Plot Omicron triggers. More...
#include <Oplot.h>


Public Member Functions | |
| double | GetSNRThreshold (const int aCollIndex) |
| Returns the SNR thrshold of given collection. | |
| void | PrintLoudestEventMap (const string aFileName="") |
| Prints the loudest event map. | |
| void | SetSNRThresholds (const double aSNR0, const double aSNR1, const double aSNR2, const double aSNR3) |
| Defines new SNR thrsholds. | |
| void | SetTimeRange (const int aTimeMin, const int aTimeMax) |
| Defines a new time range for the plots. | |
Constructors and destructors | |
| Oplot (const string aPattern, const string aDirectory="", const int aVerbose=0) | |
| Constructor of the Oplot class. | |
| virtual | ~Oplot (void) |
| Destructor of the Oplot class. | |
Plot Omicron triggers.
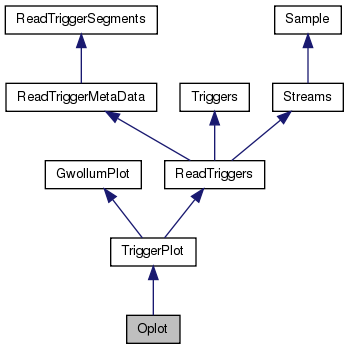
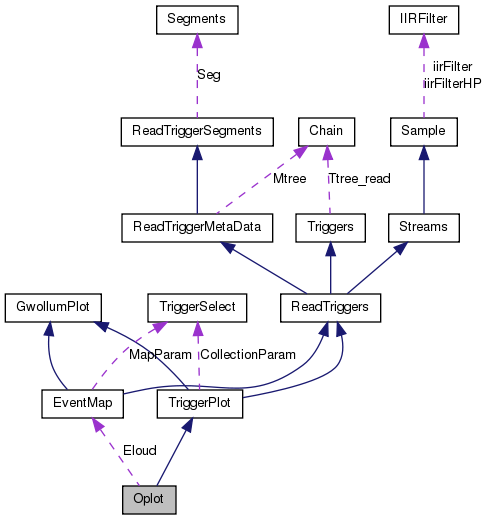
This class was specifically designed to plot Omicron triggers. It inherits from the TriggerPlot class. This class is actually just a wrapper of TriggerPlot as it defines 4 trigger collections differing by a SNR threshold. These collections are then assigned a given plotting style (colors, markers...).
| Oplot::Oplot | ( | const string | aPattern, | |
| const string | aDirectory = "", |
|||
| const int | aVerbose = 0 | |||
| ) |
Constructor of the Oplot class.
The 4 TriggerPlot collections are defined over TIME clusters (not triggers!) with 4 different SNR thresholds (atomatically set) and 4 different plotting styles.
| aPattern | input file pattern | |
| aDirectory | trigger ROOT directory | |
| aVerbose | verbosity level |
| Oplot::~Oplot | ( | void | ) | [virtual] |
Destructor of the Oplot class.
| double Oplot::GetSNRThreshold | ( | const int | aCollIndex | ) |
Returns the SNR thrshold of given collection.
| aCollIndex | collection index |
| void Oplot::PrintLoudestEventMap | ( | const string | aFileName = "" |
) |
Prints the loudest event map.
After the plots have been made (see TriggerPlot::MakeCollections()), the loudest event of the plot can be mapped. The resulting map can be saved in a file if aFileName is used.
| aFileName | output file name |
| void Oplot::SetSNRThresholds | ( | const double | aSNR0, | |
| const double | aSNR1, | |||
| const double | aSNR2, | |||
| const double | aSNR3 | |||
| ) |
Defines new SNR thrsholds.
| SNR0 | first SNR threshold | |
| SNR1 | second SNR threshold | |
| SNR2 | third SNR threshold | |
| SNR3 | fourth SNR threshold |
| void Oplot::SetTimeRange | ( | const int | aTimeMin, | |
| const int | aTimeMax | |||
| ) |
Defines a new time range for the plots.
By default, the time range is given by the input trigger files.
| aTimeMin | starting time | |
| aTimeMax | stopping time |
 1.6.1
1.6.1