Plot triggers. More...
#include <TriggerPlot.h>
Public Member Functions | |
| int | GetCollectionNClusters (const int aCollIndex) |
| Returns the number of clusters in a given collection. | |
| TriggerSelect * | GetCollectionSelection (const int aCollIndex=0) |
| Returns the selection of a given collection. | |
| bool | MakeCollections (const int aCollIndex=-1) |
| Builds collection plots. | |
| bool | PrintCollectionPanel (void) |
| Prints all plots from all collections. | |
| bool | PrintCollectionPlot (const string aPlotType) |
| Prints a given plot type from all collections. | |
| bool | PrintPlot (const string aPlotType, const int aCollIndex=0, const bool aFirst=true) |
| Prints a given plot type from a given collection. | |
| bool | PrintPlots (const string aPlotType, const vector< int > aCollIndexes, const bool aFirst=true) |
| Prints a given plot type from a few collections. | |
| bool | PrintProcPlot (const string aPlotType, const string aProcType, const string aProcName, const vector< int > aCollIndexes, const bool aFirst=true) |
| Prints a processed plot. | |
| bool | SetCollectionColor (const int aCollIndex, const int aColorIndex) |
| Assigns a color to a collection. | |
| bool | SetCollectionLegend (const int aCollIndex, const string aLegend) |
| Sets a legend to a collection. | |
| bool | SetCollectionMarker (const int aCollIndex, const int aMarkerStyleIndex, const double aMarkerSizeIndex=1.0) |
| Assigns a marker style to a collection. | |
| bool | SetCollectionUseClusters (const int aCollIndex, const int aUseClusters=1) |
| Use clusters for a given collection. | |
| void | SetDateFormat (const bool aDateFormat=true) |
| Sets the time format. | |
Constructors and destructors | |
| TriggerPlot (const int aNcoll, const string aPattern, const string aDirectory="", const int aVerbose=0) | |
| Constructor of the TriggerPlot class. | |
| virtual | ~TriggerPlot (void) |
| Destructor of the TriggerPlot class. | |
Protected Attributes | |
| TGraph ** | Gfreqtime |
| freq vs. time | |
| TGraph * | Gfreqtimeloud |
| freq vs. time (loudest event) | |
| TGraph * | Gfreqtimeloud2 |
| freq vs. time (loudest event) | |
| TGraph ** | Gsnrfreq |
| SNR vs. freq. | |
| TGraph ** | Gsnrtime |
| SNR vs. time. | |
| TH1D ** | Hfreq |
| frequency | |
| TH2D ** | Hfreqtime |
| freq vs. time container | |
| TH1D * | Hproc |
| processed histogram | |
| TH1D ** | Hsnr |
| SNR. | |
| TH2D ** | Hsnrfreq |
| SNR vs. freq container. | |
| TH2D ** | Hsnrtime |
| SNR vs. time container. | |
| TH1D ** | Htime |
| time (rate) | |
| int | Ncoll |
| number of collections | |
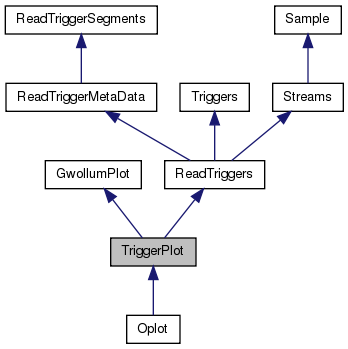
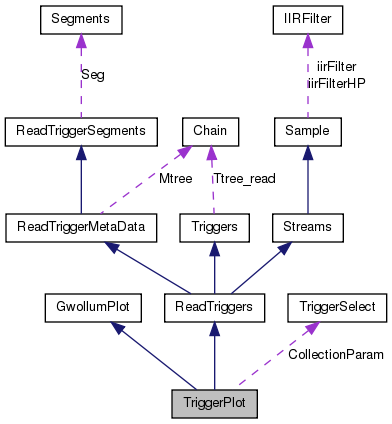
Plot triggers.
This class was designed to produce and display a 'collection' of plots representing a set of triggers. A collection is composed of several plot types:
A collection is defined by a 'selection' which is a set of criteria used to select the triggers to be plotted. This way, several collections can be defined and plotted in the same time.
| TriggerPlot::TriggerPlot | ( | const int | aNcoll, | |
| const string | aPattern, | |||
| const string | aDirectory = "", |
|||
| const int | aVerbose = 0 | |||
| ) |
Constructor of the TriggerPlot class.
A set of 'aNcoll' collections of plots are initialized. They will be filled with the input triggers. See ReadTriggers::ReadTriggers() to know how to input triggers. By default, the plot settings are defined using the input trigger metadata and are the same for all collections.
| aNcoll | number of collections | |
| aPattern | input file pattern | |
| aDirectory | trigger ROOT directory | |
| aVerbose | verbosity level |
| TriggerPlot::~TriggerPlot | ( | void | ) | [virtual] |
Destructor of the TriggerPlot class.
| int TriggerPlot::GetCollectionNClusters | ( | const int | aCollIndex | ) |
Returns the number of clusters in a given collection.
| aCollIndex | collection index |
| TriggerSelect * TriggerPlot::GetCollectionSelection | ( | const int | aCollIndex = 0 |
) |
Returns the selection of a given collection.
The returned TriggerSelect pointer can be used to modify the selection of a given collection using the methods of the TriggerSelect class. NULL is returned if the call fails.
After a new selection is defined, the plots need to be remade with MakeCollections() and printed with PrintCollectionPlot();
| aCollIndex | collection index |
| bool TriggerPlot::MakeCollections | ( | const int | aCollIndex = -1 |
) |
Builds collection plots.
Once the selections are made, use this function to build all the plots for all collections. The argument of this function can be used to make a single collection instead of all.
| aCollIndex | collection index (if <0 --> make all) |
| bool TriggerPlot::PrintCollectionPanel | ( | void | ) |
Prints all plots from all collections.
The plots from all collections are superimposed on the same plot. The scale is set by the plot of the first collection.
| bool TriggerPlot::PrintCollectionPlot | ( | const string | aPlotType | ) |
Prints a given plot type from all collections.
The plots from all collections are superimposed on the same plot. The scale is set by the plot of the first collection.
| aPlotType | plot type |
| bool TriggerPlot::PrintPlot | ( | const string | aPlotType, | |
| const int | aCollIndex = 0, |
|||
| const bool | aFirst = true | |||
| ) |
Prints a given plot type from a given collection.
If aFirst is set to false, the plot is printed on the existing print.
| aPlotType | plot type | |
| aCollIndex | collection index | |
| aFirst | flags first print |
| bool TriggerPlot::PrintPlots | ( | const string | aPlotType, | |
| const vector< int > | aCollIndexes, | |||
| const bool | aFirst = true | |||
| ) |
Prints a given plot type from a few collections.
If aFirst is set to false, the plots are printed on the existing print.
| aPlotType | plot type | |
| aCollIndexes | collection indexes | |
| aFirst | flags first print |
| bool TriggerPlot::PrintProcPlot | ( | const string | aPlotType, | |
| const string | aProcType, | |||
| const string | aProcName, | |||
| const vector< int > | aCollIndexes, | |||
| const bool | aFirst = true | |||
| ) |
Prints a processed plot.
If aFirst is set to false, the plot is printed on the existing print.
| aPlotType | plot type | |
| aProcType | process type | |
| aCollIndexes | collection indexes | |
| aFirst | flags first print |
| bool TriggerPlot::SetCollectionColor | ( | const int | aCollIndex, | |
| const int | aColorIndex | |||
| ) |
Assigns a color to a collection.
| aCollIndex | collection index | |
| aColorIndex | color index (ROOT conventions) |
| bool TriggerPlot::SetCollectionLegend | ( | const int | aCollIndex, | |
| const string | aLegend | |||
| ) |
Sets a legend to a collection.
Then use GwollumPlot::DrawLegend() to add the legend to the current plot.
| aCollIndex | collection index | |
| aLegend | legend label |
| bool TriggerPlot::SetCollectionMarker | ( | const int | aCollIndex, | |
| const int | aMarkerStyleIndex, | |||
| const double | aMarkerSizeIndex = 1.0 | |||
| ) |
Assigns a marker style to a collection.
| aCollIndex | collection index | |
| aMarkerStyleIndex | marker style index (ROOT conventions) | |
| aMarkerSizeIndex | marker size index (ROOT conventions) |
| bool TriggerPlot::SetCollectionUseClusters | ( | const int | aCollIndex, | |
| const int | aUseClusters = 1 | |||
| ) |
Use clusters for a given collection.
This function modifies the selection of collection 'aCollIndex': clusters are used instead of triggers. Of course the trigger set must be clustered first.
In fact the selection is applied to the cluster tag set with Triggers::SetClusterTag() with the following rules:
| aCollIndex | collection index | |
| aUseClusters | cluster tag selection |
| void TriggerPlot::SetDateFormat | ( | const bool | aDateFormat = true |
) |
Sets the time format.
This function can be used to switch the time format from a GPS scale to a date format.
| aDateFormat | time format: true = date, false = GPS |
TGraph** TriggerPlot::Gfreqtime [protected] |
freq vs. time
TGraph* TriggerPlot::Gfreqtimeloud [protected] |
freq vs. time (loudest event)
TGraph* TriggerPlot::Gfreqtimeloud2 [protected] |
freq vs. time (loudest event)
TGraph** TriggerPlot::Gsnrfreq [protected] |
SNR vs. freq.
TGraph** TriggerPlot::Gsnrtime [protected] |
SNR vs. time.
TH1D** TriggerPlot::Hfreq [protected] |
frequency
TH2D** TriggerPlot::Hfreqtime [protected] |
freq vs. time container
TH1D* TriggerPlot::Hproc [protected] |
processed histogram
TH1D** TriggerPlot::Hsnr [protected] |
SNR.
TH2D** TriggerPlot::Hsnrfreq [protected] |
SNR vs. freq container.
TH2D** TriggerPlot::Hsnrtime [protected] |
SNR vs. time container.
TH1D** TriggerPlot::Htime [protected] |
time (rate)
int TriggerPlot::Ncoll [protected] |
number of collections
 1.6.1
1.6.1

