Single triggers
The plot shows, as a function of time, the ranking statistic of the loudest single-detector events observed during the chunk.
If the plot and the table below are empty, it means no single trigger fulfills these requirements.
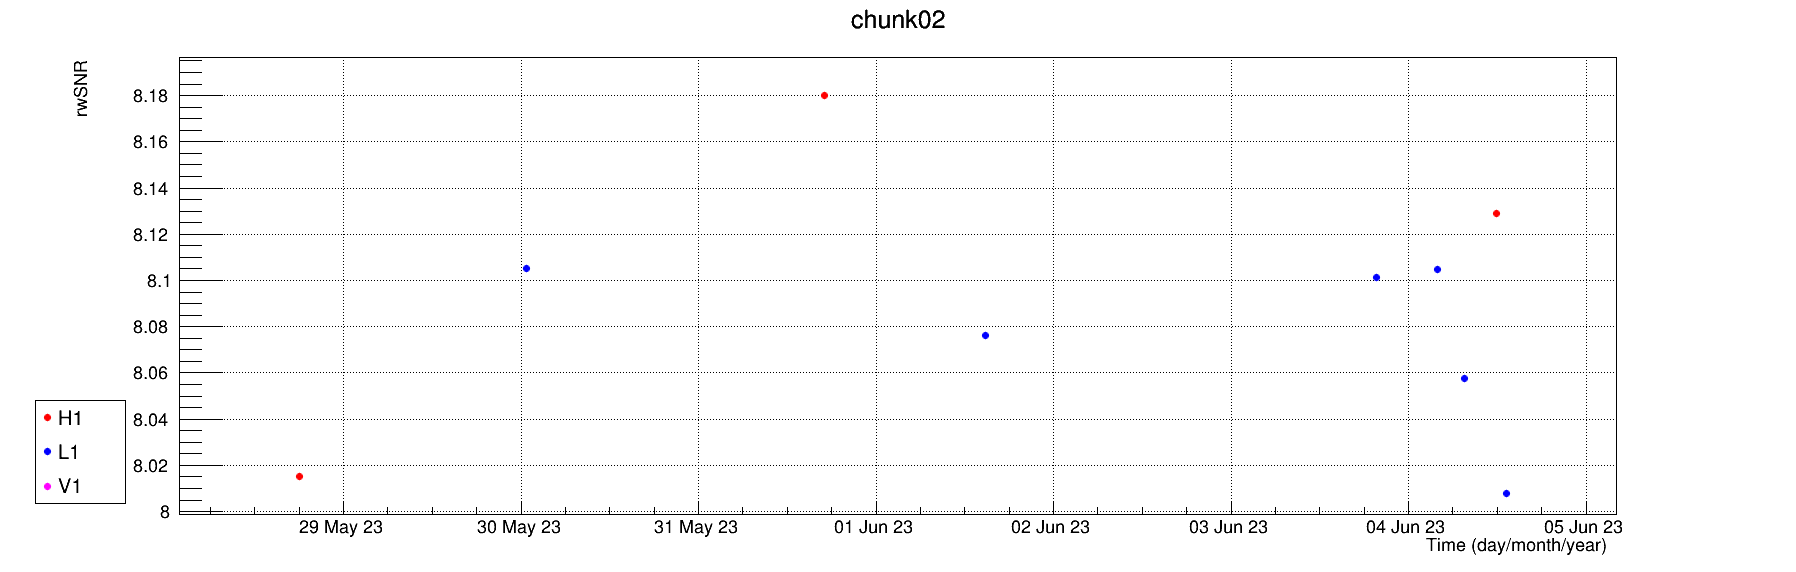
Fig 2c.1 : Single-detector events, with ranking statistic
(shown on the y axis) higher than 8, as a function of the time during the chunk.
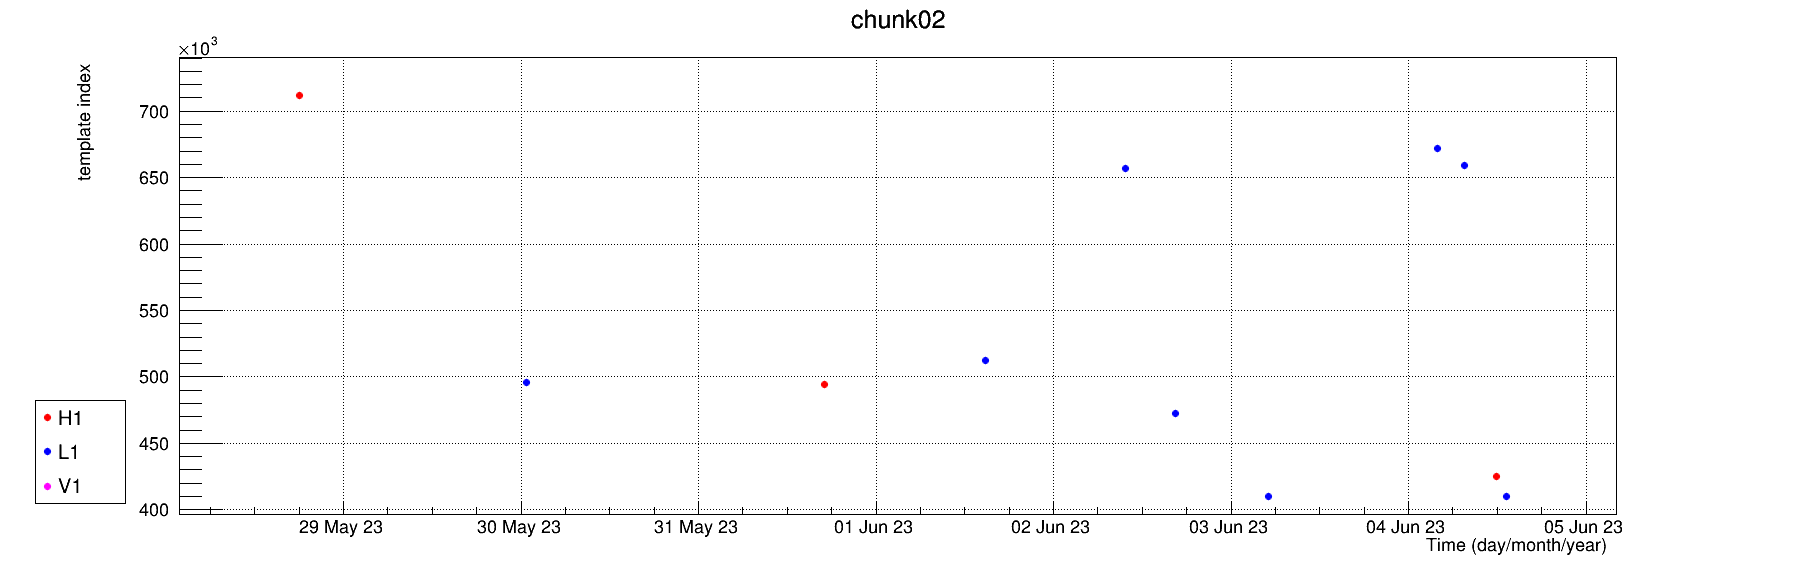
Fig 2c.2 : Template index as function of the time during the chunk, for single-detector events with ranking statistic higher than 8.
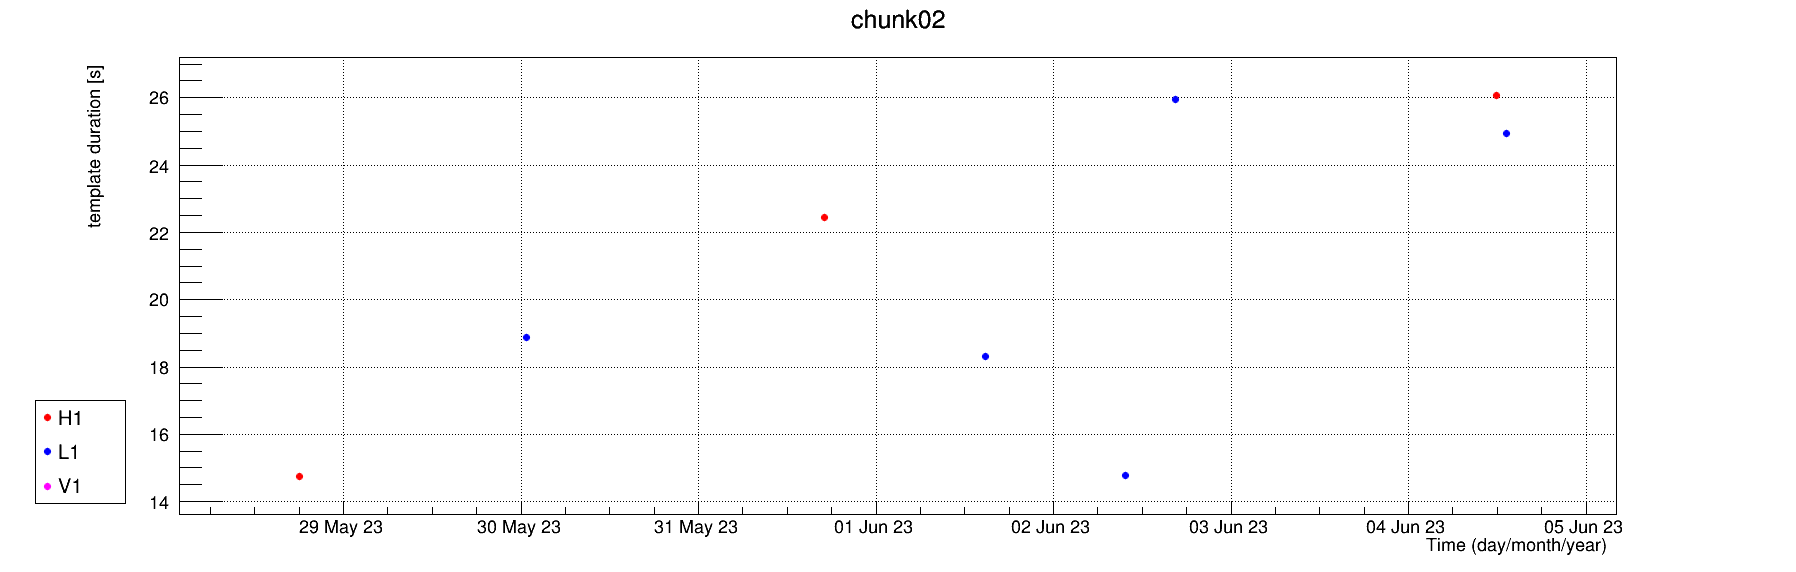
Fig 2c.3 : Template duration as function of the time during the chunk, for single-detector events with ranking statistic higher than 8.
The loudest single-detector events observed during the chunk are listed in the table below, ordered by decreasing ranking statistic. The table shows, for each event, the value of the ranking statistic (RS = reweighted SNR times the Excess Rate weight), raw SNR, SNRmax (maximum raw SNR across the template bank) and the weight applied to the SNR by the Excess Rate procedure. The events highlighted in bold have their ranking statistic close to their SNRmax and therefore are more likely to be real events than glitches. The SNRmax can be related to a template for which the chi2 was very bad, and hence the reweighted SNR quite low (this is typical of glitches). In these cases the template with maximum raw SNR is not the chosen one, and SNRmax can be higher than SNR.
| GPS time | UTC | cRS | SNR | SNRmax | ERw | mass1 | mass2 | ITF |
|---|