The distributions below show the fraction of simulated events that are detected, as a function of the effective distance and chirp mass. We consider detected events from HL double coincidences, with a minimum combined SNR of 8.


Sensitivity of the search
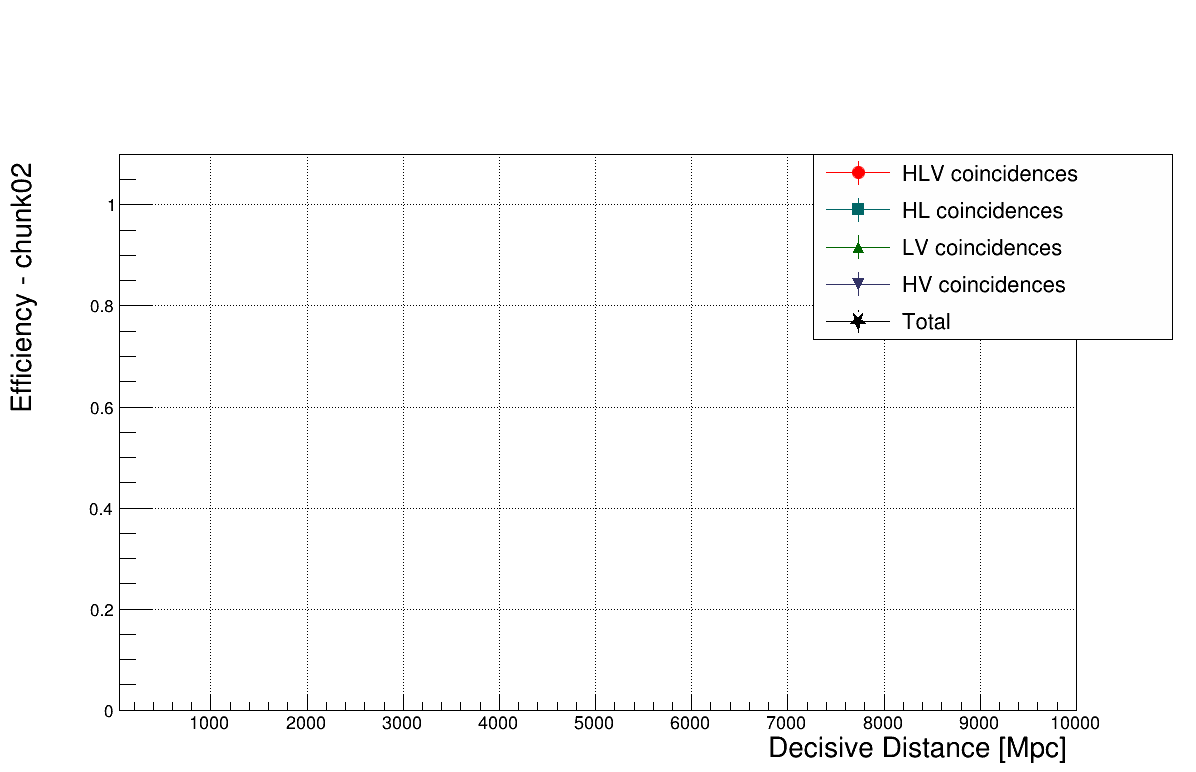
Fig 1c.1.1 : Efficiency of detection as a function of the decisive distance (the second highest effective distance). The top panel shows the distribution of the effective distance for simulated events.
Fig 1c.1.2 : Efficiency of detection as a function of the chirp mass. The top panel shows the distribution of the chirp mass for simulated events.

Fig 1c.1.3 : Efficiency of detection as a function of the total mass. The top panel shows the distribution of the chirp mass for simulated events.


Fig 1c.1.4 : Distribution of pAstro as a function of the IFAR, for all double coincidences.
Fig 1c.1.5 : Confusion matrix of simulated GW signals.


Fig 1c.1.6 : Detection efficiency (any kind of coincidence) in the plane decisive distance (the second highest effective distance) vs chirp mass, total mass, and mass ratio.

© 2023 MBTA