This page collects the distributions we monitor to make sure the false alarm rate (FAR) we associate to an event is correct. The FAR is evaluated starting from all the single trigger events, that are used to build fake coincidences
FAR monitoring
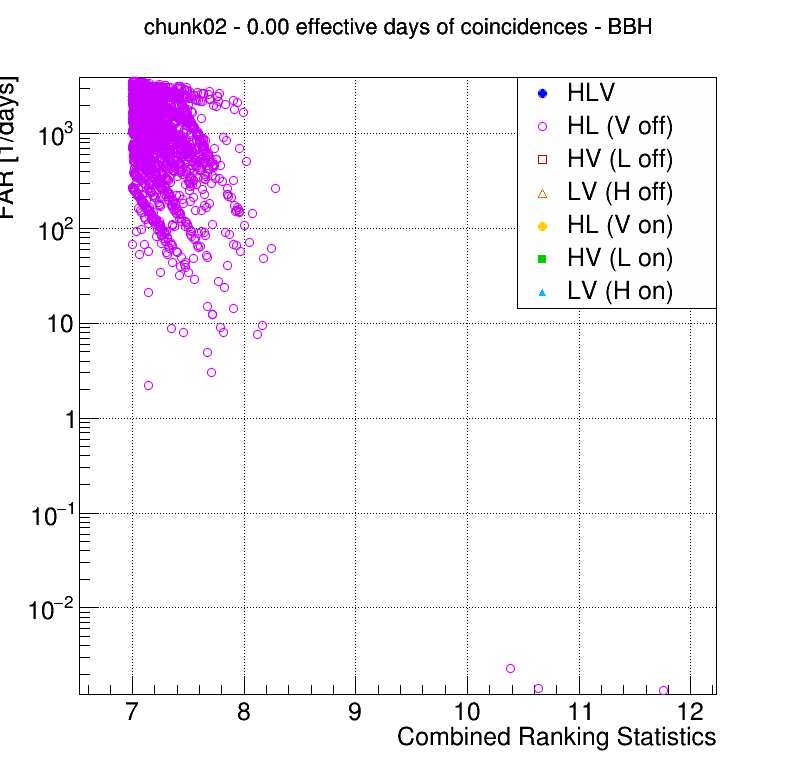
Fig 3.1.1 : Distribution of the FAR as a function of the cRS, for all double coincidences.
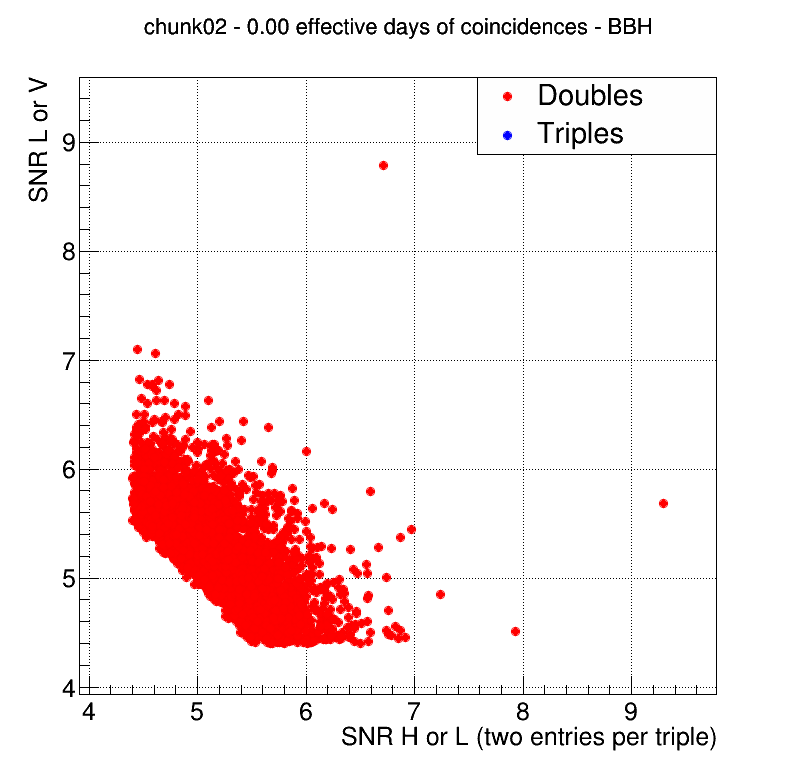
Fig 3.1.2 : For double coincidences, SNR of L or V as a function of the SNR of H or L
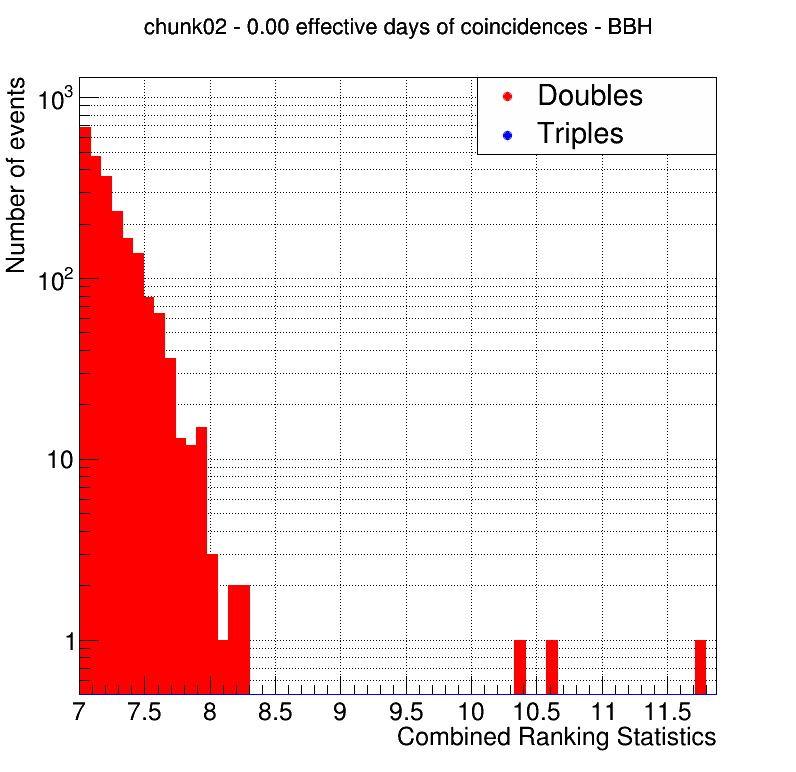
Fig 3.2.1 : Distribution of the cRS for double coincidences
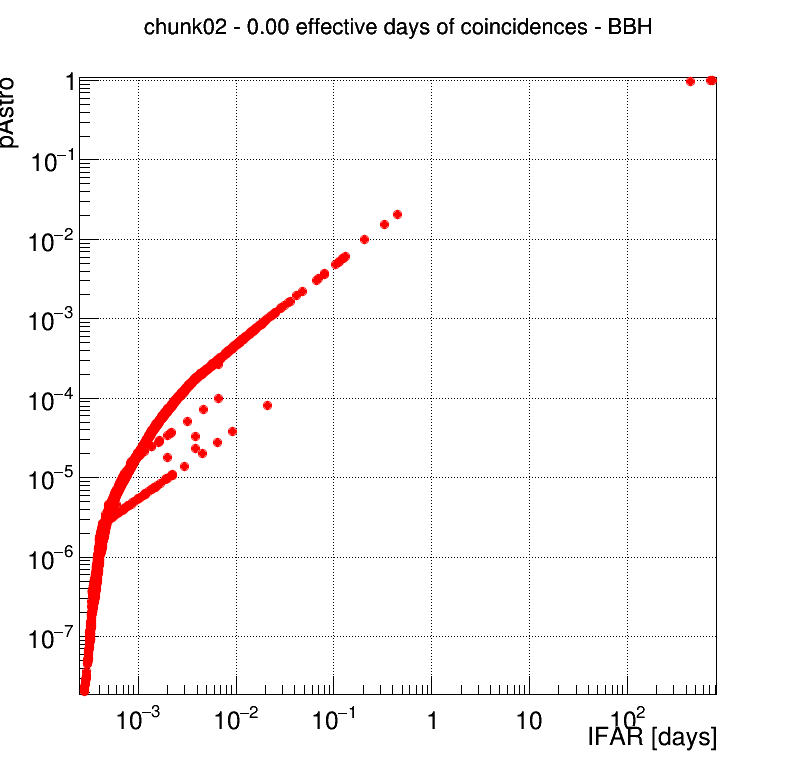
Fig 3.2.2 : Distribution of pAstro as a function of the IFAR, for all double coincidences.
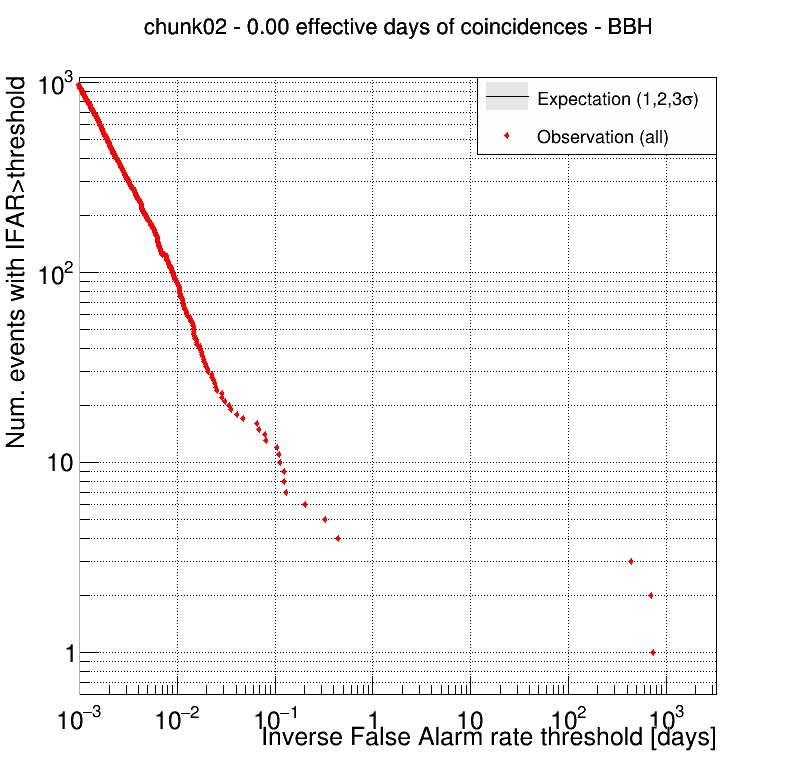
Fig 3.3 : For double coincidences, number of events with IFAR higher than a threshold, as a function of the threshold value (red points). The grey band shows the expected distribution, with poissonian errors. The error bars on events show the systematic variation of the IFAR value due to noise non-stationarity.
Candidates
| GPS time | UTC | cRS | Detectors | IFAR [years] | FAR [Hz] | mchirp | mass1 | mass2 | SNR H | SNR L | pBBH | pNSBH | pBNS | iDQ | GraceDB |
|---|