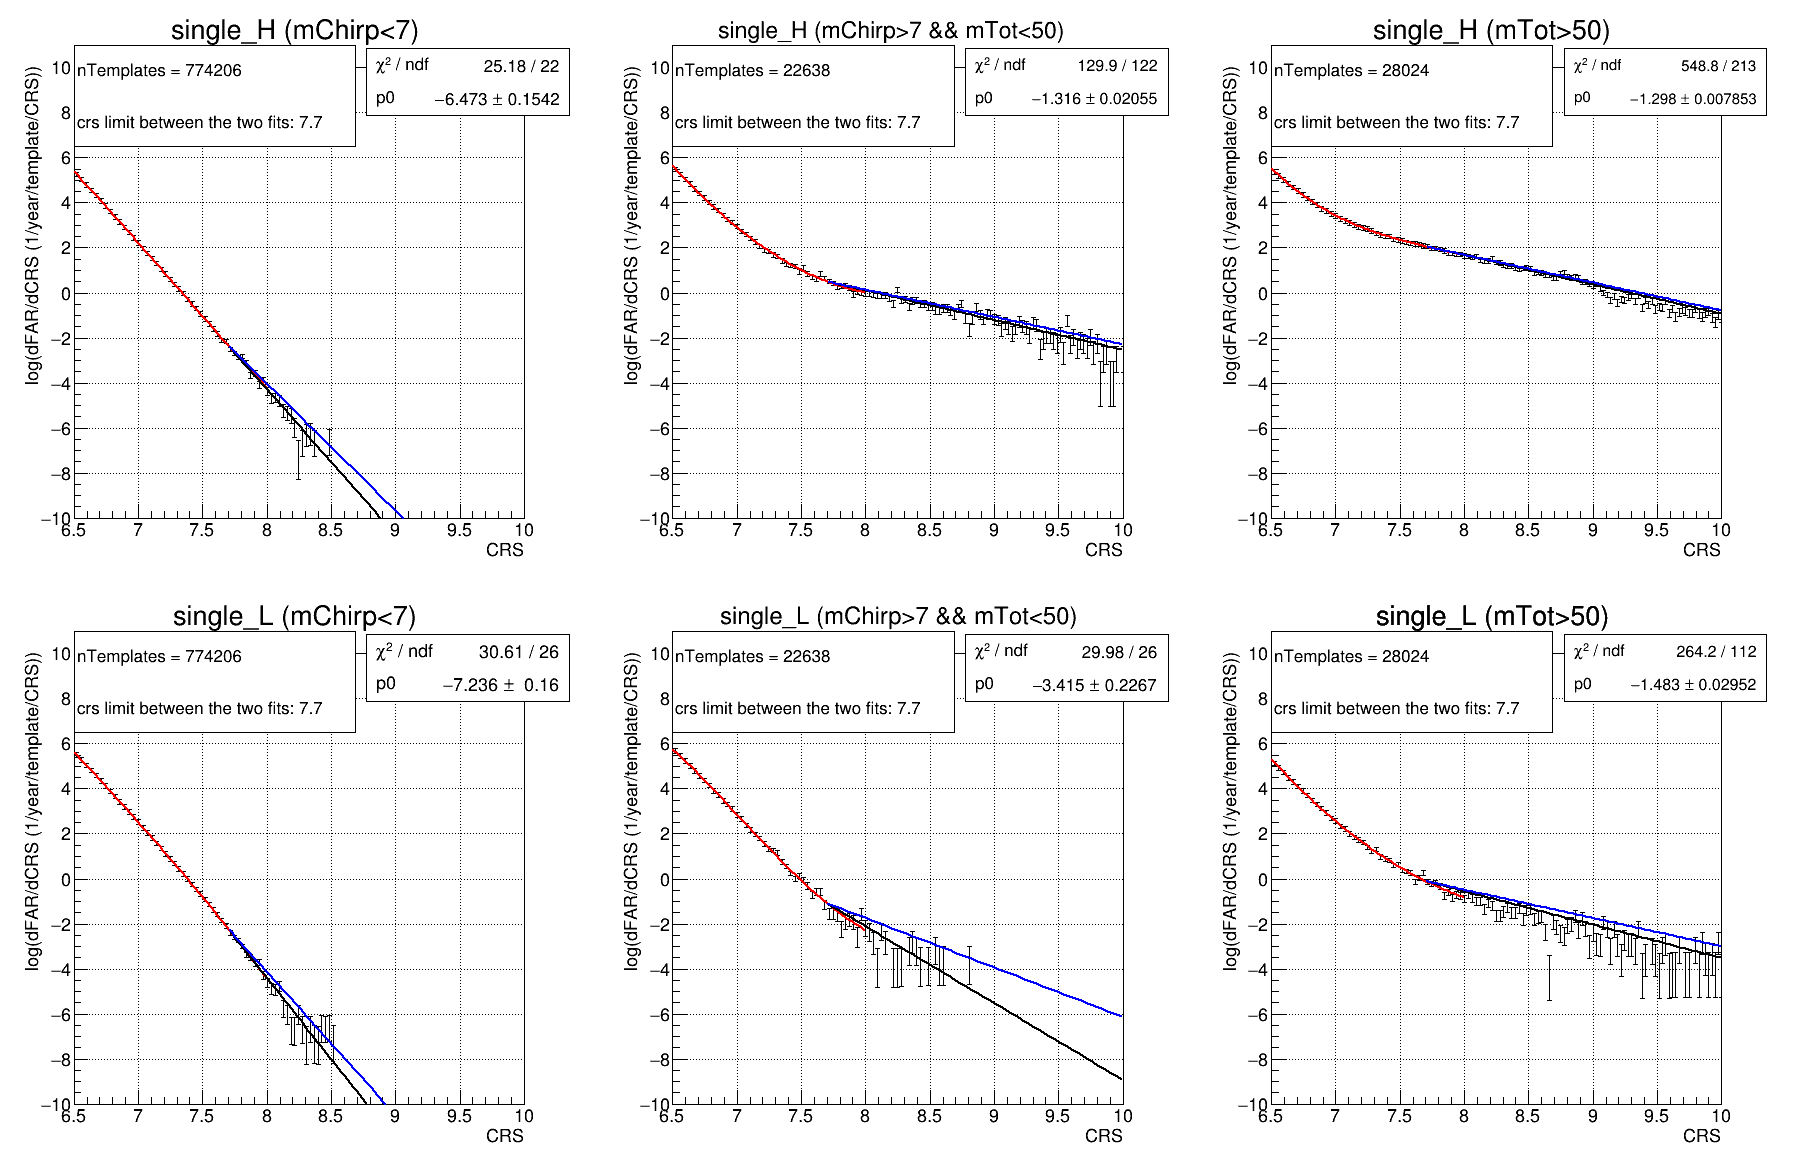
FAR model
The false alarm rate and pastro for MBTA candidates are calculated in different 2-dimensional bins of the parameters space (see this technical note about the O4a template bank used by MBTA). For a chirp mass smaller than 7 solar masses, the binning is done using the variables chirp mass (43 bins) and mass ratio (3 bins), for larger chirp mass values, the binning is done using the variables total mass (40 bins) and effective spin (3 bins). For coincident triggers, and for each bin, we first build a FAR vs cRS model, by making all possible asynchronous random combination of single detector triggers from the same template obtained on data (before clustering, and excluding times around confirmed detections). The fit of the FAR vs CRS for each bin is shown in figure 2b.1 (top). We associate a FAR value to single-detector triggers only for possibly EM-bright sources (chirp mass smaller than 7 solar masses). To evaluate the FAR as a function of CRS for single-detector triggers, we accumulate background triggers (before clustering) using the same bins in parameters space as for coincidences (figure 2b.1 bottom).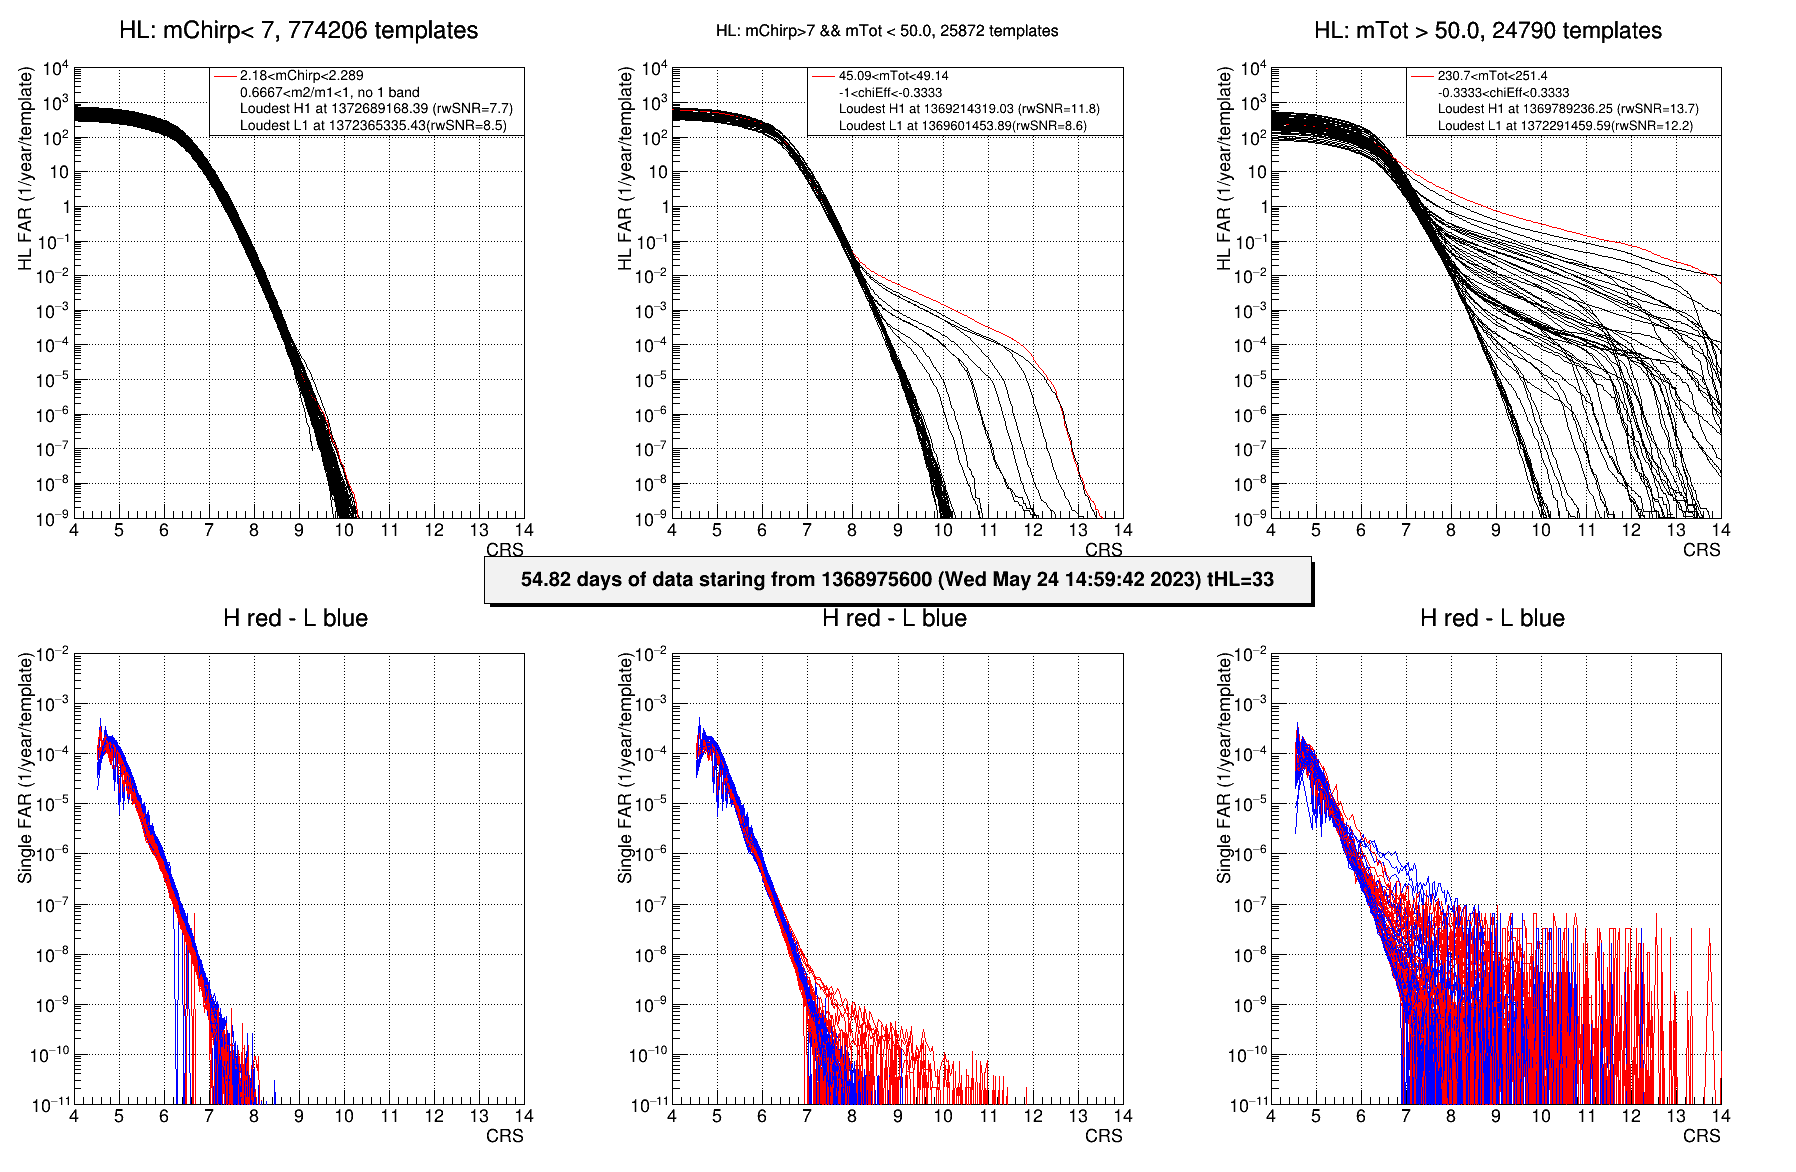
Fig 2b.1 : each curve represents the fit to the FAR distribution as a function of the combined ranking statistics, in one bin in chirp mass and mass ratio, in units (1/year) and per template (i.e. divided by the number of templates in the specific bin).
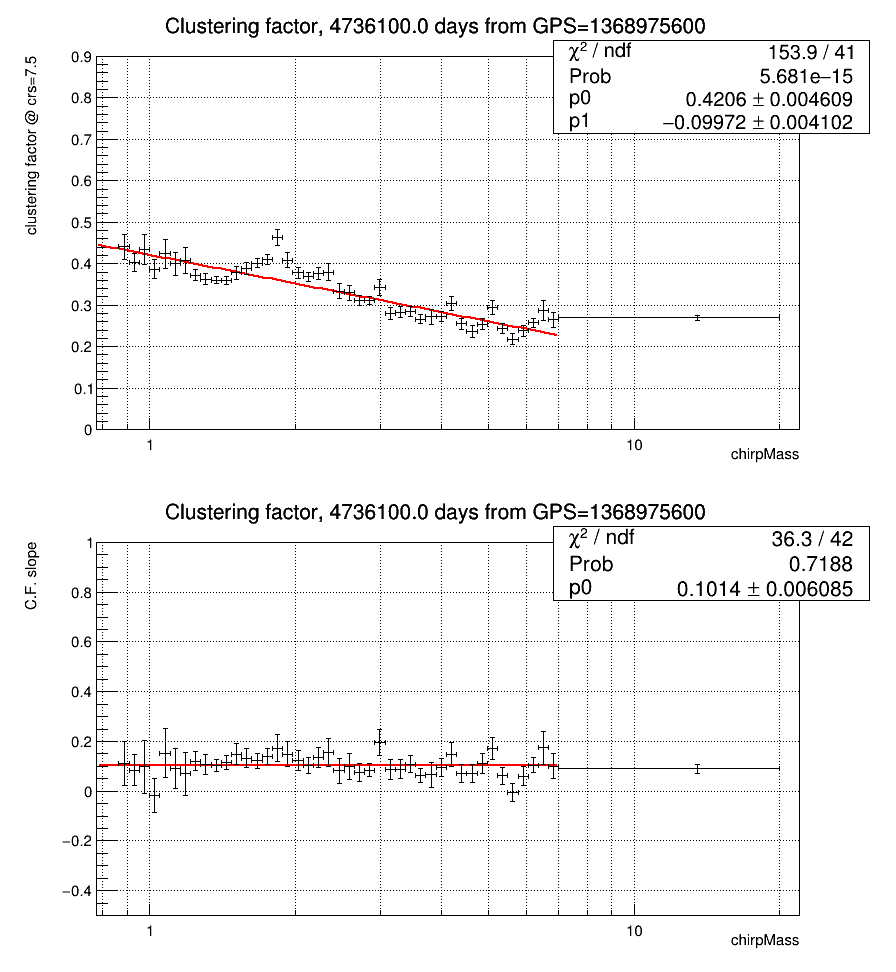
Fig 2b.2 : value of the constant term (for CRS=7.5, top) and slope (bottom) obtained by a fit to the ratio between clustered and un-clustered triggers (the clustering factor) in each chirp mass bin. The red curves are fits of the values as a function of the chirp mass, and represent the actual clustering factor applied to candidates.
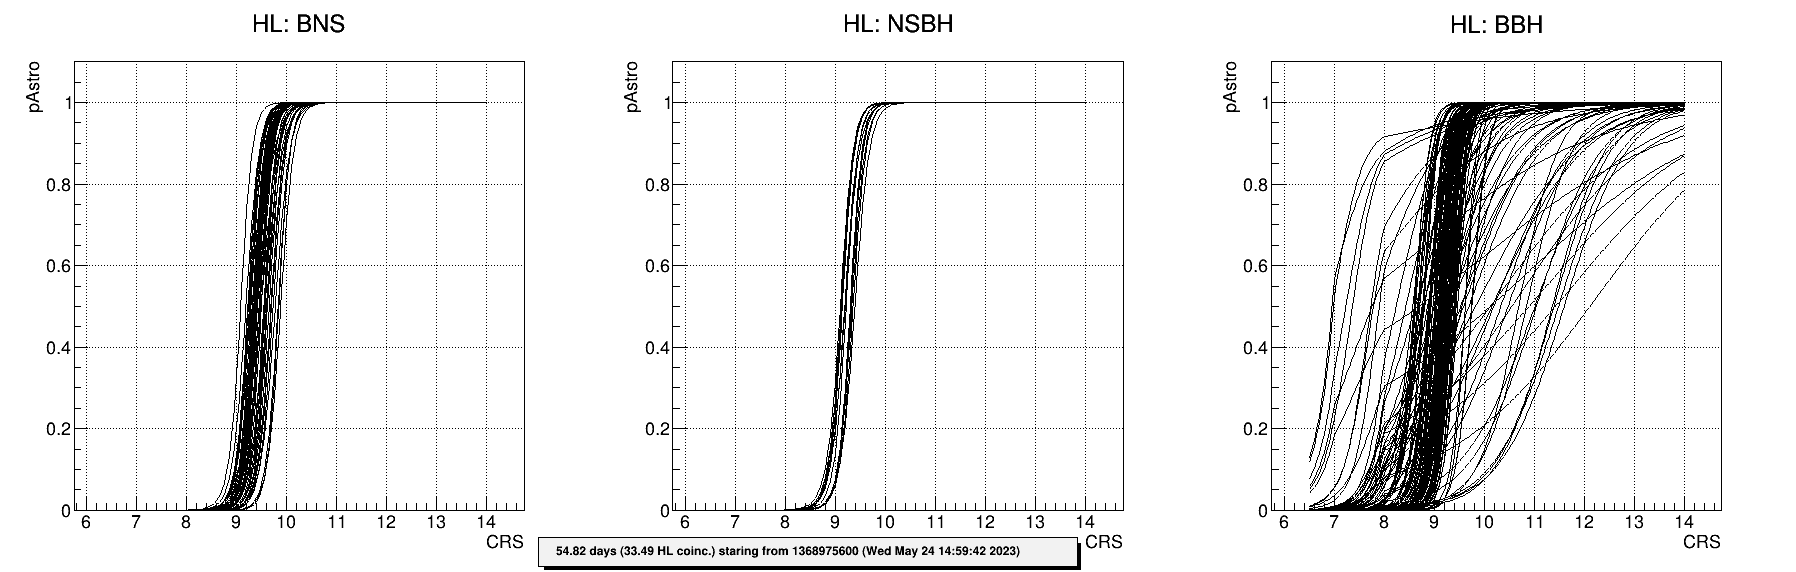
Fig 2b.3 : each curve represents the fit to the pastro distribution as a function of the combined ranking statistics, in one bin in chirp mass and mass ratio.
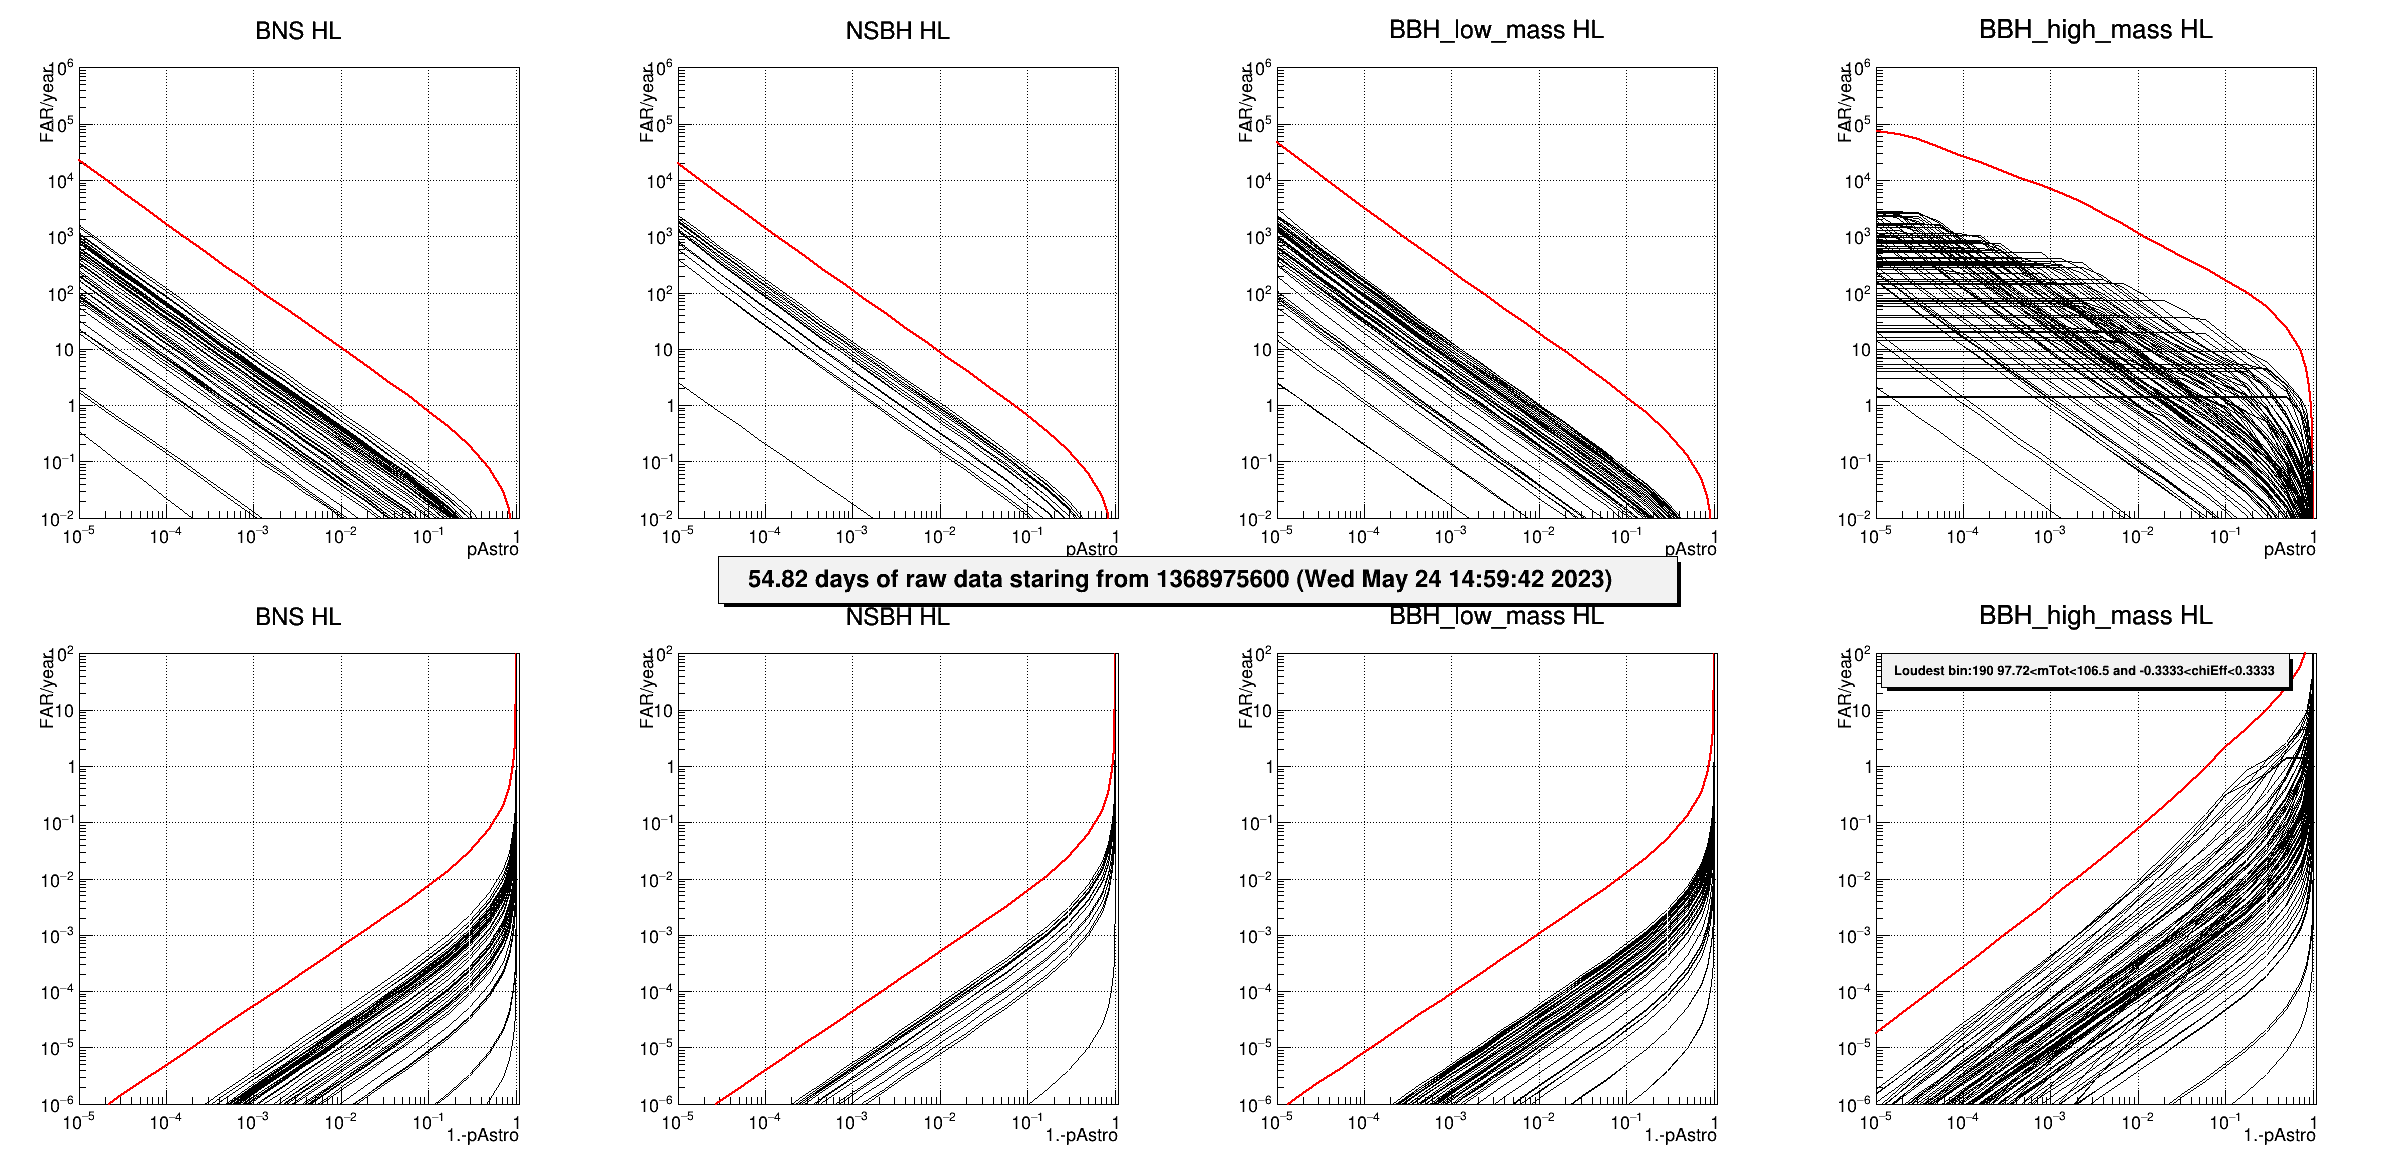
Fig 2b.4 : FAR (1/year) as a function of pastro for HL coincidences. The different pads show different regions in the parameters space and each black curve refers to a given bin (each bin is associated to the source type with the largest expected number of events). The red curve is the sum of all black curves and represents the final FAR per source type.
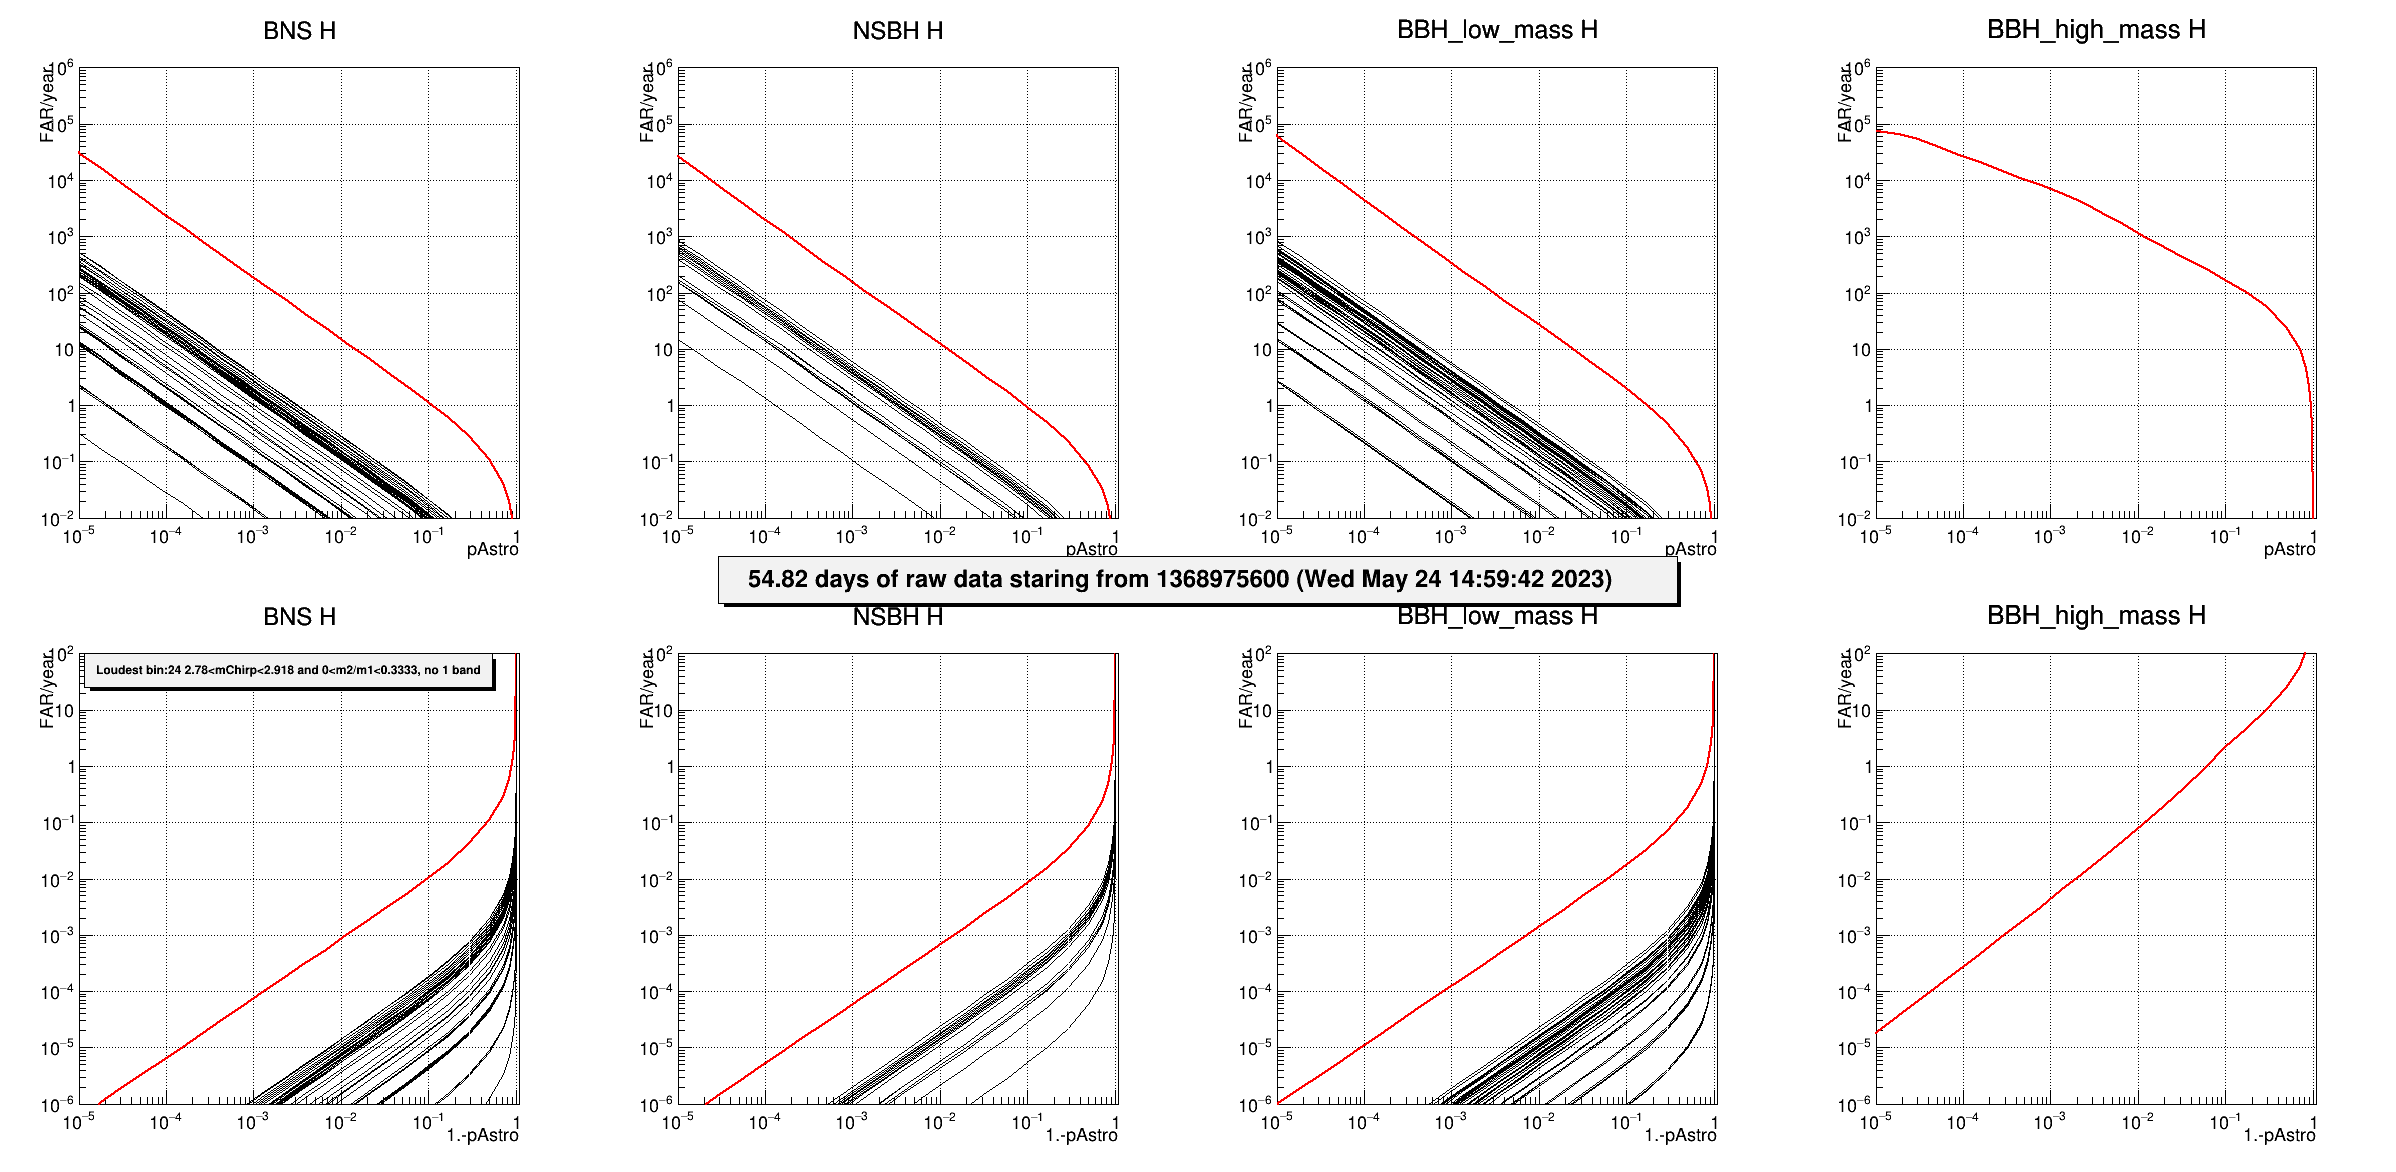
Fig 2b.5 : FAR (1/year) as a function of pastro for single-detector triggers in H. The different pads show different regions in the parameters space and each black curve refers to a given bin (each bin is associated to the source type with the largest expected number of events). The red curve is the sum of all black curves and represents the final FAR per source type.
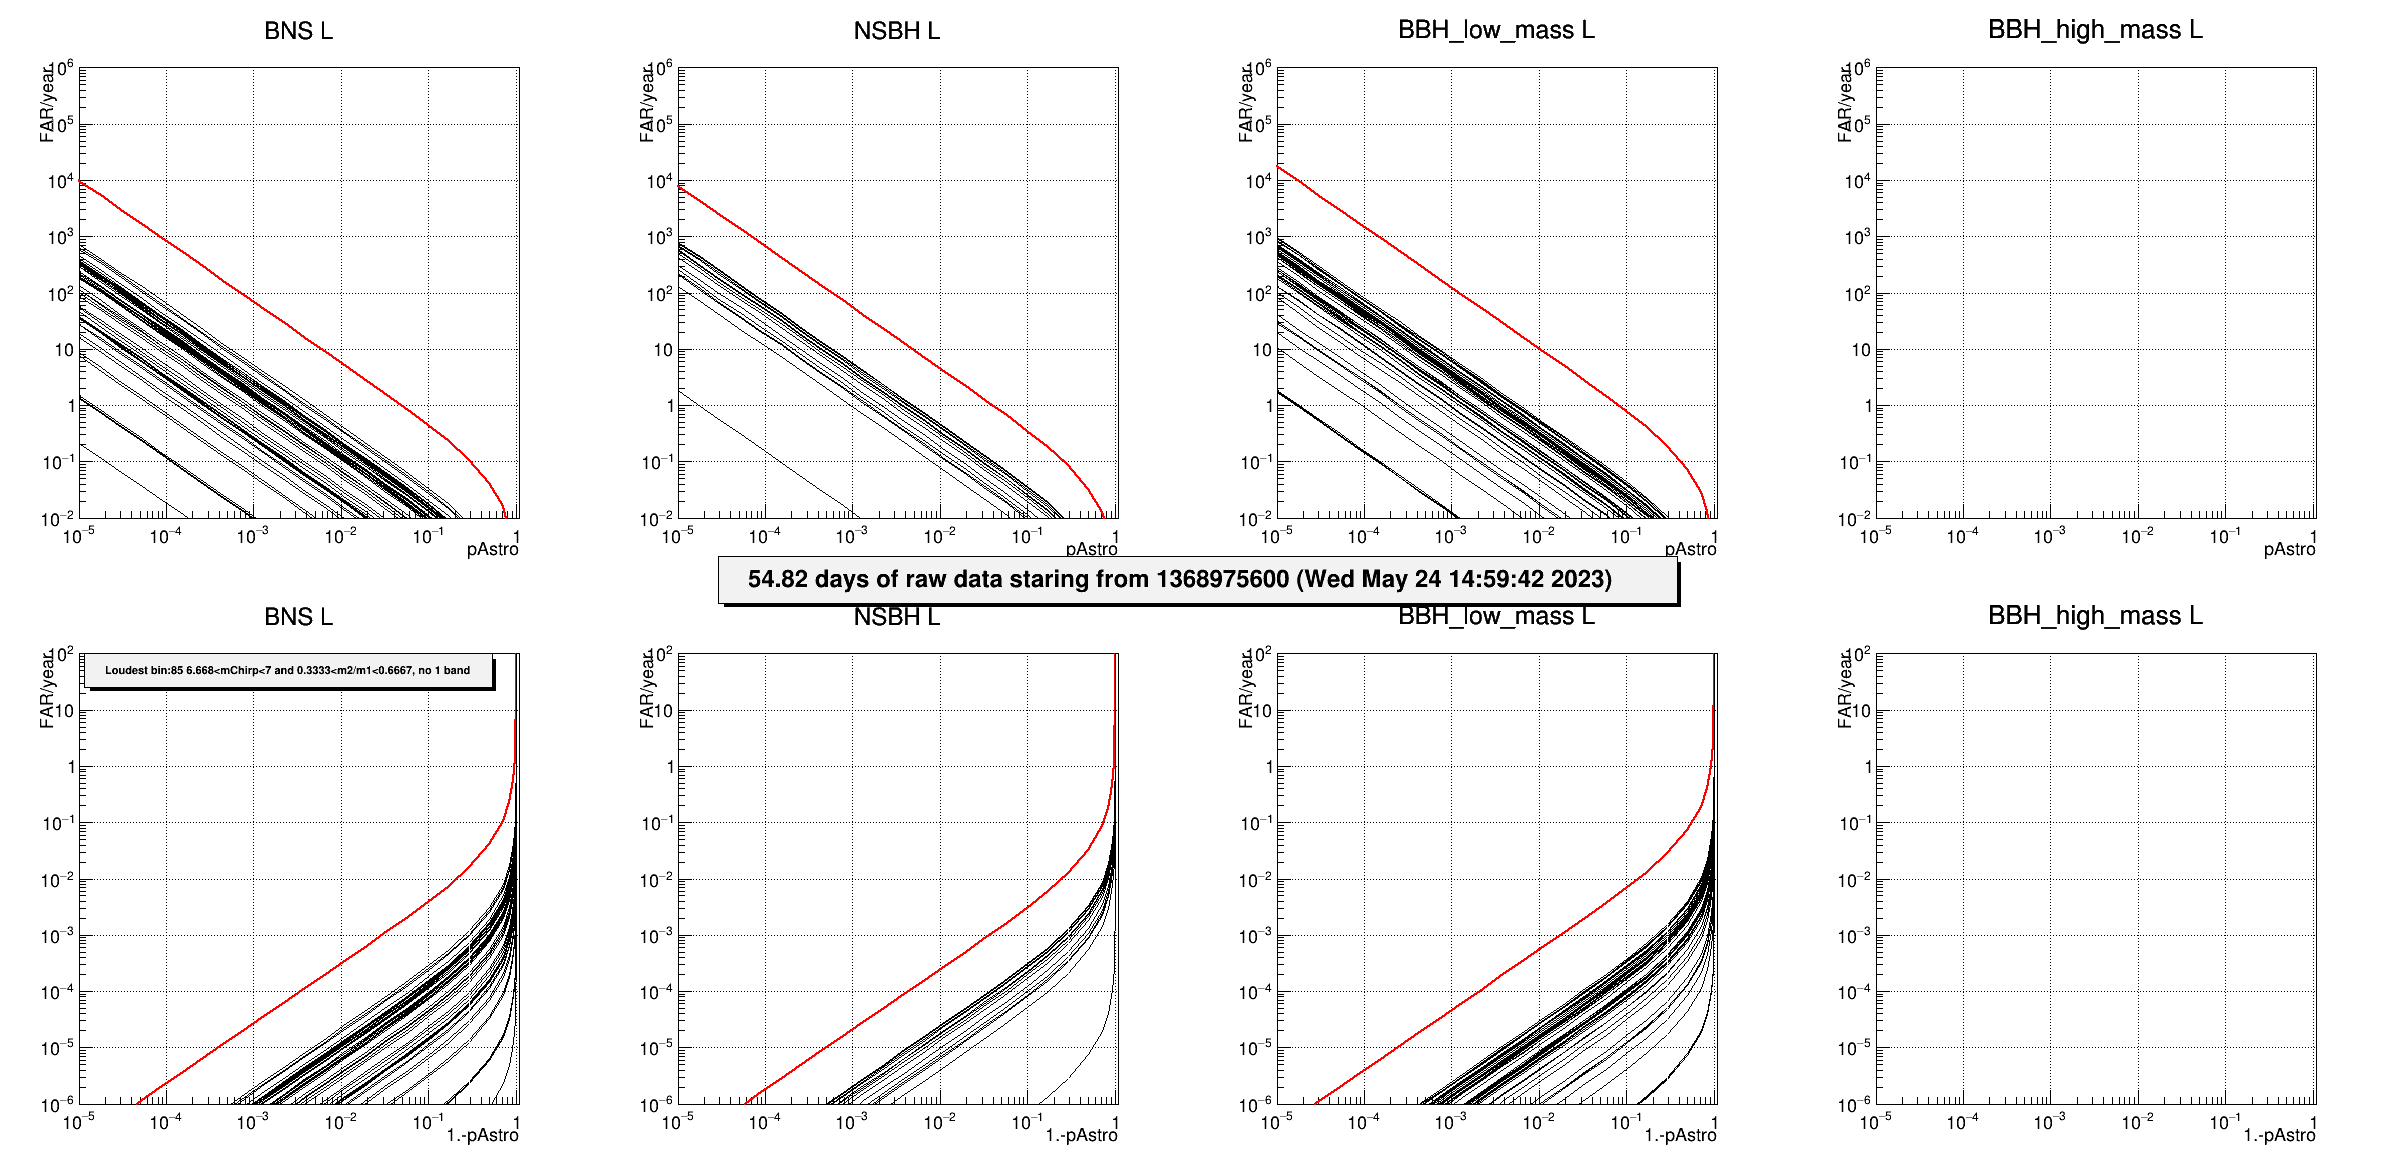
Fig 2b.6 : FAR (1/year) as a function of pastro for single-detector triggers in L. The different pads show different regions in the parameters space and each black curve refers to a given bin (each bin is associated to the source type with the largest expected number of events). The red curve is the sum of all black curves and represents the final FAR per source type.