Omicron has been derived from a well-known 'burst-type' search pipeline called Q-pipeline (a.k.a Omega). Q-pipeline is able to detect and characterize detector glitches with a very good efficiency and precision. So, the idea was to adapt it for detector characterization purposes, i.e. to run it over many auxiliary channels. To achieve this, the original matlab code has been replaced by a C++ architecture and many steps have been removed to run faster. The name Omicron was chosen to recall the Omega inheritance.
Index:
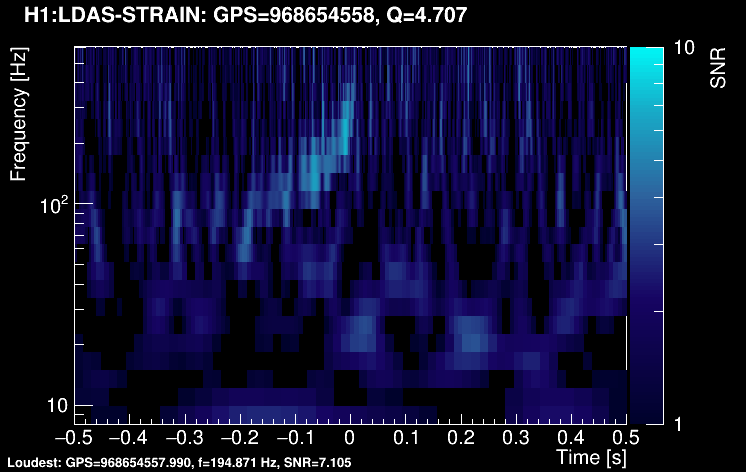
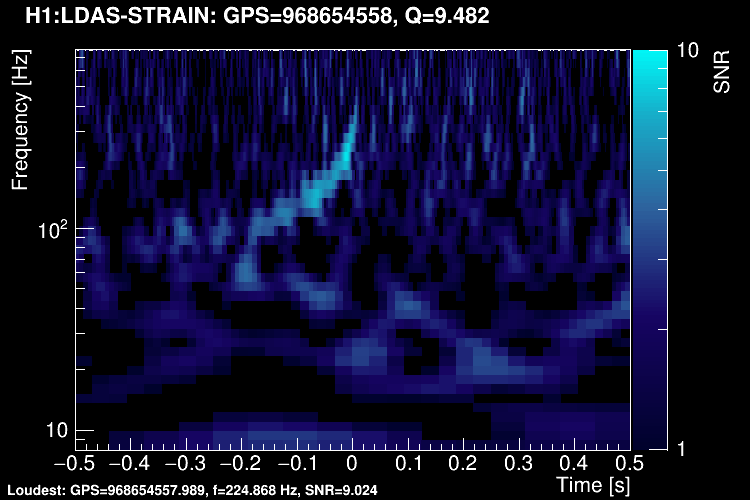
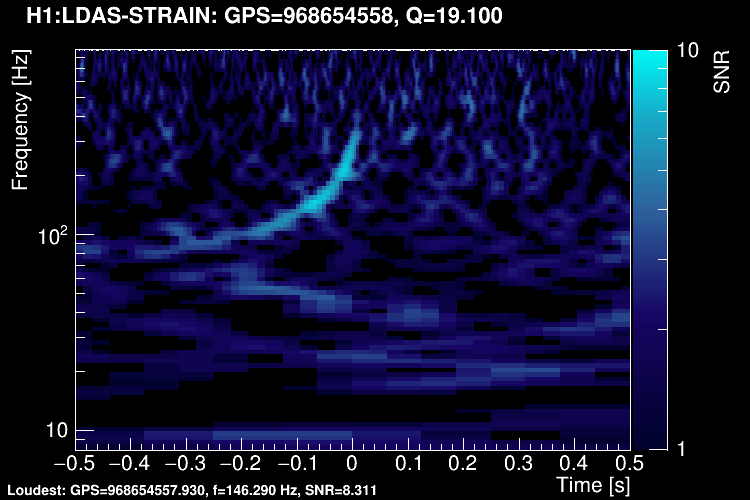
The Omicron algorithm is based on the Q-transform which consists of projecting the data onto a template bank of windowed complex exponentials defined by a central time, a central frequency, and a quality factor. The window is approximately Gaussian. The template bank is constructed to cover a finite region in central time, central frequency, and Q such that mismatch between any sinusoidal Gaussian in this signal space and the nearest basis function does not exceed a specified maximum mismatch. This naturally leads to a template bank that consists of logarithmically spaced Q planes, logarithmically spaced frequency rows, and linearly spaced tiles in time. The plots below shows the time-frequency tiling for 4 different Q values.
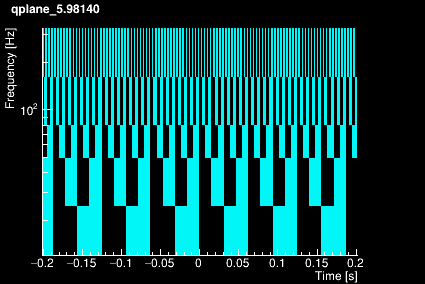 | 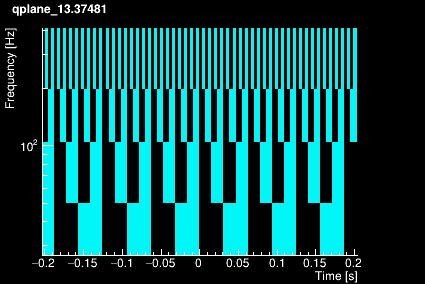 |
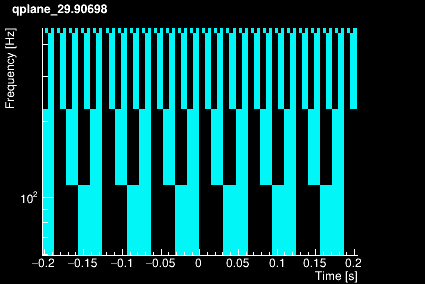 | 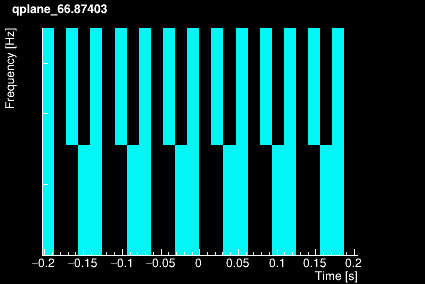 |
For each tile, a signal-to-noise ratio (SNR) is computed as the ratio of the total energy content of the tile to the local power spectral density of the data. An Omicron trigger is then defined as a tile with a SNR value greater than a given threshold. See this section for a concrete example of how the algorithm works.
Two time scales are used when running the Omicron algorithm. Data are loaded by chunk and chunks are analyzed by segment. Segments and chunks overlaps with the previous iteration by an overlap defined by the user. The overlap must be large enough to avoid edge effects. The segment structure can be represented by this cartoon:
    |________________chunk_________________|
    |                                   |_____________next chunk_____________|
    |----seg----|                          |
             |----seg----|                 |
	              |----seg----|        |
		               |----seg----|
			                |--|
					overlap
For each segment, triggers (t) are extracted as follows (overlap divided in 2):
	            |-----| ← overlap
    |---------seg---------|
       |ttttttttttttttt|
	               |
                    |---------seg---------|
		       |ttttttttttttttt|
Chunk data are used for the noise estimation (PSD). It should be large enough to get a reliable noise average but small enough to account for slow noise variations. Th chunks also define the size of output files. The segment scale is used to run the Q-transform analysis. In particular, the tiling is prepared with this time scale.
The timing structure must be specified by the user in the option file. See Options file.
The parameter space is tiled in 3 dimensions: Q, frequency and time.
First, a set of Q-planes is defined according to the maximum mismatch value specified by the user. Each Q-plane is then divided in frequency rows logarithmically distributed. Finally, each frequency row is divided in tiles linearly distributed over time.
The tiling structure only depends on the Q range , the frequency range, the segment duration and the working sampling frequency defined by the user. It it therefore built once for all when Omicron is initialized.
The power spectrum density (PSD) is computed following the median-mean method described in gr-qc/0509116. The PSD is estimated over one chunk of data. The PSD is estimated with a 0.5Hz resolution provided the search is conducted above 1Hz (more if below 1Hz). For example if the duration of one chunk is 300s, the PSD is computed 300 times and the median-mean algorithm is applied to limit the bias due to loud glitches. The PSD is then interpolated to fit the channel sampling rate chosen by the user.
The PSD for each chunk is one of the data products which can be saved on disk for sanity checks, see Options file.
To avoid dynamic range problems, the data is also high-pass filtered. This is done with zero phase distortion by first forward filtering and then reverse filtering the input data stream using a 12th order butterworth high pass filter. The cutoff frequency of the filter is specified in the option file by the lower edge of the frequency range.
When running an Omicron analysis, several data products are possible to ouptut:
- Triggers, 'keyword=triggers'. An Omicron trigger is a tile with a signal-to-noise ratio above a given threshold. Triggers produced by Omicron are stored in a TTree structure (named 'triggers') saved in a ROOT file (other formats are supported). A trigger file is created for each channel and each chunk. The triggers produced by Omicron follow the GWOLLUM convention. For mor details, see the GWOLLUM convention.
- Maps, 'keyword=maps'. An Omicron map is a time-frequency representation of the tiles and their energy content. Maps are defined over one segment. There is one map per Q value and one combined map.
- Time-series, 'keyword=timeseries'. For each chunk, the time-series can be saved (after re-sampling).
- PSD, 'keyword=psd'. For each chunk, the PSD can be saved.
- ASD, 'keyword=asd'. For each chunk, the ASD can be saved.
- Html report, 'keyword=html'. At the end of a processing, a html report can be dumped to present a summary of the analysis. If at least one web-supported graphical format (like png or gif) is present in the option file, plots will be made to display additional information
This section summarizes the internal steps of Omicron. We used the example of a compact binary coalescence simulated signal injected in the data (a.k.a the big dog). After being loaded, the data vector is down-sampled to a user-defined working frequency. In our example, we downsampled the data from 16384Hz to 2048Hz.
The data vector is then high-passed at the lower range frequency value of the search (specified by the user). This is done with zero phase distortion by first forward filtering and then reverse filtering the input data stream using a 12th order butterworth high pass filter. In our example we used the search frequency range: 8Hz → 1024 Hz.
The power spectral density (PSD) is then computed using the median-mean method over the full time chunk. Here is the result for our example:
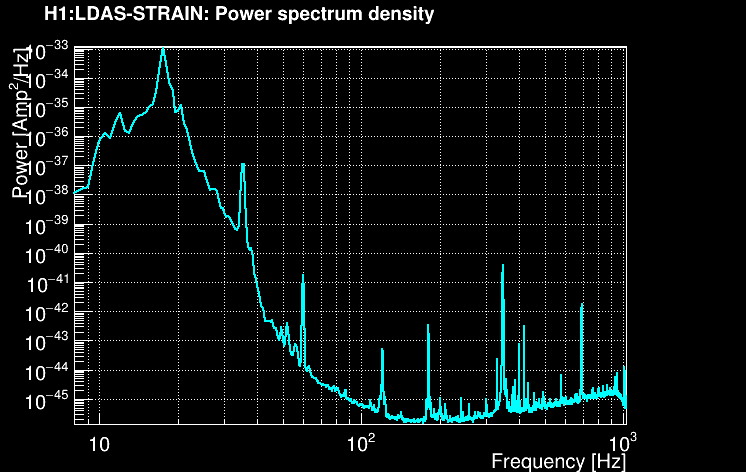
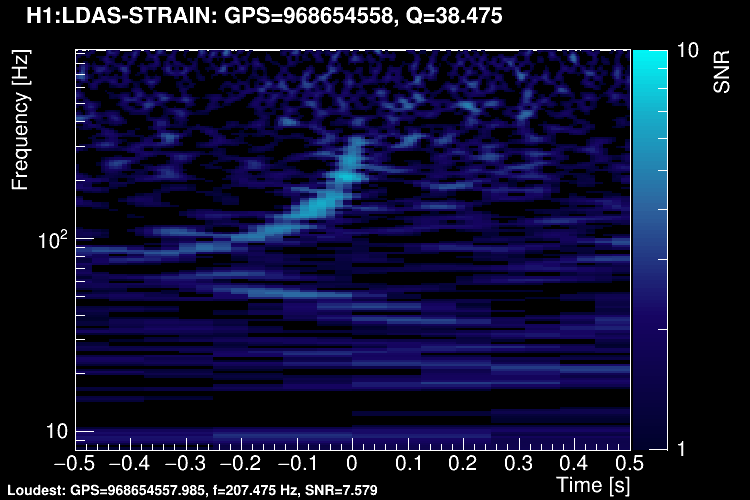
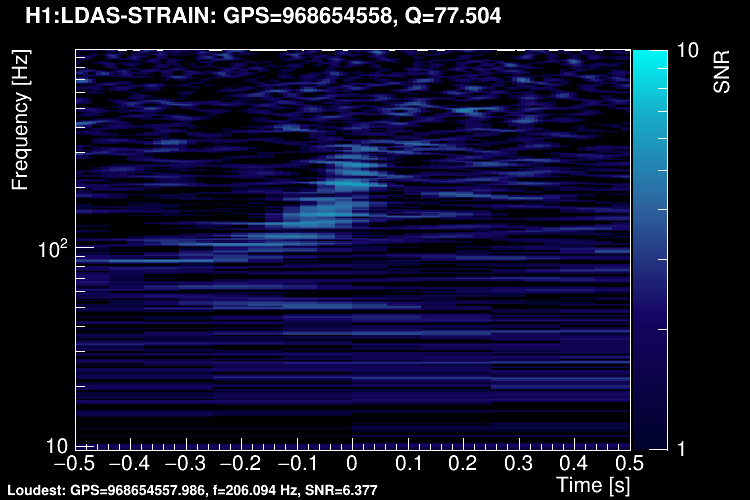
The data vector is Fourier-transformed and normalized using the PSD. This data is projected over the Omicron tiles and the tile energy is computed. An amplitude SNR value is finally obtained for each tile. Here is what it looks like for our glitch (5 Q-planes were used):
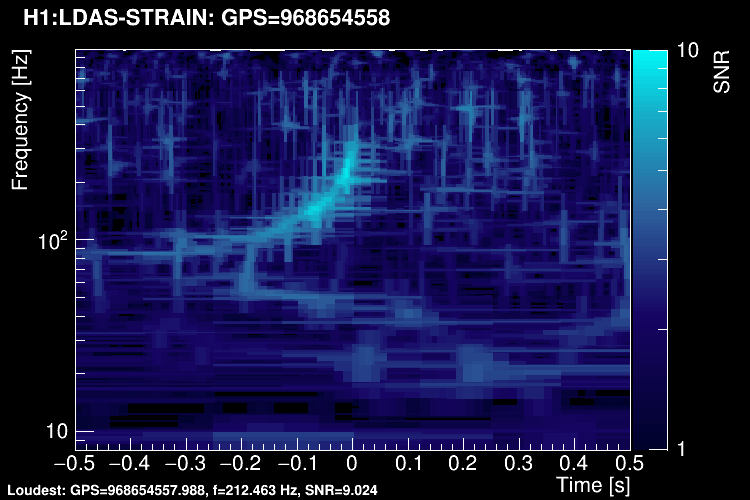
These 5 plots can be combined into one. You can either represent all the tiles in a single time-frequency plane and plotting the highest SNR tile on the top:
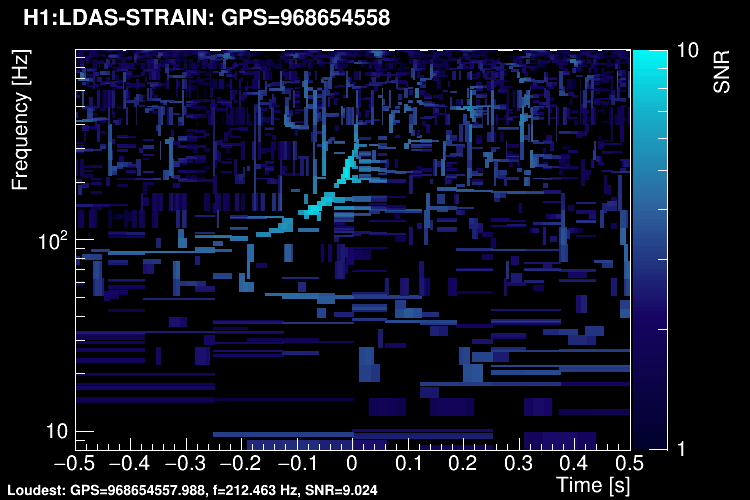
Or, starting from this representation, you can keep only the highest-SNR tiles and removing overlapping tiles (tiledown method):
When it comes to save triggers on disk, tiles with a SNR above a user-specified threshold are retained. The time and frequency information is given by the tile central point. An amplitude parameter is computed for each tile. It is given by SNR x sqrt(power) where power is a weighted average of the PSD over the tile.
Tiles are usually time-clustered to describe an event in totality. In this case, the cluster takes the time/frequency/SNR/amplitude value of the highest-SNR tile.
First you need to make sure your environment is well-defined by sourcing the Omicron setup script.
Then, to run Omicron, you need to provide a timing and a parameter file. There are 3 different ways to run Omicron:
- Over a single stretch of data:
omicron 993574004 993574123 ./parameters.txt
This commands runs the Omicron algorithm continuously between 2 GPS times - Over a list of time segments:
omicron ./segments.txt ./parameters.txt
This commands runs the Omicron algorithm over a list of disjoint time segments. segments.txt is a text file with 2 columns [GPS start] [GPS end] following the GWOLLUM convention for segments. - Over a single chunk:
omicron 993574004 ./parameters.txt
This commands runs the Omicron algorithm over one single chunk of data centered on a given GPS time.
The user option file contains a list of parameters to pilot the Omicron processing. It is composed of a list of keywords to define a given parameter. Parameters are organized in different classes: DATA, INJECTION, PARAMETER and OUTPUT. Only 3 parameters are mandatory (the DATA class): a pointer to the frame file list, the list of channels to process and the sampling frequency. The option file will then look like this:
	  DATA  FFL	           /virgoData/ffl/raw.ffl
	  DATA  CHANNELS           V1:h_16384Hz V1:Pr_B1_ACp
	  DATA  SAMPLEFREQUENCY    2048
With this configuration all the other options are set to default or 'guessed' from what is provided. In the following we list all the available options the user can include in the option file. None of them are mandatory. If an option is not provided, a default value is assigned or is guessed from the available information. Click here to get an example of option file
**************    DATA CLASS

→	  DATA FFL [path to ffl file]
	  Path to the 'frame file list' file to access the desired channels.
          Two formats are supported:
          - the 'ffl' format (Virgo convention, 5 columns):
            [frame file path] [GPS start] [file duration] [0] [0]
          - the 'lalcache' format (LIGO convention, 5 columns):
            [observatory] [frame type] [GPS start]  [file duration] [frame file path]
          The input format is automatically detected by Omicron
          This option is not mandatory but it should be used for a standard offline Omicron processing.

→	  DATA CHANNELS [list of channels]
	  List of main channels to process. Channel names must be separated by spaces or this option
          can be used on several lines when listing channels
            Default = 'V1:Pr_B1_ACp'

→	  DATA SAMPLEFREQUENCY [sampling frequency]
	  Sampling frequency to which channels will be downsampled.
          Upsampling is impossible.
	  Only one value is possible, common to all channels.
	  This parameter is very important since it will strongly influence the processing time.


**************    INJECTION CLASS

→	  INJECTION CHANNELS [list of injection channels]
	  Injection channels can be added to the main channels.
          There must be exactly as many injection channels as main channels.

→	  INJECTION FACTORS [list of factors for injection channels]
	  Injection channels are added with factors provided with this option
          There must be exactly as many factors as injection channels.

→	  INJECTION FILENAME [injection file path]
	  Injections can also be performed through an injection file listing the source/waveform parameters.
          The injection file must be a ROOT file generated with the InjGen class.


**************    PARAMETER CLASS

→	  PARAMETER CHUNKDURATION    [chunk duration]
→	  PARAMETER SEGMENTDURATION  [block duration]
→	  PARAMETER OVERLAPDURATION  [overlap duration]
          Chunk, segment and overlap durations in seconds.
	  The three values of duration must verify the relation described in the timing section.
	  If not, the values will be updated to fit the requirements.

→	  PARAMETER FREQUENCYRANGE [minimum frequency] [maximum frequency]
	  Frequency range for the search.
	  If [maximum frequency] is too large, the Nyquist frequency will be used

→	  PARAMETER QRANGE [minimum Q] [maximum Q]
	  Q range for the search. Q must be greater than sqrt(11).


→	  PARAMETER MISMATCHMAX [maximum mismatch]
	  Maximum energy mismatch between tiles.

→	  PARAMETER SNRTHRESHOLD [trigger SNR threshold] [map SNR threshold]
	  Tile SNR thresholds.
          For triggers, a tile is saved if the SNR is larger than this value.
          For maps, a map is saved if the loudest tile in the firt time window is larger than this value

→	  PARAMETER TILEDOWN  [0/1]
          When 1, the tiledown algorithm is applied before saving the output.
          When 0, do not use the tiledown algorithm.

→	  PARAMETER CLUSTERING [clustering method]
	  Cluster triggers before saving them on disk.
          Only one clustering method is currently available: "TIME"
          If this option is not given, triggers are not clustered.
          IMPORTANT: this option is useless for triggers saved in a ROOT format:
          clusters are never saved in GWOLLUM trigger files, only triggers are.
          The clustering performed with GWOLLUM routines is always performed on the fly
          when trigger files are loaded.

→	  PARAMETER CLUSTERDT [δt parameter]
	  When the "TIME" clustering algorithm is selected,
          it is possible to set the δt parameter with this option.

→	  PARAMETER WINDOWS [list of time windows]
          This option lists the time windows (in s) used for the plot output.

→	  PARAMETER SNRSCALE [scale]
          This option only applies when maps are selected as an output product.
          When a map is plotted, the SNR vertical scale ranges from 1 and up to the [scale] value.
          If the [scale] value is smaller than 1, the vertically scale is automatically adjusted
          to the maximum SNR value of the map.


**************    OUTPUT CLASS

→	  OUTPUT DIRECTORY [path output directory]
	  Path to output directory.
	  The directory must be created before running Omicron.

→	  OUTPUT PRODUCTS [list of products]
	  List of output data products.
	  Possible products: triggers, maps, timeseries, psd, asd and html

→	  OUTPUT FORMAT [list output formats]
	  List of output formats.
          Possible formats: root, txt, xml, png, gif, pdf, eps, ps, csv and many other...

→	  OUTPUT NTRIGGERMAX [Nmax]
	  Sets the maximum number of tiles above SNR threshold.
          When saving triggers, if the number of tiles in a segment and with a SNR
          above threshold is larger than [Nmax], none of the tiles in this segment are saved to disk.
          This option was introduced to save disk space when the data quality is really bad.

→	  OUTPUT TRIGGERRATEMAX [rate max]
	  Sets the maximum number of tiles above SNR threshold.
          This option is the same as PARAMETER/NTRIGGERMAX.
          Instead of having a limit on the absolute number of triggers, a trigger rate [Hz] limit is used.

→	  OUTPUT STYLE [output style]
	  Name of an output style supported by the GwollumPlot class.

→	  OUTPUT VERBOSITY [verbosity level]
	  Verbosity level: 0, 1, 2 or 3
	  0: no printing
	  1: basic printing
	  2: parameters printing
	  3: full printing (debugging)
Omicron triggers can be printed with this tool. The command is very simple if triggers were centrally produced:
GetOmicronTriggers -c V1:h_4096Hz -s 934228815 -e 934232415
If you produced your own triggers, you need to specify the trigger files location:
GetOmicronTriggers -t "/path/to/my/triggers/*.root" -s 934228815 -e 934232415
This command prints every triggers between GPS times 934228815 and 934232415 for the channel 'V1:h_4096Hz'.
This tool is highly tunable. You can control the output, de-activate the clustering, select the triggers... For a complete list of available options, type:
GetOmicronTriggers -h
To get the list of available channels, type:
GetOmicronTriggers -l
IMPORTANT note: by default, triggers are time clustered. This can take some time. You can de-activate this option with the '-C 0.0' option.
To monitor the triggers produced by Omicron, use this tool to print a set of plots (for centrally-produced triggers):
GetOmicronPlots -c V1:h_4096Hz -s 934228815 -e 934232415
If you produced your own triggers, you need to specify the trigger files location:
GetOmicronPlots -t "/path/to/my/triggers/*.root" -s 934228815 -e 934232415
This command plots the trigger properties of channel 'V1:h_4096Hz' between GPS times 934228815 and 934232415.
This tool is tunable. For a complete list of available options, type:
GetOmicronPlots -h
|
|
Florent Robinet |