Index
Timing
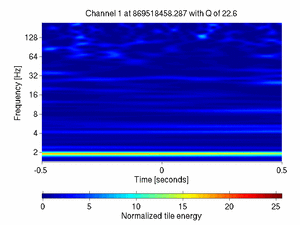
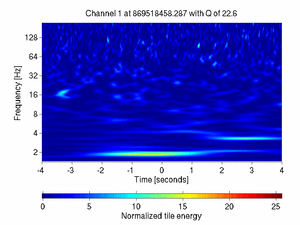
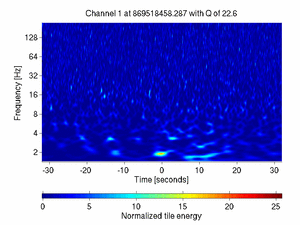
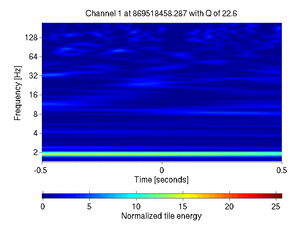
Event time
| GPS: | 869518458.28699994 | ||||
| UTC: | Thu | 2007 | Jul | 26 | 20:54:04 |
| PDT: | Thu | 2007 | Jul | 26 | 13:54:04 |
| CDT: | Thu | 2007 | Jul | 26 | 15:54:04 |
| CEST: | Thu | 2007 | Jul | 26 | 22:54:04 |
Detector logs
Gravitational wave data
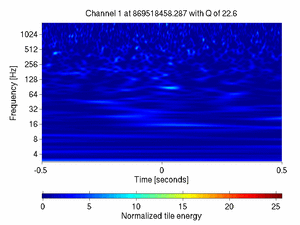
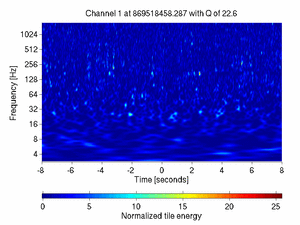
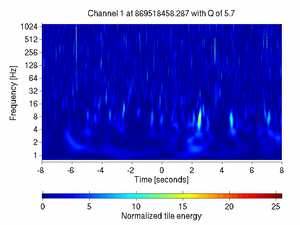
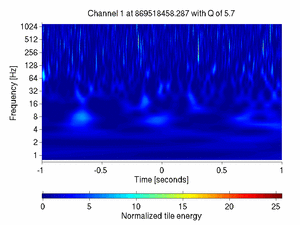
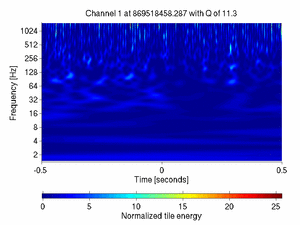
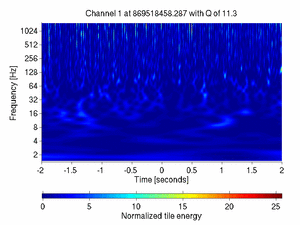
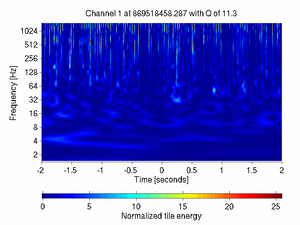
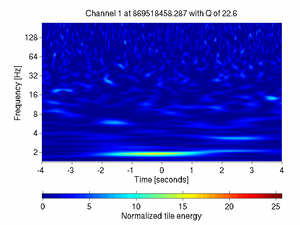
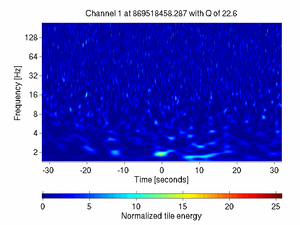
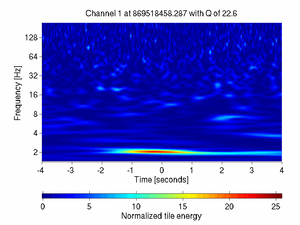
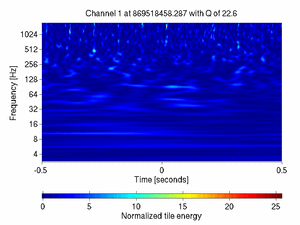
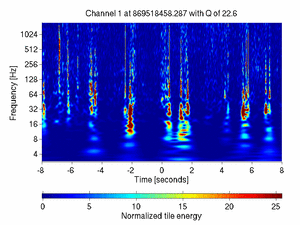
V1:Pr_B1_ACp
most significant tile:
t = 869518458.308 s,
f = 1.7×10³ Hz,
Q = 2.3×101,
Z = 1.1×101,
X = 1.0×10⁻¹² Hz-½
time series: raw, high passed, whitened | spectrogram: raw, whitened, autoscaled | eventgram: raw, whitened, autoscaled

time series: raw, high passed, whitened | spectrogram: raw, whitened, autoscaled | eventgram: raw, whitened, autoscaled


Virgo Photodiode readout
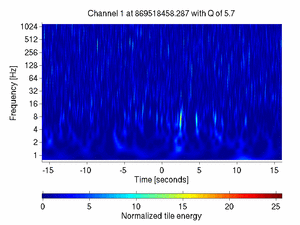
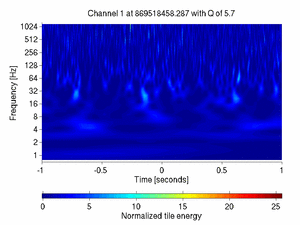
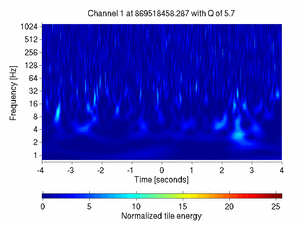
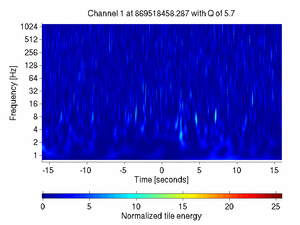
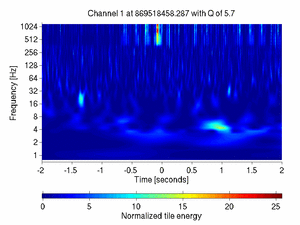
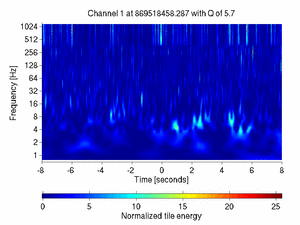
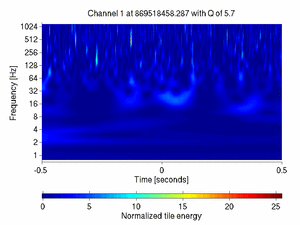
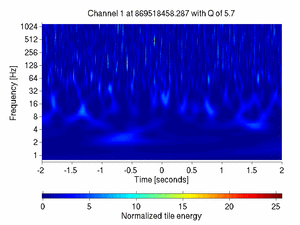
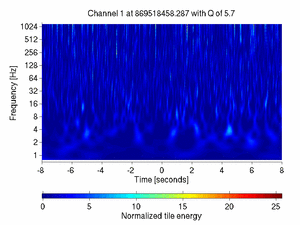
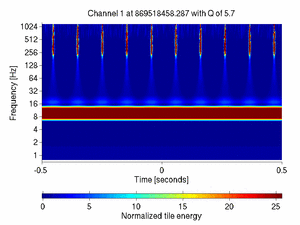
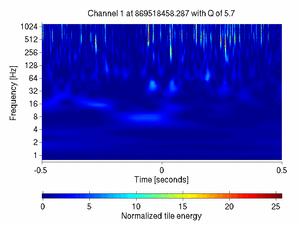
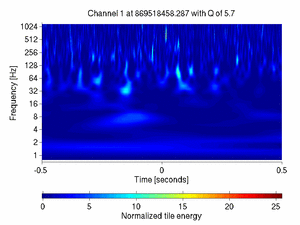
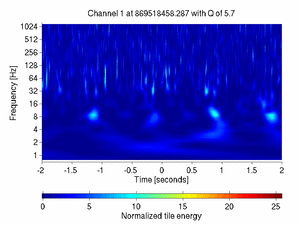
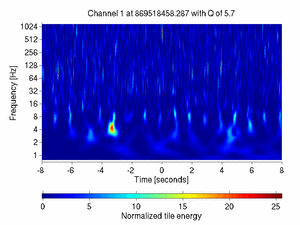
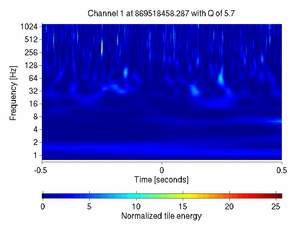
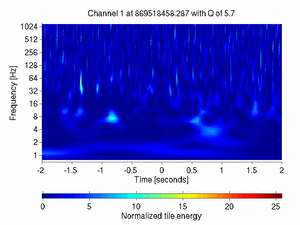
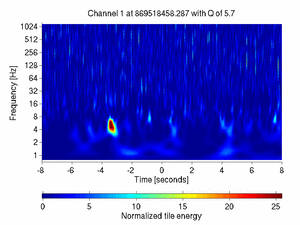
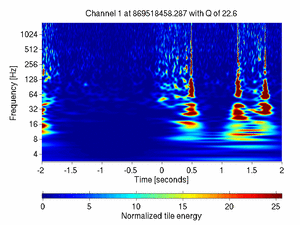
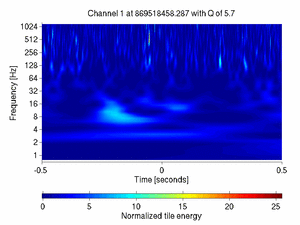
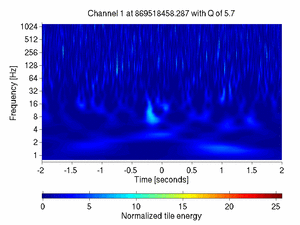
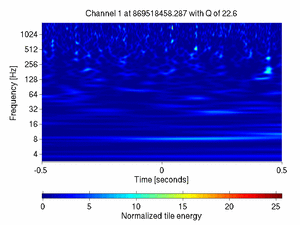
V1:Pr_B2_DC
most significant tile:
t = 869518458.091 s,
f = 4.1×10² Hz,
Q = 5.7×100,
Z = 3.0×101,
X = 9.0×10⁻¹¹ Hz-½
time series: raw, high passed, whitened | spectrogram: raw, whitened, autoscaled | eventgram: raw, whitened, autoscaled


time series: raw, high passed, whitened | spectrogram: raw, whitened, autoscaled | eventgram: raw, whitened, autoscaled


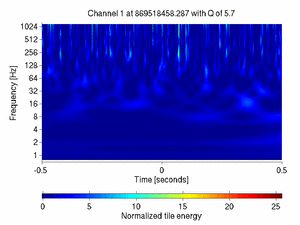
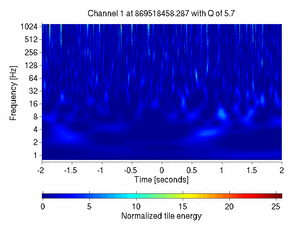
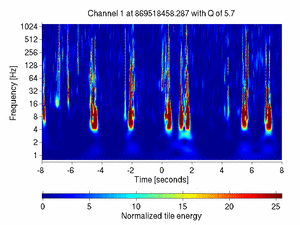
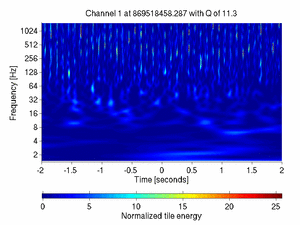
V1:Pr_B2_d1_DC
most significant tile:
t = 869518458.091 s,
f = 4.9×10² Hz,
Q = 5.7×100,
Z = 2.6×101,
X = 1.8×10⁻⁴ Hz-½
time series: raw, high passed, whitened | spectrogram: raw, whitened, autoscaled | eventgram: raw, whitened, autoscaled

time series: raw, high passed, whitened | spectrogram: raw, whitened, autoscaled | eventgram: raw, whitened, autoscaled


V1:Pr_B5_d1_ACq
most significant tile:
t = 869518458.023 s,
f = 9.9×10² Hz,
Q = 5.7×100,
Z = 1.7×101,
X = 2.5×10⁻⁵ Hz-½
time series: raw, high passed, whitened | spectrogram: raw, whitened, autoscaled | eventgram: raw, whitened, autoscaled
time series: raw, high passed, whitened | spectrogram: raw, whitened, autoscaled | eventgram: raw, whitened, autoscaled


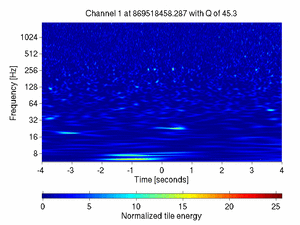
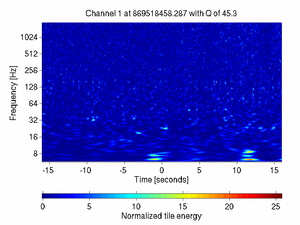
V1:Pr_RFCRef_d1_ACq
most significant tile:
t = 869518458.656 s,
f = 2.7×10² Hz,
Q = 4.5×101,
Z = 1.8×101,
X = 2.5×10⁻⁴ Hz-½
time series: raw, high passed, whitened | spectrogram: raw, whitened, autoscaled | eventgram: raw, whitened, autoscaled

time series: raw, high passed, whitened | spectrogram: raw, whitened, autoscaled | eventgram: raw, whitened, autoscaled


Virgo Suspension control
V1:Sc_BS_txCorr
most significant tile:
t = 869518458.233 s,
f = 1.2×10³ Hz,
Q = 5.7×100,
Z = 3.9×101,
X = 3.0×10⁻¹¹ Hz-½
time series: raw, high passed, whitened | spectrogram: raw, whitened, autoscaled | eventgram: raw, whitened, autoscaled

time series: raw, high passed, whitened | spectrogram: raw, whitened, autoscaled | eventgram: raw, whitened, autoscaled


V1:Sc_NI_txCorr
most significant tile:
t = 869518458.158 s,
f = 4.9×10² Hz,
Q = 5.7×100,
Z = 2.0×101,
X = 7.8×10⁻¹² Hz-½
time series: raw, high passed, whitened | spectrogram: raw, whitened, autoscaled | eventgram: raw, whitened, autoscaled

time series: raw, high passed, whitened | spectrogram: raw, whitened, autoscaled | eventgram: raw, whitened, autoscaled


V1:Sc_PR_tyCorr
most significant tile:
t = 869518458.358 s,
f = 1.2×10³ Hz,
Q = 5.7×100,
Z = 3.2×101,
X = 10.0×10⁻⁸ Hz-½
time series: raw, high passed, whitened | spectrogram: raw, whitened, autoscaled | eventgram: raw, whitened, autoscaled
time series: raw, high passed, whitened | spectrogram: raw, whitened, autoscaled | eventgram: raw, whitened, autoscaled


V1:Sc_NI_tyCorr
most significant tile:
t = 869518458.422 s,
f = 1.2×10³ Hz,
Q = 5.7×100,
Z = 2.2×101,
X = 3.7×10⁻¹² Hz-½
time series: raw, high passed, whitened | spectrogram: raw, whitened, autoscaled | eventgram: raw, whitened, autoscaled


time series: raw, high passed, whitened | spectrogram: raw, whitened, autoscaled | eventgram: raw, whitened, autoscaled


V1:Sc_NE_tyCorr
most significant tile:
t = 869518458.113 s,
f = 1.2×10³ Hz,
Q = 5.7×100,
Z = 3.6×101,
X = 1.9×10⁻¹⁰ Hz-½
time series: raw, high passed, whitened | spectrogram: raw, whitened, autoscaled | eventgram: raw, whitened, autoscaled


time series: raw, high passed, whitened | spectrogram: raw, whitened, autoscaled | eventgram: raw, whitened, autoscaled


V1:Sc_WE_tyCorr
most significant tile:
t = 869518458.133 s,
f = 1.2×10³ Hz,
Q = 5.7×100,
Z = 3.2×101,
X = 3.5×10⁻¹¹ Hz-½
time series: raw, high passed, whitened | spectrogram: raw, whitened, autoscaled | eventgram: raw, whitened, autoscaled


time series: raw, high passed, whitened | spectrogram: raw, whitened, autoscaled | eventgram: raw, whitened, autoscaled


V1:Sc_IB_zCorr
most significant tile:
t = 869518458.039 s,
f = 7.0×10² Hz,
Q = 5.7×100,
Z = 3.1×10⁴,
X = 1.4×10⁻¹² Hz-½
time series: raw, high passed, whitened | spectrogram: raw, whitened, autoscaled | eventgram: raw, whitened, autoscaled


time series: raw, high passed, whitened | spectrogram: raw, whitened, autoscaled | eventgram: raw, whitened, autoscaled


V1:Bs_SL_D4_DCHF
most significant tile:
t = 869518458.531 s,
f = 5.1×101 Hz,
Q = 5.7×100,
Z = 6.2×101,
X = 1.6×10⁻³ Hz-½
time series: raw, high passed, whitened | spectrogram: raw, whitened, autoscaled | eventgram: raw, whitened, autoscaled


time series: raw, high passed, whitened | spectrogram: raw, whitened, autoscaled | eventgram: raw, whitened, autoscaled


Virgo injection channel
Virgo Environmental Accoustic
Virgo Environmental Magnetic
V1:Em_MABDCE01
most significant tile:
t = 869518458.135 s,
f = 9.9×10² Hz,
Q = 5.7×100,
Z = 2.0×101,
X = 3.2×10⁻² Hz-½
time series: raw, high passed, whitened | spectrogram: raw, whitened, autoscaled | eventgram: raw, whitened, autoscaled


time series: raw, high passed, whitened | spectrogram: raw, whitened, autoscaled | eventgram: raw, whitened, autoscaled


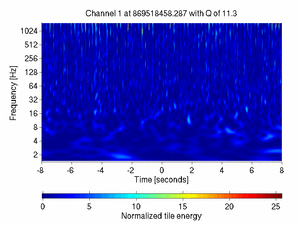
V1:Em_MABDCE02
most significant tile:
t = 869518458.155 s,
f = 1.5×10³ Hz,
Q = 1.1×101,
Z = 4.7×101,
X = 3.5×10⁻² Hz-½
time series: raw, high passed, whitened | spectrogram: raw, whitened, autoscaled | eventgram: raw, whitened, autoscaled


time series: raw, high passed, whitened | spectrogram: raw, whitened, autoscaled | eventgram: raw, whitened, autoscaled


V1:Em_MABDCE03
most significant tile:
t = 869518458.155 s,
f = 1.5×10³ Hz,
Q = 1.1×101,
Z = 4.4×101,
X = 1.4×10⁻¹ Hz-½
time series: raw, high passed, whitened | spectrogram: raw, whitened, autoscaled | eventgram: raw, whitened, autoscaled

time series: raw, high passed, whitened | spectrogram: raw, whitened, autoscaled | eventgram: raw, whitened, autoscaled


V1:Em_MABDWE01
most significant tile:
t = 869518458.230 s,
f = 5.9×10² Hz,
Q = 5.7×100,
Z = 3.4×101,
X = 3.5×10⁻² Hz-½
time series: raw, high passed, whitened | spectrogram: raw, whitened, autoscaled | eventgram: raw, whitened, autoscaled


time series: raw, high passed, whitened | spectrogram: raw, whitened, autoscaled | eventgram: raw, whitened, autoscaled


V1:Em_MABDWE02
most significant tile:
t = 869518458.091 s,
f = 1.5×10³ Hz,
Q = 1.1×101,
Z = 1.2×10²,
X = 1.8×10⁻¹ Hz-½
time series: raw, high passed, whitened | spectrogram: raw, whitened, autoscaled | eventgram: raw, whitened, autoscaled


time series: raw, high passed, whitened | spectrogram: raw, whitened, autoscaled | eventgram: raw, whitened, autoscaled


V1:Em_MABDWE03
most significant tile:
t = 869518458.230 s,
f = 5.9×10² Hz,
Q = 5.7×100,
Z = 5.2×101,
X = 4.8×10⁻² Hz-½
time series: raw, high passed, whitened | spectrogram: raw, whitened, autoscaled | eventgram: raw, whitened, autoscaled


time series: raw, high passed, whitened | spectrogram: raw, whitened, autoscaled | eventgram: raw, whitened, autoscaled


Virgo Environmental Seismic
V1:Em_SEBDCE02
most significant tile:
t = 869518458.500 s,
f = 2.0×100 Hz,
Q = 2.3×101,
Z = 1.6×101,
X = 1.1×10⁻¹ Hz-½
time series: raw, high passed, whitened | spectrogram: raw, whitened, autoscaled | eventgram: raw, whitened, autoscaled


time series: raw, high passed, whitened | spectrogram: raw, whitened, autoscaled | eventgram: raw, whitened, autoscaled


V1:Em_SEBDCE05
most significant tile:
t = 869518458.500 s,
f = 1.9×100 Hz,
Q = 2.3×101,
Z = 1.7×101,
X = 1.9×100 Hz-½
time series: raw, high passed, whitened | spectrogram: raw, whitened, autoscaled | eventgram: raw, whitened, autoscaled
time series: raw, high passed, whitened | spectrogram: raw, whitened, autoscaled | eventgram: raw, whitened, autoscaled


V1:Em_SEBDCE08
most significant tile:
t = 869518458.500 s,
f = 1.9×100 Hz,
Q = 2.3×101,
Z = 1.5×101,
X = 1.2×10⁻¹ Hz-½
time series: raw, high passed, whitened | spectrogram: raw, whitened, autoscaled | eventgram: raw, whitened, autoscaled
time series: raw, high passed, whitened | spectrogram: raw, whitened, autoscaled | eventgram: raw, whitened, autoscaled


V1:Em_SEBDCE11
most significant tile:
t = 869518458.500 s,
f = 1.9×100 Hz,
Q = 2.3×101,
Z = 1.6×101,
X = 6.0×10⁻² Hz-½
time series: raw, high passed, whitened | spectrogram: raw, whitened, autoscaled | eventgram: raw, whitened, autoscaled


time series: raw, high passed, whitened | spectrogram: raw, whitened, autoscaled | eventgram: raw, whitened, autoscaled


V1:Em_SEBDMC03
most significant tile:
t = 869518458.500 s,
f = 2.0×100 Hz,
Q = 2.3×101,
Z = 2.0×101,
X = 9.5×10⁻² Hz-½
time series: raw, high passed, whitened | spectrogram: raw, whitened, autoscaled | eventgram: raw, whitened, autoscaled


time series: raw, high passed, whitened | spectrogram: raw, whitened, autoscaled | eventgram: raw, whitened, autoscaled


V1:Bs_La_ACChiller
most significant tile:
t = 869518458.105 s,
f = 1.5×10³ Hz,
Q = 2.3×101,
Z = 4.9×101,
X = 7.6×10⁻⁵ Hz-½
time series: raw, high passed, whitened | spectrogram: raw, whitened, autoscaled | eventgram: raw, whitened, autoscaled


time series: raw, high passed, whitened | spectrogram: raw, whitened, autoscaled | eventgram: raw, whitened, autoscaled


Virgo Beam source
V1:Bs_BMS_QF_DC
most significant tile:
t = 869518458.307 s,
f = 1.5×10³ Hz,
Q = 2.3×101,
Z = 1.9×101,
X = 5.1×10⁻⁵ Hz-½
time series: raw, high passed, whitened | spectrogram: raw, whitened, autoscaled | eventgram: raw, whitened, autoscaled


time series: raw, high passed, whitened | spectrogram: raw, whitened, autoscaled | eventgram: raw, whitened, autoscaled


V1:Bs_BMS_QN_DC
most significant tile:
t = 869518458.303 s,
f = 7.0×10² Hz,
Q = 5.7×100,
Z = 2.2×101,
X = 5.8×10⁻⁵ Hz-½
time series: raw, high passed, whitened | spectrogram: raw, whitened, autoscaled | eventgram: raw, whitened, autoscaled
time series: raw, high passed, whitened | spectrogram: raw, whitened, autoscaled | eventgram: raw, whitened, autoscaled


V1:Bs_IMC_DR_AC1
most significant tile:
t = 869518458.438 s,
f = 1.4×10³ Hz,
Q = 1.1×101,
Z = 4.2×101,
X = 1.4×10⁻⁴ Hz-½
time series: raw, high passed, whitened | spectrogram: raw, whitened, autoscaled | eventgram: raw, whitened, autoscaled

time series: raw, high passed, whitened | spectrogram: raw, whitened, autoscaled | eventgram: raw, whitened, autoscaled


V1:Bs_IMC_DR_DC
most significant tile:
t = 869518458.037 s,
f = 1.6×10³ Hz,
Q = 2.3×101,
Z = 3.6×101,
X = 9.3×10⁻⁵ Hz-½
time series: raw, high passed, whitened | spectrogram: raw, whitened, autoscaled | eventgram: raw, whitened, autoscaled


time series: raw, high passed, whitened | spectrogram: raw, whitened, autoscaled | eventgram: raw, whitened, autoscaled


V1:Bs_IMC_QF_DC
most significant tile:
t = 869518458.305 s,
f = 1.1×10³ Hz,
Q = 2.3×101,
Z = 2.1×101,
X = 4.0×10⁻⁵ Hz-½
time series: raw, high passed, whitened | spectrogram: raw, whitened, autoscaled | eventgram: raw, whitened, autoscaled

time series: raw, high passed, whitened | spectrogram: raw, whitened, autoscaled | eventgram: raw, whitened, autoscaled


V1:Bs_RFC_DR_DC
most significant tile:
t = 869518458.037 s,
f = 3.5×10² Hz,
Q = 5.7×100,
Z = 2.3×101,
X = 5.0×10⁻⁵ Hz-½
time series: raw, high passed, whitened | spectrogram: raw, whitened, autoscaled | eventgram: raw, whitened, autoscaled
time series: raw, high passed, whitened | spectrogram: raw, whitened, autoscaled | eventgram: raw, whitened, autoscaled


V1:Bs_SL_Icorr_DC
most significant tile:
t = 869518458.305 s,
f = 6.1×101 Hz,
Q = 5.7×100,
Z = 2.3×101,
X = 1.1×10⁻³ Hz-½
time series: raw, high passed, whitened | spectrogram: raw, whitened, autoscaled | eventgram: raw, whitened, autoscaled


time series: raw, high passed, whitened | spectrogram: raw, whitened, autoscaled | eventgram: raw, whitened, autoscaled


V1:Bs_SL_Icorr_DCHF
most significant tile:
t = 869518458.500 s,
f = 1.7×10³ Hz,
Q = 2.3×101,
Z = 4.0×101,
X = 1.7×10⁻³ Hz-½
time series: raw, high passed, whitened | spectrogram: raw, whitened, autoscaled | eventgram: raw, whitened, autoscaled

time series: raw, high passed, whitened | spectrogram: raw, whitened, autoscaled | eventgram: raw, whitened, autoscaled


V1:Bs_SL_QF_ACv
most significant tile:
t = 869518458.234 s,
f = 5.9×10² Hz,
Q = 5.7×100,
Z = 2.5×101,
X = 6.3×10⁻⁵ Hz-½
time series: raw, high passed, whitened | spectrogram: raw, whitened, autoscaled | eventgram: raw, whitened, autoscaled

time series: raw, high passed, whitened | spectrogram: raw, whitened, autoscaled | eventgram: raw, whitened, autoscaled


V1:Bs_SL_QN_ACh
most significant tile:
t = 869518458.330 s,
f = 1.4×10³ Hz,
Q = 2.3×101,
Z = 1.9×101,
X = 3.1×10⁻⁵ Hz-½
time series: raw, high passed, whitened | spectrogram: raw, whitened, autoscaled | eventgram: raw, whitened, autoscaled


time series: raw, high passed, whitened | spectrogram: raw, whitened, autoscaled | eventgram: raw, whitened, autoscaled


Calibration
V1:Ca_NI_F7_CoilL
most significant tile:
t = 869518458.145 s,
f = 6.4×10² Hz,
Q = 2.3×101,
Z = 2.2×101,
X = 6.5×10⁻⁵ Hz-½
time series: raw, high passed, whitened | spectrogram: raw, whitened, autoscaled | eventgram: raw, whitened, autoscaled


time series: raw, high passed, whitened | spectrogram: raw, whitened, autoscaled | eventgram: raw, whitened, autoscaled


V1:Ca_WE_F7_CoilR
most significant tile:
t = 869518458.068 s,
f = 1.8×10³ Hz,
Q = 4.5×101,
Z = 3.7×10²,
X = 2.1×10⁻⁴ Hz-½
time series: raw, high passed, whitened | spectrogram: raw, whitened, autoscaled | eventgram: raw, whitened, autoscaled


time series: raw, high passed, whitened | spectrogram: raw, whitened, autoscaled | eventgram: raw, whitened, autoscaled


