| Ox option file: | OriInj_nametest_waveforms_options.txt |
| Omicron option files: | detector 0, detector 1 |
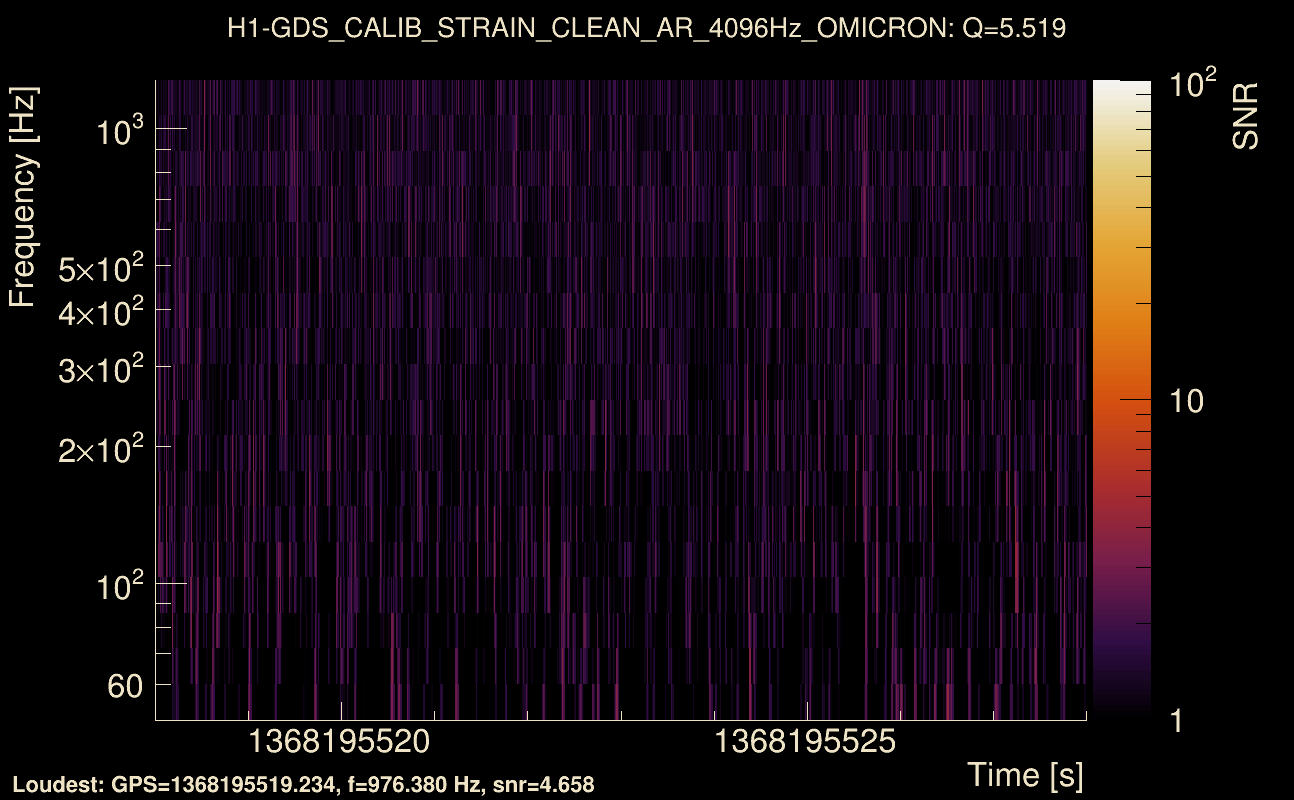
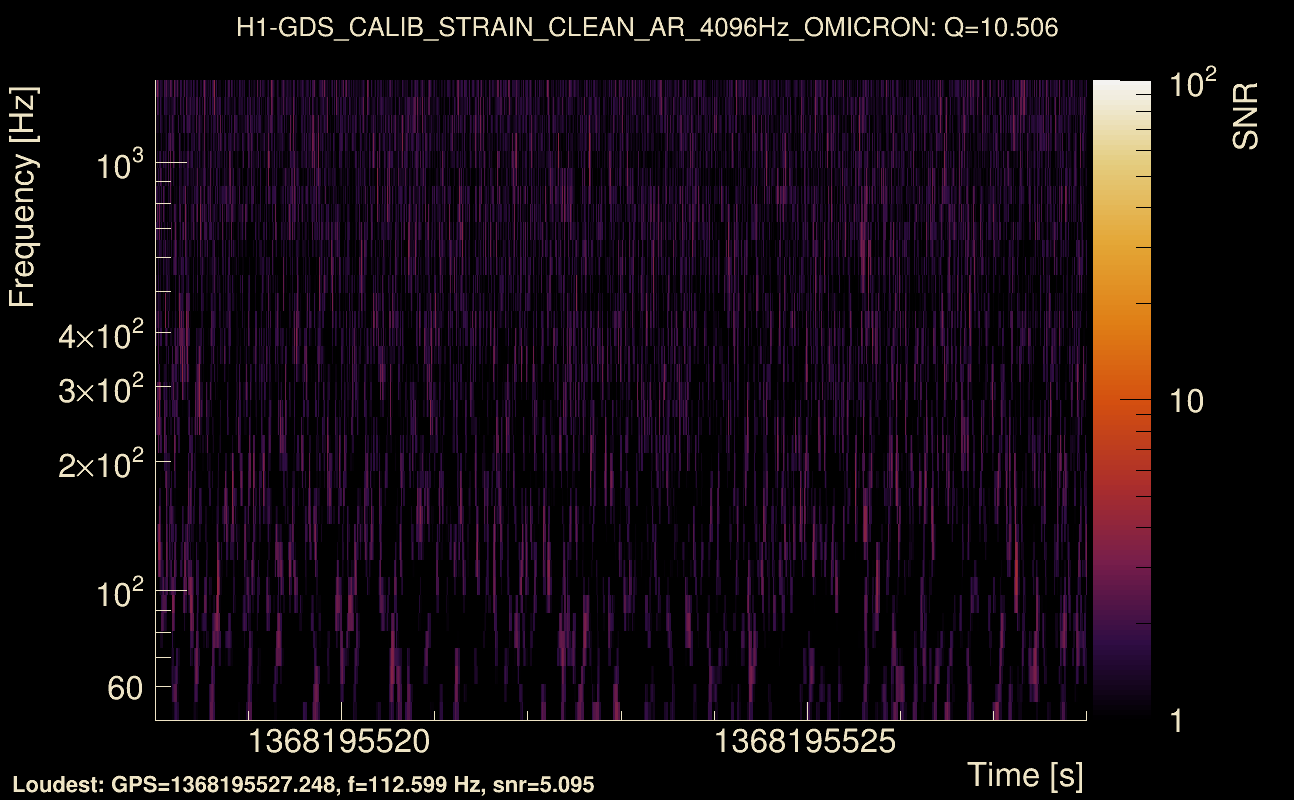
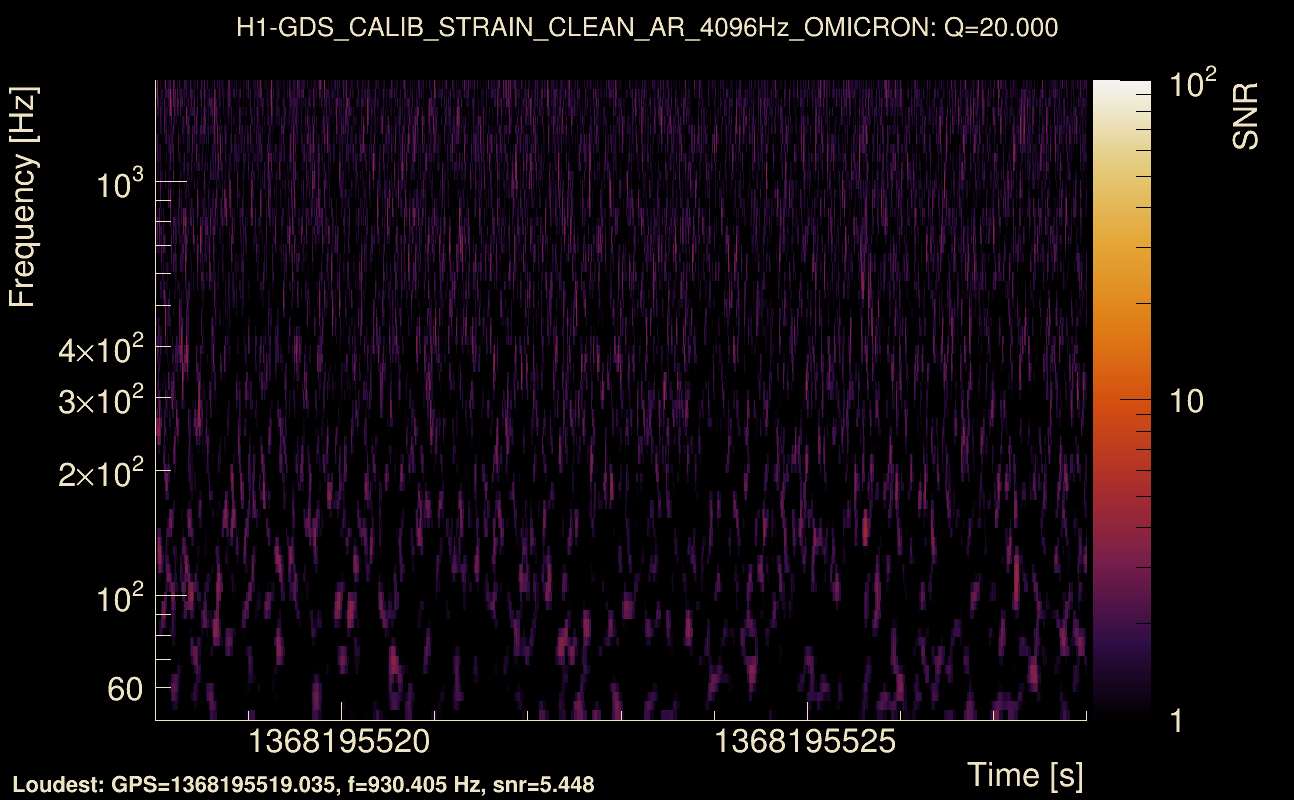
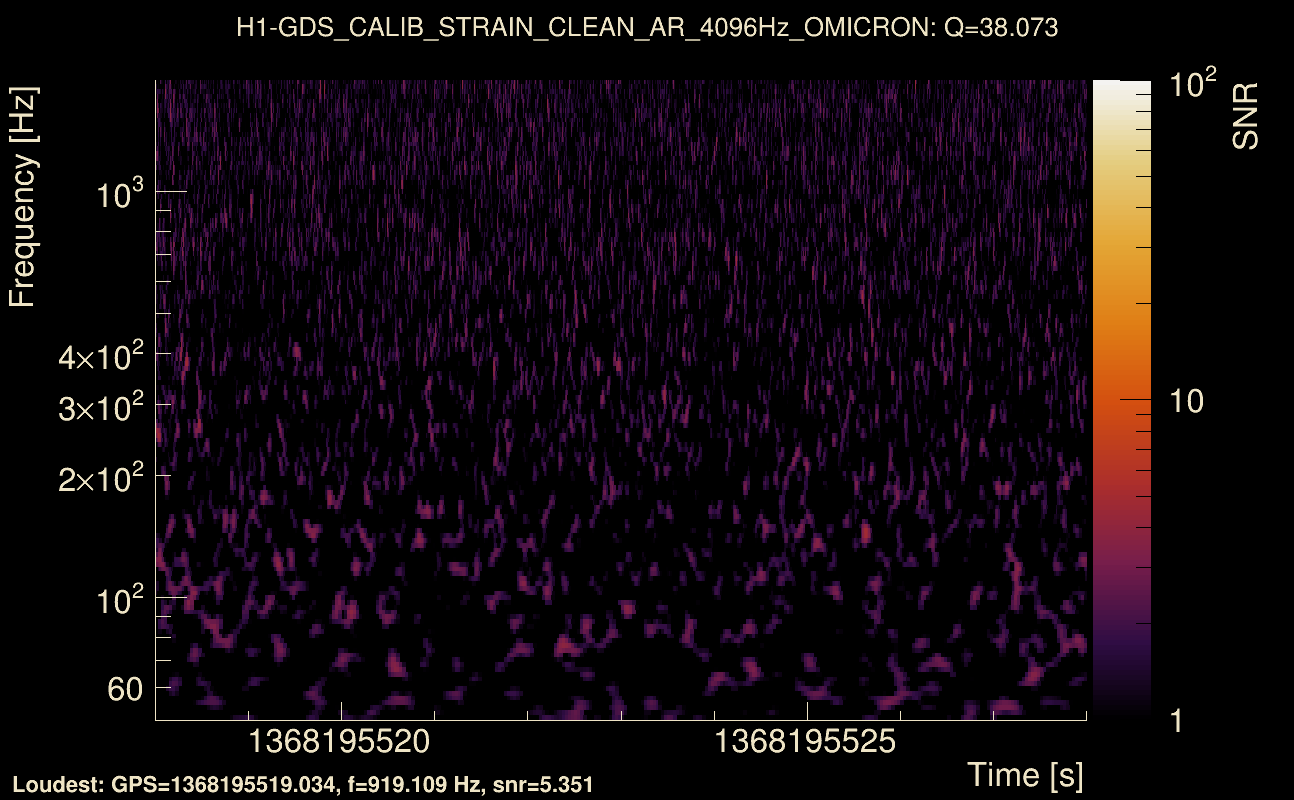
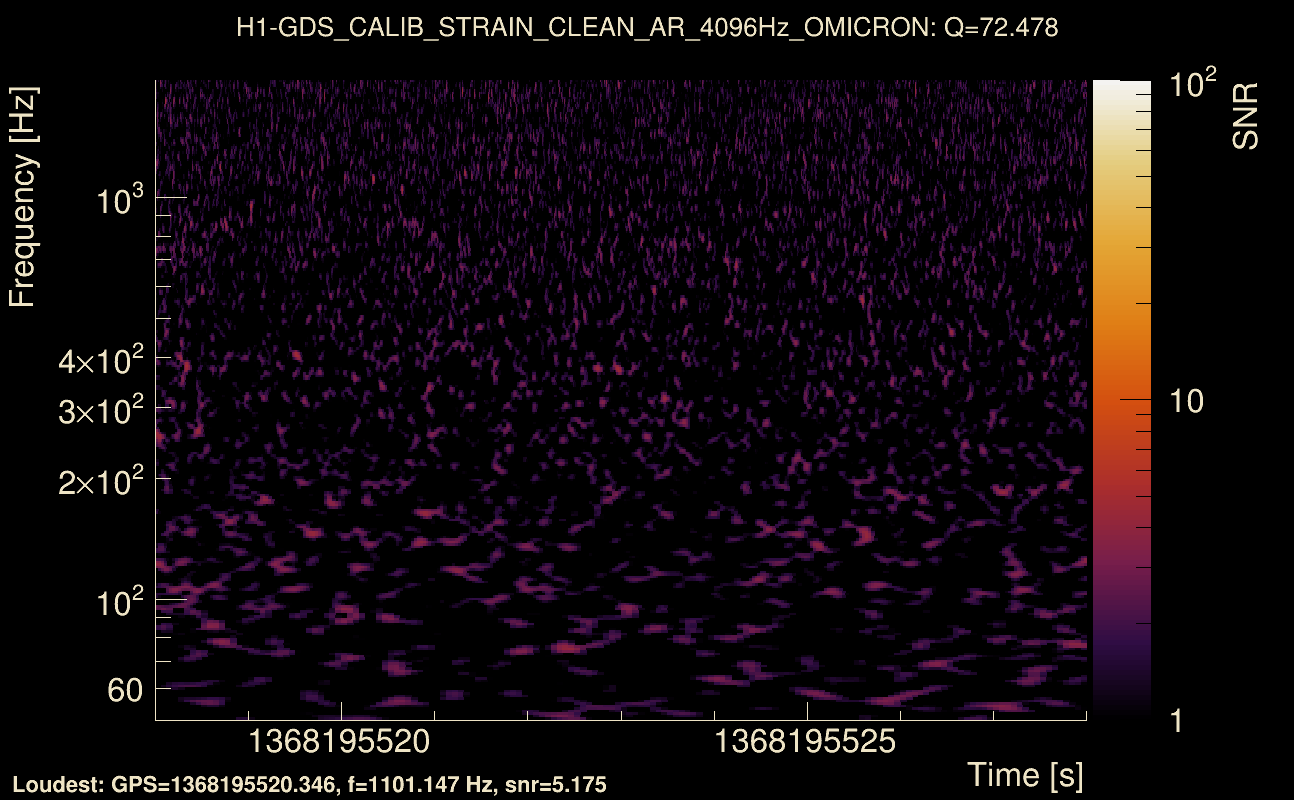
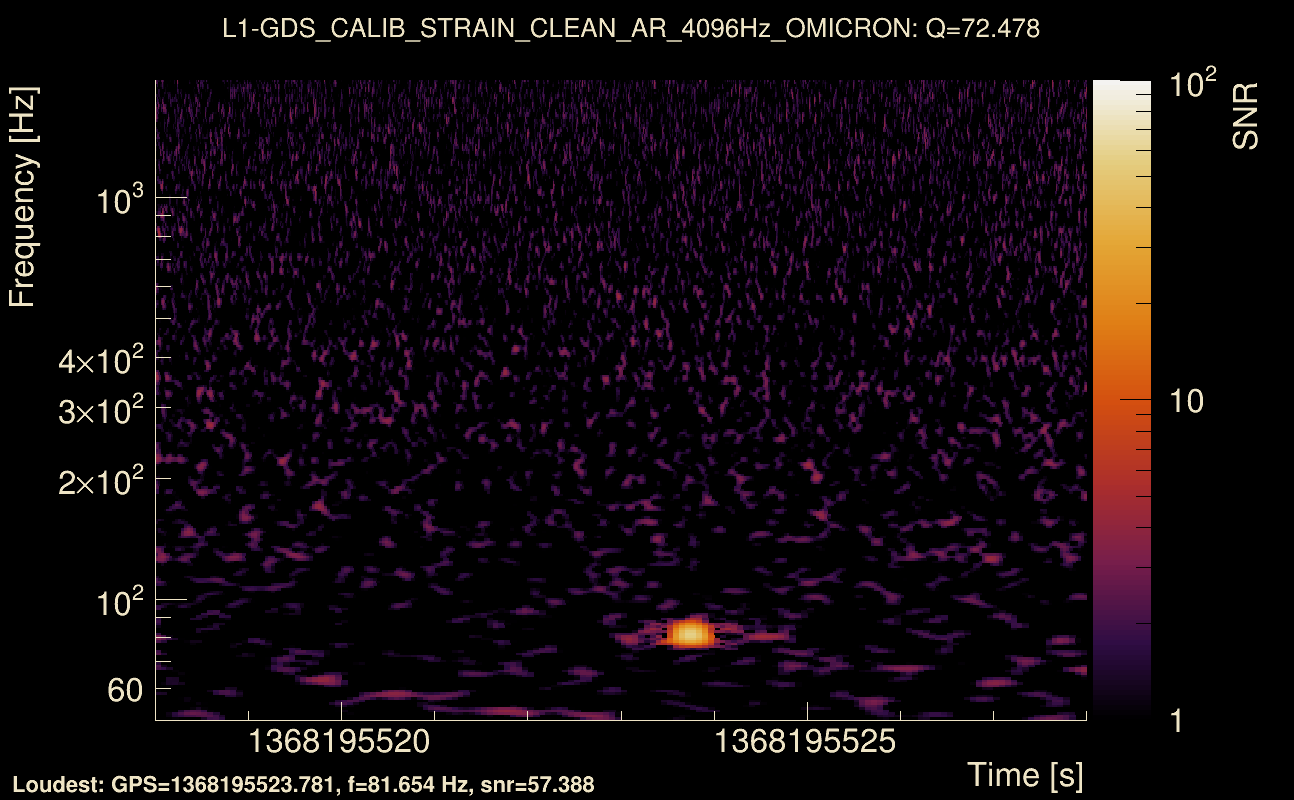
| Detector channel names: | H1:GDS-CALIB_STRAIN_CLEAN_AR_4096Hz, L1:GDS-CALIB_STRAIN_CLEAN_AR_4096Hz |
| Omicron analysis time window and overlap: | 16 s, 6 s |
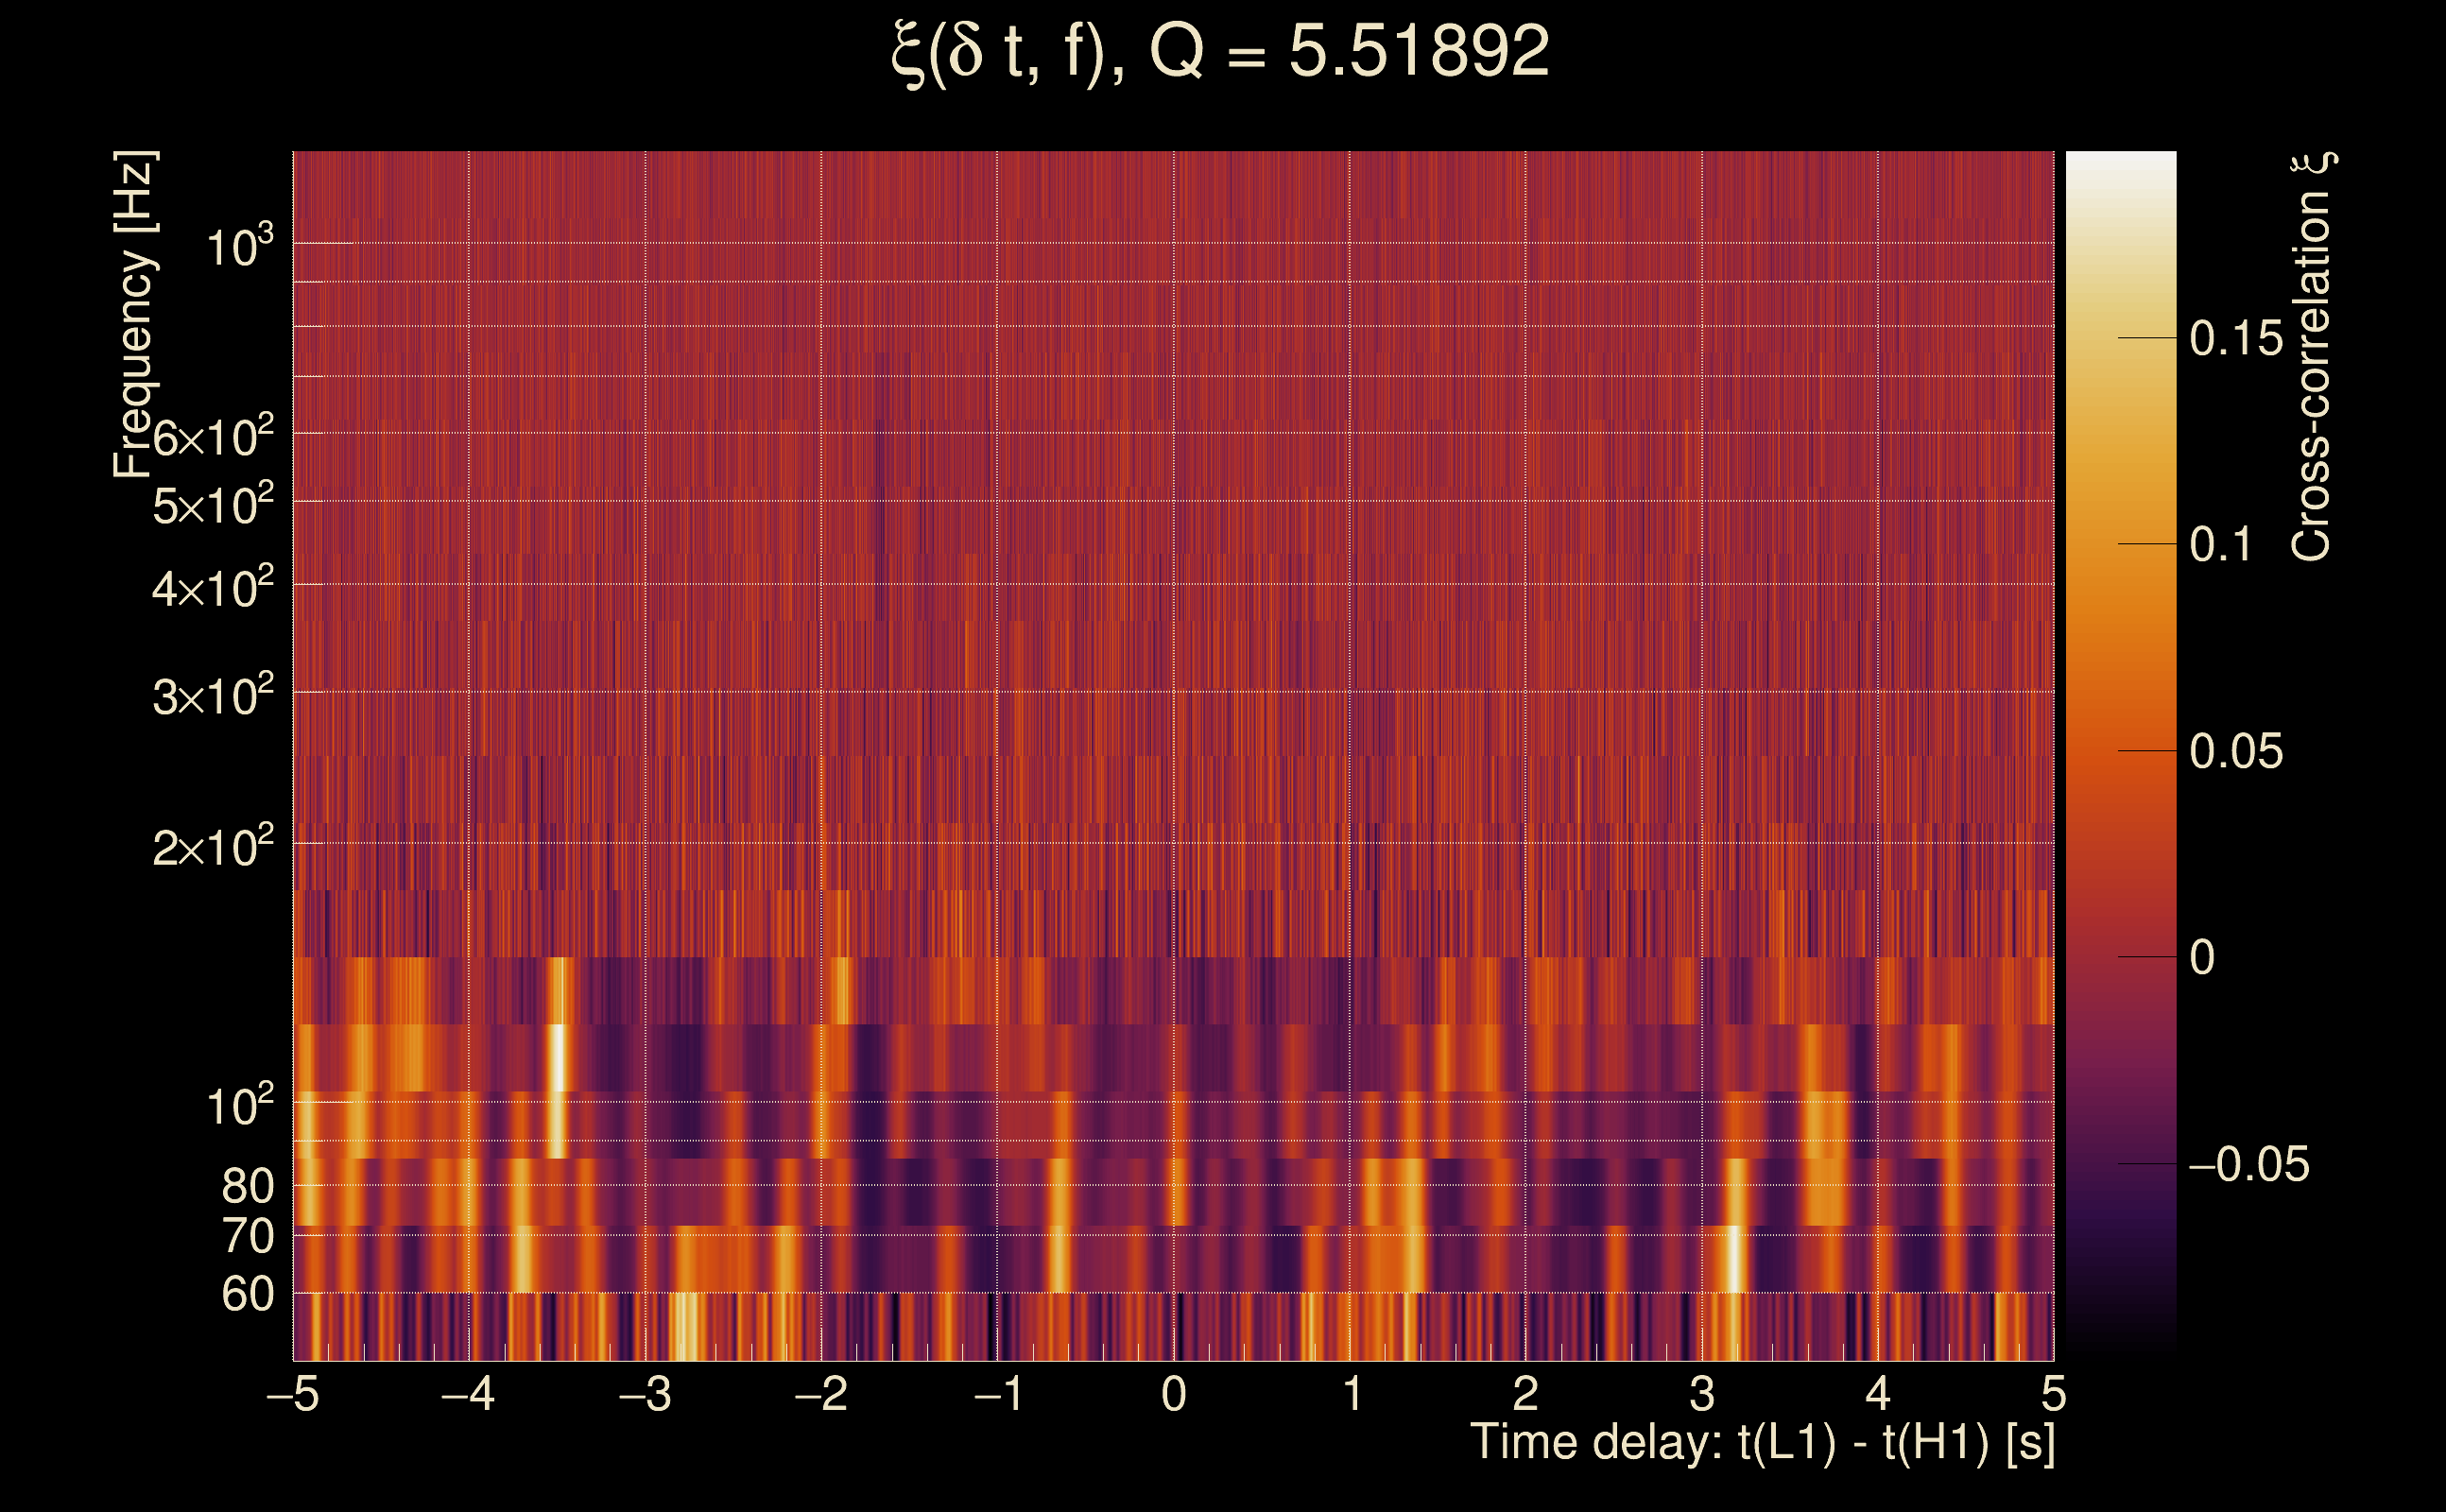
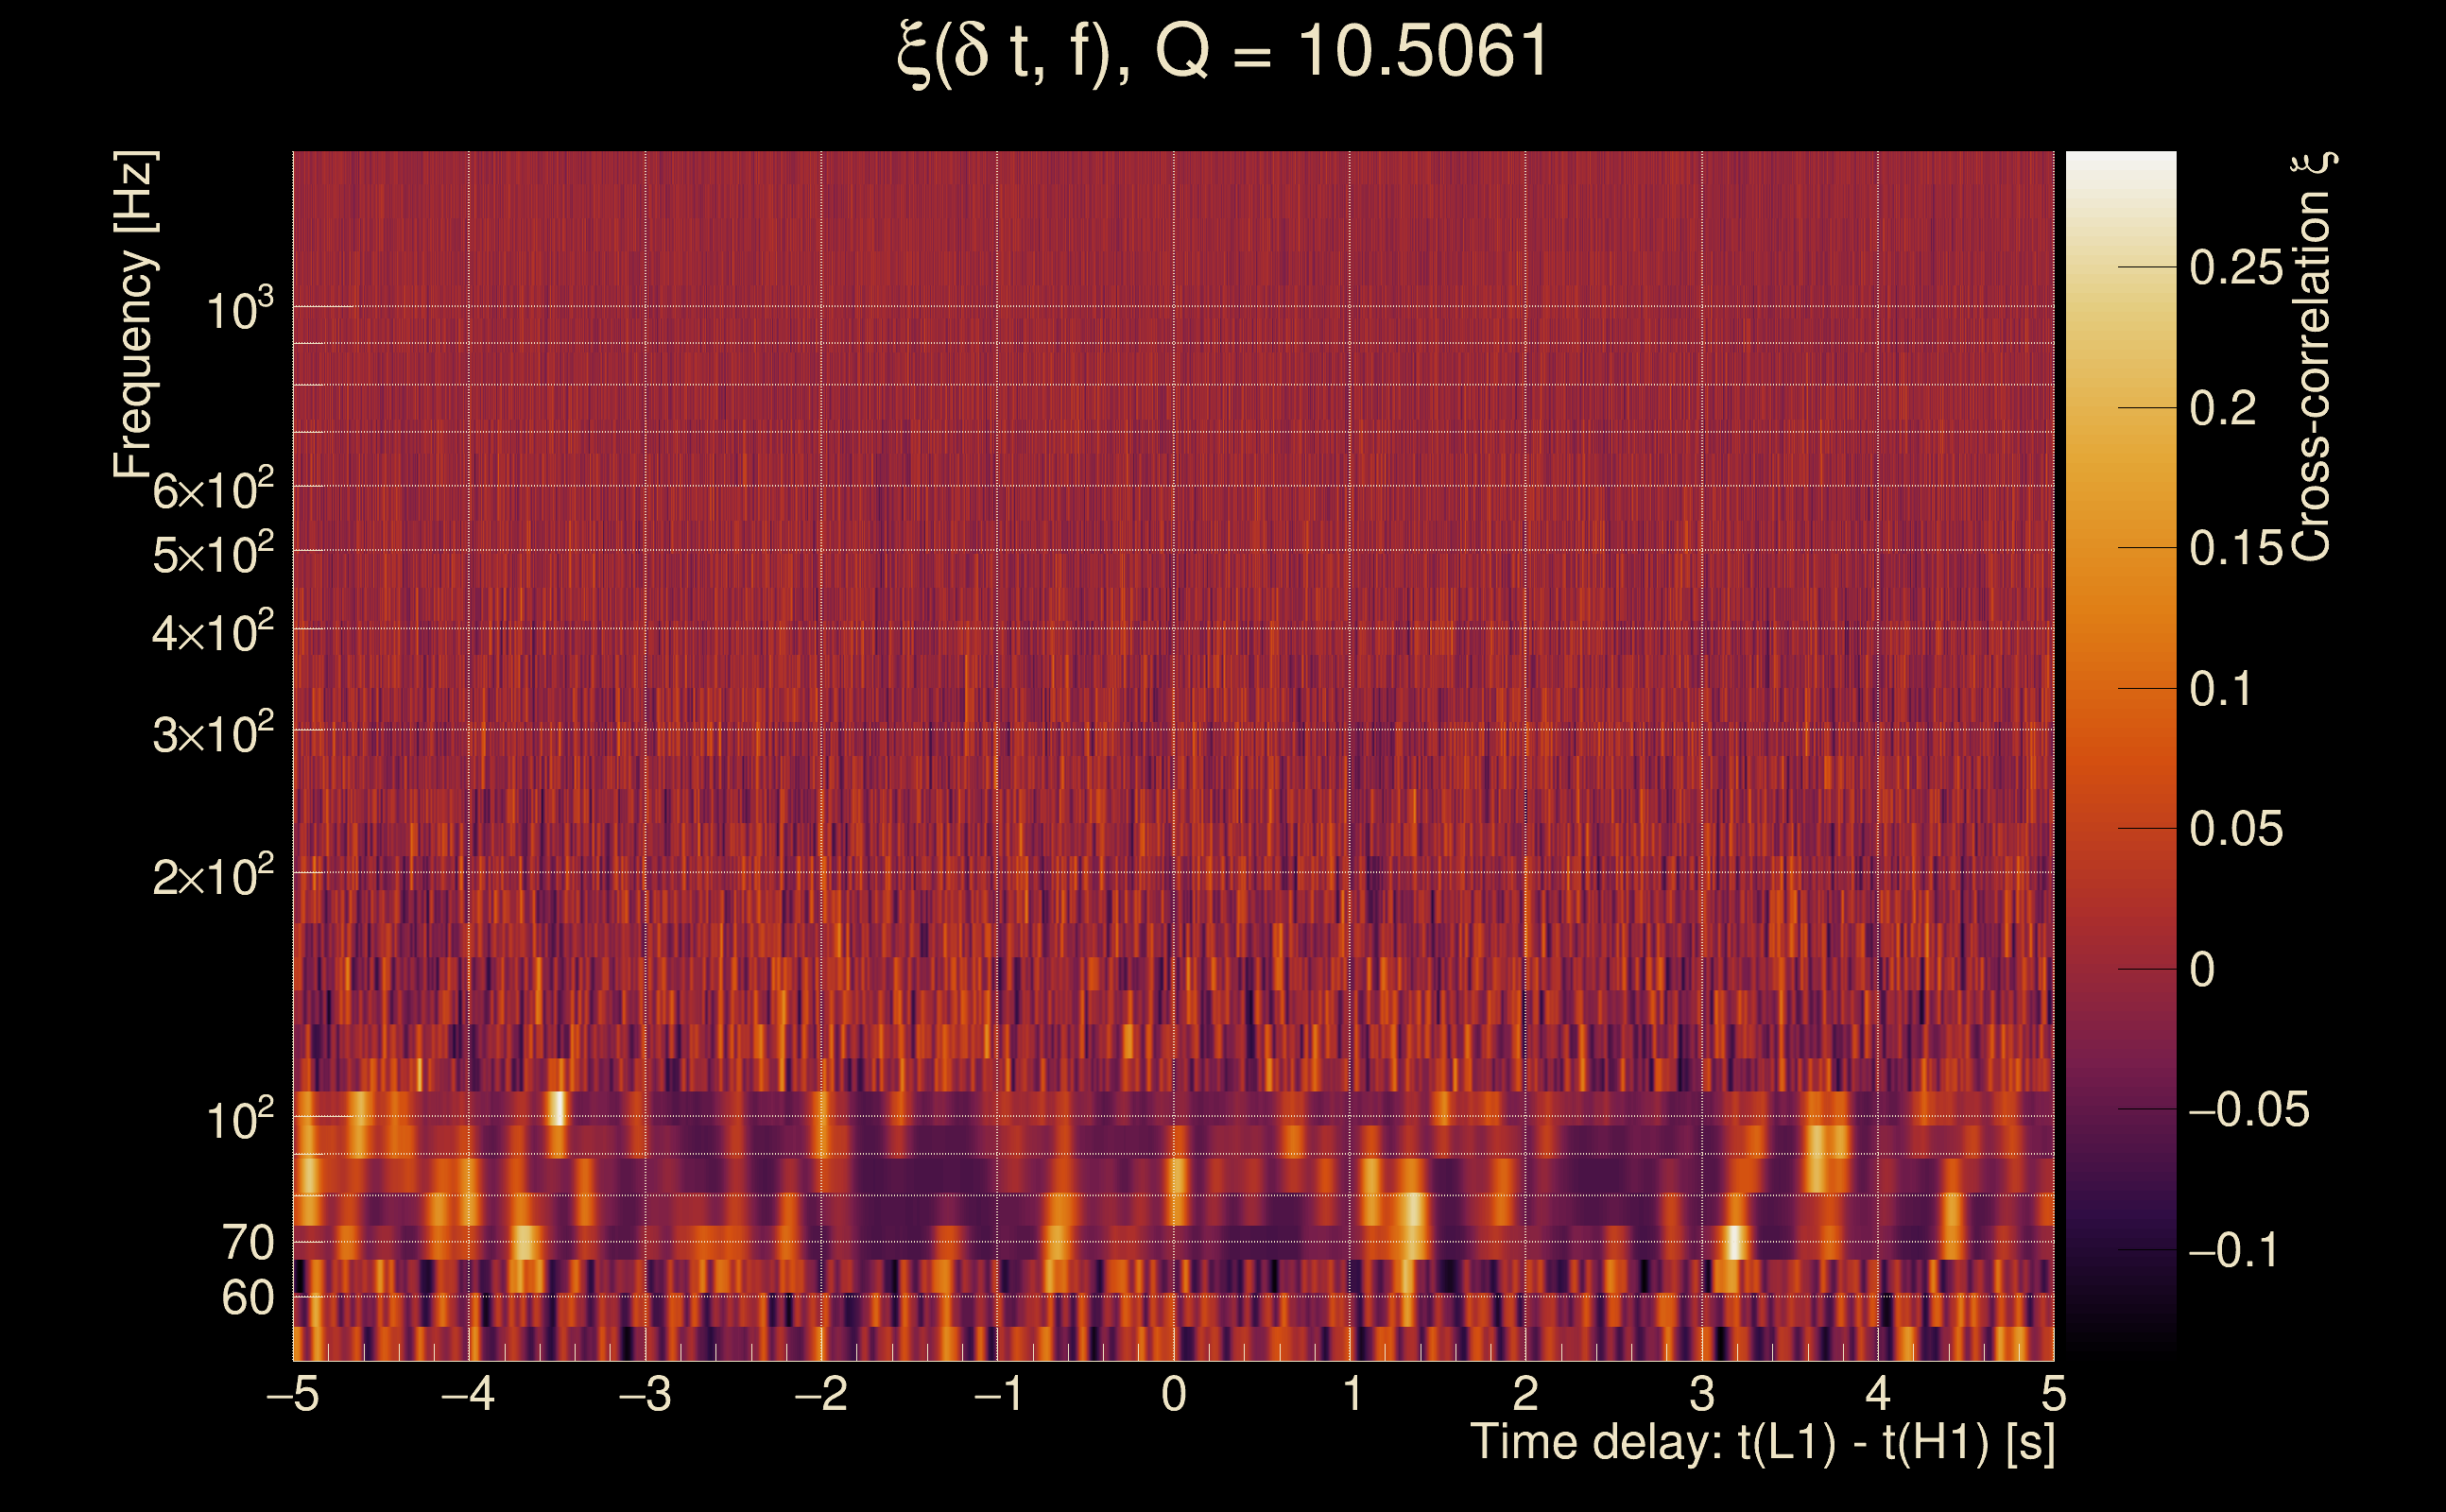
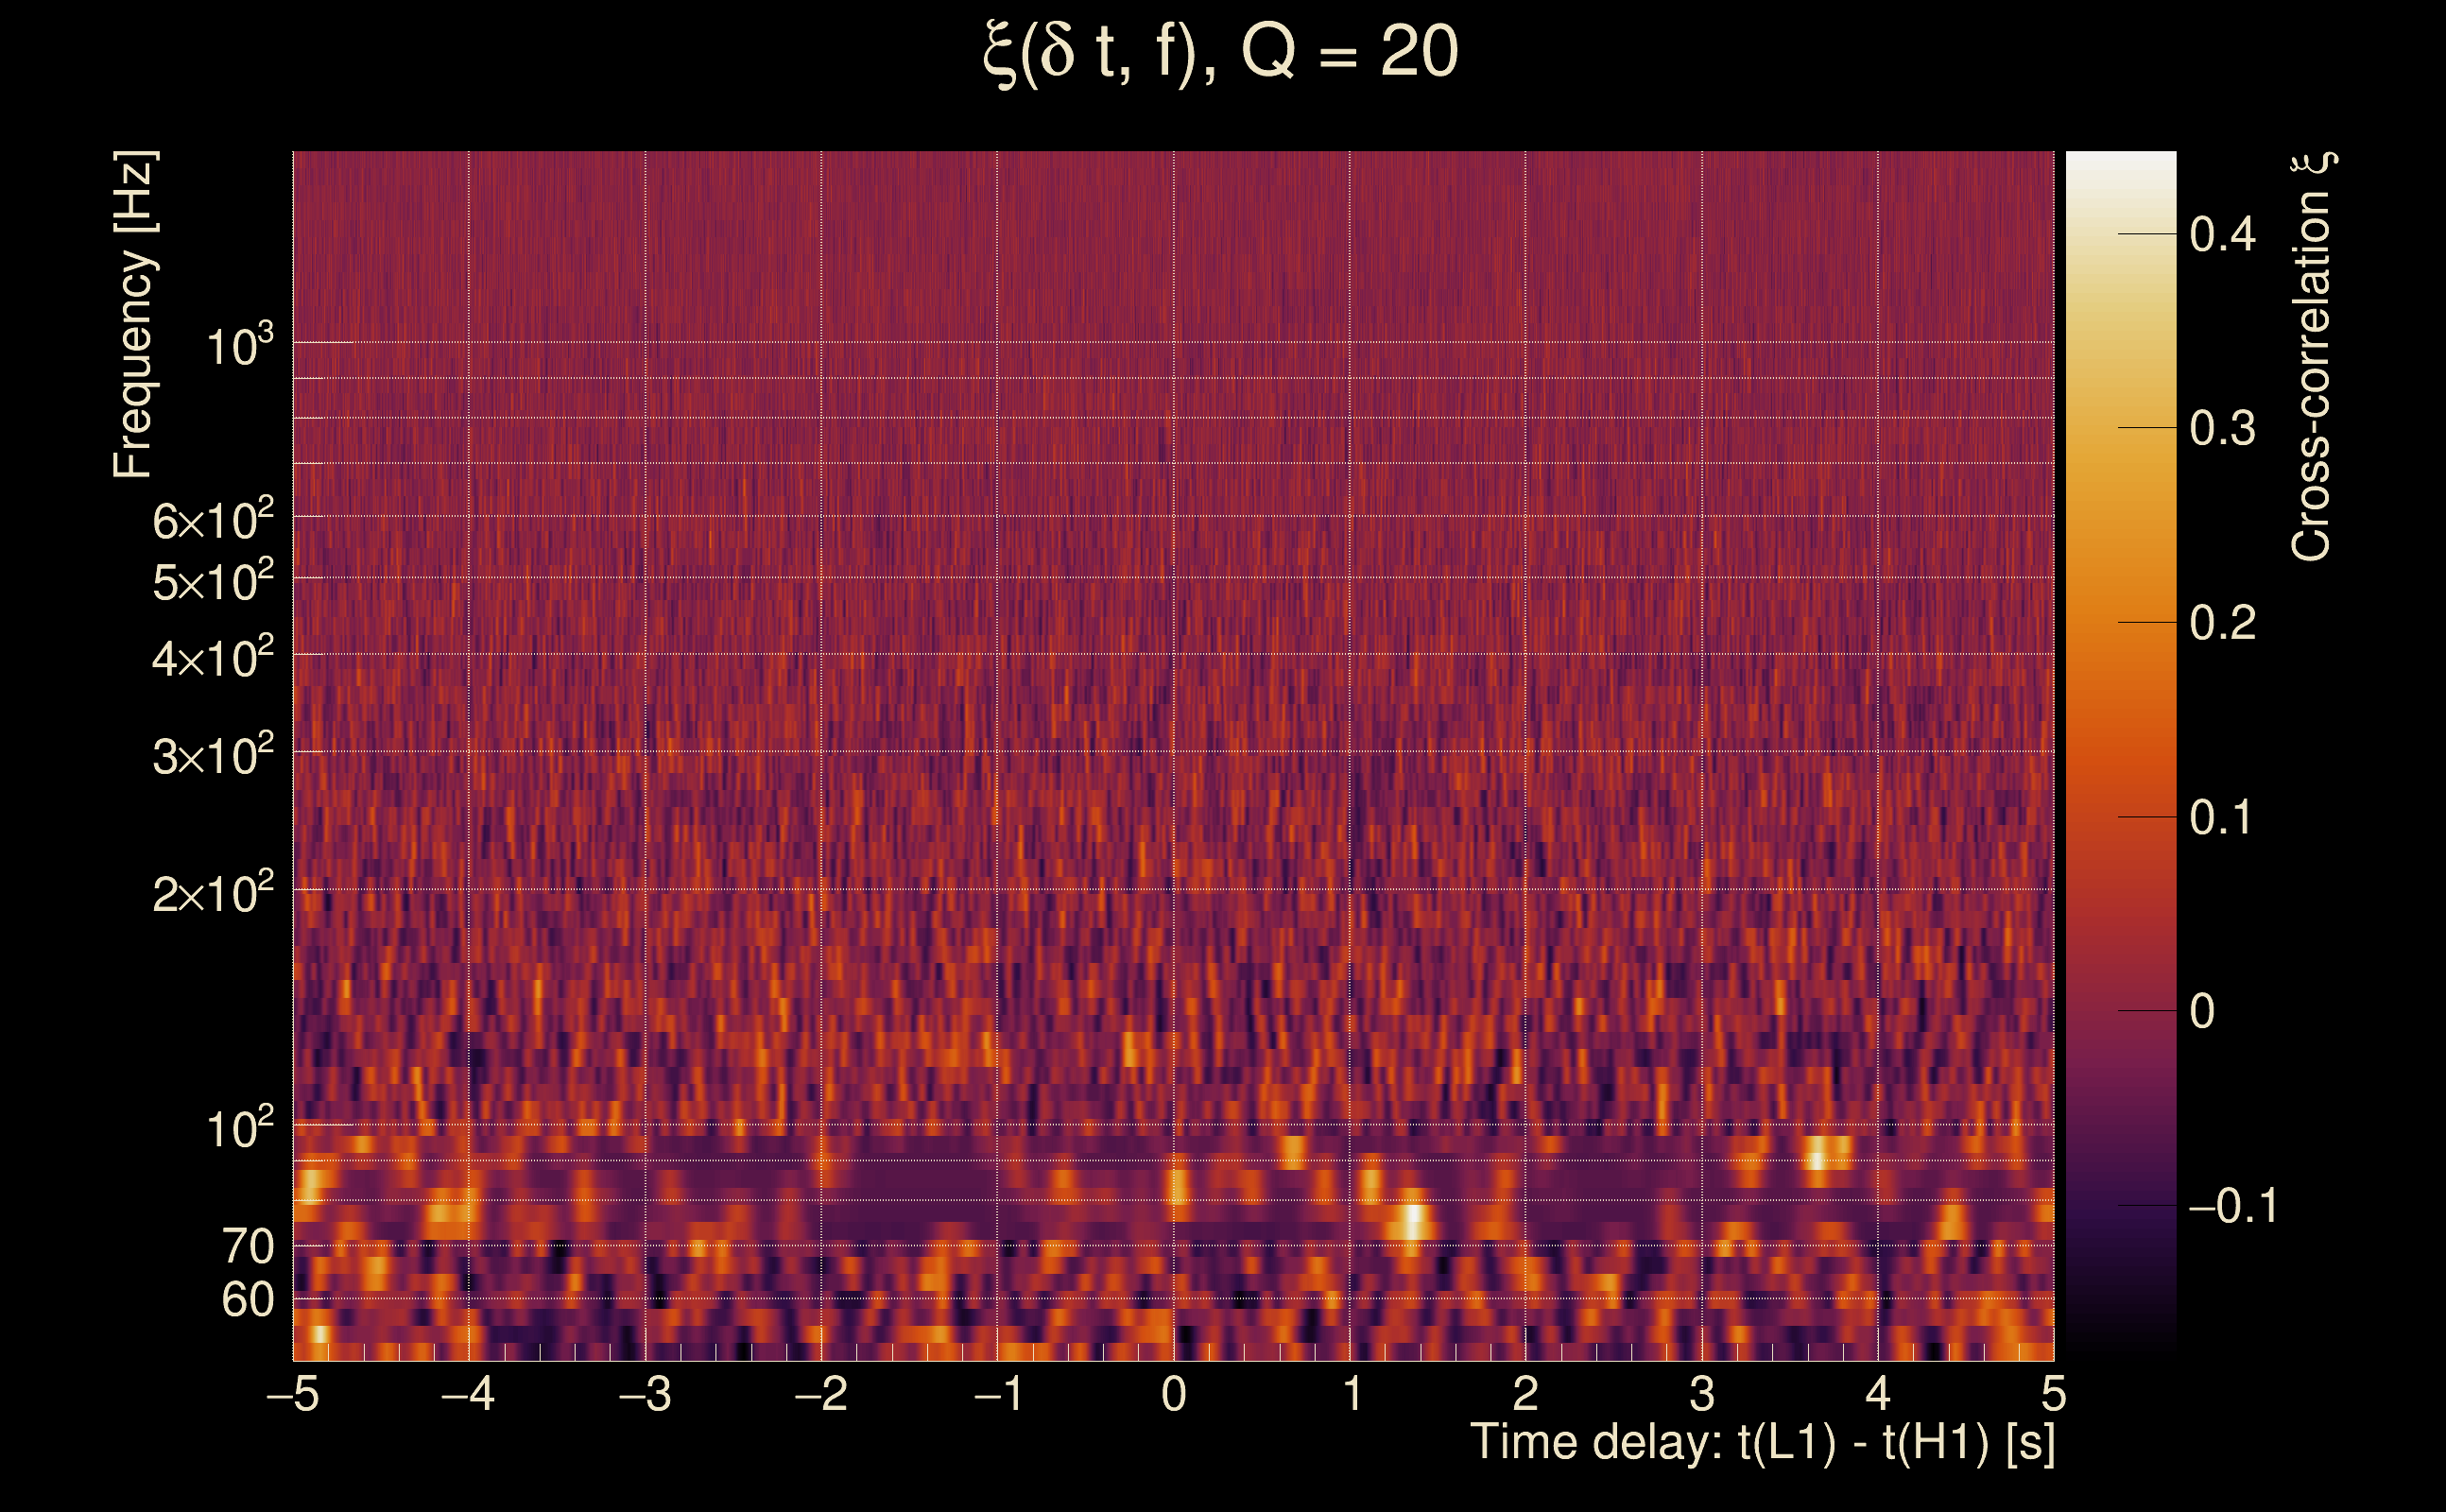
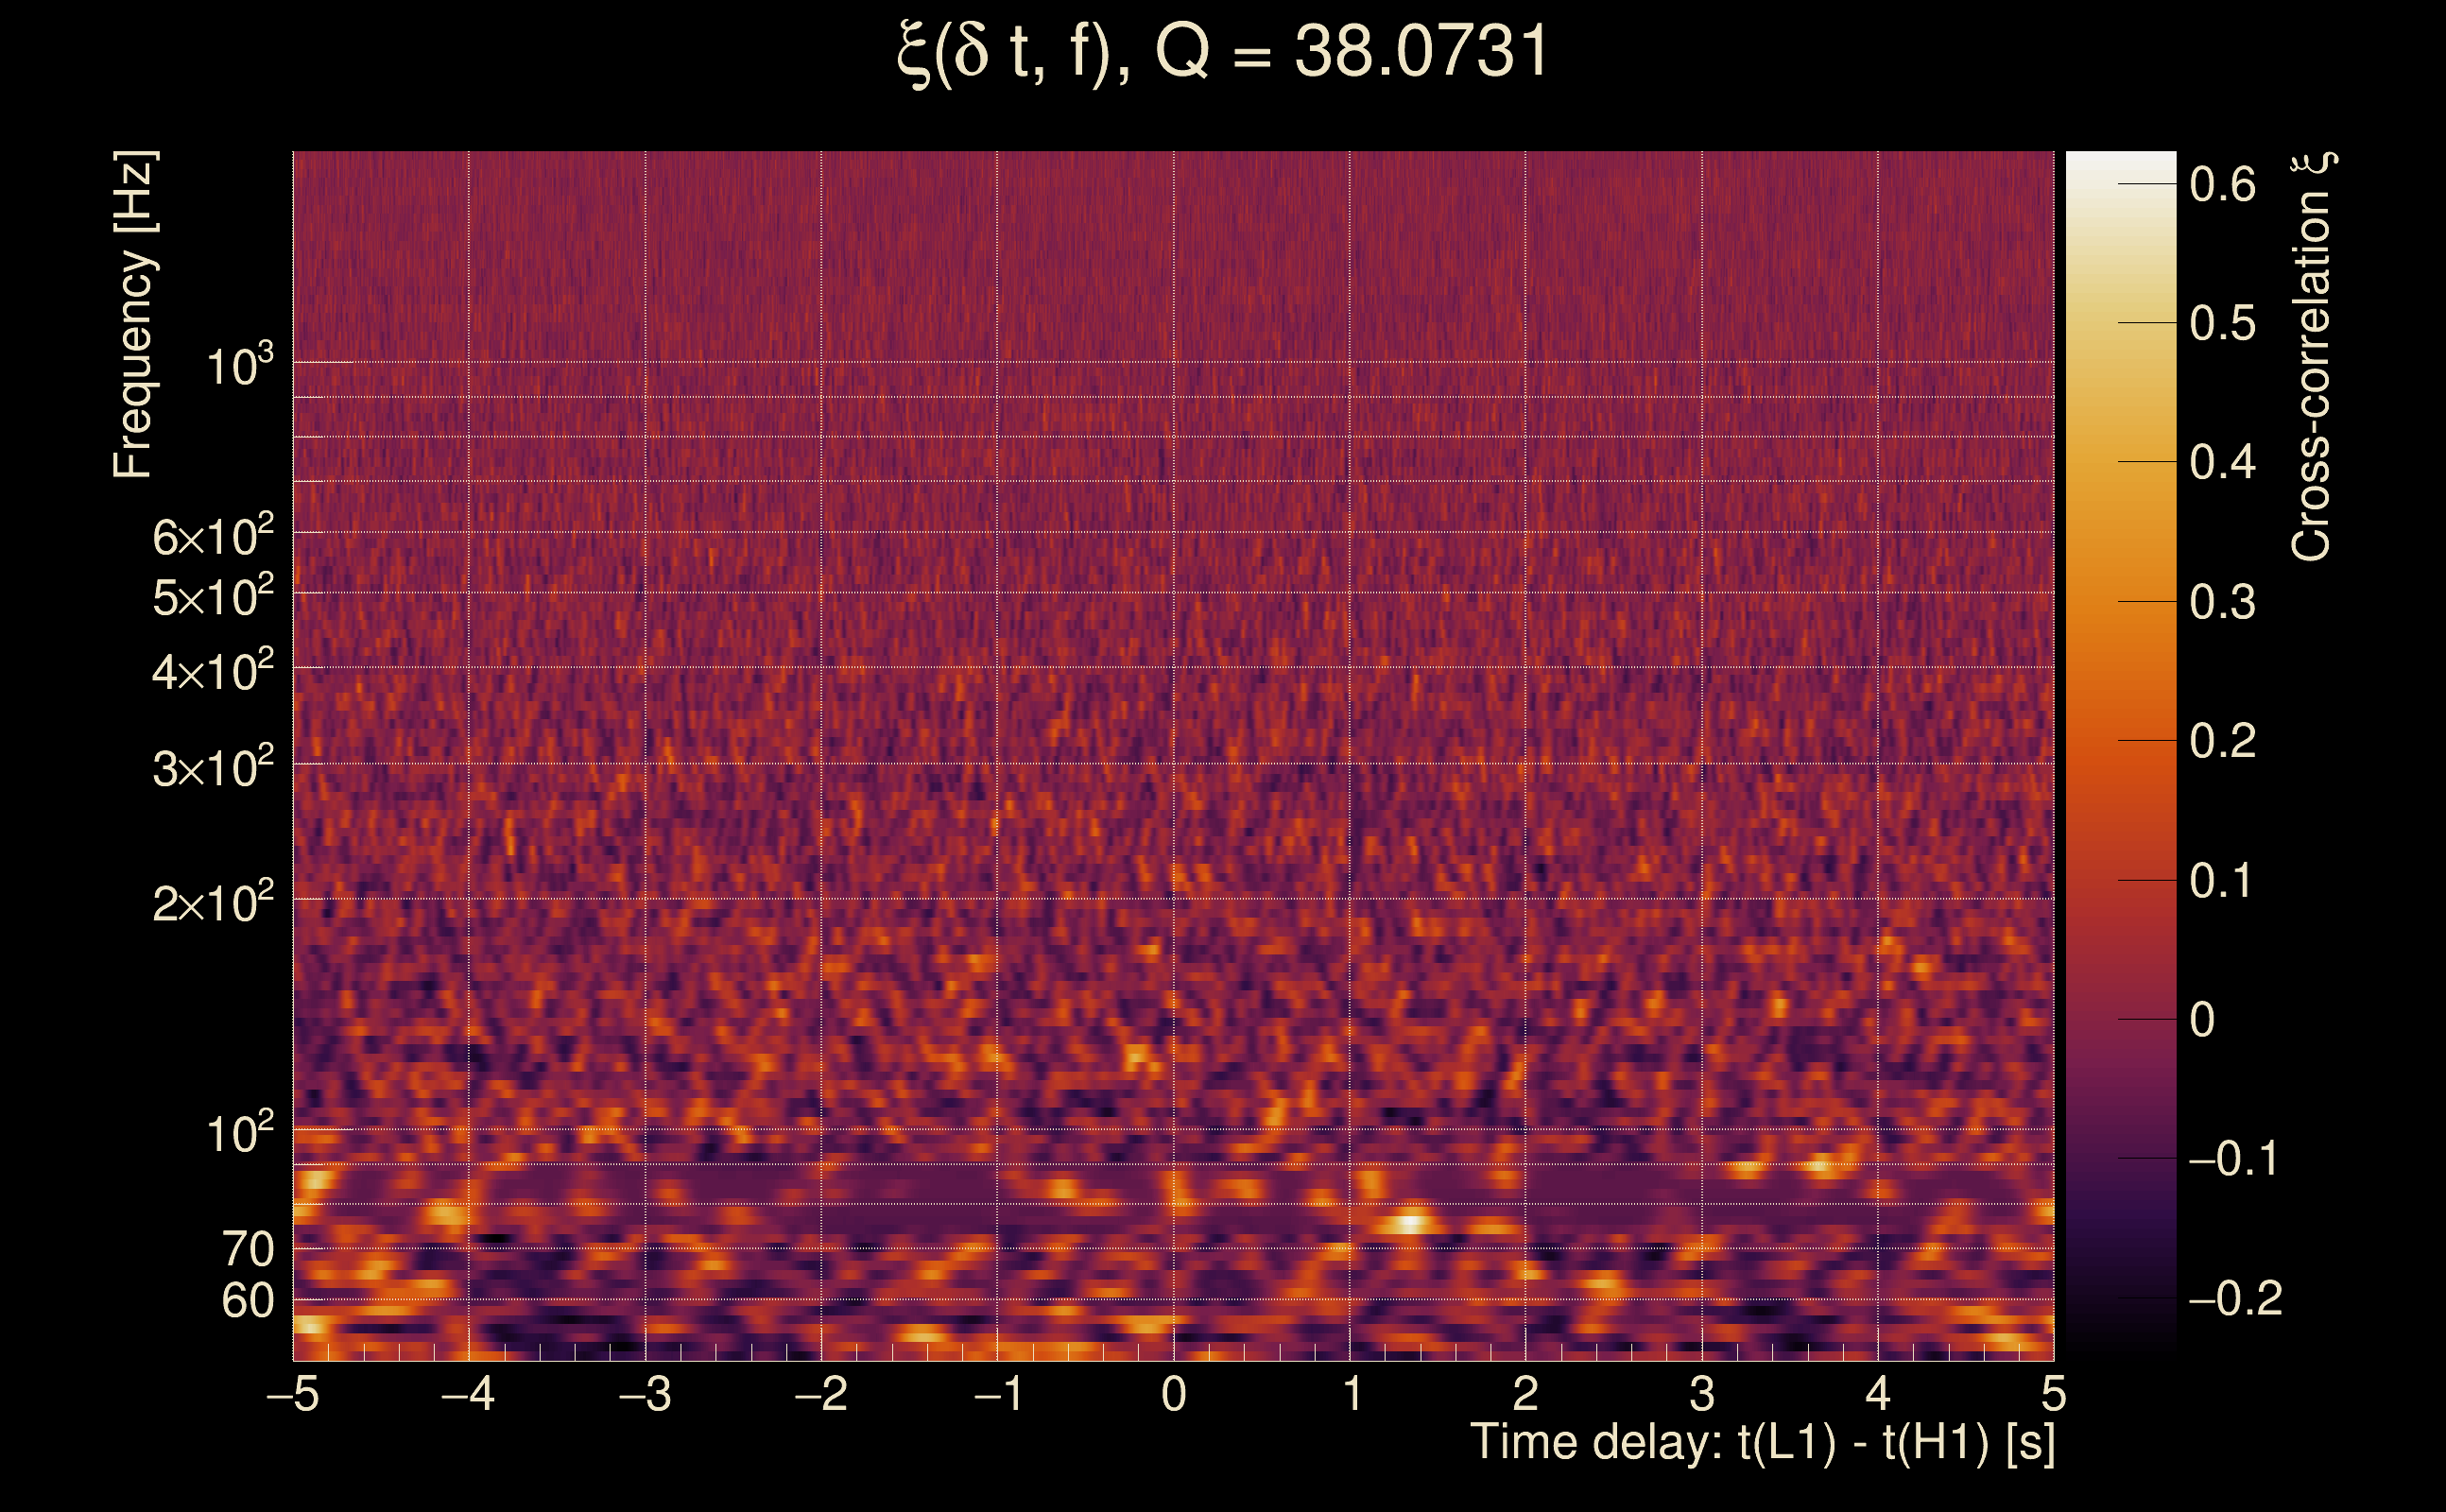
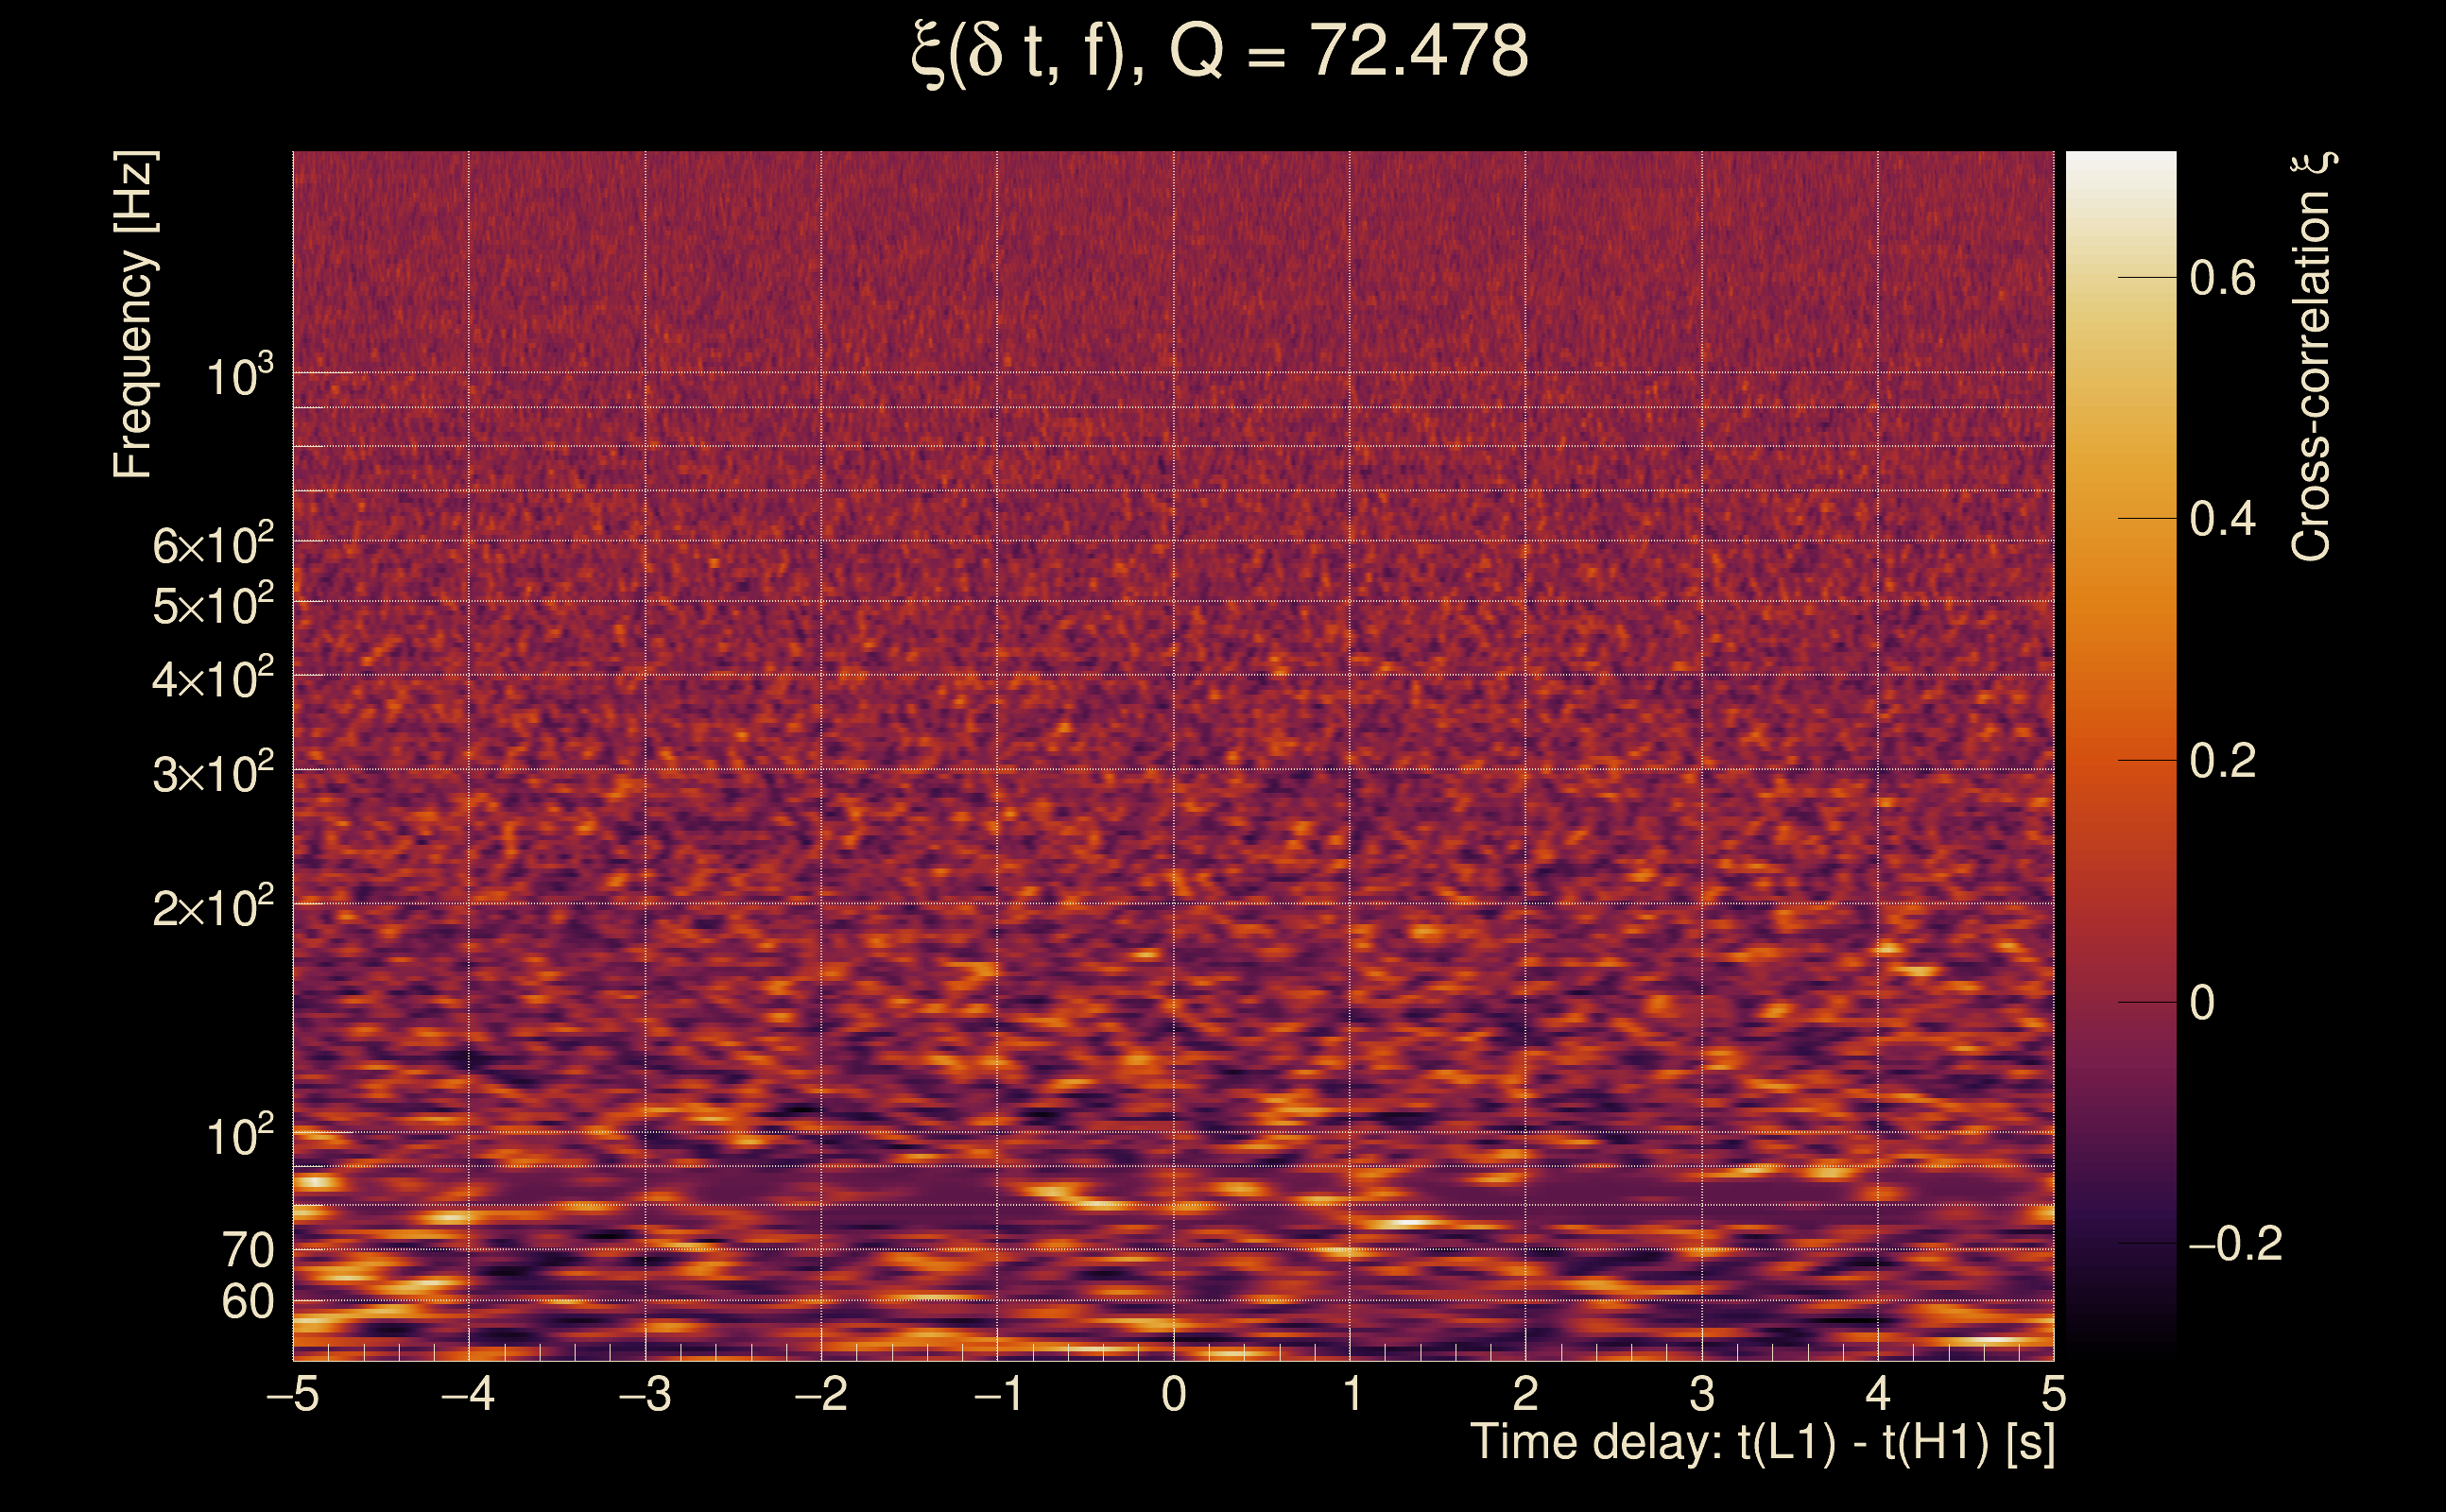
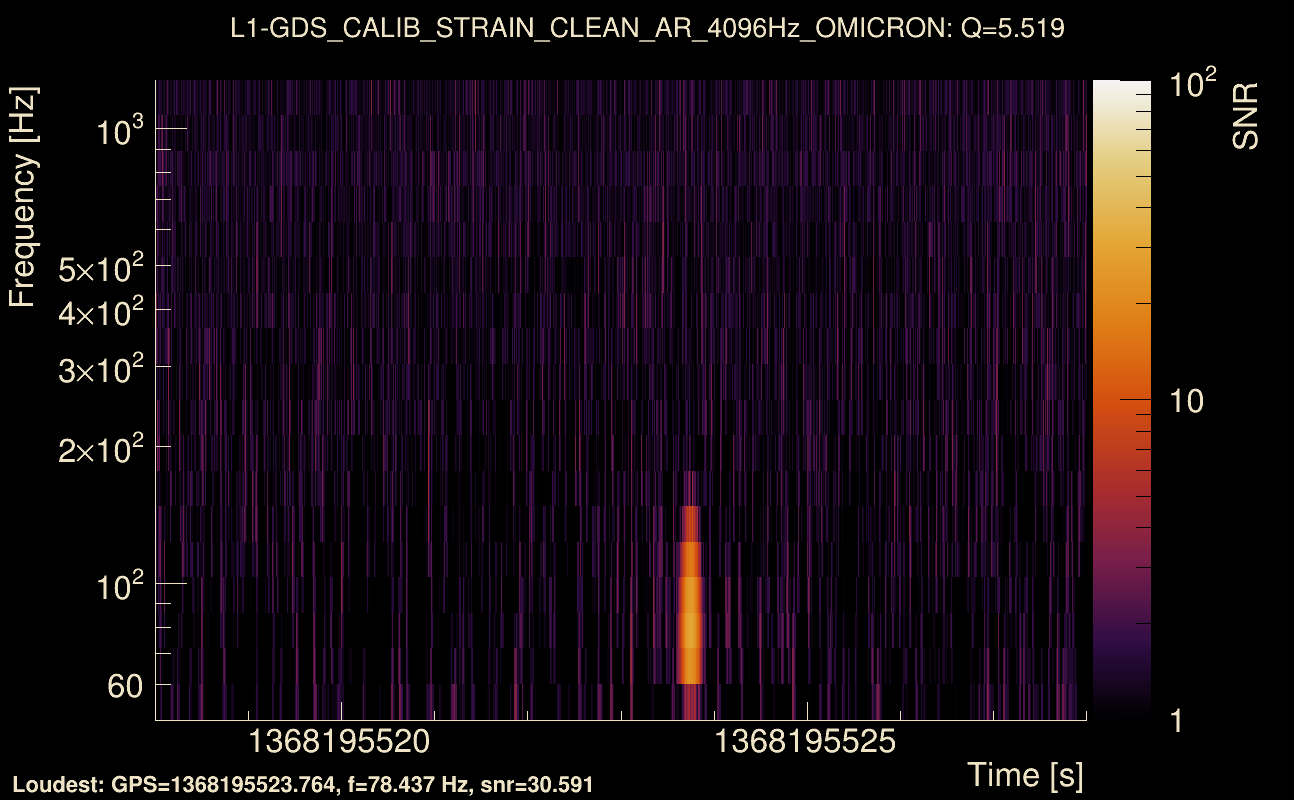
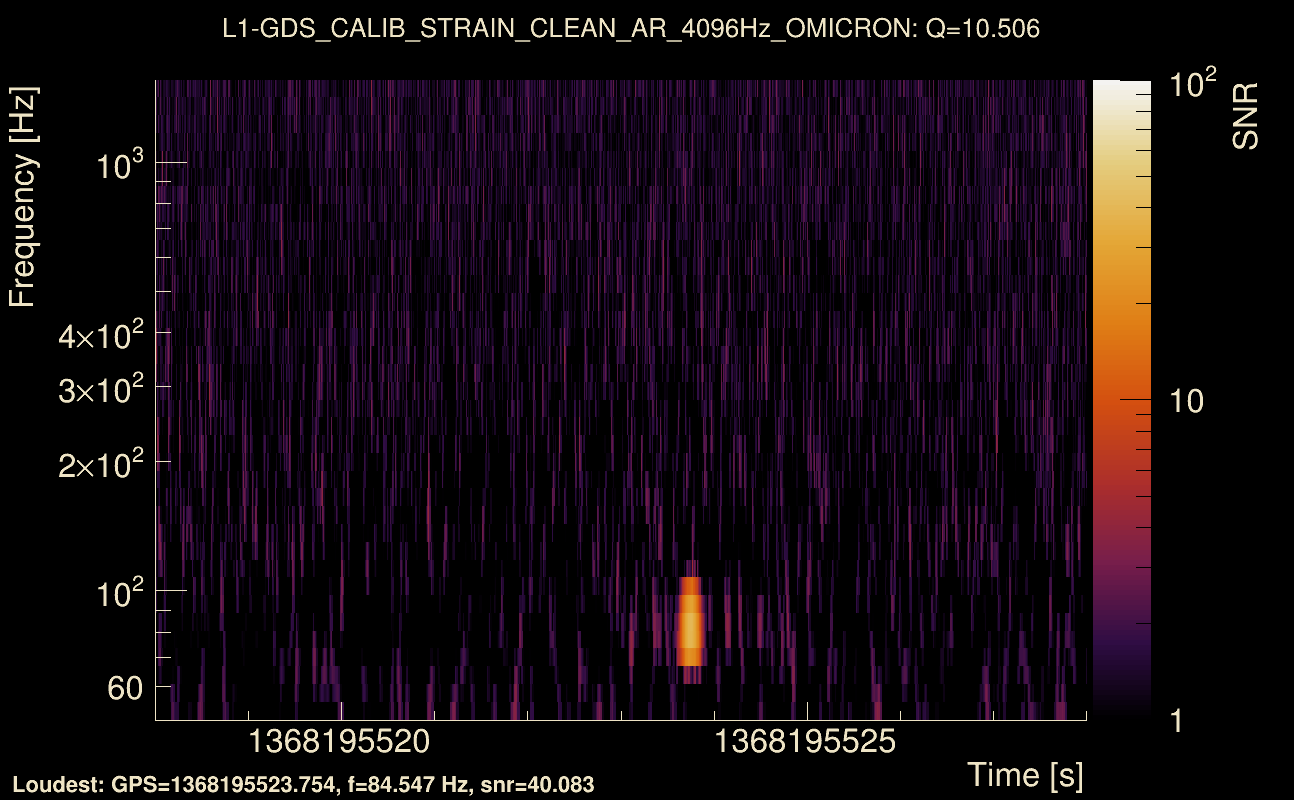
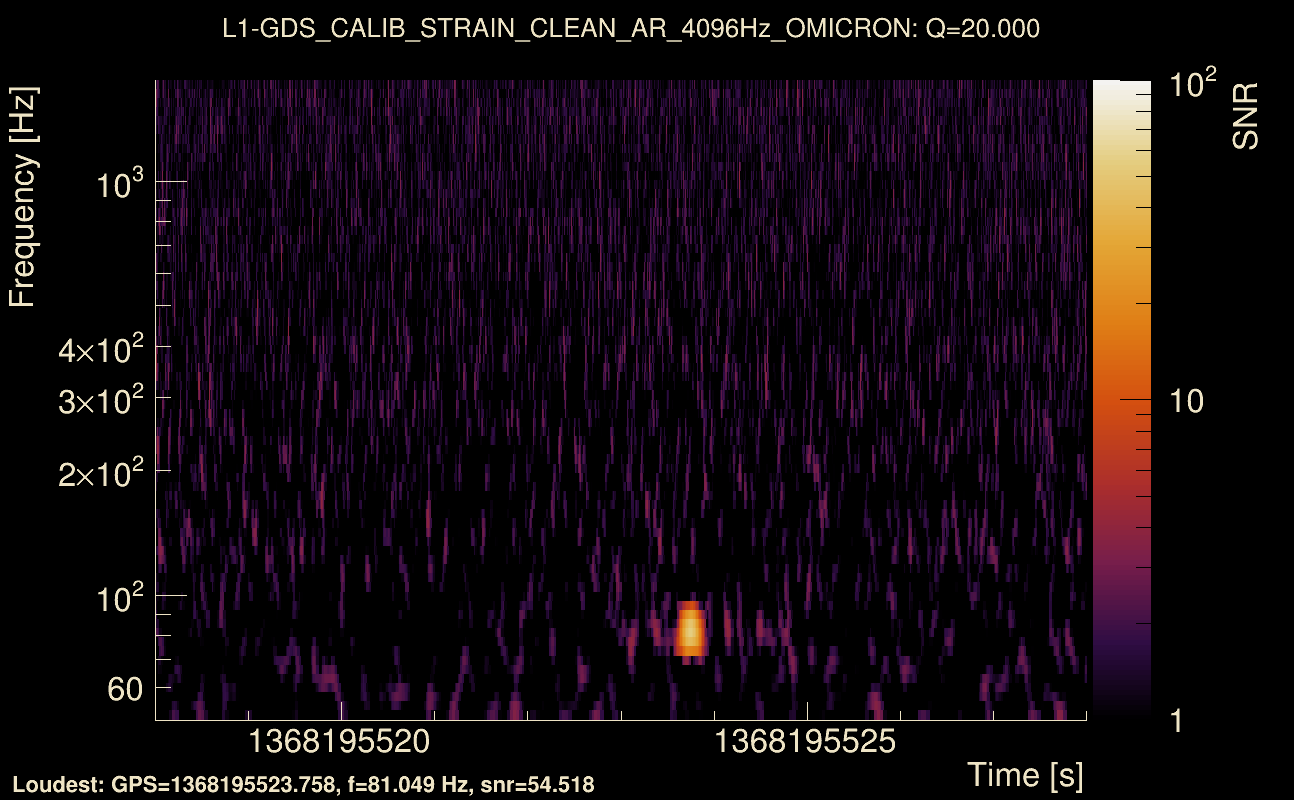
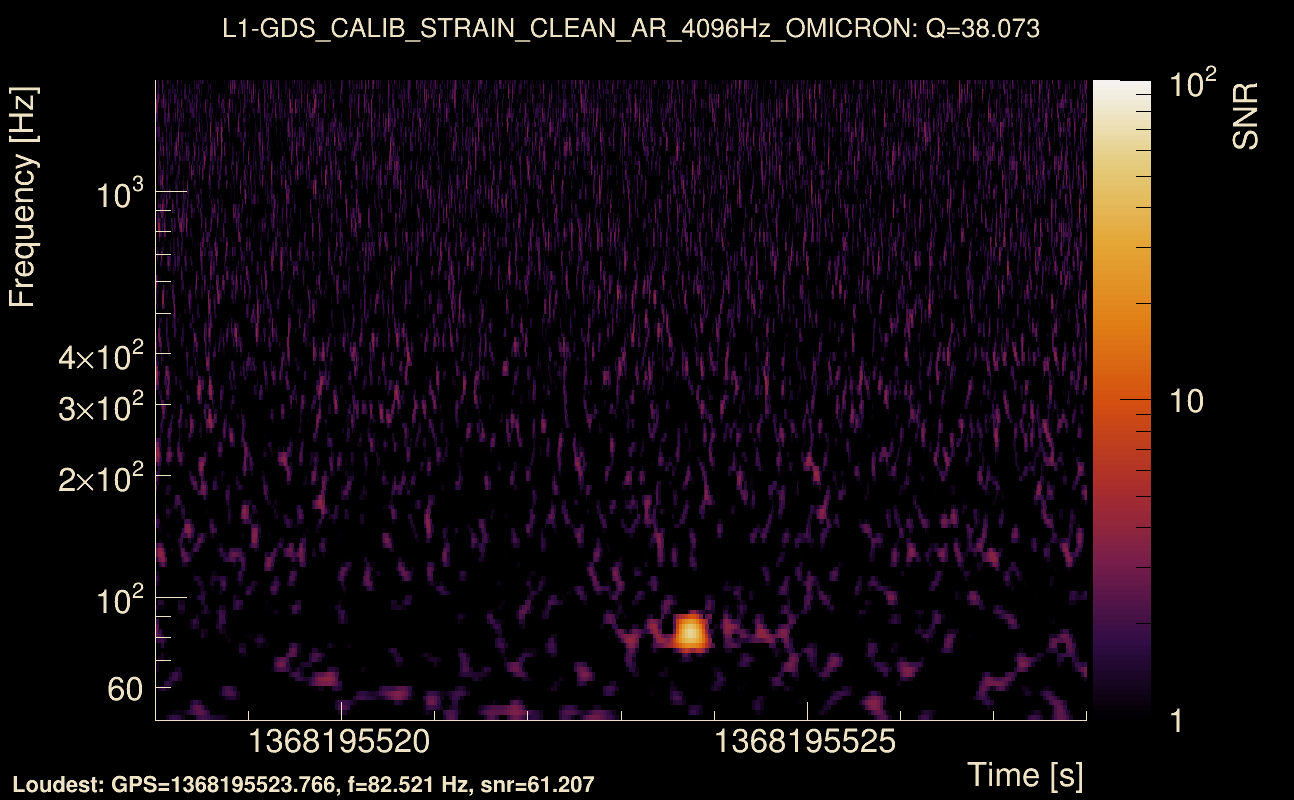
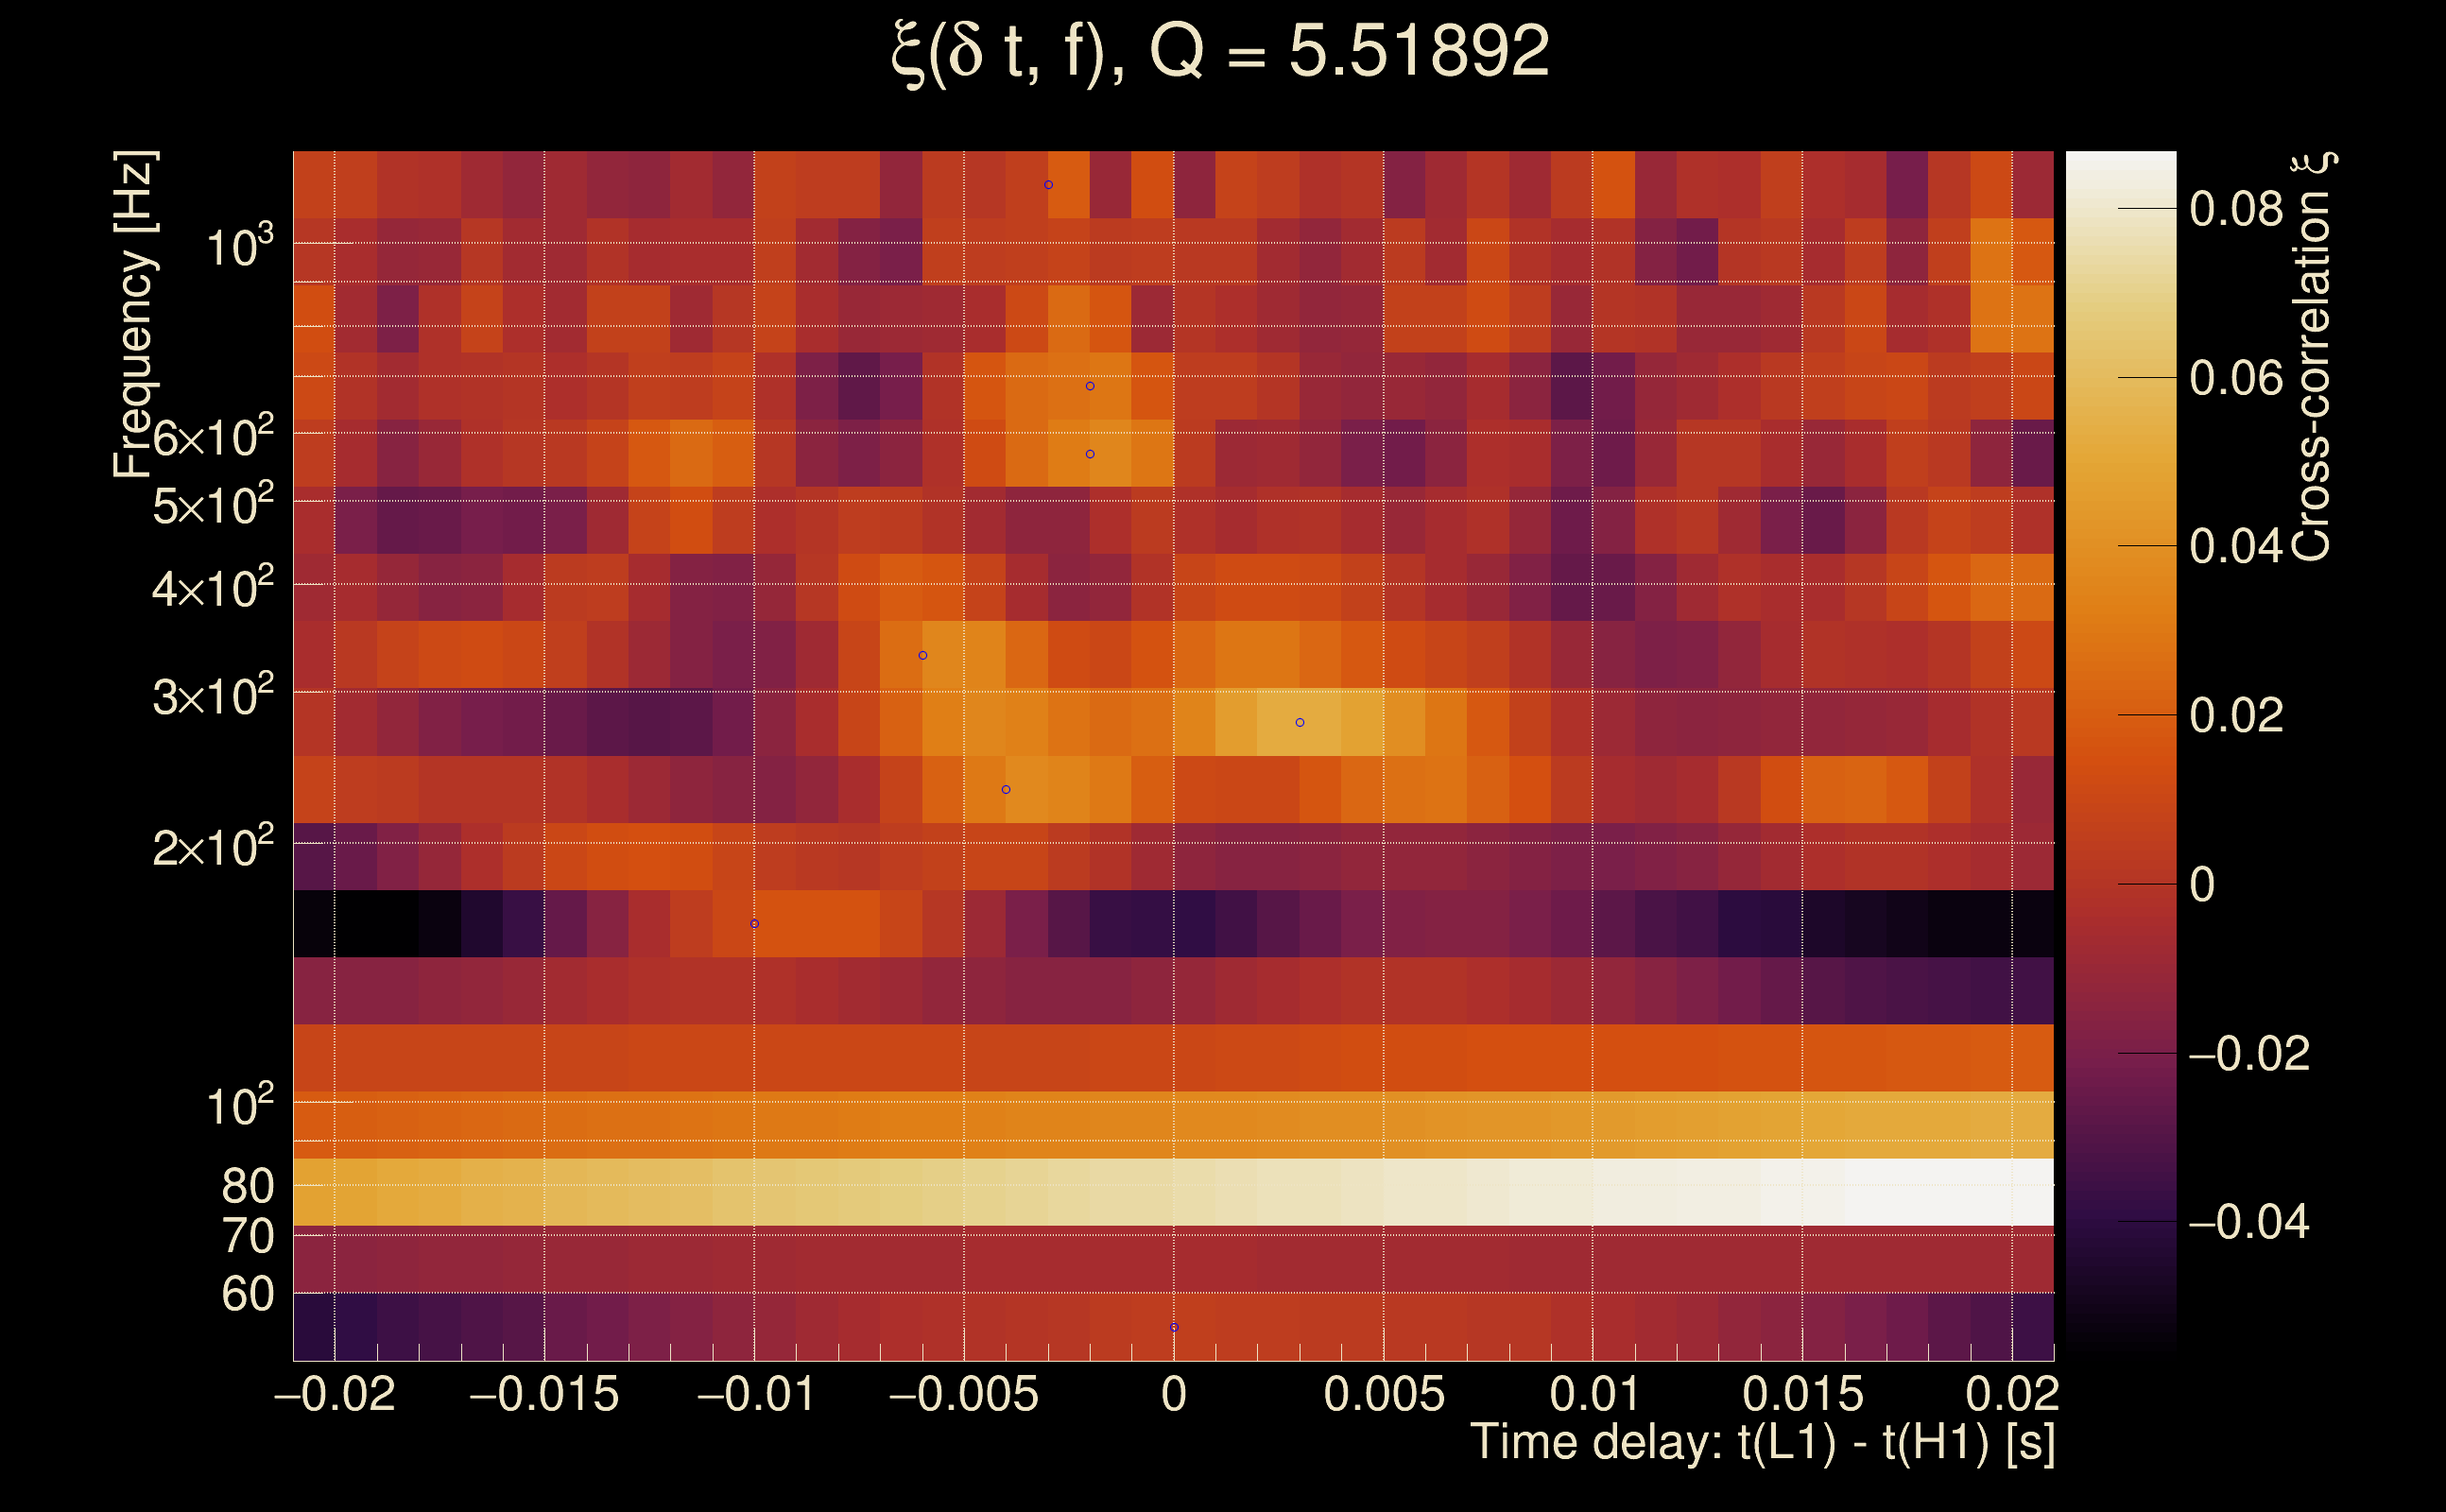
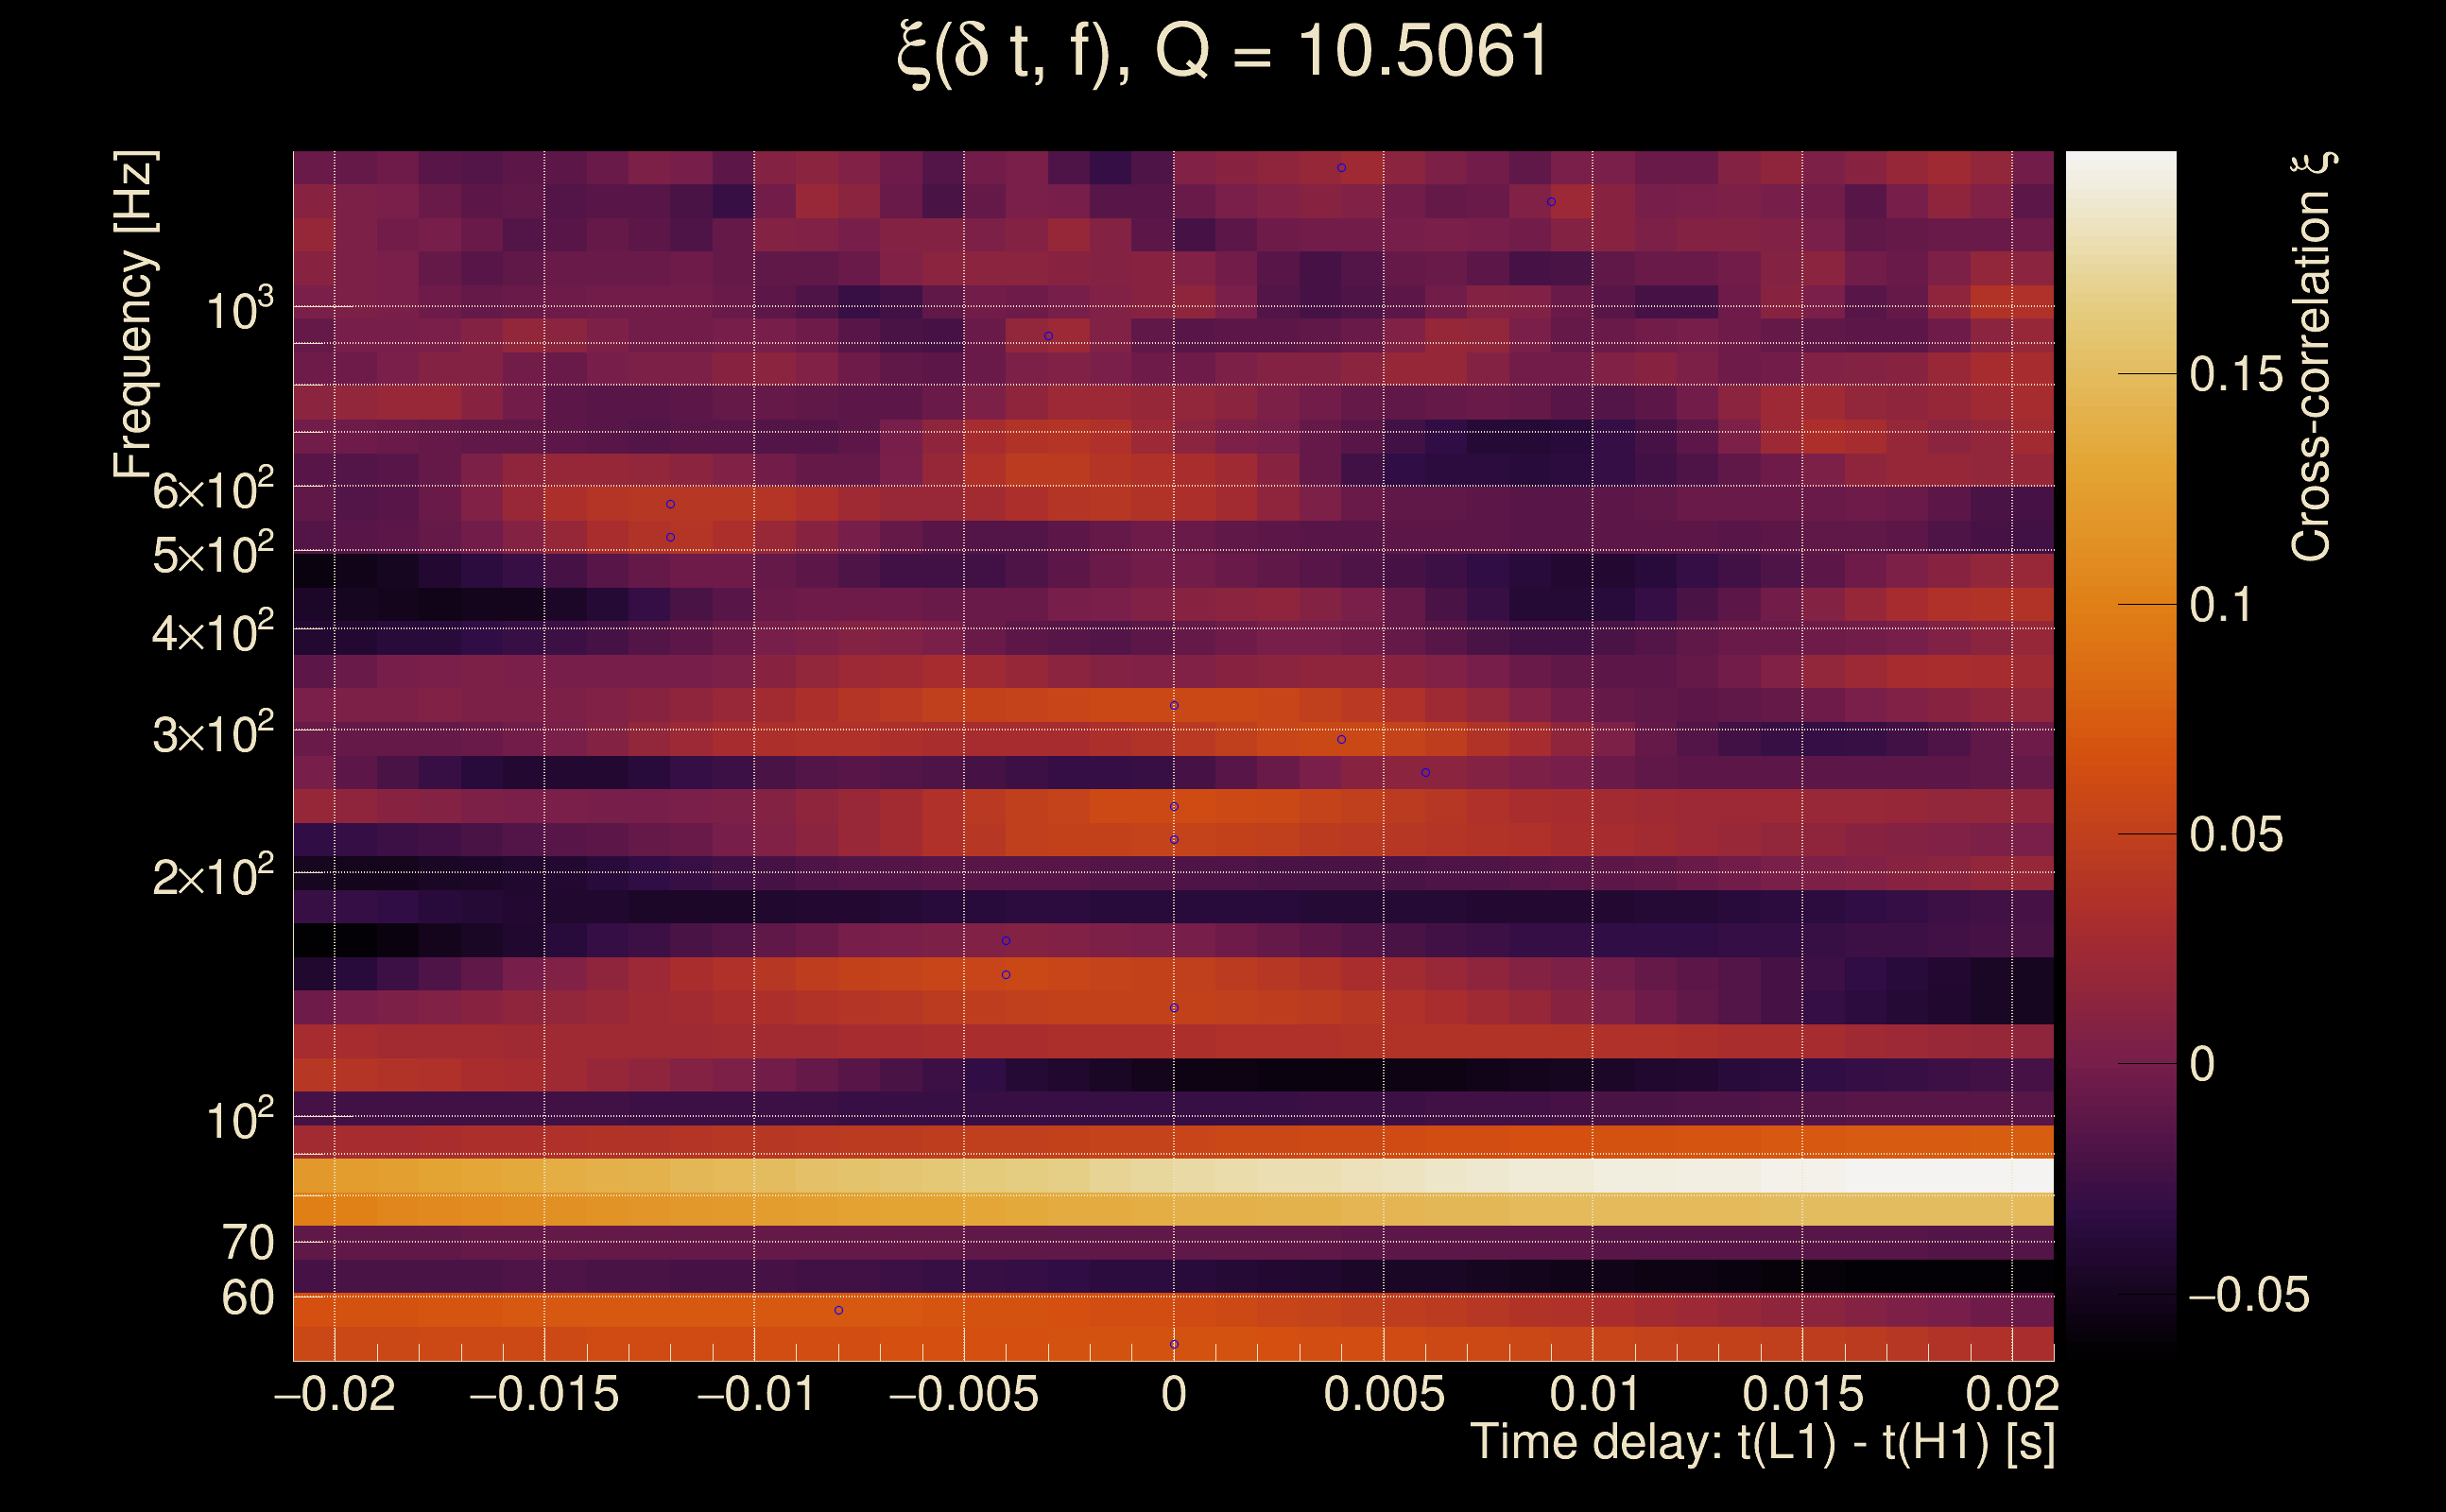
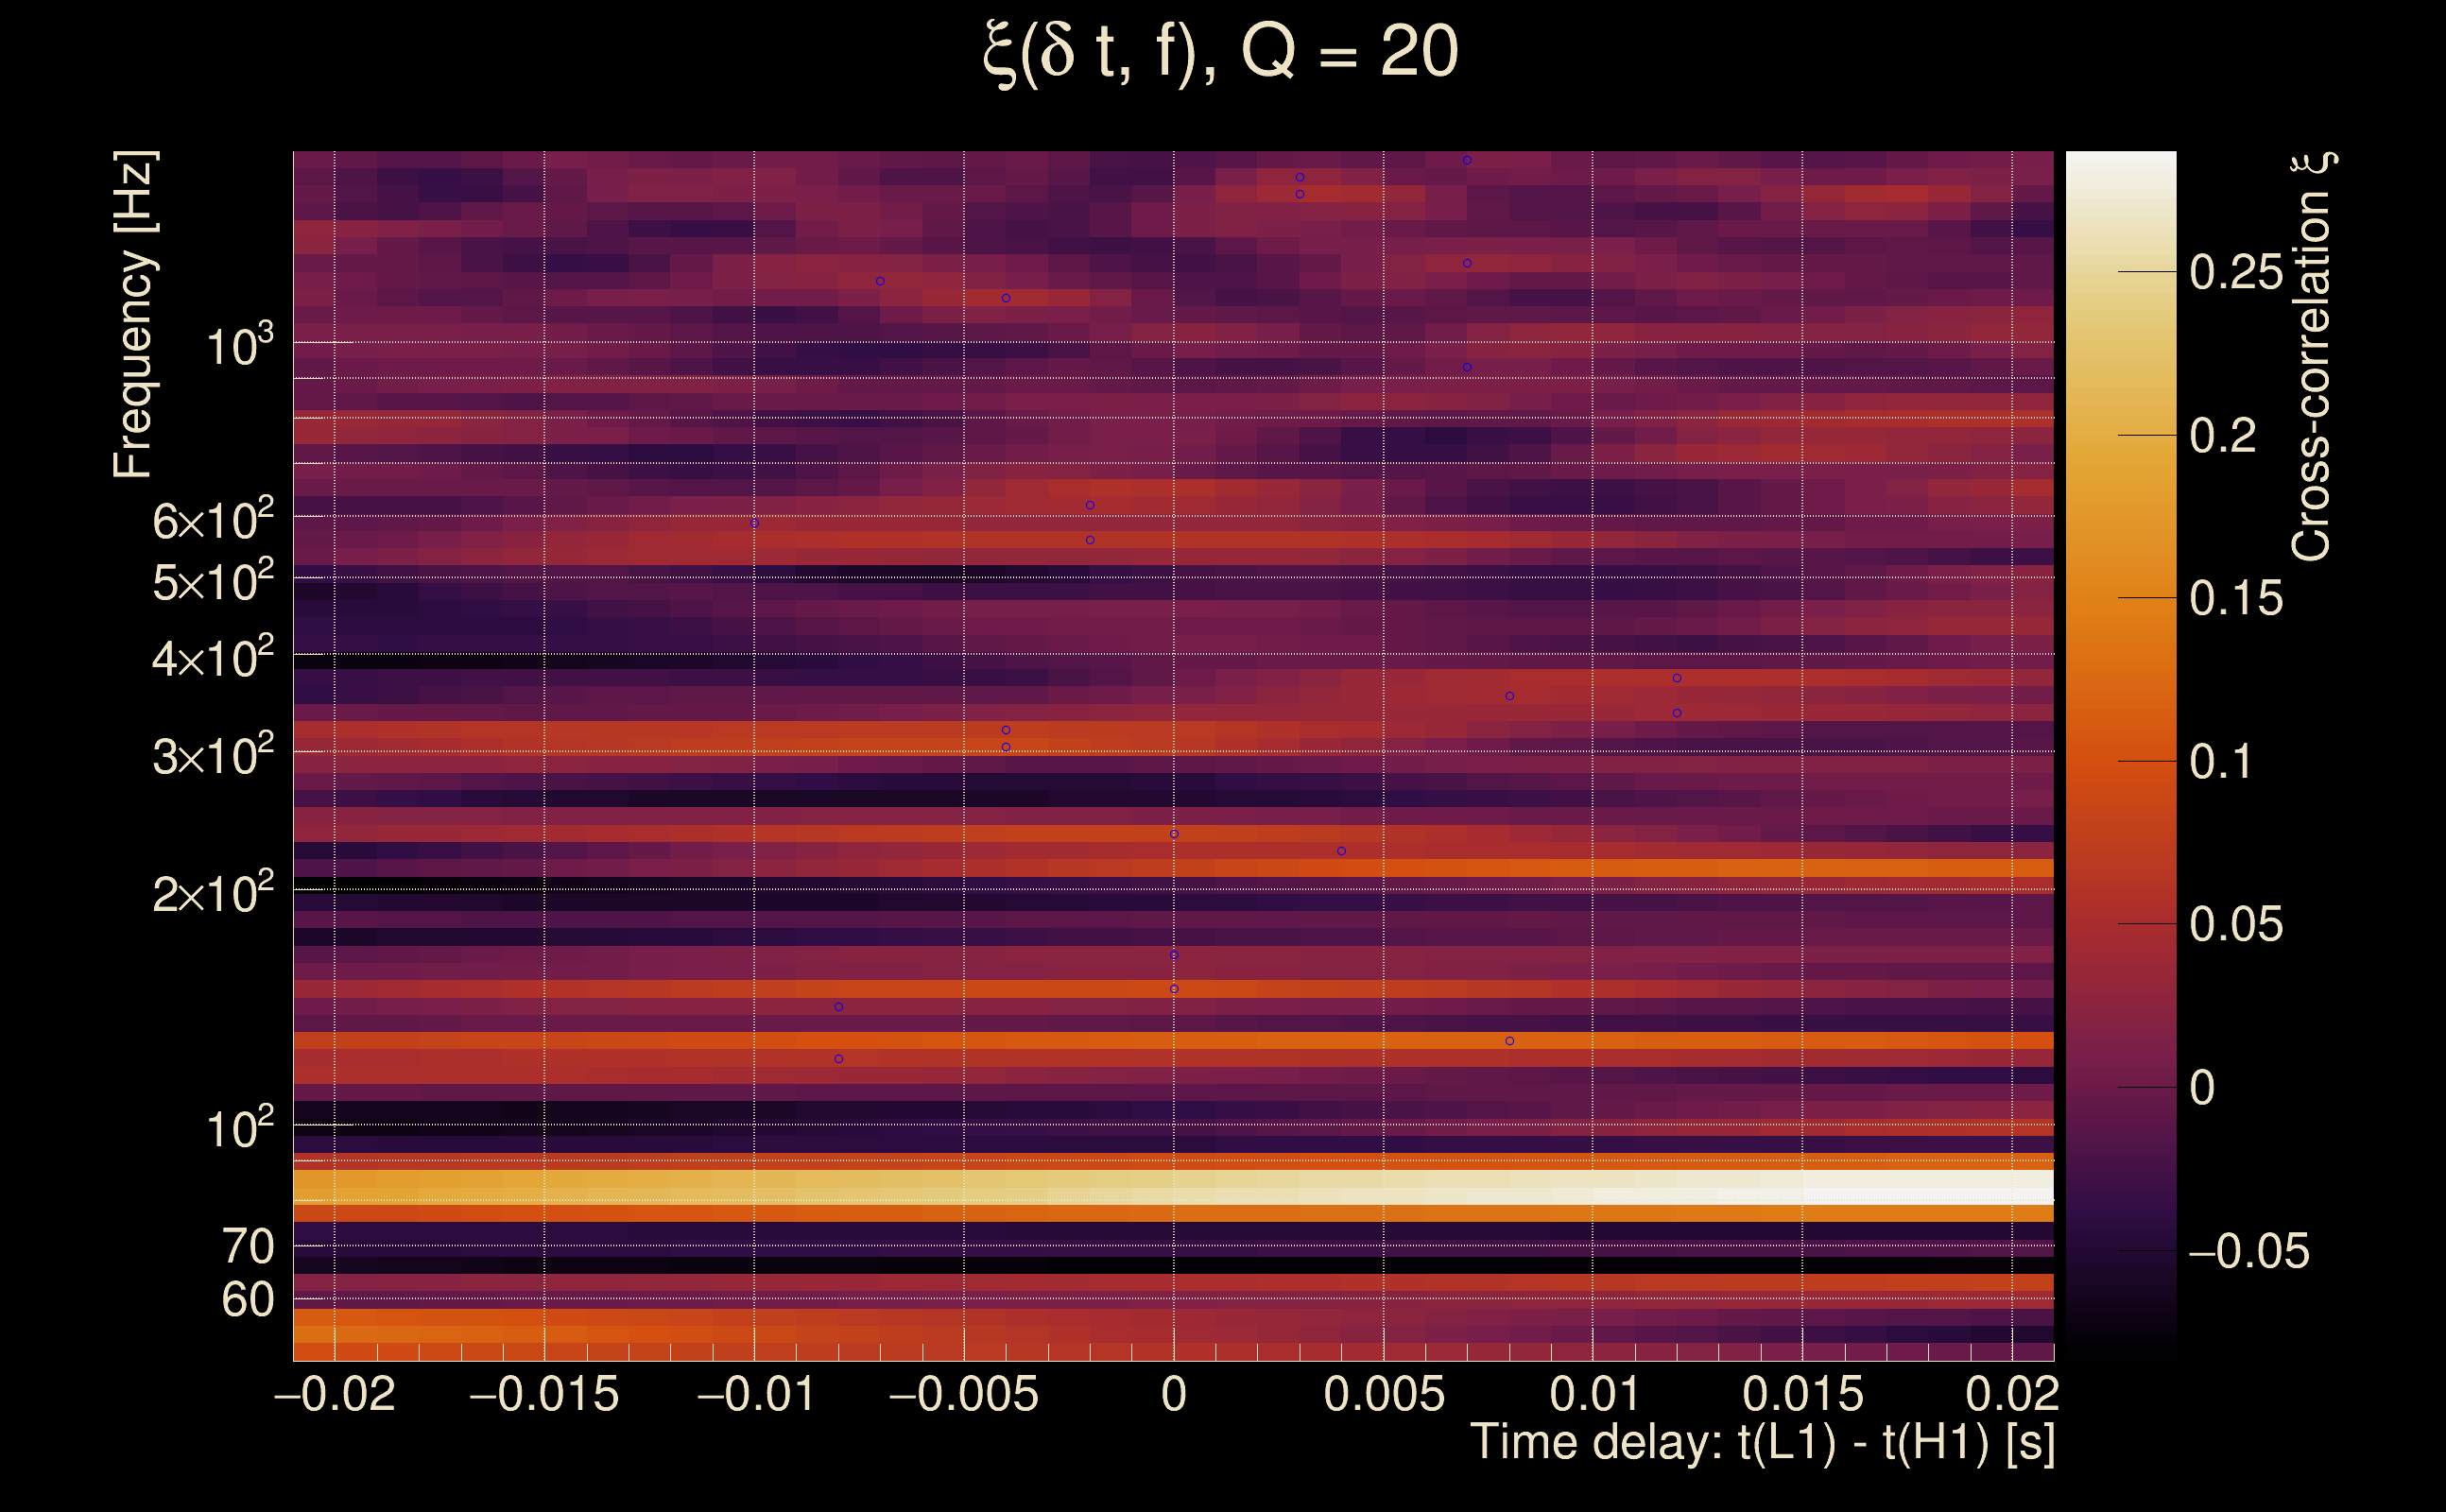
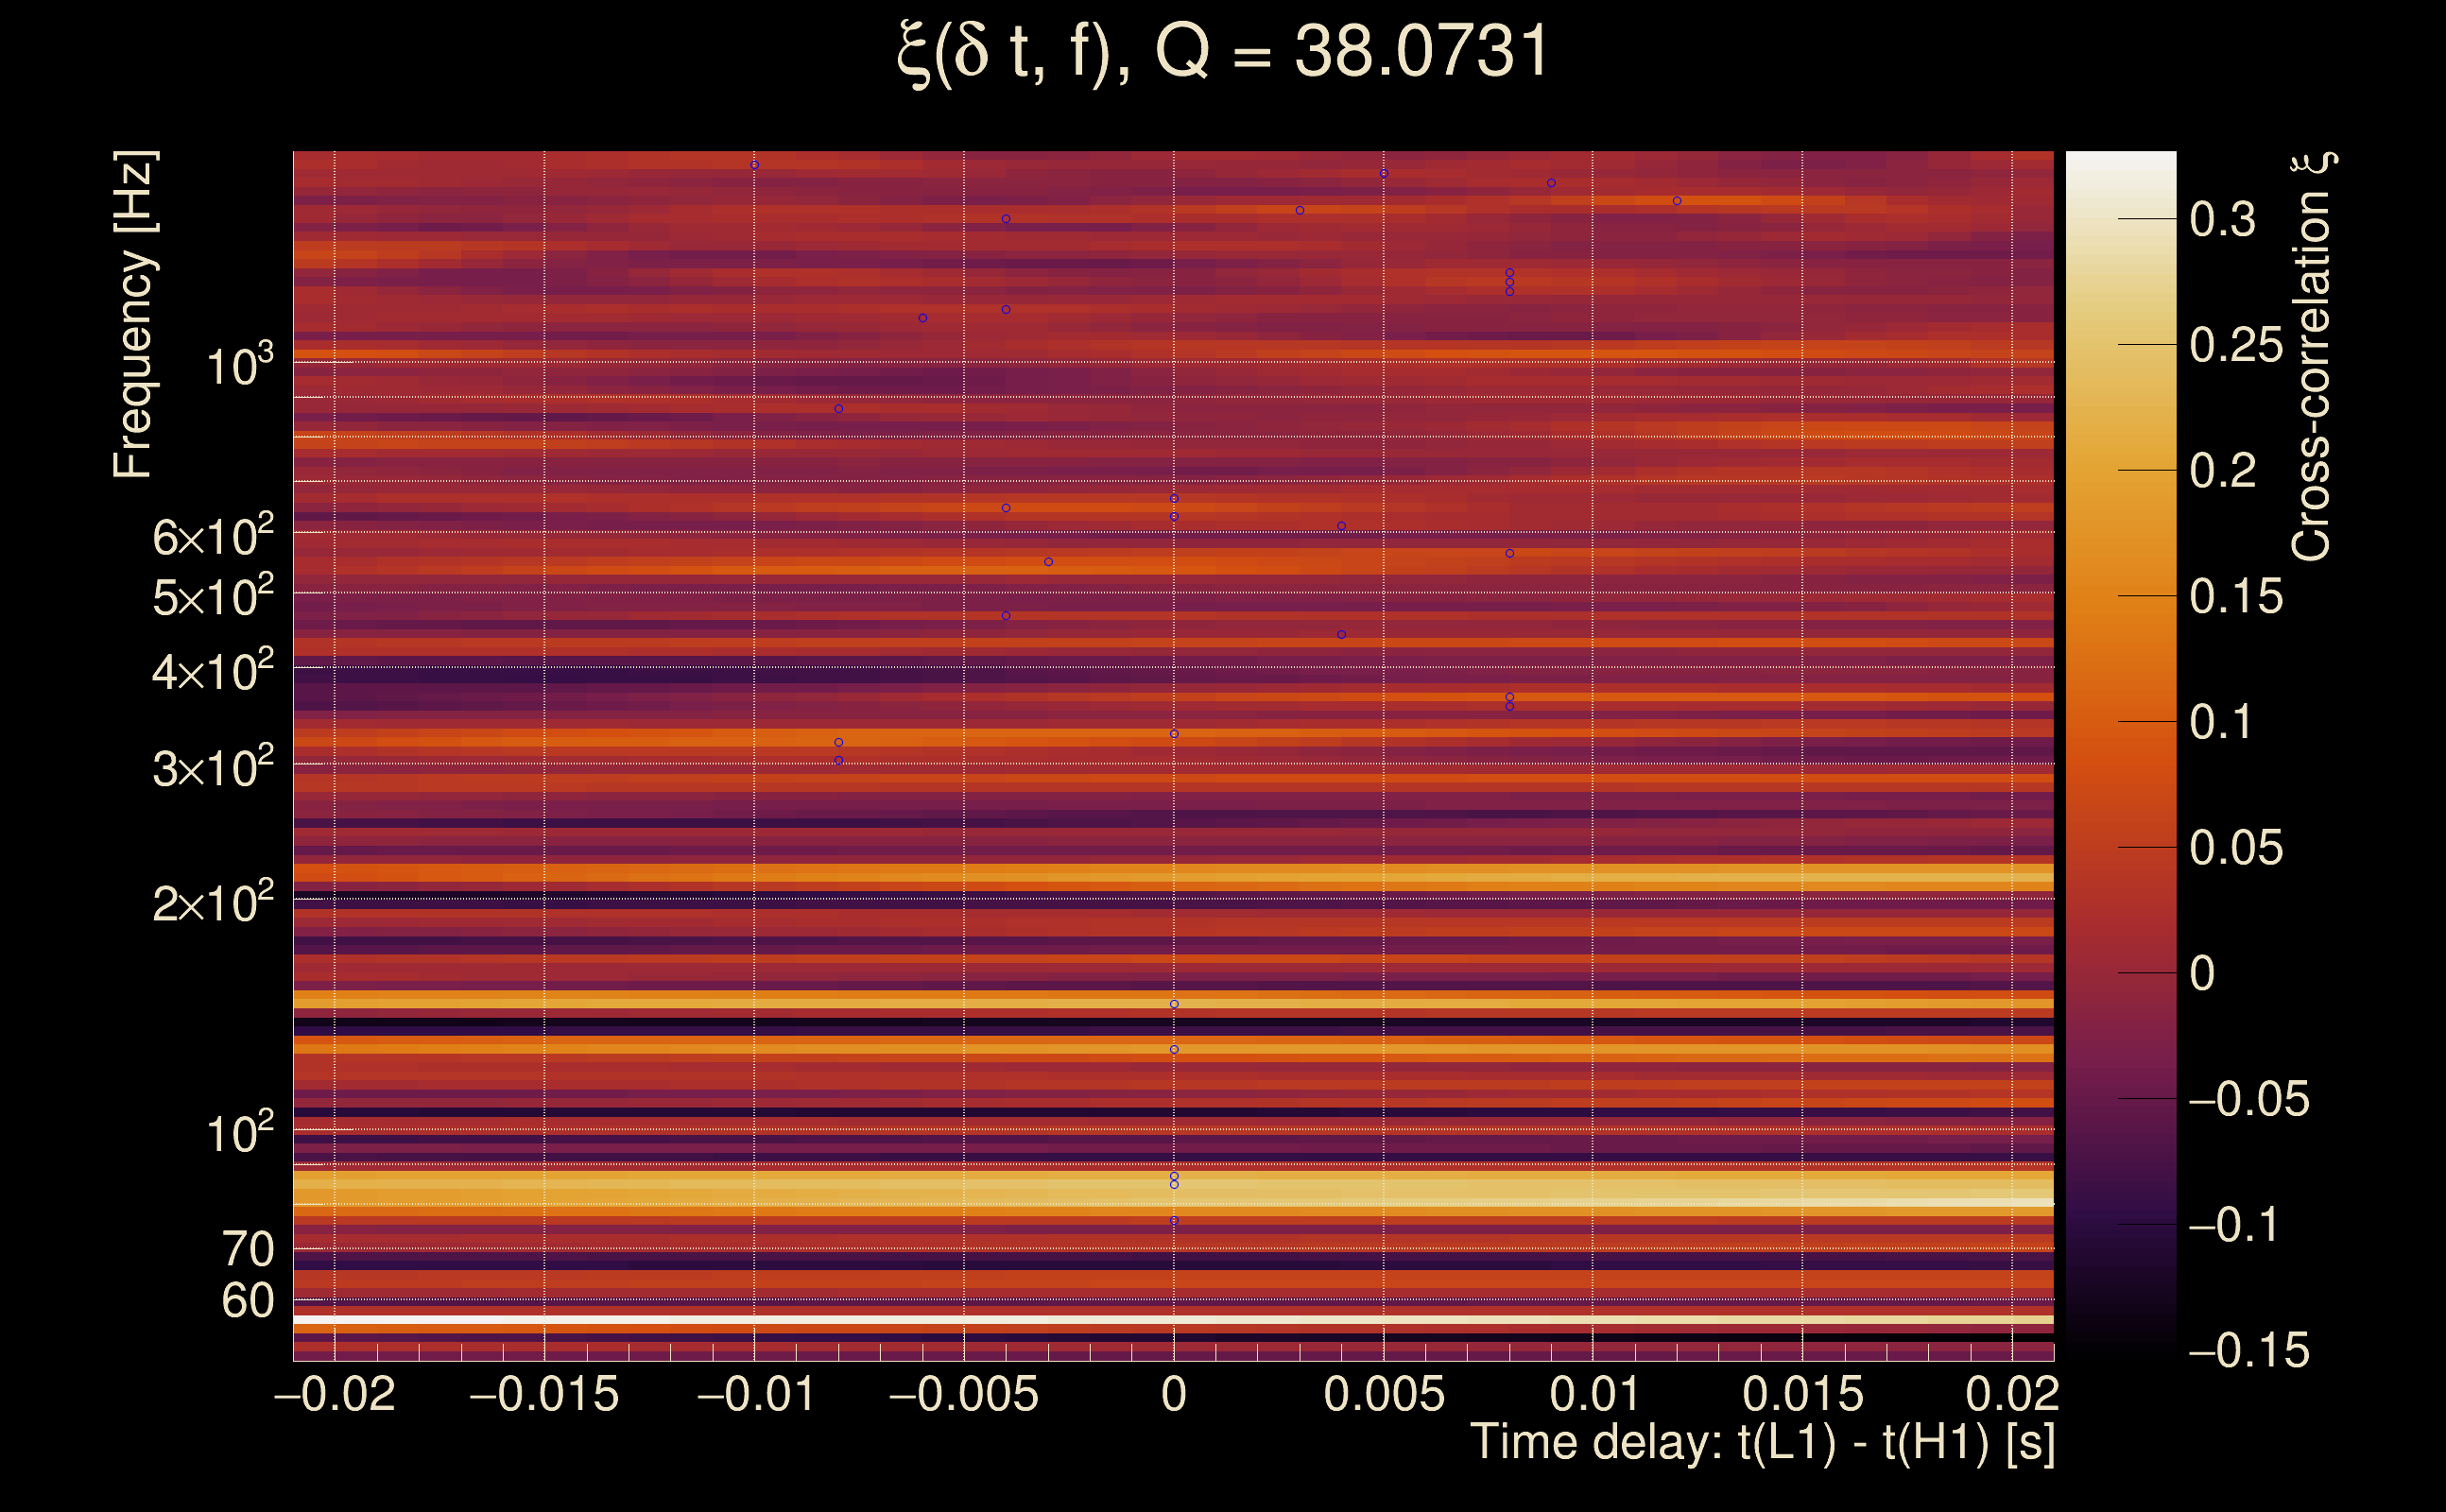
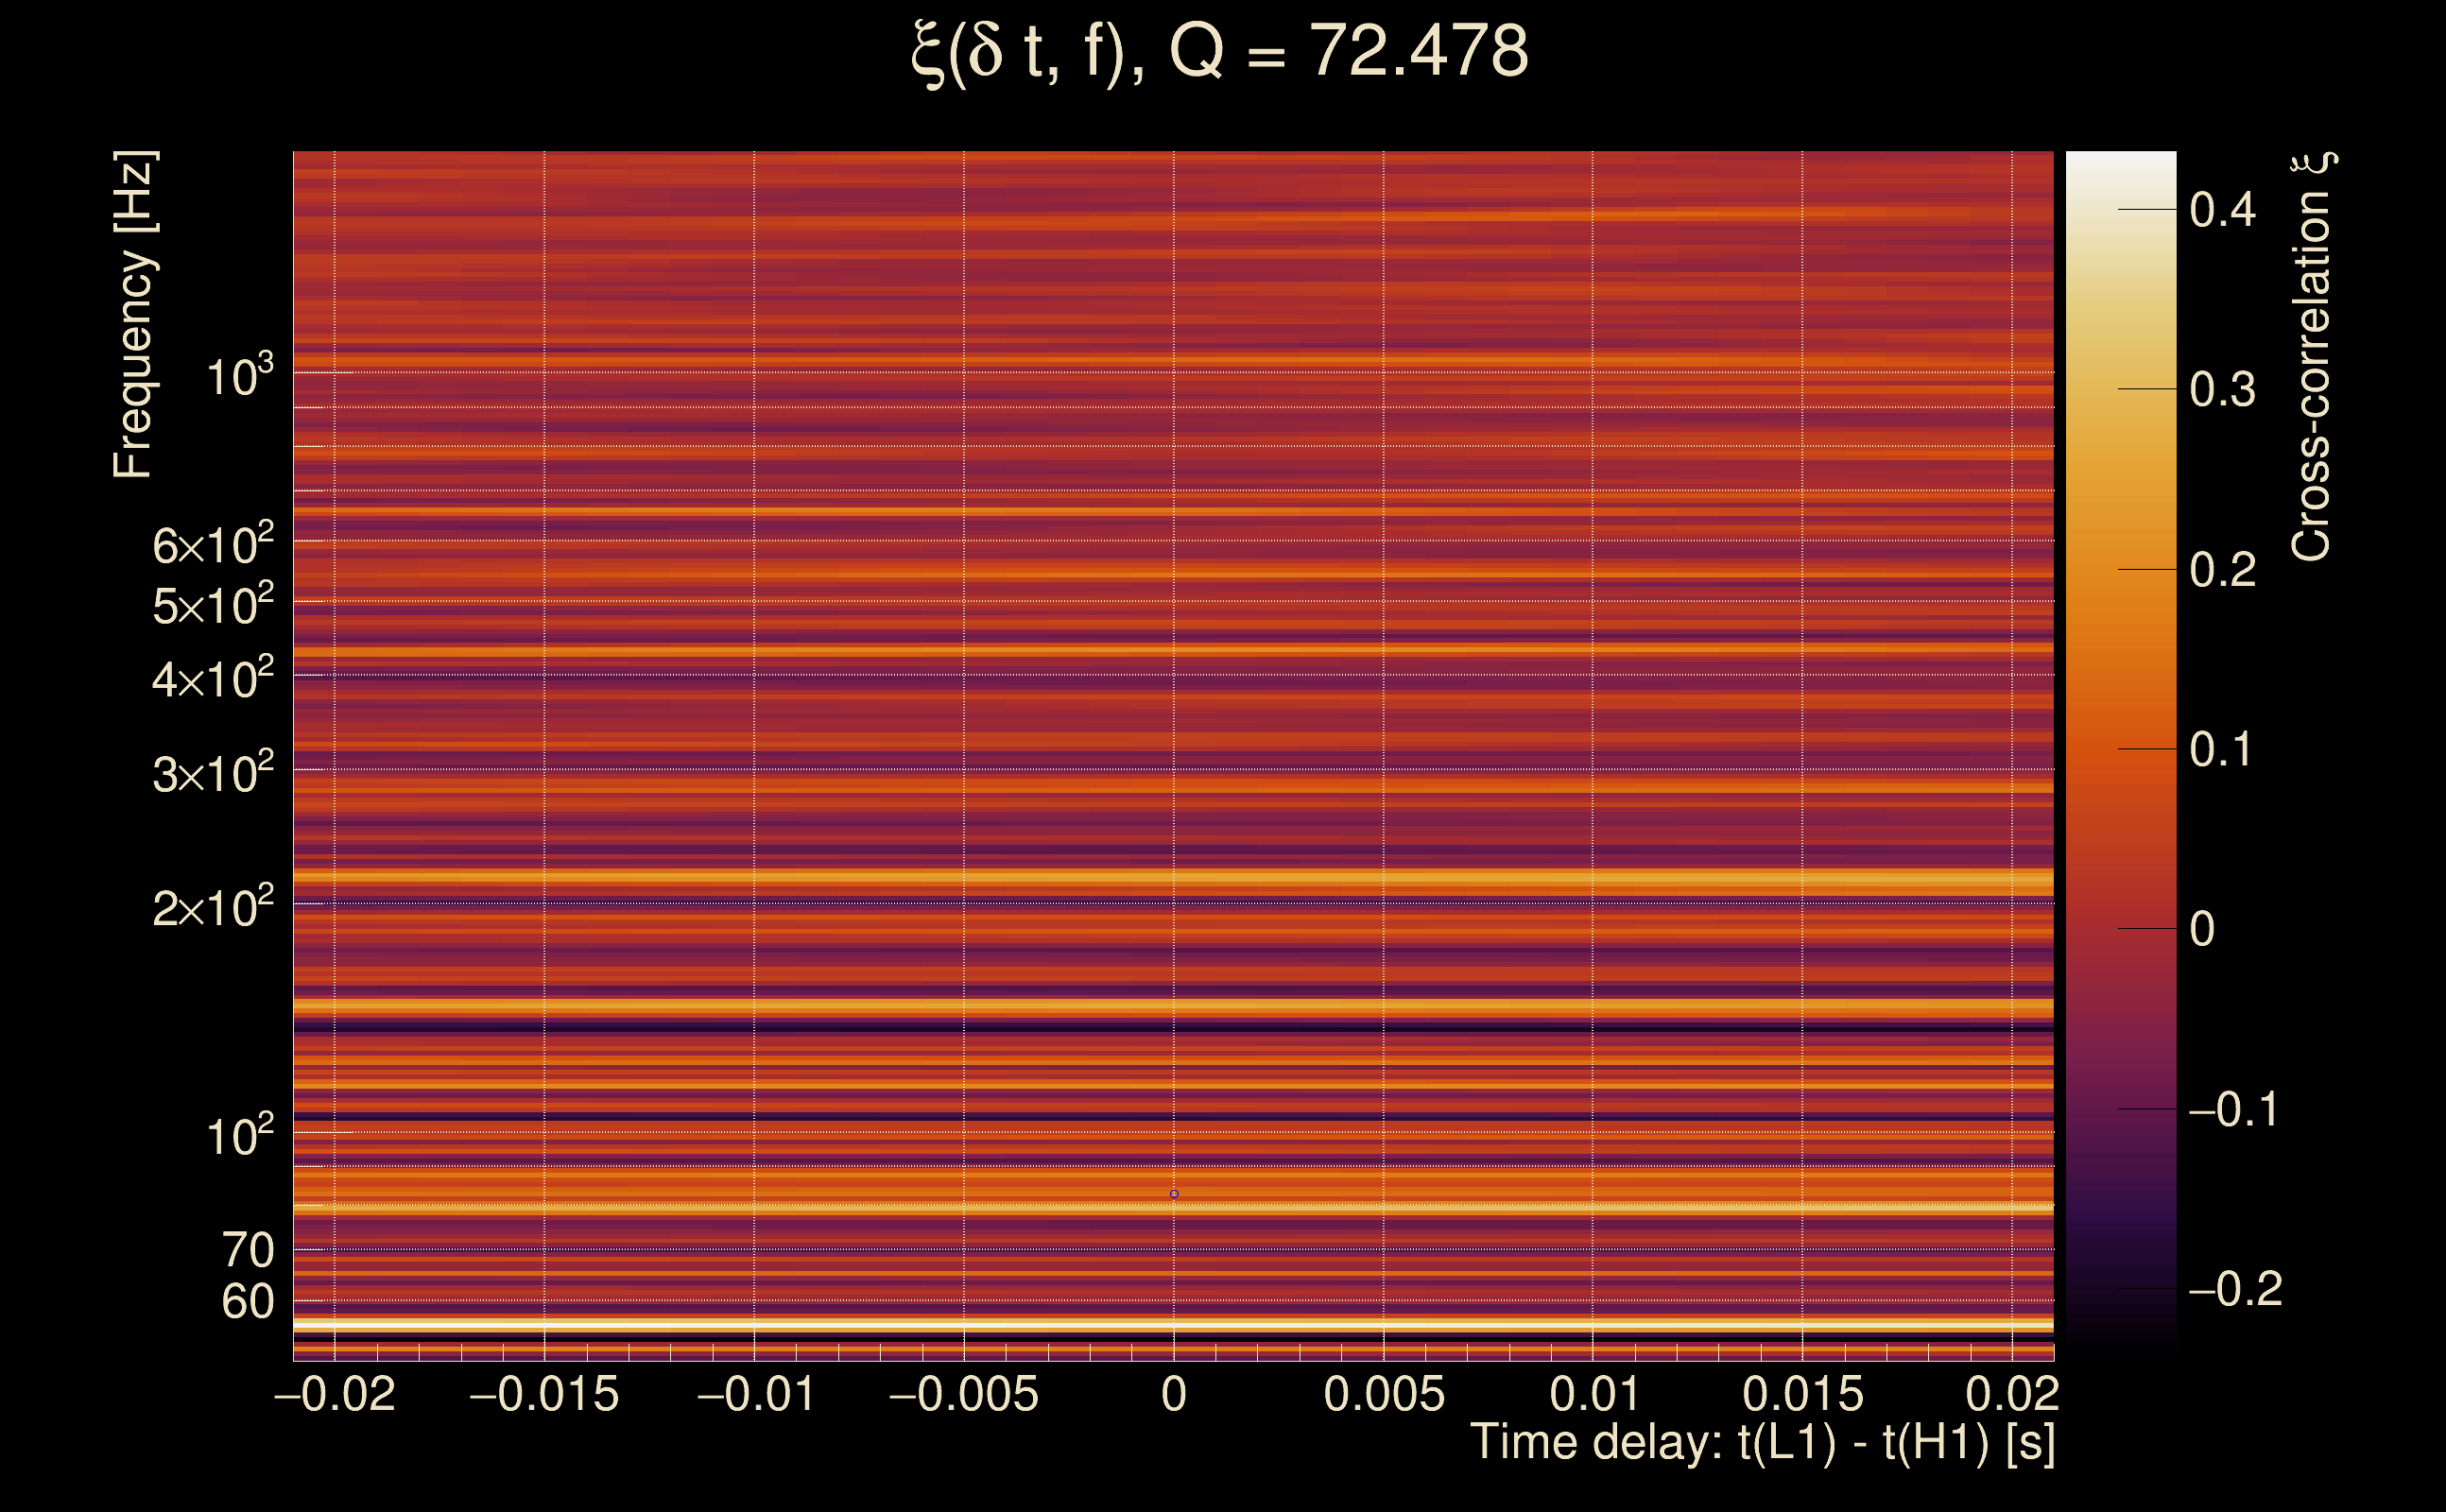
| Number of Q planes: | 5 (Q = 5.51892 → Q = 72.478) |
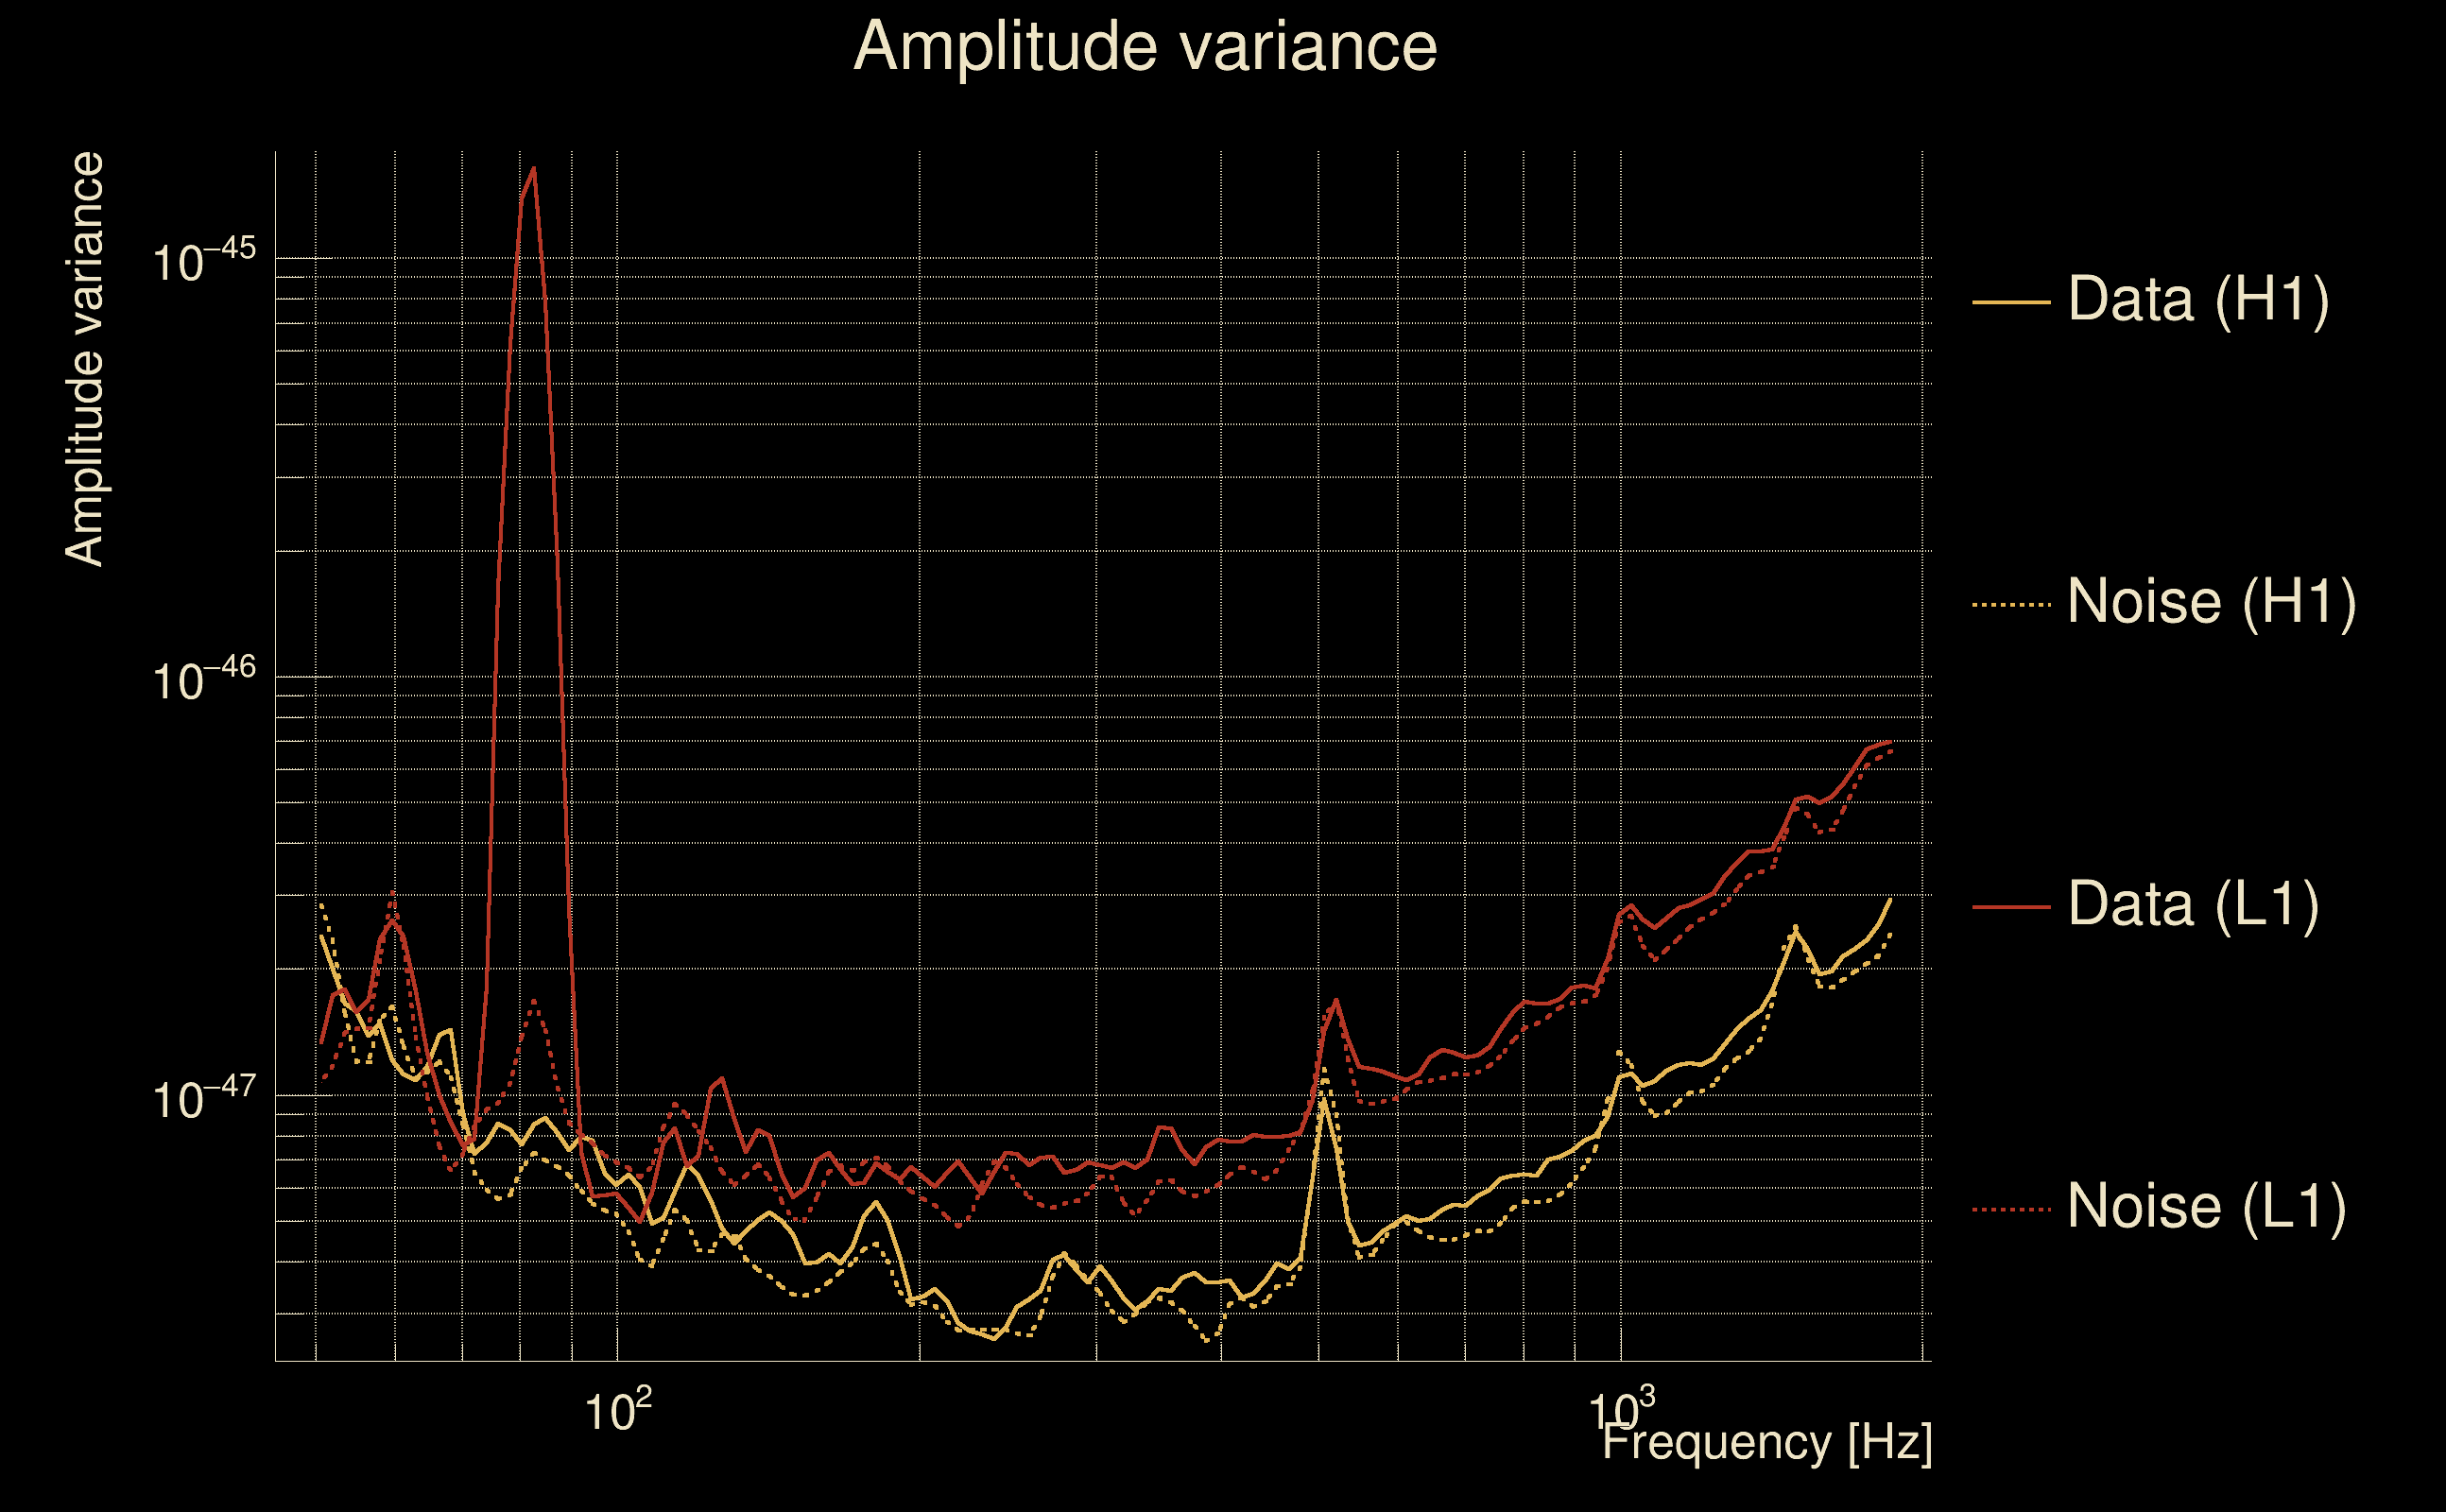
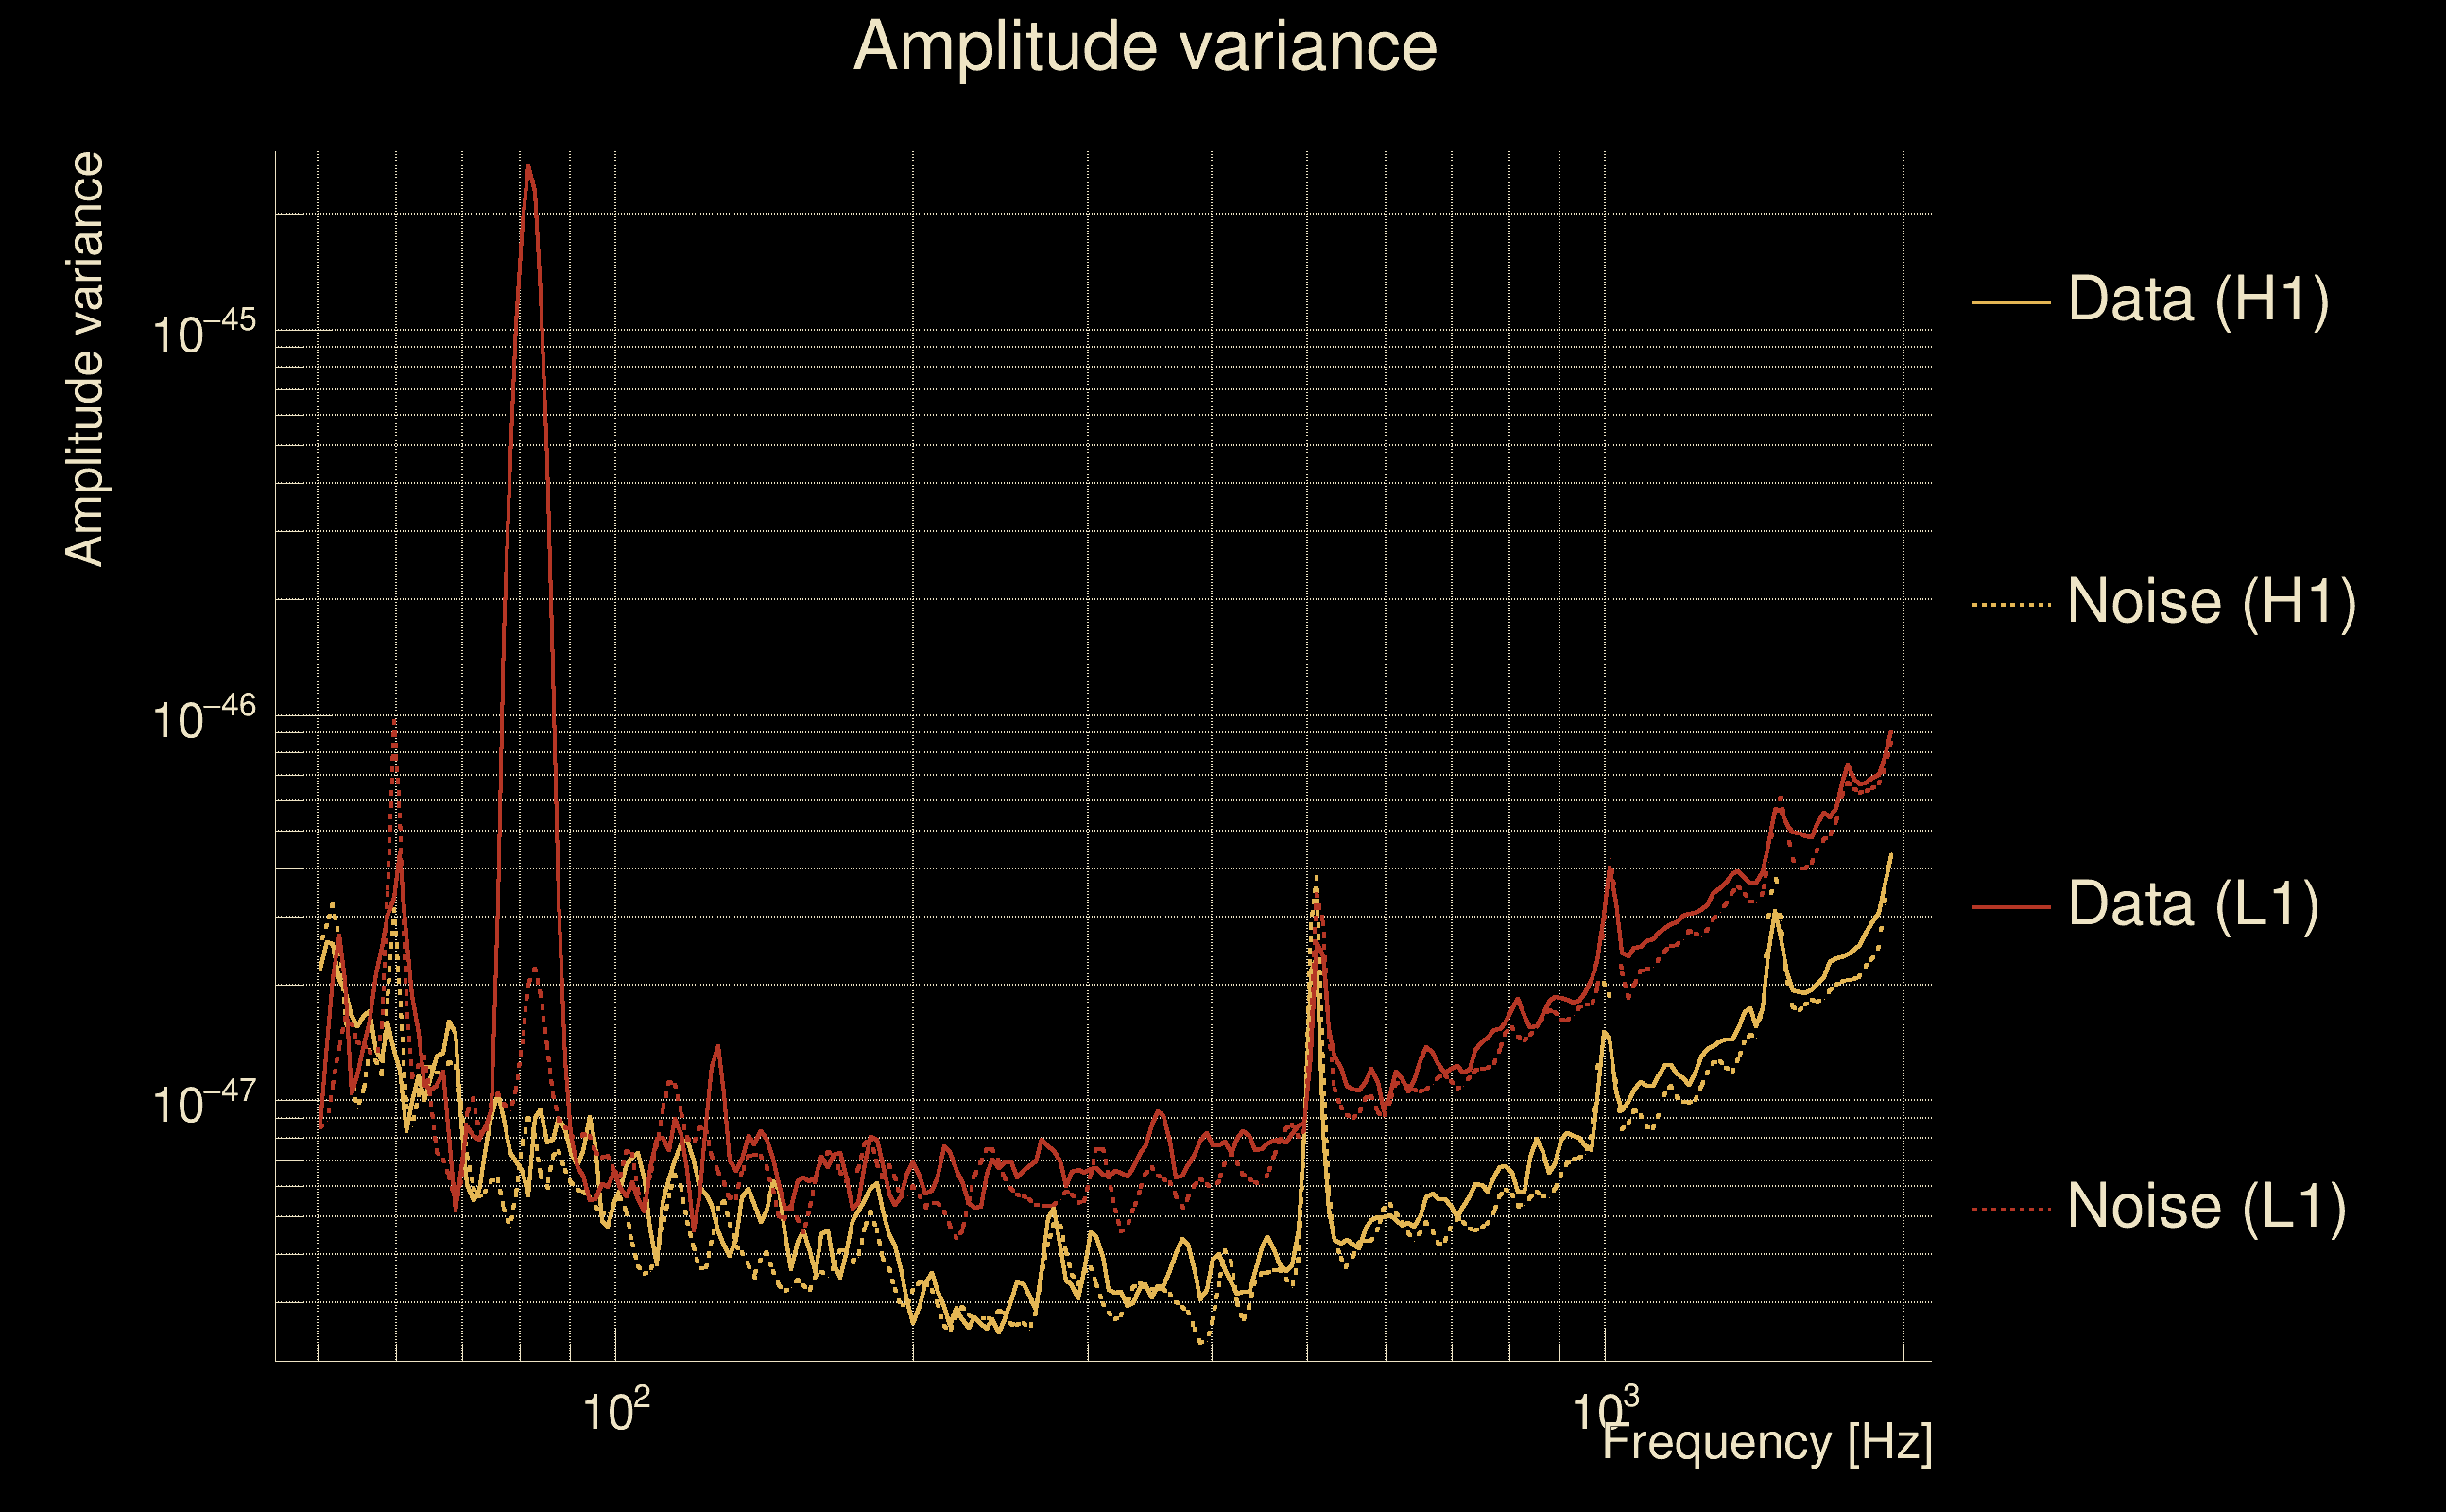
| Omicron frequency range: | 50 Hz → 1958.38 Hz |
| Light travel time between detectors: | 0.0100128 s |
| Slice extra-time (calibration uncertainty + slice veto): | 0.0129872 s |
| Number of time-delay bins in a cross-correlation map: | 10000 |
| Number of slices in a cross-correlation map: | 217 |
| Number of time-delay bins in a slice: | 46 |
| SNR gating: | < 100 (detector 0), < 100 (detector 1) |
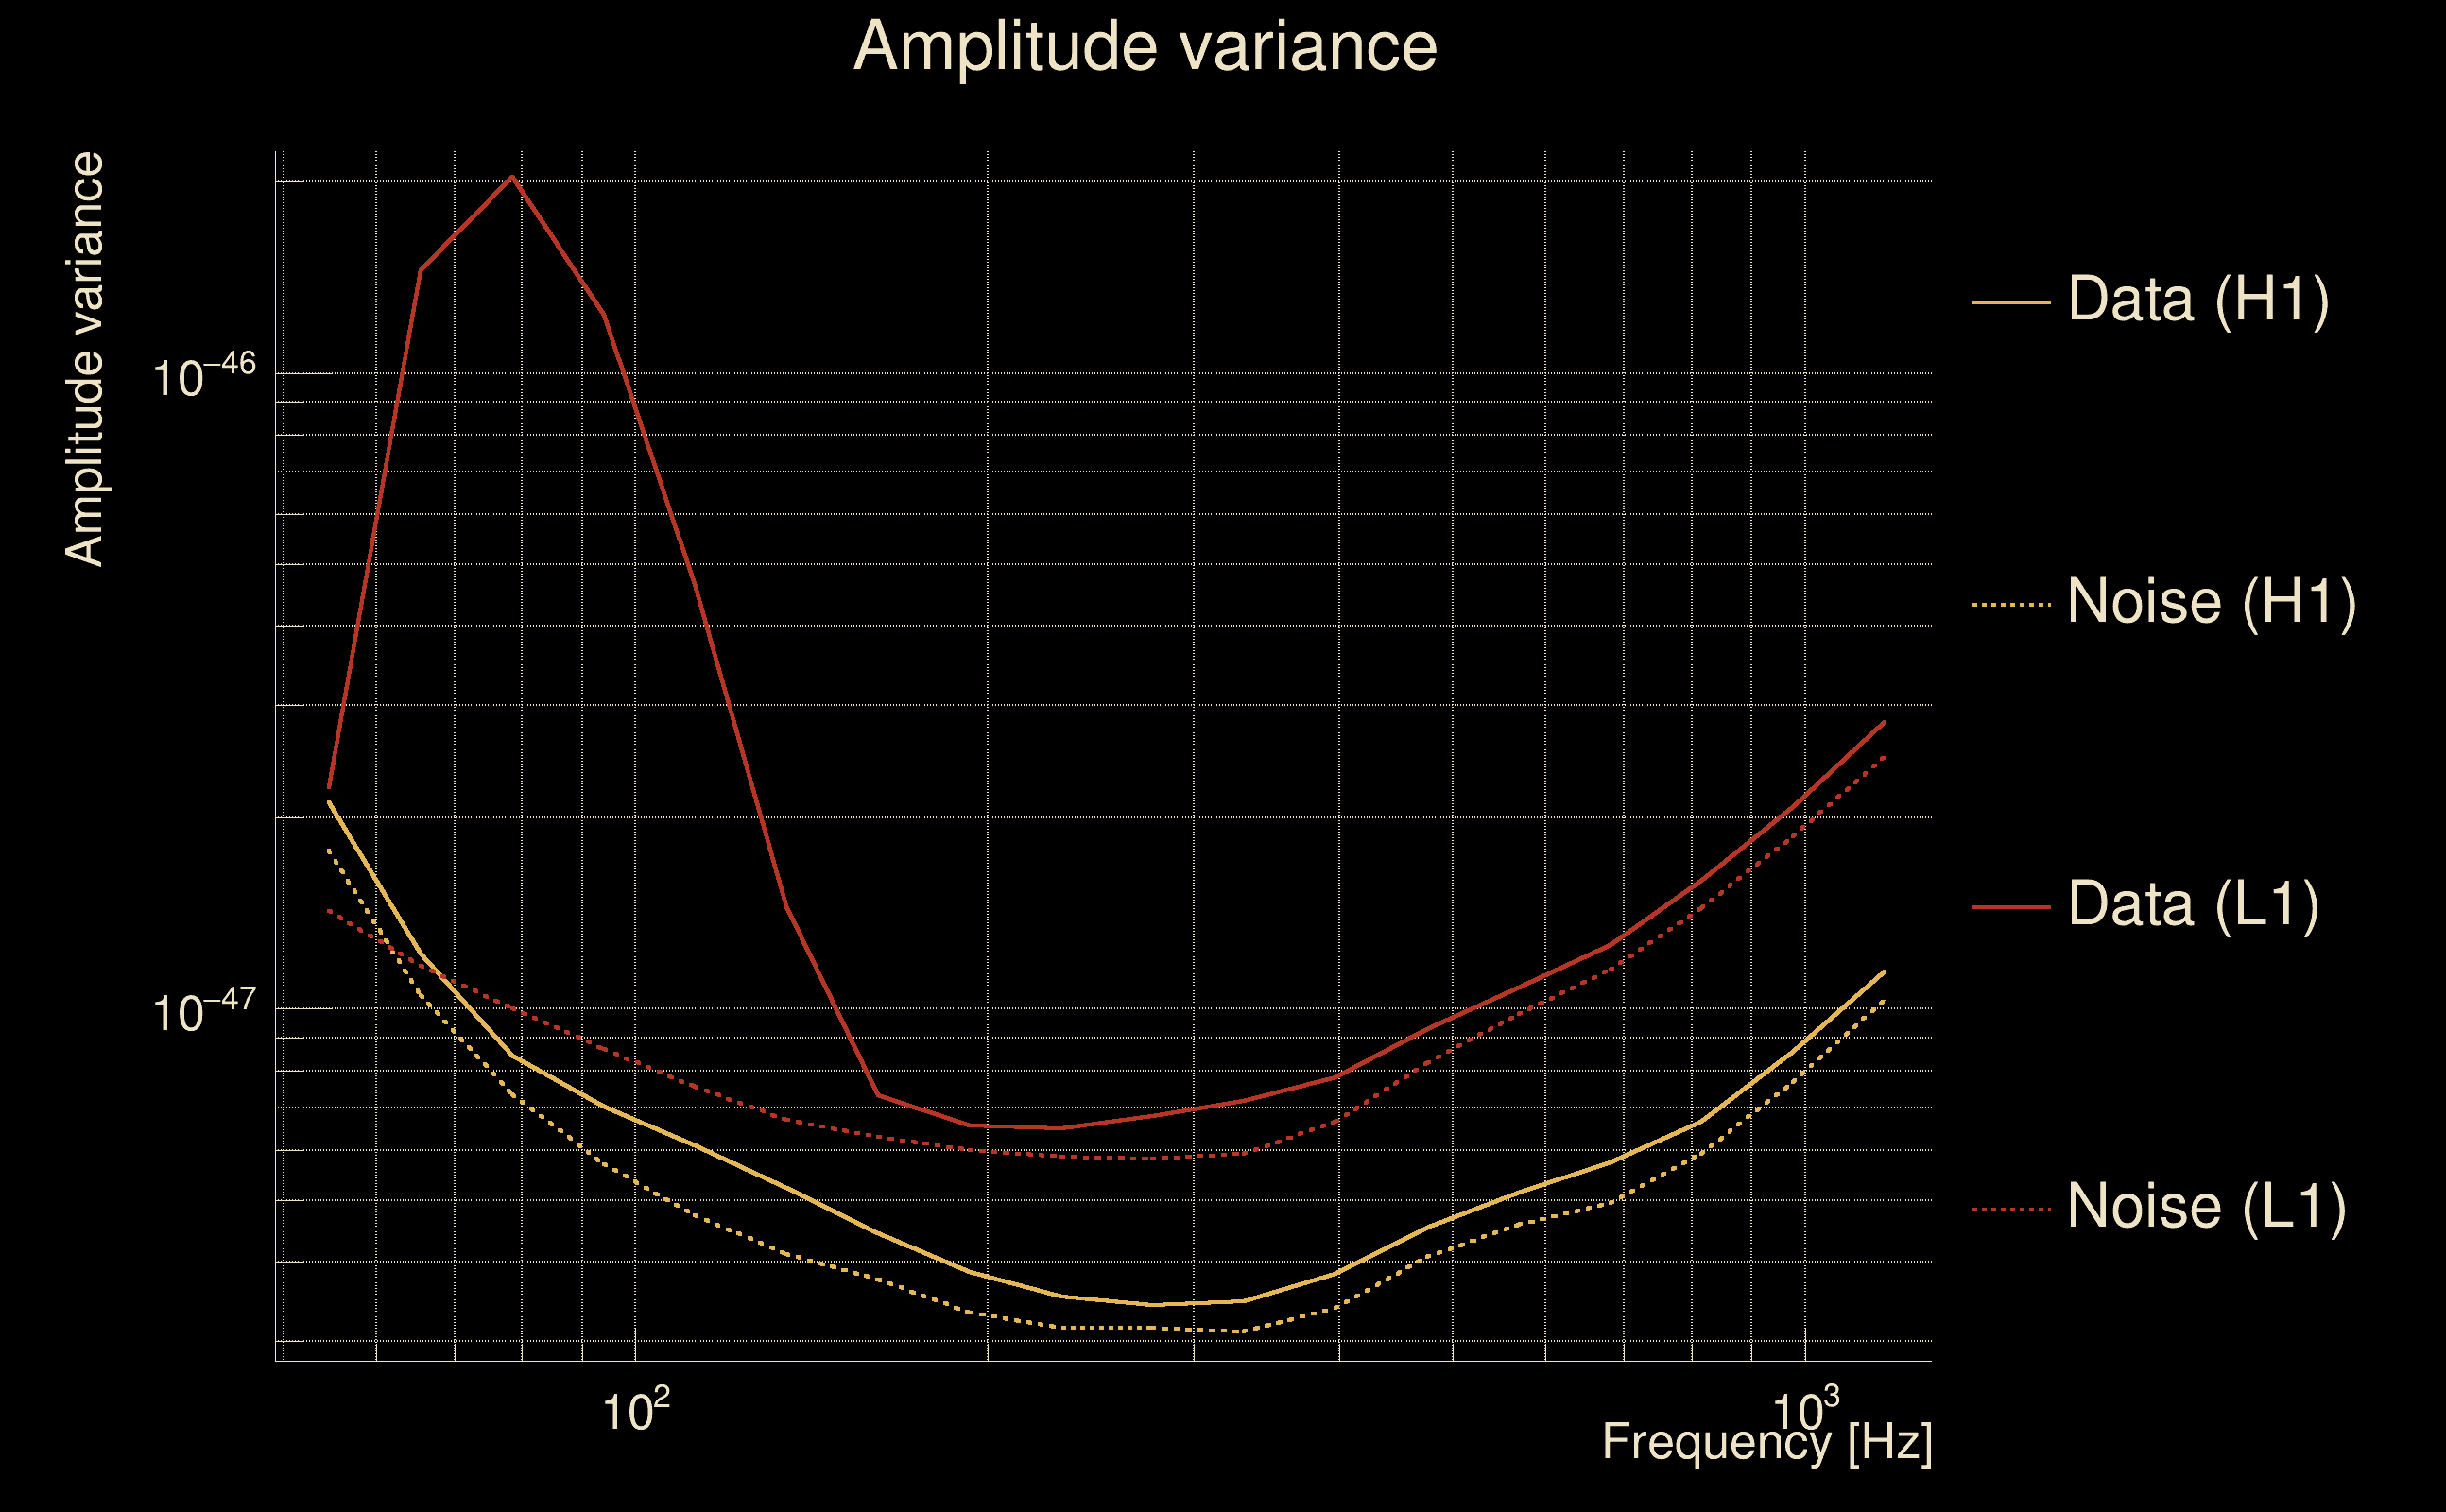
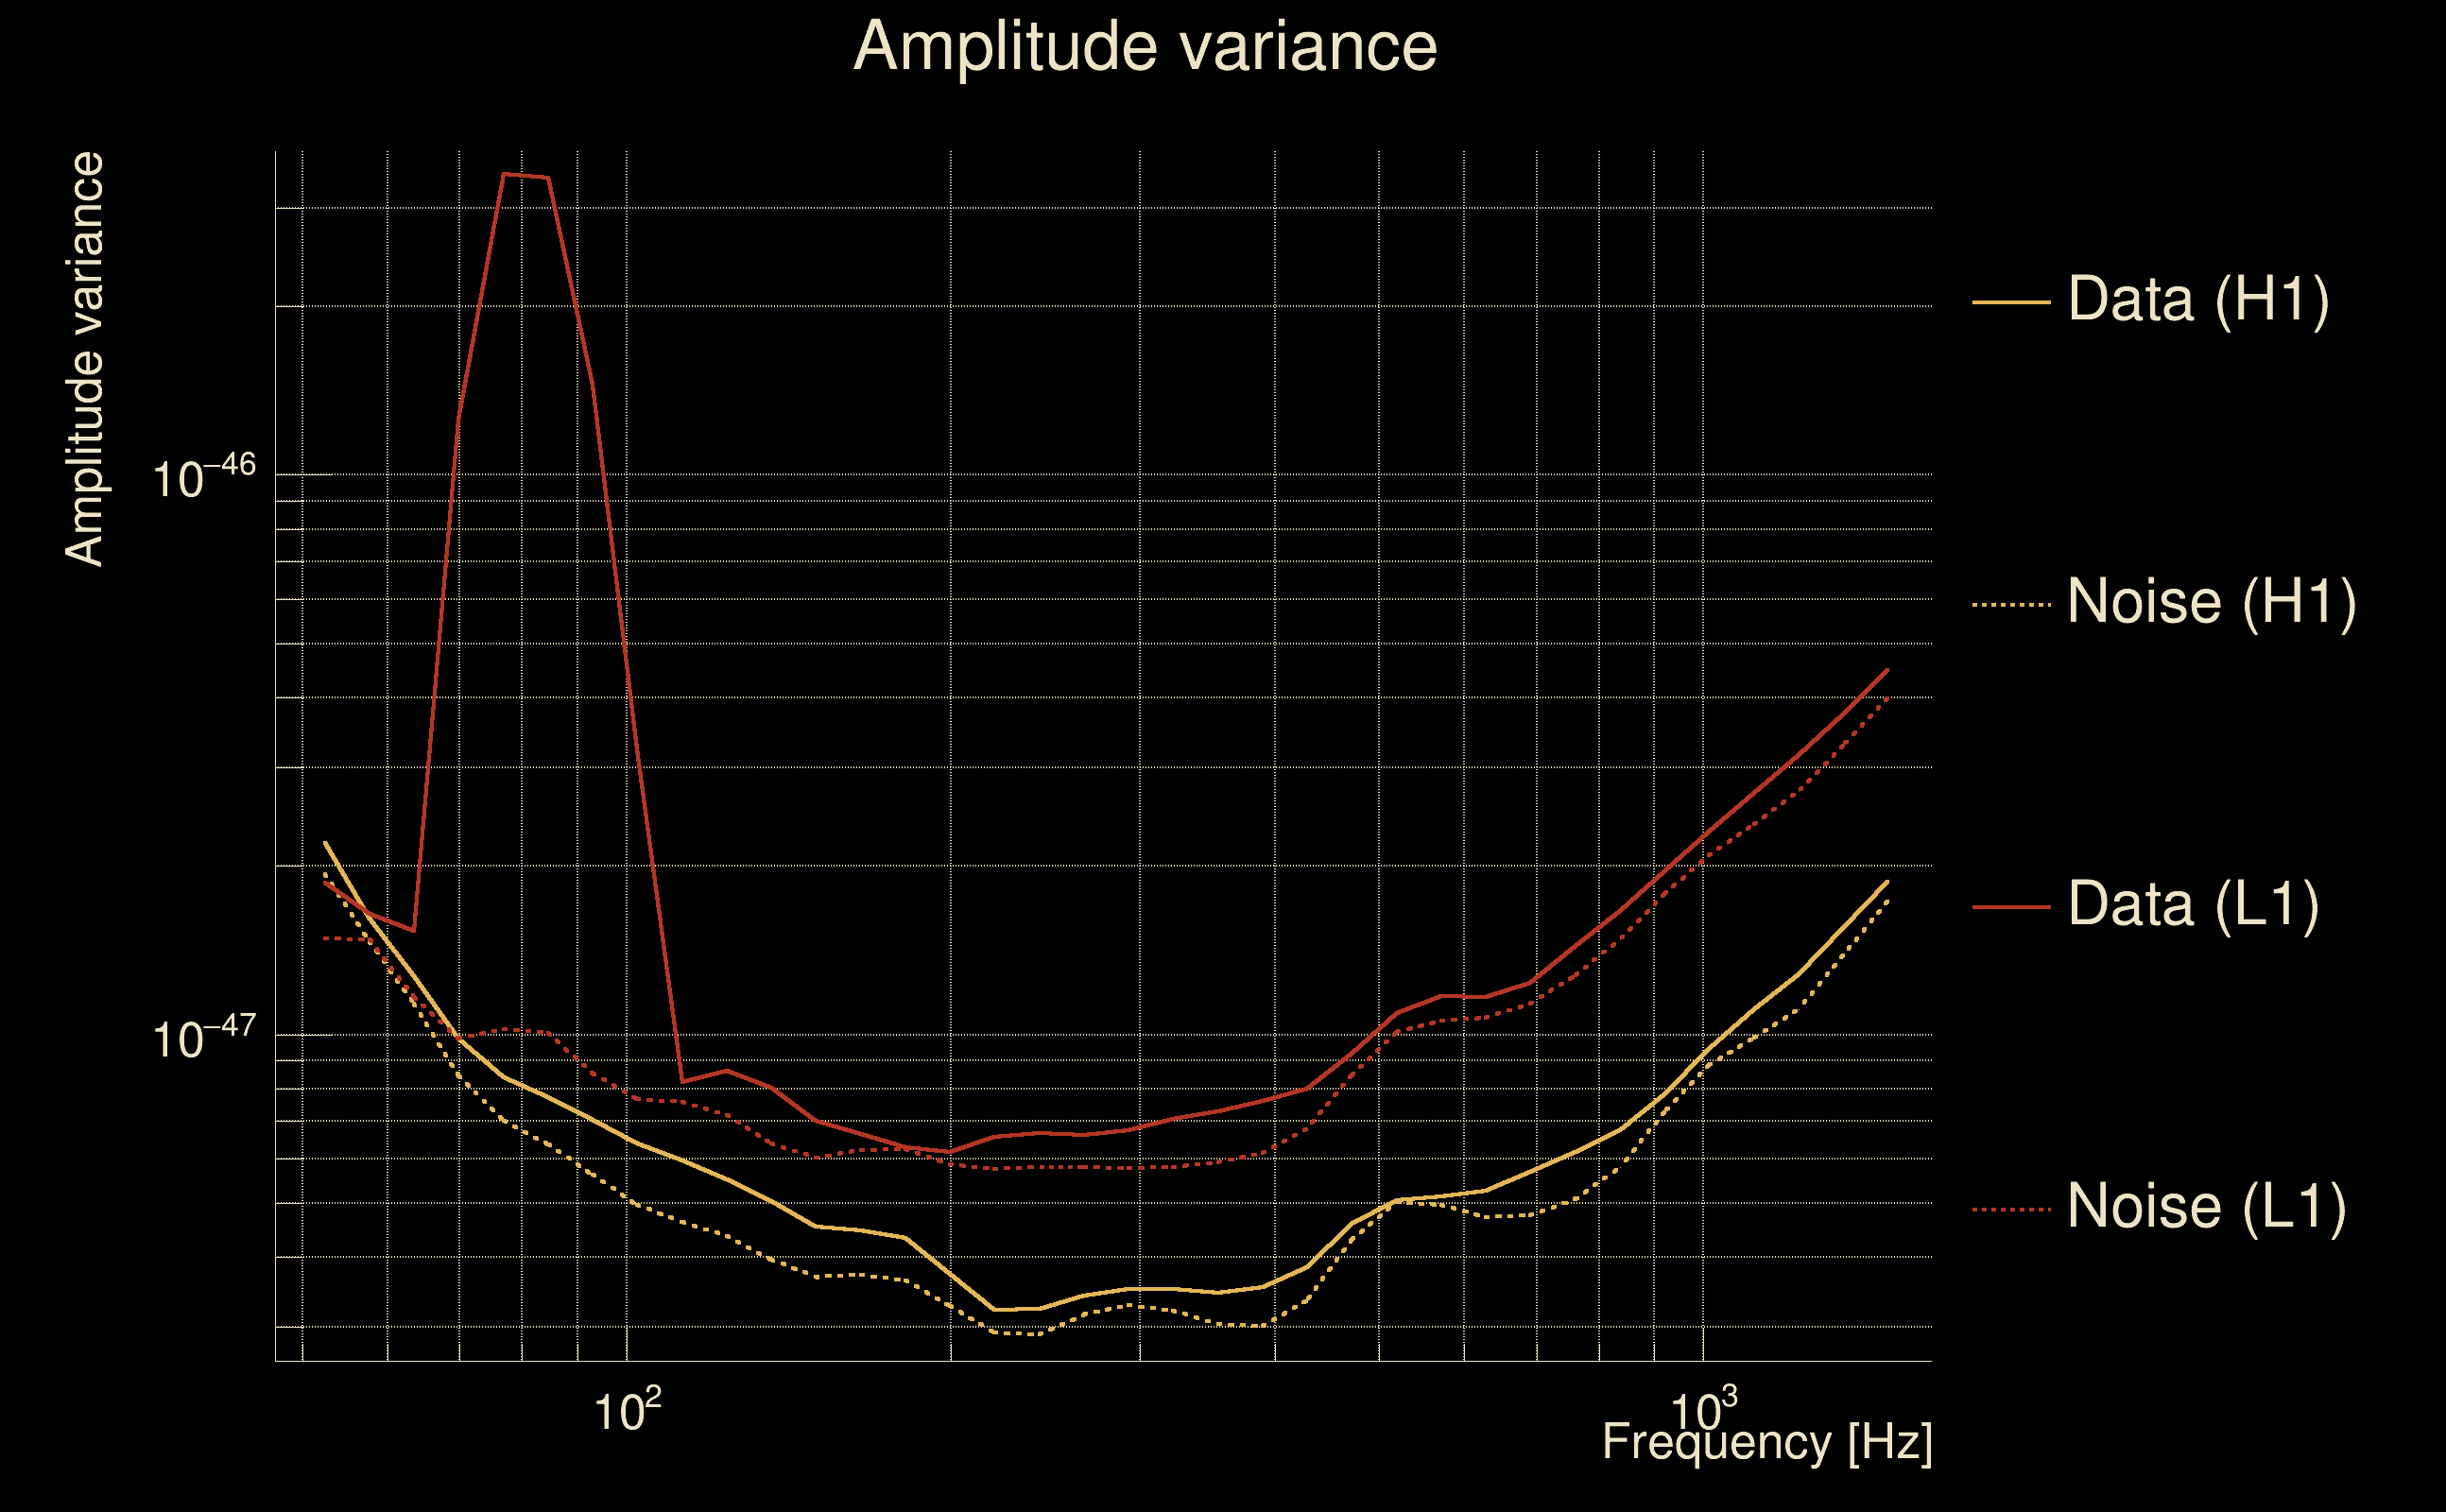
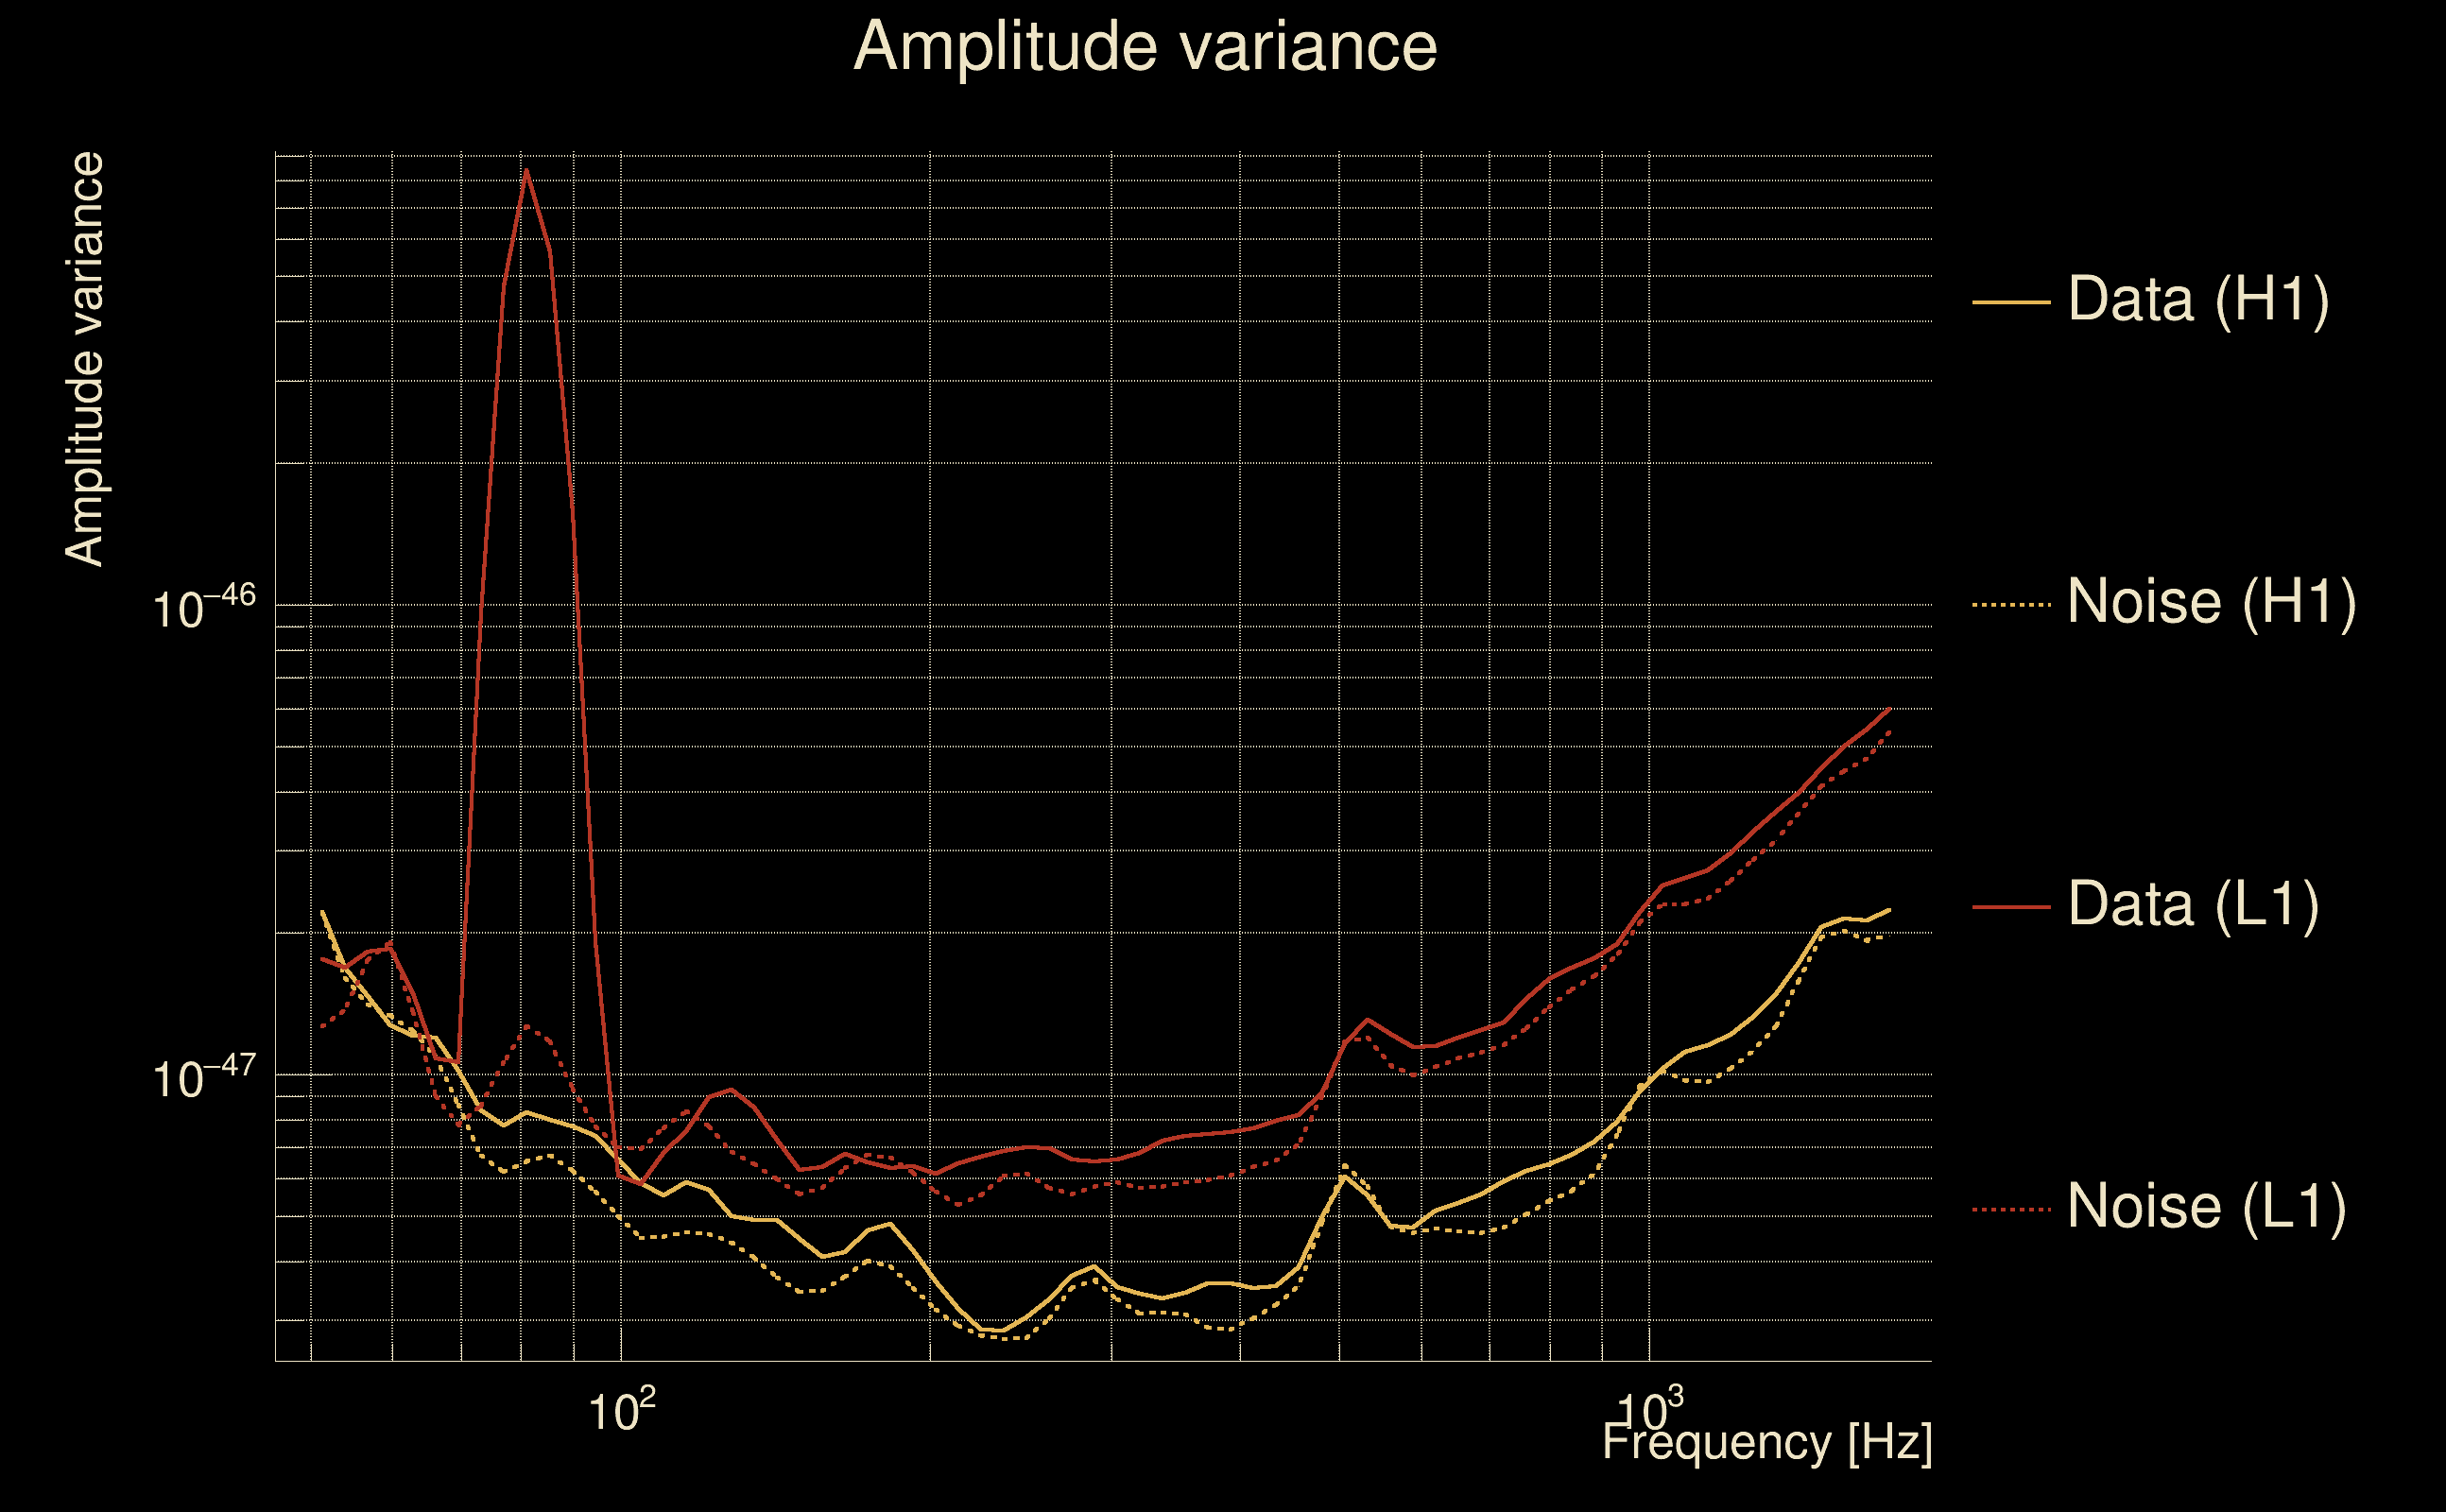
| Amplitude spectrograms: | normalization = 1e-22, power index = 2 |
| White noise SNR variance: | 0.523175 (after applying a correction factor = 1) |
| Amplitude ratio confidence level: | 3 sigma |
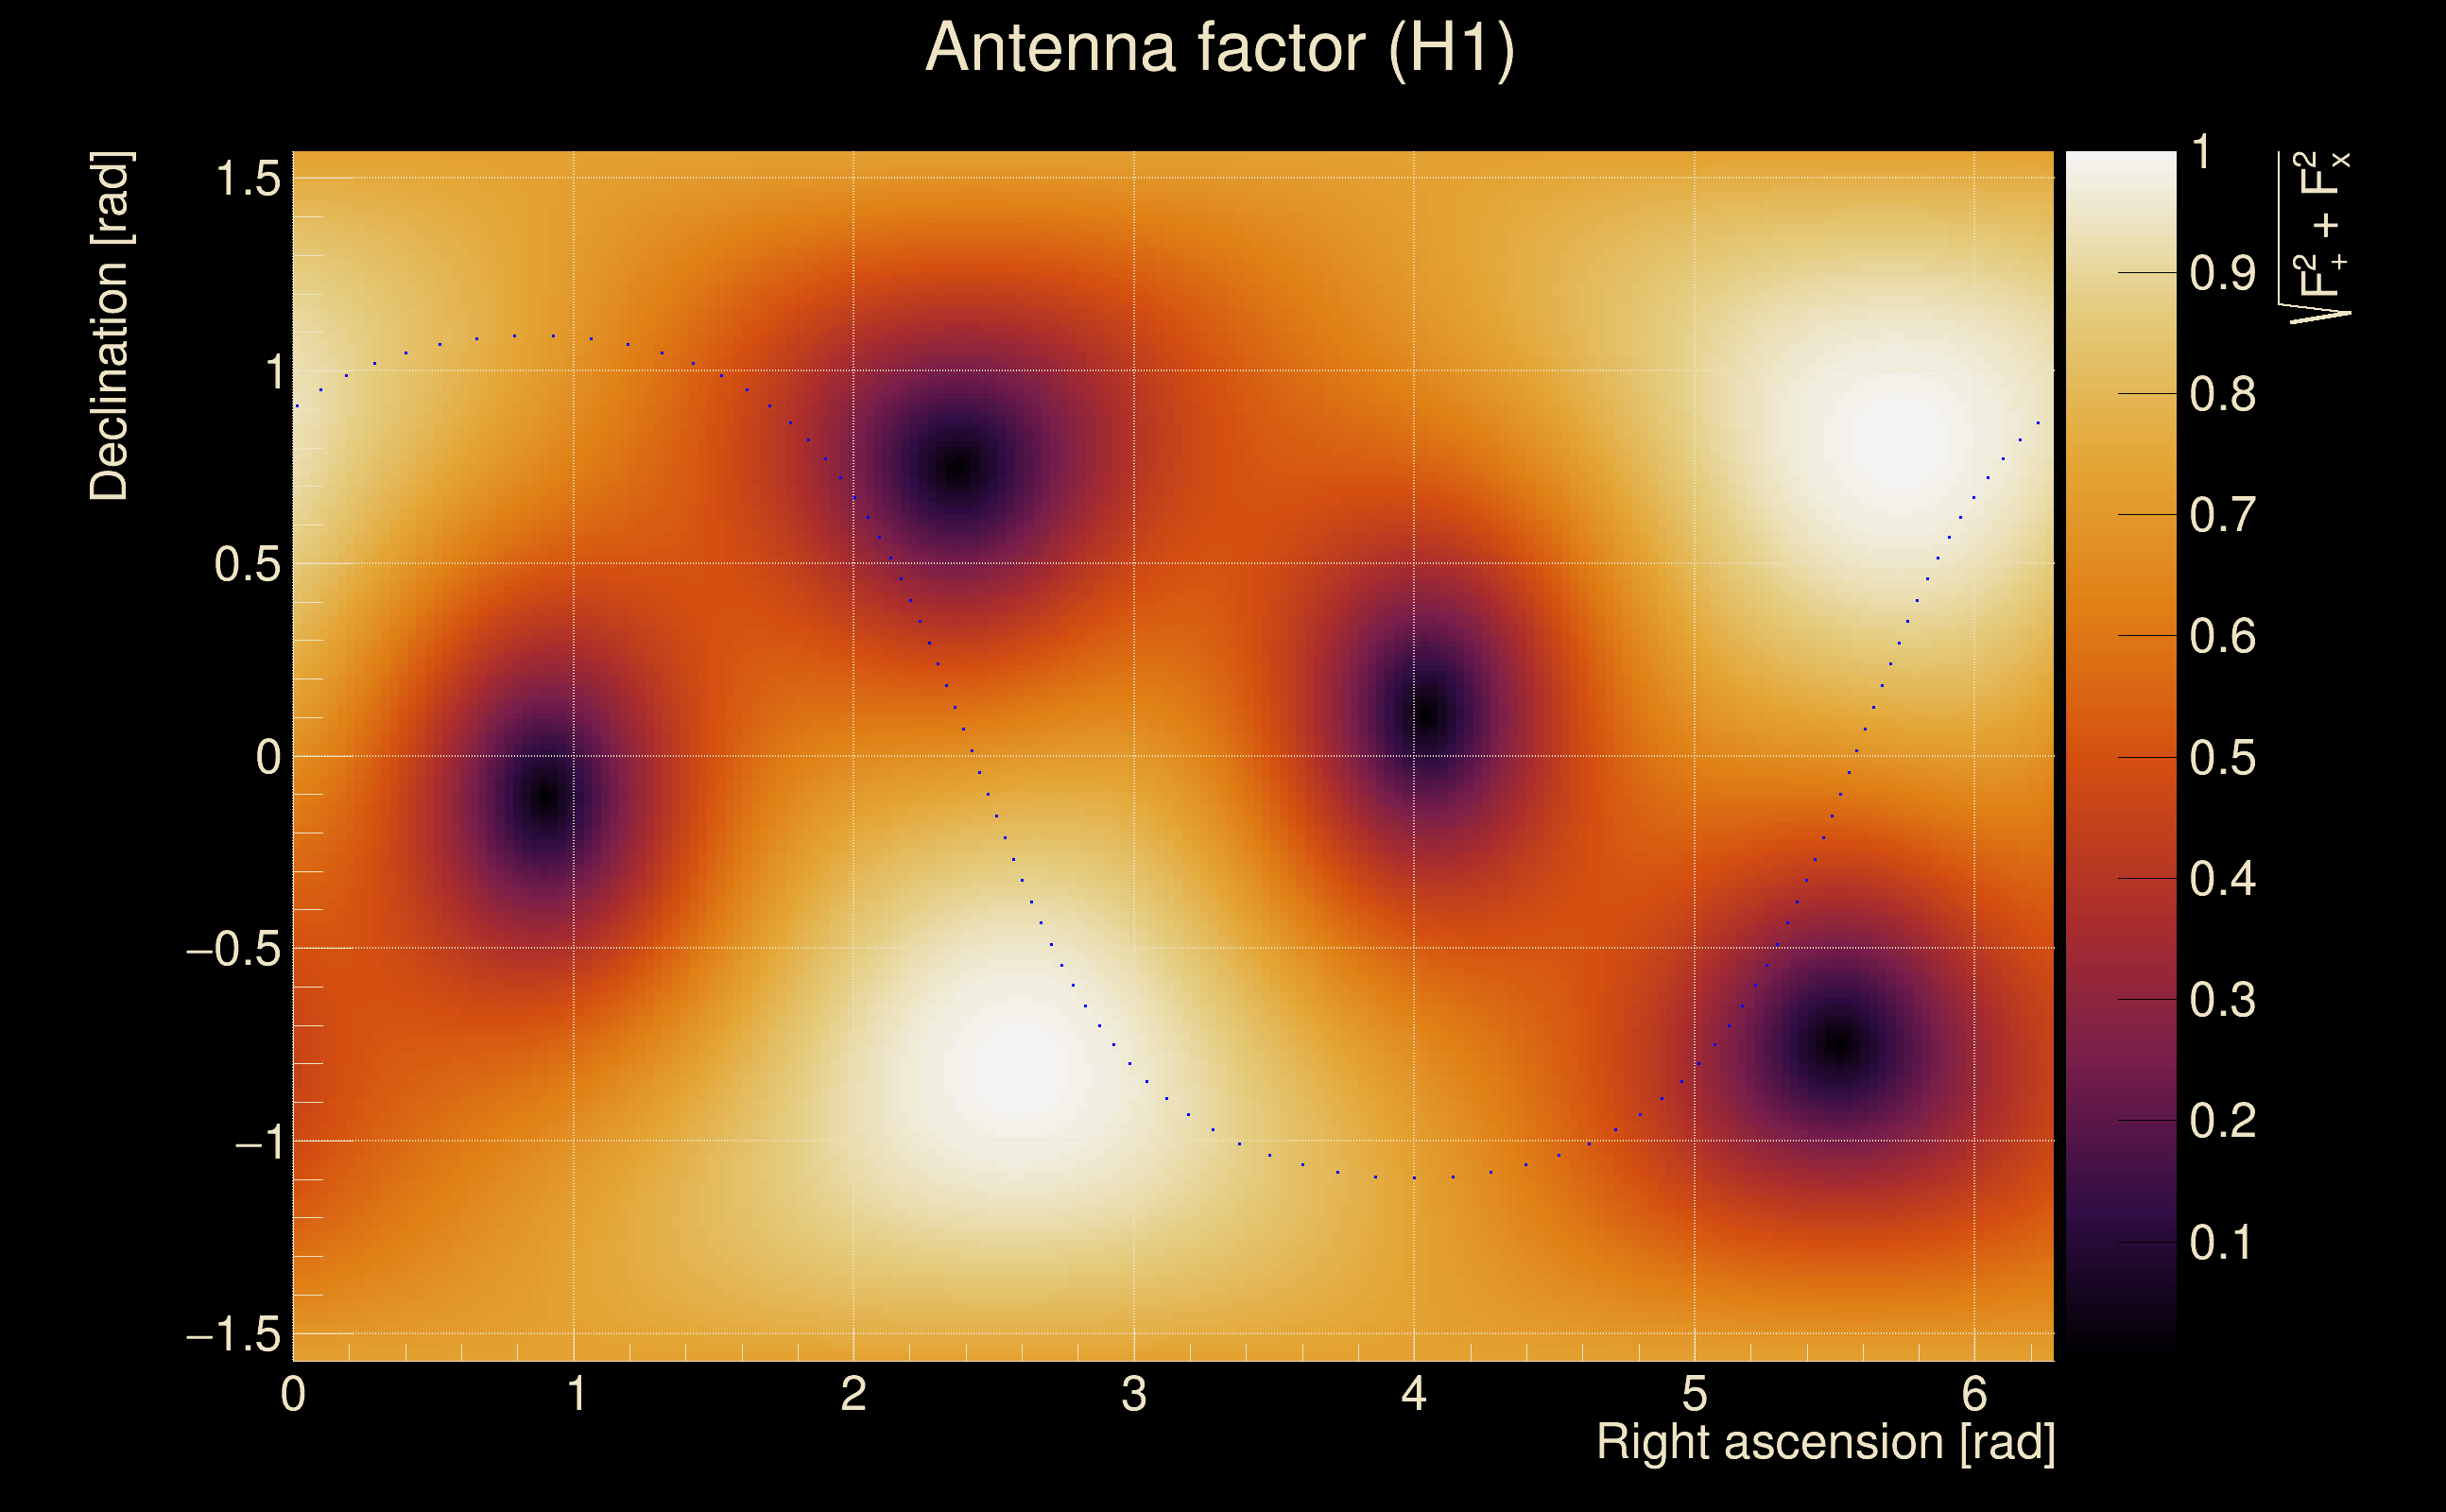
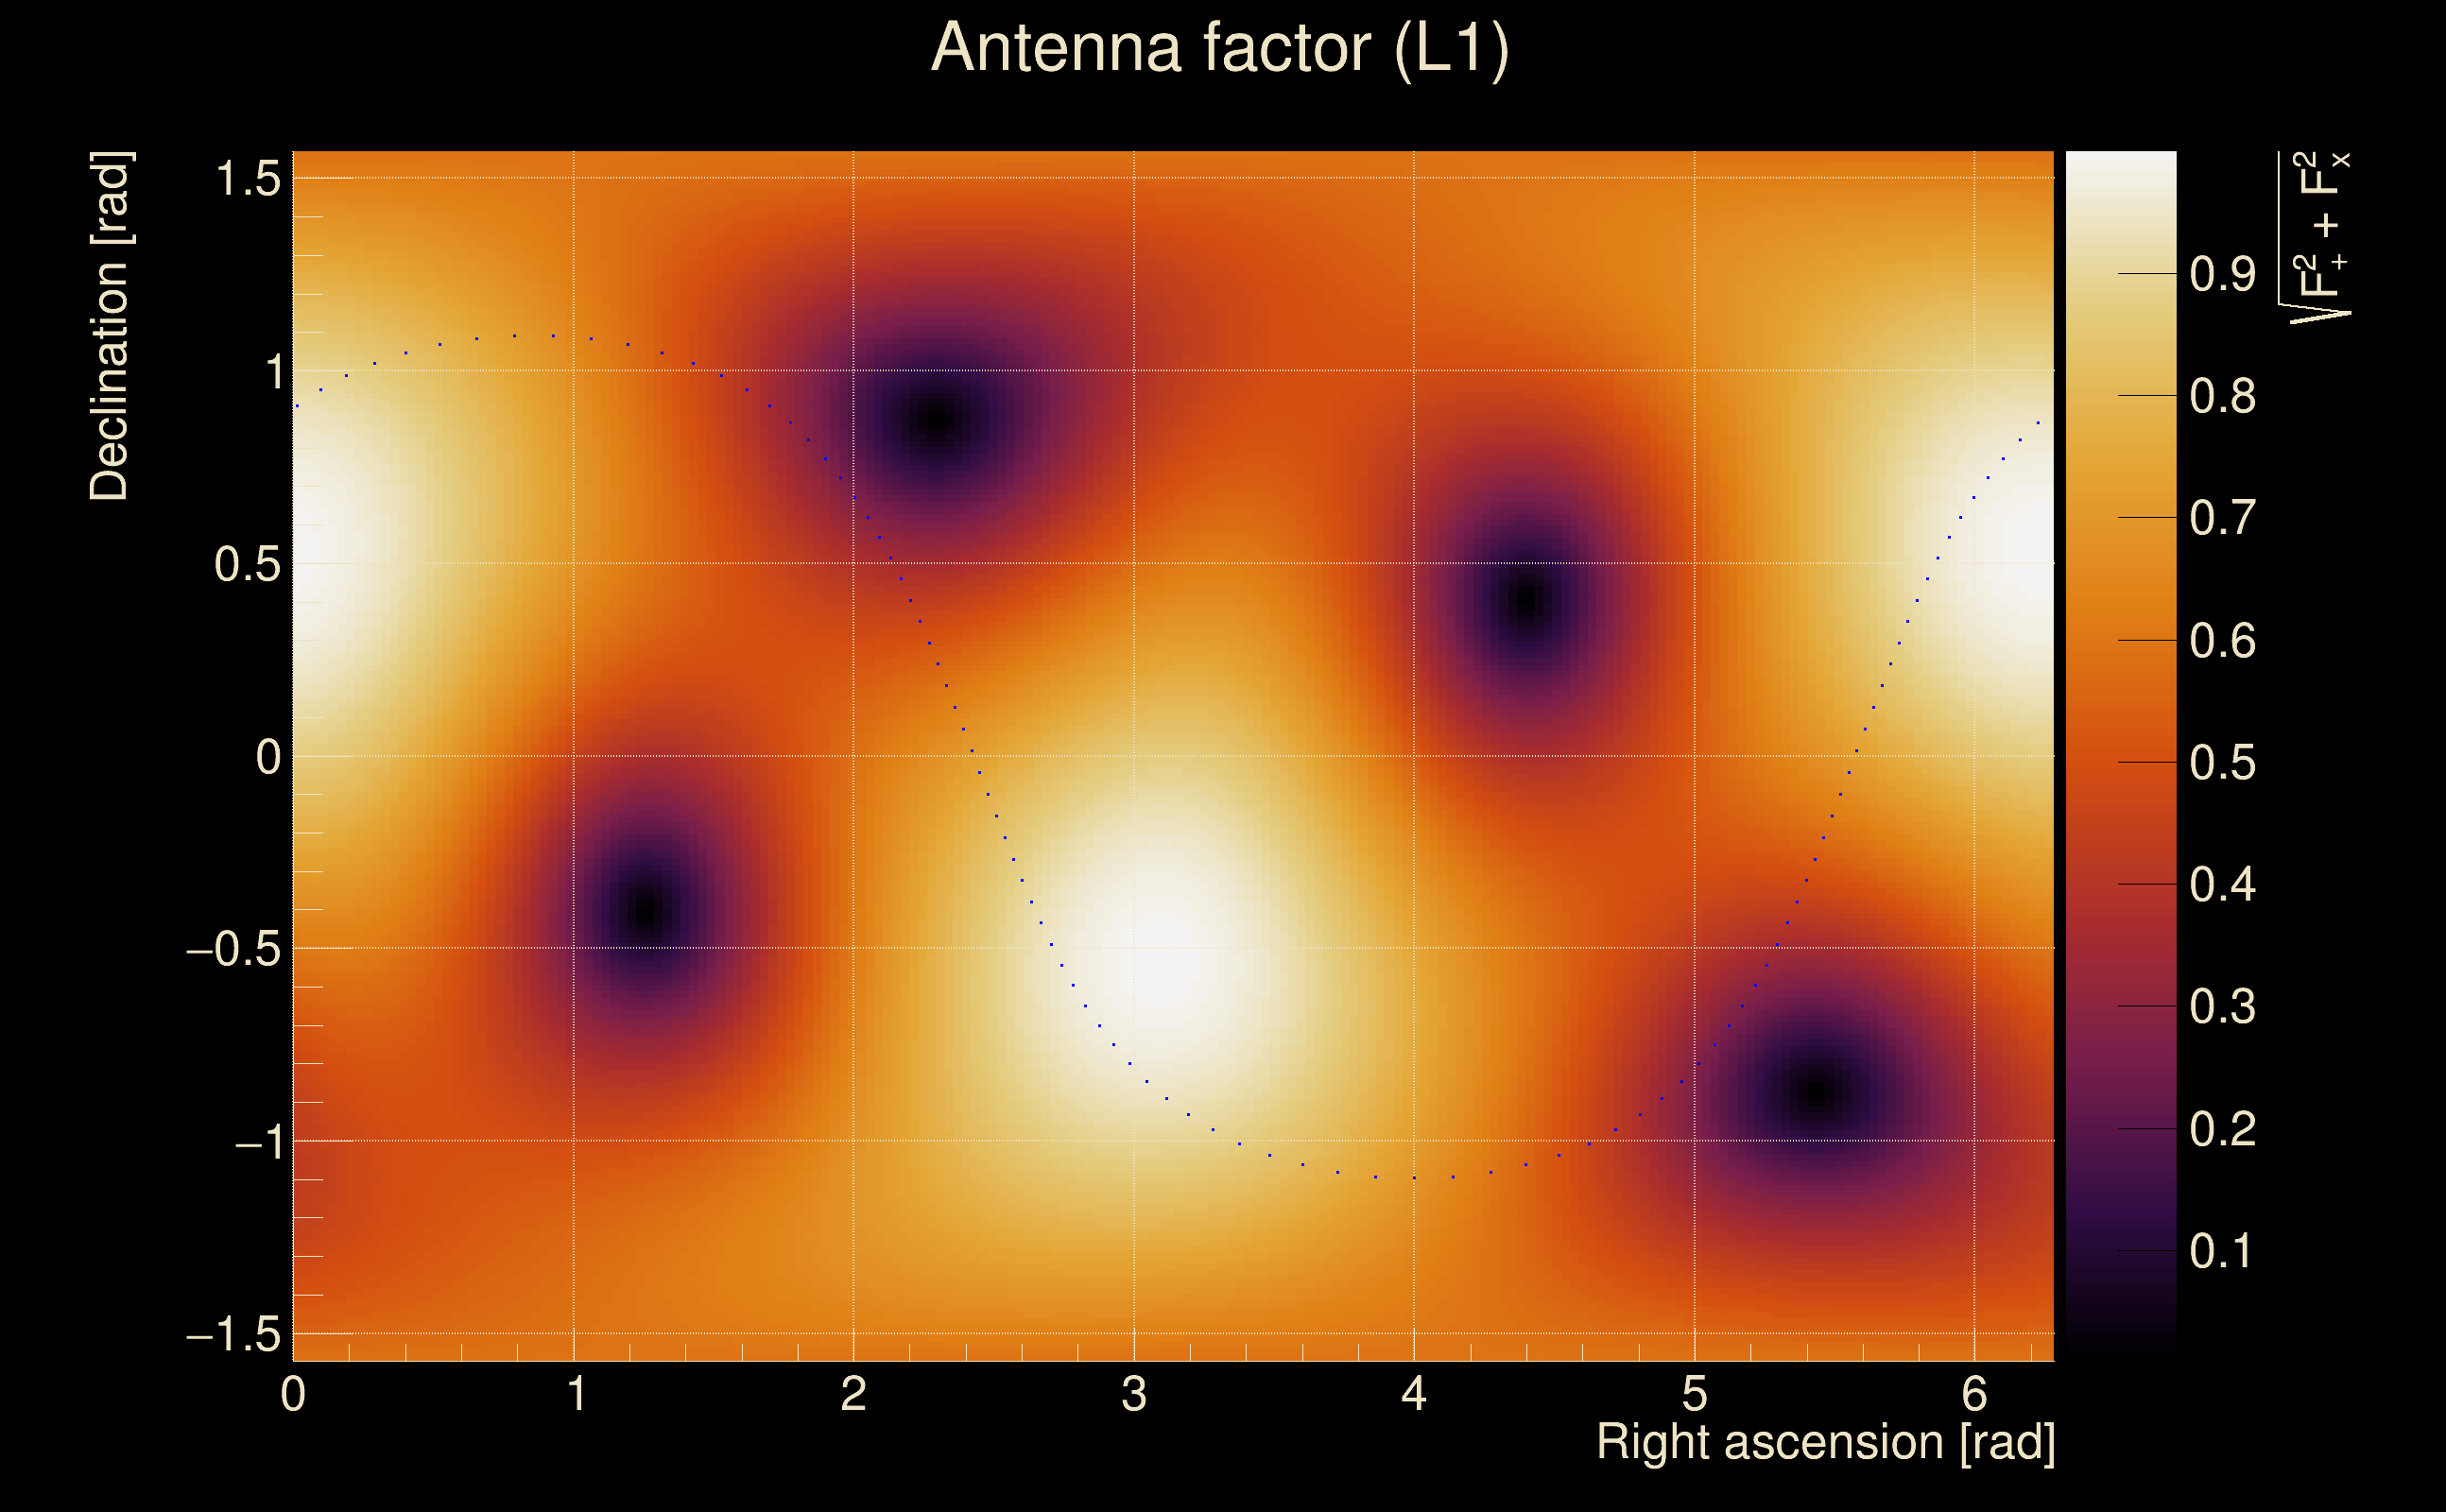
| Target sky positon: | Ra: 6.0135, Dec: 0.3475 [rad] |
| Event time t(H1): | GPS = 1368195518 (Mon May 15 14:18:20 2023
) → GPS = 1368195528 (Mon May 15 14:18:30 2023
) |
| Event time t(L1): | GPS = 1368195518 (Mon May 15 14:18:30 2023
) → GPS = 1368195528 (Mon May 15 14:18:30 2023
) |
| Omicron analysis time window (H1): | GPS = 1368195515 → GPS = 1368195531 |
| Omicron analysis time window (L1): | GPS = 1368195515 → GPS = 1368195531 |
| Time delay between detectors t(L1) - t(H1): | -2.29266e-05 s (slice index = 108 / 217), δt_gw = -2.29266e-05 s |
| Time delay standard deviation: | 0.0772856 s |
| [targeted mode] Time delay probability: | 0.736658 (0.336283 sigmas), δt_target = -0.00203156 s |
| Frequency: | 309.214 Hz |
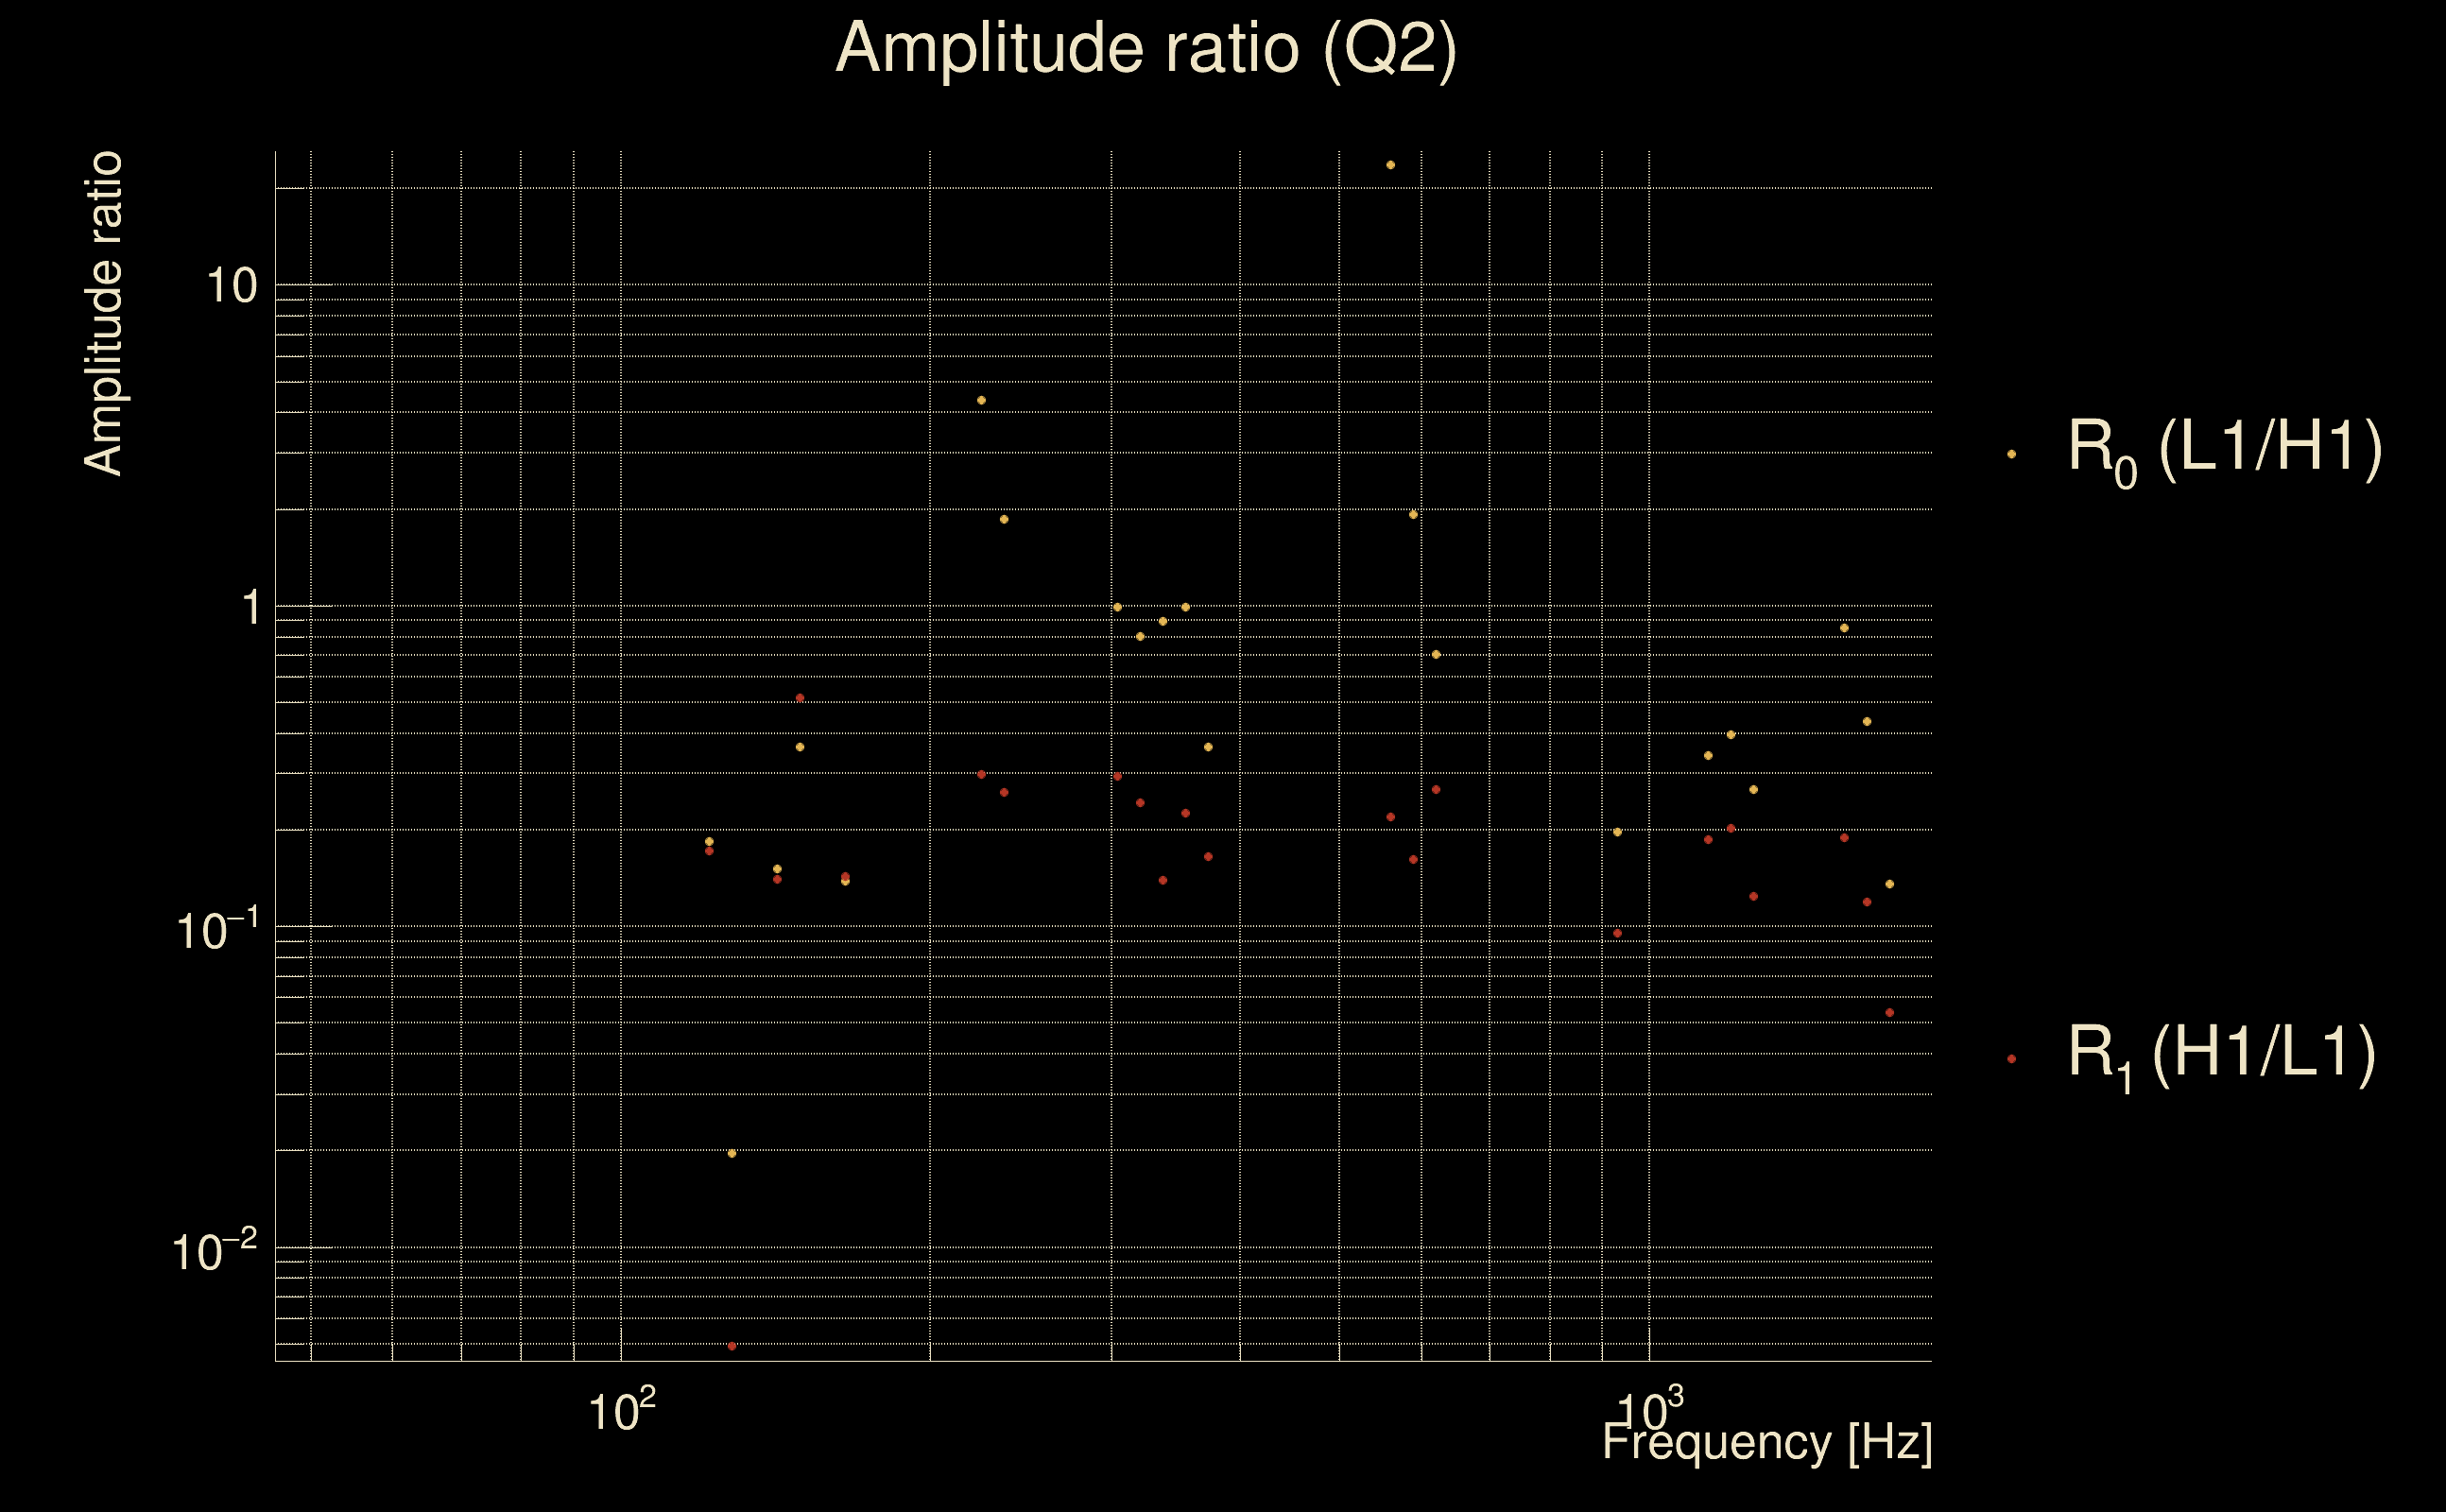
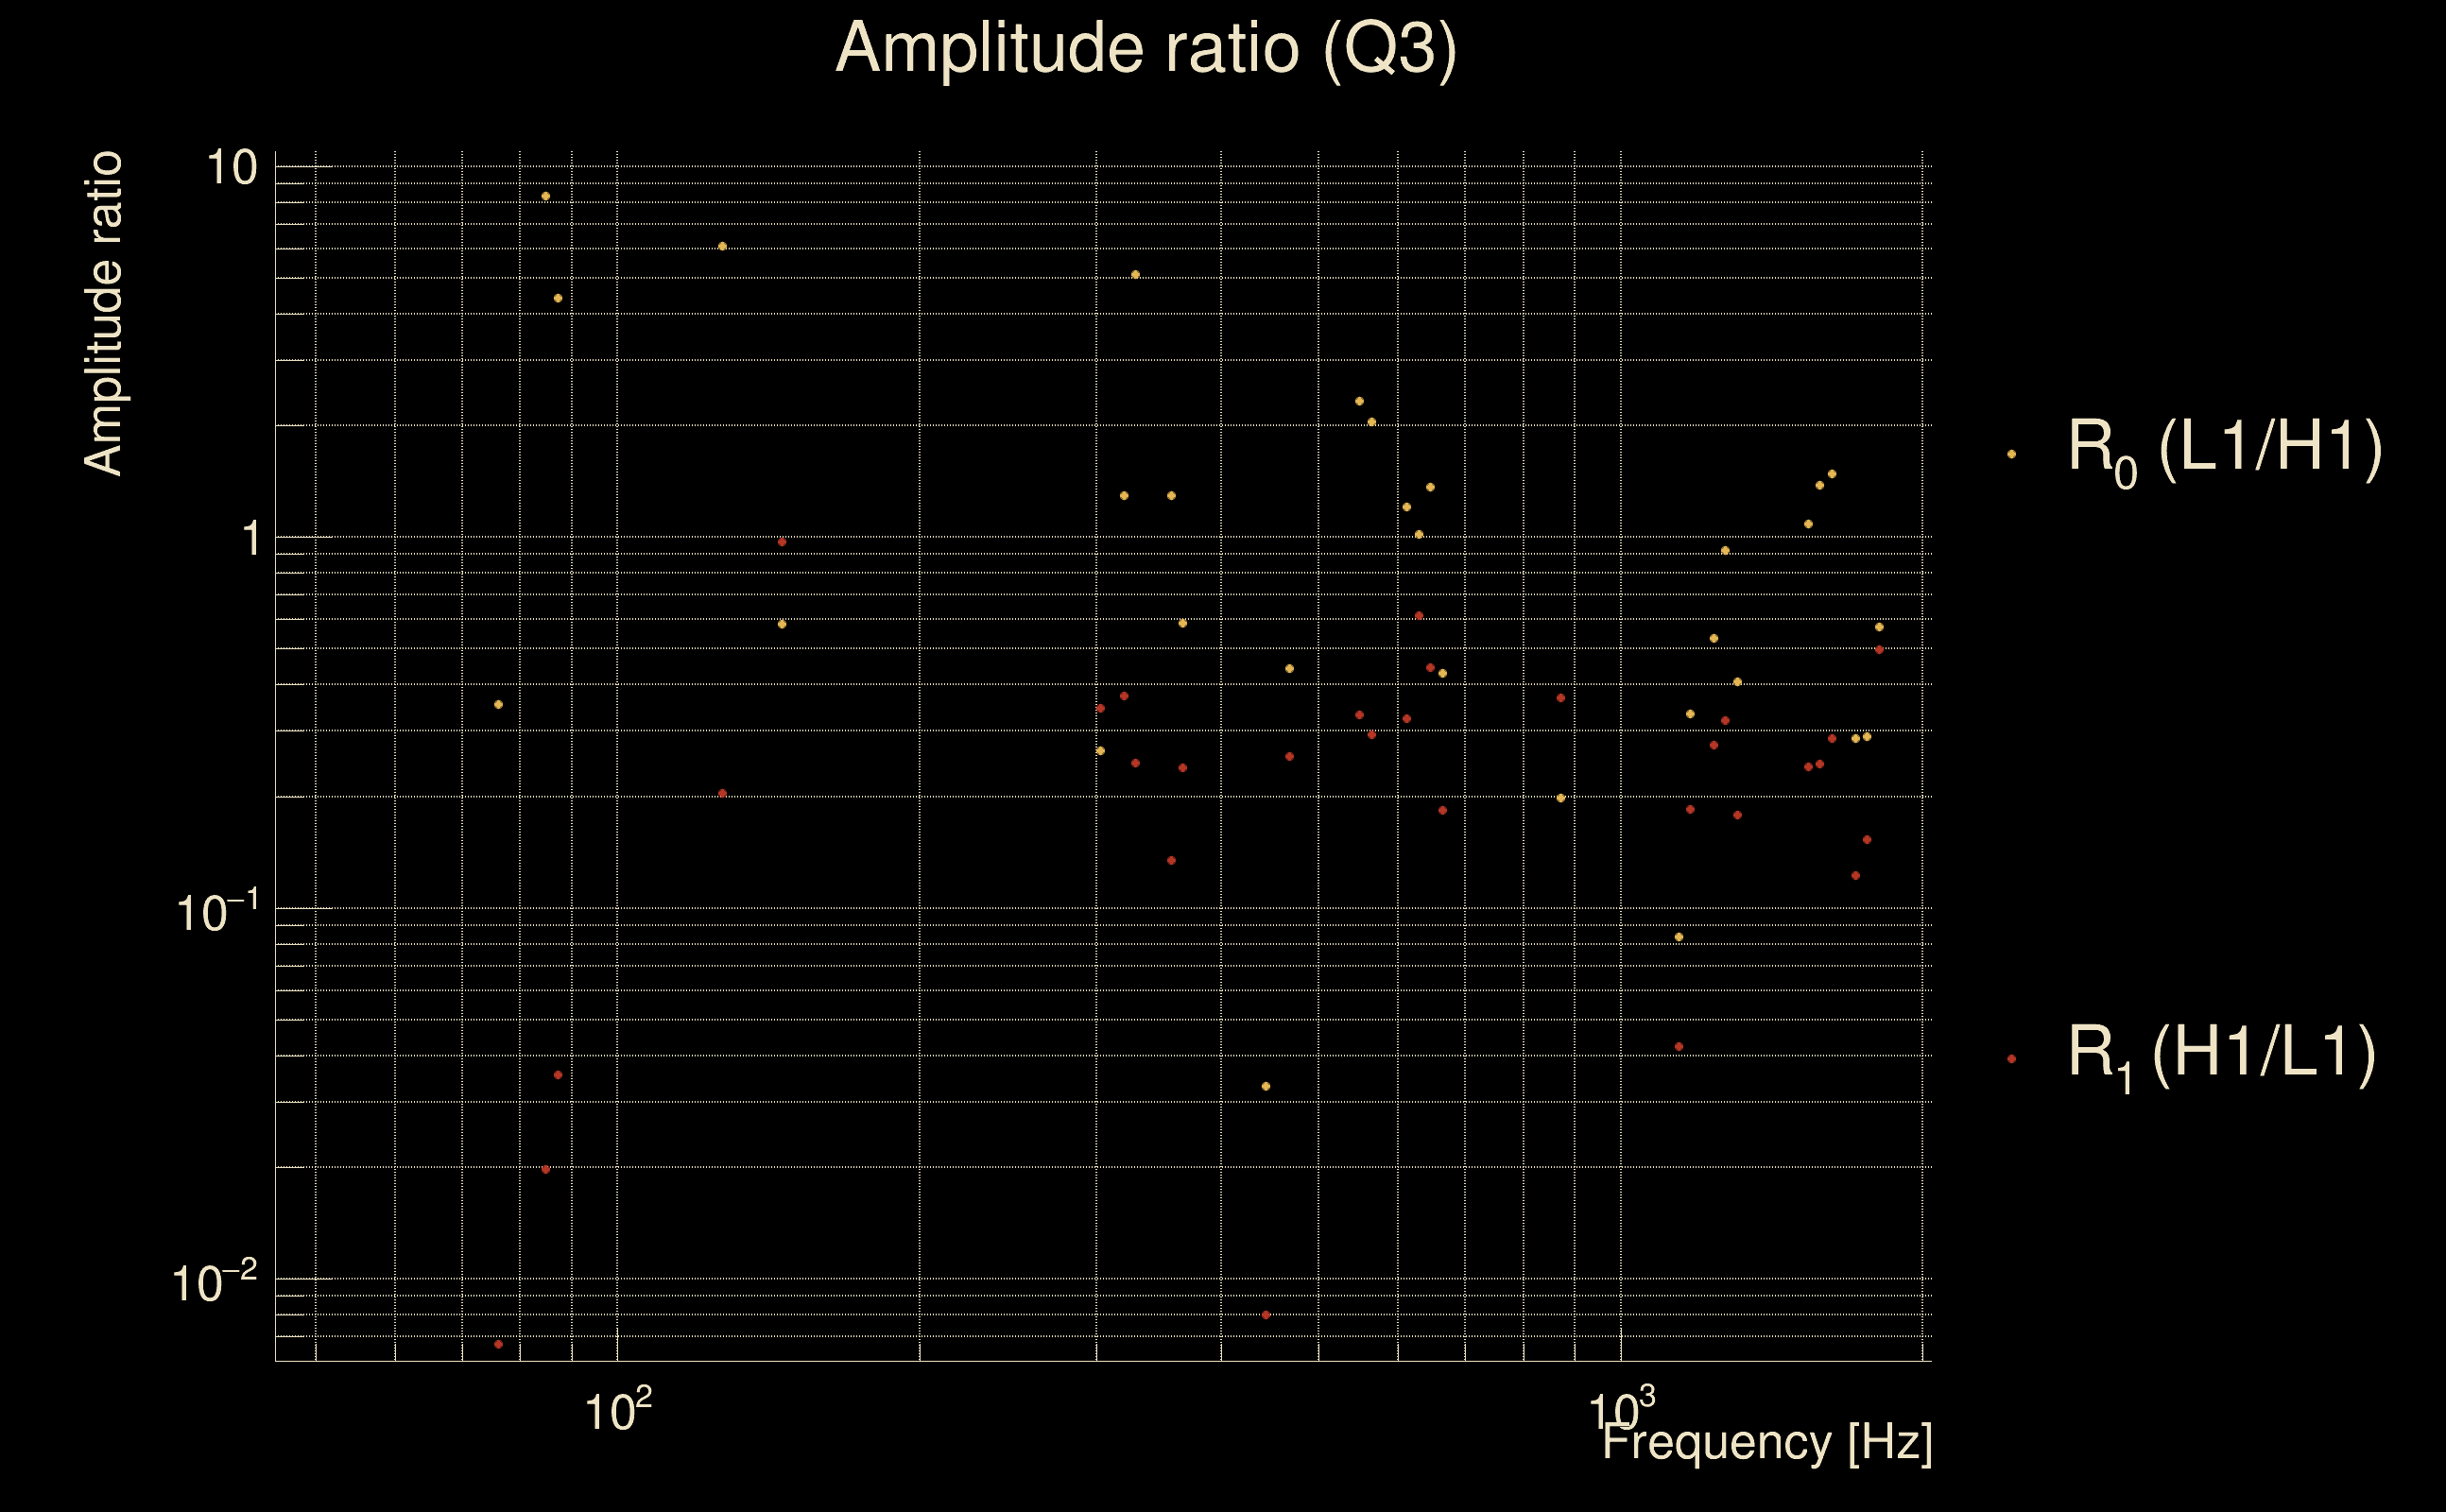
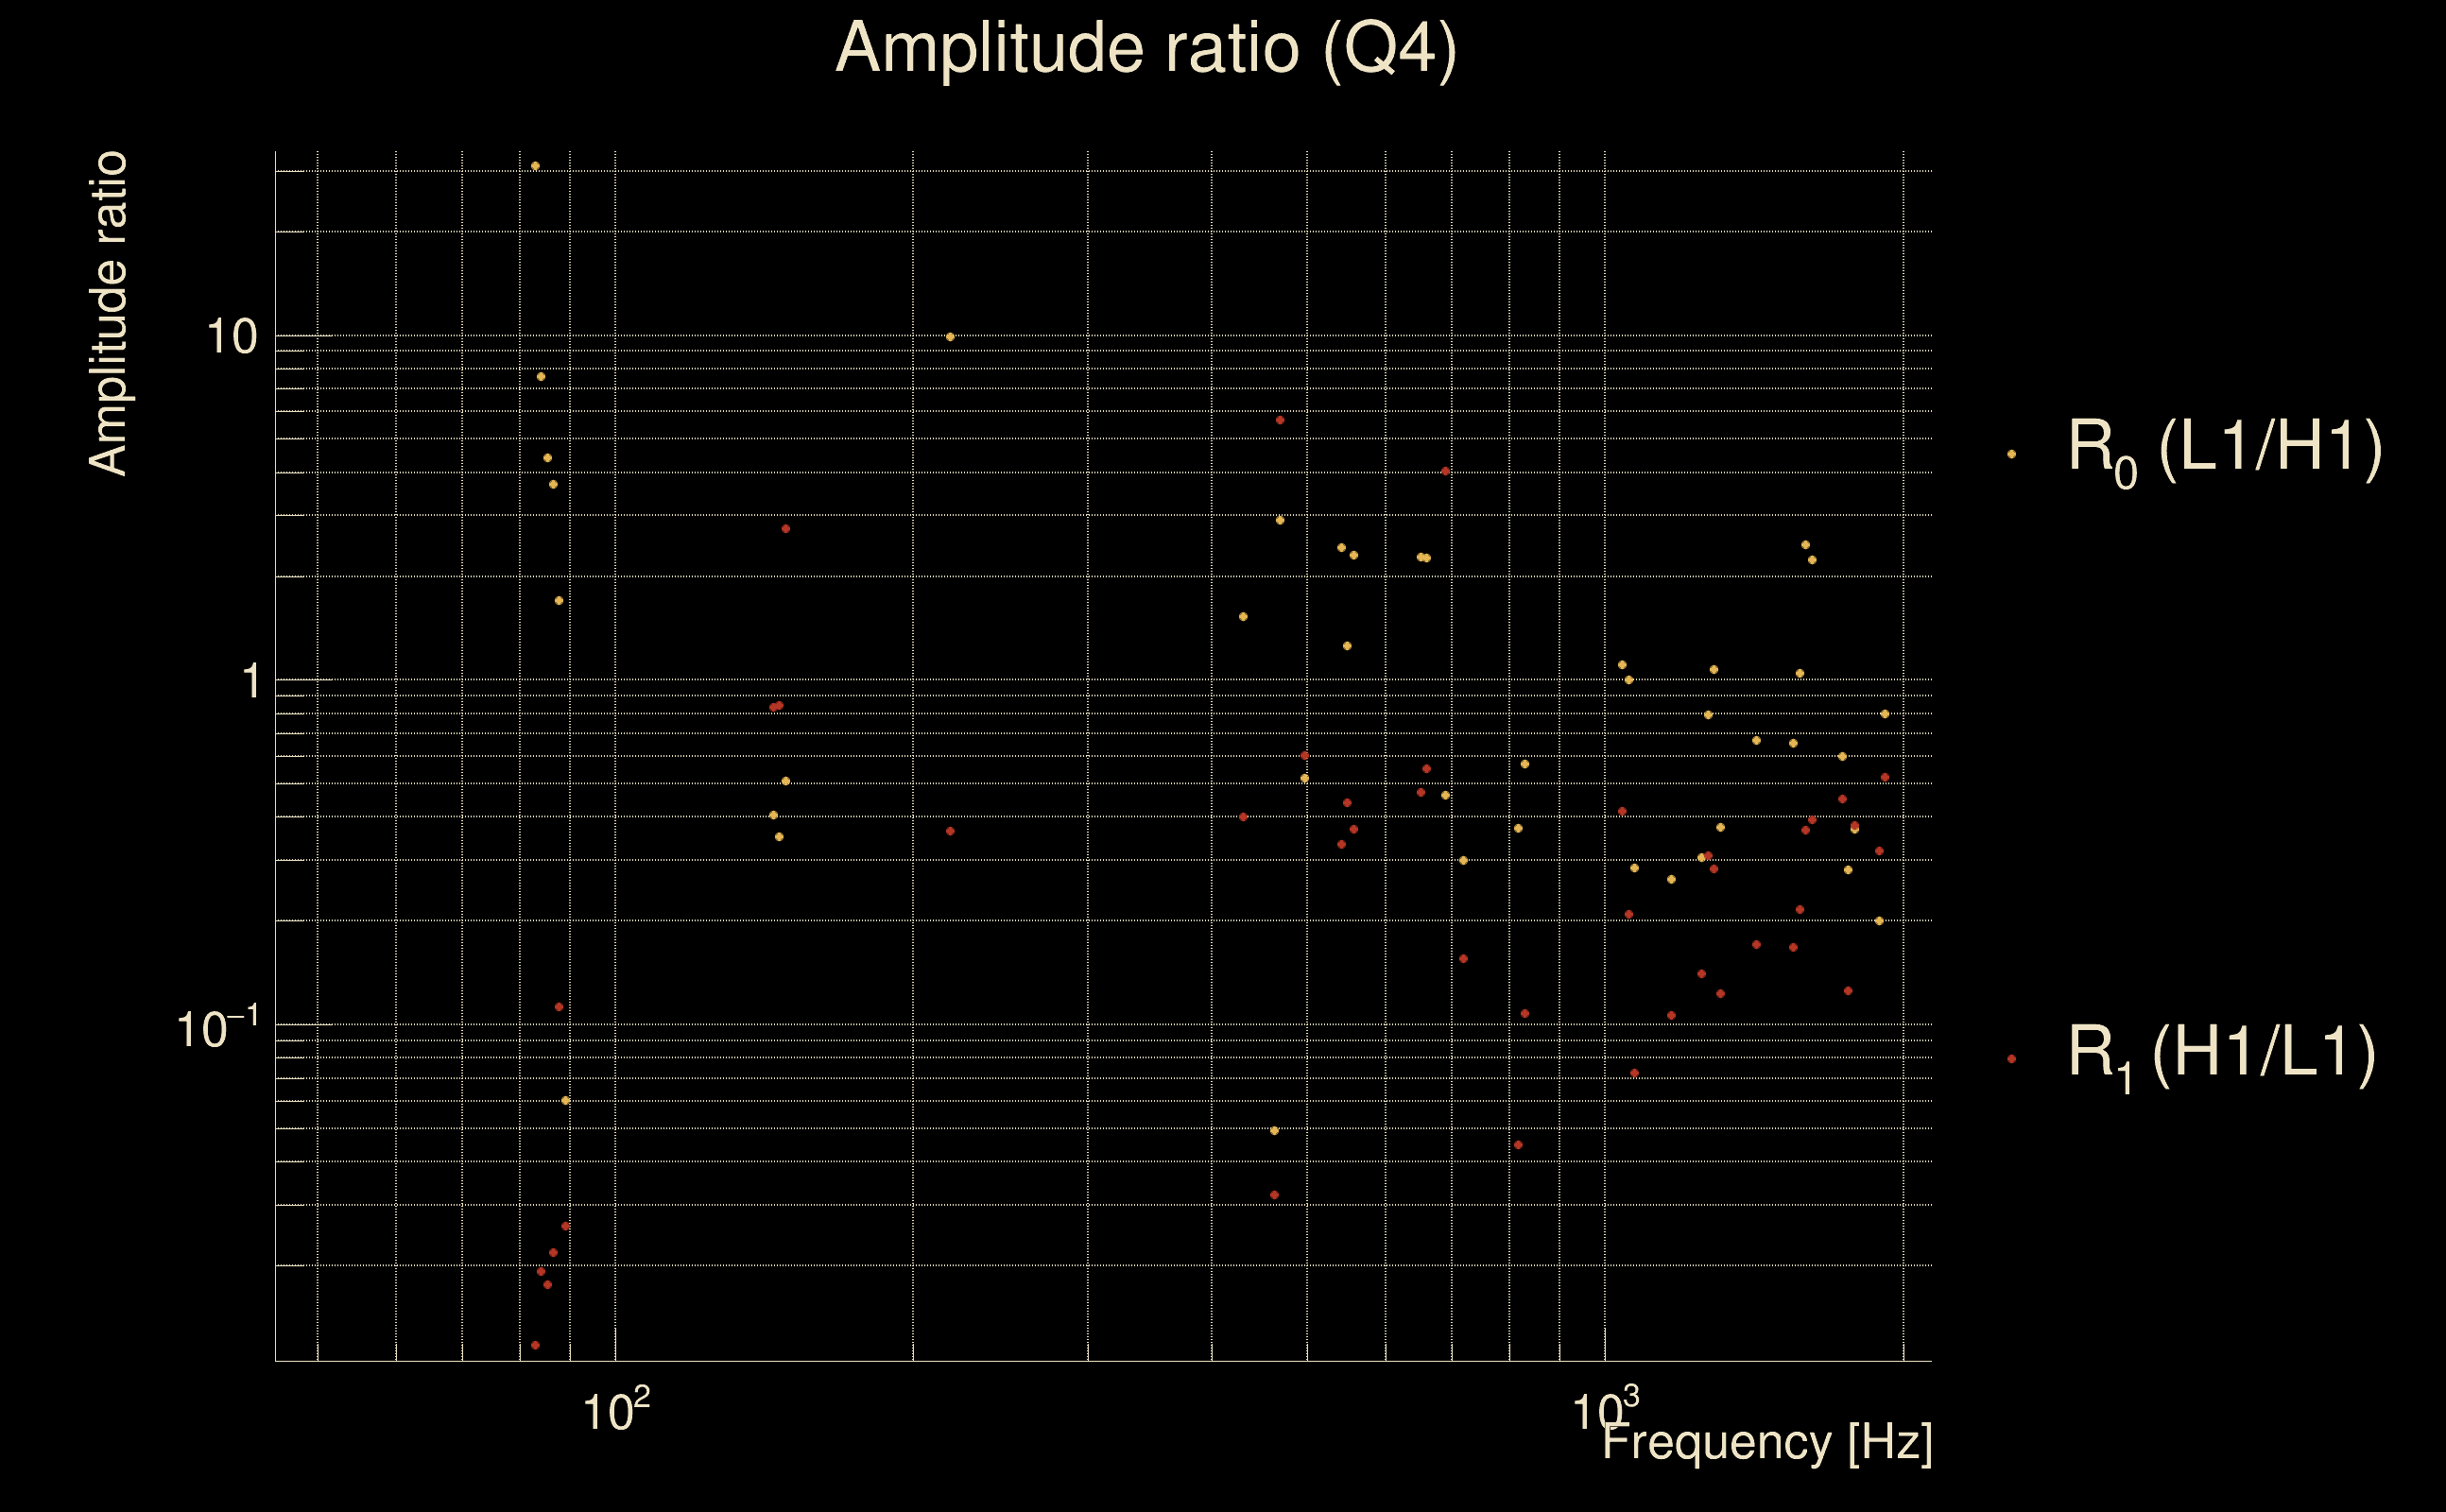
| Ξ: | 0.0191528 ± 0.0427831 (variance = 0.0018304): Q0: 0.0357369, Q1: 0.0528795, Q2: 0.0638533, Q3: 0.131037, Q4: 0.140918 |
| Rank: | R_A = 6.49582e-16 |
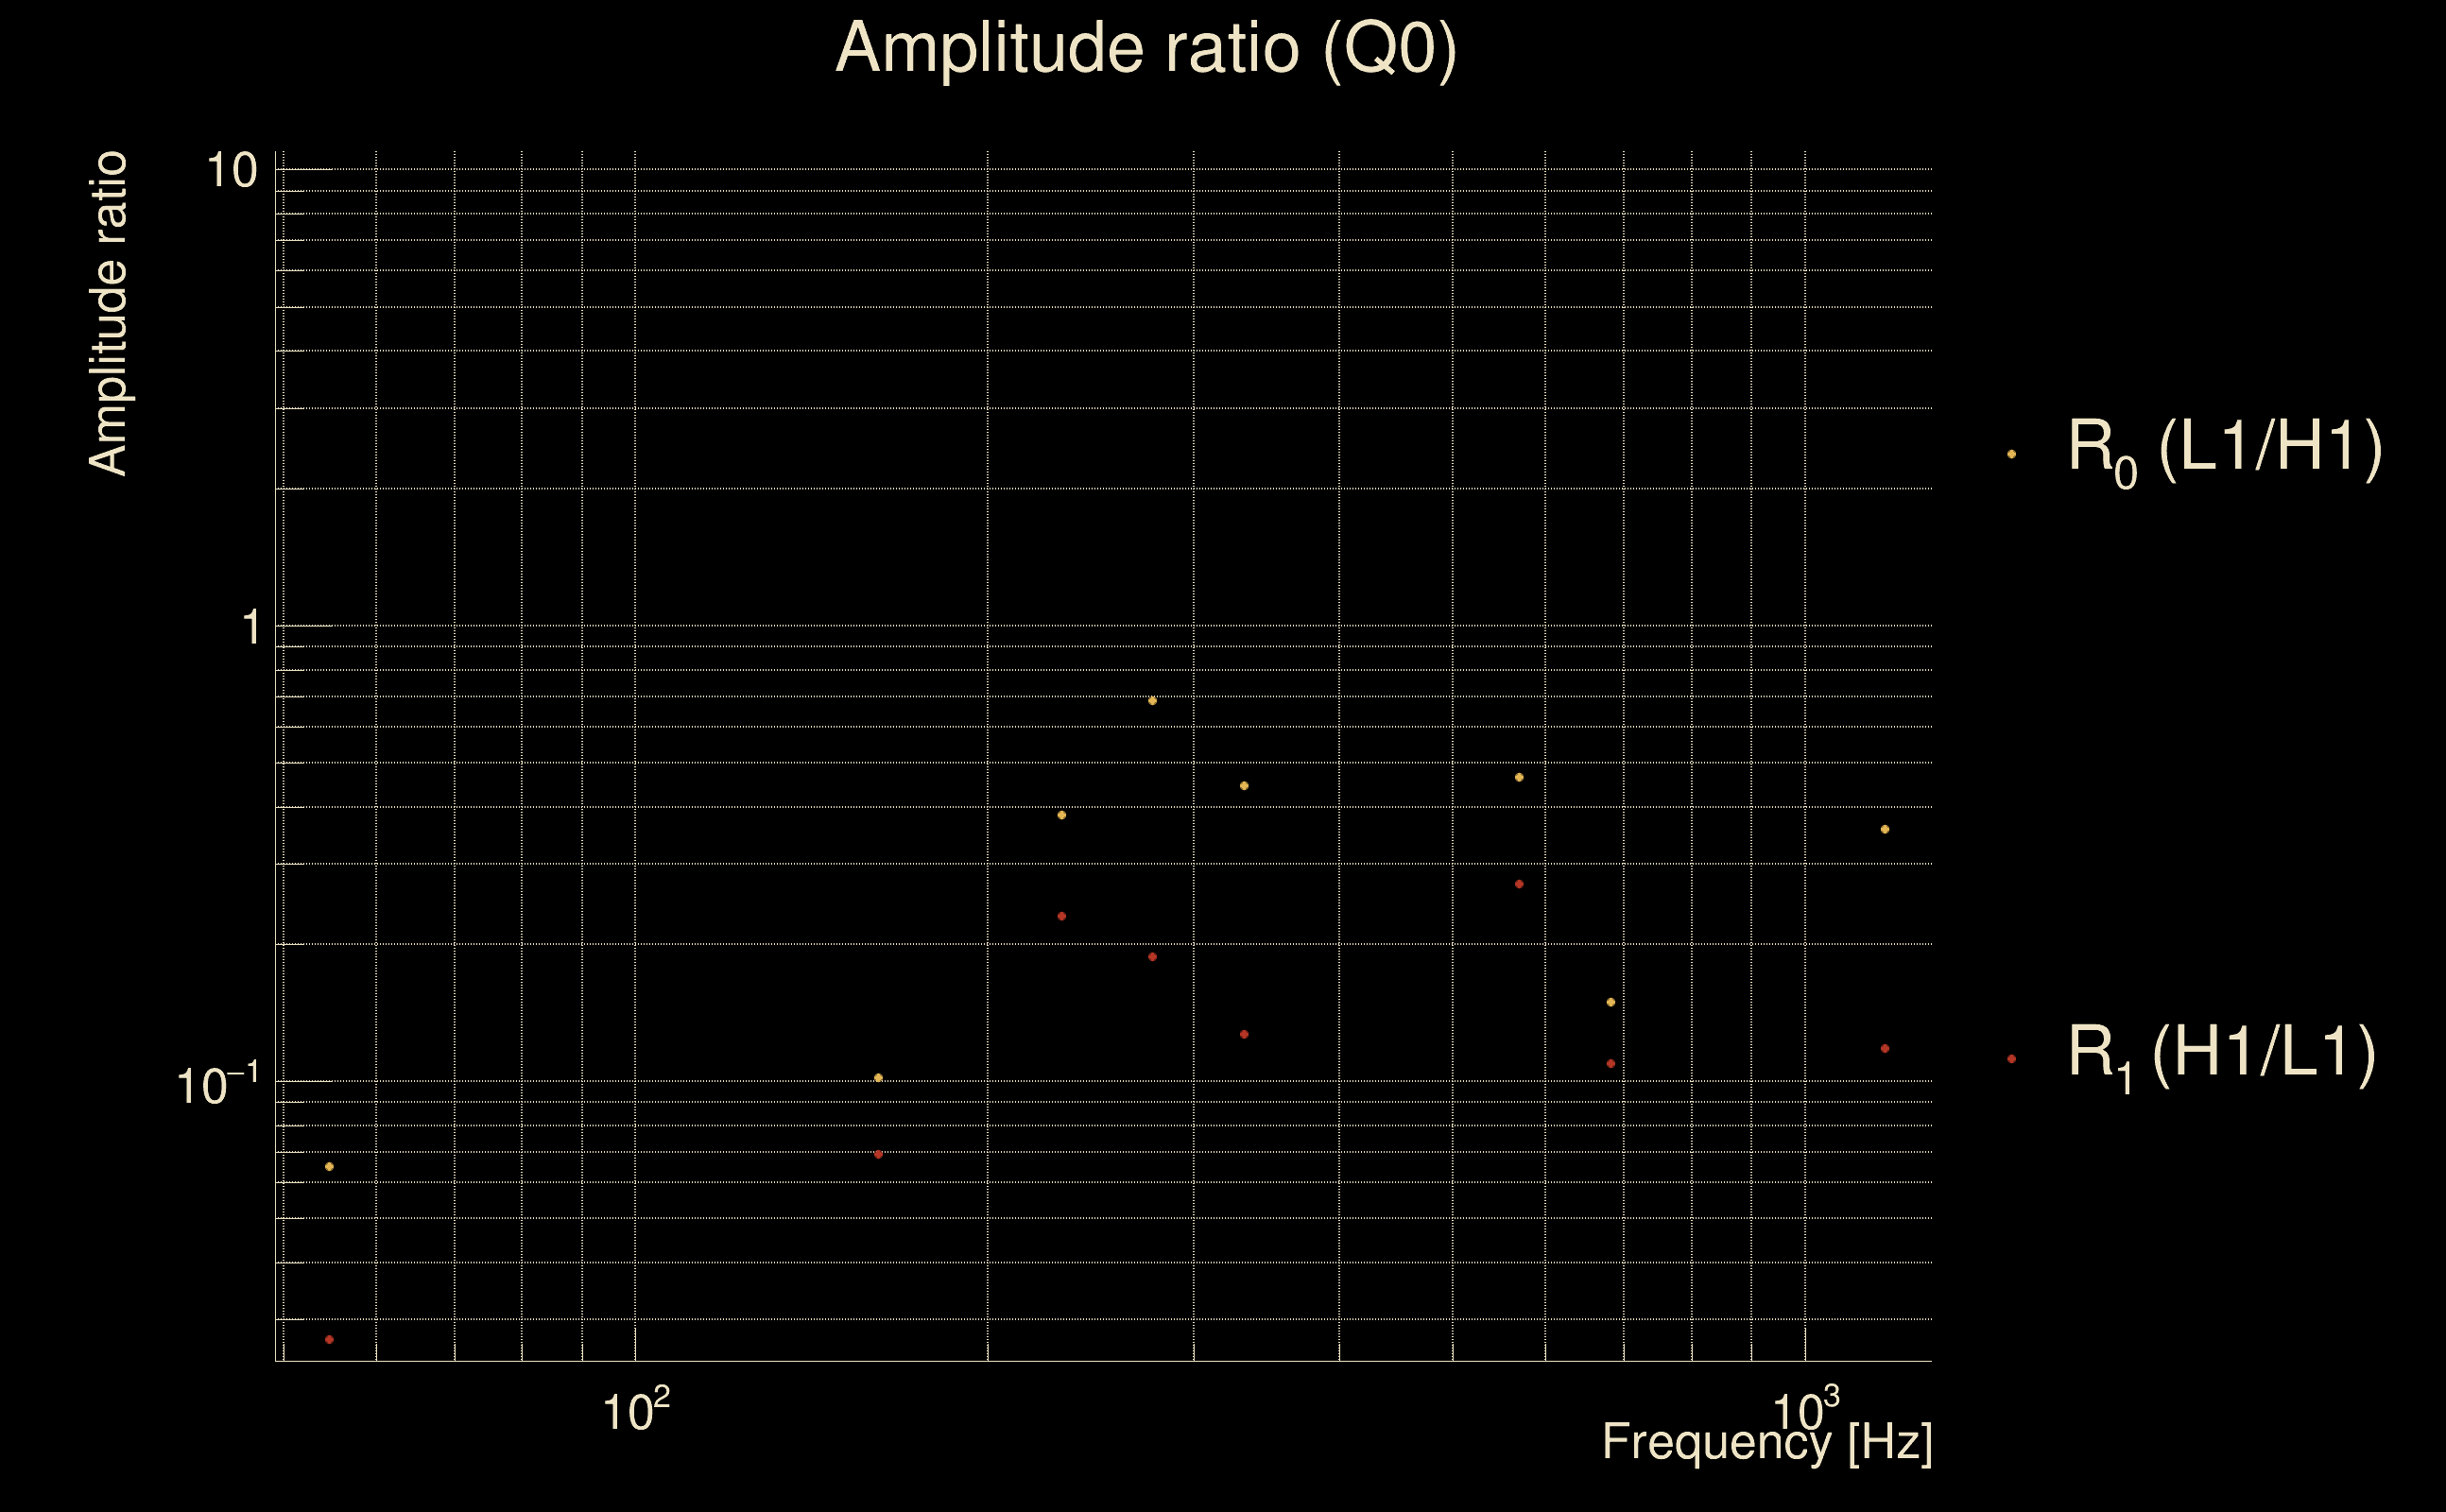
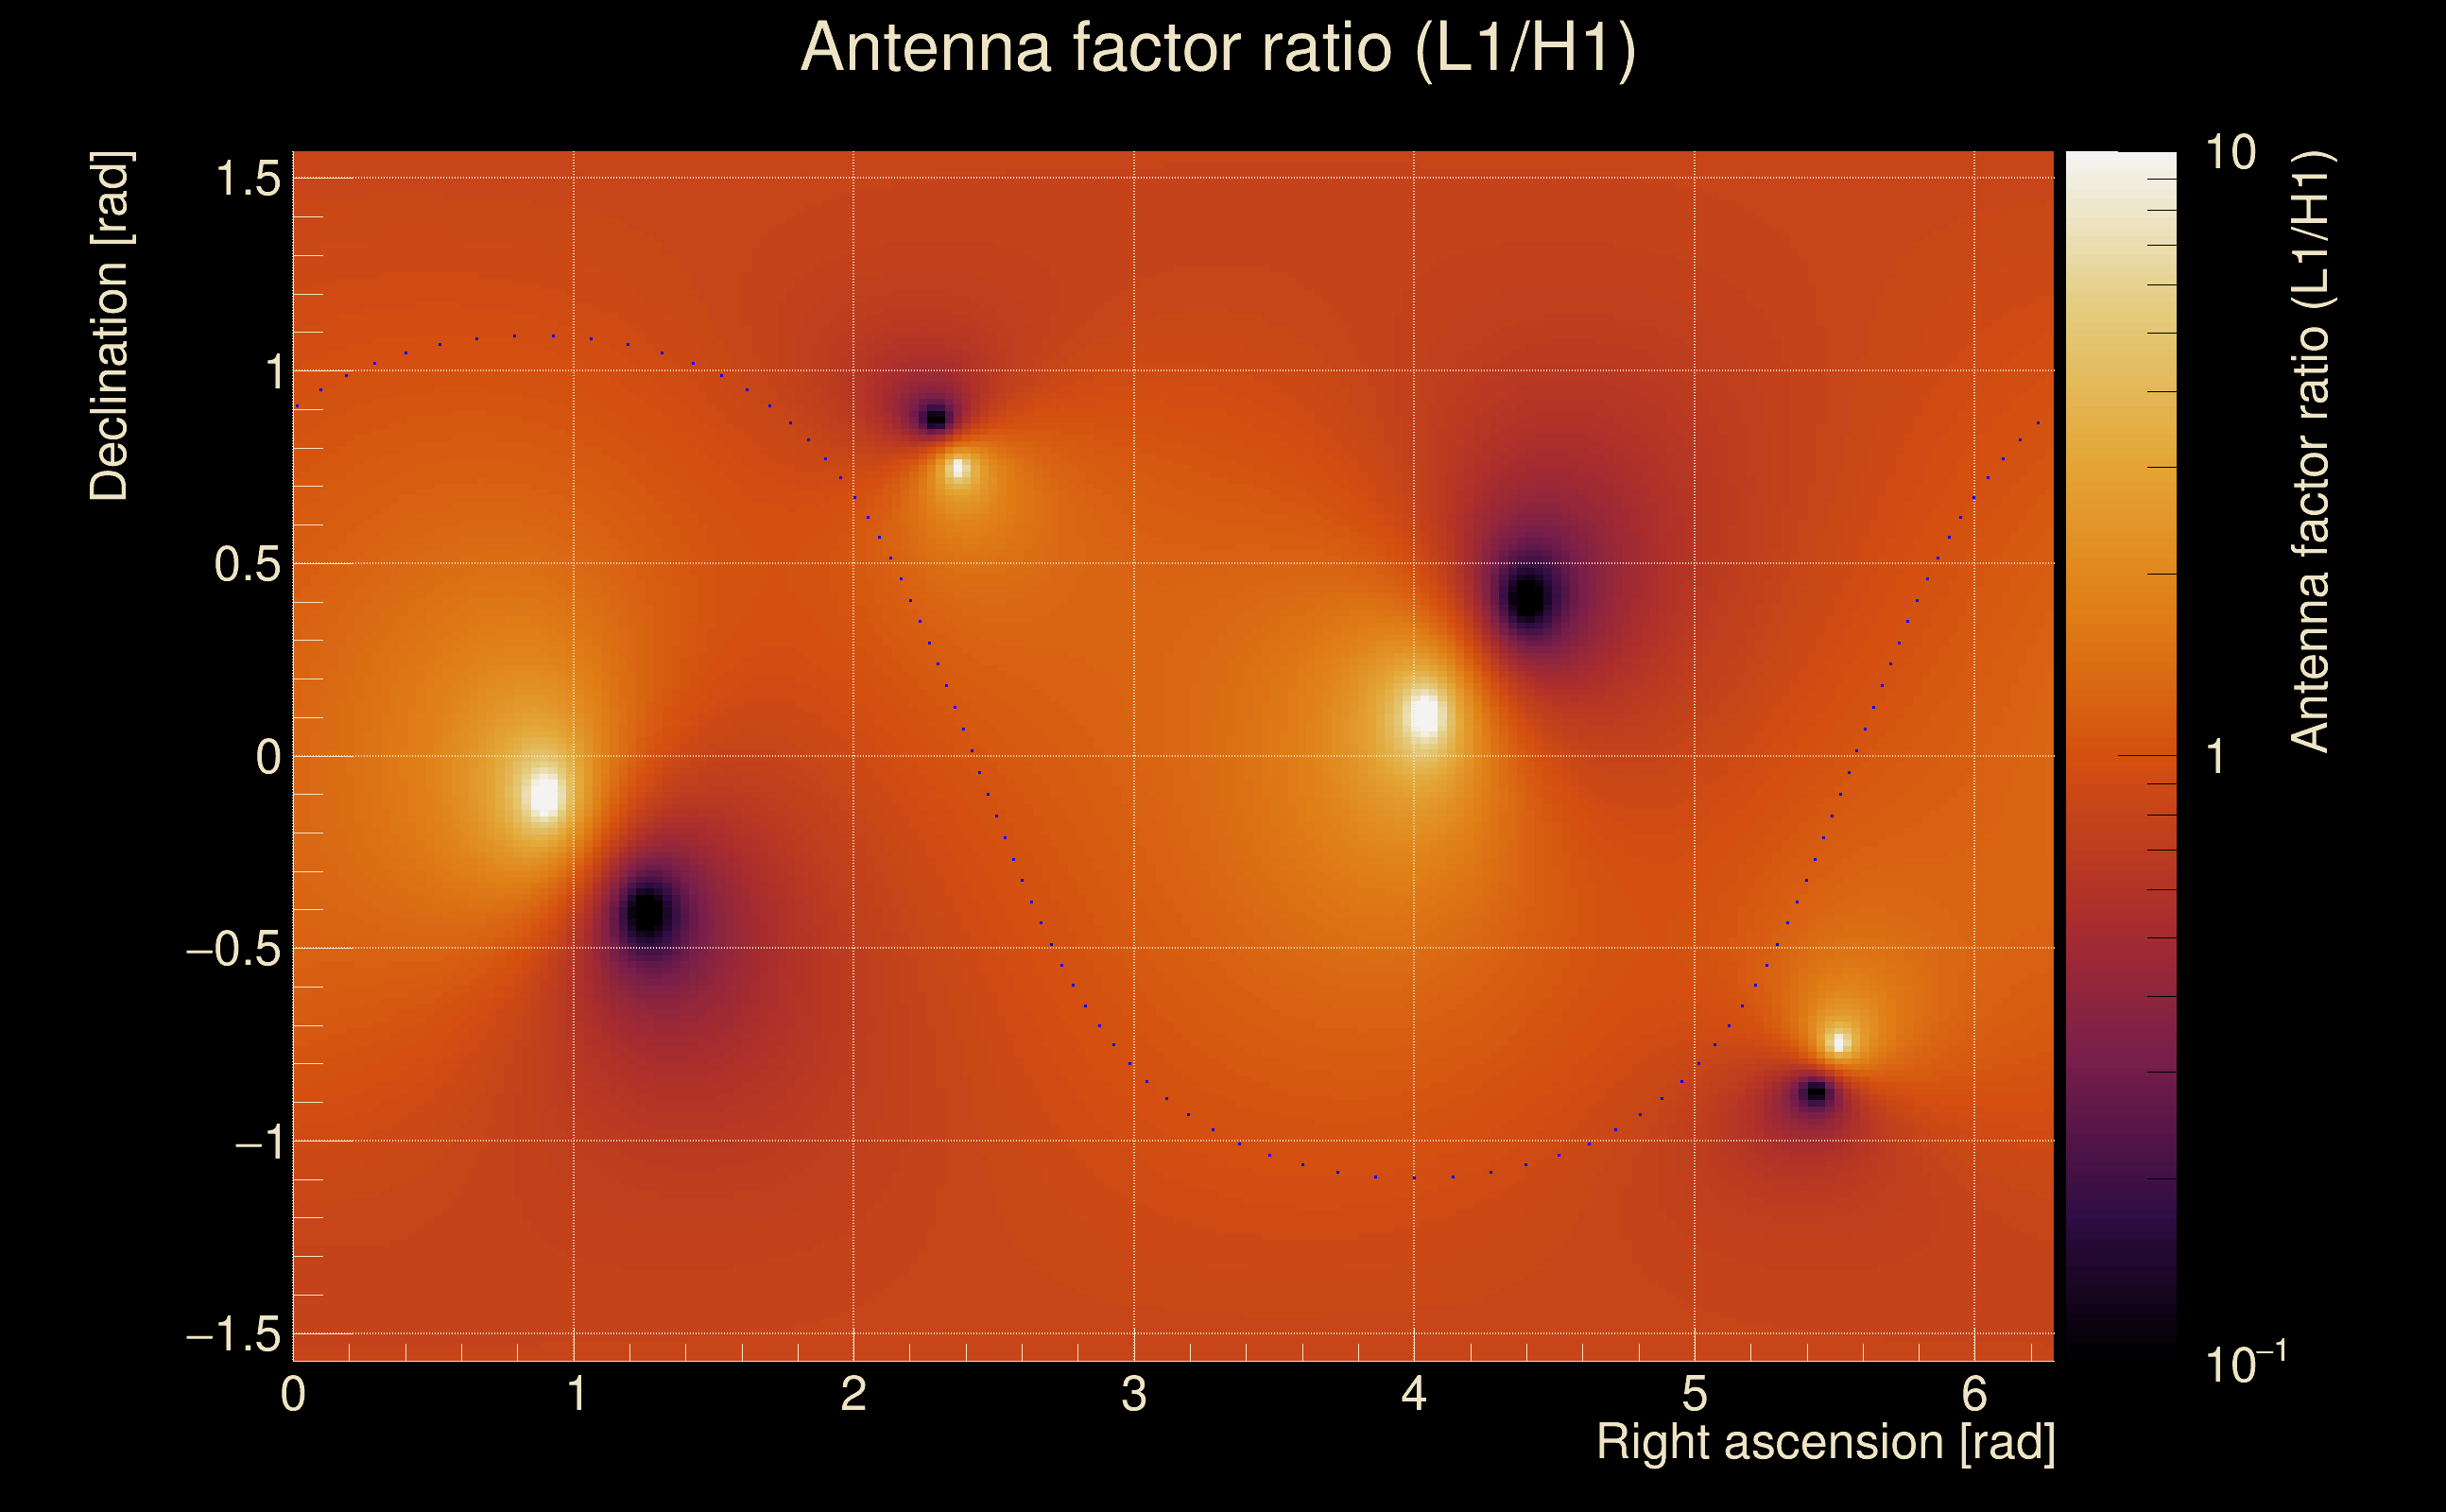
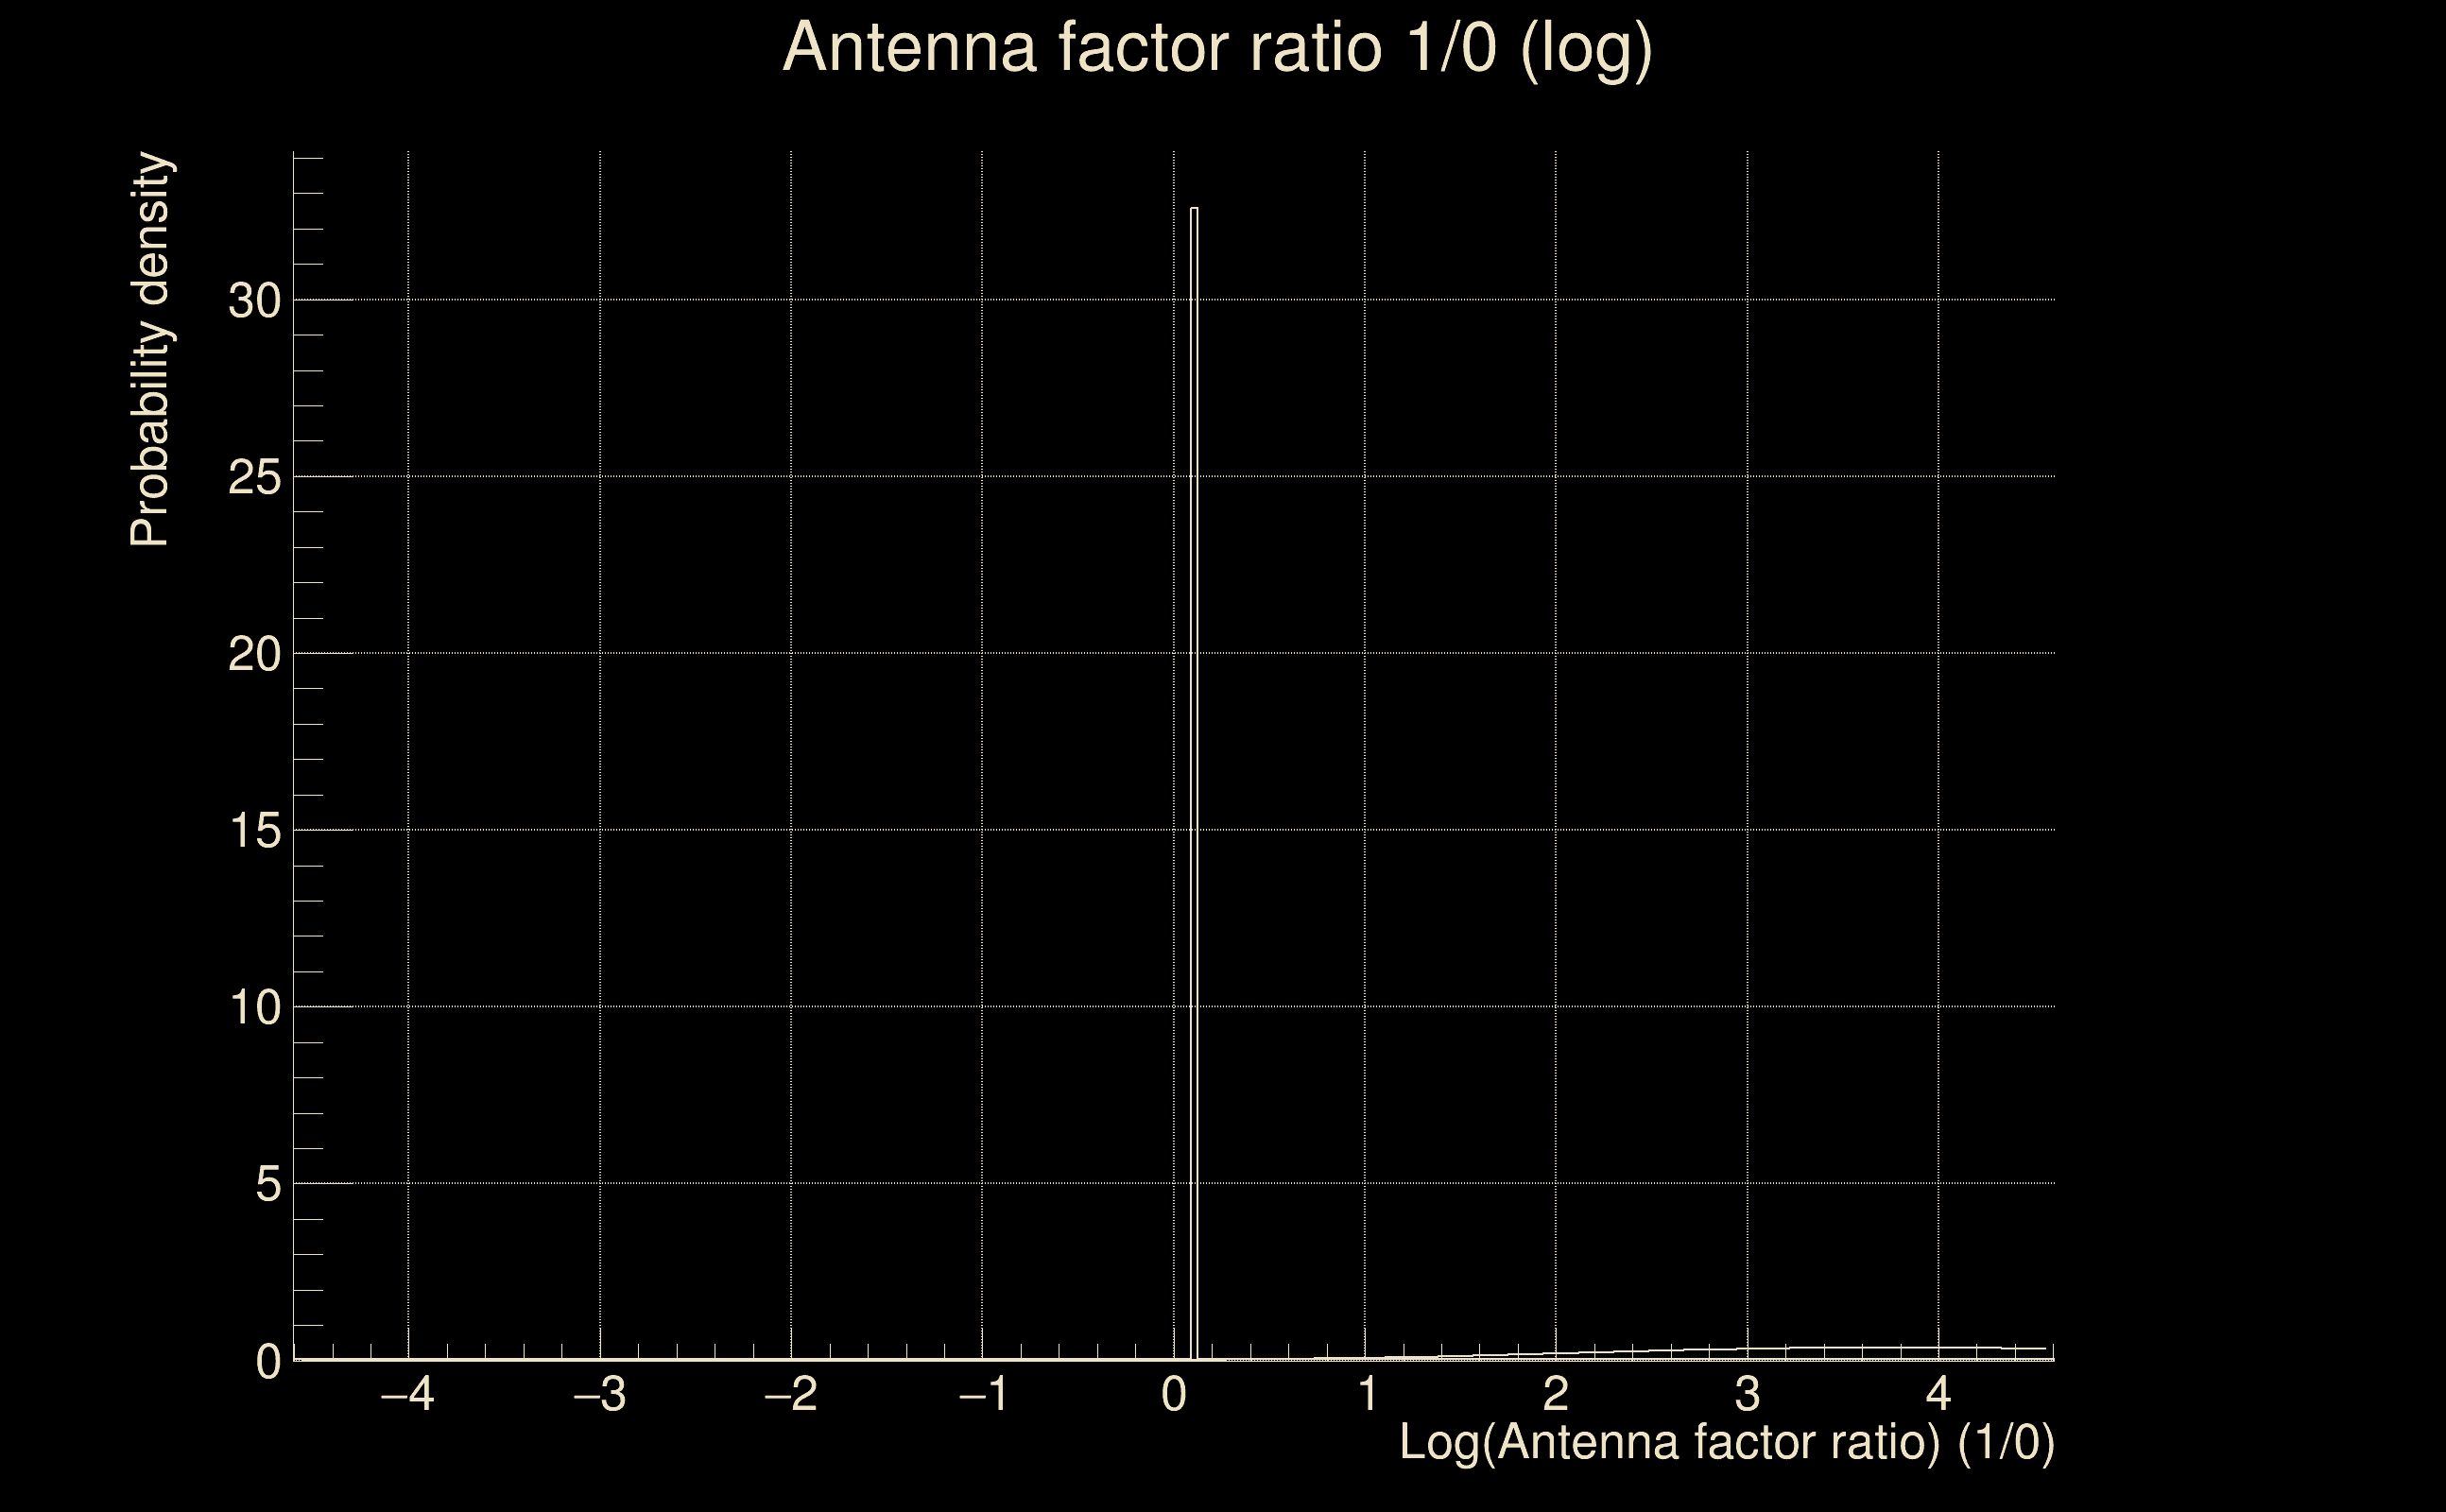
| Log of amplitude ratio (L1/H1): | 3.74744, variance = 1.15114 (L1/H1: -1.03605, variance = 1.44876, H1/L1: -3.78534, variance = 1.16935) |
| Amplitude ratio (L1/H1): | 42.4125 ⋇ 2.92387 (L1/H1: 0.354852 ⋇ 3.33224, H1/L1: 0.0227012 ⋇ 2.94871) |
| Amplitude ratio H1|L1 compatibility (probability): | 0.00288498 |
| Antenna factor probability: | 0.000664612 |
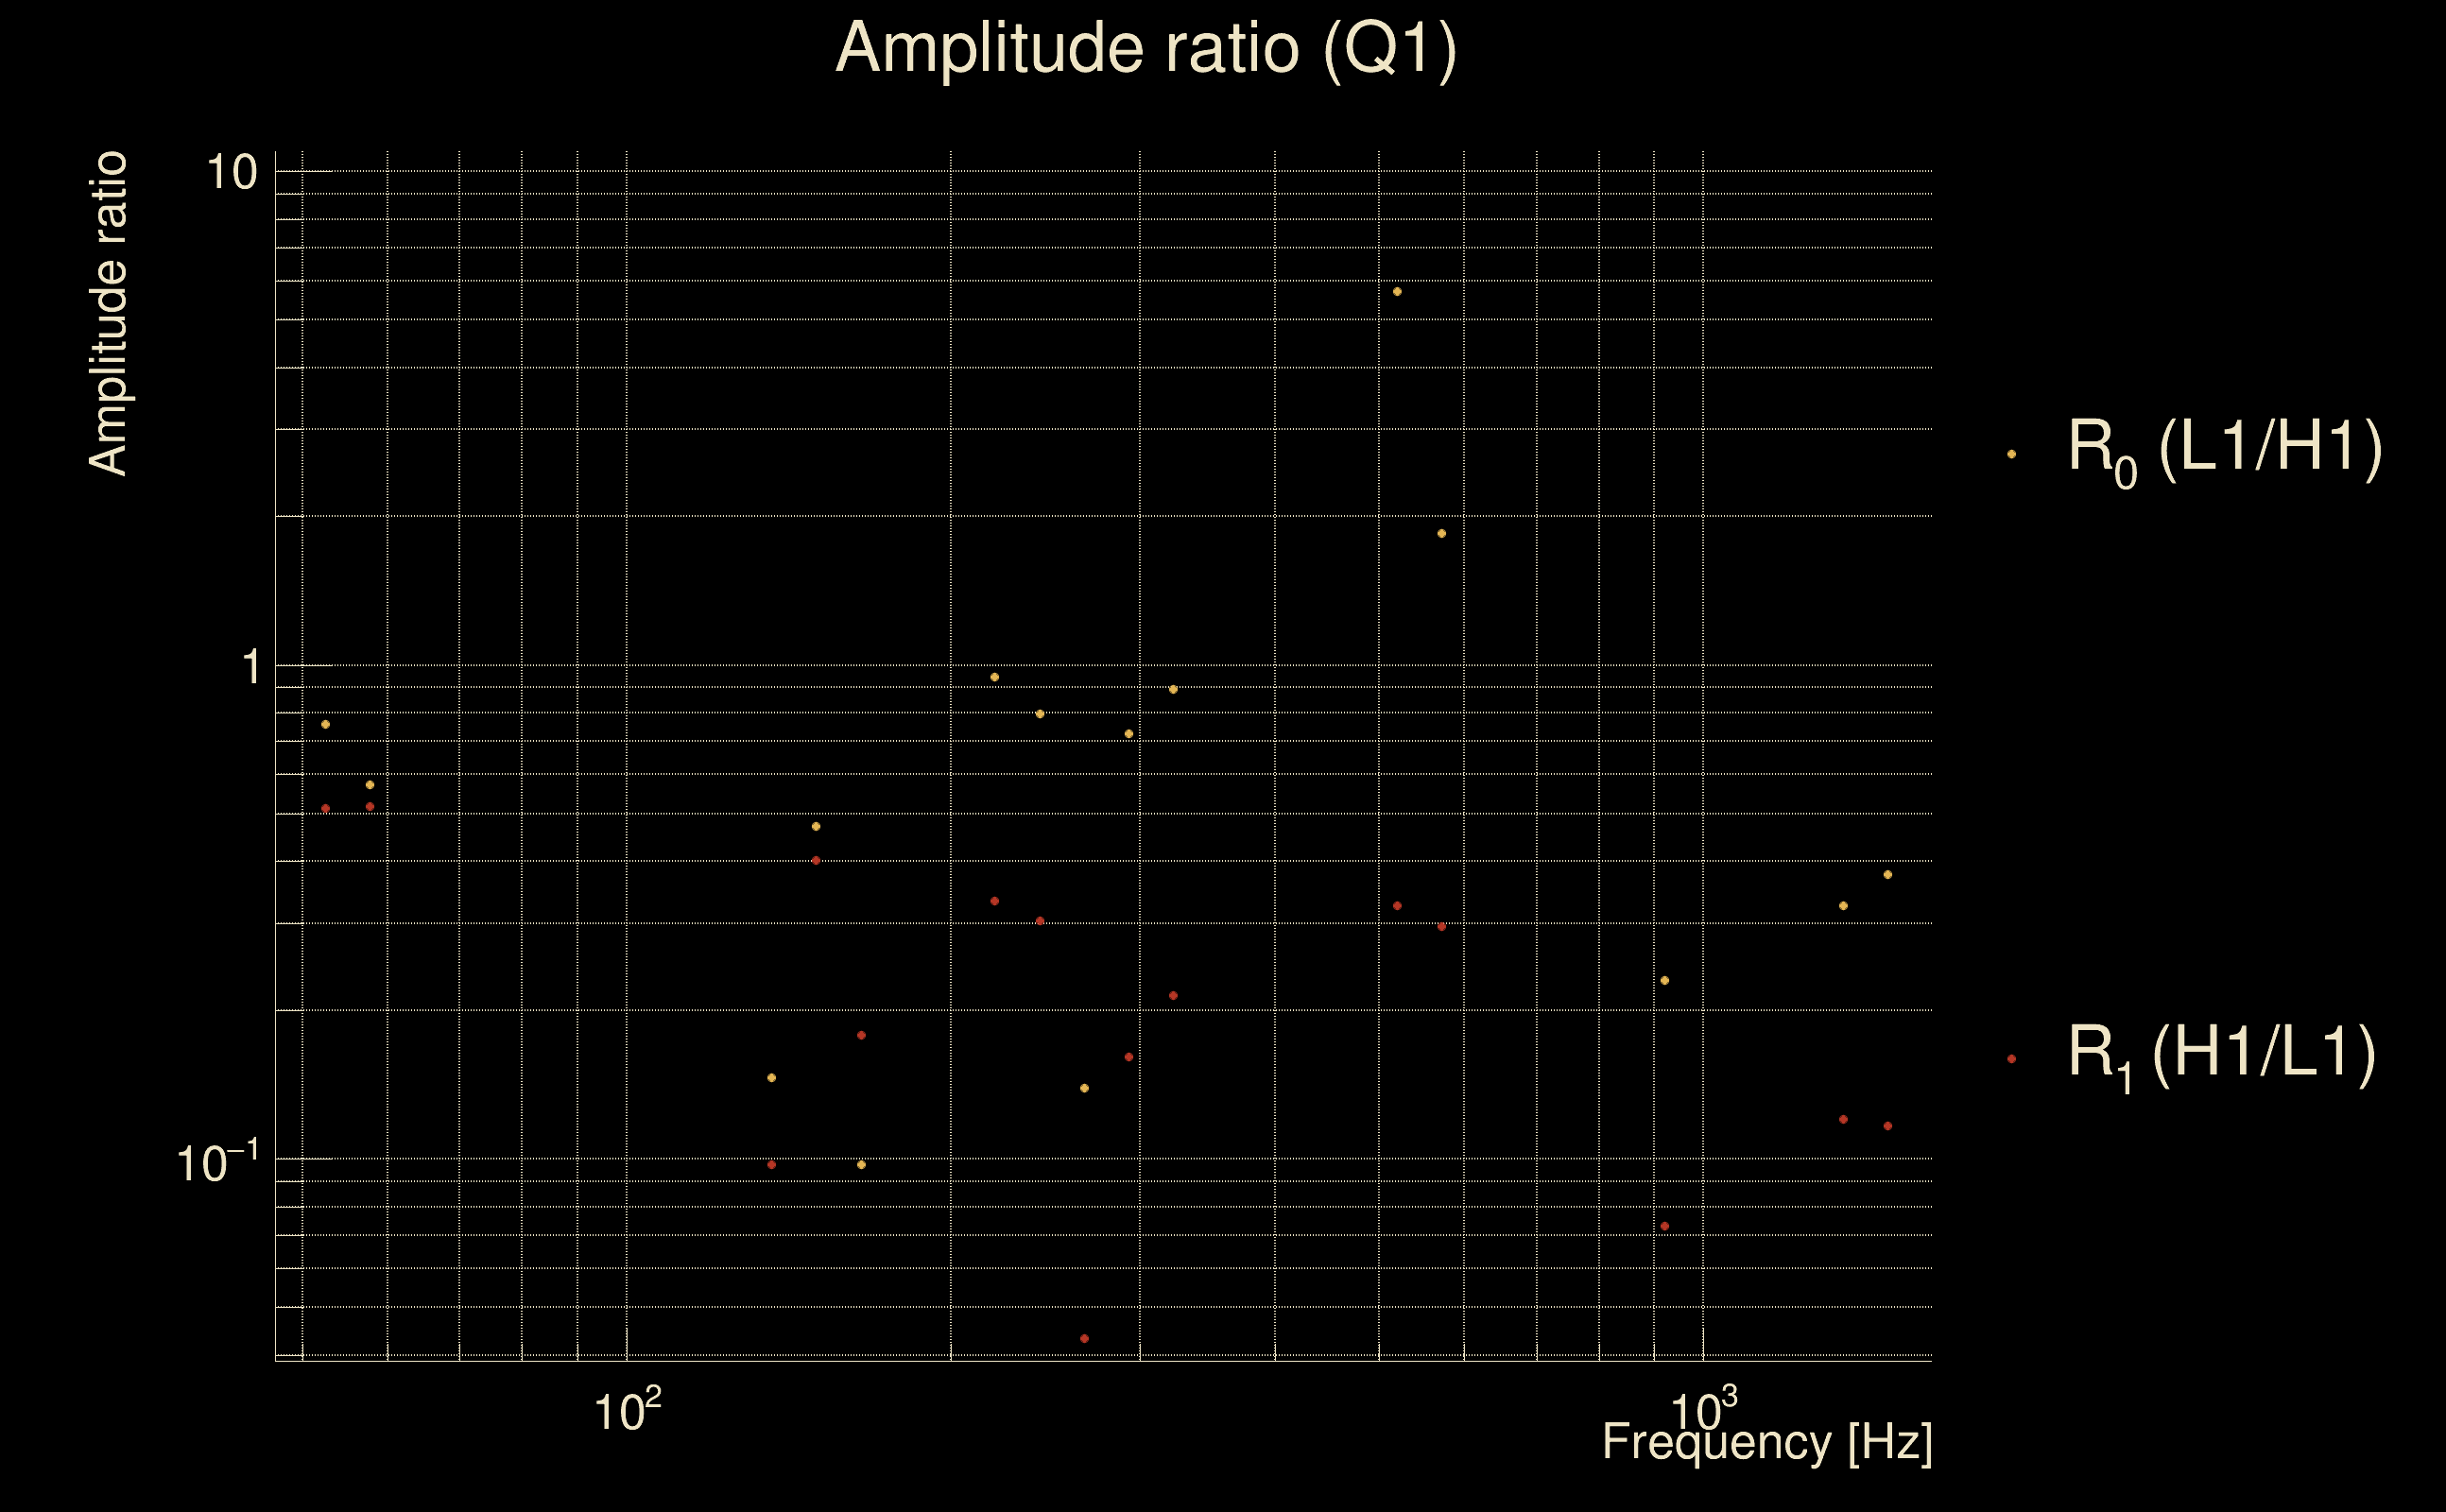
| Number of rejected frequency rows: | Q0: 10 / 18, Q1: 21 / 36, Q2: 48 / 70, Q3: 104 / 134, Q4: 217 / 258 |
| Maximum signal-to-noise ratio: | H1: 5.44765, L1: 61.2068 |
| SNR variance: | H1: 0.600256, L1: 1.96264 |