| Omicron version: | 4.2.0: documentation gitlab repository |
| Omicron run by: | unknown |
| Report produced on: | Fri Oct 24 12:41:08 2025 UTC |
| Ox option file: | Targeted_O4bw_2min_options.txt |
| Omicron option files: | detector 0, detector 1 |
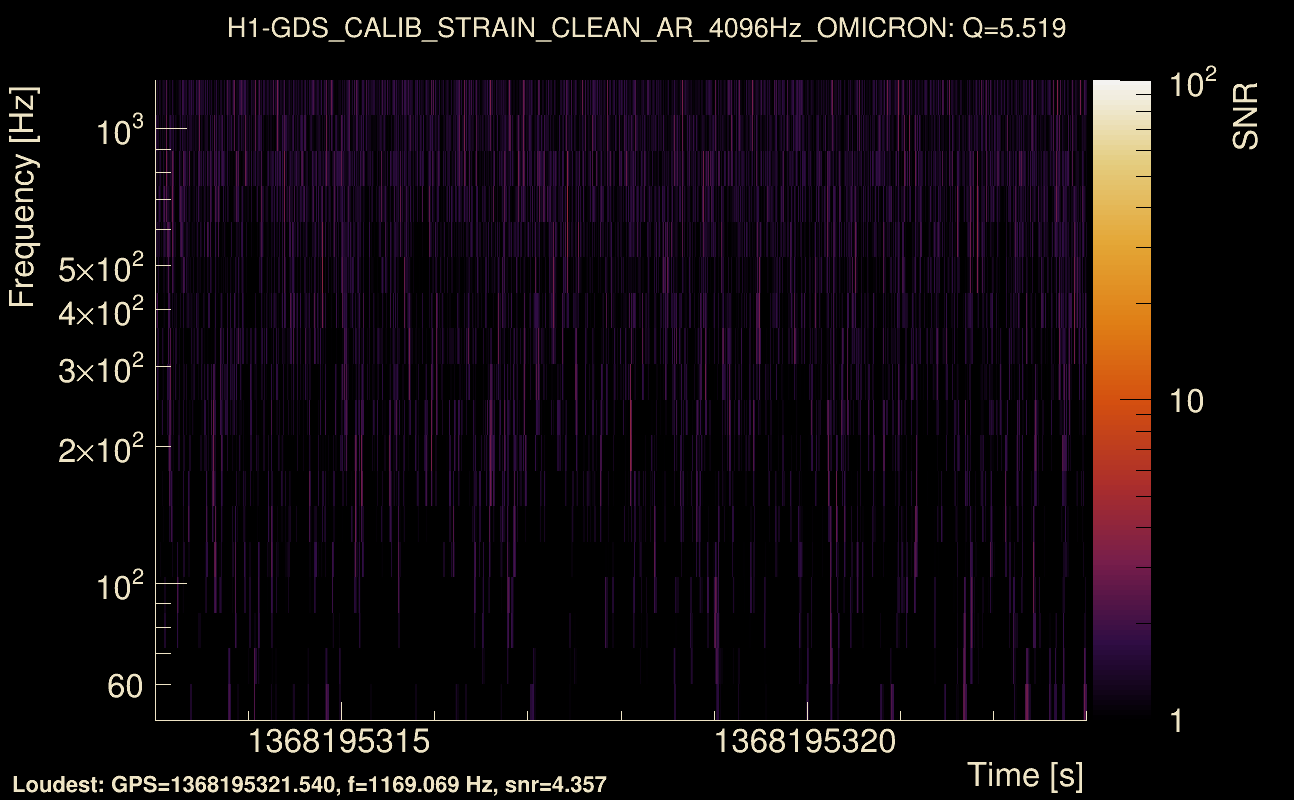
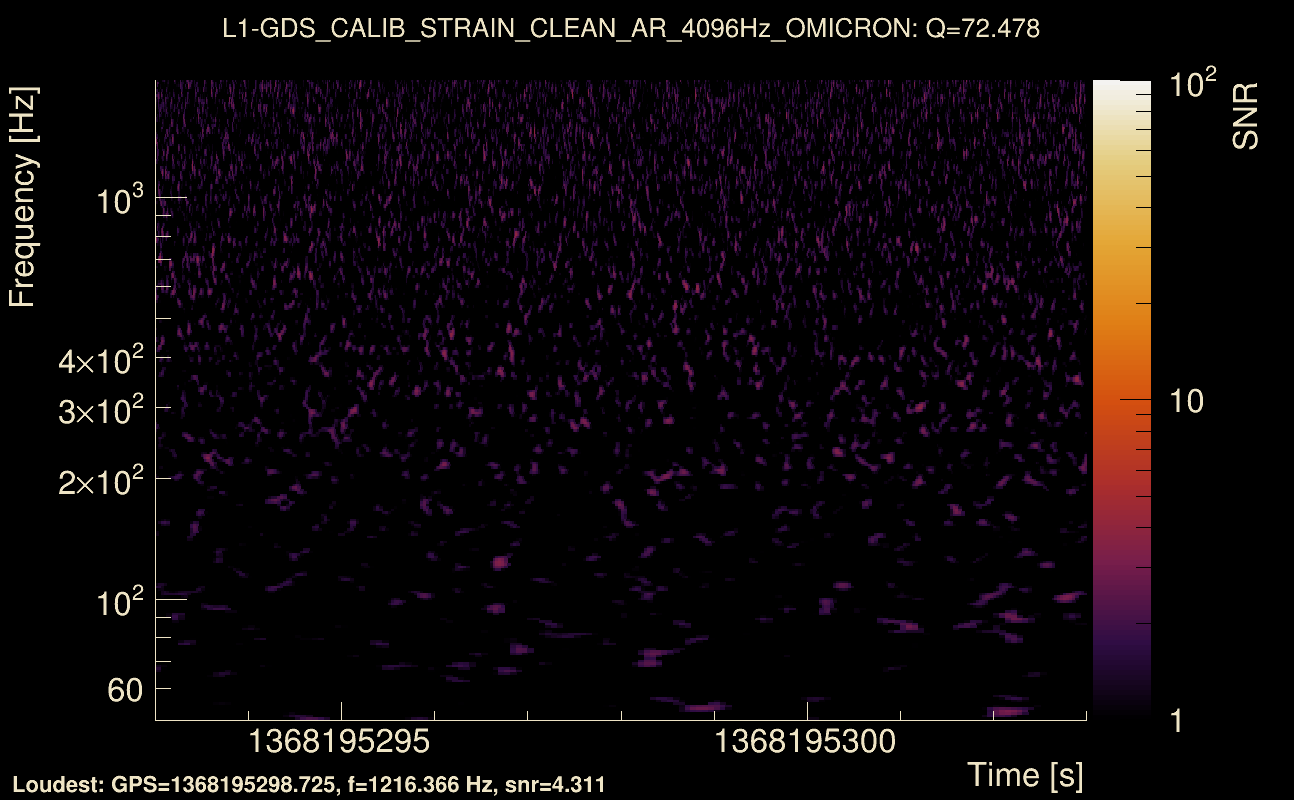
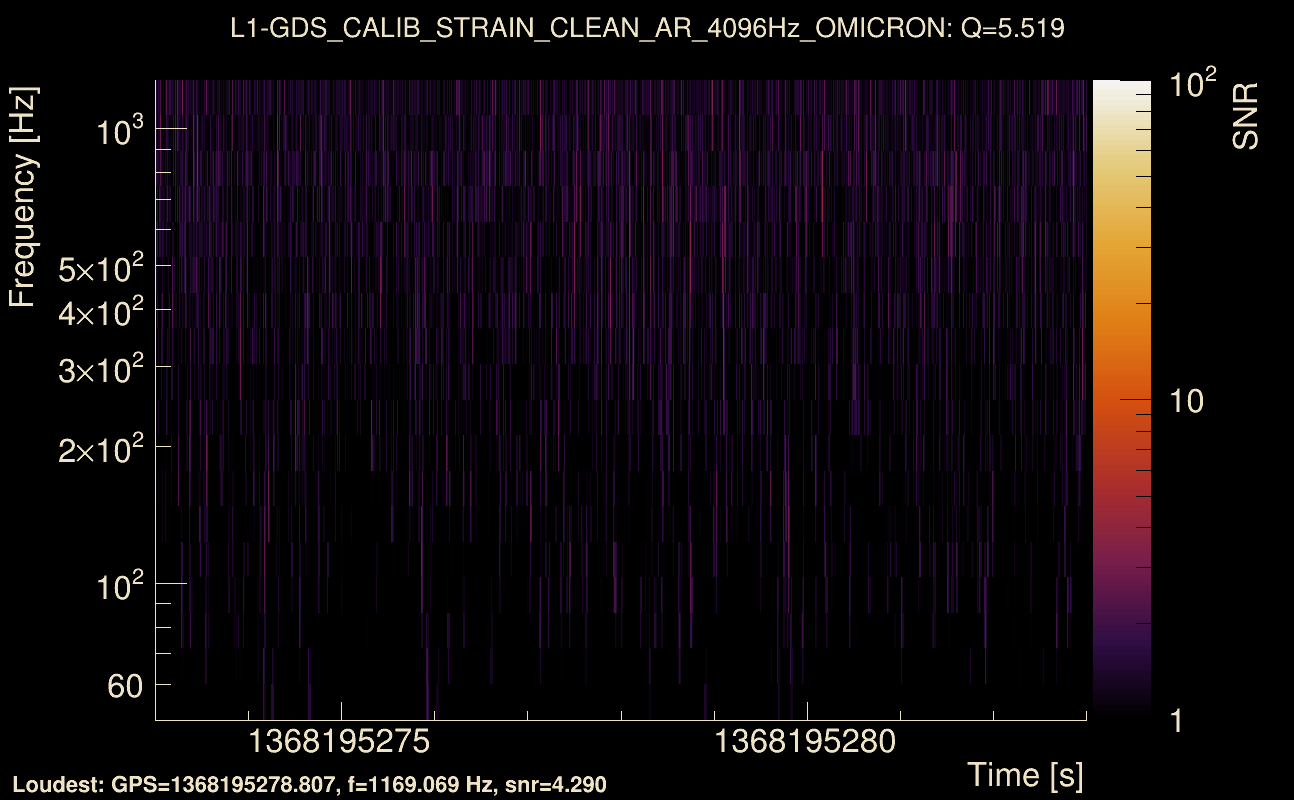
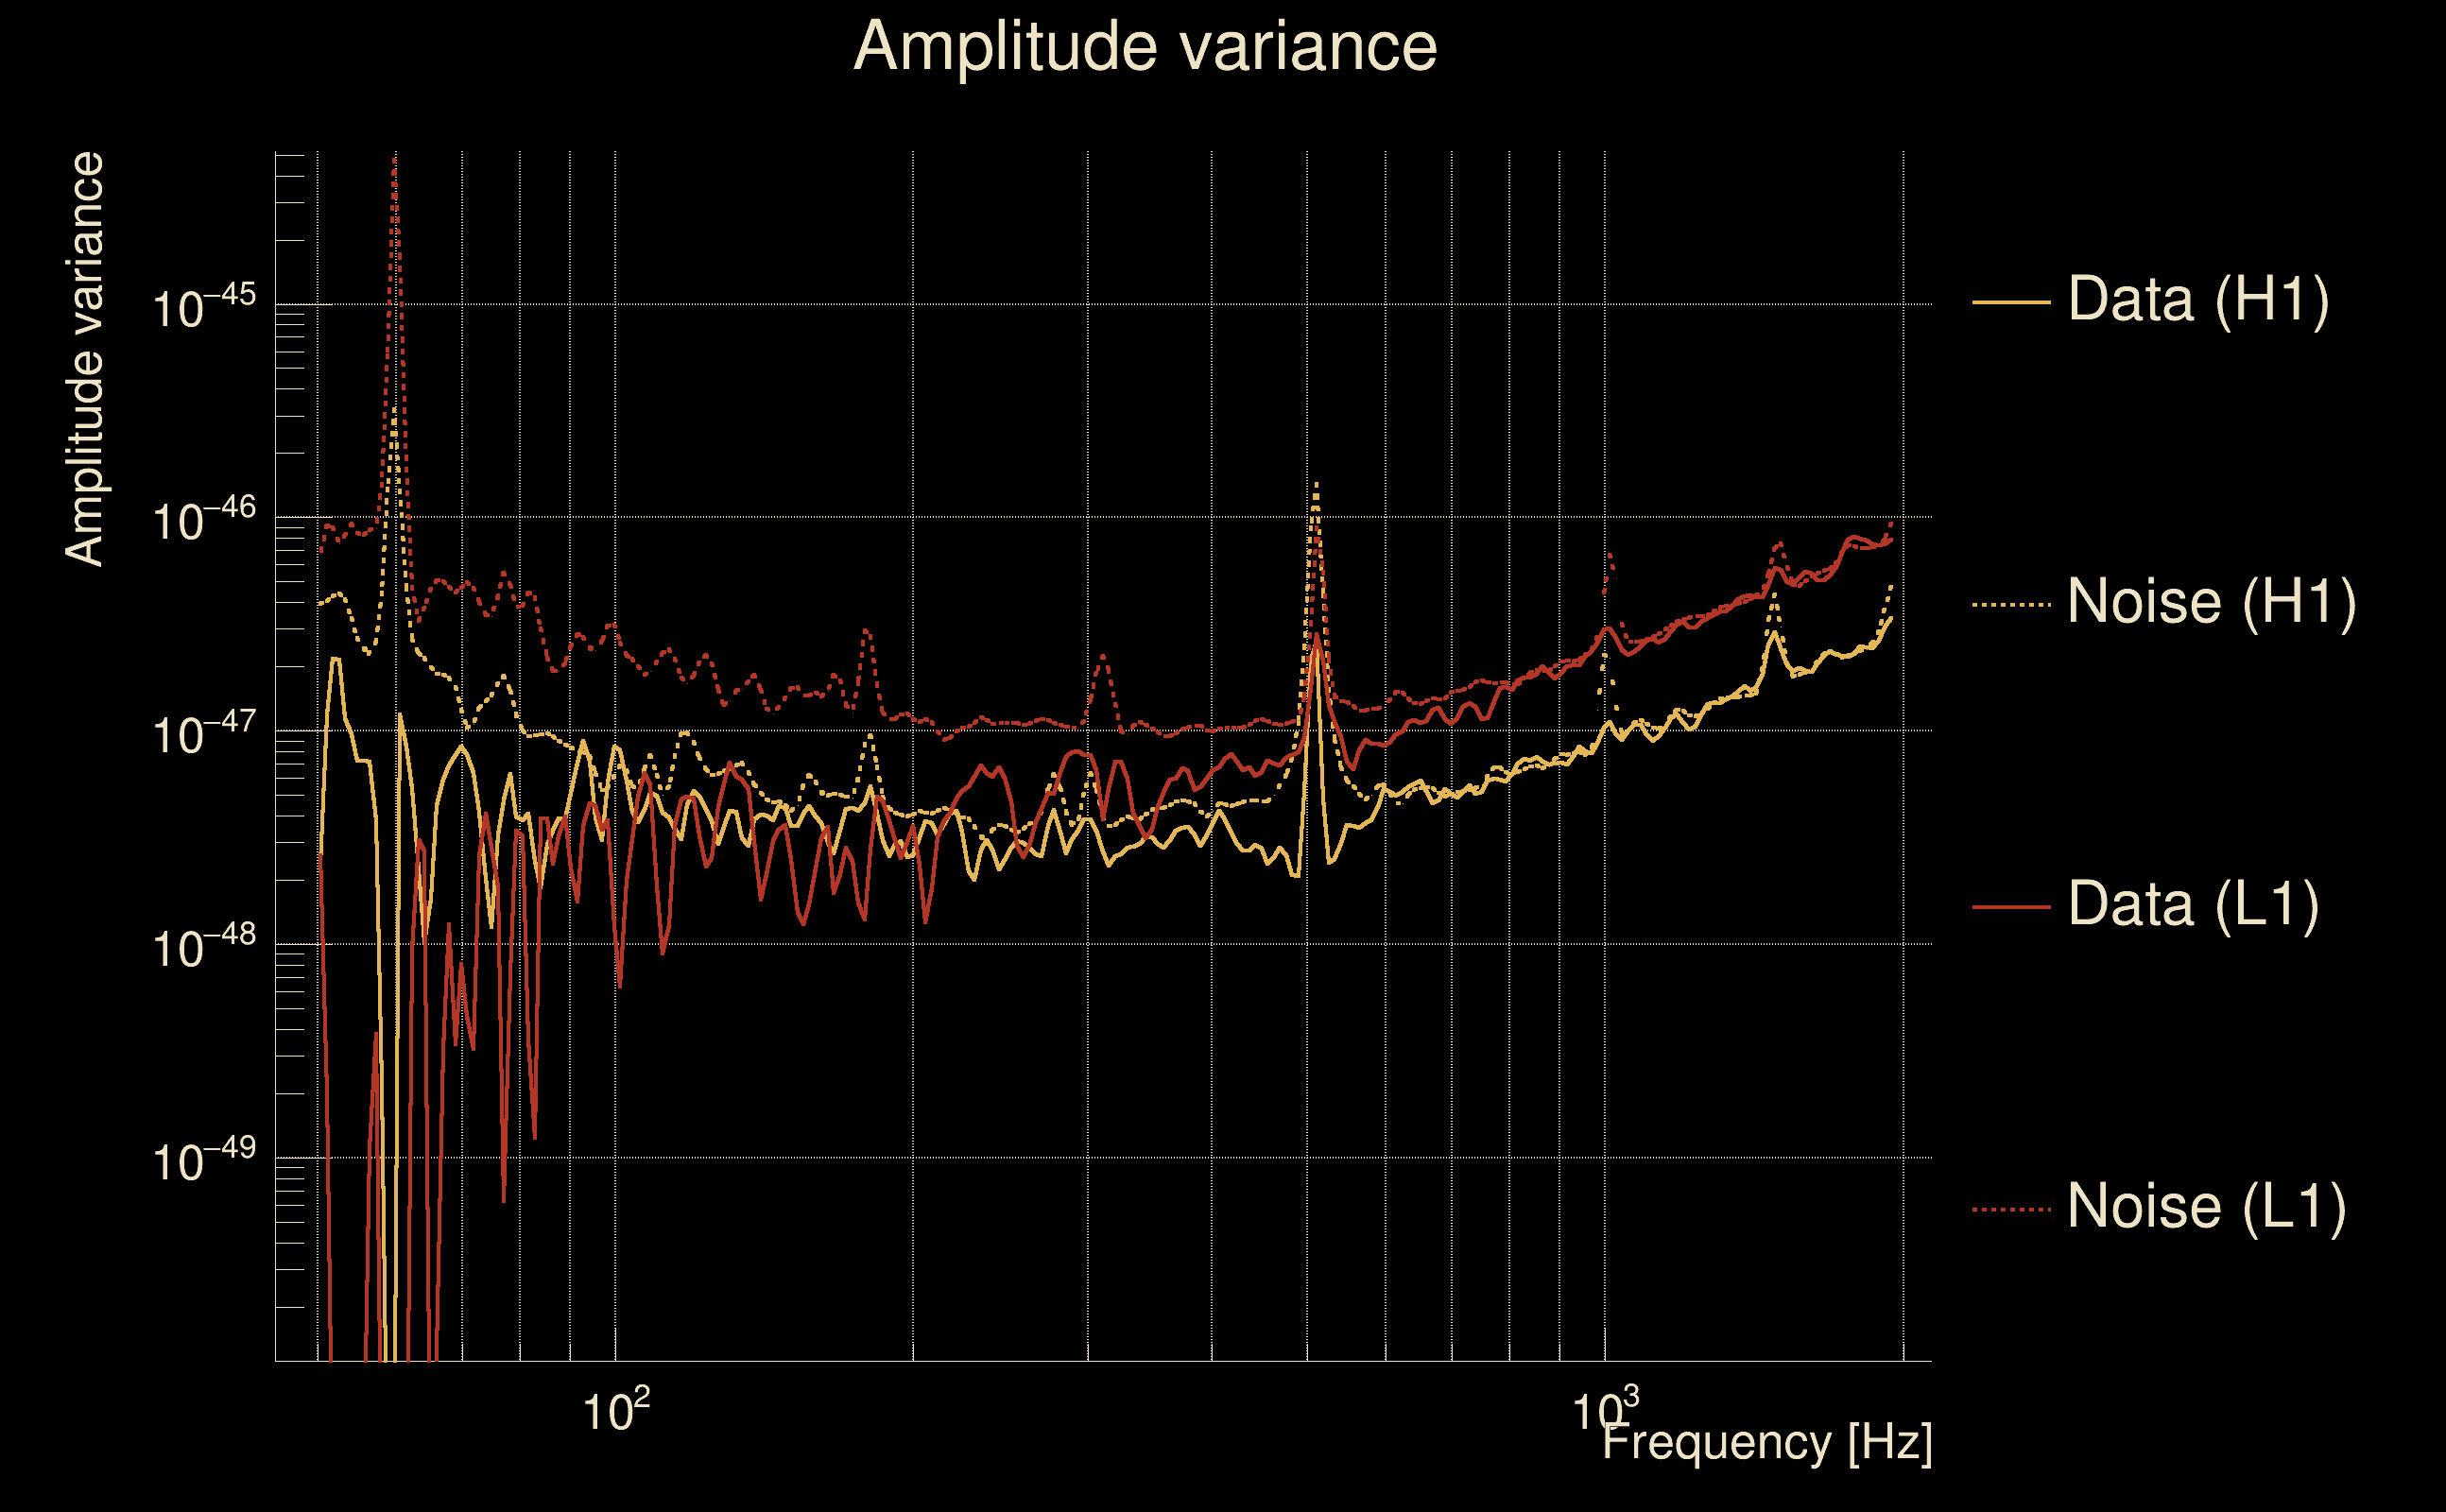
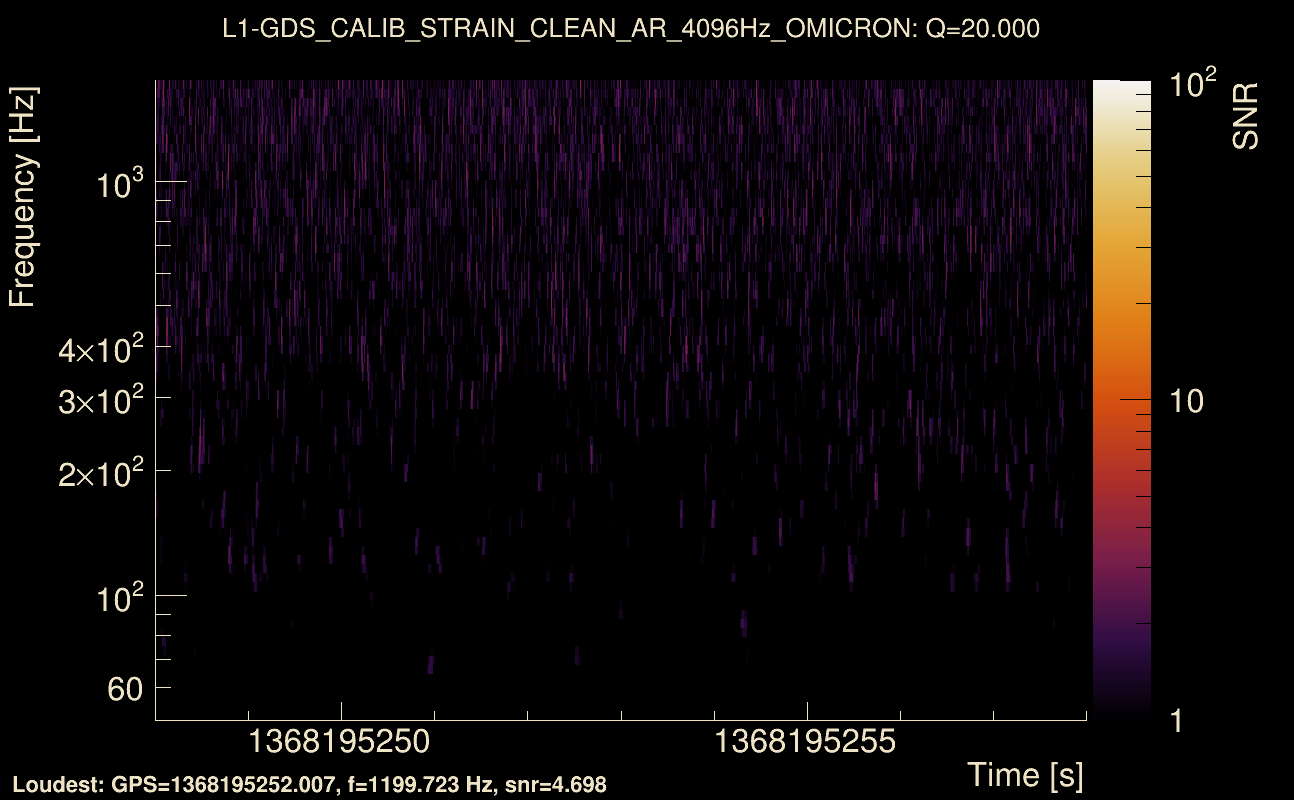
| Detector channel names: | H1:GDS-CALIB_STRAIN_CLEAN_AR_4096Hz, L1:GDS-CALIB_STRAIN_CLEAN_AR_4096Hz |
| Omicron analysis time window and overlap: | 16 s, 6 s |
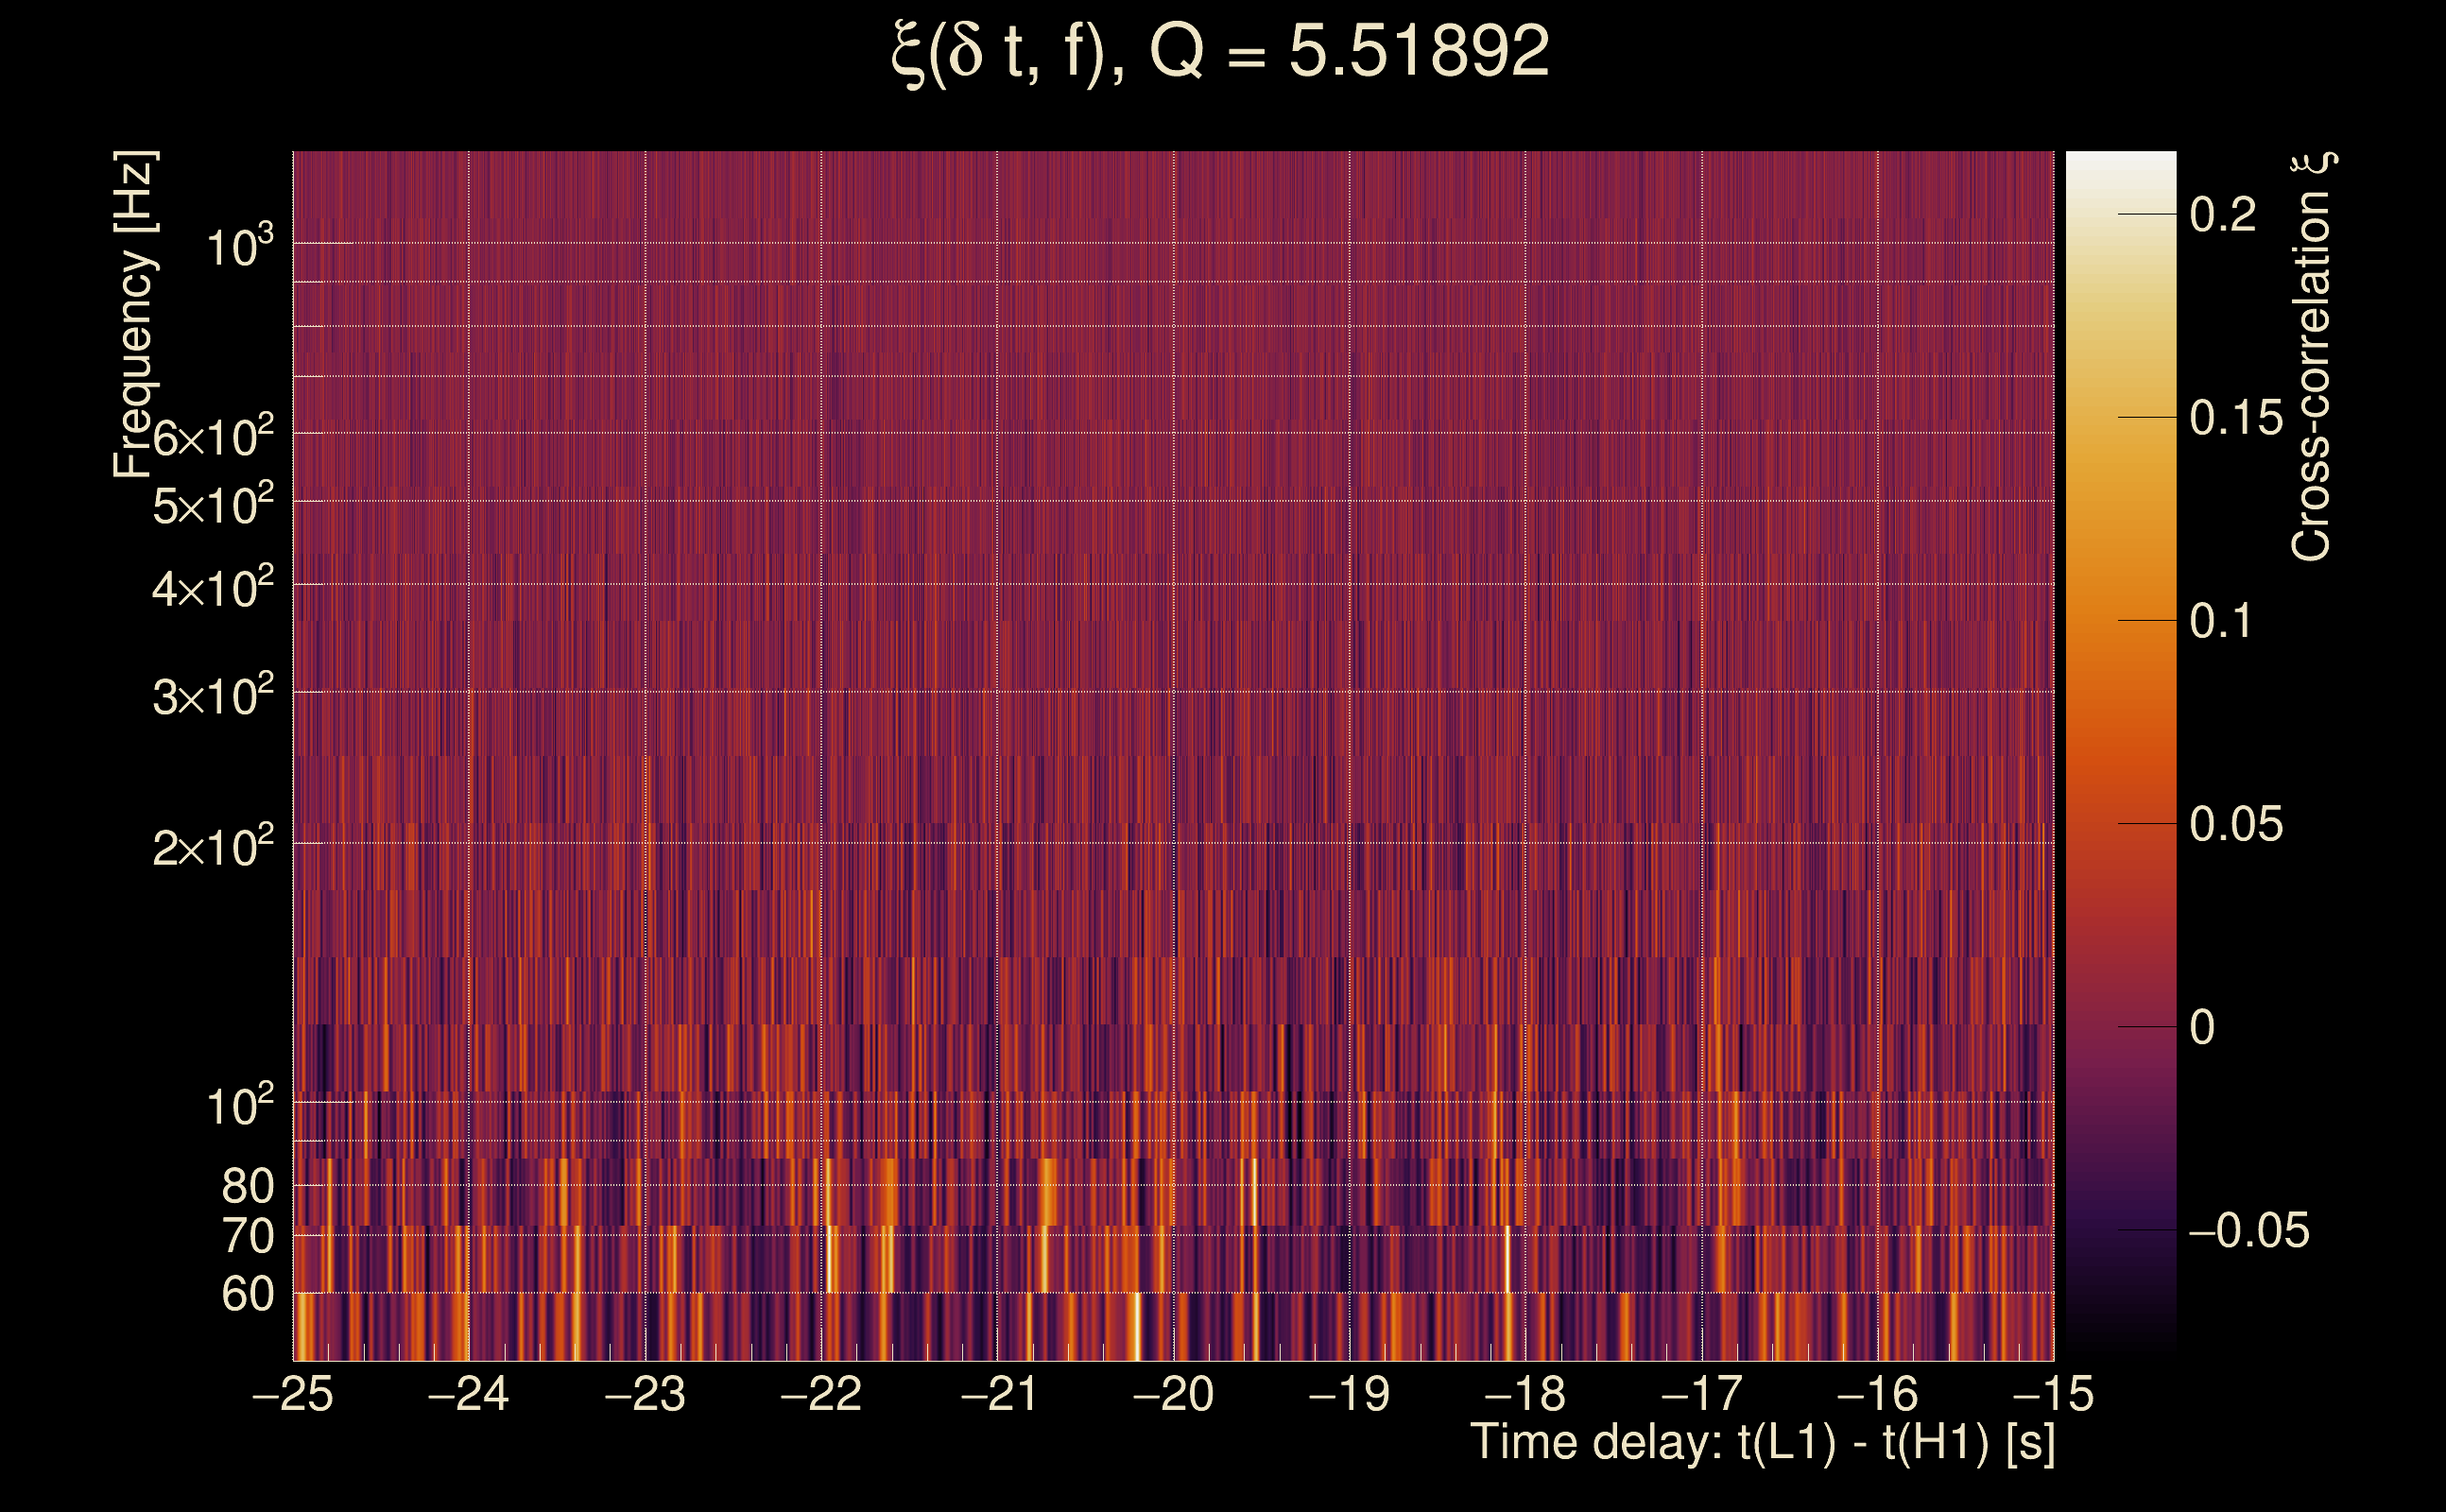
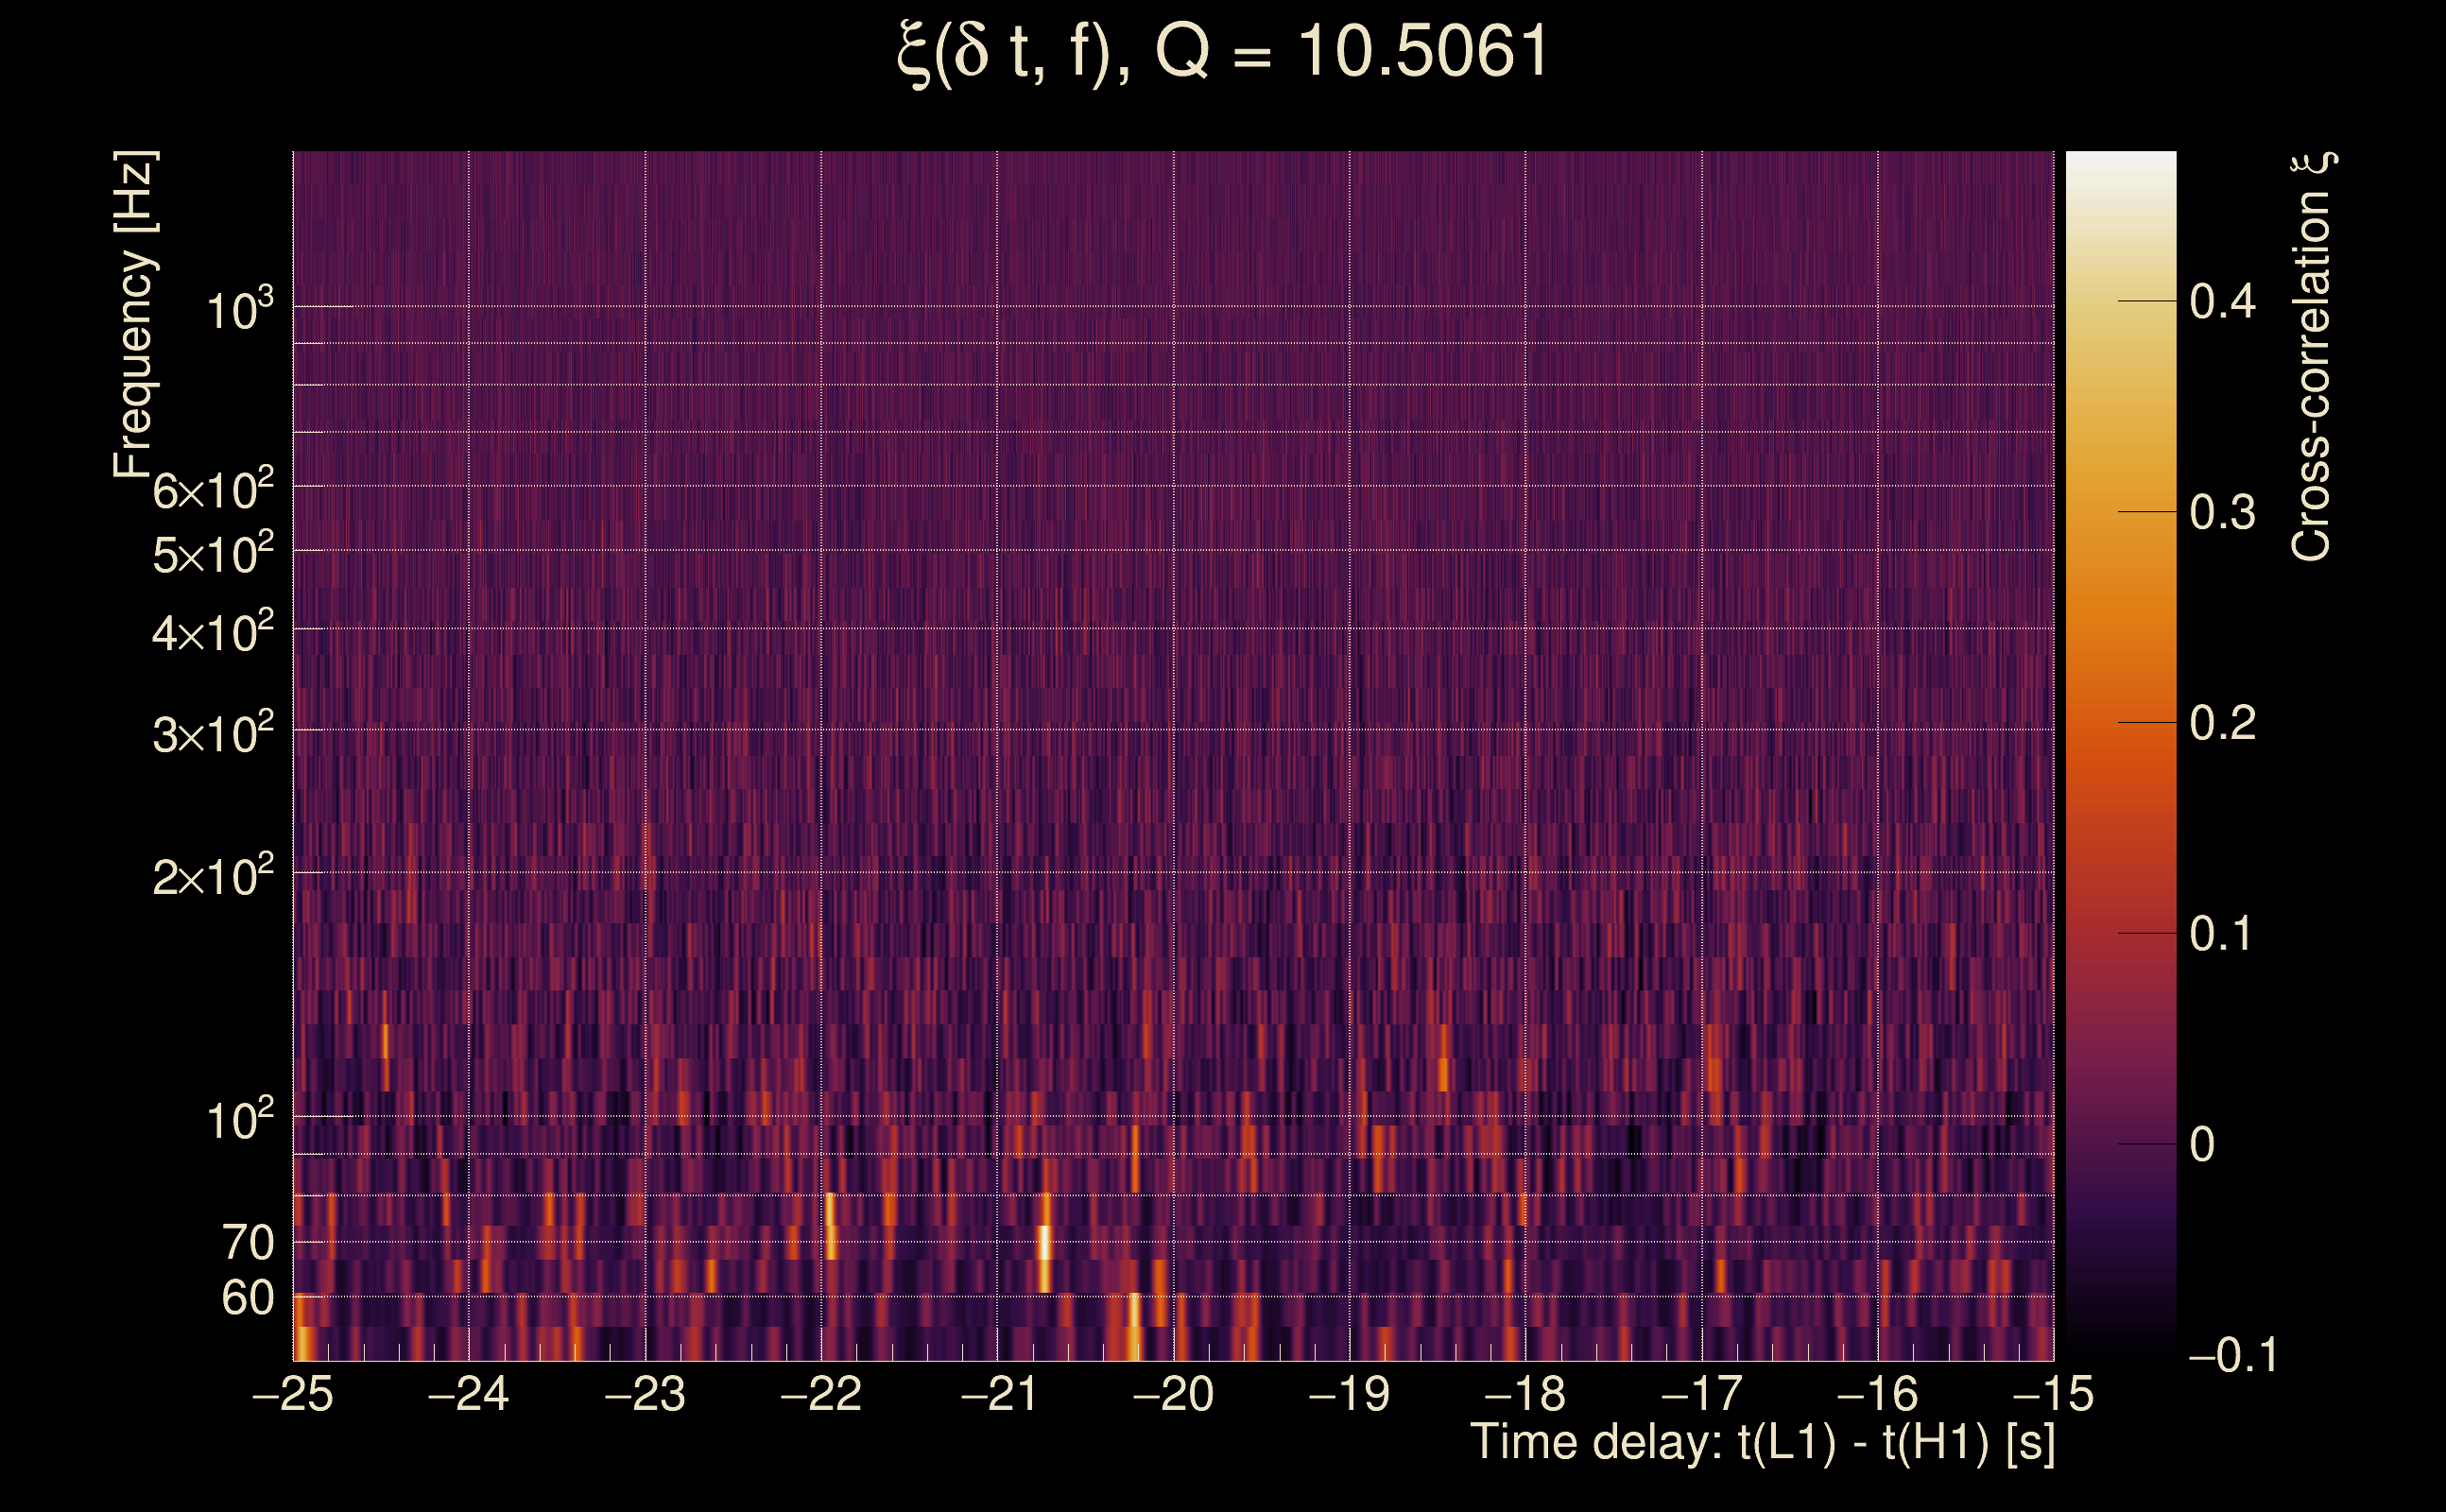
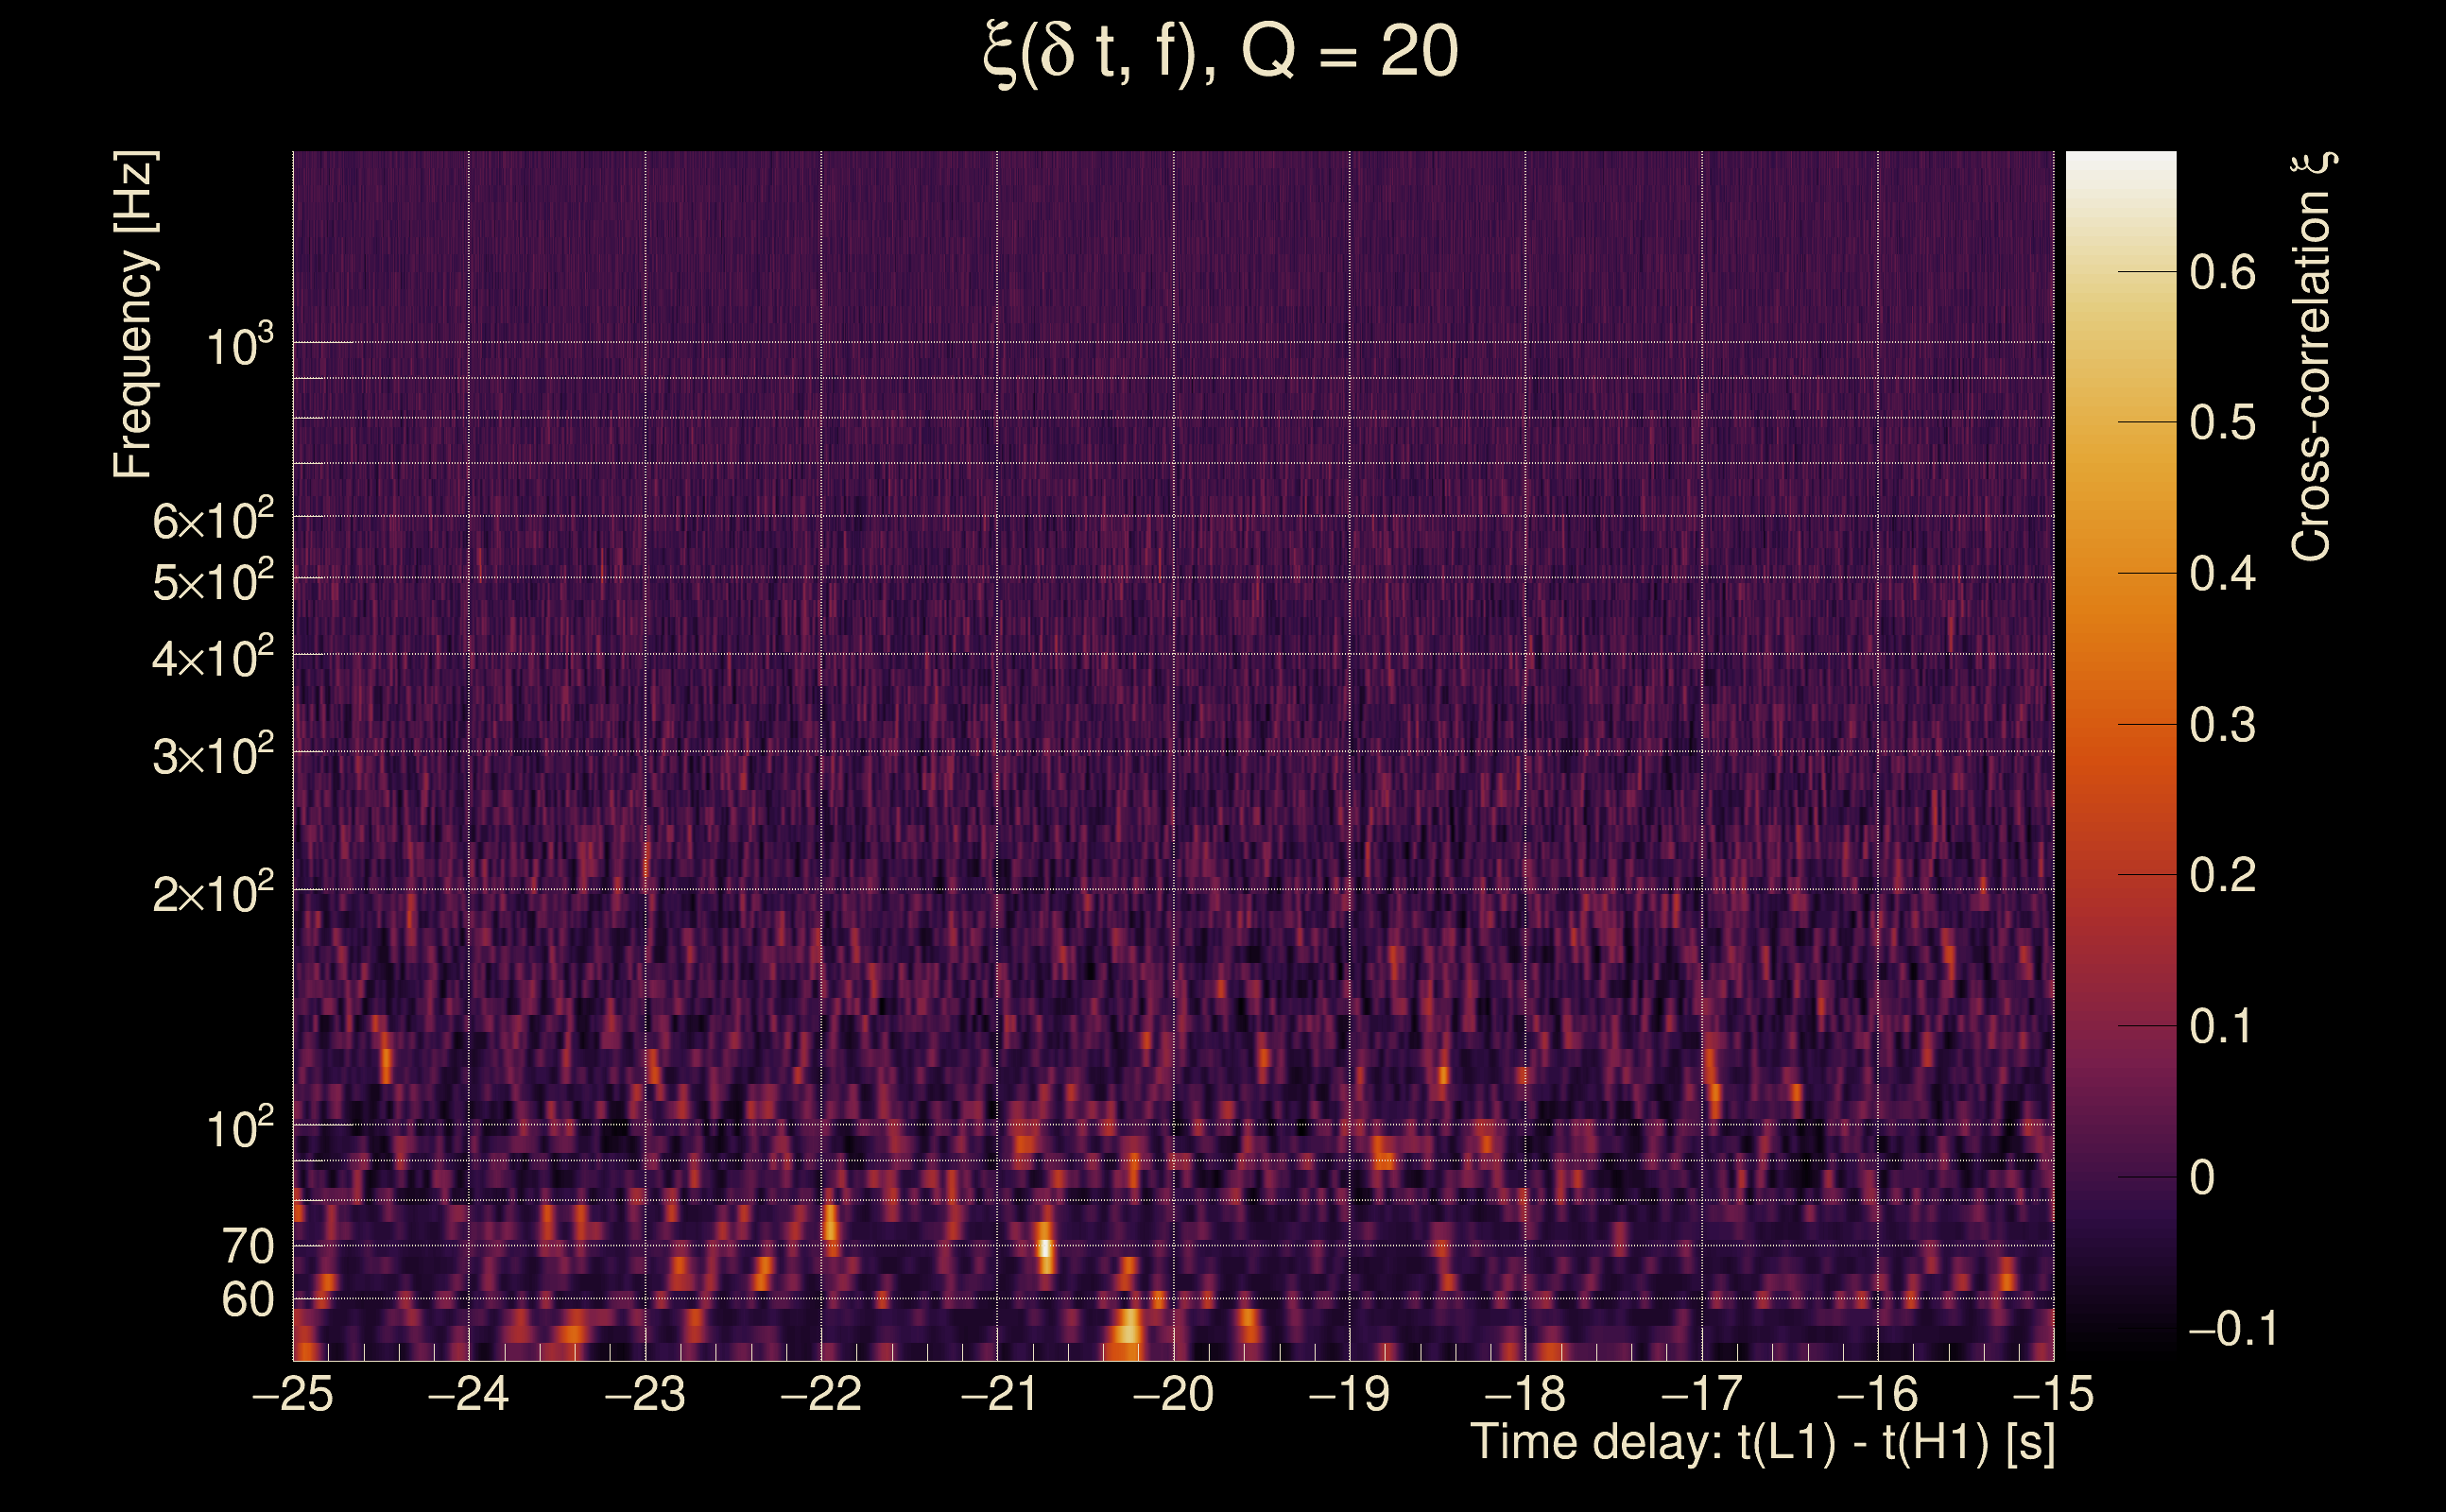
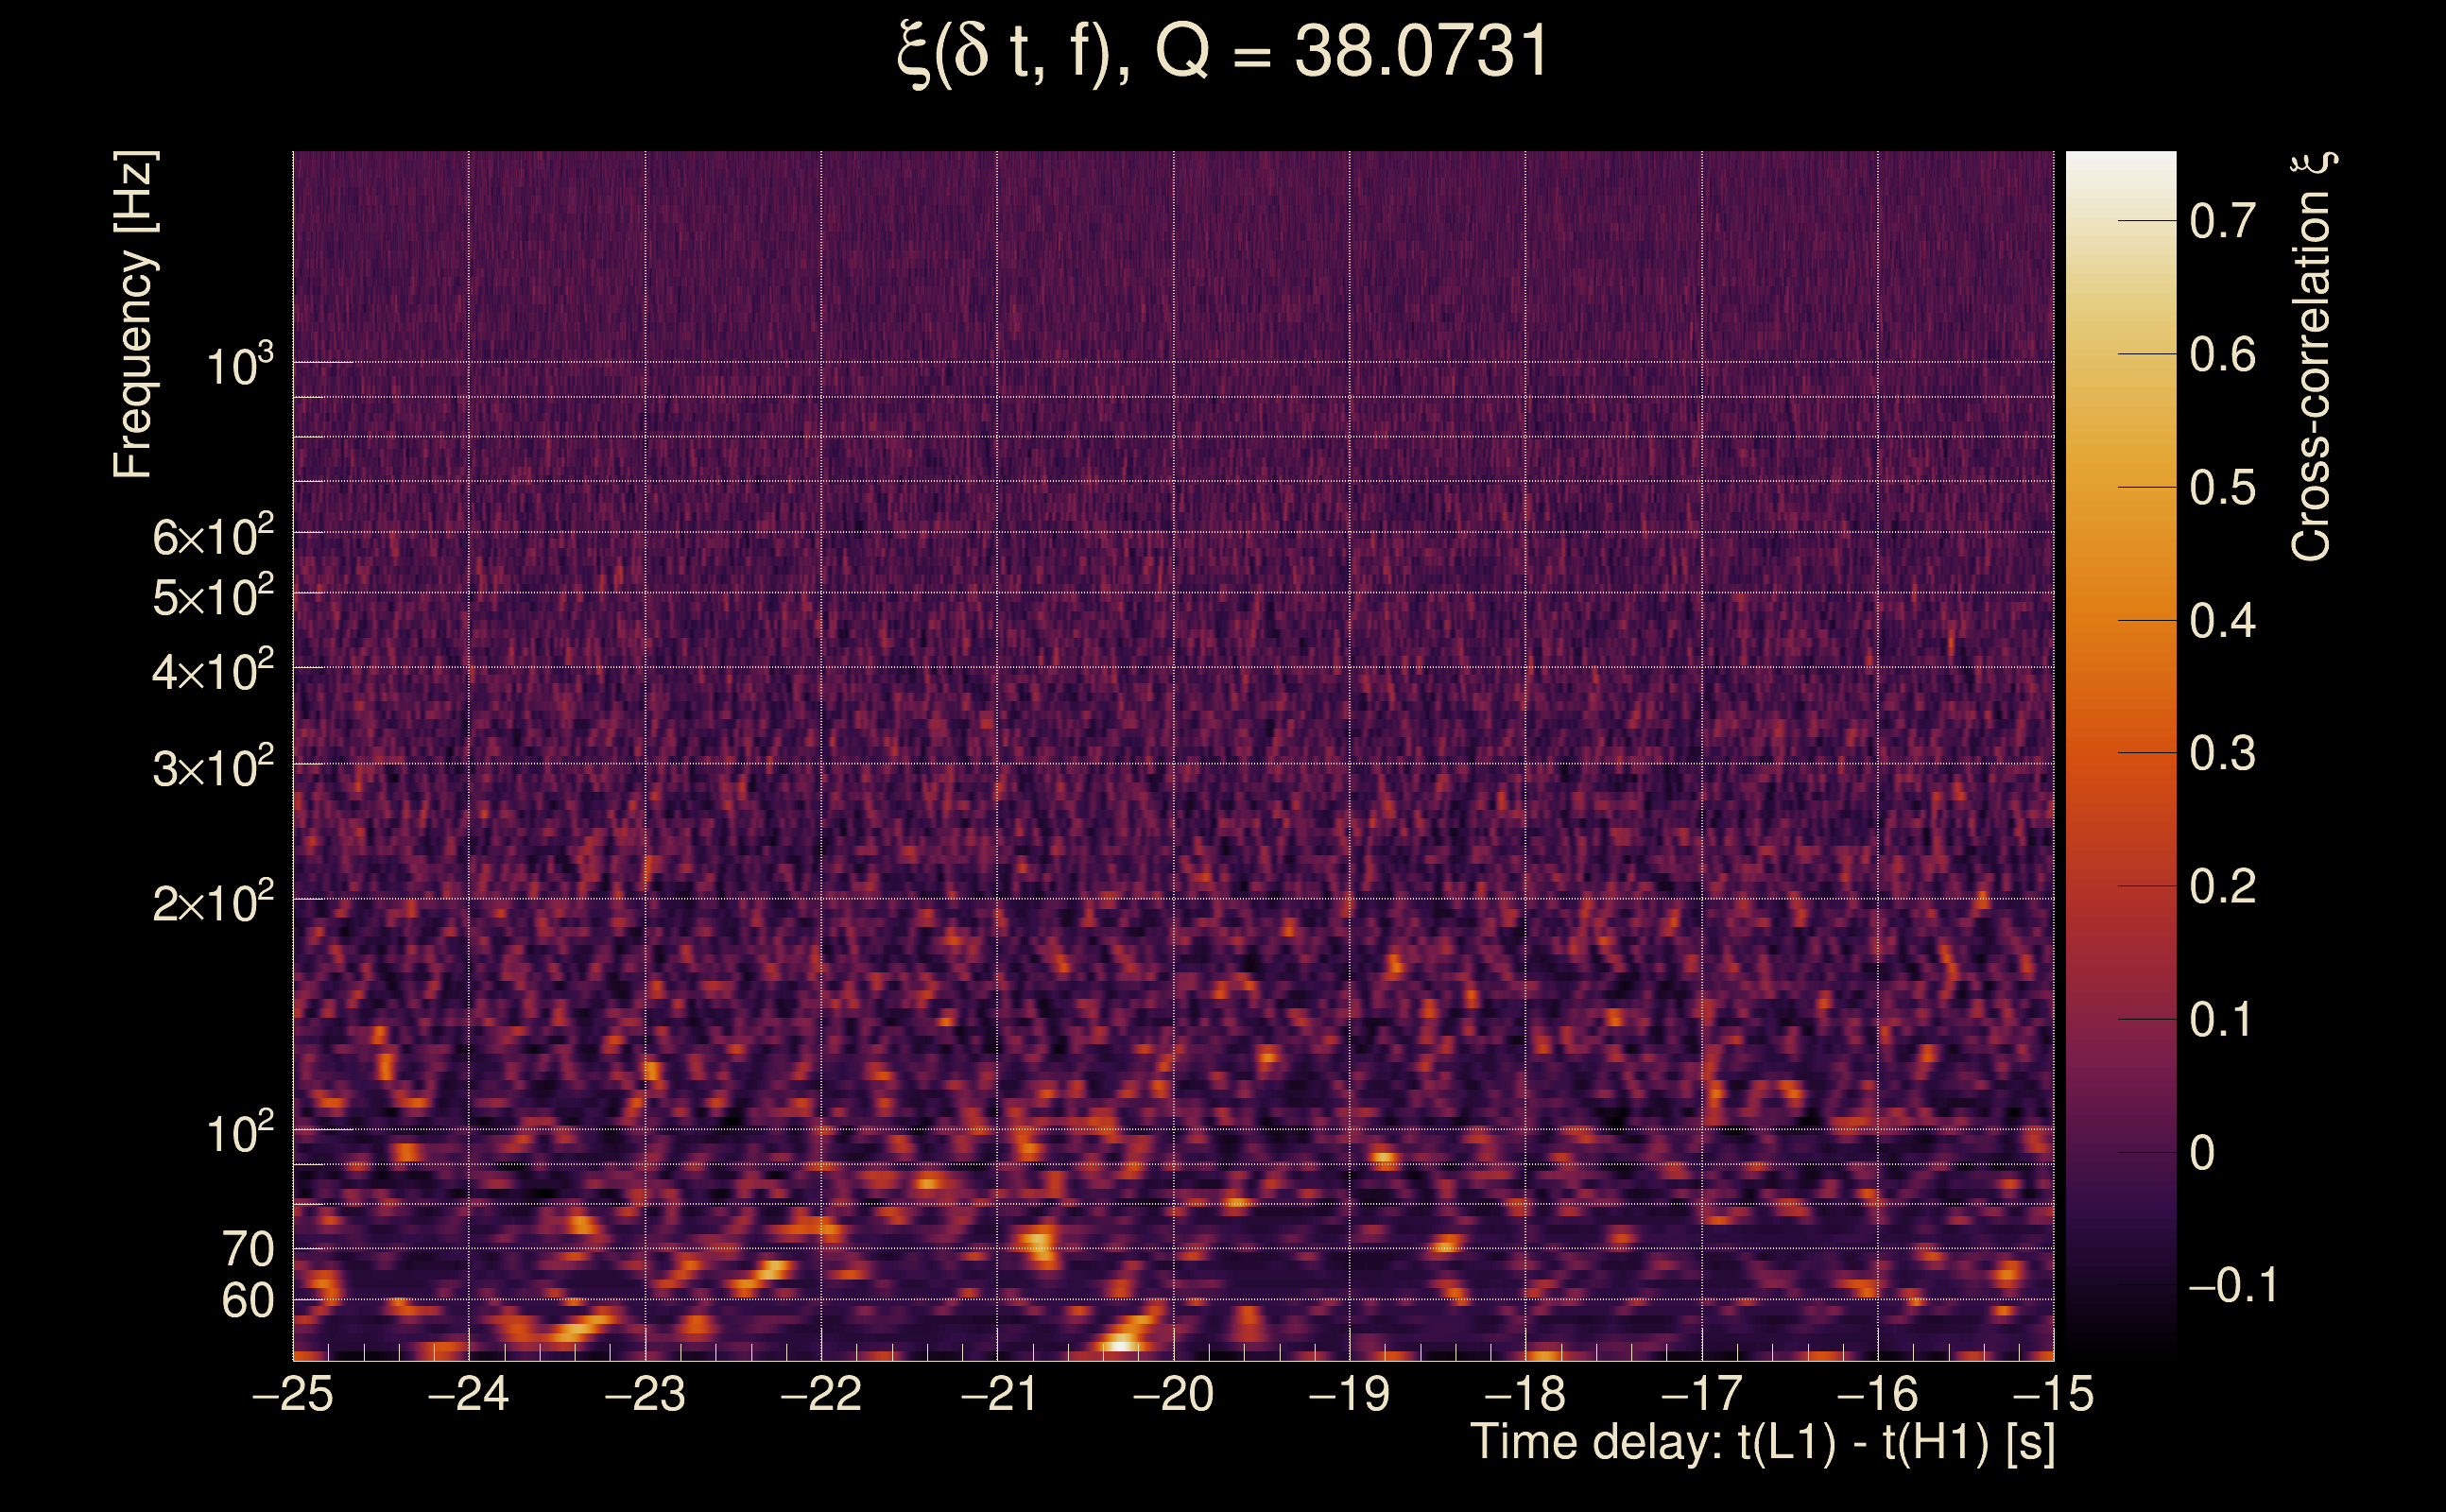
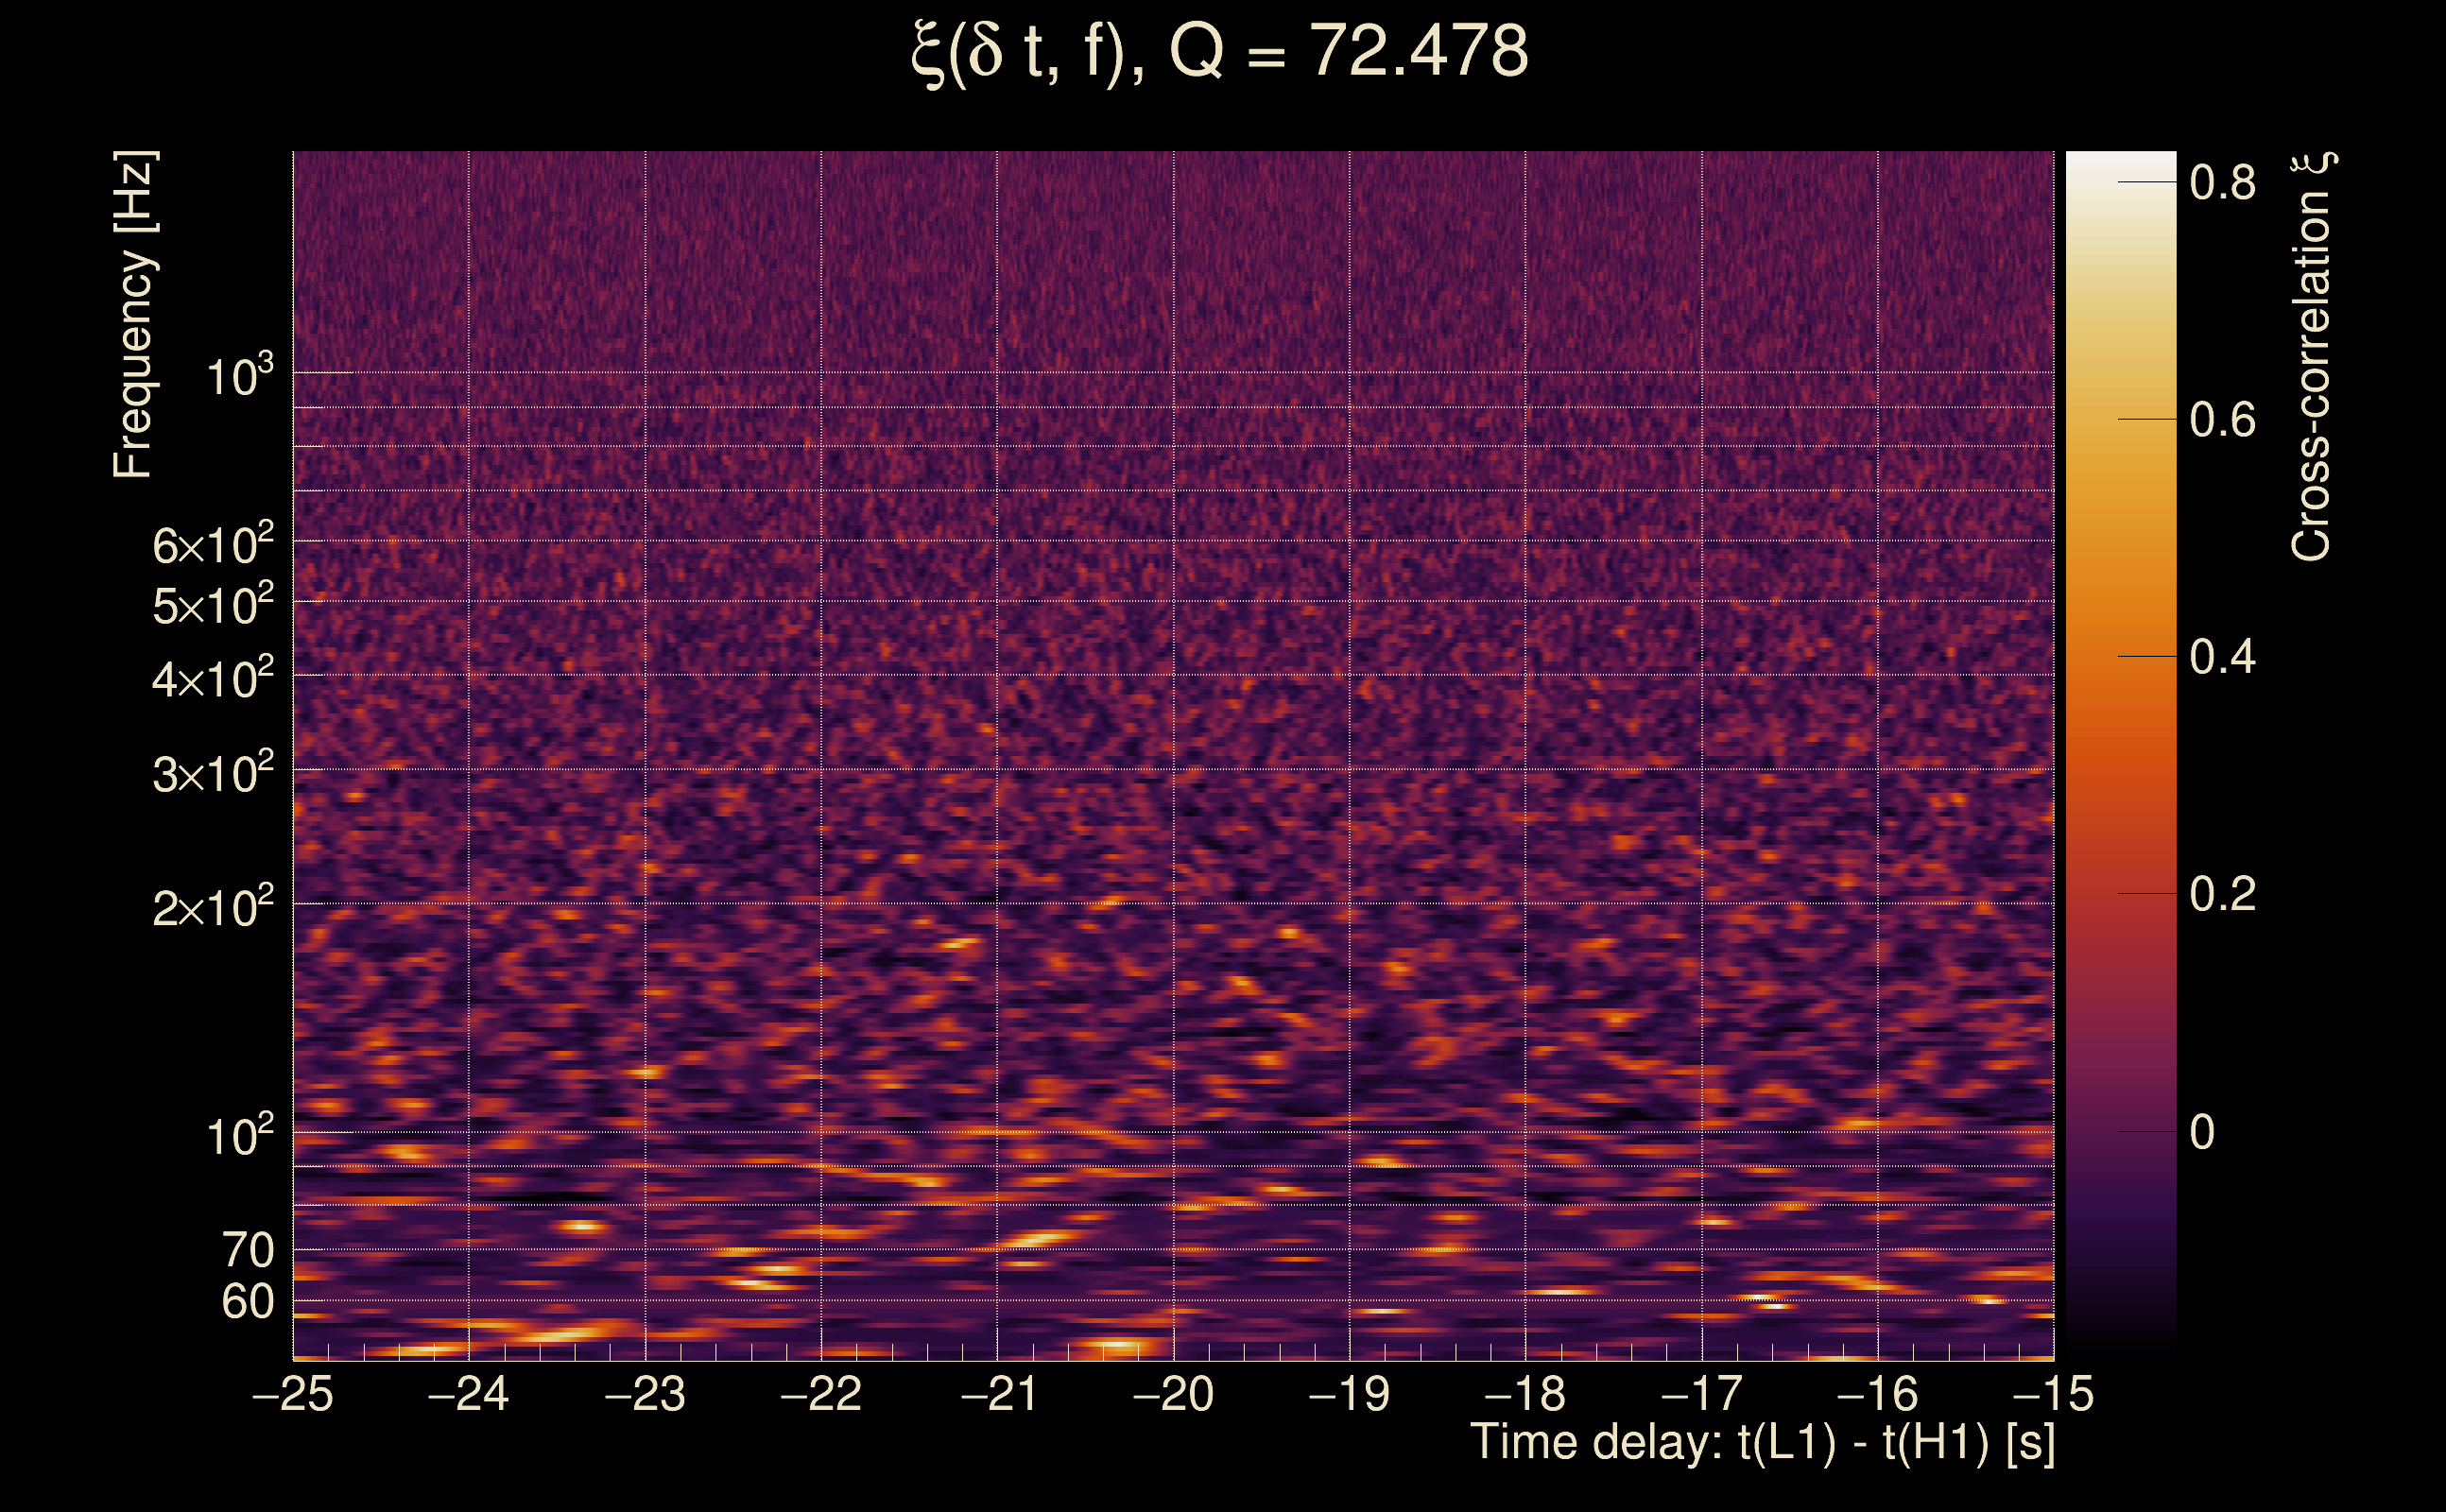
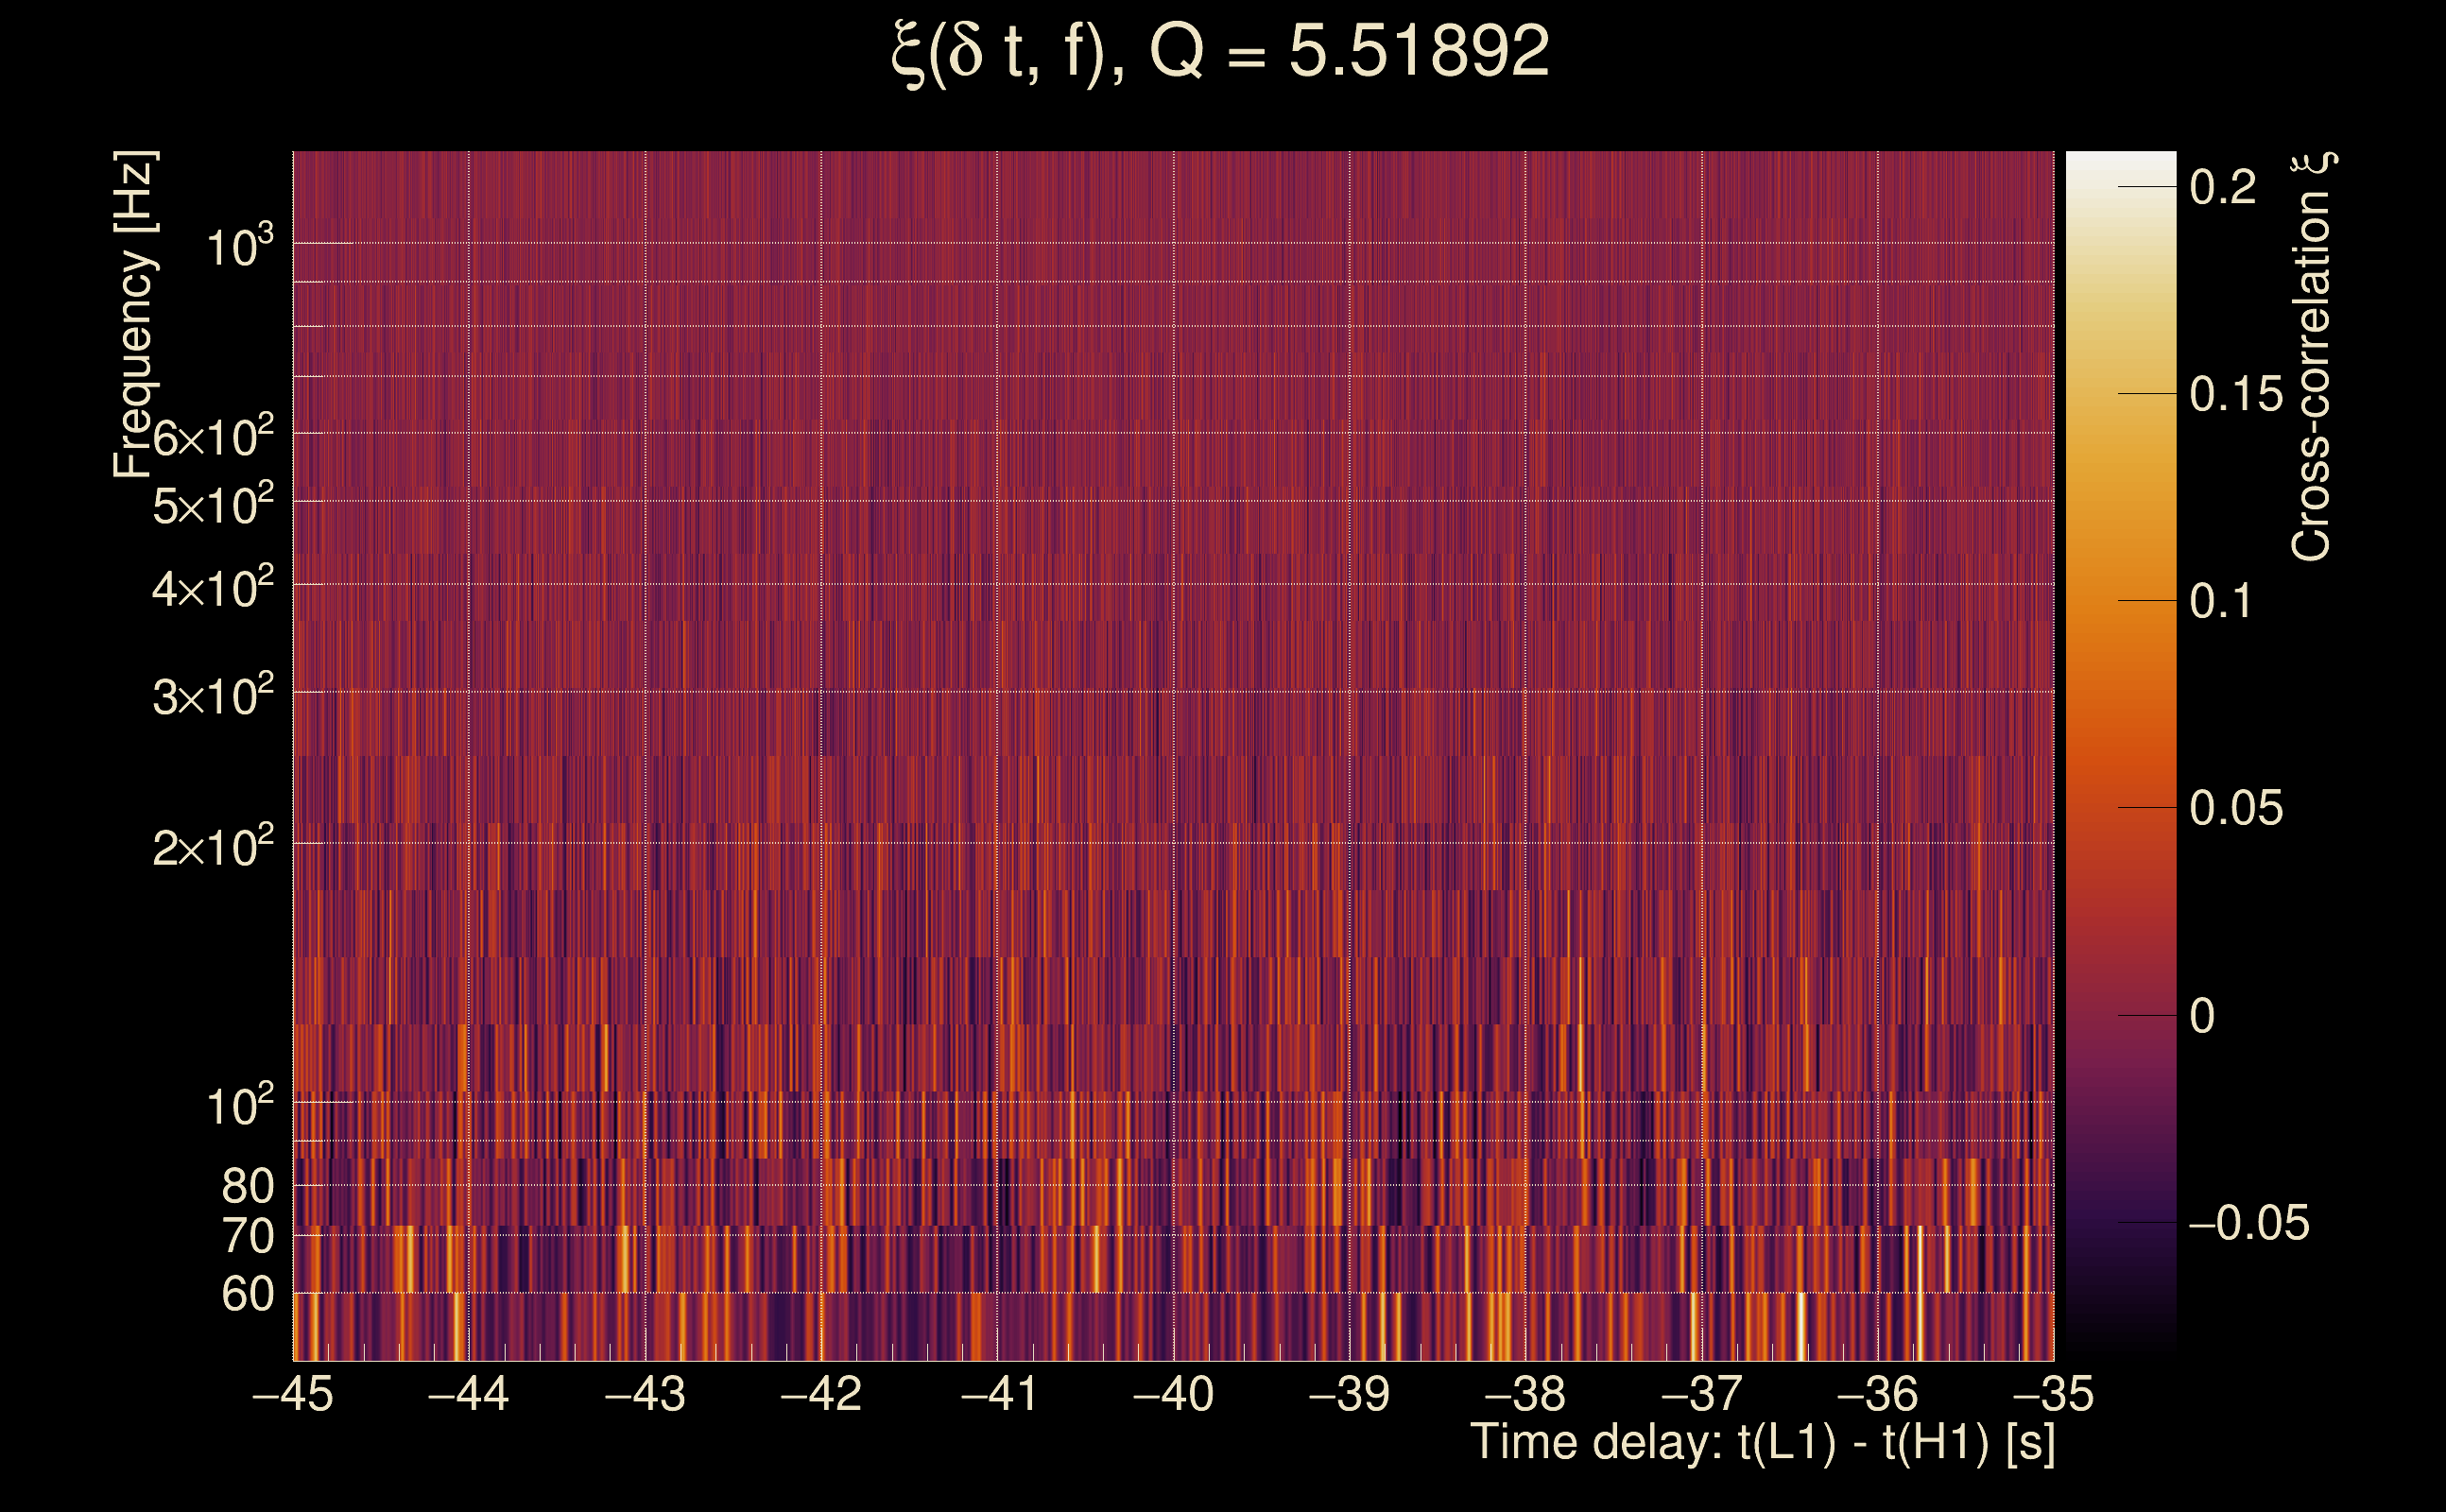
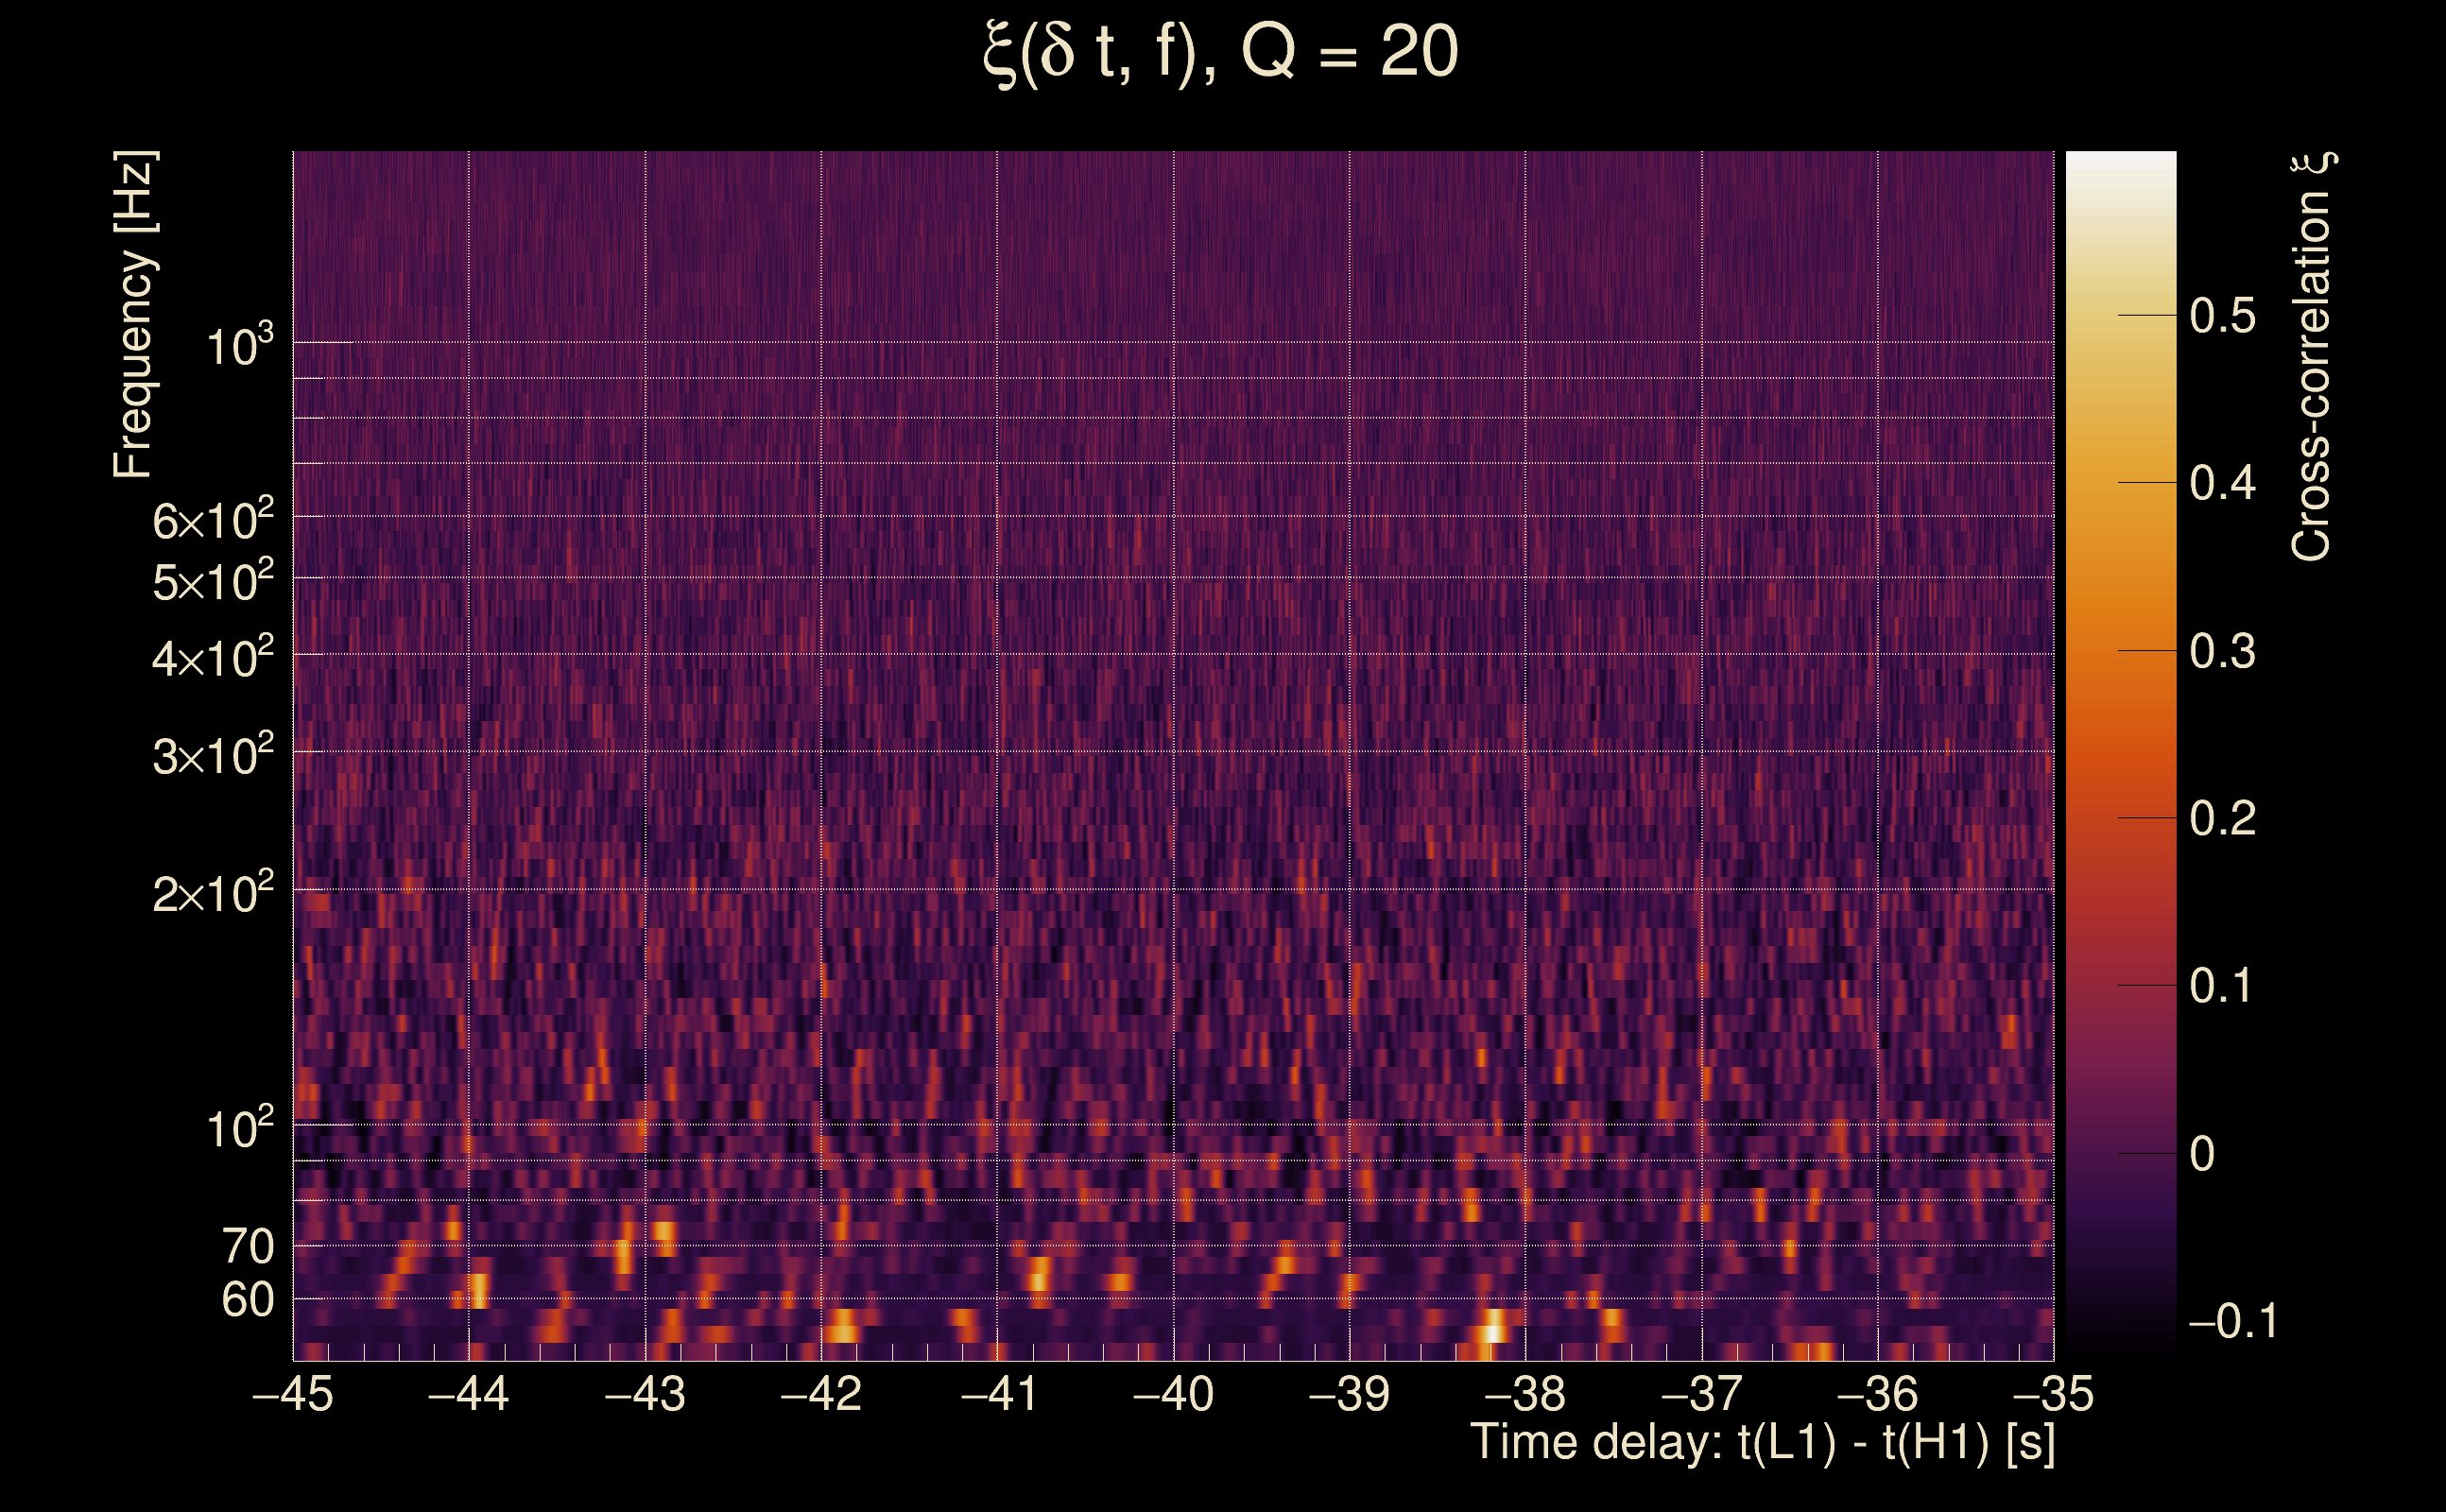
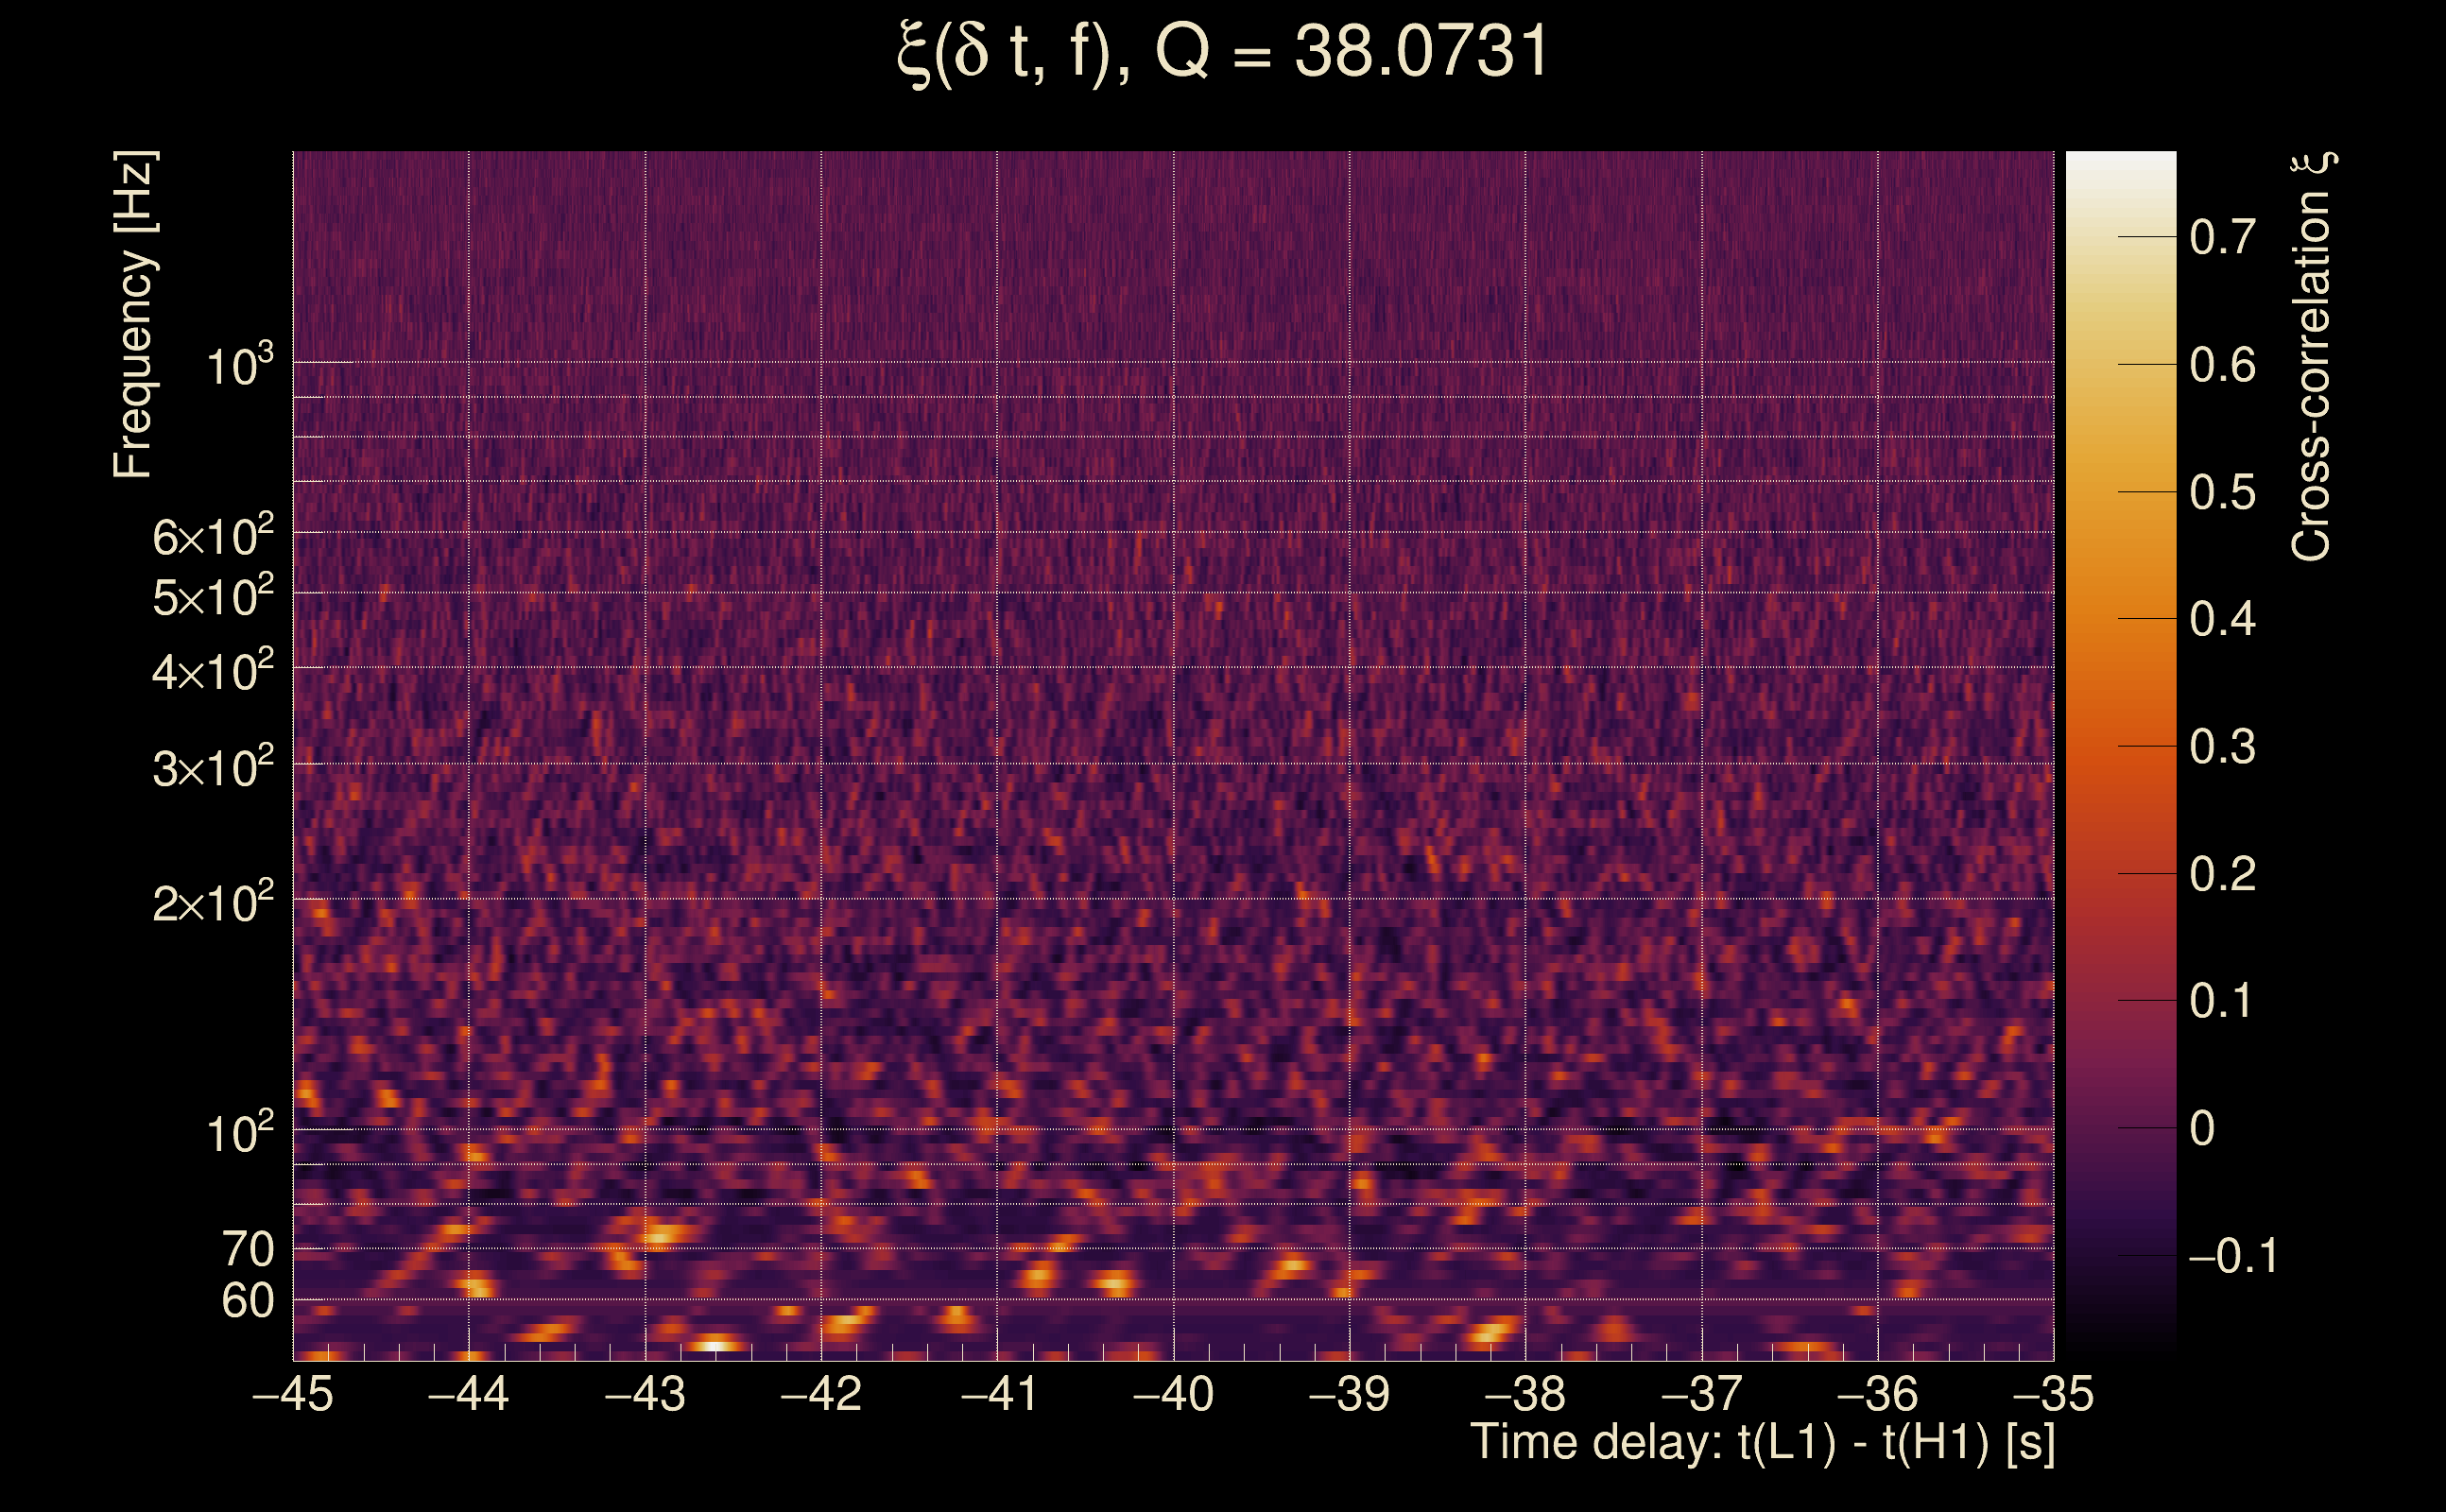
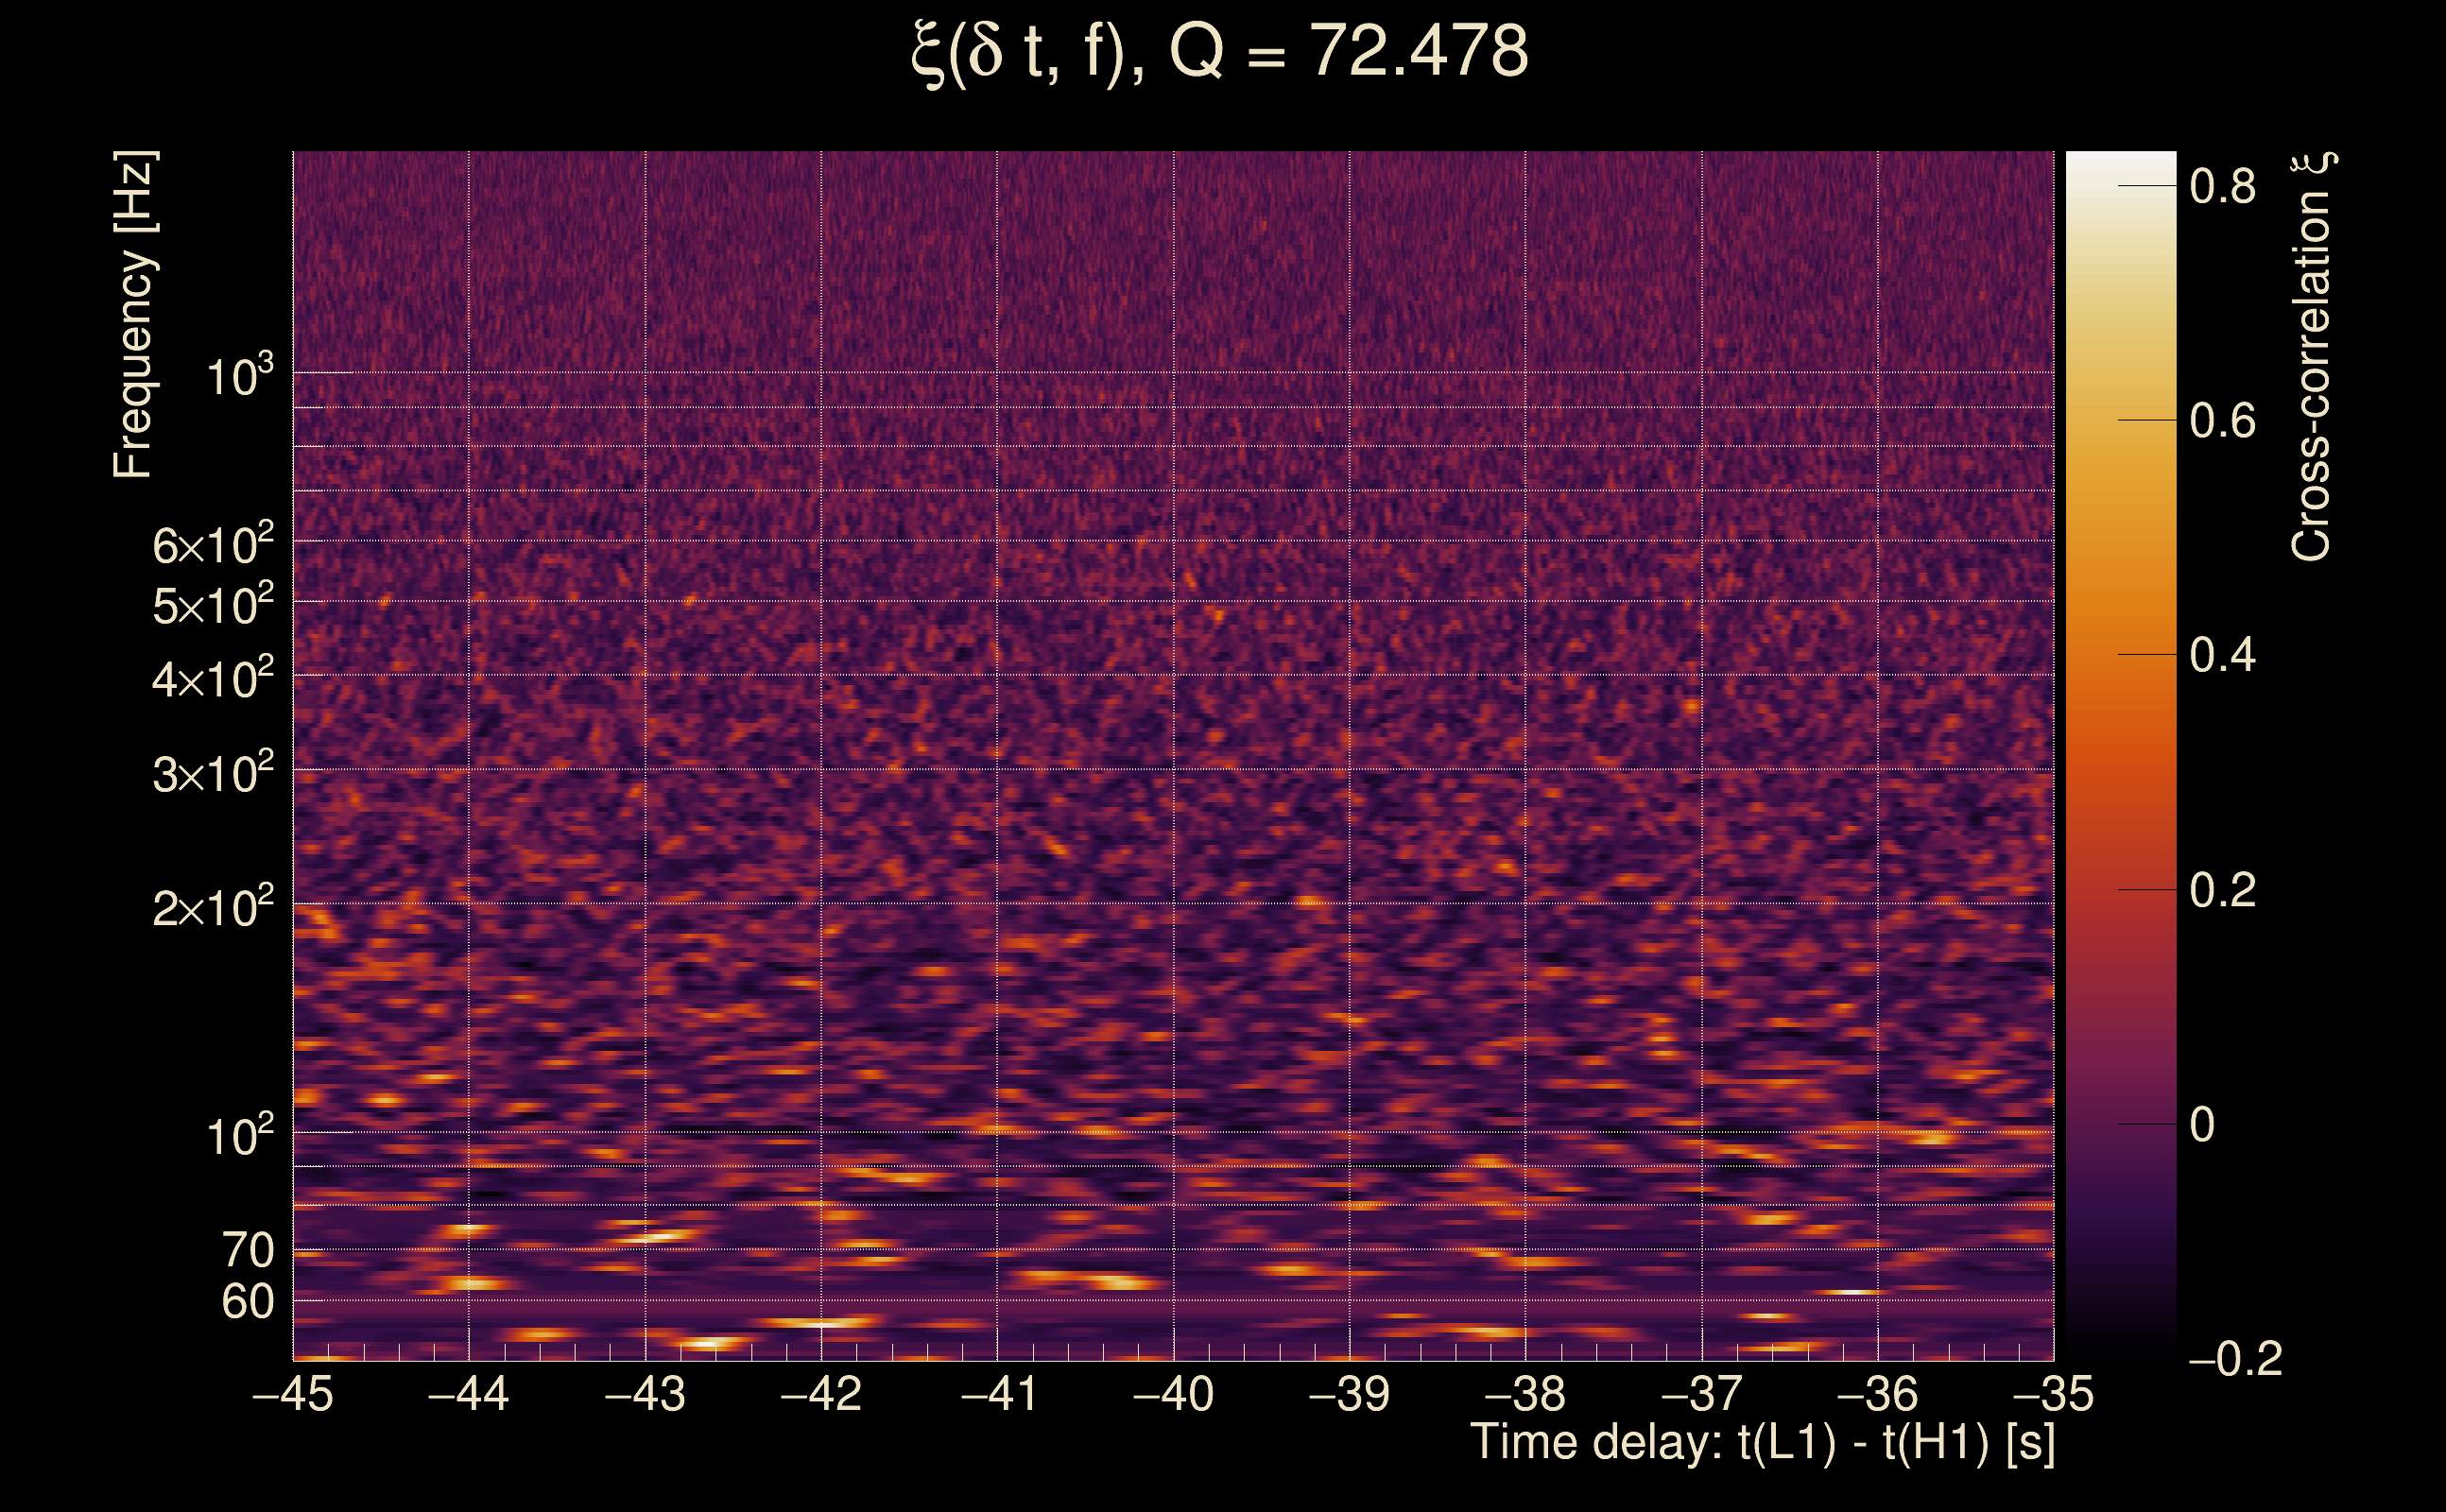
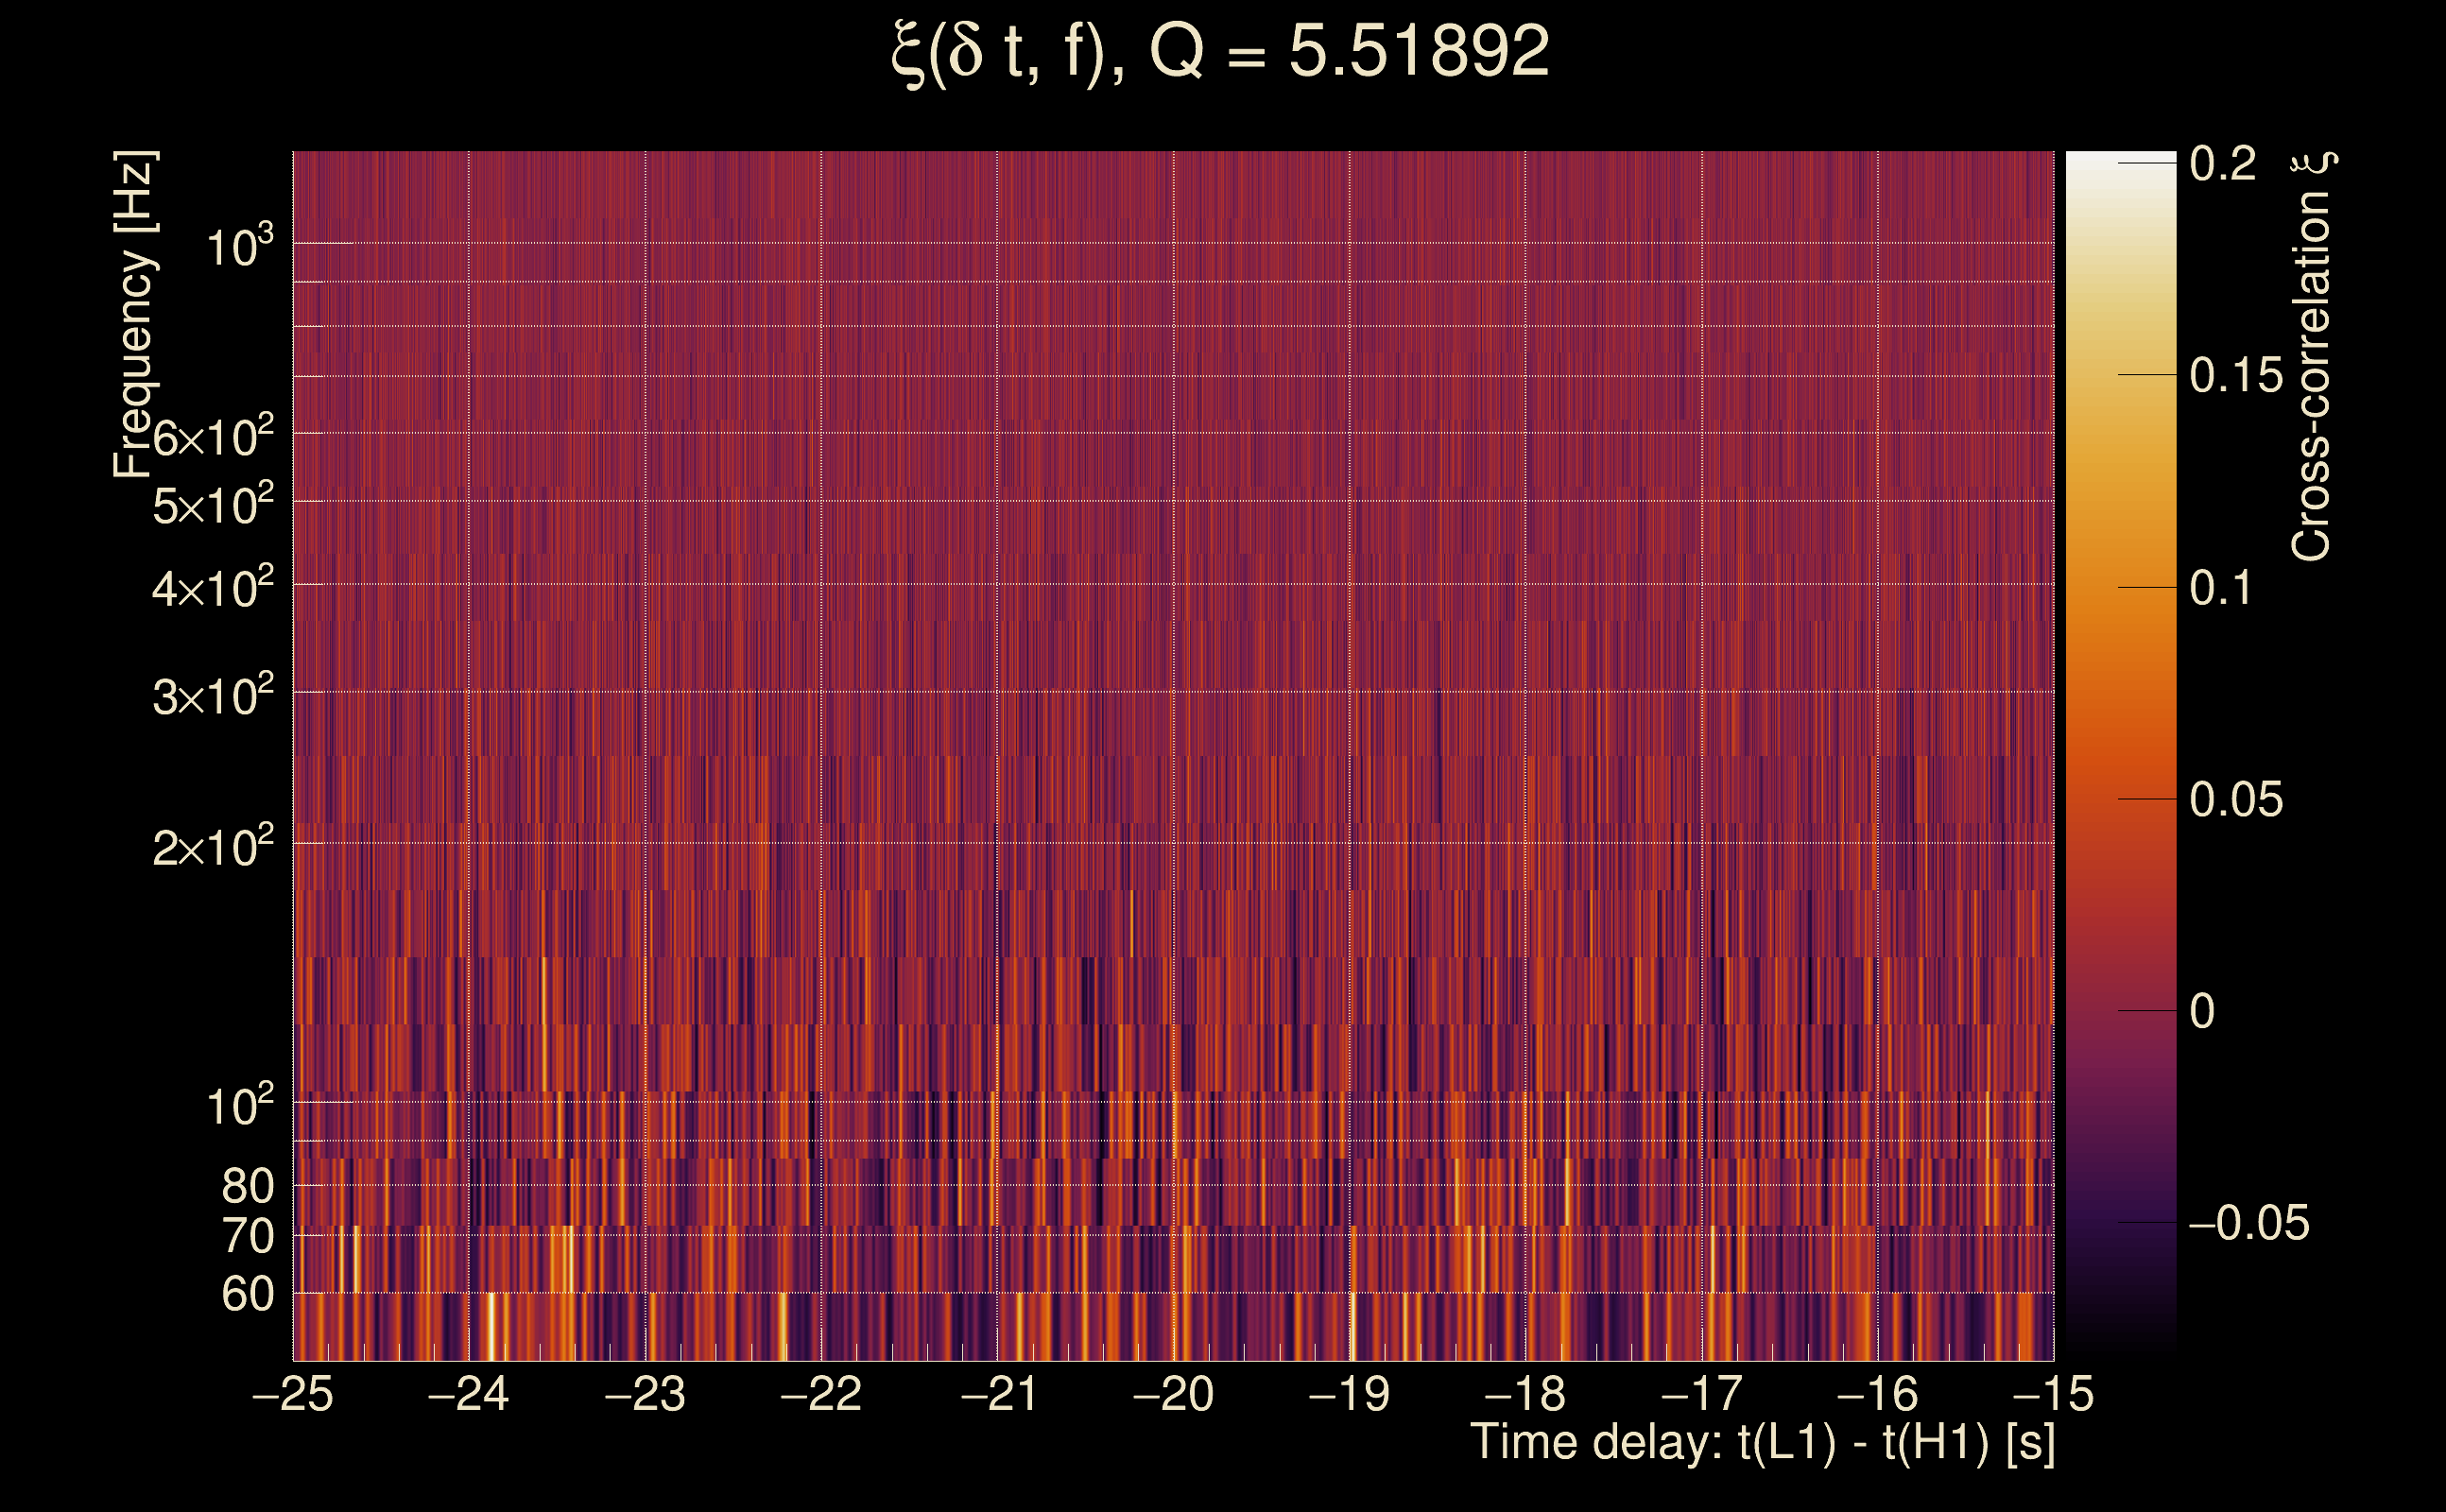
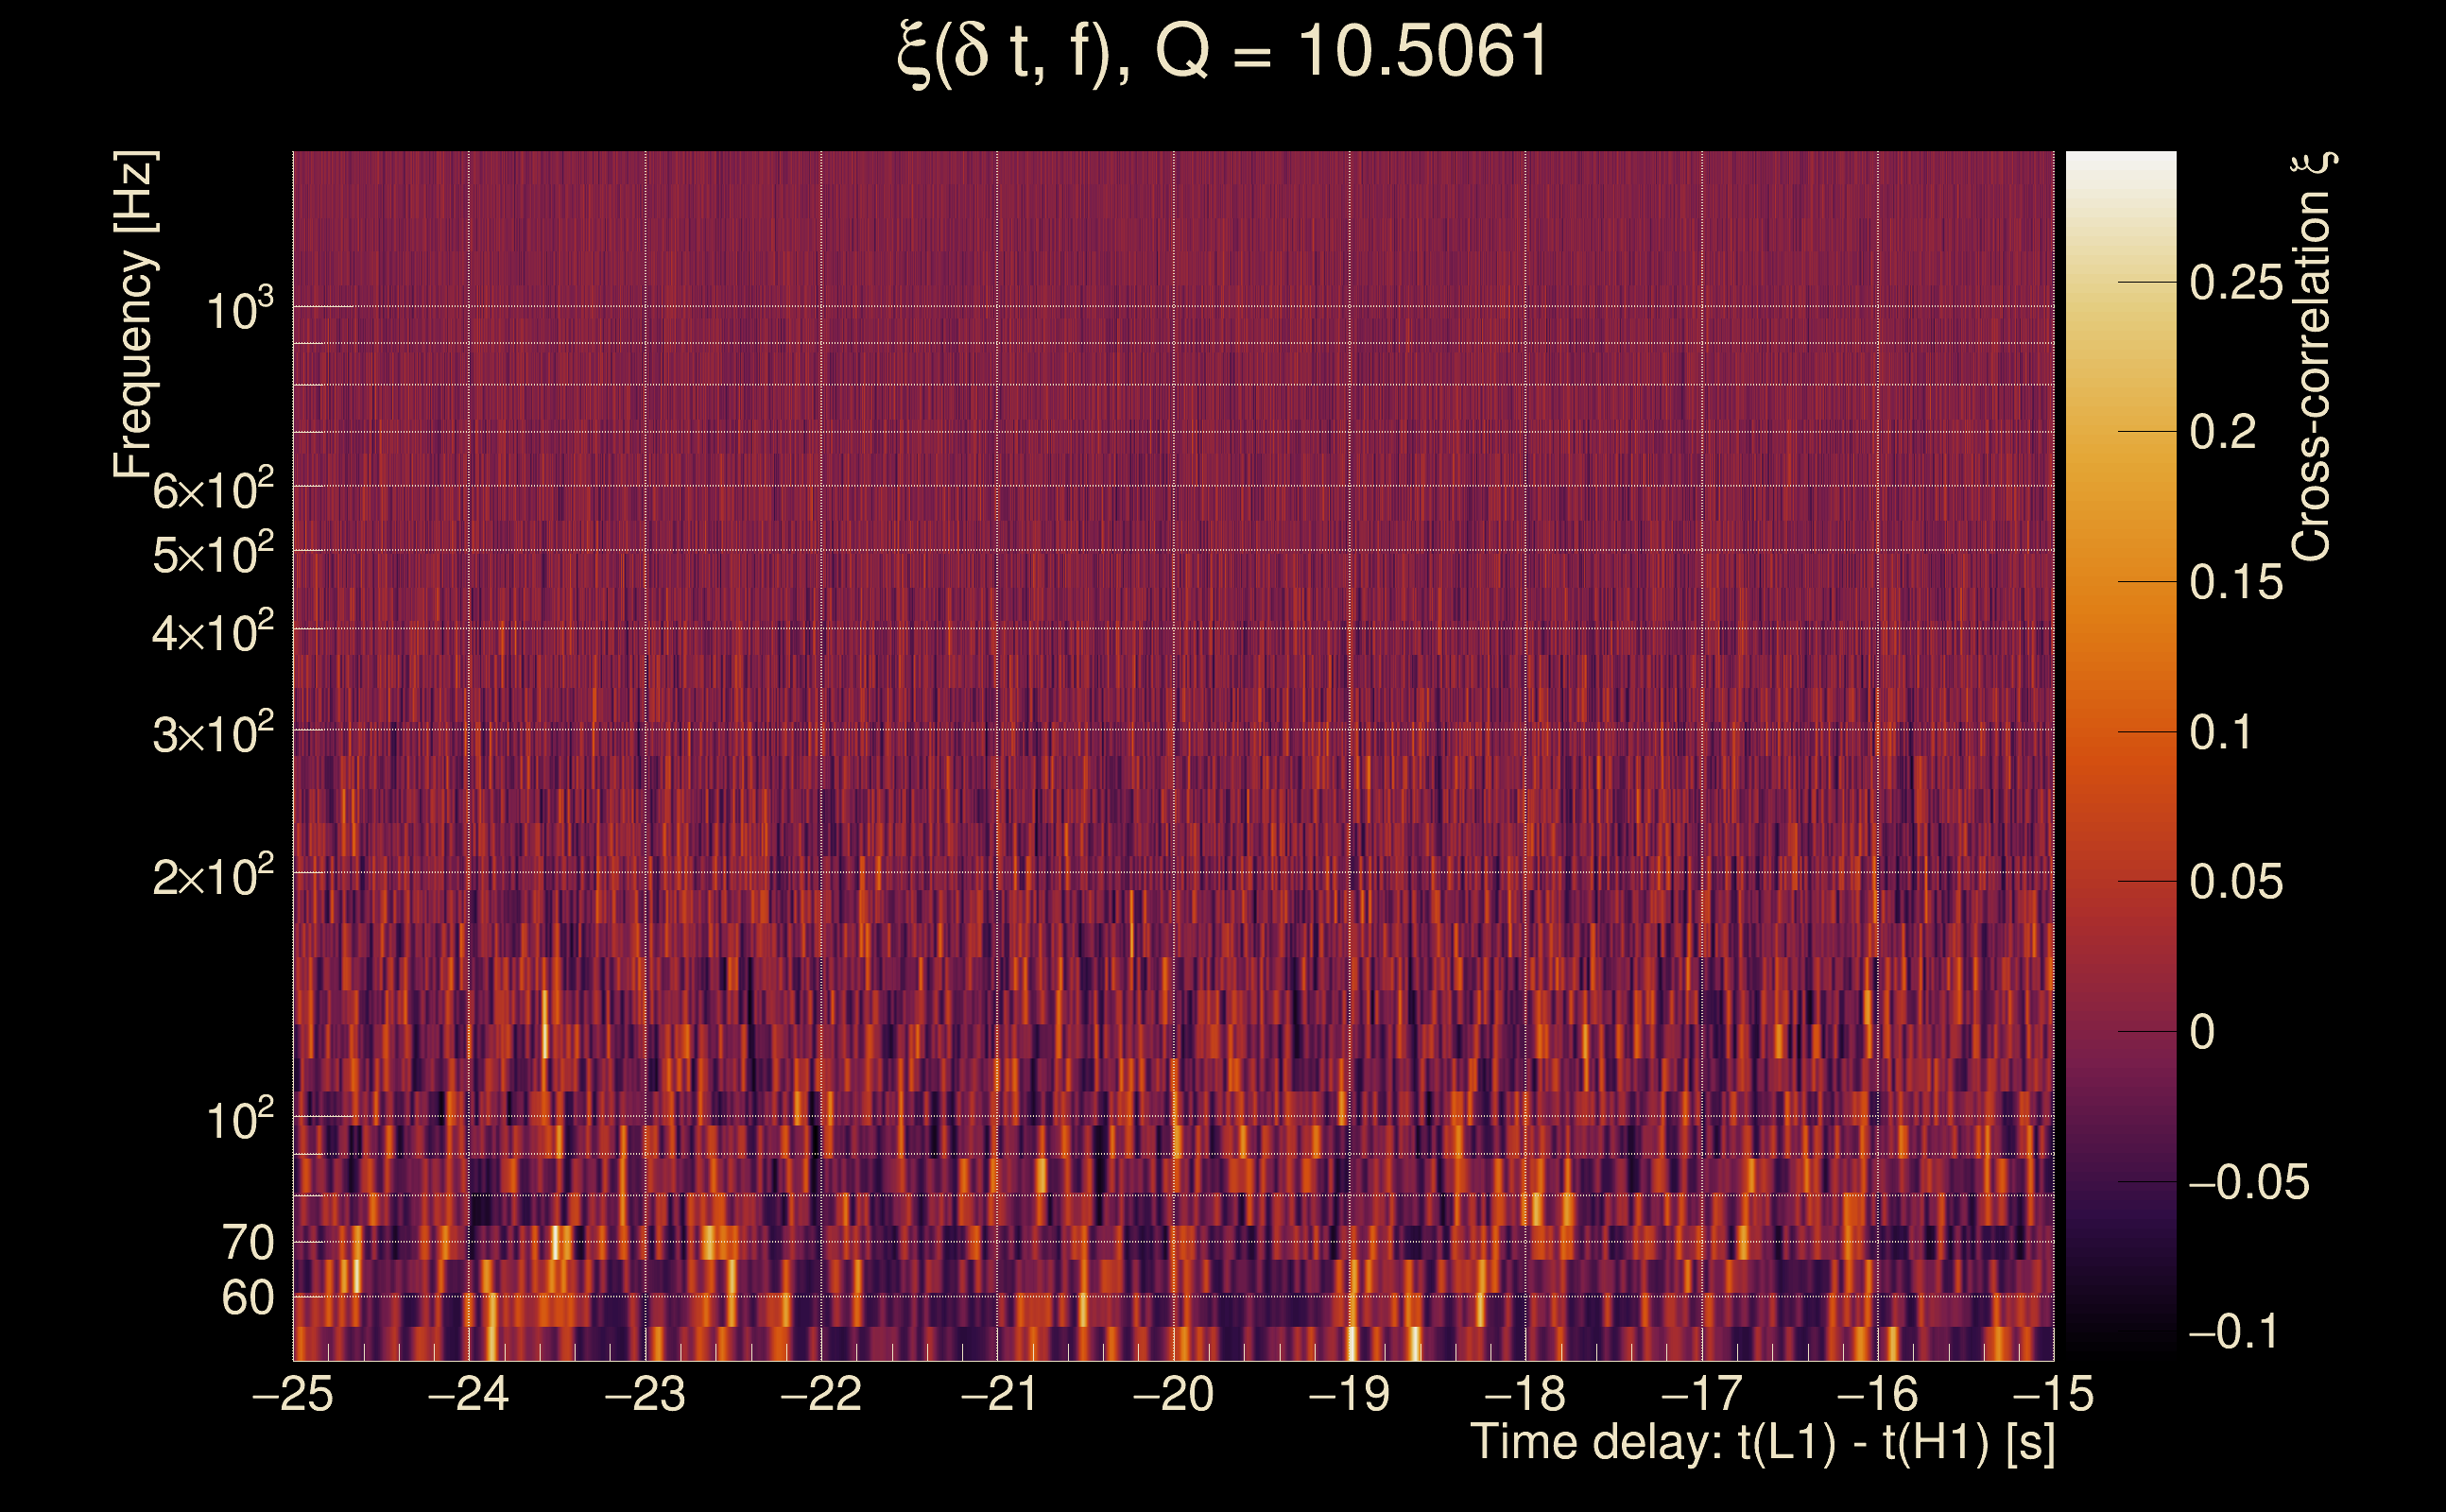
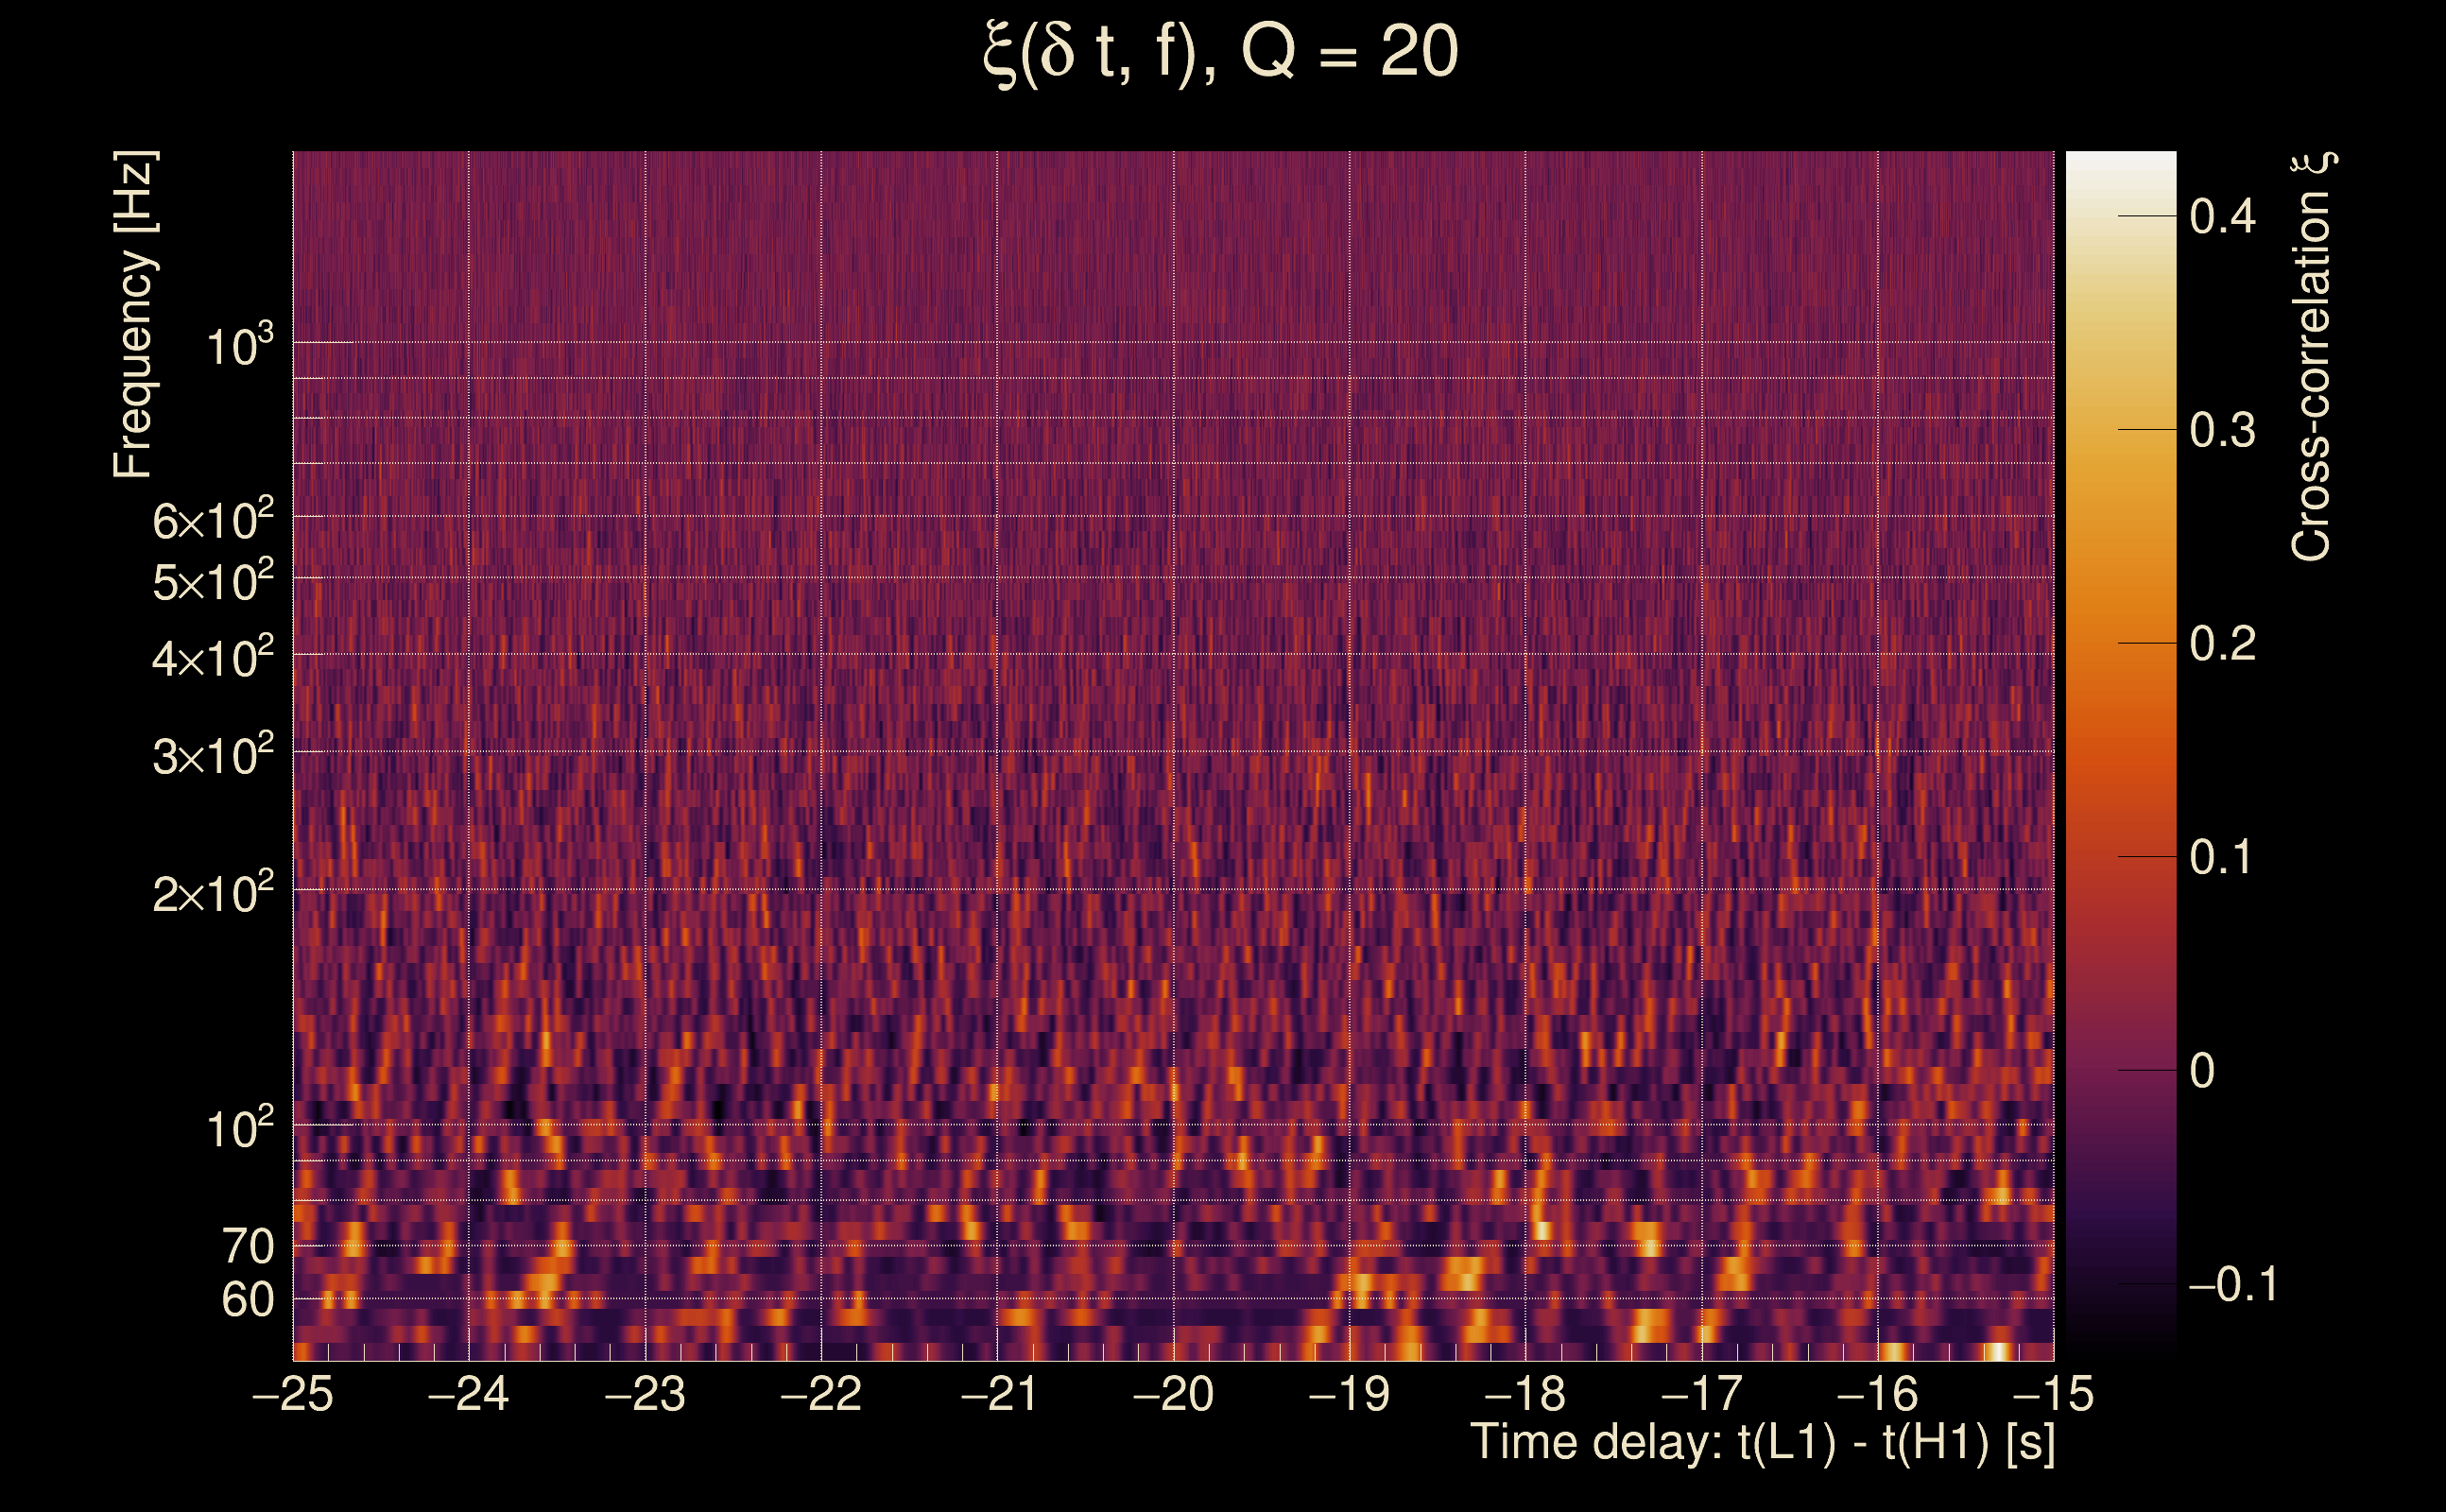
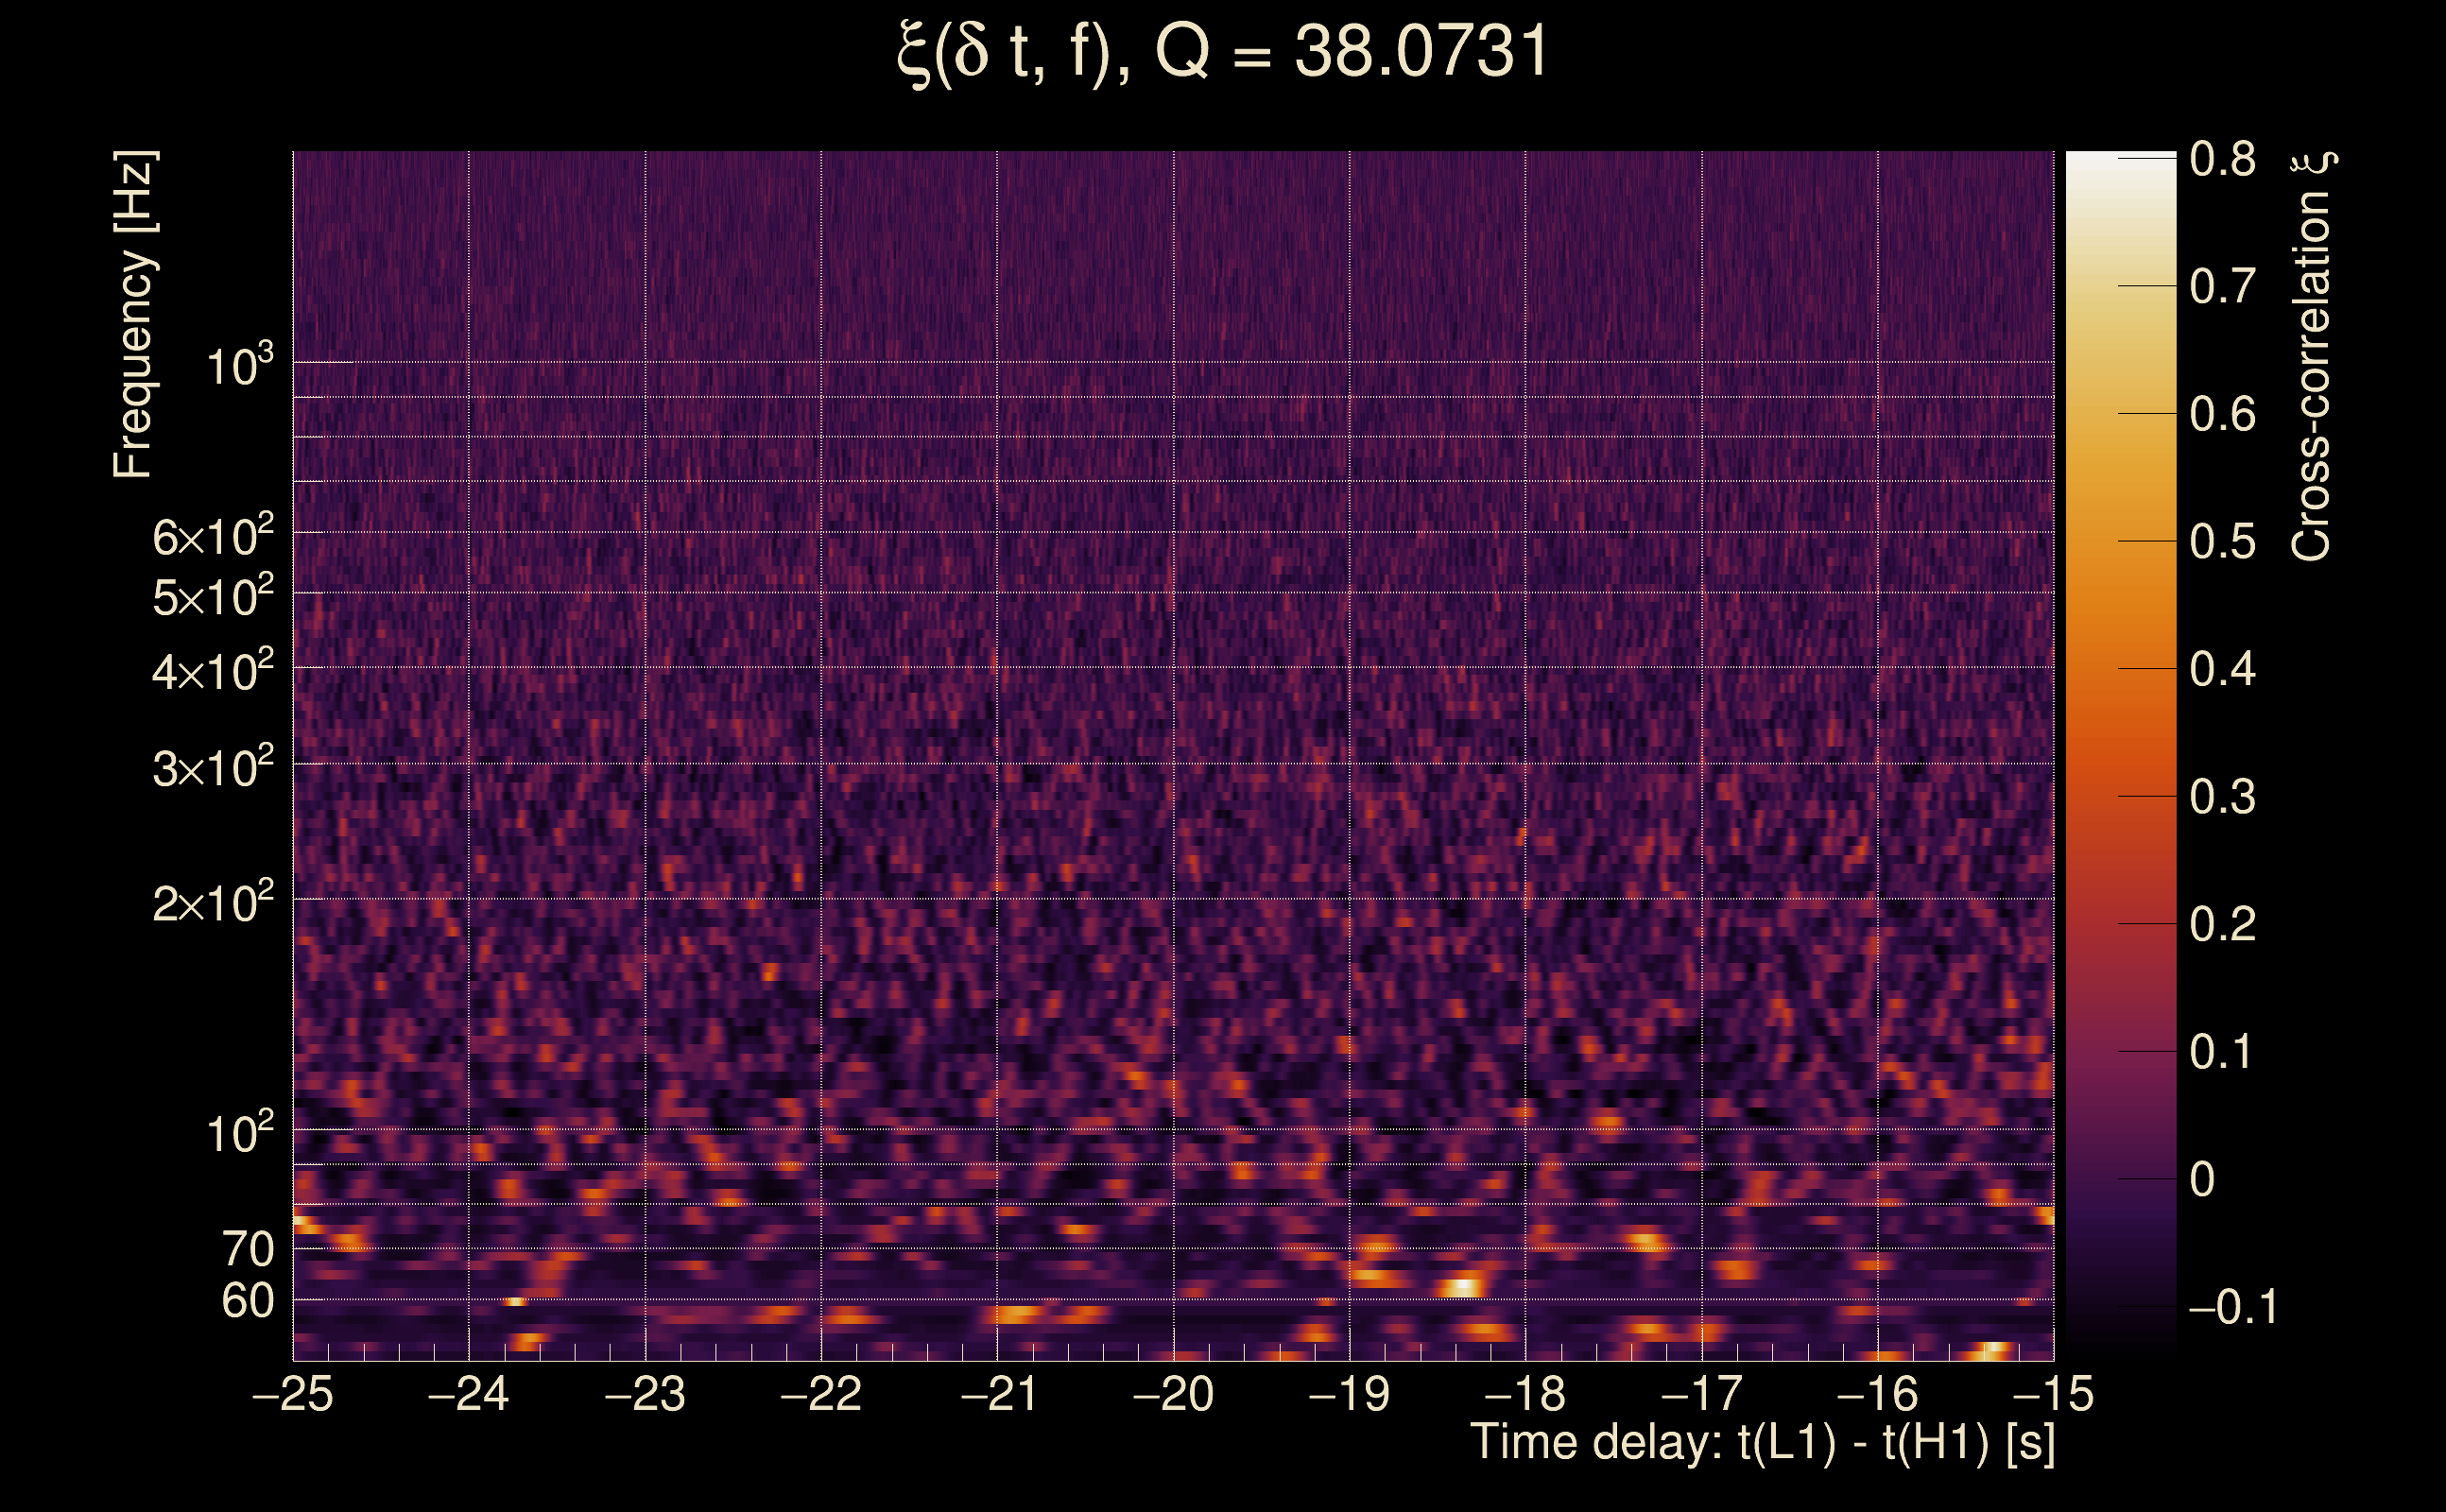
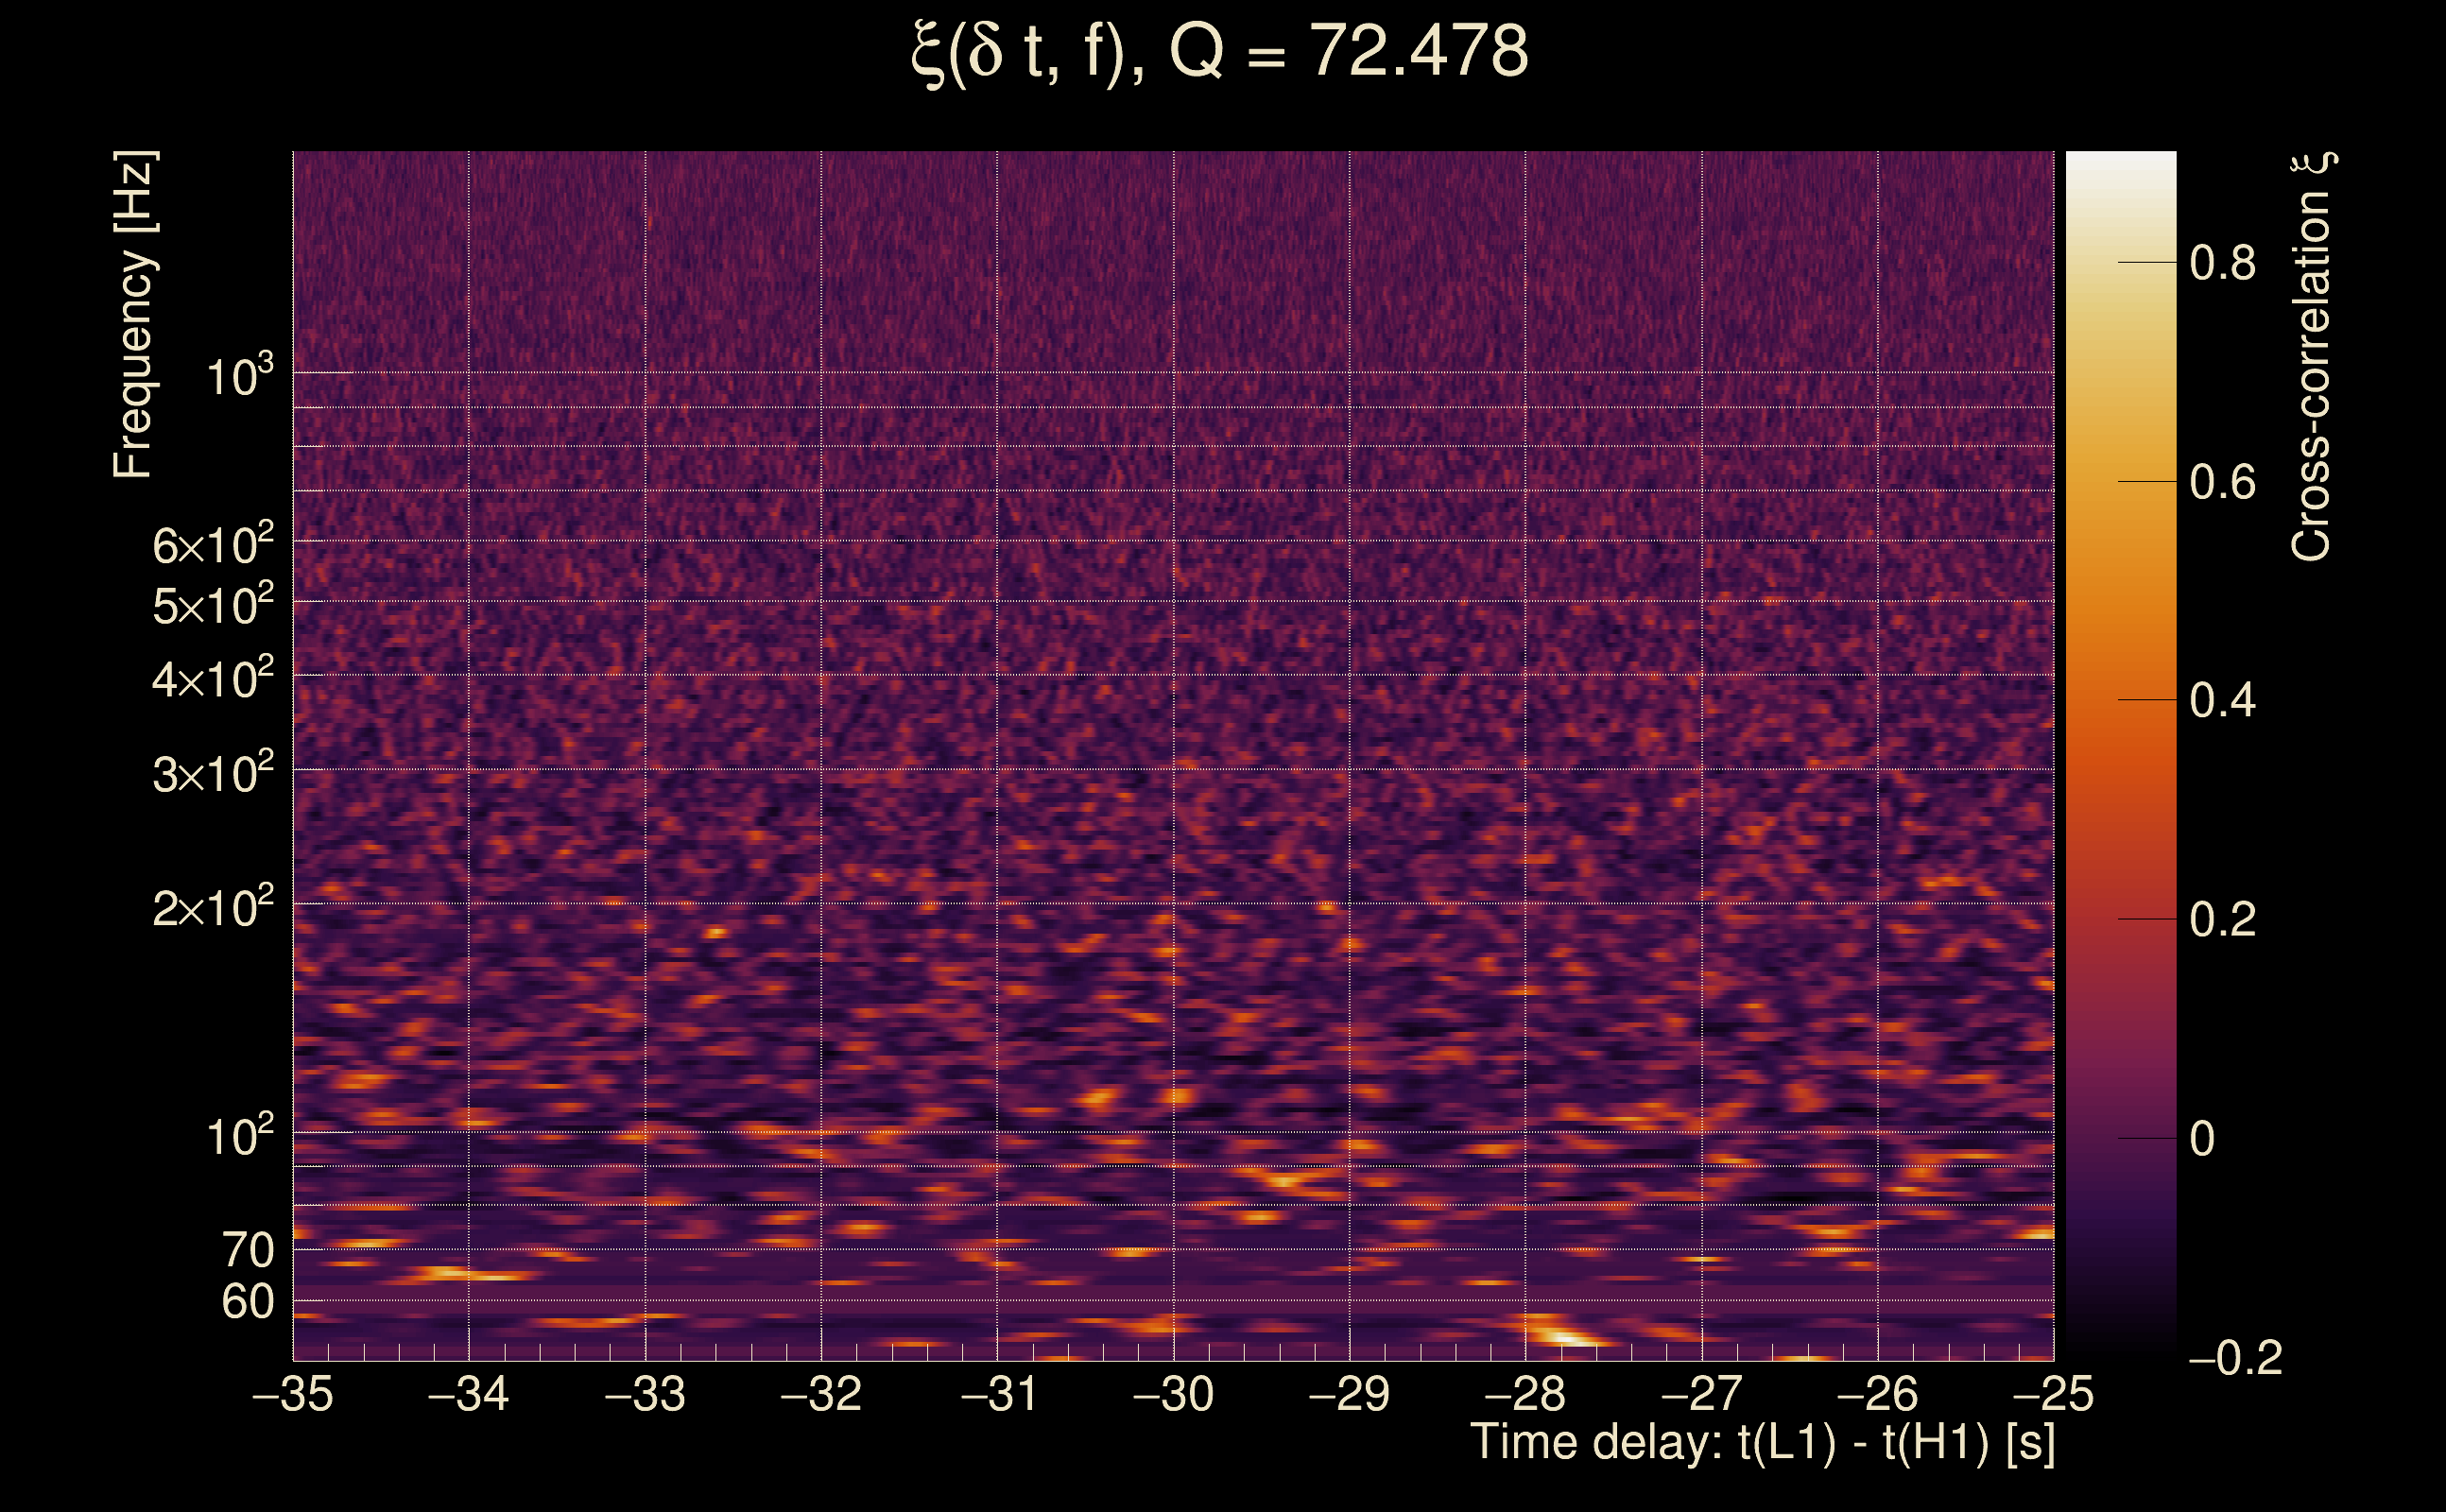
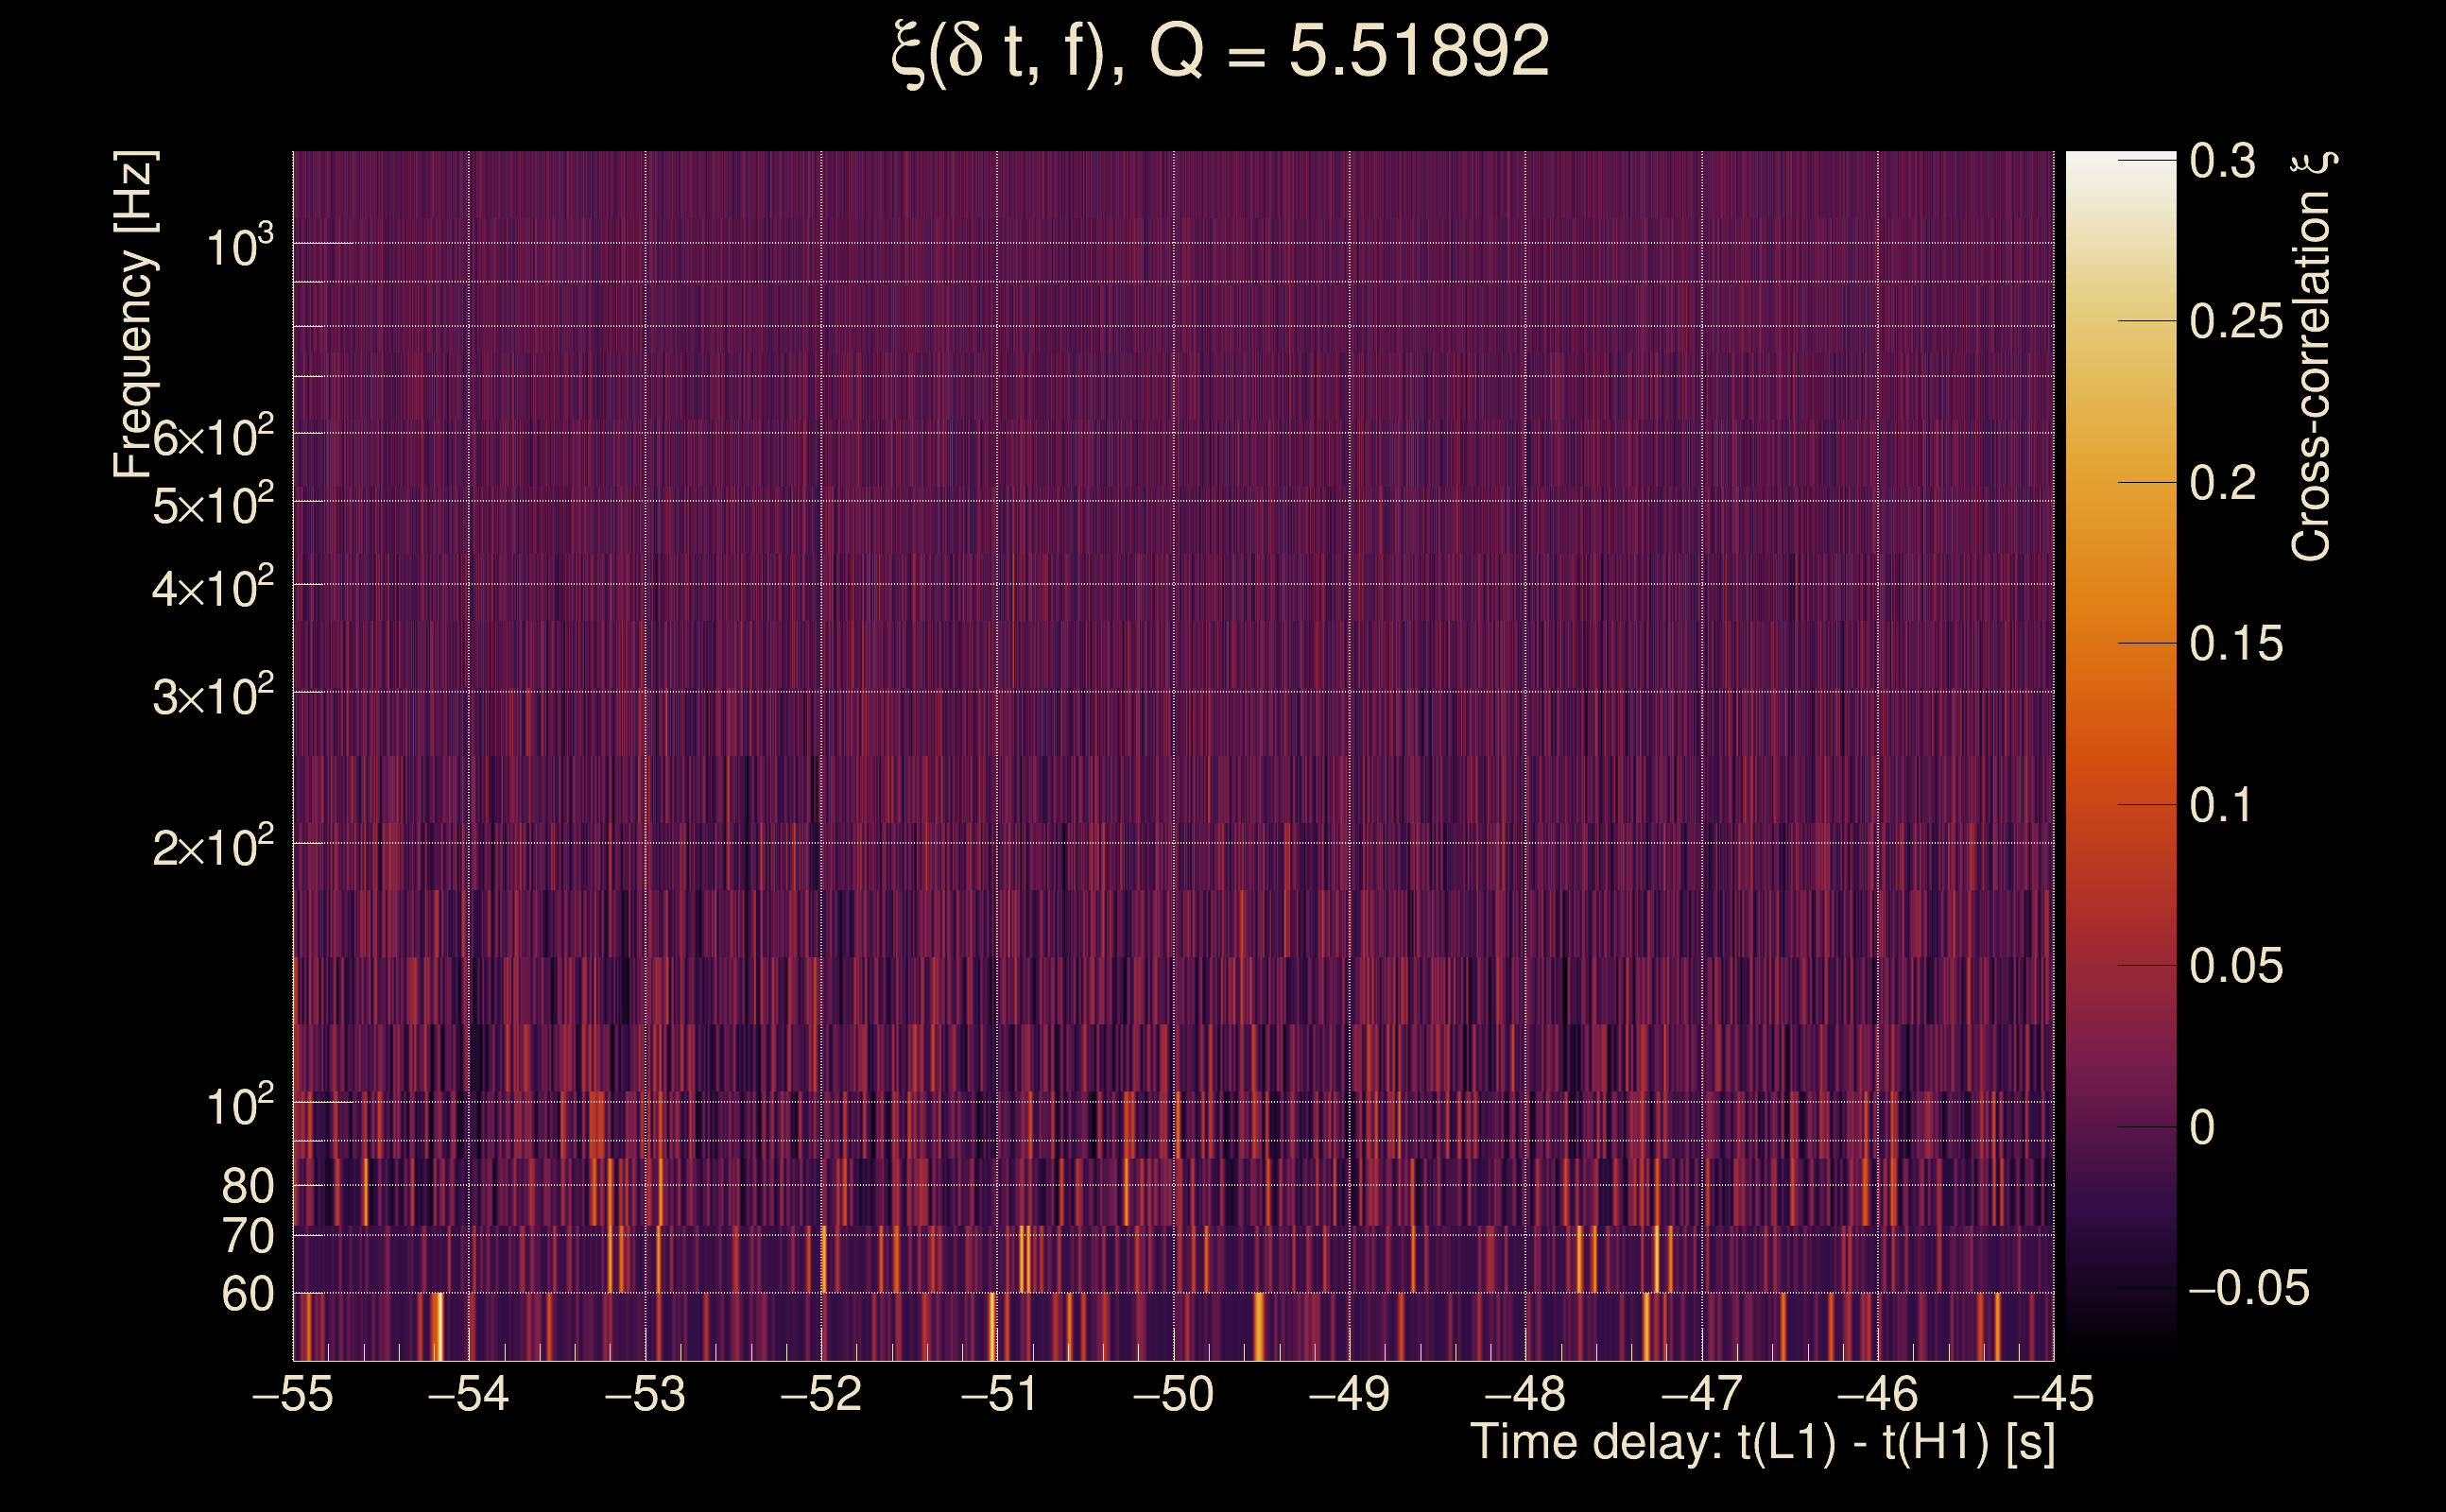
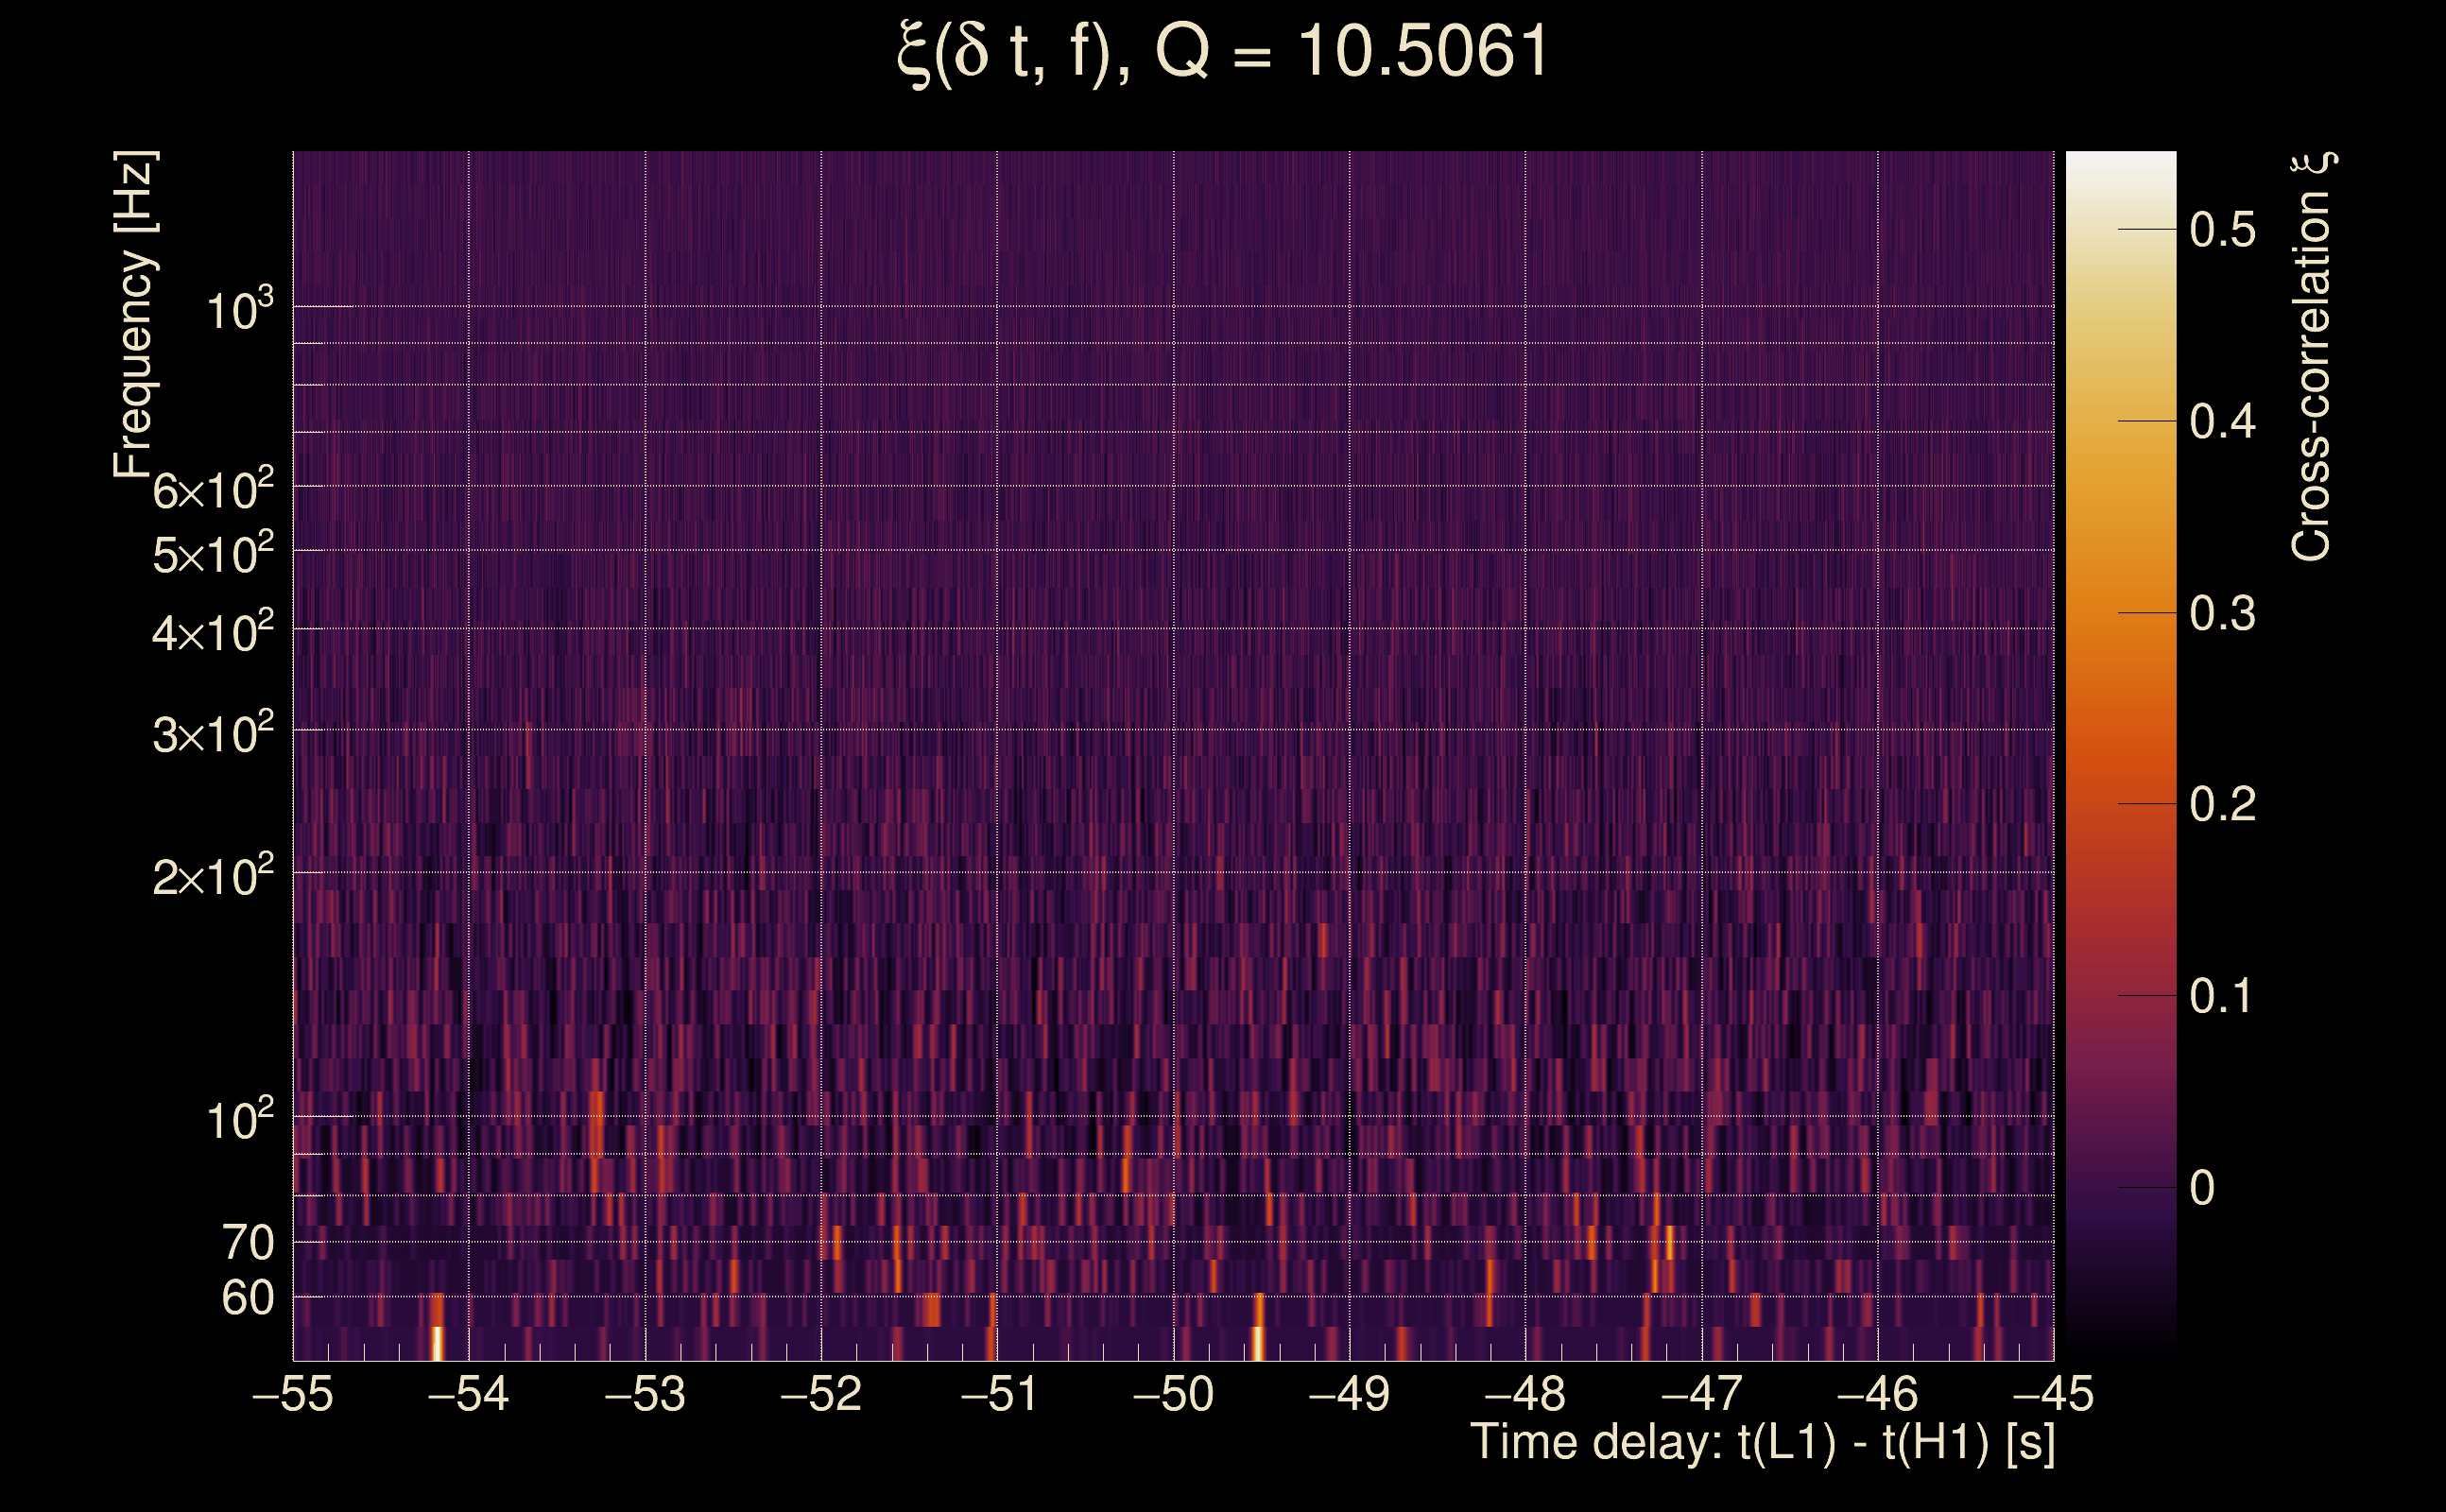
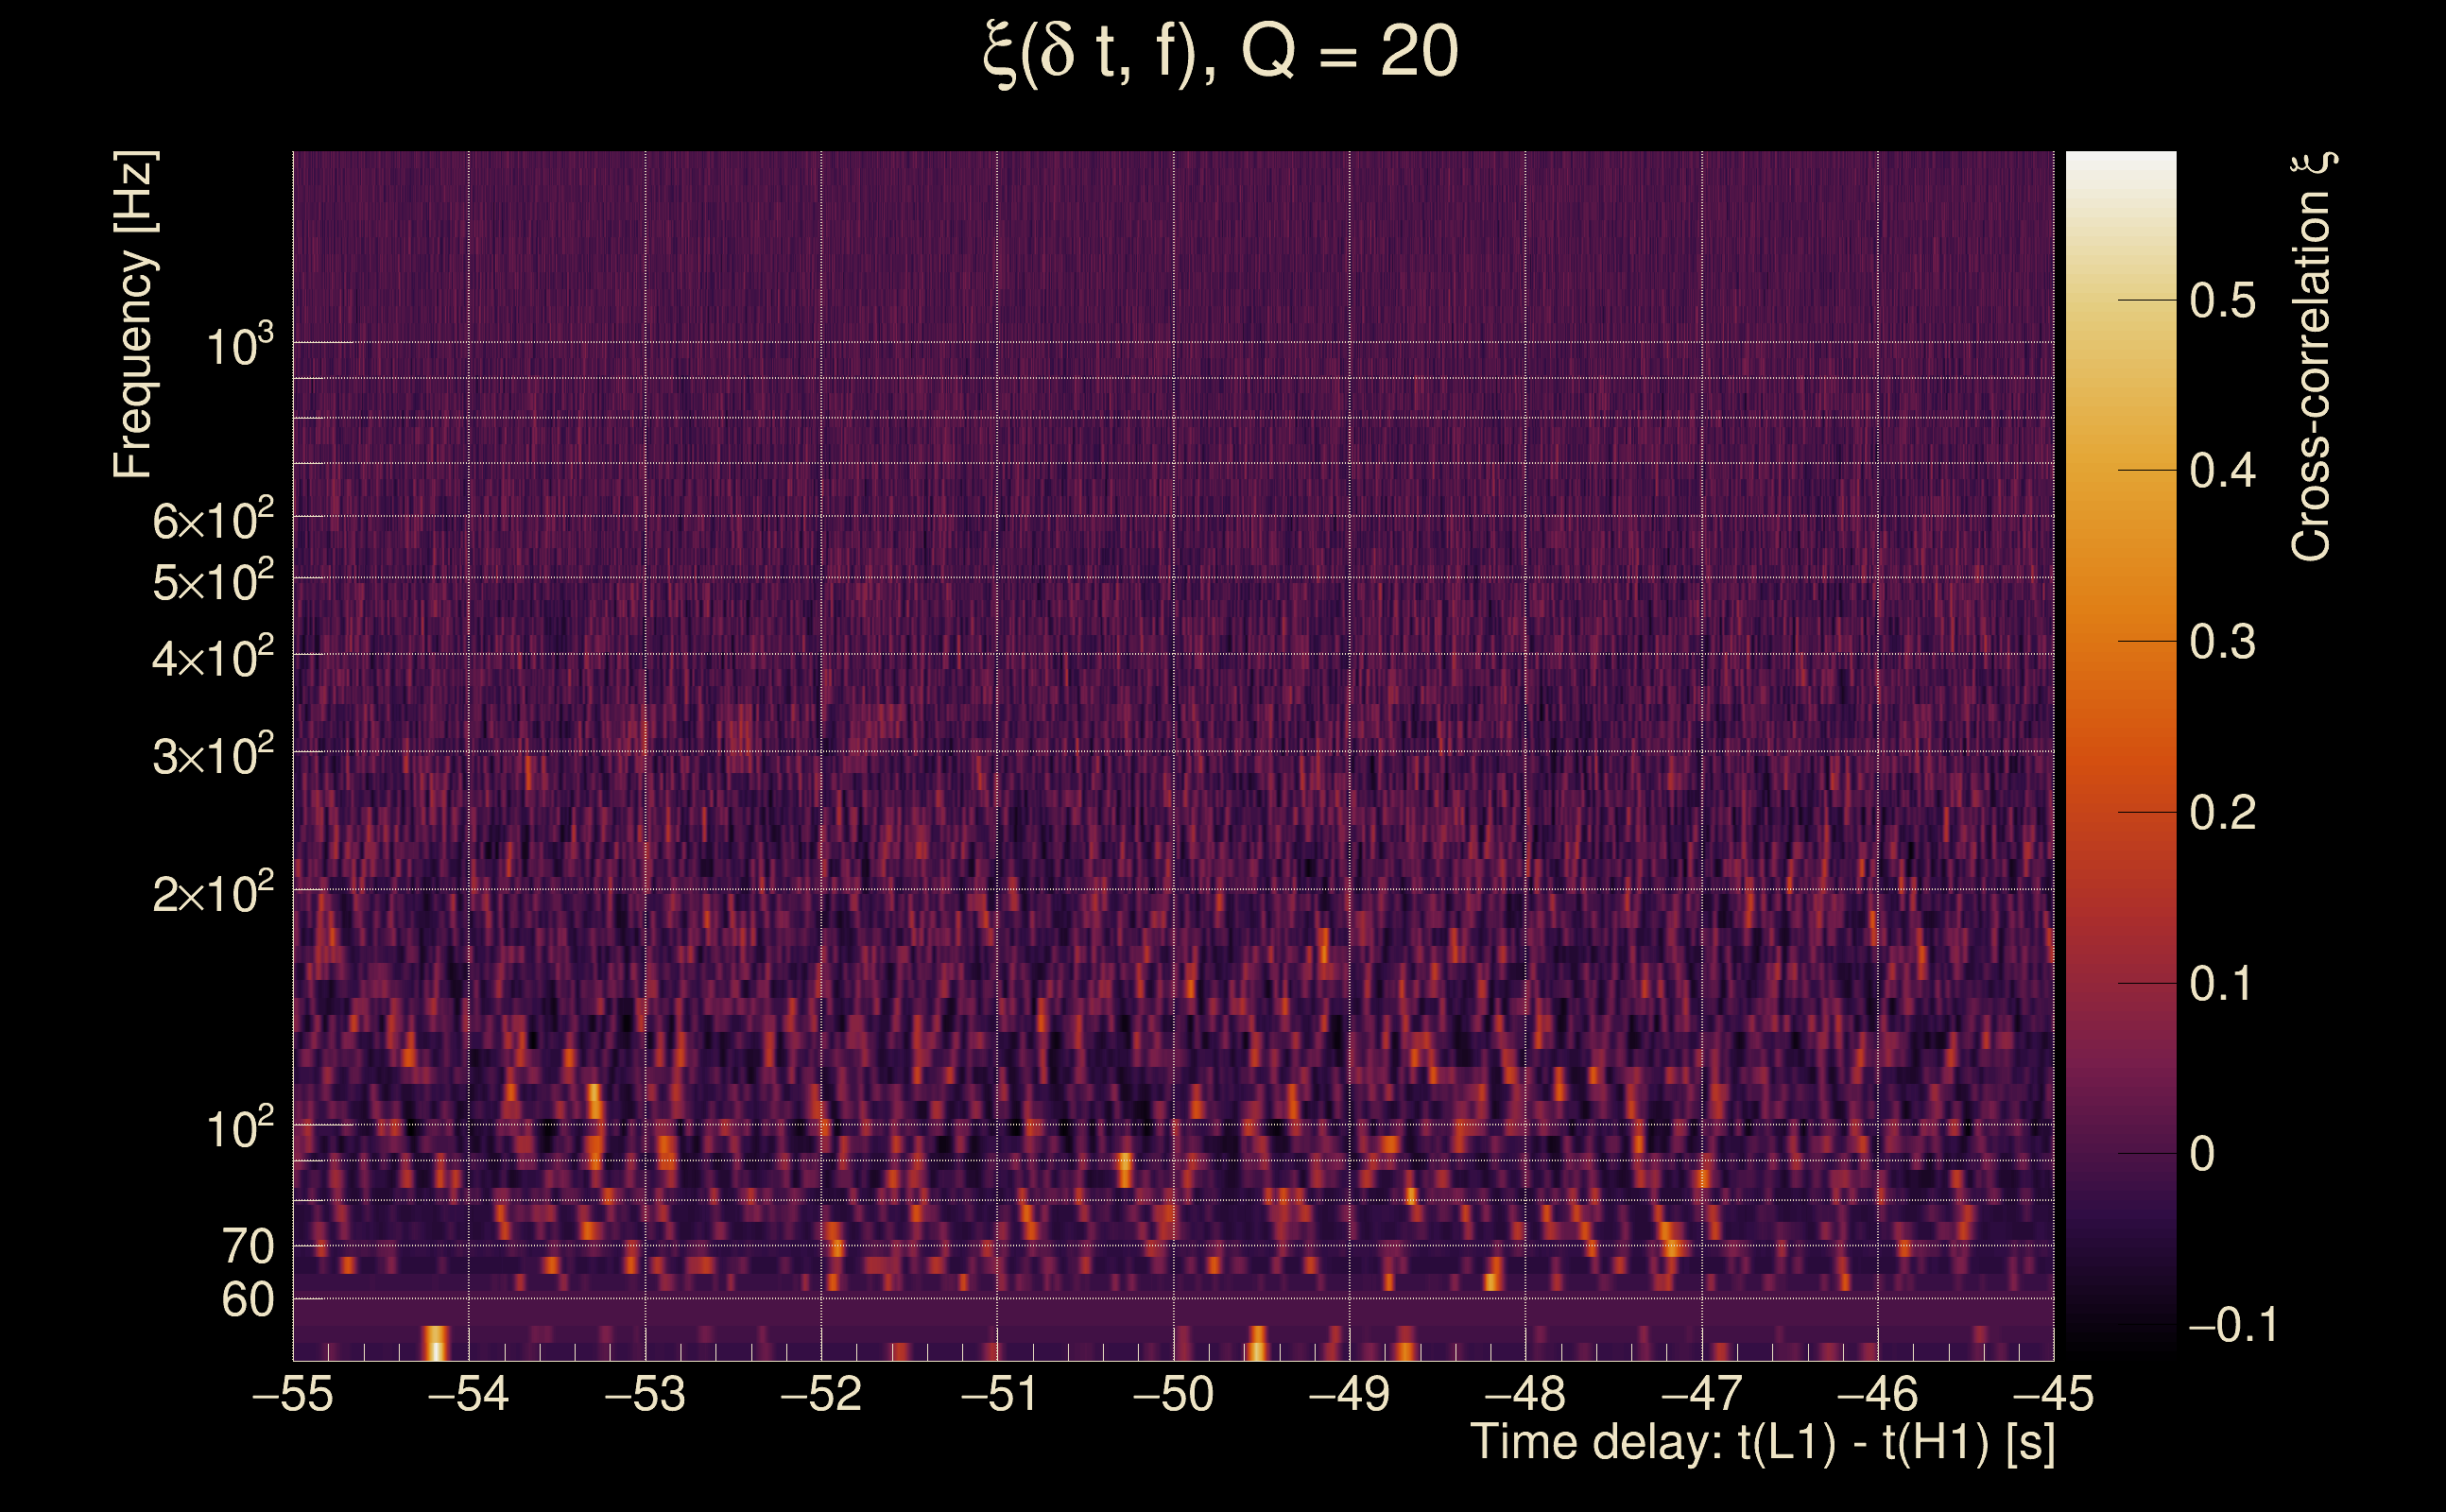
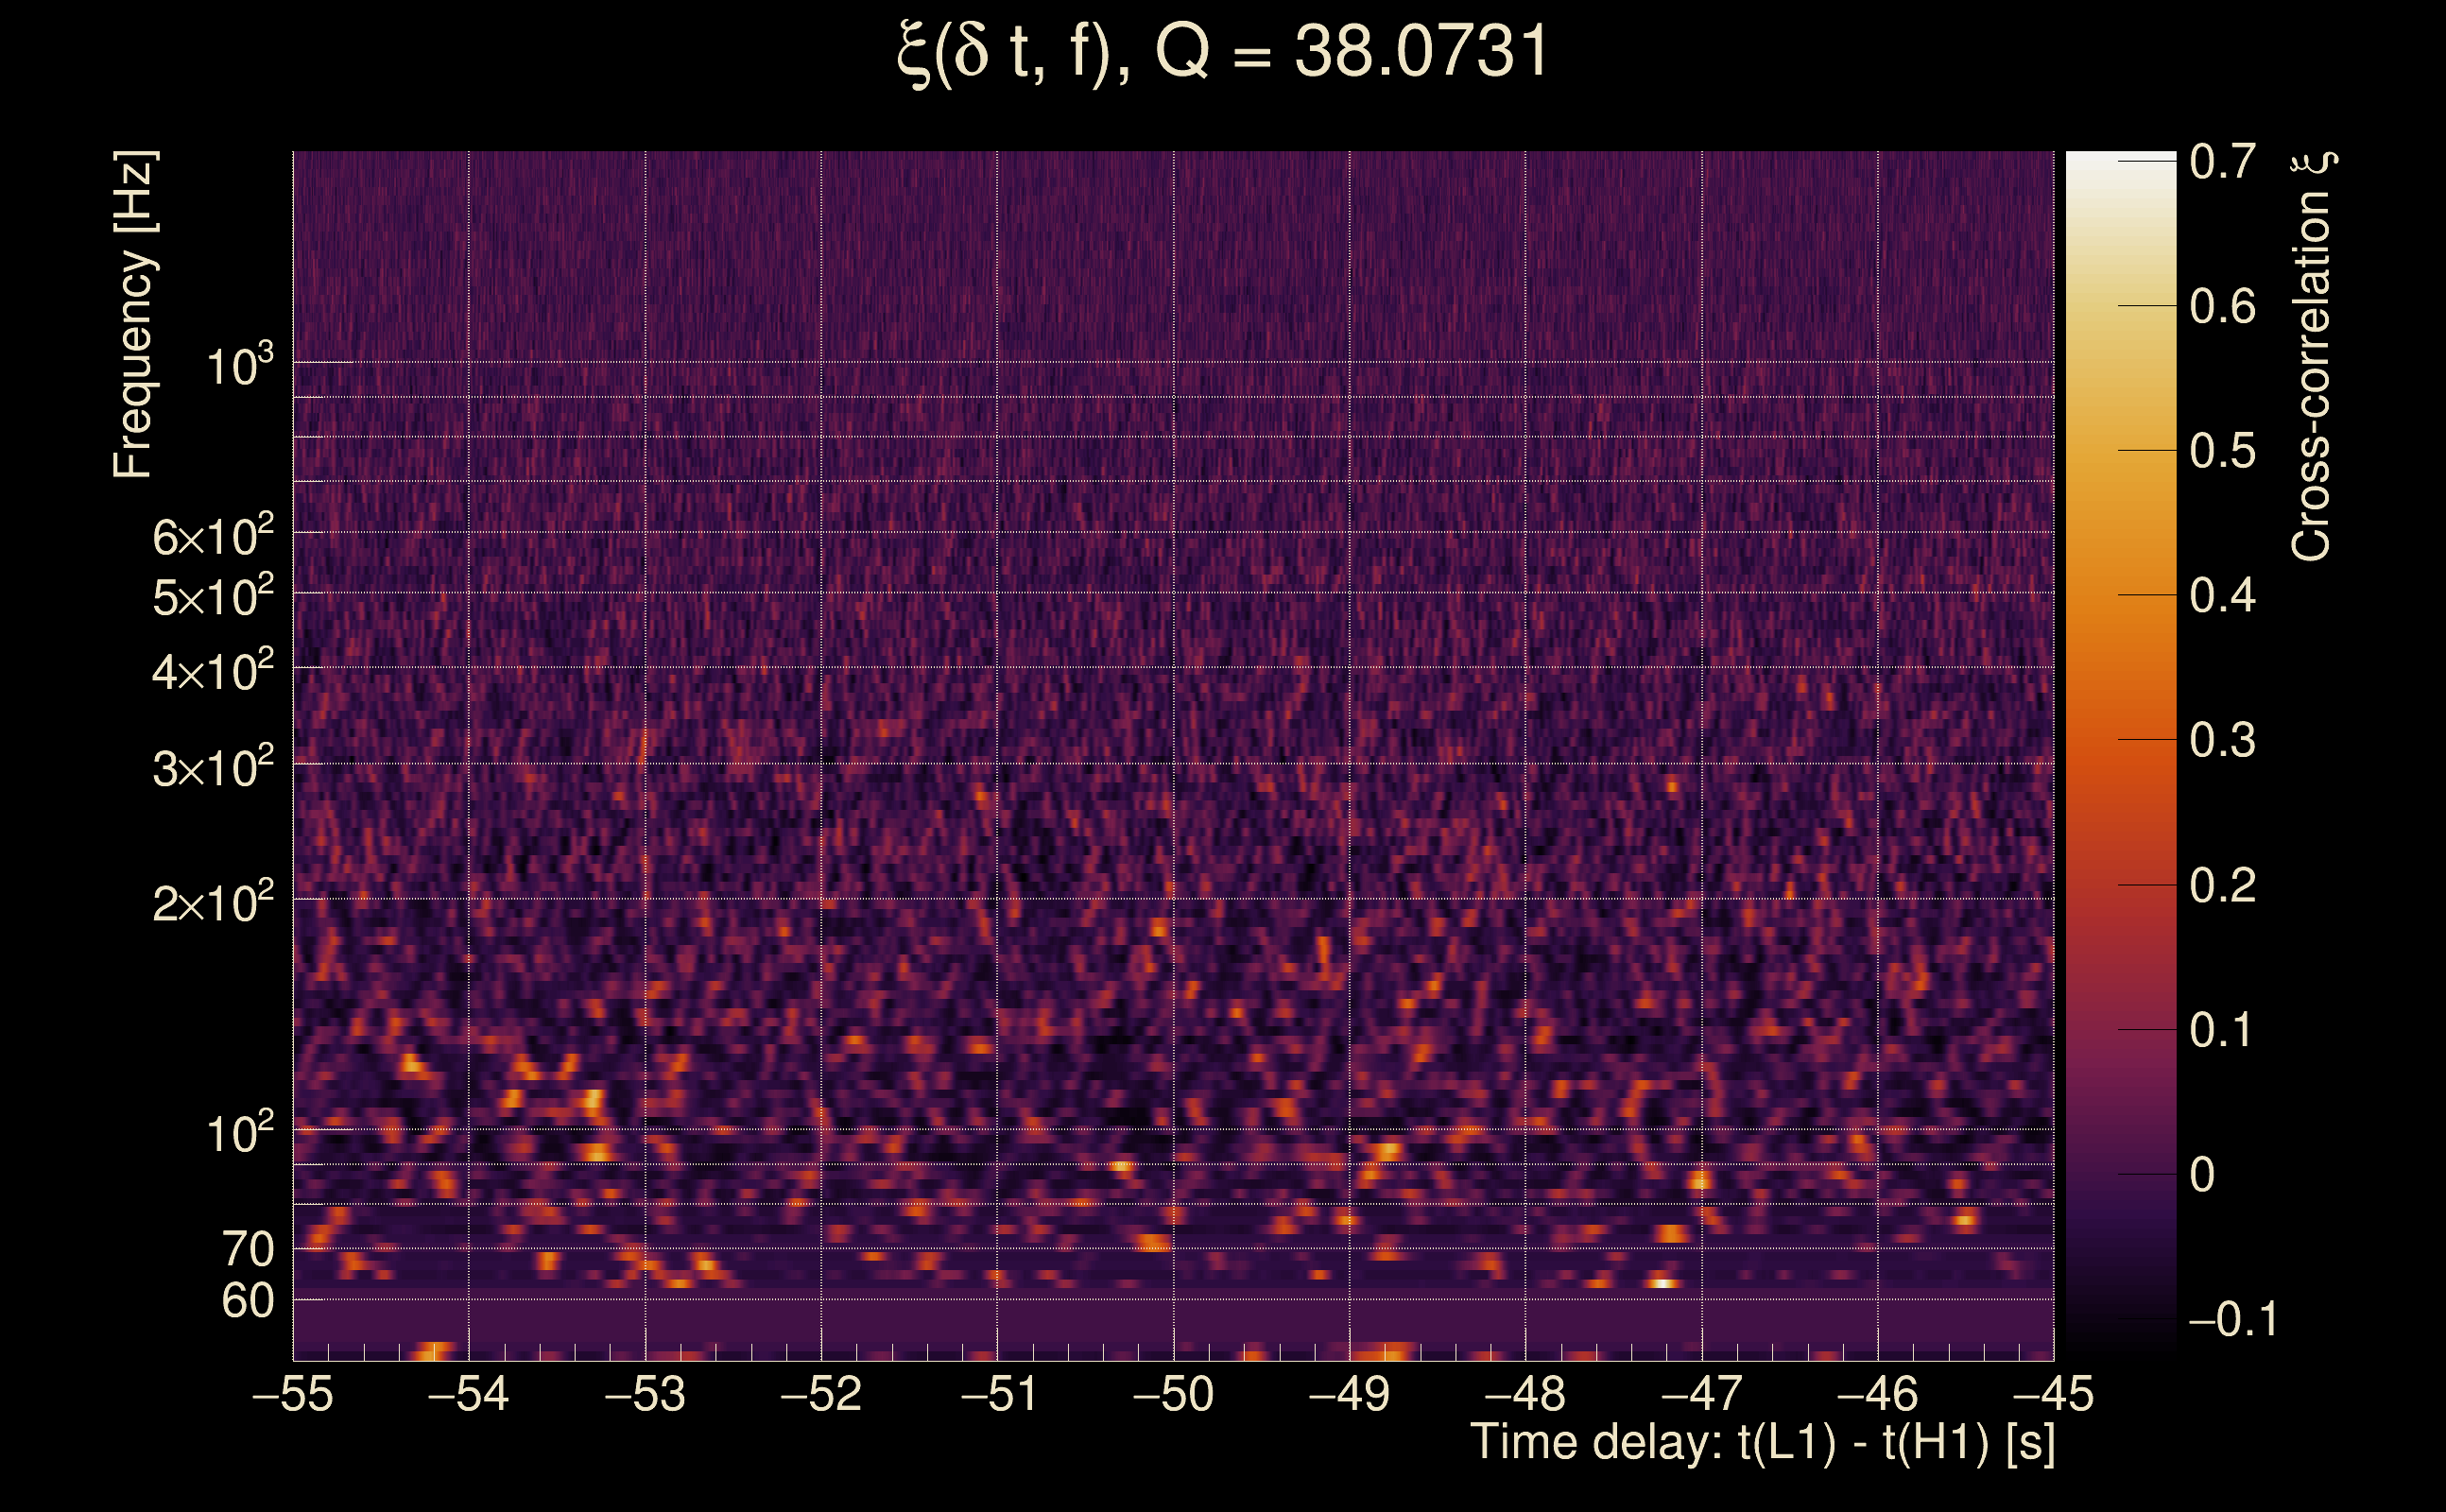
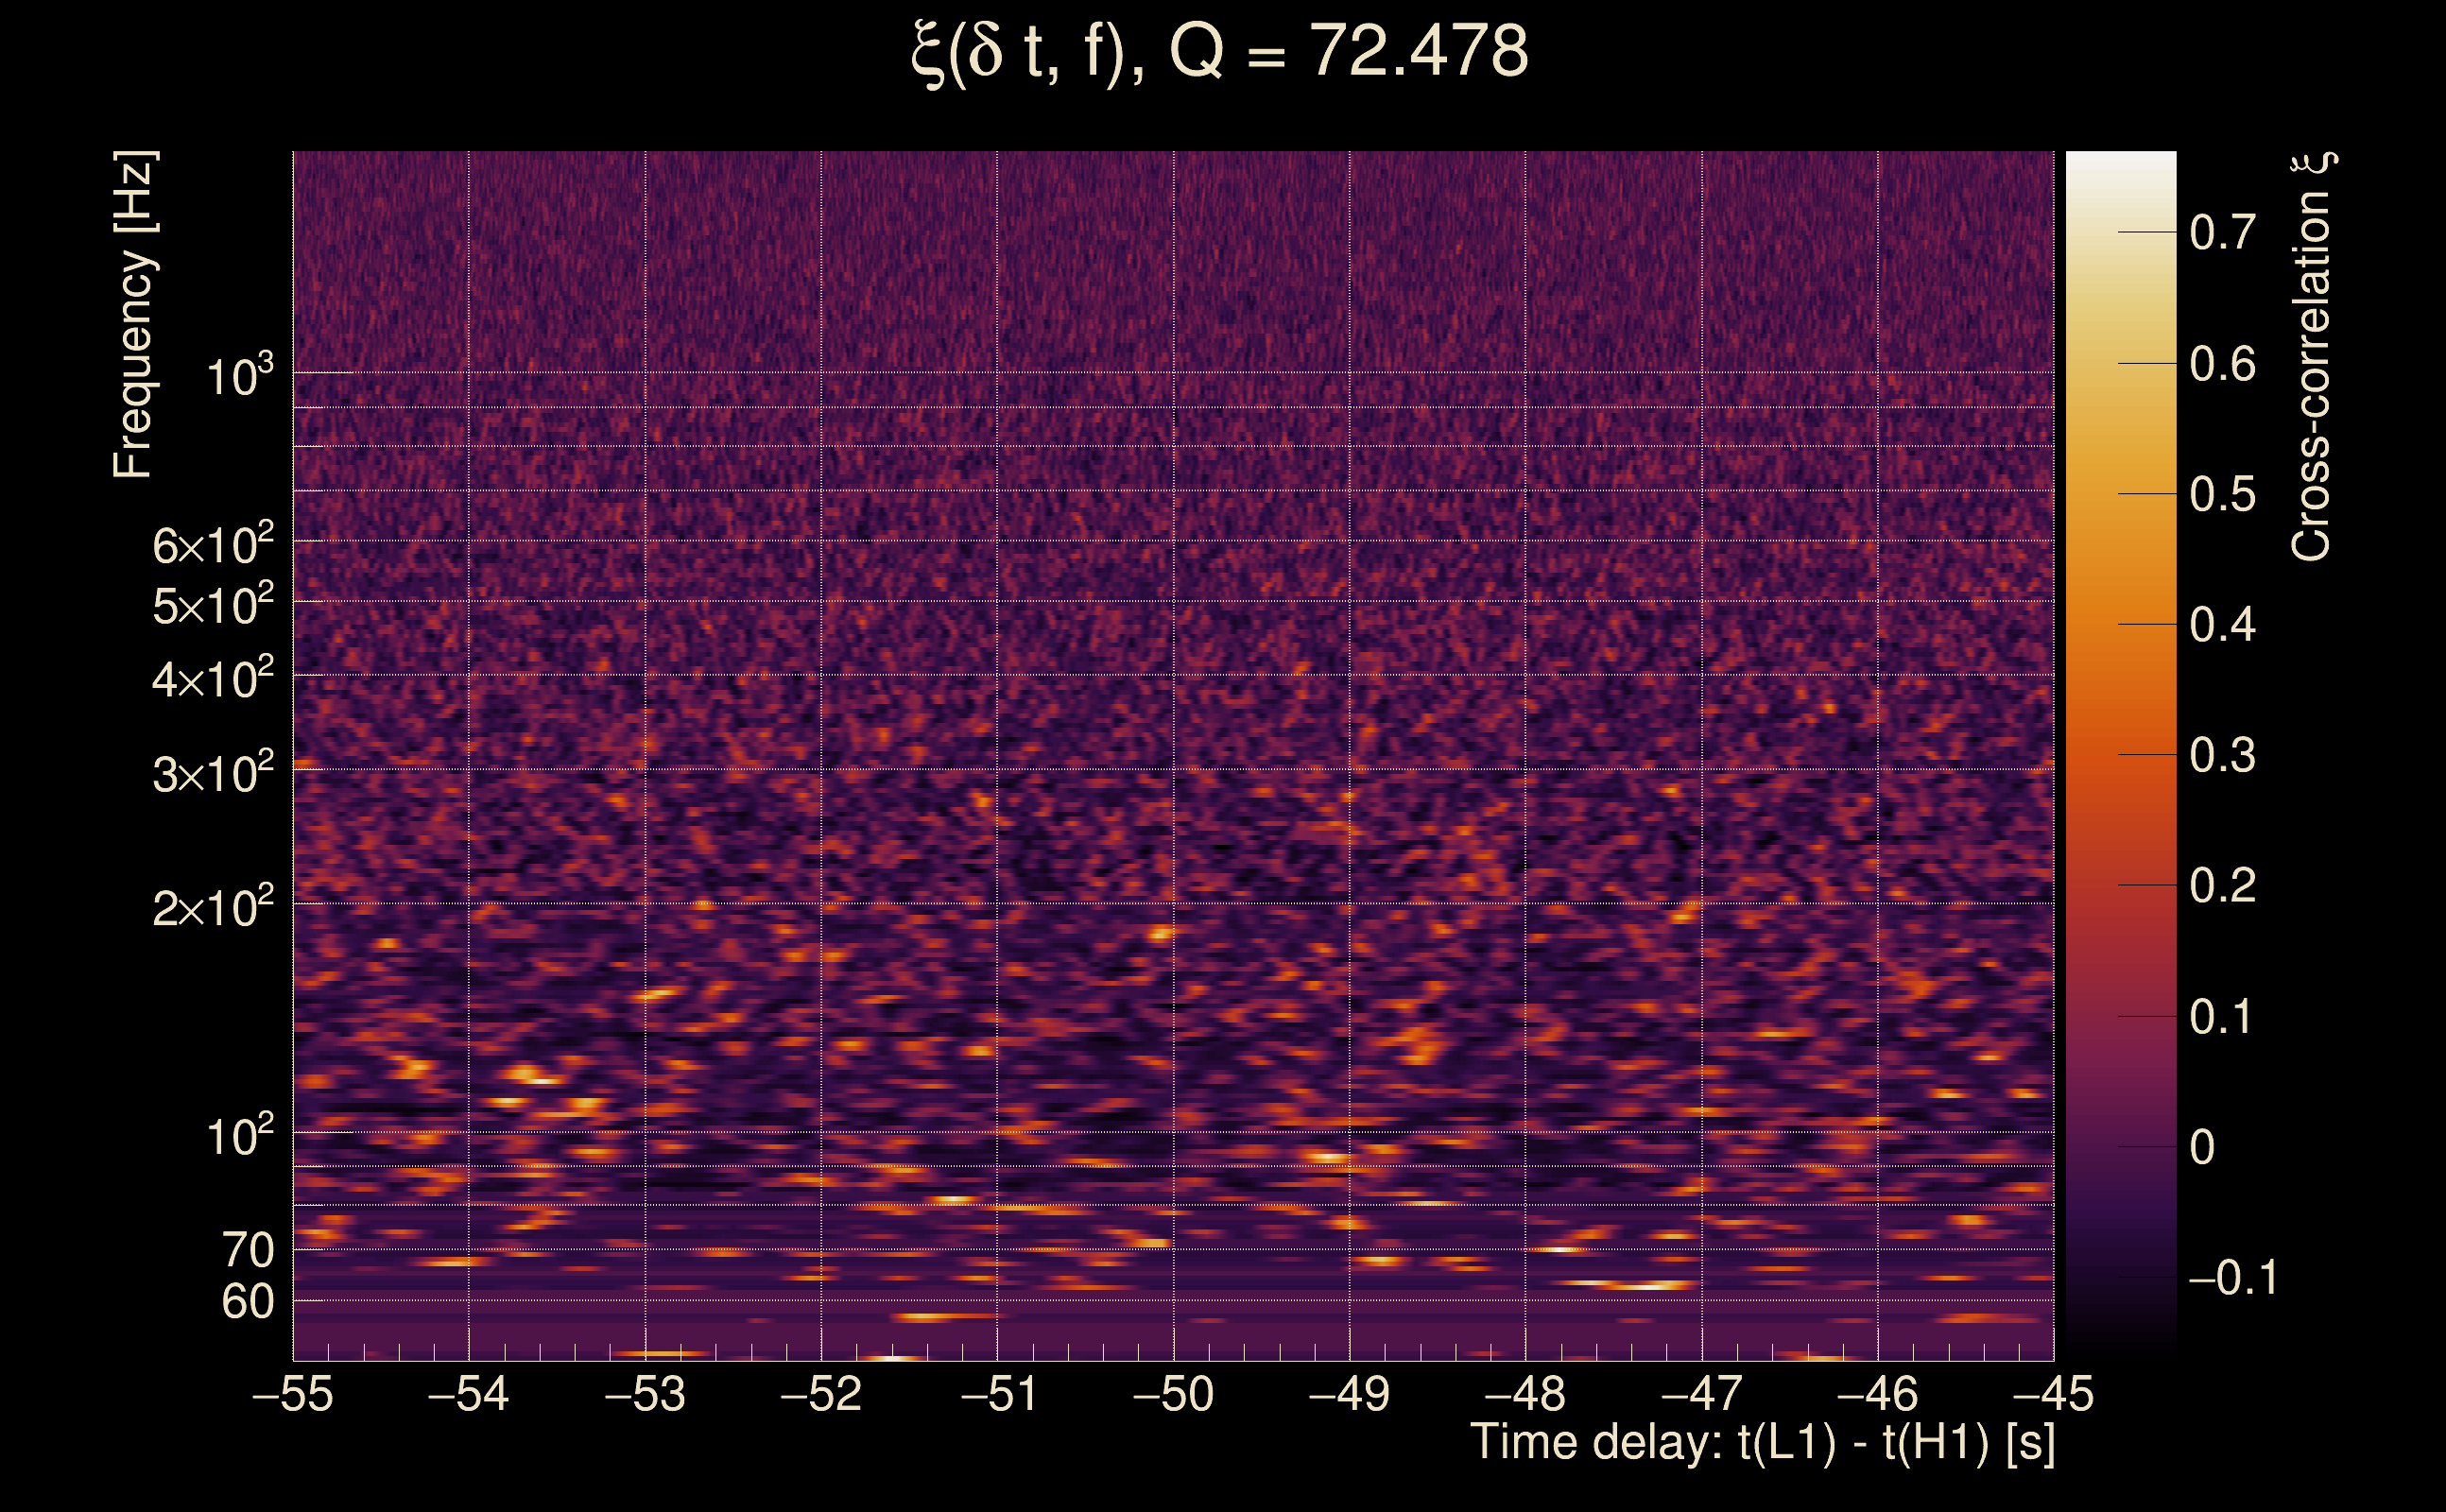
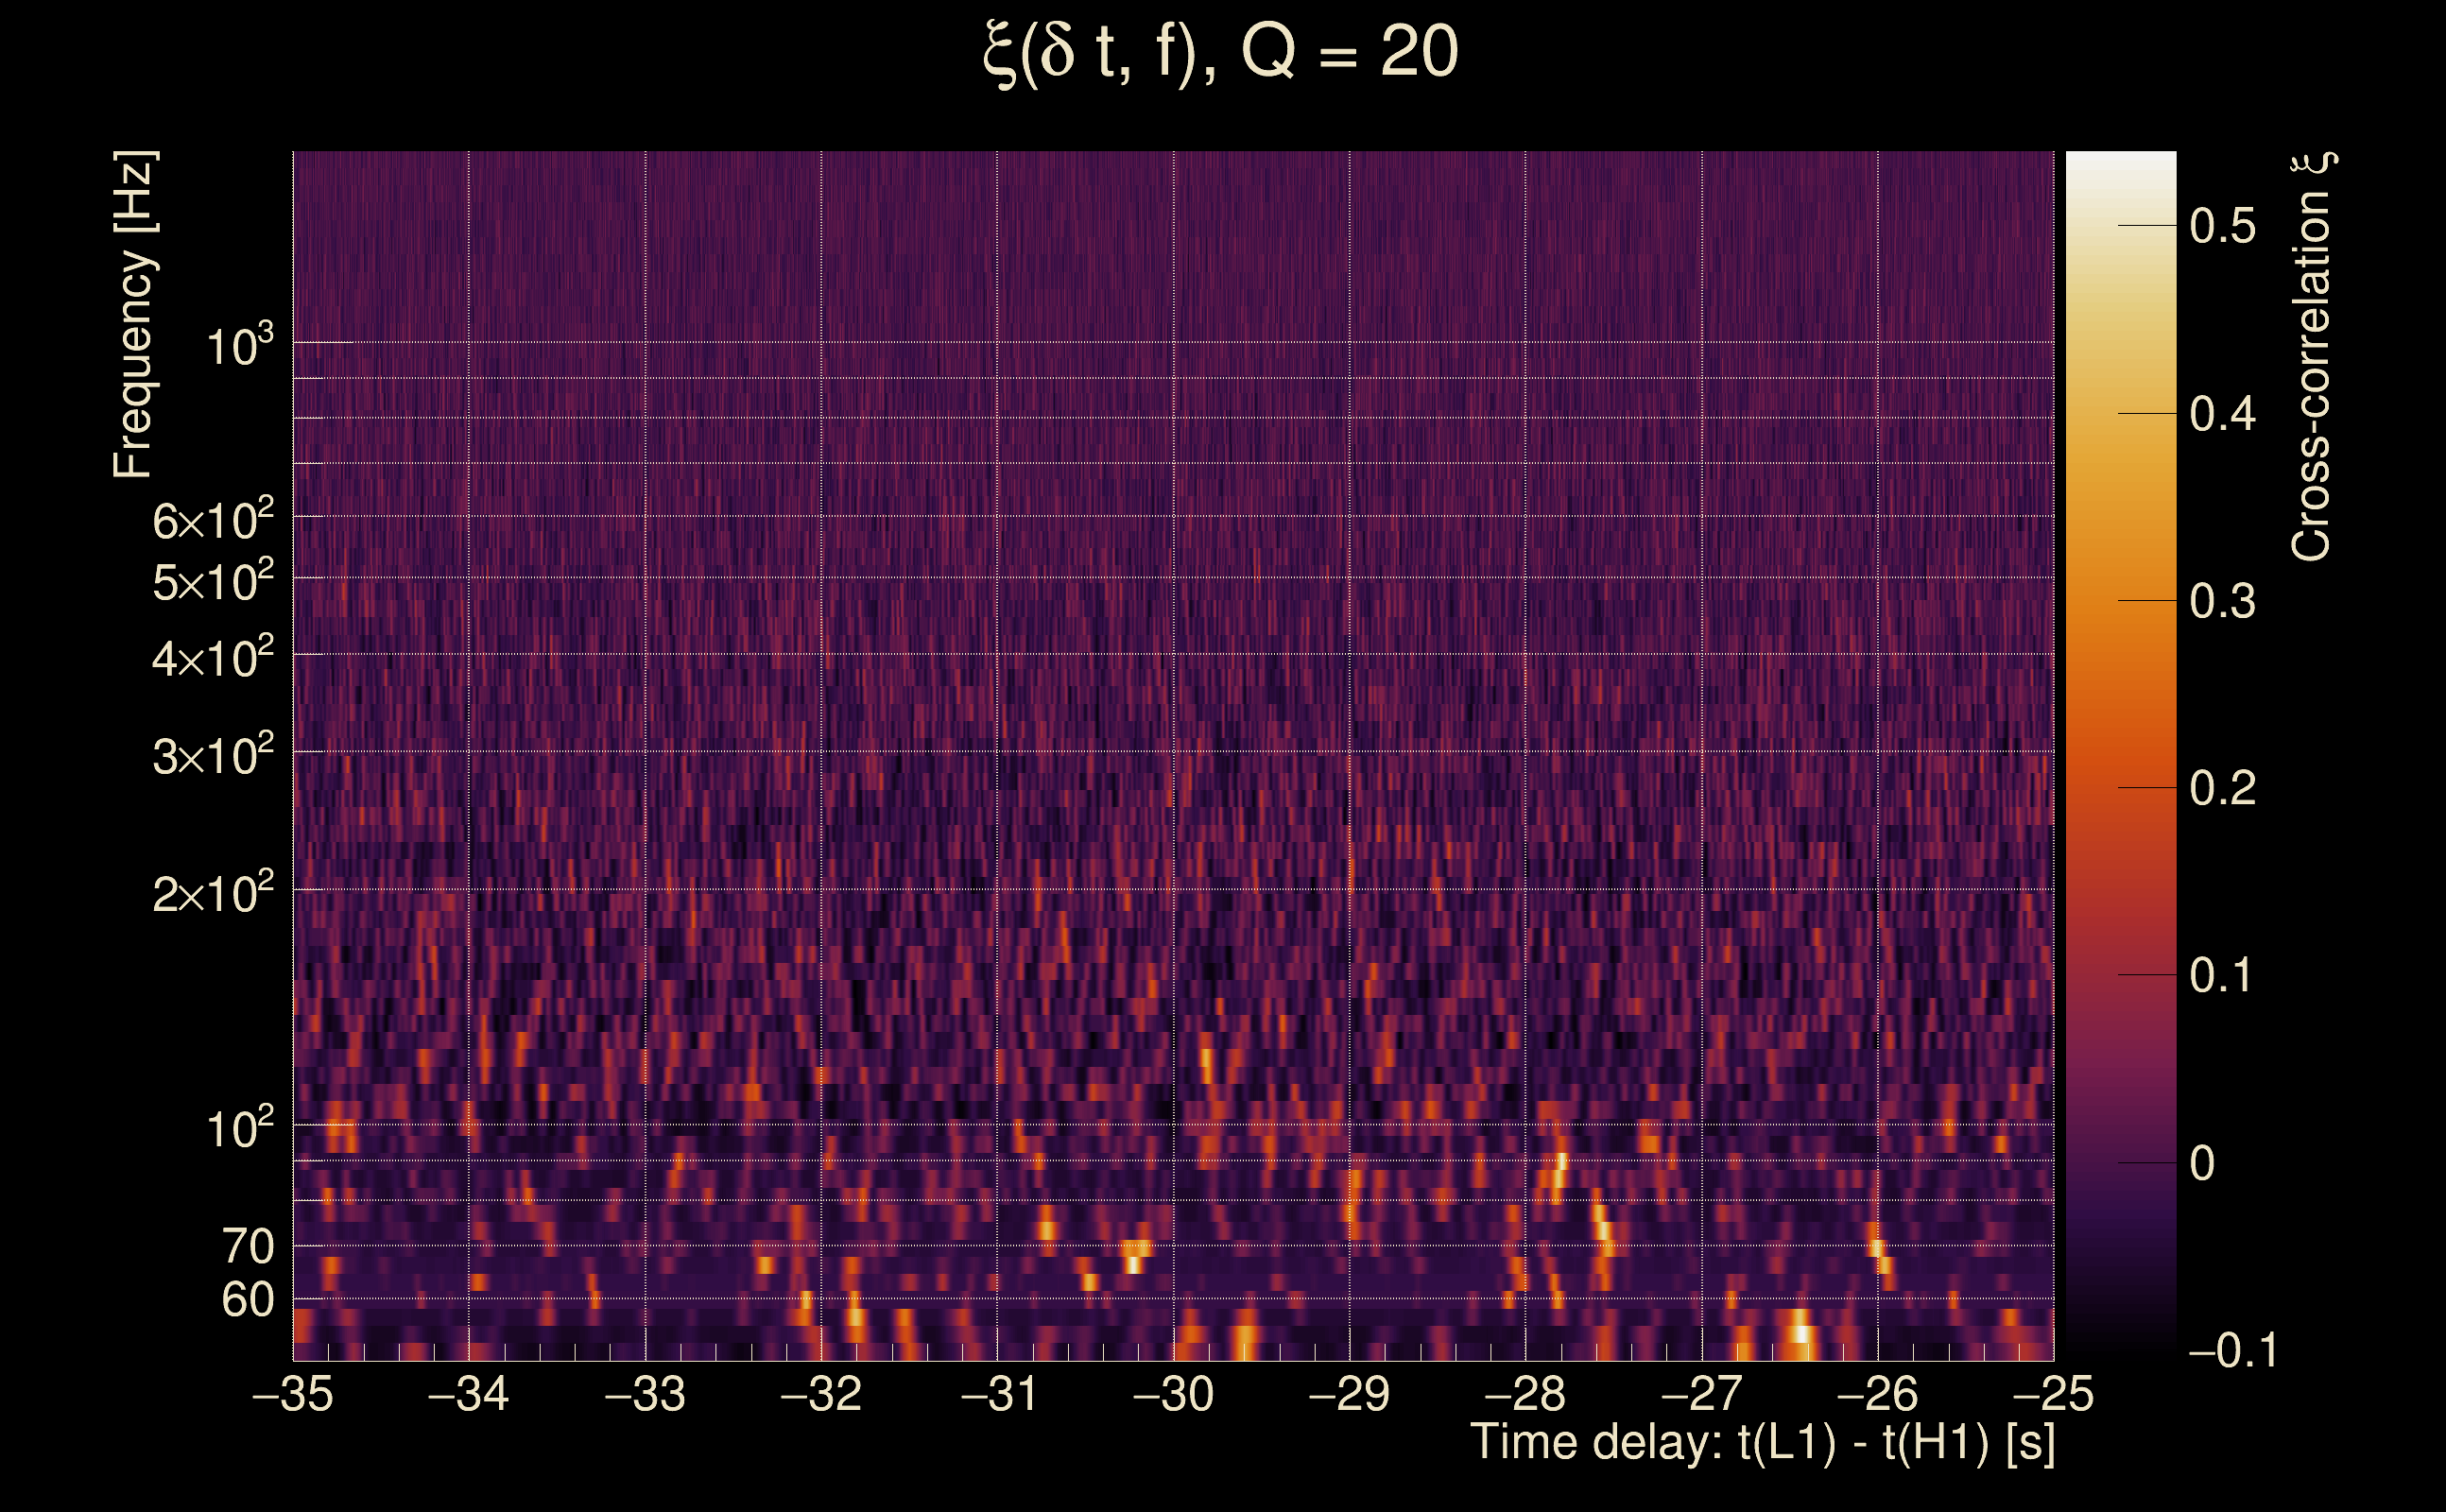
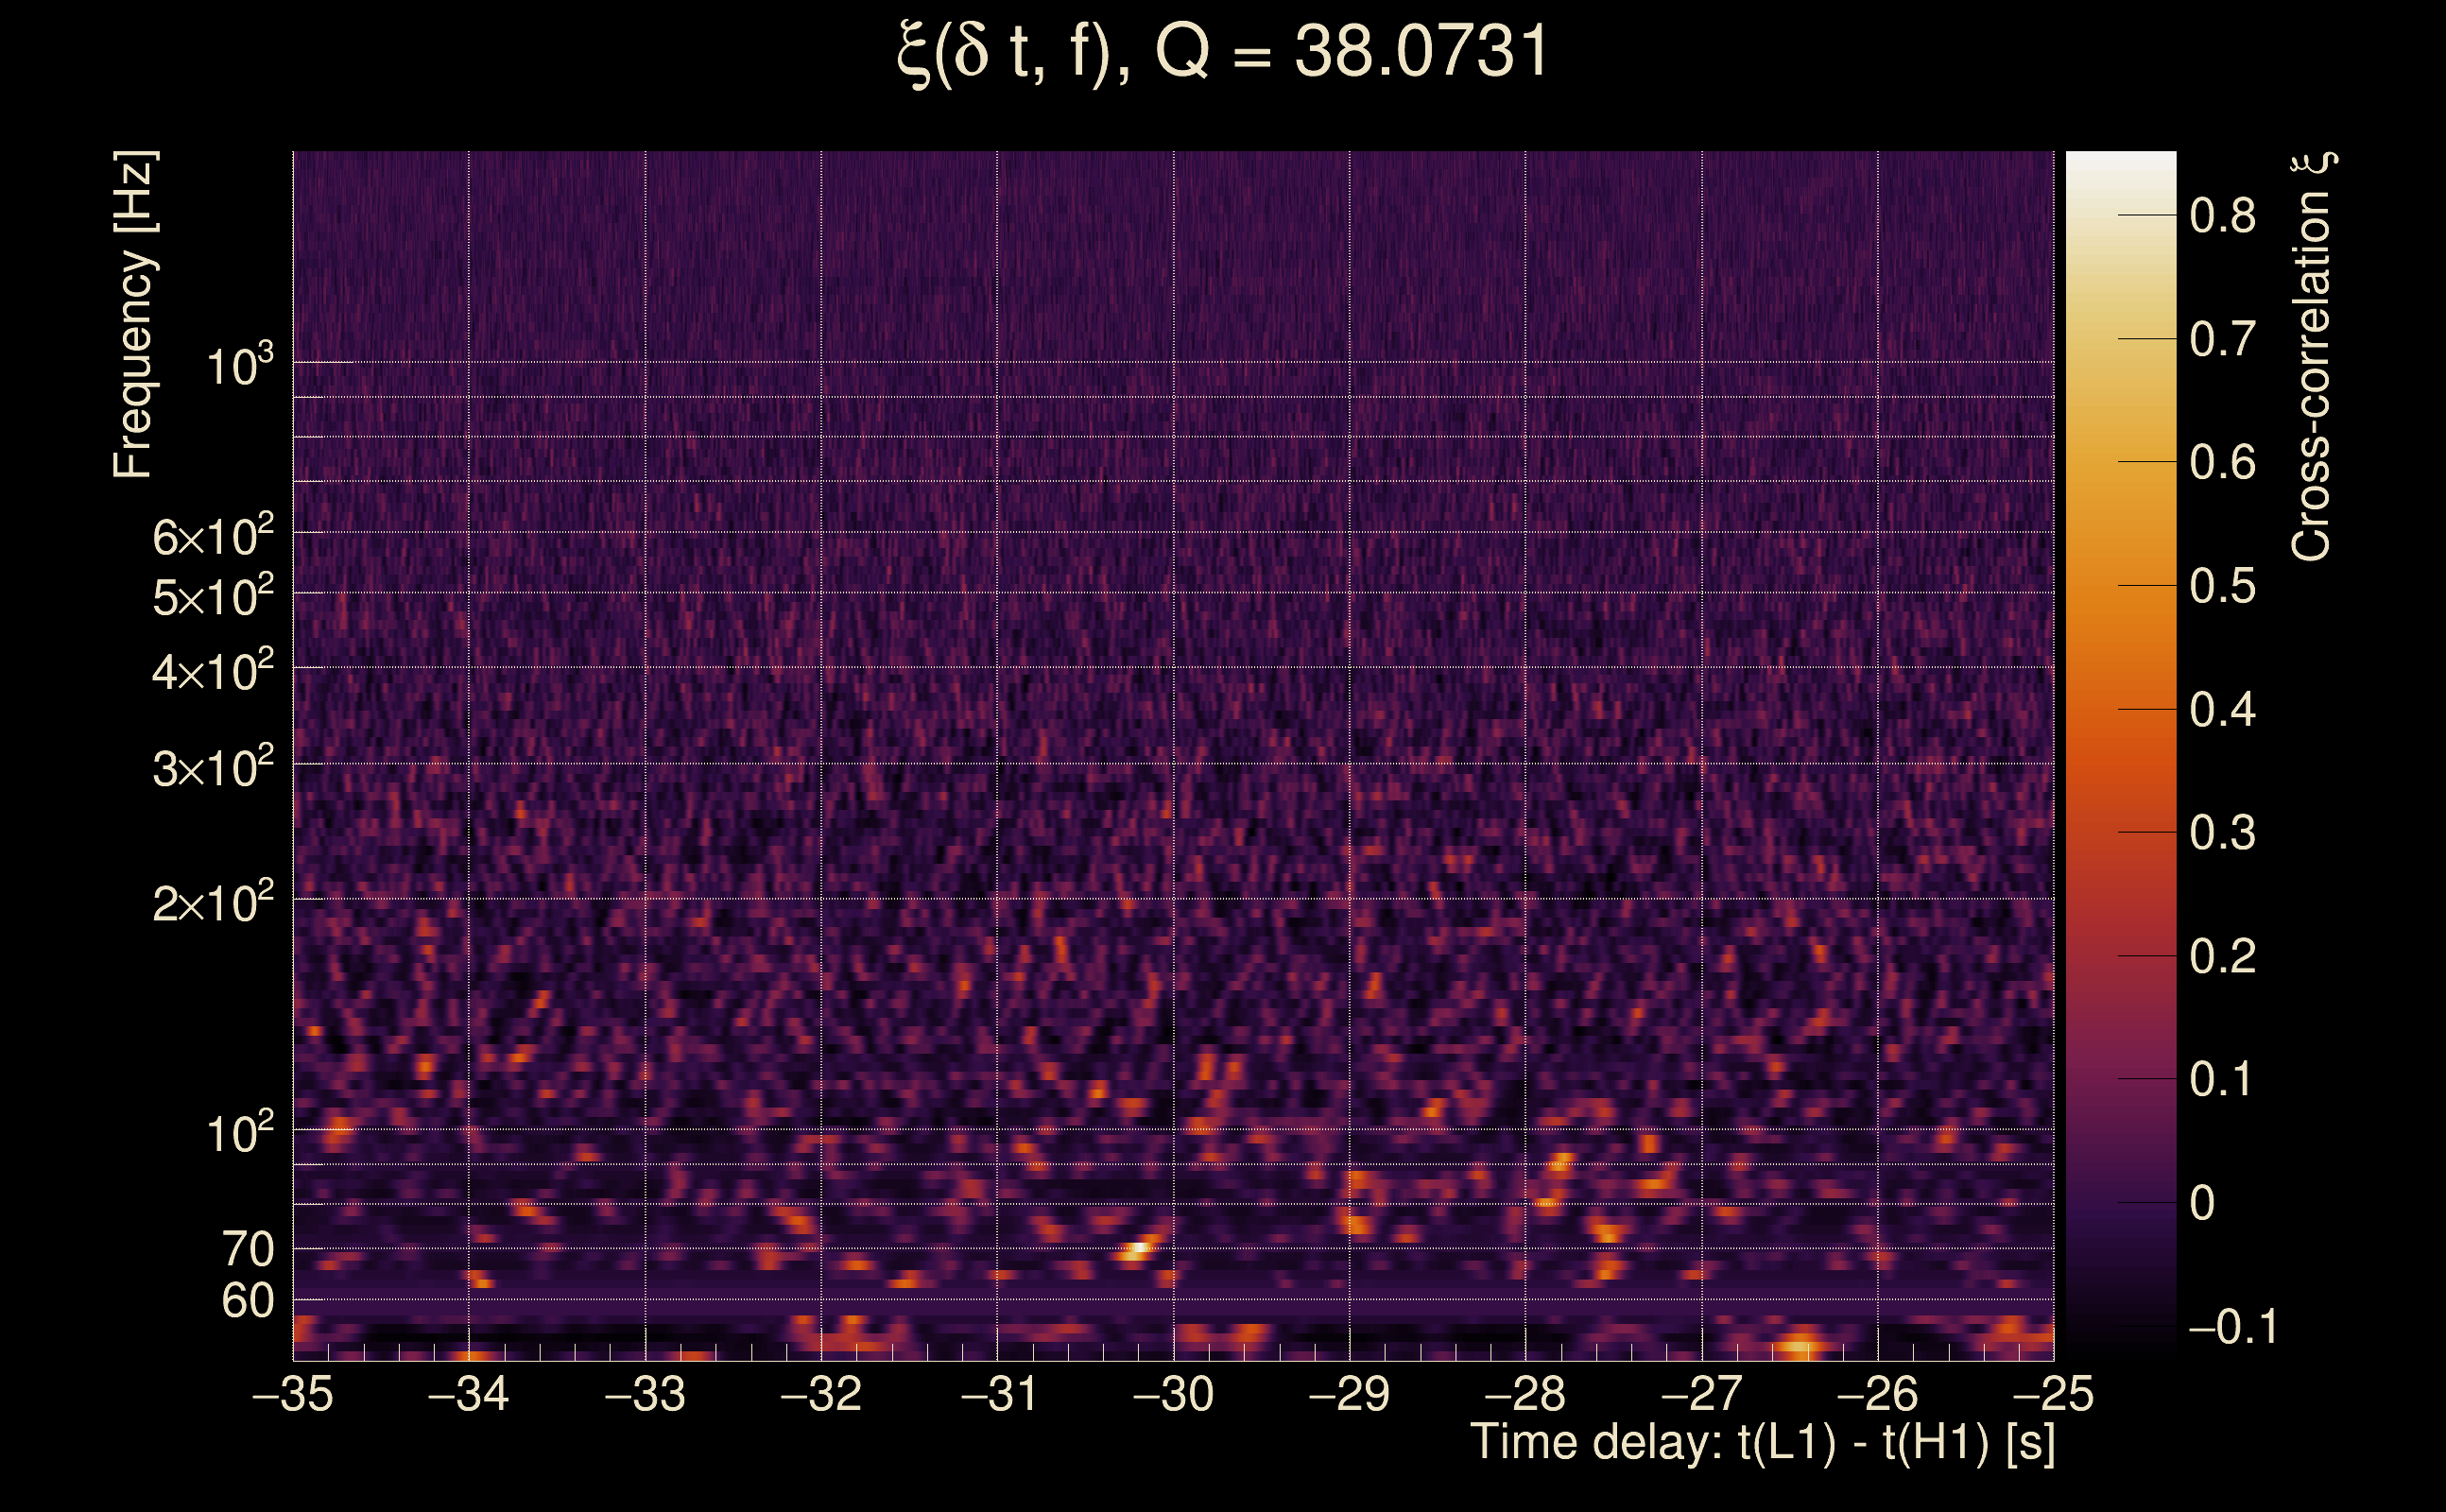
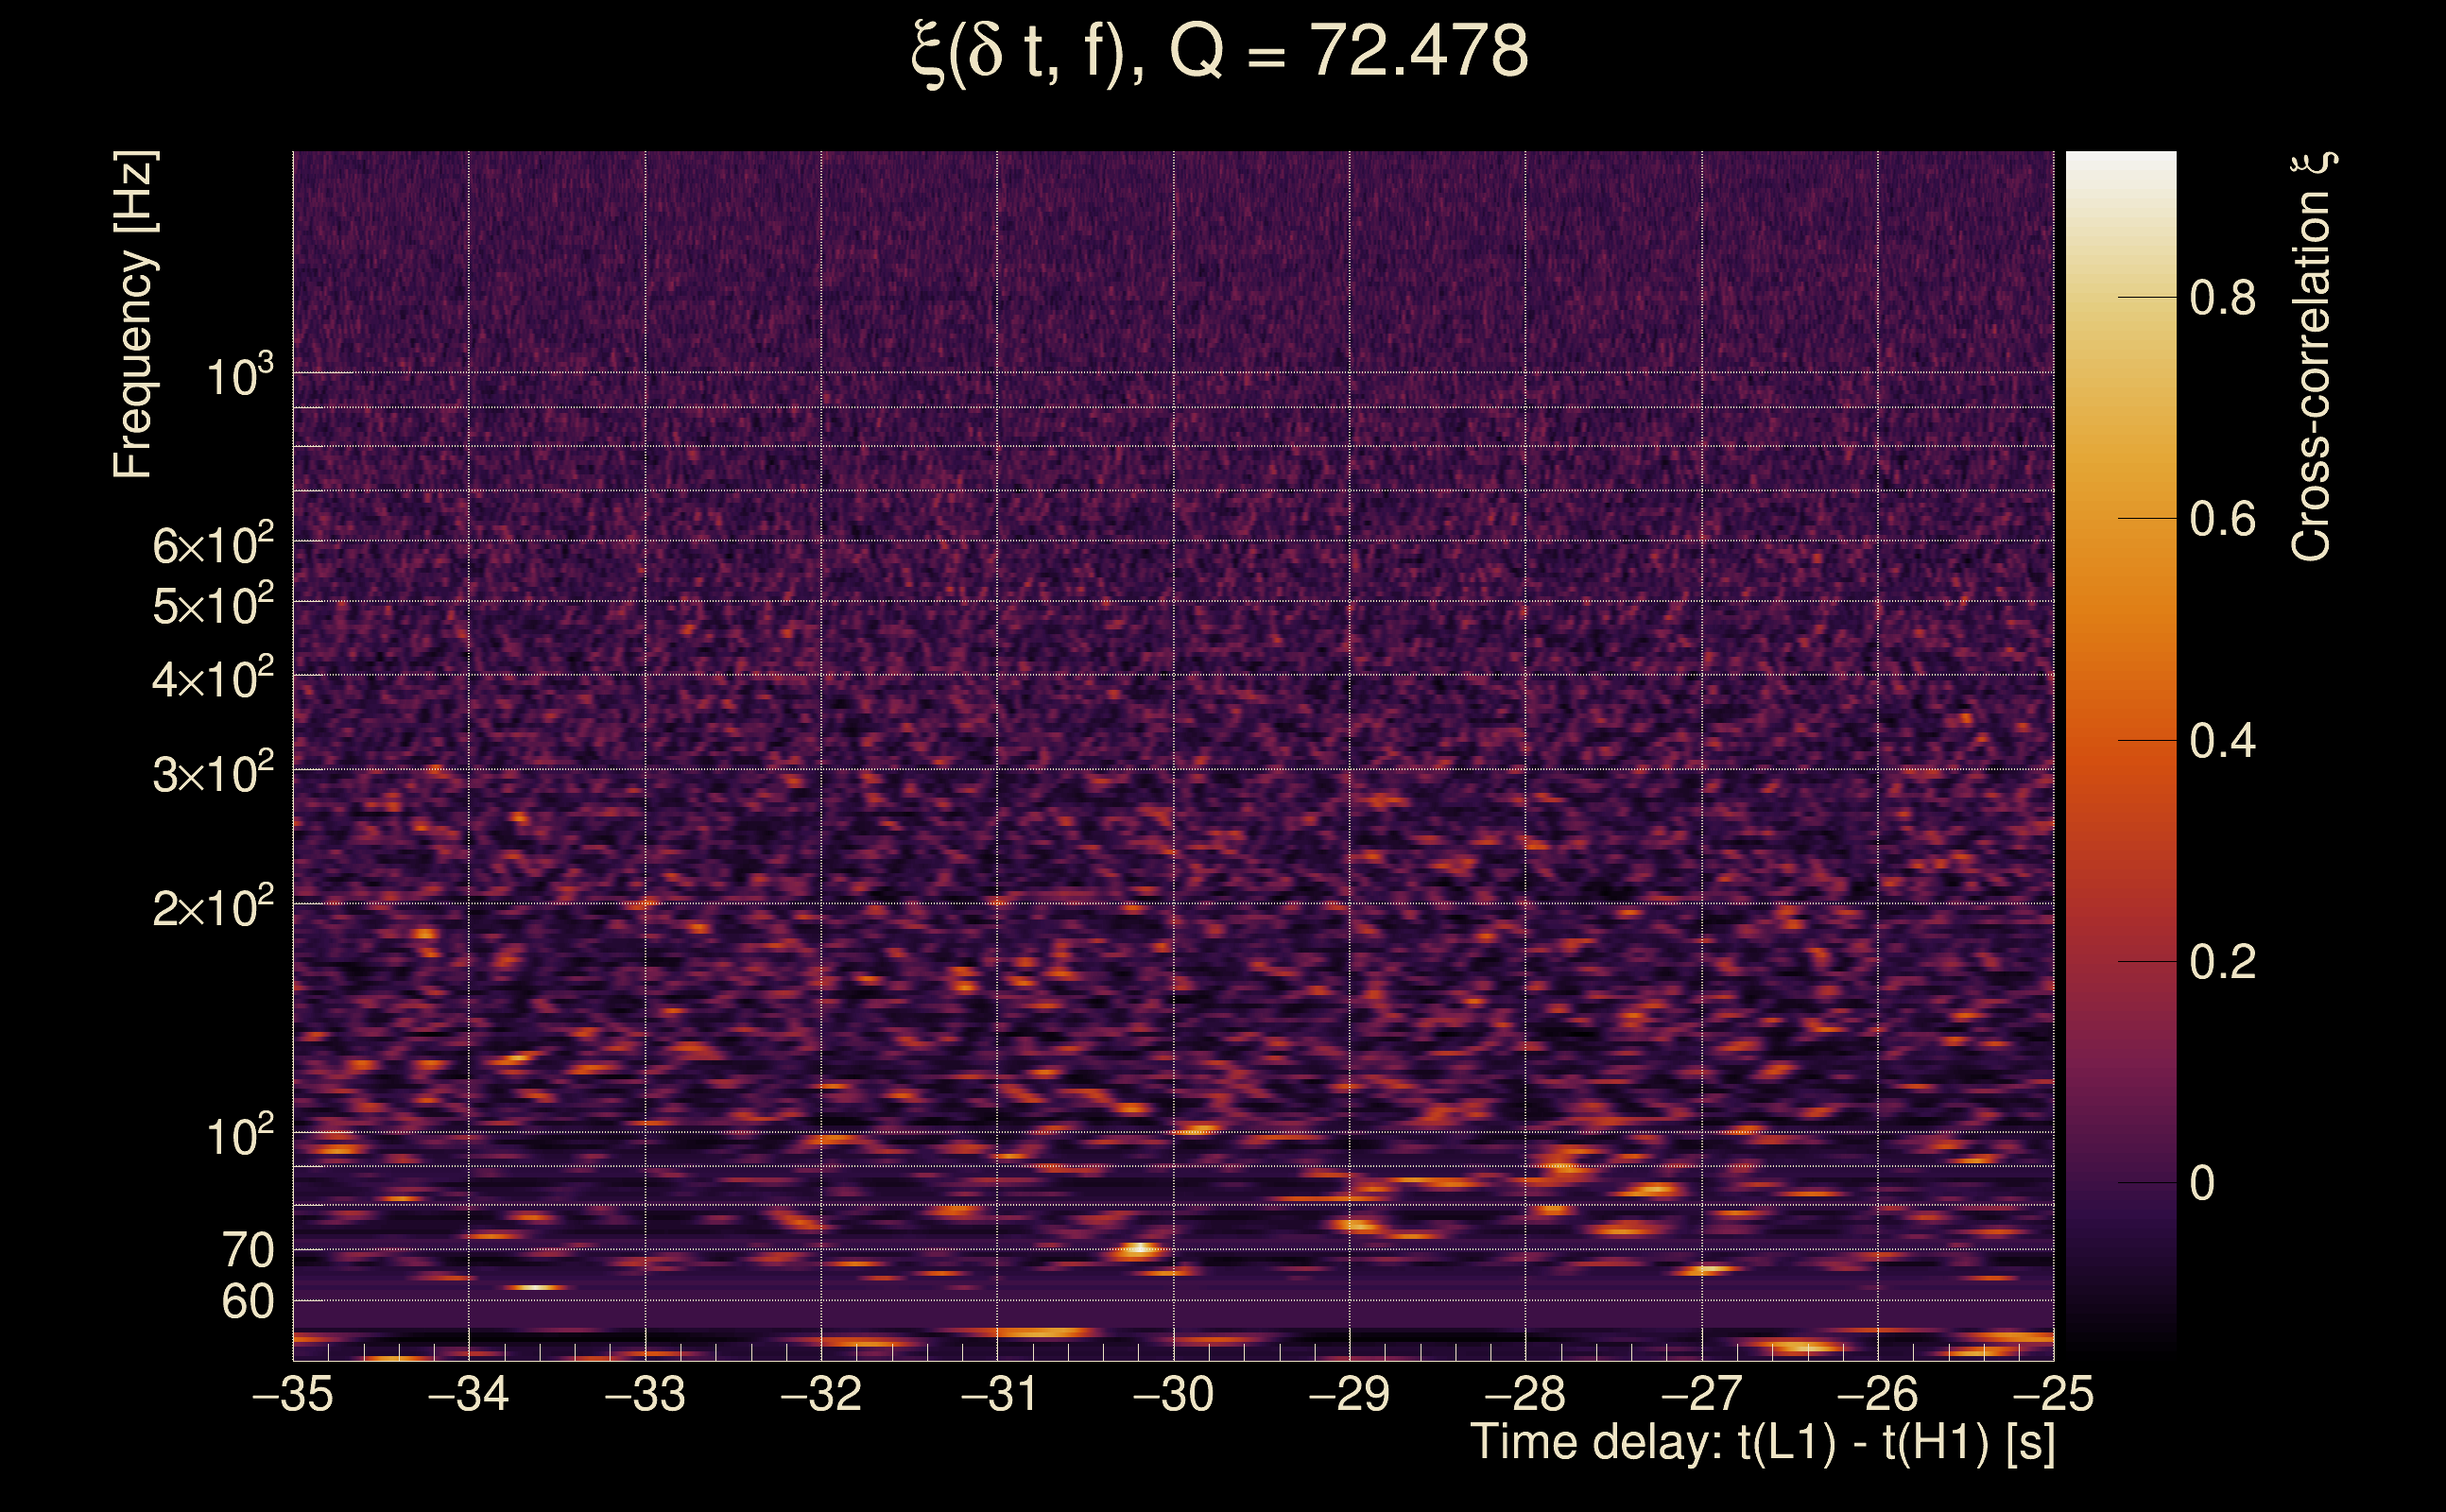
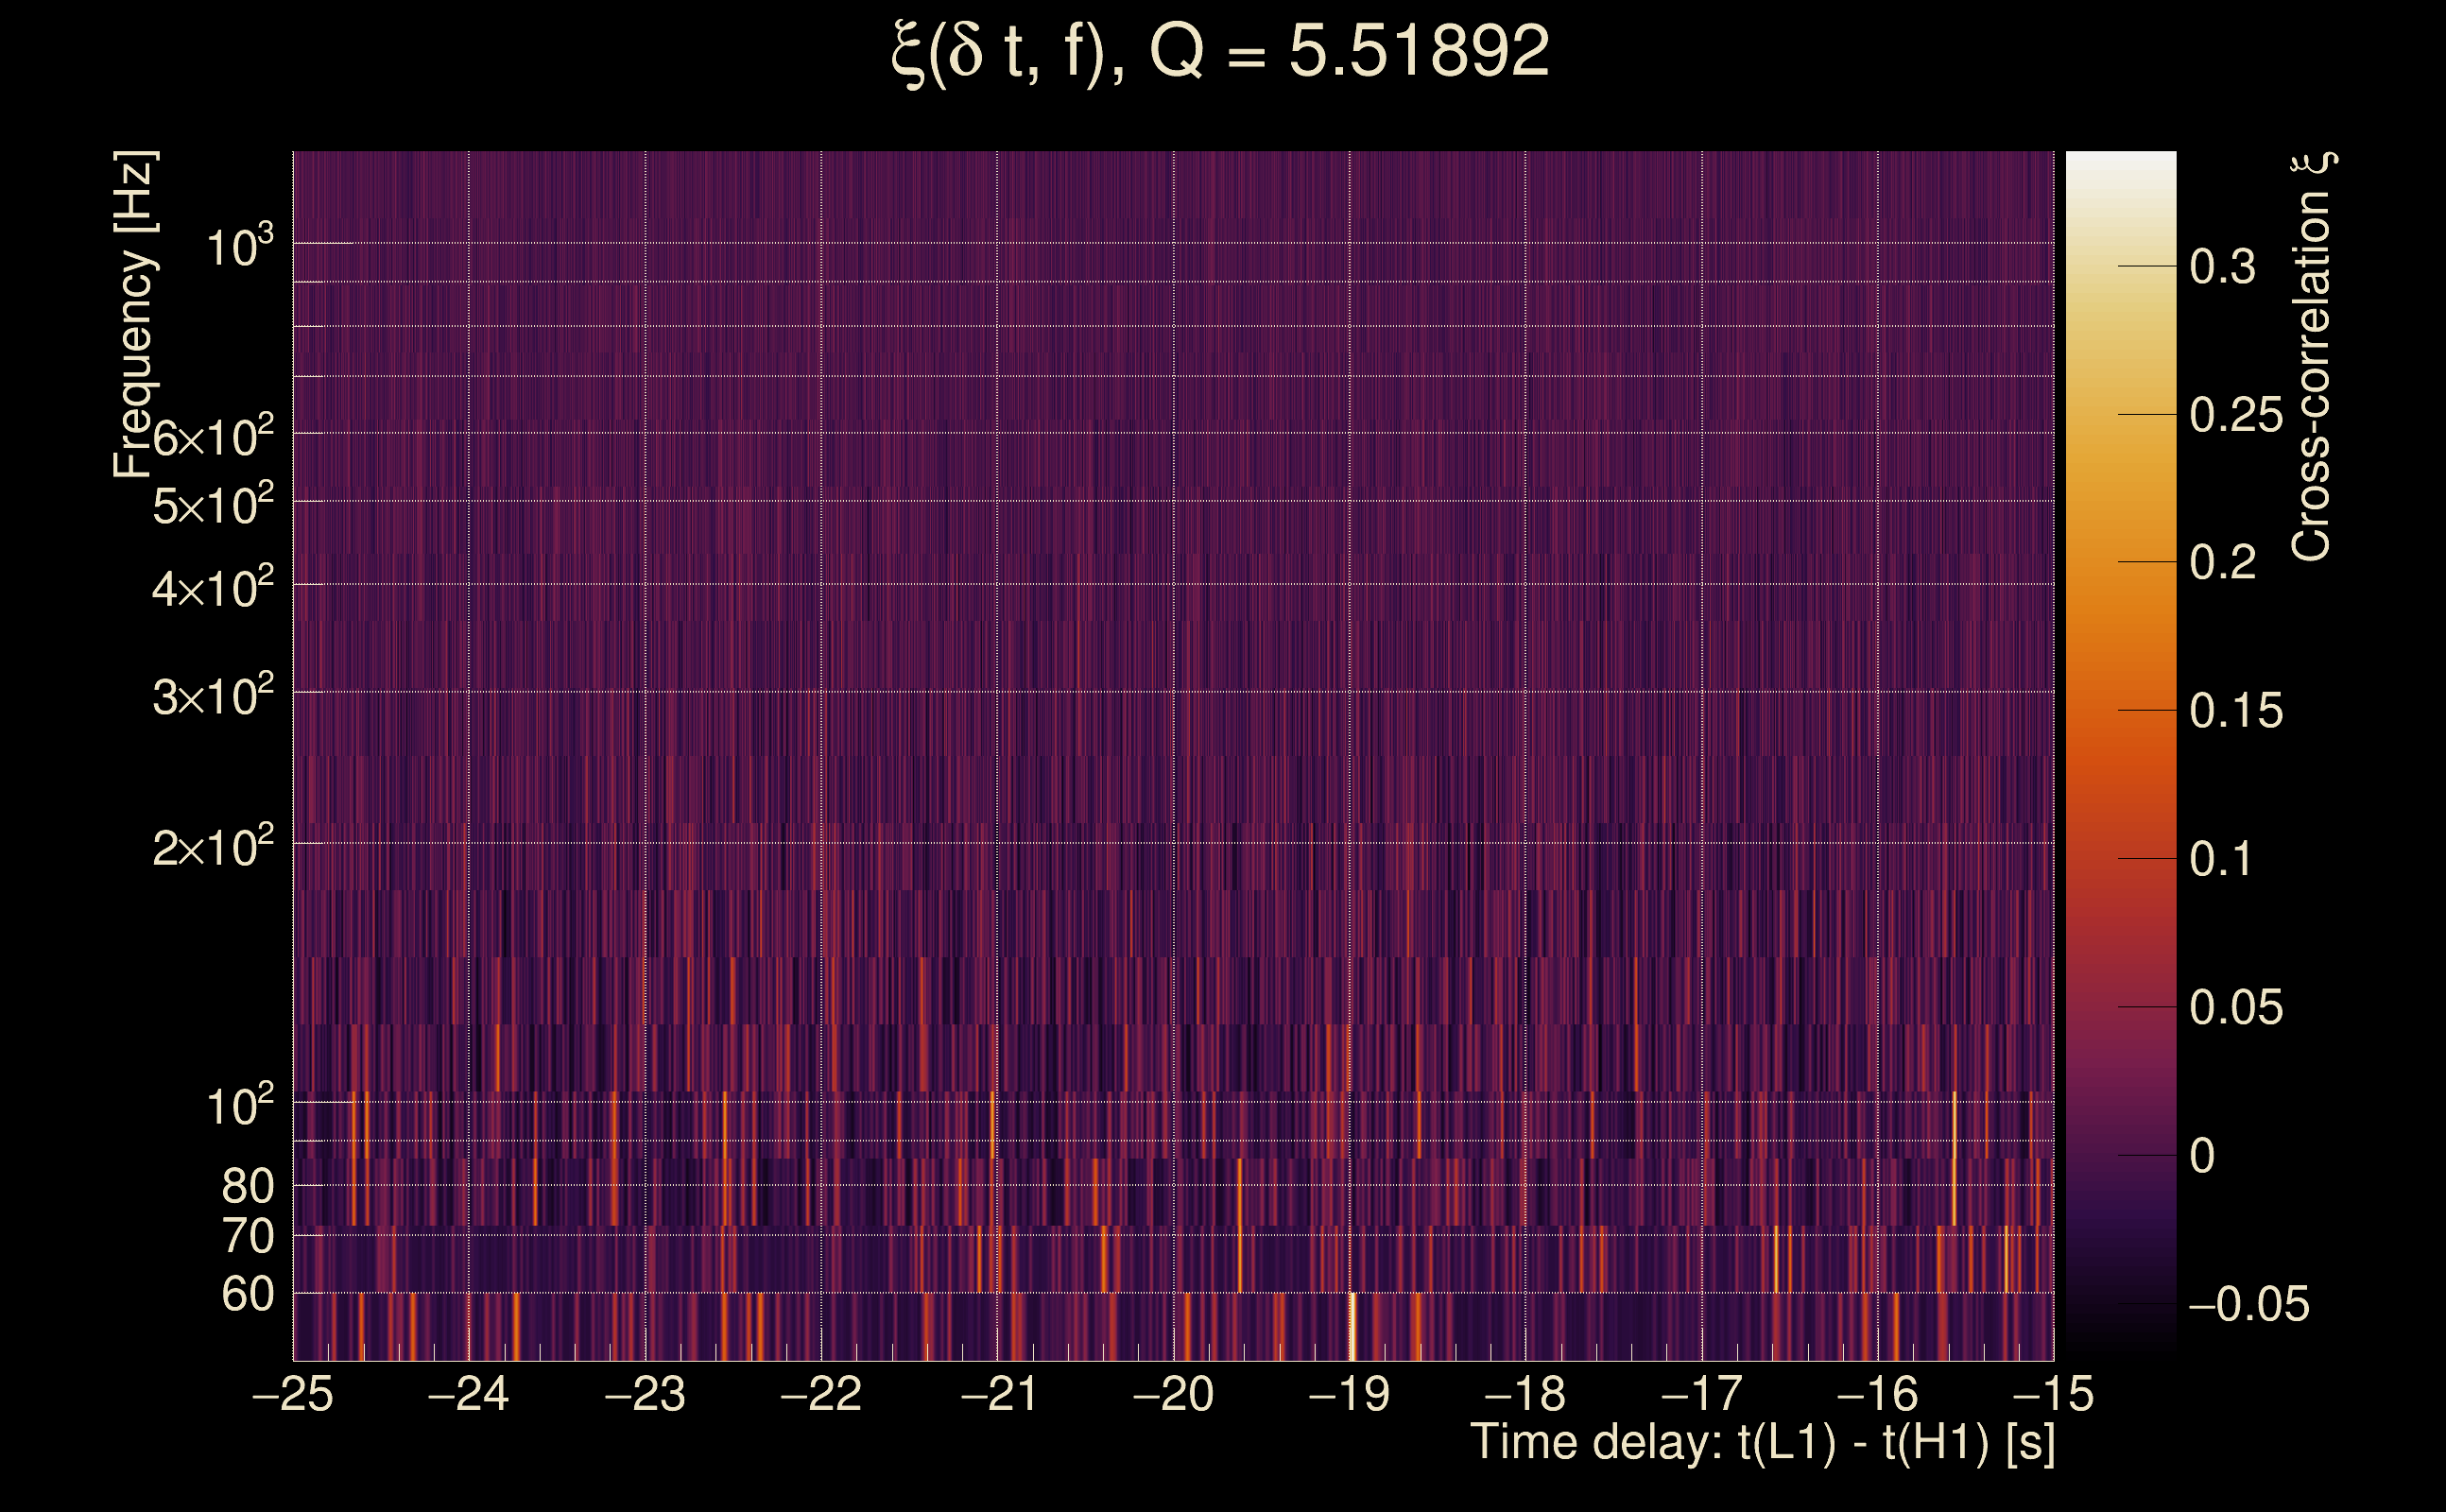
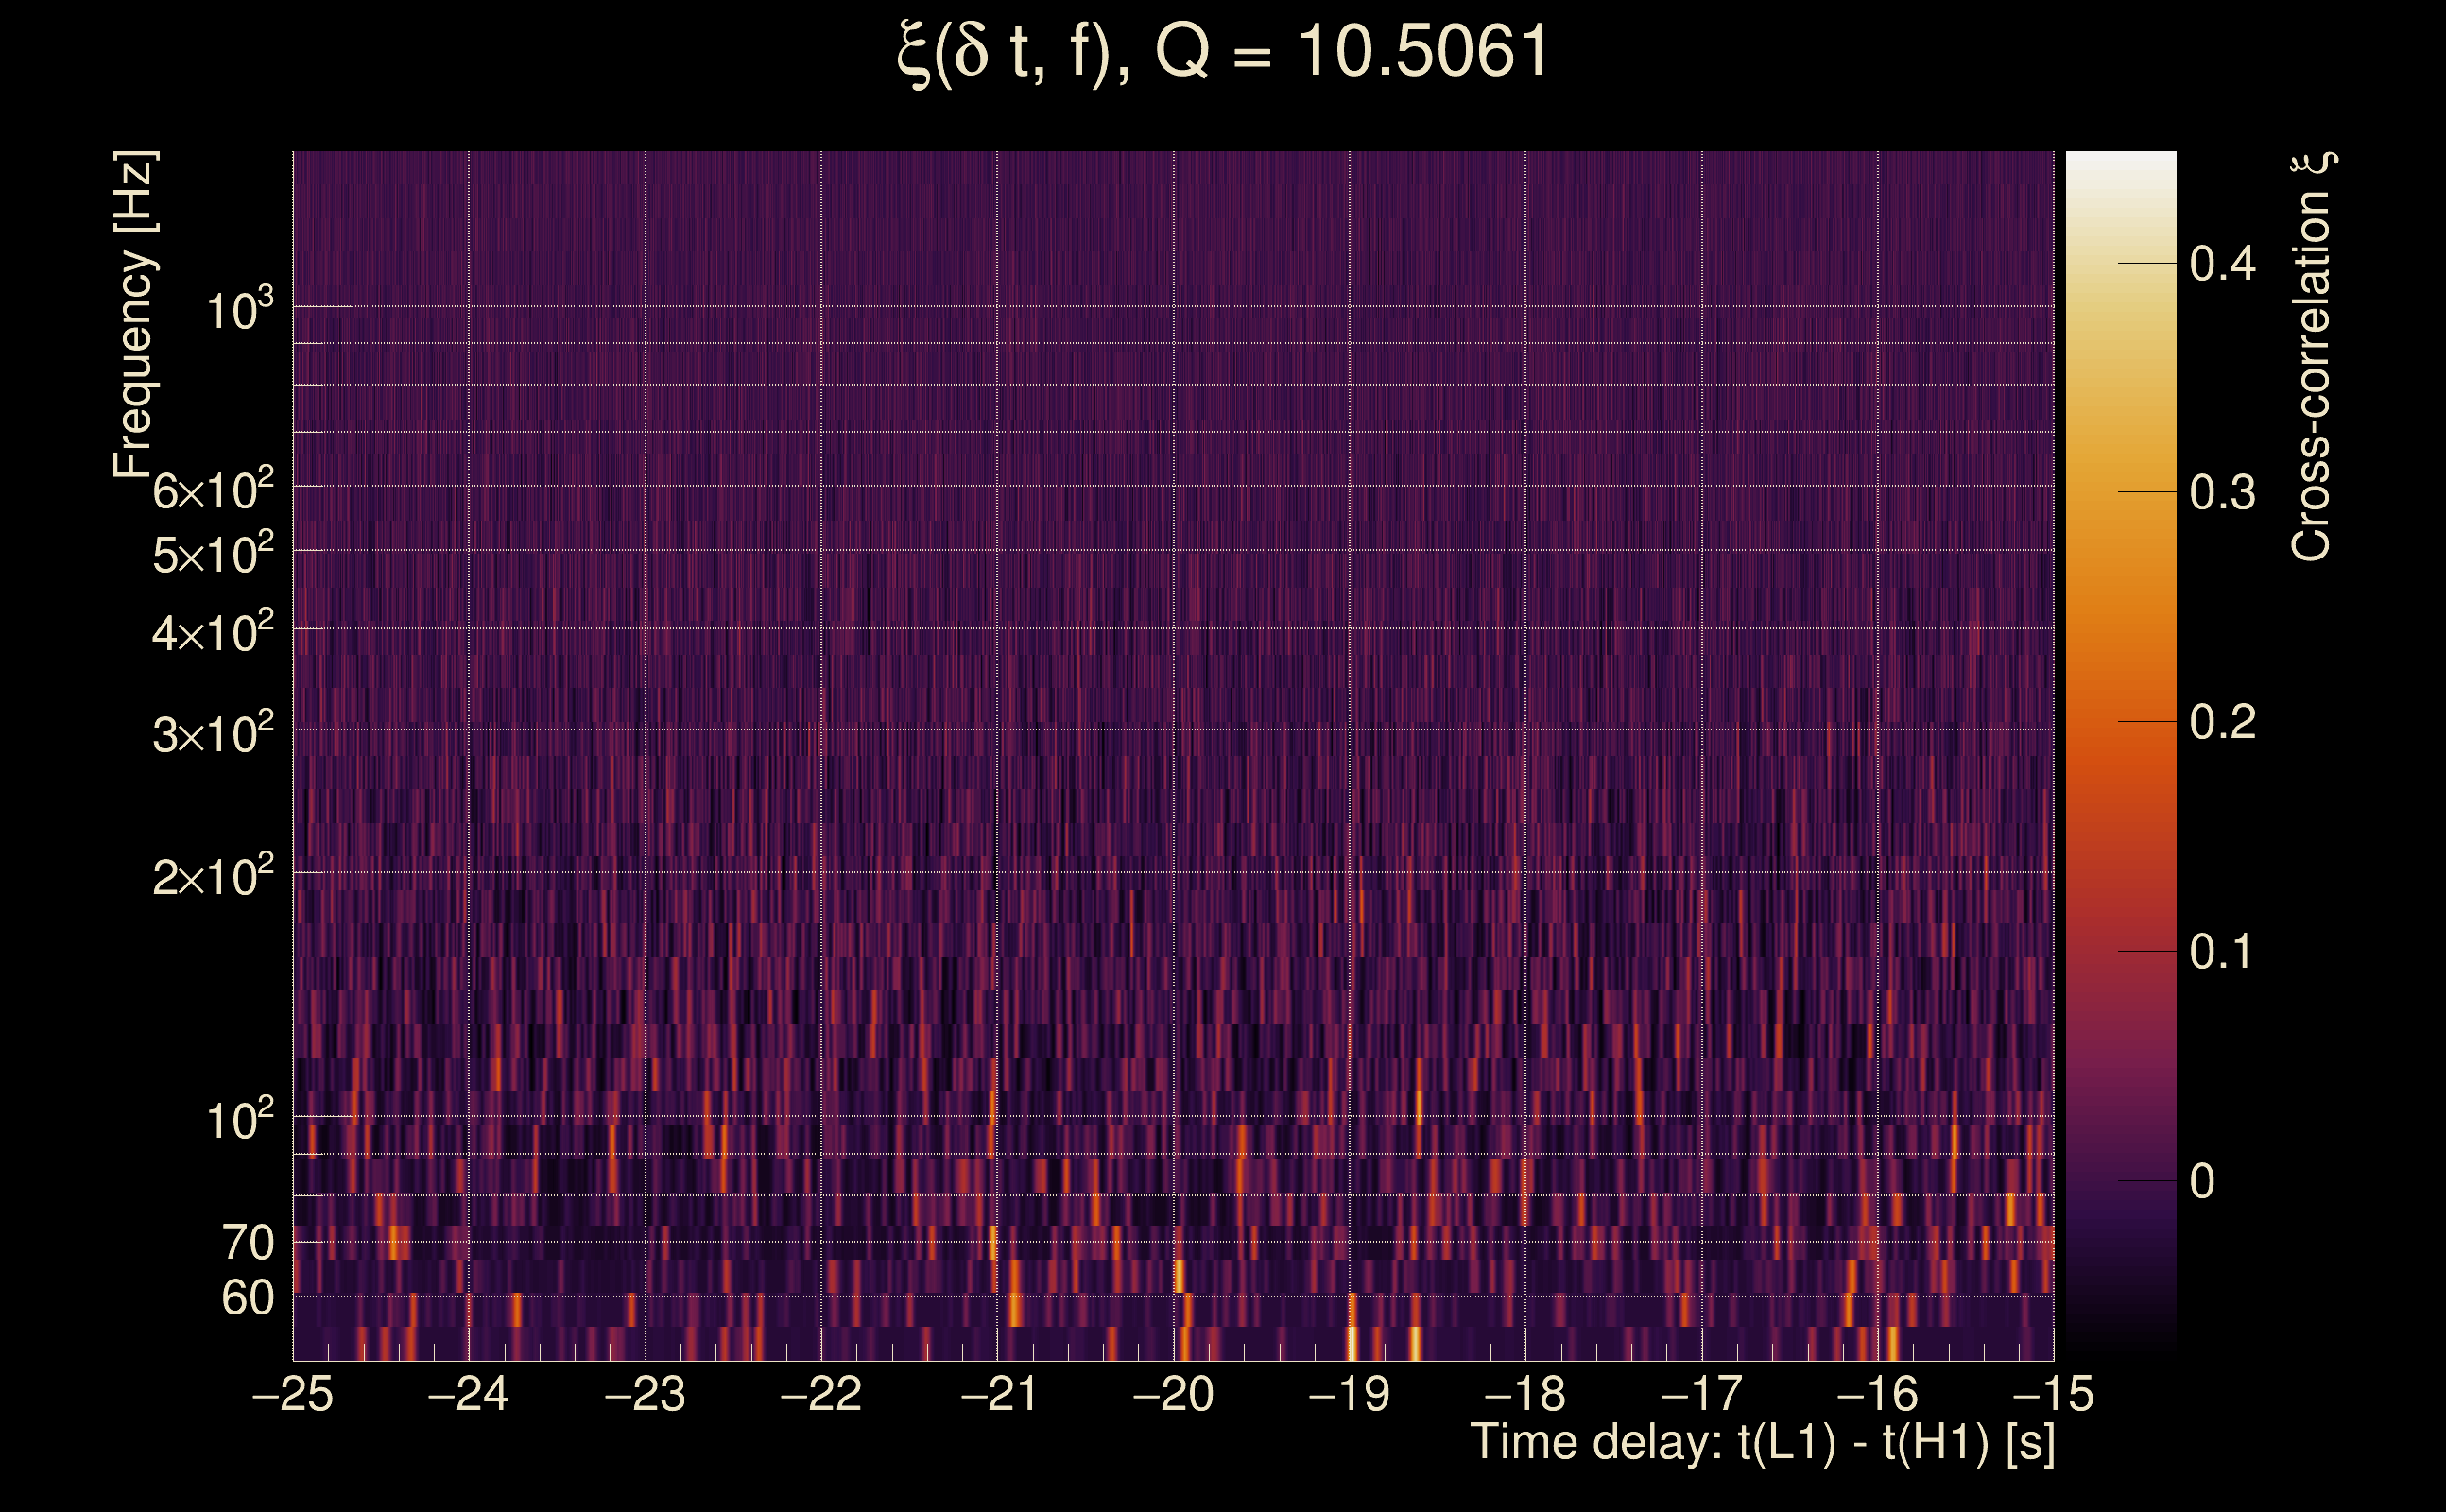
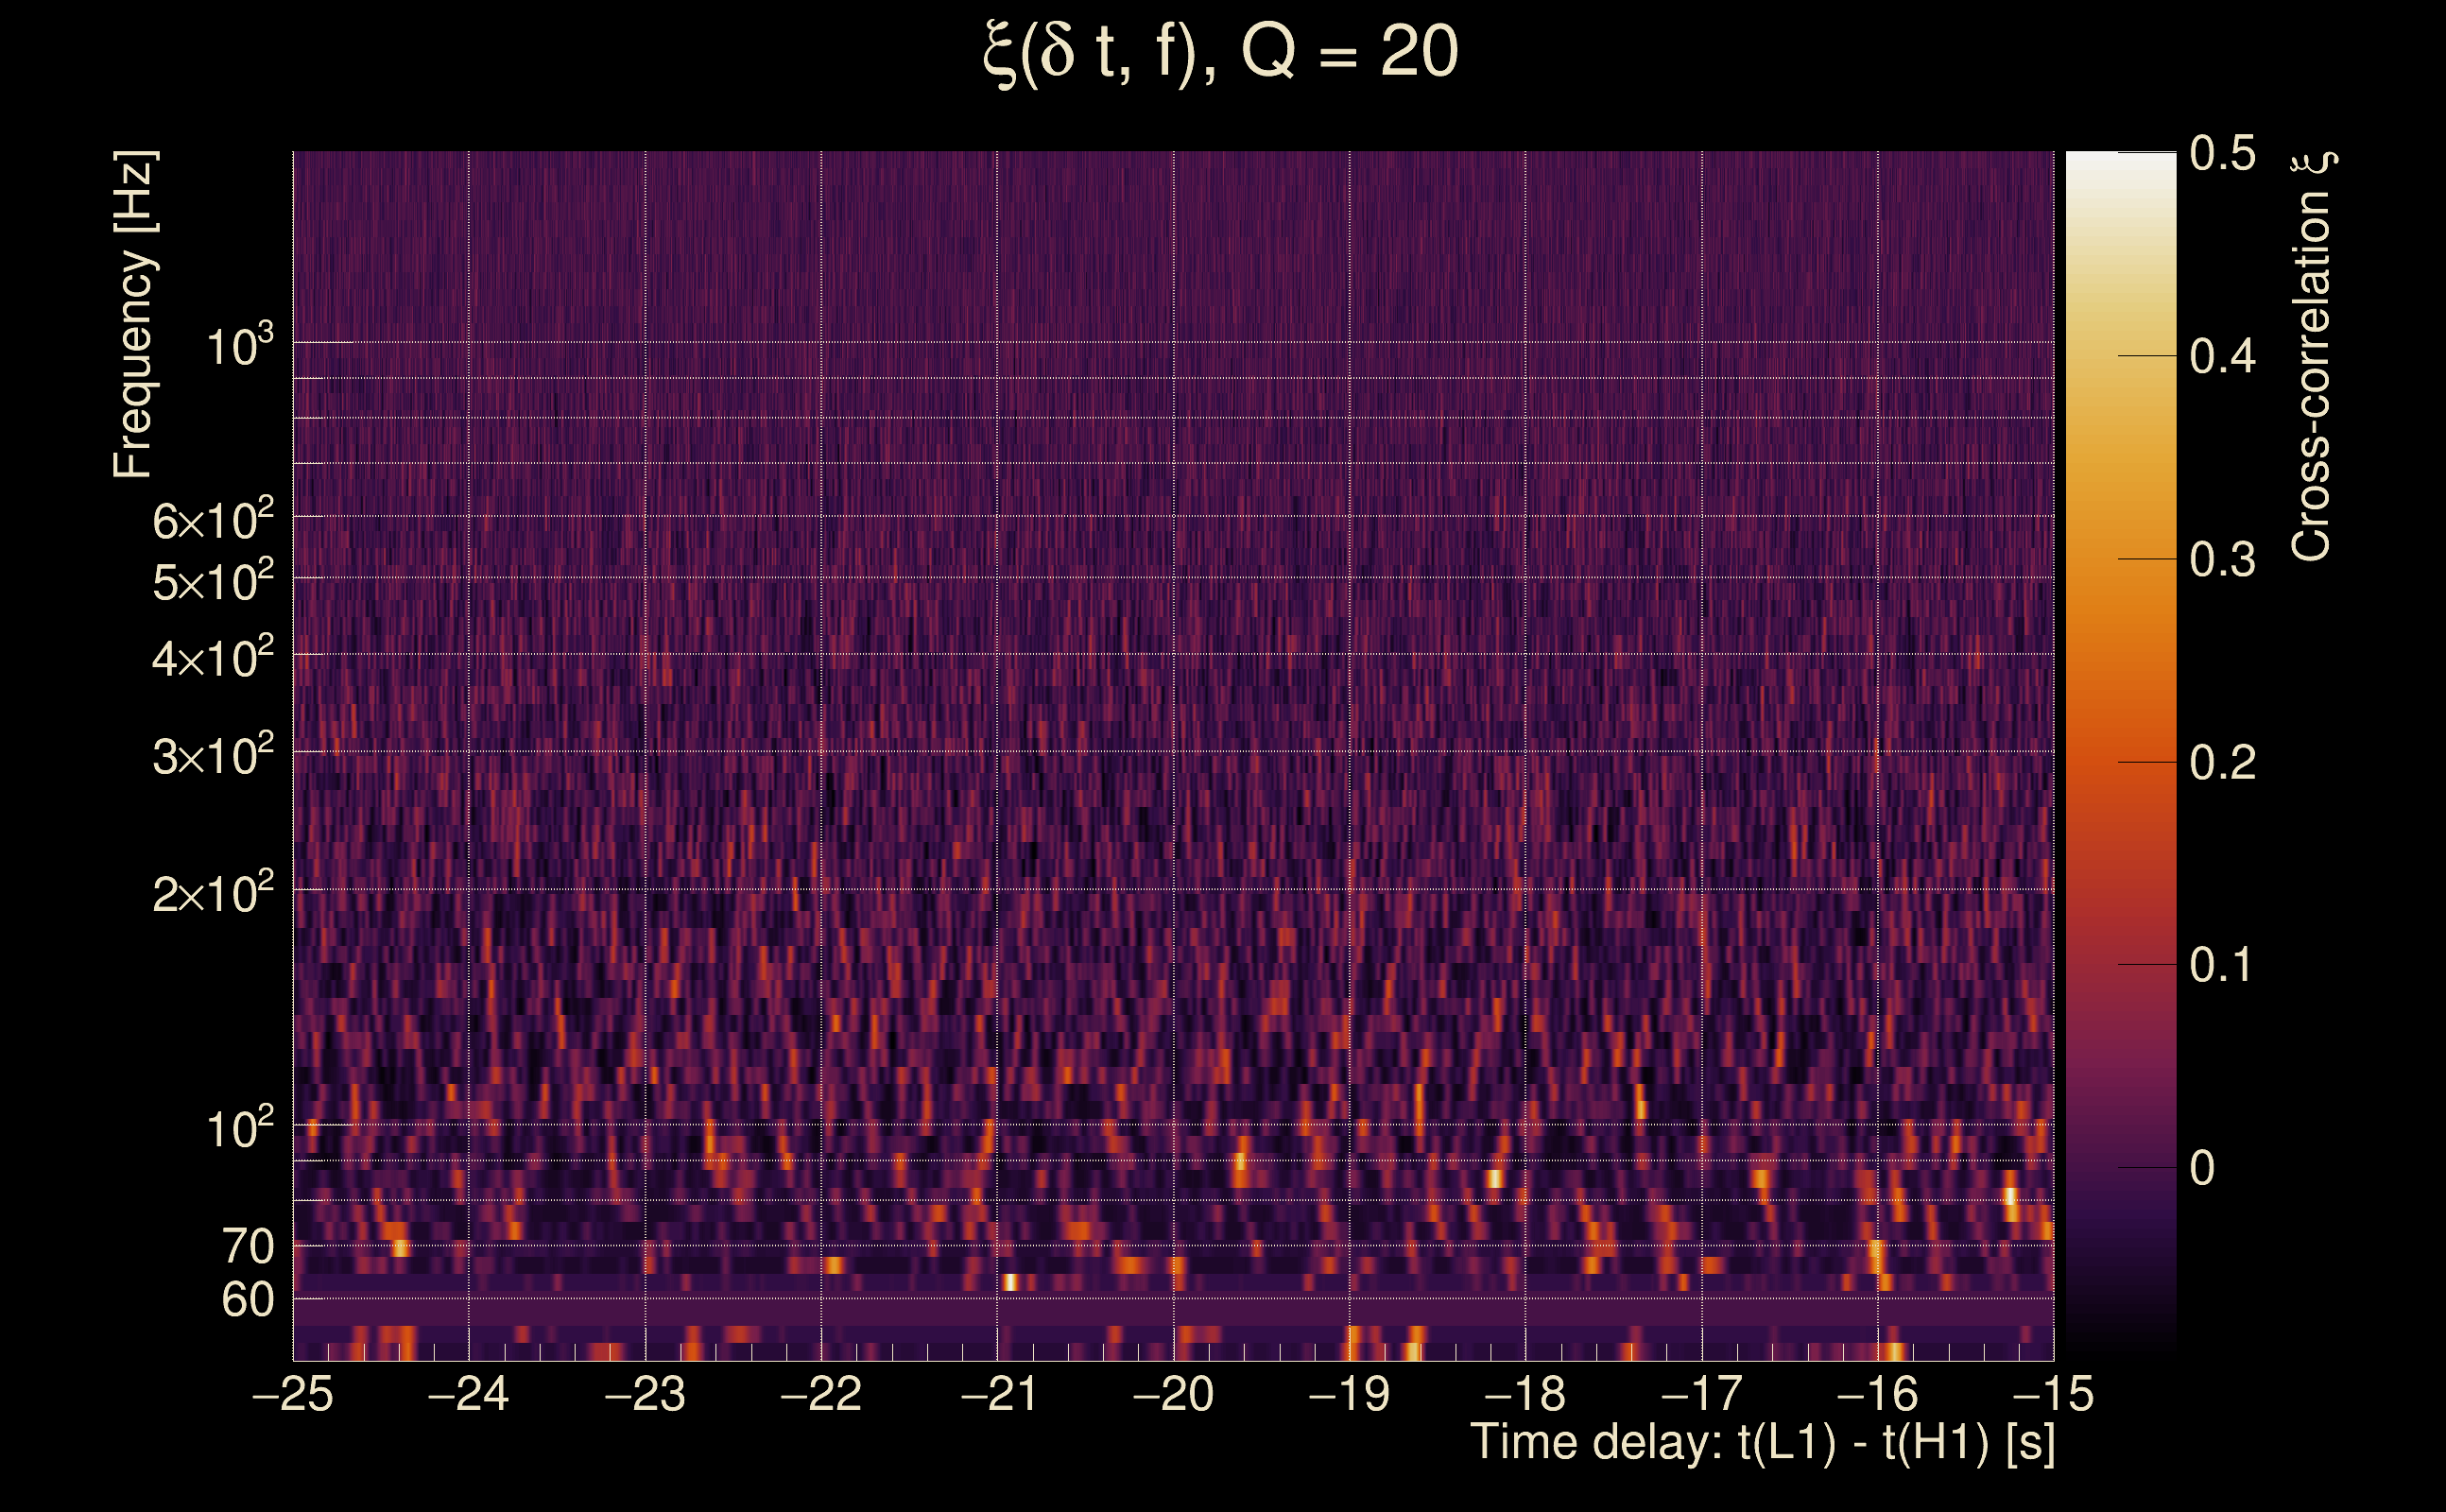
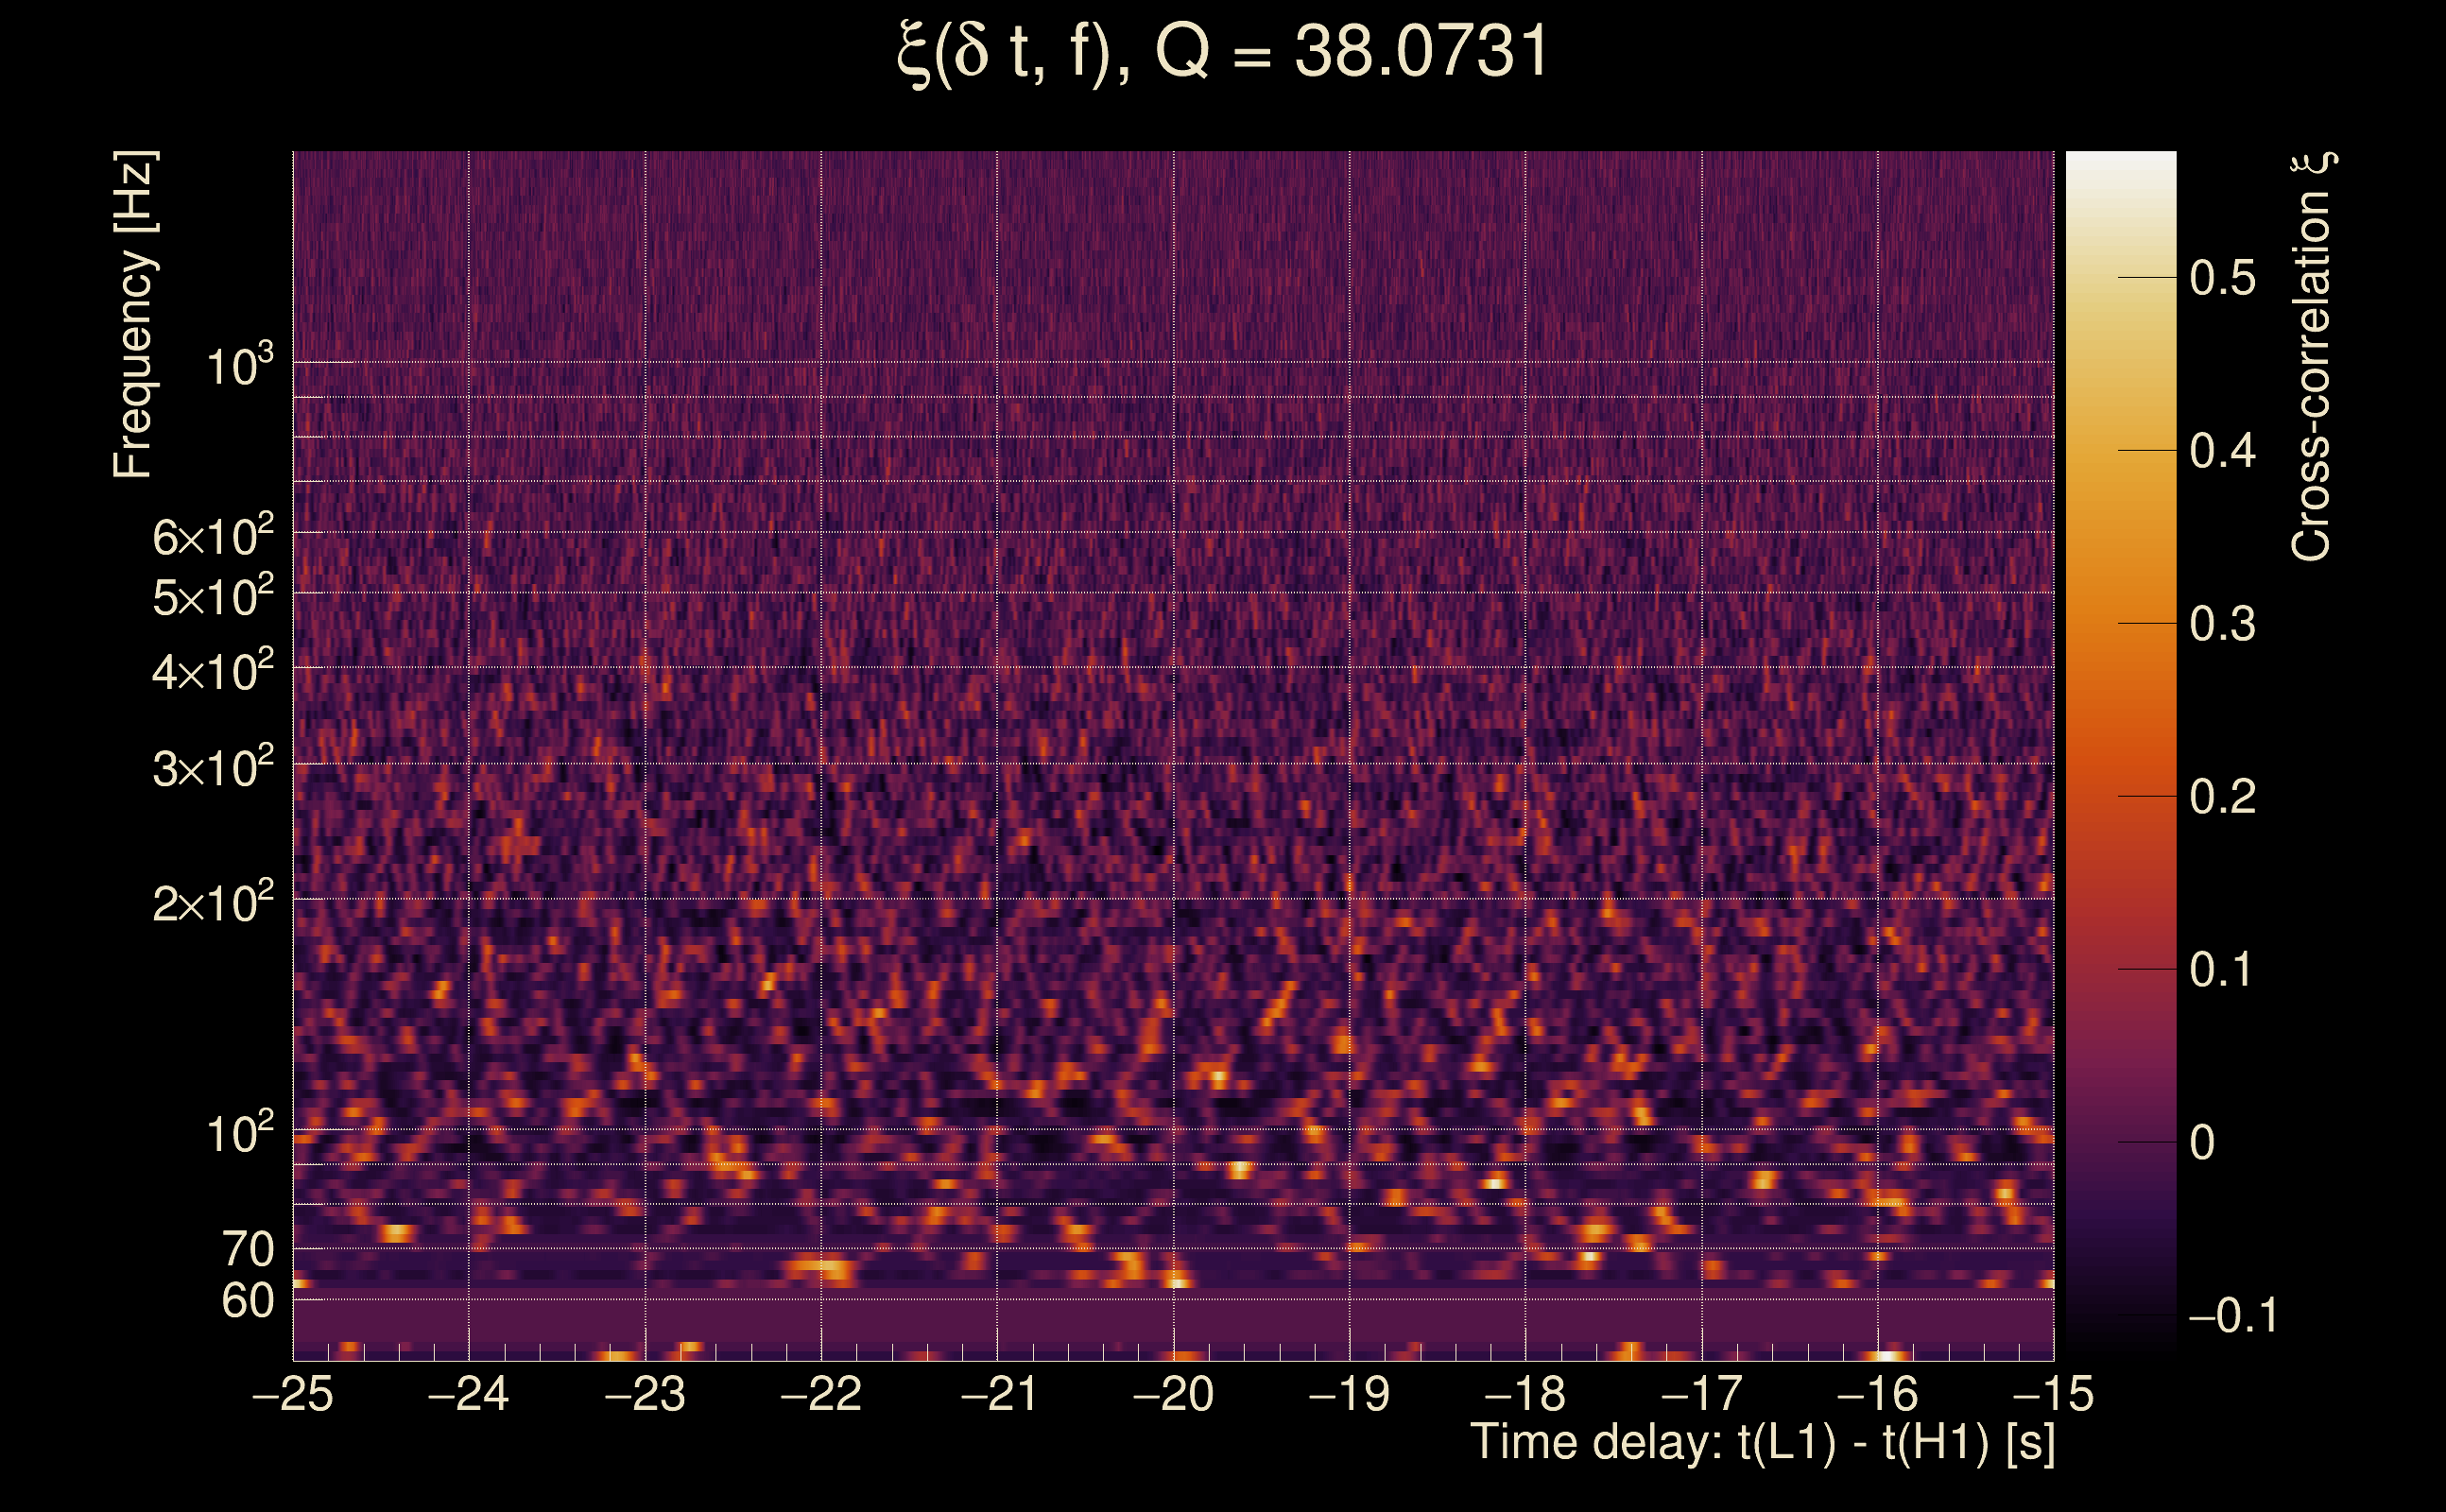
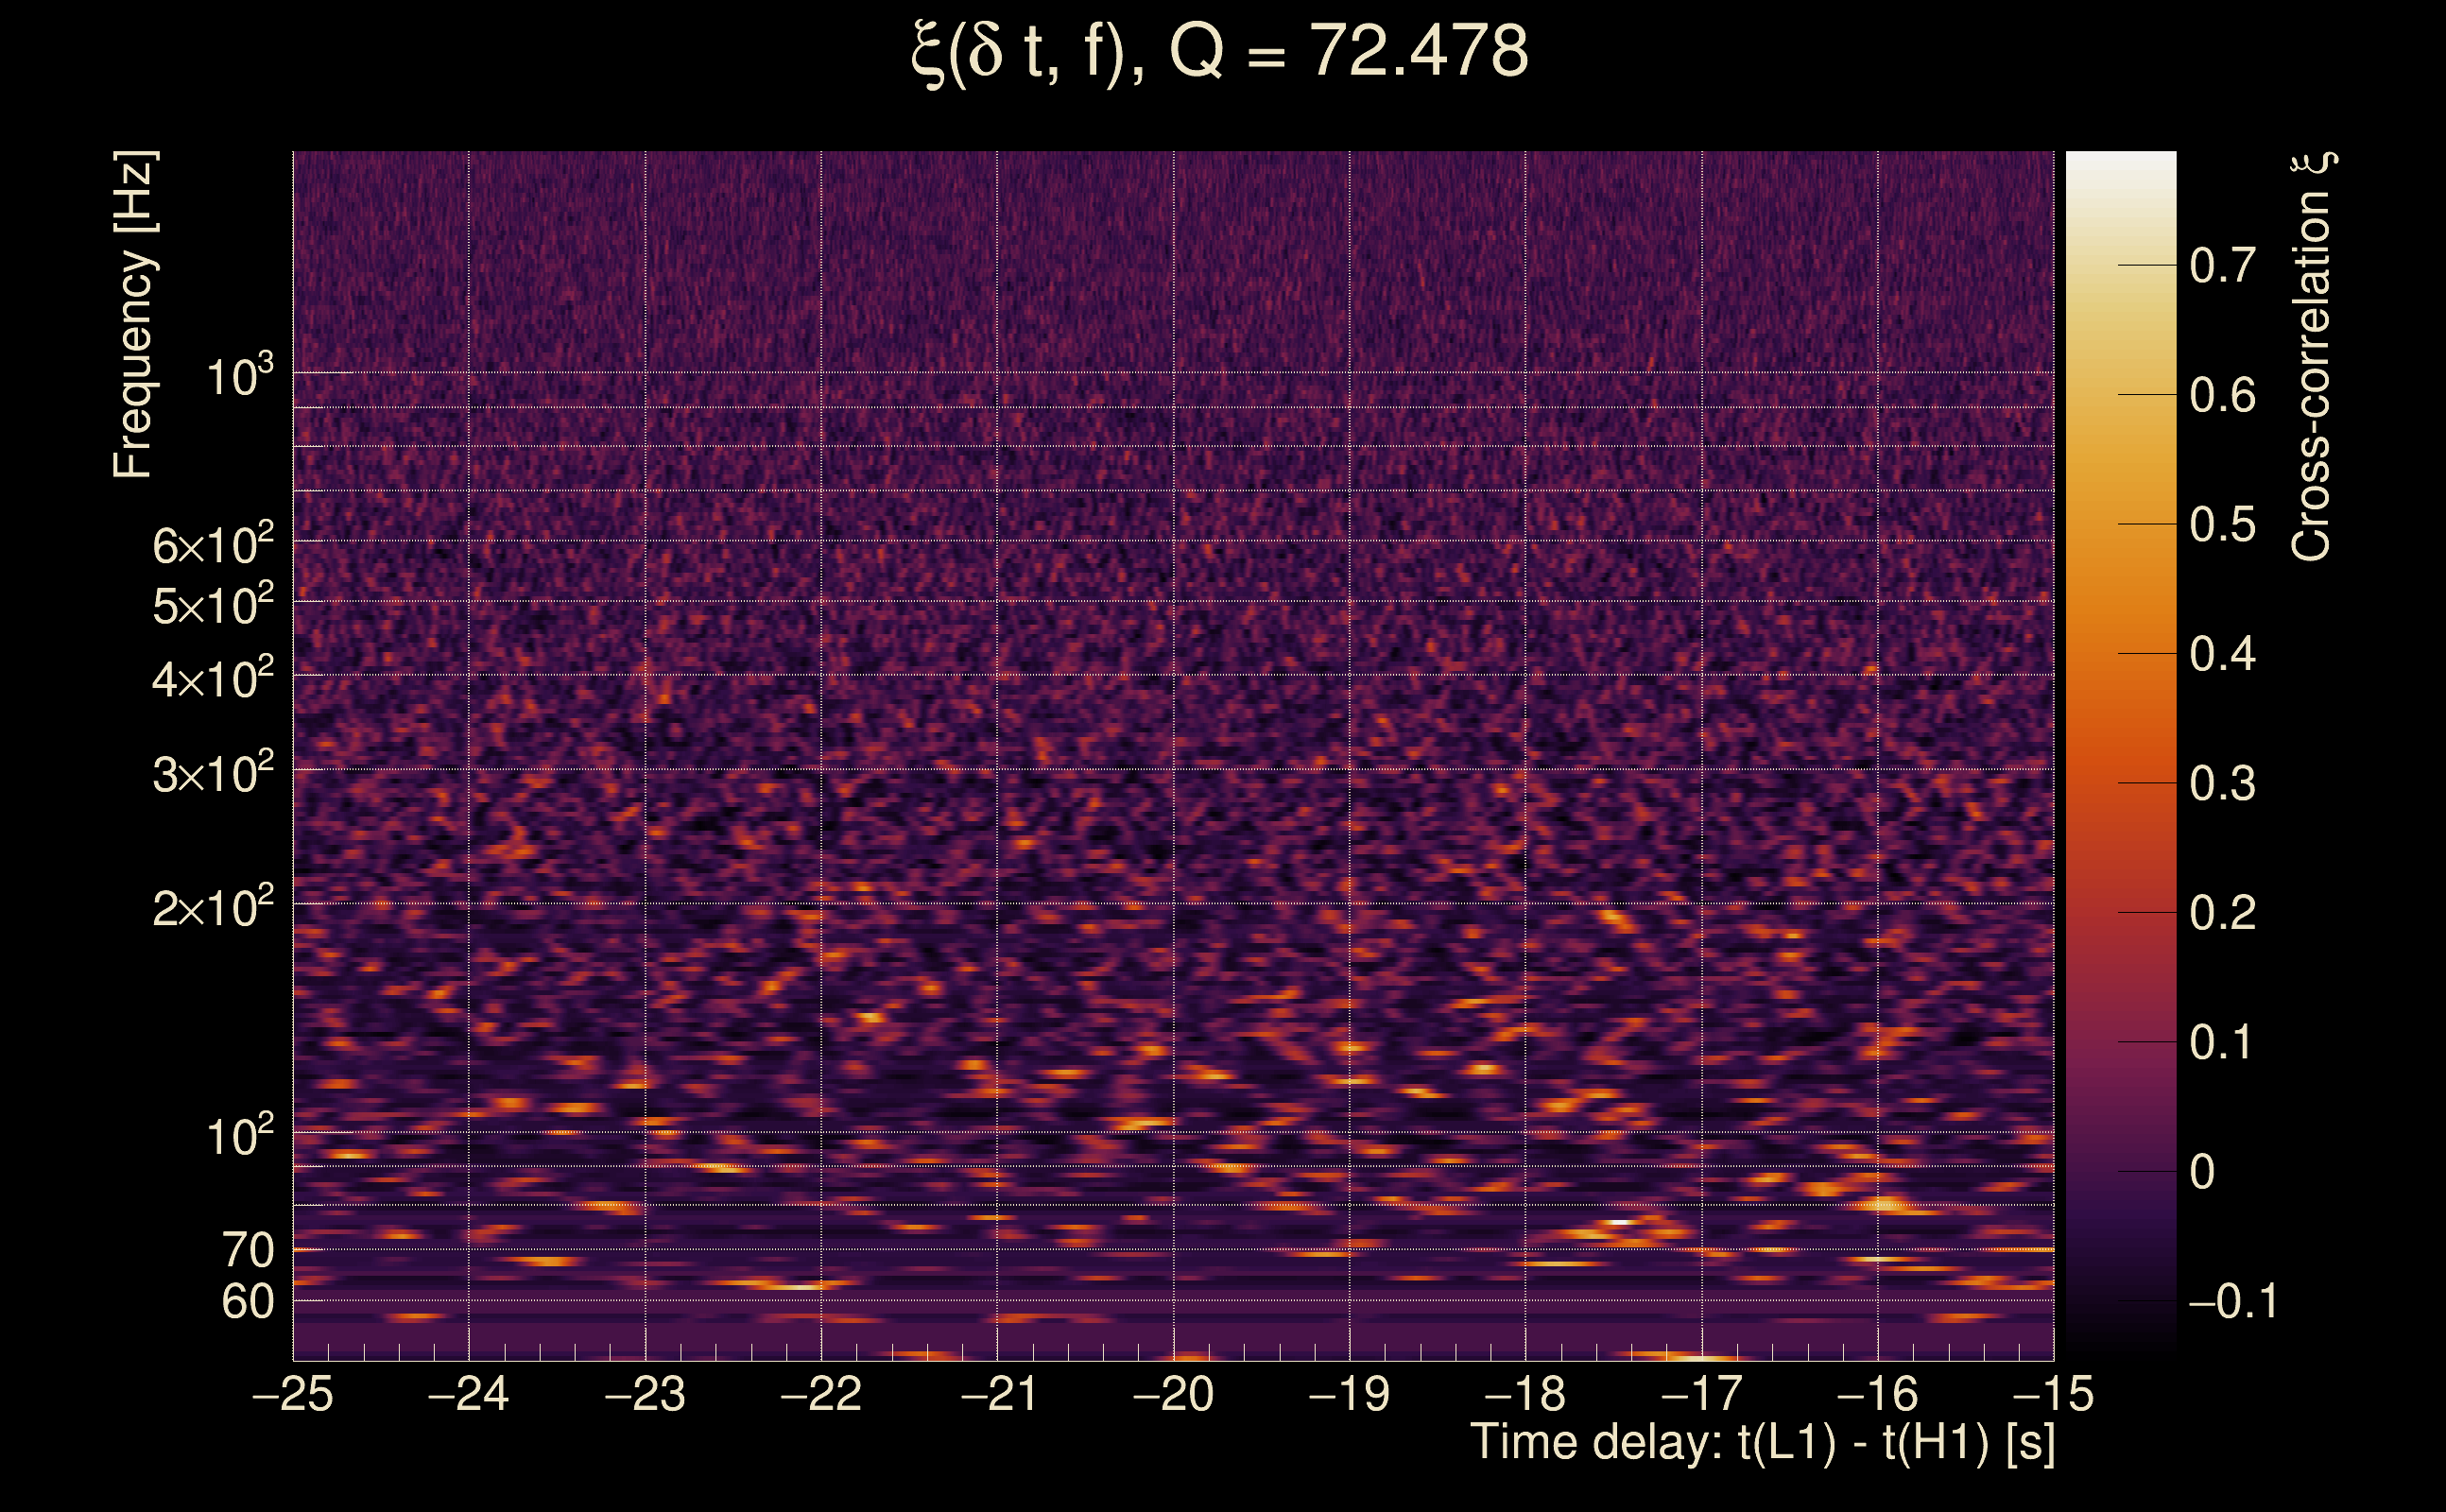
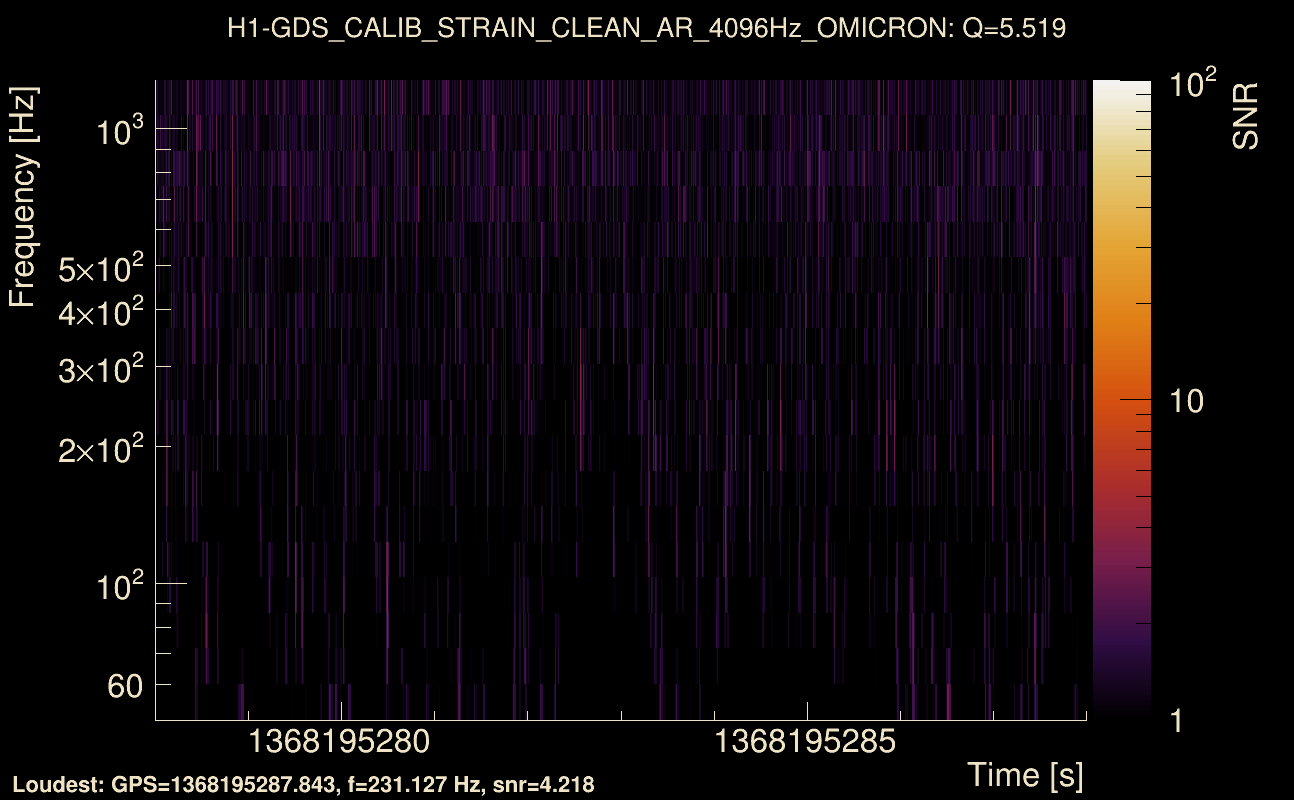
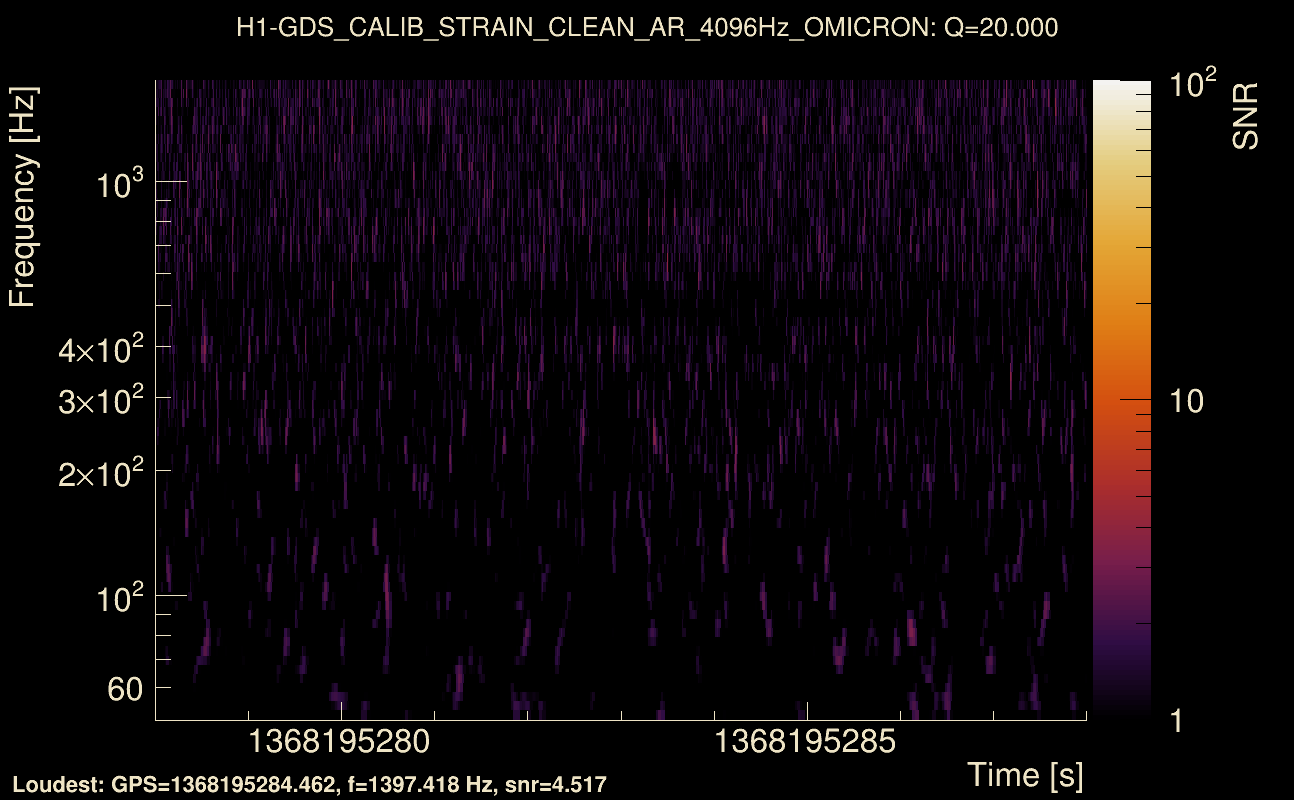
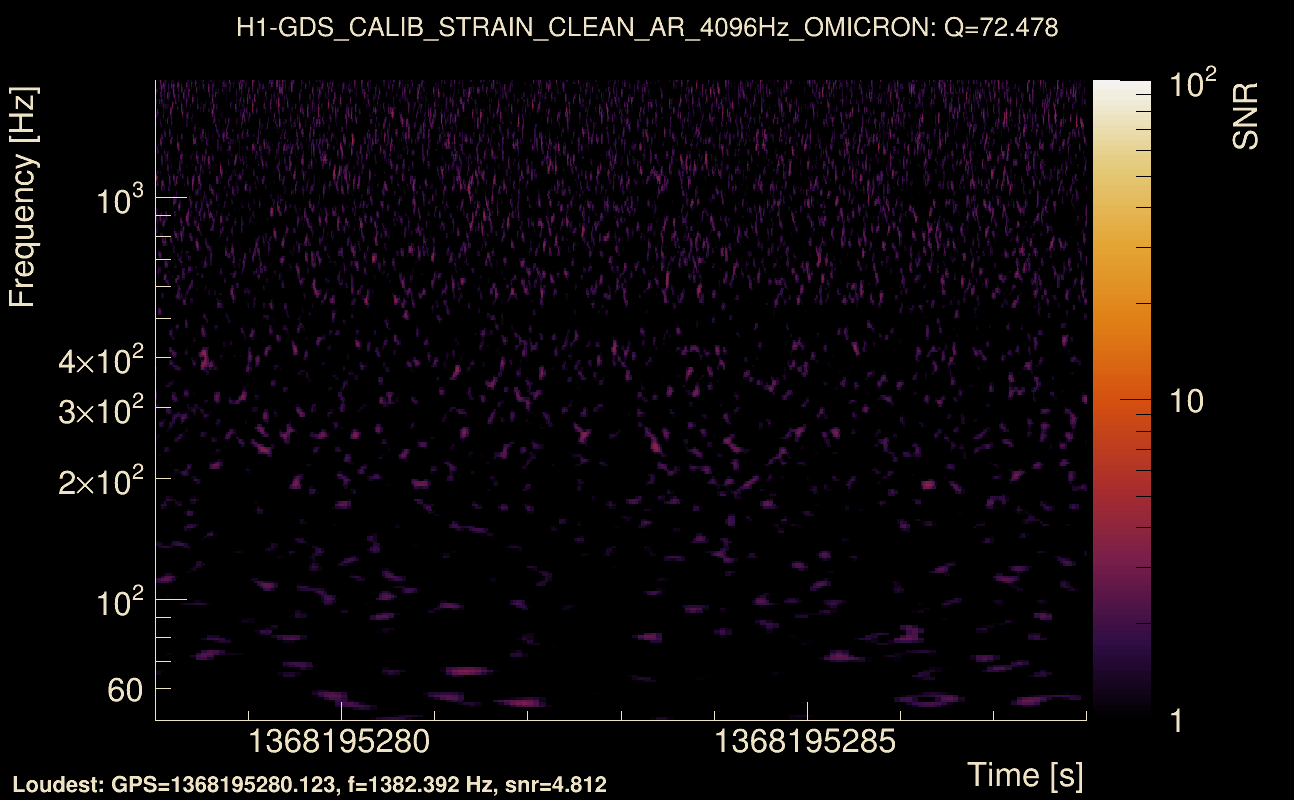
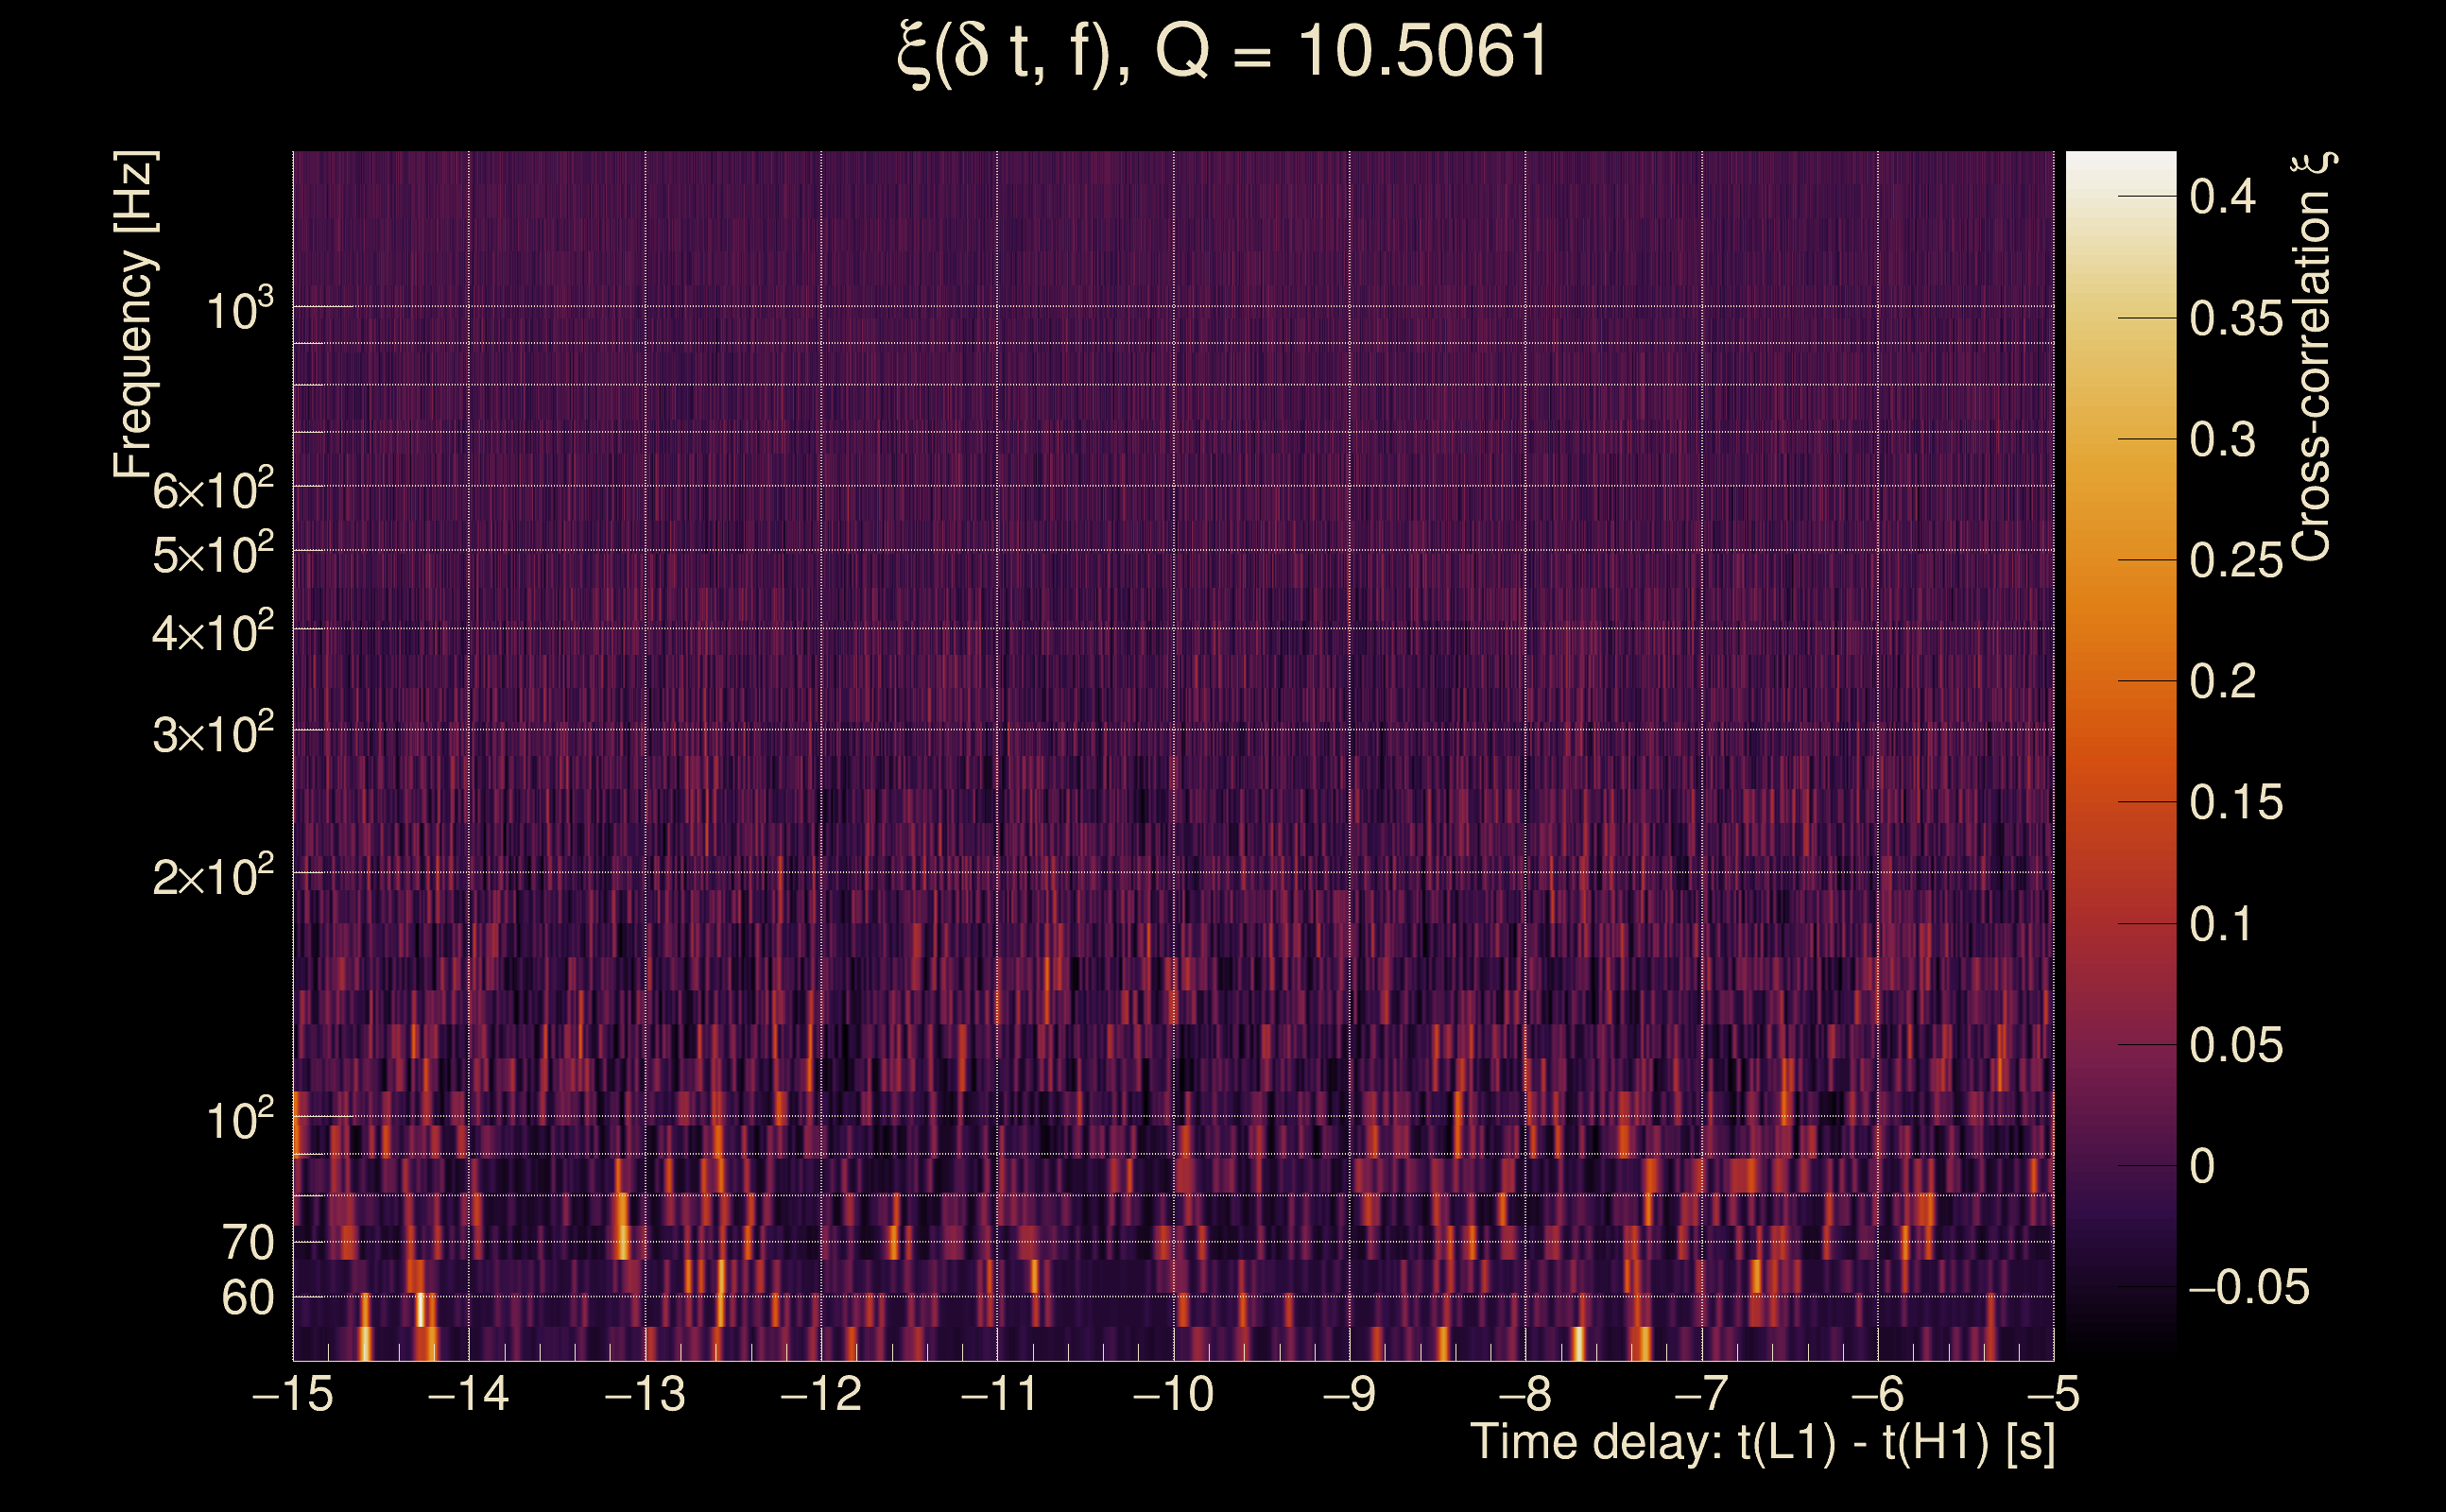
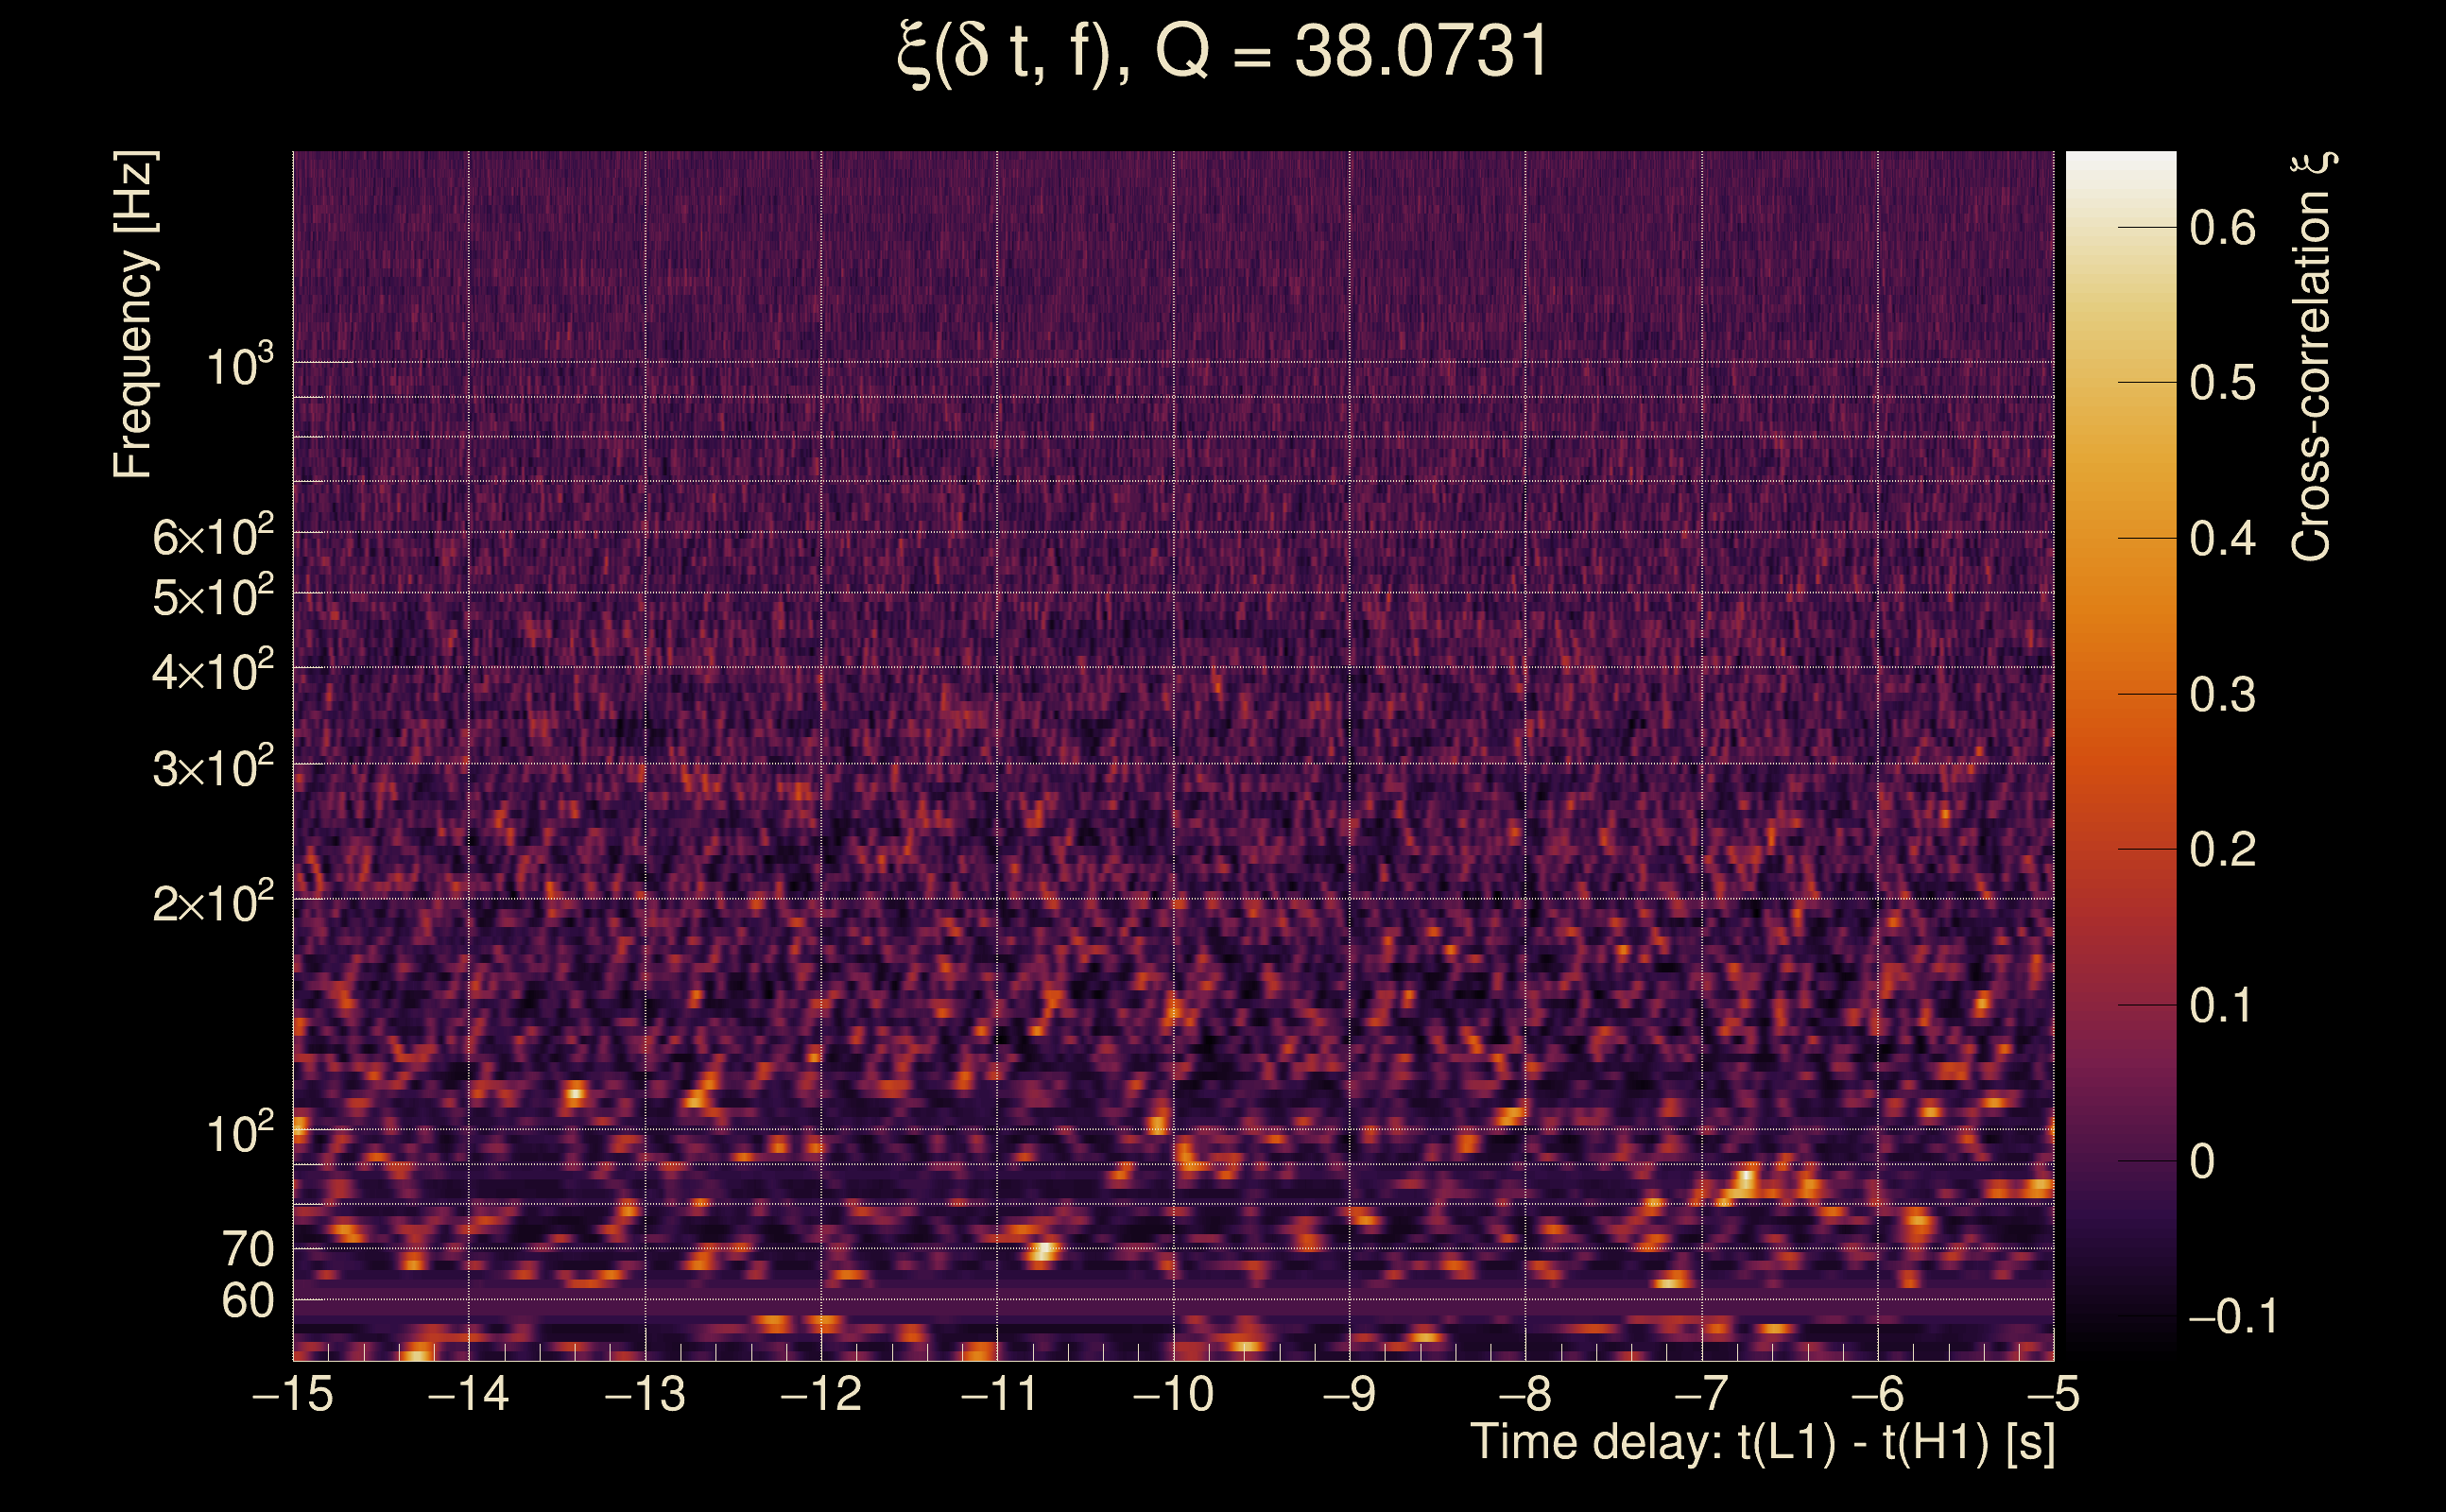
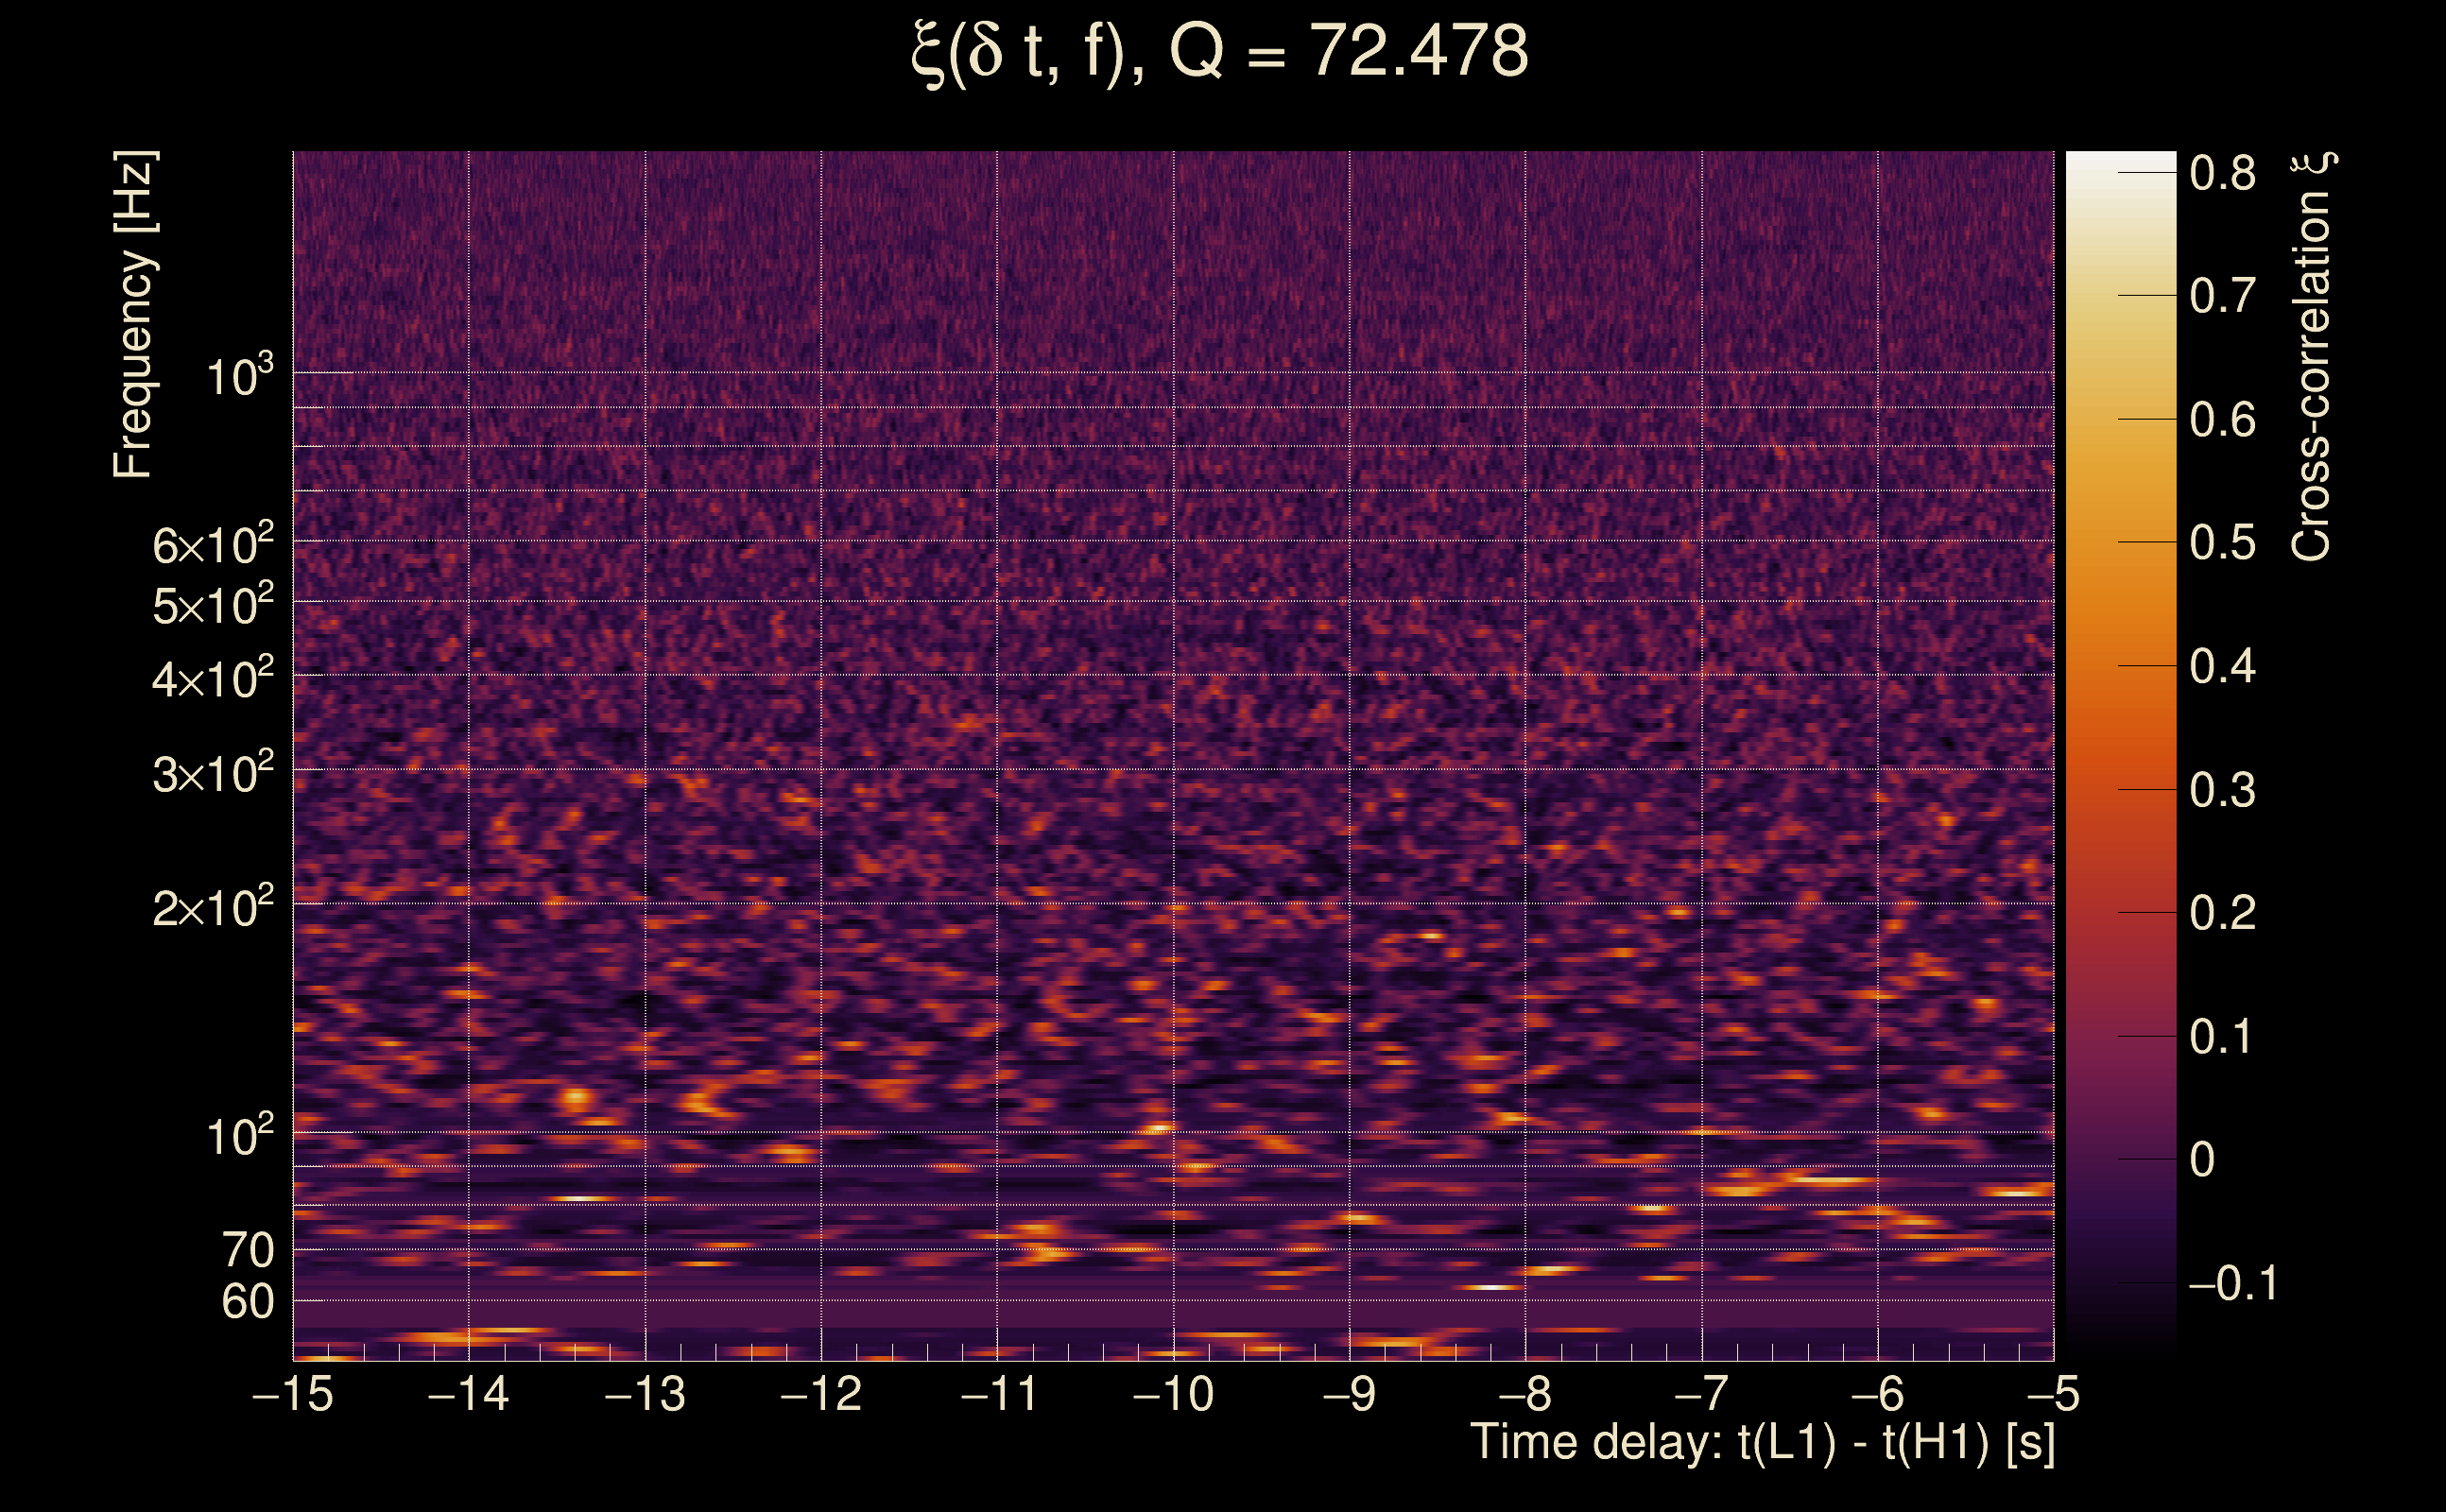
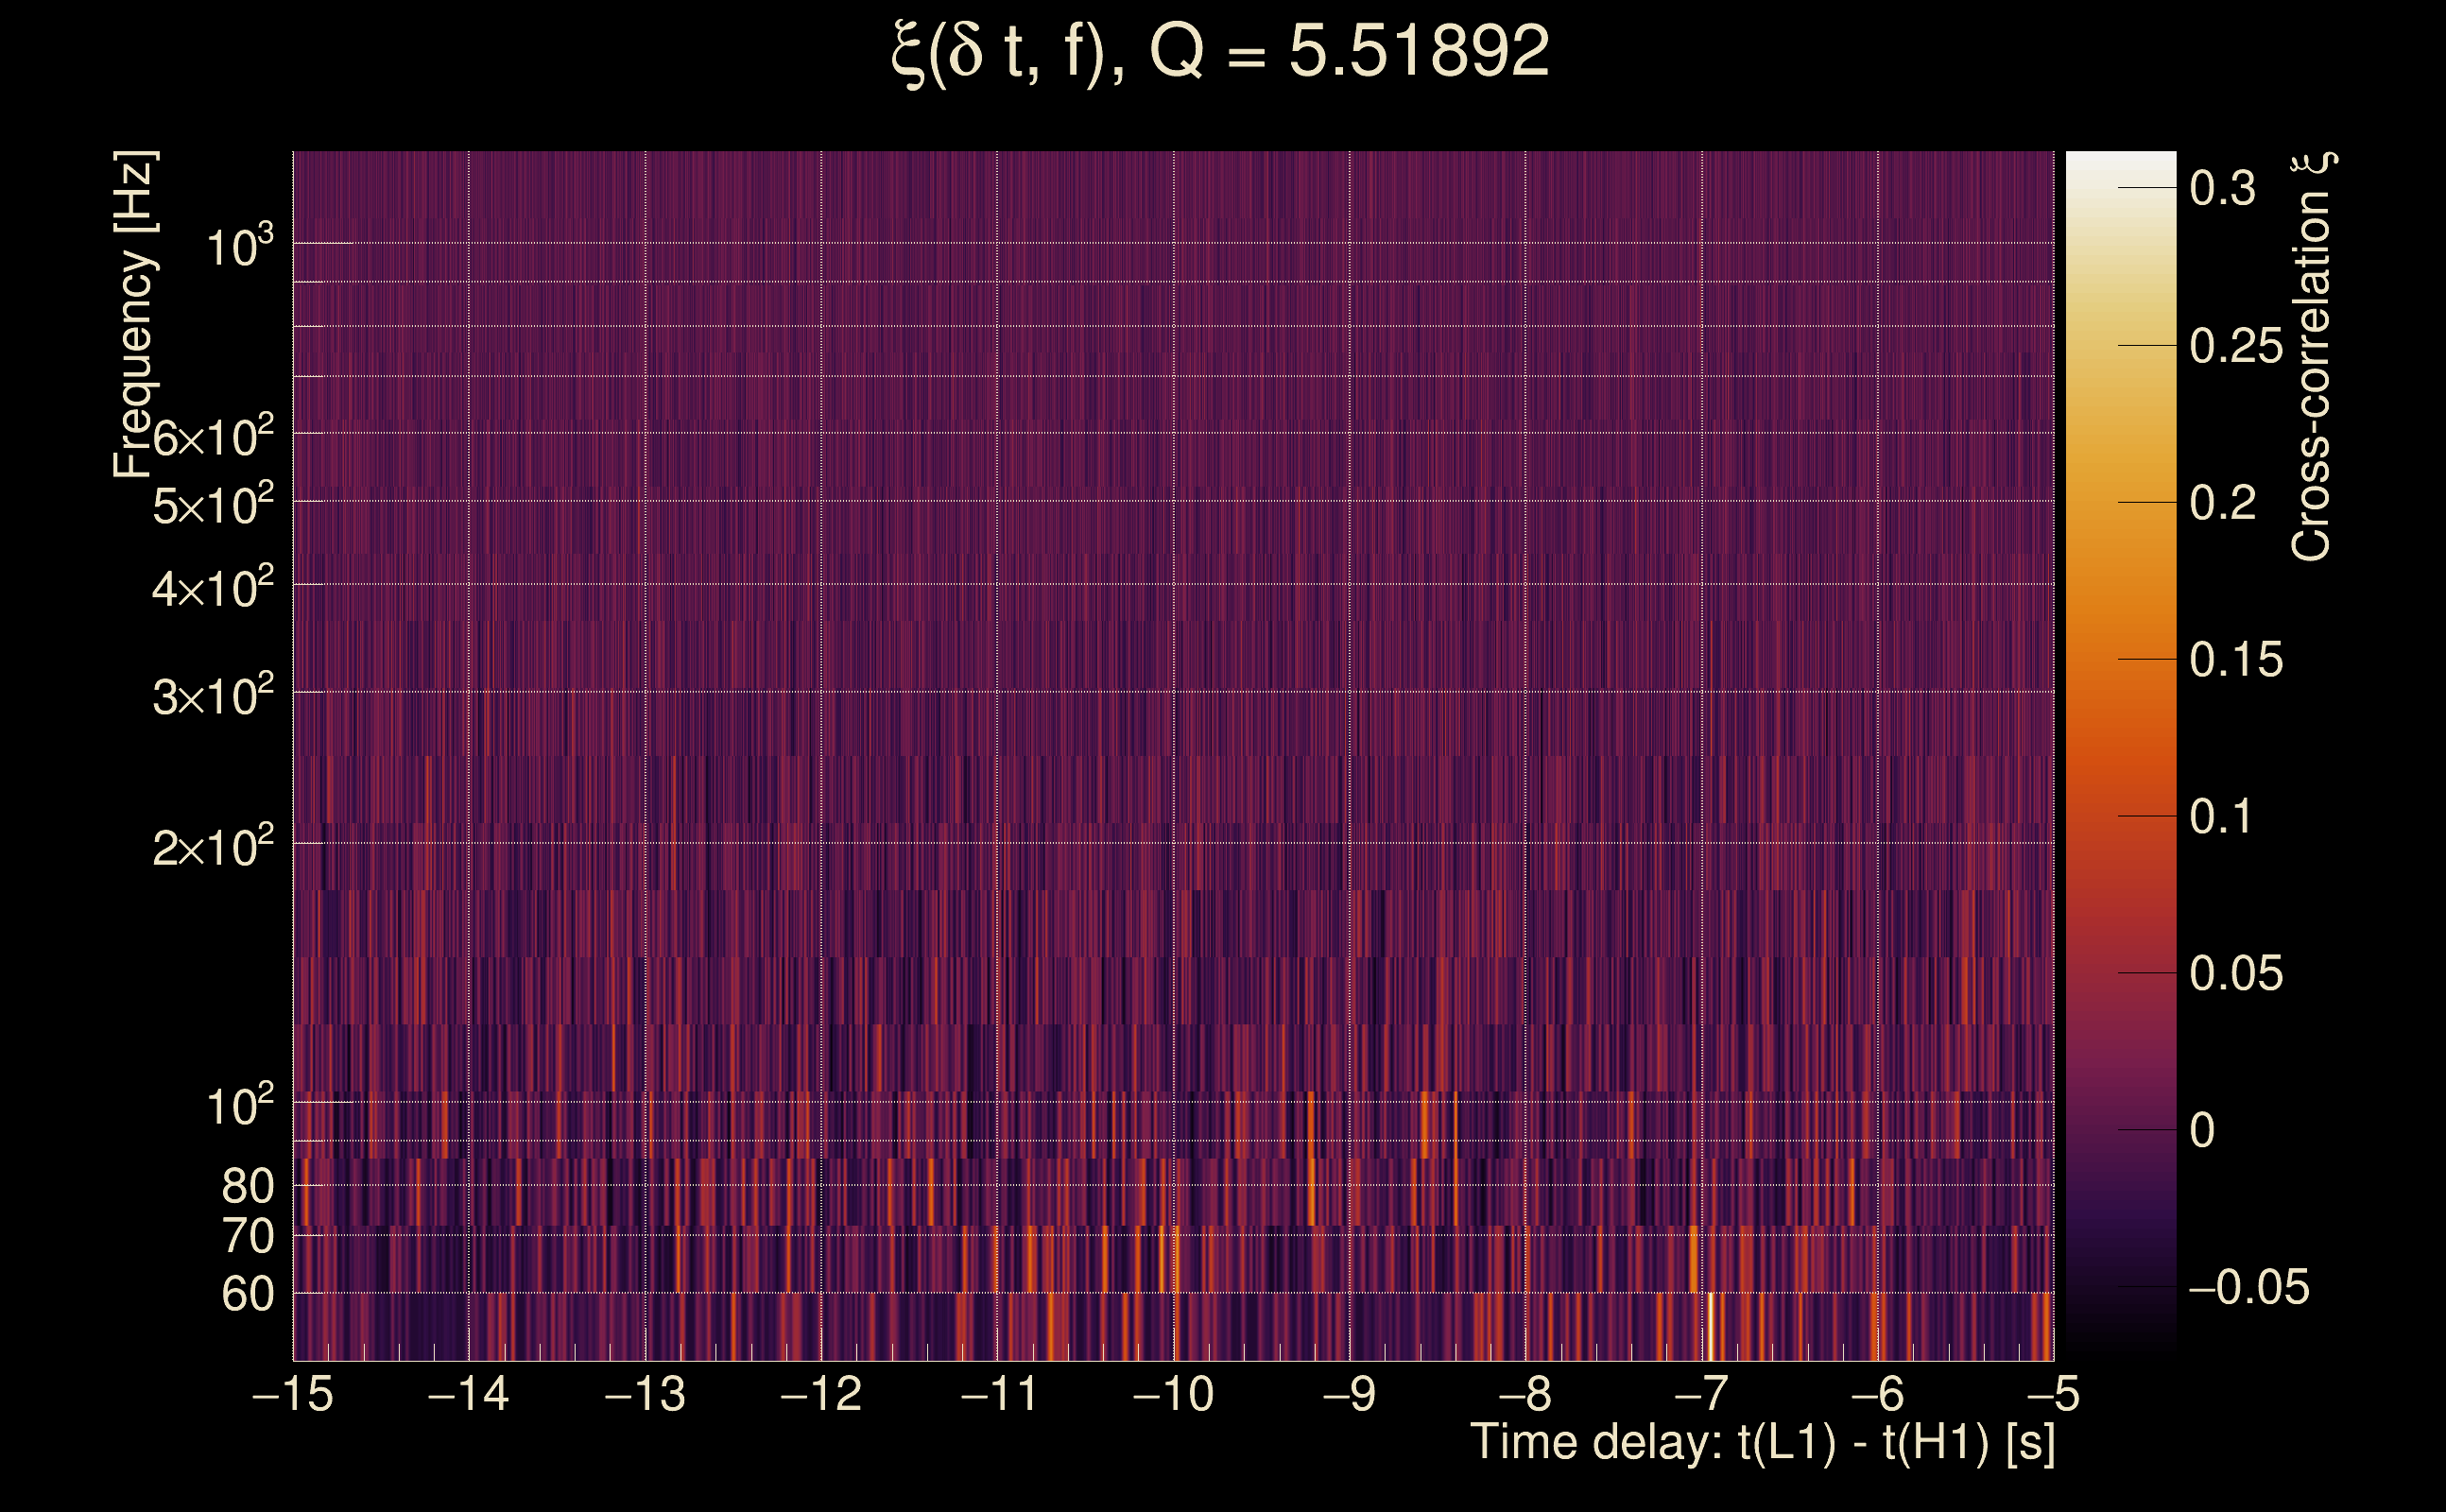
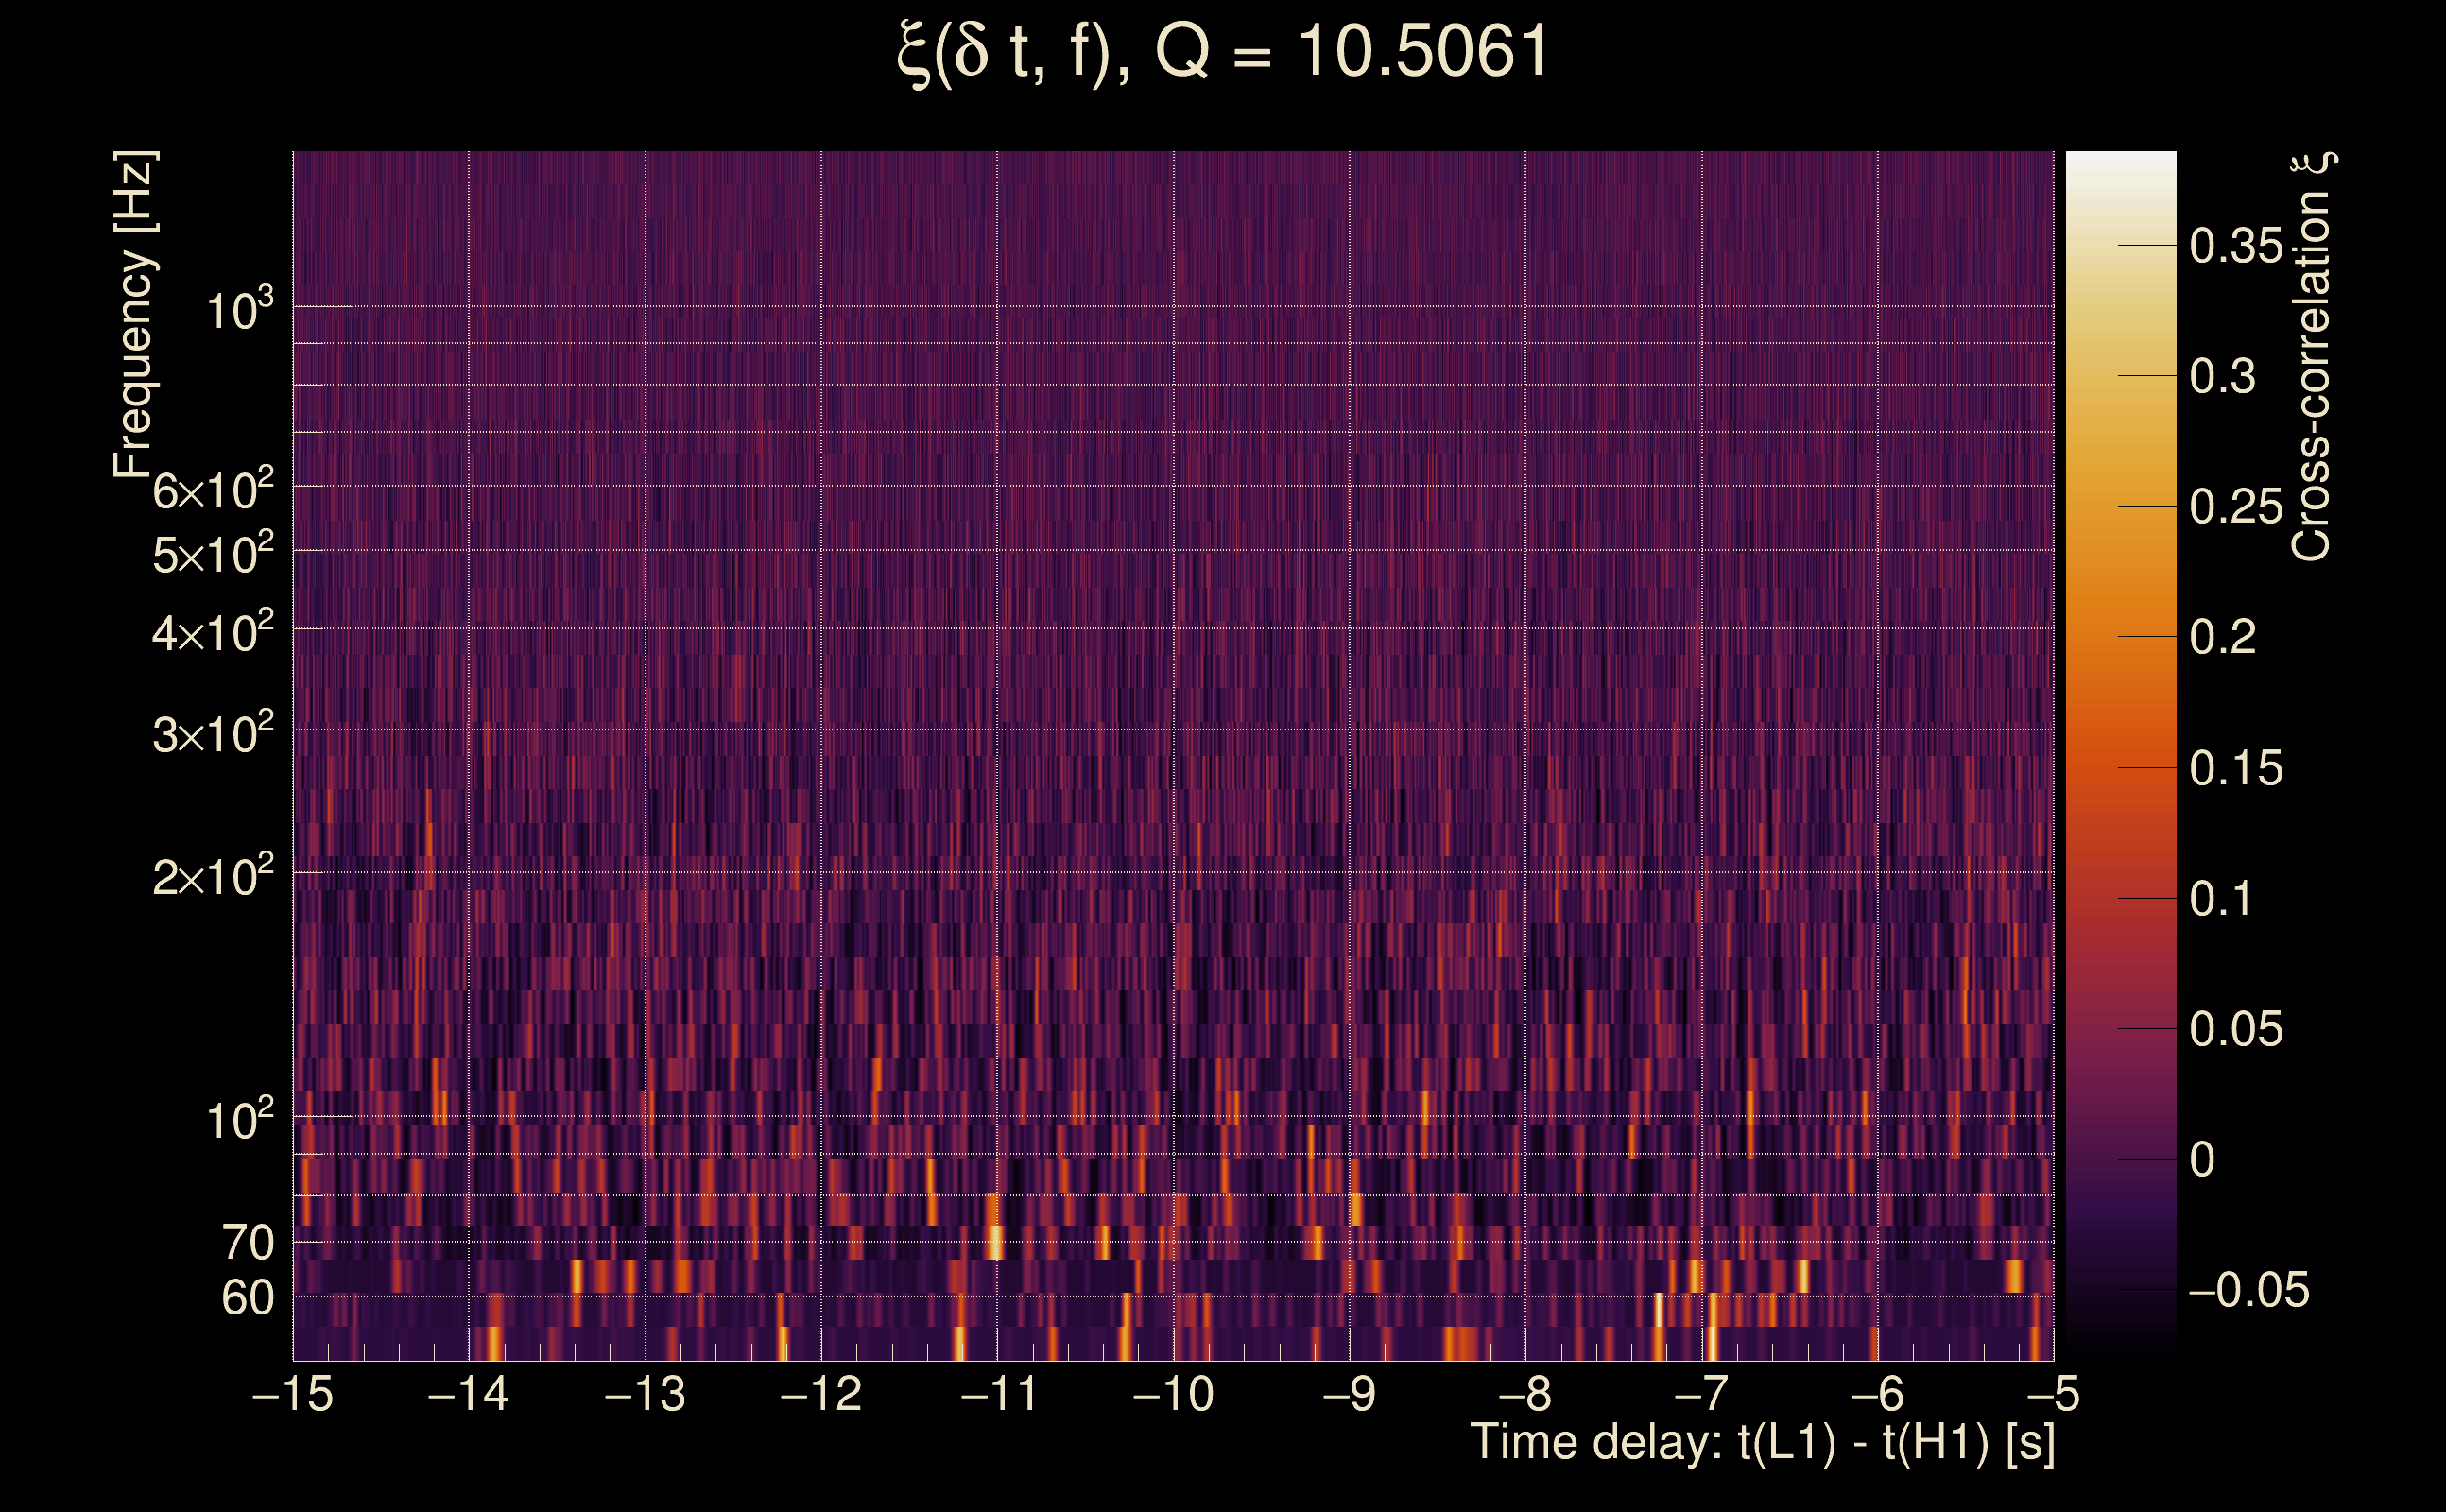
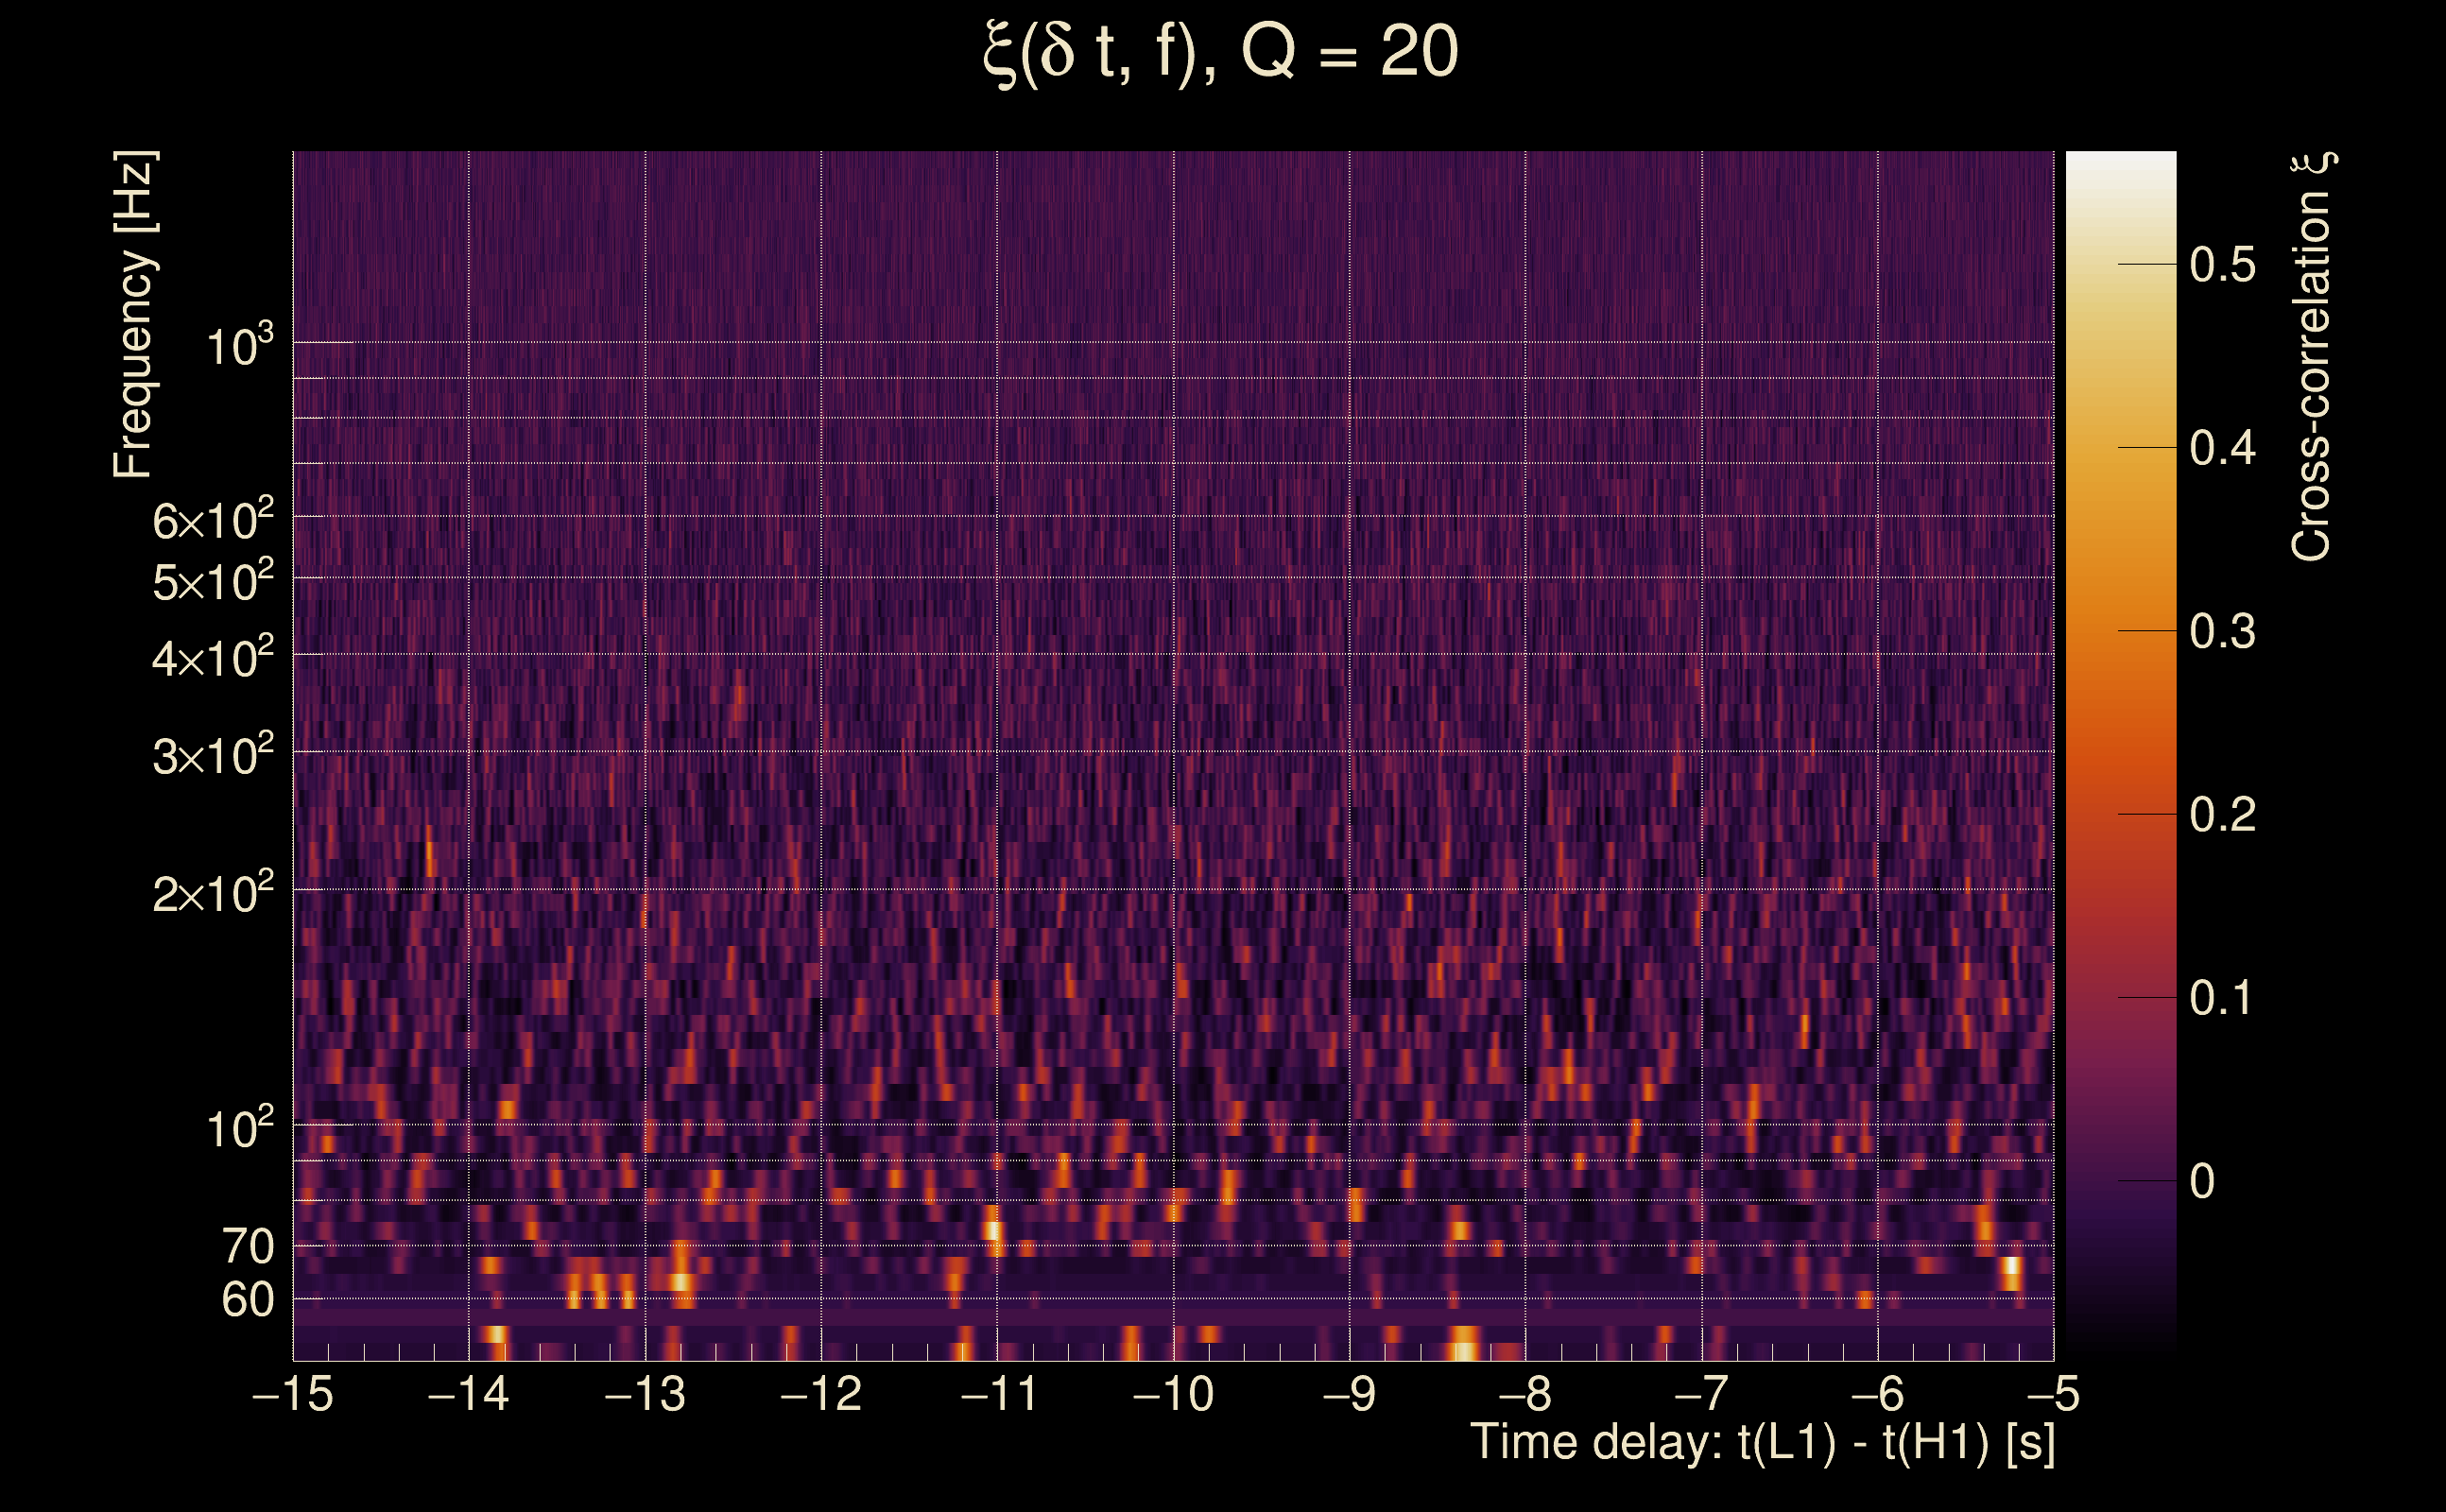
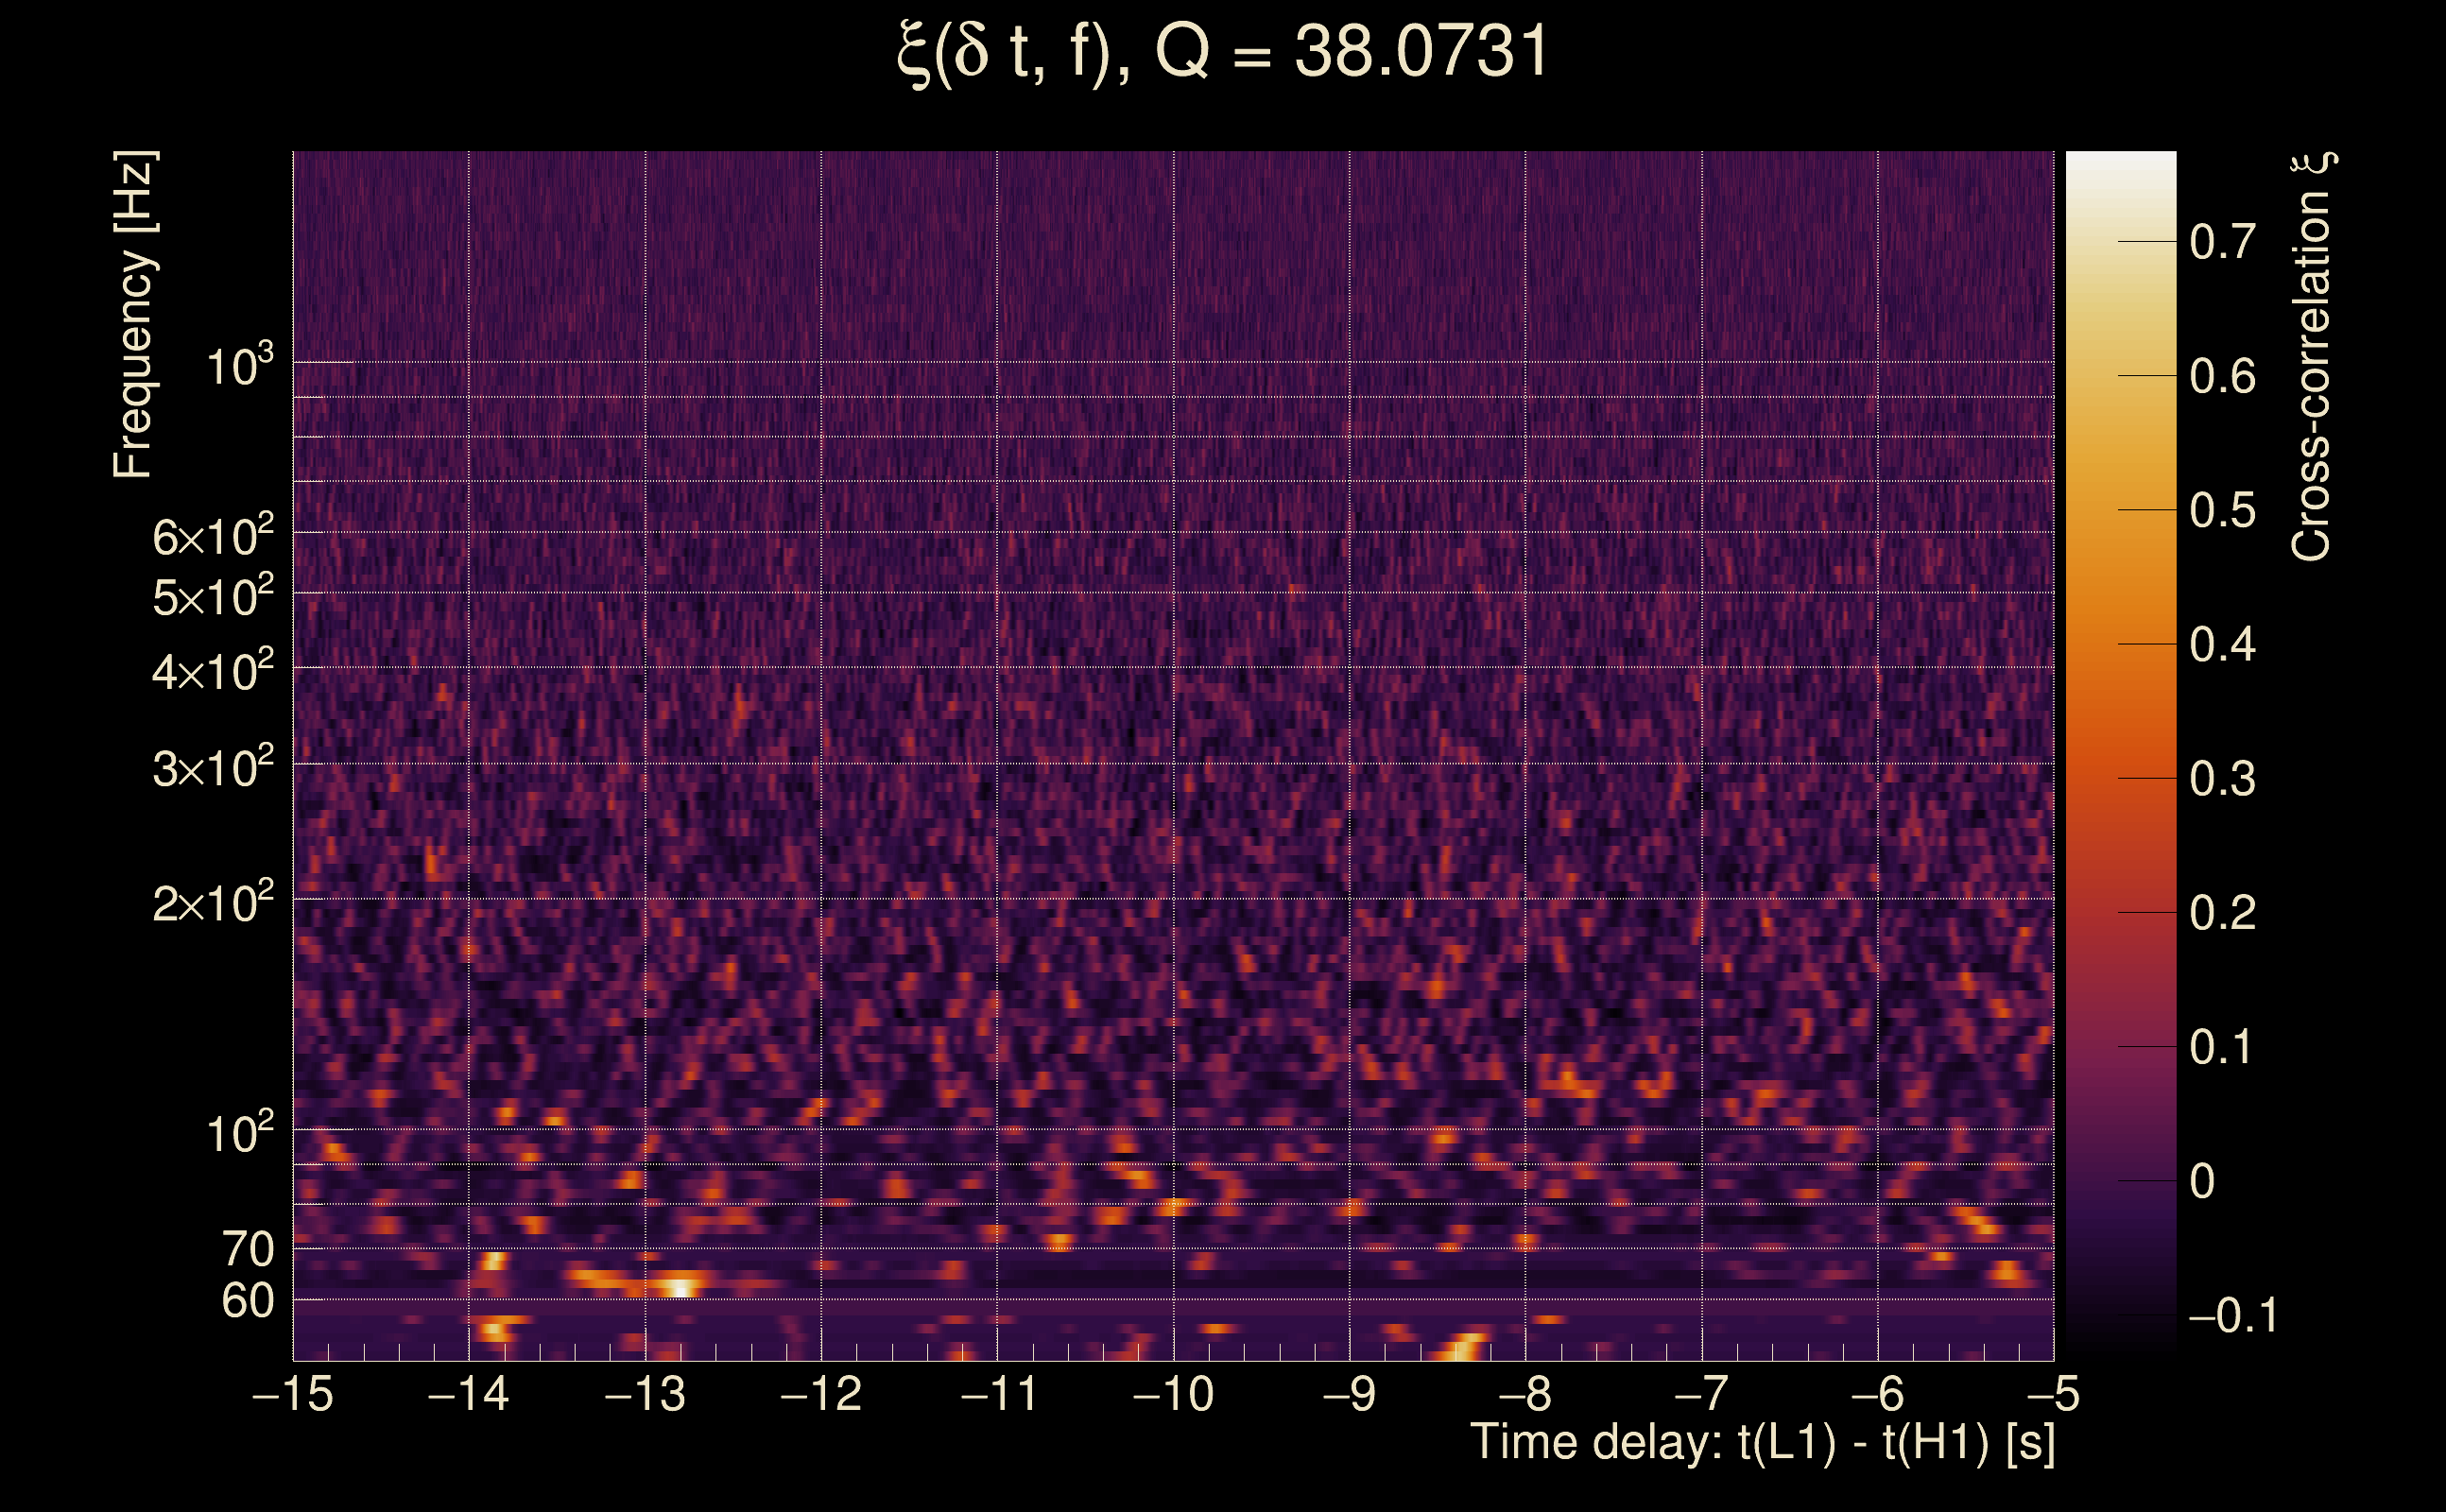
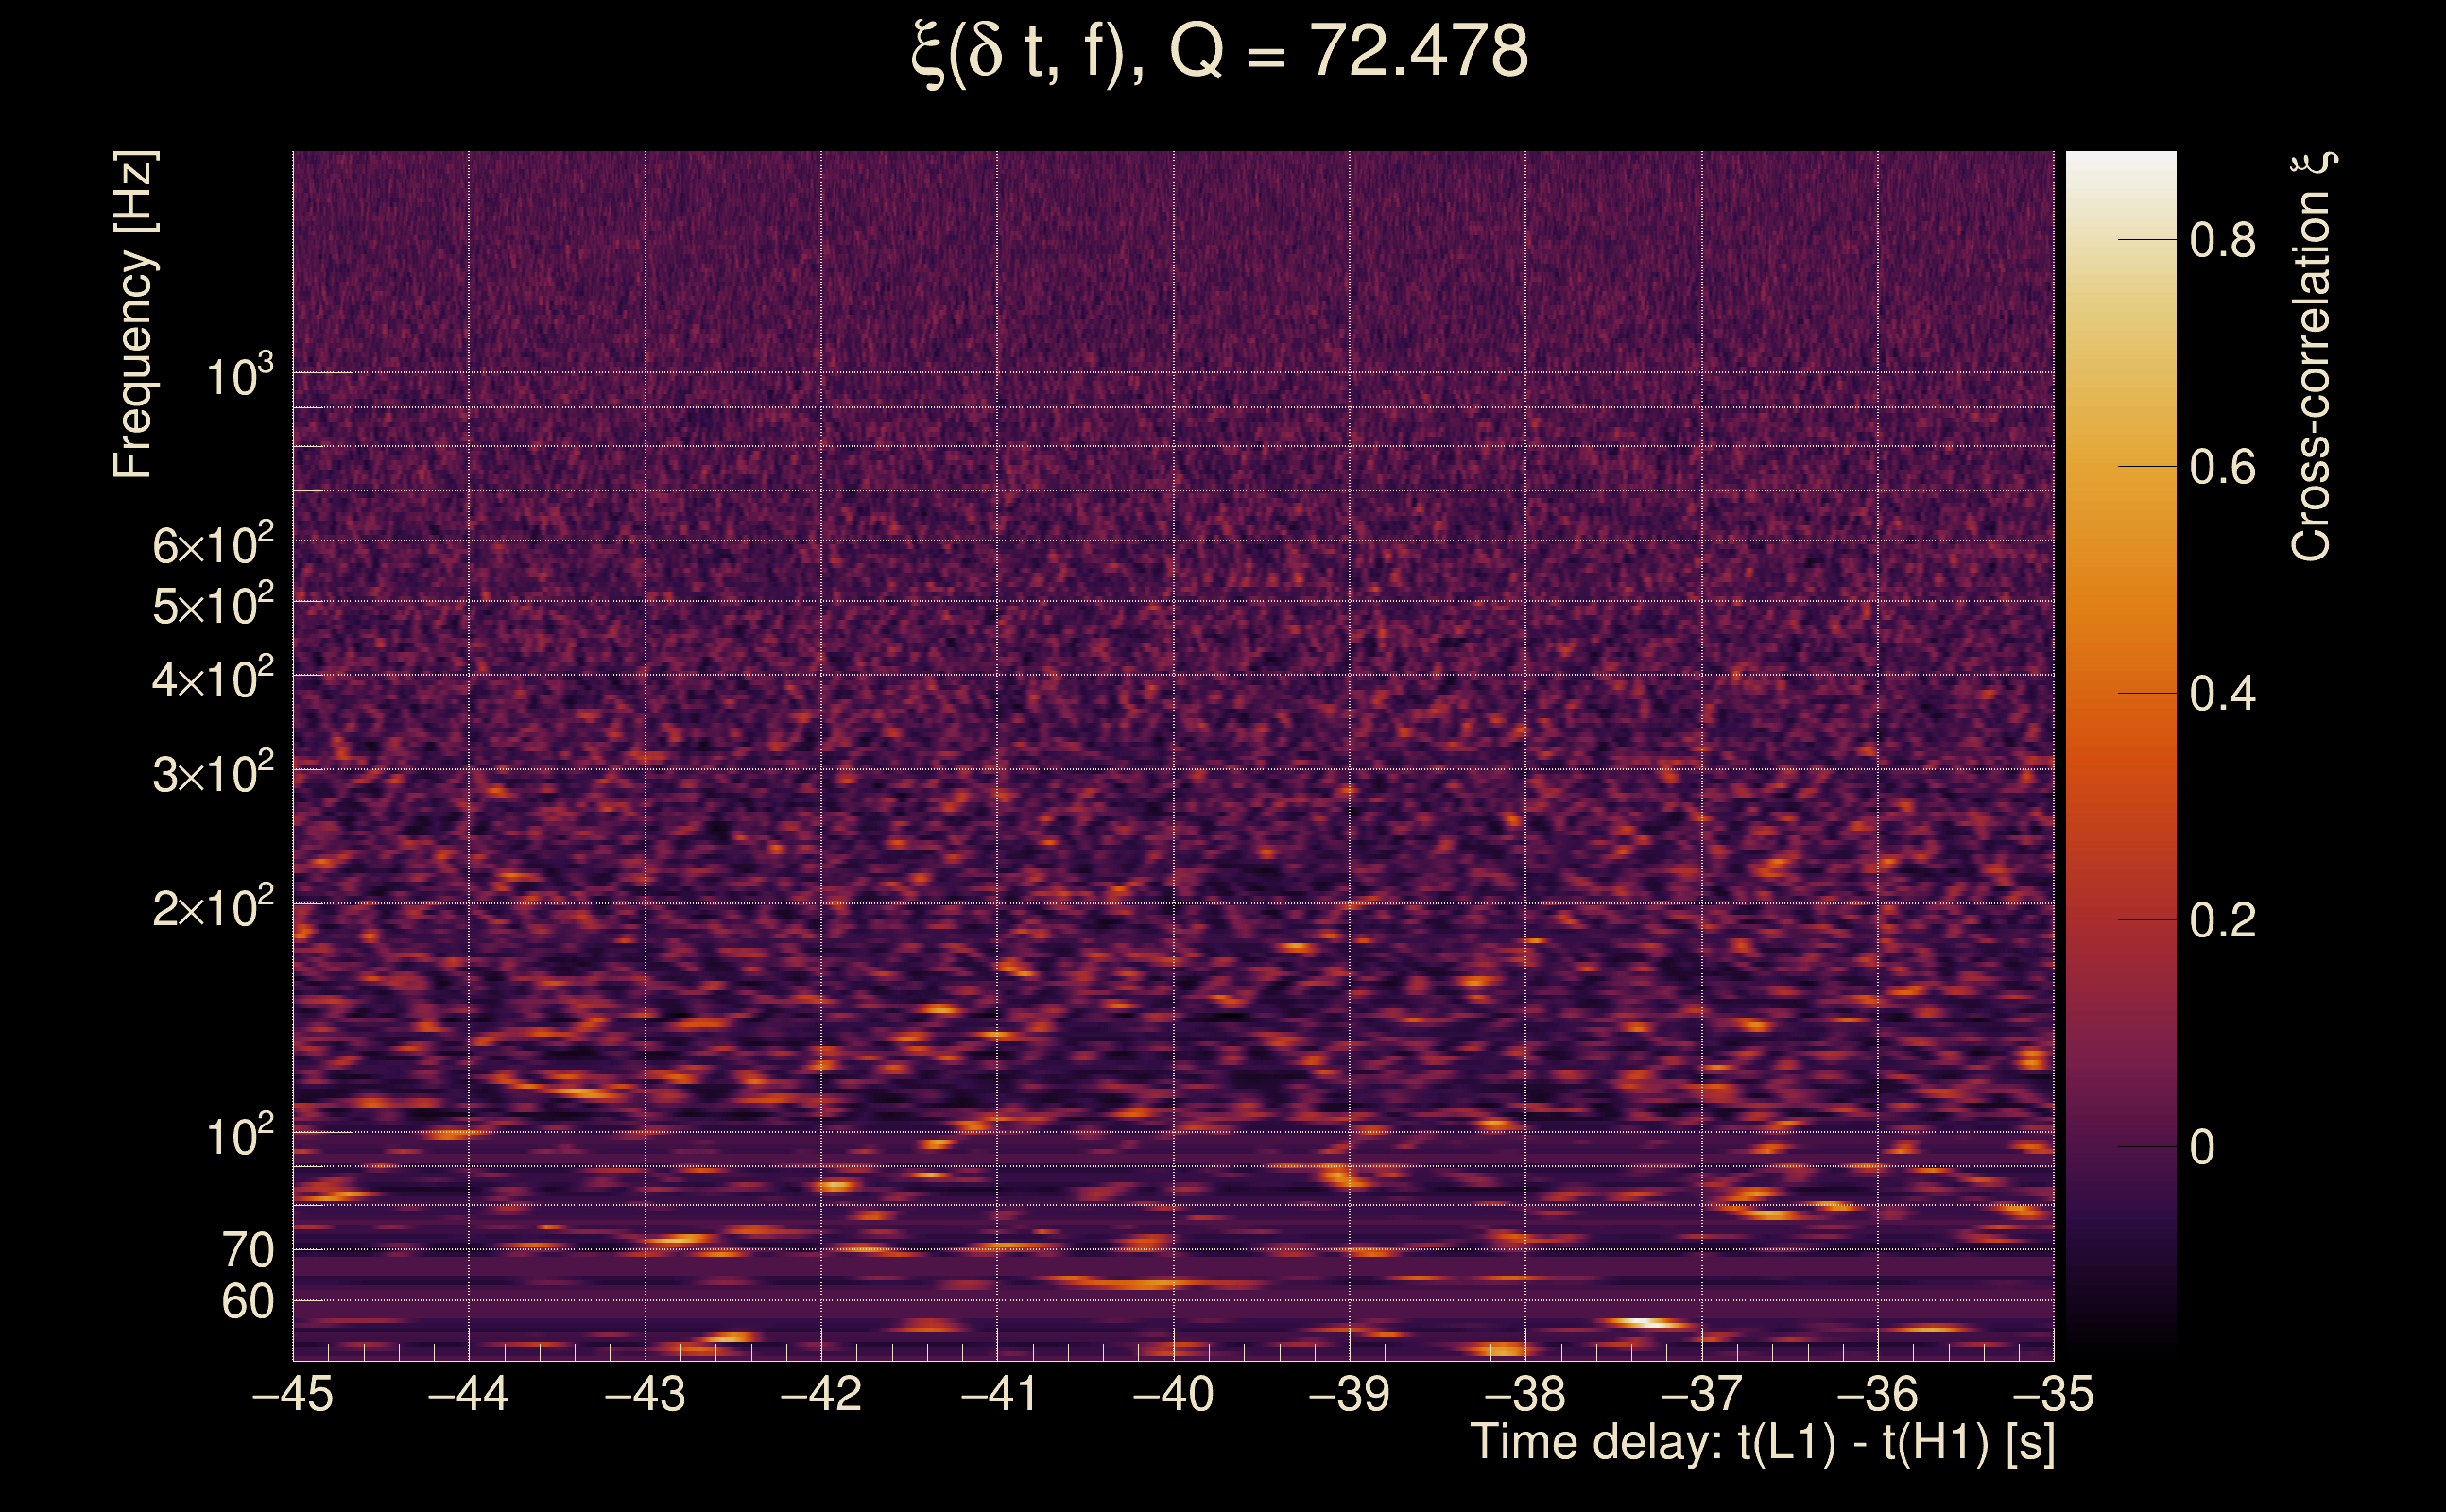
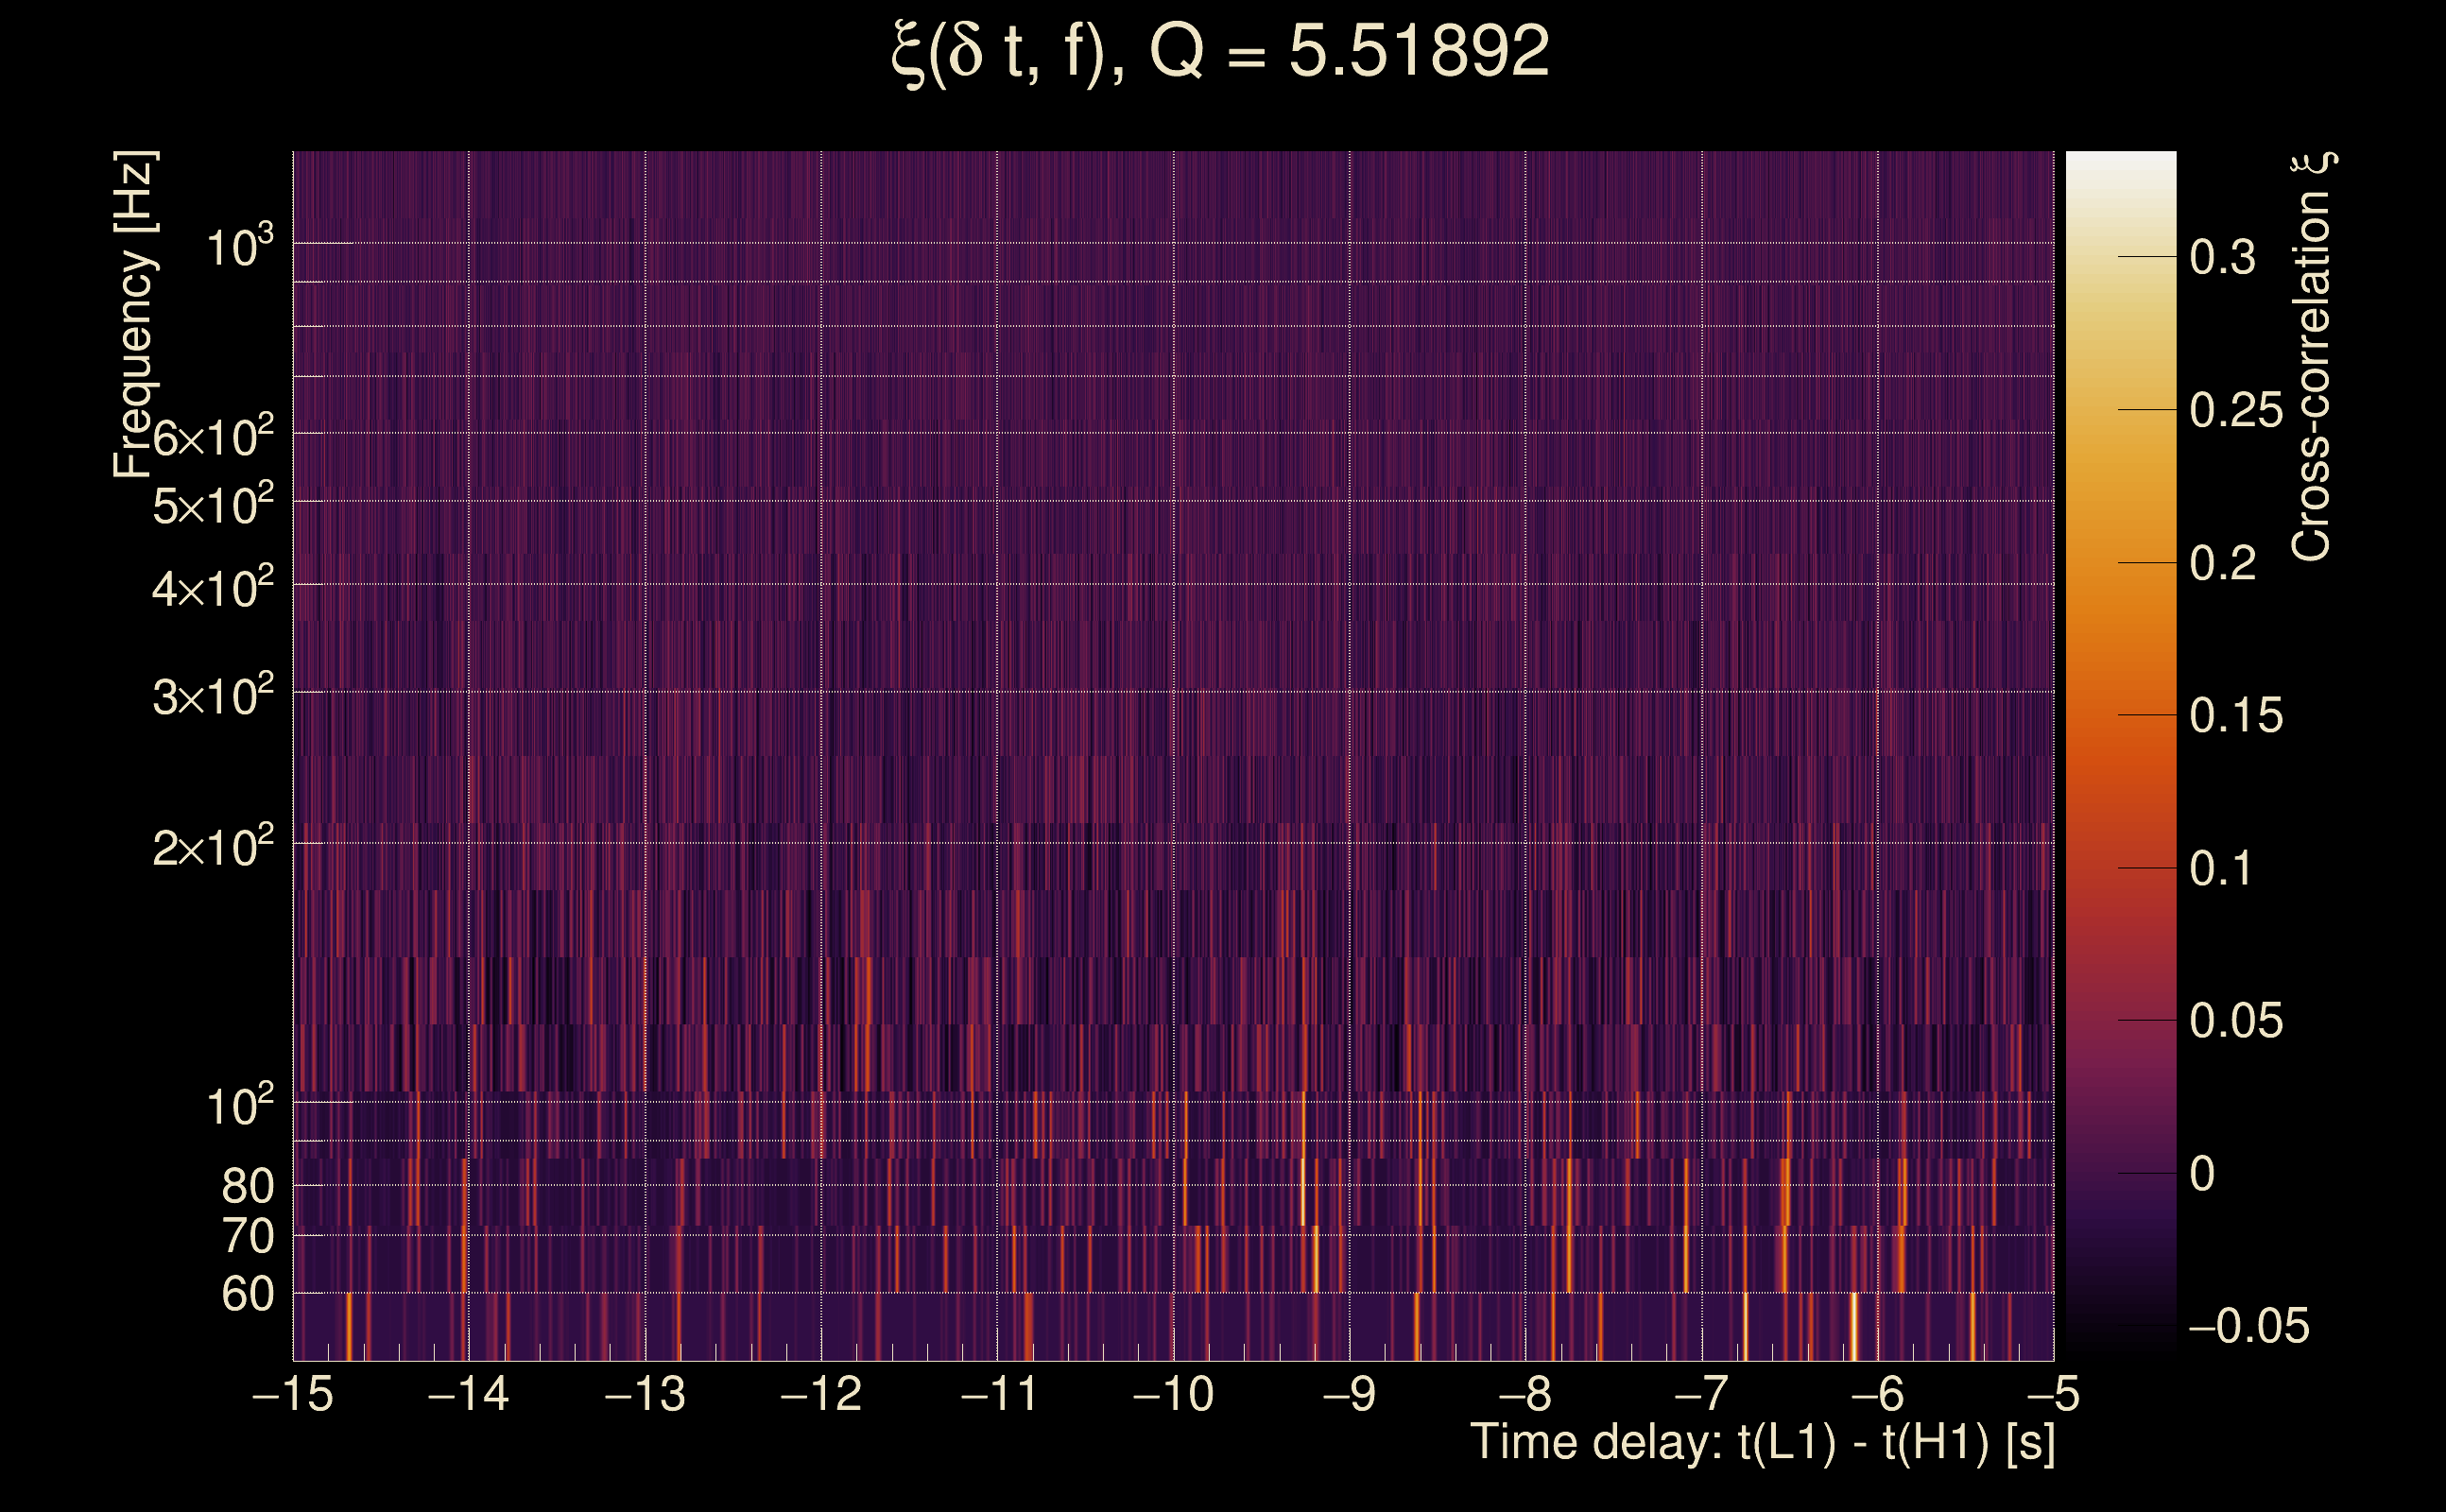
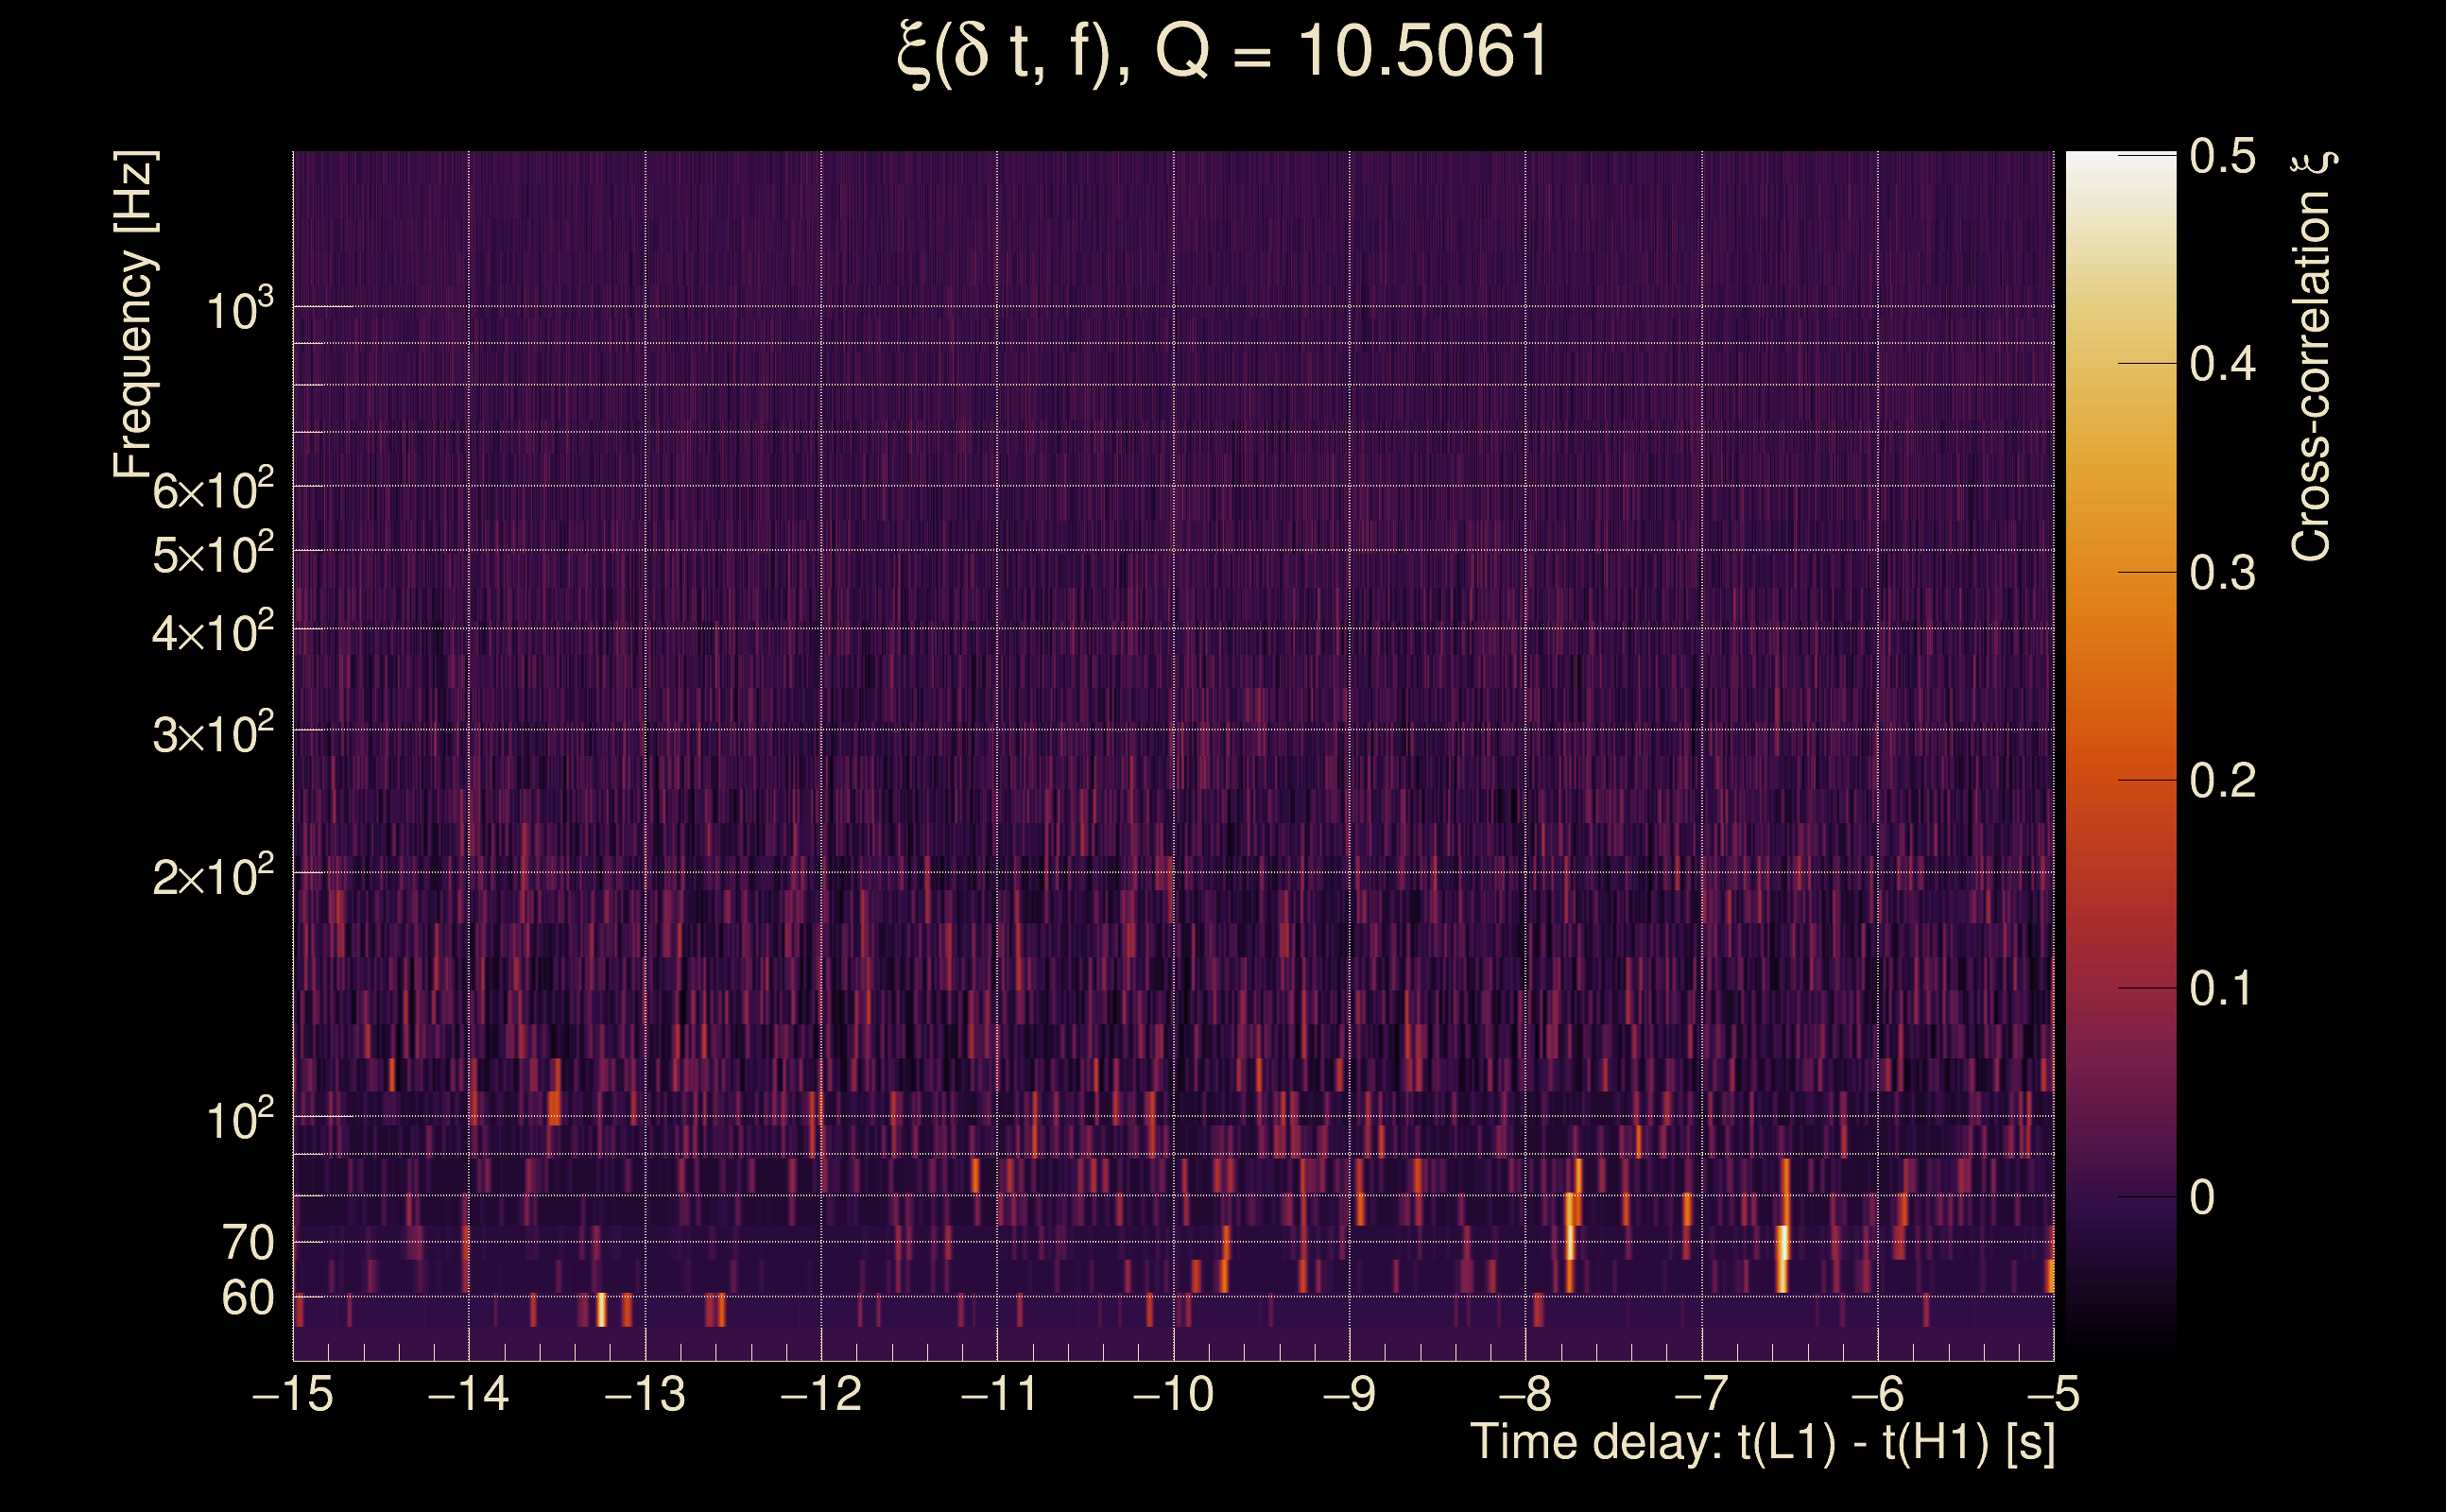
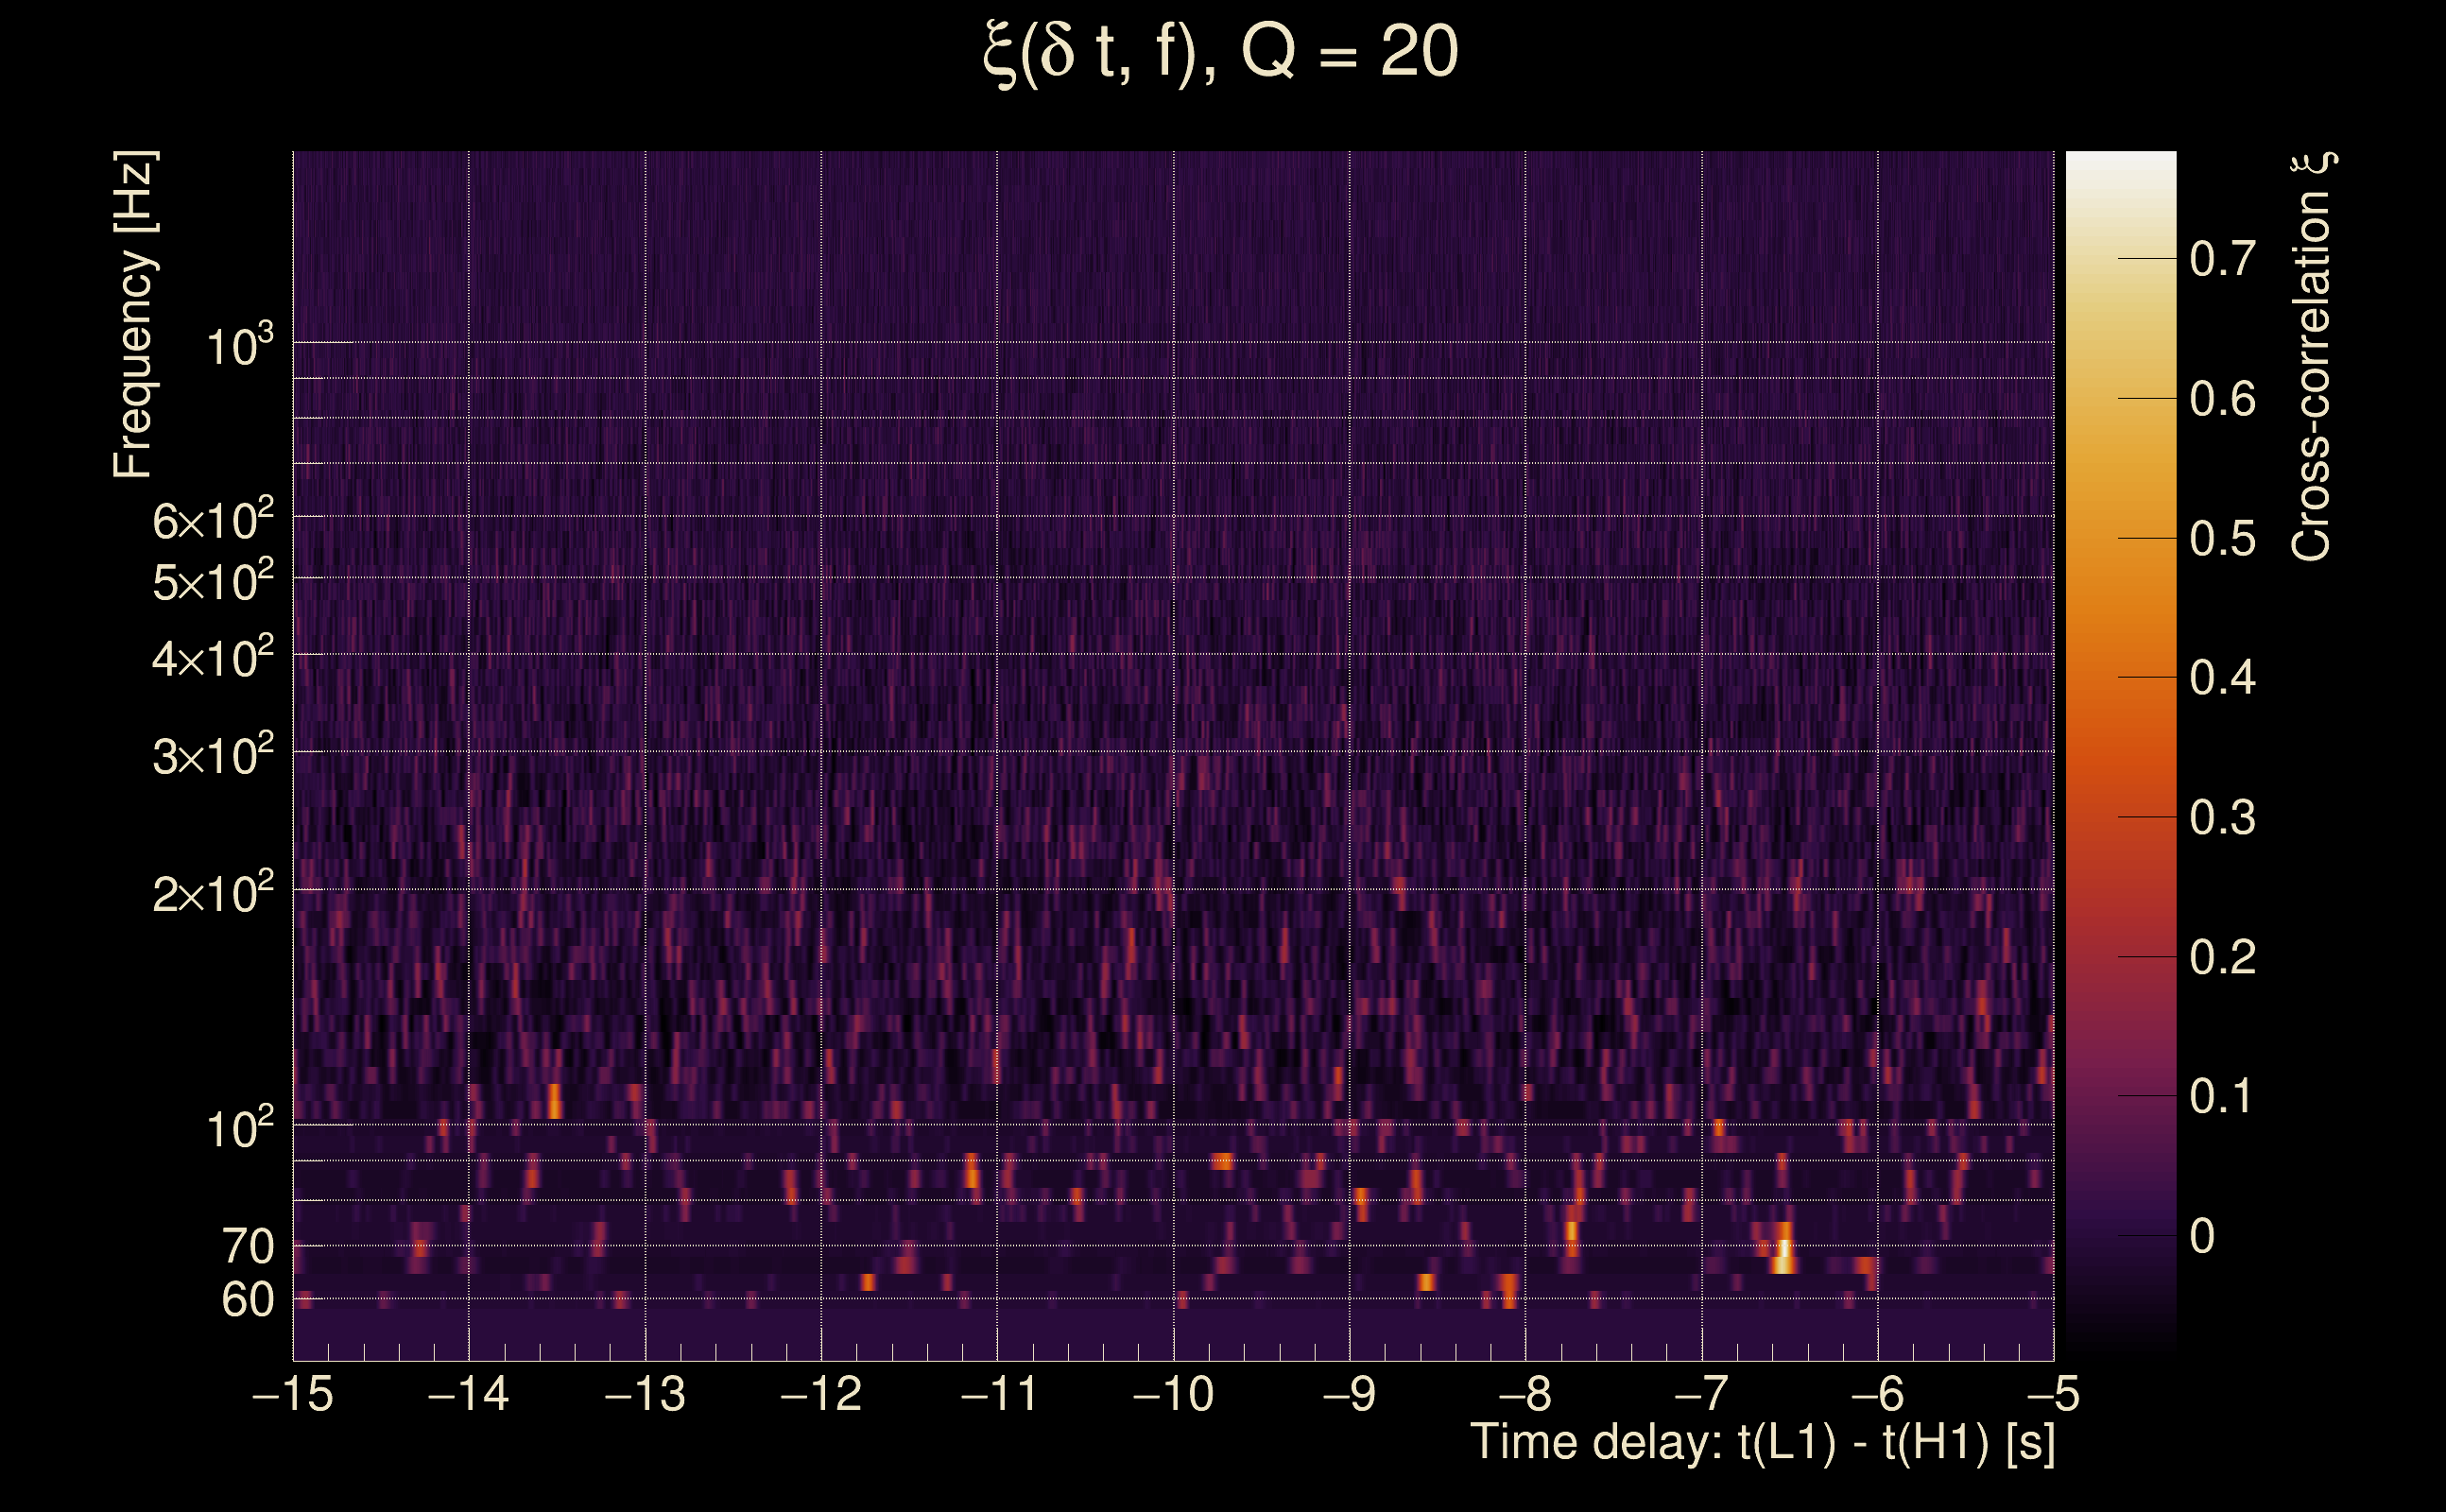
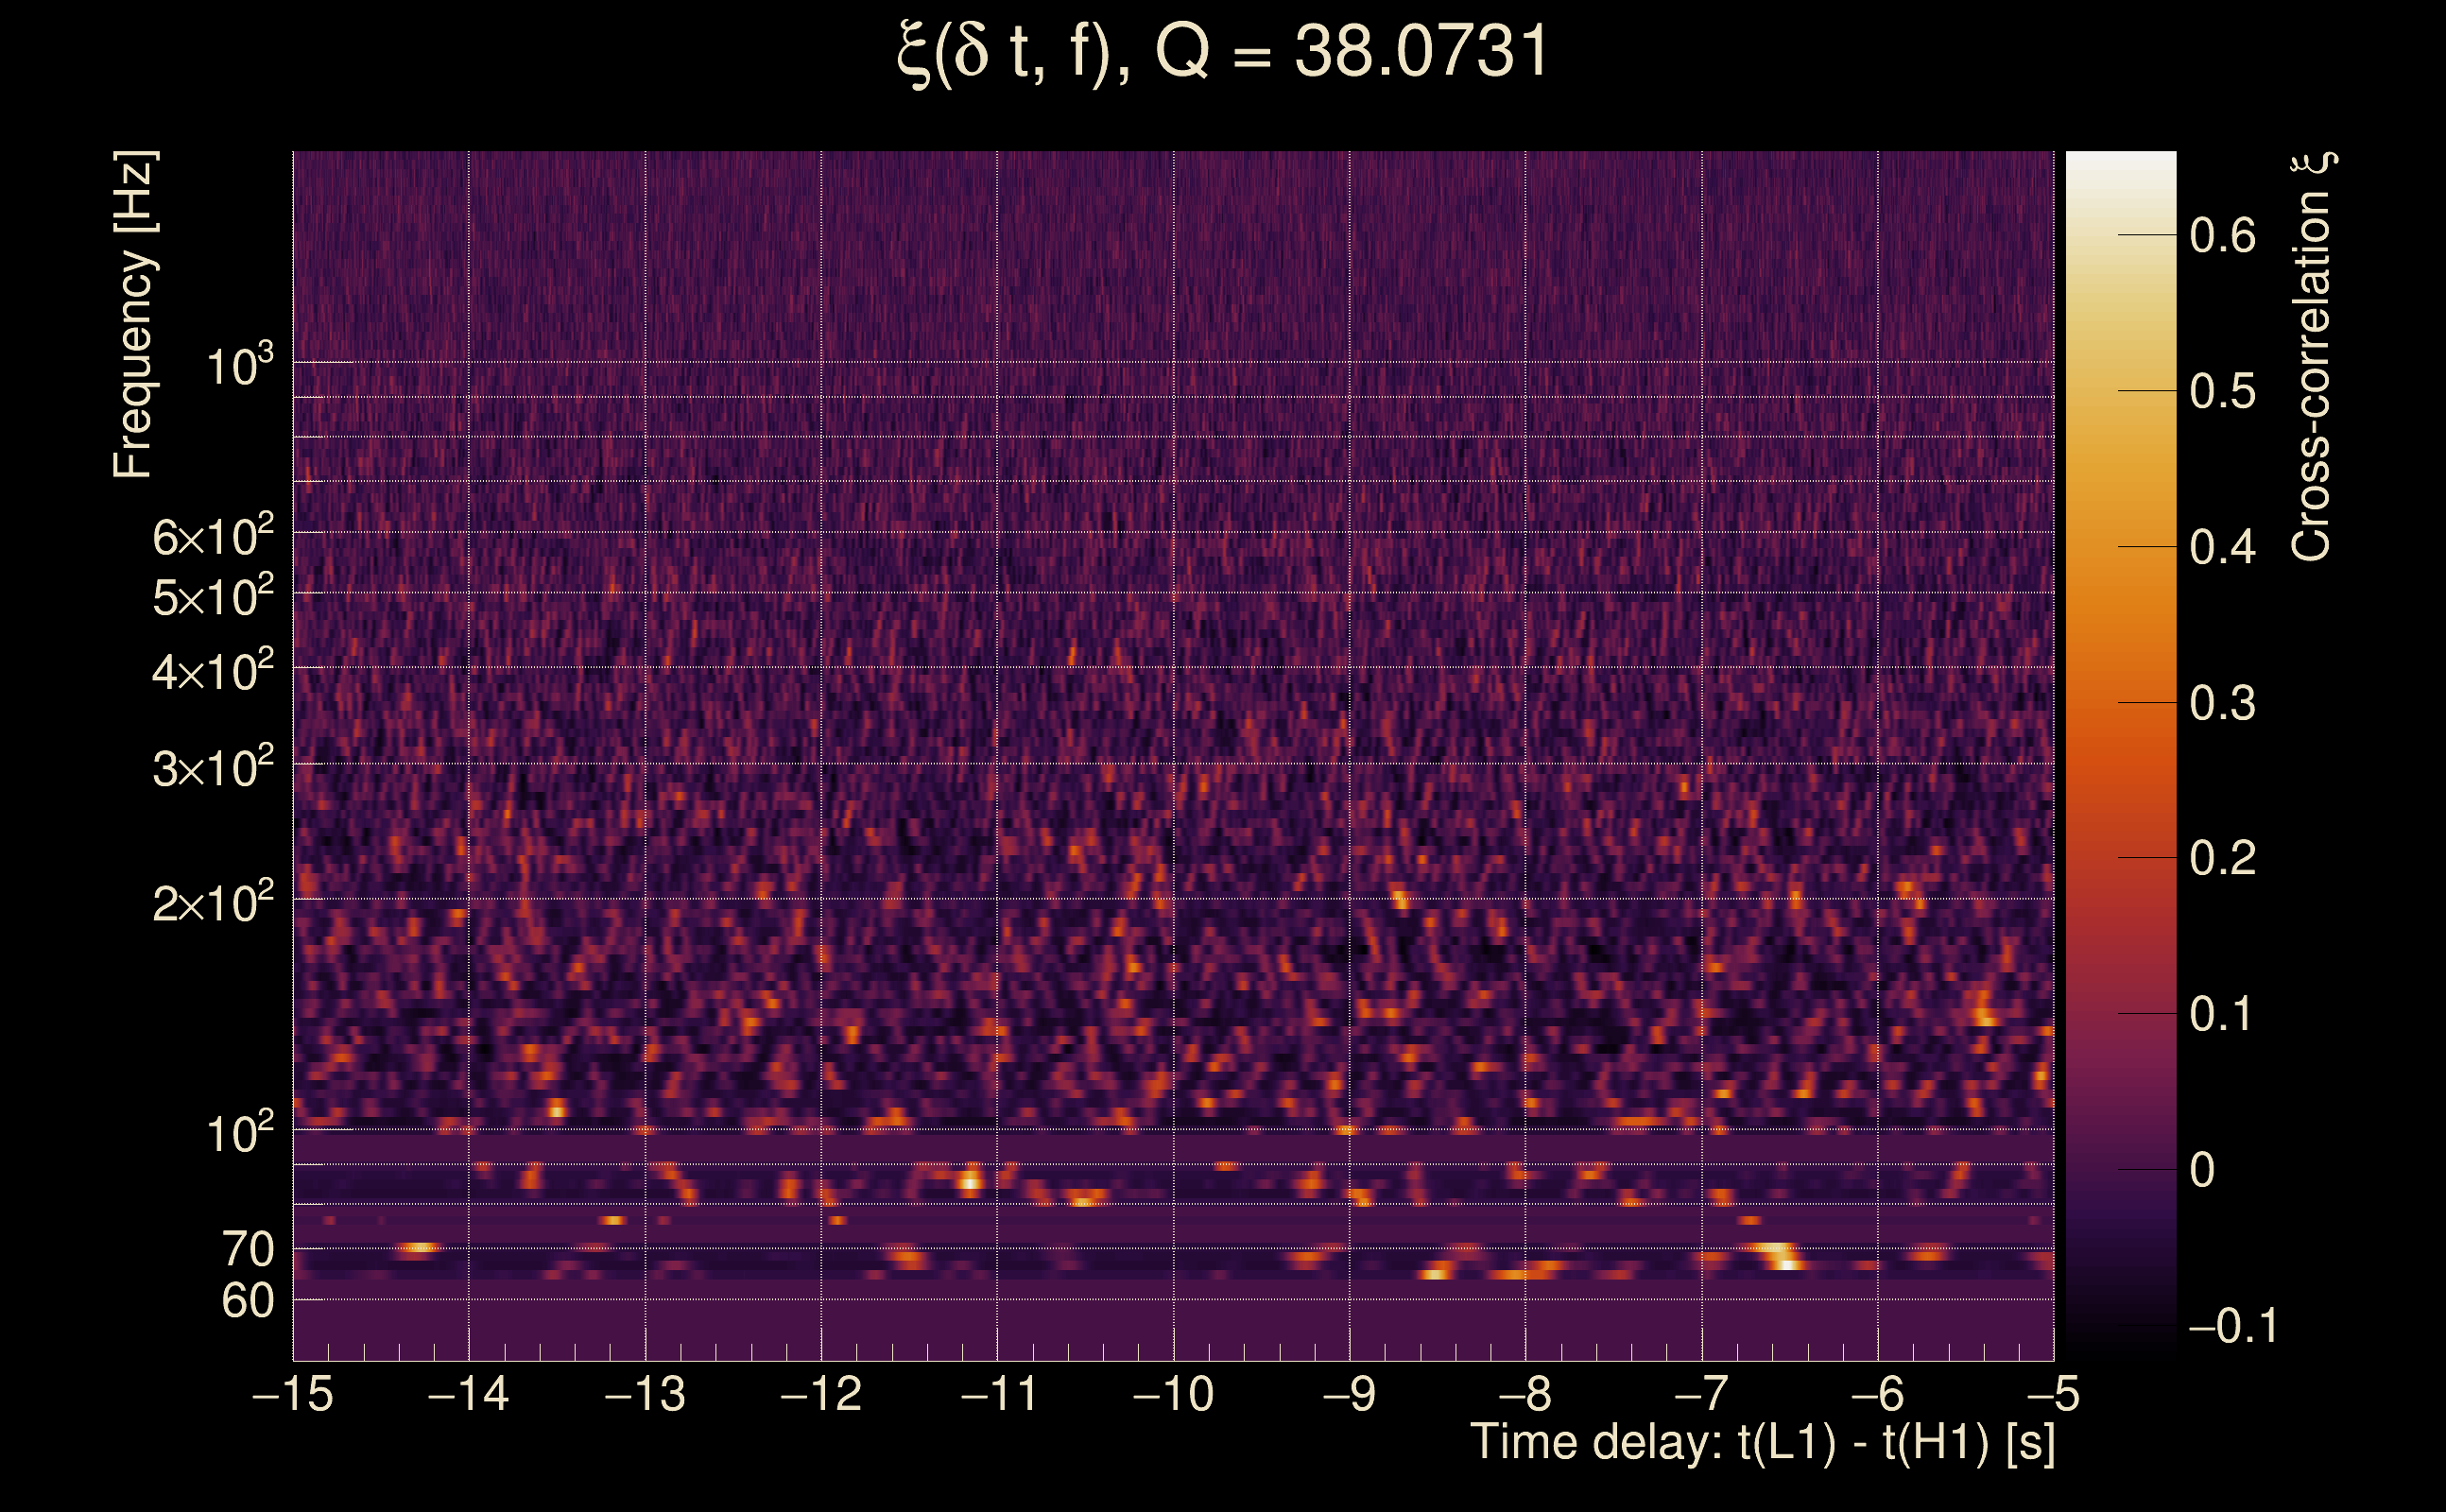
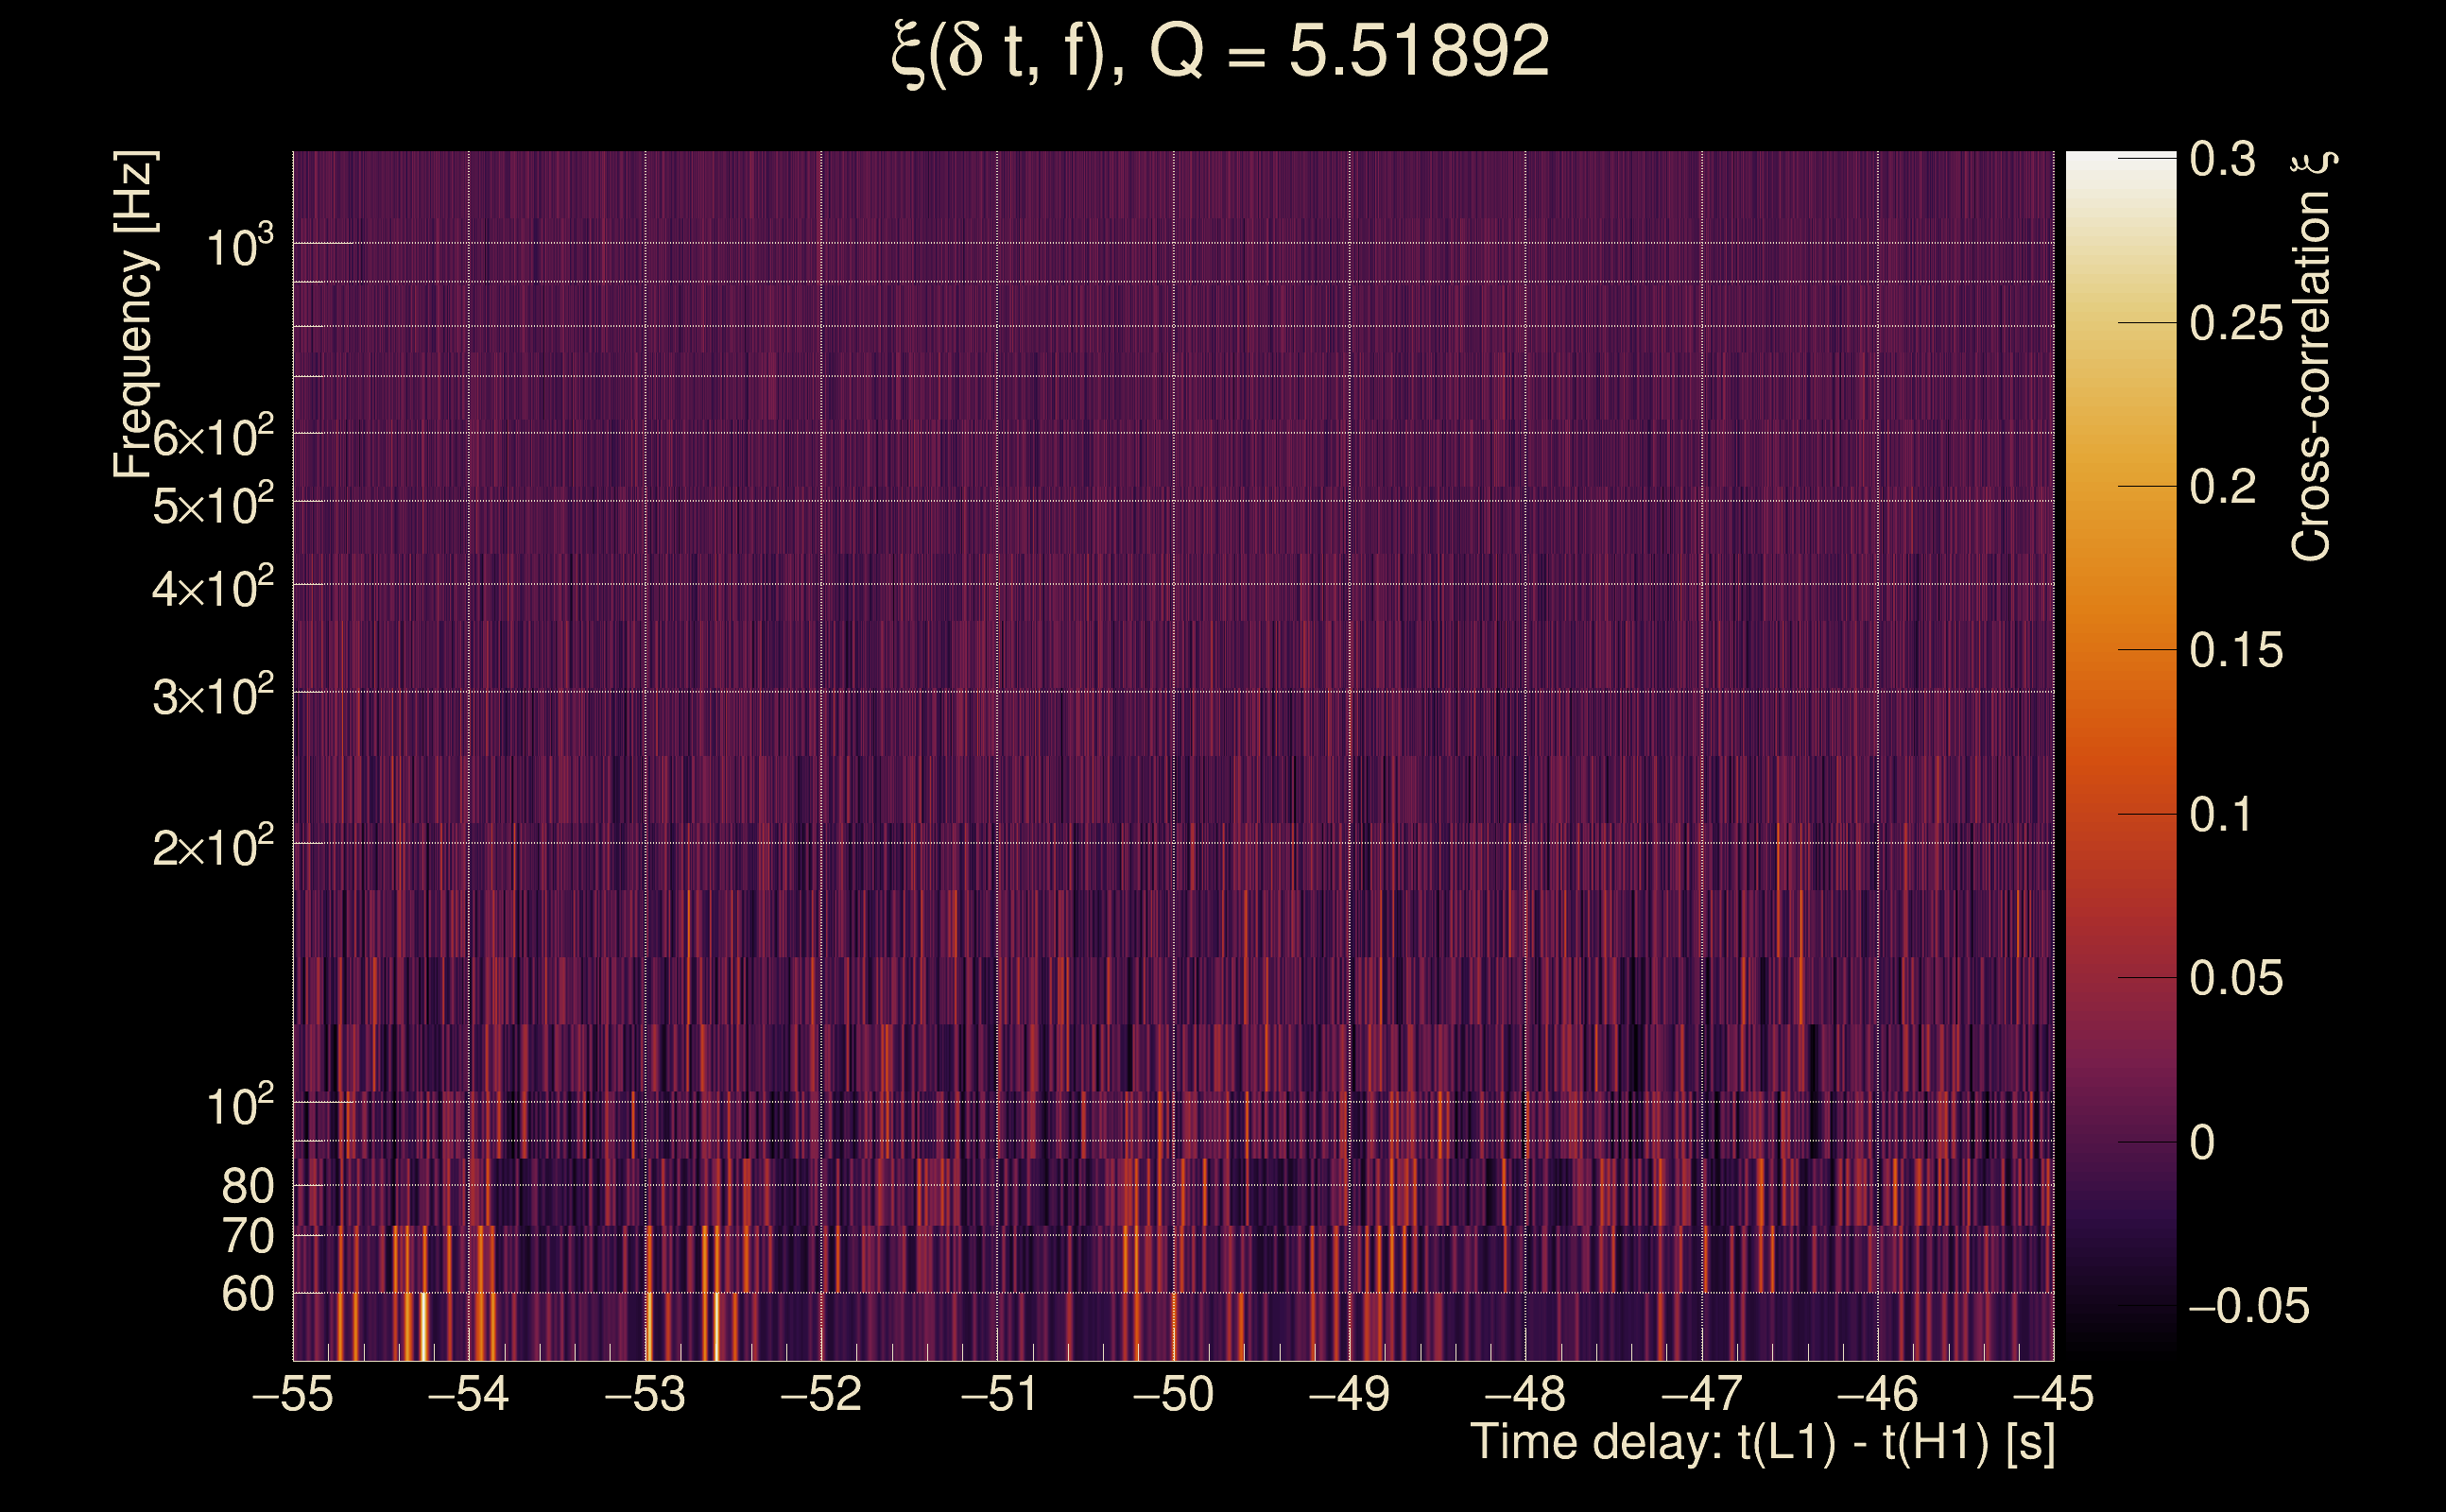
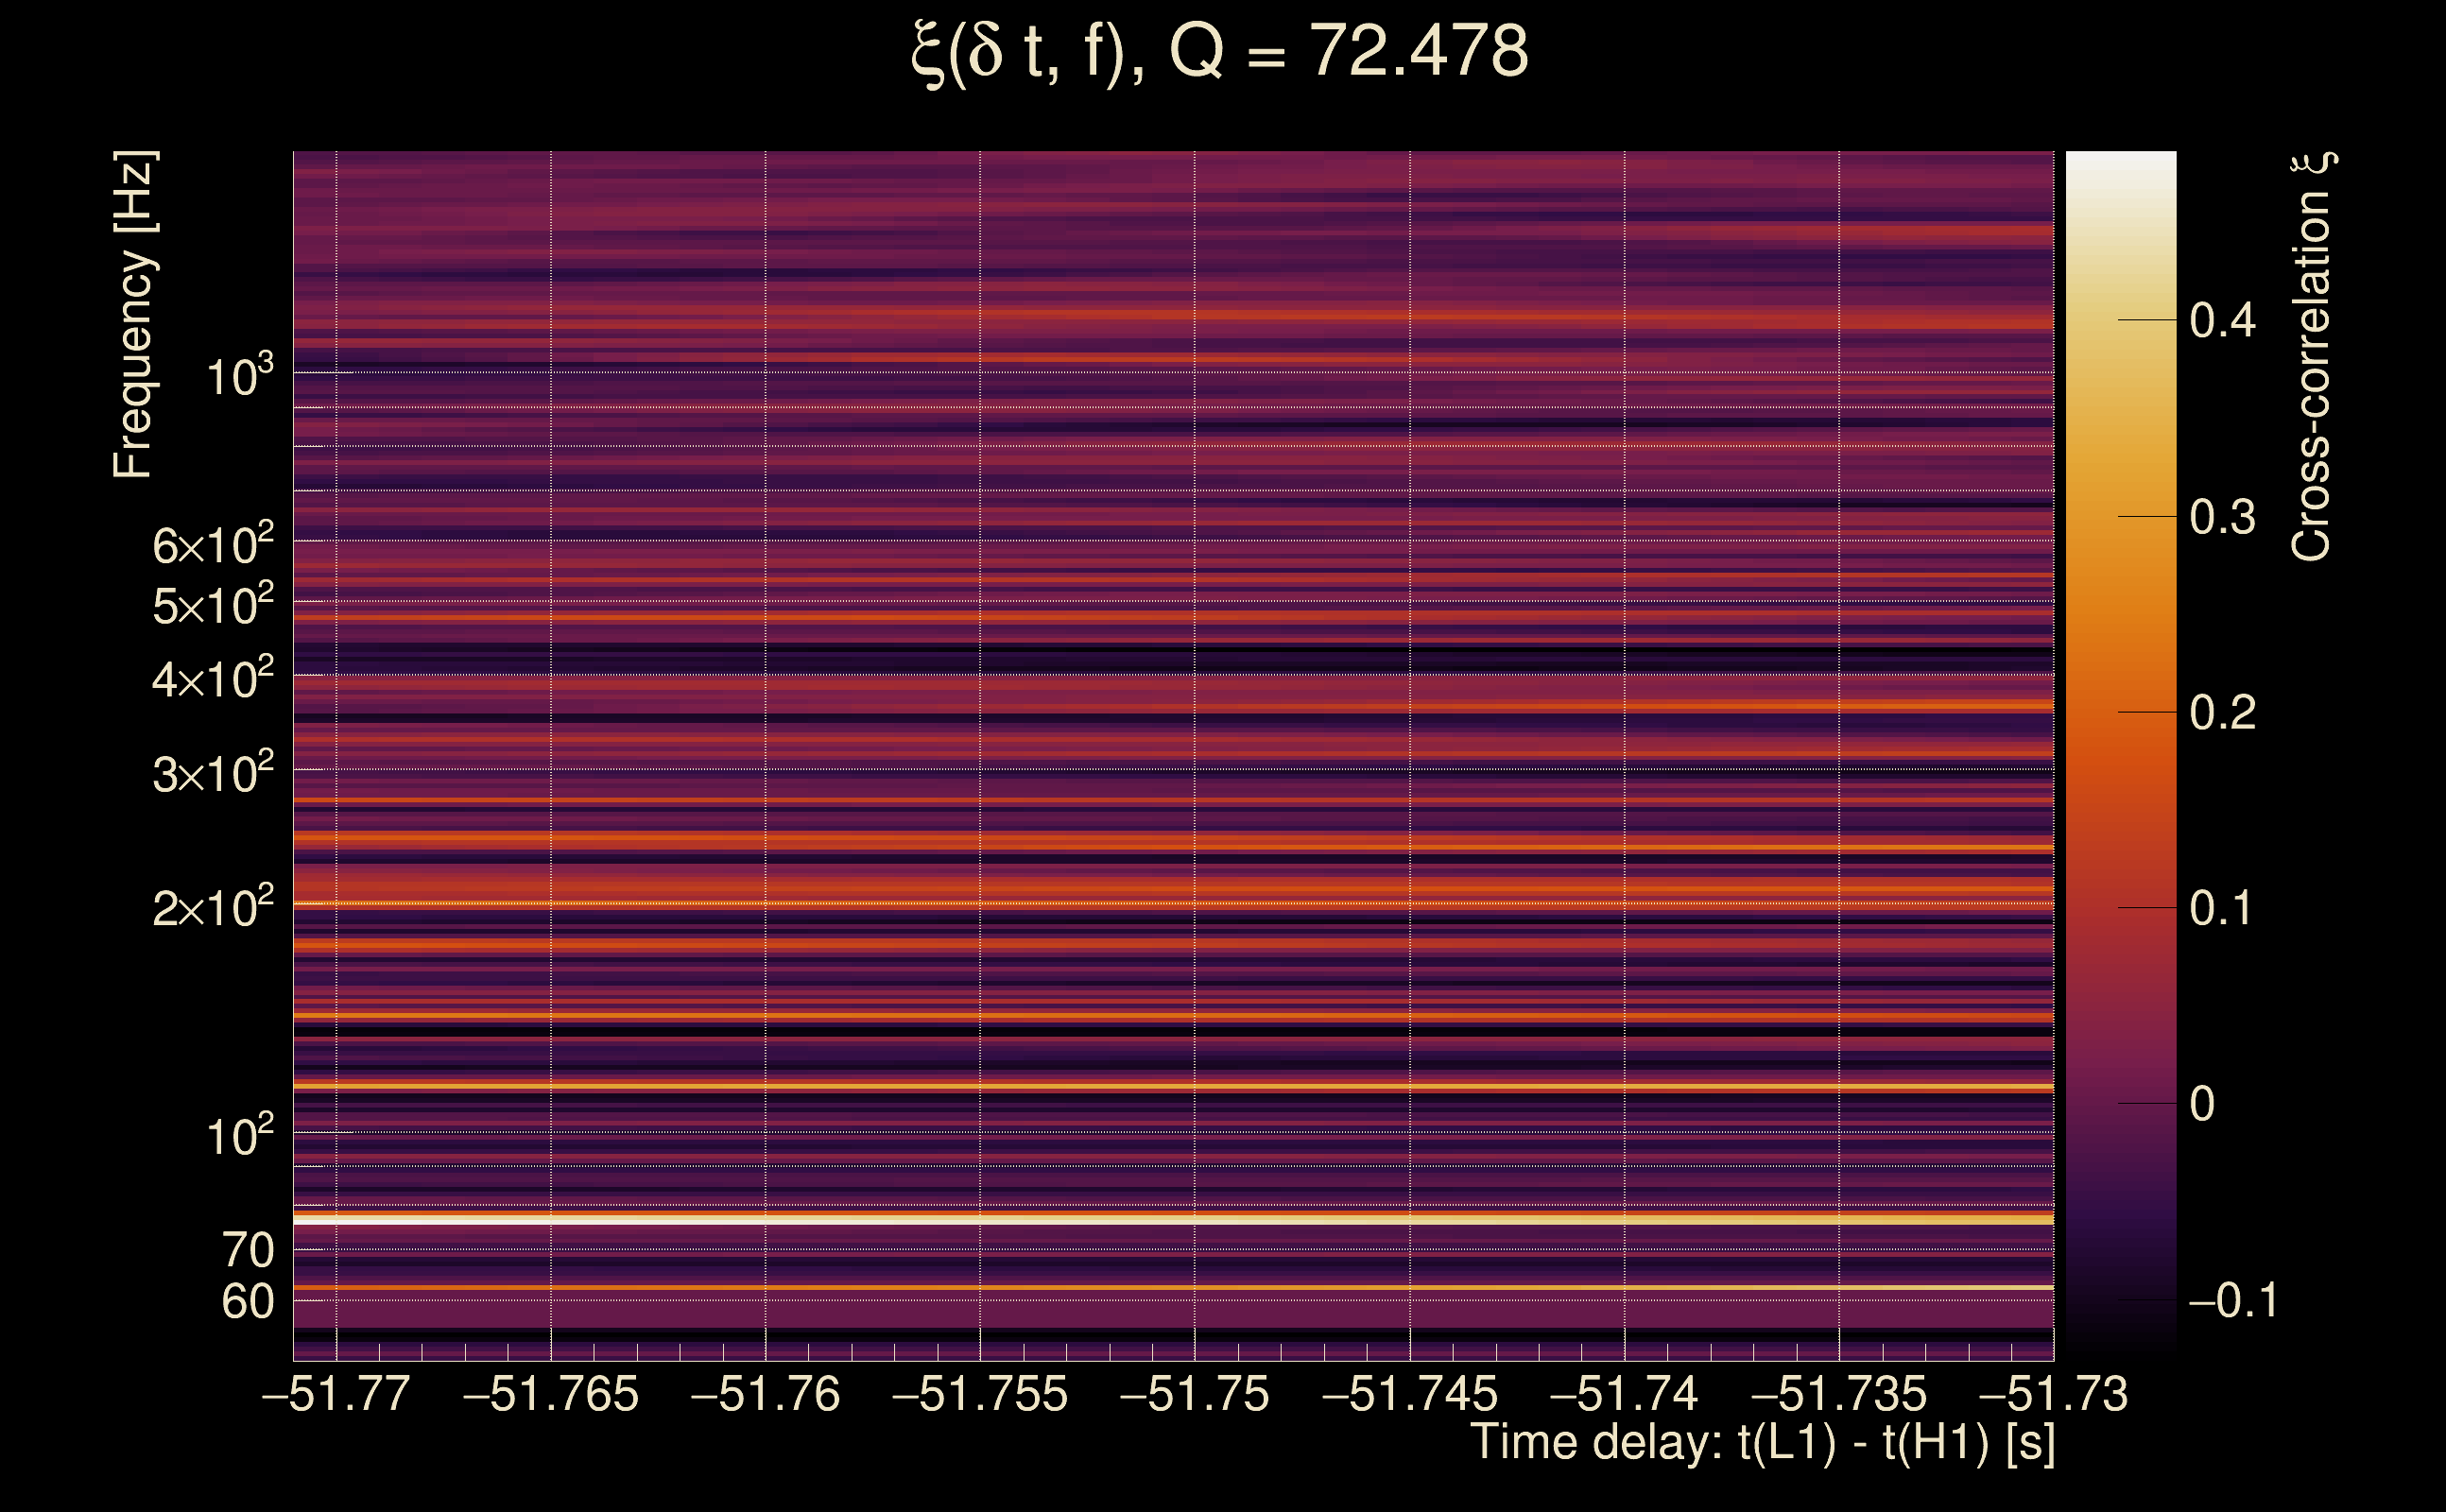
| Number of Q planes: | 5 (Q = 5.51892 → Q = 72.478) |
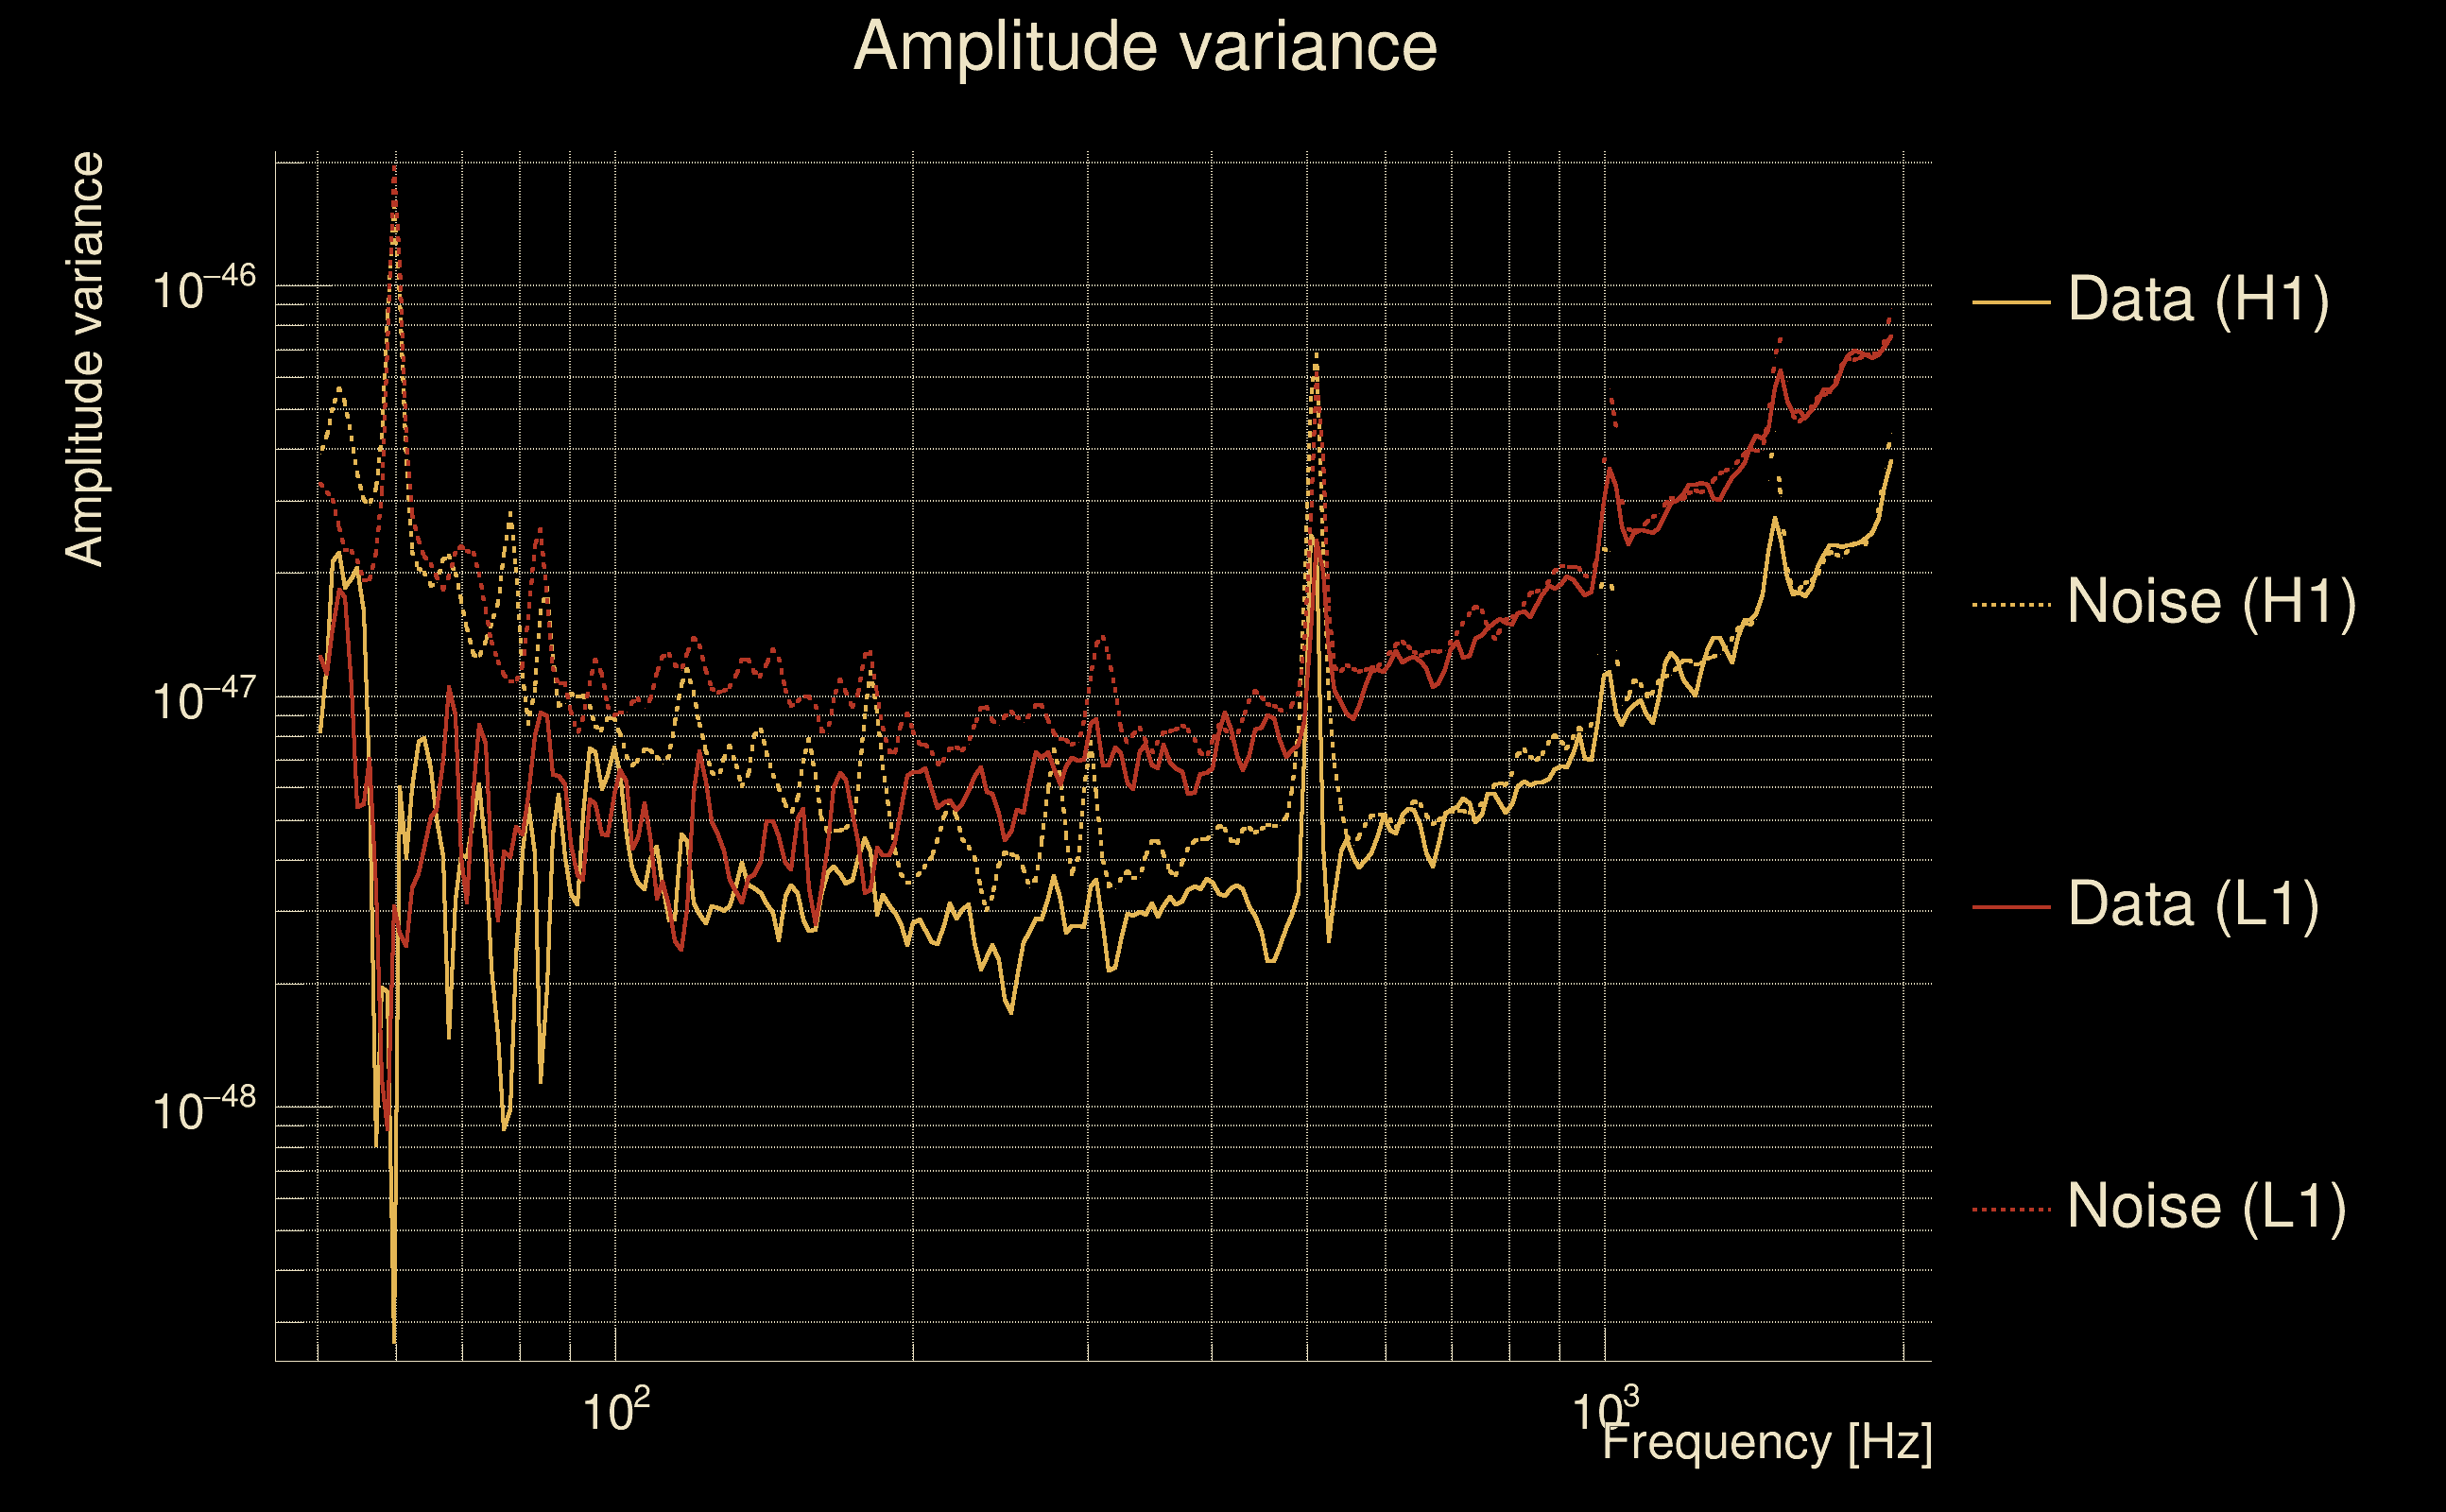
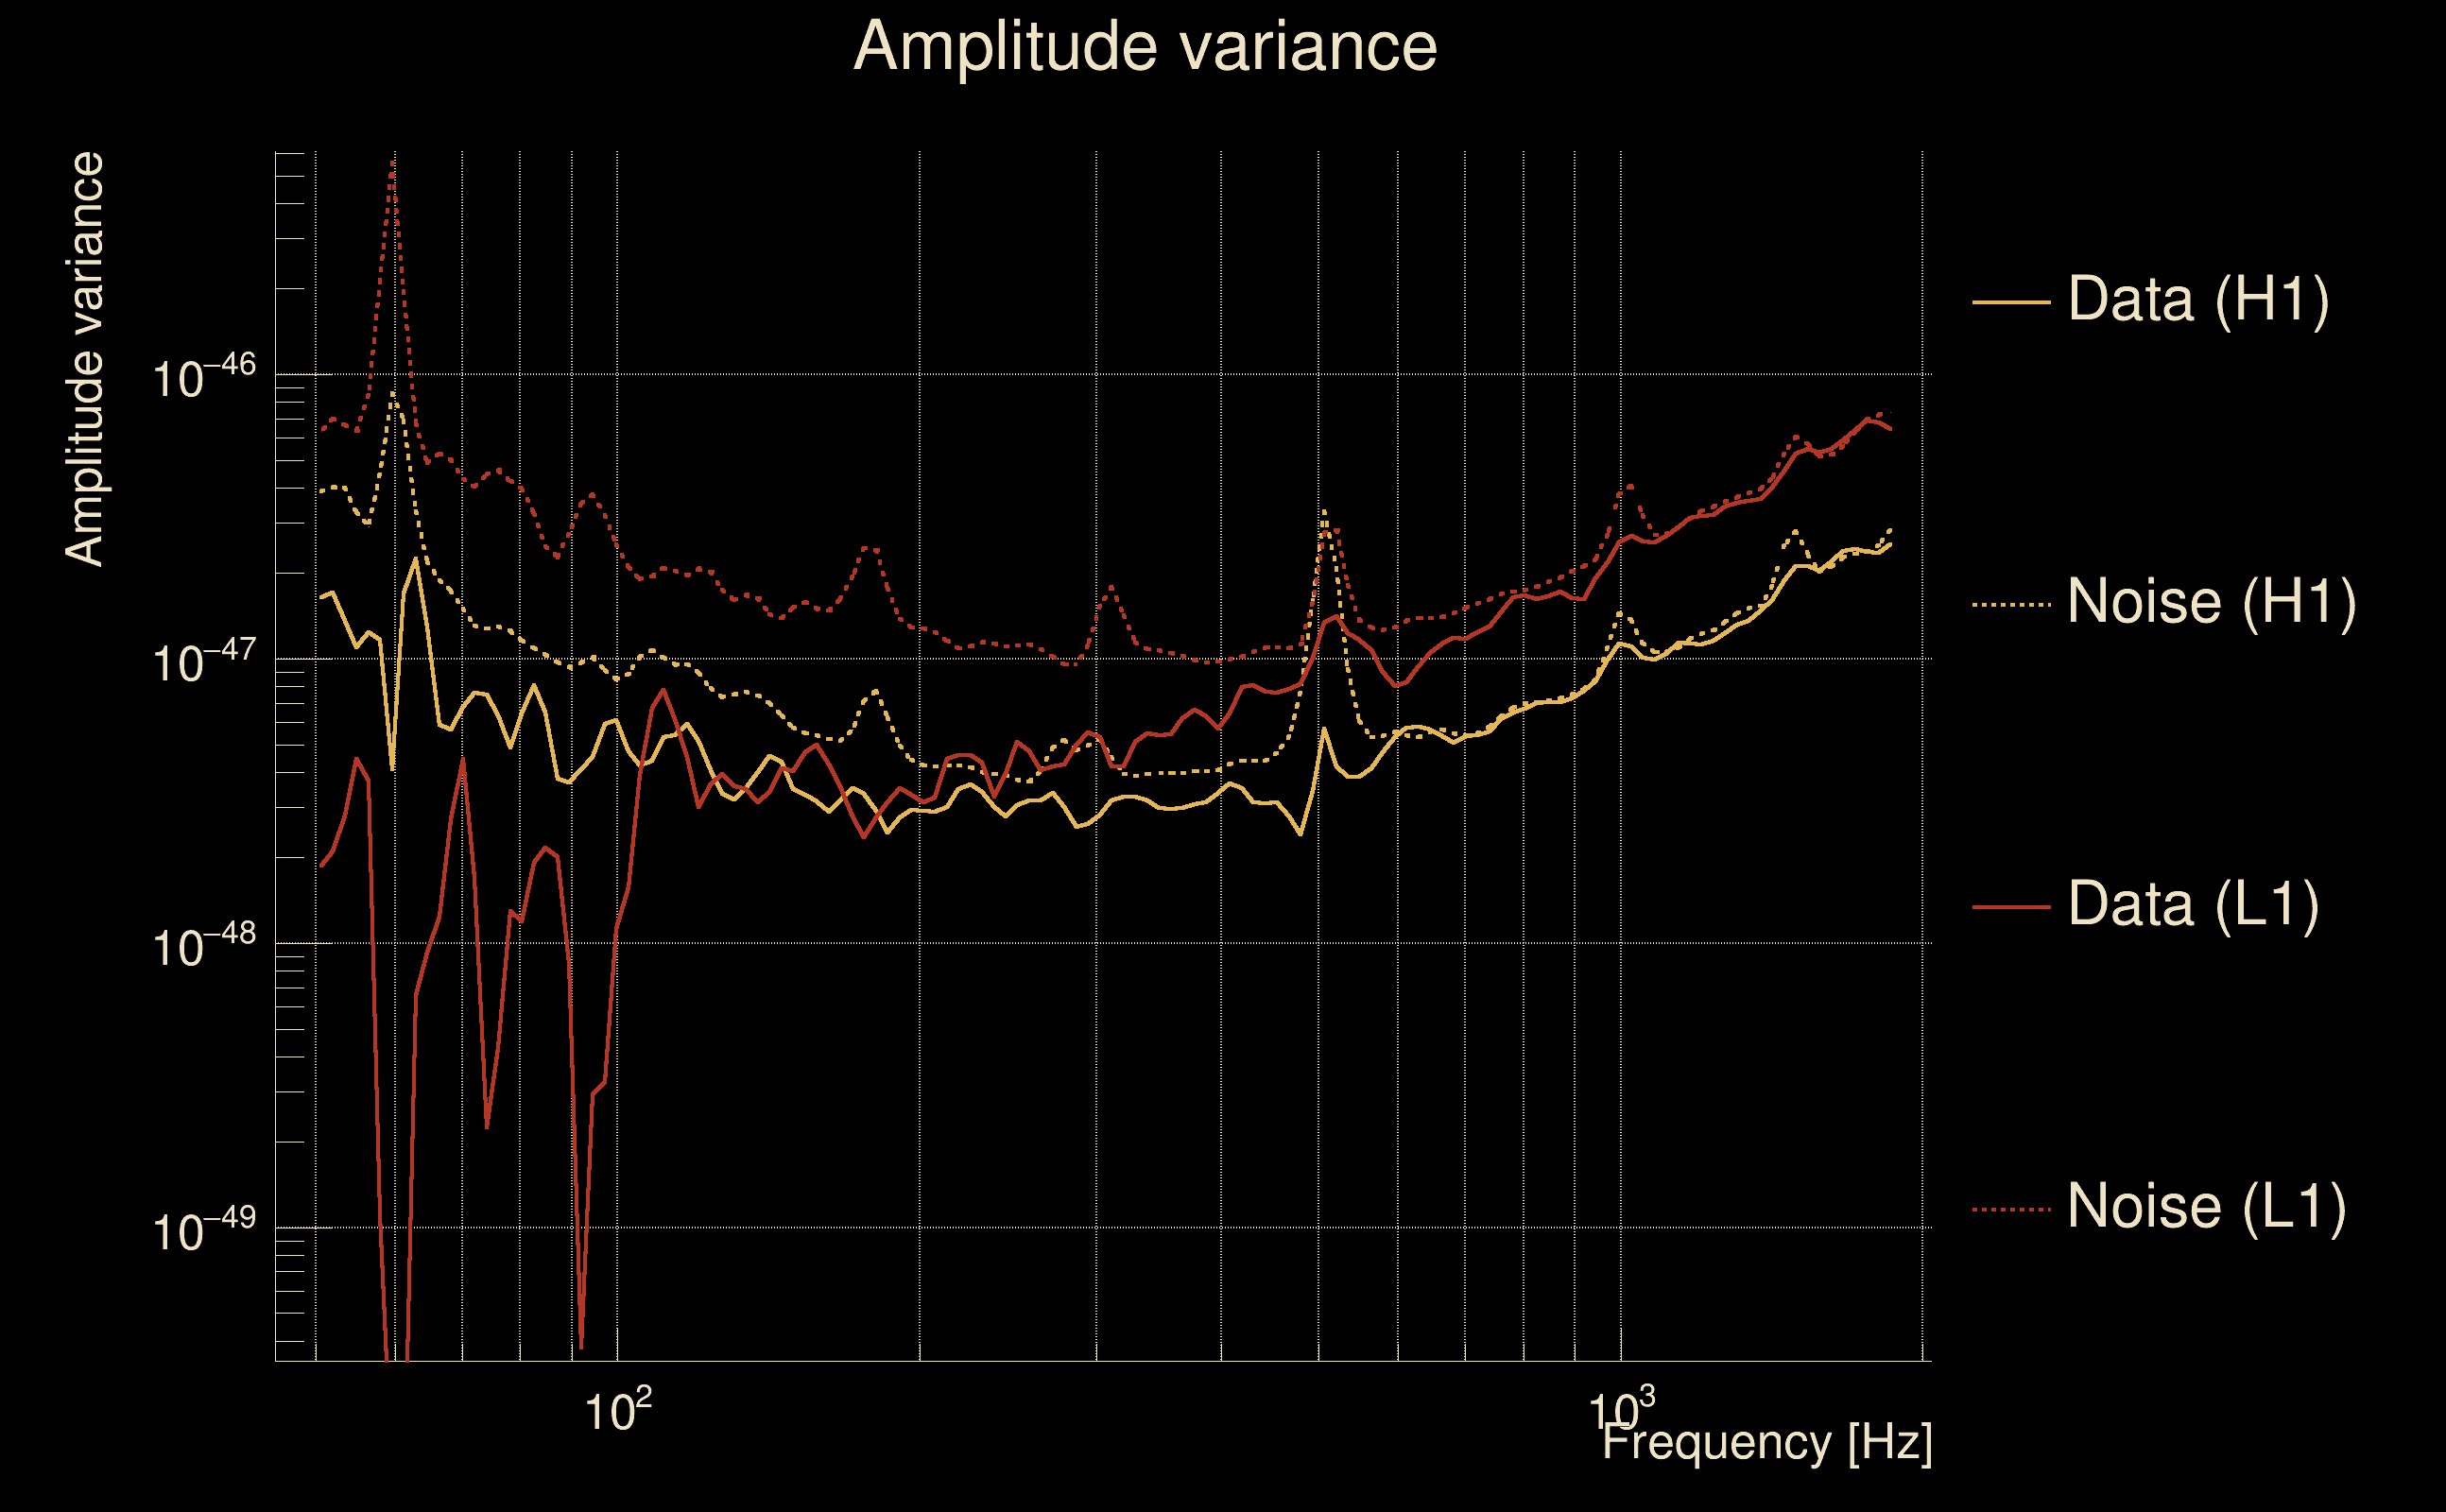
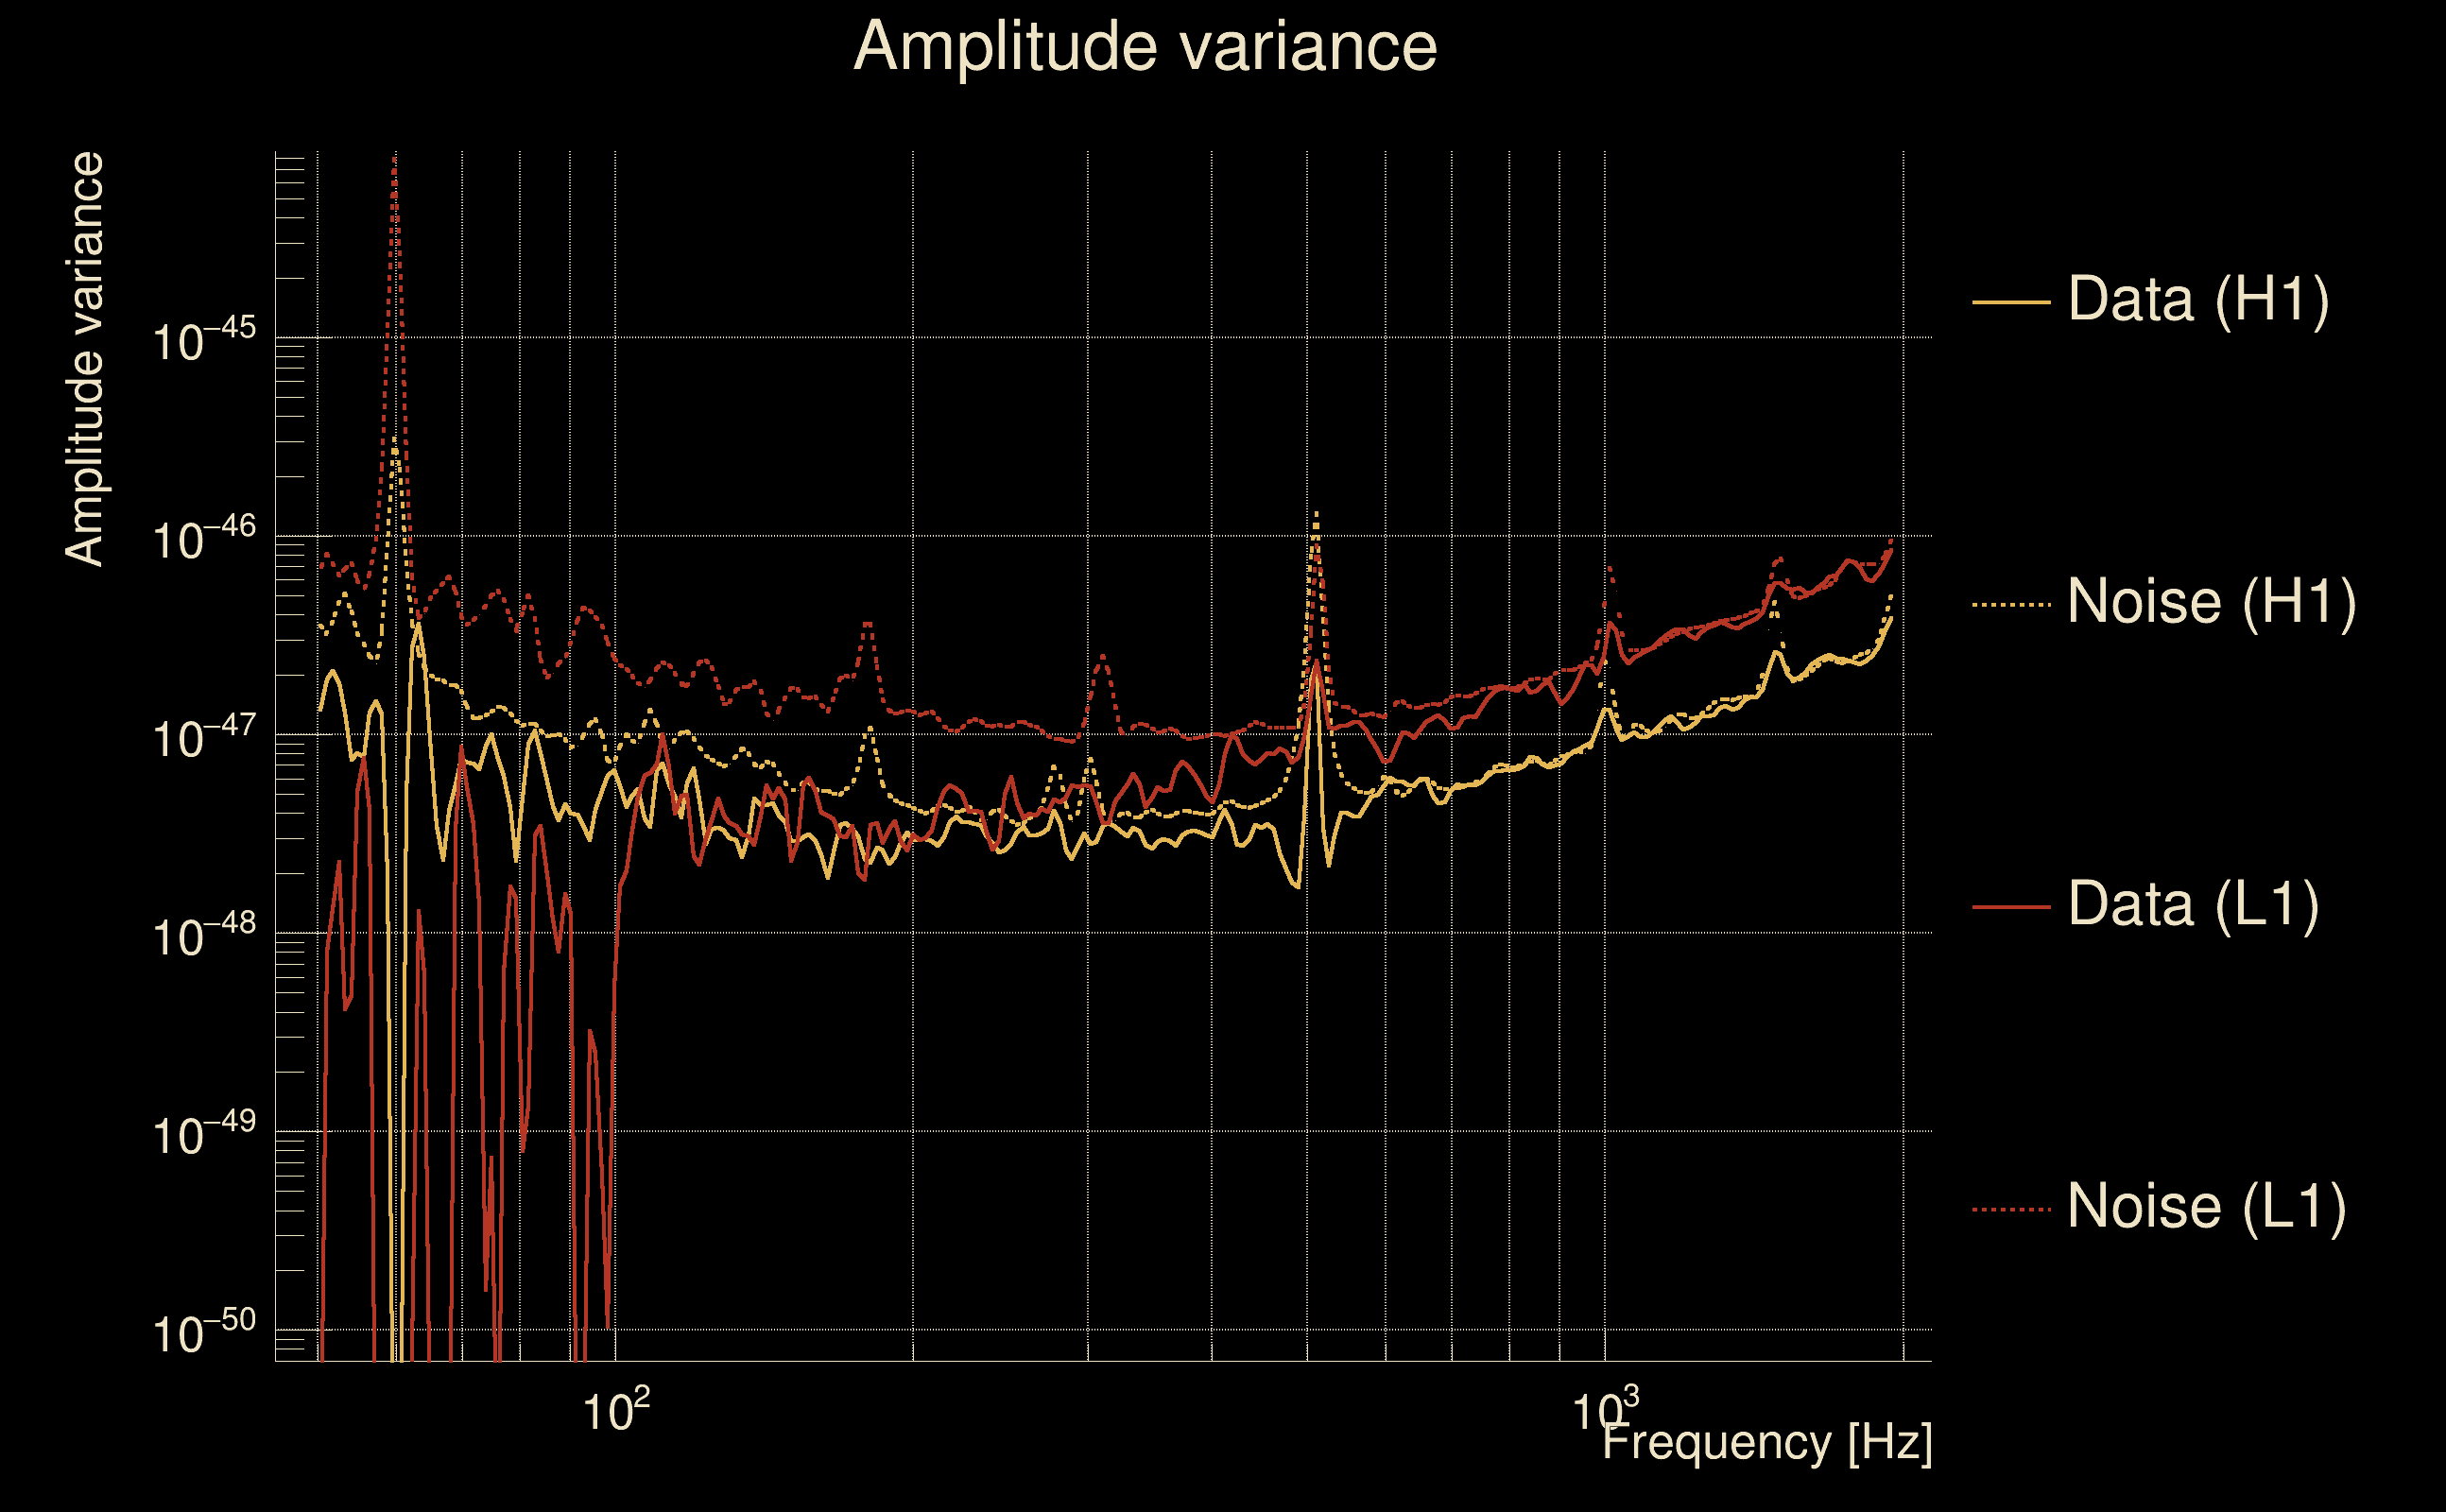
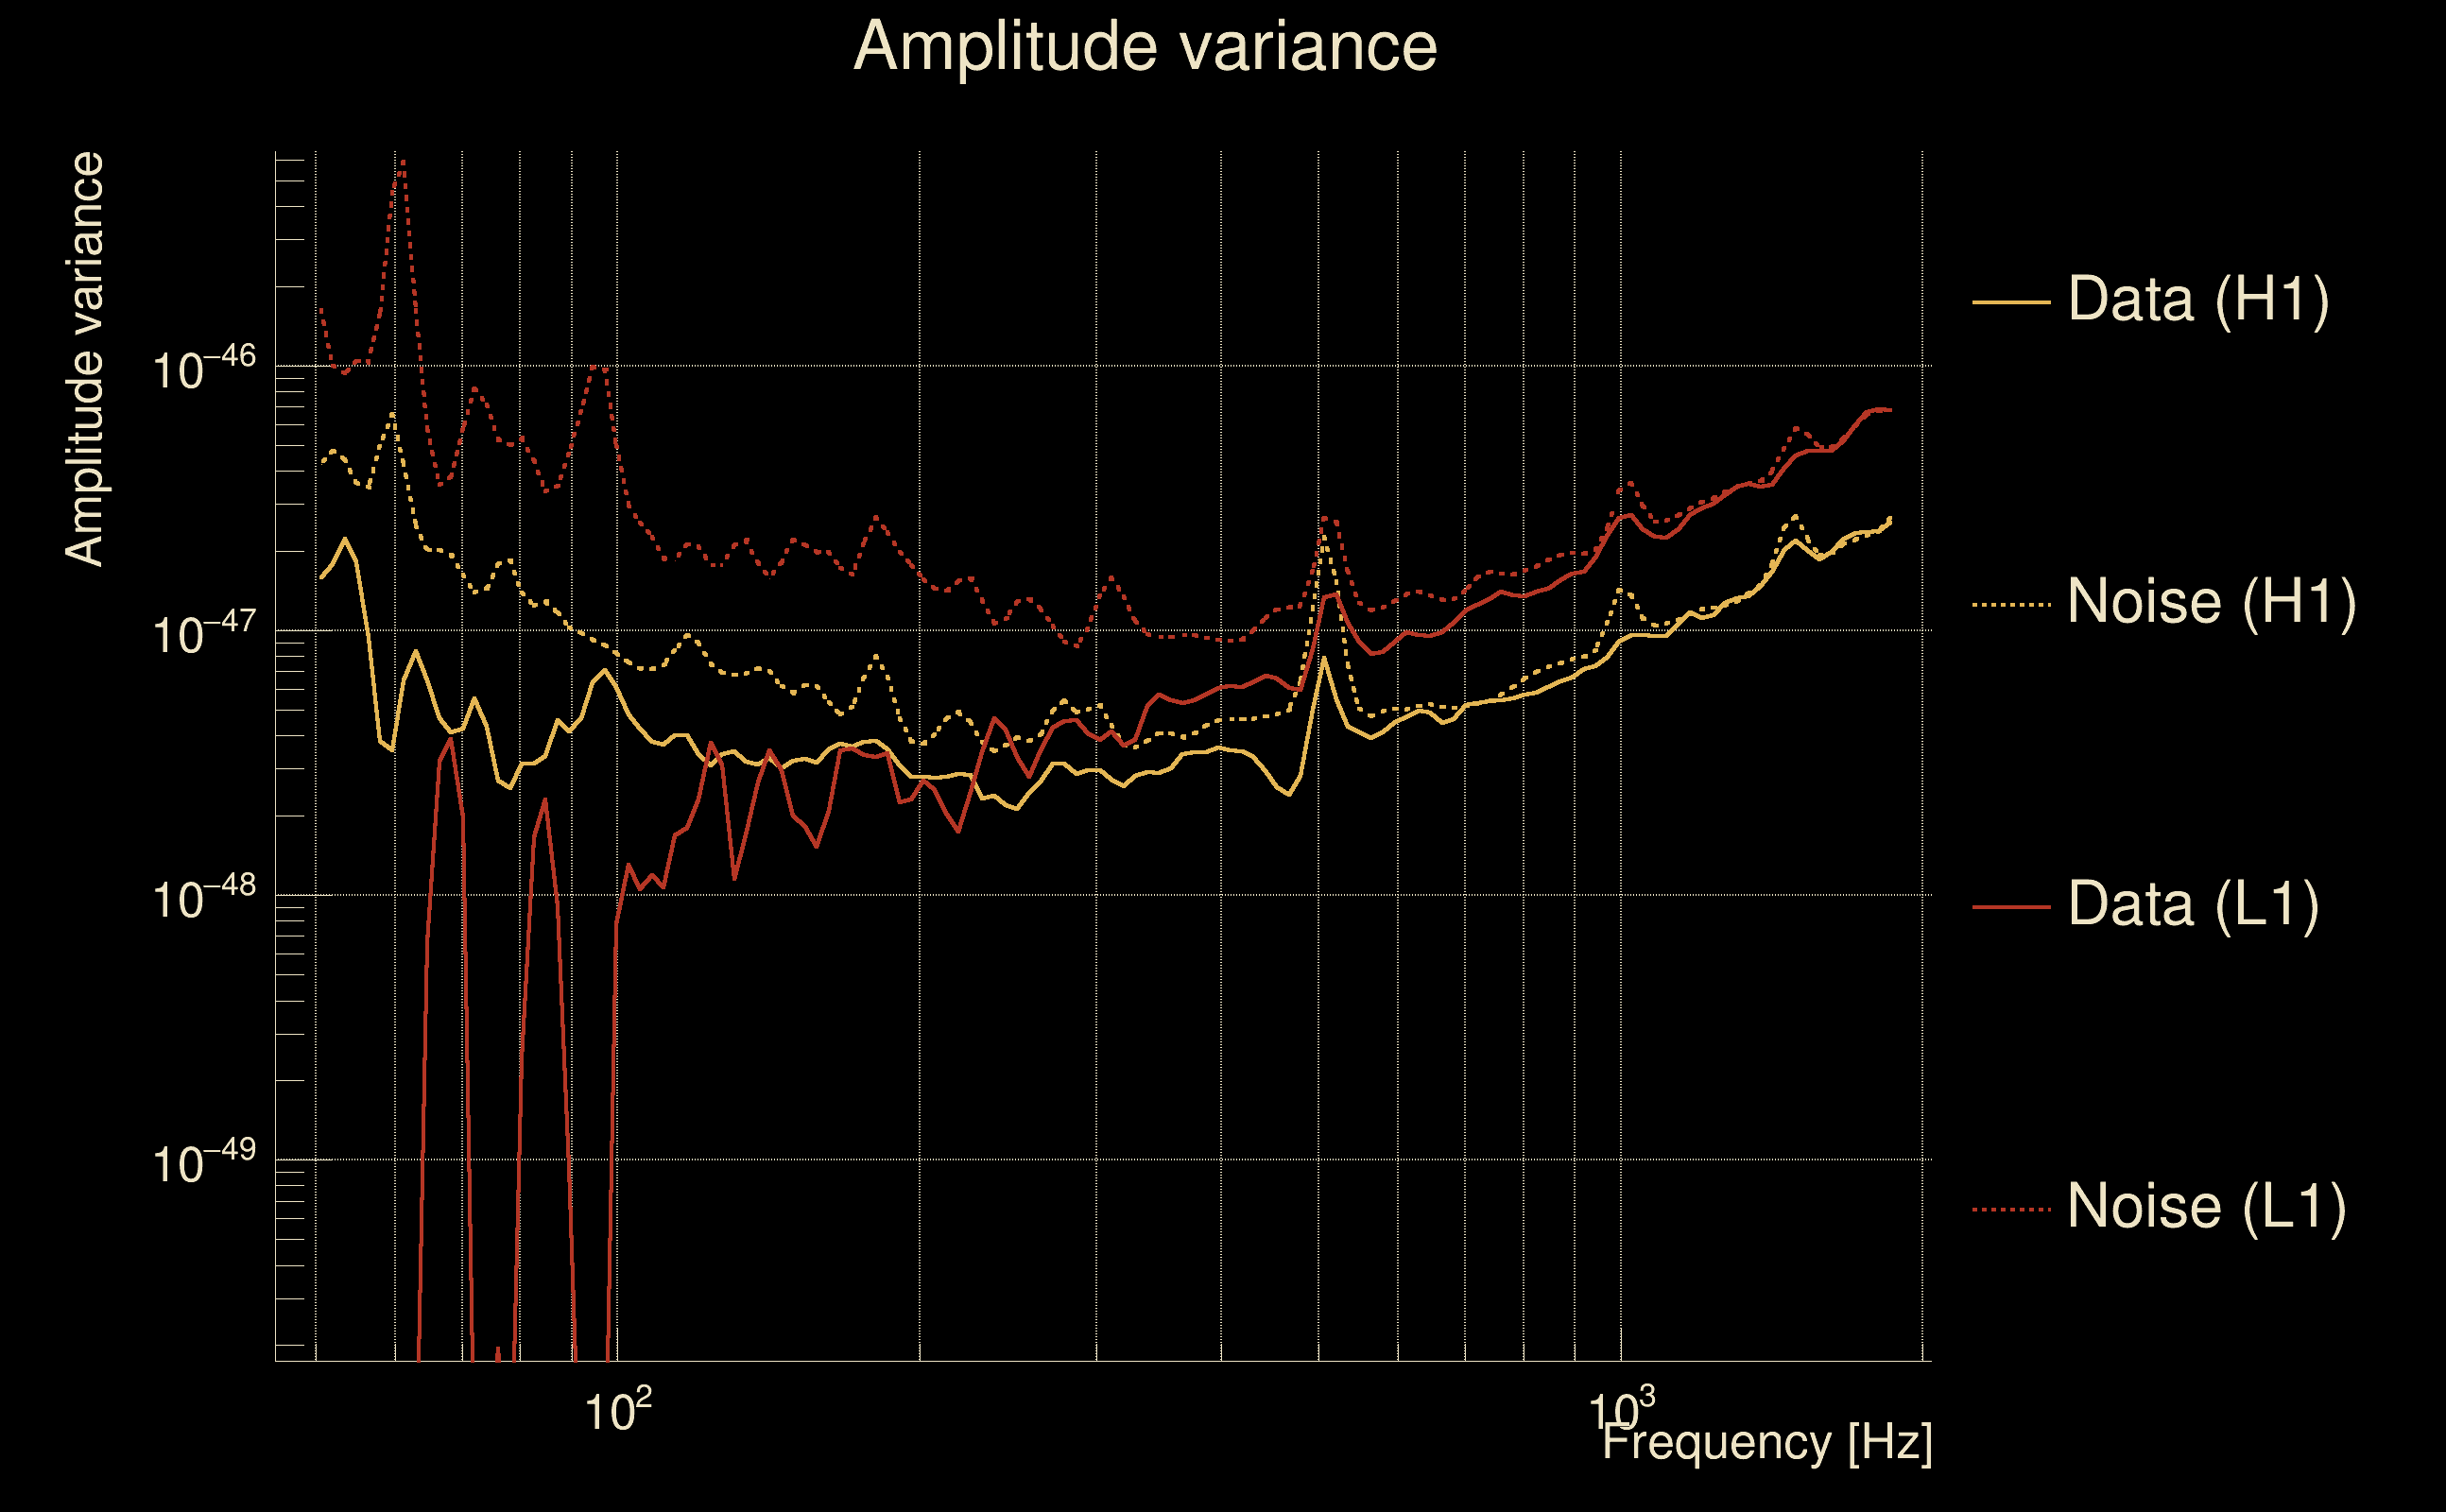
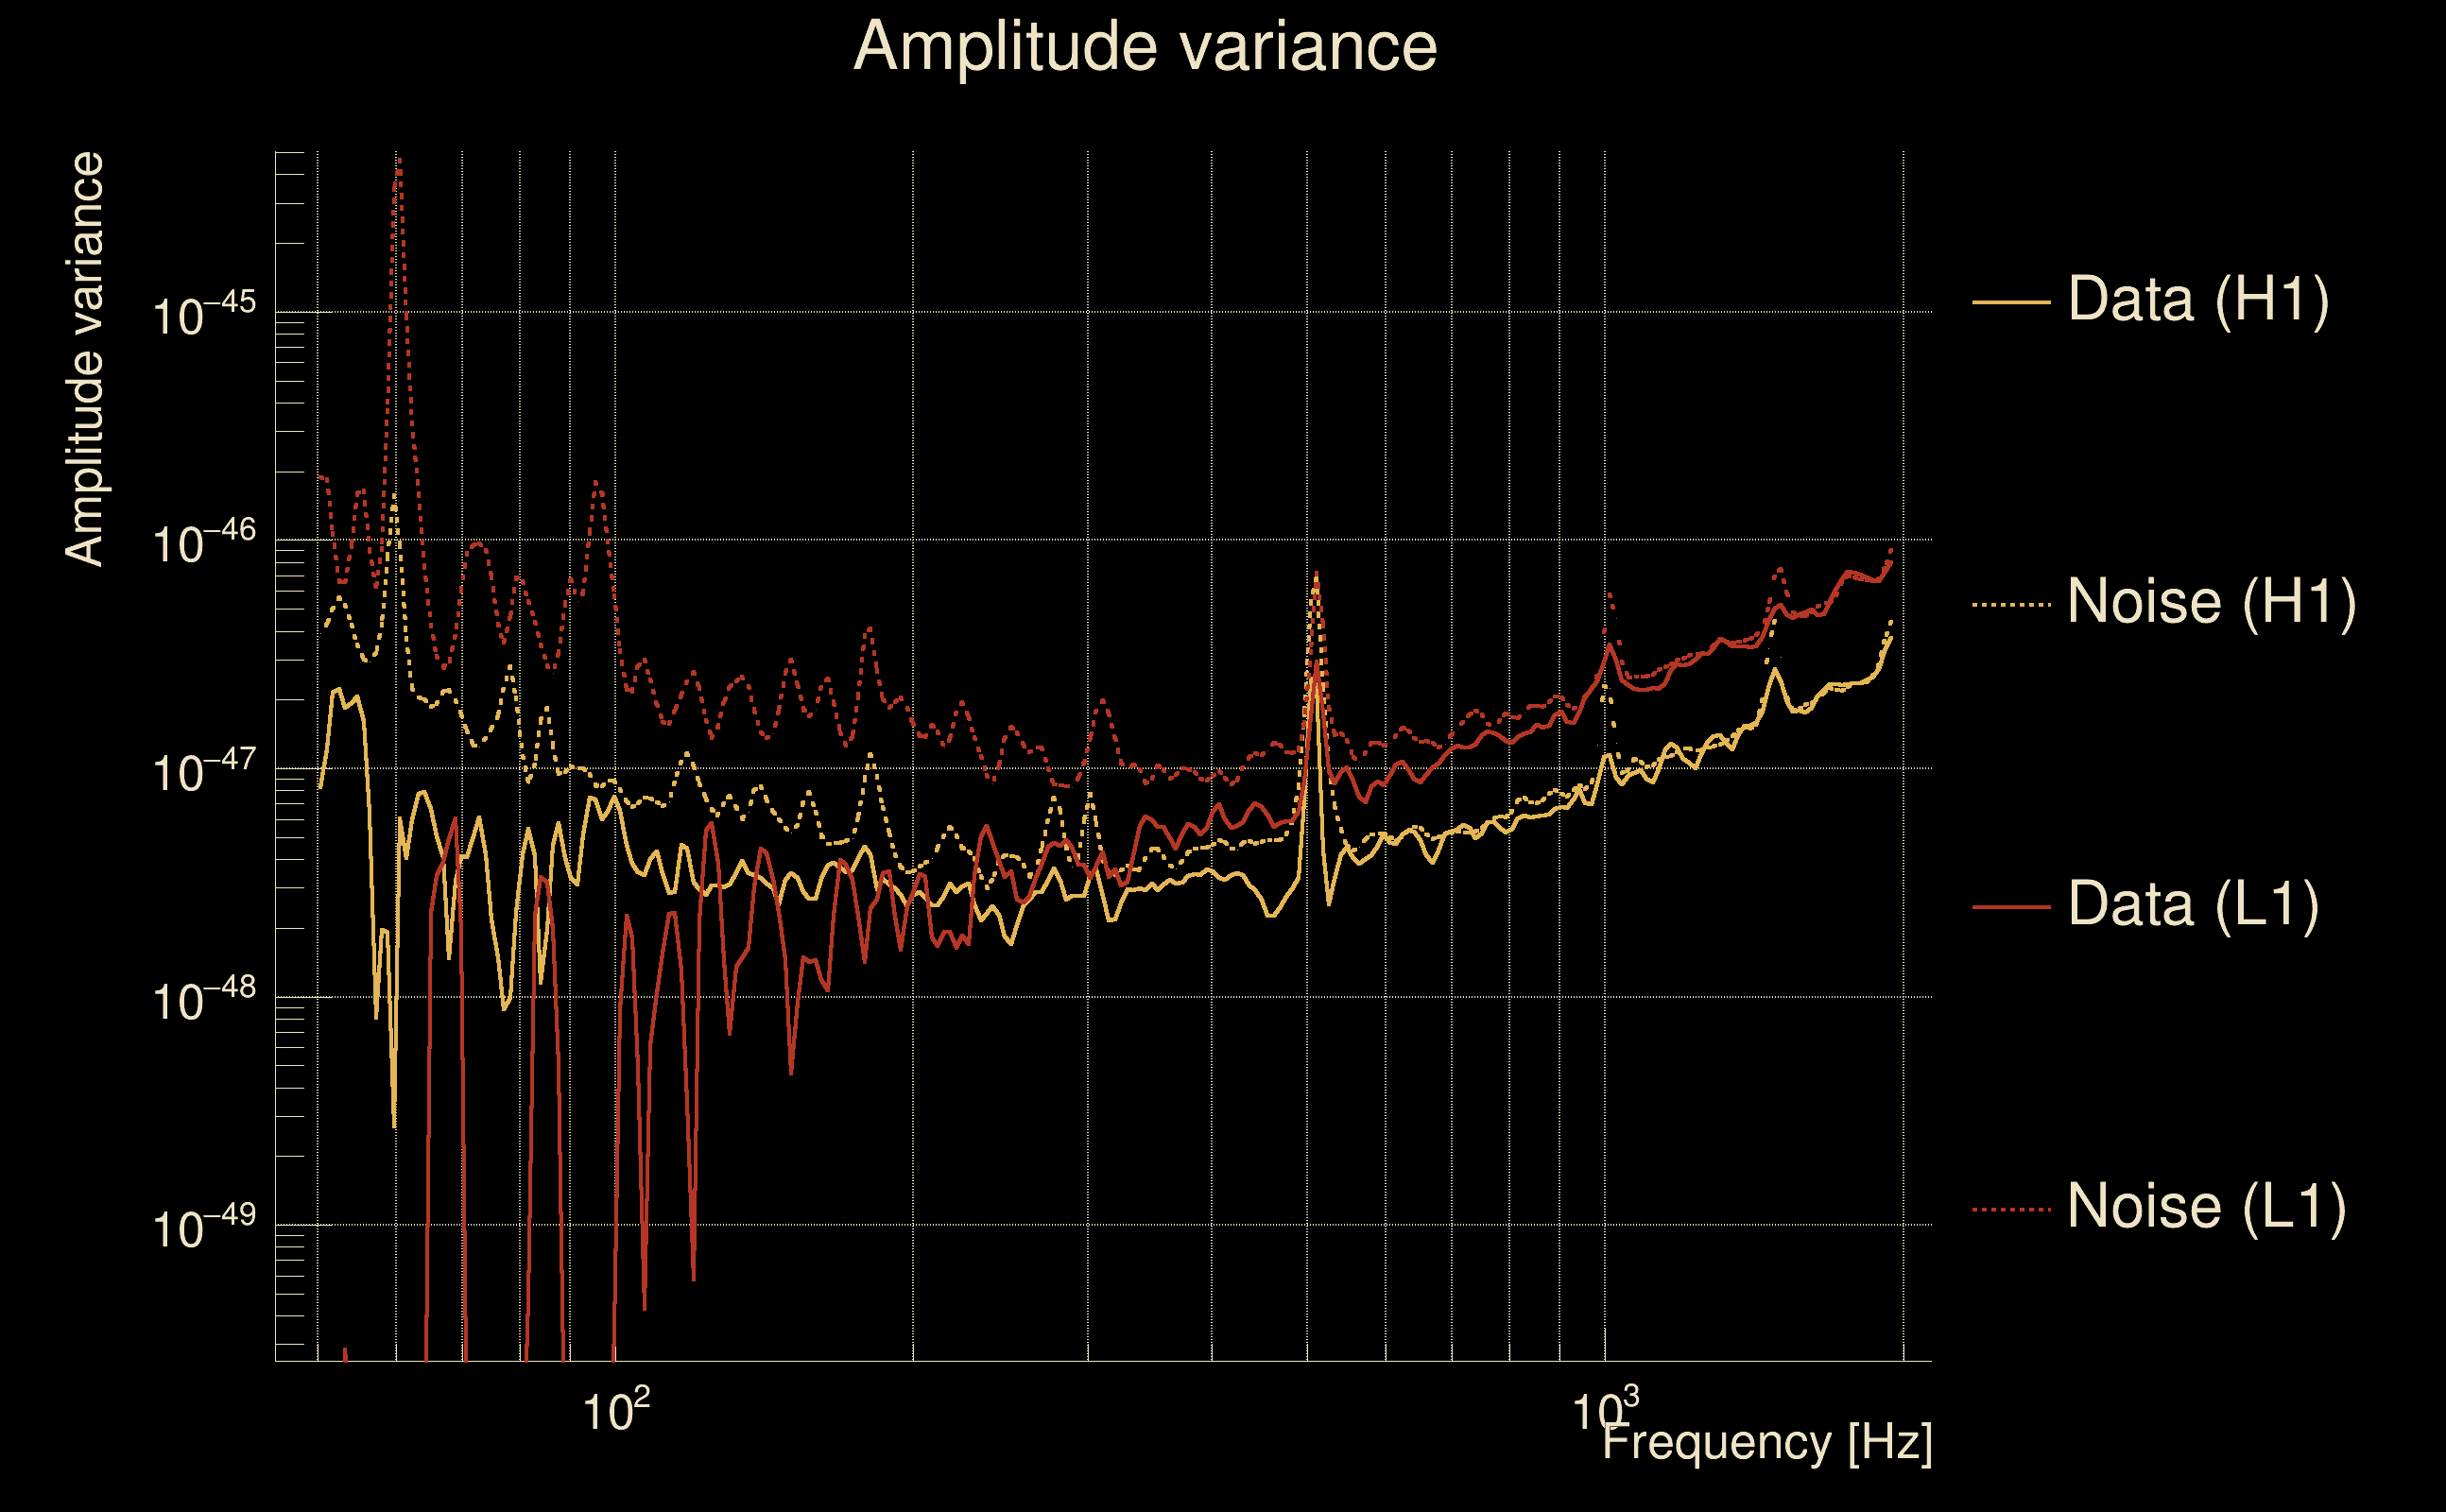
| Omicron frequency range: | 50 Hz → 1958.38 Hz |
| Light travel time between detectors: | 0.0100128 s |
| Slice extra-time (calibration uncertainty + slice veto): | 0.0129872 s |
| Number of time-delay bins in a cross-correlation map: | 10000 |
| Number of slices in a cross-correlation map: | 217 |
| Number of time-delay bins in a slice: | 46 |
| SNR gating: | < 100 (detector 0), < 100 (detector 1) |
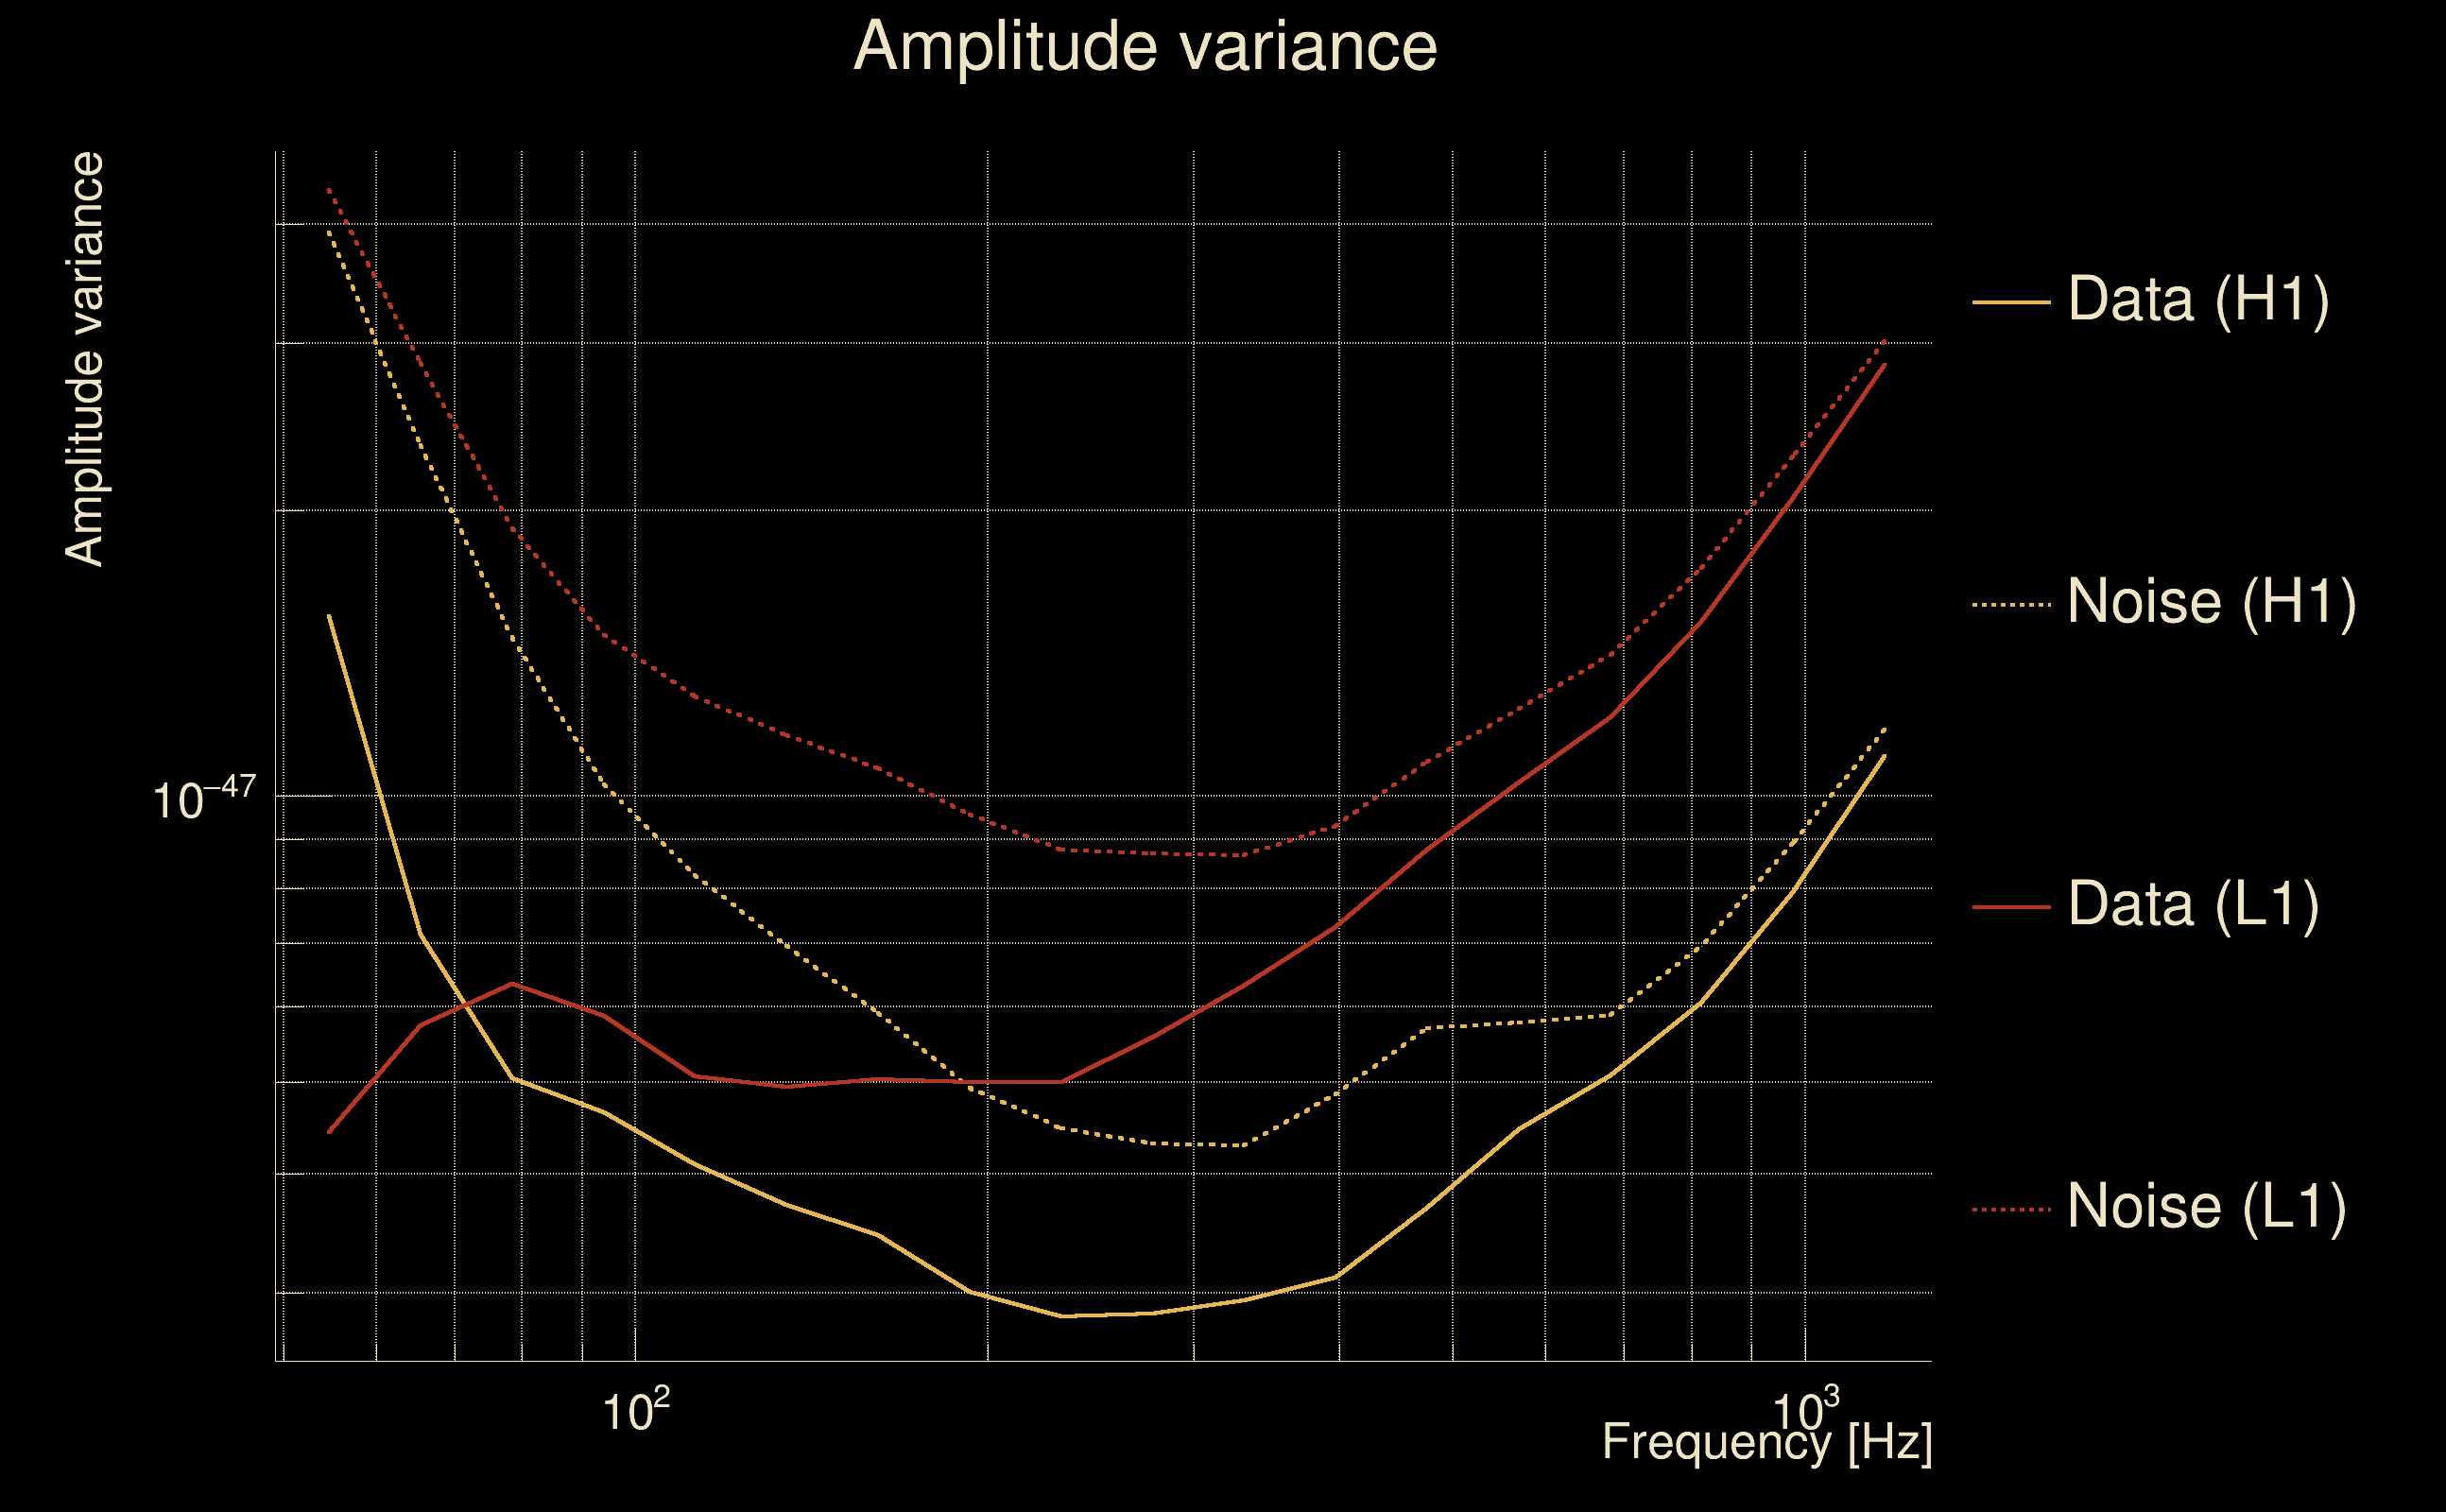
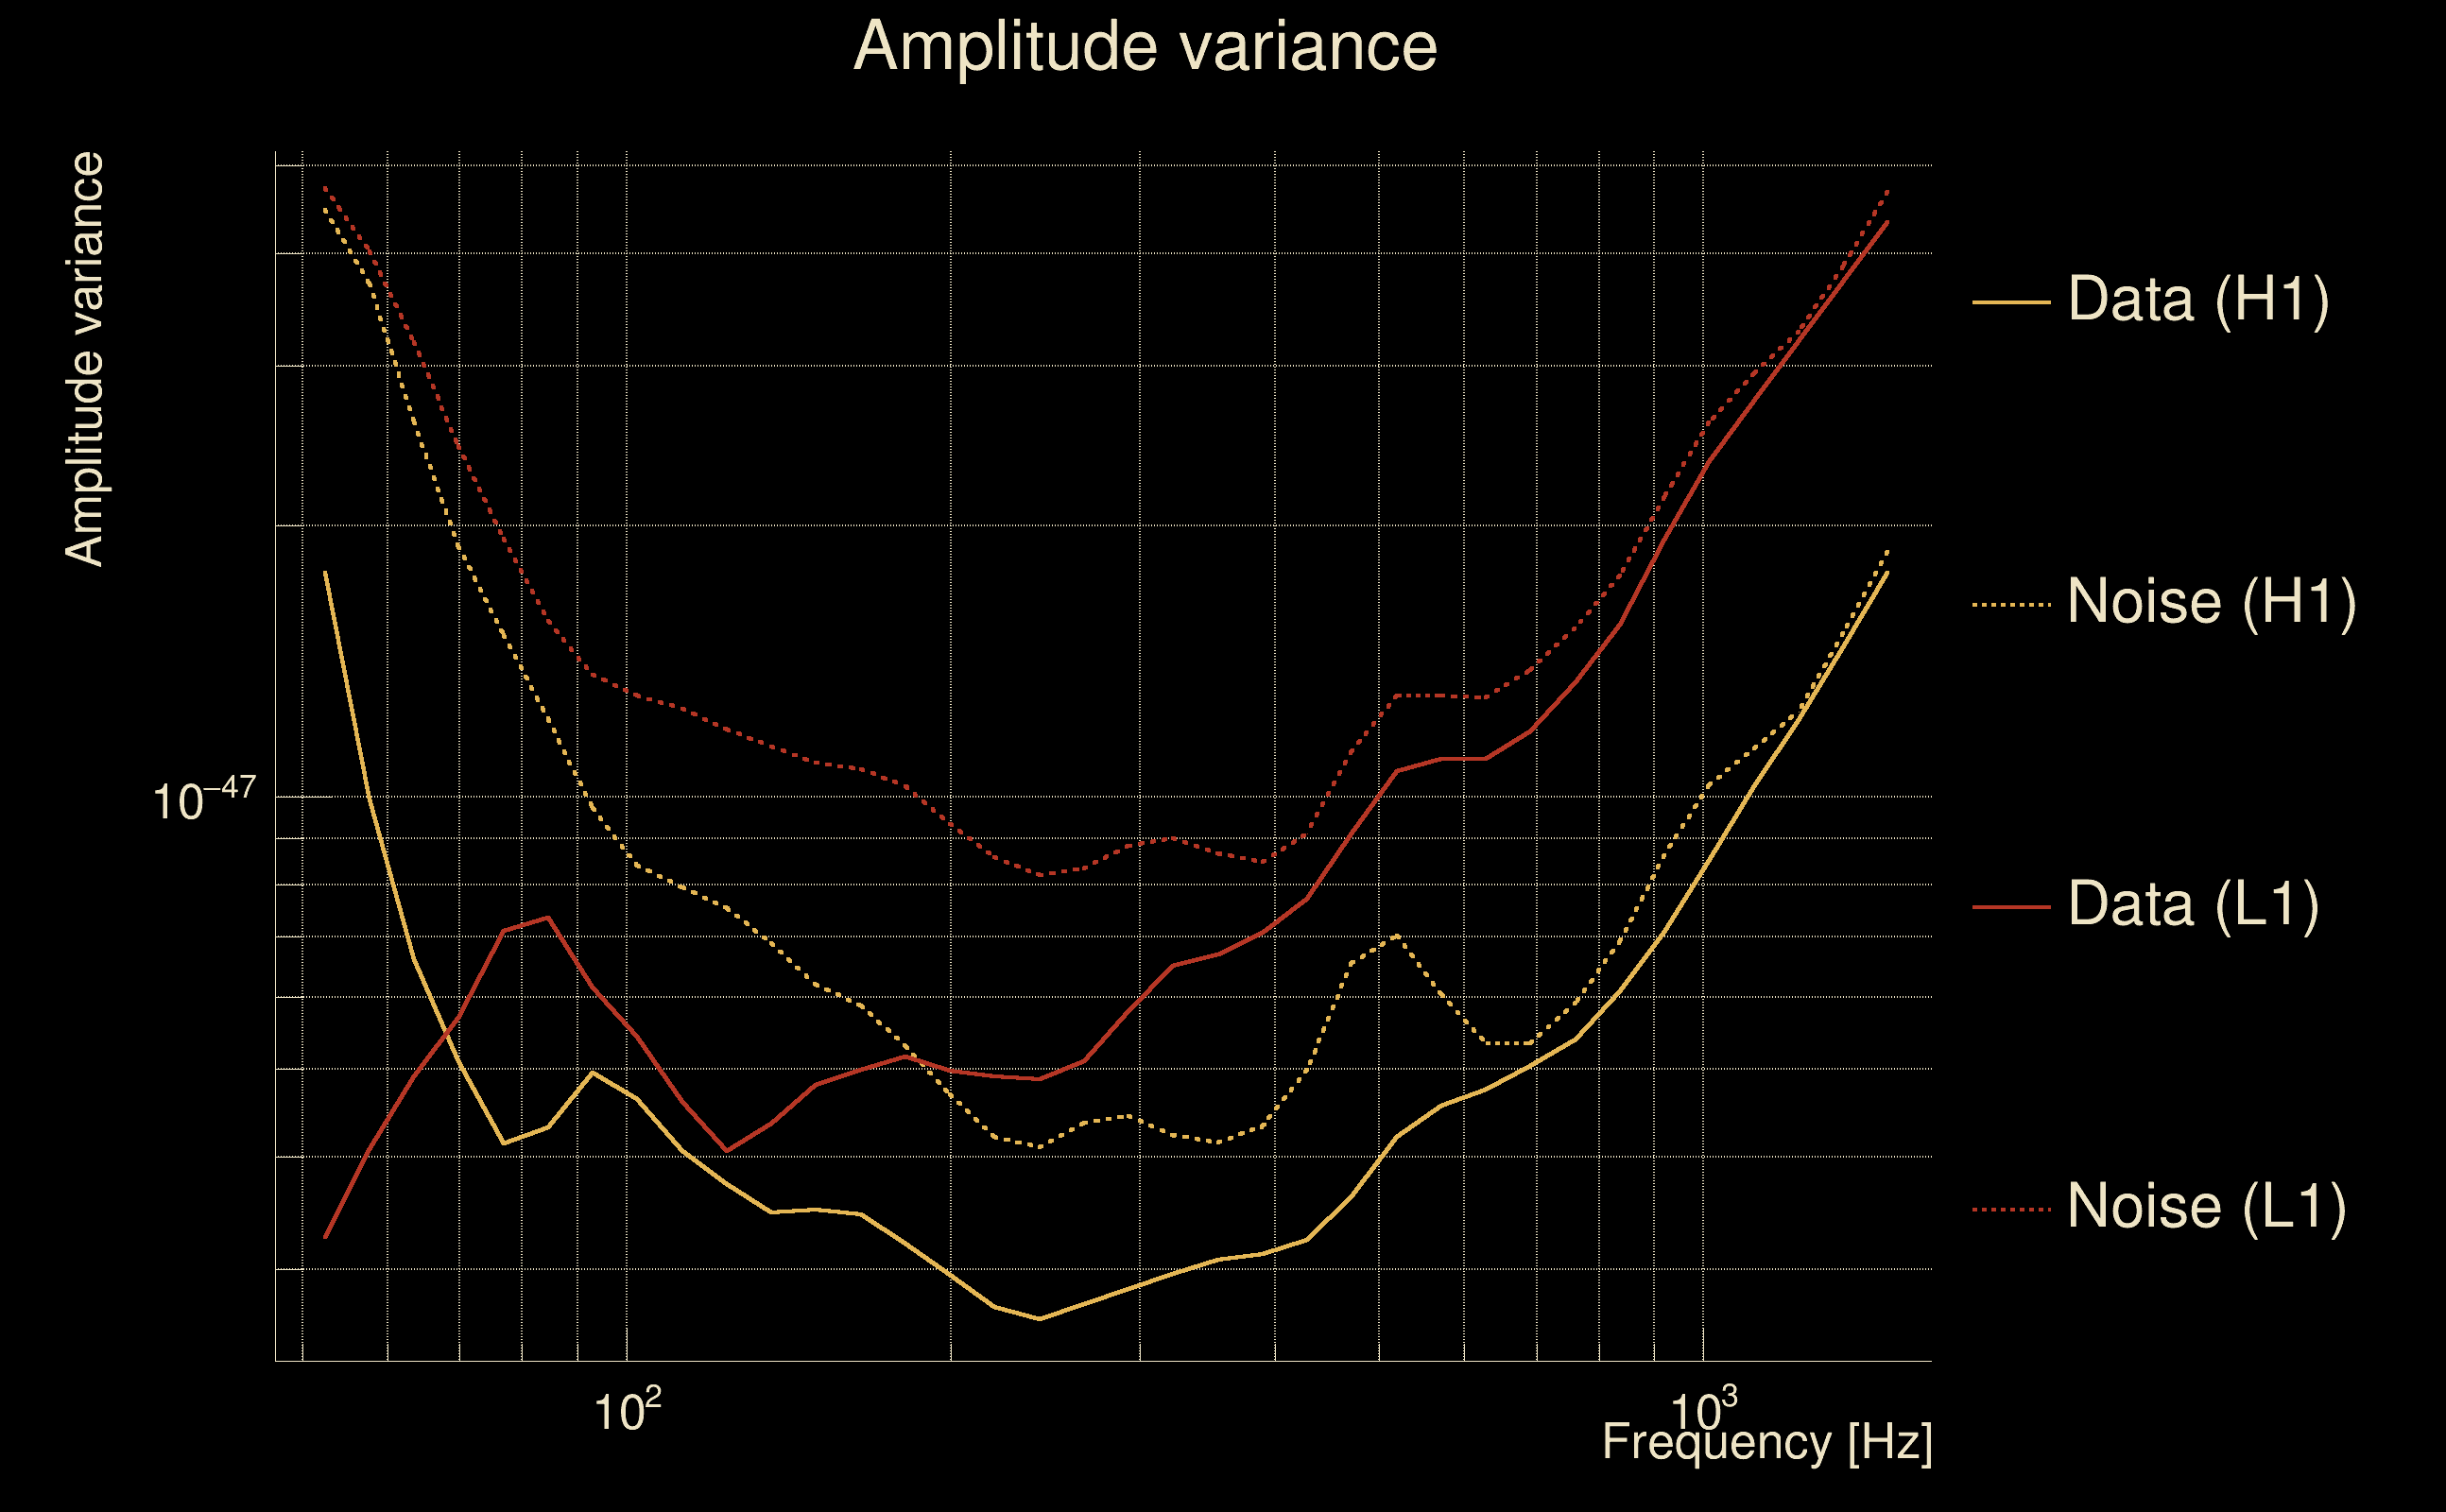
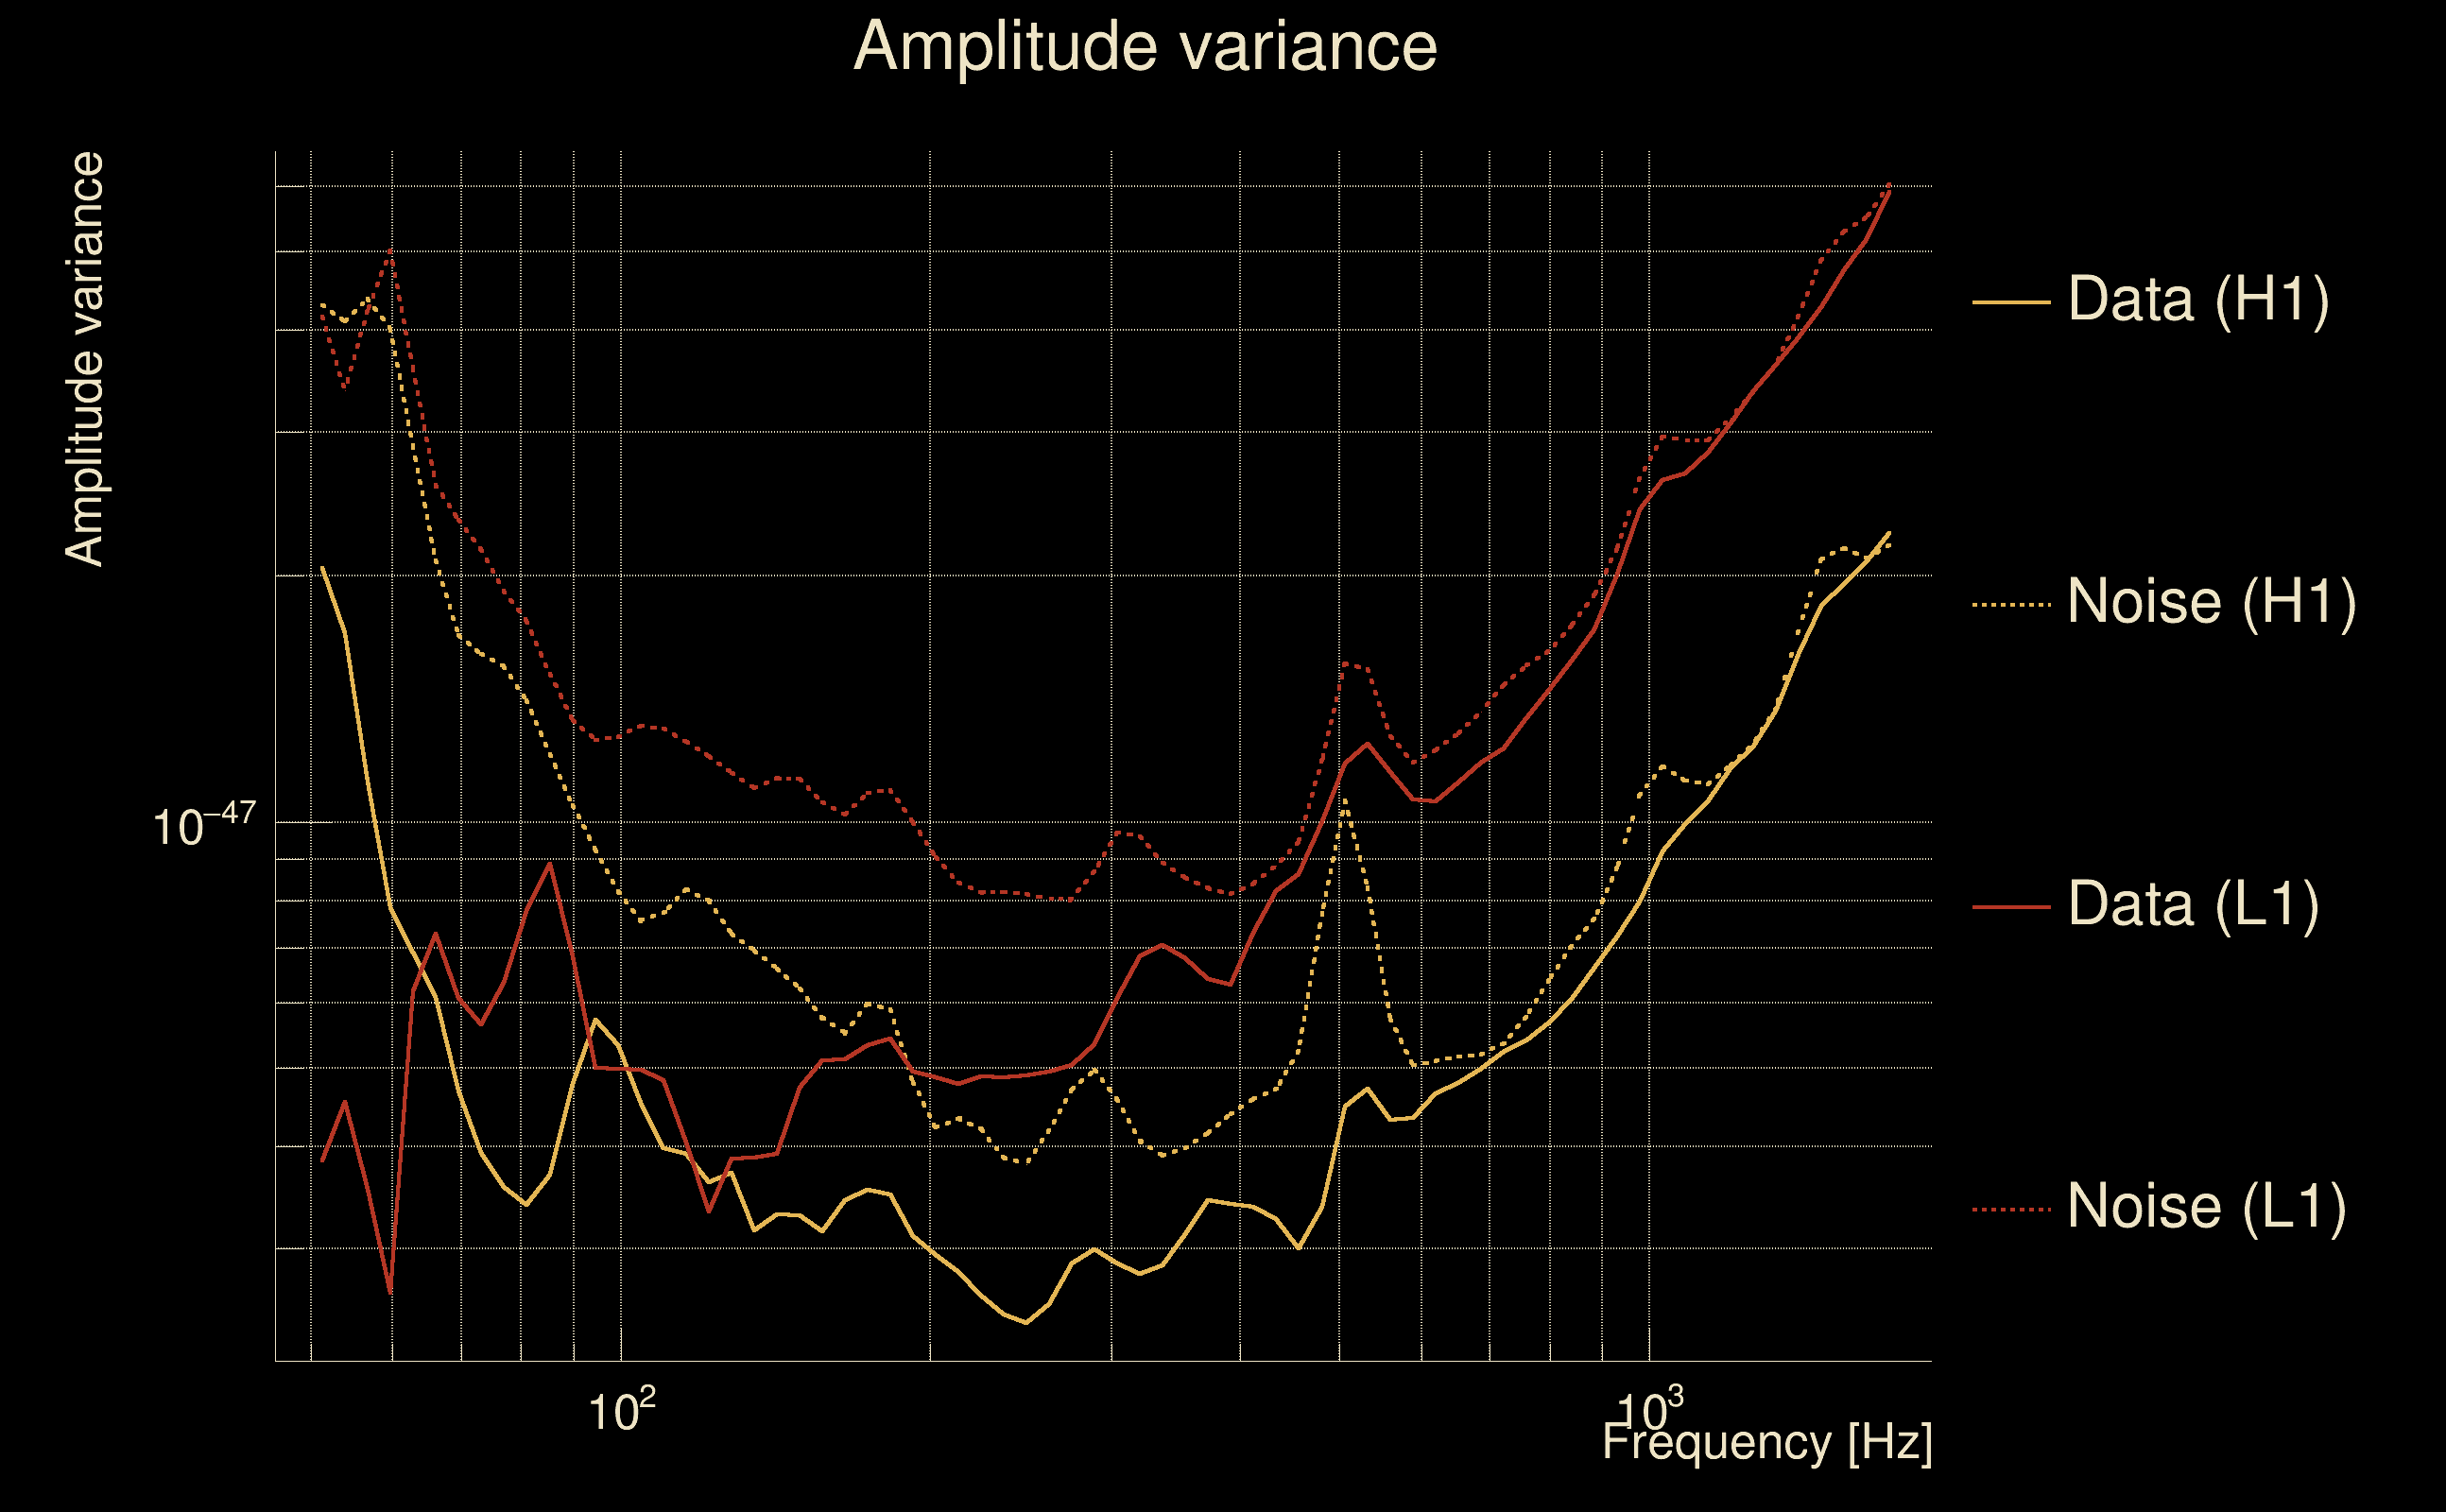
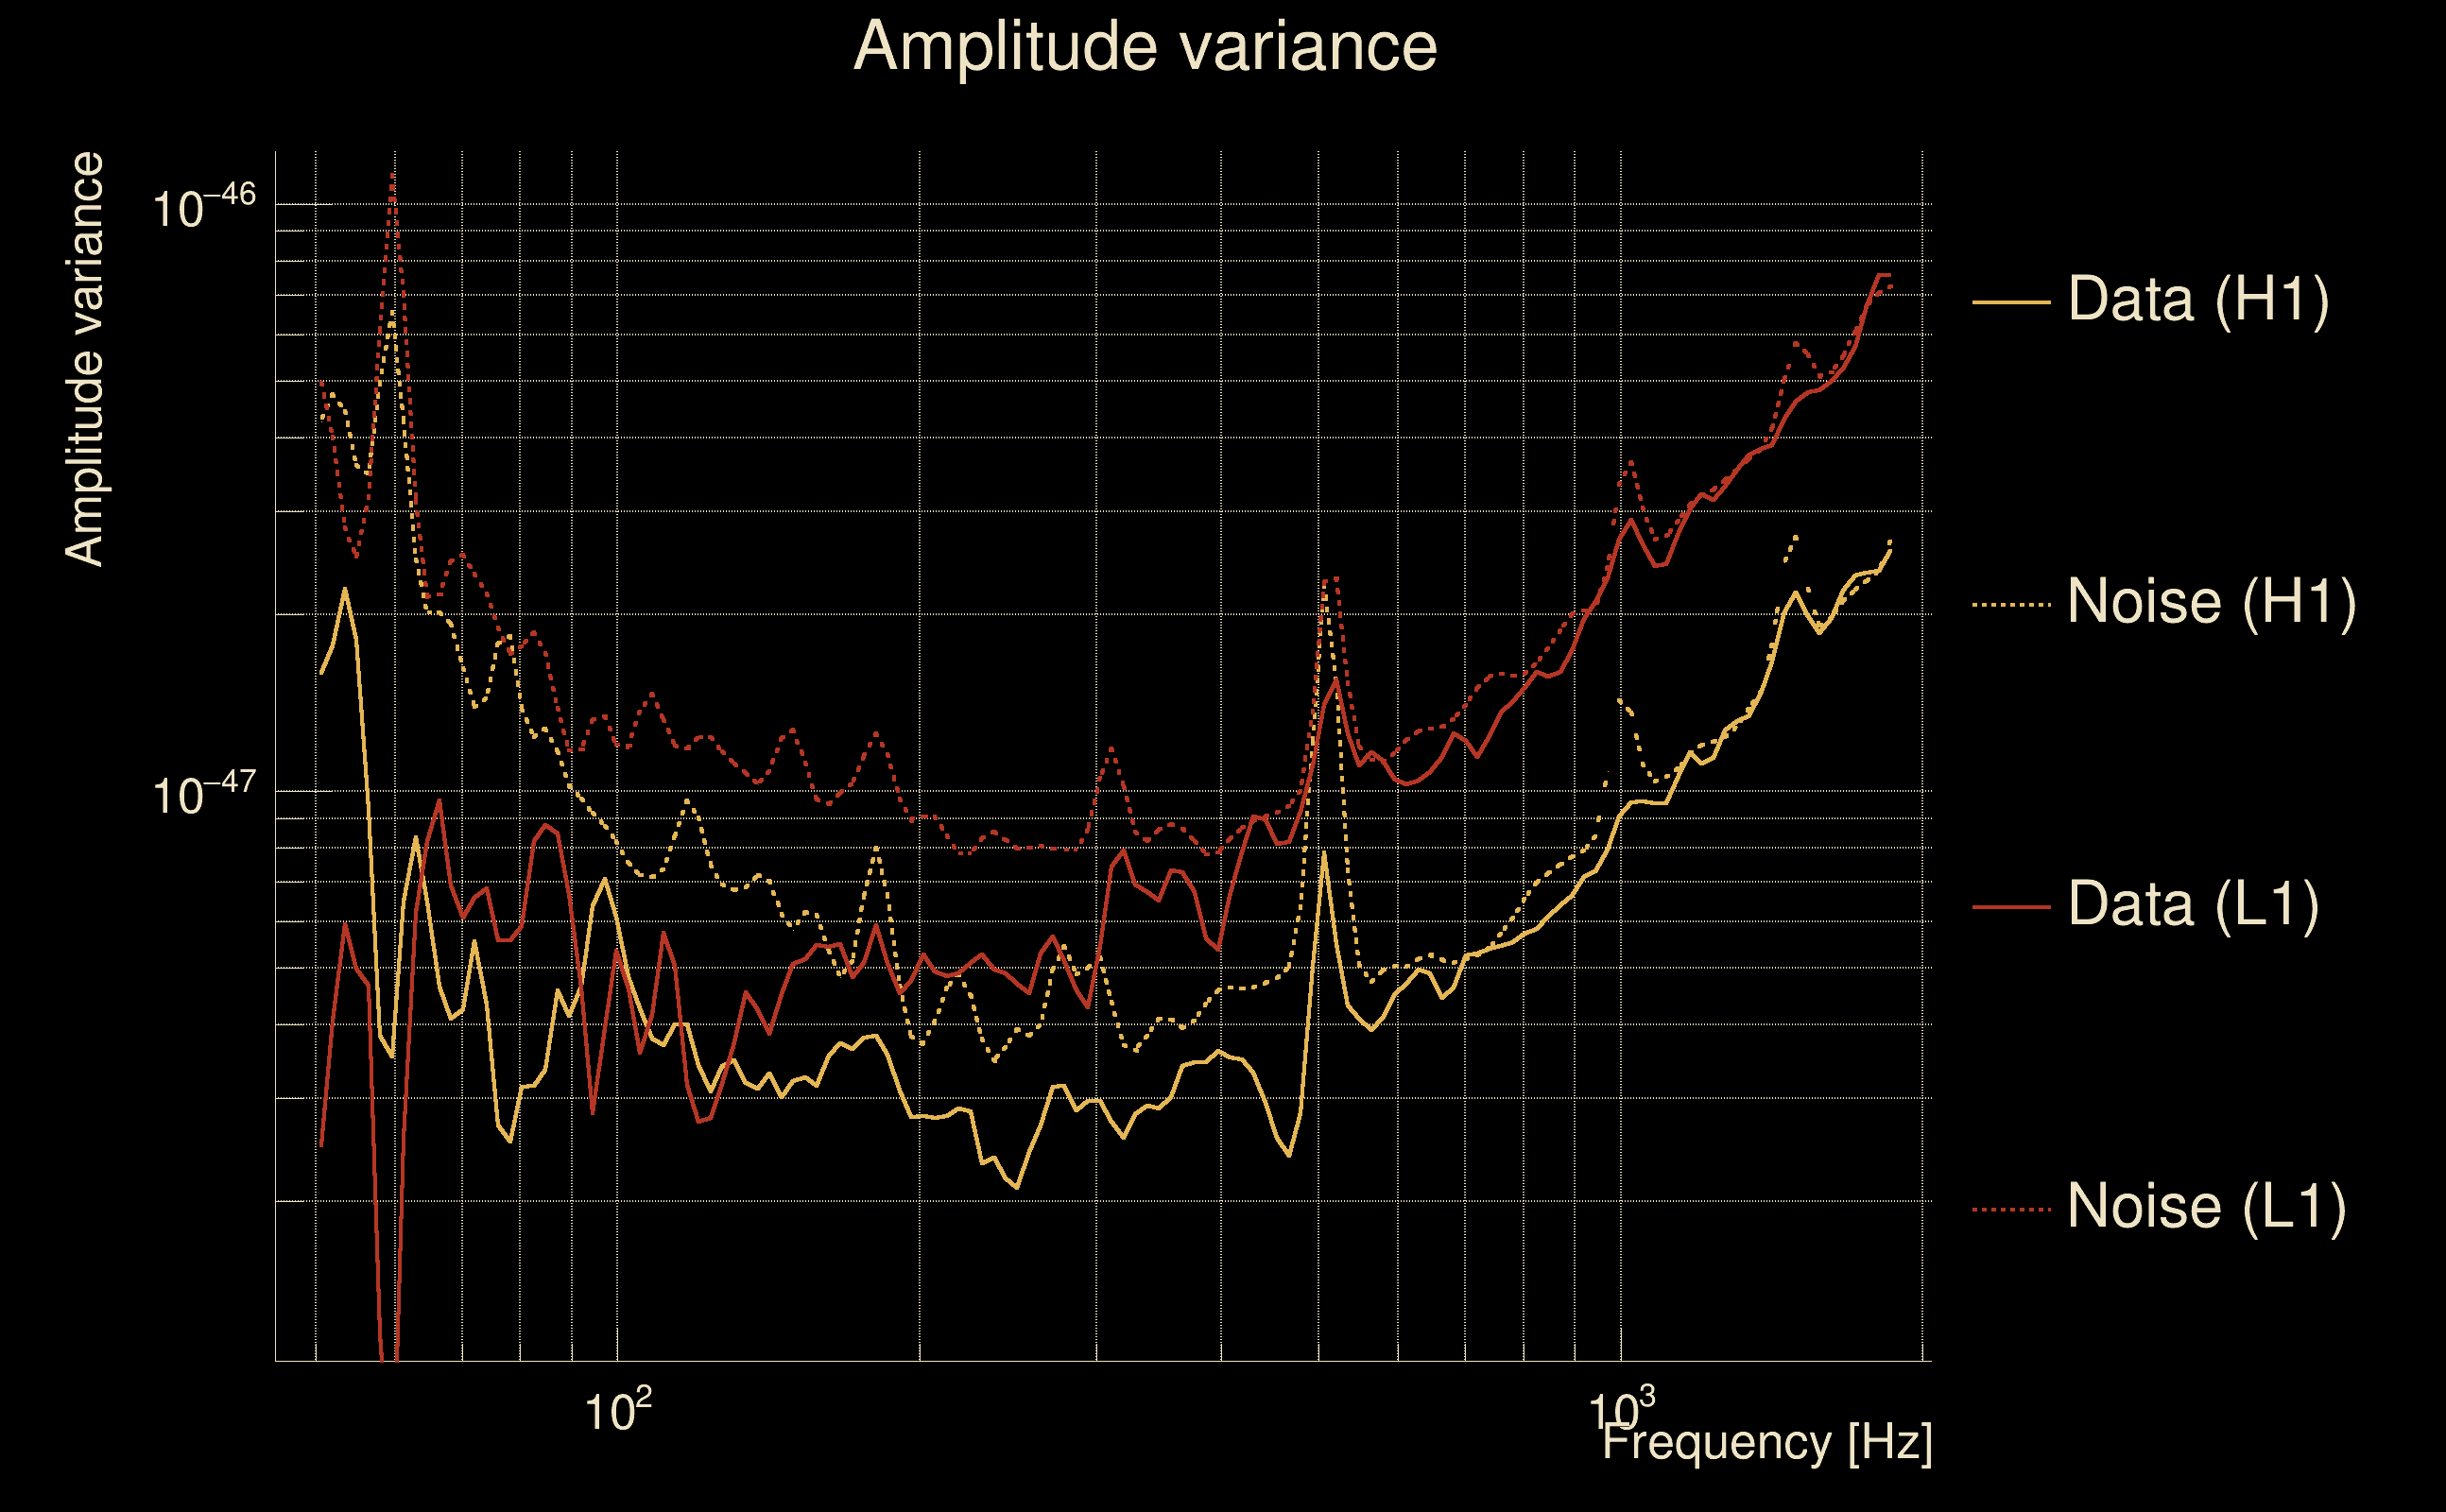
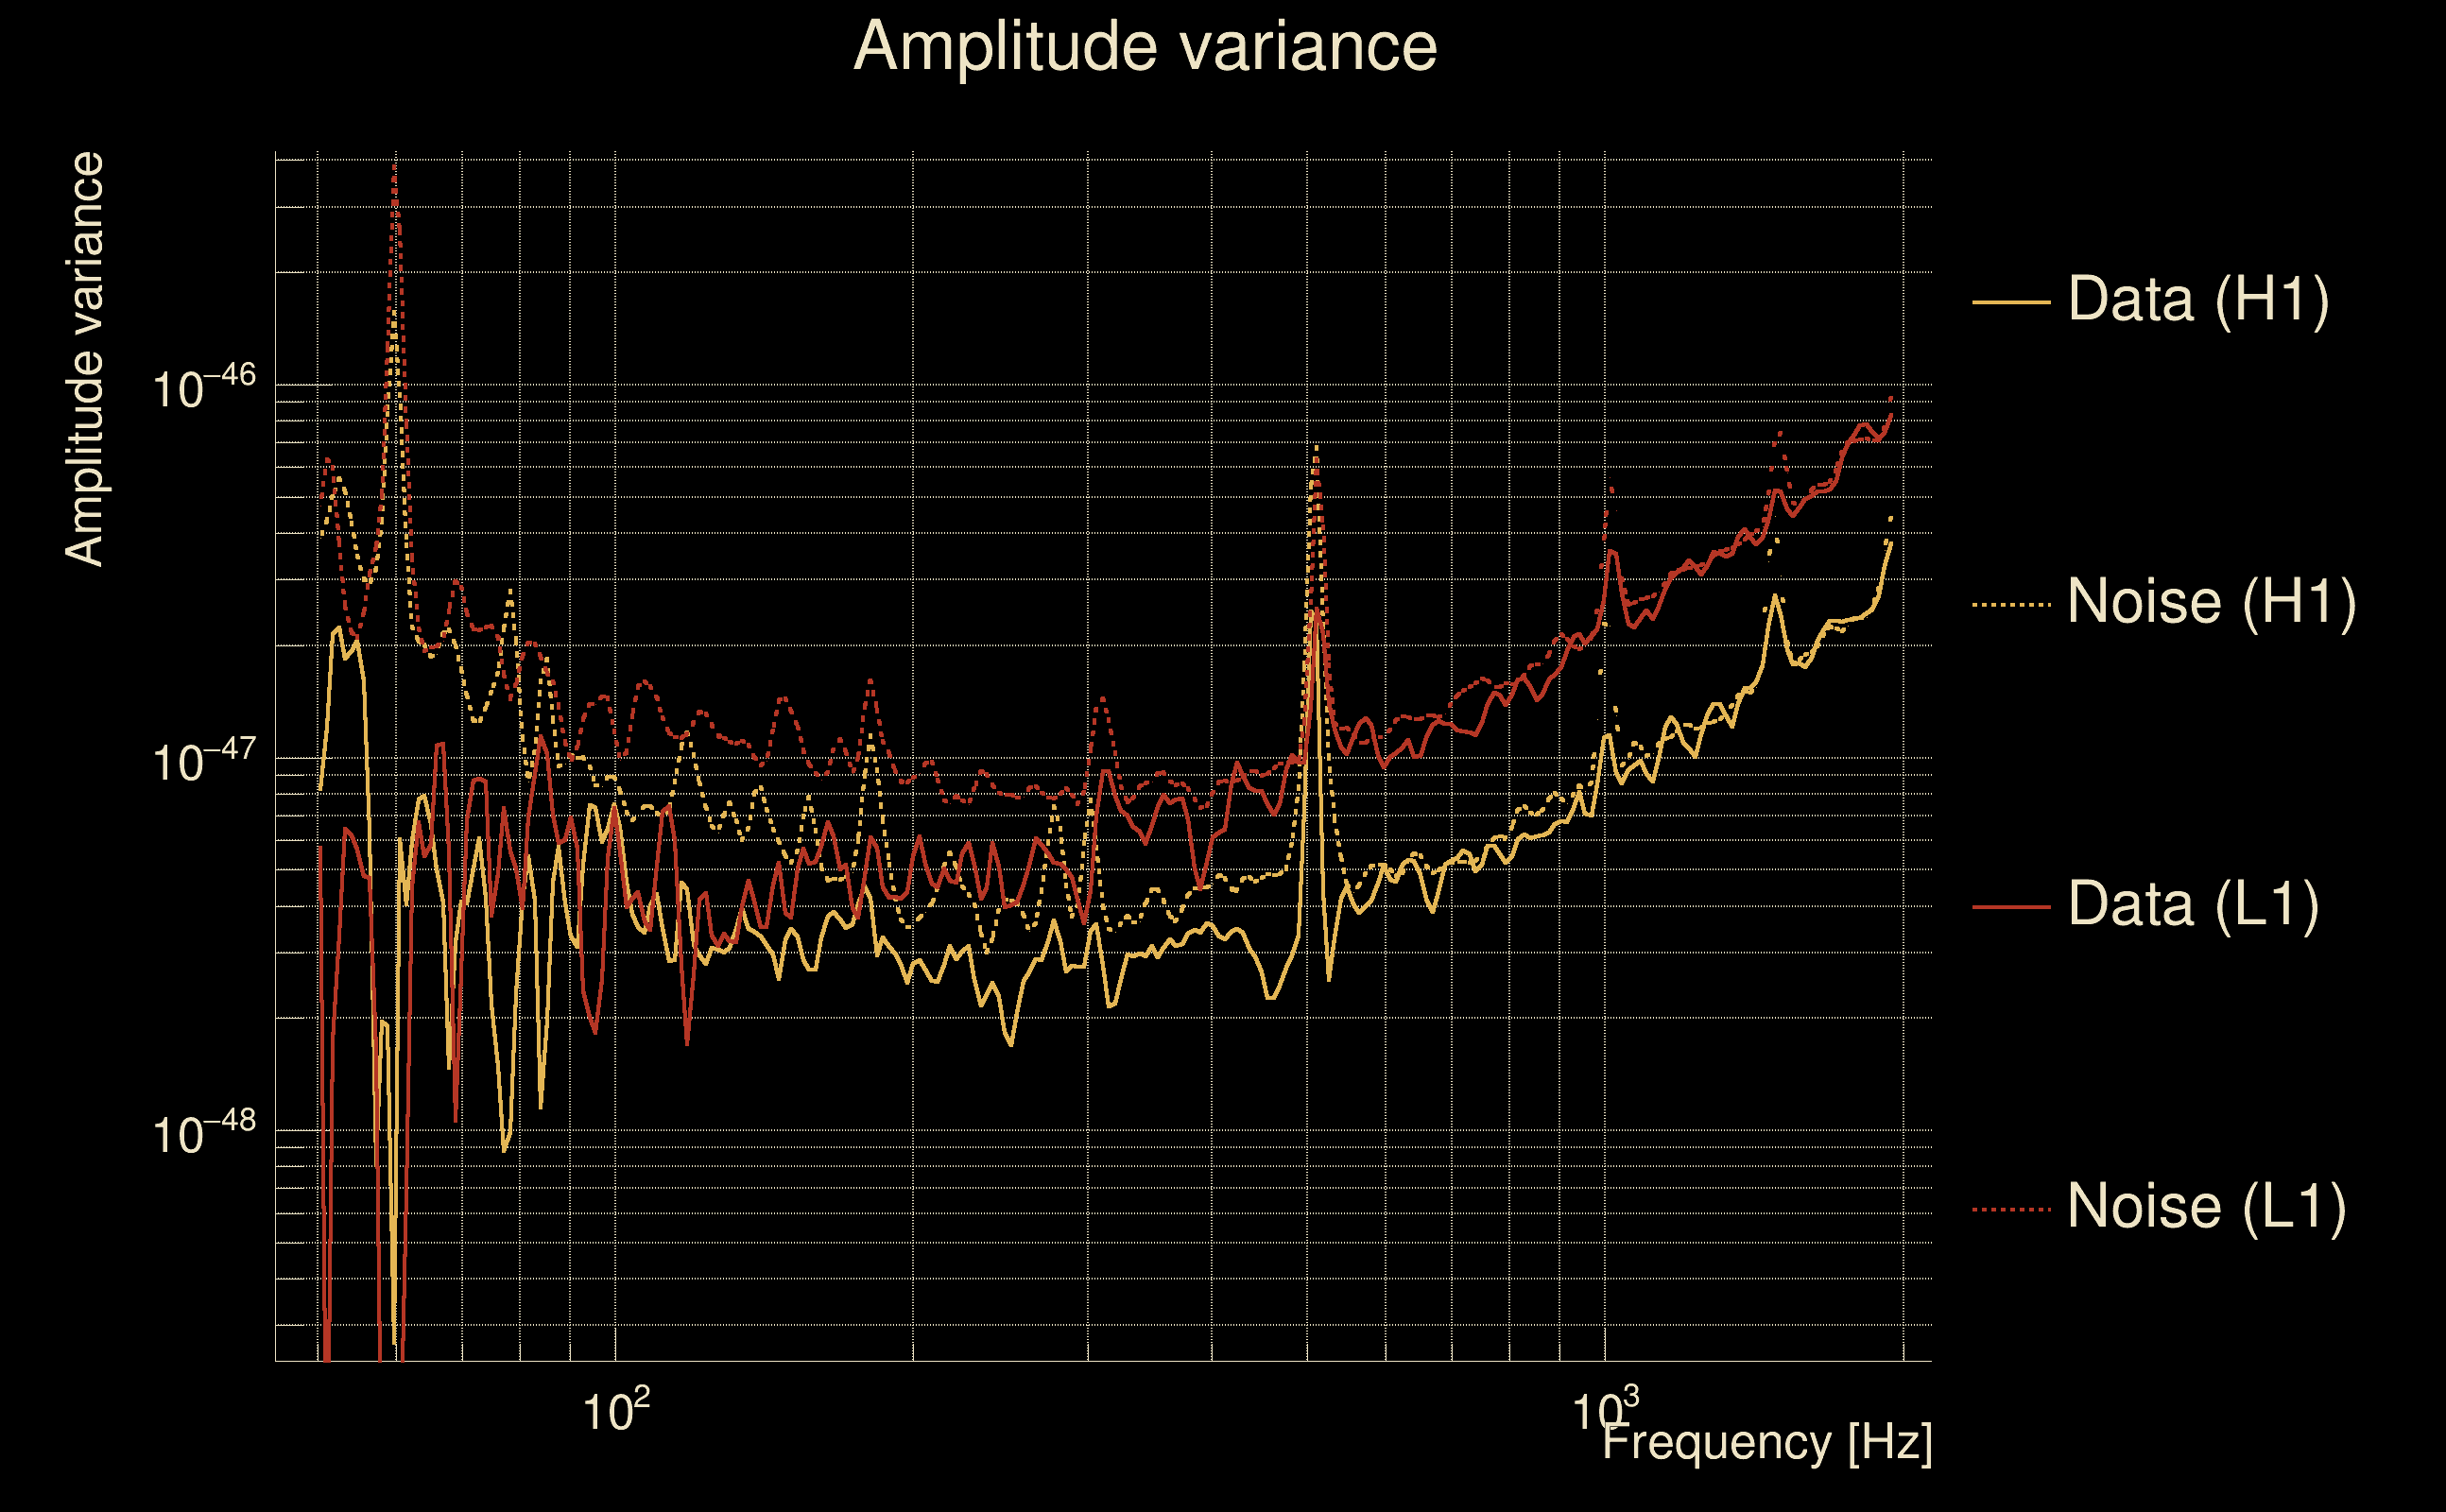
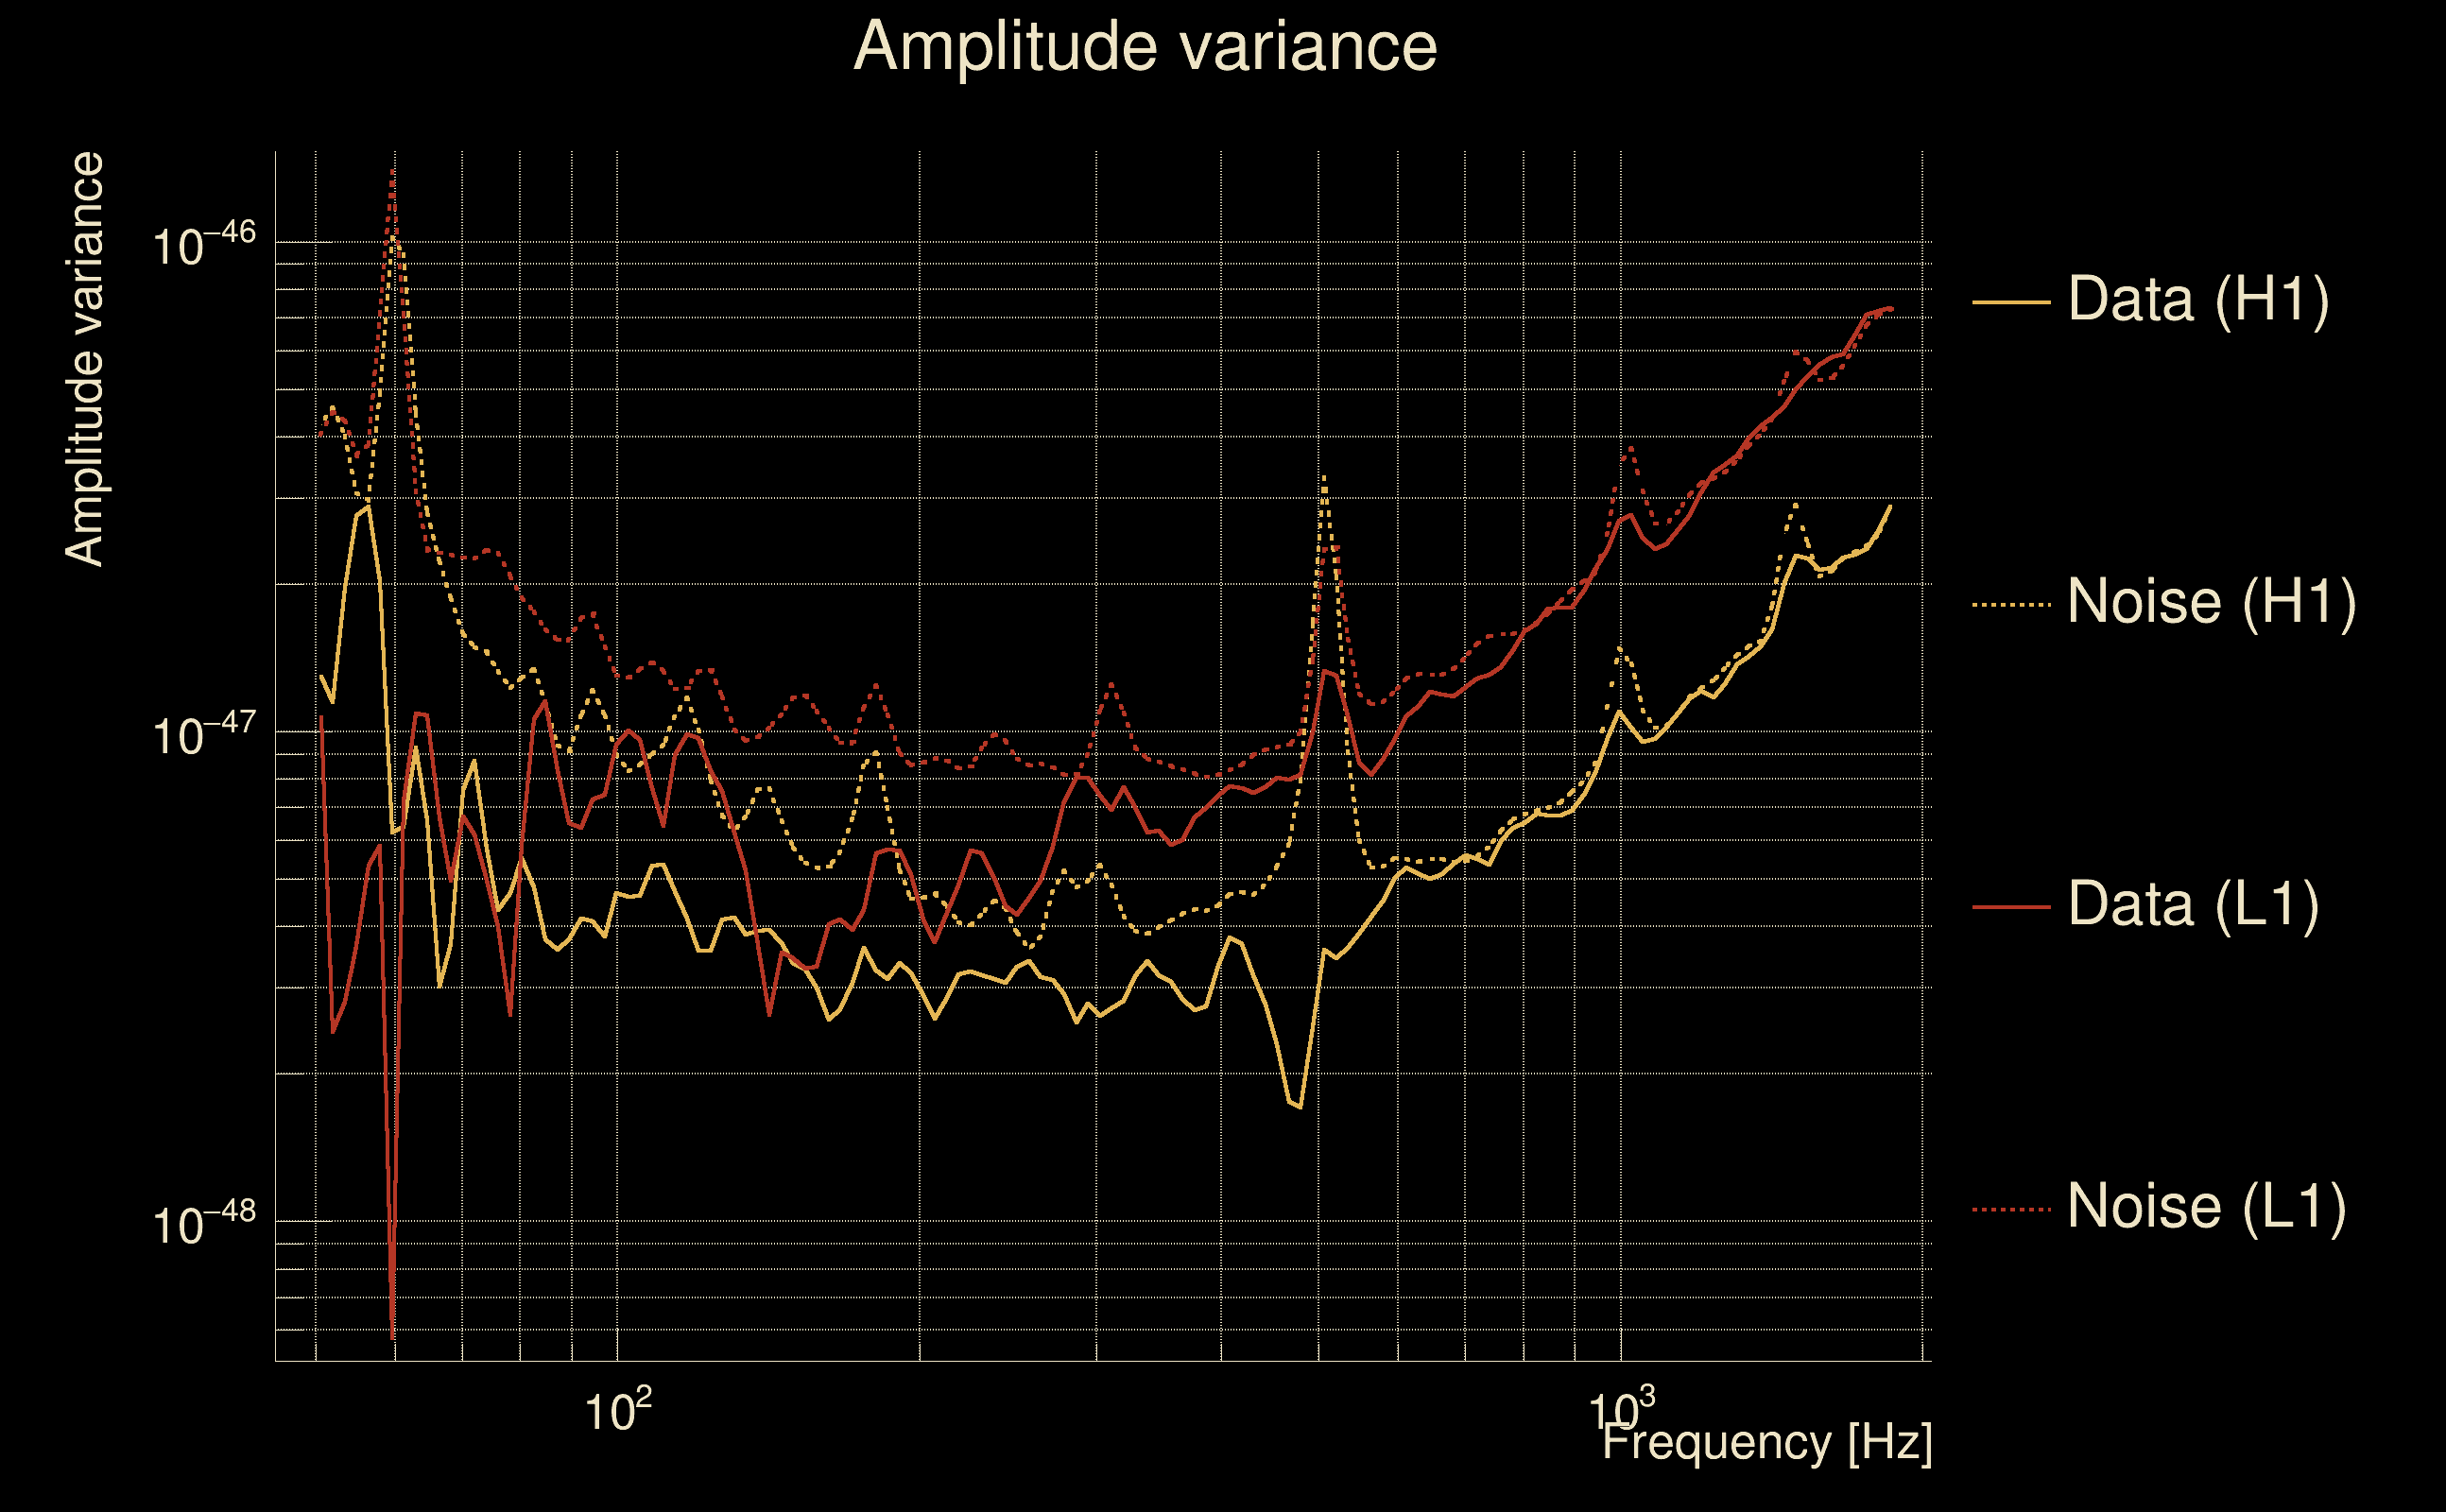
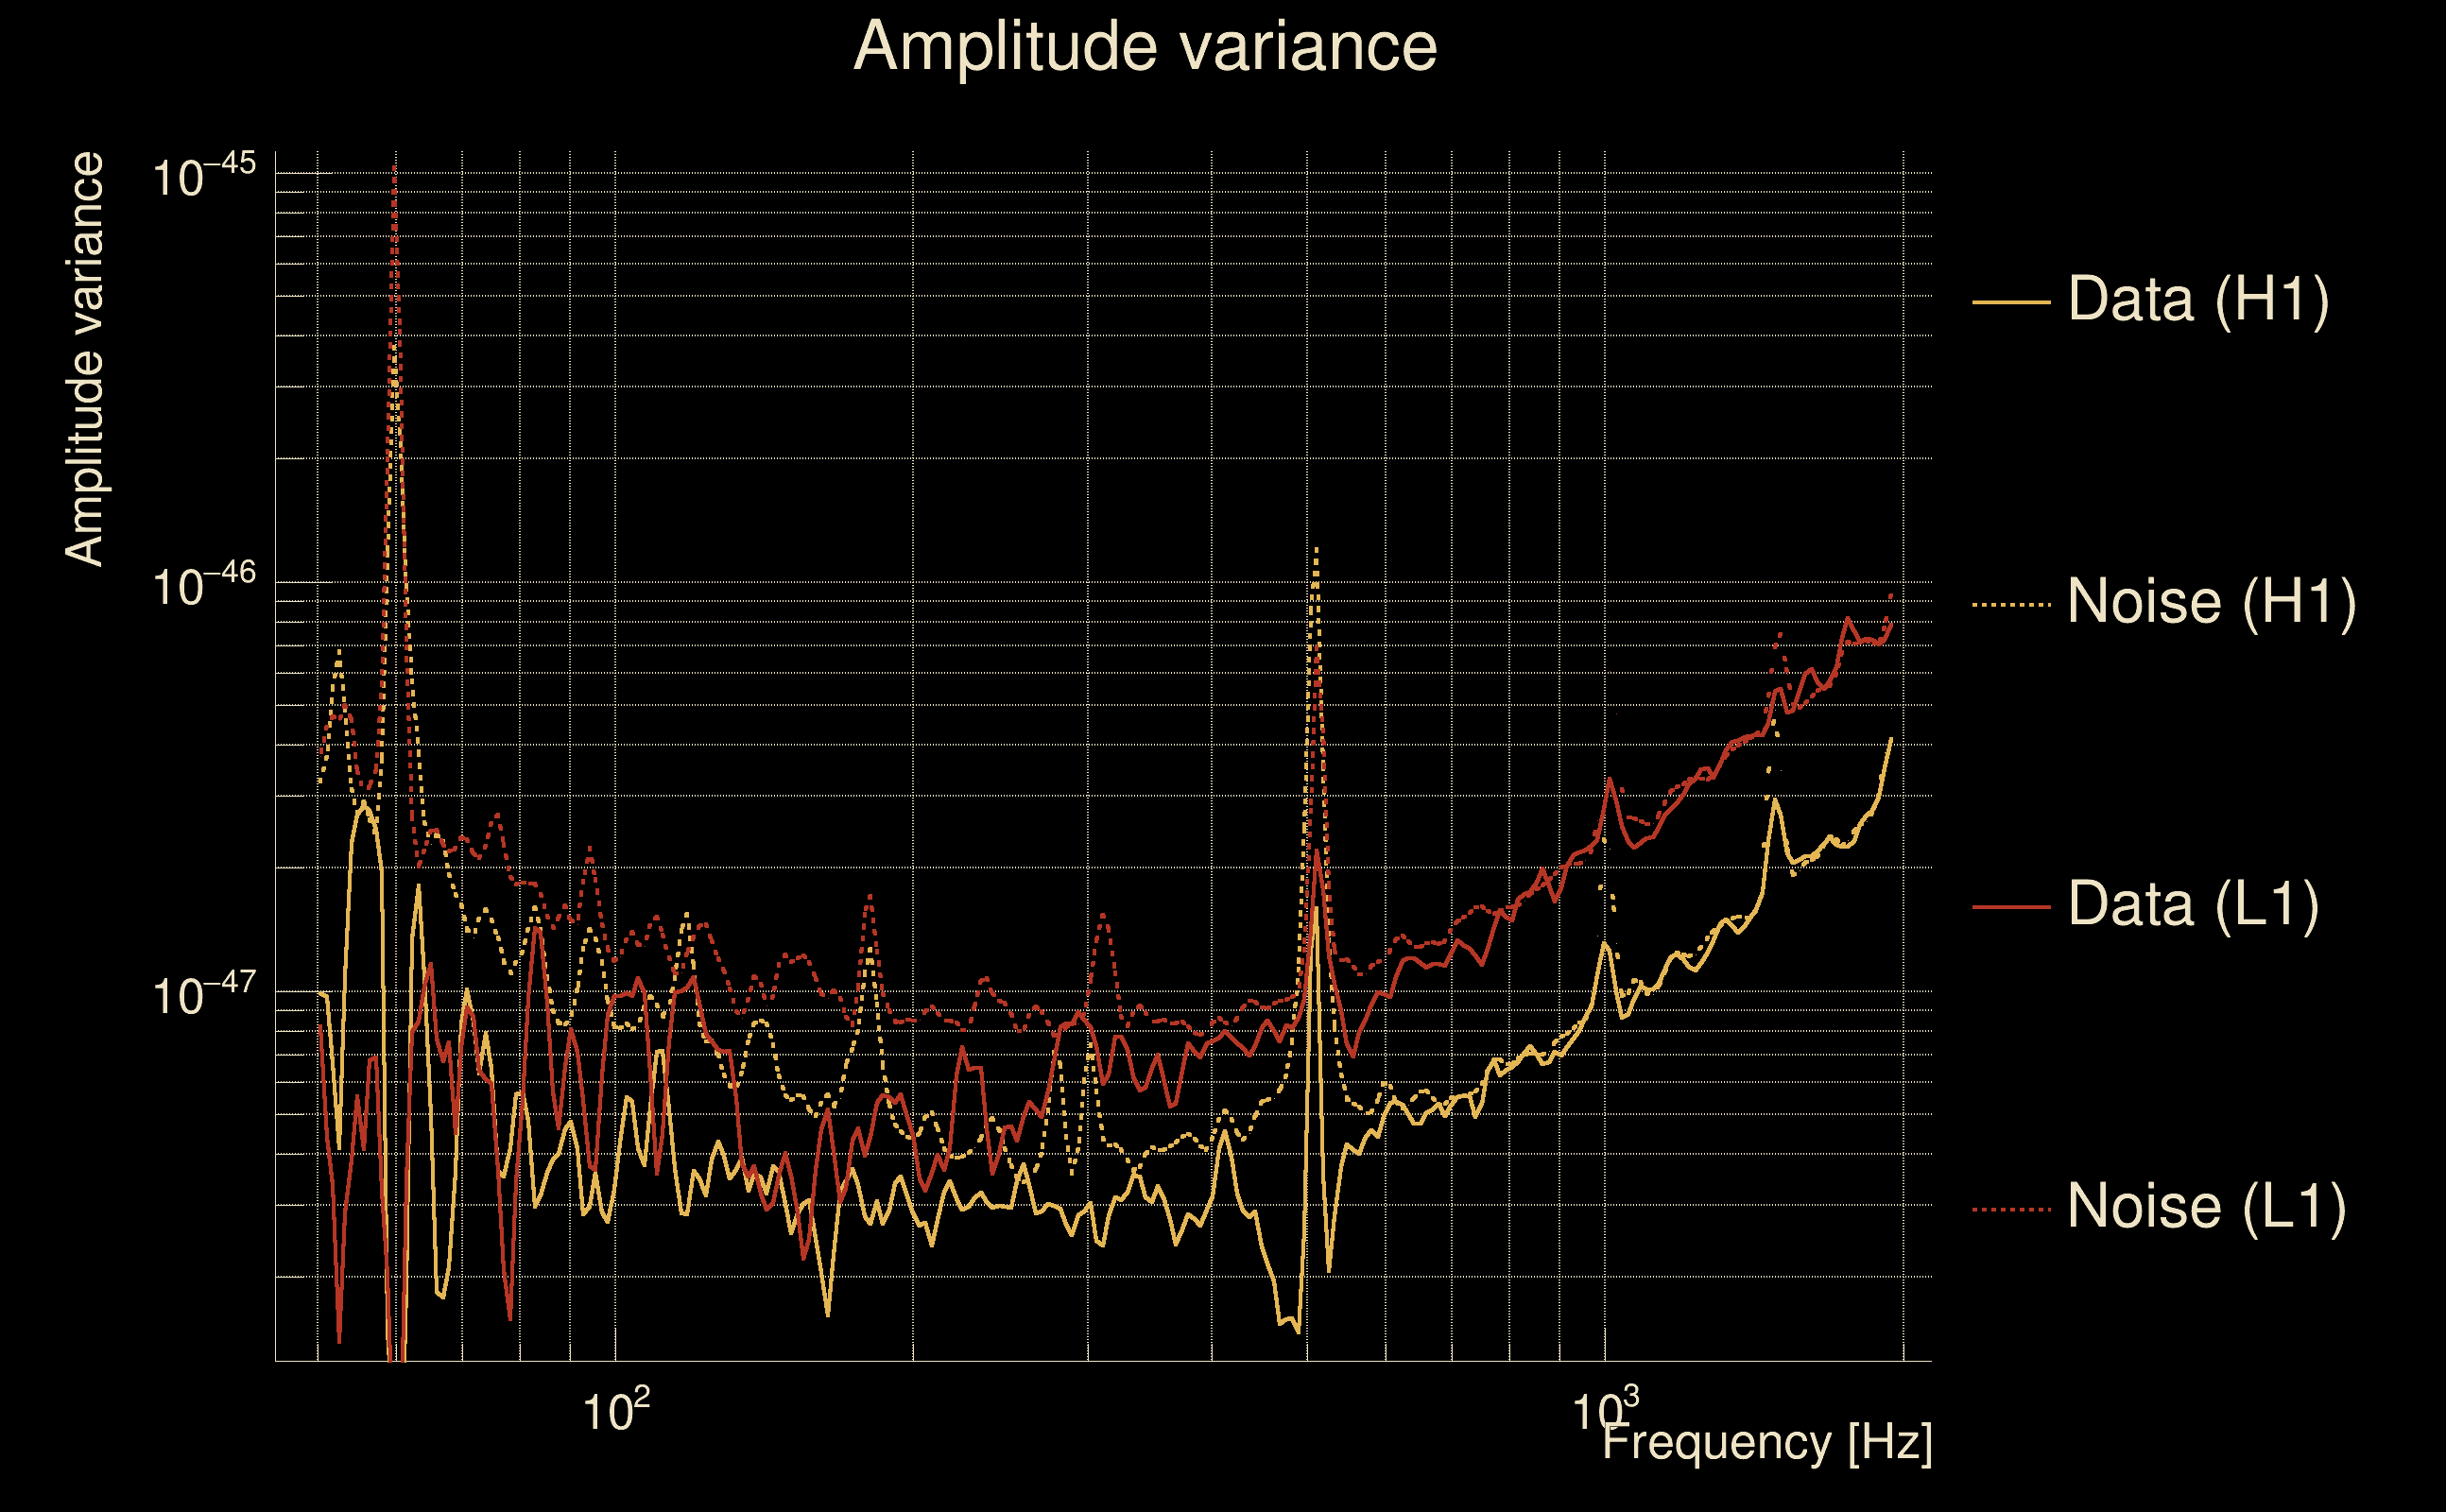
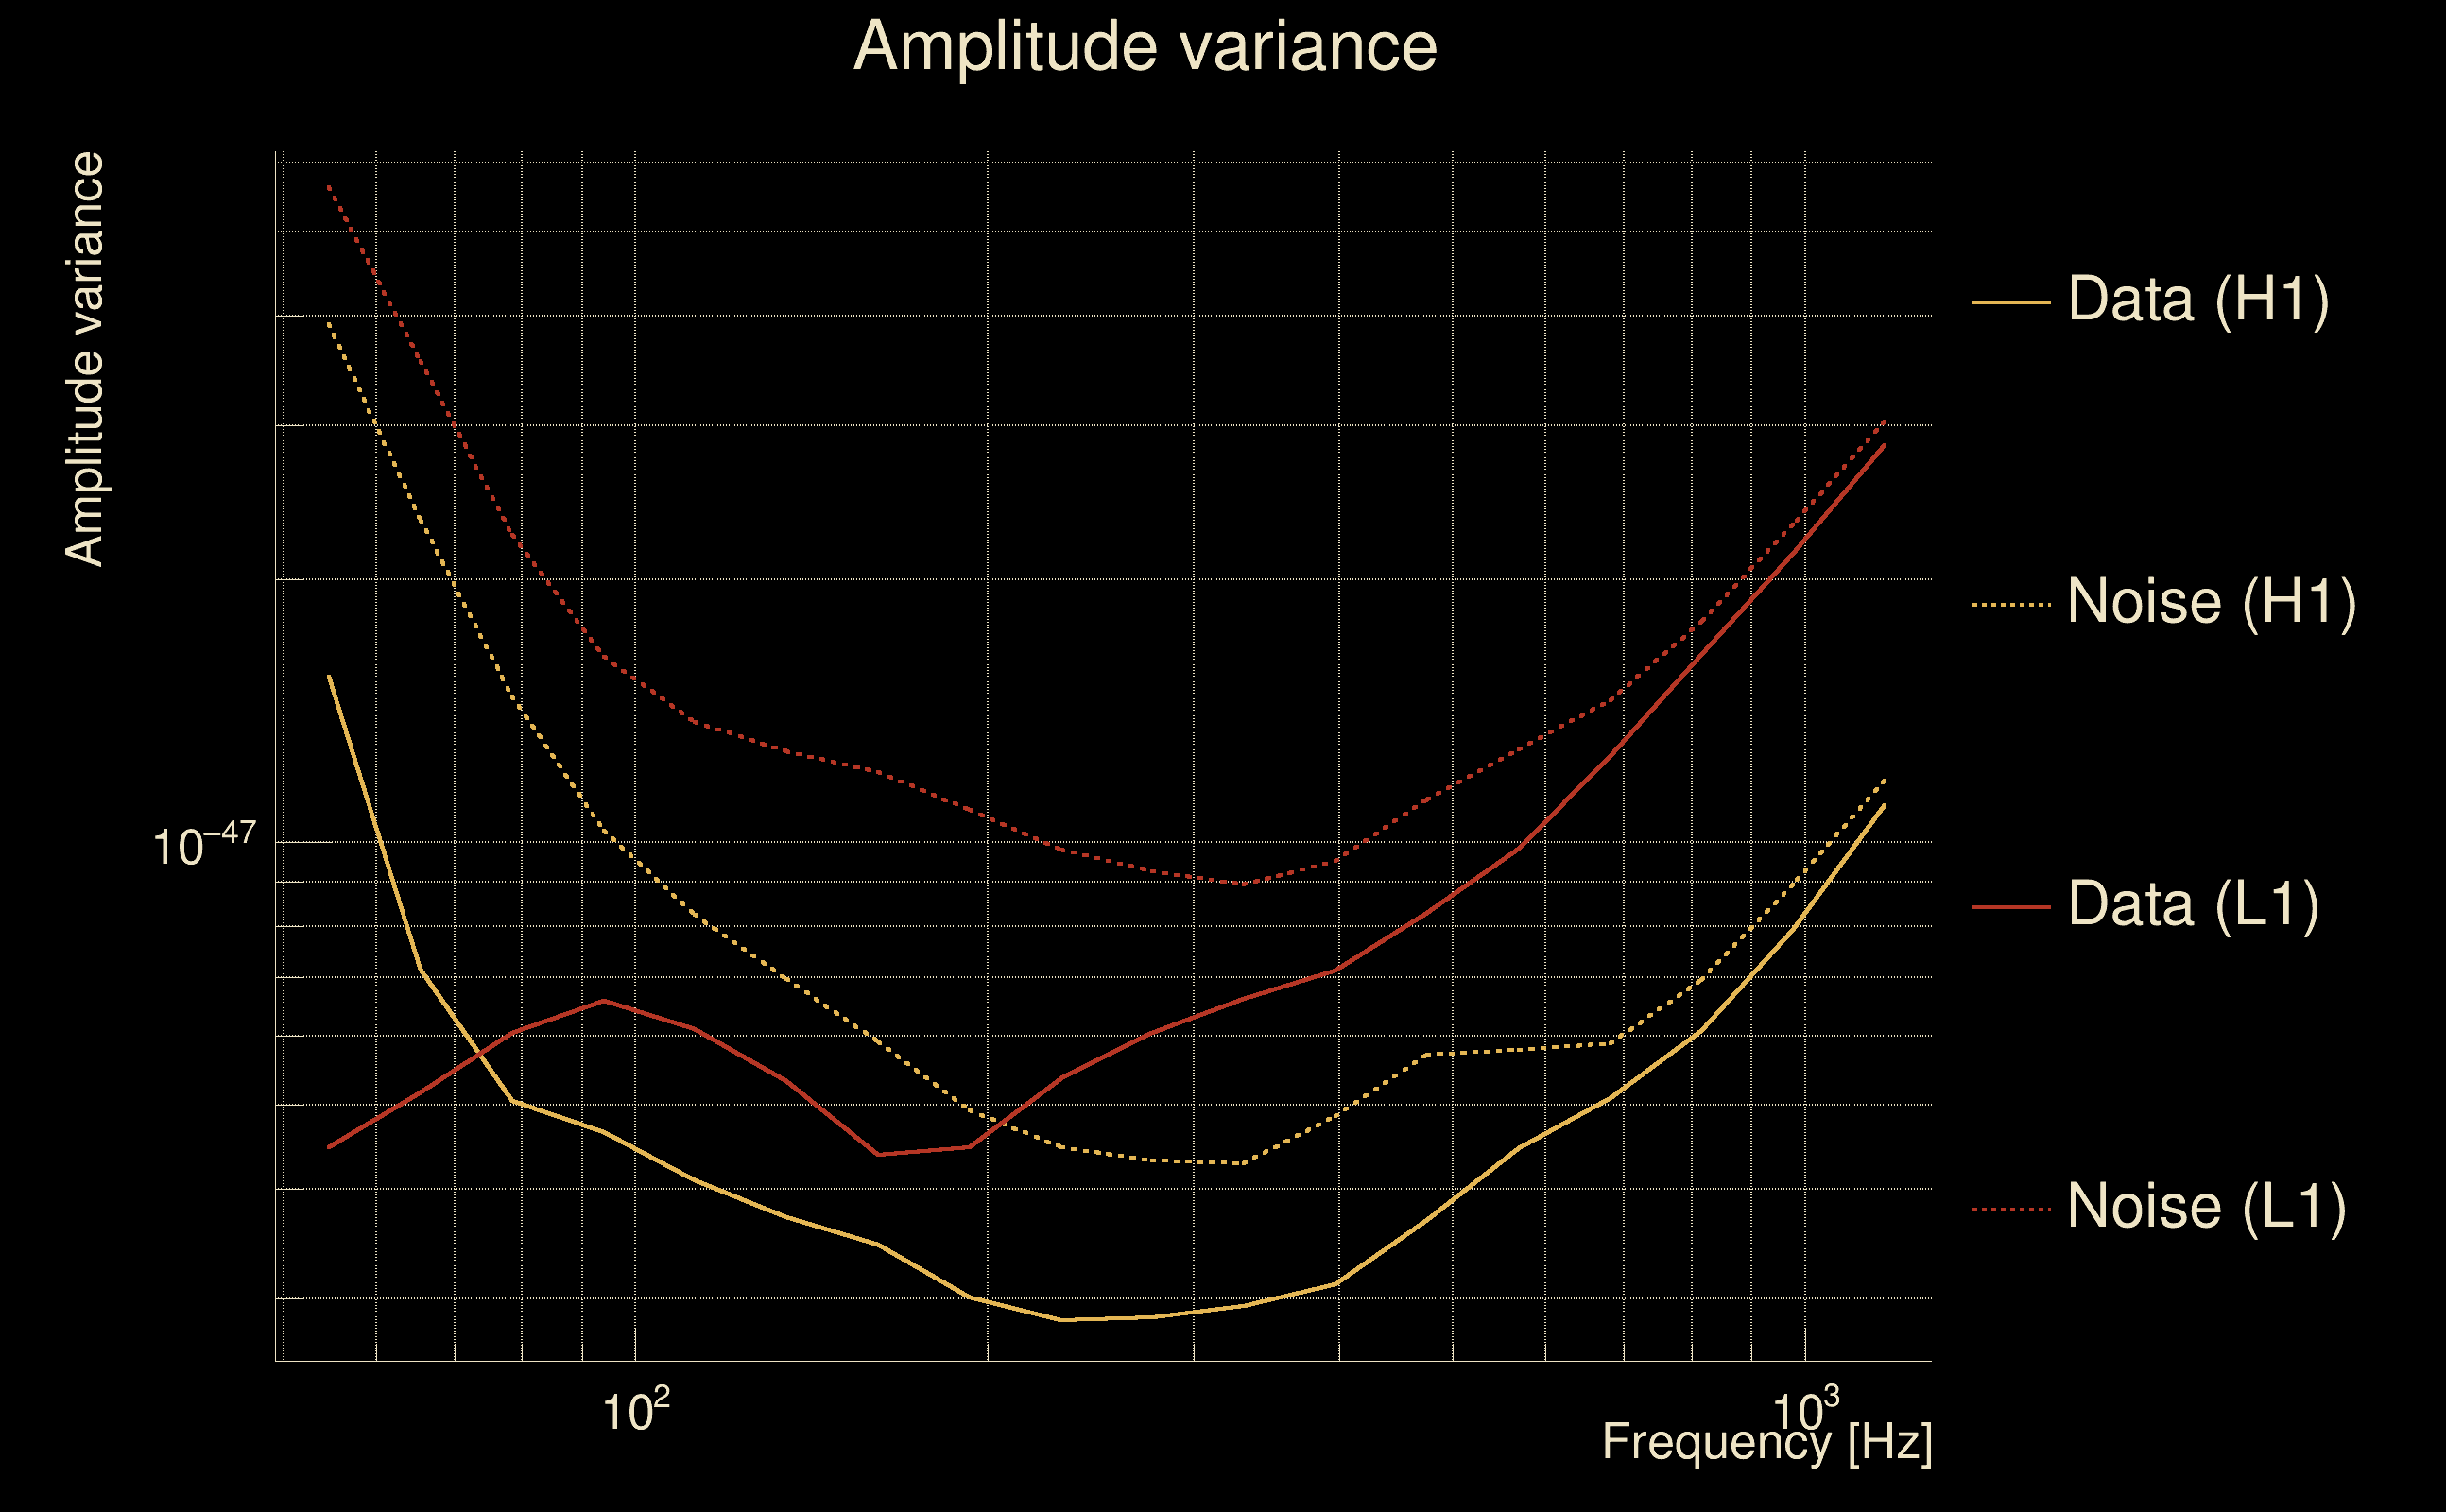
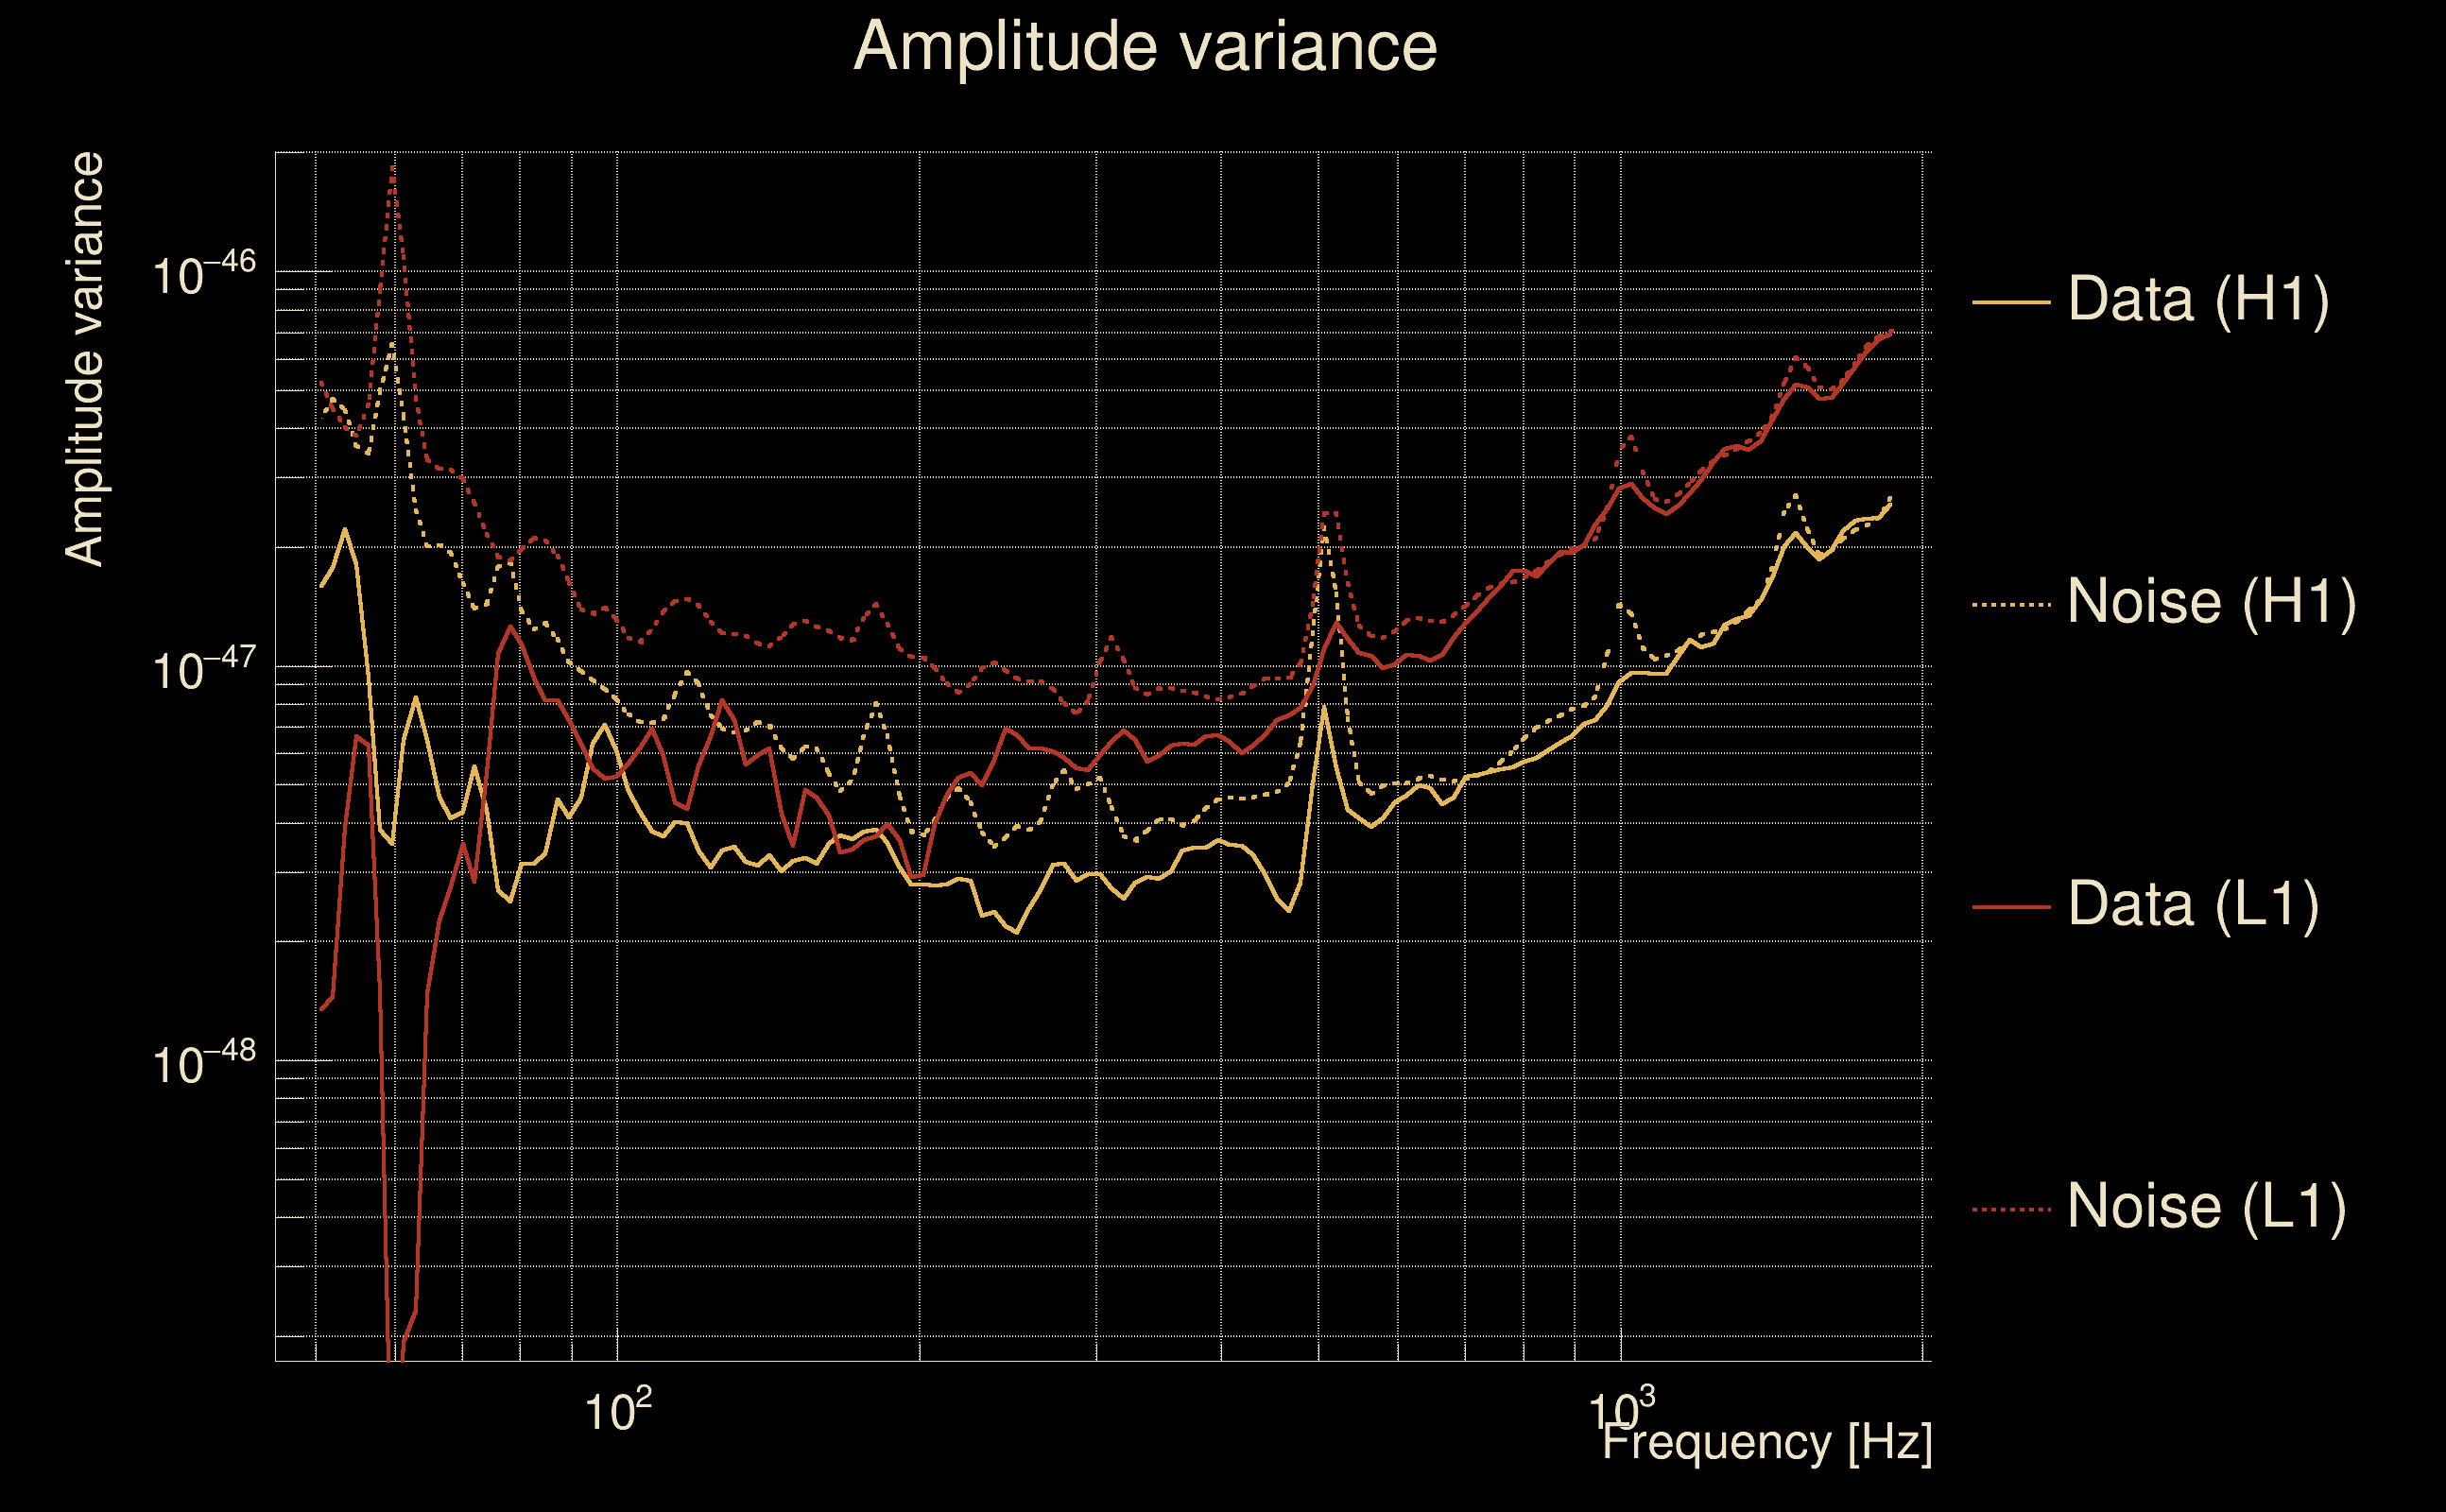
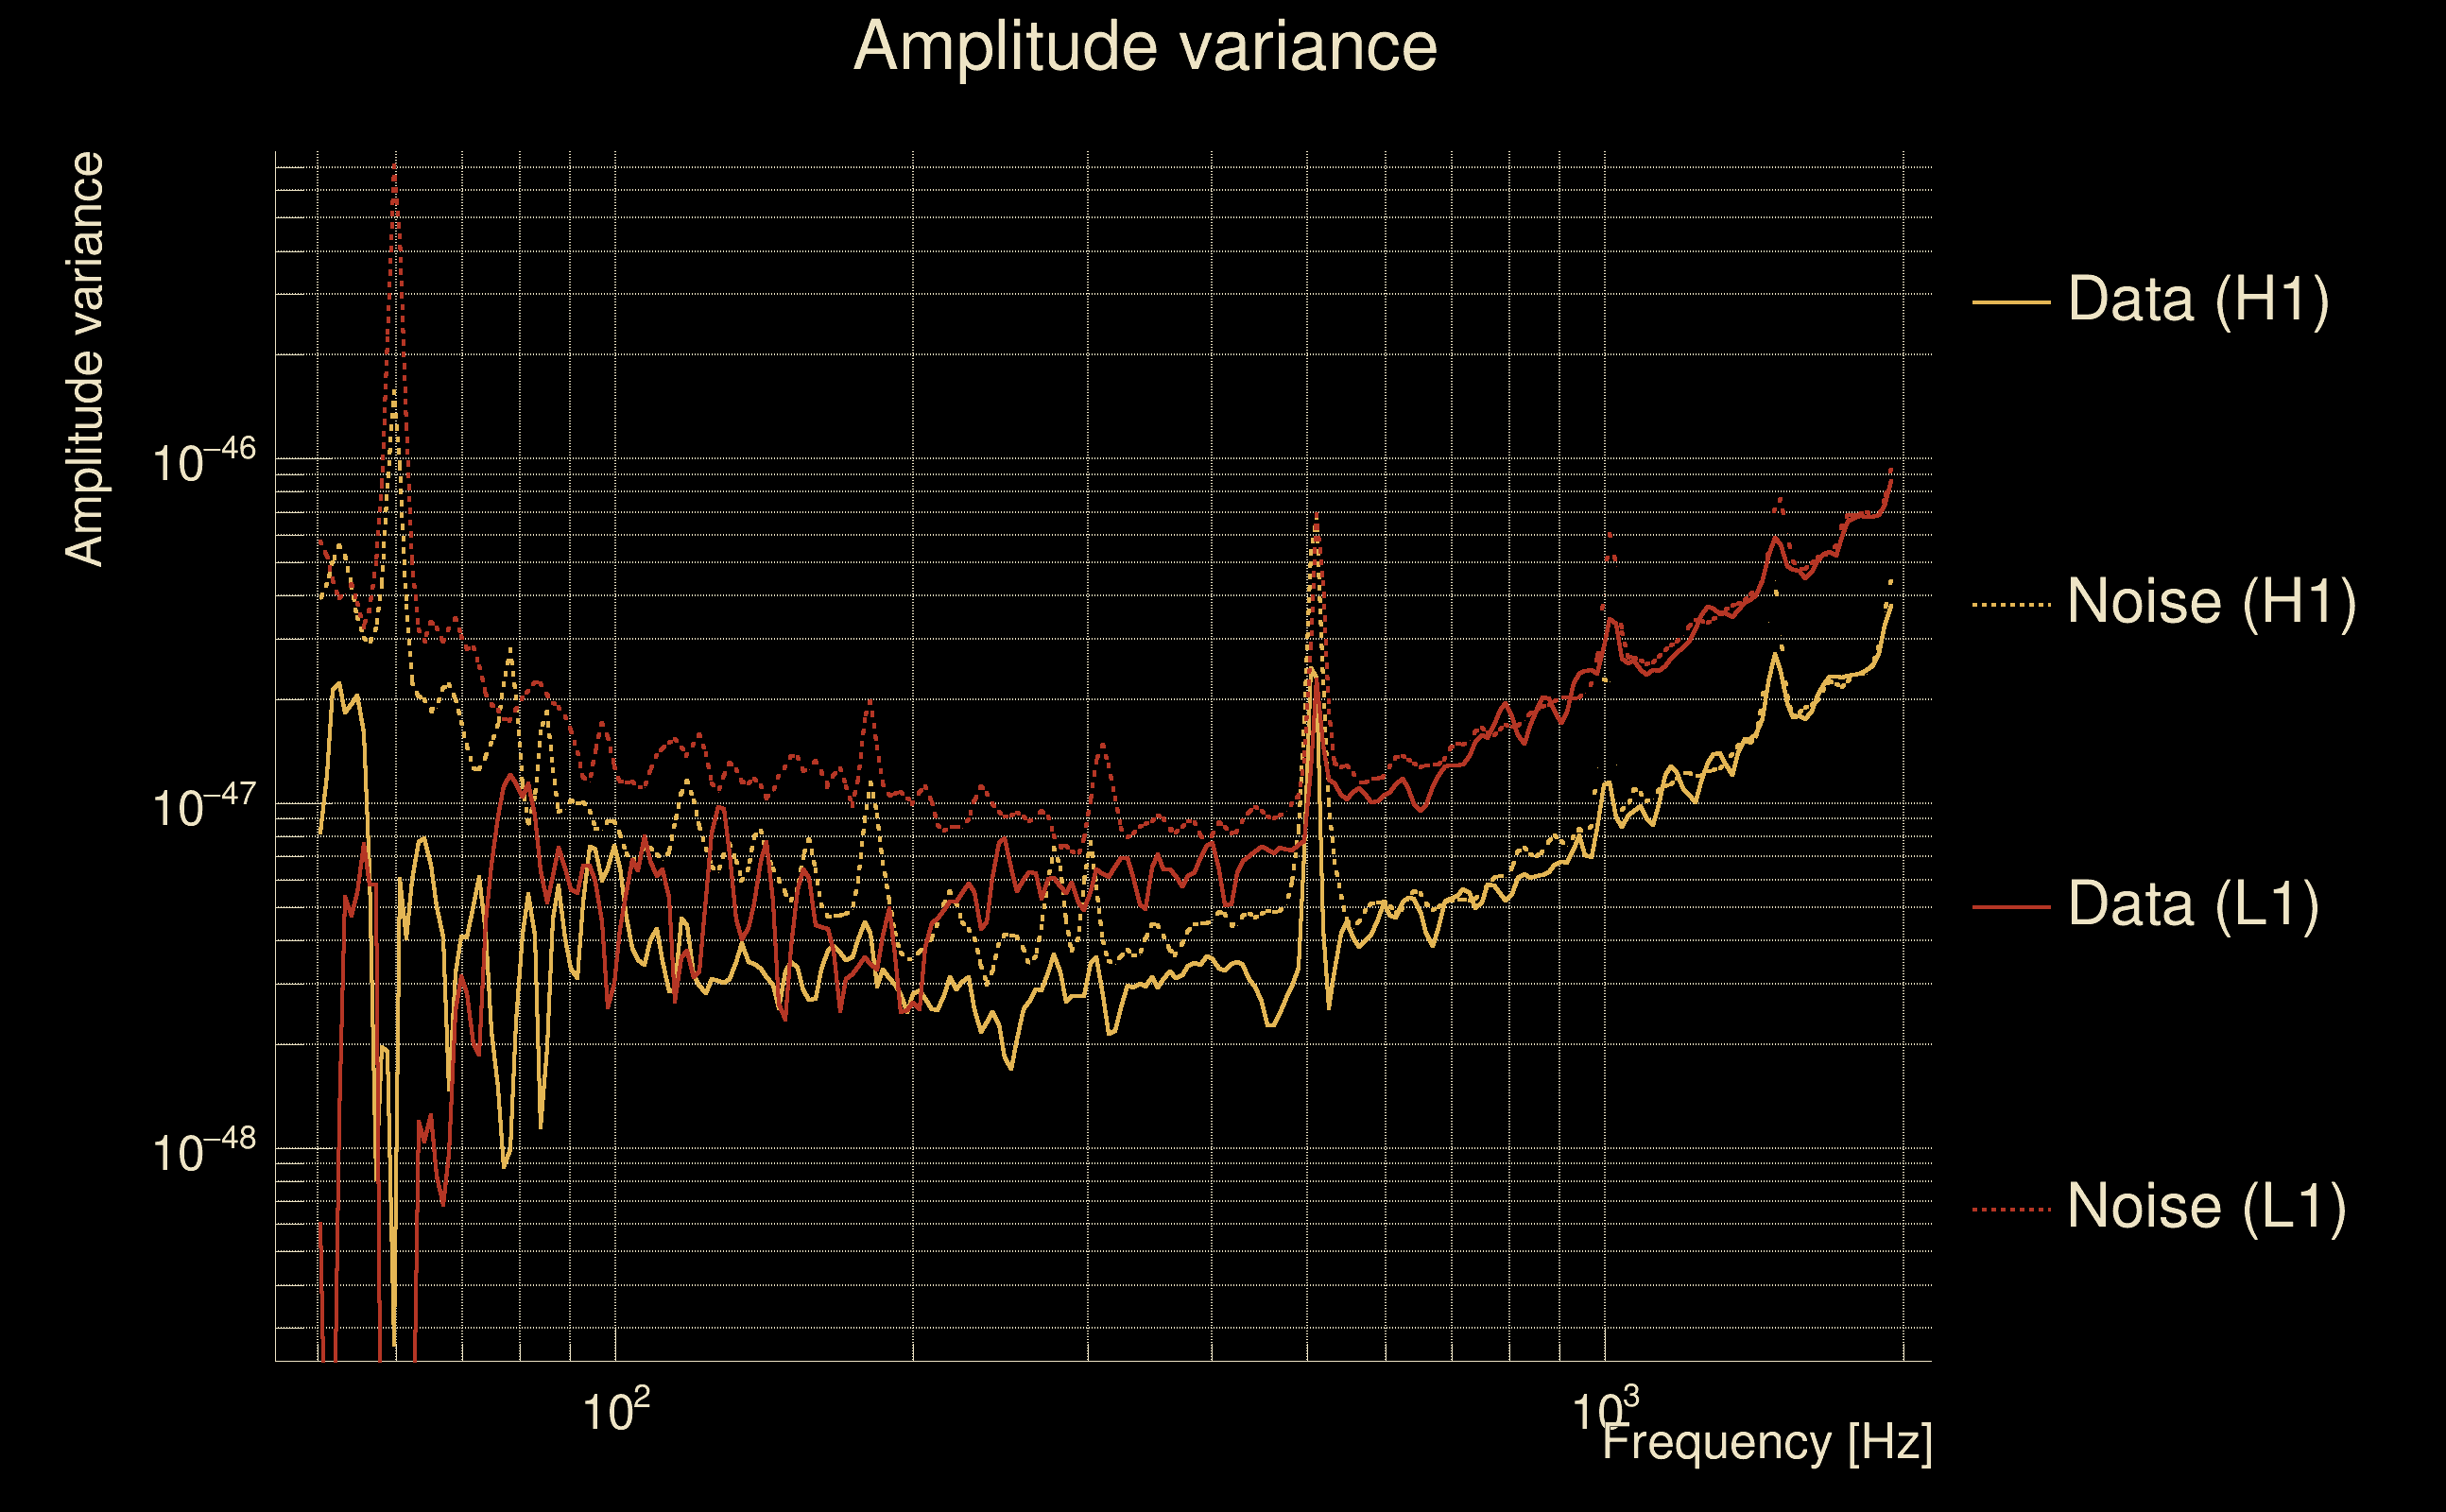
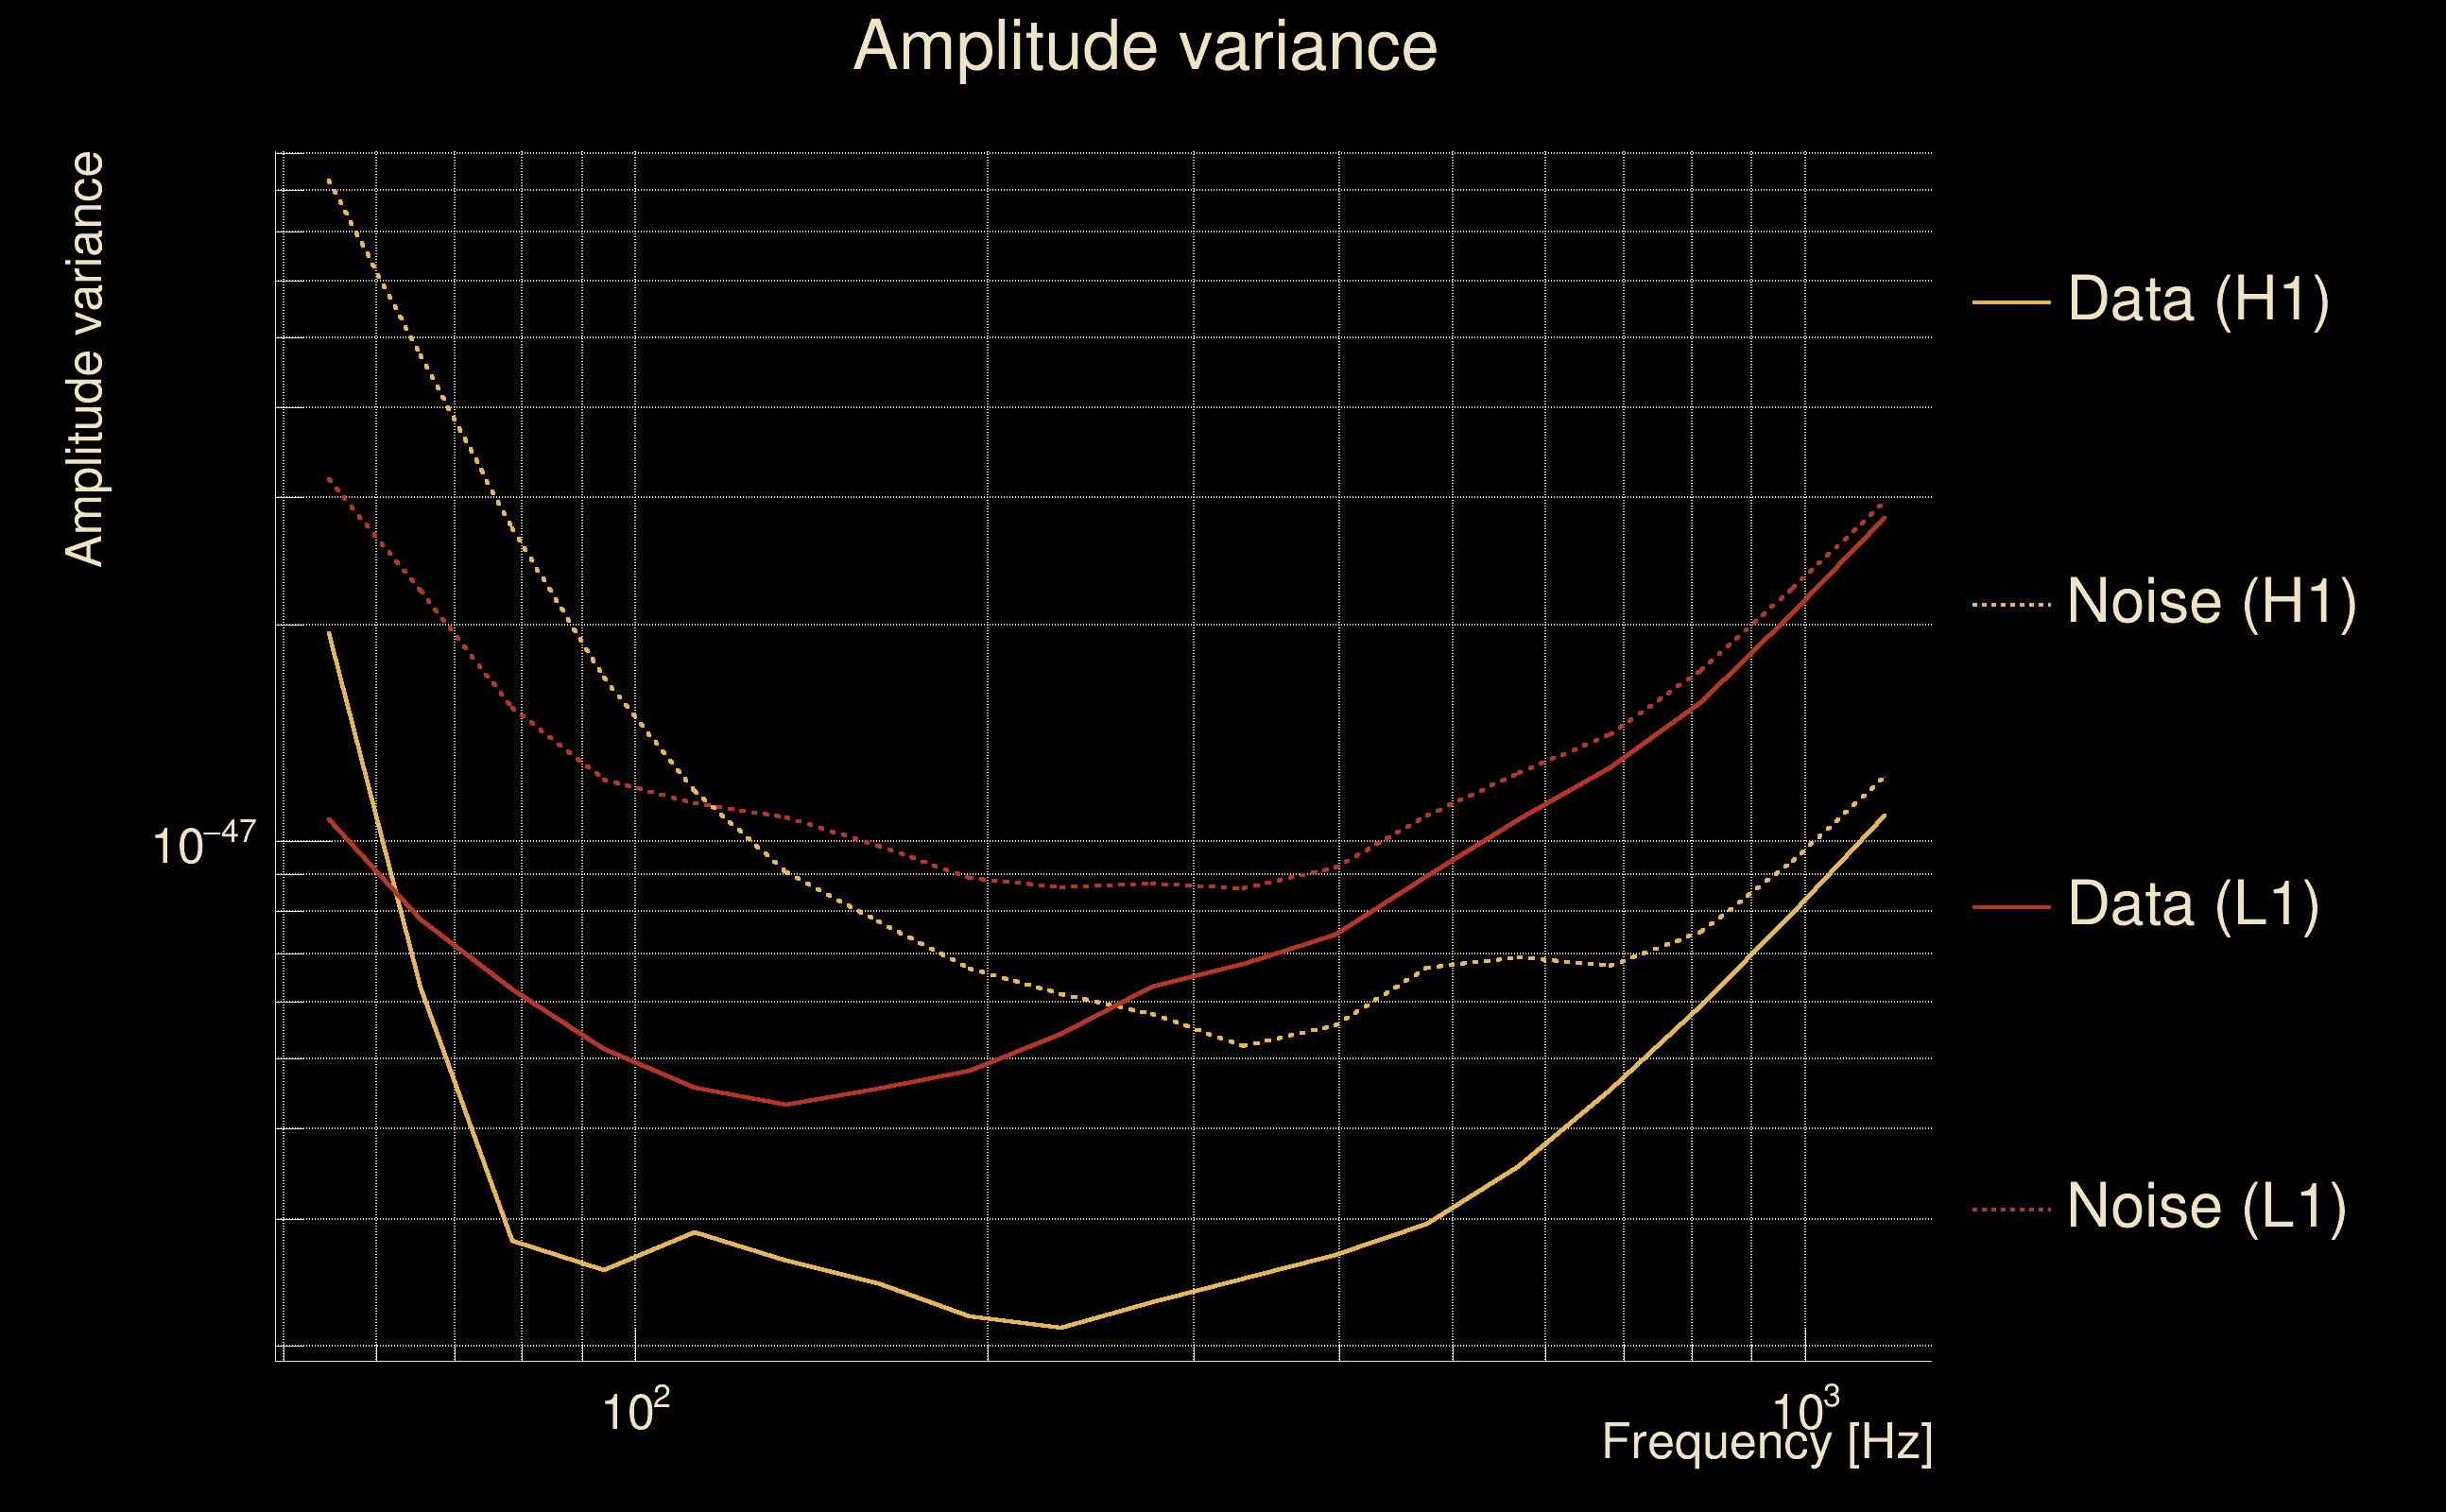
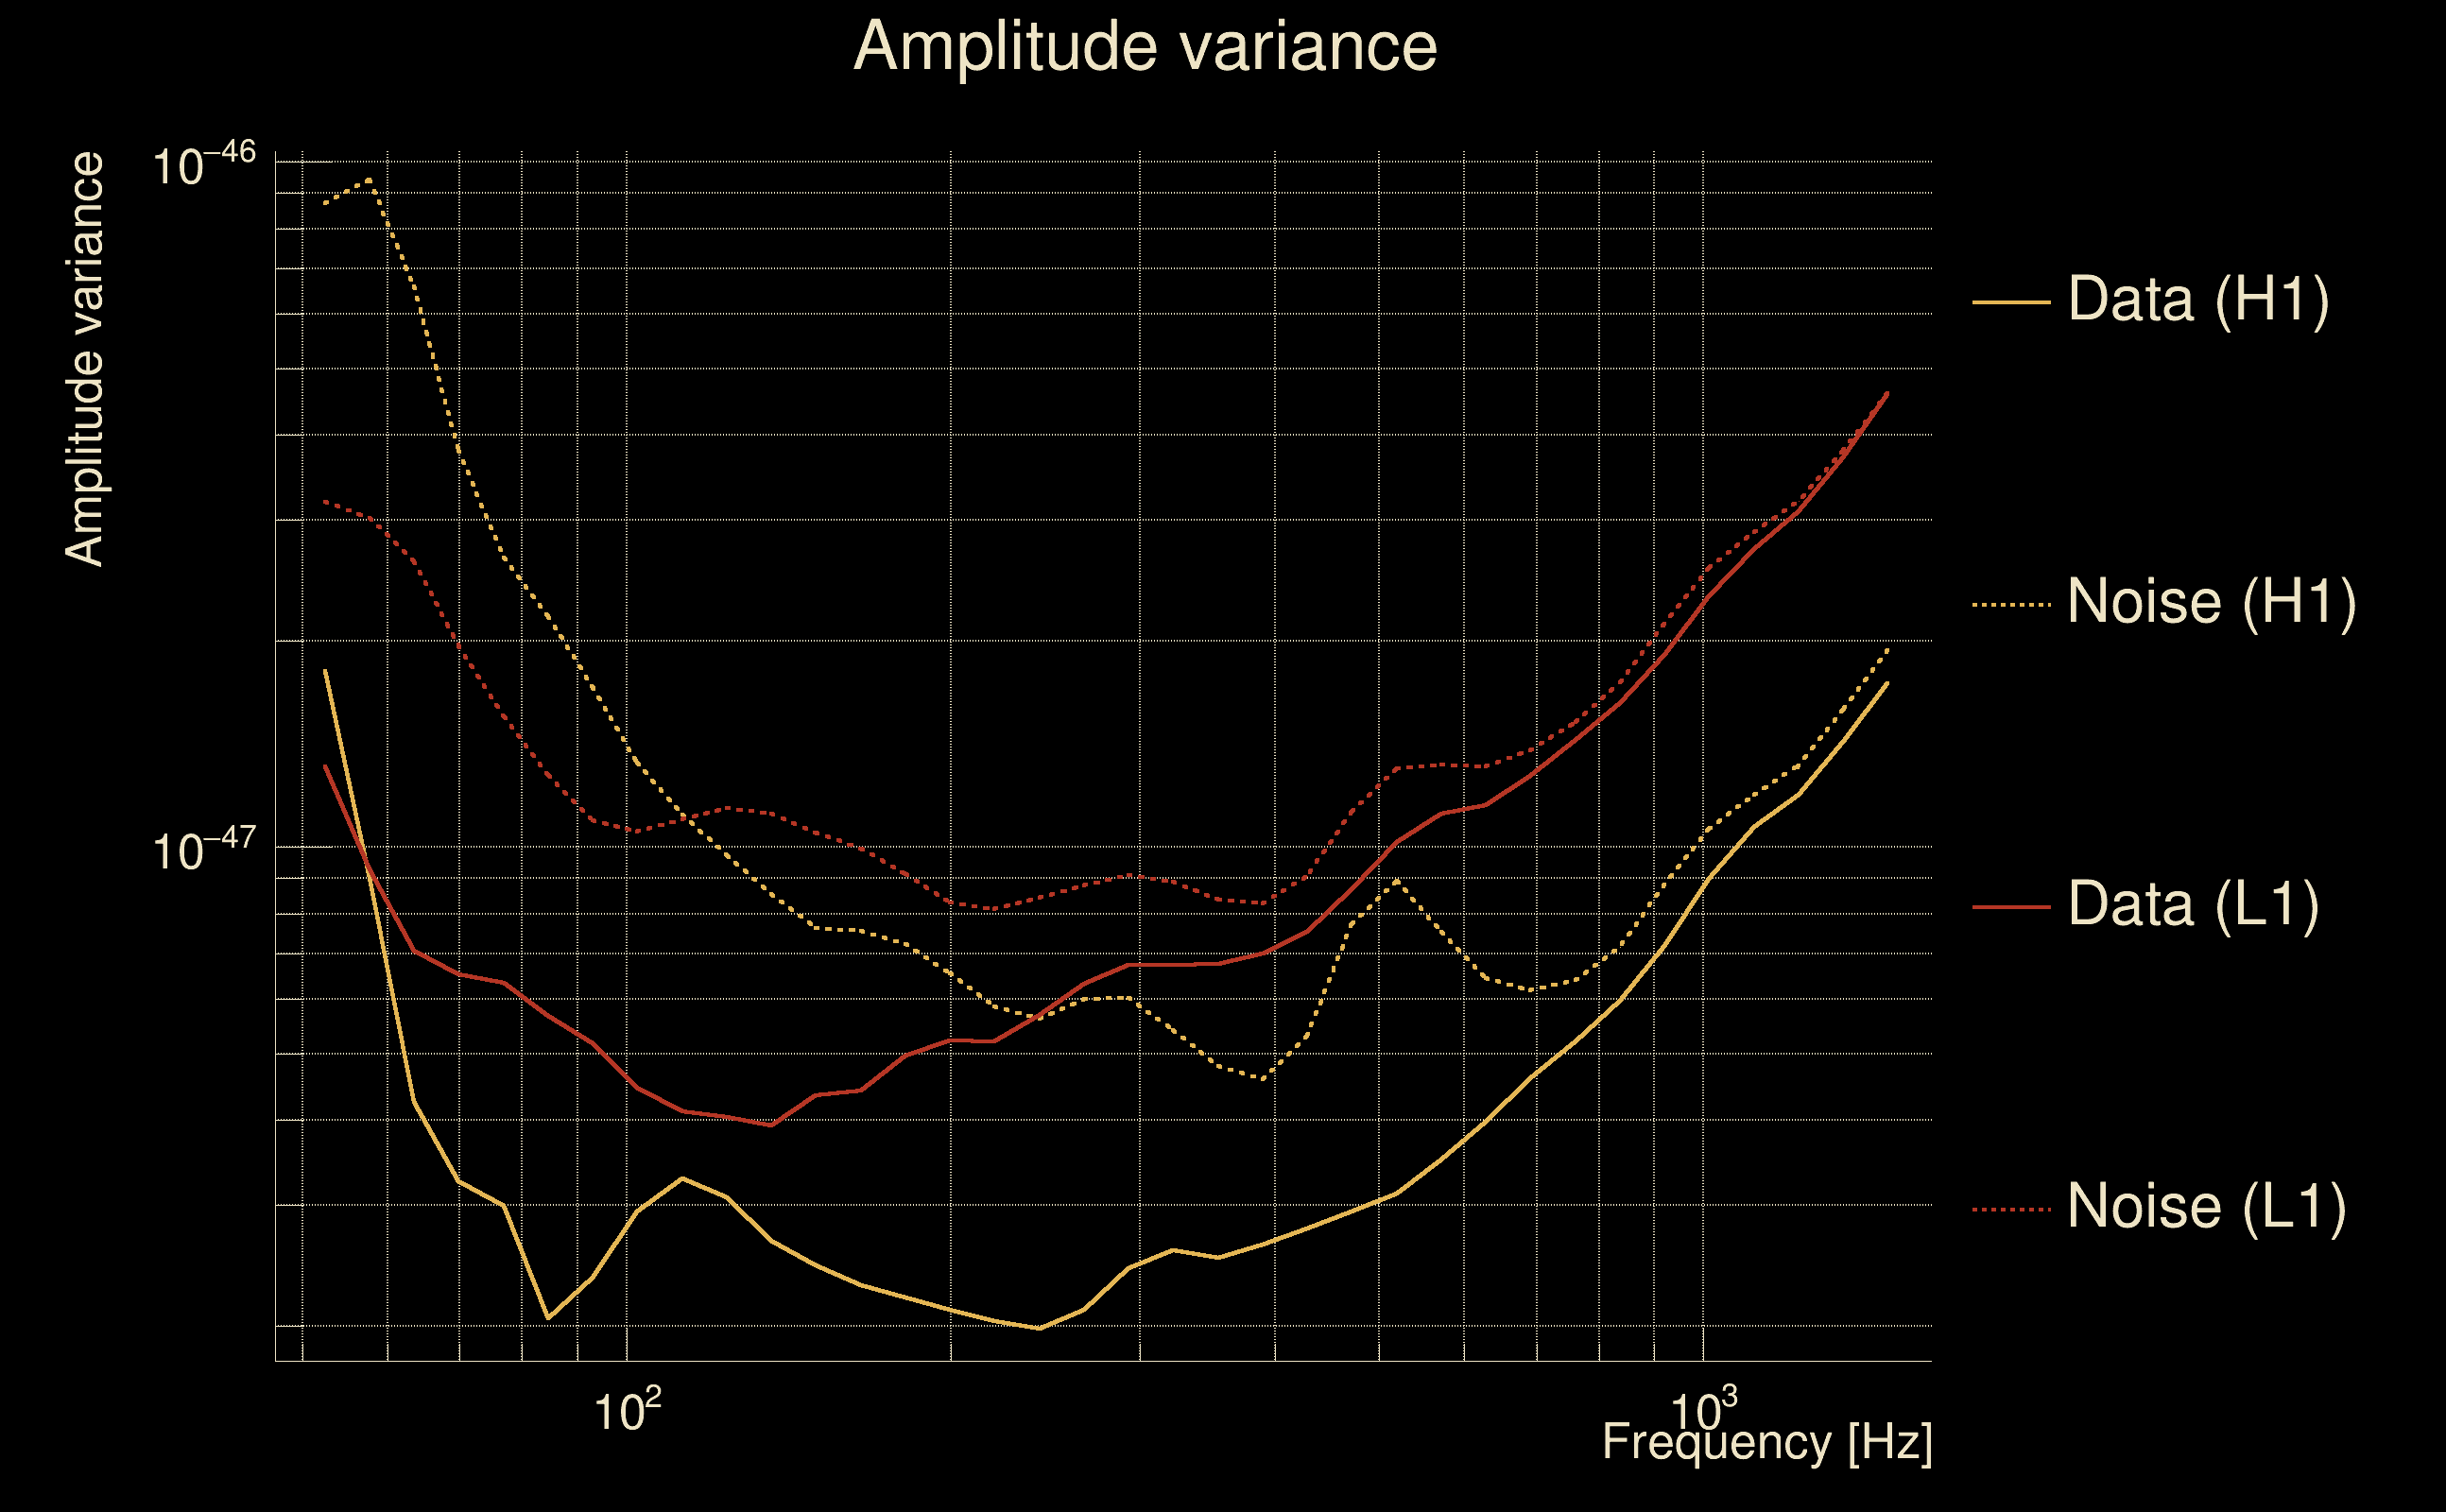
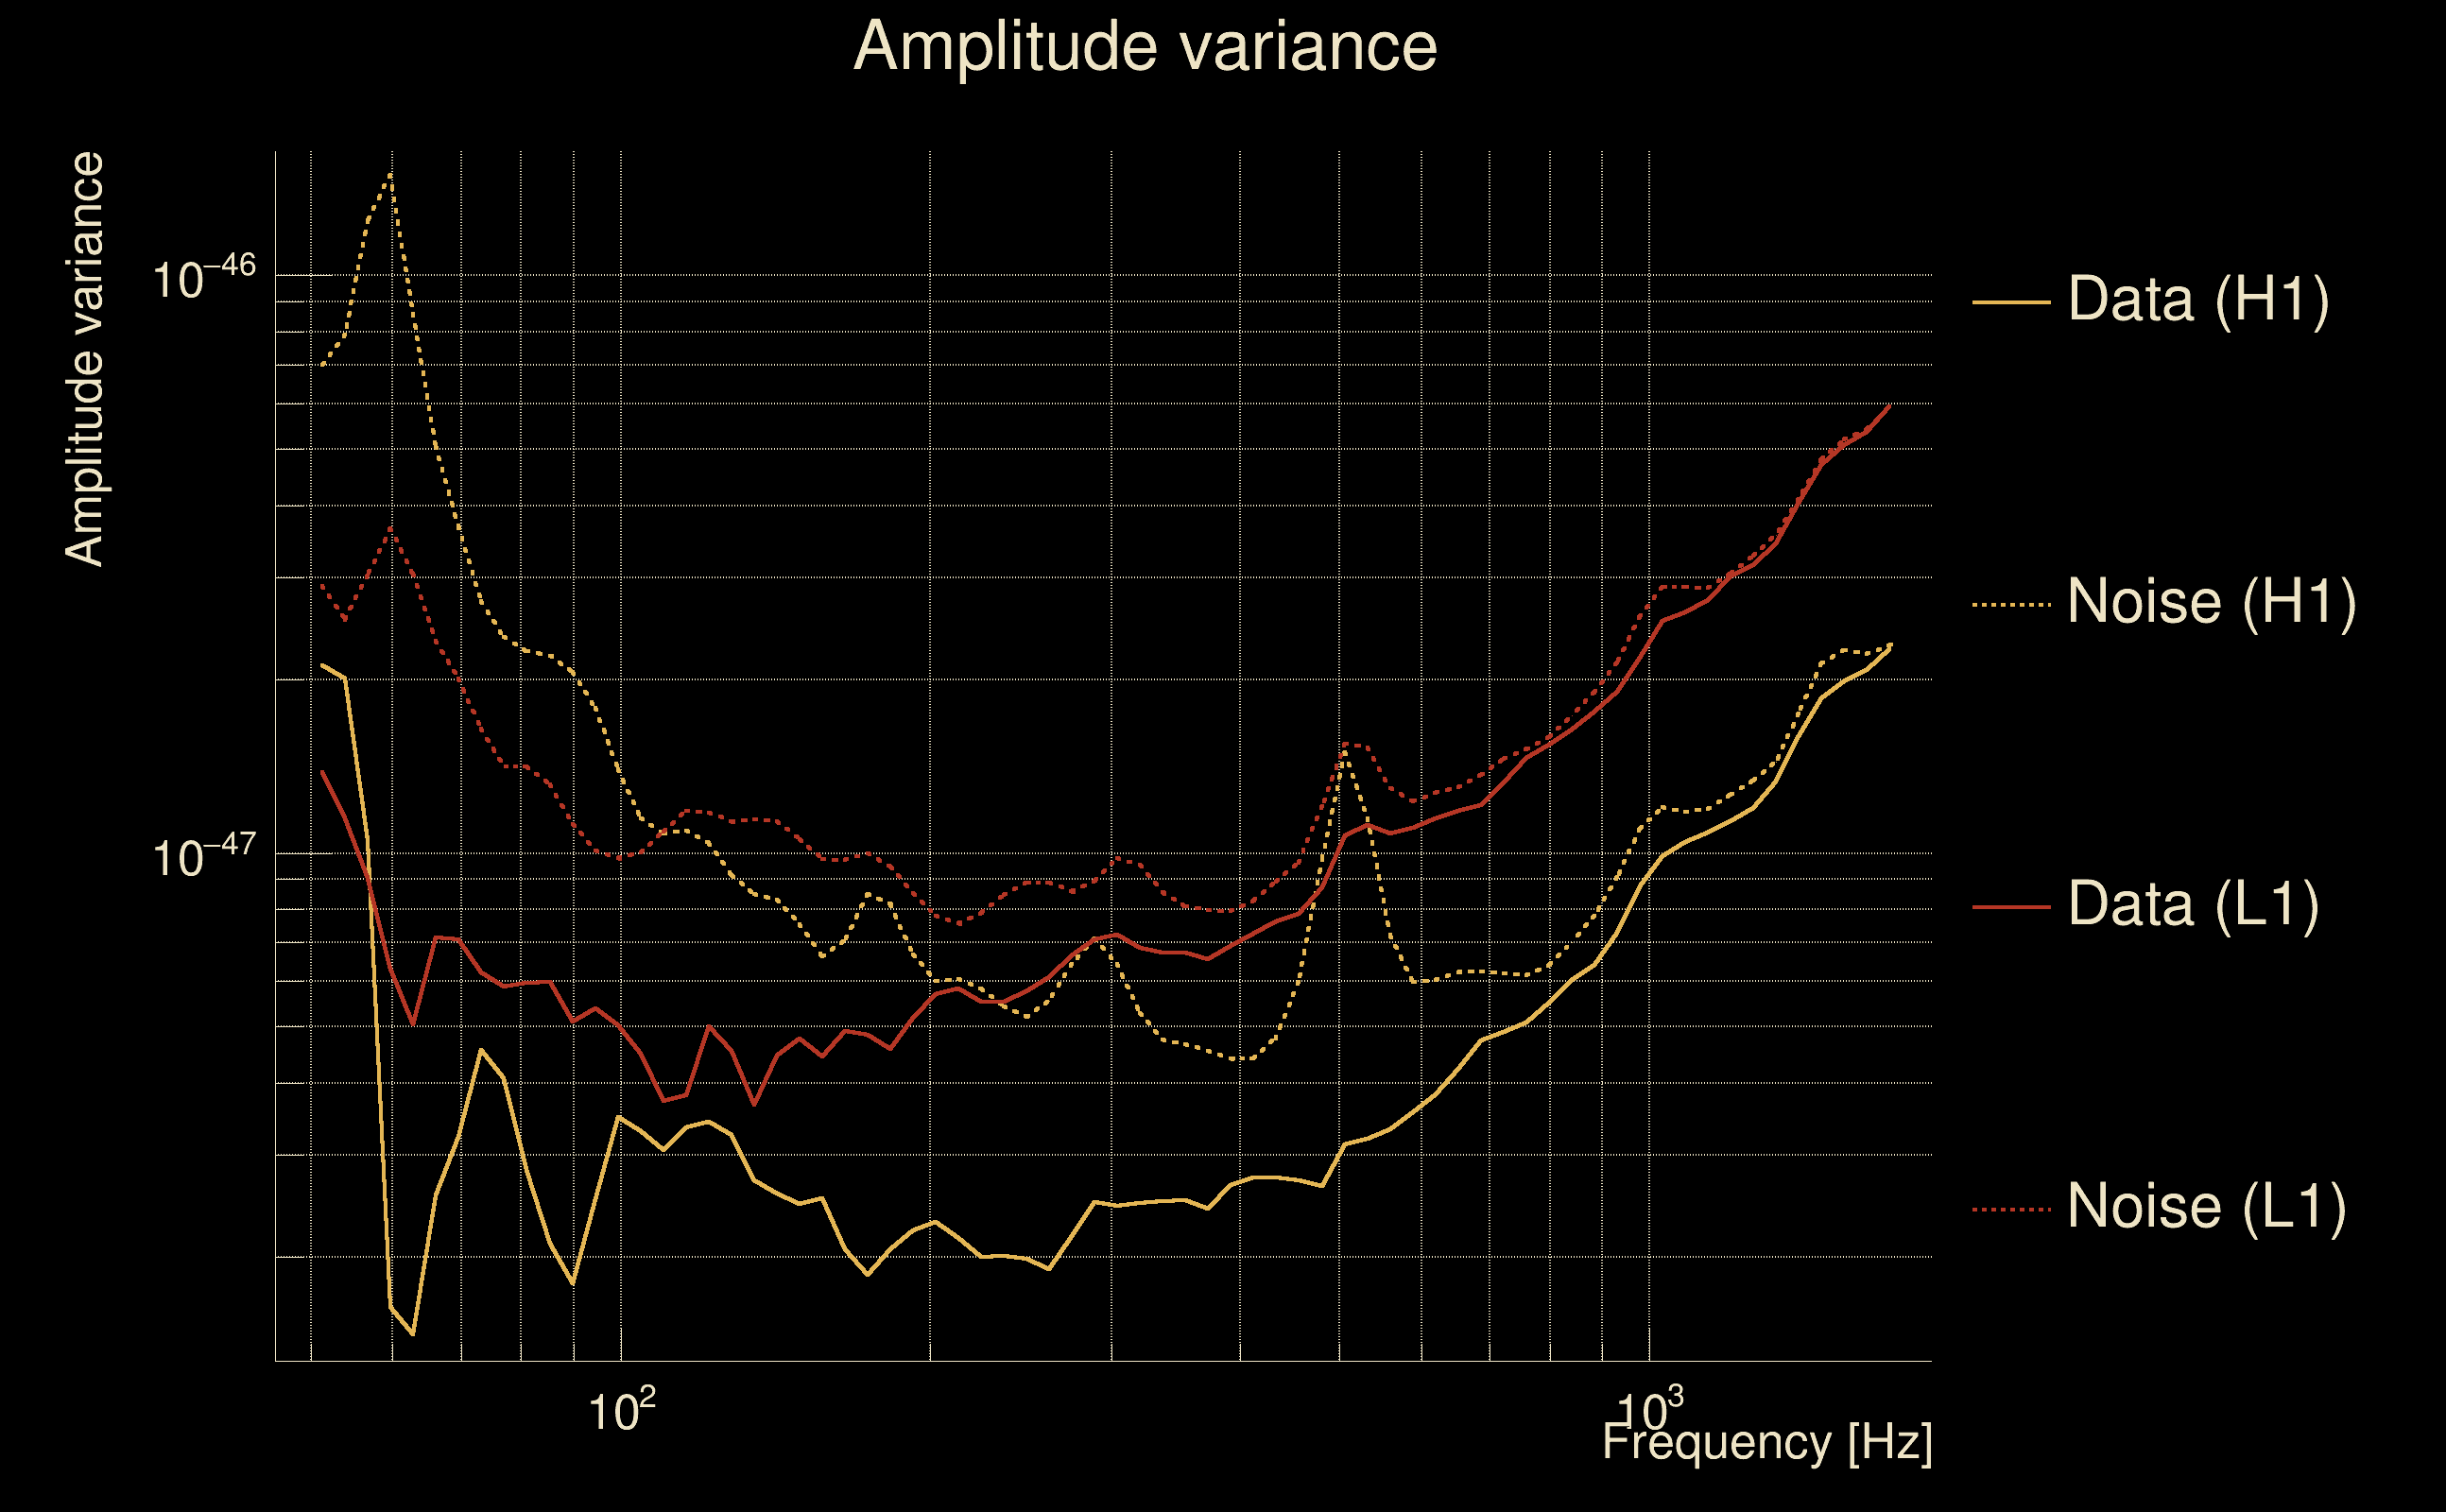
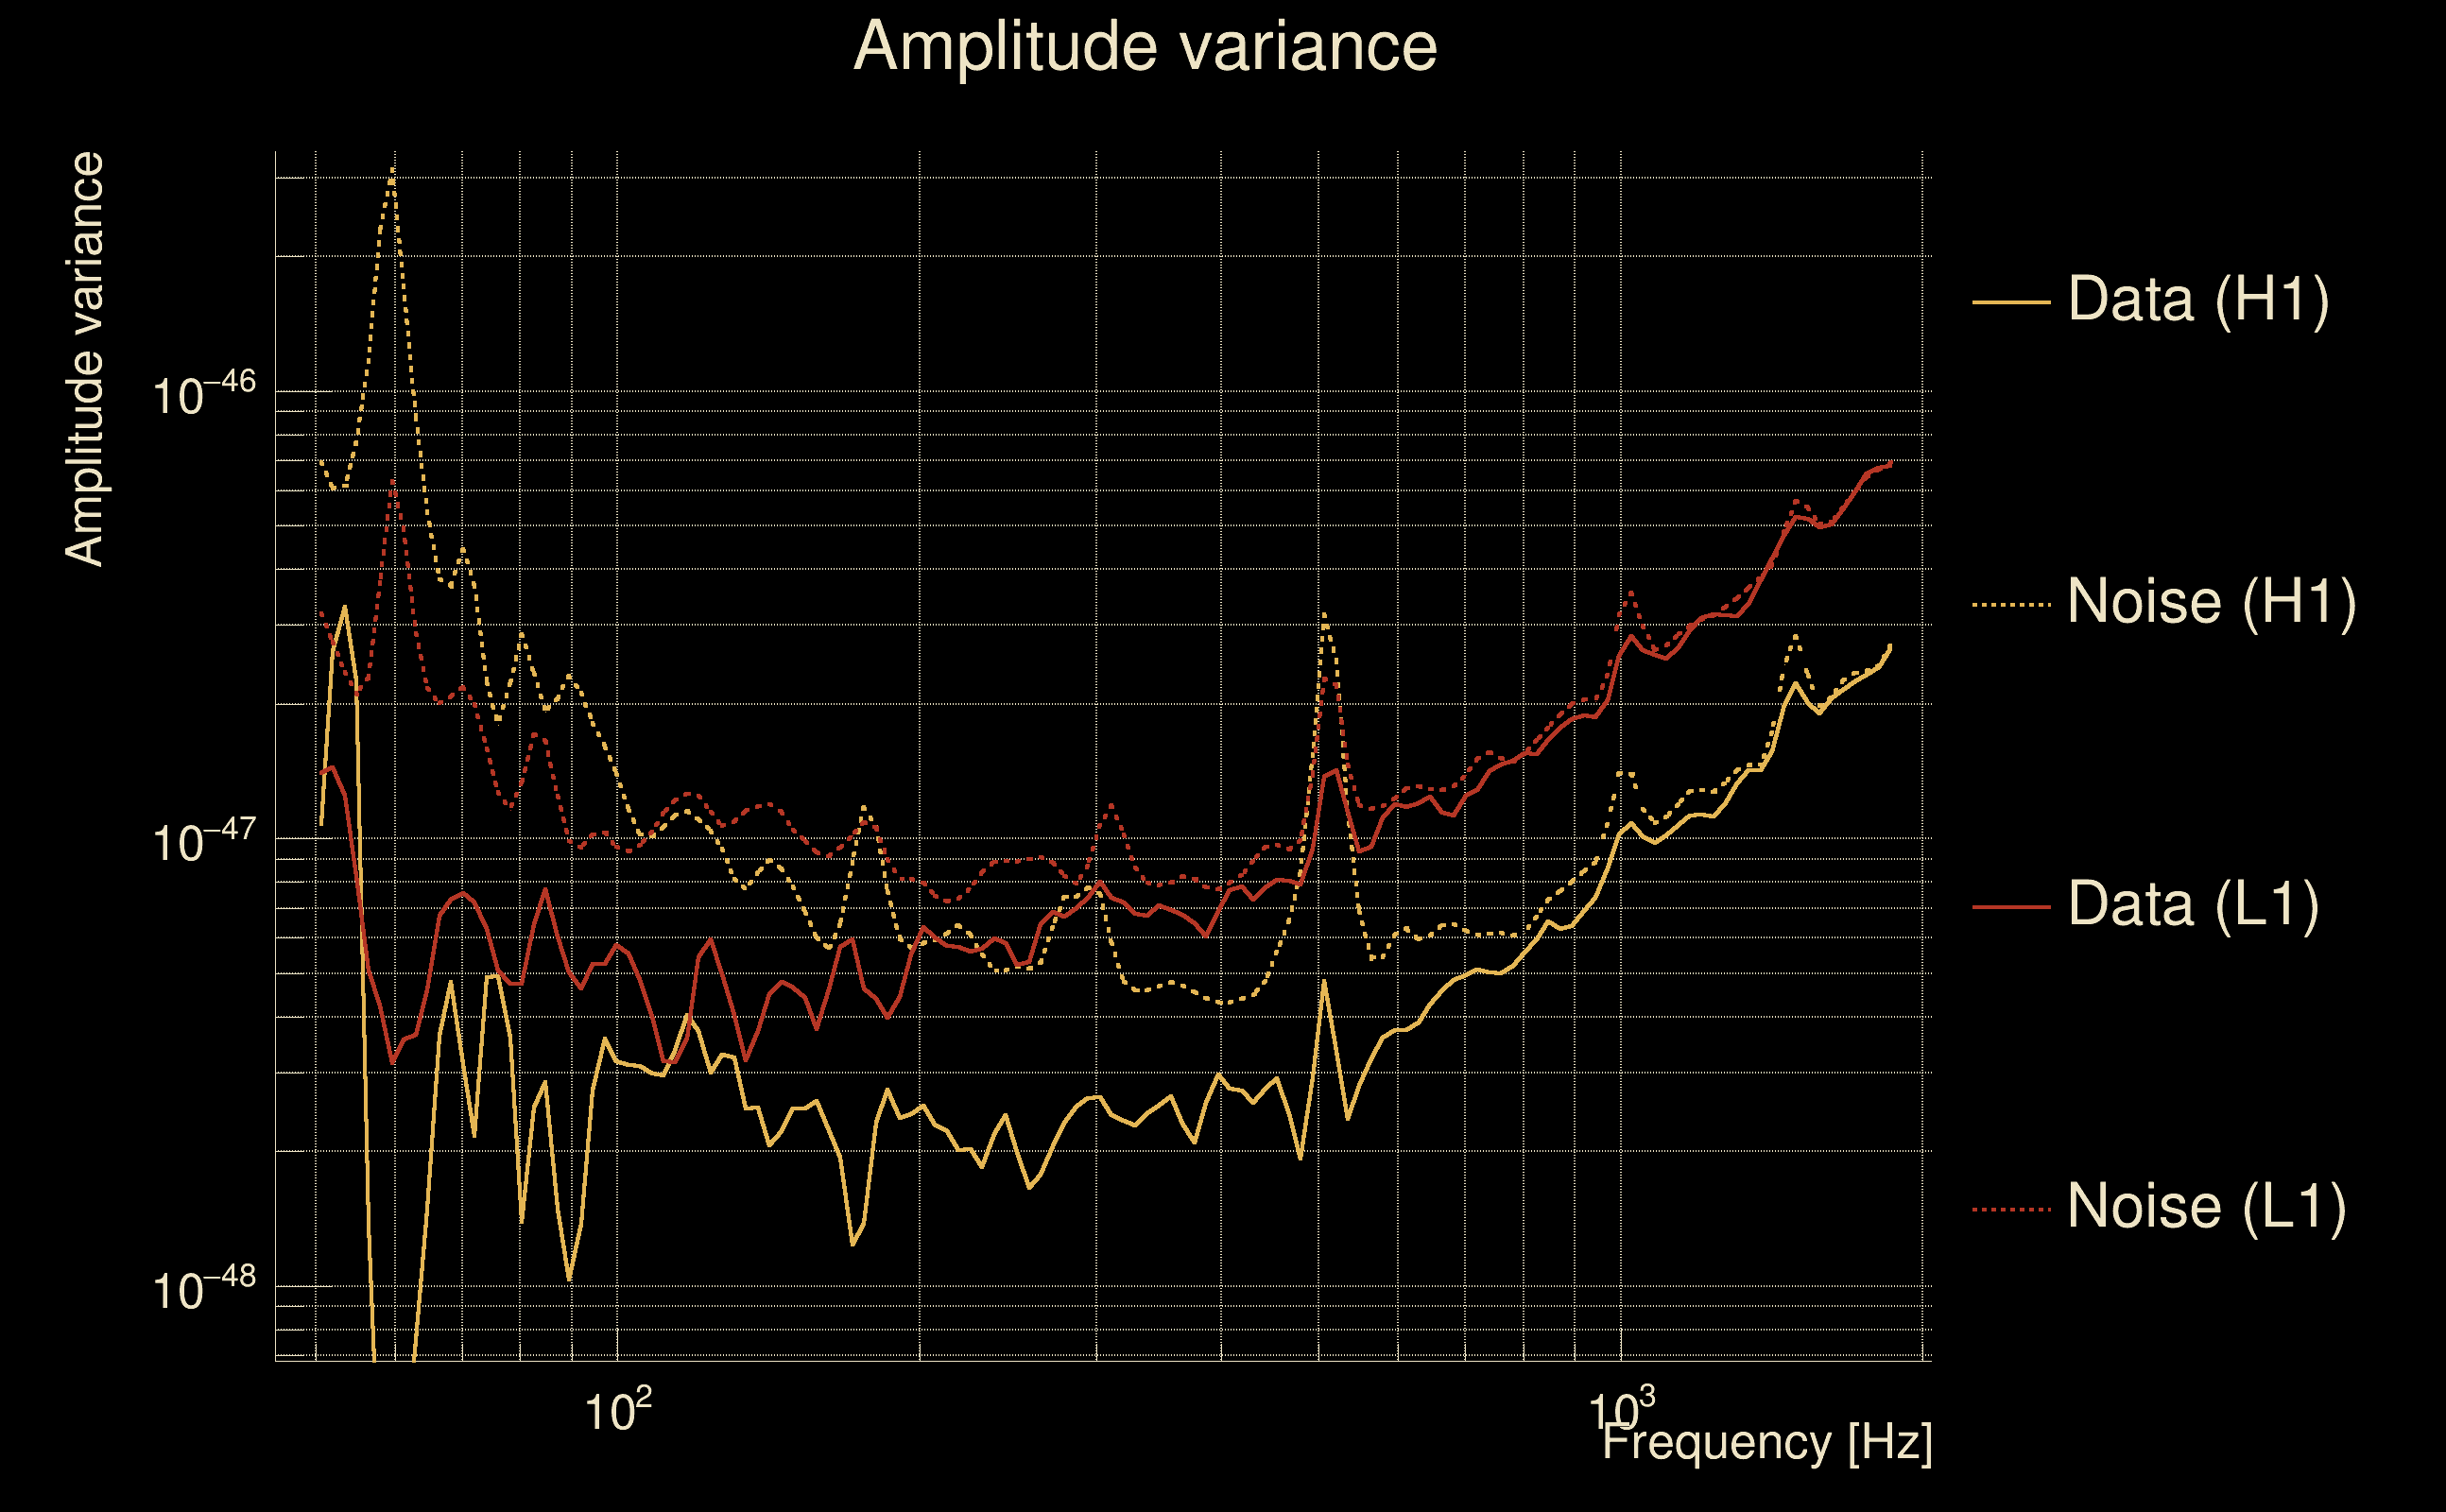
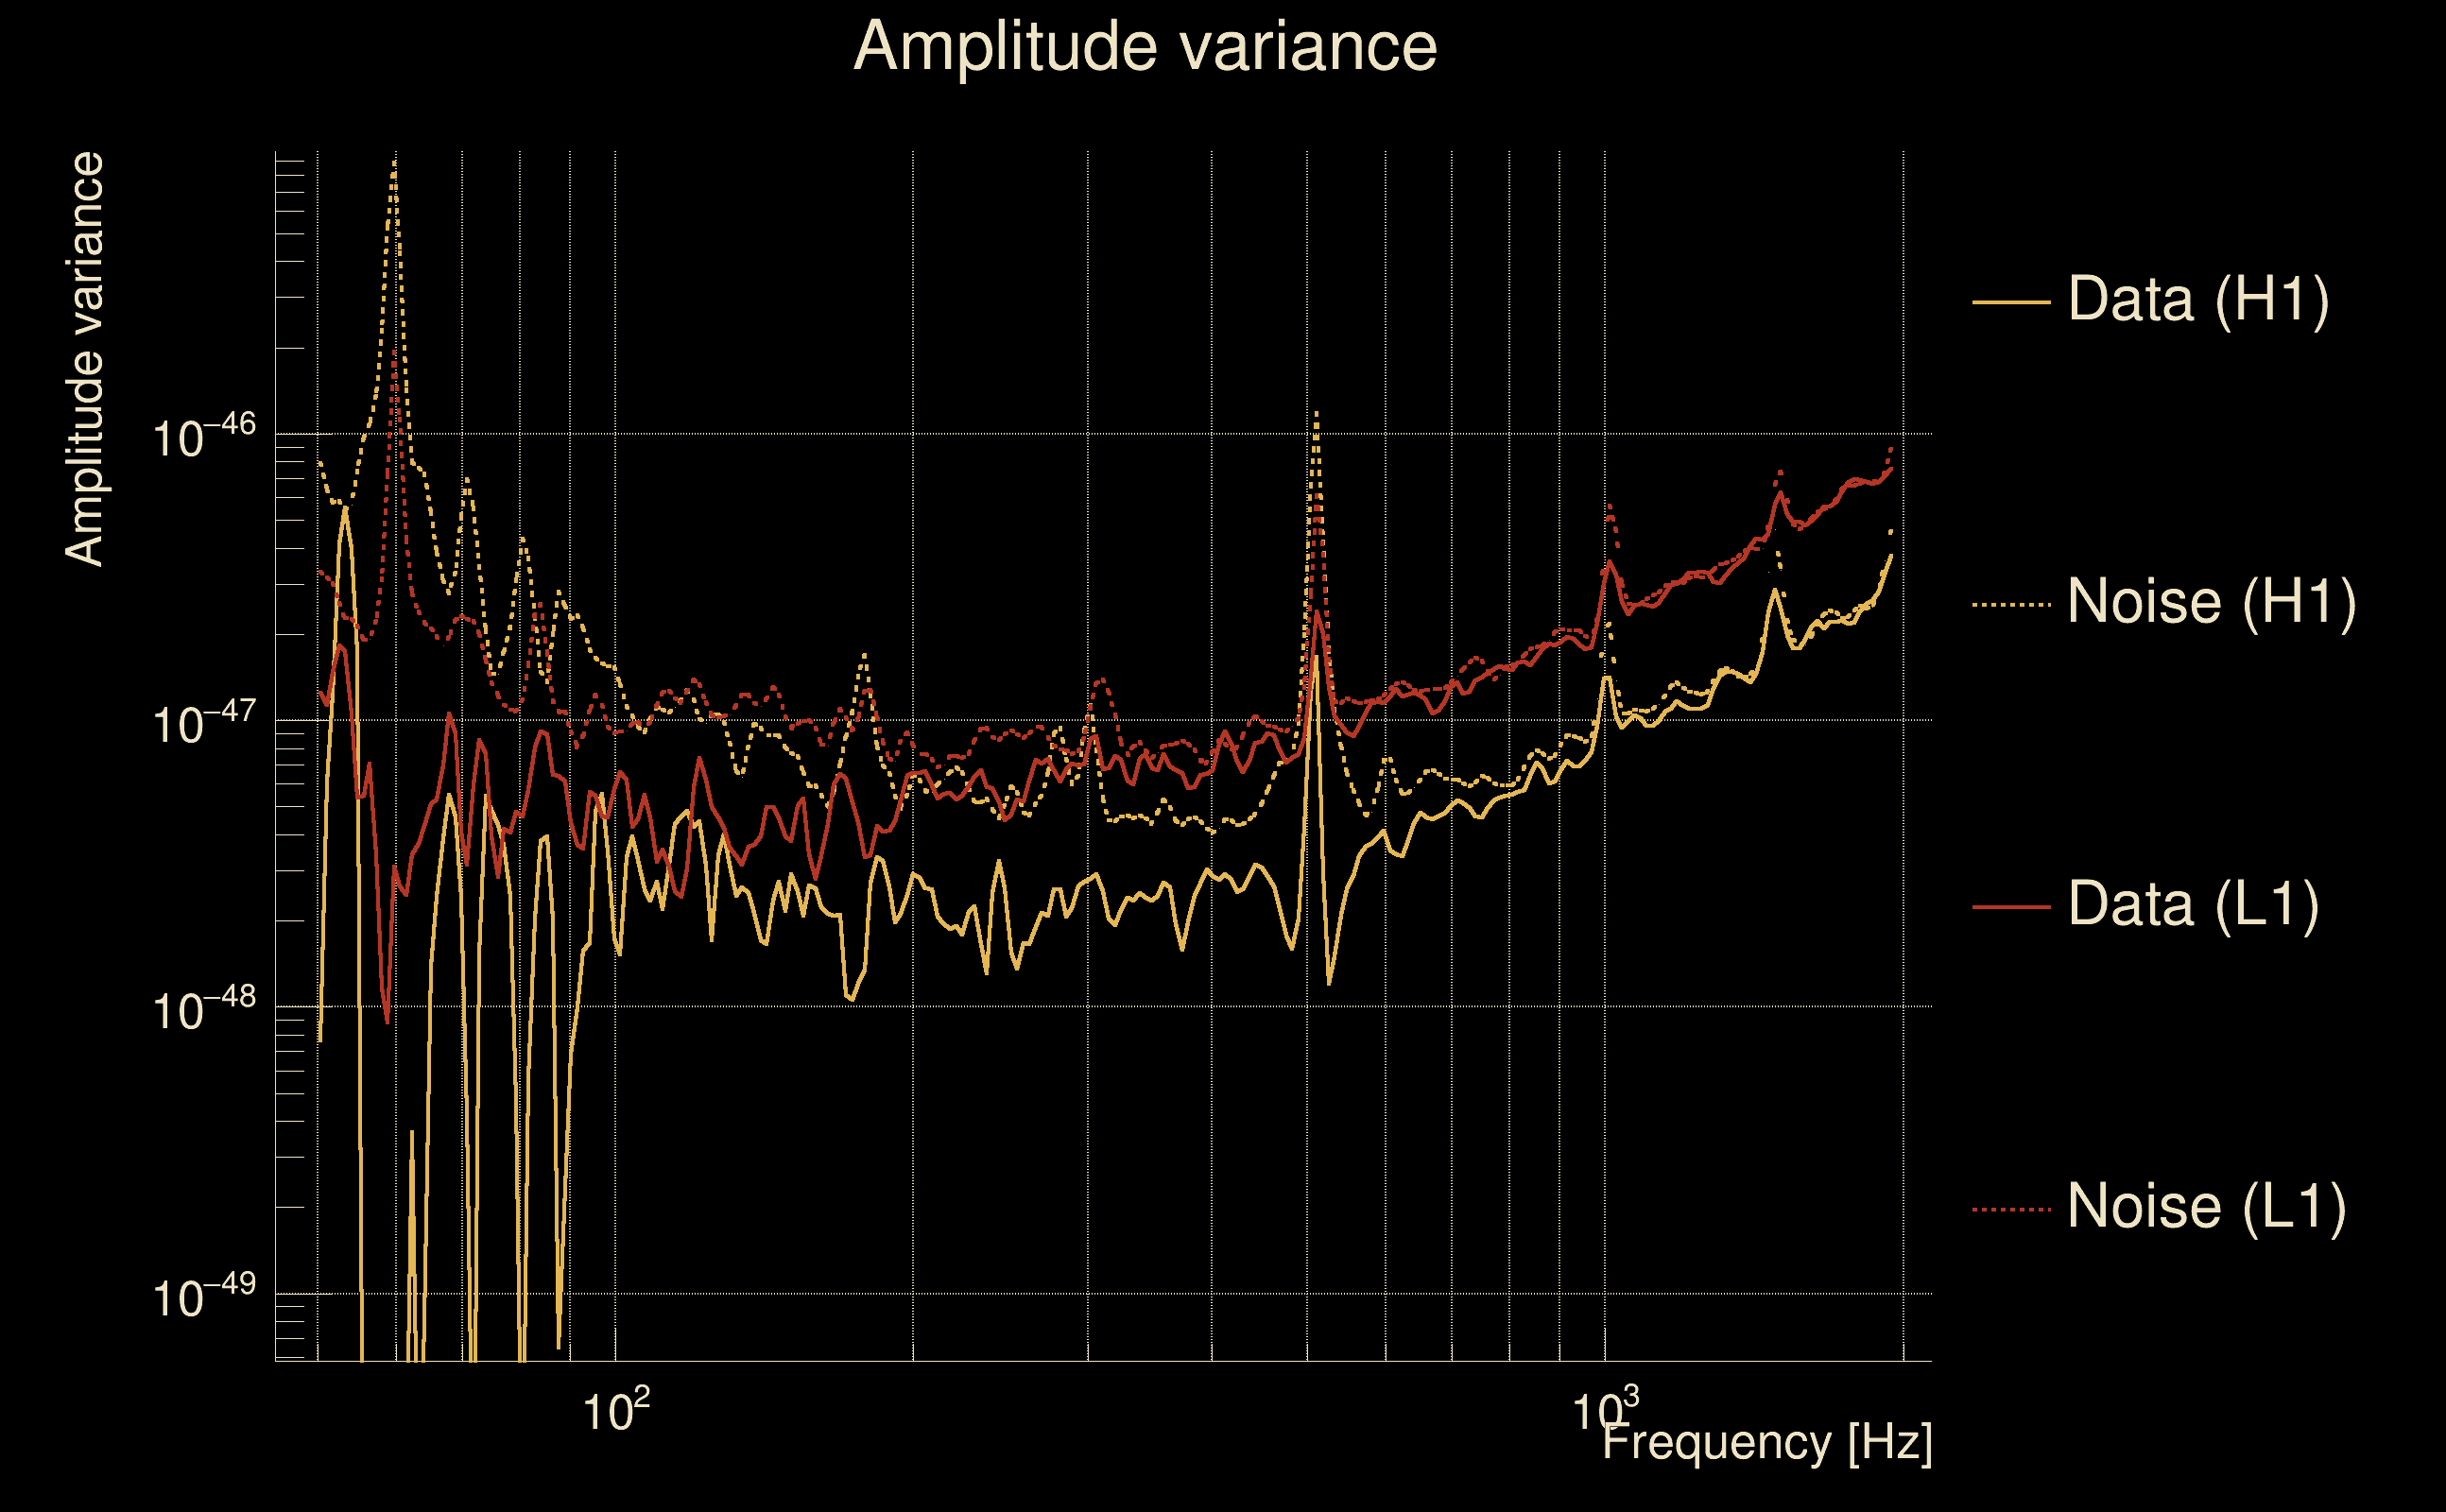
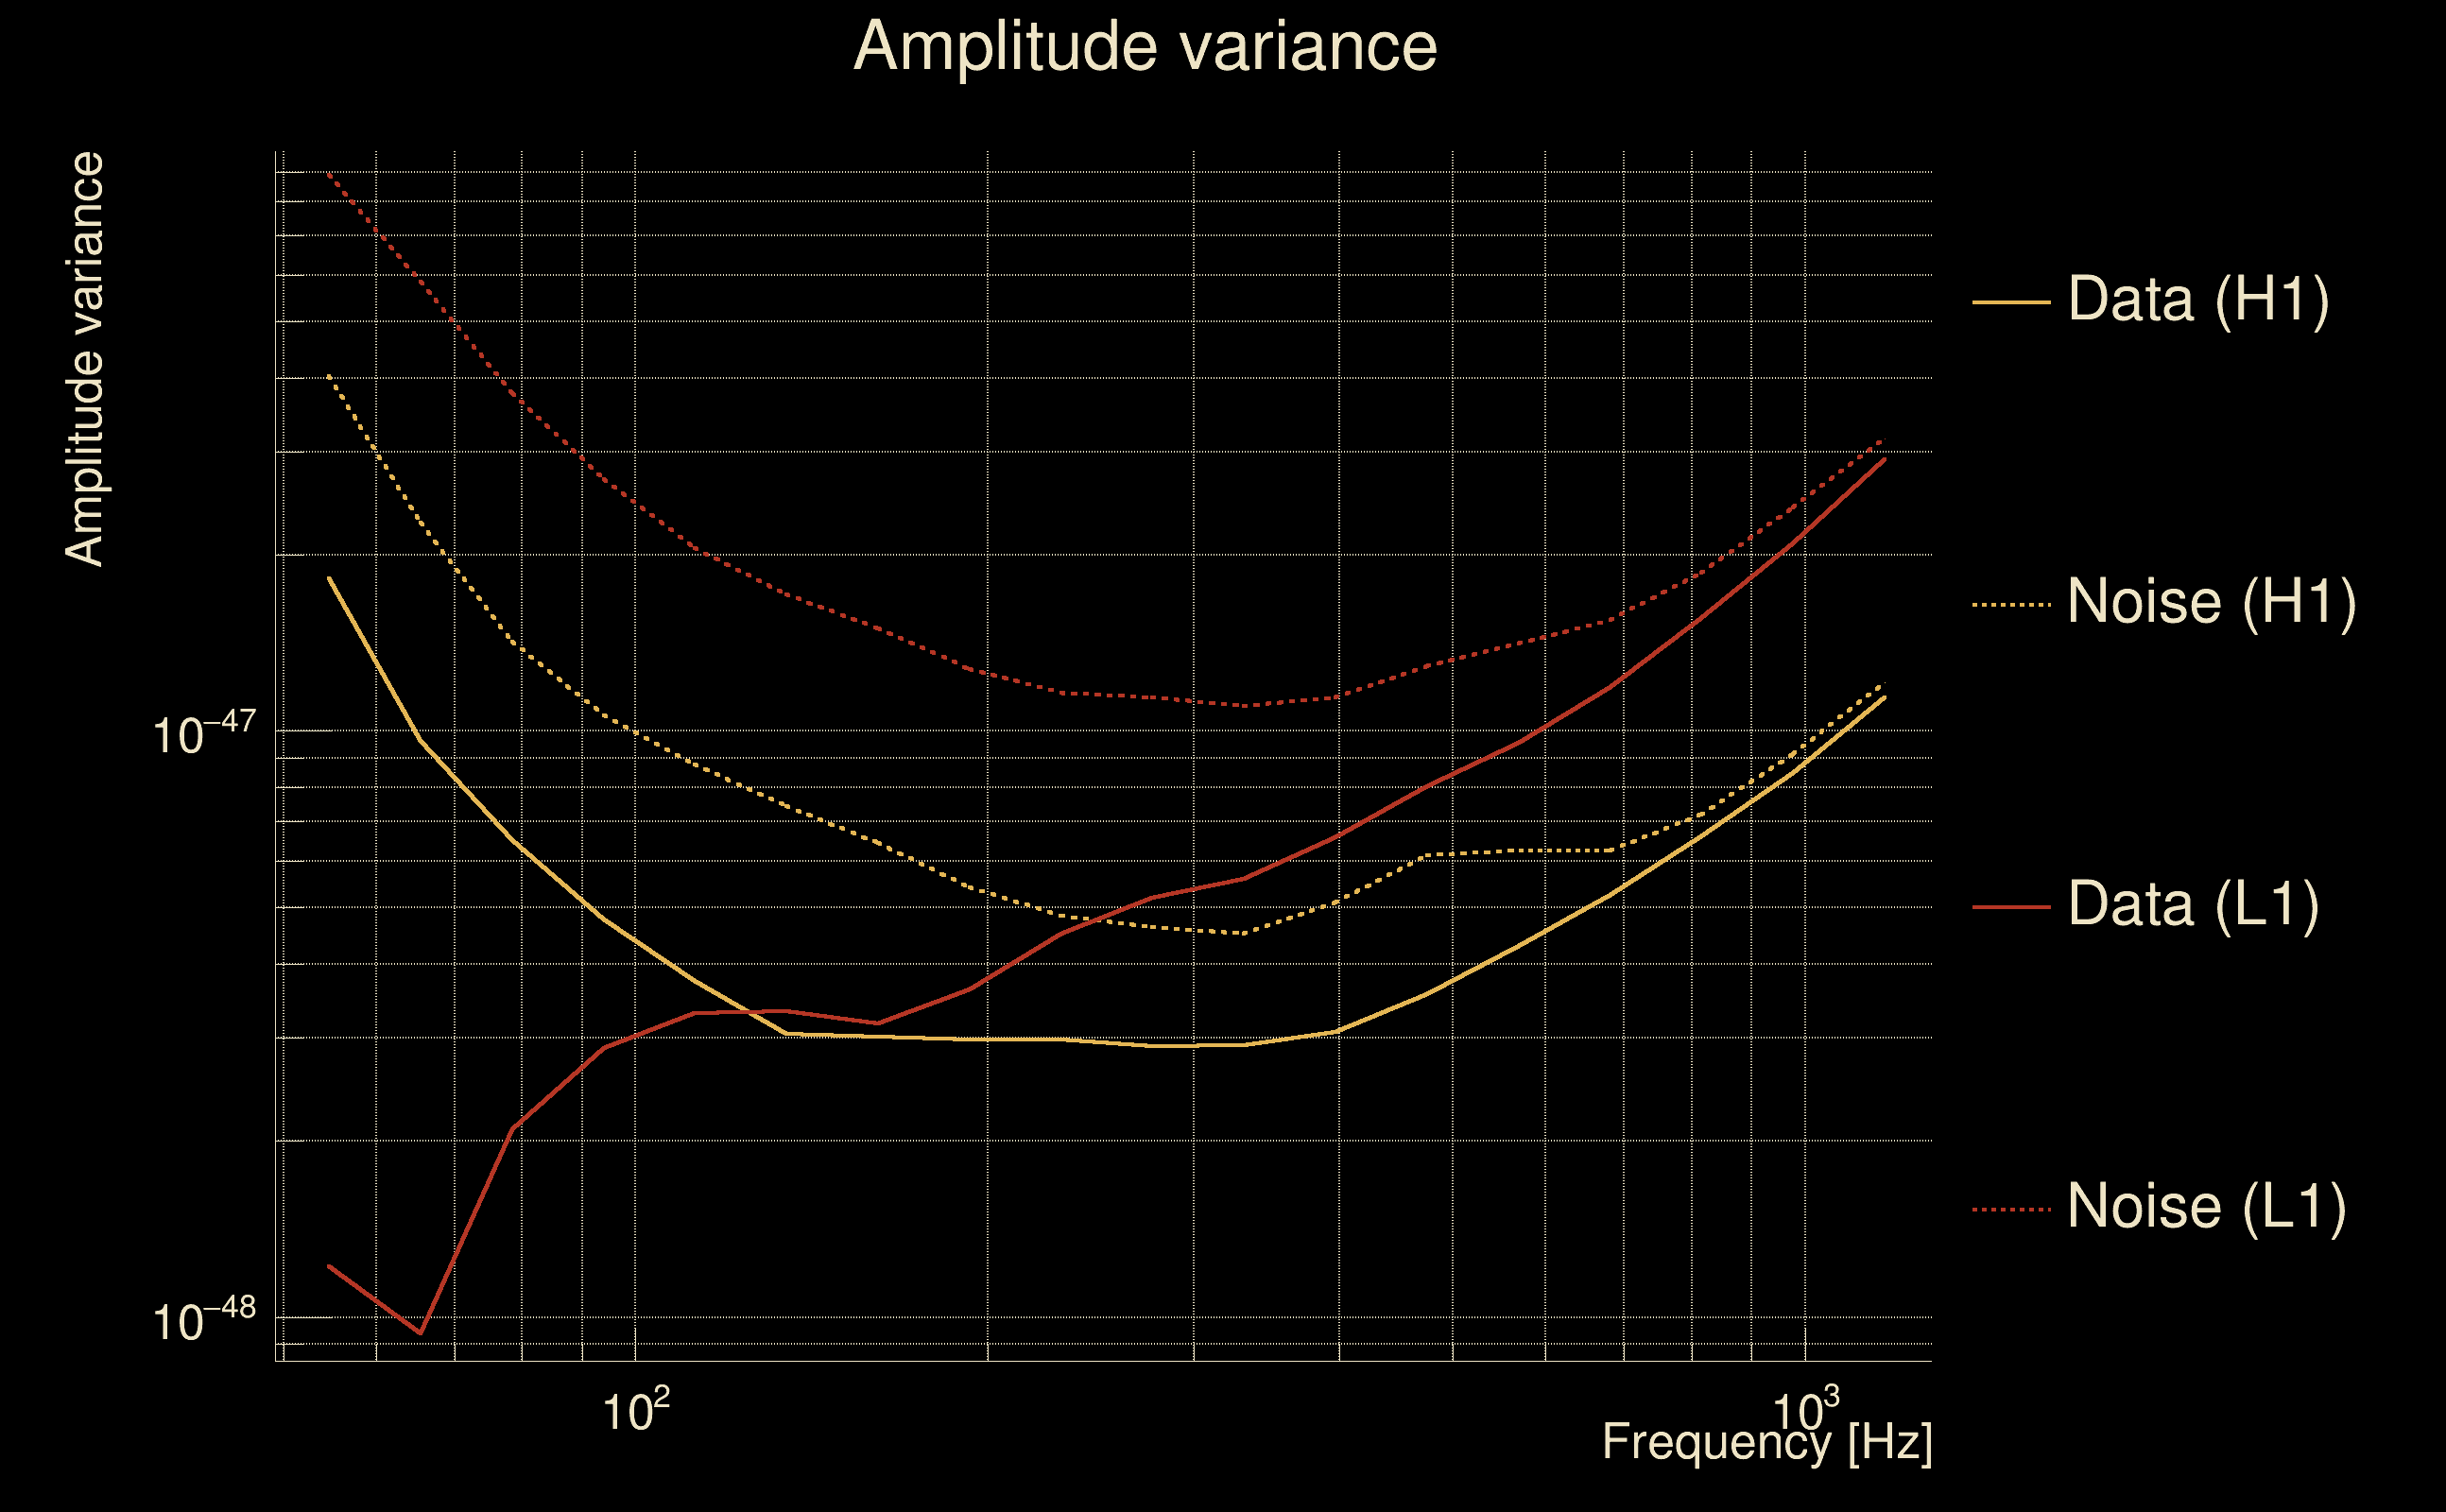
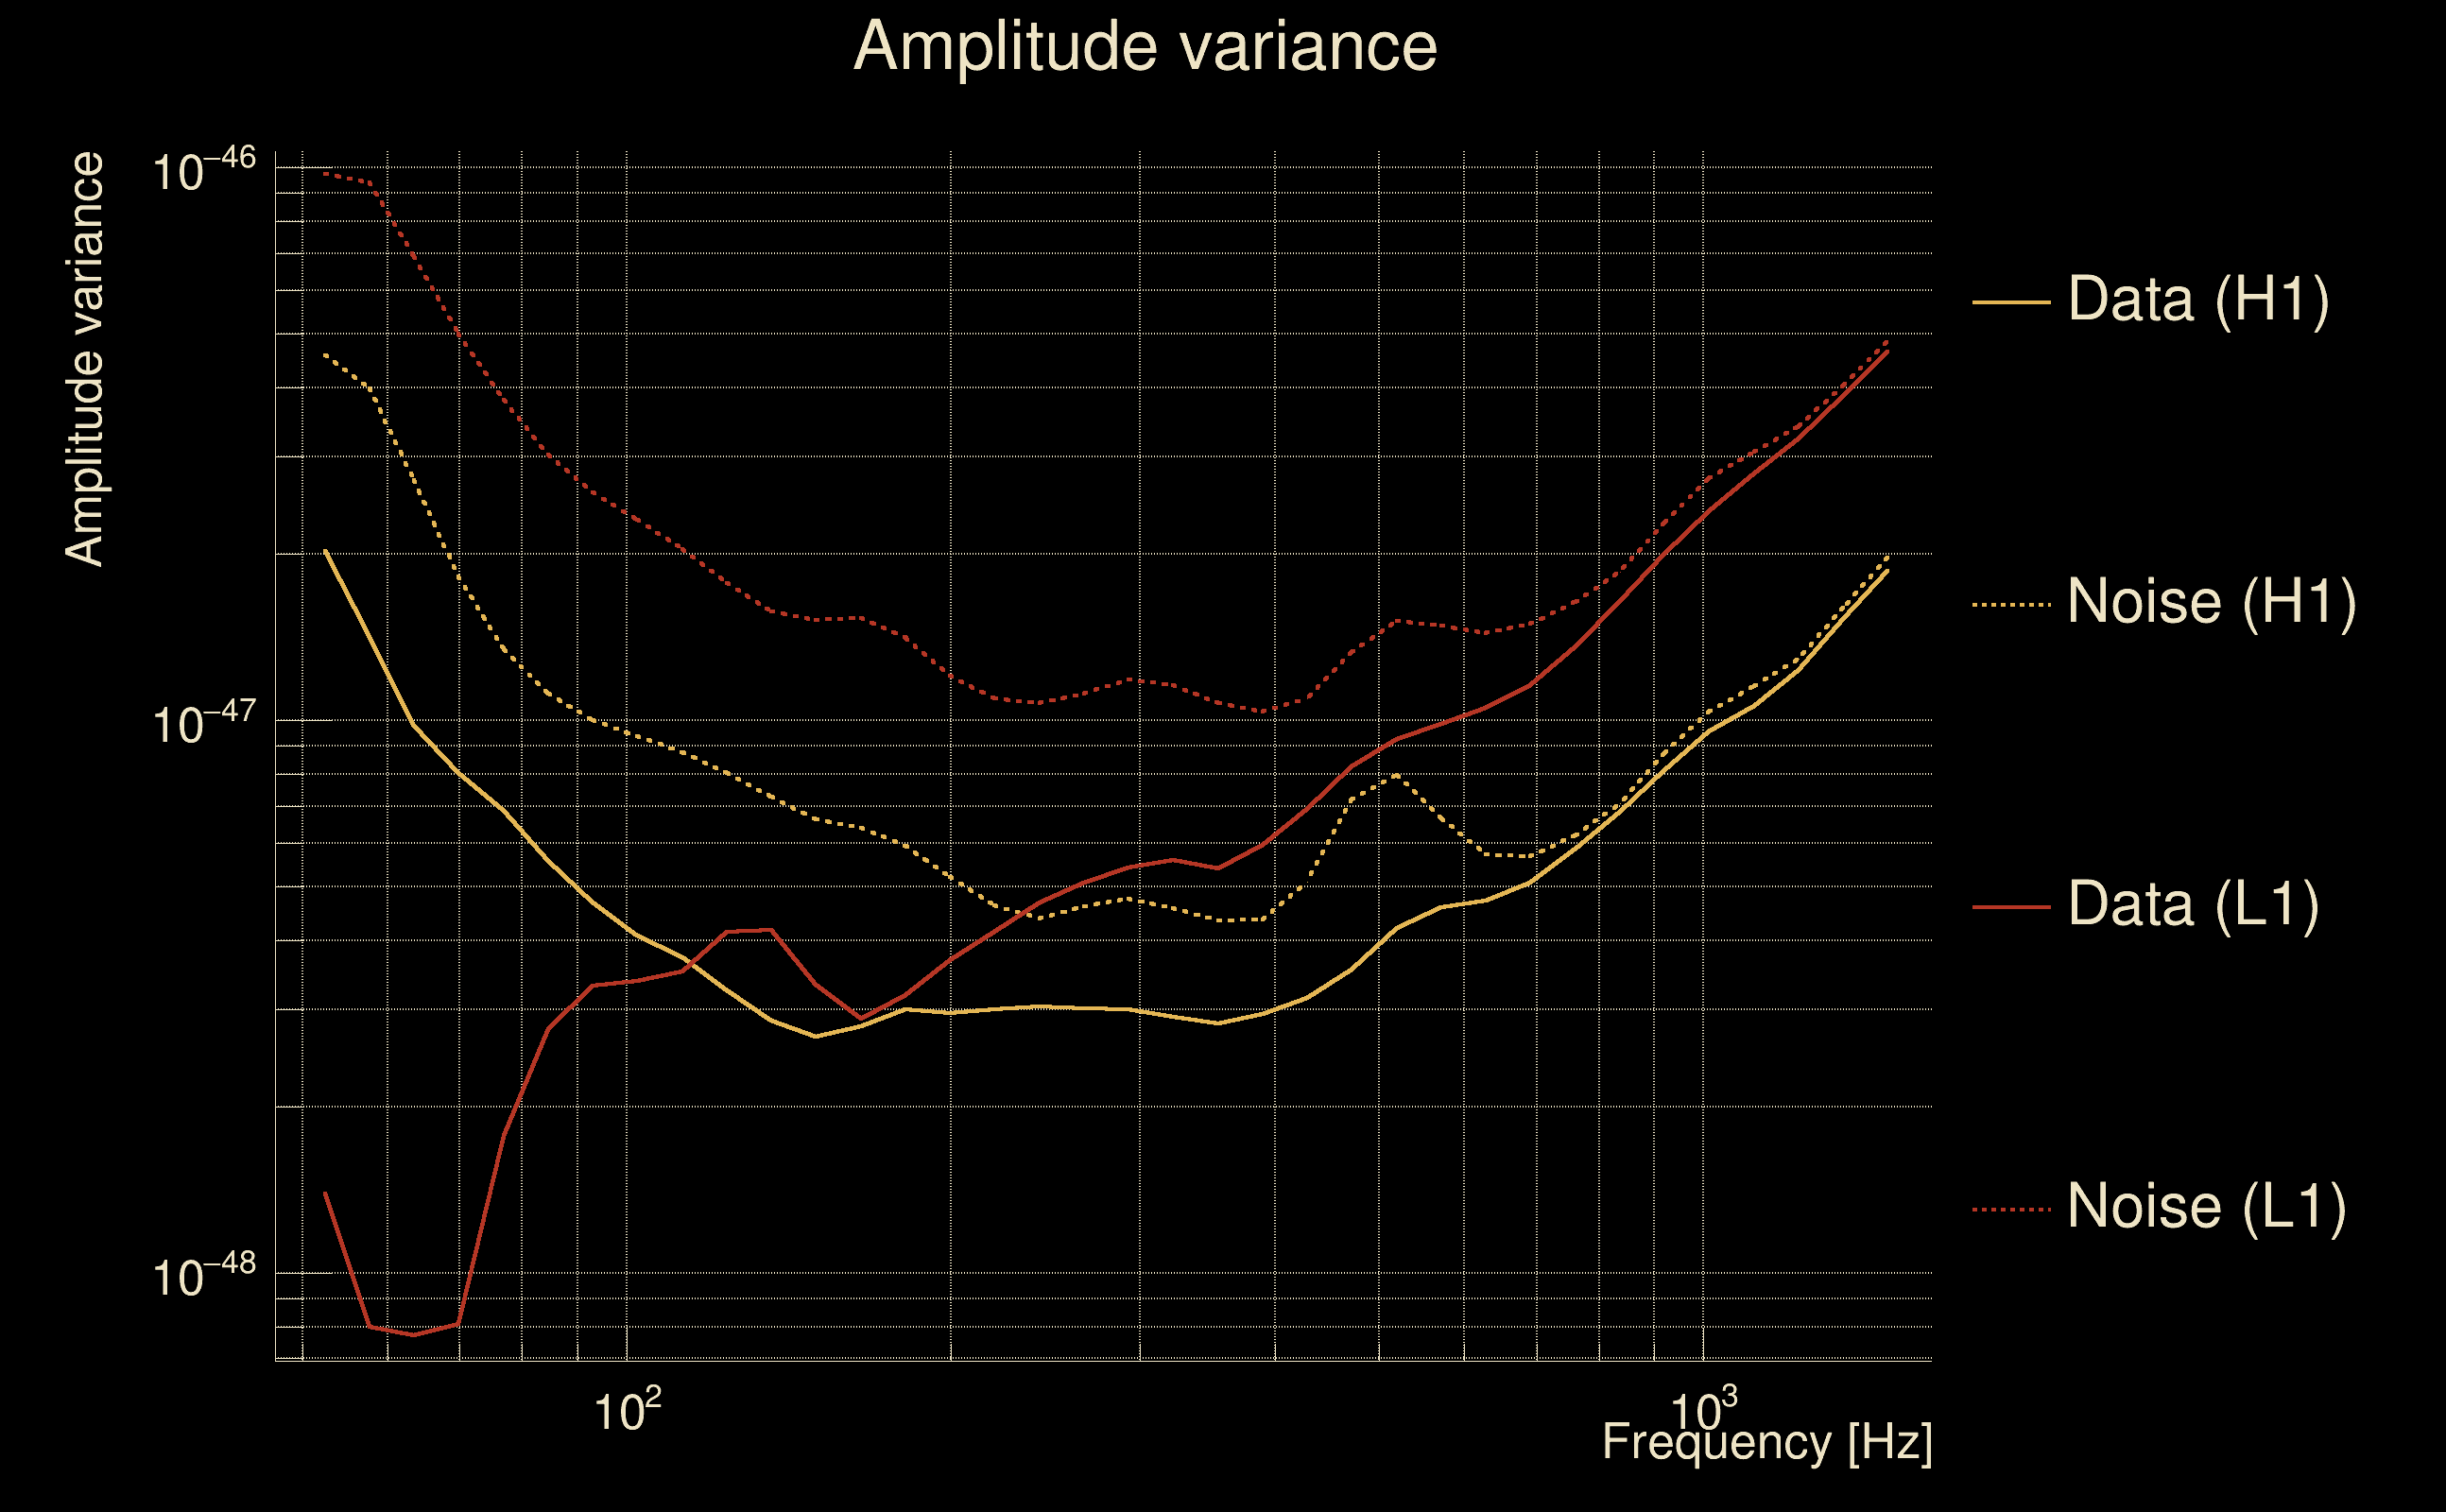
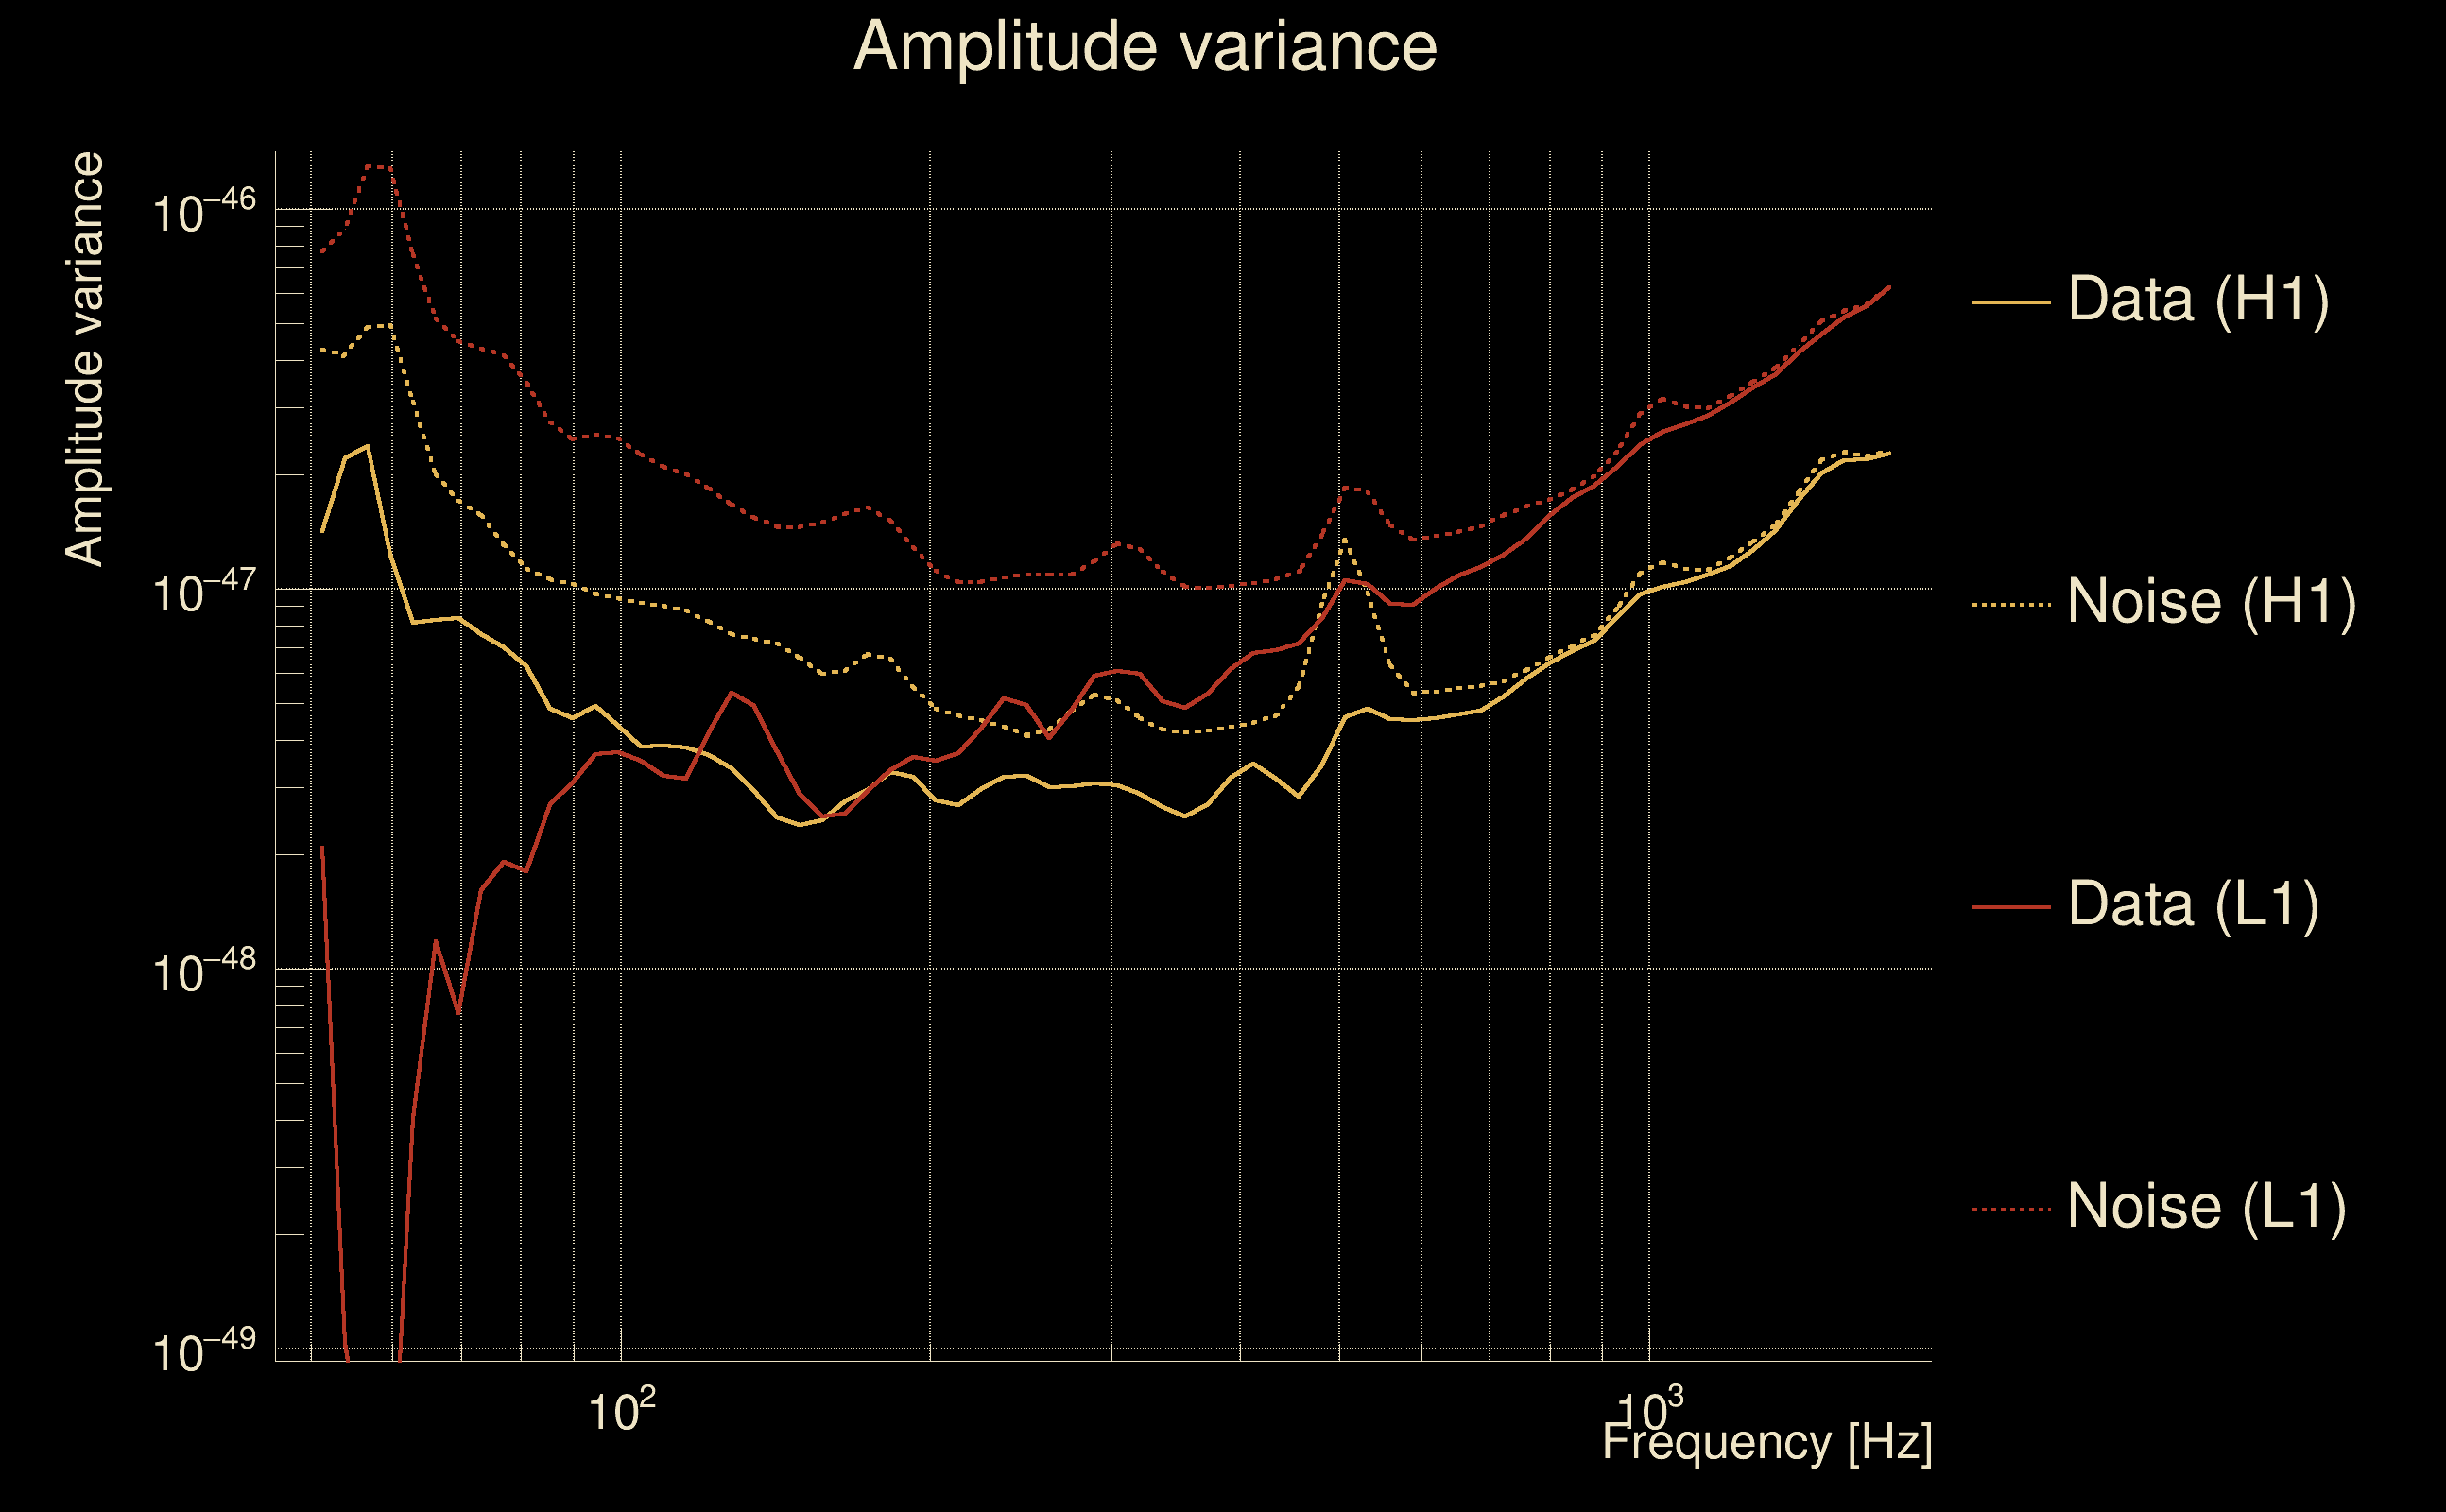
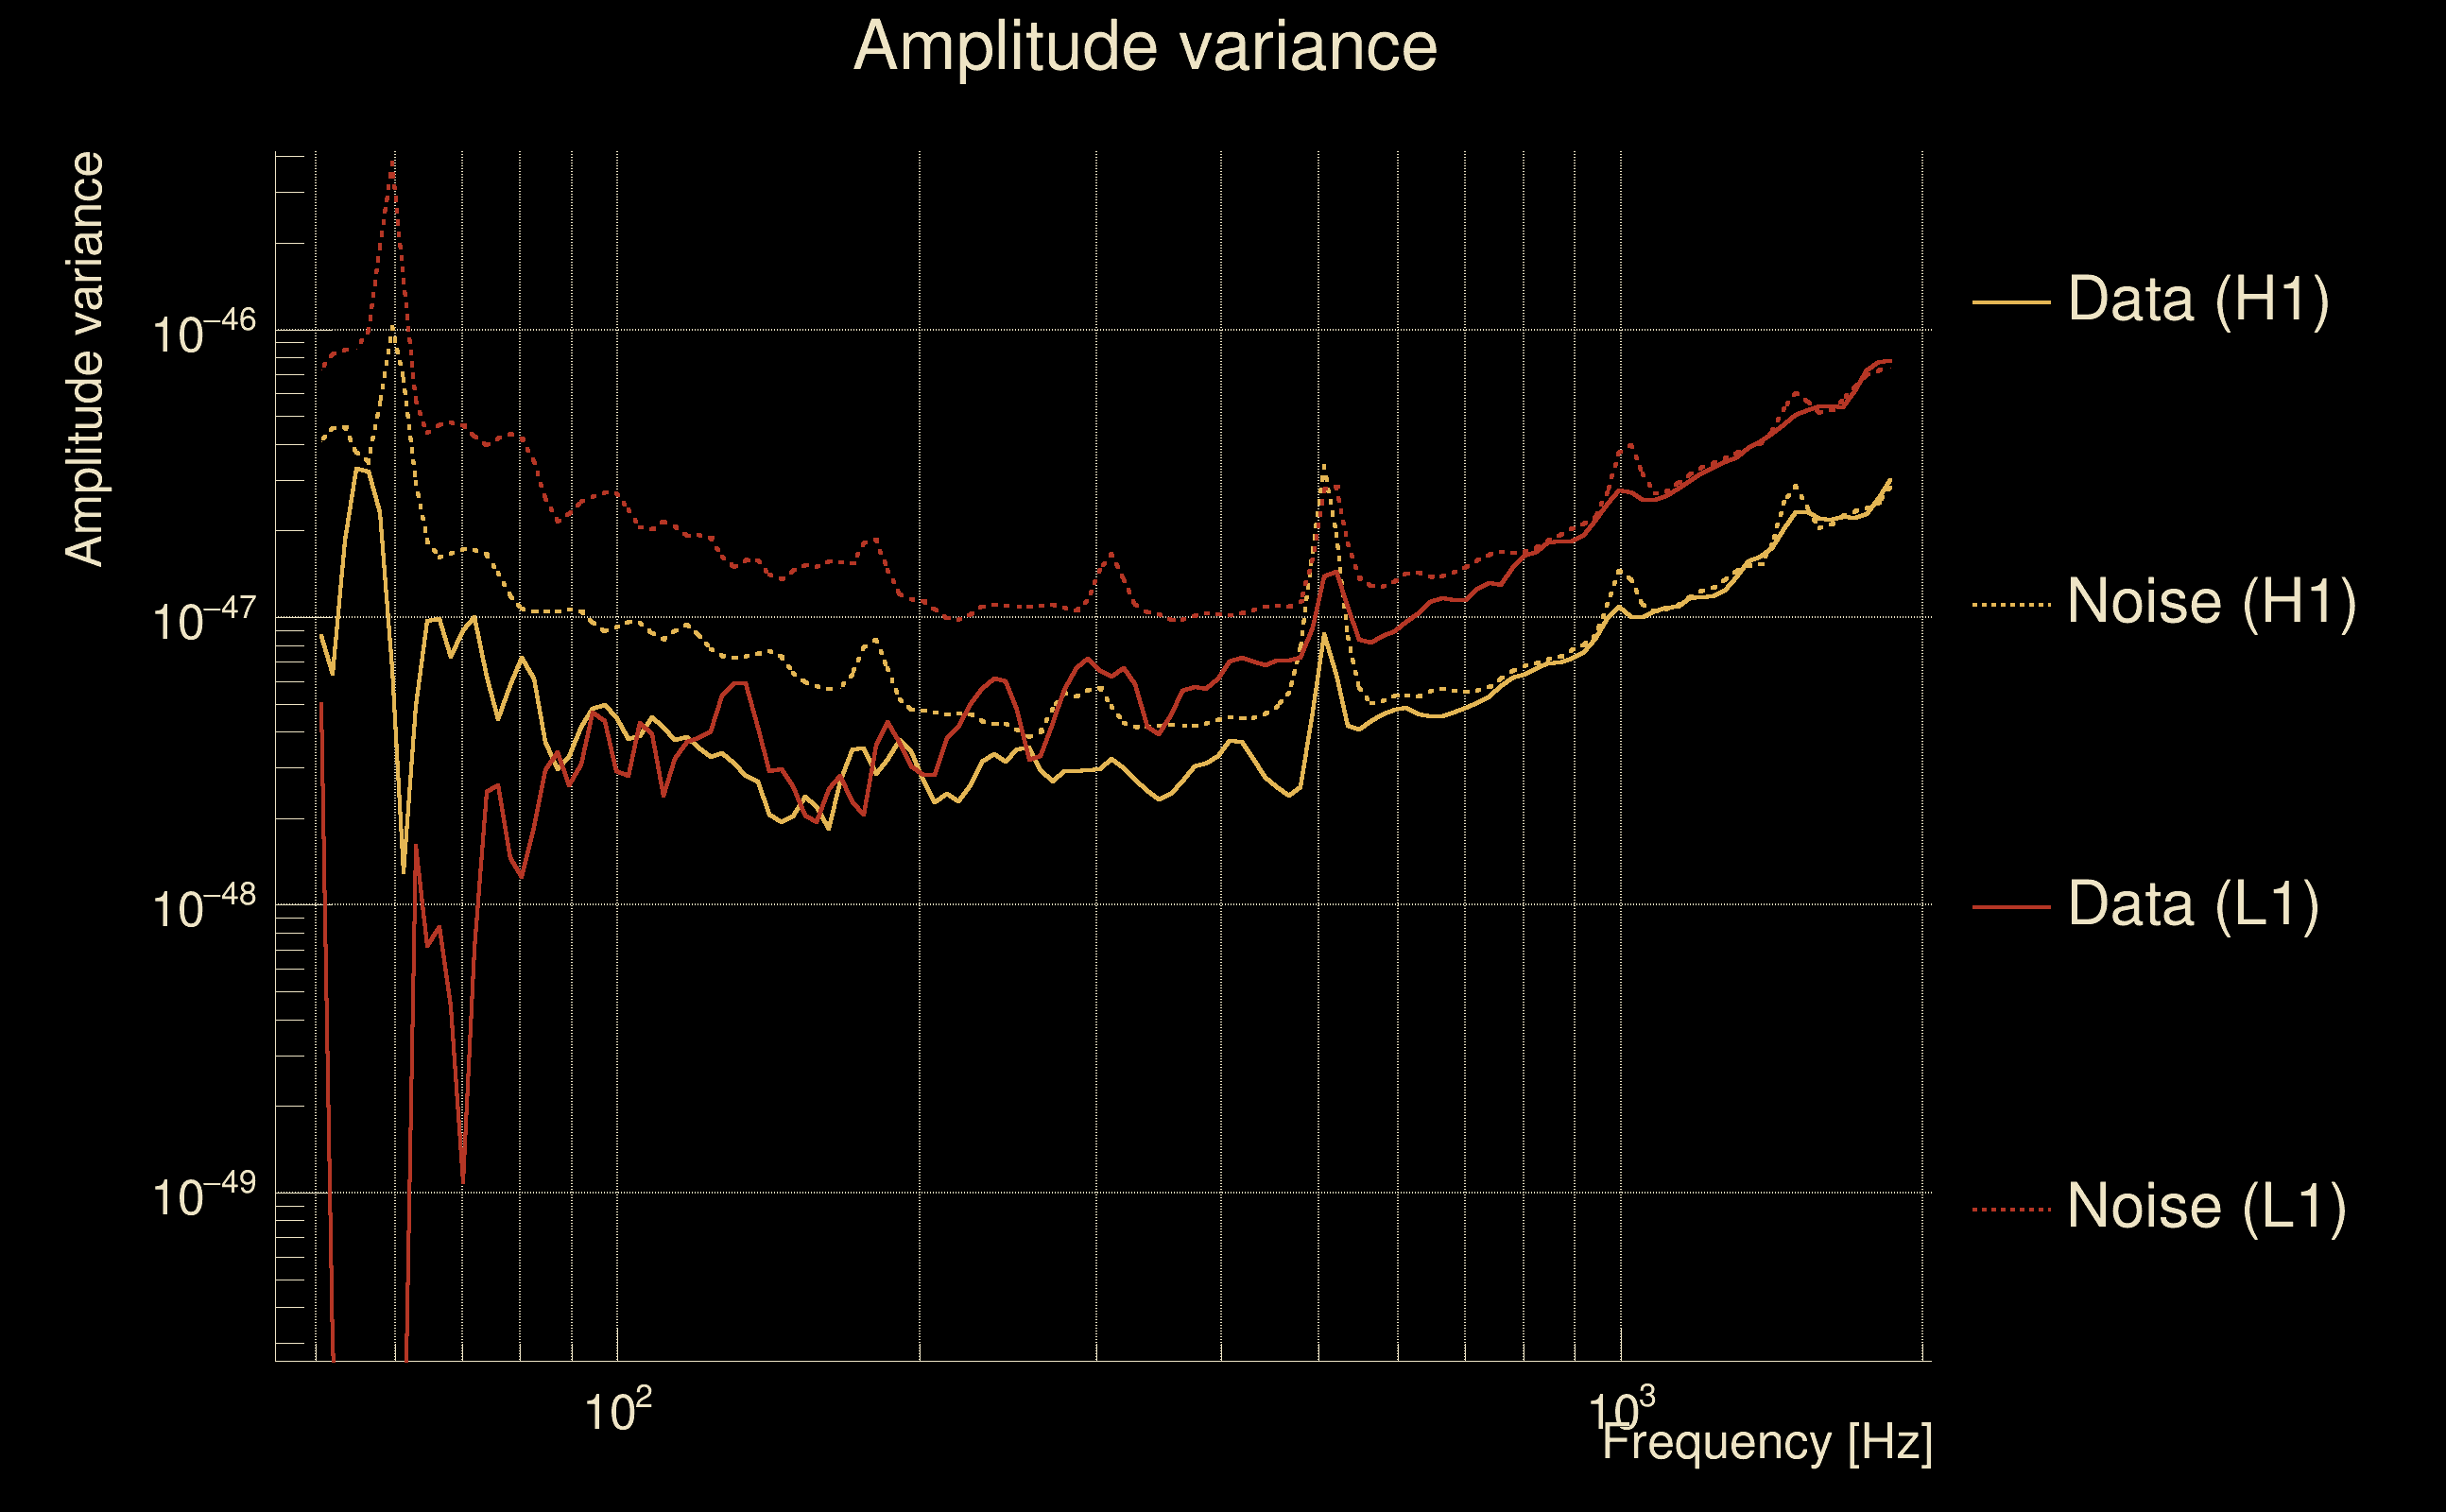
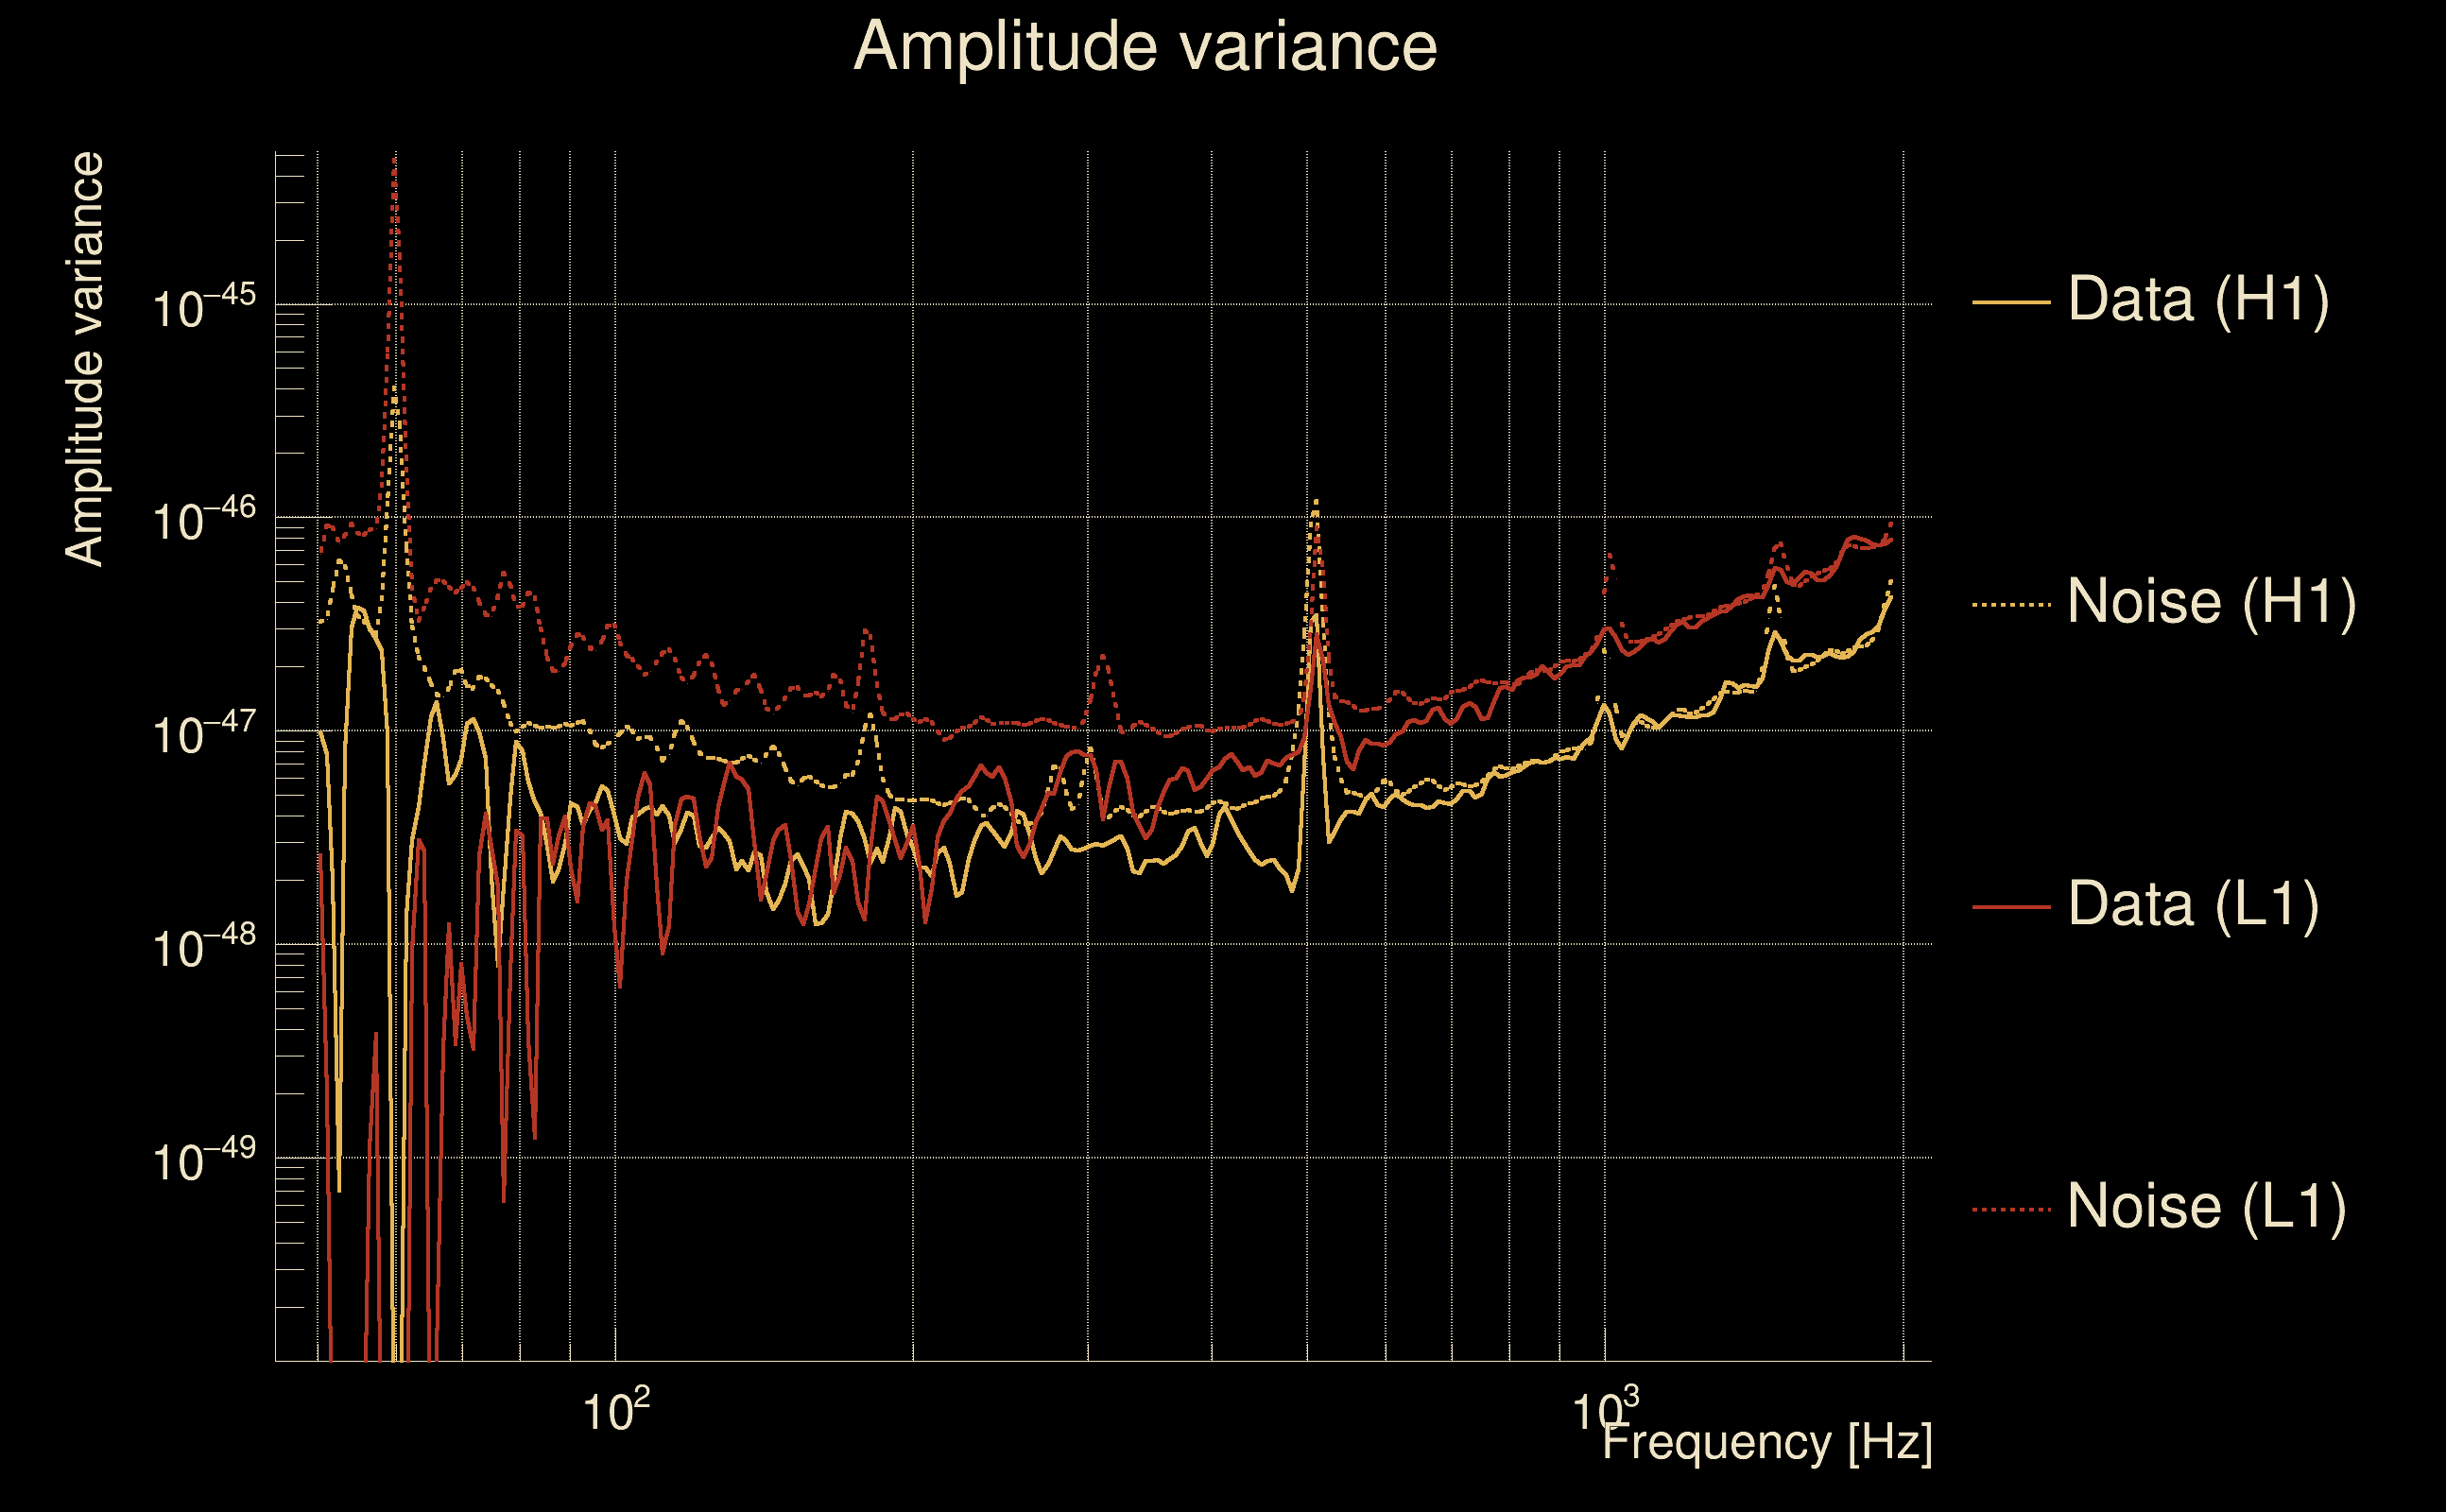
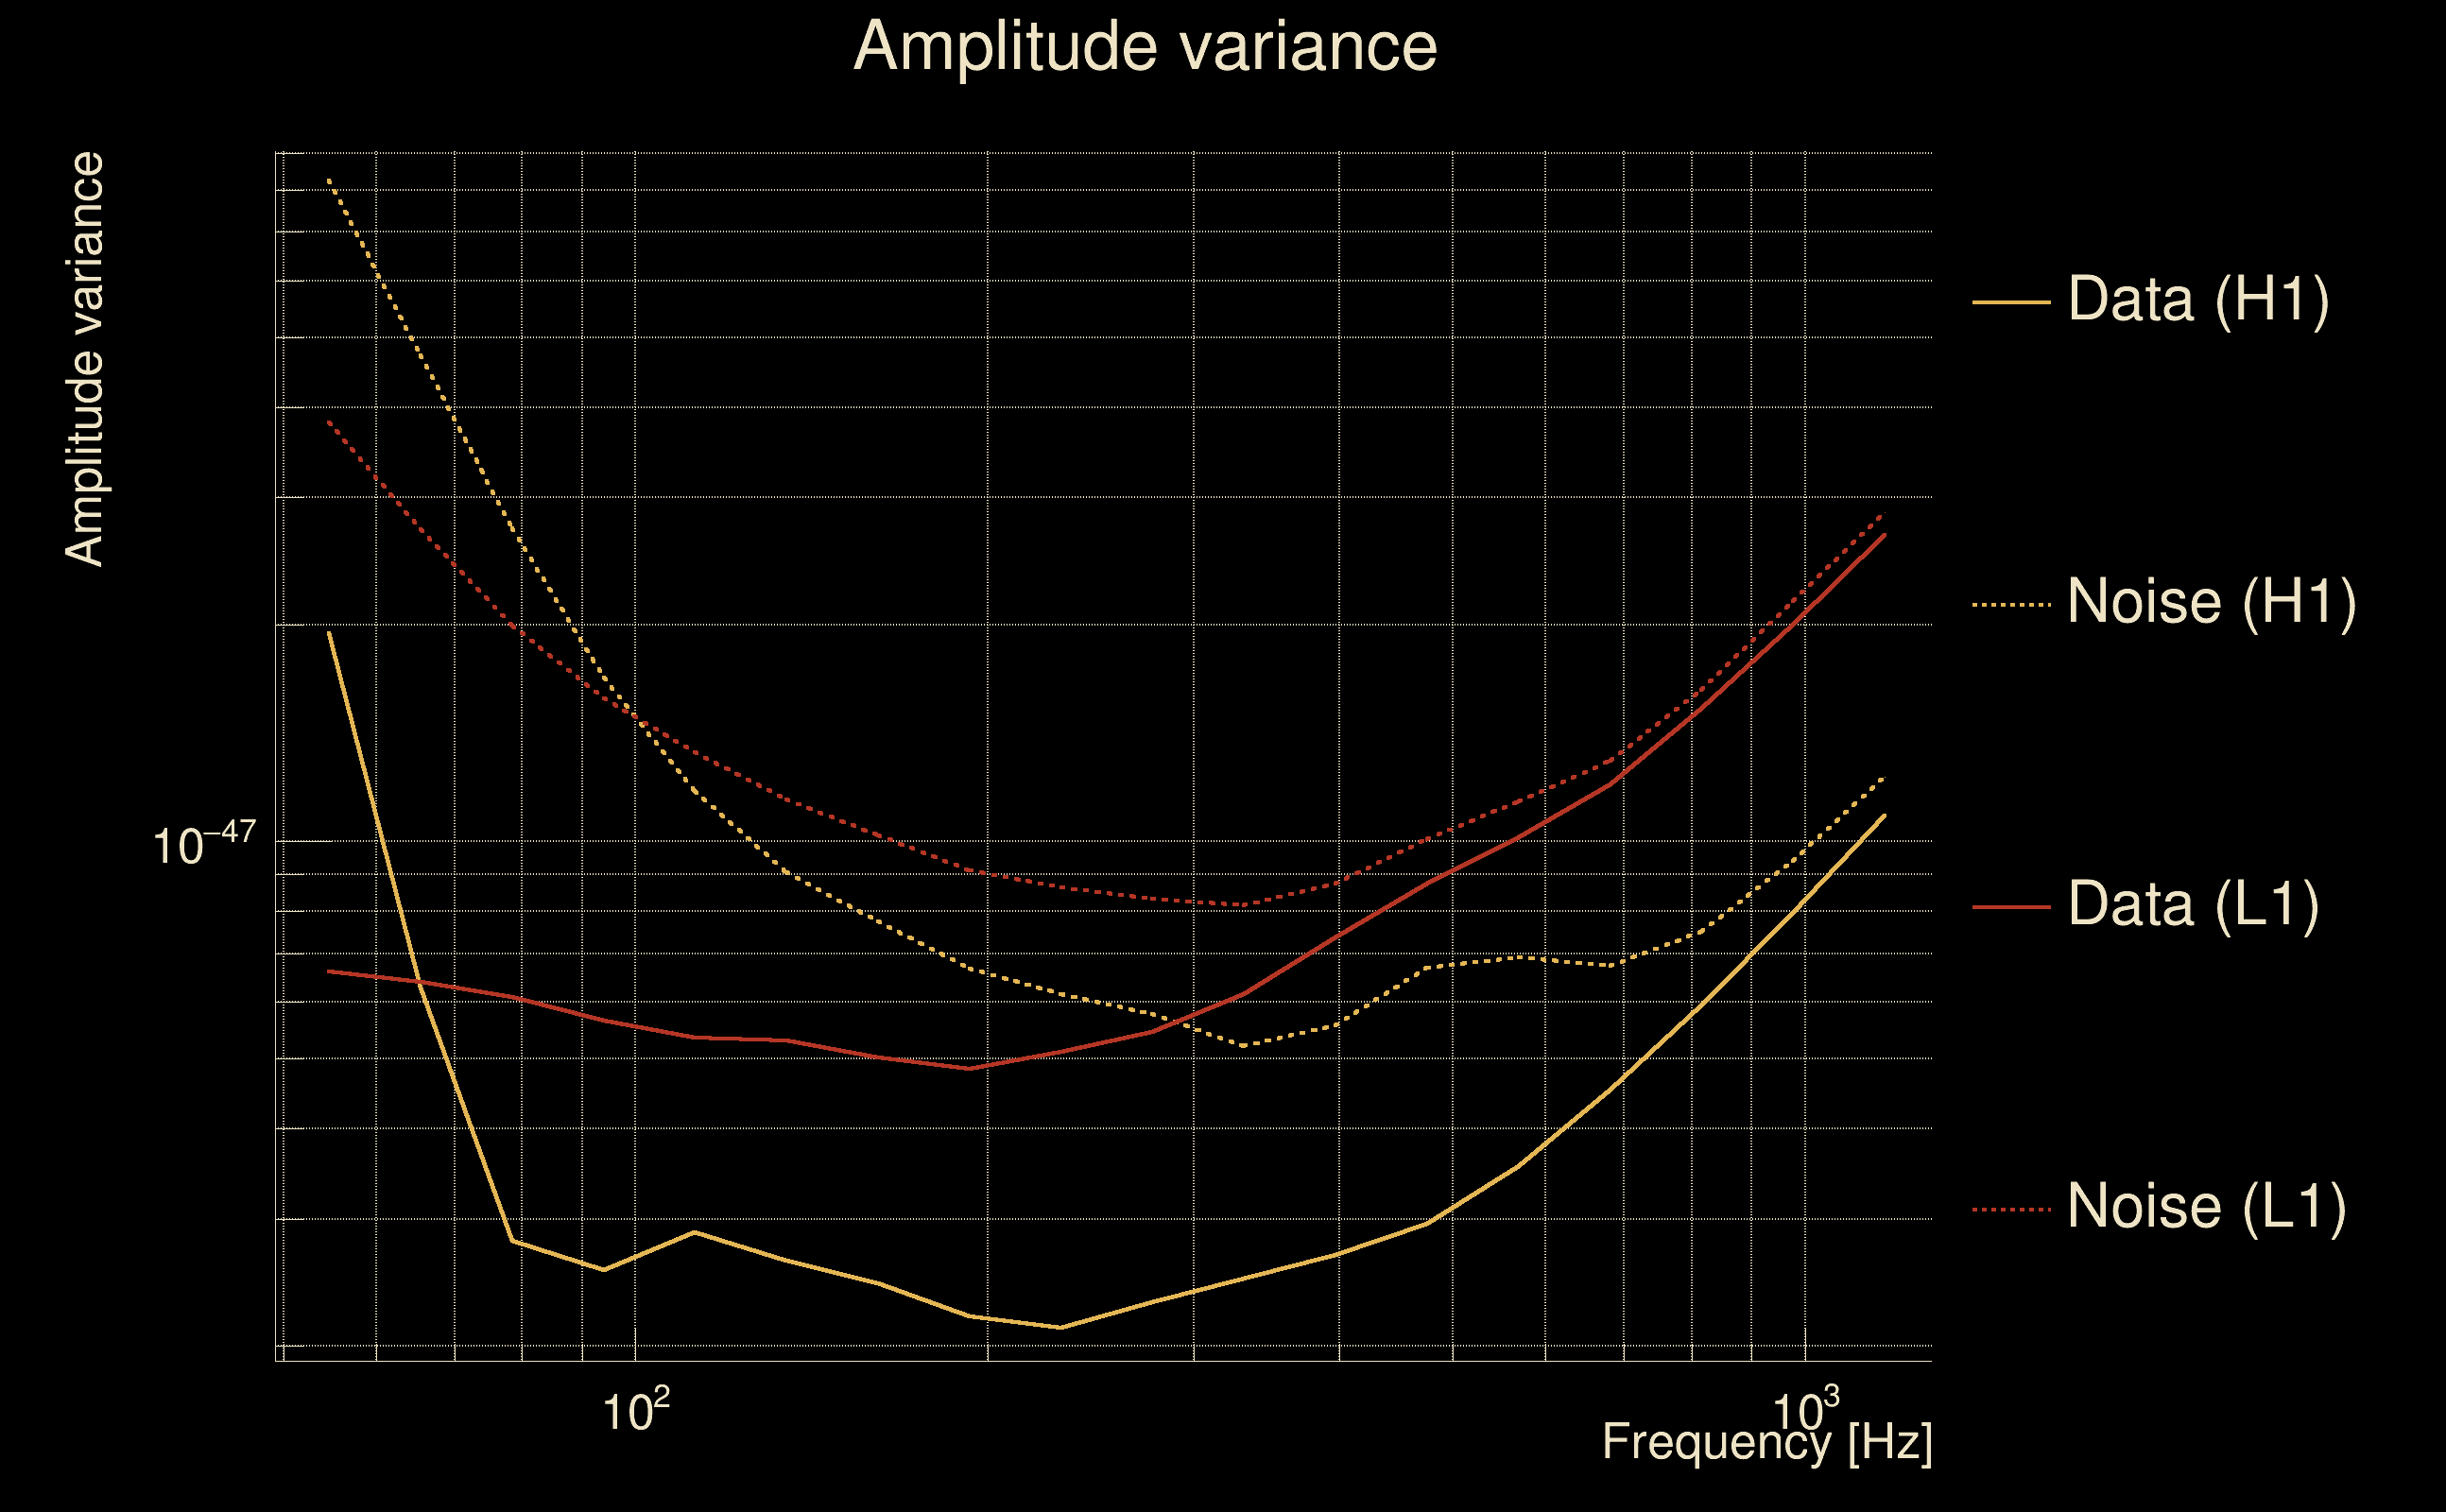
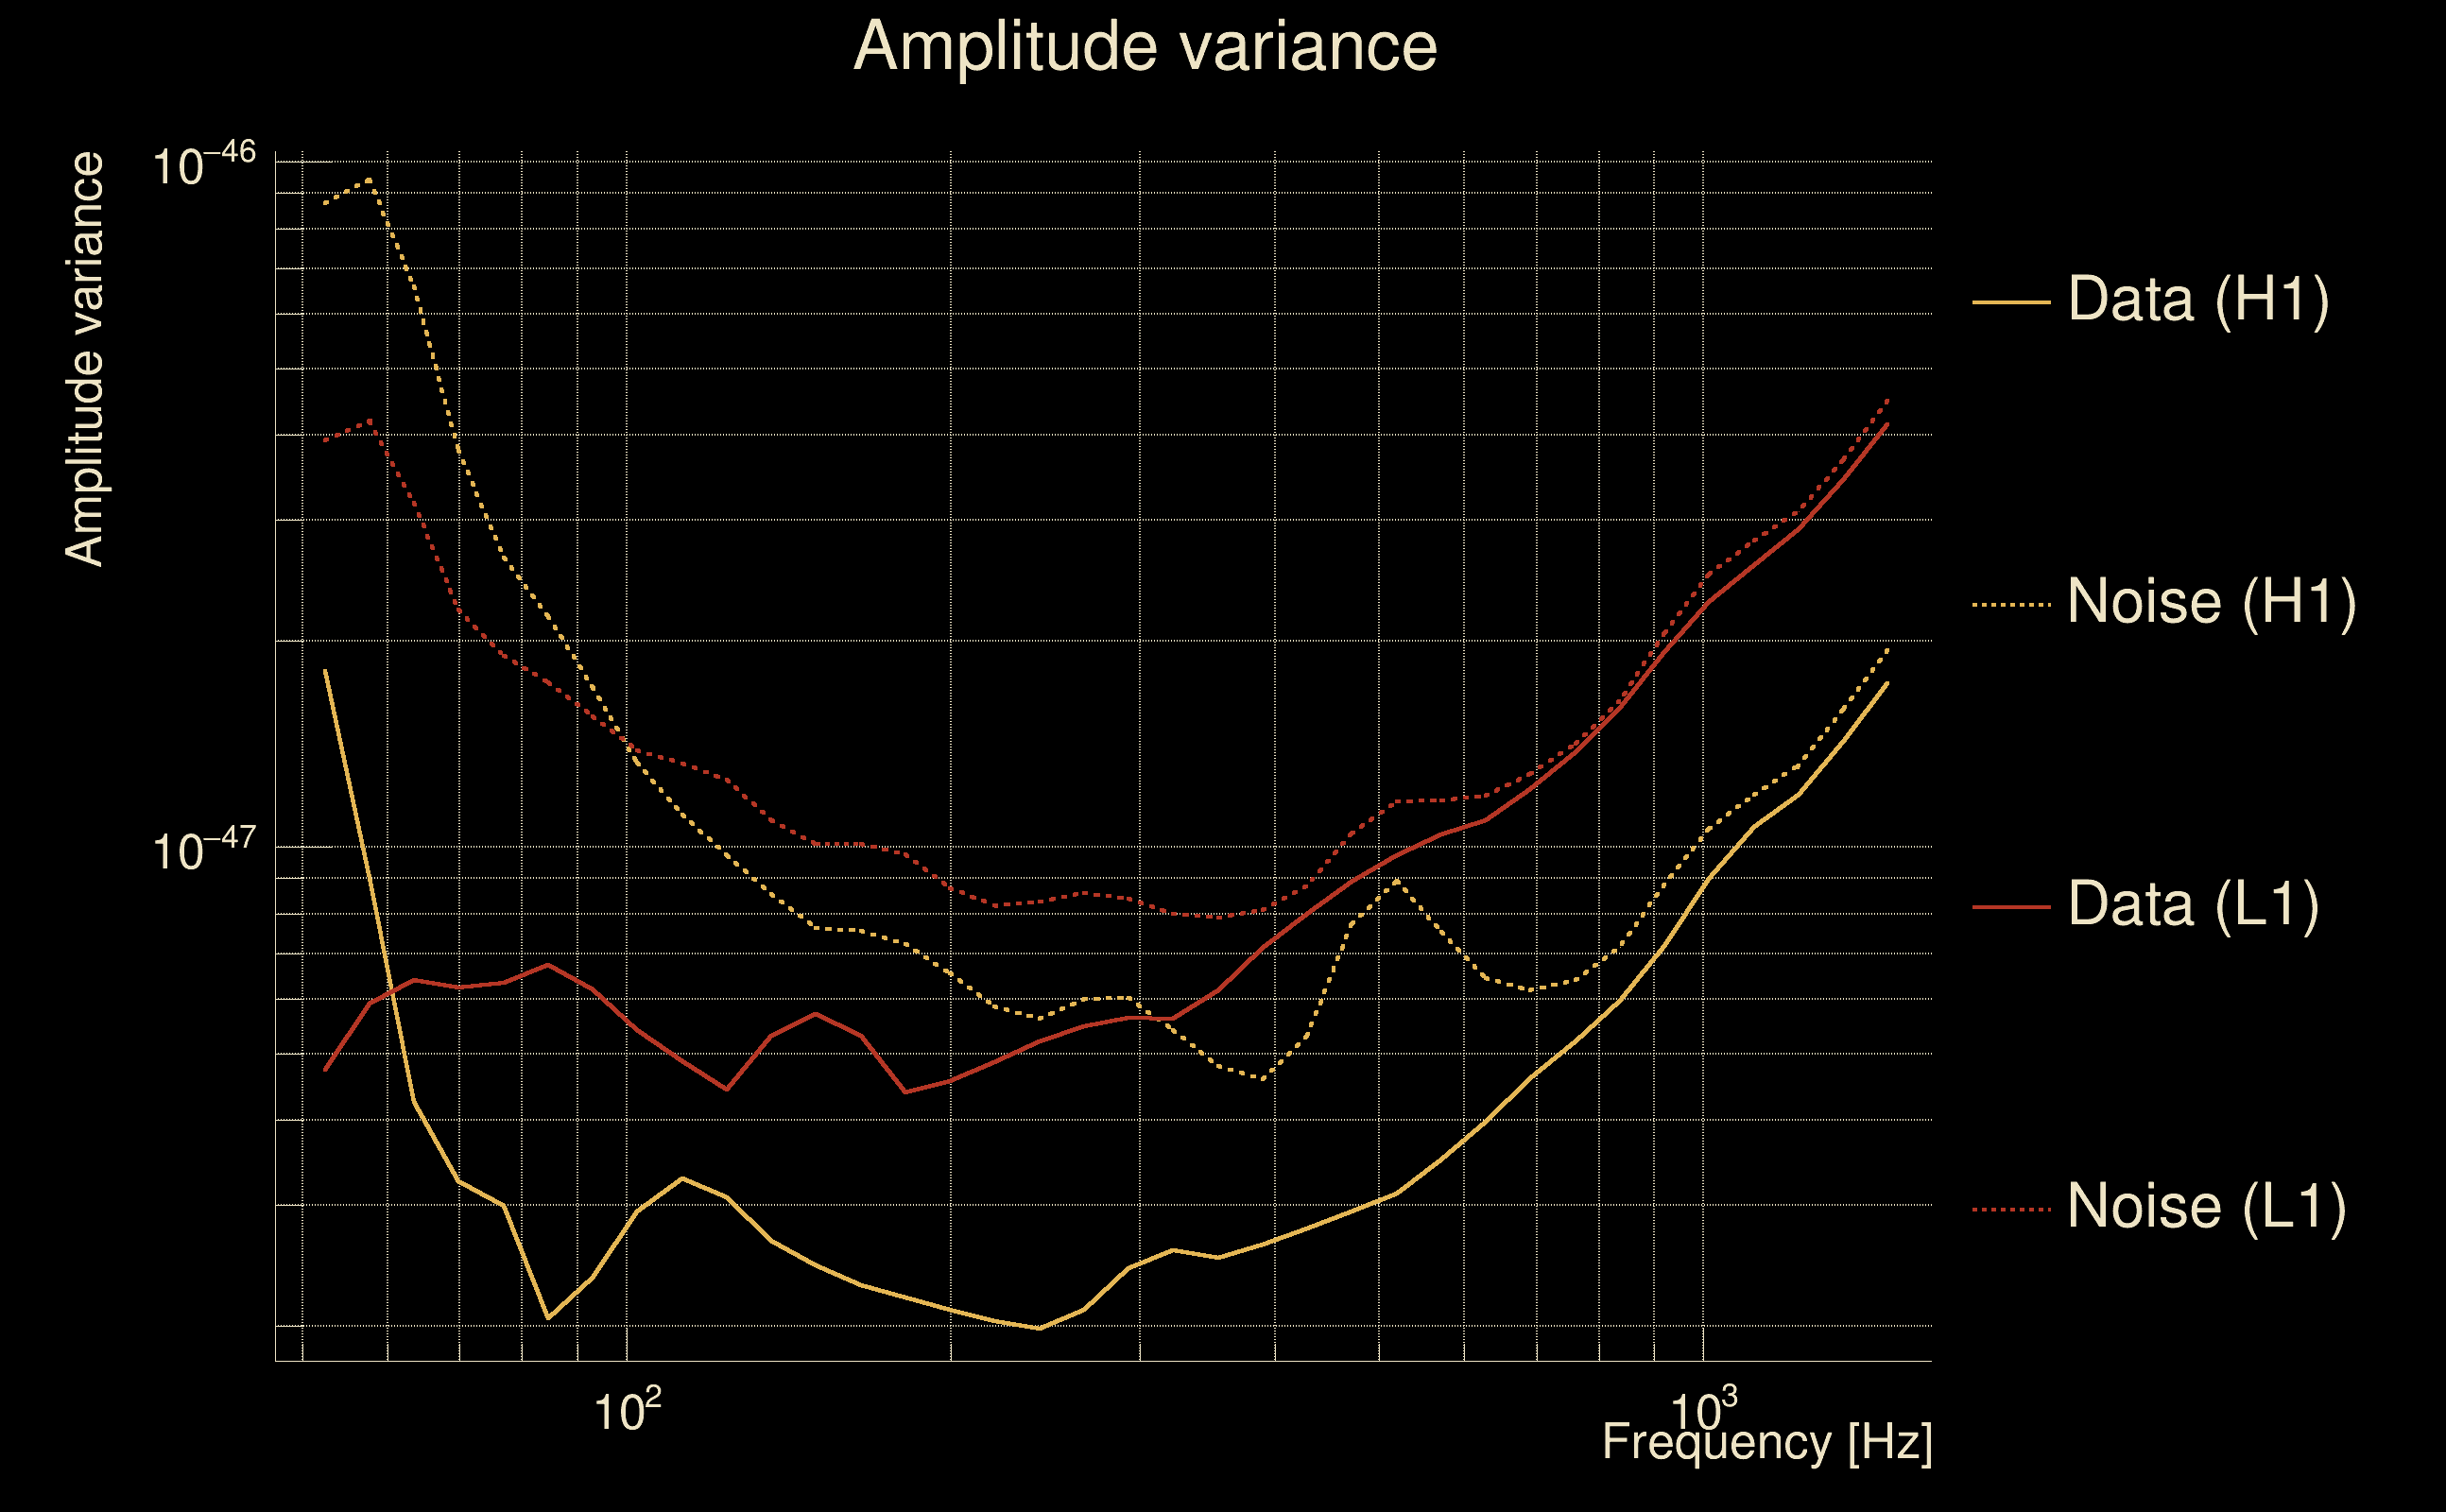
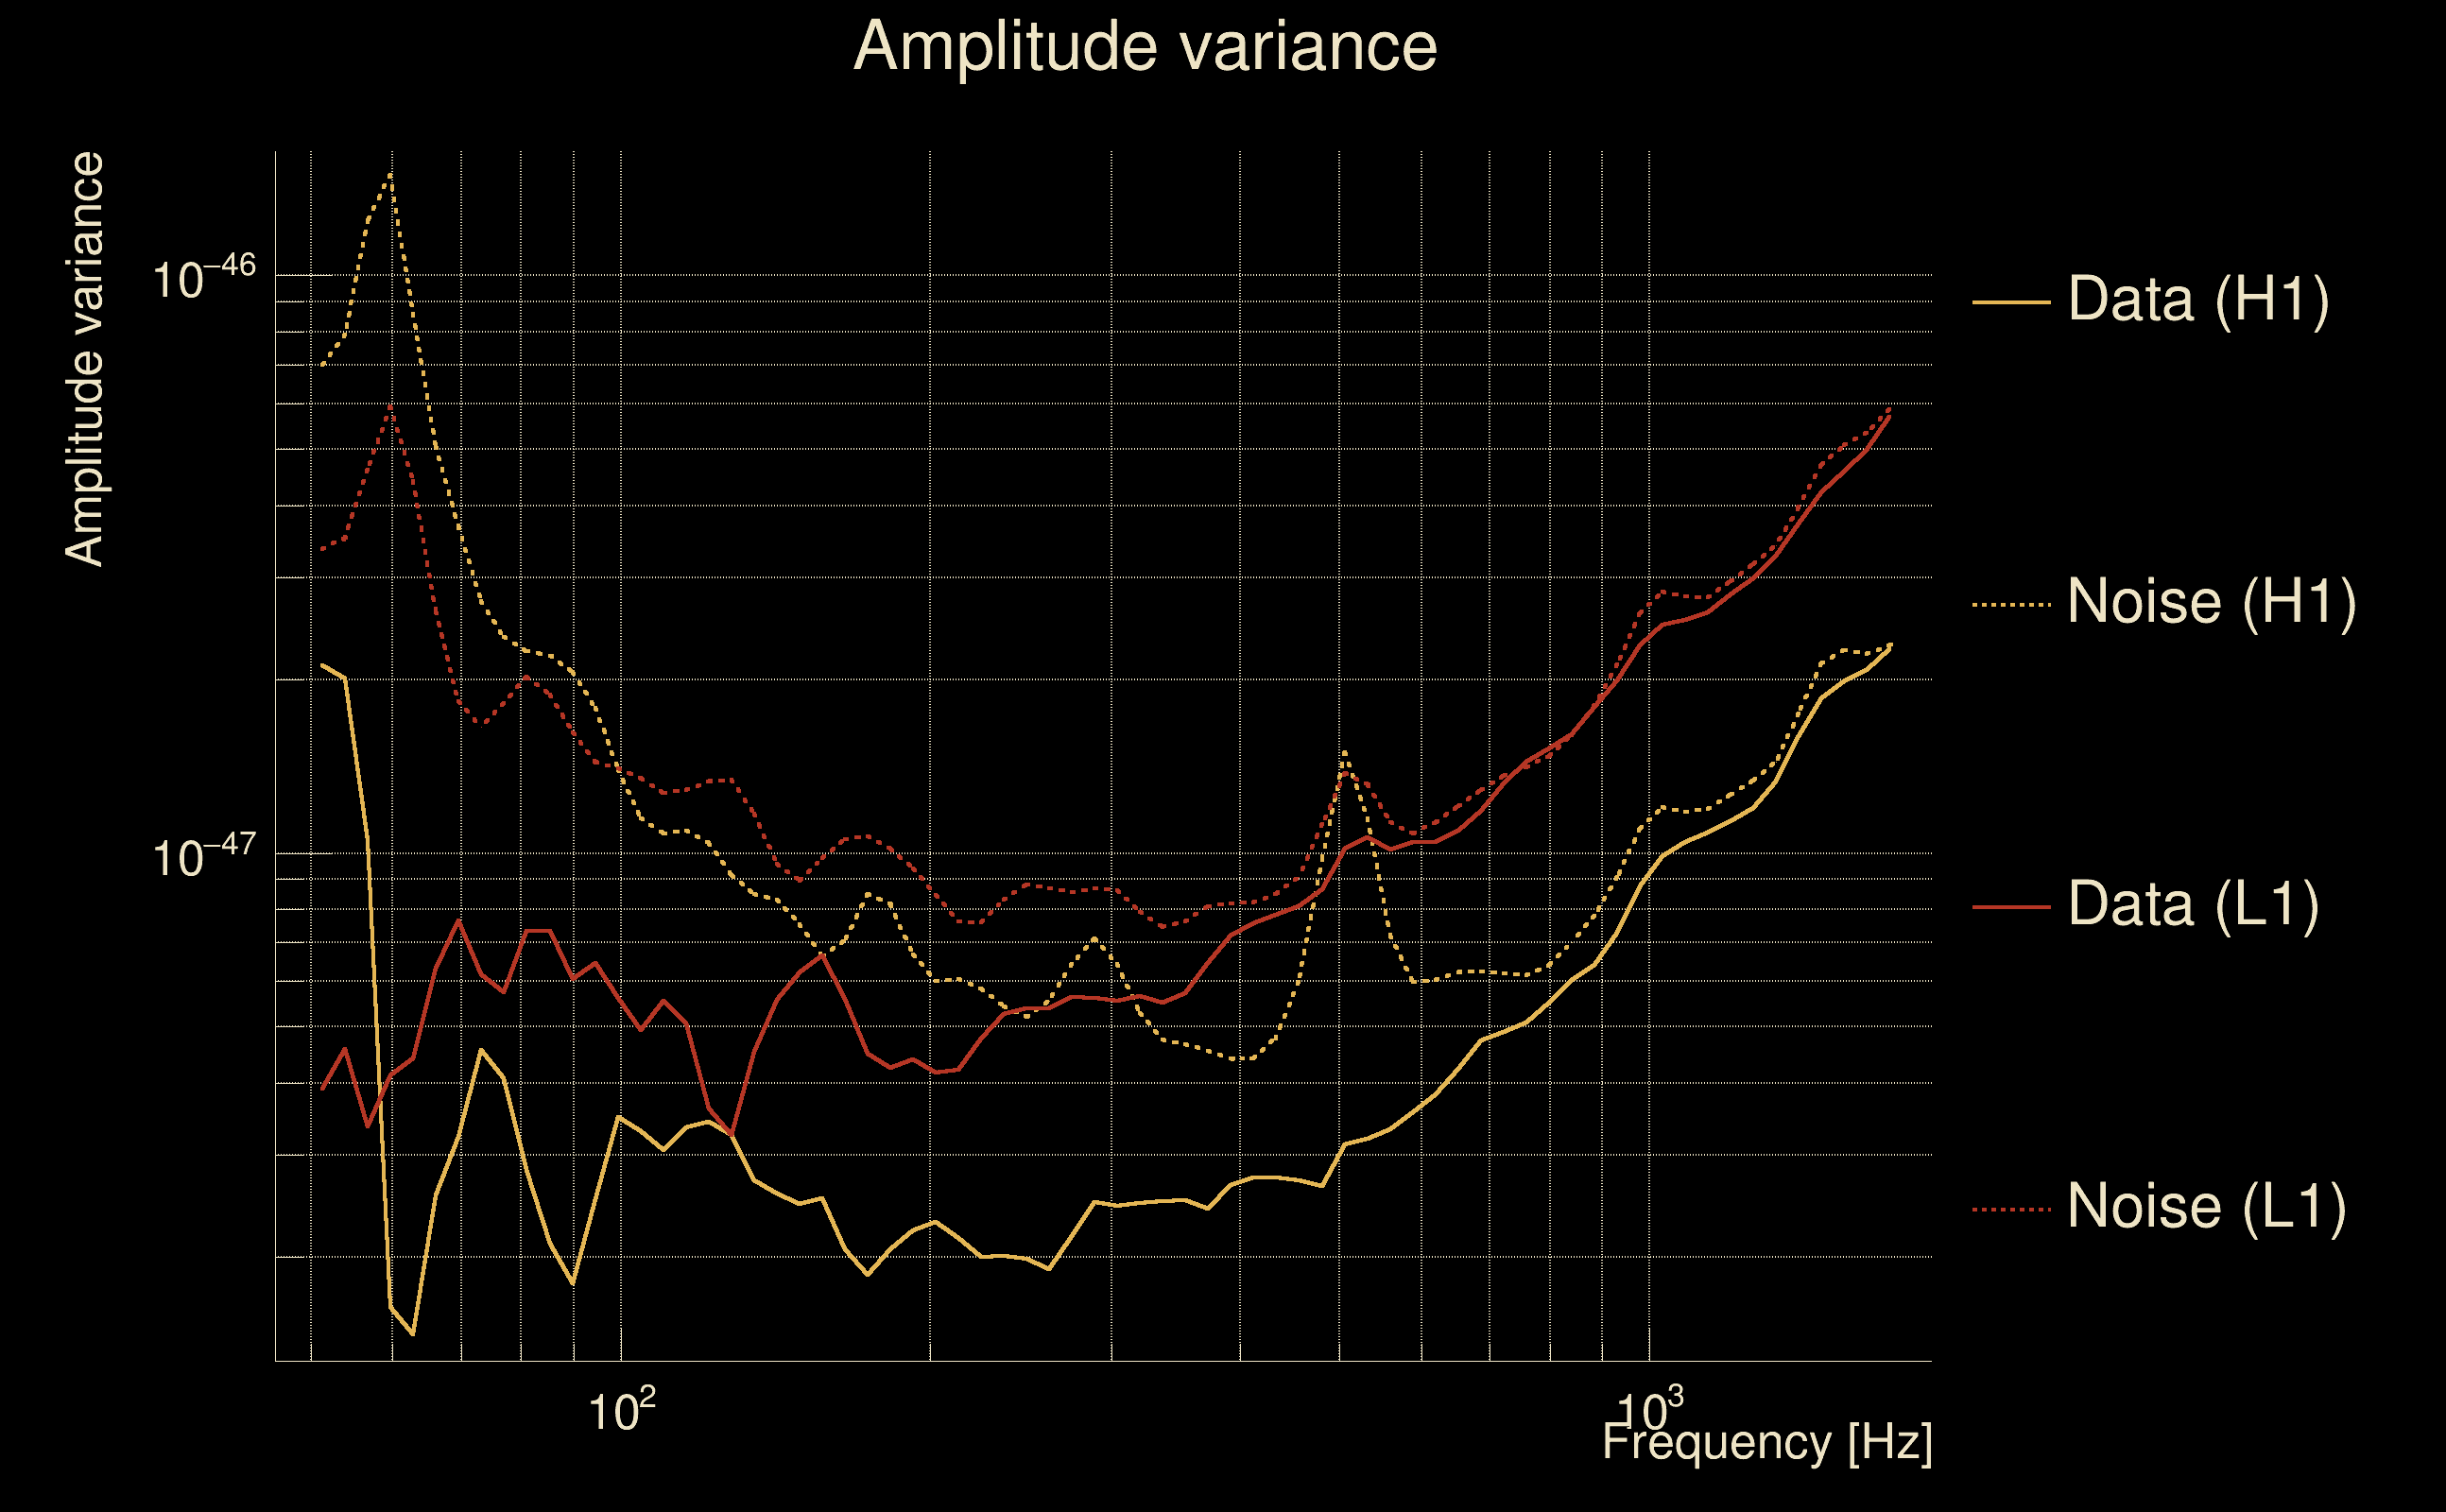
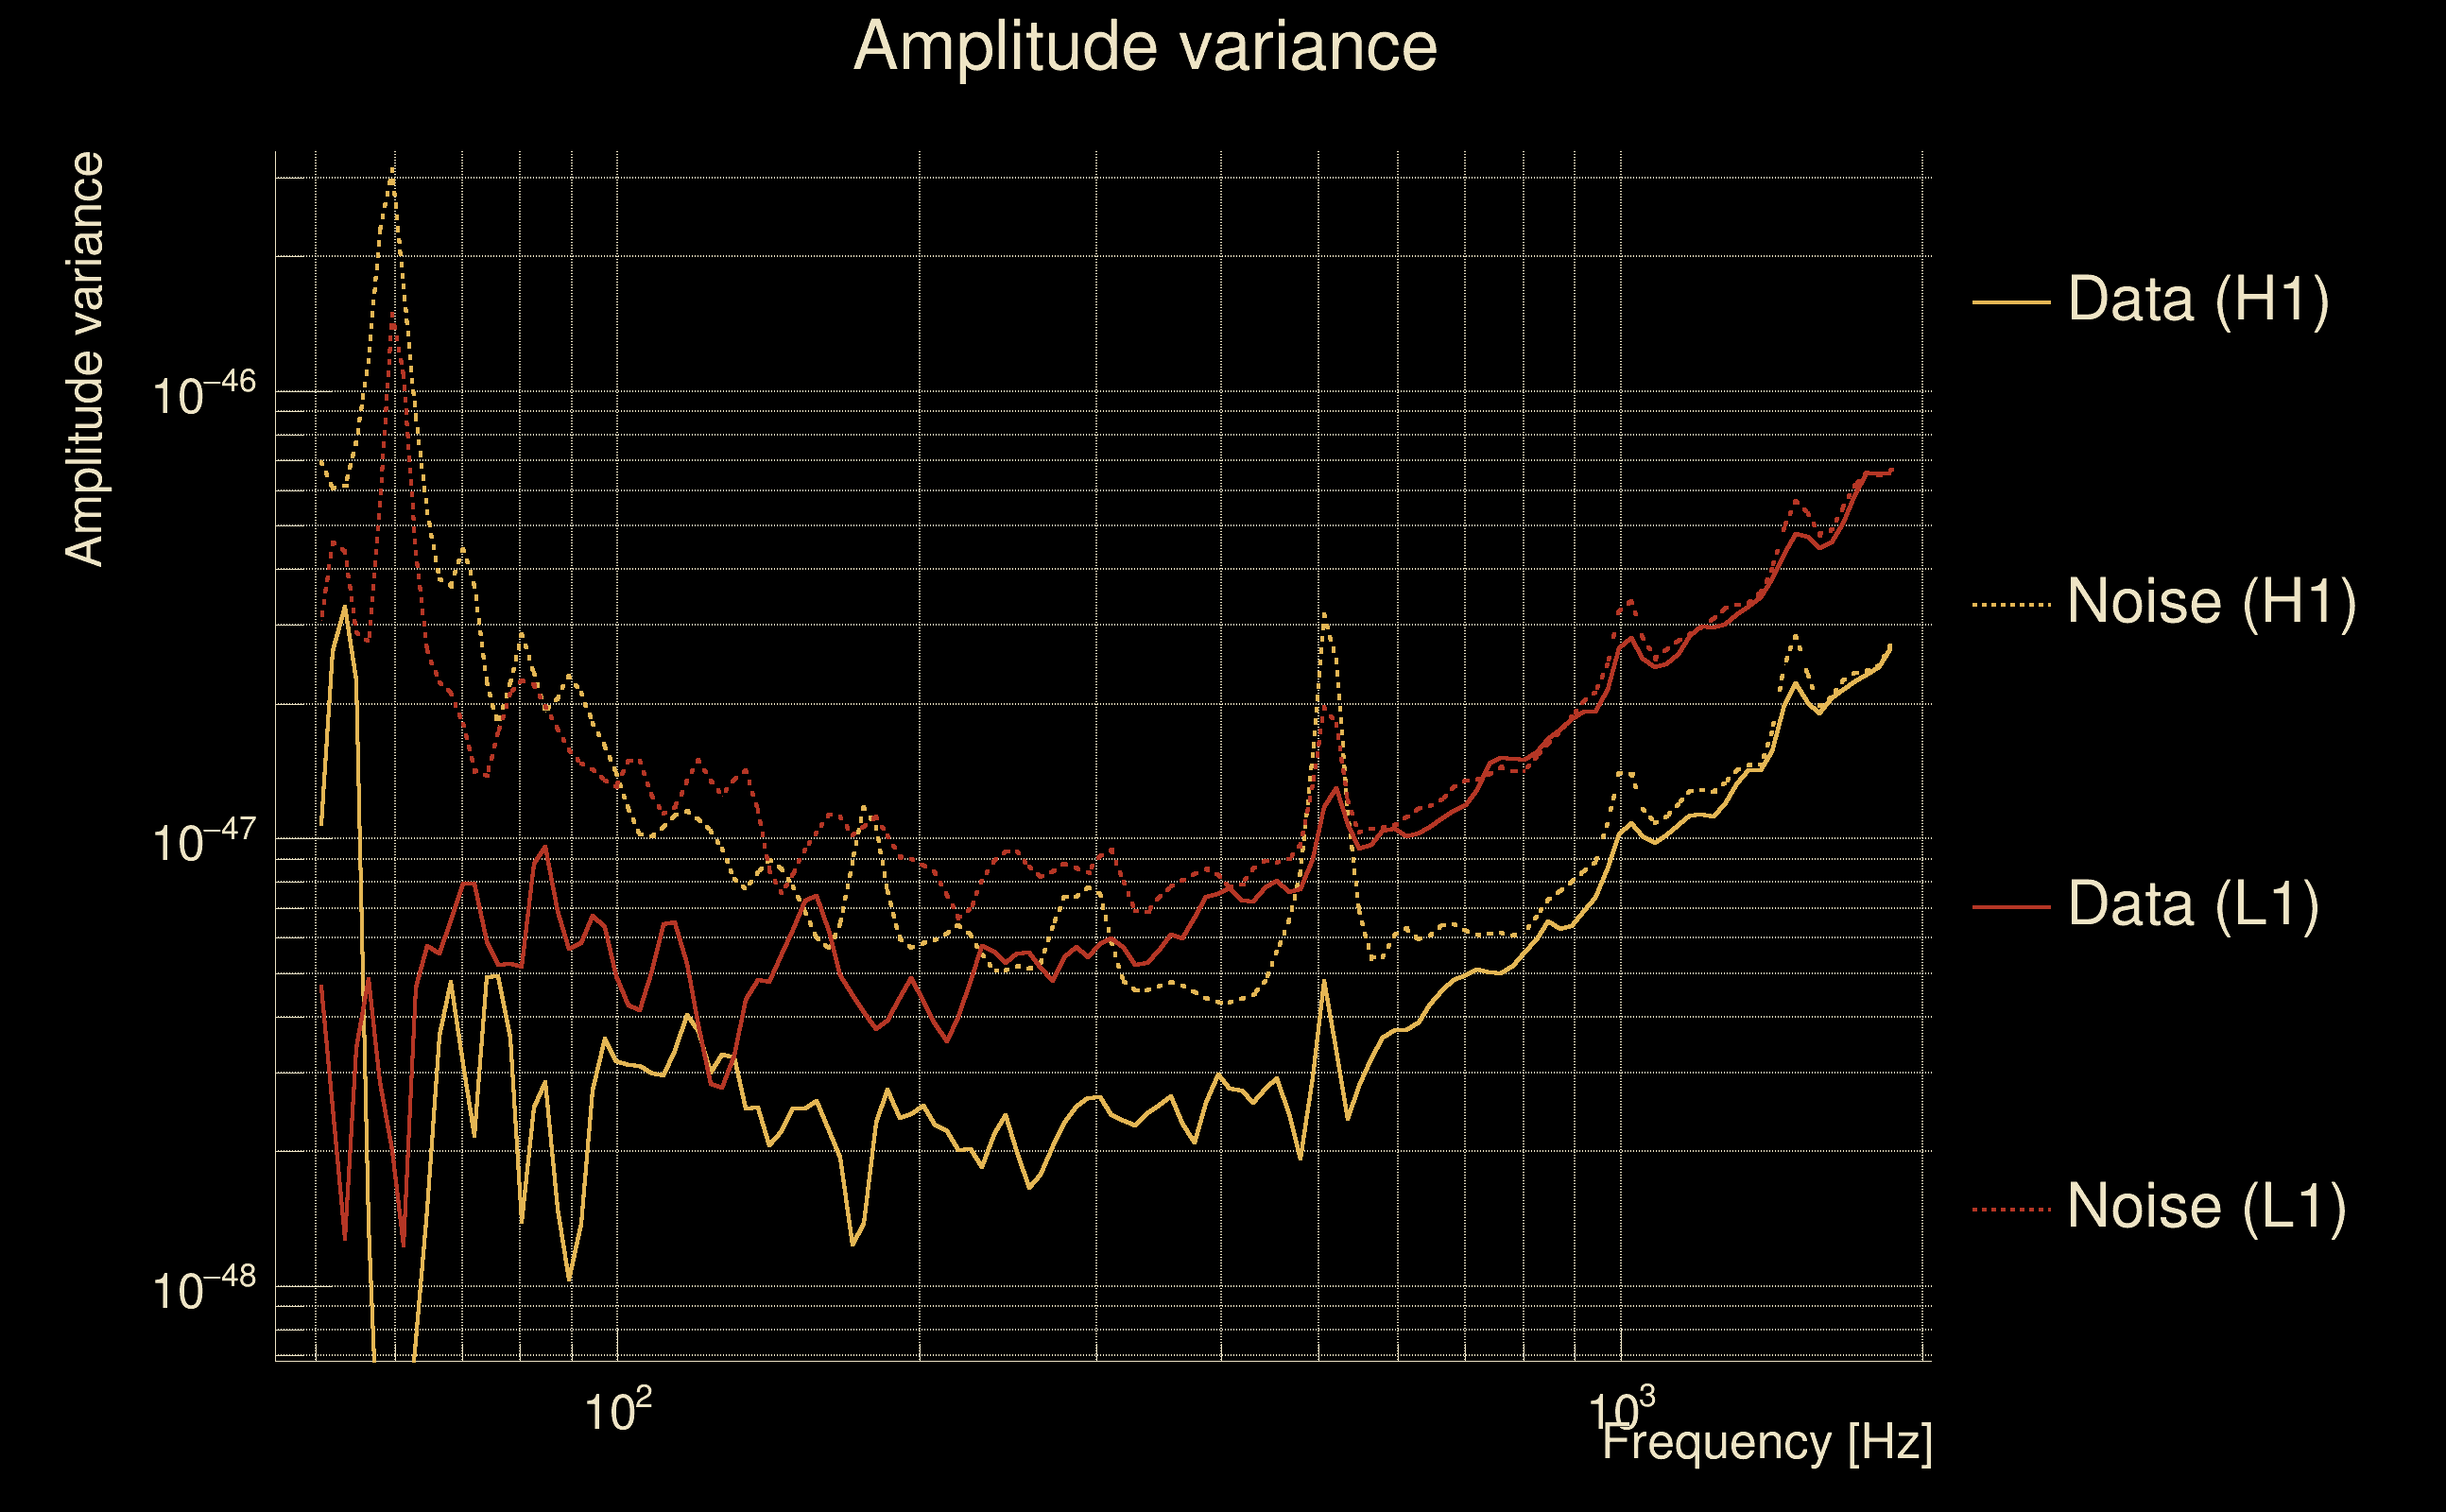
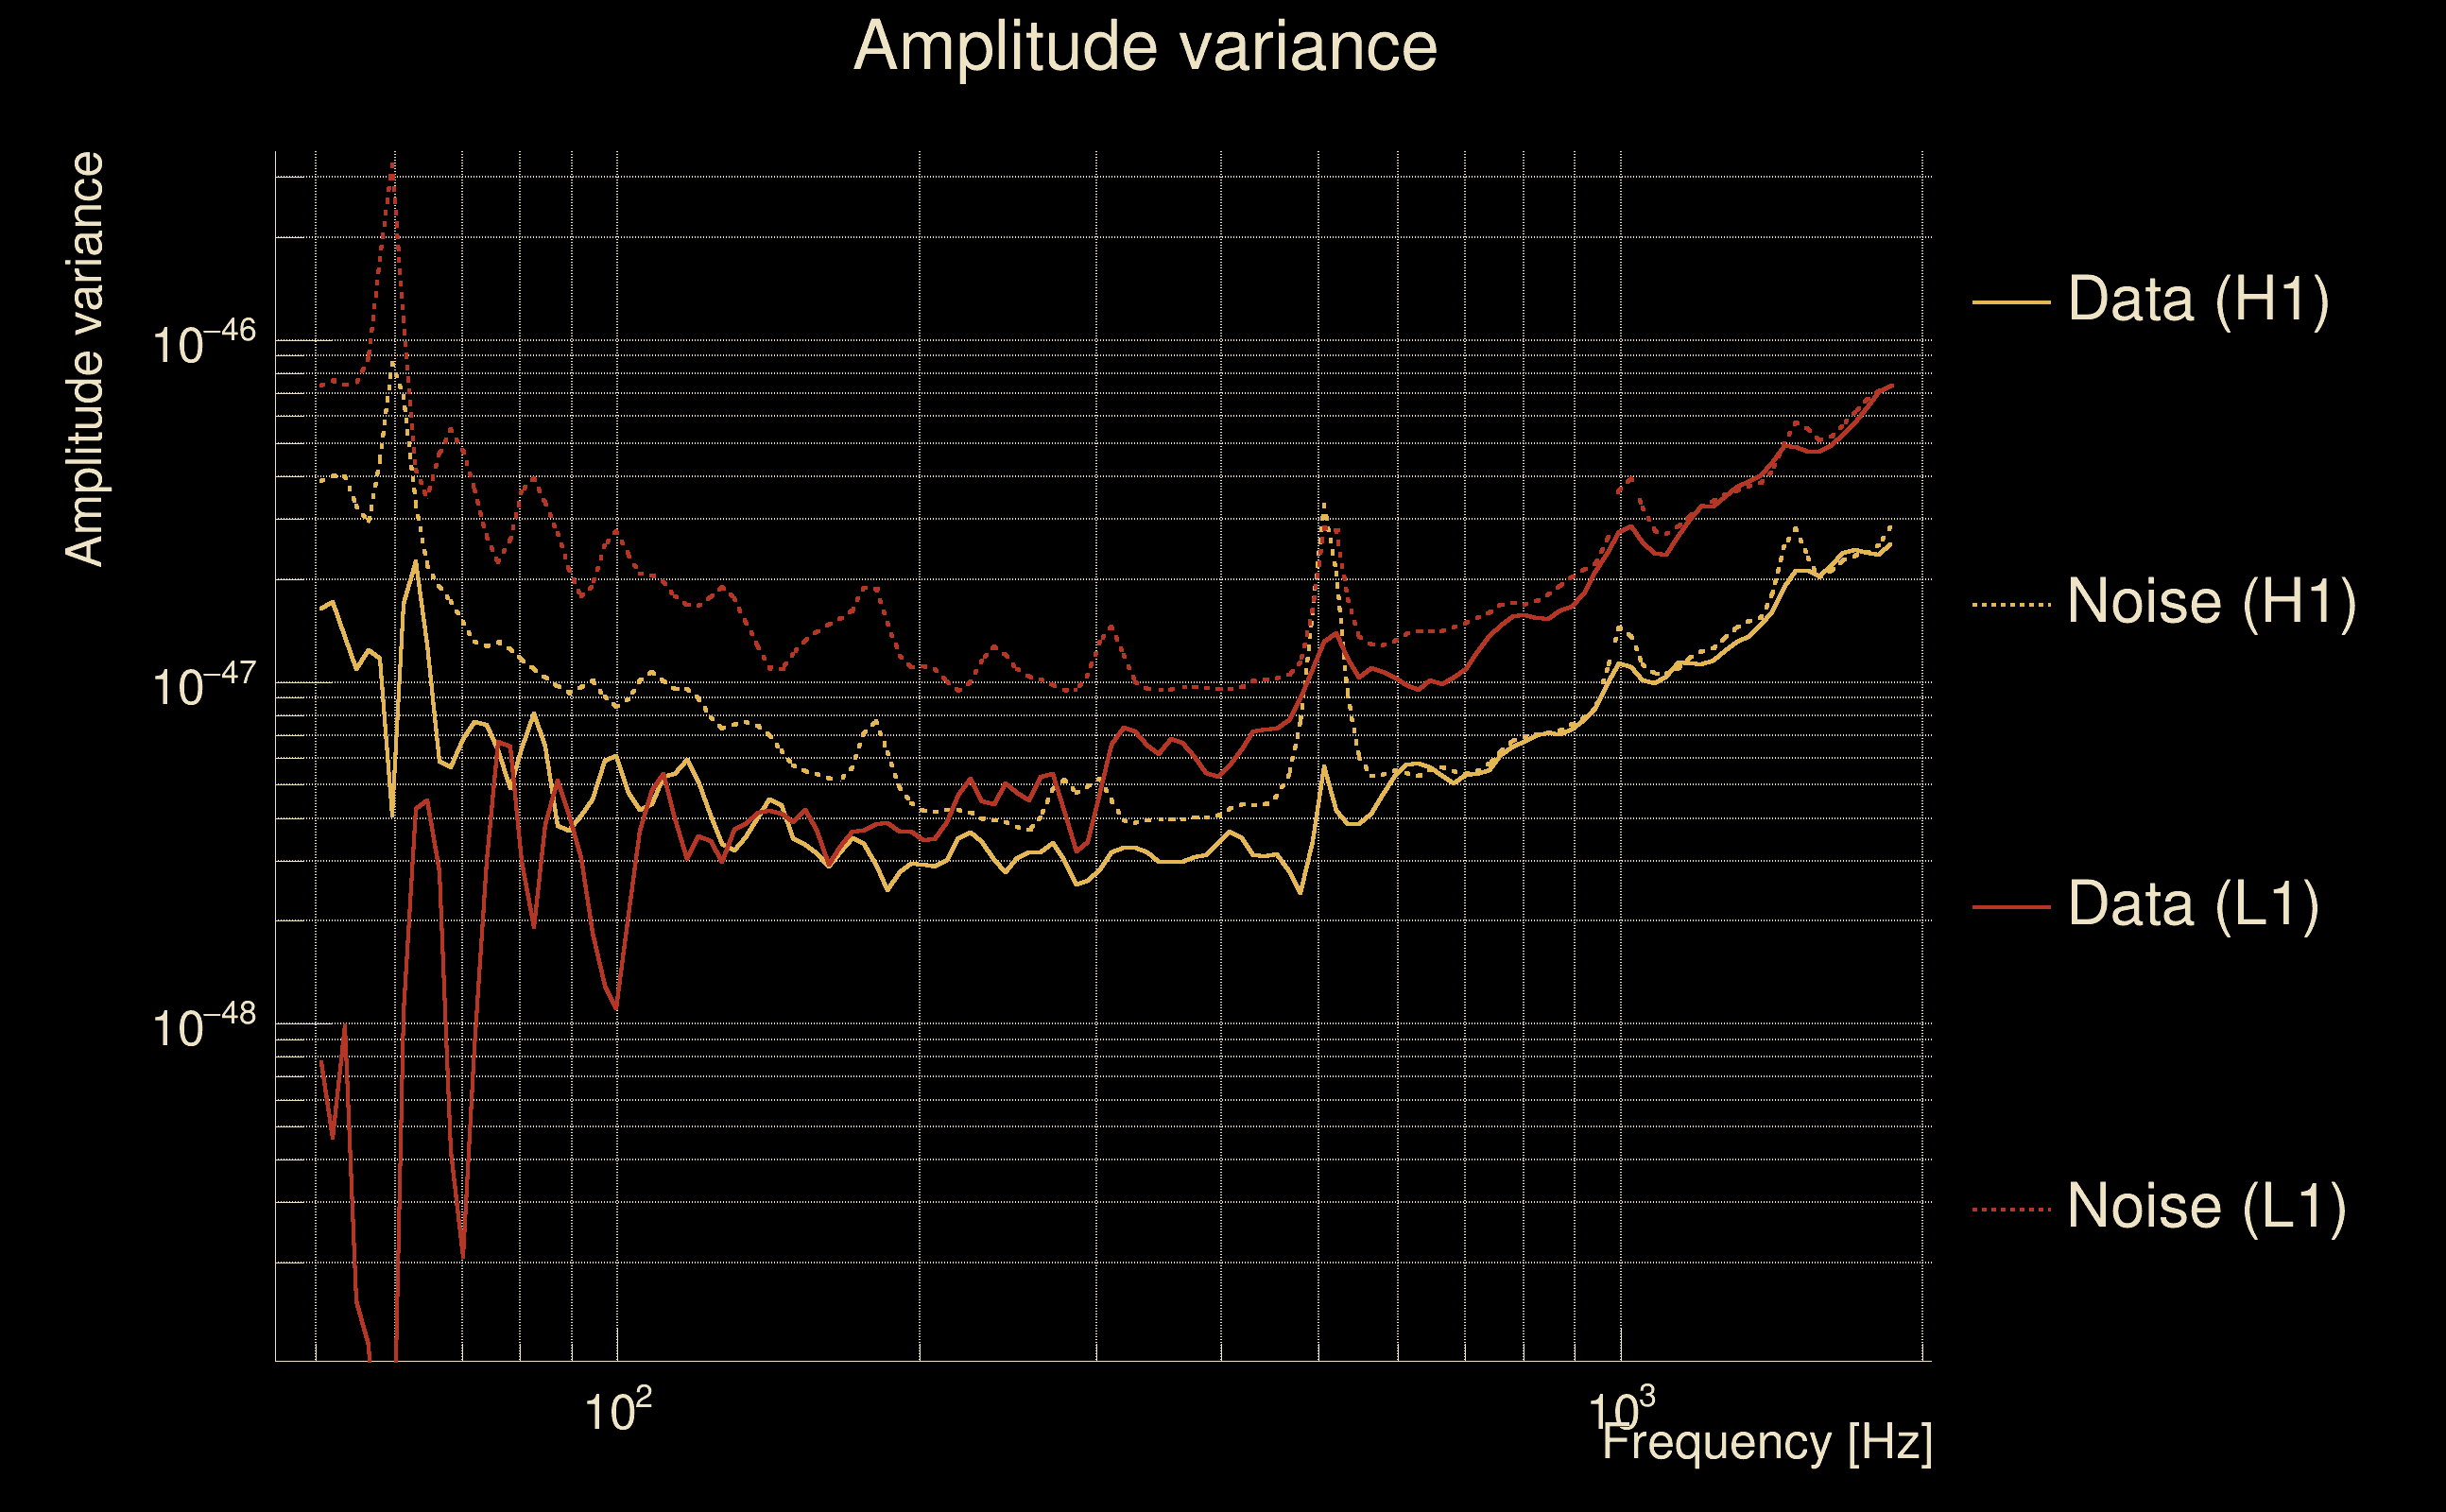
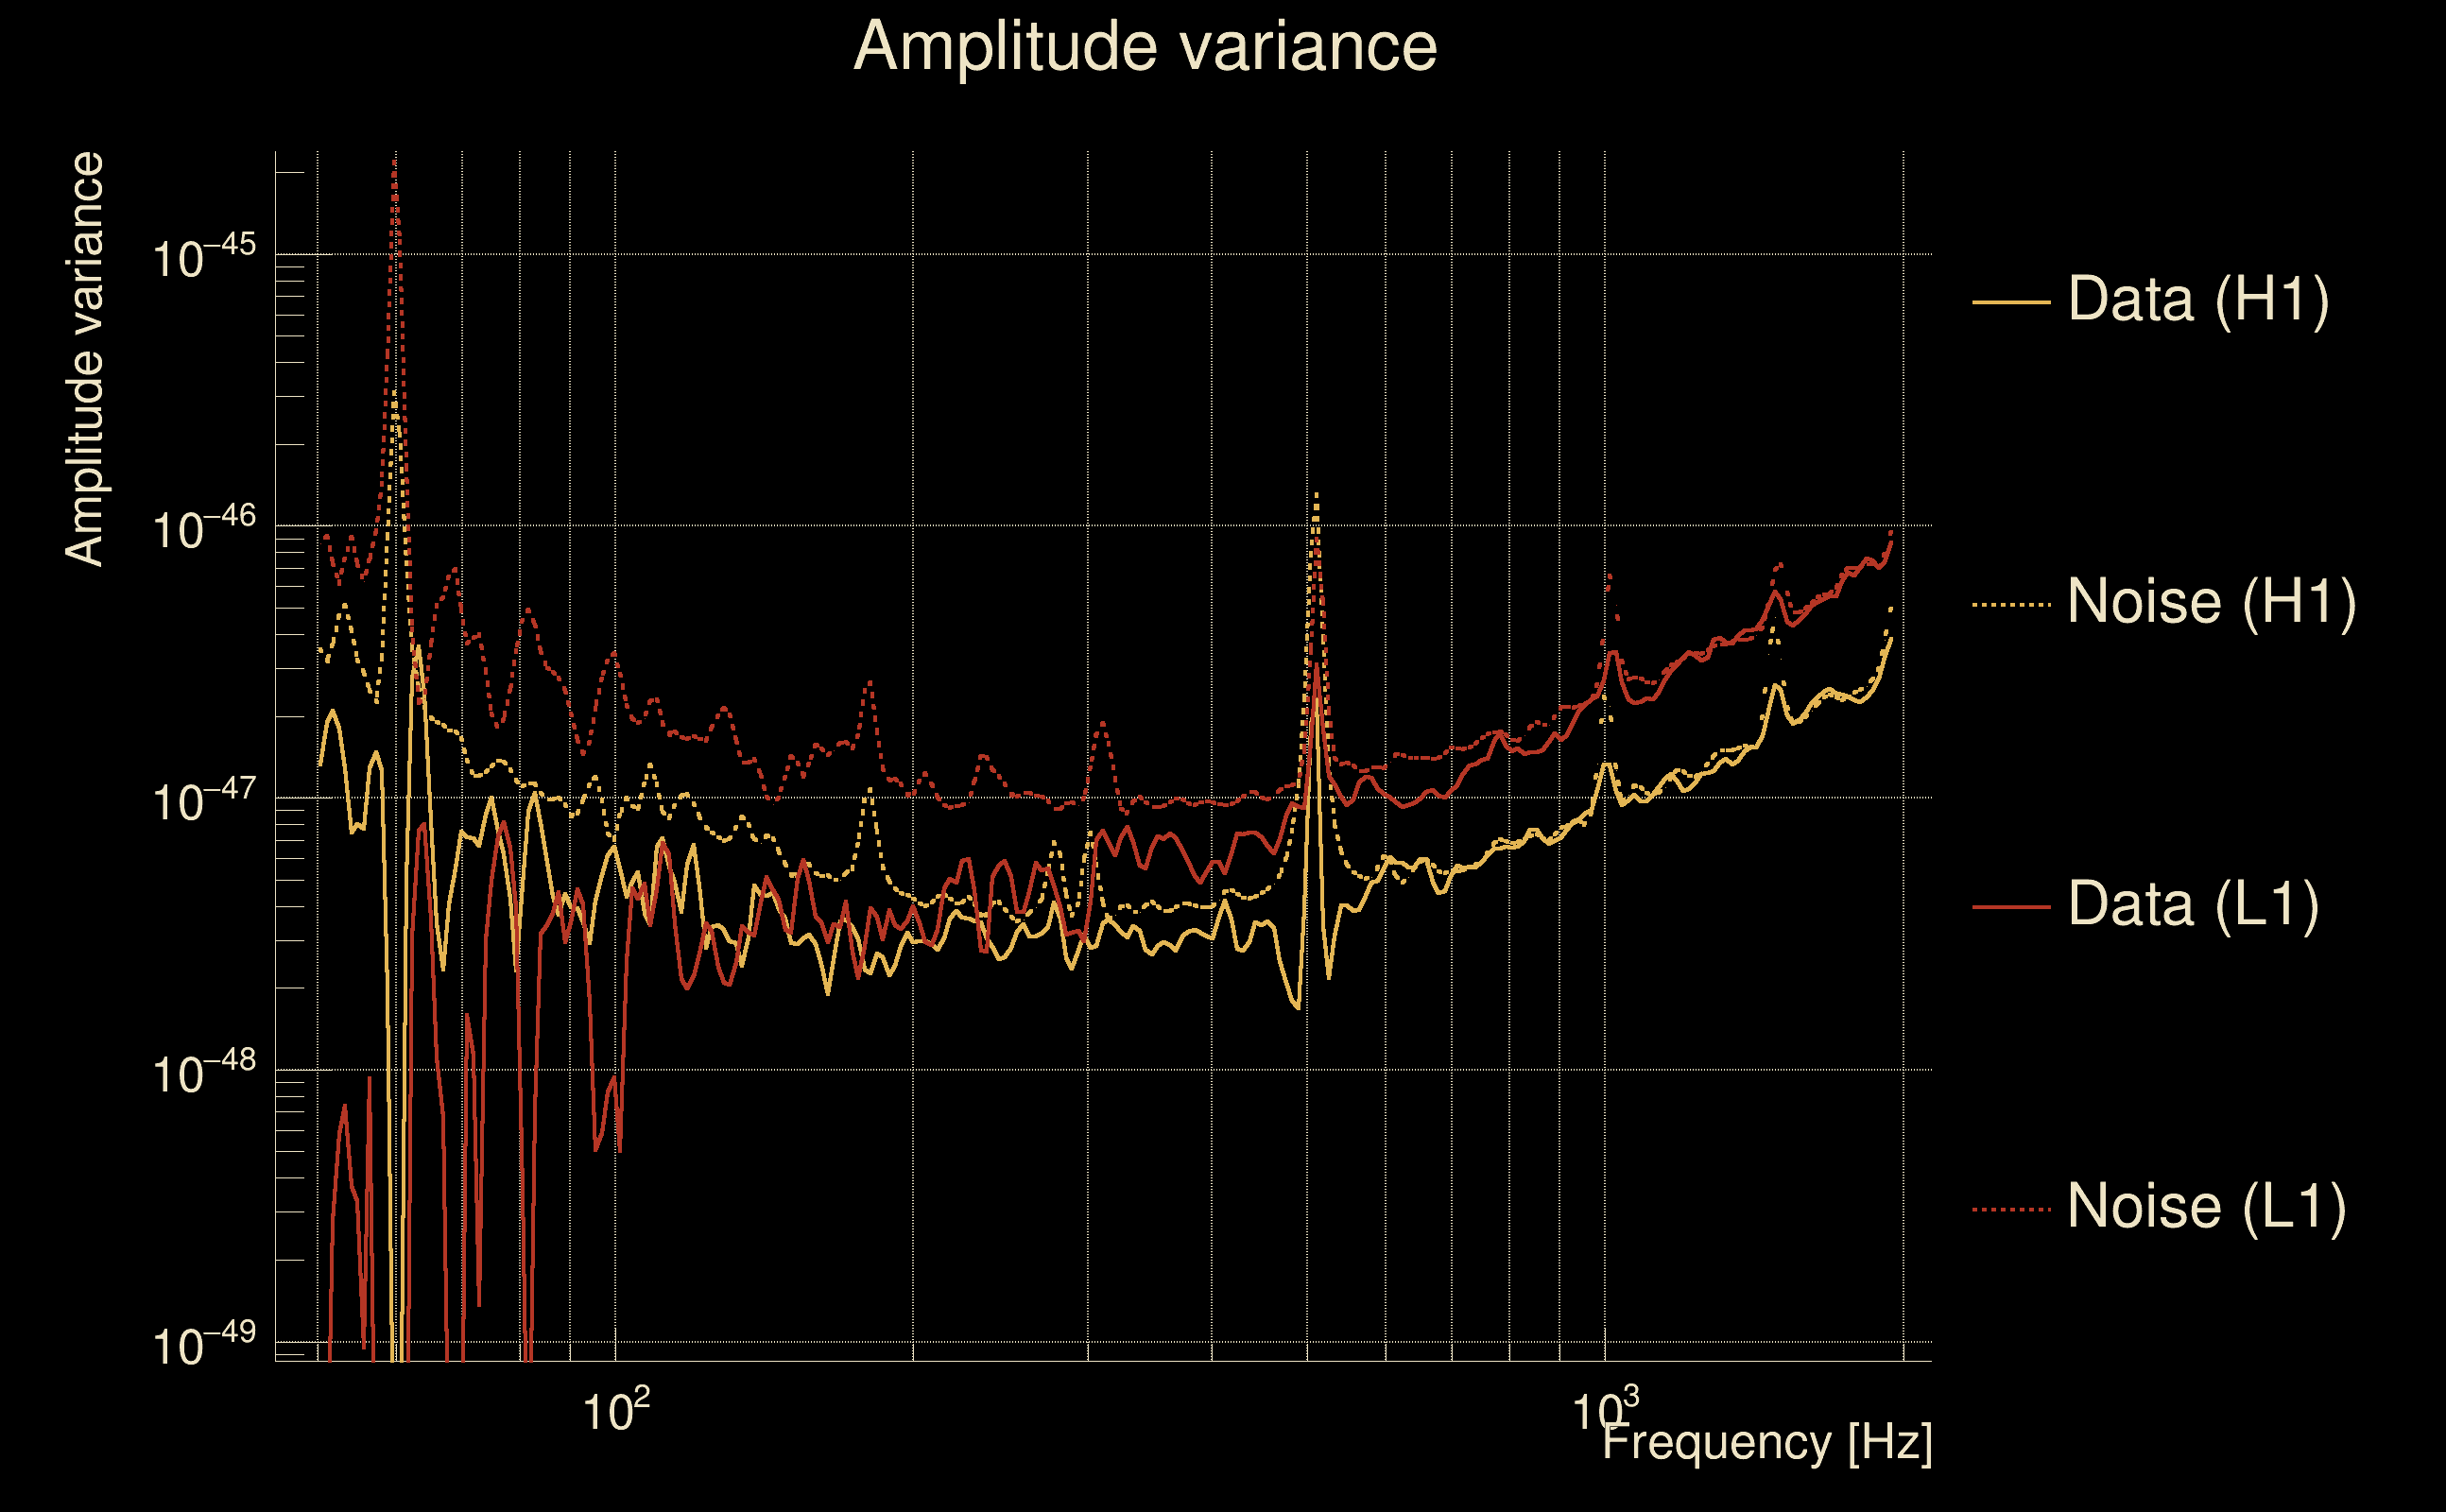
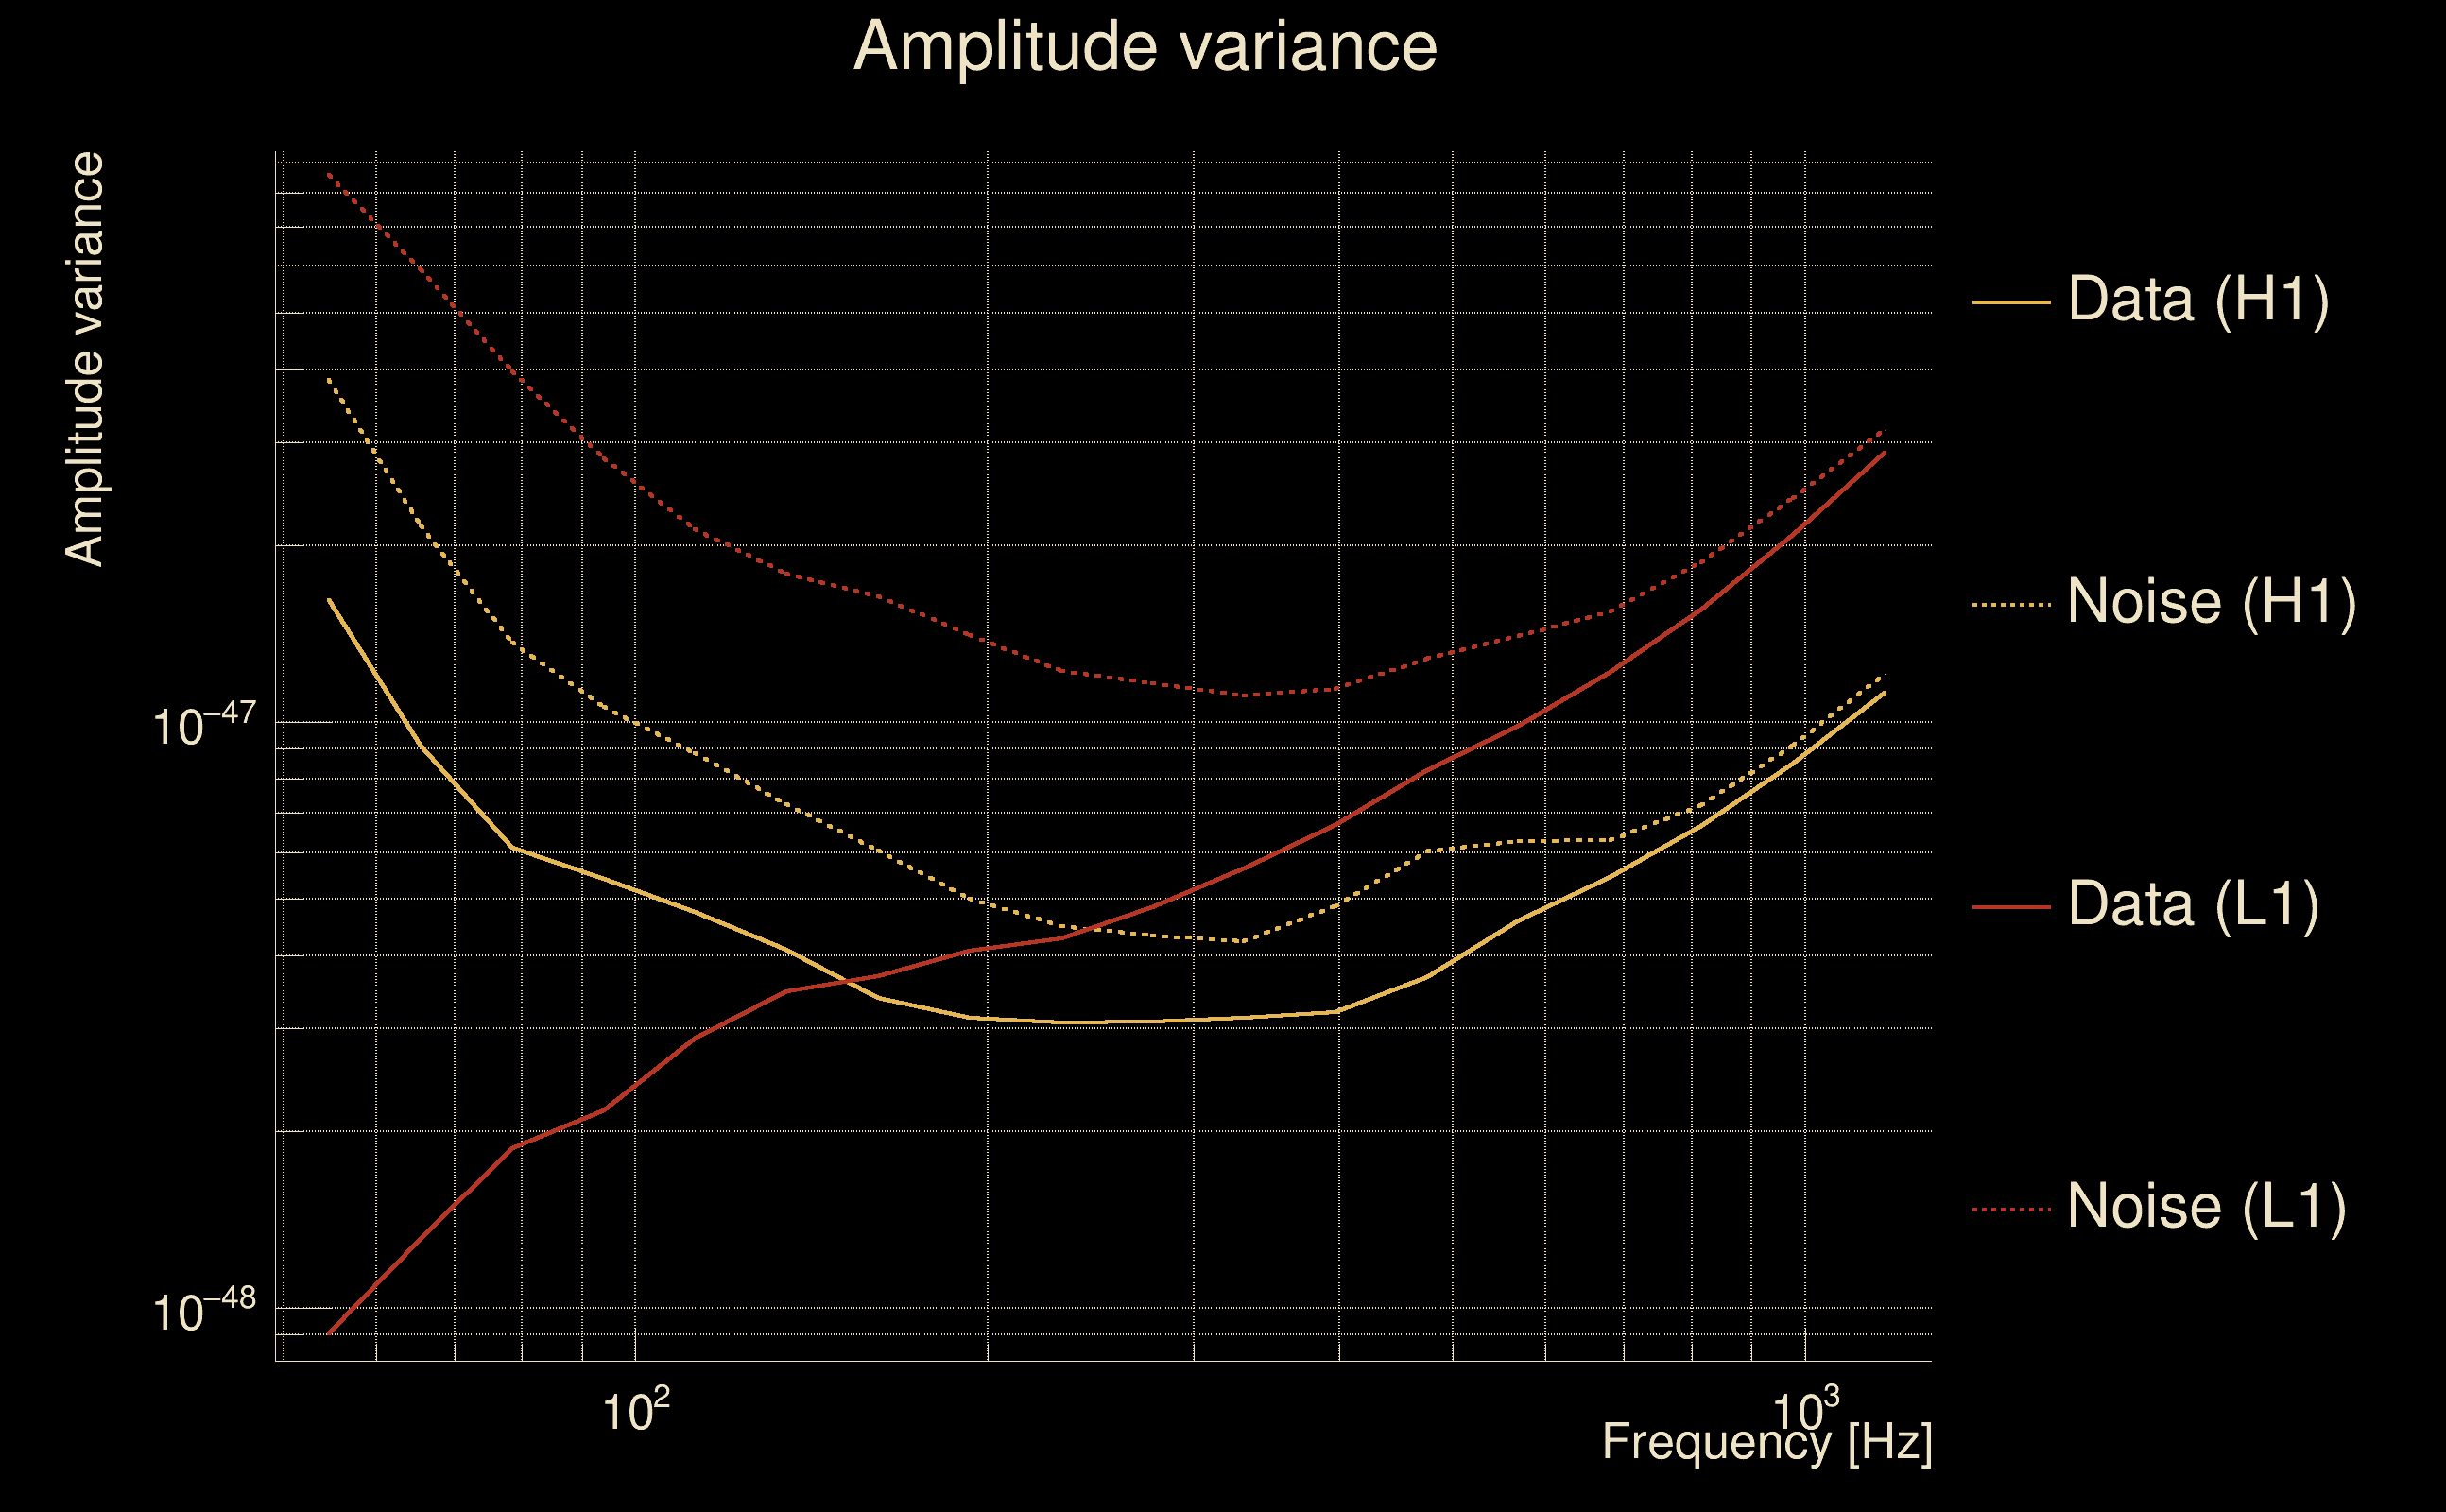
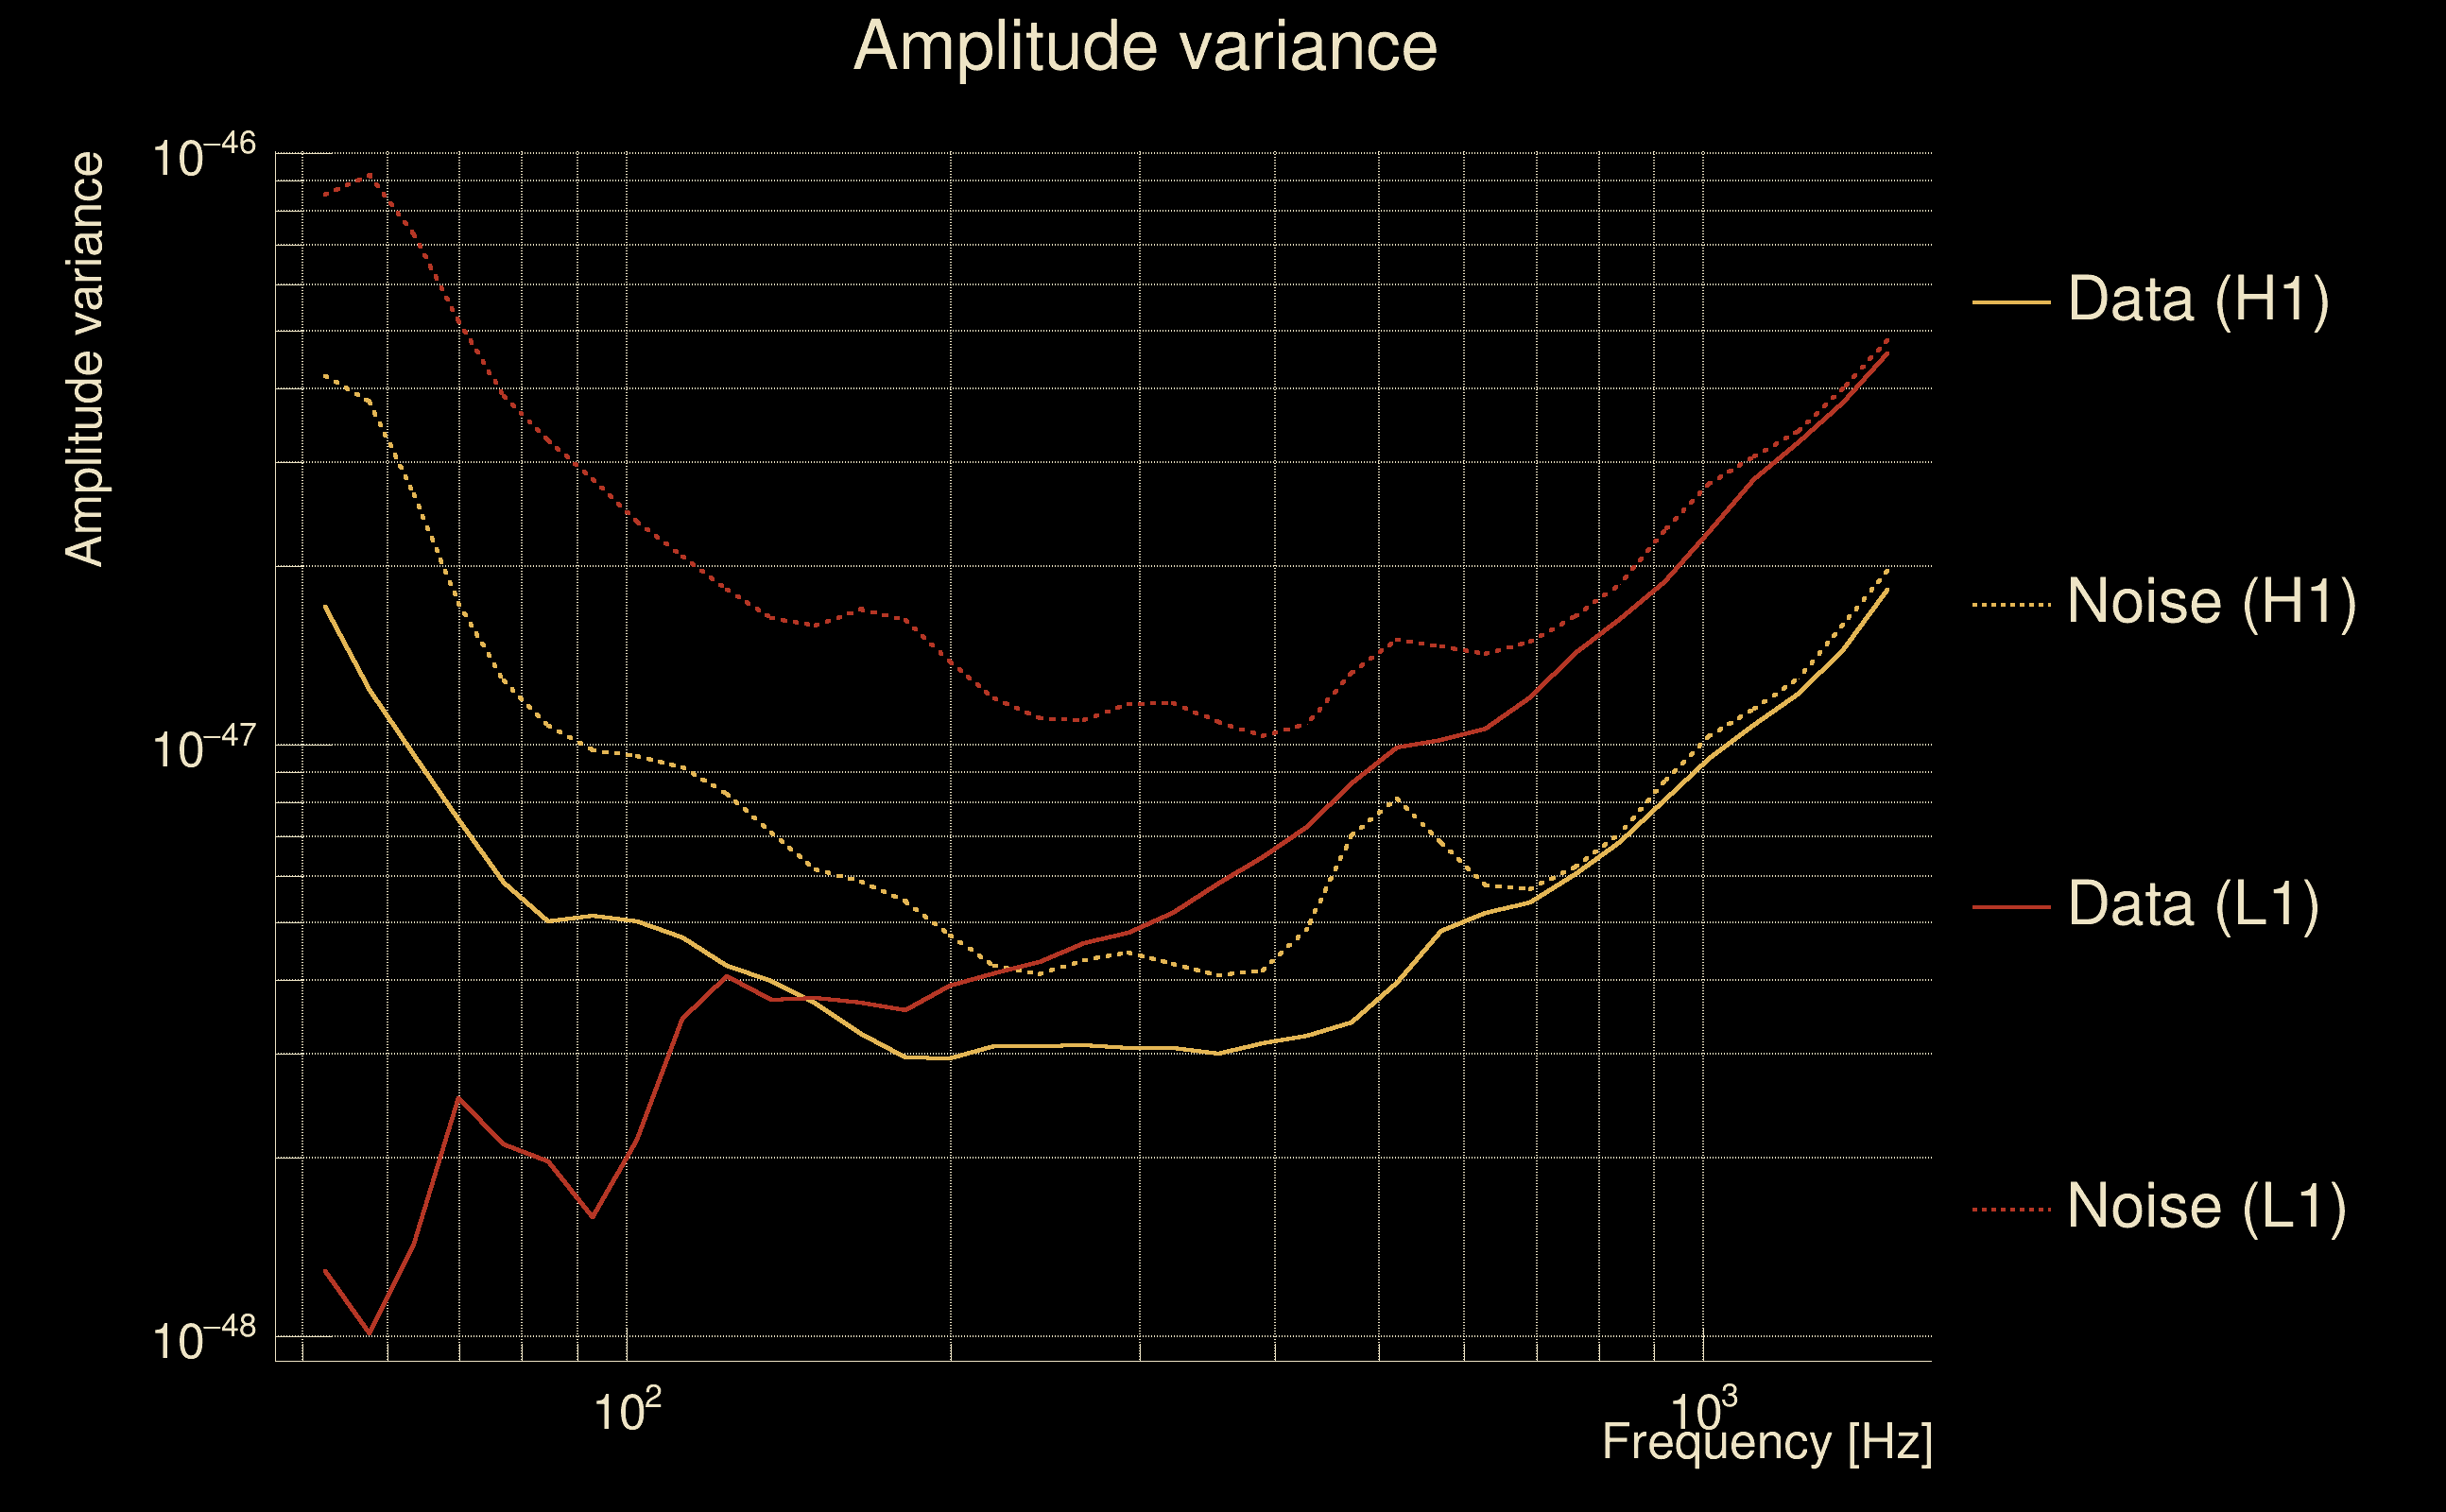
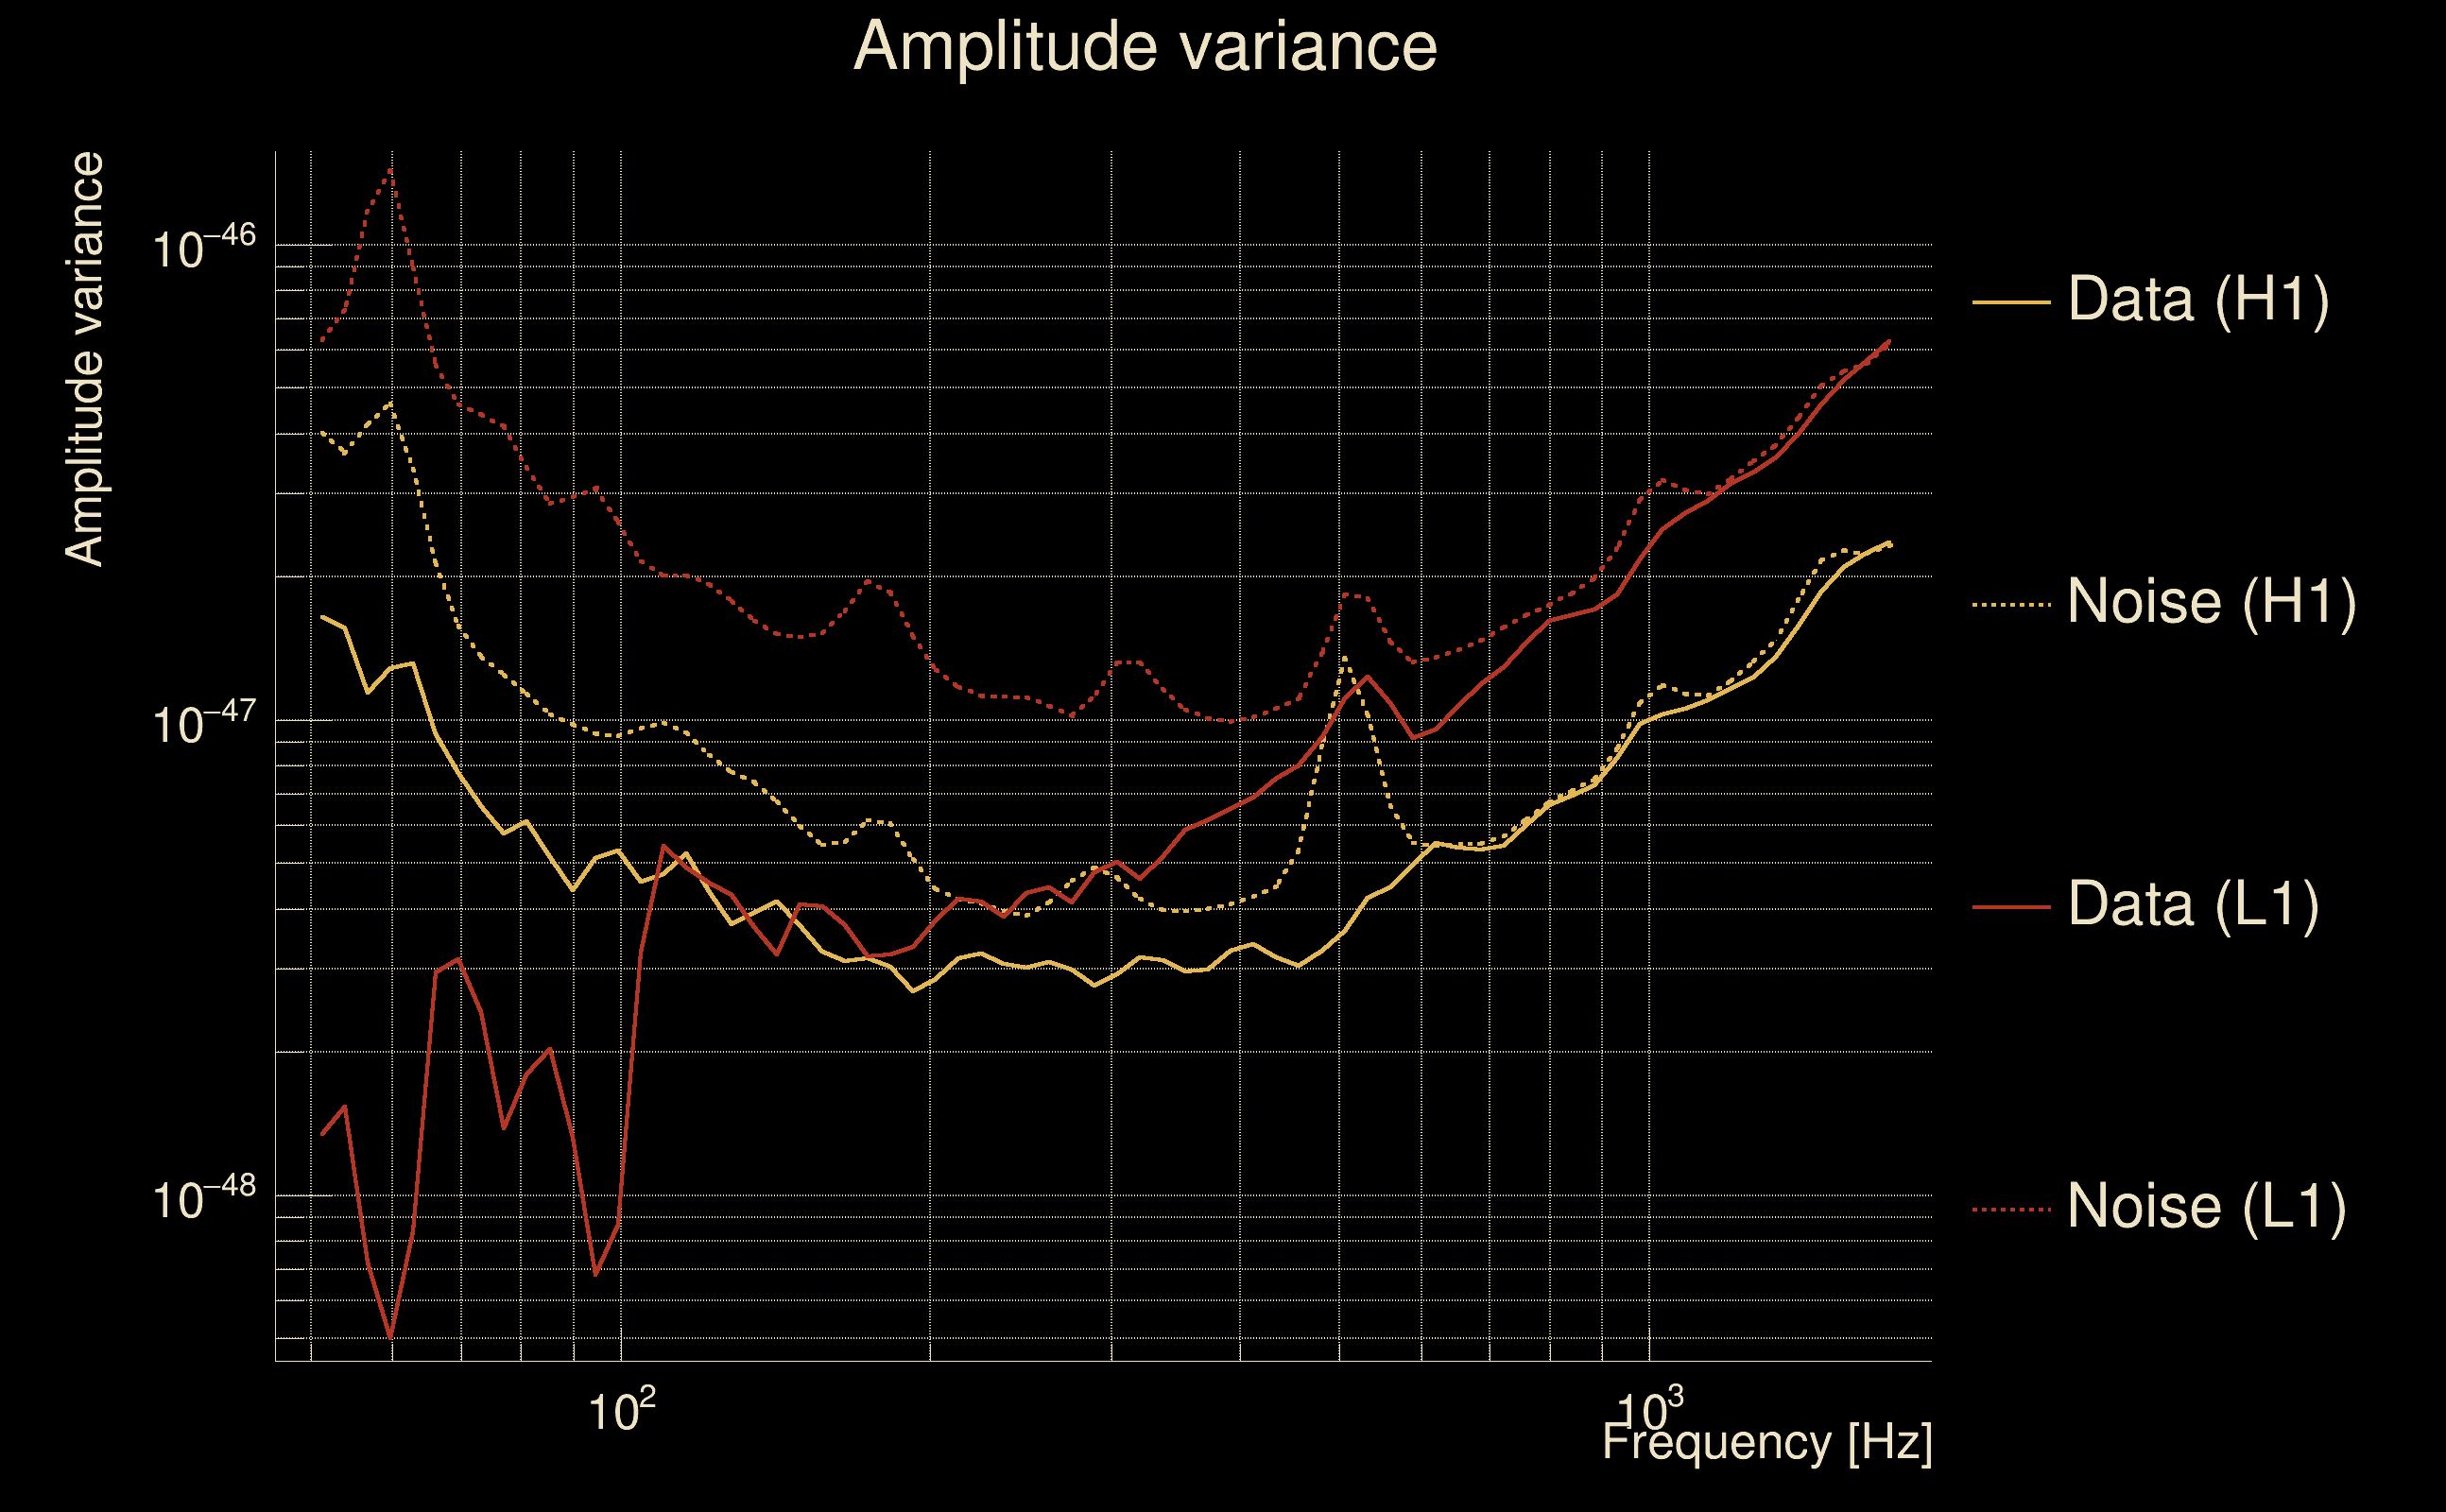
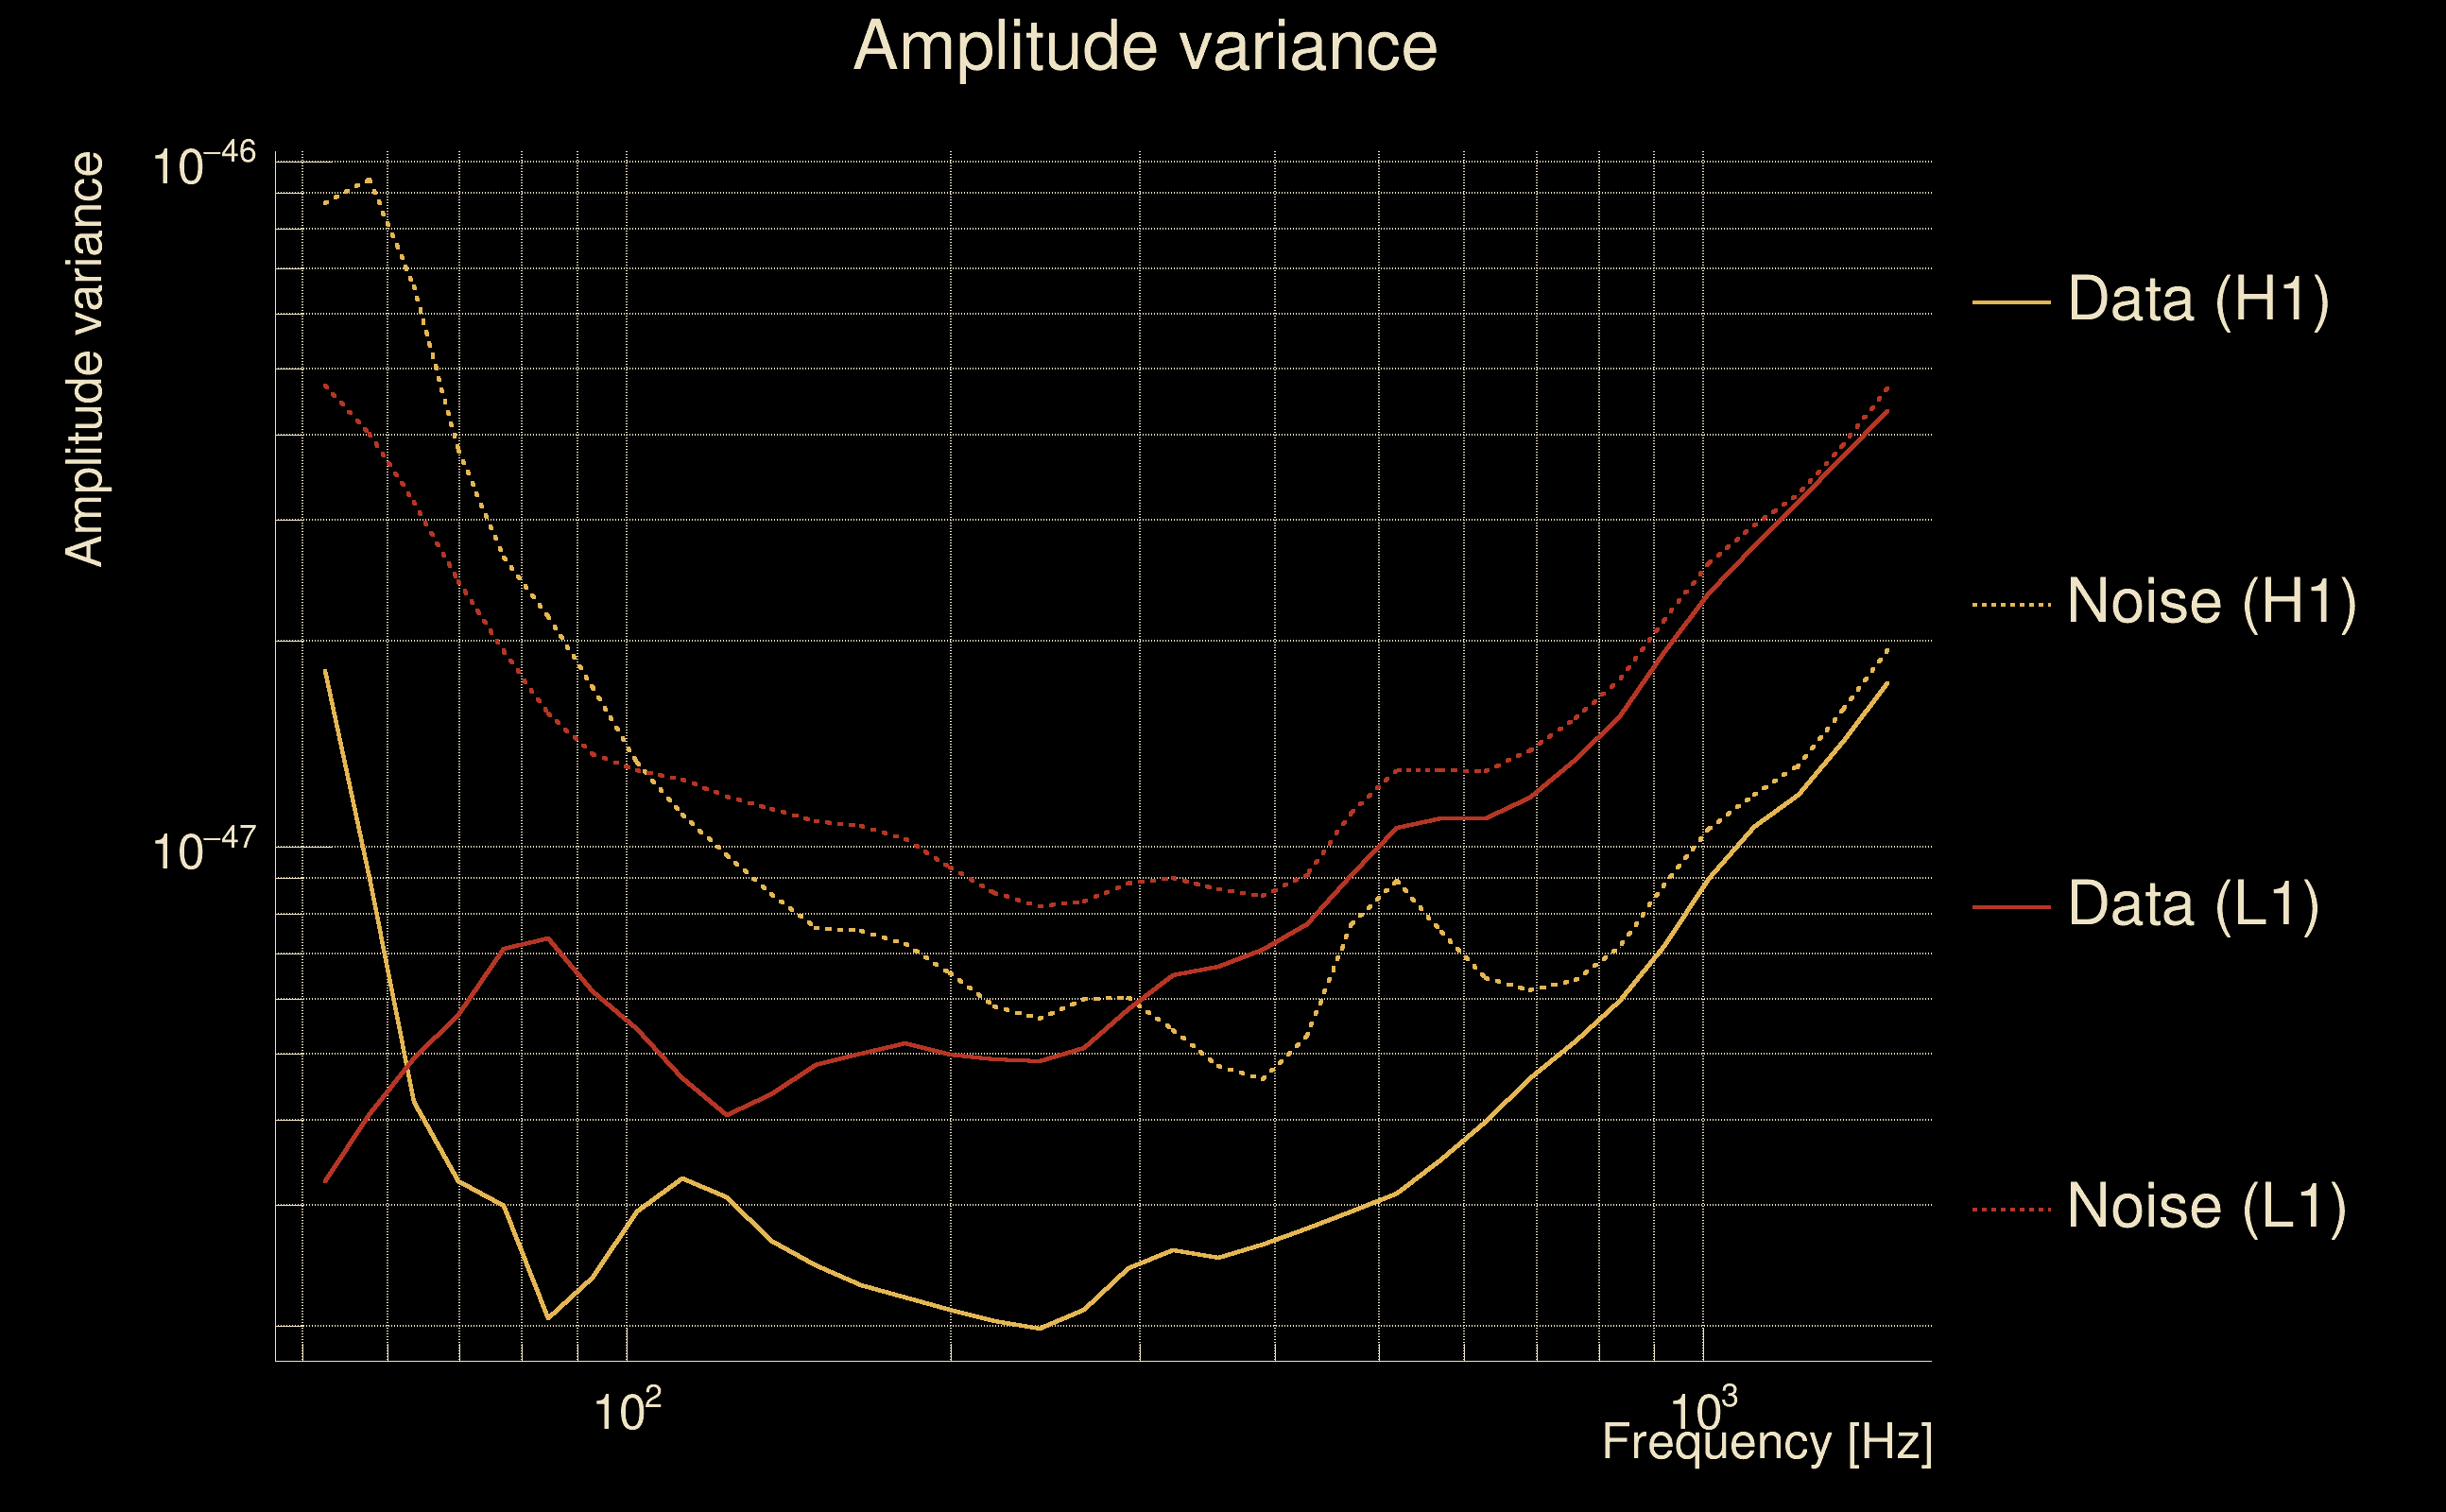
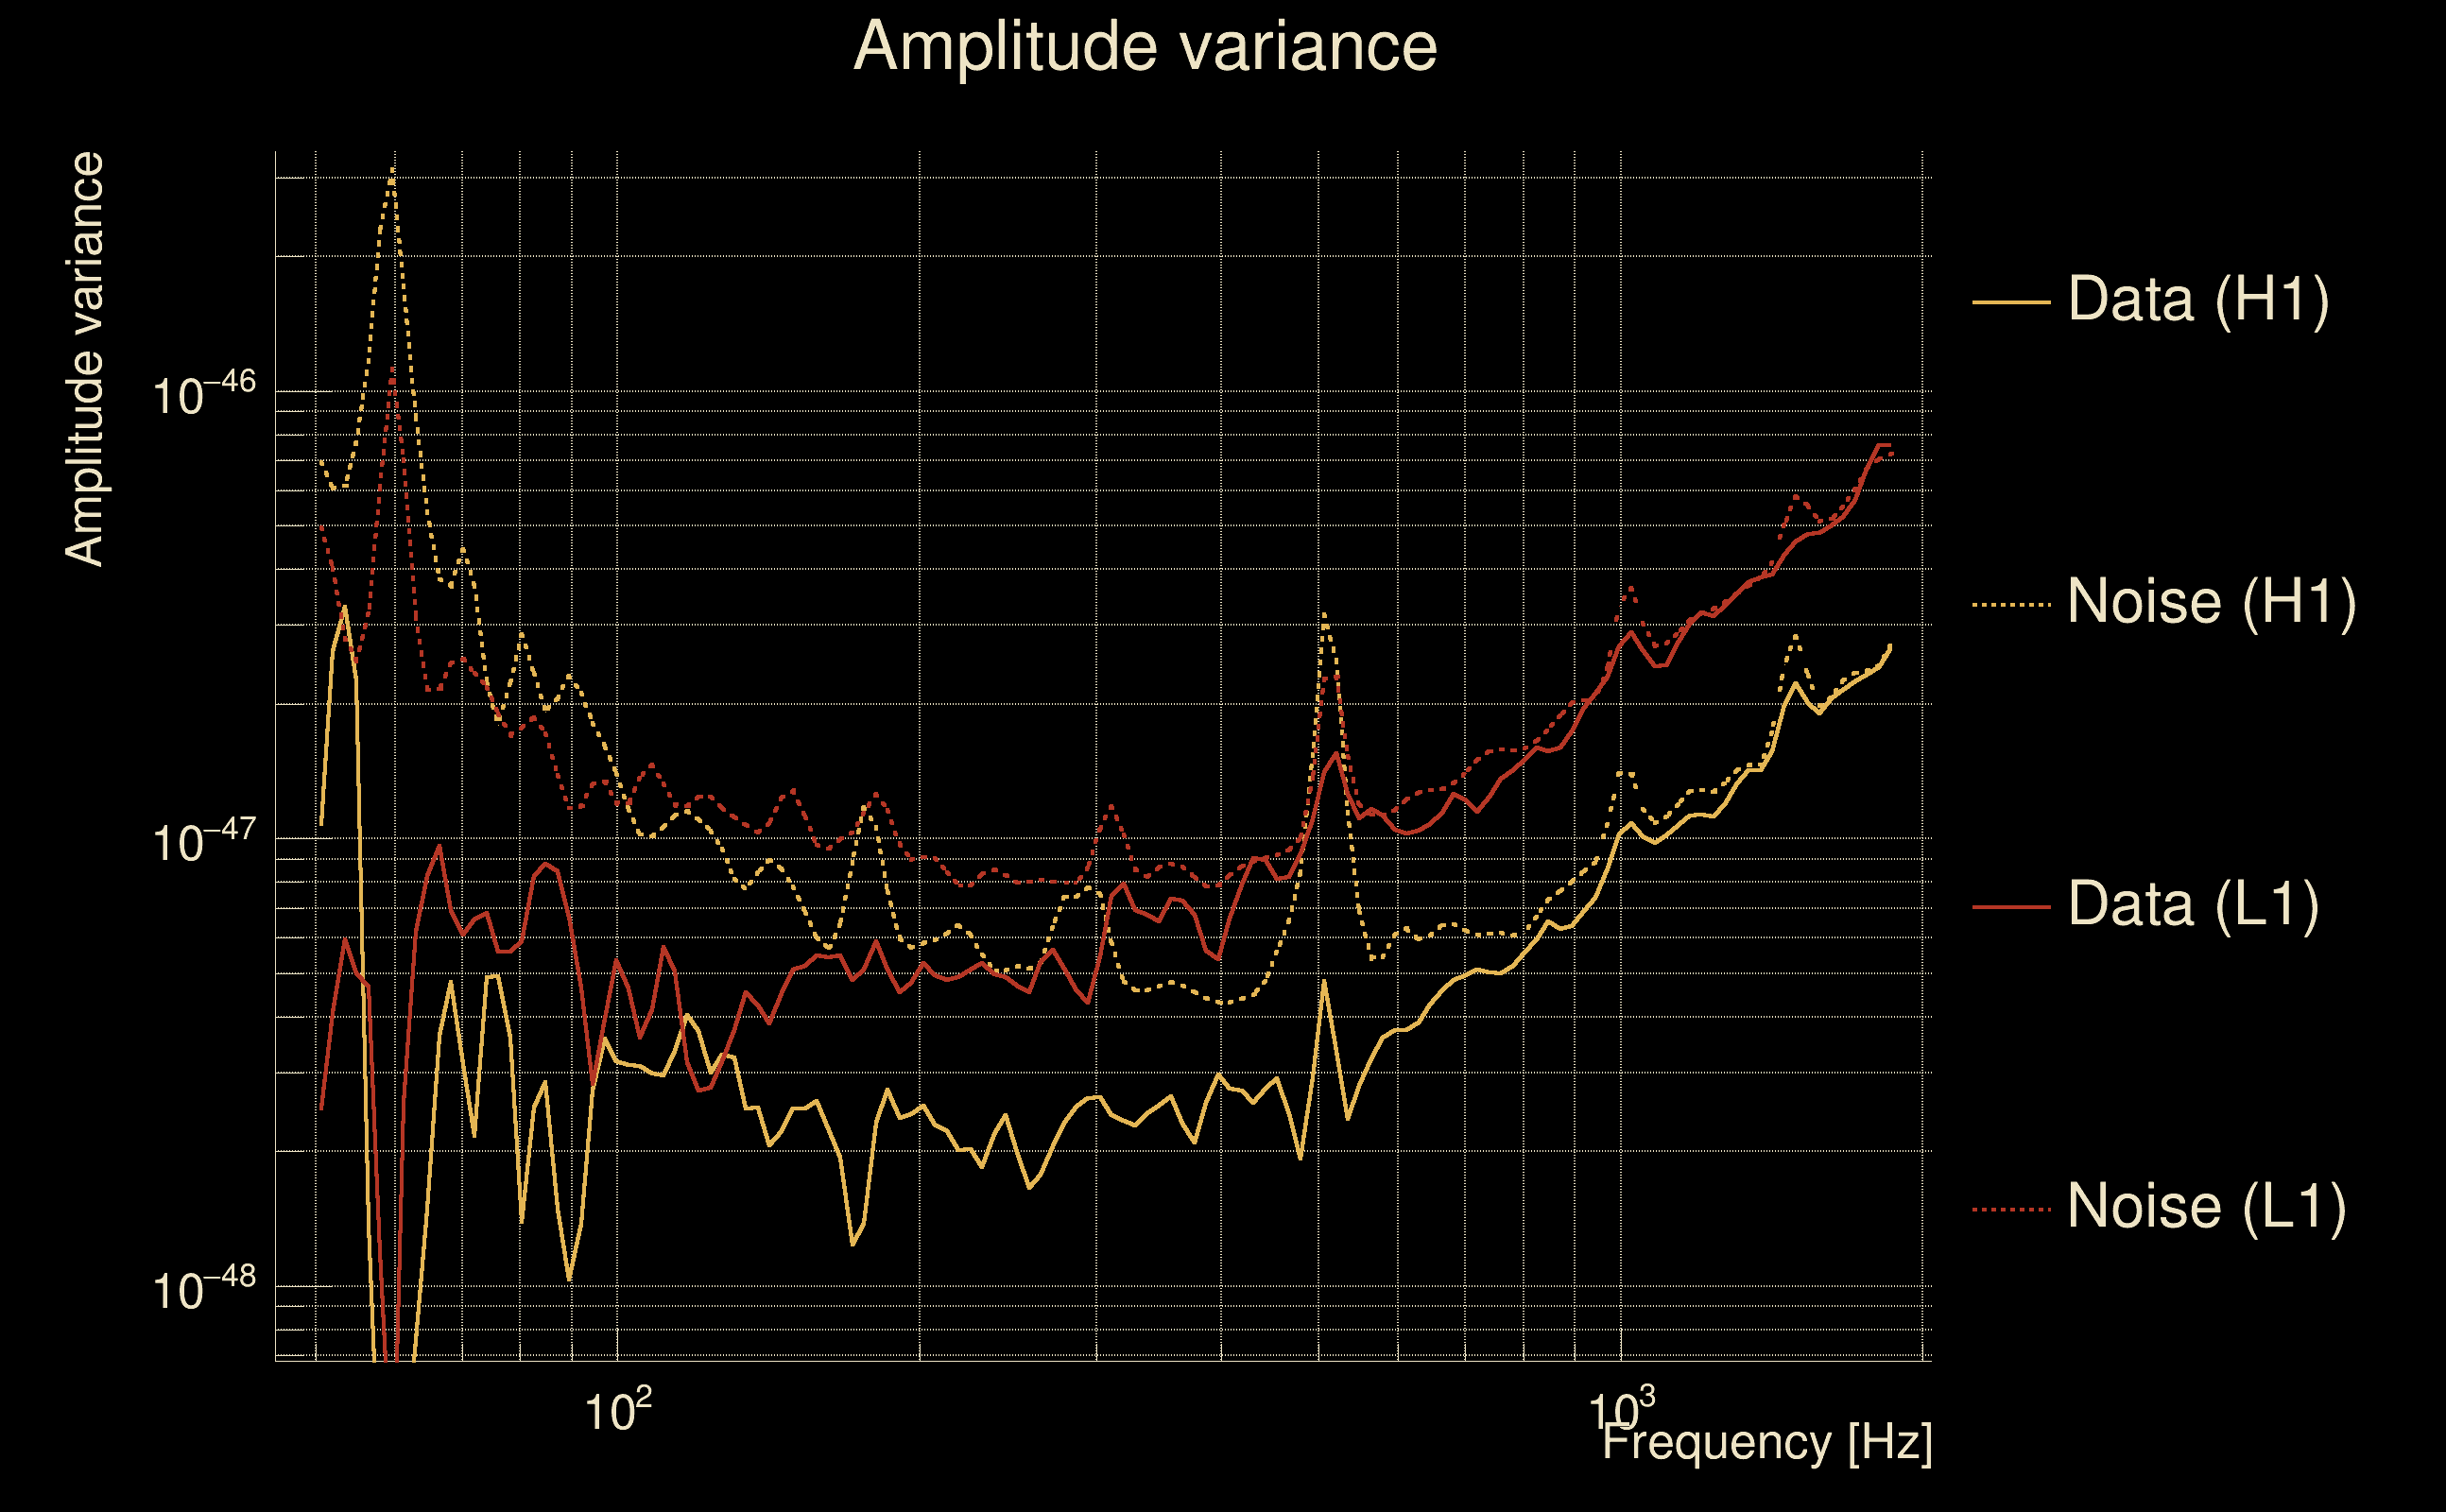
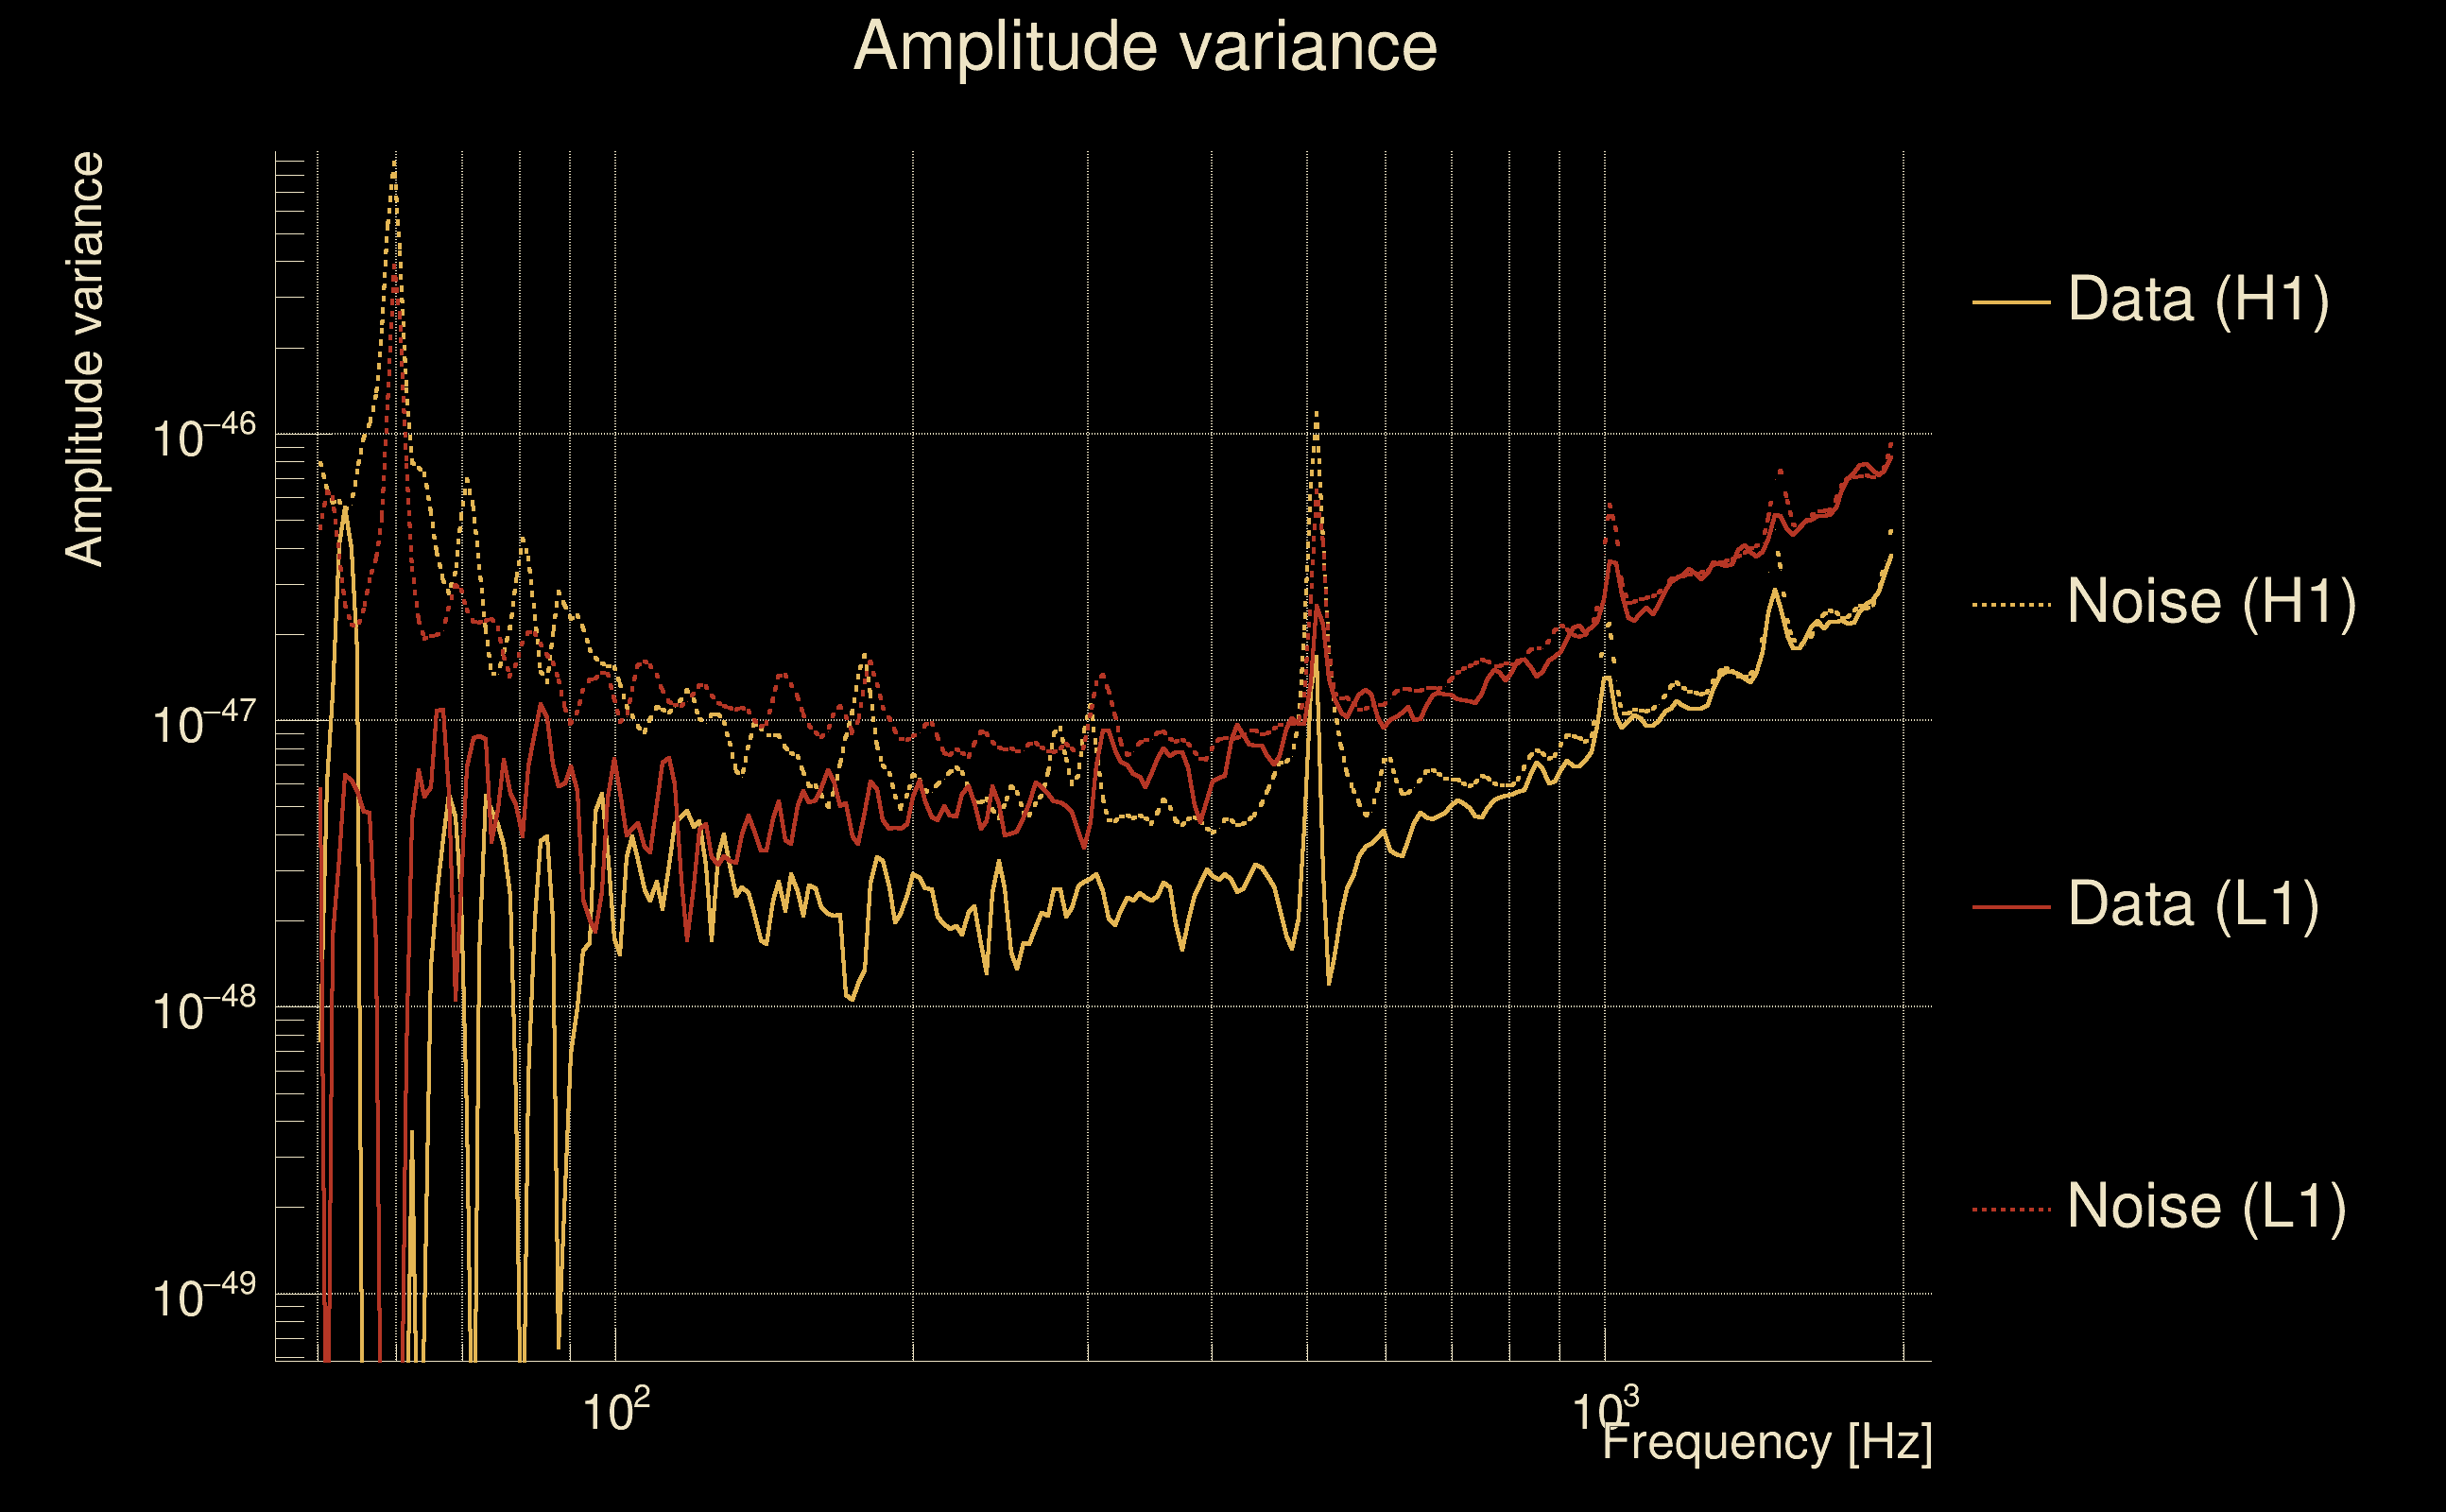
| Amplitude spectrograms: | normalization = 1e-22, power index = 2 |
| White noise SNR variance: | 0.523175 (after applying a correction factor = 1) |
| Amplitude ratio confidence level: | 3 sigma |
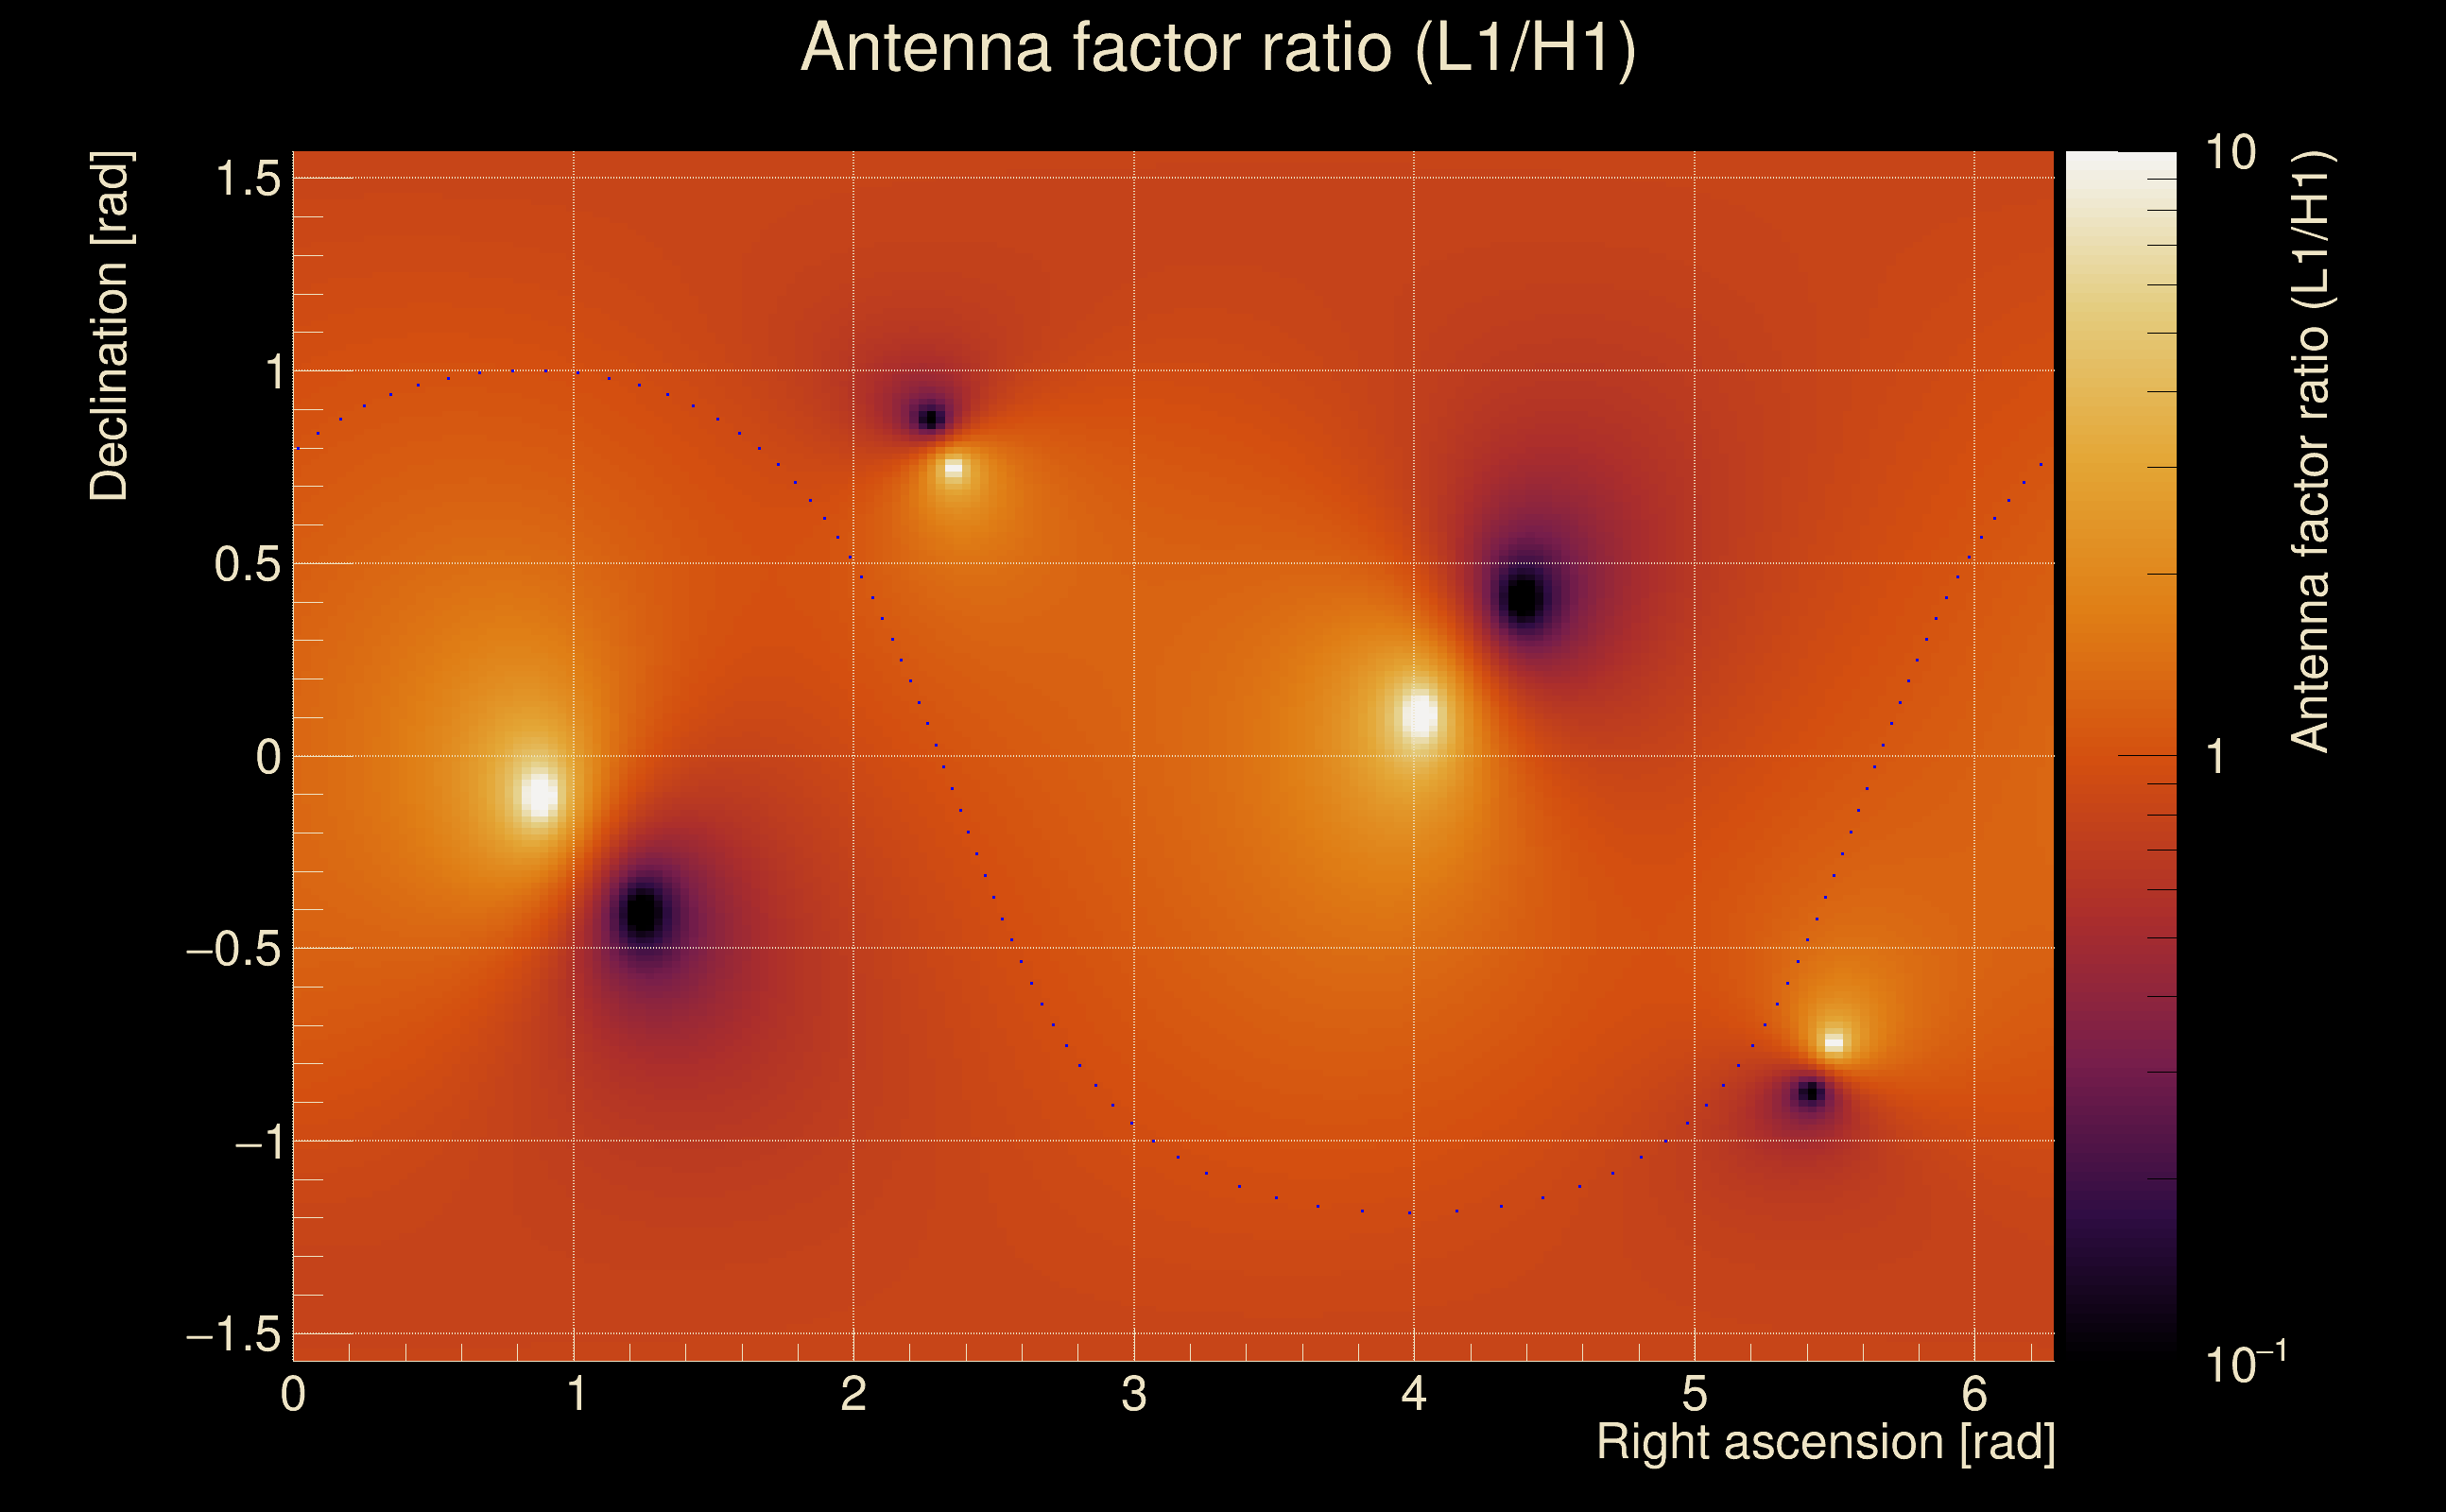
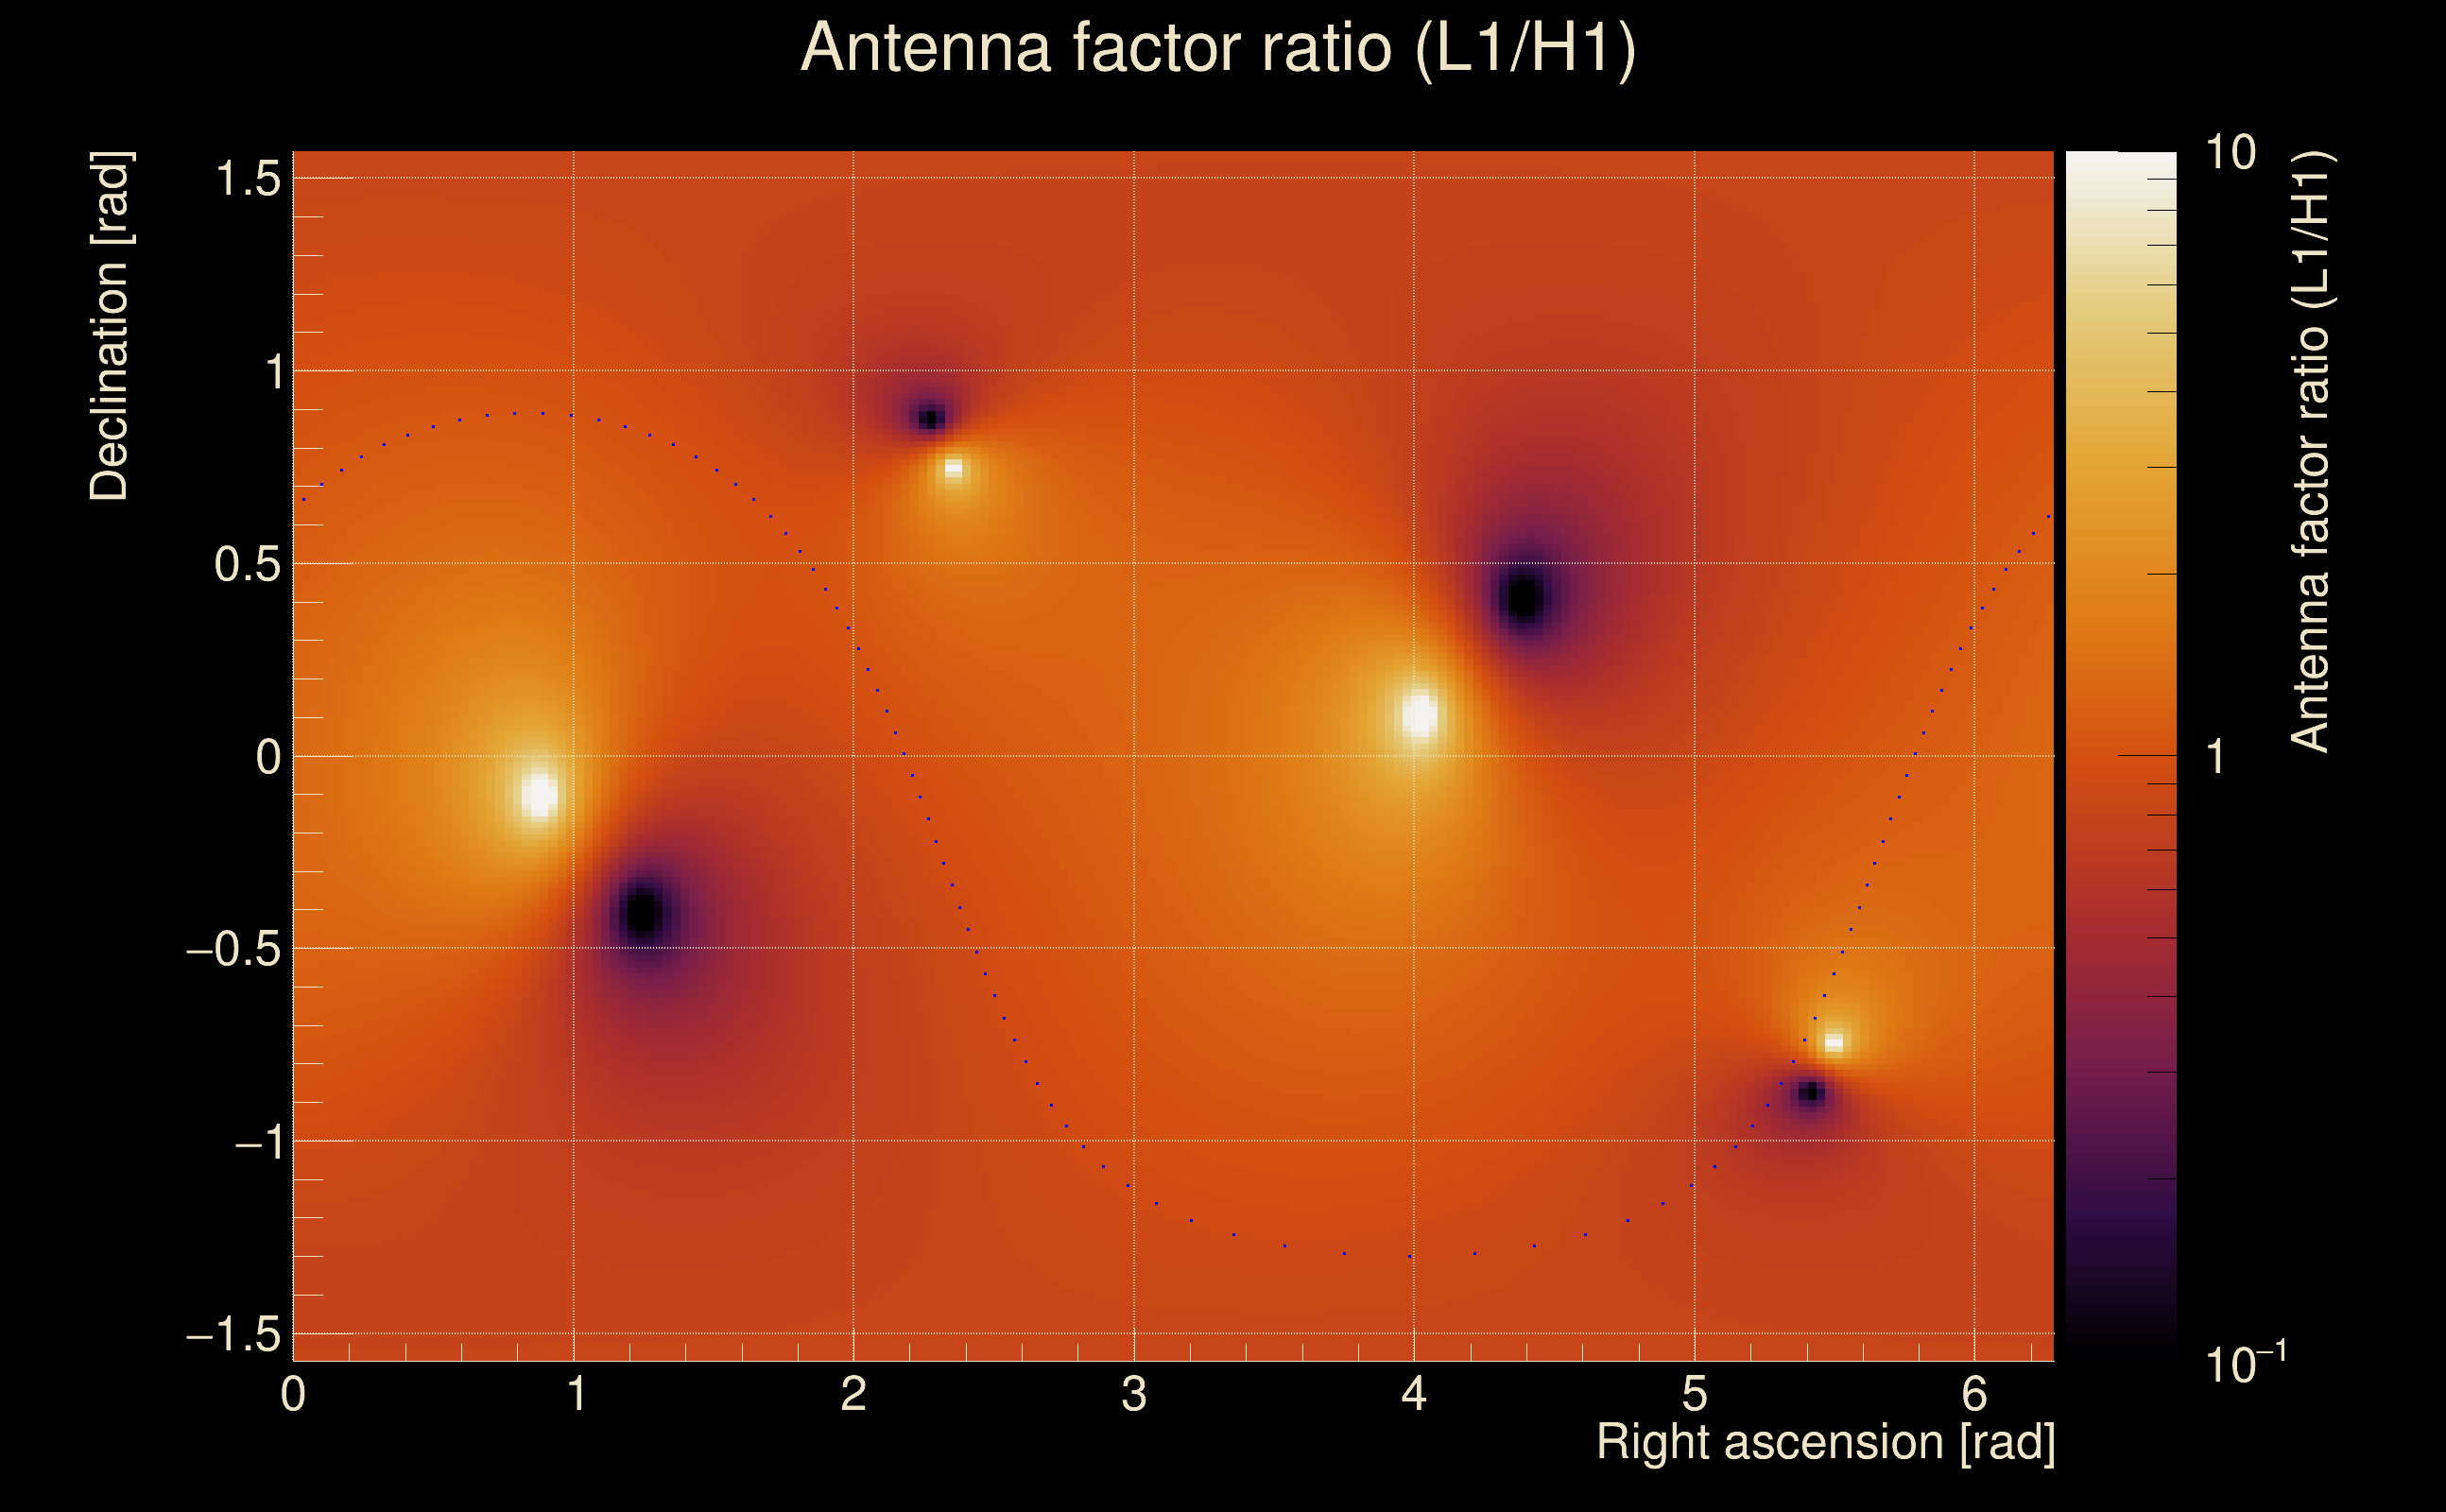
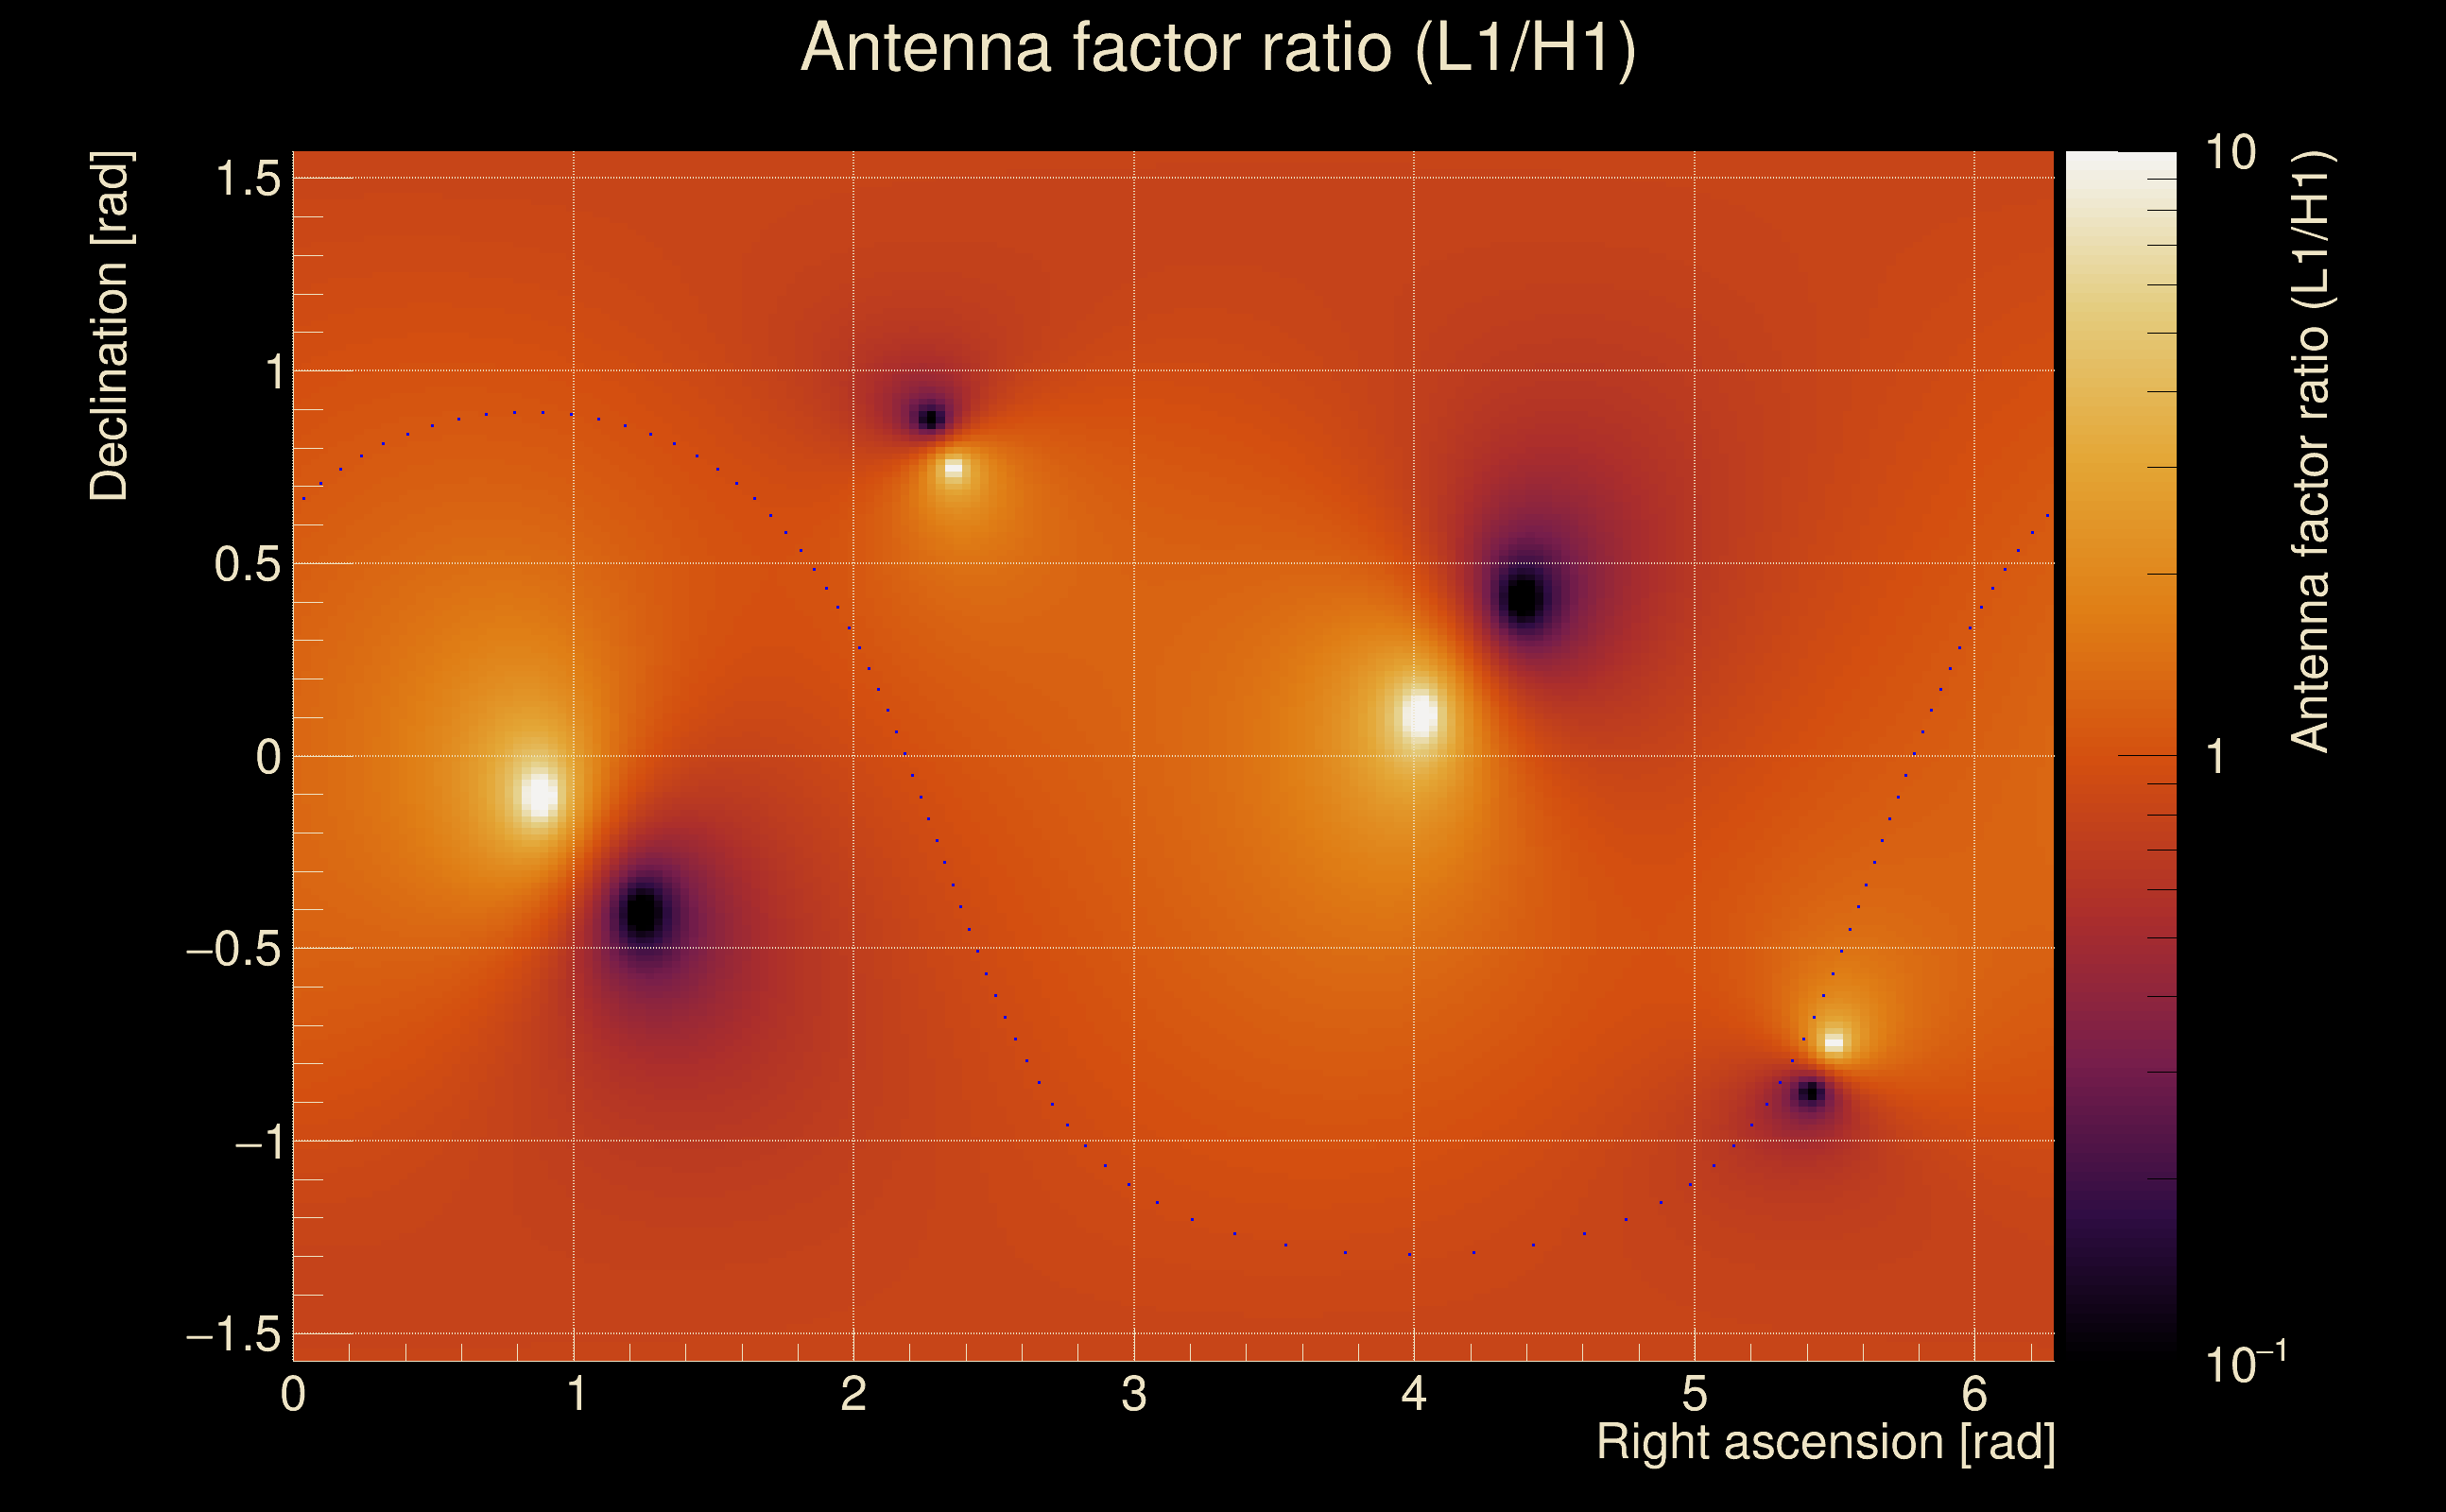
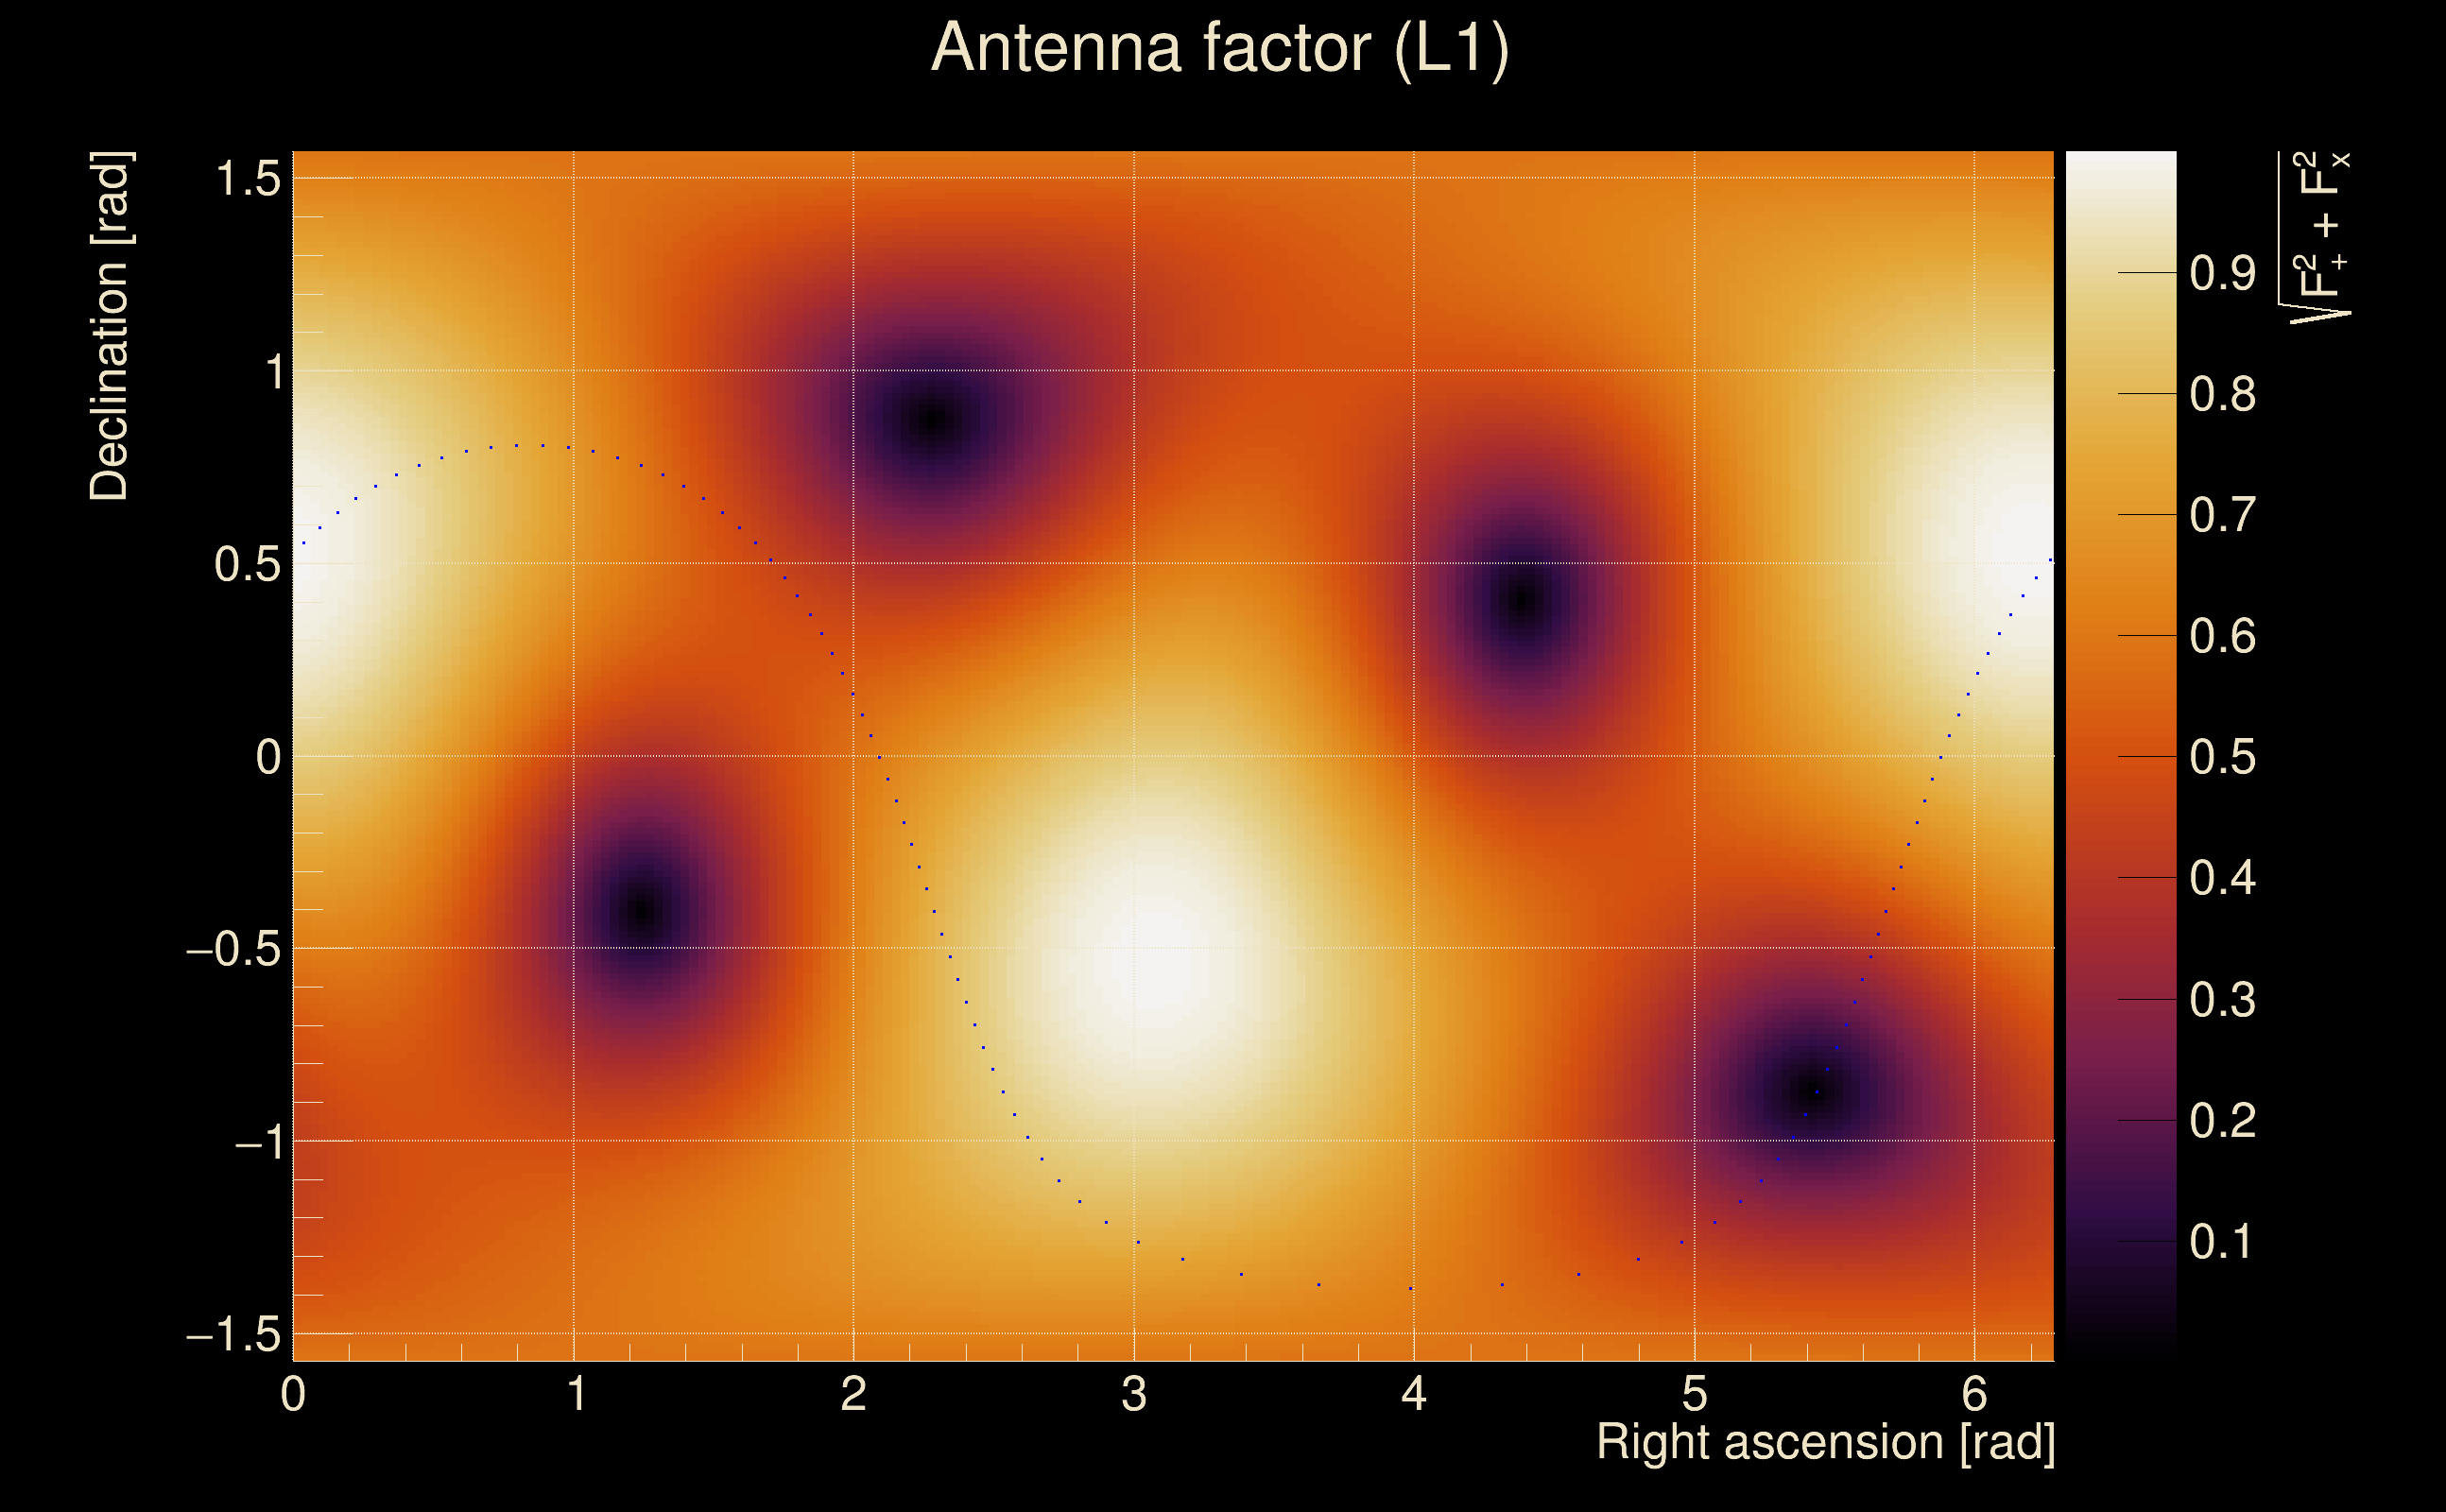
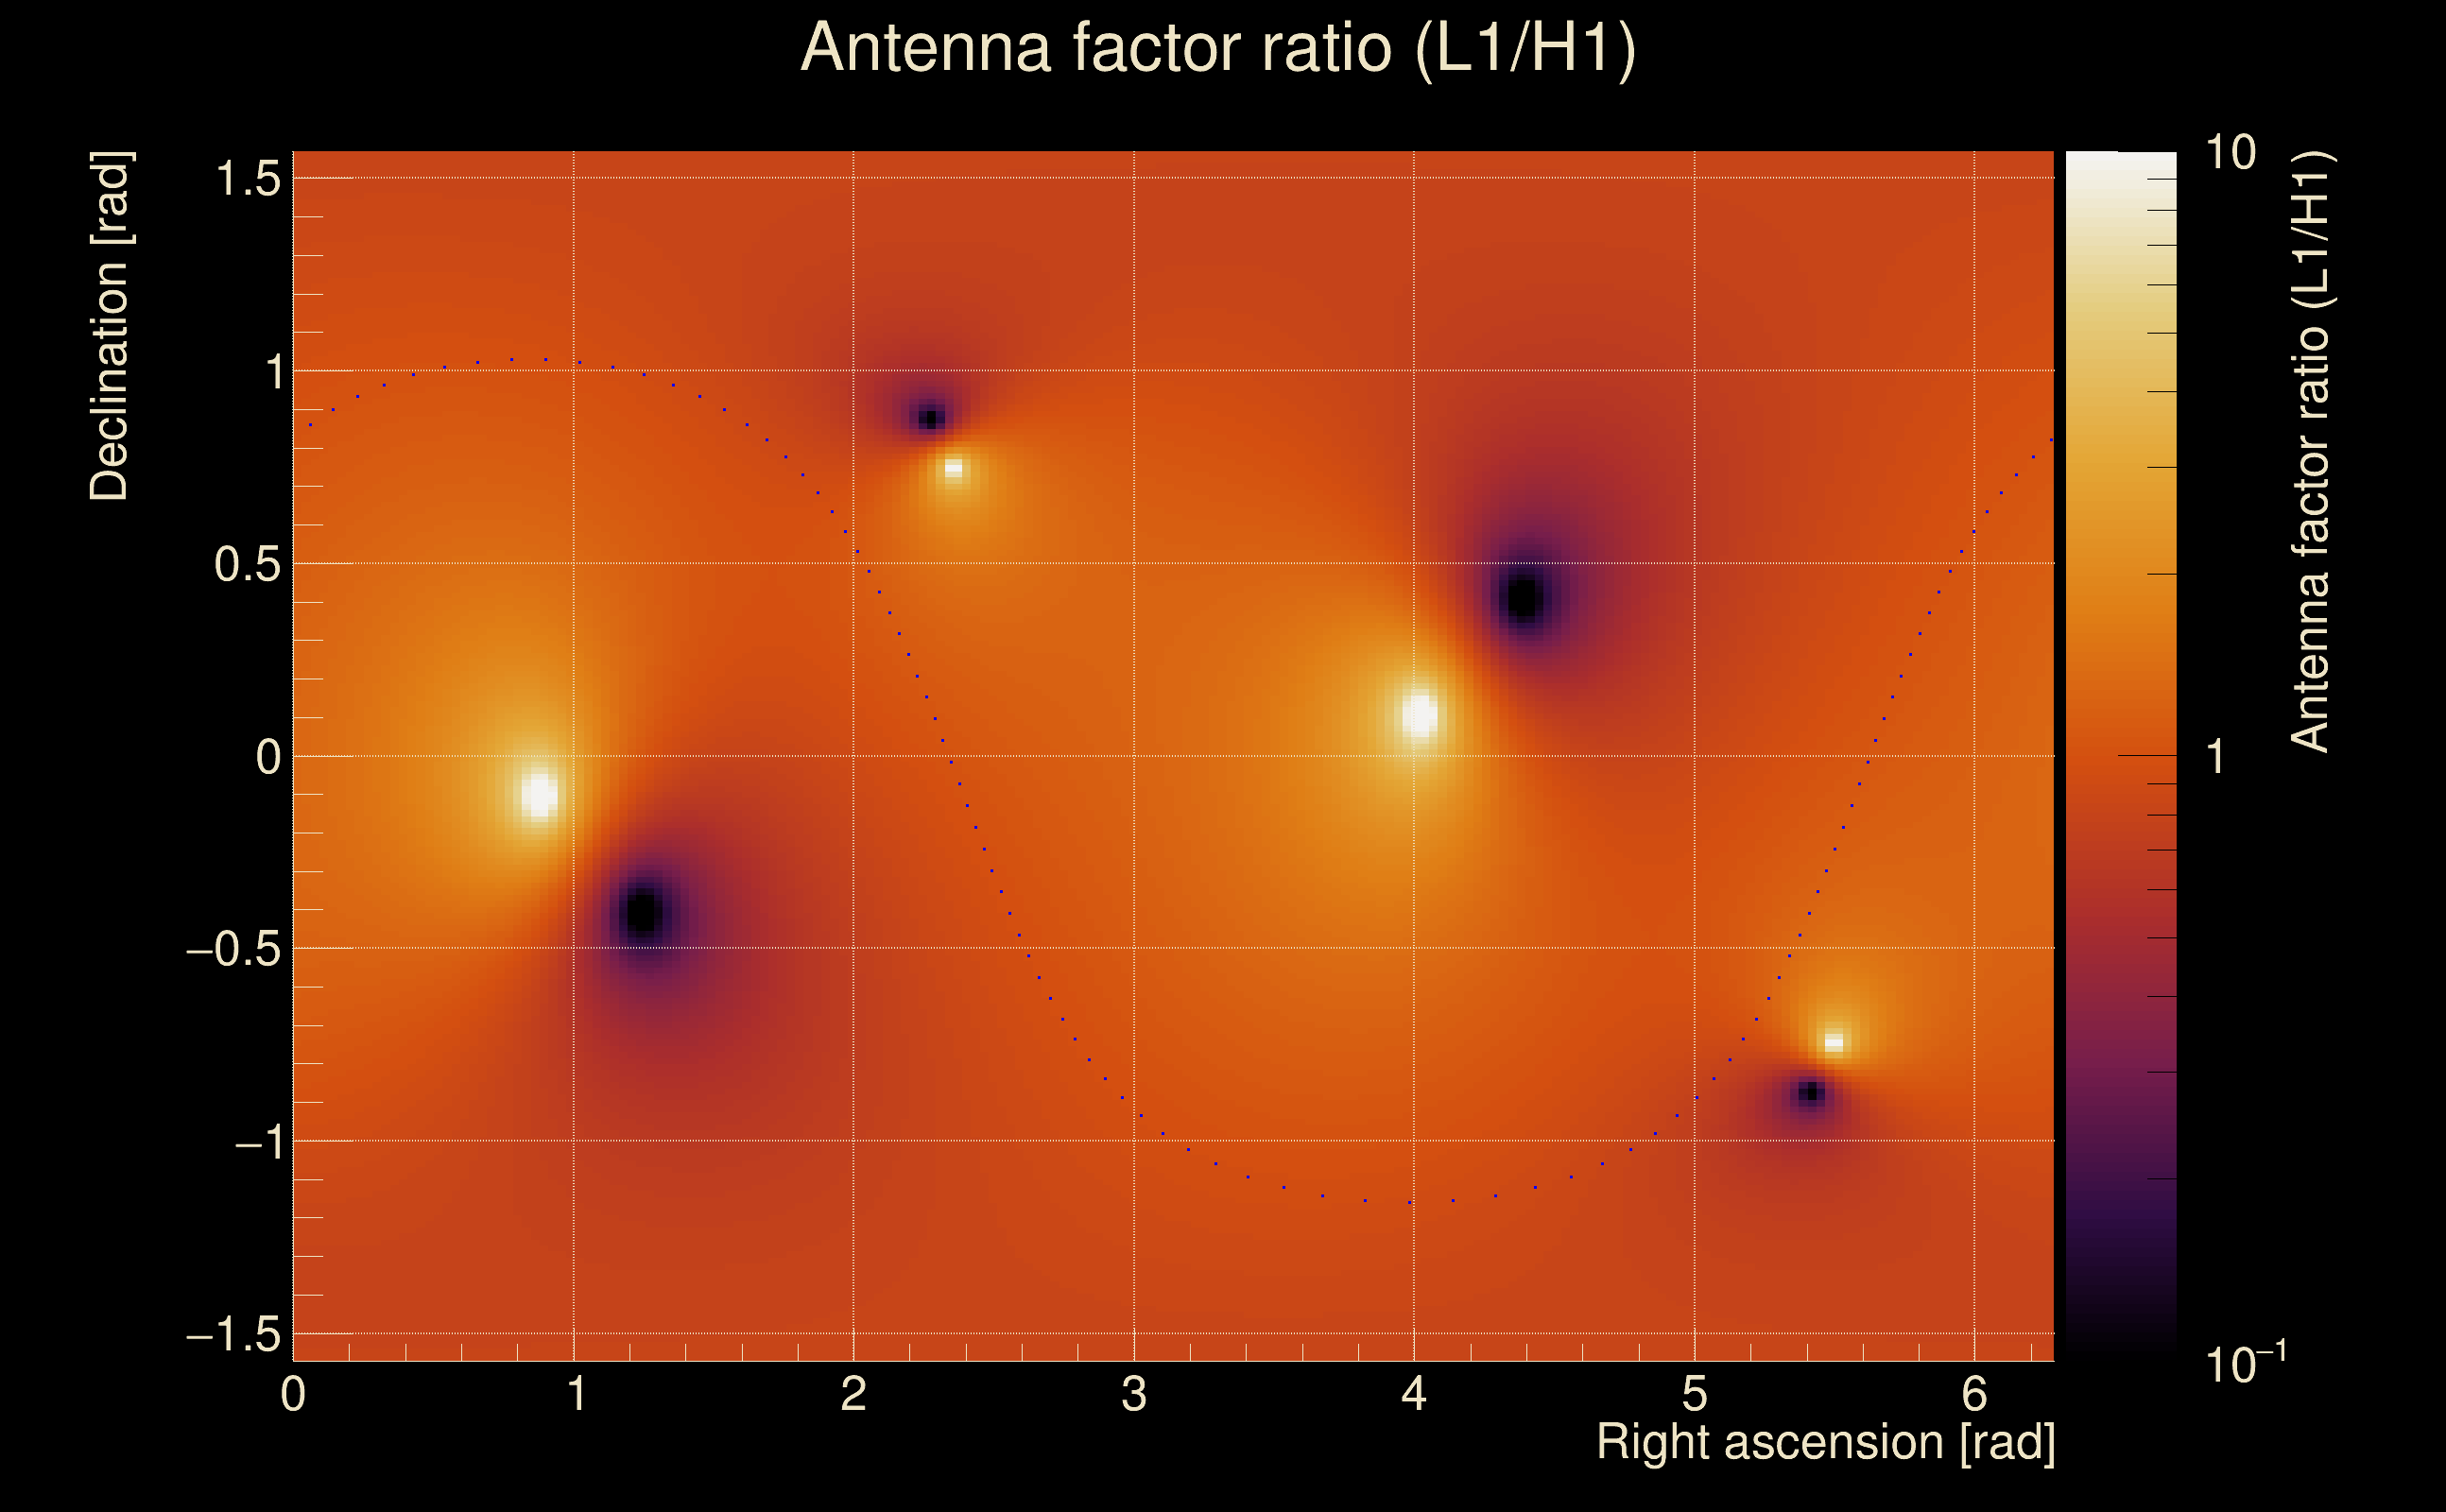
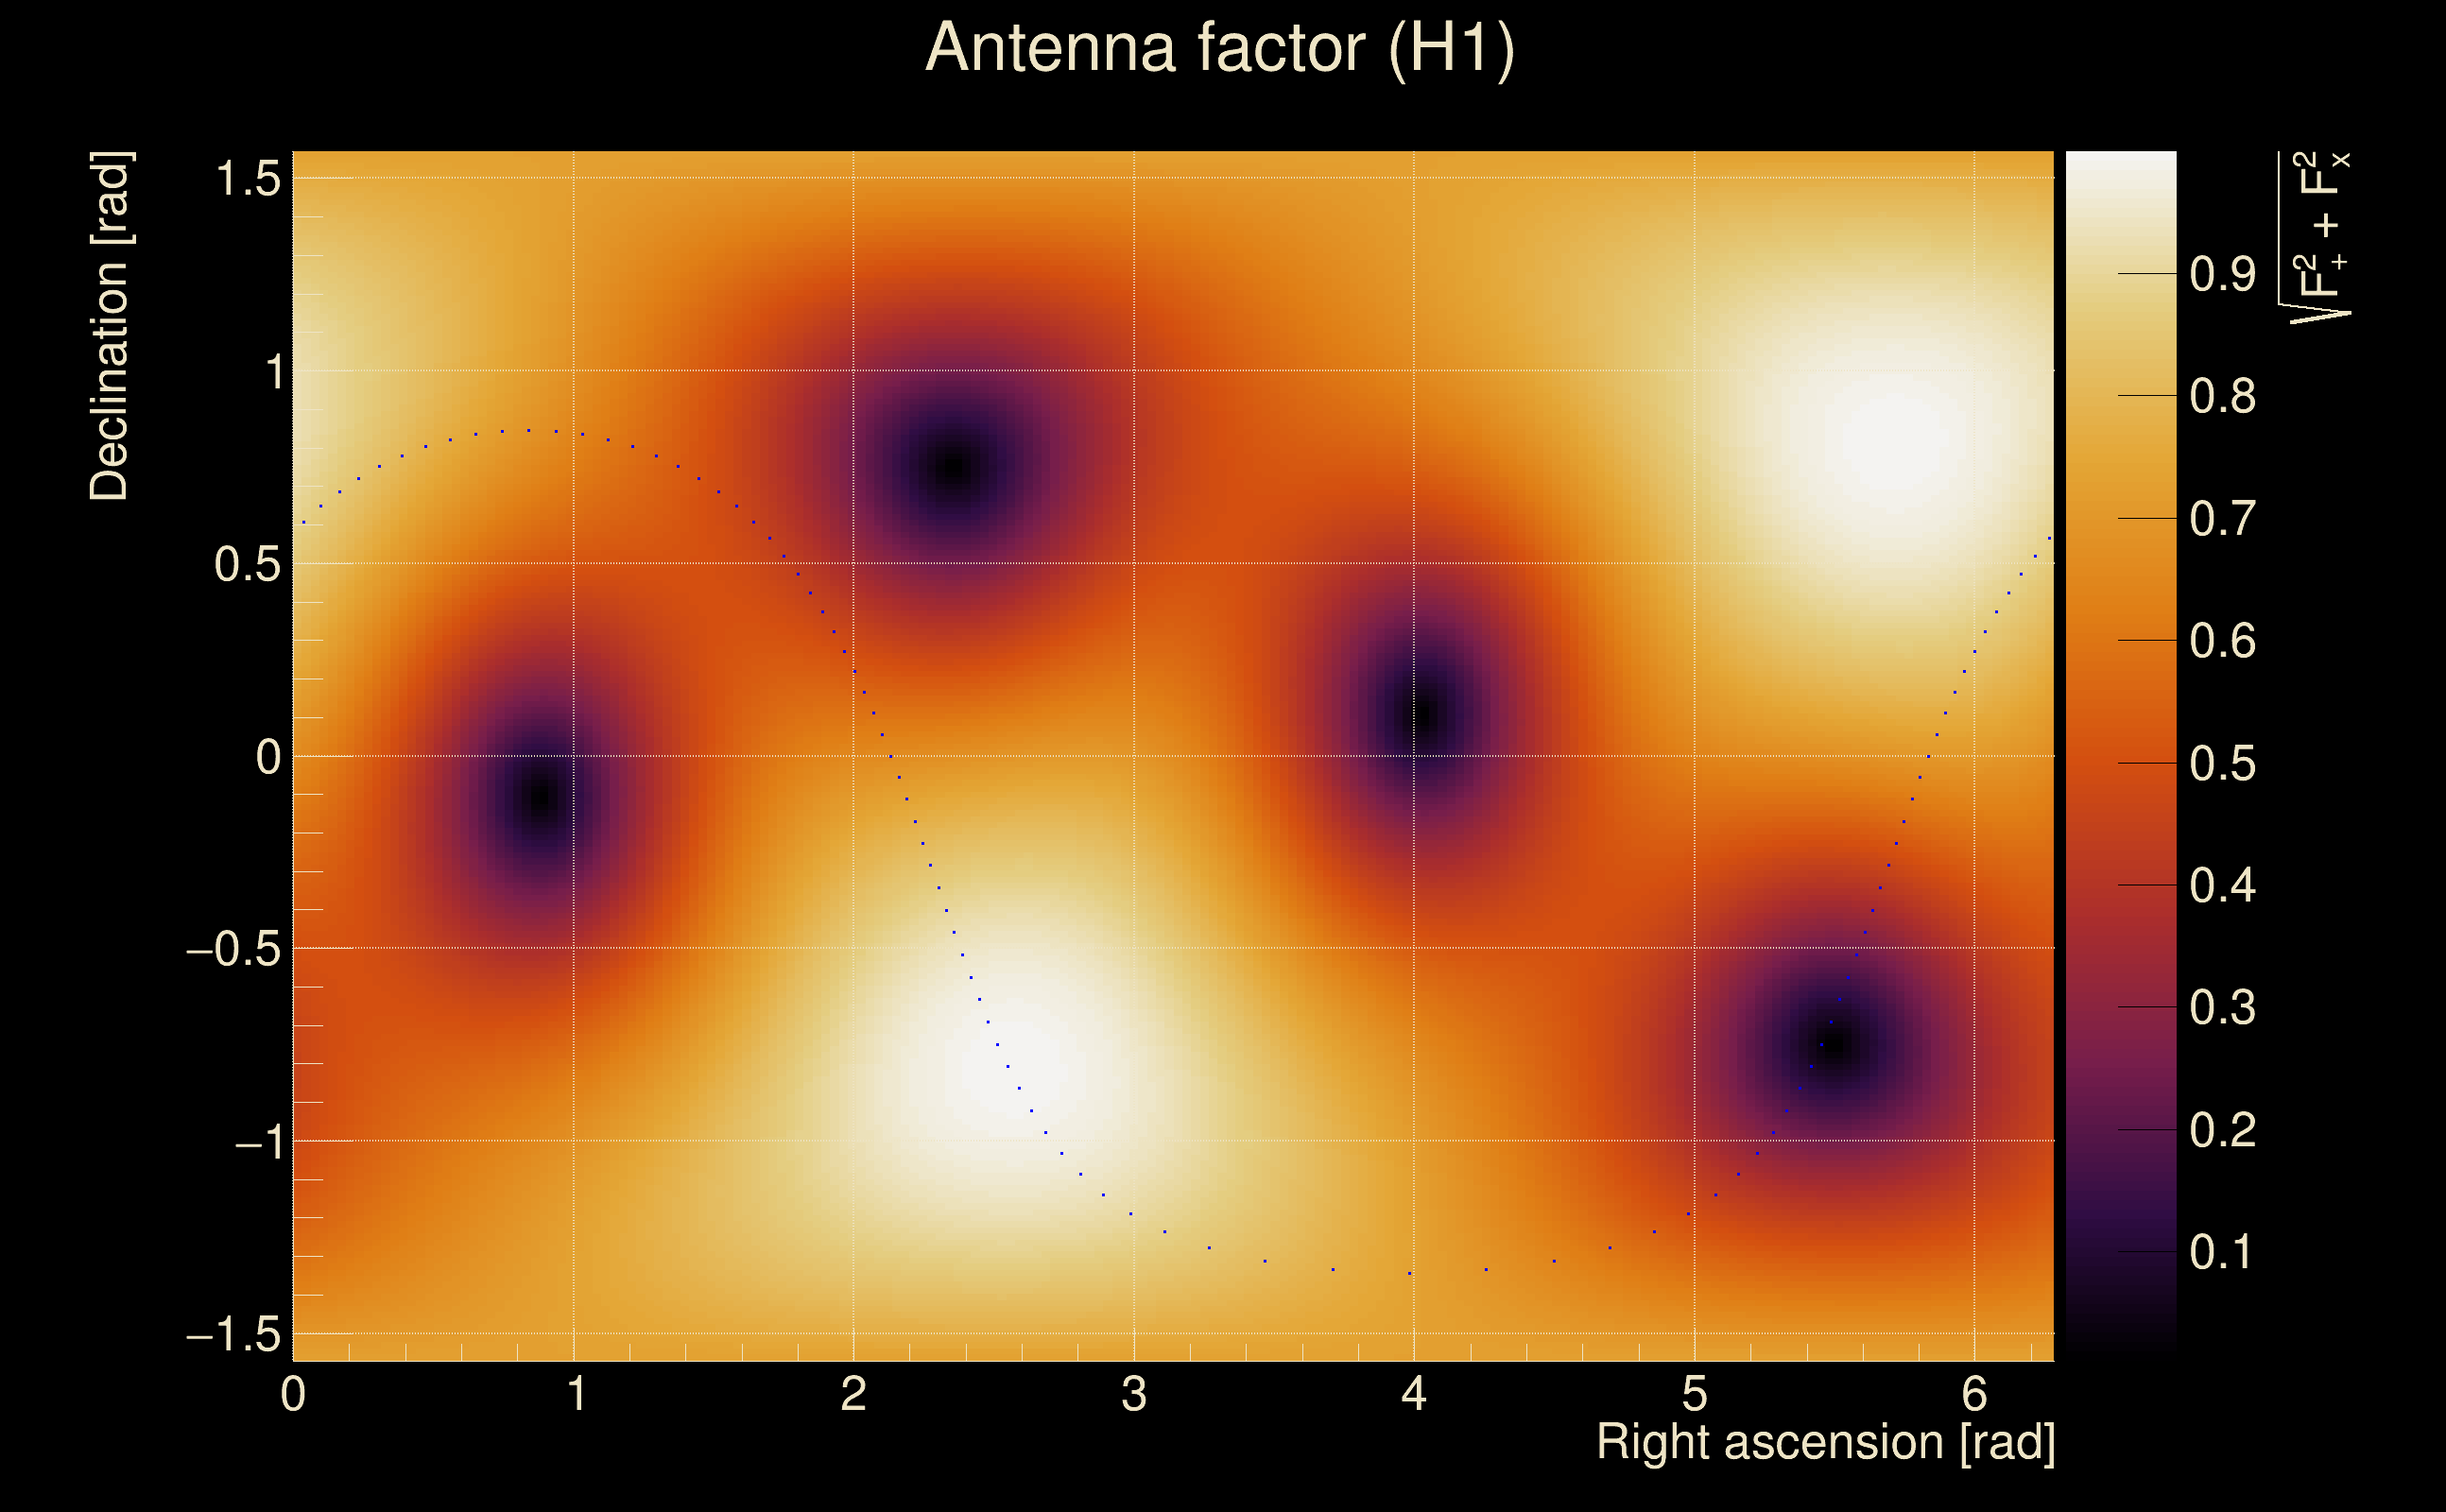
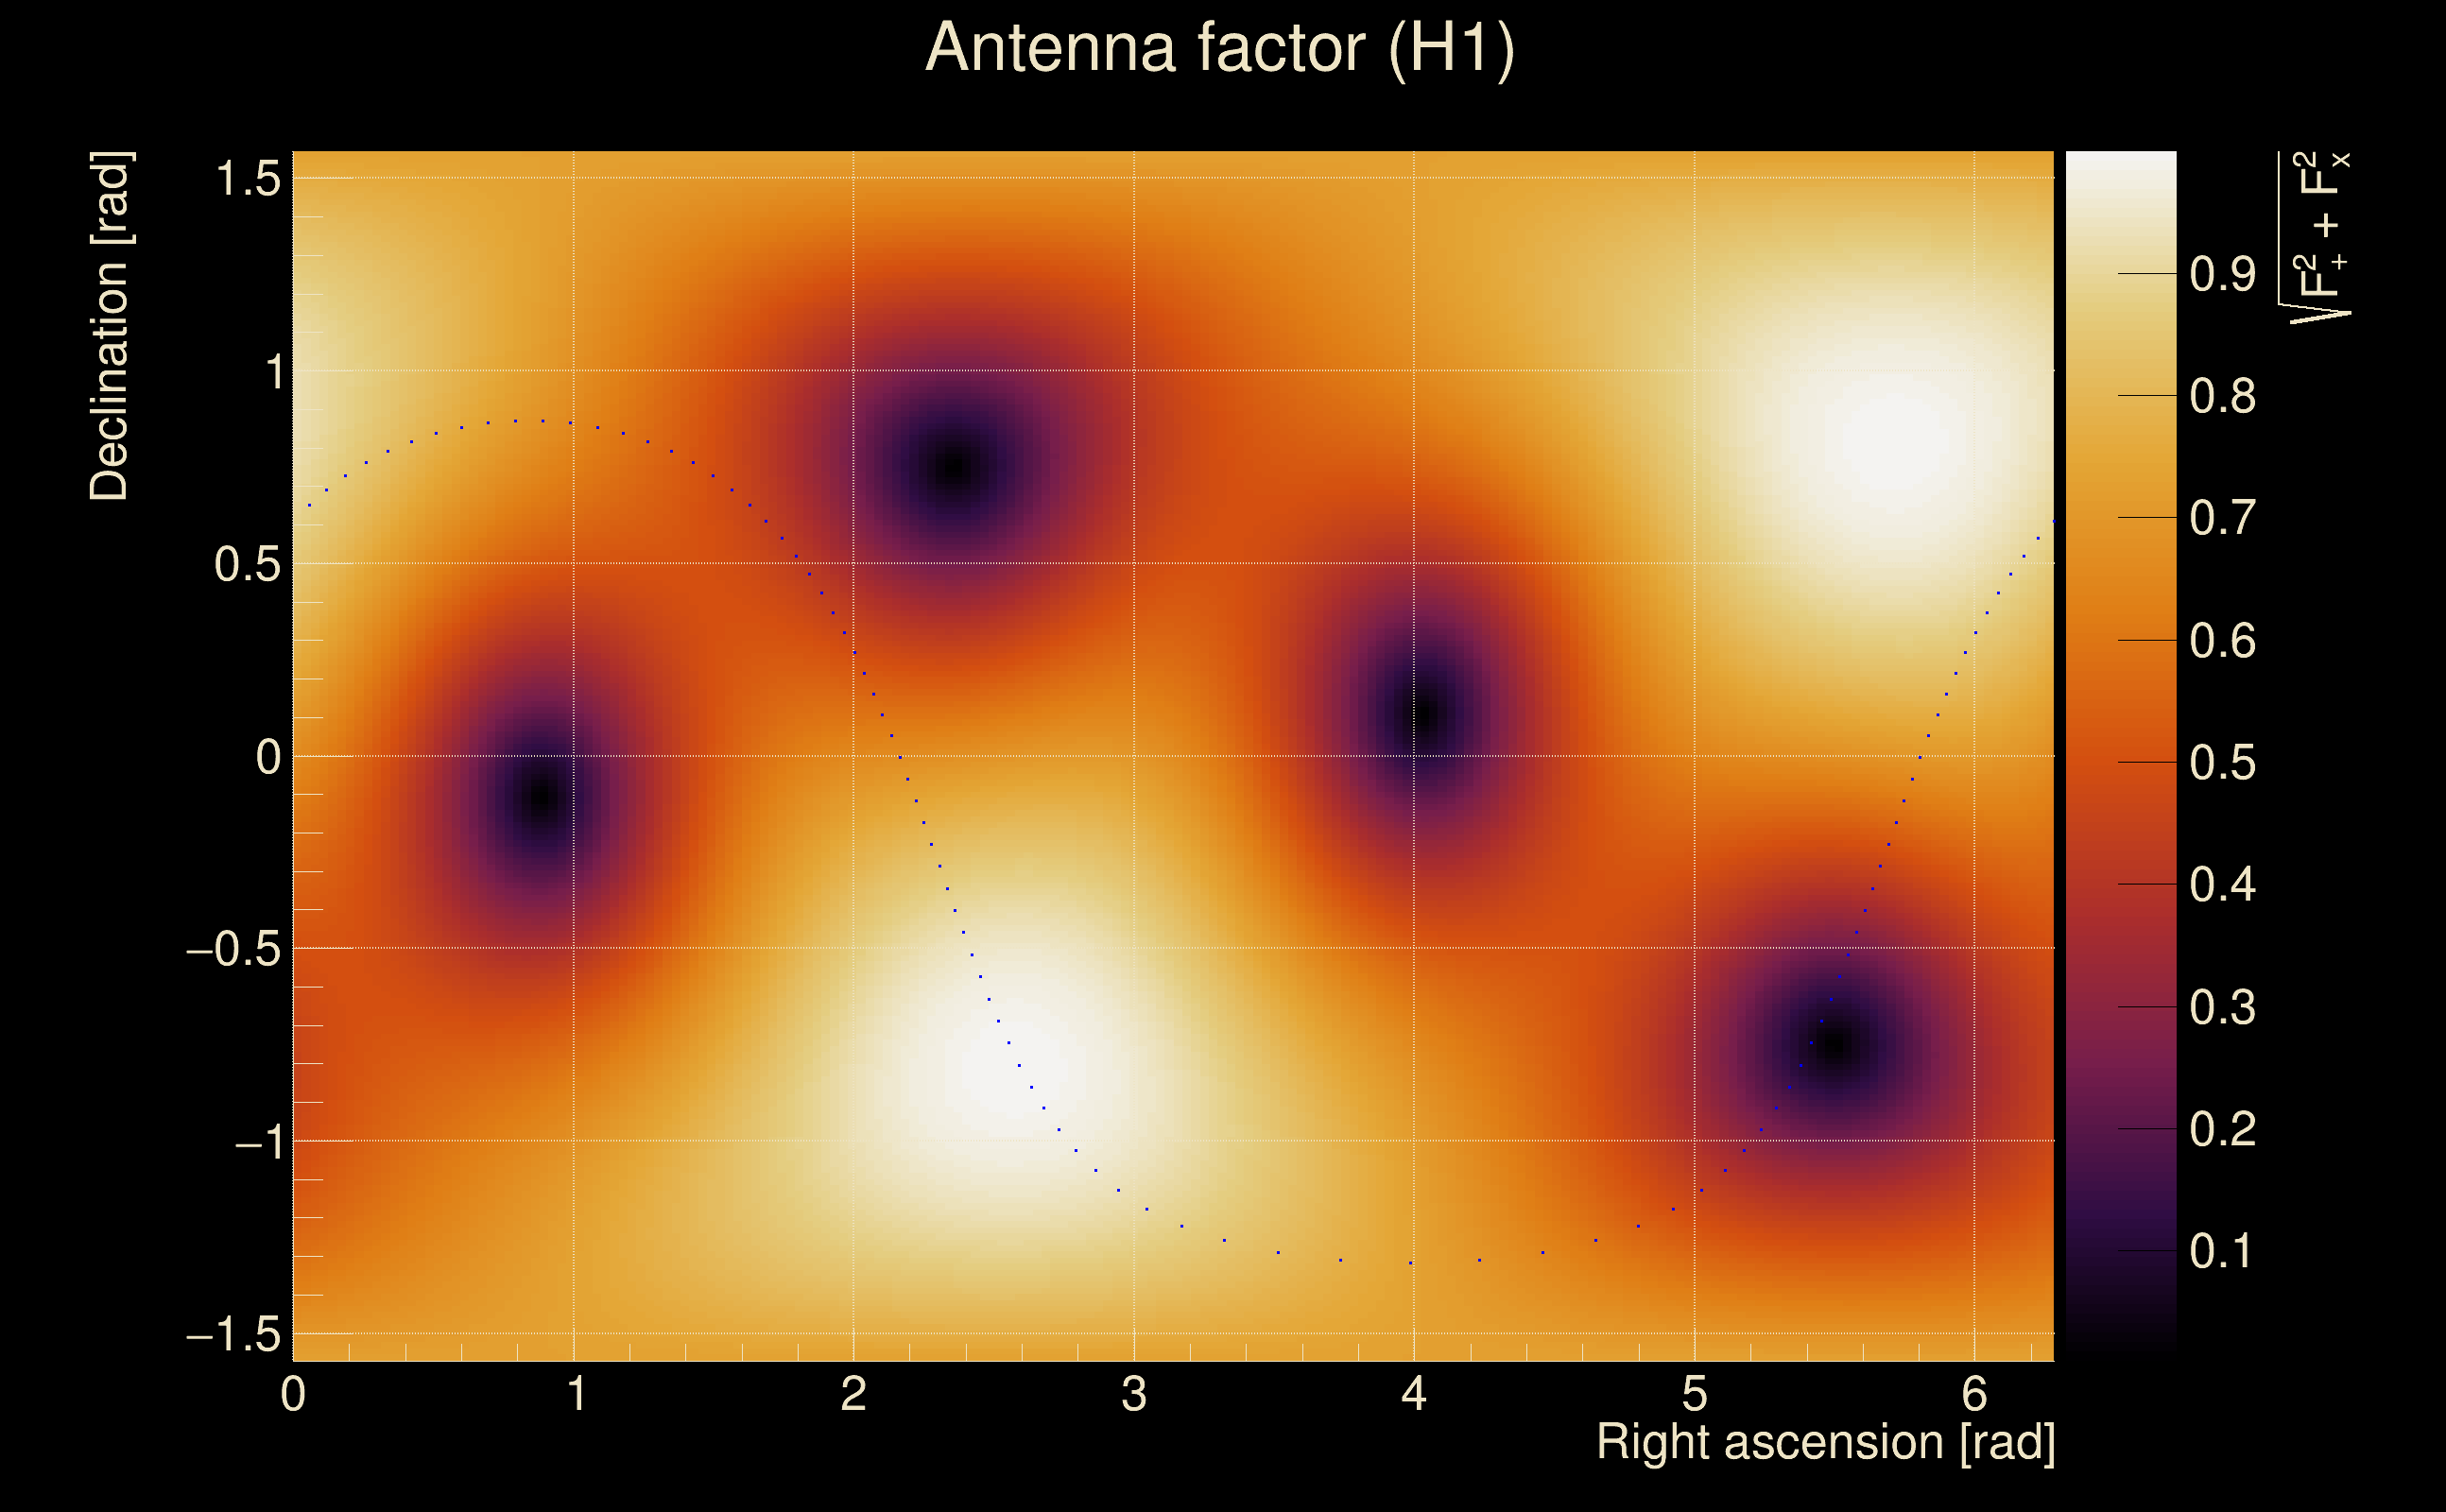
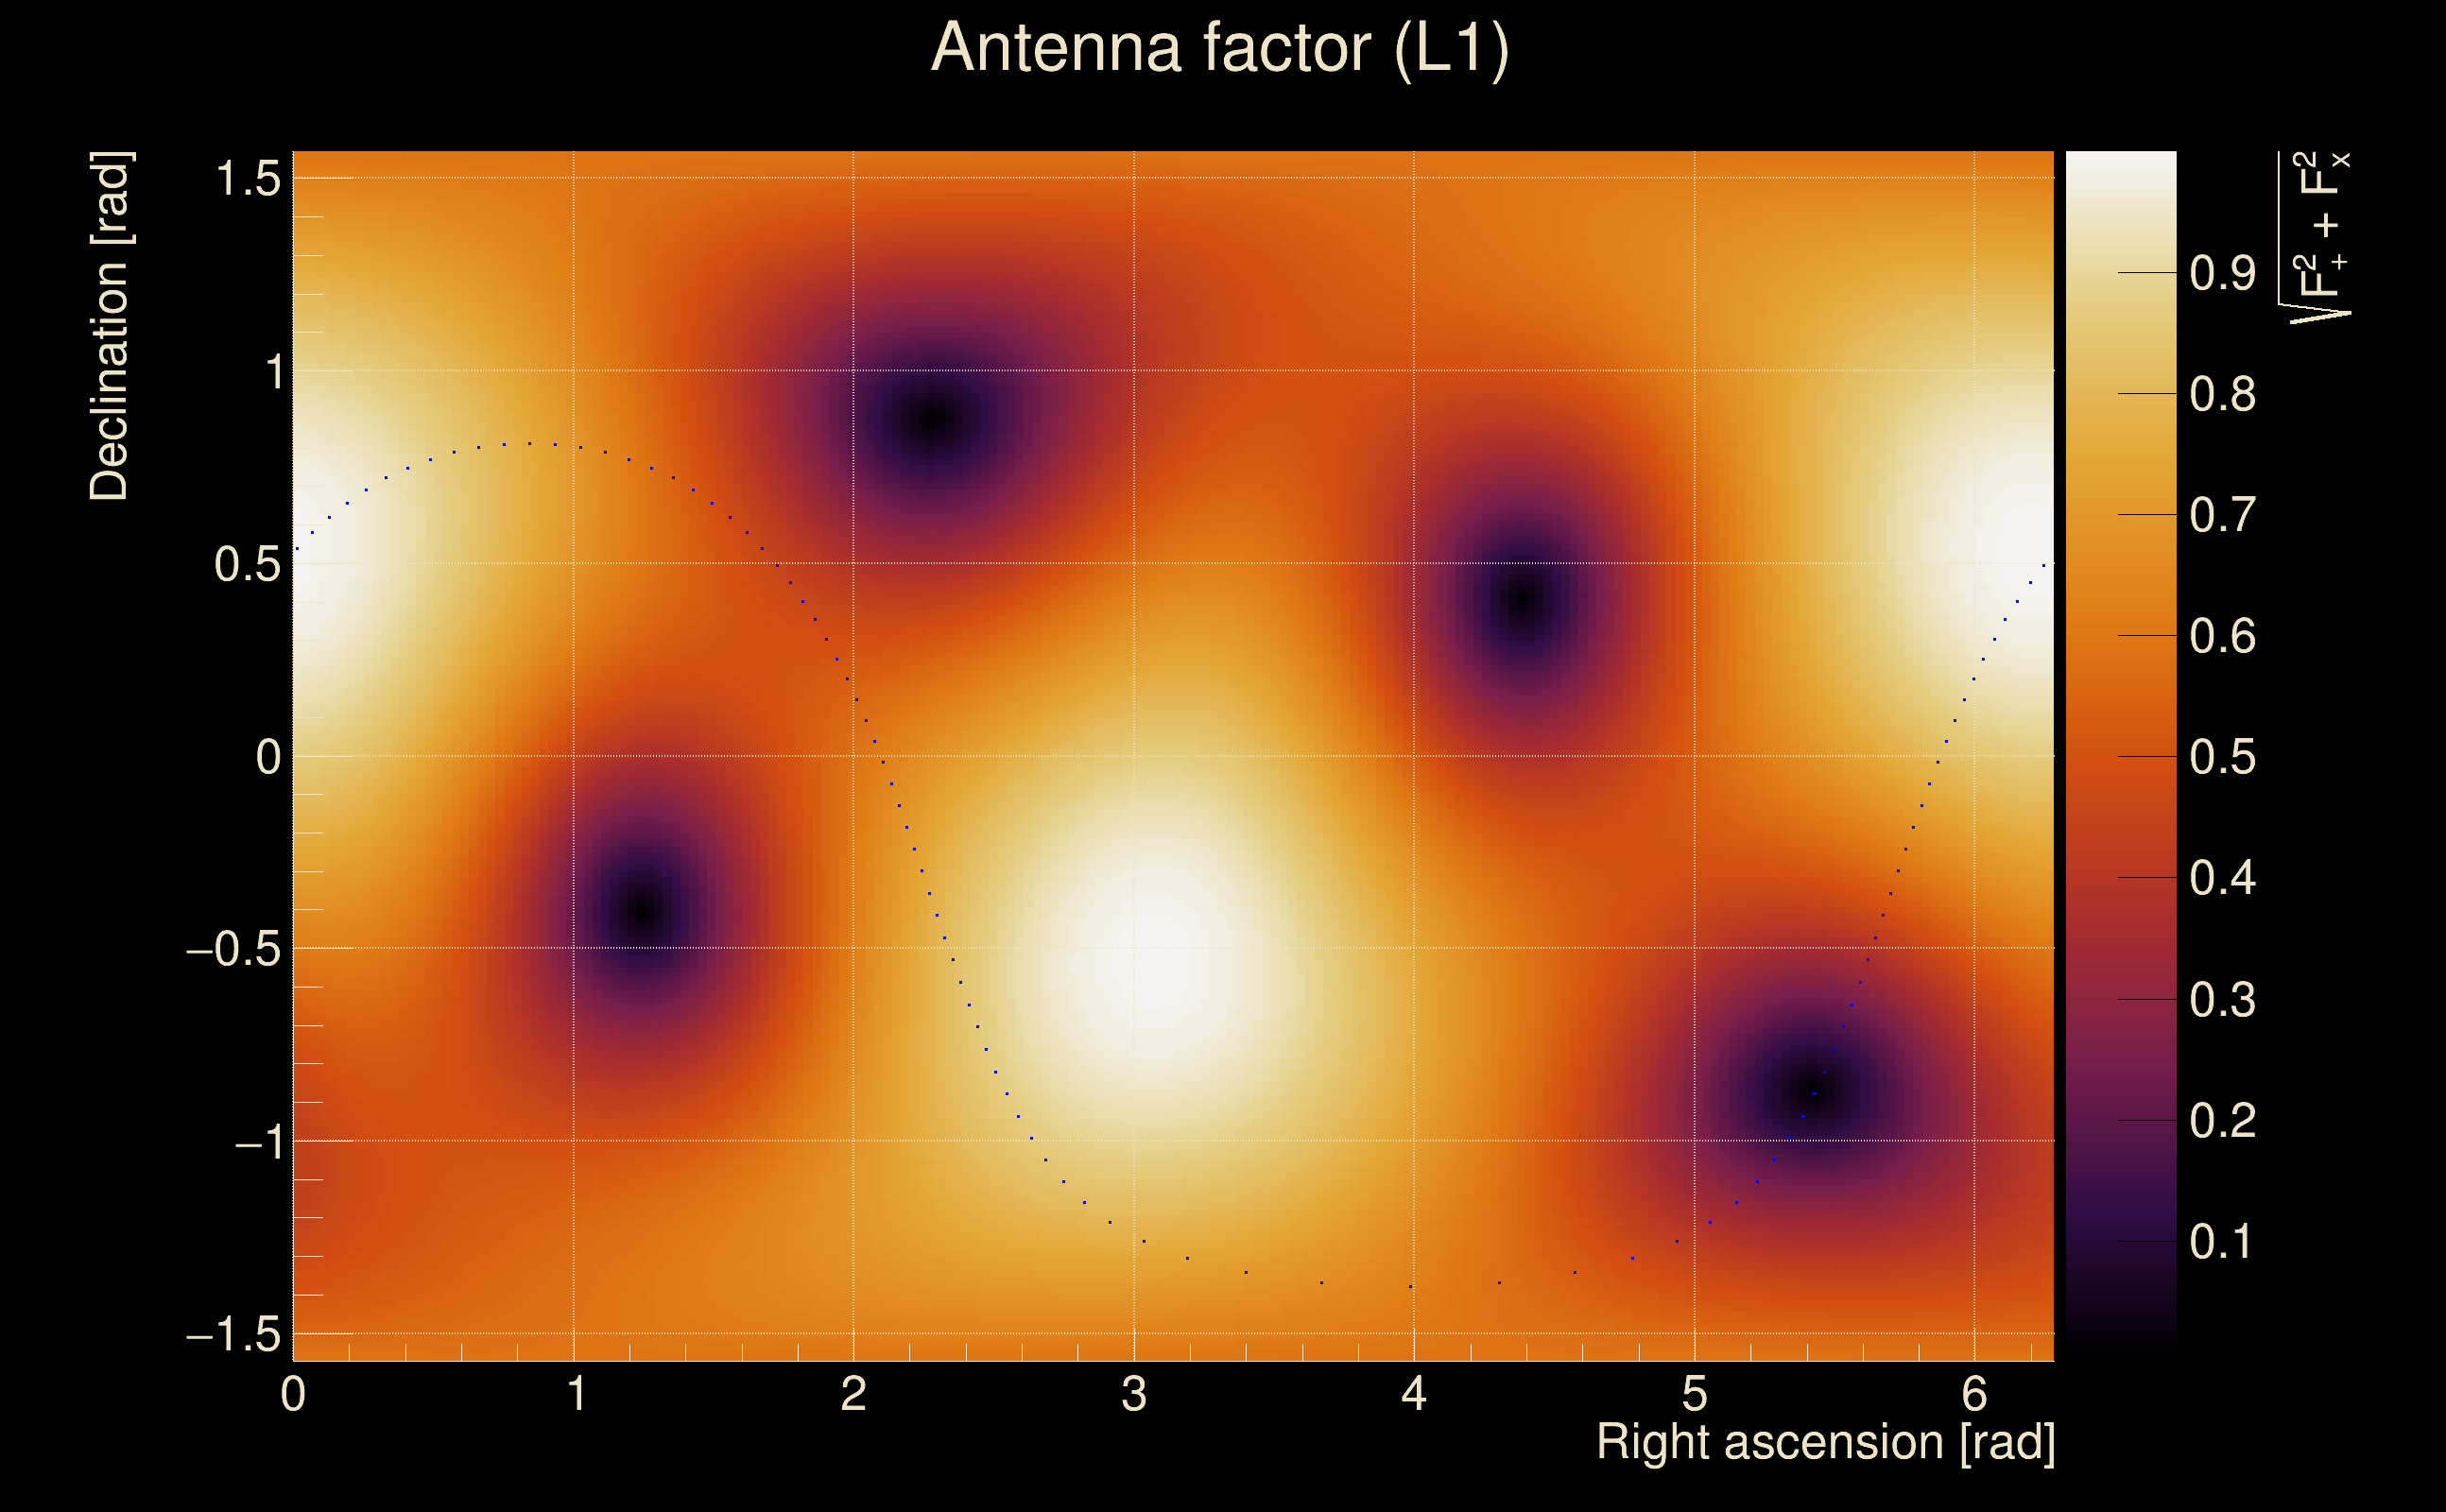
| Target sky positon: | Ra: 6.0135, Dec: 0.3475 [rad] |
| List of input Ox files: | Targeted_O4bw_2min_file_list.txt (10 files) |
| Analysis result file: | Targeted_O4bw_2min_results-0.root |
| Slice selected for the the fakeground: | slice index=64 (-47.976 s), time lag = -40 s |
| Foreground | Fakeground | Background | ||
|---|---|---|---|---|
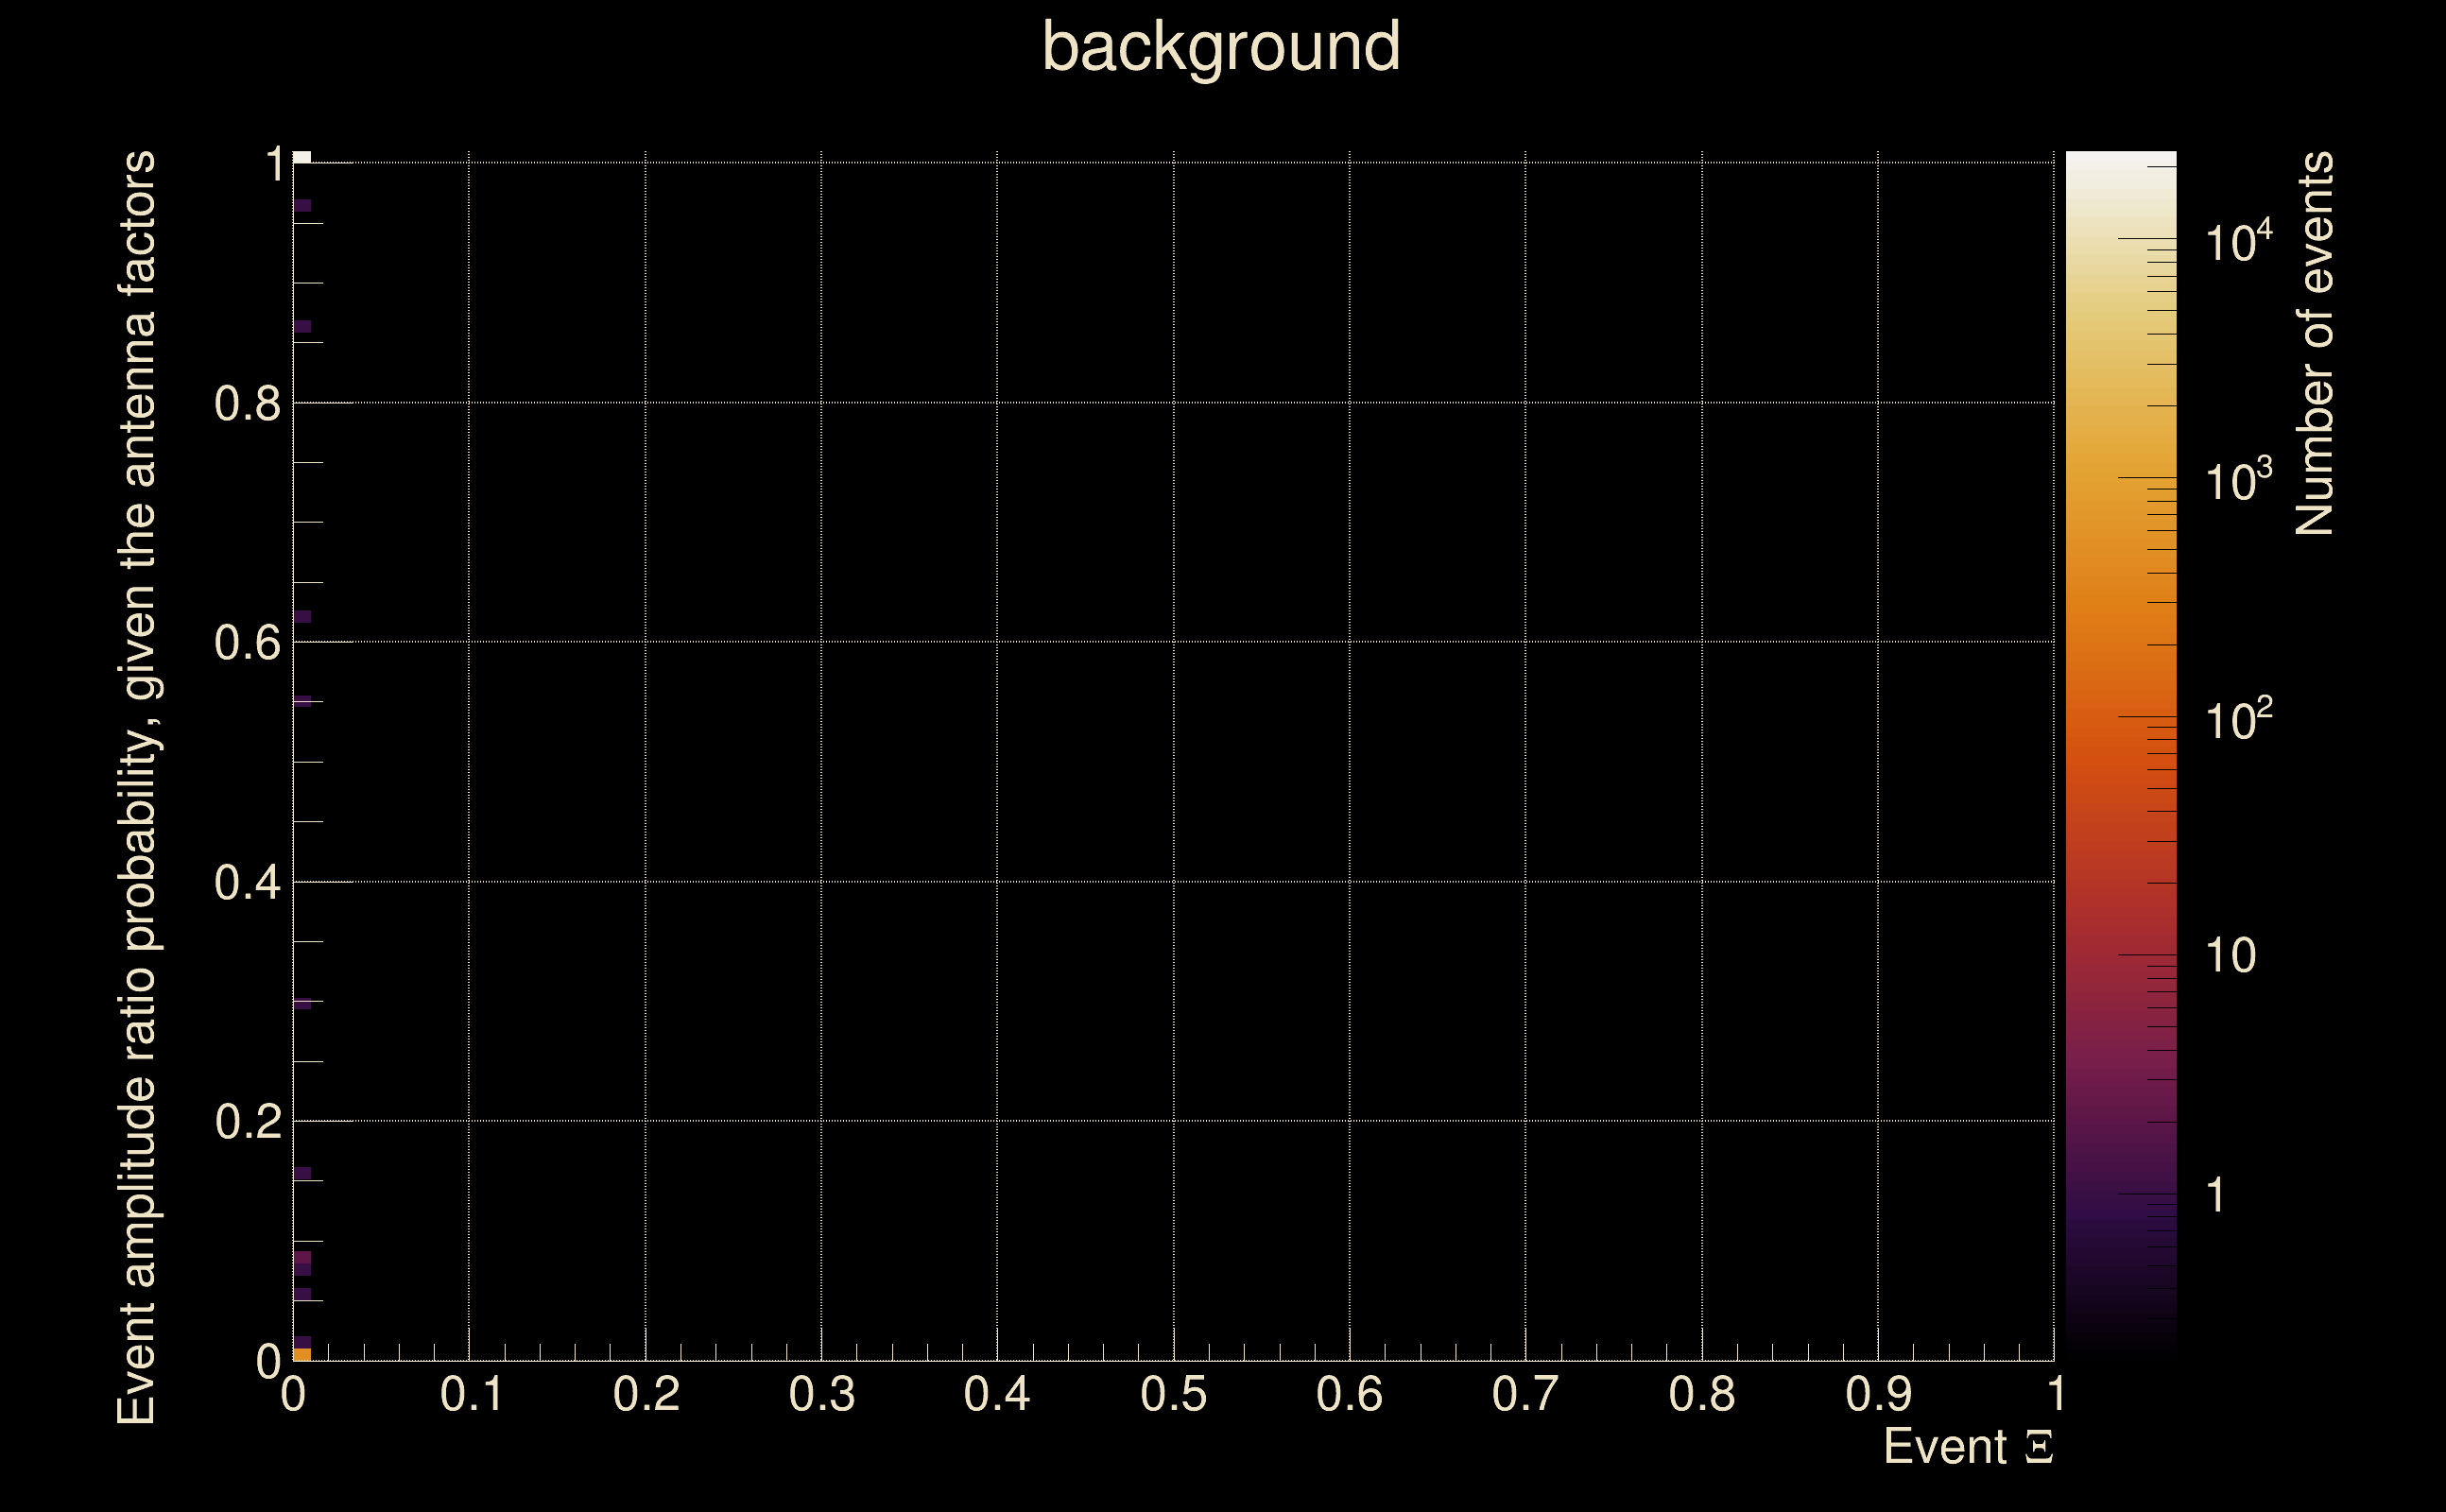
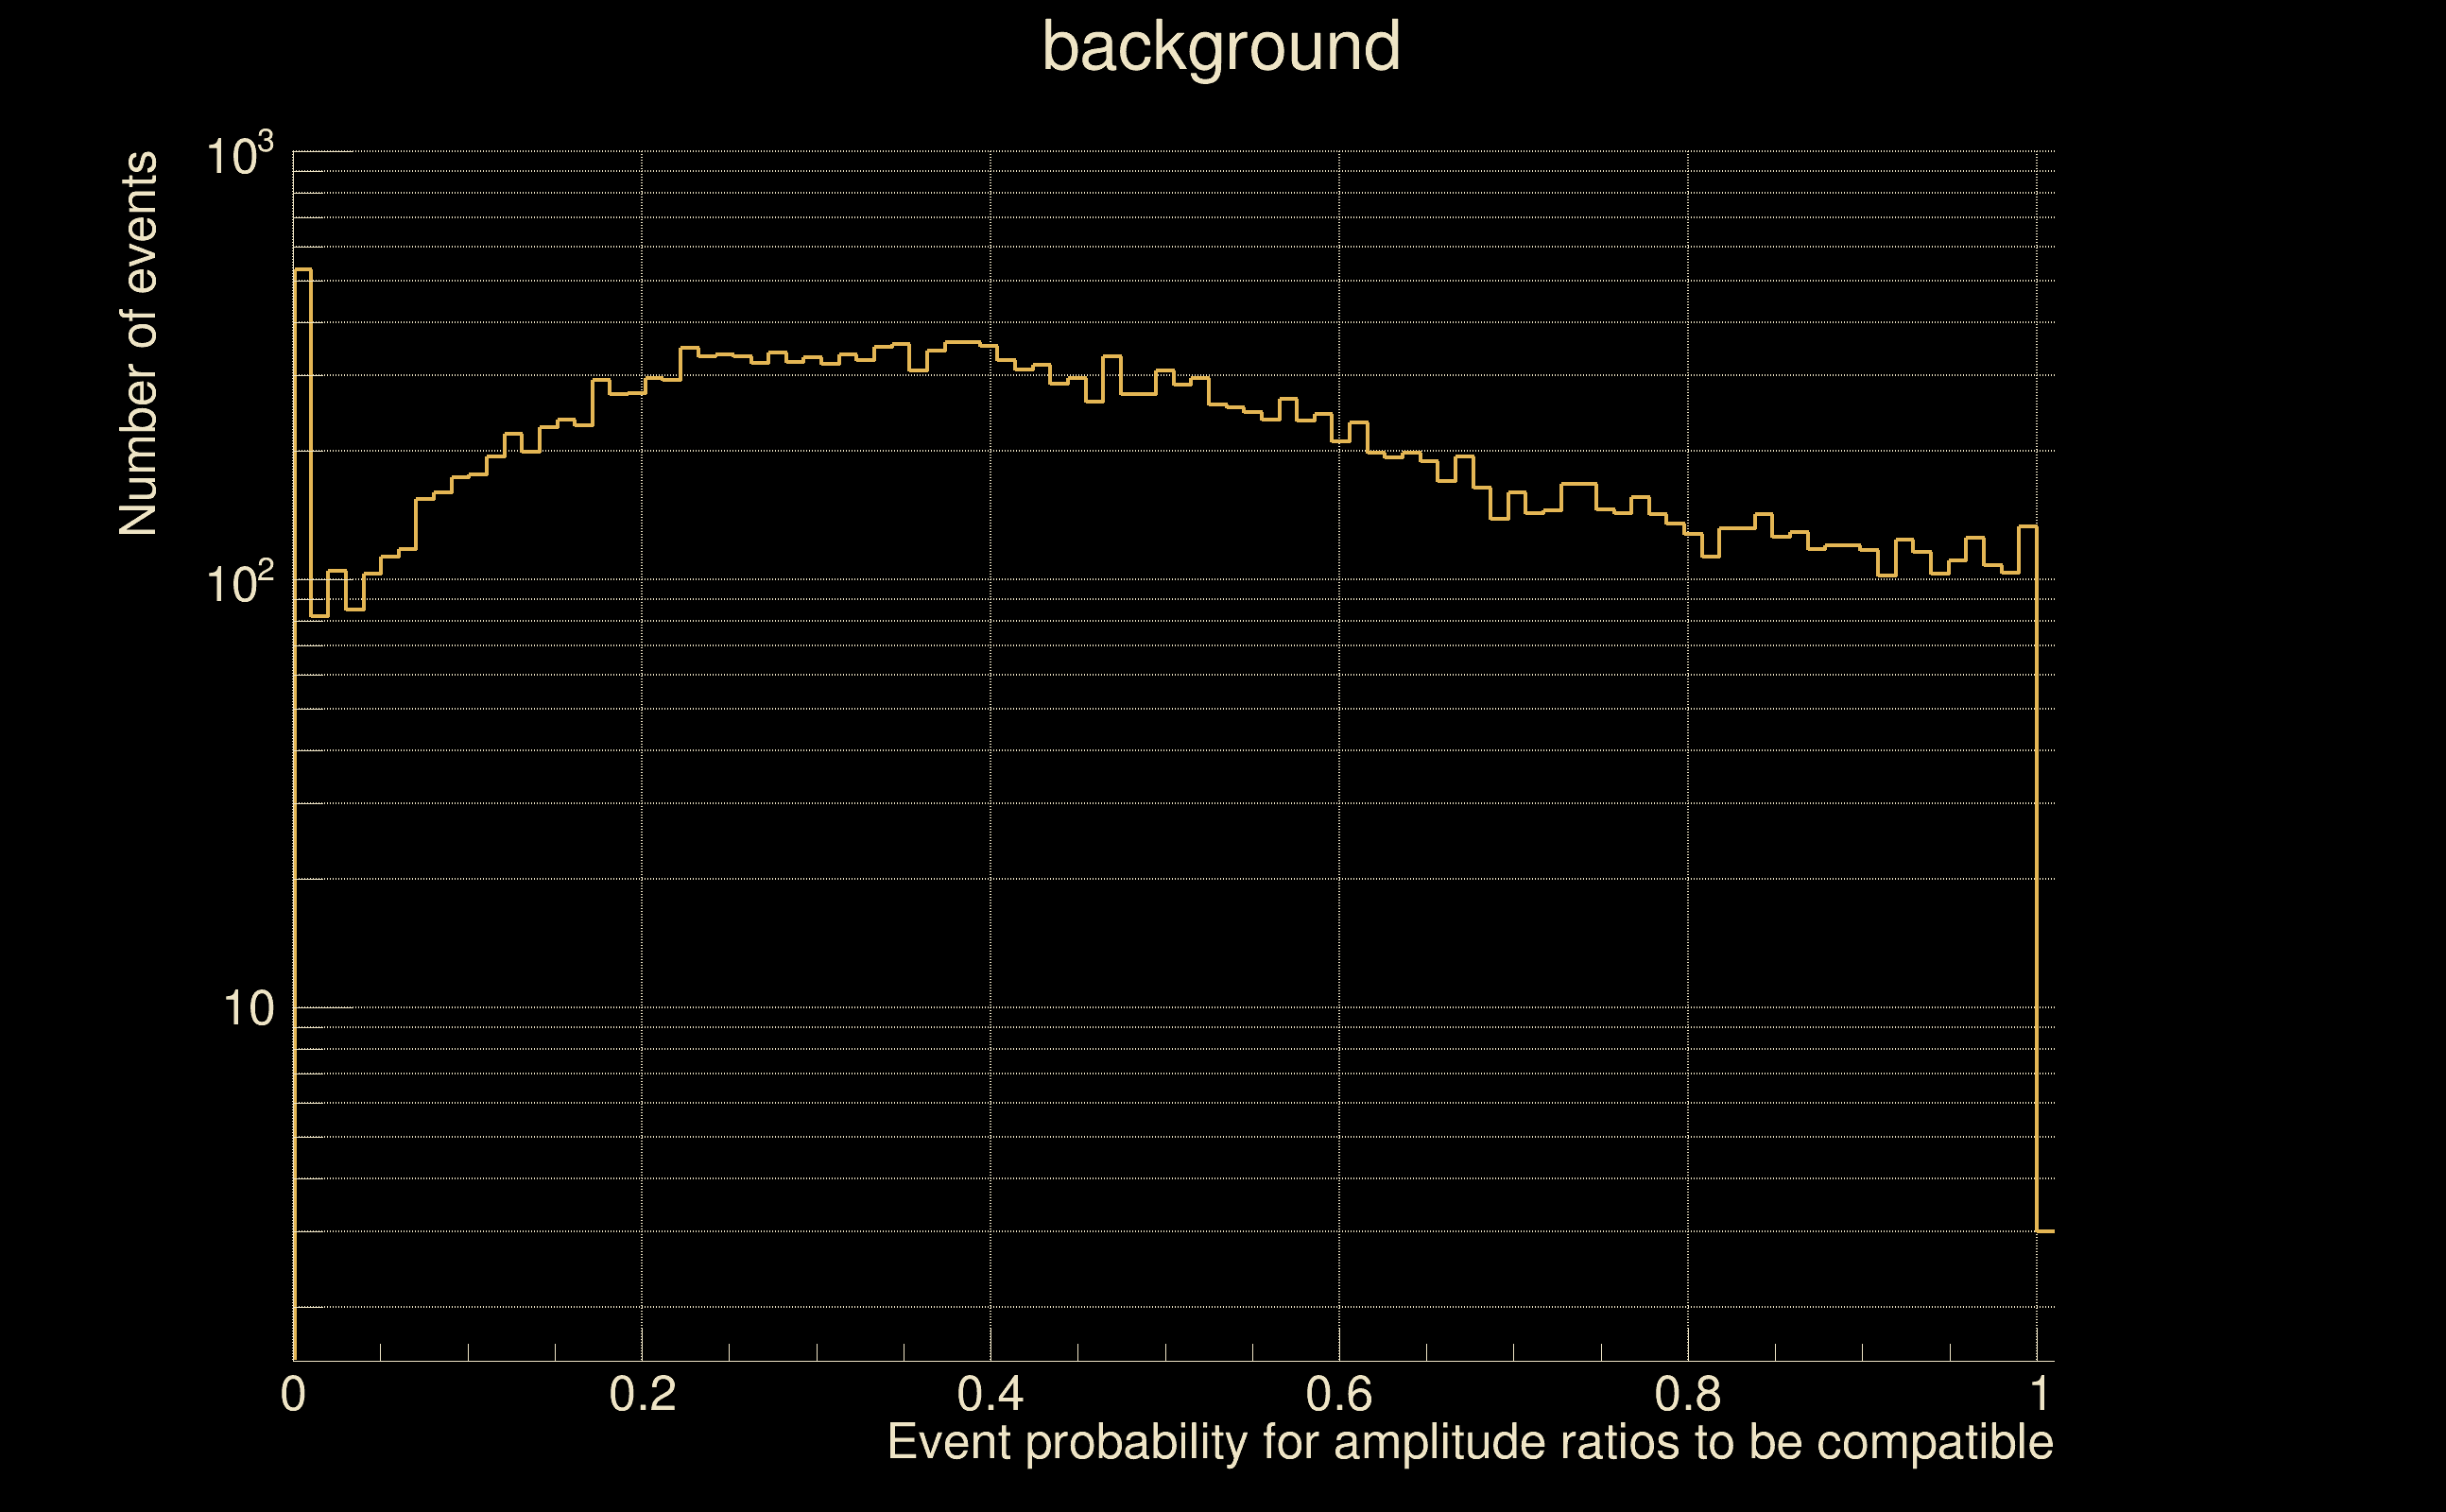
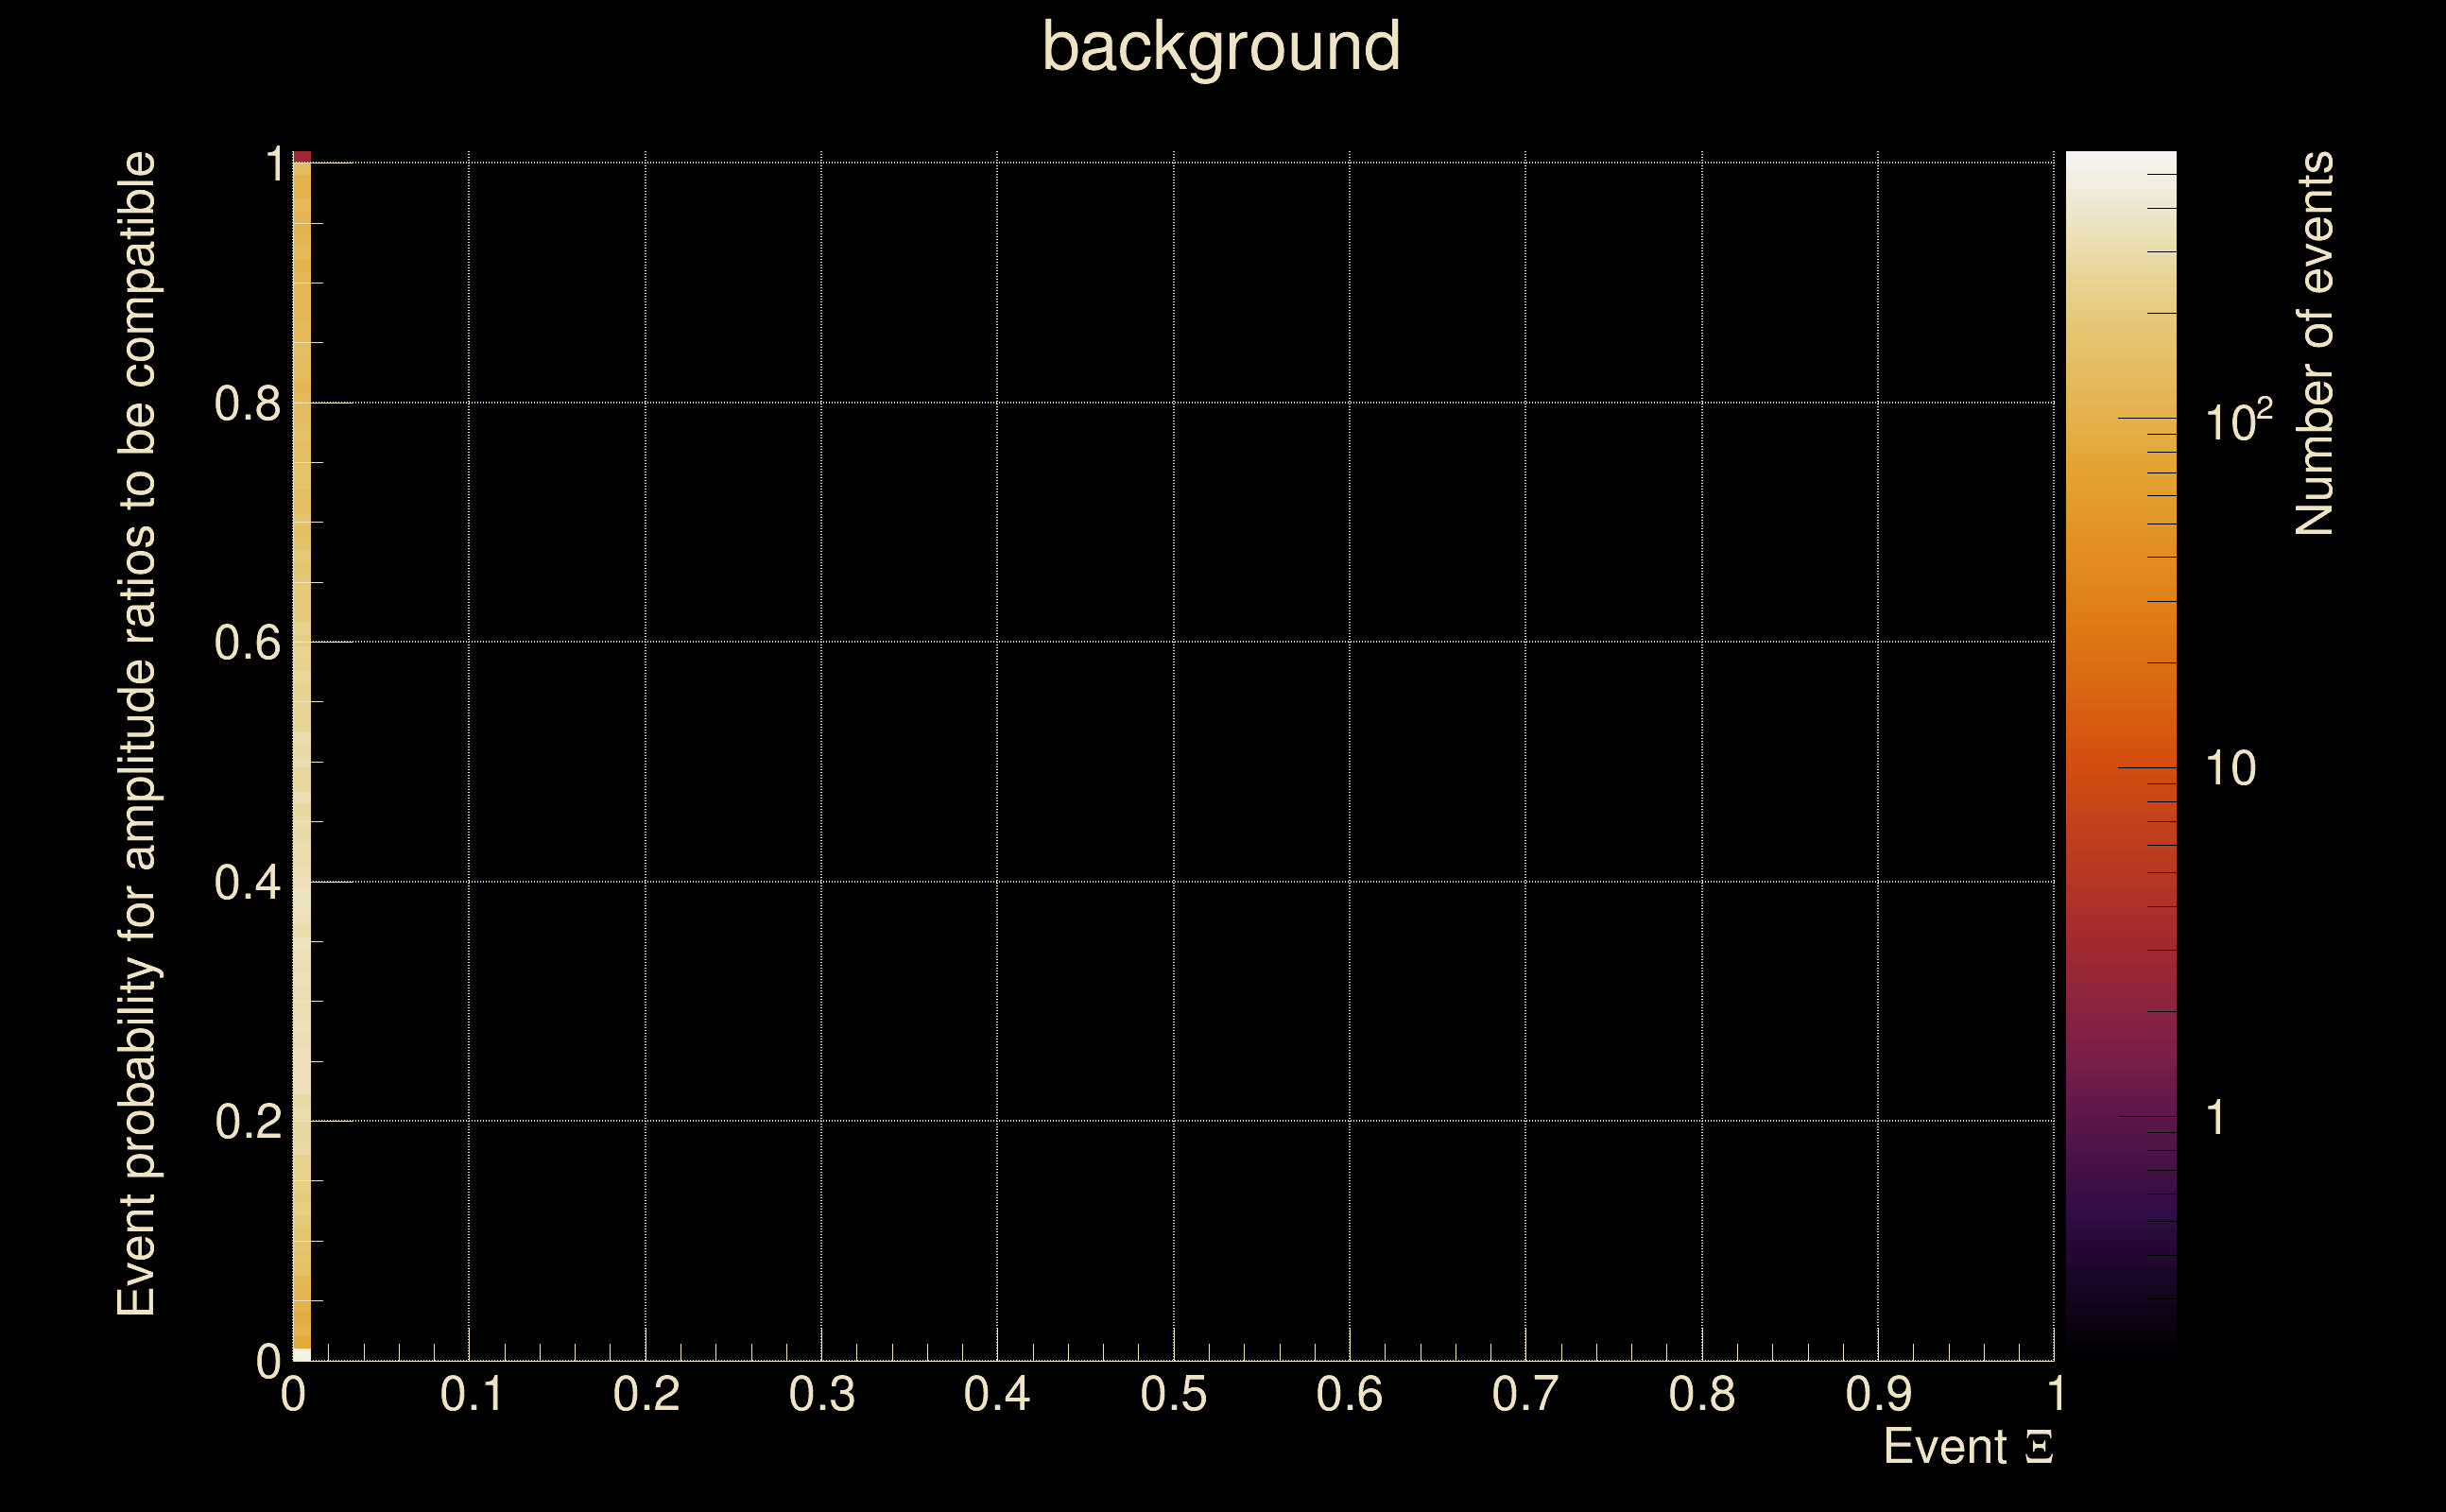
| Number of processed ox events | 0 | 13 | 21687 | |
| Start Date (detector 0) | - | Mon May 15 14:13:35 2023 UTC | Mon May 15 14:14:05 2023 UTC | |
| End Date (detector 0) | - | Mon May 15 14:15:15 2023 UTC | Mon May 15 14:15:15 2023 UTC | |
| Start GPS (detector 0) | - | 1368195233 | 1368195263 | |
| End GPS (detector 0) | - | 1368195333 | 1368195333 | |
| Used livetime (detector 0) | 0 s | 70 s | 100 s | |
| Start Date (detector 1) | - | Mon May 15 14:13:25 2023 UTC | Mon May 15 14:13:25 2023 UTC | |
| End Date (detector 1) | - | Mon May 15 14:15:05 2023 UTC | Mon May 15 14:14:35 2023 UTC | |
| Start GPS (detector 1) | - | 1368195223 | 1368195223 | |
| End GPS (detector 1) | - | 1368195323 | 1368195293 | |
| Used livetime (detector 1) | 0 s | 70 s | 100 s | |
| Cumulative livetime | 0 s | 130 s | 216870 s | |
| 0 years, 0 days, 0 hours, 0 min, 0 s | 0 years, 0 days, 0 hours, 2 min, 10 s | 0 years, 2 days, 12 hours, 14 min, 30 s |
|
|
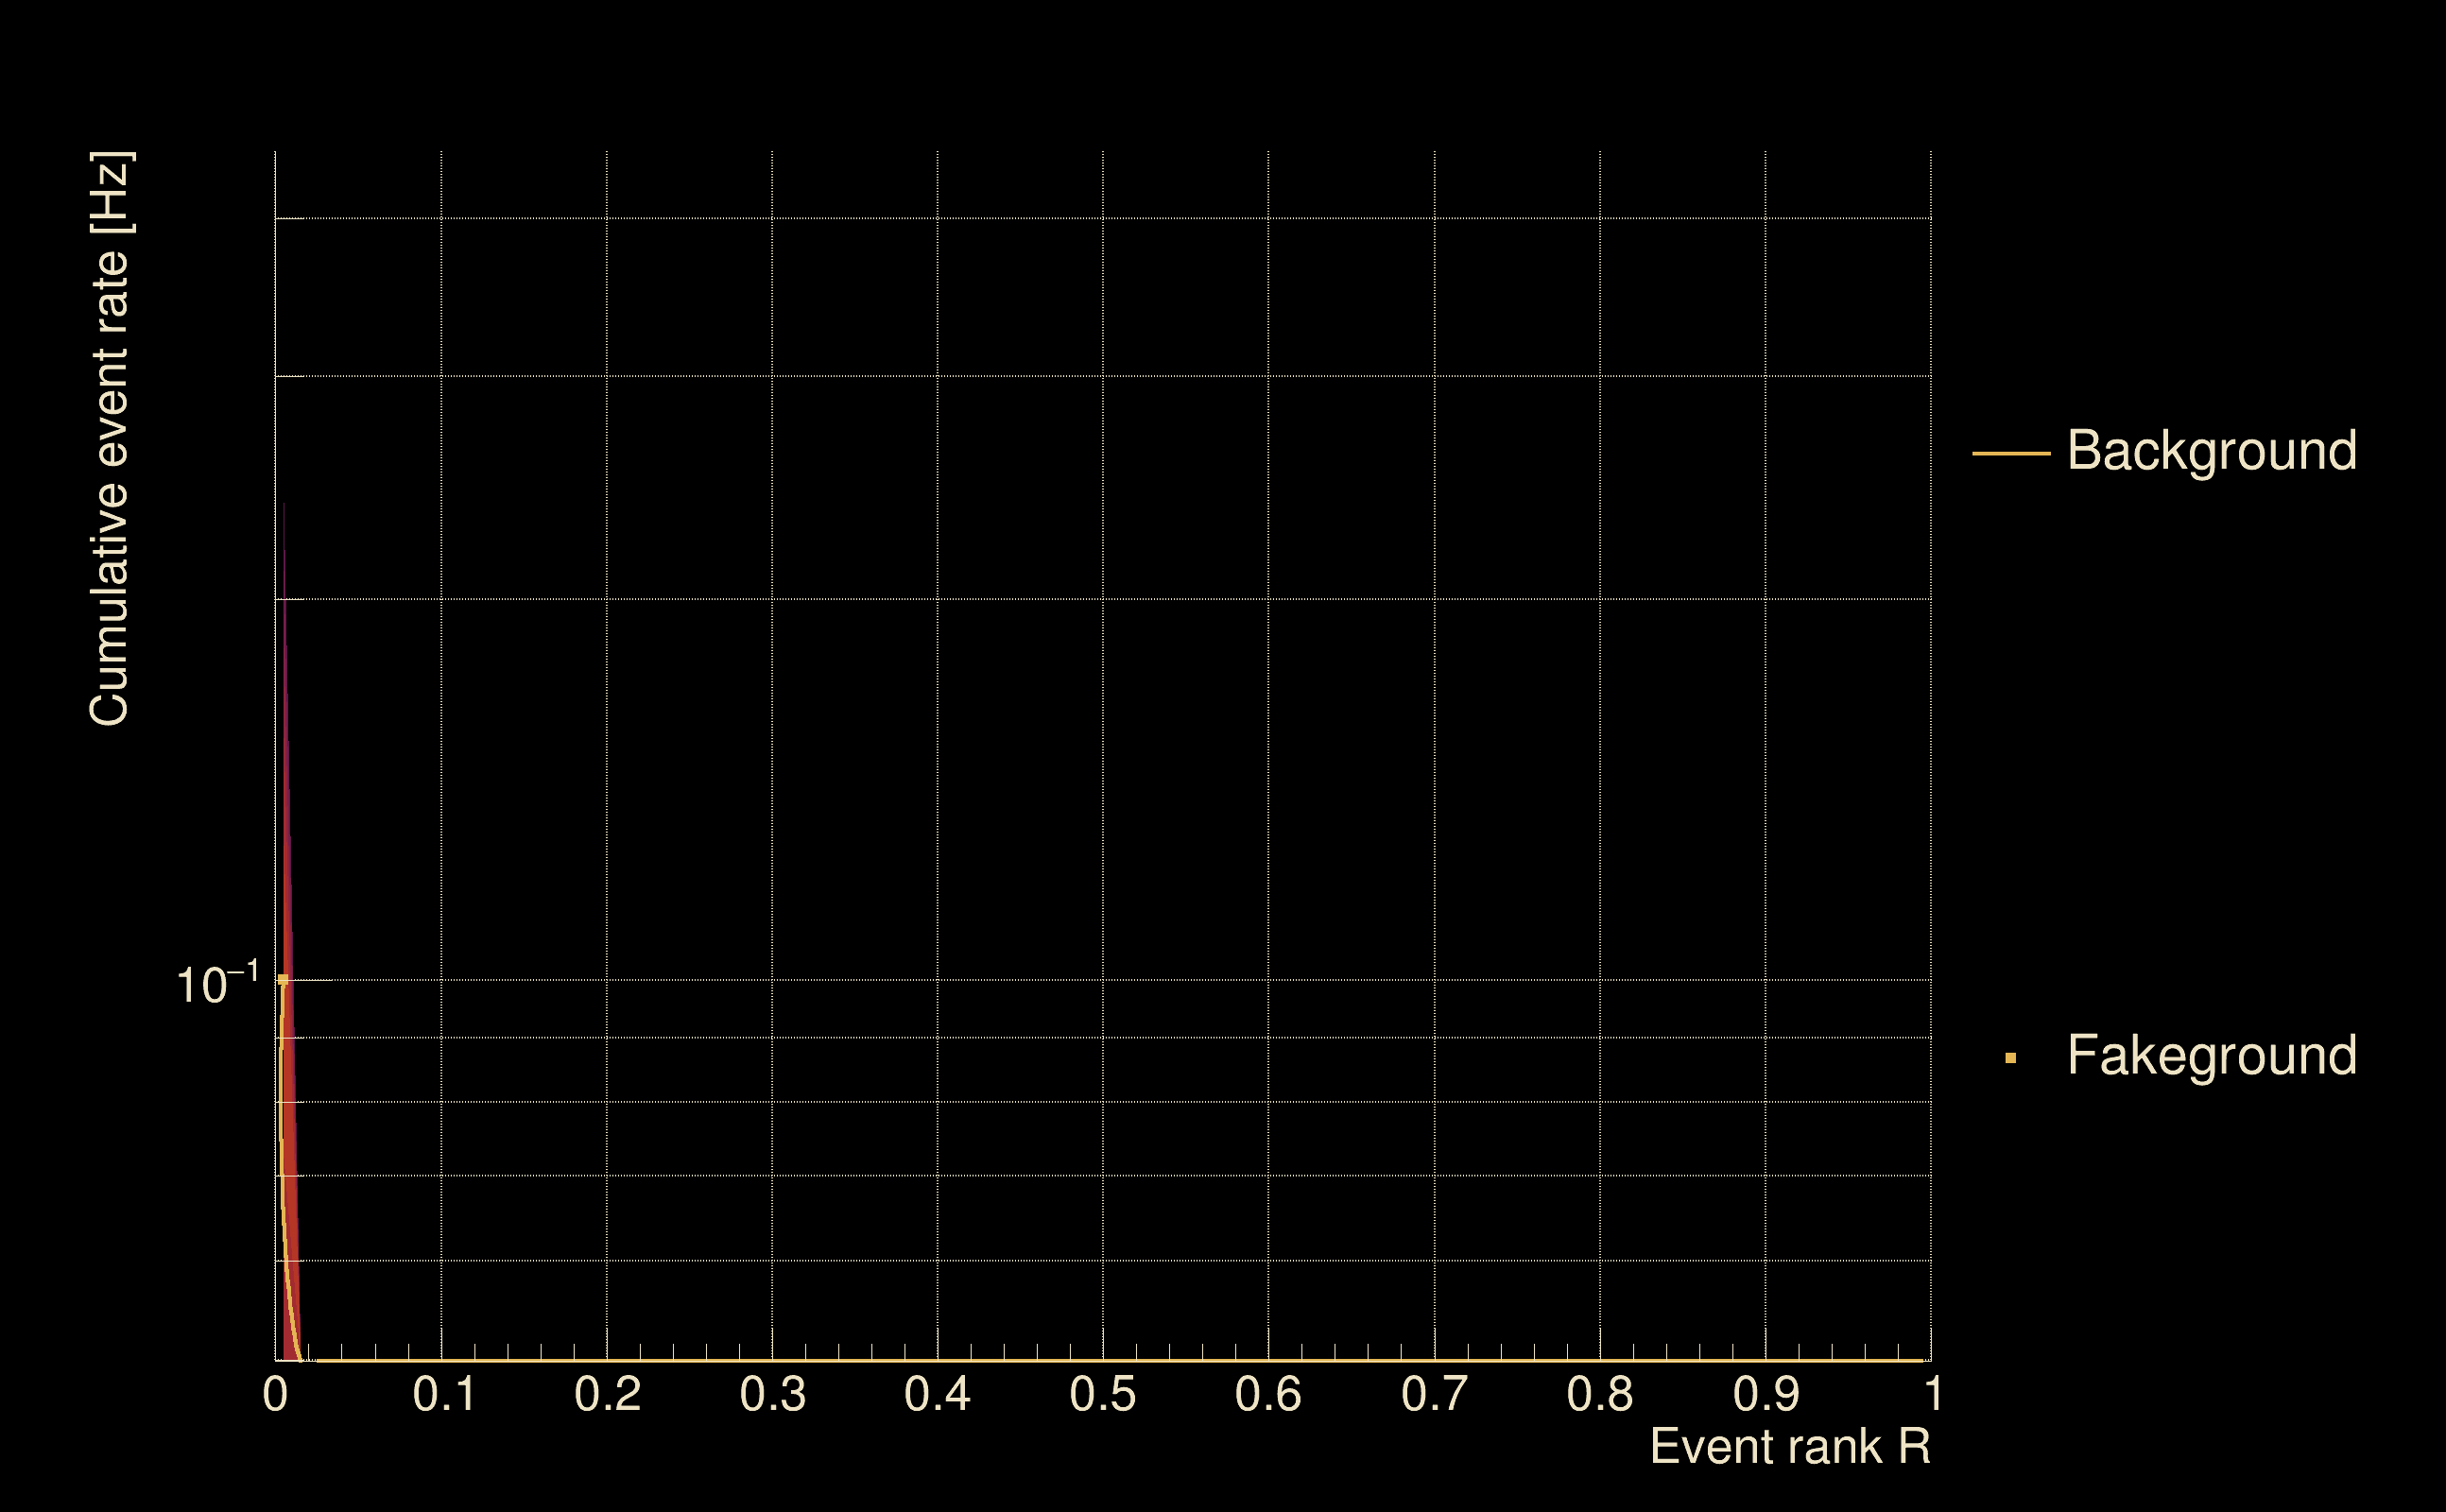
| Detection threshold: | R > 0.005 |
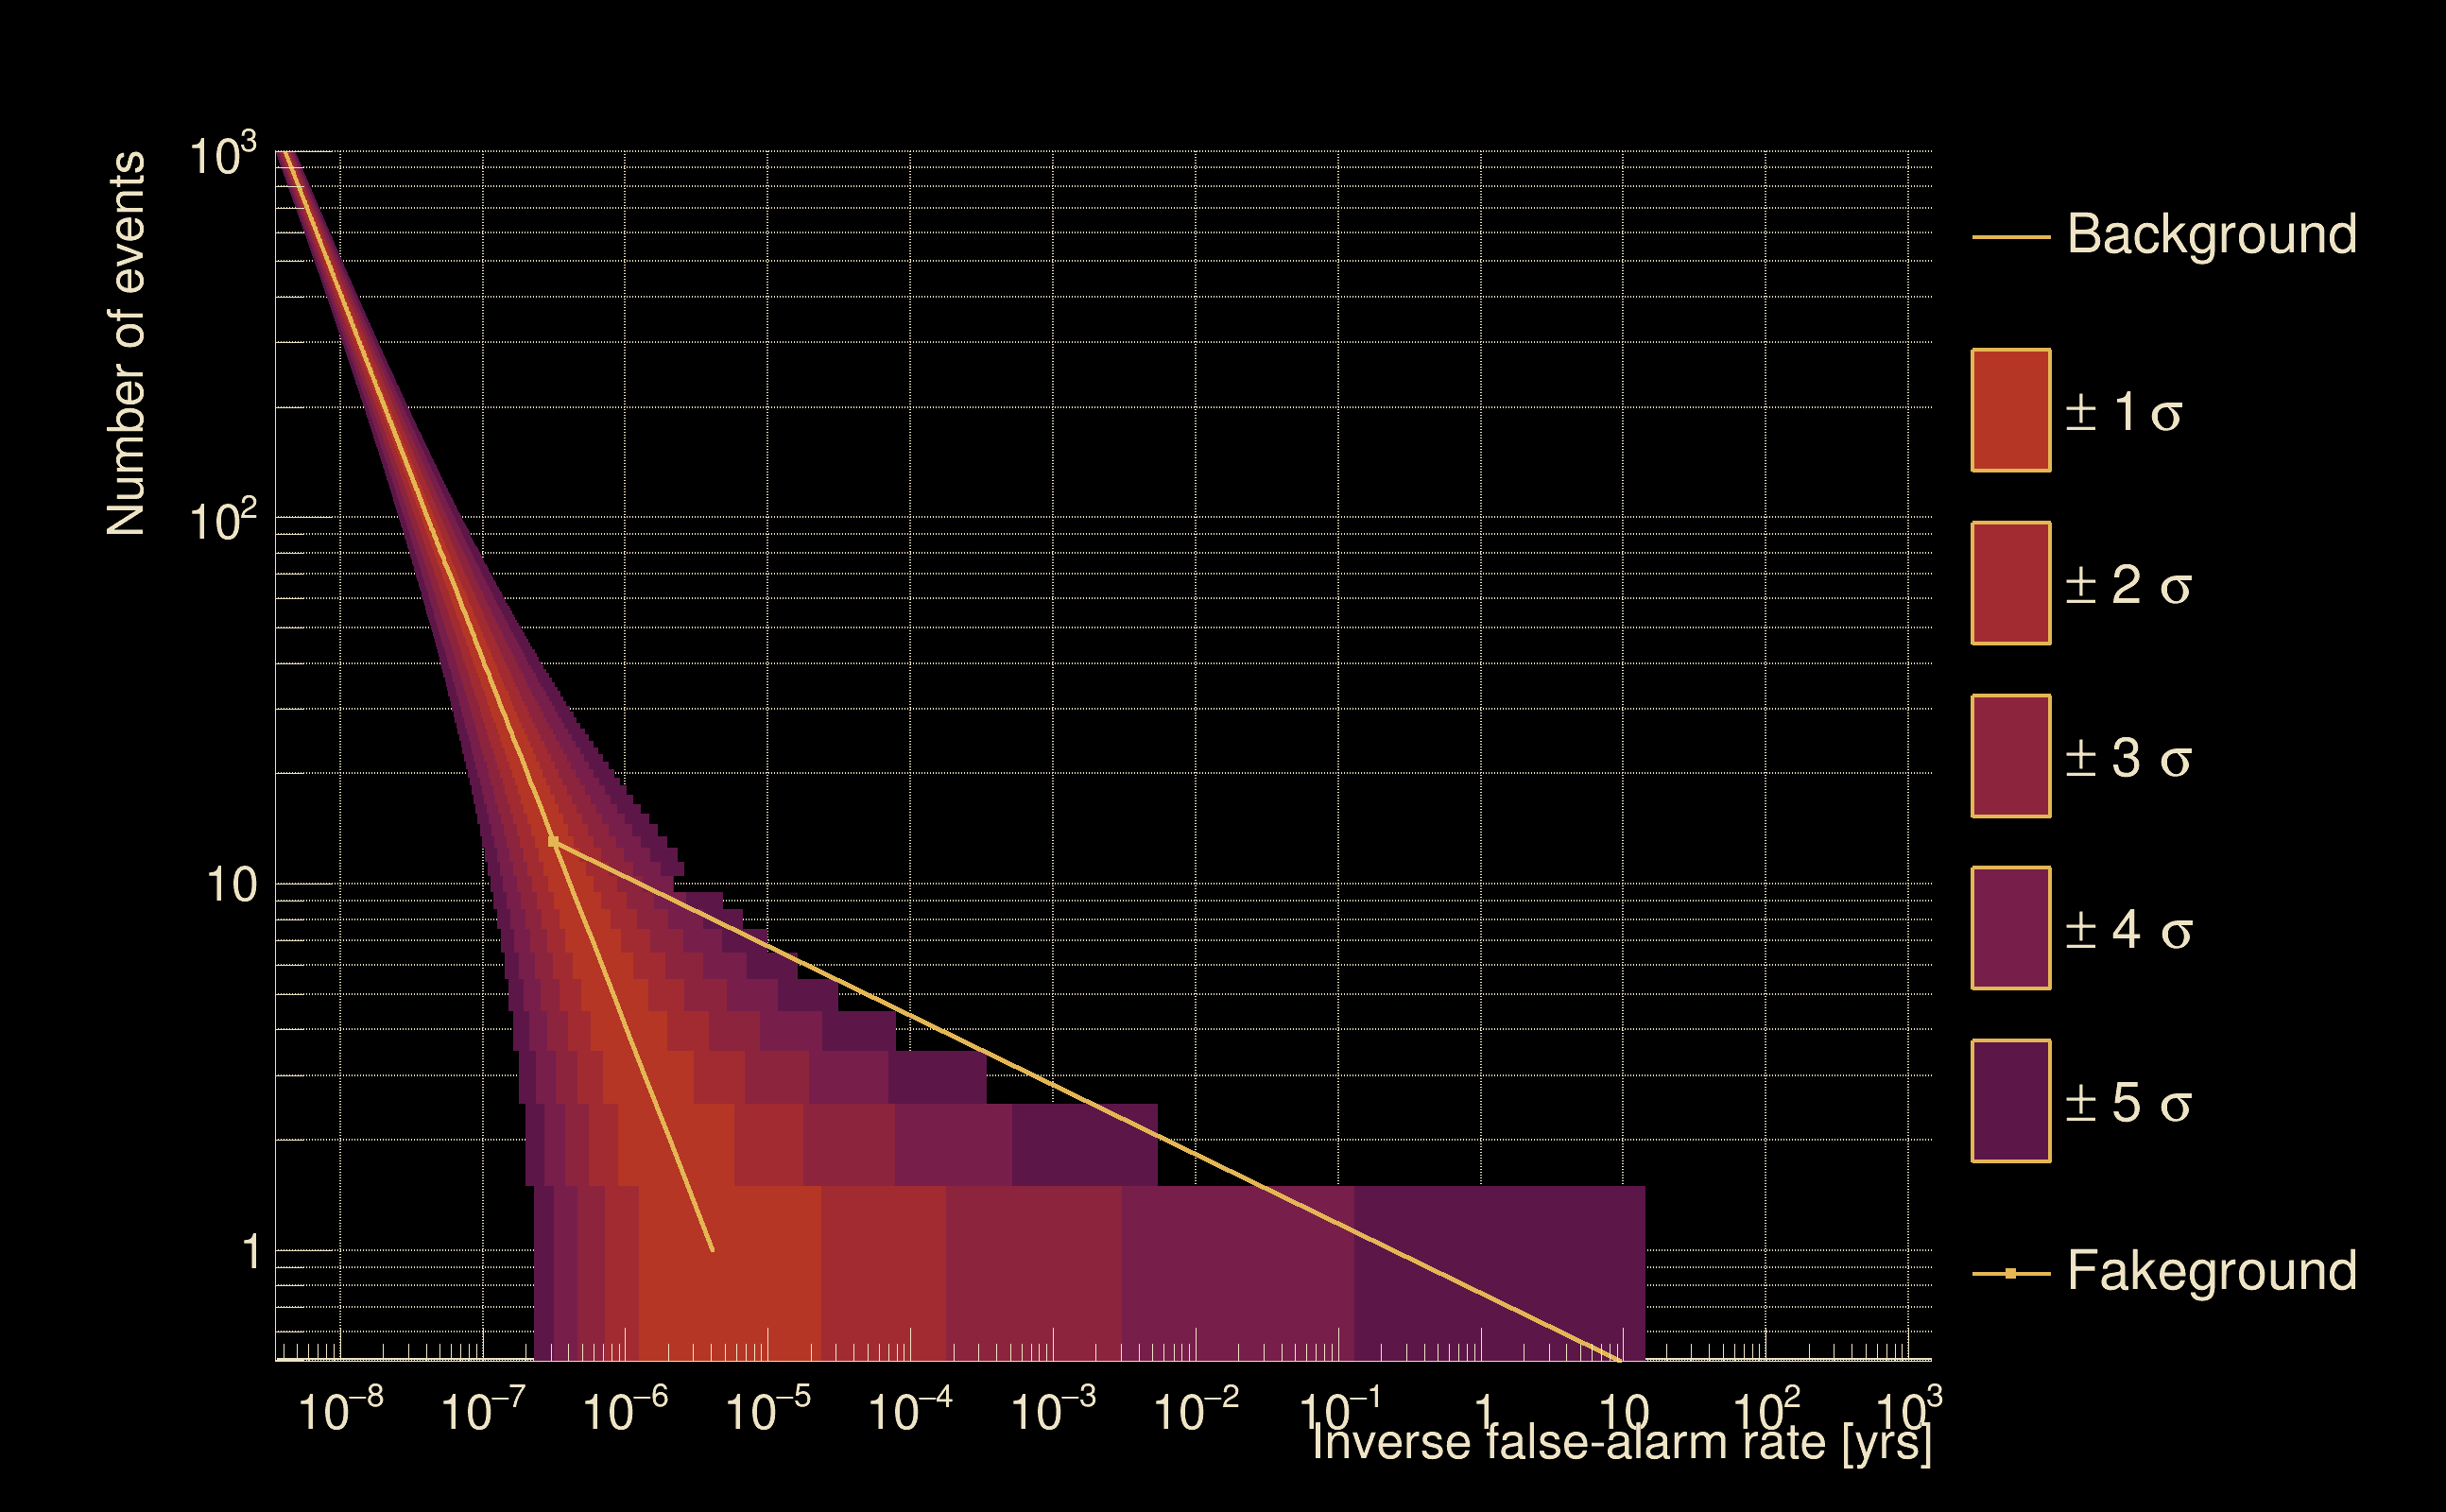
| False-alarm rate above that detection threshold: | 0.05 |
| Alternative threshold at 1/1000 yrs: | R > 0.005 |
| Alternative threshold at 1/100 yrs: | R > 0.005 |
| Alternative threshold at 1/10 yrs: | R > 0.005 |
| Alternative threshold at 1/1 yr: | R > 0.005 |
| Alternative threshold at 1/1 d: | R > 0.005 |
 |
|
 |
 |
 |
 |
 |
 |
 |
 |
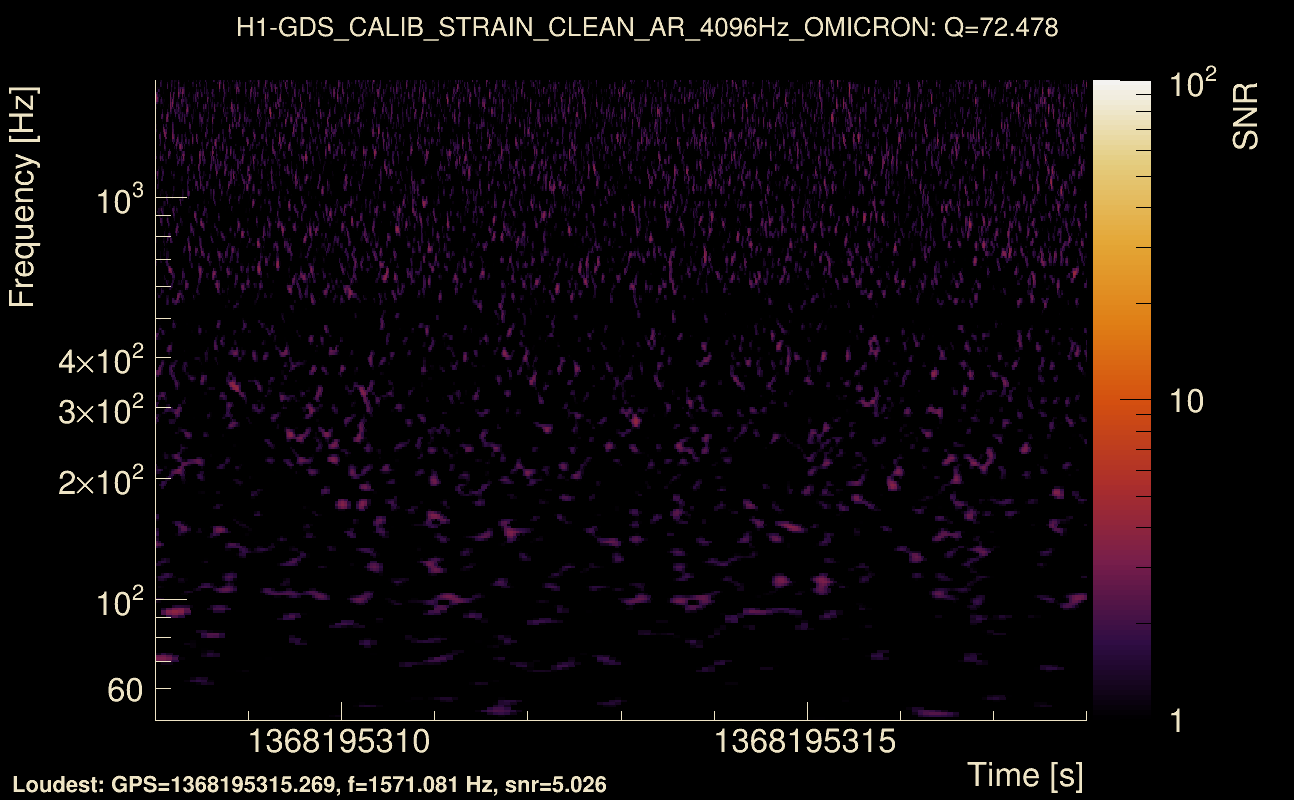
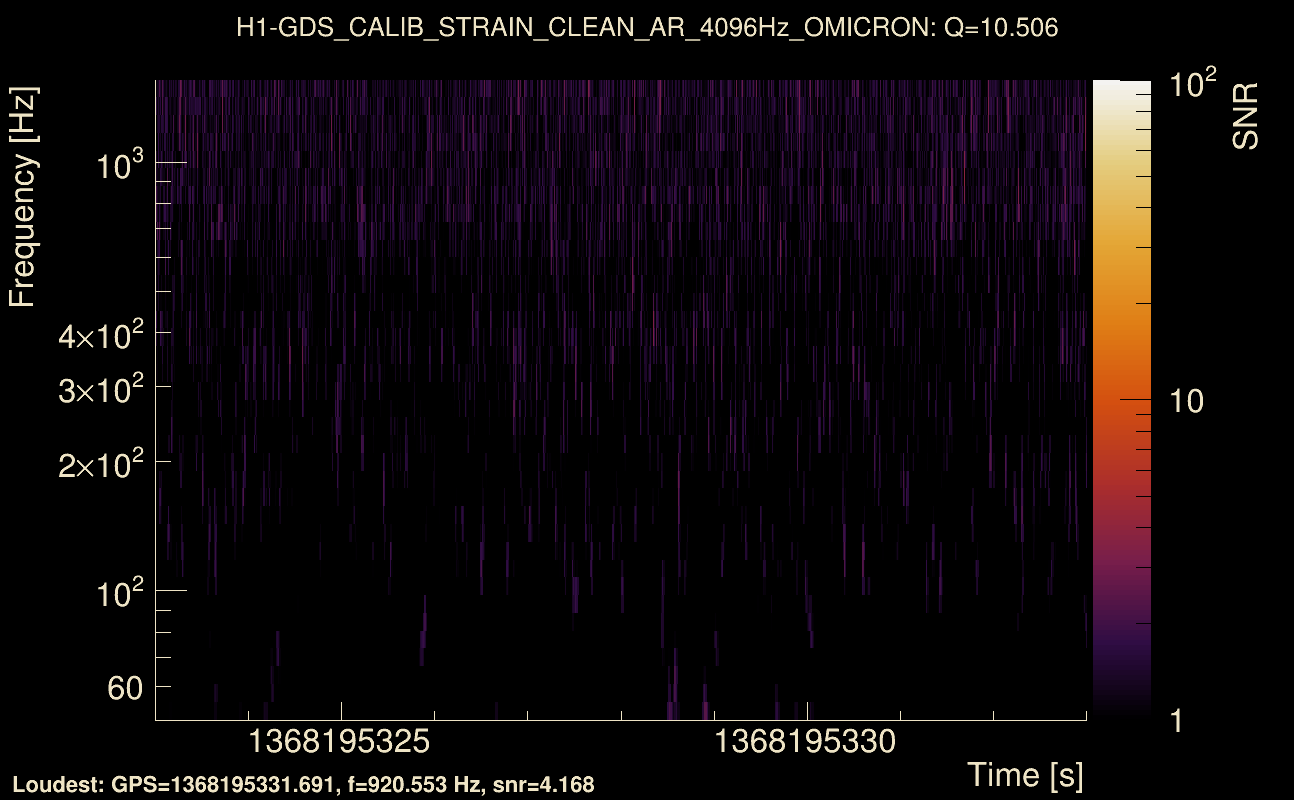
| Event time t(H1): | GPS = 1368195313 (Mon May 15 14:14:55 2023 ) → GPS = 1368195323 (Mon May 15 14:15:05 2023 ) |
| Event time t(L1): | GPS = 1368195293 (Mon May 15 14:15:05 2023 ) → GPS = 1368195303 (Mon May 15 14:14:45 2023 ) |
| Omicron analysis time window (H1): | GPS = 1368195310 → GPS = 1368195326 |
| Omicron analysis time window (L1): | GPS = 1368195290 → GPS = 1368195306 |
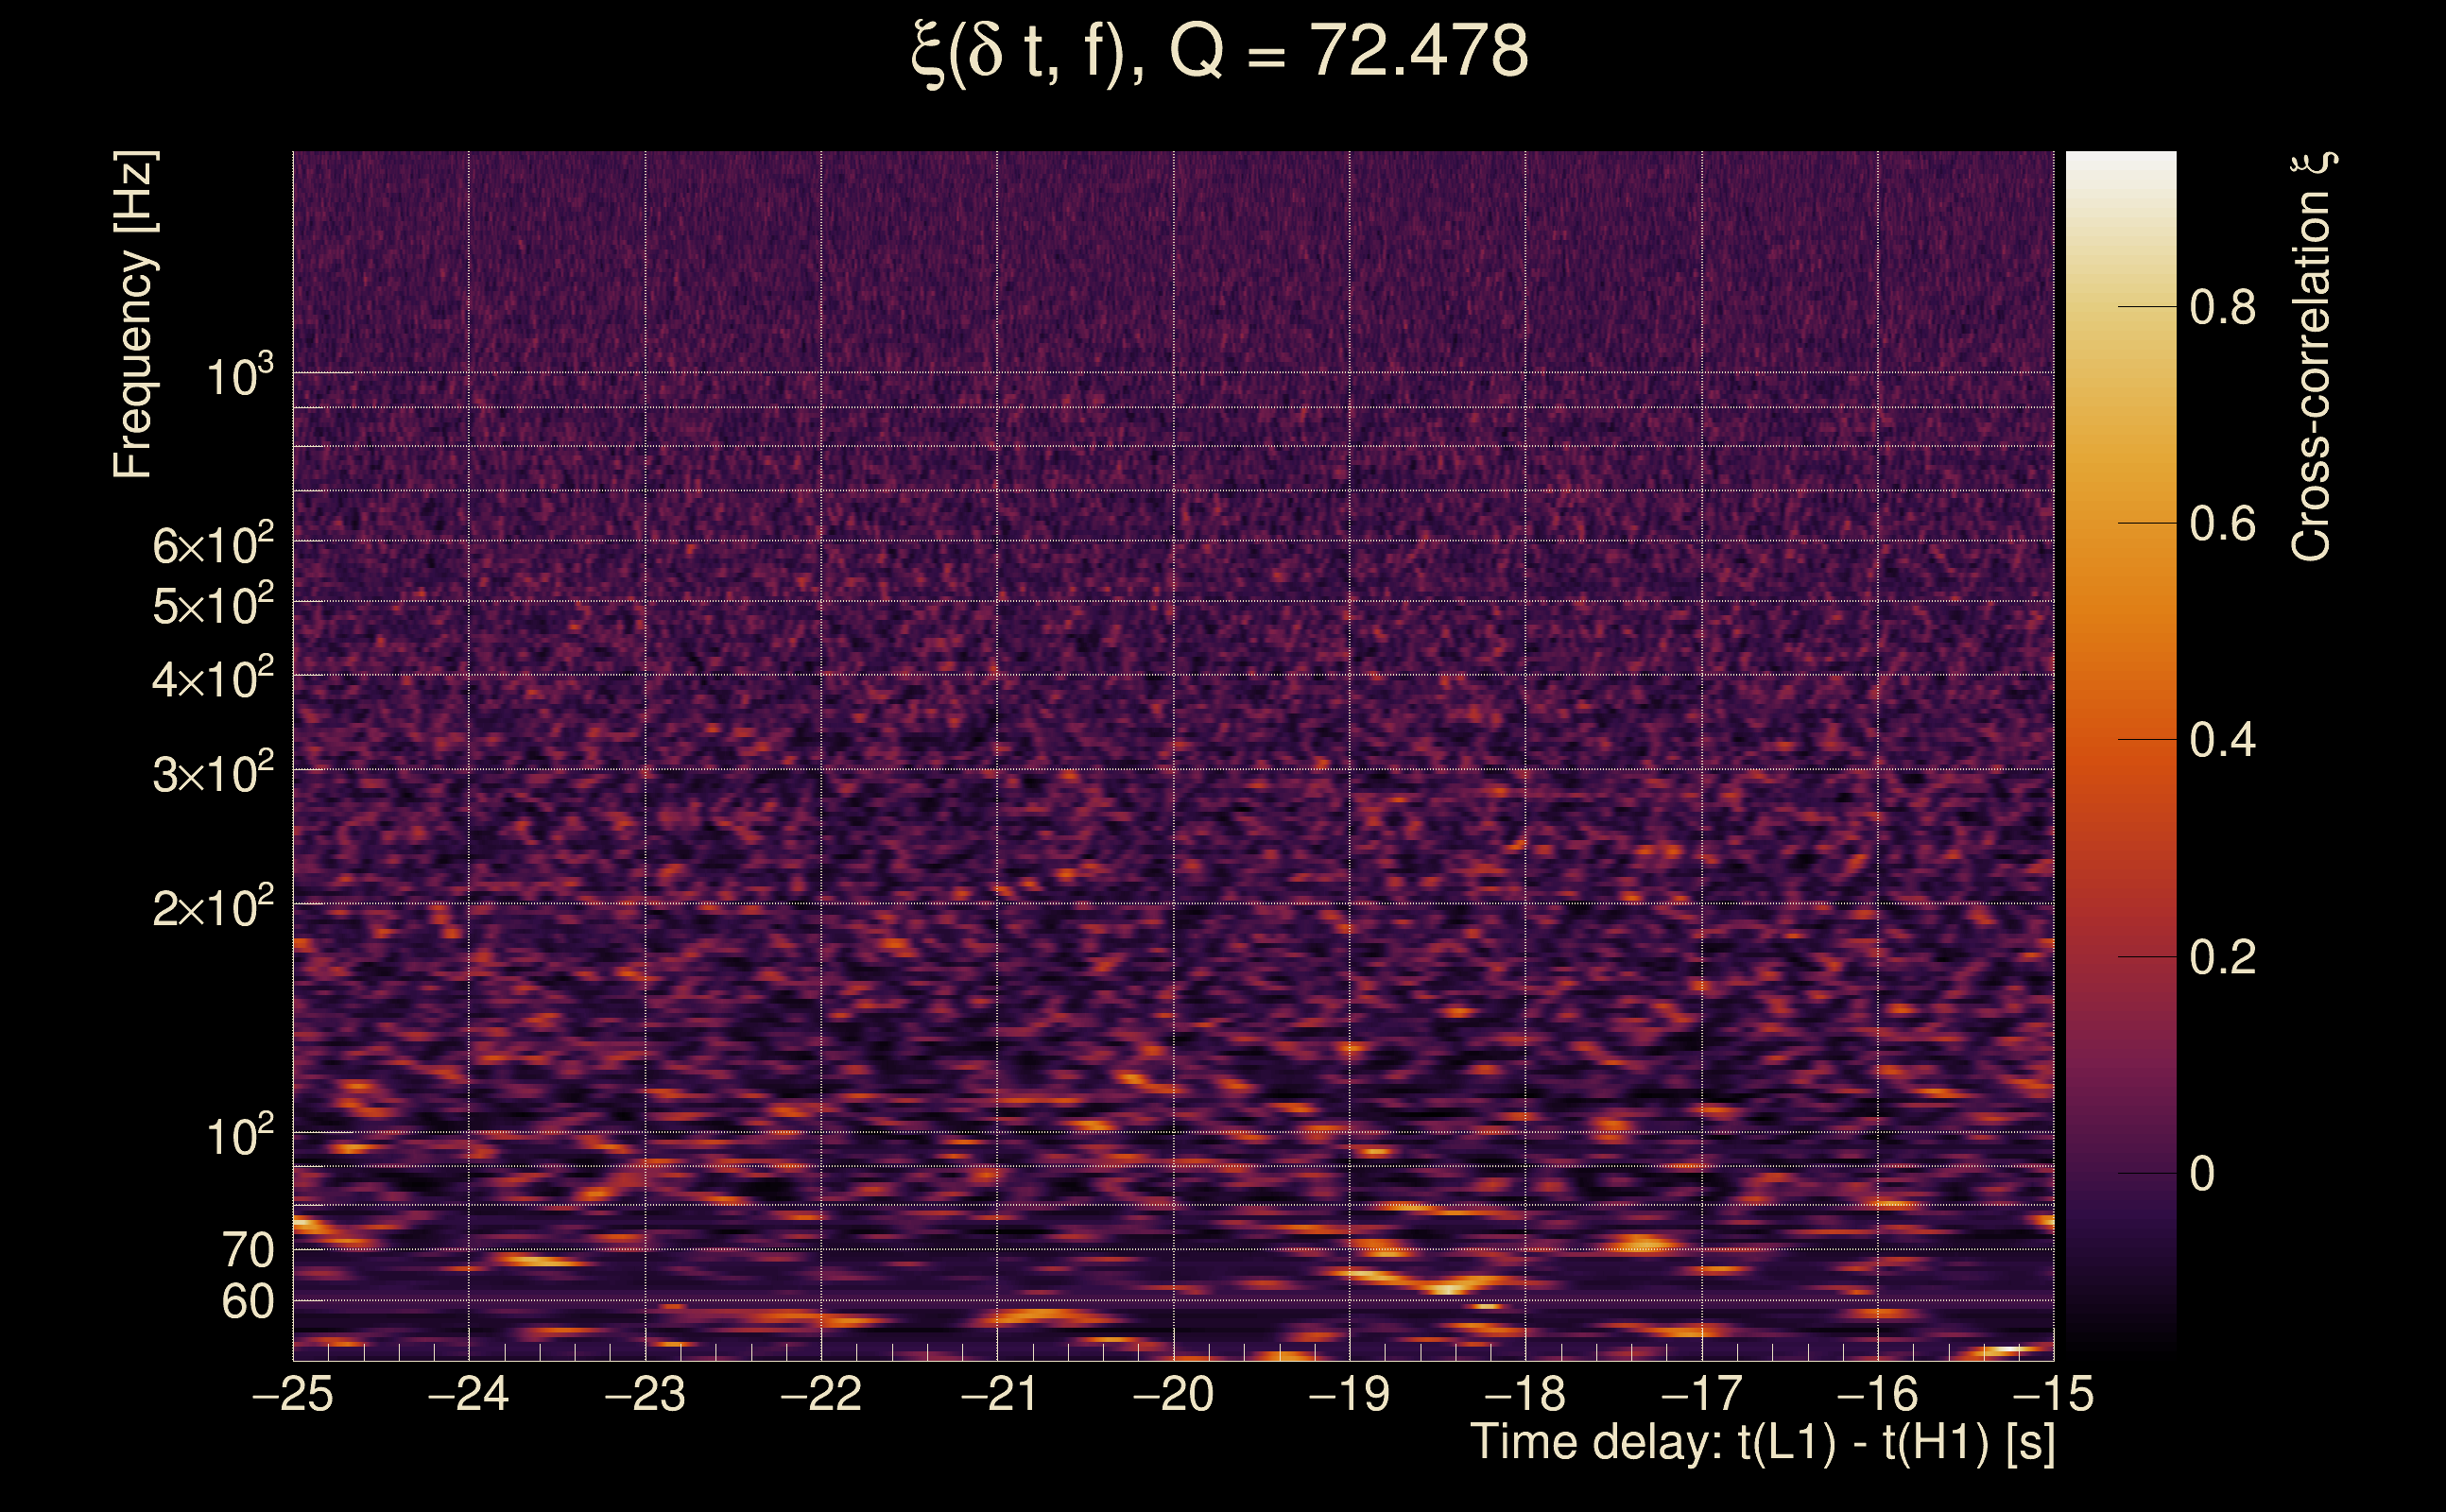
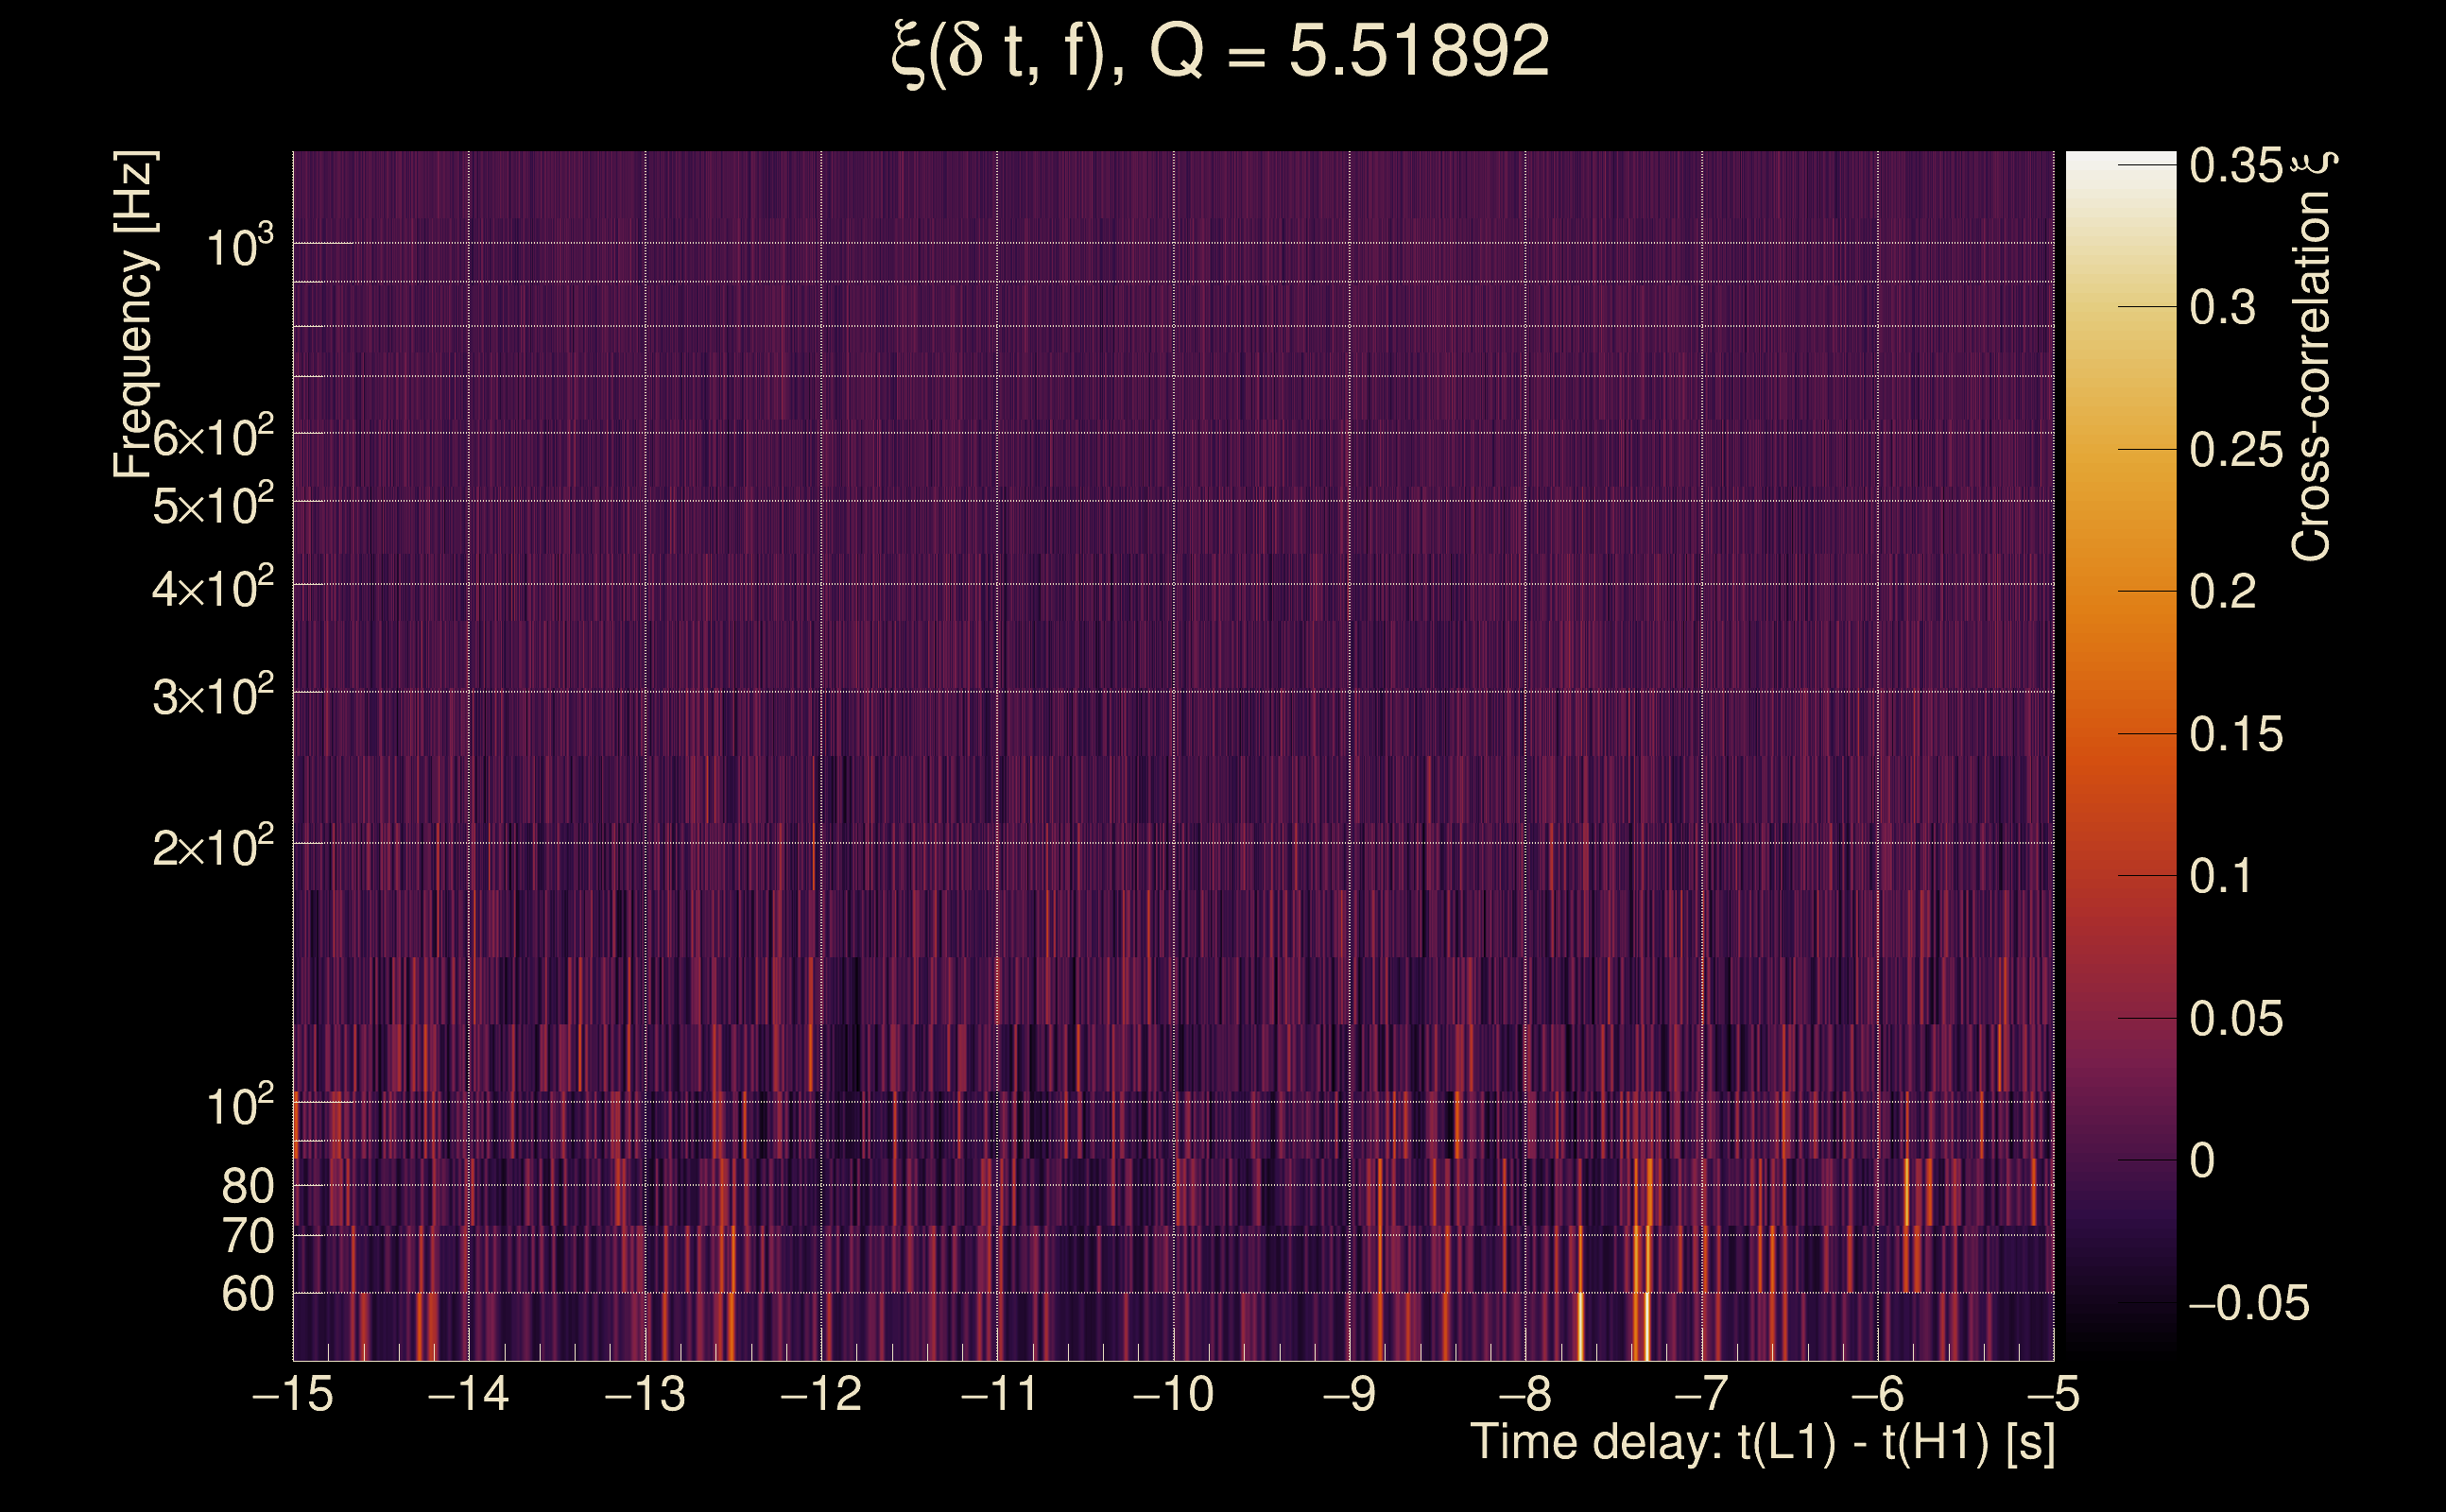
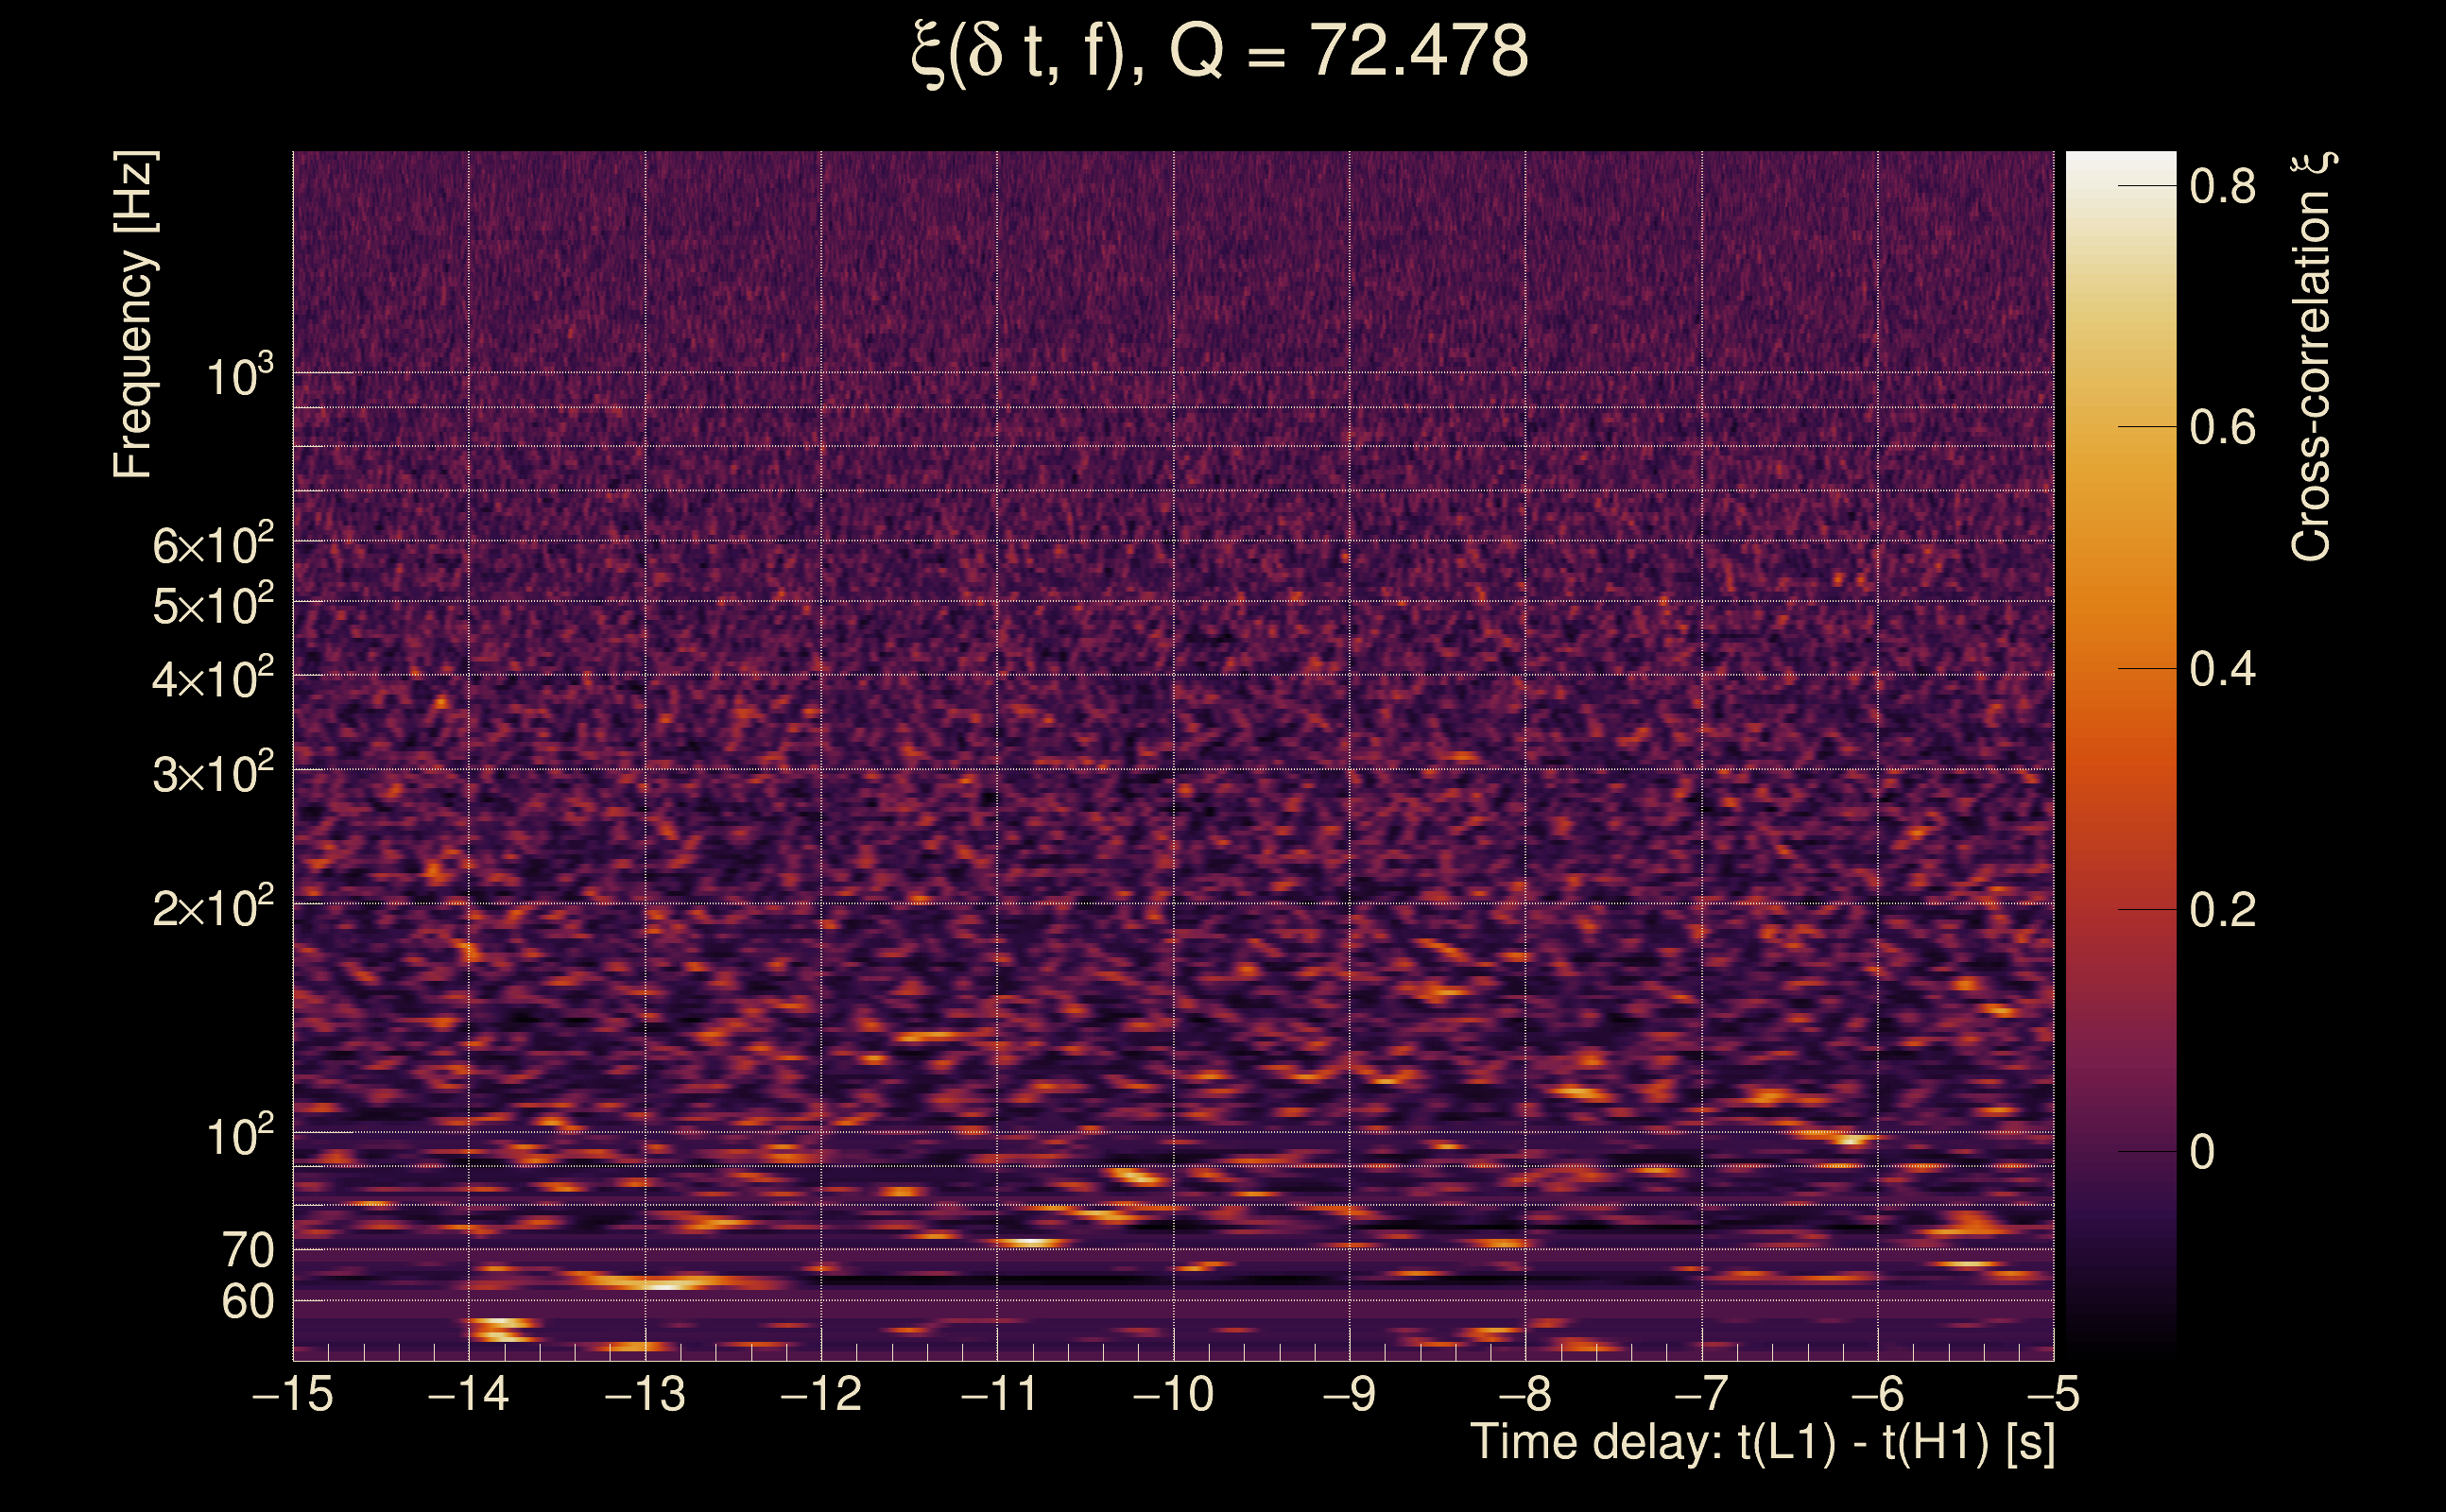
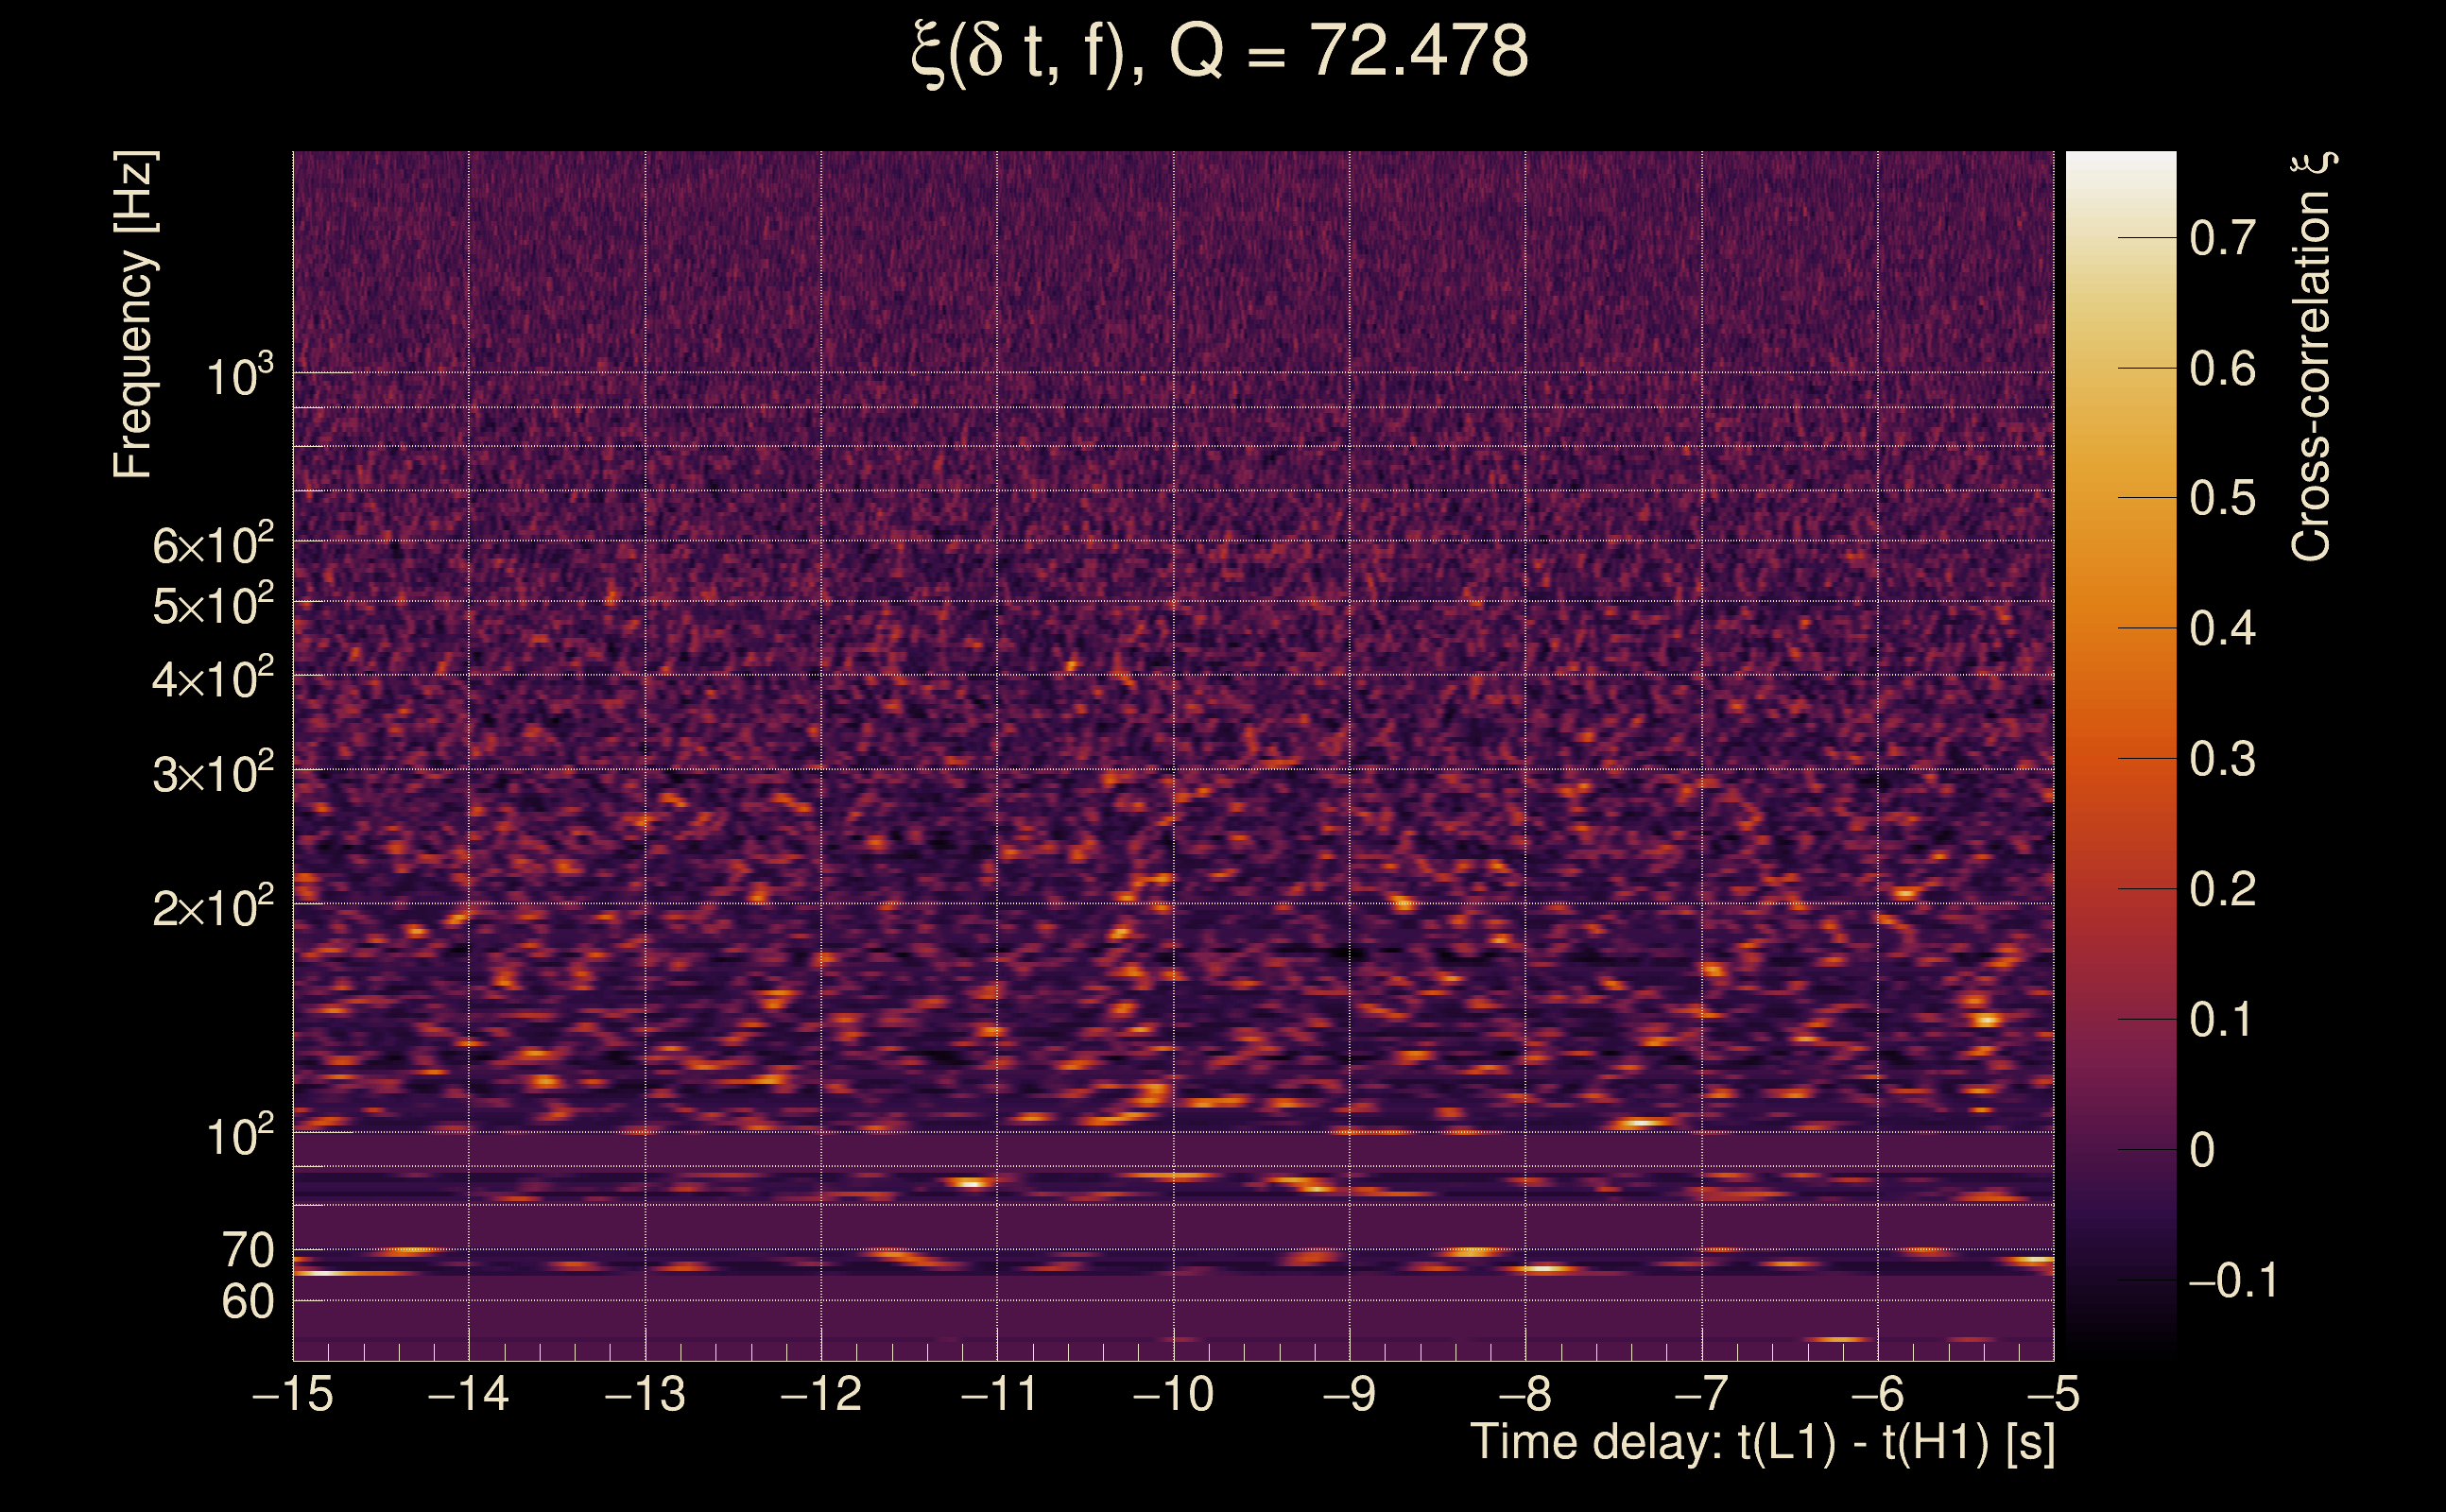
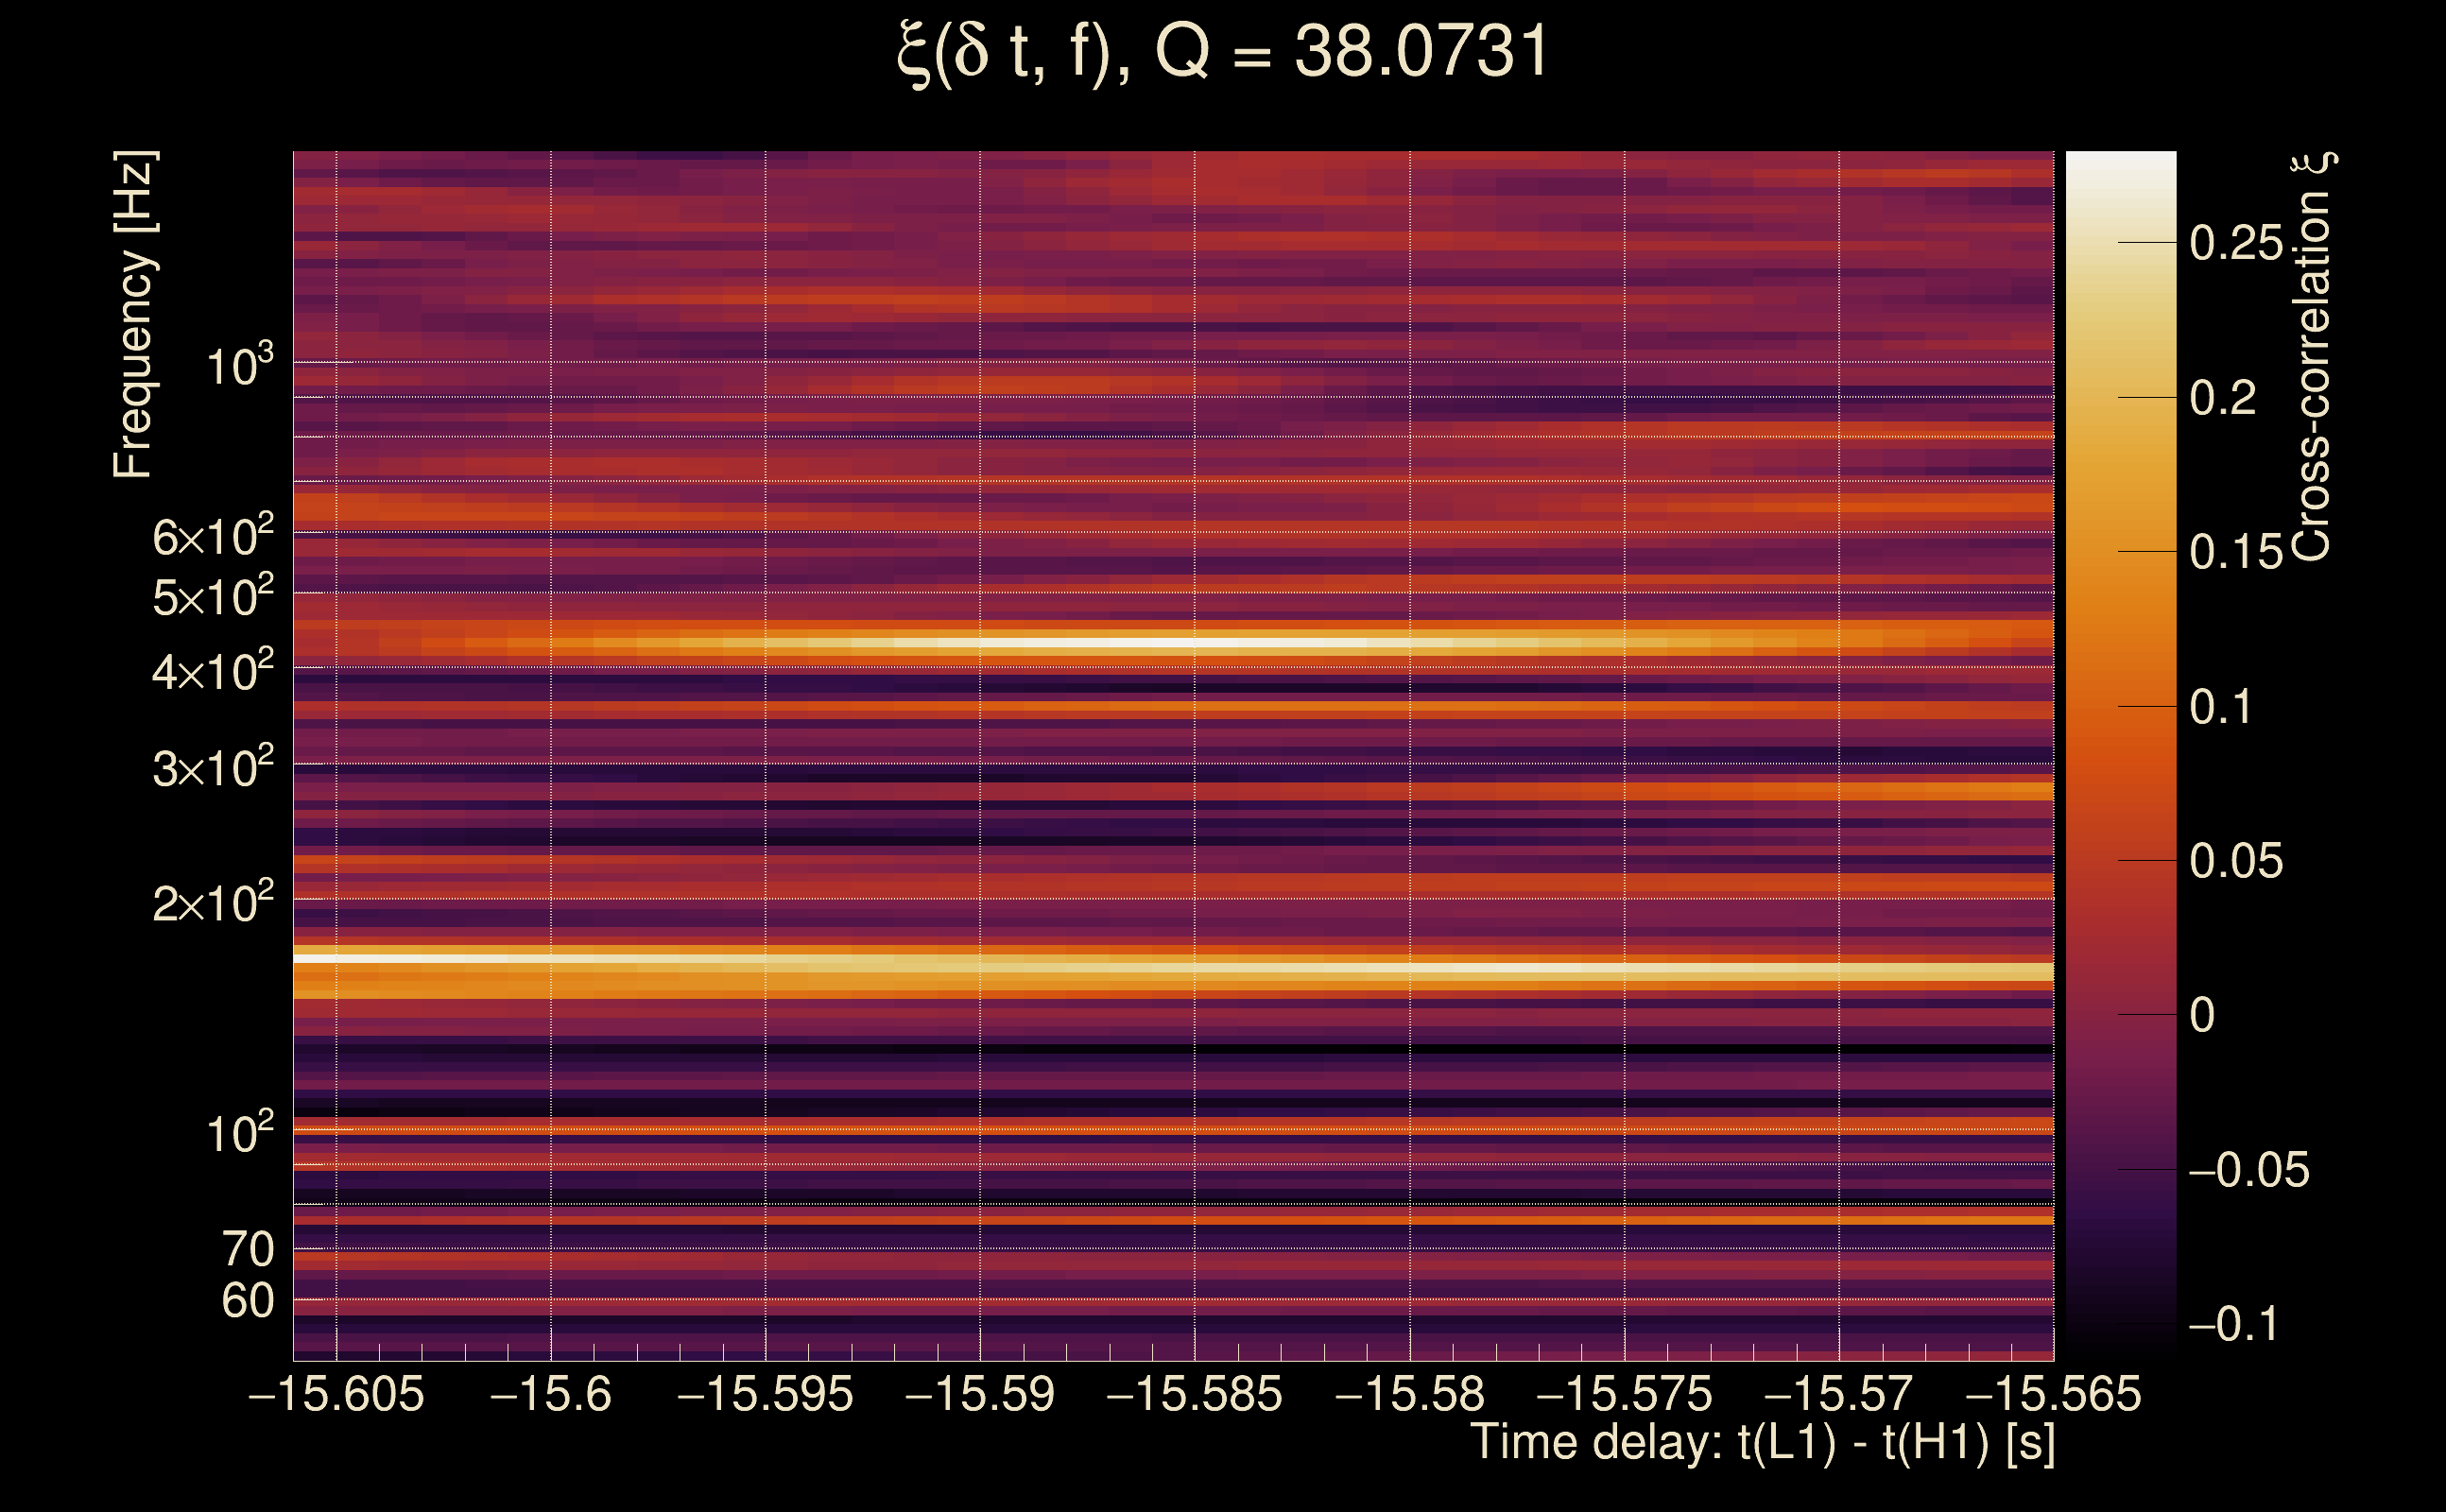
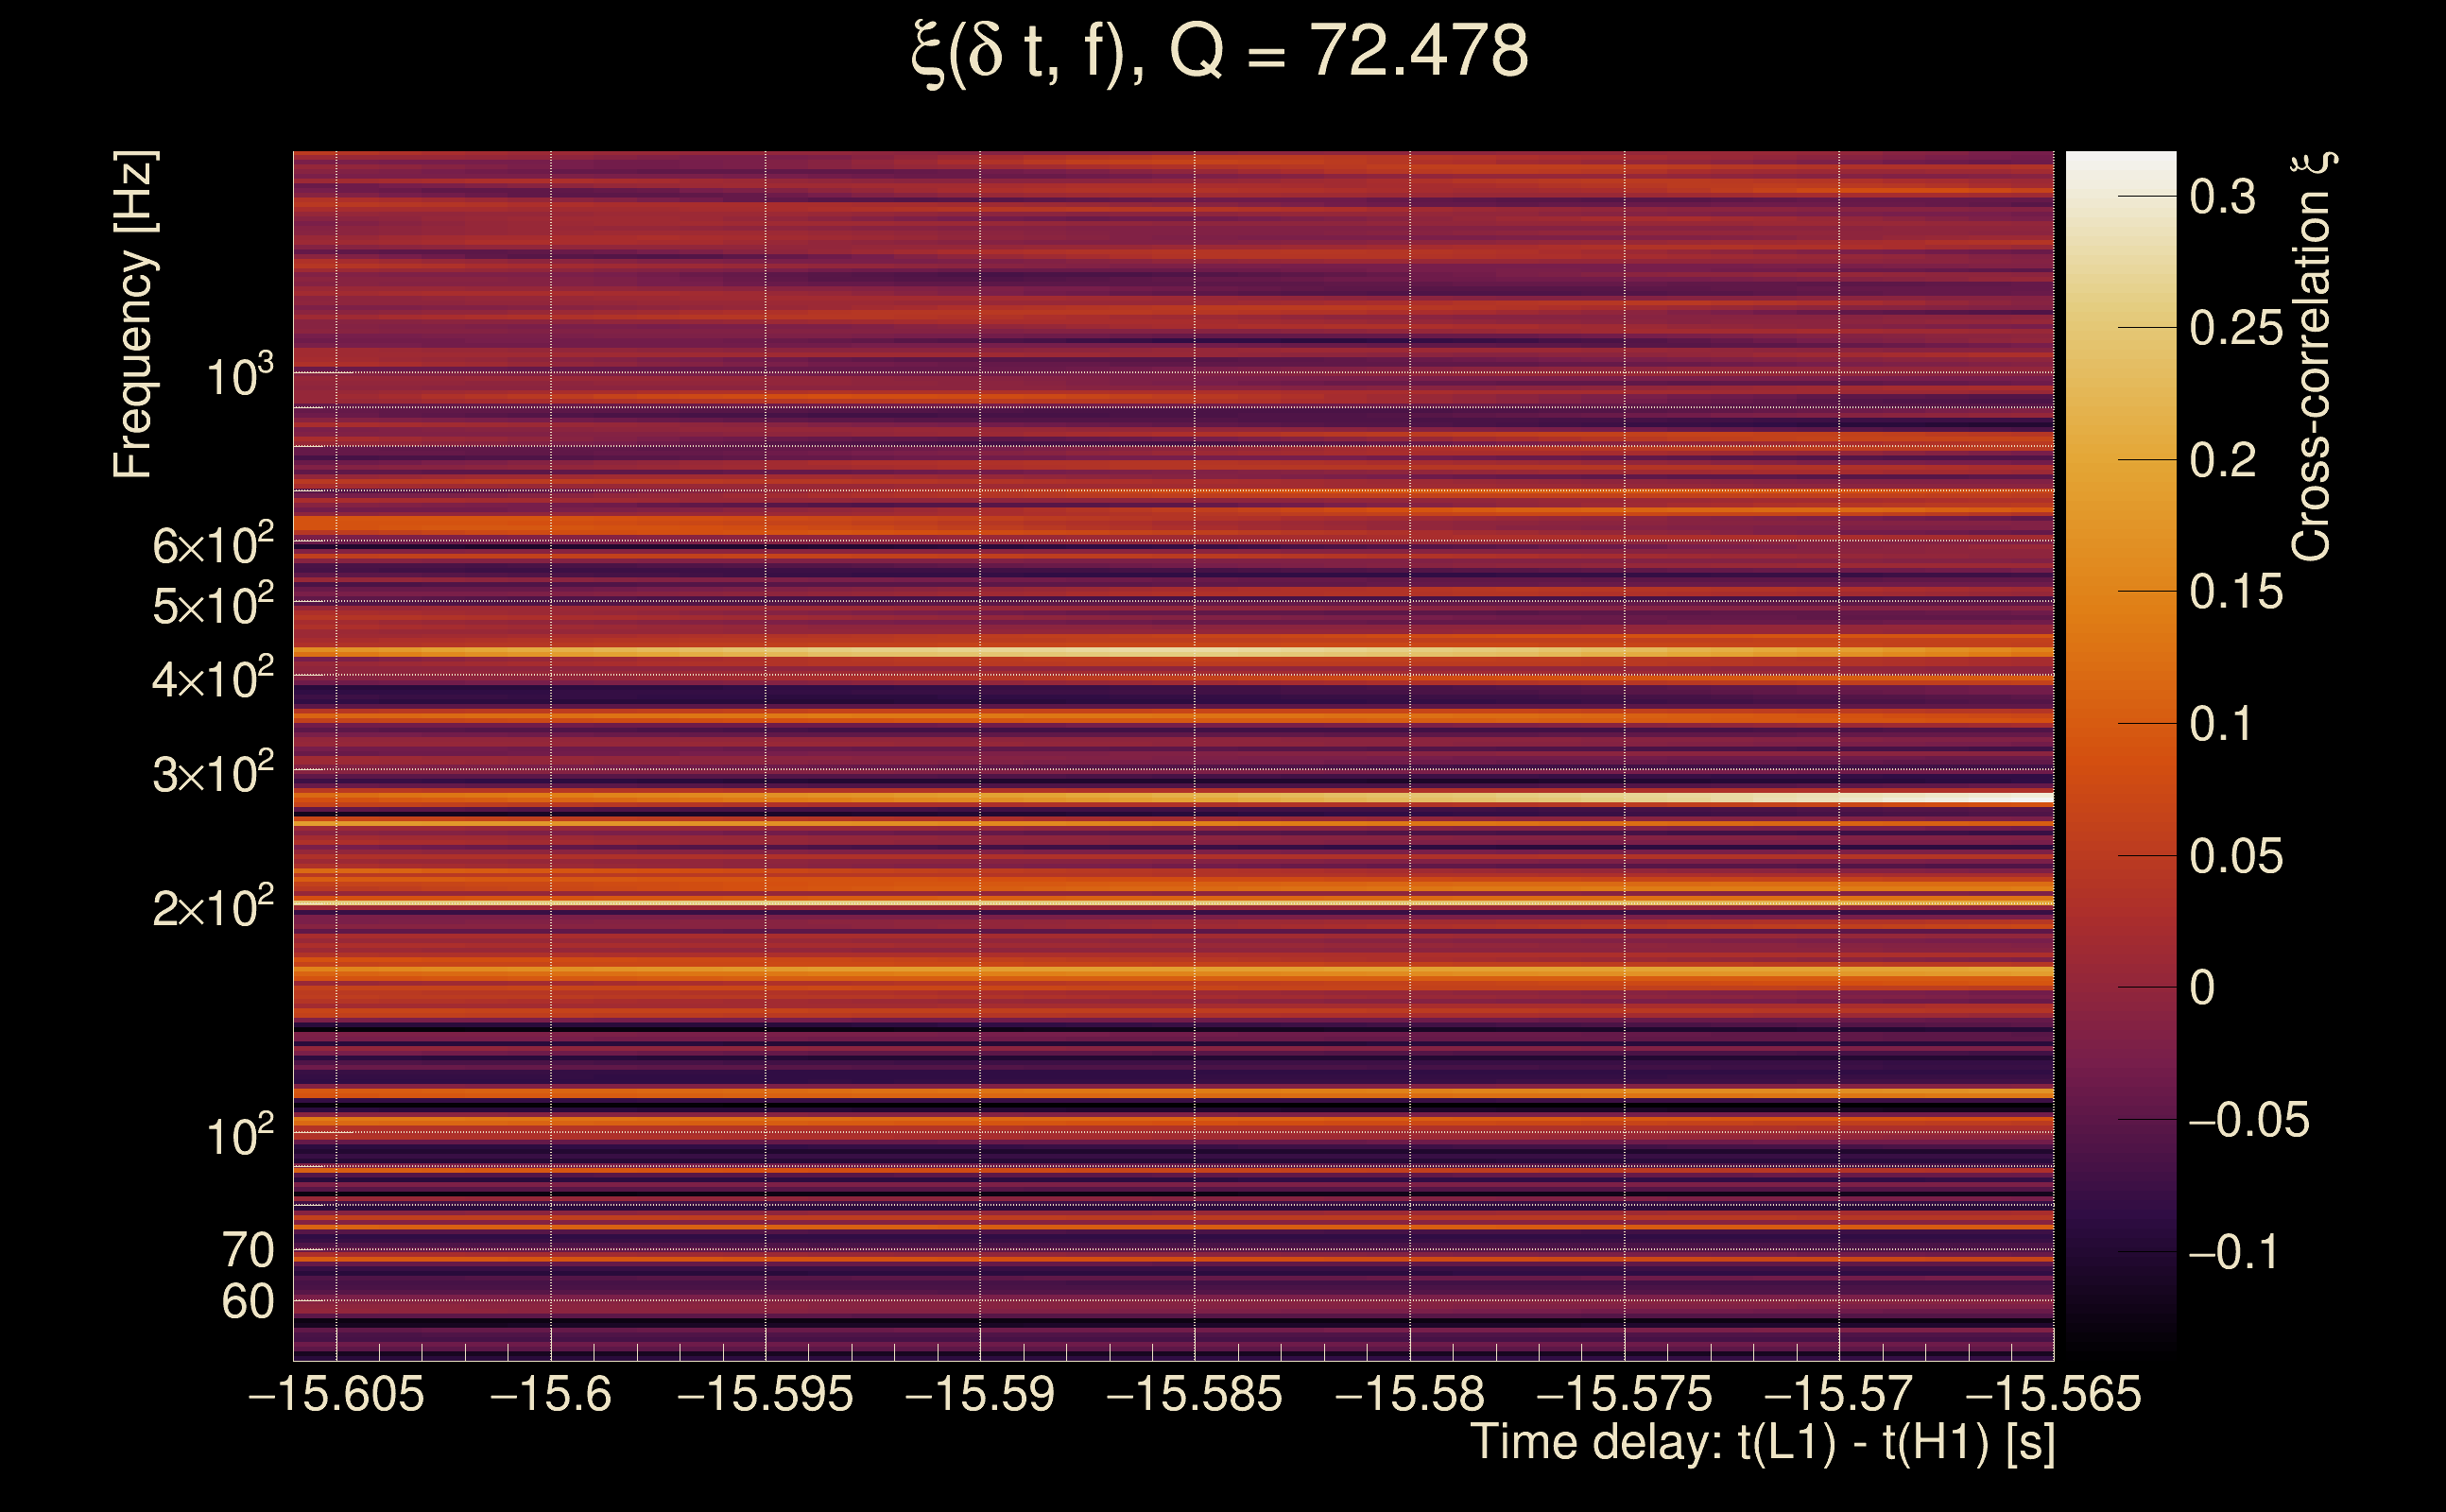
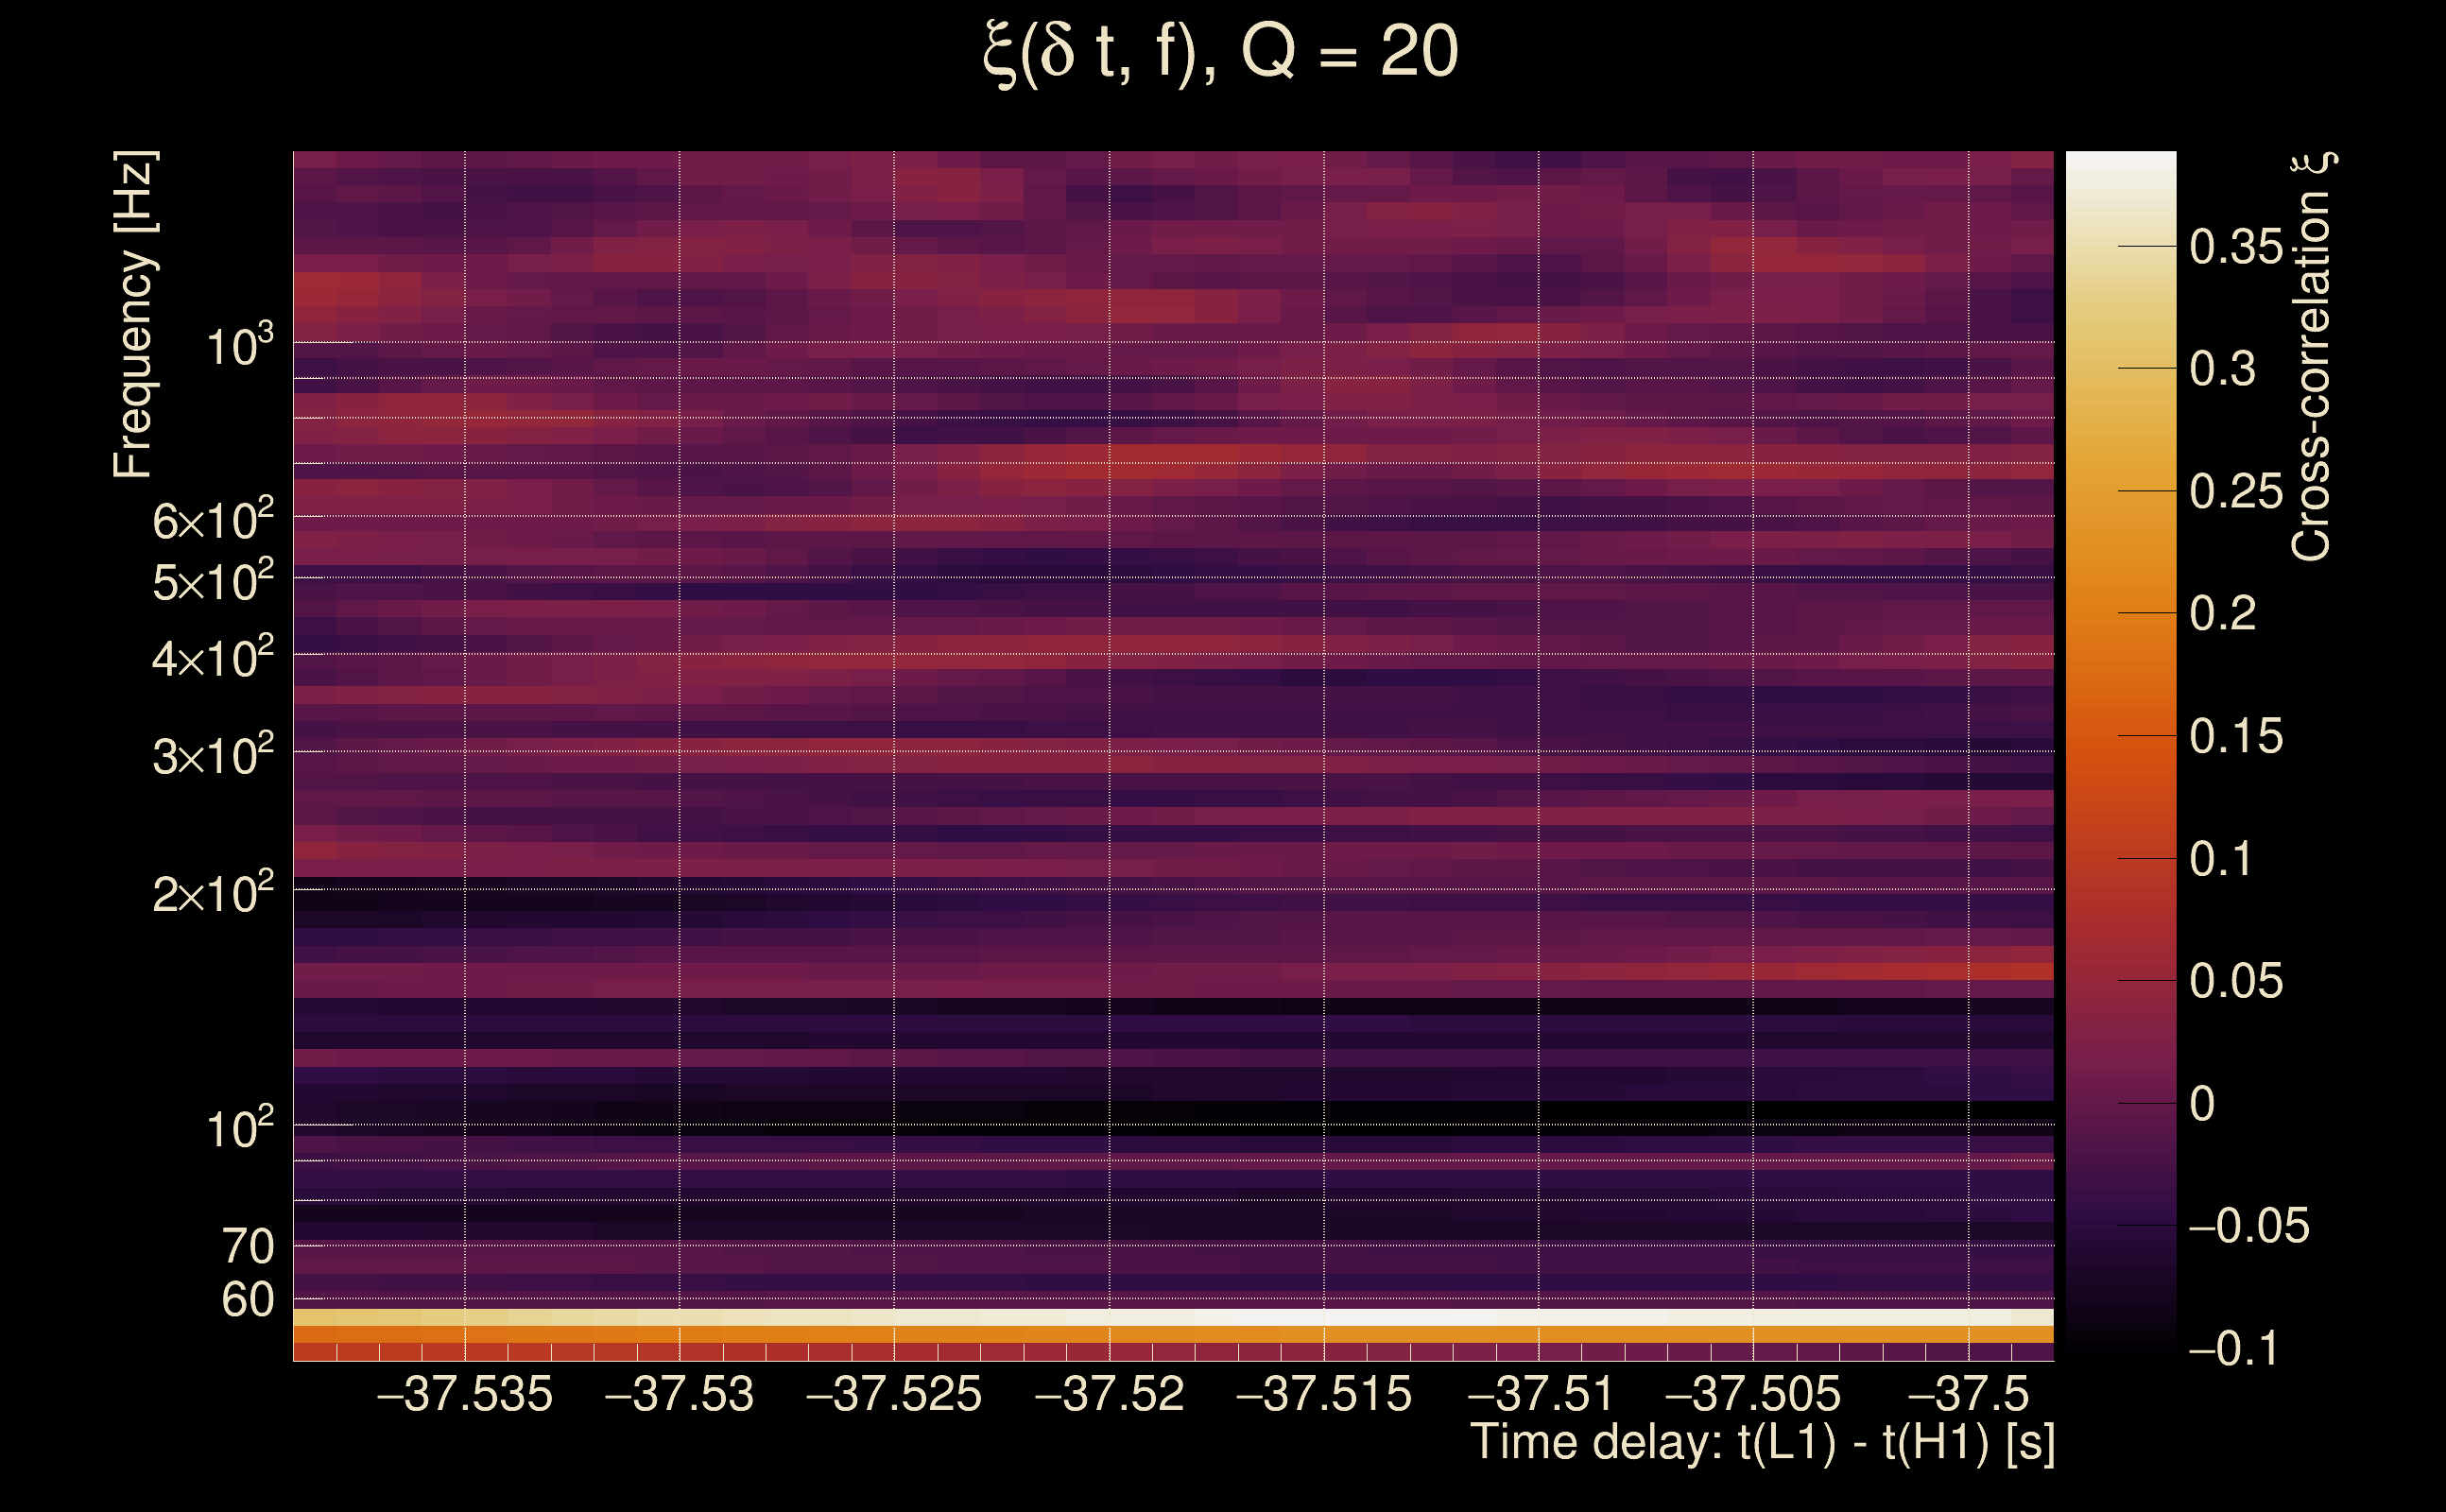
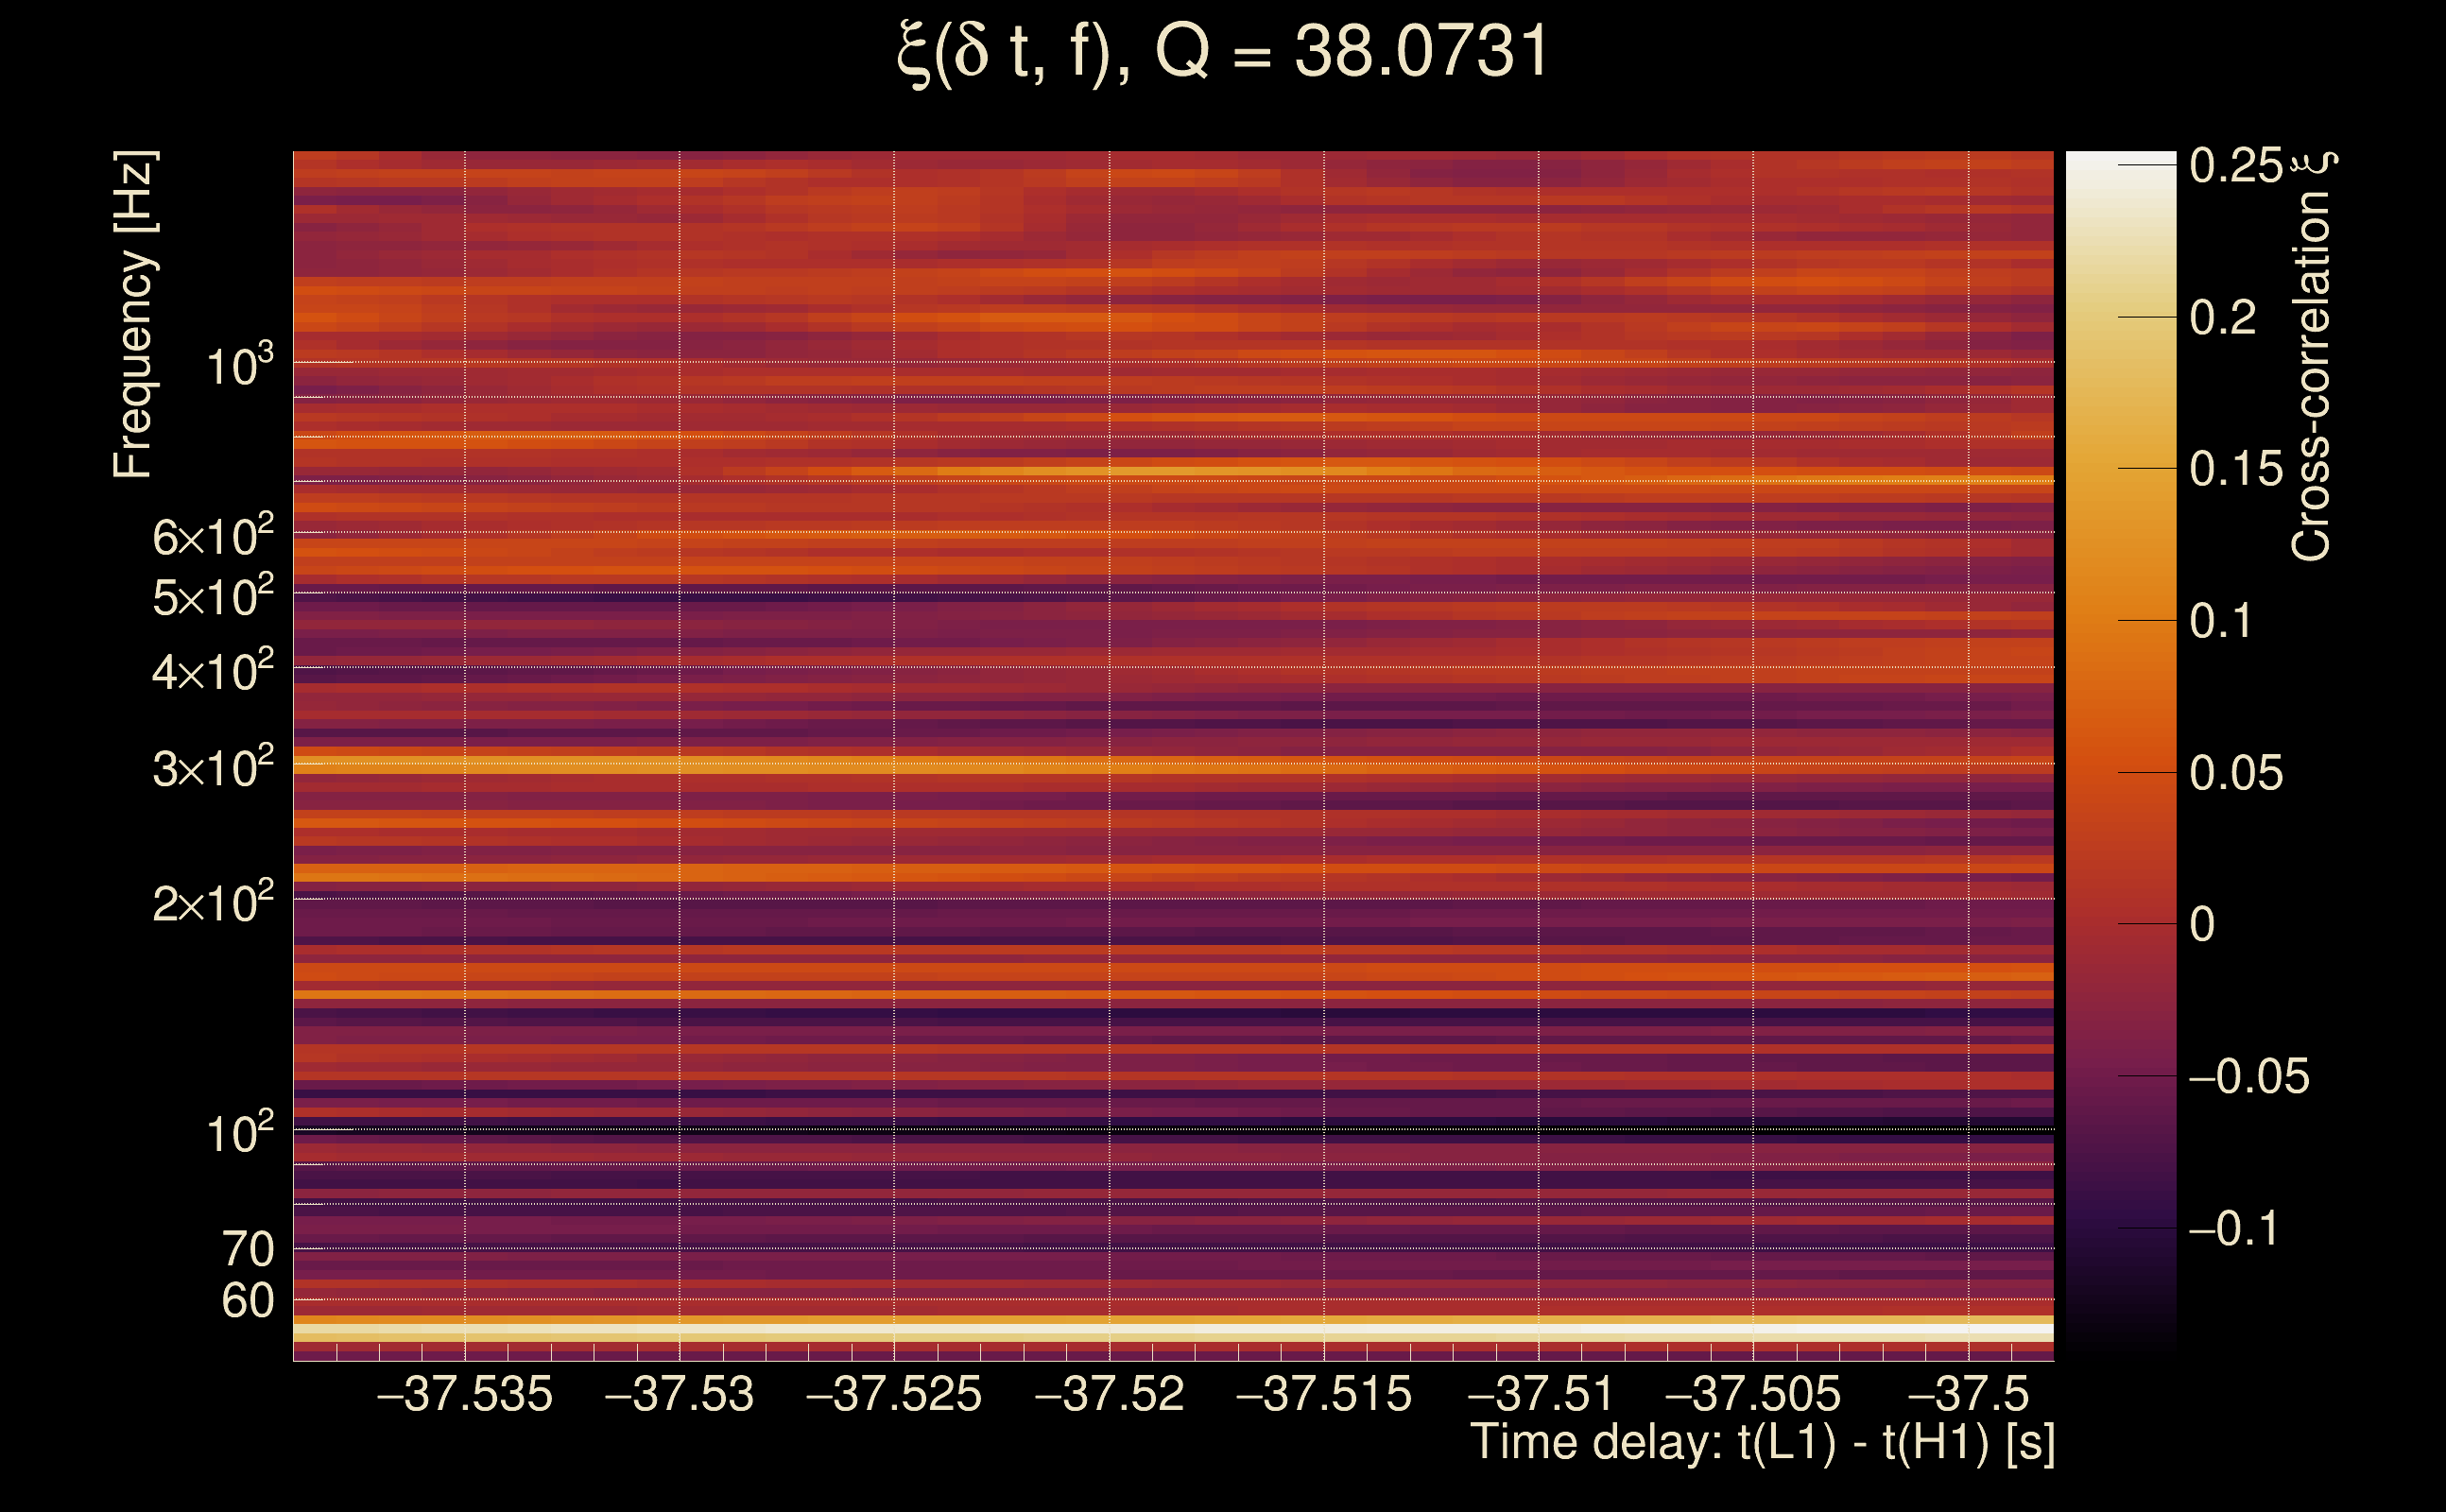
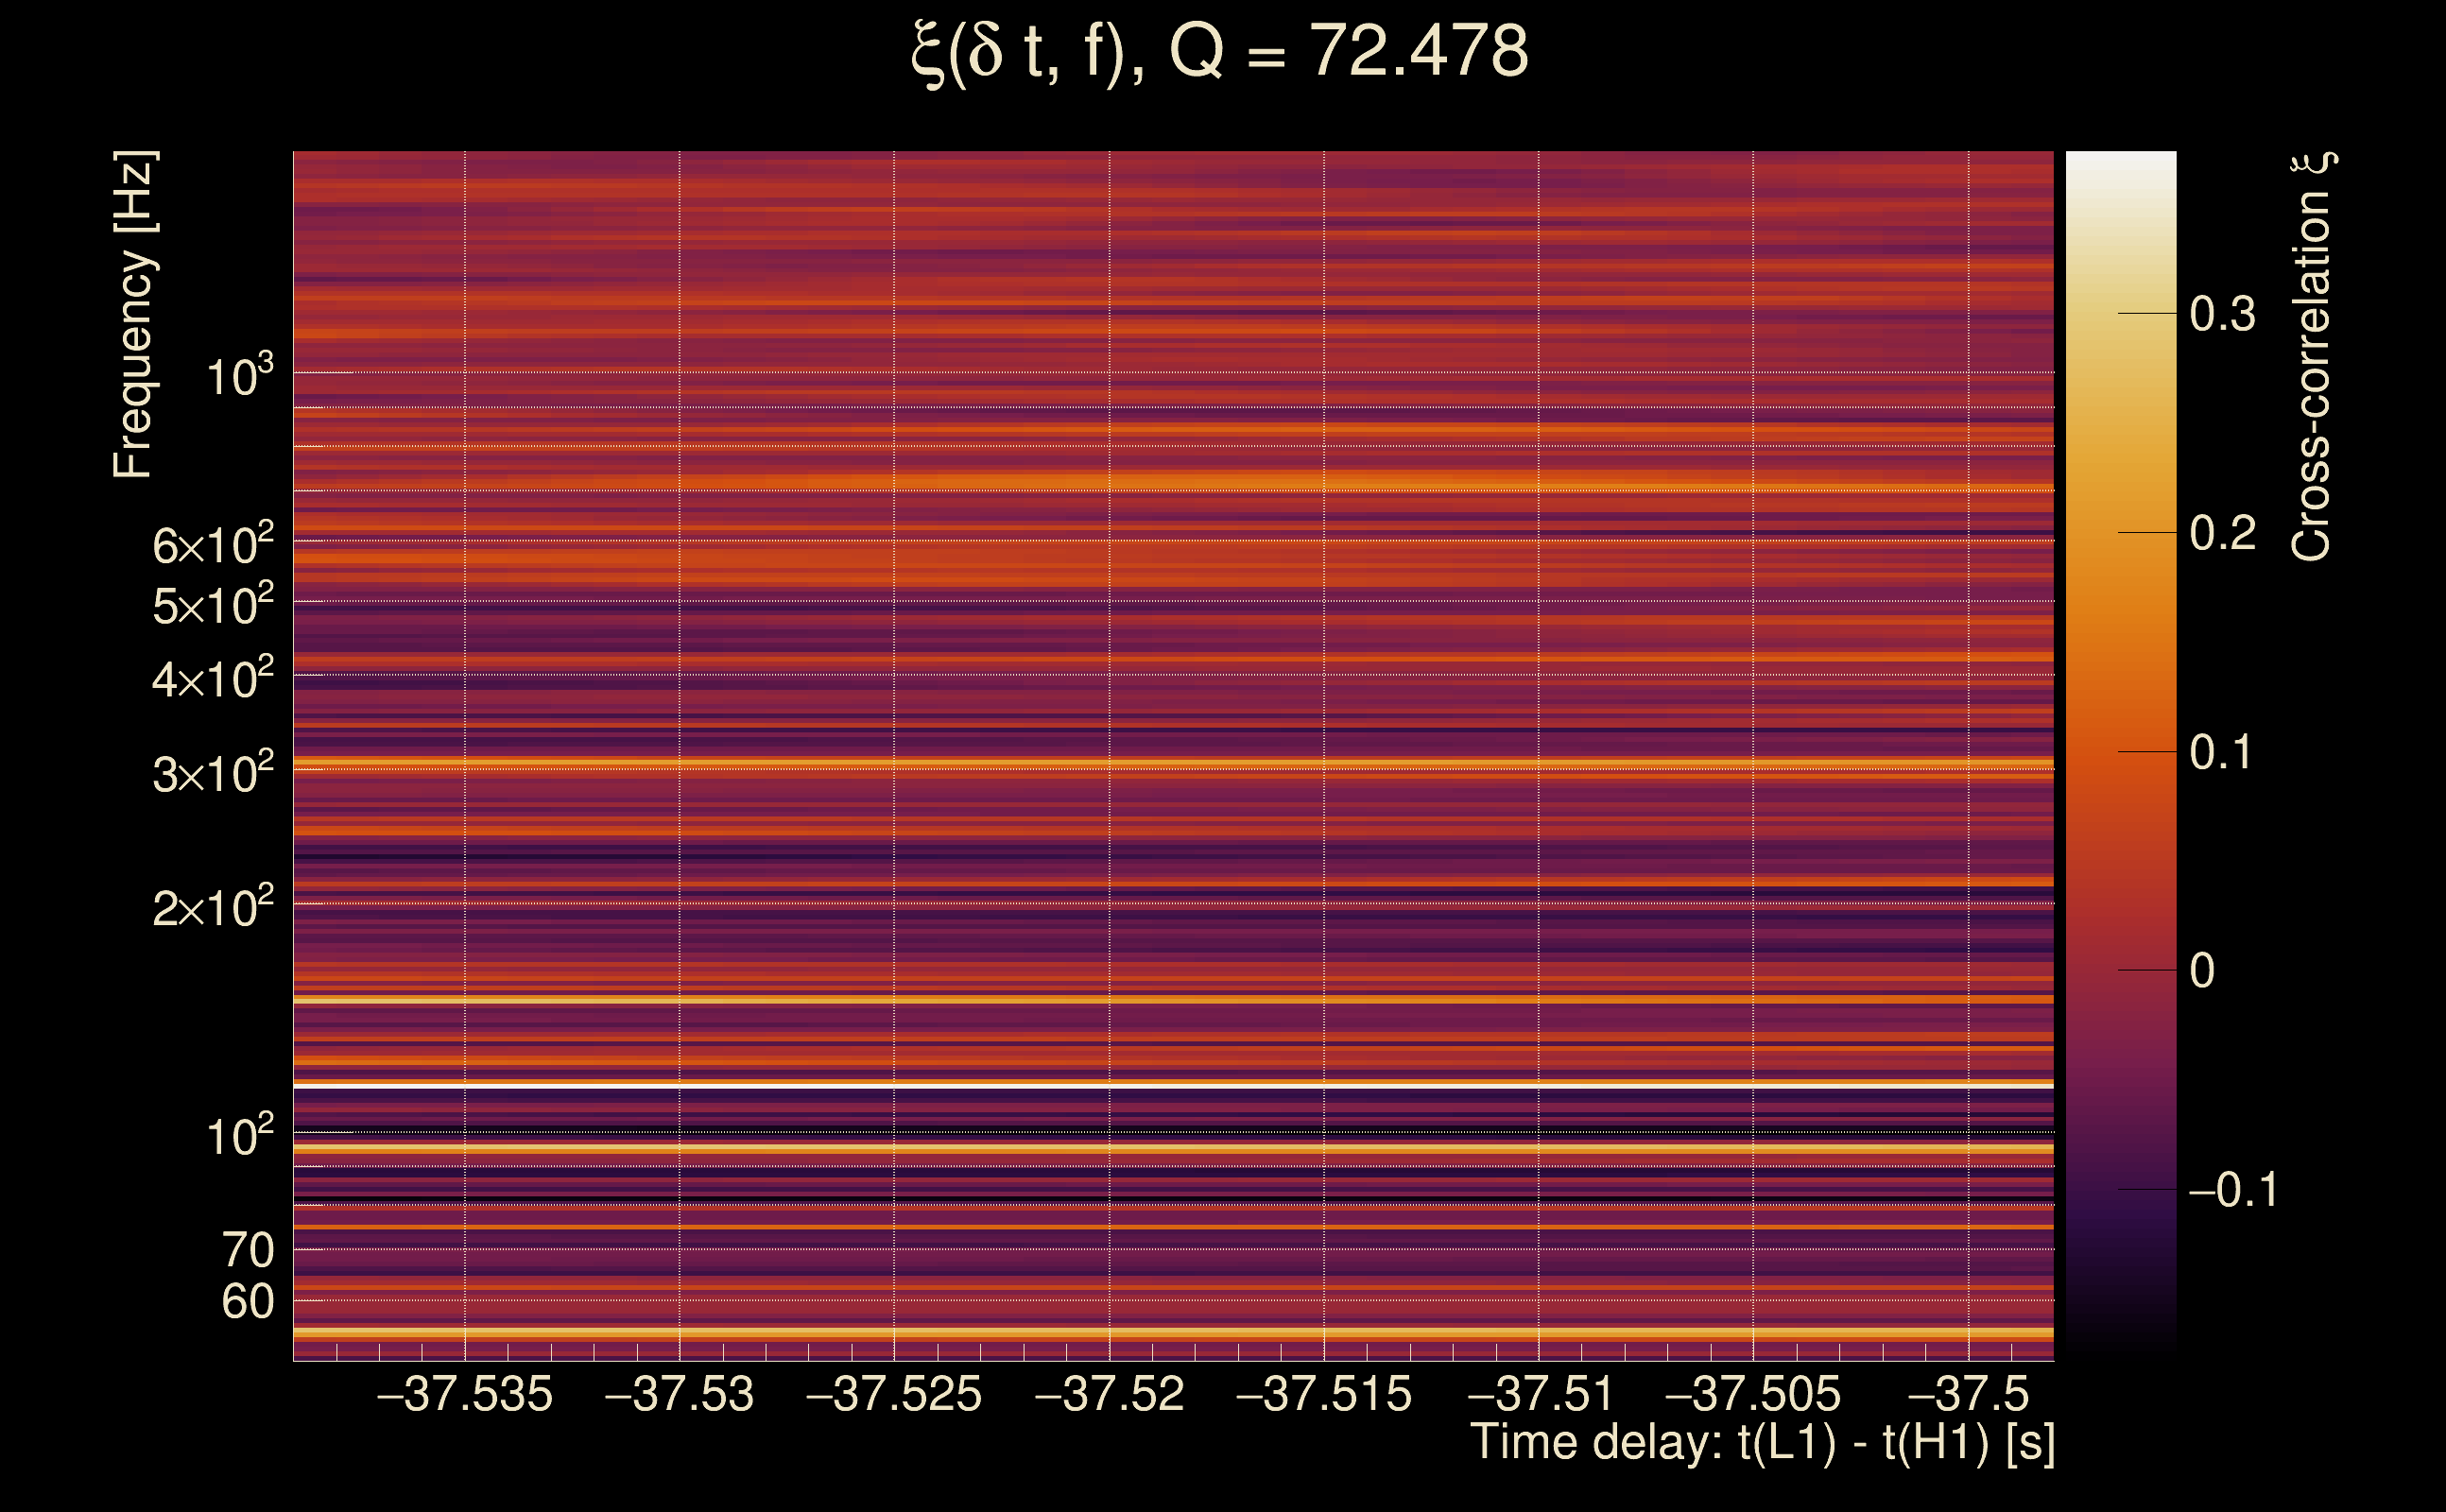
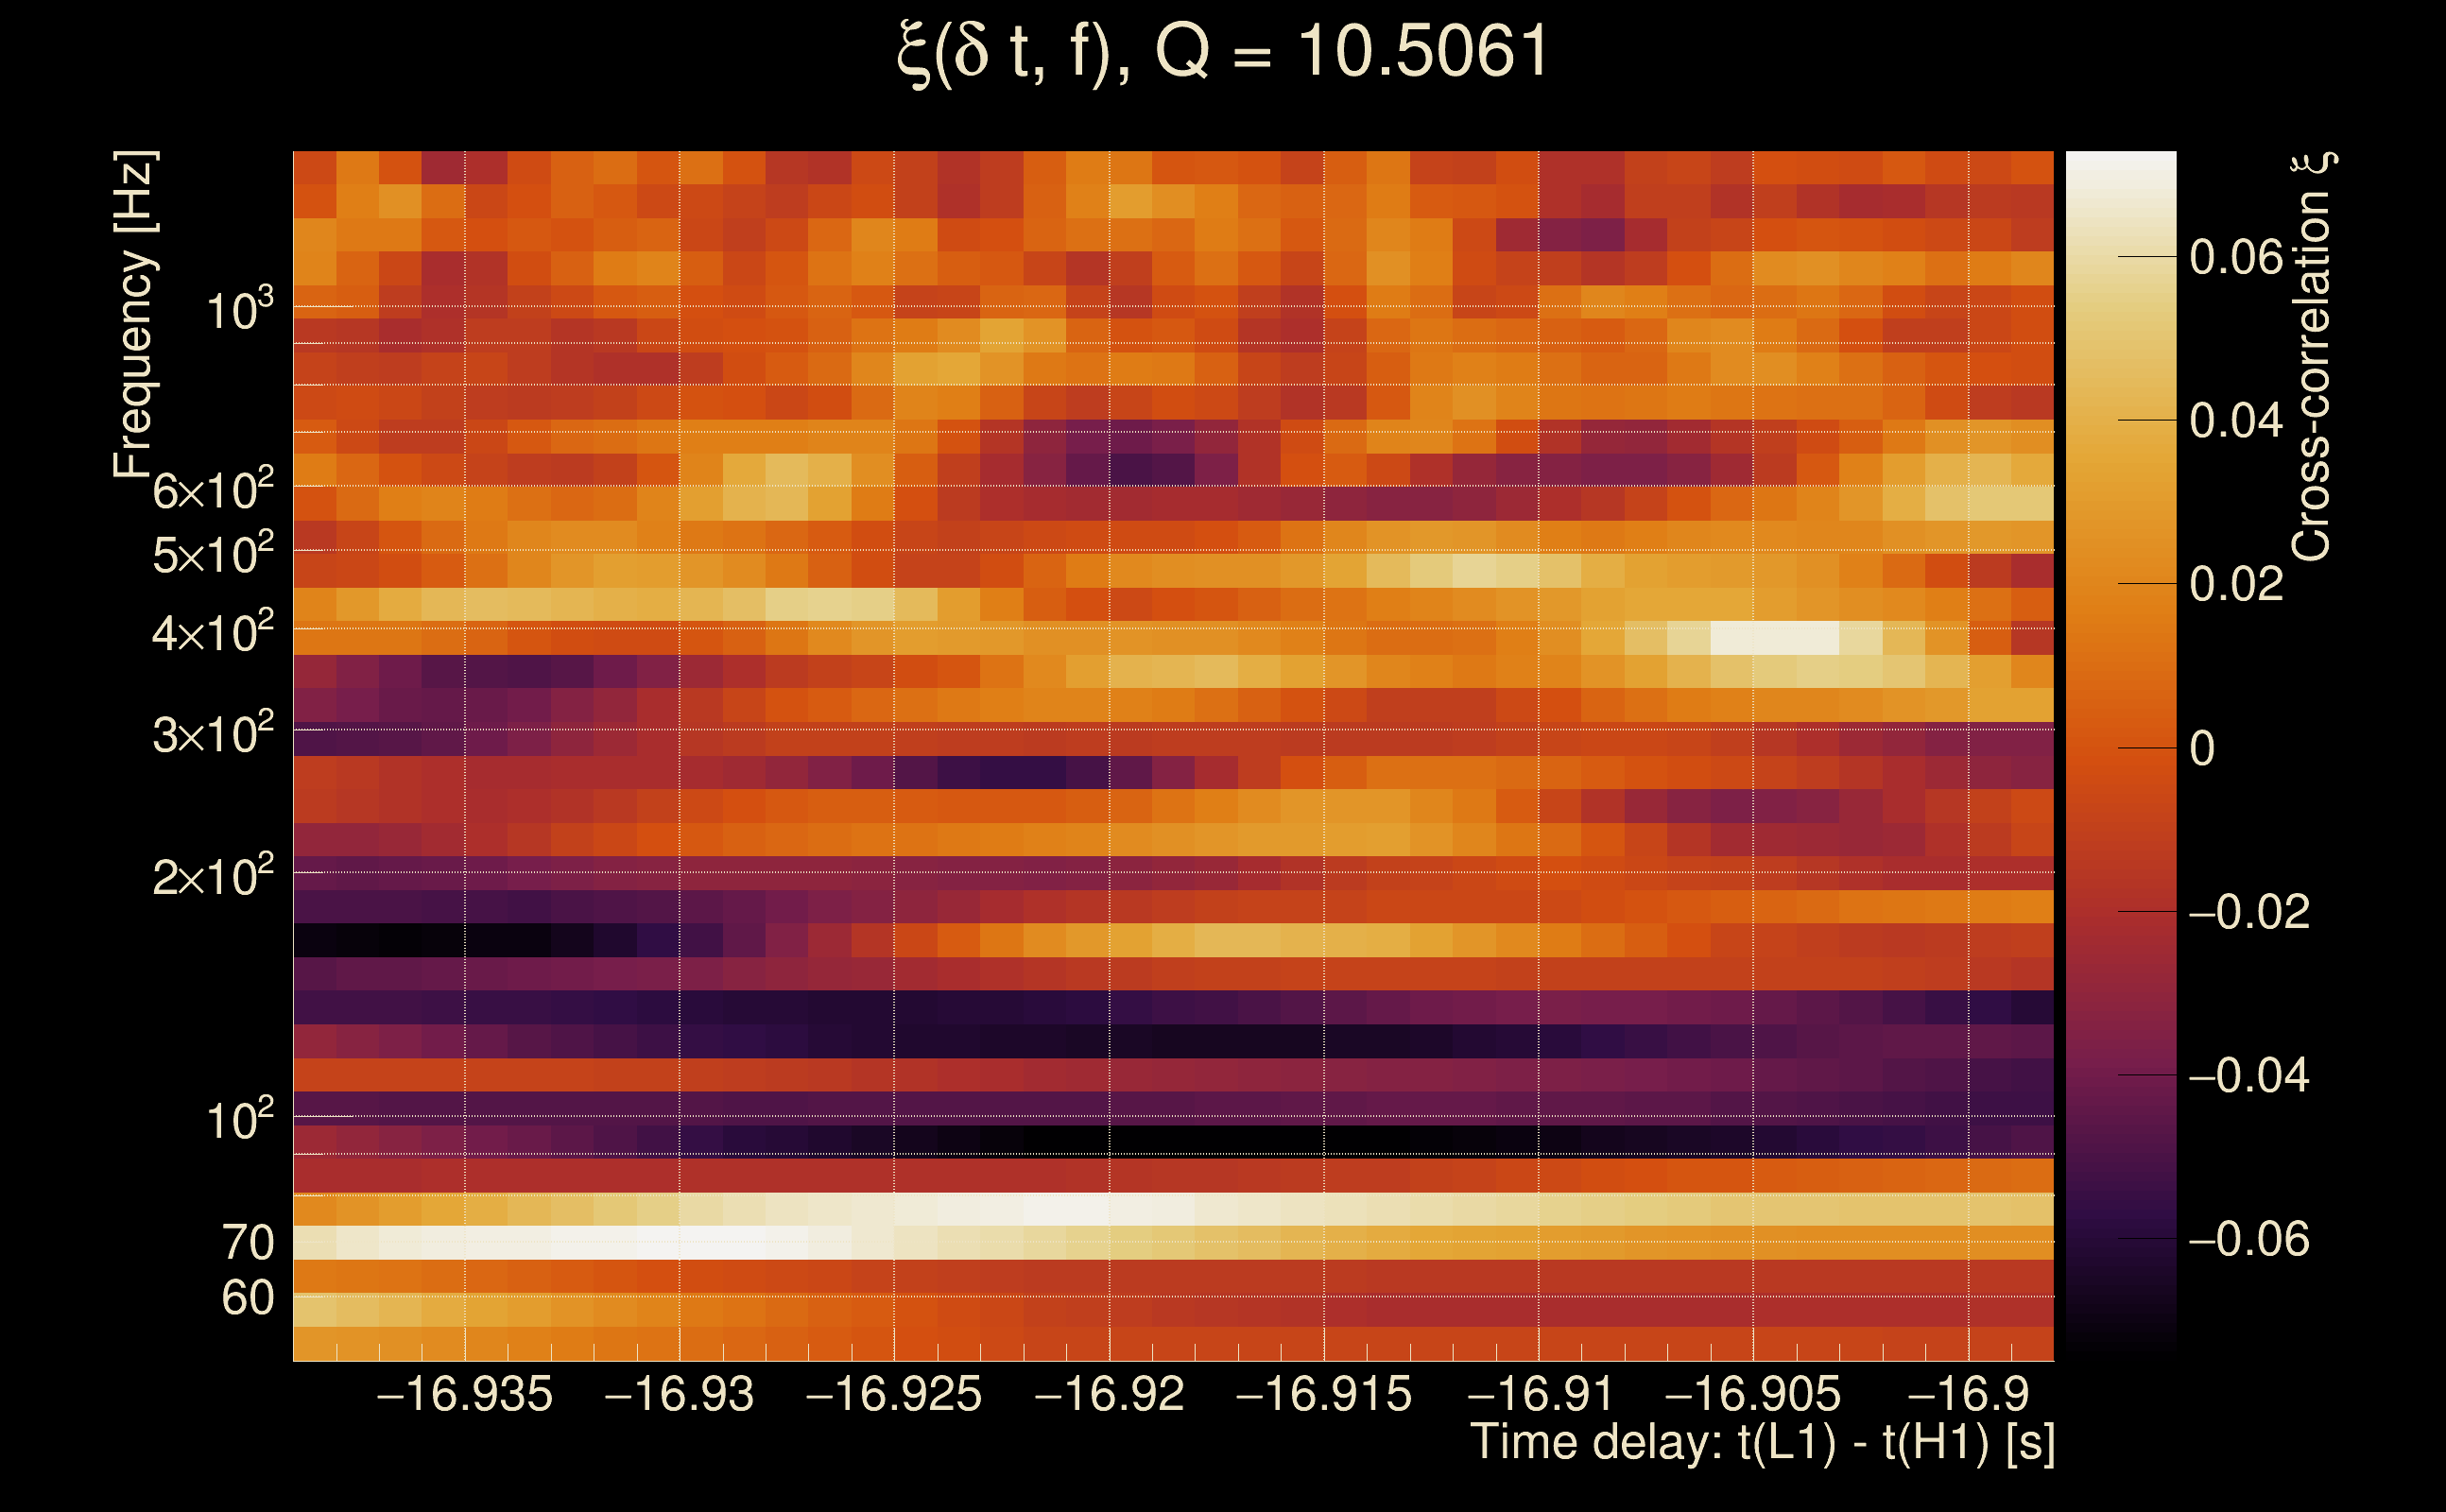
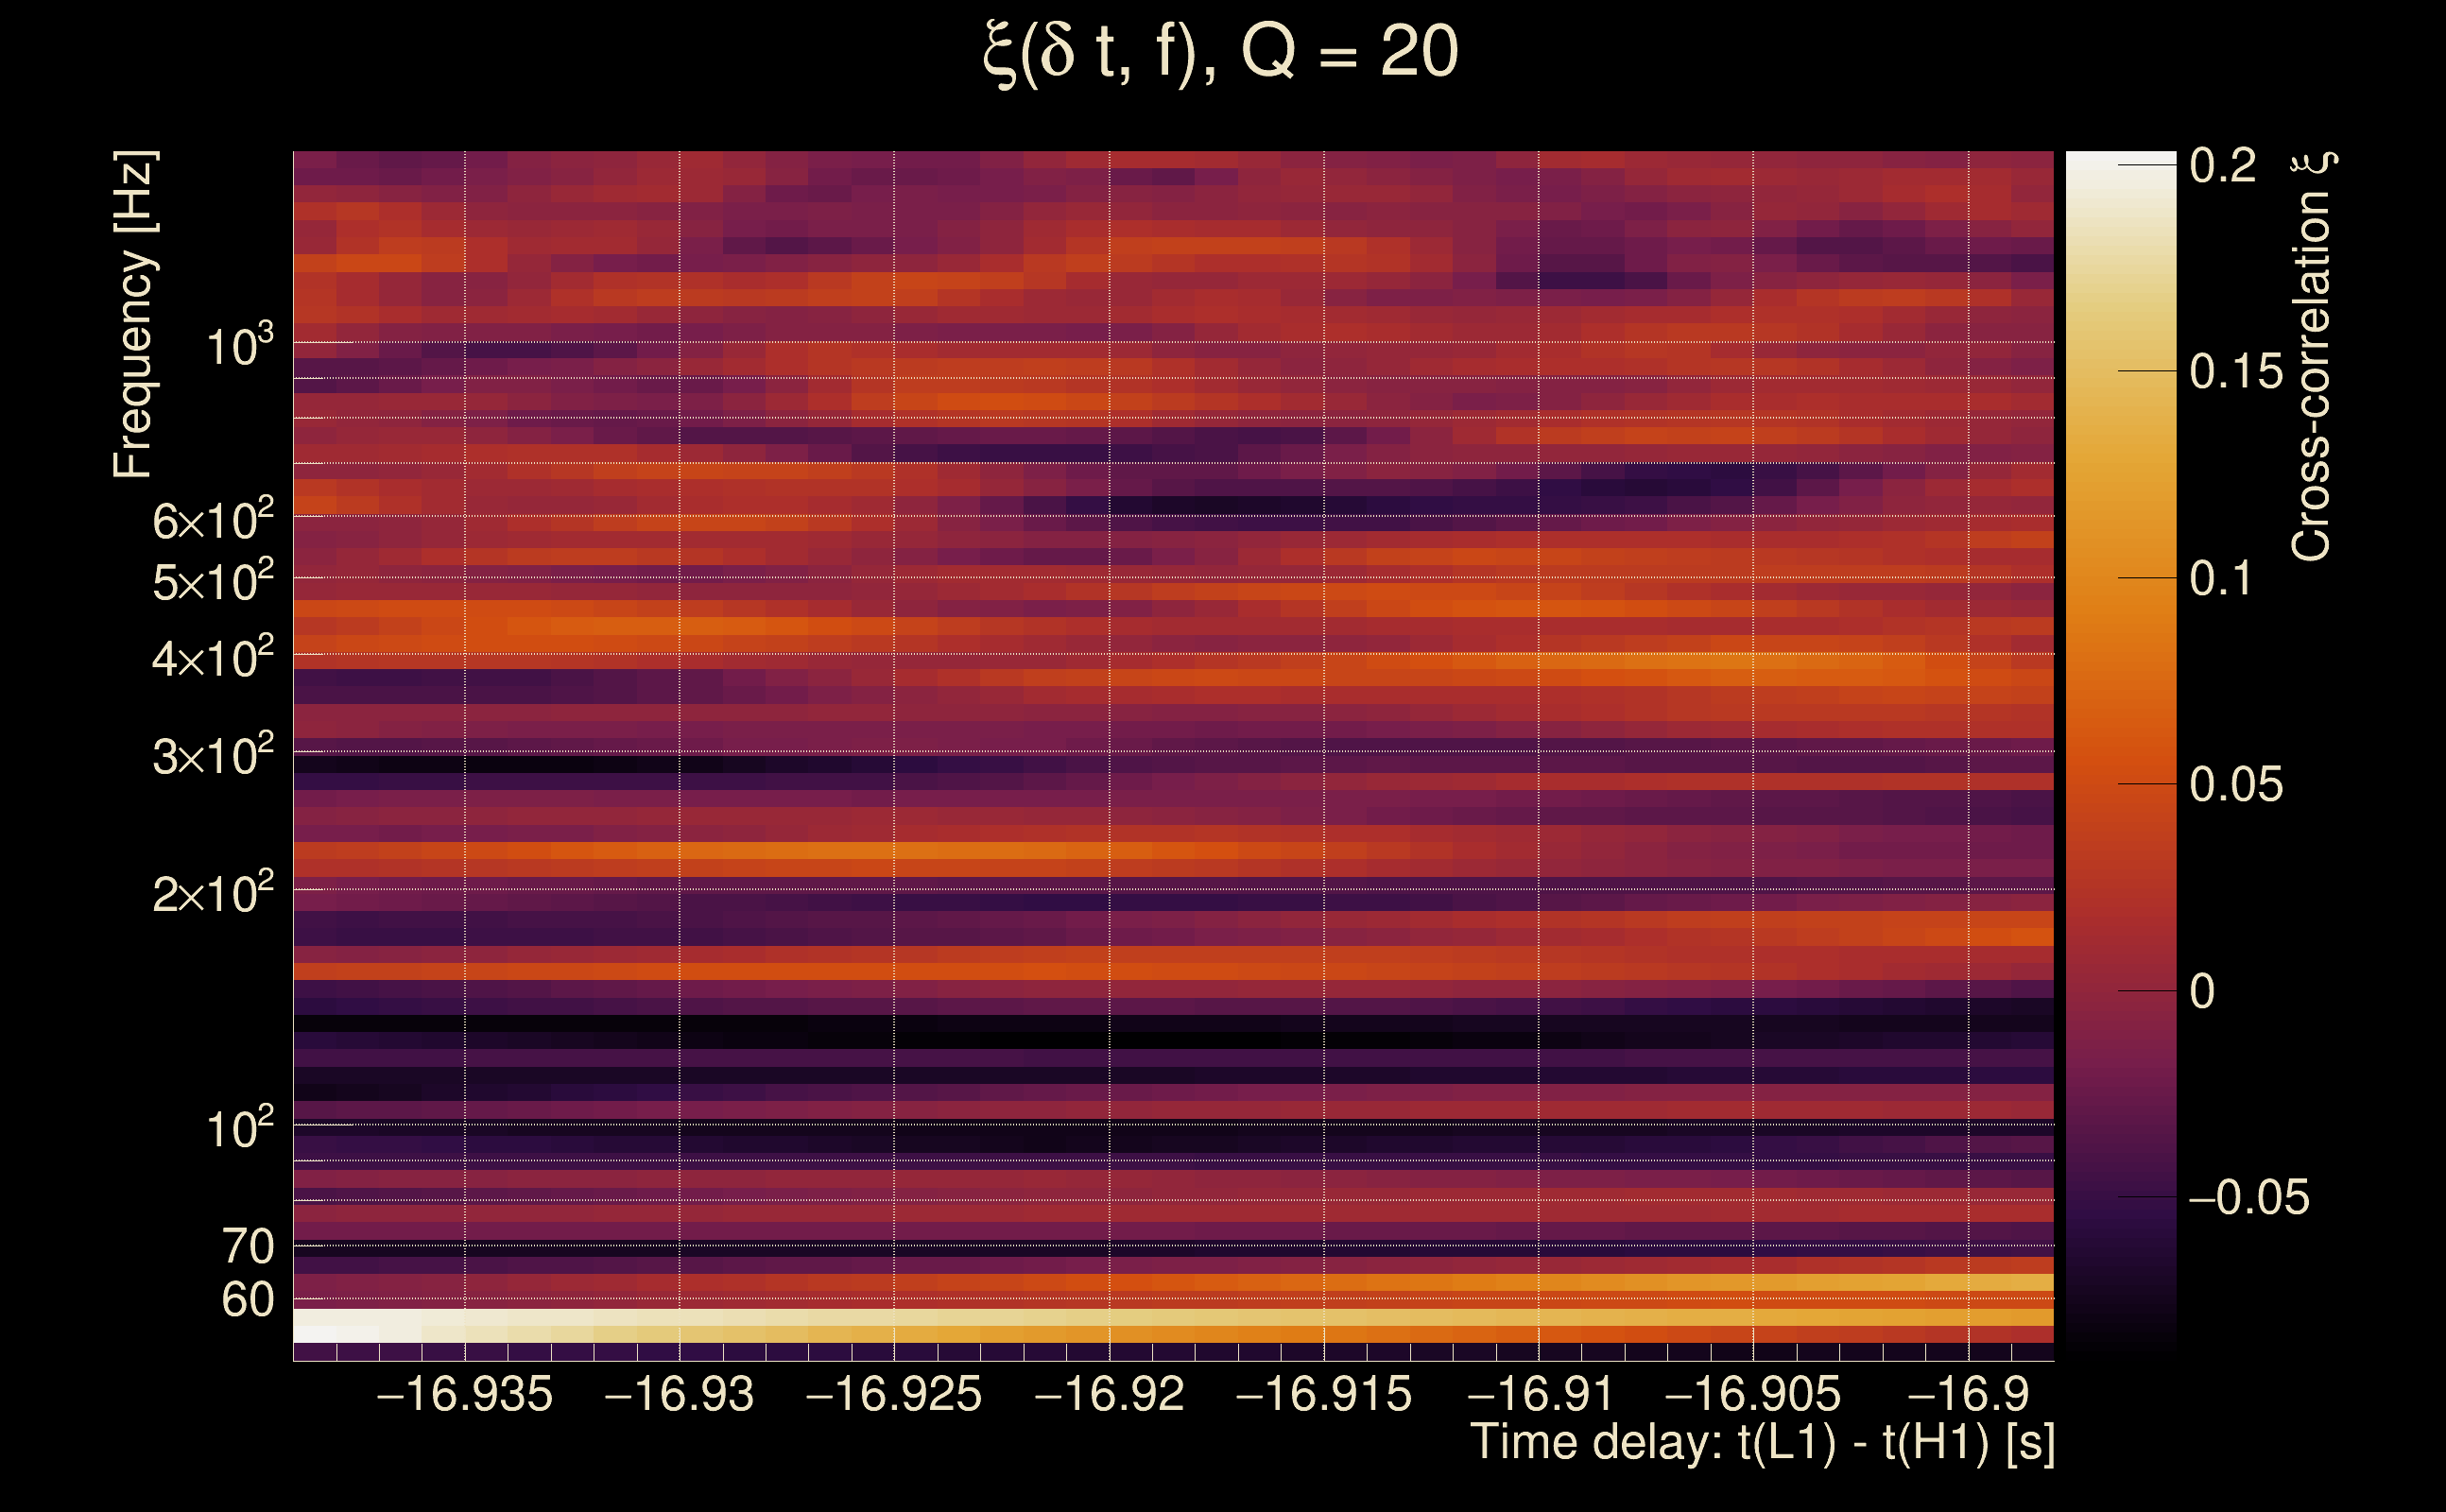
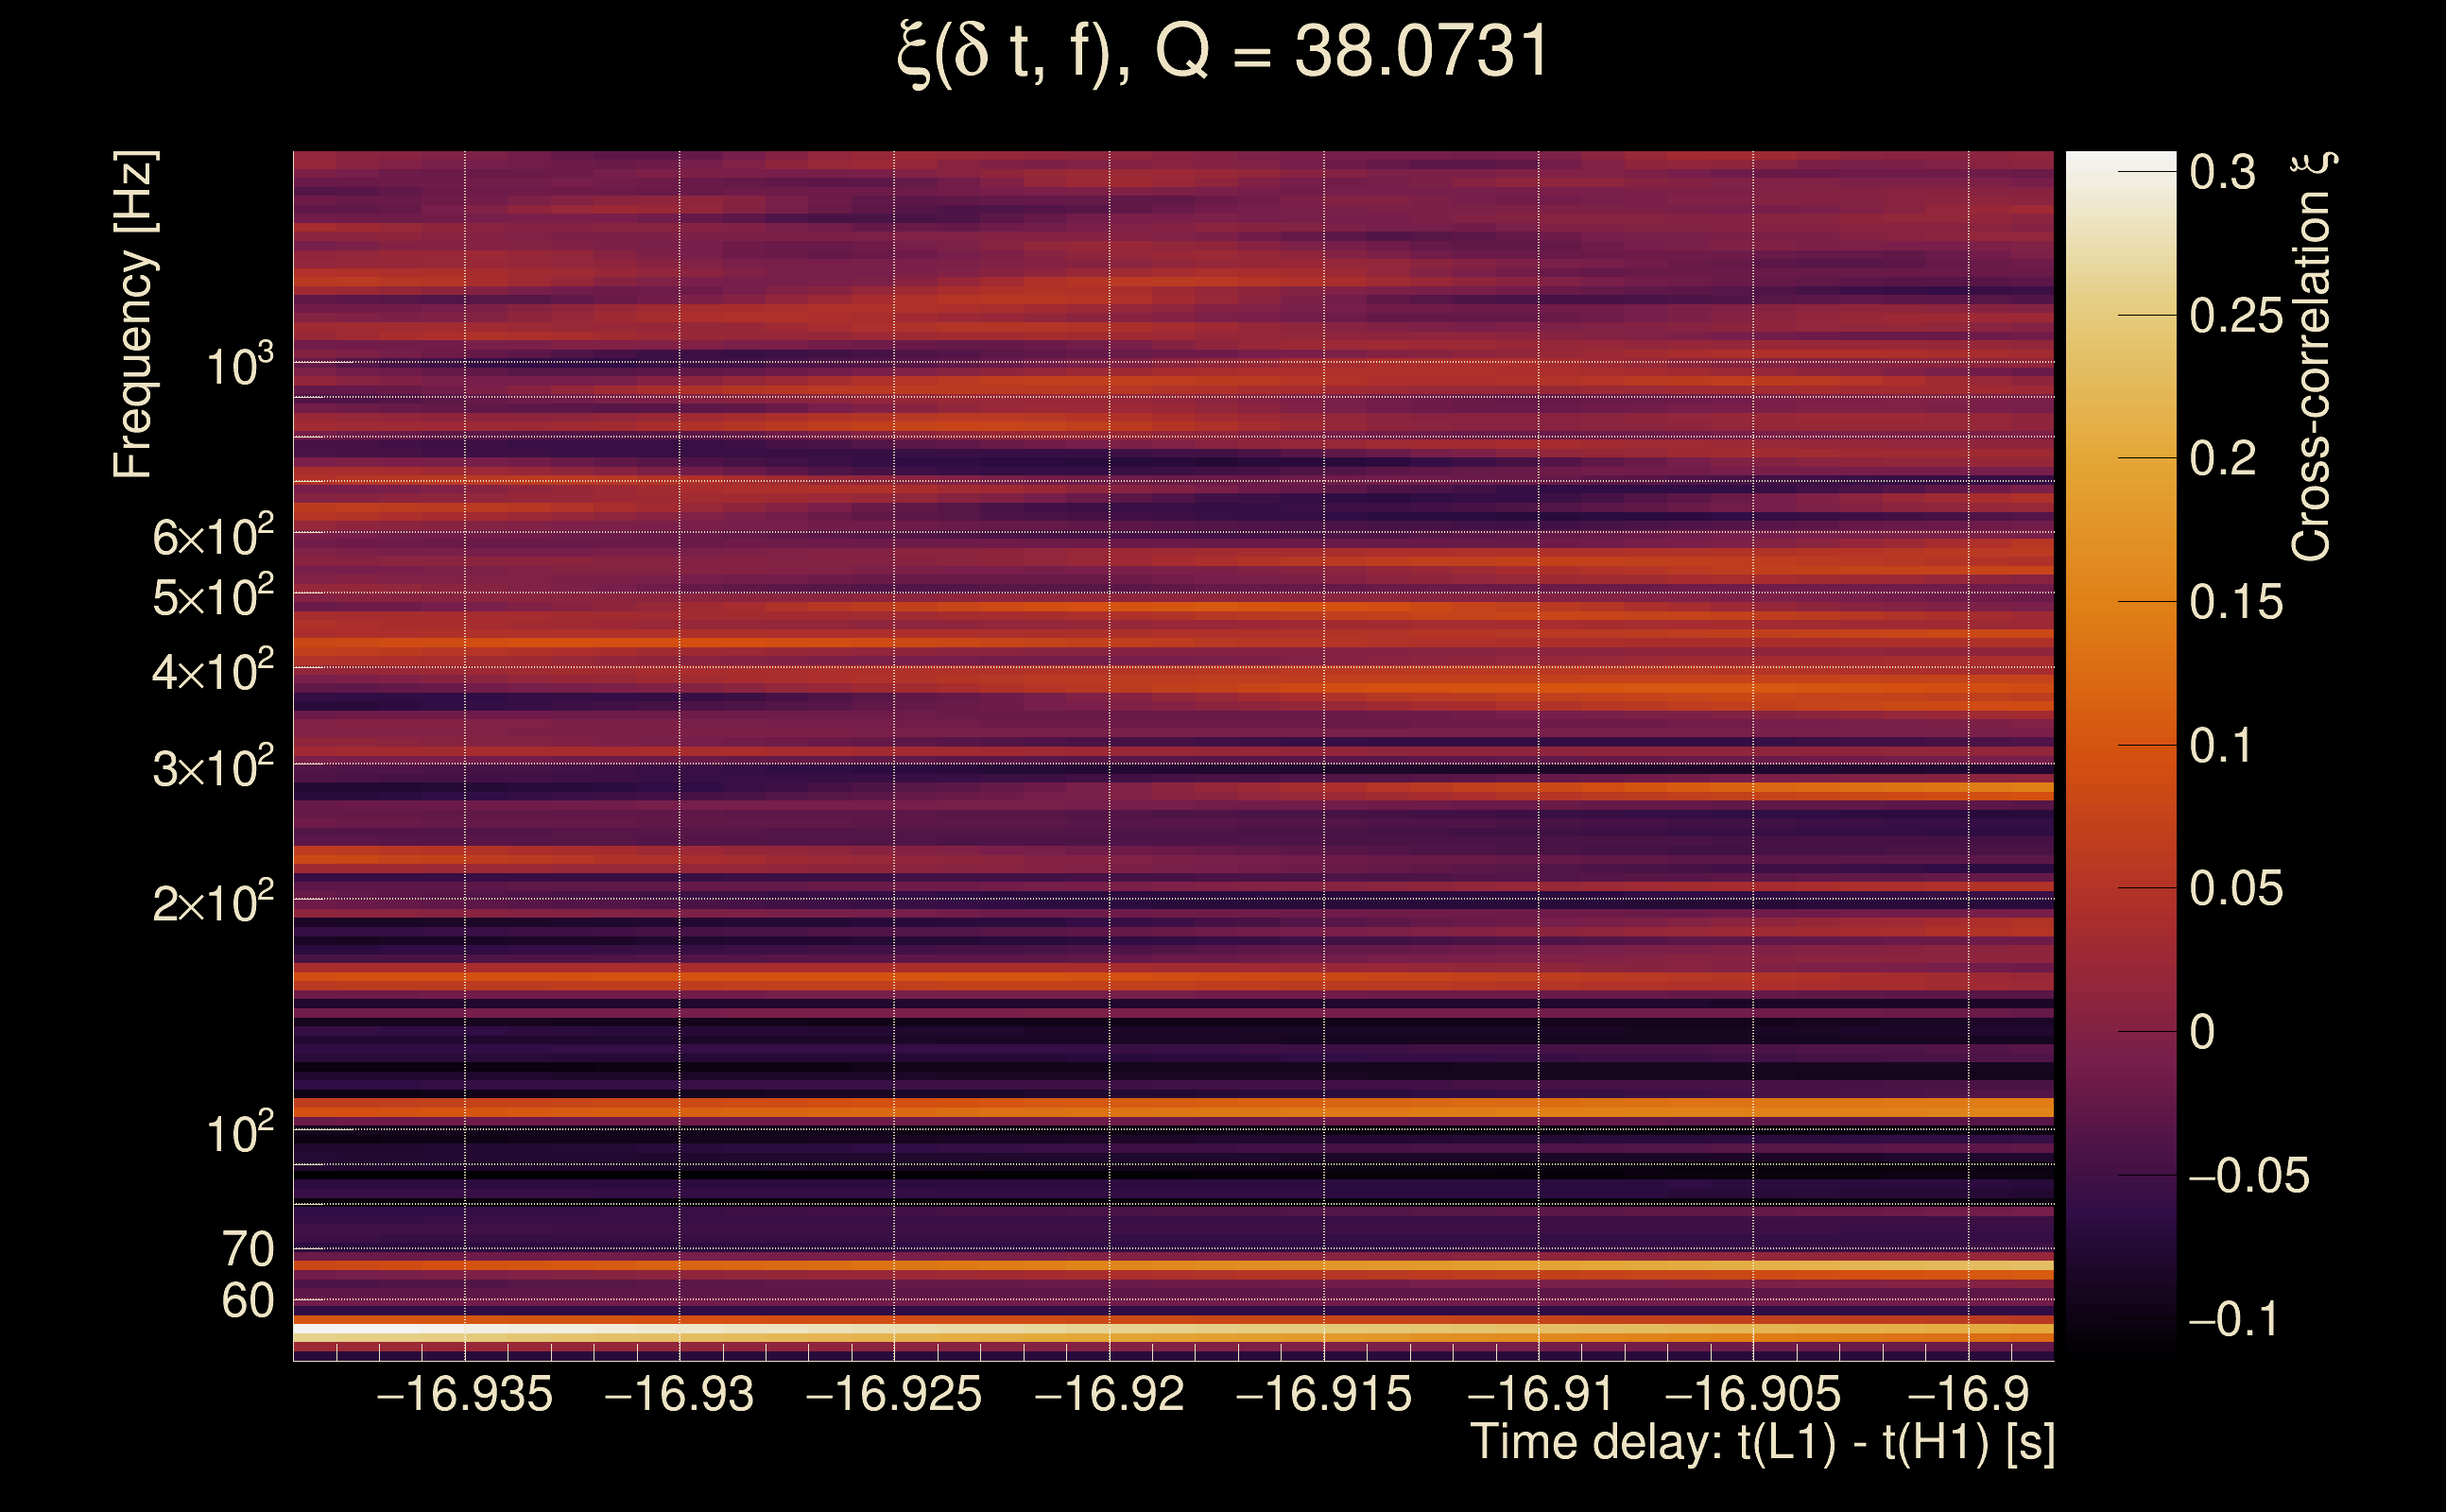
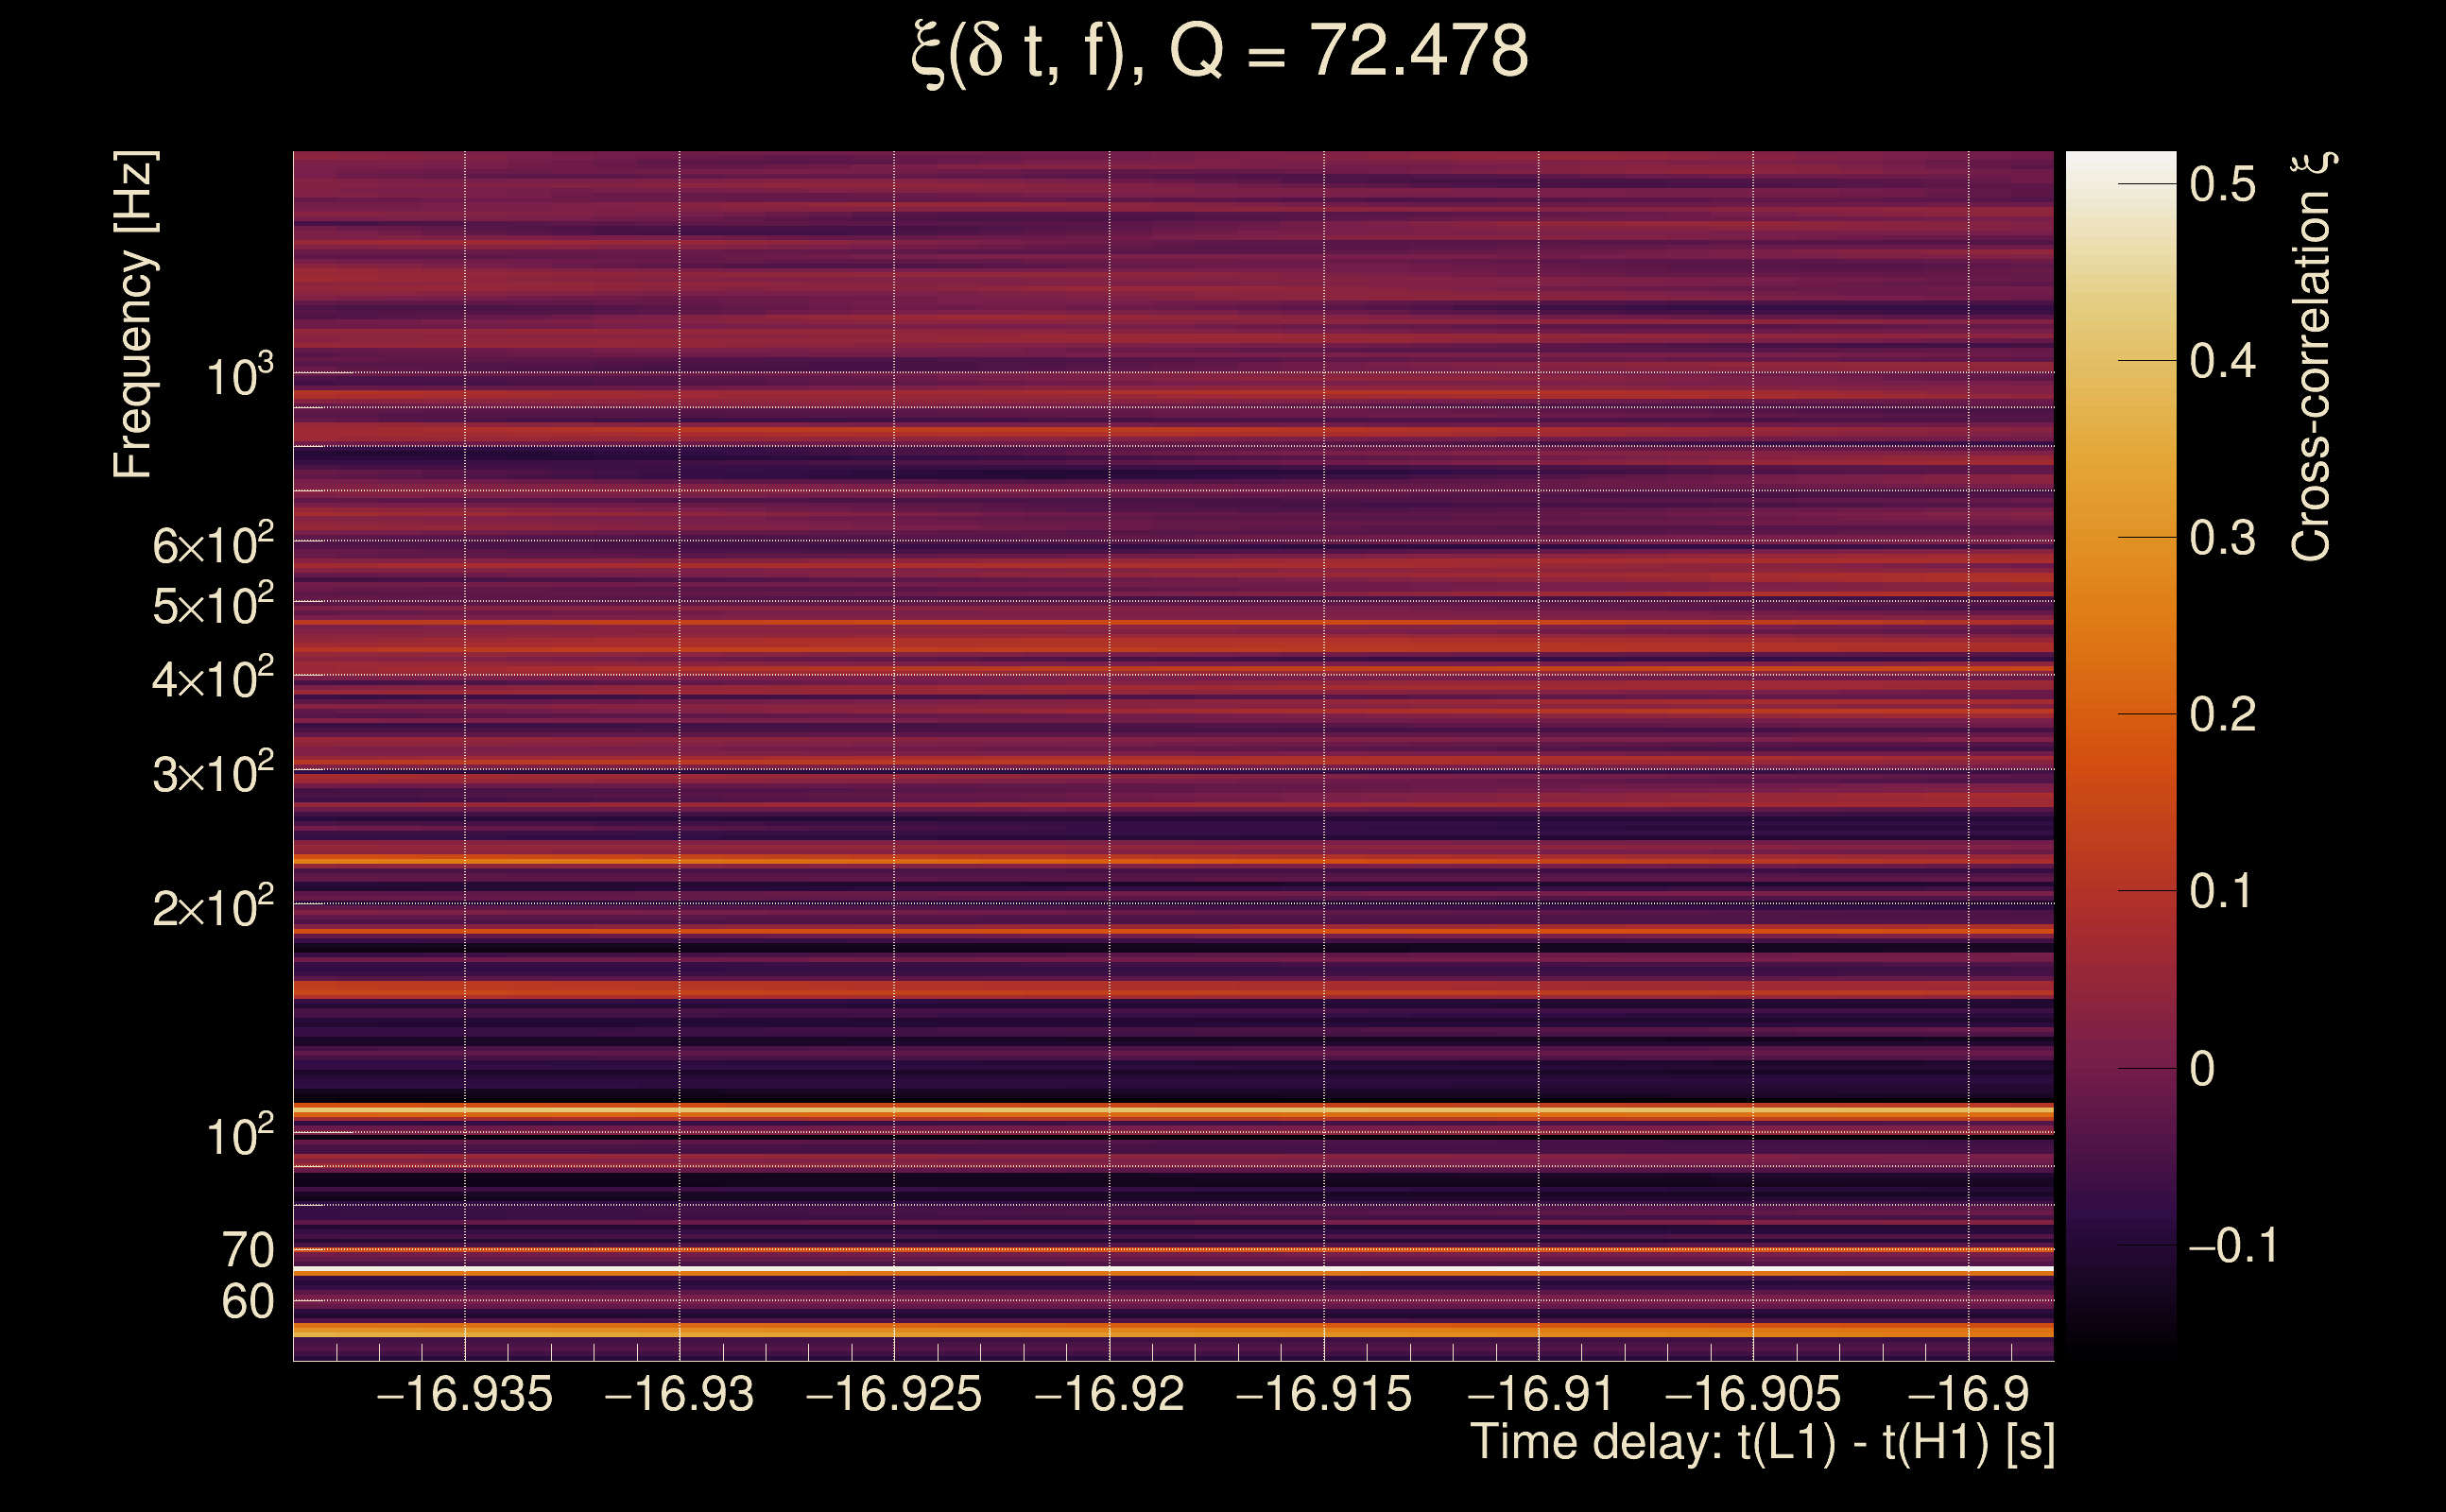
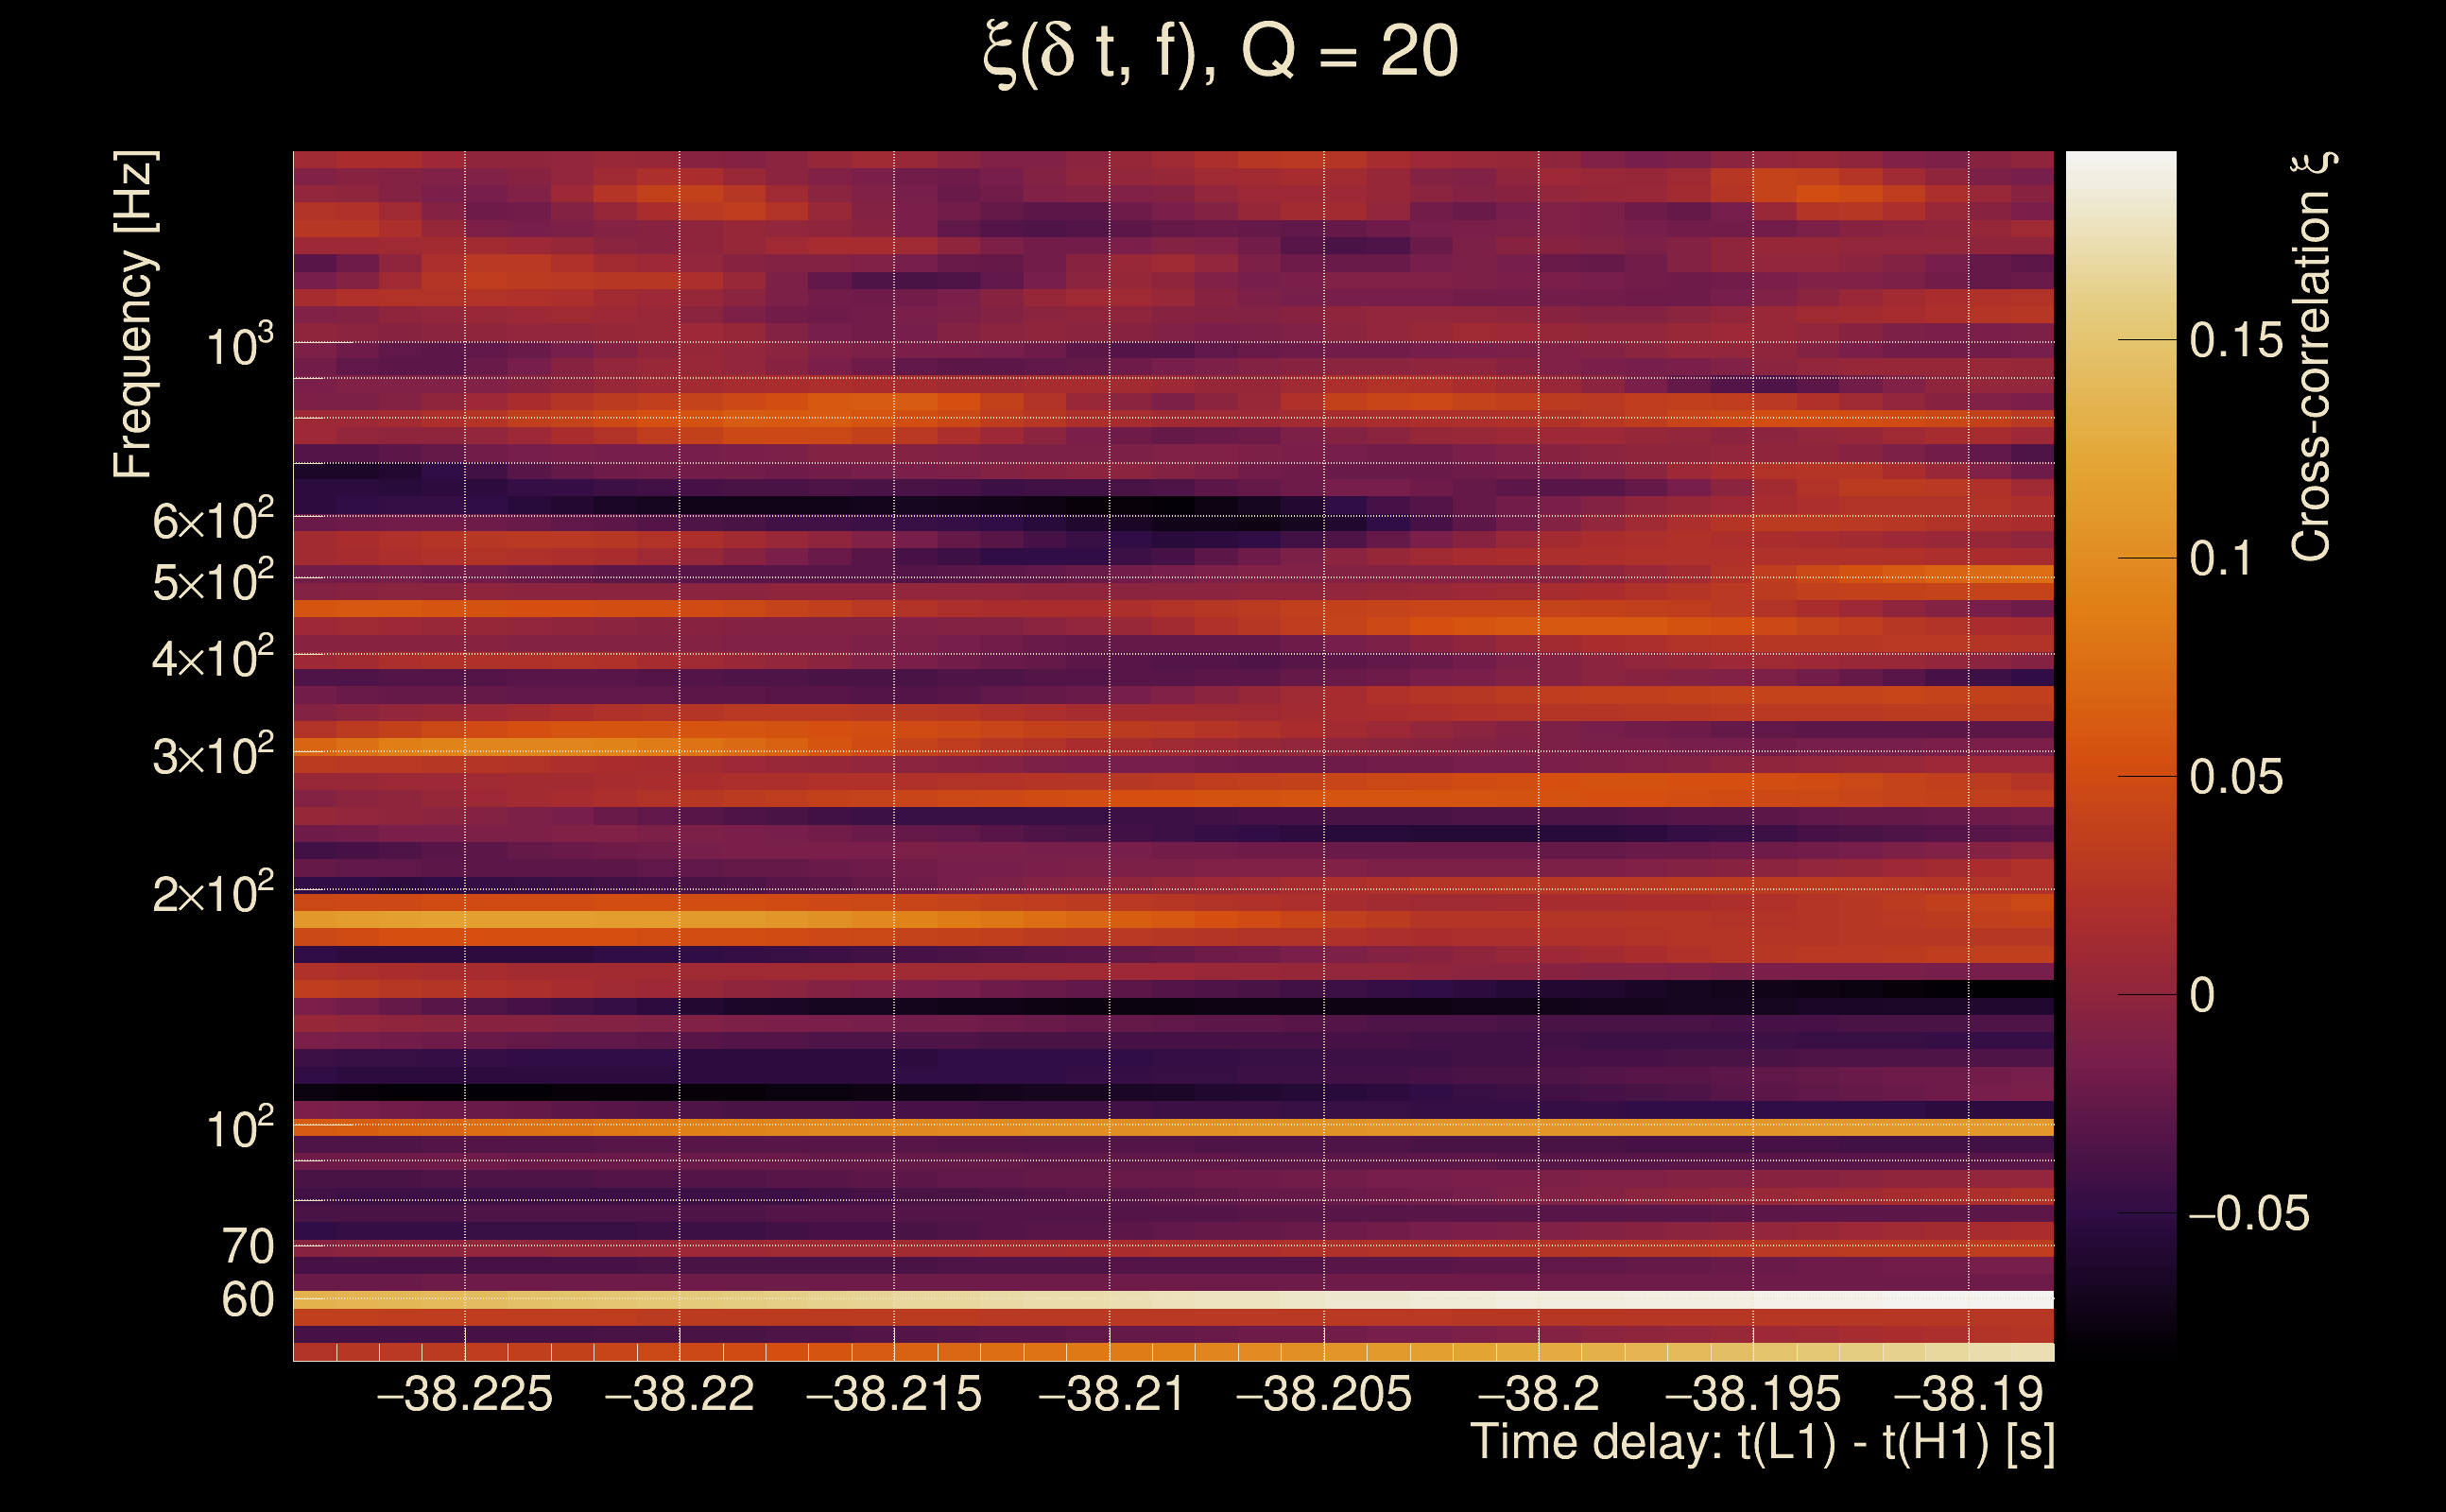
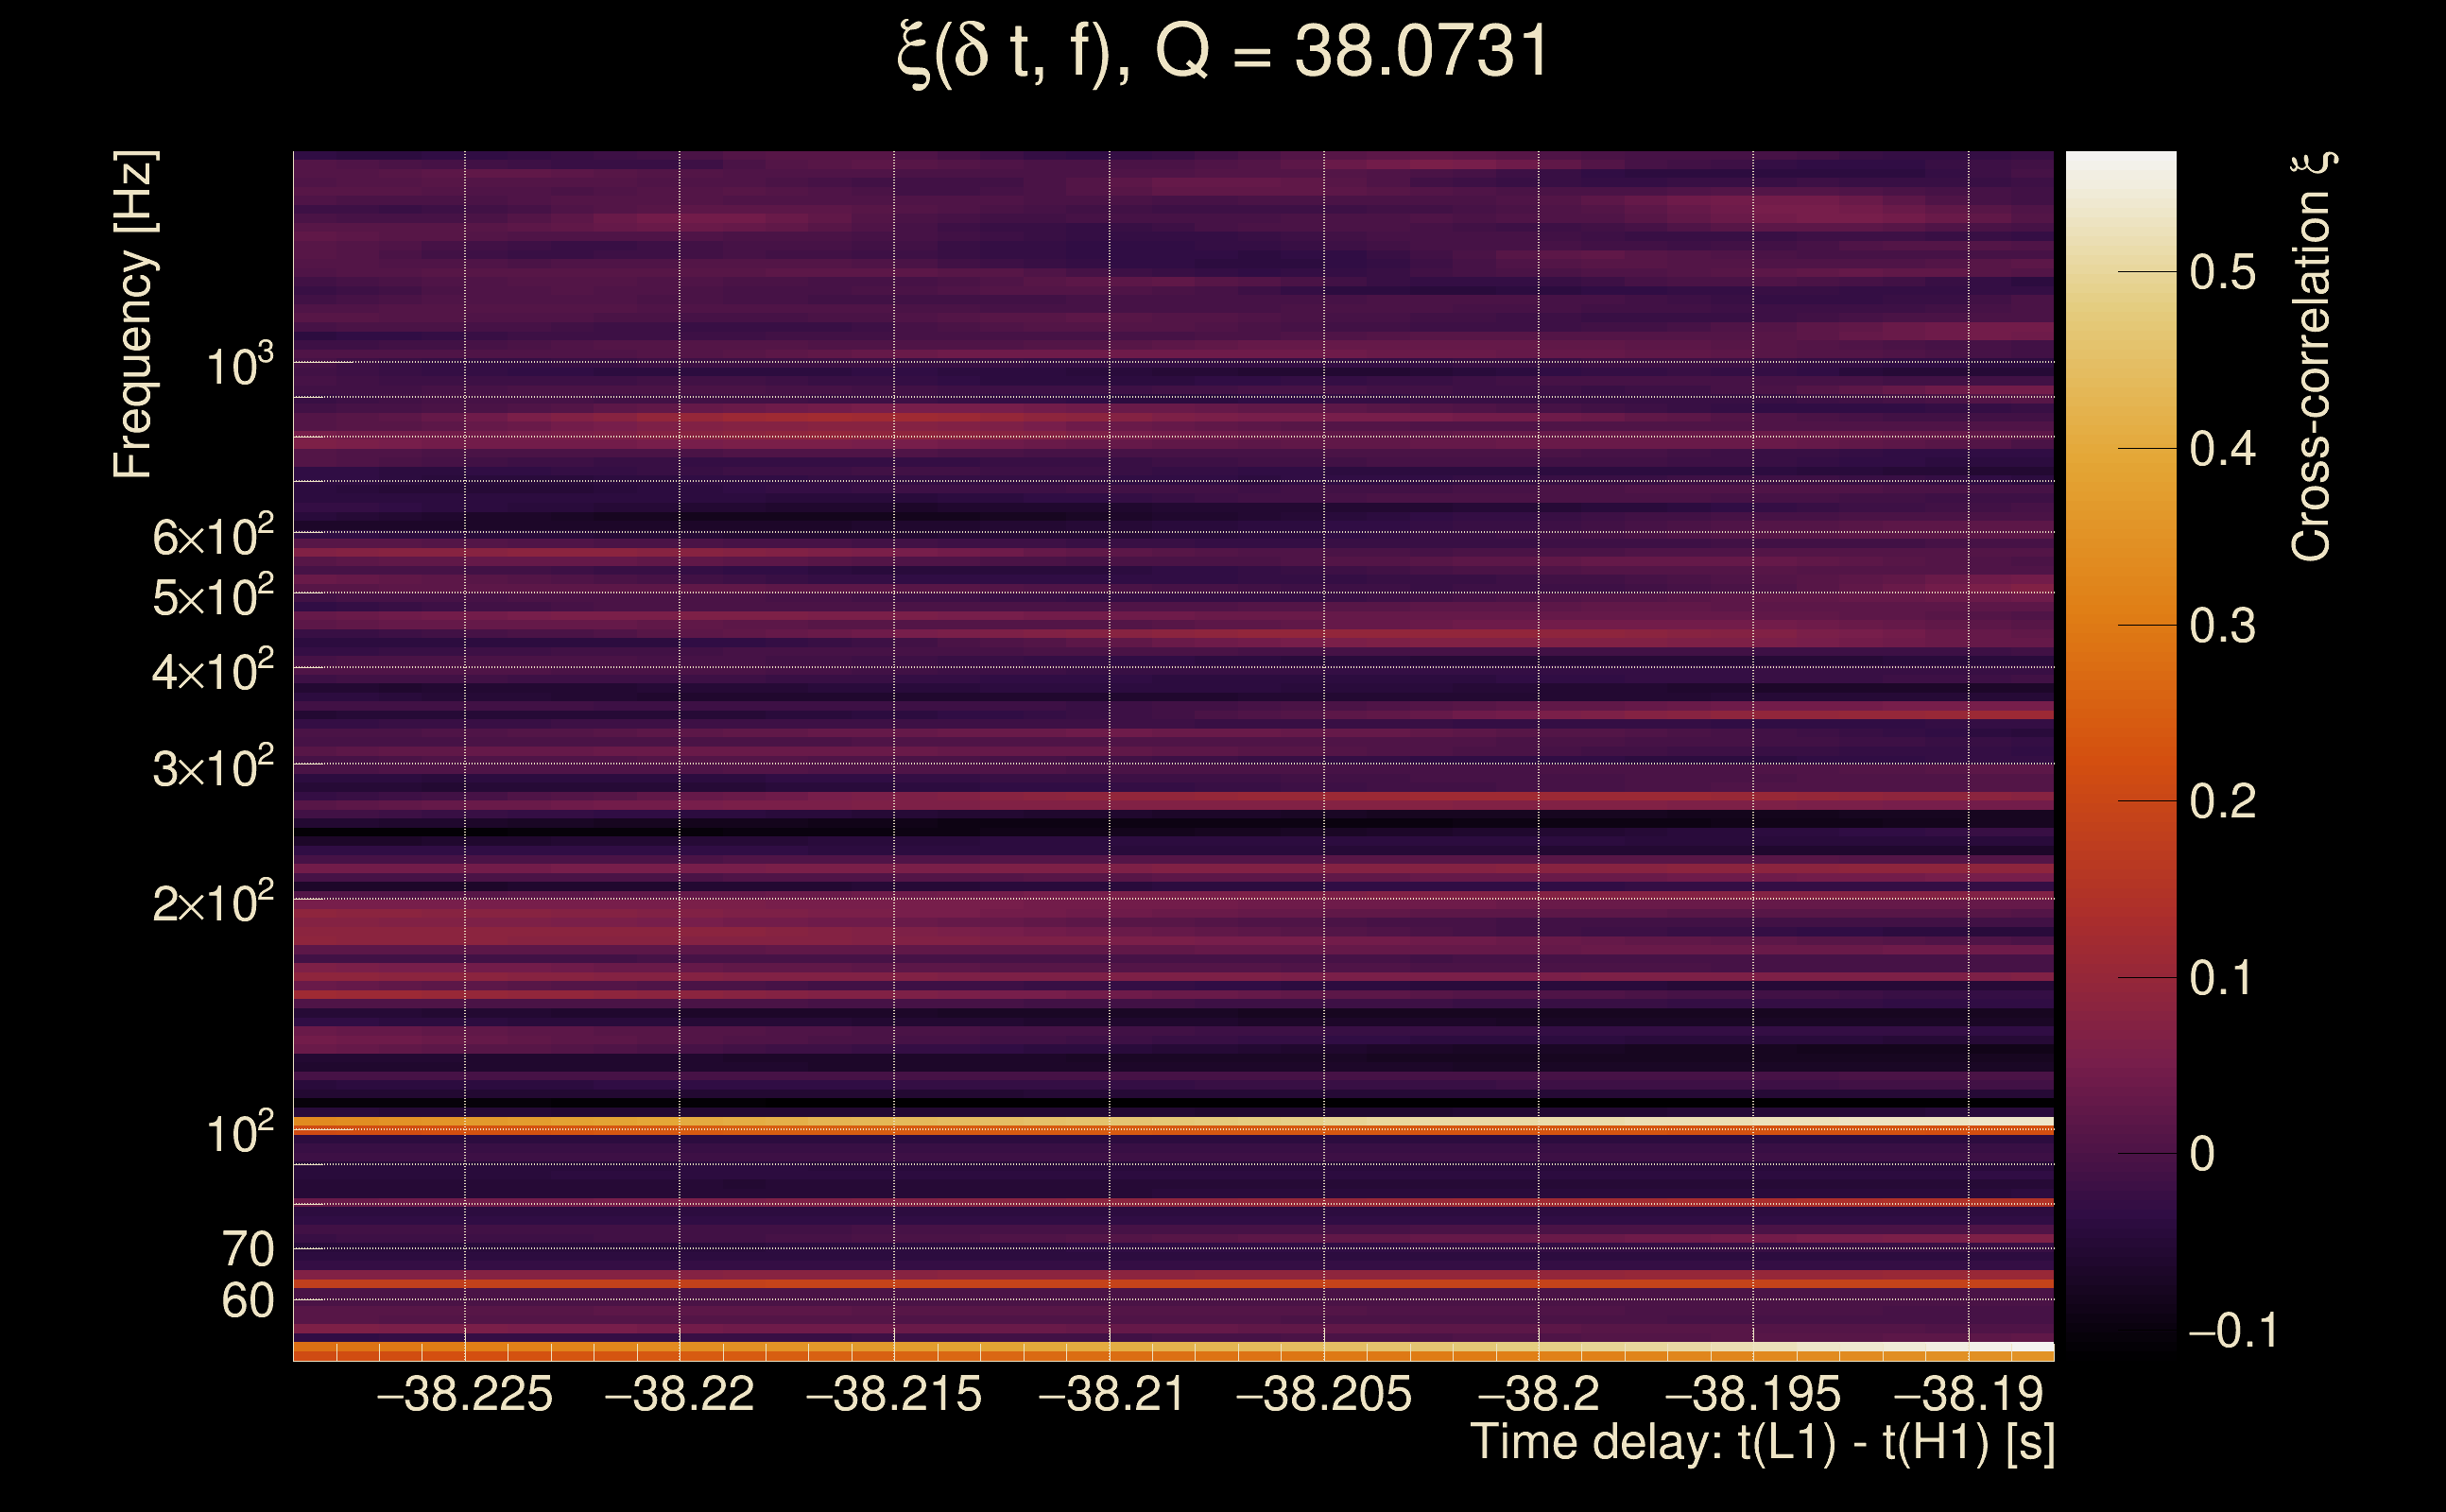
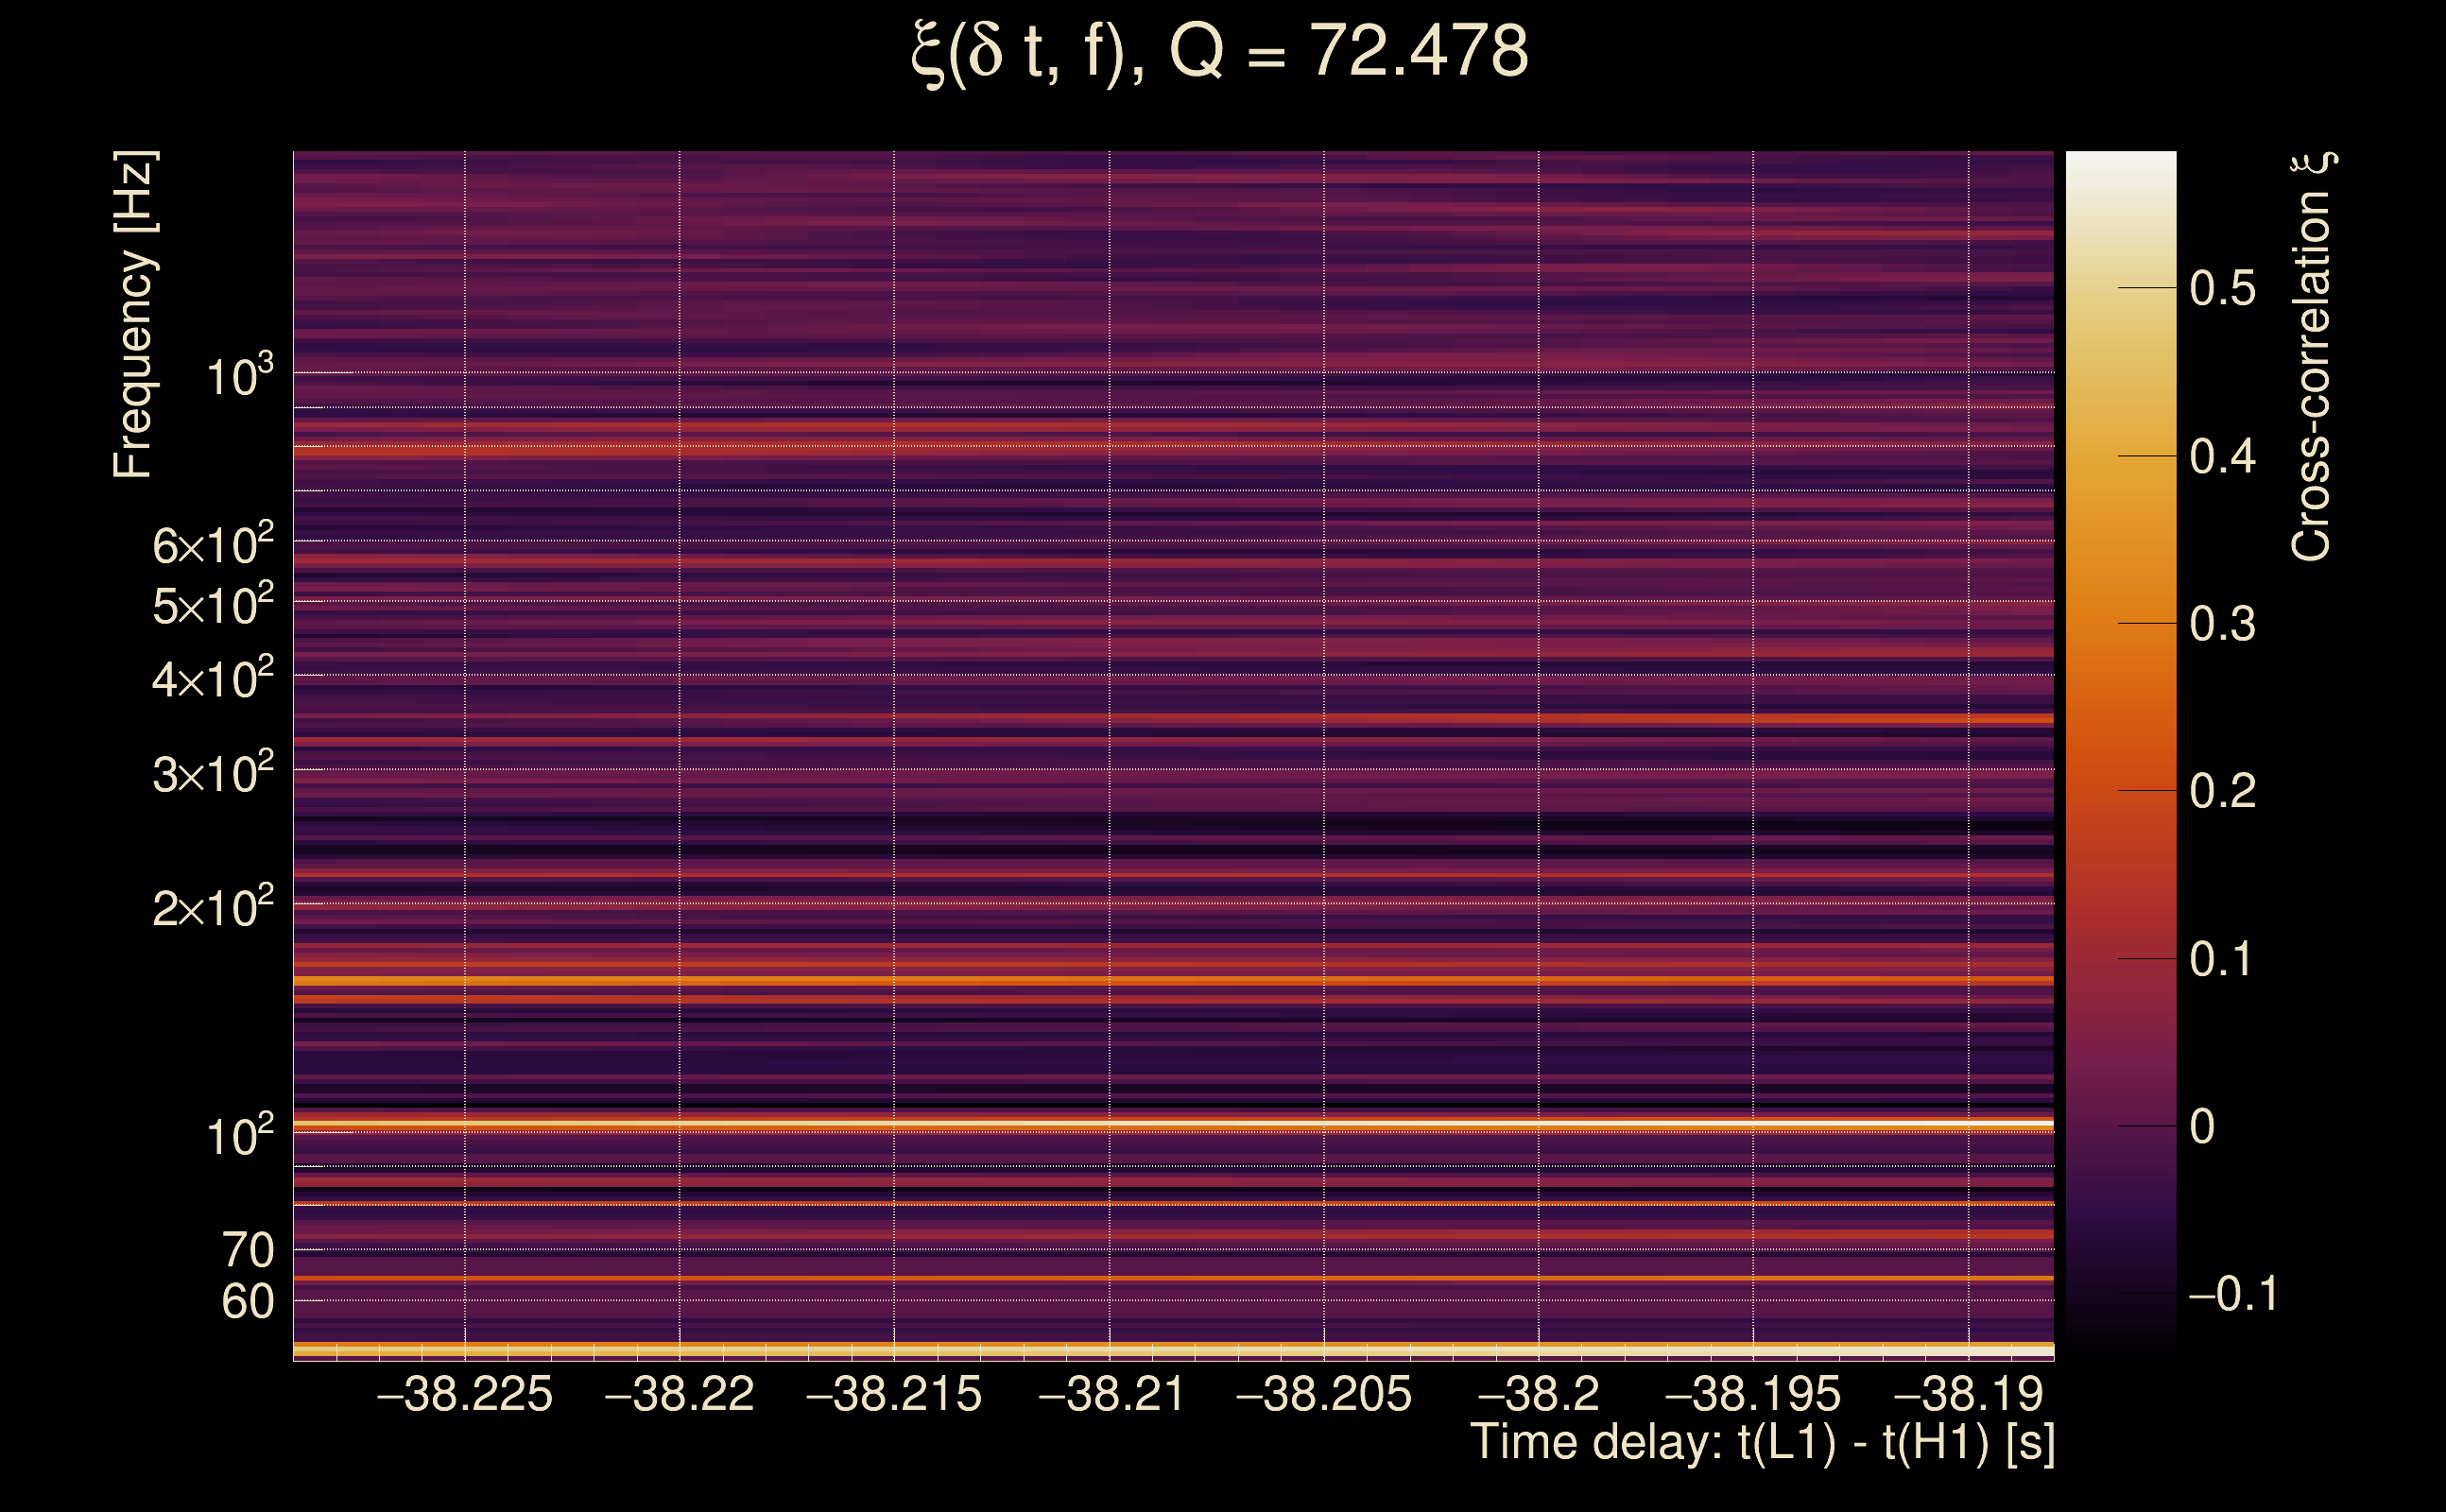
| Time delay between detectors t(L1) - t(H1): | -15.5856 s (slice index = 12 / 217), δt_gw = -0.00161467 s |
| Time delay uncertainty: | 0.00564974 s |
| [targeted mode] Time delay probability: | 0.925308 (0.0937498 sigmas), δt_target = 1.72247e+45 s |
| Frequency: | 541.593 Hz |
| Ξ: | 0.0031023 ± 0.0547046 (variance = 0.00299259): Q0: 0, Q1: 0.0543091, Q2: 0.113581, Q3: 0.16235, Q4: 0.077572 |
| Rank: | R_A = 0.00175956 |
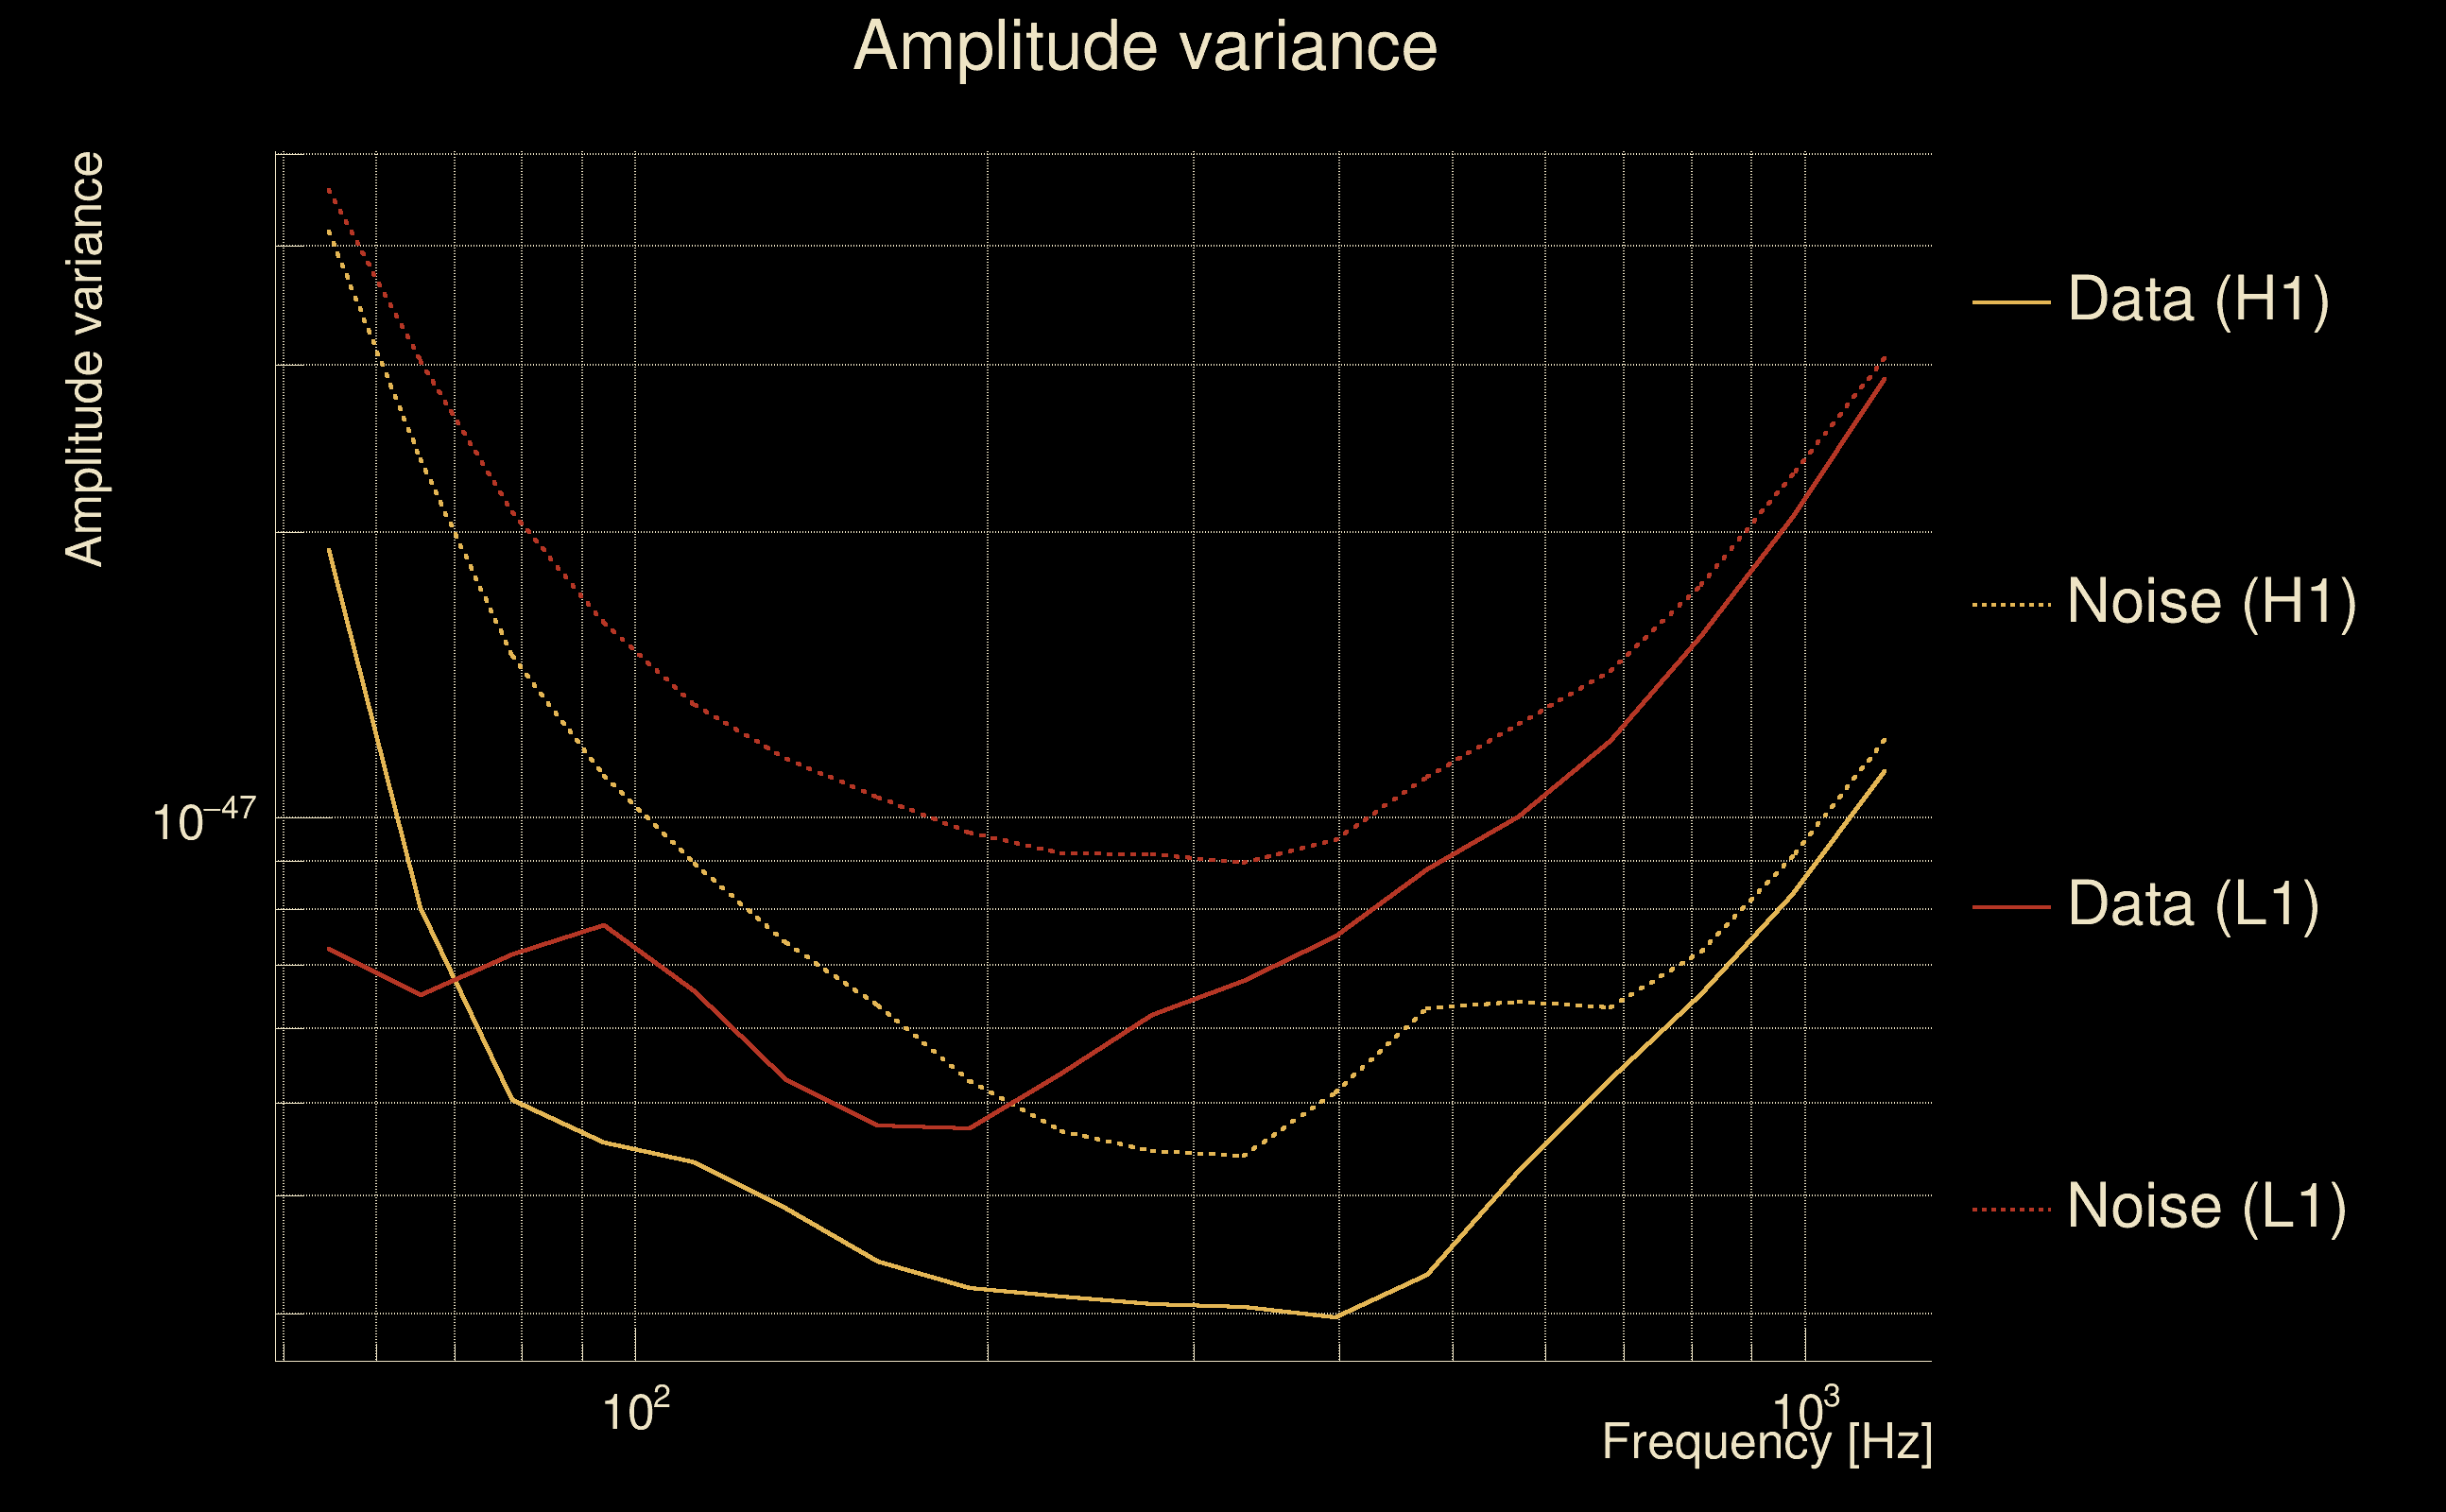
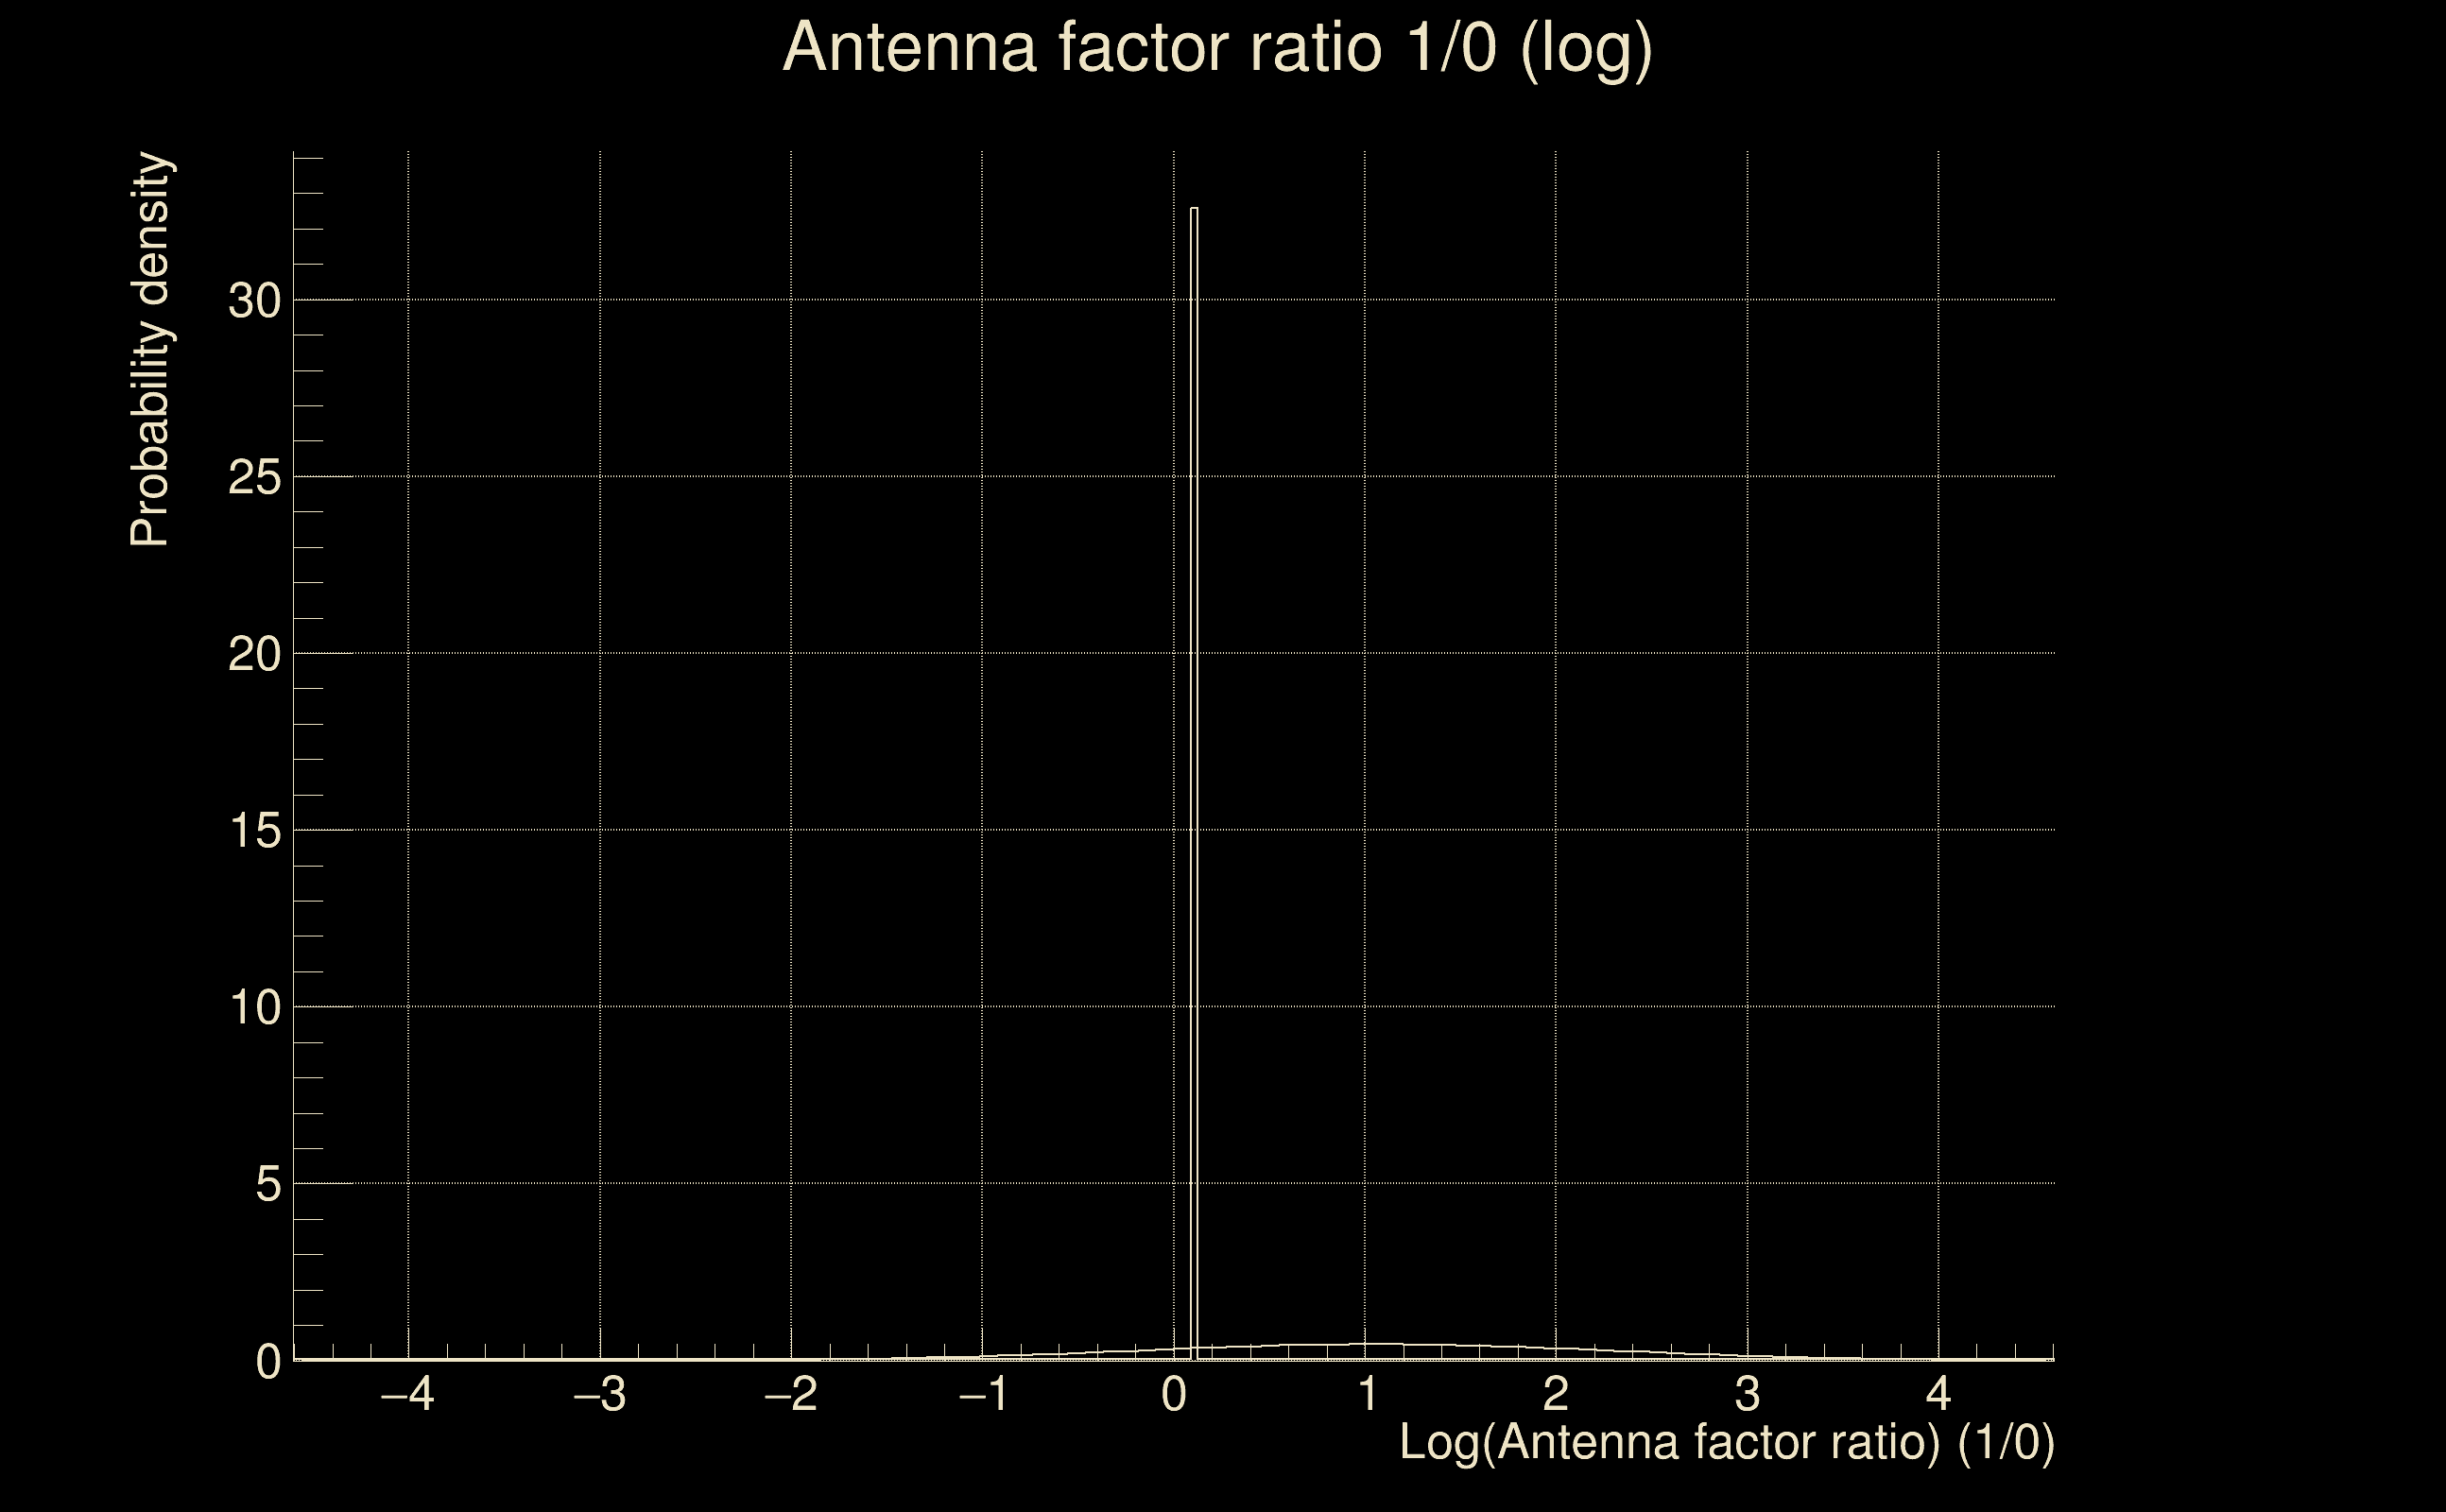
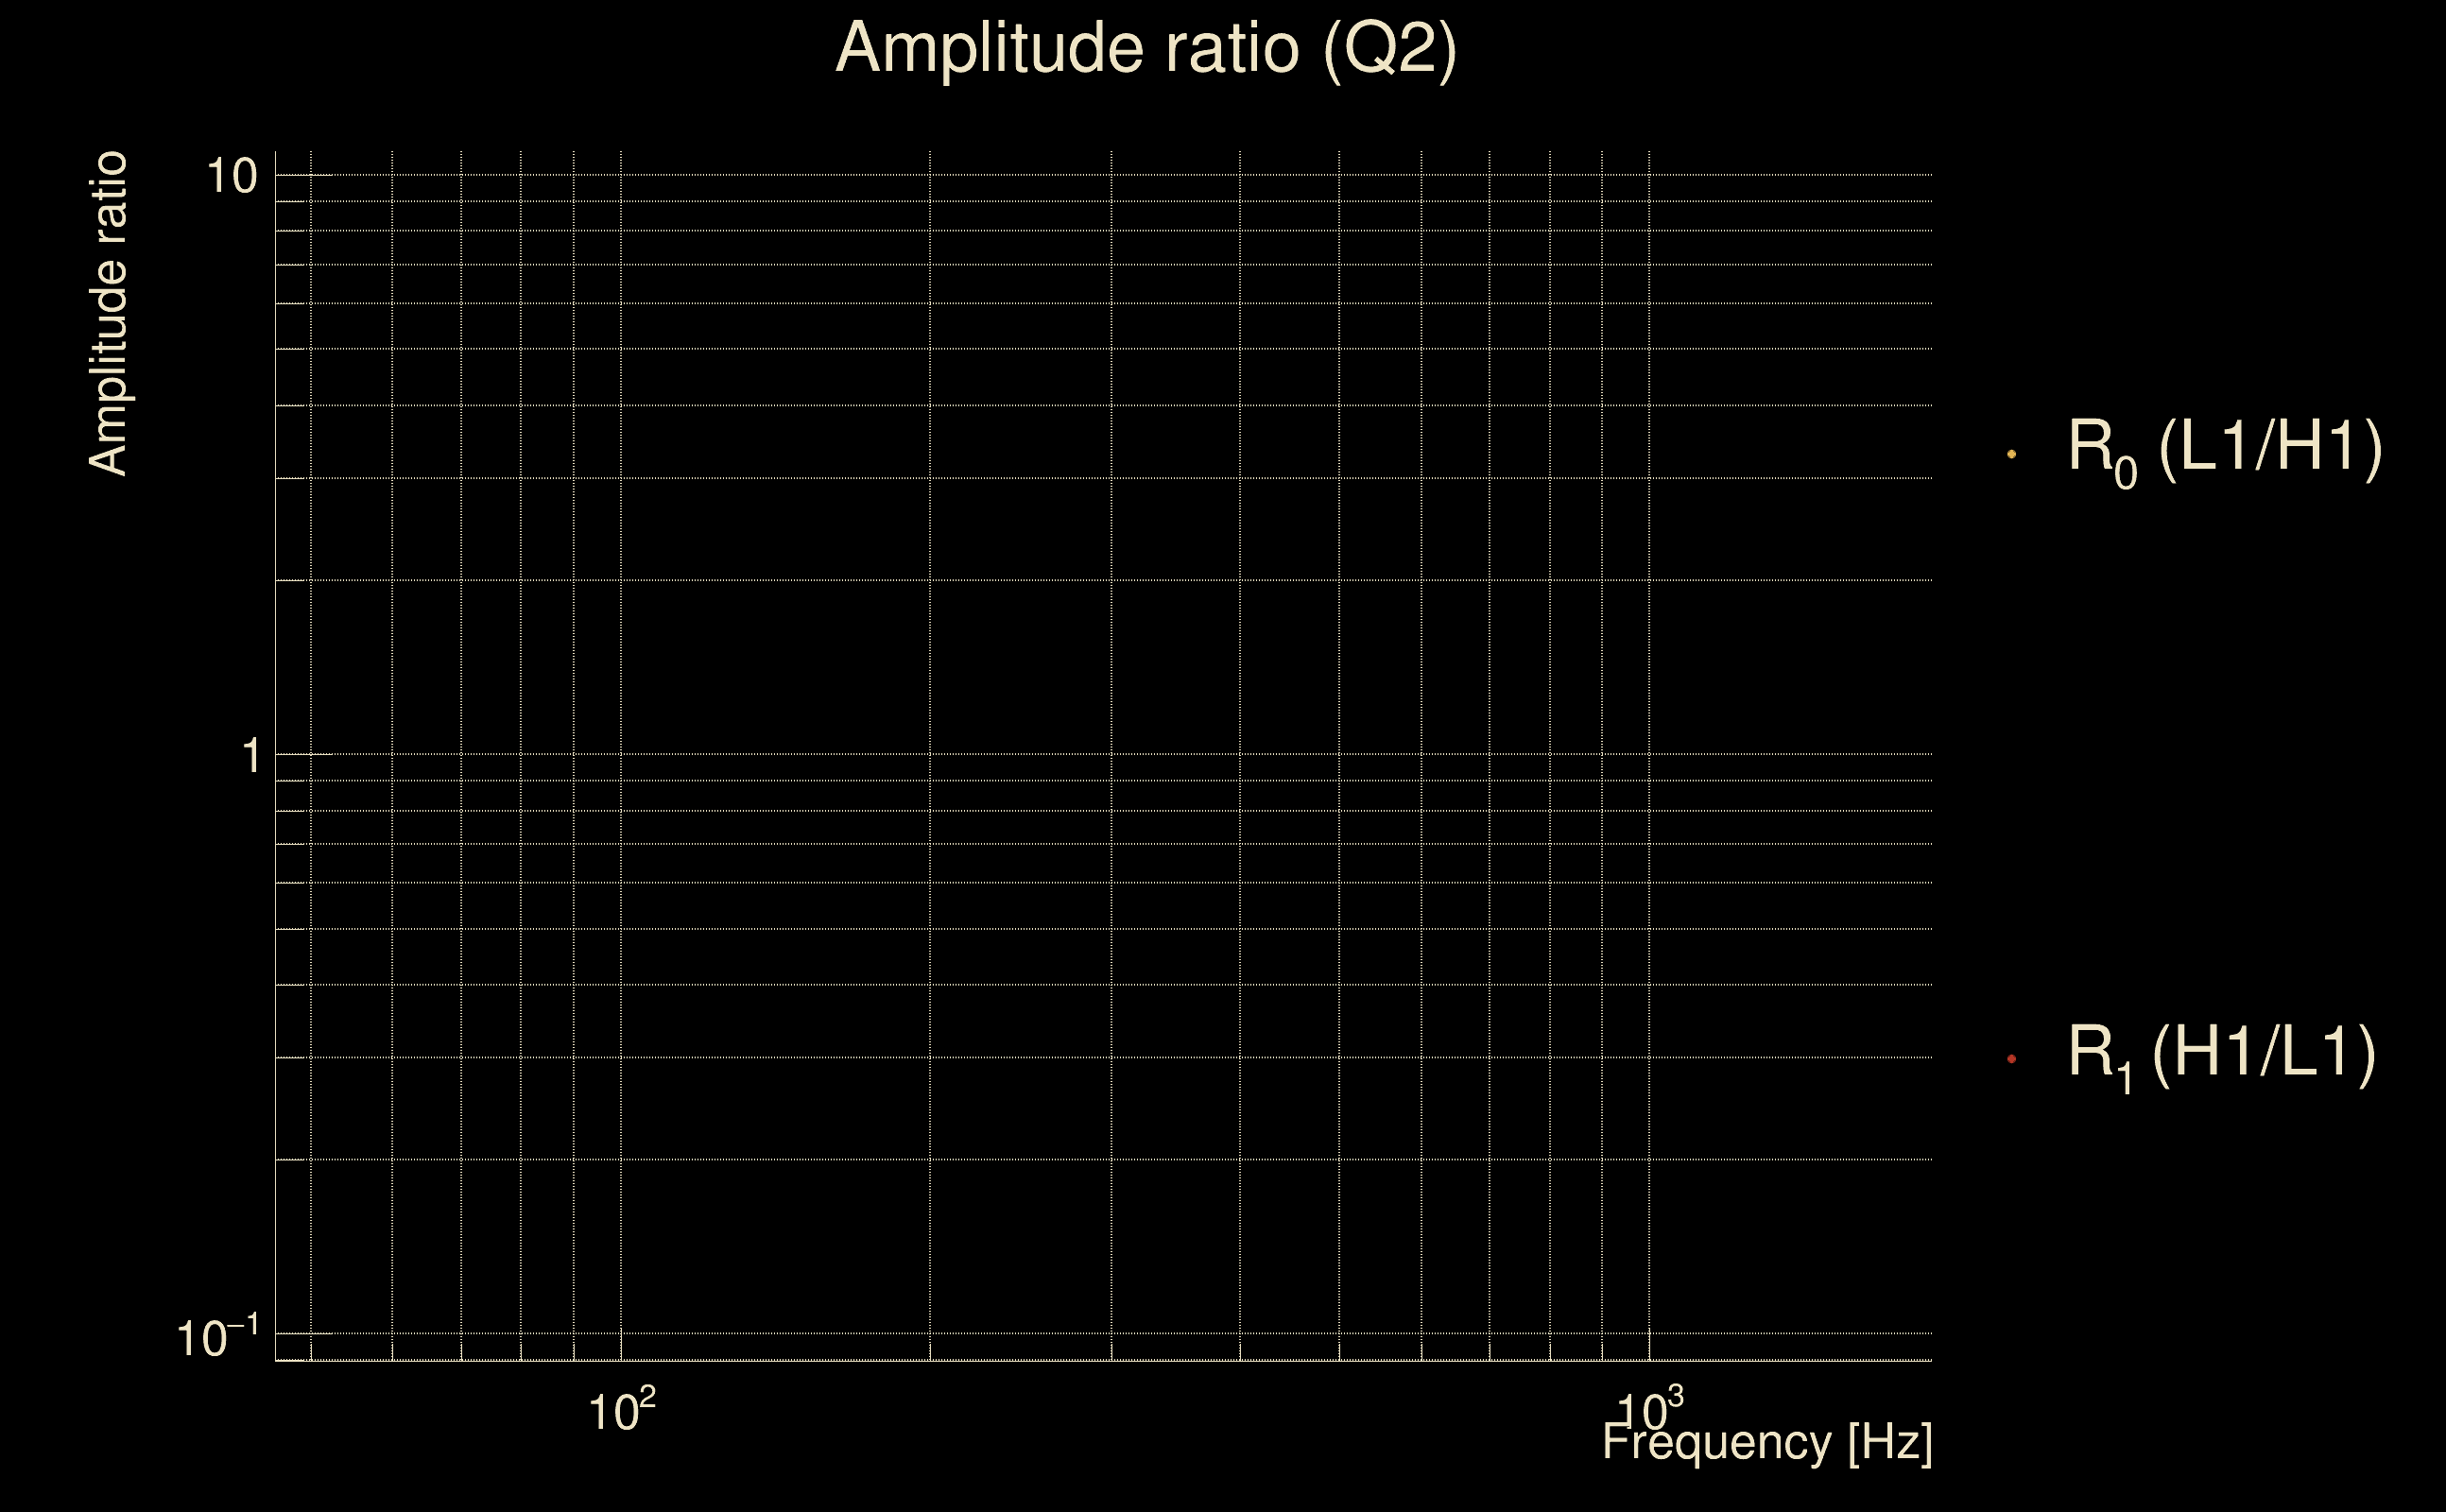
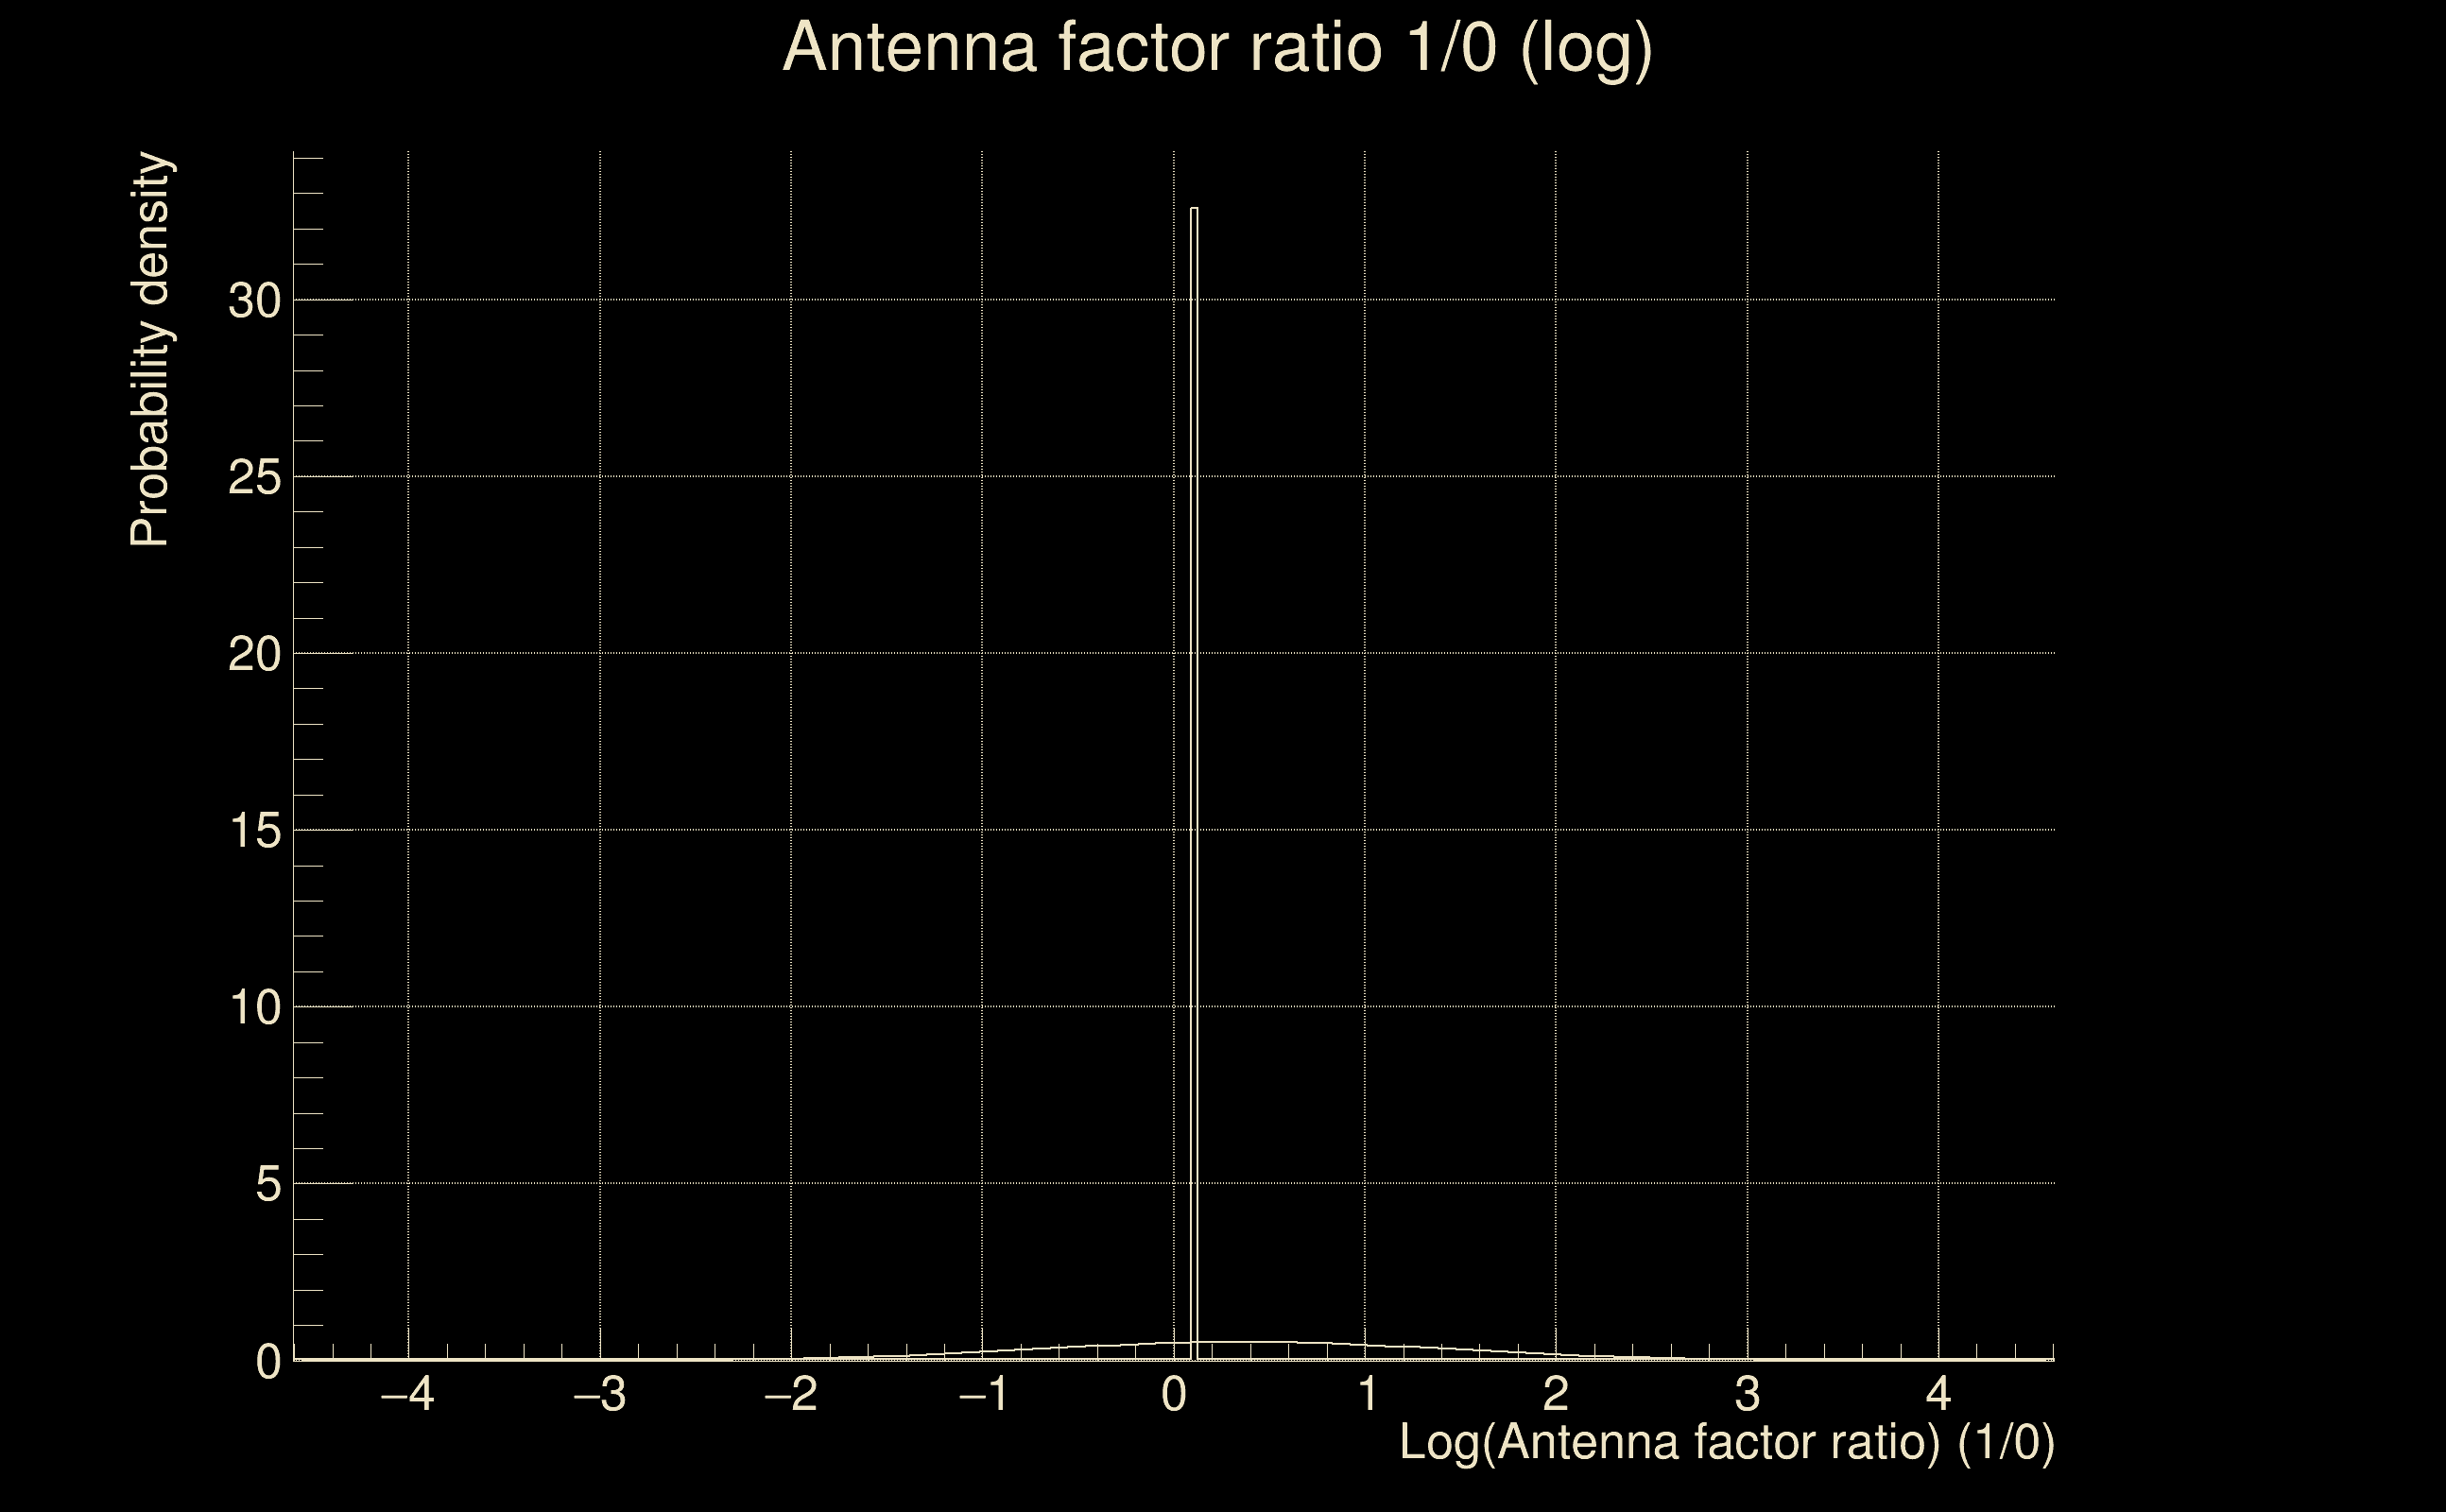
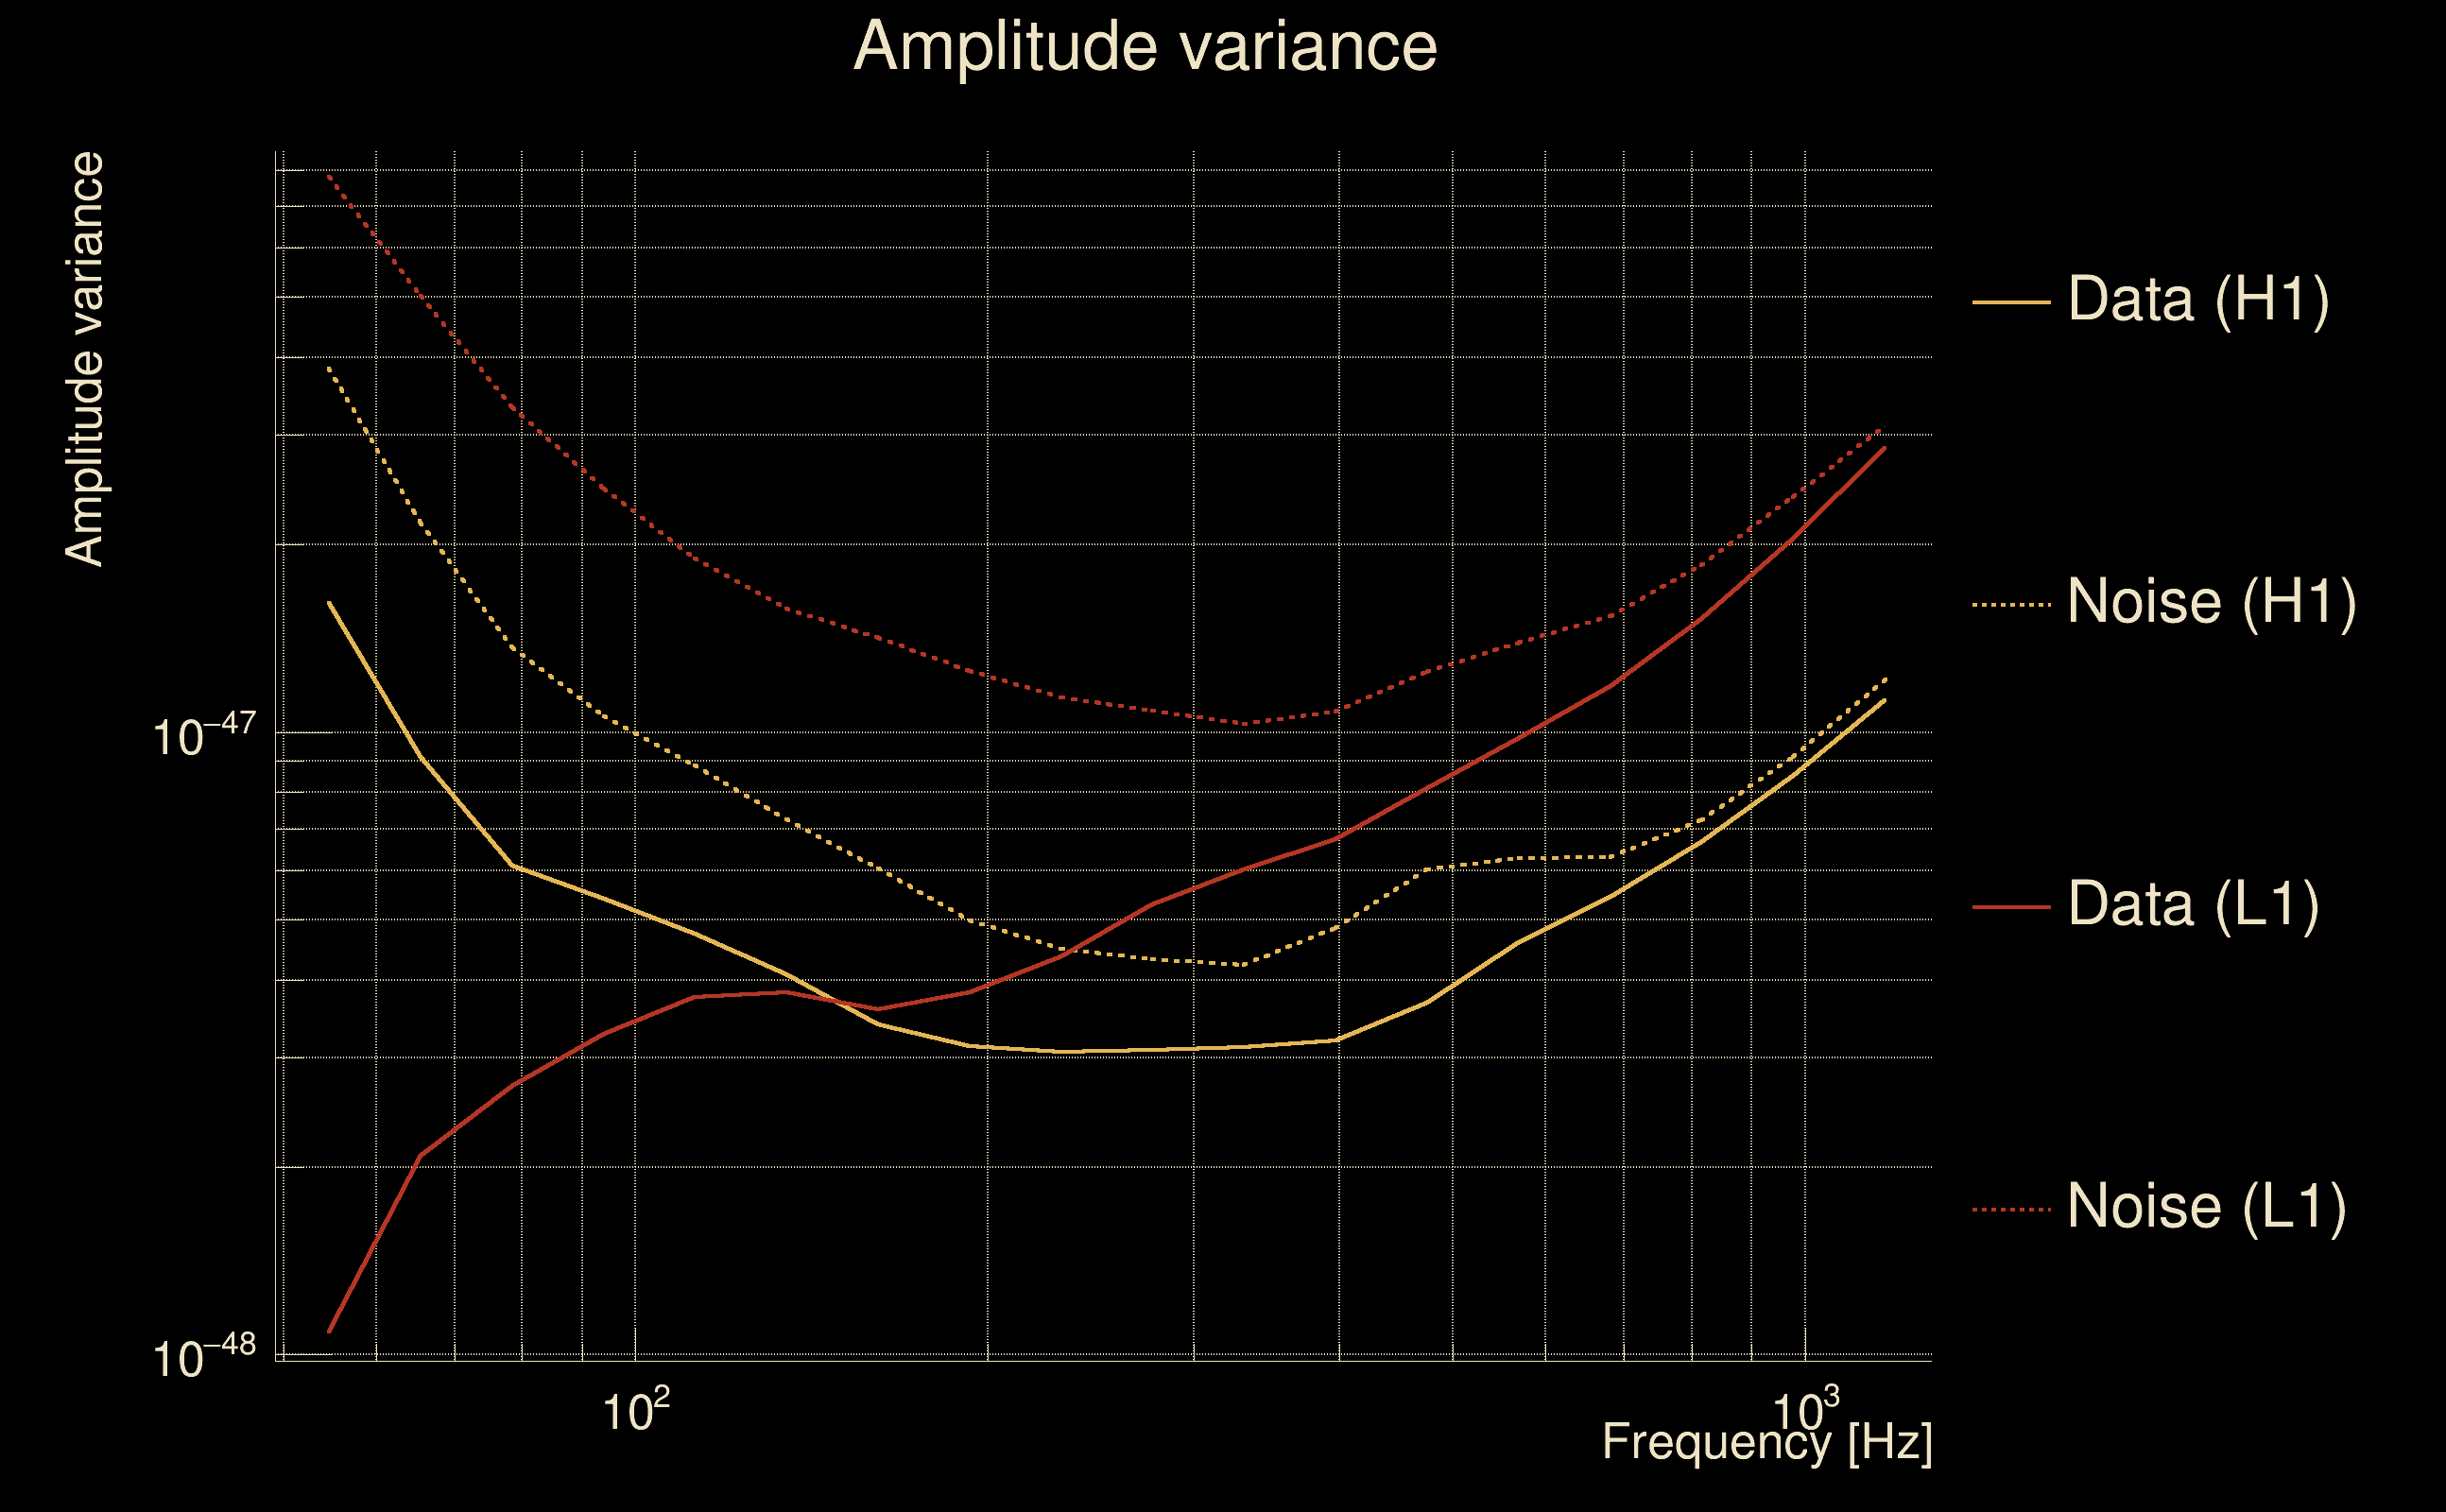
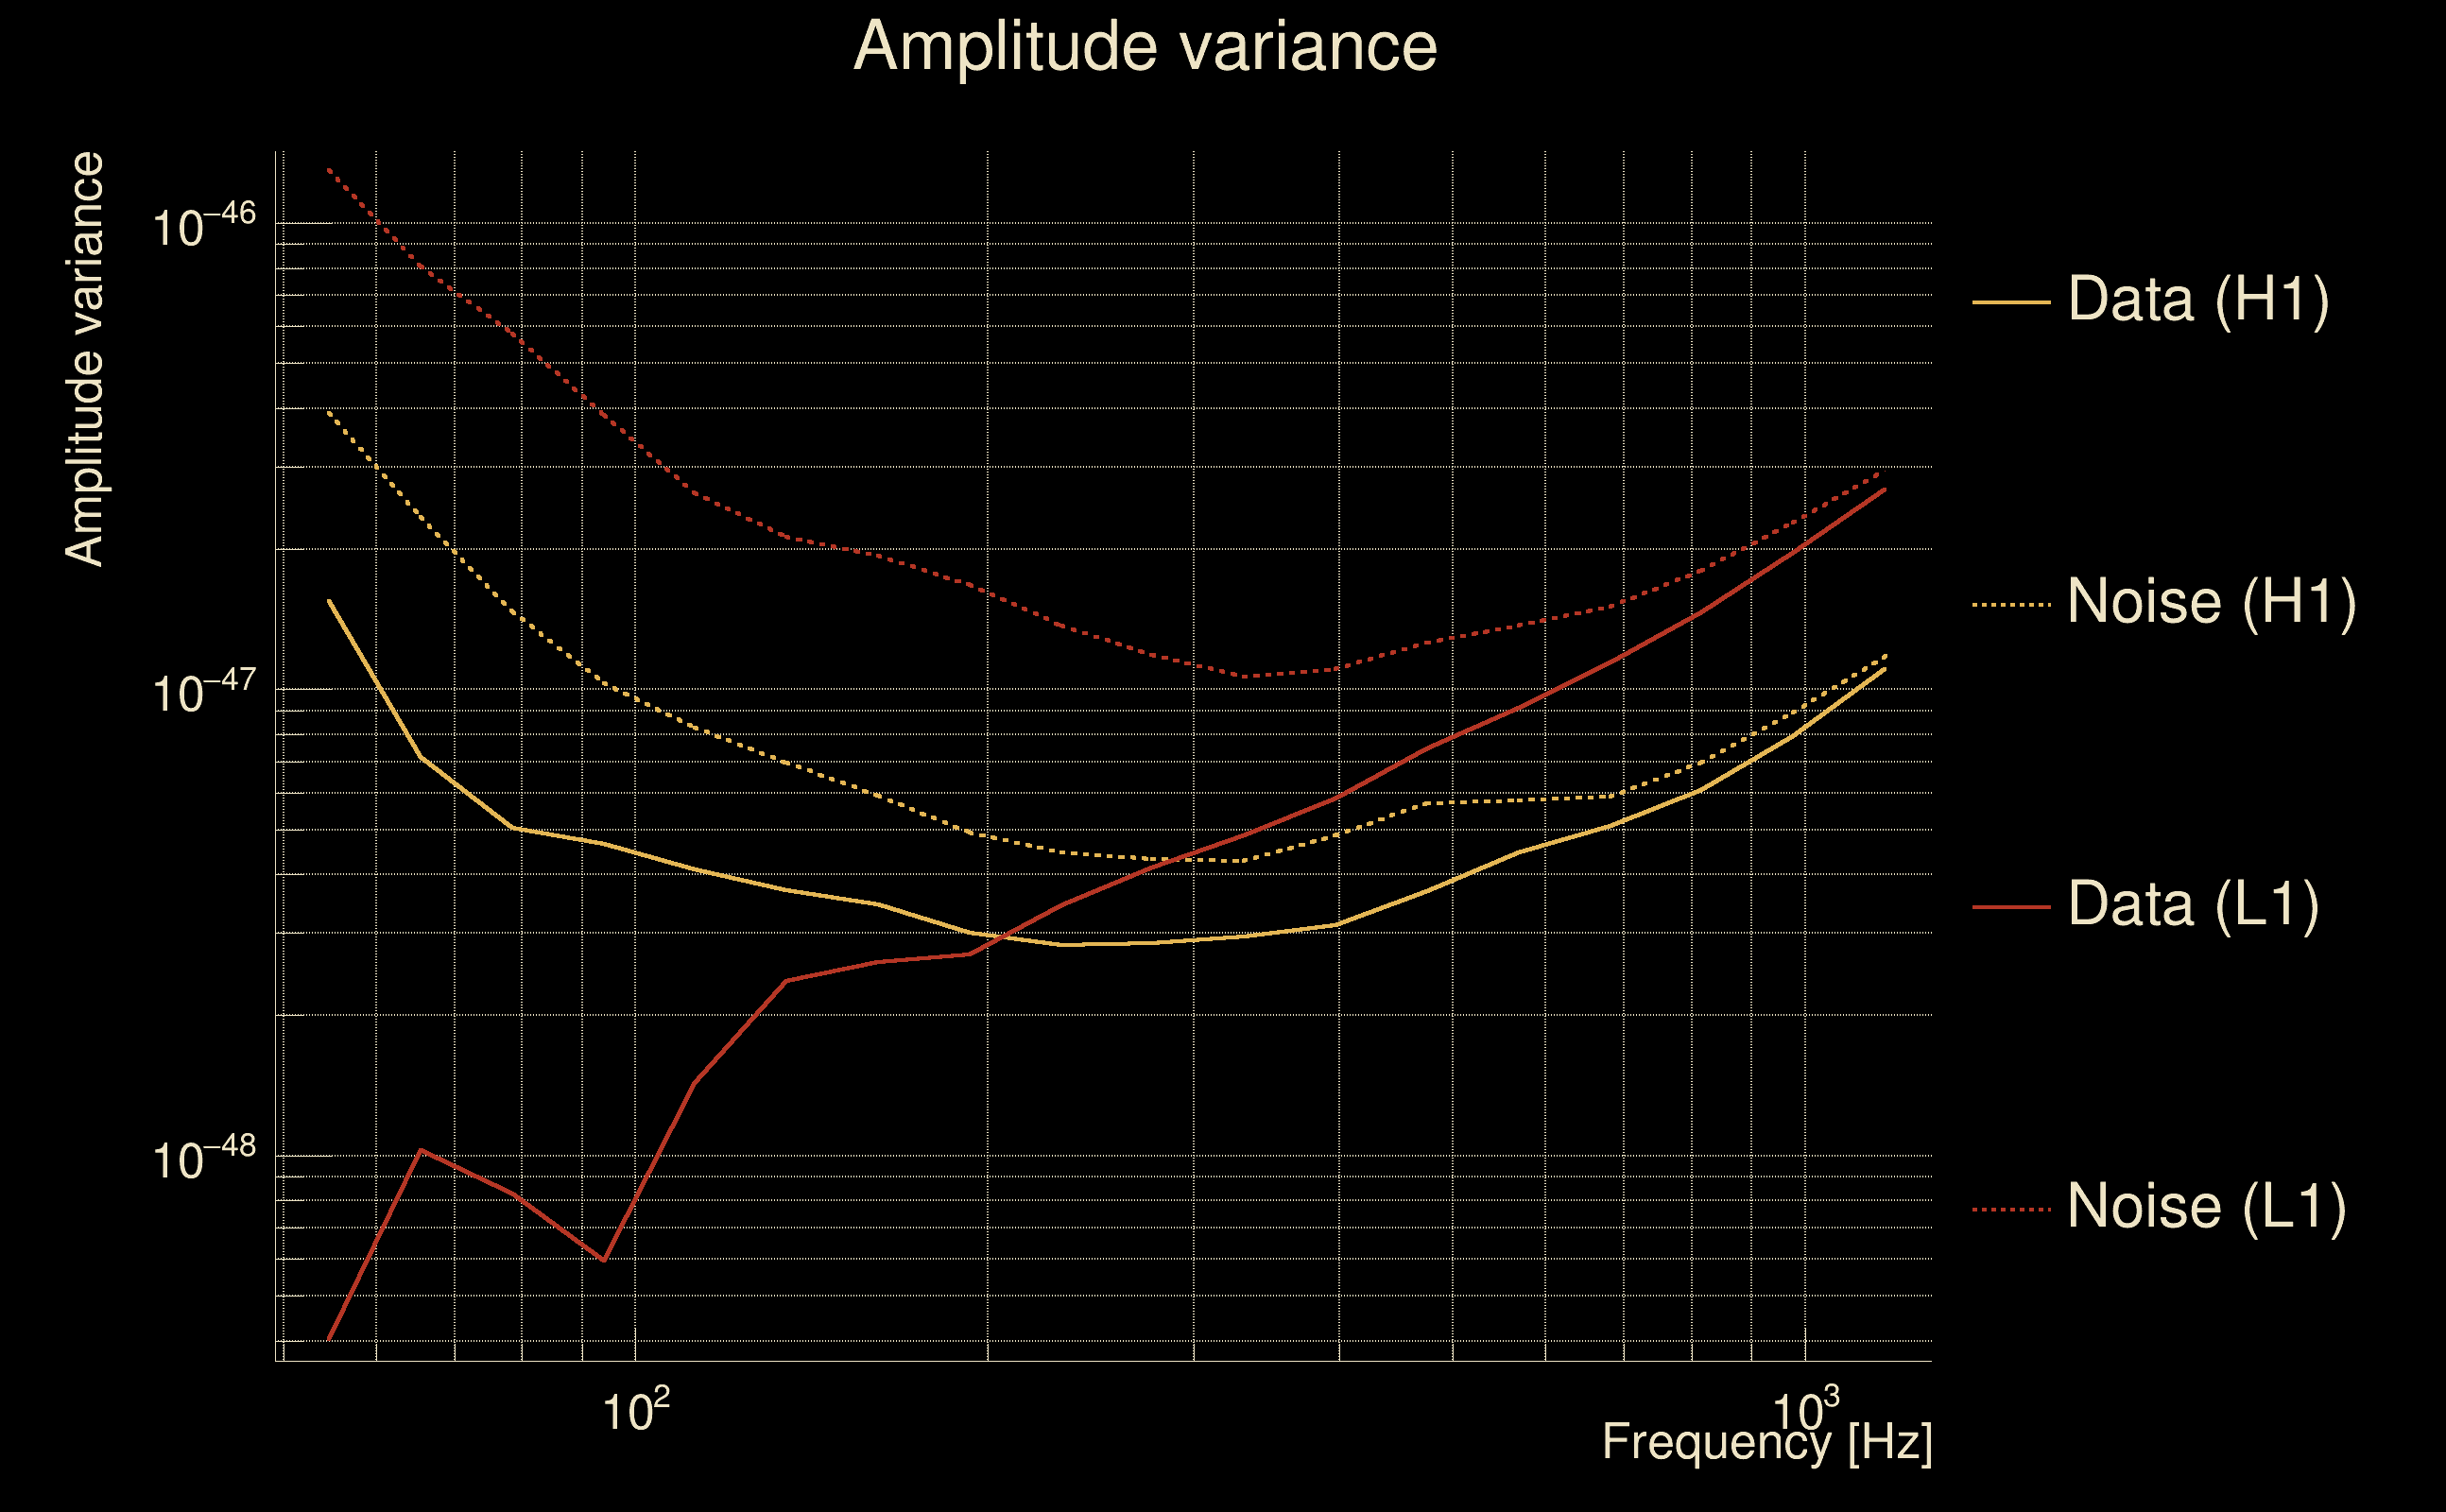
| Log of amplitude ratio (L1/H1): | 0.334359, variance = 0.518049 (L1/H1: -0.0339562, variance = 0.876089, H1/L1: -0.692641, variance = 1.18713) |
| Amplitude ratio (L1/H1): | 1.39704 ⋇ 2.05393 (L1/H1: 0.966614 ⋇ 2.54975, H1/L1: 0.500253 ⋇ 2.97294) |
| Amplitude ratio H1|L1 compatibility (probability): | 0.612962 |
| Antenna factor probability: | 1 |
| Number of rejected frequency rows: | Q0: 18 / 18, Q1: 35 / 36, Q2: 63 / 70, Q3: 121 / 134, Q4: 244 / 258 |
| Maximum signal-to-noise ratio: | H1: 4.95564, L1: 5.02454 |
| SNR variance: | H1: 0.457613, L1: 0.483077 |
| Click here for a zoomed plot | Click here for a zoomed plot | Click here for a zoomed plot | Click here for a zoomed plot | Click here for a zoomed plot |
 |
 |
 |
 |
 |
 |
 |
 |
 |
 |
 |
 |
 |
 |
 |
 |
 |
 |
 |
 |
 |
 |
 |
 |
 |
 |
 |
 |
 |
 |
 |
 |
 |
 |
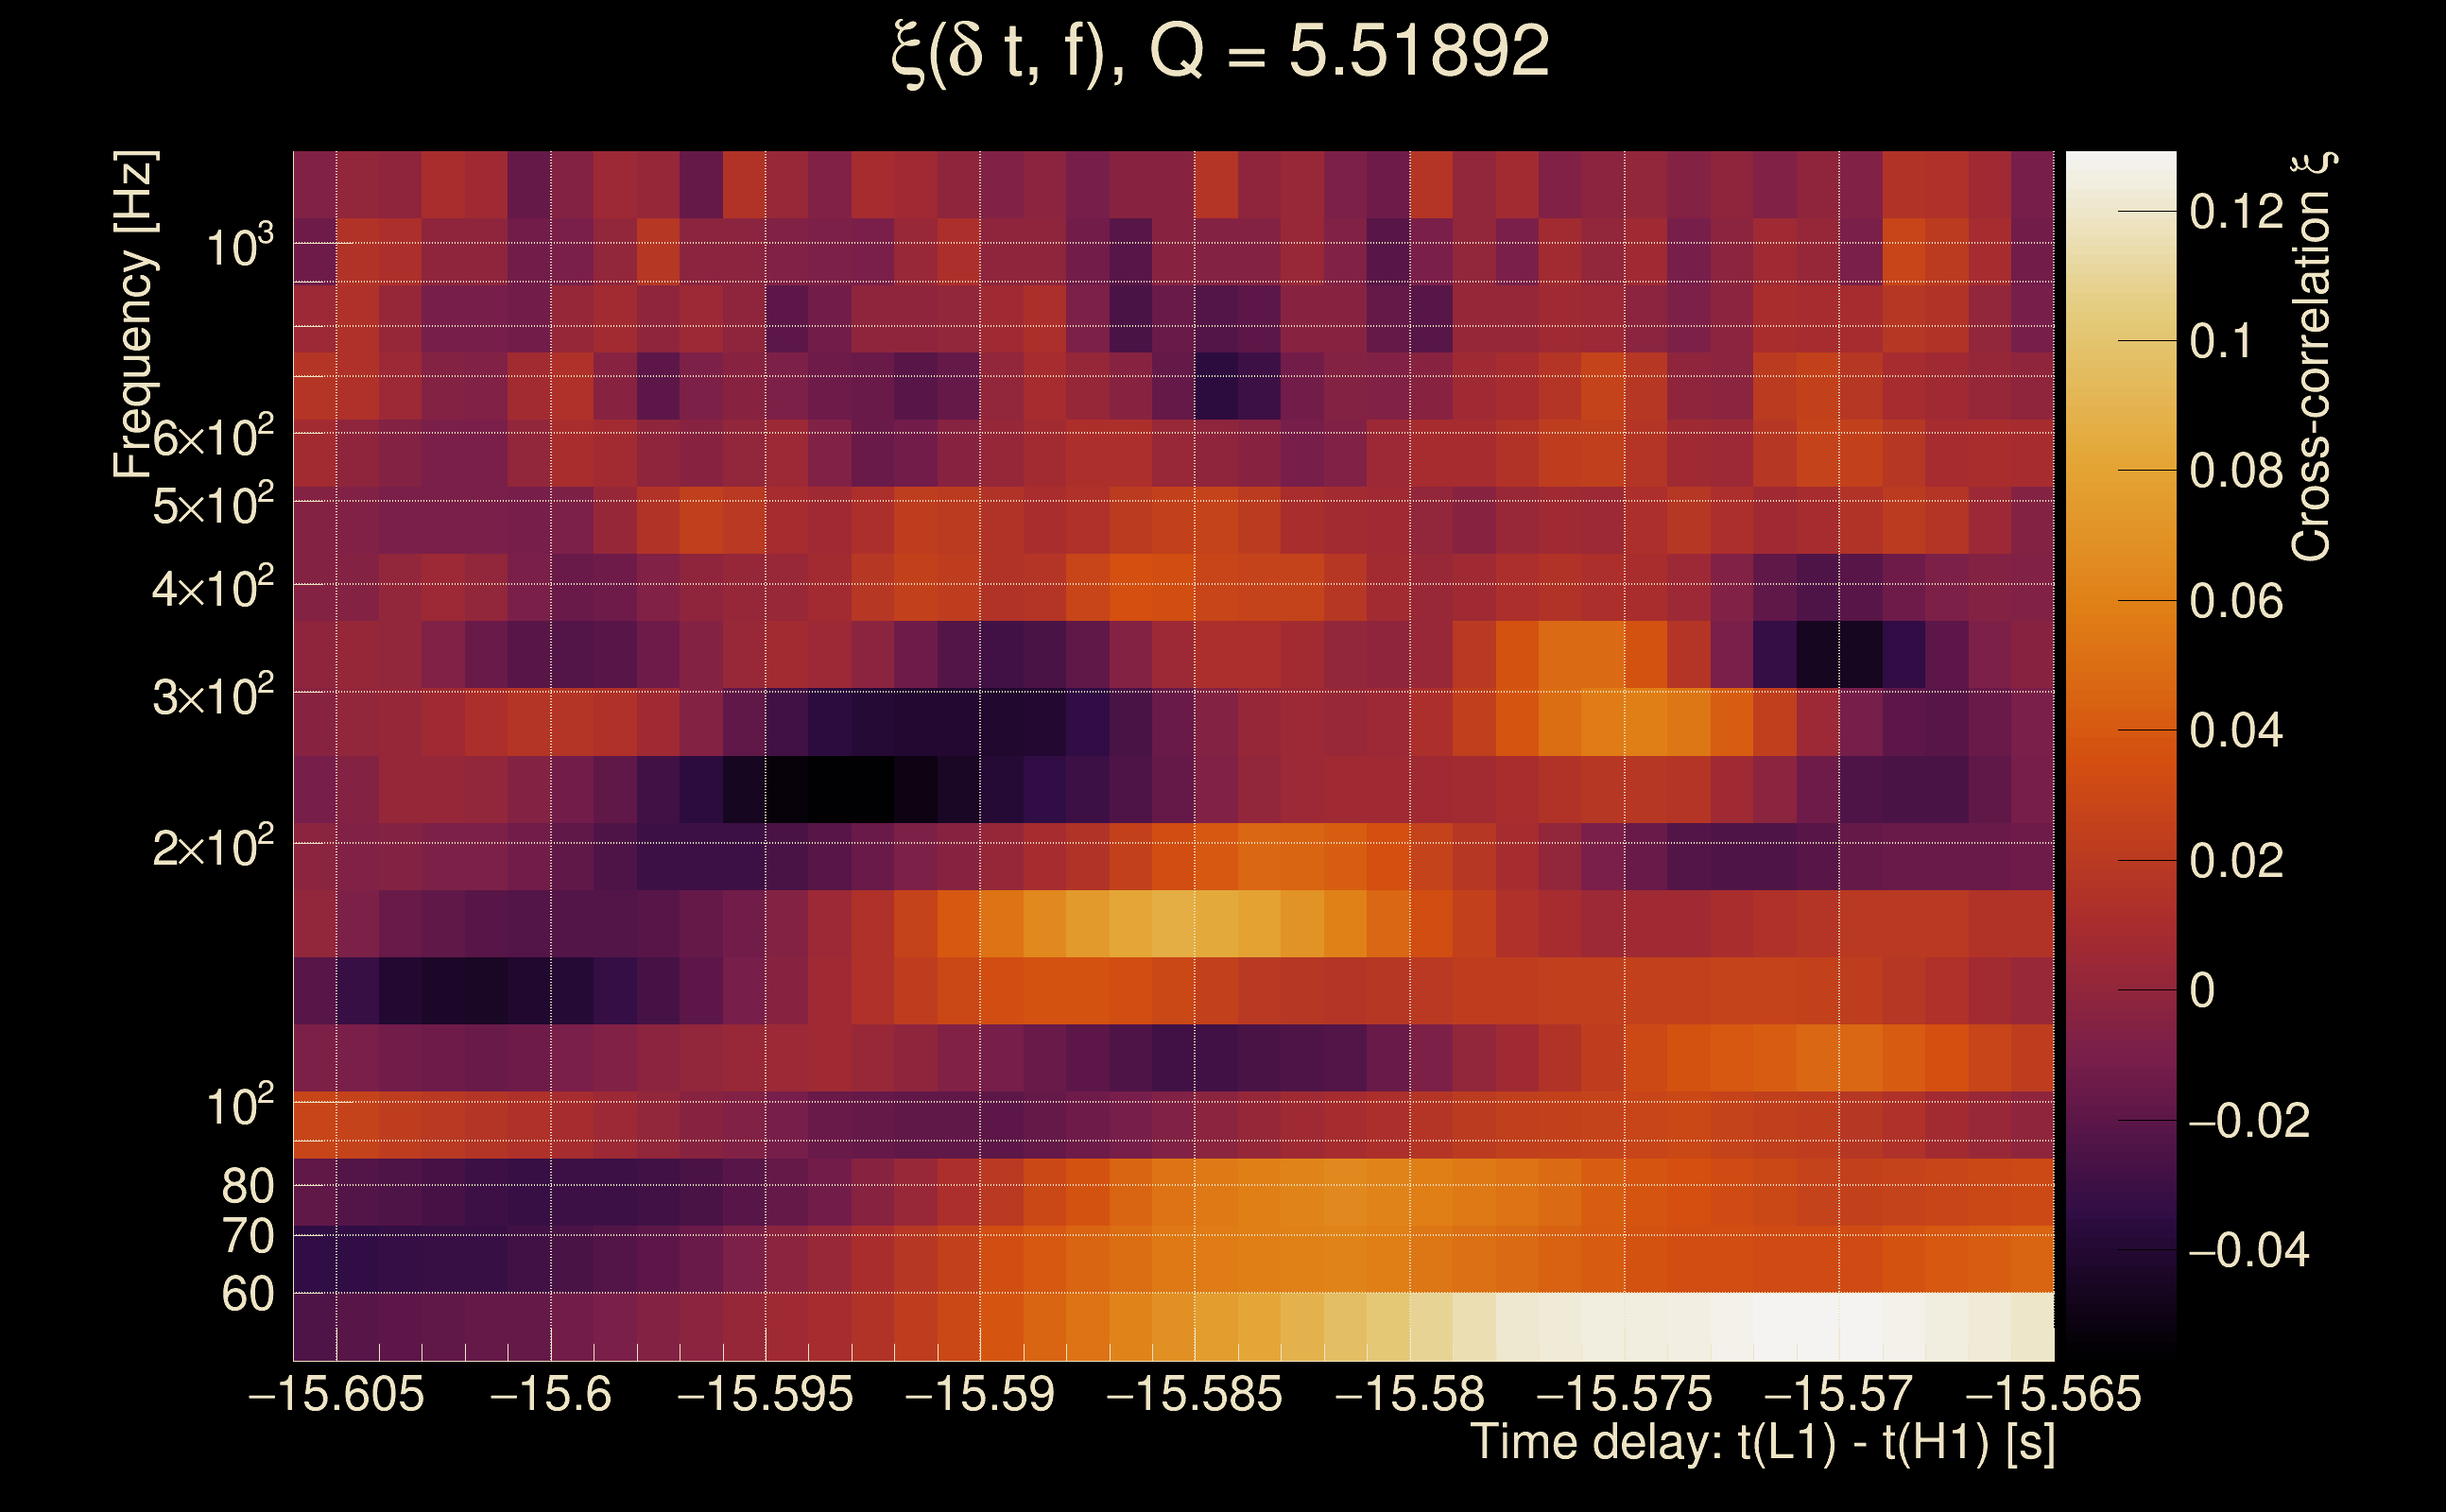
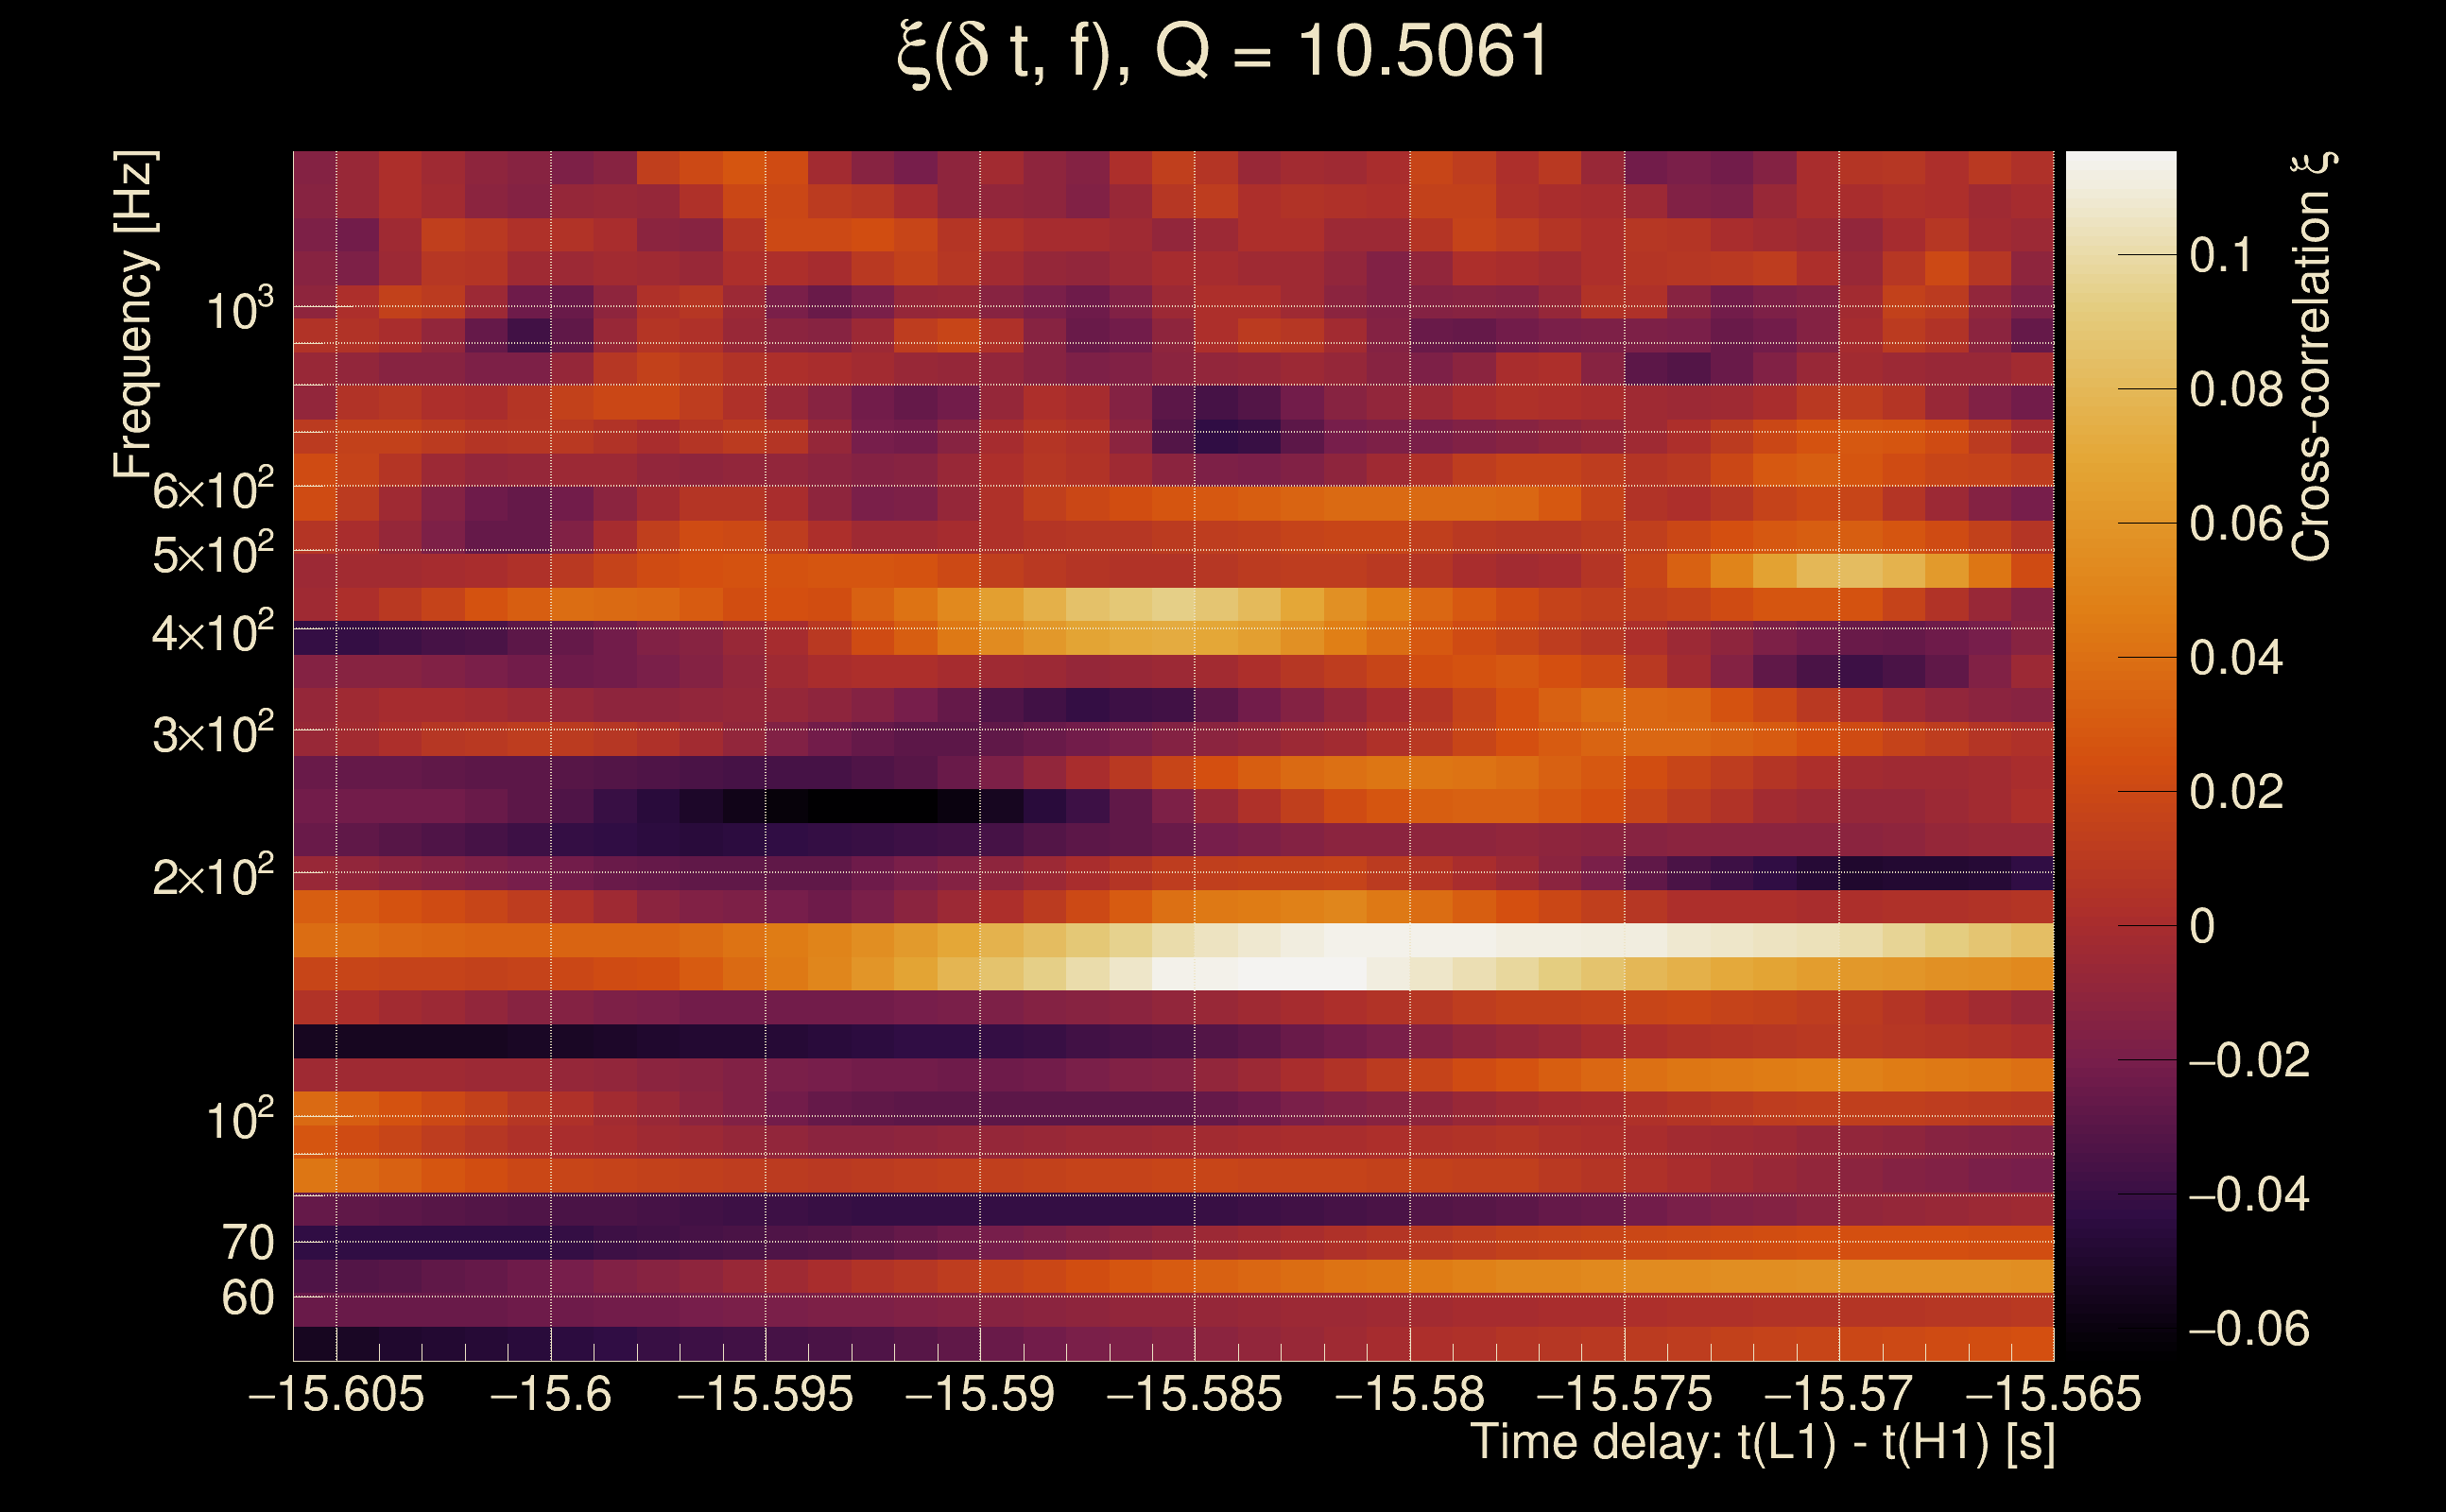
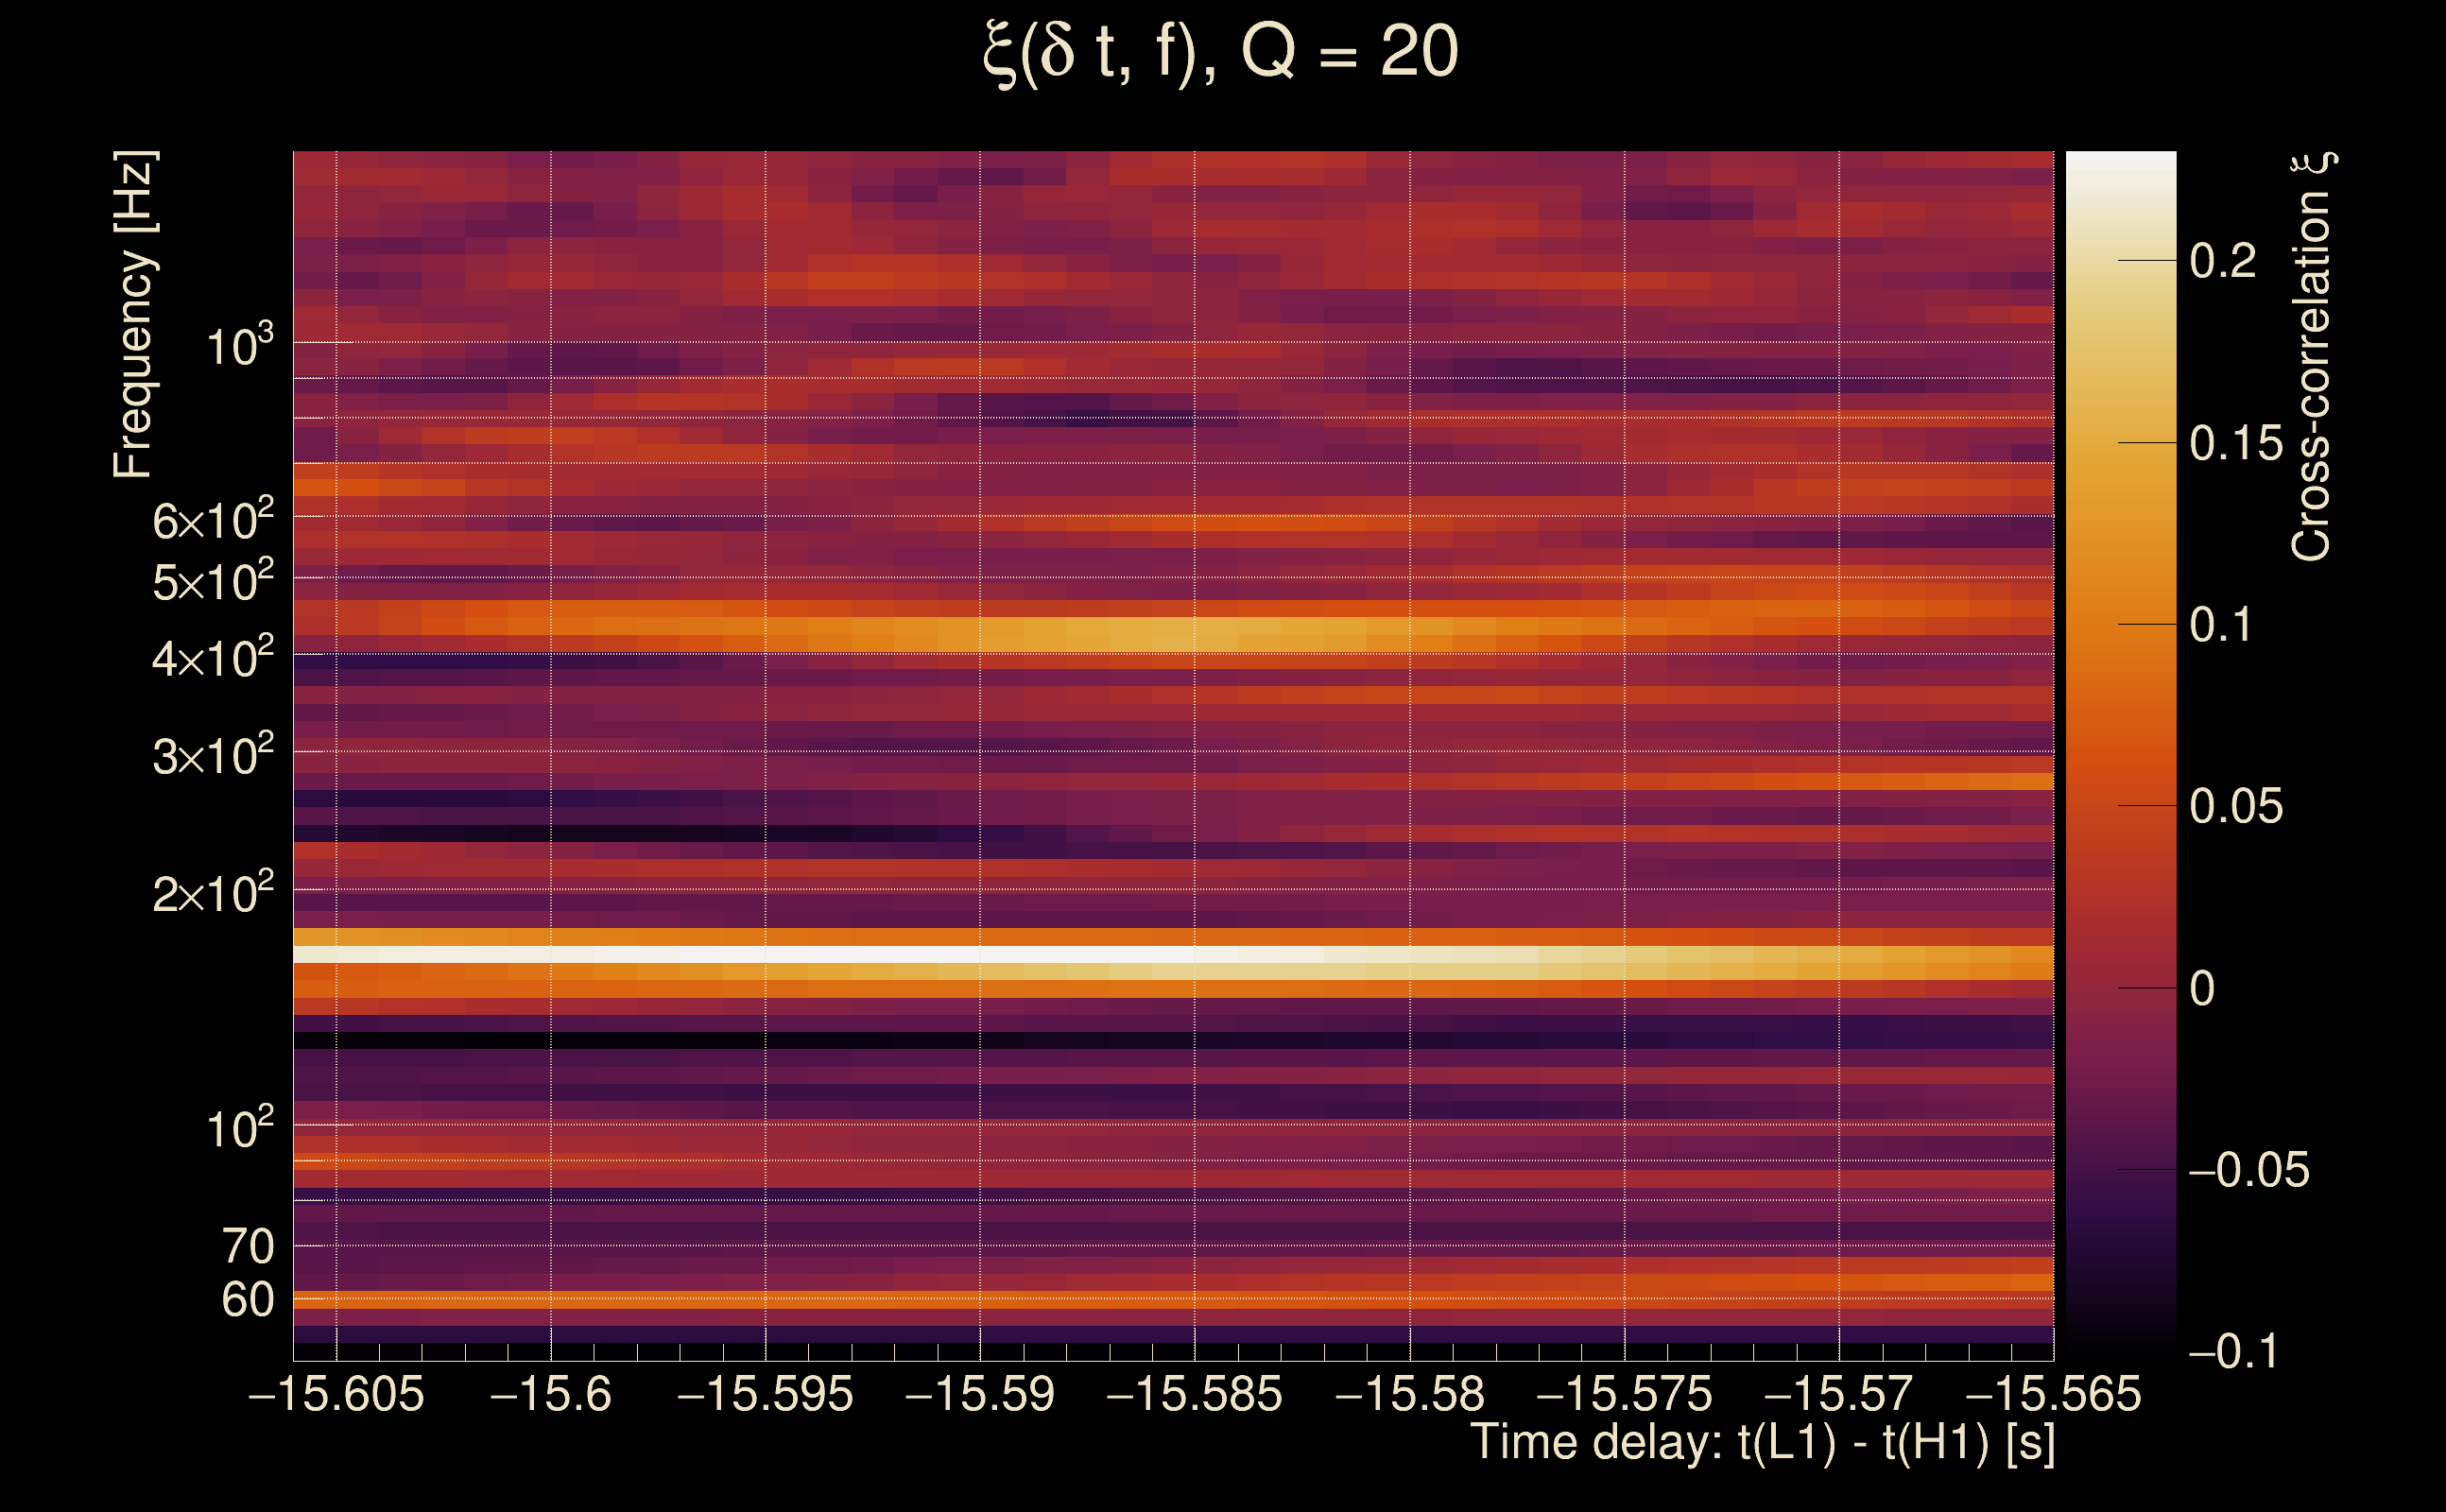
| Event time t(H1): | GPS = 1368195313 (Mon May 15 14:14:55 2023 ) → GPS = 1368195323 (Mon May 15 14:15:05 2023 ) |
| Event time t(L1): | GPS = 1368195273 (Mon May 15 14:15:05 2023 ) → GPS = 1368195283 (Mon May 15 14:14:25 2023 ) |
| Omicron analysis time window (H1): | GPS = 1368195310 → GPS = 1368195326 |
| Omicron analysis time window (L1): | GPS = 1368195270 → GPS = 1368195286 |
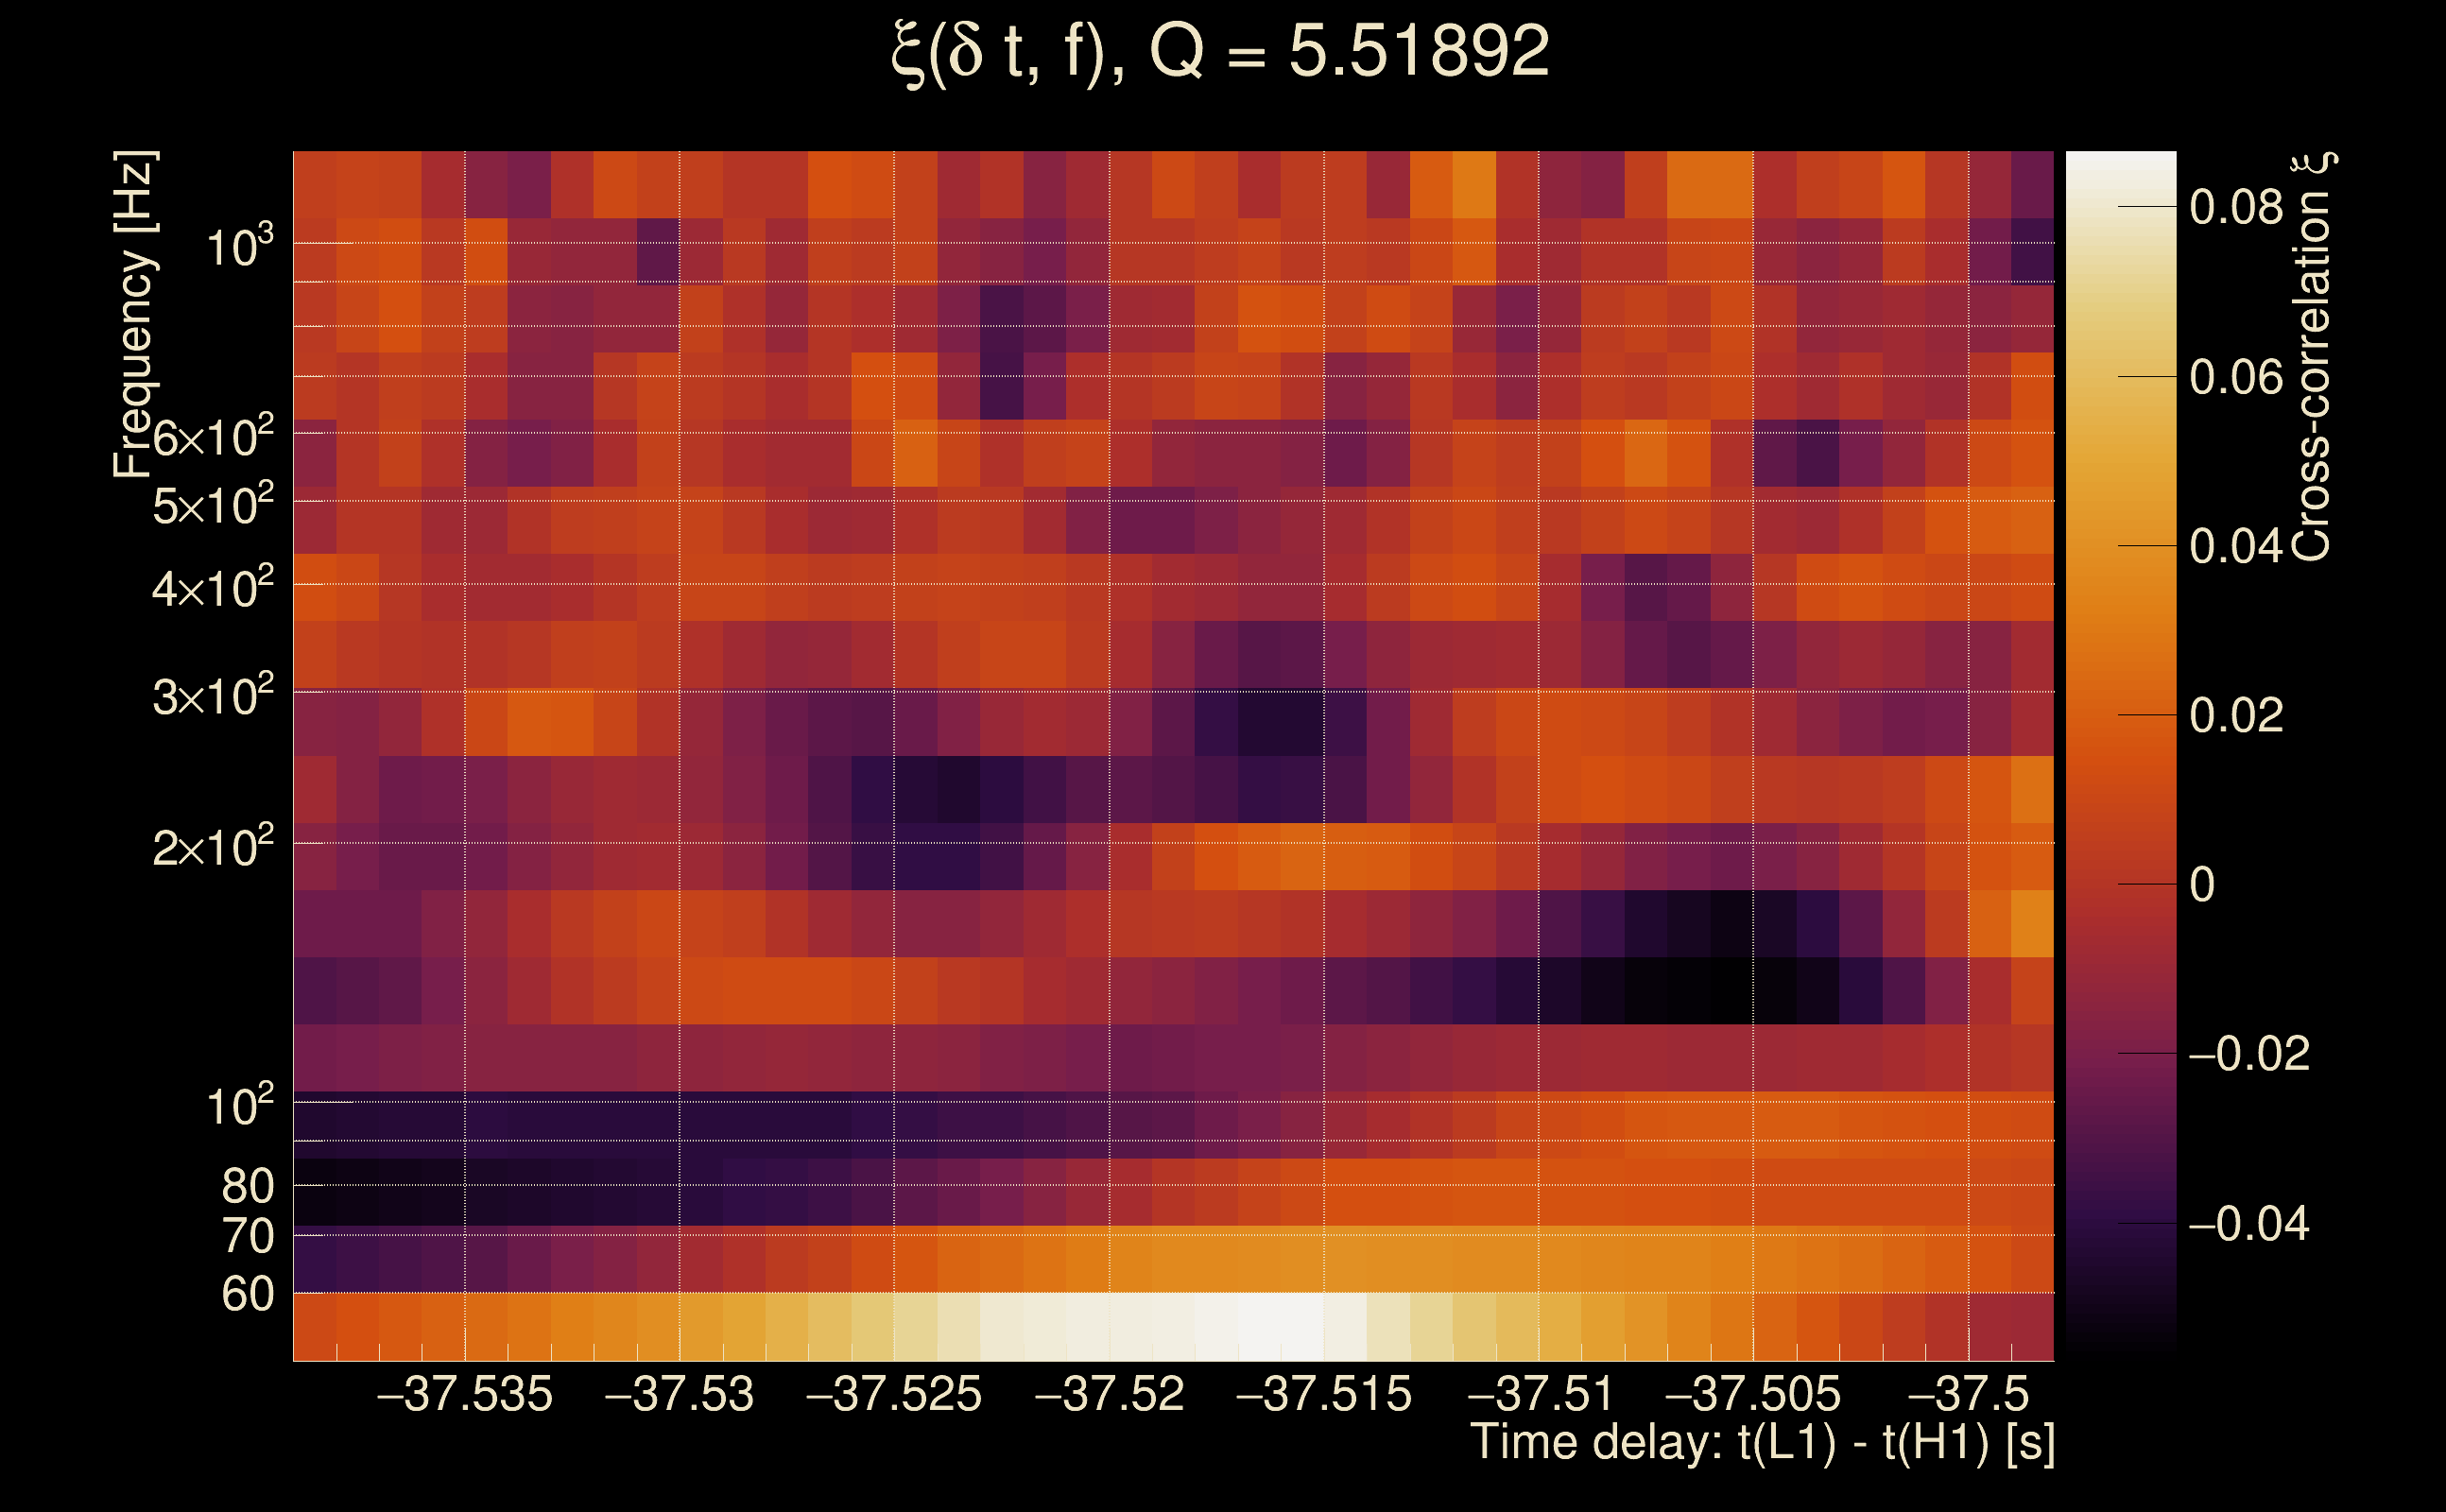
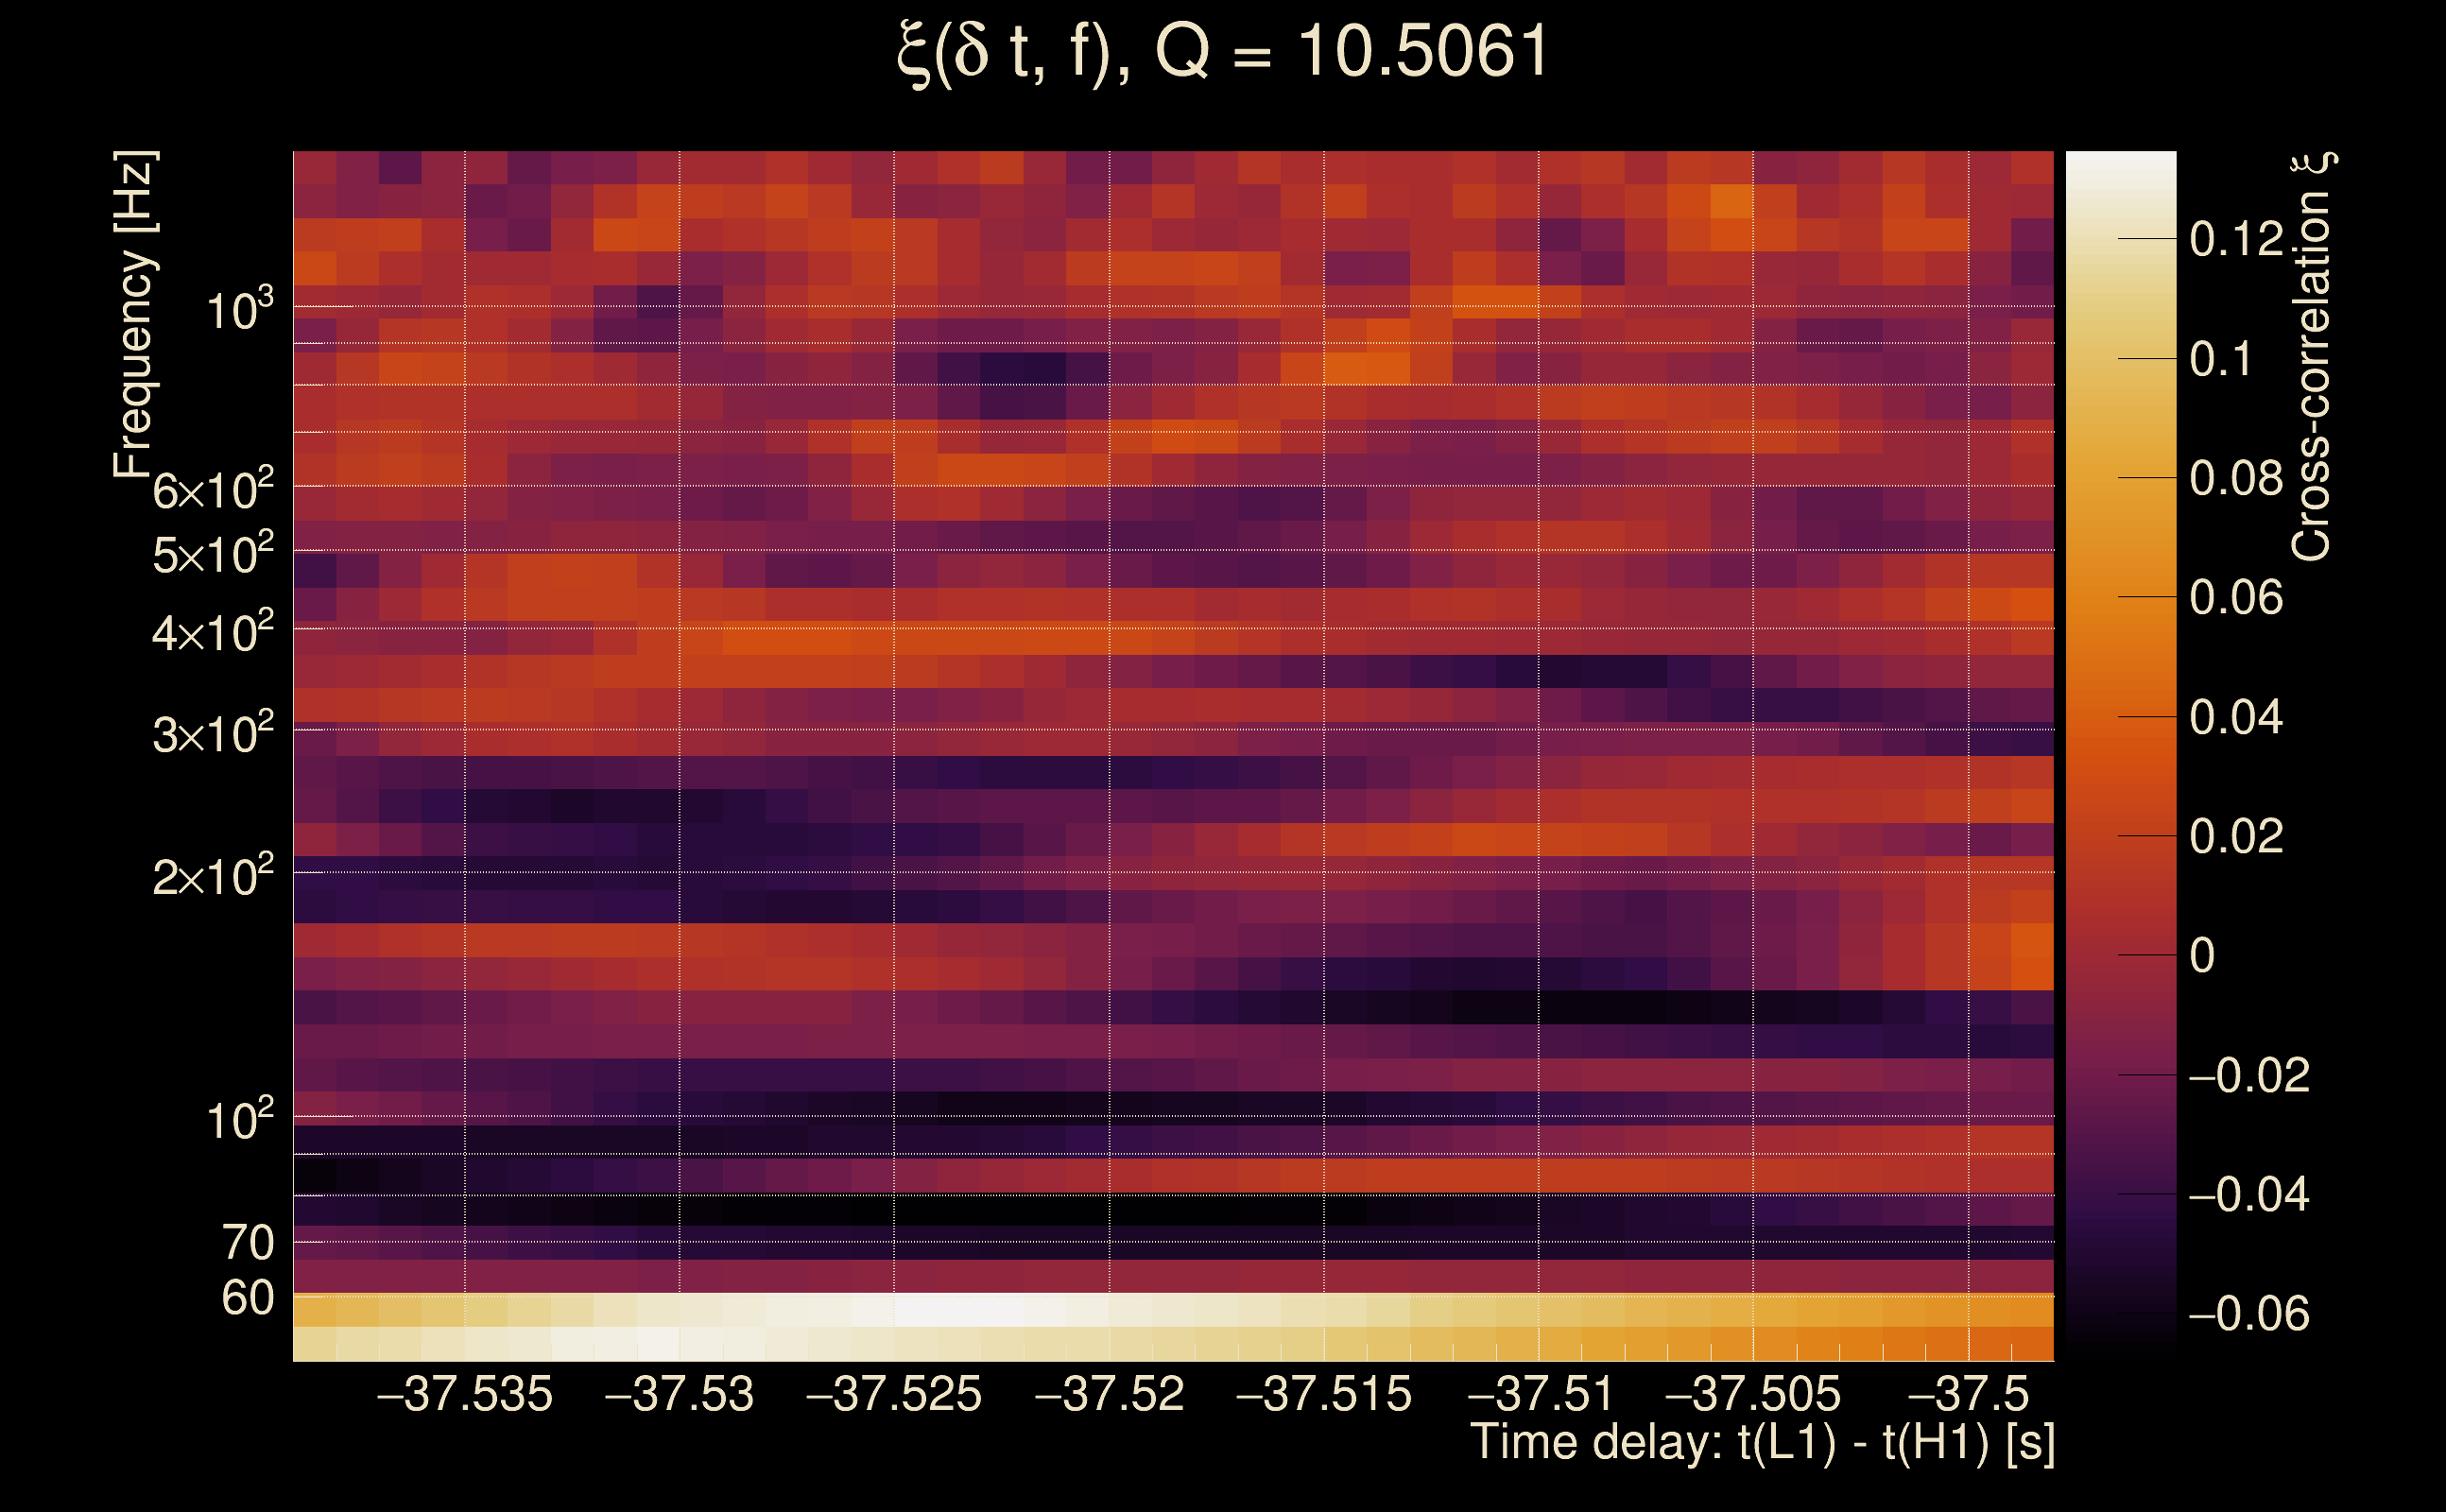
| Time delay between detectors t(L1) - t(H1): | -39.9559 s (slice index = 107 / 217), δt_gw = -0.00193664 s |
| Time delay uncertainty: | 0.00613946 s |
| [targeted mode] Time delay probability: | 0.973013 (0.03383 sigmas), δt_target = -0.00214434 s |
| Frequency: | 667.619 Hz |
| Ξ: | 0.00163284 ± 0.025374 (variance = 0.000643842): Q0: 0, Q1: 0.0555267, Q2: 0.0678836, Q3: 0.0404155, Q4: 0.0684365 |
| Rank: | R_A = 0.00120177 |
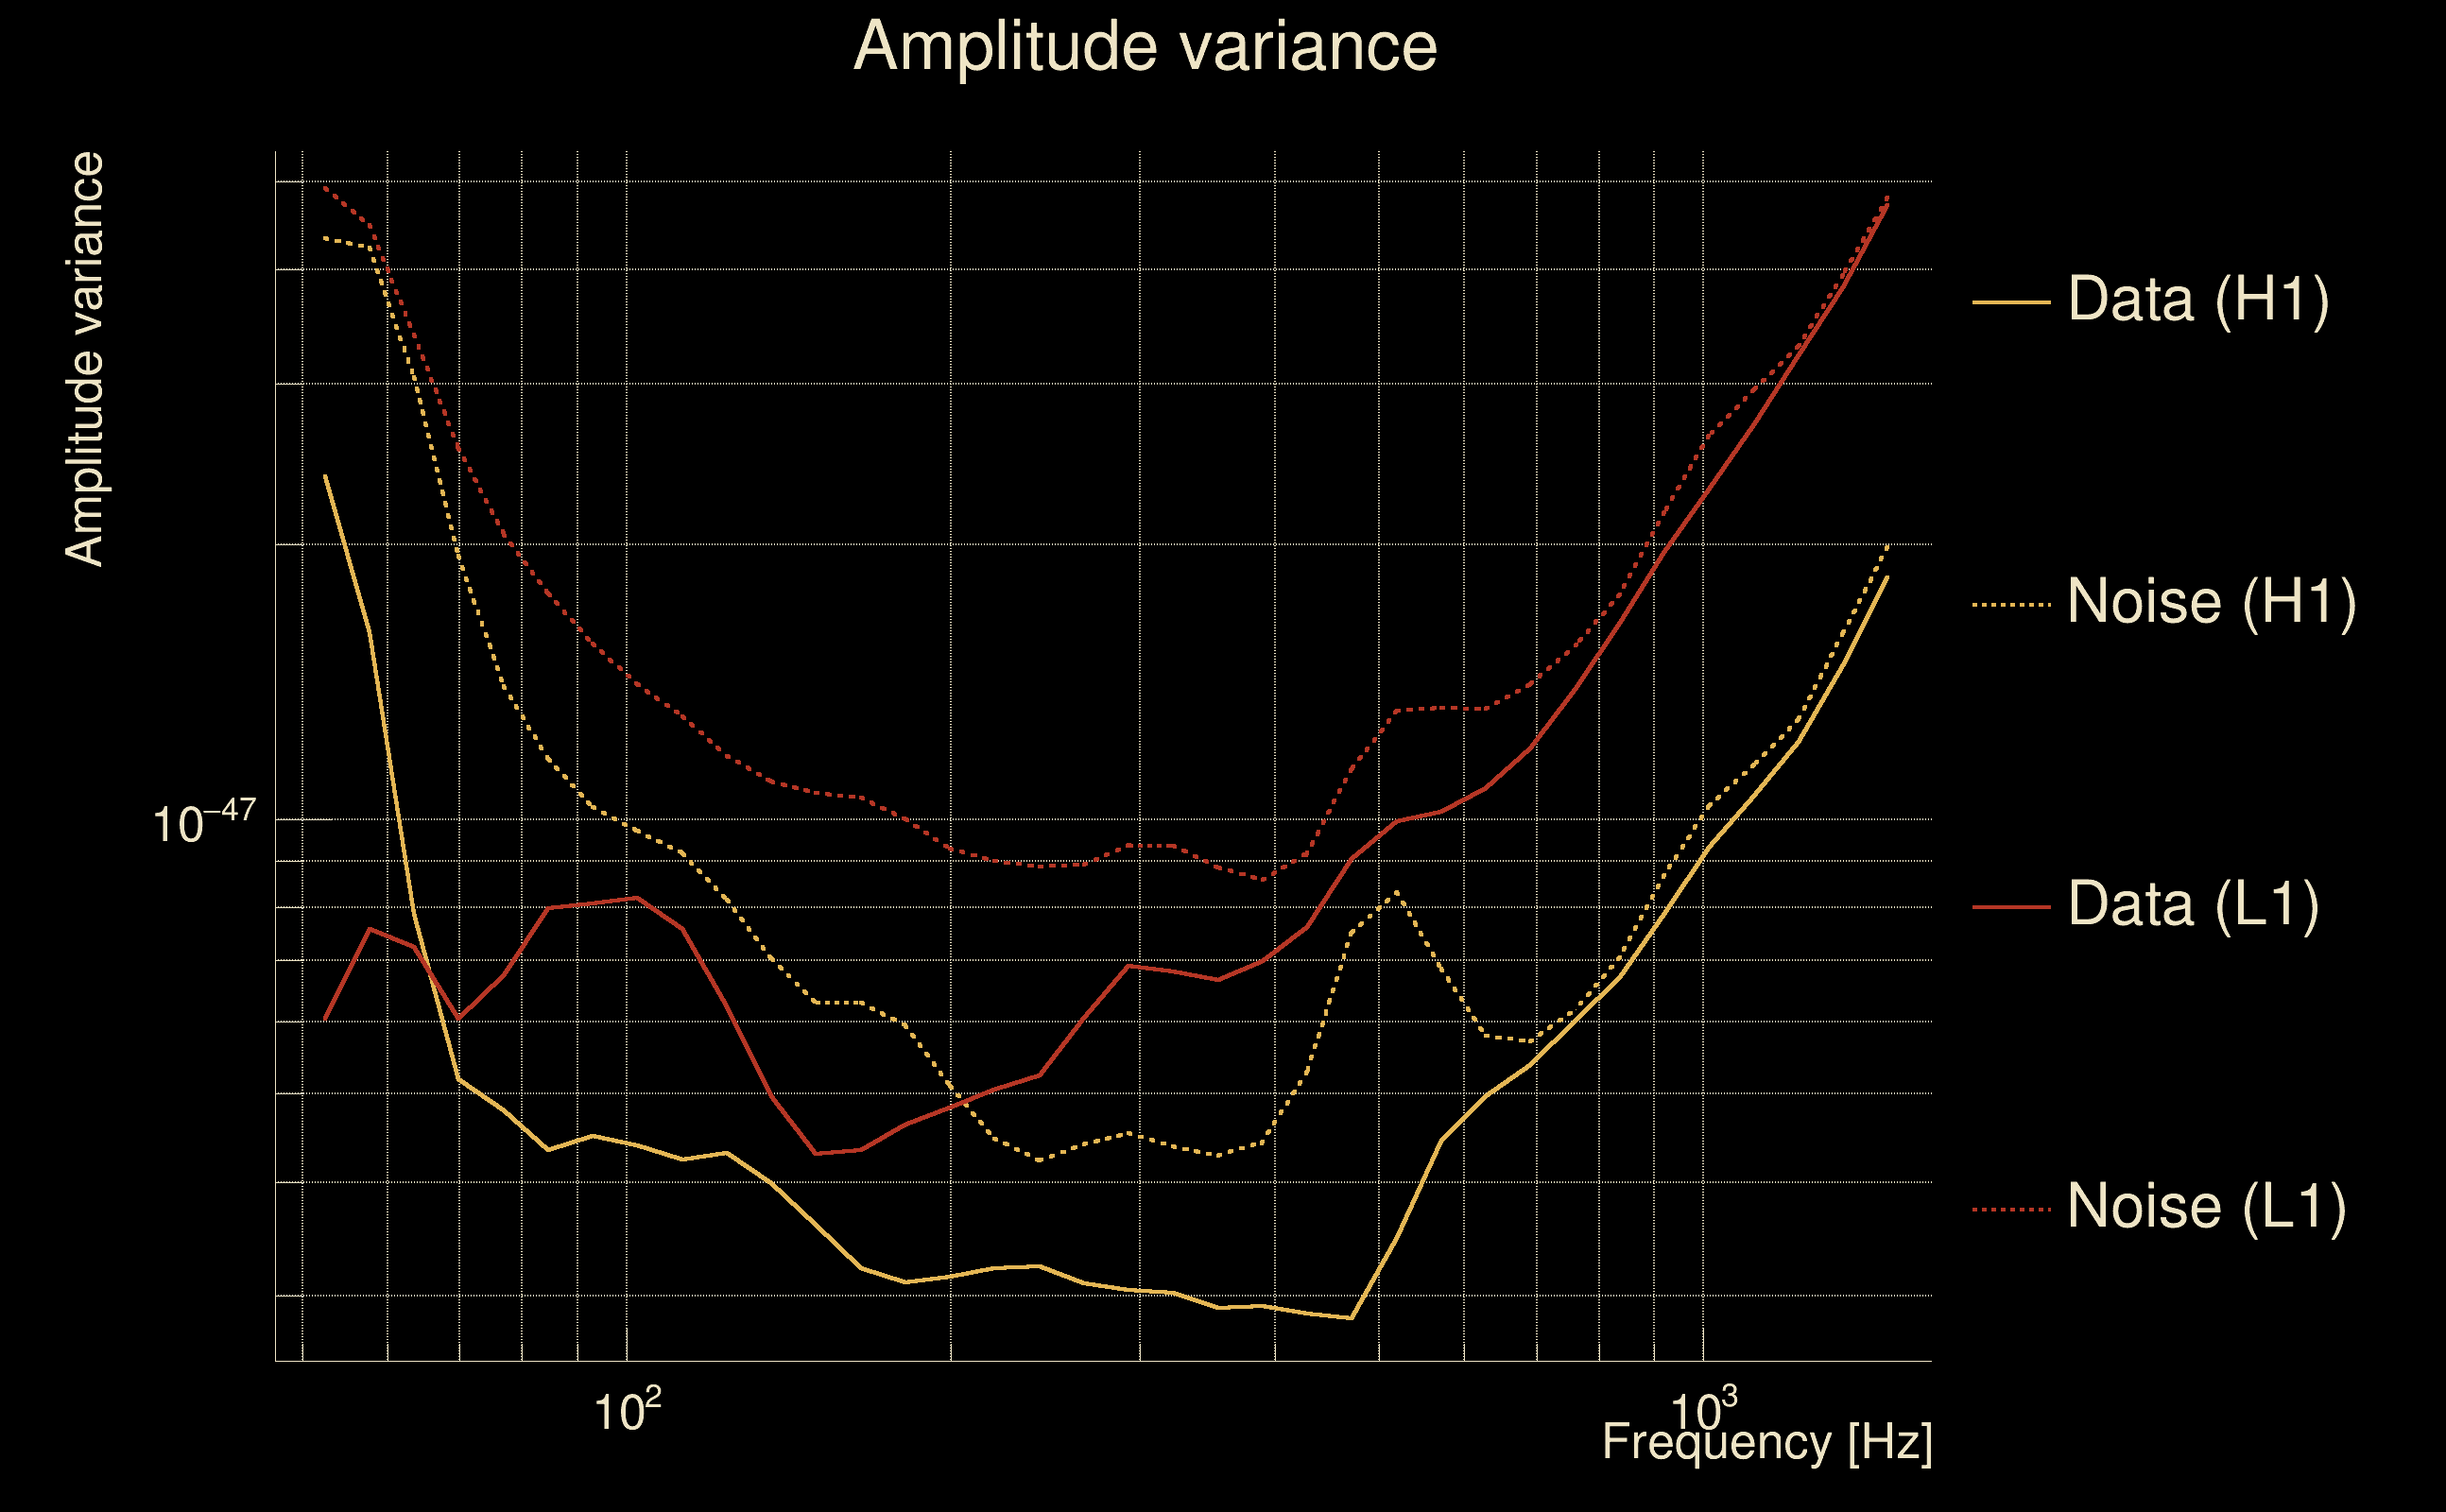
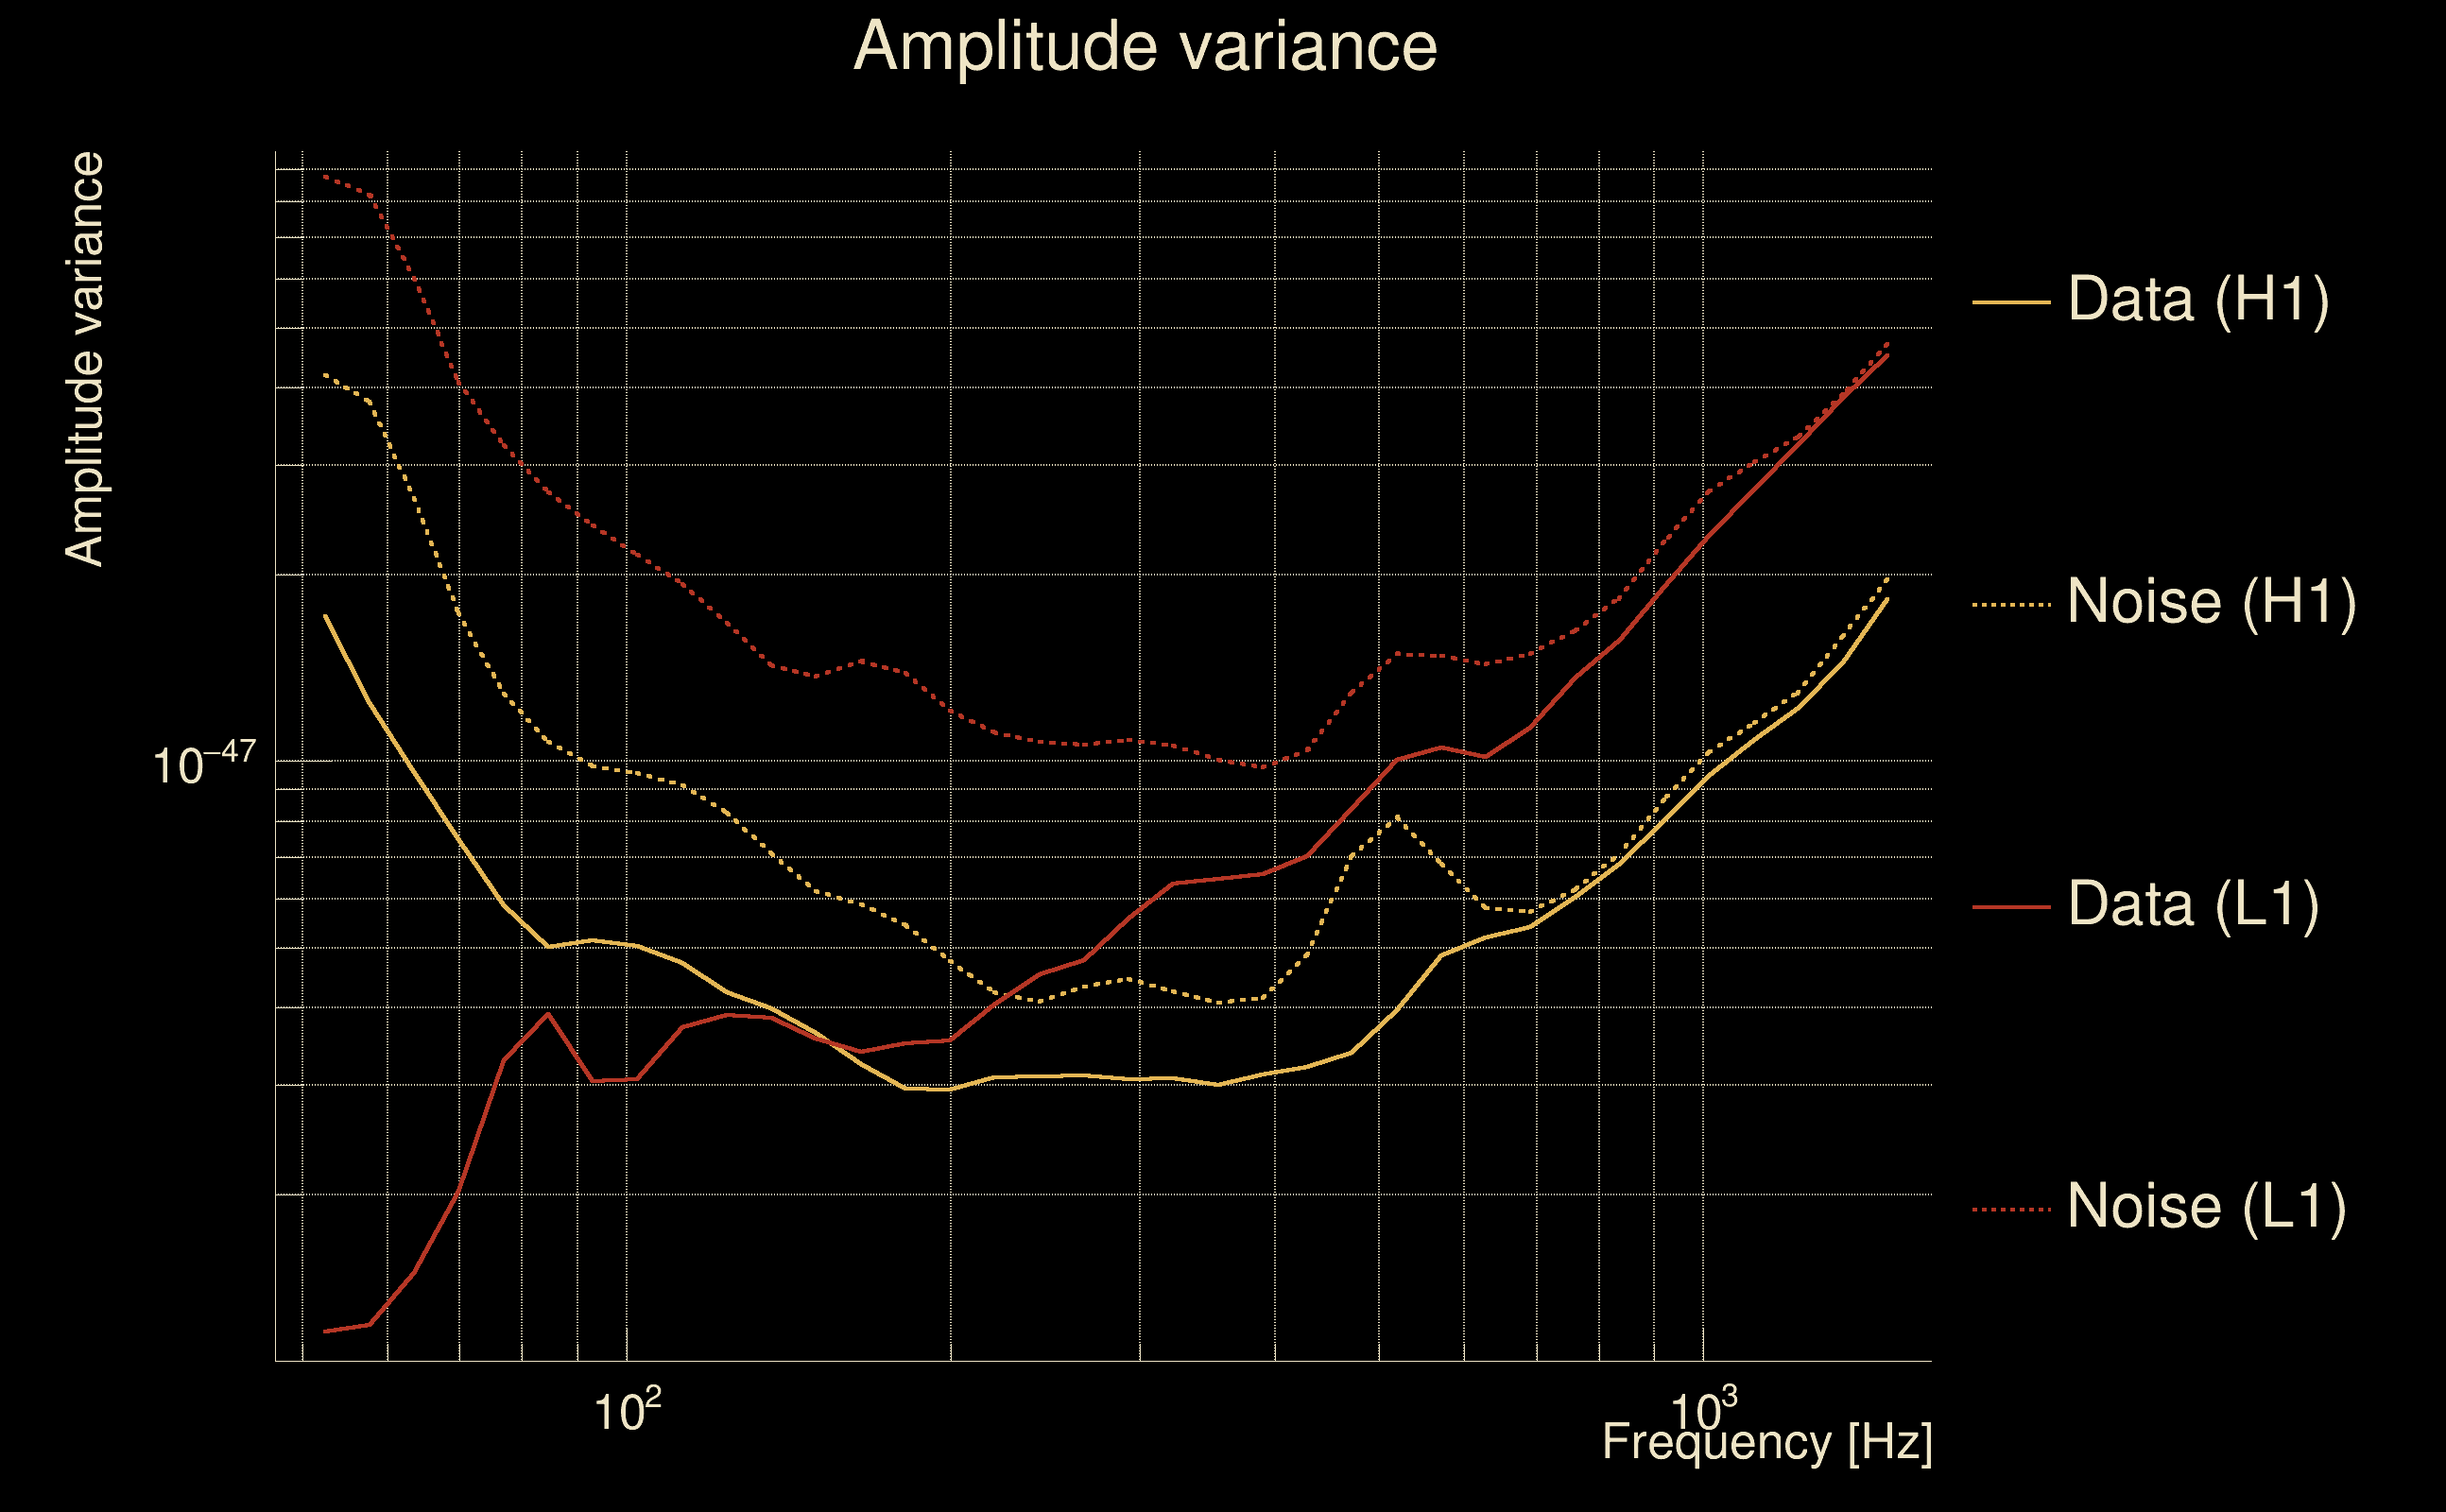
| Log of amplitude ratio (L1/H1): | 0.231858, variance = 0.50116 (L1/H1: 0.0110716, variance = 1.12044, H1/L1: -0.450509, variance = 0.886426) |
| Amplitude ratio (L1/H1): | 1.26094 ⋇ 2.02978 (L1/H1: 1.01113 ⋇ 2.88207, H1/L1: 0.637304 ⋇ 2.56383) |
| Amplitude ratio H1|L1 compatibility (probability): | 0.756411 |
| Antenna factor probability: | 1 |
| Number of rejected frequency rows: | Q0: 18 / 18, Q1: 34 / 36, Q2: 65 / 70, Q3: 127 / 134, Q4: 251 / 258 |
| Maximum signal-to-noise ratio: | H1: 4.89204, L1: 4.91588 |
| SNR variance: | H1: 0.449999, L1: 0.455537 |
| Click here for a zoomed plot | Click here for a zoomed plot | Click here for a zoomed plot | Click here for a zoomed plot | Click here for a zoomed plot |
 |
 |
 |
 |
 |
 |
 |
 |
 |
 |
 |
 |
 |
 |
 |
|
|
|
|
|
 |
 |
 |
 |
 |
 |
 |
 |
 |
 |
 |
 |
 |
 |
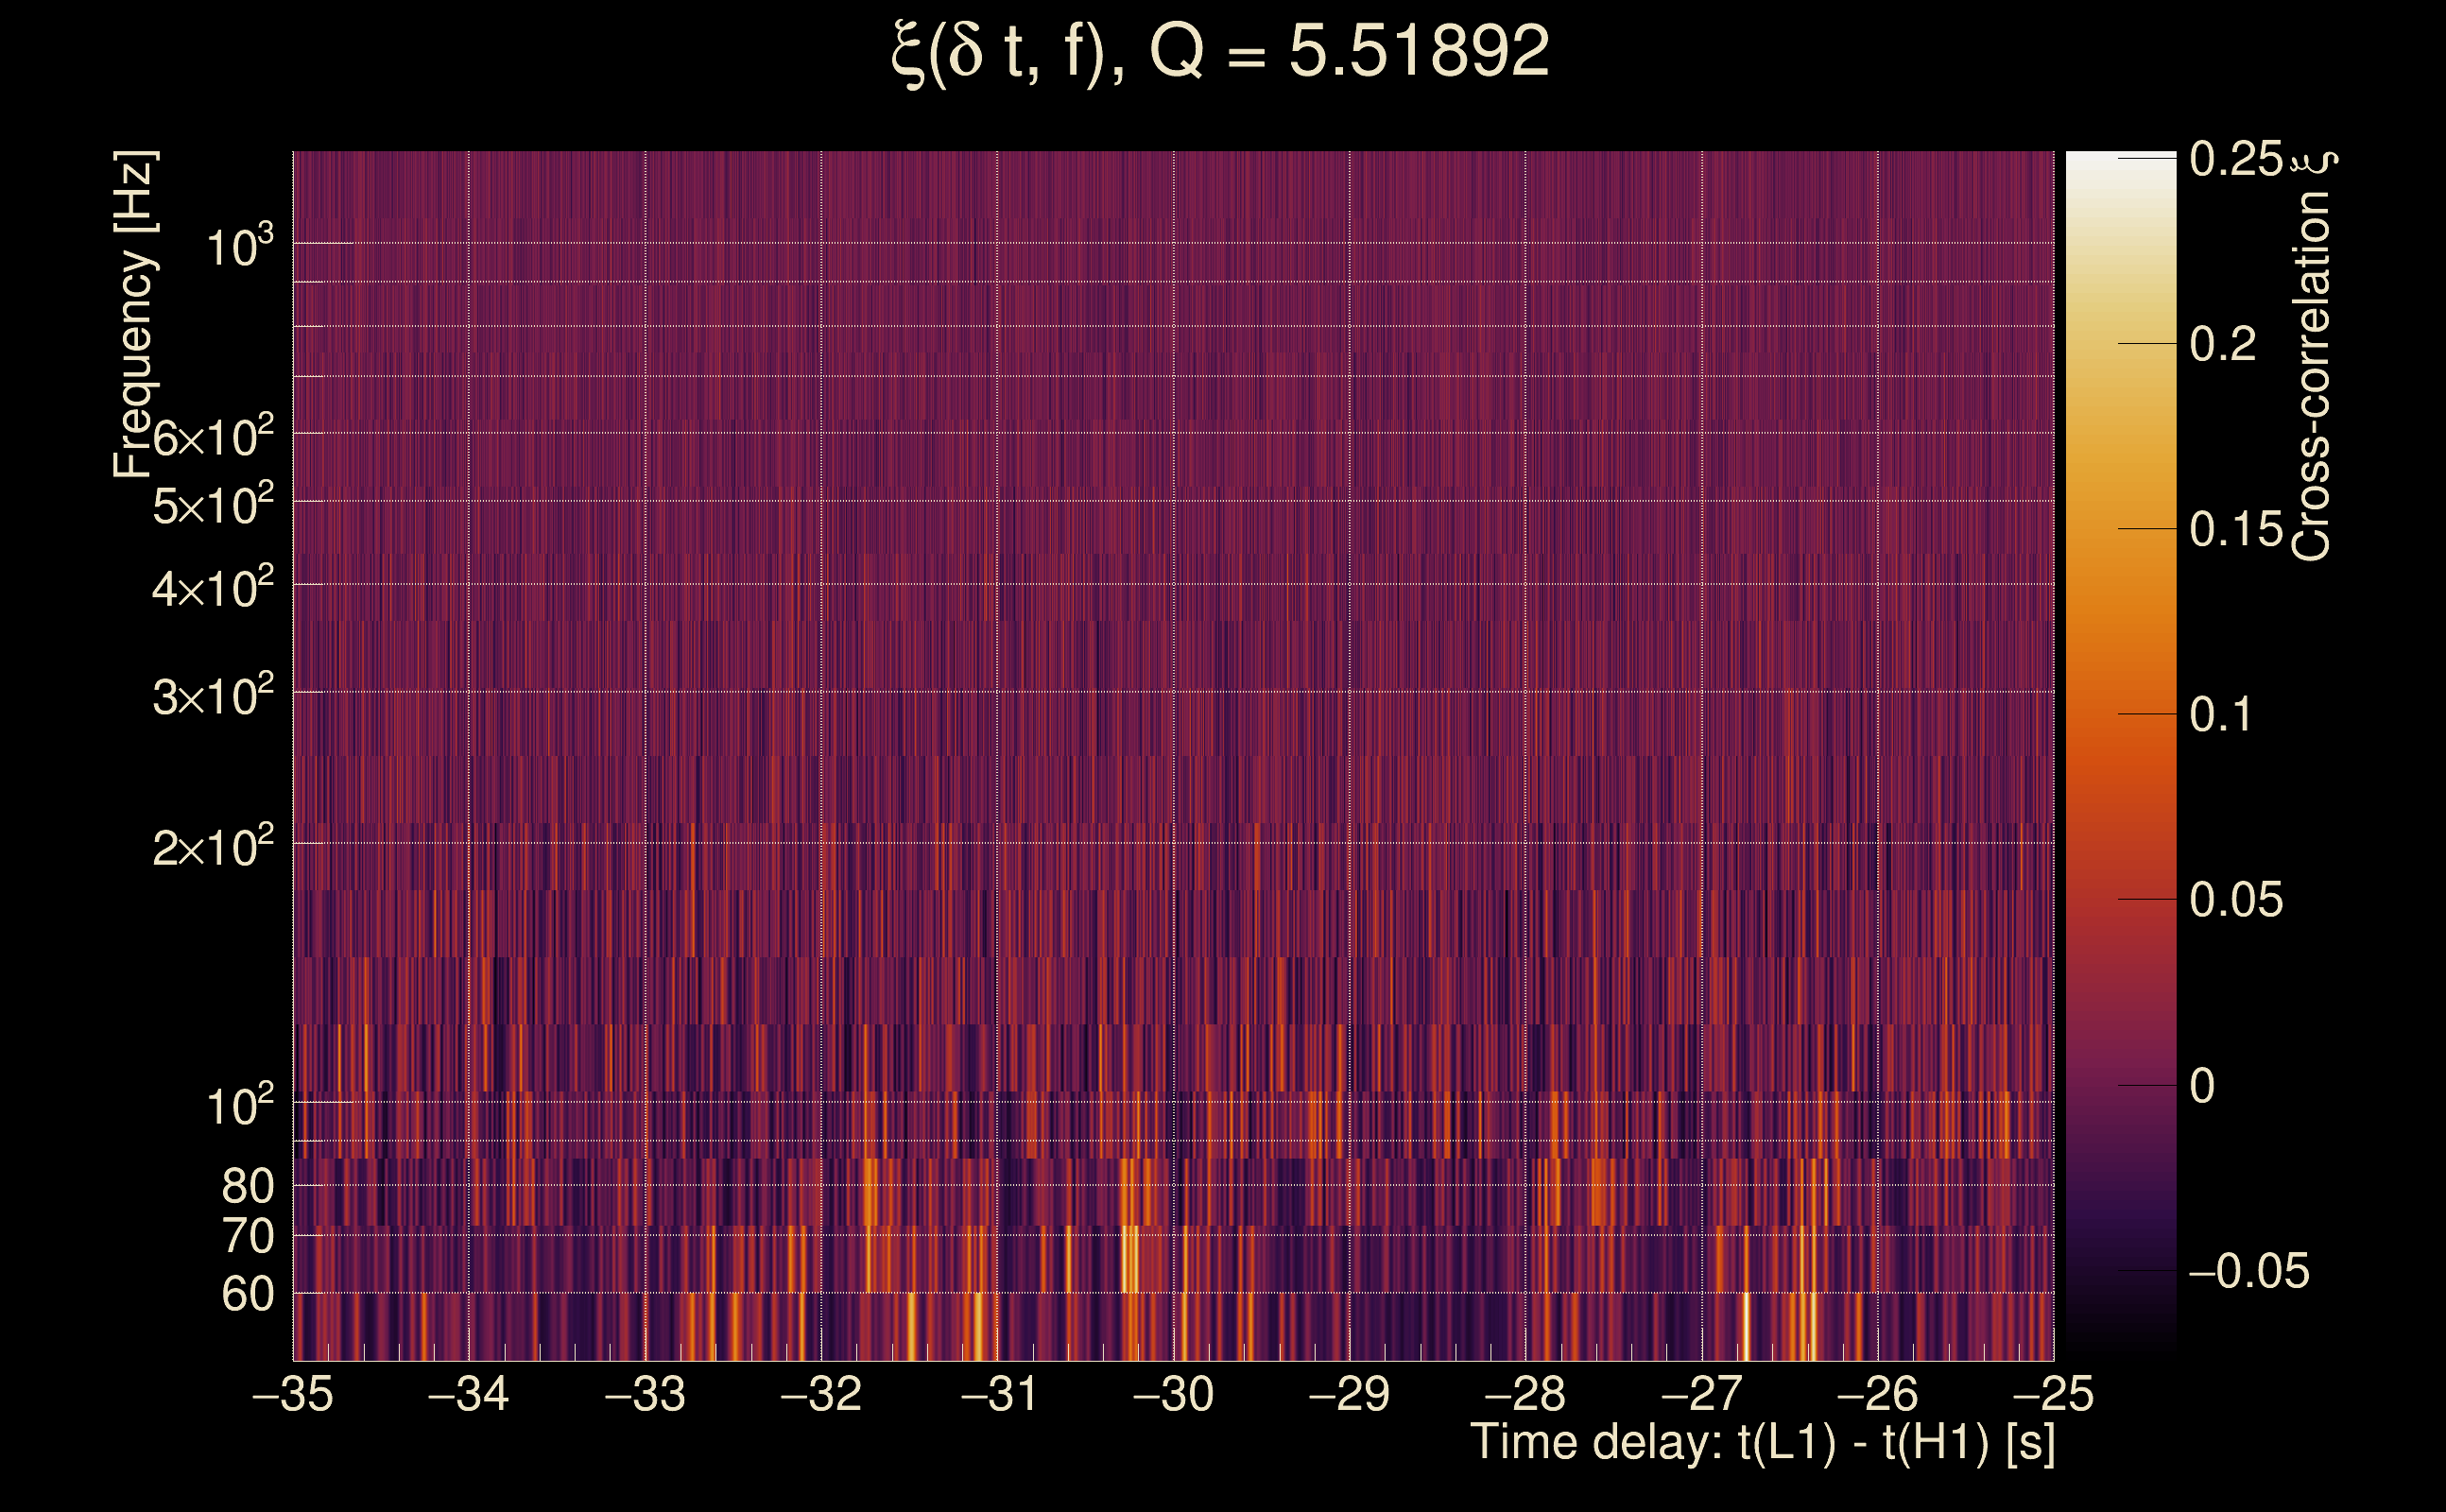
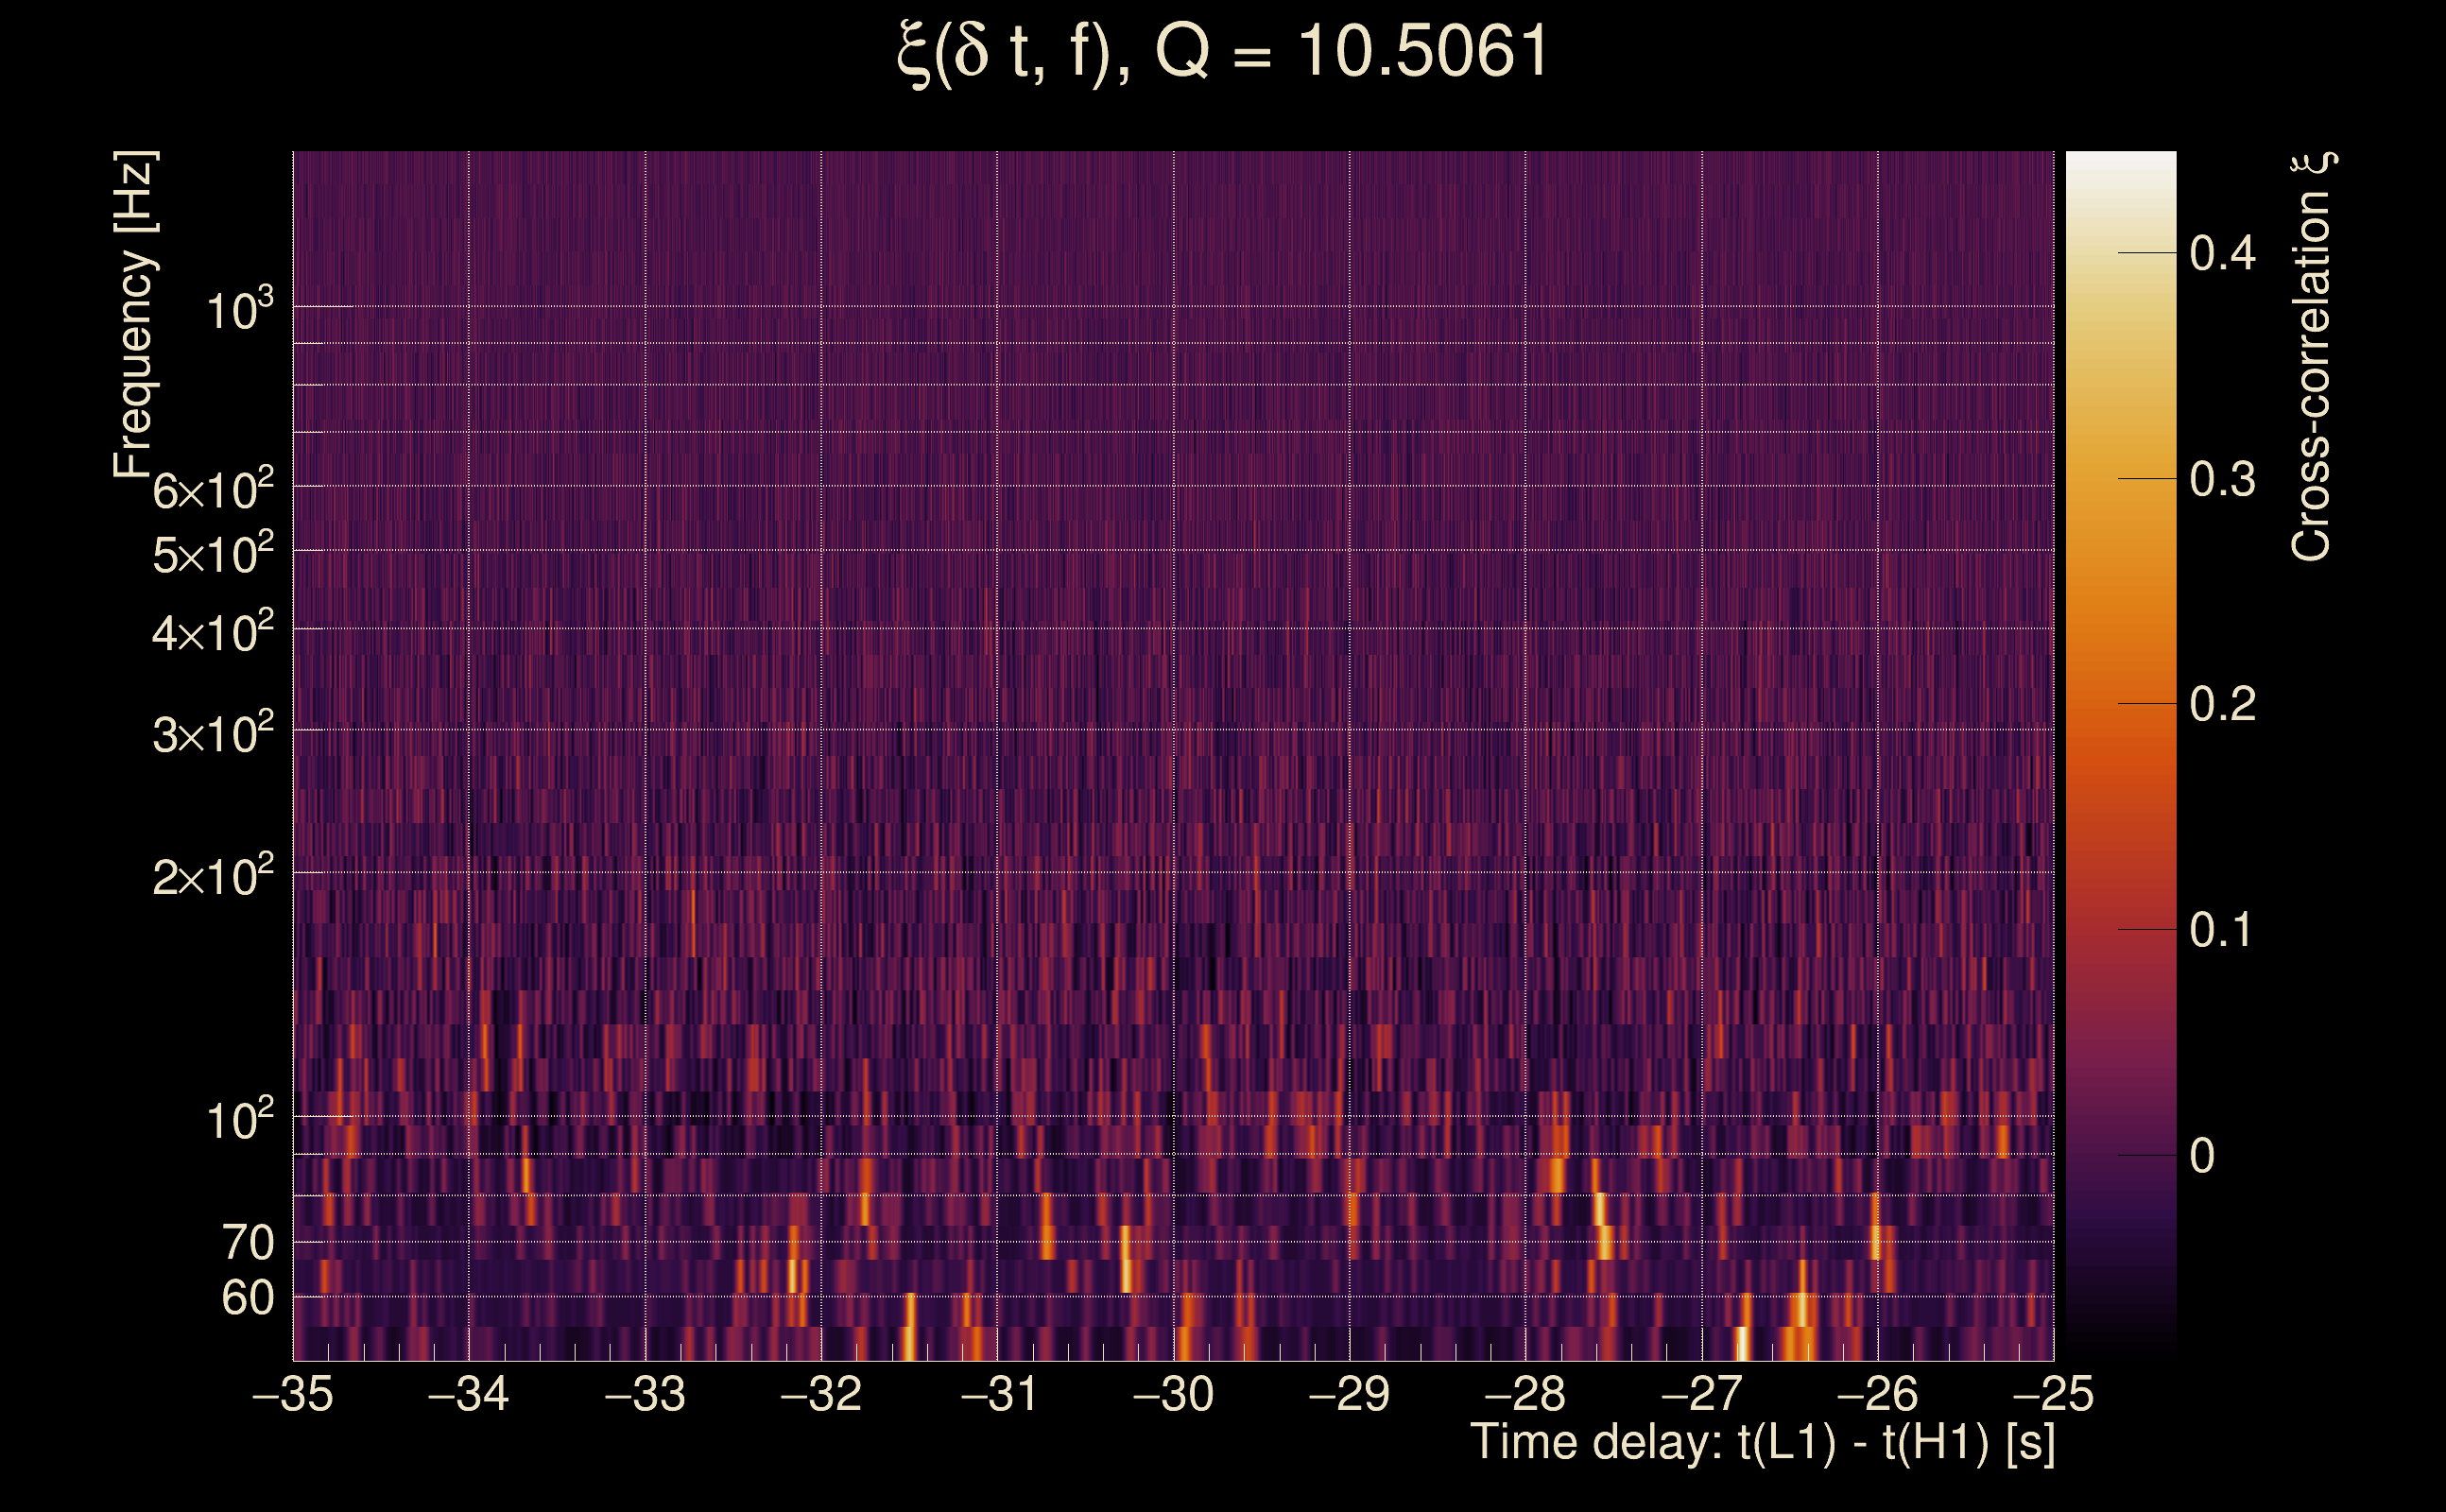
| Event time t(H1): | GPS = 1368195283 (Mon May 15 14:14:25 2023 ) → GPS = 1368195293 (Mon May 15 14:14:35 2023 ) |
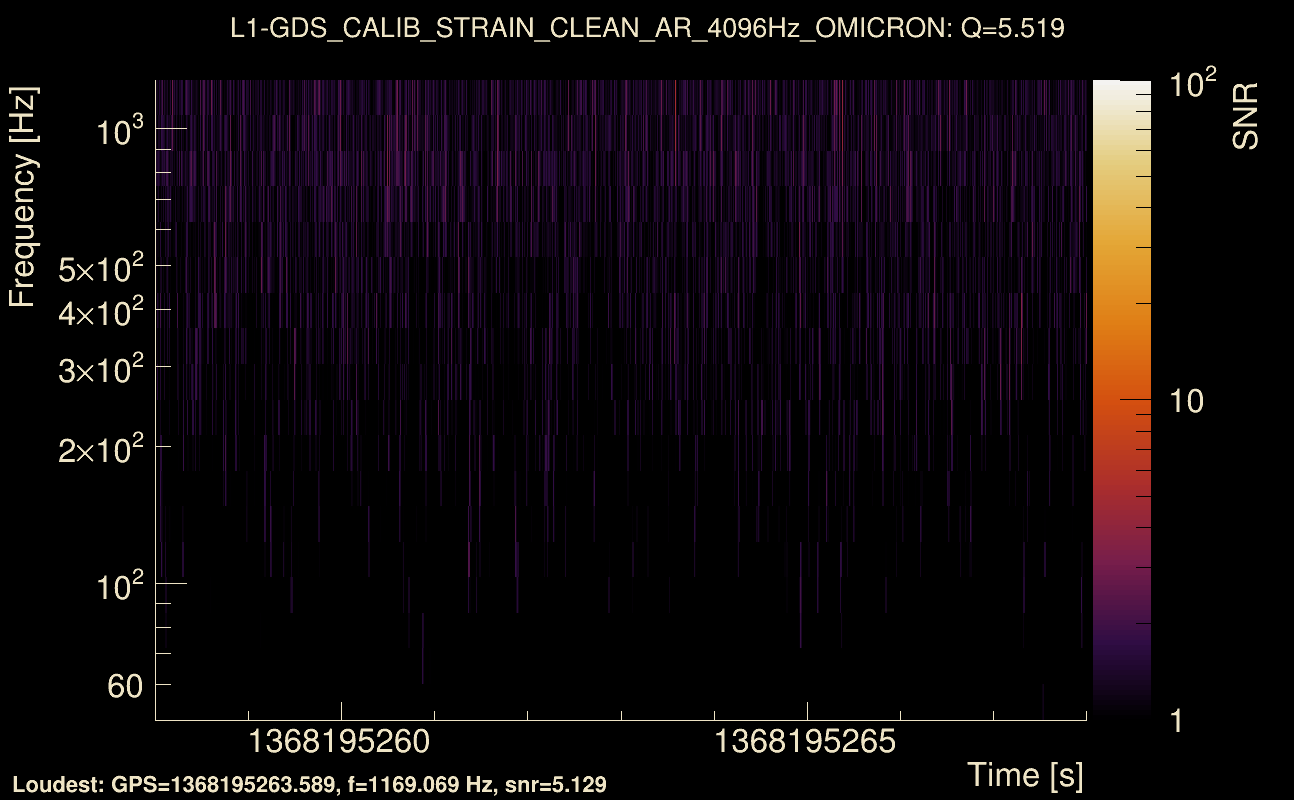
| Event time t(L1): | GPS = 1368195263 (Mon May 15 14:14:35 2023 ) → GPS = 1368195273 (Mon May 15 14:14:15 2023 ) |
| Omicron analysis time window (H1): | GPS = 1368195280 → GPS = 1368195296 |
| Omicron analysis time window (L1): | GPS = 1368195260 → GPS = 1368195276 |
| Time delay between detectors t(L1) - t(H1): | -21.0129 s (slice index = 130 / 217), δt_gw = -0.000931215 s |
| Time delay uncertainty: | 0.00938632 s |
| [targeted mode] Time delay probability: | 0.895798 (0.130971 sigmas), δt_target = -0.00214434 s |
| Frequency: | 605.363 Hz |
| Ξ: | 0.00172425 ± 0.0547951 (variance = 0.0030025): Q0: 0, Q1: 0.046324, Q2: 0.0542834, Q3: 0.130746, Q4: 0.145918 |
| Rank: | R_A = 0.00116722 |
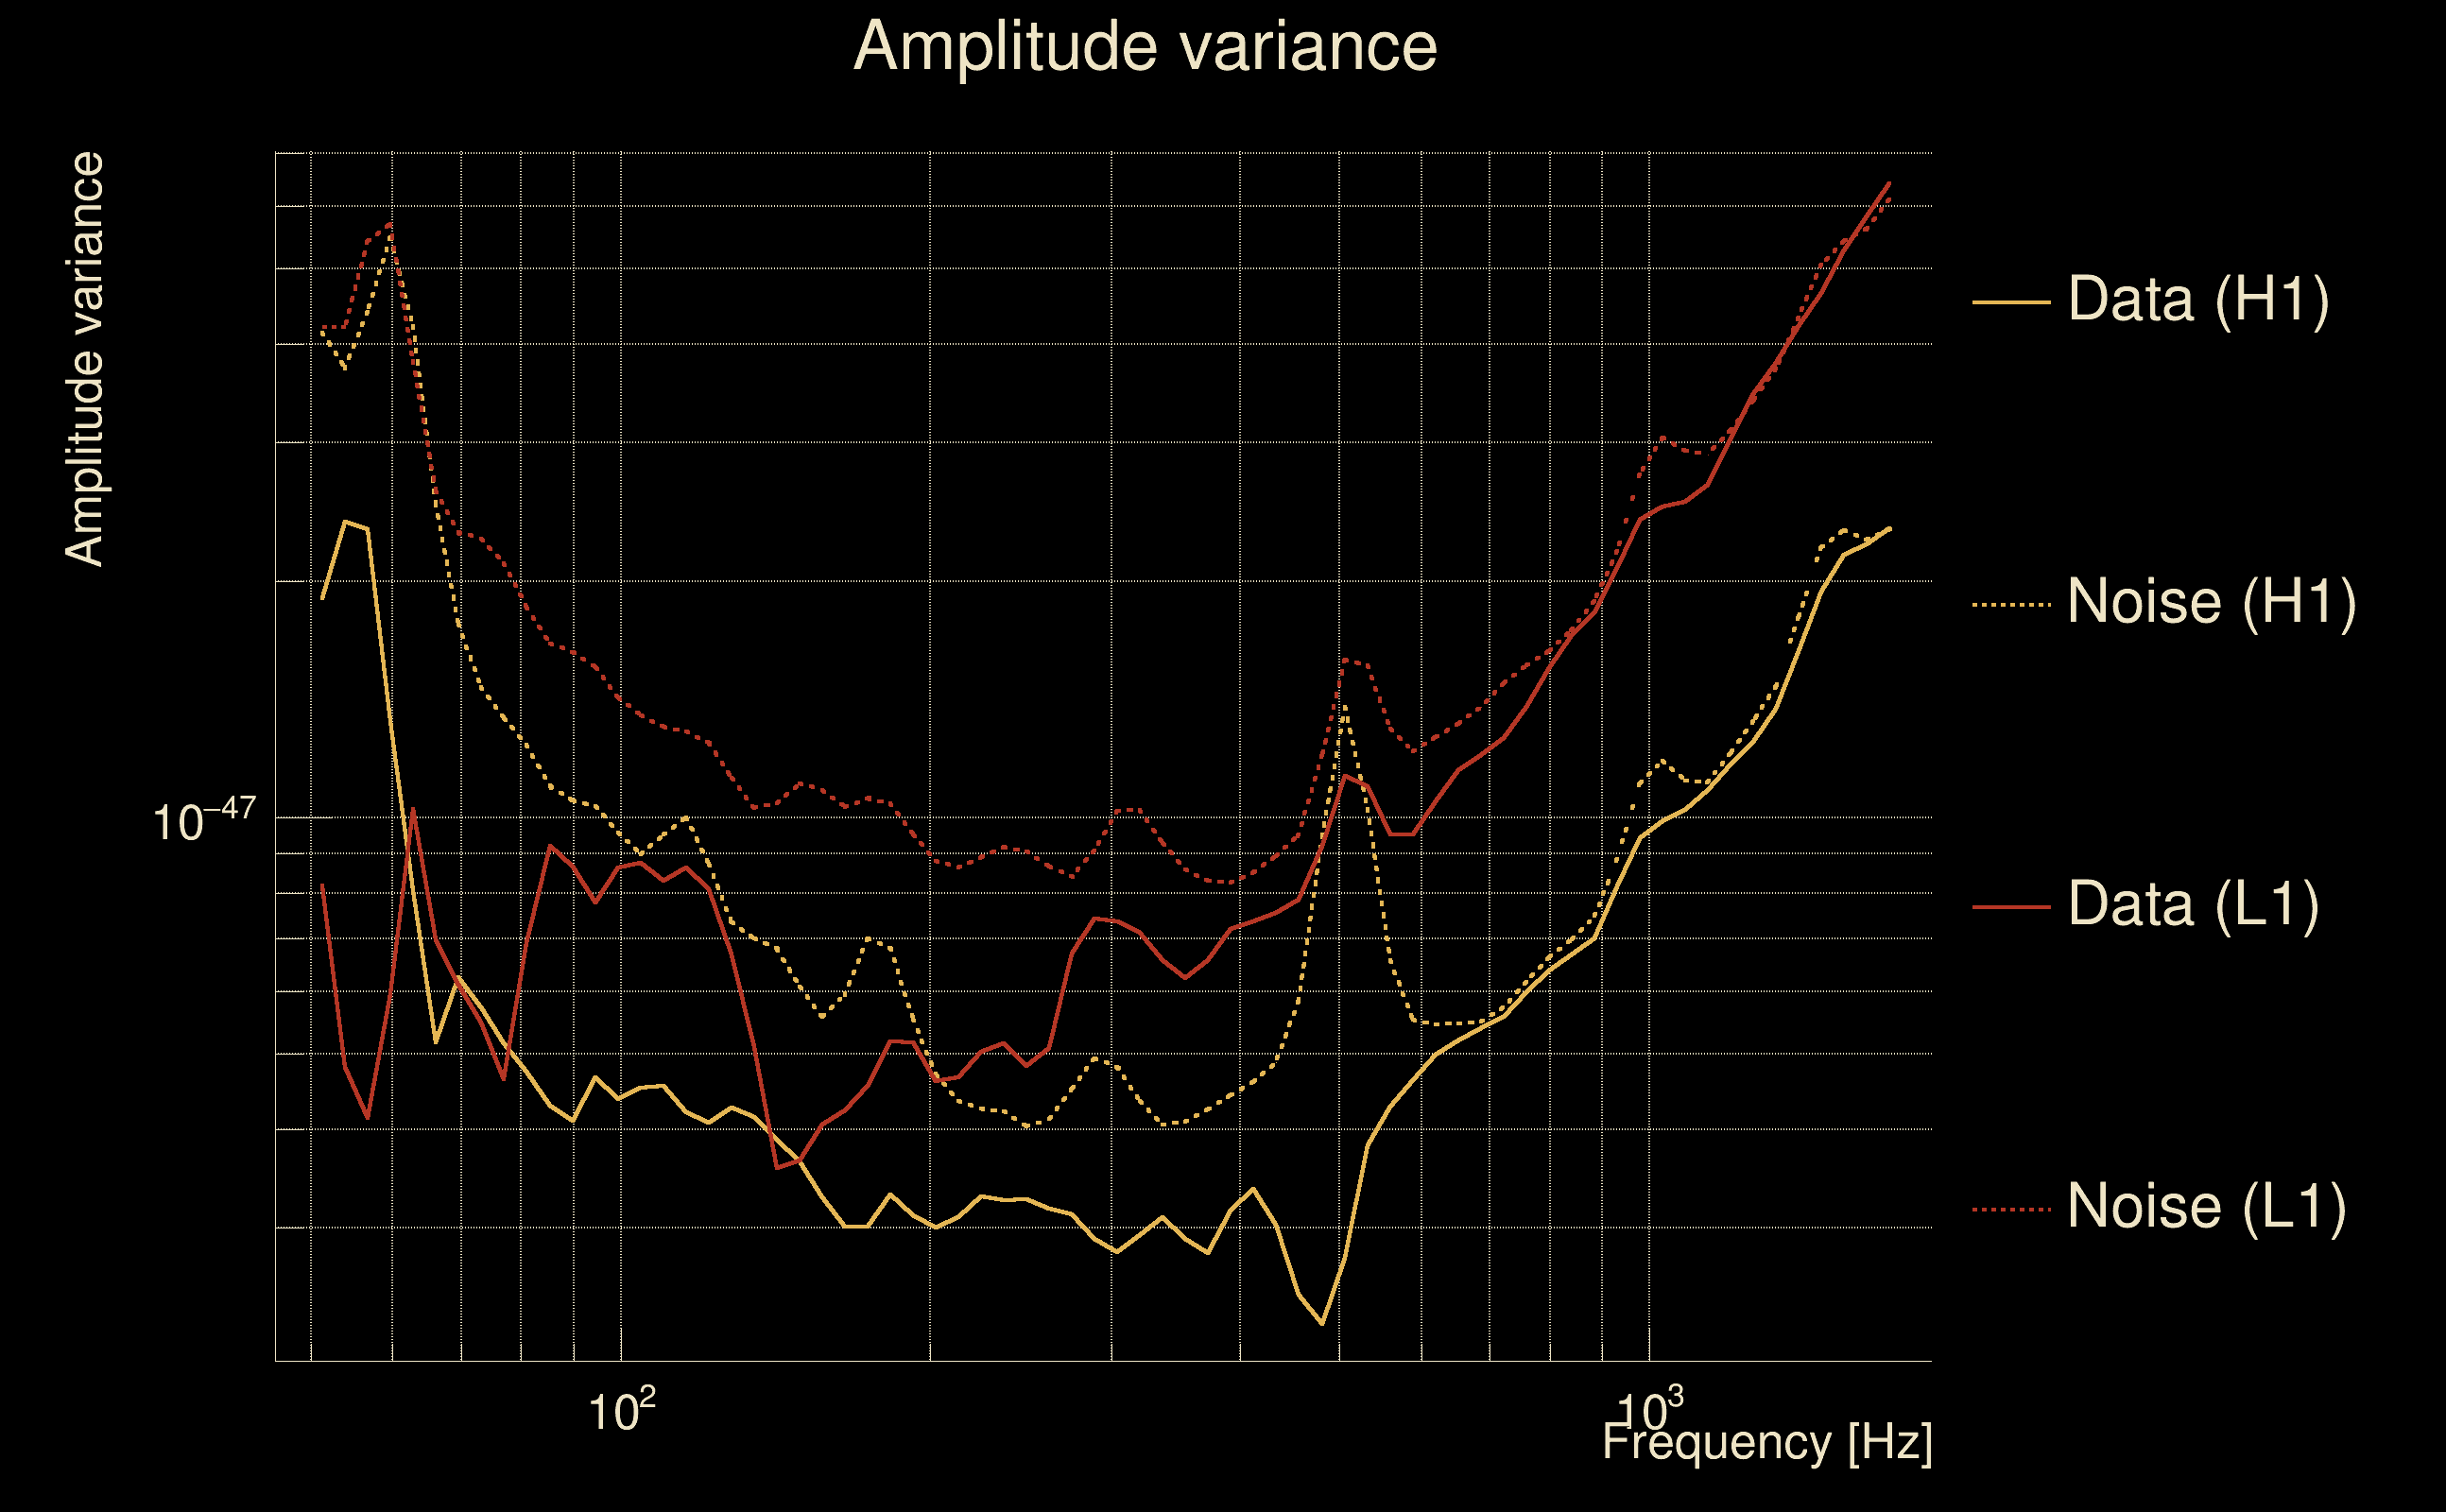
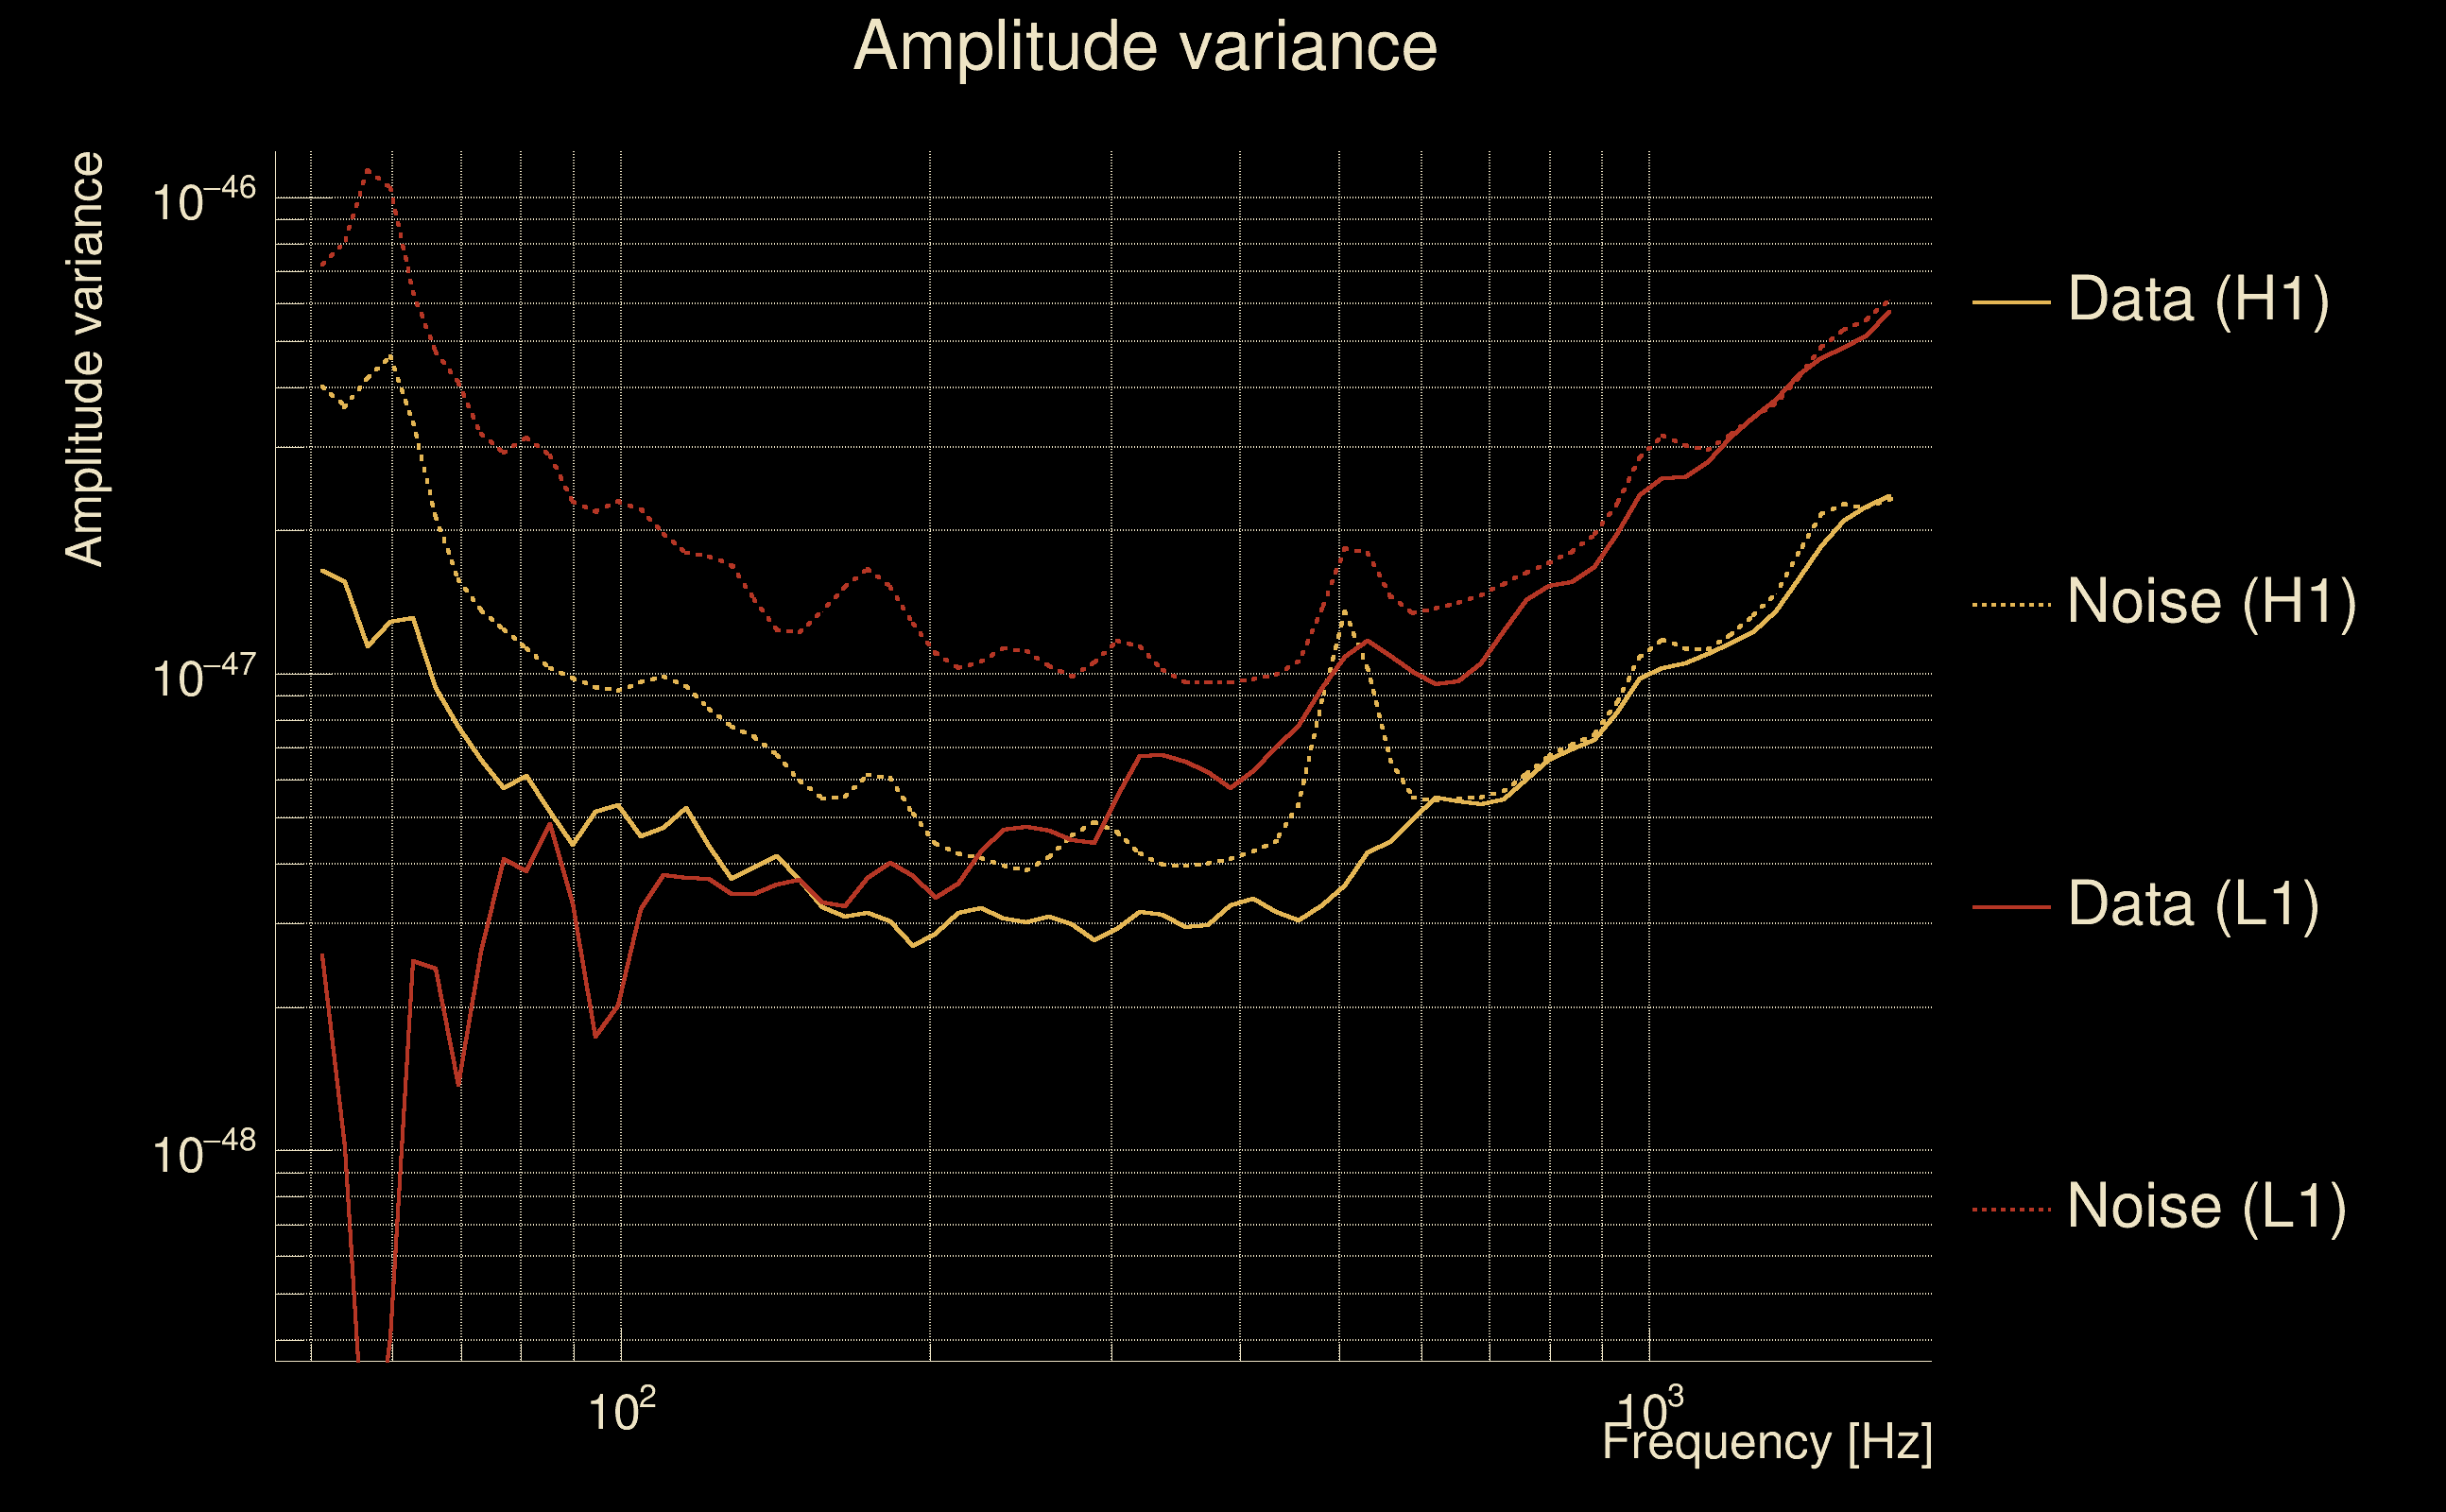
| Log of amplitude ratio (L1/H1): | 0.569415, variance = 0.750386 (L1/H1: 0.271322, variance = 0.95748, H1/L1: -0.778748, variance = 1.70216) |
| Amplitude ratio (L1/H1): | 1.76723 ⋇ 2.37797 (L1/H1: 1.3117 ⋇ 2.66049, H1/L1: 0.45898 ⋇ 3.68647) |
| Amplitude ratio H1|L1 compatibility (probability): | 0.755691 |
| Antenna factor probability: | 1 |
| Number of rejected frequency rows: | Q0: 18 / 18, Q1: 34 / 36, Q2: 67 / 70, Q3: 128 / 134, Q4: 240 / 258 |
| Maximum signal-to-noise ratio: | H1: 4.68794, L1: 5.59422 |
| SNR variance: | H1: 0.439115, L1: 0.469644 |
| Click here for a zoomed plot | Click here for a zoomed plot | Click here for a zoomed plot | Click here for a zoomed plot | Click here for a zoomed plot |
 |
 |
 |
 |
 |
 |
 |
 |
 |
 |
 |
 |
 |
 |
 |
 |
 |
 |
 |
 |
 |
 |
 |
 |
 |
 |
 |
 |
 |
 |
 |
 |
 |
 |
| Event time t(H1): | GPS = 1368195283 (Mon May 15 14:14:25 2023 ) → GPS = 1368195293 (Mon May 15 14:14:35 2023 ) |
| Event time t(L1): | GPS = 1368195263 (Mon May 15 14:14:35 2023 ) → GPS = 1368195273 (Mon May 15 14:14:15 2023 ) |
| Omicron analysis time window (H1): | GPS = 1368195280 → GPS = 1368195296 |
| Omicron analysis time window (L1): | GPS = 1368195260 → GPS = 1368195276 |
| Time delay between detectors t(L1) - t(H1): | -23.82 s (slice index = 191 / 217), δt_gw = -0.00203722 s |
| Time delay uncertainty: | 0.0072544 s |
| [targeted mode] Time delay probability: | 0.986436 (0.0170009 sigmas), δt_target = -0.00216055 s |
| Frequency: | 728.447 Hz |
| Ξ: | 0.00103163 ± 0.0360848 (variance = 0.00130211): Q0: 0, Q1: 0.0322783, Q2: 0.0539695, Q3: 0.0849312, Q4: 0.100547 |
| Rank: | R_A = 0.00101384 |
| Log of amplitude ratio (L1/H1): | 0.578727, variance = 0.504495 (L1/H1: 0.574879, variance = 0.979233, H1/L1: -0.581429, variance = 0.978937) |
| Amplitude ratio (L1/H1): | 1.78377 ⋇ 2.03456 (L1/H1: 1.77692 ⋇ 2.69006, H1/L1: 0.559099 ⋇ 2.68965) |
| Amplitude ratio H1|L1 compatibility (probability): | 0.996265 |
| Antenna factor probability: | 1 |
| Number of rejected frequency rows: | Q0: 18 / 18, Q1: 35 / 36, Q2: 67 / 70, Q3: 126 / 134, Q4: 247 / 258 |
| Maximum signal-to-noise ratio: | H1: 4.68794, L1: 5.59422 |
| SNR variance: | H1: 0.439115, L1: 0.469644 |
| Click here for a zoomed plot | Click here for a zoomed plot | Click here for a zoomed plot | Click here for a zoomed plot | Click here for a zoomed plot |
|
|
|
|
|
|
|
|
|
|
|
|
|
|
|
|
|
|
|
|
|
|
|
|
|
 |
 |
 |
 |
 |
 |
 |
 |
 |
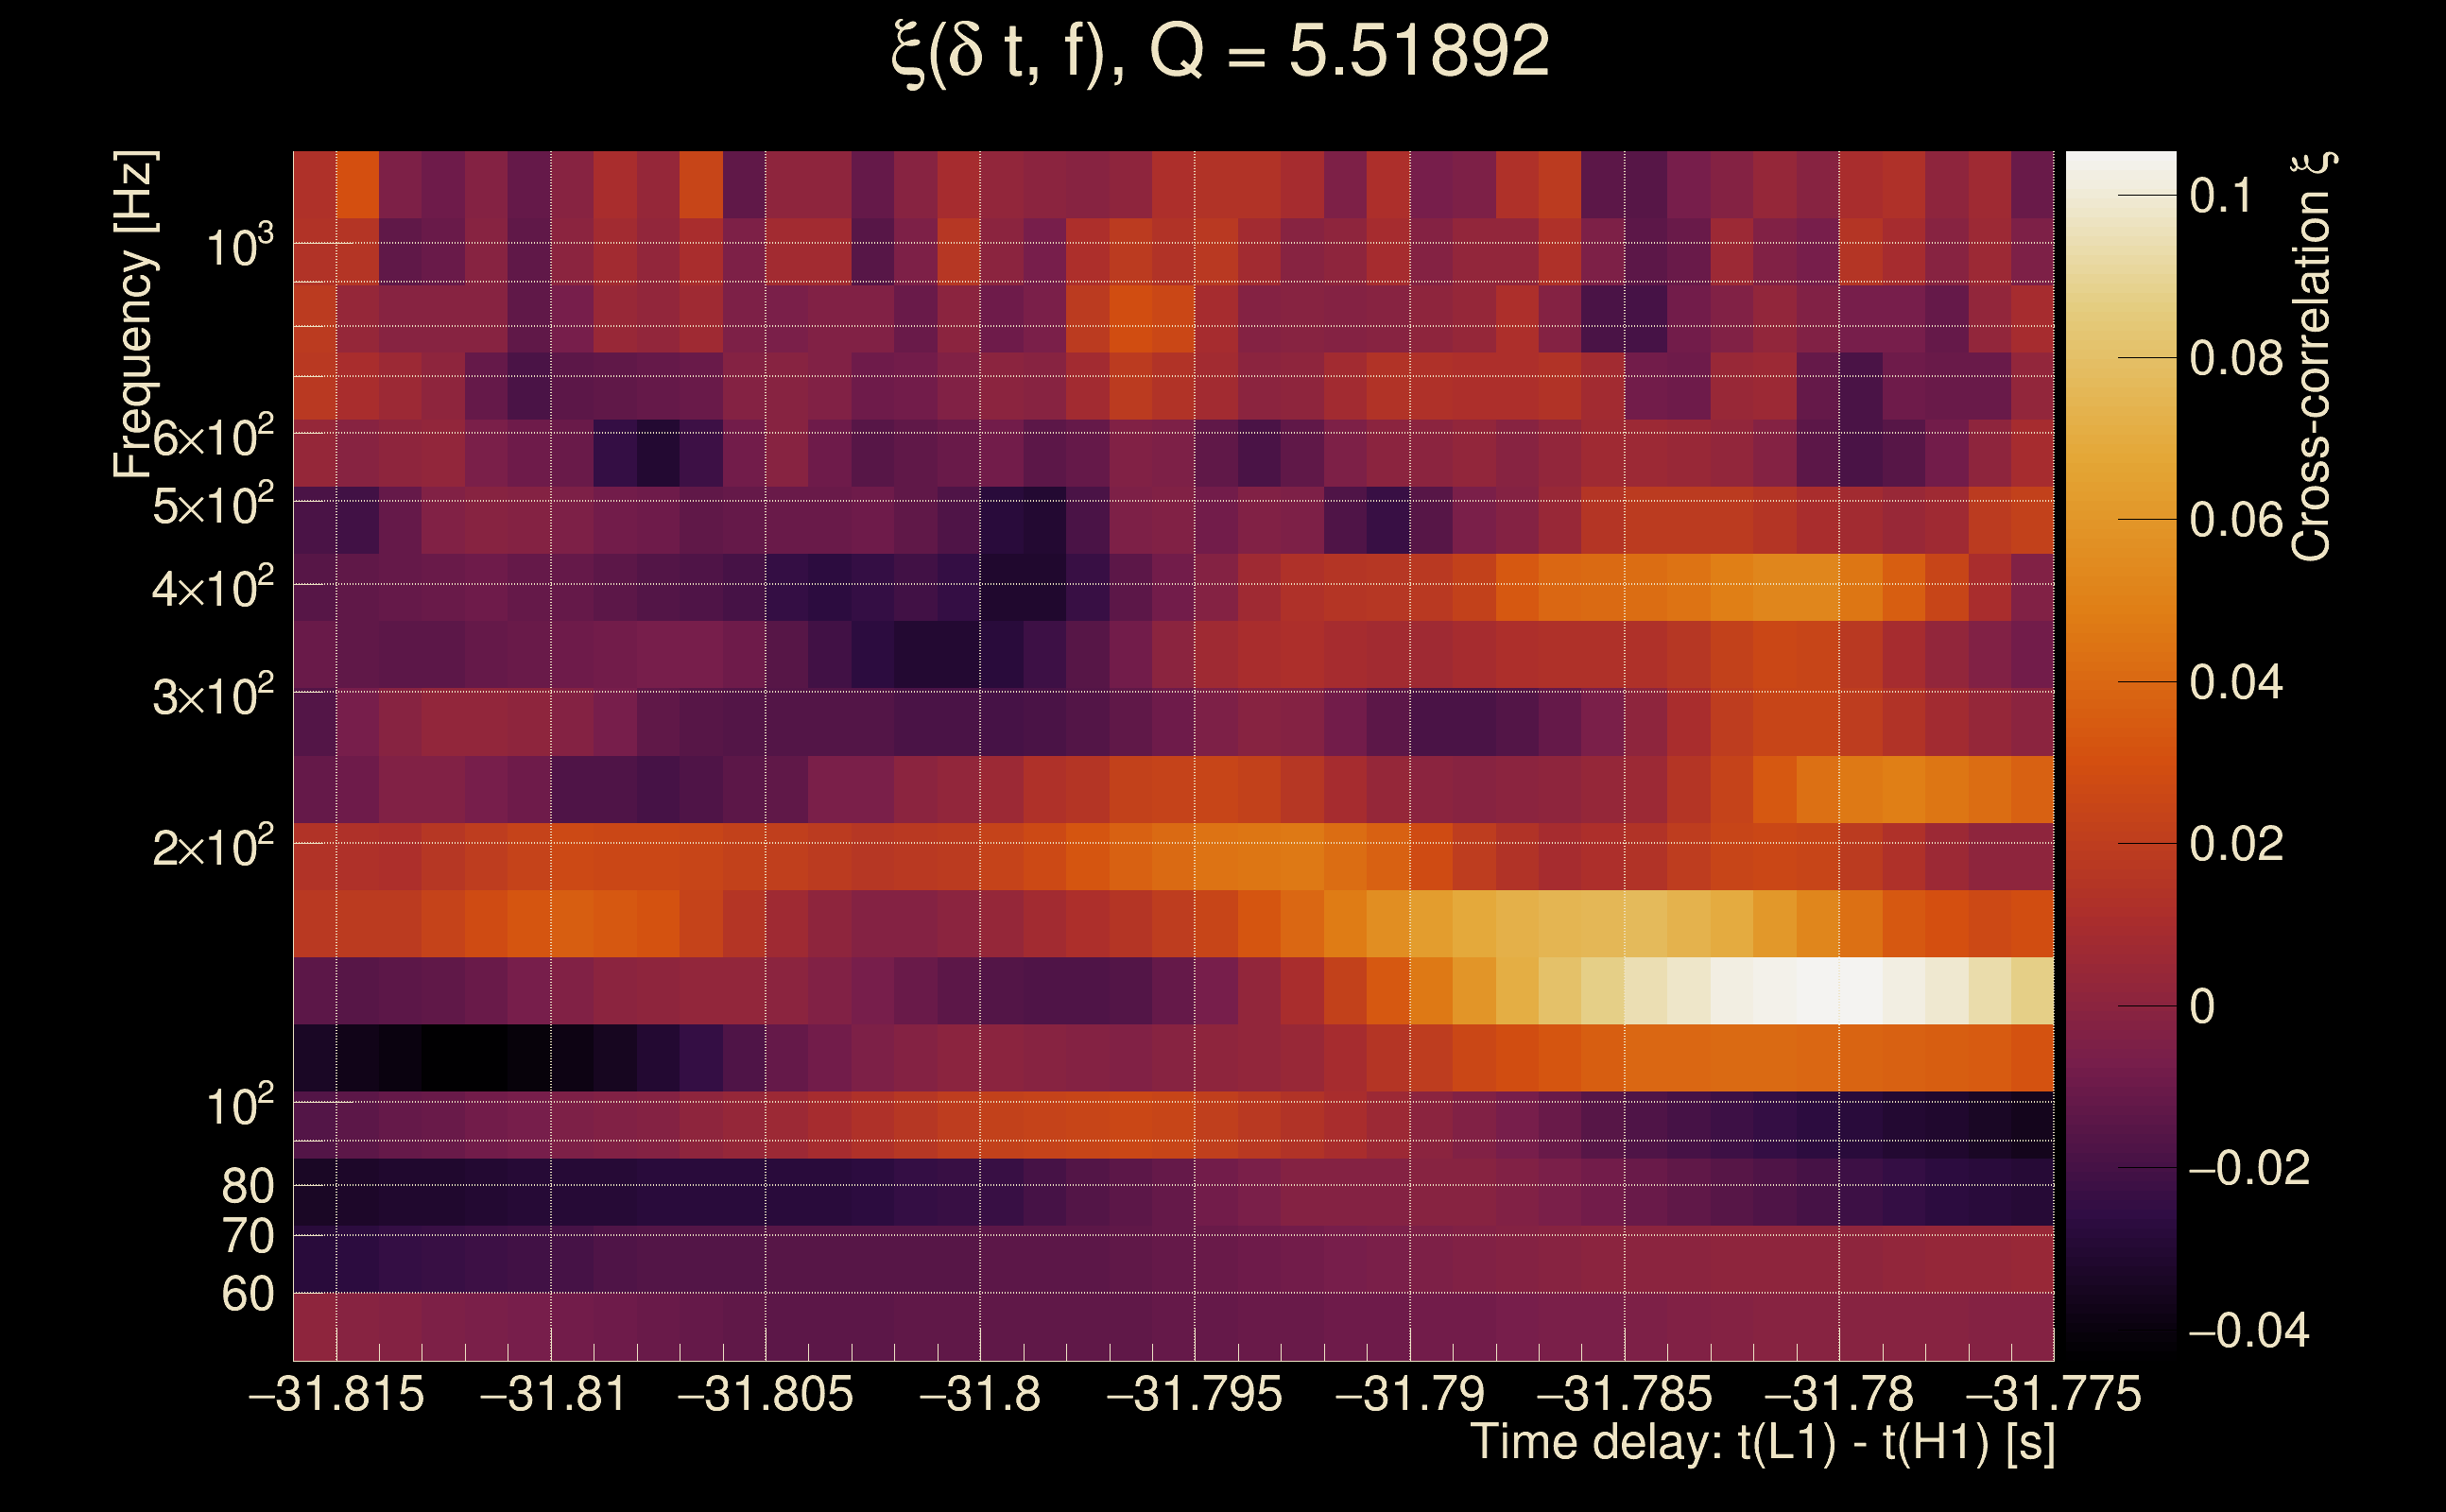
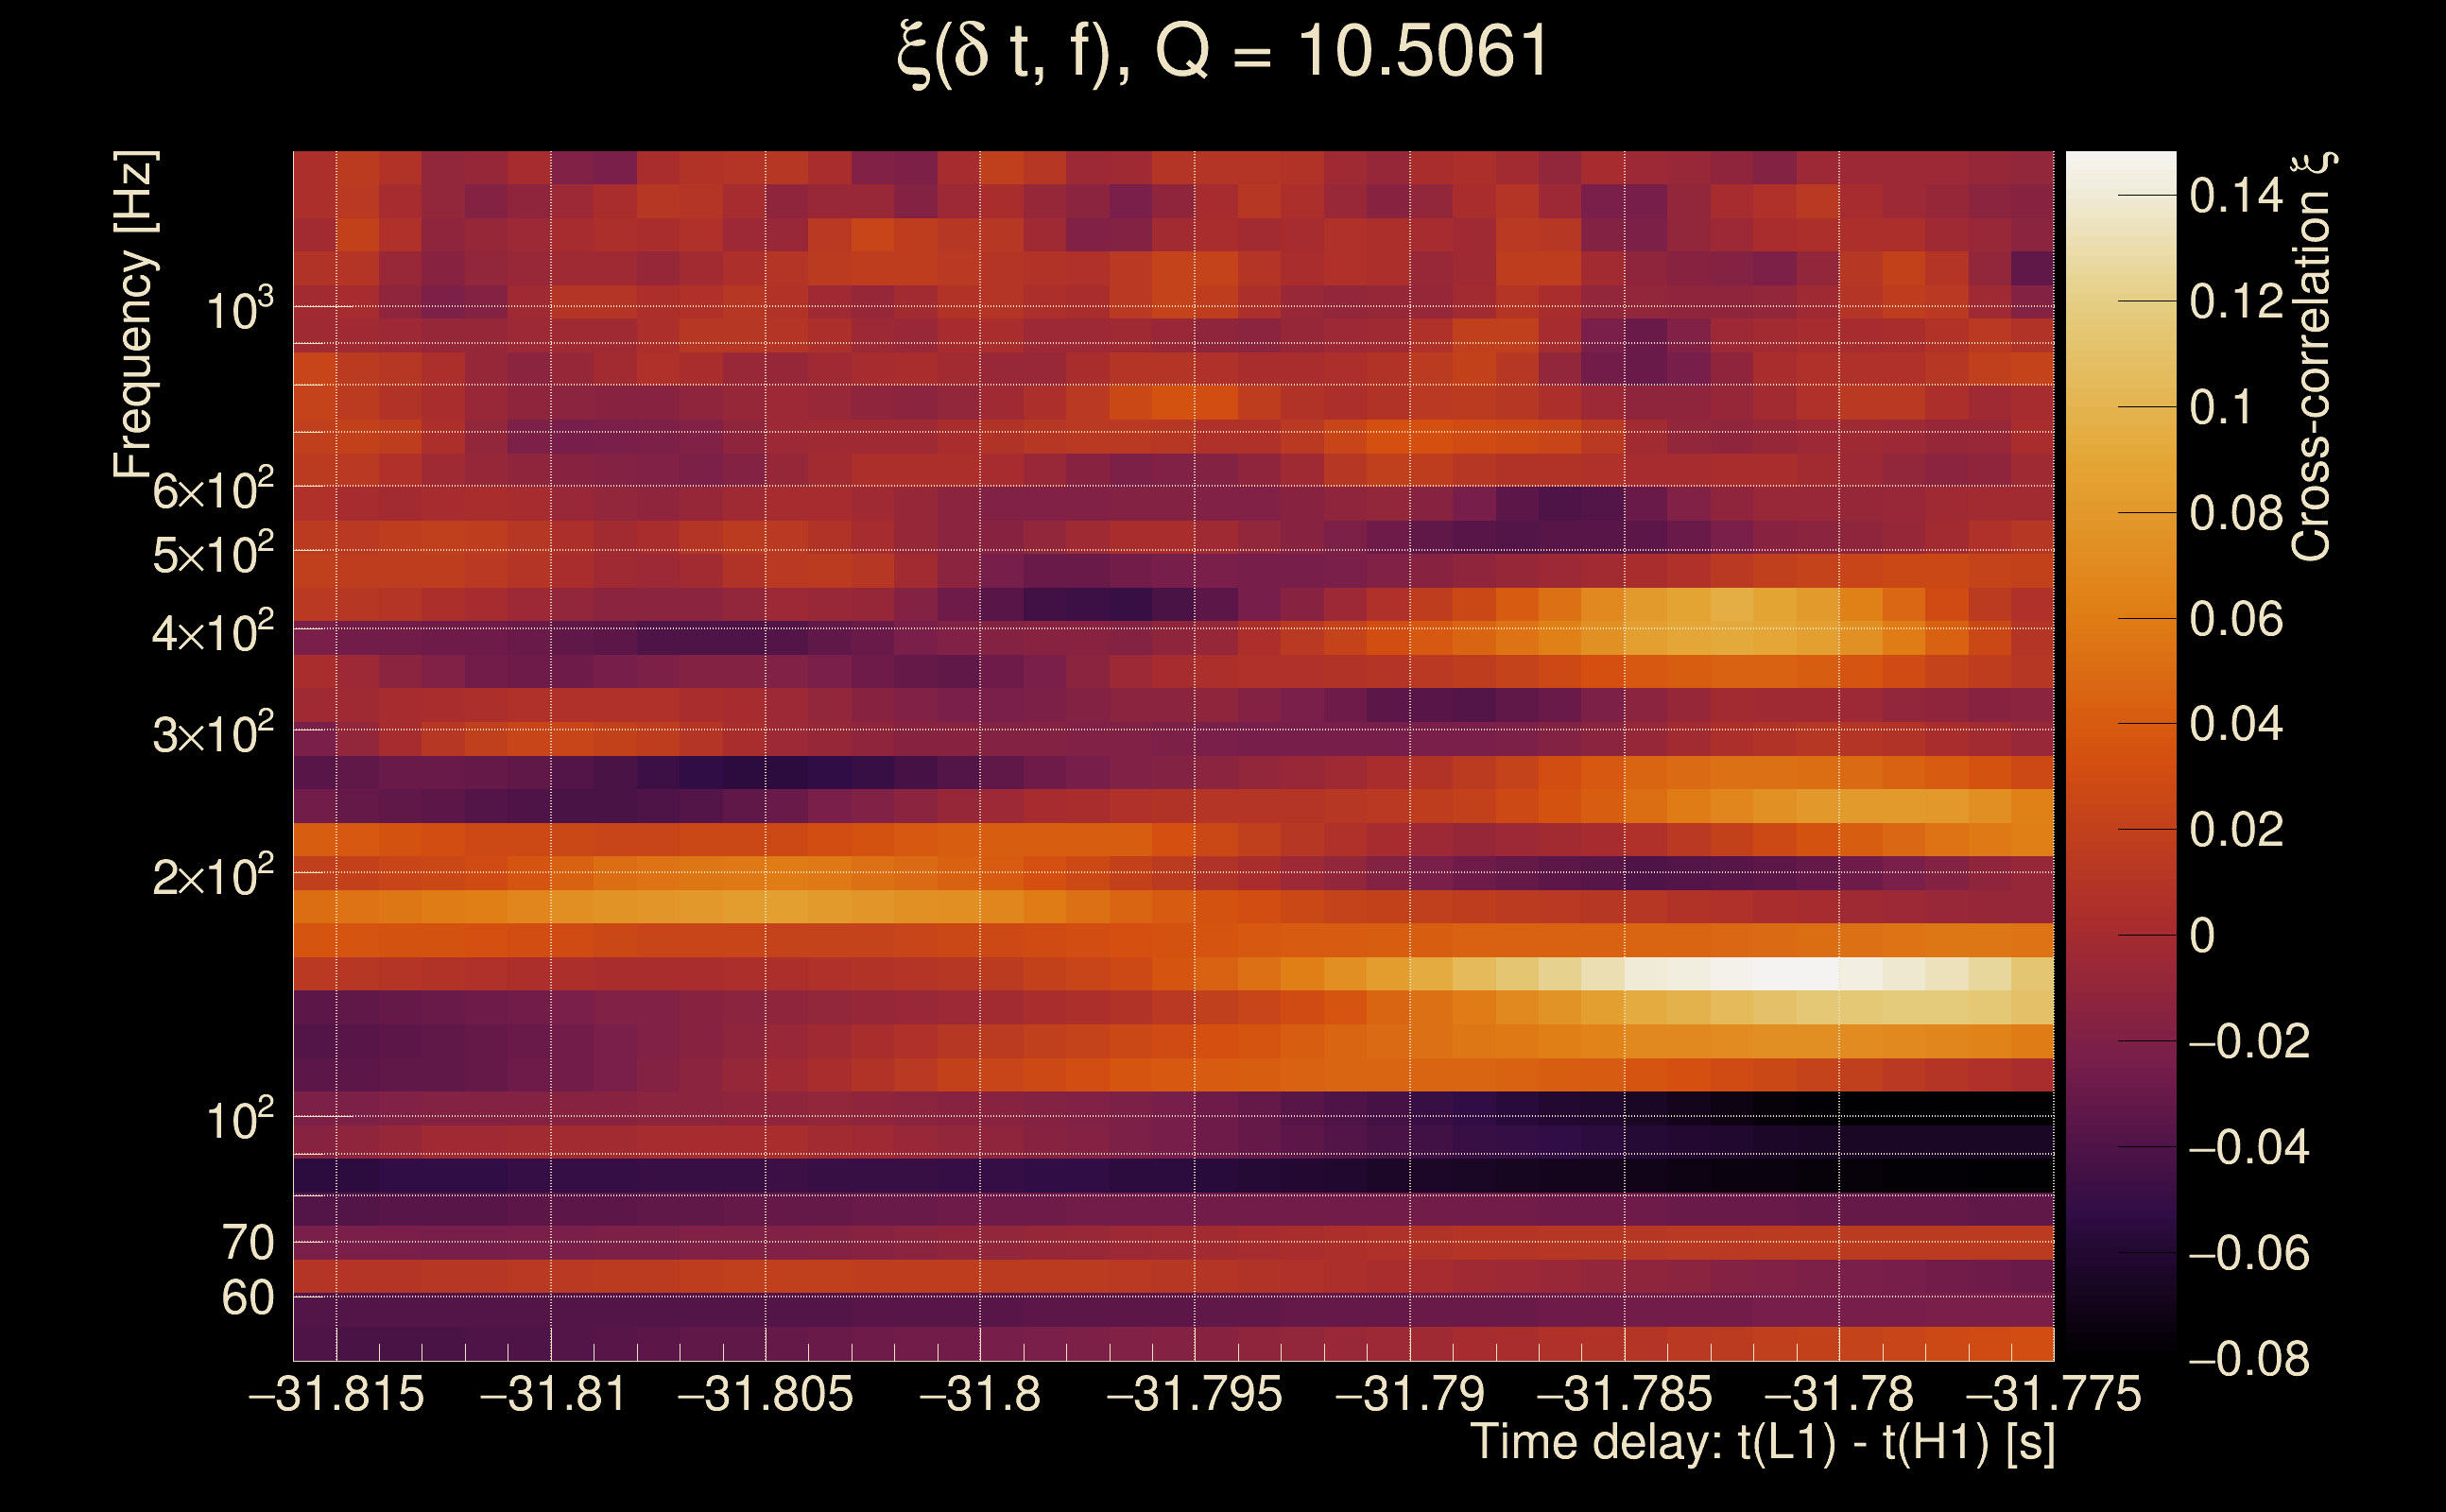
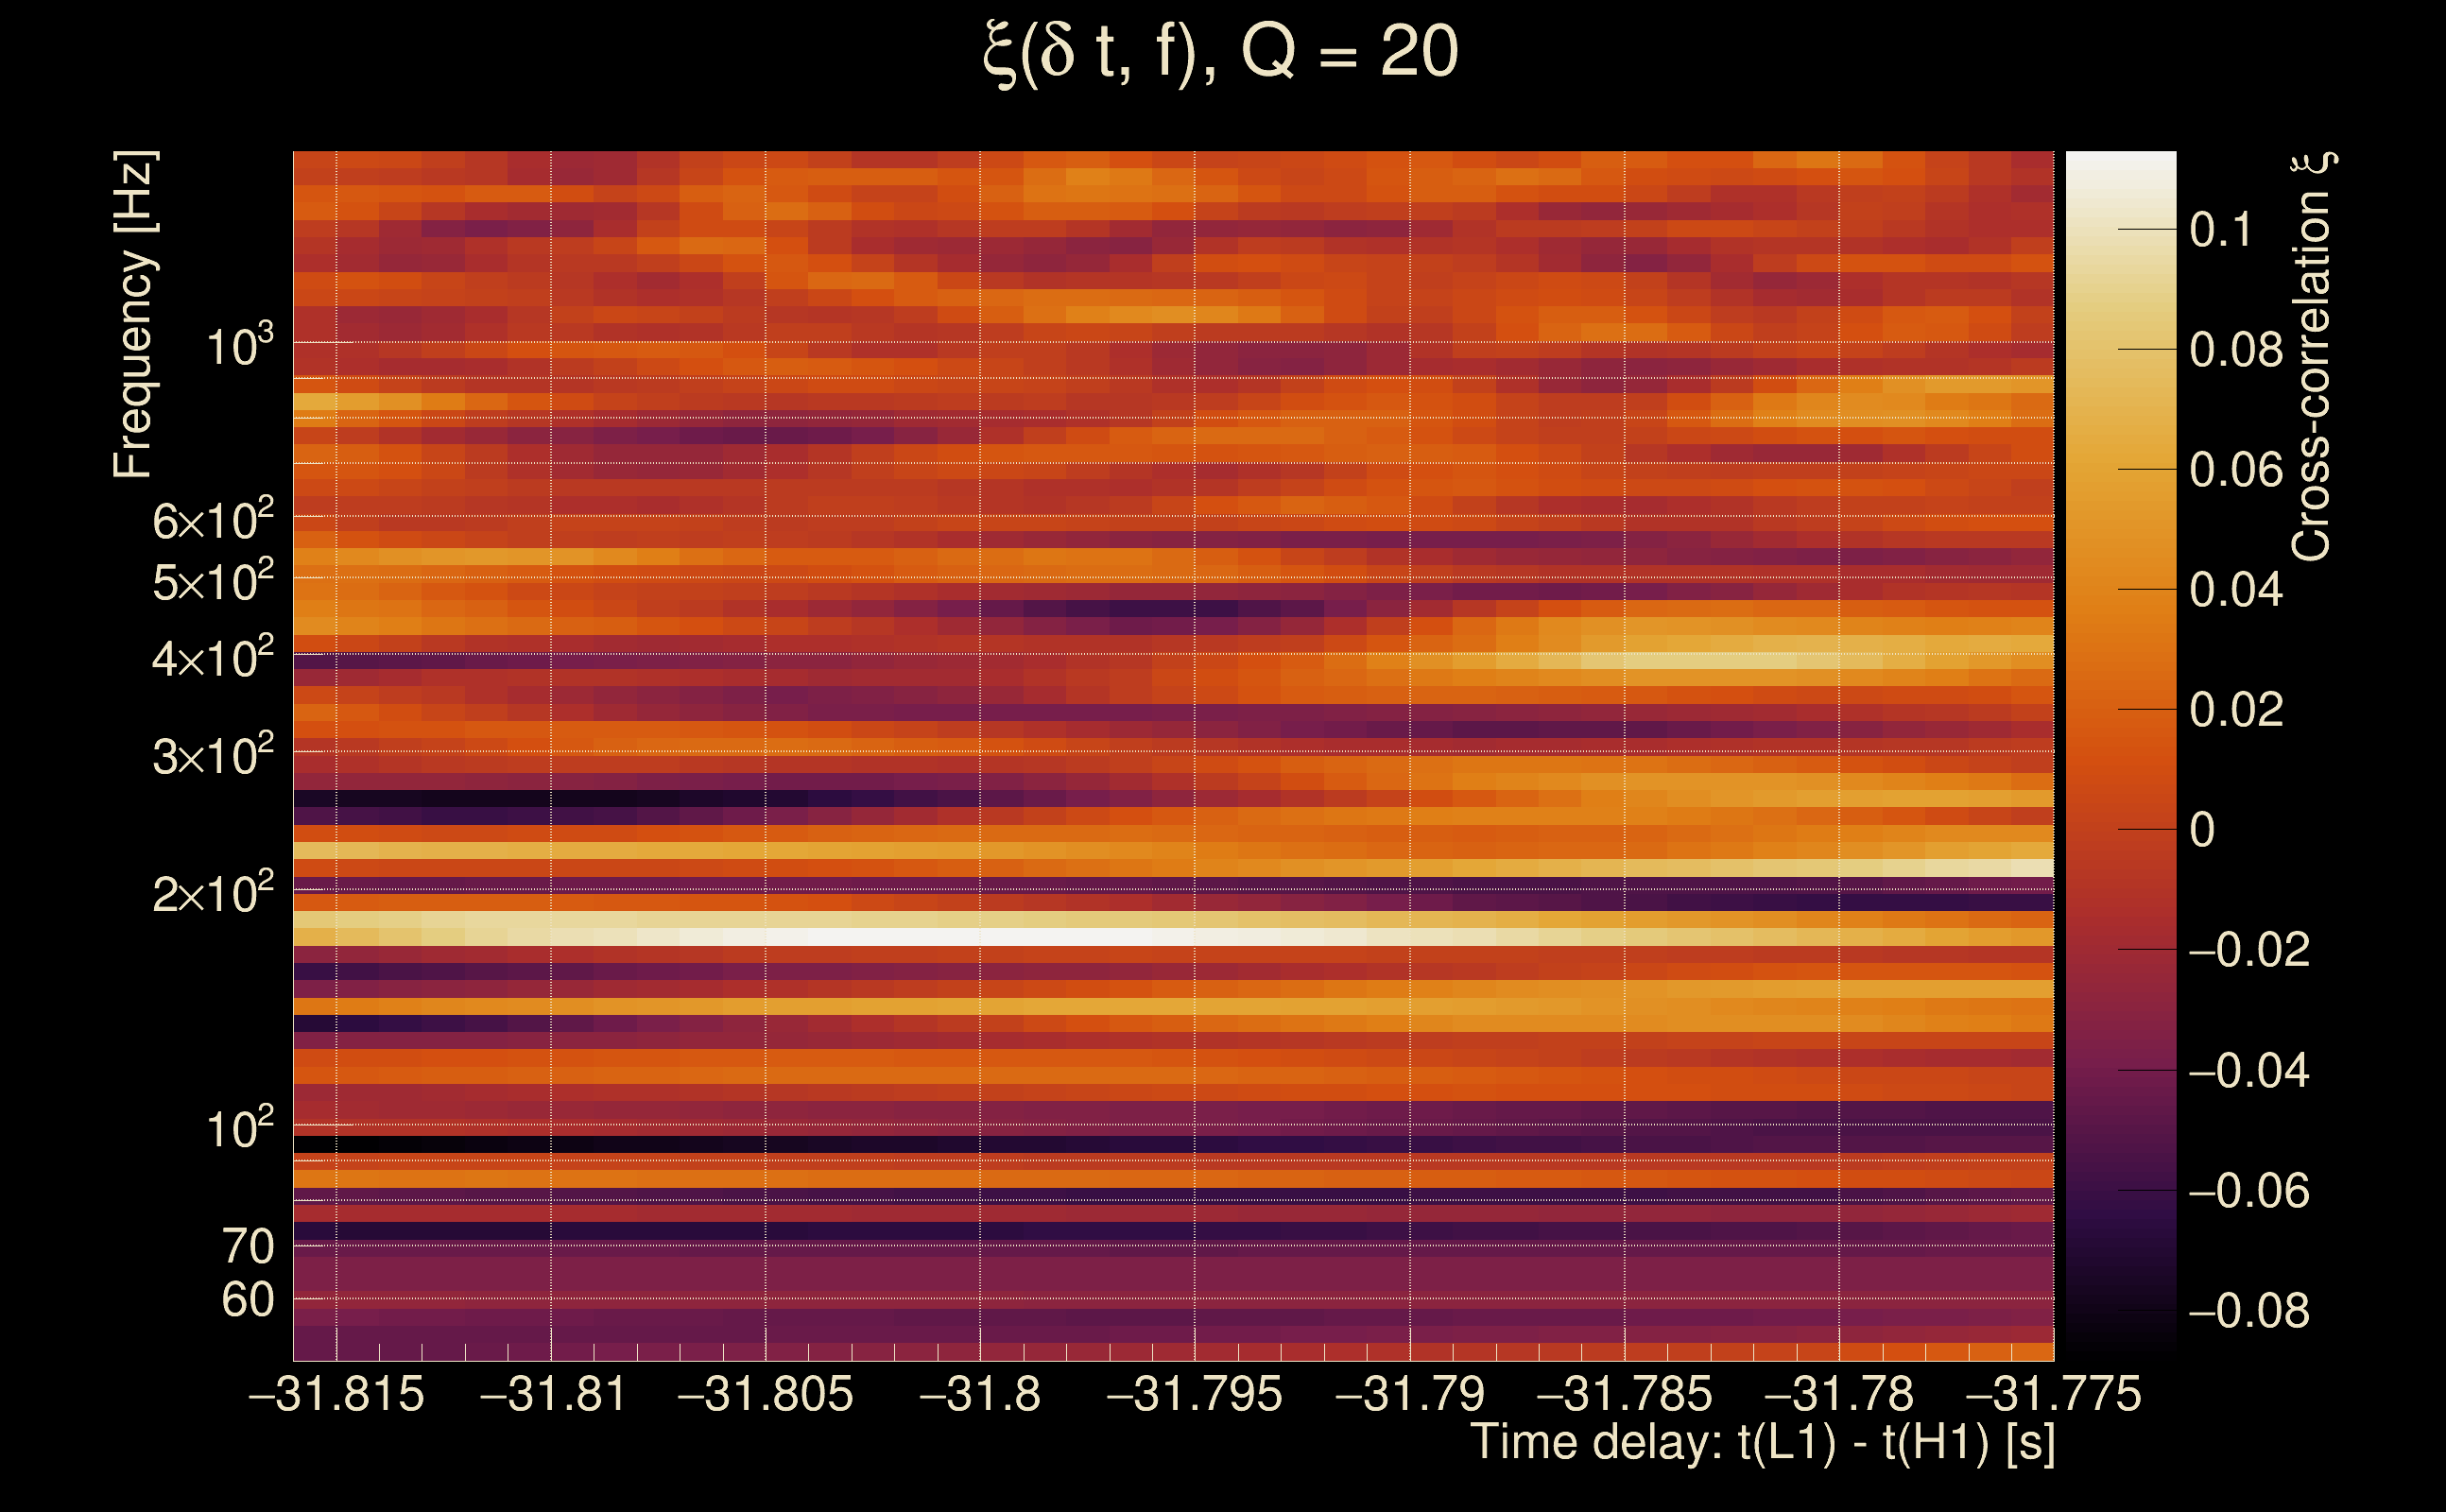
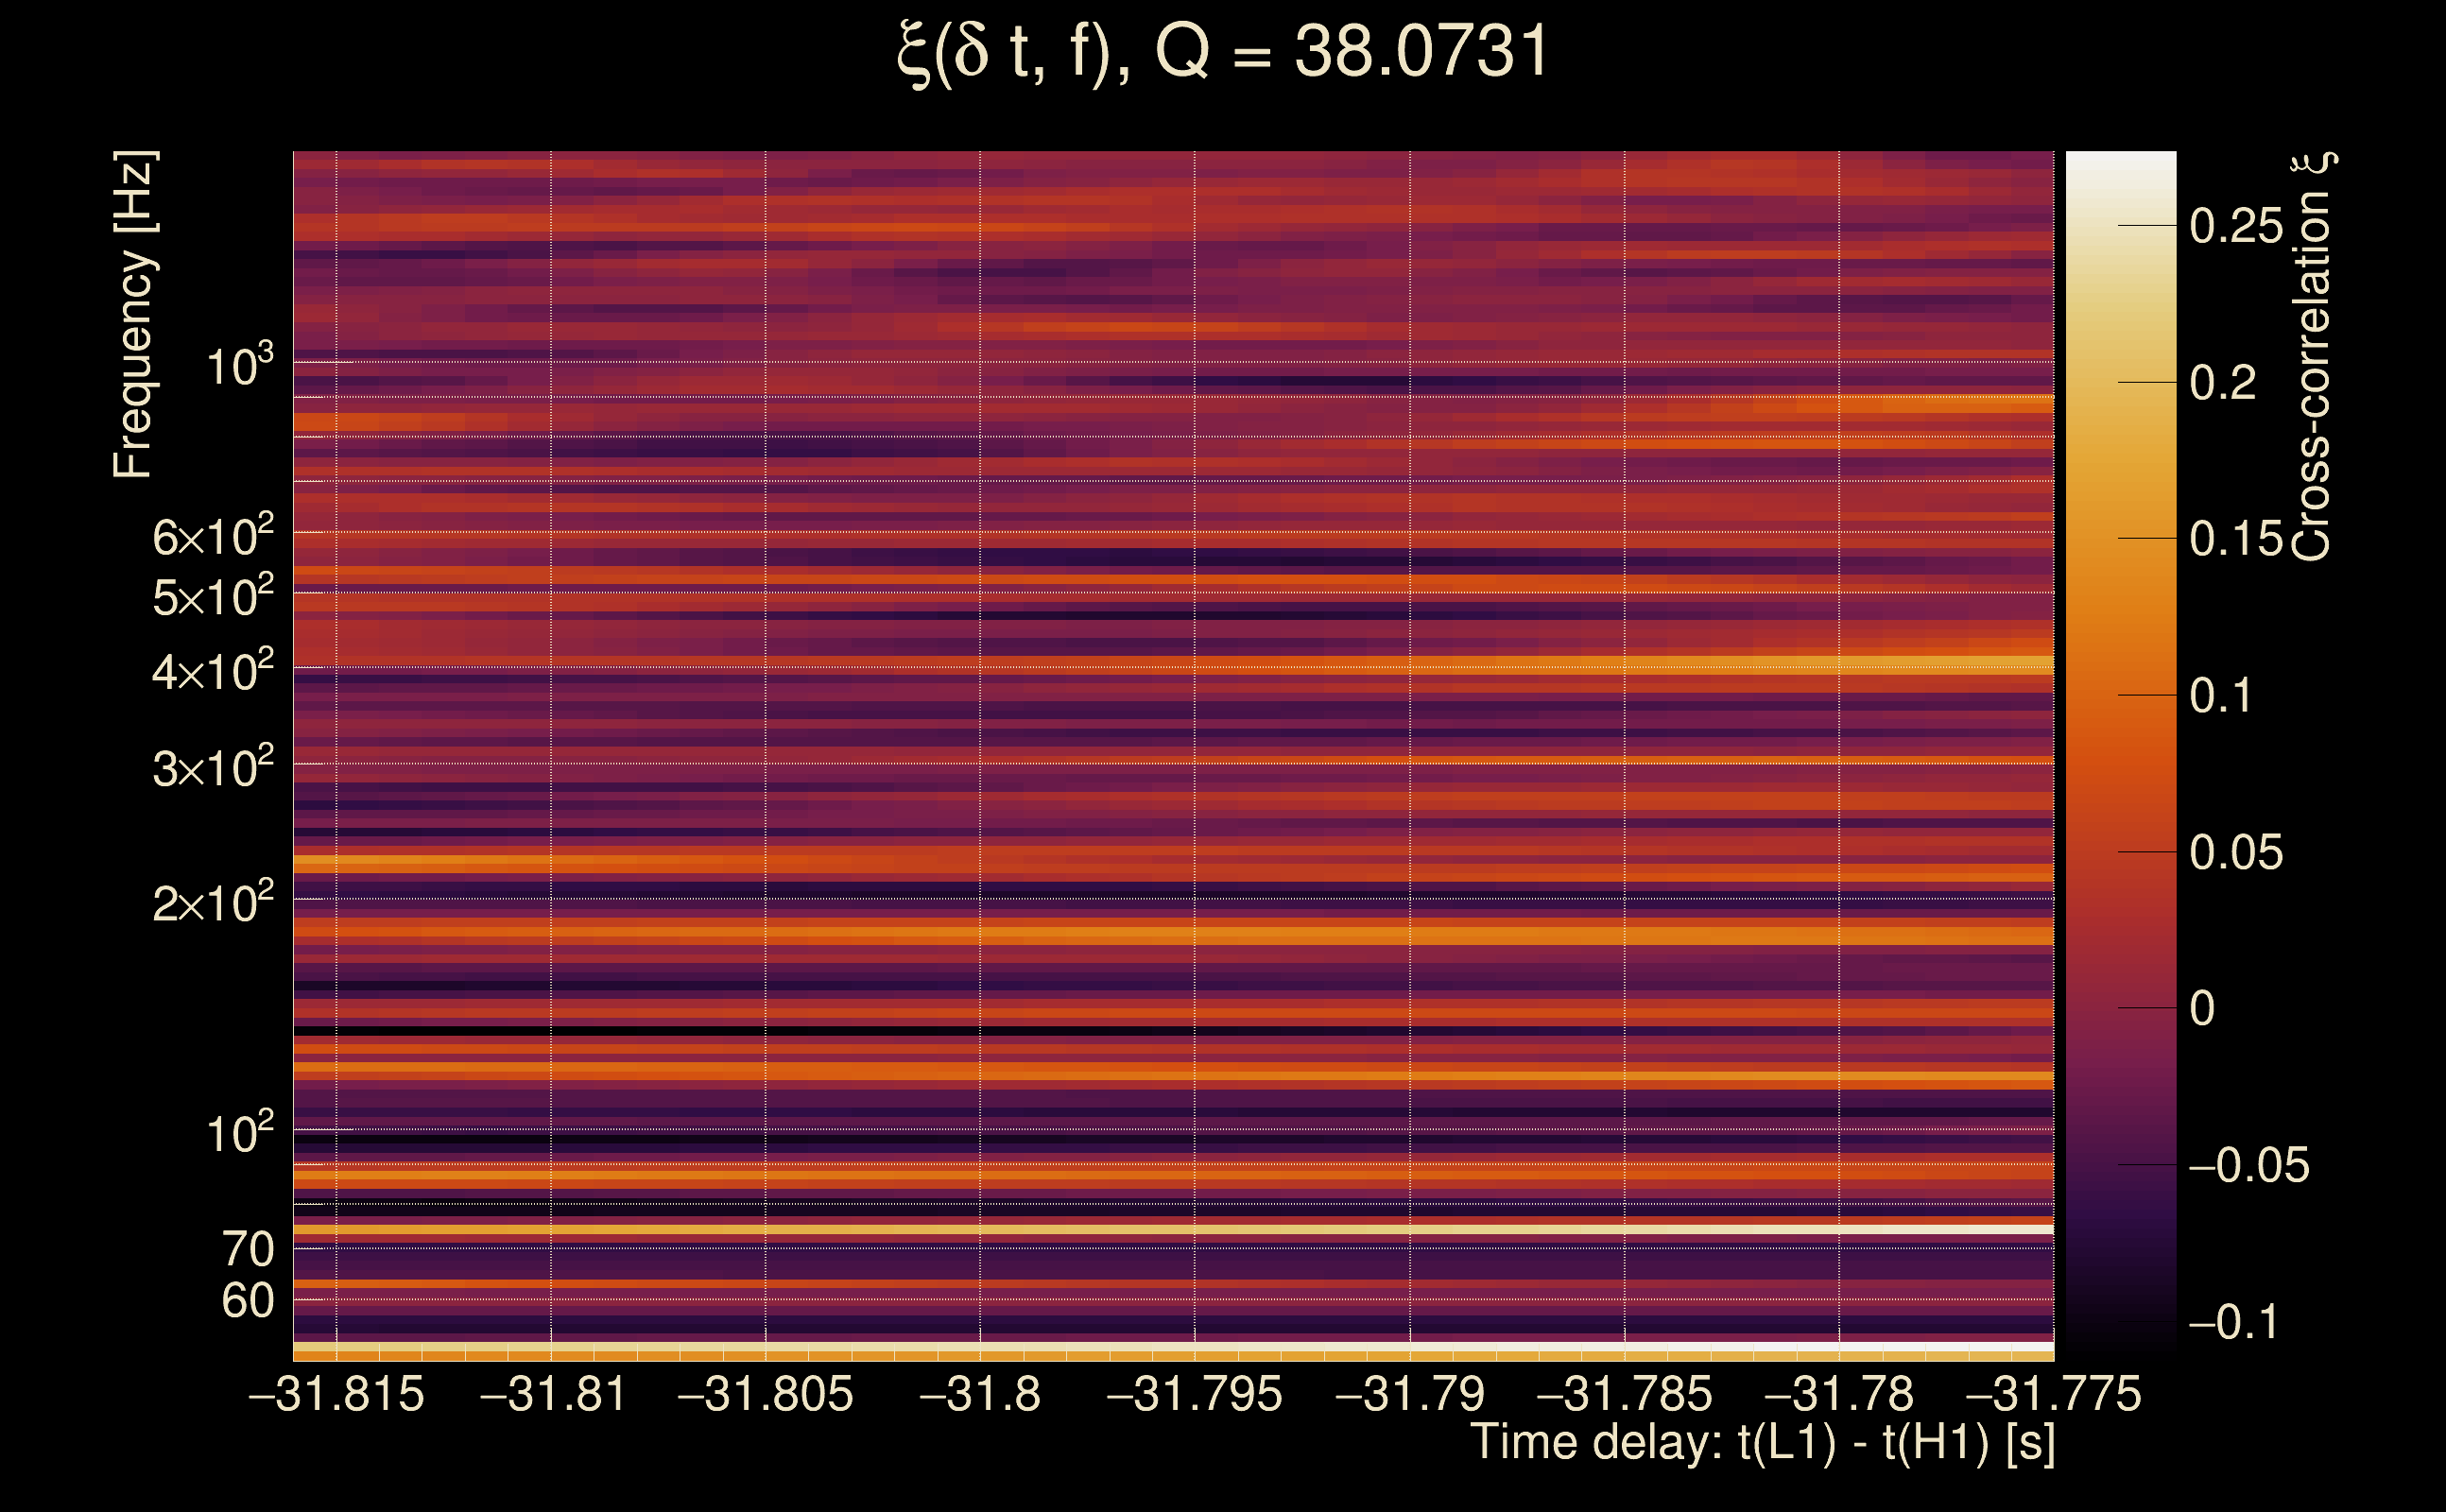
| Event time t(H1): | GPS = 1368195313 (Mon May 15 14:14:55 2023 ) → GPS = 1368195323 (Mon May 15 14:15:05 2023 ) |
| Event time t(L1): | GPS = 1368195283 (Mon May 15 14:15:05 2023 ) → GPS = 1368195293 (Mon May 15 14:14:35 2023 ) |
| Omicron analysis time window (H1): | GPS = 1368195310 → GPS = 1368195326 |
| Omicron analysis time window (L1): | GPS = 1368195280 → GPS = 1368195296 |
| Time delay between detectors t(L1) - t(H1): | -31.7951 s (slice index = 147 / 217), δt_gw = -0.00114599 s |
| Time delay uncertainty: | 0.00912619 s |
| [targeted mode] Time delay probability: | 0.91289 (0.109393 sigmas), δt_target = -0.00216055 s |
| Frequency: | 564.004 Hz |
| Ξ: | 0.00186899 ± 0.0254196 (variance = 0.000646157): Q0: 0, Q1: 0.0714516, Q2: 0.0539449, Q3: 0.0436323, Q4: 0.0660874 |
| Rank: | R_A = 0.000953391 |
| Log of amplitude ratio (L1/H1): | 0.680006, variance = 0.777374 (L1/H1: 0.15032, variance = 0.94059, H1/L1: -1.16291, variance = 2.05916) |
| Amplitude ratio (L1/H1): | 1.97389 ⋇ 2.41497 (L1/H1: 1.16221 ⋇ 2.63752, H1/L1: 0.312574 ⋇ 4.19955) |
| Amplitude ratio H1|L1 compatibility (probability): | 0.558785 |
| Antenna factor probability: | 1 |
| Number of rejected frequency rows: | Q0: 18 / 18, Q1: 33 / 36, Q2: 68 / 70, Q3: 131 / 134, Q4: 249 / 258 |
| Maximum signal-to-noise ratio: | H1: 4.87116, L1: 5.10162 |
| SNR variance: | H1: 0.447886, L1: 0.47788 |
| Click here for a zoomed plot | Click here for a zoomed plot | Click here for a zoomed plot | Click here for a zoomed plot | Click here for a zoomed plot |
 |
 |
 |
 |
 |
 |
 |
 |
 |
 |
 |
 |
 |
 |
 |
|
|
|
|
|
 |
 |
 |
 |
 |
 |
 |
 |
 |
 |
 |
 |
 |
 |
| Event time t(H1): | GPS = 1368195283 (Mon May 15 14:14:25 2023 ) → GPS = 1368195293 (Mon May 15 14:14:35 2023 ) |
| Event time t(L1): | GPS = 1368195263 (Mon May 15 14:14:35 2023 ) → GPS = 1368195273 (Mon May 15 14:14:15 2023 ) |
| Omicron analysis time window (H1): | GPS = 1368195280 → GPS = 1368195296 |
| Omicron analysis time window (L1): | GPS = 1368195260 → GPS = 1368195276 |
| Time delay between detectors t(L1) - t(H1): | -24.096 s (slice index = 197 / 217), δt_gw = -0.00200677 s |
| Time delay uncertainty: | 0.00621273 s |
| [targeted mode] Time delay probability: | 0.980253 (0.0247516 sigmas), δt_target = -0.00214434 s |
| Frequency: | 891.721 Hz |
| Ξ: | 0.000978577 ± 0.0220435 (variance = 0.000485916): Q0: 0, Q1: 0.0380103, Q2: 0.0383714, Q3: 0.0551212, Q4: 0.0644458 |
| Rank: | R_A = 0.000926944 |
| Log of amplitude ratio (L1/H1): | 1.0544, variance = 0.770907 (L1/H1: 1.01248, variance = 1.22744, H1/L1: -1.08384, variance = 1.6285) |
| Amplitude ratio (L1/H1): | 2.87026 ⋇ 2.40611 (L1/H1: 2.75243 ⋇ 3.02799, H1/L1: 0.338293 ⋇ 3.58273) |
| Amplitude ratio H1|L1 compatibility (probability): | 0.966319 |
| Antenna factor probability: | 1 |
| Number of rejected frequency rows: | Q0: 18 / 18, Q1: 34 / 36, Q2: 68 / 70, Q3: 126 / 134, Q4: 250 / 258 |
| Maximum signal-to-noise ratio: | H1: 4.68794, L1: 5.59422 |
| SNR variance: | H1: 0.439115, L1: 0.469644 |
| Click here for a zoomed plot | Click here for a zoomed plot | Click here for a zoomed plot | Click here for a zoomed plot | Click here for a zoomed plot |
|
|
|
|
|
|
|
|
|
|
|
|
|
|
|
|
|
|
|
|
|
|
|
|
|
 |
 |
 |
 |
 |
 |
 |
 |
 |
| Event time t(H1): | GPS = 1368195313 (Mon May 15 14:14:55 2023 ) → GPS = 1368195323 (Mon May 15 14:15:05 2023 ) |
| Event time t(L1): | GPS = 1368195273 (Mon May 15 14:15:05 2023 ) → GPS = 1368195283 (Mon May 15 14:14:25 2023 ) |
| Omicron analysis time window (H1): | GPS = 1368195310 → GPS = 1368195326 |
| Omicron analysis time window (L1): | GPS = 1368195270 → GPS = 1368195286 |
| Time delay between detectors t(L1) - t(H1): | -42.122 s (slice index = 154 / 217), δt_gw = -0.00604772 s |
| Time delay uncertainty: | 0.00665815 s |
| [targeted mode] Time delay probability: | 0.557703 (0.586256 sigmas), δt_target = -0.00216055 s |
| Frequency: | 585.949 Hz |
| Ξ: | 0.00245484 ± 0.0472738 (variance = 0.00223481): Q0: 0, Q1: 0.0329016, Q2: 0.0882905, Q3: 0.0917459, Q4: 0.133971 |
| Rank: | R_A = 0.00090747 |
| Log of amplitude ratio (L1/H1): | 0.577423, variance = 0.445062 (L1/H1: 0.285381, variance = 0.739734, H1/L1: -0.866641, variance = 1.03758) |
| Amplitude ratio (L1/H1): | 1.78144 ⋇ 1.94864 (L1/H1: 1.33027 ⋇ 2.36334, H1/L1: 0.420361 ⋇ 2.76936) |
| Amplitude ratio H1|L1 compatibility (probability): | 0.662835 |
| Antenna factor probability: | 1 |
| Number of rejected frequency rows: | Q0: 18 / 18, Q1: 33 / 36, Q2: 63 / 70, Q3: 124 / 134, Q4: 251 / 258 |
| Maximum signal-to-noise ratio: | H1: 4.89204, L1: 4.91588 |
| SNR variance: | H1: 0.449999, L1: 0.455537 |
| Click here for a zoomed plot | Click here for a zoomed plot | Click here for a zoomed plot | Click here for a zoomed plot | Click here for a zoomed plot |
|
|
|
|
|
|
|
|
|
|
|
|
|
|
|
|
|
|
|
|
|
|
|
|
|
 |
 |
 |
 |
 |
 |
 |
 |
 |
| Event time t(H1): | GPS = 1368195313 (Mon May 15 14:14:55 2023 ) → GPS = 1368195323 (Mon May 15 14:15:05 2023 ) |
| Event time t(L1): | GPS = 1368195273 (Mon May 15 14:15:05 2023 ) → GPS = 1368195283 (Mon May 15 14:14:25 2023 ) |
| Omicron analysis time window (H1): | GPS = 1368195310 → GPS = 1368195326 |
| Omicron analysis time window (L1): | GPS = 1368195270 → GPS = 1368195286 |
| Time delay between detectors t(L1) - t(H1): | -35.3585 s (slice index = 7 / 217), δt_gw = -0.00448116 s |
| Time delay uncertainty: | 0.00445574 s |
| [targeted mode] Time delay probability: | 0.599965 (0.524451 sigmas), δt_target = -0.00214434 s |
| Frequency: | 664.052 Hz |
| Ξ: | 0.00177056 ± 0.021294 (variance = 0.000453435): Q0: 0, Q1: 0.0484079, Q2: 0.0553284, Q3: 0.0471516, Q4: 0.0580669 |
| Rank: | R_A = 0.000902274 |
| Log of amplitude ratio (L1/H1): | 0.336395, variance = 0.429888 (L1/H1: 0.211279, variance = 0.853758, H1/L1: -0.460301, variance = 0.86564) |
| Amplitude ratio (L1/H1): | 1.39989 ⋇ 1.92641 (L1/H1: 1.23526 ⋇ 2.51932, H1/L1: 0.631094 ⋇ 2.53552) |
| Amplitude ratio H1|L1 compatibility (probability): | 0.849379 |
| Antenna factor probability: | 1 |
| Number of rejected frequency rows: | Q0: 18 / 18, Q1: 33 / 36, Q2: 64 / 70, Q3: 131 / 134, Q4: 252 / 258 |
| Maximum signal-to-noise ratio: | H1: 4.89204, L1: 4.91588 |
| SNR variance: | H1: 0.449999, L1: 0.455537 |
| Click here for a zoomed plot | Click here for a zoomed plot | Click here for a zoomed plot | Click here for a zoomed plot | Click here for a zoomed plot |
|
|
|
|
|
|
|
|
|
|
|
|
|
|
|
|
|
|
|
|
|
|
|
|
|
 |
 |
 |
 |
 |
 |
 |
 |
 |
| Event time t(H1): | GPS = 1368195313 (Mon May 15 14:14:55 2023 ) → GPS = 1368195323 (Mon May 15 14:15:05 2023 ) |
| Event time t(L1): | GPS = 1368195273 (Mon May 15 14:15:05 2023 ) → GPS = 1368195283 (Mon May 15 14:14:25 2023 ) |
| Omicron analysis time window (H1): | GPS = 1368195310 → GPS = 1368195326 |
| Omicron analysis time window (L1): | GPS = 1368195270 → GPS = 1368195286 |
| Time delay between detectors t(L1) - t(H1): | -37.5186 s (slice index = 54 / 217), δt_gw = -0.00261835 s |
| Time delay uncertainty: | 0.00385884 s |
| [targeted mode] Time delay probability: | 0.902235 (0.122839 sigmas), δt_target = -0.00214434 s |
| Frequency: | 800.525 Hz |
| Ξ: | 0.00140606 ± 0.0328936 (variance = 0.00108199): Q0: 0, Q1: 0.0396006, Q2: 0.0589076, Q3: 0.0552668, Q4: 0.101974 |
| Rank: | R_A = 0.000891807 |
| Log of amplitude ratio (L1/H1): | 0.02796, variance = 0.76311 (L1/H1: -0.306985, variance = 1.7612, H1/L1: -0.359665, variance = 1.29569) |
| Amplitude ratio (L1/H1): | 1.02835 ⋇ 2.39543 (L1/H1: 0.735662 ⋇ 3.7701, H1/L1: 0.69791 ⋇ 3.12141) |
| Amplitude ratio H1|L1 compatibility (probability): | 0.702986 |
| Antenna factor probability: | 1 |
| Number of rejected frequency rows: | Q0: 18 / 18, Q1: 34 / 36, Q2: 64 / 70, Q3: 131 / 134, Q4: 251 / 258 |
| Maximum signal-to-noise ratio: | H1: 4.89204, L1: 4.91588 |
| SNR variance: | H1: 0.449999, L1: 0.455537 |
| Click here for a zoomed plot | Click here for a zoomed plot | Click here for a zoomed plot | Click here for a zoomed plot | Click here for a zoomed plot |
|
|
|
|
|
|
|
|
|
|
|
|
|
|
|
|
|
|
|
|
|
|
|
|
|
 |
 |
 |
 |
 |
 |
 |
 |
 |
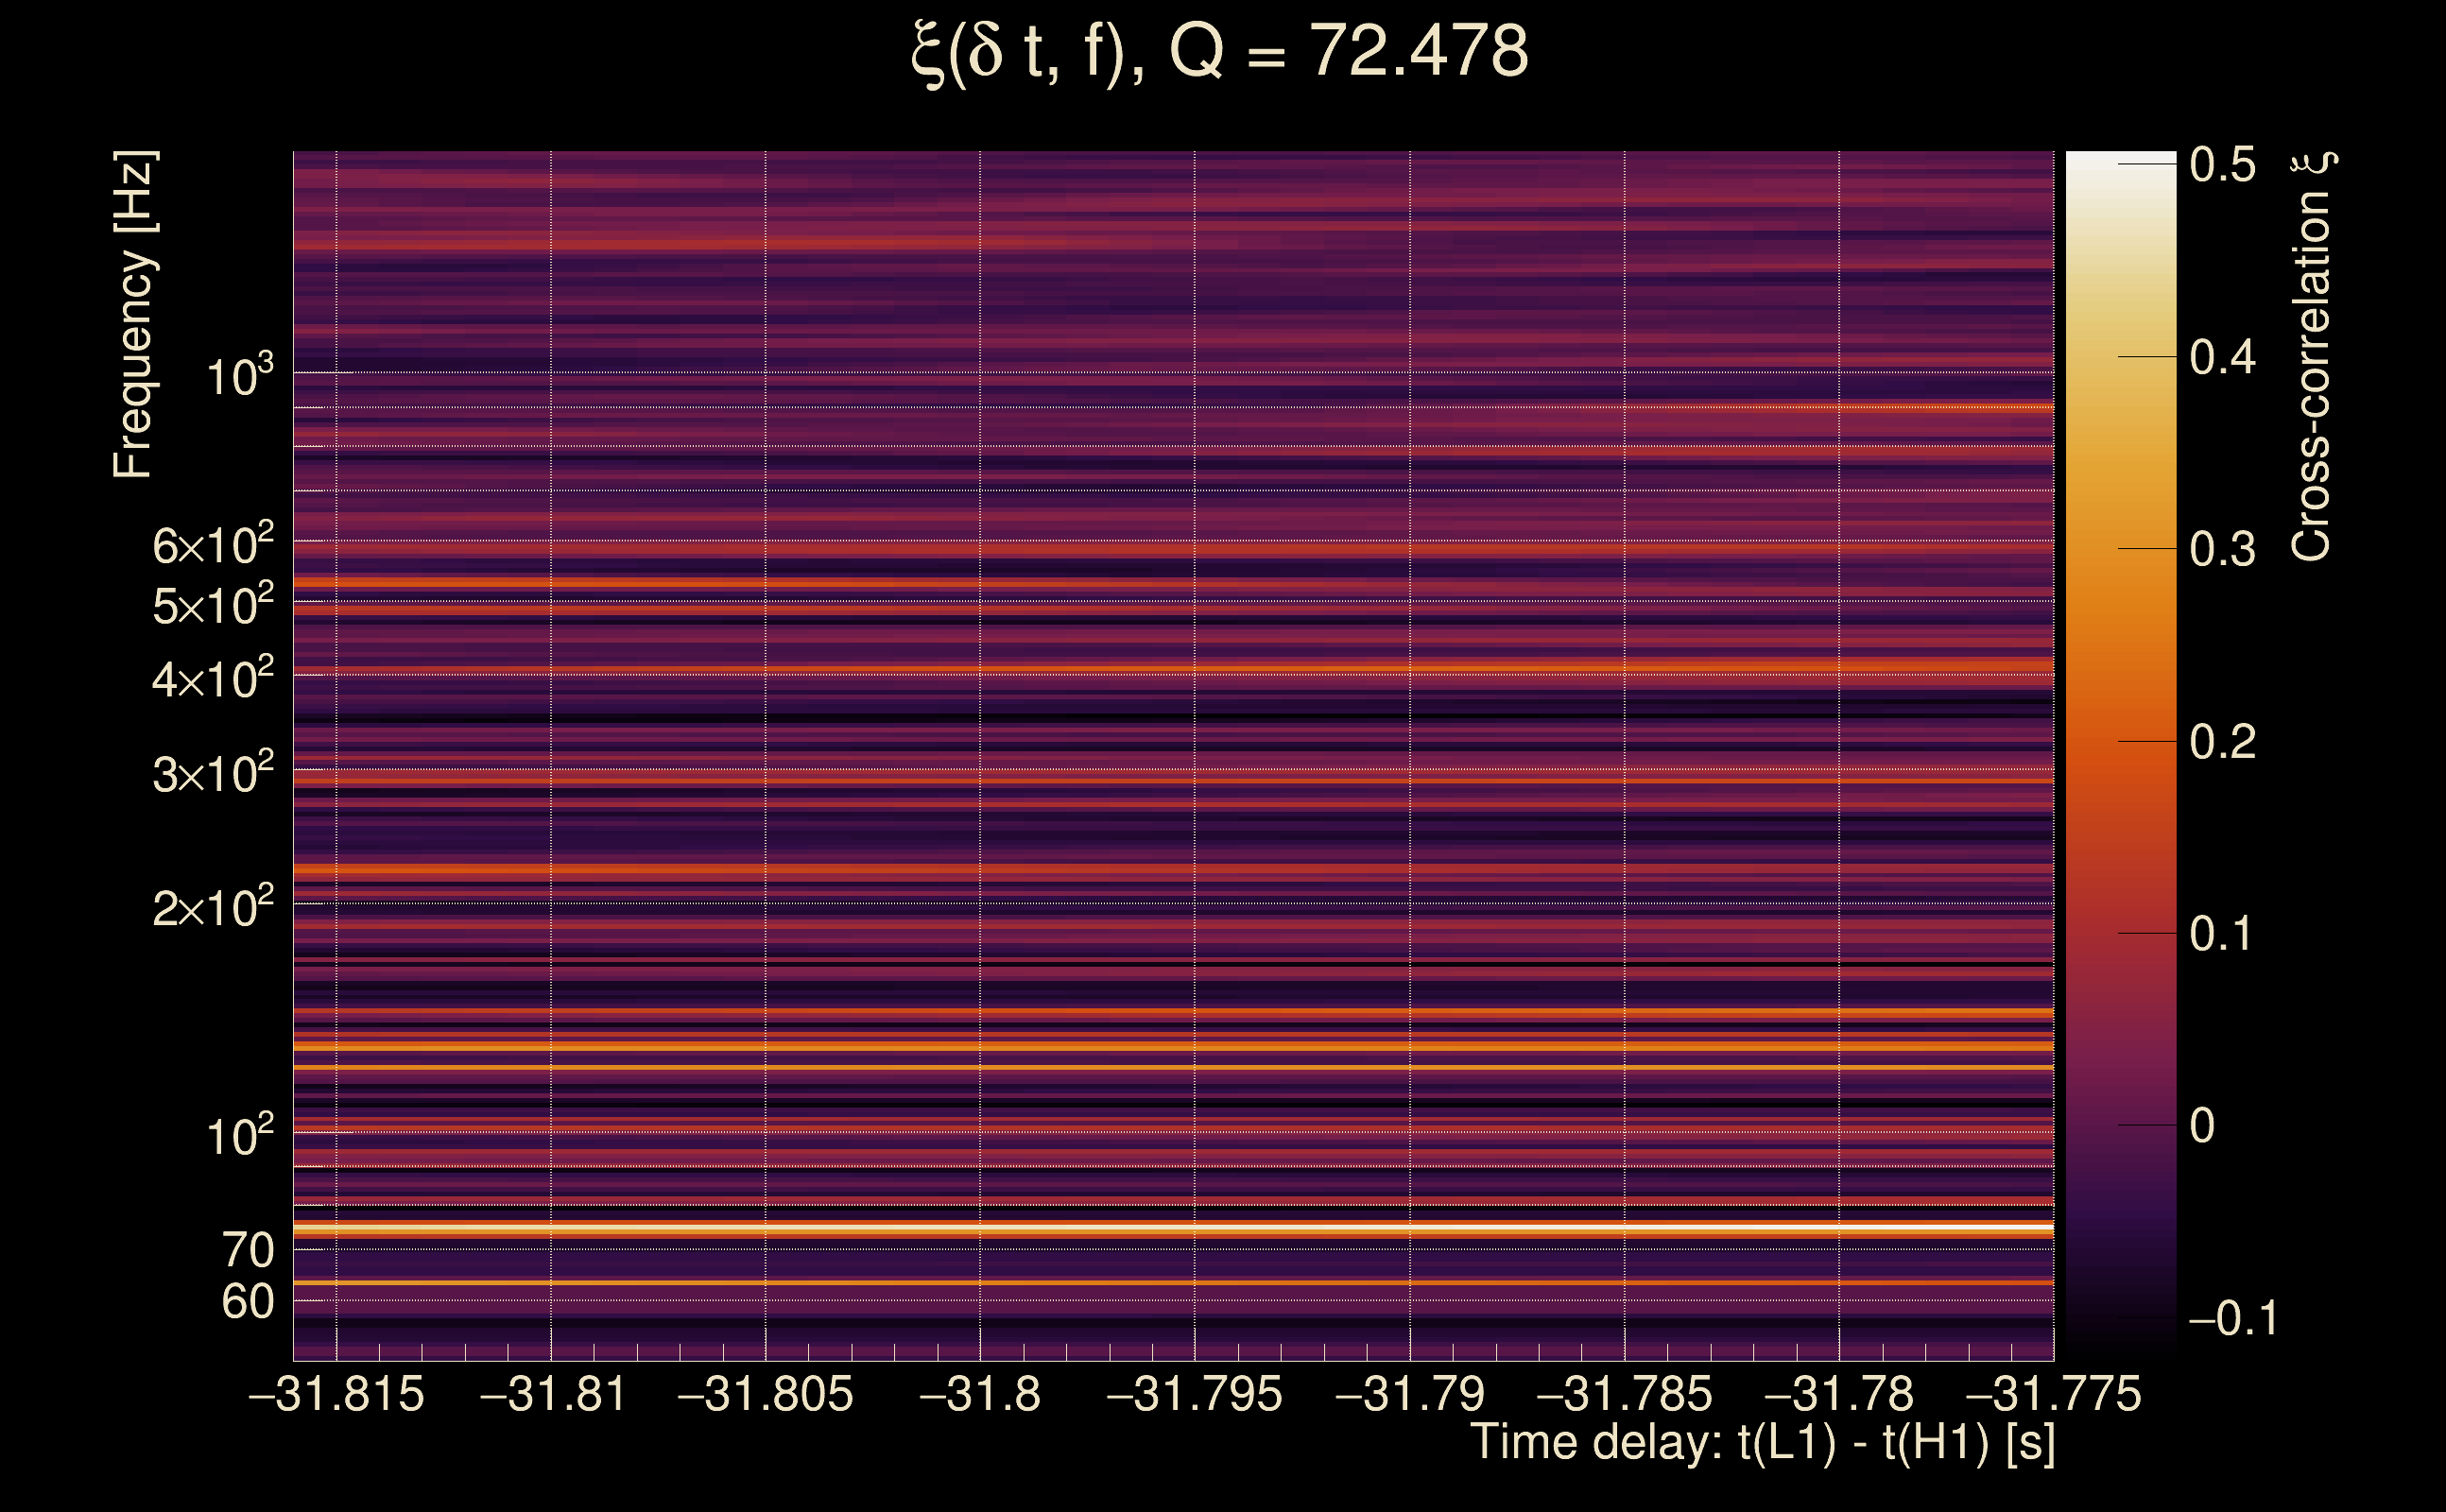
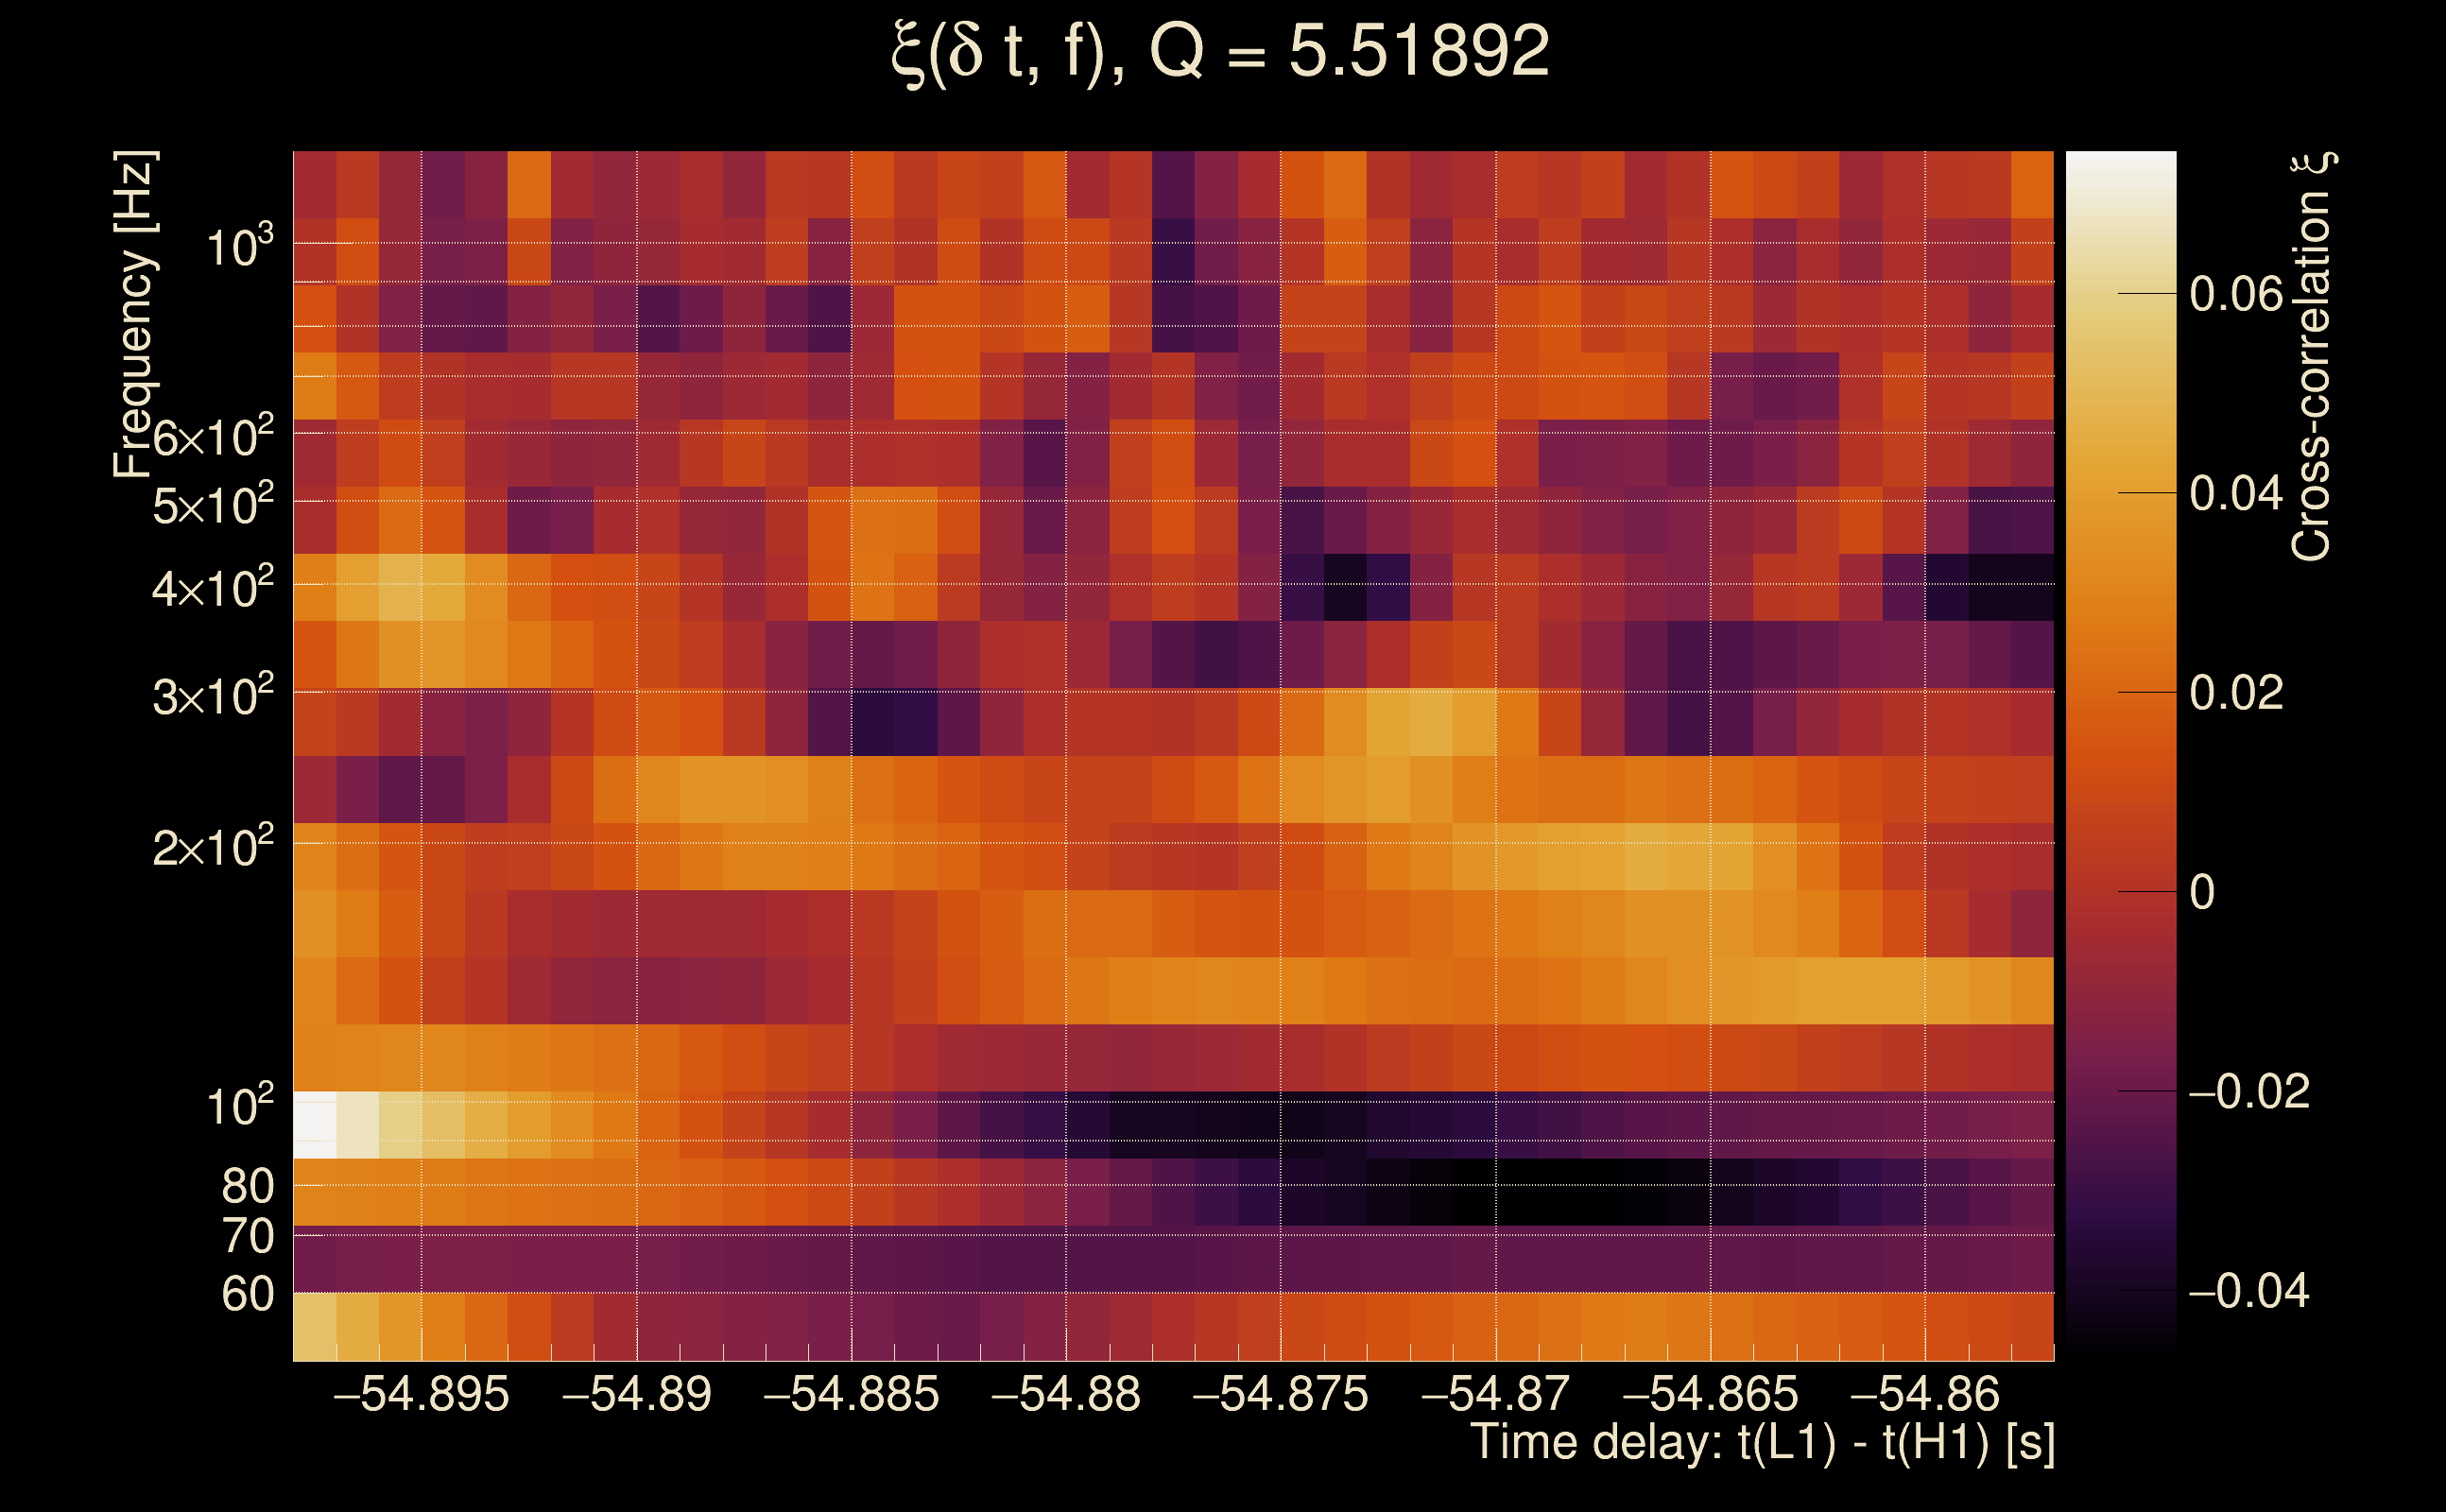
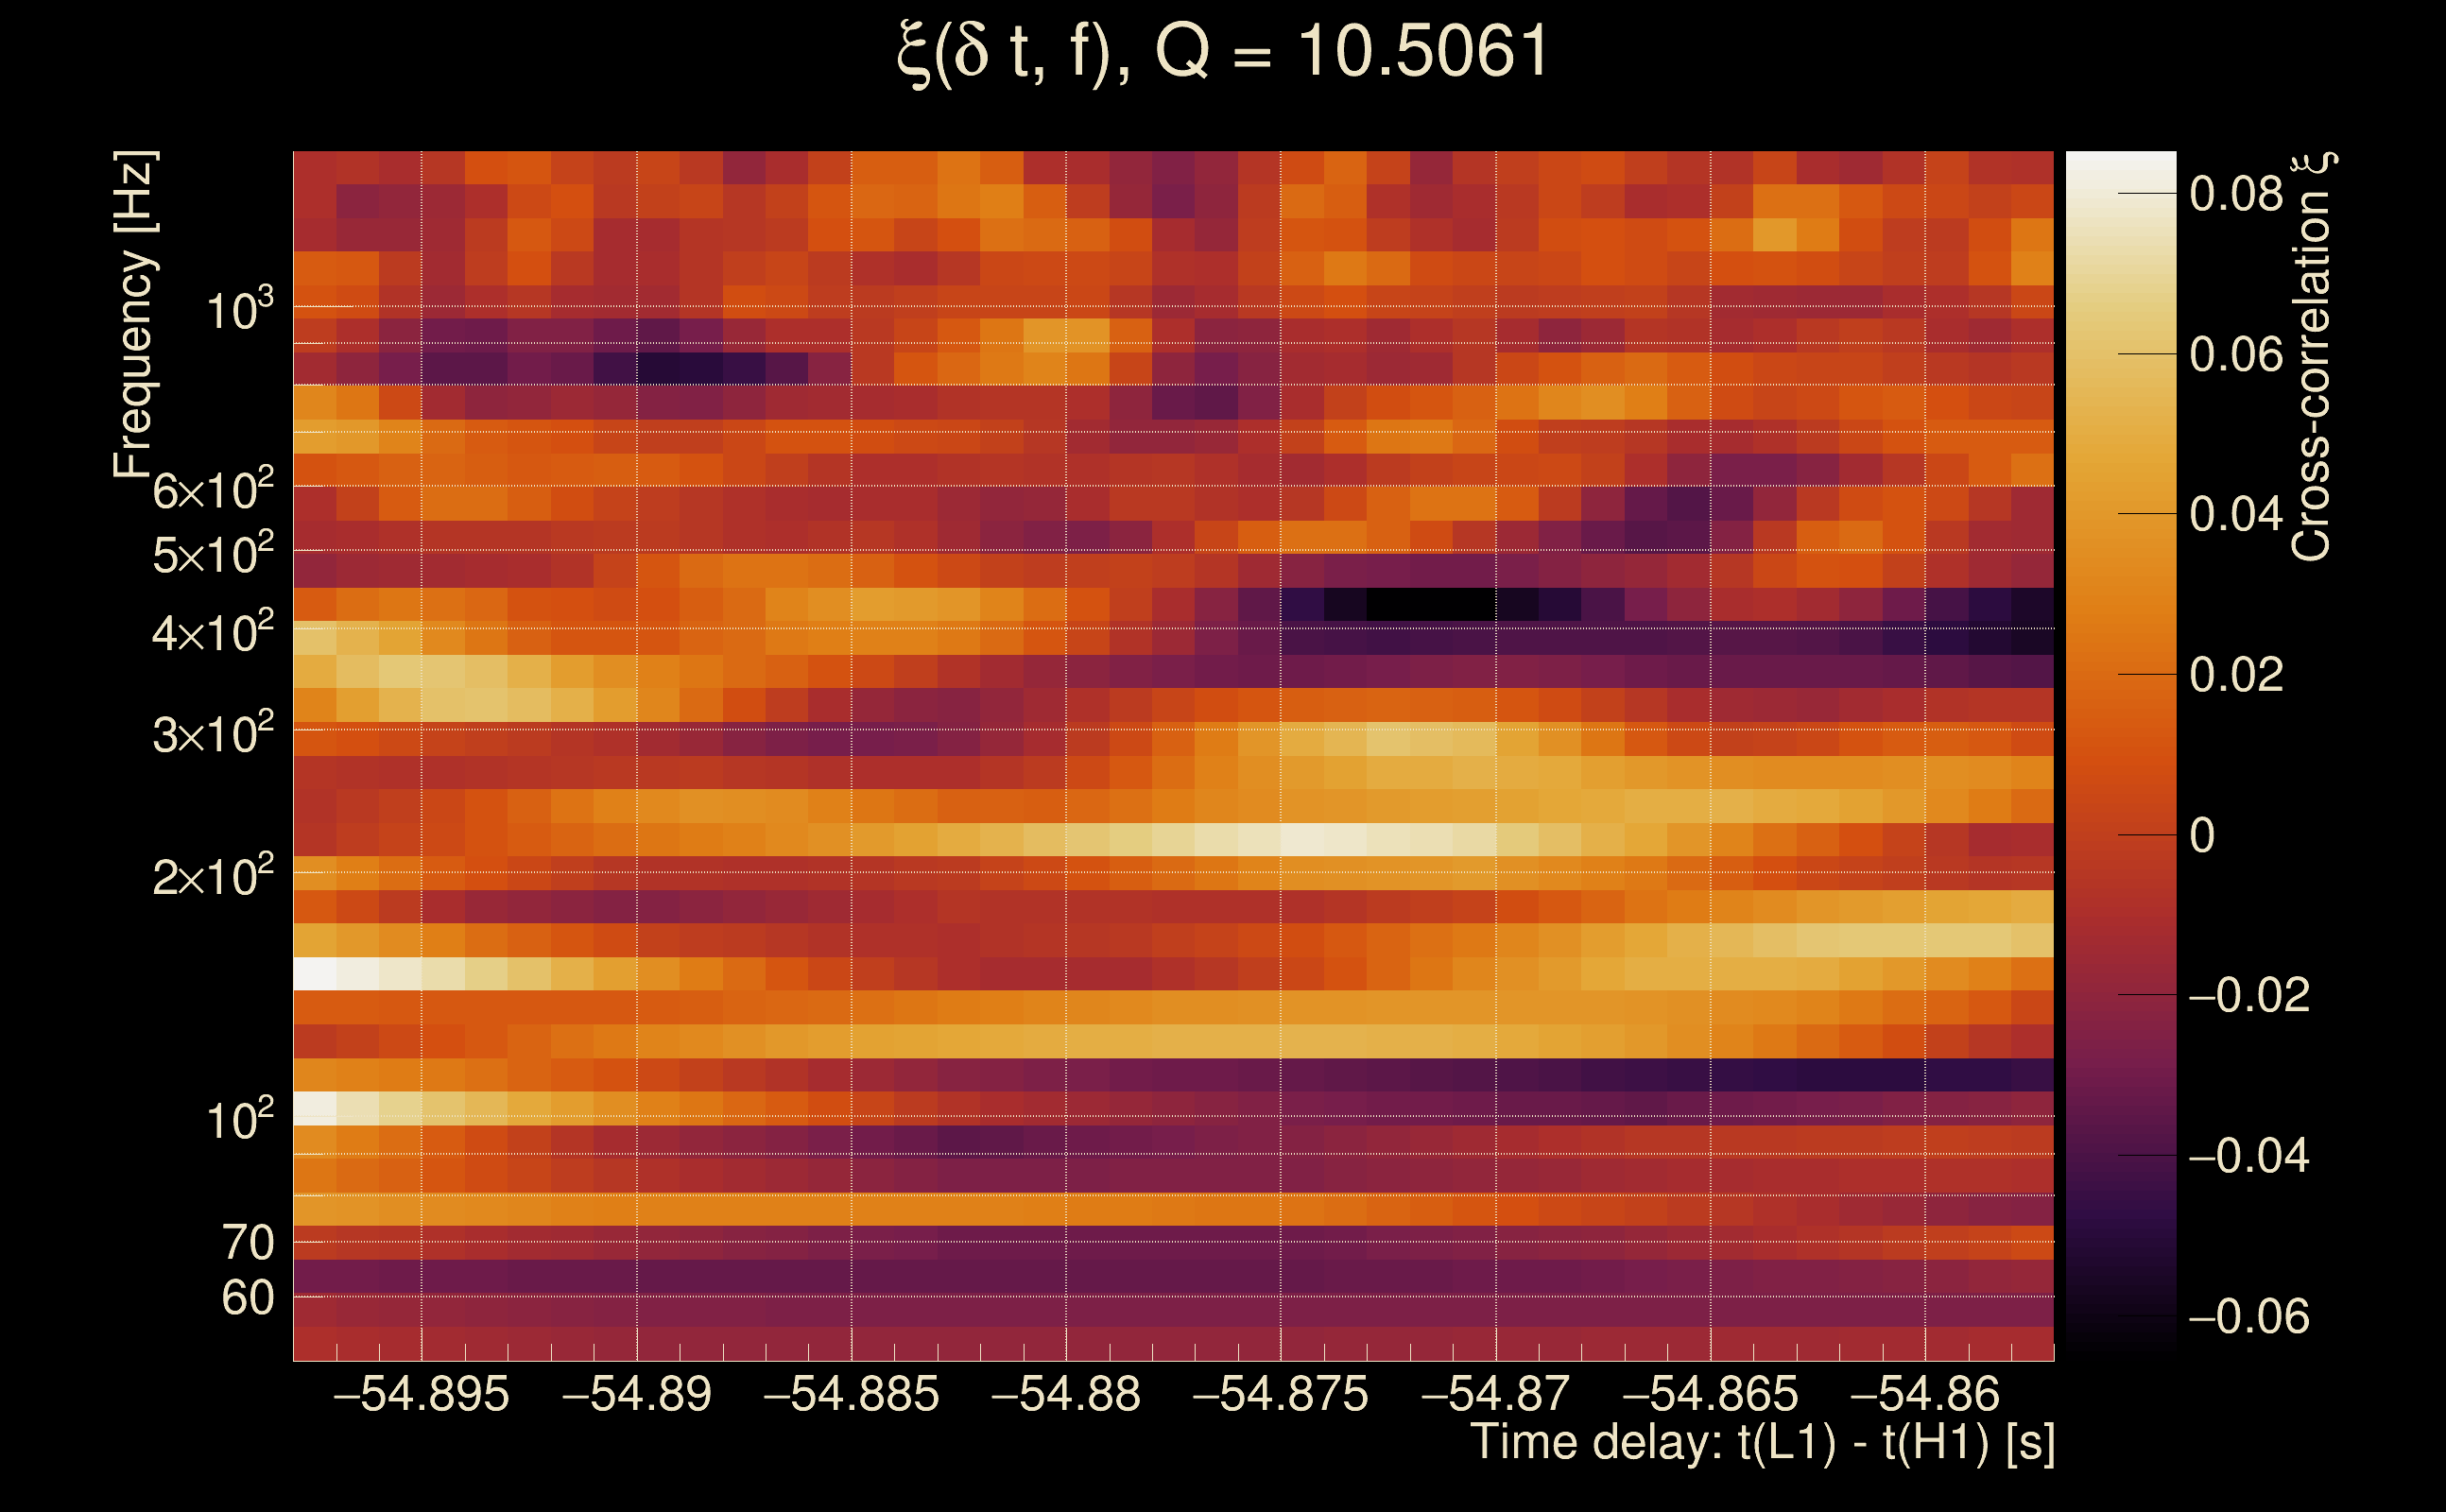
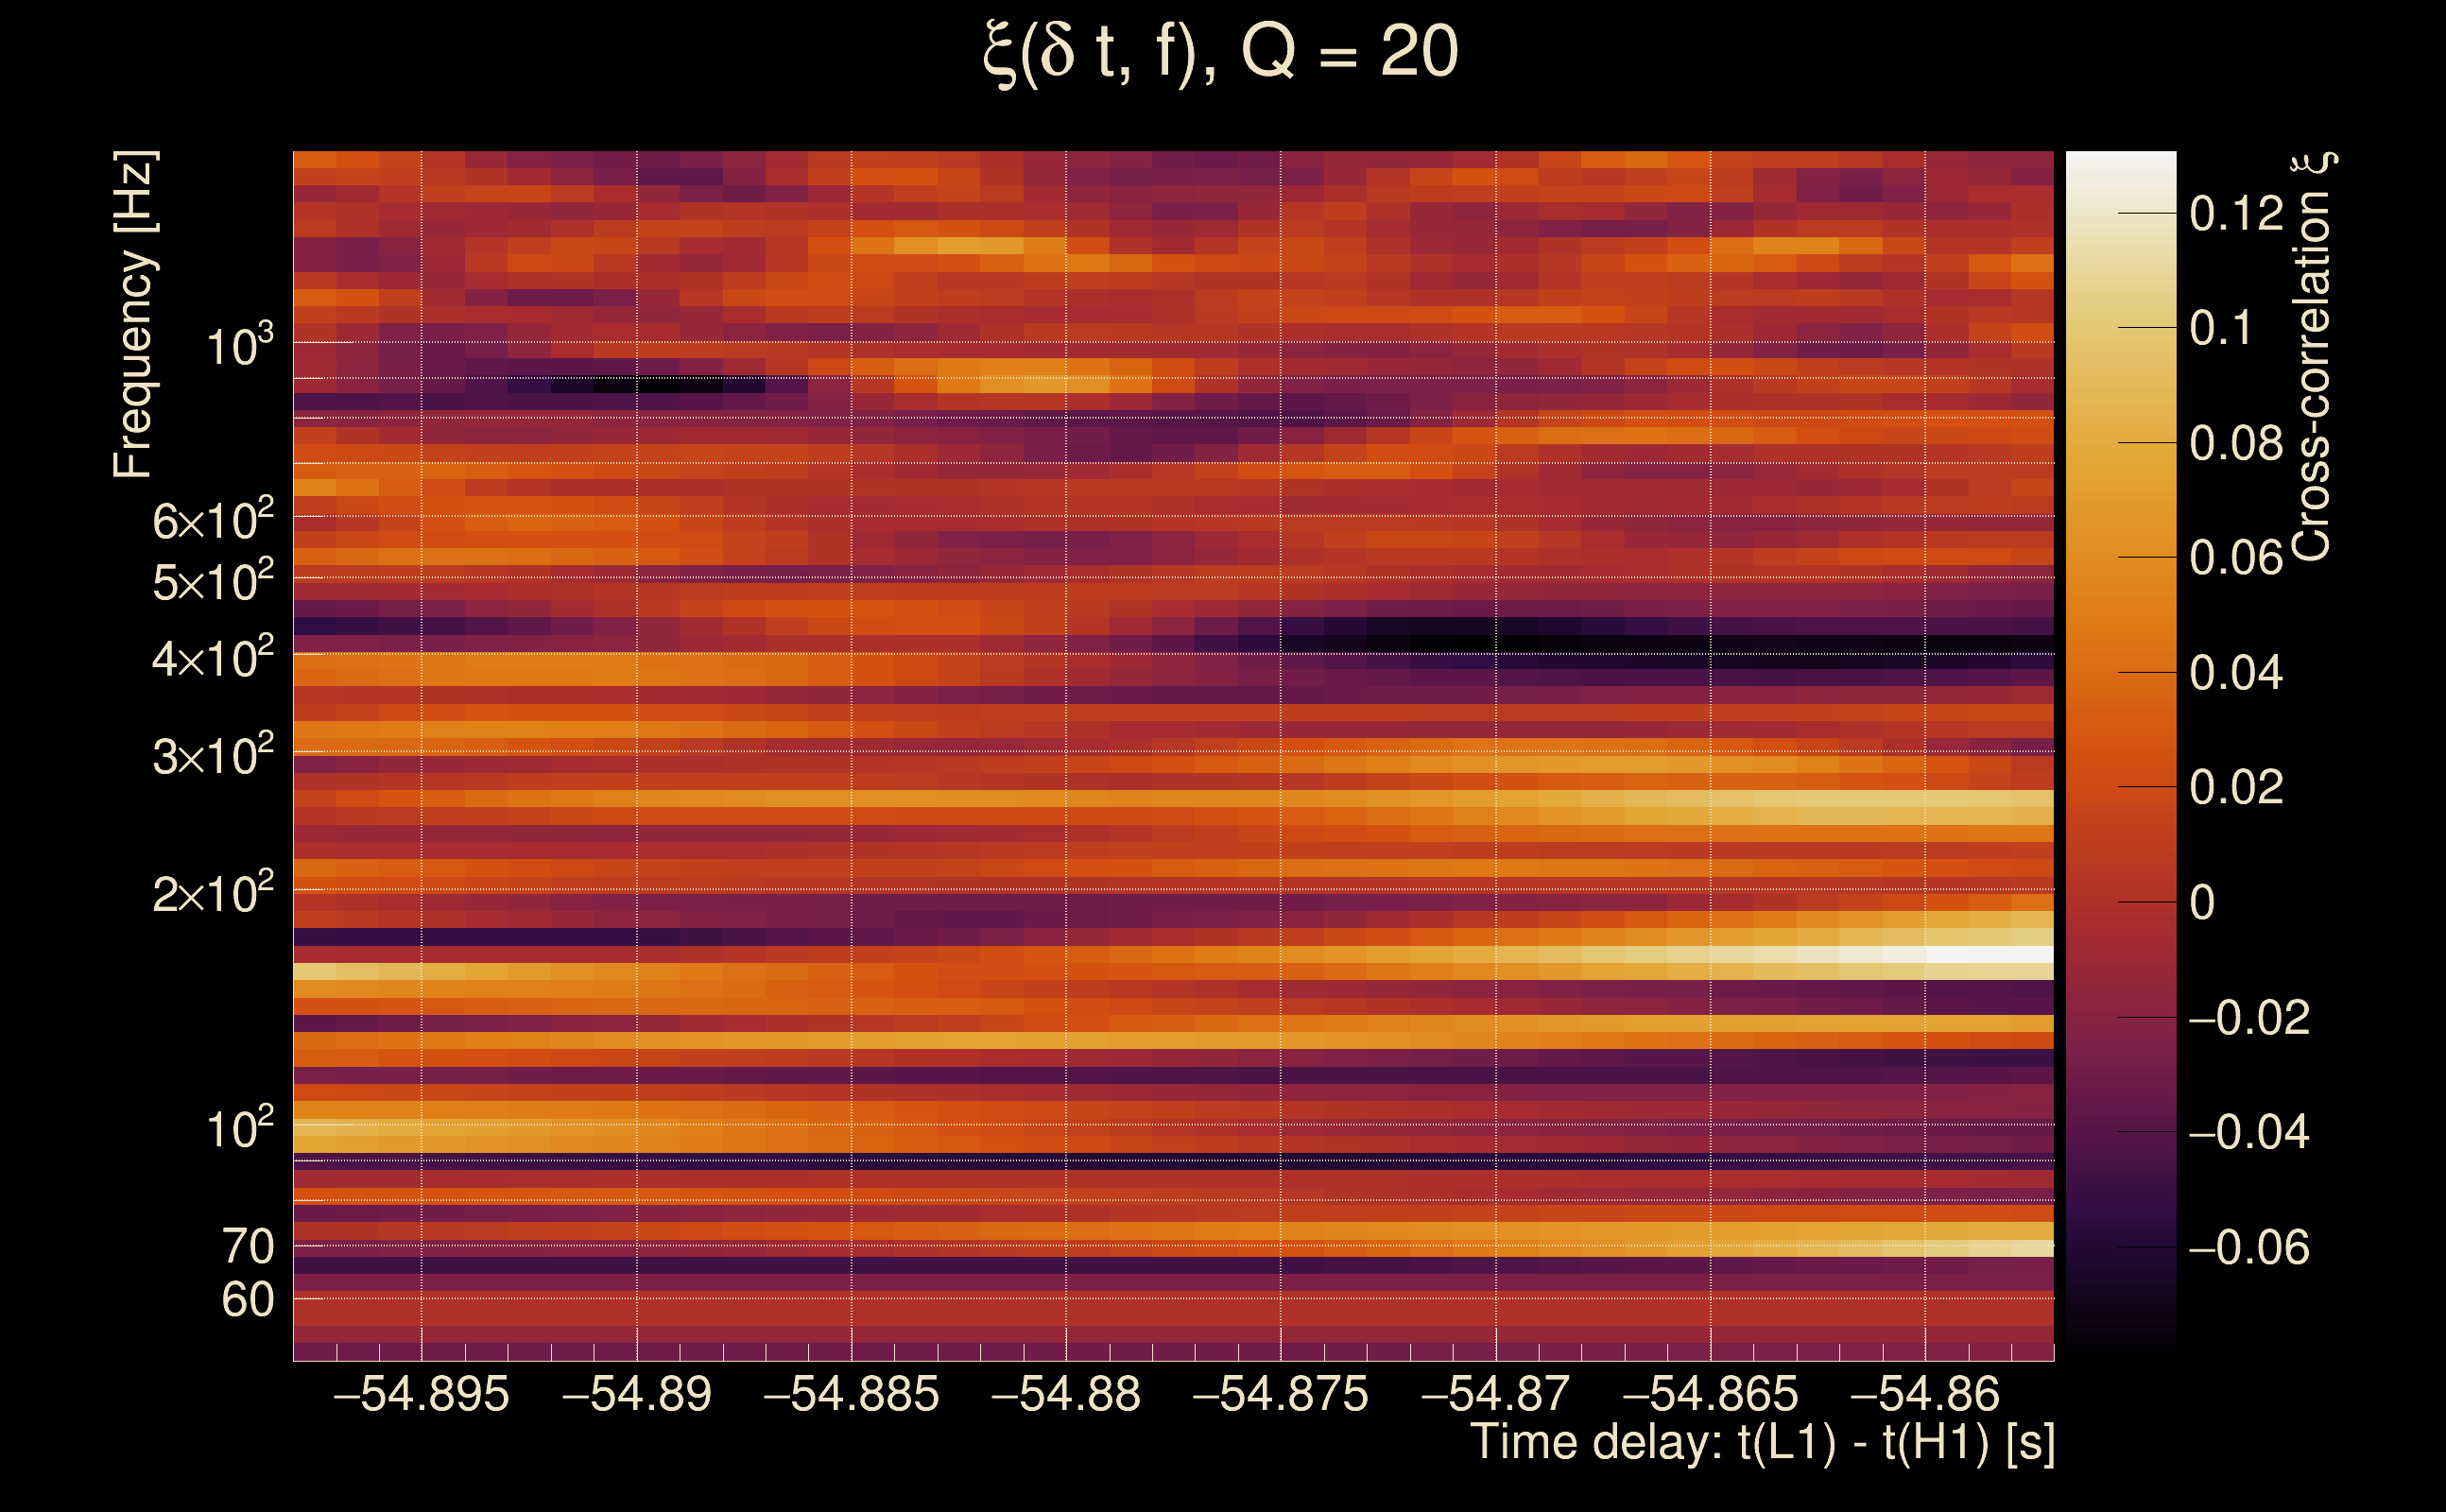
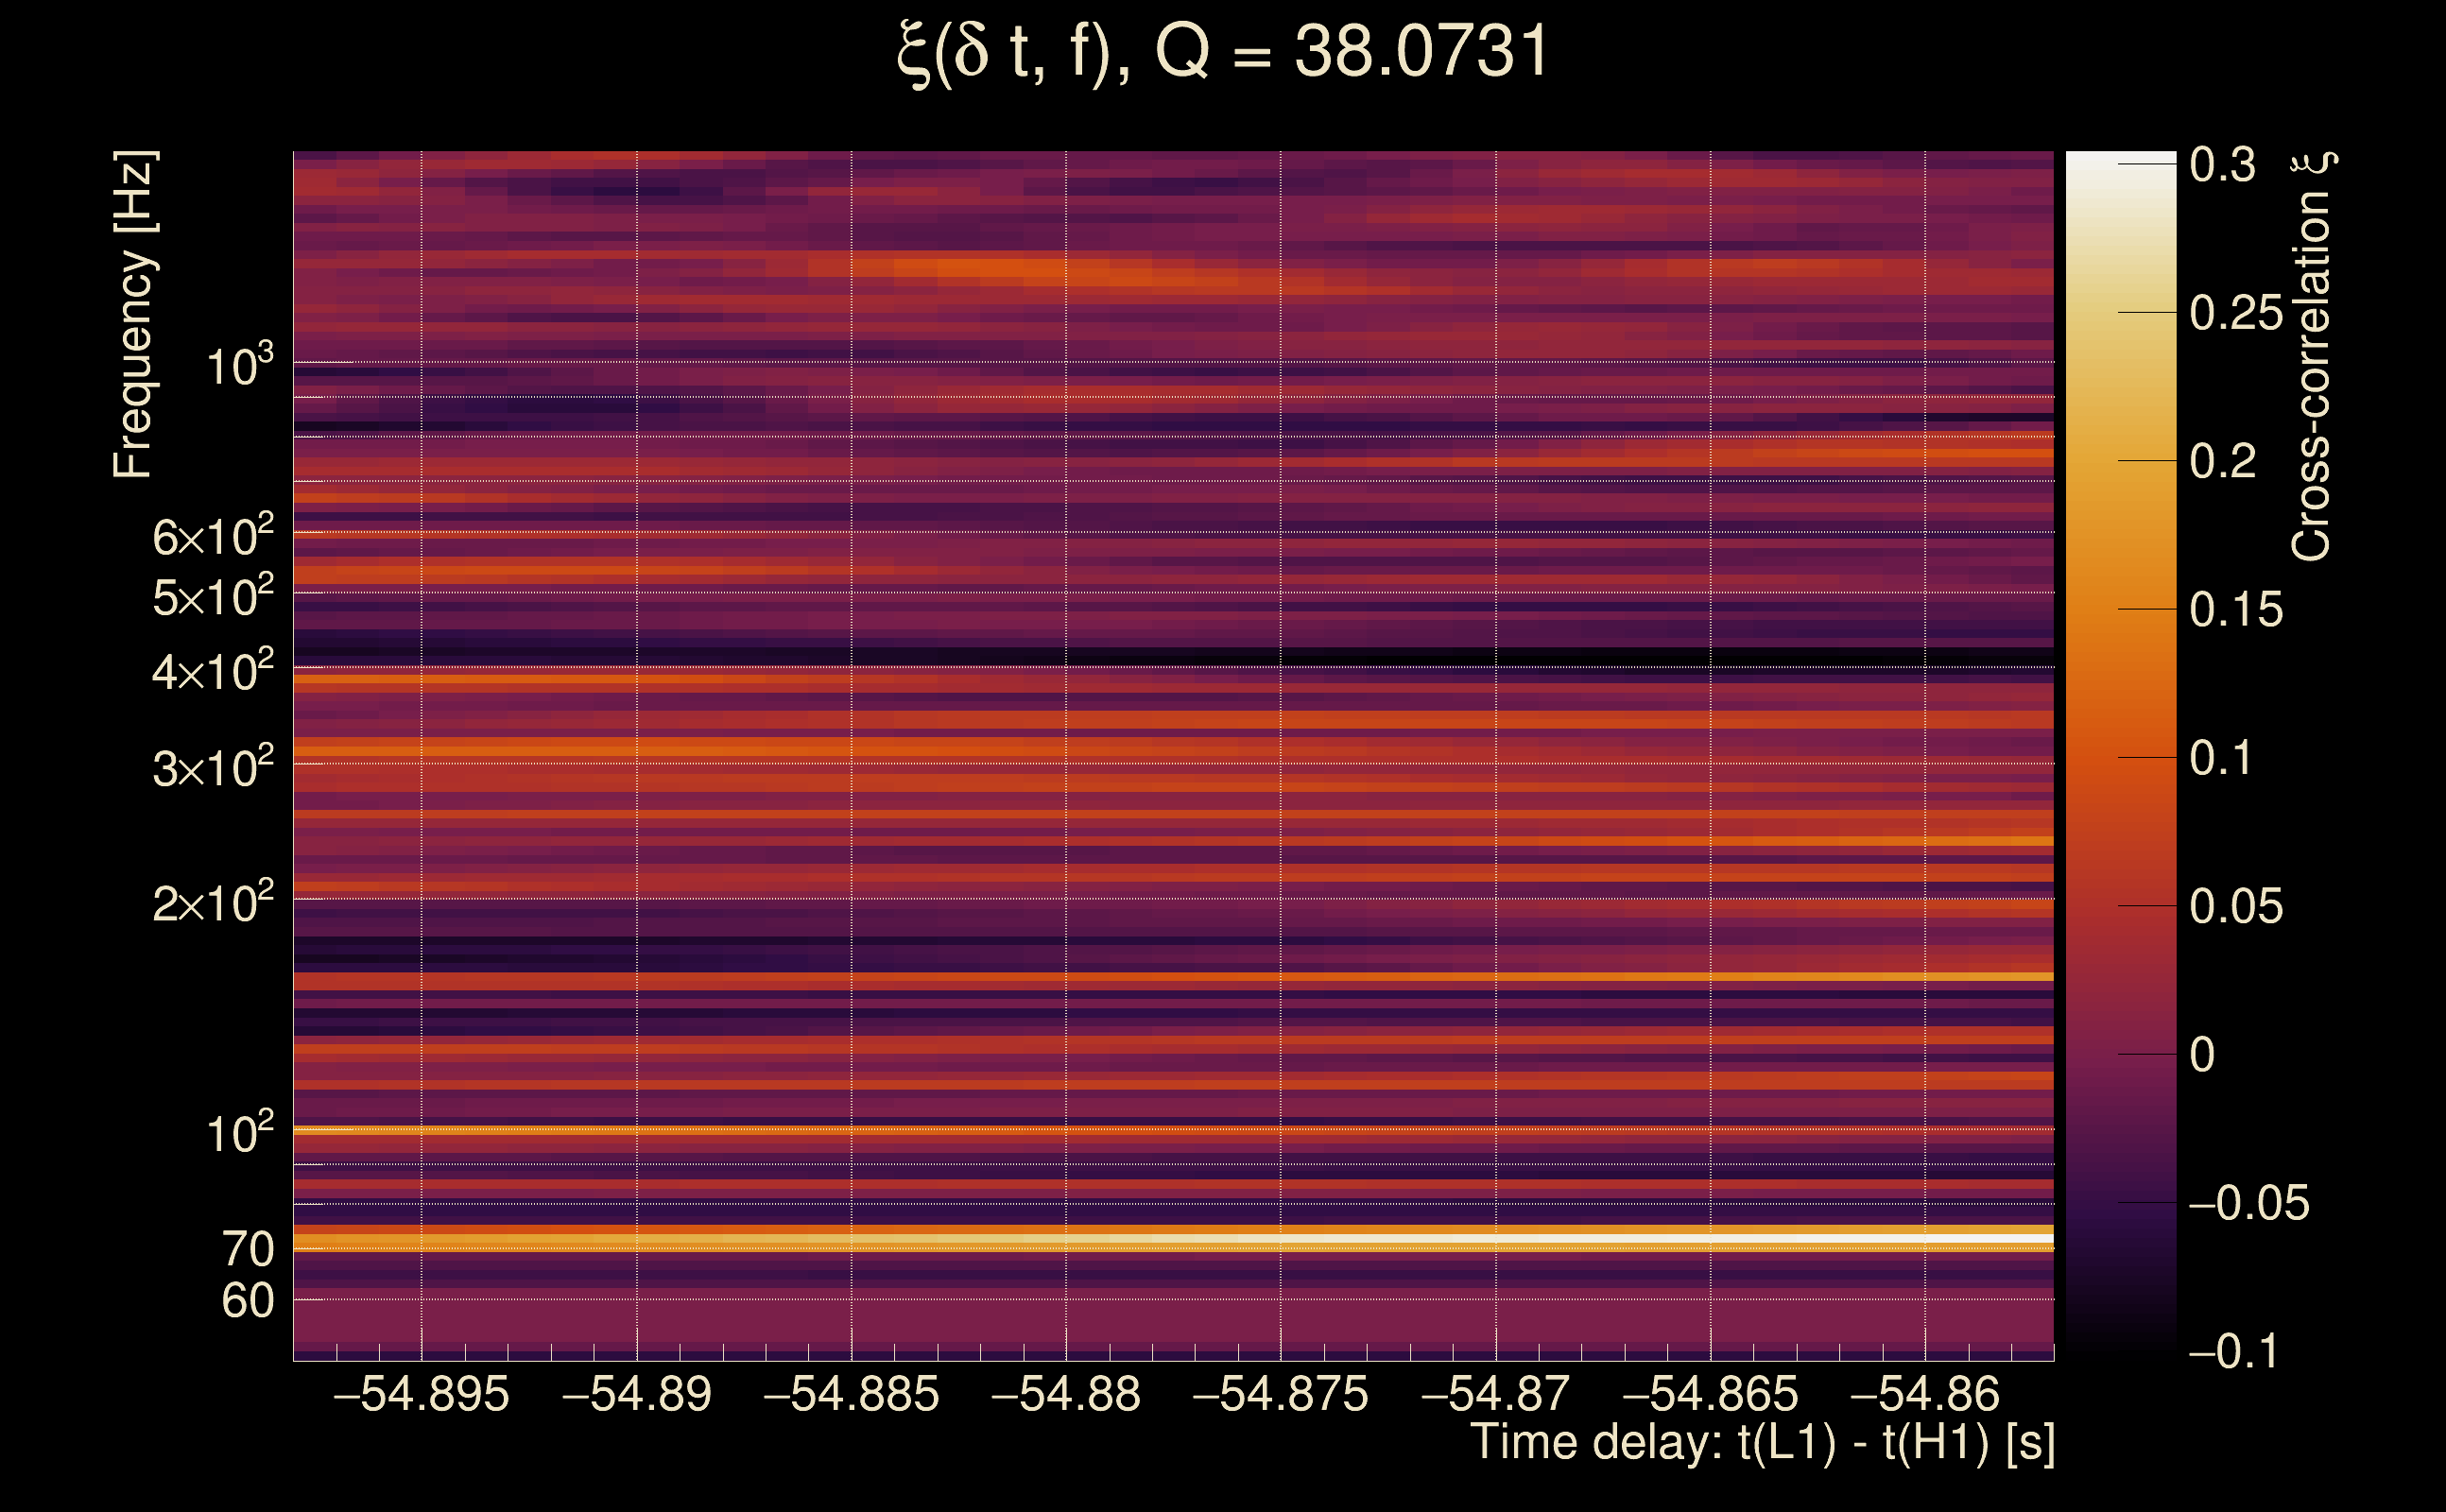
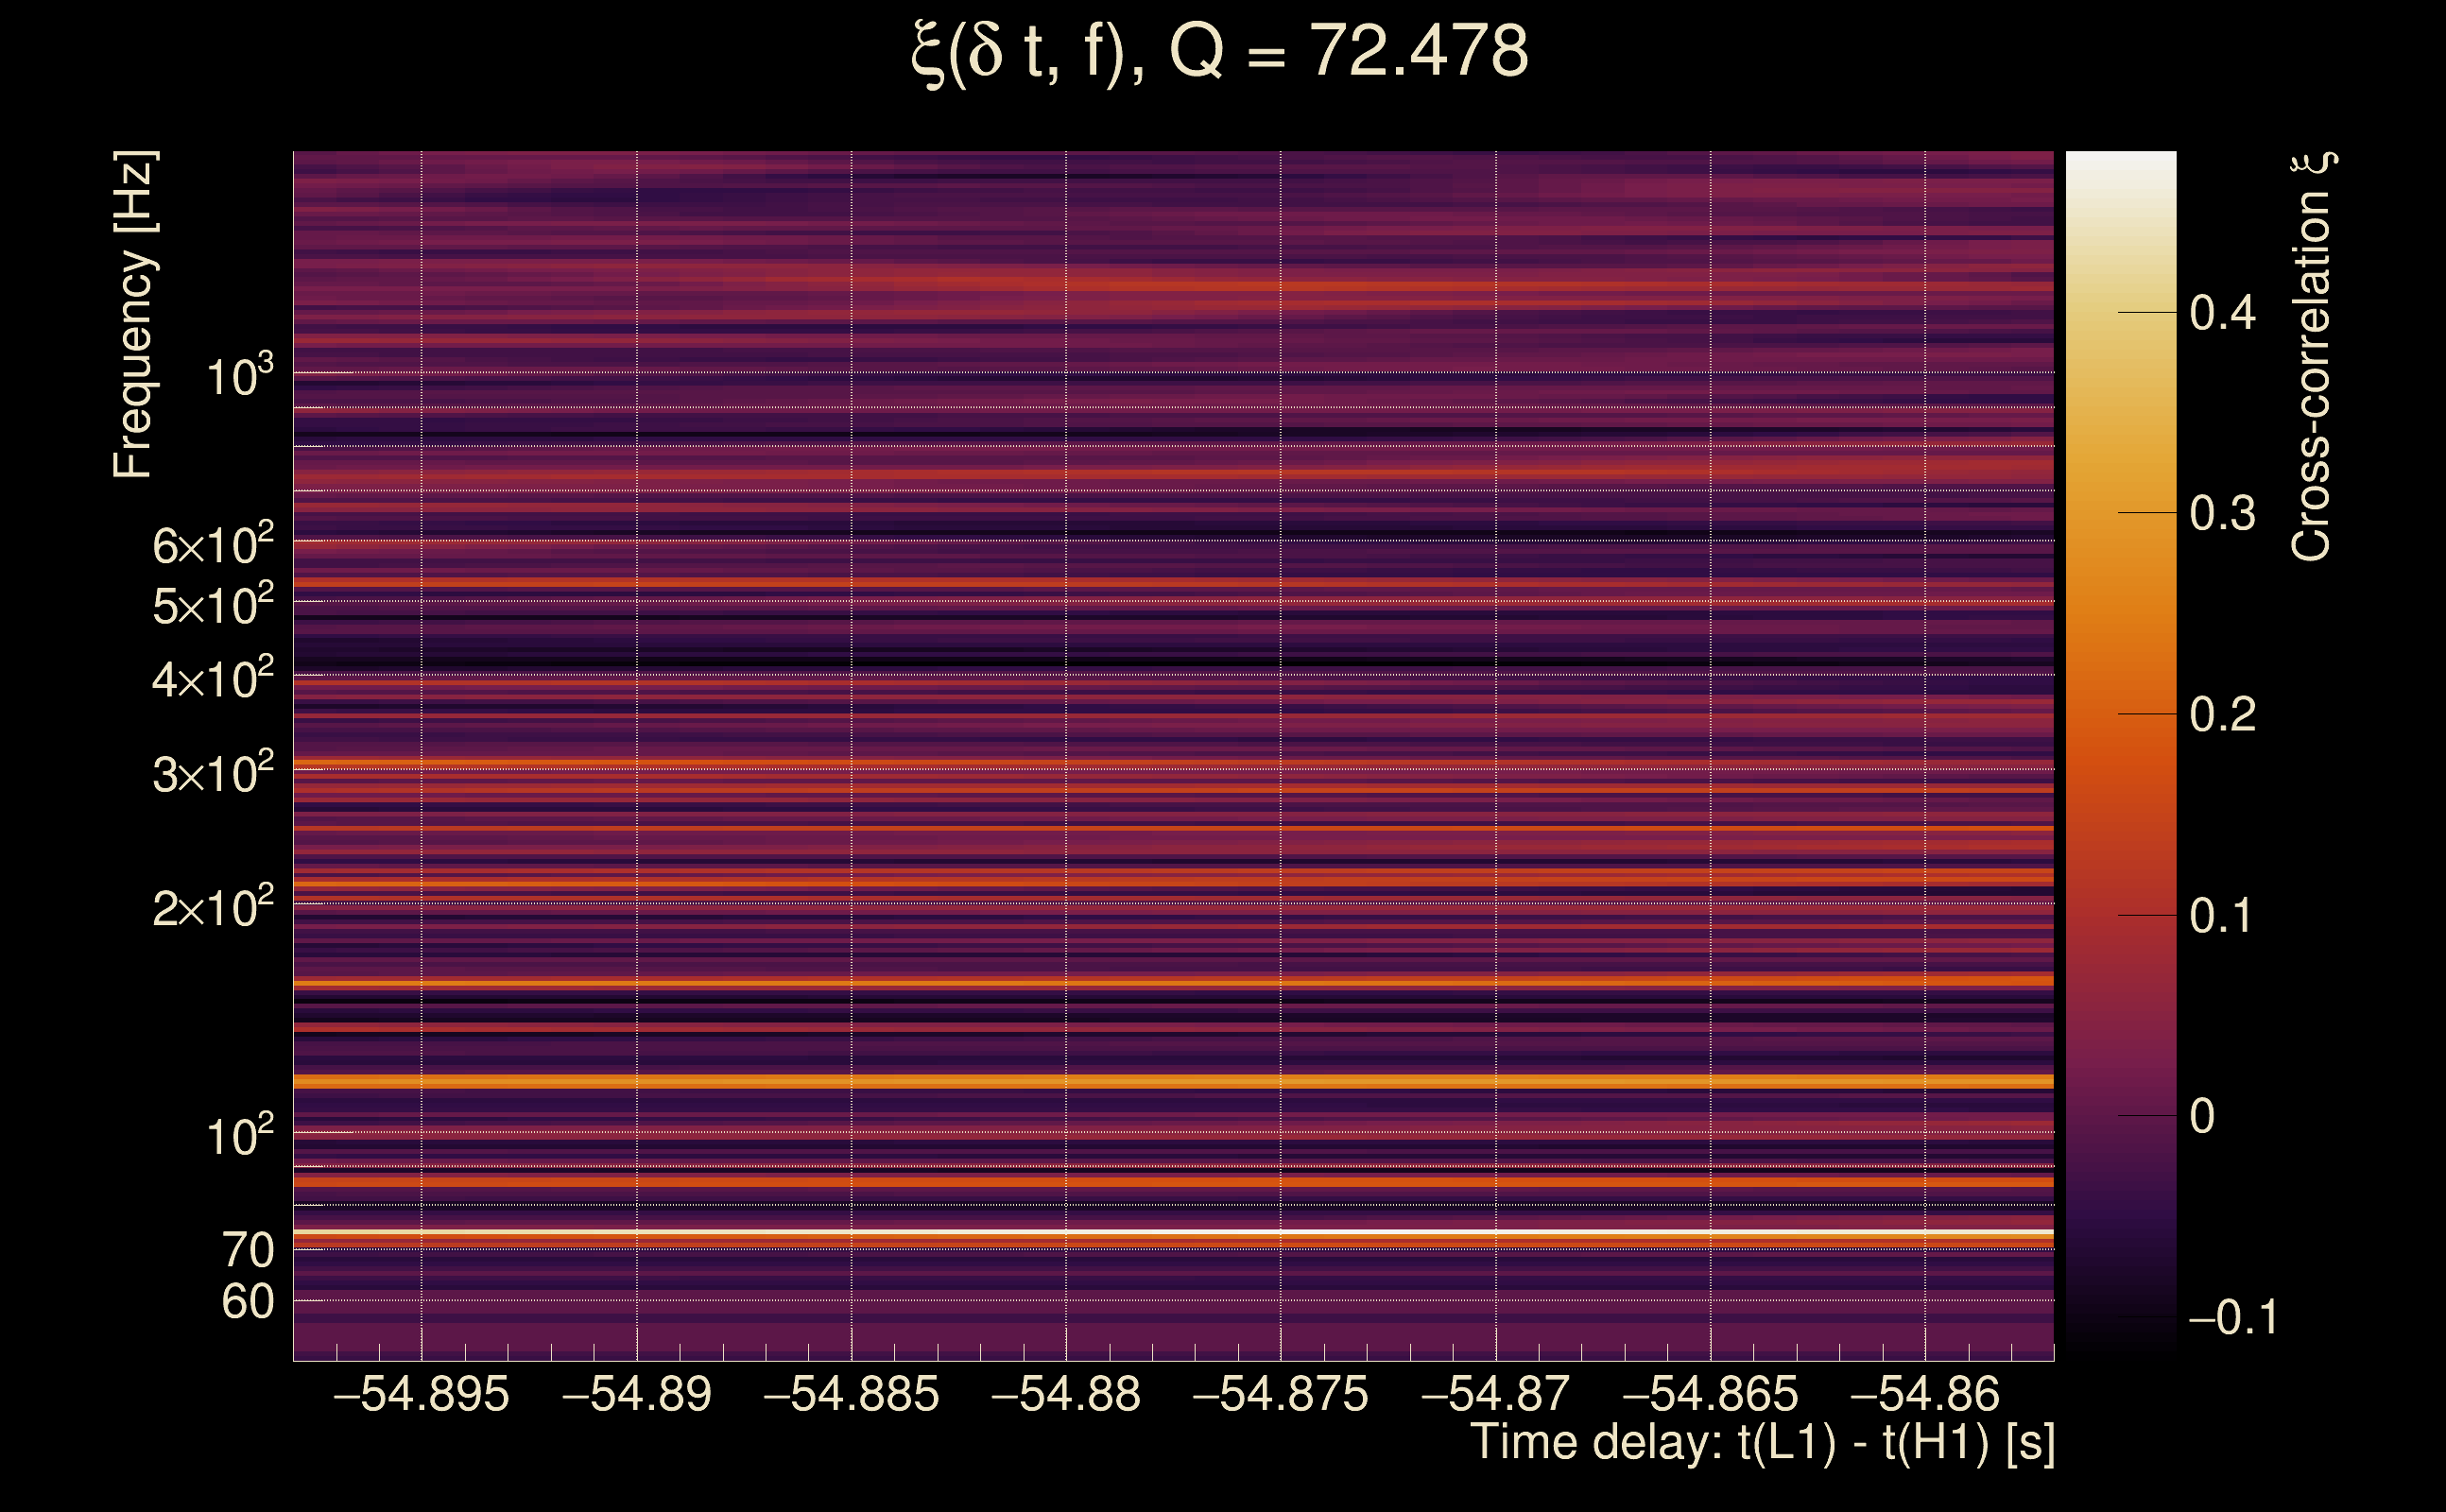
| Event time t(H1): | GPS = 1368195308 (Mon May 15 14:14:50 2023 ) → GPS = 1368195318 (Mon May 15 14:15:00 2023 ) |
| Event time t(L1): | GPS = 1368195258 (Mon May 15 14:15:00 2023 ) → GPS = 1368195268 (Mon May 15 14:14:10 2023 ) |
| Omicron analysis time window (H1): | GPS = 1368195305 → GPS = 1368195321 |
| Omicron analysis time window (L1): | GPS = 1368195255 → GPS = 1368195271 |
| Time delay between detectors t(L1) - t(H1): | -54.8771 s (slice index = 214 / 217), δt_gw = -0.00109452 s |
| Time delay uncertainty: | 0.00842891 s |
| [targeted mode] Time delay probability: | 0.900634 (0.12486 sigmas), δt_target = -0.00214434 s |
| Frequency: | 1170.57 Hz |
| Ξ: | 0.00103022 ± 0.0268325 (variance = 0.000719985): Q0: 0, Q1: 0.0332032, Q2: 0.049828, Q3: 0.0705322, Q4: 0.072583 |
| Rank: | R_A = 0.000867547 |
| Log of amplitude ratio (L1/H1): | 0.960408, variance = 0.449158 (L1/H1: 1.02549, variance = 1.11204, H1/L1: -0.91412, variance = 0.752749) |
| Amplitude ratio (L1/H1): | 2.61276 ⋇ 1.95461 (L1/H1: 2.78845 ⋇ 2.87063, H1/L1: 0.400869 ⋇ 2.38122) |
| Amplitude ratio H1|L1 compatibility (probability): | 0.935002 |
| Antenna factor probability: | 1 |
| Number of rejected frequency rows: | Q0: 18 / 18, Q1: 35 / 36, Q2: 65 / 70, Q3: 126 / 134, Q4: 254 / 258 |
| Maximum signal-to-noise ratio: | H1: 4.7613, L1: 5.64566 |
| SNR variance: | H1: 0.437735, L1: 0.467769 |
| Click here for a zoomed plot | Click here for a zoomed plot | Click here for a zoomed plot | Click here for a zoomed plot | Click here for a zoomed plot |
 |
 |
 |
 |
 |
 |
 |
 |
 |
 |
 |
 |
 |
 |
 |
 |
 |
 |
 |
 |
 |
 |
 |
 |
 |
 |
 |
 |
 |
 |
 |
 |
 |
 |
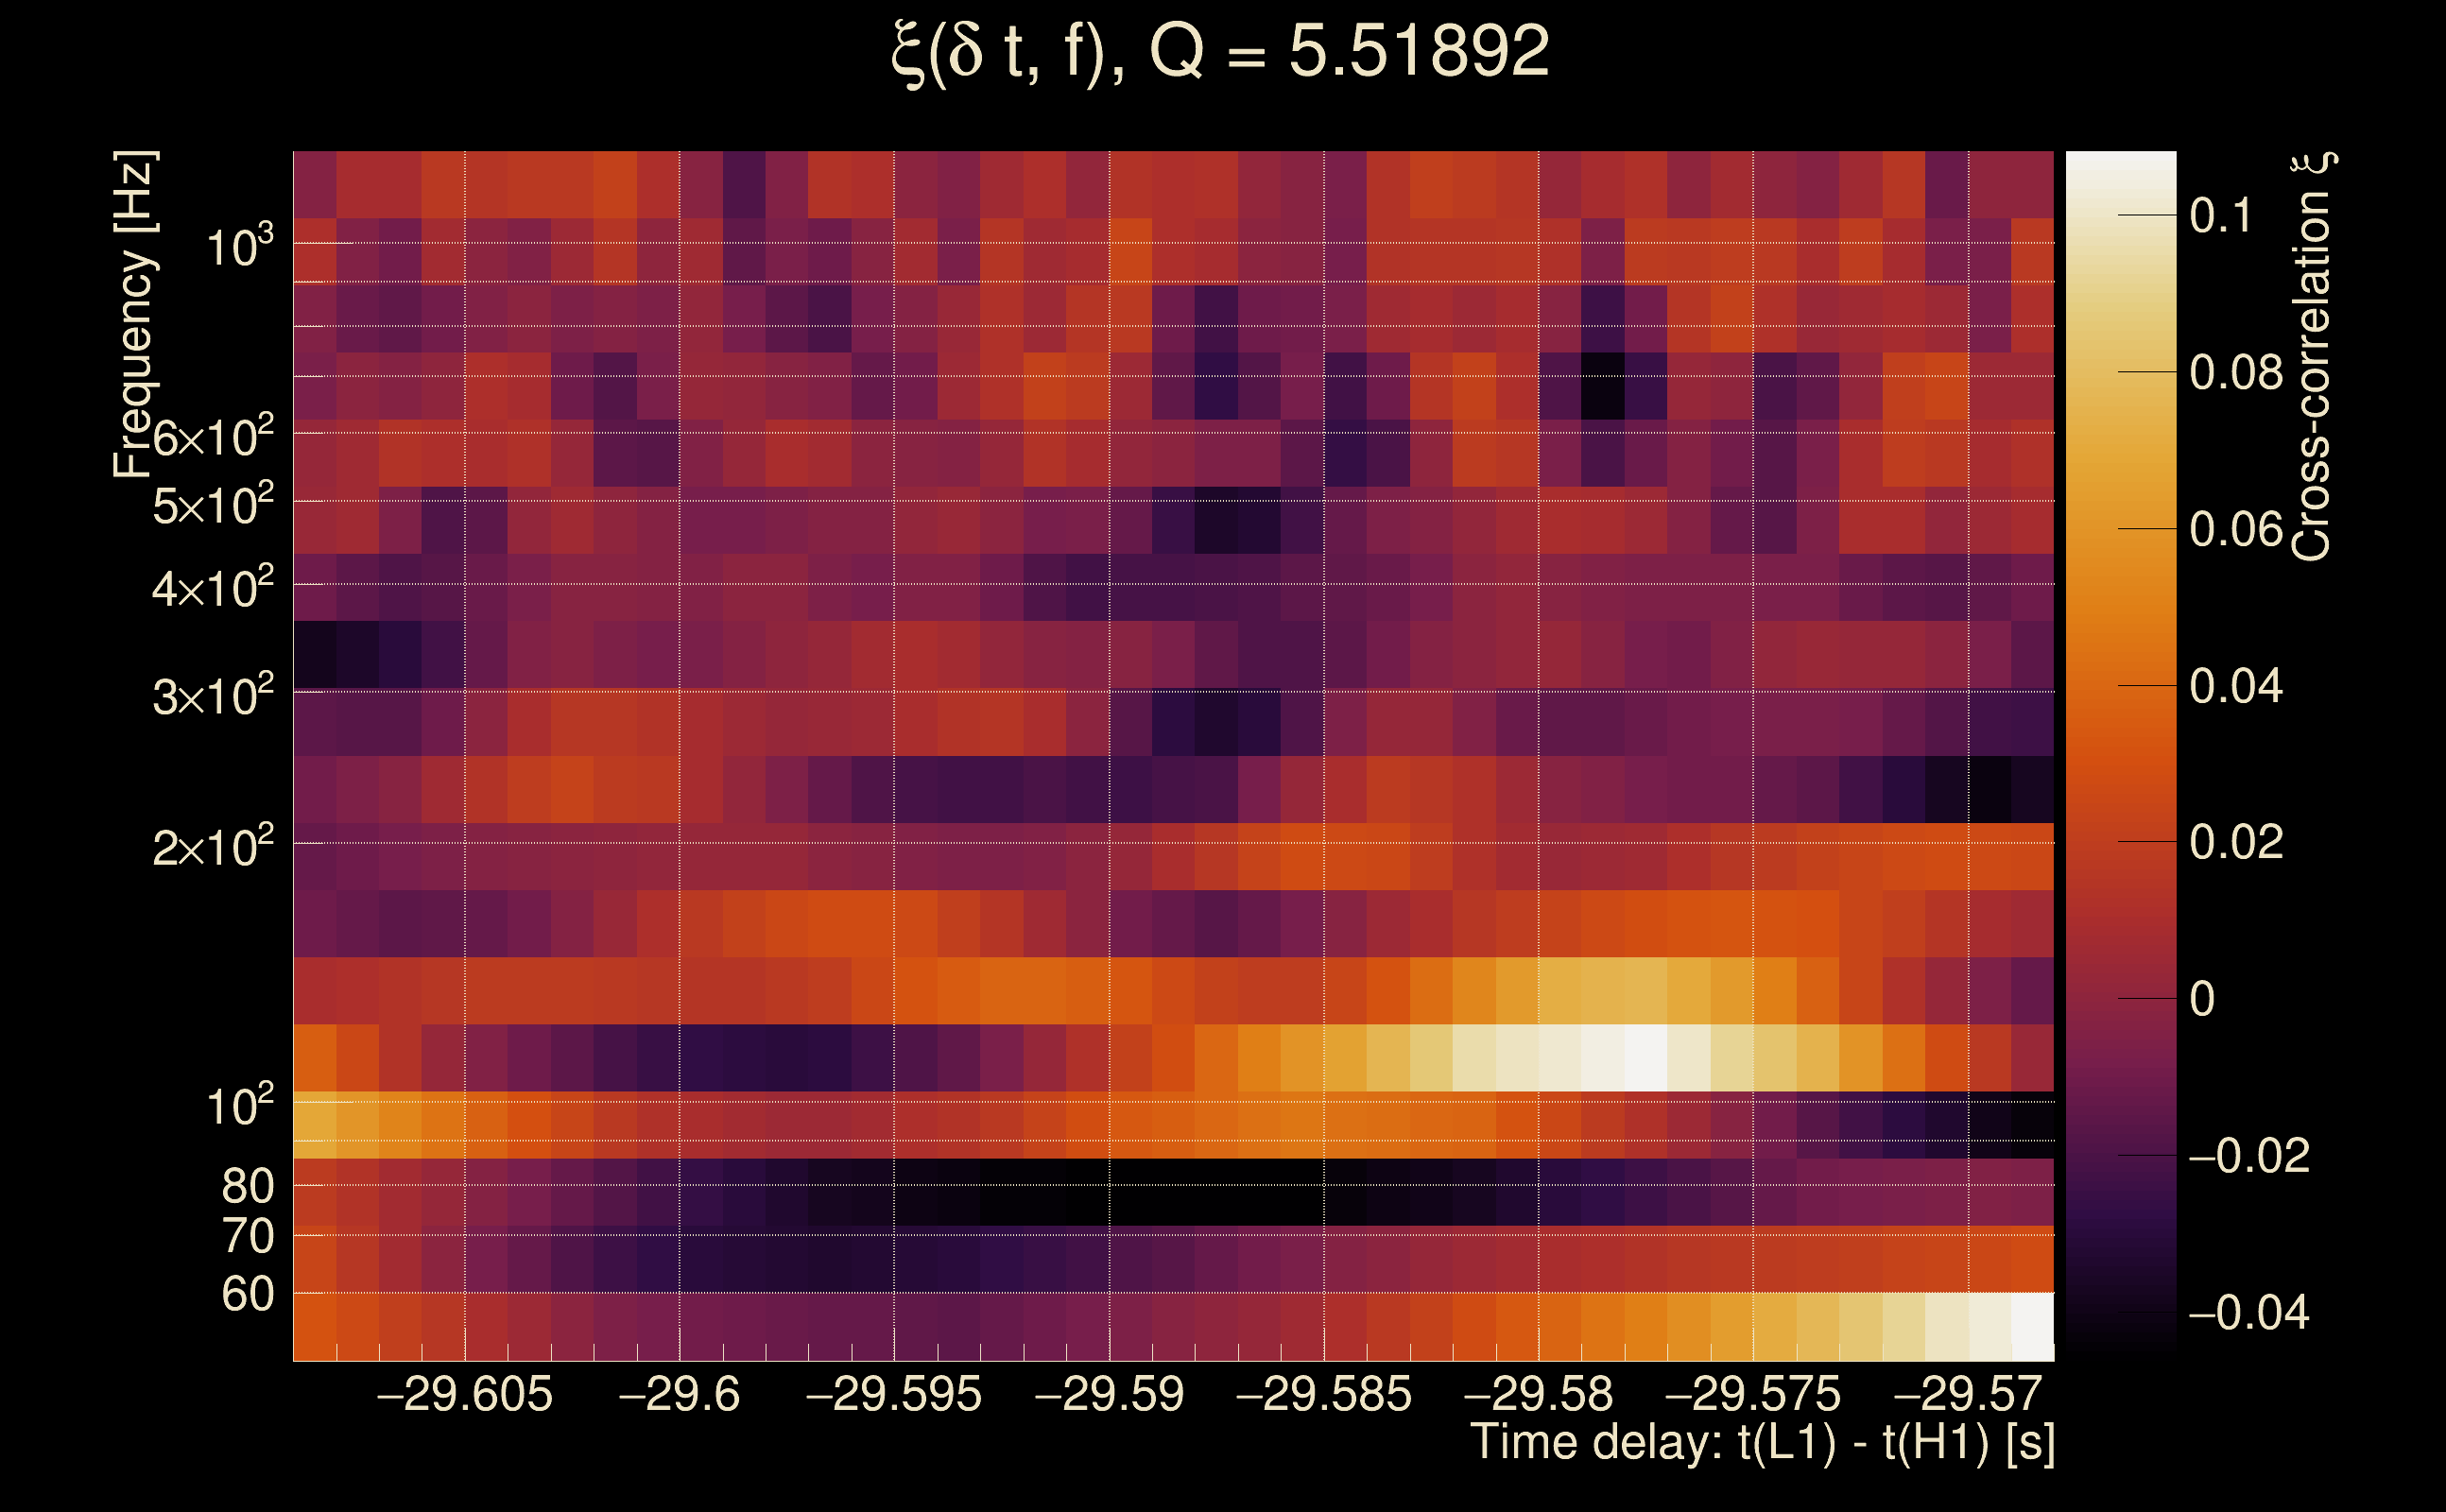
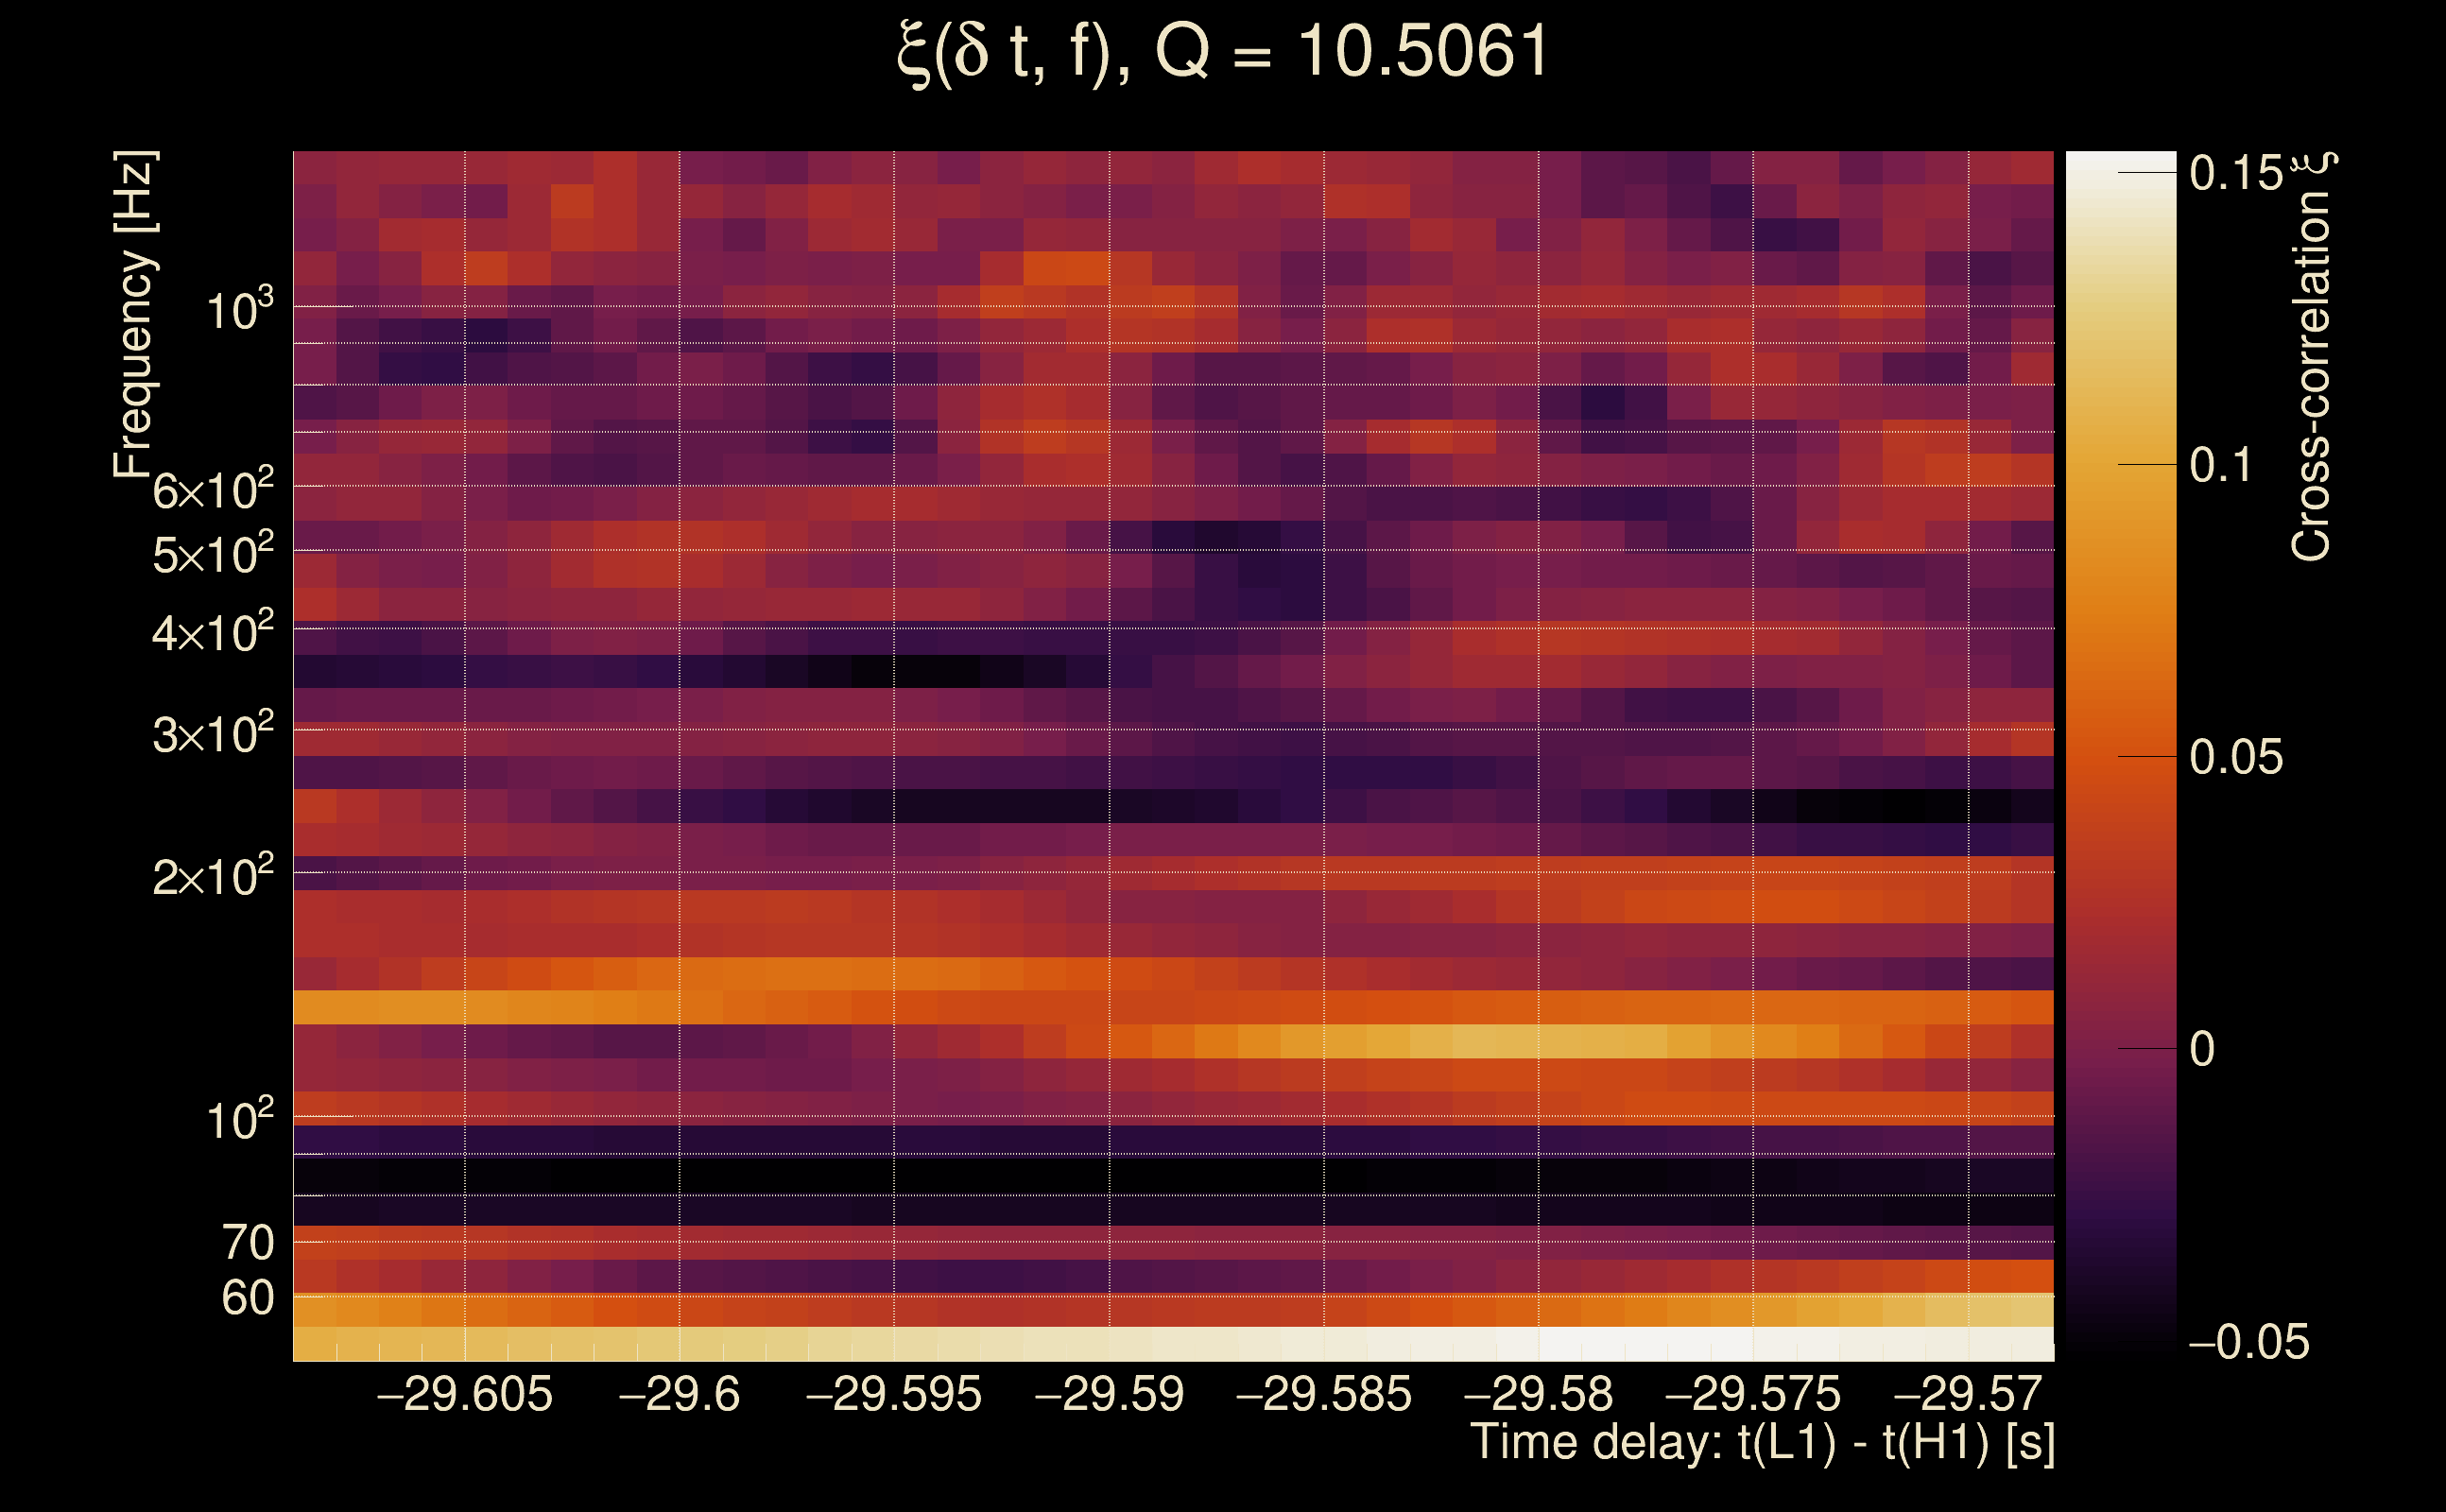
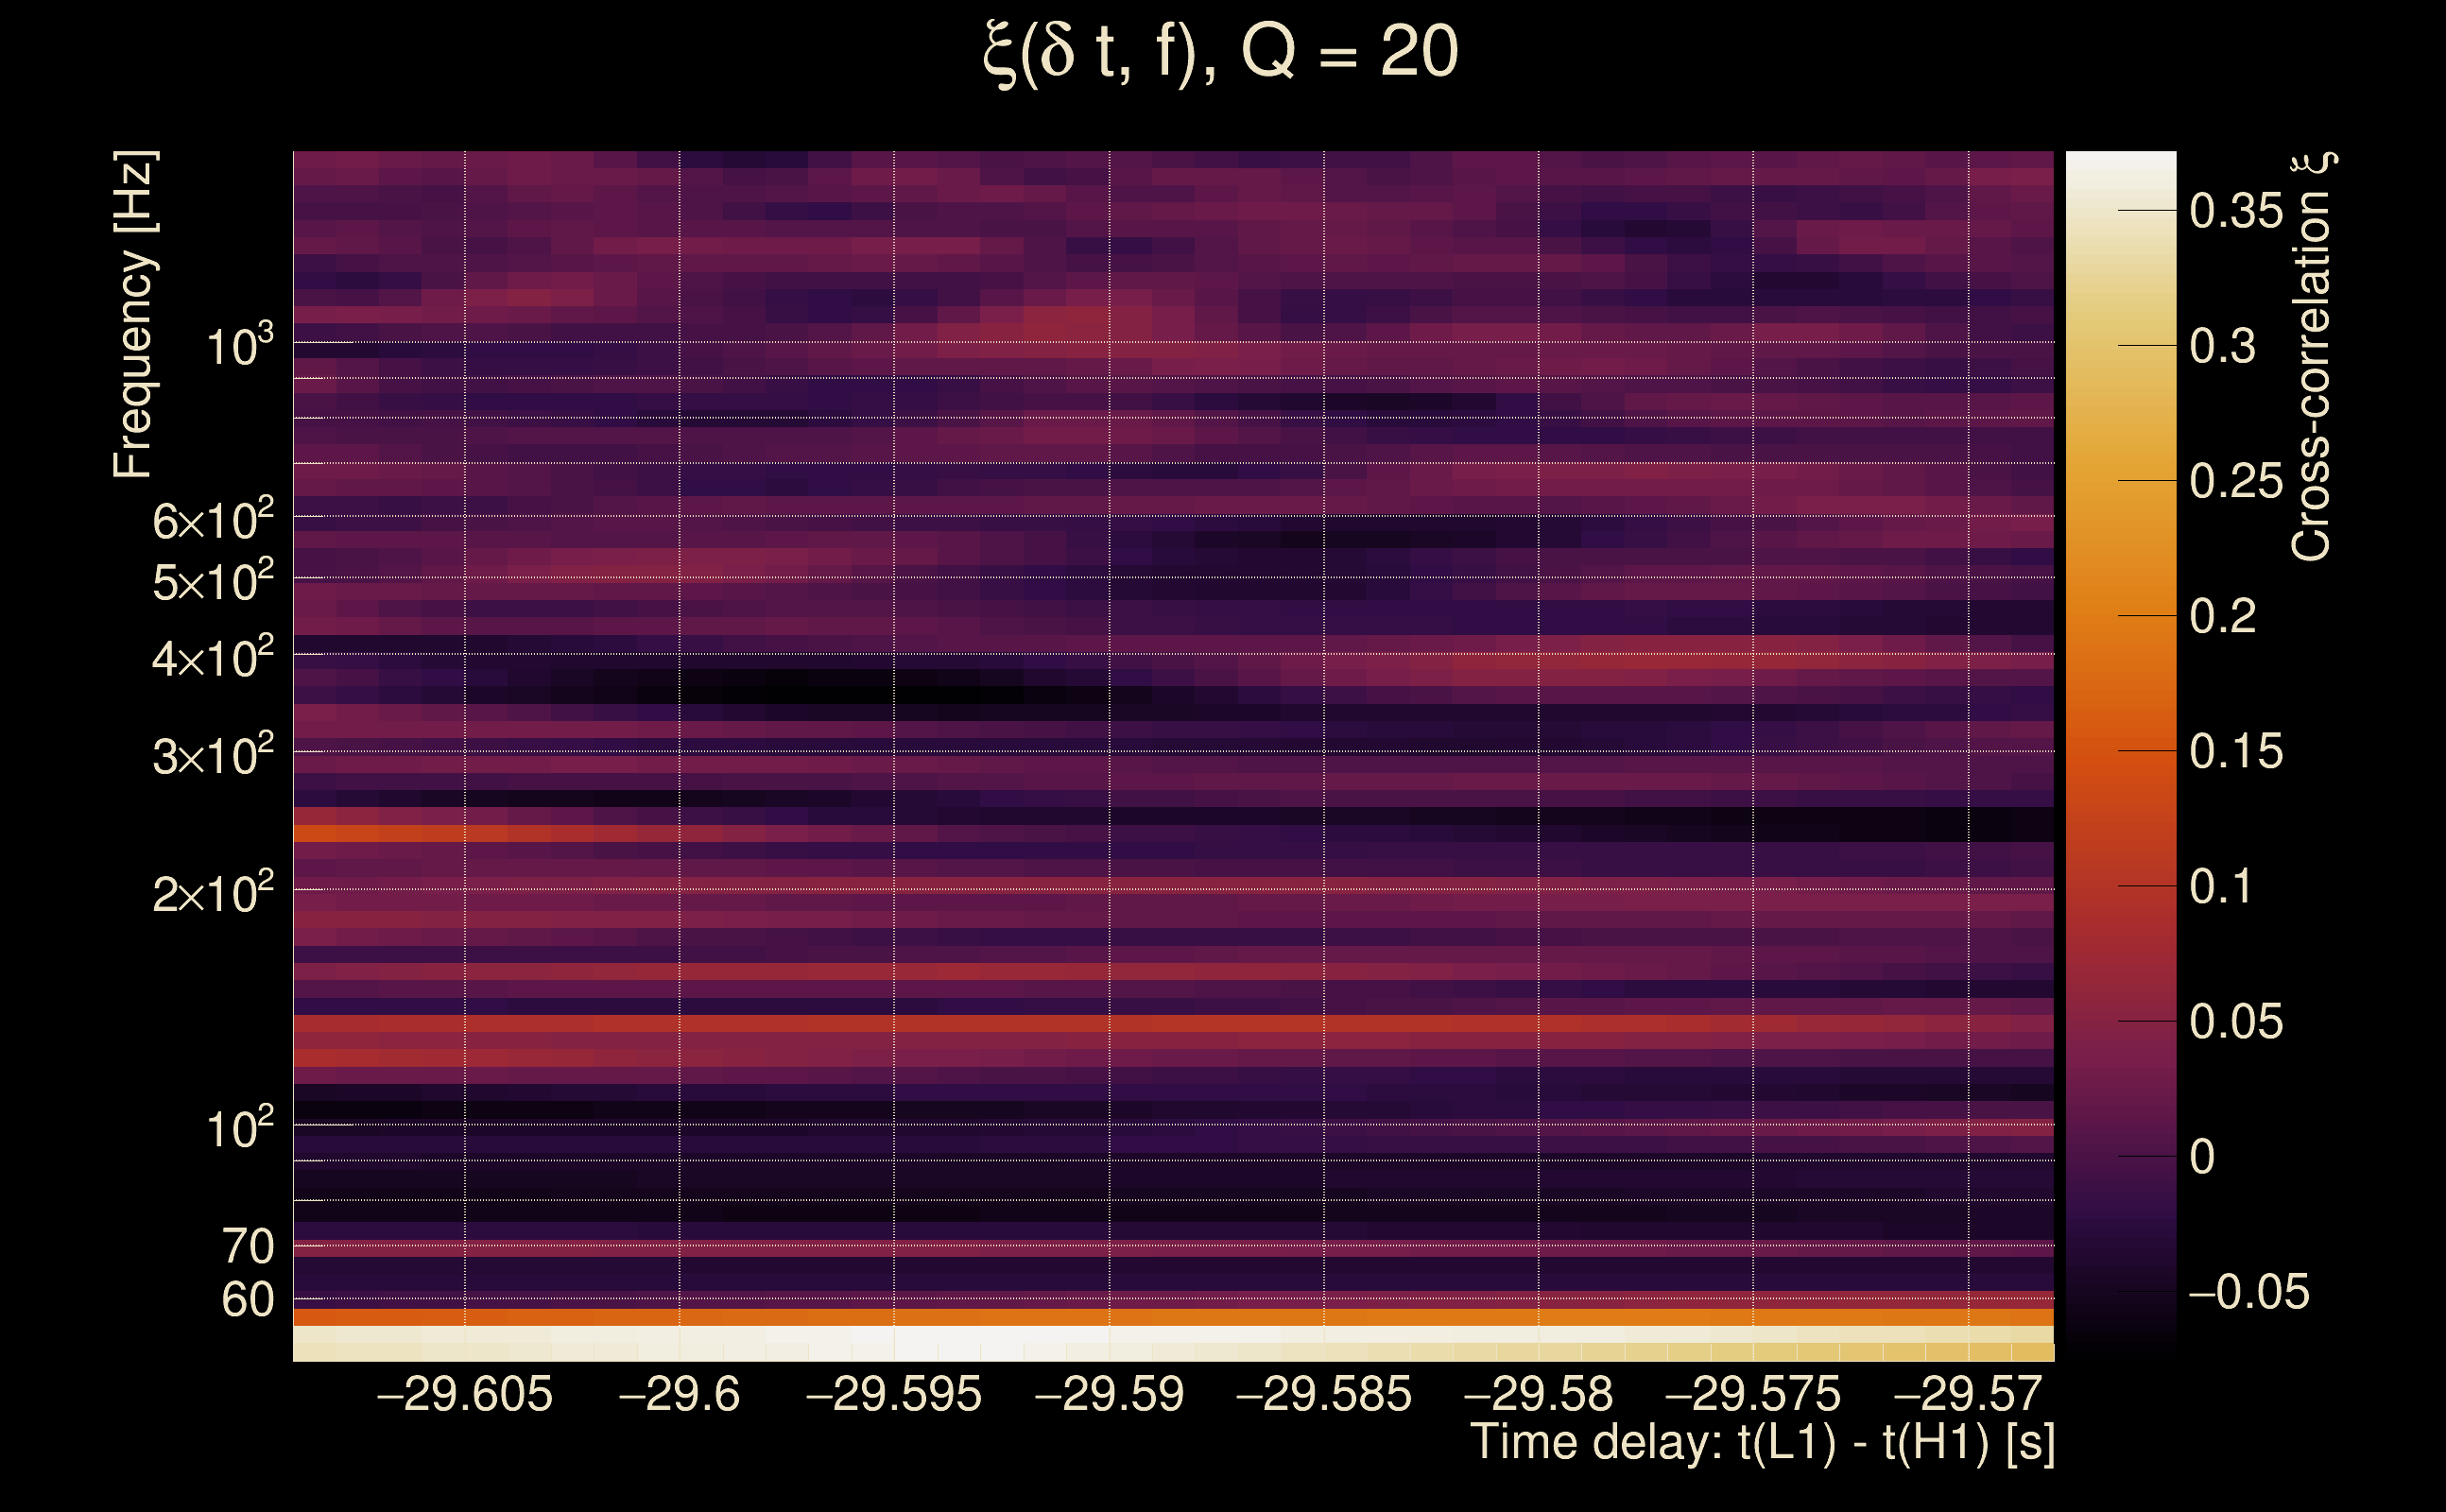
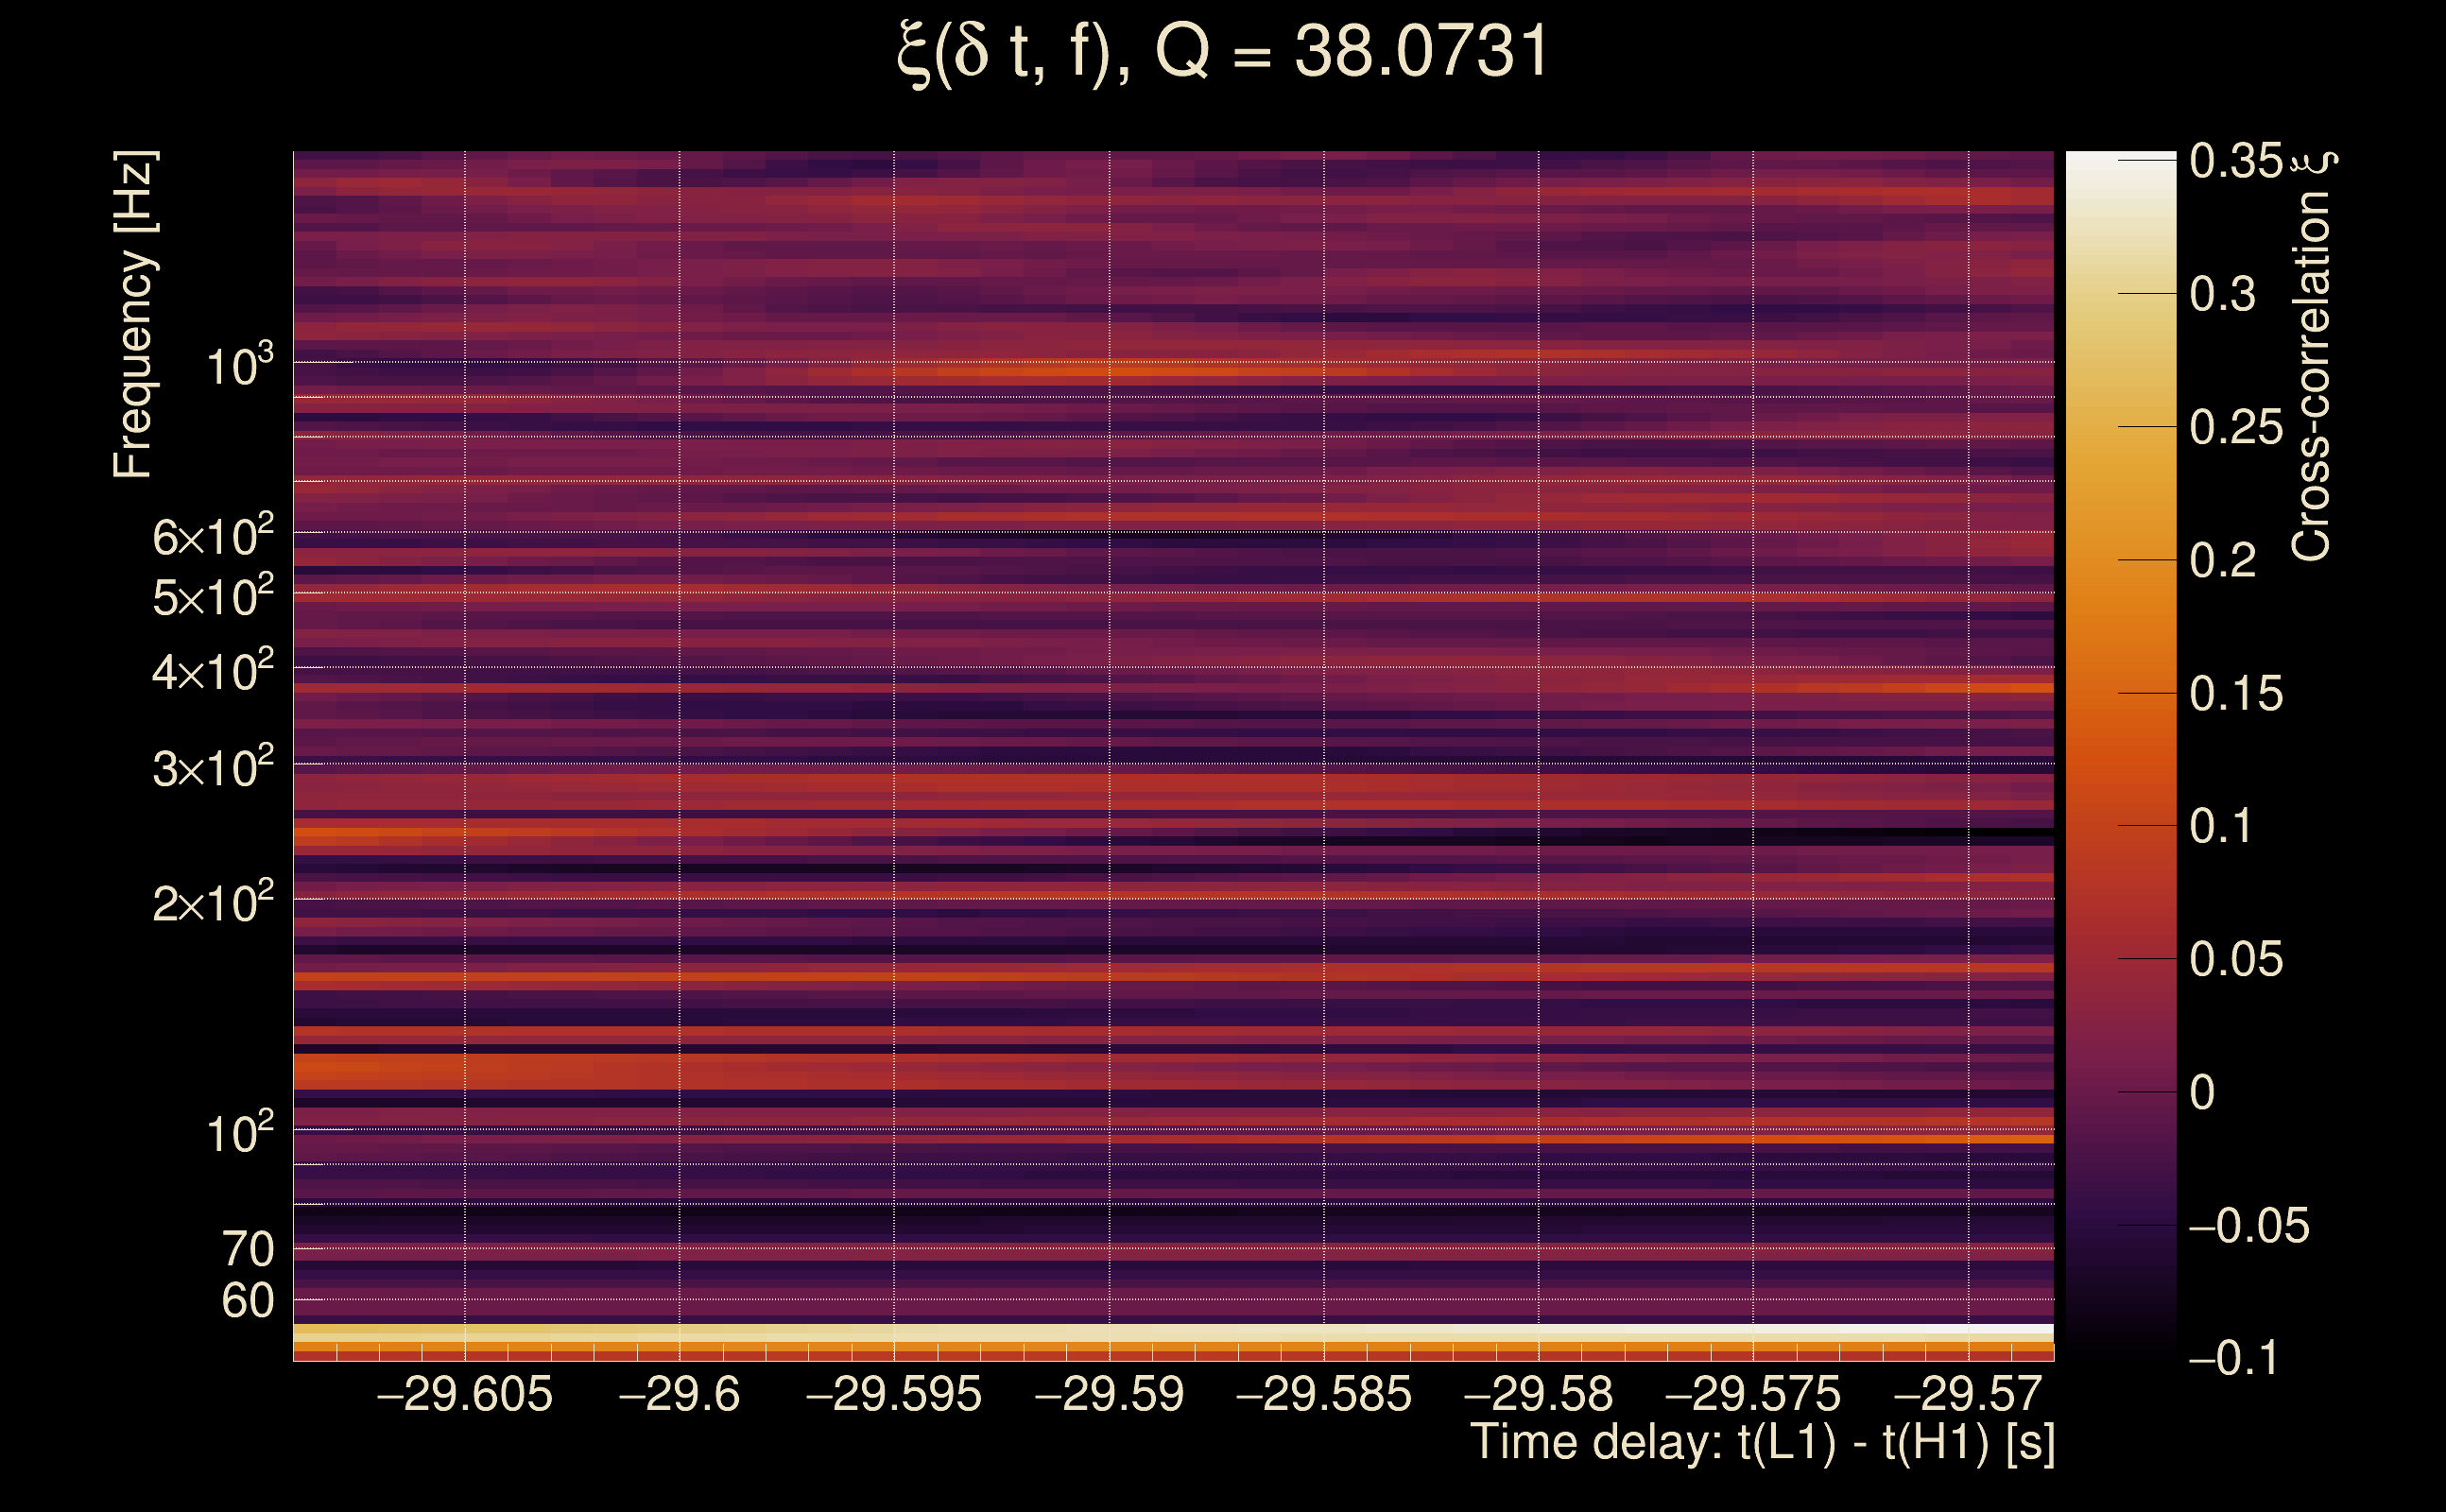
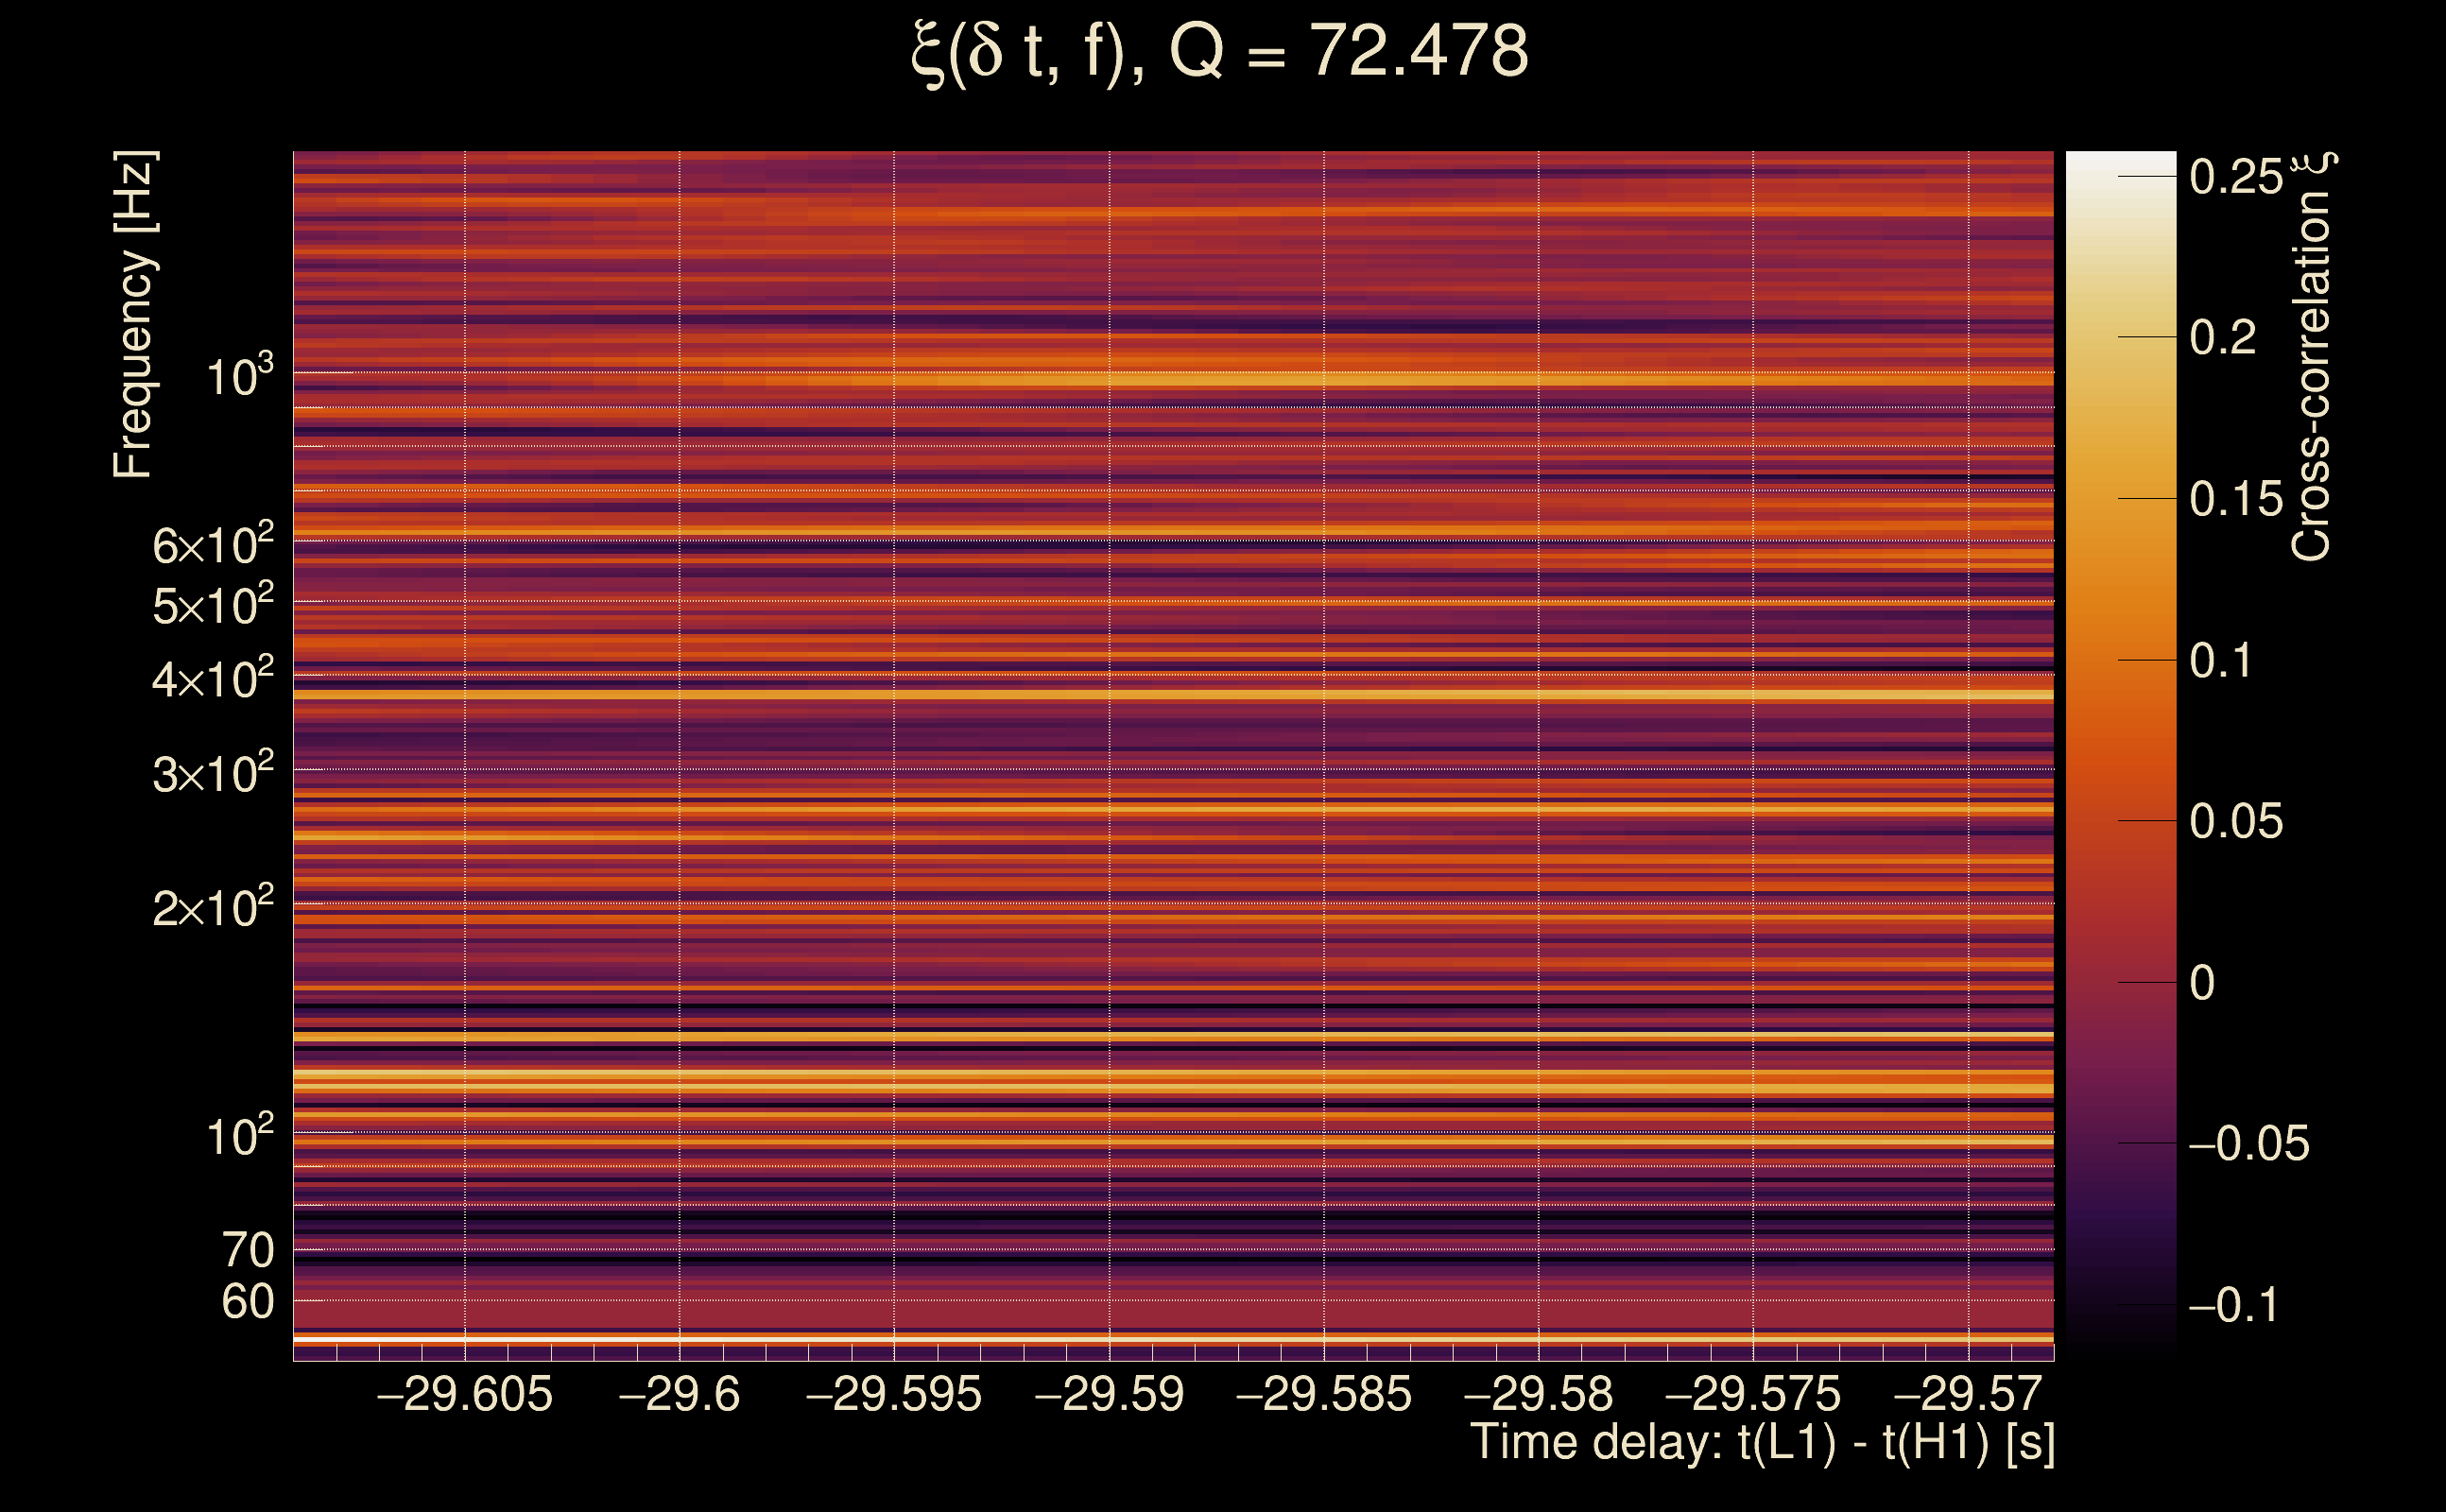
| Event time t(H1): | GPS = 1368195323 (Mon May 15 14:15:05 2023 ) → GPS = 1368195333 (Mon May 15 14:15:15 2023 ) |
| Event time t(L1): | GPS = 1368195293 (Mon May 15 14:15:15 2023 ) → GPS = 1368195303 (Mon May 15 14:14:45 2023 ) |
| Omicron analysis time window (H1): | GPS = 1368195320 → GPS = 1368195336 |
| Omicron analysis time window (L1): | GPS = 1368195290 → GPS = 1368195306 |
| Time delay between detectors t(L1) - t(H1): | -29.5888 s (slice index = 99 / 217), δt_gw = -0.00284487 s |
| Time delay uncertainty: | 0.00520346 s |
| [targeted mode] Time delay probability: | 0.892037 (0.135728 sigmas), δt_target = -0.00214696 s |
| Frequency: | 262.742 Hz |
| Ξ: | 0.00186511 ± 0.0728278 (variance = 0.00530389): Q0: 0, Q1: 0.0358273, Q2: 0.213556, Q3: 0.061221, Q4: 0.0784337 |
| Rank: | R_A = 0.000832028 |
| Log of amplitude ratio (L1/H1): | 0.317292, variance = 0.566284 (L1/H1: -0.134456, variance = 0.910867, H1/L1: -0.902861, variance = 1.45538) |
| Amplitude ratio (L1/H1): | 1.3734 ⋇ 2.12234 (L1/H1: 0.874192 ⋇ 2.5971, H1/L1: 0.405408 ⋇ 3.3414) |
| Amplitude ratio H1|L1 compatibility (probability): | 0.500093 |
| Antenna factor probability: | 1 |
| Number of rejected frequency rows: | Q0: 18 / 18, Q1: 35 / 36, Q2: 67 / 70, Q3: 125 / 134, Q4: 246 / 258 |
| Maximum signal-to-noise ratio: | H1: 5.72055, L1: 5.02454 |
| SNR variance: | H1: 0.473828, L1: 0.483077 |
| Click here for a zoomed plot | Click here for a zoomed plot | Click here for a zoomed plot | Click here for a zoomed plot | Click here for a zoomed plot |
 |
 |
 |
 |
 |
 |
 |
 |
 |
 |
 |
 |
 |
 |
 |
 |
 |
 |
 |
 |
|
|
|
|
|
 |
 |
 |
 |
 |
 |
 |
 |
 |
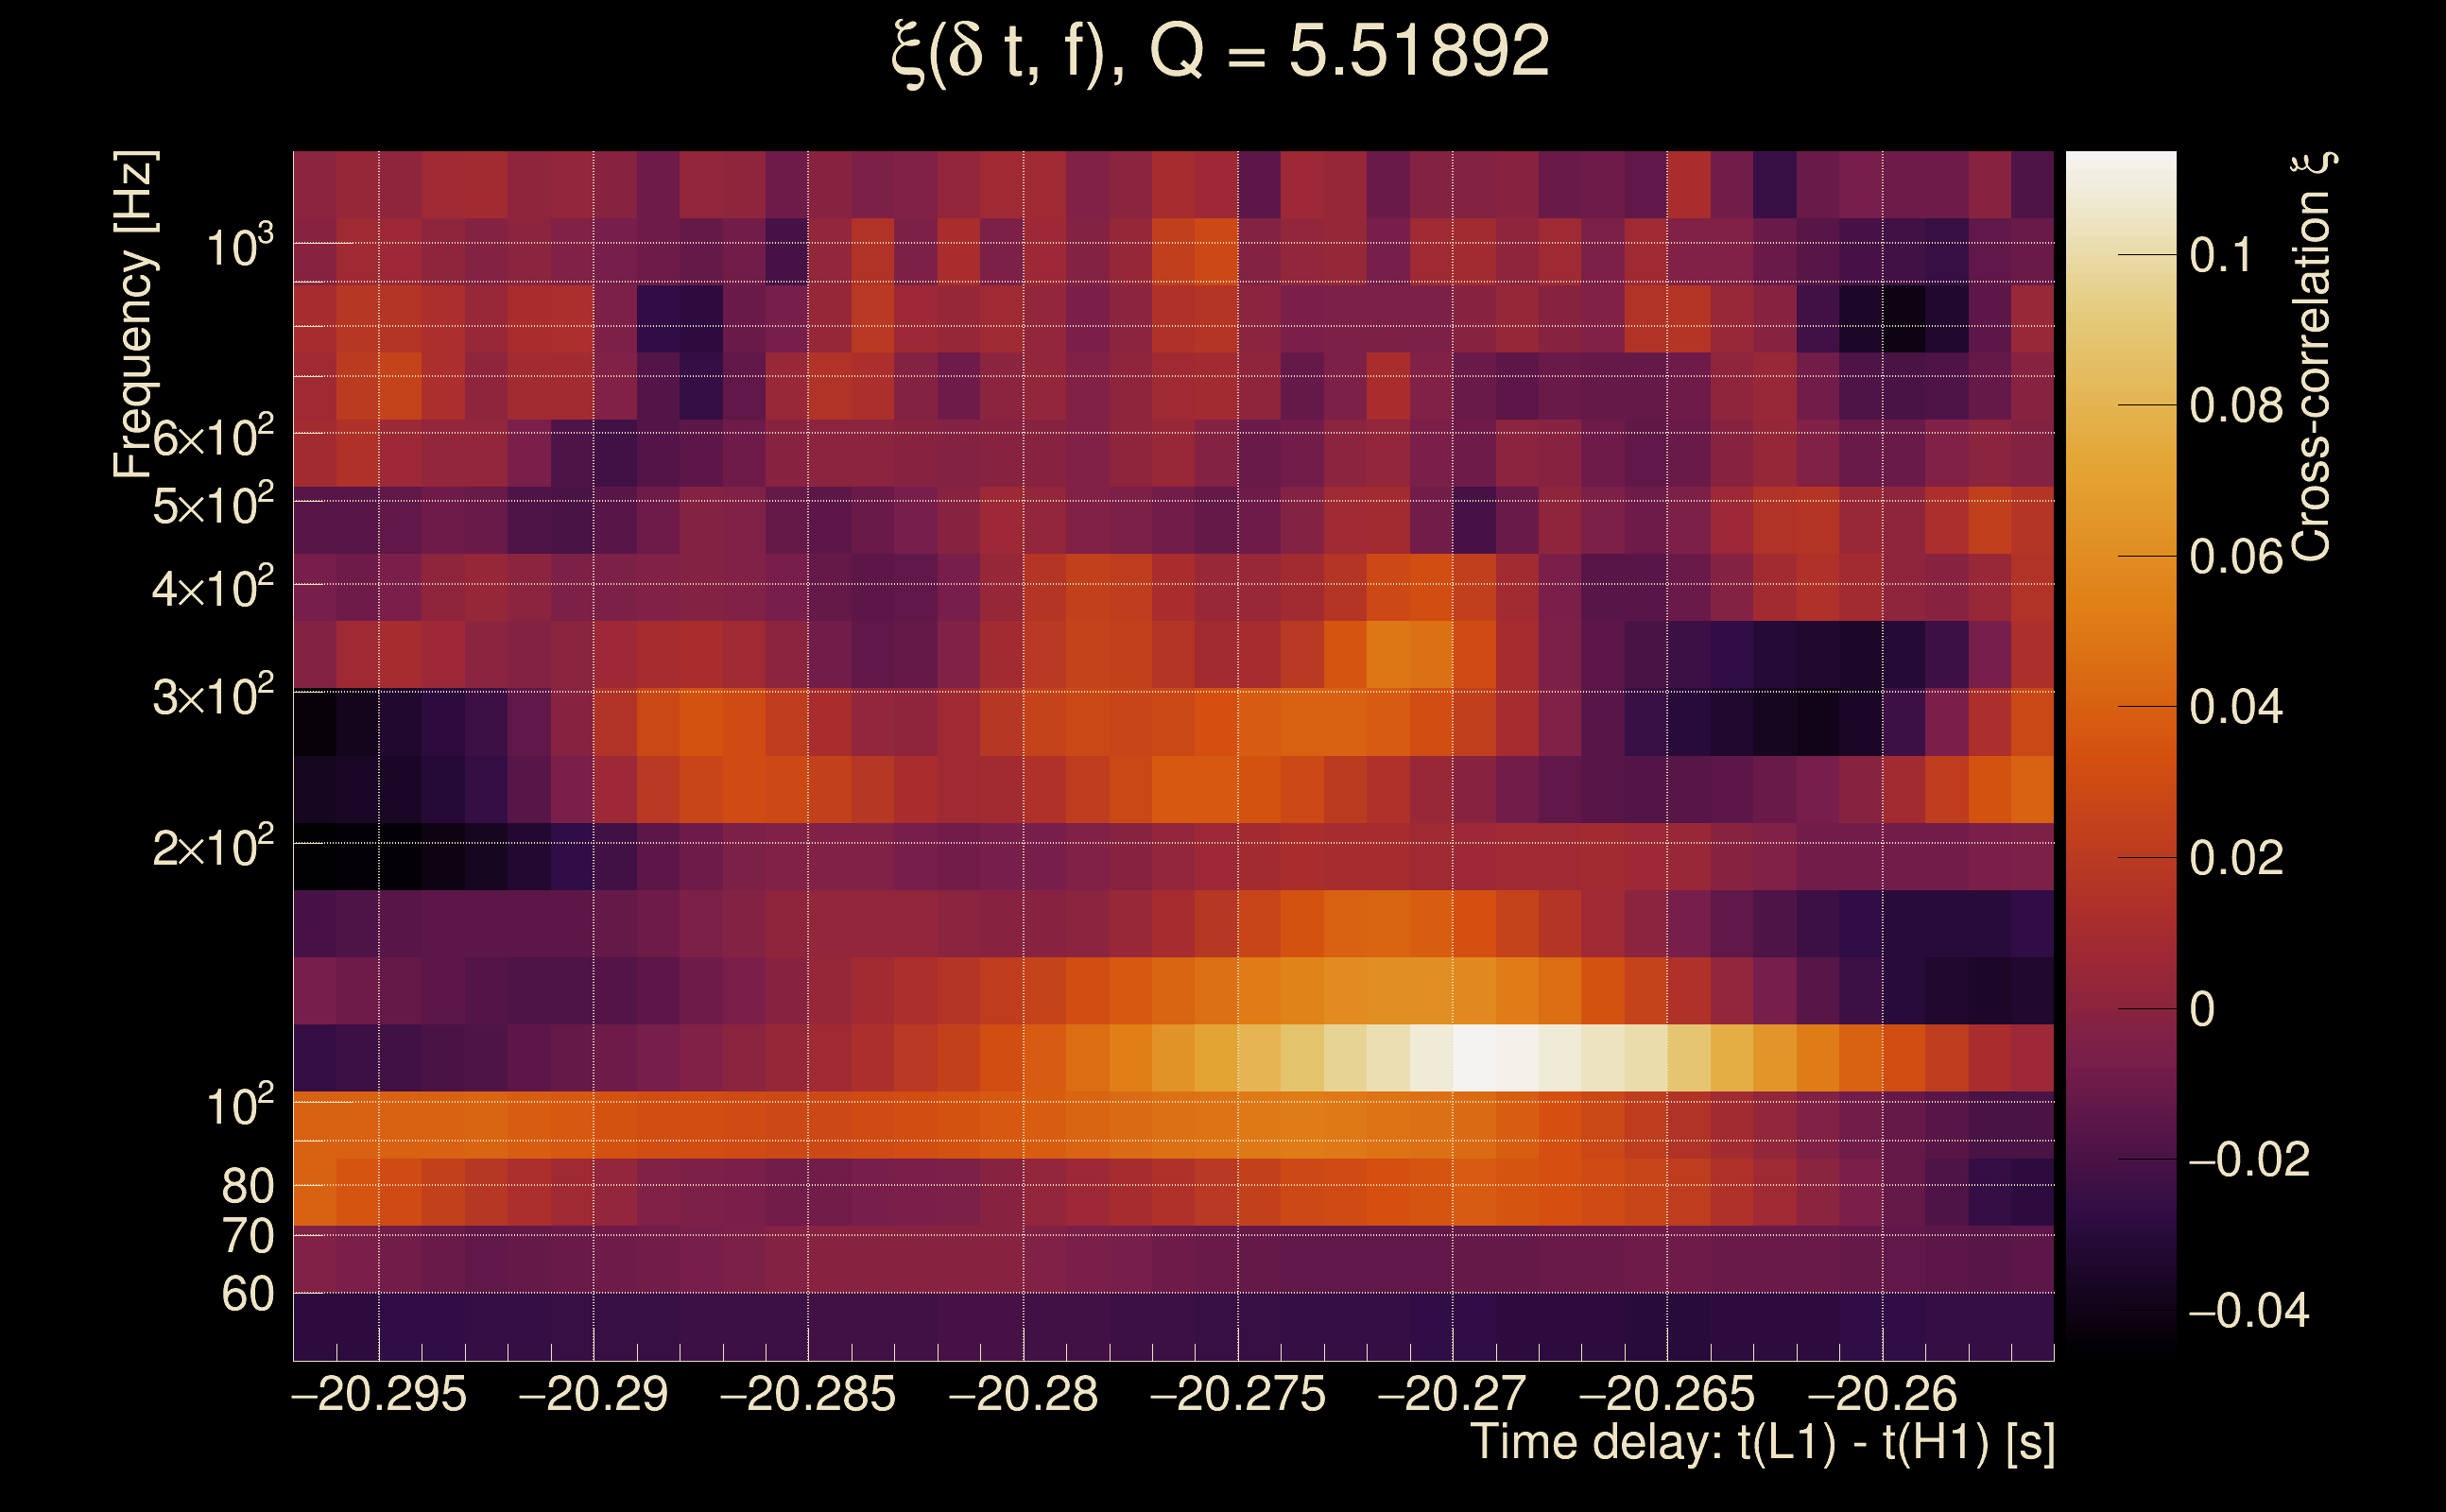
| Event time t(H1): | GPS = 1368195278 (Mon May 15 14:14:20 2023 ) → GPS = 1368195288 (Mon May 15 14:14:30 2023 ) |
| Event time t(L1): | GPS = 1368195258 (Mon May 15 14:14:30 2023 ) → GPS = 1368195268 (Mon May 15 14:14:10 2023 ) |
| Omicron analysis time window (H1): | GPS = 1368195275 → GPS = 1368195291 |
| Omicron analysis time window (L1): | GPS = 1368195255 → GPS = 1368195271 |
| Time delay between detectors t(L1) - t(H1): | -20.2763 s (slice index = 114 / 217), δt_gw = -0.00034252 s |
| Time delay uncertainty: | 0.00680314 s |
| [targeted mode] Time delay probability: | 0.788965 (0.267654 sigmas), δt_target = -0.00213861 s |
| Frequency: | 548.214 Hz |
| Ξ: | 0.00168609 ± 0.051696 (variance = 0.00267248): Q0: 0, Q1: 0, Q2: 0.0872114, Q3: 0.123614, Q4: 0.09726 |
| Rank: | R_A = 0.000792043 |
| Log of amplitude ratio (L1/H1): | 0.826903, variance = 0.693003 (L1/H1: 0.346756, variance = 0.895095, H1/L1: -1.18975, variance = 1.62499) |
| Amplitude ratio (L1/H1): | 2.28623 ⋇ 2.29899 (L1/H1: 1.41447 ⋇ 2.57563, H1/L1: 0.304298 ⋇ 3.57781) |
| Amplitude ratio H1|L1 compatibility (probability): | 0.595401 |
| Antenna factor probability: | 1 |
| Number of rejected frequency rows: | Q0: 18 / 18, Q1: 36 / 36, Q2: 65 / 70, Q3: 123 / 134, Q4: 245 / 258 |
| Maximum signal-to-noise ratio: | H1: 4.90781, L1: 5.64566 |
| SNR variance: | H1: 0.425836, L1: 0.467769 |
| Click here for a zoomed plot | Click here for a zoomed plot | Click here for a zoomed plot | Click here for a zoomed plot | Click here for a zoomed plot |
 |
 |
 |
 |
 |
 |
 |
 |
 |
 |
 |
 |
 |
 |
 |
 |
 |
 |
 |
 |
|
|
|
|
|
 |
 |
 |
 |
 |
 |
 |
 |
 |
| Event time t(H1): | GPS = 1368195323 (Mon May 15 14:15:05 2023 ) → GPS = 1368195333 (Mon May 15 14:15:15 2023 ) |
| Event time t(L1): | GPS = 1368195313 (Mon May 15 14:15:15 2023 ) → GPS = 1368195323 (Mon May 15 14:15:05 2023 ) |
| Omicron analysis time window (H1): | GPS = 1368195320 → GPS = 1368195336 |
| Omicron analysis time window (L1): | GPS = 1368195310 → GPS = 1368195326 |
| Time delay between detectors t(L1) - t(H1): | -14.3251 s (slice index = 202 / 217), δt_gw = -0.00112606 s |
| Time delay uncertainty: | 0.00511392 s |
| [targeted mode] Time delay probability: | 0.843045 (0.198001 sigmas), δt_target = -0.00216341 s |
| Frequency: | 453.525 Hz |
| Ξ: | 0.00100662 ± 0.0364484 (variance = 0.00132849): Q0: 0, Q1: 0, Q2: 0.0465635, Q3: 0.0971014, Q4: 0.0519434 |
| Rank: | R_A = 0.000790182 |
| Log of amplitude ratio (L1/H1): | 0.523363, variance = 0.480003 (L1/H1: 0.469314, variance = 0.658184, H1/L1: -0.594288, variance = 1.43293) |
| Amplitude ratio (L1/H1): | 1.68769 ⋇ 1.99935 (L1/H1: 1.5989 ⋇ 2.2508, H1/L1: 0.551956 ⋇ 3.31034) |
| Amplitude ratio H1|L1 compatibility (probability): | 0.93113 |
| Antenna factor probability: | 1 |
| Number of rejected frequency rows: | Q0: 18 / 18, Q1: 36 / 36, Q2: 67 / 70, Q3: 120 / 134, Q4: 251 / 258 |
| Maximum signal-to-noise ratio: | H1: 5.75287, L1: 5.02203 |
| SNR variance: | H1: 0.478788, L1: 0.496313 |
| Click here for a zoomed plot | Click here for a zoomed plot | Click here for a zoomed plot | Click here for a zoomed plot | Click here for a zoomed plot |
 |
 |
 |
 |
 |
 |
 |
 |
 |
 |
 |
 |
 |
 |
 |
|
|
|
|
|
 |
 |
 |
 |
 |
 |
 |
 |
 |
 |
 |
 |
 |
 |
| Event time t(H1): | GPS = 1368195323 (Mon May 15 14:15:05 2023 ) → GPS = 1368195333 (Mon May 15 14:15:15 2023 ) |
| Event time t(L1): | GPS = 1368195313 (Mon May 15 14:15:15 2023 ) → GPS = 1368195323 (Mon May 15 14:15:05 2023 ) |
| Omicron analysis time window (H1): | GPS = 1368195320 → GPS = 1368195336 |
| Omicron analysis time window (L1): | GPS = 1368195310 → GPS = 1368195326 |
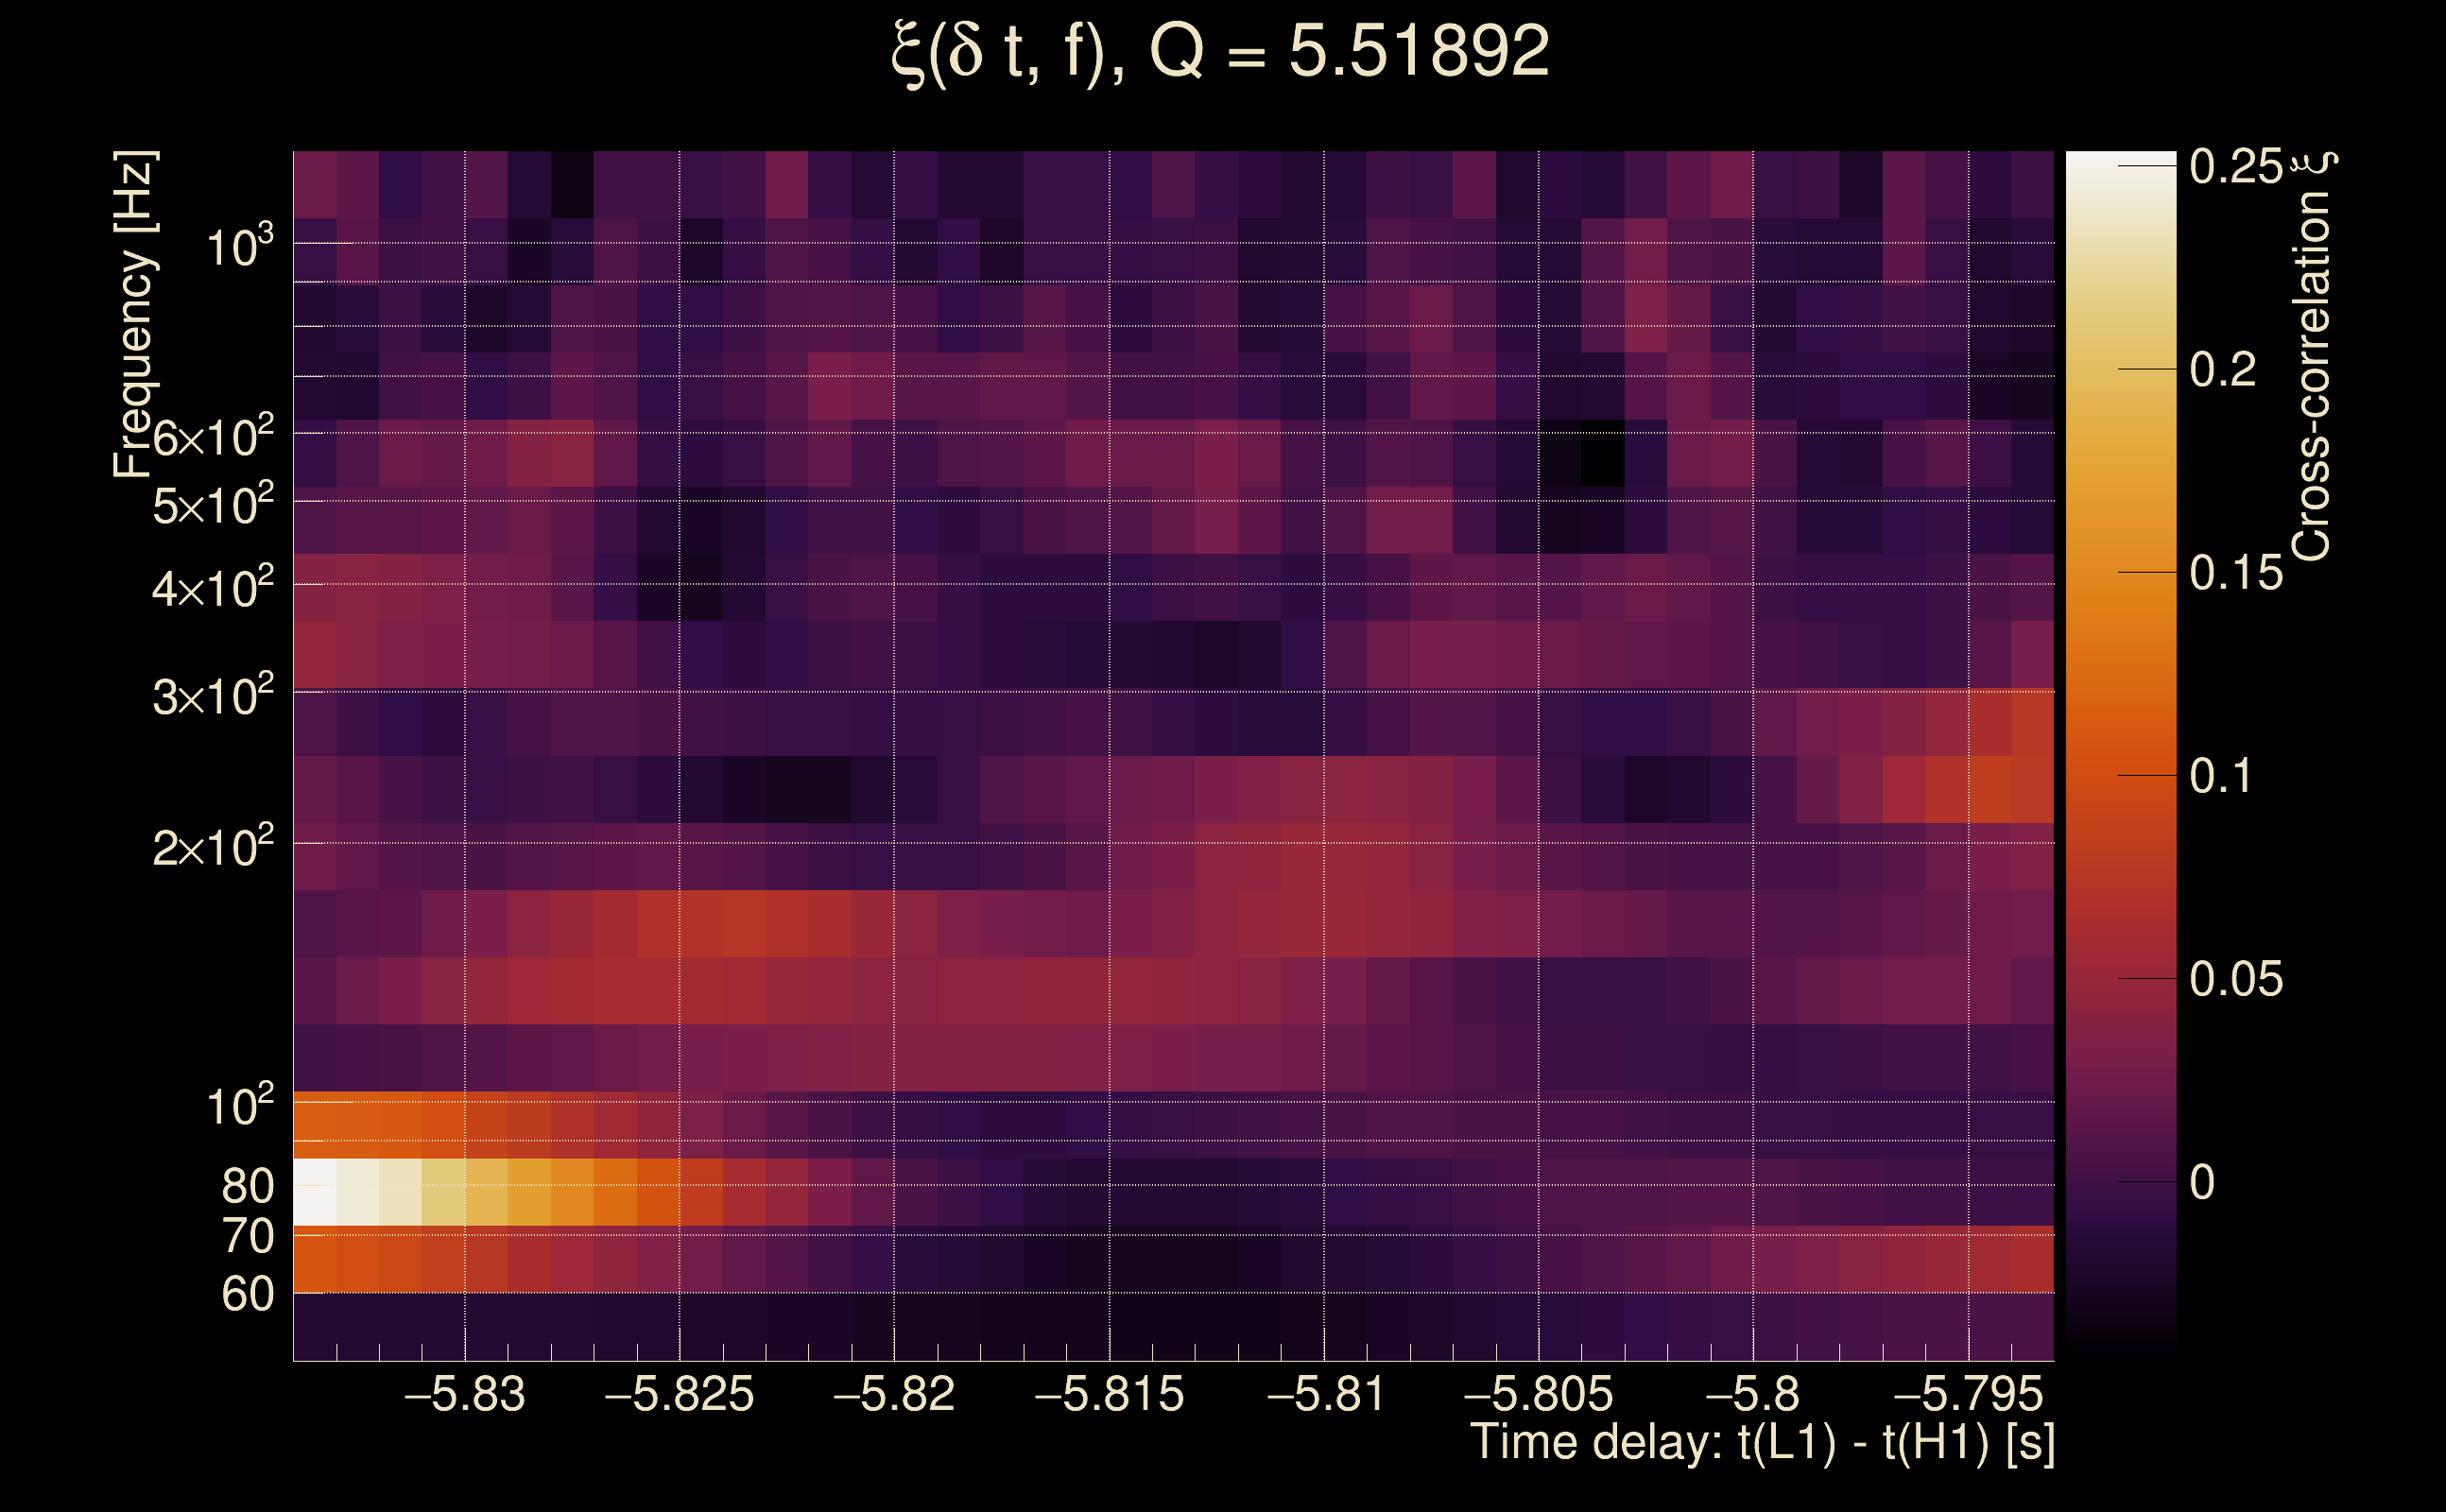
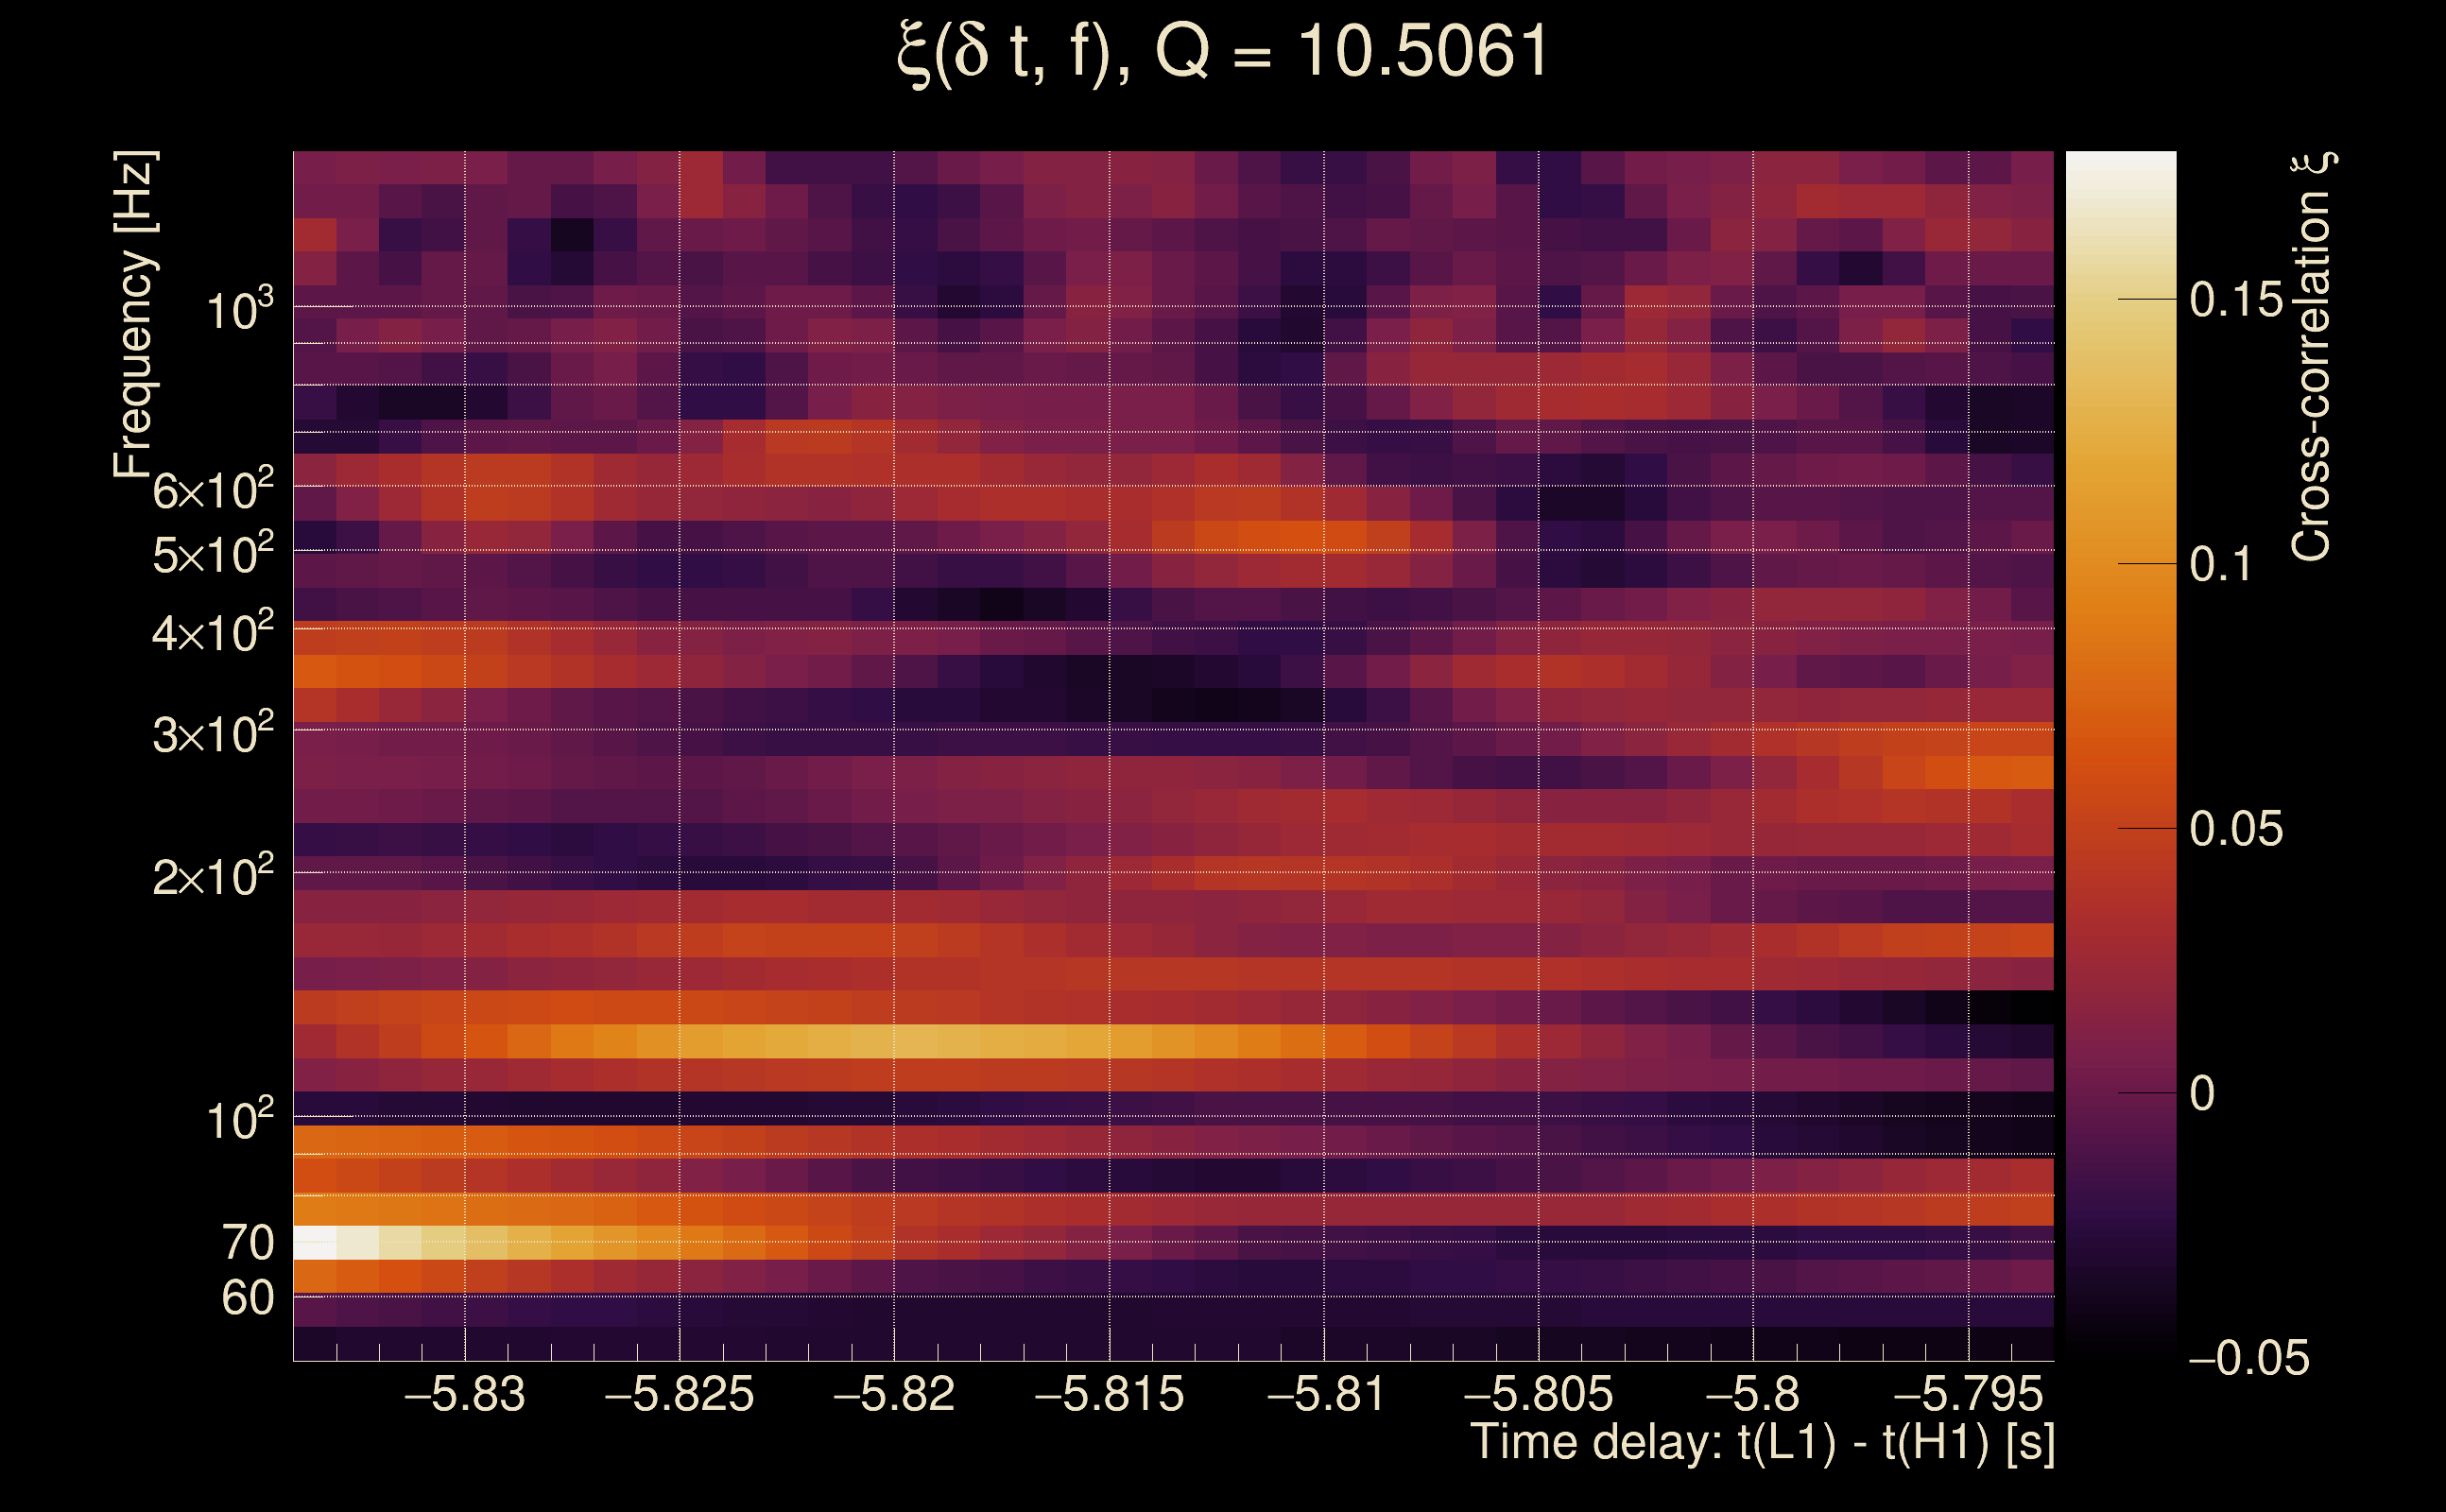
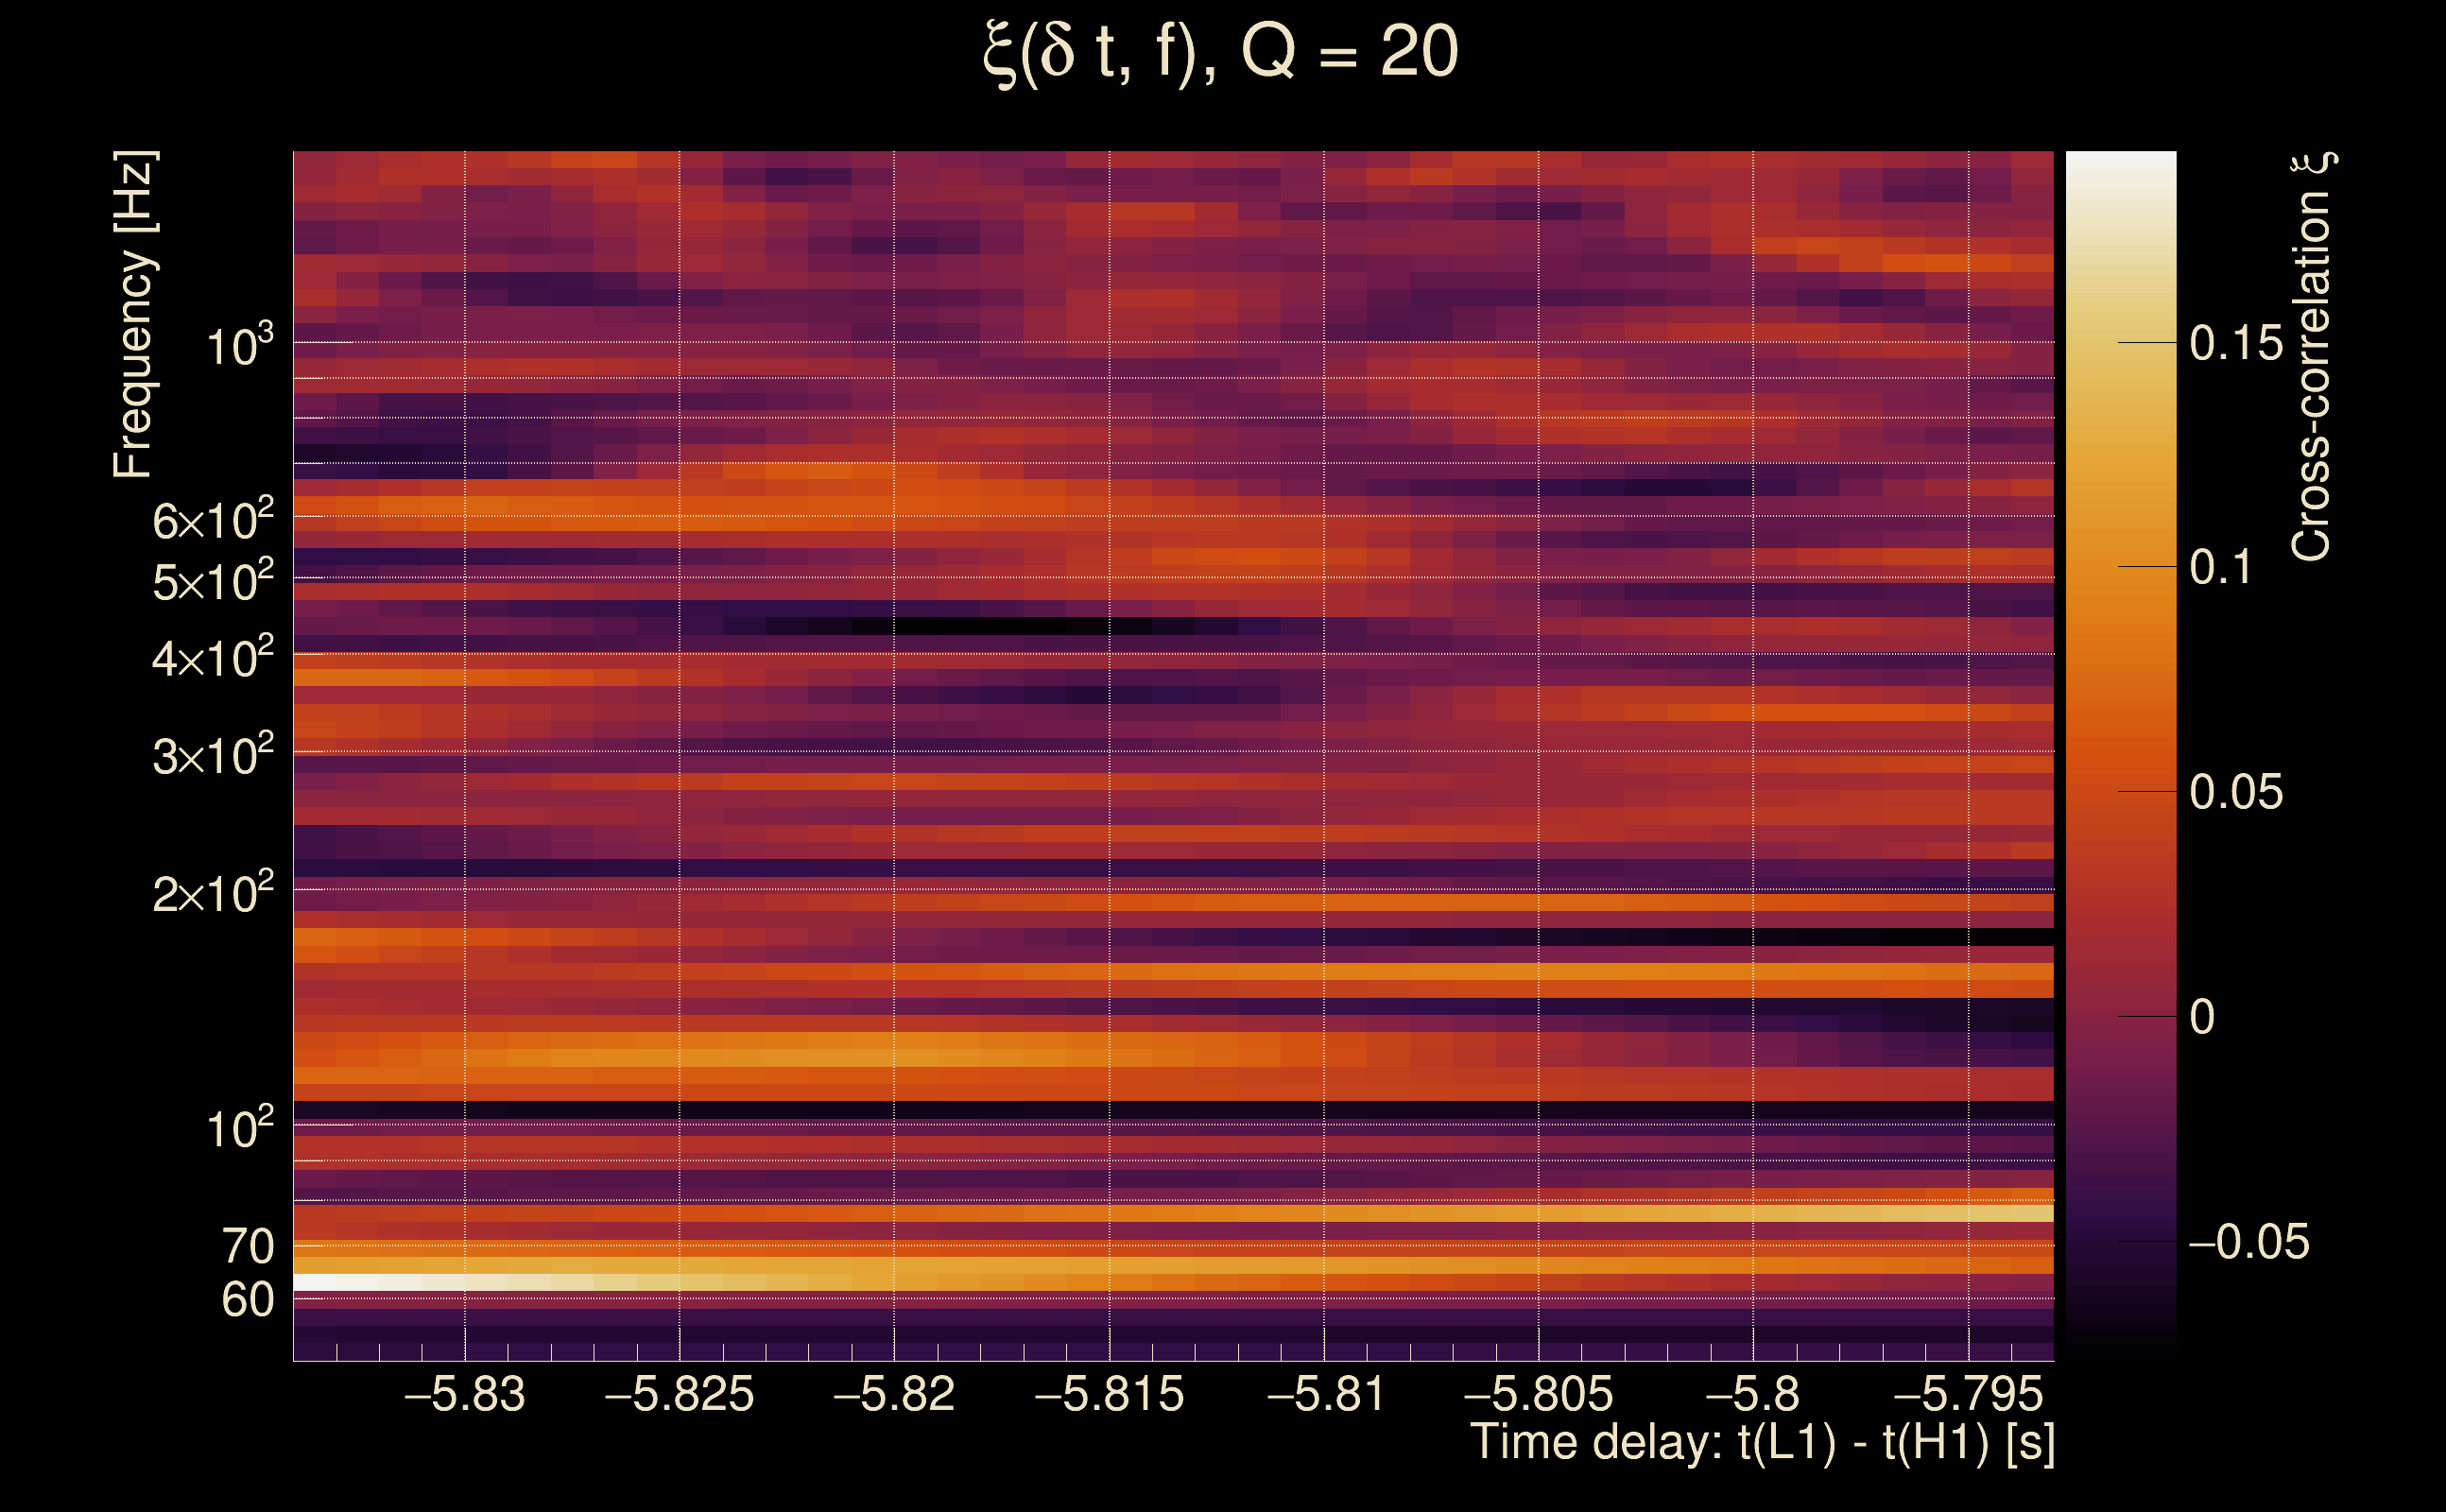
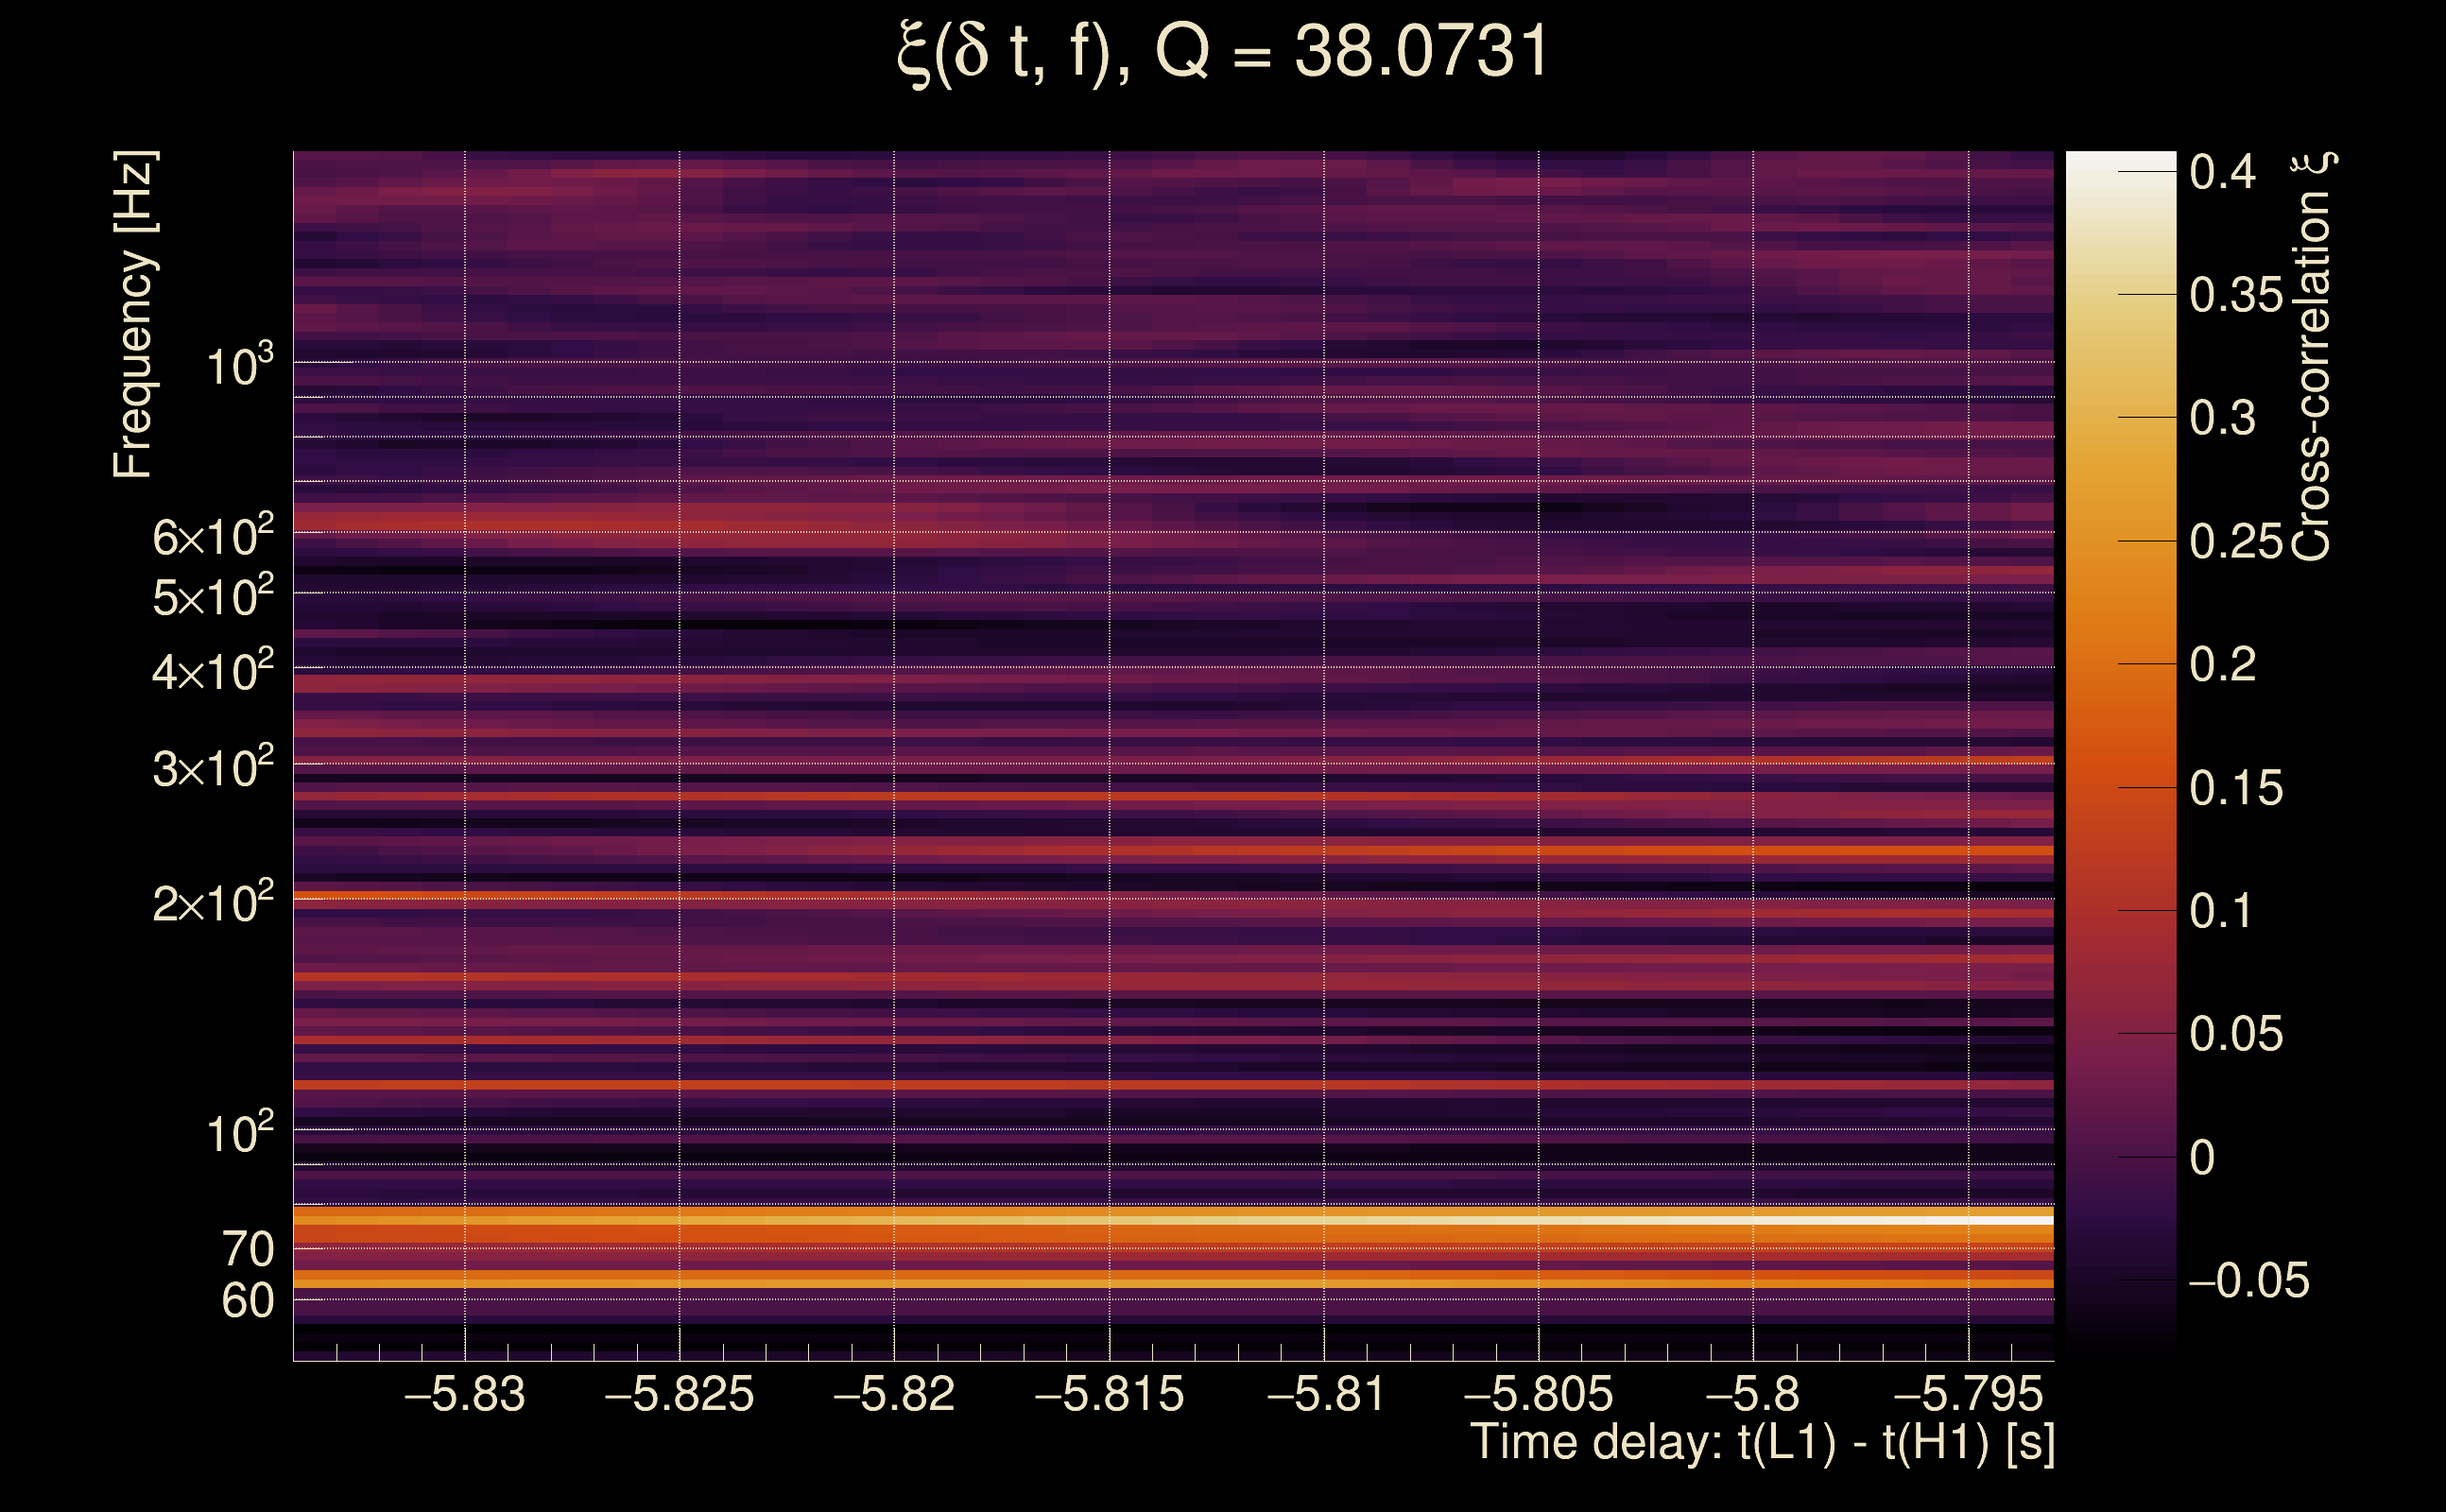
| Time delay between detectors t(L1) - t(H1): | -5.81382 s (slice index = 17 / 217), δt_gw = 0.000182843 s |
| Time delay uncertainty: | 0.00841071 s |
| [targeted mode] Time delay probability: | 0.782539 (0.276012 sigmas), δt_target = -0.00213861 s |
| Frequency: | 365.197 Hz |
| Ξ: | 0.00132748 ± 0.0613982 (variance = 0.00376974): Q0: 0, Q1: 0, Q2: 0.157142, Q3: 0.0486508, Q4: 0.105945 |
| Rank: | R_A = 0.00078216 |
| Log of amplitude ratio (L1/H1): | 0.67028, variance = 0.622752 (L1/H1: 0.444948, variance = 0.816533, H1/L1: -0.965968, variance = 1.92346) |
| Amplitude ratio (L1/H1): | 1.95479 ⋇ 2.20152 (L1/H1: 1.56041 ⋇ 2.46853, H1/L1: 0.380615 ⋇ 4.00238) |
| Amplitude ratio H1|L1 compatibility (probability): | 0.752944 |
| Antenna factor probability: | 1 |
| Number of rejected frequency rows: | Q0: 18 / 18, Q1: 36 / 36, Q2: 67 / 70, Q3: 122 / 134, Q4: 248 / 258 |
| Maximum signal-to-noise ratio: | H1: 5.75287, L1: 5.02203 |
| SNR variance: | H1: 0.478788, L1: 0.496313 |
| Click here for a zoomed plot | Click here for a zoomed plot | Click here for a zoomed plot | Click here for a zoomed plot | Click here for a zoomed plot |
|
|
|
|
|
|
|
|
|
|
|
|
|
|
|
|
|
|
|
|
|
|
|
|
|
 |
 |
 |
 |
 |
 |
 |
 |
 |
| Event time t(H1): | GPS = 1368195283 (Mon May 15 14:14:25 2023 ) → GPS = 1368195293 (Mon May 15 14:14:35 2023 ) |
| Event time t(L1): | GPS = 1368195263 (Mon May 15 14:14:35 2023 ) → GPS = 1368195273 (Mon May 15 14:14:15 2023 ) |
| Omicron analysis time window (H1): | GPS = 1368195280 → GPS = 1368195296 |
| Omicron analysis time window (L1): | GPS = 1368195260 → GPS = 1368195276 |
| Time delay between detectors t(L1) - t(H1): | -20.8746 s (slice index = 127 / 217), δt_gw = -0.000636784 s |
| Time delay uncertainty: | 0.0079655 s |
| [targeted mode] Time delay probability: | 0.848294 (0.191296 sigmas), δt_target = -0.00213861 s |
| Frequency: | 850.975 Hz |
| Ξ: | 0.00133054 ± 0.0248684 (variance = 0.000618439): Q0: 0, Q1: 0.0388299, Q2: 0.0601257, Q3: 0.0727489, Q4: 0.050635 |
| Rank: | R_A = 0.000771159 |
| Log of amplitude ratio (L1/H1): | 0.344152, variance = 0.576572 (L1/H1: -0.0350397, variance = 1.64058, H1/L1: -0.610436, variance = 0.861649) |
| Amplitude ratio (L1/H1): | 1.41079 ⋇ 2.13683 (L1/H1: 0.965567 ⋇ 3.5997, H1/L1: 0.543114 ⋇ 2.53008) |
| Amplitude ratio H1|L1 compatibility (probability): | 0.683235 |
| Antenna factor probability: | 1 |
| Number of rejected frequency rows: | Q0: 18 / 18, Q1: 34 / 36, Q2: 66 / 70, Q3: 127 / 134, Q4: 248 / 258 |
| Maximum signal-to-noise ratio: | H1: 4.68794, L1: 5.59422 |
| SNR variance: | H1: 0.439115, L1: 0.469644 |
| Click here for a zoomed plot | Click here for a zoomed plot | Click here for a zoomed plot | Click here for a zoomed plot | Click here for a zoomed plot |
|
|
|
|
|
|
|
|
|
|
|
|
|
|
|
|
|
|
|
|
|
|
|
|
|
 |
 |
 |
 |
 |
 |
 |
 |
 |
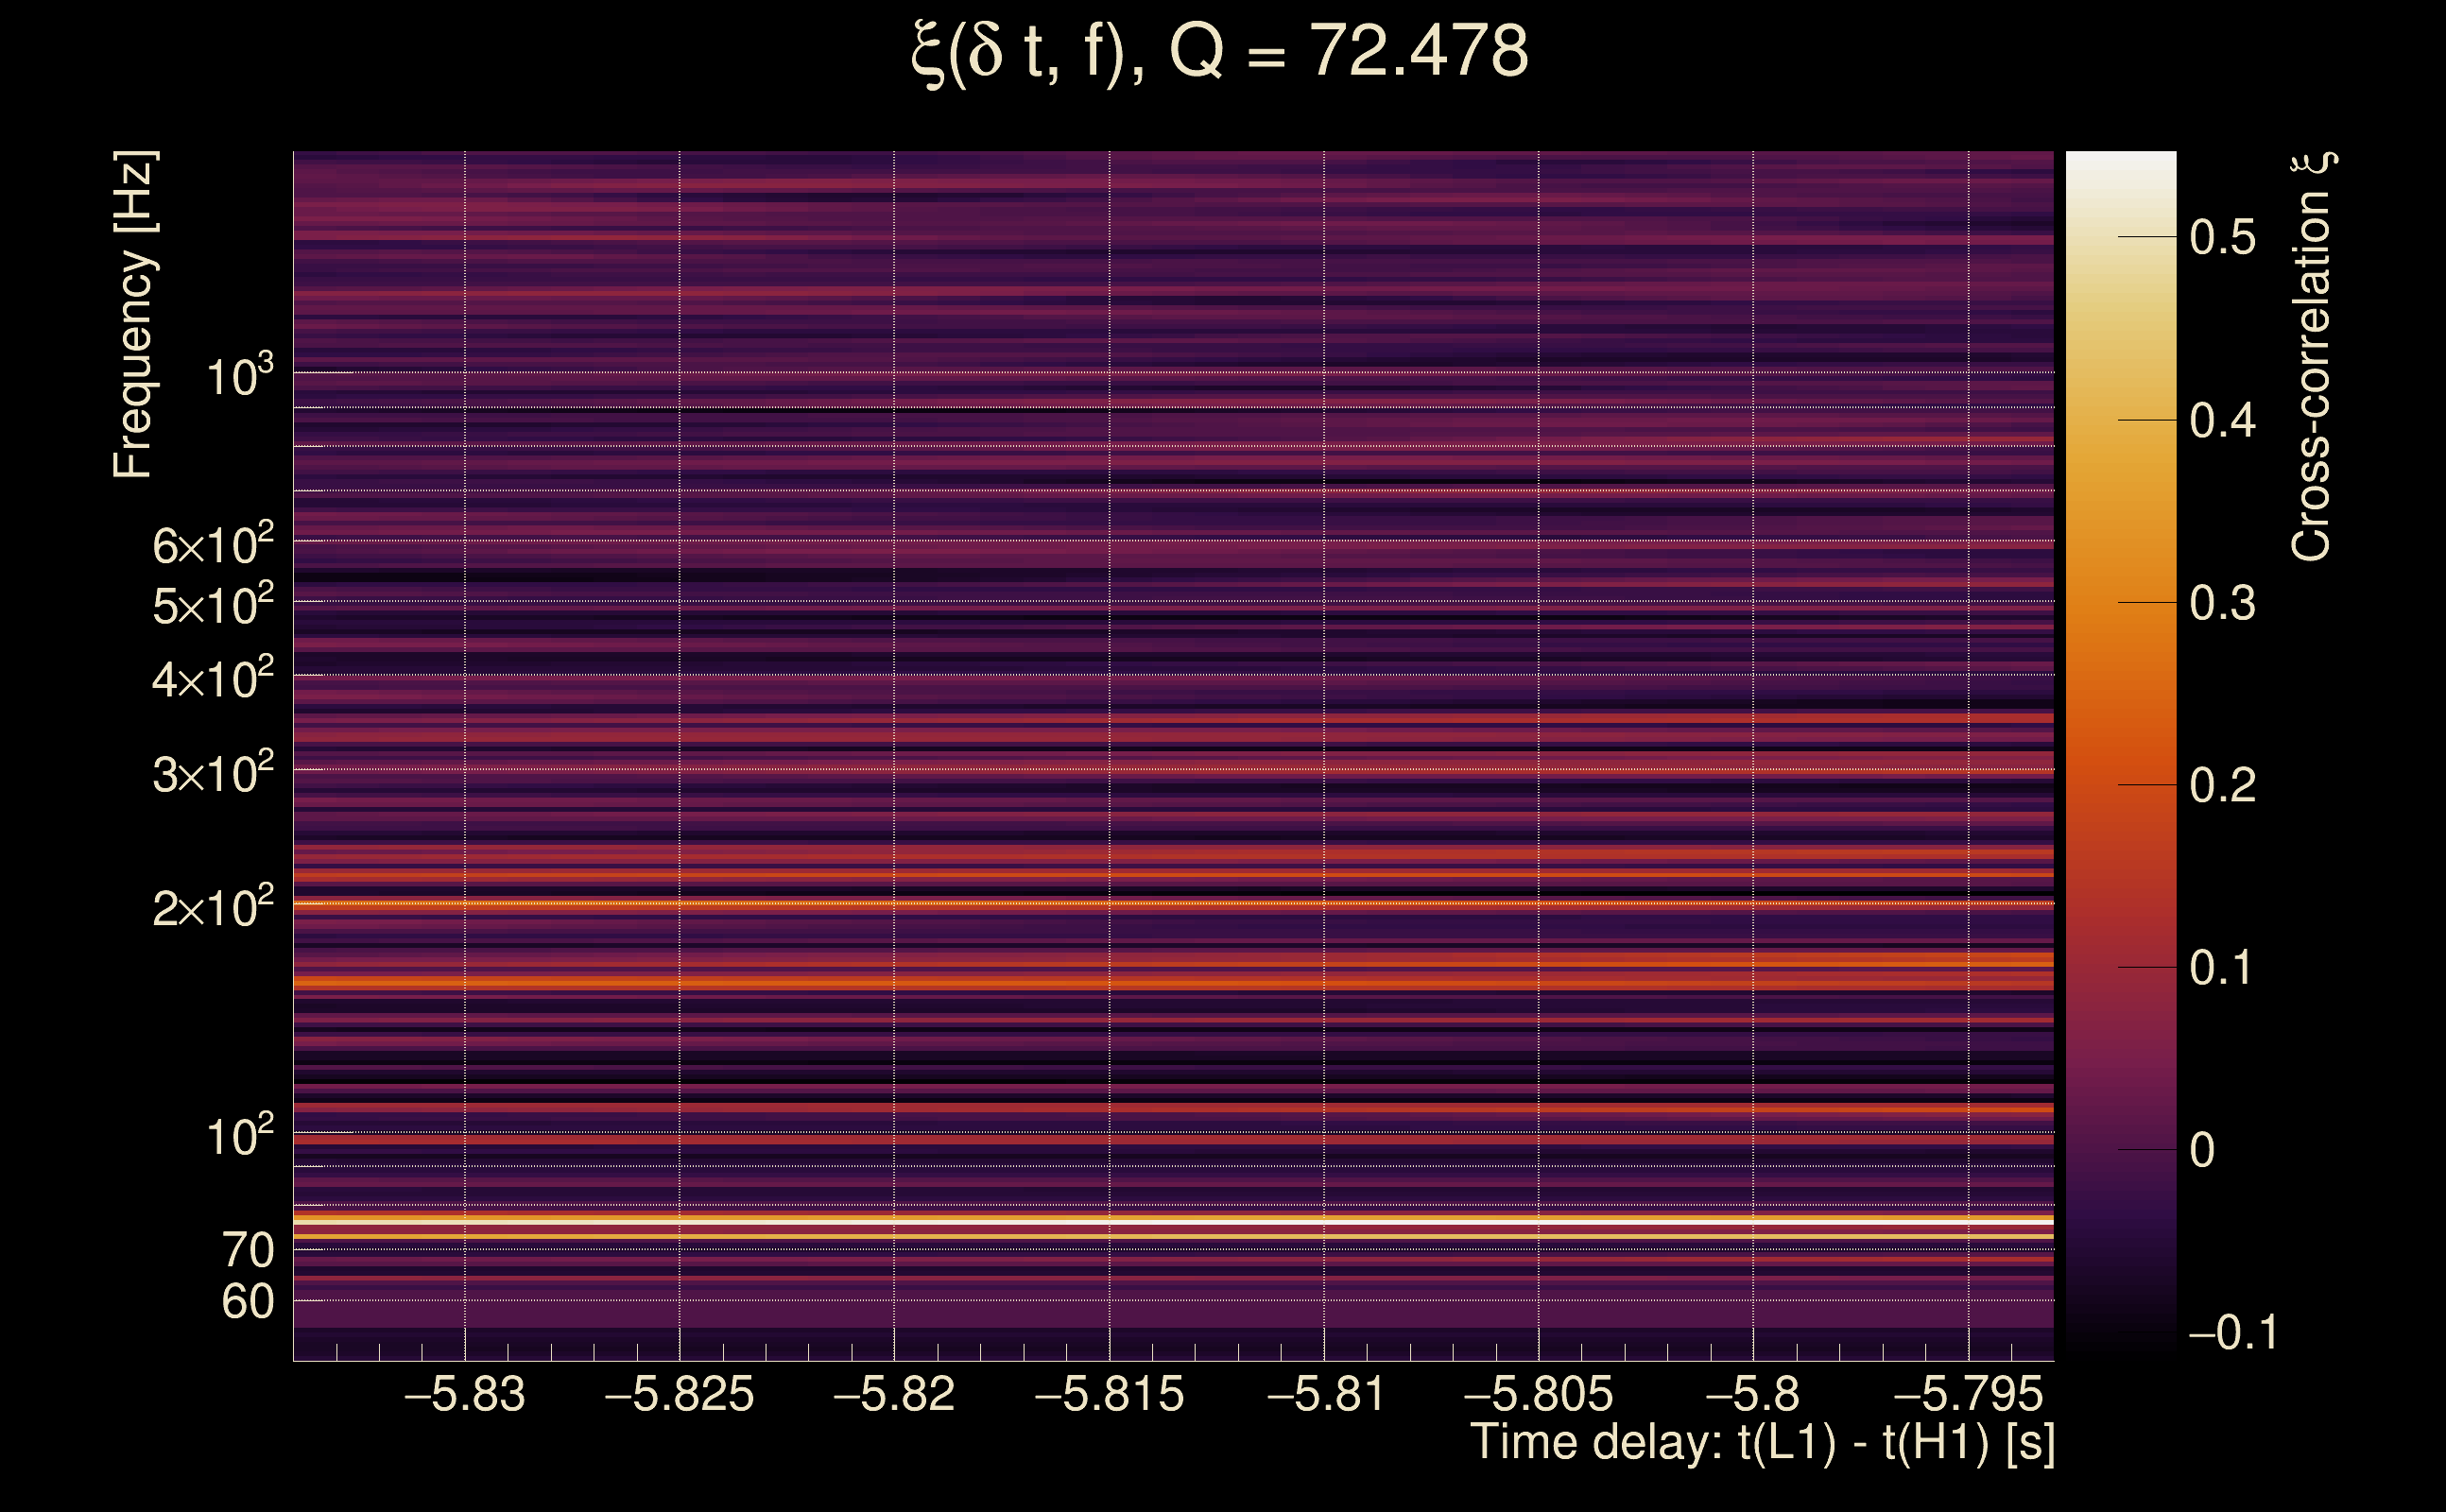
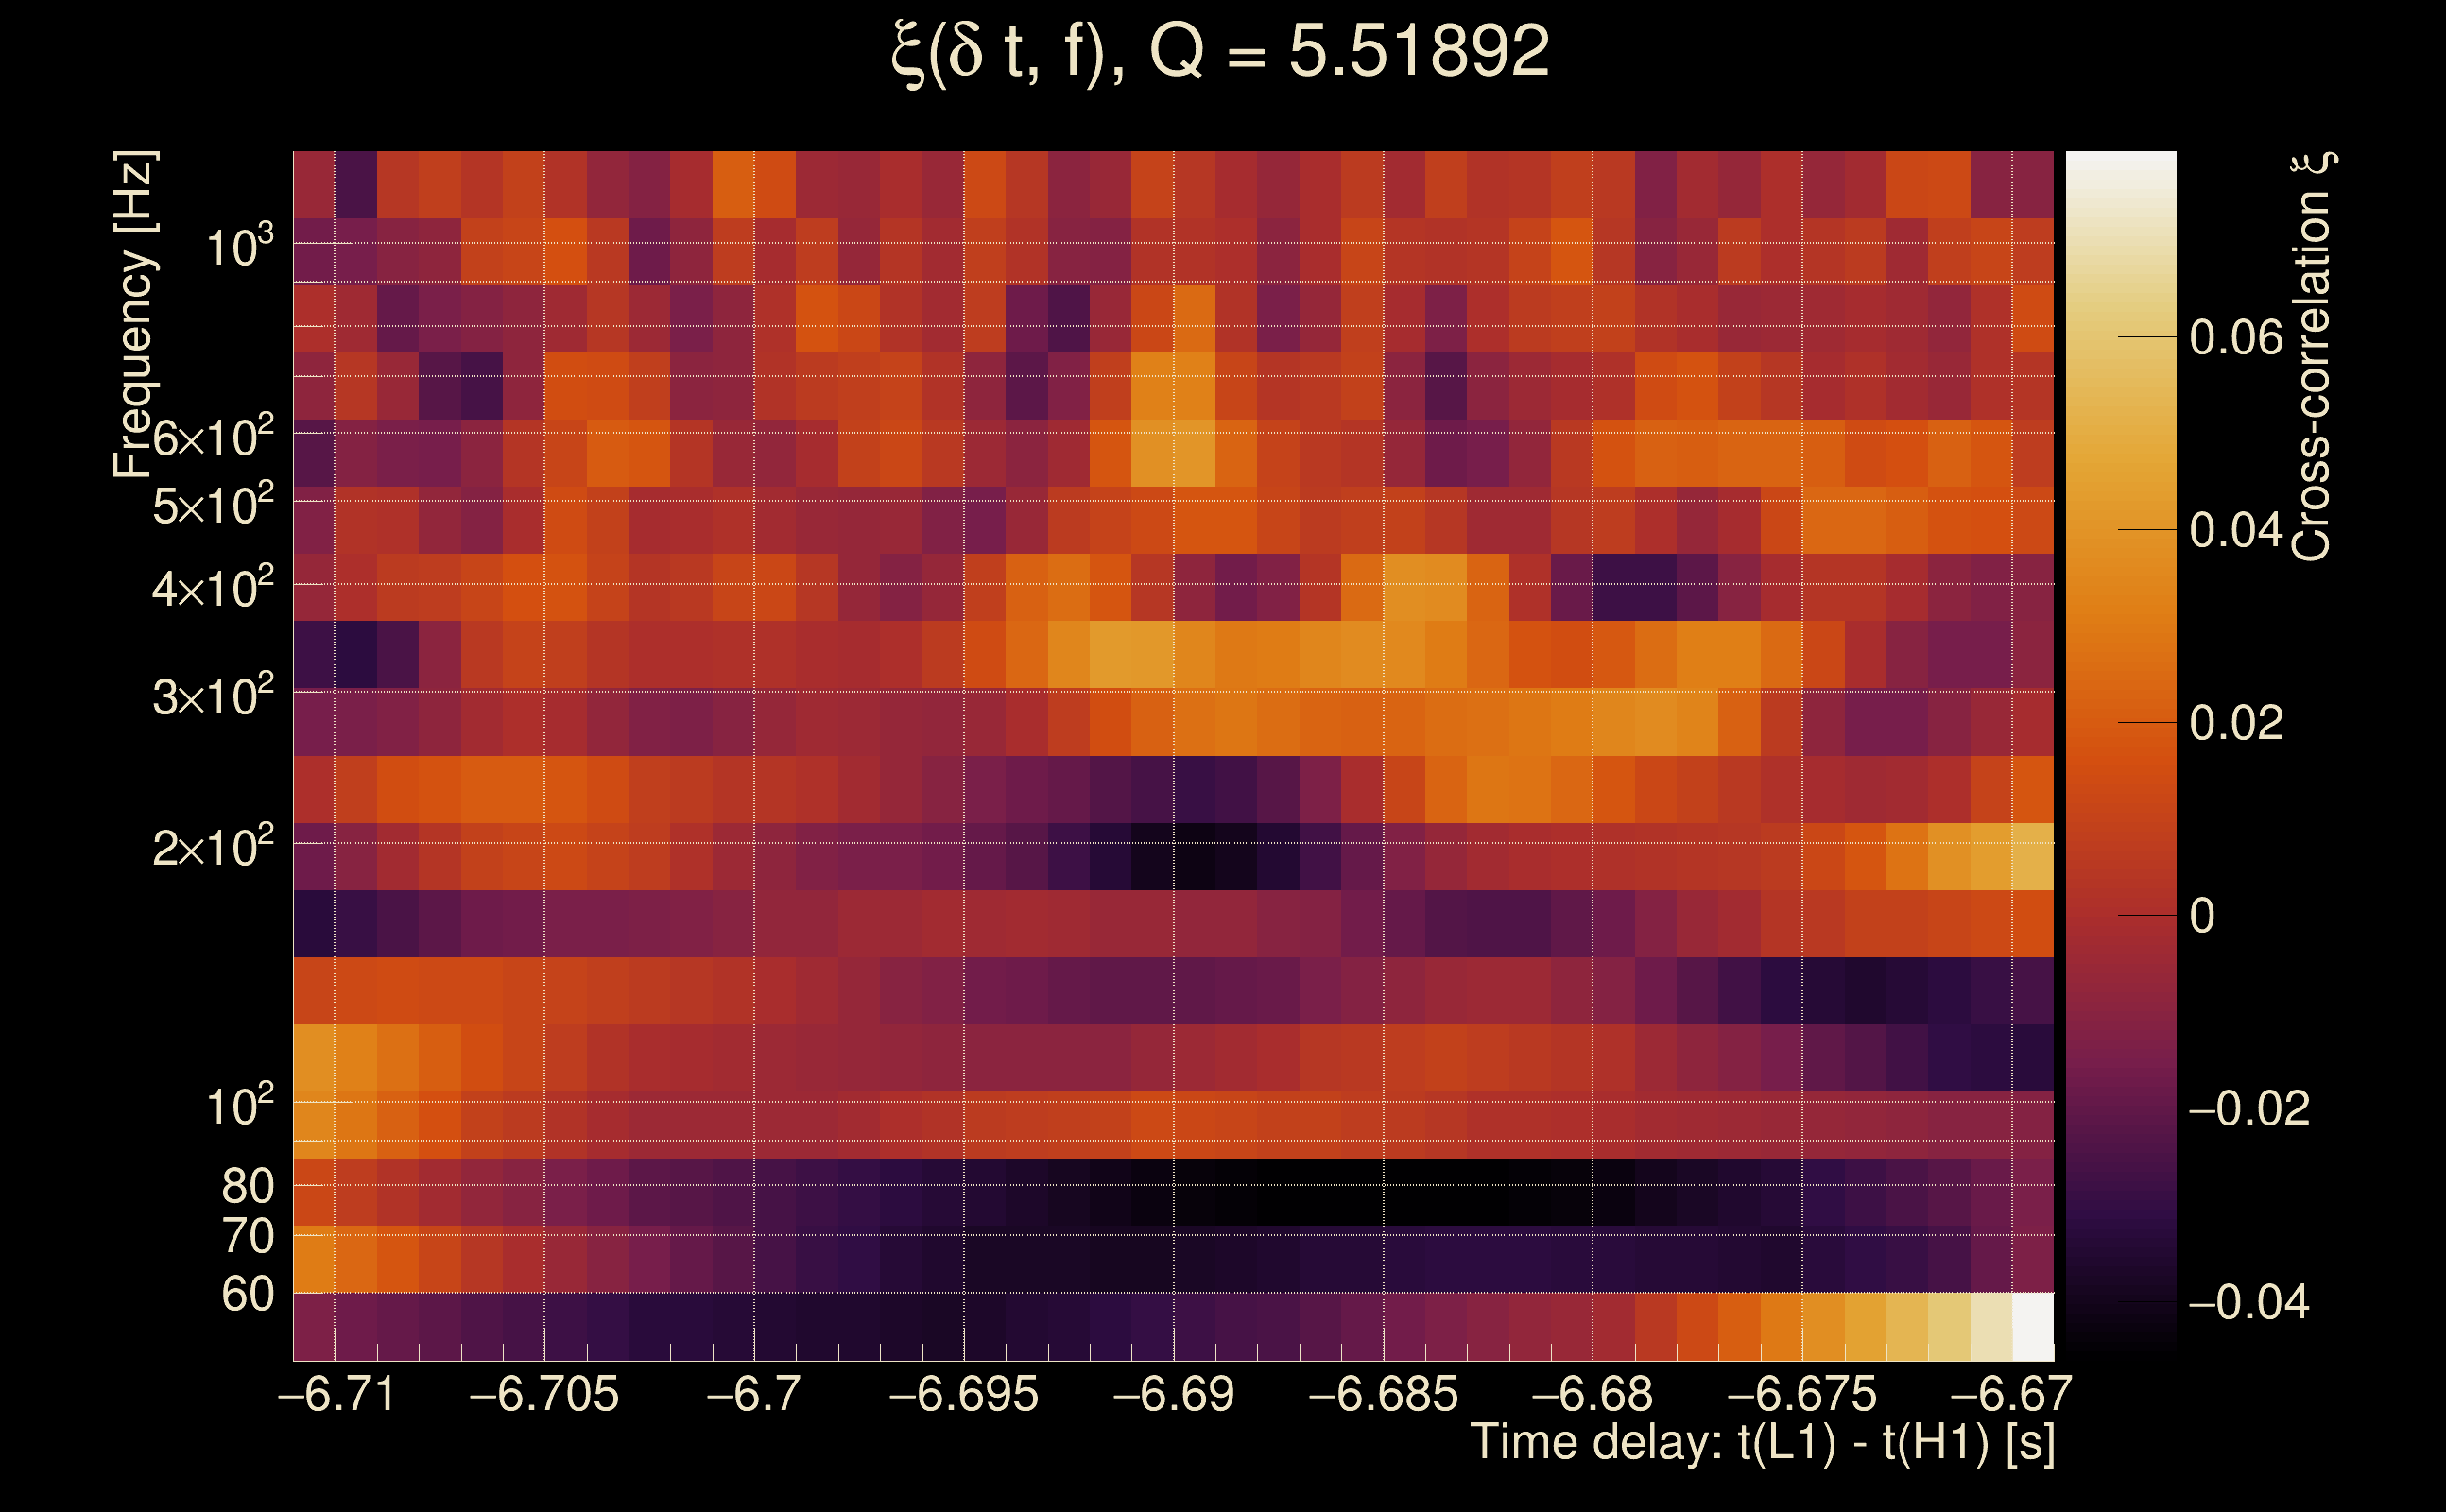
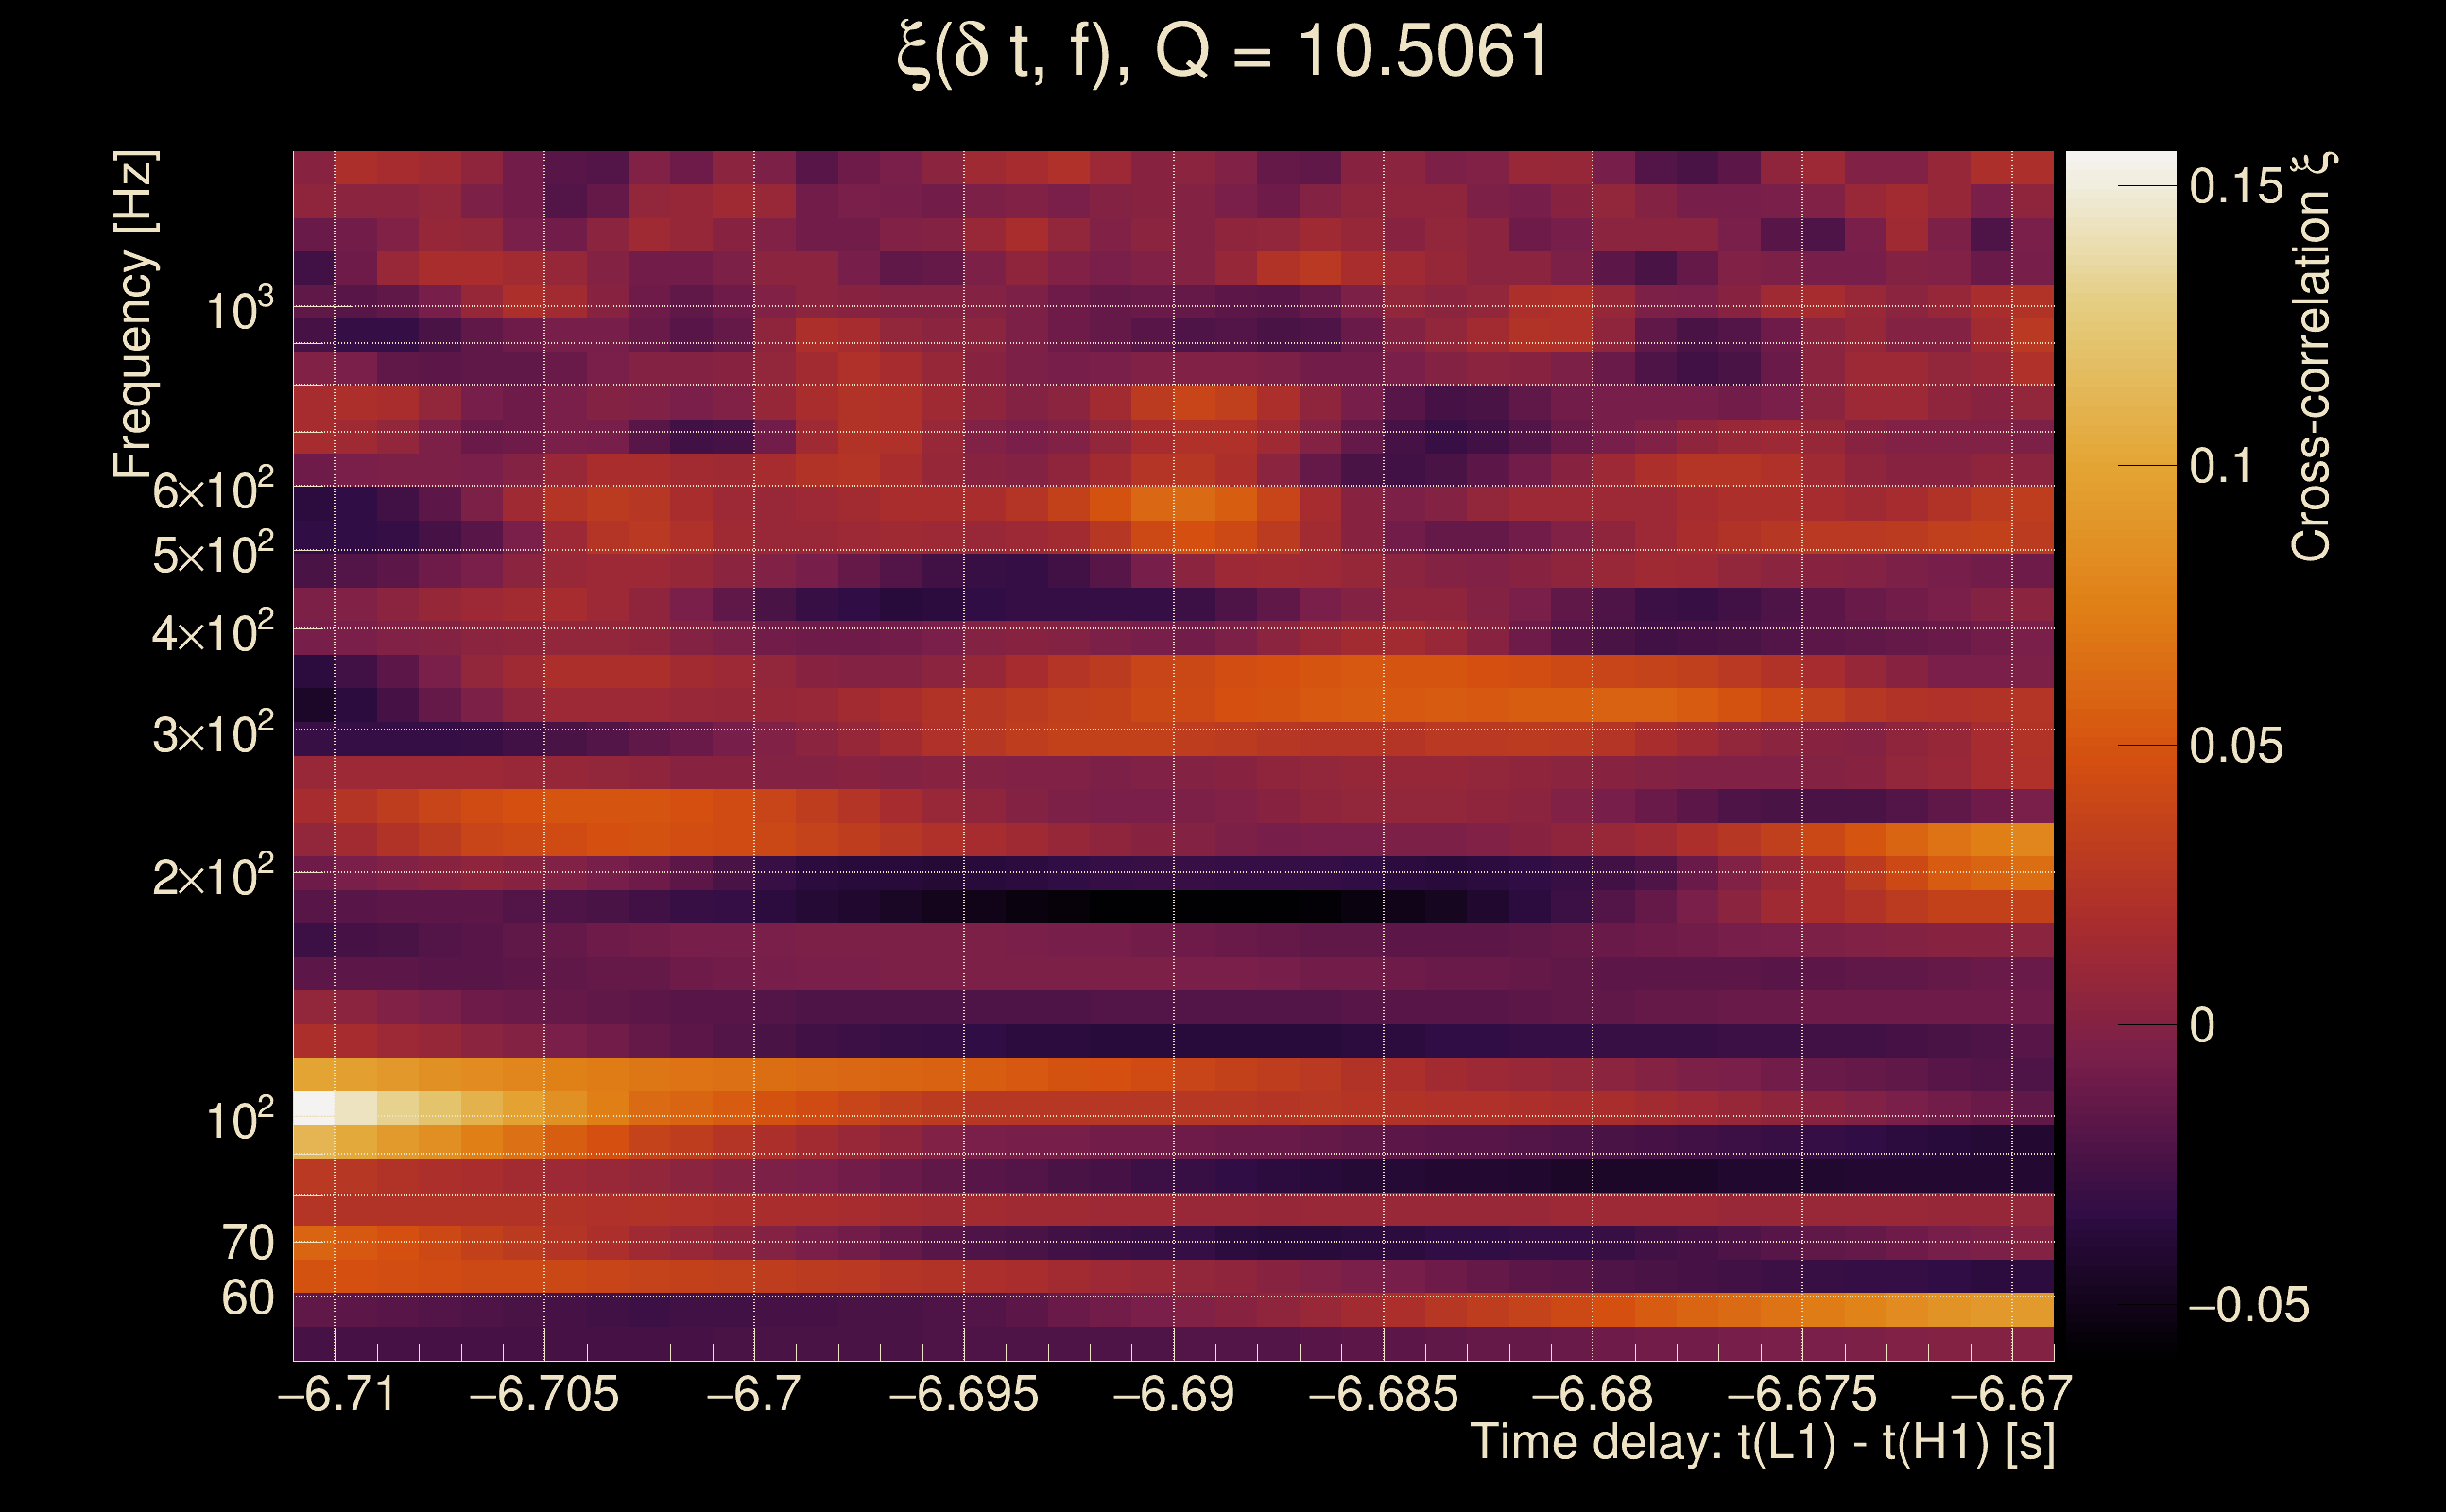
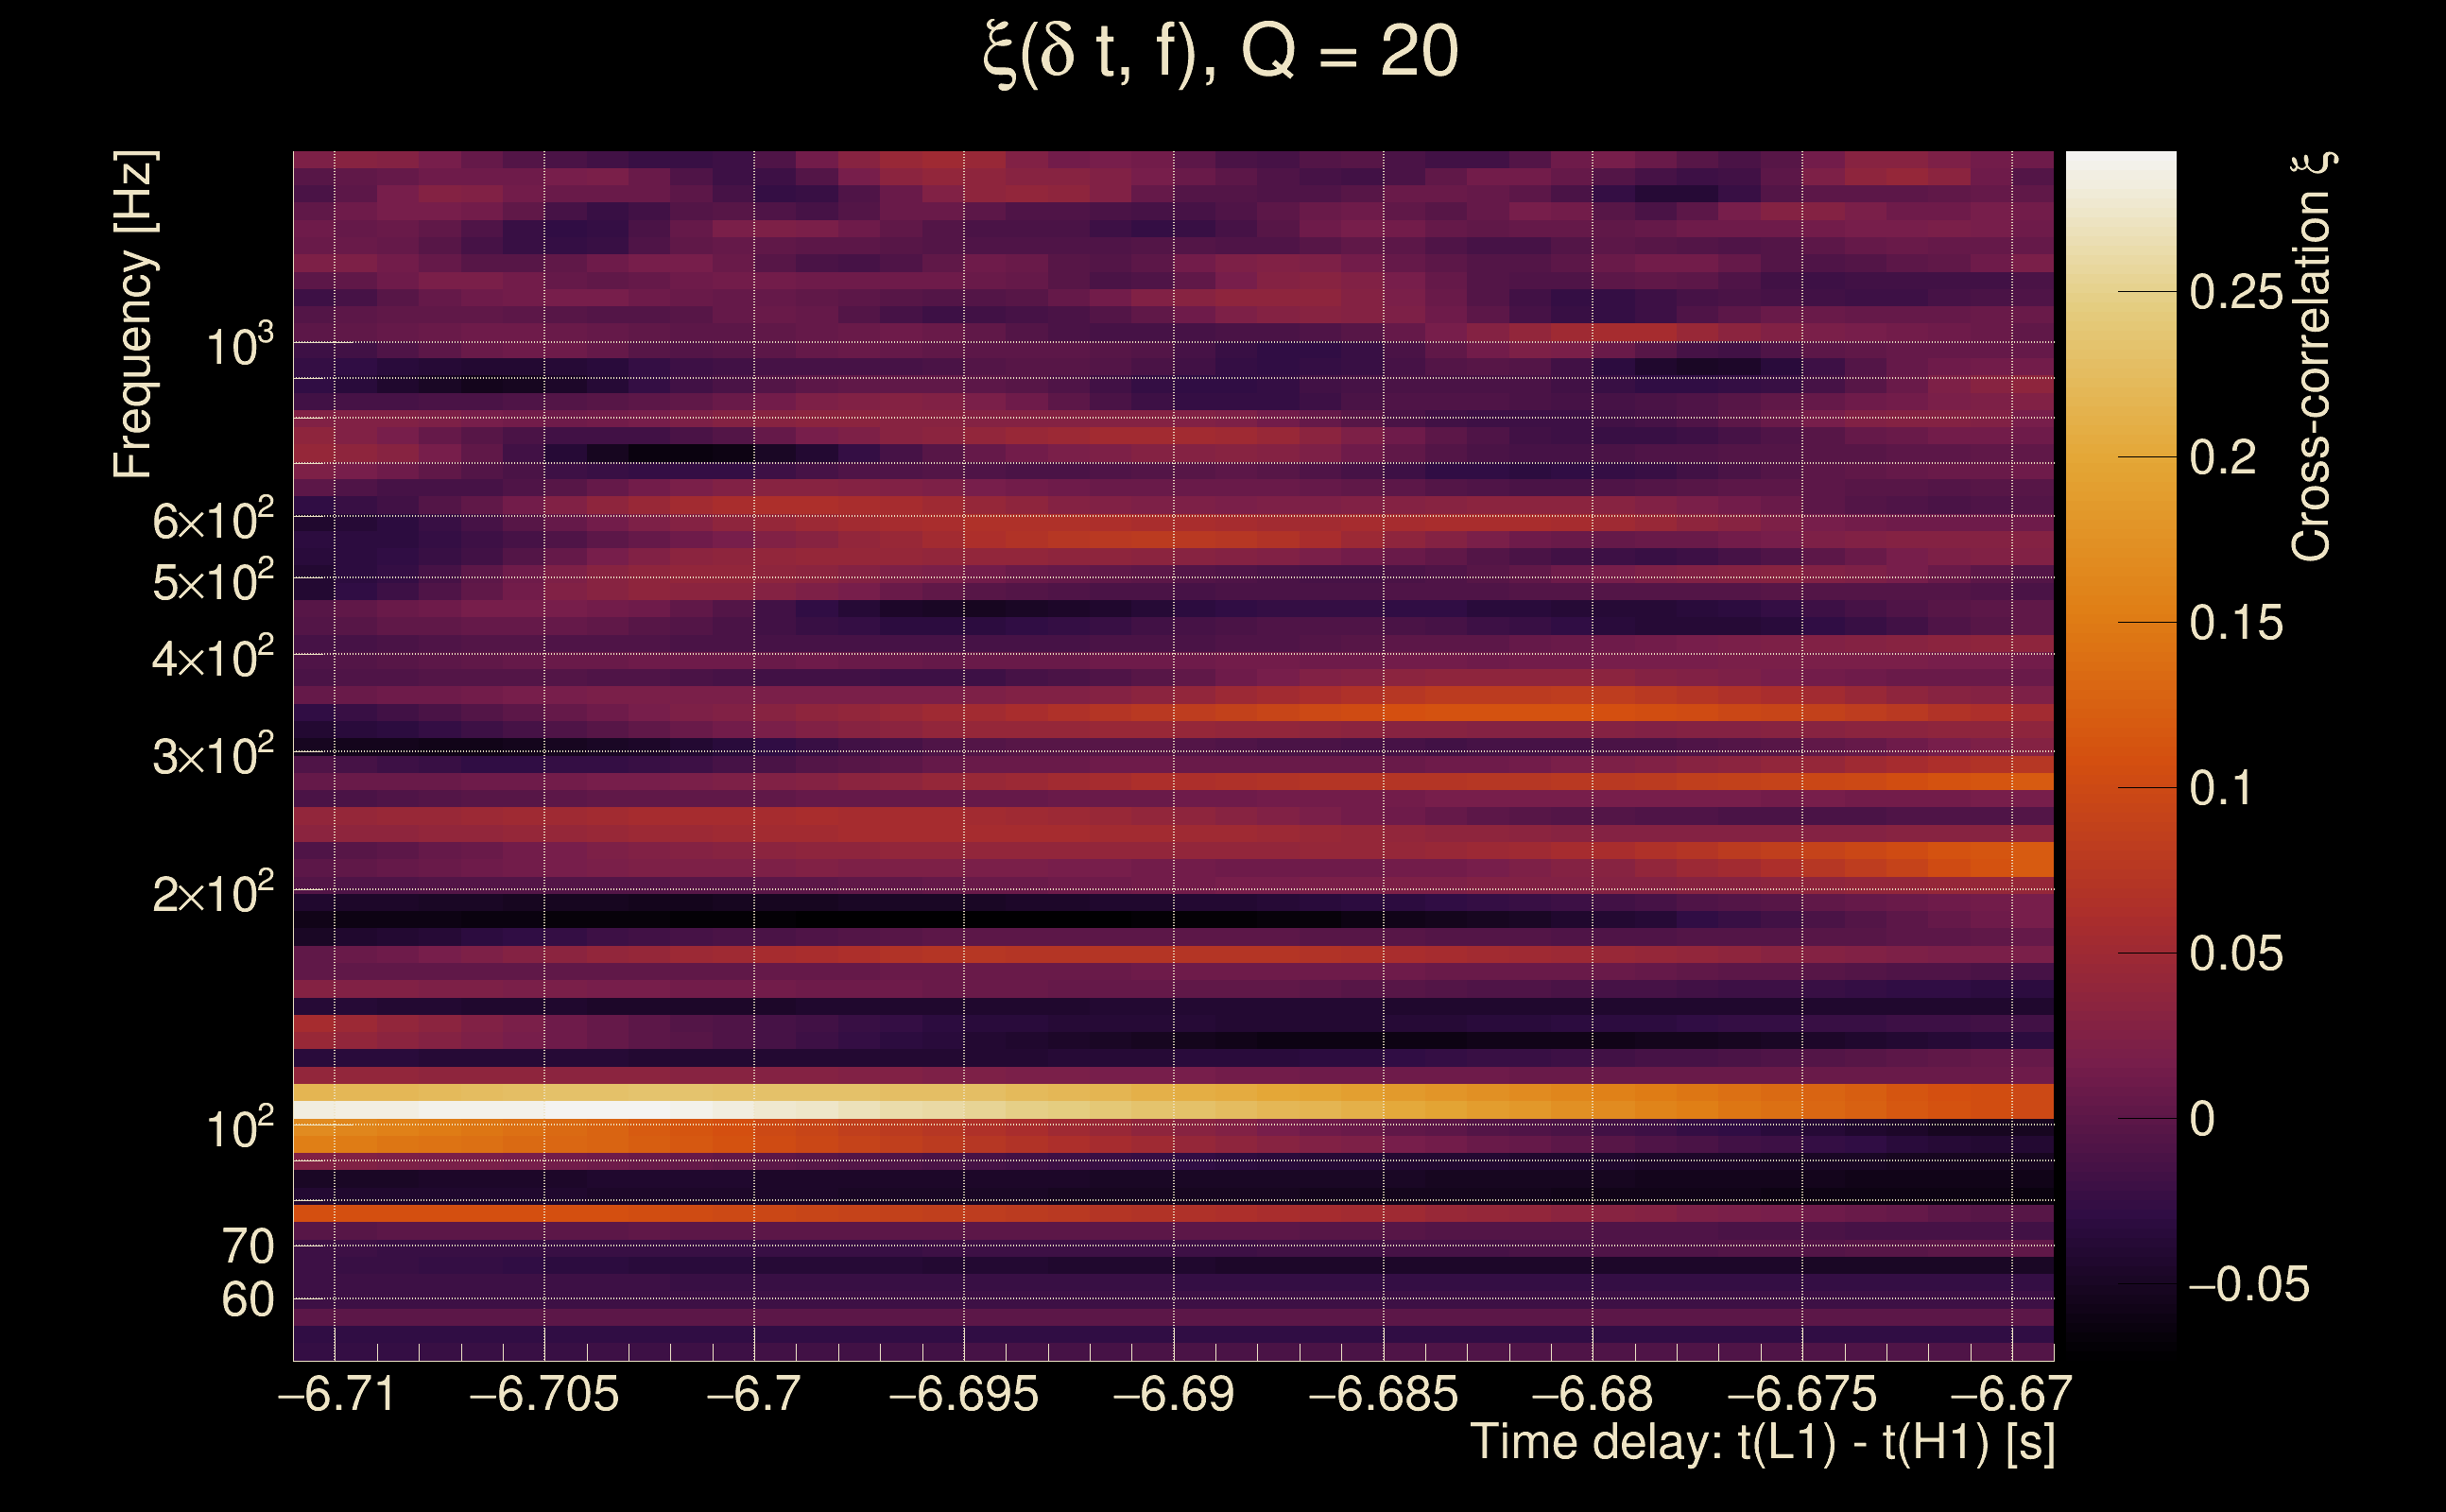
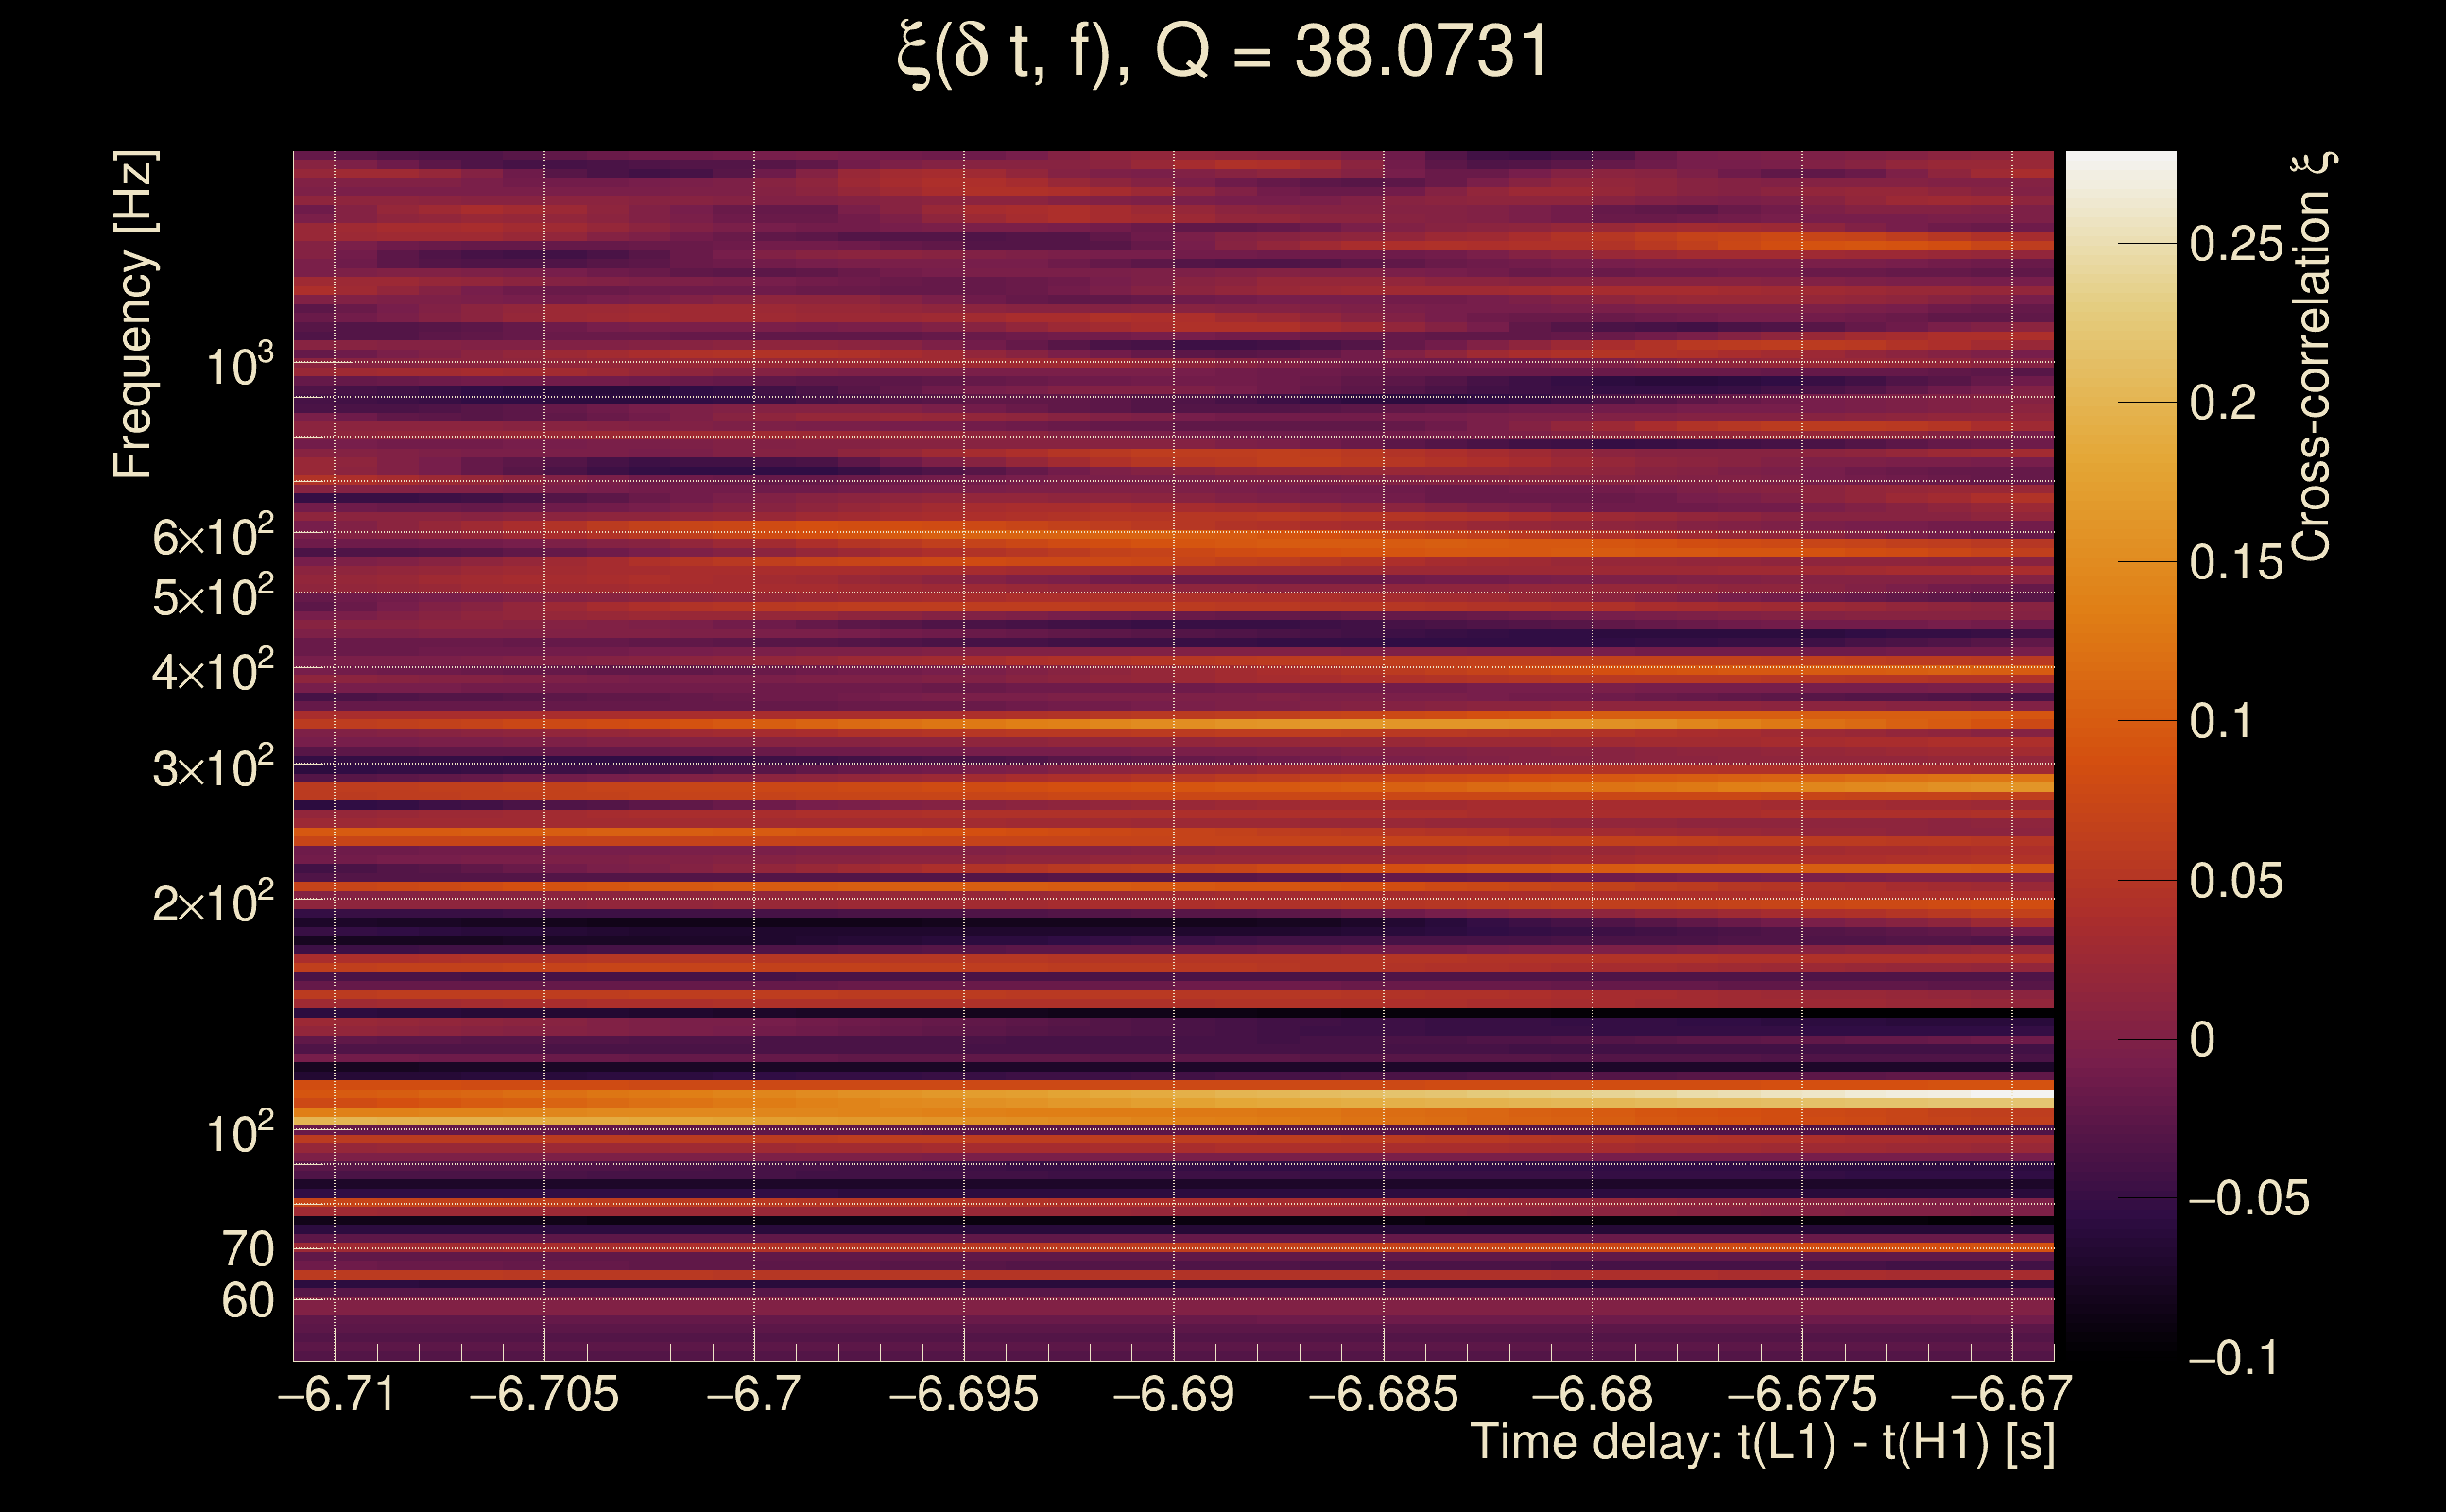
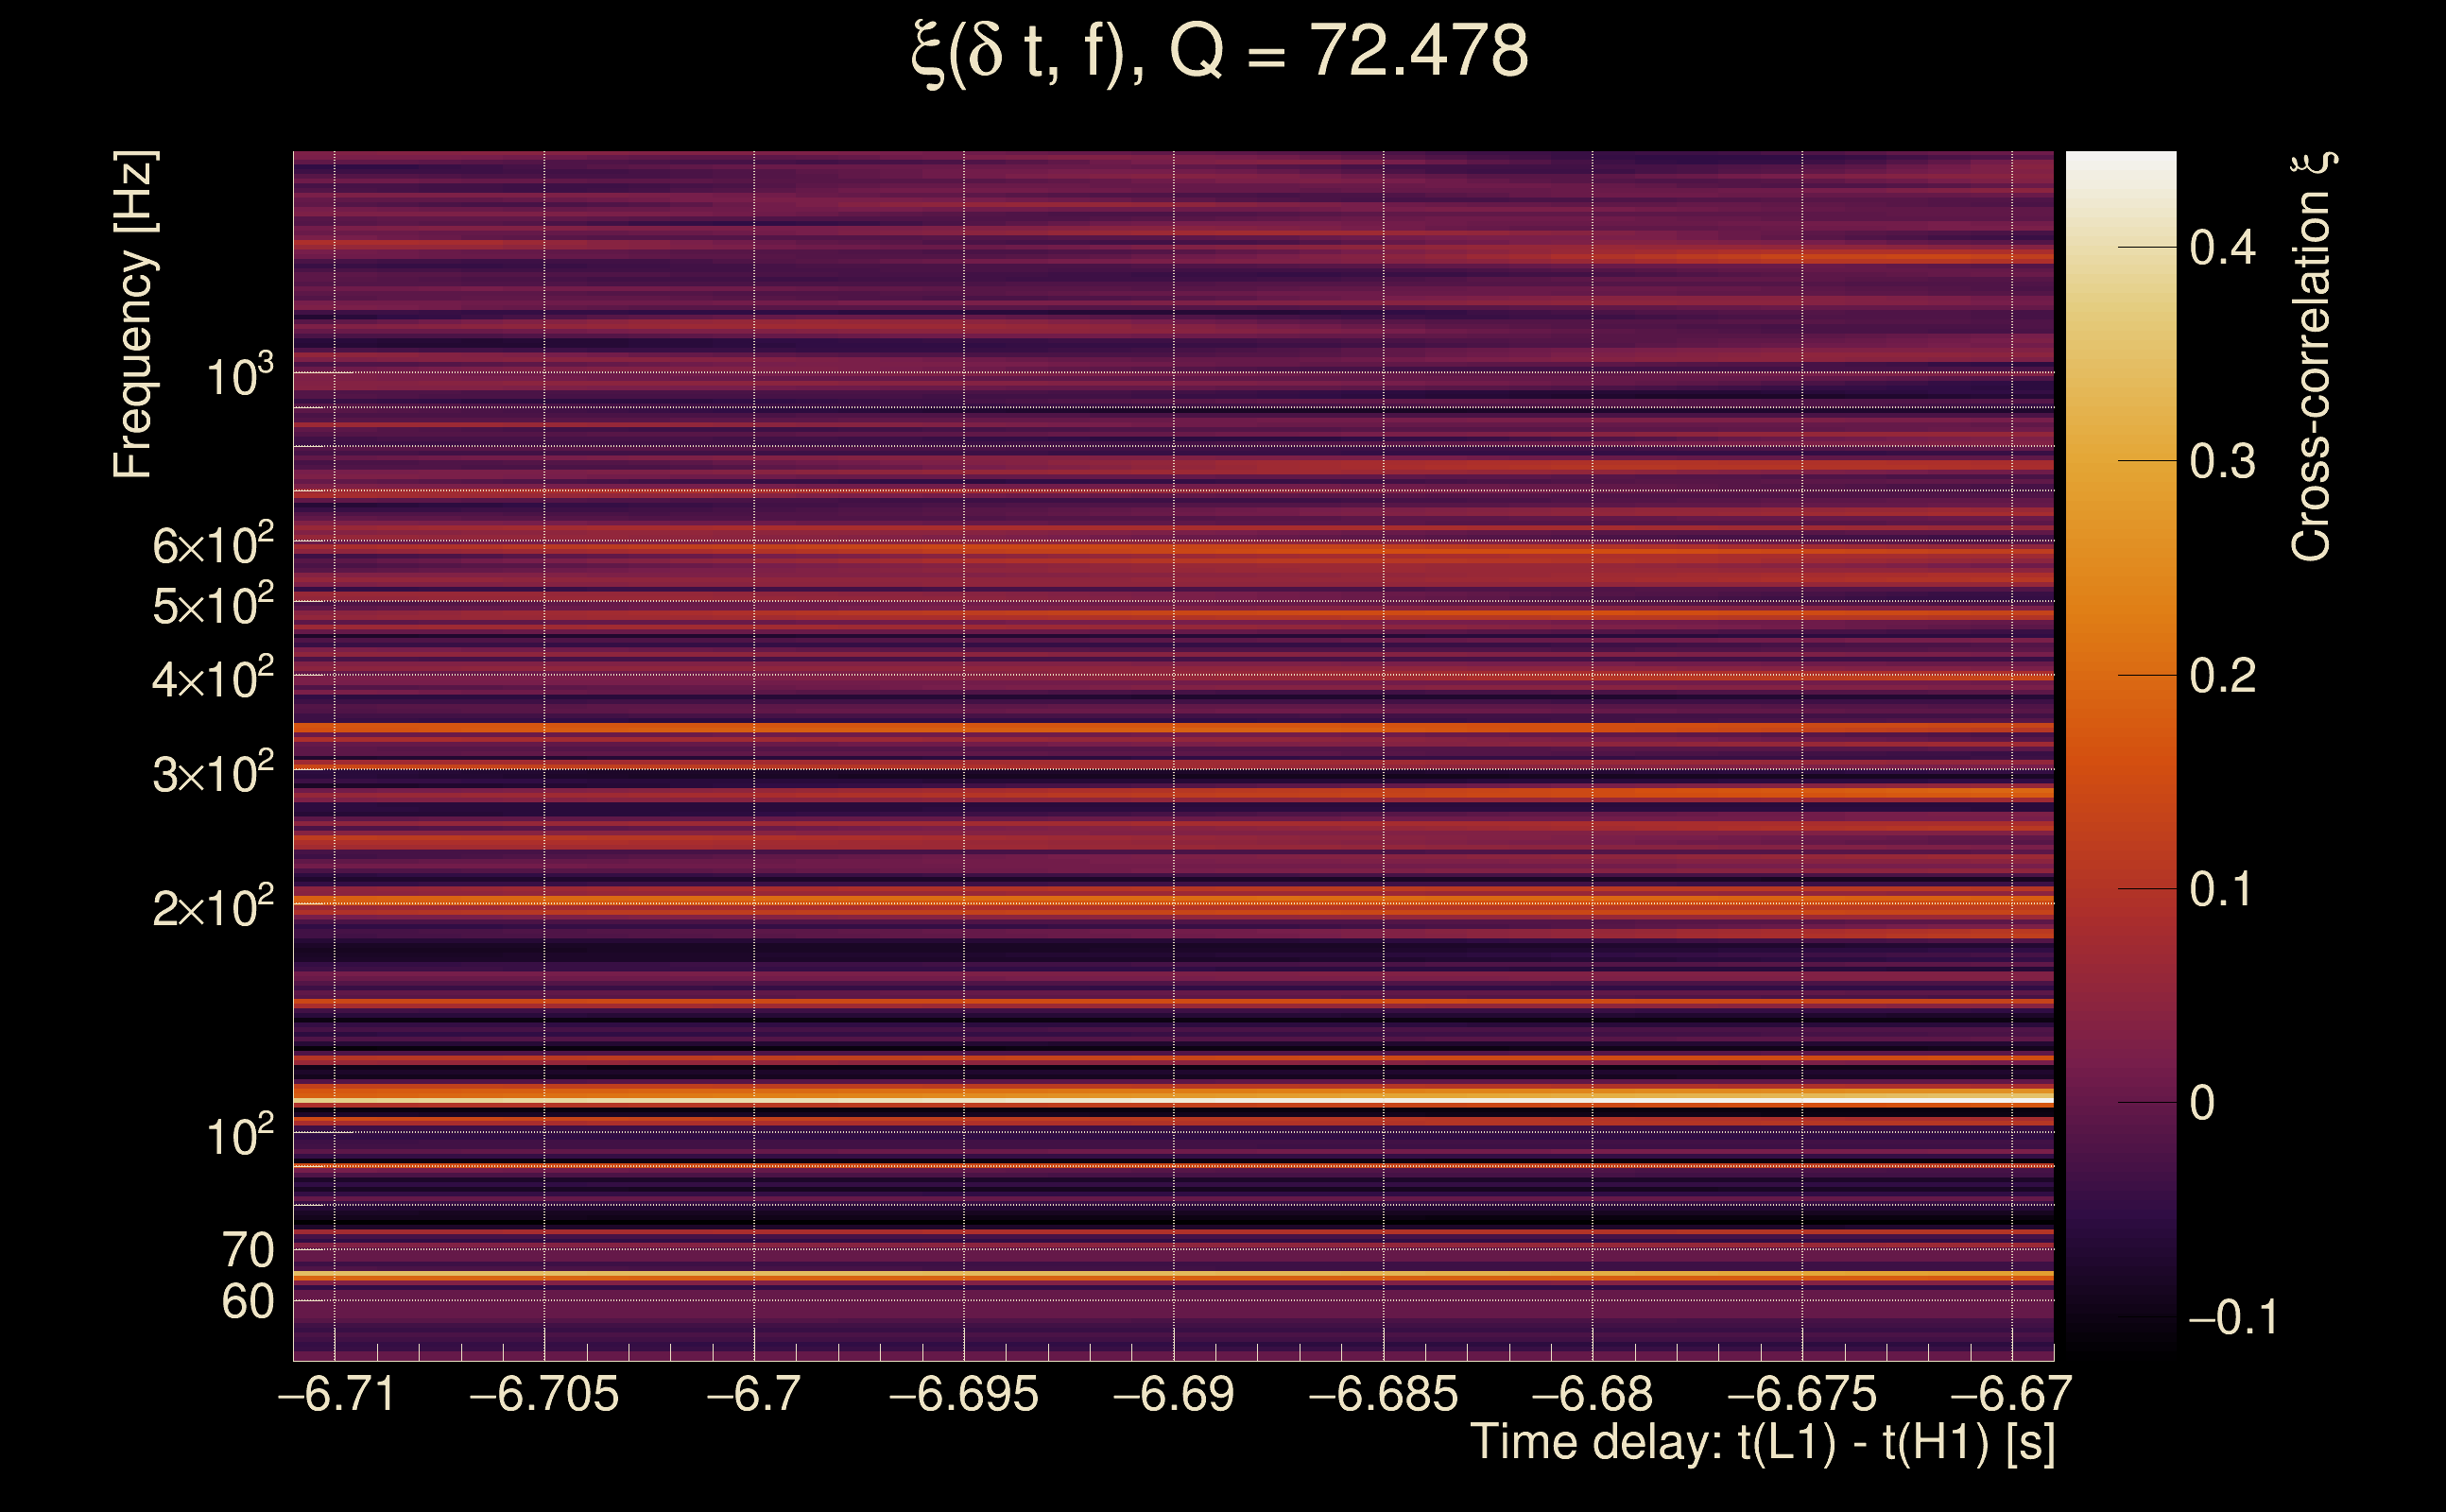
| Event time t(H1): | GPS = 1368195288 (Mon May 15 14:14:30 2023 ) → GPS = 1368195298 (Mon May 15 14:14:40 2023 ) |
| Event time t(L1): | GPS = 1368195278 (Mon May 15 14:14:40 2023 ) → GPS = 1368195288 (Mon May 15 14:14:30 2023 ) |
| Omicron analysis time window (H1): | GPS = 1368195285 → GPS = 1368195301 |
| Omicron analysis time window (L1): | GPS = 1368195275 → GPS = 1368195291 |
| Time delay between detectors t(L1) - t(H1): | -6.69002 s (slice index = 36 / 217), δt_gw = -0.00202228 s |
| Time delay uncertainty: | 0.00467761 s |
| [targeted mode] Time delay probability: | 0.976866 (0.0289984 sigmas), δt_target = -0.00216055 s |
| Frequency: | 765.097 Hz |
| Ξ: | 0.000794113 ± 0.0271453 (variance = 0.000736867): Q0: 0, Q1: 0.0377551, Q2: 0.0446901, Q3: 0.0832957, Q4: 0.0568877 |
| Rank: | R_A = 0.000759859 |
| Log of amplitude ratio (L1/H1): | 0.452473, variance = 0.495483 (L1/H1: 0.434285, variance = 1.22527, H1/L1: -0.470462, variance = 0.761695) |
| Amplitude ratio (L1/H1): | 1.5722 ⋇ 2.02163 (L1/H1: 1.54386 ⋇ 3.02502, H1/L1: 0.624713 ⋇ 2.39349) |
| Amplitude ratio H1|L1 compatibility (probability): | 0.979525 |
| Antenna factor probability: | 1 |
| Number of rejected frequency rows: | Q0: 18 / 18, Q1: 35 / 36, Q2: 67 / 70, Q3: 129 / 134, Q4: 250 / 258 |
| Maximum signal-to-noise ratio: | H1: 4.99122, L1: 5.01871 |
| SNR variance: | H1: 0.457096, L1: 0.459591 |
| Click here for a zoomed plot | Click here for a zoomed plot | Click here for a zoomed plot | Click here for a zoomed plot | Click here for a zoomed plot |
 |
 |
 |
 |
 |
 |
 |
 |
 |
 |
 |
 |
 |
 |
 |
 |
 |
 |
 |
 |
 |
 |
 |
 |
 |
 |
 |
 |
 |
 |
 |
 |
 |
 |
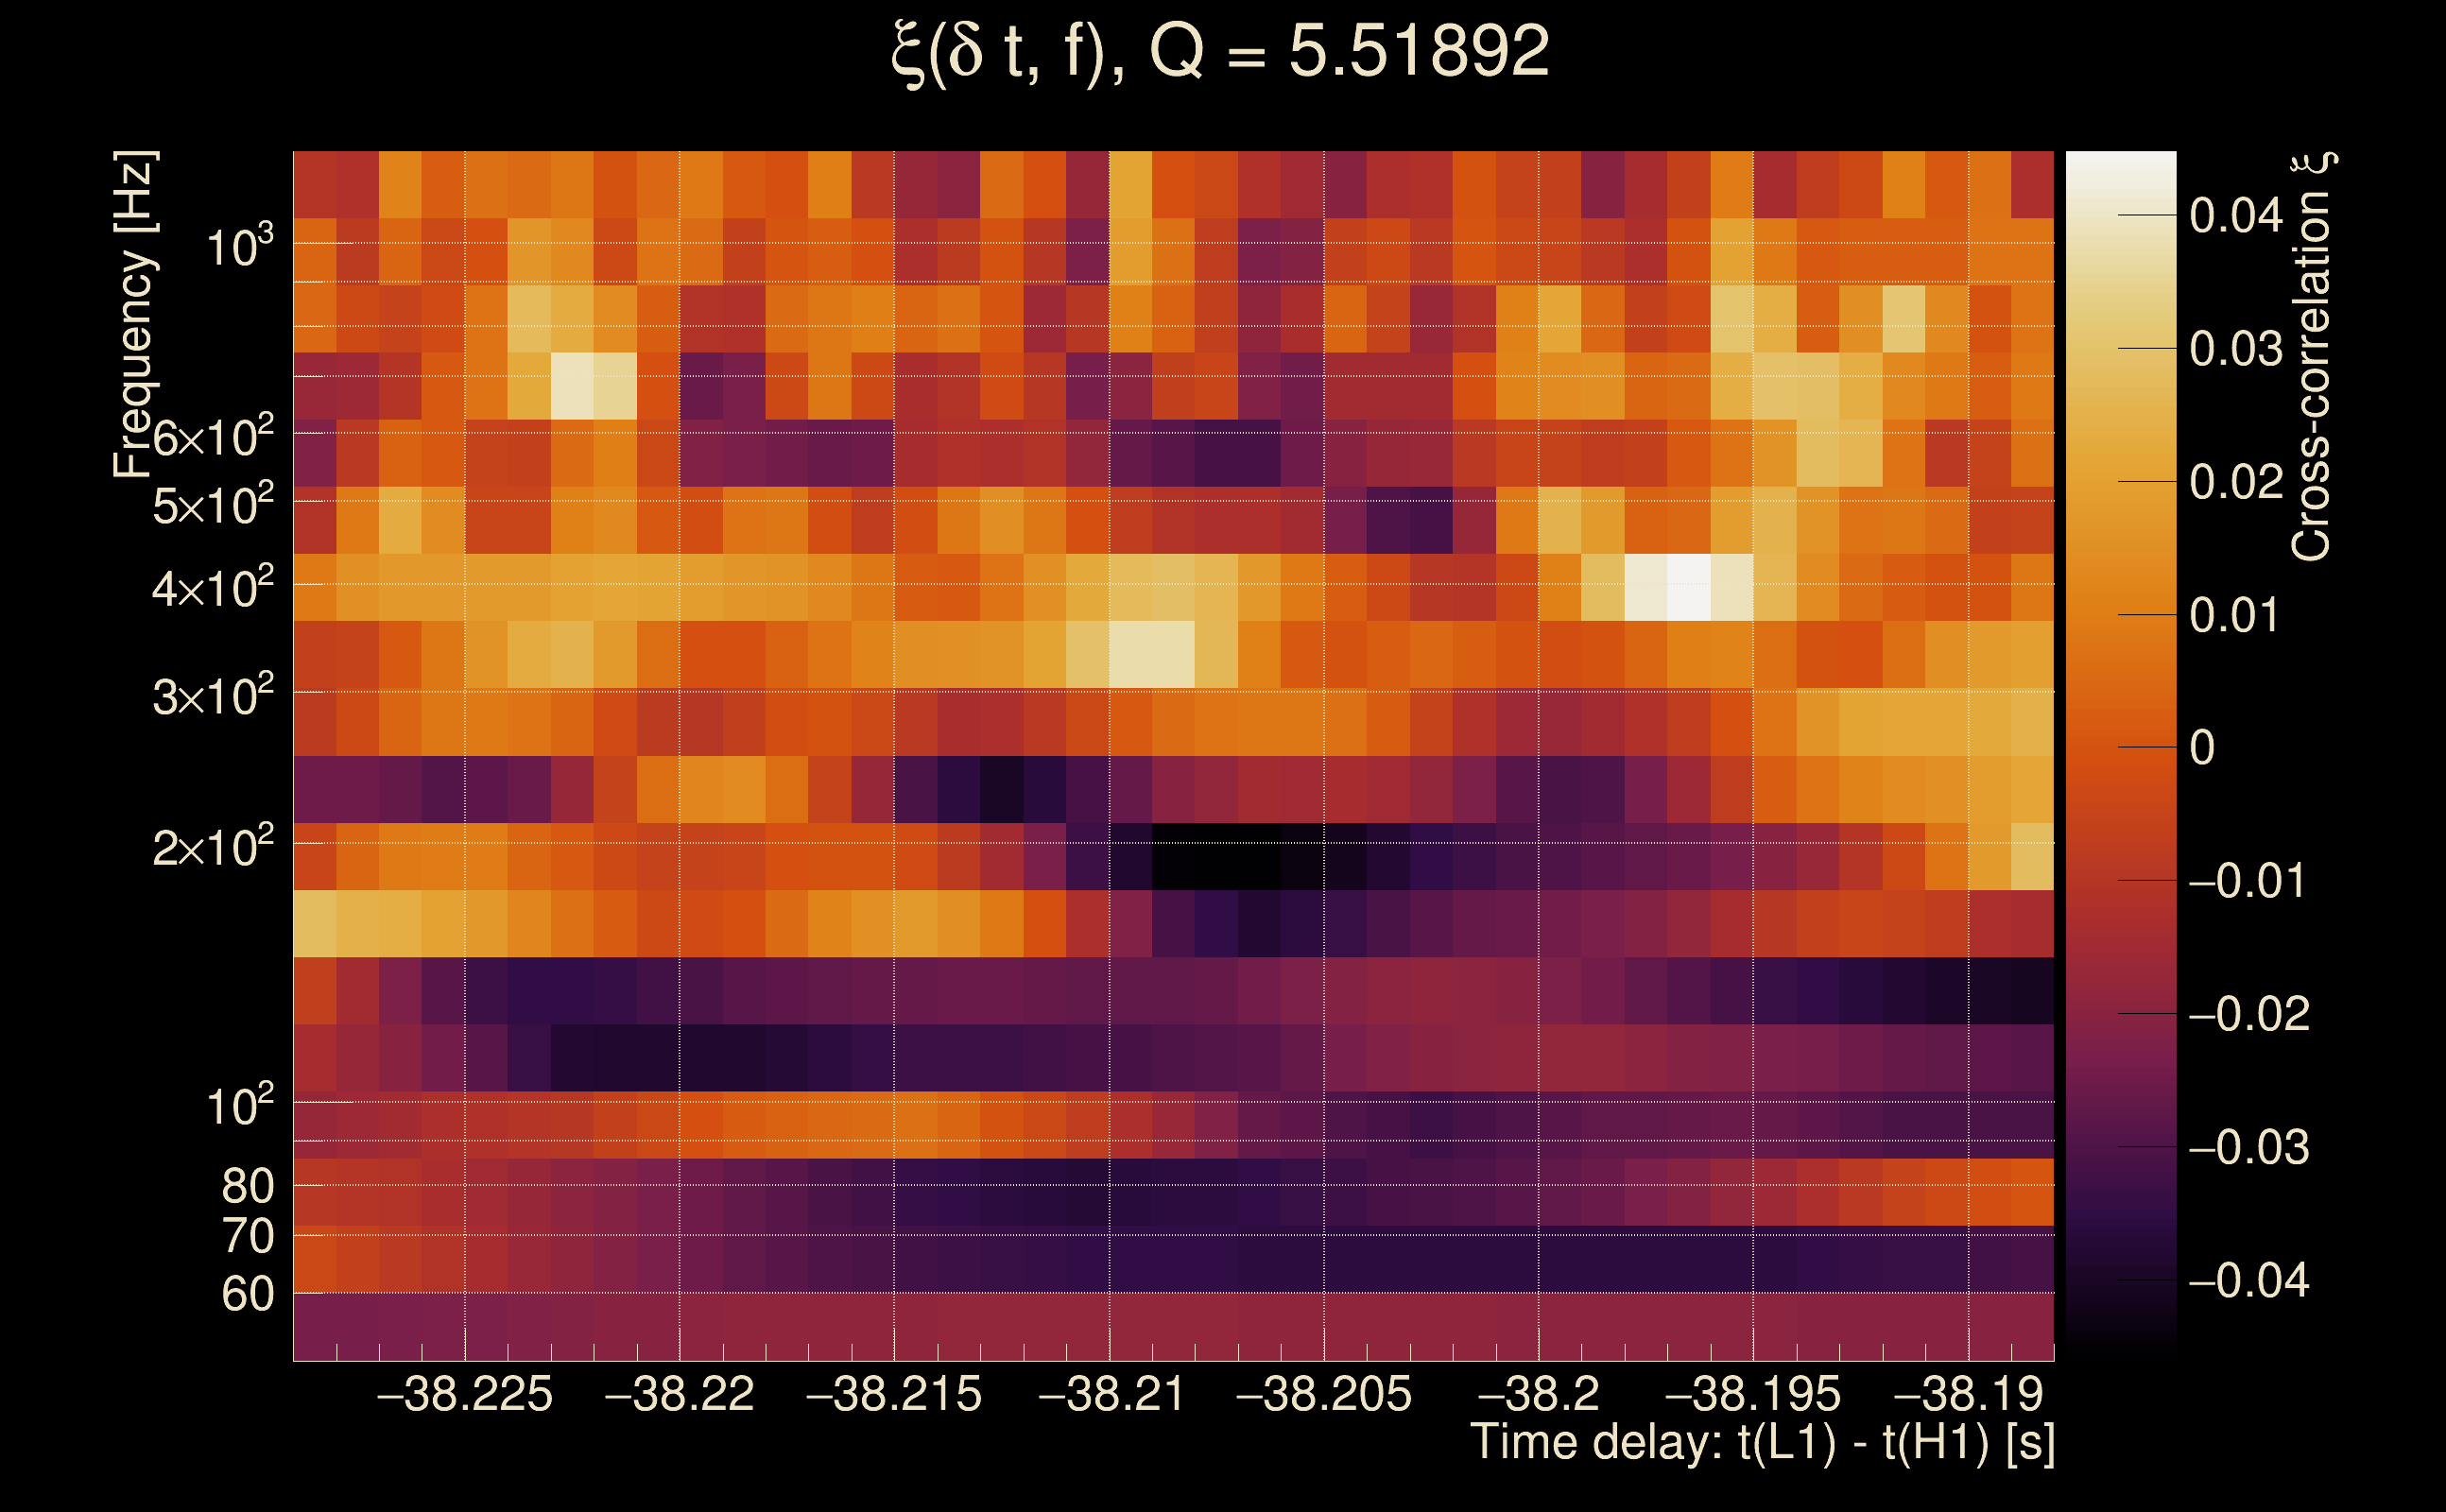
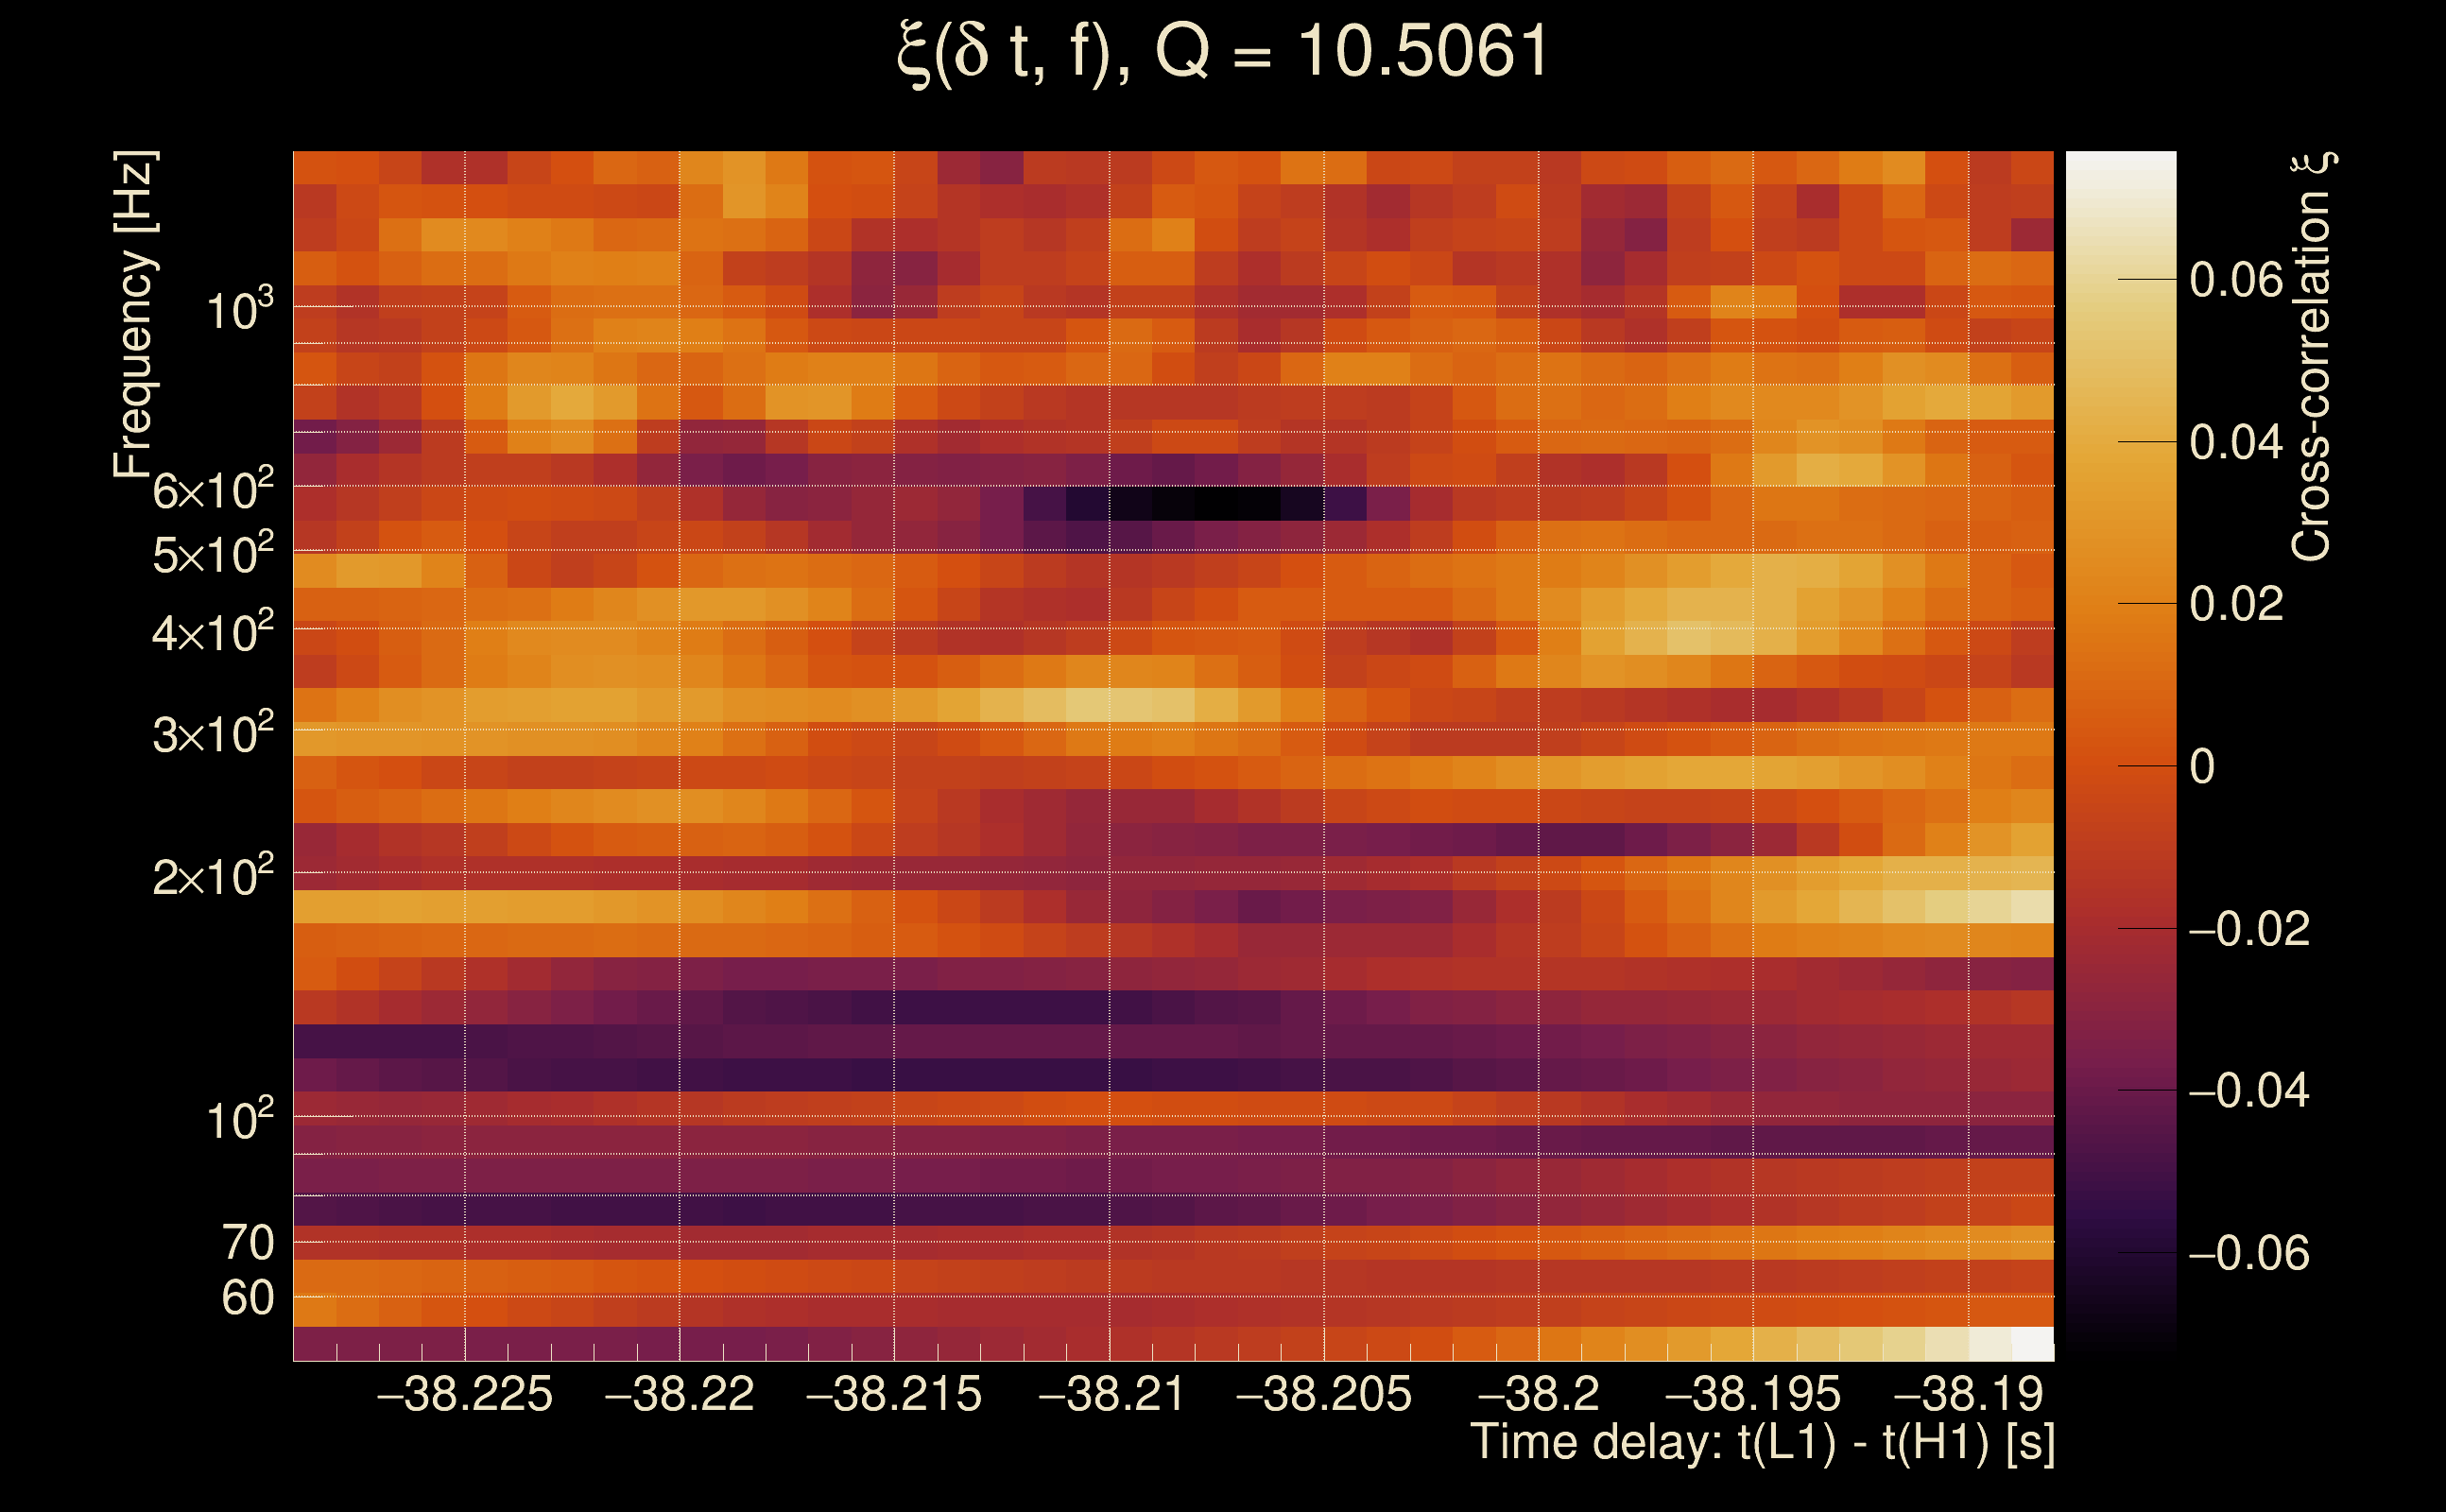
| Event time t(H1): | GPS = 1368195288 (Mon May 15 14:14:30 2023 ) → GPS = 1368195298 (Mon May 15 14:14:40 2023 ) |
| Event time t(L1): | GPS = 1368195248 (Mon May 15 14:14:40 2023 ) → GPS = 1368195258 (Mon May 15 14:14:00 2023 ) |
| Omicron analysis time window (H1): | GPS = 1368195285 → GPS = 1368195301 |
| Omicron analysis time window (L1): | GPS = 1368195245 → GPS = 1368195261 |
| Time delay between detectors t(L1) - t(H1): | -38.2085 s (slice index = 69 / 217), δt_gw = -0.00245491 s |
| Time delay uncertainty: | 0.00749032 s |
| [targeted mode] Time delay probability: | 0.968373 (0.0396493 sigmas), δt_target = -0.00215793 s |
| Frequency: | 941.755 Hz |
| Ξ: | 0.00099723 ± 0.0306226 (variance = 0.000937746): Q0: 0, Q1: 0.0359064, Q2: 0.0570747, Q3: 0.0808249, Q4: 0.0815535 |
| Rank: | R_A = 0.00075931 |
| Log of amplitude ratio (L1/H1): | 0.50728, variance = 0.576455 (L1/H1: 0.3136, variance = 1.01586, H1/L1: -0.727958, variance = 1.31963) |
| Amplitude ratio (L1/H1): | 1.66077 ⋇ 2.13667 (L1/H1: 1.36834 ⋇ 2.73984, H1/L1: 0.482894 ⋇ 3.15425) |
| Amplitude ratio H1|L1 compatibility (probability): | 0.786287 |
| Antenna factor probability: | 1 |
| Number of rejected frequency rows: | Q0: 18 / 18, Q1: 35 / 36, Q2: 66 / 70, Q3: 128 / 134, Q4: 252 / 258 |
| Maximum signal-to-noise ratio: | H1: 4.98261, L1: 4.66789 |
| SNR variance: | H1: 0.446727, L1: 0.443973 |
| Click here for a zoomed plot | Click here for a zoomed plot | Click here for a zoomed plot | Click here for a zoomed plot | Click here for a zoomed plot |
 |
 |
 |
 |
 |
 |
 |
 |
 |
 |
 |
 |
 |
 |
 |
|
|
|
|
|
 |
 |
 |
 |
 |
 |
 |
 |
 |
 |
 |
 |
 |
 |
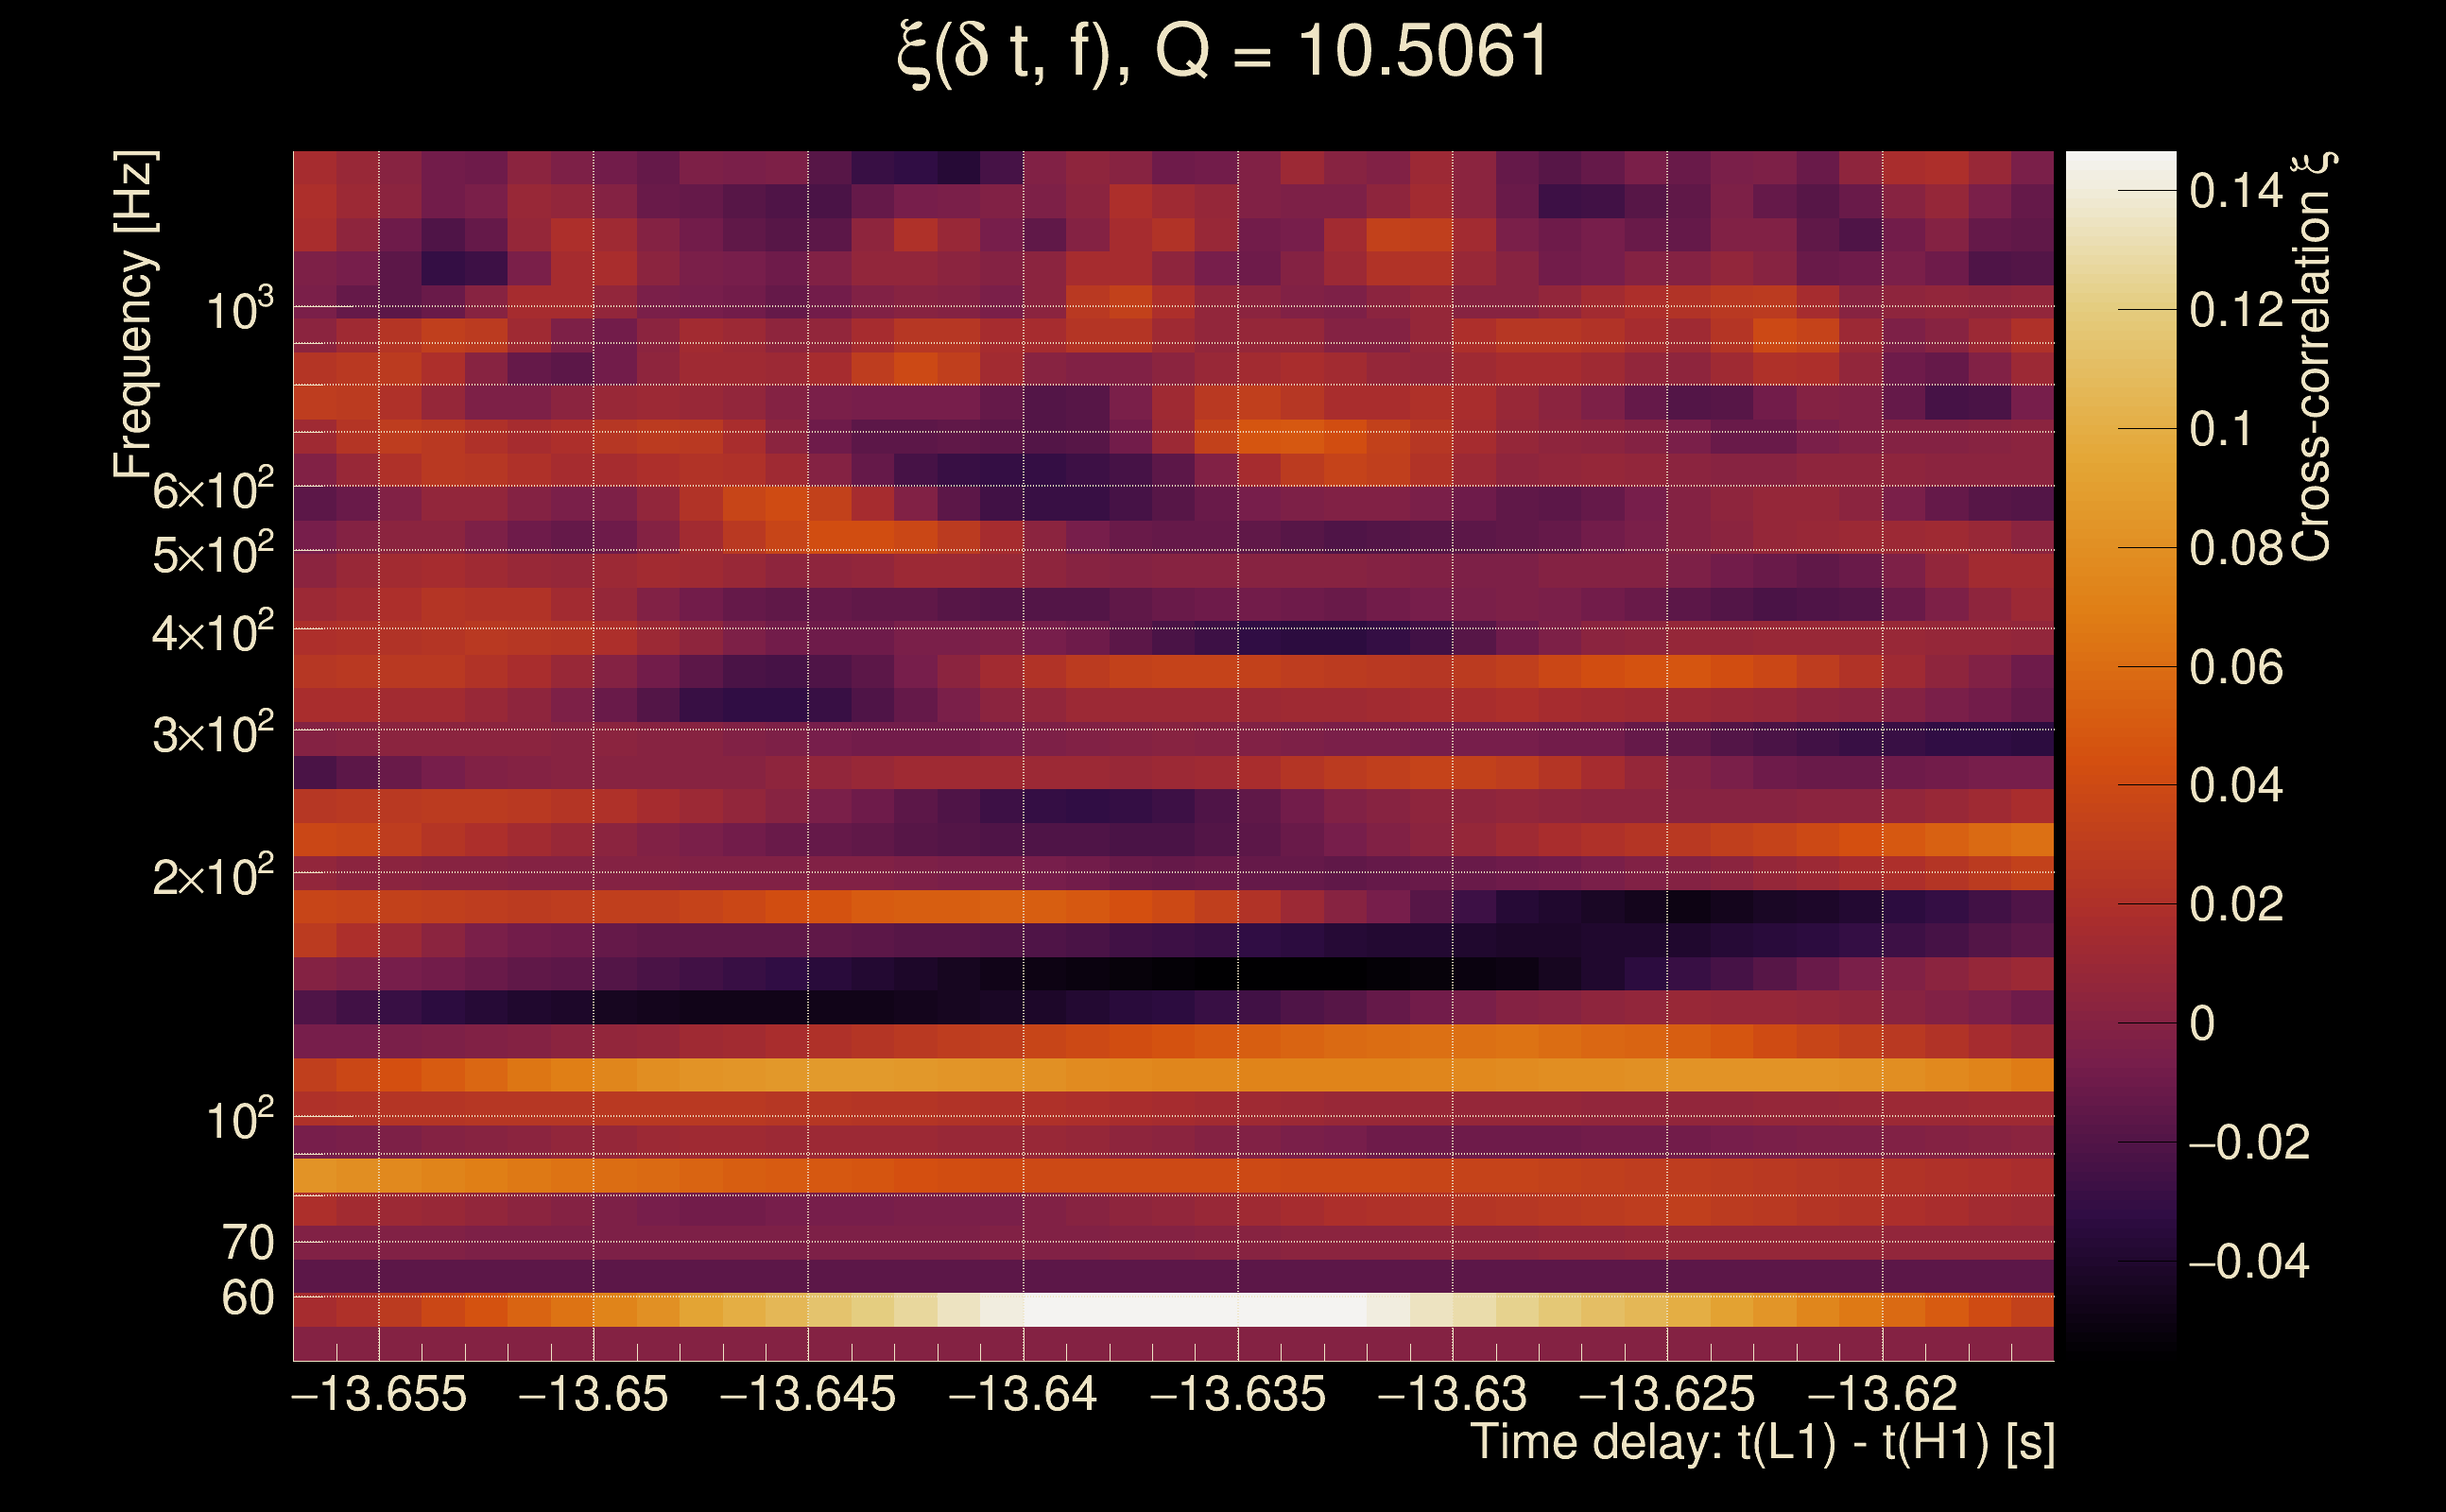
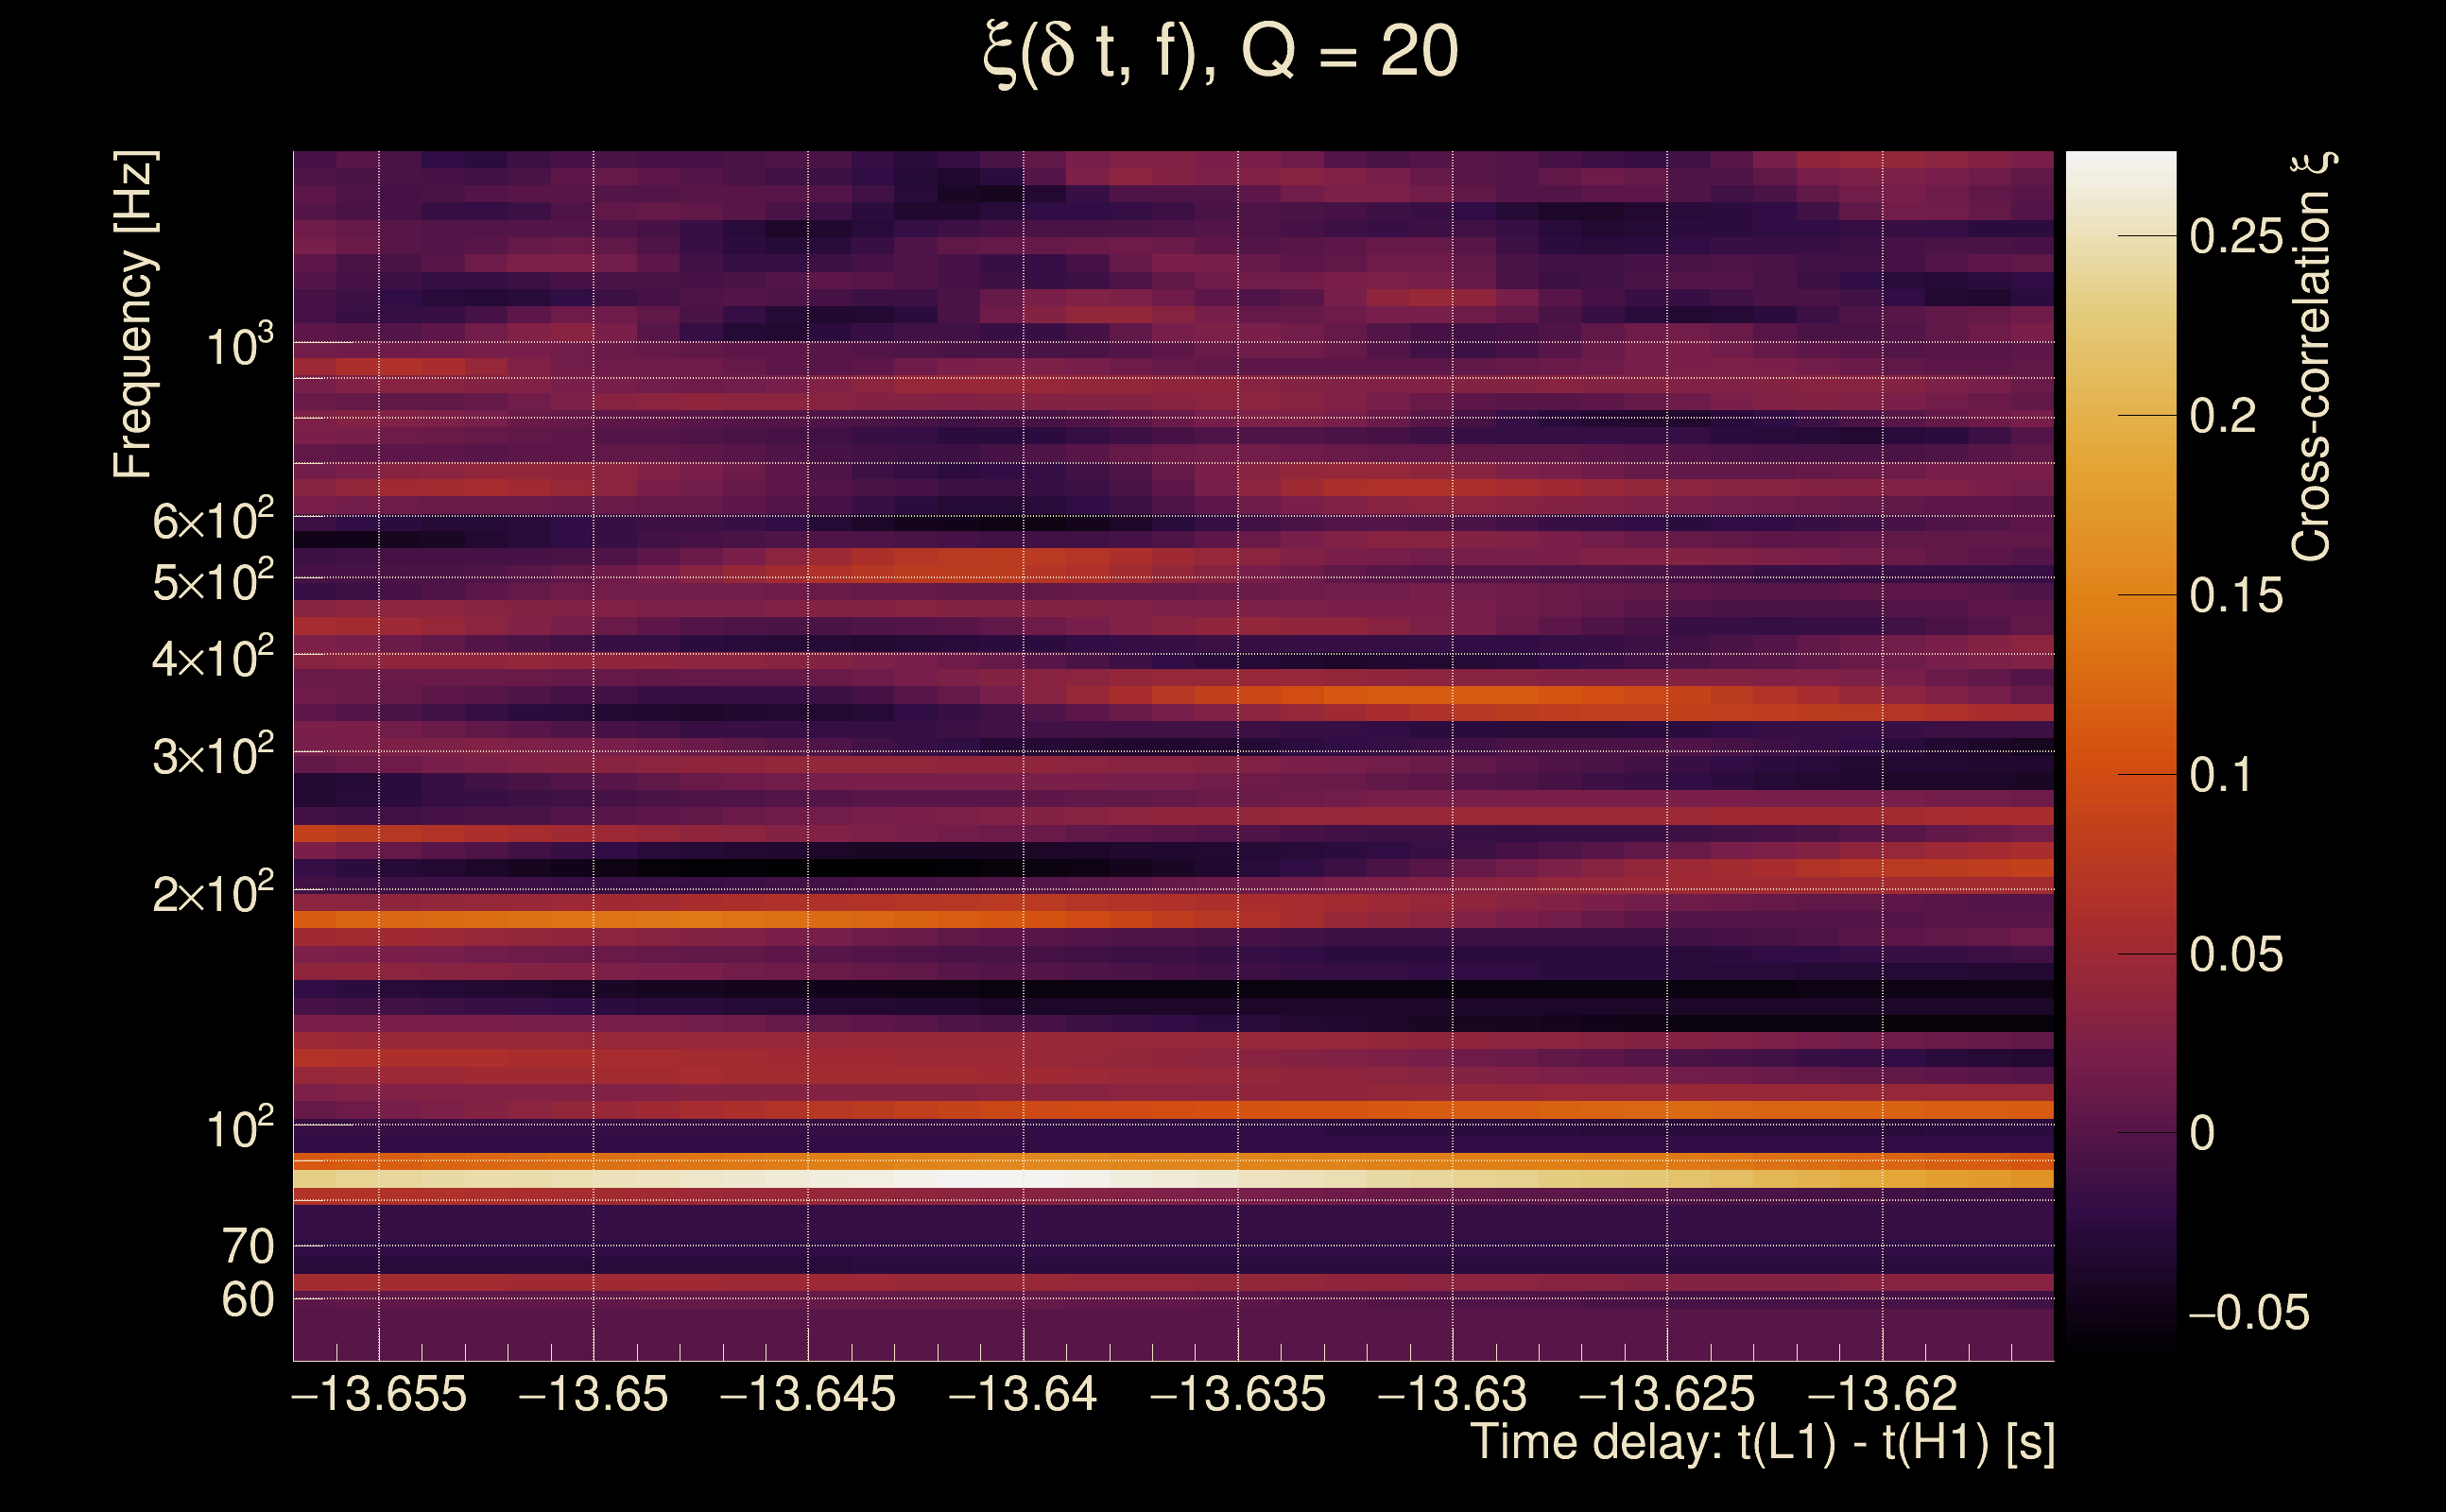
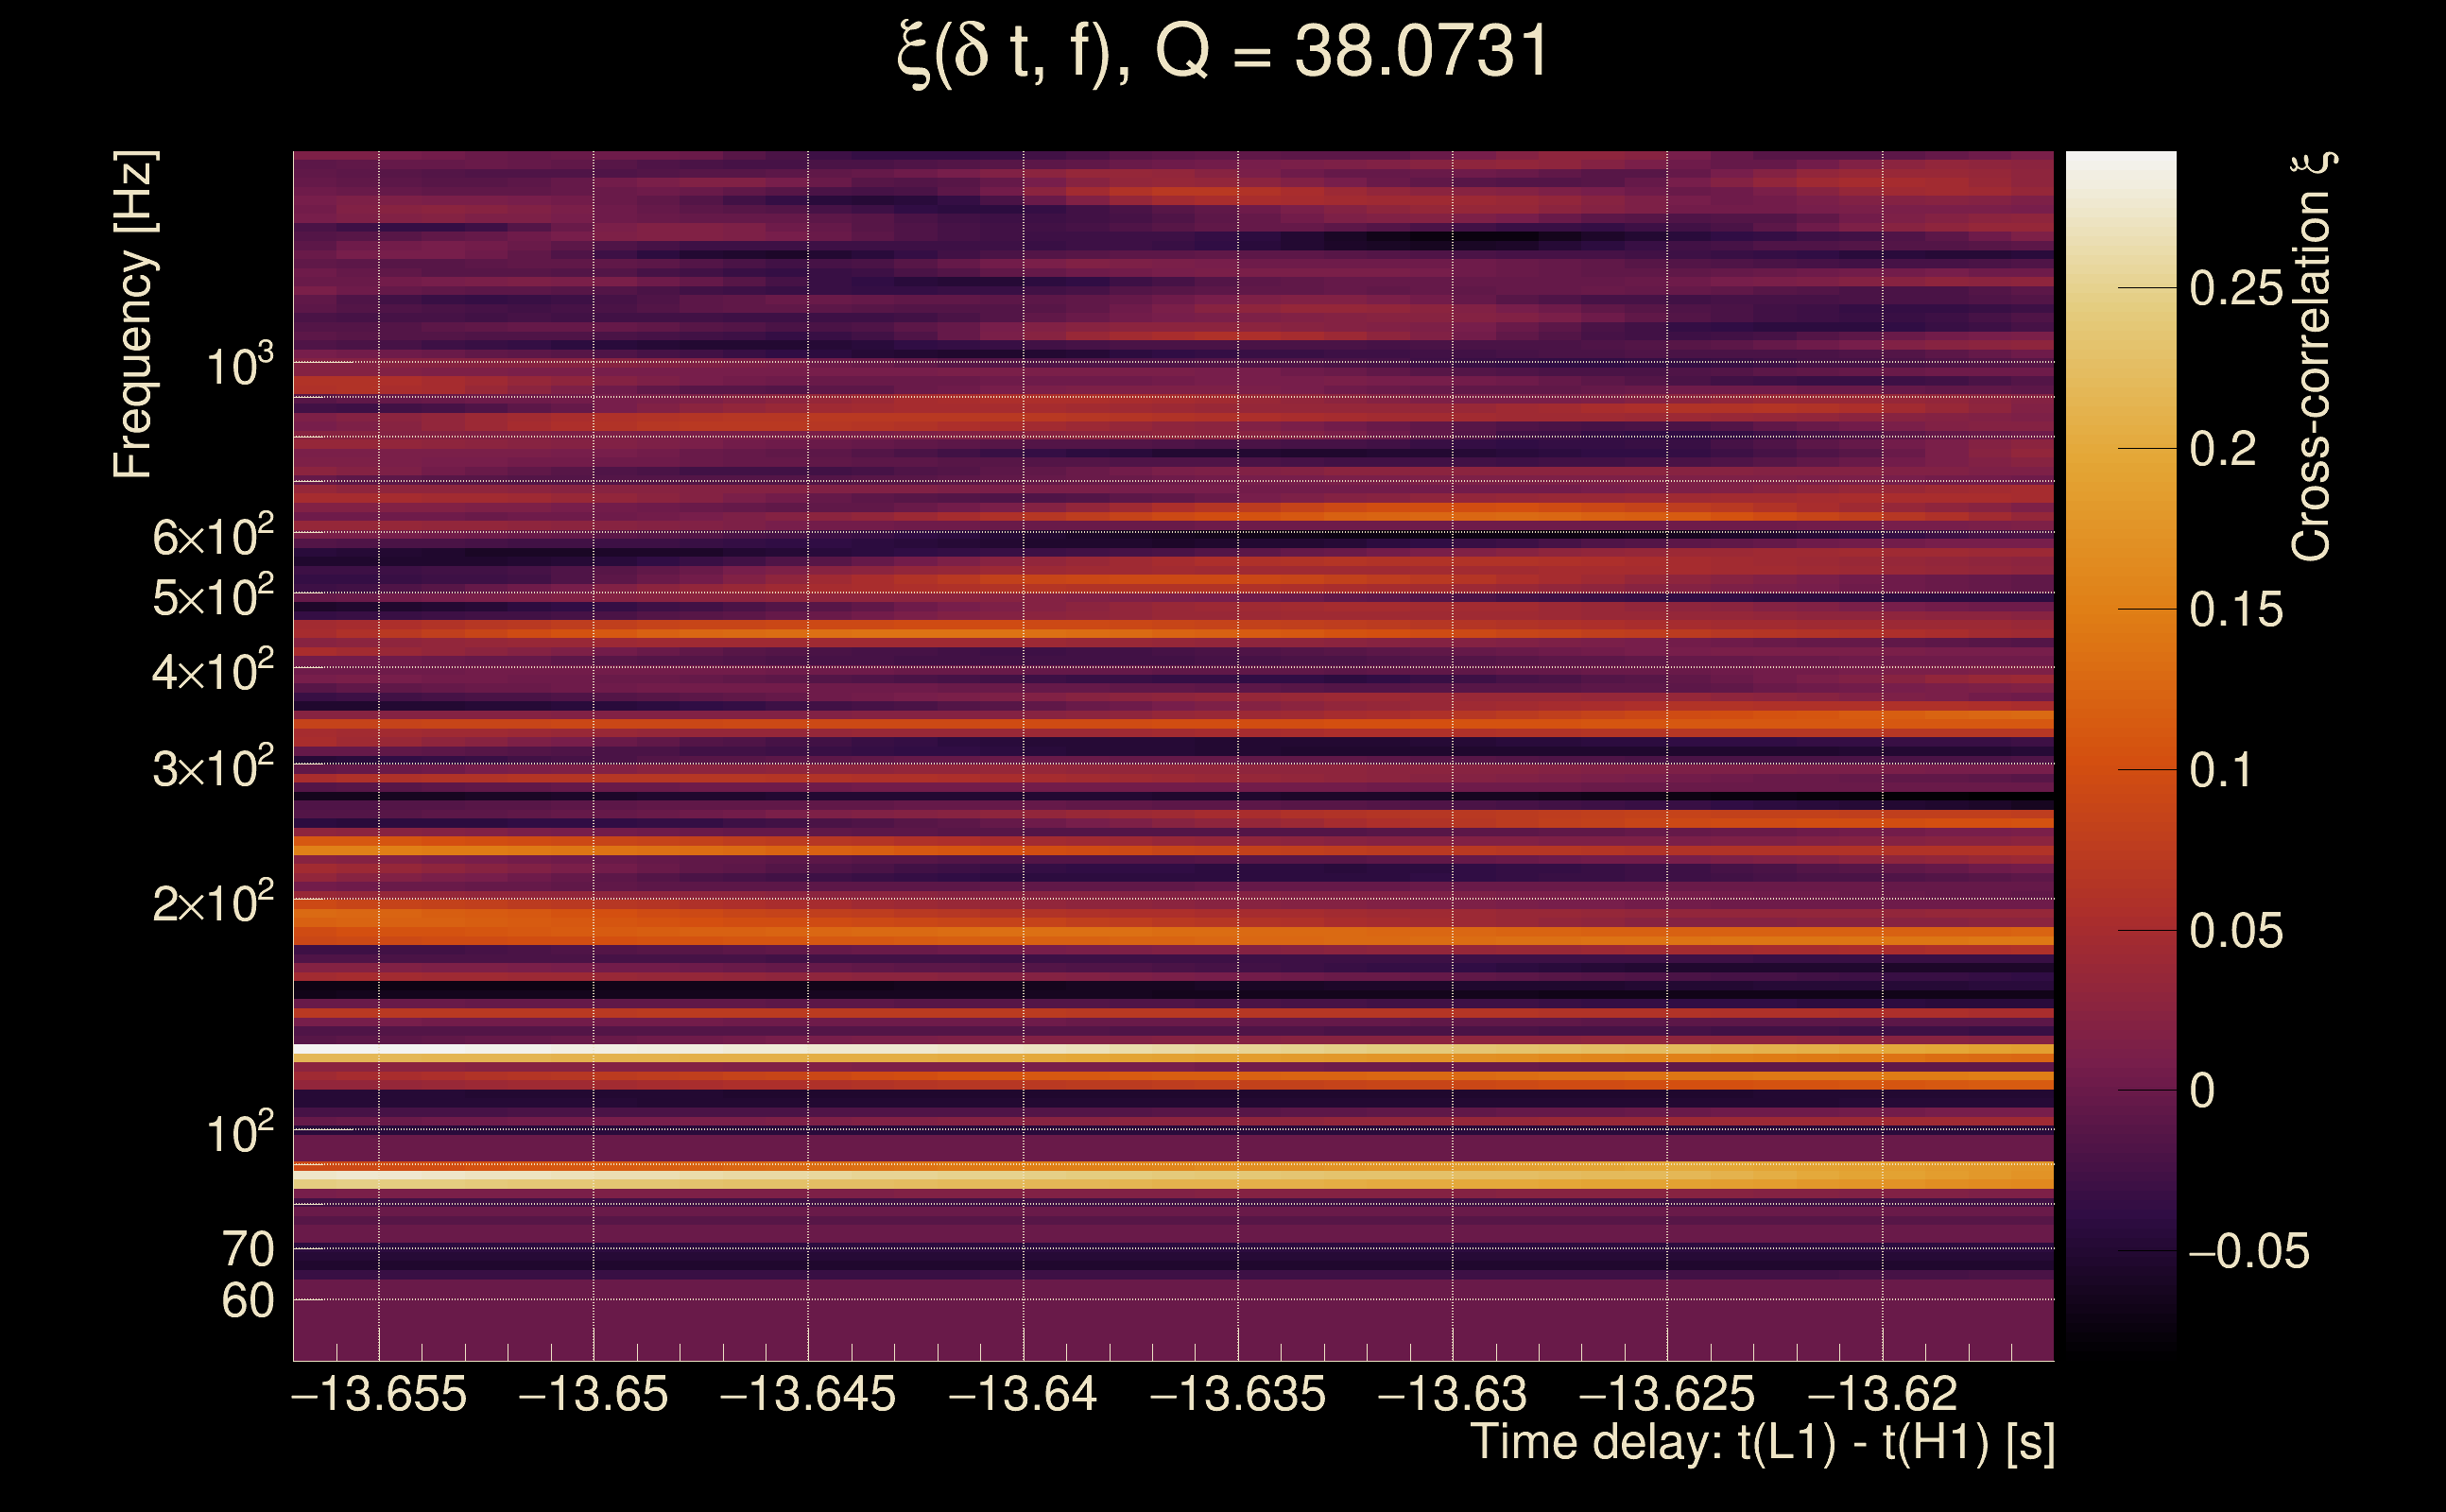
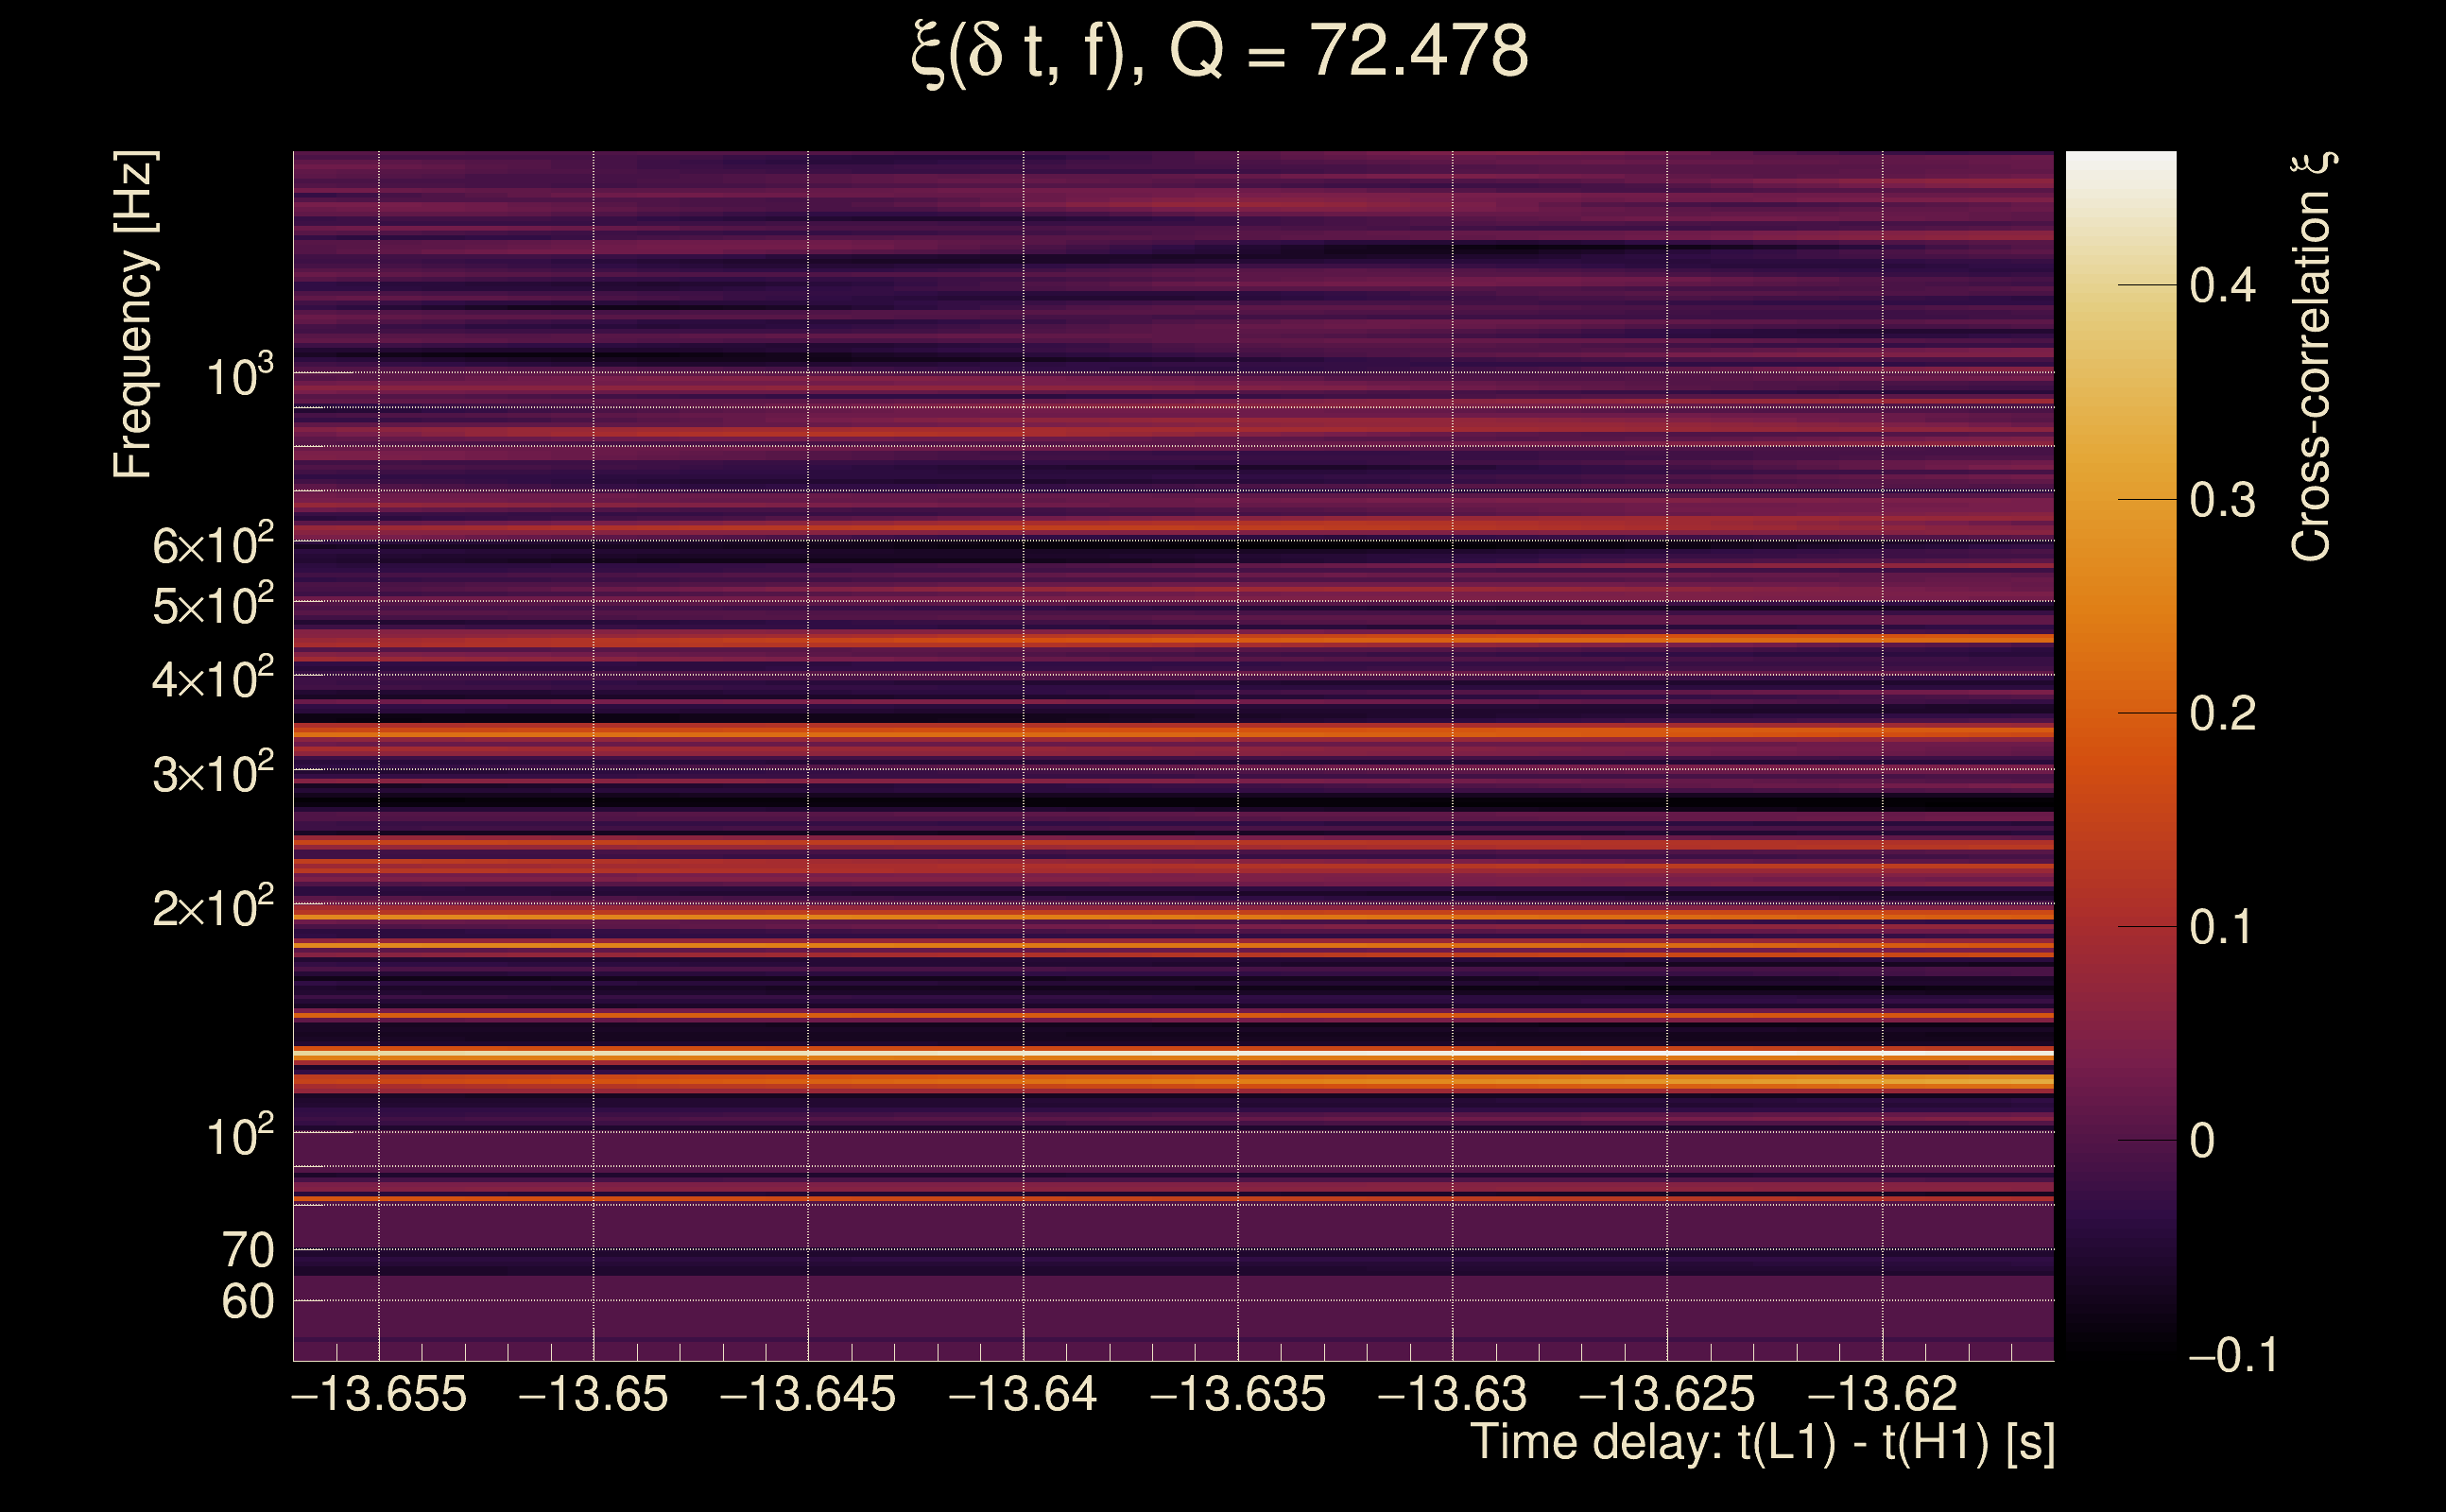
| Event time t(H1): | GPS = 1368195313 (Mon May 15 14:14:55 2023 ) → GPS = 1368195323 (Mon May 15 14:15:05 2023 ) |
| Event time t(L1): | GPS = 1368195303 (Mon May 15 14:15:05 2023 ) → GPS = 1368195313 (Mon May 15 14:14:55 2023 ) |
| Omicron analysis time window (H1): | GPS = 1368195310 → GPS = 1368195326 |
| Omicron analysis time window (L1): | GPS = 1368195300 → GPS = 1368195316 |
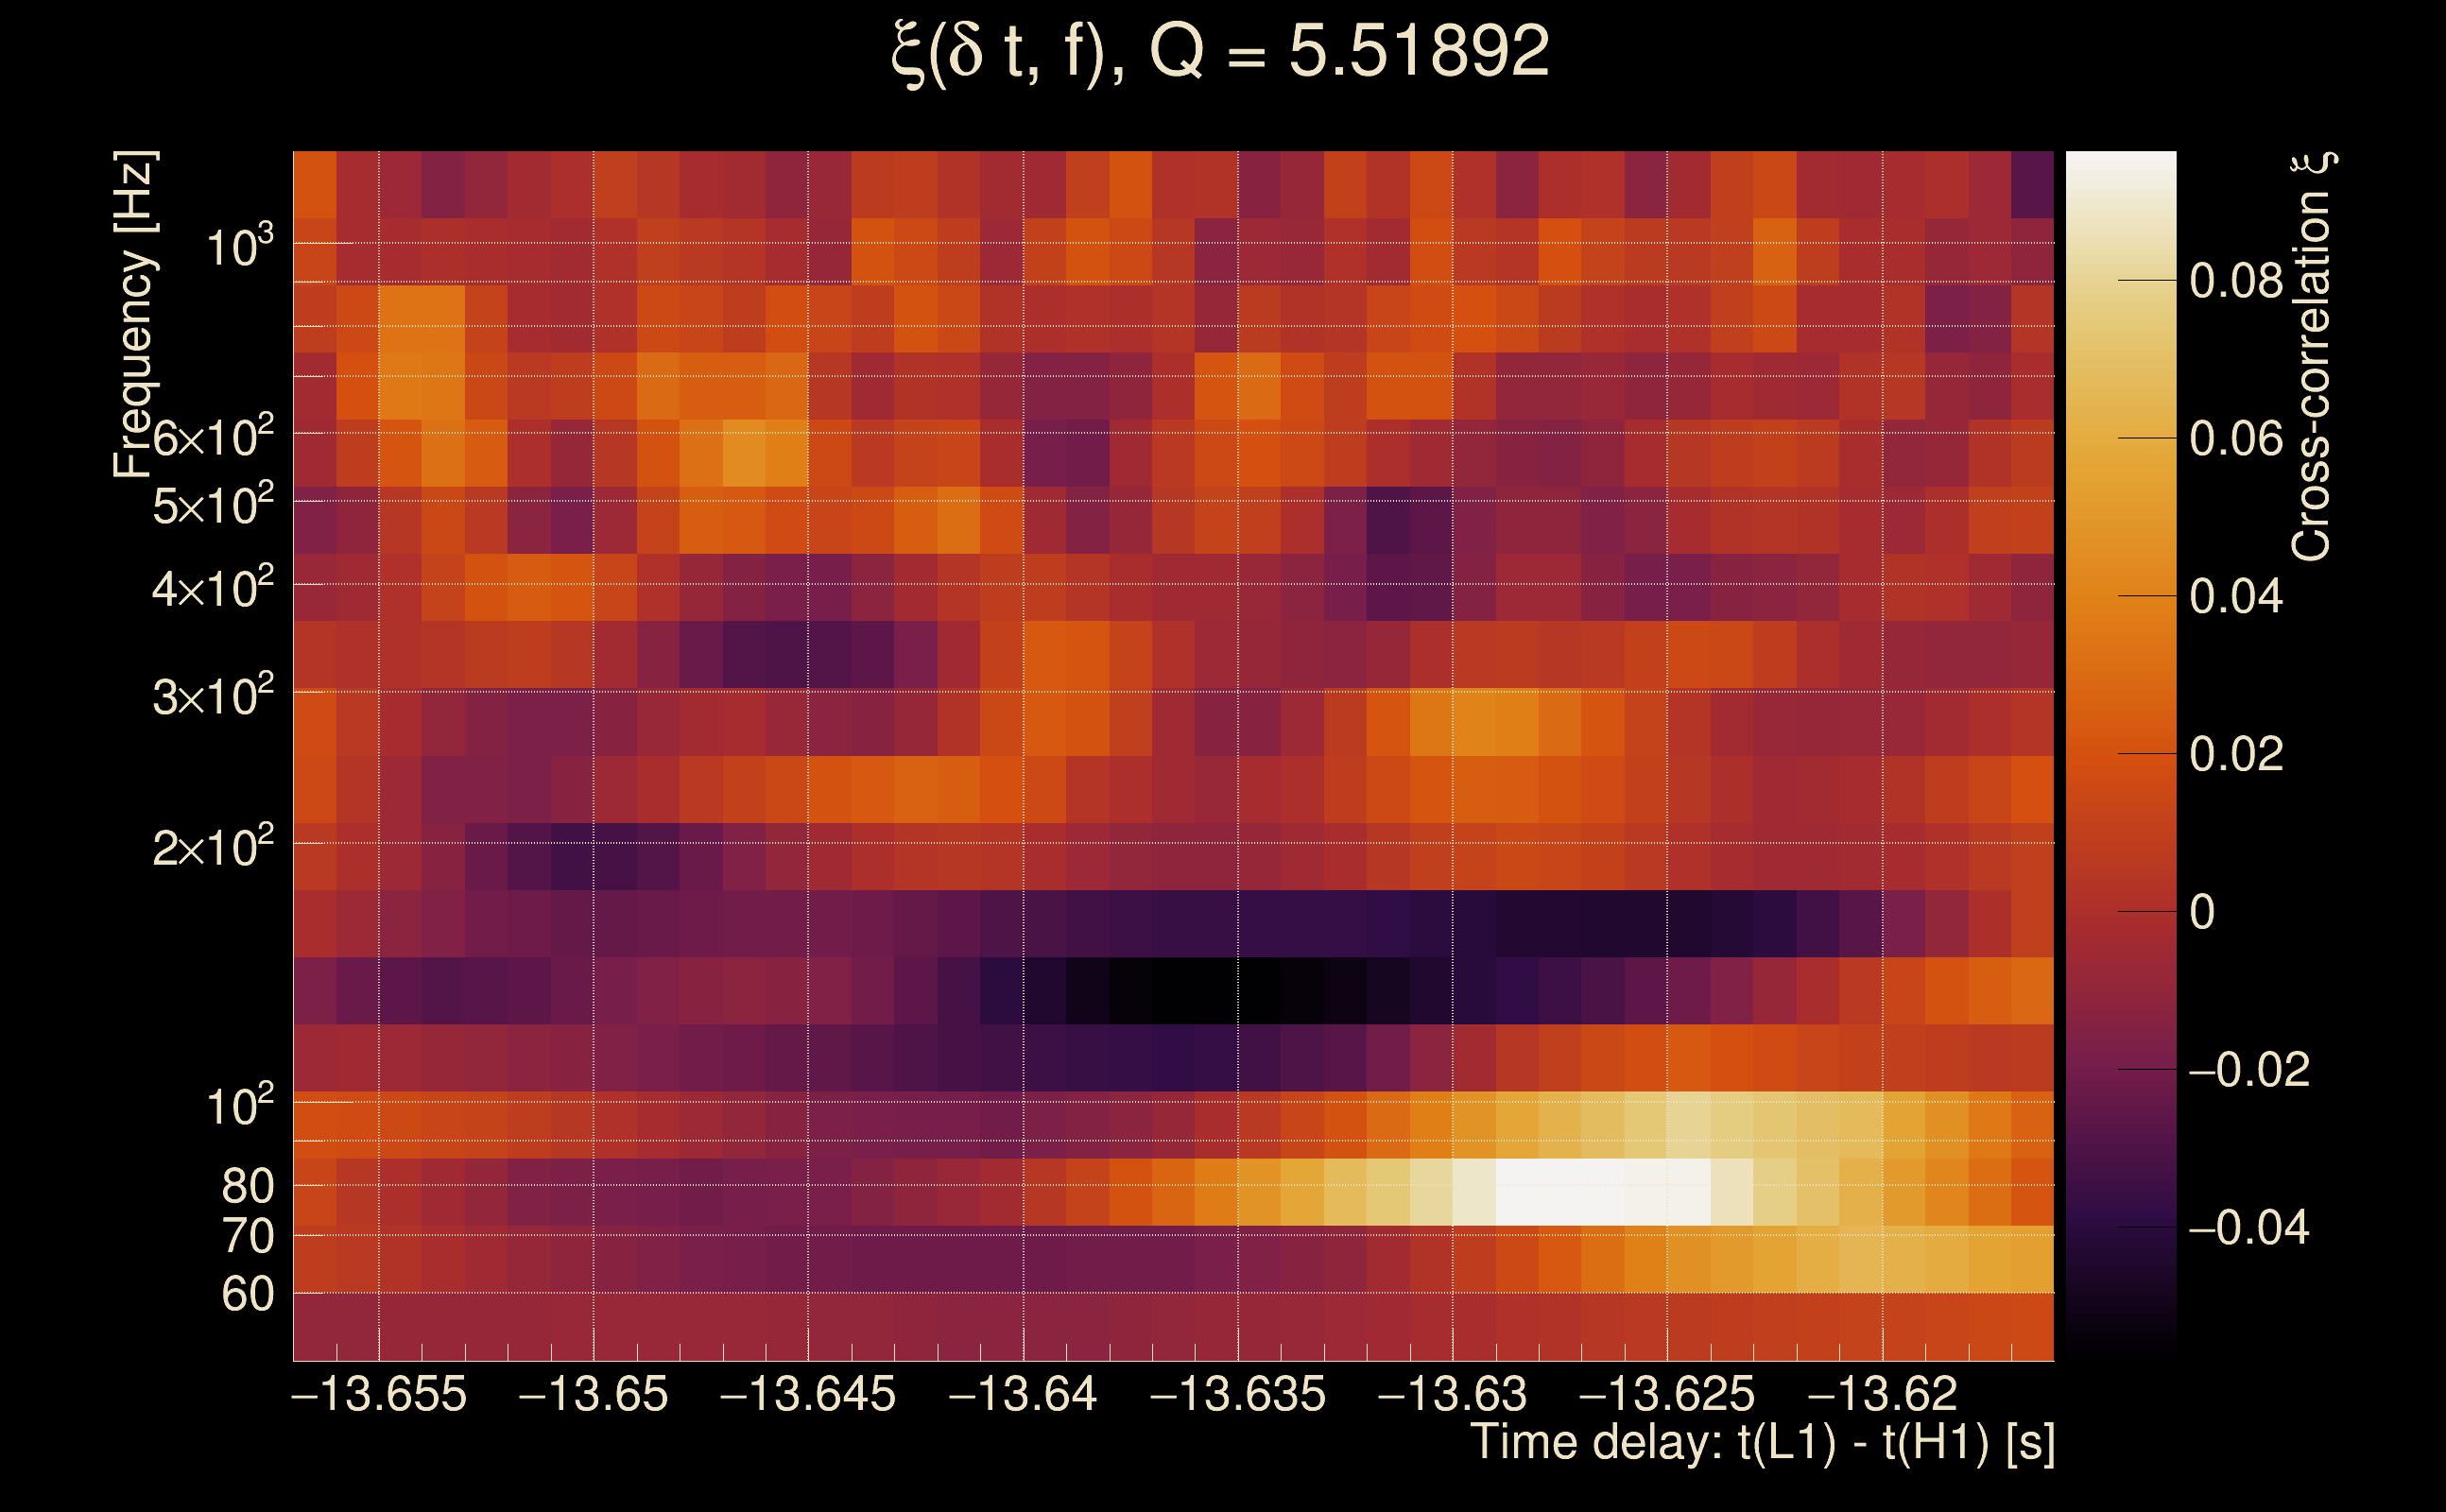
| Time delay between detectors t(L1) - t(H1): | -13.6362 s (slice index = 187 / 217), δt_gw = -0.00221074 s |
| Time delay uncertainty: | 0.00493162 s |
| [targeted mode] Time delay probability: | 0.989257 (0.0134645 sigmas), δt_target = -0.00215793 s |
| Frequency: | 770.429 Hz |
| Ξ: | 0.00123046 ± 0.0351041 (variance = 0.0012323): Q0: 0, Q1: 0.0331633, Q2: 0.052833, Q3: 0.092375, Q4: 0.0905723 |
| Rank: | R_A = 0.000749235 |
| Log of amplitude ratio (L1/H1): | 0.654122, variance = 0.555121 (L1/H1: 0.253308, variance = 0.89369, H1/L1: -0.987687, variance = 1.2446) |
| Amplitude ratio (L1/H1): | 1.92345 ⋇ 2.10658 (L1/H1: 1.28828 ⋇ 2.57372, H1/L1: 0.372437 ⋇ 3.05144) |
| Amplitude ratio H1|L1 compatibility (probability): | 0.615519 |
| Antenna factor probability: | 1 |
| Number of rejected frequency rows: | Q0: 18 / 18, Q1: 35 / 36, Q2: 66 / 70, Q3: 125 / 134, Q4: 244 / 258 |
| Maximum signal-to-noise ratio: | H1: 4.95006, L1: 5.42615 |
| SNR variance: | H1: 0.454878, L1: 0.489377 |
| Click here for a zoomed plot | Click here for a zoomed plot | Click here for a zoomed plot | Click here for a zoomed plot | Click here for a zoomed plot |
 |
 |
 |
 |
 |
 |
 |
 |
 |
 |
 |
 |
 |
 |
 |
|
|
|
|
|
 |
 |
 |
 |
 |
 |
 |
 |
 |
 |
 |
 |
 |
 |
| Event time t(H1): | GPS = 1368195283 (Mon May 15 14:14:25 2023 ) → GPS = 1368195293 (Mon May 15 14:14:35 2023 ) |
| Event time t(L1): | GPS = 1368195263 (Mon May 15 14:14:35 2023 ) → GPS = 1368195273 (Mon May 15 14:14:15 2023 ) |
| Omicron analysis time window (H1): | GPS = 1368195280 → GPS = 1368195296 |
| Omicron analysis time window (L1): | GPS = 1368195260 → GPS = 1368195276 |
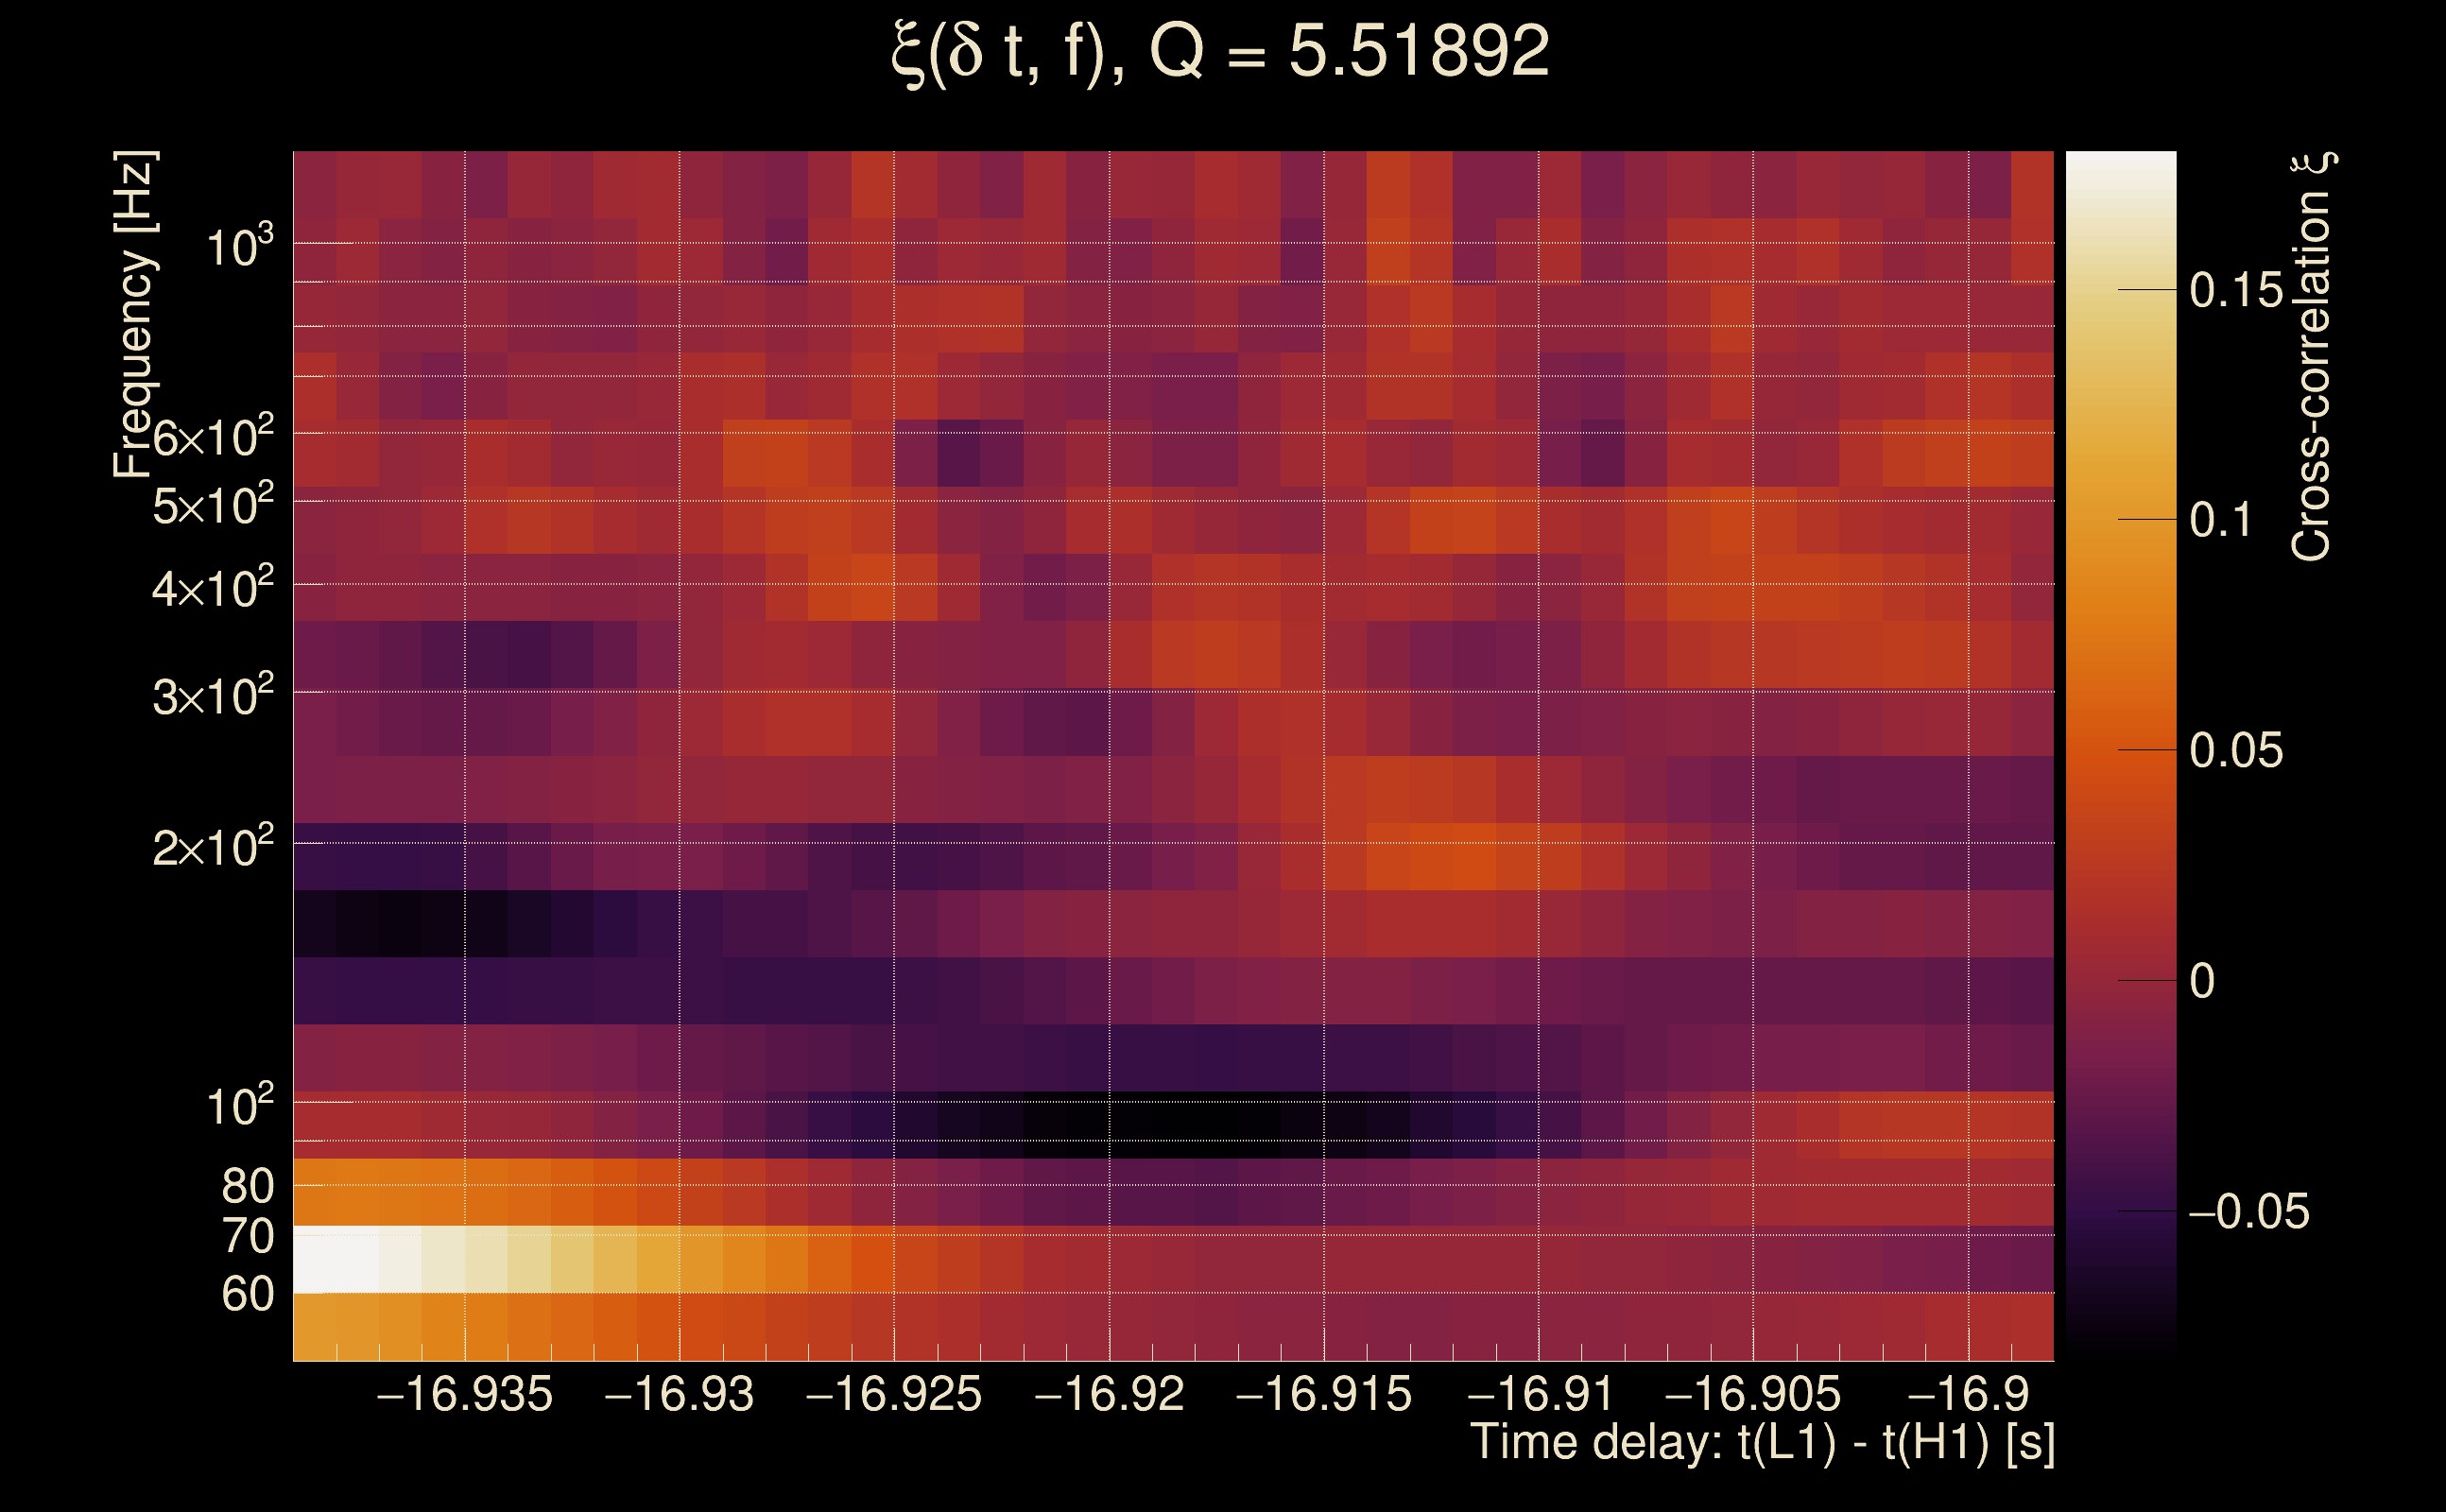
| Time delay between detectors t(L1) - t(H1): | -16.9181 s (slice index = 41 / 217), δt_gw = -0.000143295 s |
| Time delay uncertainty: | 0.00730783 s |
| [targeted mode] Time delay probability: | 0.782517 (0.27604 sigmas), δt_target = -0.00214434 s |
| Frequency: | 809.465 Hz |
| Ξ: | 0.00113864 ± 0.024687 (variance = 0.000609448): Q0: 0, Q1: 0.030231, Q2: 0.0487647, Q3: 0.0570025, Q4: 0.0715815 |
| Rank: | R_A = 0.000749039 |
| Log of amplitude ratio (L1/H1): | 0.757905, variance = 0.702245 (L1/H1: 0.572401, variance = 0.852924, H1/L1: -0.888173, variance = 1.61423) |
| Amplitude ratio (L1/H1): | 2.1338 ⋇ 2.31174 (L1/H1: 1.77252 ⋇ 2.51819, H1/L1: 0.411407 ⋇ 3.56272) |
| Amplitude ratio H1|L1 compatibility (probability): | 0.84067 |
| Antenna factor probability: | 1 |
| Number of rejected frequency rows: | Q0: 18 / 18, Q1: 34 / 36, Q2: 65 / 70, Q3: 128 / 134, Q4: 250 / 258 |
| Maximum signal-to-noise ratio: | H1: 4.68794, L1: 5.59422 |
| SNR variance: | H1: 0.439115, L1: 0.469644 |
| Click here for a zoomed plot | Click here for a zoomed plot | Click here for a zoomed plot | Click here for a zoomed plot | Click here for a zoomed plot |
|
|
|
|
|
|
|
|
|
|
|
|
|
|
|
|
|
|
|
|
|
|
|
|
|
 |
 |
 |
 |
 |
 |
 |
 |
 |
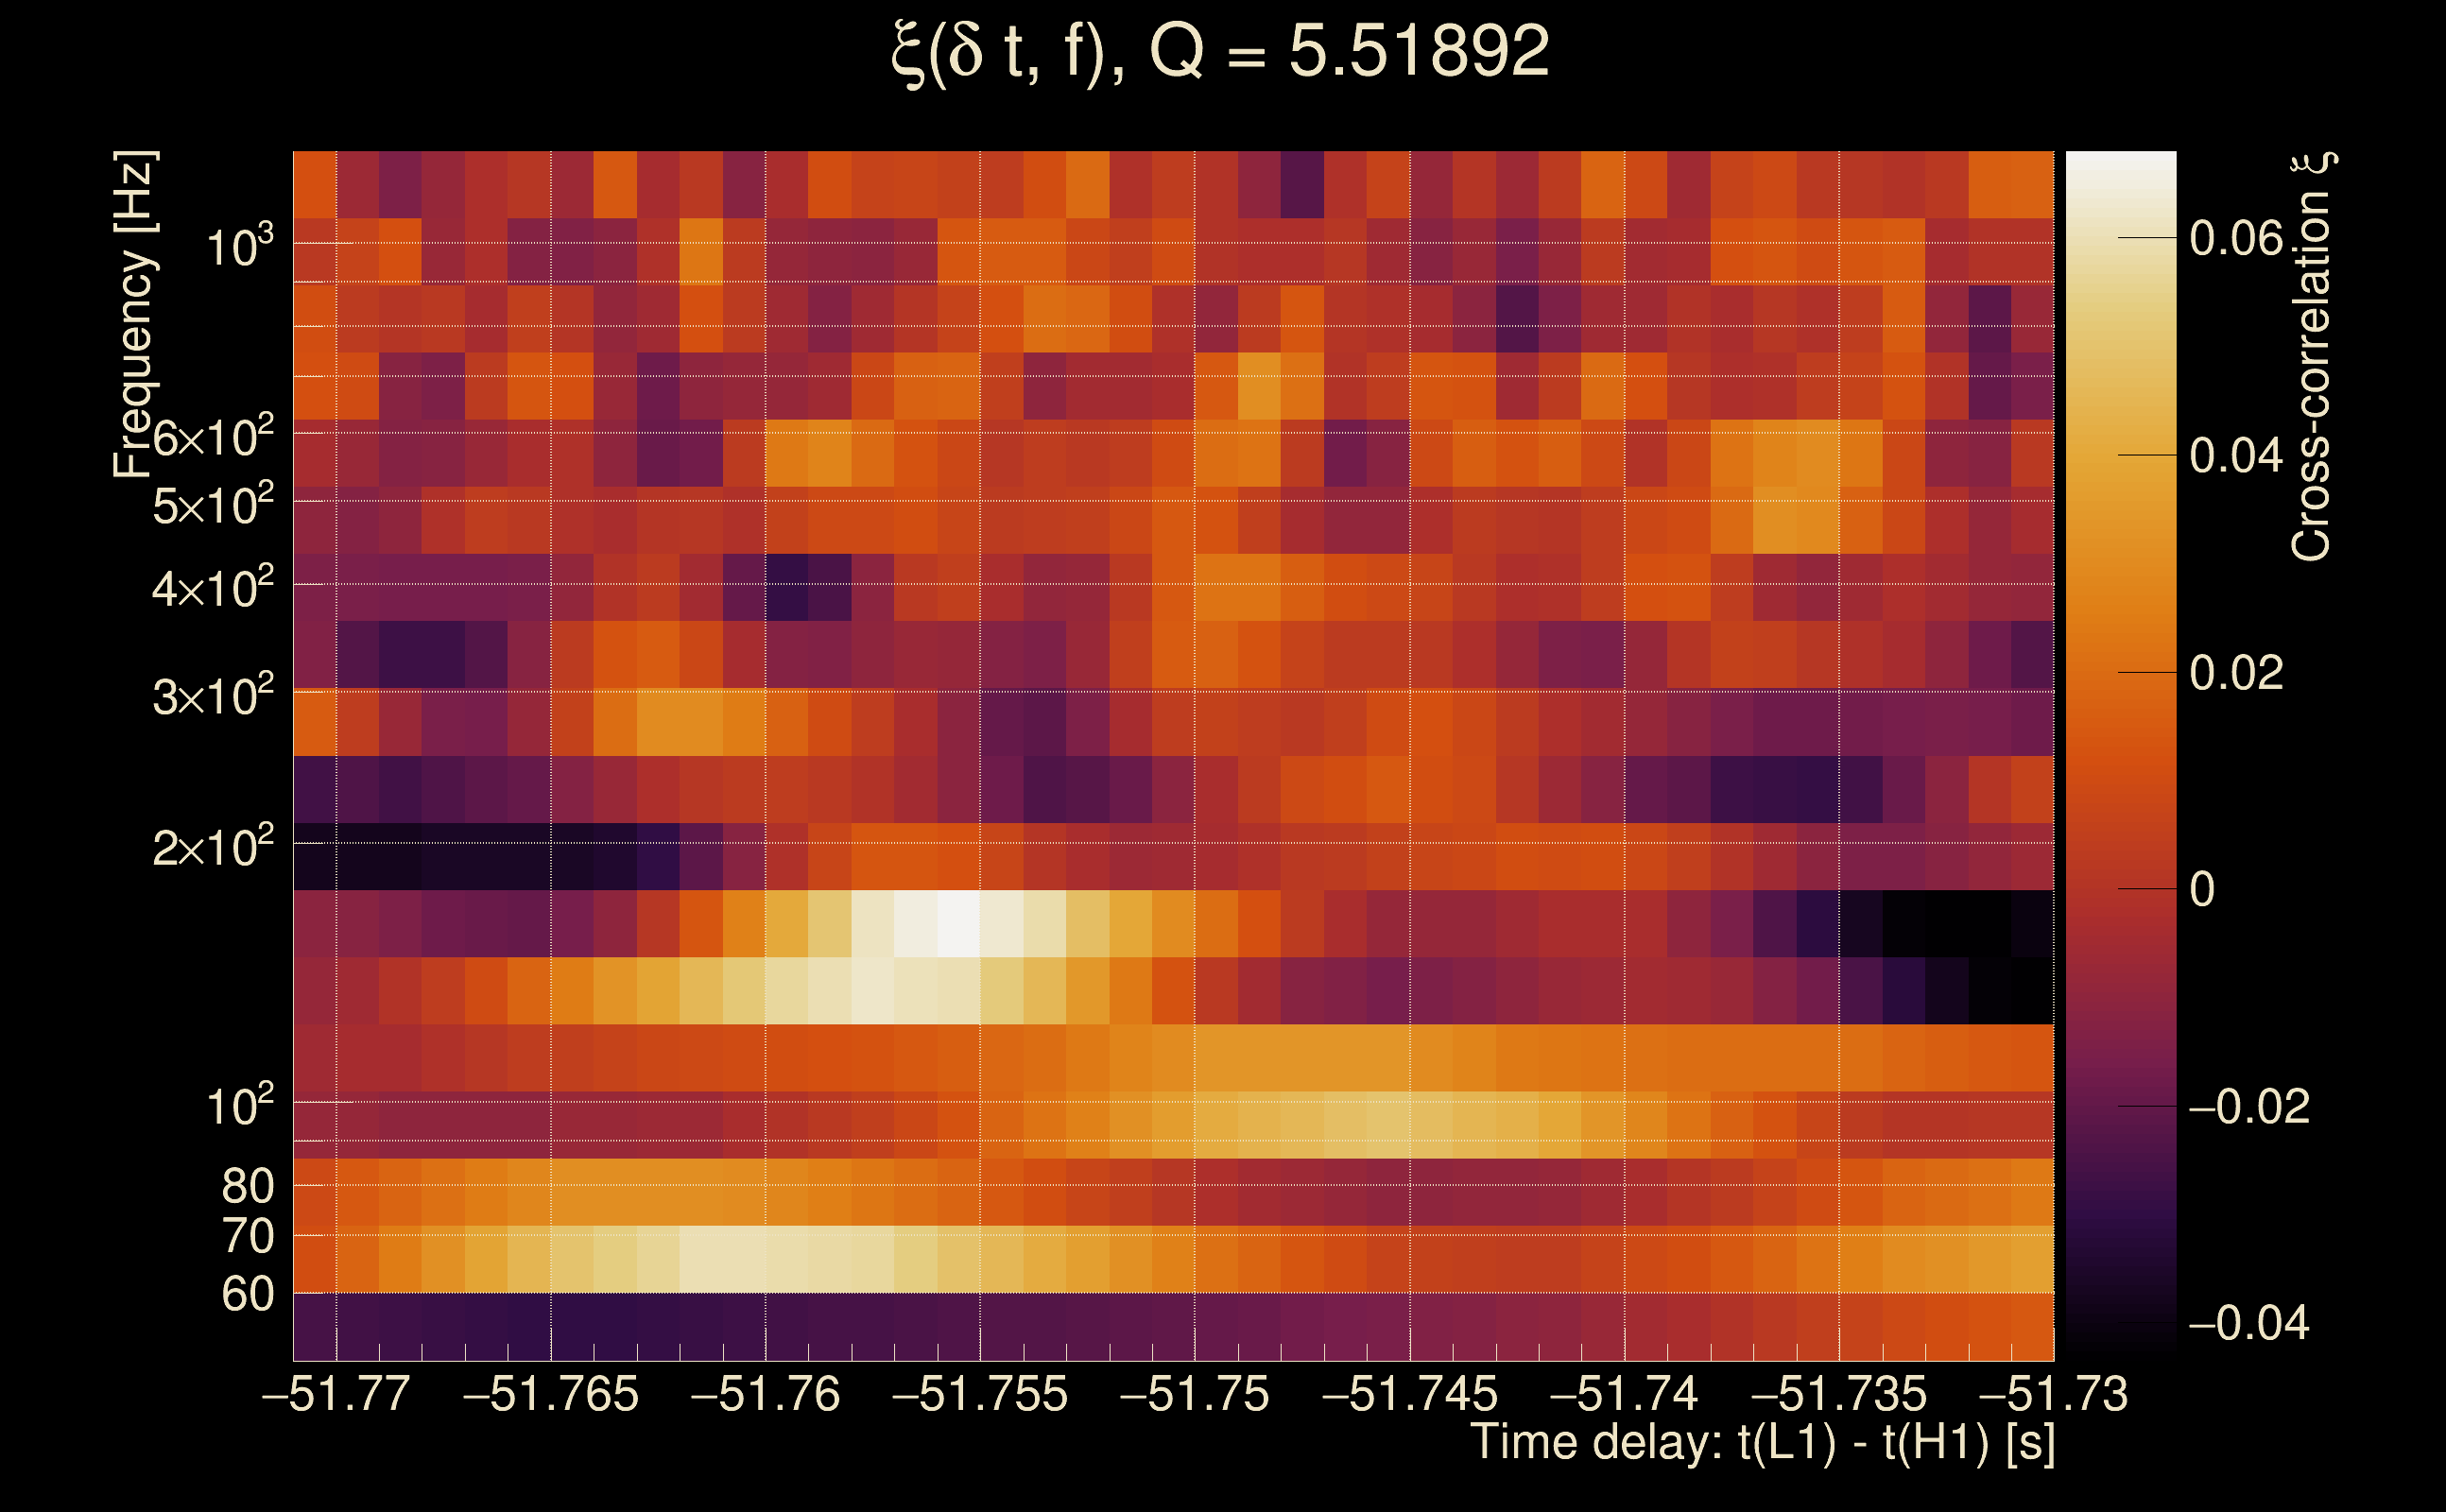
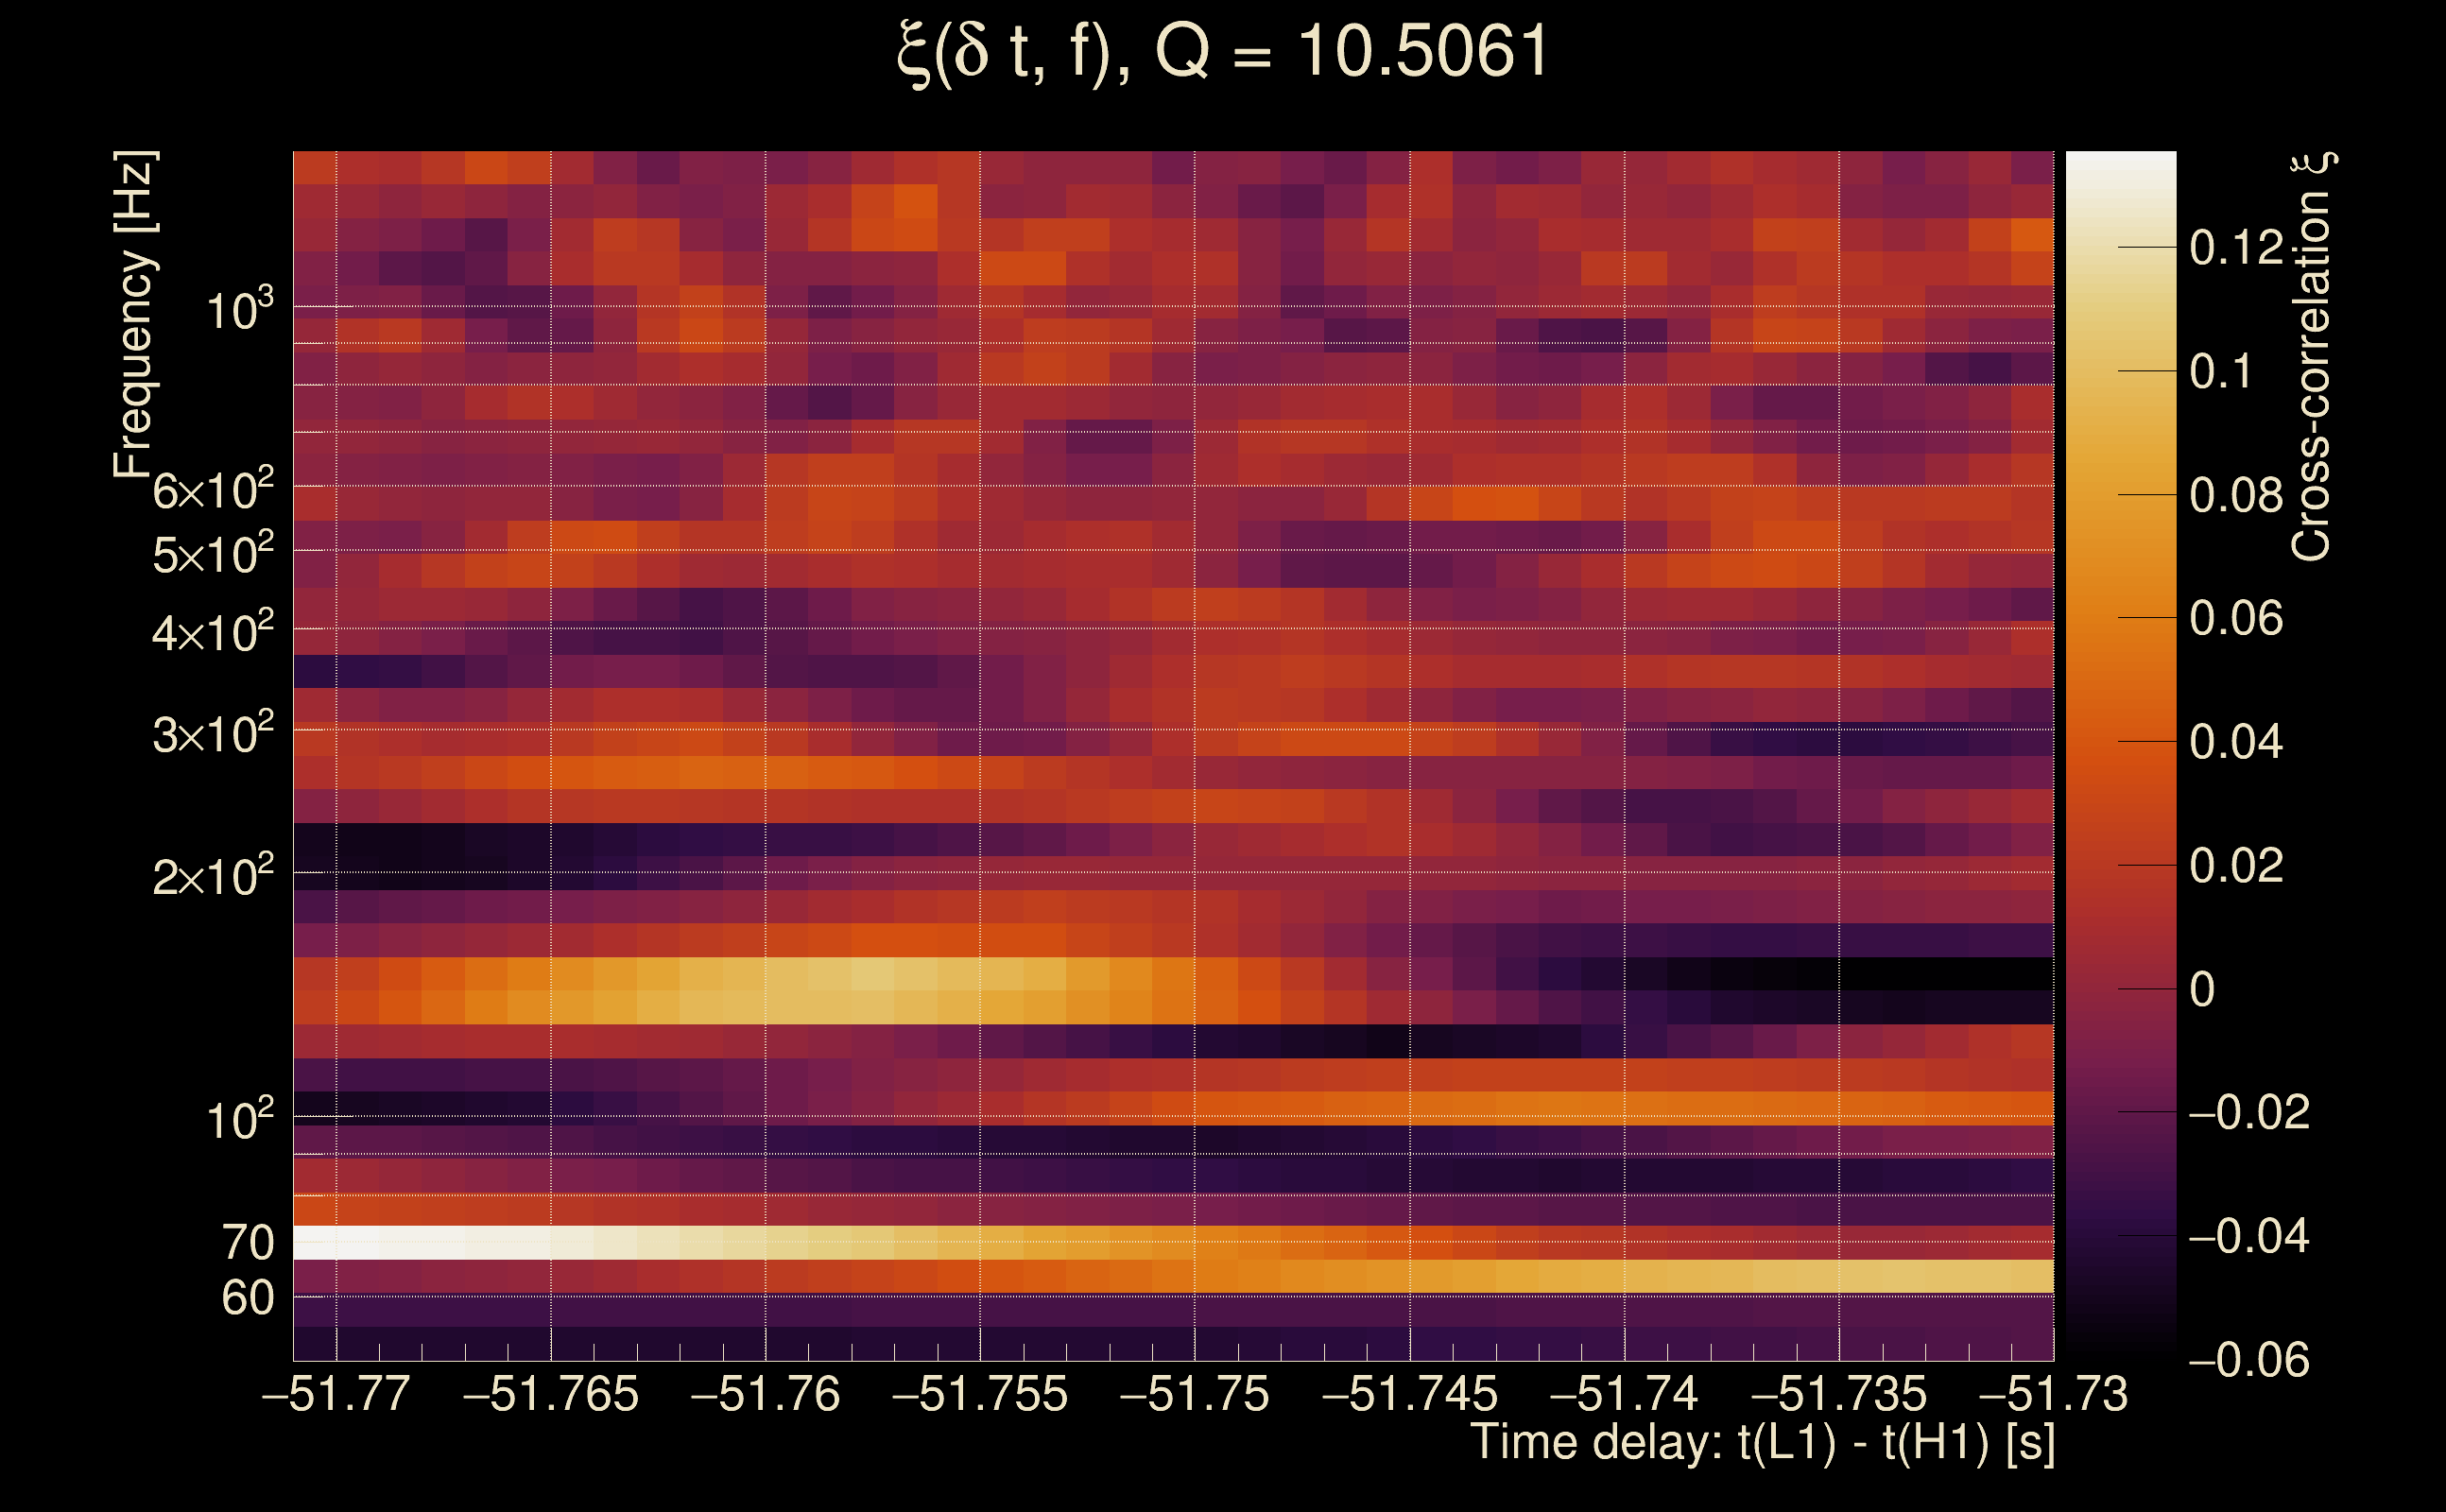
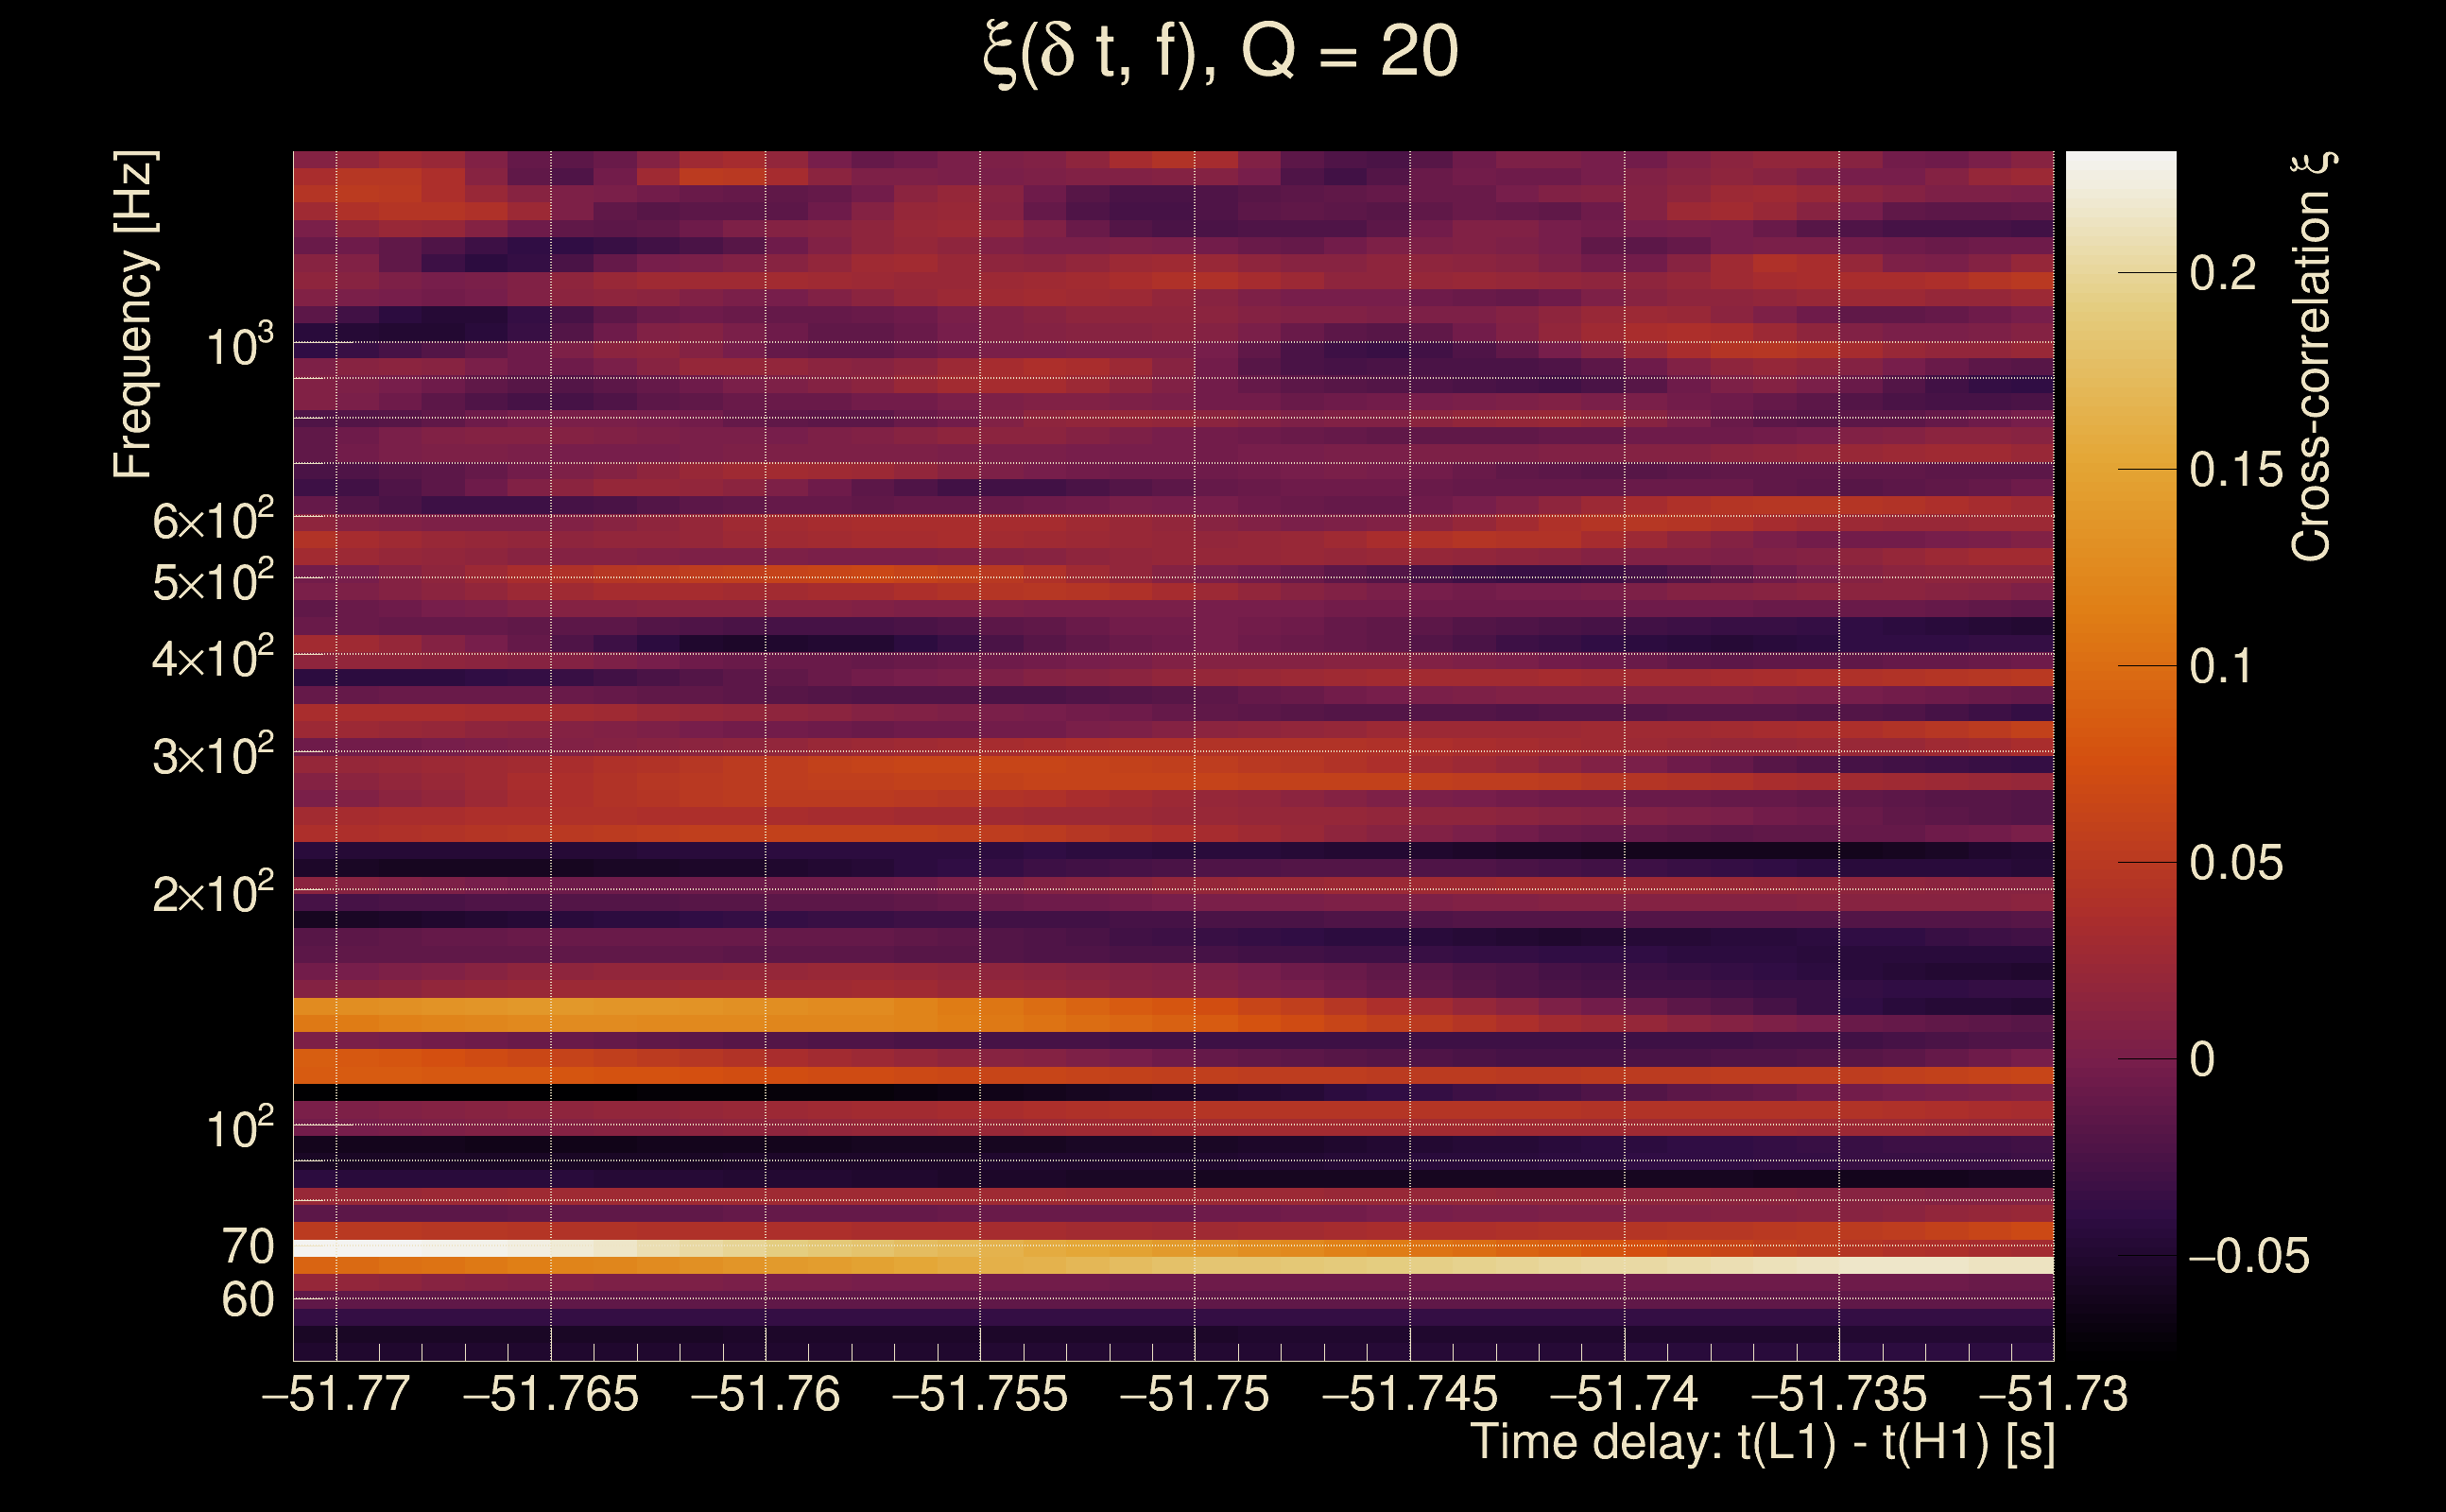
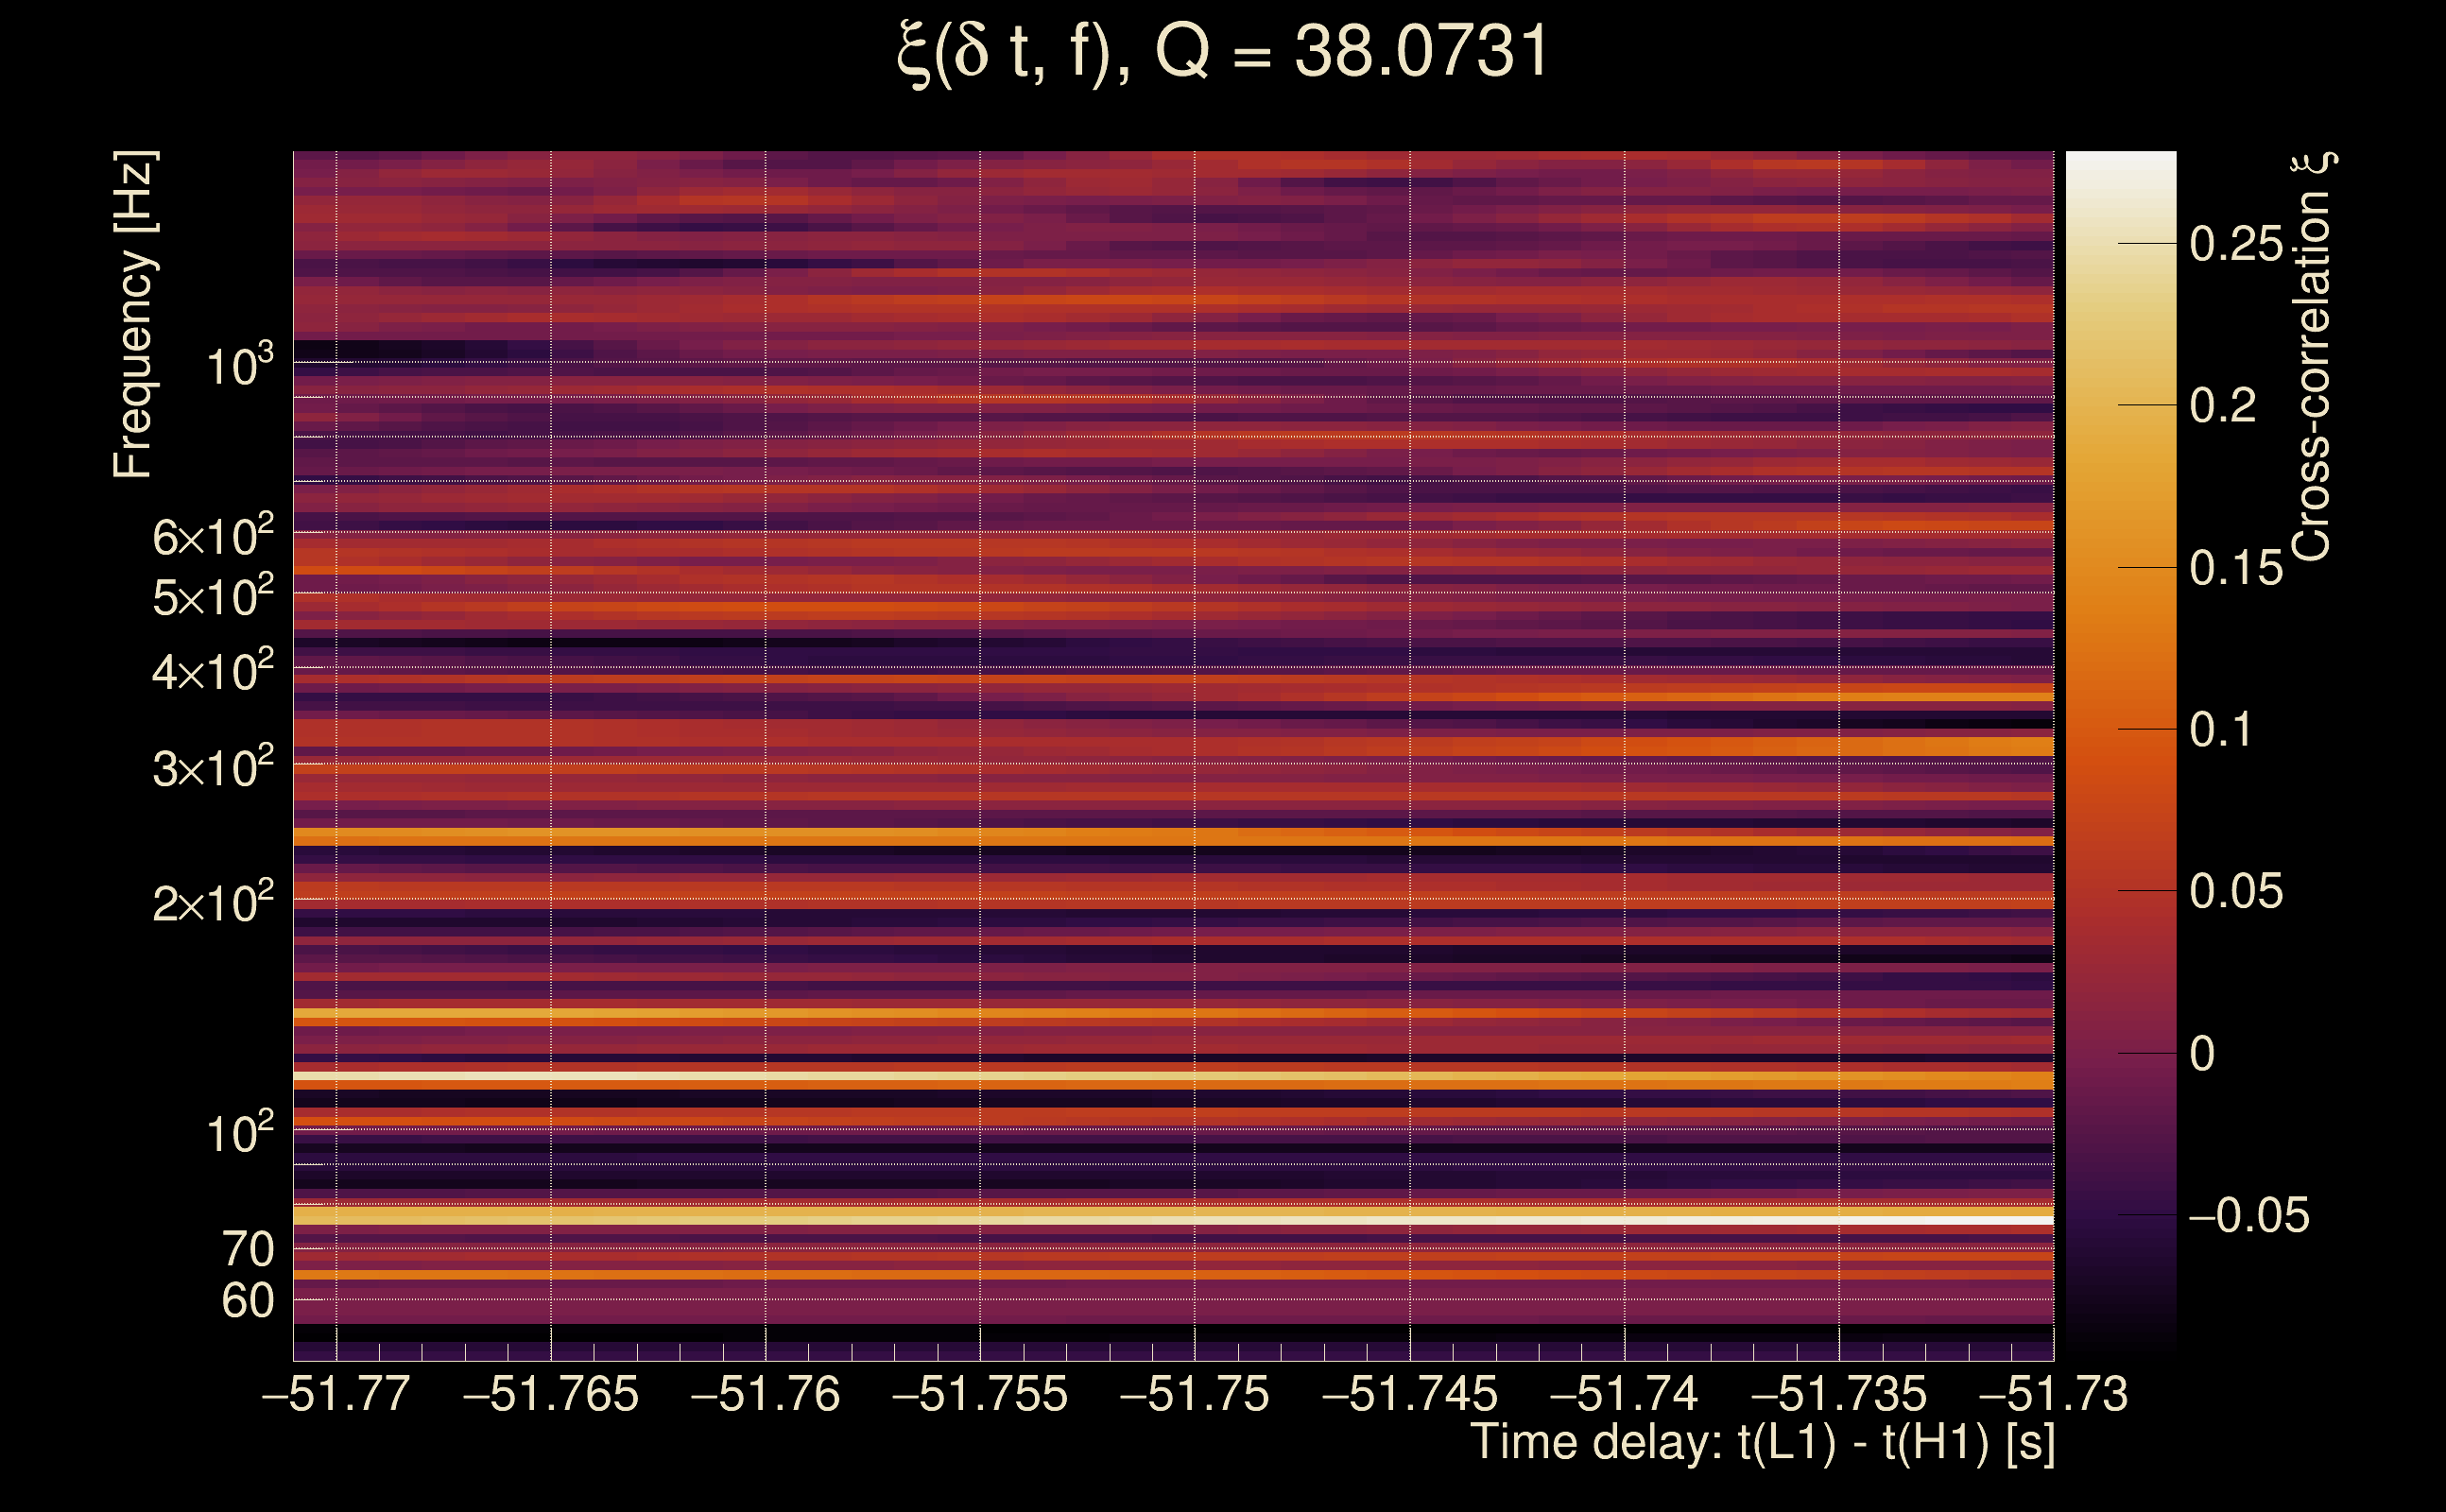
| Event time t(H1): | GPS = 1368195323 (Mon May 15 14:15:05 2023 ) → GPS = 1368195333 (Mon May 15 14:15:15 2023 ) |
| Event time t(L1): | GPS = 1368195273 (Mon May 15 14:15:15 2023 ) → GPS = 1368195283 (Mon May 15 14:14:25 2023 ) |
| Omicron analysis time window (H1): | GPS = 1368195320 → GPS = 1368195336 |
| Omicron analysis time window (L1): | GPS = 1368195270 → GPS = 1368195286 |
| Time delay between detectors t(L1) - t(H1): | -51.7508 s (slice index = 146 / 217), δt_gw = -0.00279794 s |
| Time delay uncertainty: | 0.00688206 s |
| [targeted mode] Time delay probability: | 0.923676 (0.0958041 sigmas), δt_target = -0.00216055 s |
| Frequency: | 1147.11 Hz |
| Ξ: | 0.000882333 ± 0.0329629 (variance = 0.00108655): Q0: 0, Q1: 0.0408492, Q2: 0.0430664, Q3: 0.0681395, Q4: 0.0997248 |
| Rank: | R_A = 0.000746789 |
| Log of amplitude ratio (L1/H1): | 0.44754, variance = 0.39245 (L1/H1: 0.391994, variance = 0.771672, H1/L1: -0.522143, variance = 0.762562) |
| Amplitude ratio (L1/H1): | 1.56446 ⋇ 1.87097 (L1/H1: 1.47993 ⋇ 2.40716, H1/L1: 0.593248 ⋇ 2.39468) |
| Amplitude ratio H1|L1 compatibility (probability): | 0.916317 |
| Antenna factor probability: | 1 |
| Number of rejected frequency rows: | Q0: 18 / 18, Q1: 35 / 36, Q2: 66 / 70, Q3: 129 / 134, Q4: 251 / 258 |
| Maximum signal-to-noise ratio: | H1: 5.69713, L1: 4.91588 |
| SNR variance: | H1: 0.461341, L1: 0.455537 |
| Click here for a zoomed plot | Click here for a zoomed plot | Click here for a zoomed plot | Click here for a zoomed plot | Click here for a zoomed plot |
 |
 |
 |
 |
 |
 |
 |
 |
 |
 |
 |
 |
 |
 |
 |
|
|
|
|
|
|
|
|
|
|
 |
 |
 |
 |
 |
 |
 |
 |
 |
| florent.robinet@ijclab.in2p3.fr |