| Omicron version: | 4.2.0: documentation gitlab repository |
| Omicron run by: | unknown |
| Report produced on: | Mon Oct 27 12:53:30 2025 UTC |
| Ox option file: | Targeted_O4bw_2min_options.txt |
| Omicron option files: | detector 0, detector 1 |
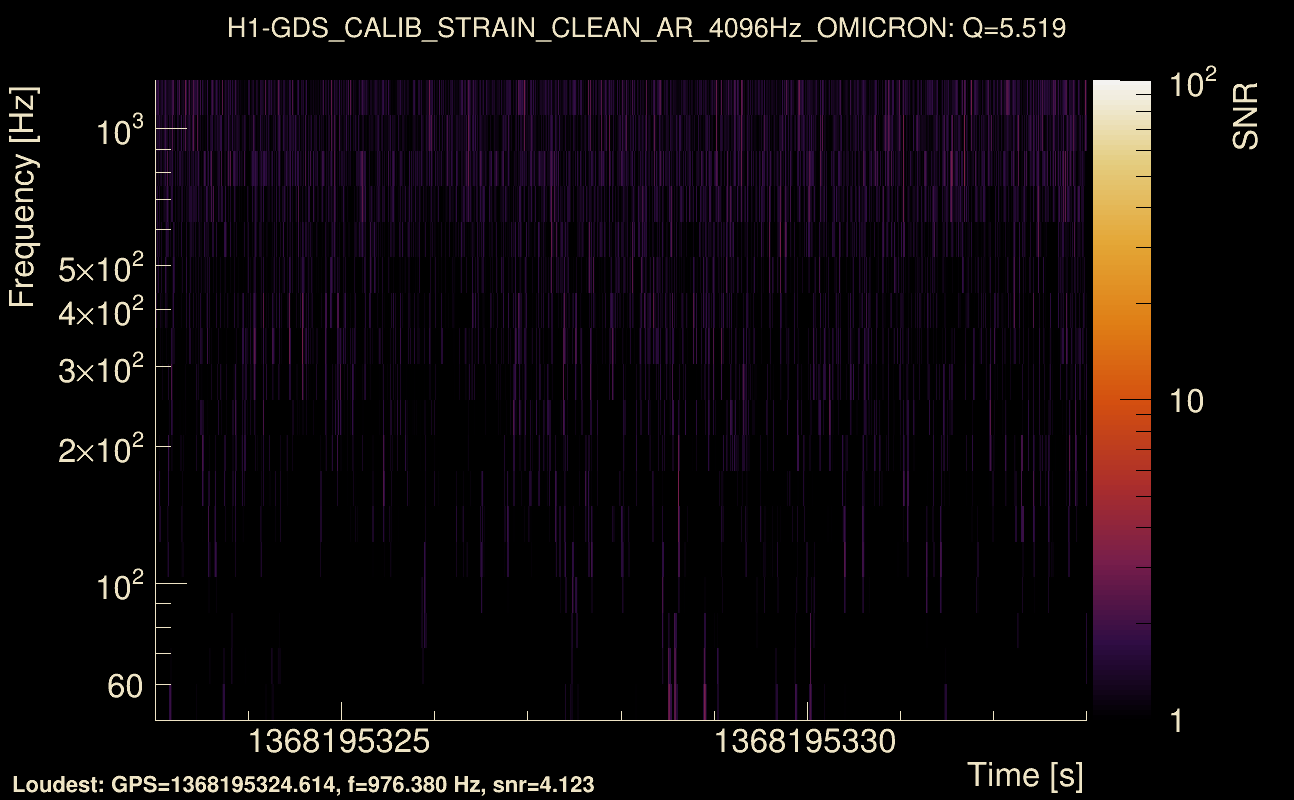
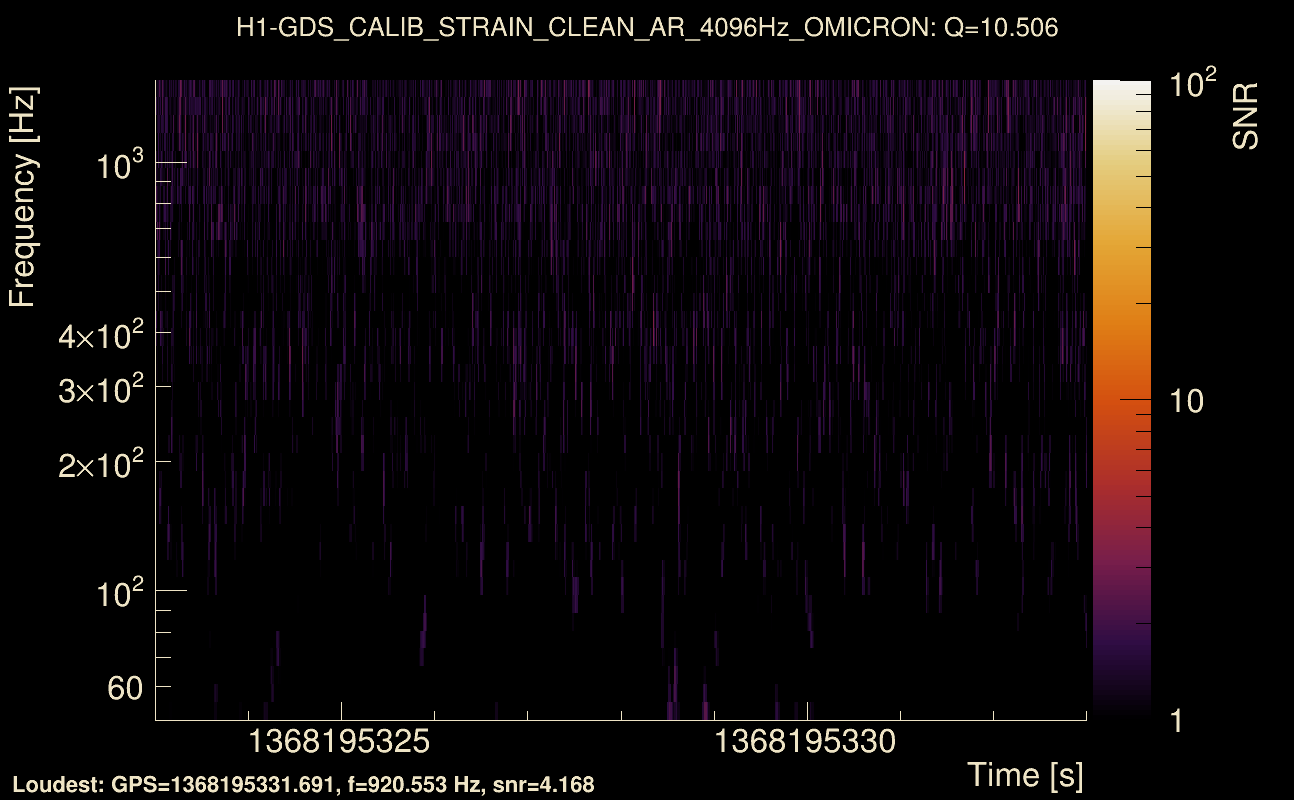
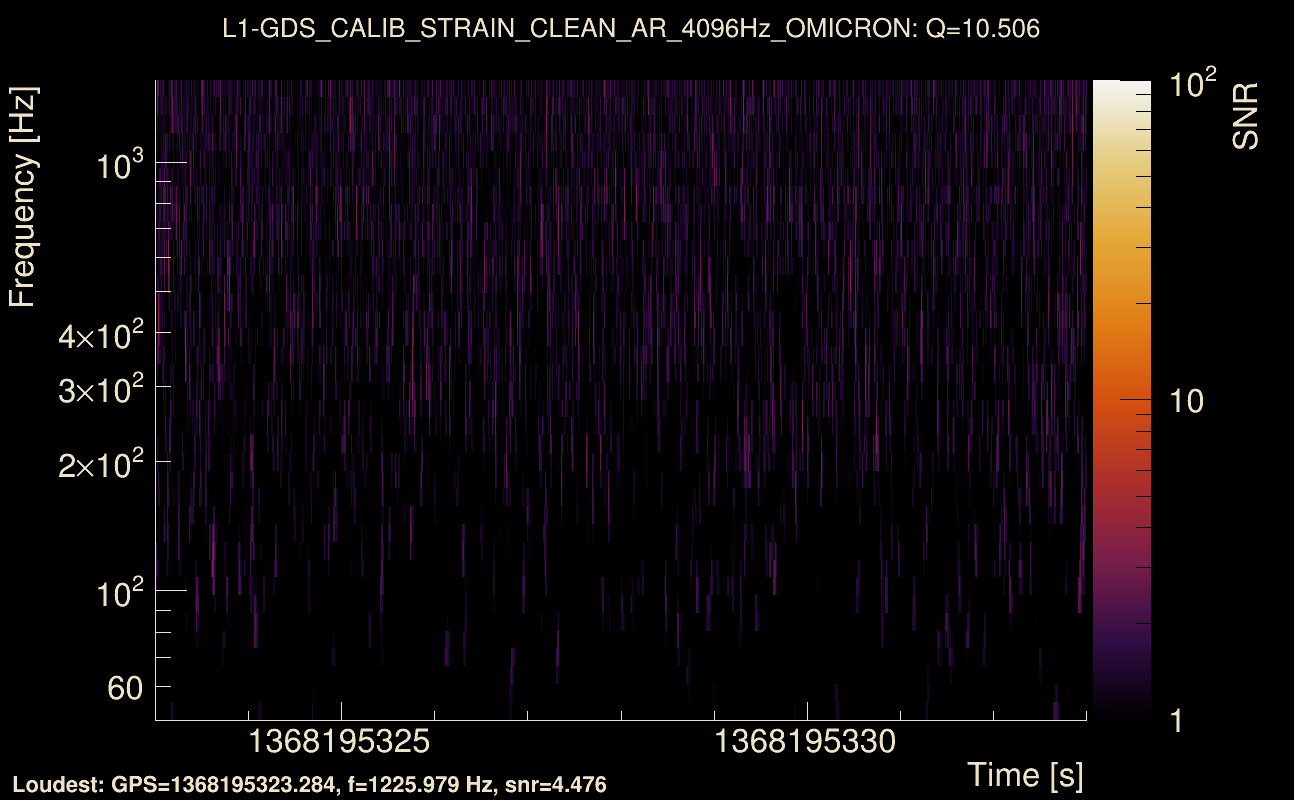
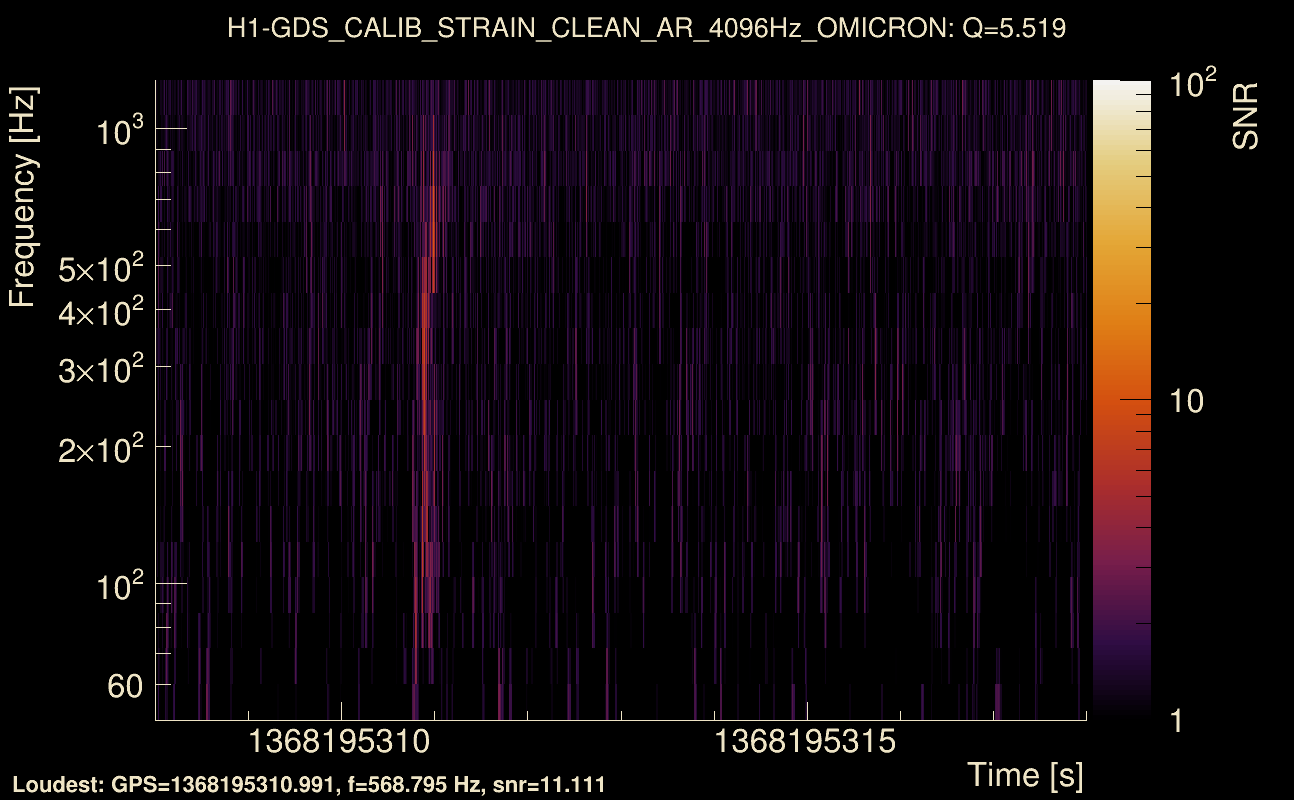
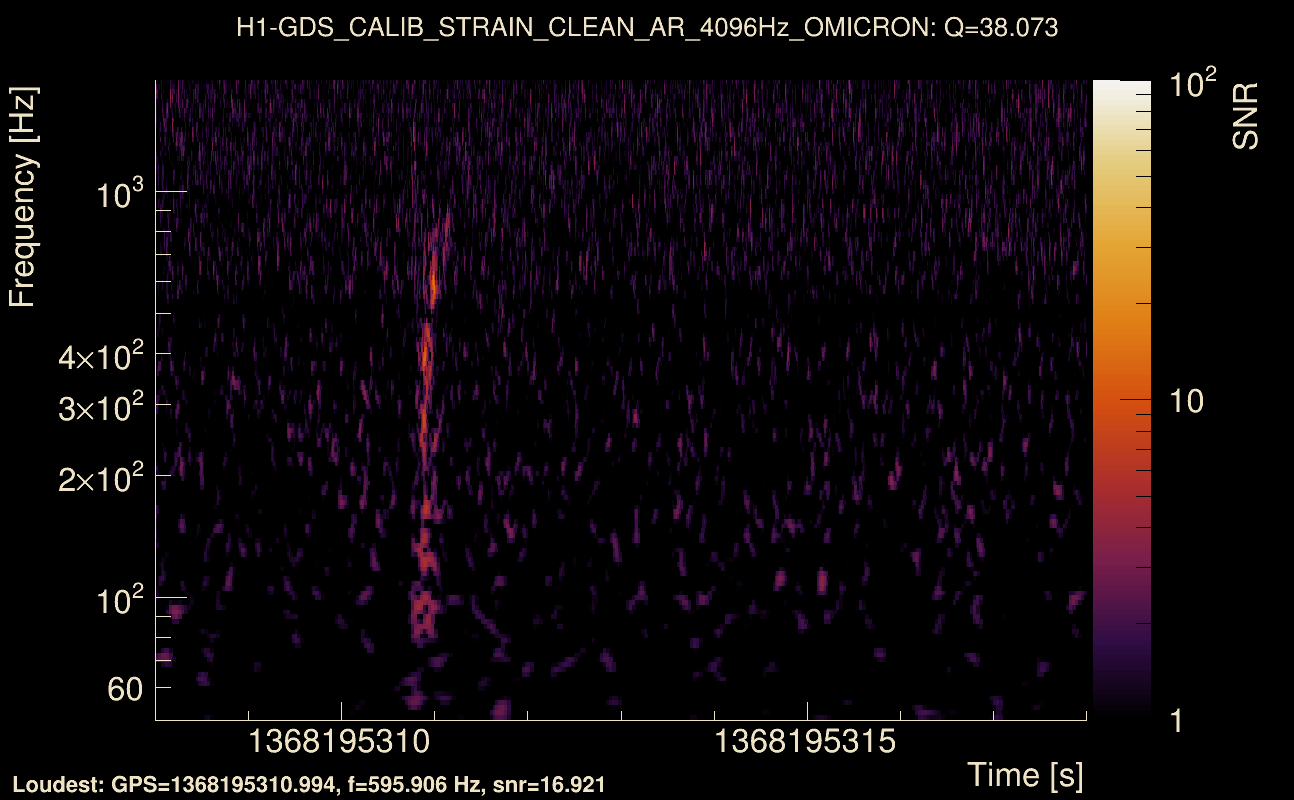
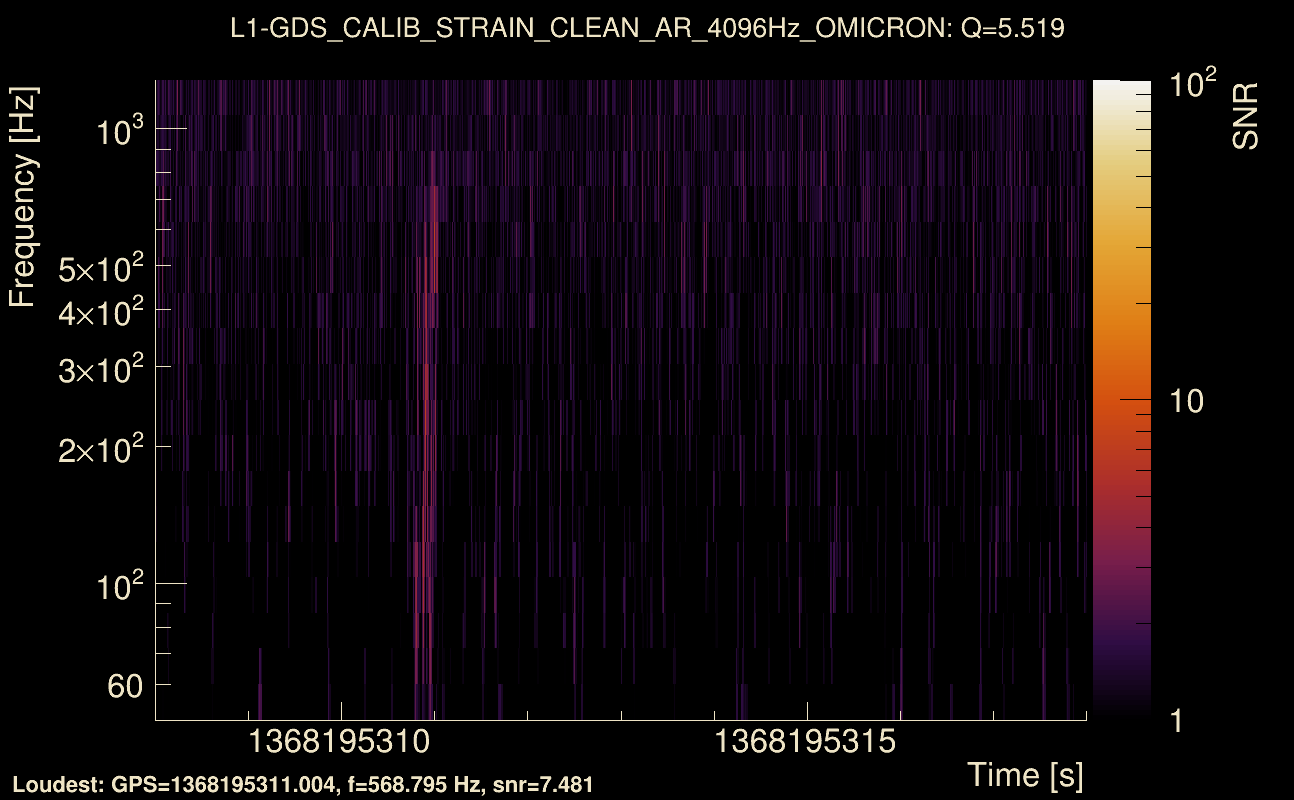
| Detector channel names: | H1:GDS-CALIB_STRAIN_CLEAN_AR_4096Hz, L1:GDS-CALIB_STRAIN_CLEAN_AR_4096Hz |
| Omicron analysis time window and overlap: | 16 s, 6 s |
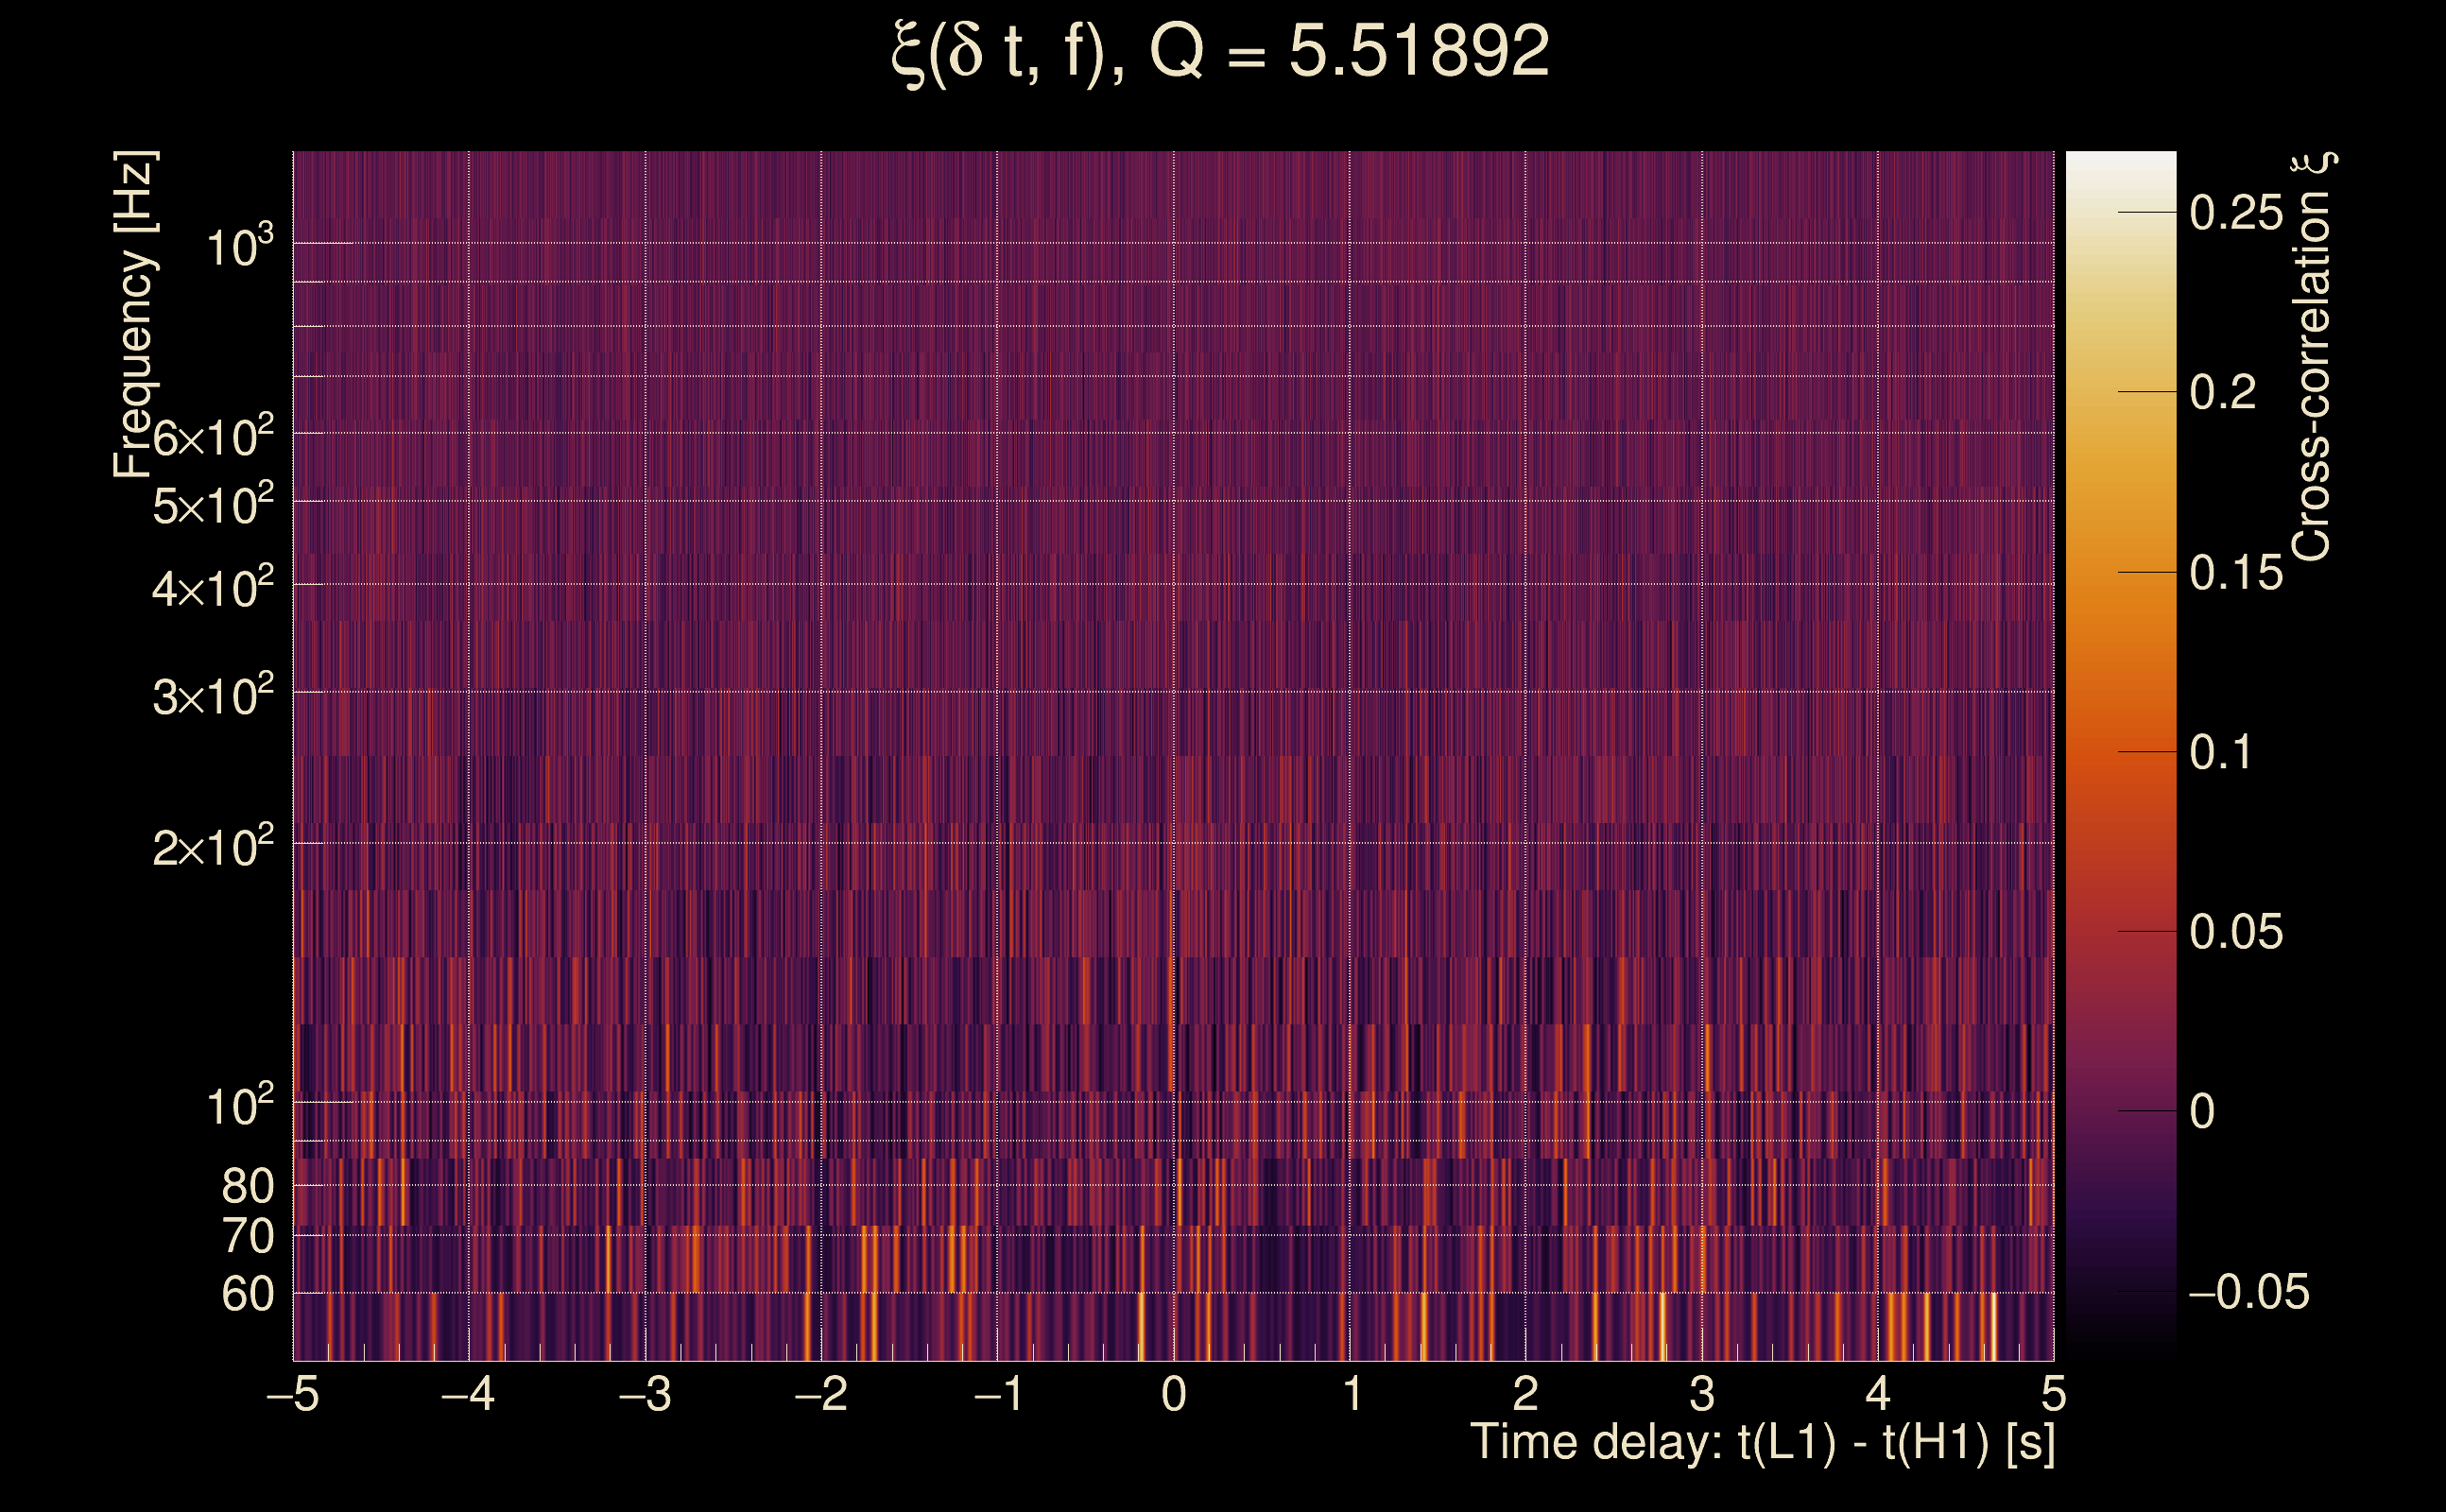
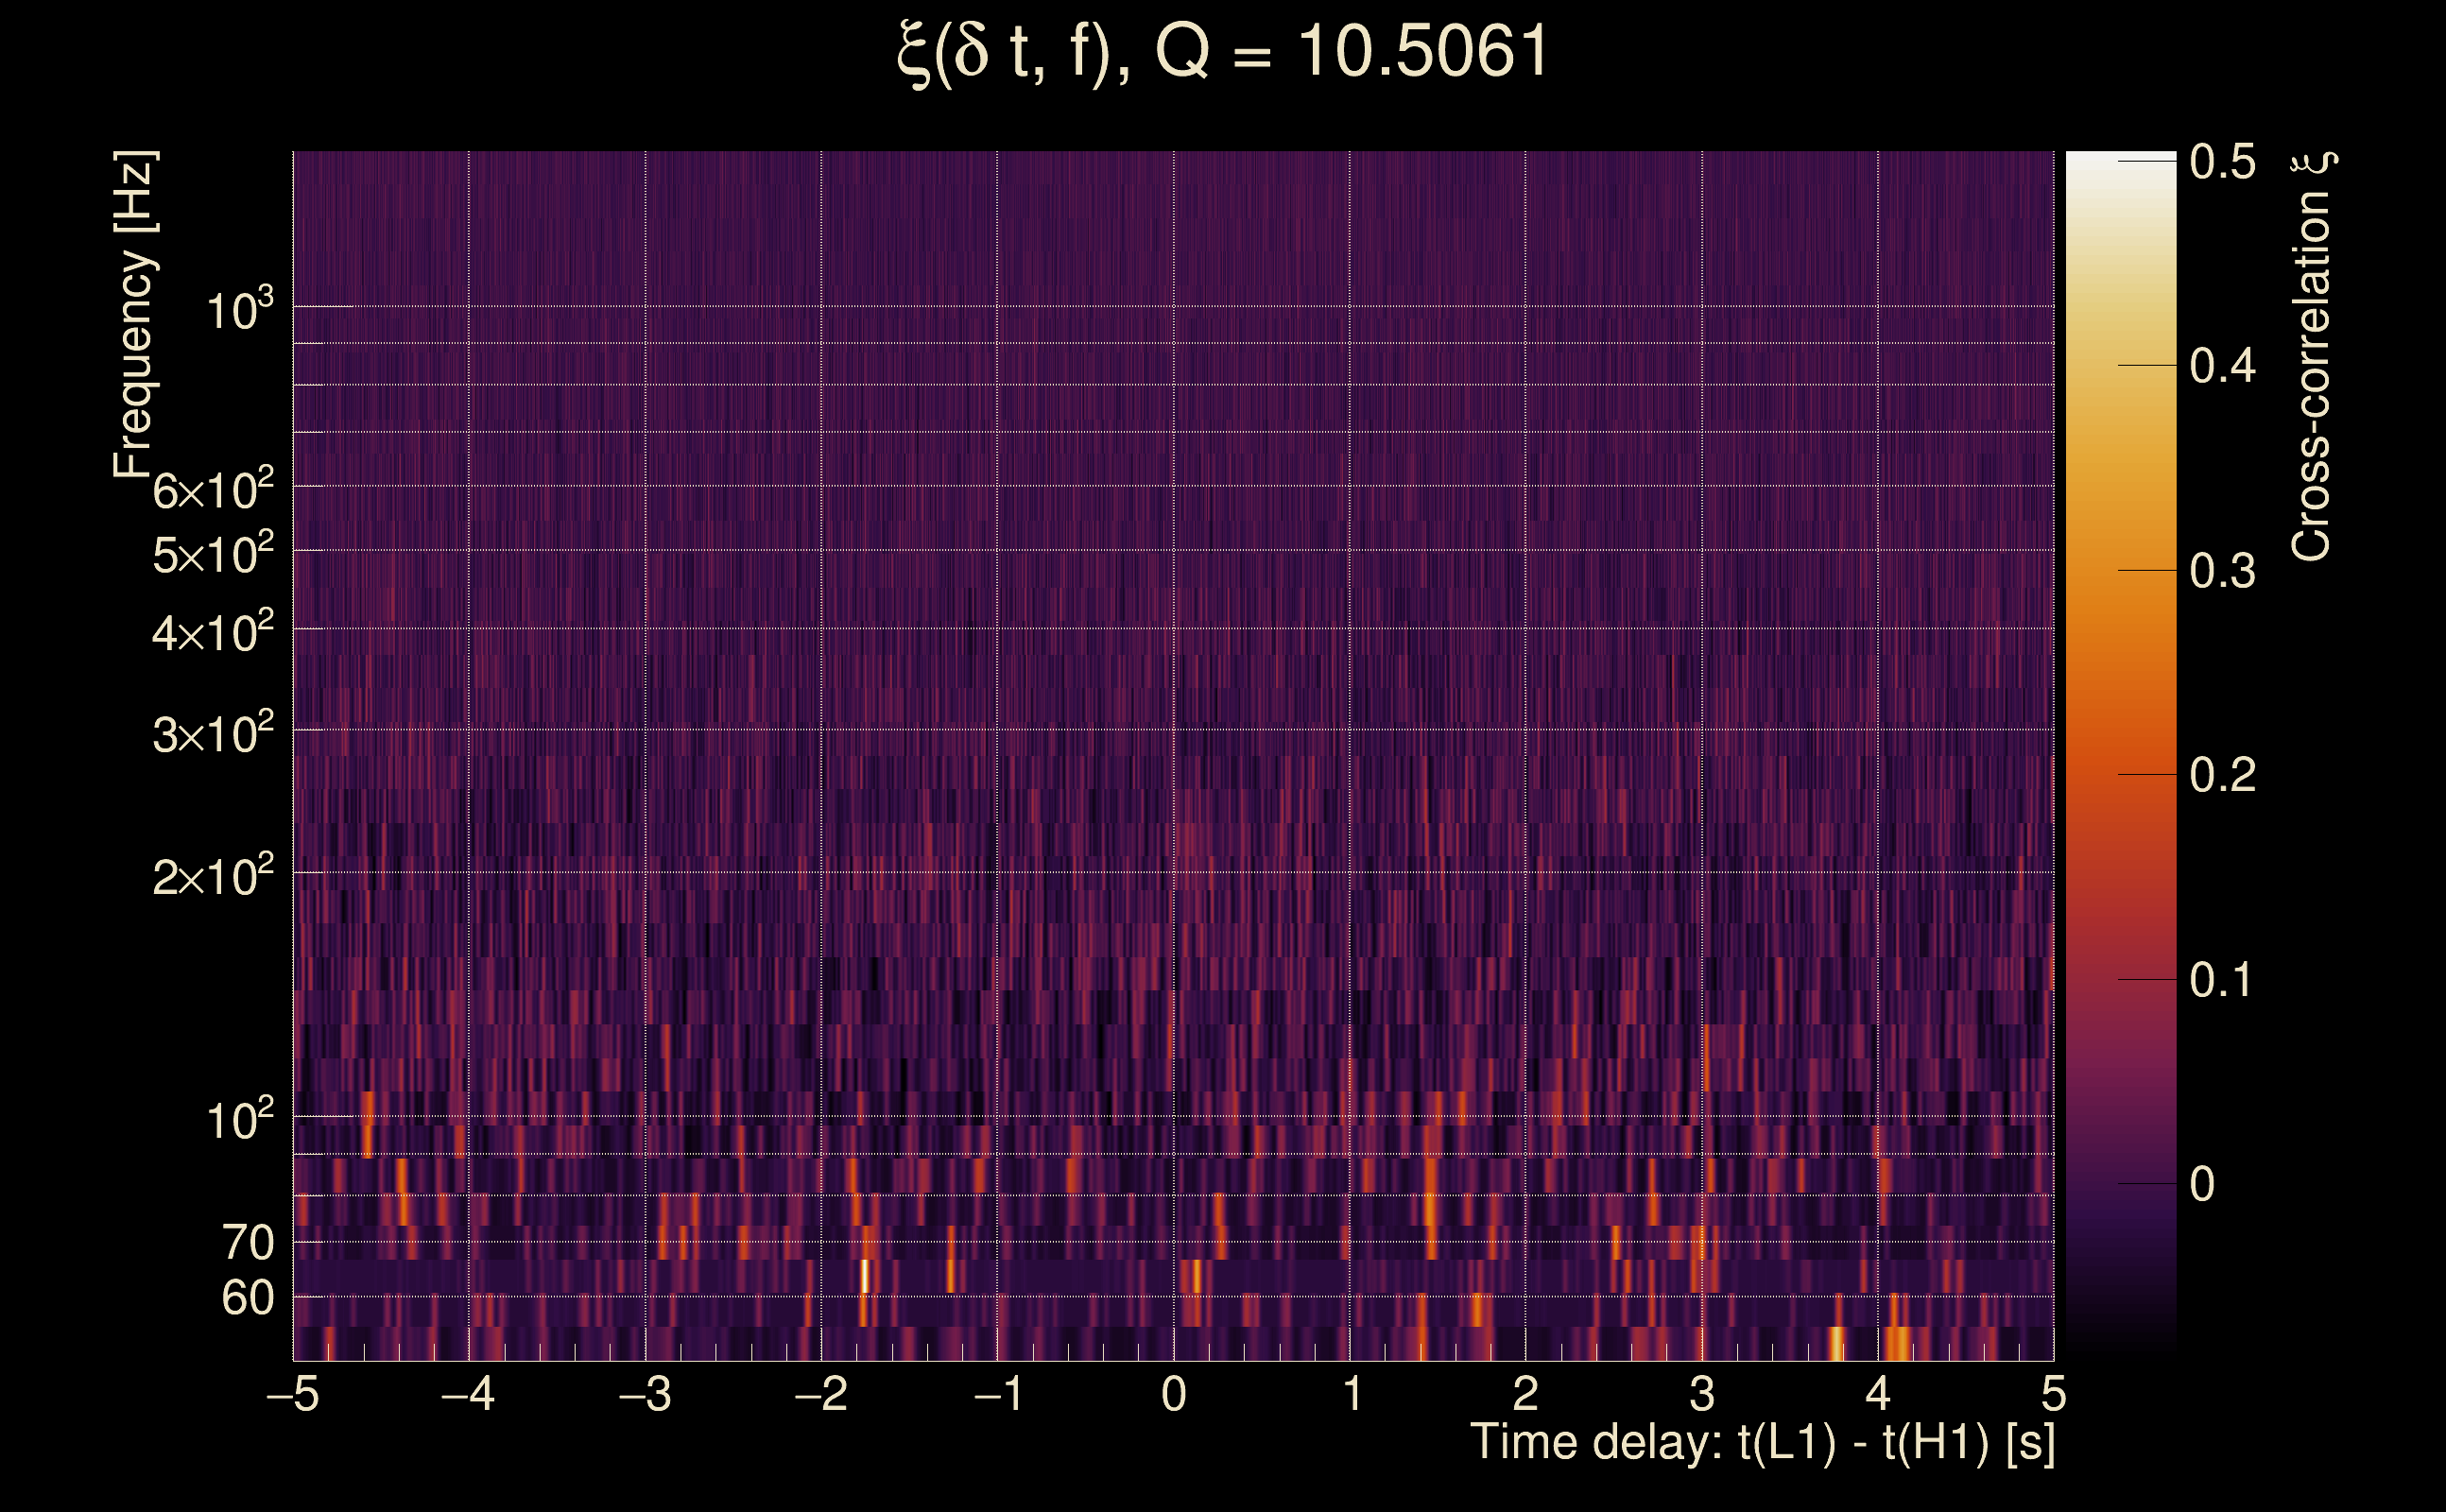
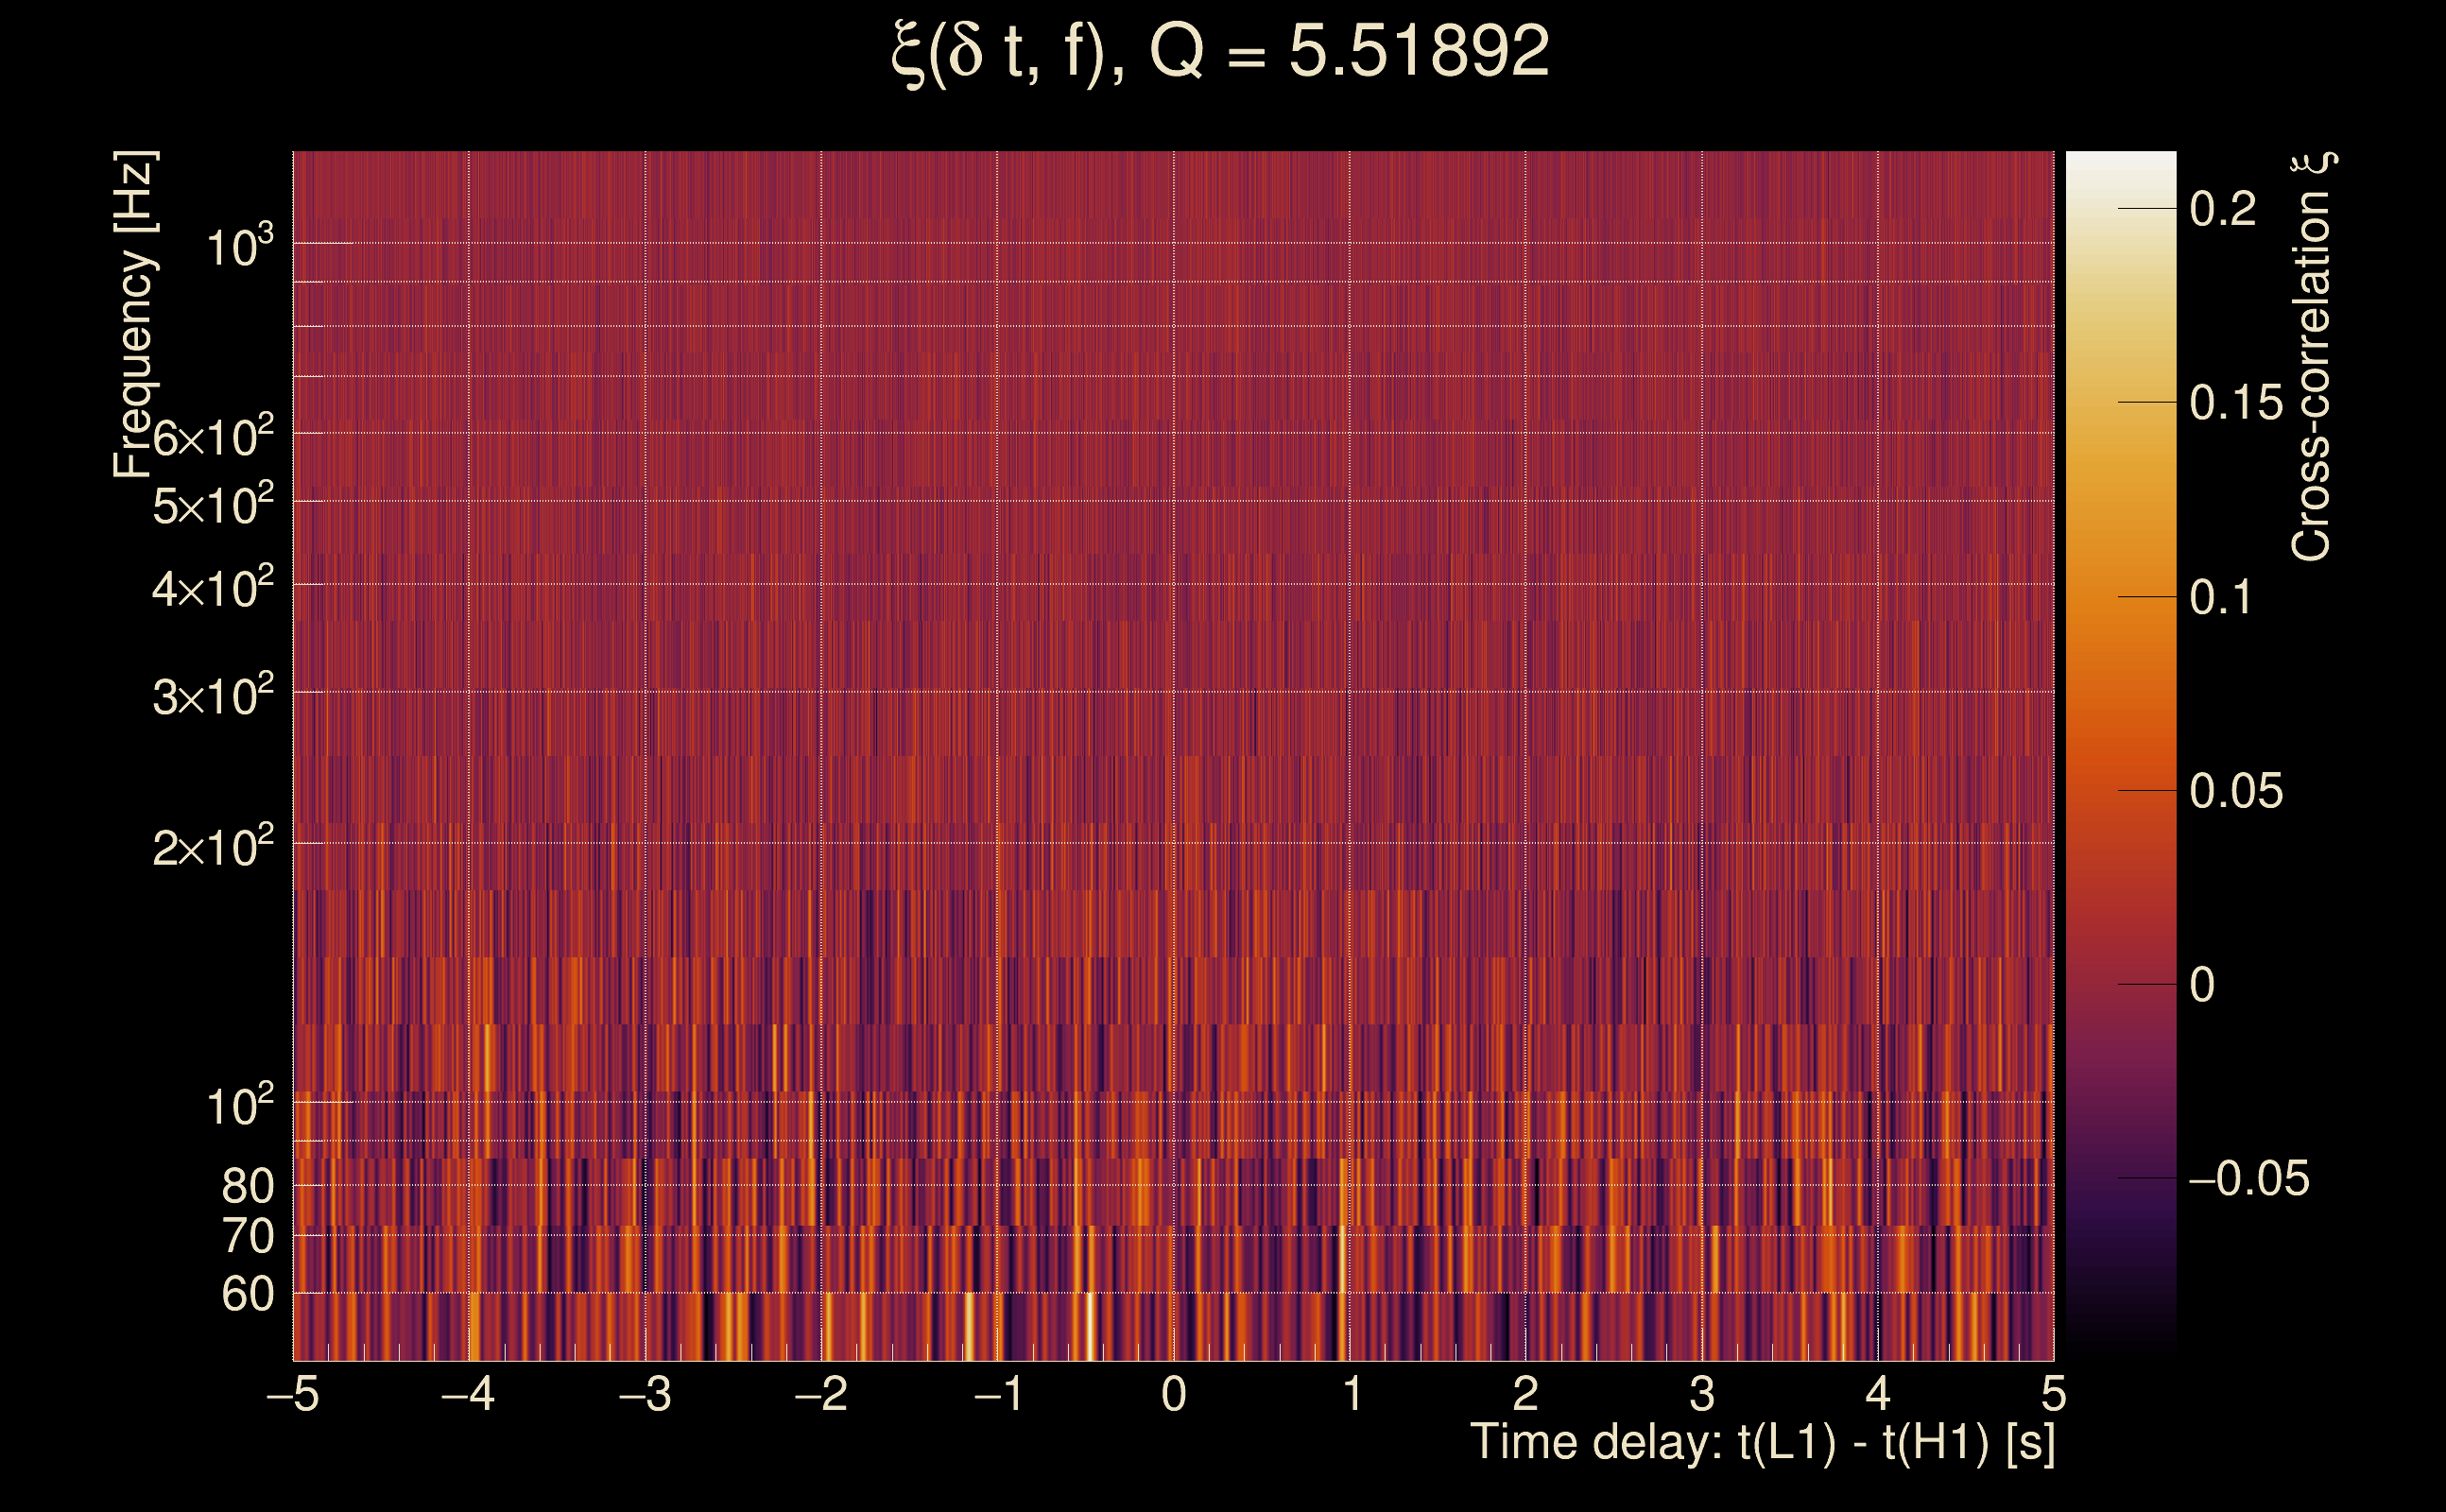
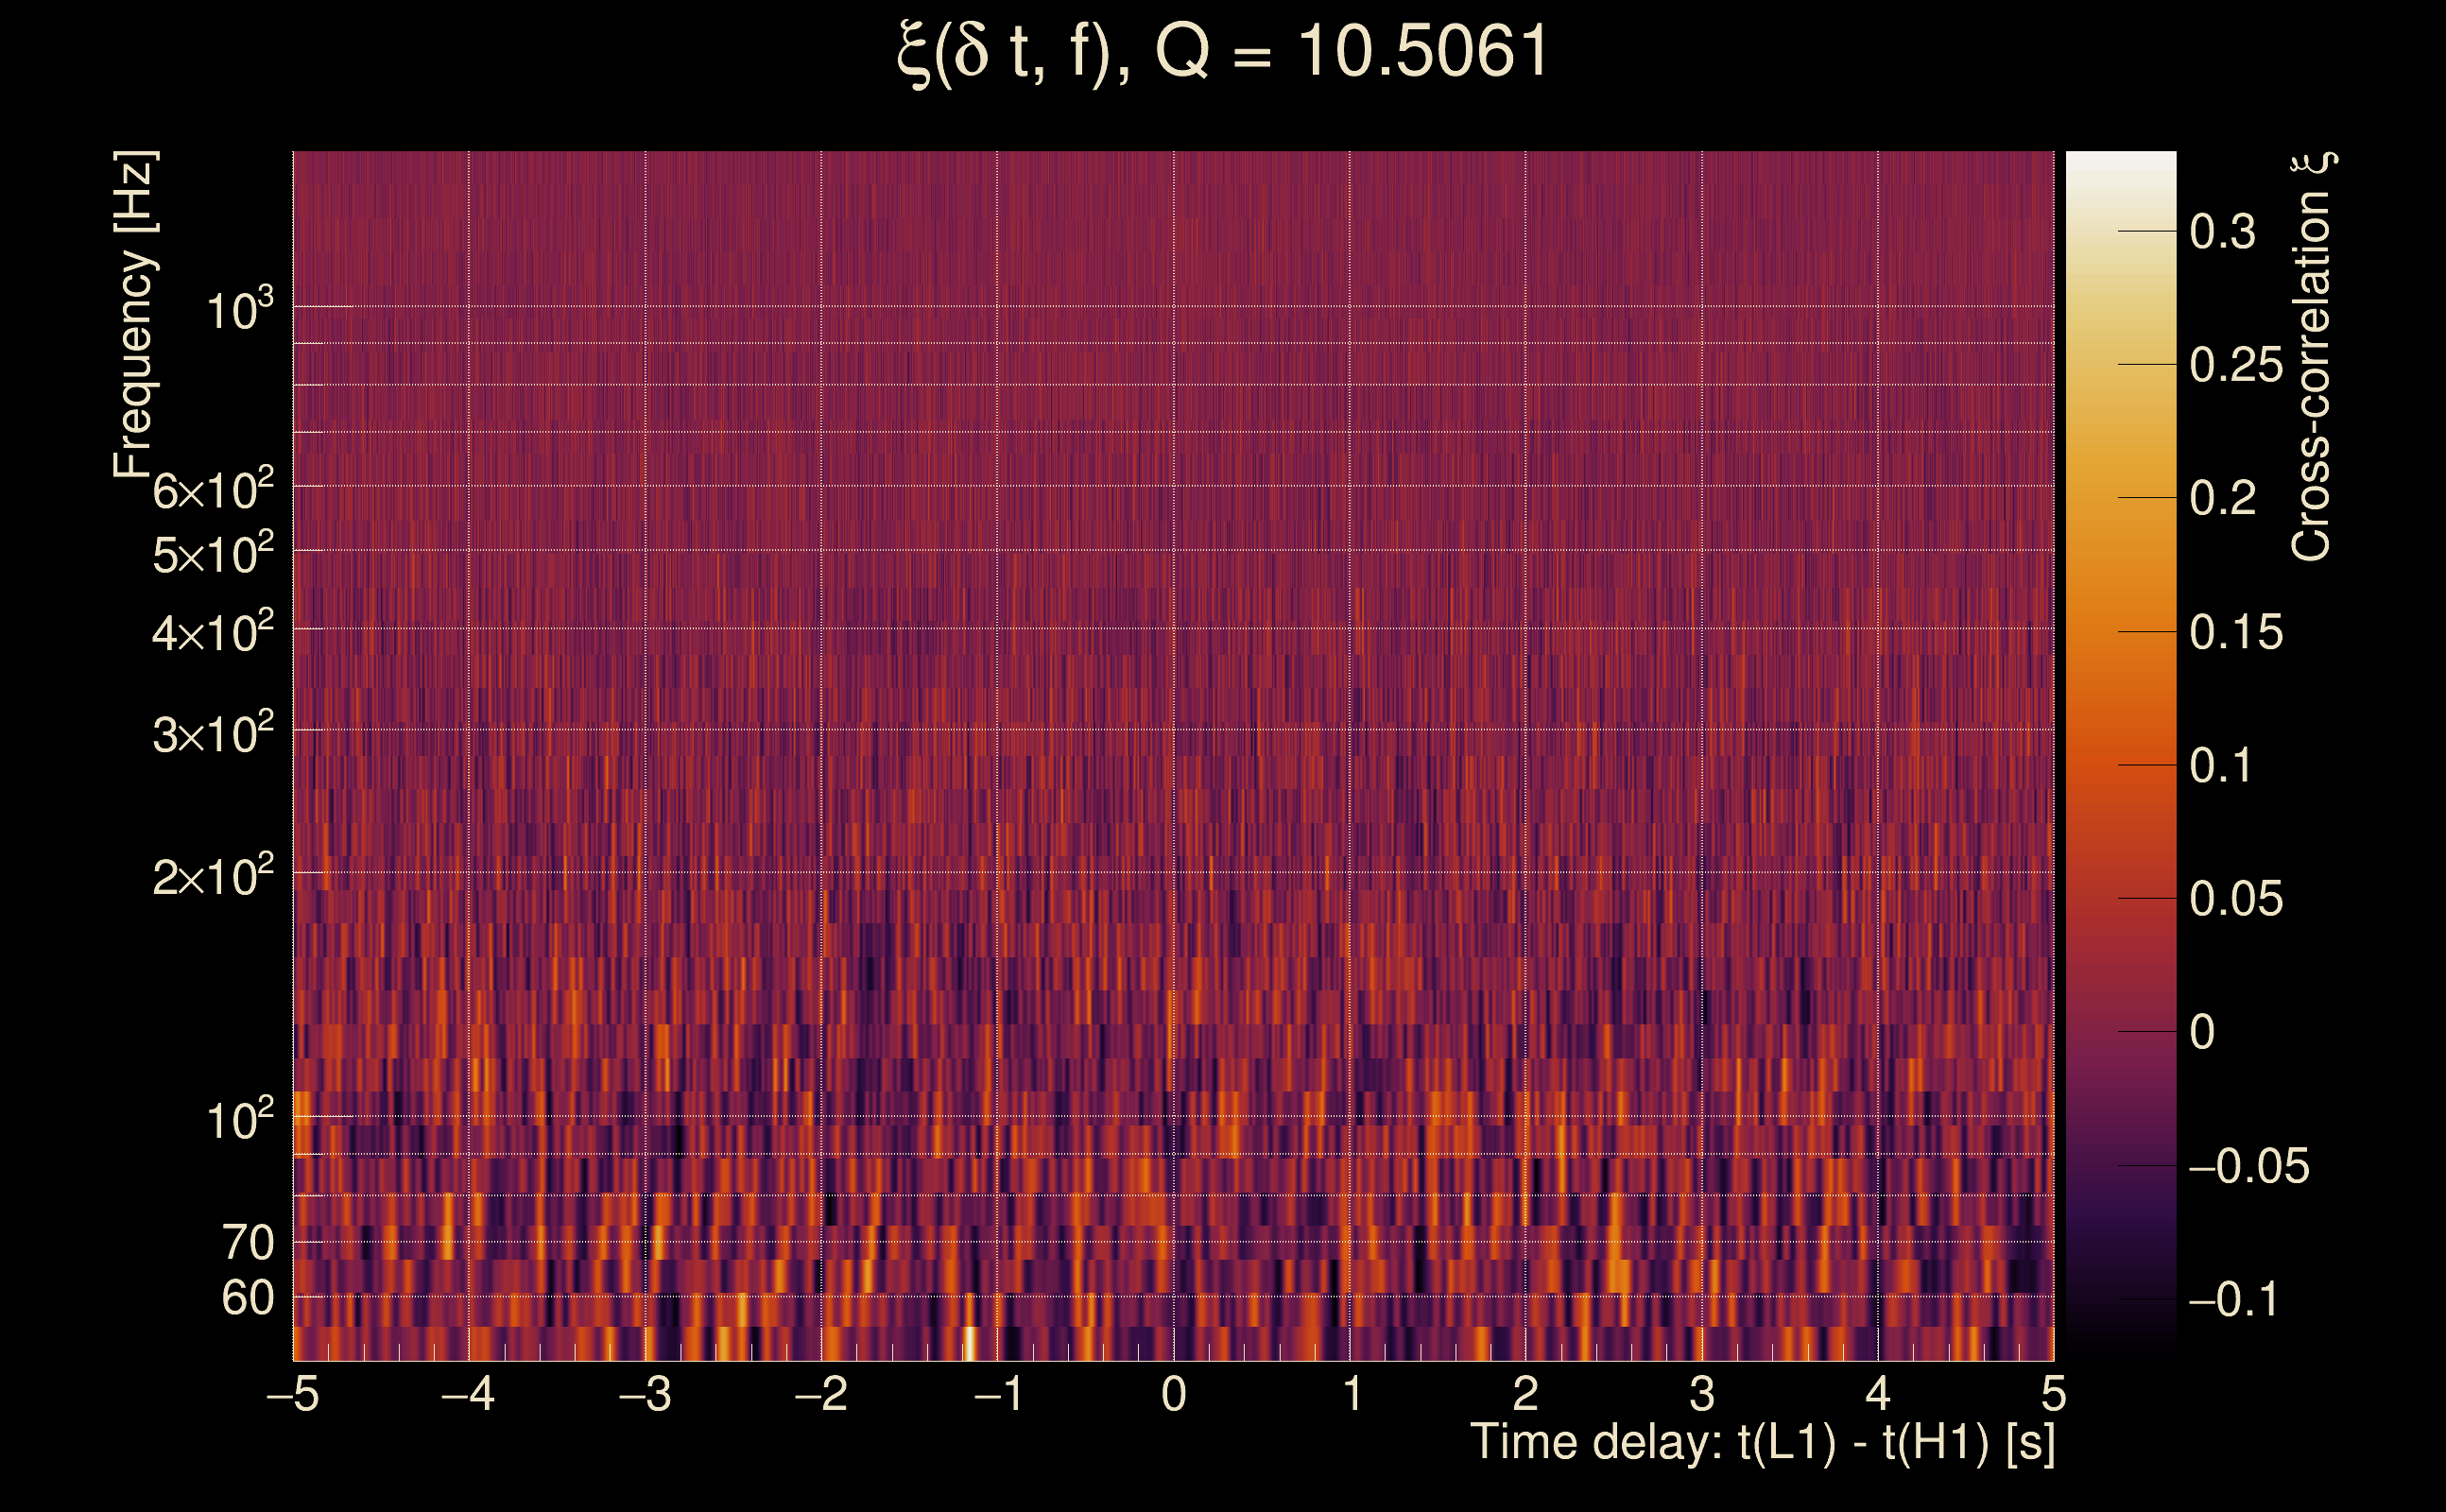
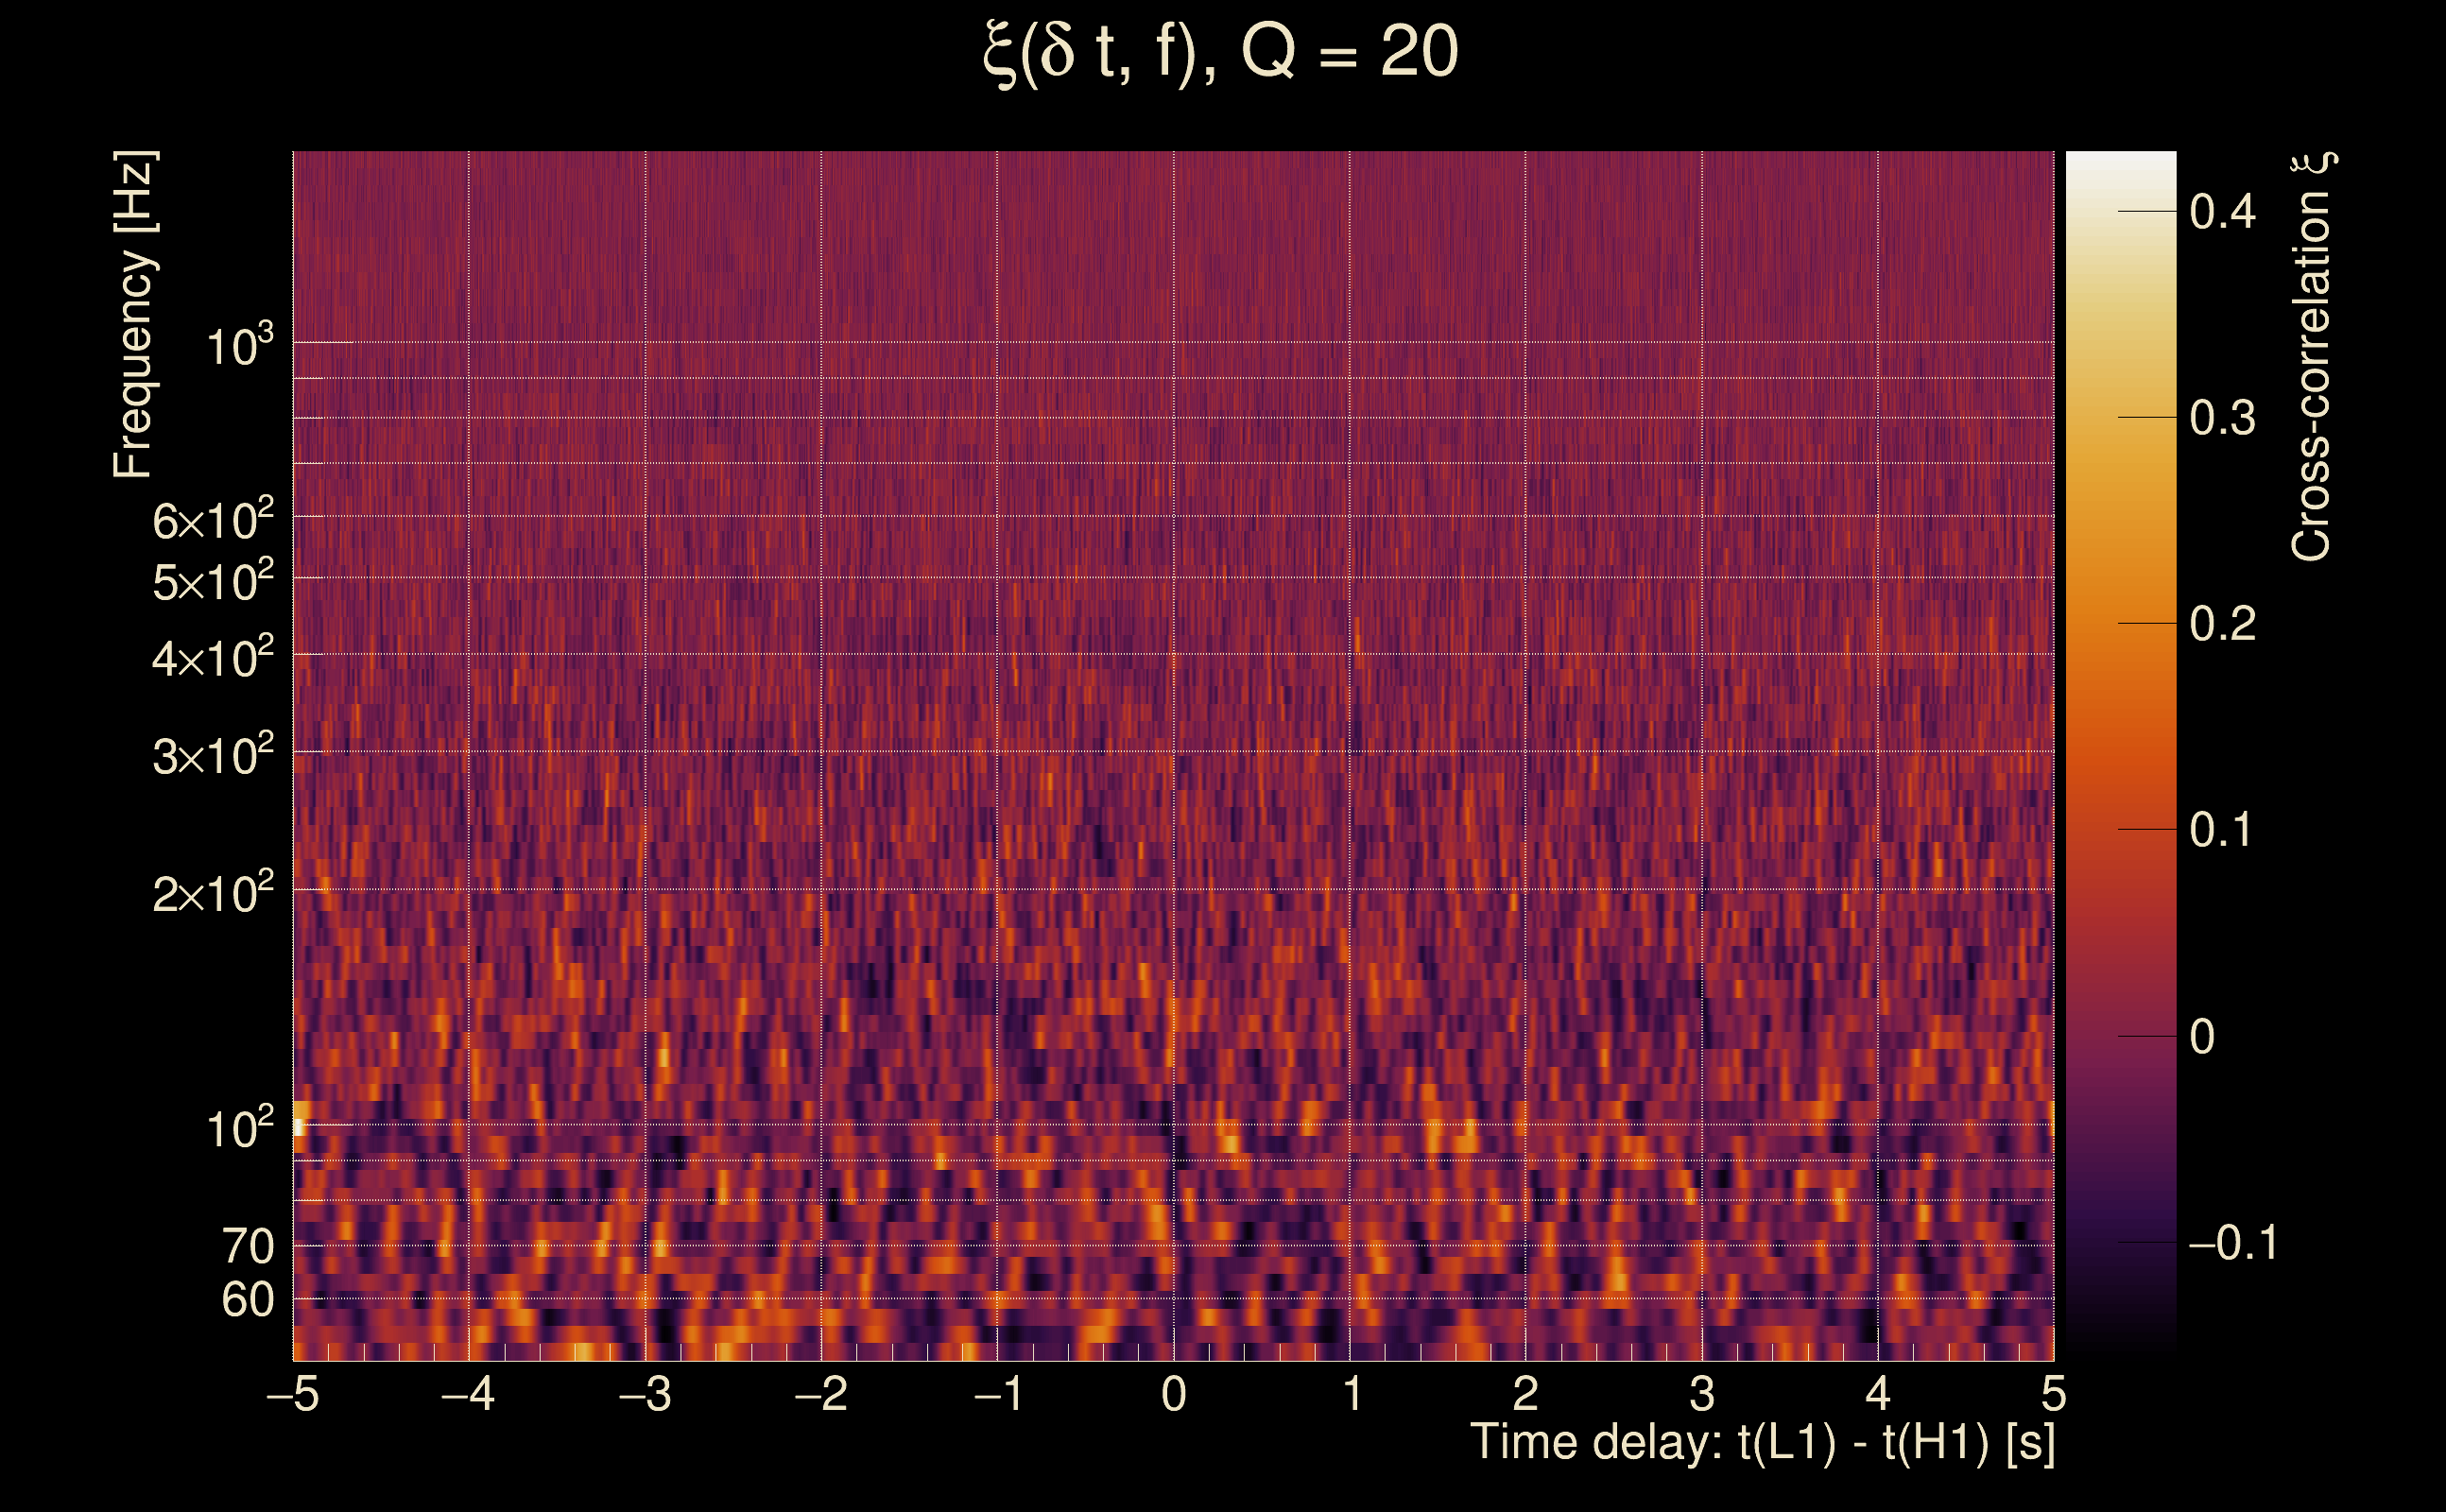
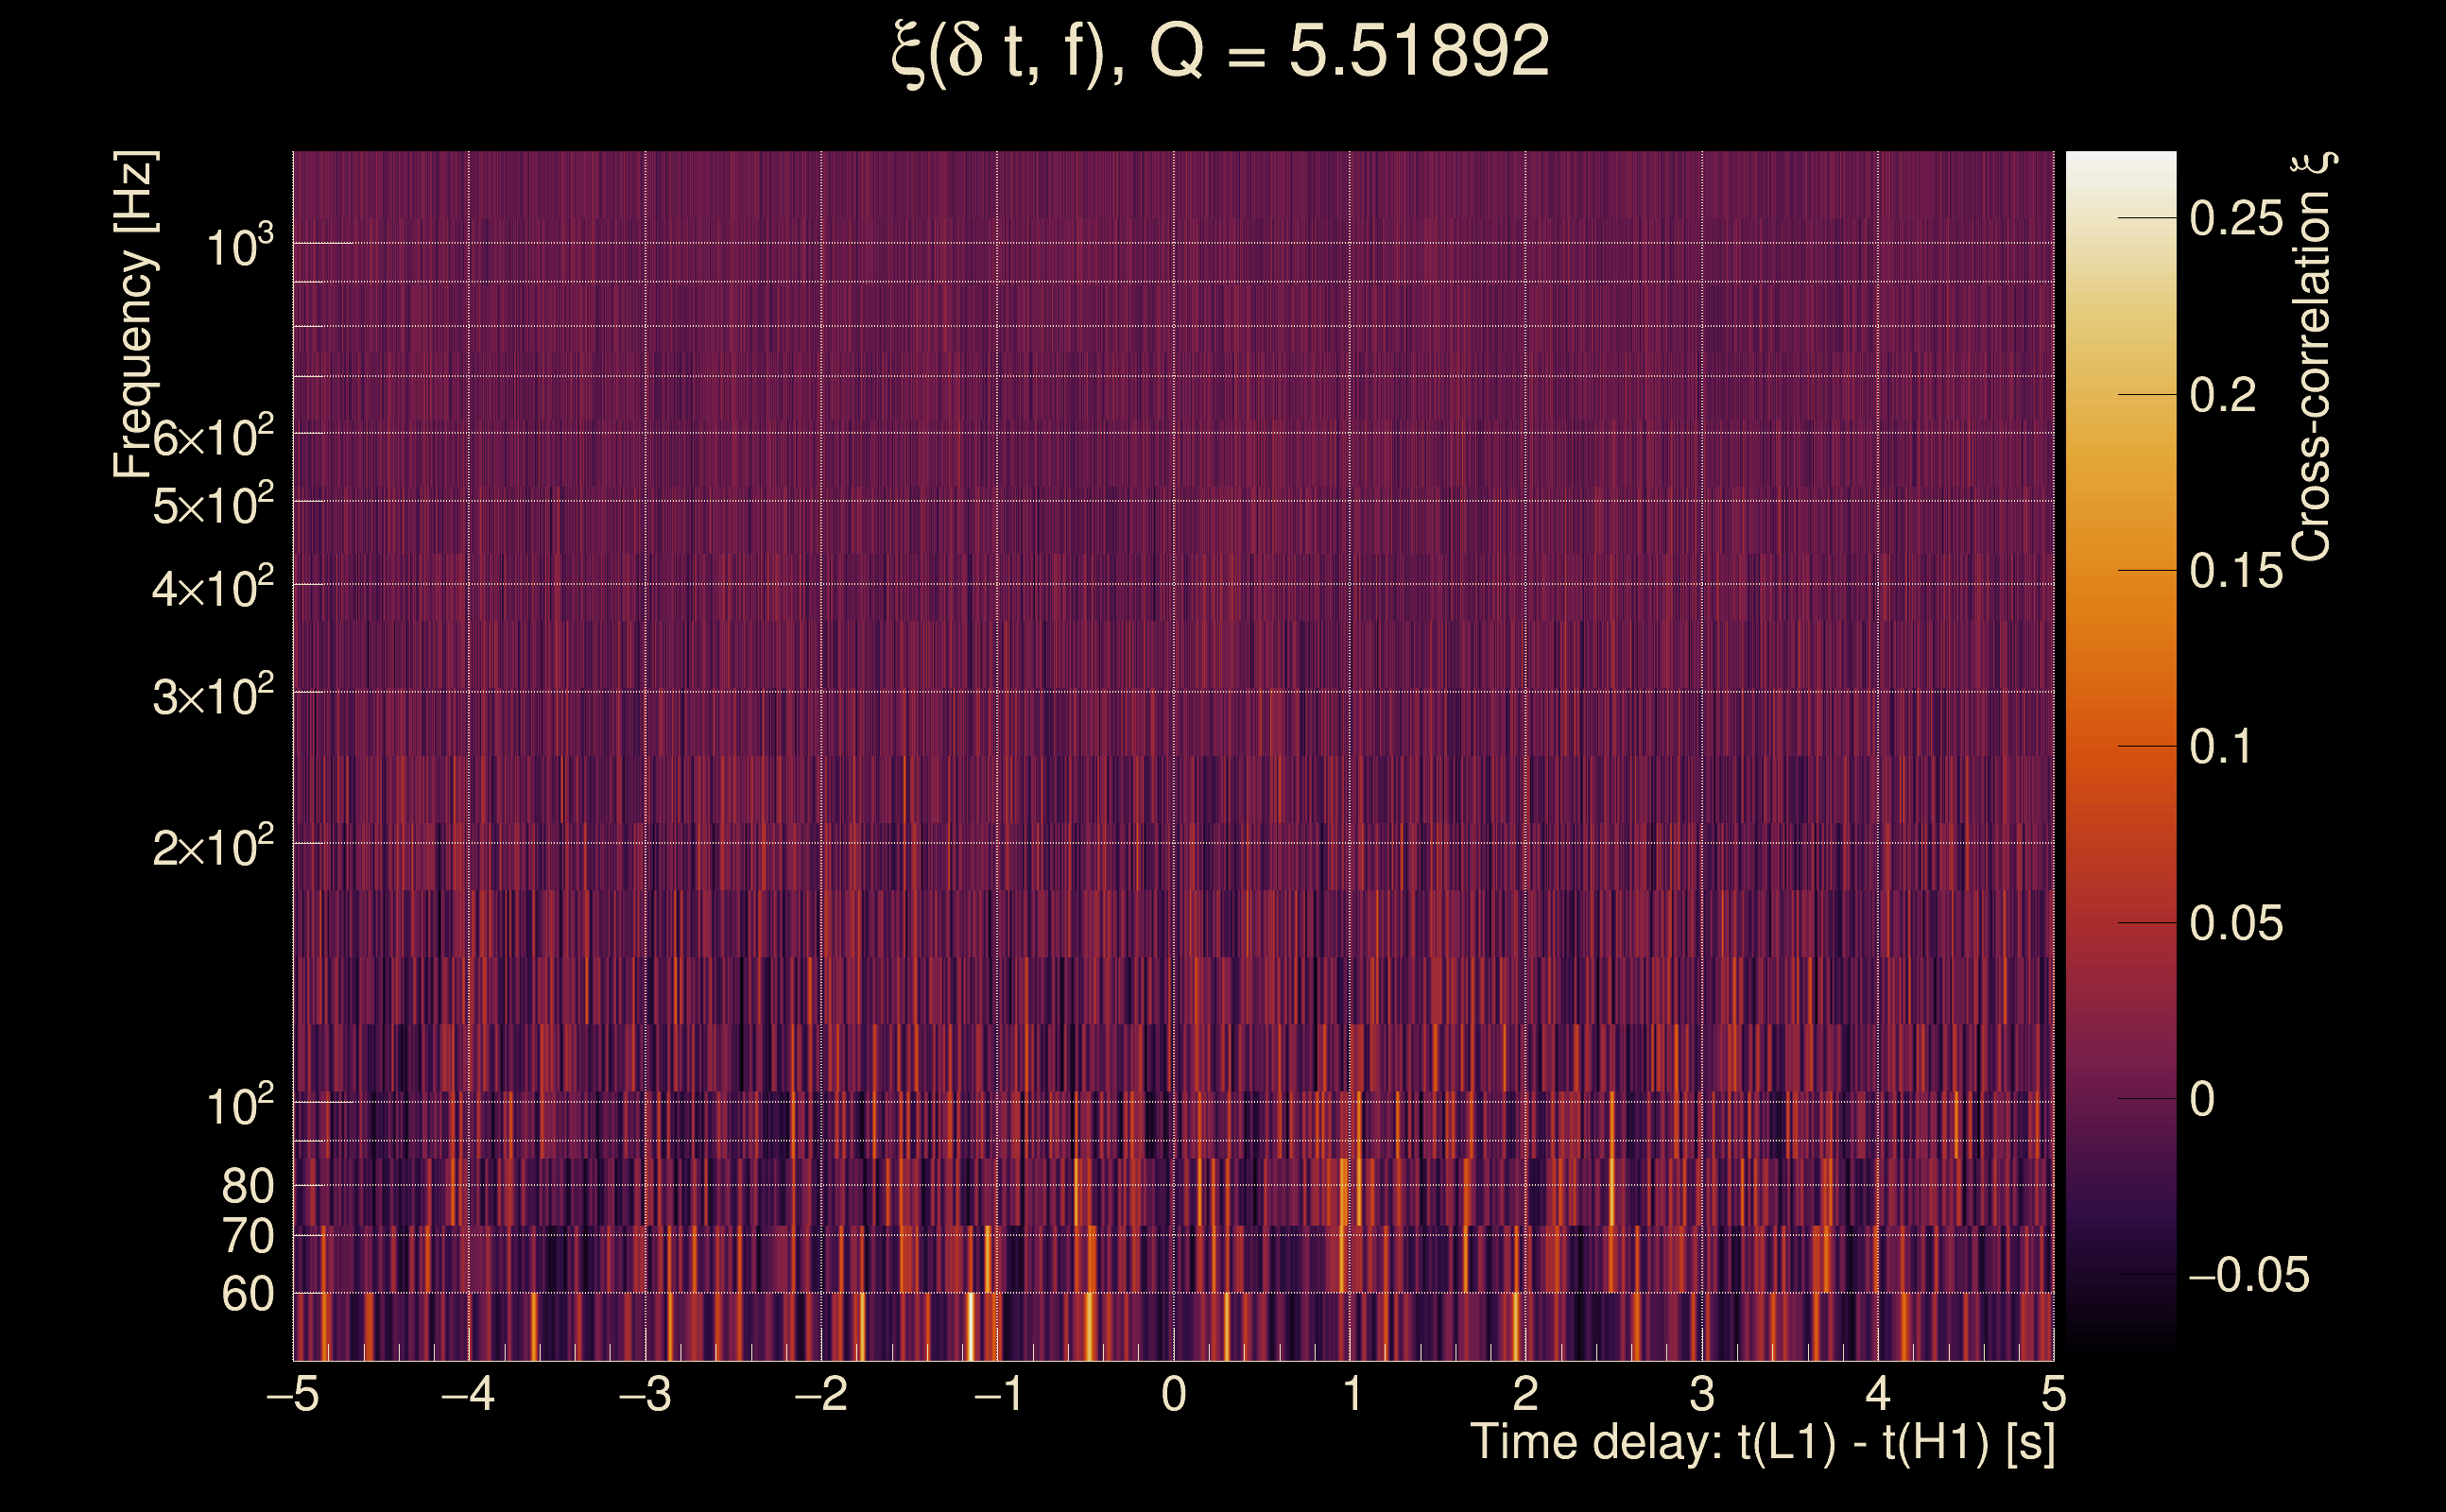
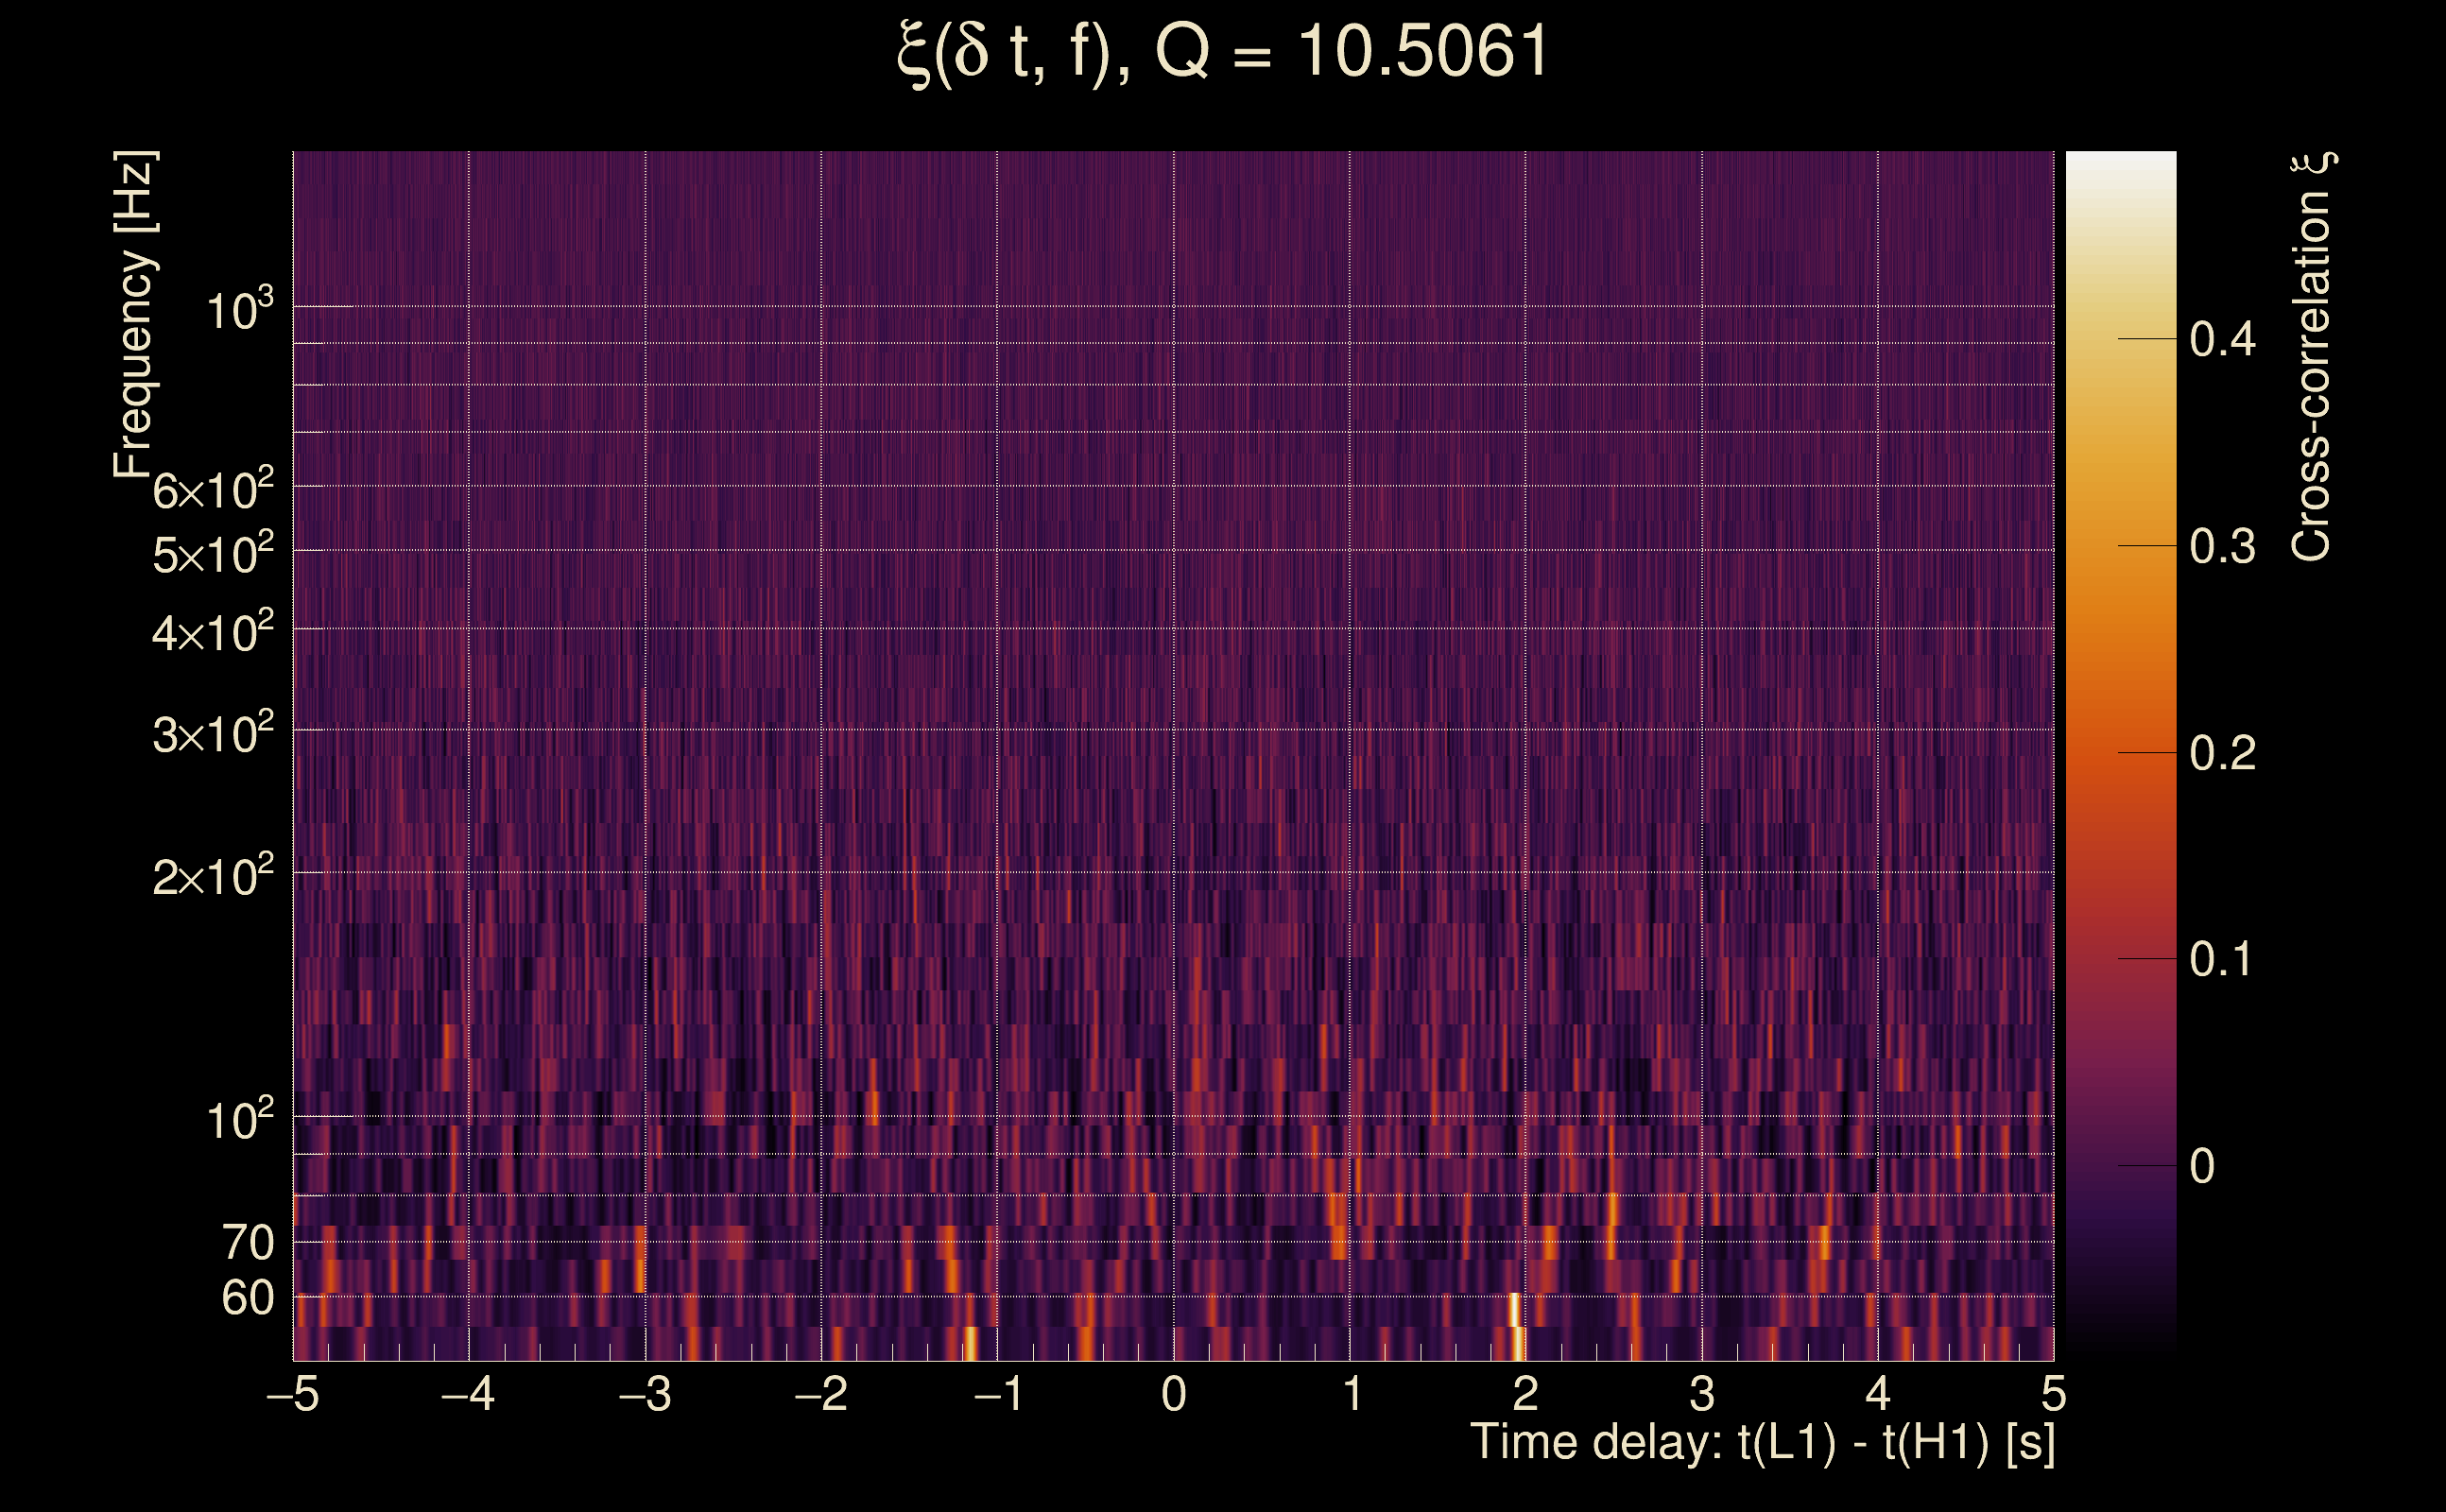
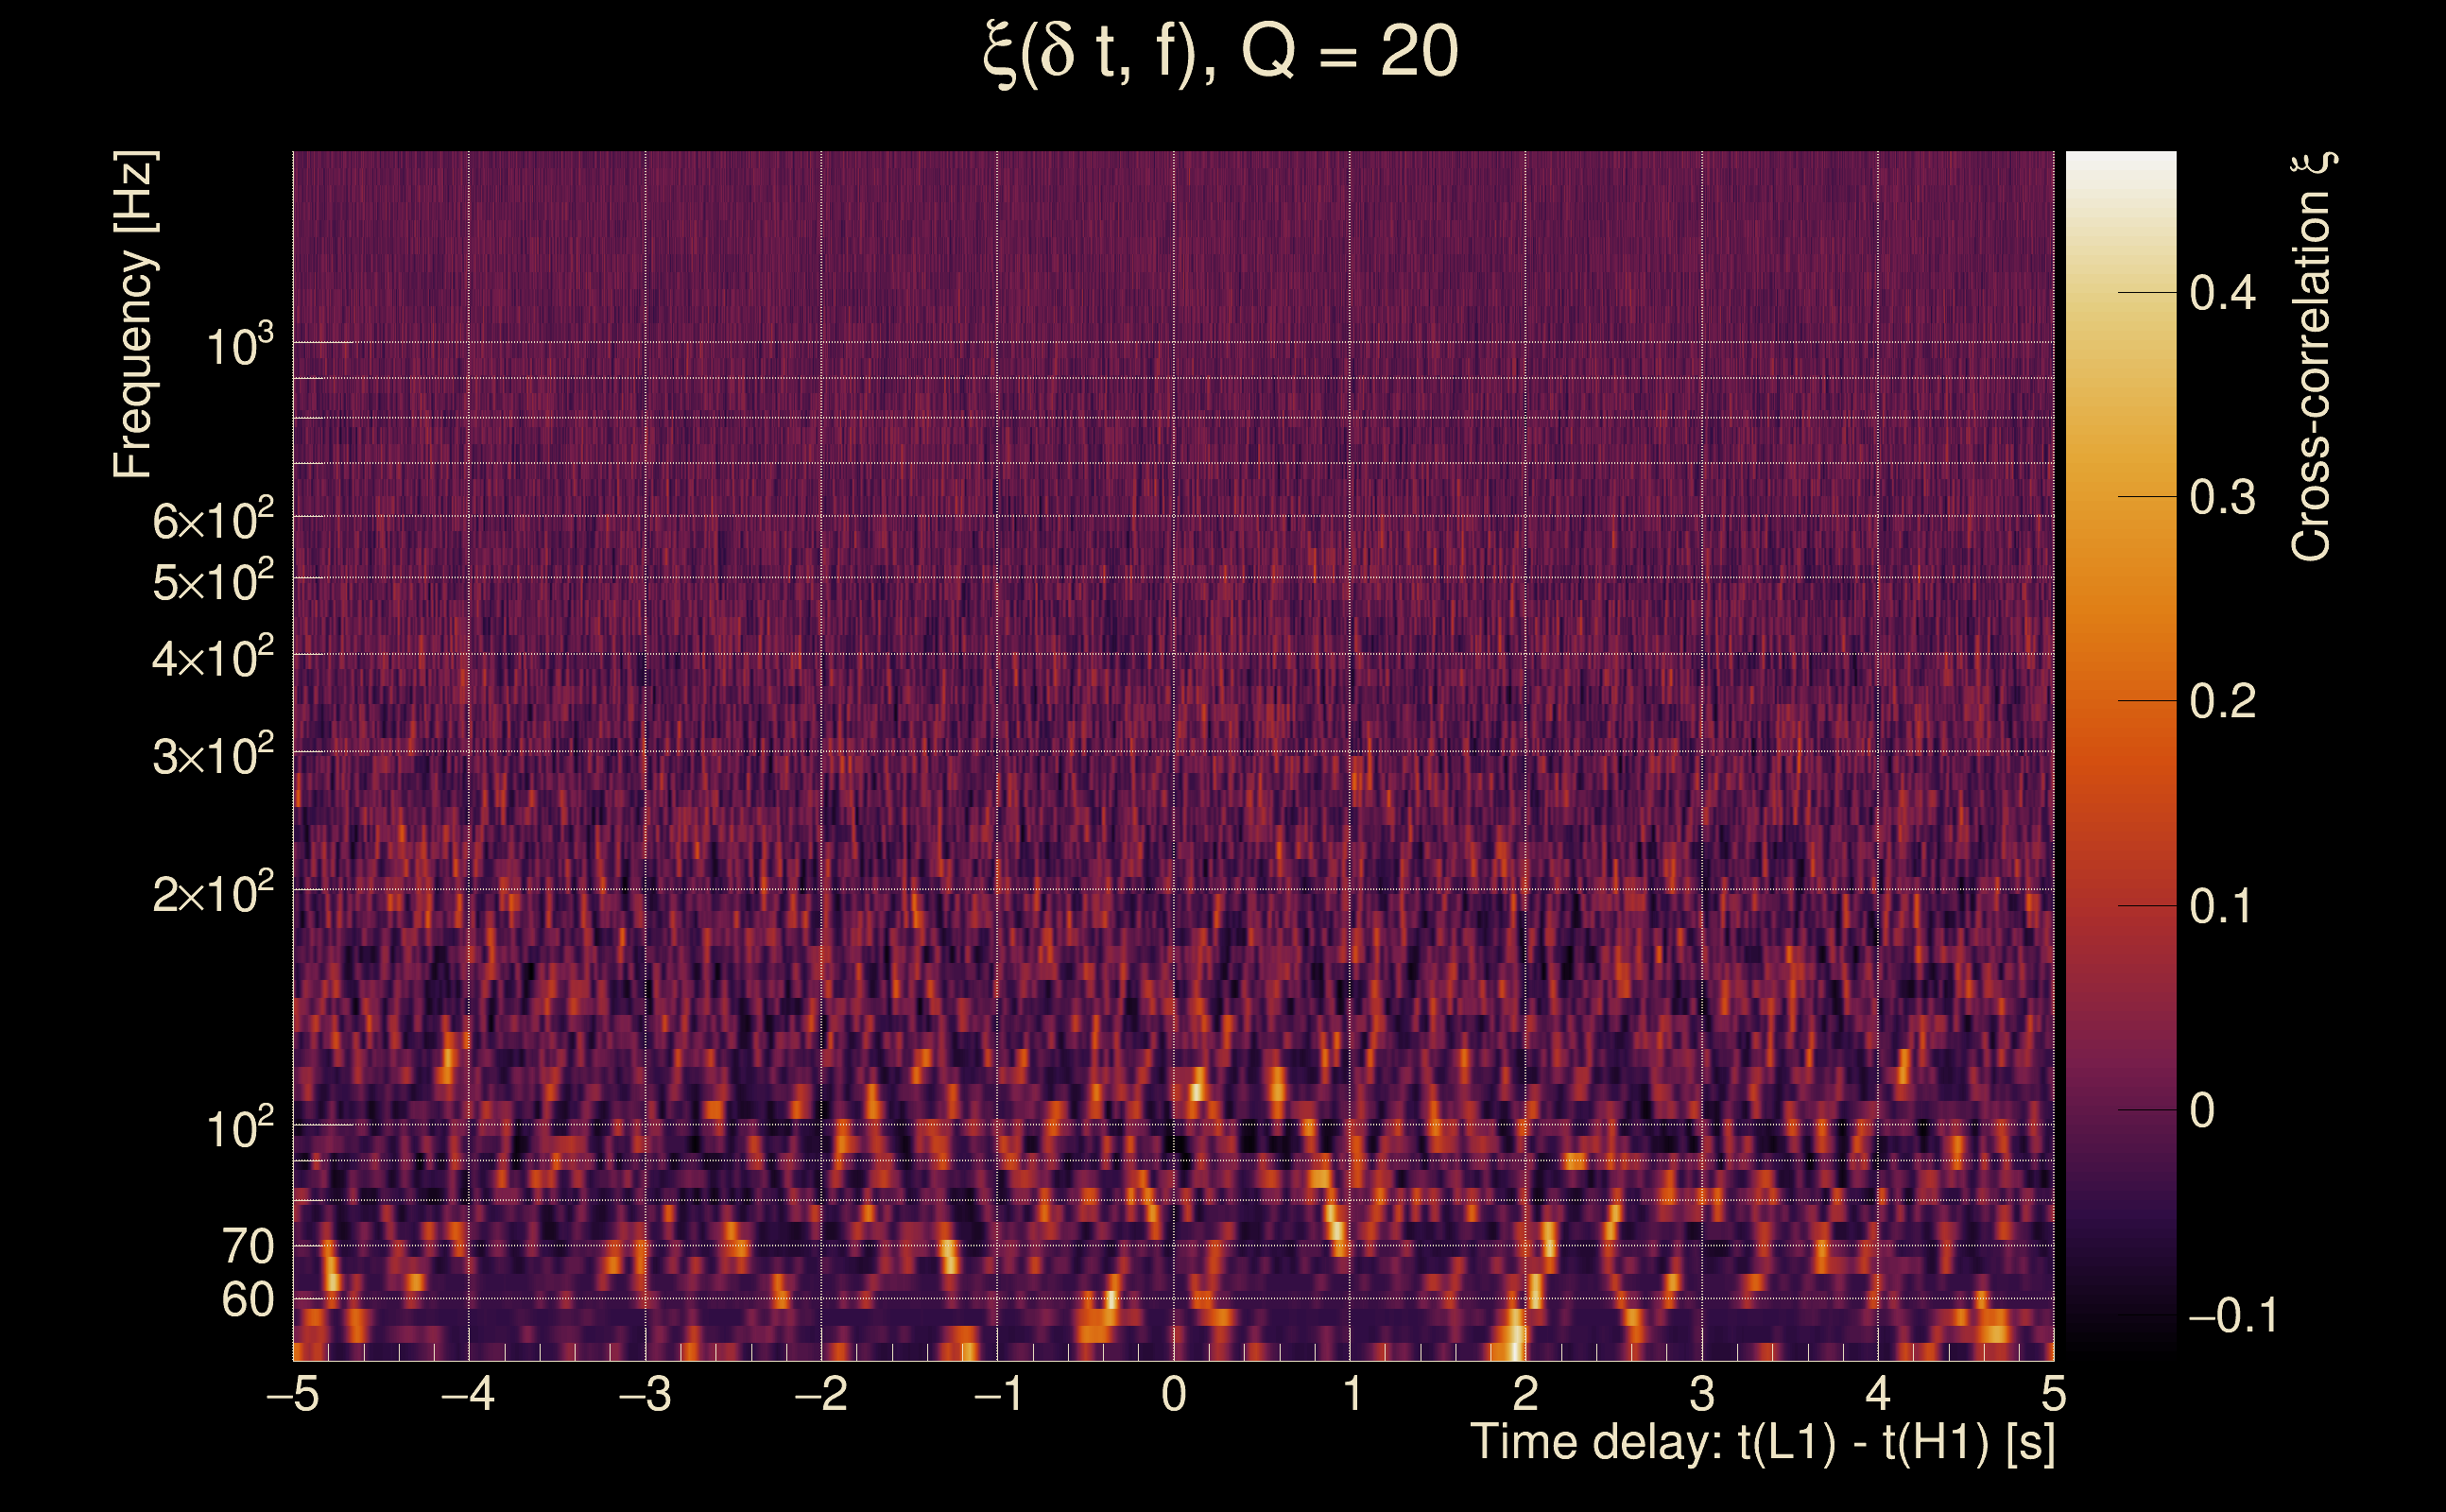
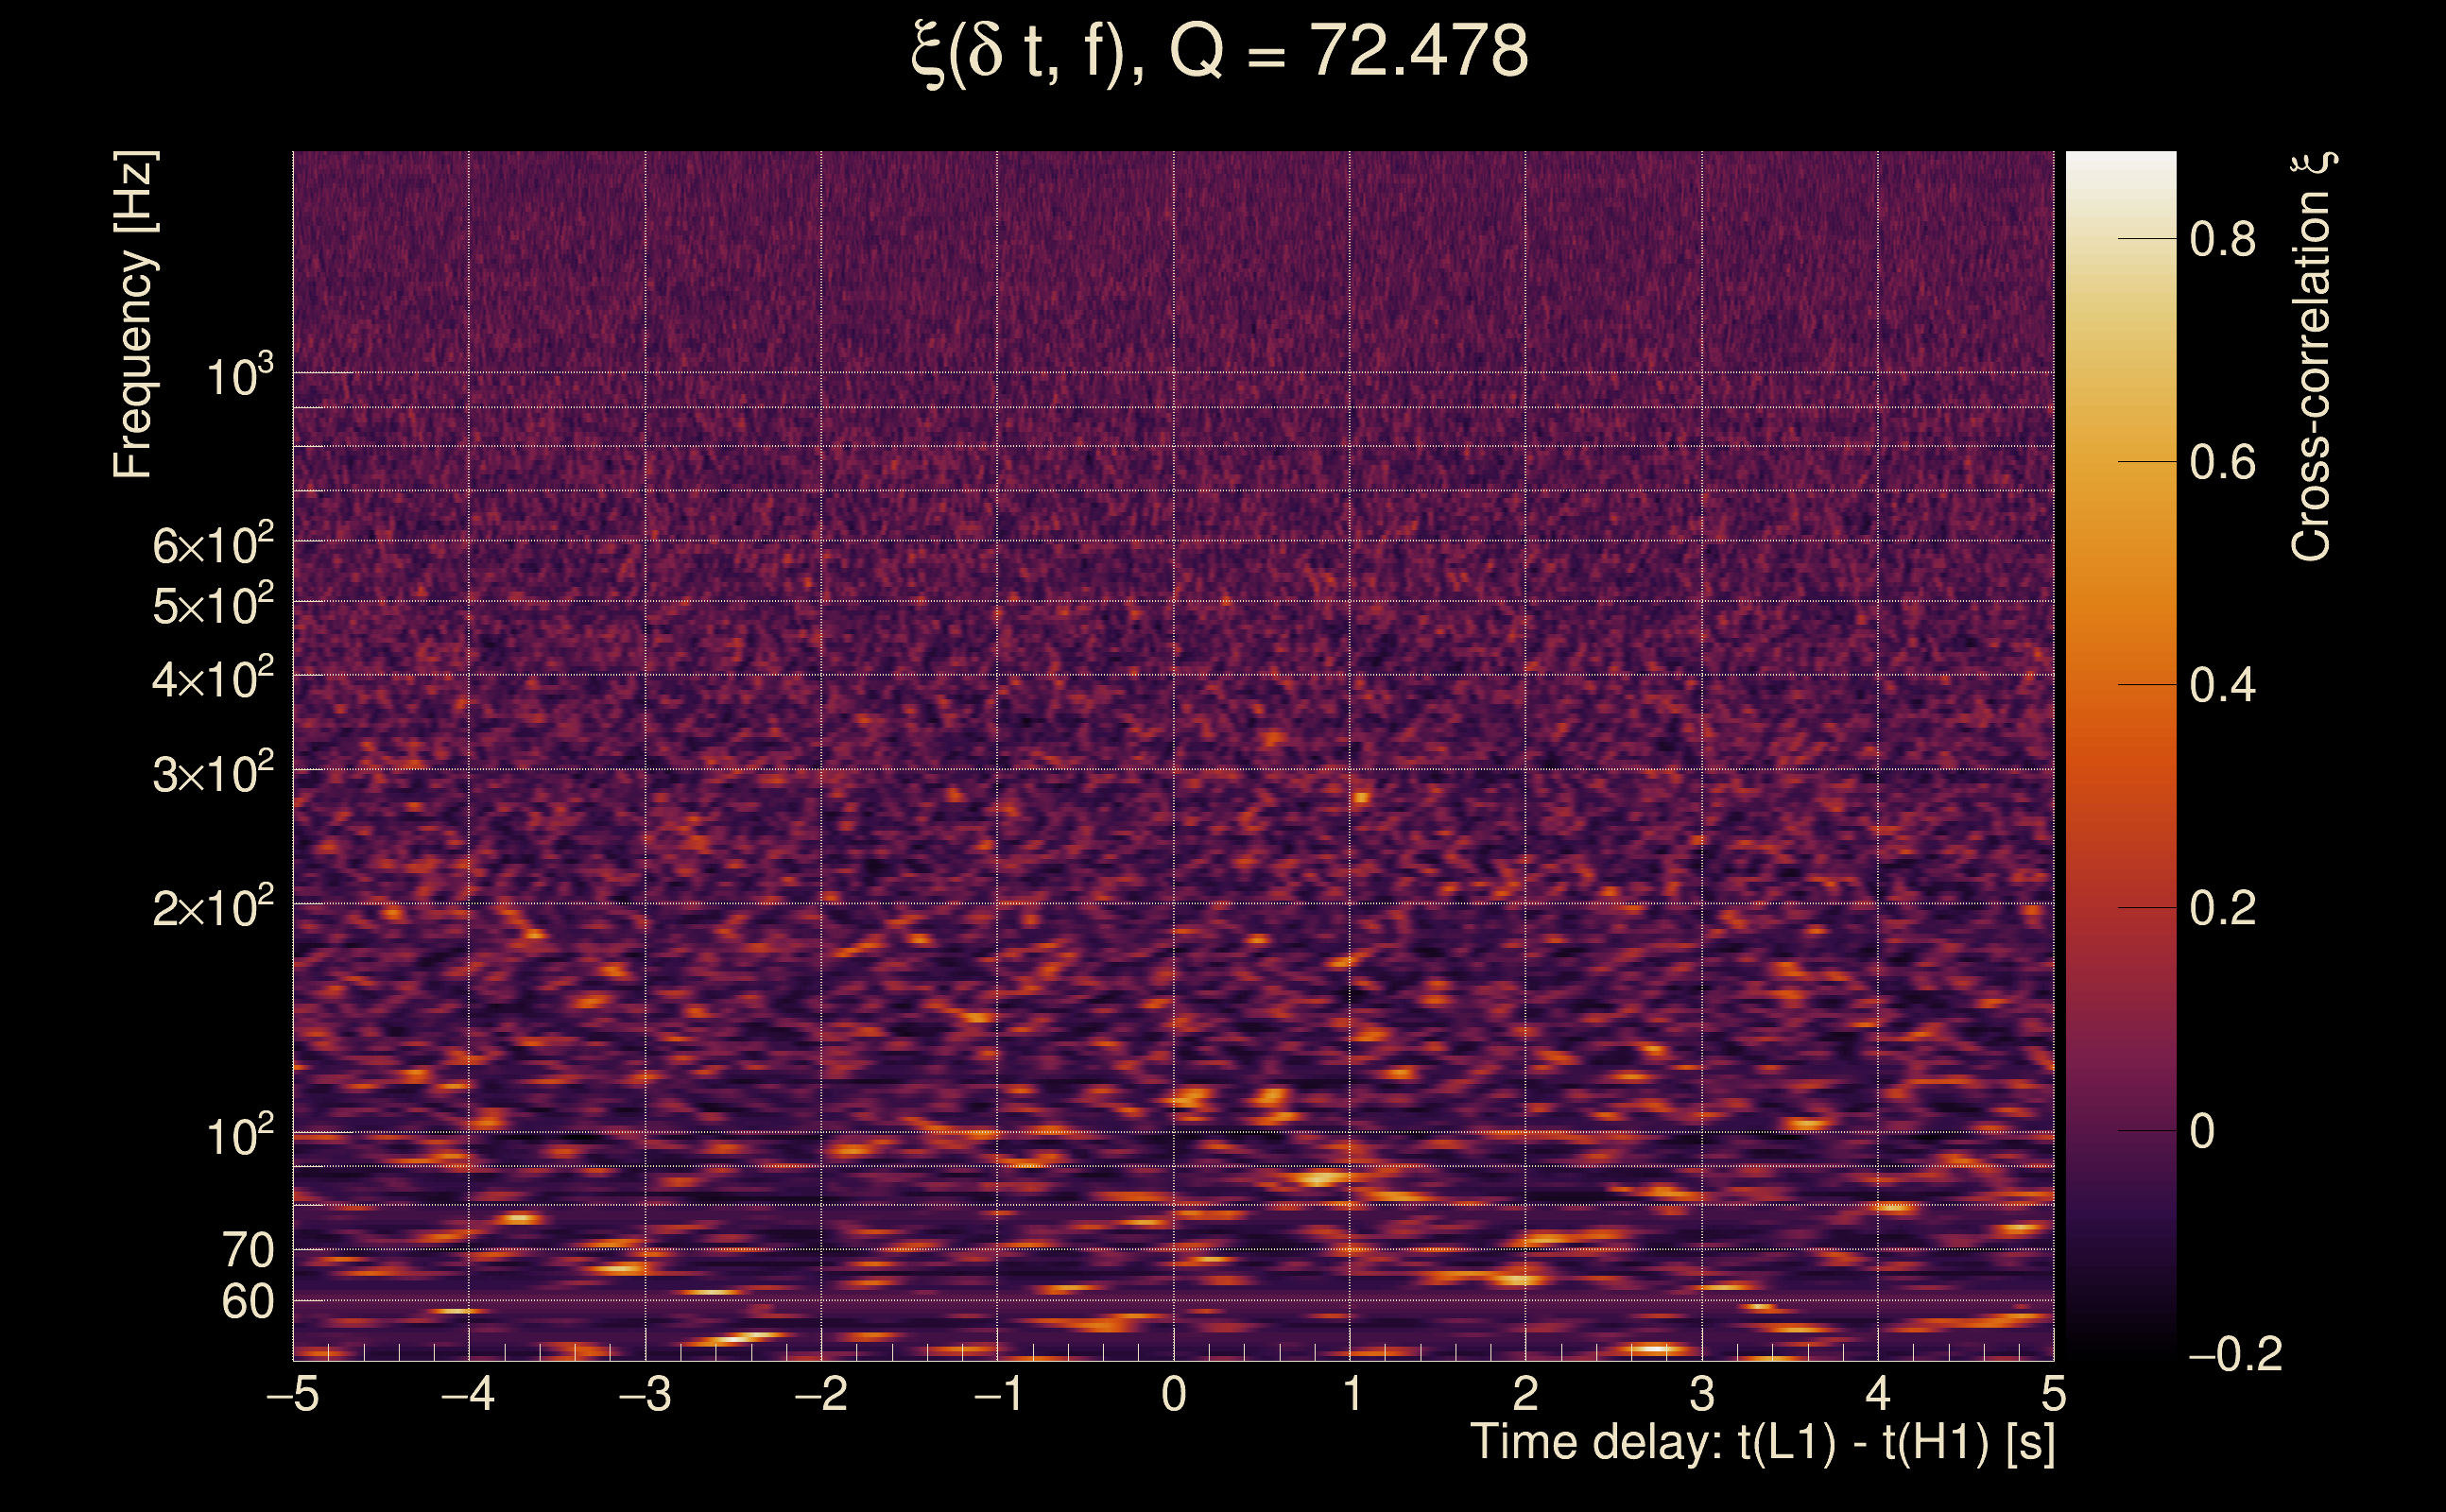
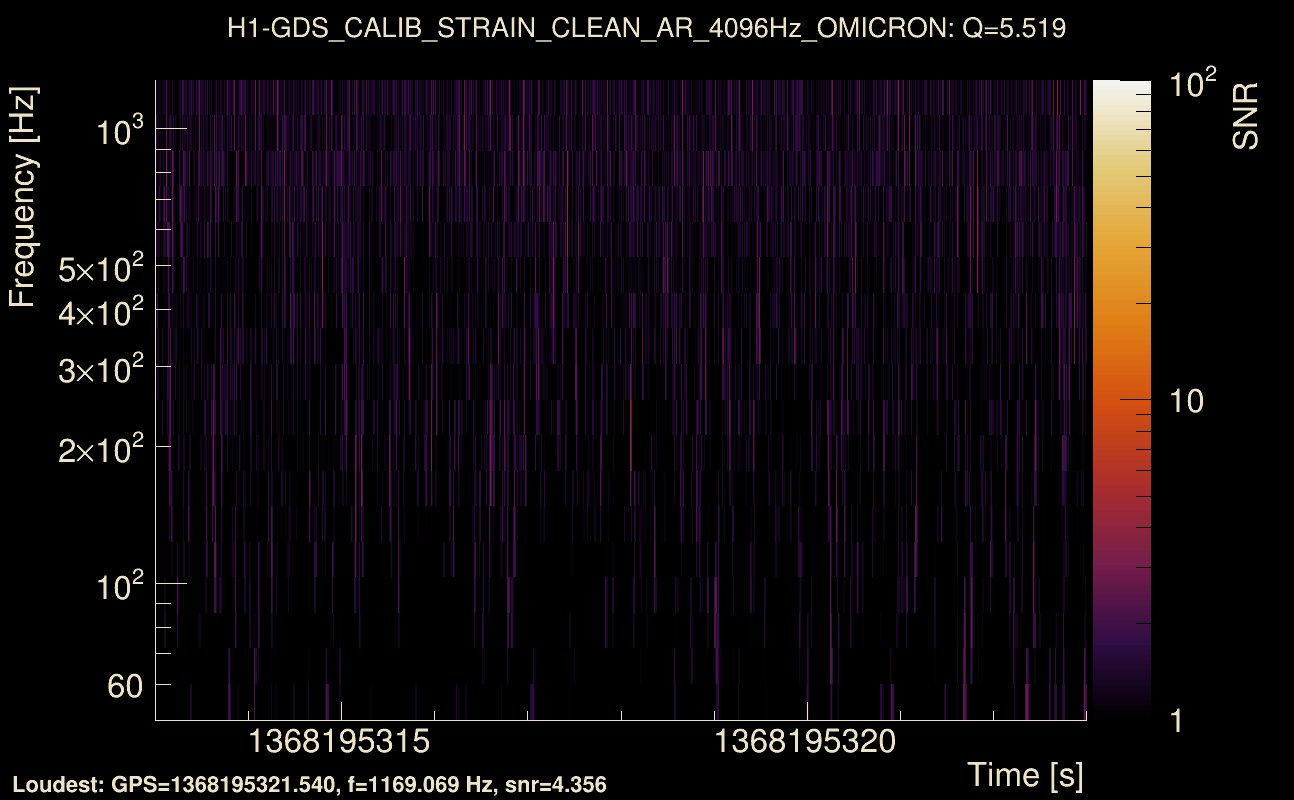
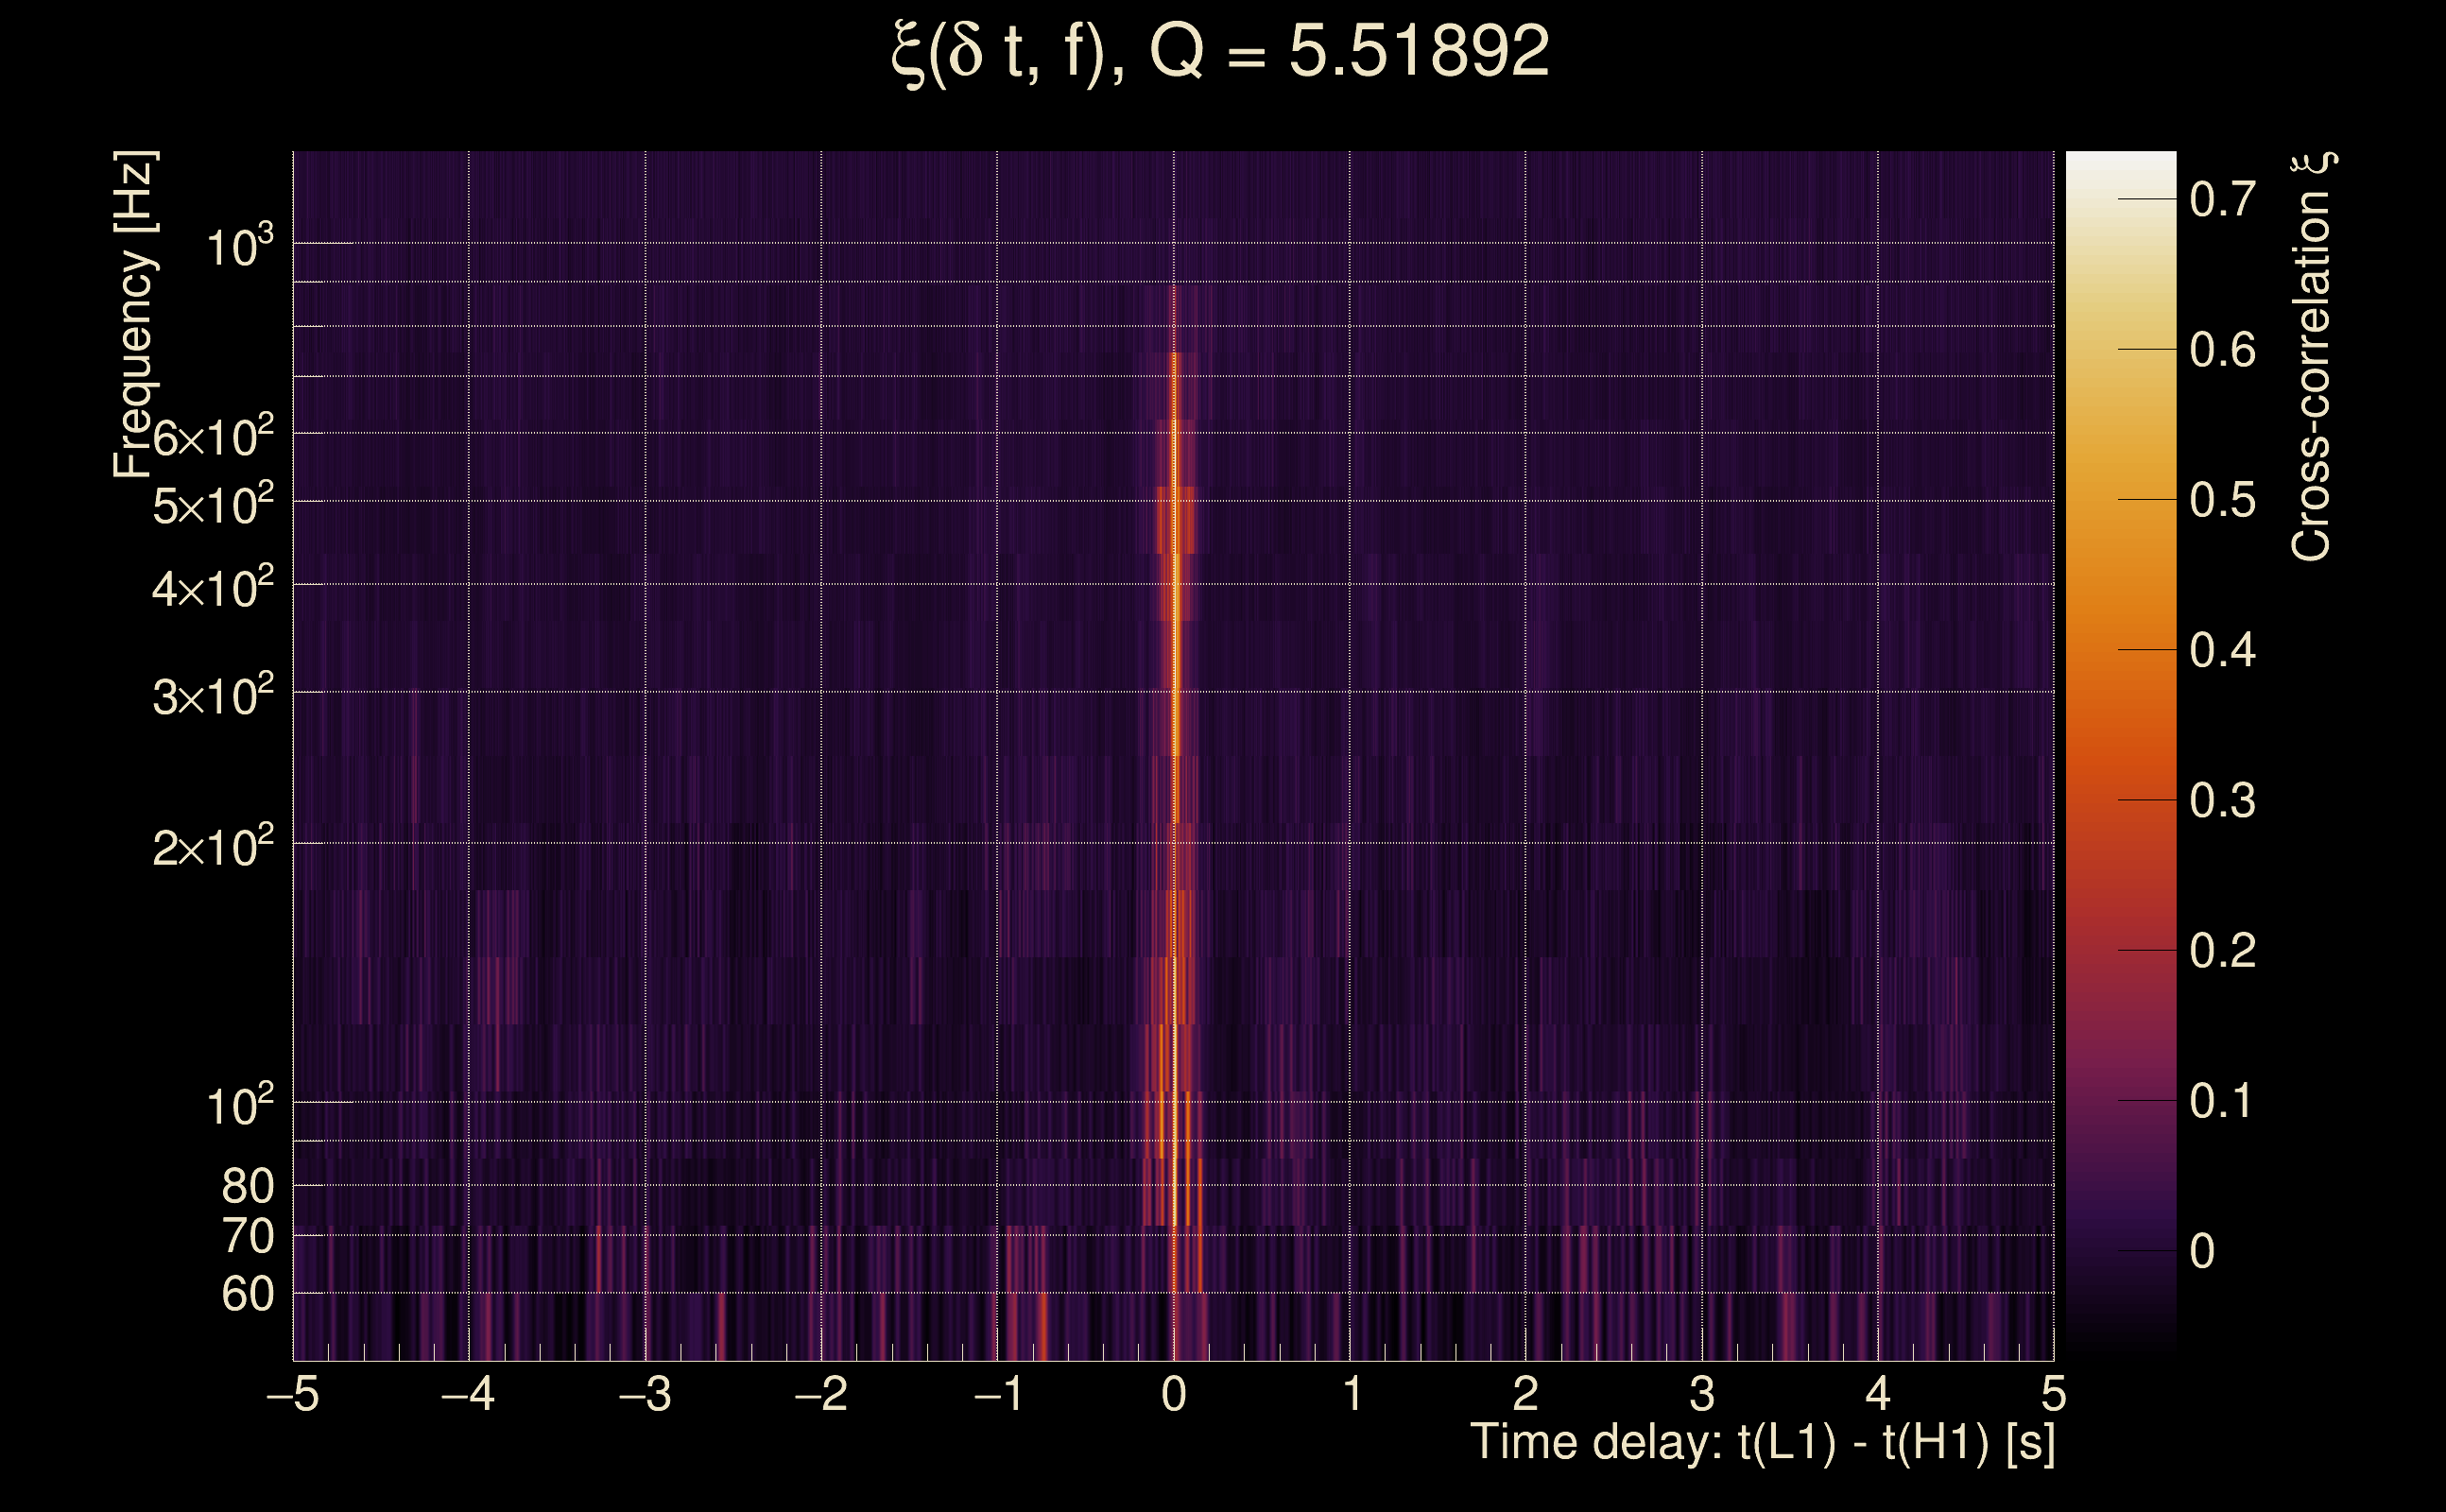
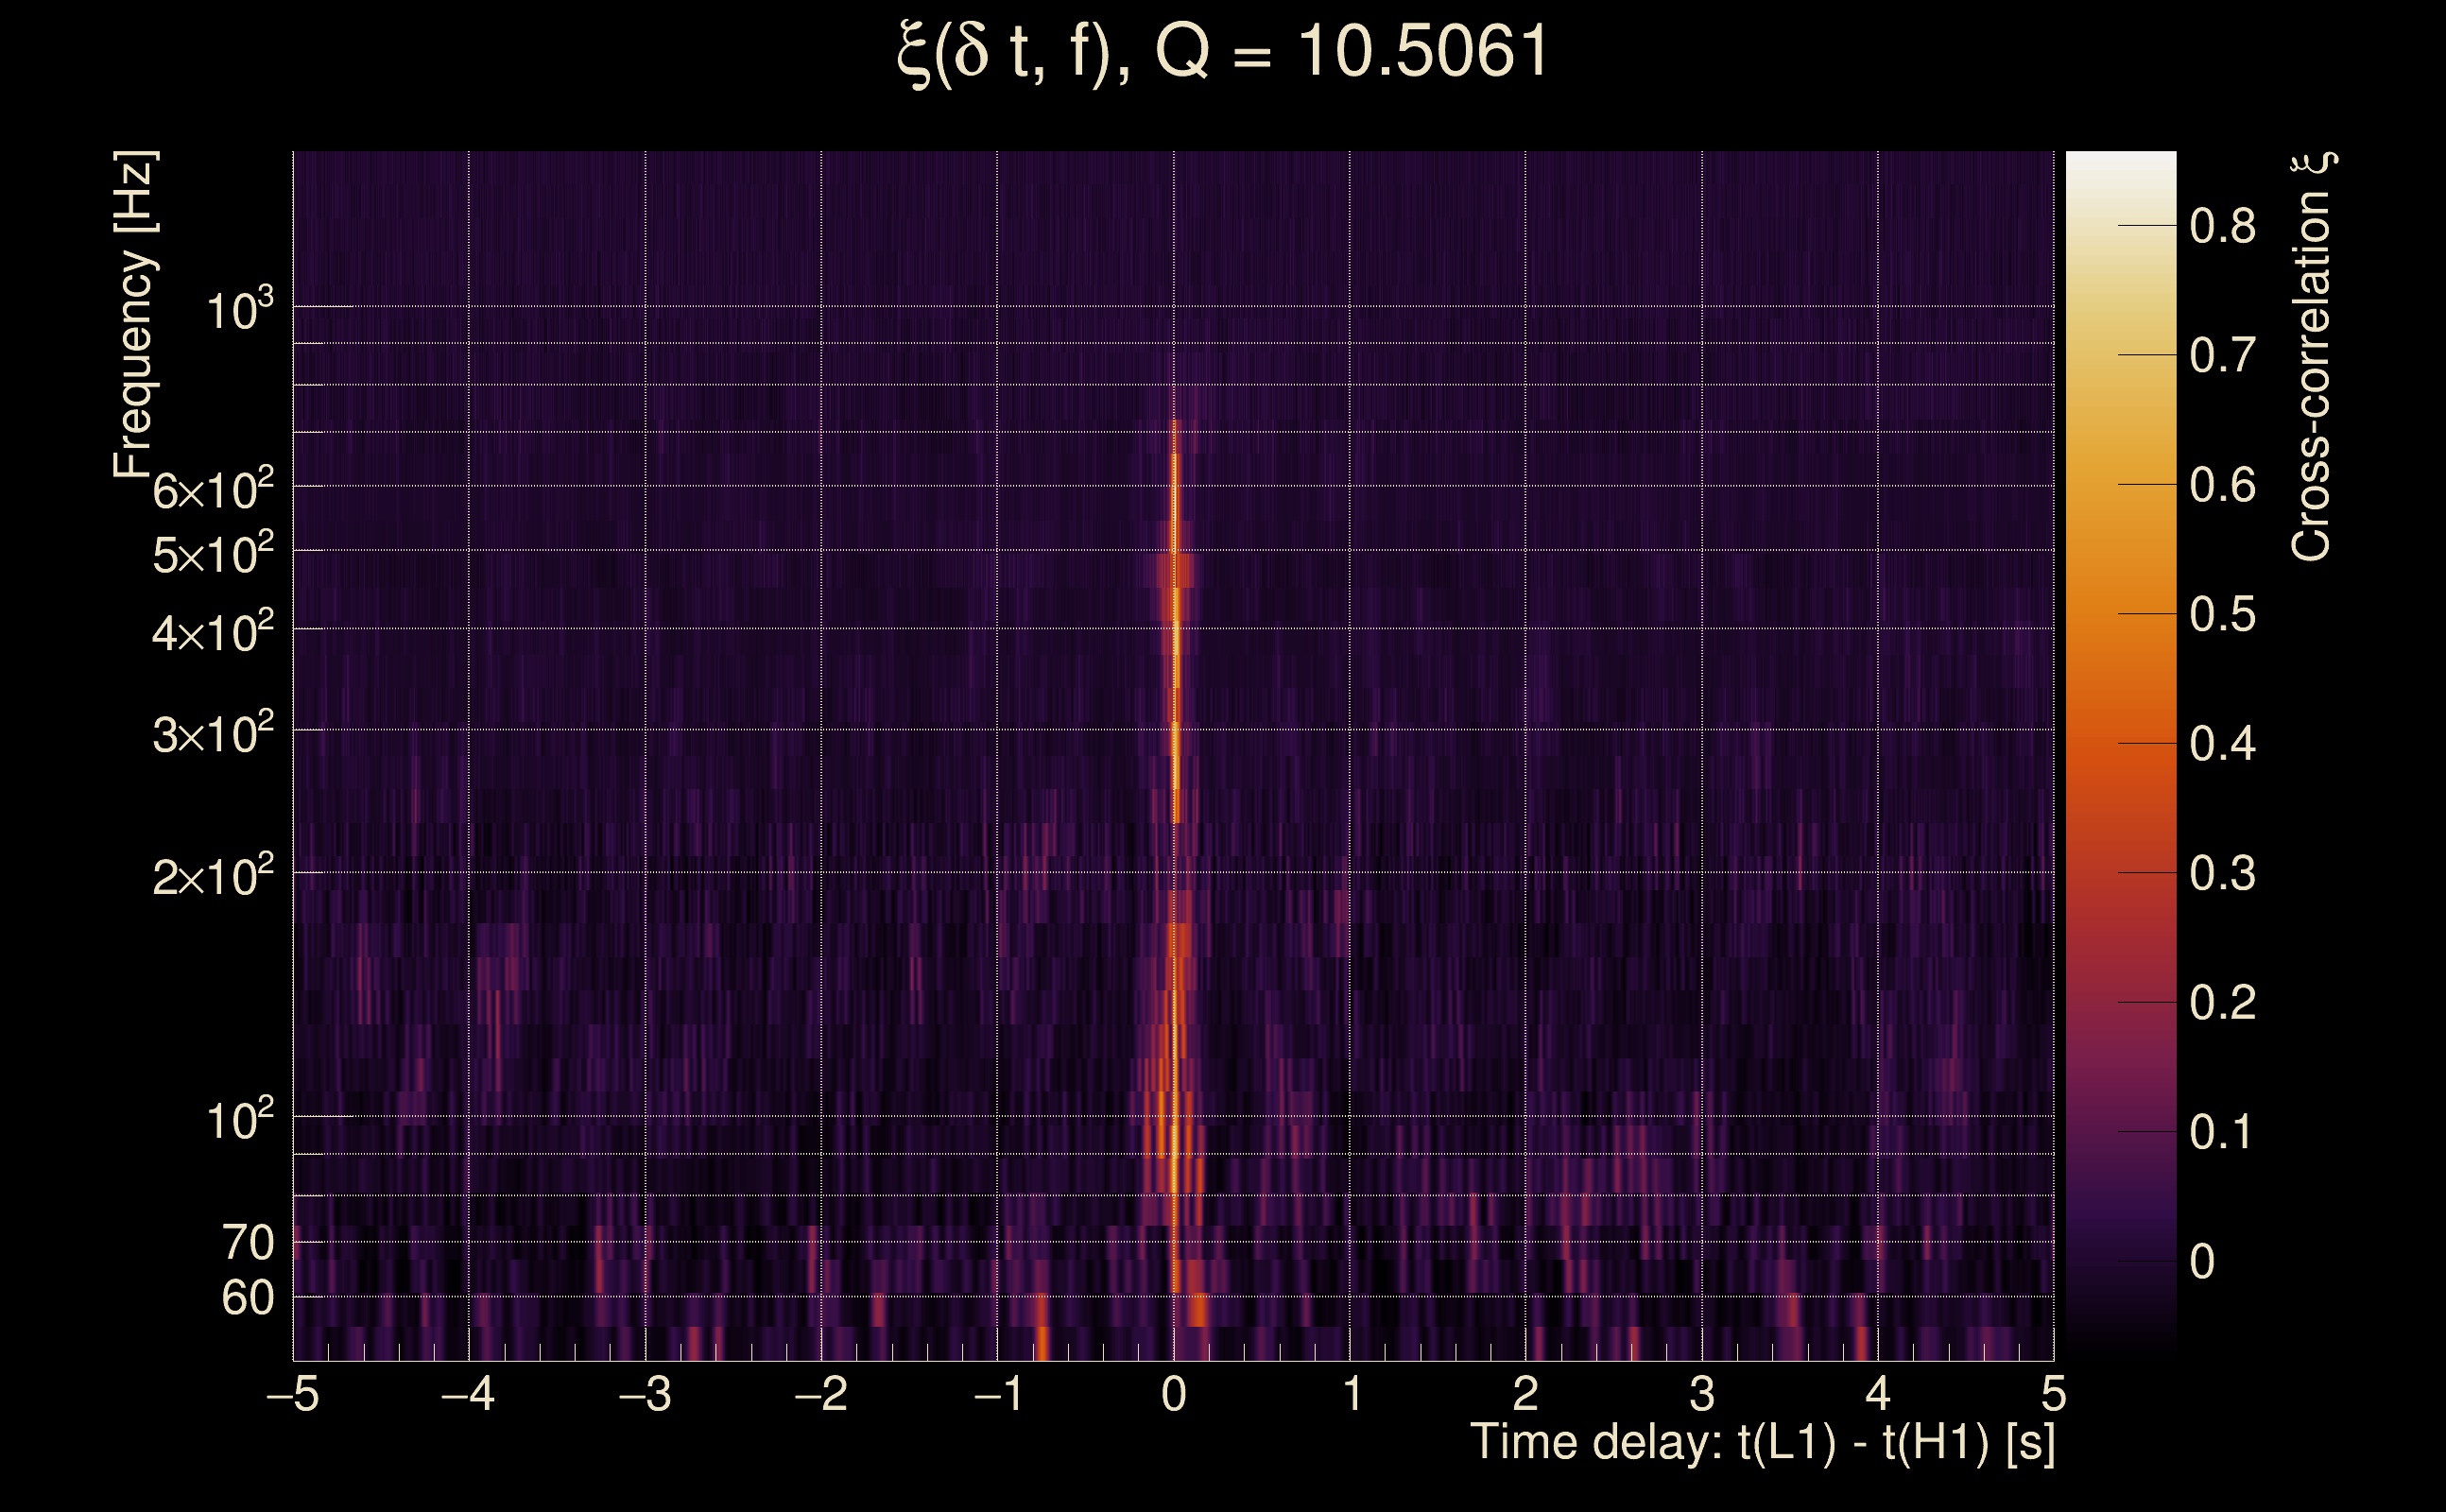
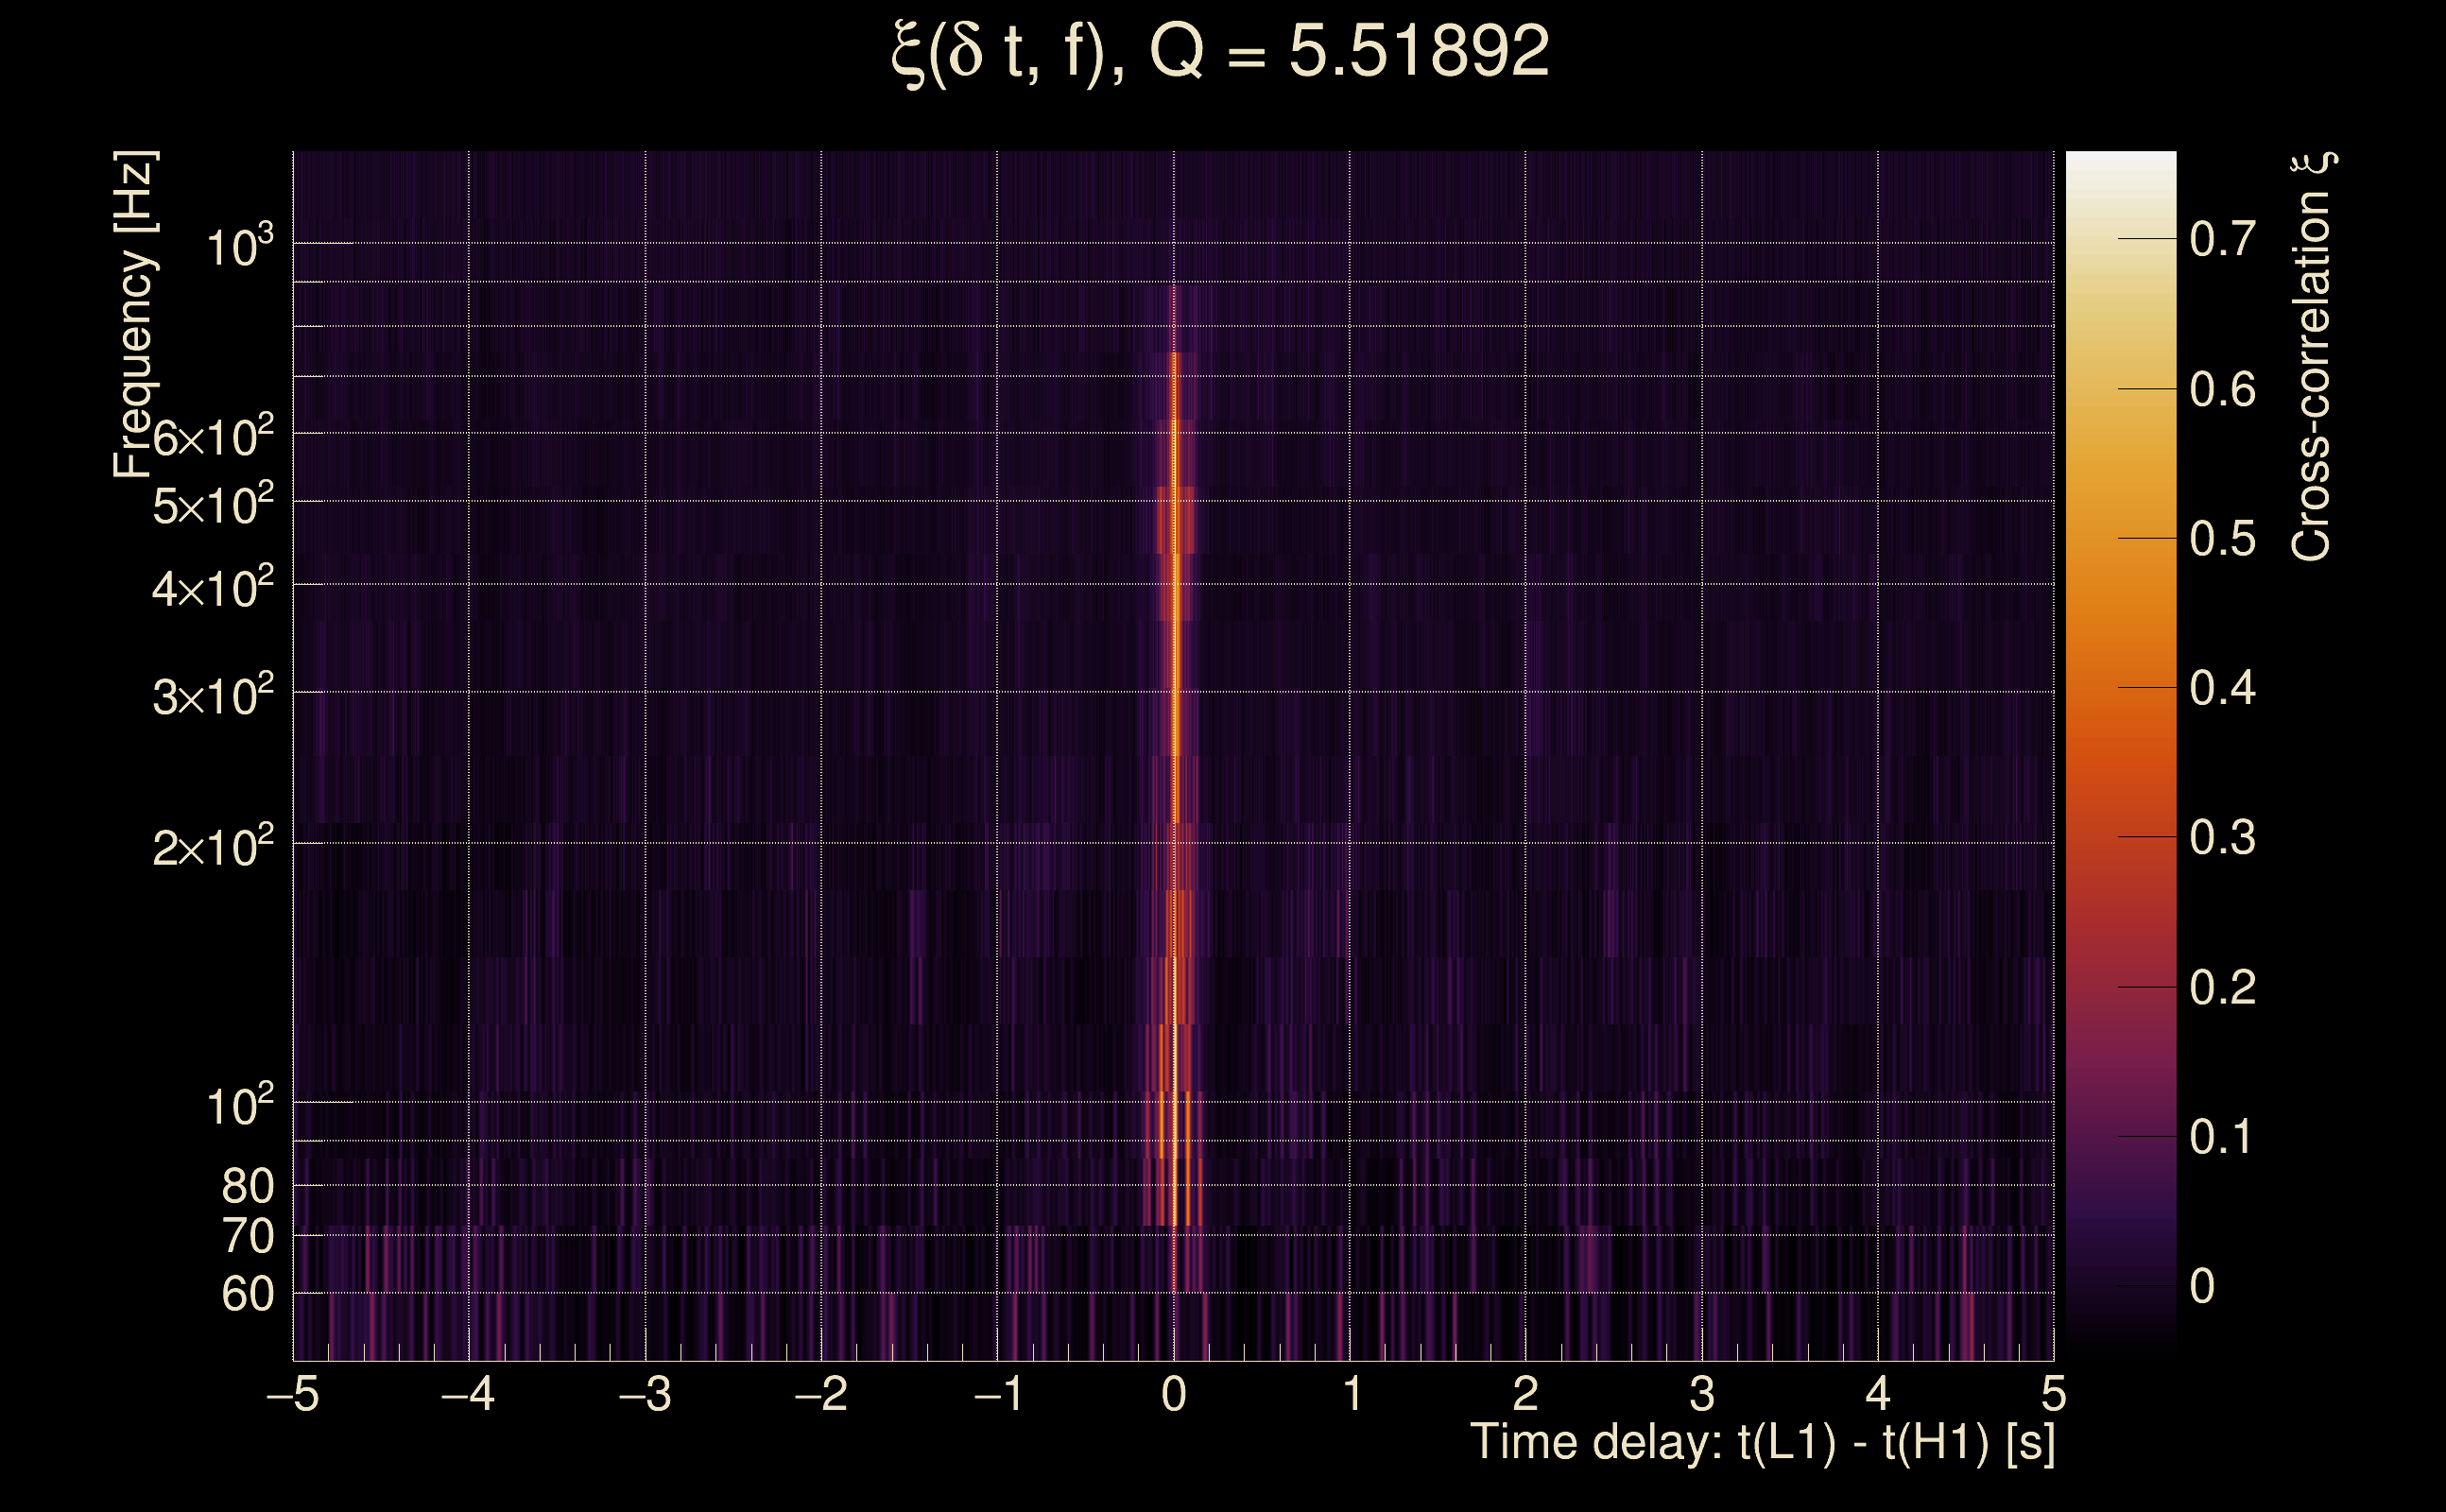
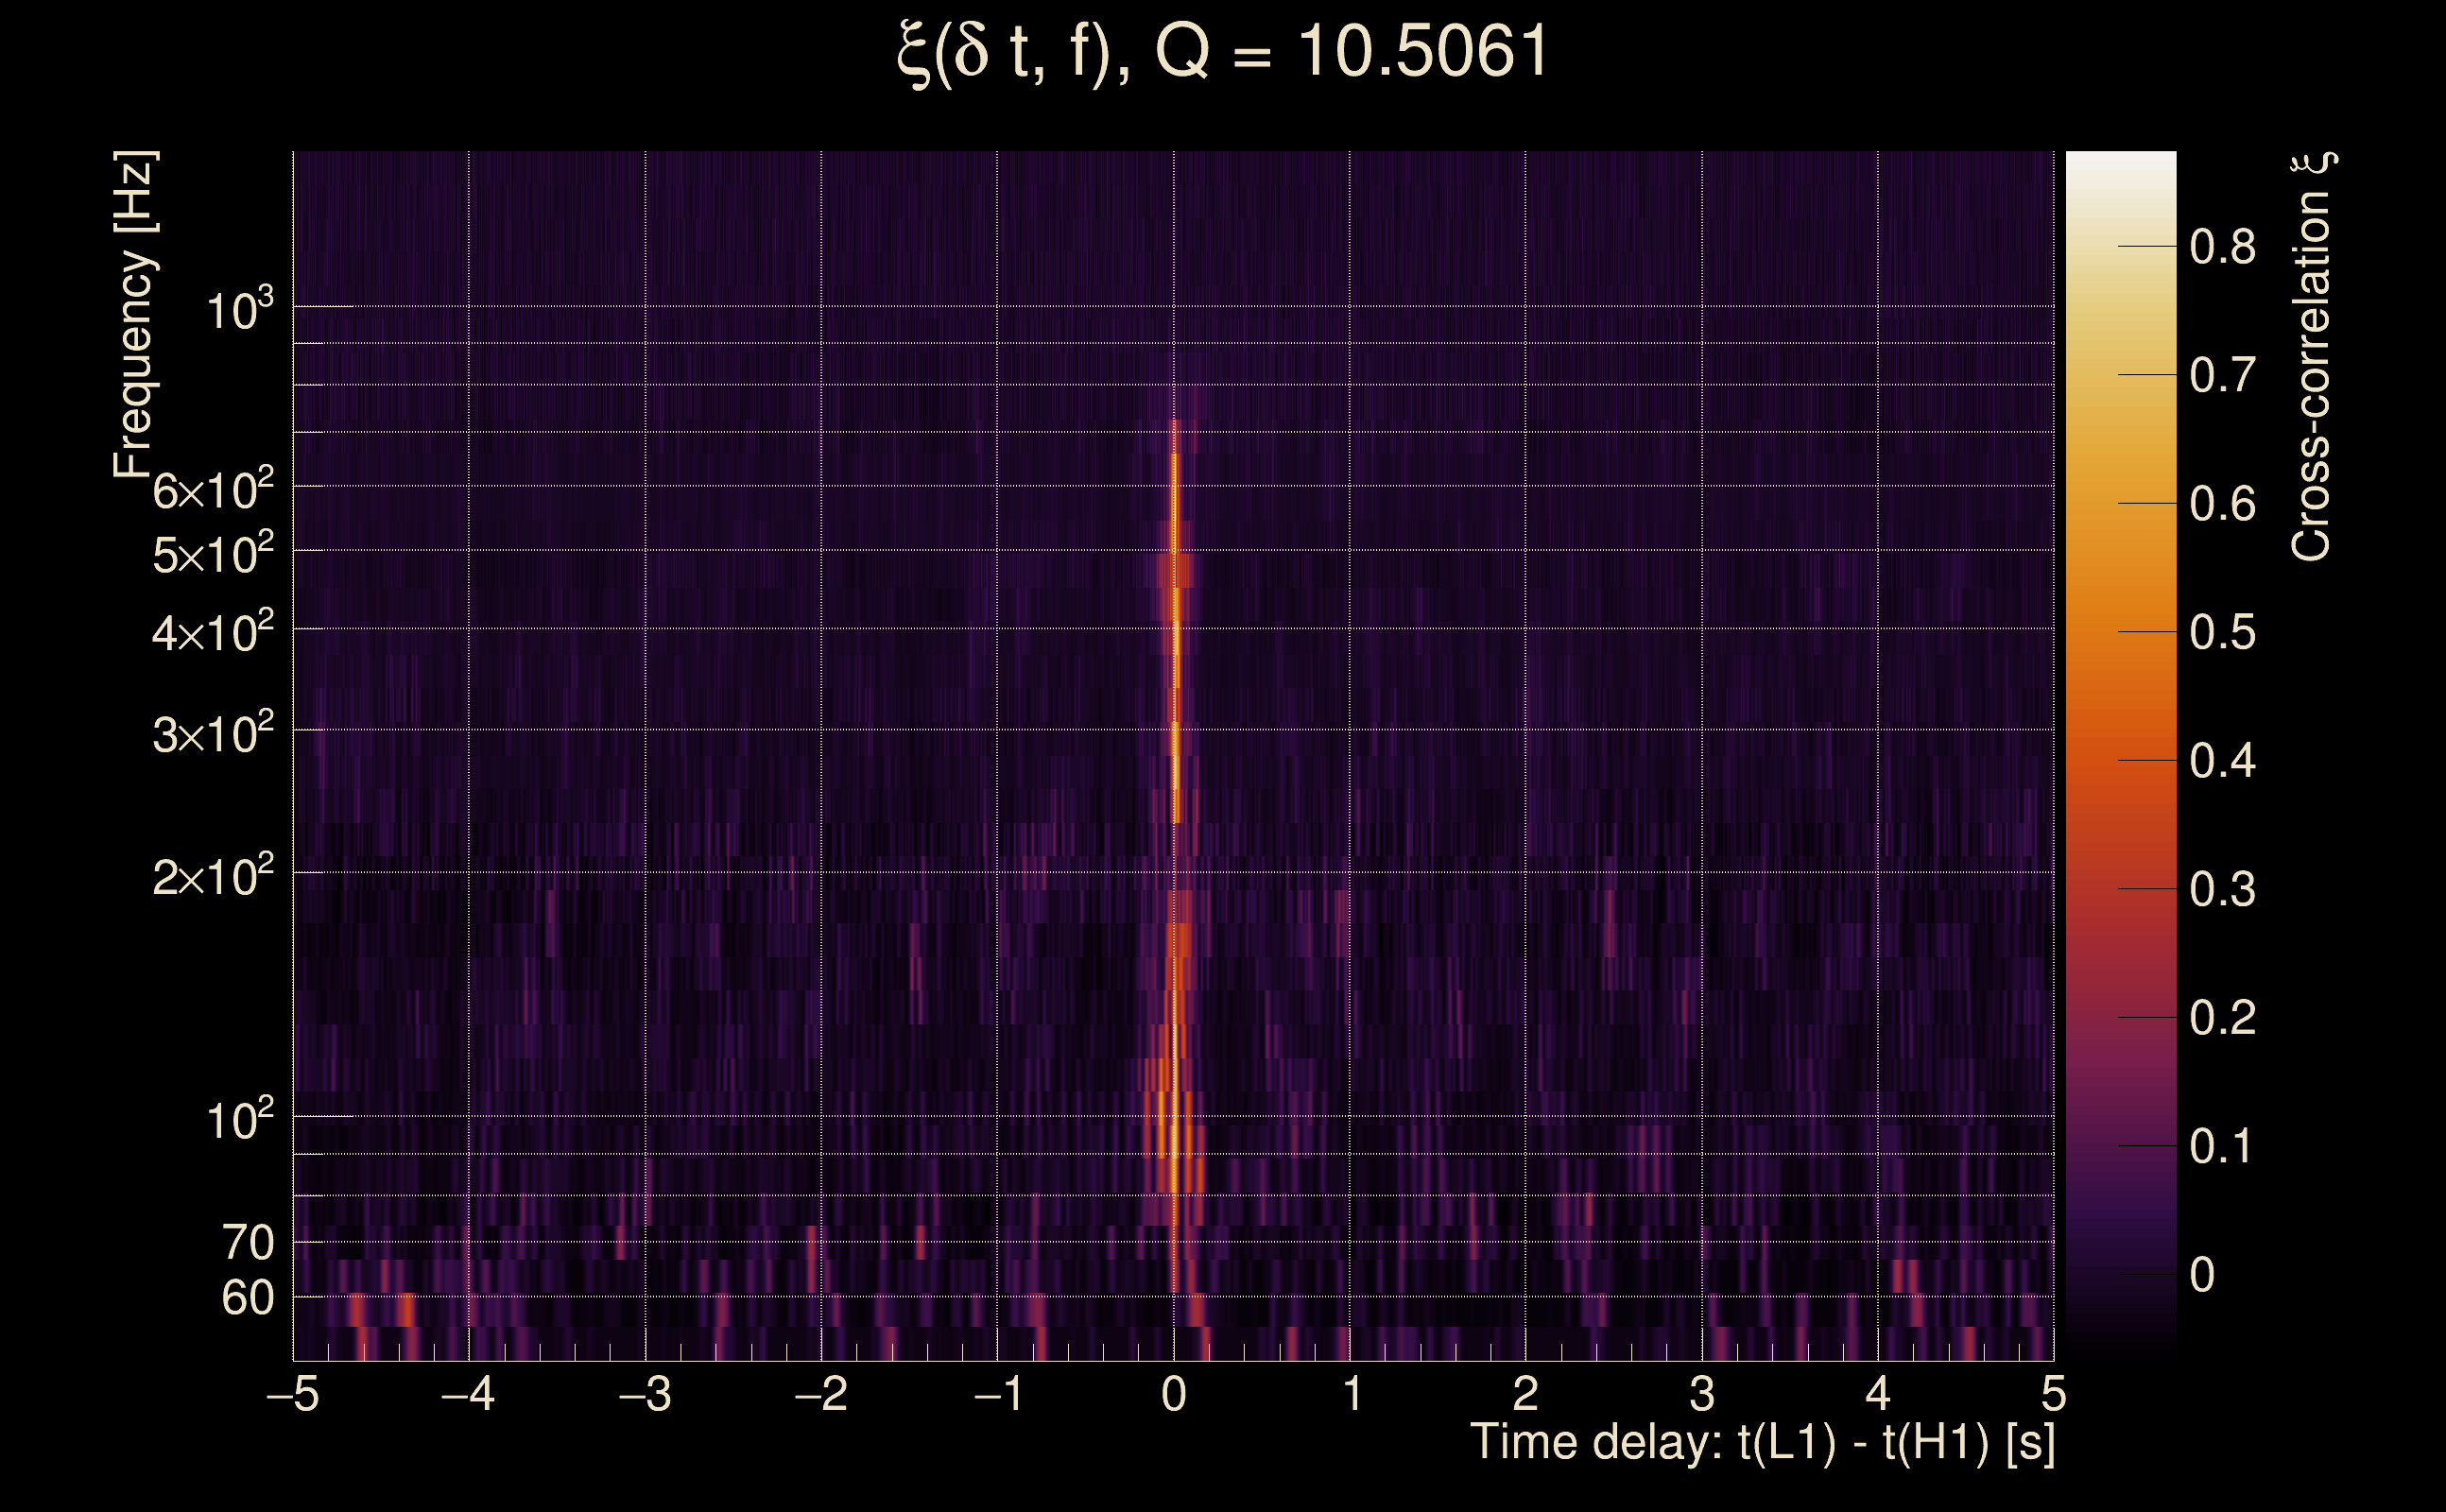
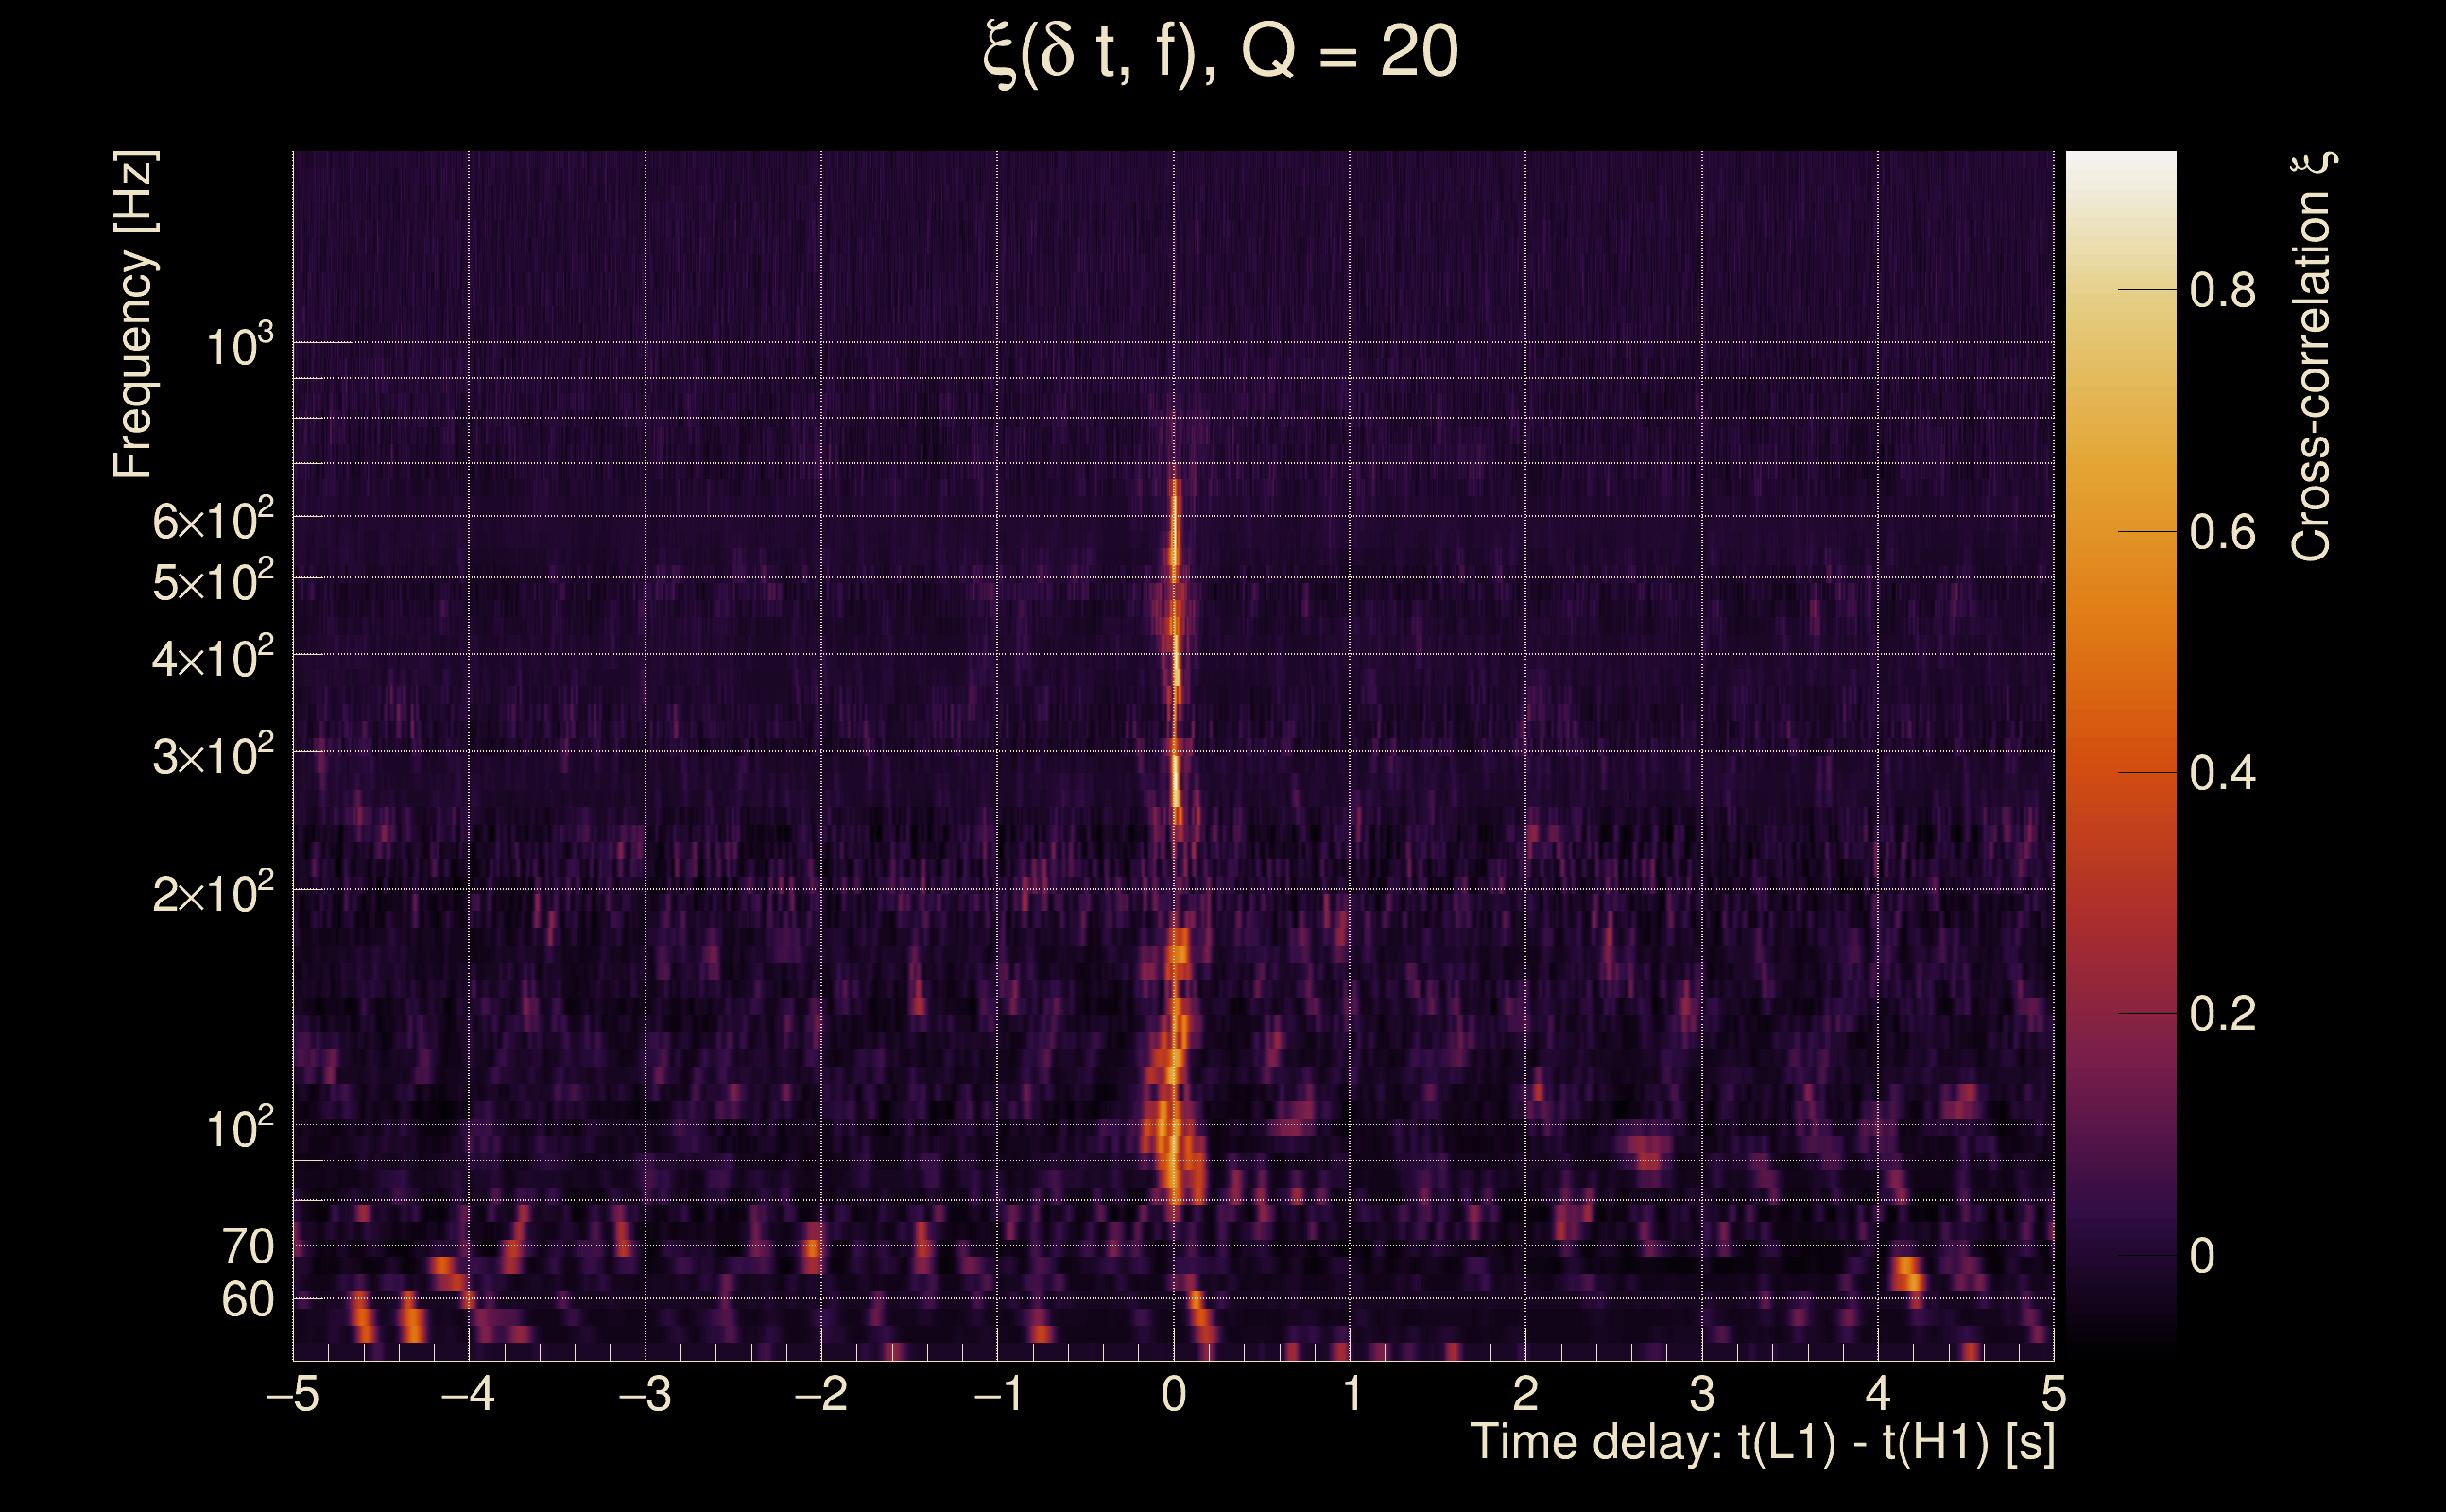
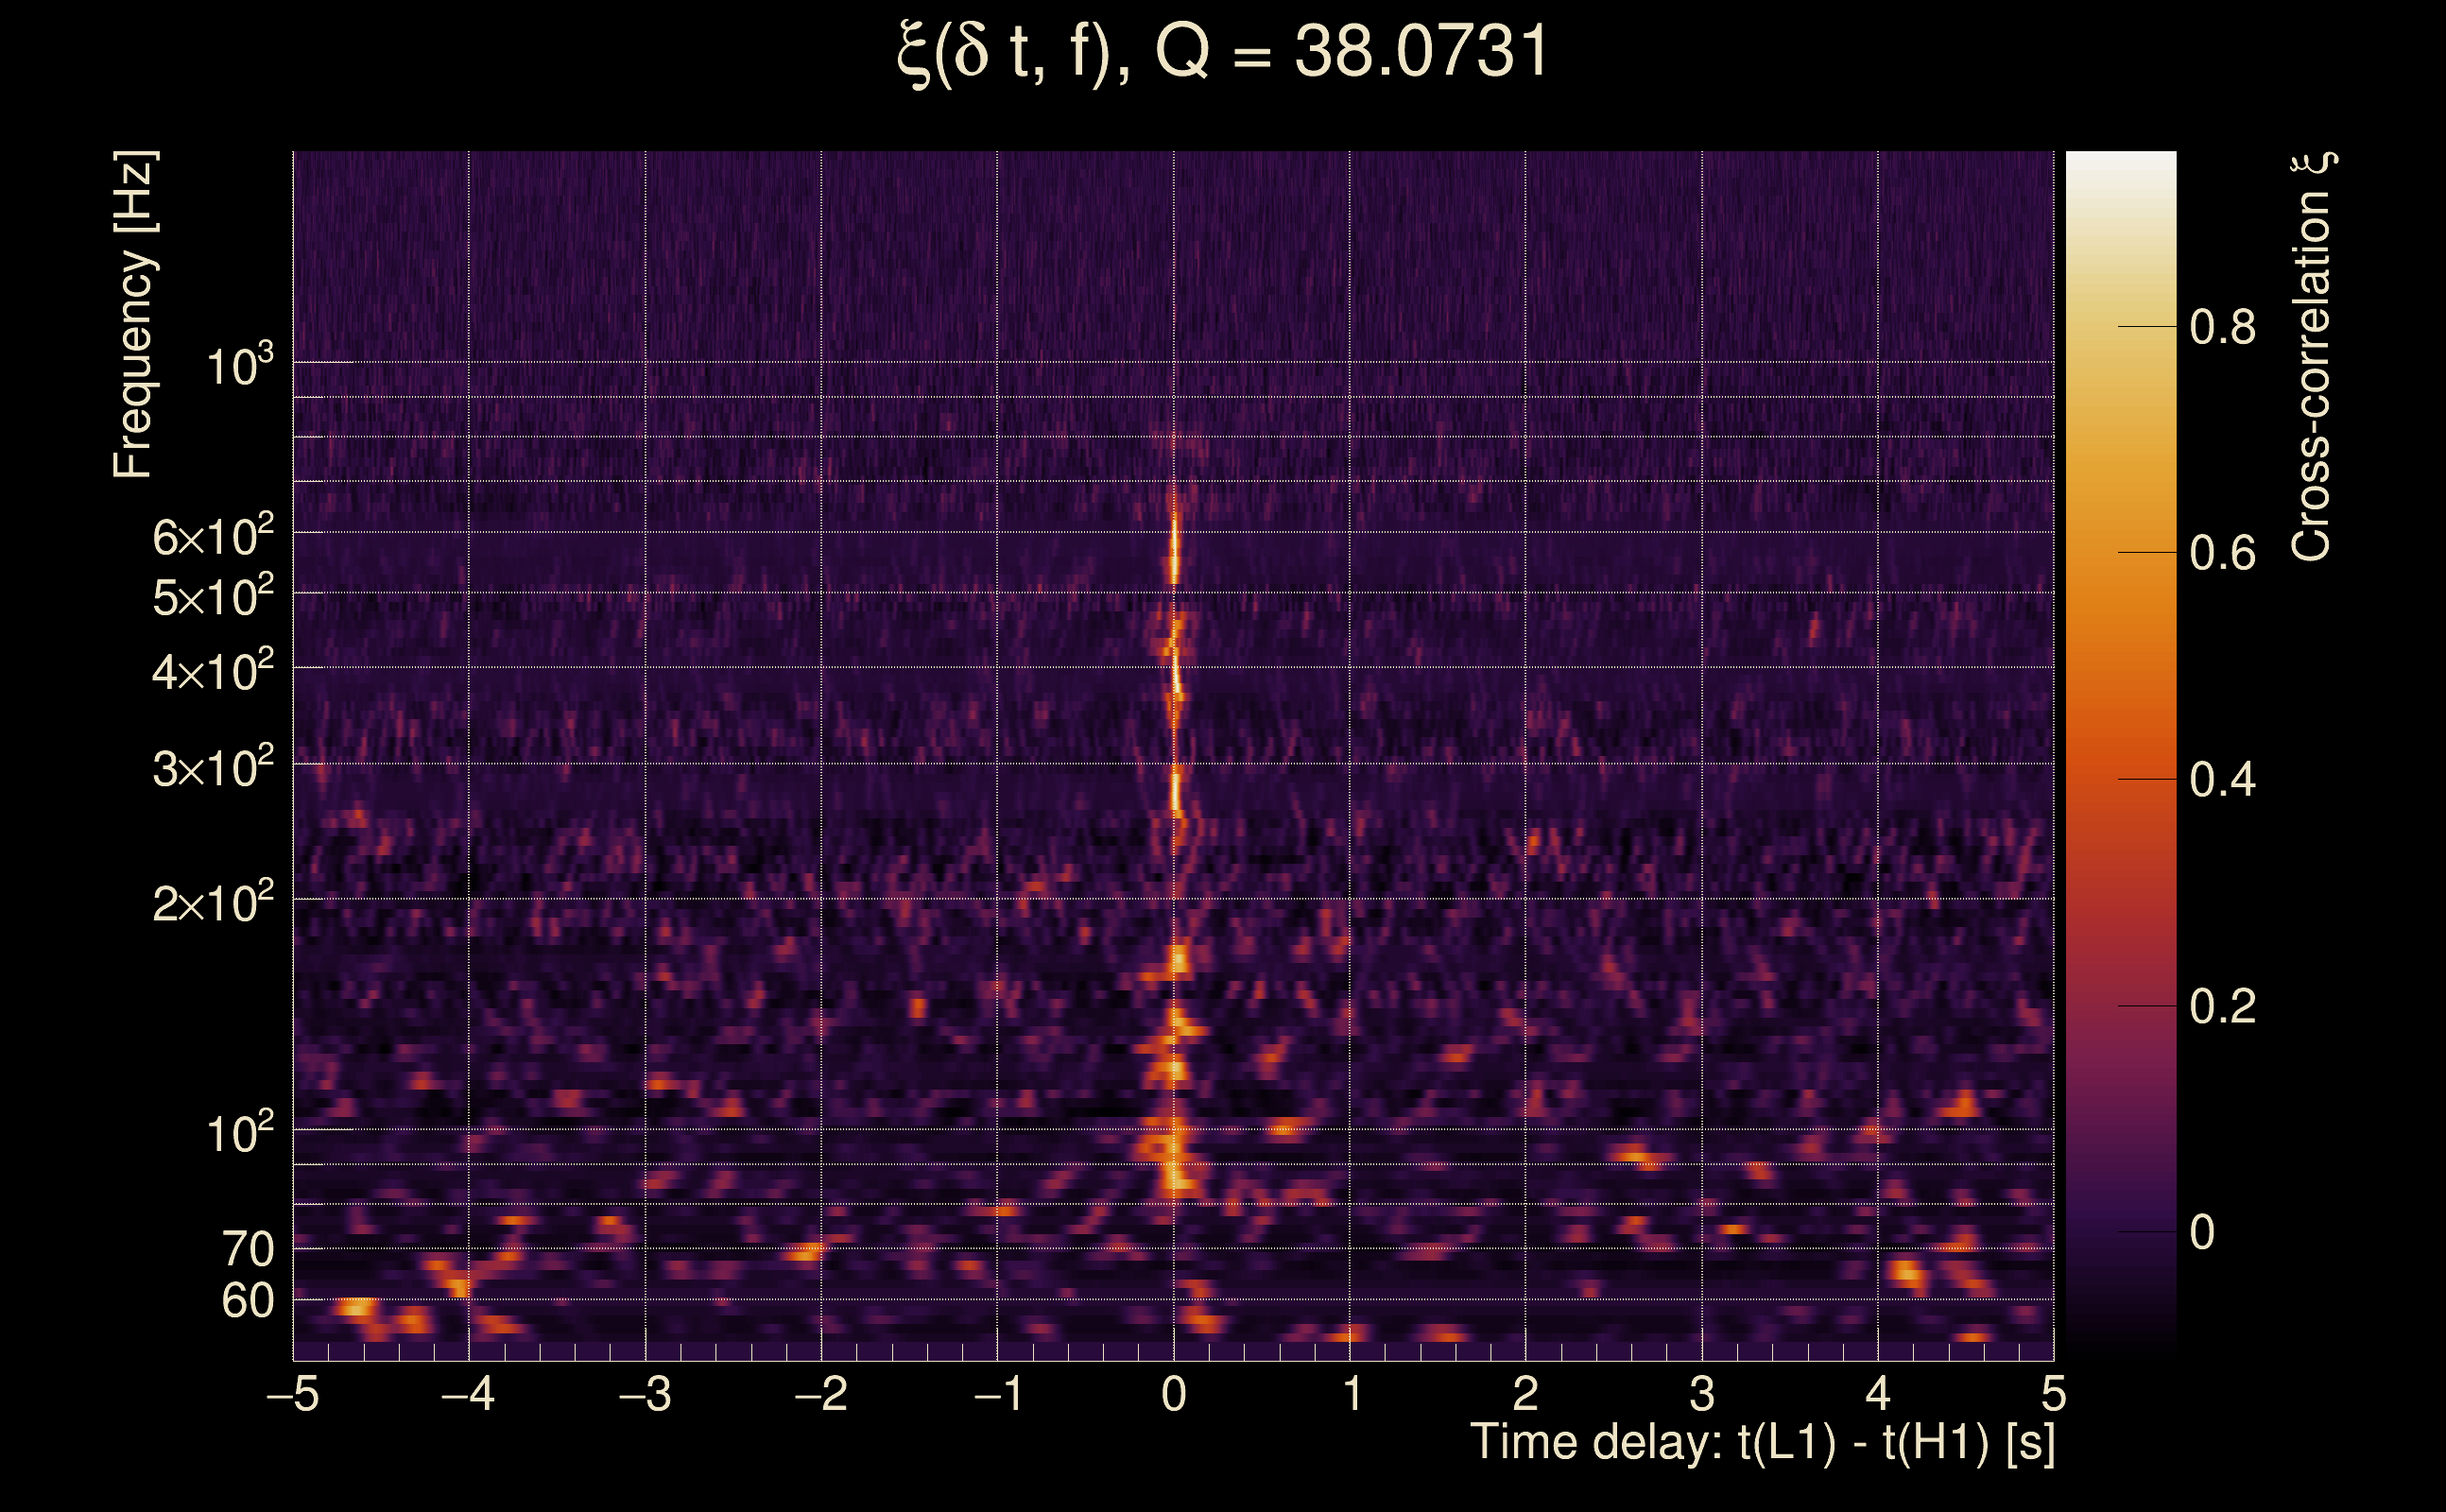
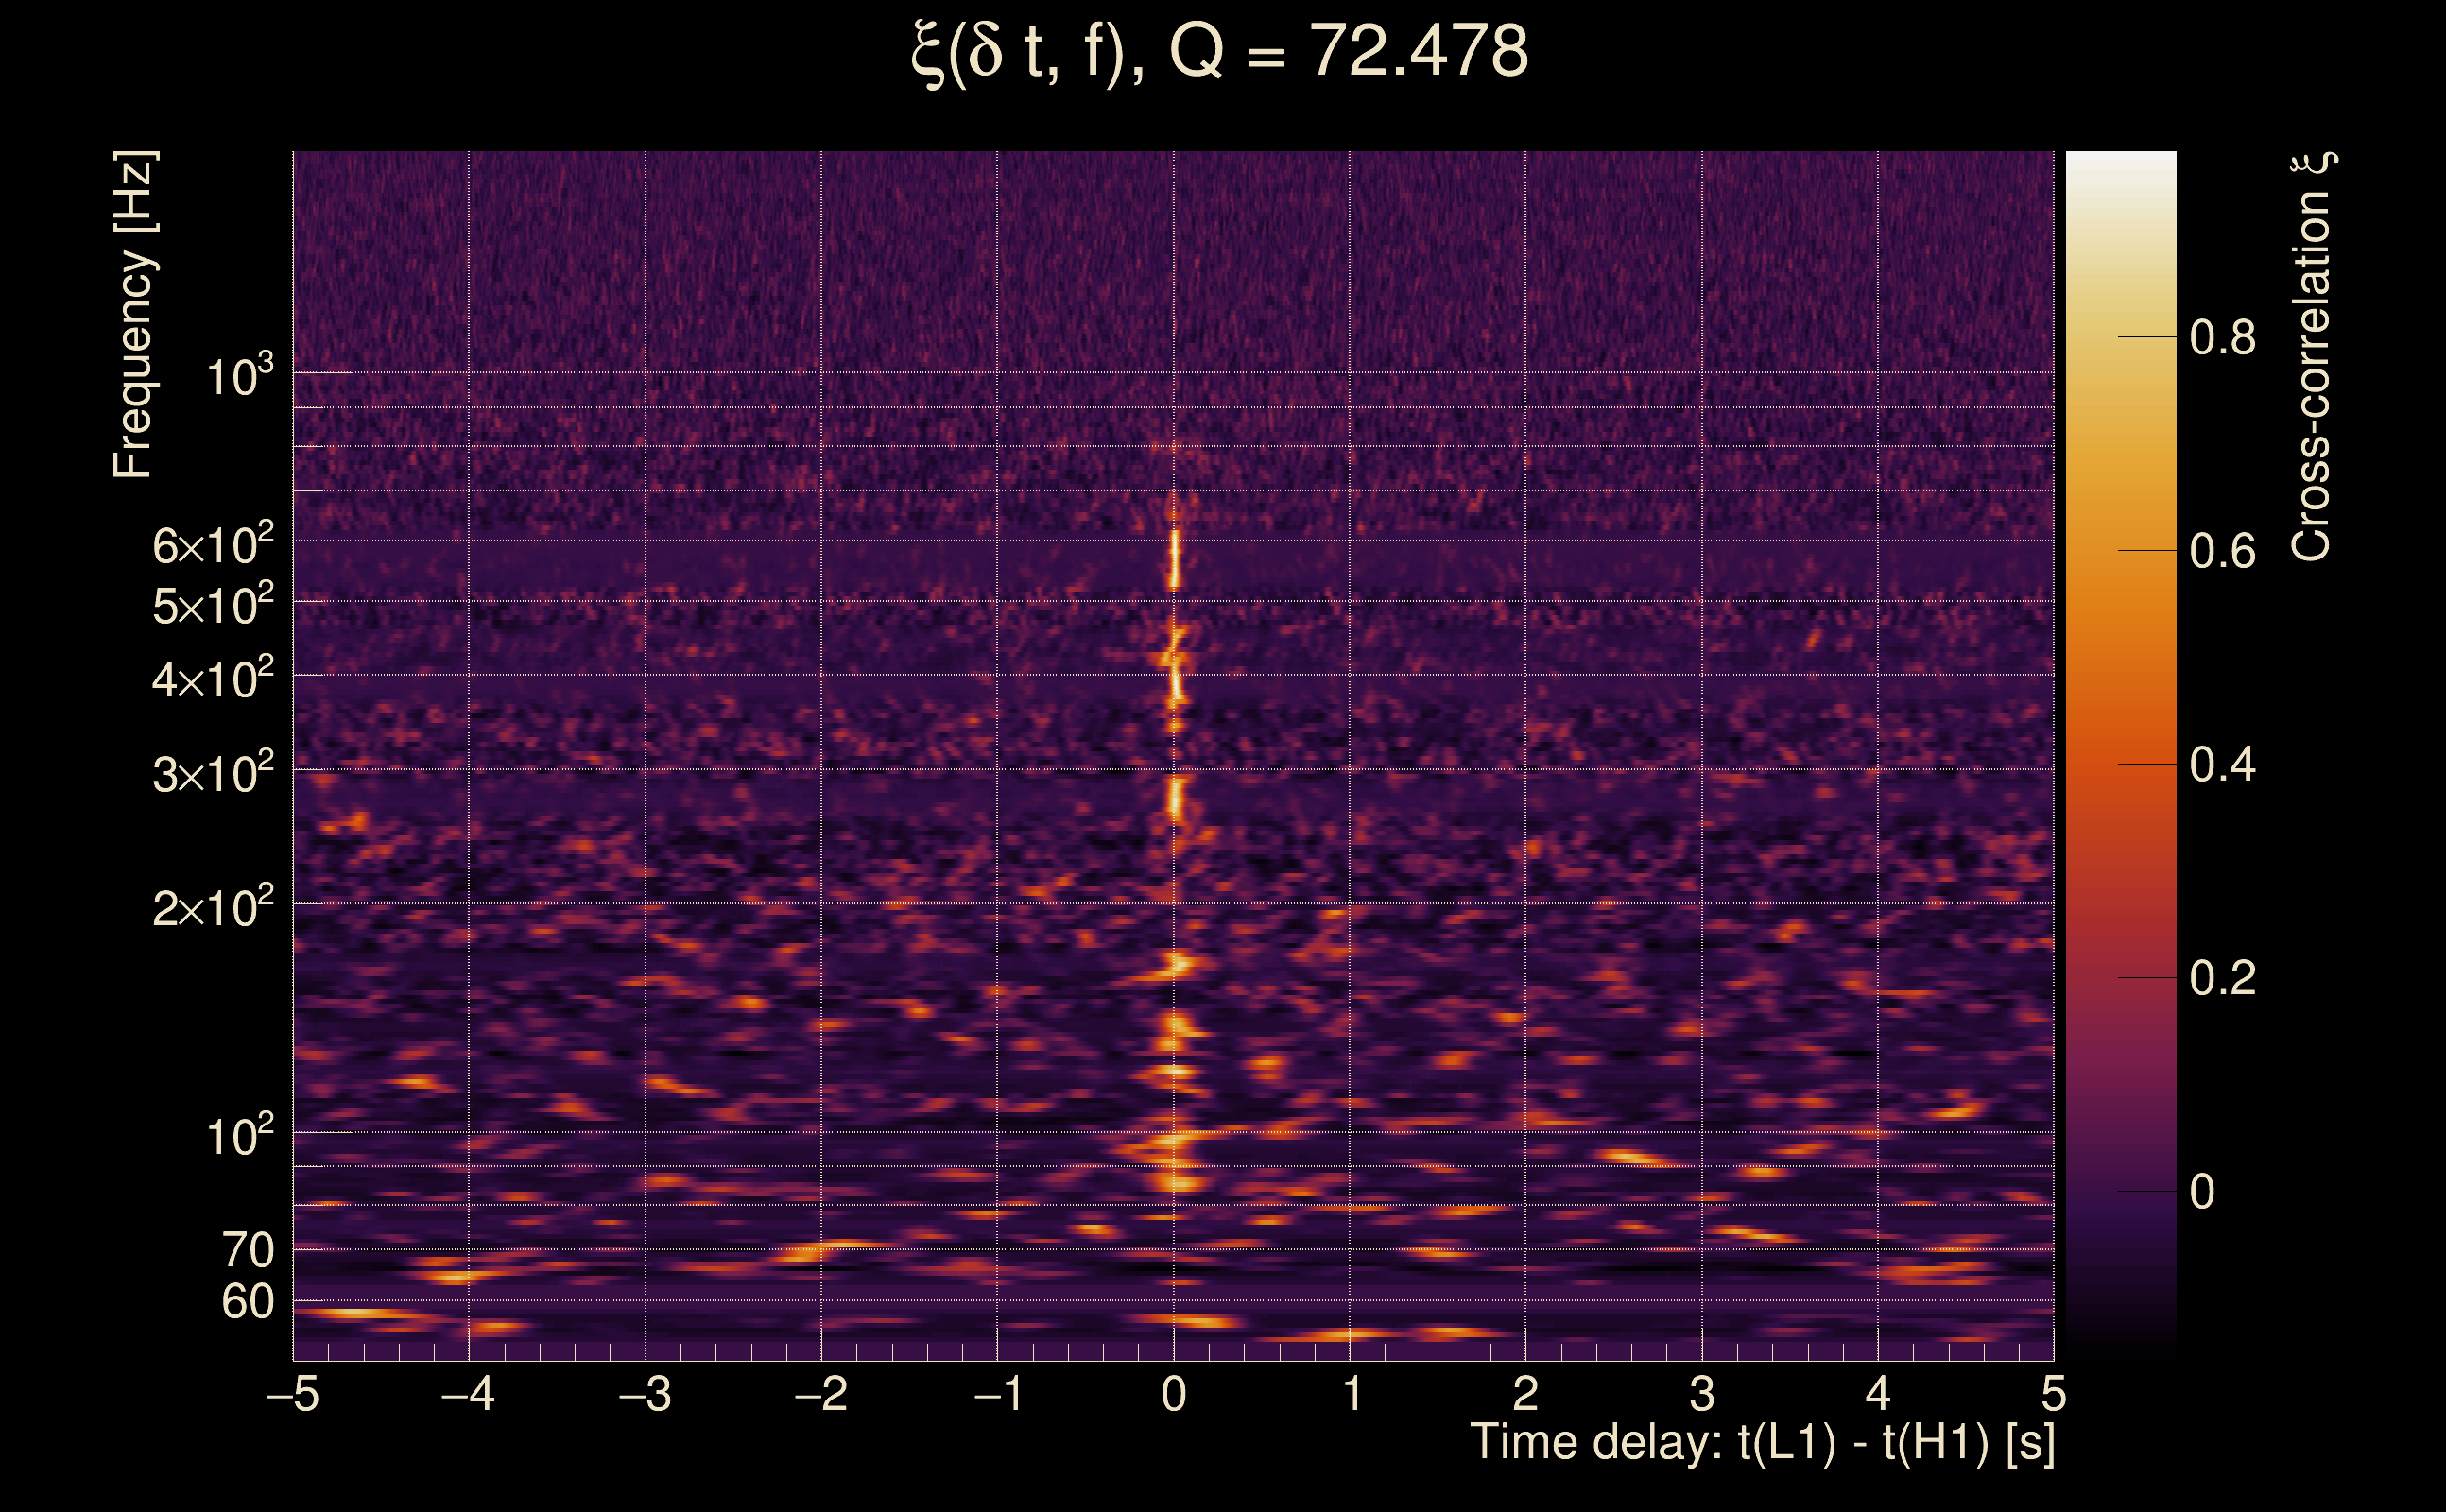
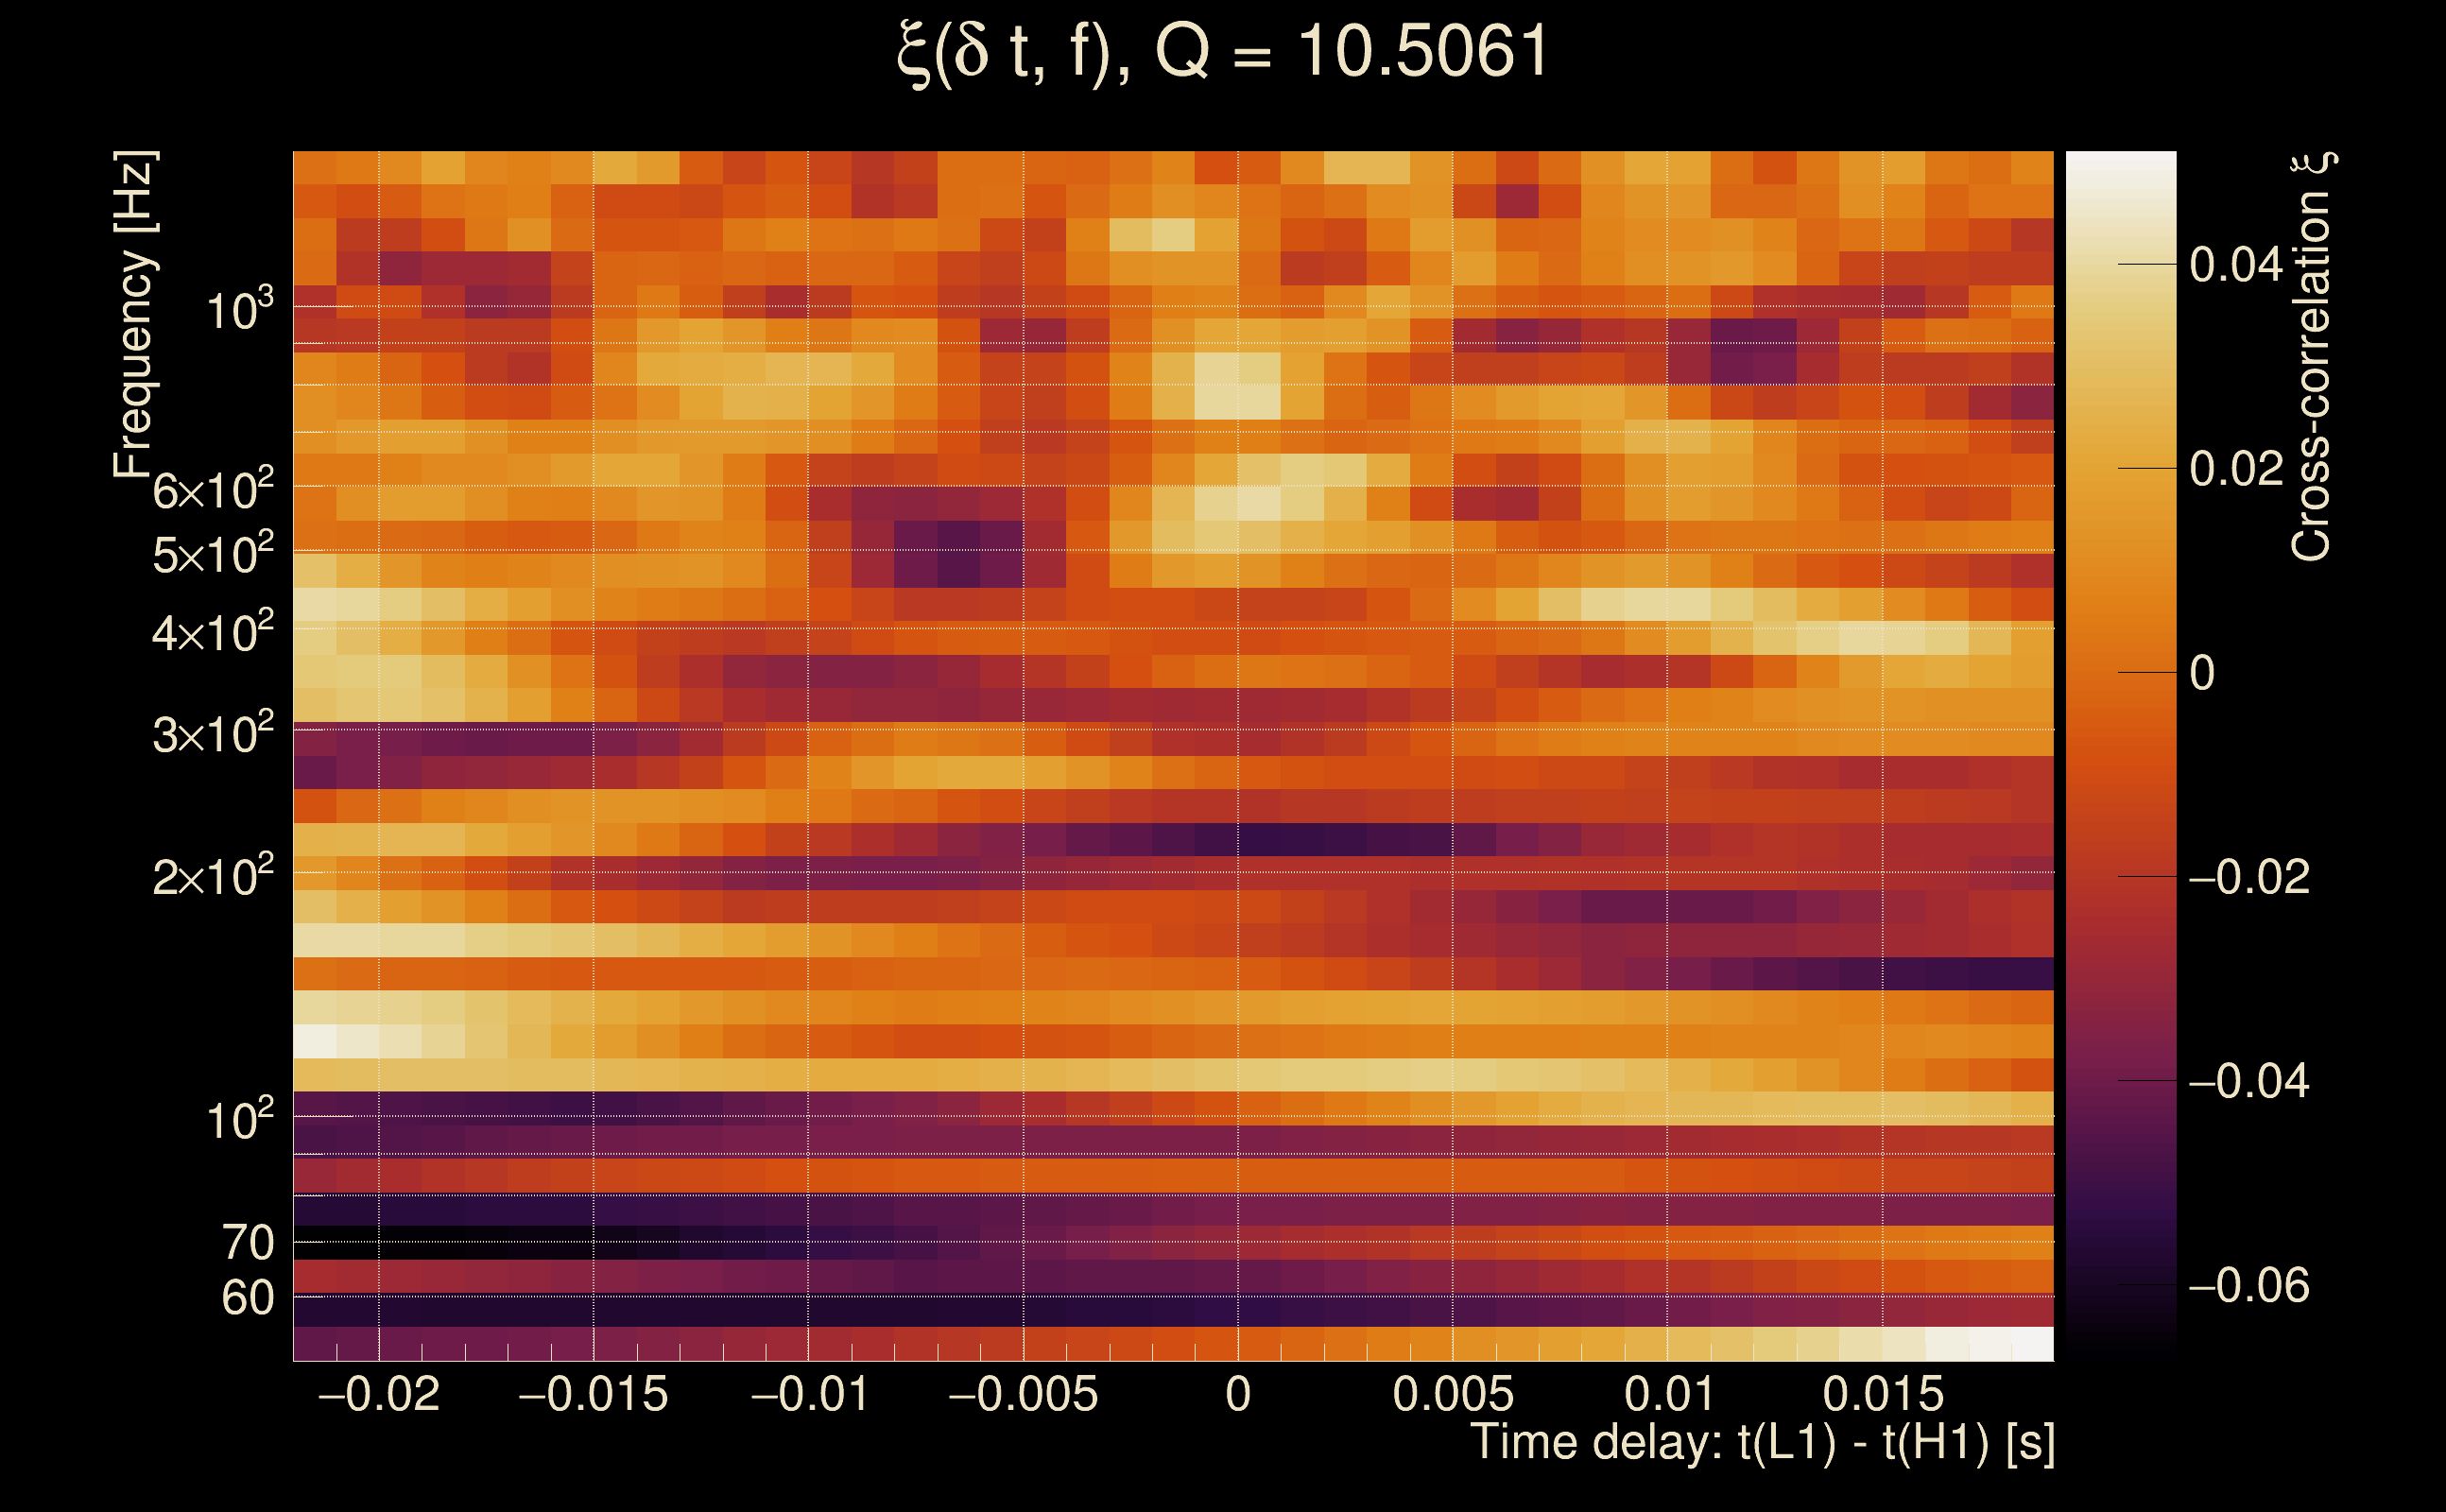
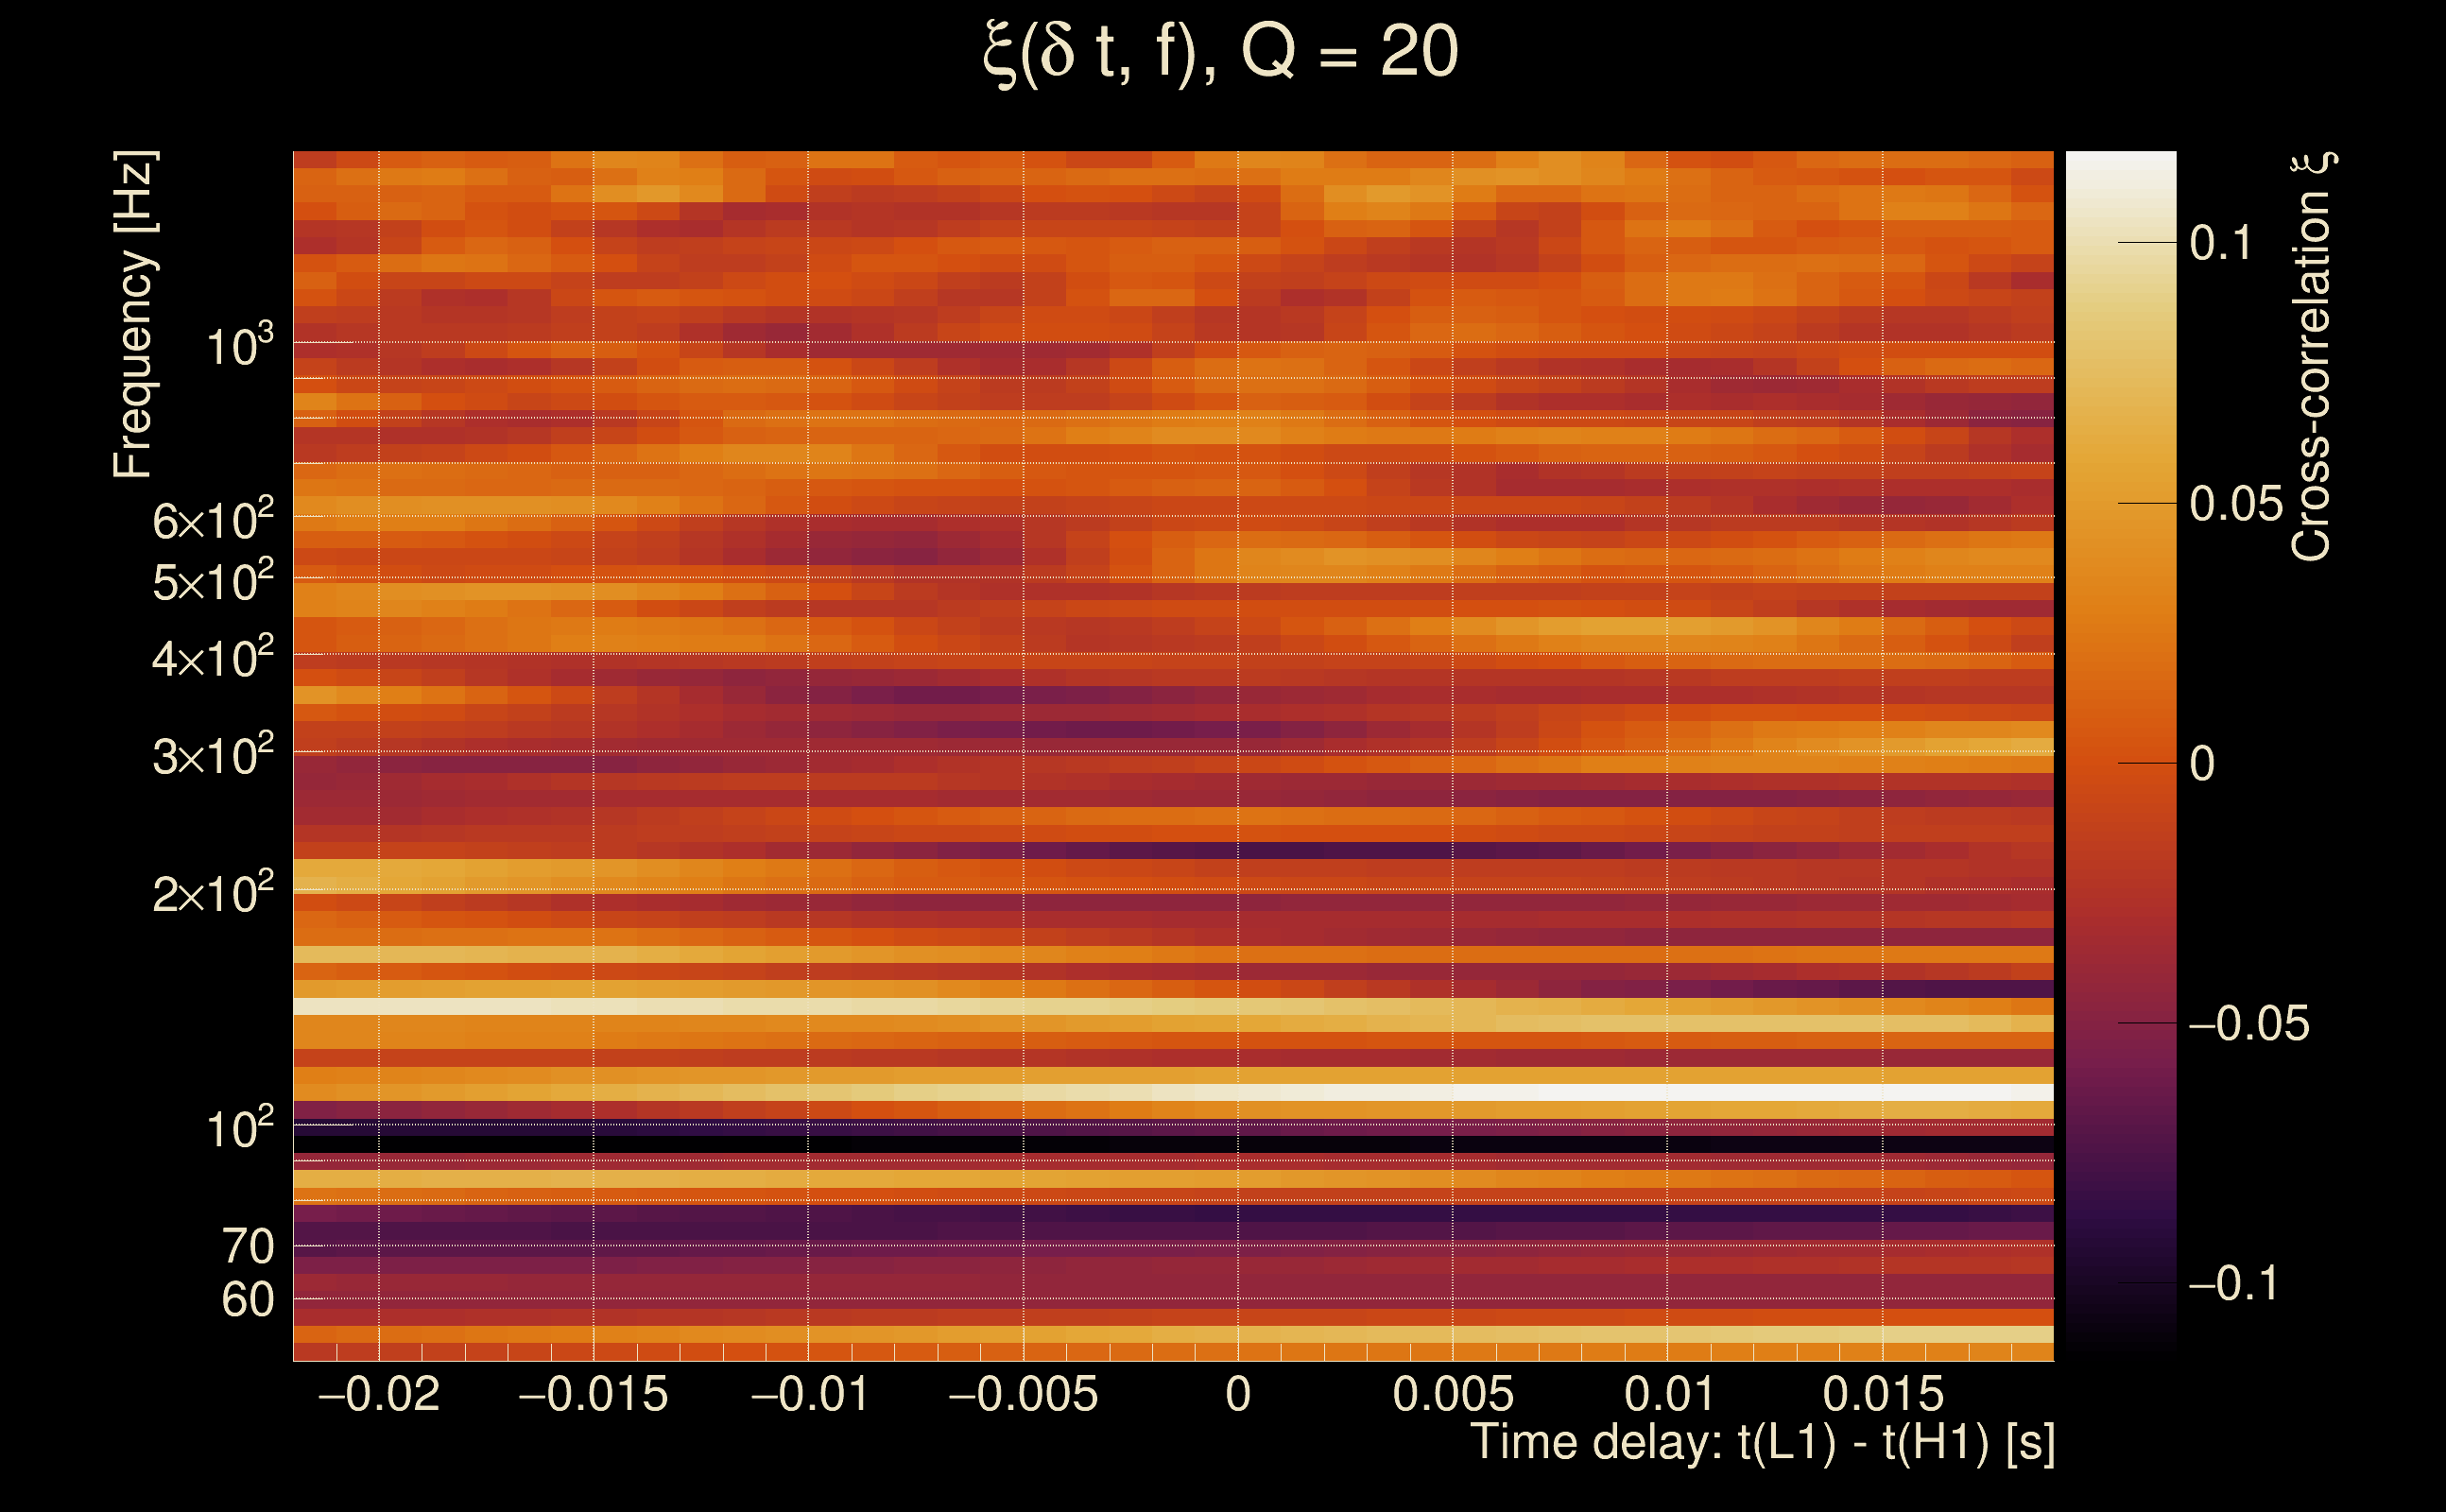
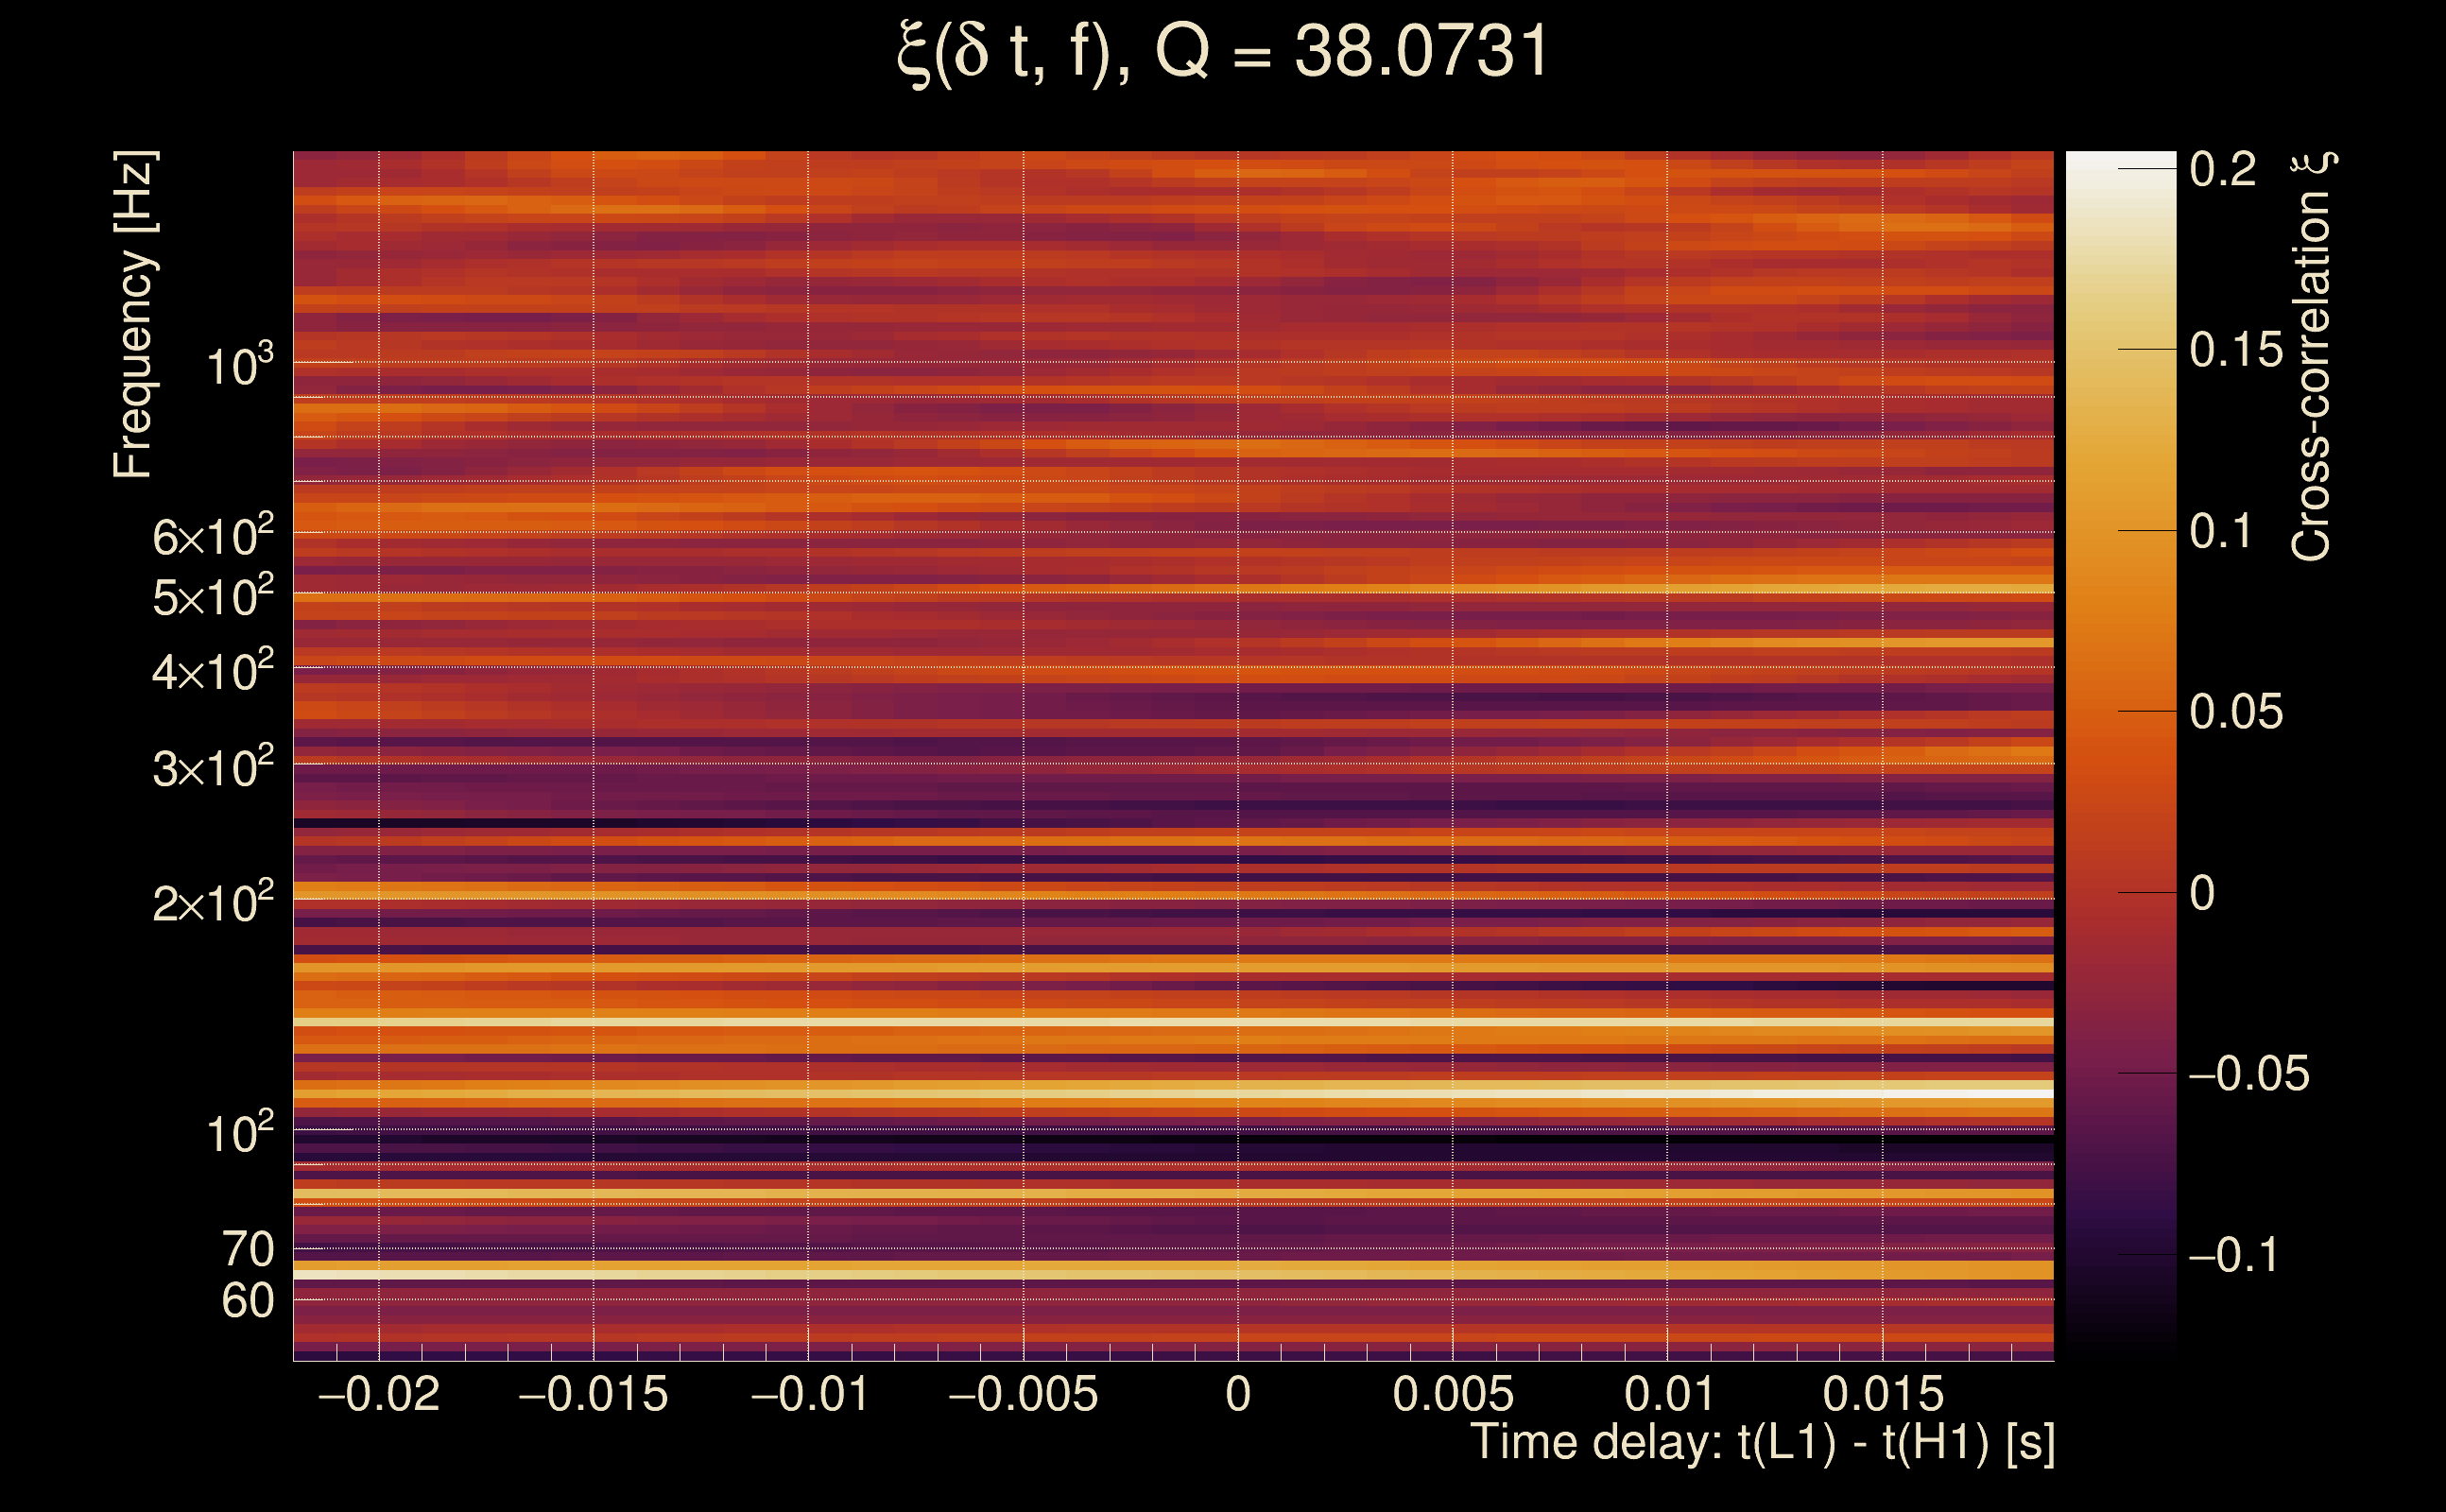
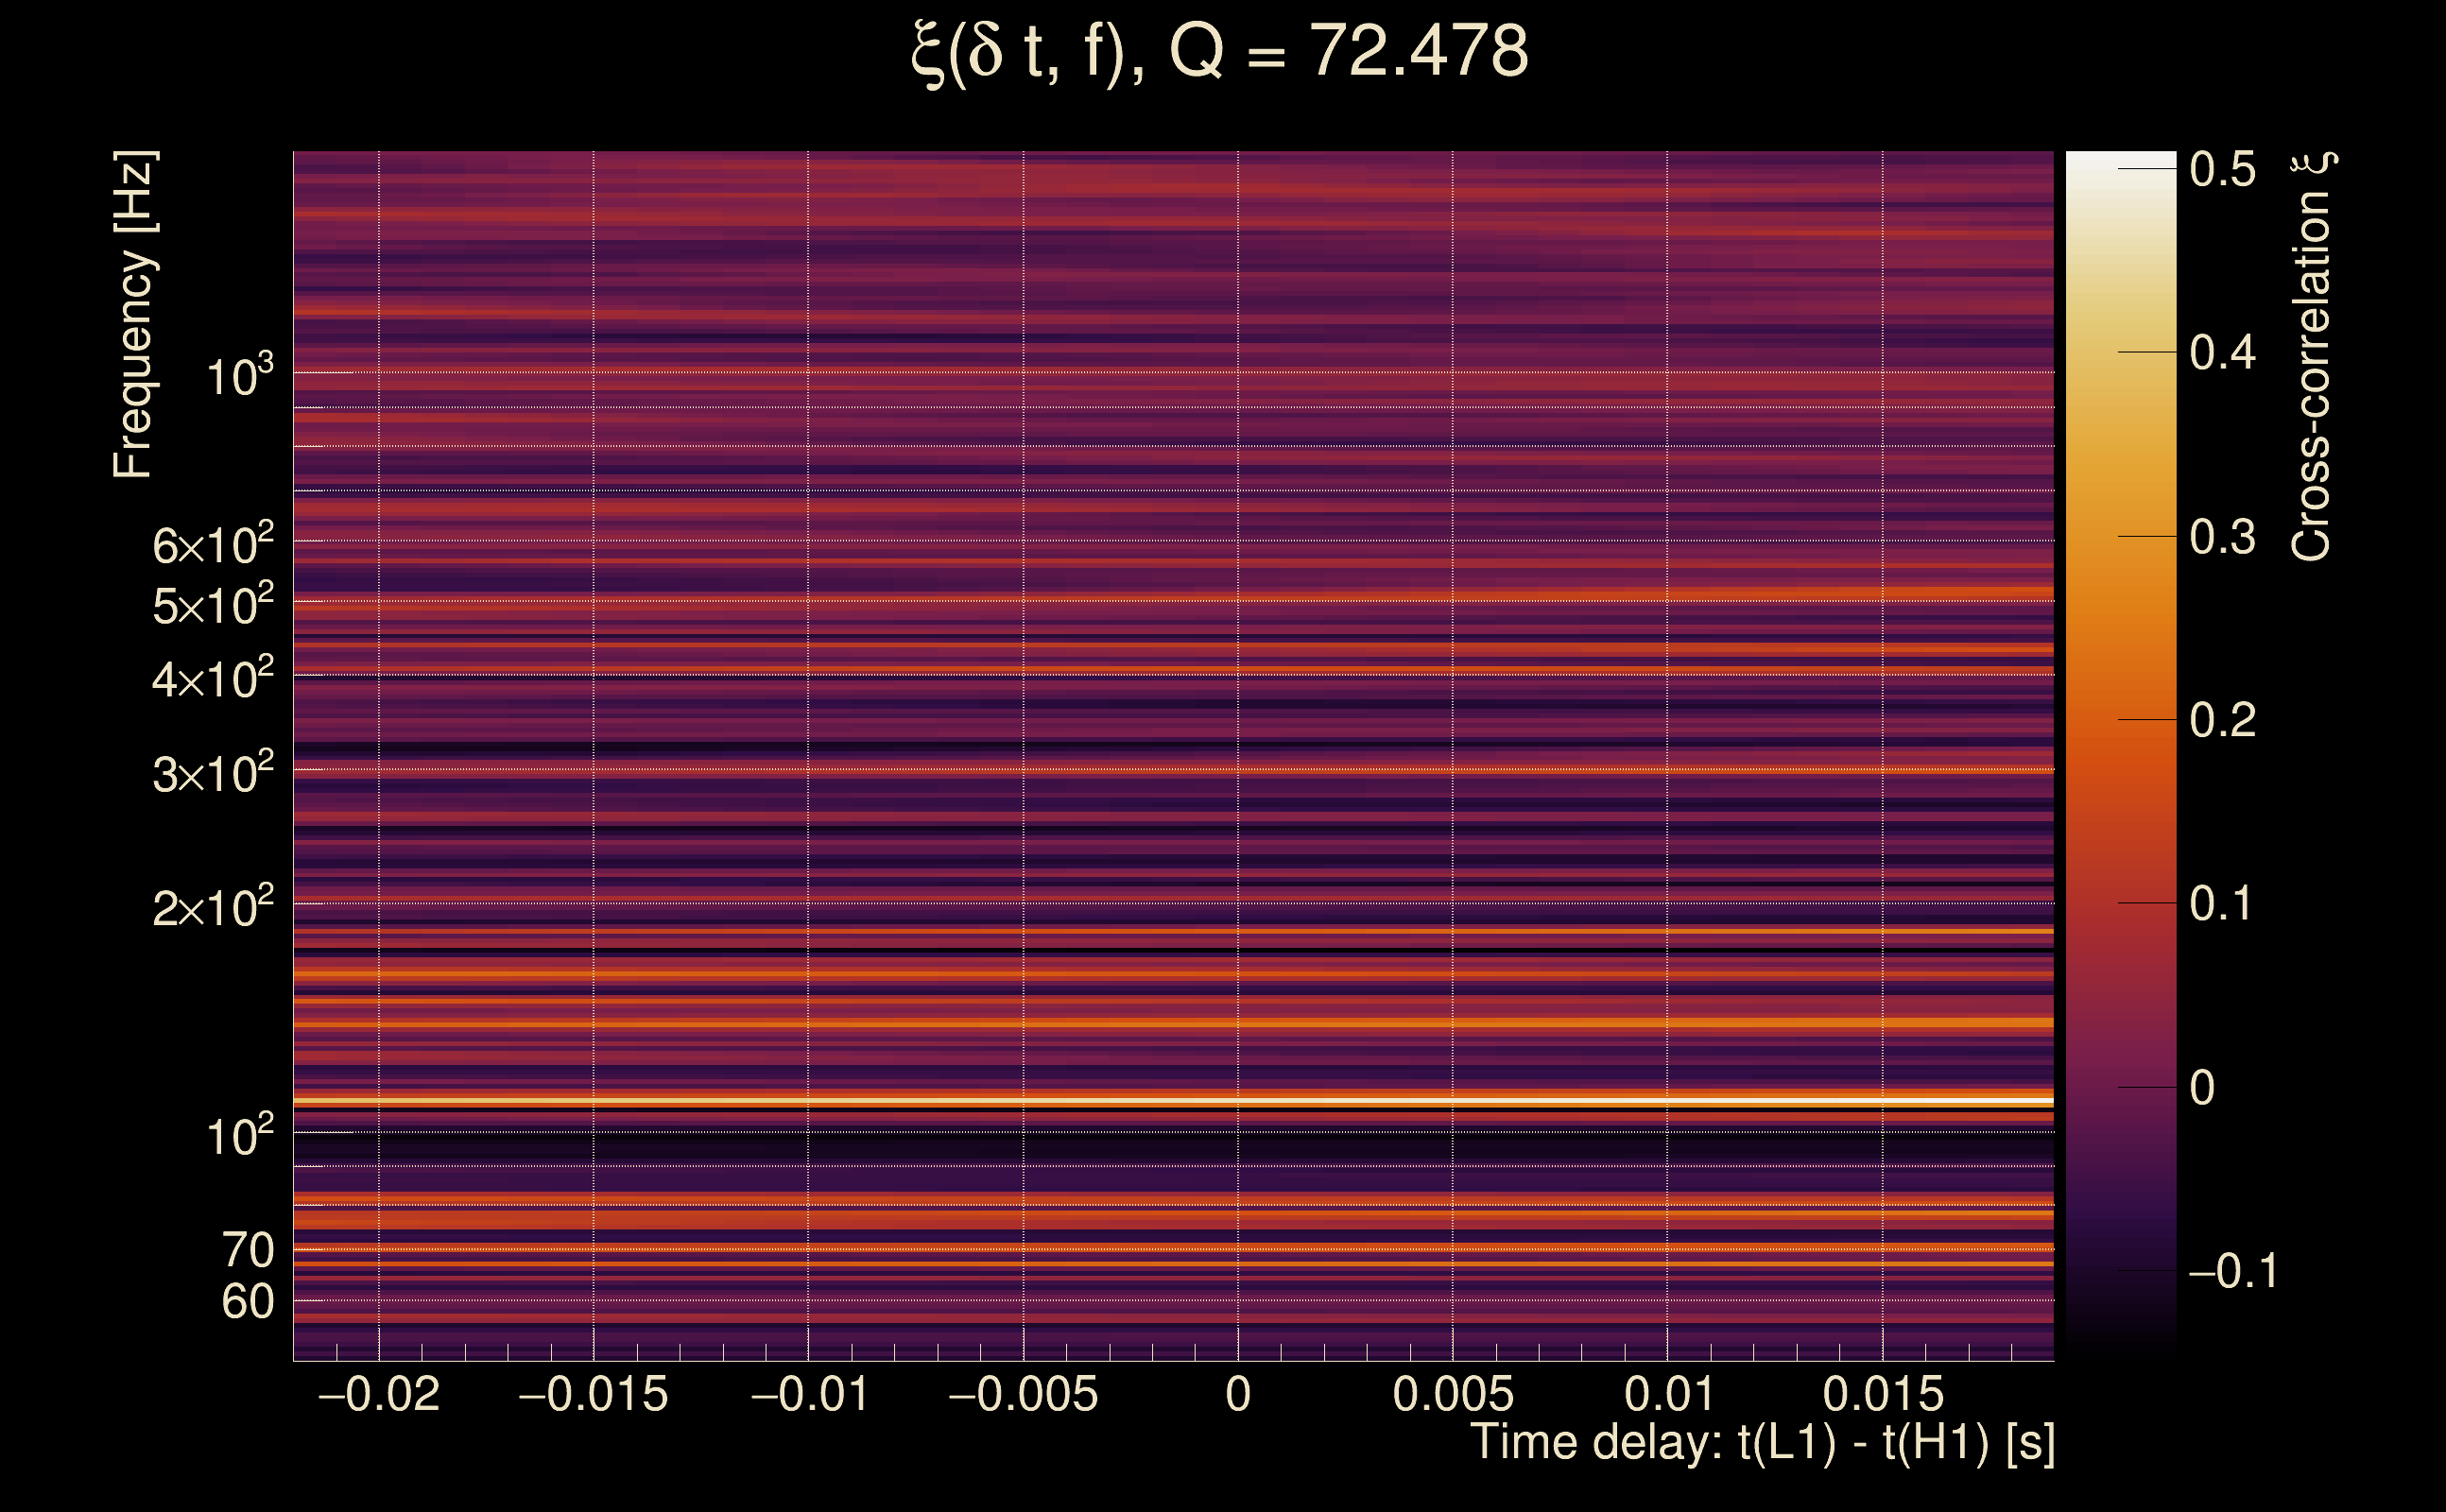
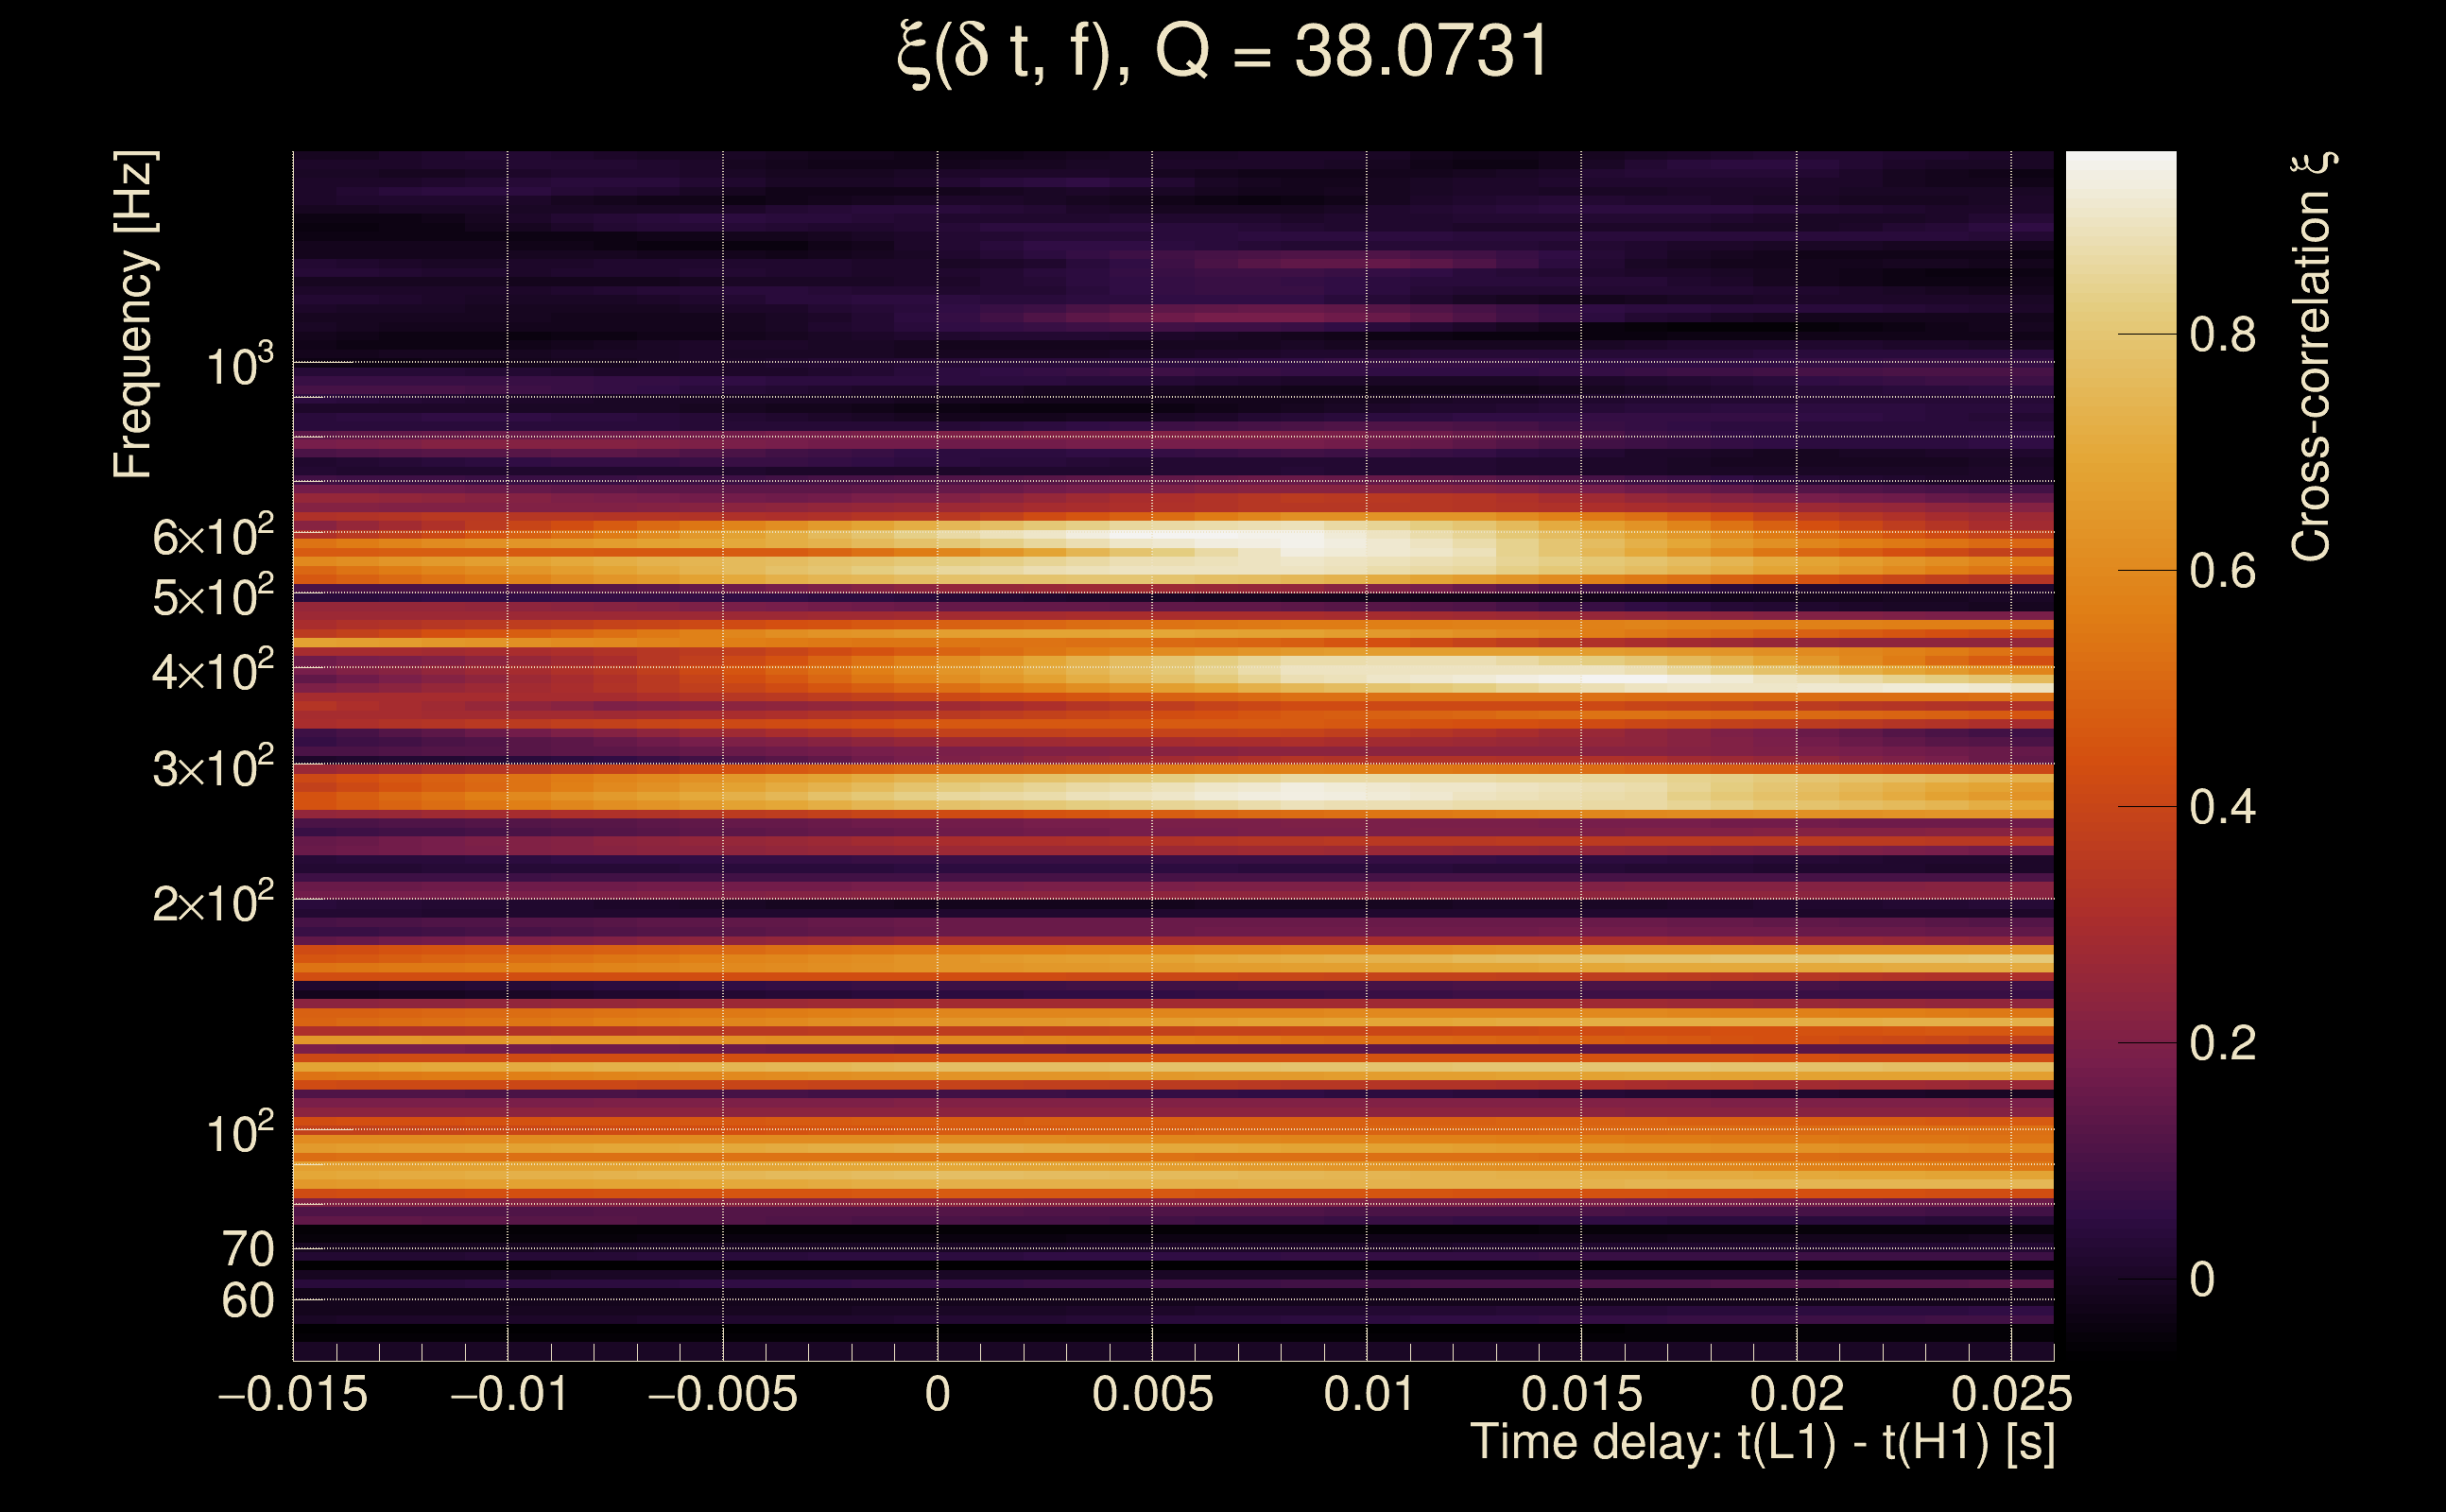
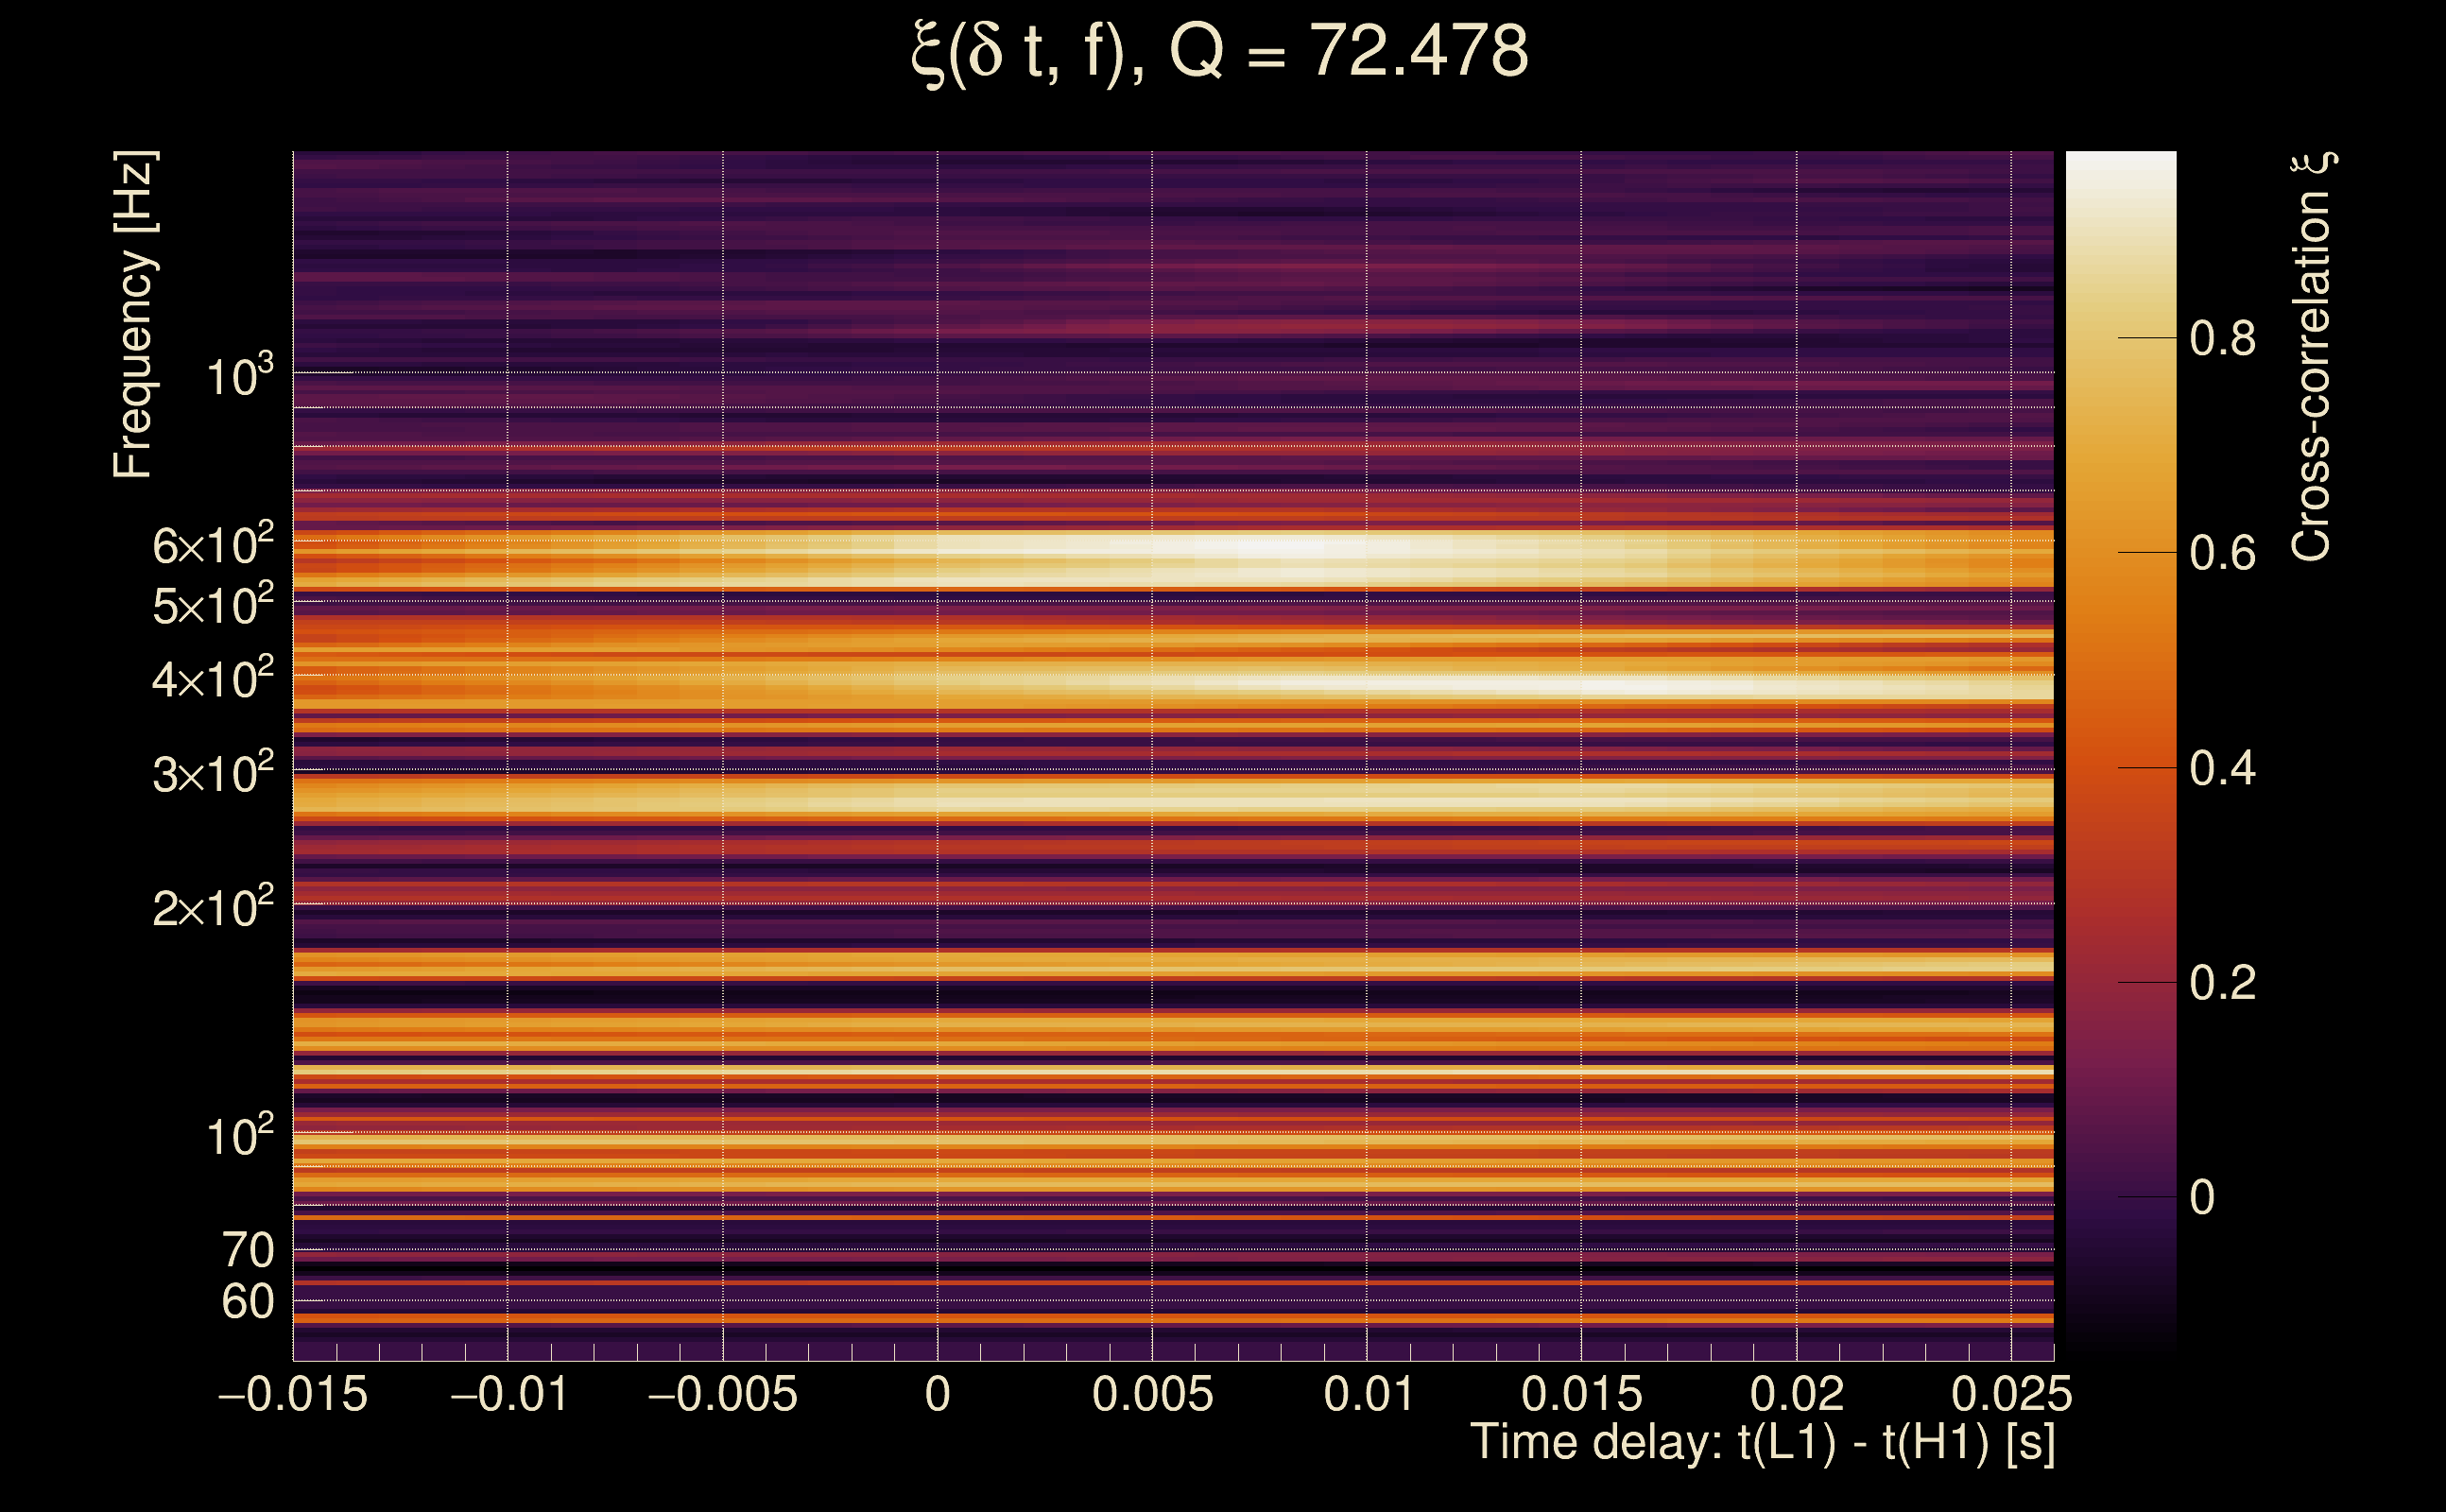
| Number of Q planes: | 5 (Q = 5.51892 → Q = 72.478) |
| Omicron frequency range: | 50 Hz → 1958.38 Hz |
| Light travel time between detectors: | 0.0100128 s |
| Slice extra-time (calibration uncertainty + slice veto): | 0.0129872 s |
| Number of time-delay bins in a cross-correlation map: | 10000 |
| Number of slices in a cross-correlation map: | 217 |
| Number of time-delay bins in a slice: | 46 |
| SNR gating: | < 1000 (detector 0), < 1000 (detector 1) |
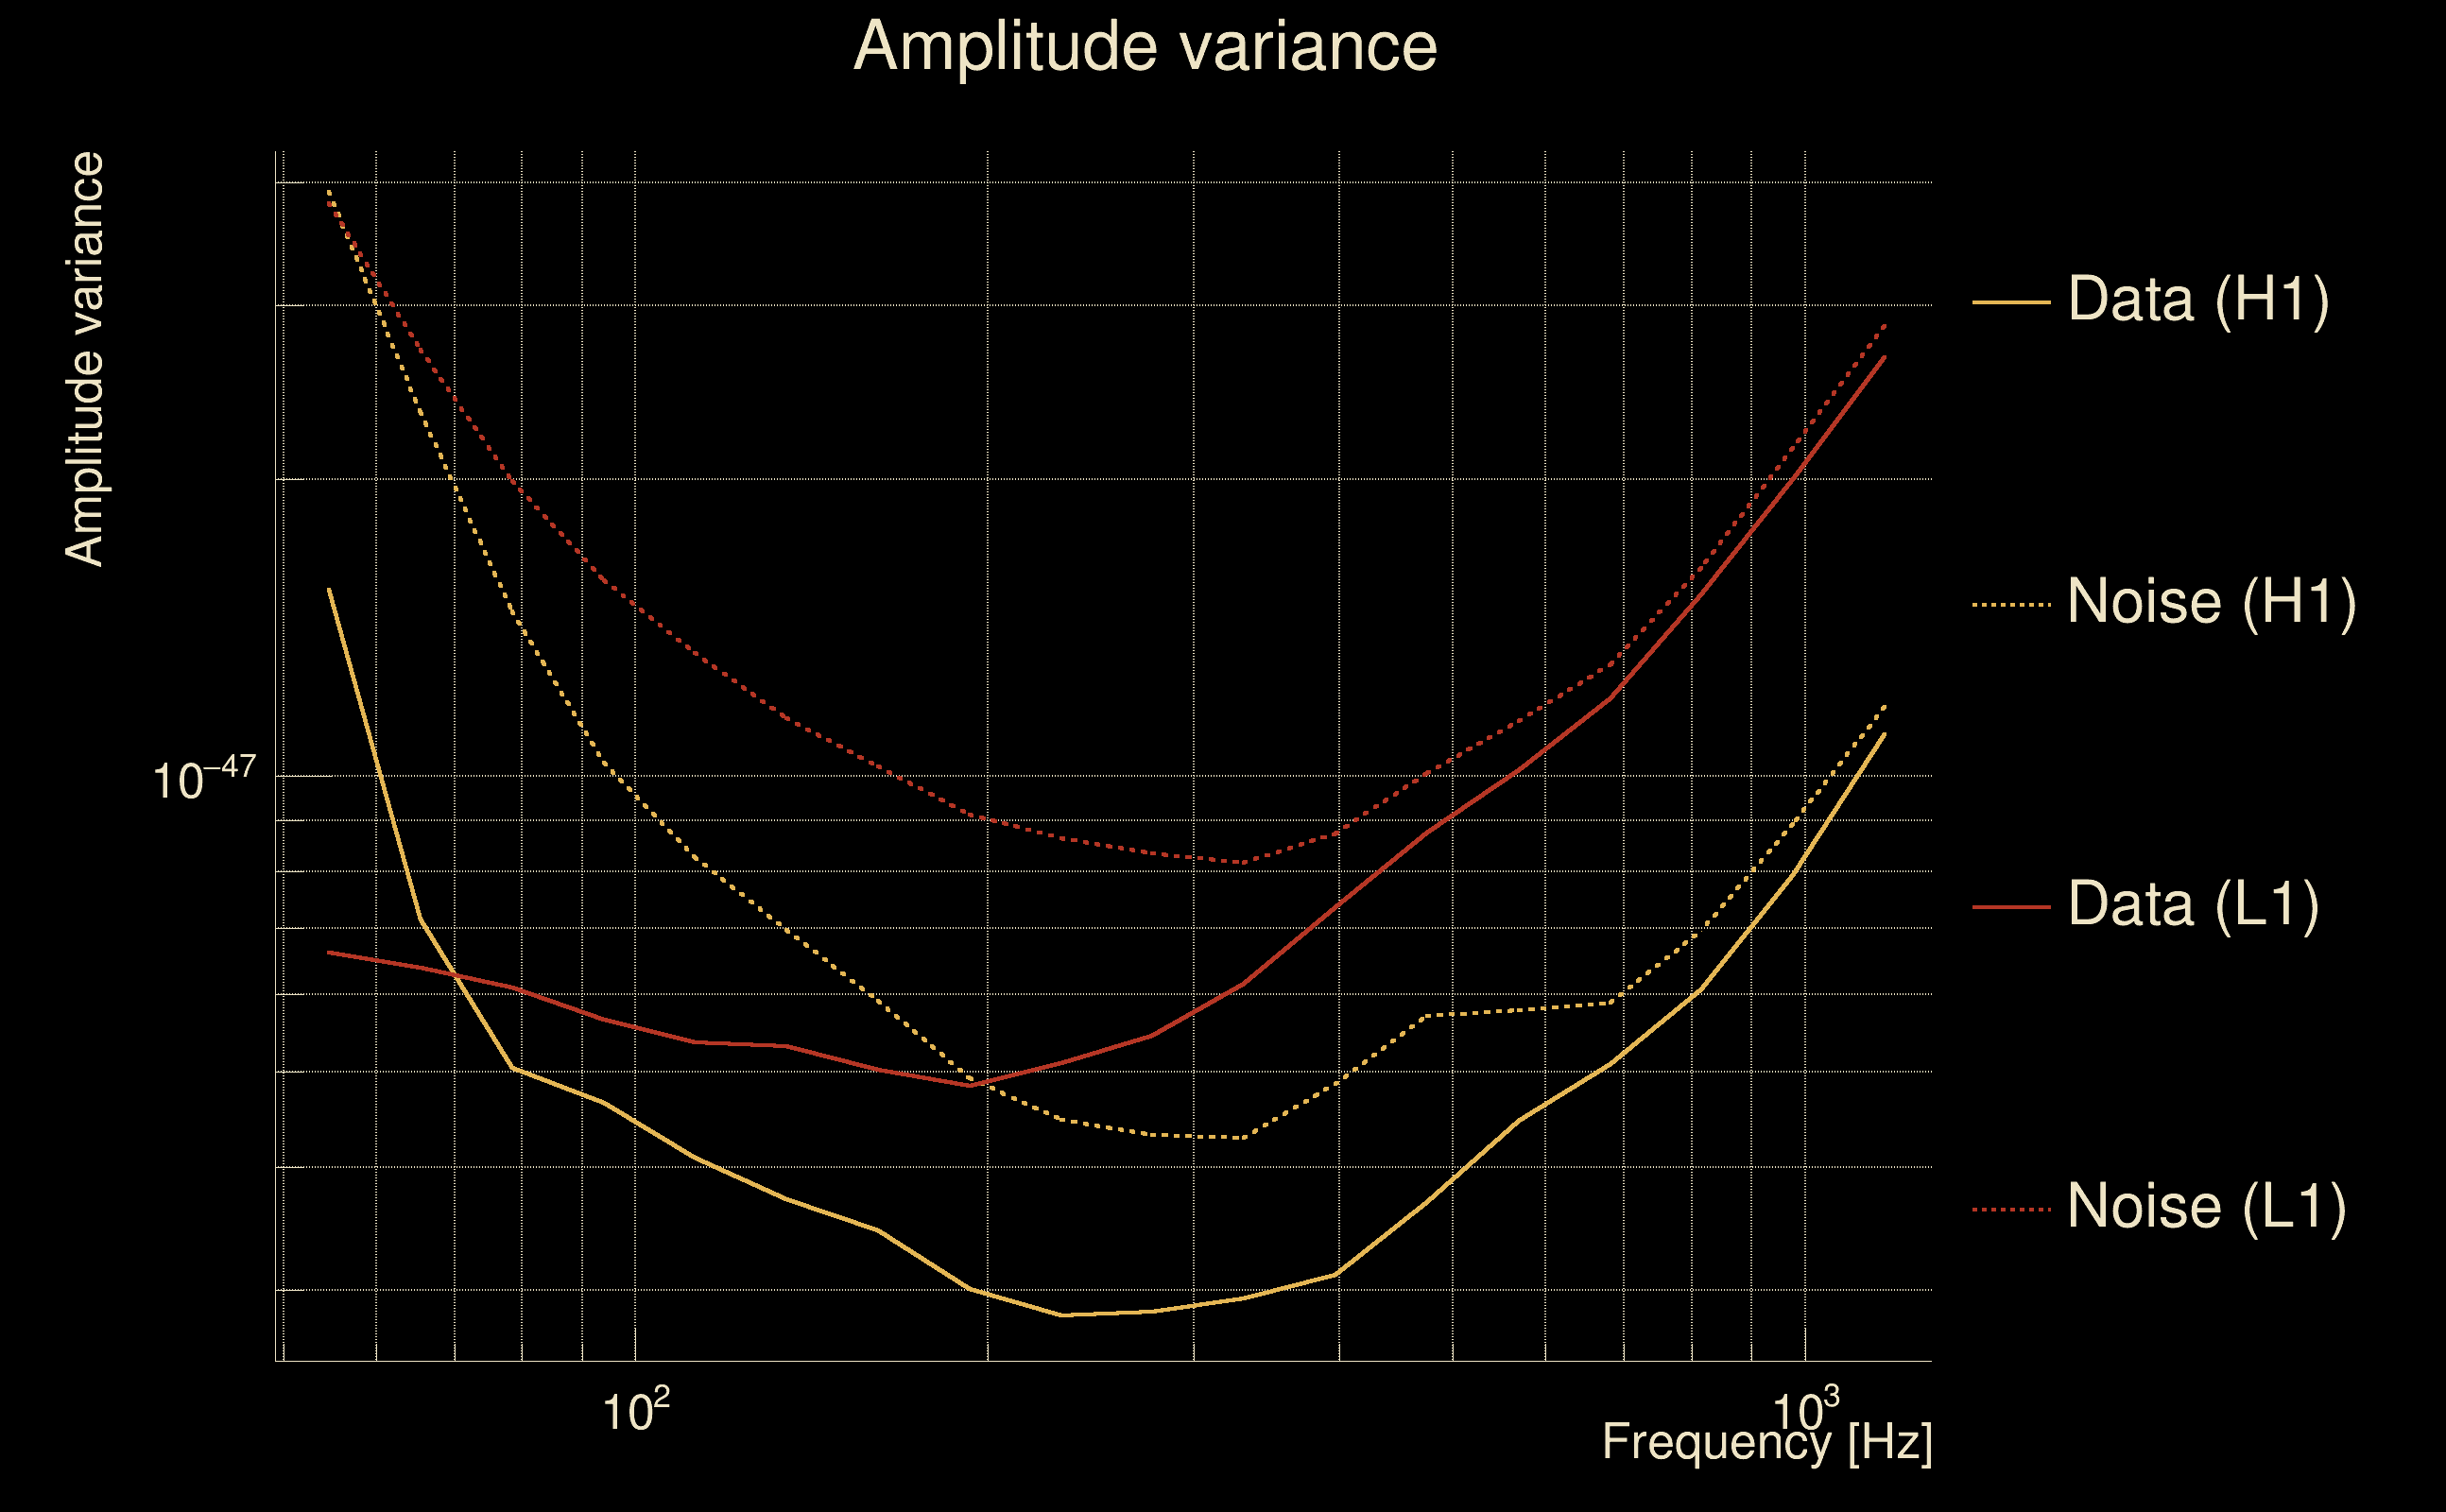
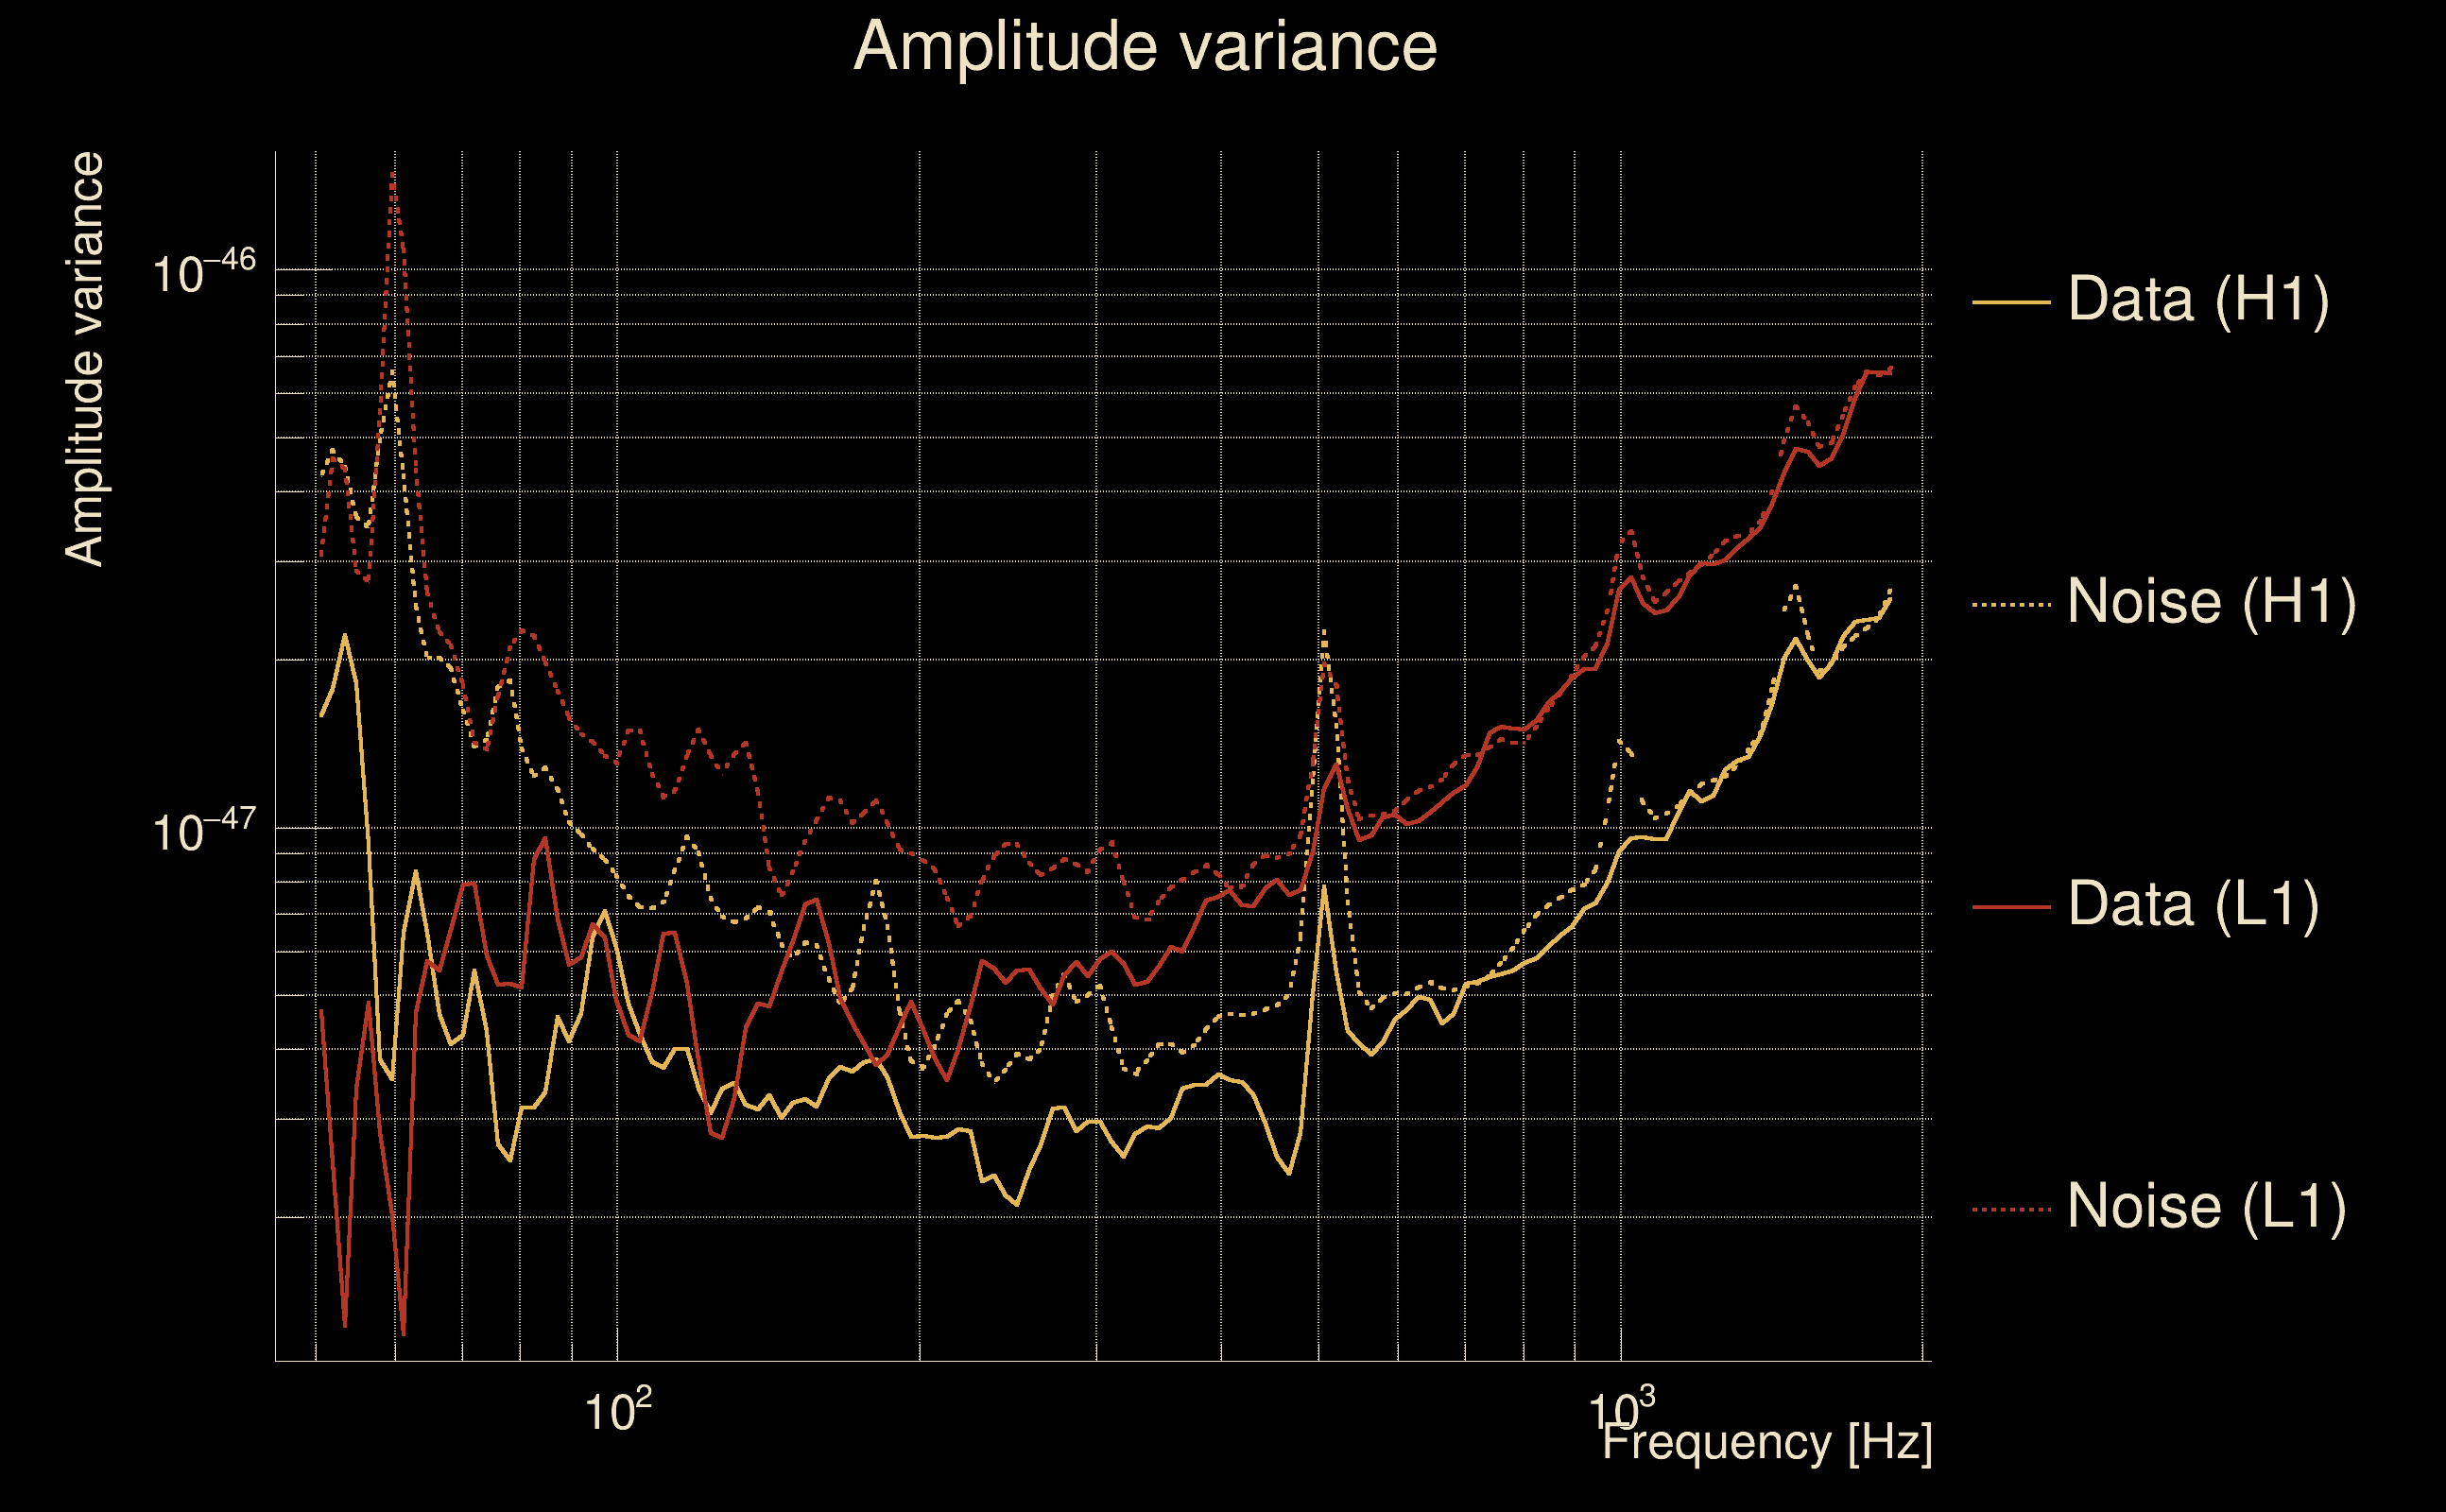
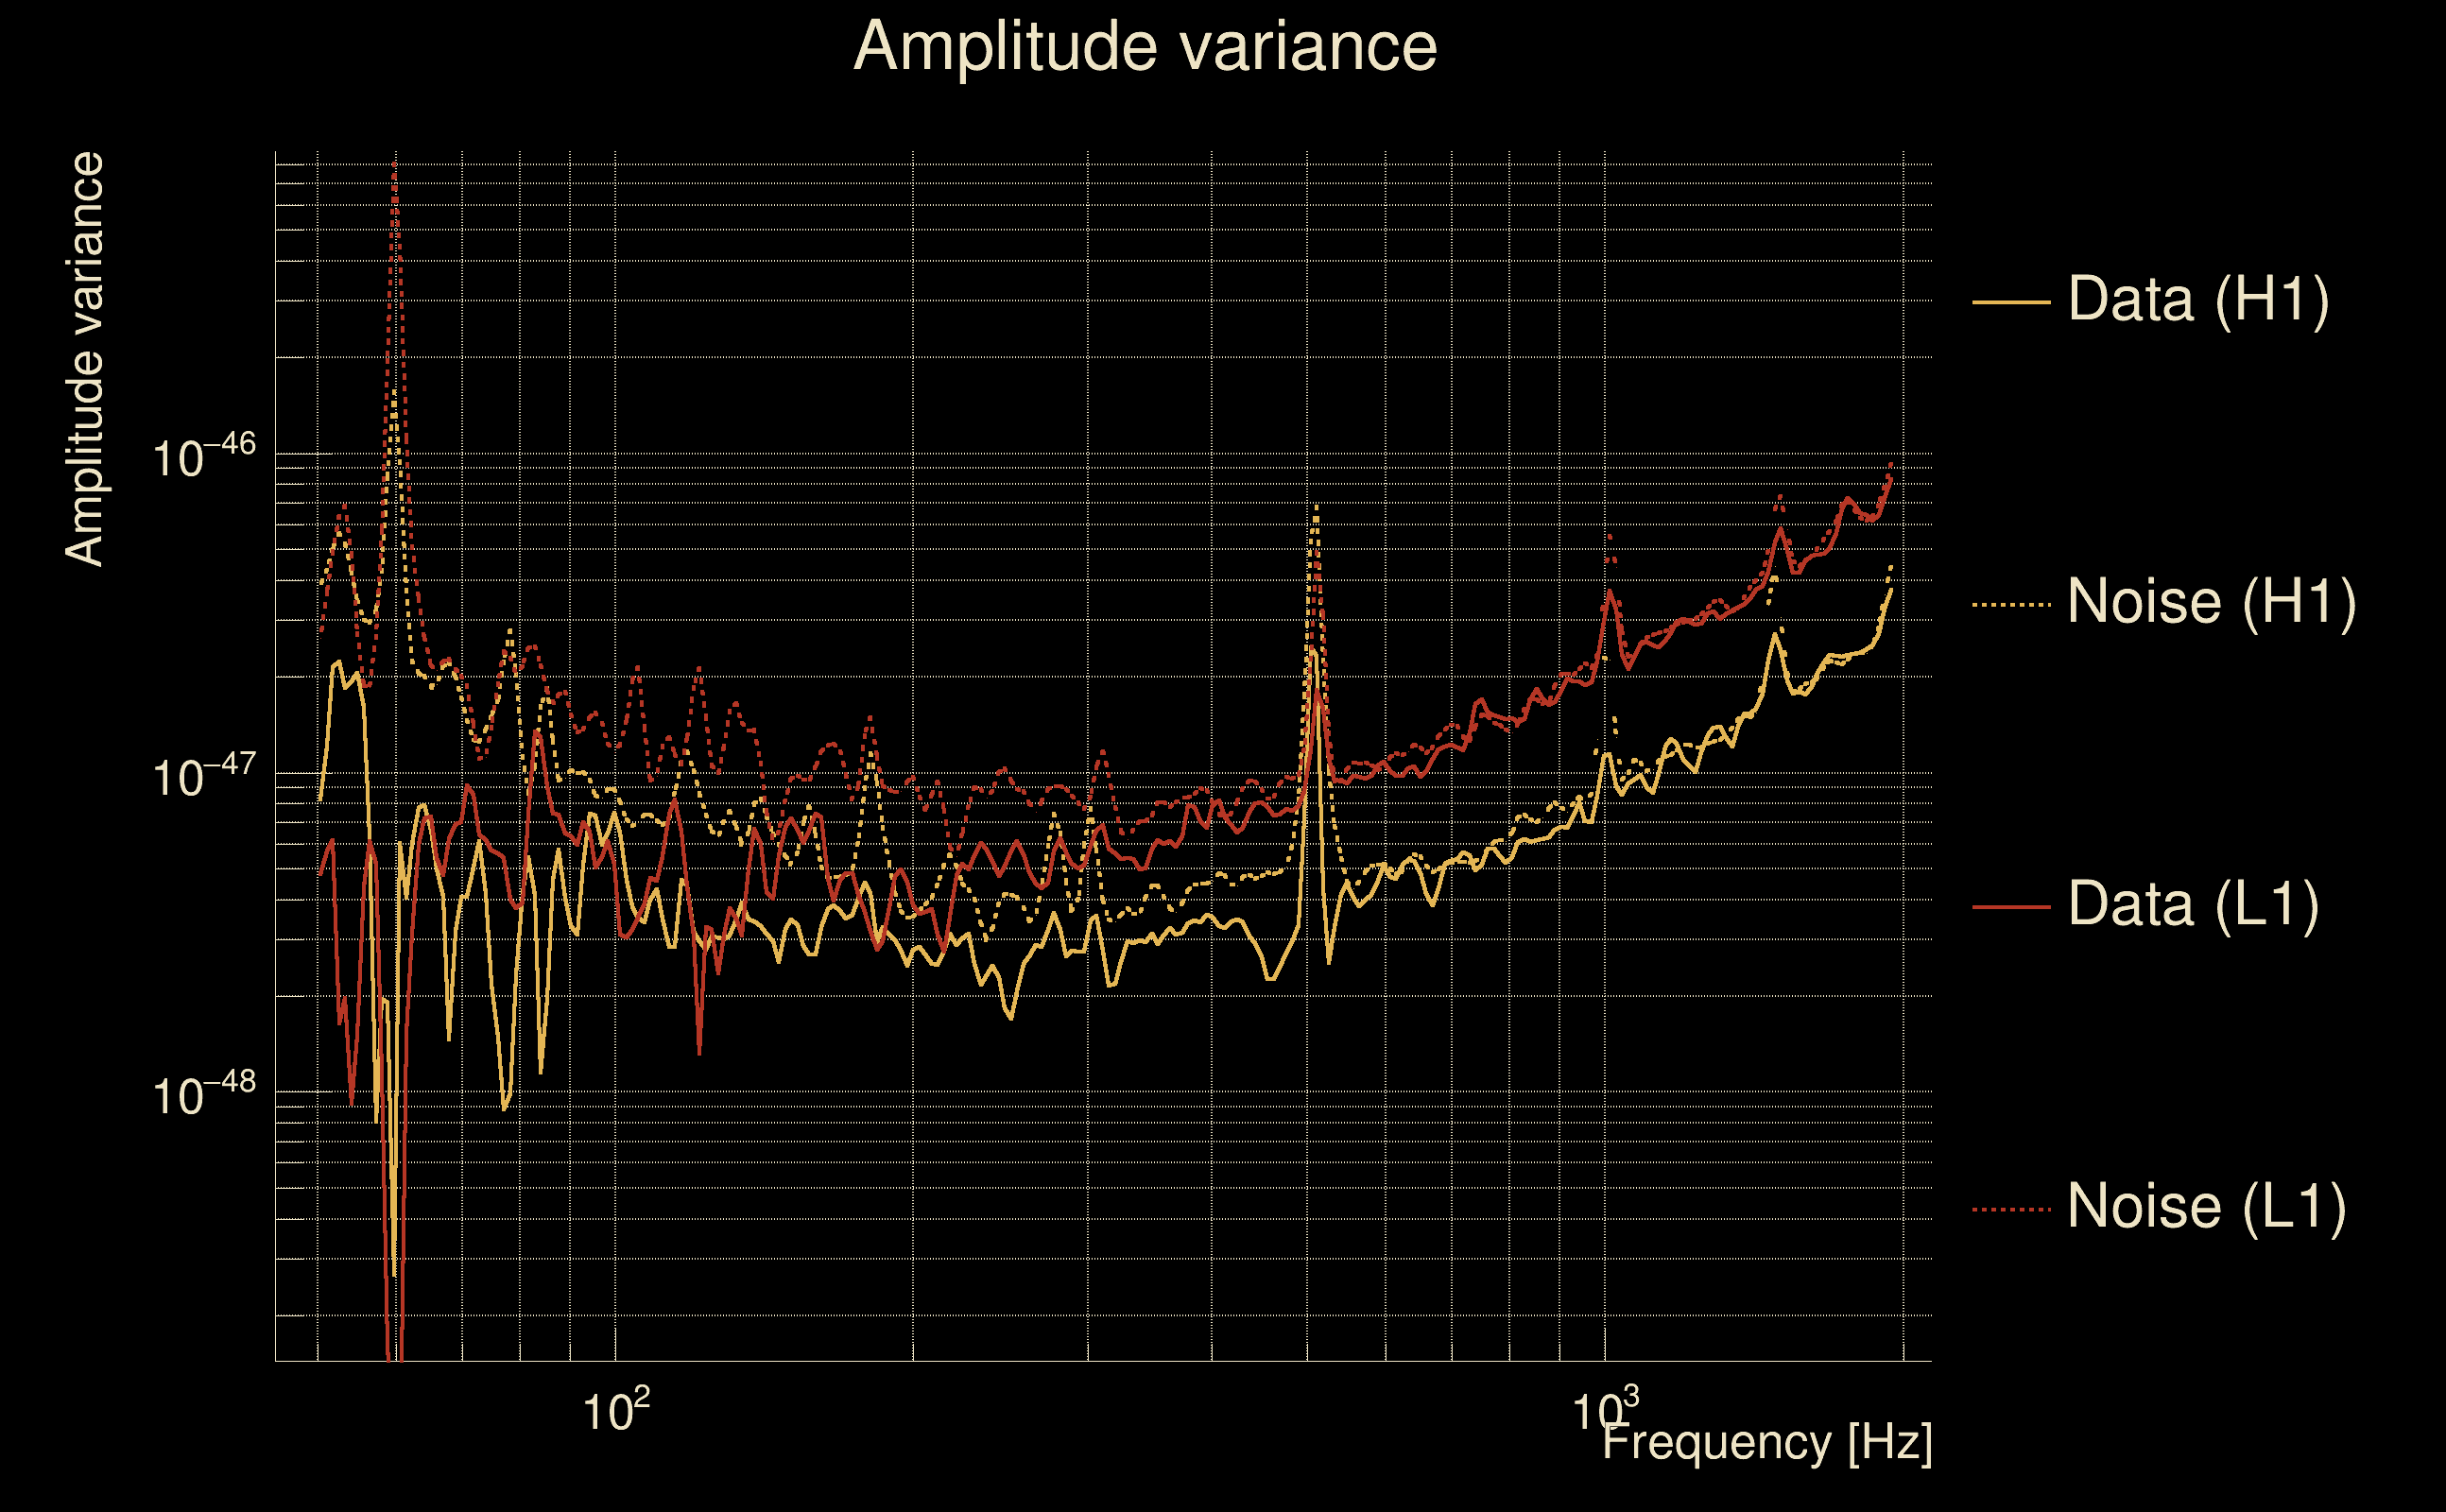
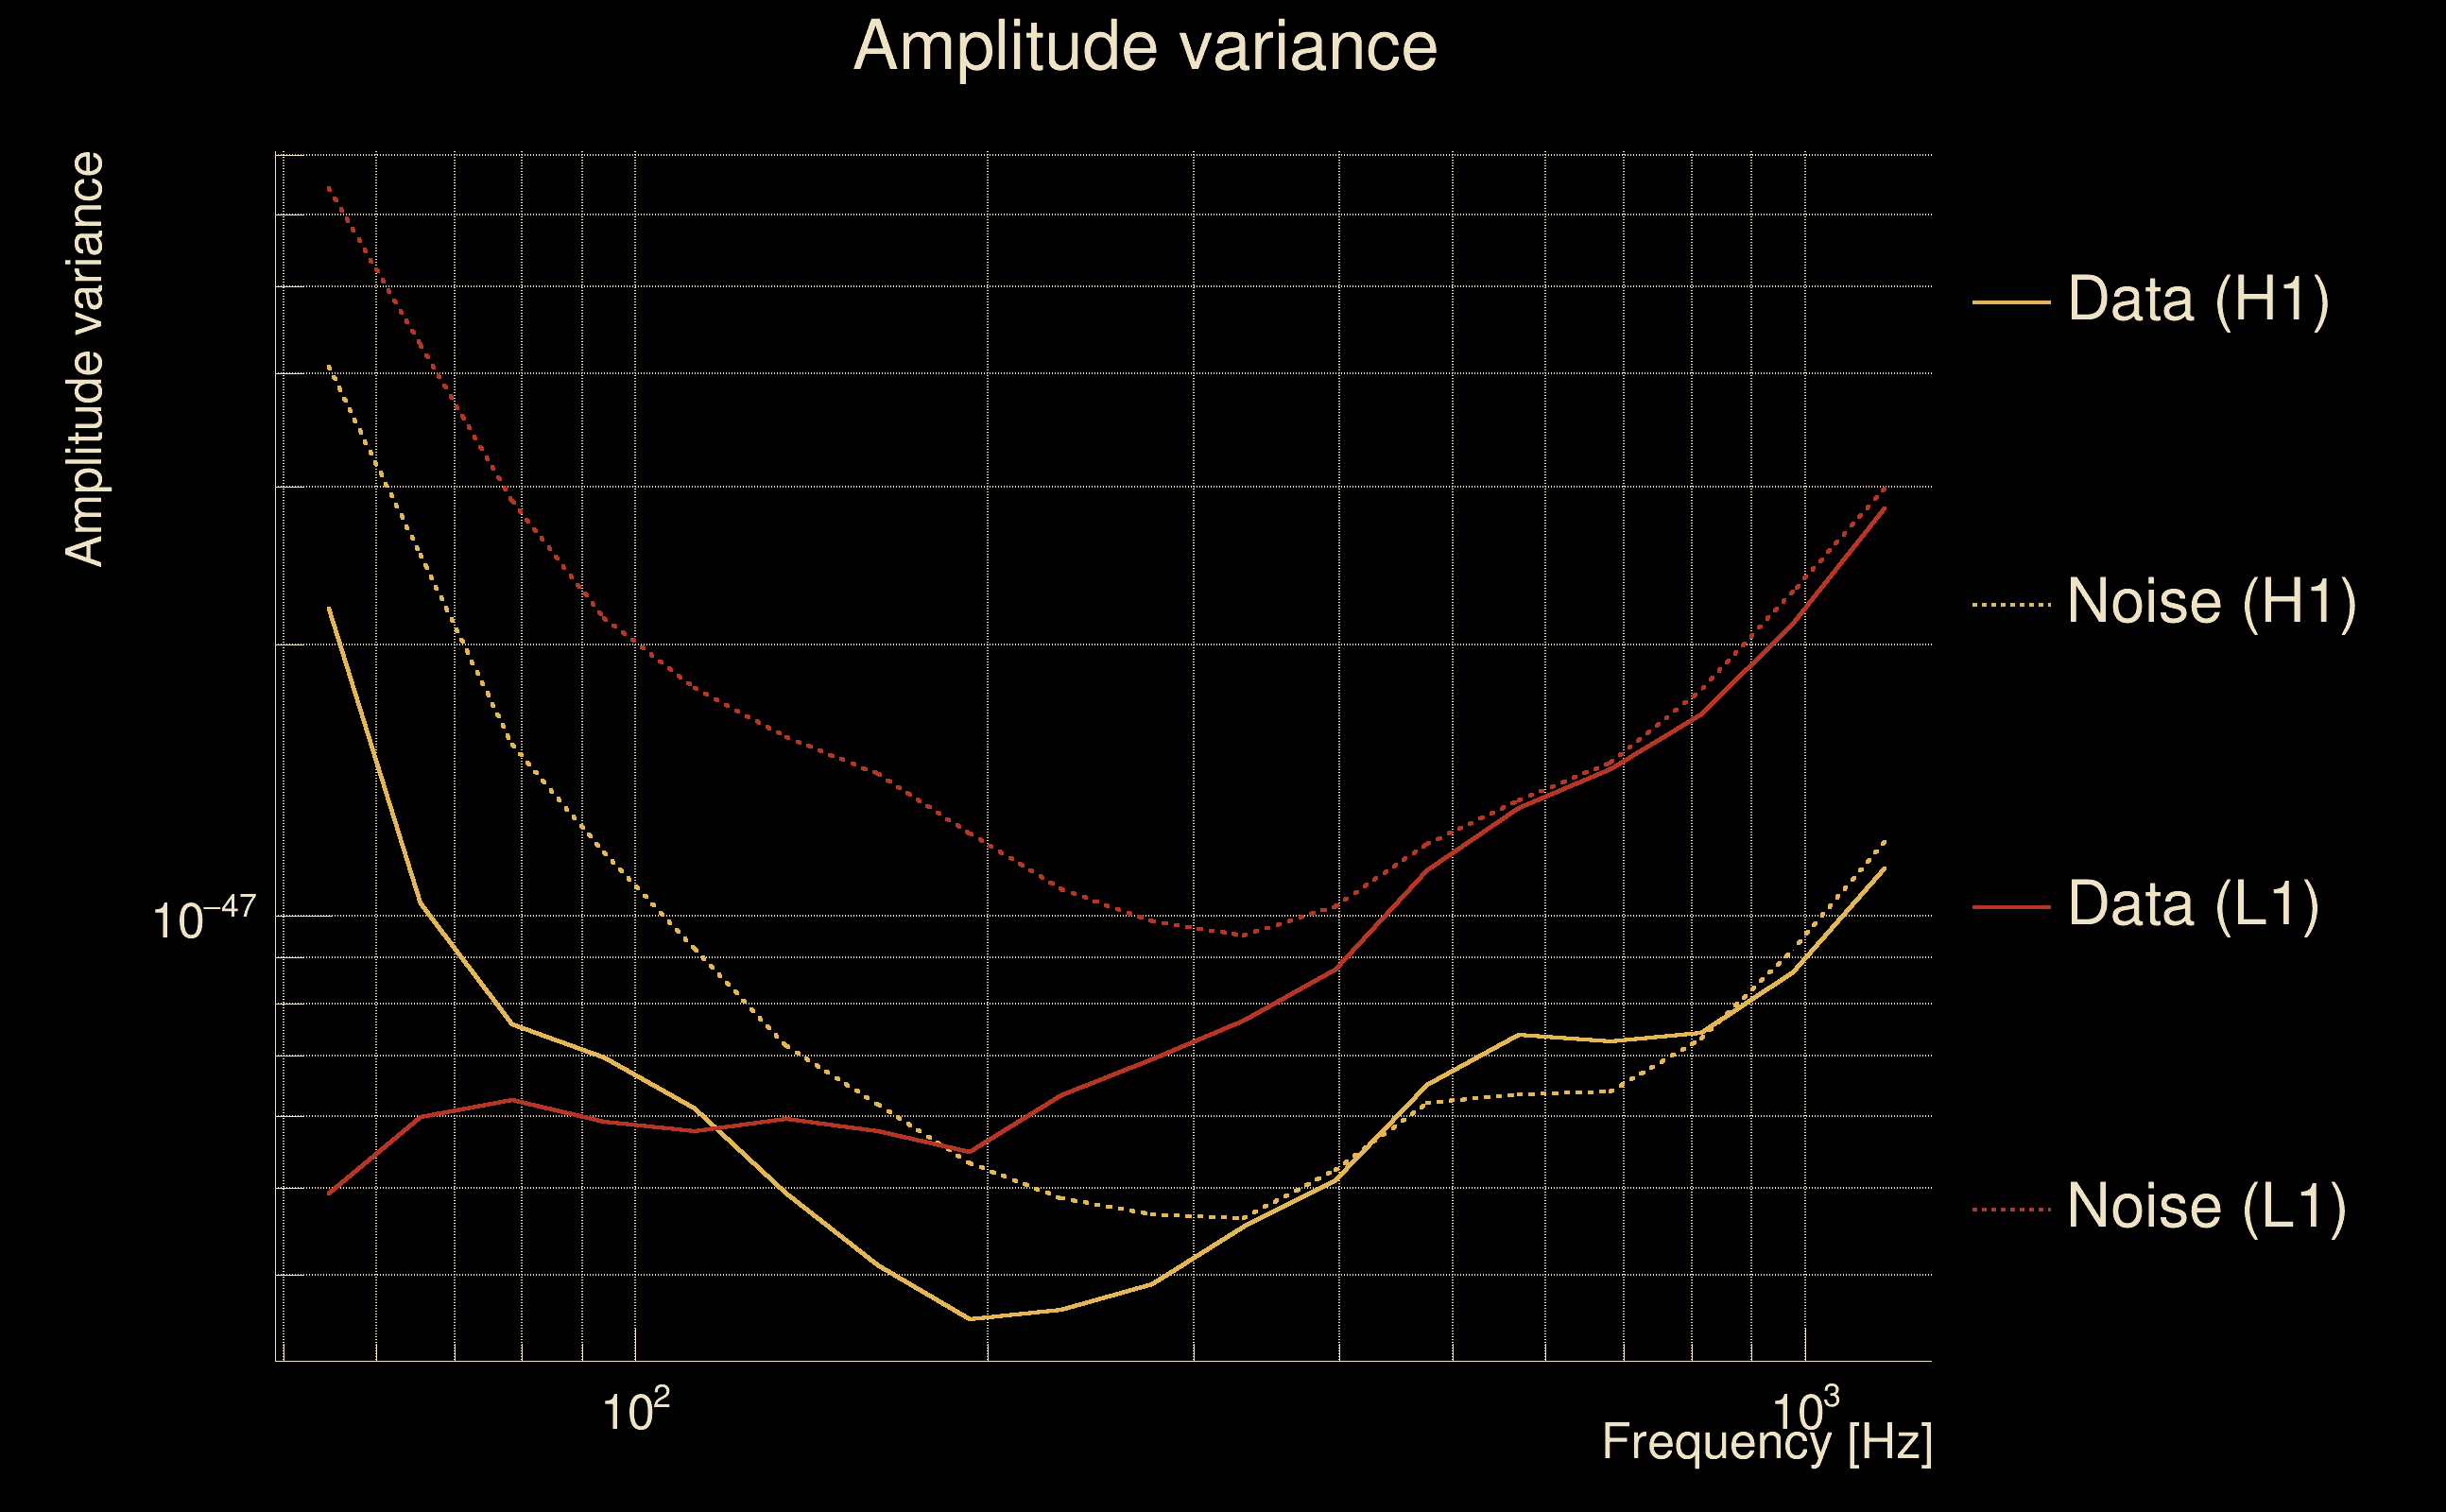
| Amplitude spectrograms: | normalization = 1e-22, power index = 2 |
| White noise SNR variance: | 0.523175 (after applying a correction factor = 1) |
| Amplitude ratio confidence level: | 3 sigma |
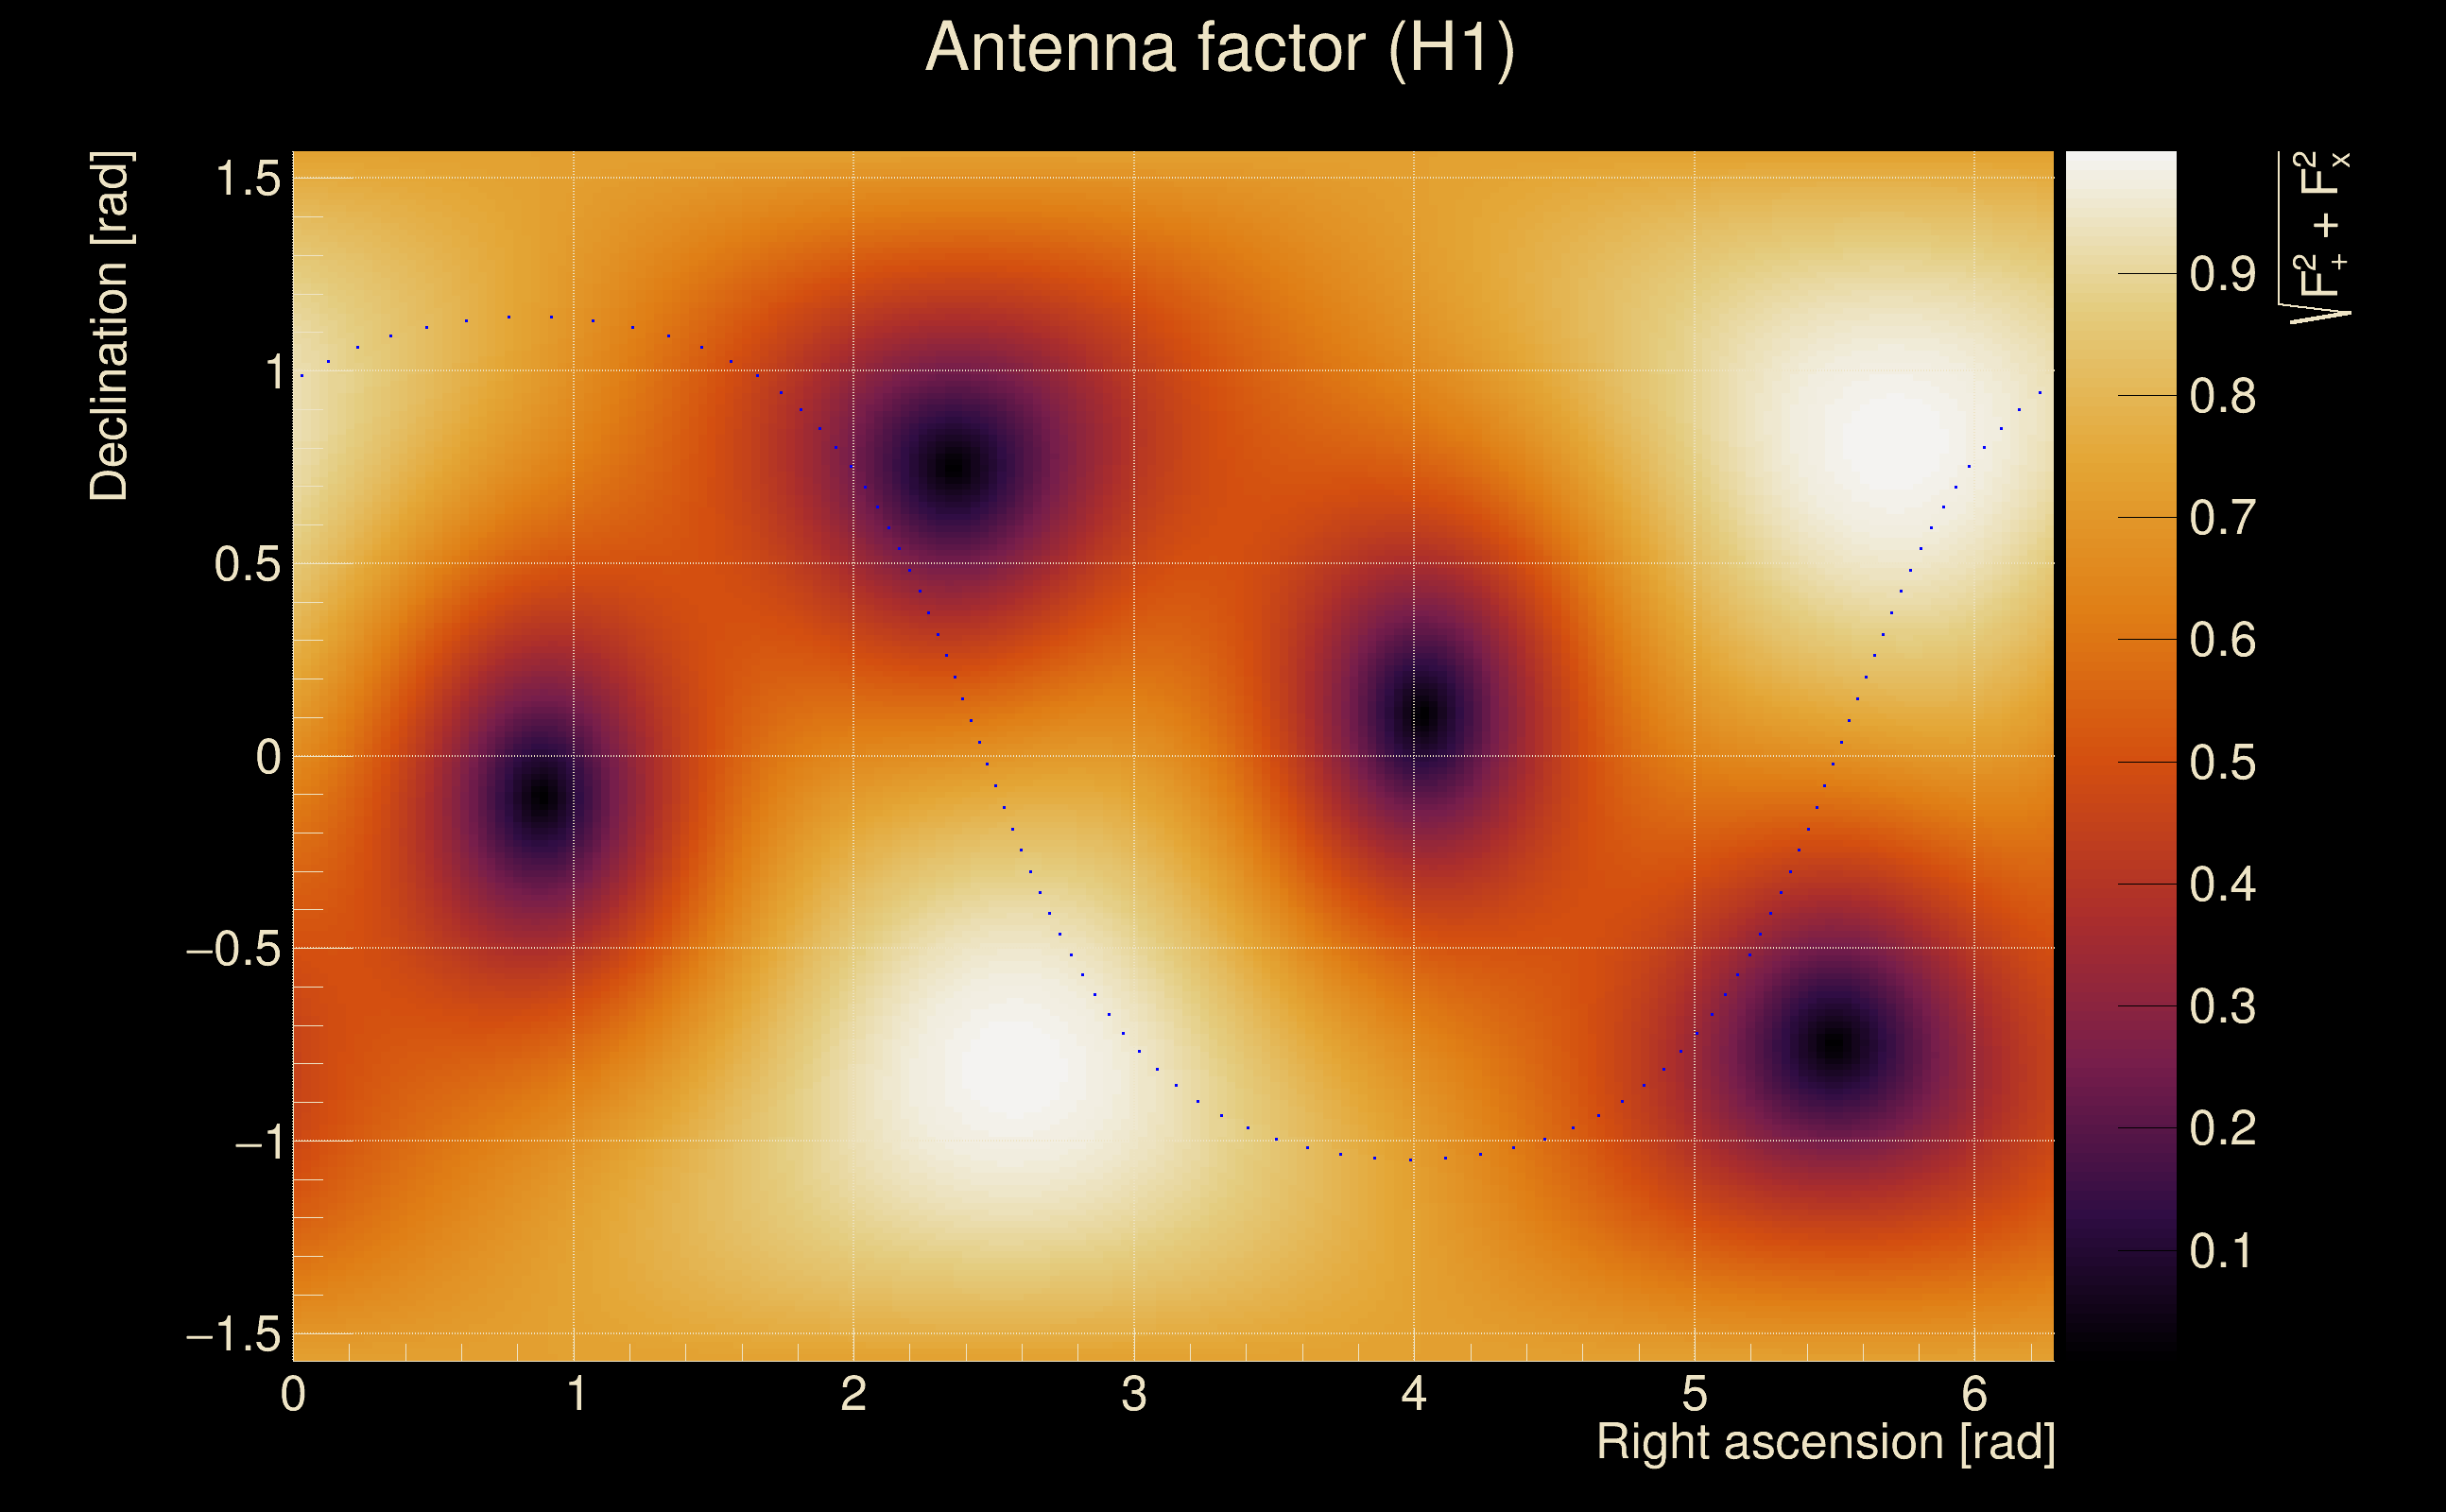
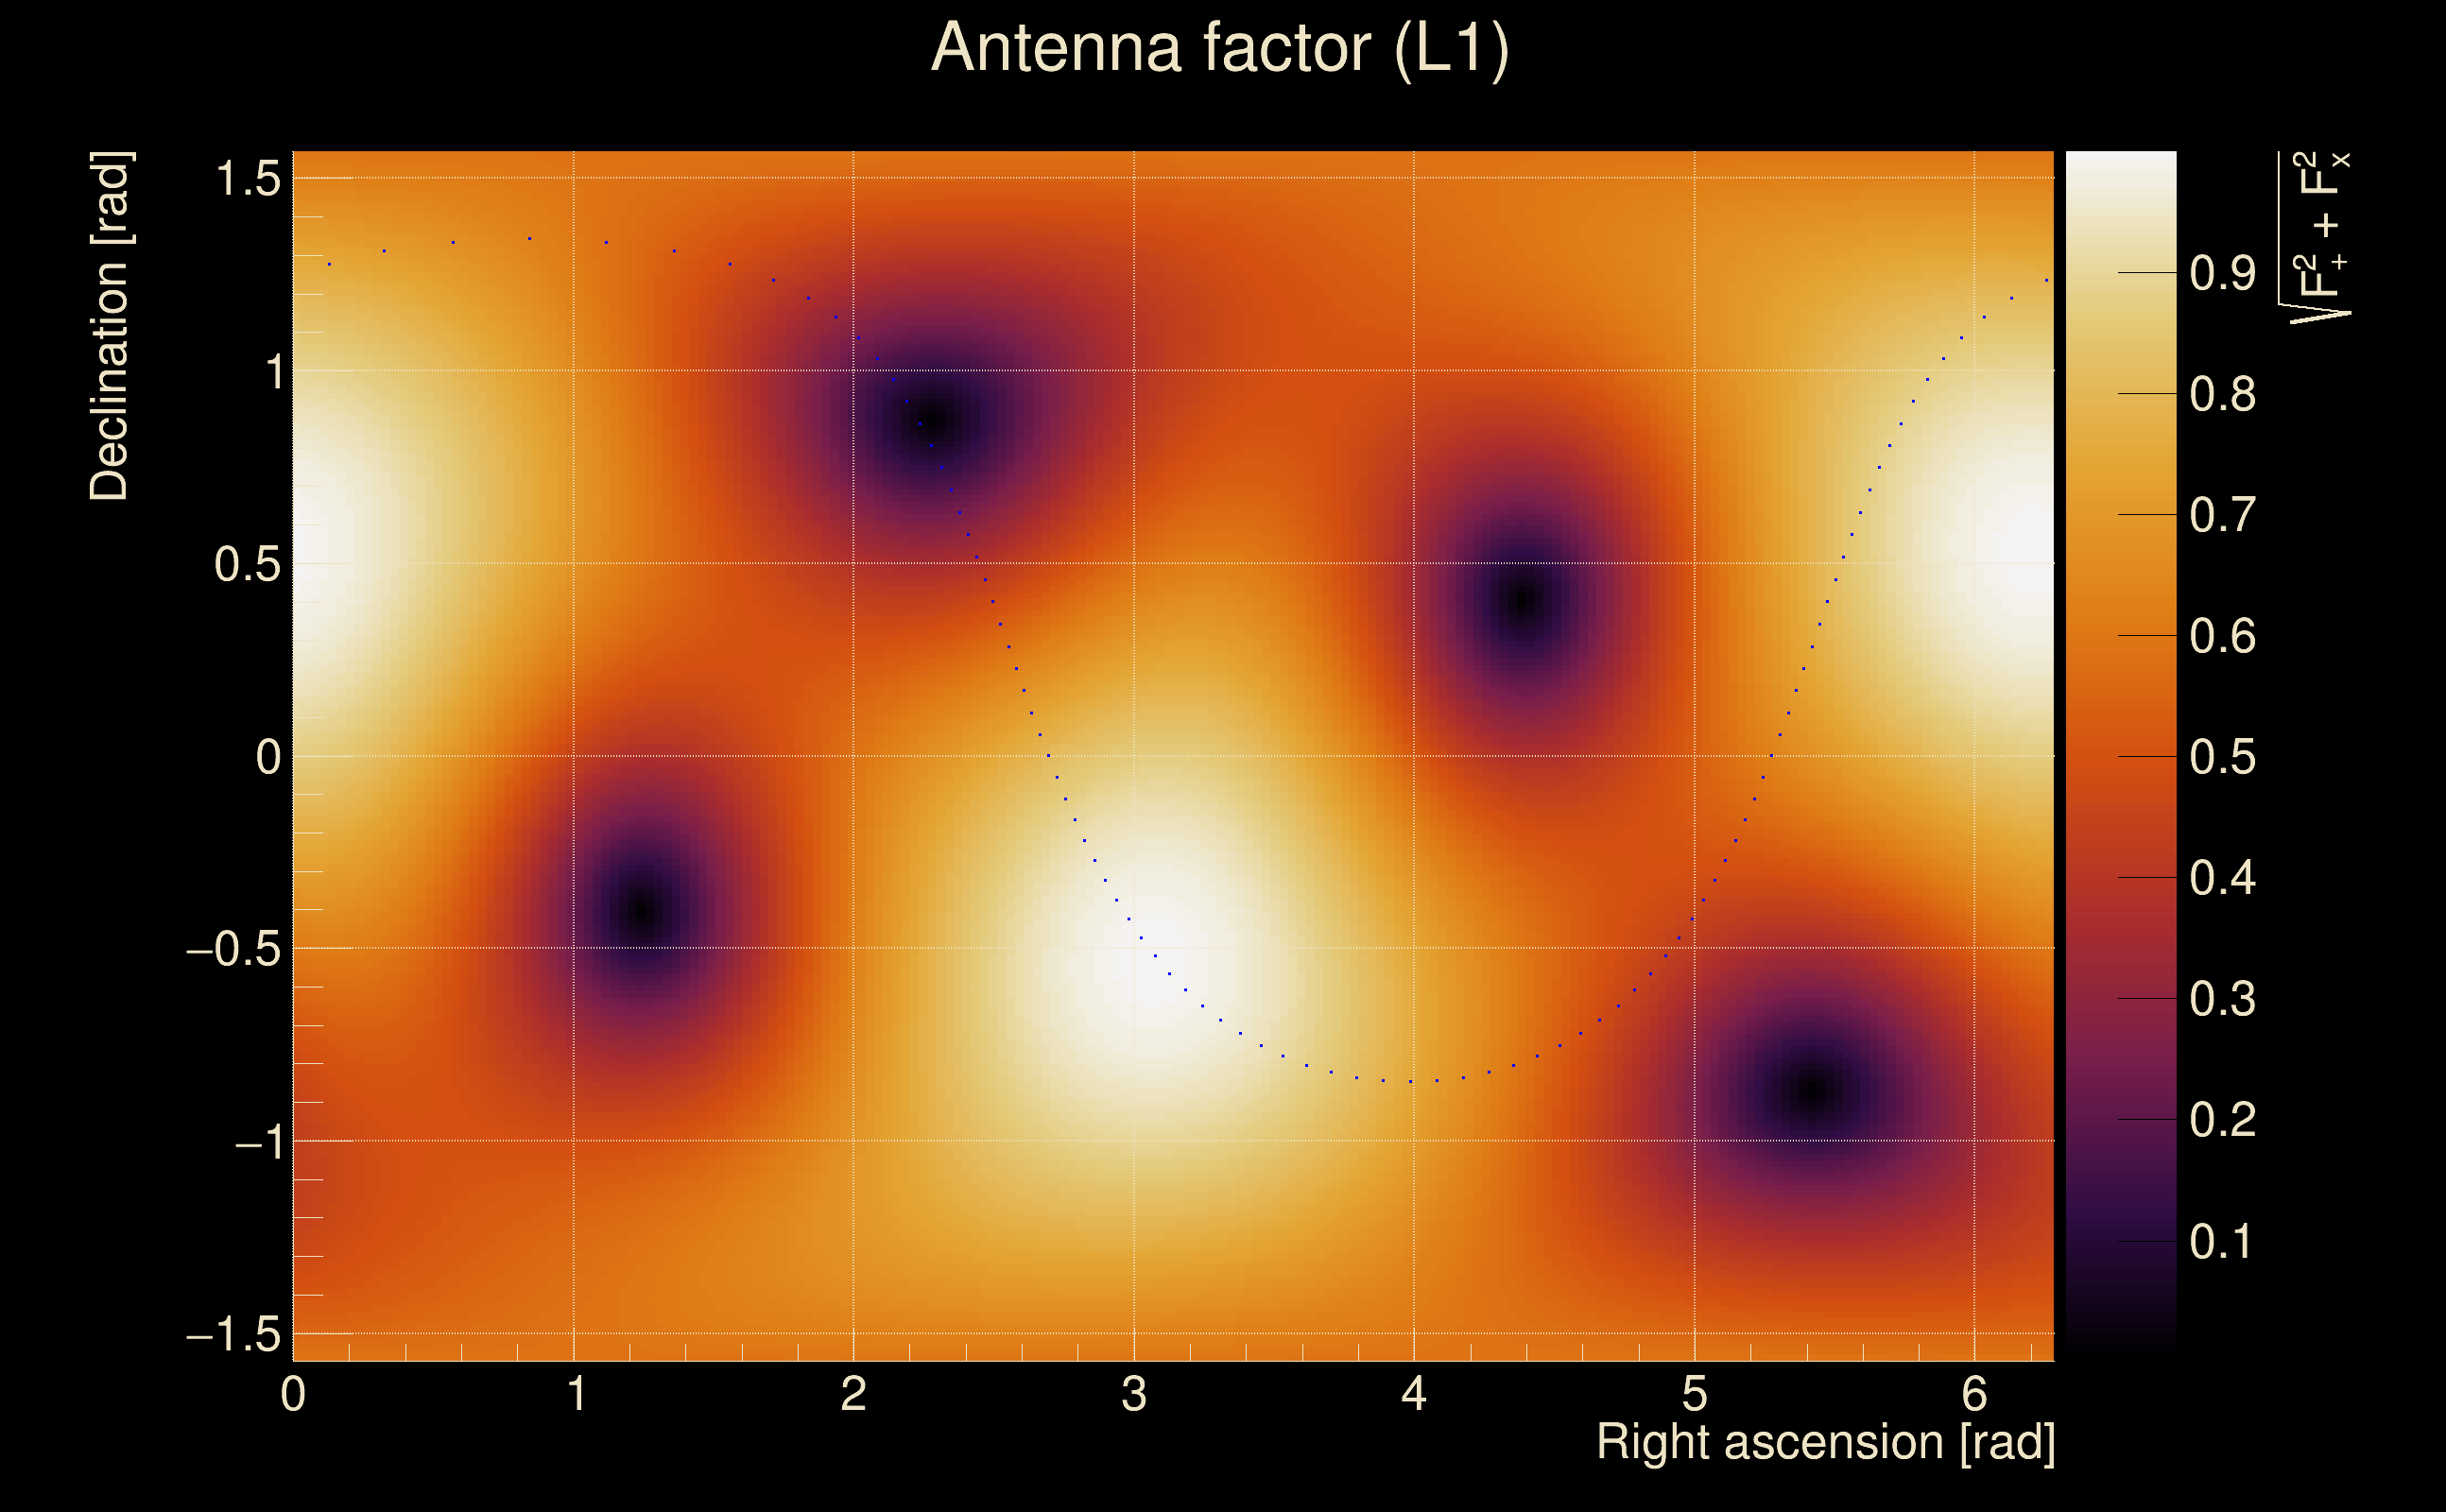
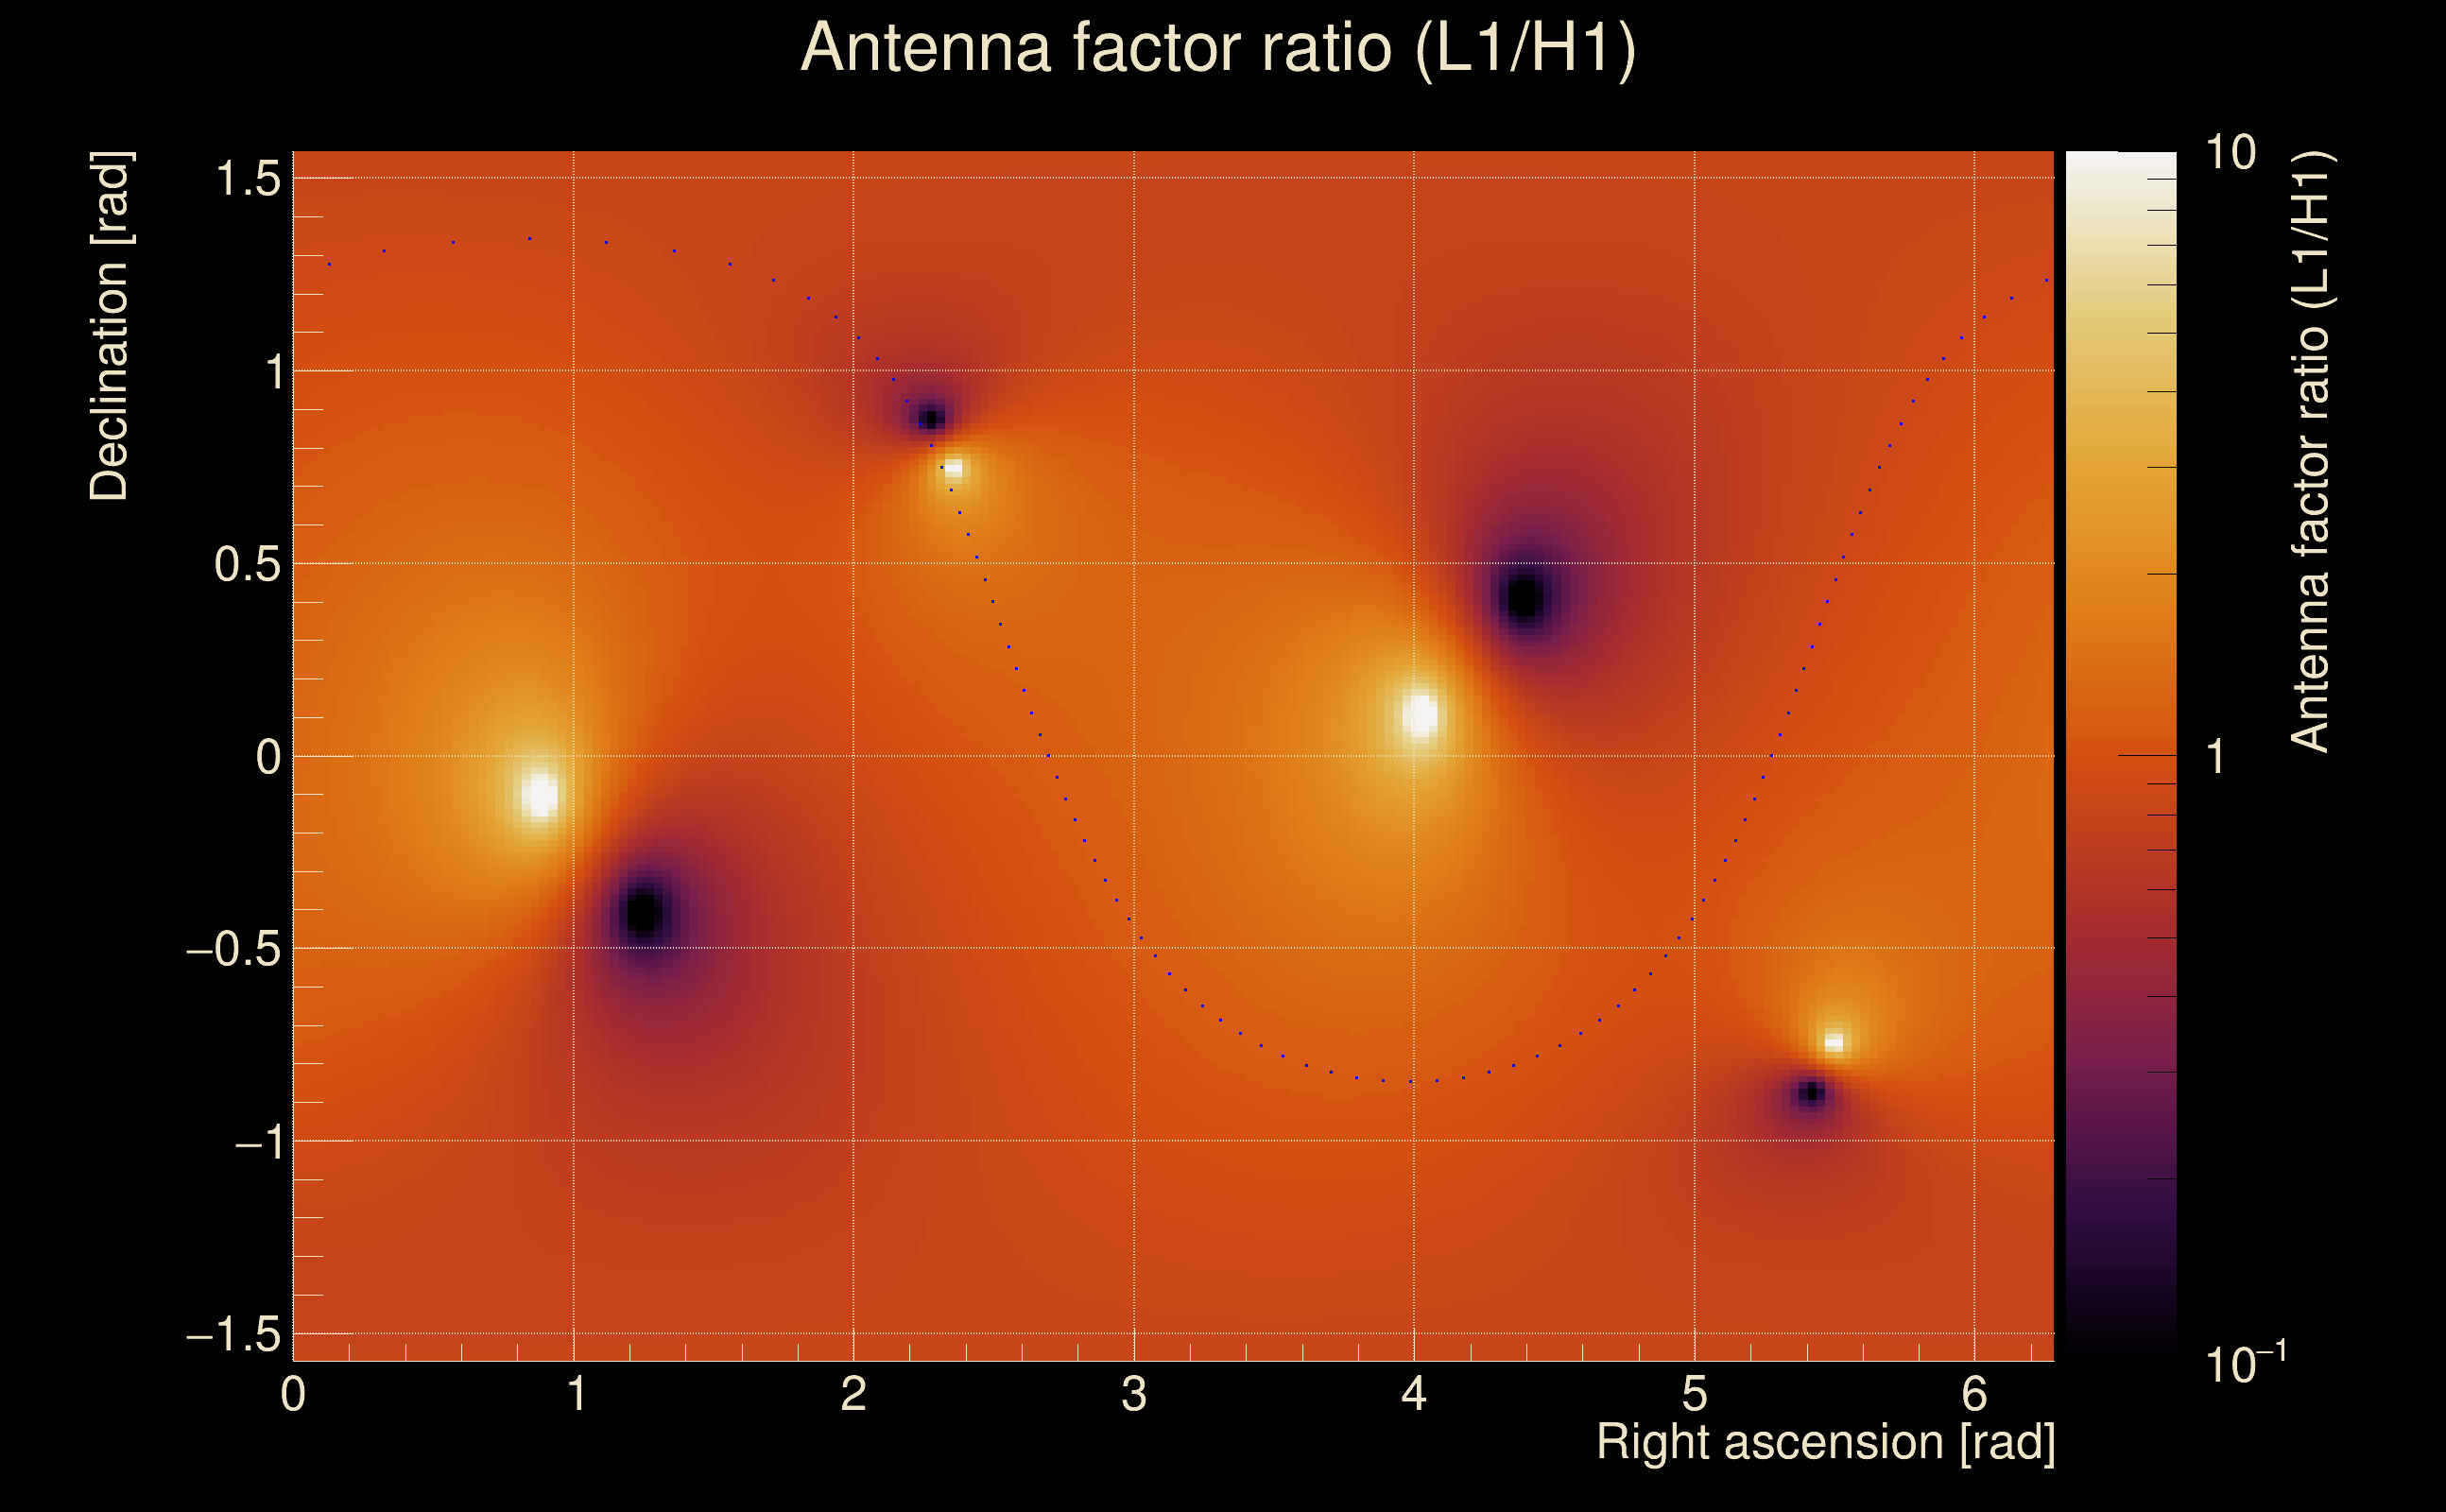
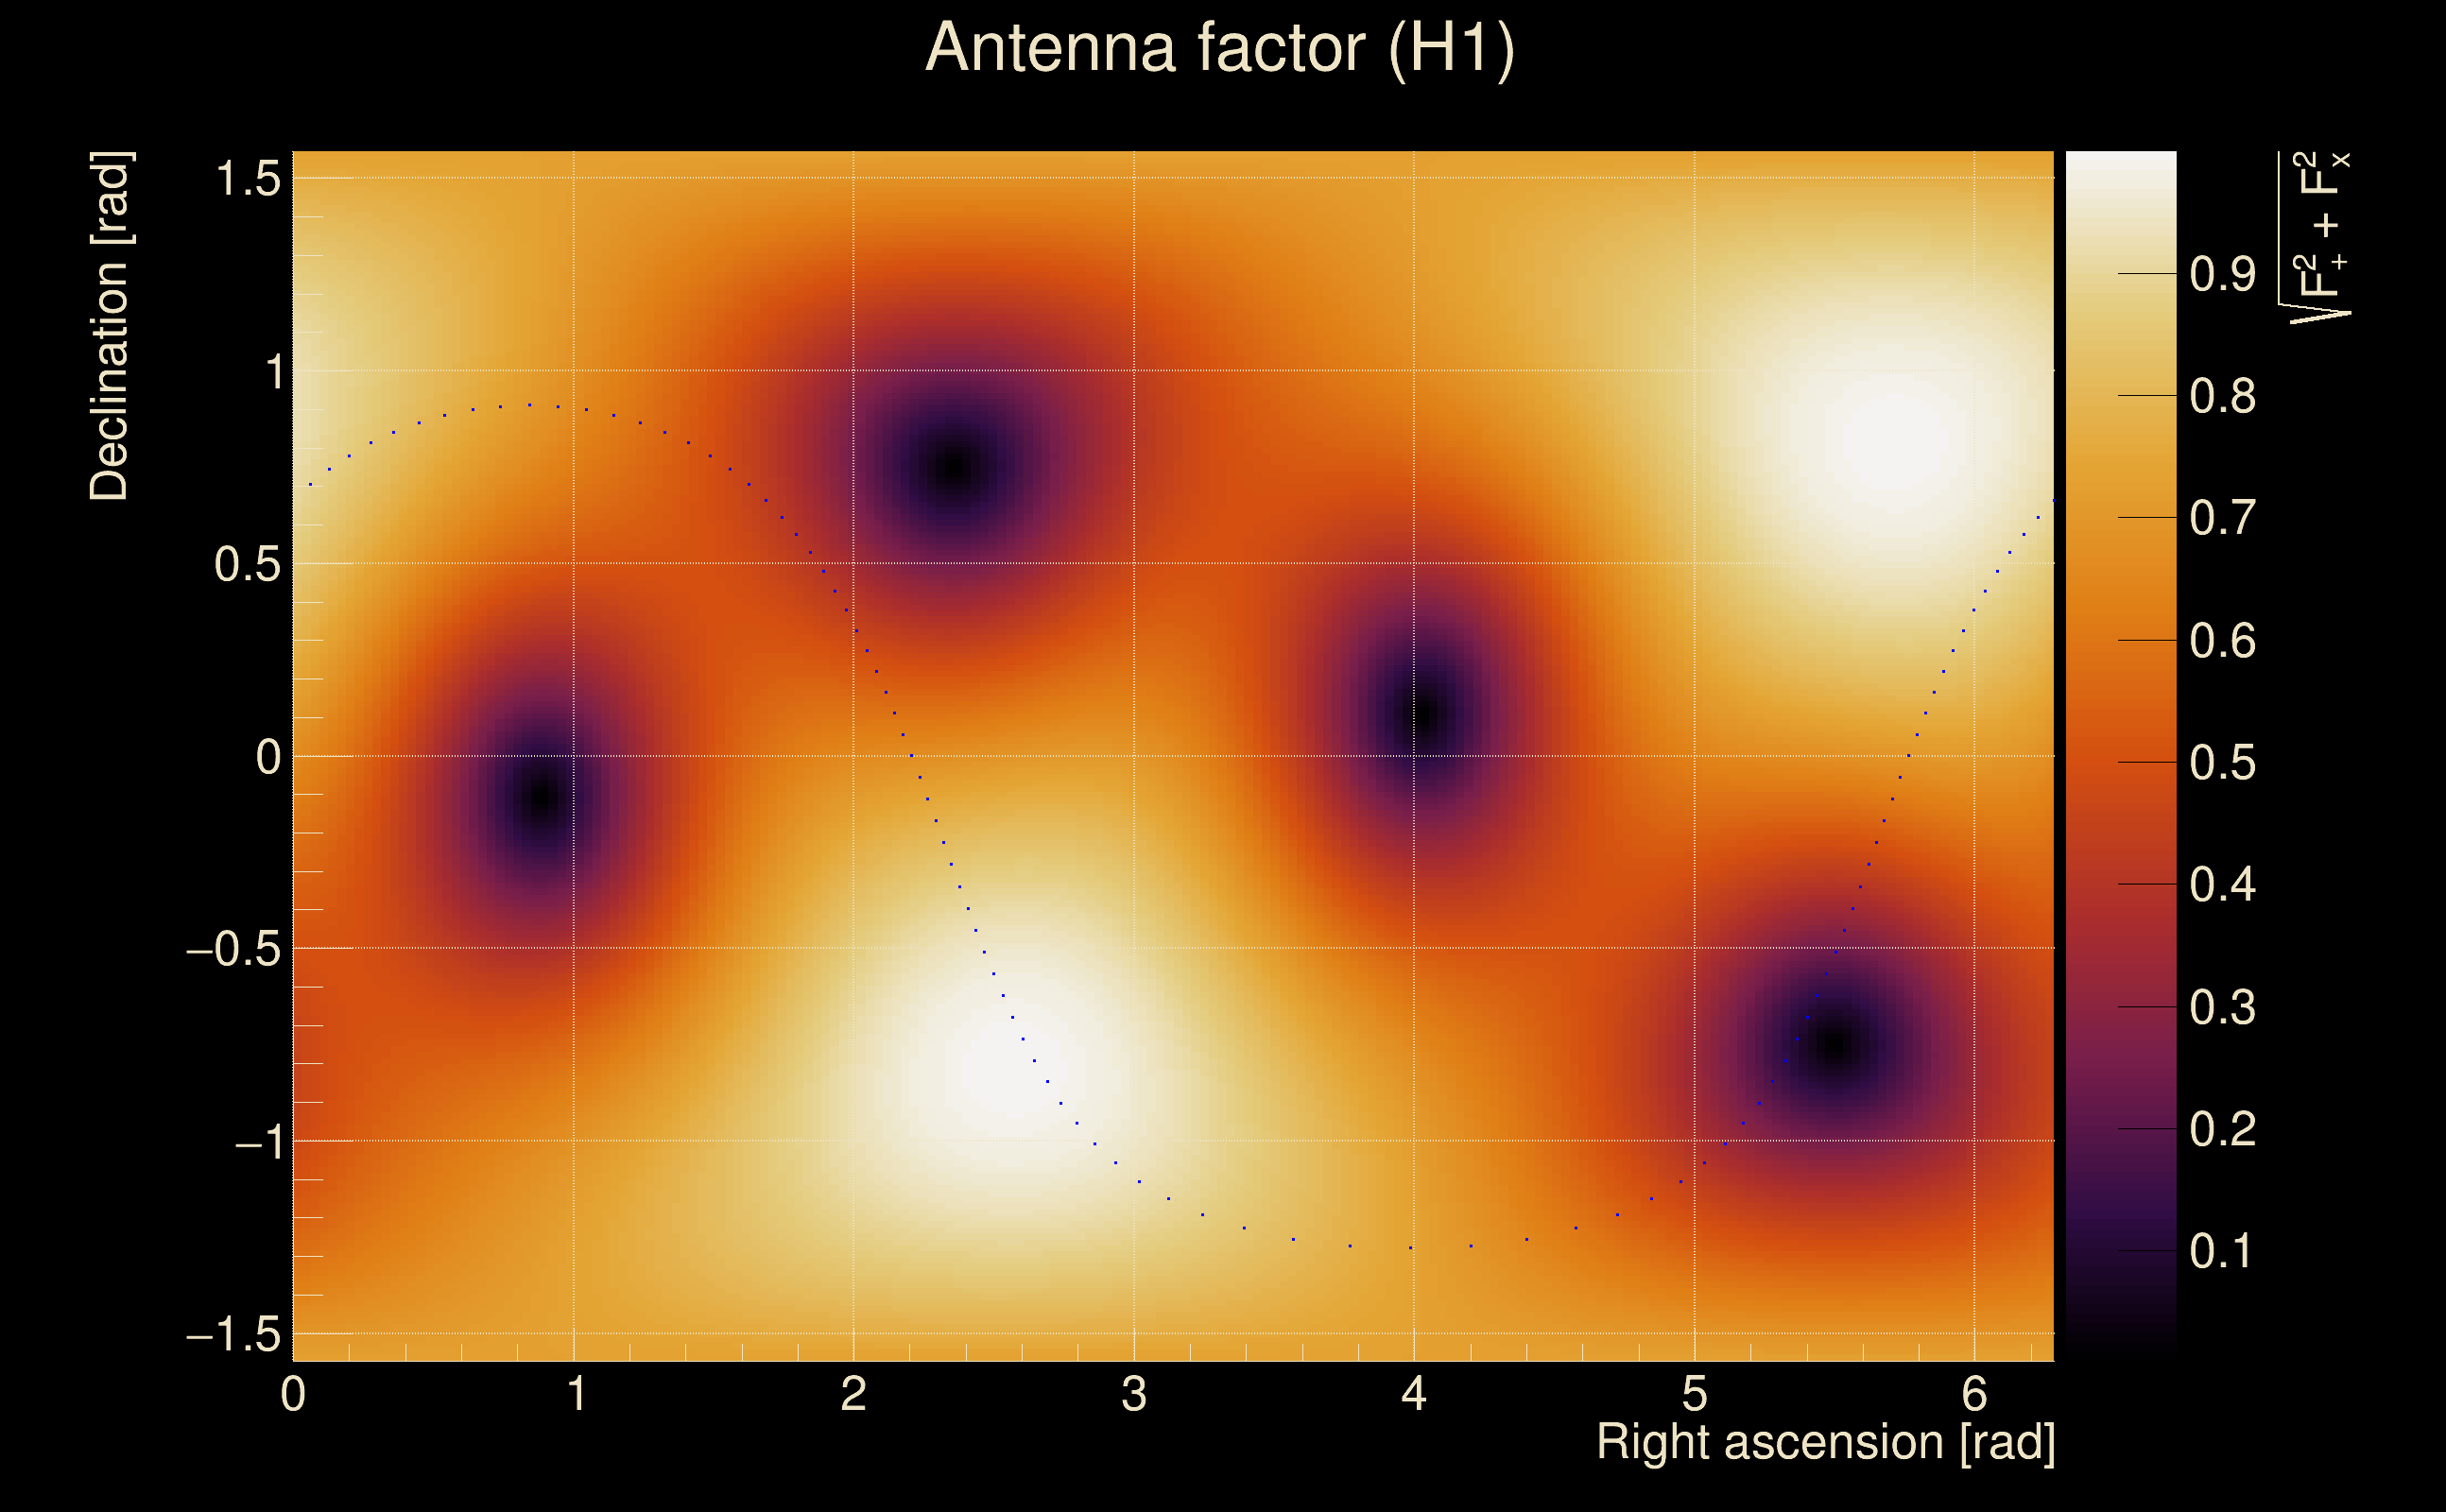
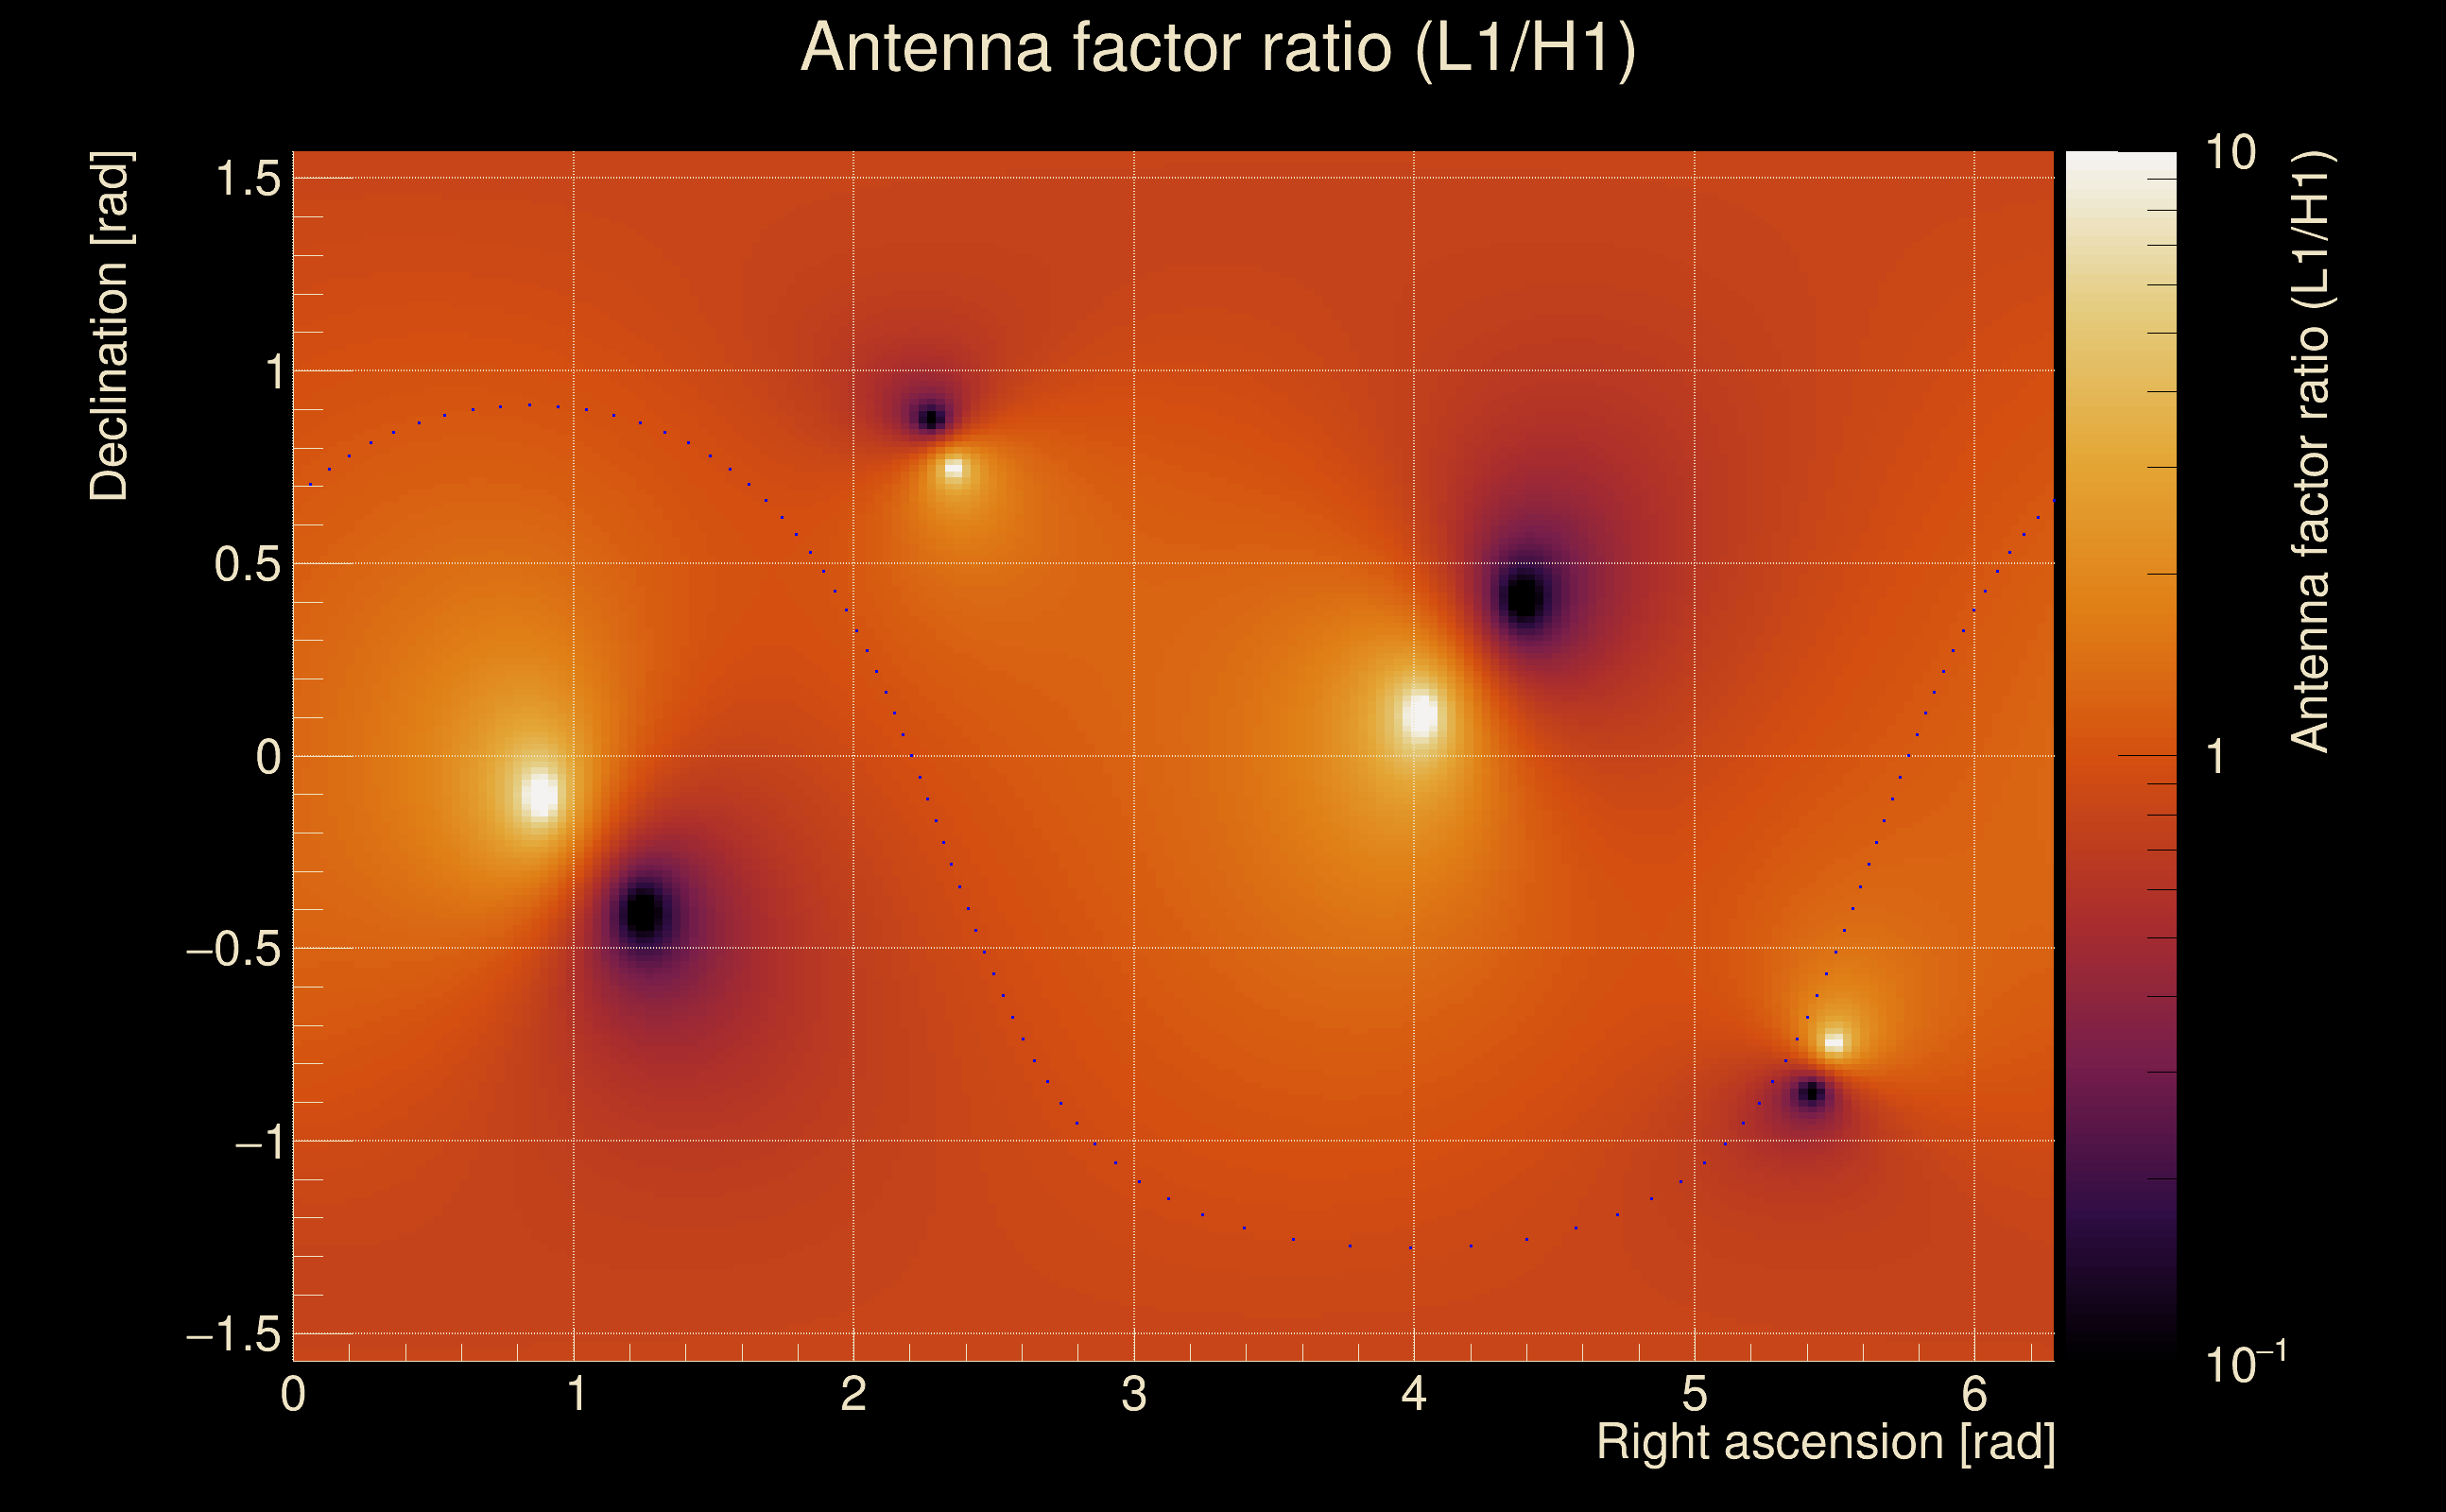
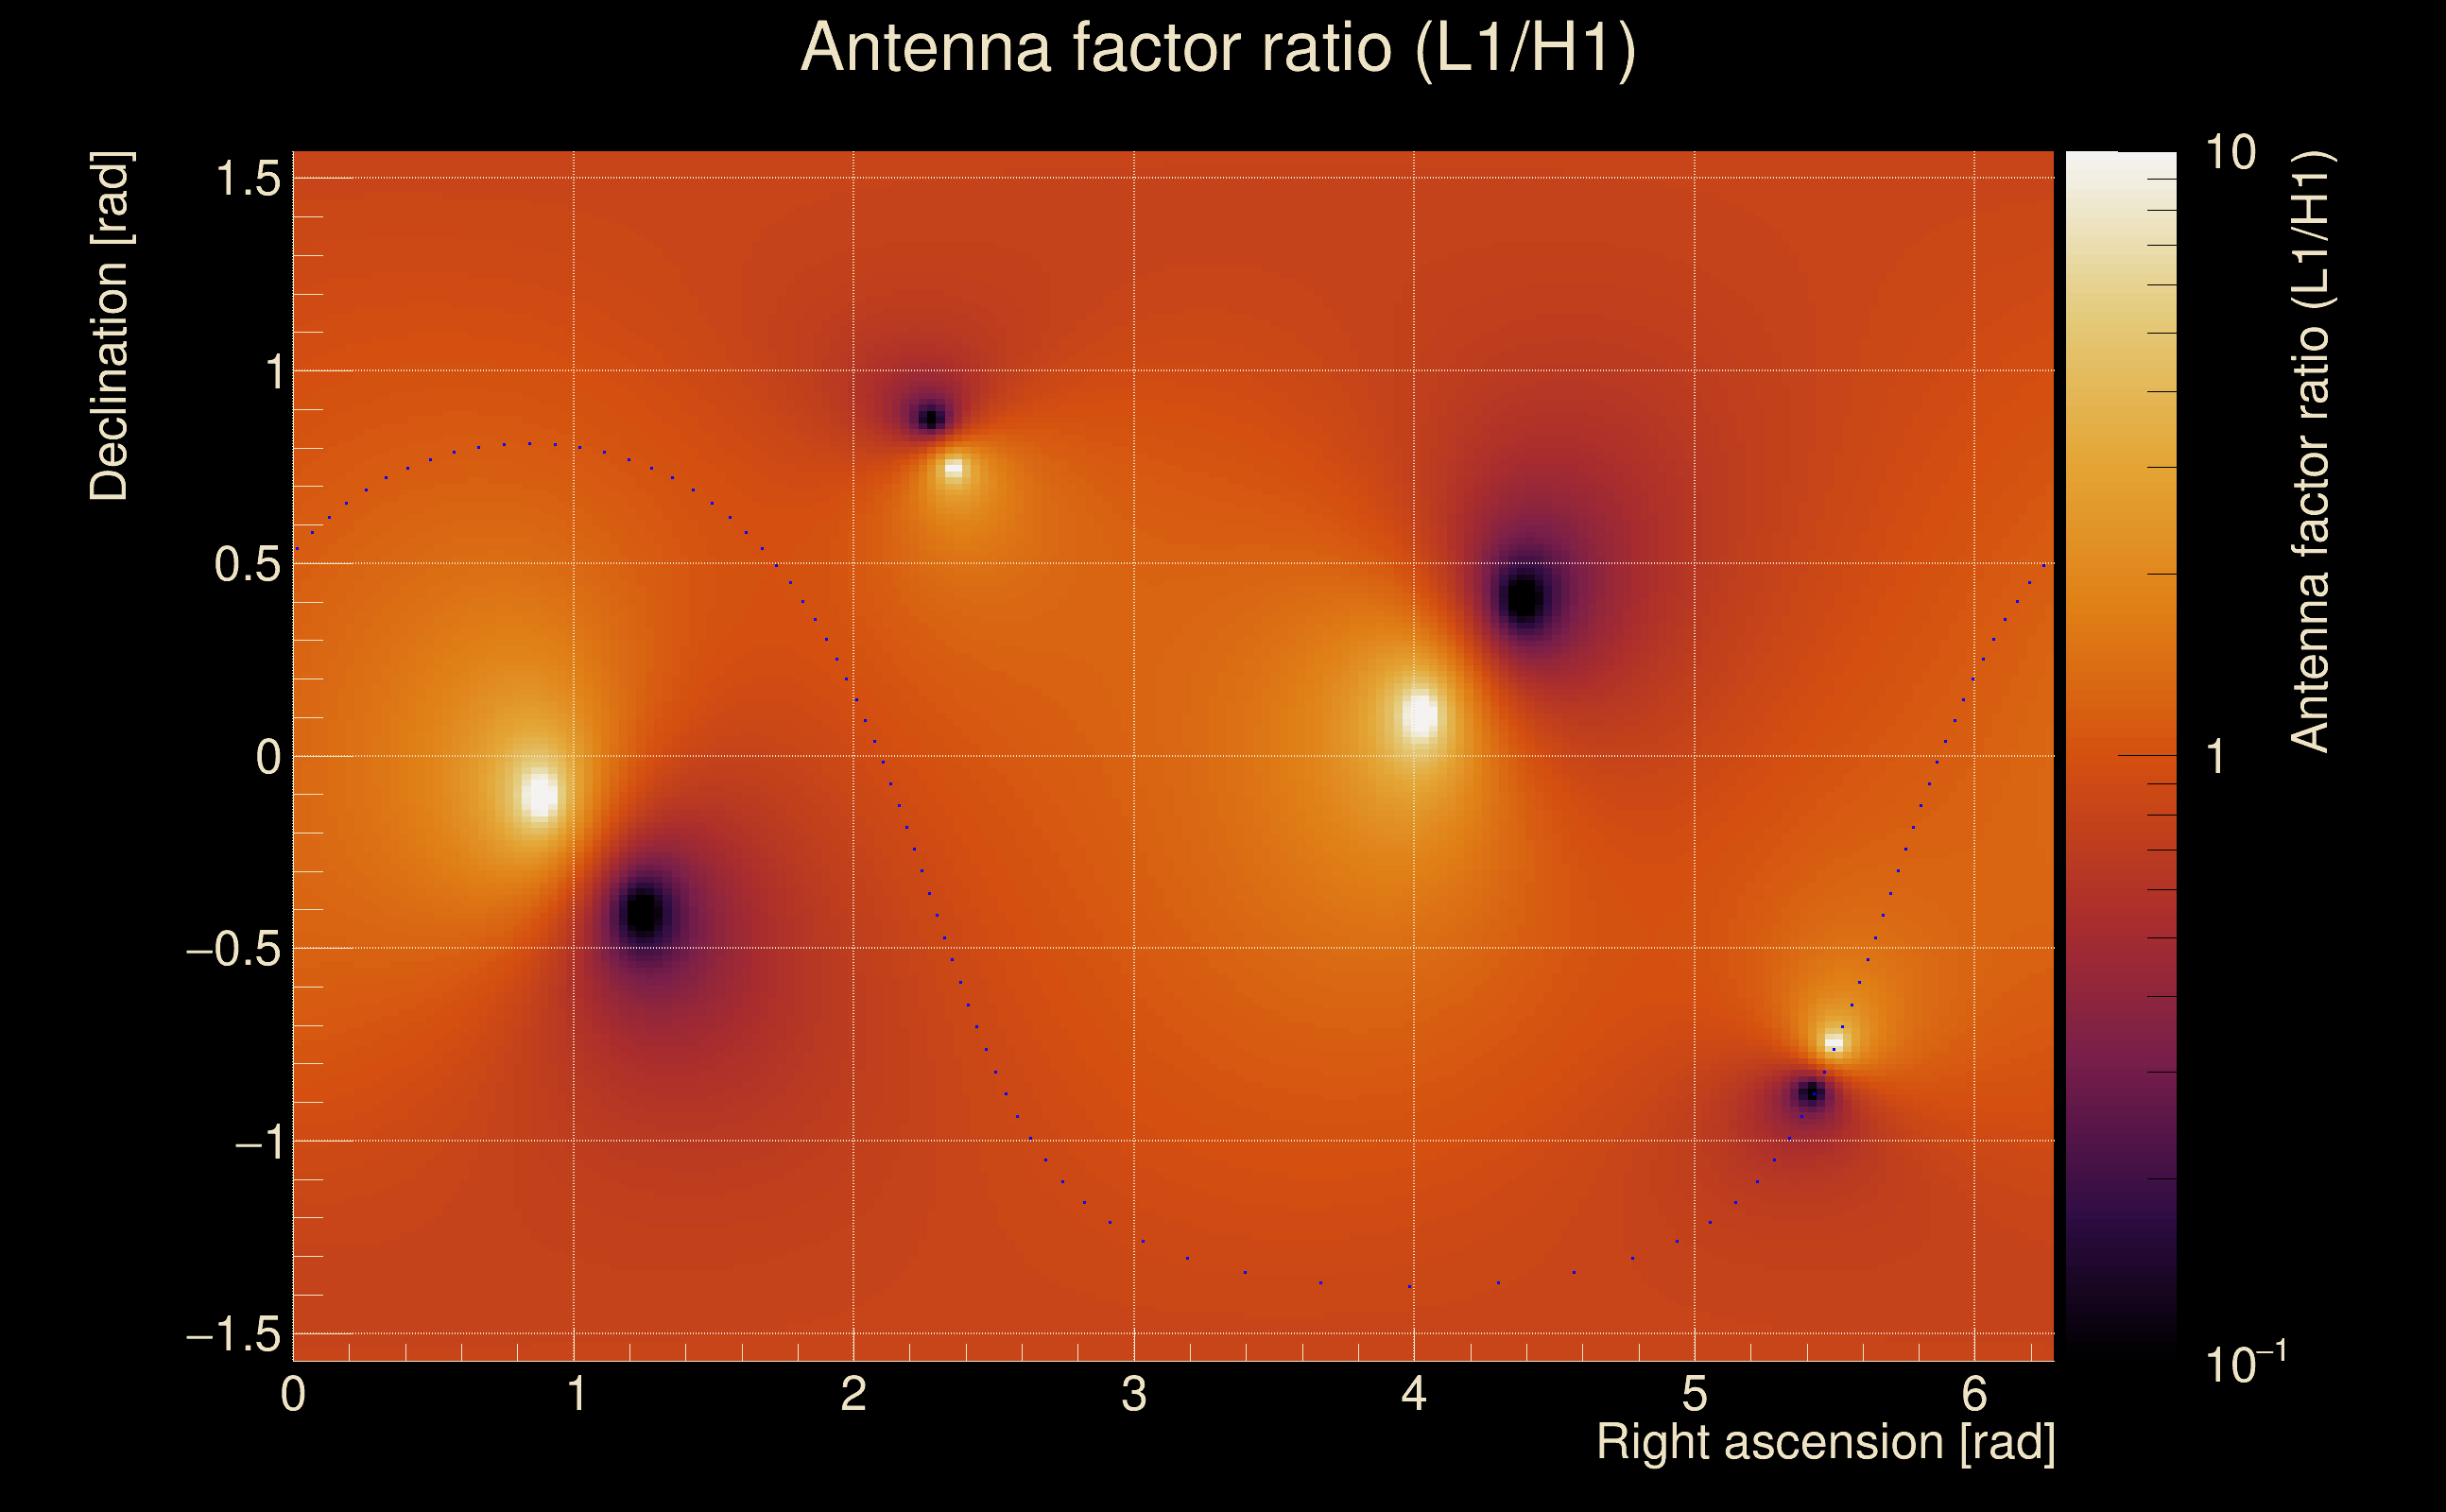
| Target sky positon: | Ra: 3.68109, Dec: 0.94792 [rad] |
| List of input Ox files: | Targeted_O4bw_2min_file_list.txt (1 files) |
| Analysis result file: | Targeted_O4bw_2min_results-0.root |
| Slice selected for the the fakeground: | slice index=87 (0.966 s), time lag = 0 s |
| Foreground | Fakeground | Background | ||
|---|---|---|---|---|
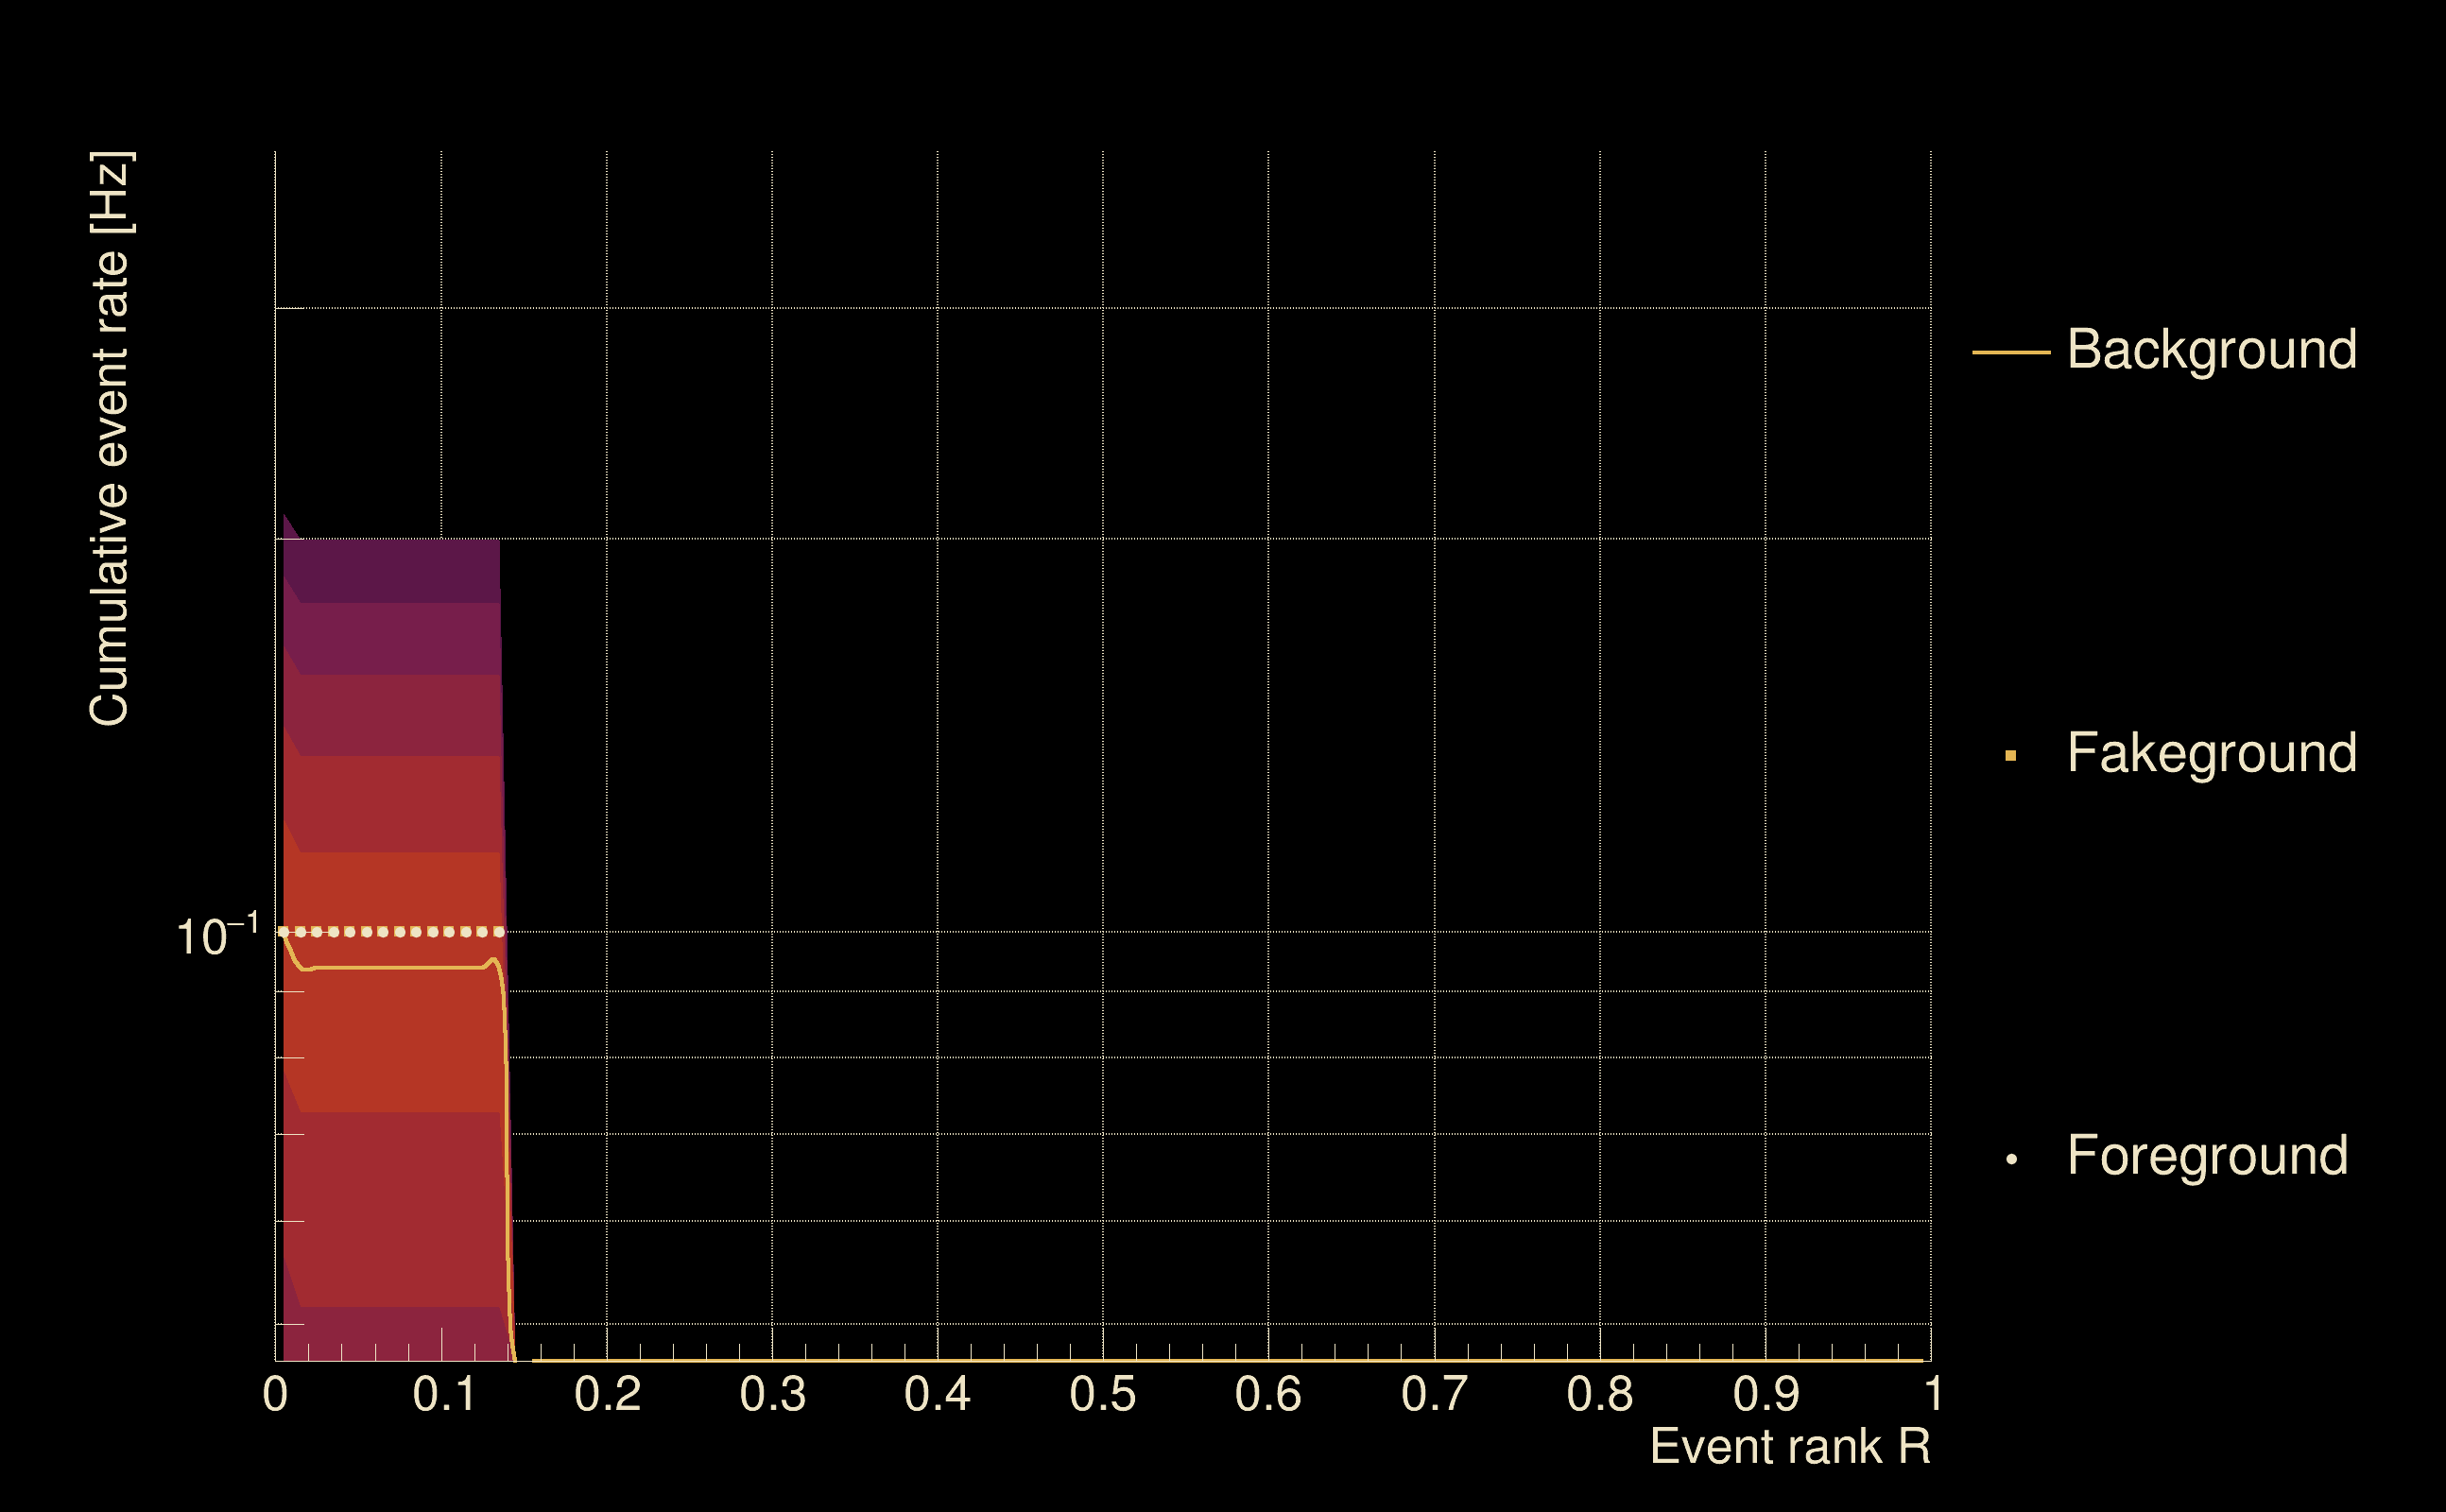
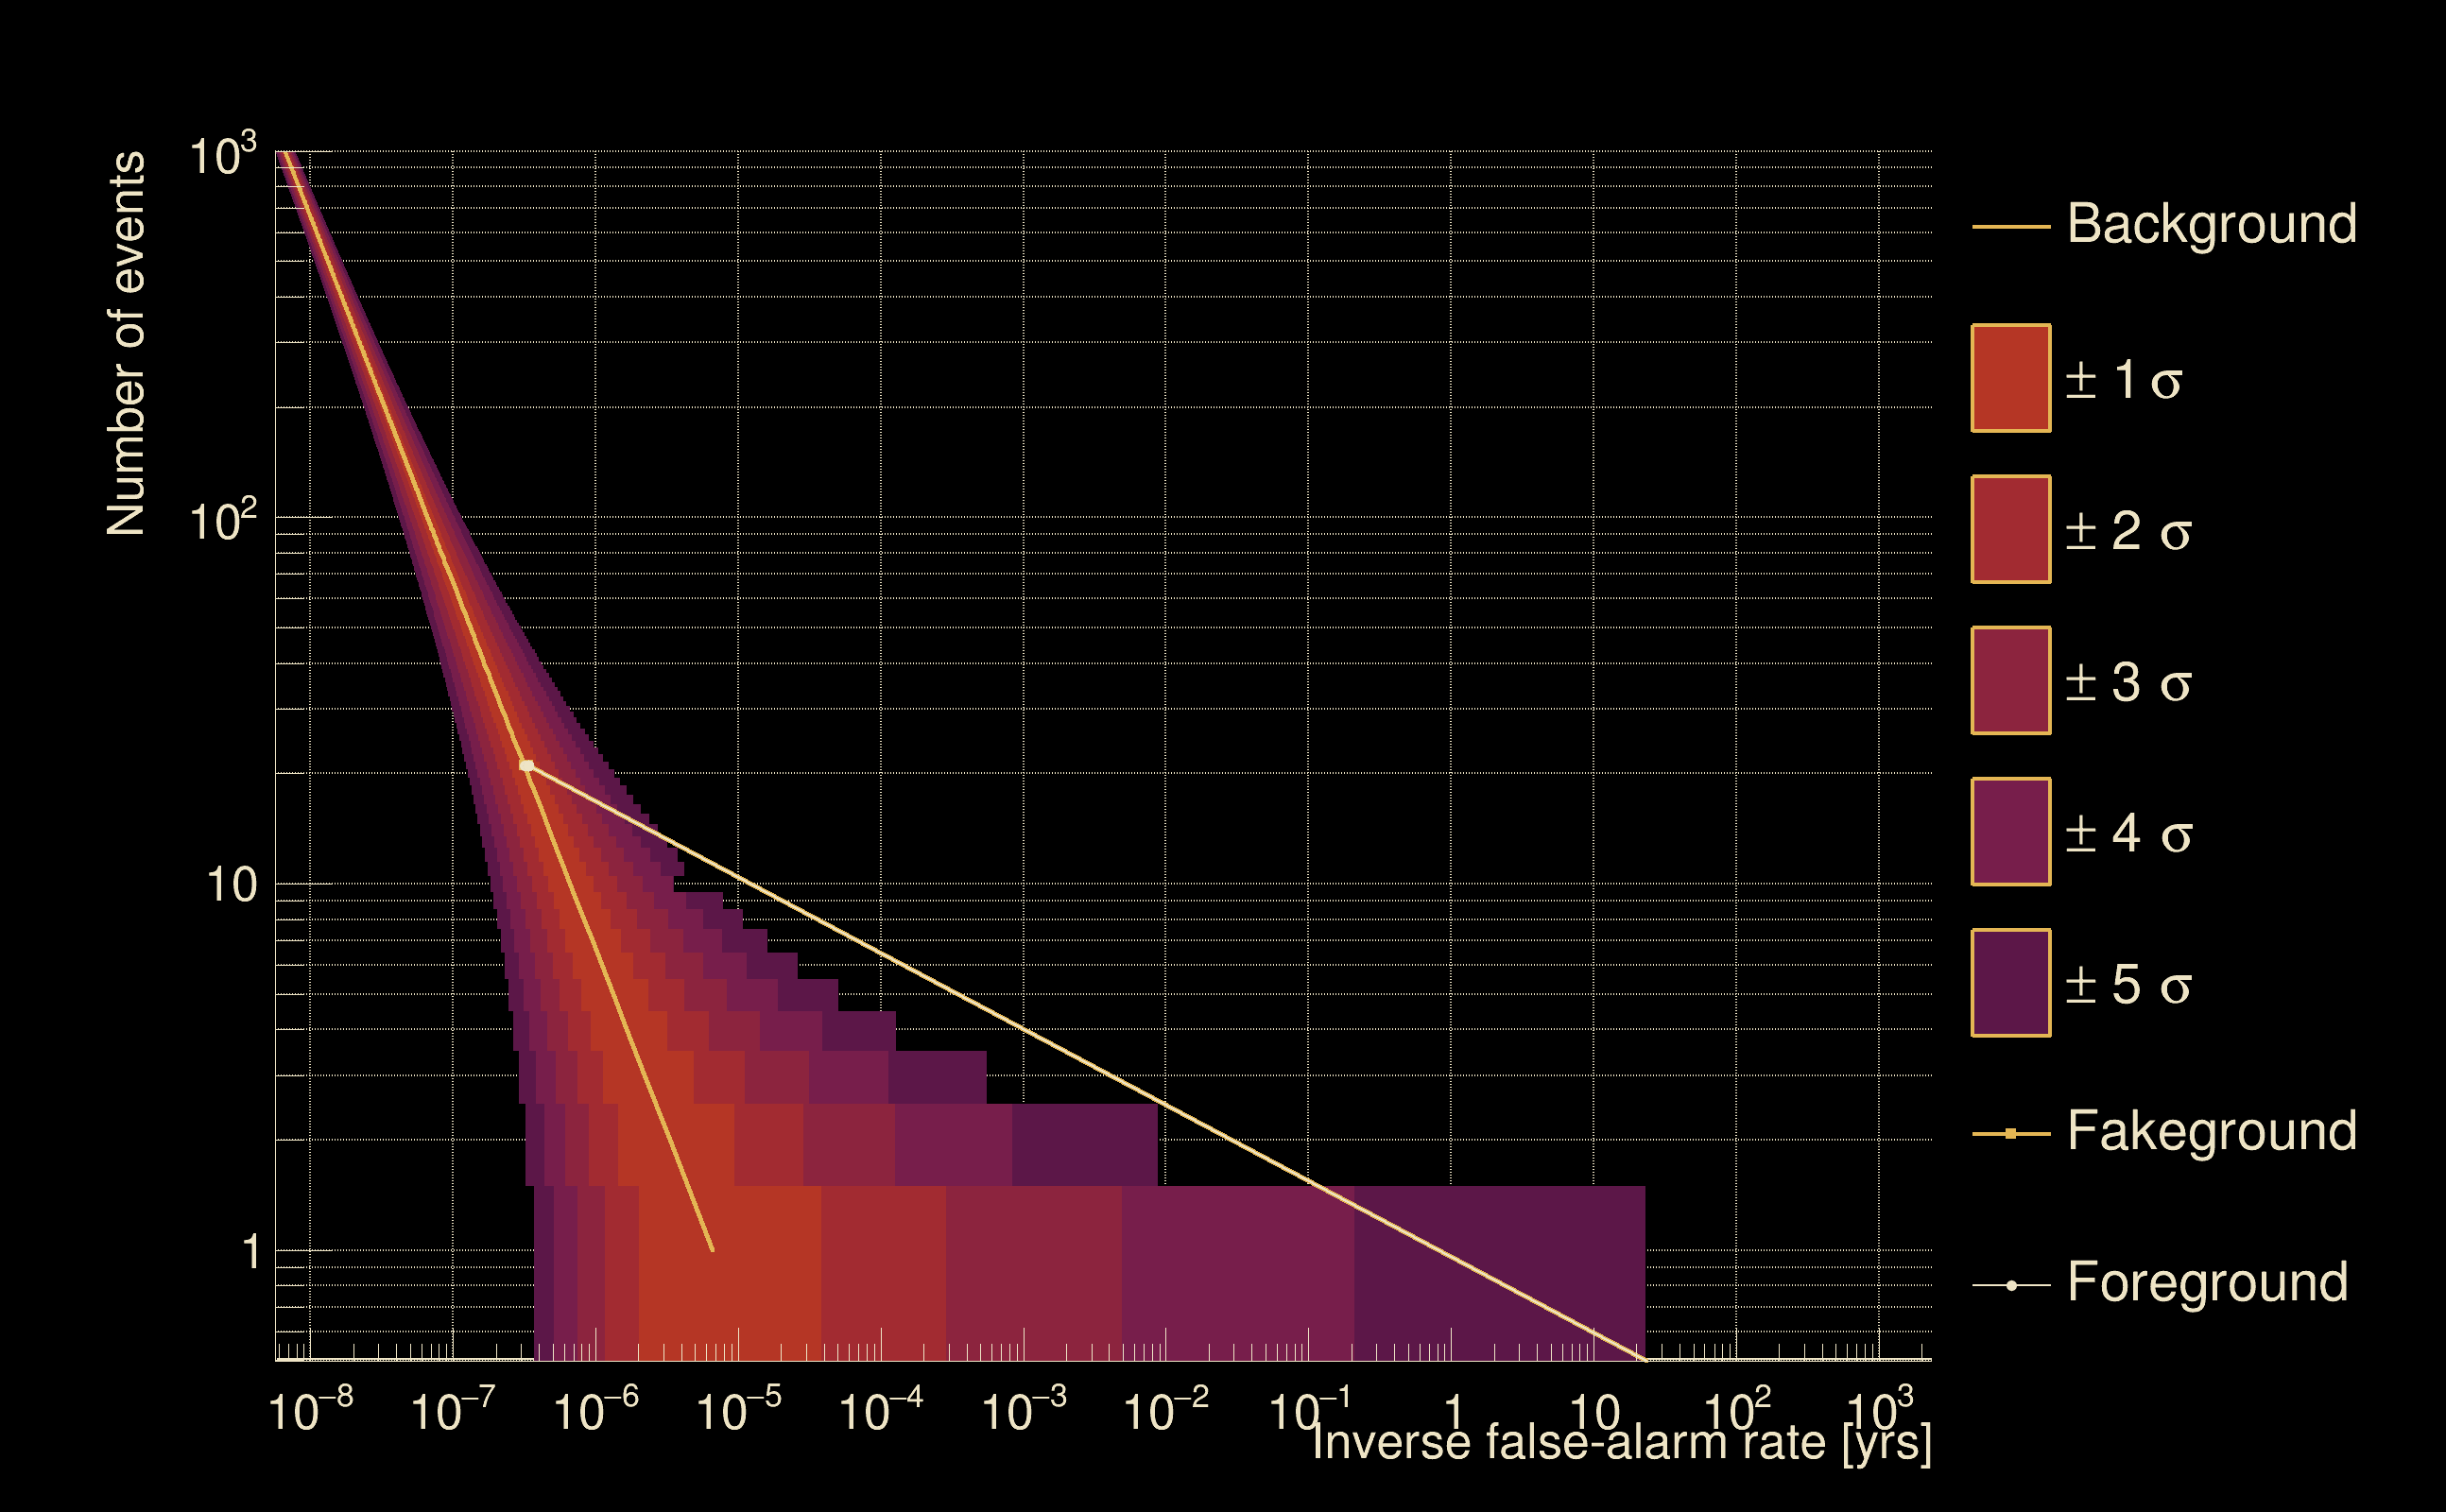
| Number of processed ox events | 21 | 21 | 4515 | |
| Start Date (detector 0) | Mon May 15 14:13:25 2023 UTC | Mon May 15 14:13:25 2023 UTC | Mon May 15 14:13:25 2023 UTC | |
| End Date (detector 0) | Mon May 15 14:15:15 2023 UTC | Mon May 15 14:15:15 2023 UTC | Mon May 15 14:15:15 2023 UTC | |
| Start GPS (detector 0) | 1368195223 | 1368195223 | 1368195223 | |
| End GPS (detector 0) | 1368195333 | 1368195333 | 1368195333 | |
| Used livetime (detector 0) | 110 s | 110 s | 110 s | |
| Start Date (detector 1) | Mon May 15 14:13:25 2023 UTC | Mon May 15 14:13:25 2023 UTC | Mon May 15 14:13:25 2023 UTC | |
| End Date (detector 1) | Mon May 15 14:15:15 2023 UTC | Mon May 15 14:15:15 2023 UTC | Mon May 15 14:15:15 2023 UTC | |
| Start GPS (detector 1) | 1368195223 | 1368195223 | 1368195223 | |
| End GPS (detector 1) | 1368195333 | 1368195333 | 1368195333 | |
| Used livetime (detector 1) | 110 s | 110 s | 110 s | |
| Cumulative livetime | 210 s | 210 s | 45150 s | |
| 0 years, 0 days, 0 hours, 3 min, 30 s | 0 years, 0 days, 0 hours, 3 min, 30 s | 0 years, 0 days, 12 hours, 32 min, 30 s |
|
|
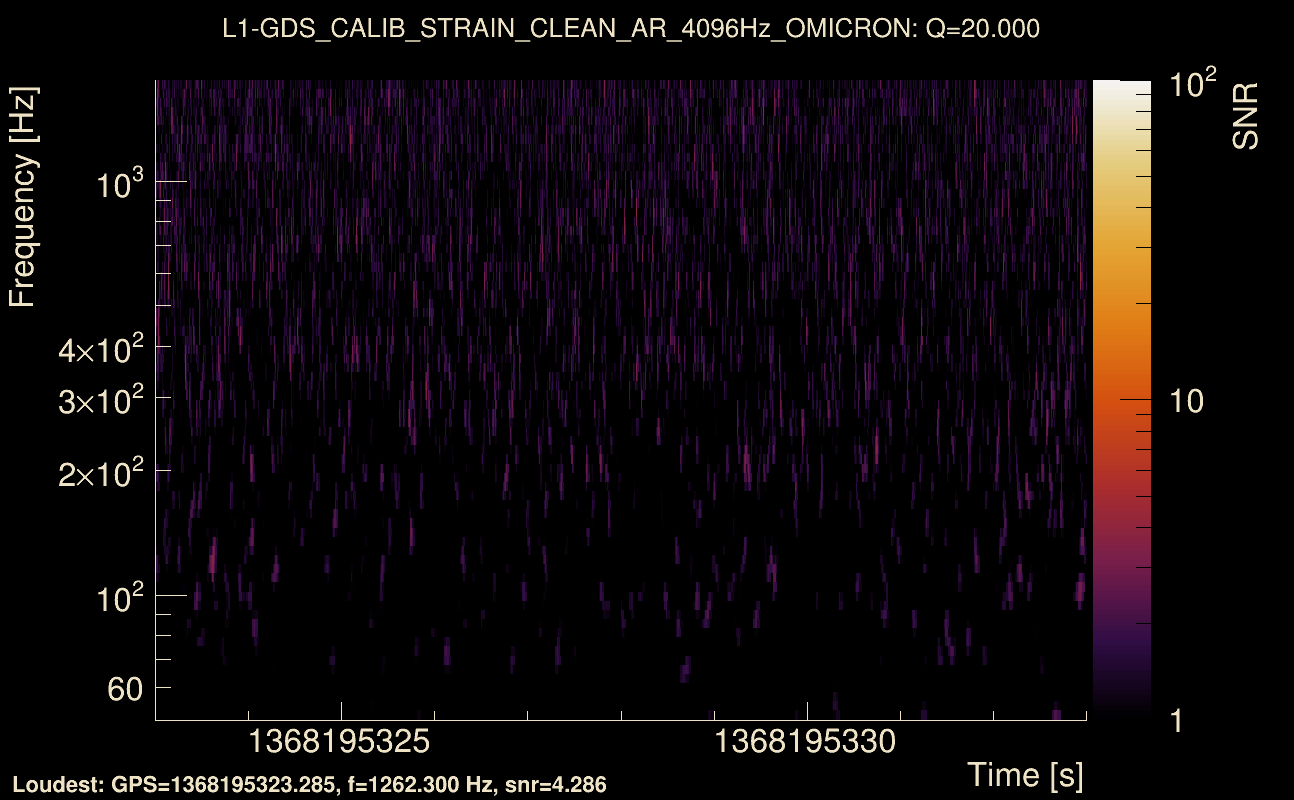
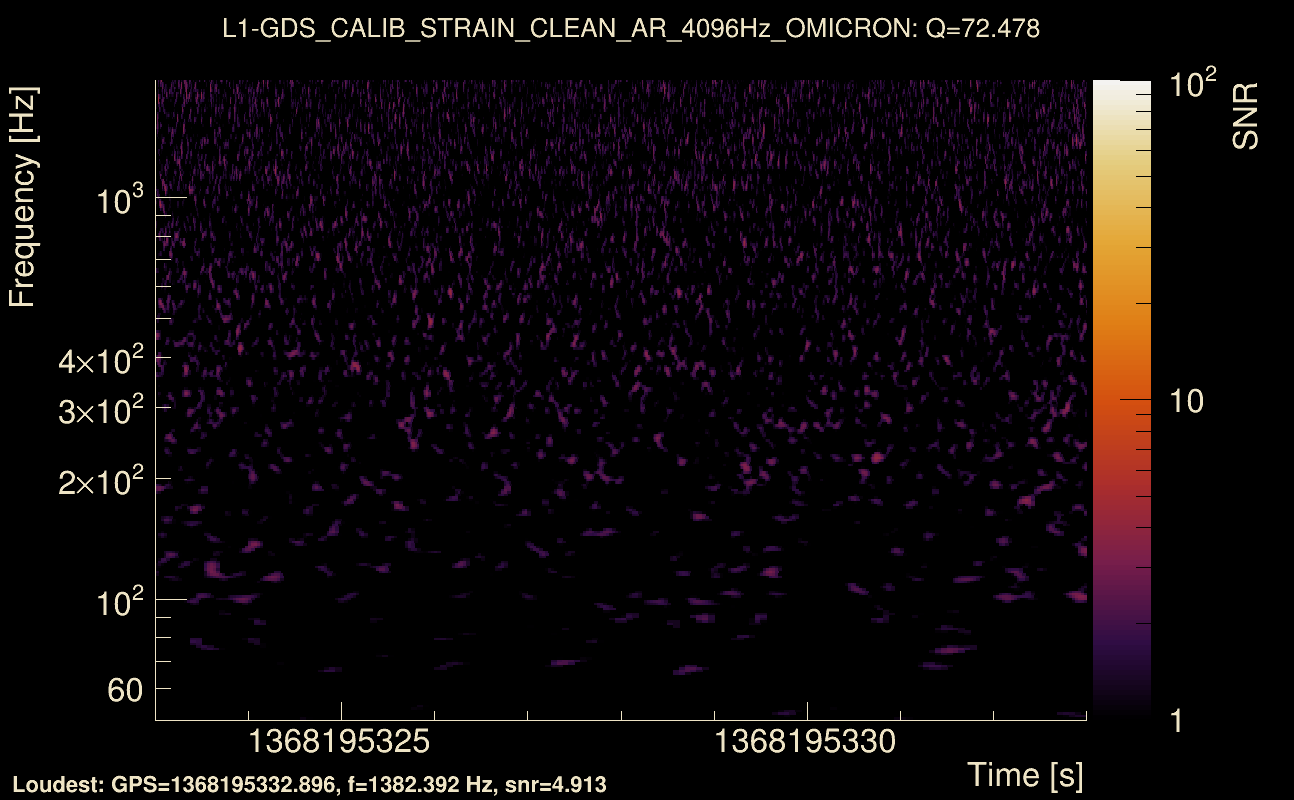
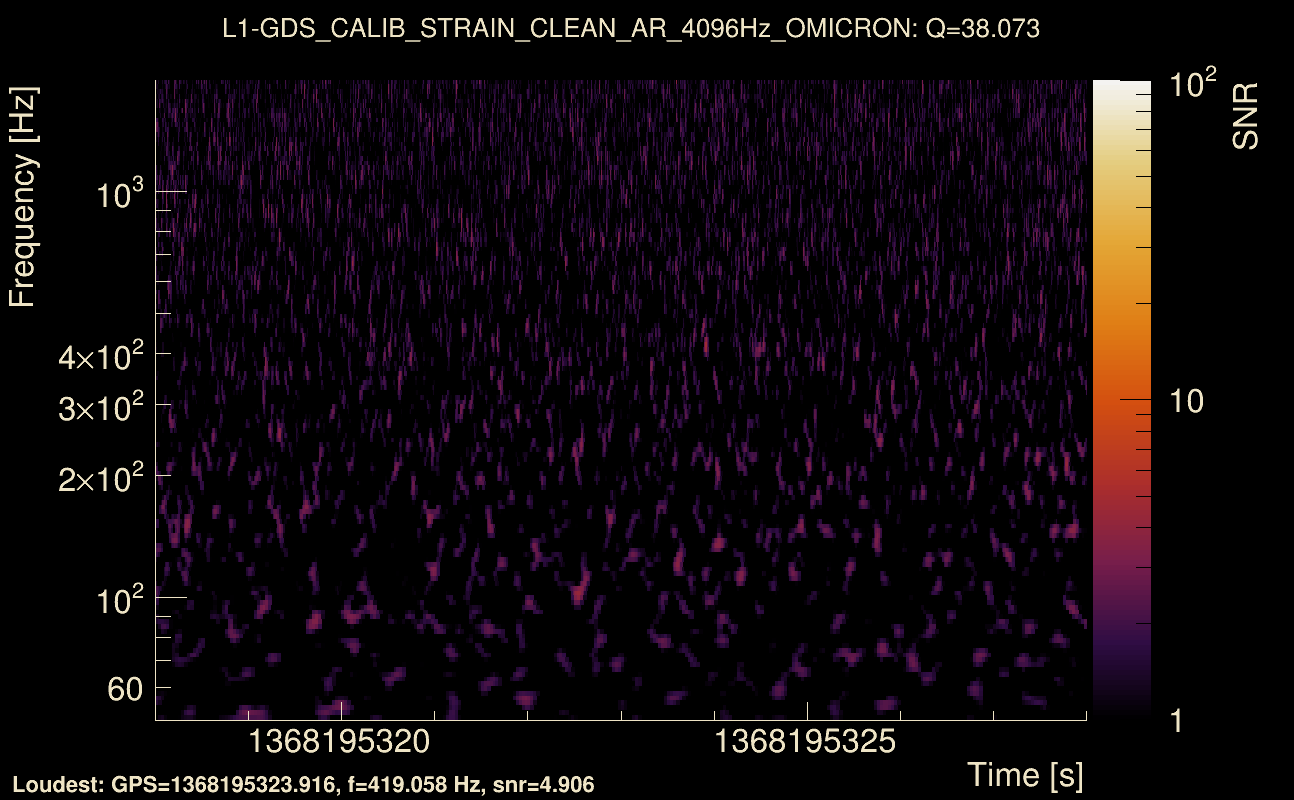
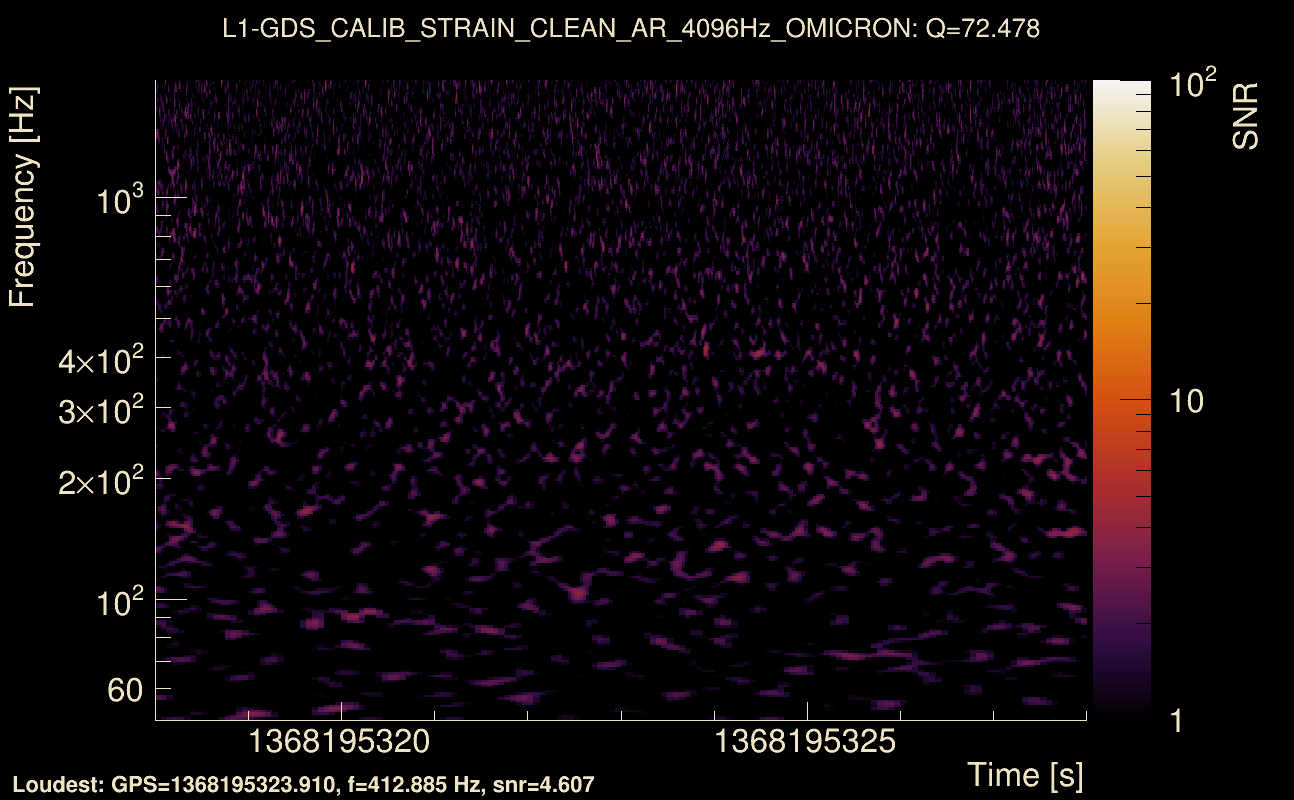
| Event time t(H1): | GPS = 1368195323 (Mon May 15 14:15:05 2023 ) → GPS = 1368195333 (Mon May 15 14:15:15 2023 ) |
| Event time t(L1): | GPS = 1368195323 (Mon May 15 14:15:15 2023 ) → GPS = 1368195333 (Mon May 15 14:15:15 2023 ) |
| Omicron analysis time window (H1): | GPS = 1368195320 → GPS = 1368195336 |
| Omicron analysis time window (L1): | GPS = 1368195320 → GPS = 1368195336 |
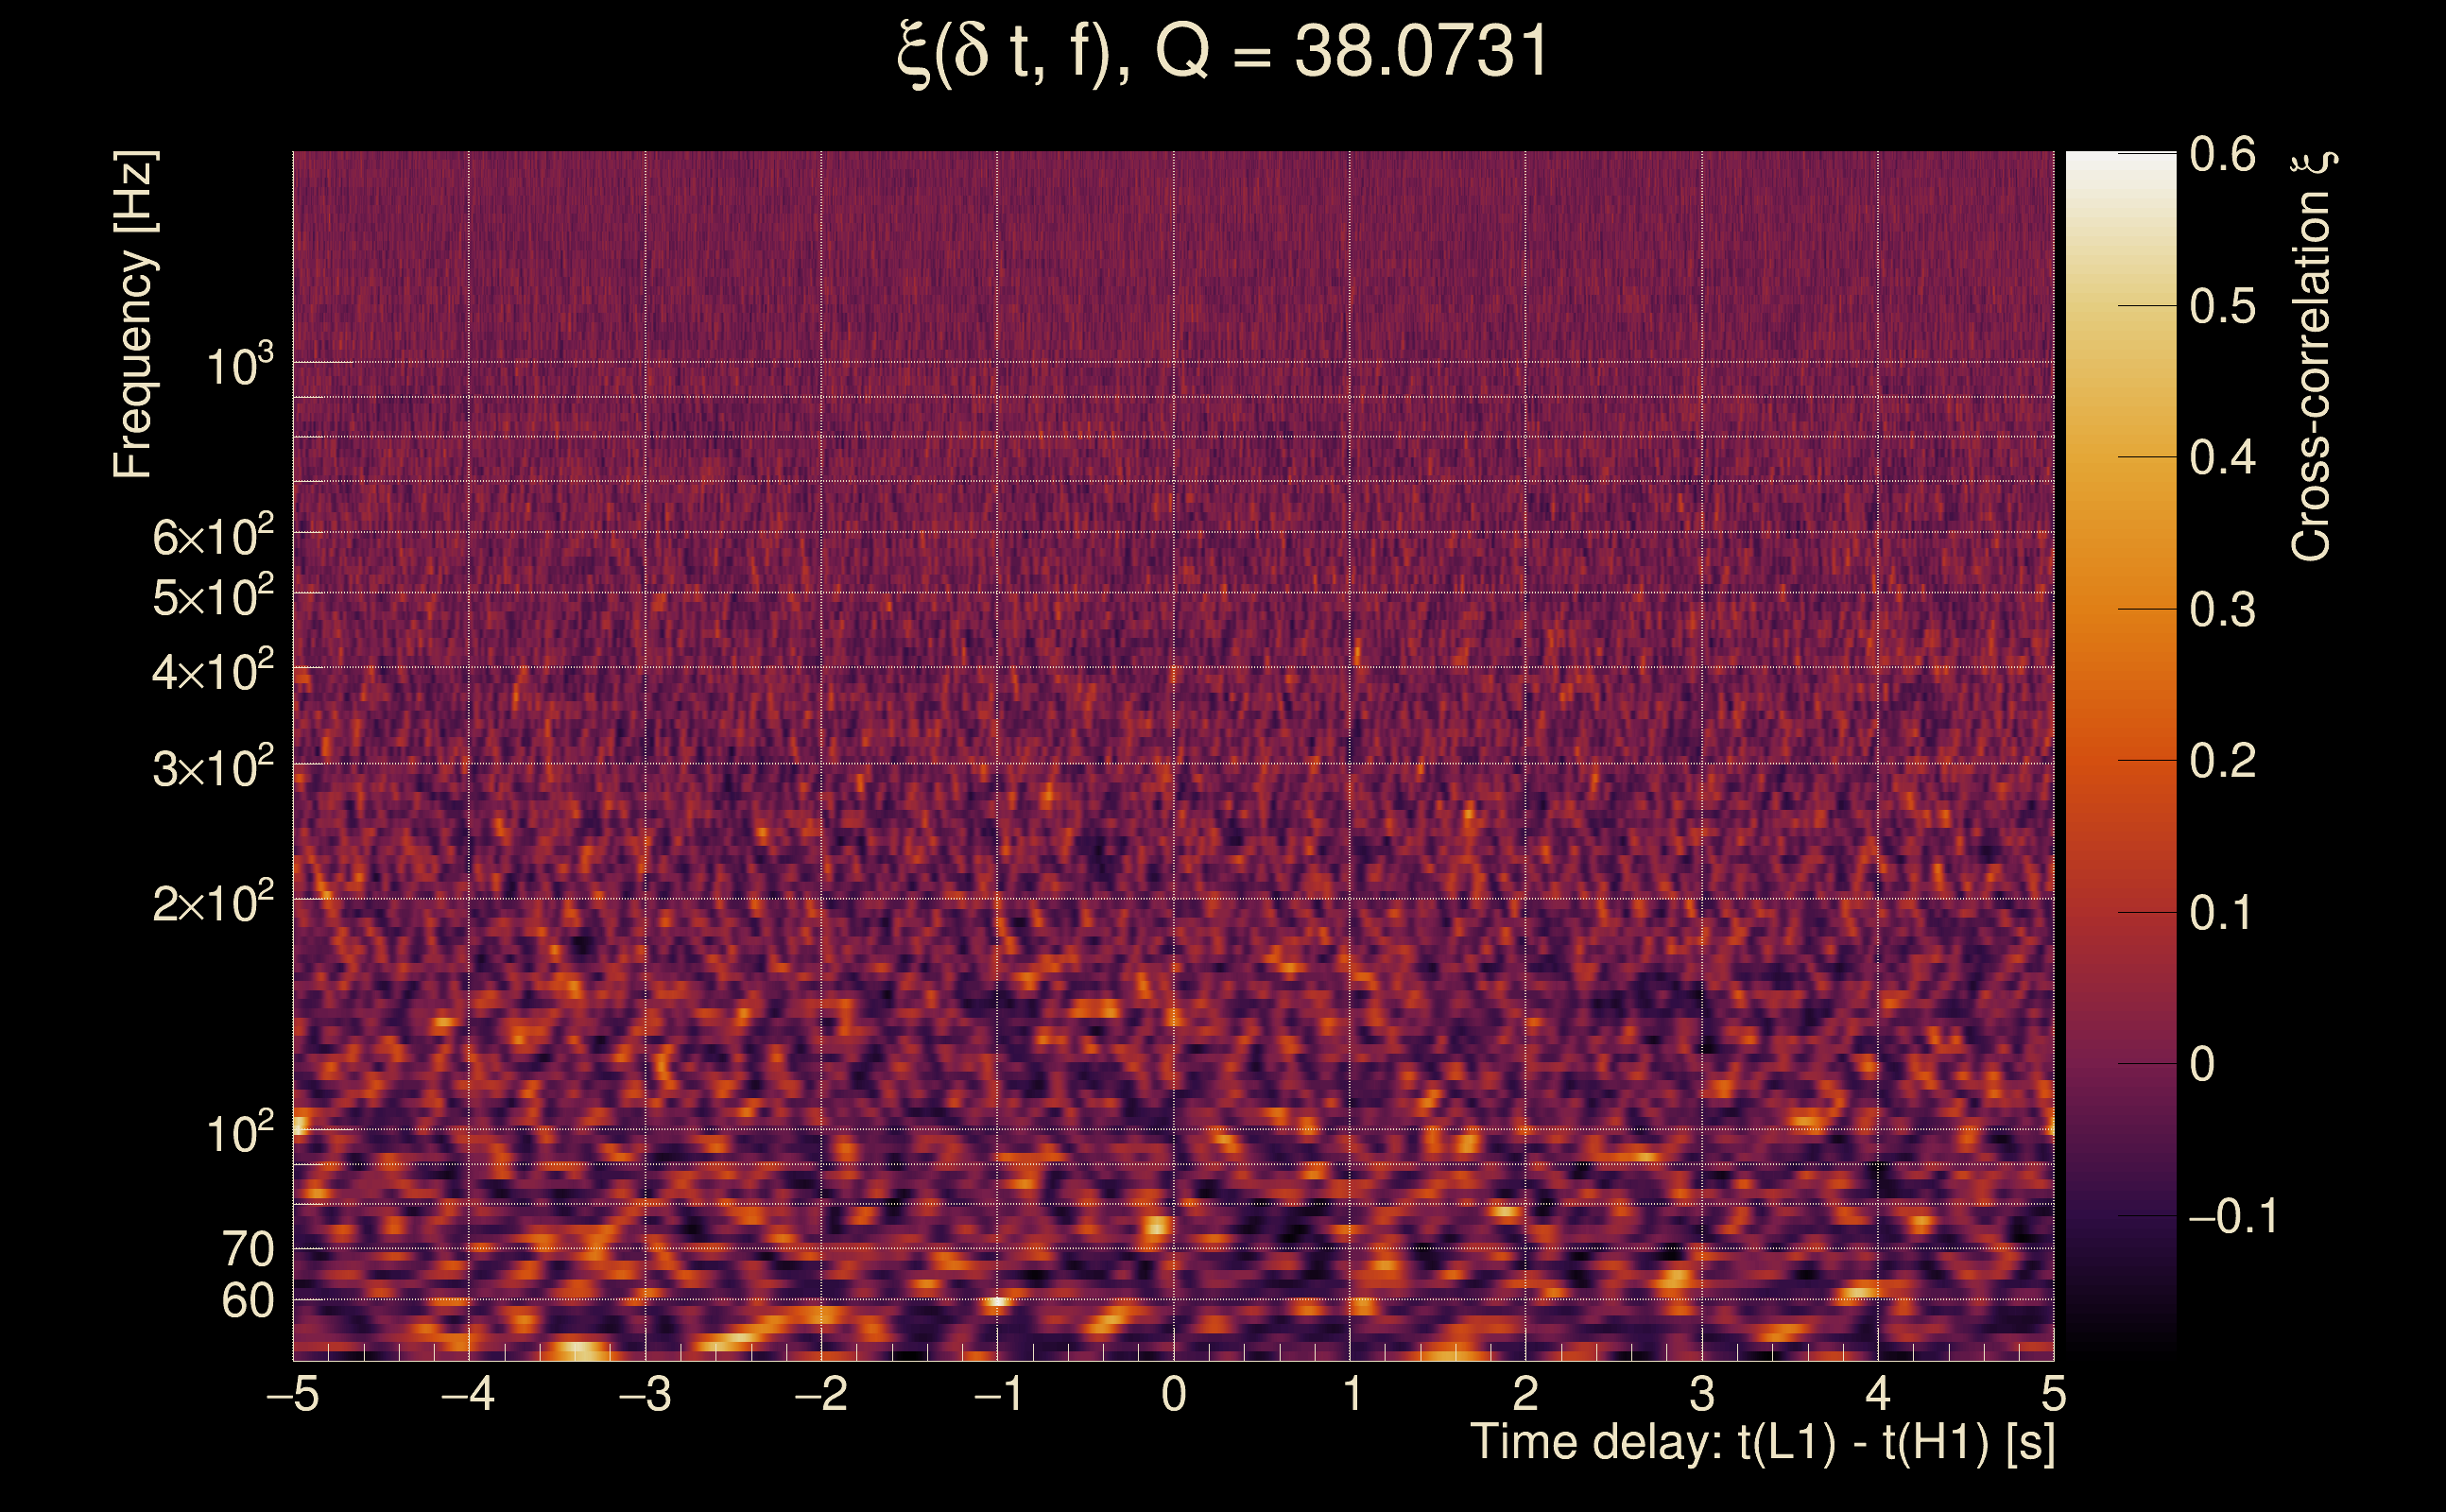
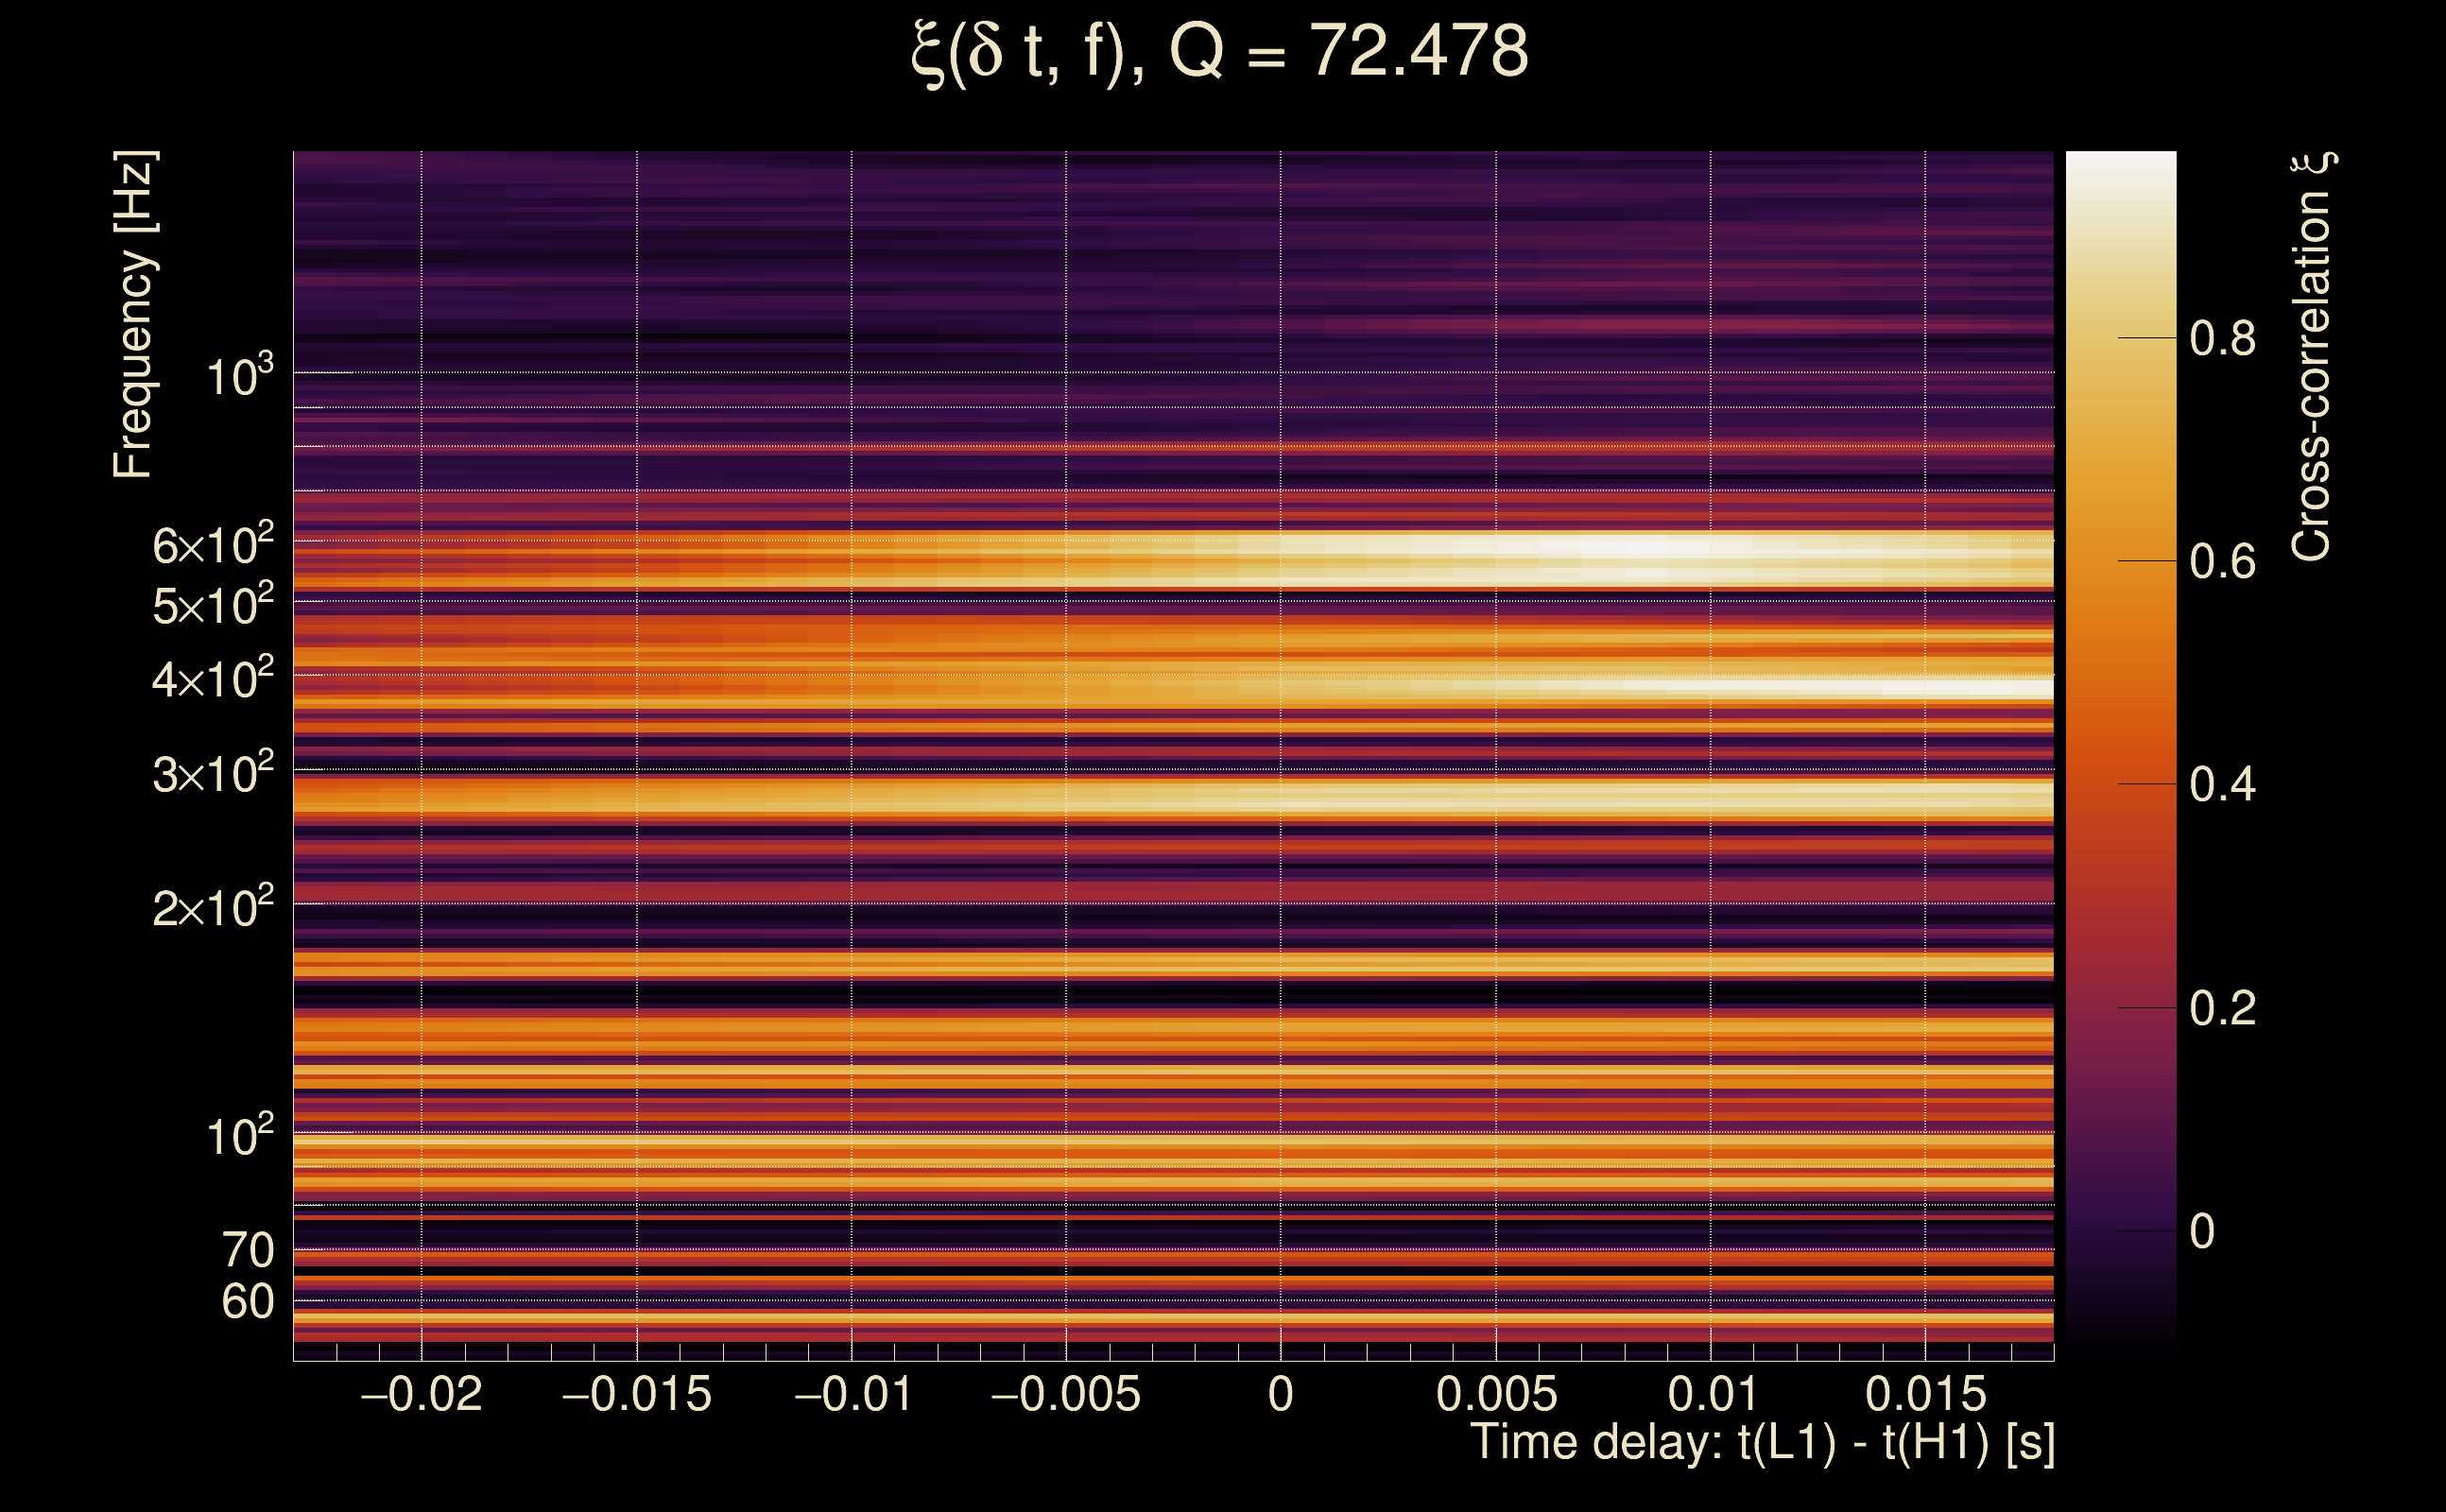
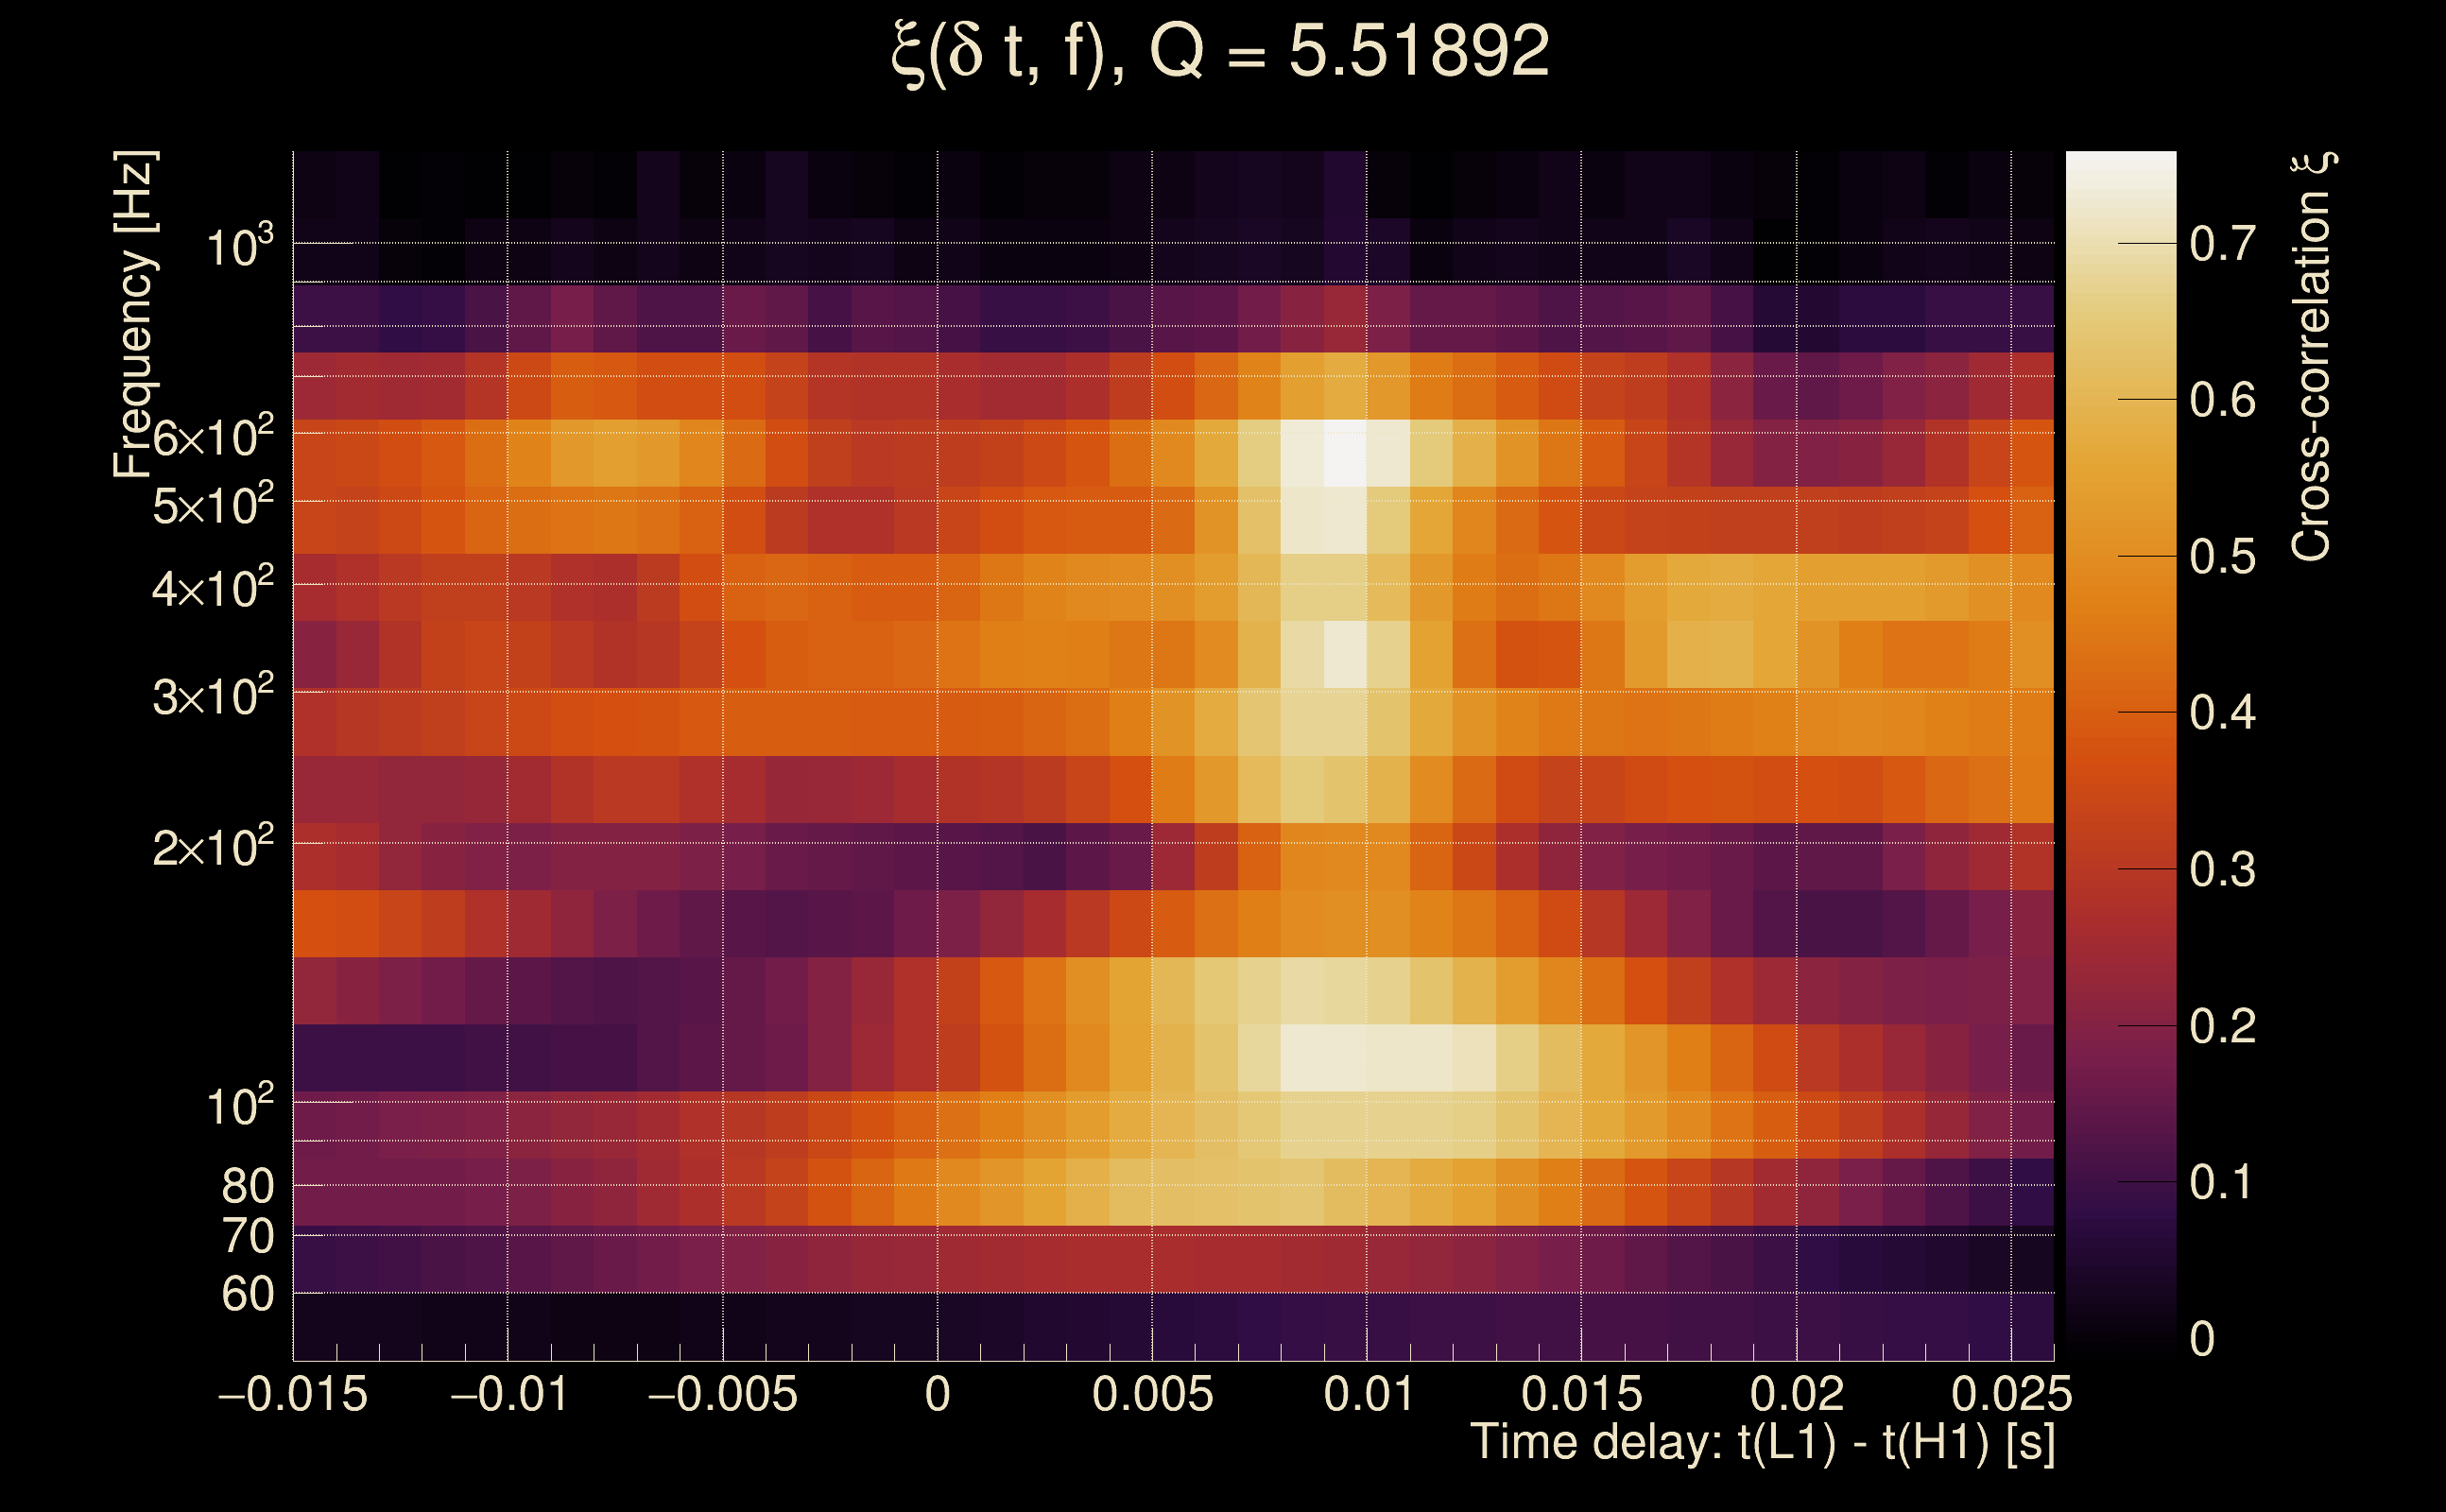
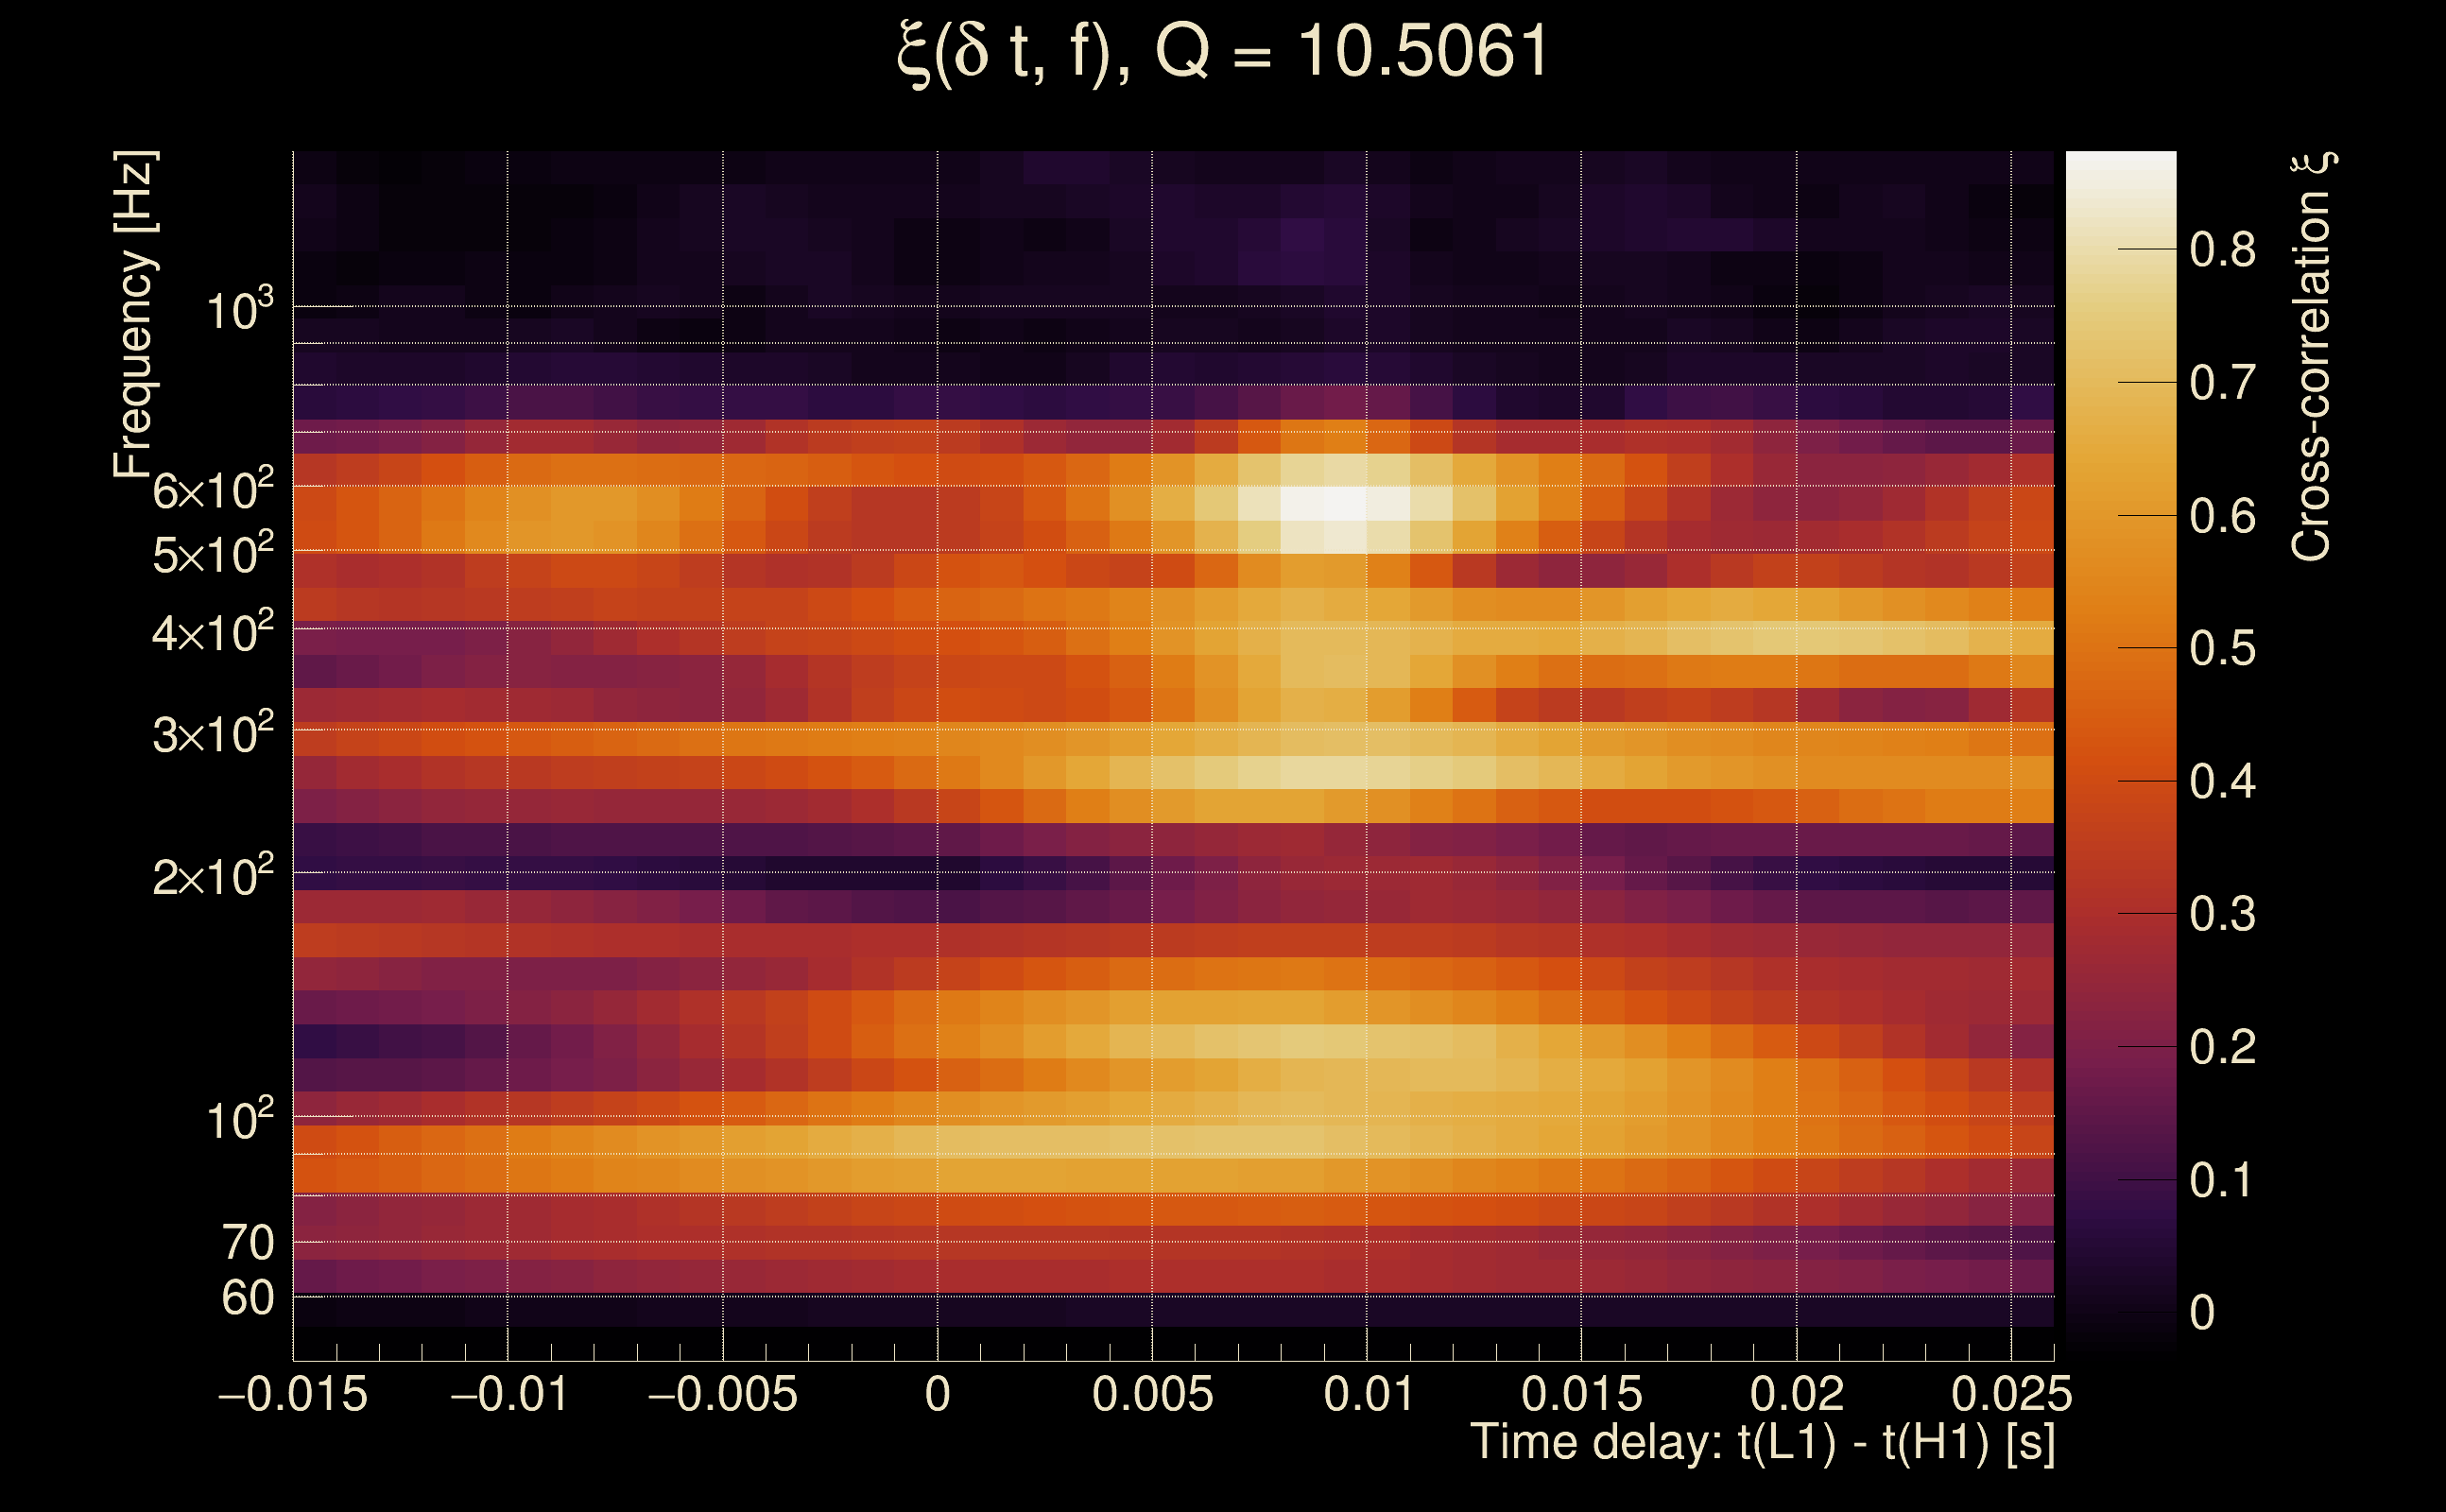
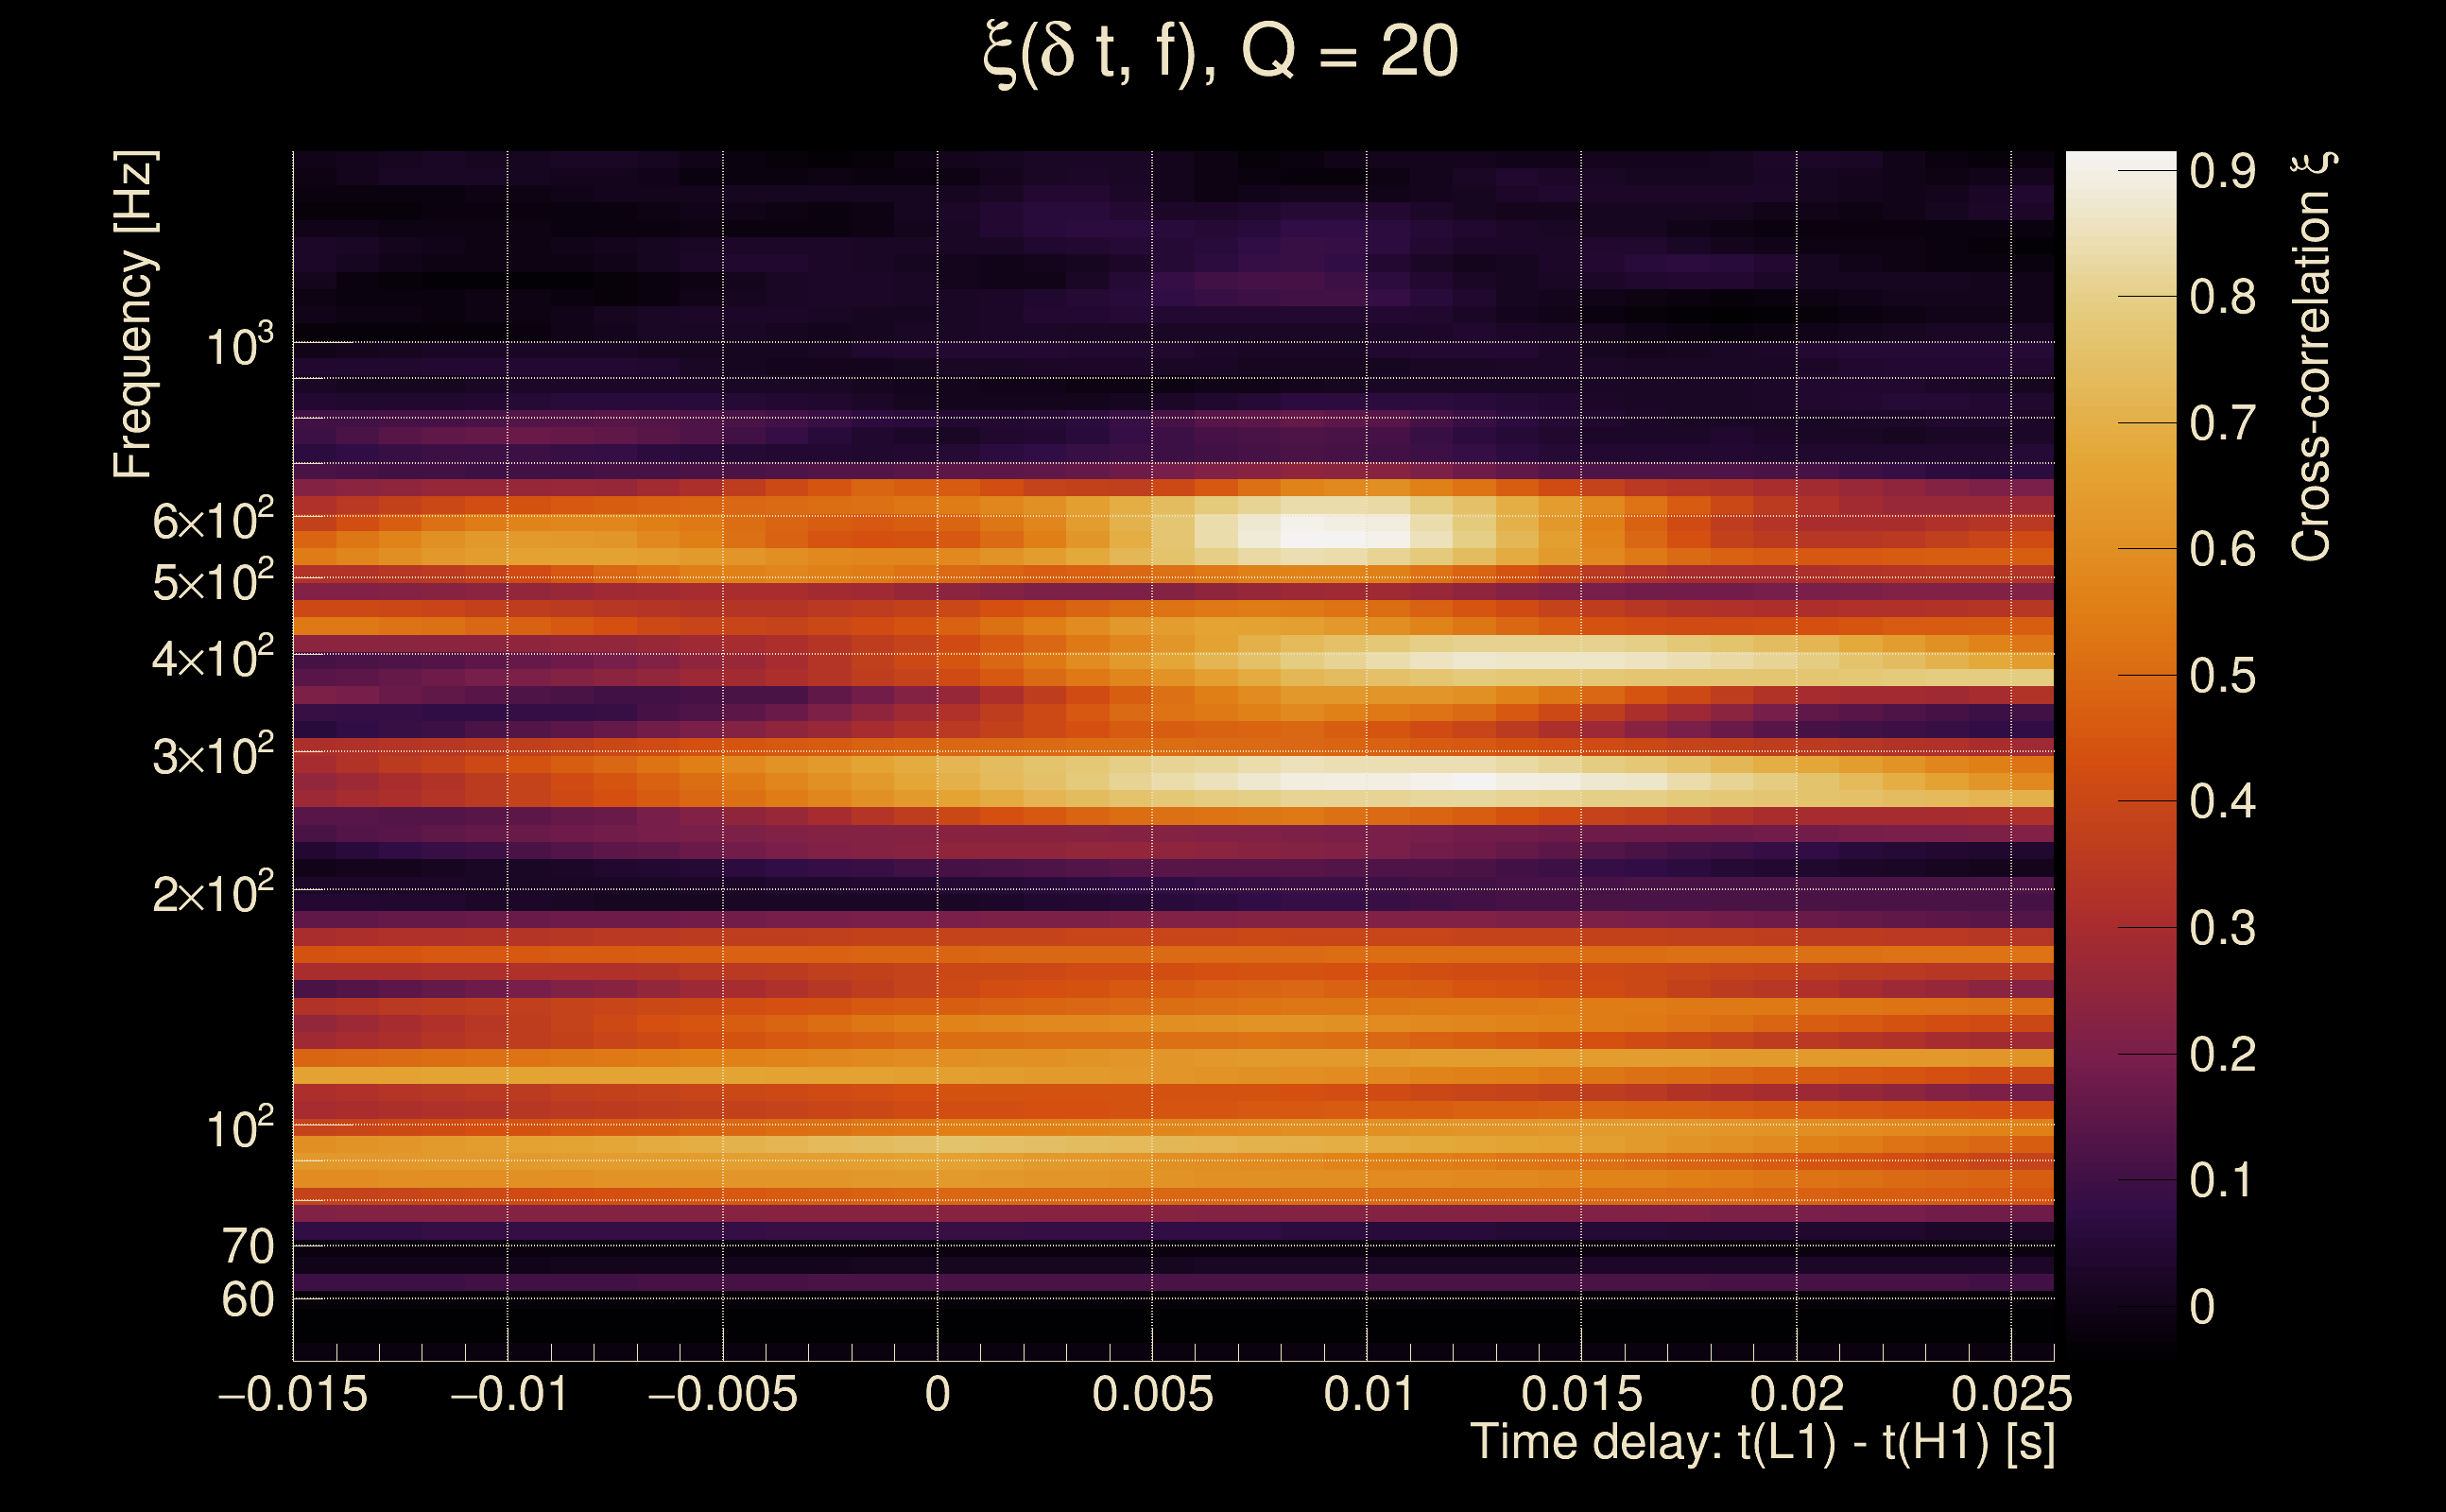
| Time delay between detectors t(L1) - t(H1): | 0.000460924 s (slice index = 108 / 217), δt_gw = 0.000460924 s |
| Time delay uncertainty: | 0.00718768 s |
| [targeted mode] Time delay probability: | 0.25269 (1.14384 sigmas), δt_target = 1.72247e+45 s |
| Frequency: | 553.6 Hz |
| Ξ: | 0.000180064 ± 0.0245255 (variance = 0.0006015): Q0: 0, Q1: 0, Q2: 0, Q3: 0.0435609, Q4: 0.0553921 |
| Rank: | R_X = 0.13682 |
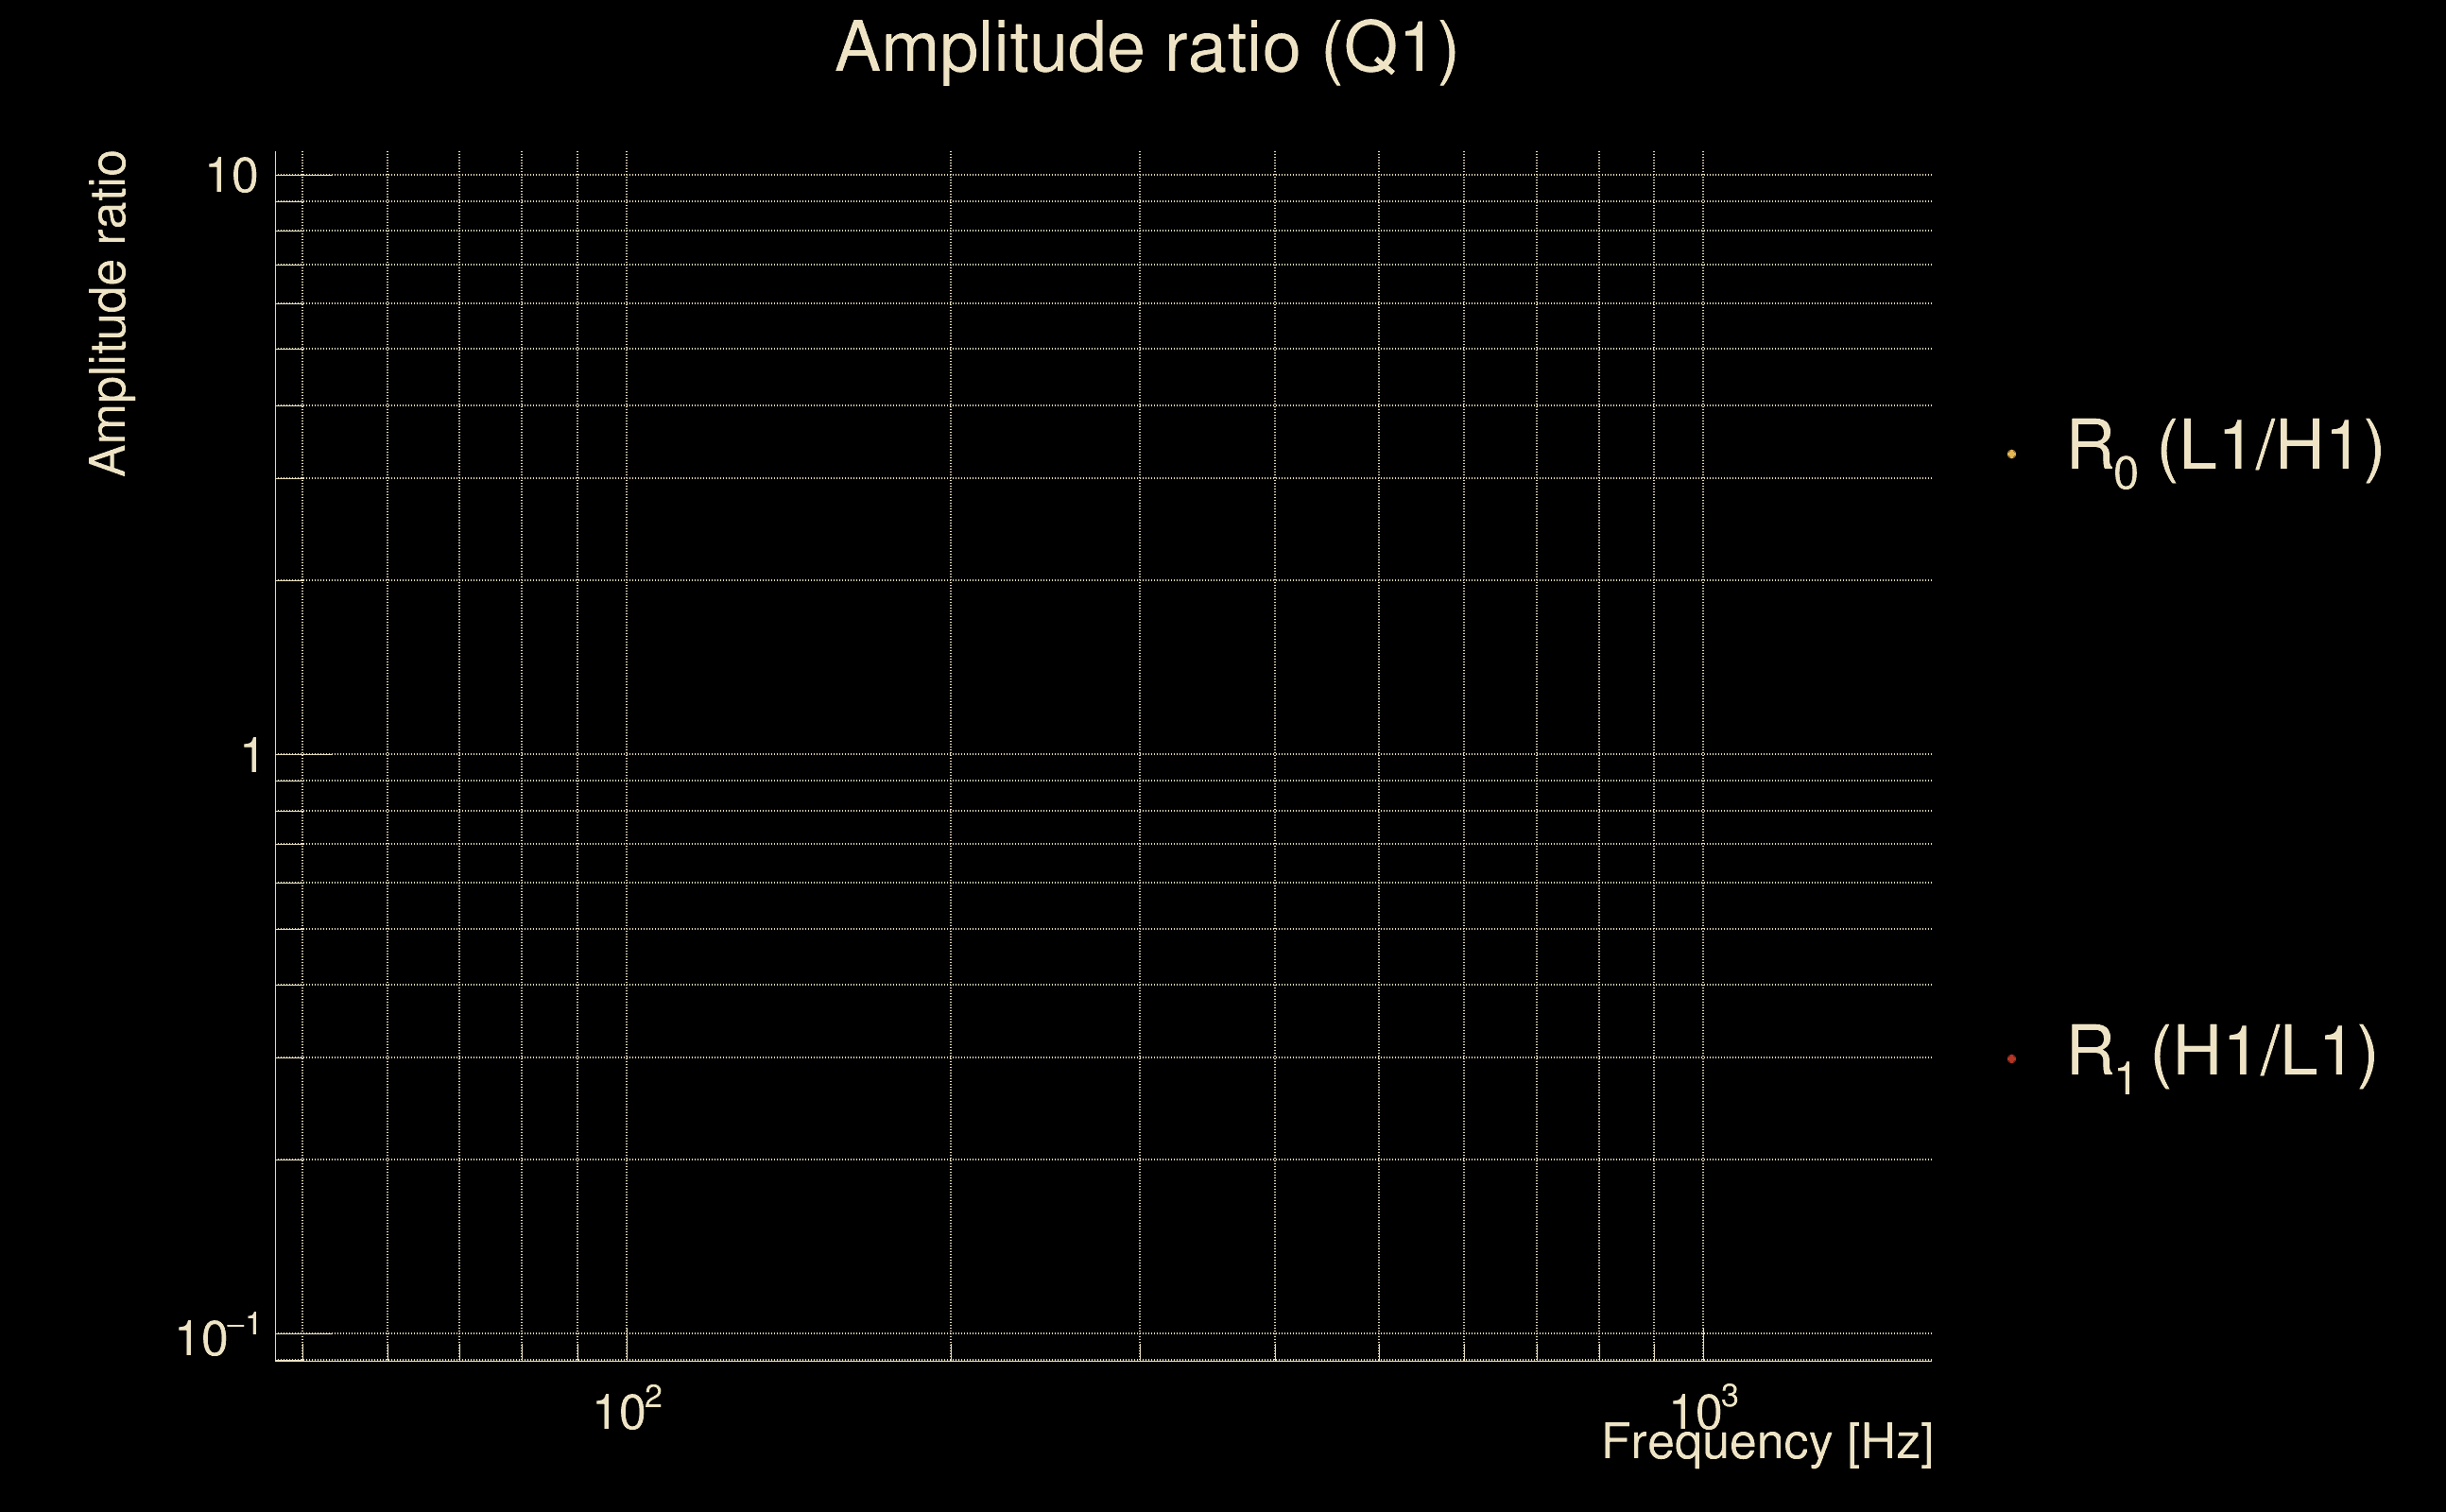
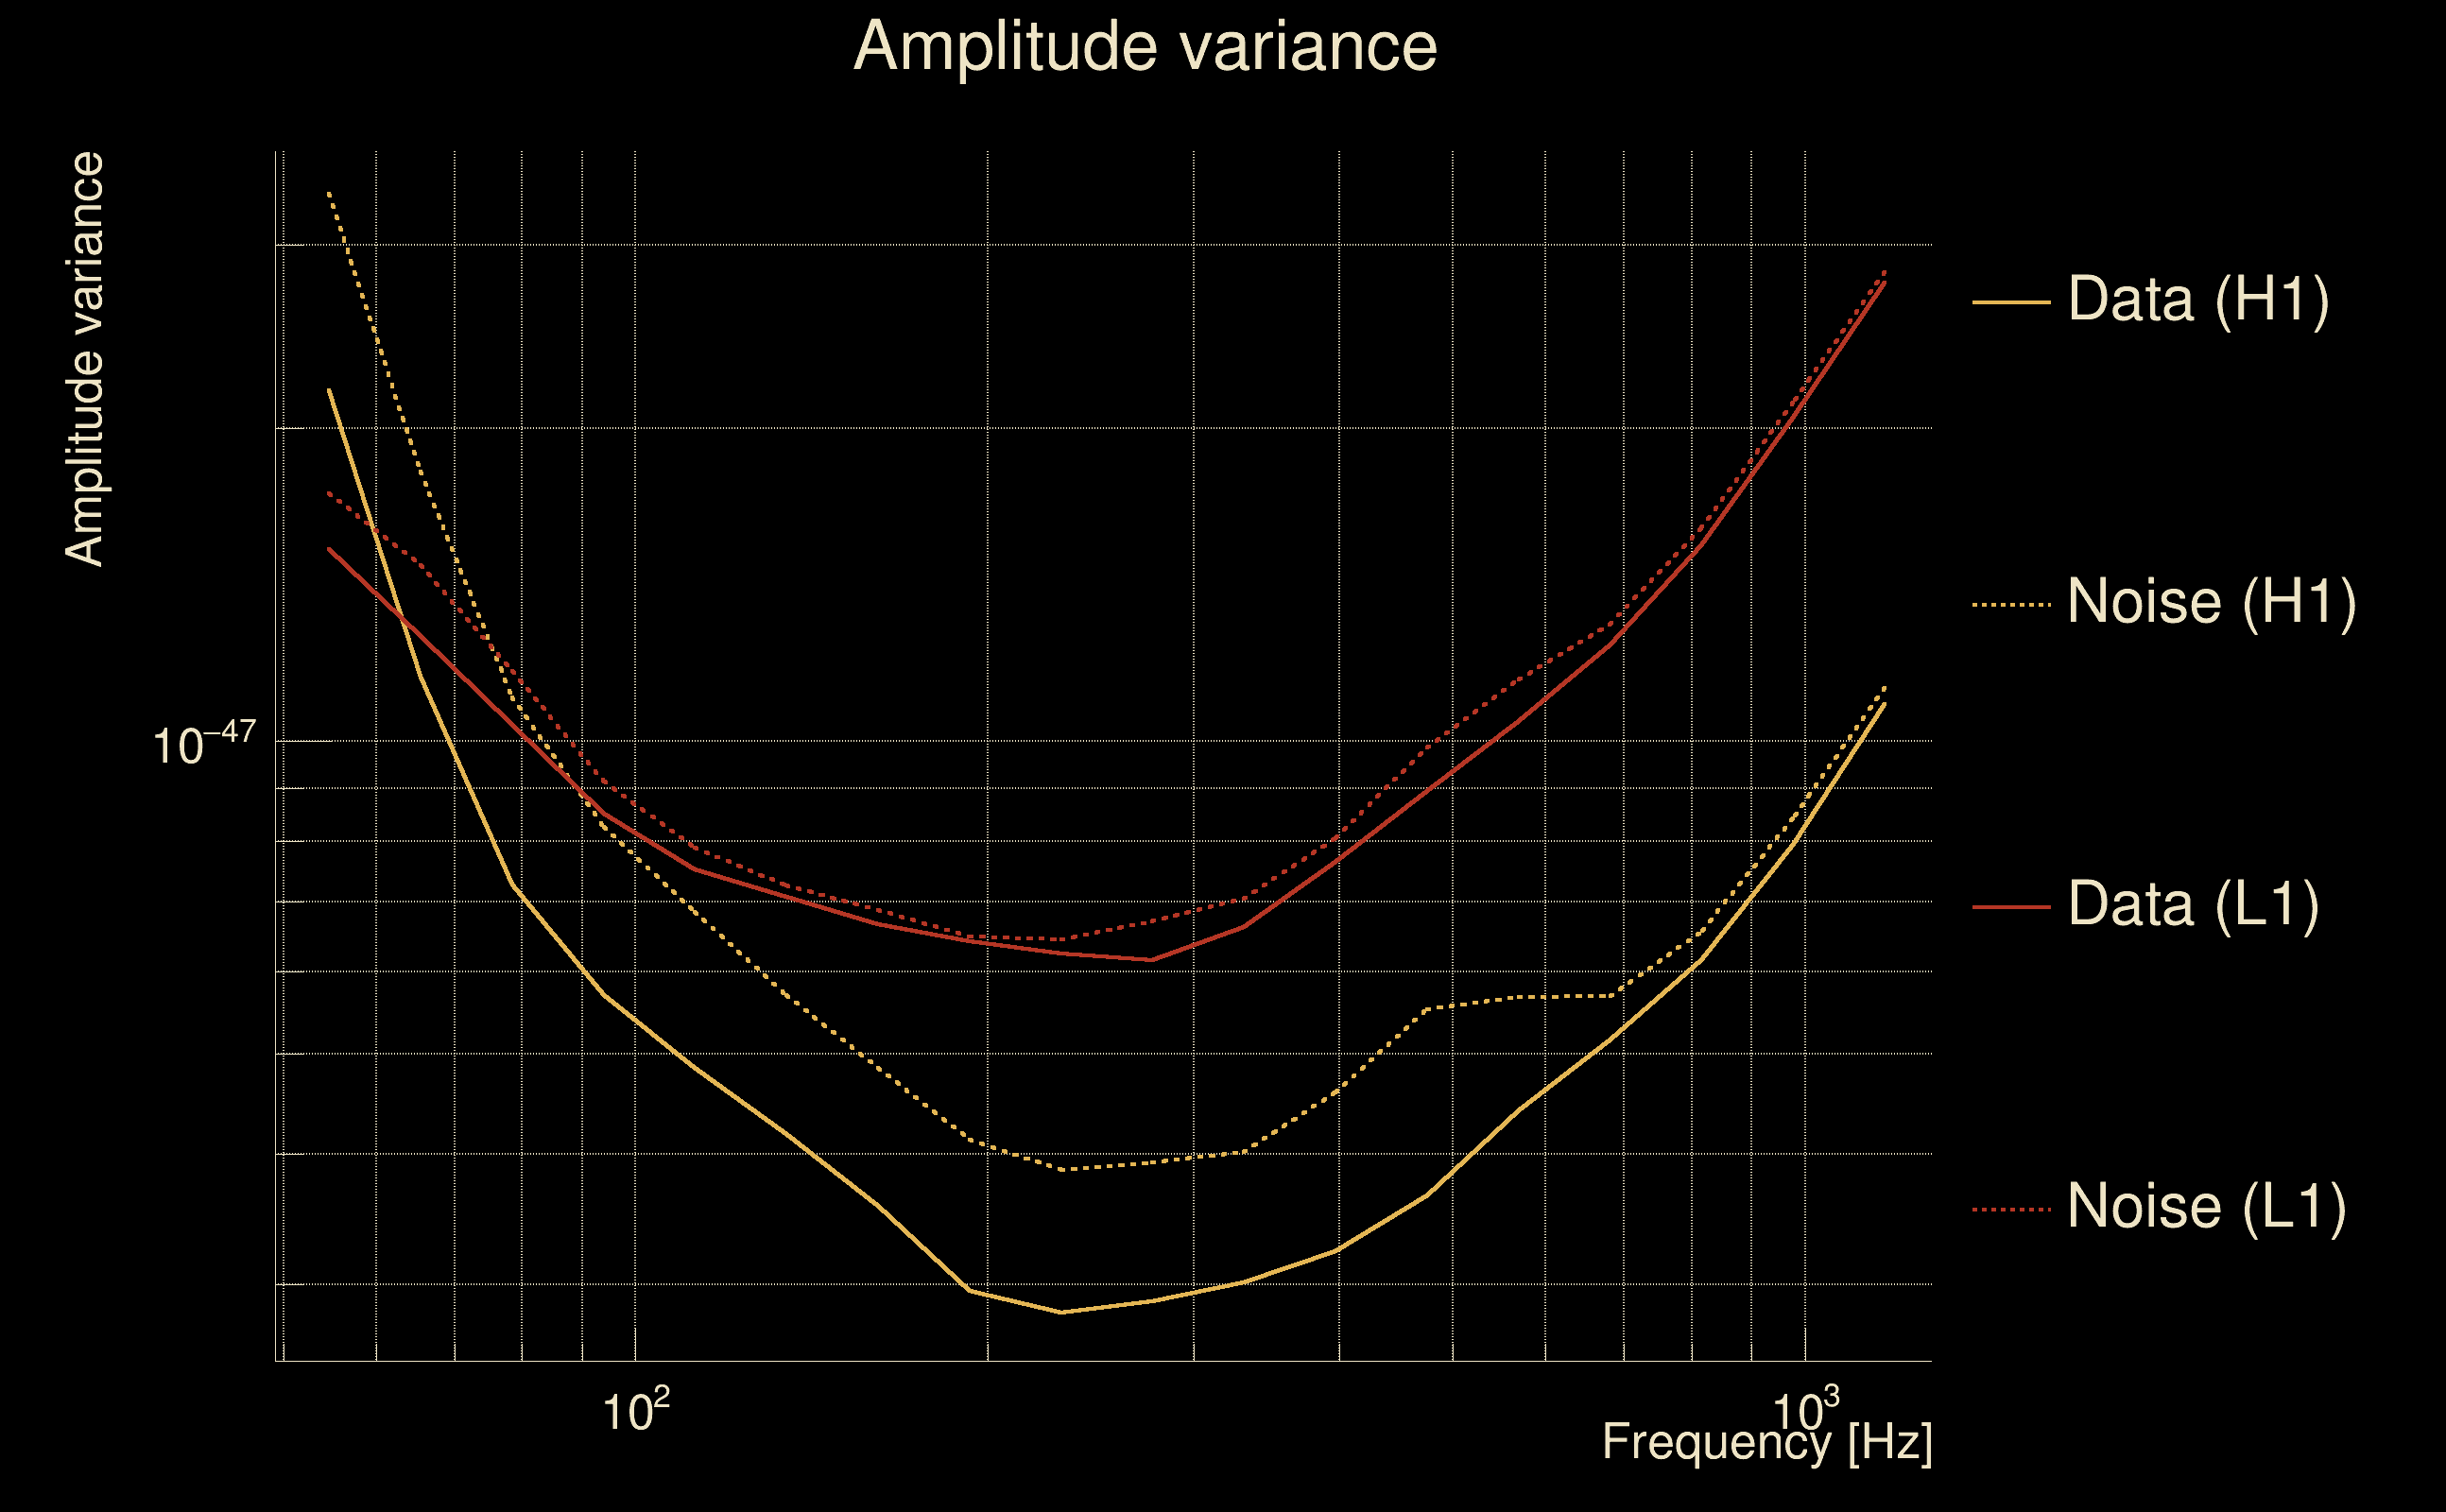
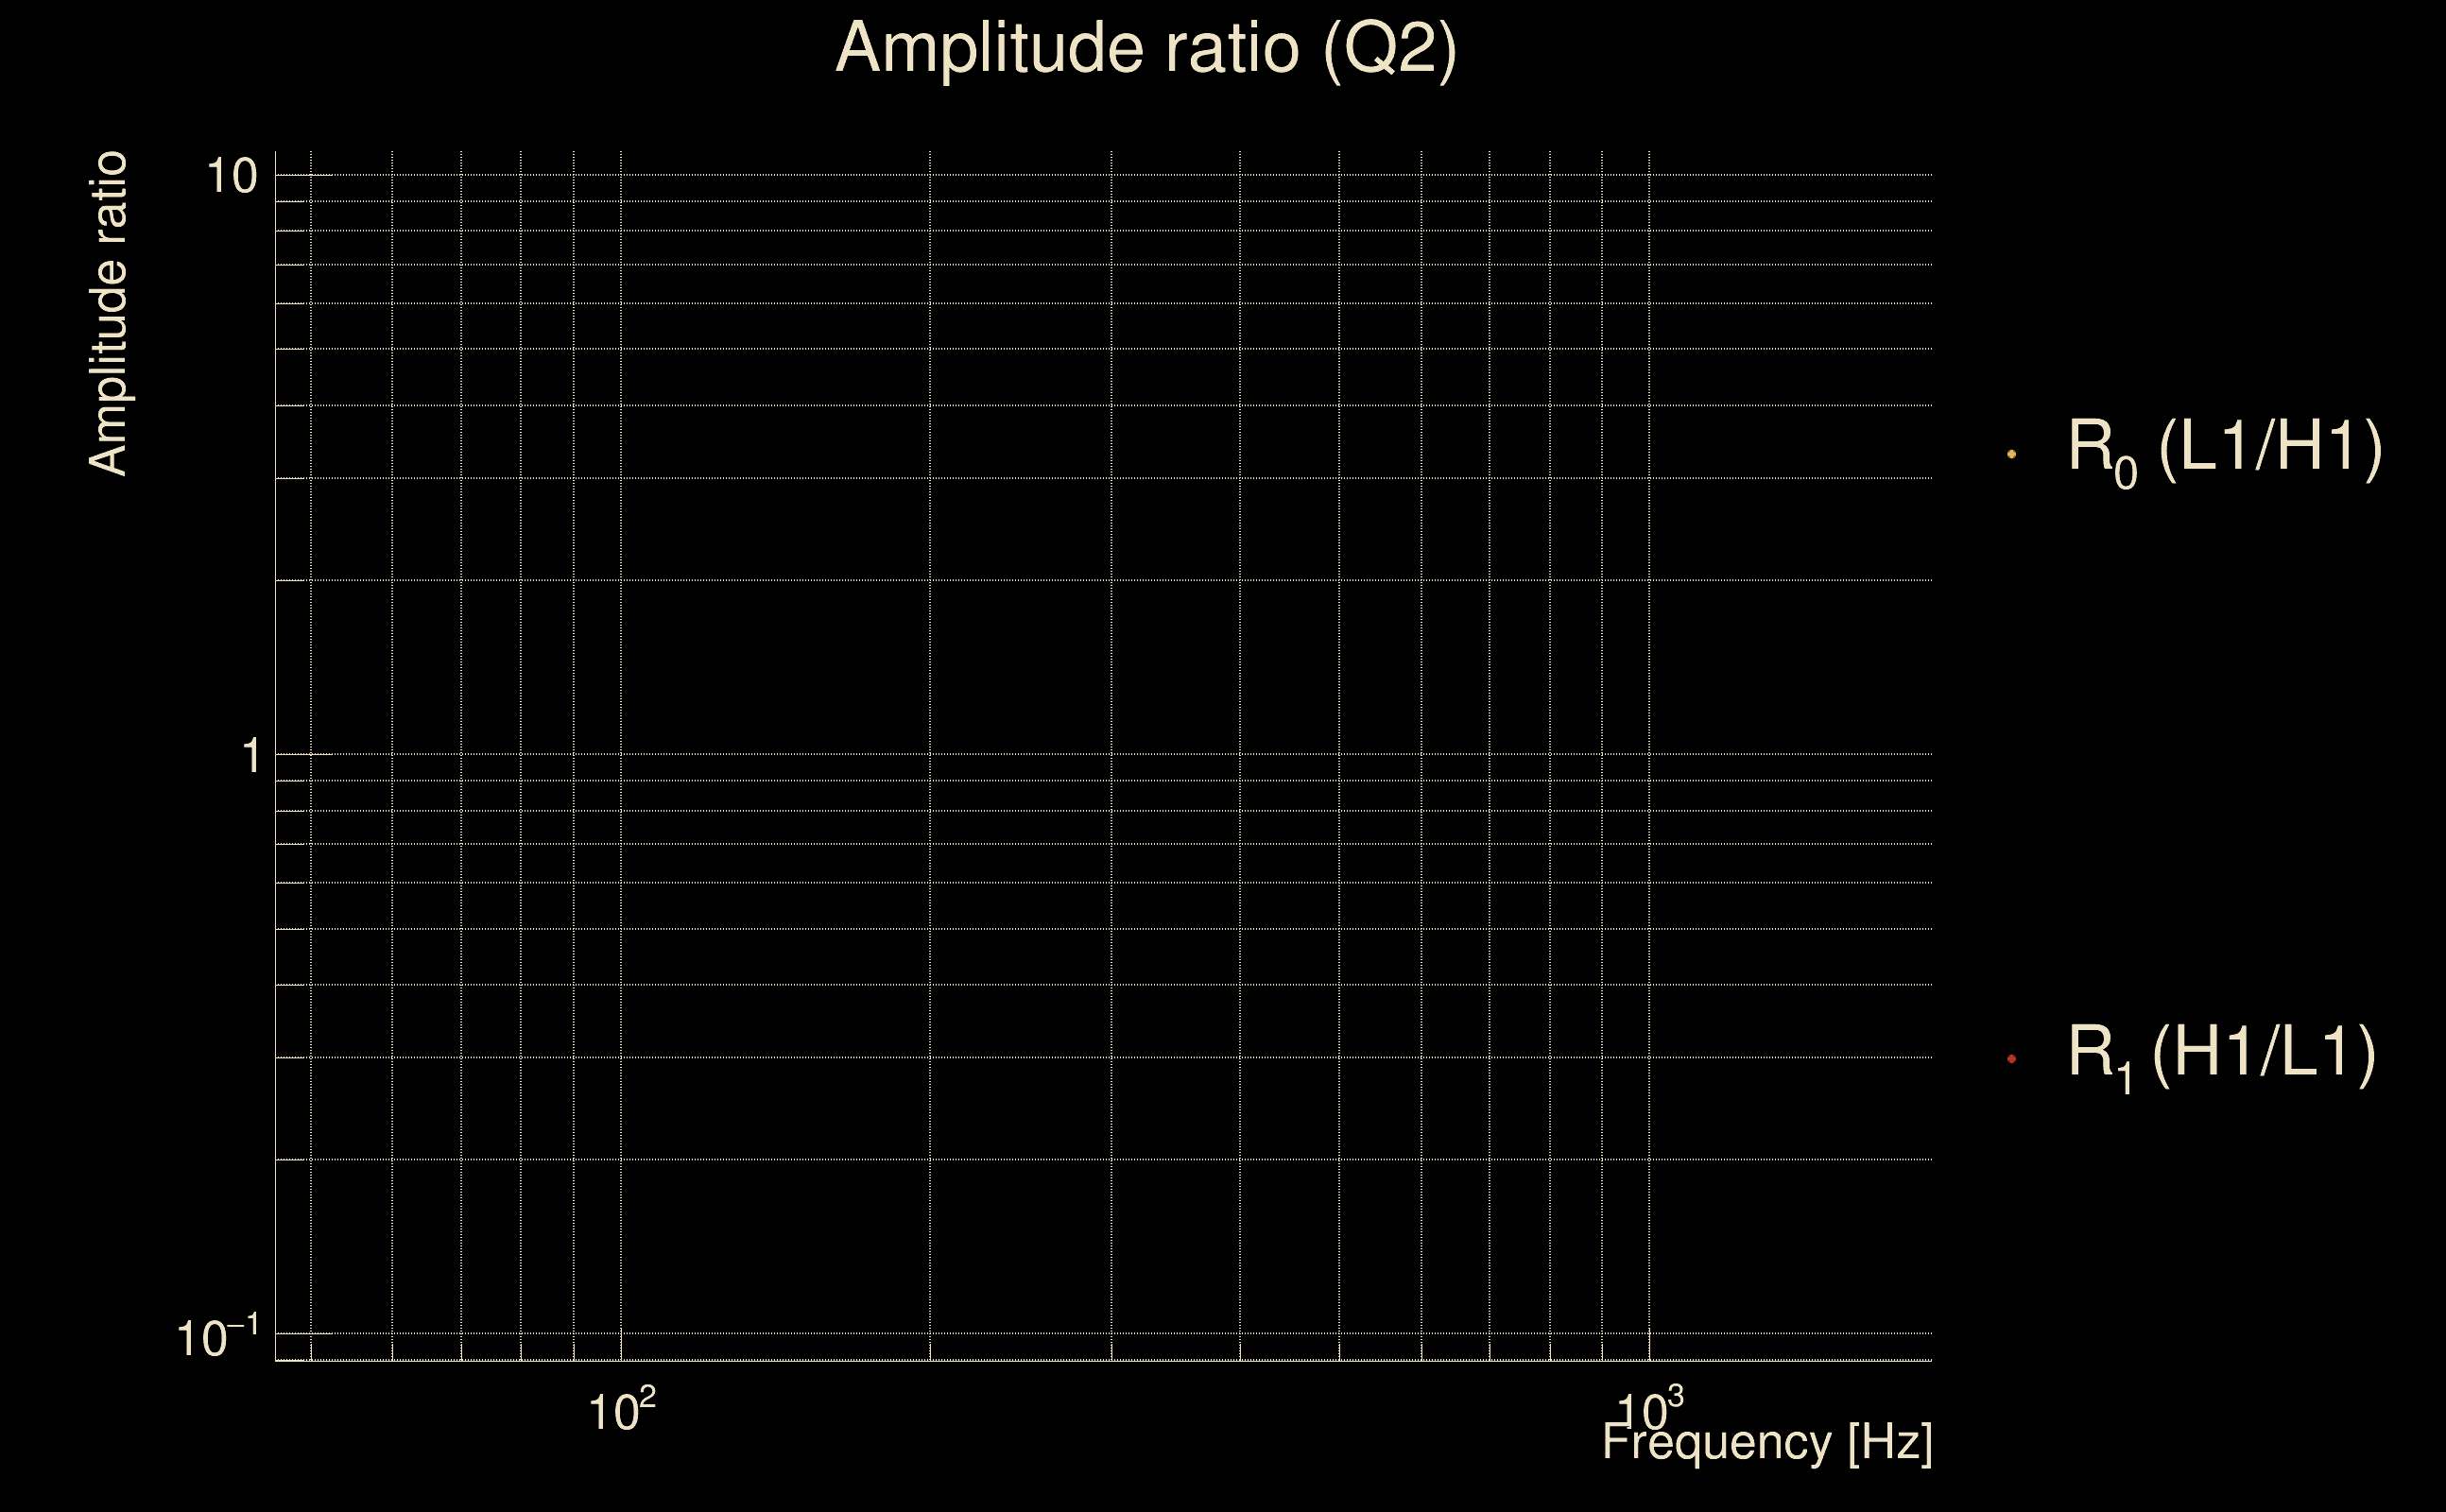
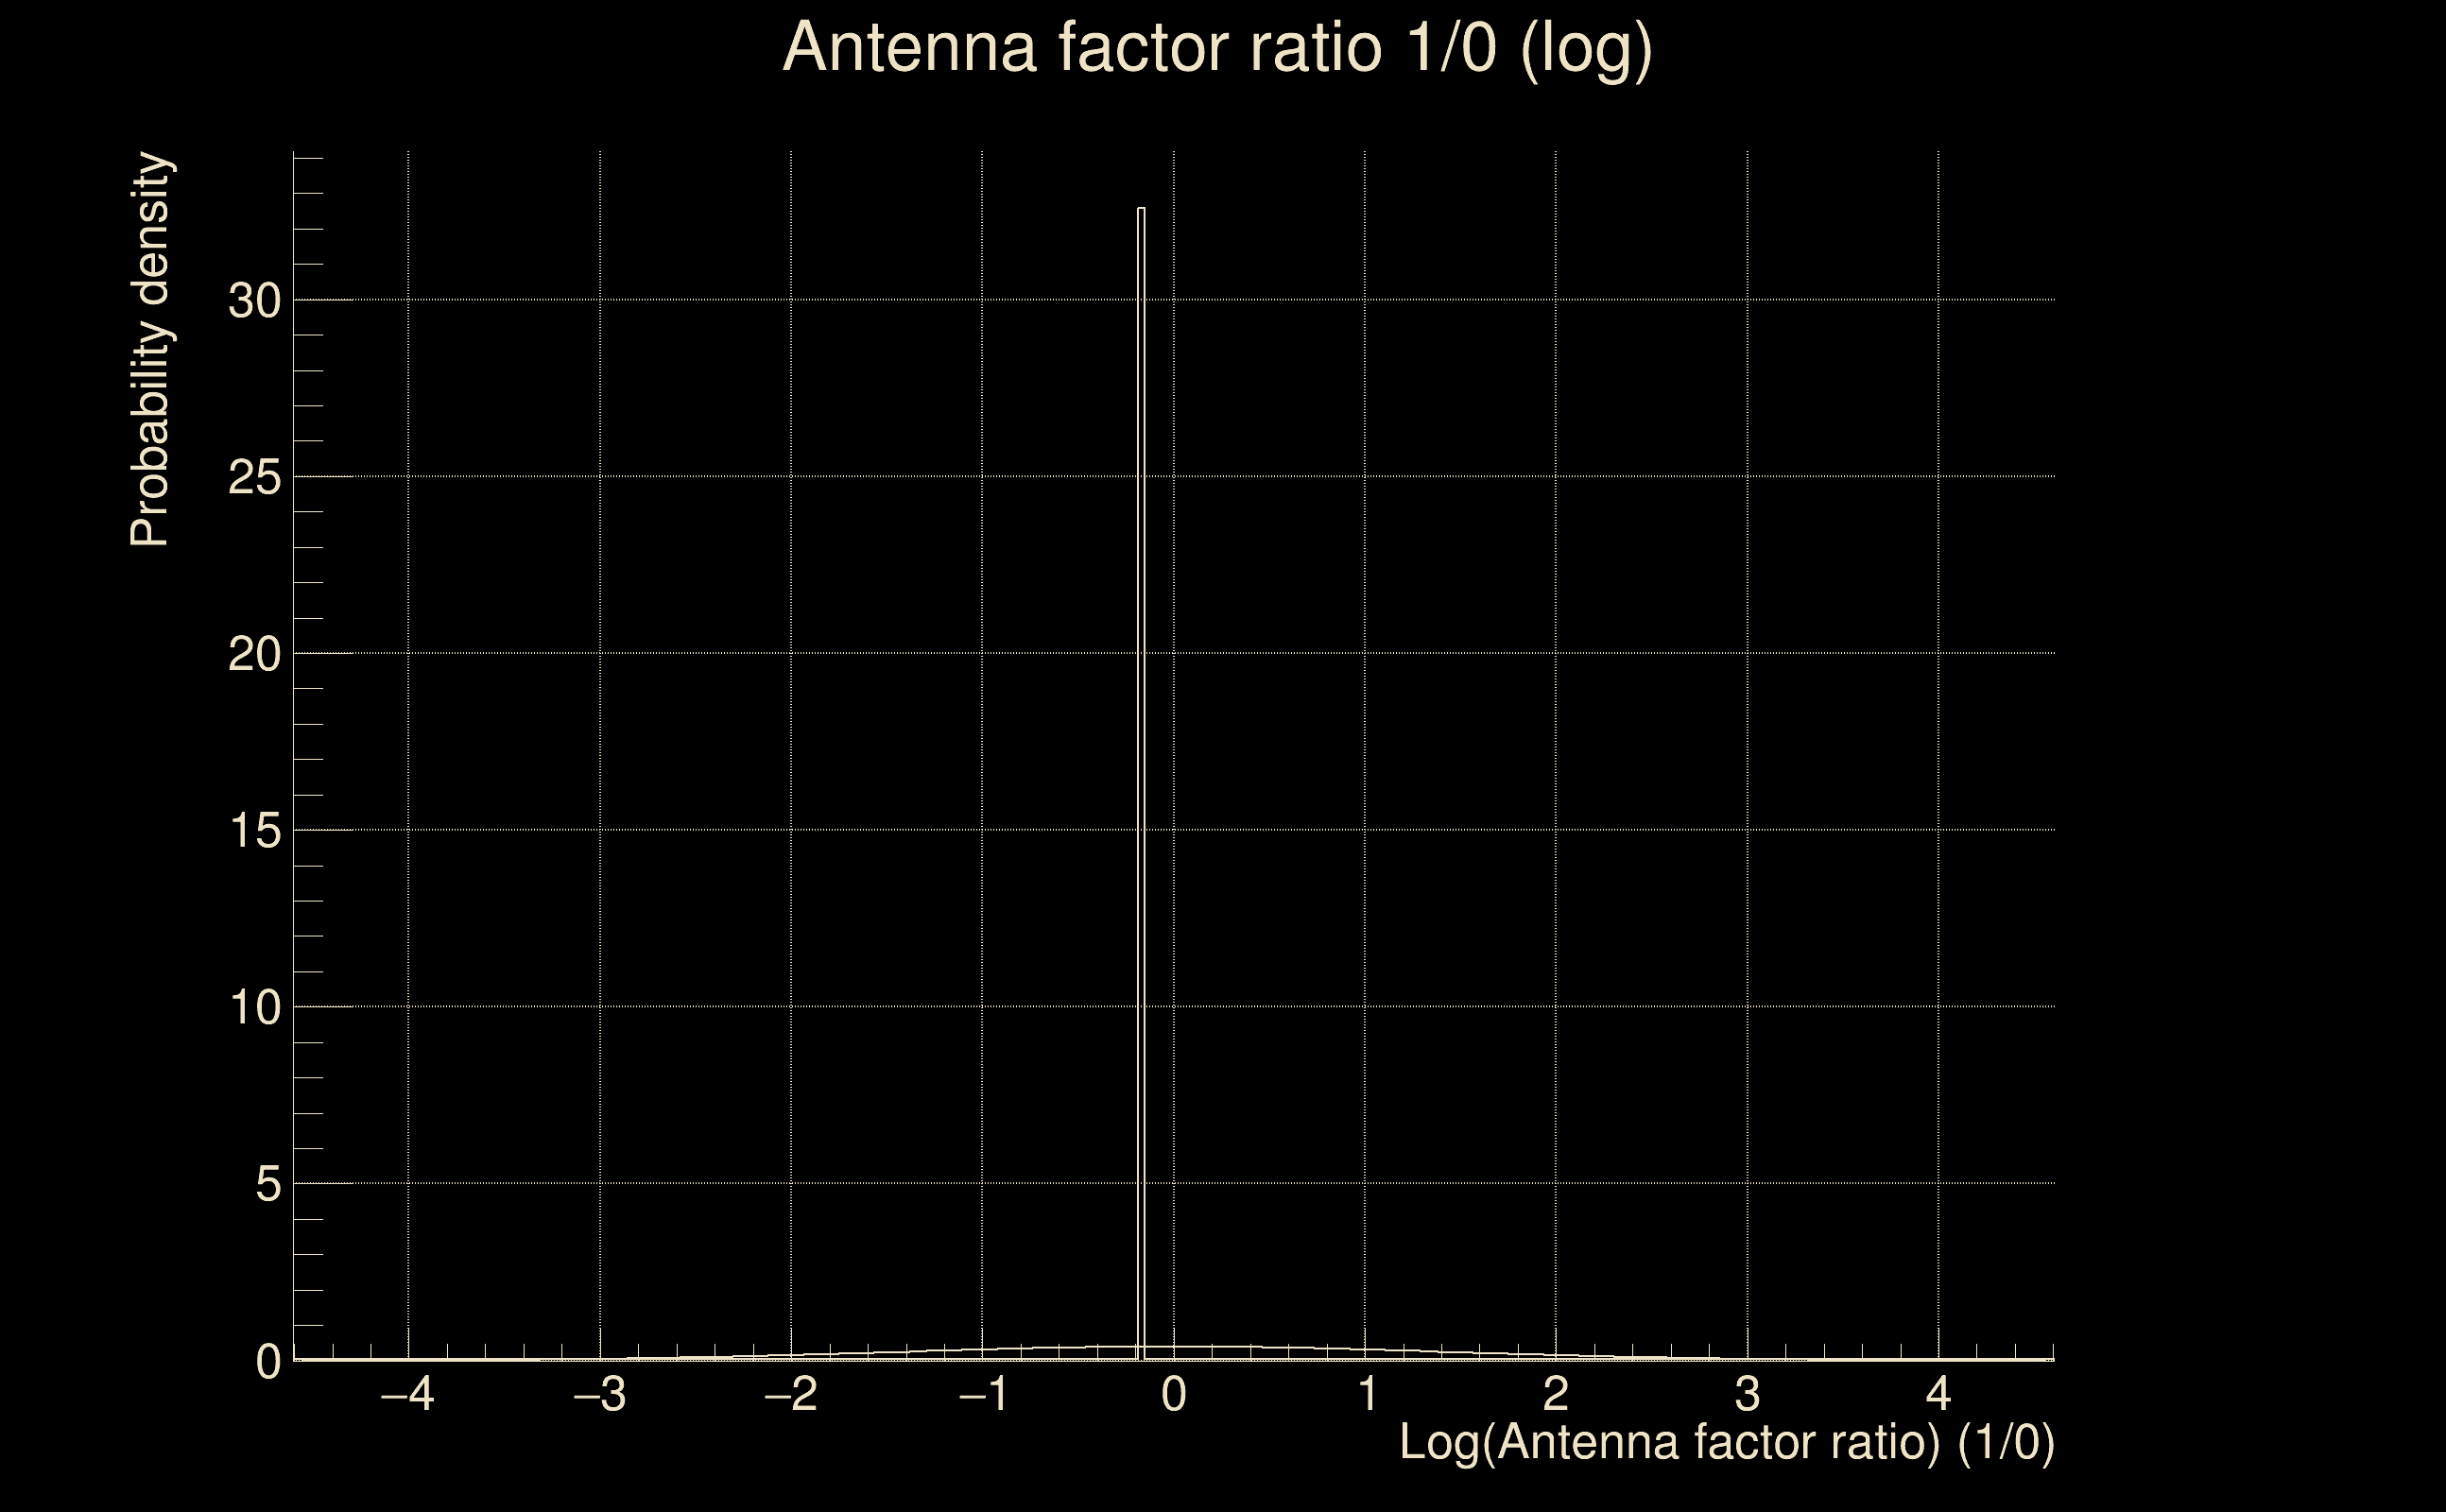
| Log of amplitude ratio (L1/H1): | 0.59896, variance = 0.289798 (L1/H1: -0.0593672, variance = 0.530225, H1/L1: -1.44481, variance = 0.637583) |
| Amplitude ratio (L1/H1): | 1.82022 ⋇ 1.71314 (L1/H1: 0.942361 ⋇ 2.07128, H1/L1: 0.235791 ⋇ 2.22218) |
| Amplitude ratio H1|L1 compatibility (probability): | 0.163948 |
| Antenna factor probability: | 1 |
| Number of rejected frequency rows: | Q0: 18 / 18, Q1: 36 / 36, Q2: 70 / 70, Q3: 129 / 134, Q4: 249 / 258 |
| Maximum signal-to-noise ratio: | H1: 5.7045, L1: 5.03259 |
| SNR variance: | H1: 0.481224, L1: 0.49914 |
| Click here for a zoomed plot | Click here for a zoomed plot | Click here for a zoomed plot | Click here for a zoomed plot | Click here for a zoomed plot |
 |
 |
 |
 |
 |
 |
 |
 |
 |
 |
 |
 |
 |
 |
 |
 |
 |
 |
 |
 |
 |
 |
 |
 |
 |
 |
 |
 |
 |
 |
 |
 |
 |
 |
| Event time t(H1): | GPS = 1368195318 (Mon May 15 14:15:00 2023 ) → GPS = 1368195328 (Mon May 15 14:15:10 2023 ) |
| Event time t(L1): | GPS = 1368195318 (Mon May 15 14:15:10 2023 ) → GPS = 1368195328 (Mon May 15 14:15:10 2023 ) |
| Omicron analysis time window (H1): | GPS = 1368195315 → GPS = 1368195331 |
| Omicron analysis time window (L1): | GPS = 1368195315 → GPS = 1368195331 |
| Time delay between detectors t(L1) - t(H1): | 0.00245652 s (slice index = 108 / 217), δt_gw = 0.00245652 s |
| Time delay uncertainty: | 0.00641238 s |
| [targeted mode] Time delay probability: | 0.331546 (0.971004 sigmas), δt_target = 0.00868249 s |
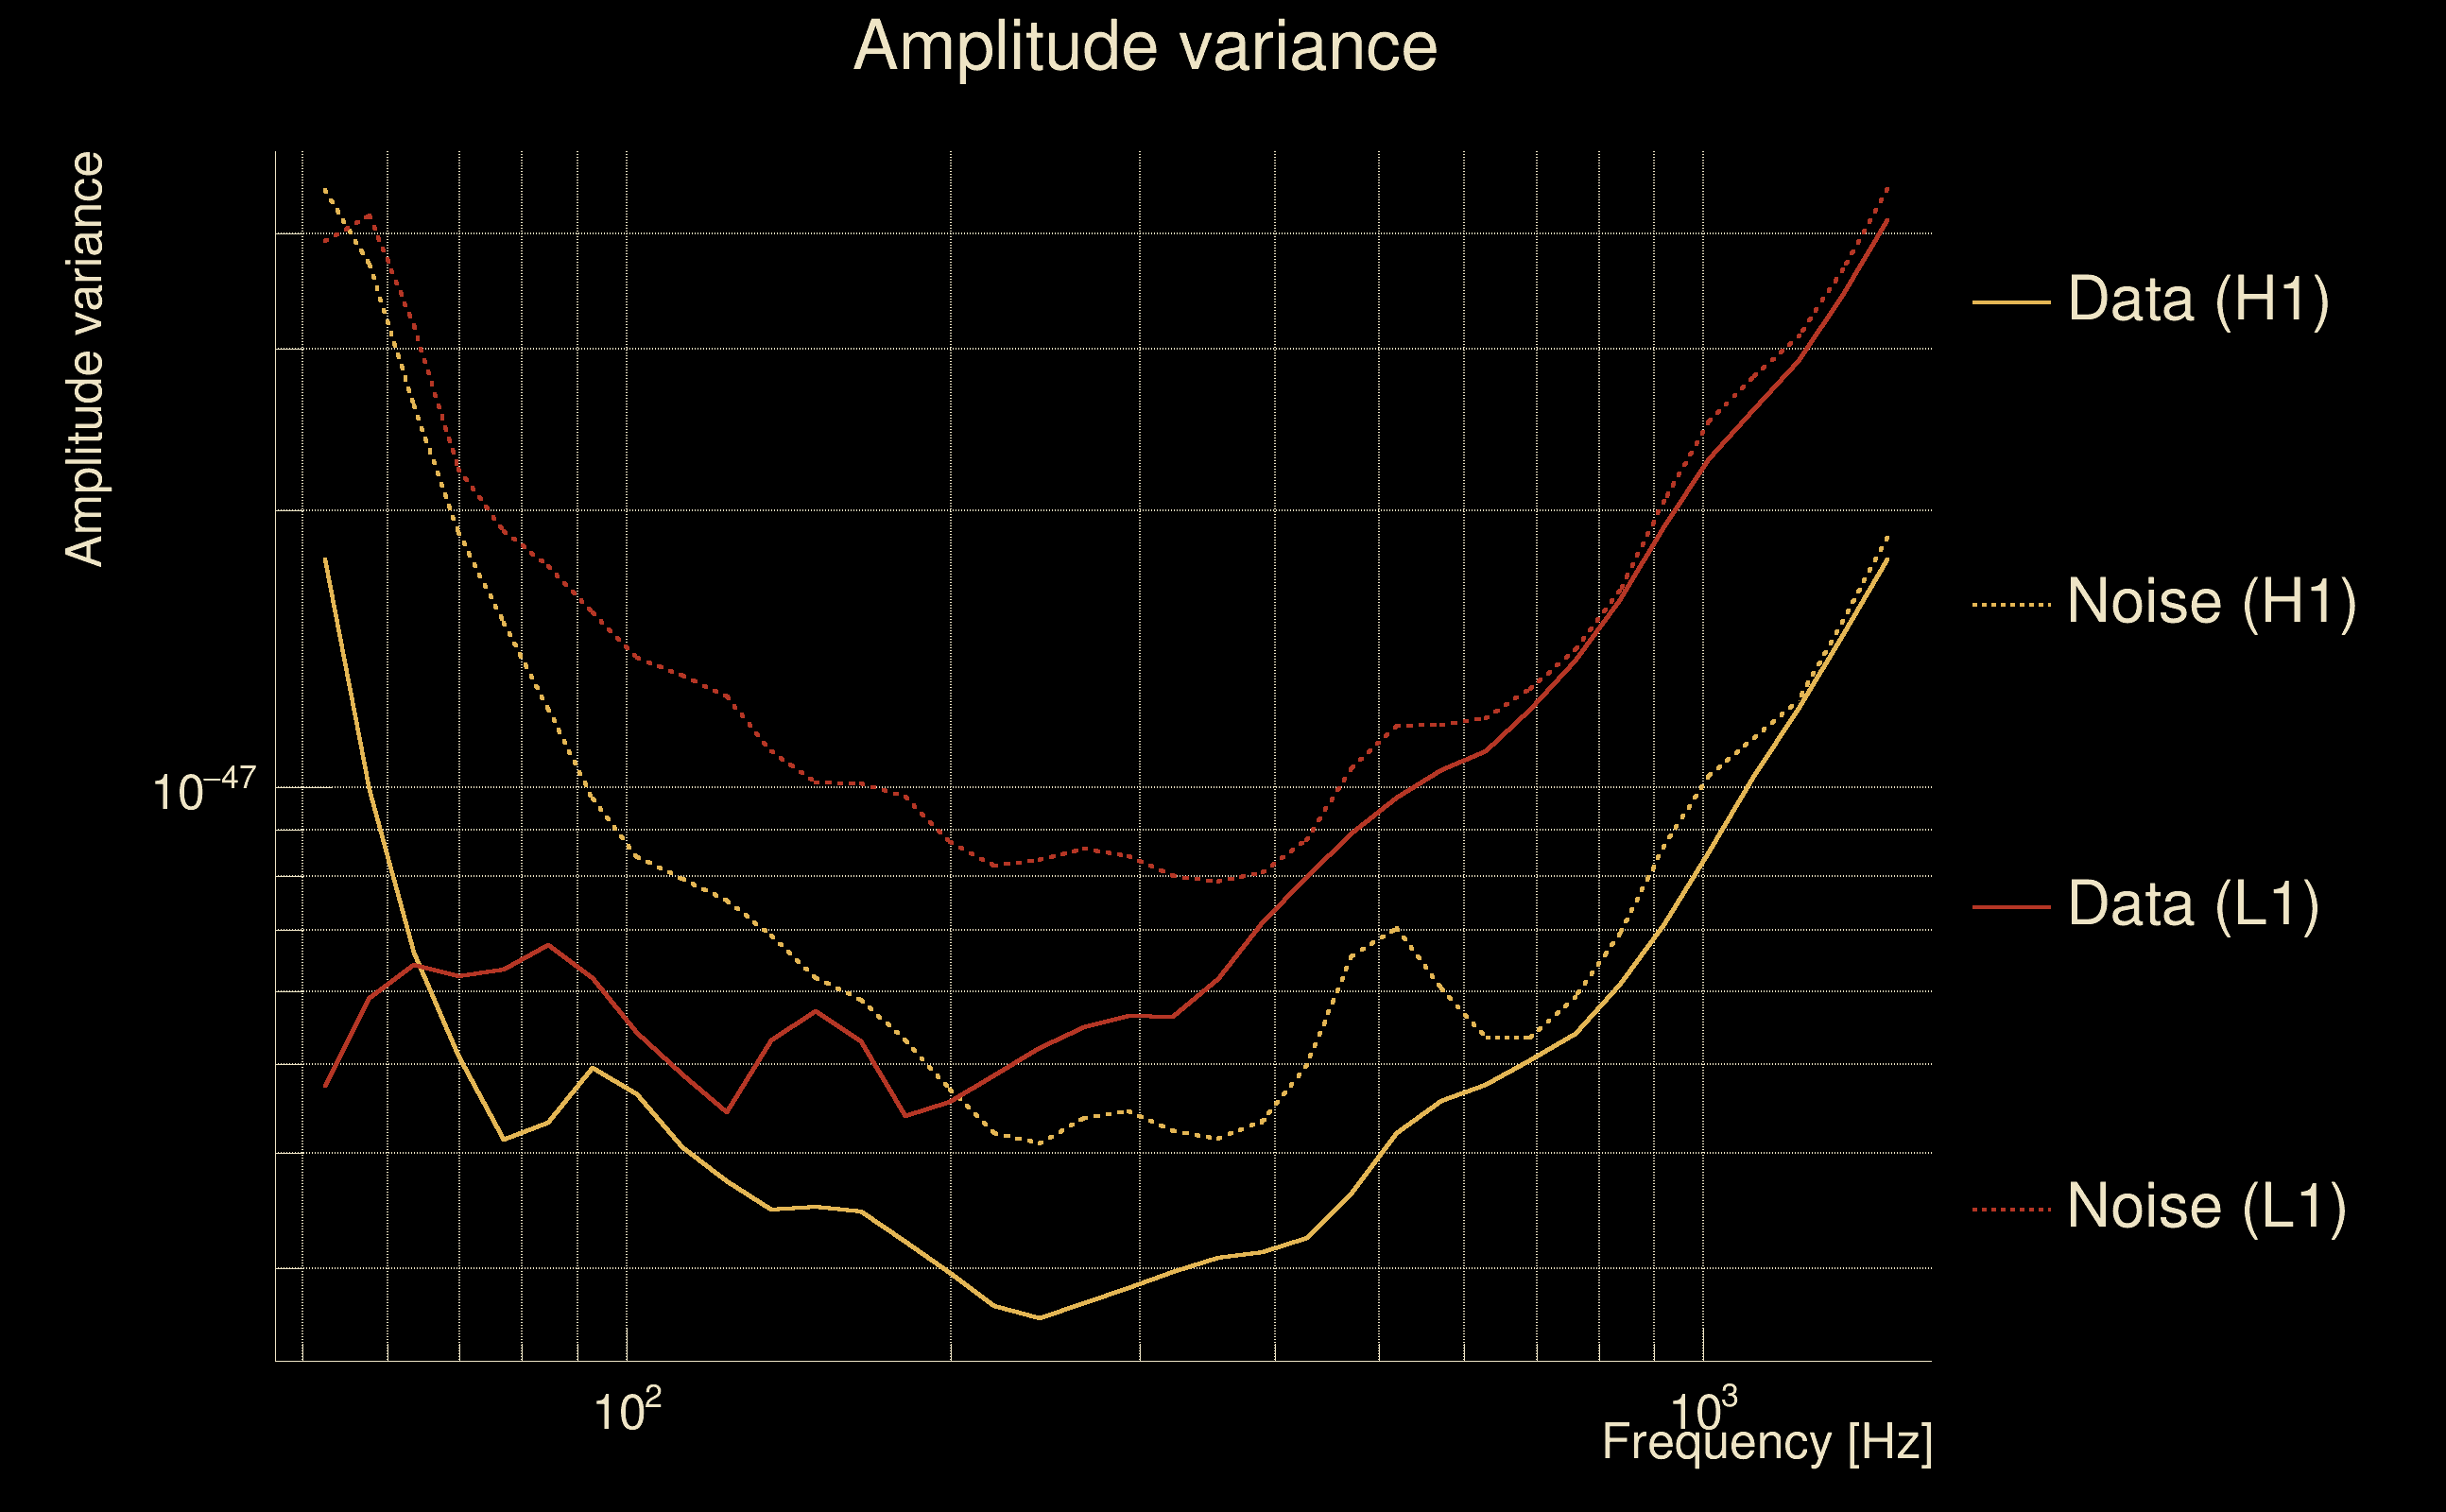
| Frequency: | 656.069 Hz |
| Ξ: | 0.00136041 ± 0.0354355 (variance = 0.00125568): Q0: 0, Q1: 0.0371384, Q2: 0.0544277, Q3: 0.104924, Q4: 0.0760445 |
| Rank: | R_X = 0.13682 |
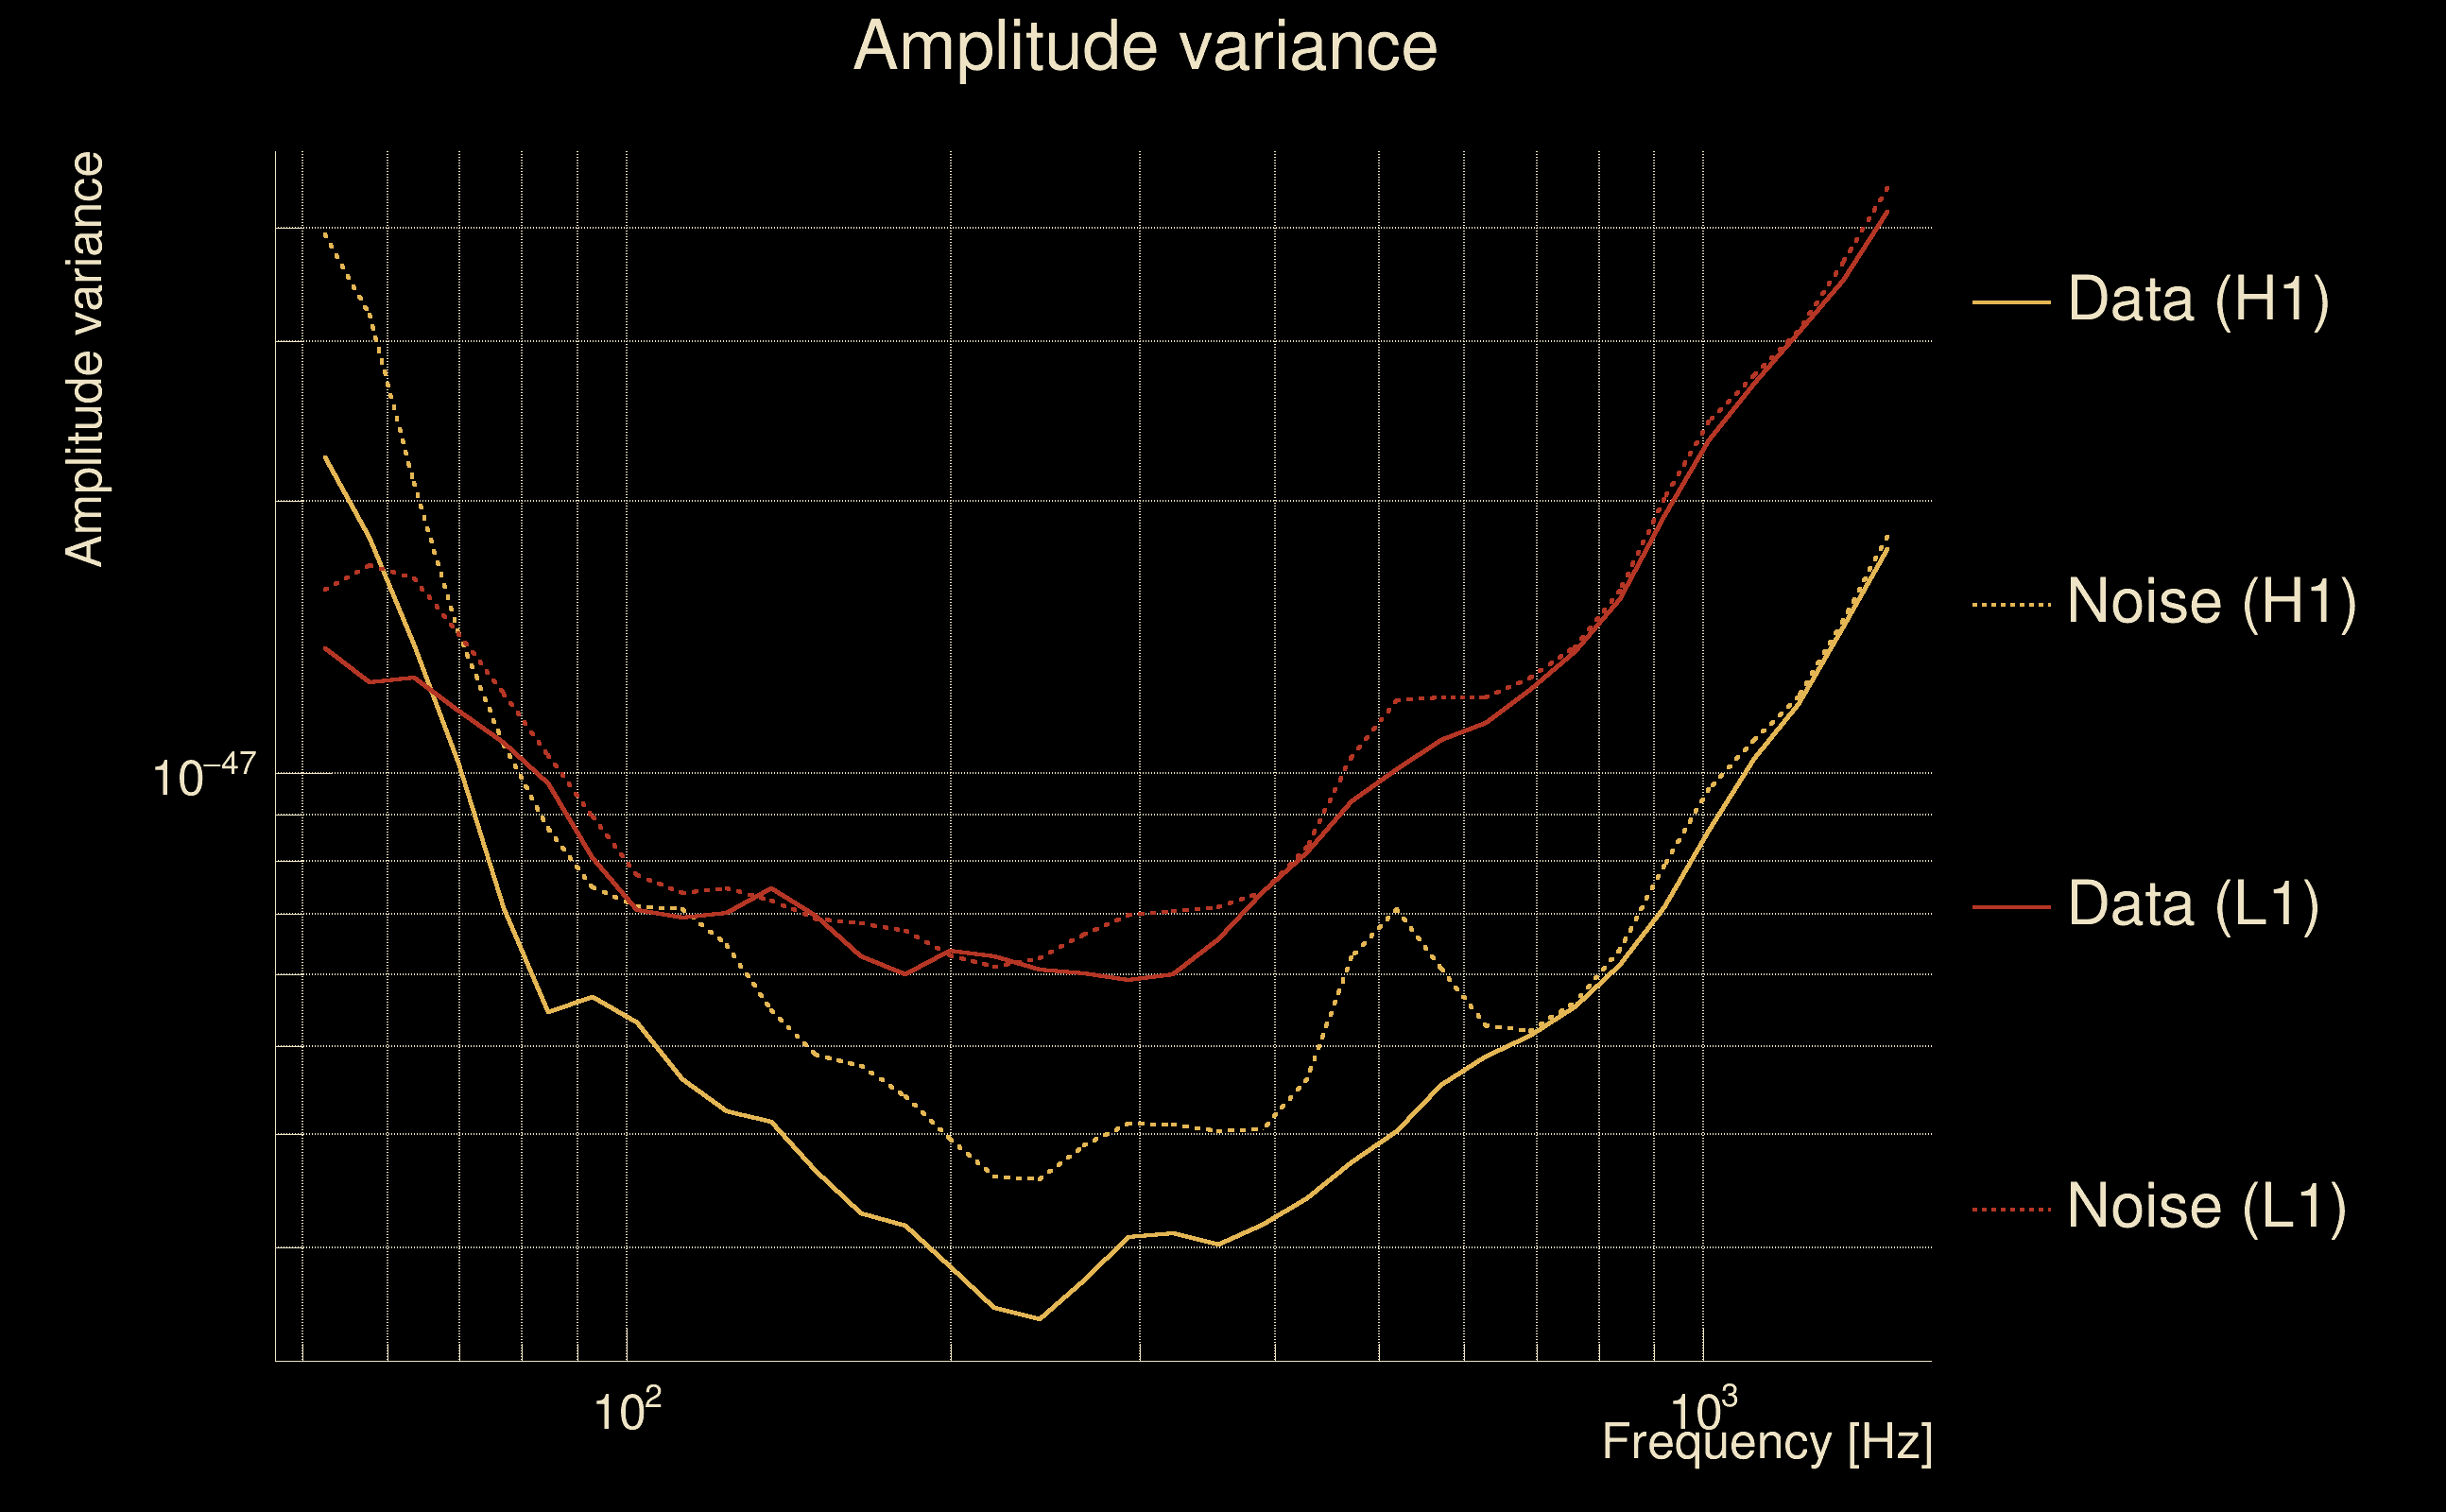
| Log of amplitude ratio (L1/H1): | 0.465256, variance = 0.555693 (L1/H1: 0.277992, variance = 1.1514, H1/L1: -0.641369, variance = 1.07403) |
| Amplitude ratio (L1/H1): | 1.59242 ⋇ 2.10739 (L1/H1: 1.32048 ⋇ 2.92423, H1/L1: 0.526571 ⋇ 2.81892) |
| Amplitude ratio H1|L1 compatibility (probability): | 0.807552 |
| Antenna factor probability: | 1 |
| Number of rejected frequency rows: | Q0: 18 / 18, Q1: 34 / 36, Q2: 66 / 70, Q3: 128 / 134, Q4: 248 / 258 |
| Maximum signal-to-noise ratio: | H1: 4.90349, L1: 5.05634 |
| SNR variance: | H1: 0.458614, L1: 0.492998 |
| Click here for a zoomed plot | Click here for a zoomed plot | Click here for a zoomed plot | Click here for a zoomed plot | Click here for a zoomed plot |
 |
 |
 |
 |
 |
 |
 |
 |
 |
 |
 |
 |
 |
 |
 |
 |
 |
 |
 |
 |
 |
 |
 |
 |
 |
 |
 |
 |
 |
 |
 |
 |
 |
 |
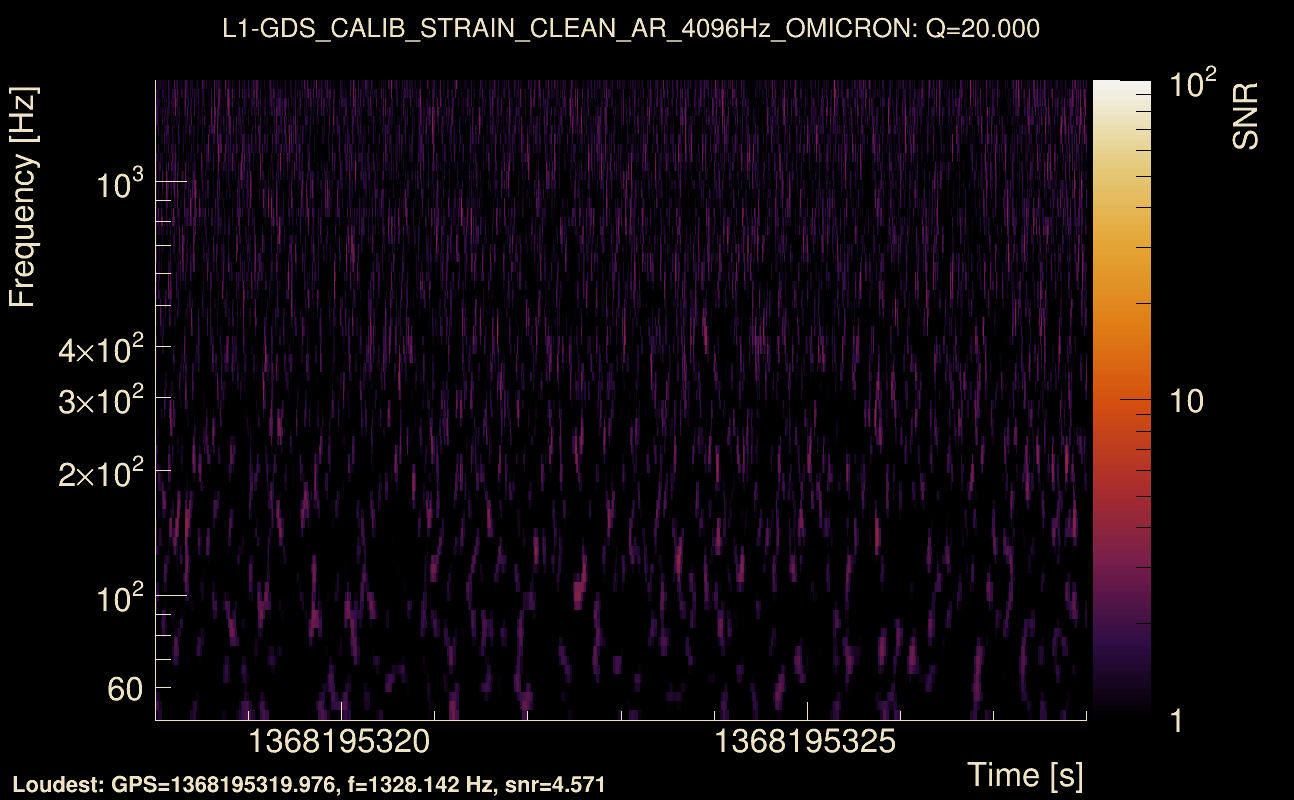
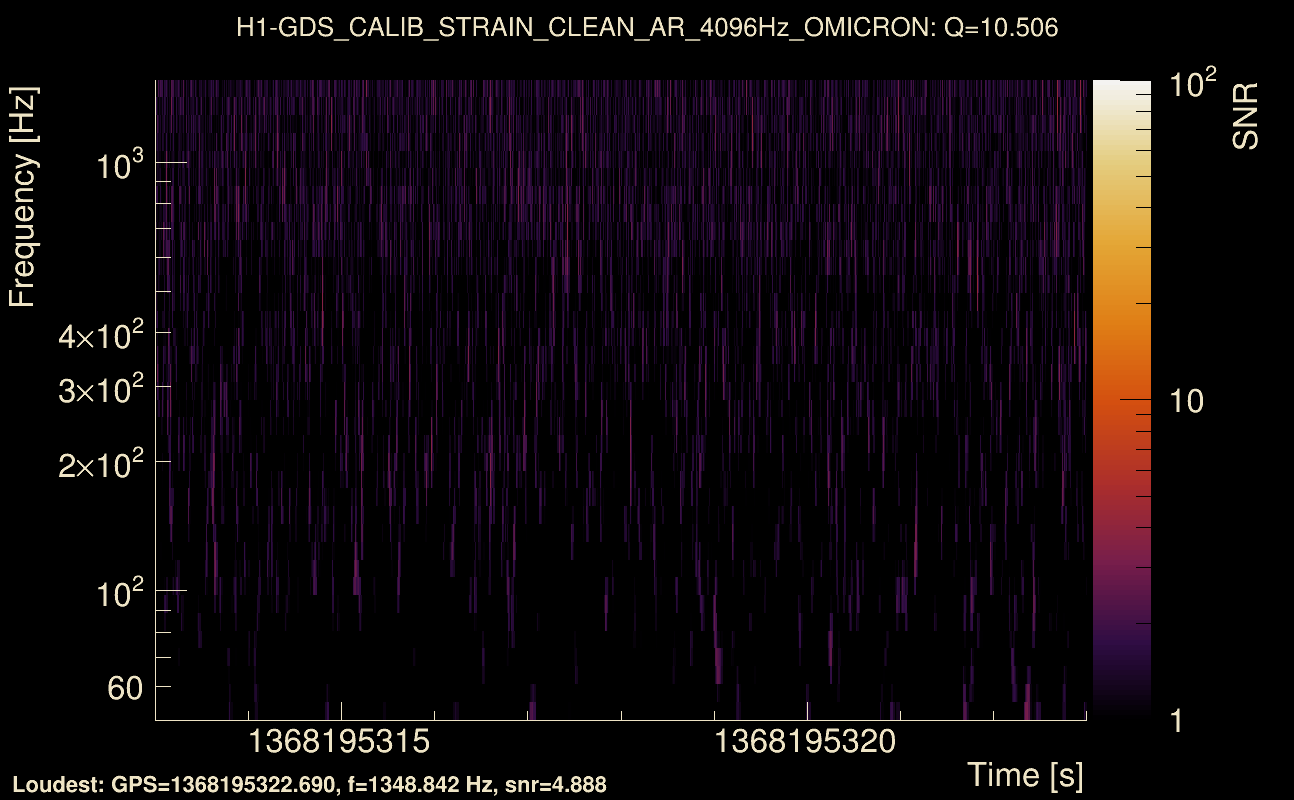
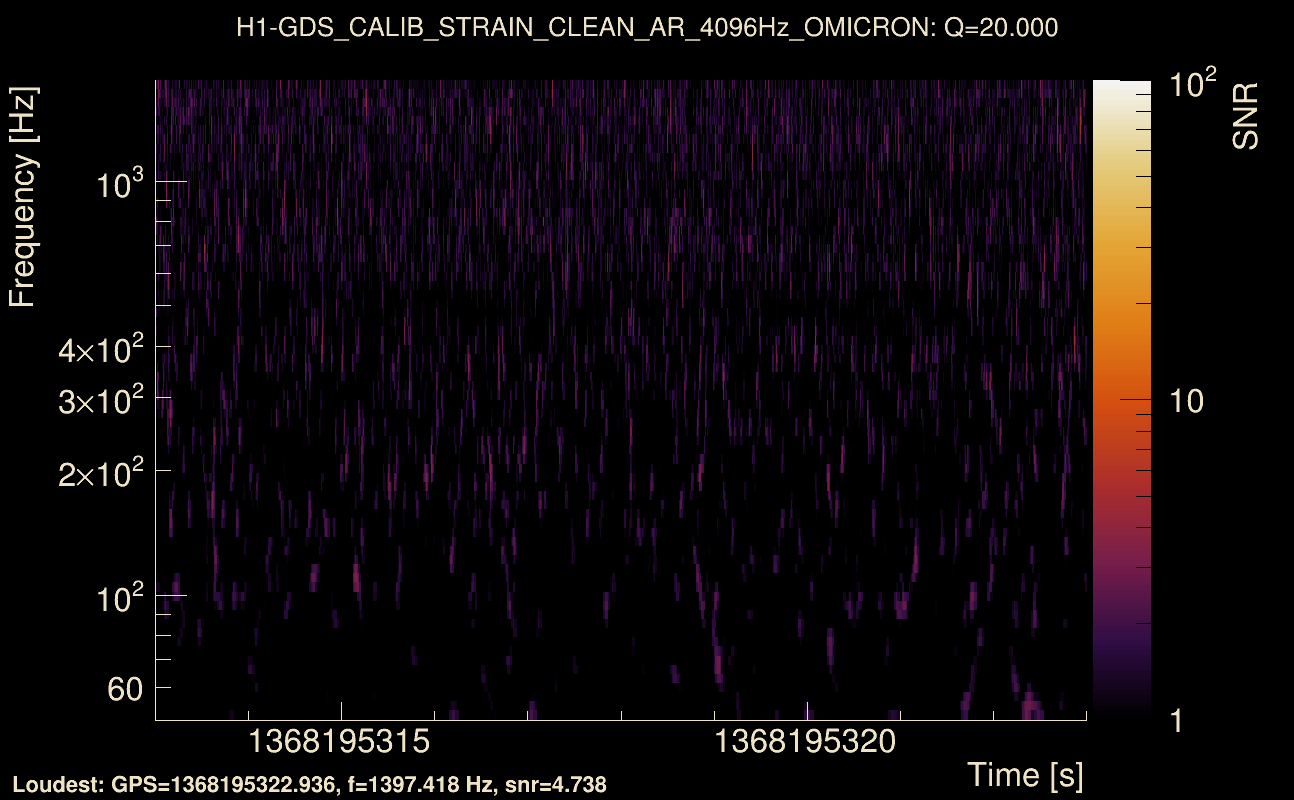
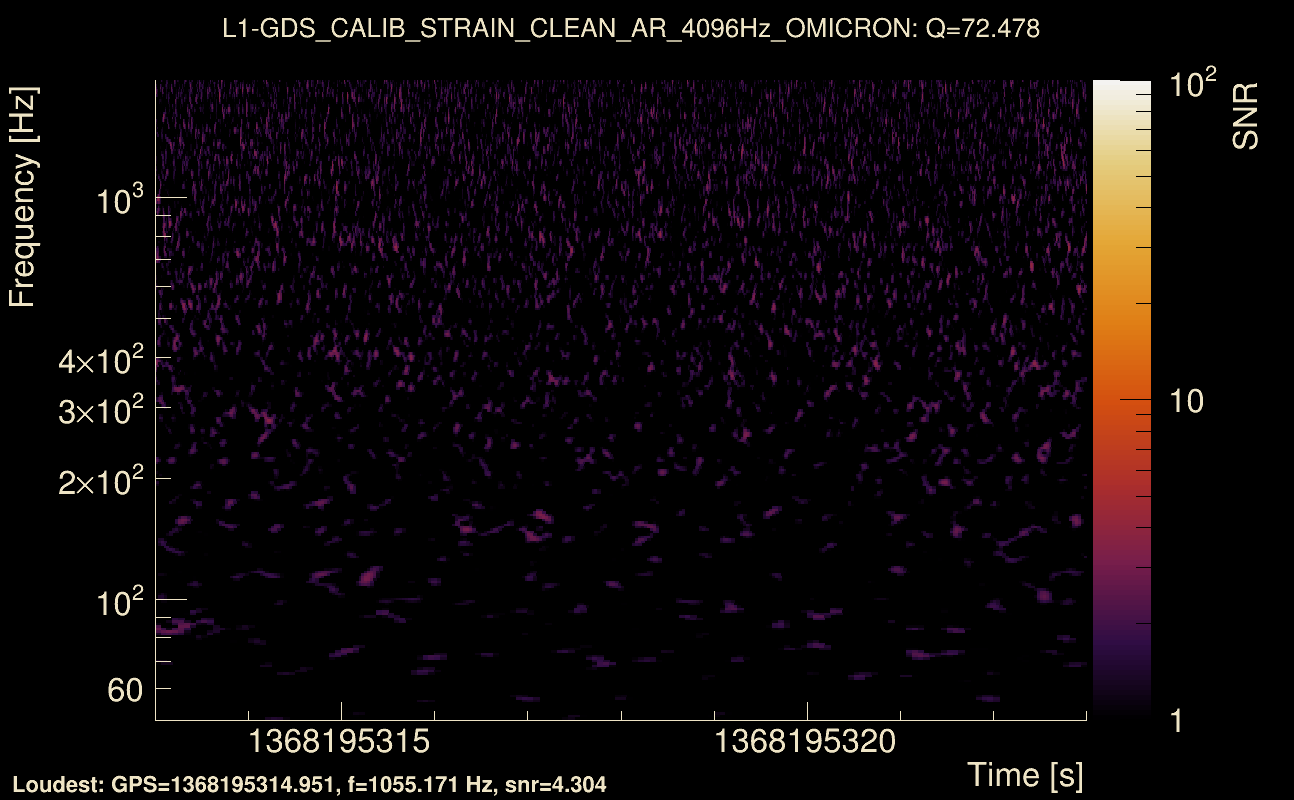
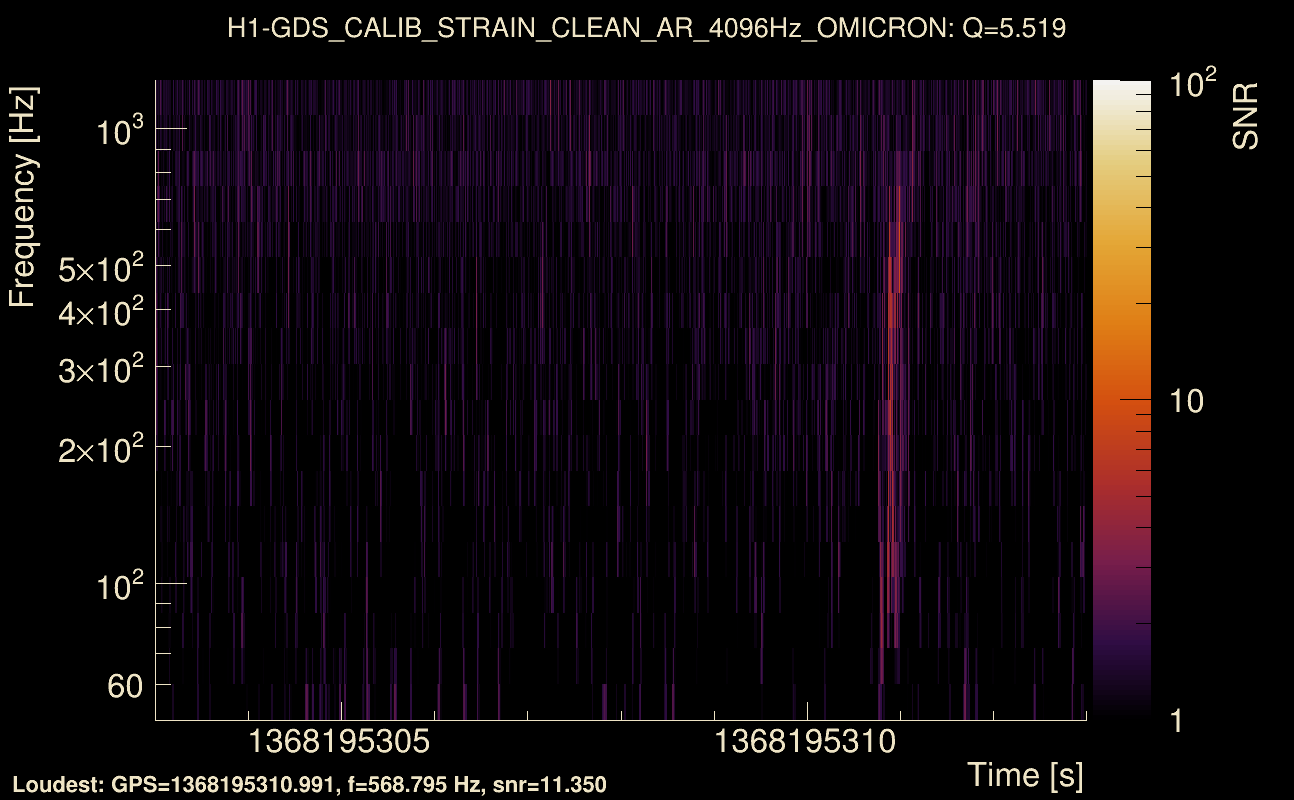
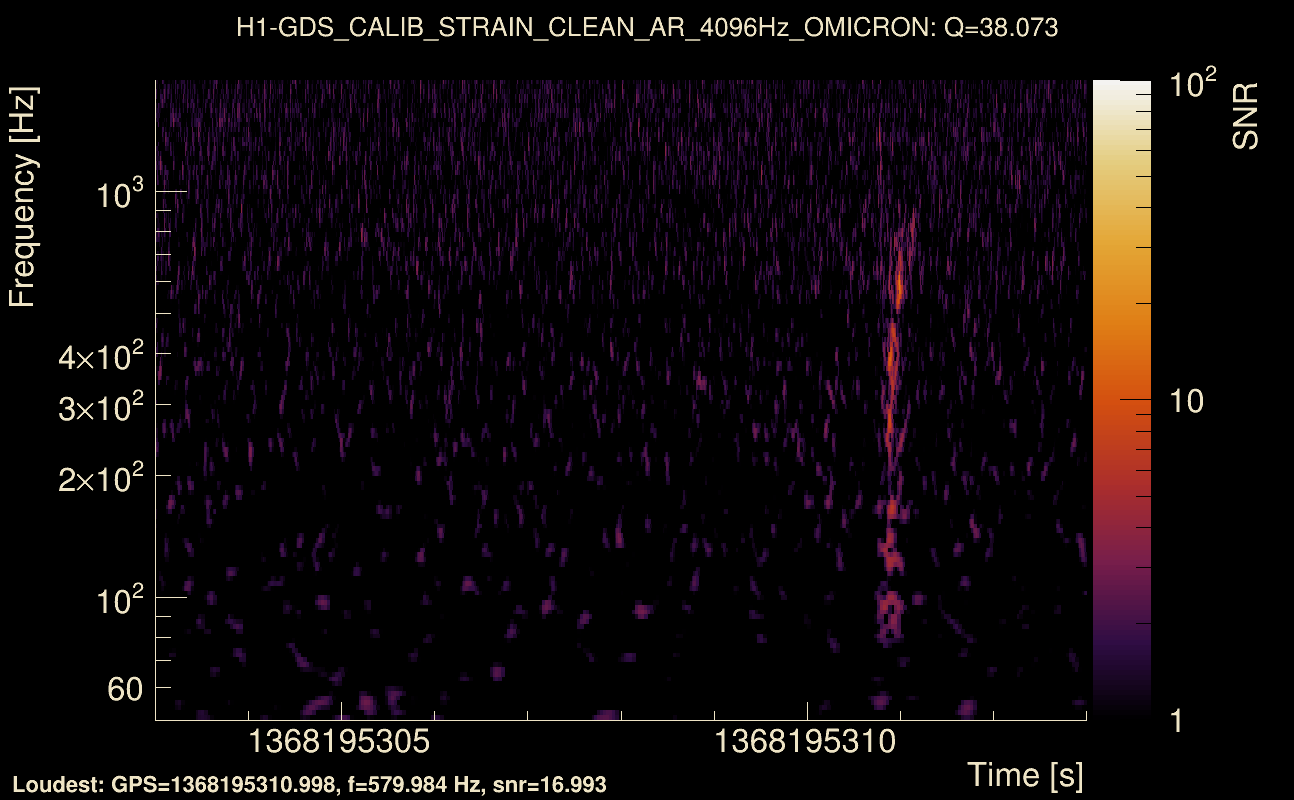
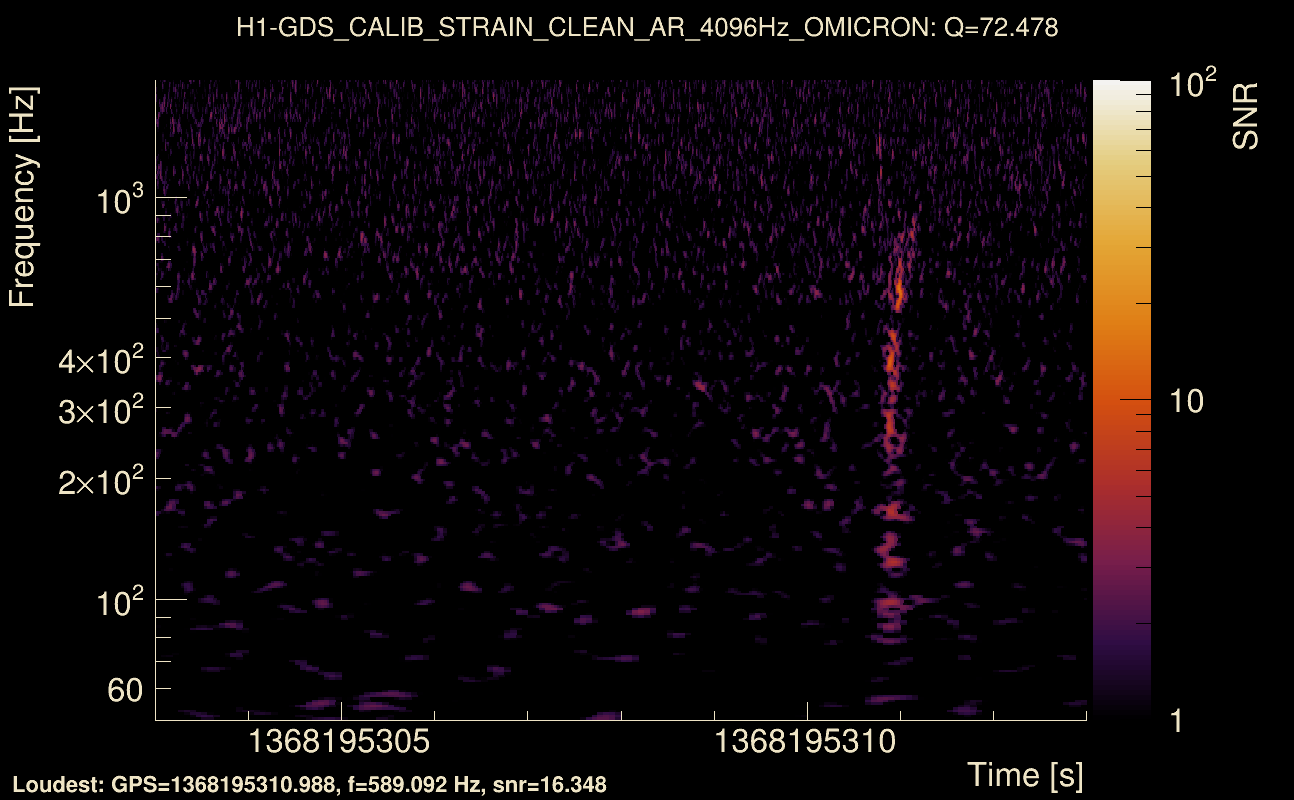
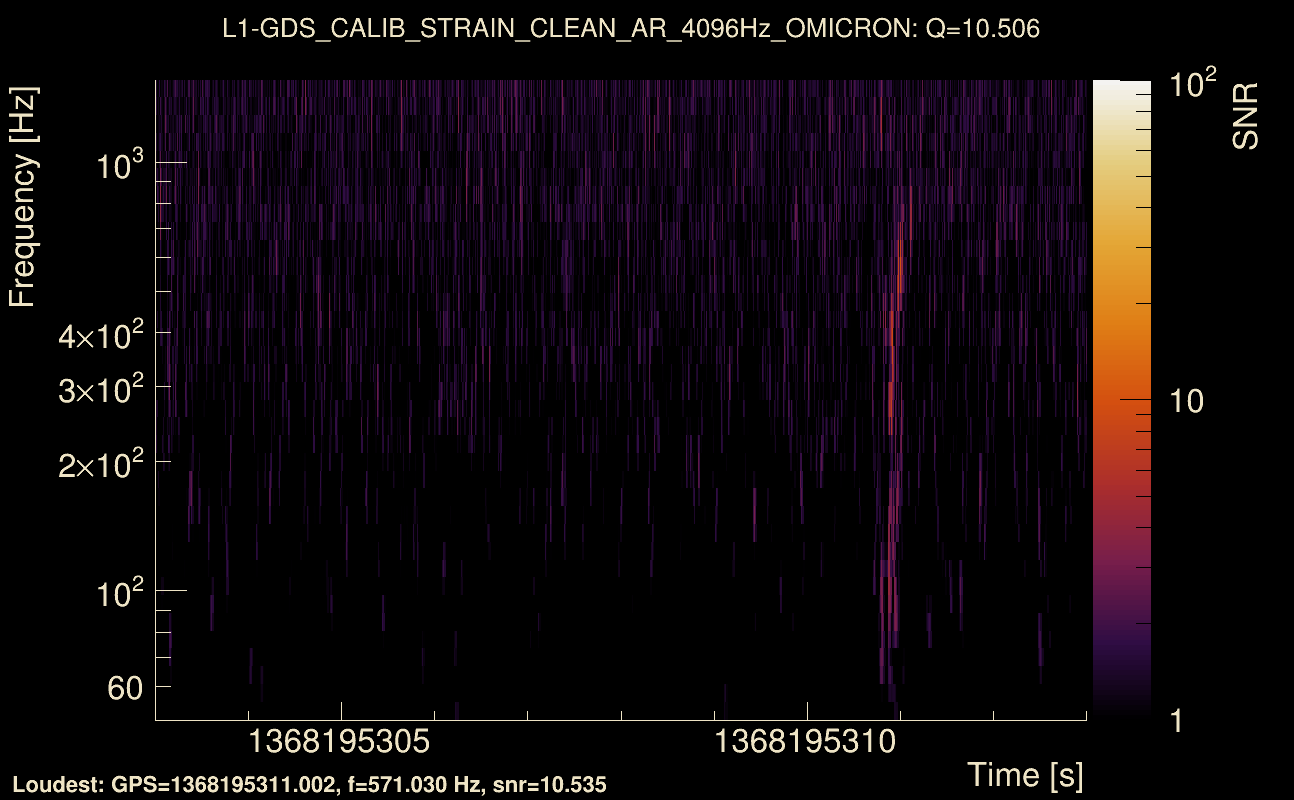
| Event time t(H1): | GPS = 1368195313 (Mon May 15 14:14:55 2023 ) → GPS = 1368195323 (Mon May 15 14:15:05 2023 ) |
| Event time t(L1): | GPS = 1368195313 (Mon May 15 14:15:05 2023 ) → GPS = 1368195323 (Mon May 15 14:15:05 2023 ) |
| Omicron analysis time window (H1): | GPS = 1368195310 → GPS = 1368195326 |
| Omicron analysis time window (L1): | GPS = 1368195310 → GPS = 1368195326 |
| Time delay between detectors t(L1) - t(H1): | -0.00182715 s (slice index = 108 / 217), δt_gw = -0.00182715 s |
| Time delay uncertainty: | 0.00600829 s |
| [targeted mode] Time delay probability: | 0.0802241 (1.74939 sigmas), δt_target = 0.00868297 s |
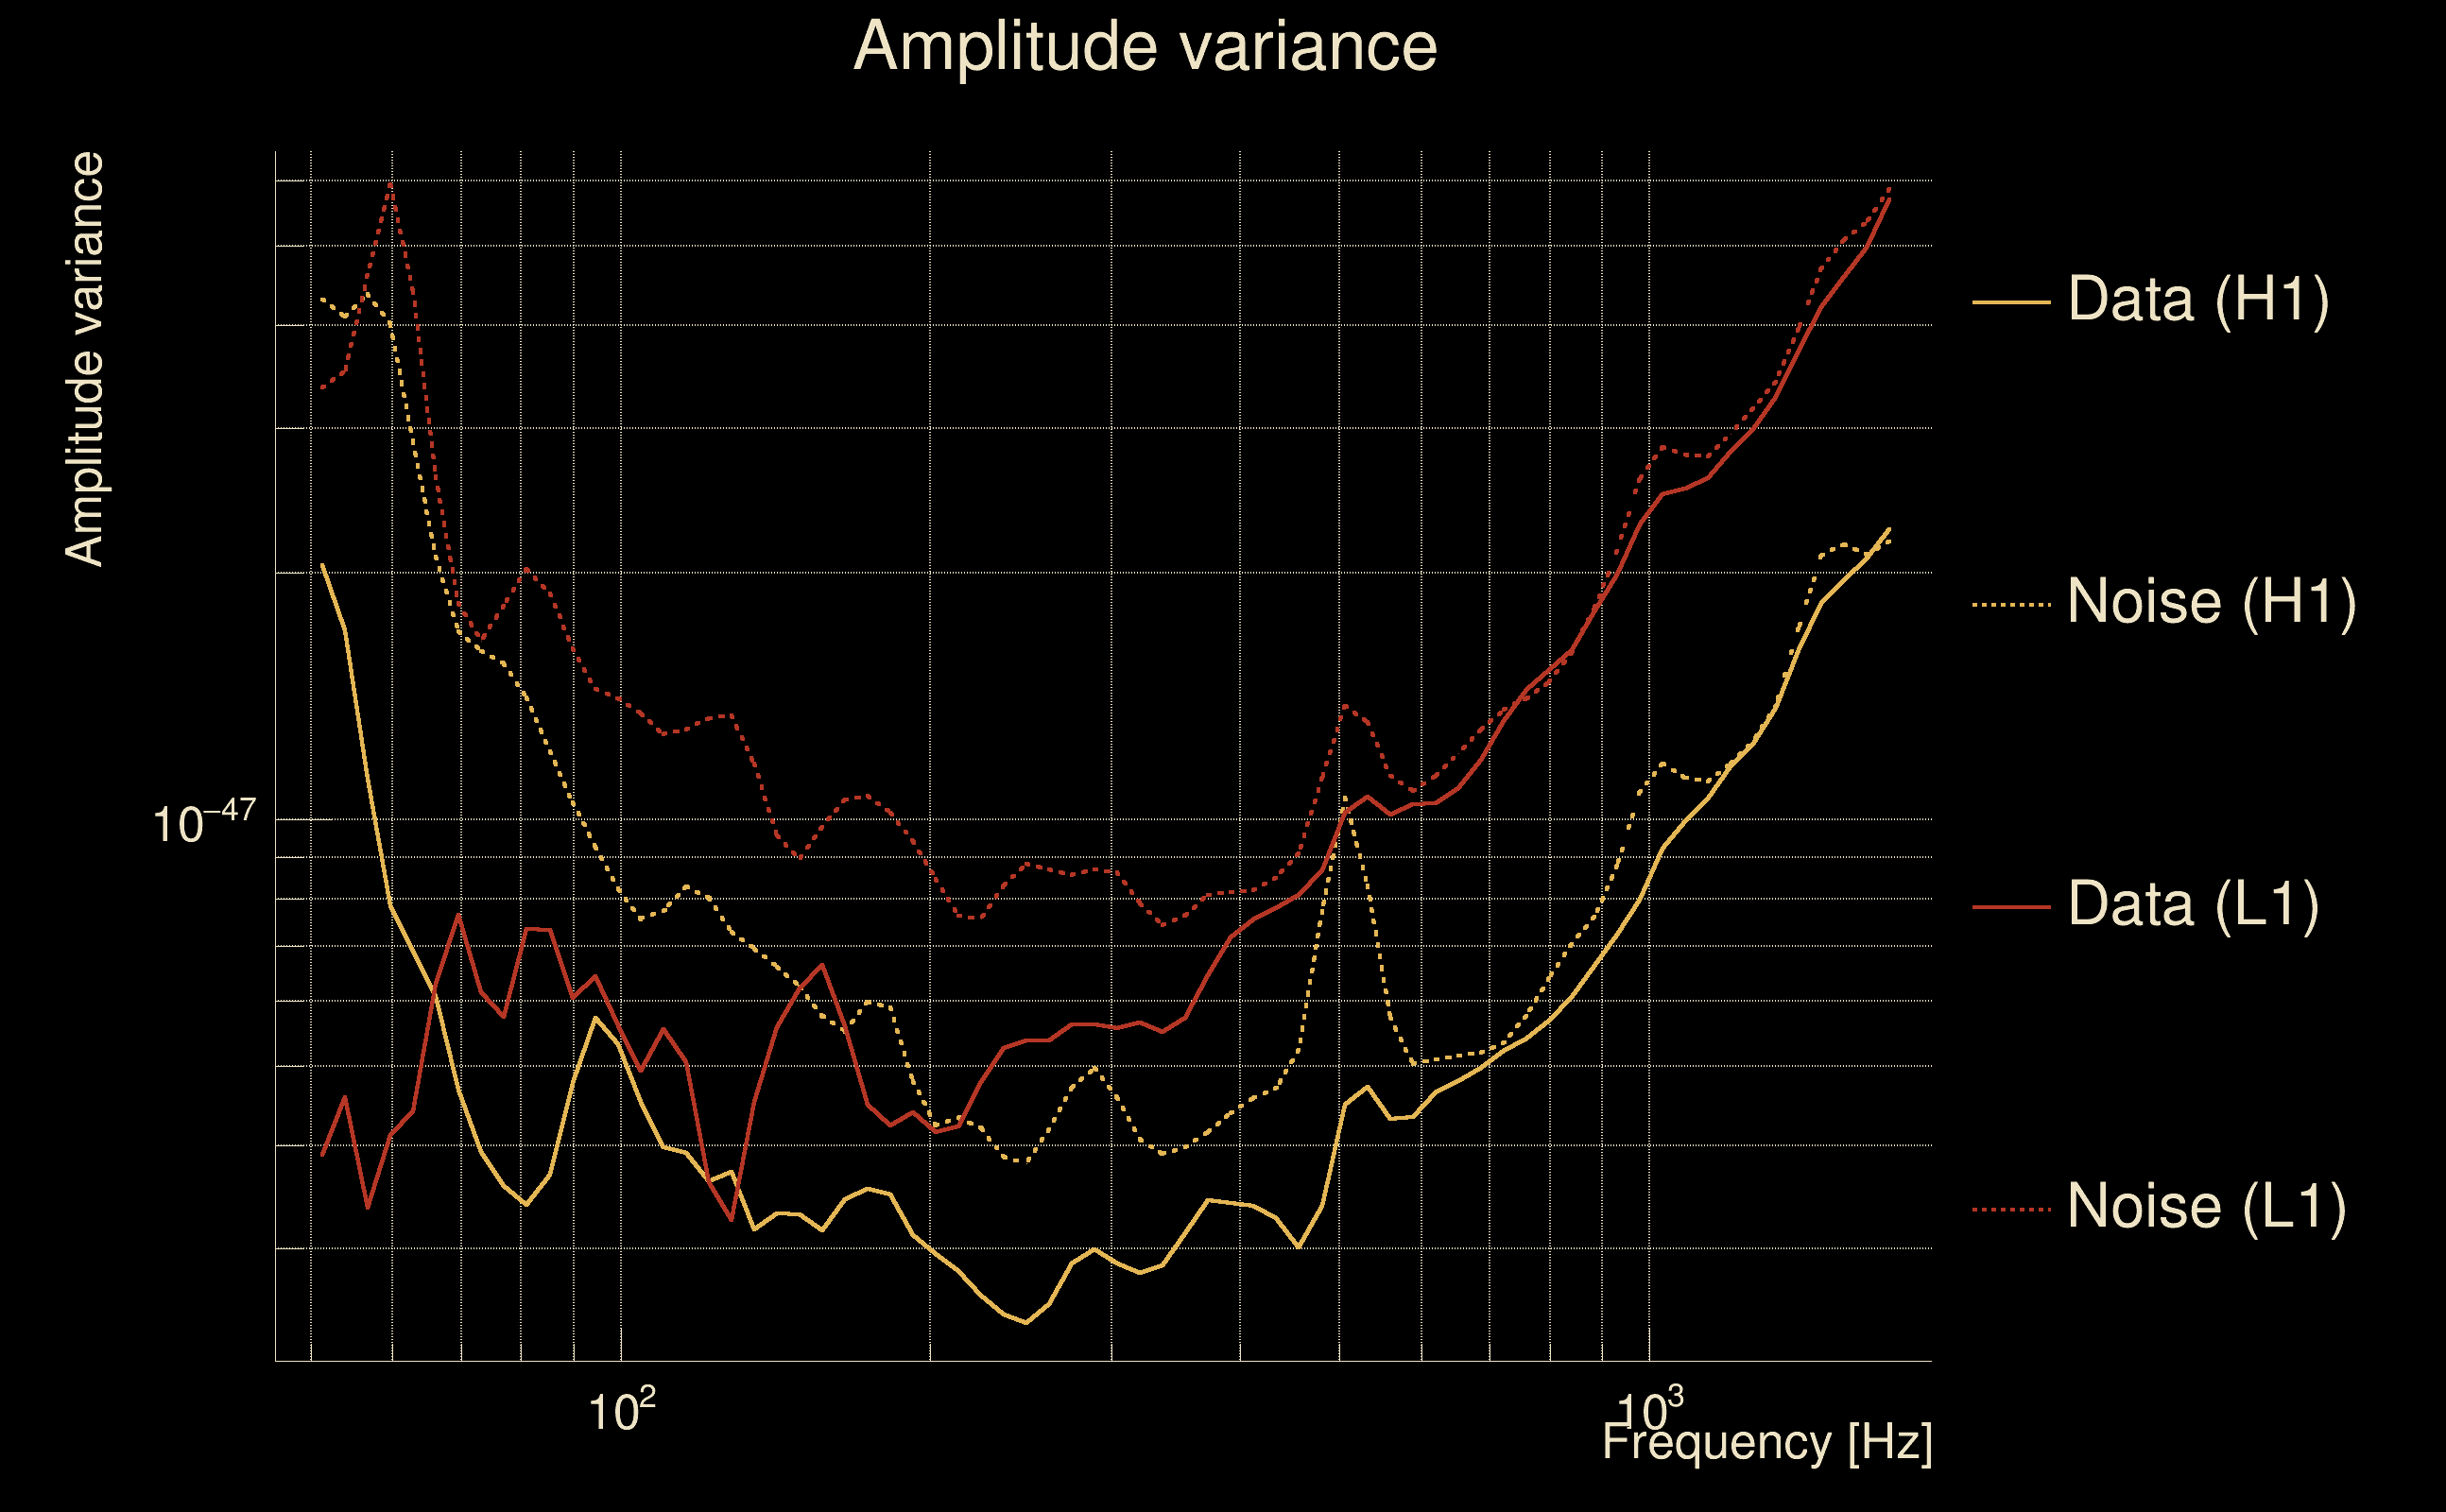
| Frequency: | 656.279 Hz |
| Ξ: | 0.00111449 ± 0.0286542 (variance = 0.00082106): Q0: 0, Q1: 0.0417308, Q2: 0.0566081, Q3: 0.0501396, Q4: 0.0890433 |
| Rank: | R_X = 0.13682 |
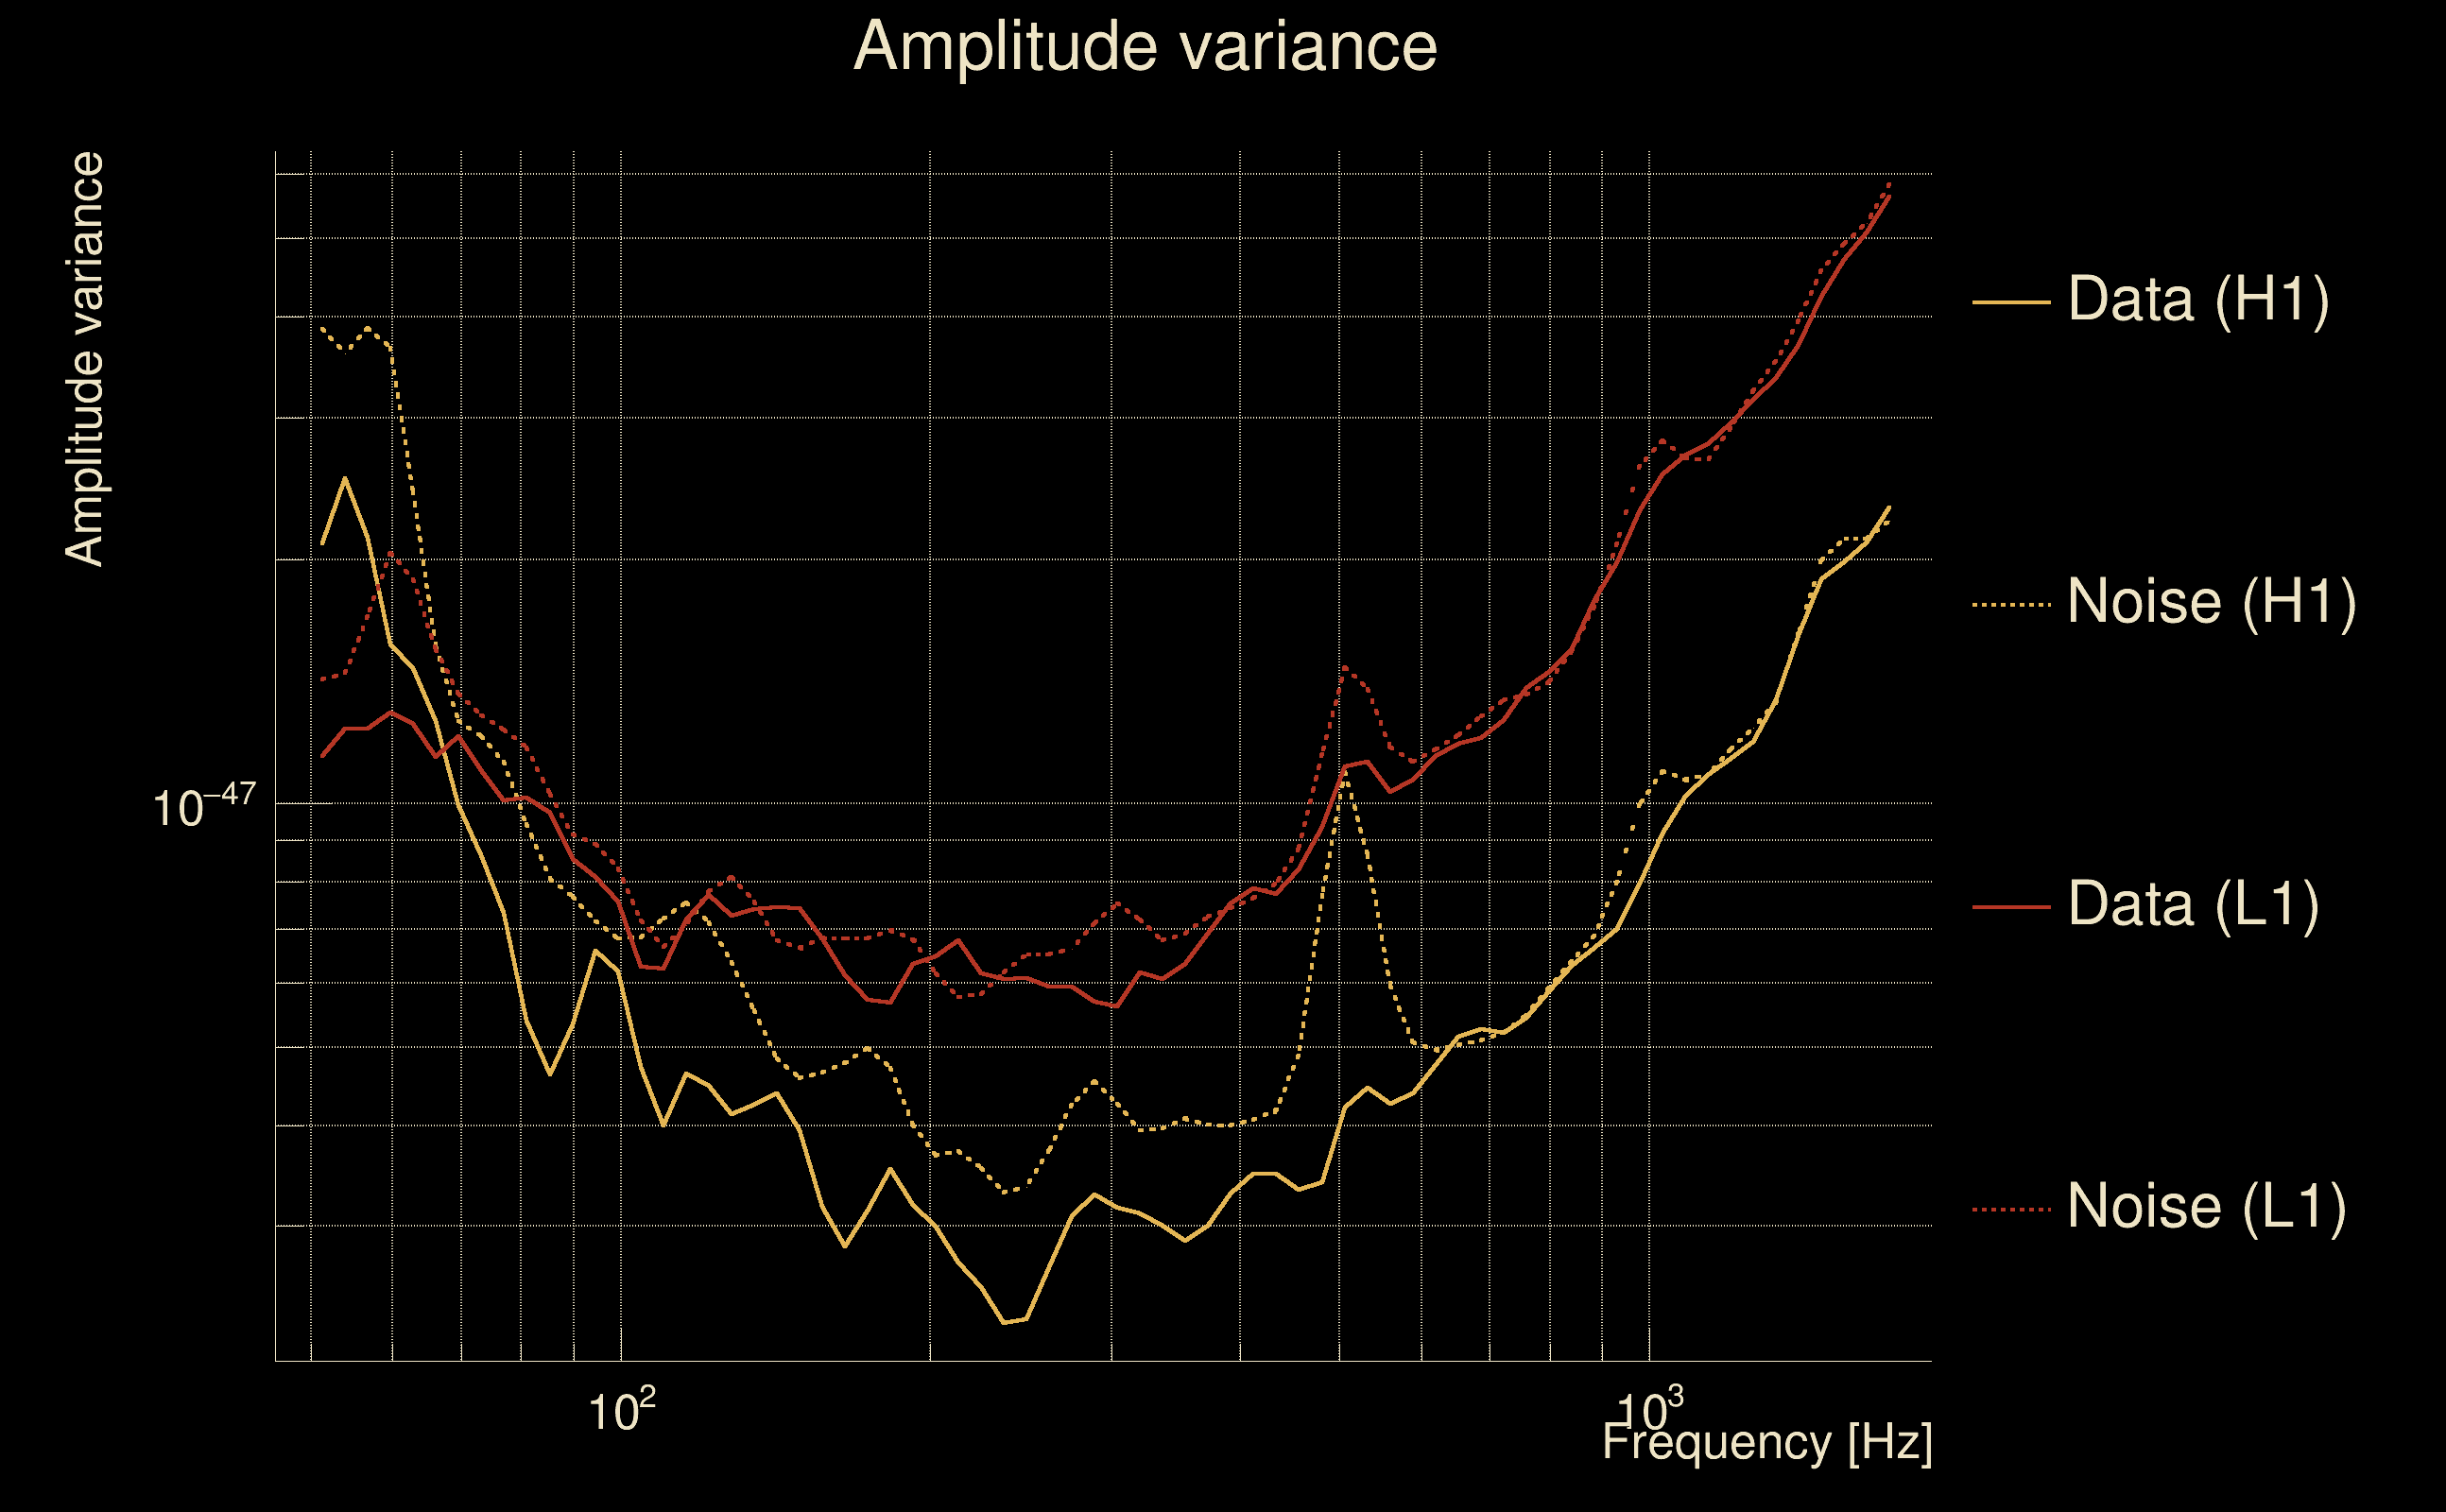
| Log of amplitude ratio (L1/H1): | 0.445622, variance = 0.465109 (L1/H1: -0.360027, variance = 0.968149, H1/L1: -1.2305, variance = 0.893909) |
| Amplitude ratio (L1/H1): | 1.56146 ⋇ 1.97781 (L1/H1: 0.697658 ⋇ 2.67499, H1/L1: 0.292146 ⋇ 2.57402) |
| Amplitude ratio H1|L1 compatibility (probability): | 0.243781 |
| Antenna factor probability: | 1 |
| Number of rejected frequency rows: | Q0: 18 / 18, Q1: 35 / 36, Q2: 65 / 70, Q3: 128 / 134, Q4: 247 / 258 |
| Maximum signal-to-noise ratio: | H1: 4.95688, L1: 5.02203 |
| SNR variance: | H1: 0.447335, L1: 0.496313 |
| Click here for a zoomed plot | Click here for a zoomed plot | Click here for a zoomed plot | Click here for a zoomed plot | Click here for a zoomed plot |
 |
 |
 |
 |
 |
 |
 |
 |
 |
 |
 |
 |
 |
 |
 |
 |
 |
 |
 |
 |
 |
 |
 |
 |
 |
 |
 |
 |
 |
 |
 |
 |
 |
 |
| Event time t(H1): | GPS = 1368195308 (Mon May 15 14:14:50 2023 ) → GPS = 1368195318 (Mon May 15 14:15:00 2023 ) |
| Event time t(L1): | GPS = 1368195308 (Mon May 15 14:15:00 2023 ) → GPS = 1368195318 (Mon May 15 14:15:00 2023 ) |
| Omicron analysis time window (H1): | GPS = 1368195305 → GPS = 1368195321 |
| Omicron analysis time window (L1): | GPS = 1368195305 → GPS = 1368195321 |
| Time delay between detectors t(L1) - t(H1): | -0.00278747 s (slice index = 108 / 217), δt_gw = -0.00278747 s |
| Time delay uncertainty: | 0.00300836 s |
| [targeted mode] Time delay probability: | 0.00013715 (3.81325 sigmas), δt_target = 0.00868368 s |
| Frequency: | 566.062 Hz |
| Ξ: | 0.000115579 ± 0.0269612 (variance = 0.000726904): Q0: 0, Q1: 0, Q2: 0.0307214, Q3: 0.0155628, Q4: 0.0726455 |
| Rank: | R_X = 0.13682 |
| Log of amplitude ratio (L1/H1): | 0.384106, variance = 0.712402 (L1/H1: -0.571411, variance = 2.06043, H1/L1: -1.16544, variance = 0.976117) |
| Amplitude ratio (L1/H1): | 1.4683 ⋇ 2.32574 (L1/H1: 0.564728 ⋇ 4.20142, H1/L1: 0.311785 ⋇ 2.68582) |
| Amplitude ratio H1|L1 compatibility (probability): | 0.318901 |
| Antenna factor probability: | 1 |
| Number of rejected frequency rows: | Q0: 18 / 18, Q1: 36 / 36, Q2: 69 / 70, Q3: 133 / 134, Q4: 253 / 258 |
| Maximum signal-to-noise ratio: | H1: 4.86133, L1: 5.37595 |
| SNR variance: | H1: 0.458921, L1: 0.483131 |
| Click here for a zoomed plot | Click here for a zoomed plot | Click here for a zoomed plot | Click here for a zoomed plot | Click here for a zoomed plot |
 |
 |
 |
 |
 |
 |
 |
 |
 |
 |
 |
 |
 |
 |
 |
 |
 |
 |
 |
 |
 |
 |
 |
 |
 |
 |
 |
 |
 |
 |
 |
 |
 |
 |
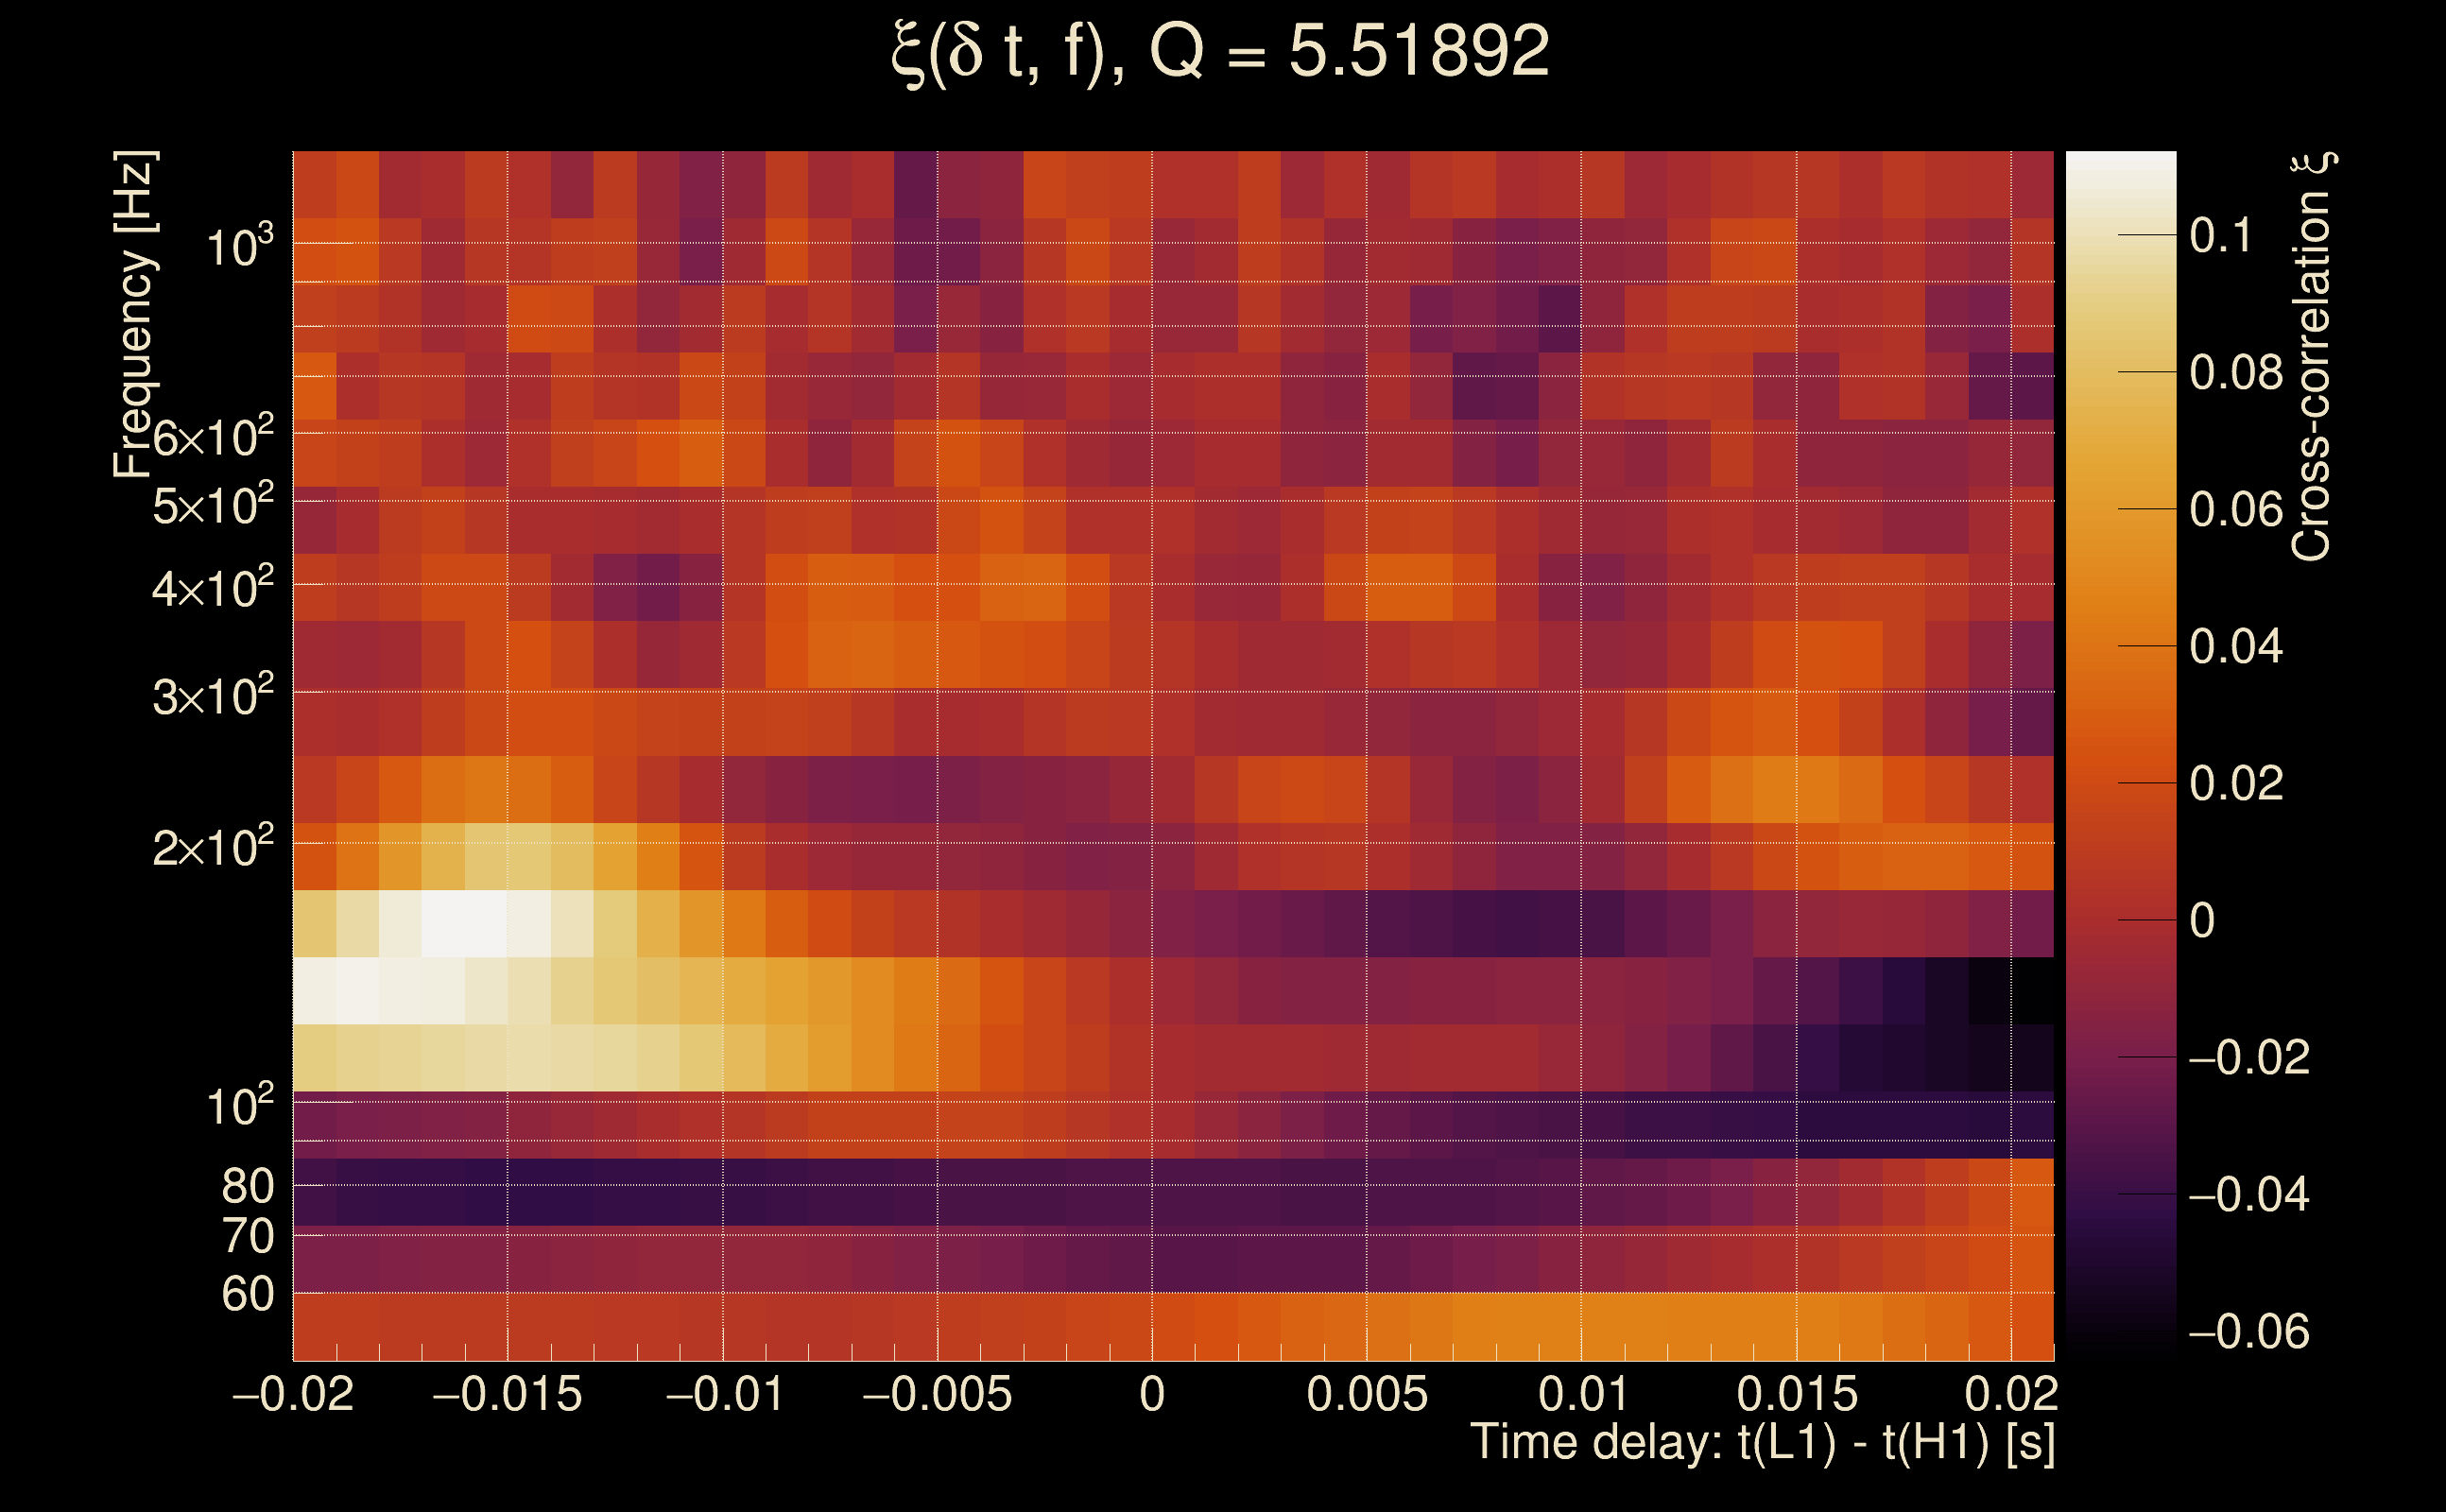
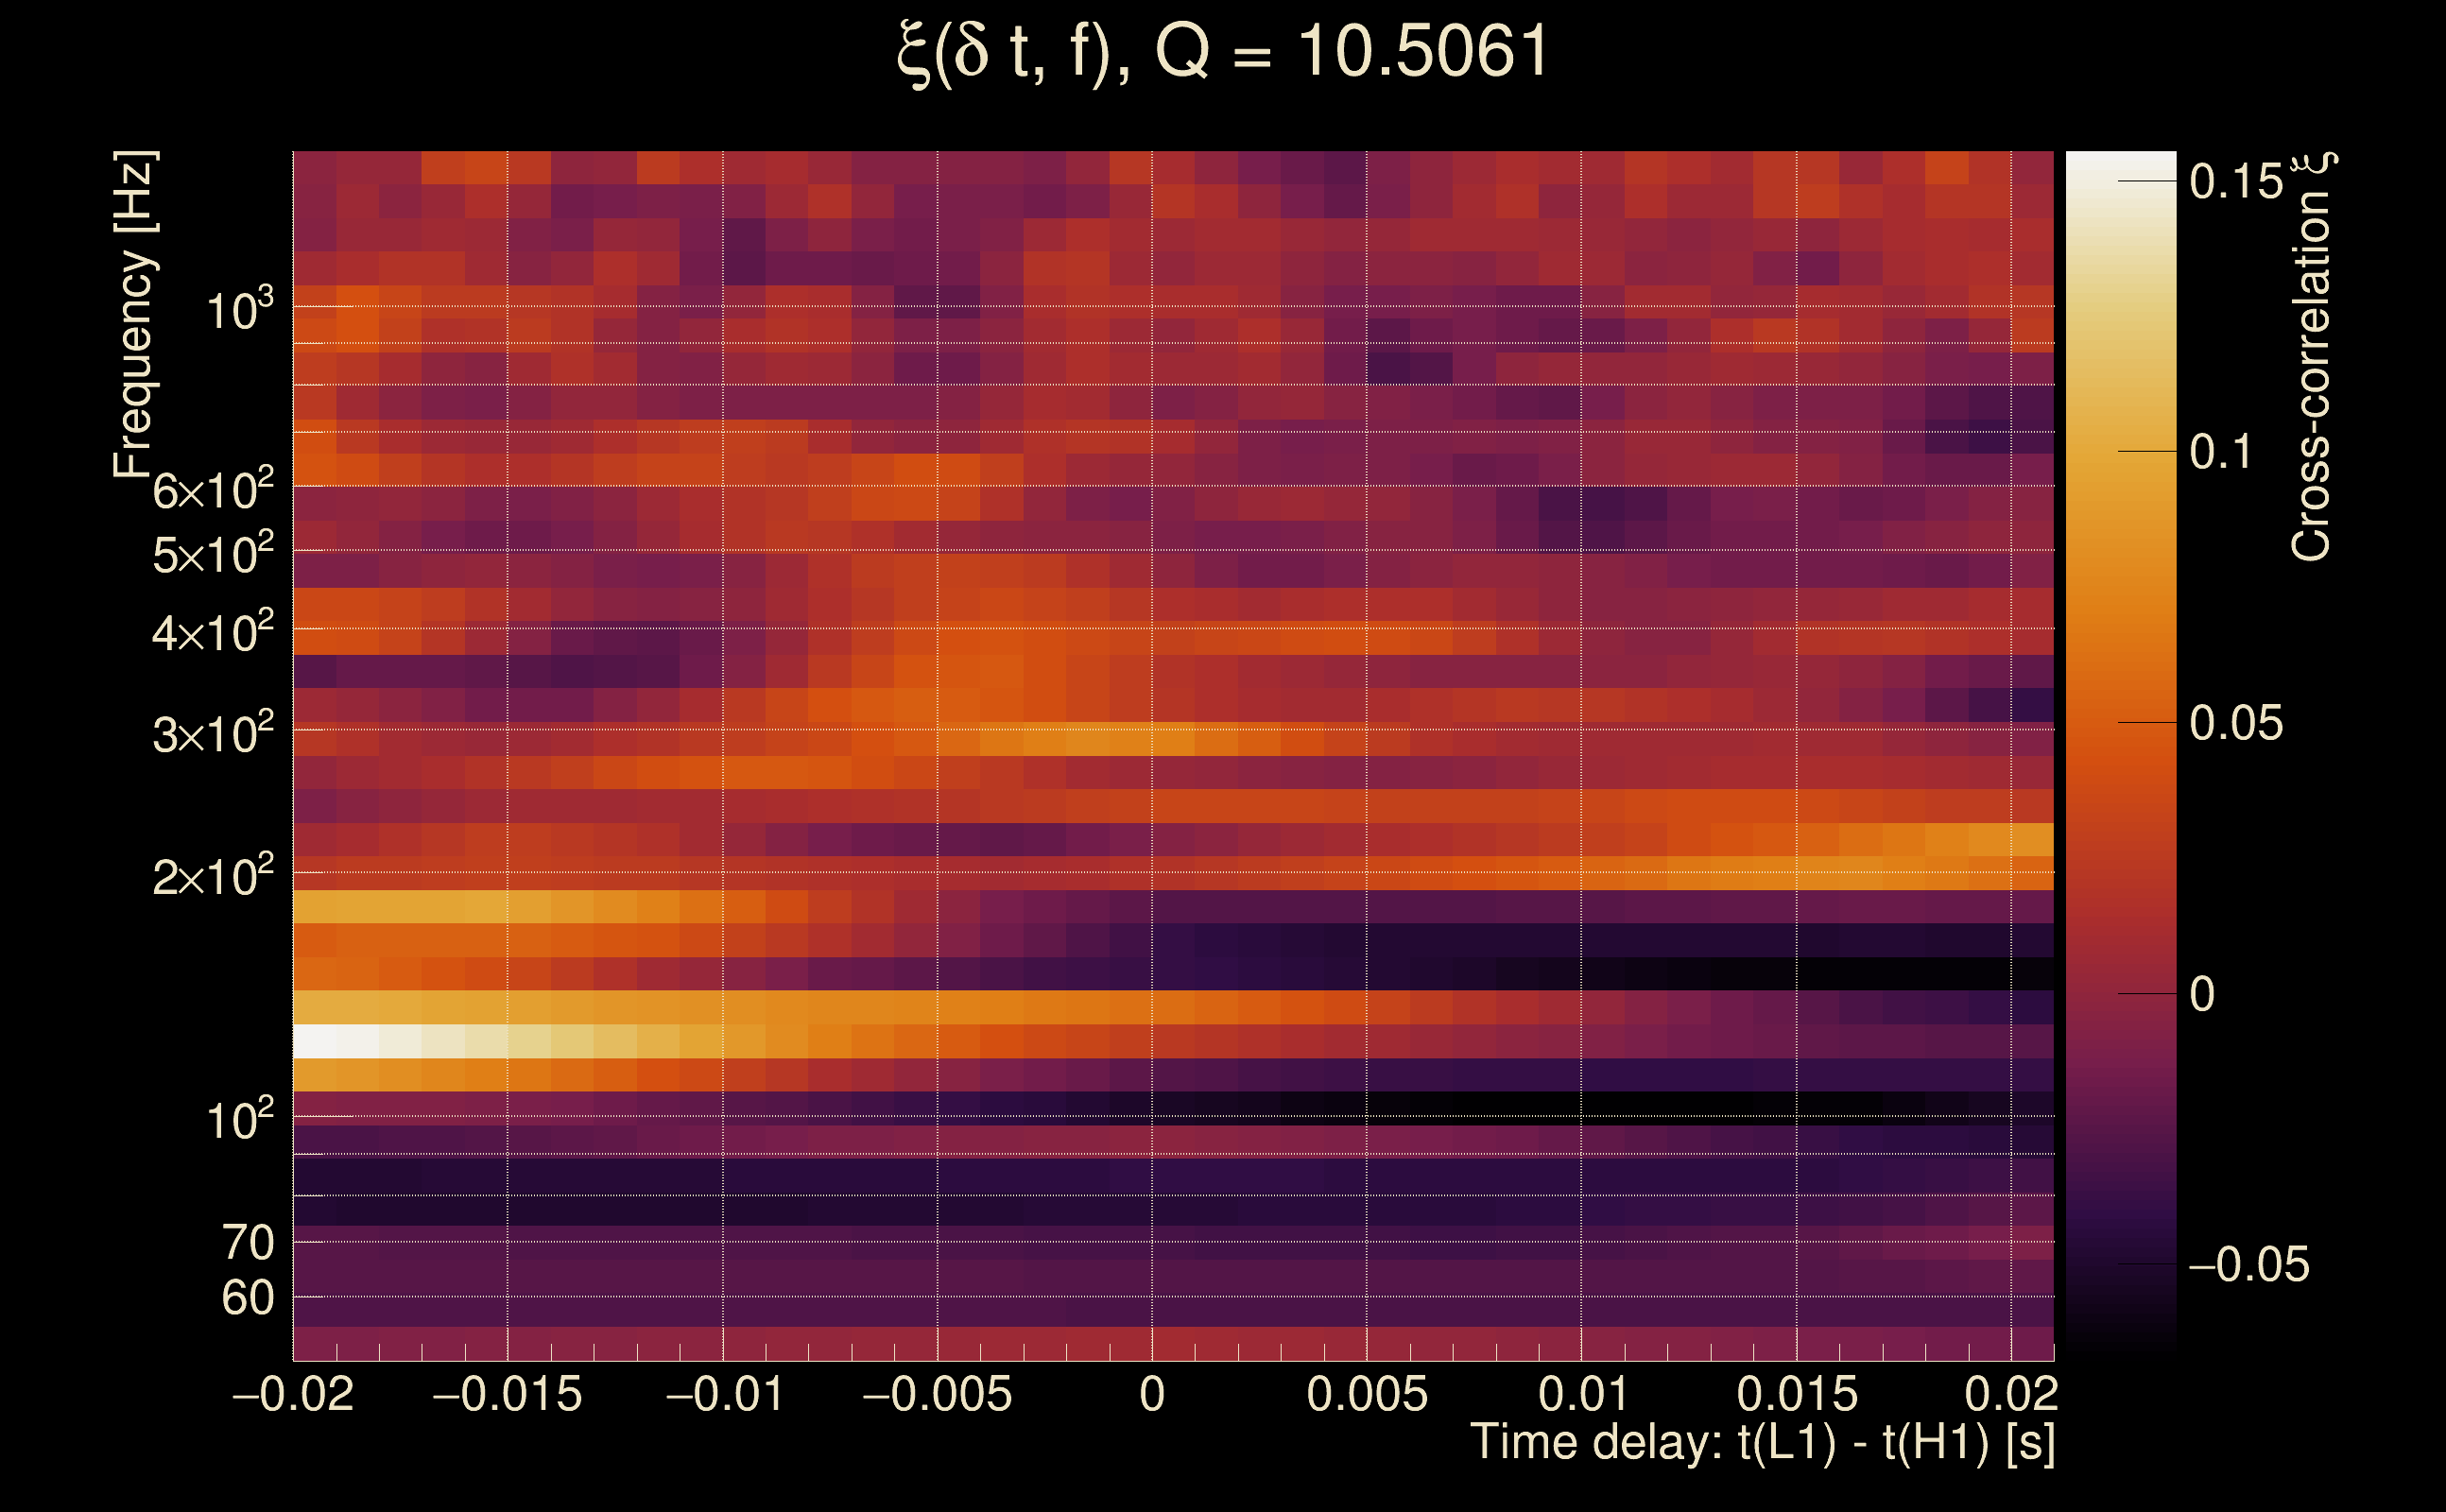
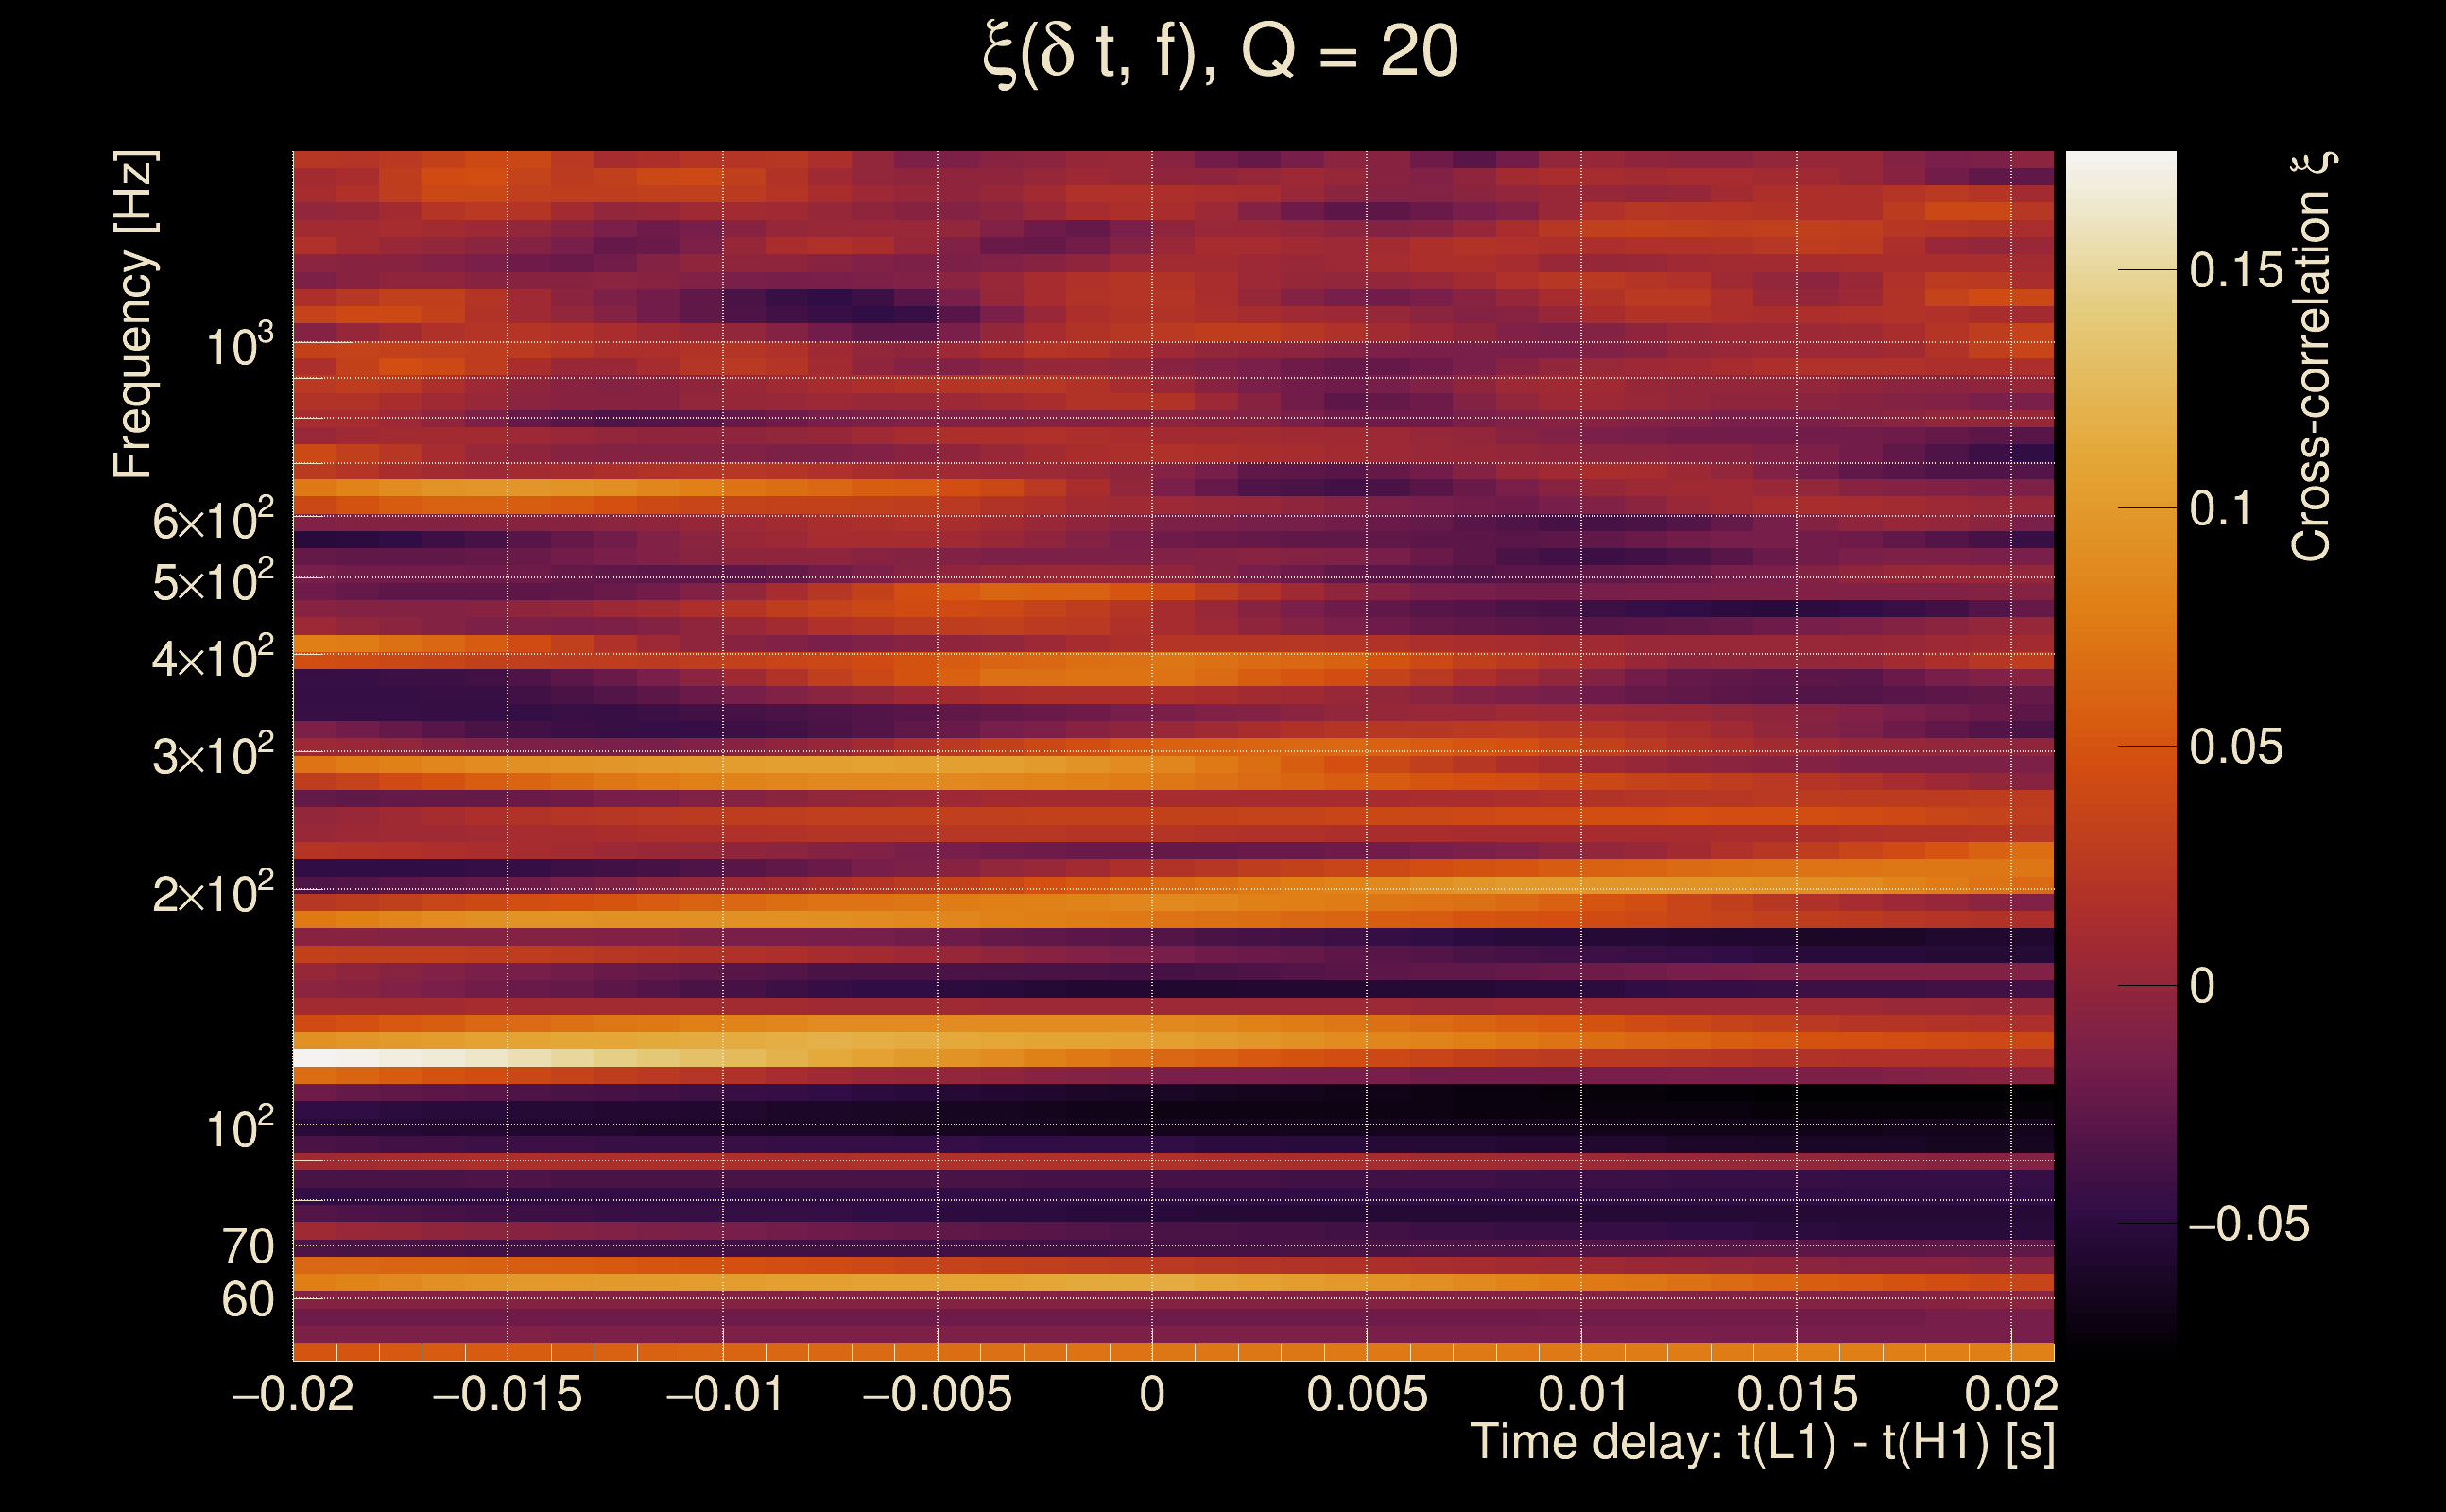
| Event time t(H1): | GPS = 1368195303 (Mon May 15 14:14:45 2023 ) → GPS = 1368195313 (Mon May 15 14:14:55 2023 ) |
| Event time t(L1): | GPS = 1368195303 (Mon May 15 14:14:55 2023 ) → GPS = 1368195313 (Mon May 15 14:14:55 2023 ) |
| Omicron analysis time window (H1): | GPS = 1368195300 → GPS = 1368195316 |
| Omicron analysis time window (L1): | GPS = 1368195300 → GPS = 1368195316 |
| Time delay between detectors t(L1) - t(H1): | 0.00580403 s (slice index = 108 / 217), δt_gw = 0.00580403 s |
| Time delay uncertainty: | 0.000758942 s |
| [targeted mode] Time delay probability: | 0.000147316 (3.79555 sigmas), δt_target = 0.00868416 s |
| Frequency: | 725.835 Hz |
| Ξ: | 0.000181235 ± 0.0470426 (variance = 0.002213): Q0: 0, Q1: 0, Q2: 0.0411167, Q3: 0.0499351, Q4: 0.128555 |
| Rank: | R_X = 0.13682 |
| Log of amplitude ratio (L1/H1): | 0.77464, variance = 0.273983 (L1/H1: 0.990185, variance = 0.513276, H1/L1: -0.601698, variance = 0.559592) |
| Amplitude ratio (L1/H1): | 2.16981 ⋇ 1.68781 (L1/H1: 2.69173 ⋇ 2.04712, H1/L1: 0.54788 ⋇ 2.1129) |
| Amplitude ratio H1|L1 compatibility (probability): | 0.707615 |
| Antenna factor probability: | 1 |
| Number of rejected frequency rows: | Q0: 18 / 18, Q1: 36 / 36, Q2: 69 / 70, Q3: 132 / 134, Q4: 255 / 258 |
| Maximum signal-to-noise ratio: | H1: 4.86041, L1: 5.42615 |
| SNR variance: | H1: 0.454874, L1: 0.489377 |
| Click here for a zoomed plot | Click here for a zoomed plot | Click here for a zoomed plot | Click here for a zoomed plot | Click here for a zoomed plot |
 |
 |
 |
 |
 |
 |
 |
 |
 |
 |
 |
 |
 |
 |
 |
 |
 |
 |
 |
 |
 |
 |
 |
 |
 |
 |
 |
 |
 |
 |
 |
 |
 |
 |
| Event time t(H1): | GPS = 1368195298 (Mon May 15 14:14:40 2023 ) → GPS = 1368195308 (Mon May 15 14:14:50 2023 ) |
| Event time t(L1): | GPS = 1368195298 (Mon May 15 14:14:50 2023 ) → GPS = 1368195308 (Mon May 15 14:14:50 2023 ) |
| Omicron analysis time window (H1): | GPS = 1368195295 → GPS = 1368195311 |
| Omicron analysis time window (L1): | GPS = 1368195295 → GPS = 1368195311 |
| Time delay between detectors t(L1) - t(H1): | 0.00177939 s (slice index = 108 / 217), δt_gw = 0.00177939 s |
| Time delay uncertainty: | 0.00779987 s |
| [targeted mode] Time delay probability: | 0.375944 (0.885394 sigmas), δt_target = 0.00868464 s |
| Frequency: | 614.236 Hz |
| Ξ: | 0.000308973 ± 0.032948 (variance = 0.00108557): Q0: 0, Q1: 0, Q2: 0.068087, Q3: 0.0530318, Q4: 0.0756541 |
| Rank: | R_X = 0.13682 |
| Log of amplitude ratio (L1/H1): | 0.348167, variance = 0.496958 (L1/H1: -0.207351, variance = 0.854642, H1/L1: -0.924513, variance = 1.14313) |
| Amplitude ratio (L1/H1): | 1.41647 ⋇ 2.02375 (L1/H1: 0.812734 ⋇ 2.52053, H1/L1: 0.396725 ⋇ 2.91297) |
| Amplitude ratio H1|L1 compatibility (probability): | 0.42325 |
| Antenna factor probability: | 1 |
| Number of rejected frequency rows: | Q0: 18 / 18, Q1: 36 / 36, Q2: 69 / 70, Q3: 130 / 134, Q4: 251 / 258 |
| Maximum signal-to-noise ratio: | H1: 5.09311, L1: 5.00024 |
| SNR variance: | H1: 0.441209, L1: 0.493389 |