| Omicron version: | 4.2.0: documentation gitlab repository |
| Omicron run by: | unknown |
| Report produced on: | Mon Oct 27 12:48:44 2025 UTC |
| Ox option file: | Targeted_O4bw_2min_options.txt |
| Omicron option files: | detector 0, detector 1 |
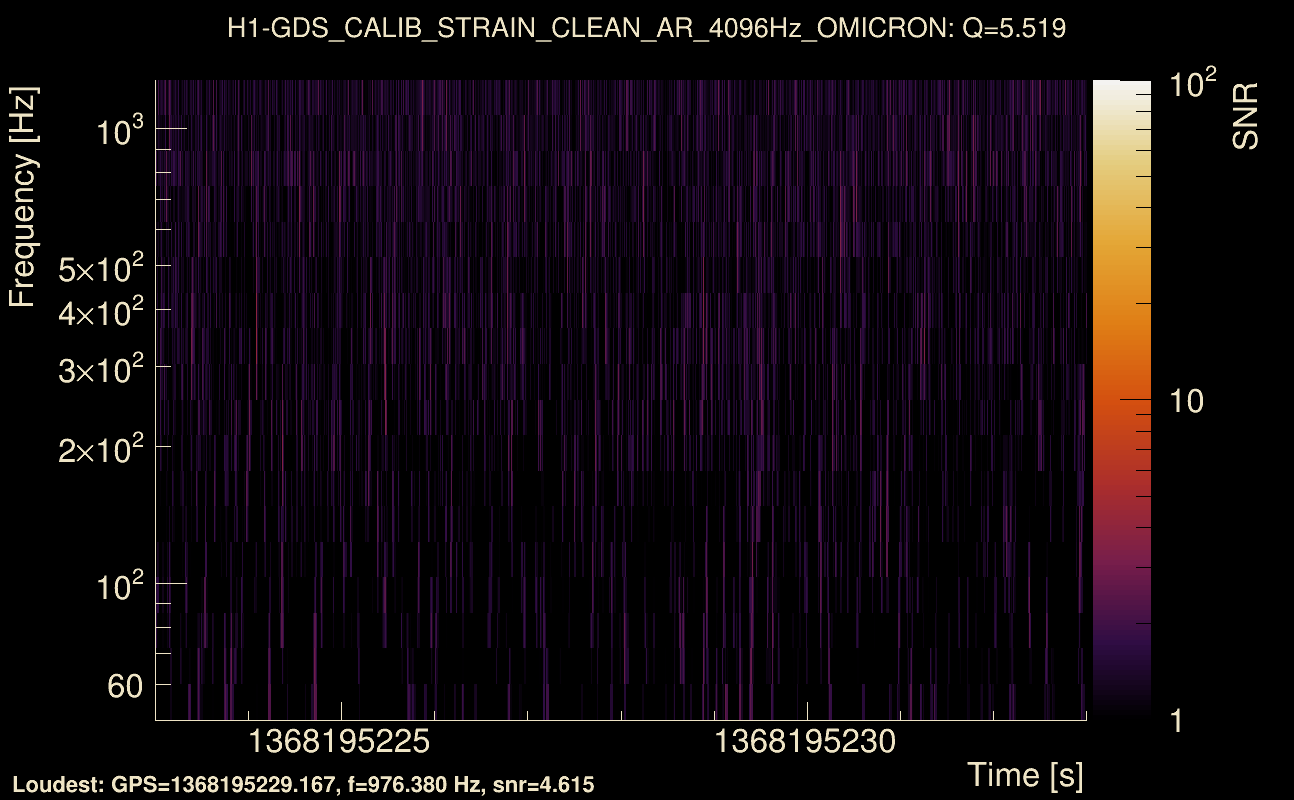
| Detector channel names: | H1:GDS-CALIB_STRAIN_CLEAN_AR_4096Hz, L1:GDS-CALIB_STRAIN_CLEAN_AR_4096Hz |
| Omicron analysis time window and overlap: | 16 s, 6 s |
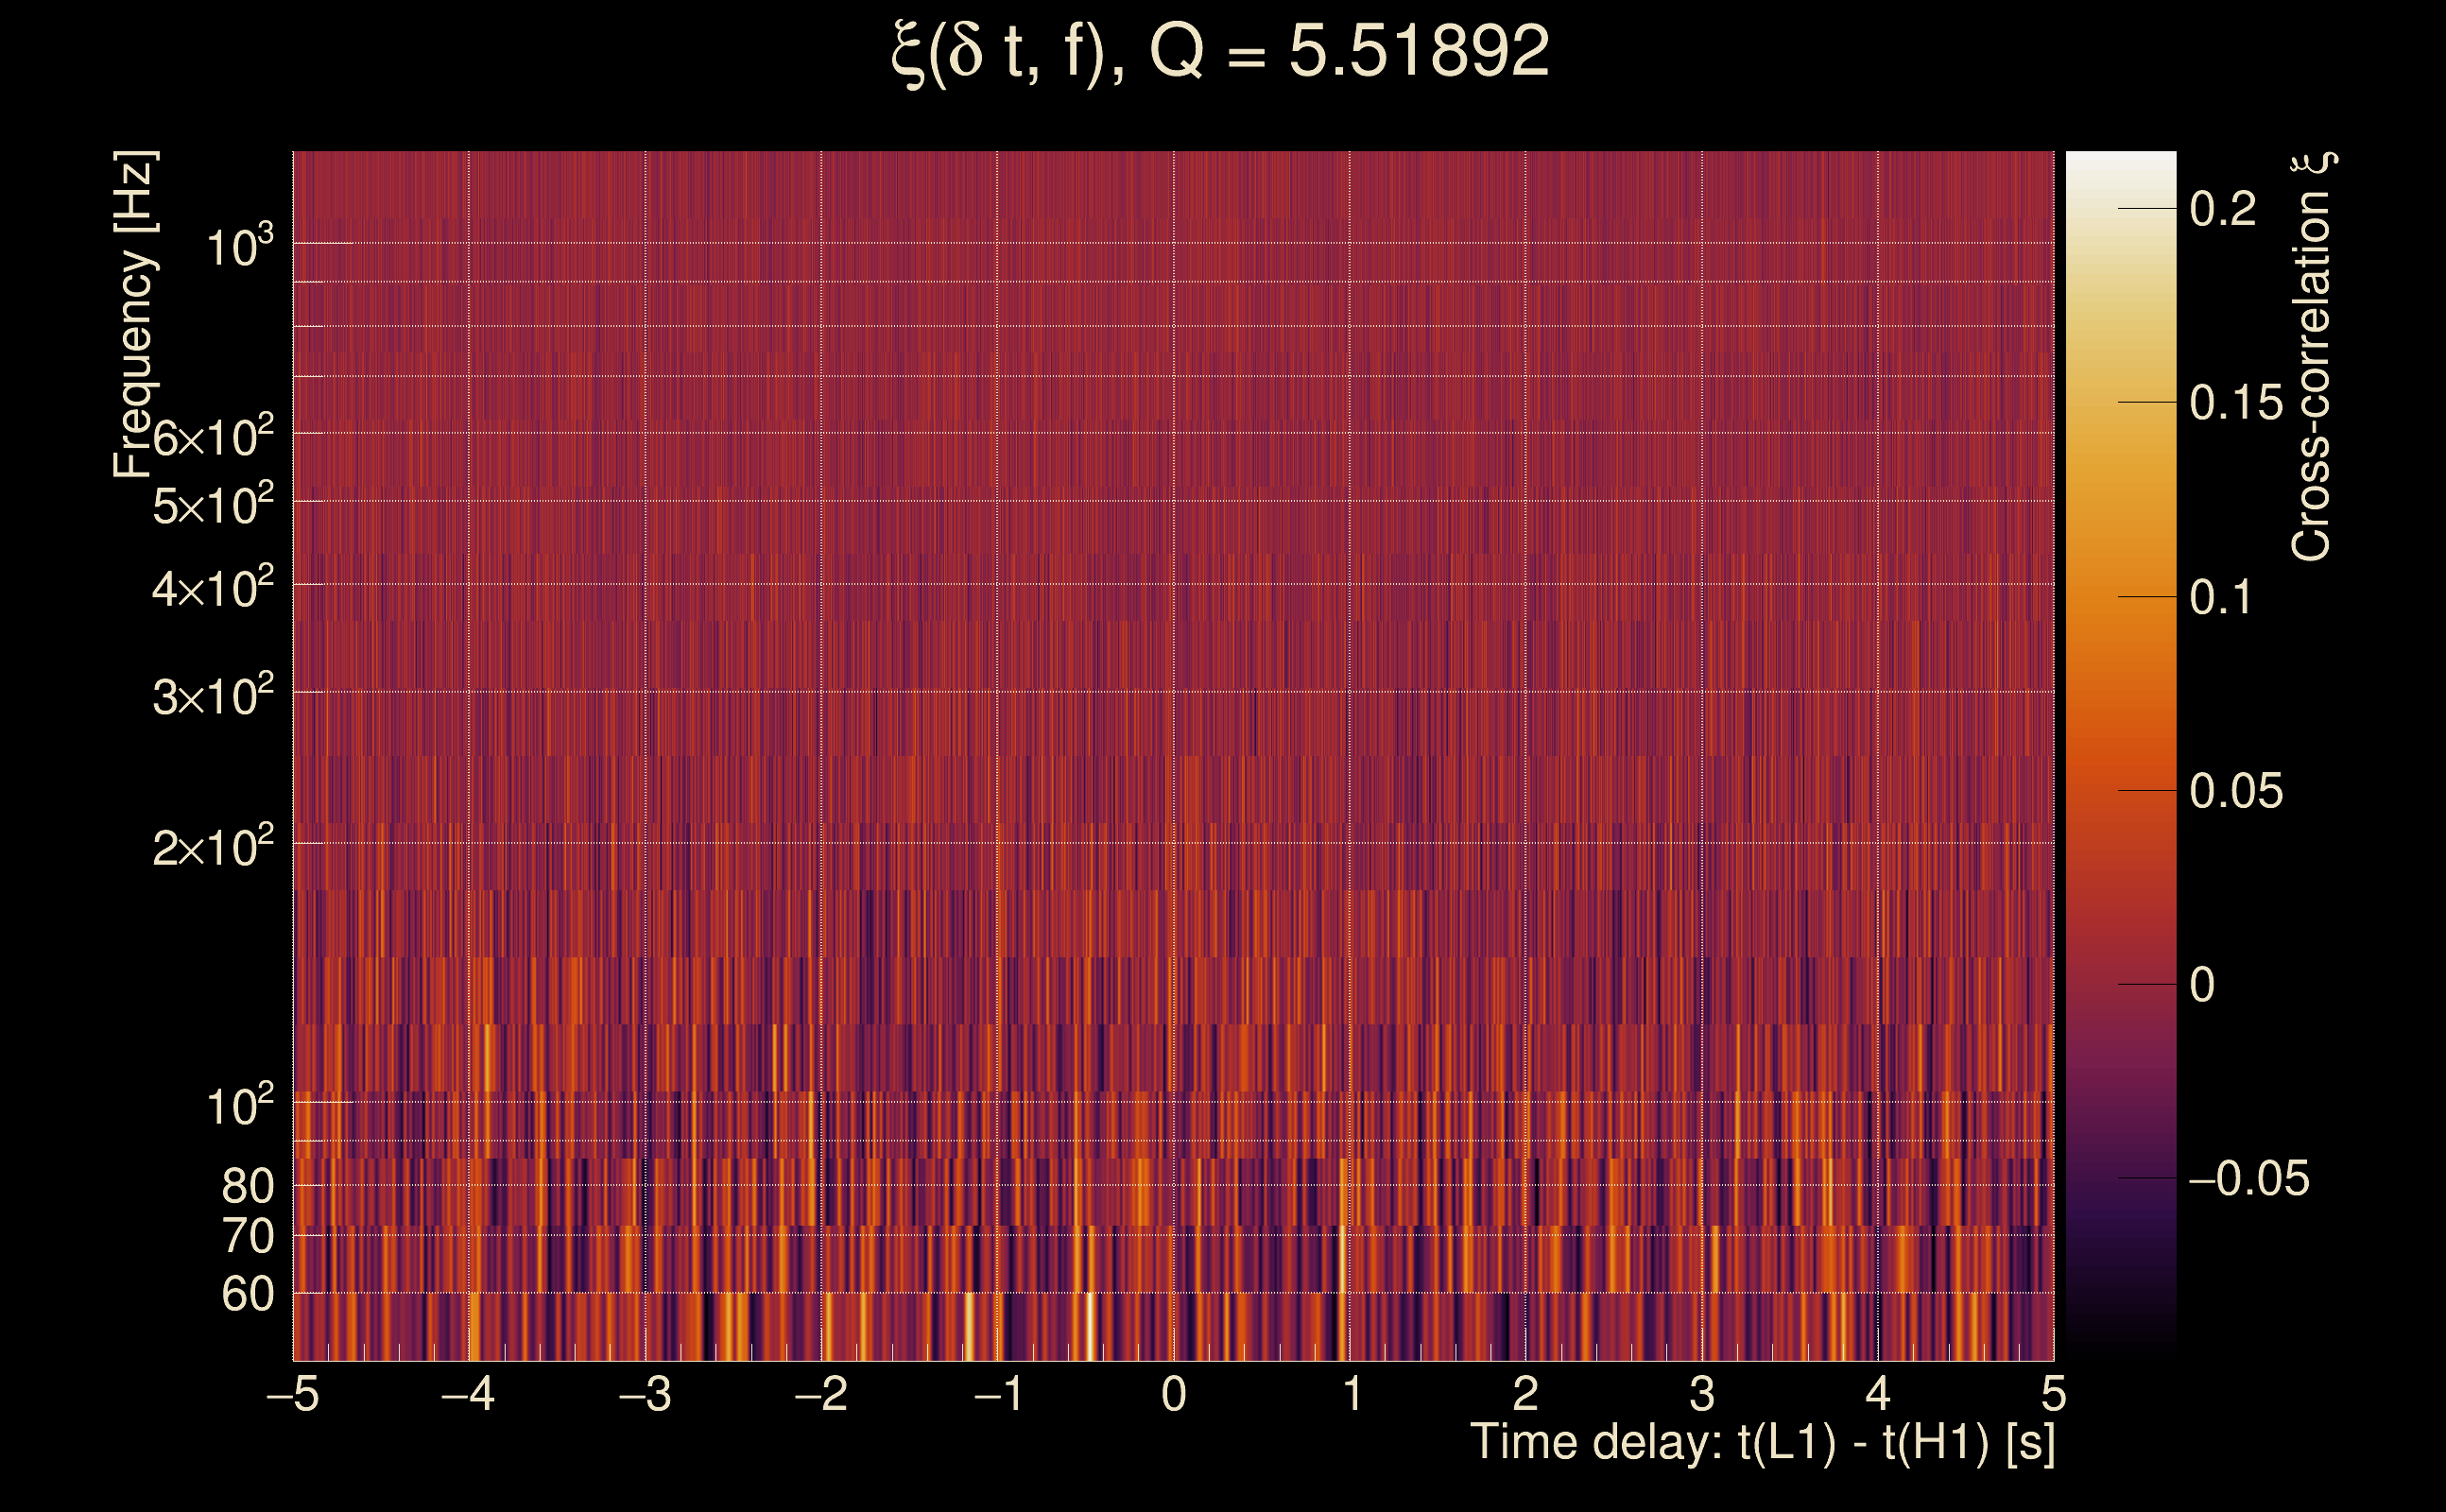
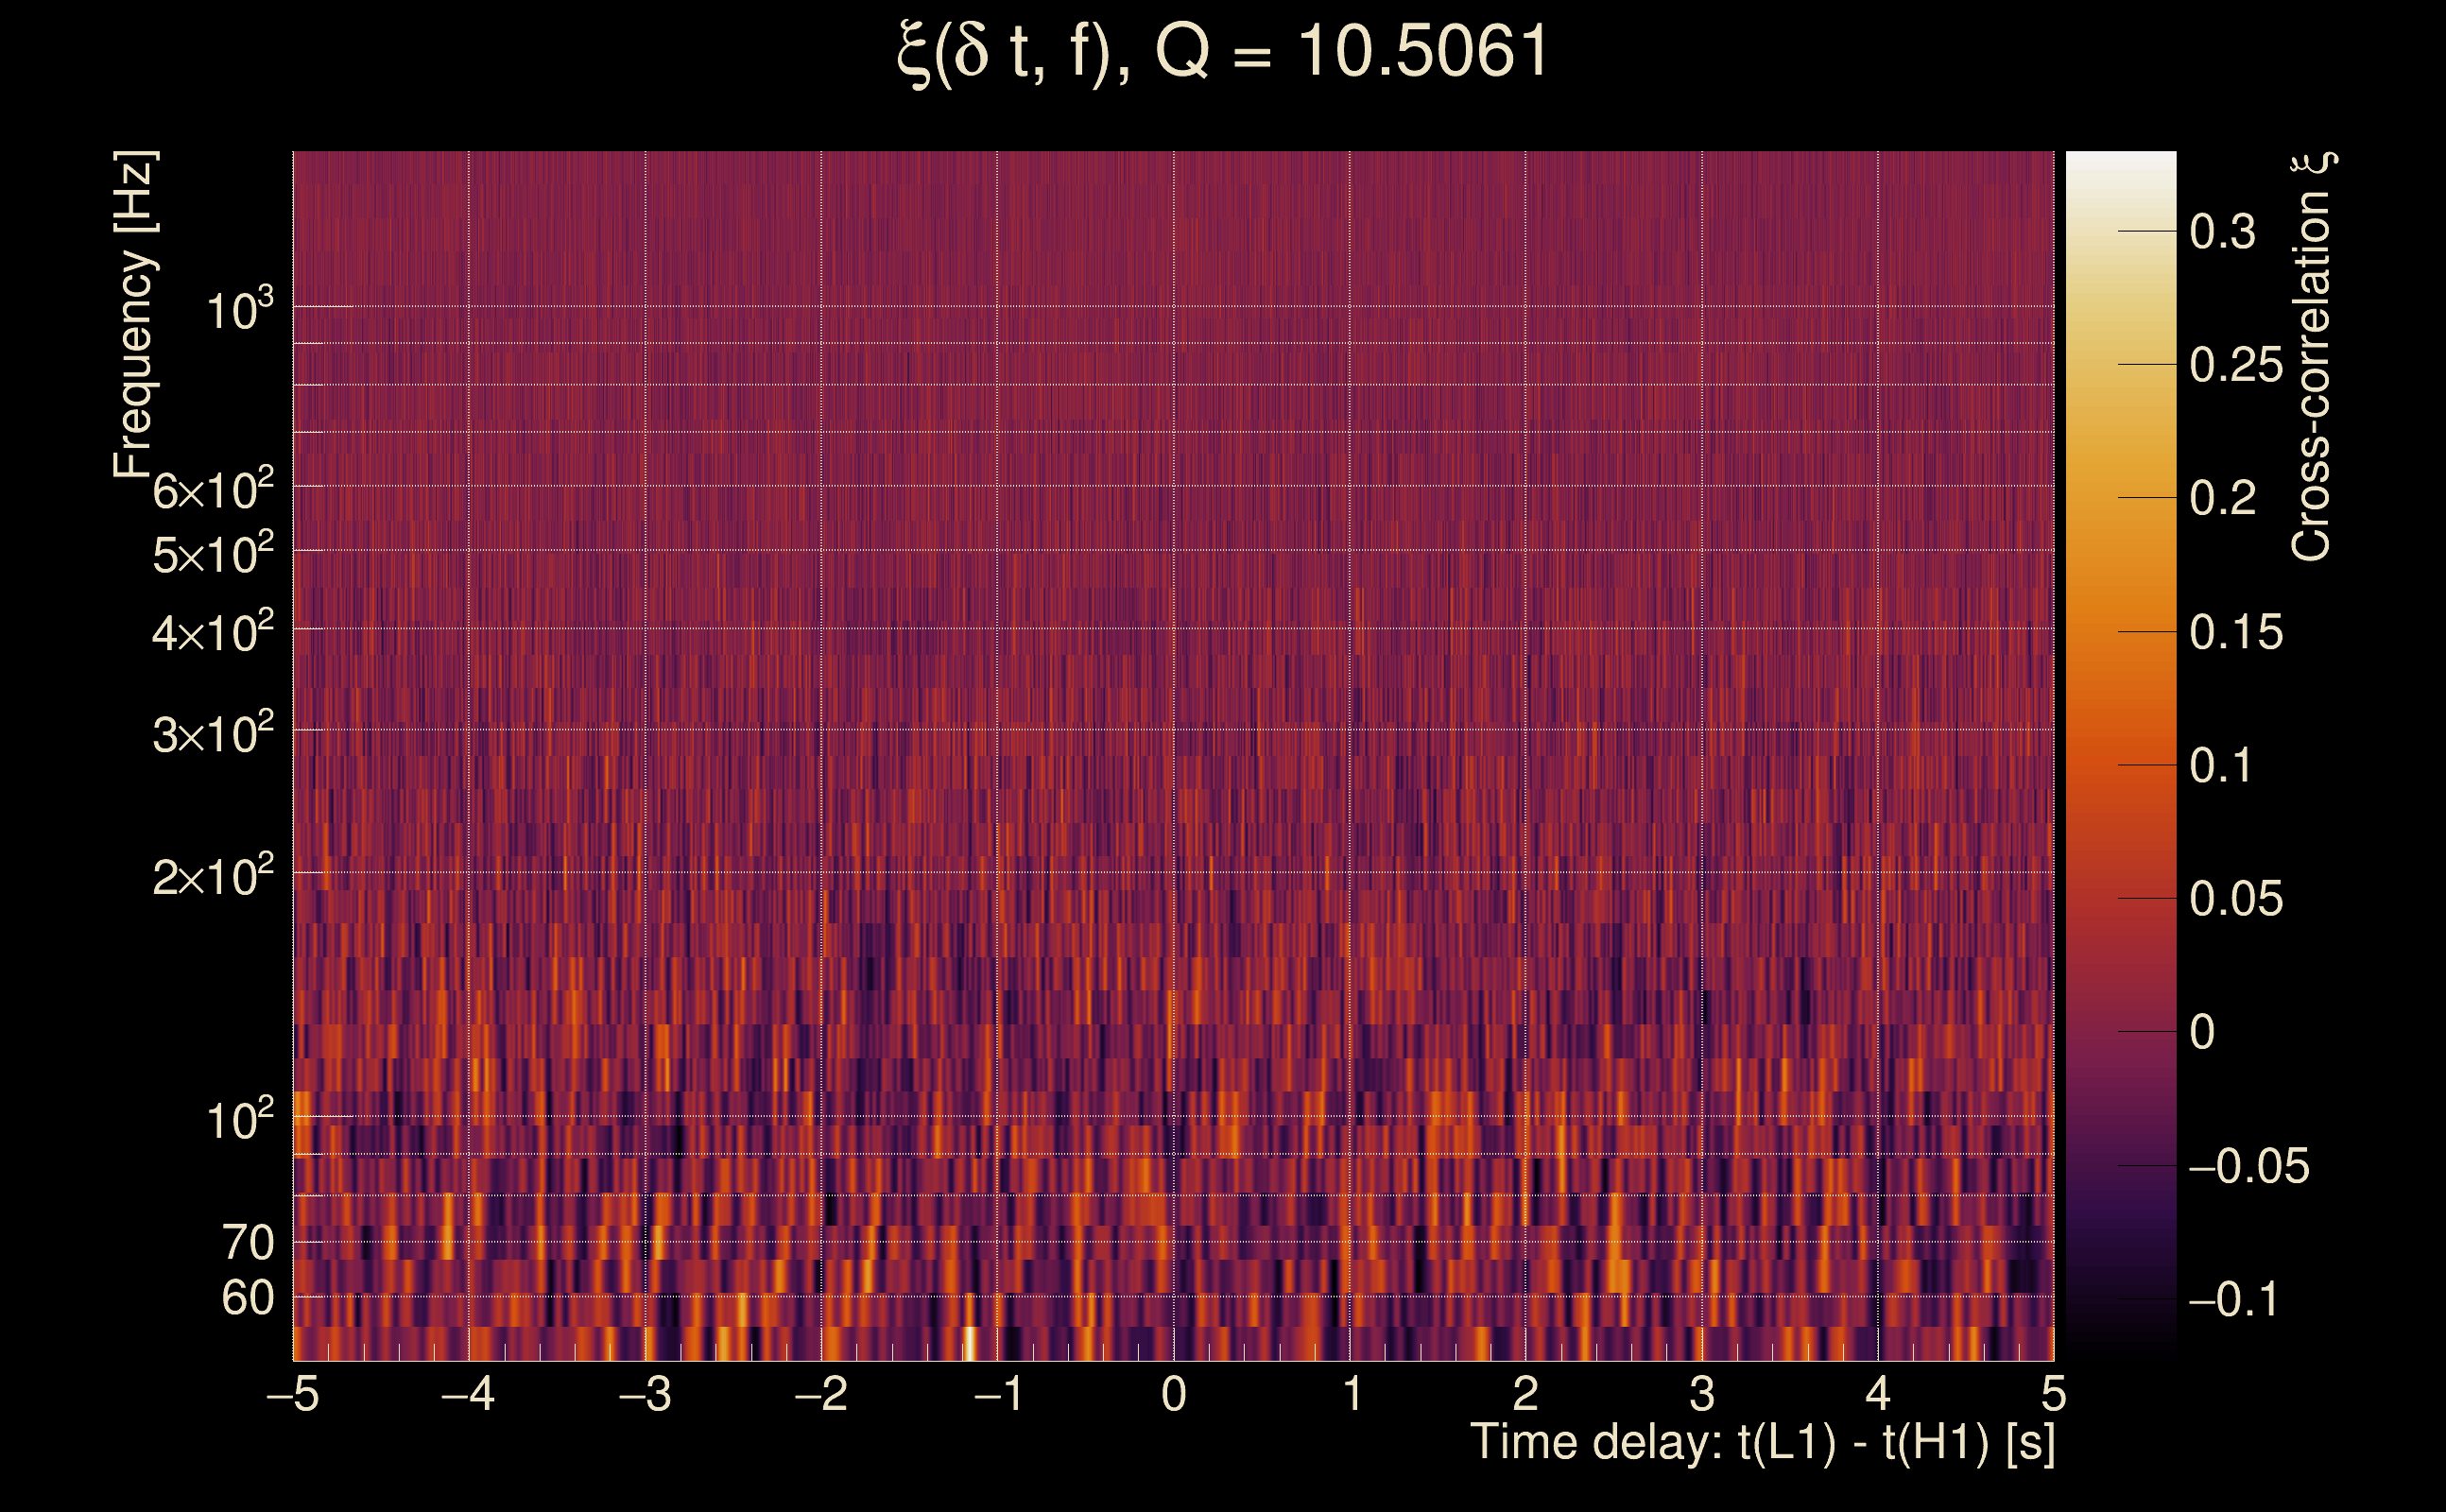
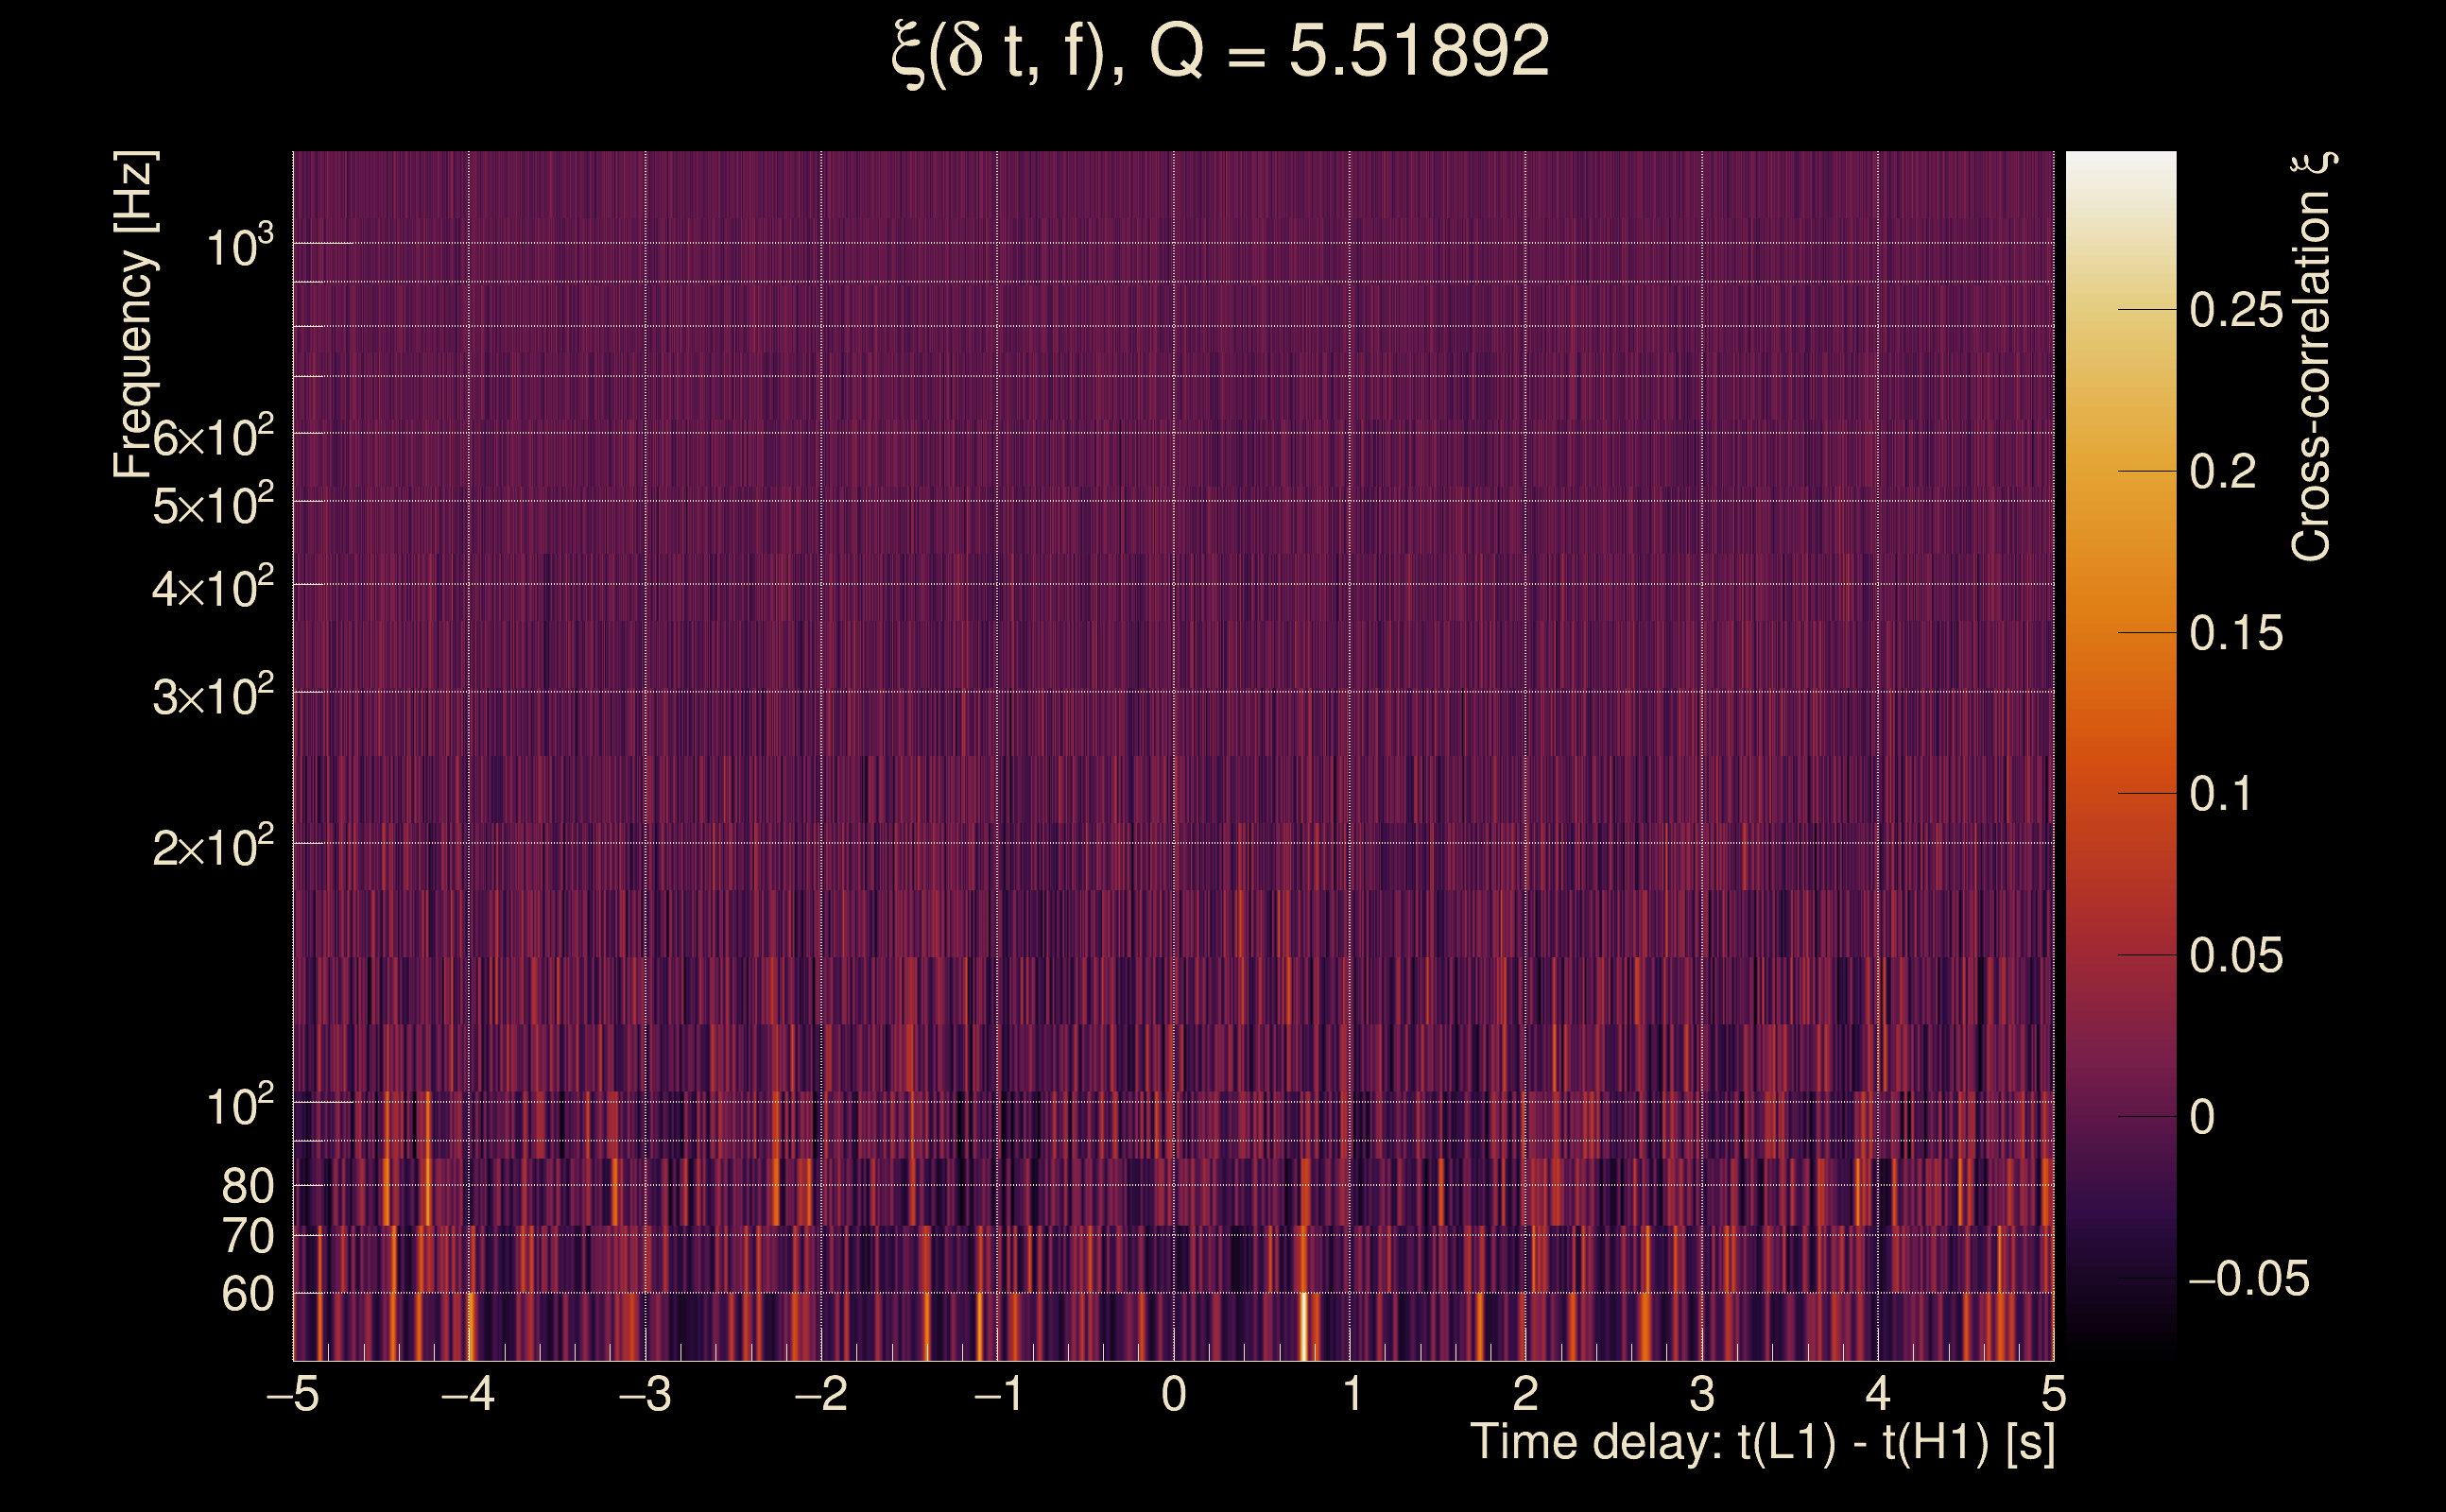
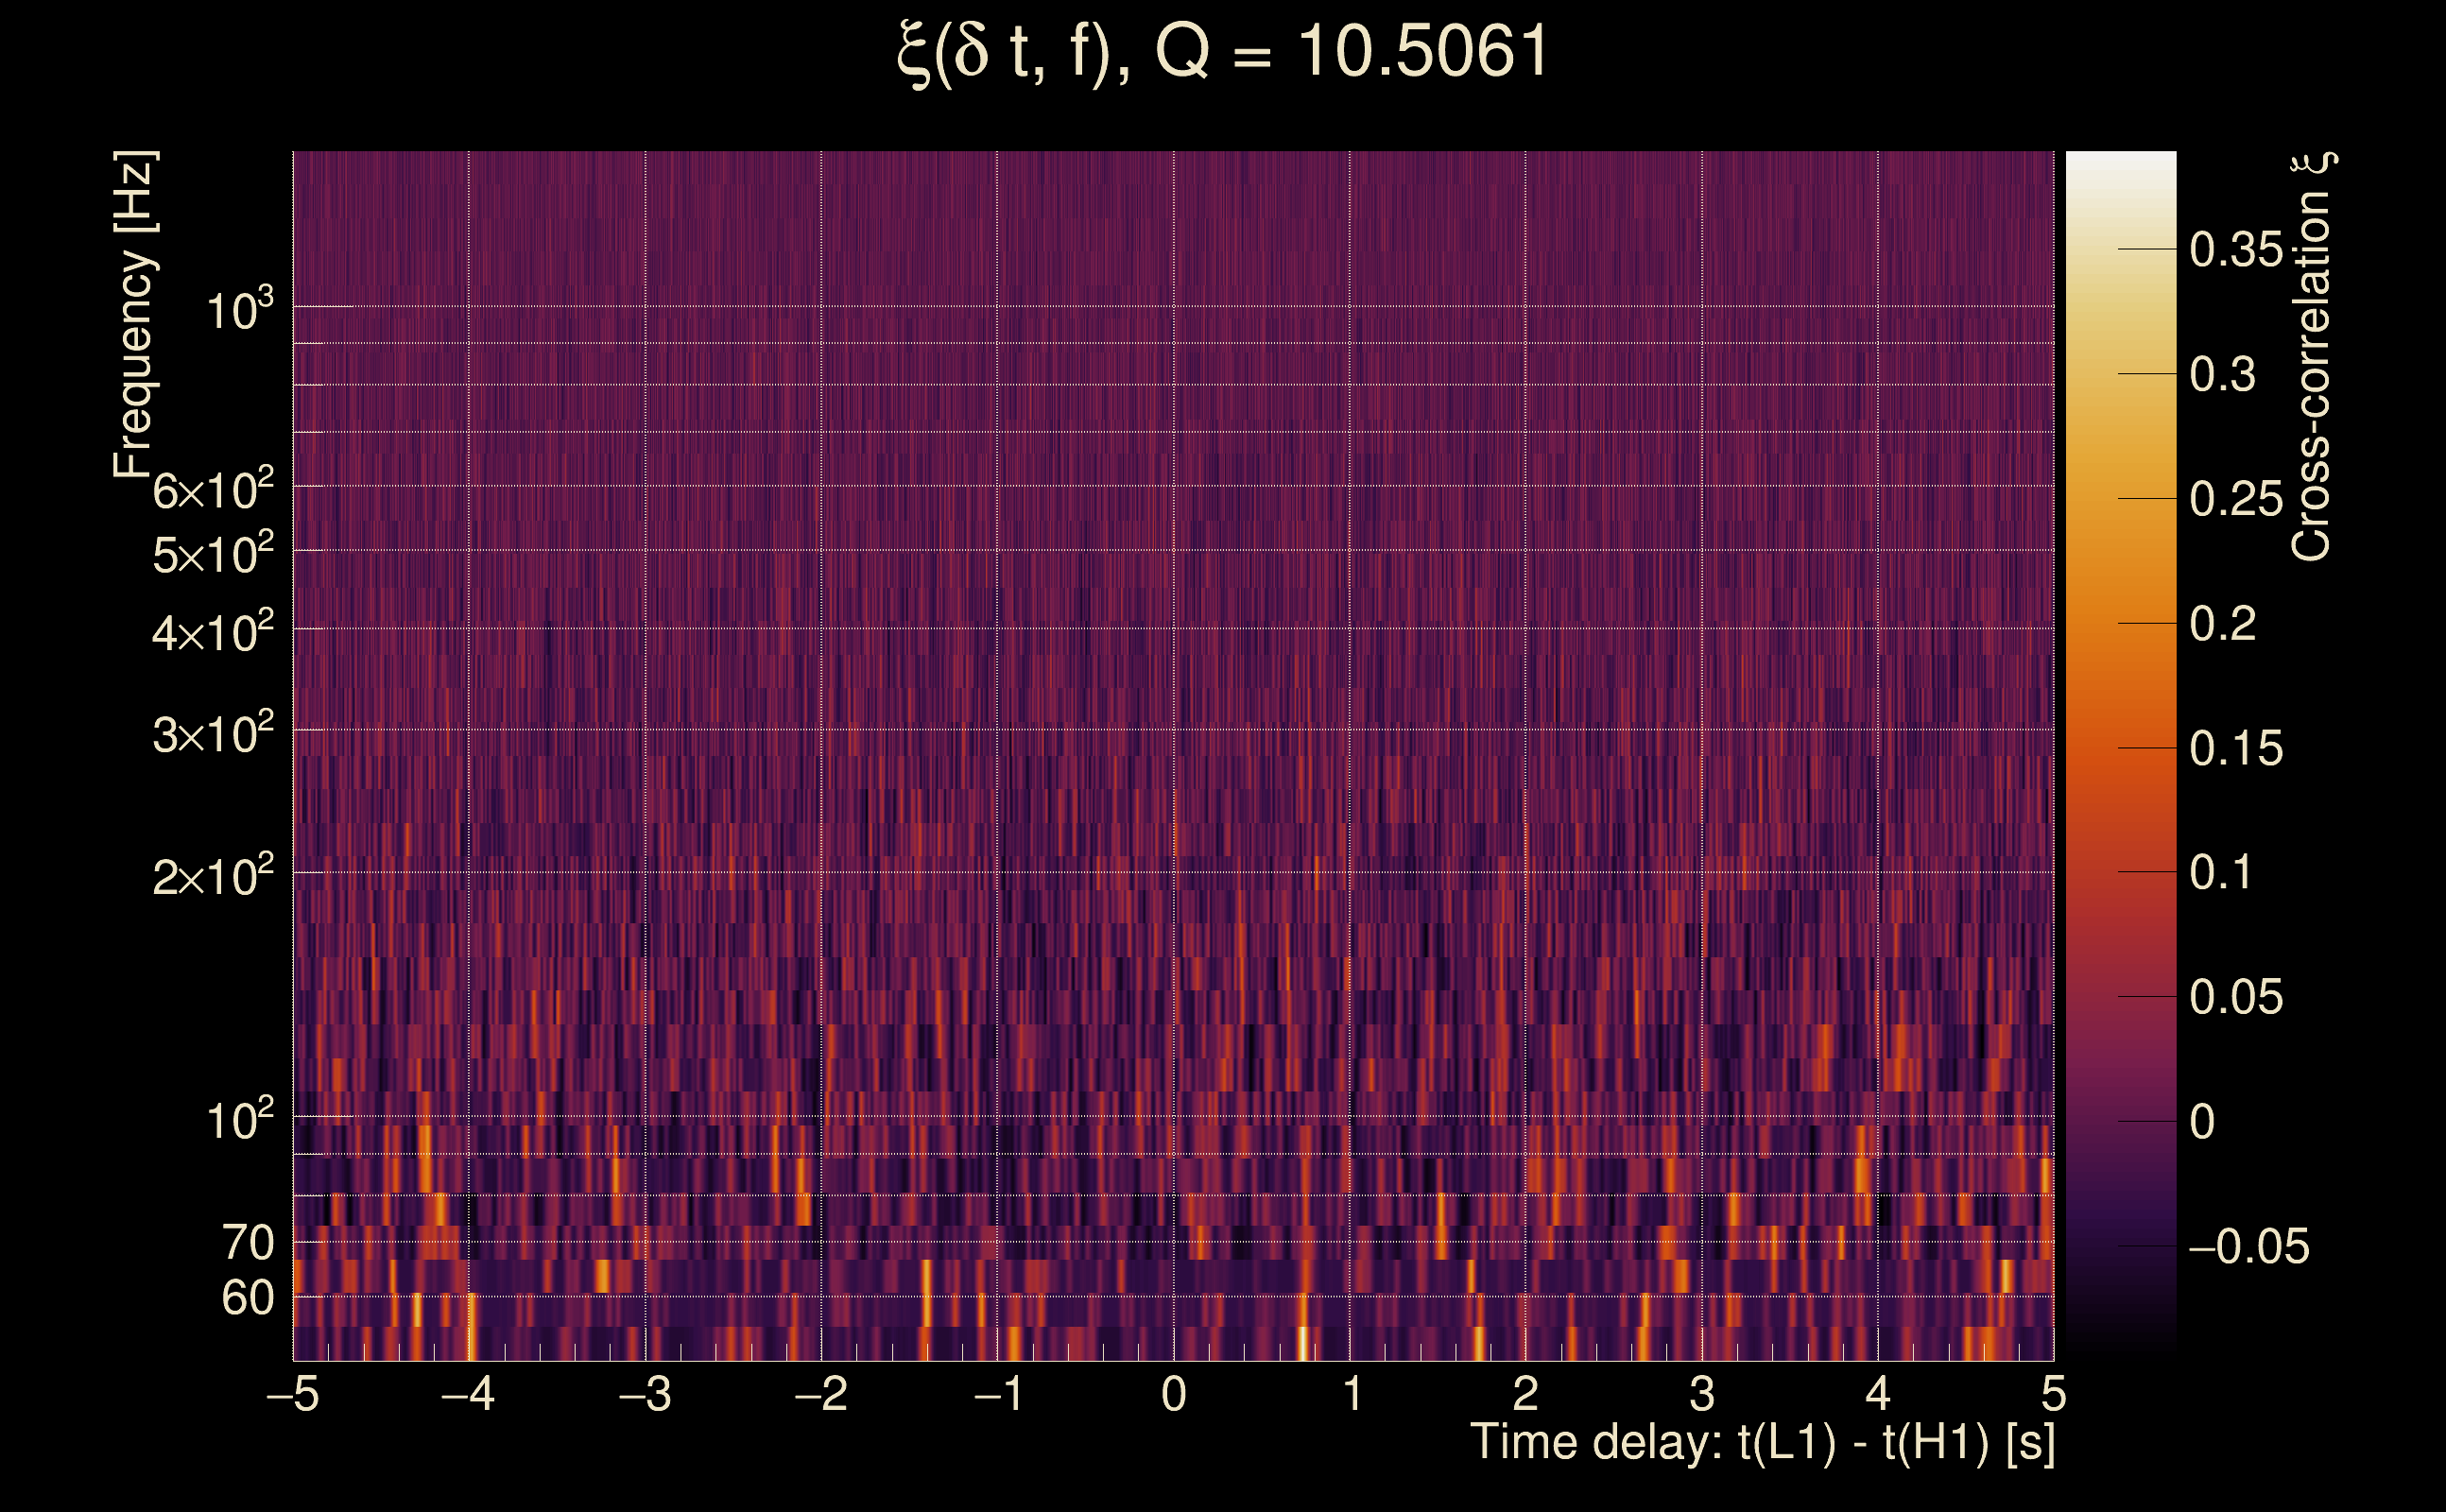
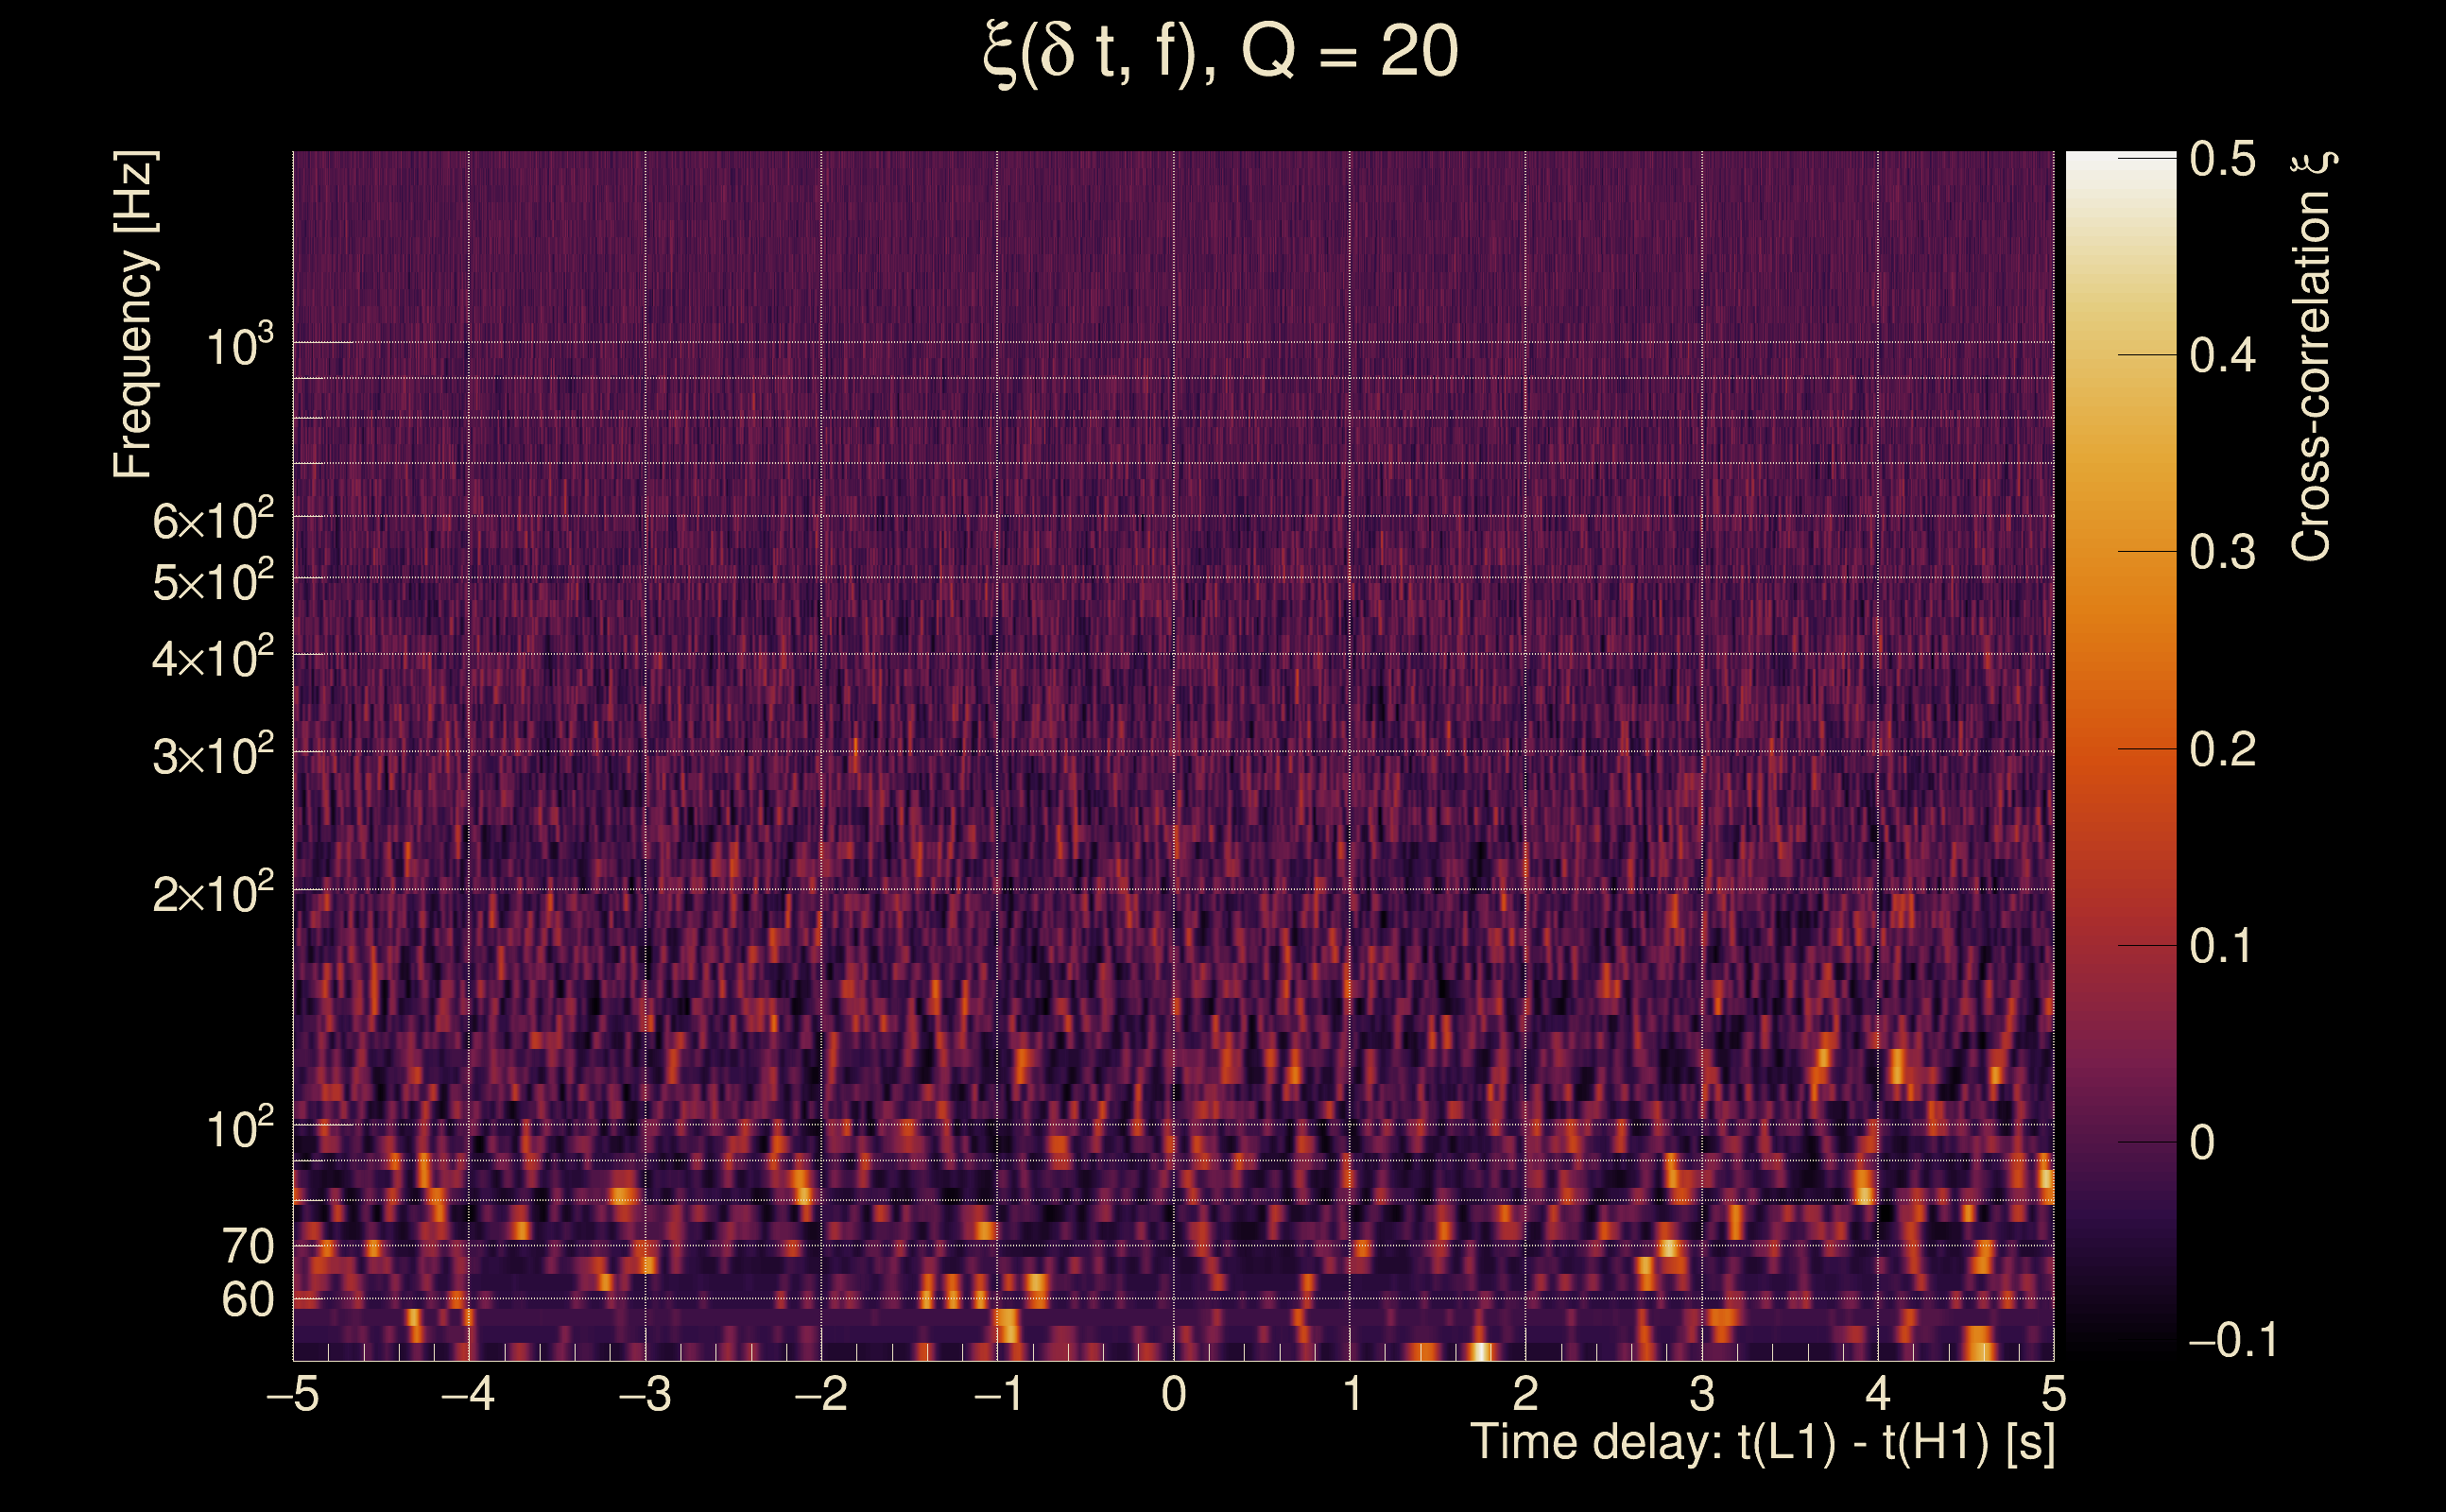
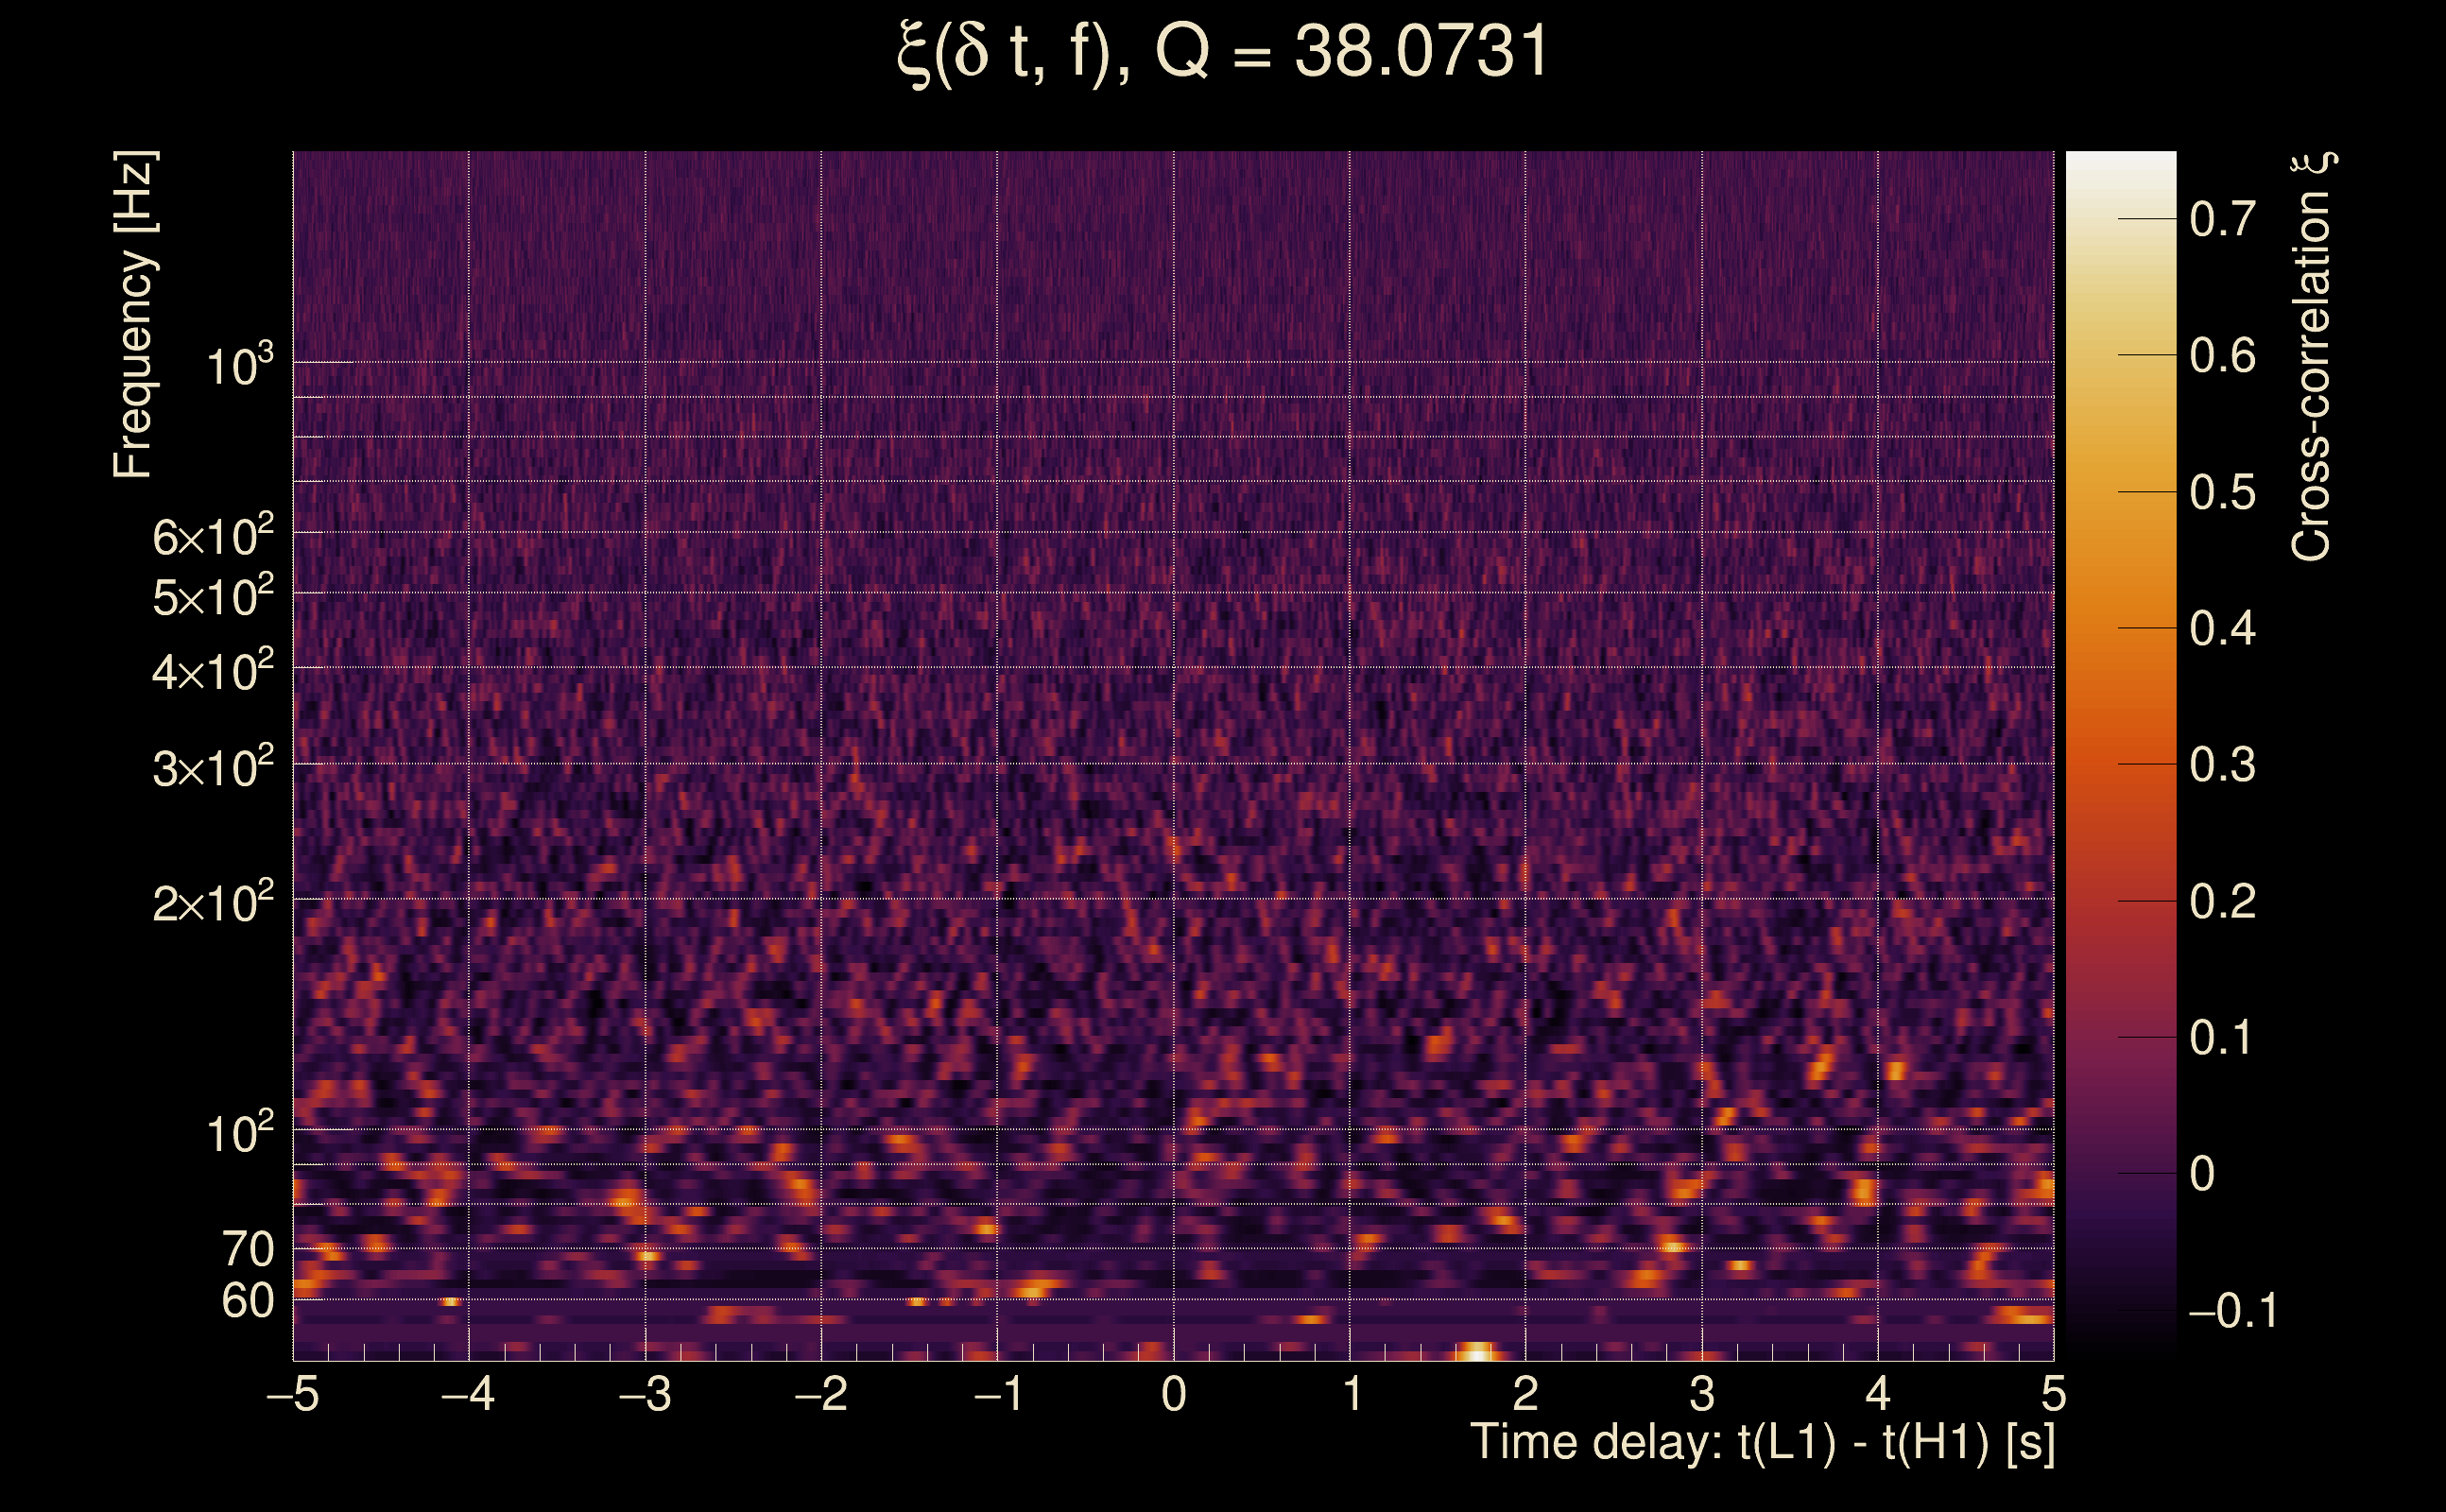
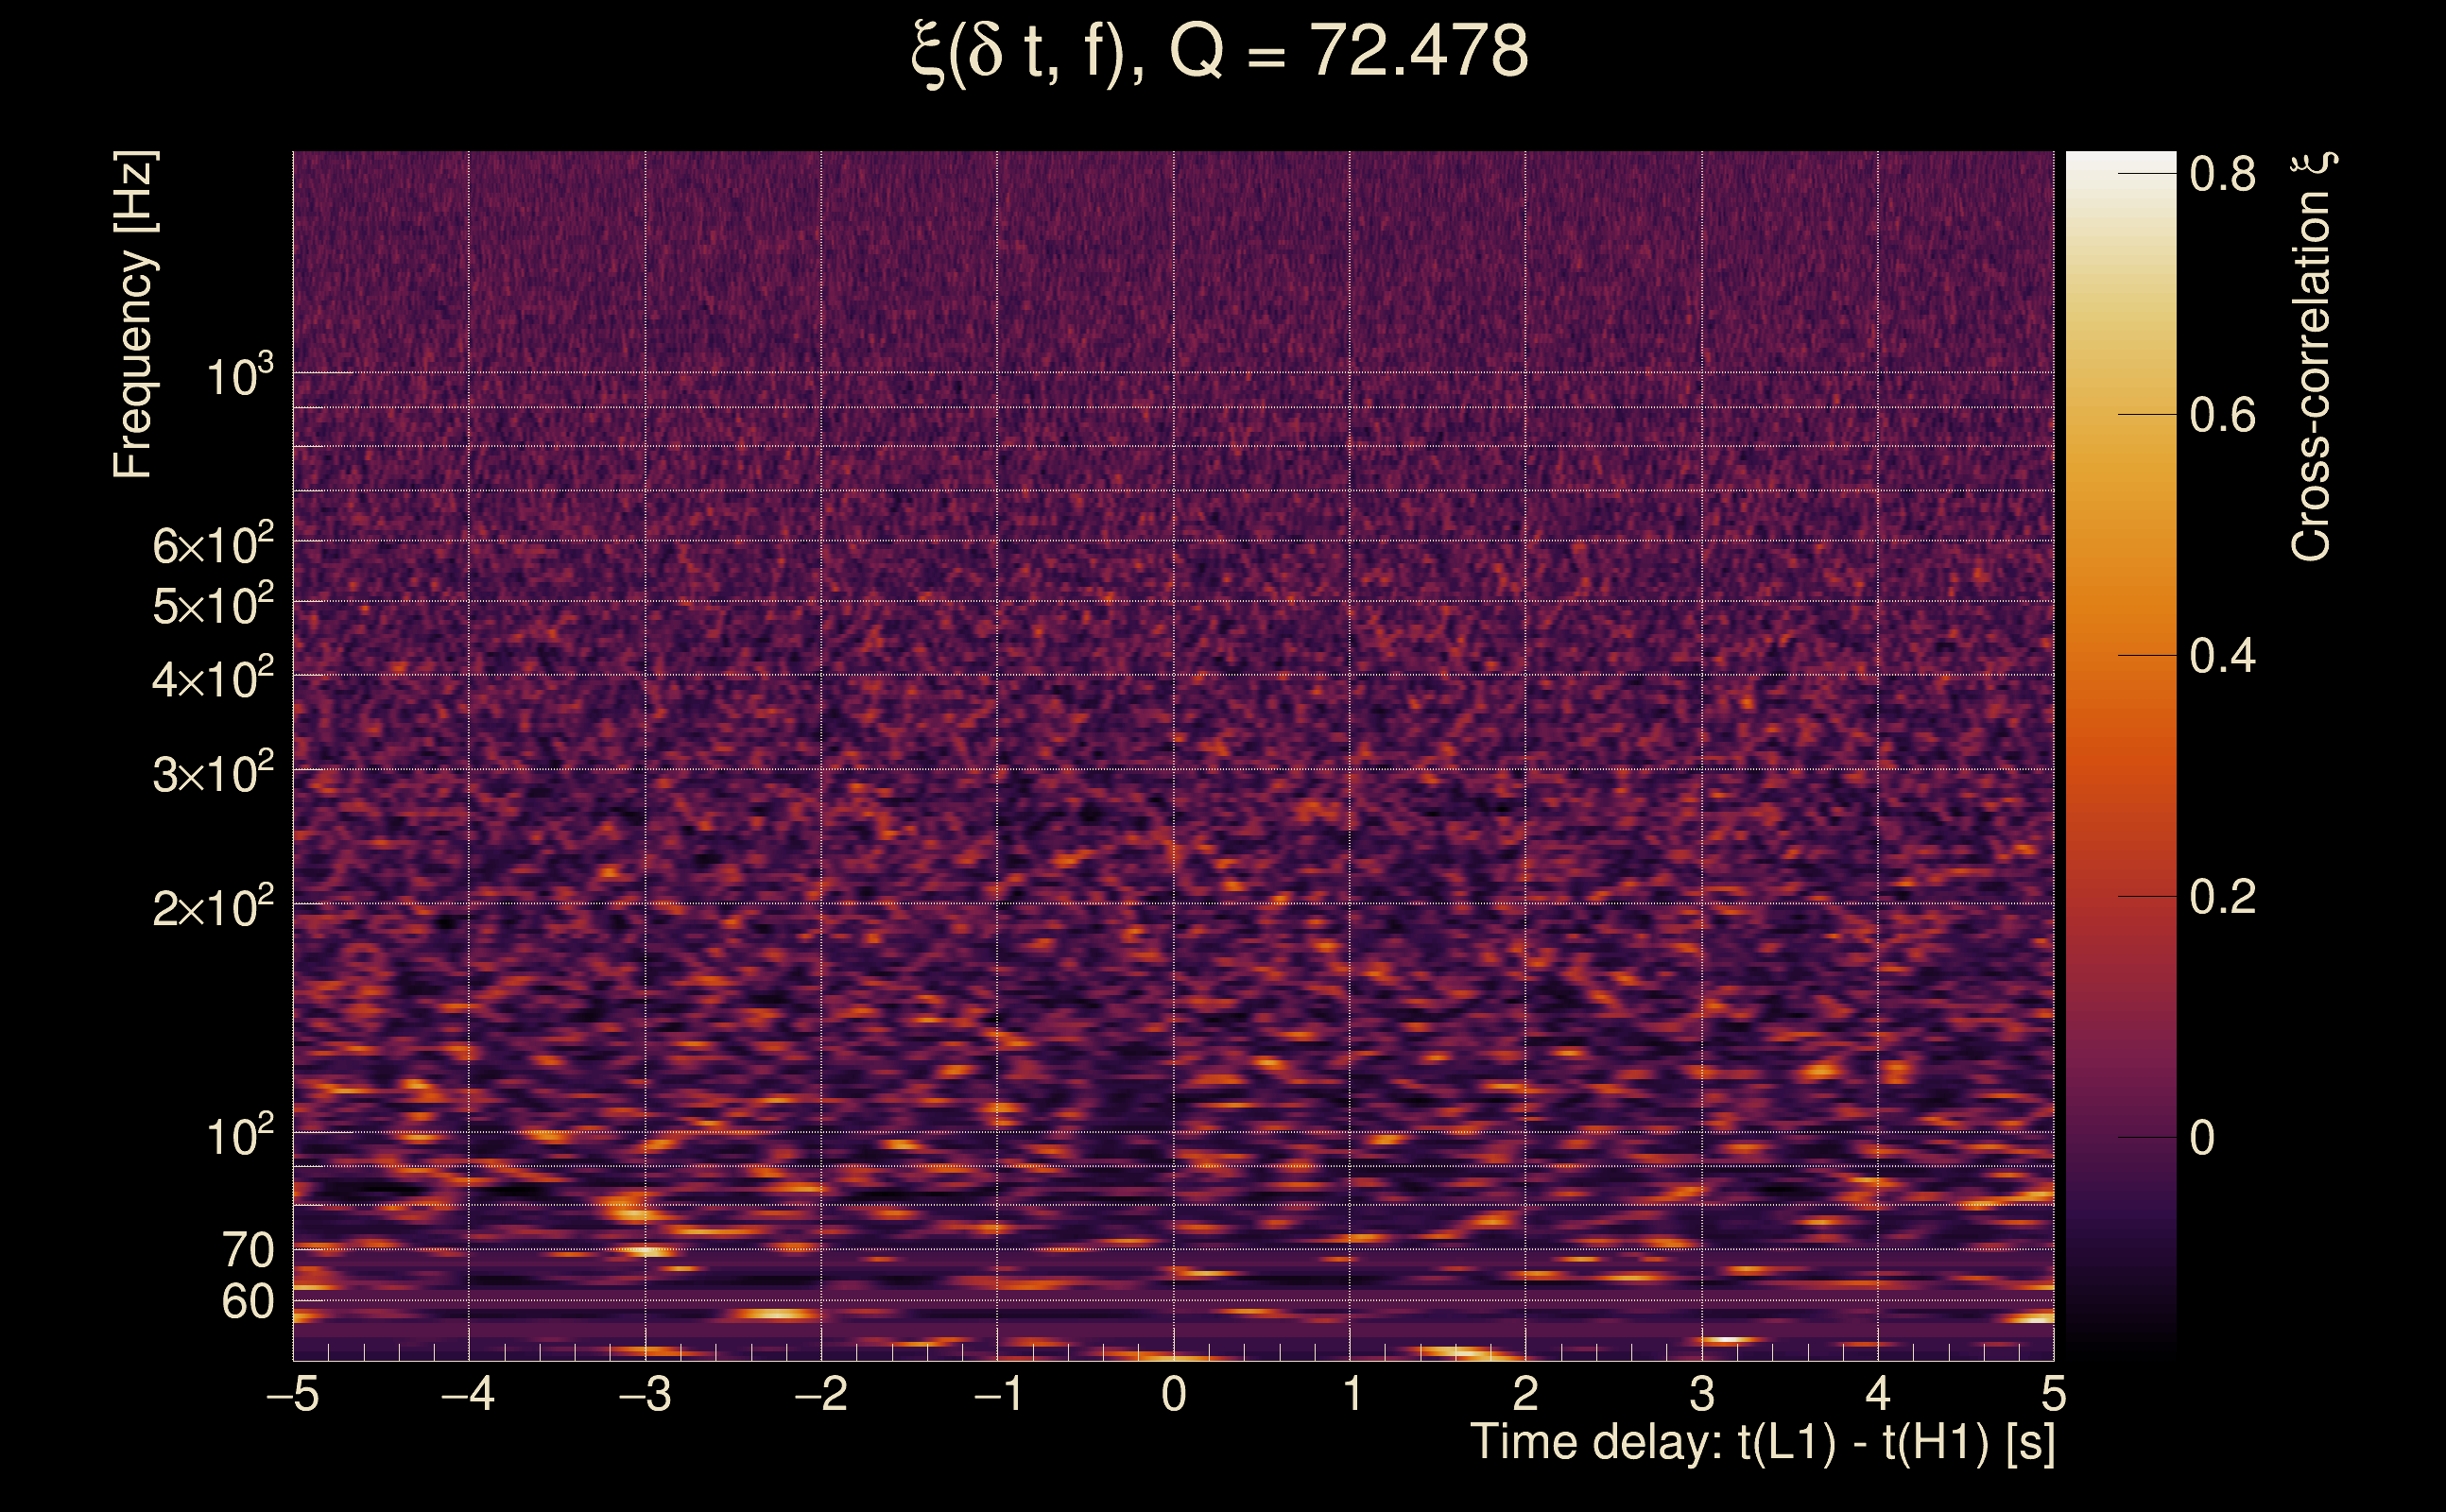
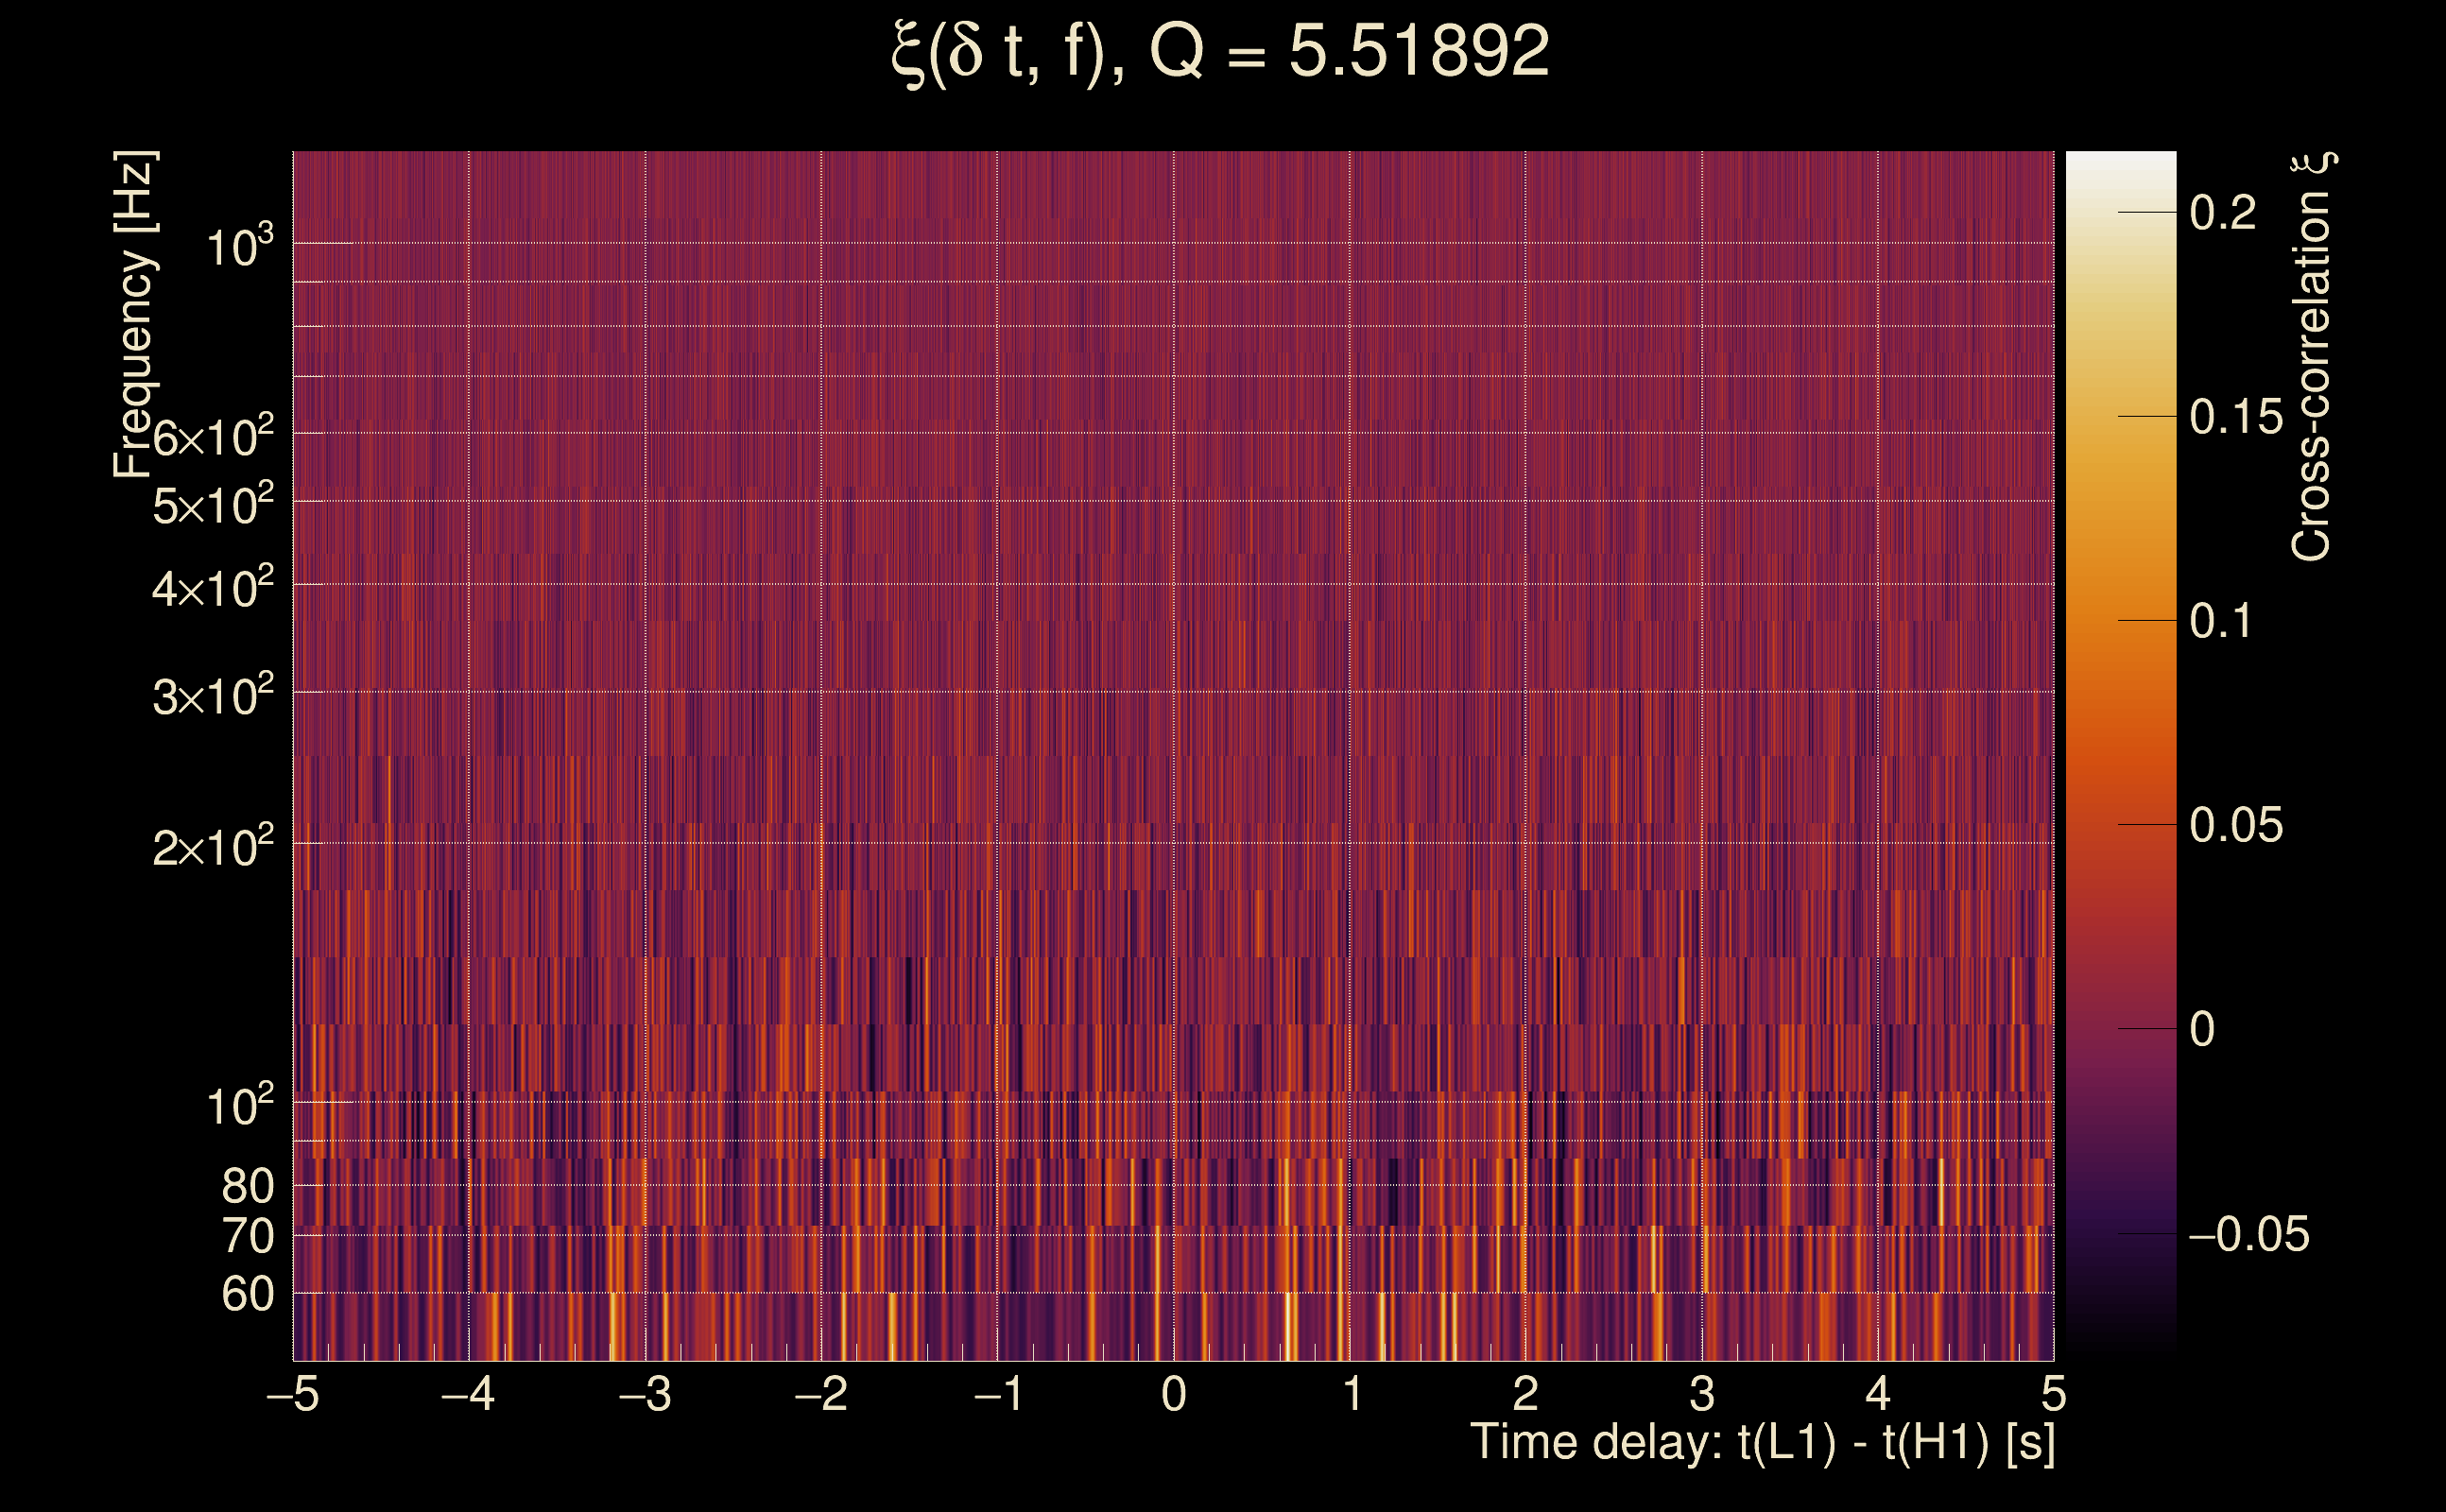
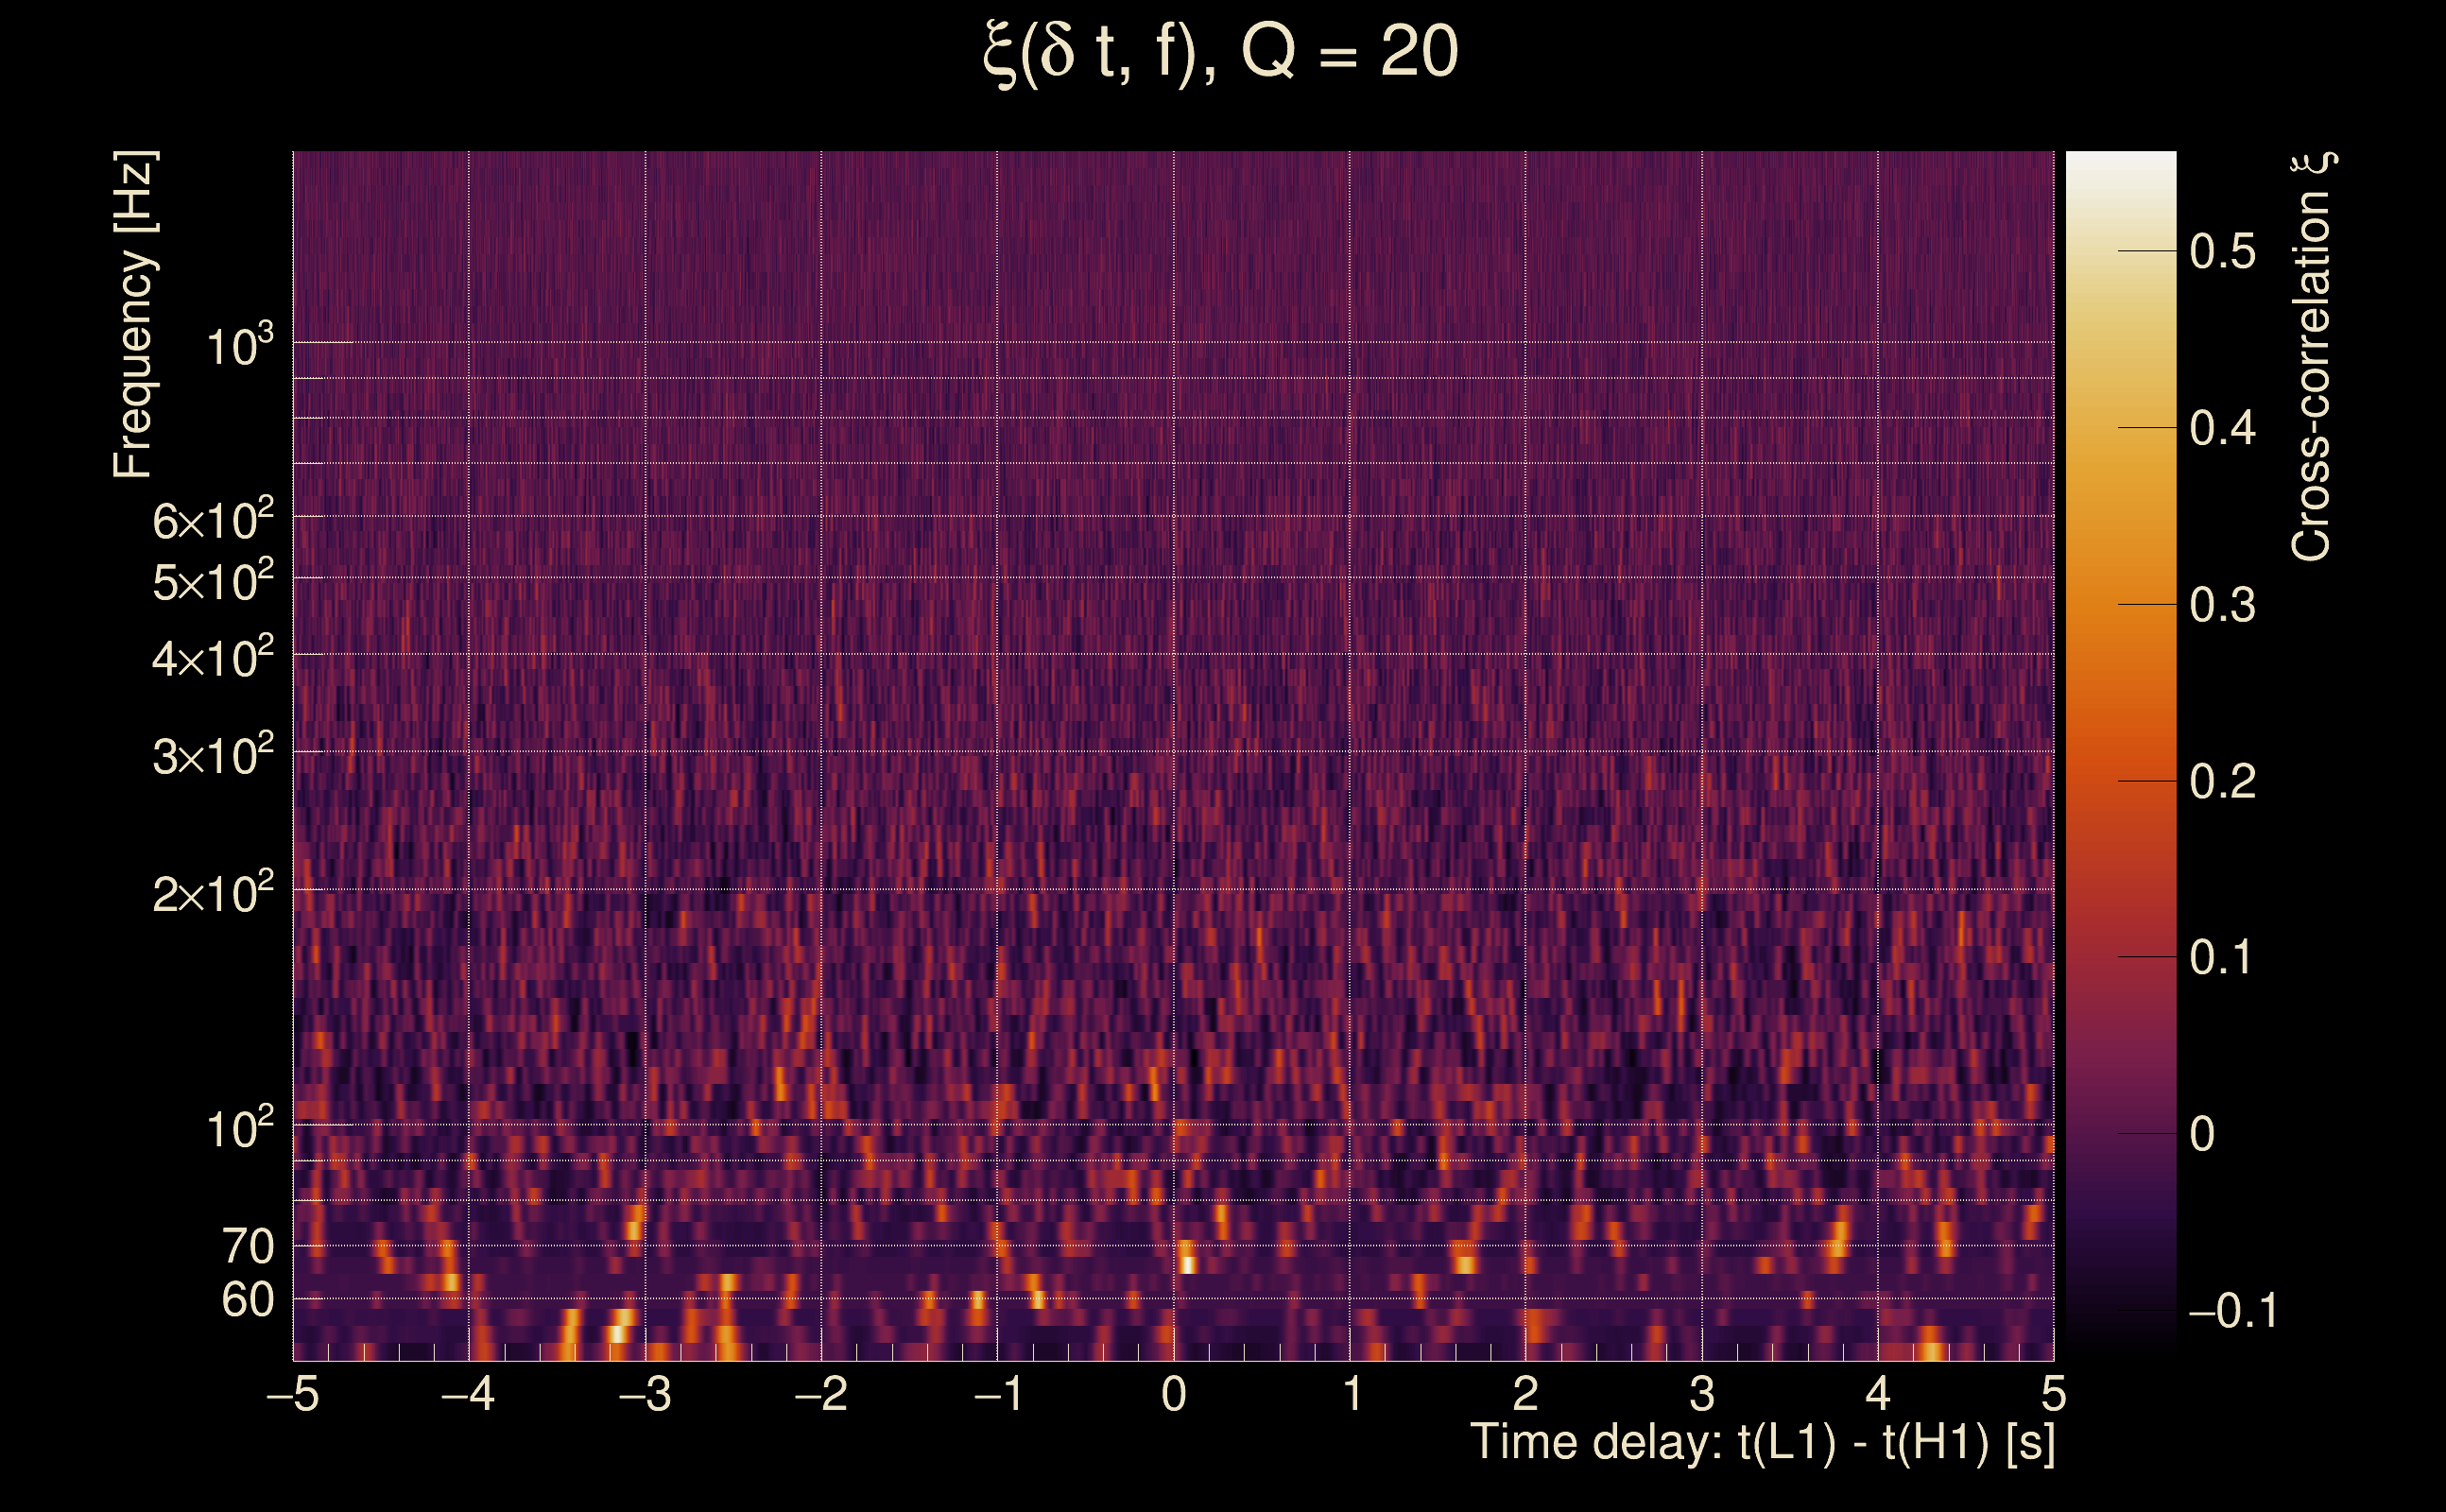
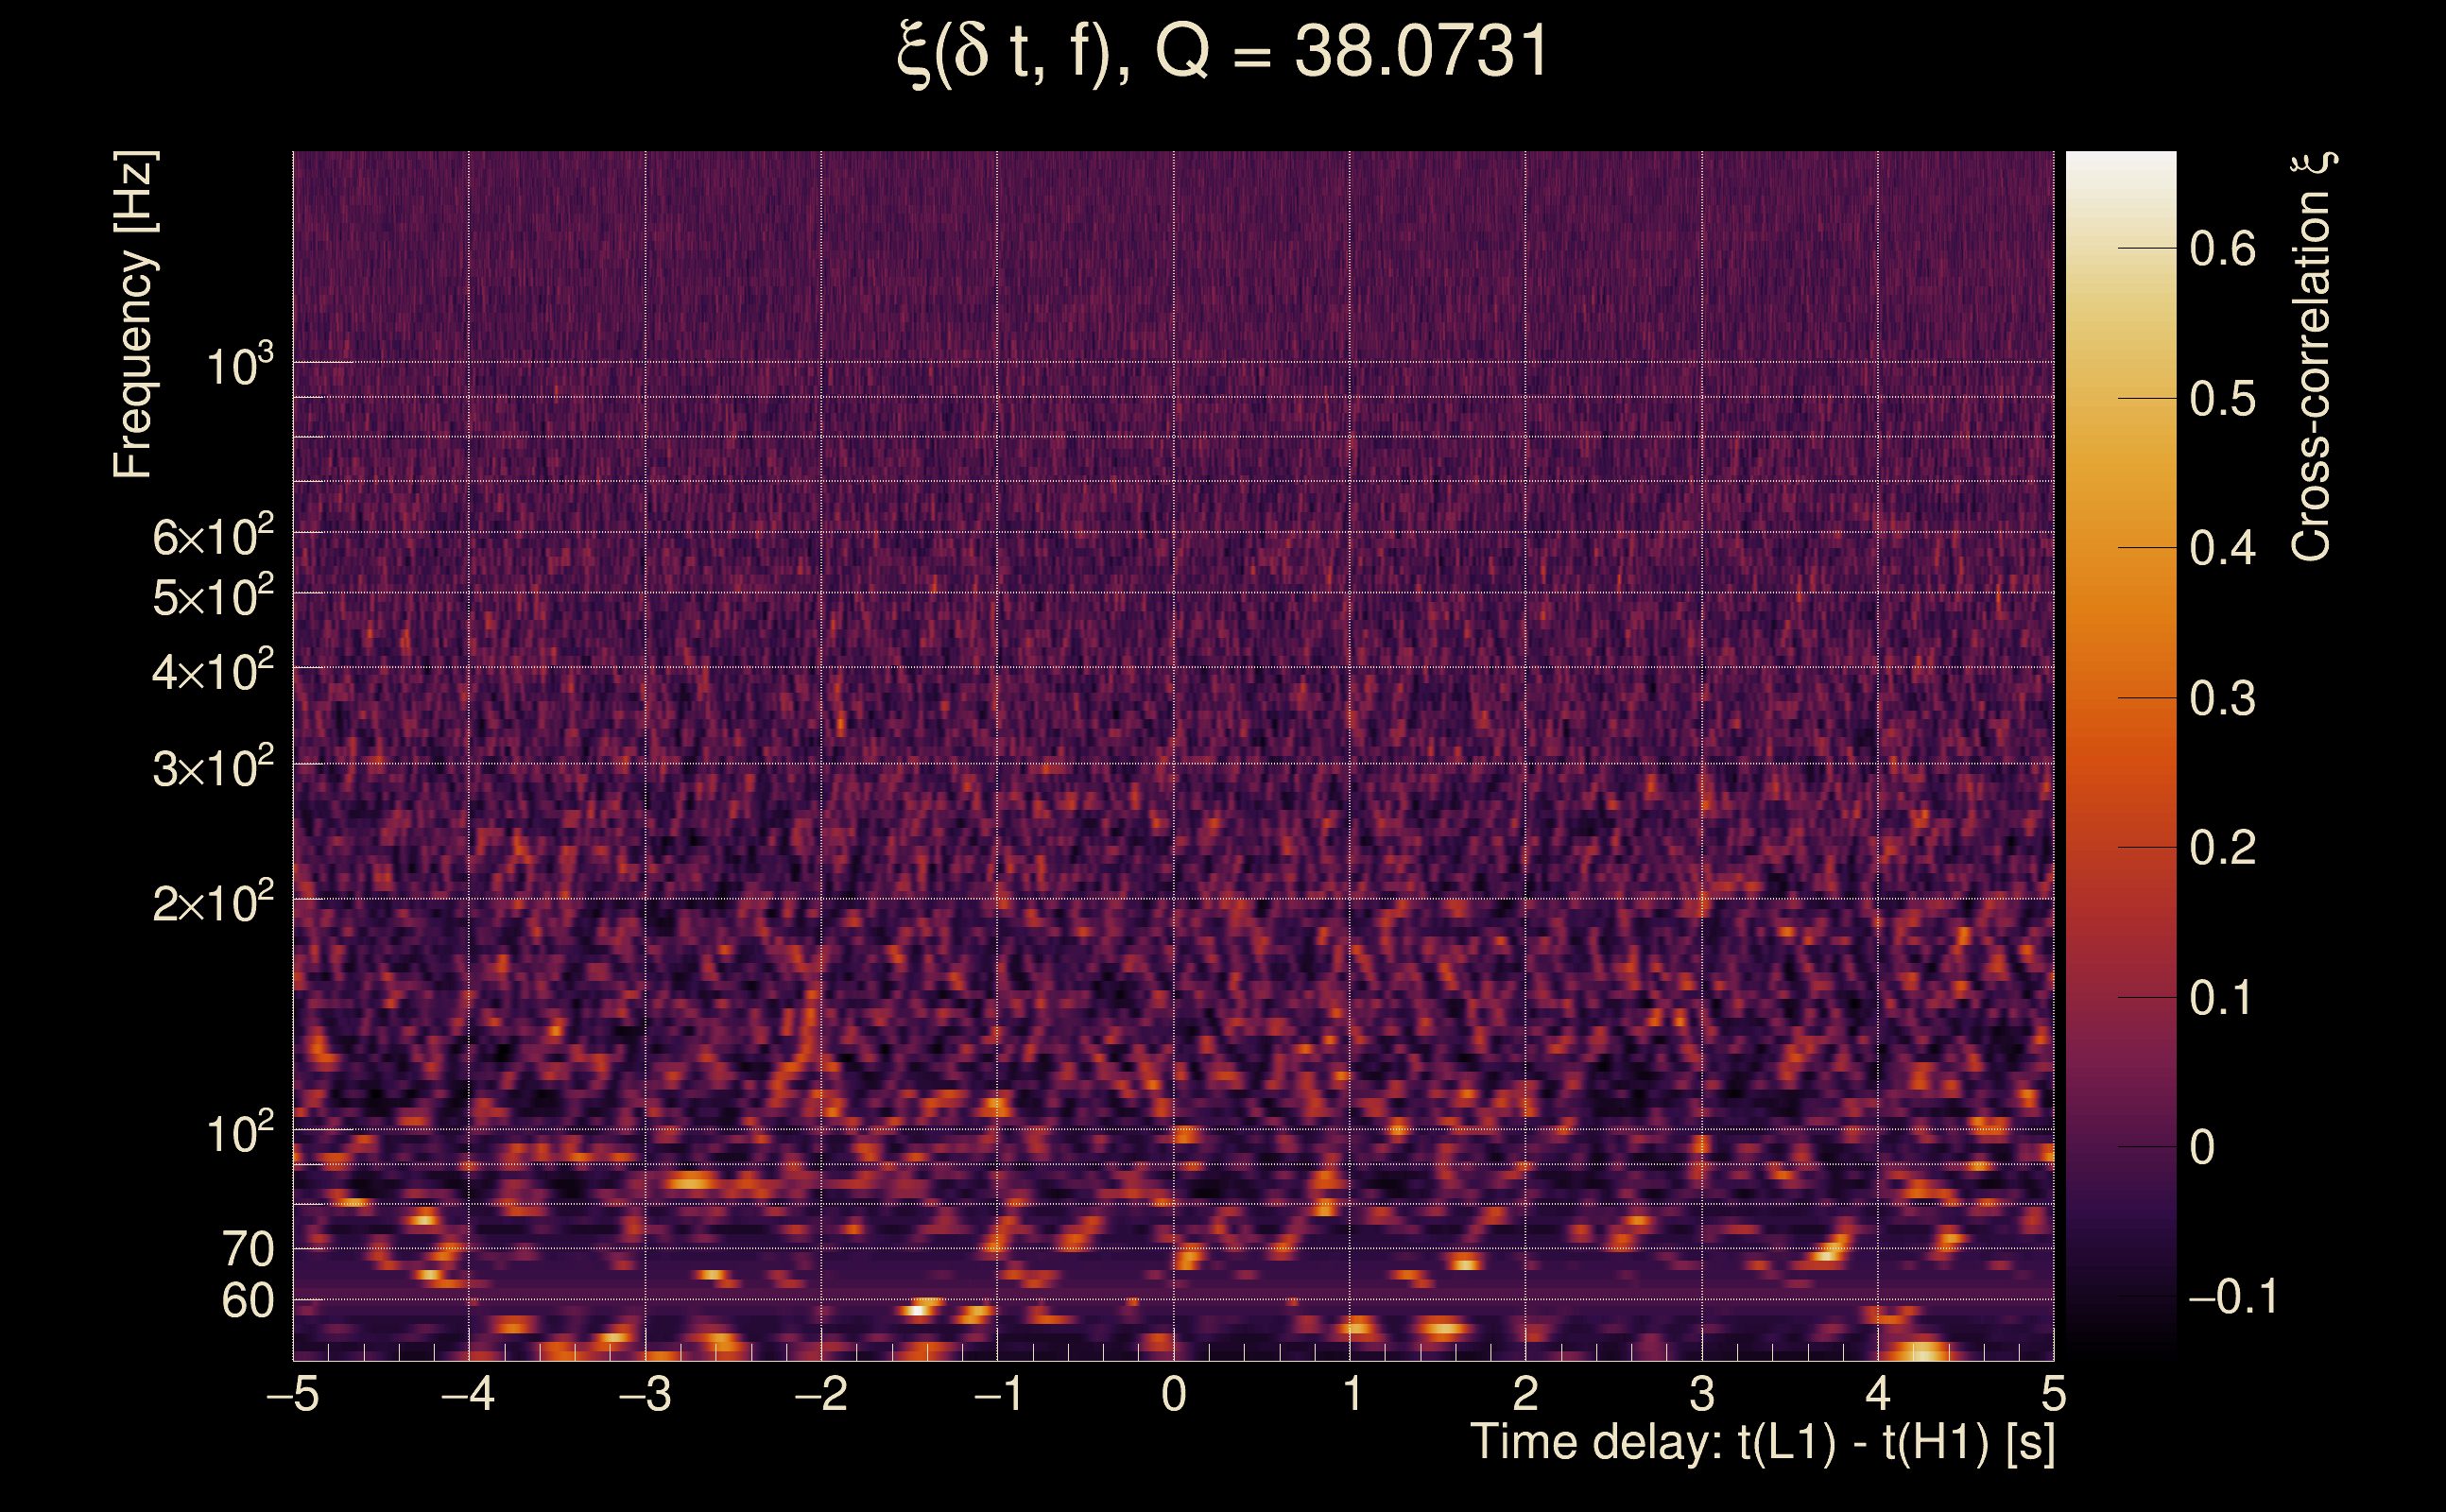
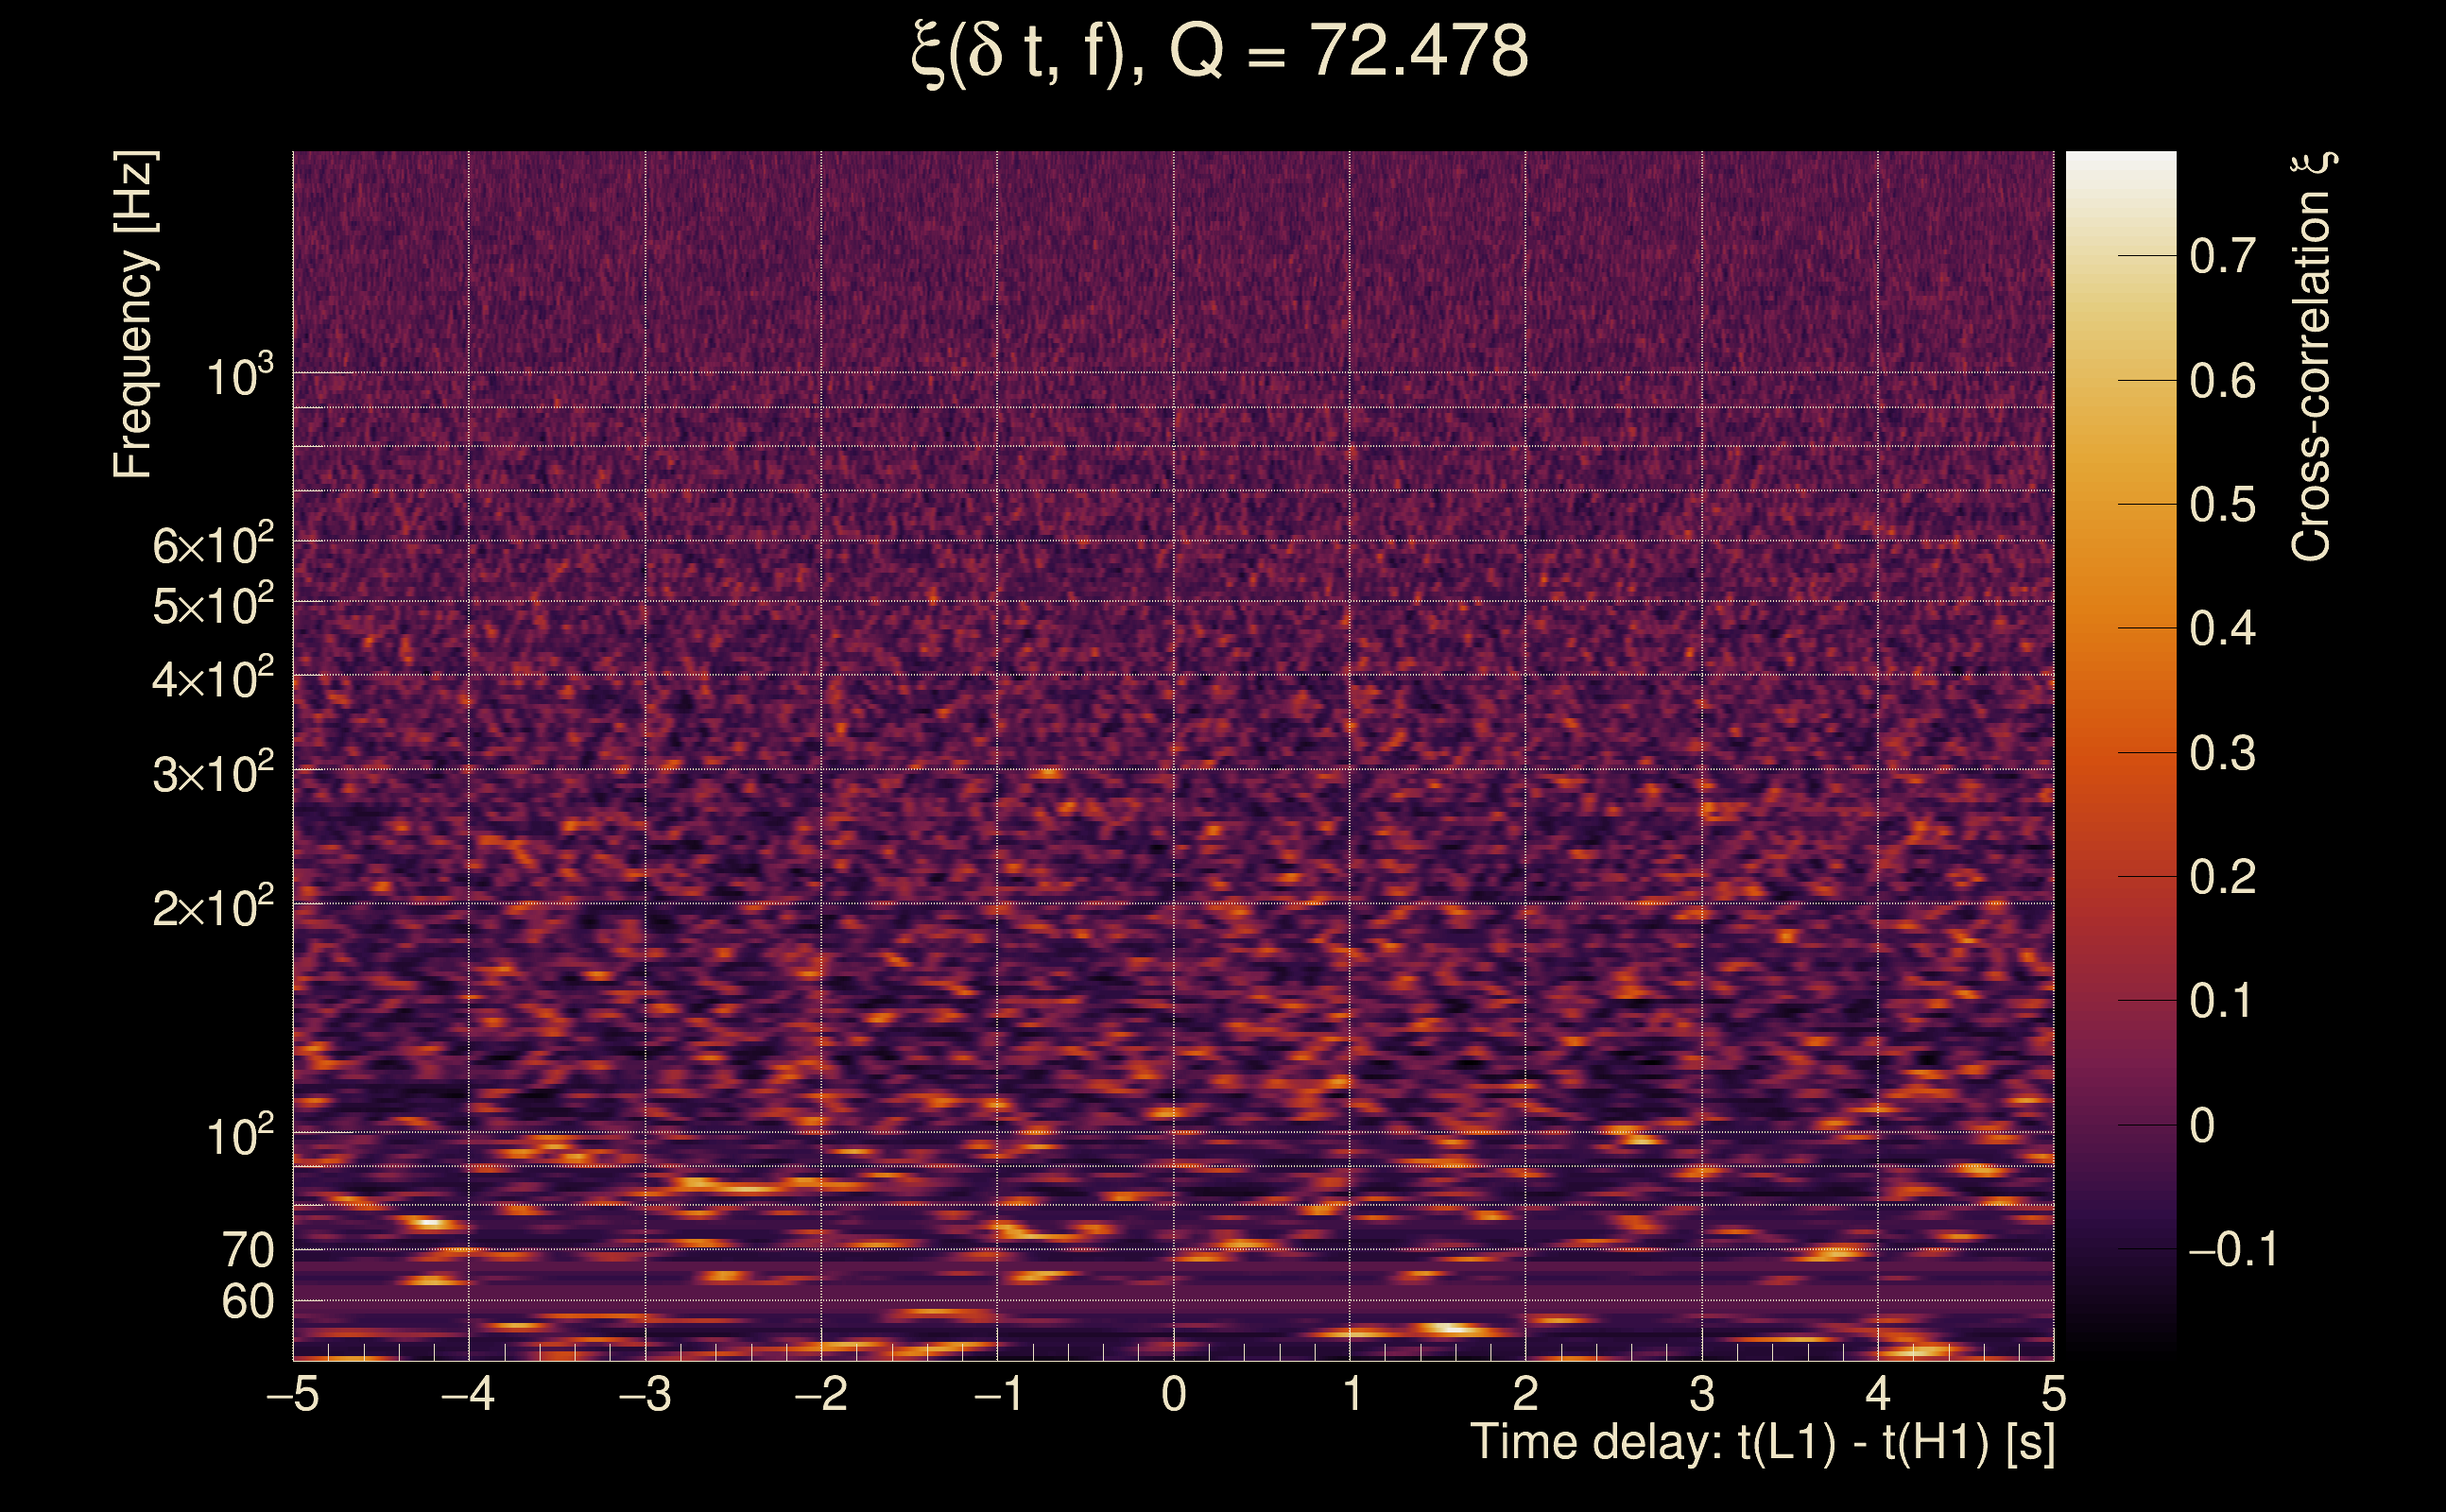
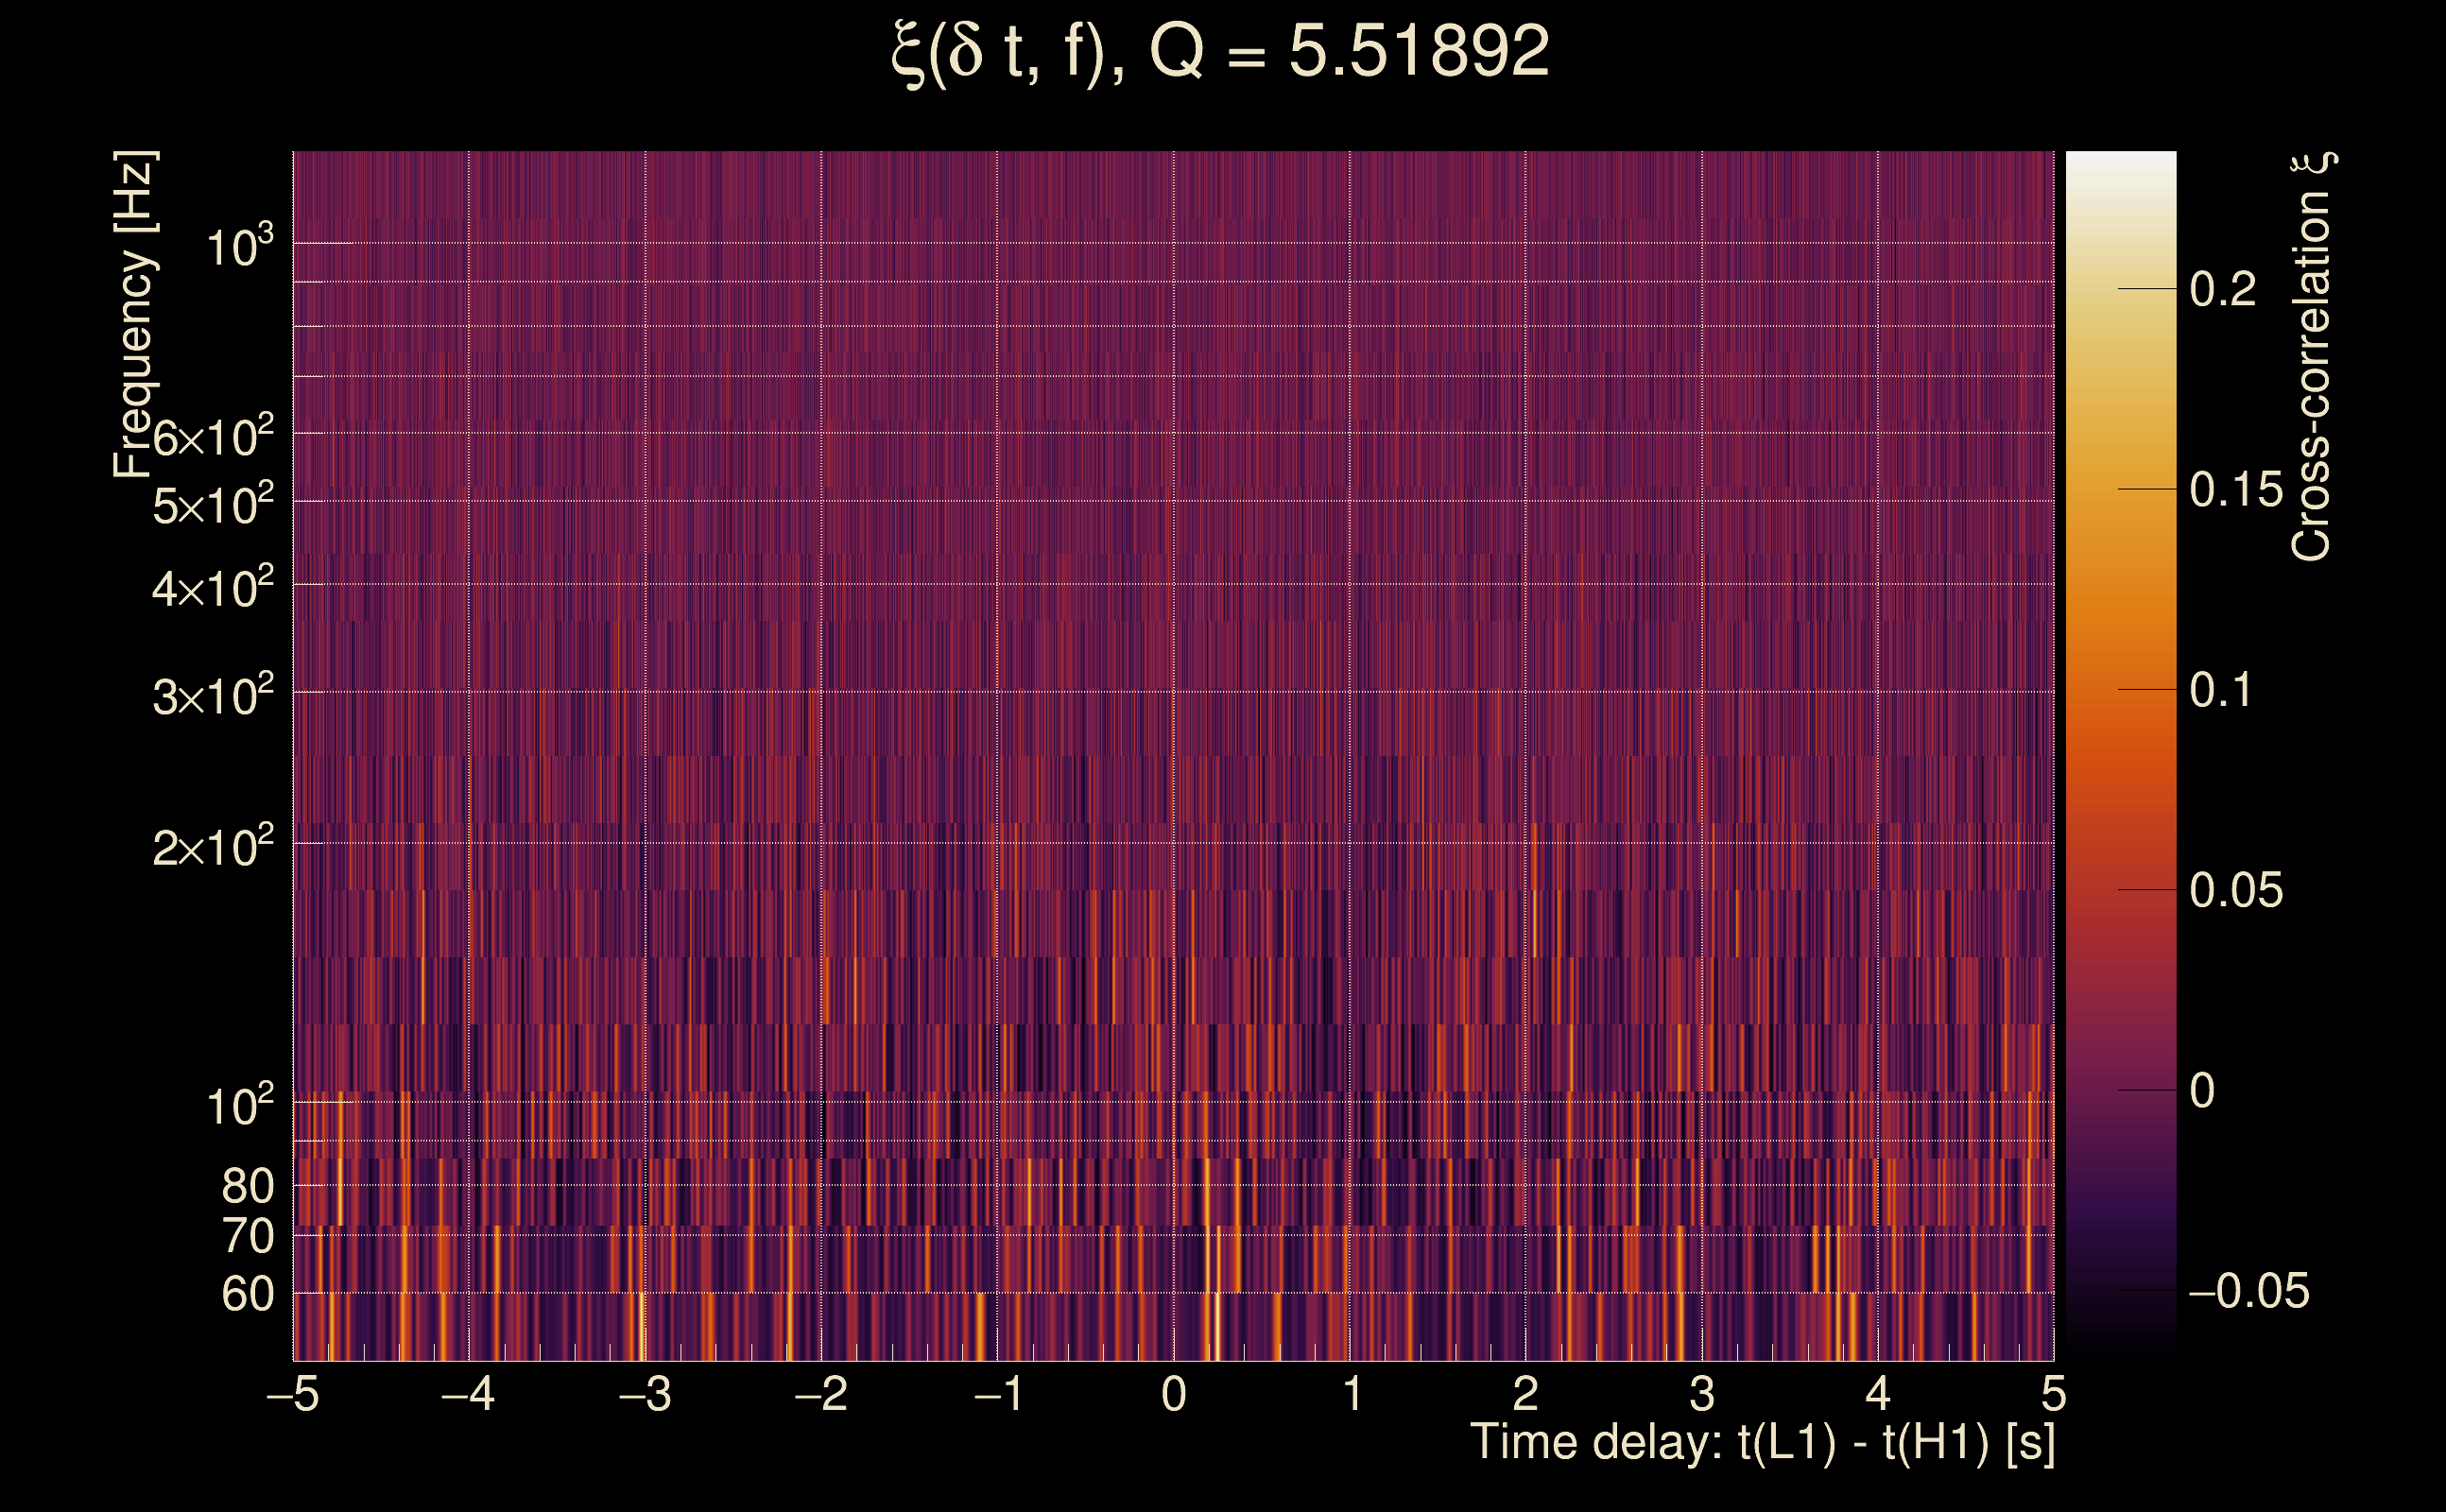
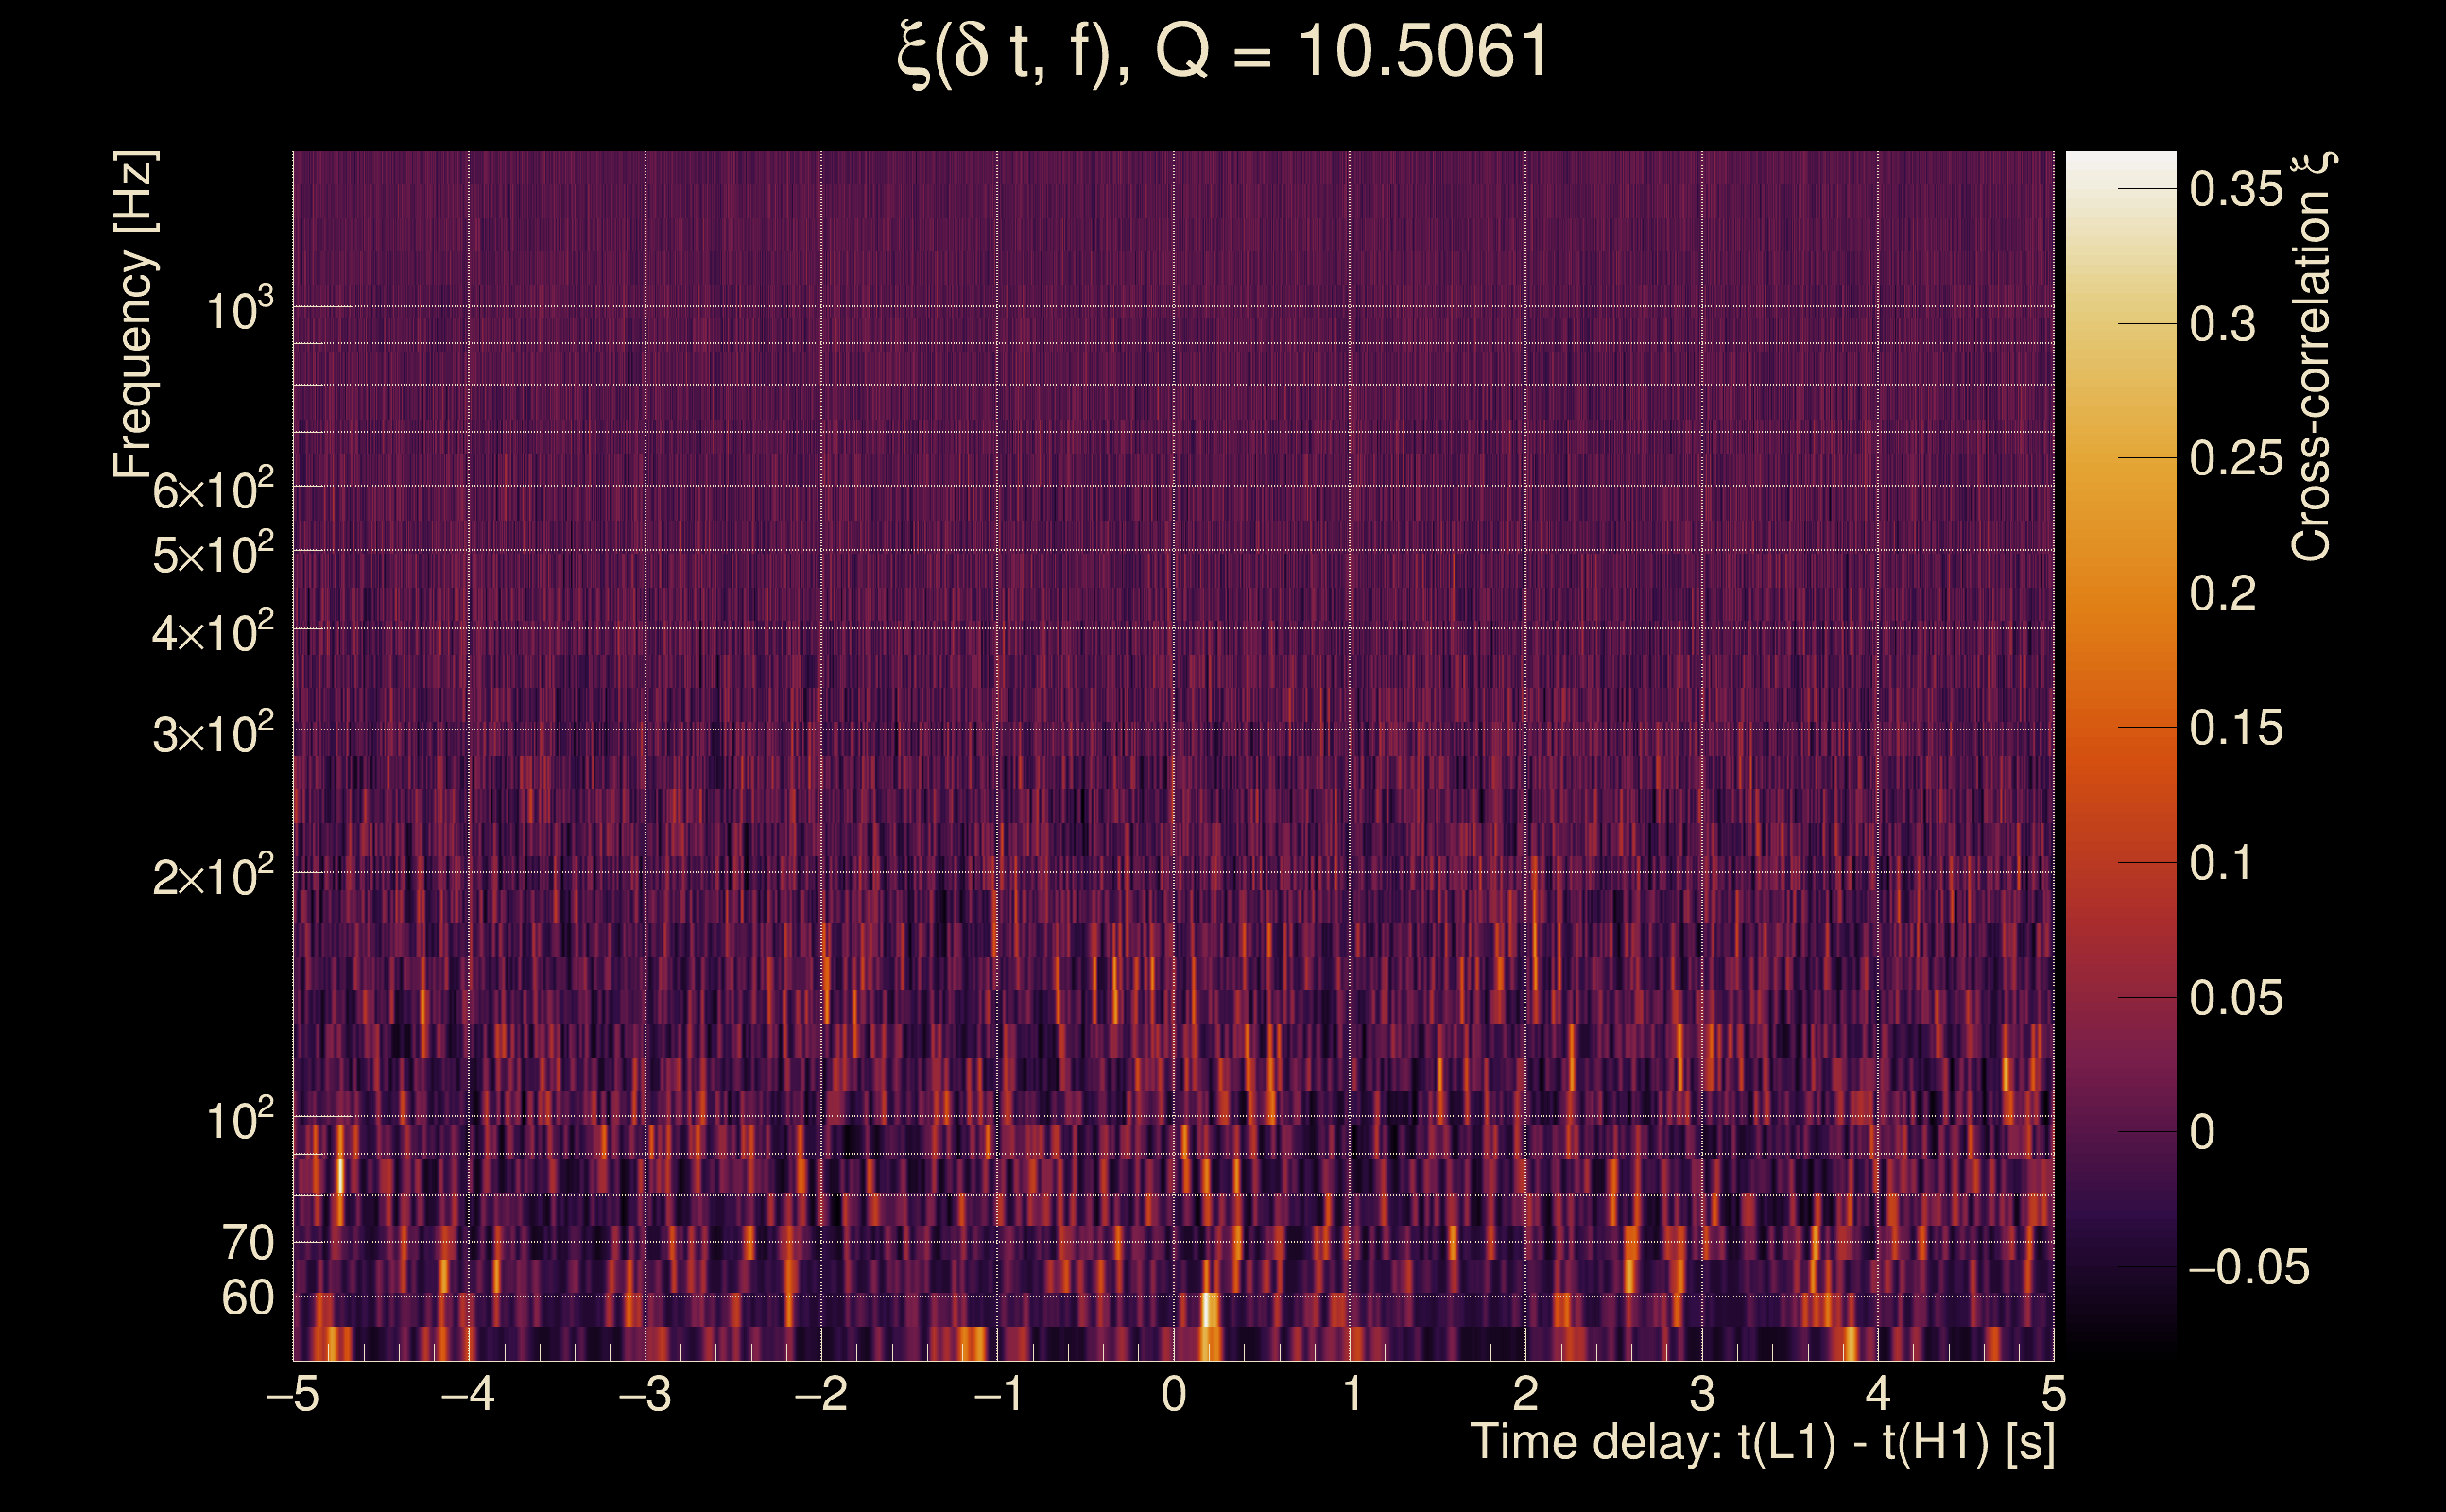
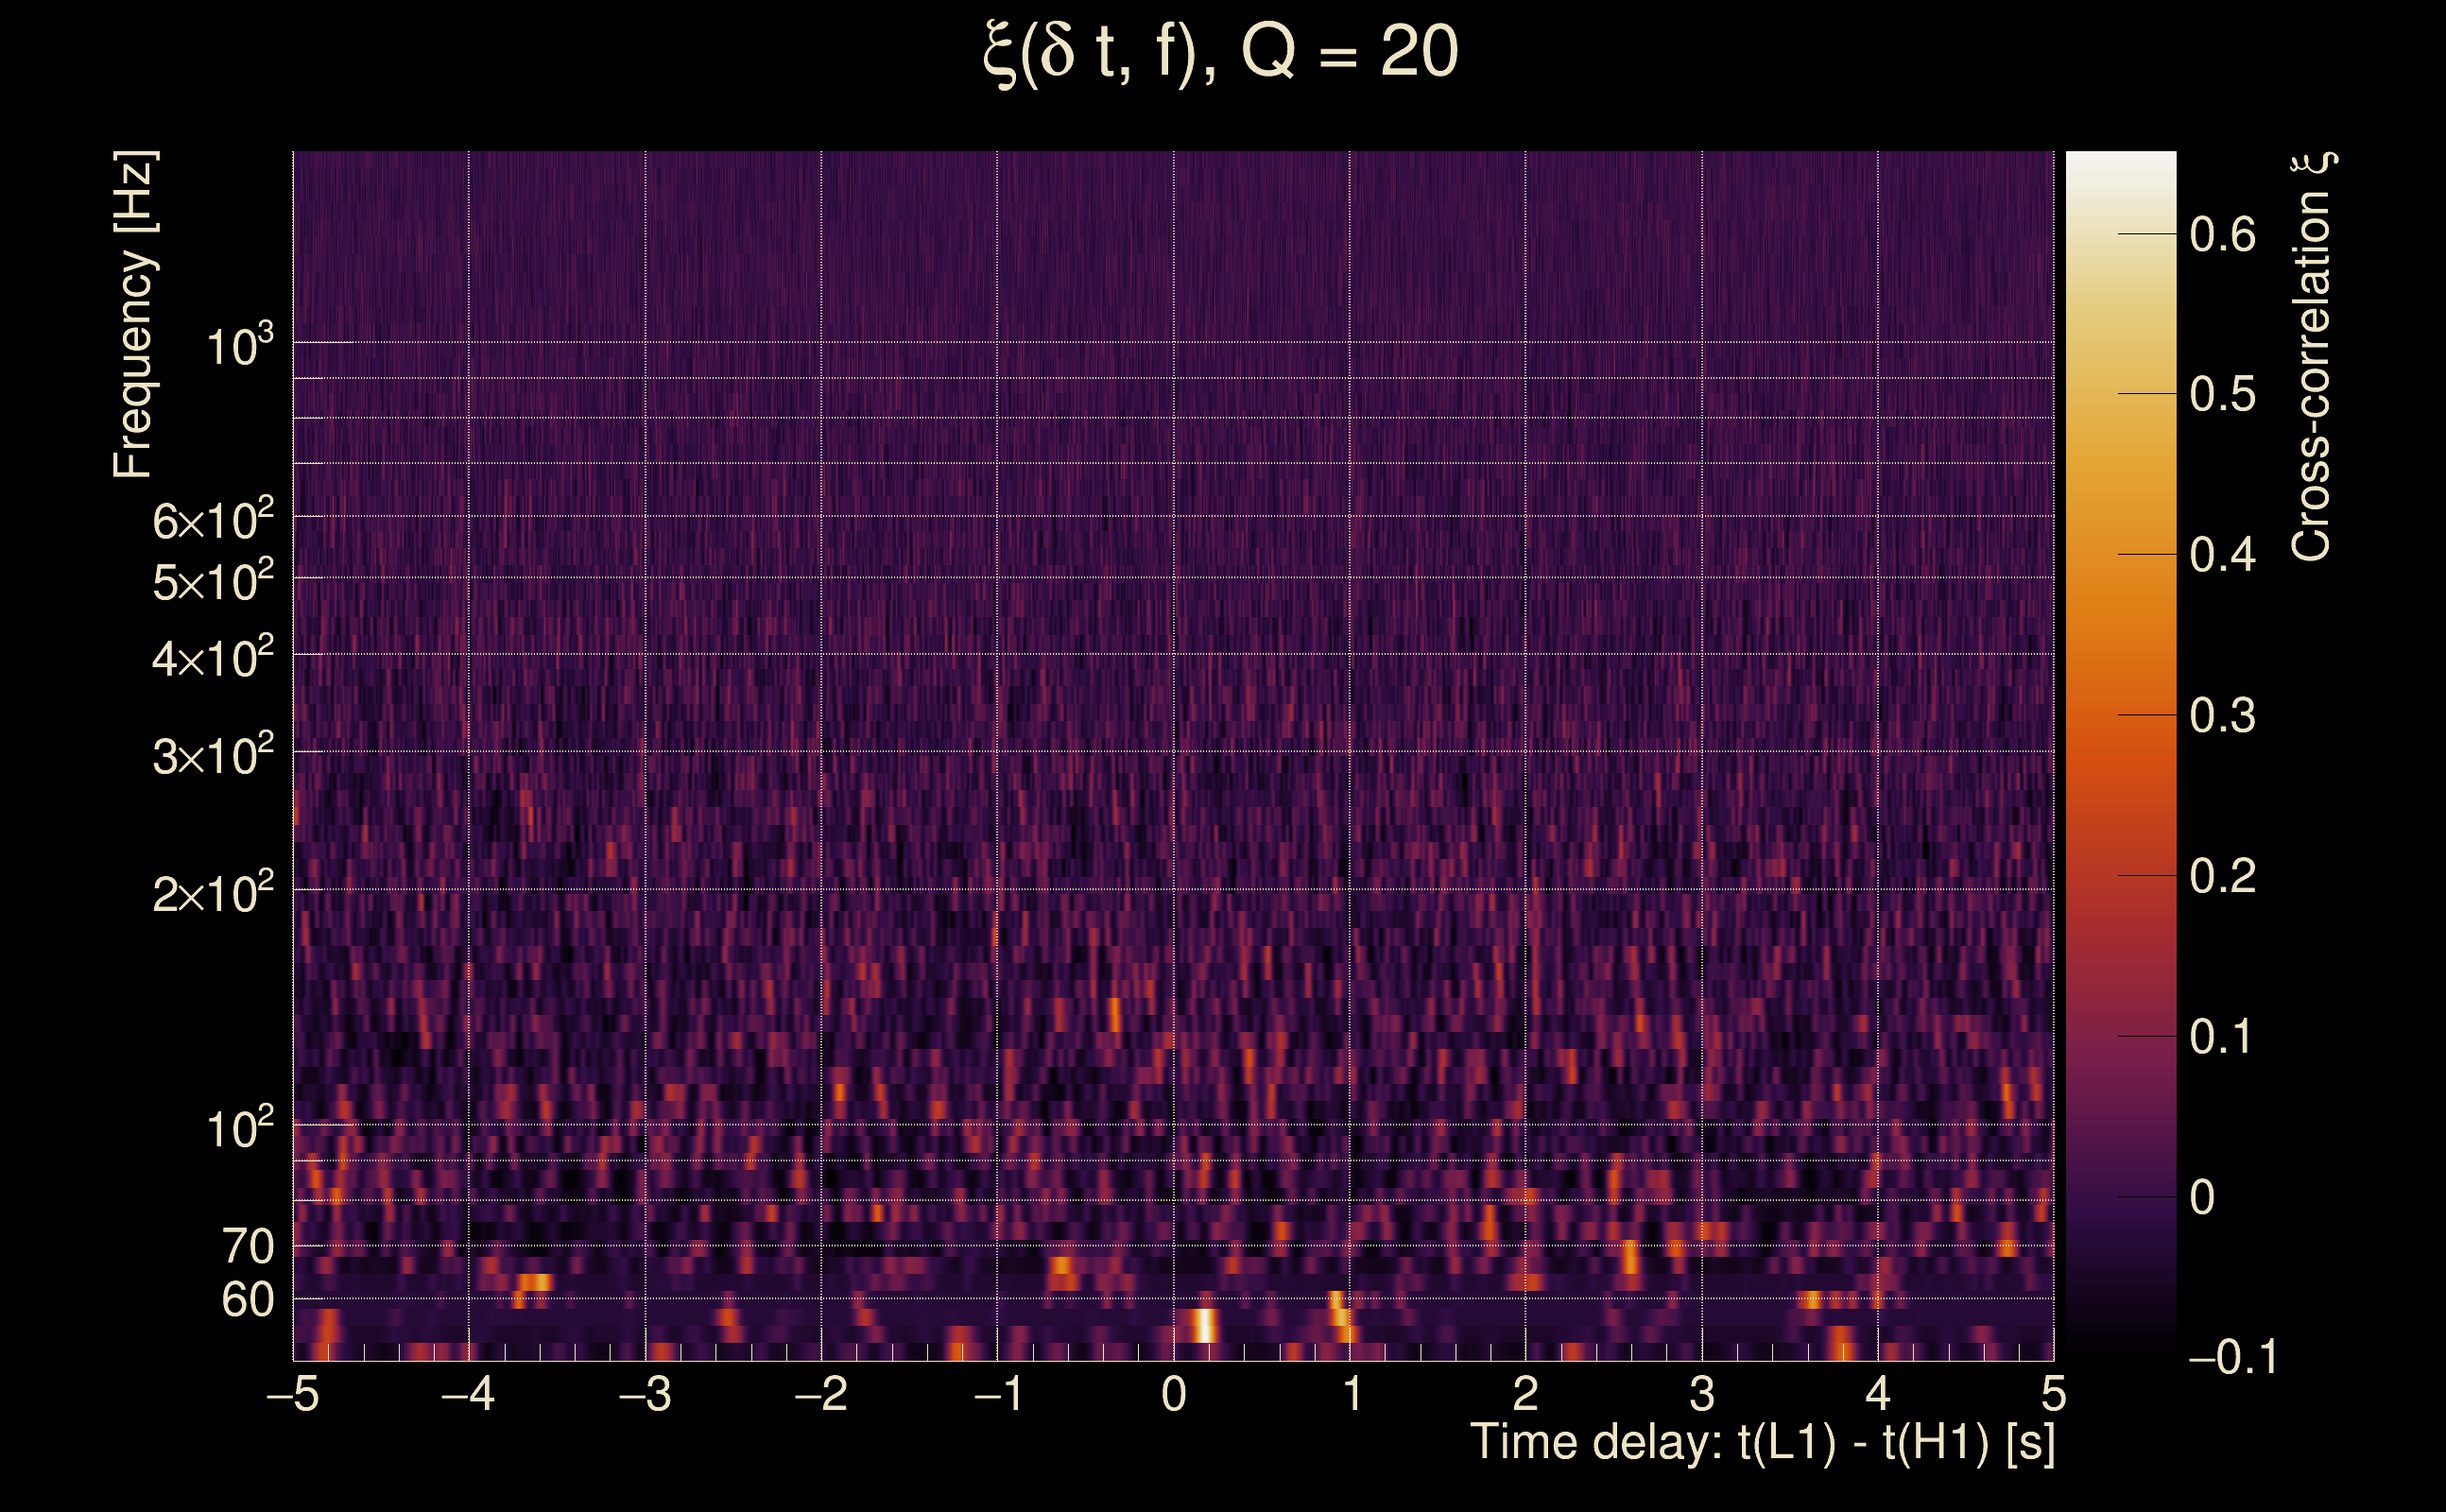
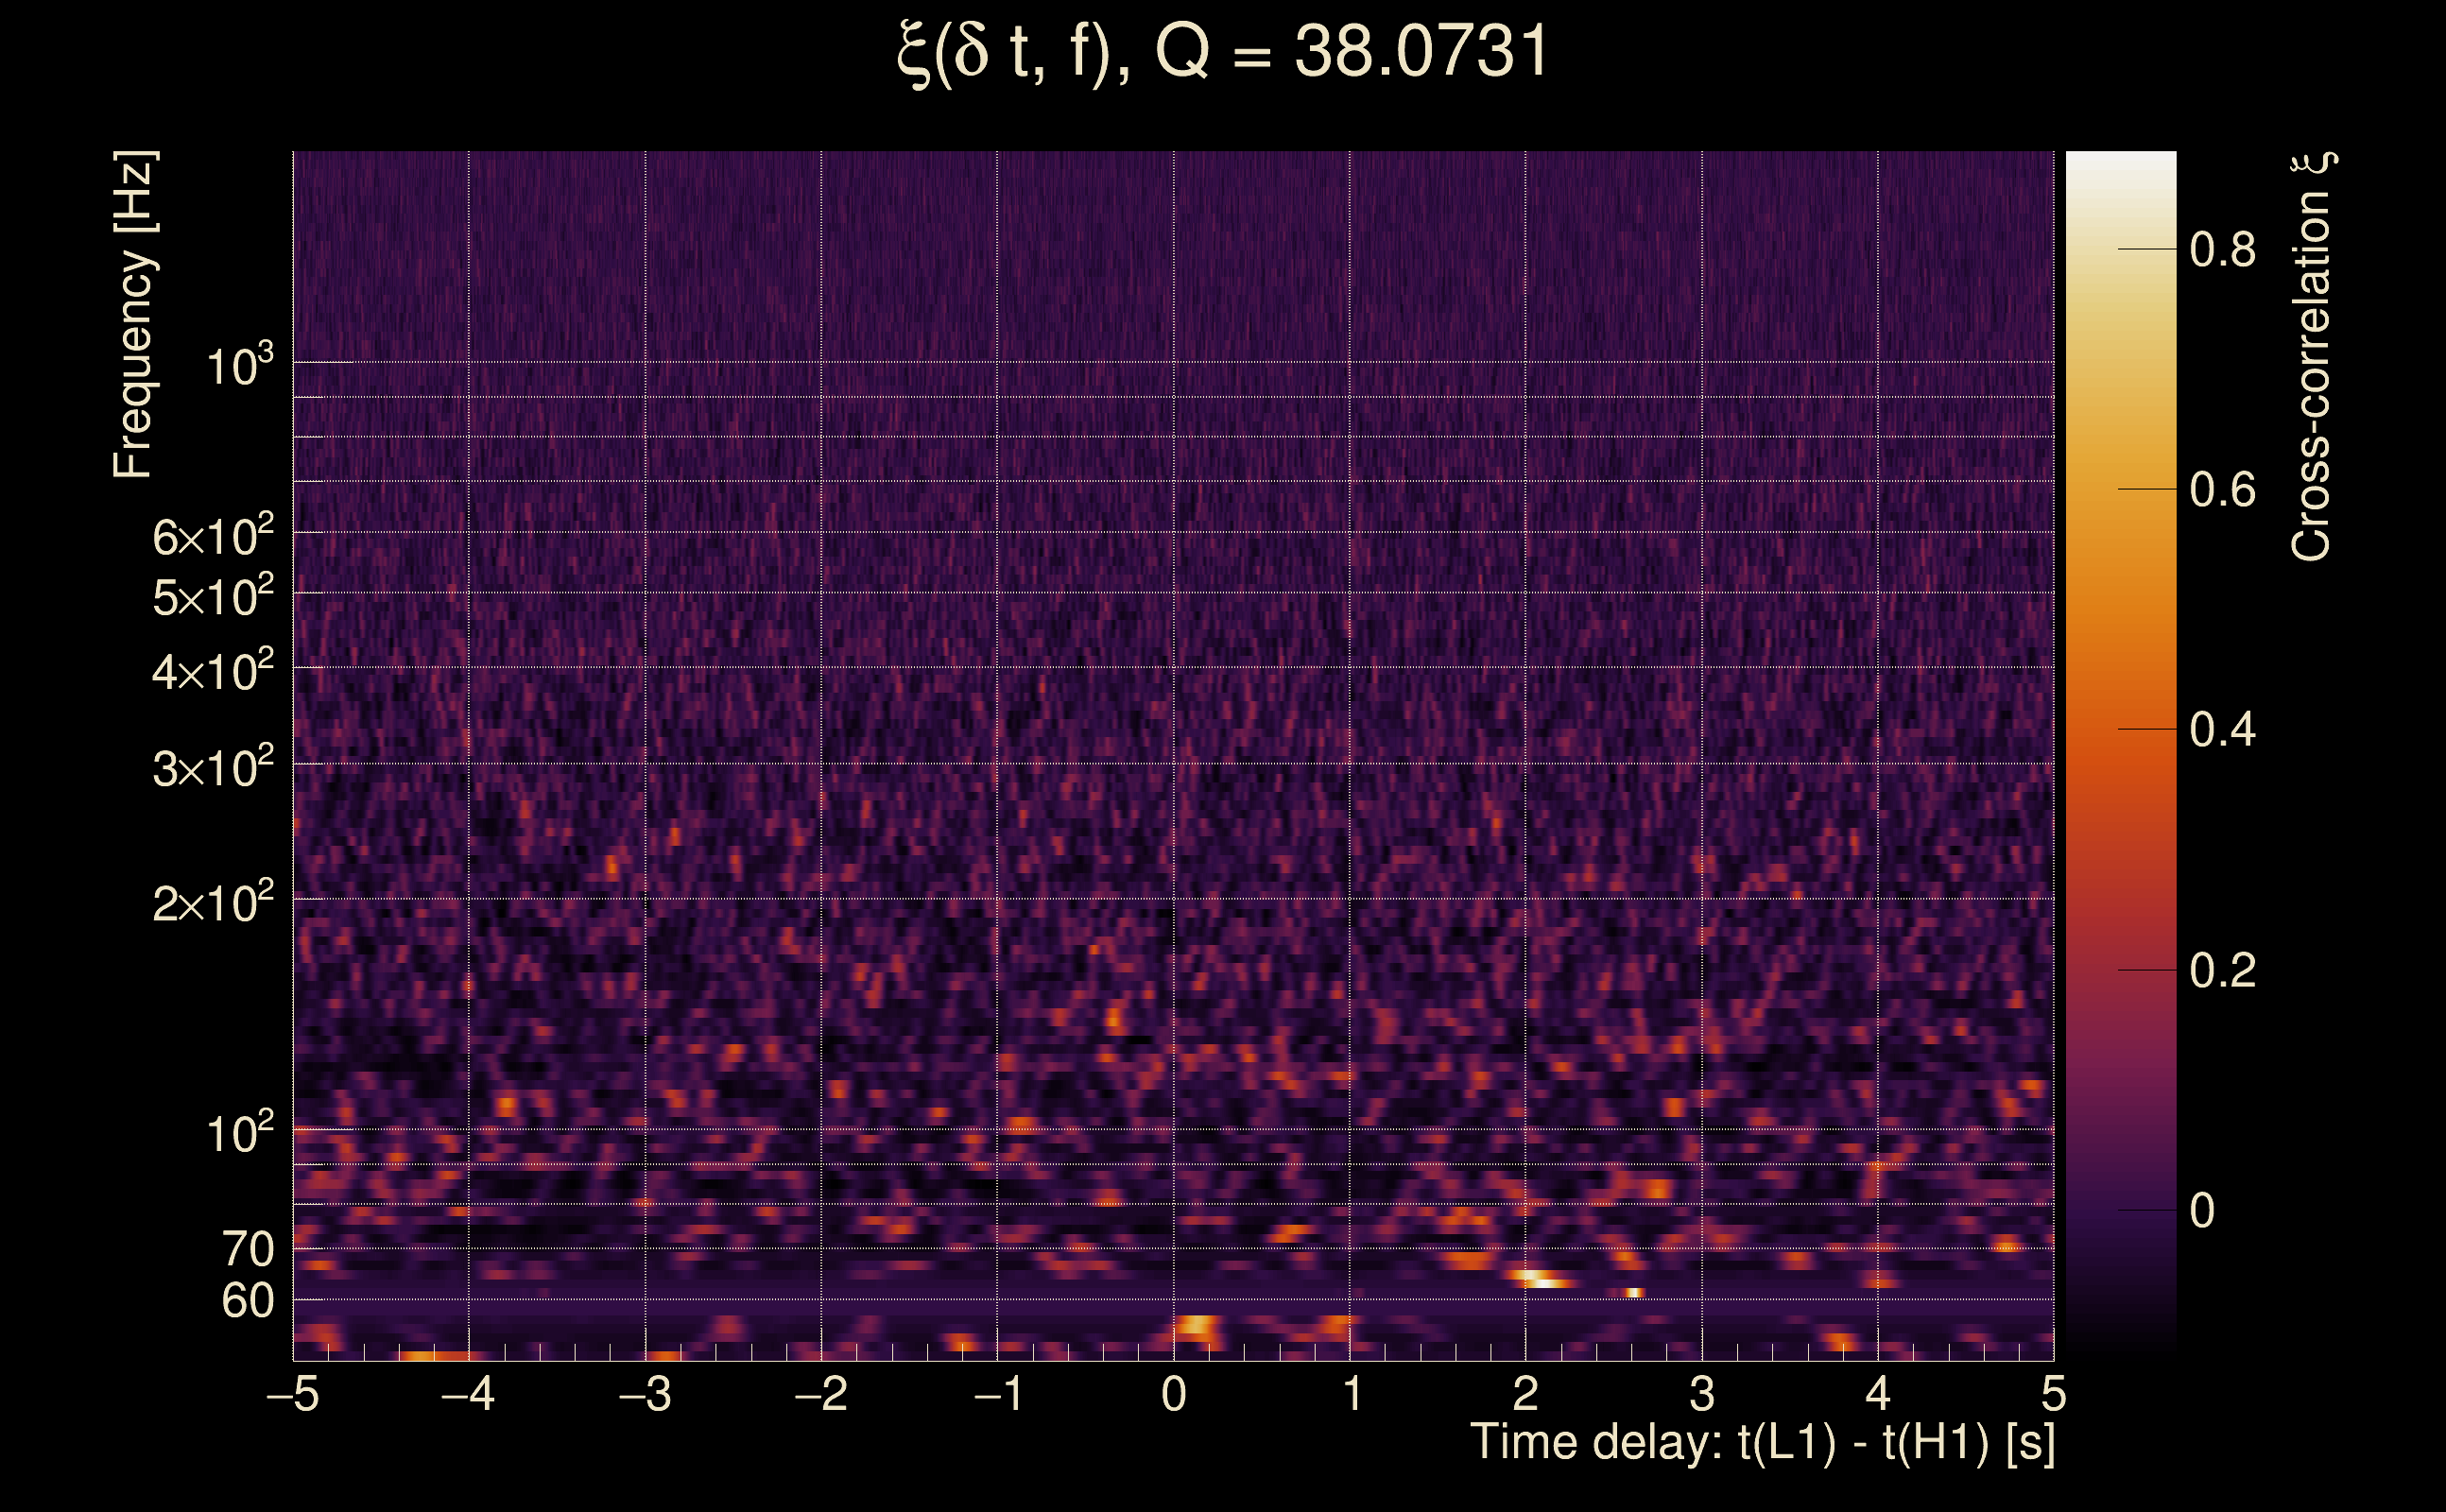
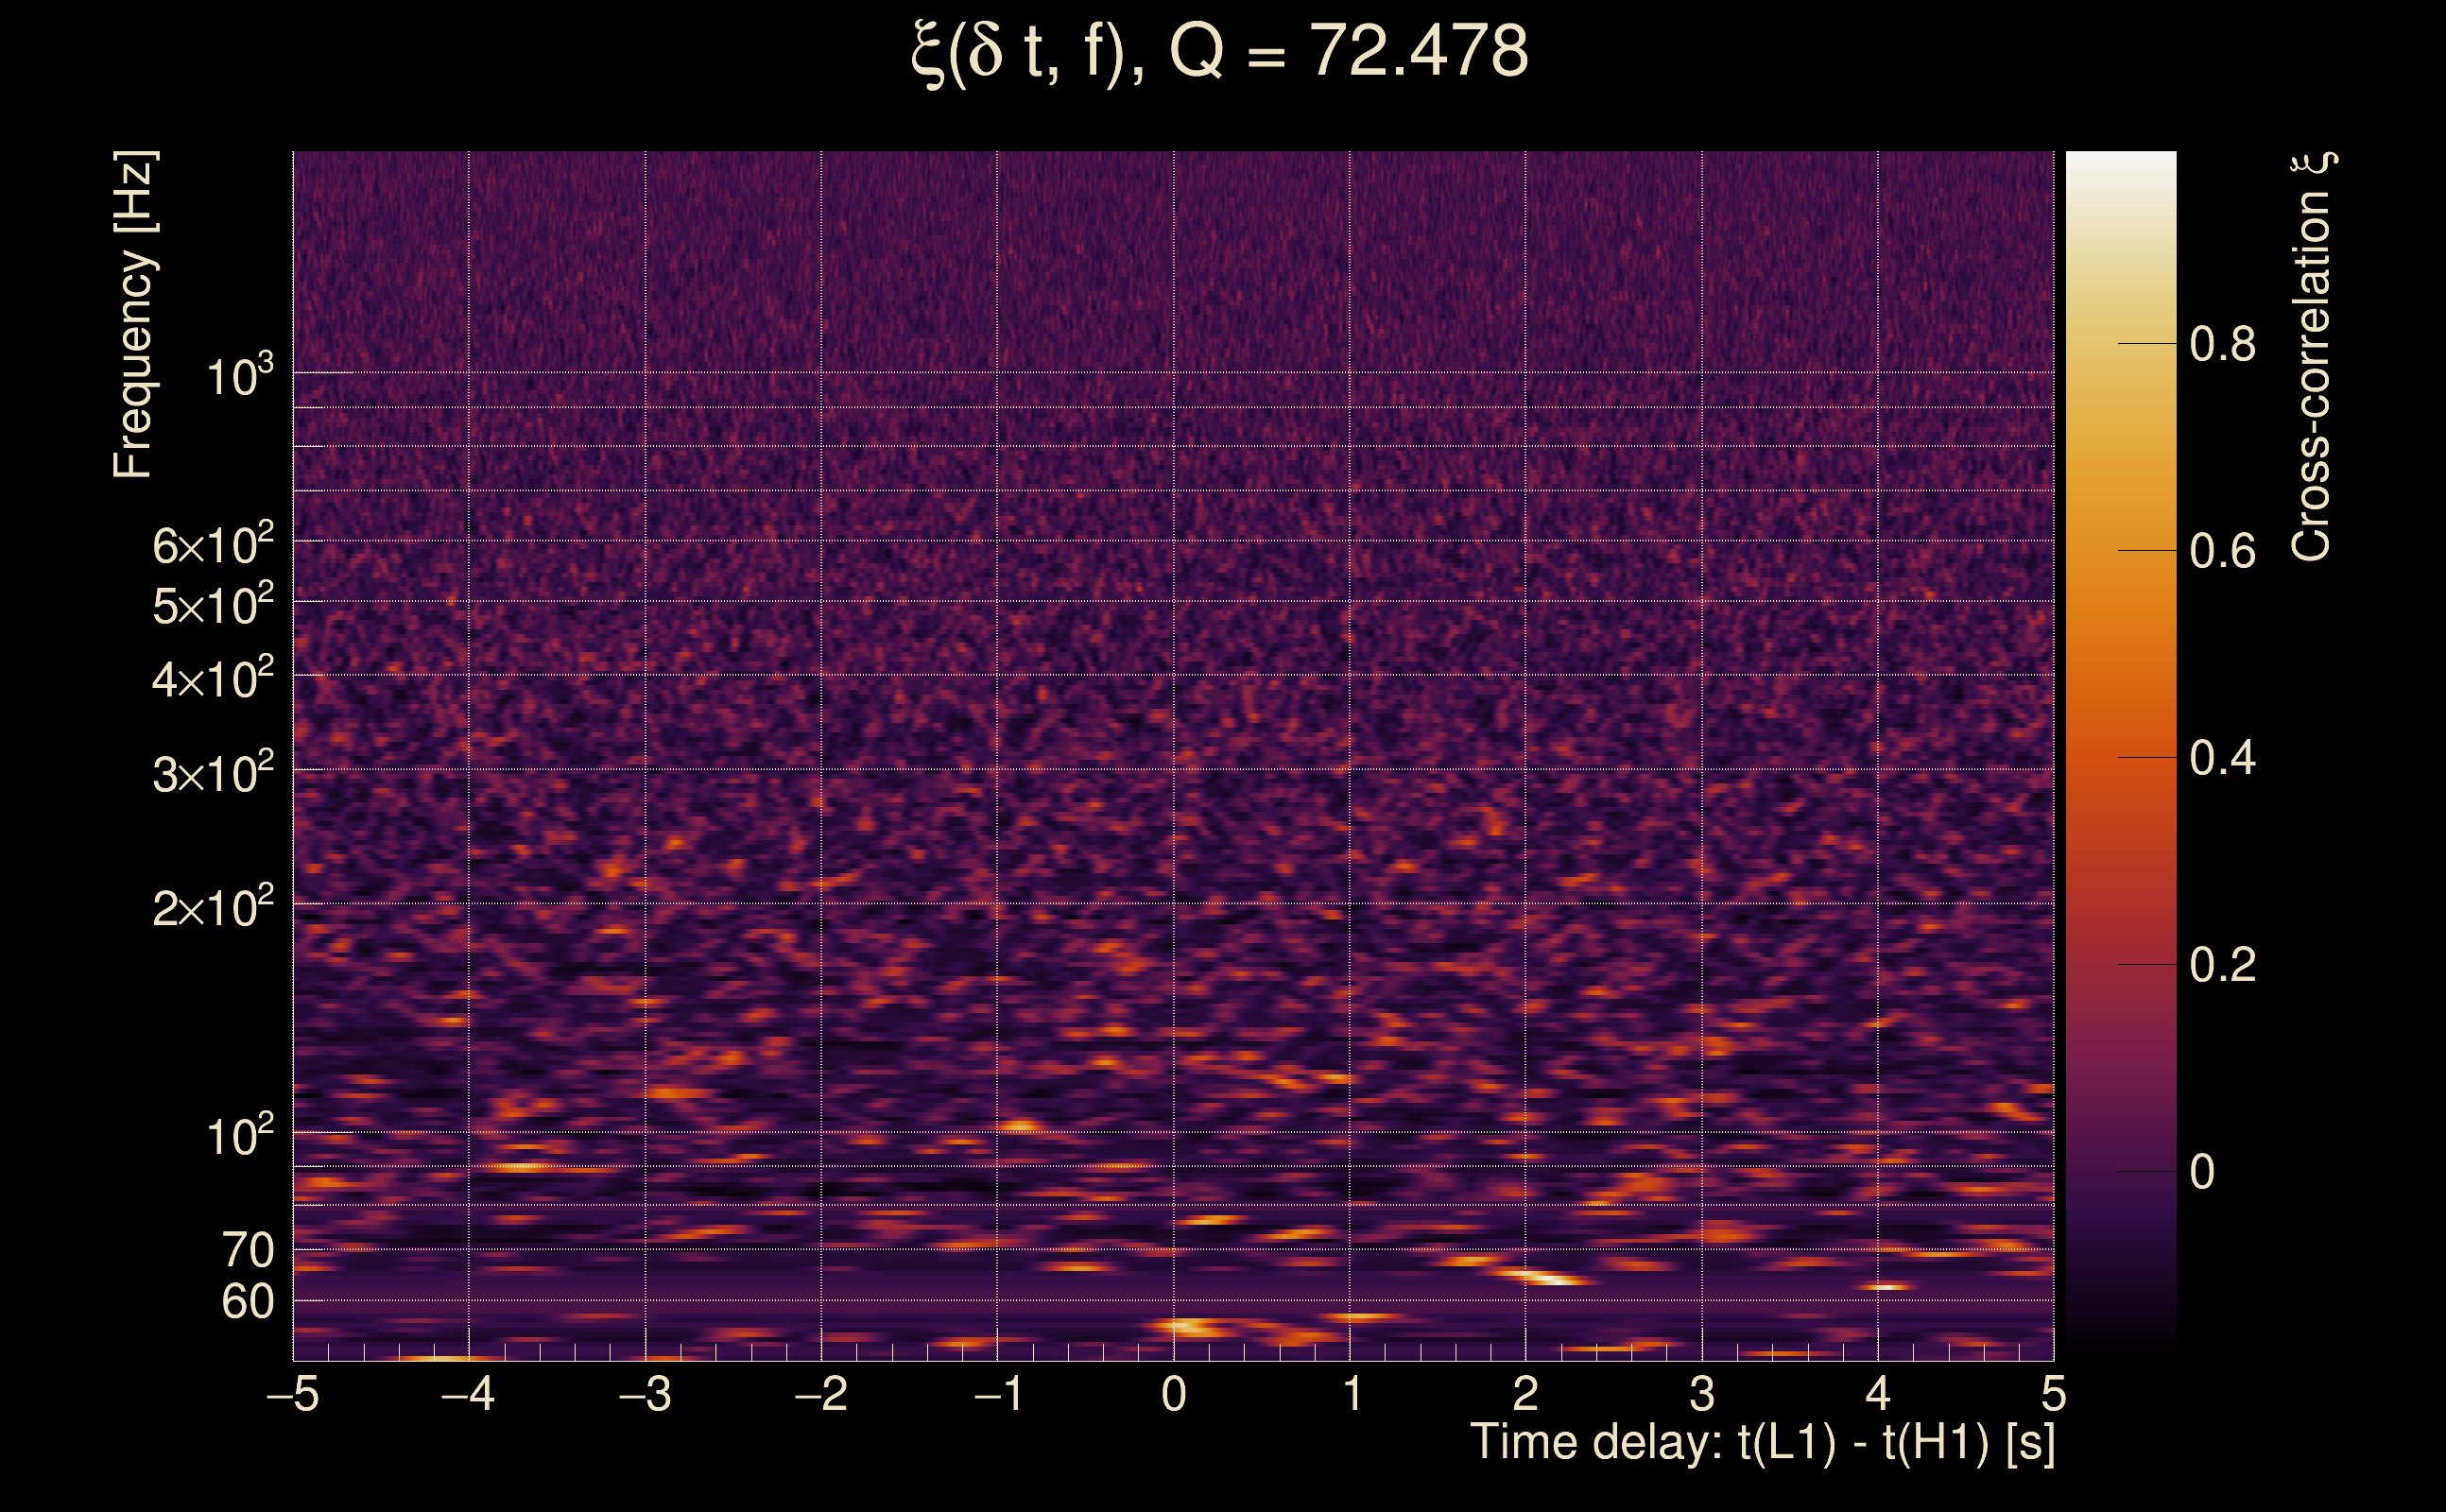
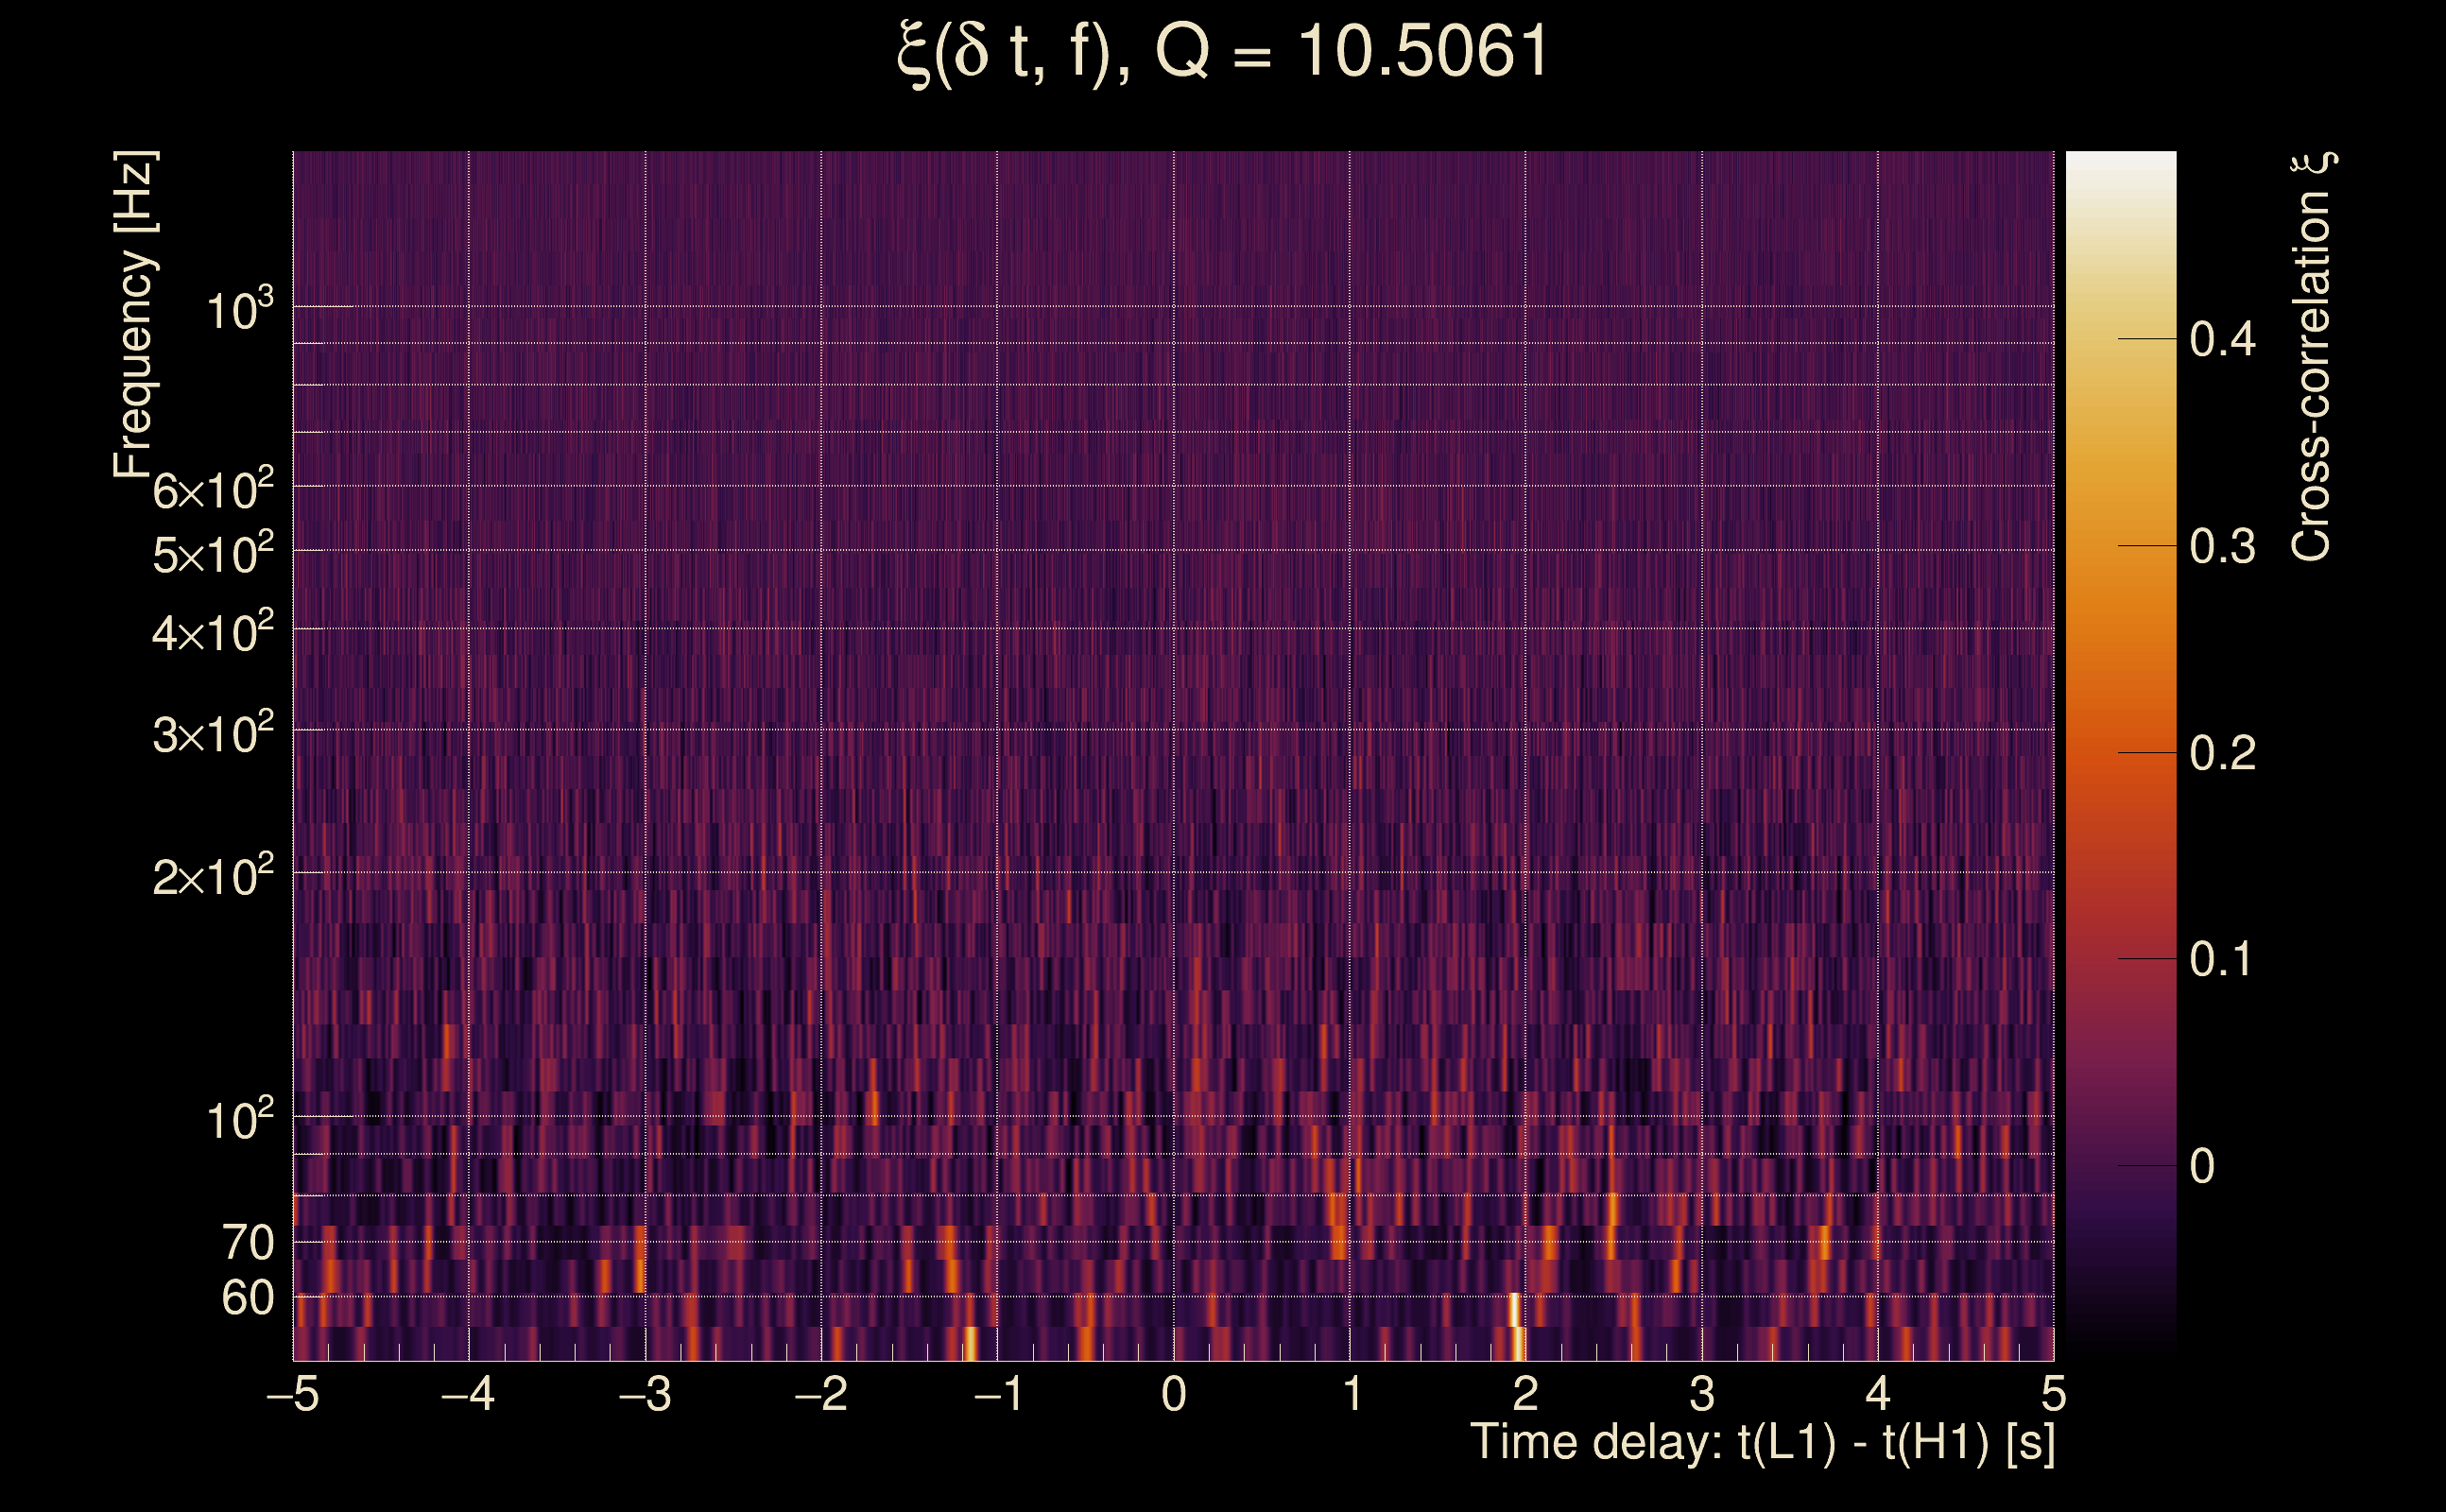
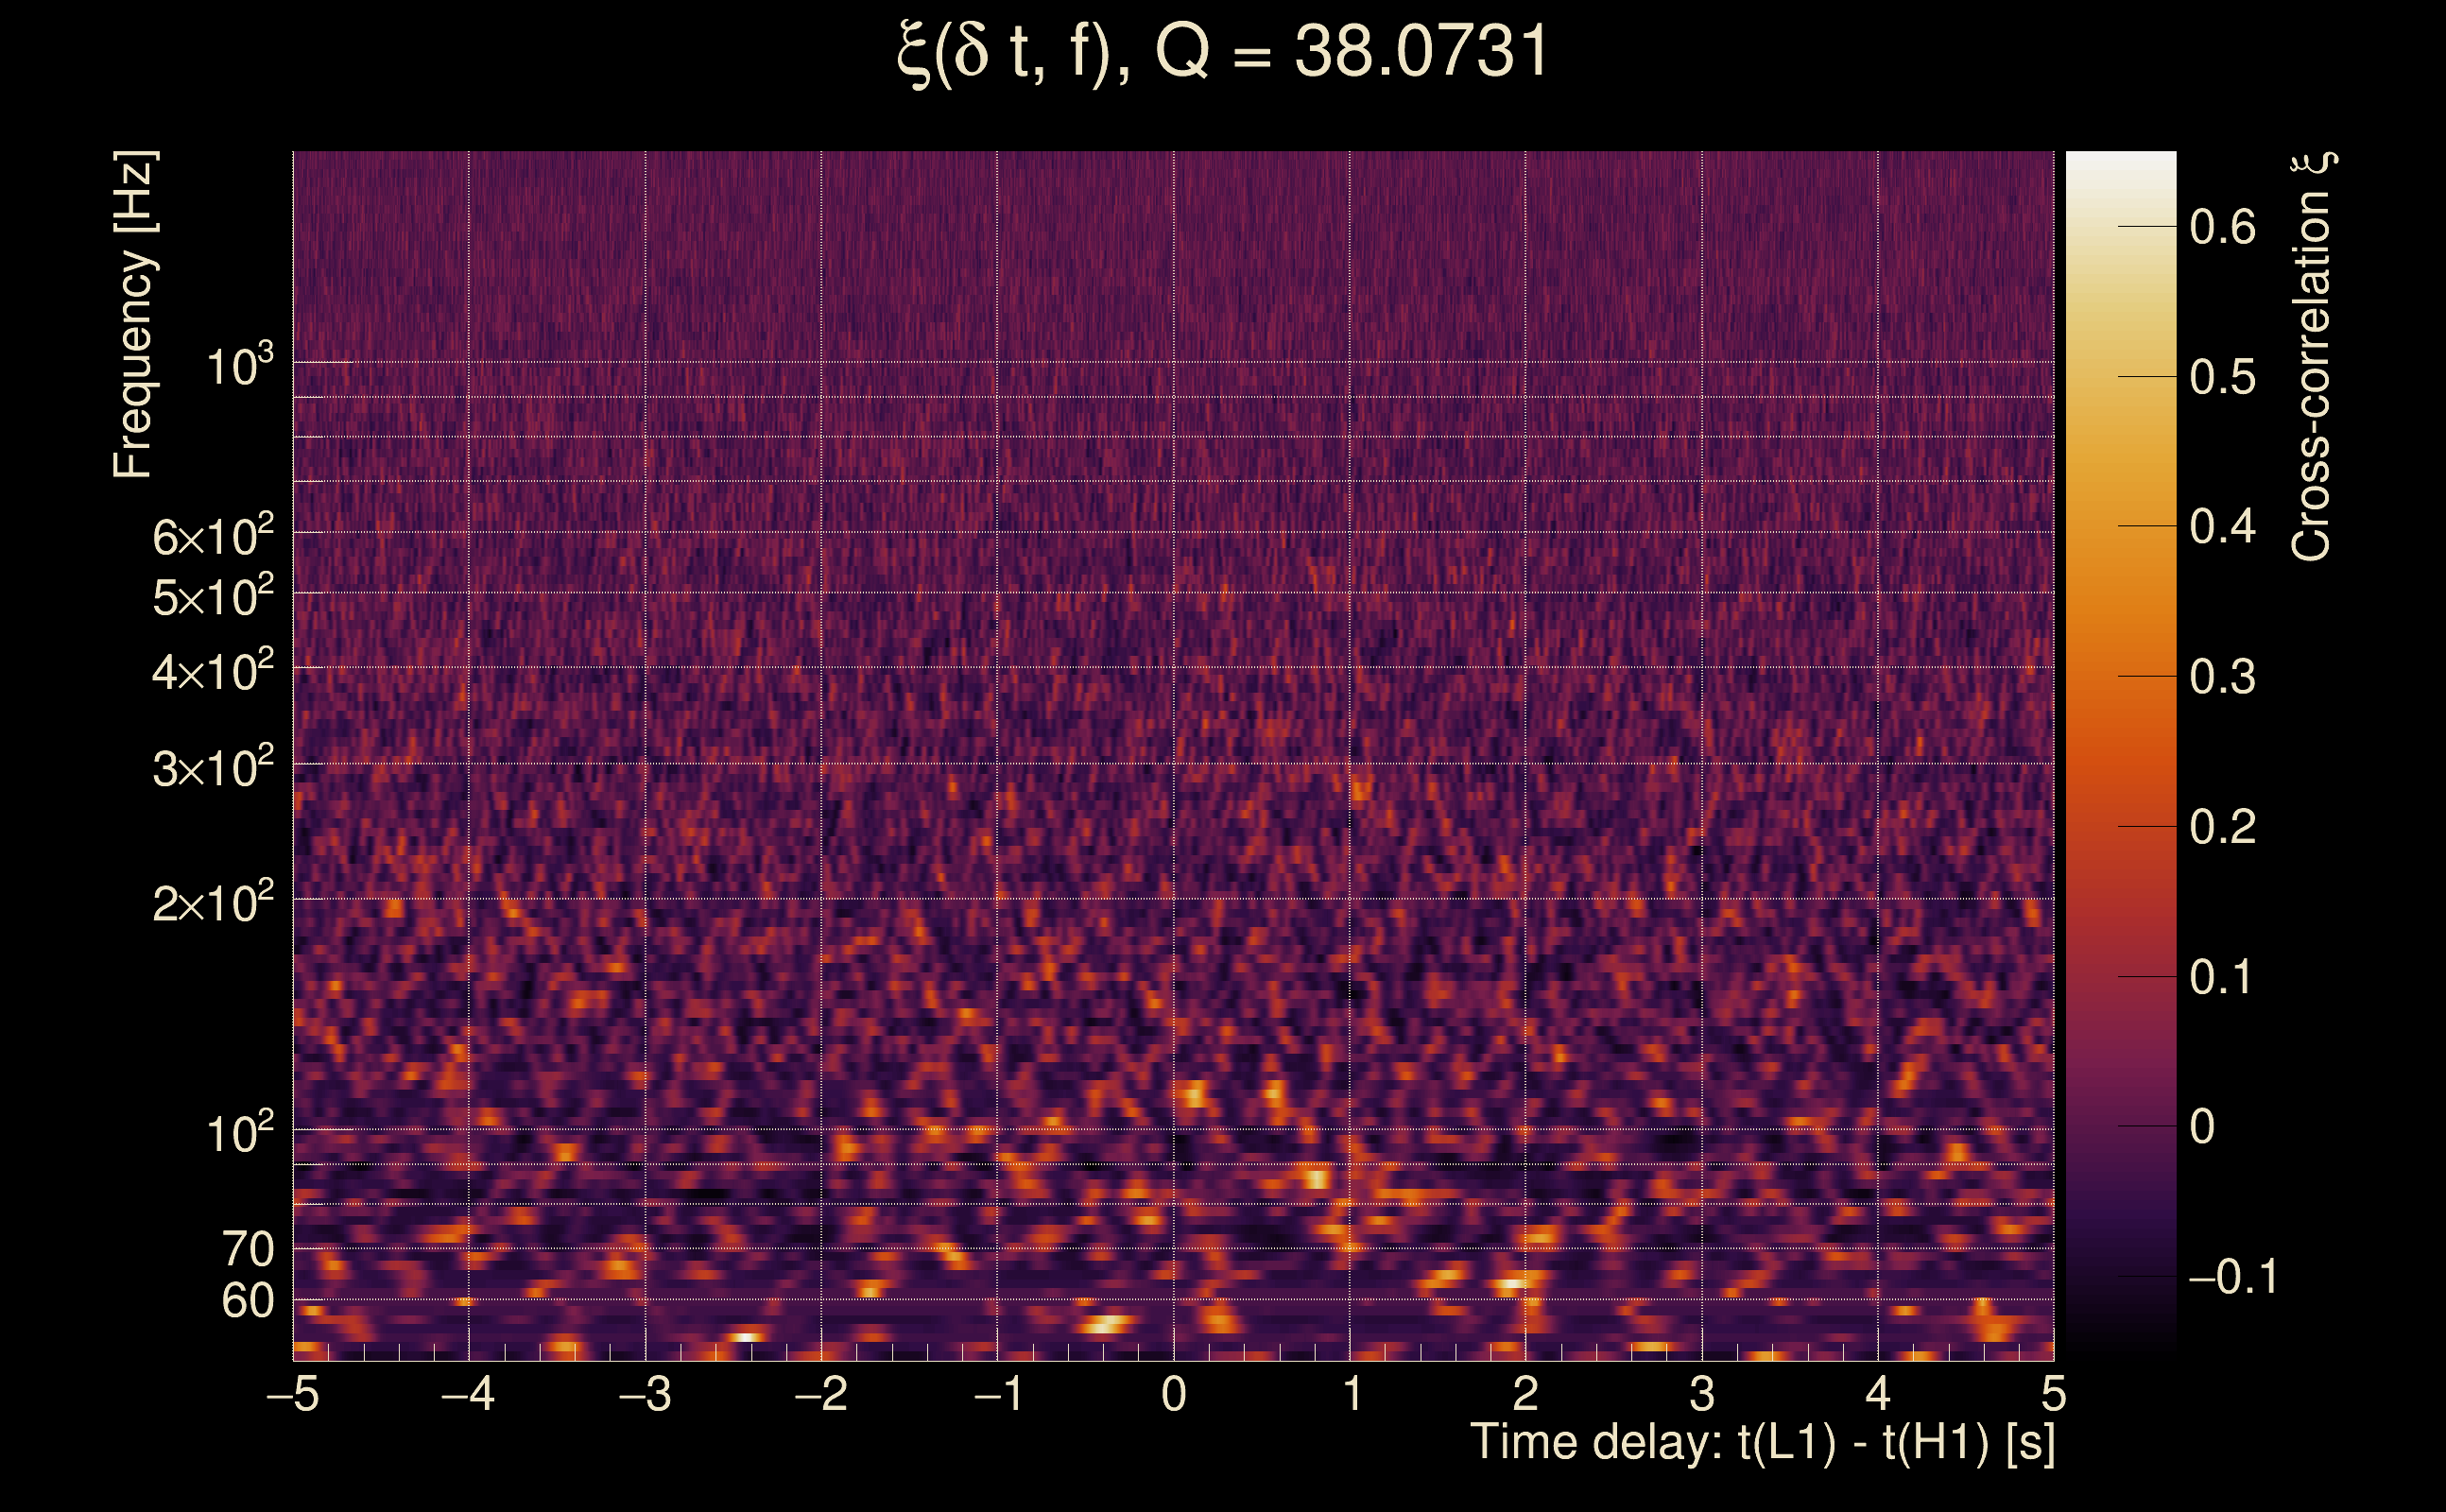
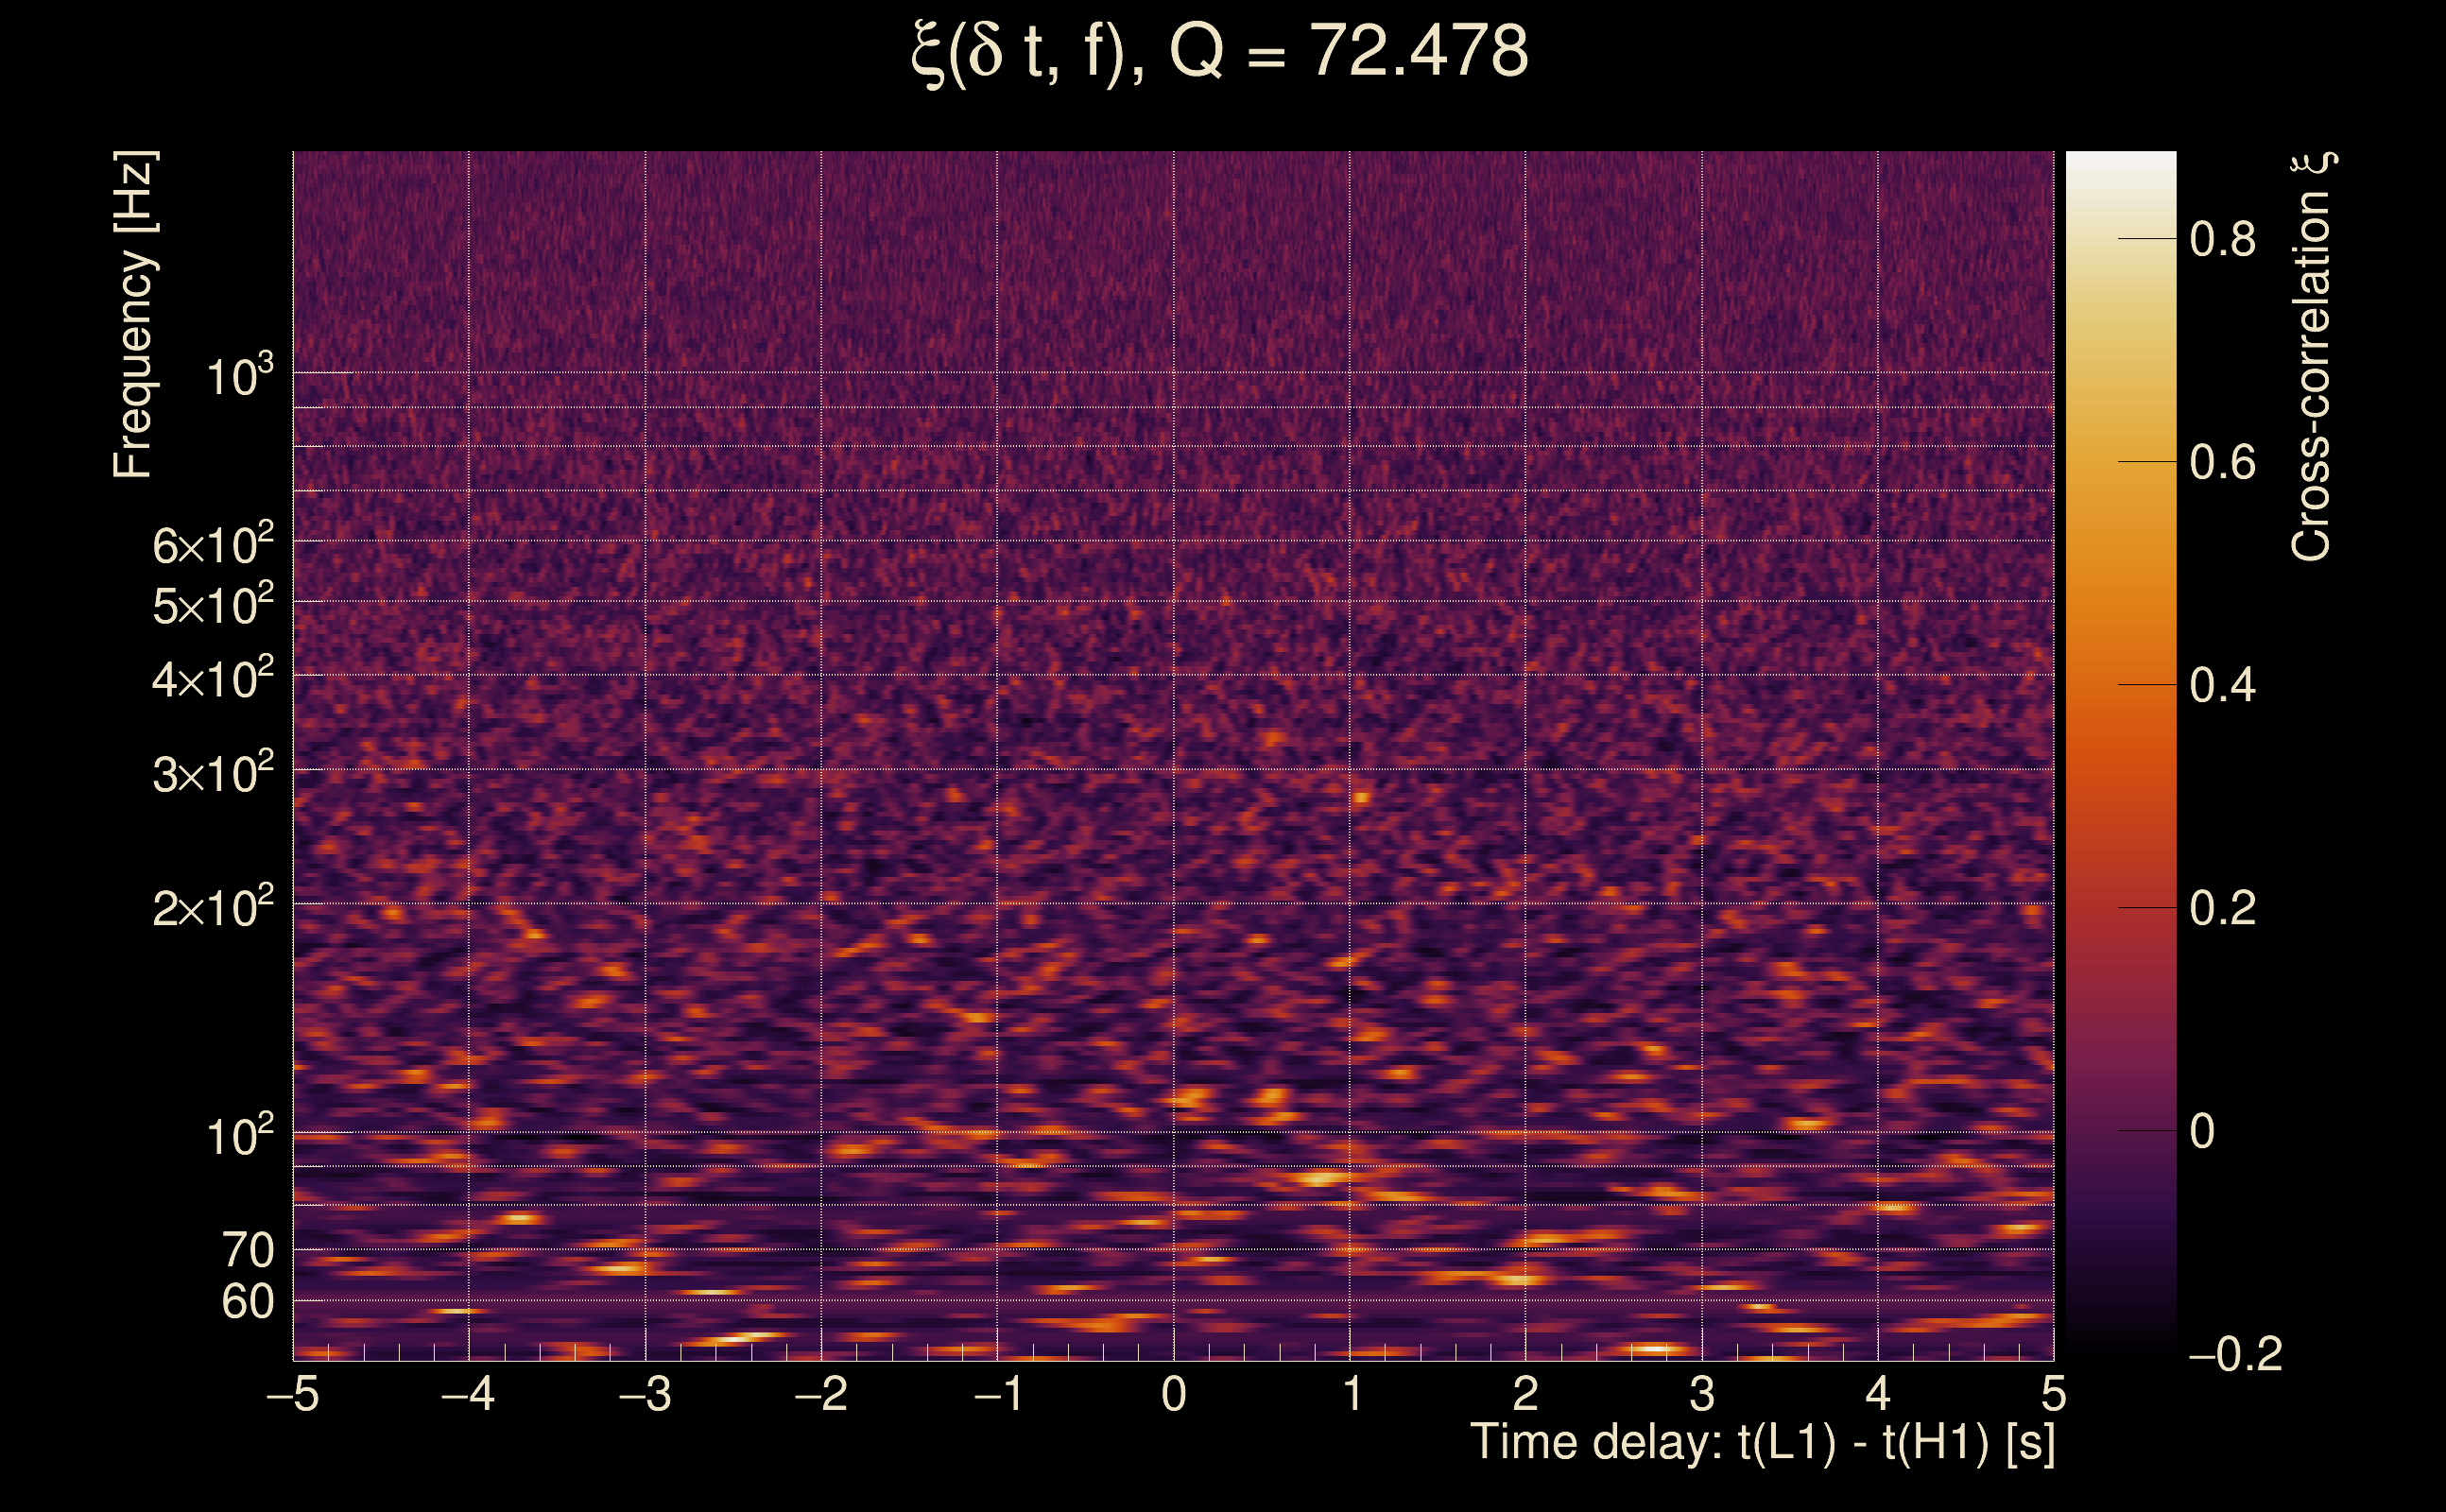
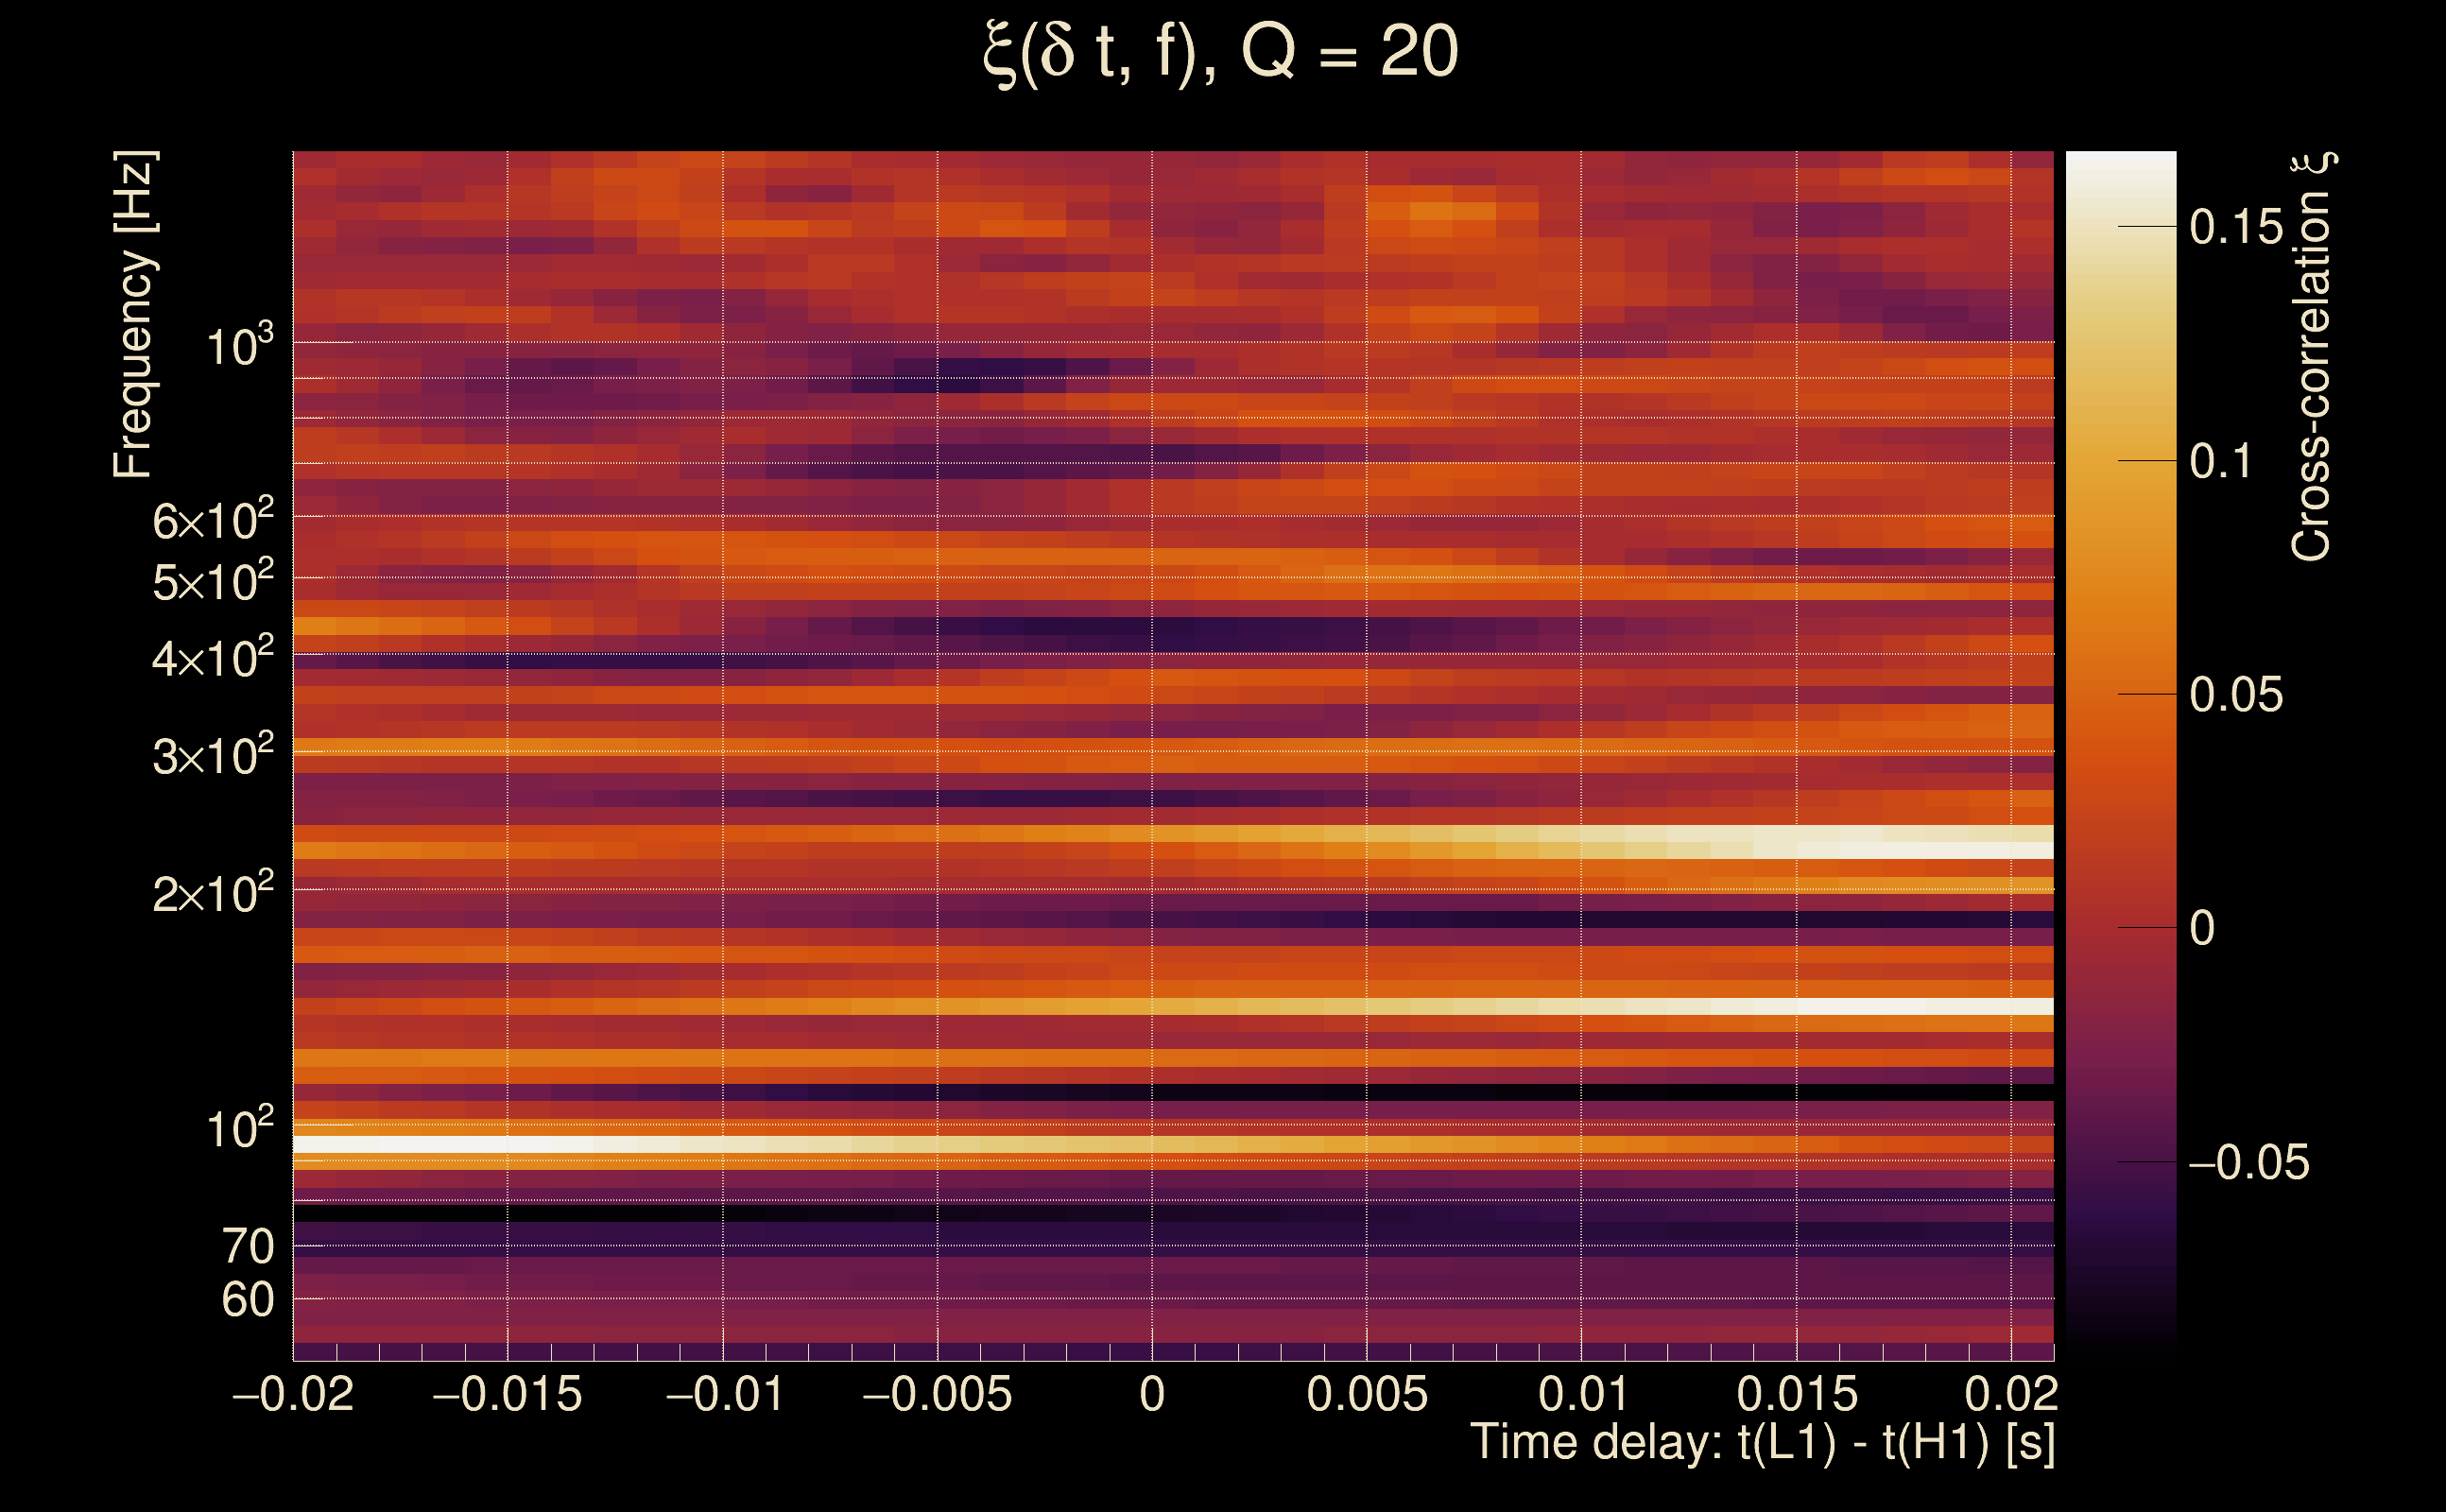
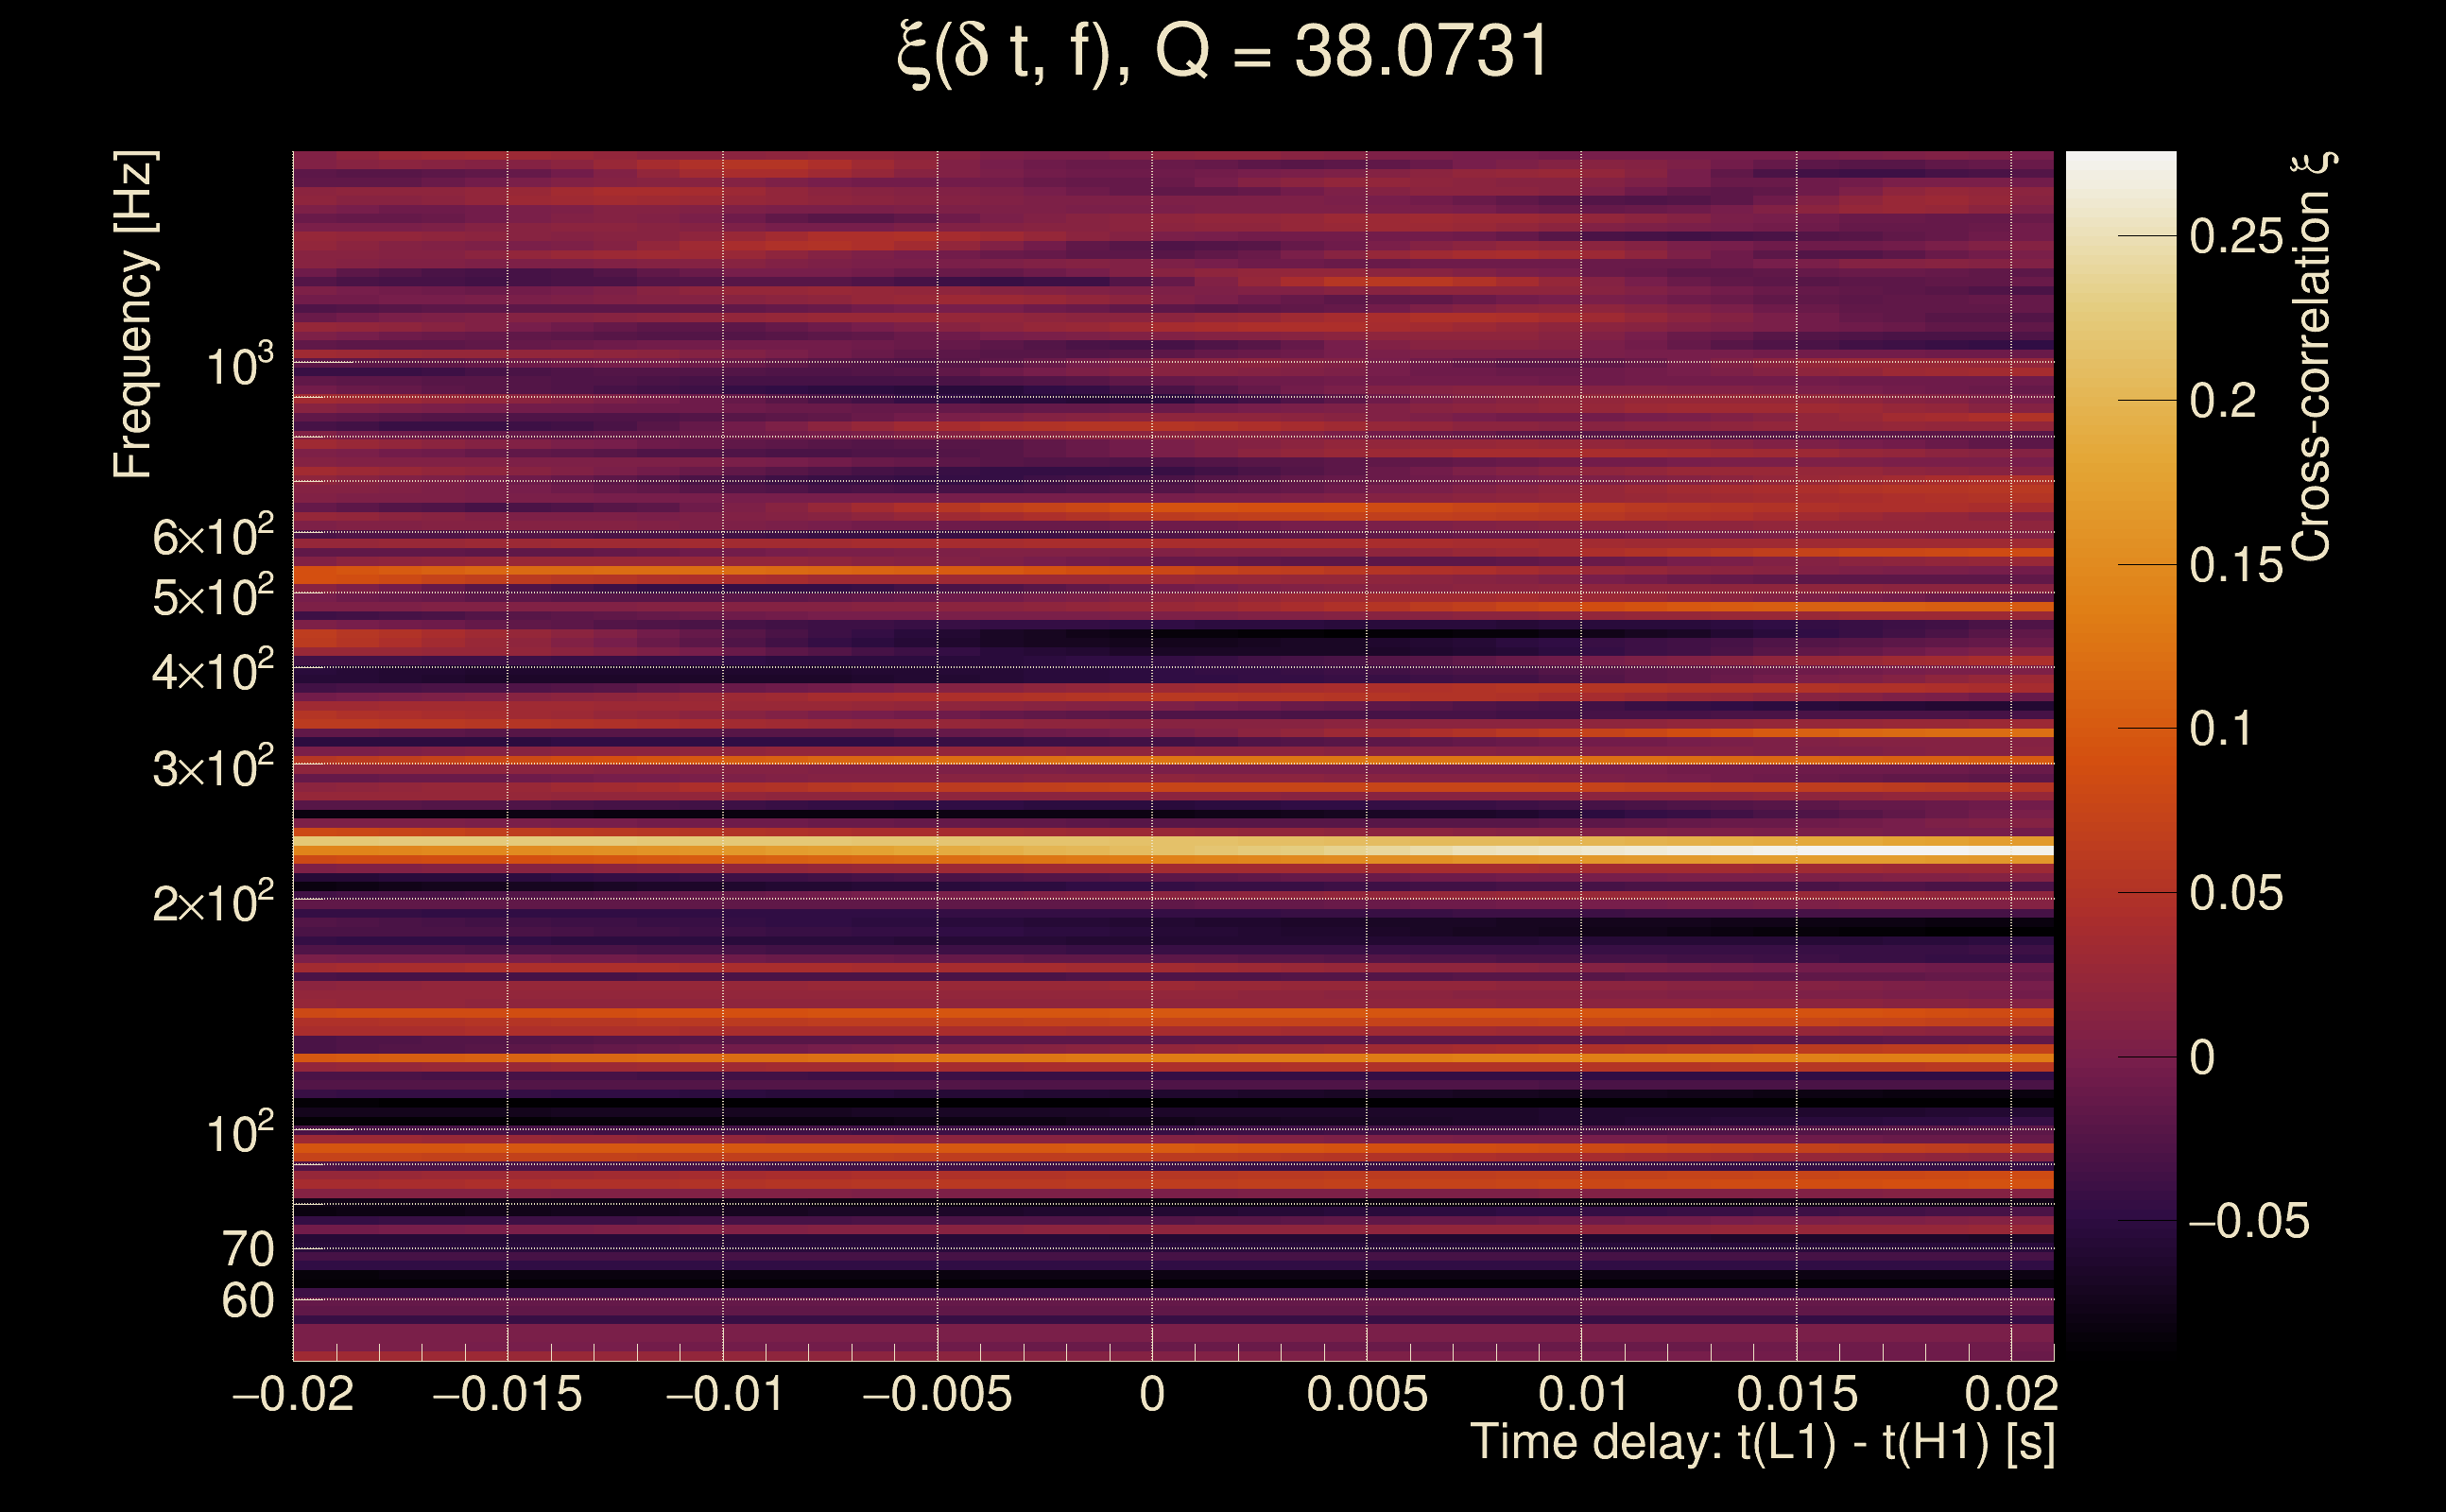
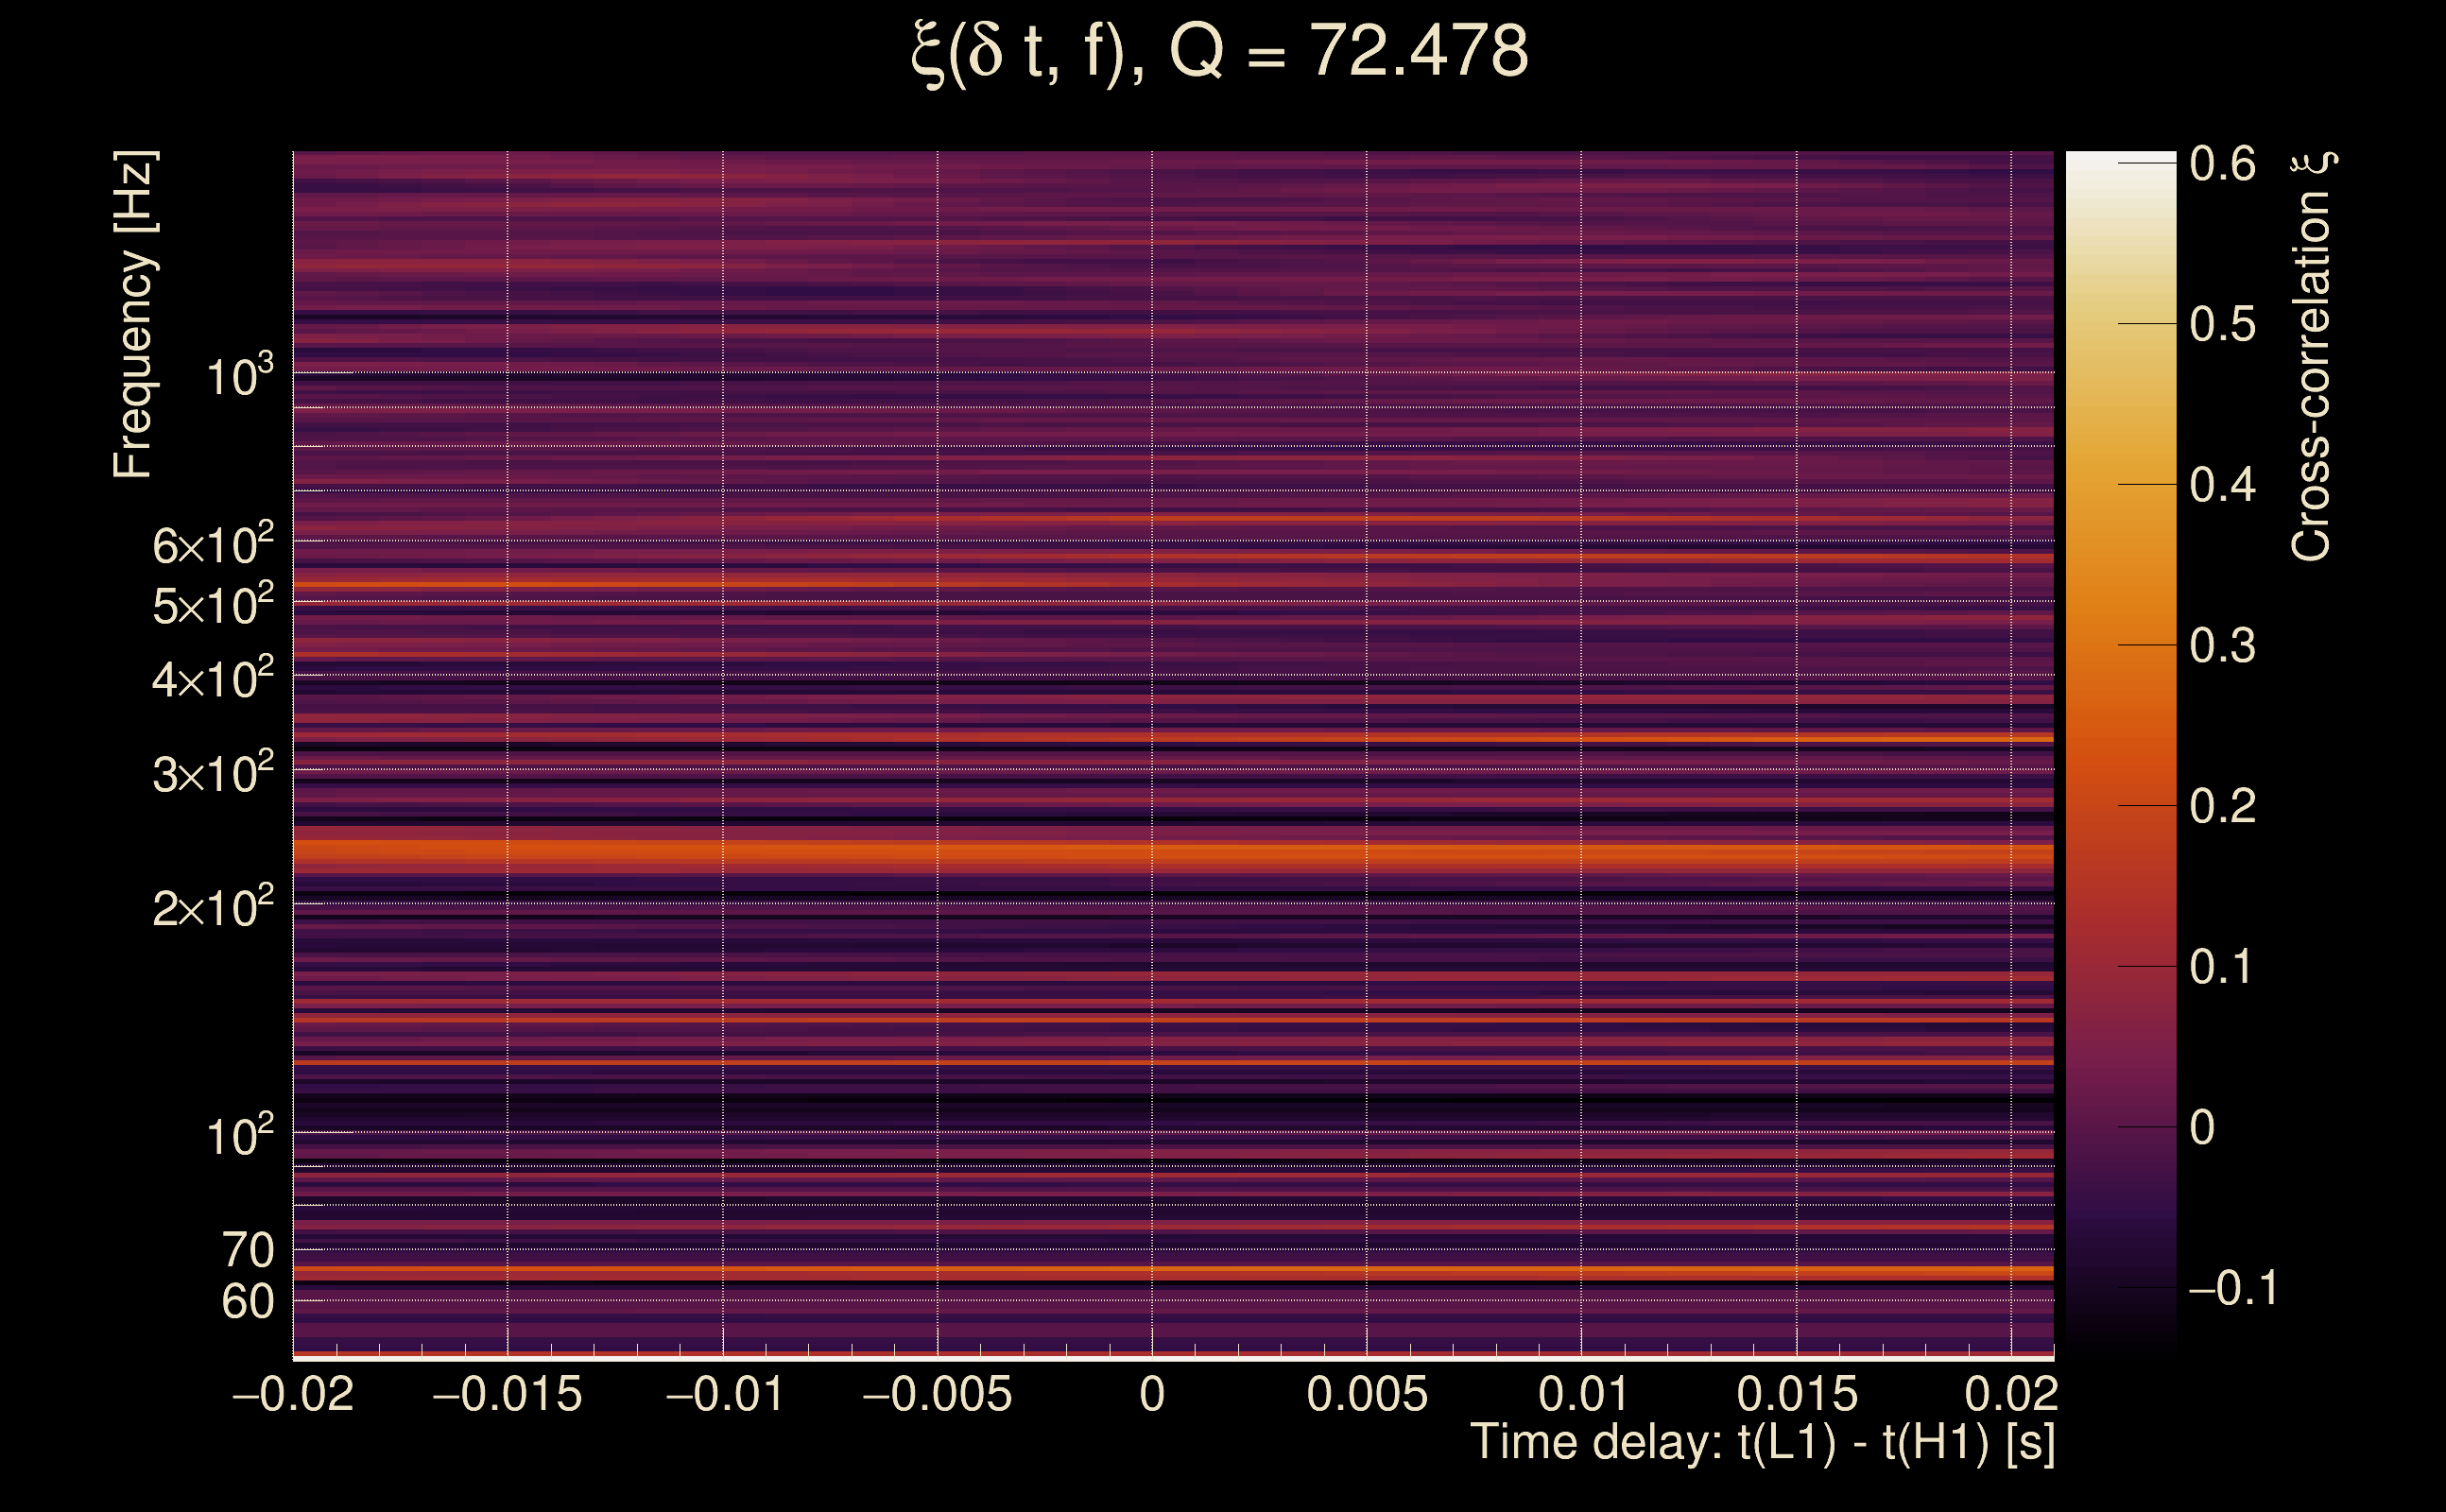
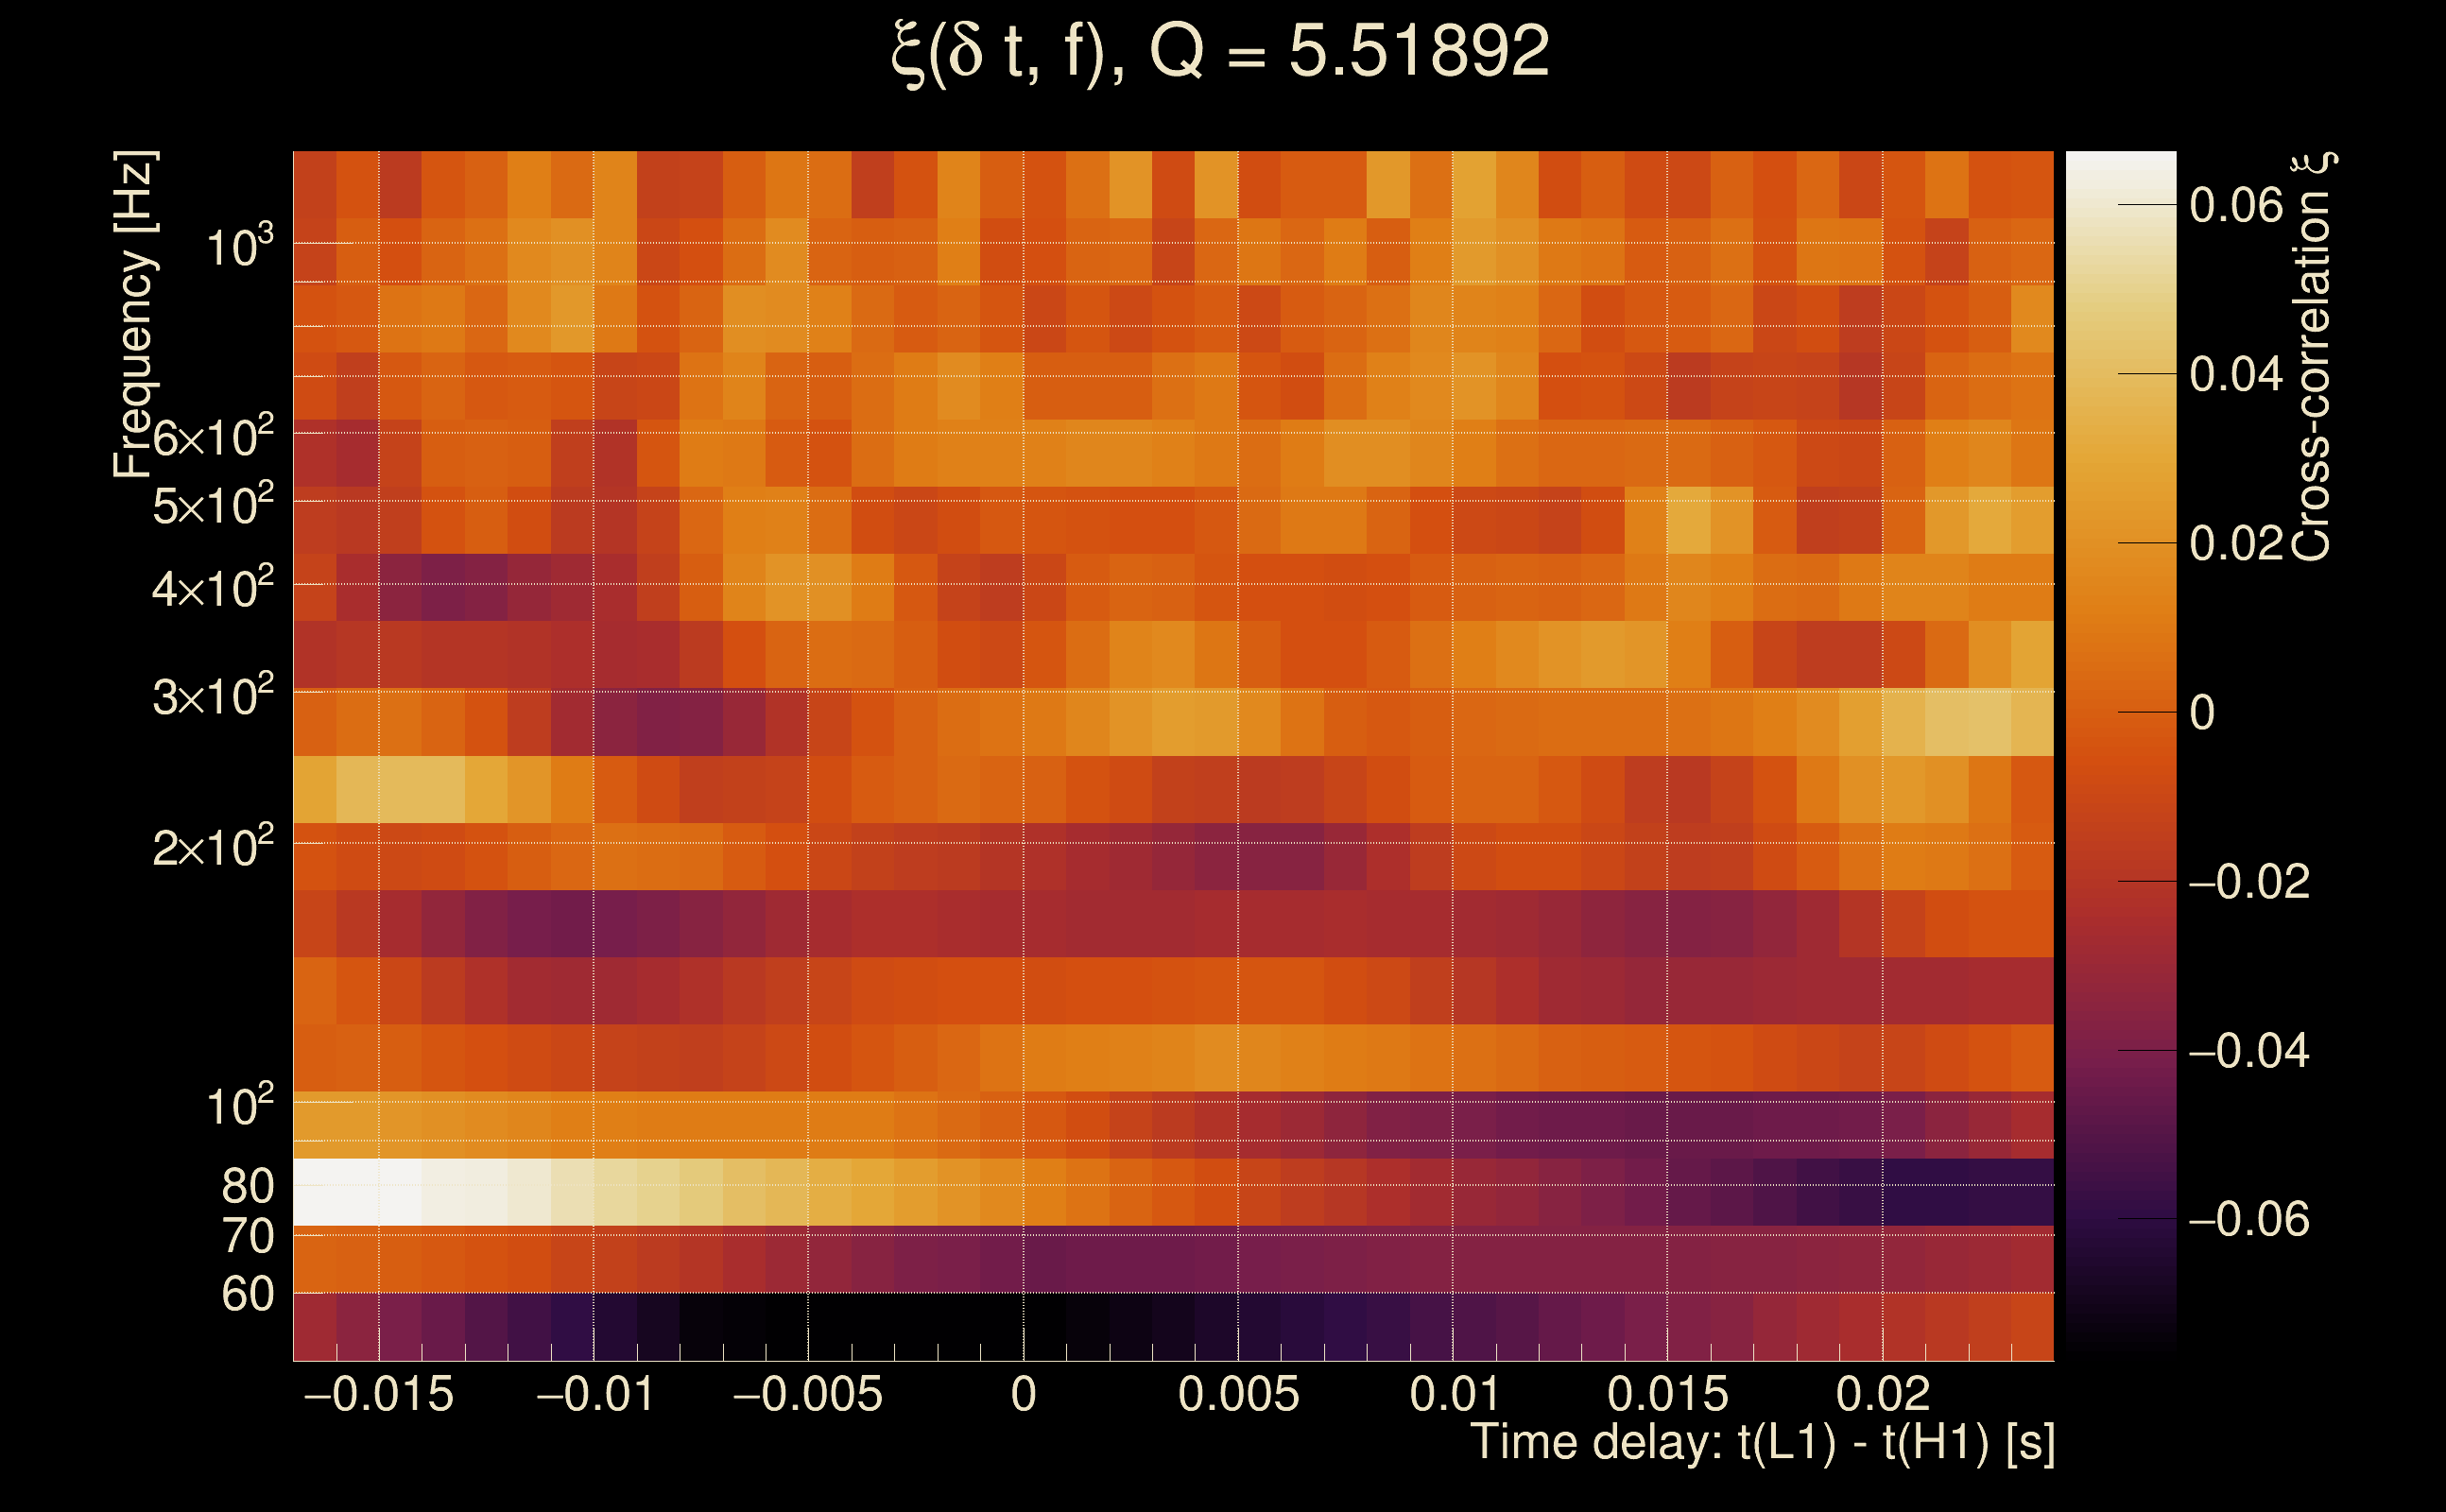
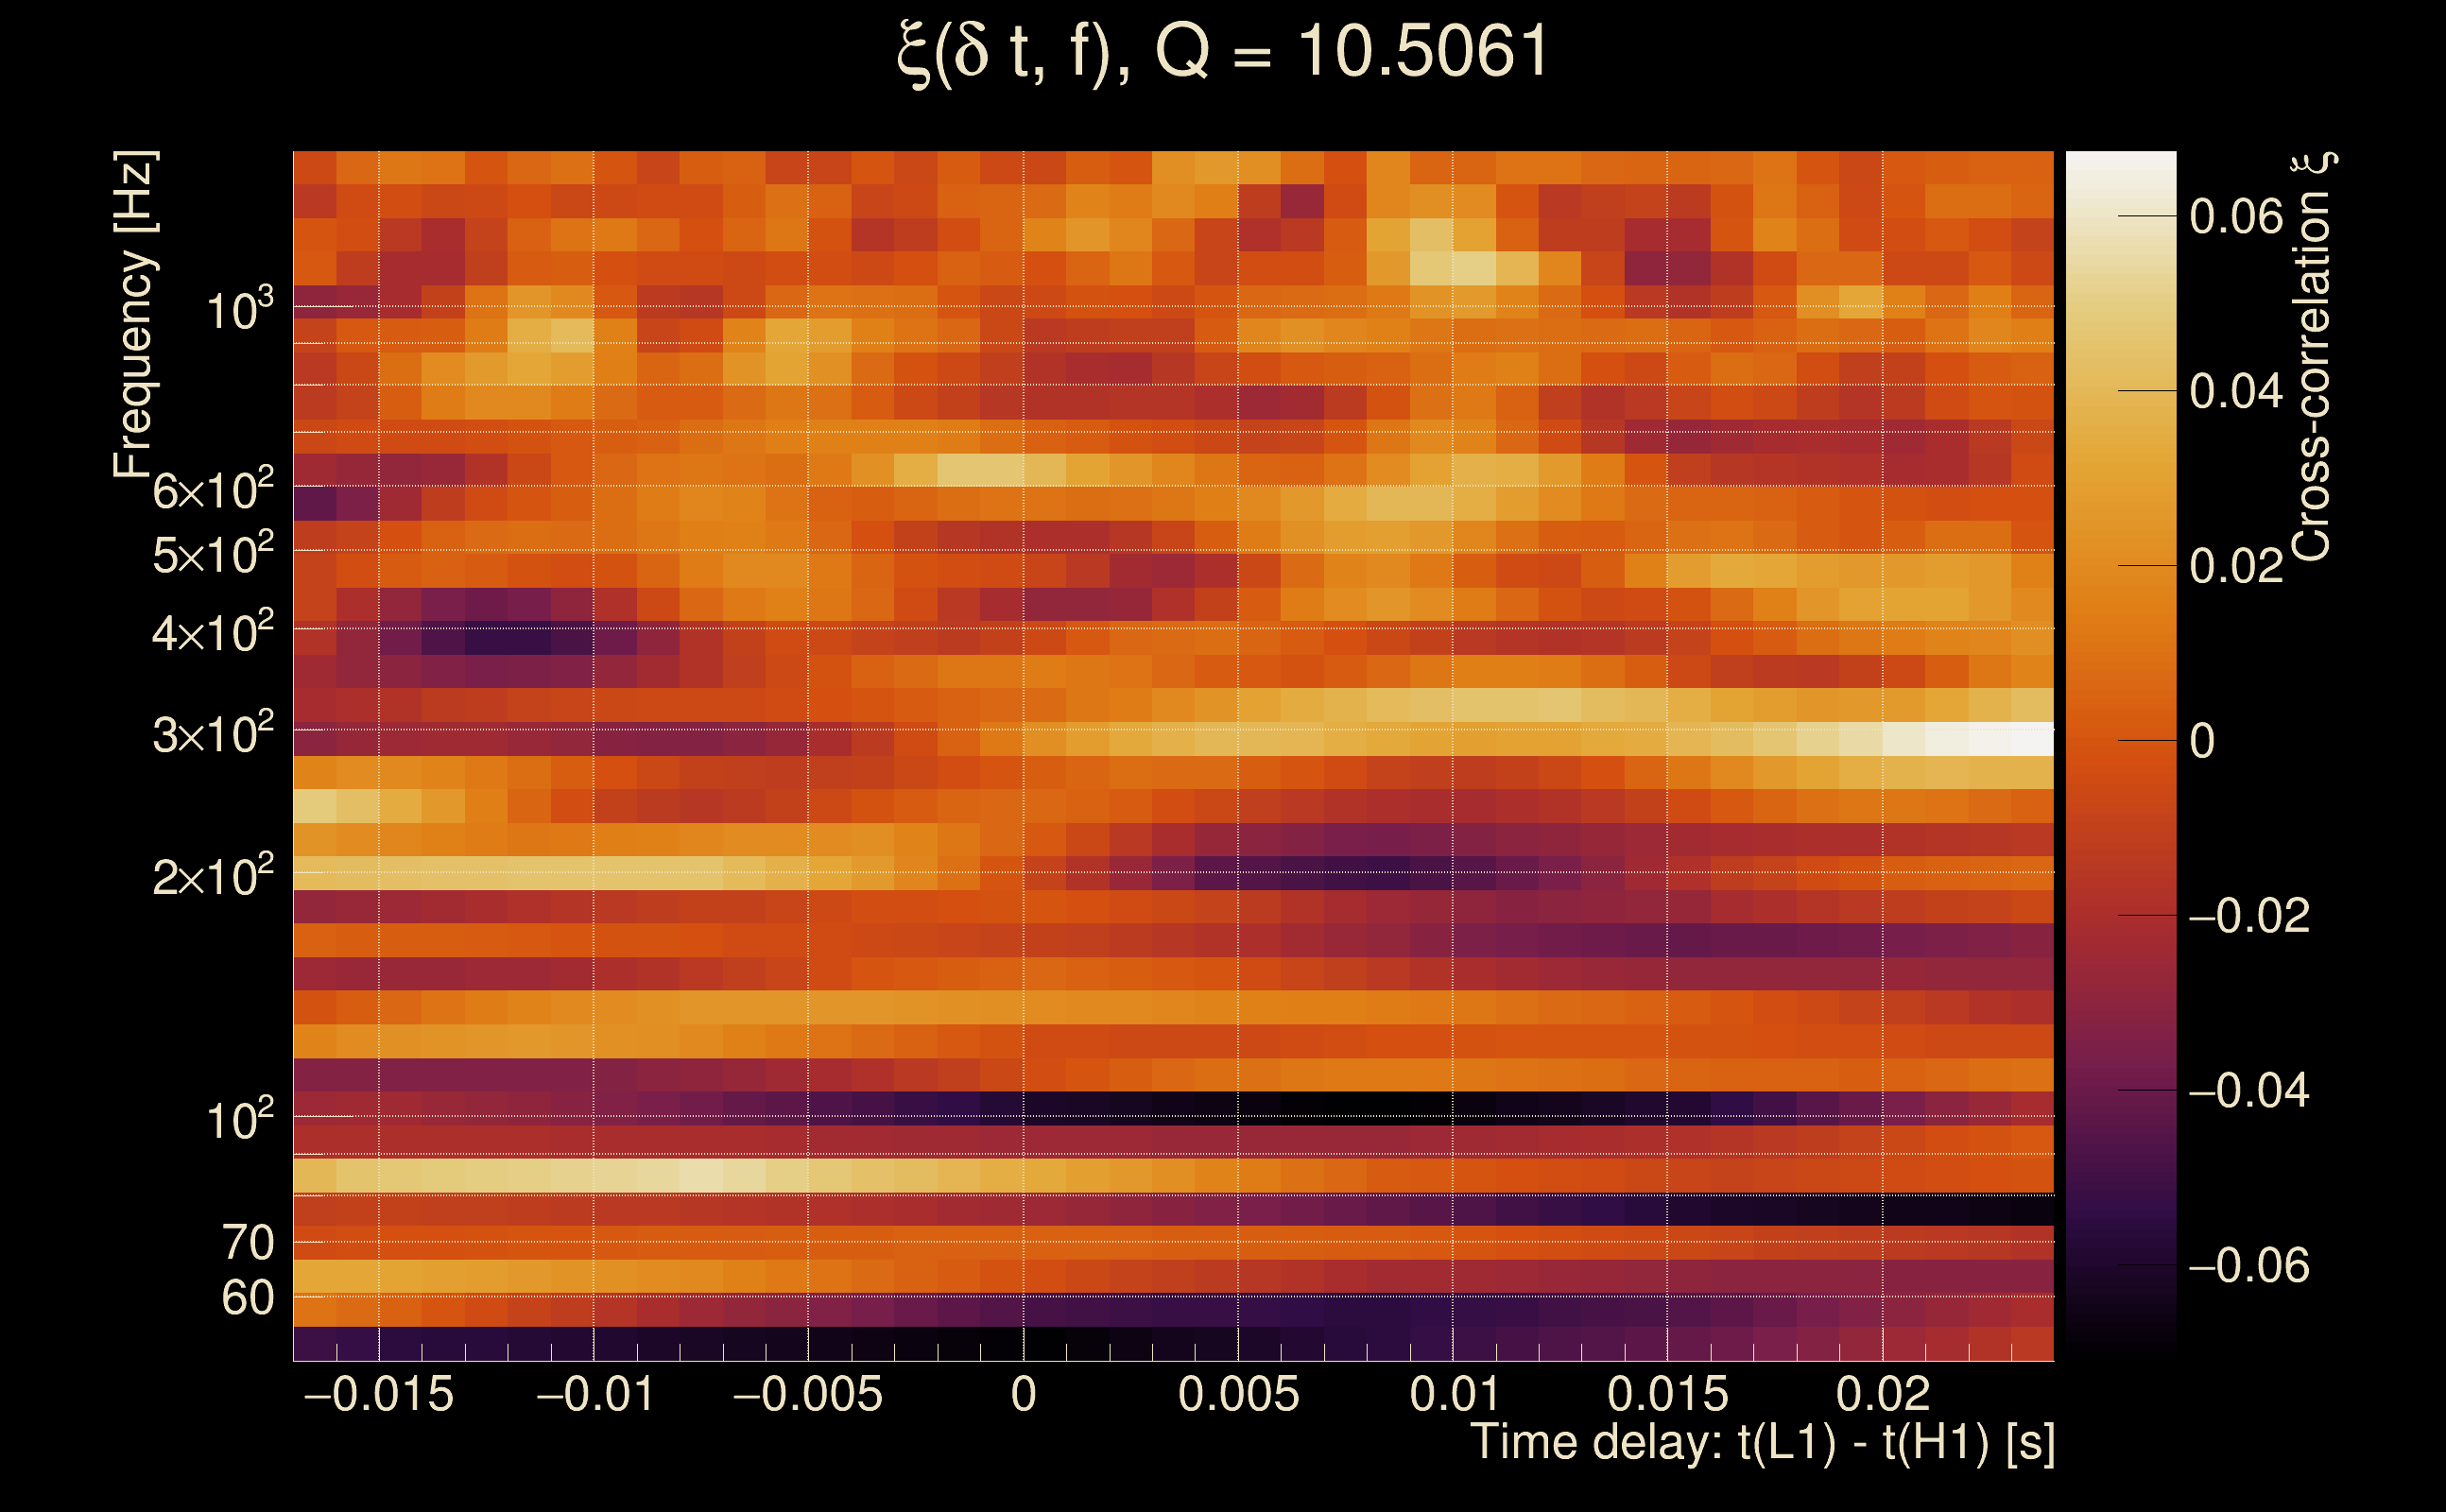
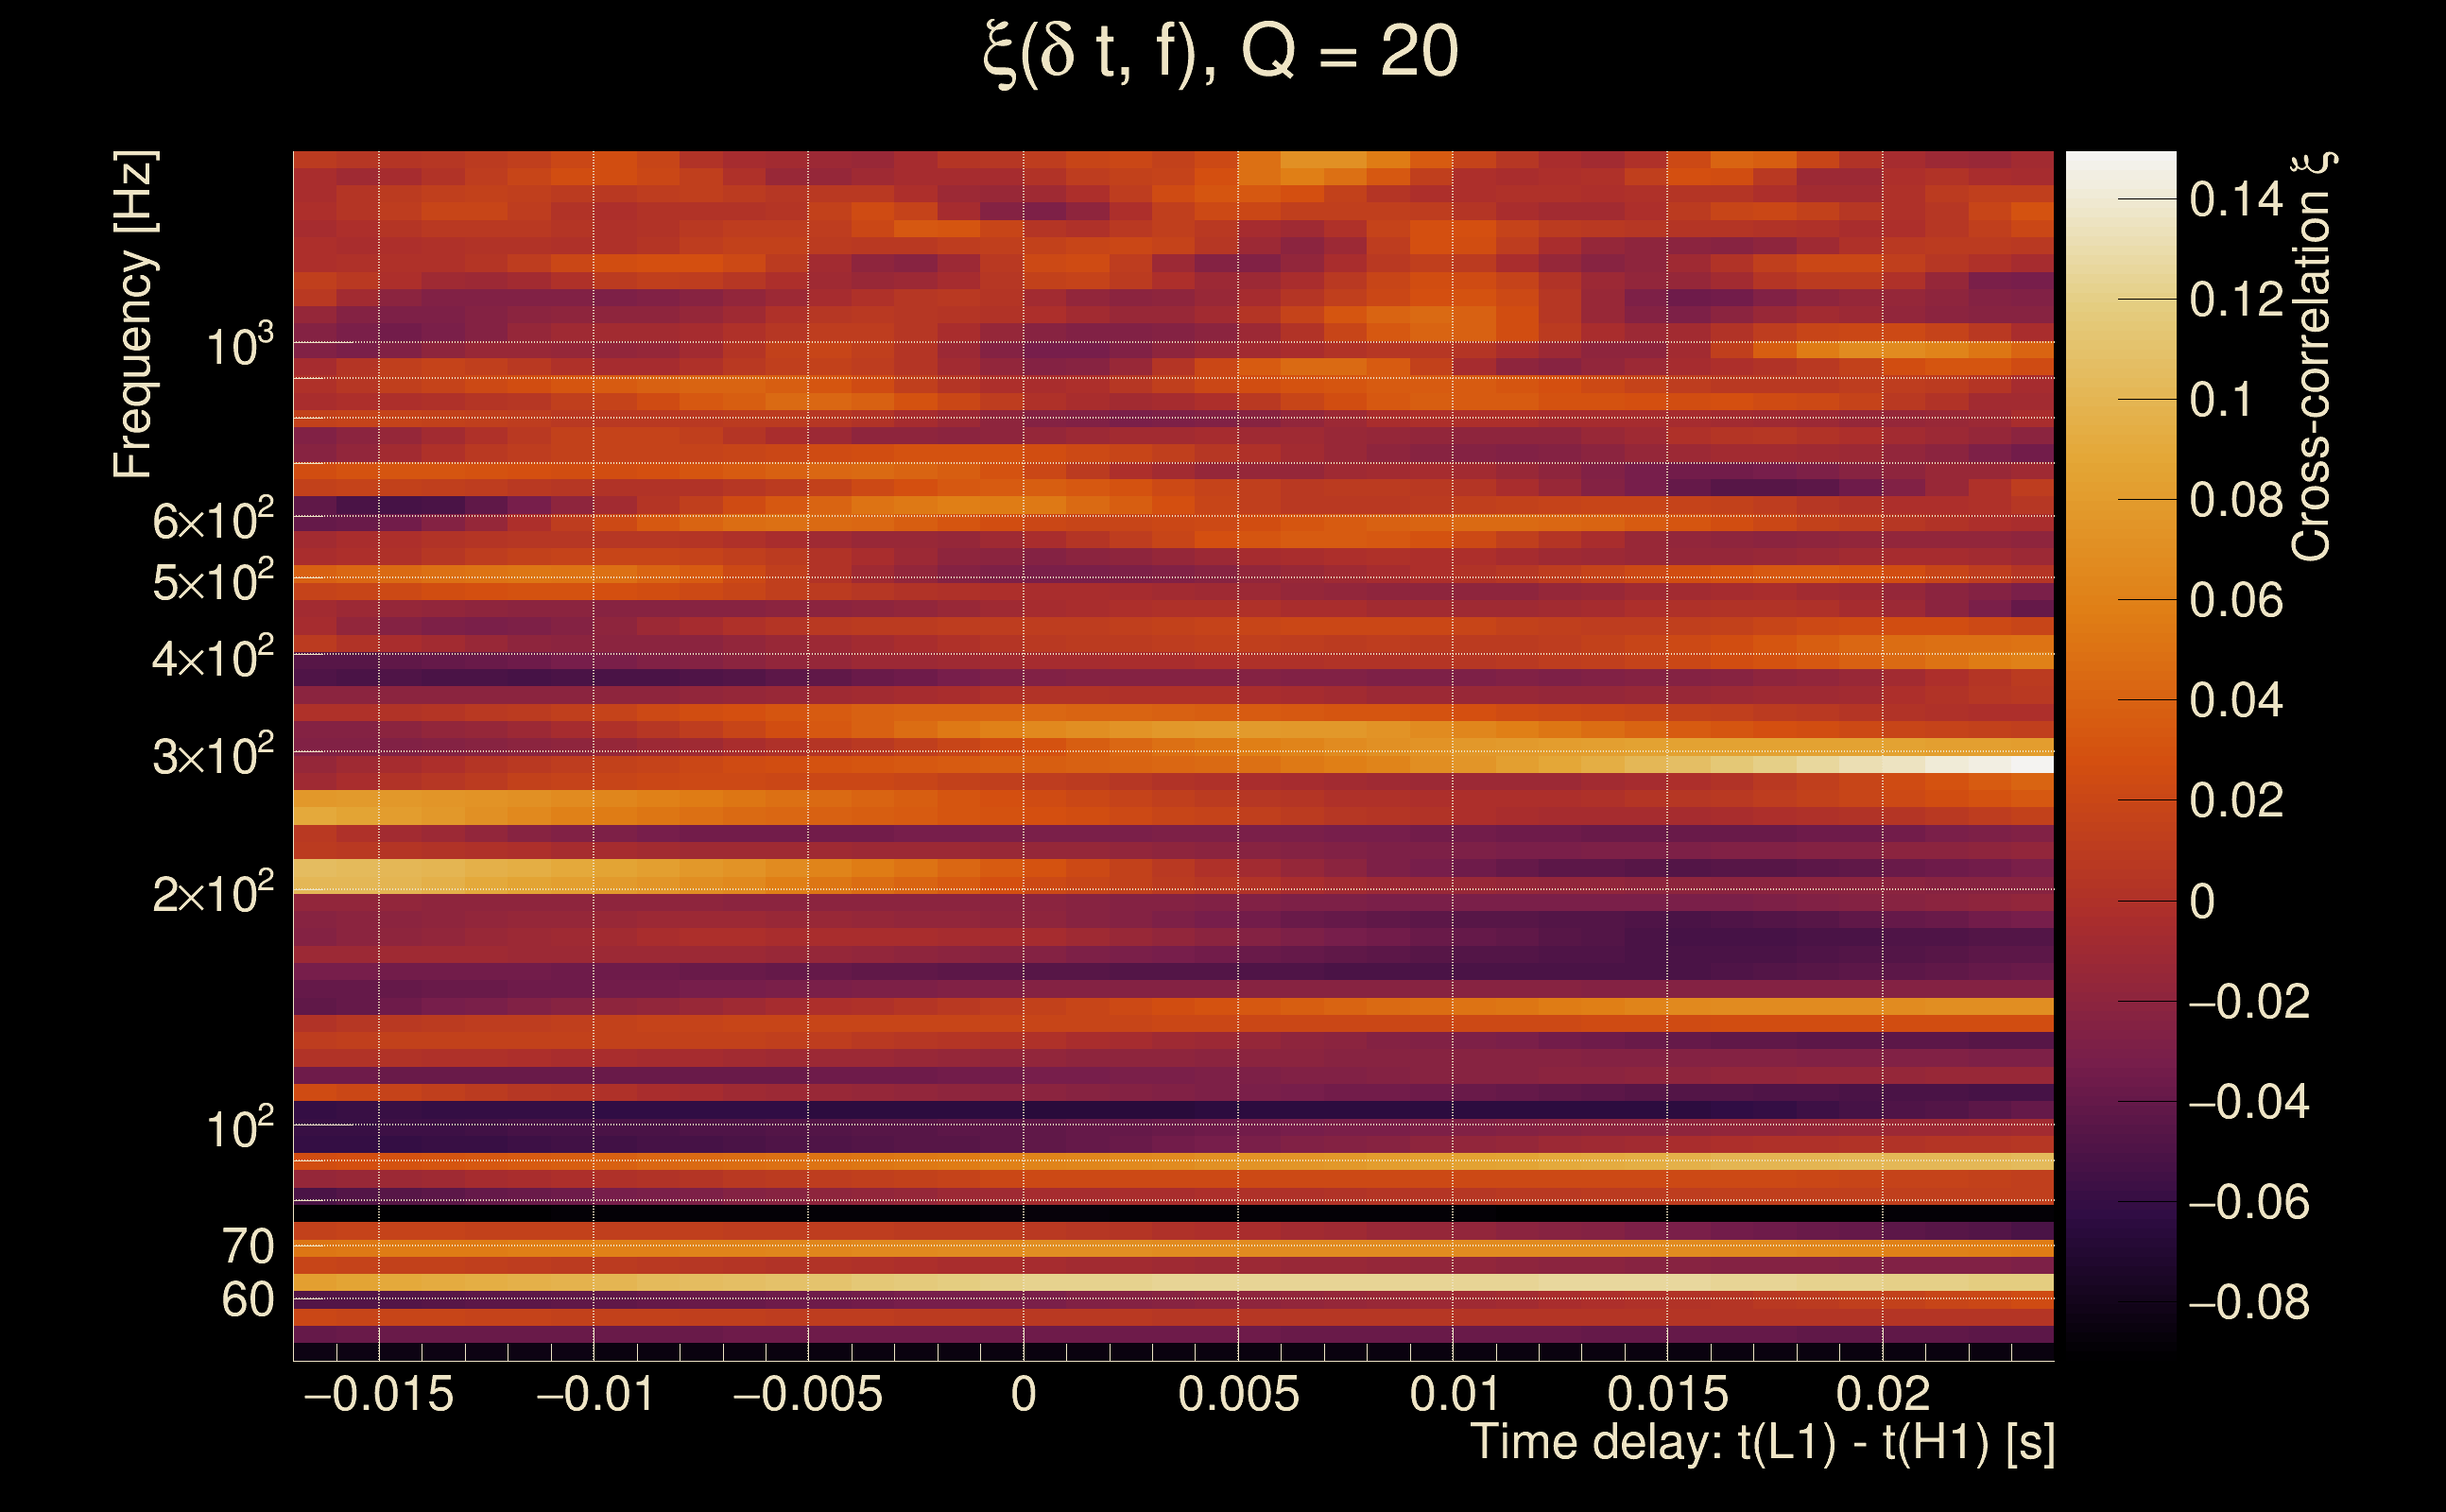
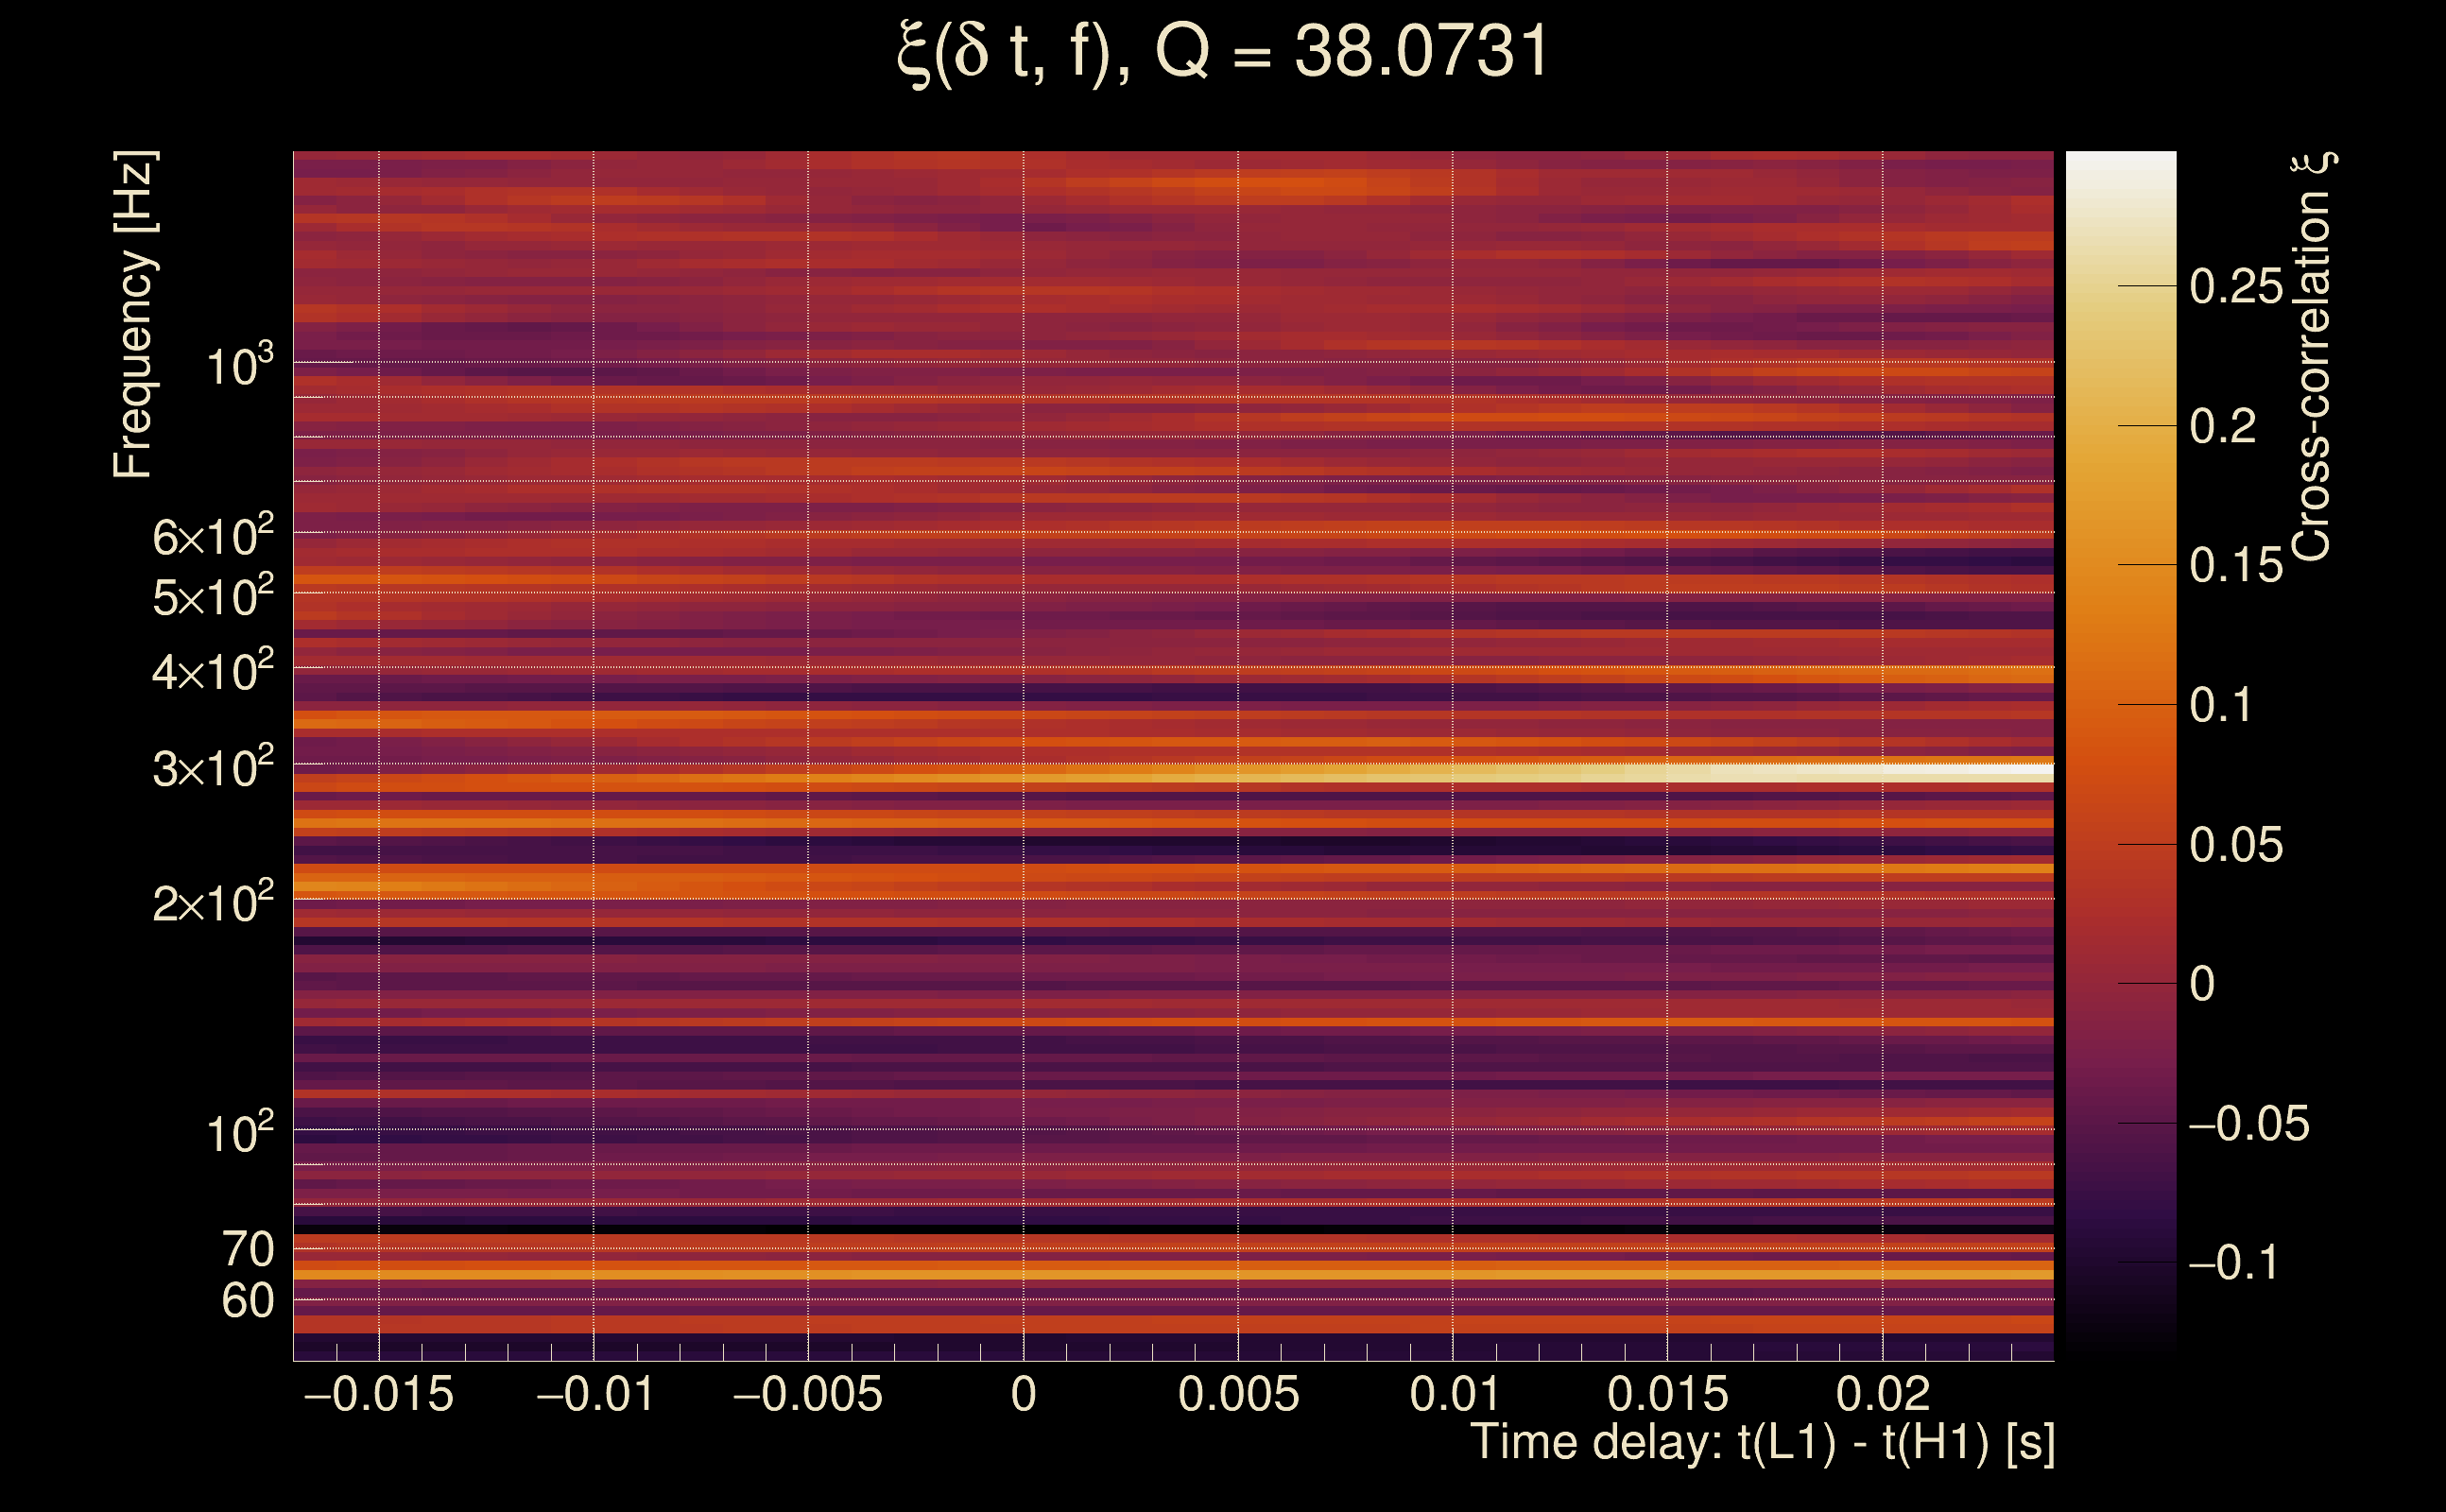
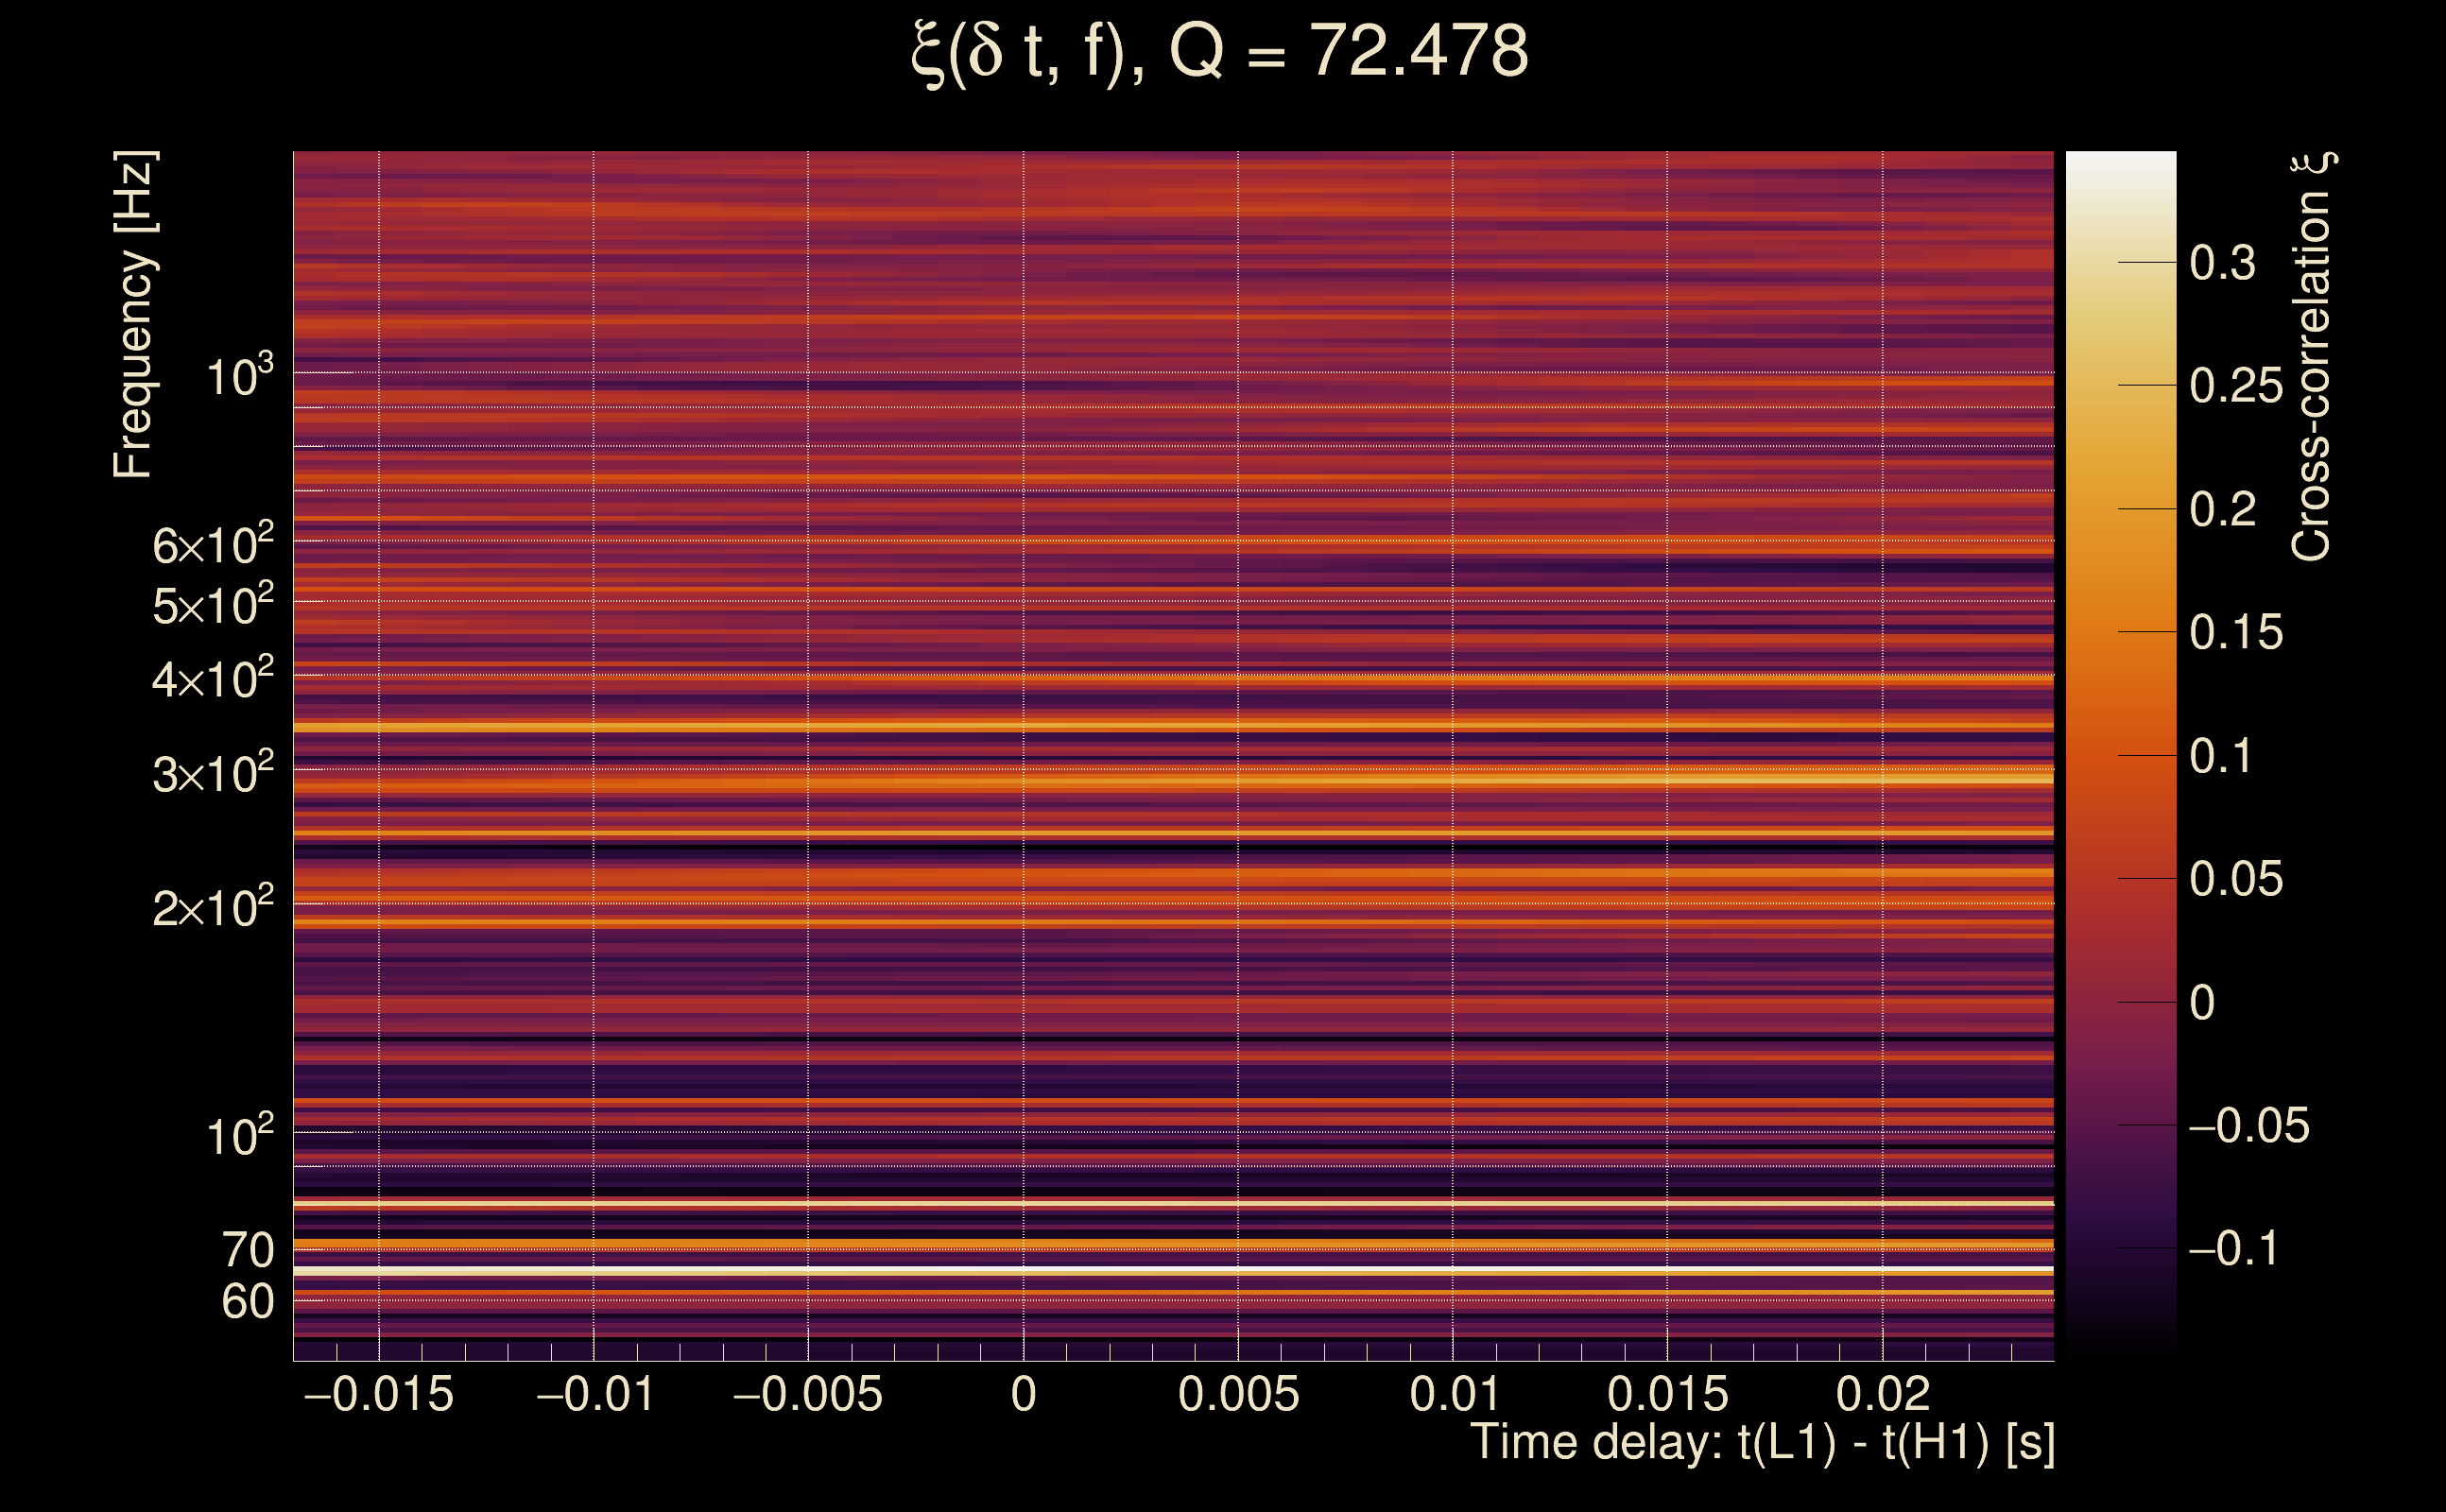
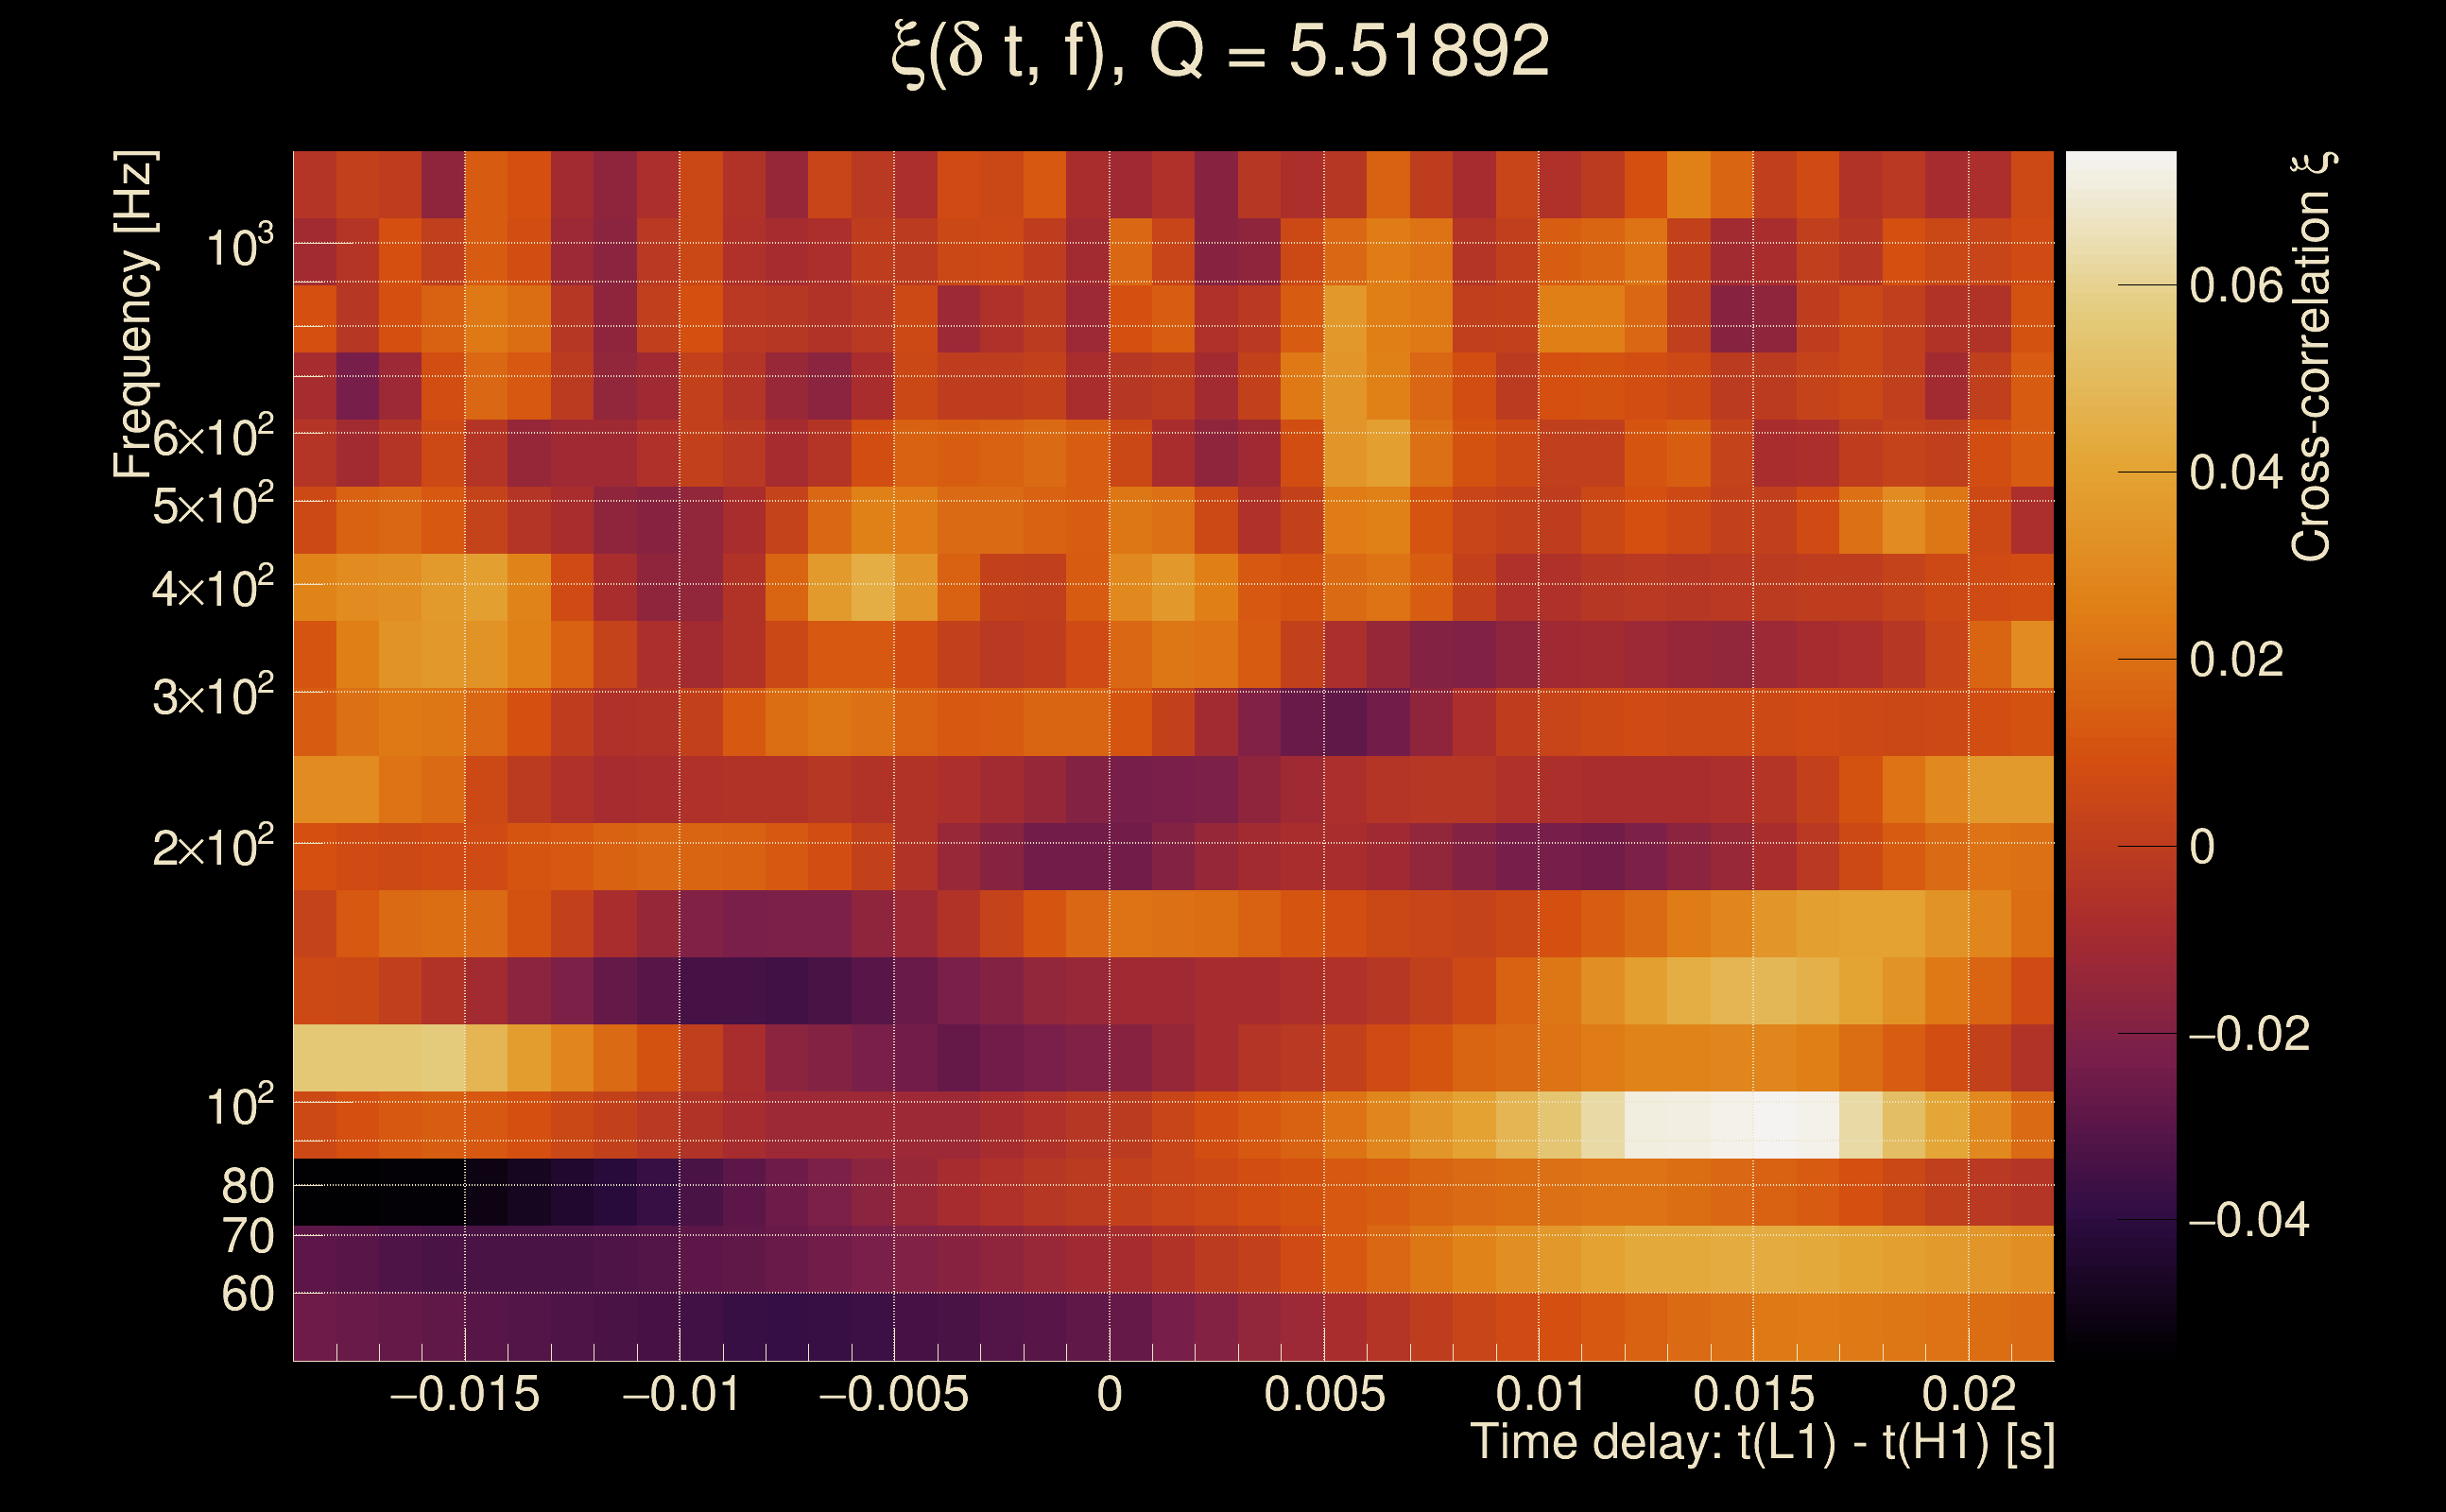
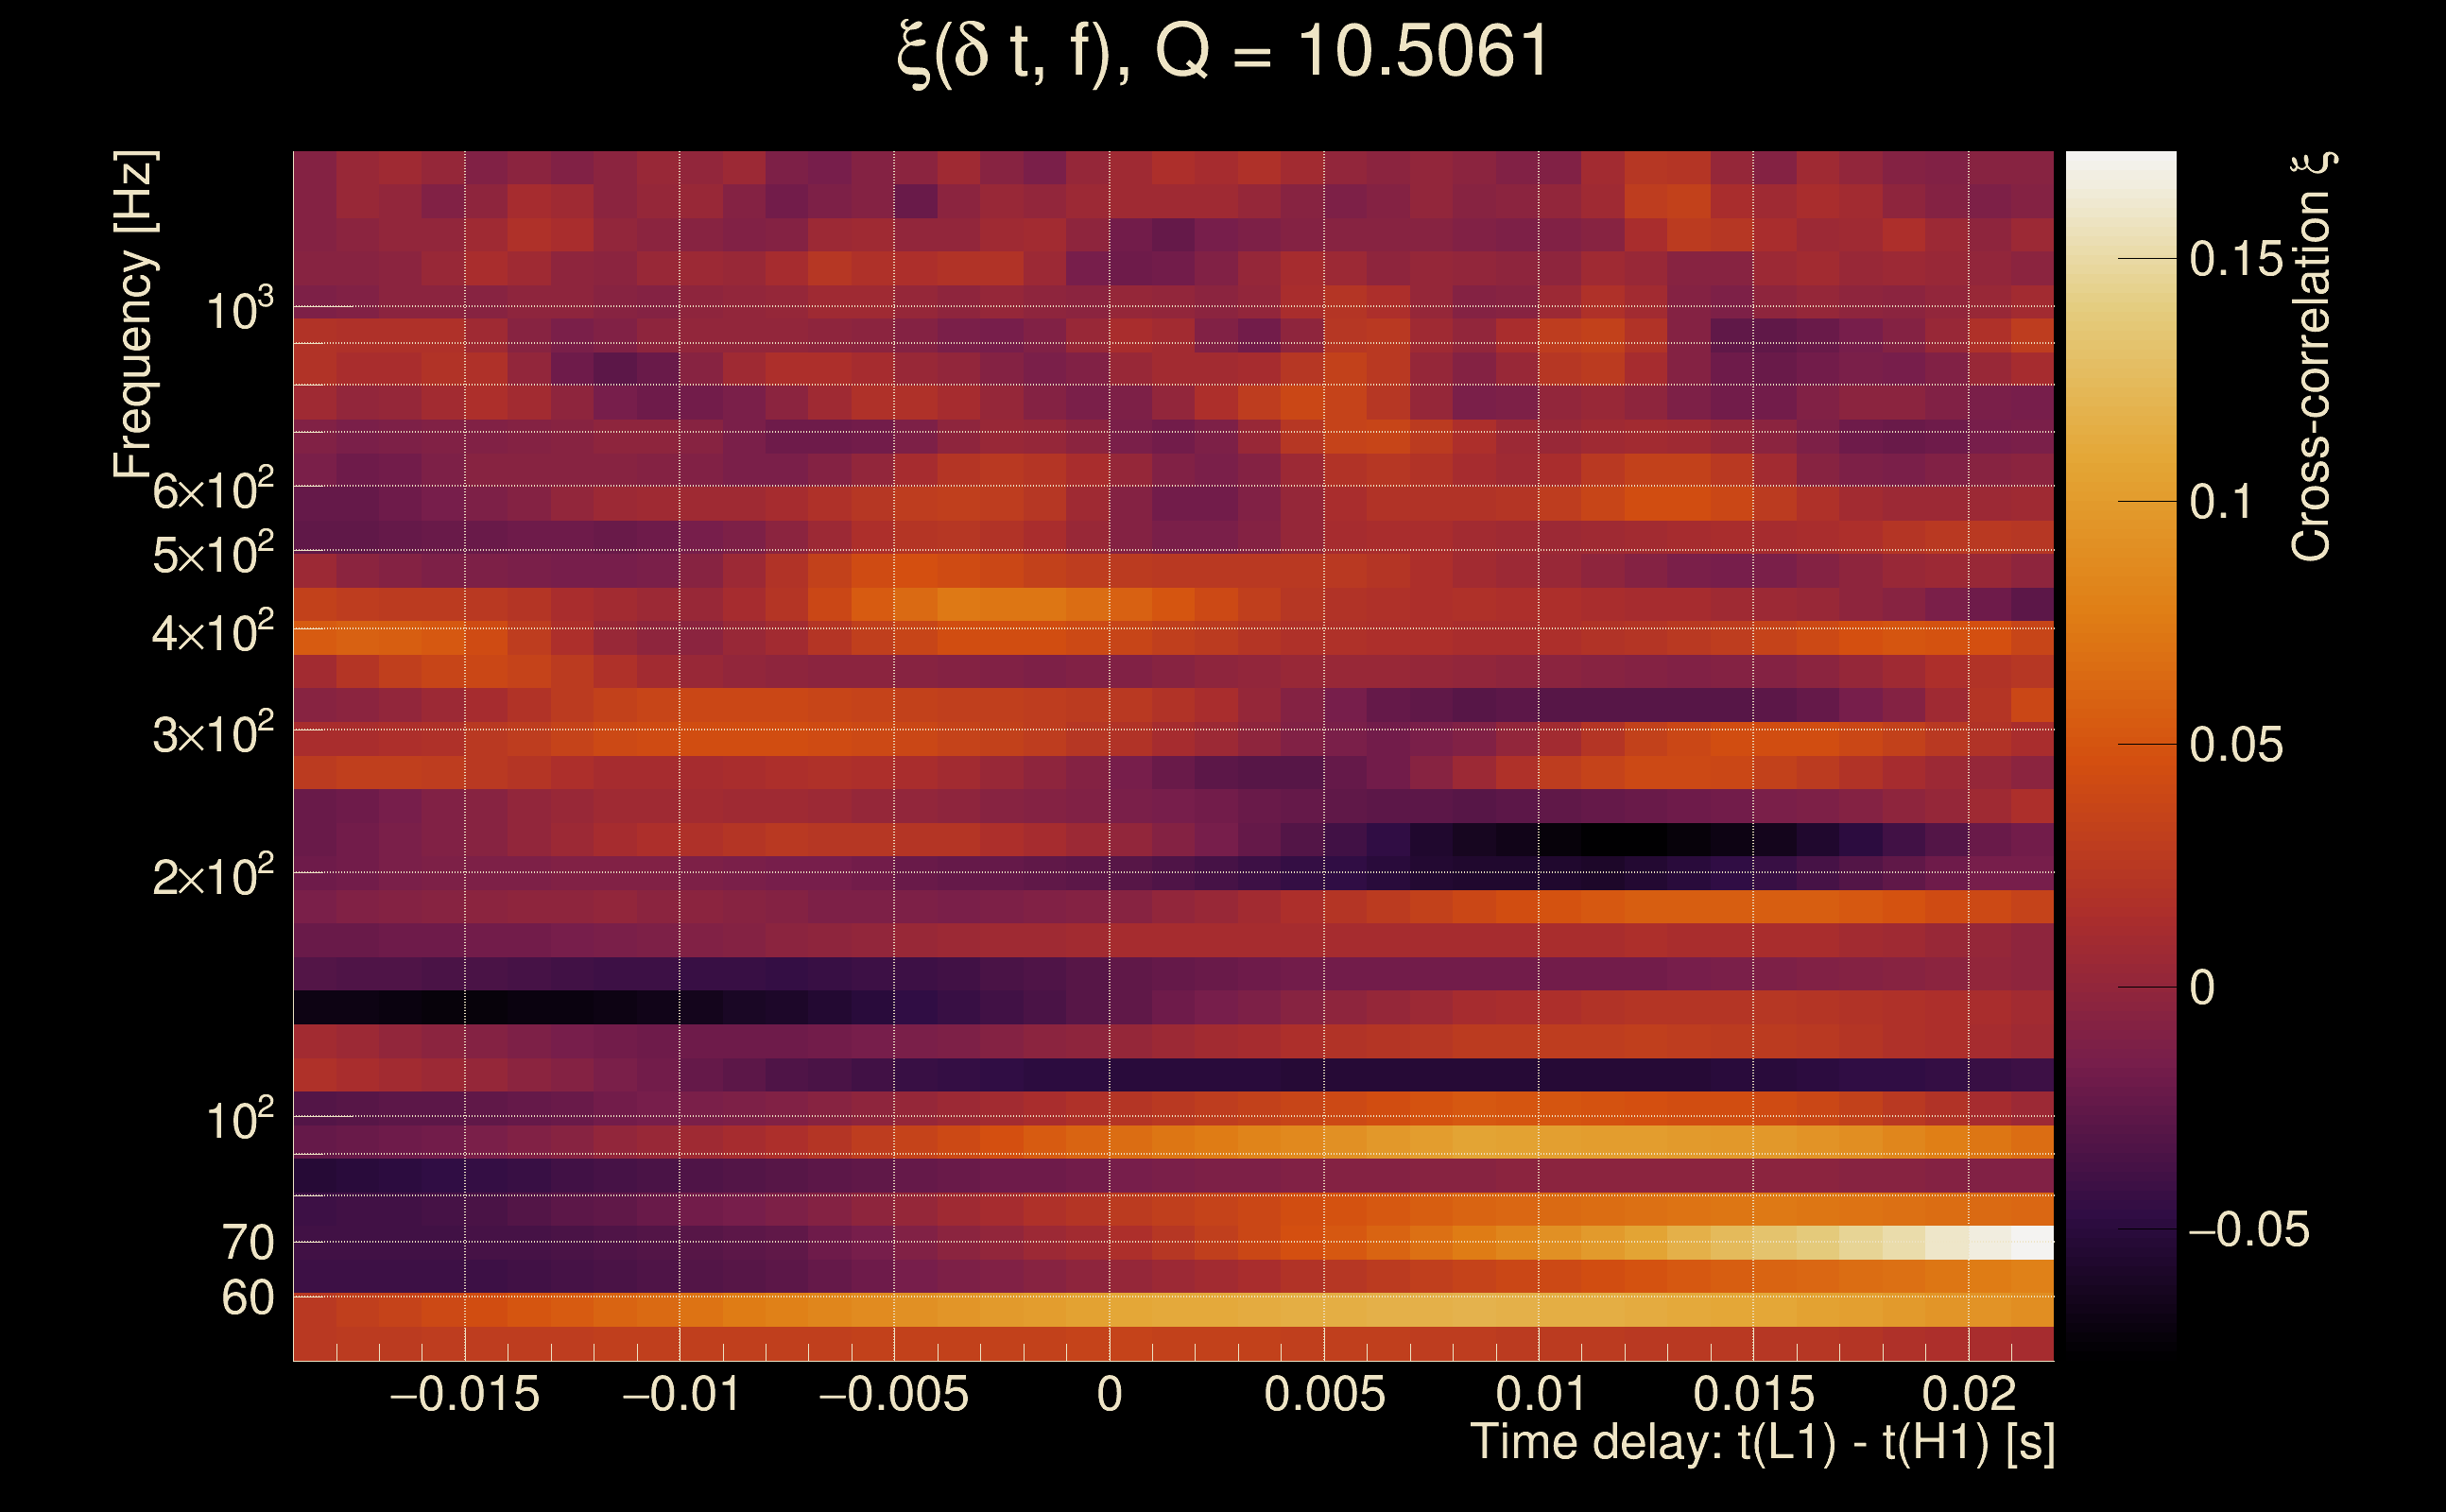
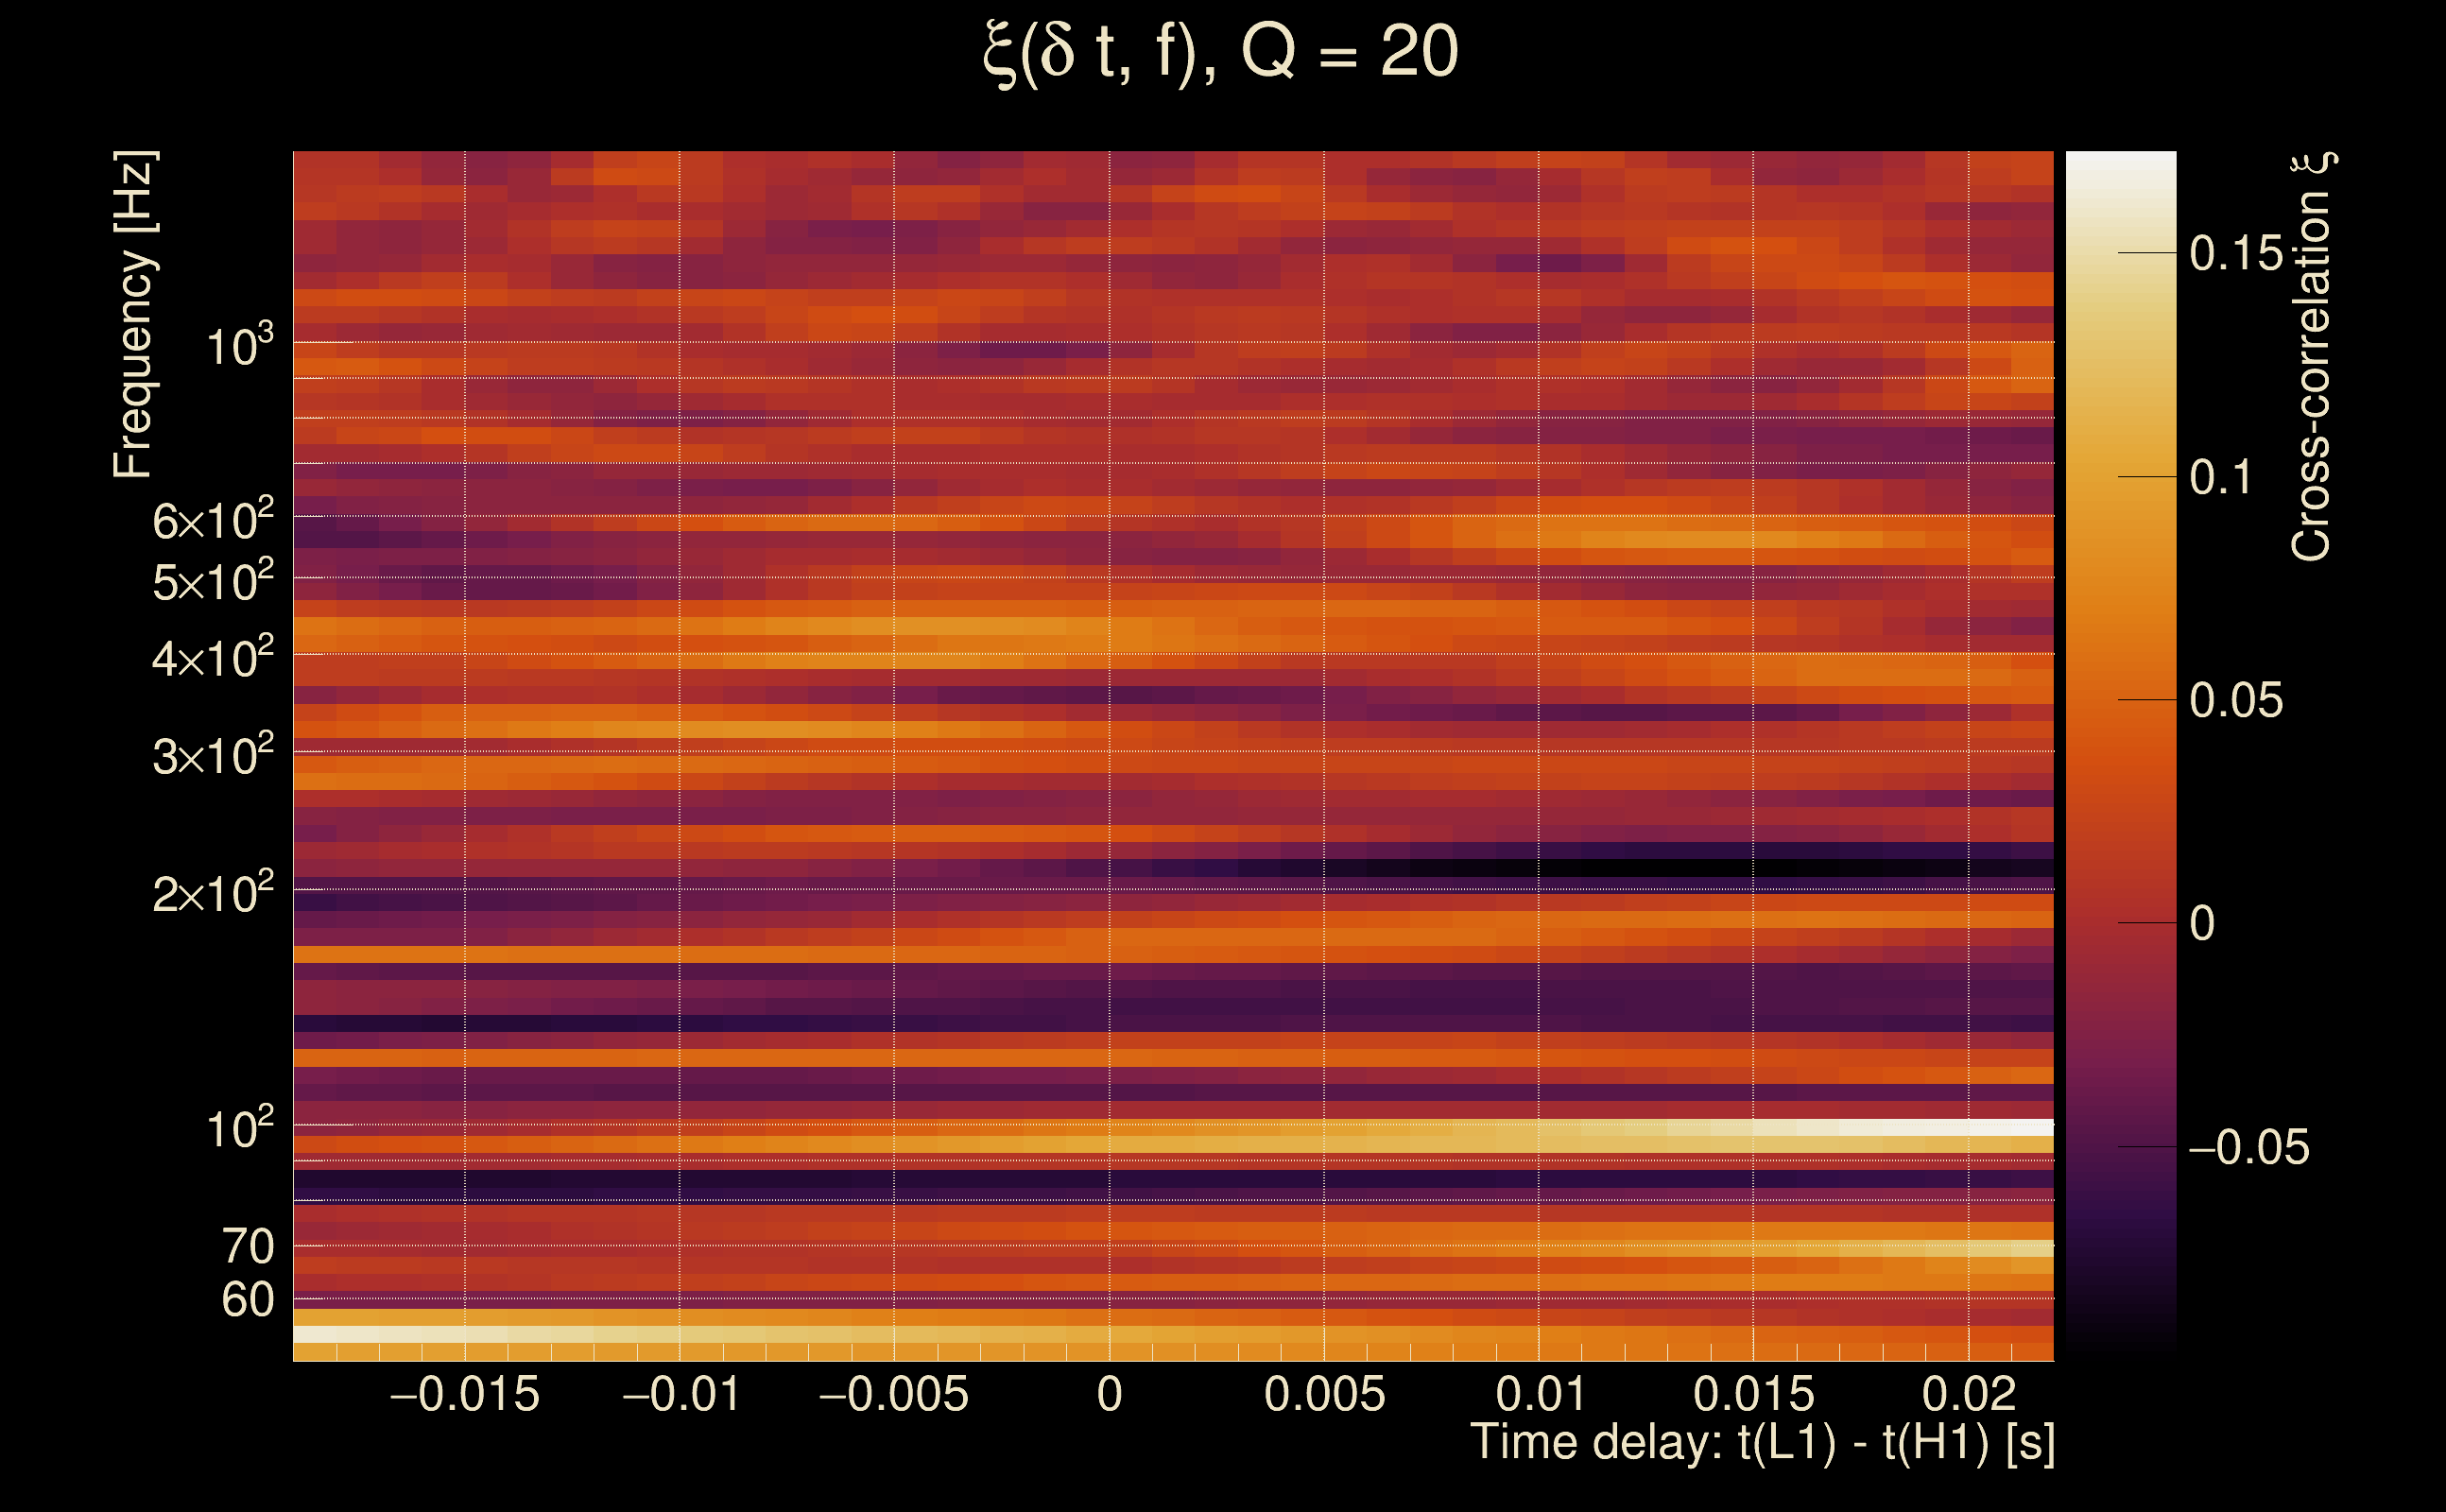
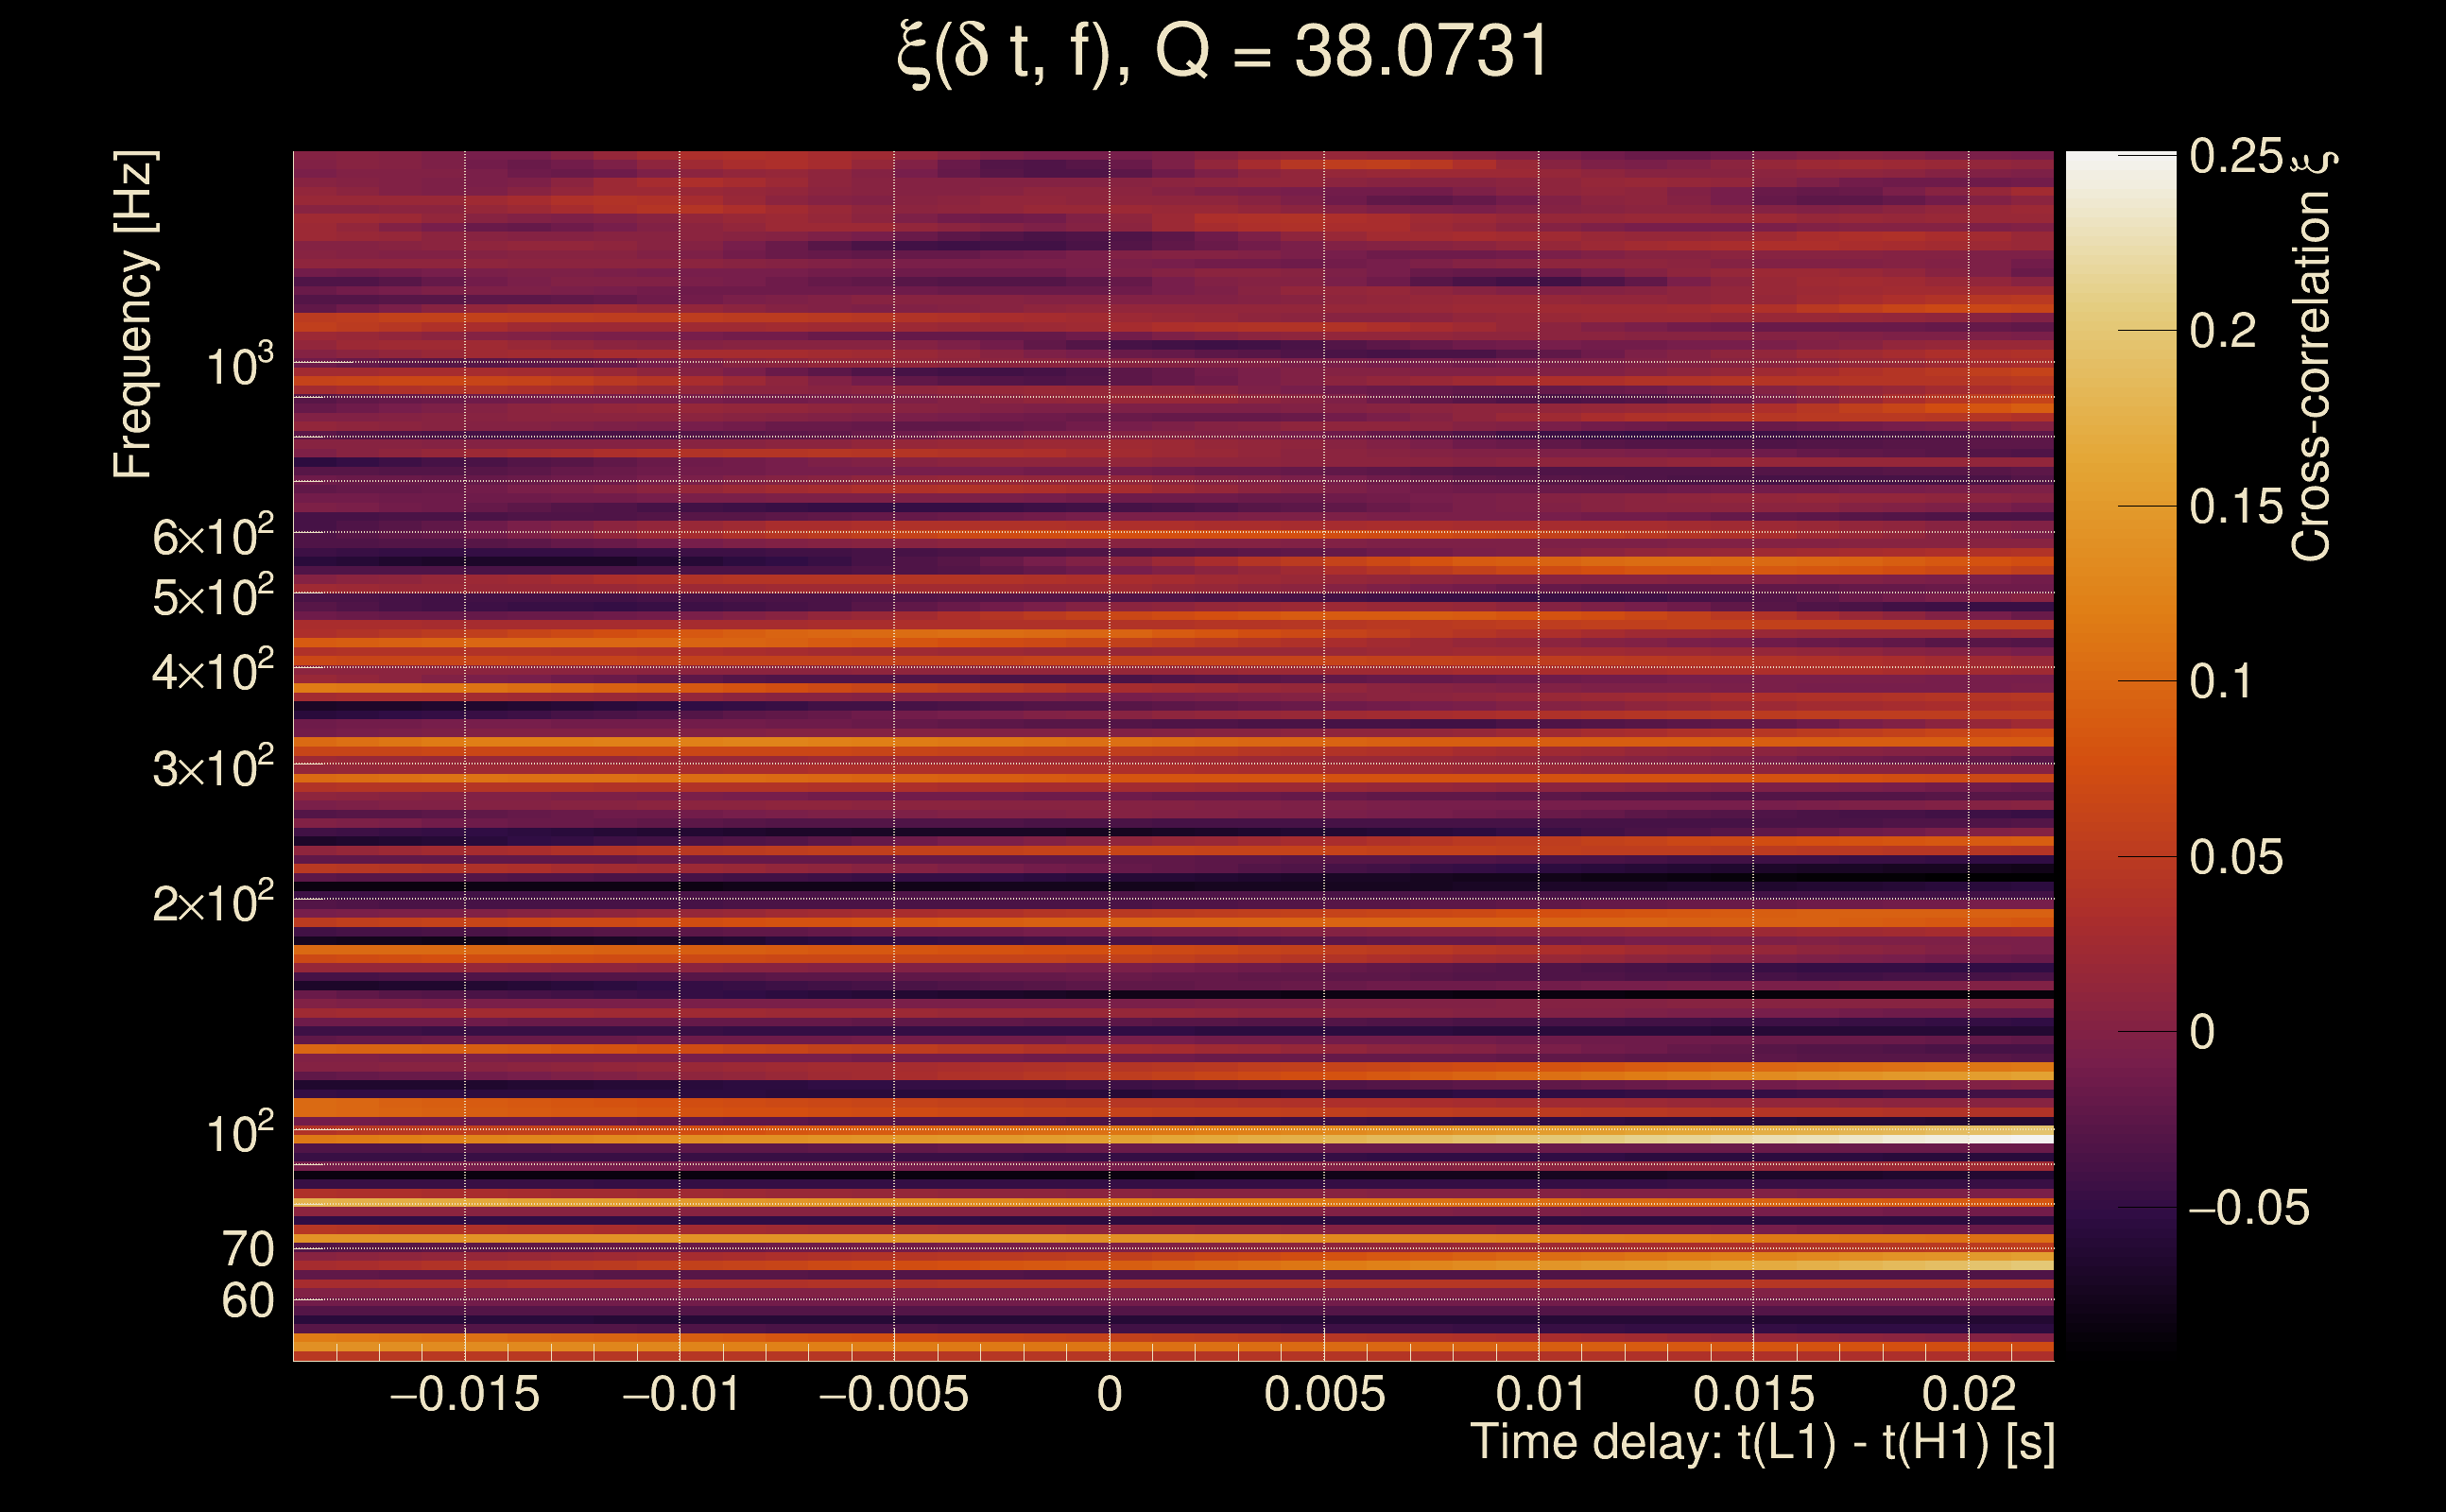
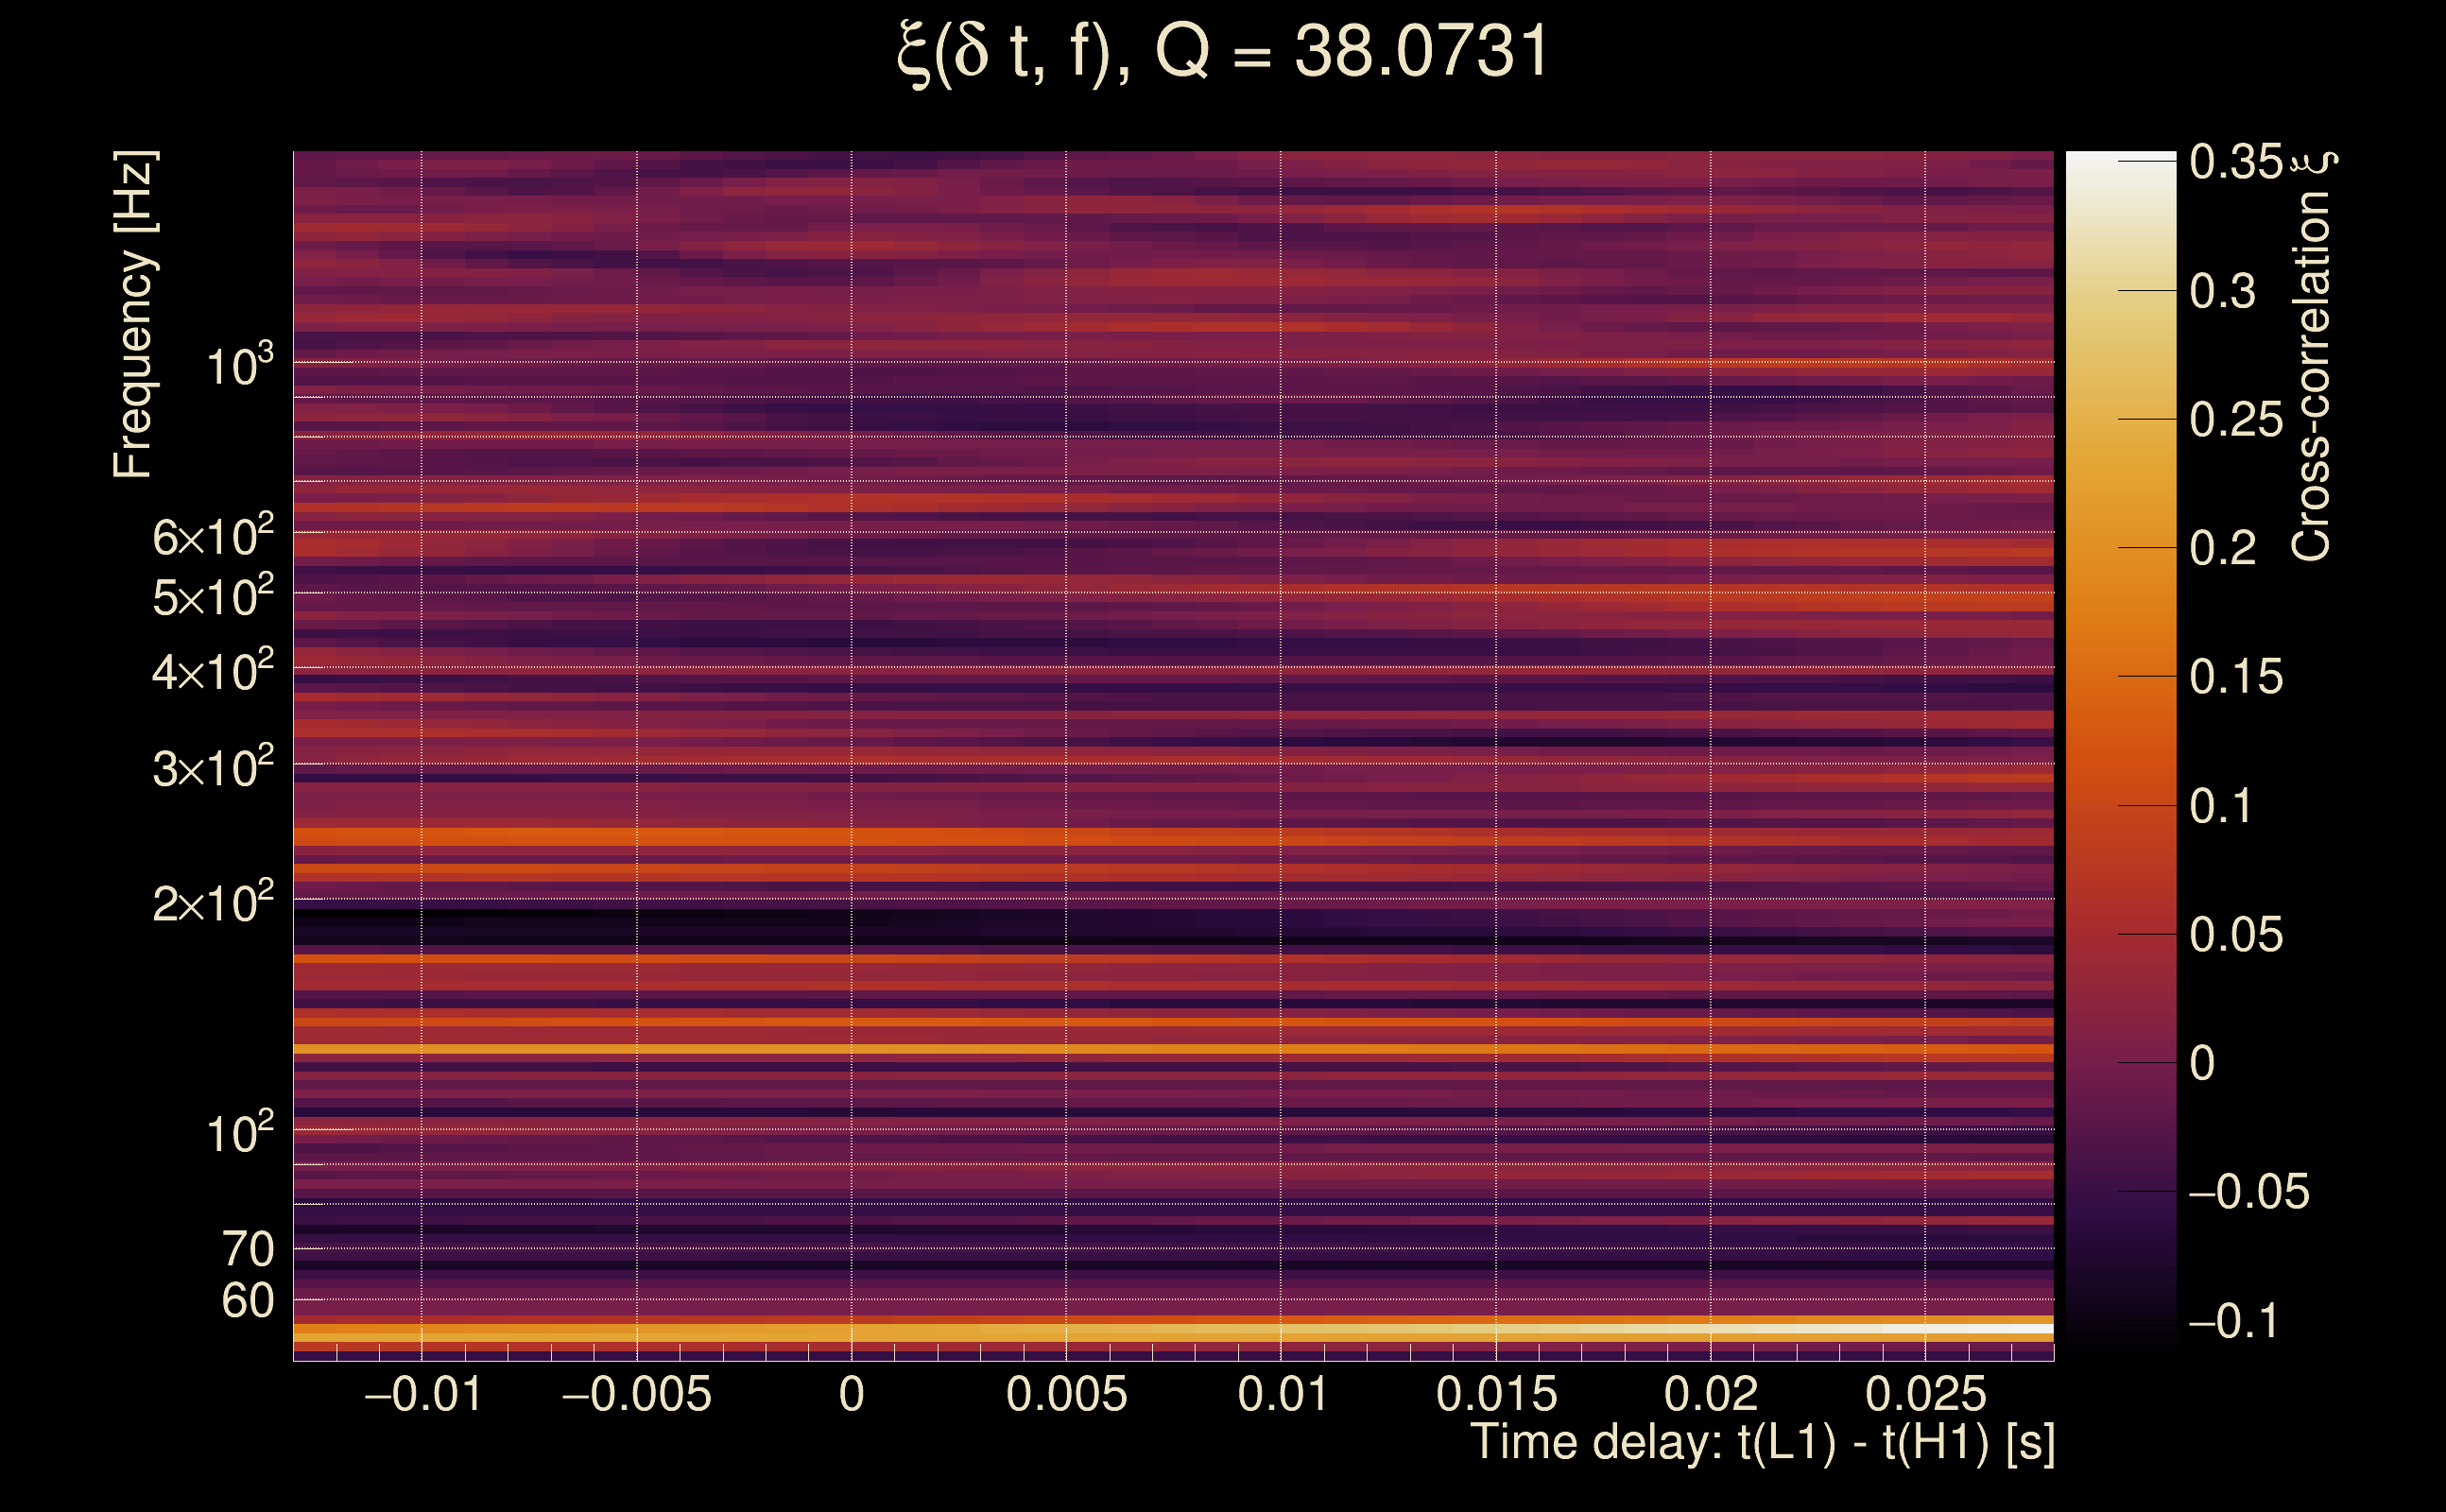
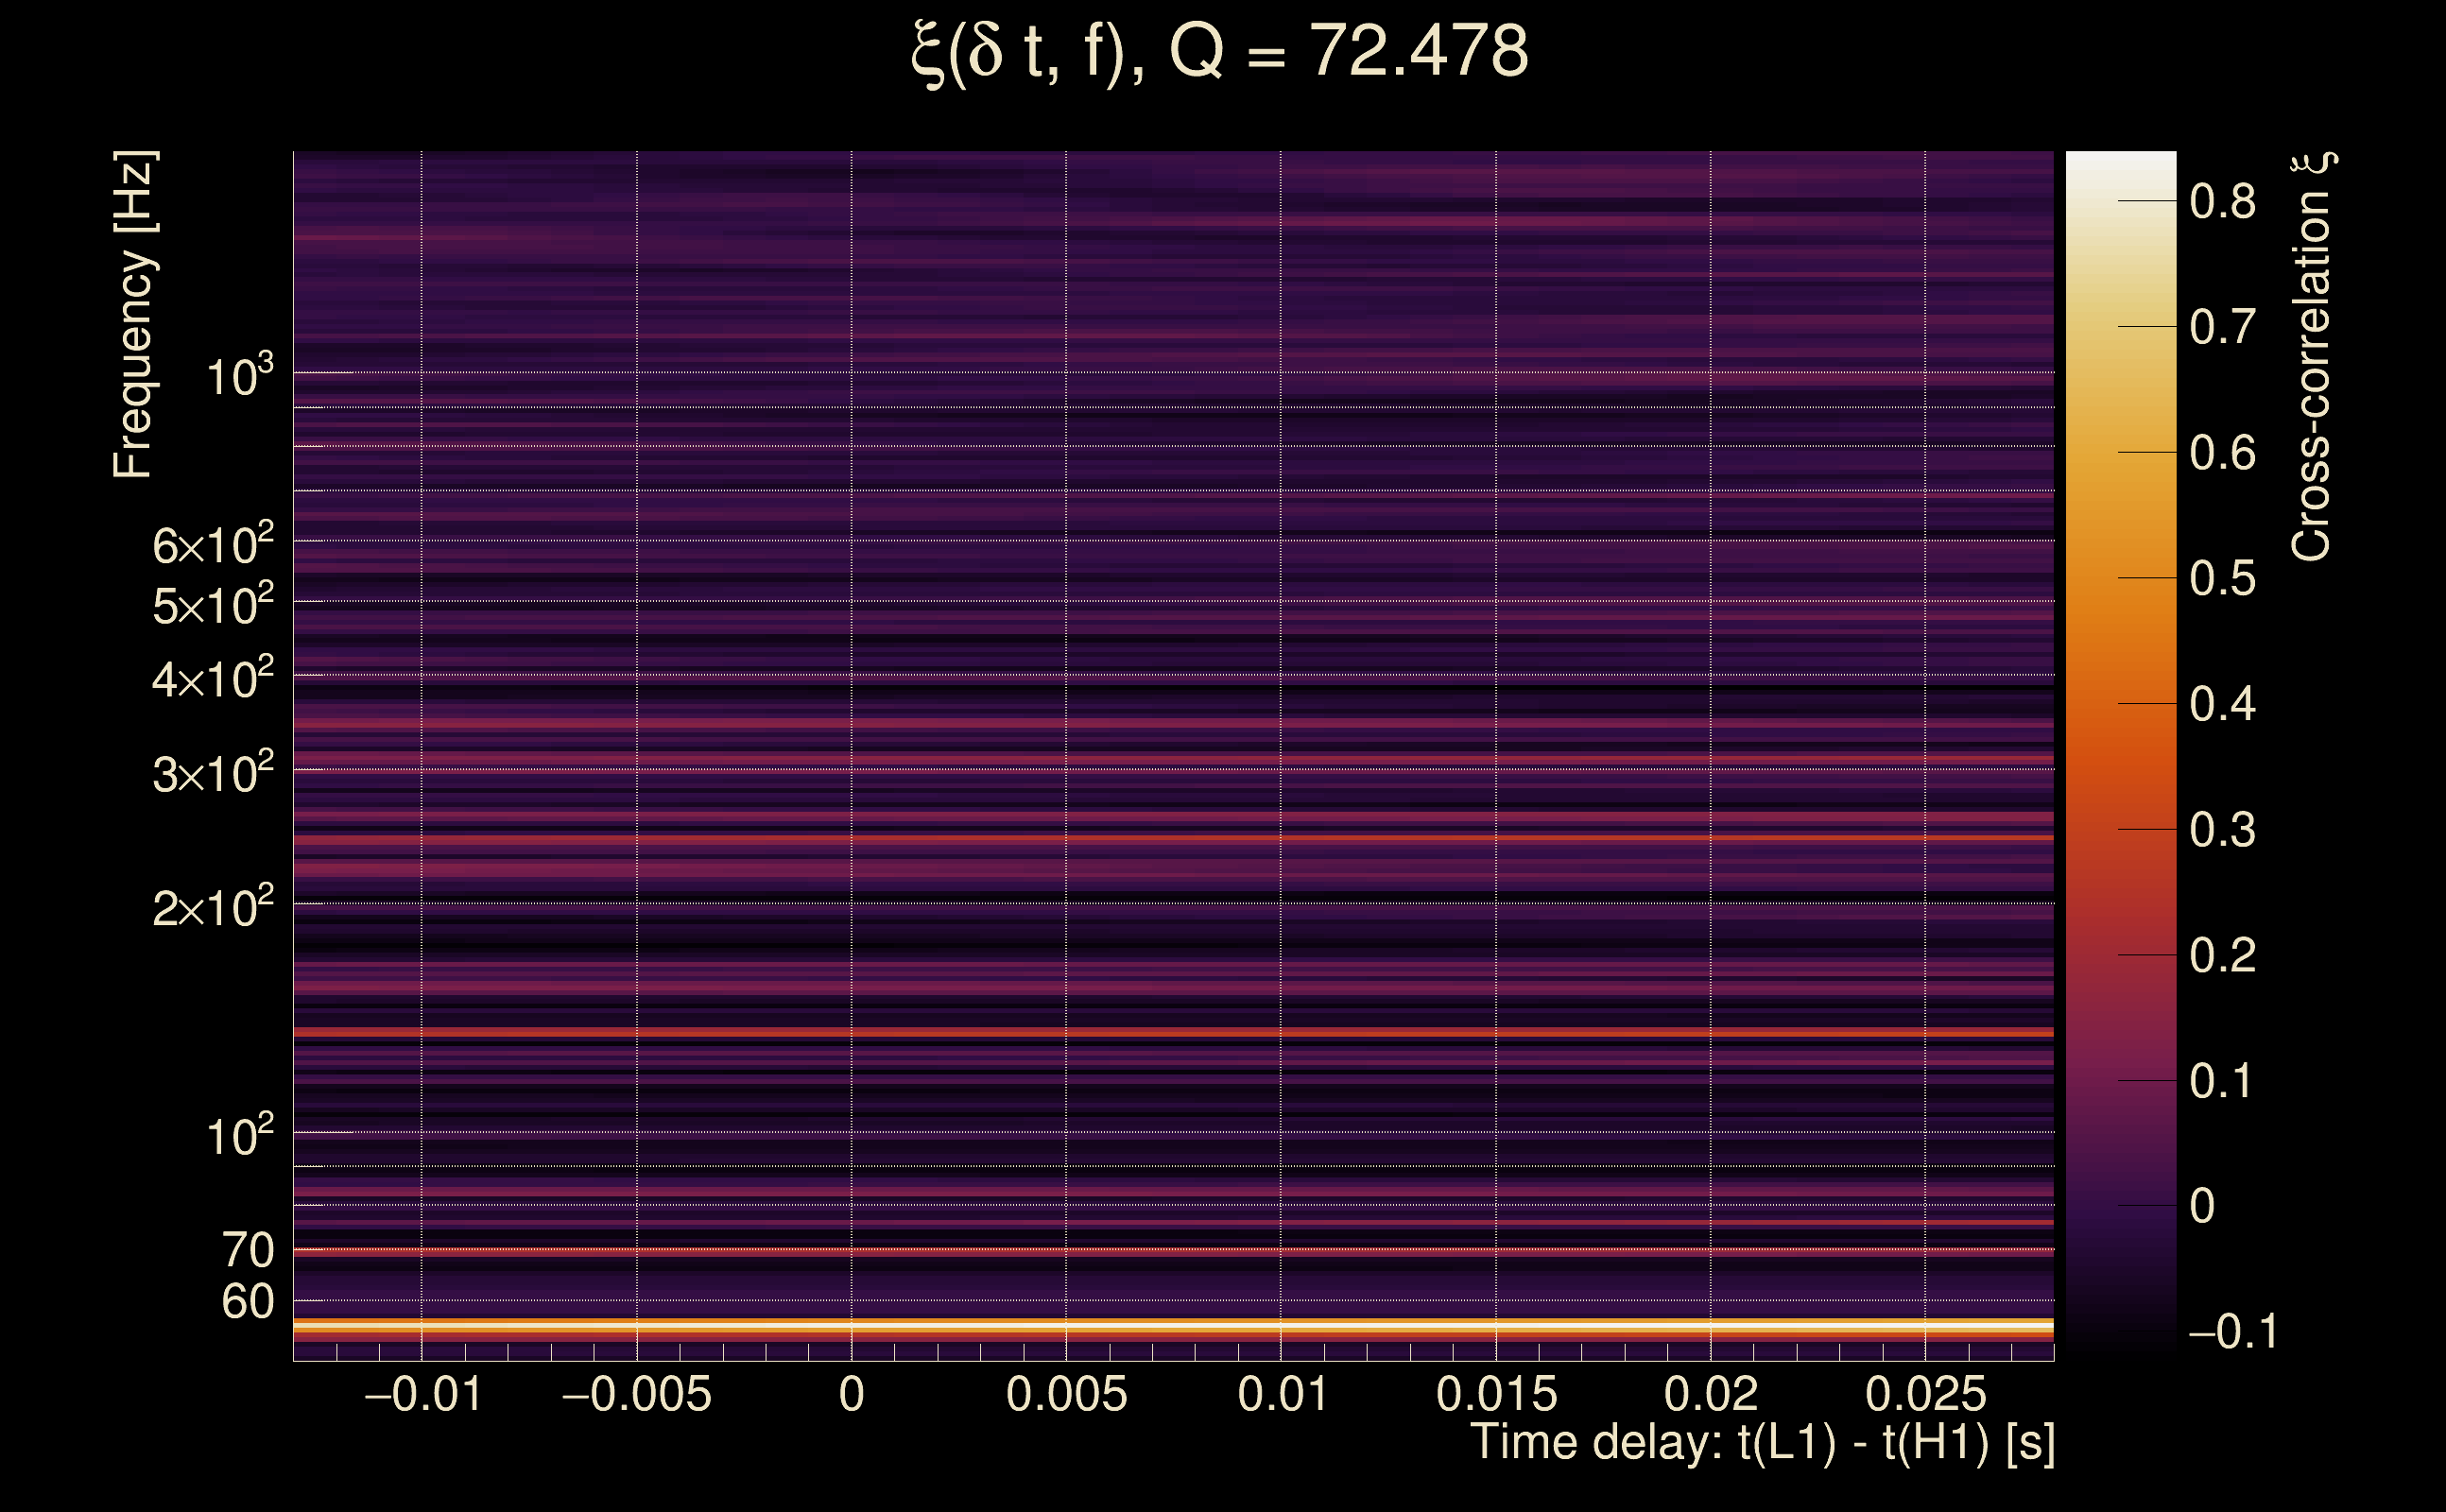
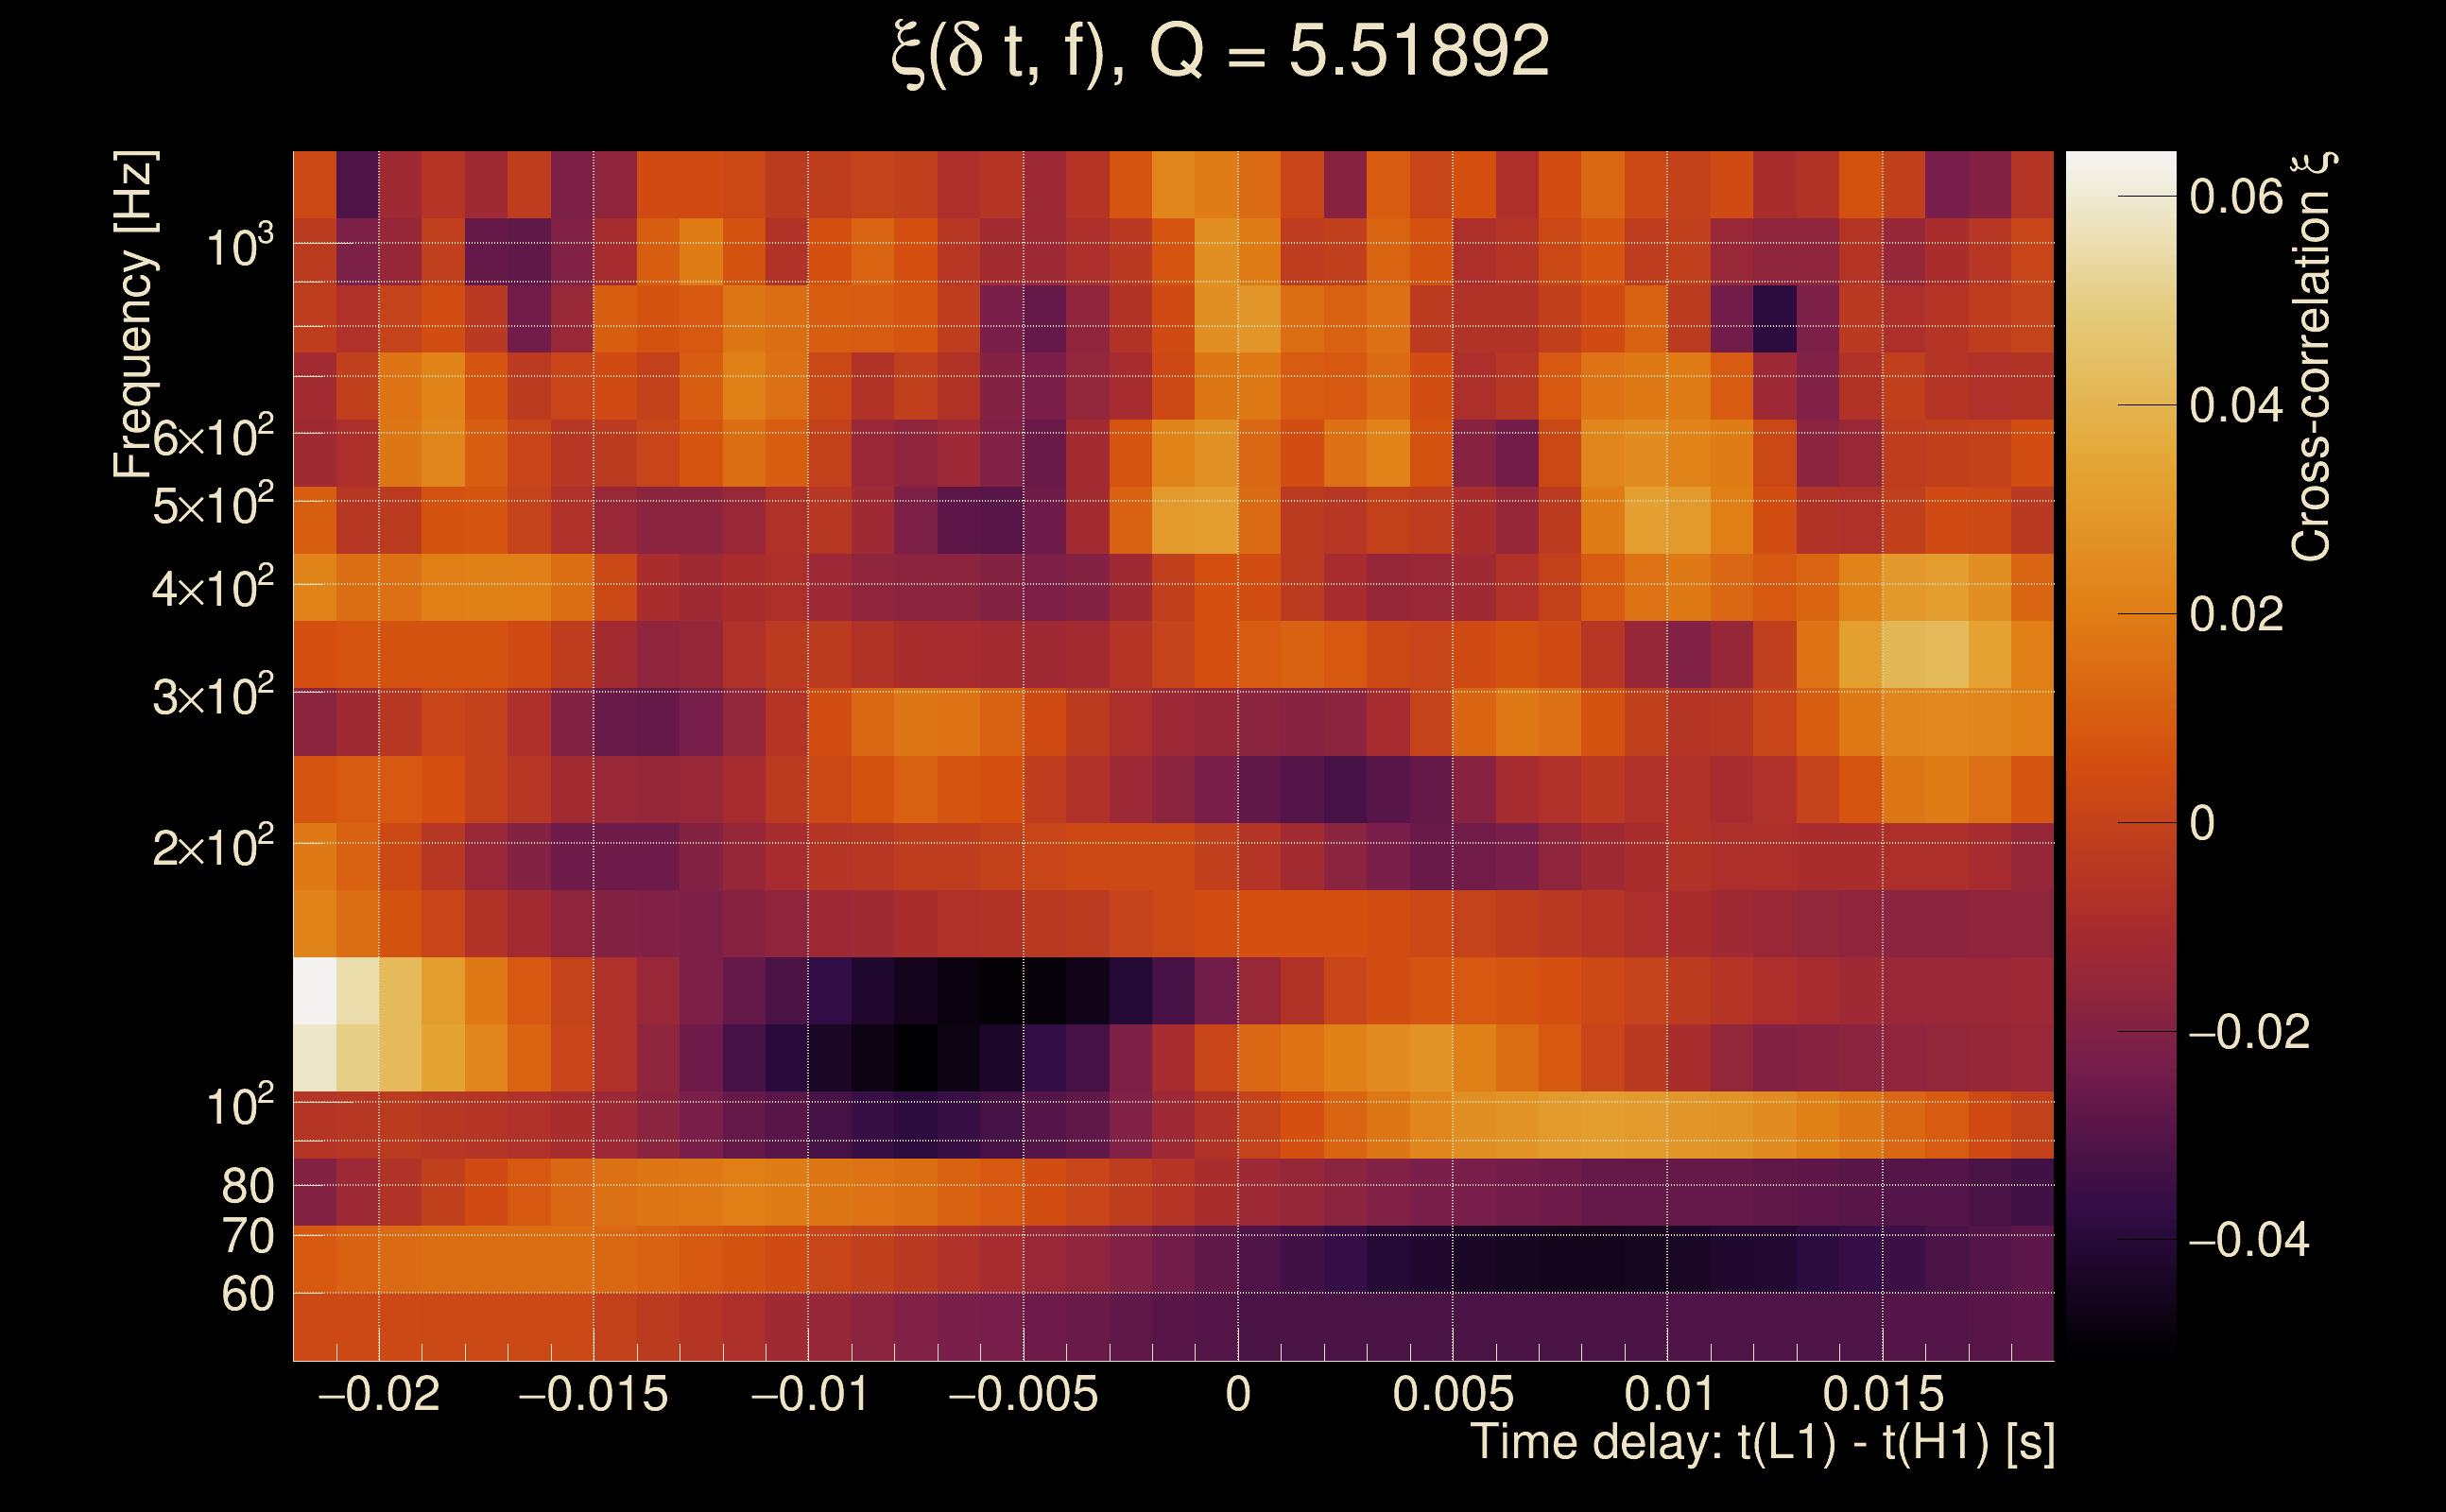
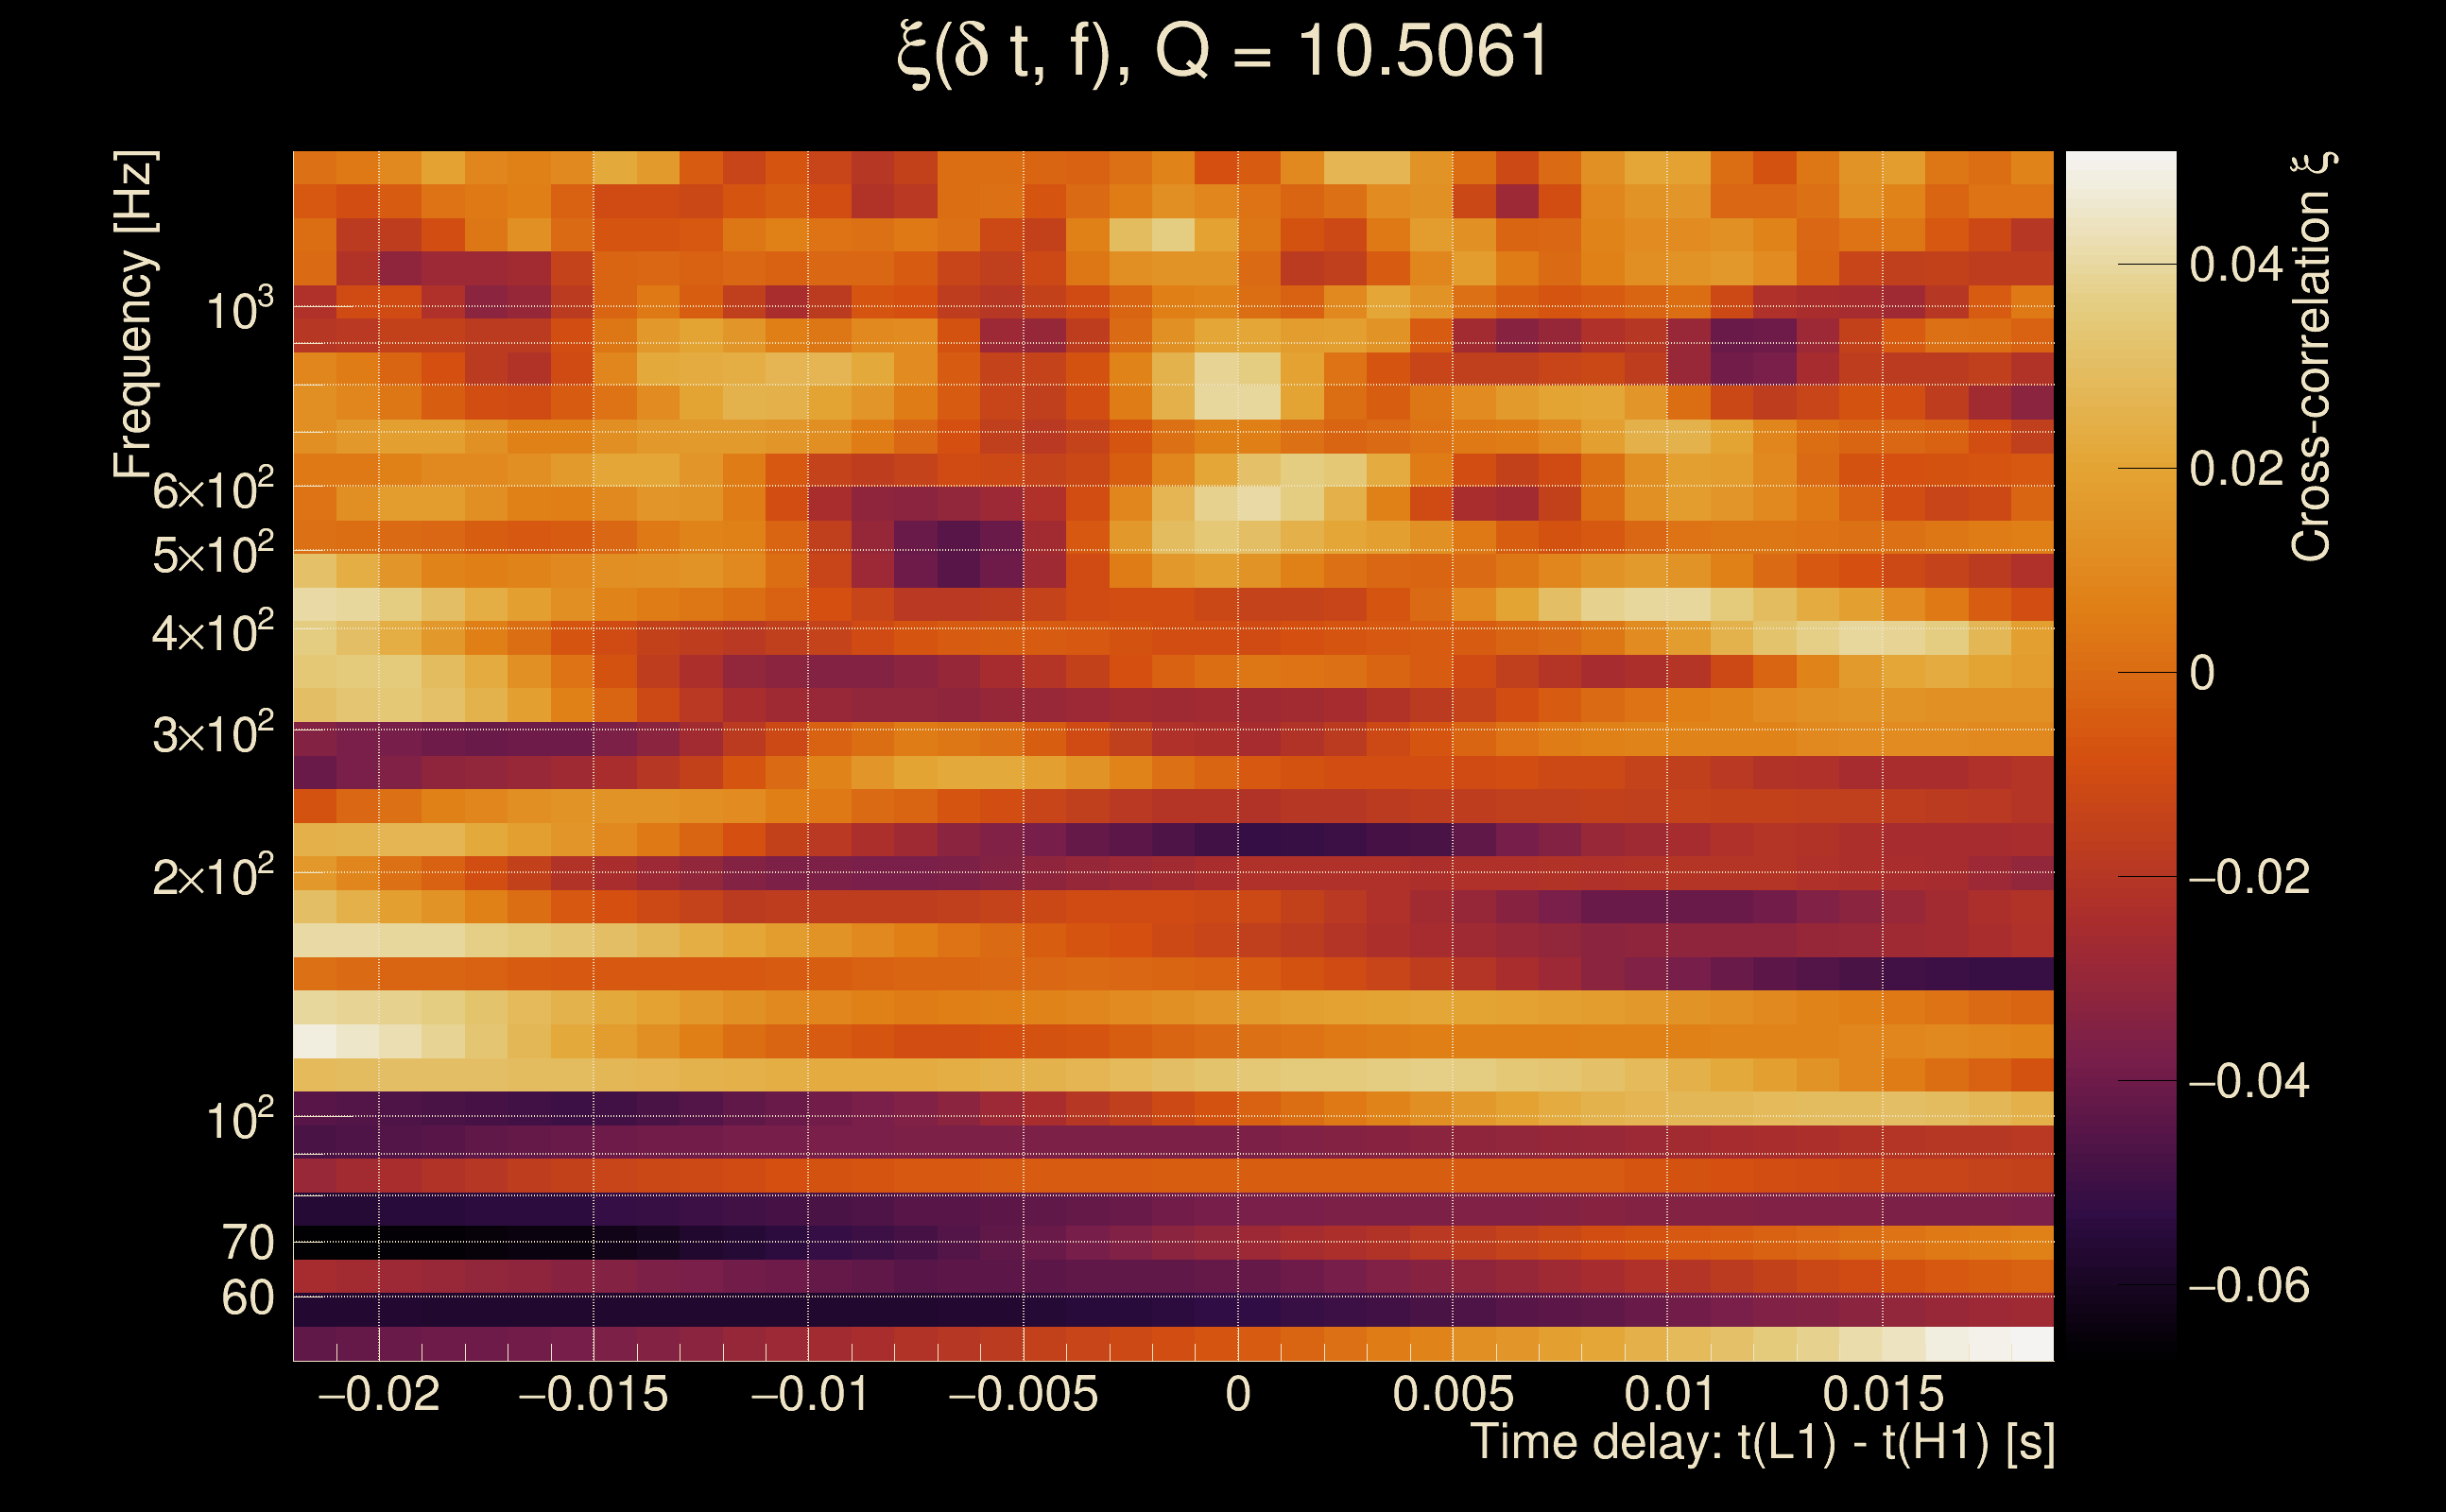
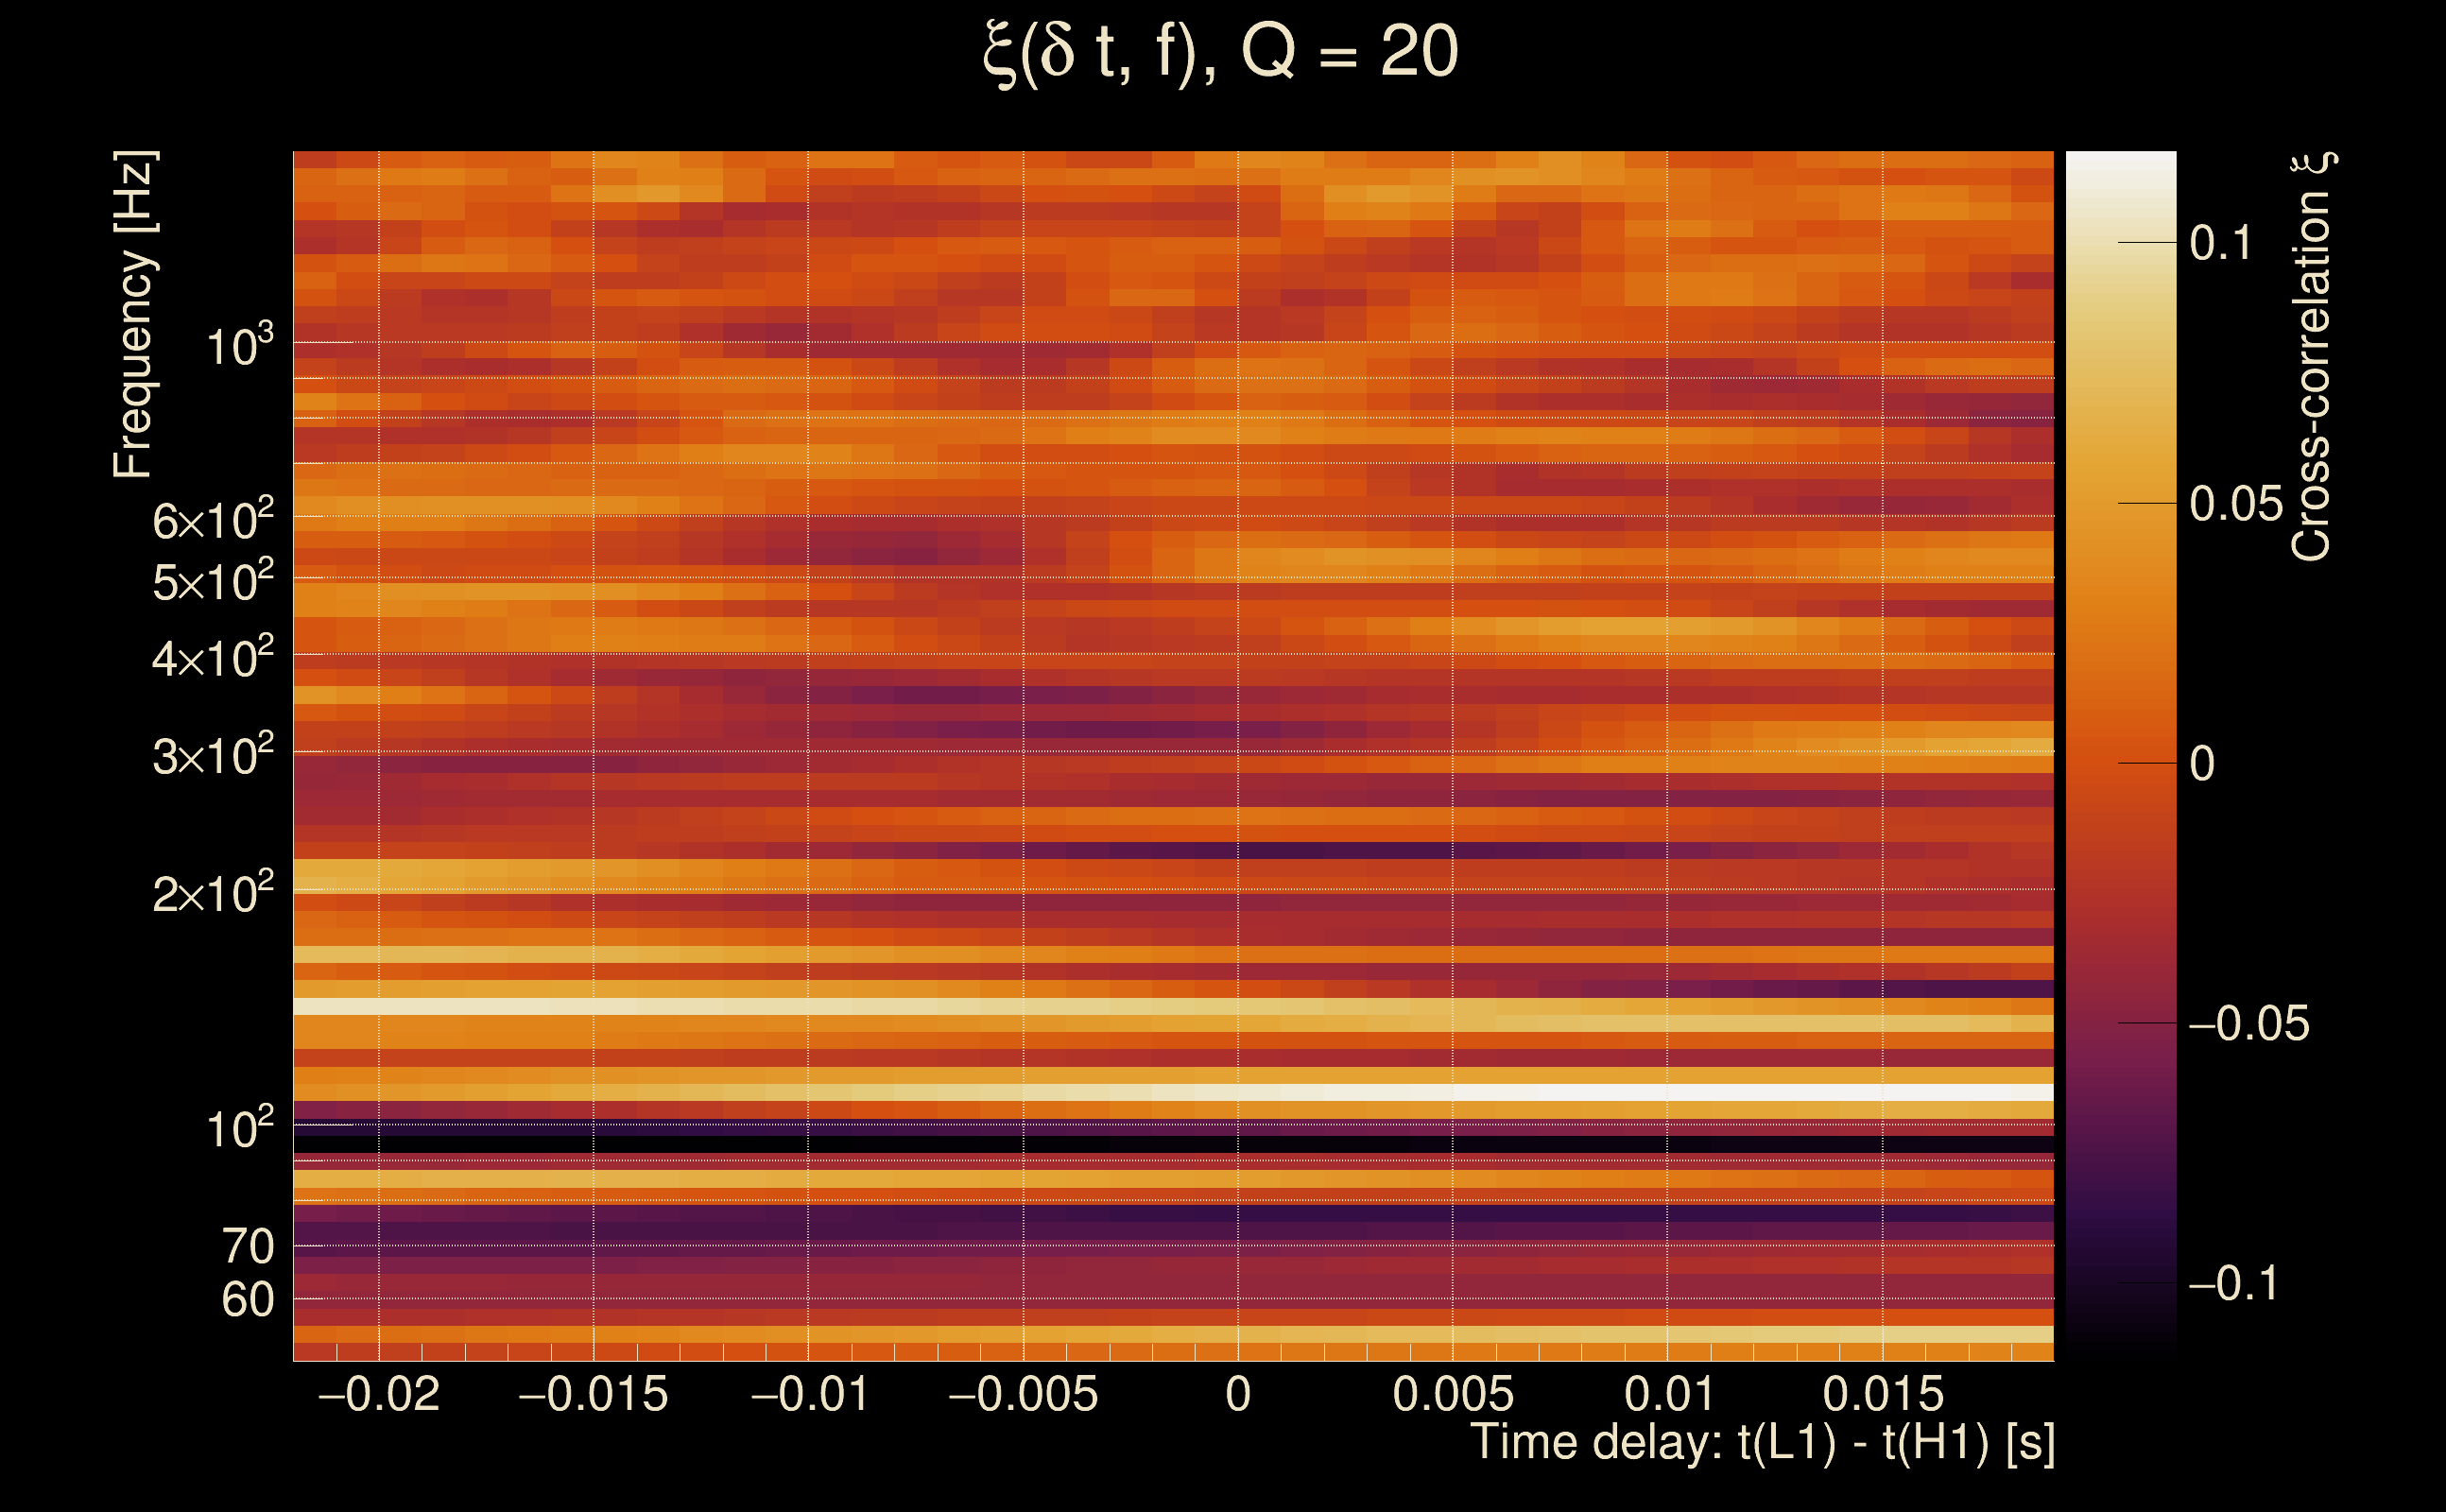
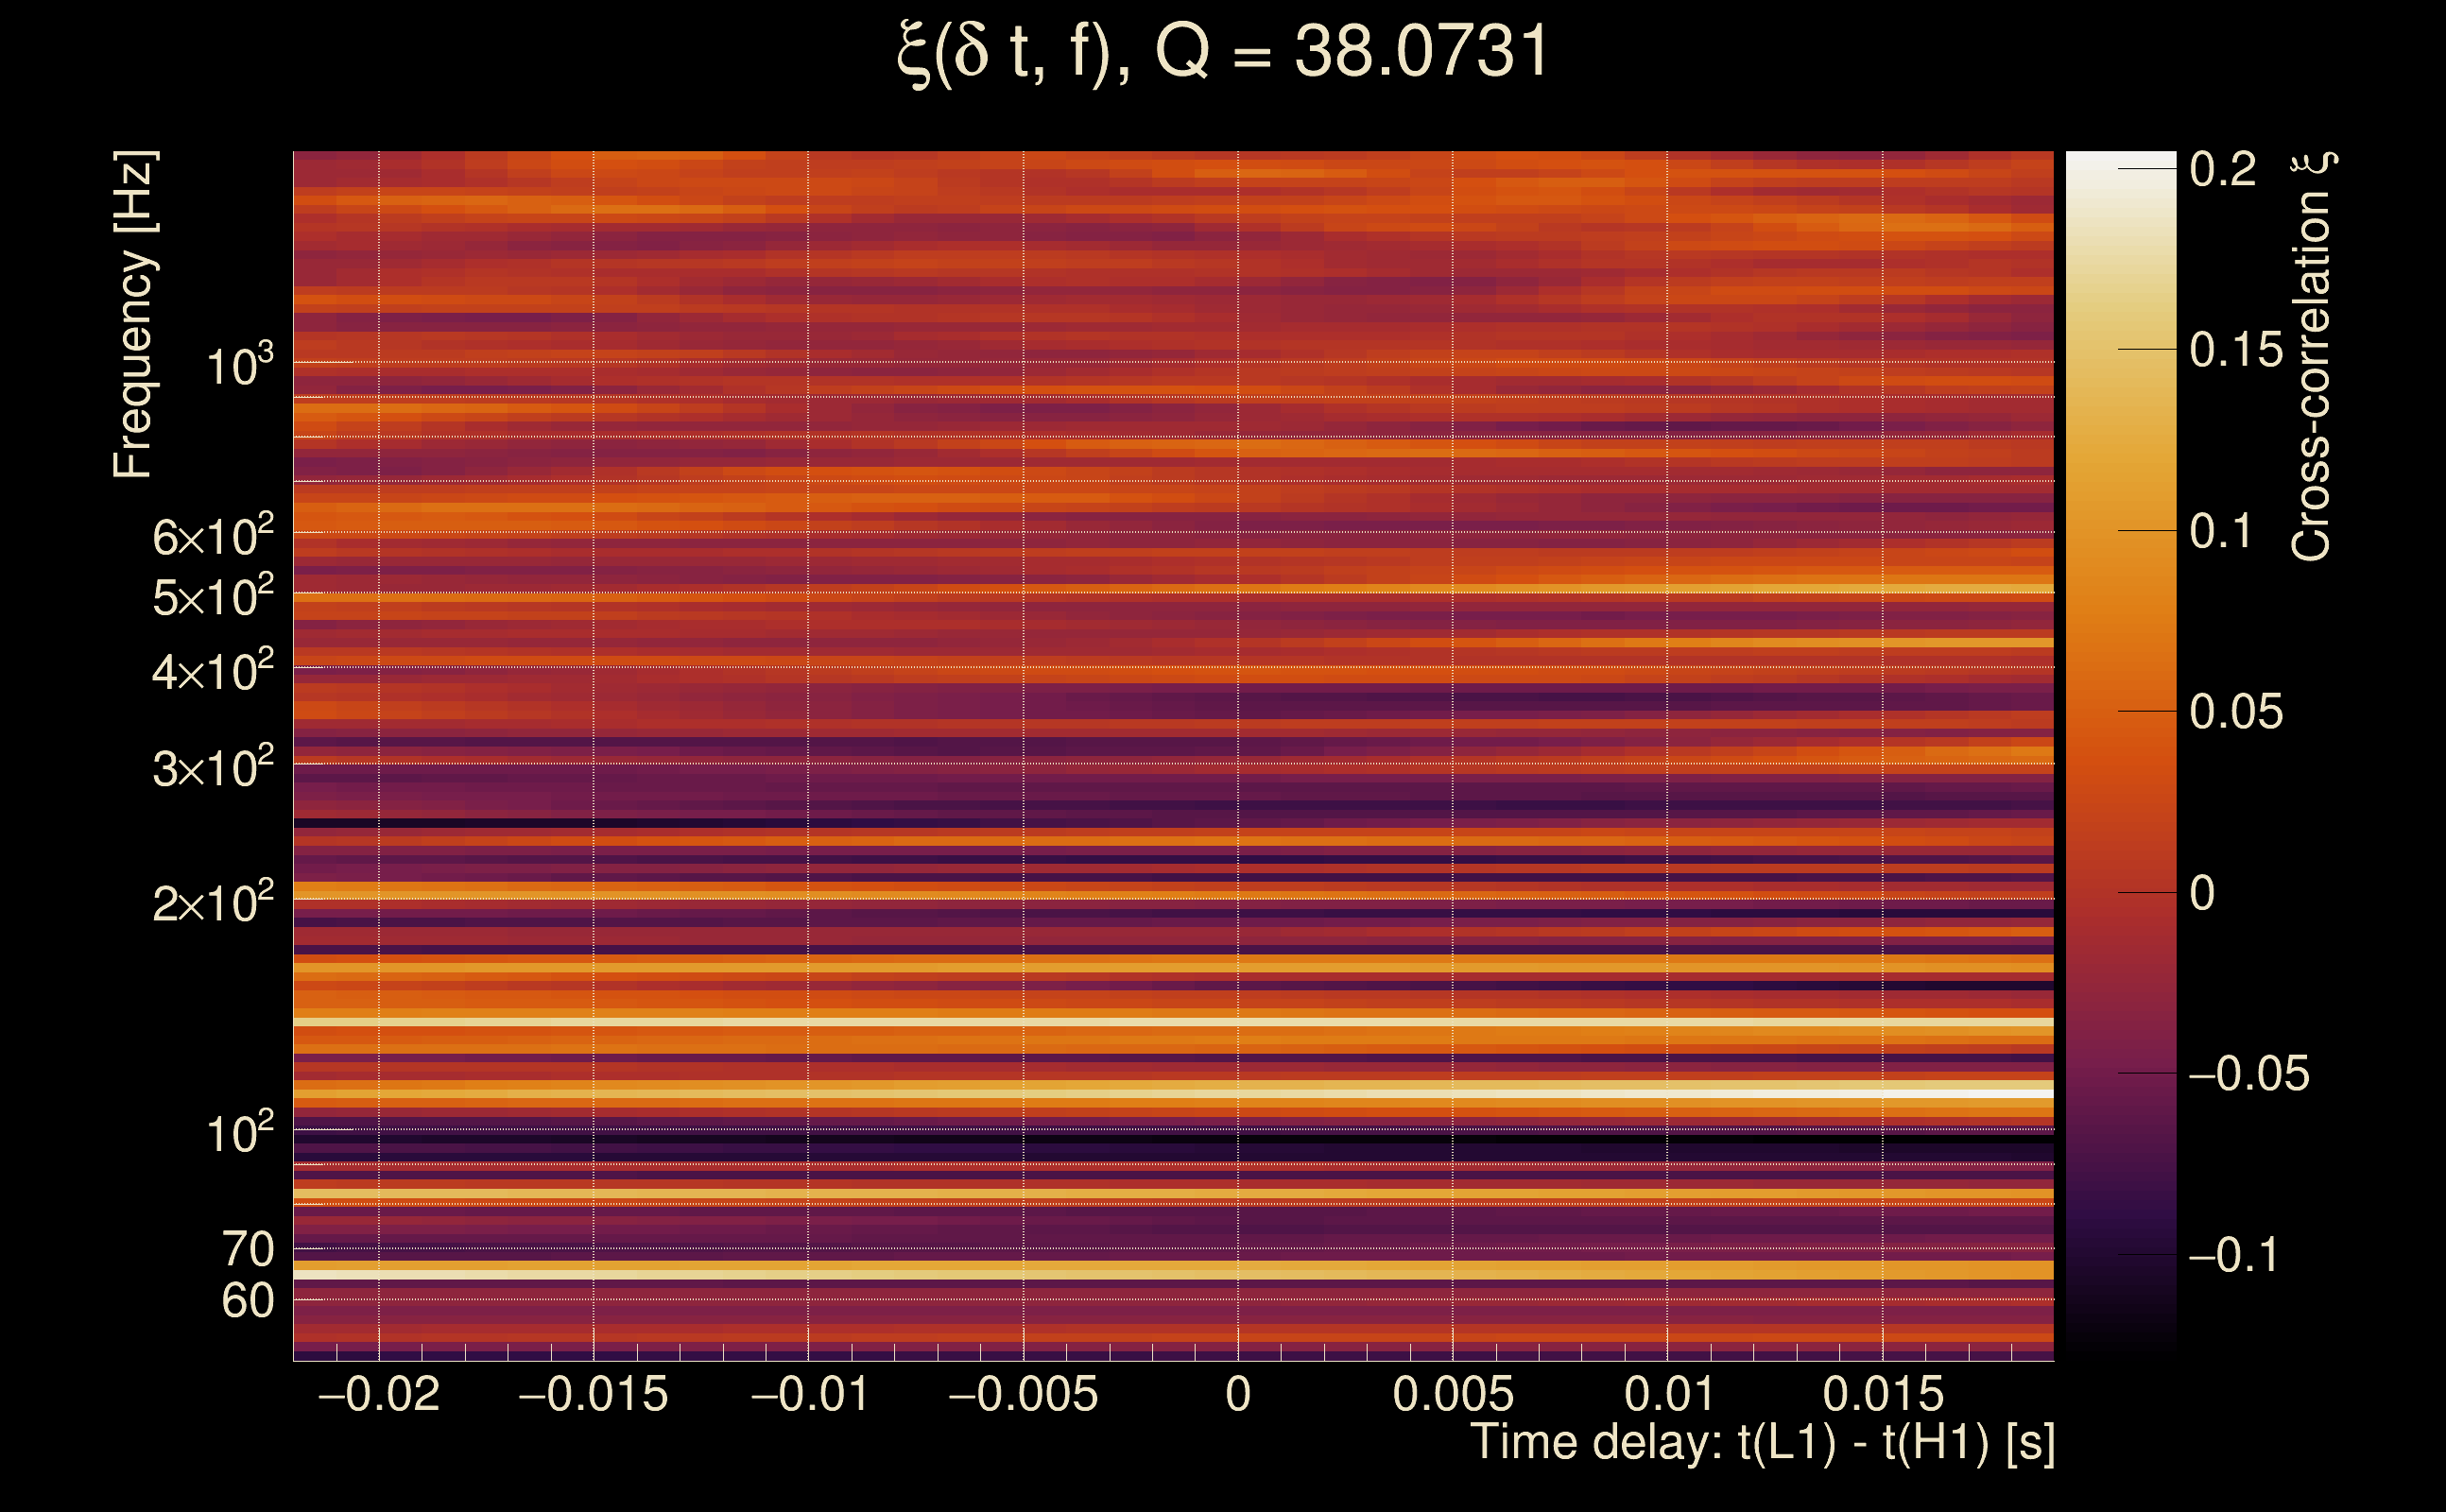
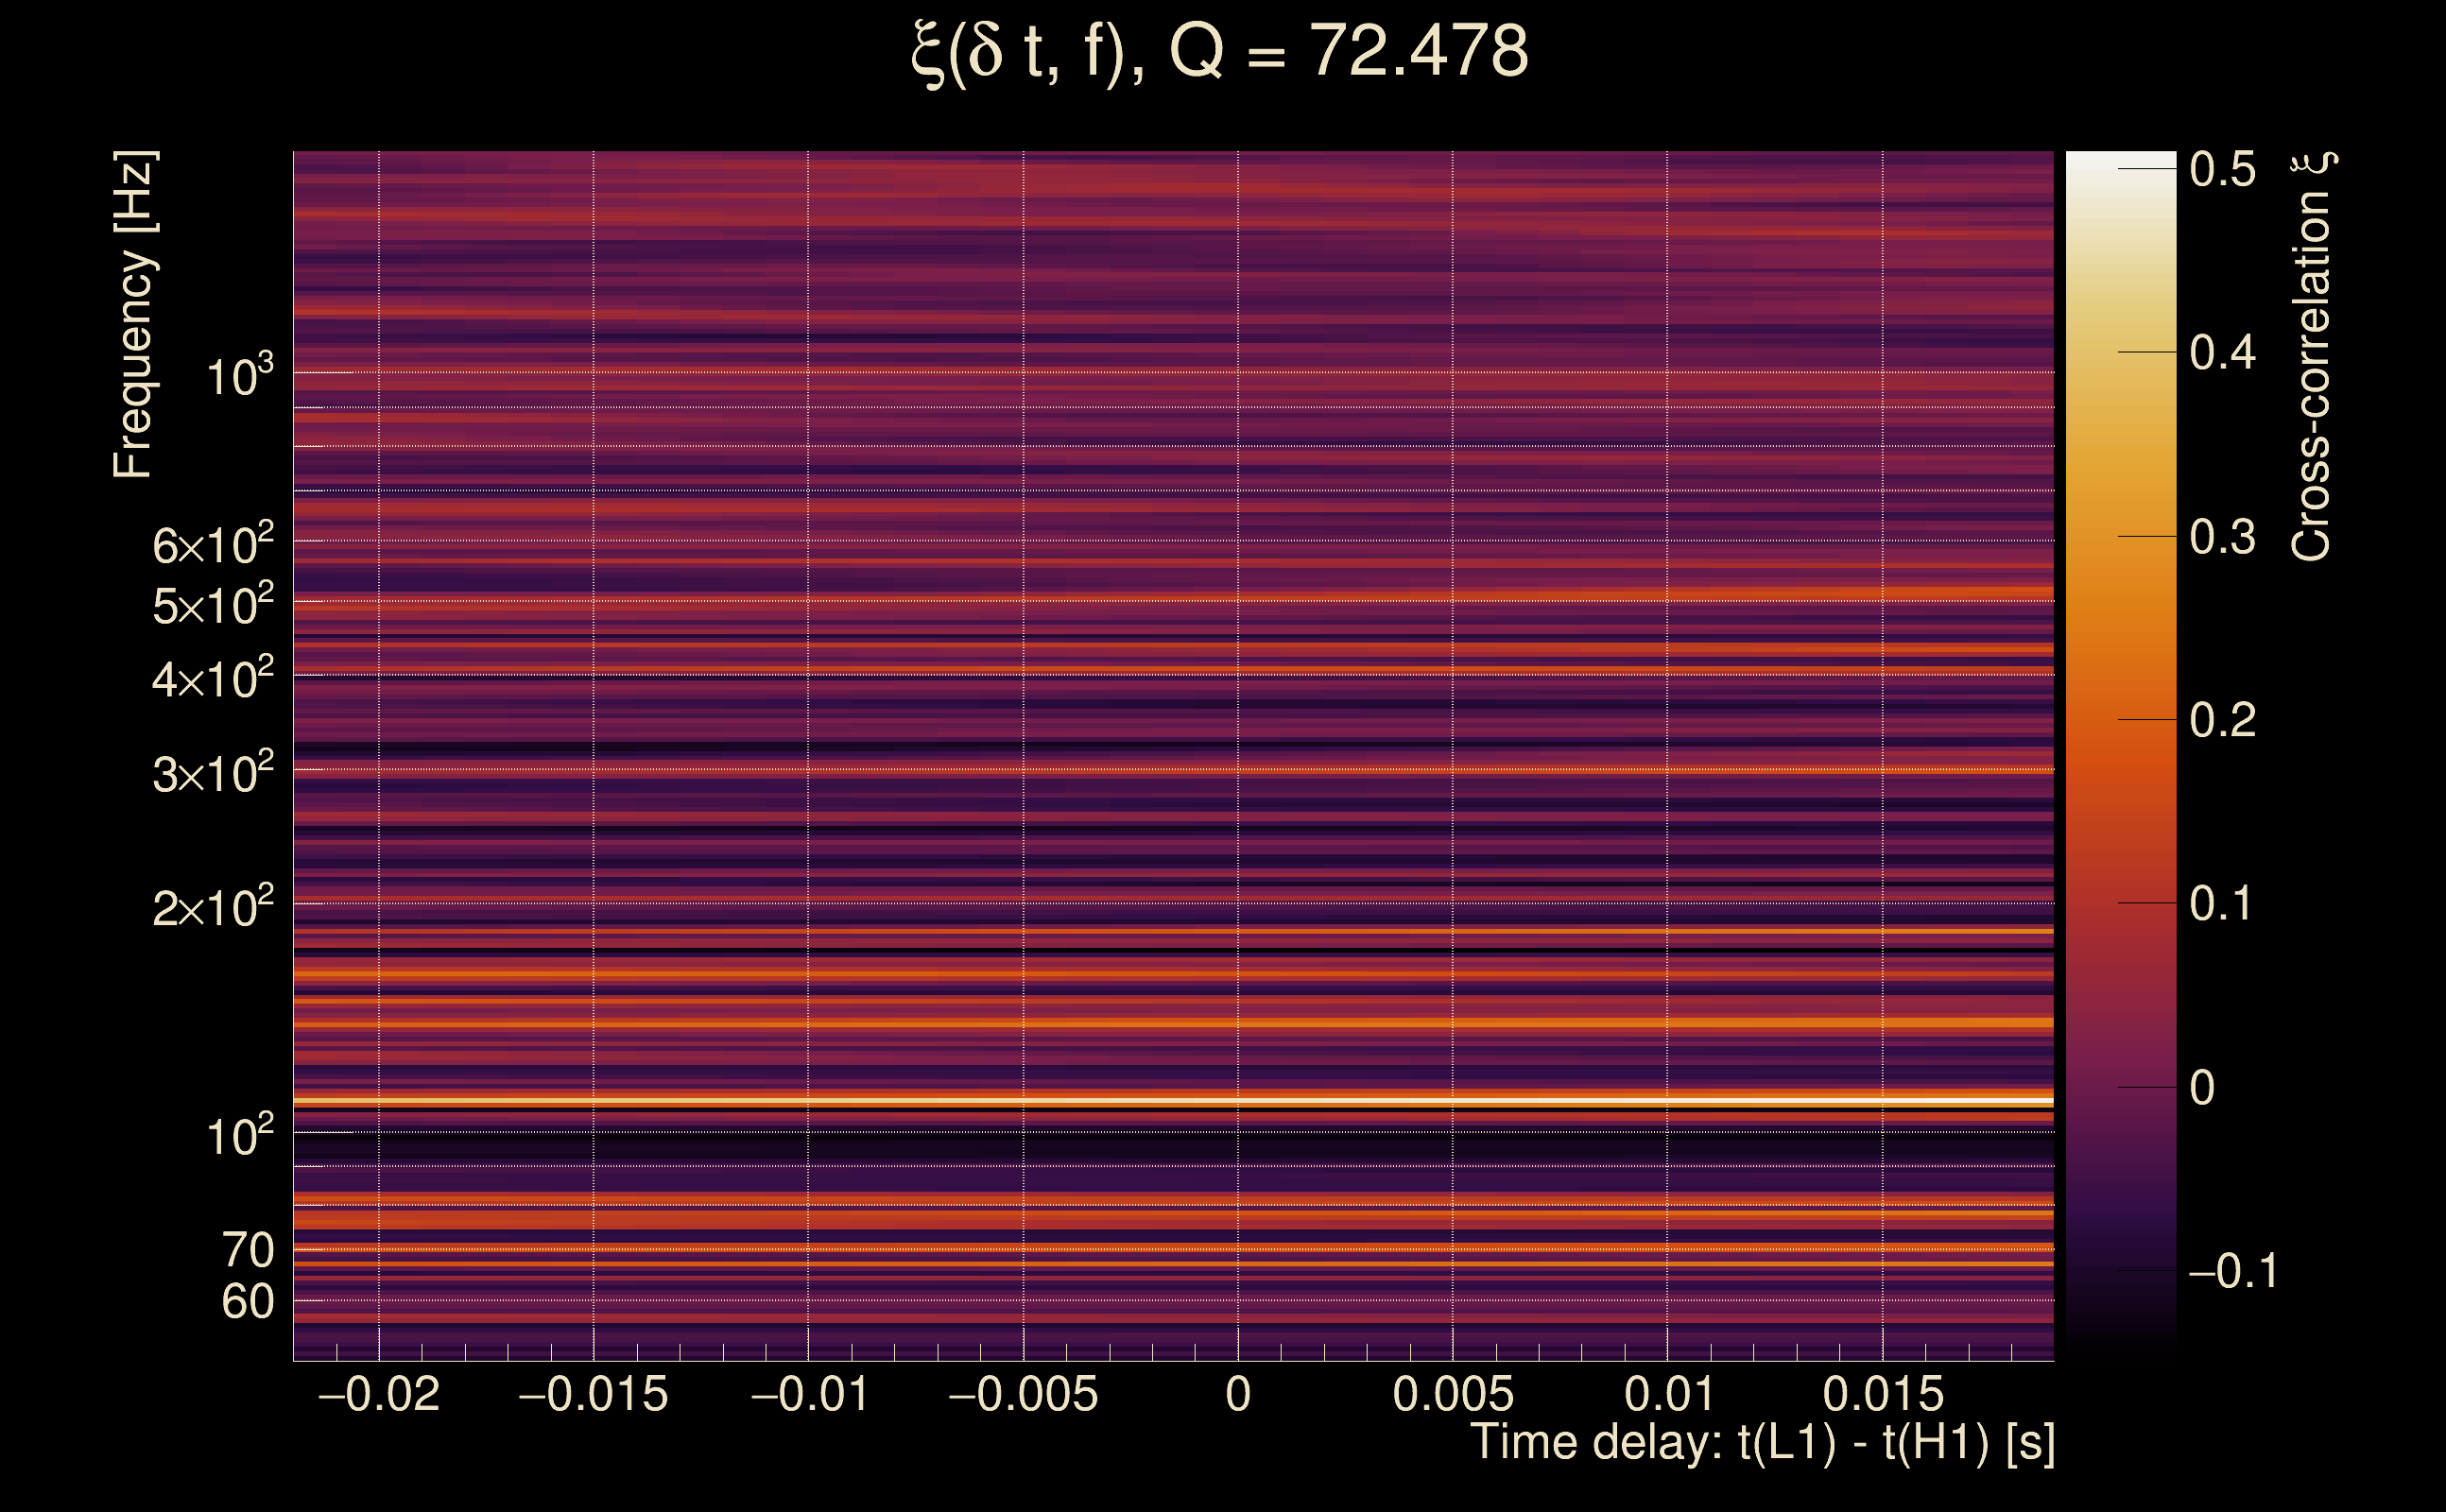
| Number of Q planes: | 5 (Q = 5.51892 → Q = 72.478) |
| Omicron frequency range: | 50 Hz → 1958.38 Hz |
| Light travel time between detectors: | 0.0100128 s |
| Slice extra-time (calibration uncertainty + slice veto): | 0.0129872 s |
| Number of time-delay bins in a cross-correlation map: | 10000 |
| Number of slices in a cross-correlation map: | 217 |
| Number of time-delay bins in a slice: | 46 |
| SNR gating: | < 1000 (detector 0), < 1000 (detector 1) |
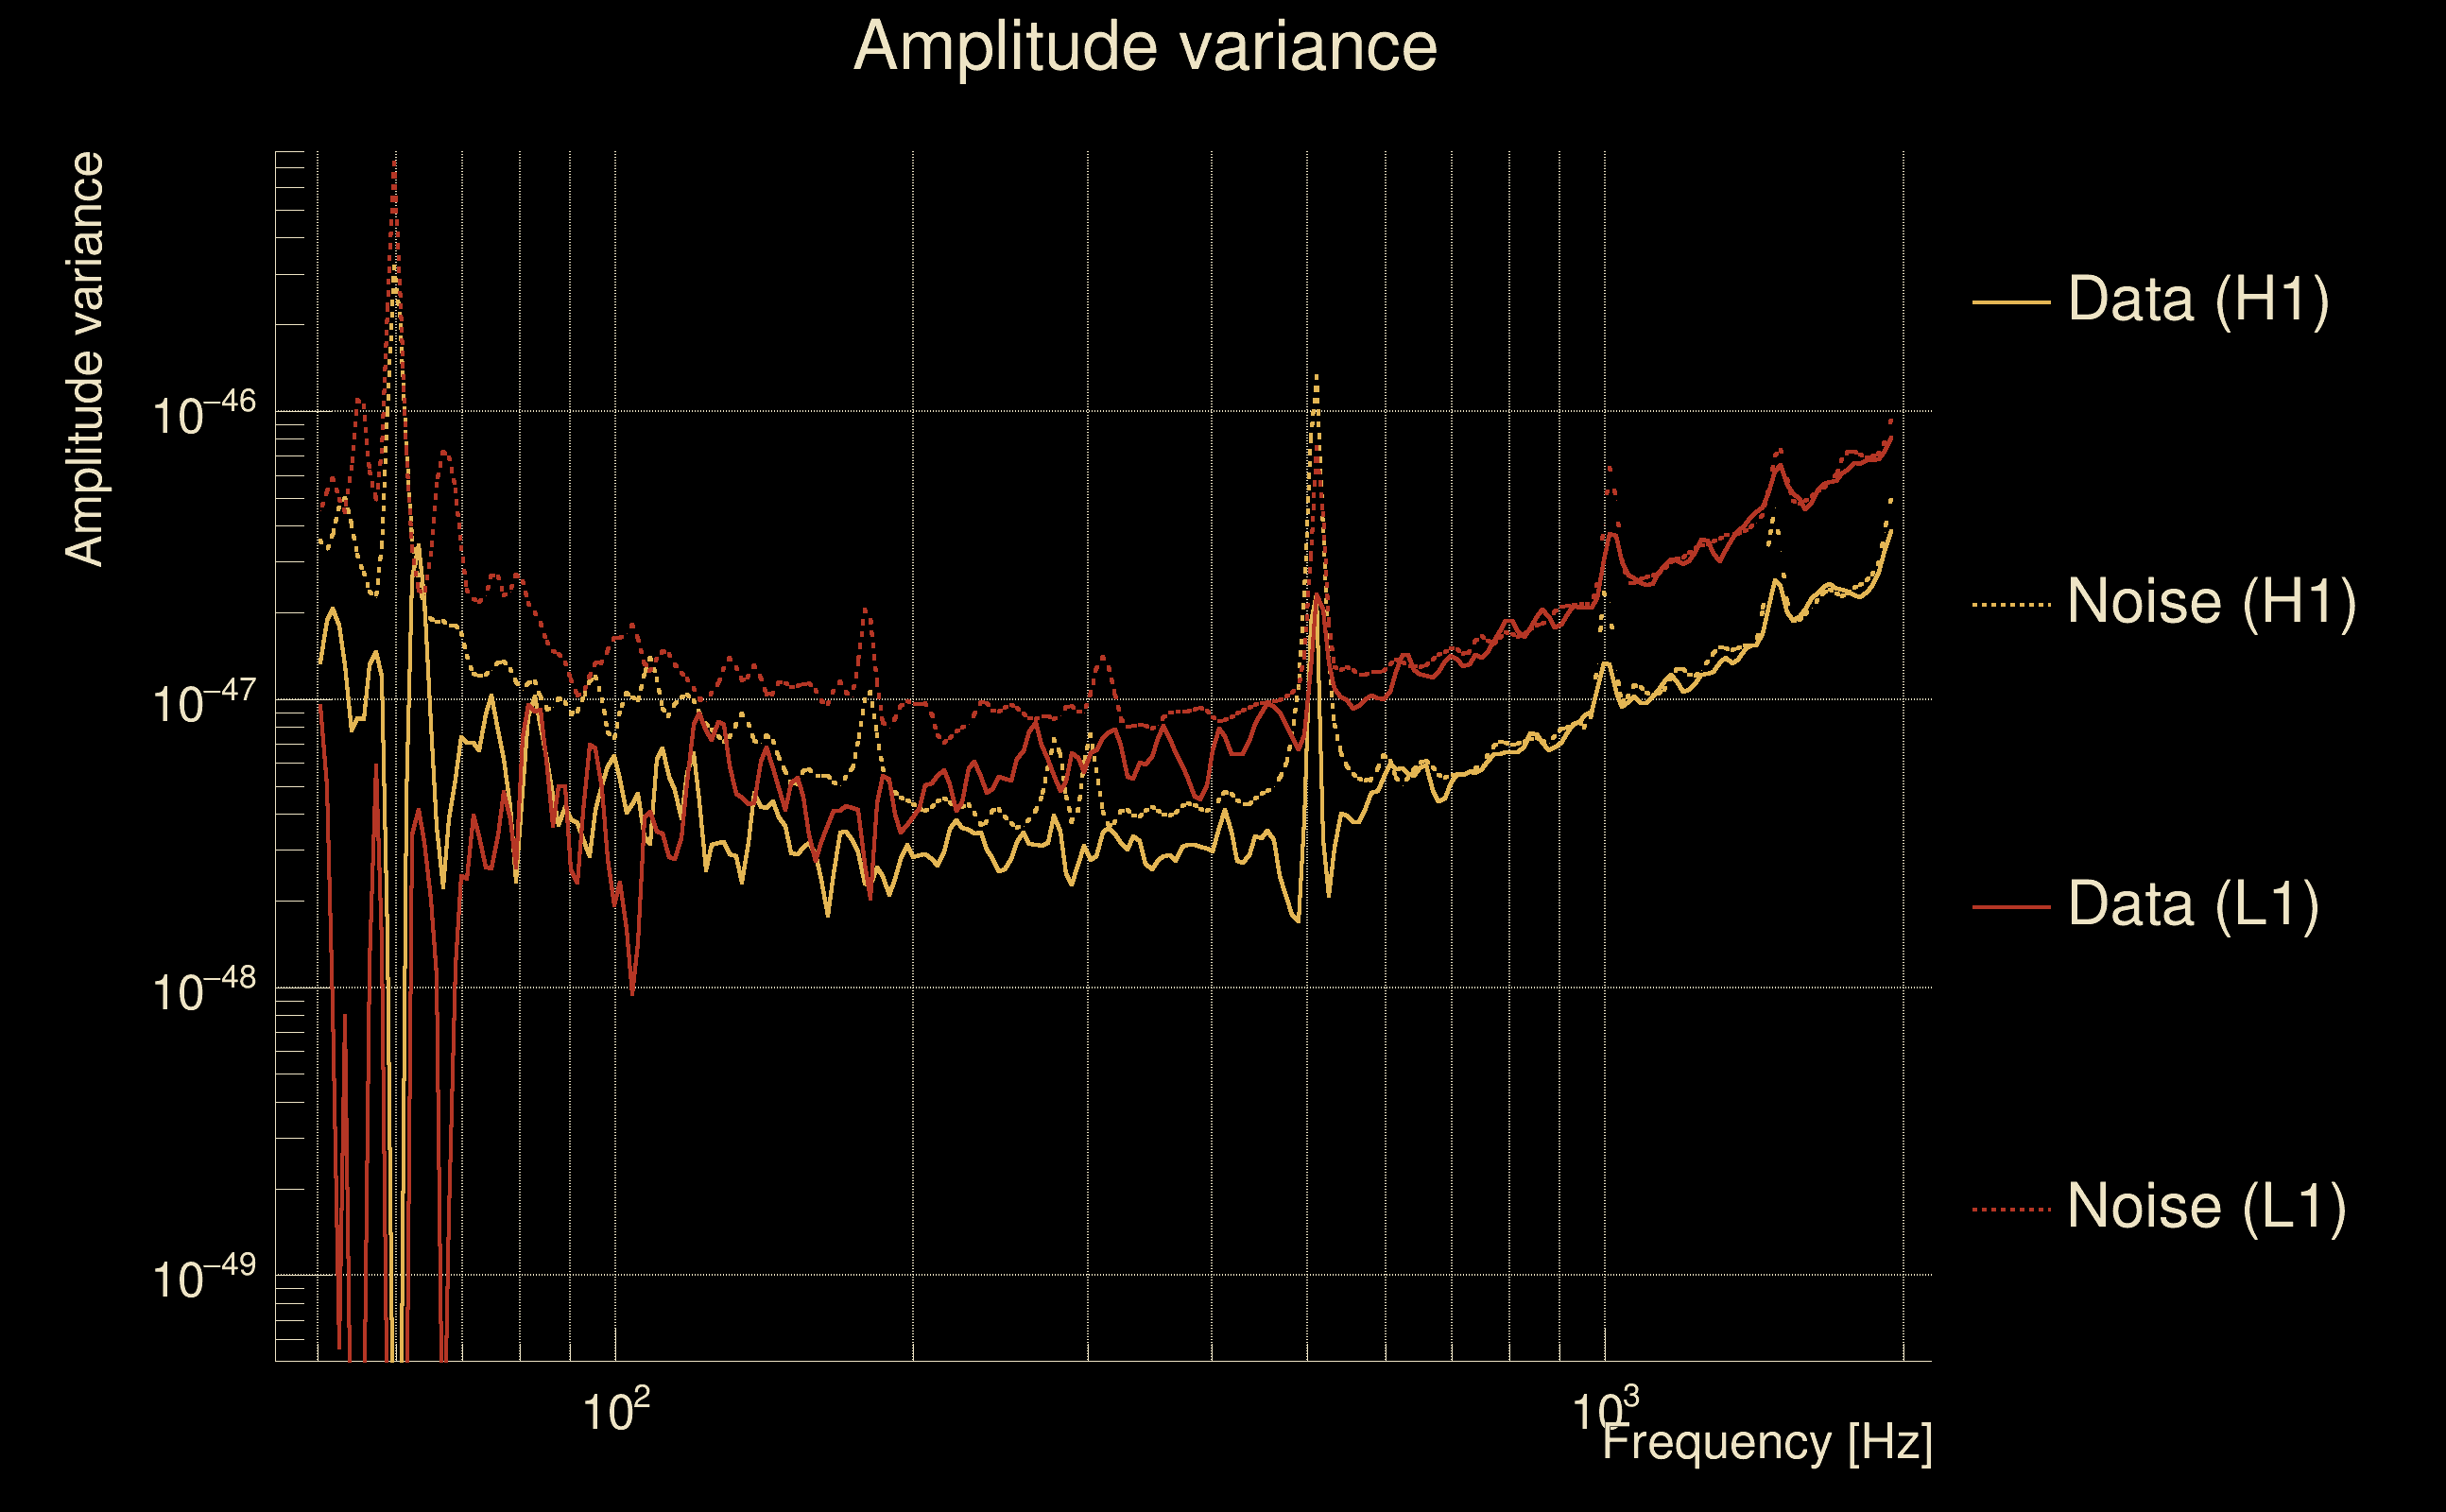
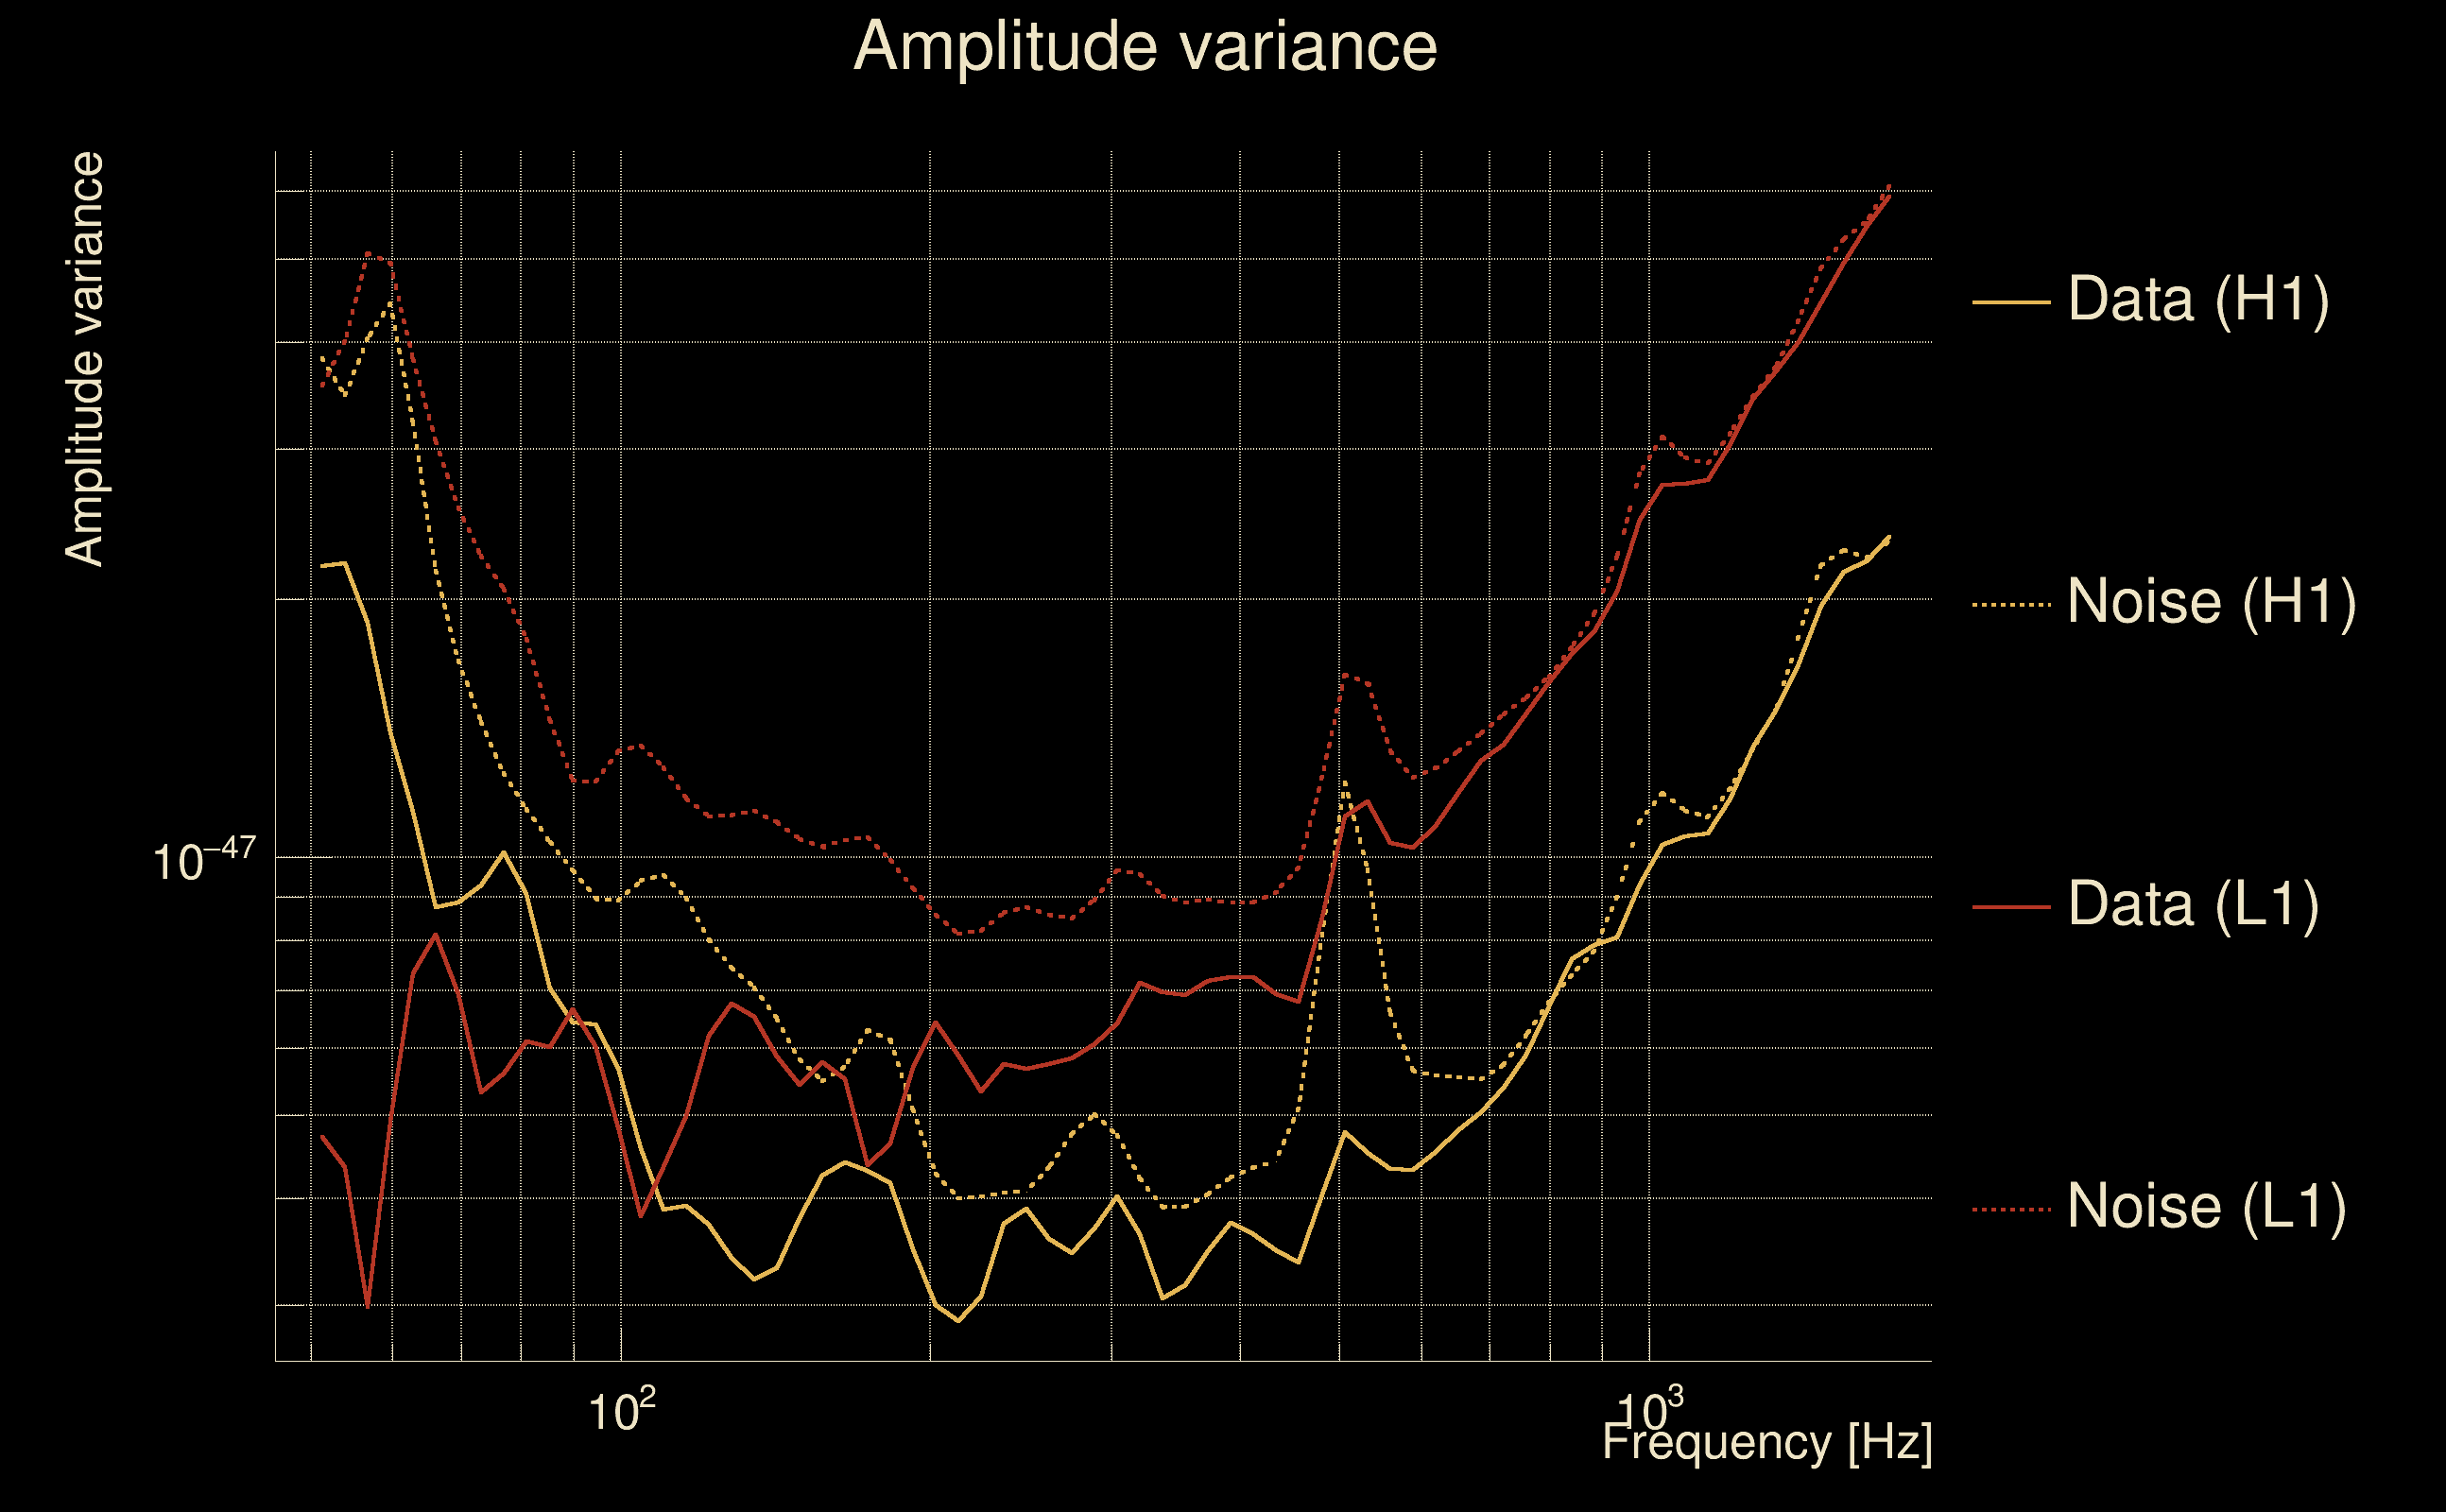
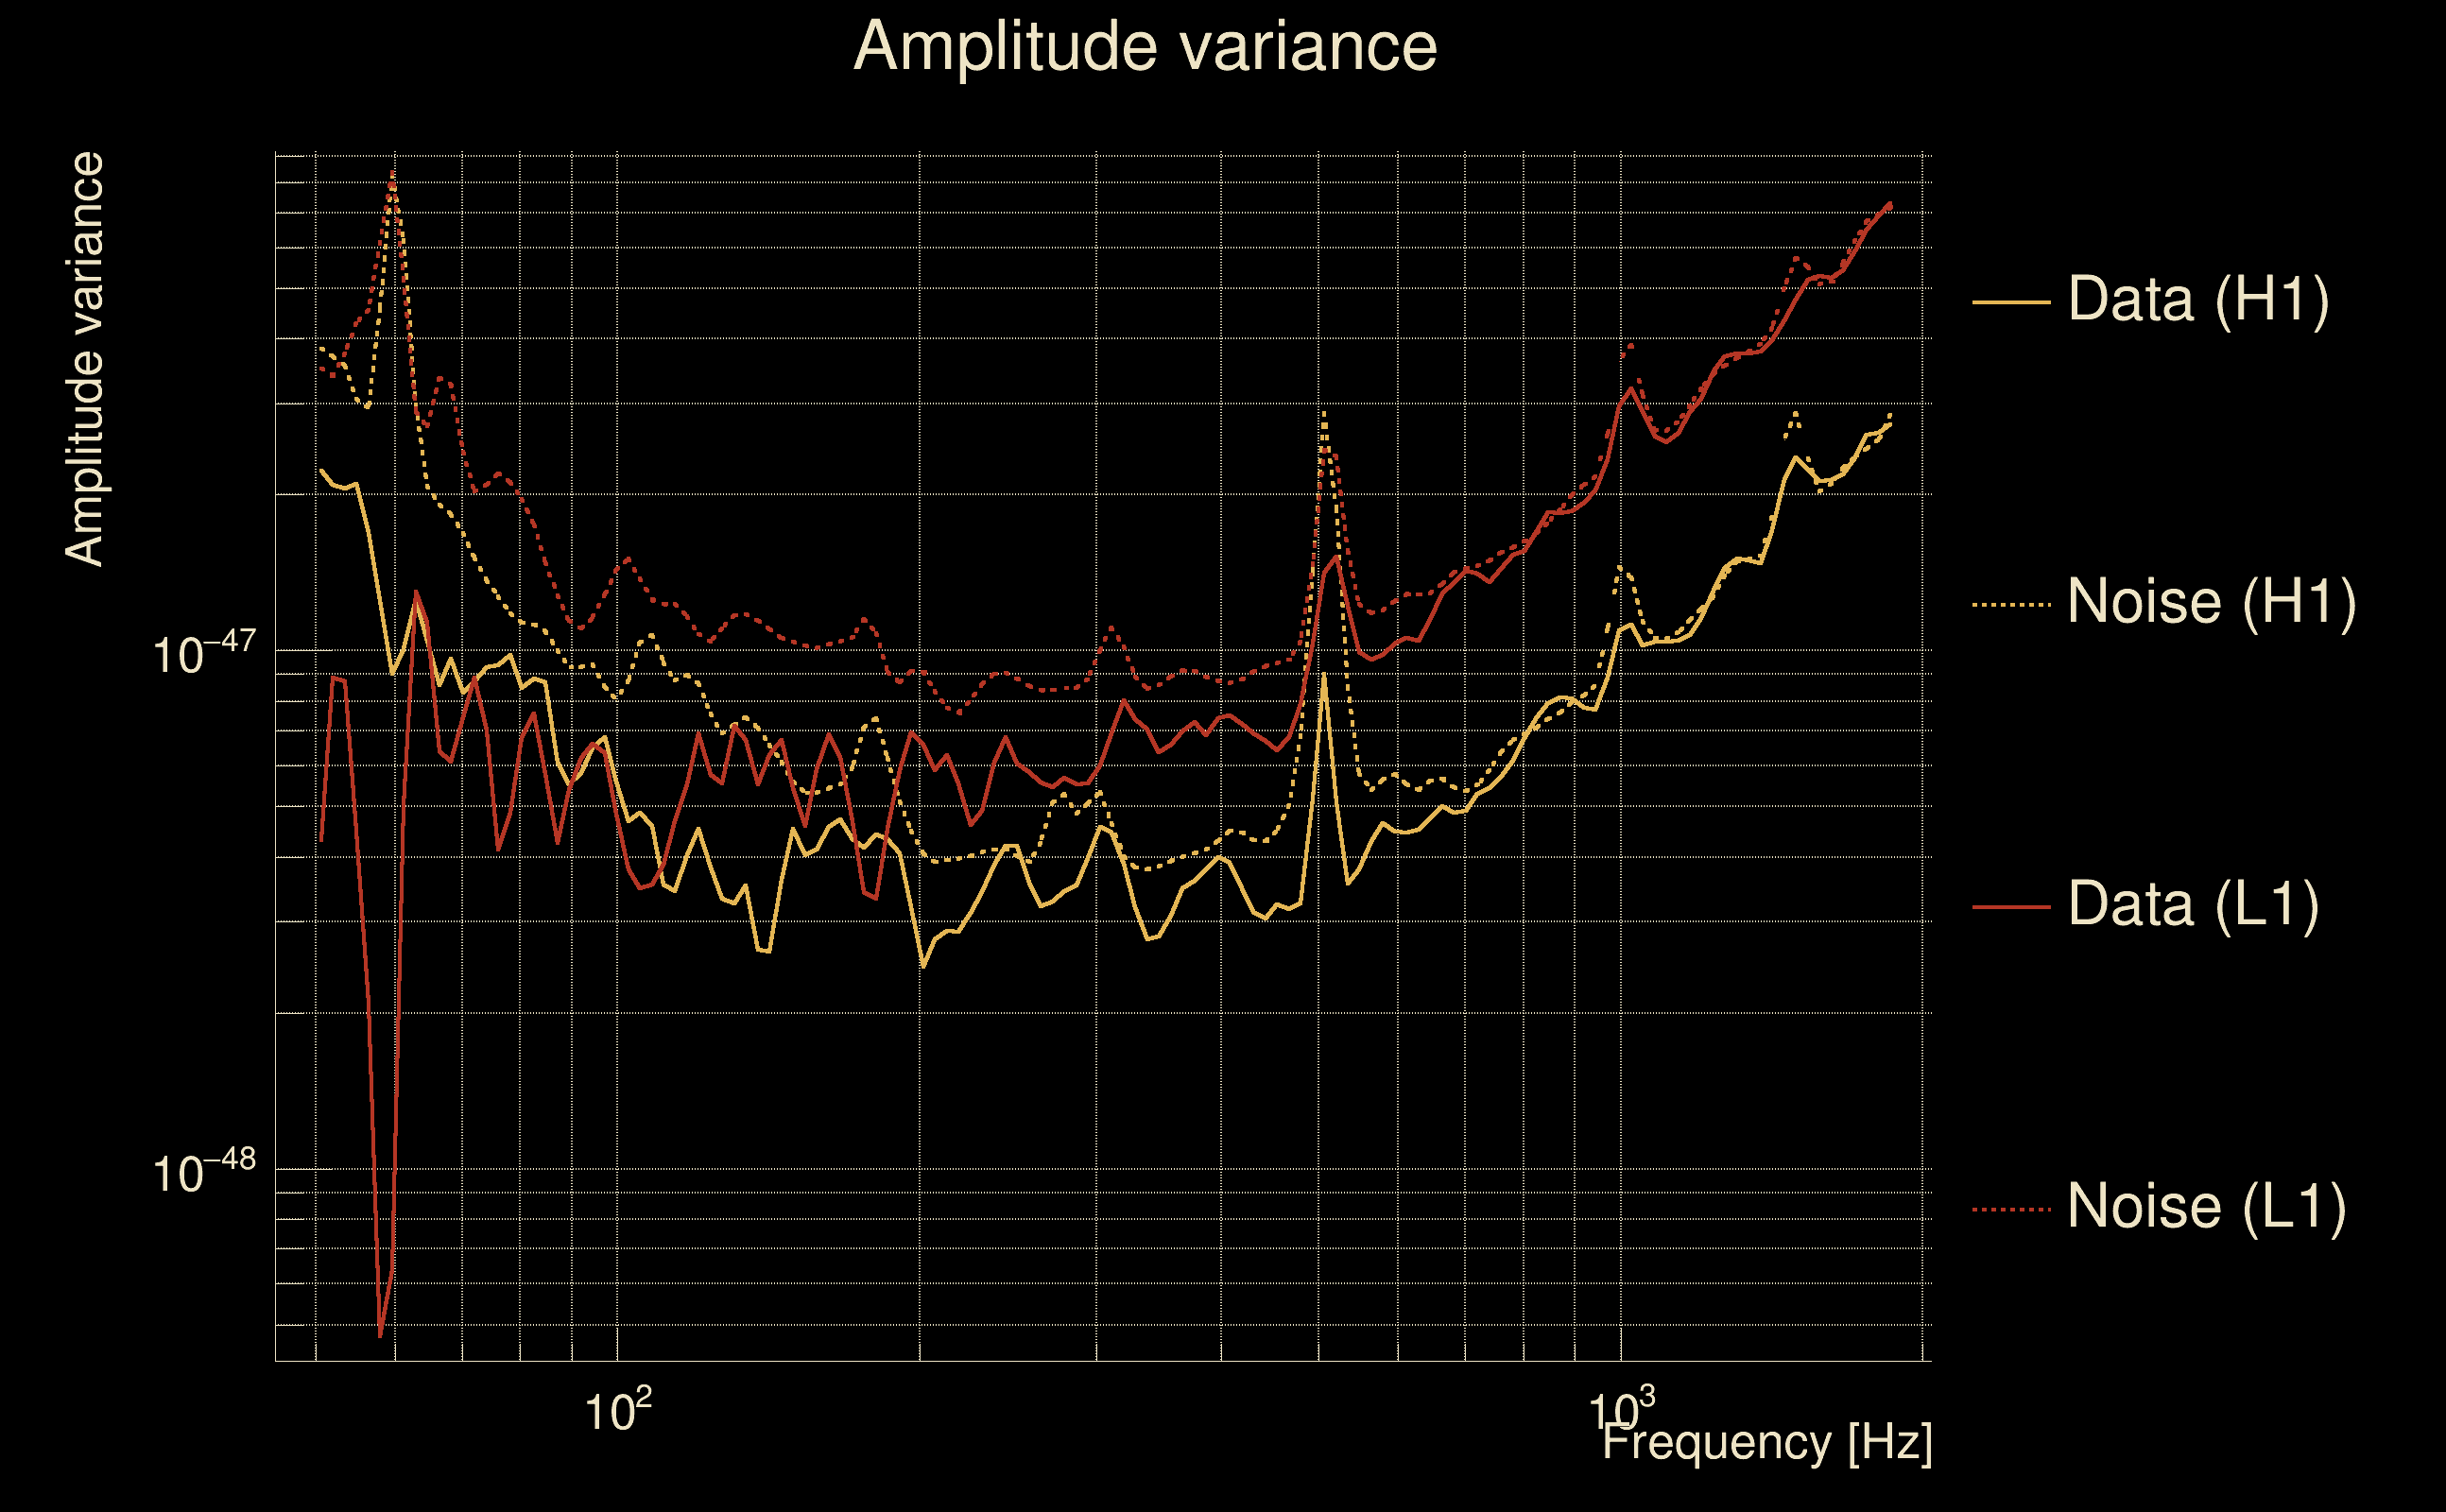
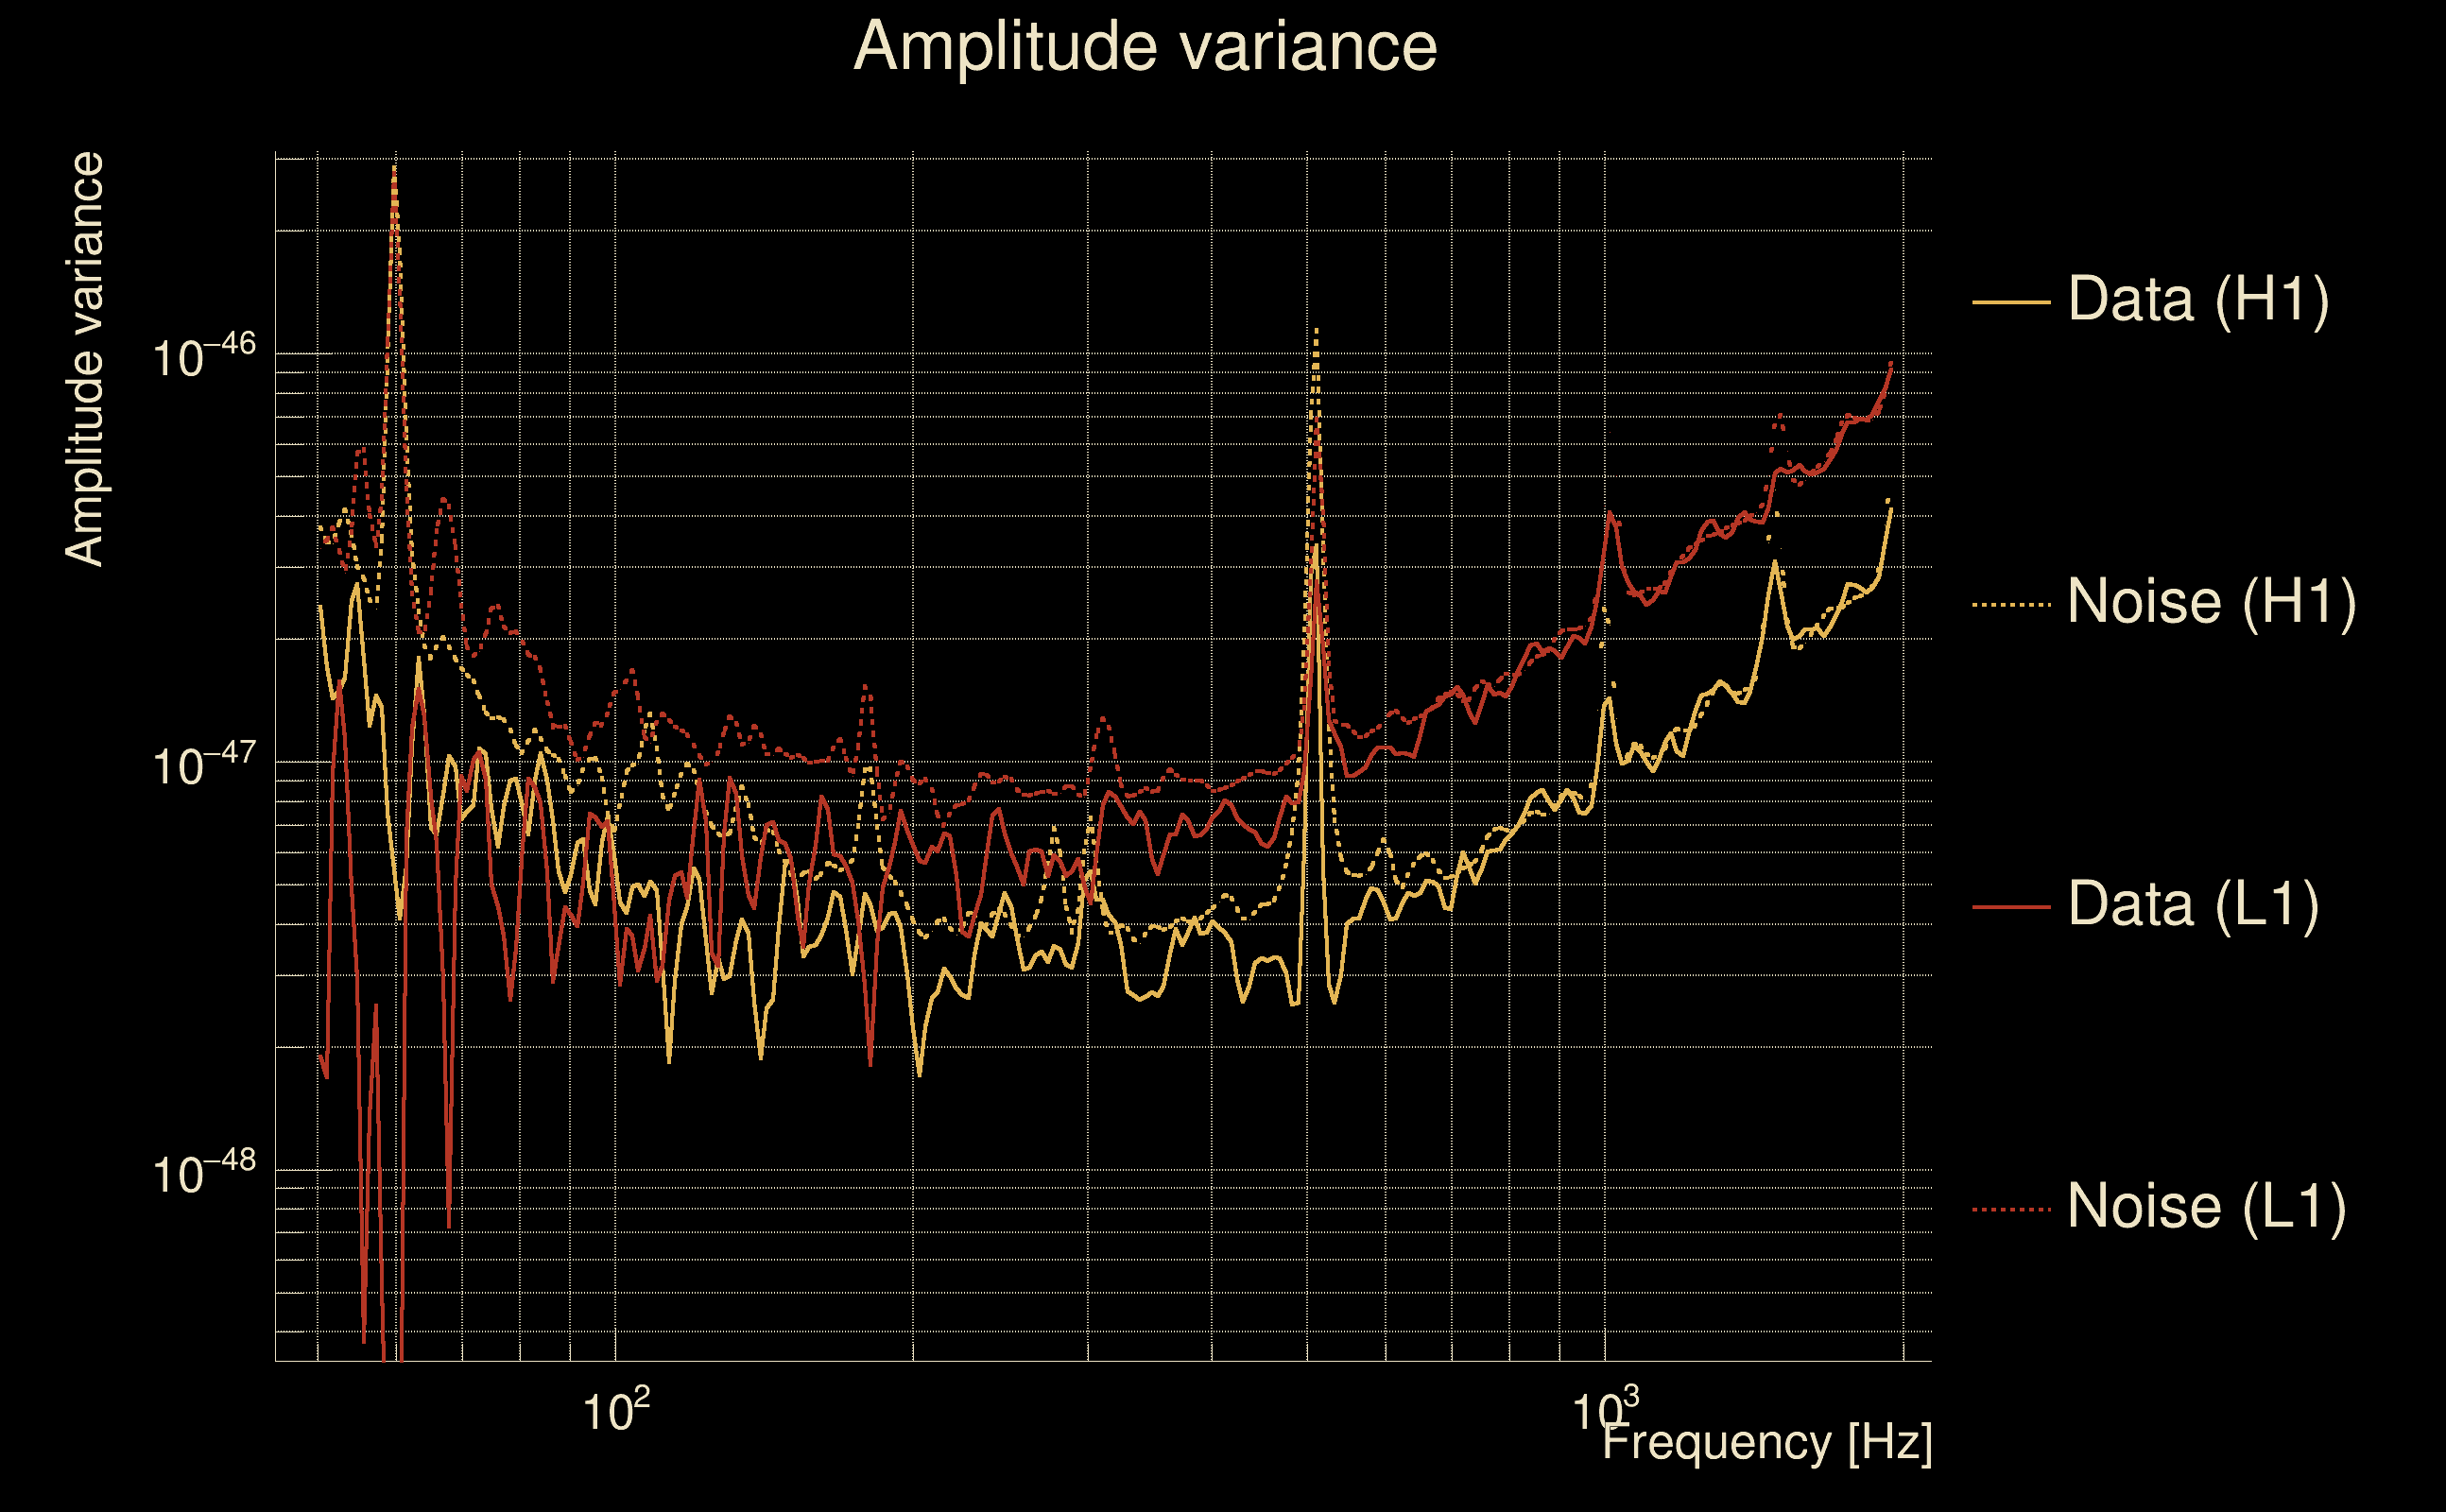
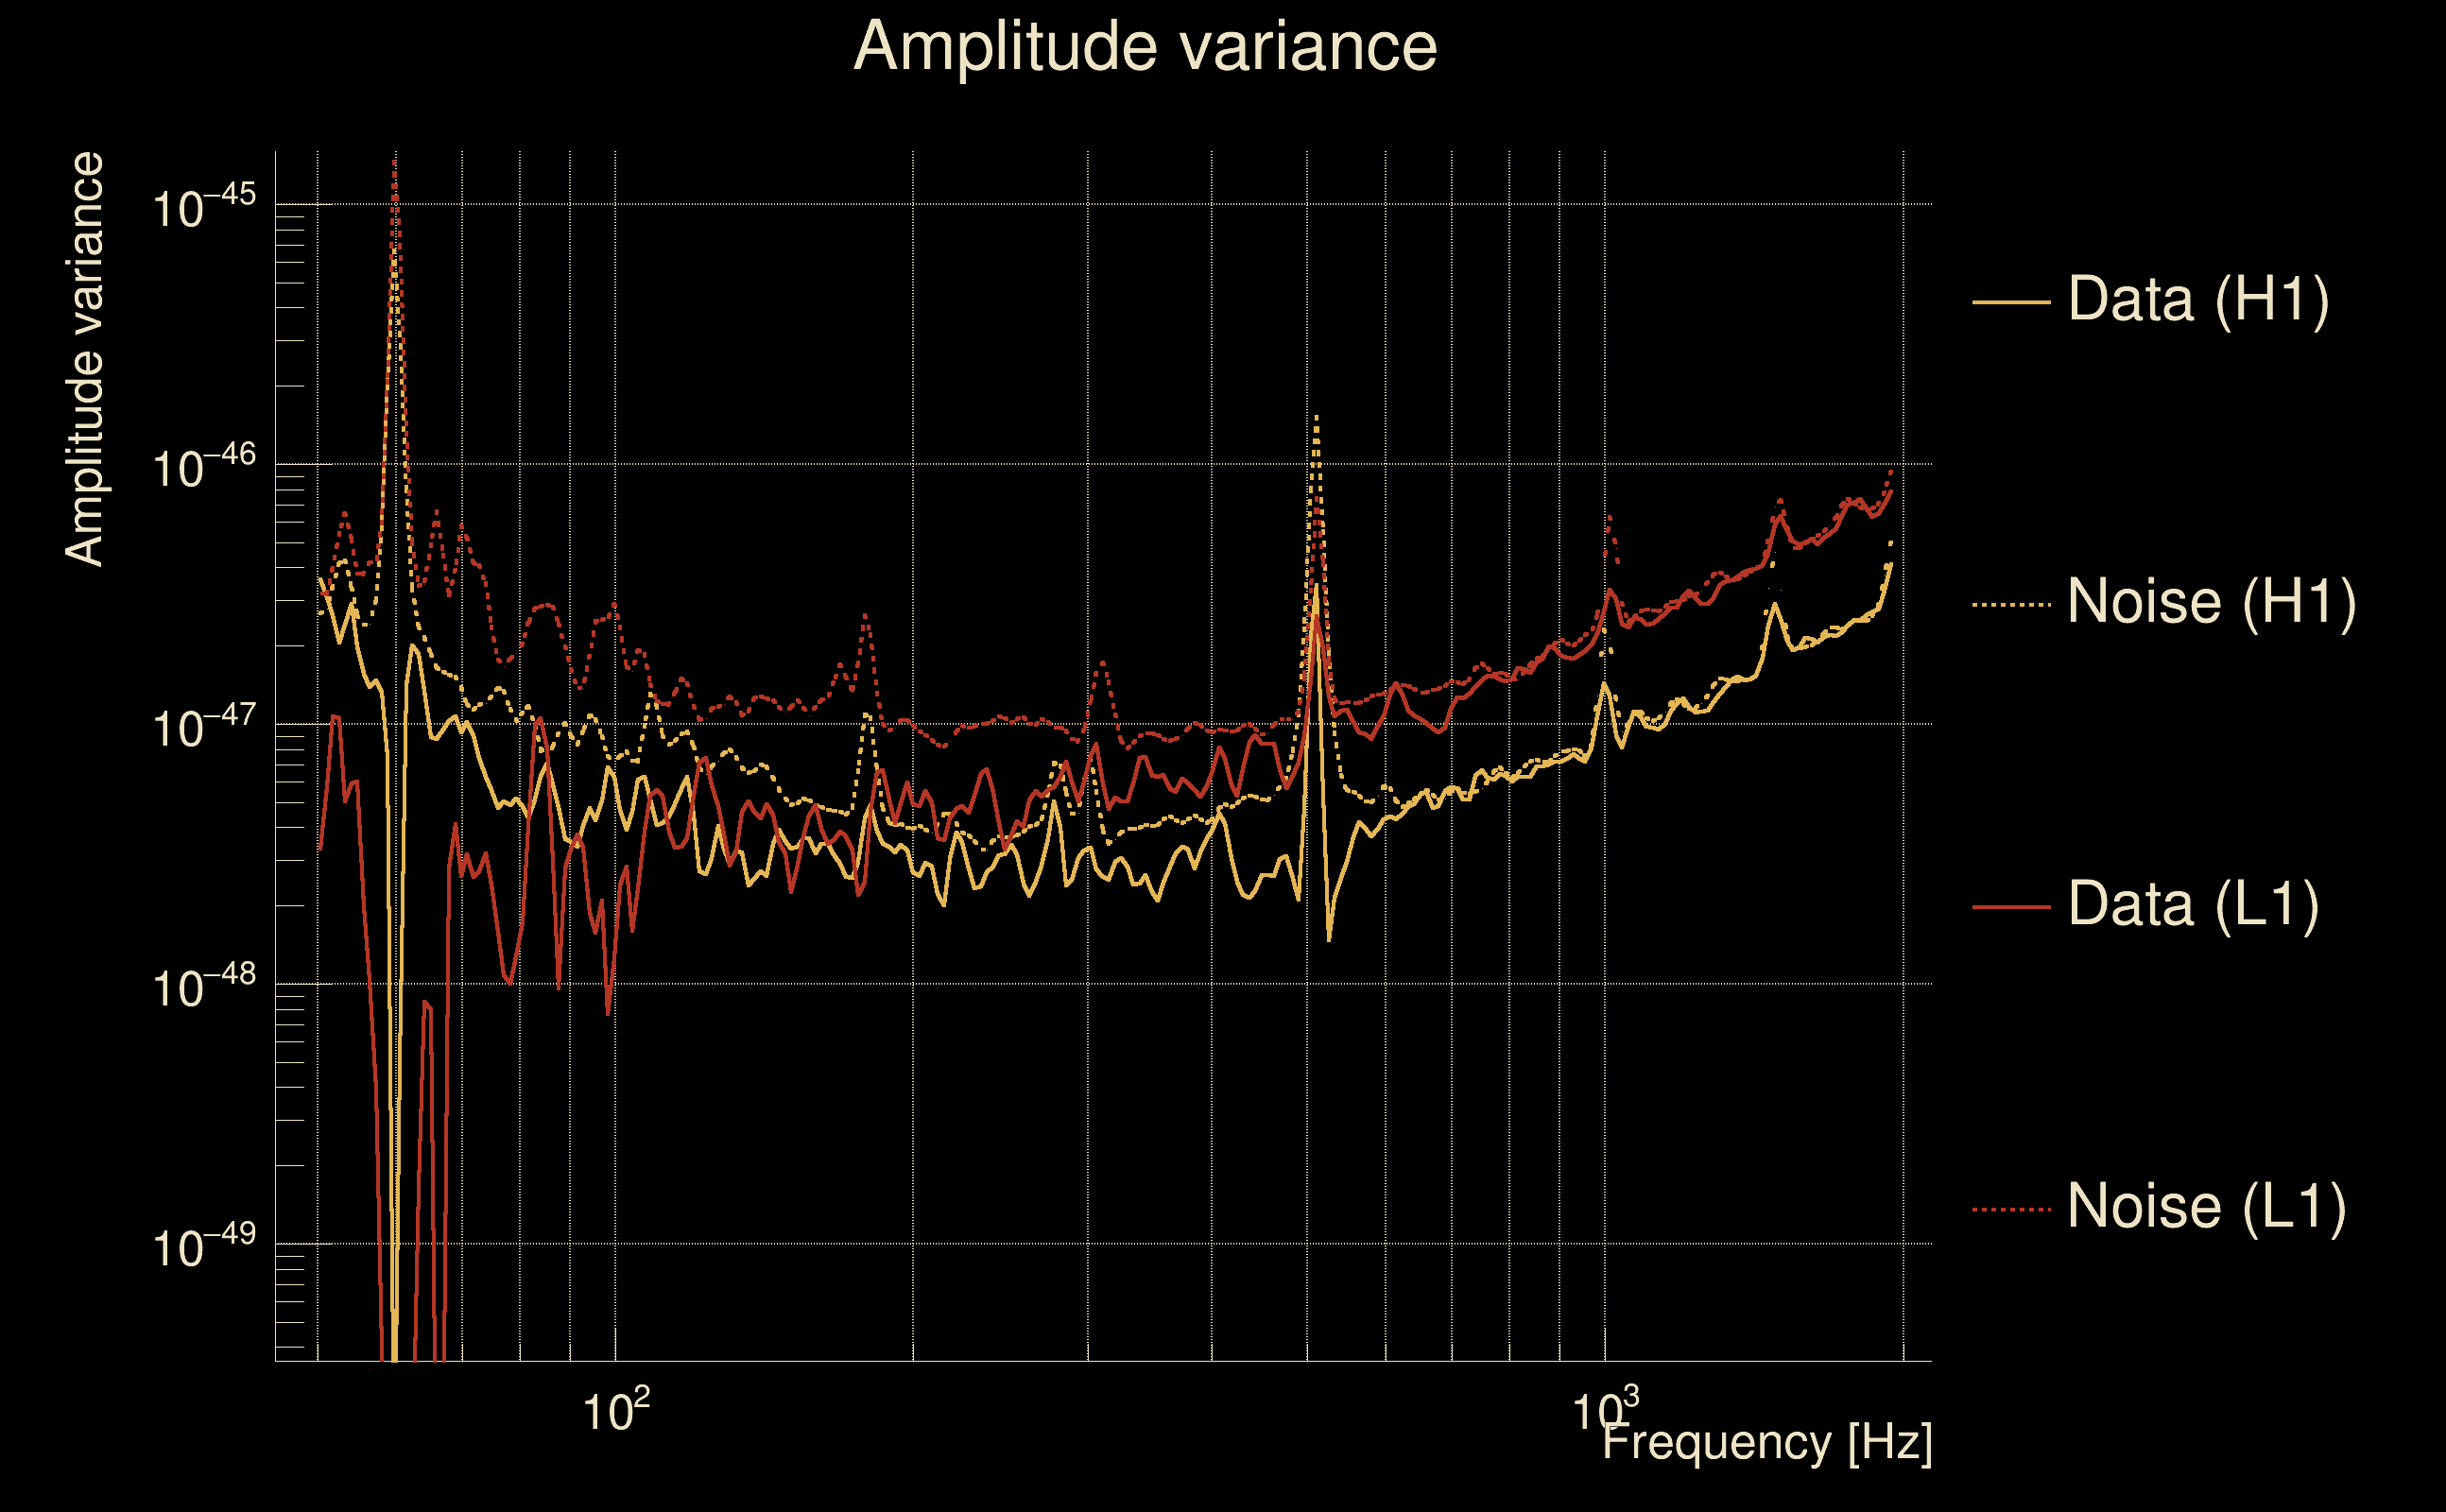
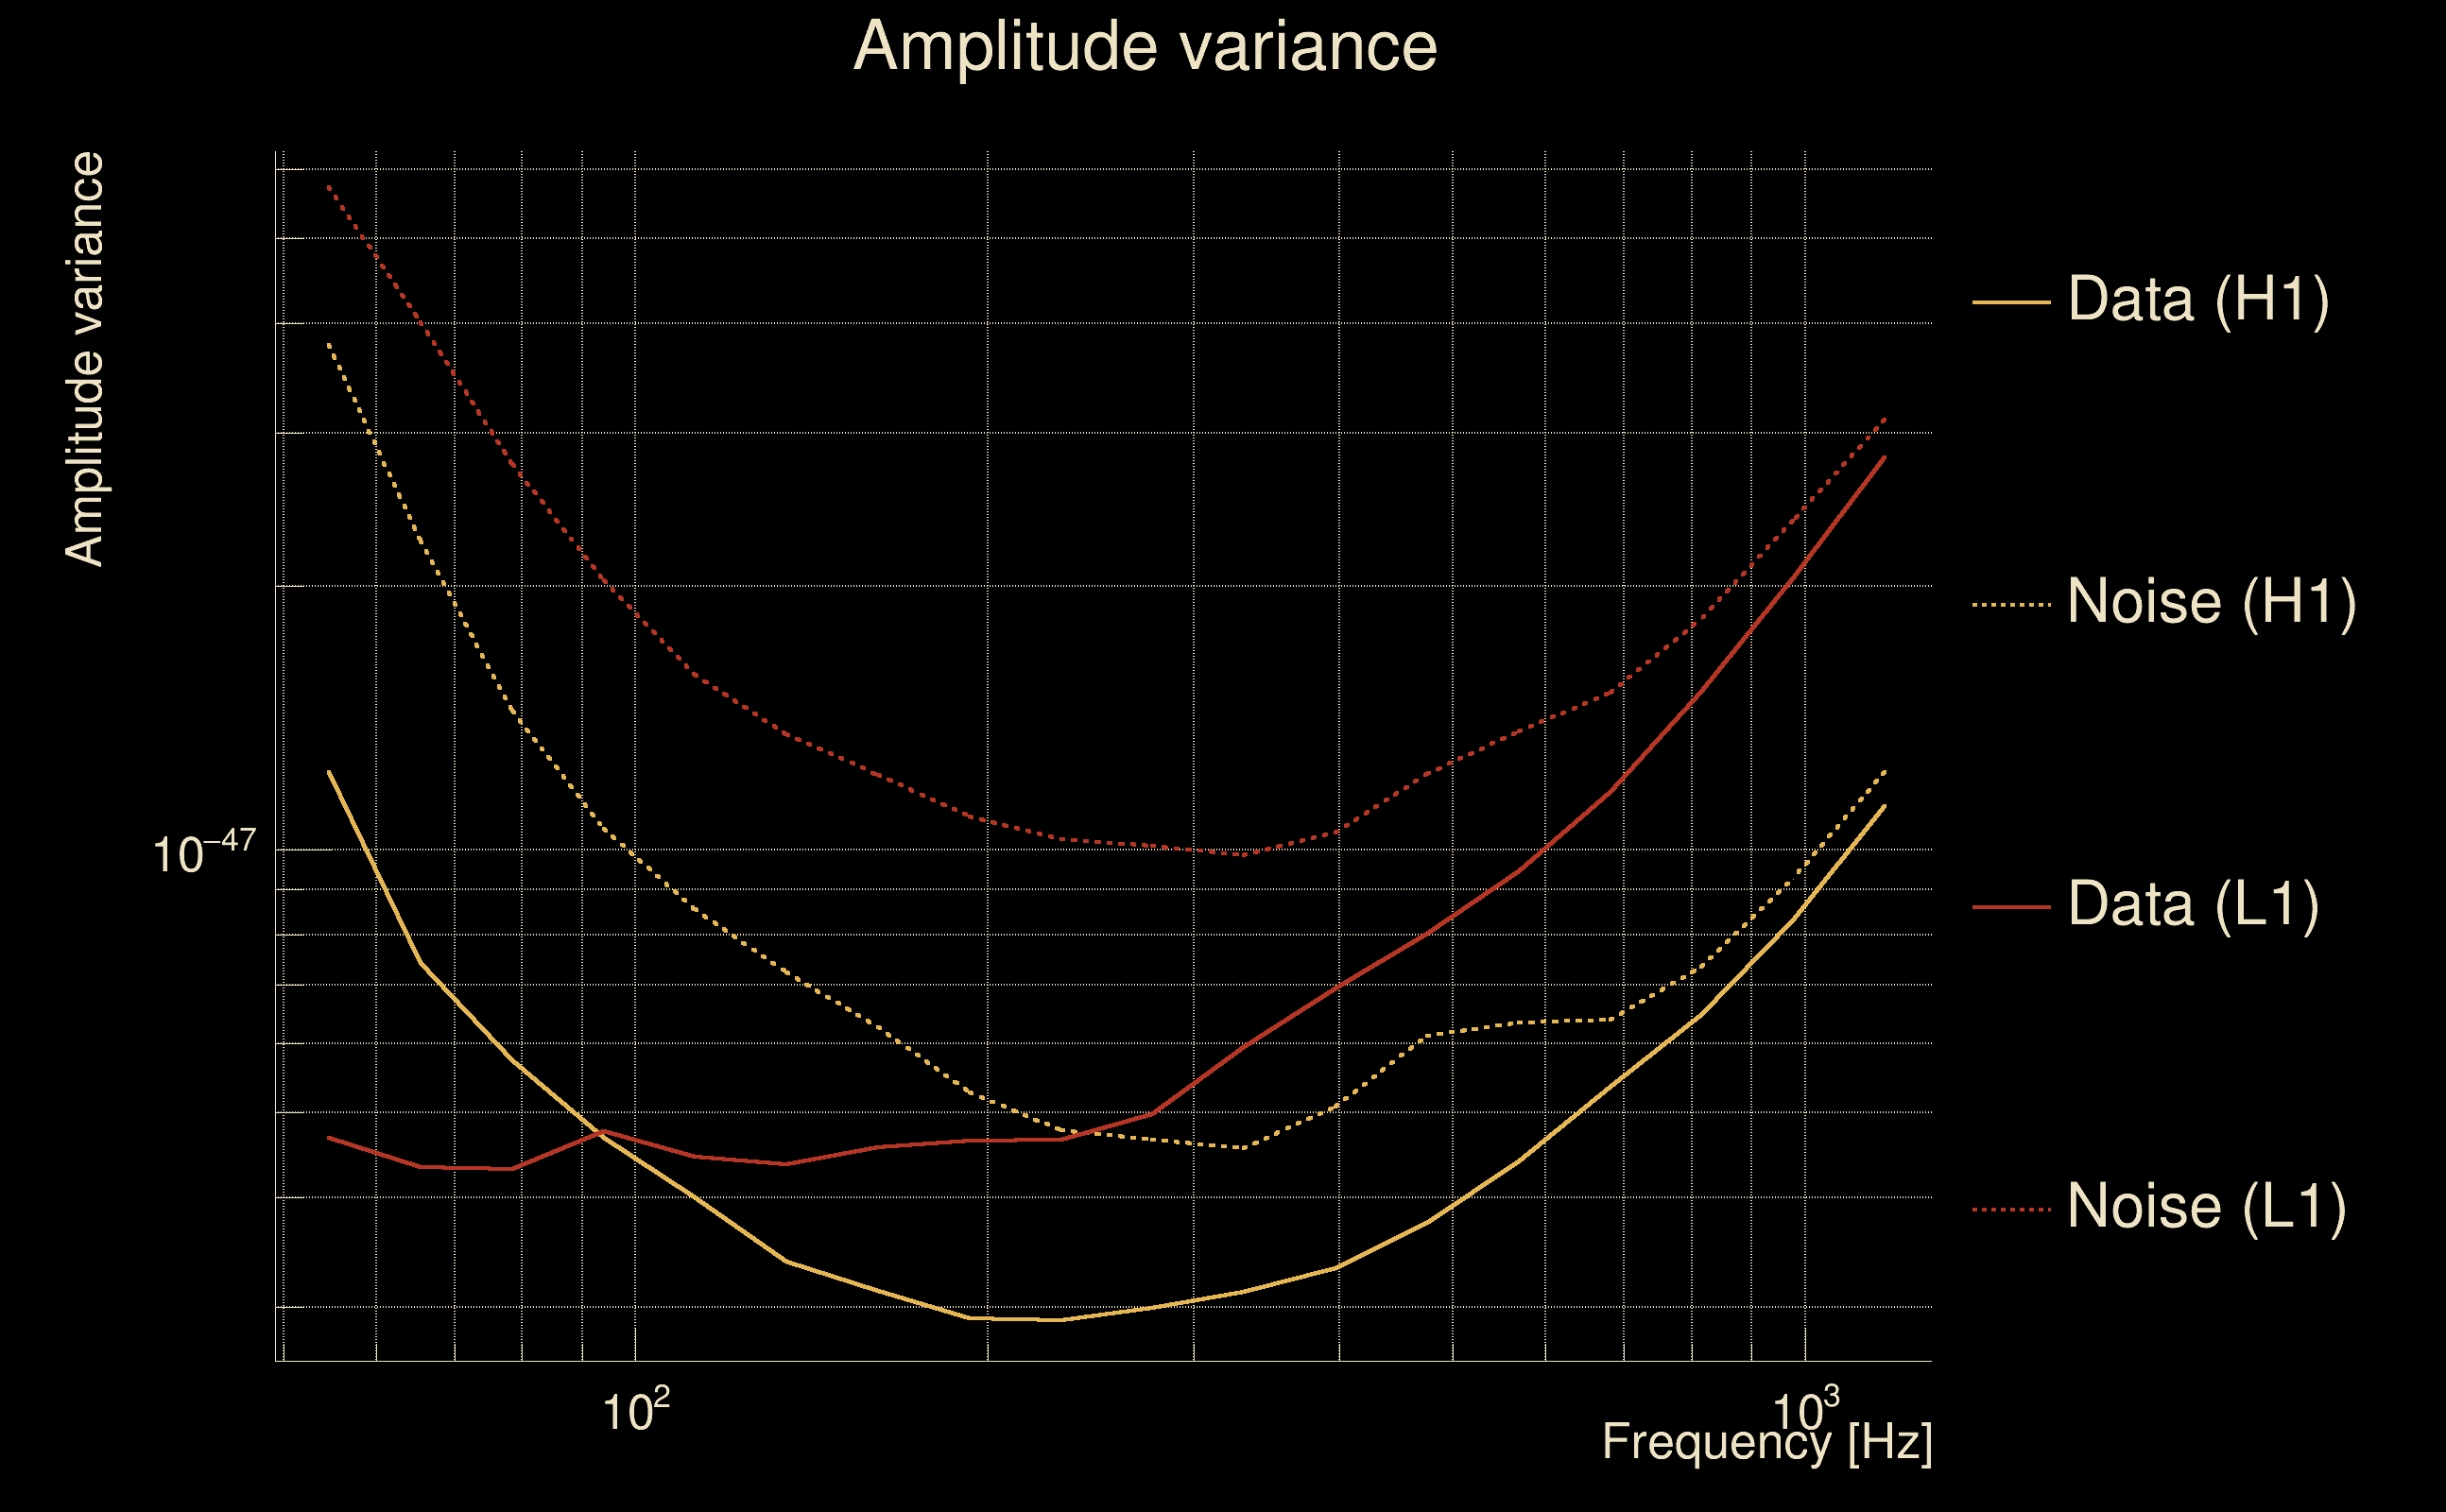
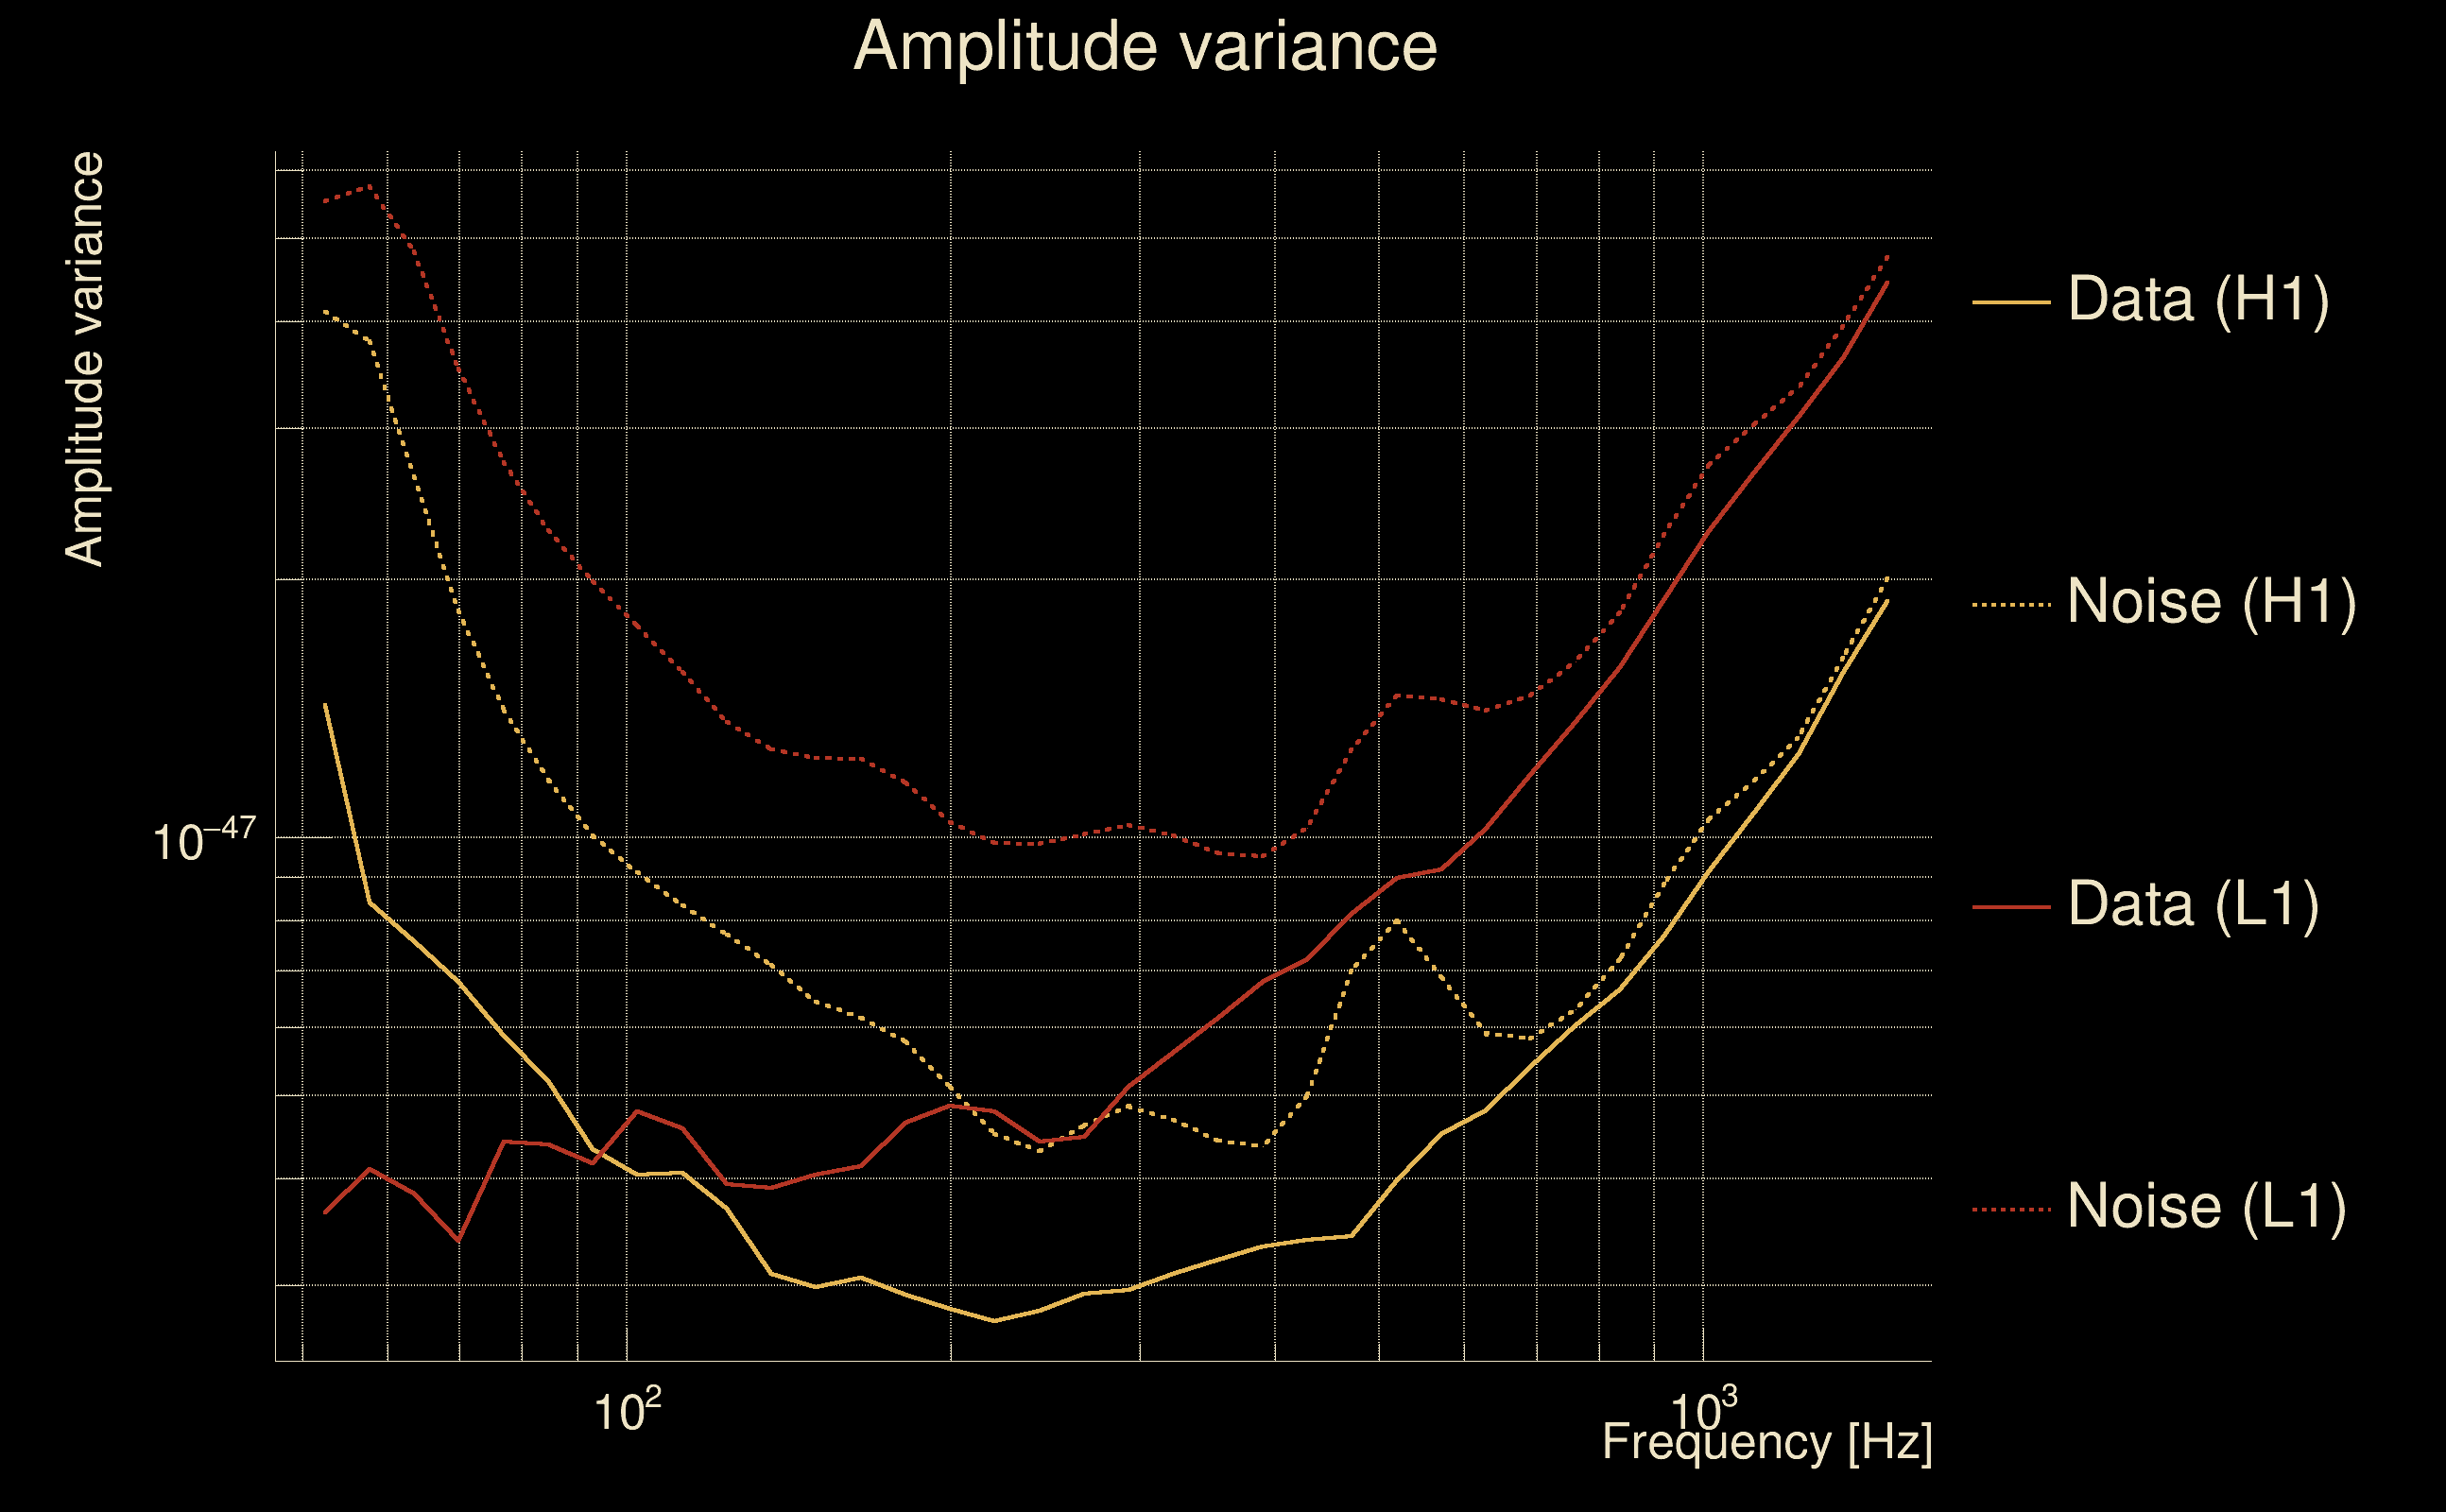
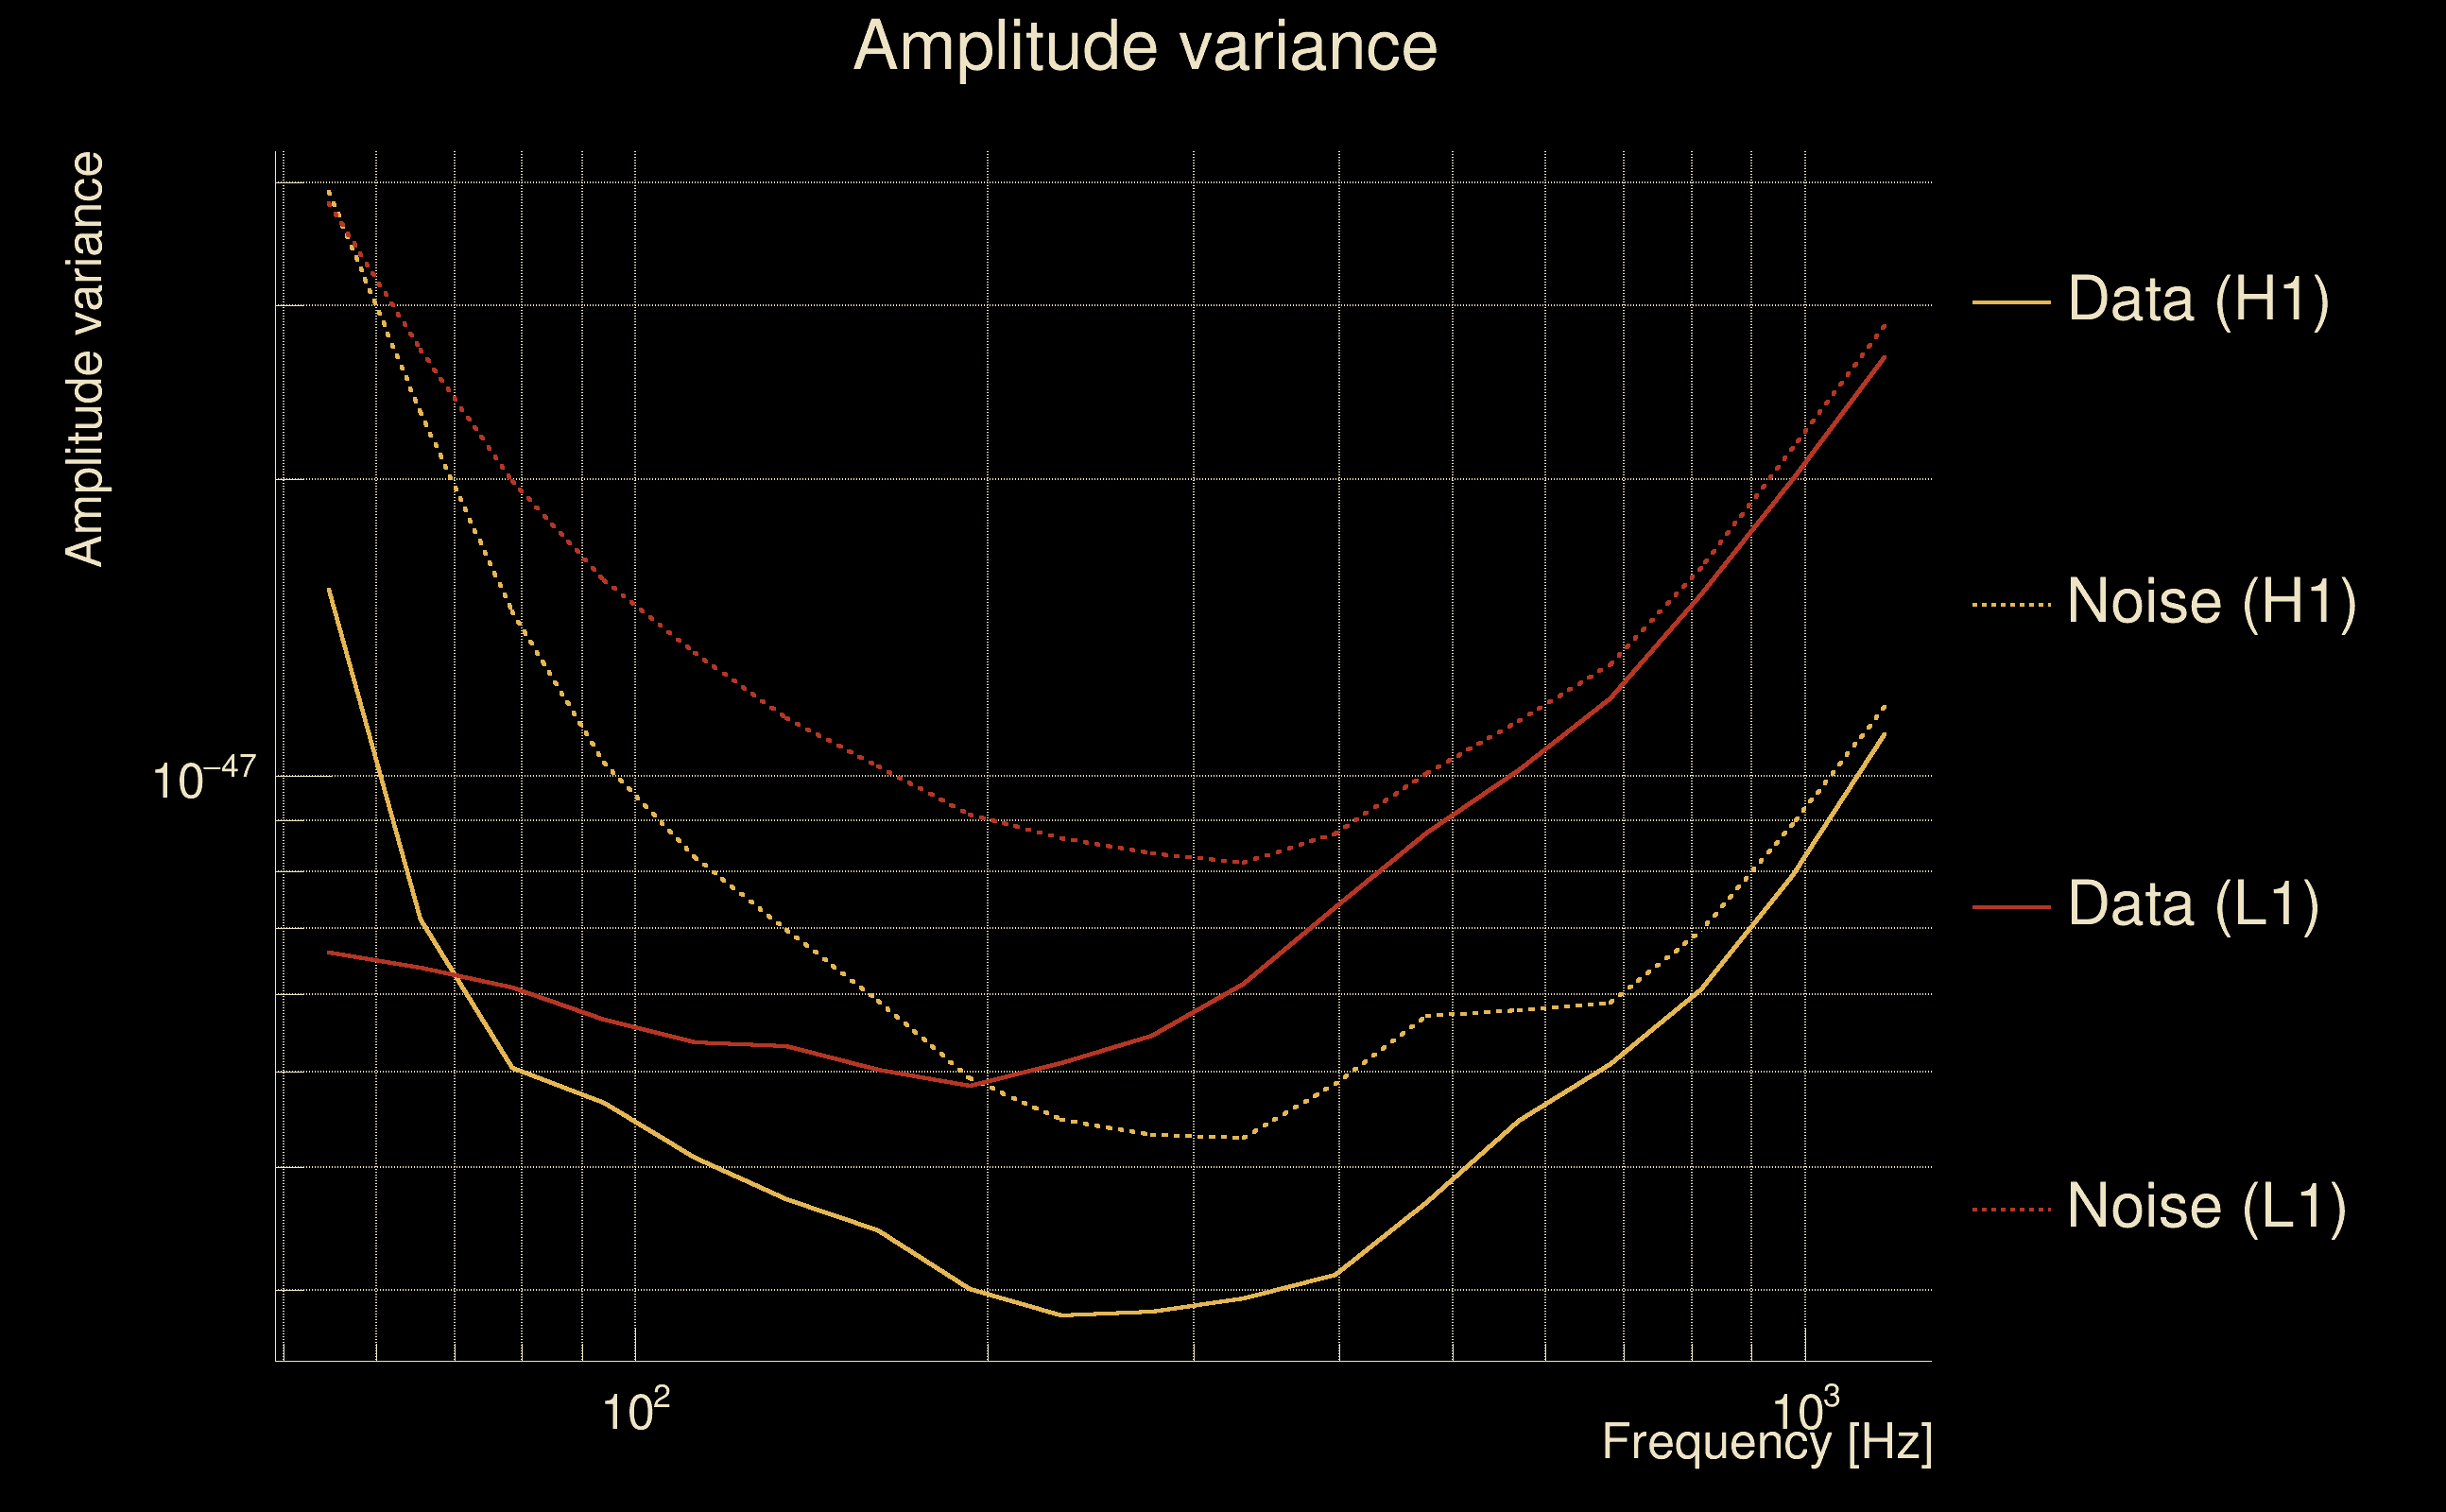
| Amplitude spectrograms: | normalization = 1e-22, power index = 2 |
| White noise SNR variance: | 0.523175 (after applying a correction factor = 1) |
| Amplitude ratio confidence level: | 3 sigma |
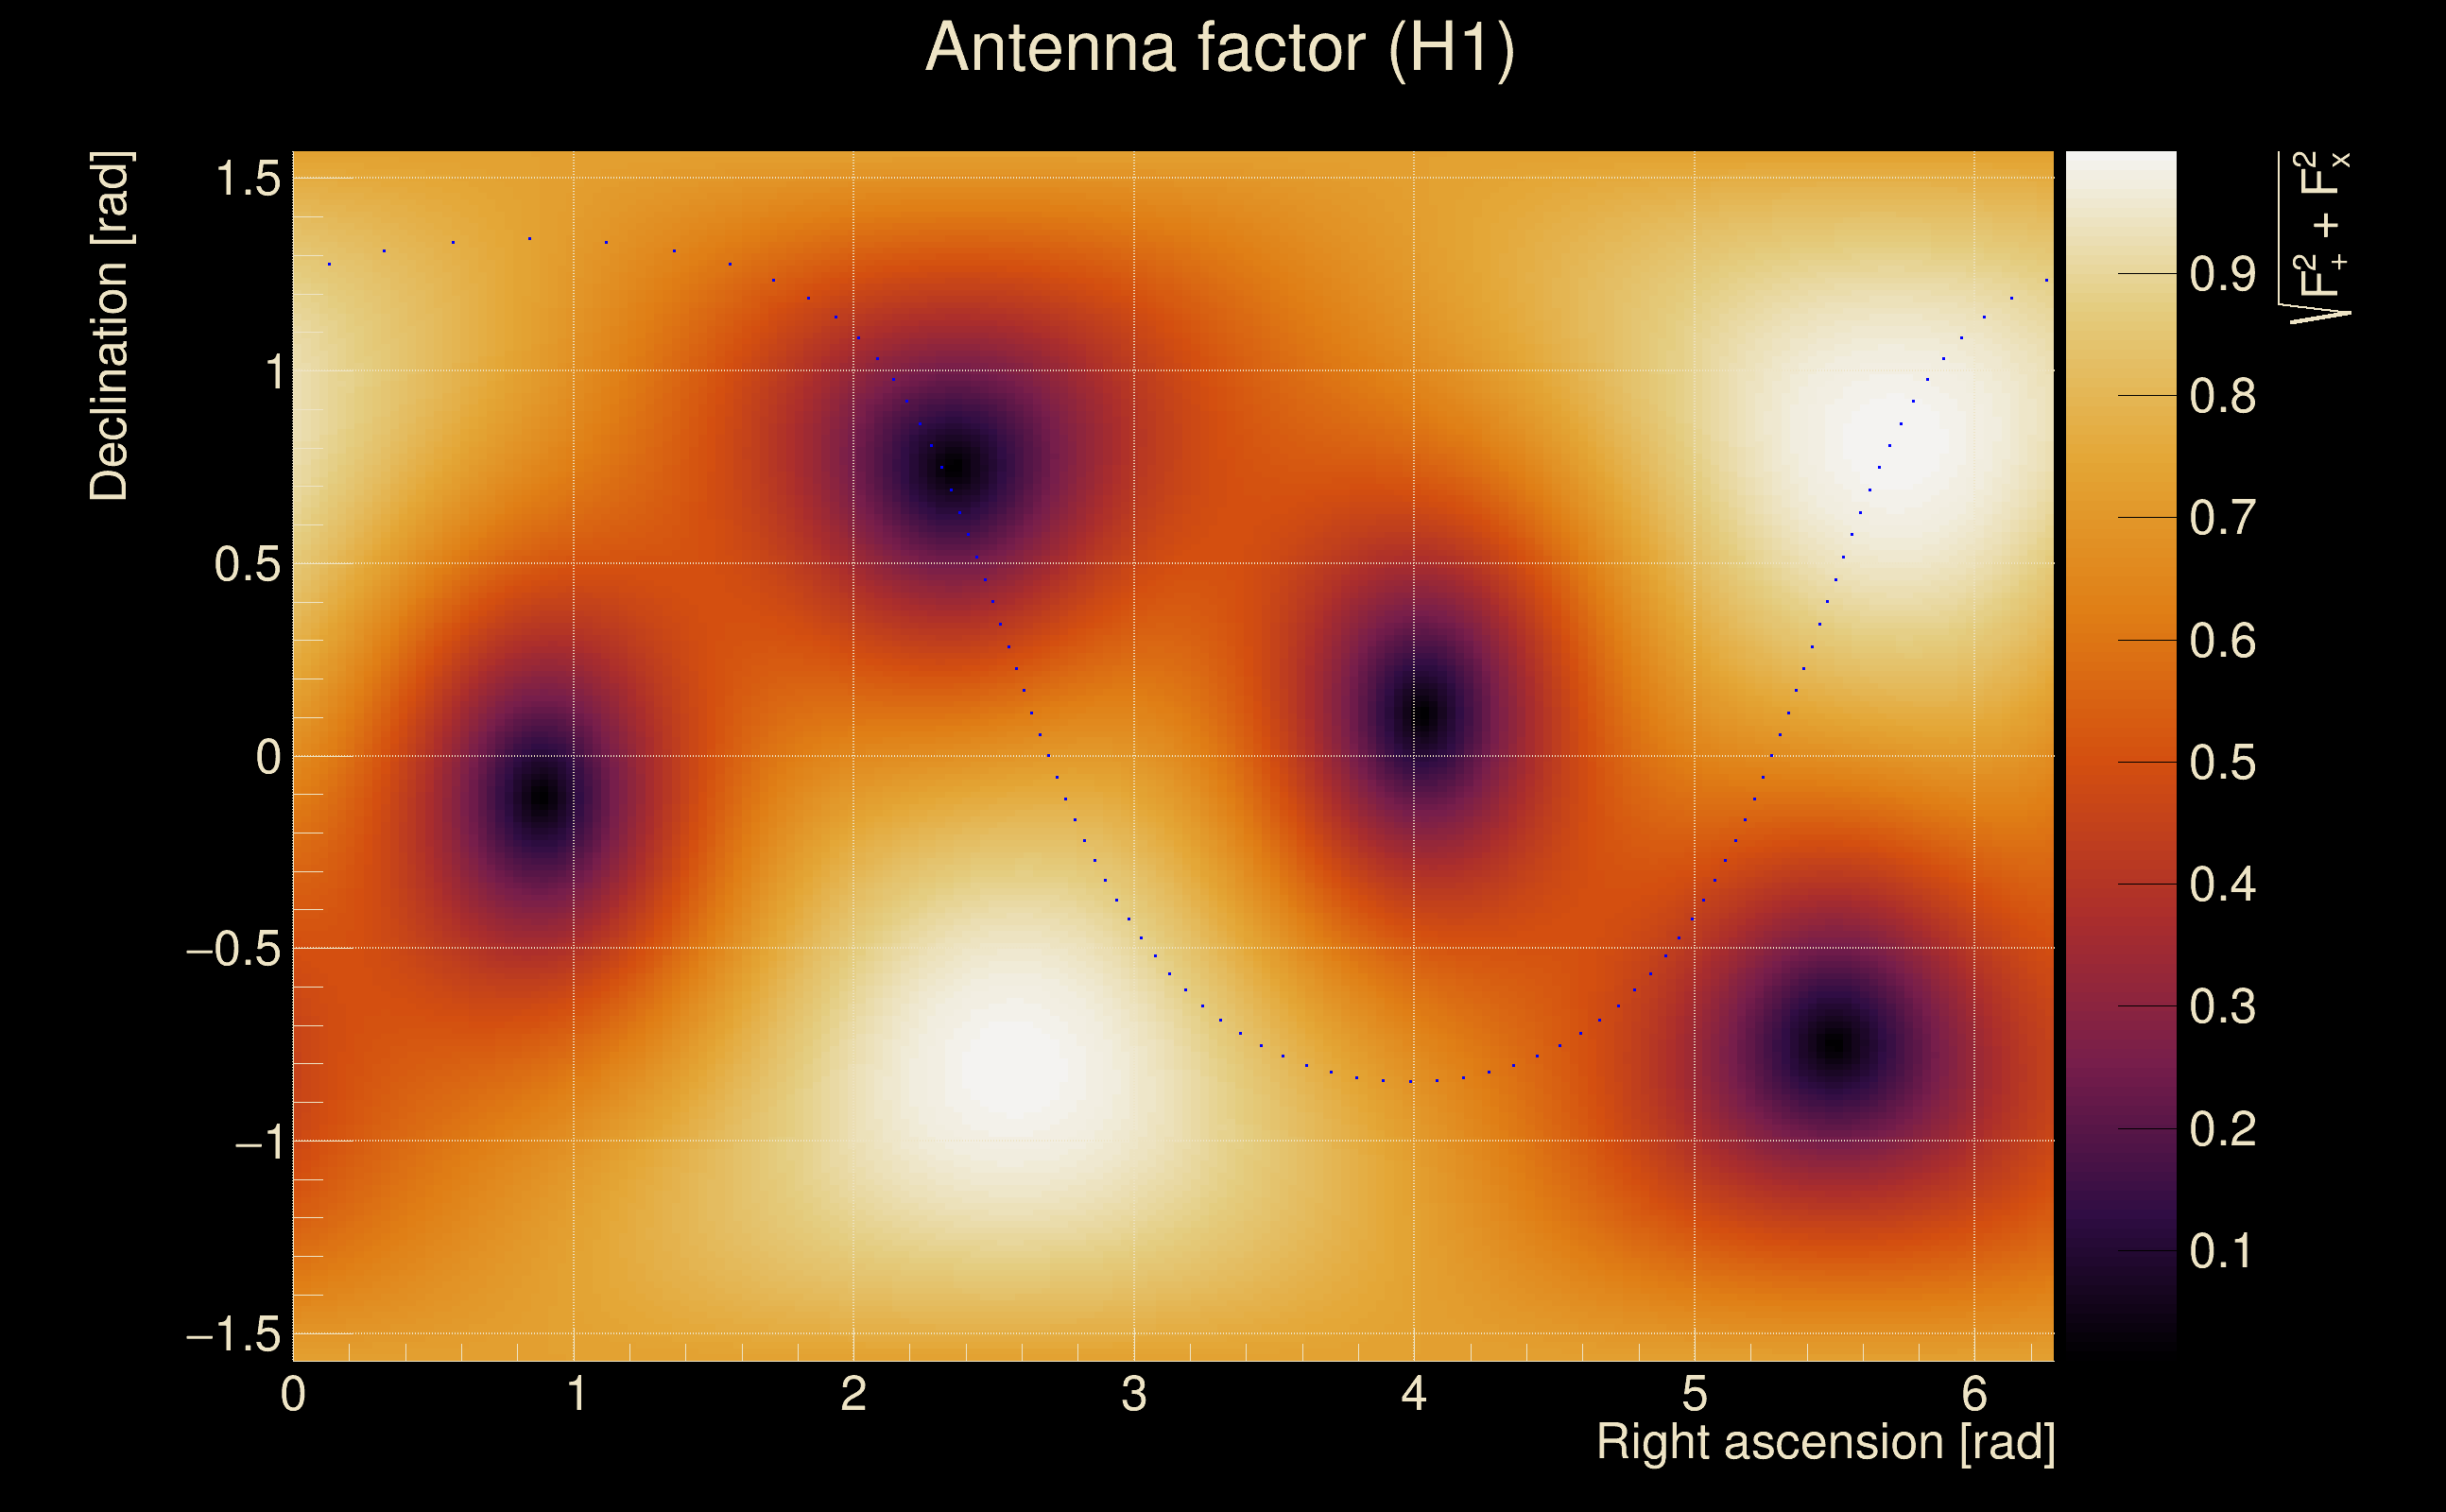
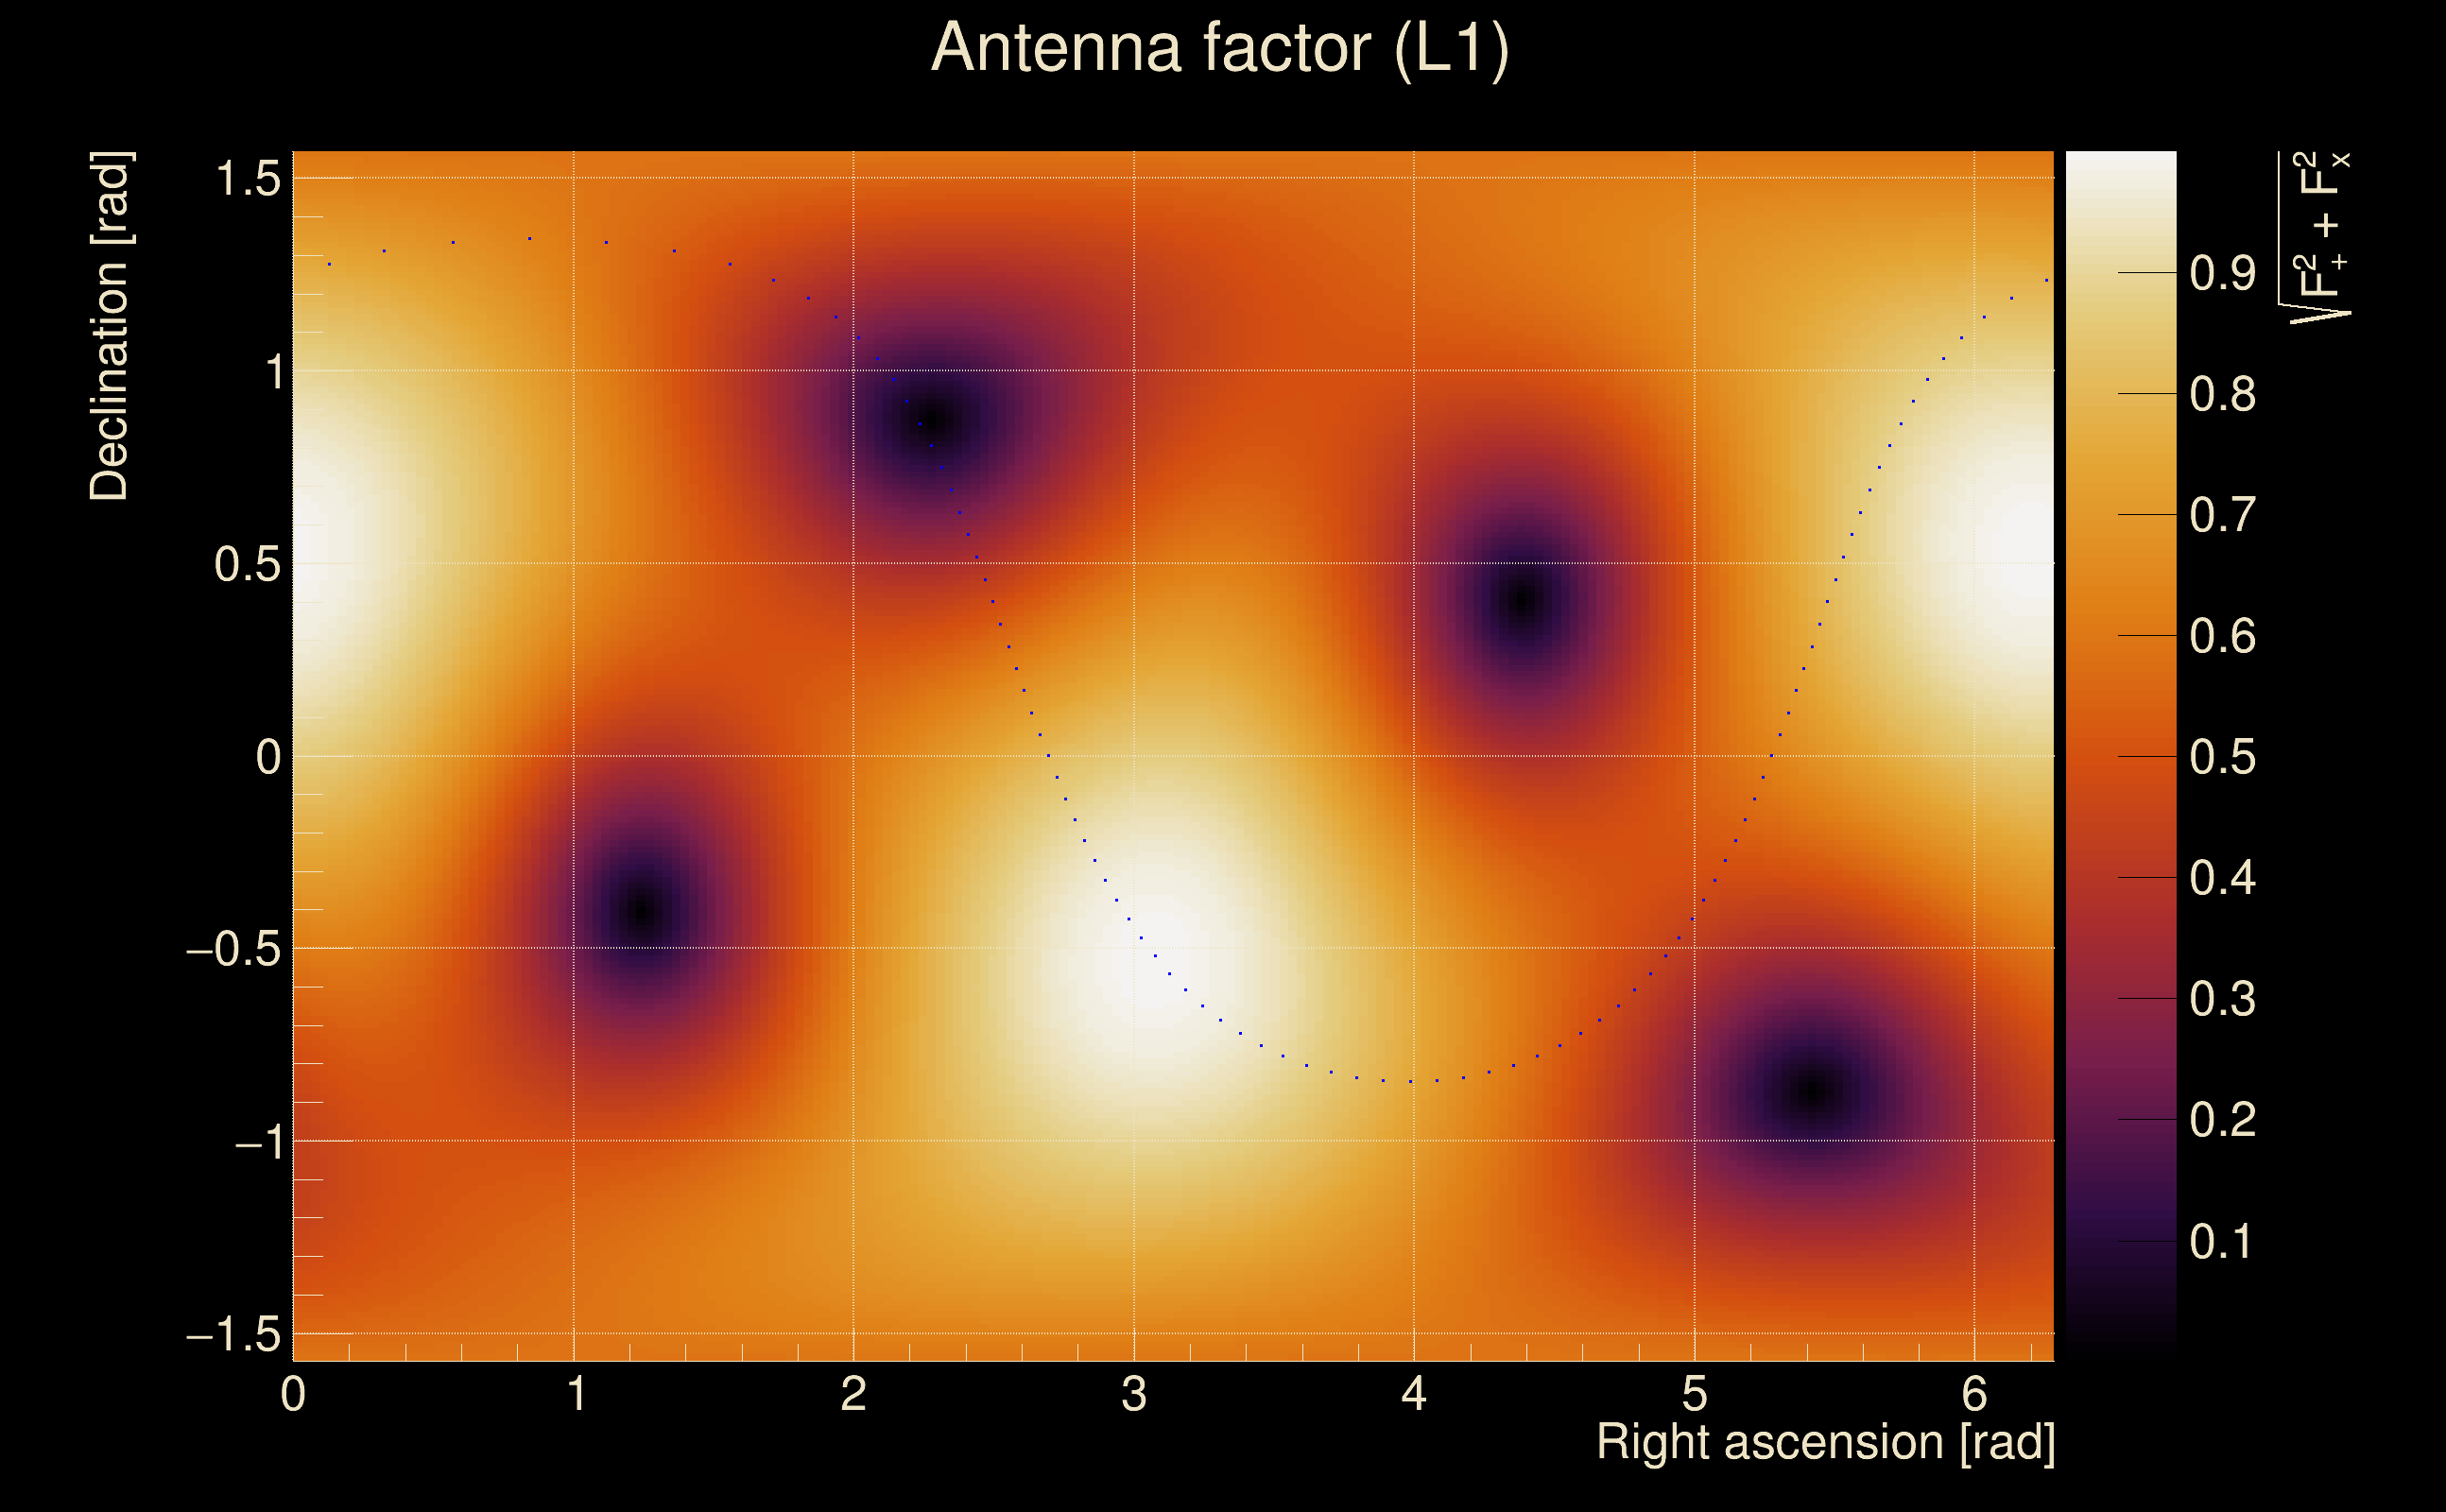
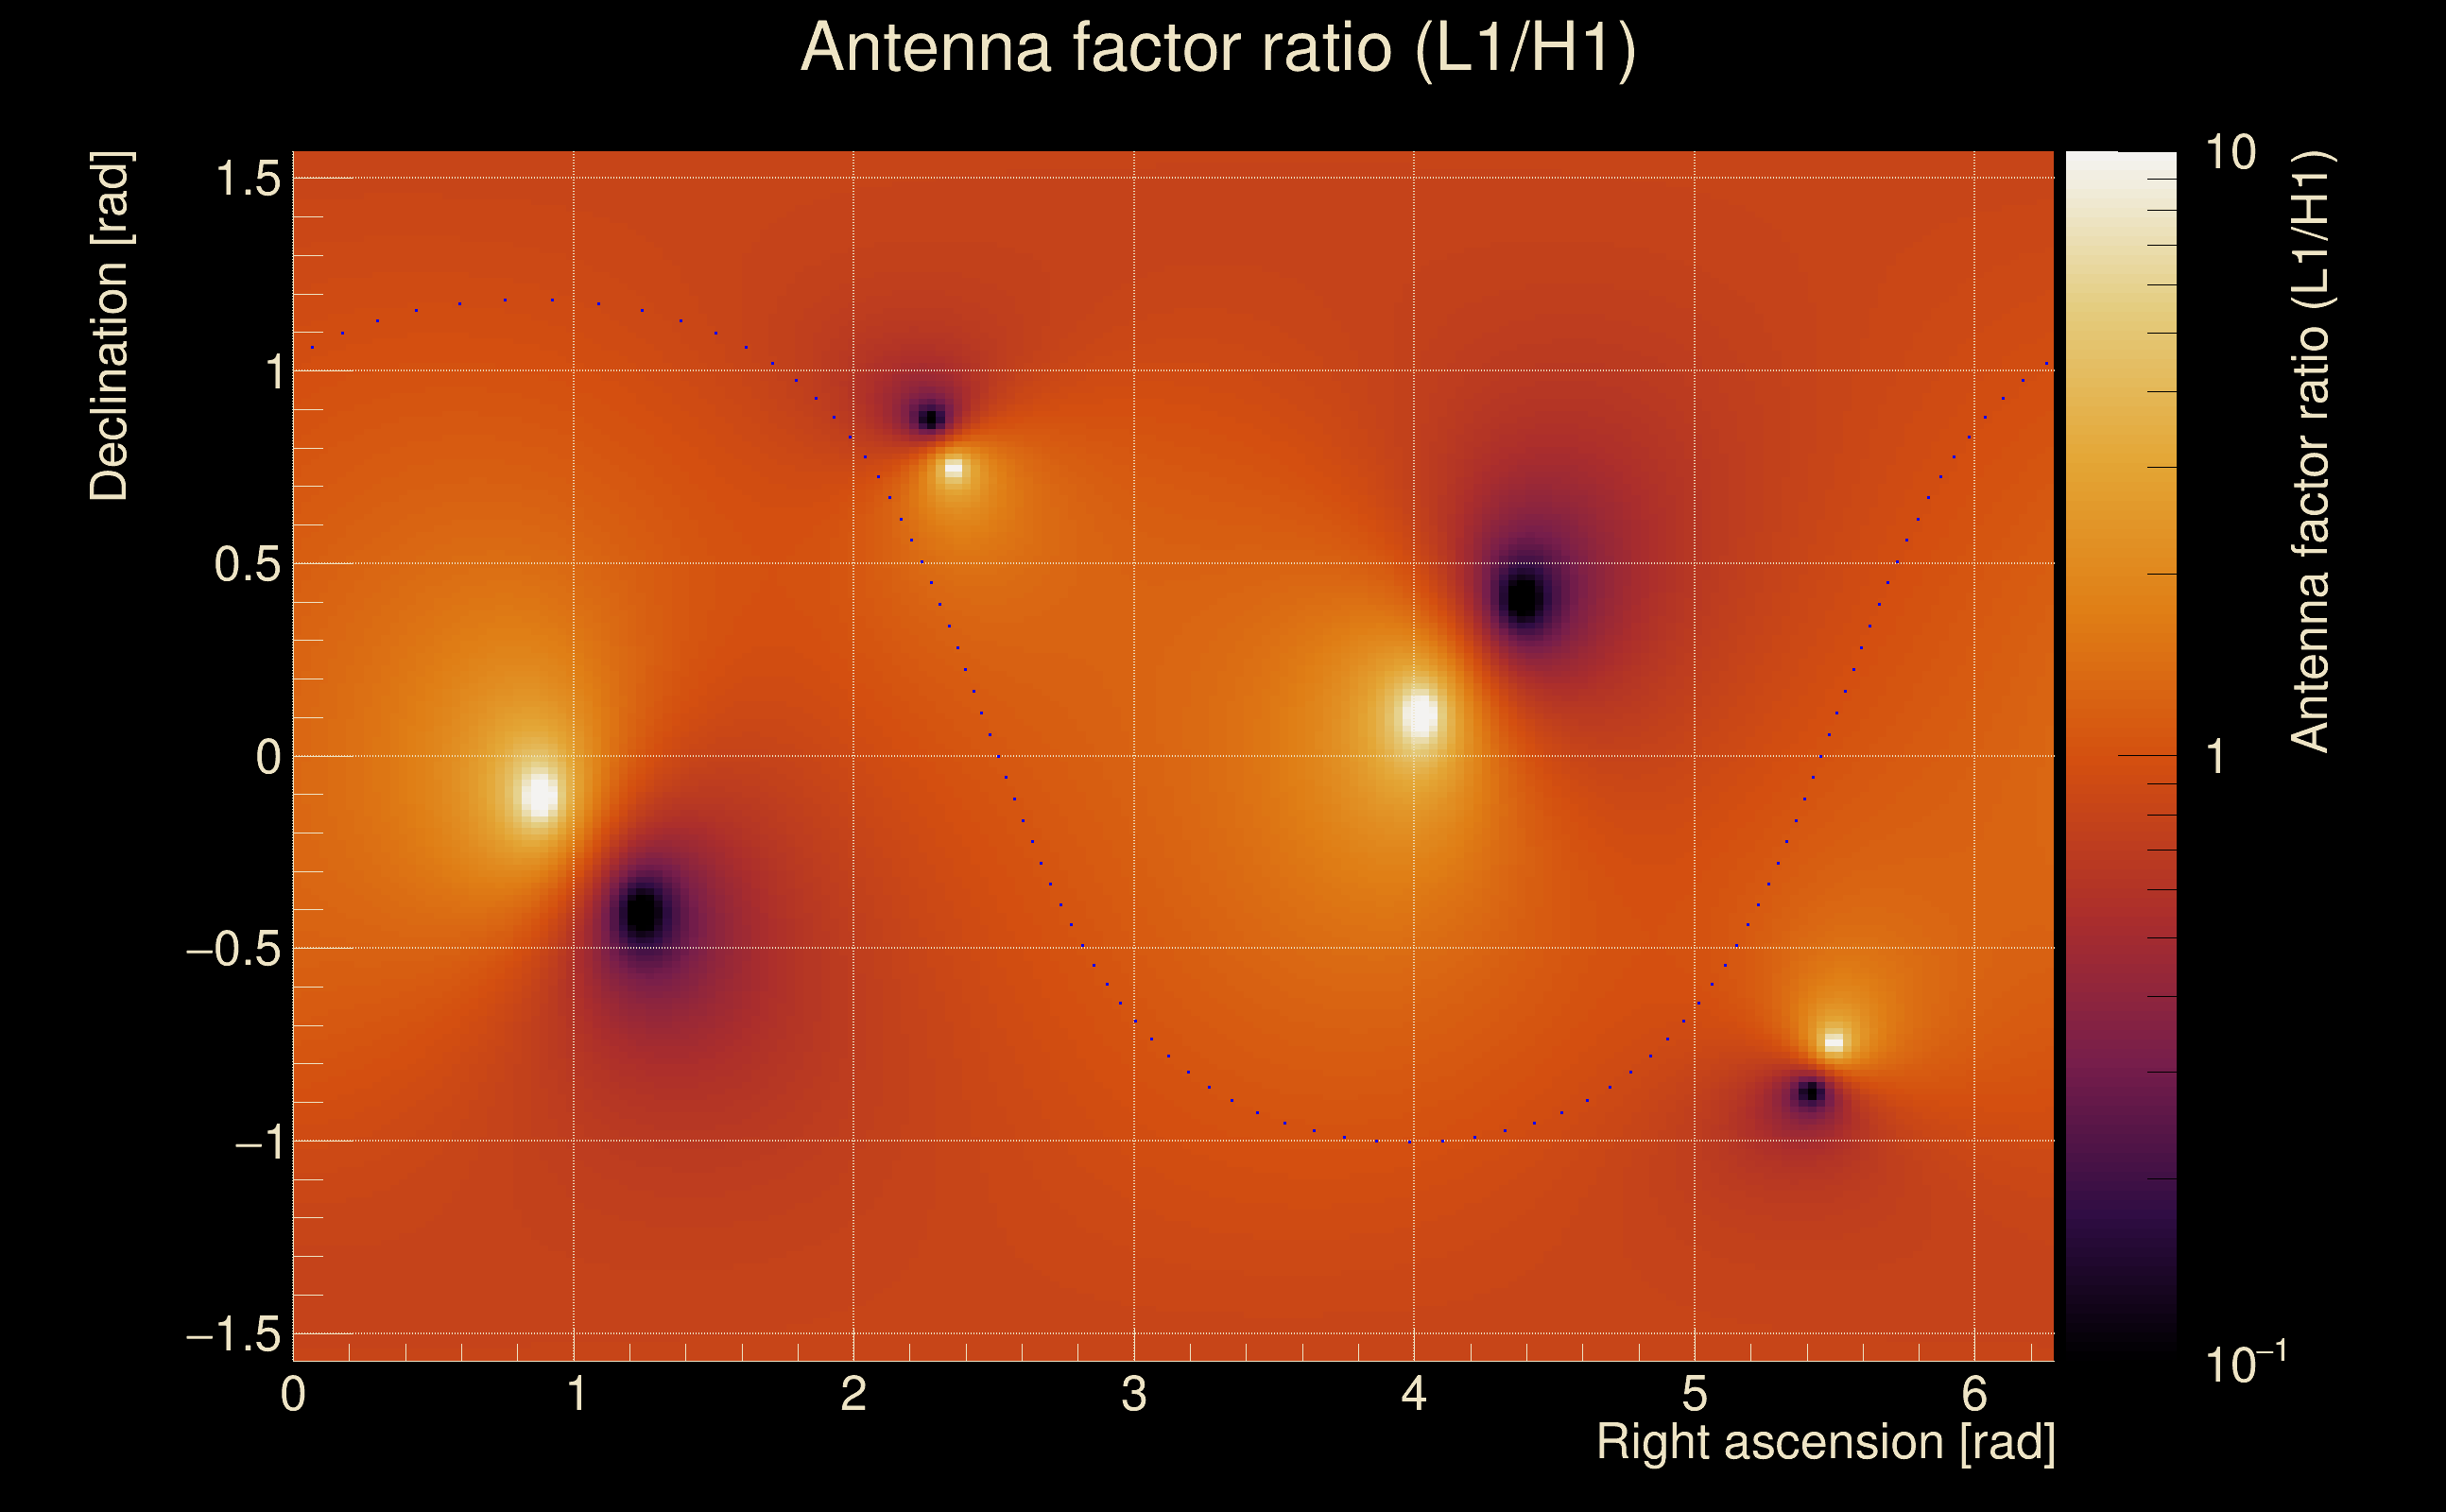
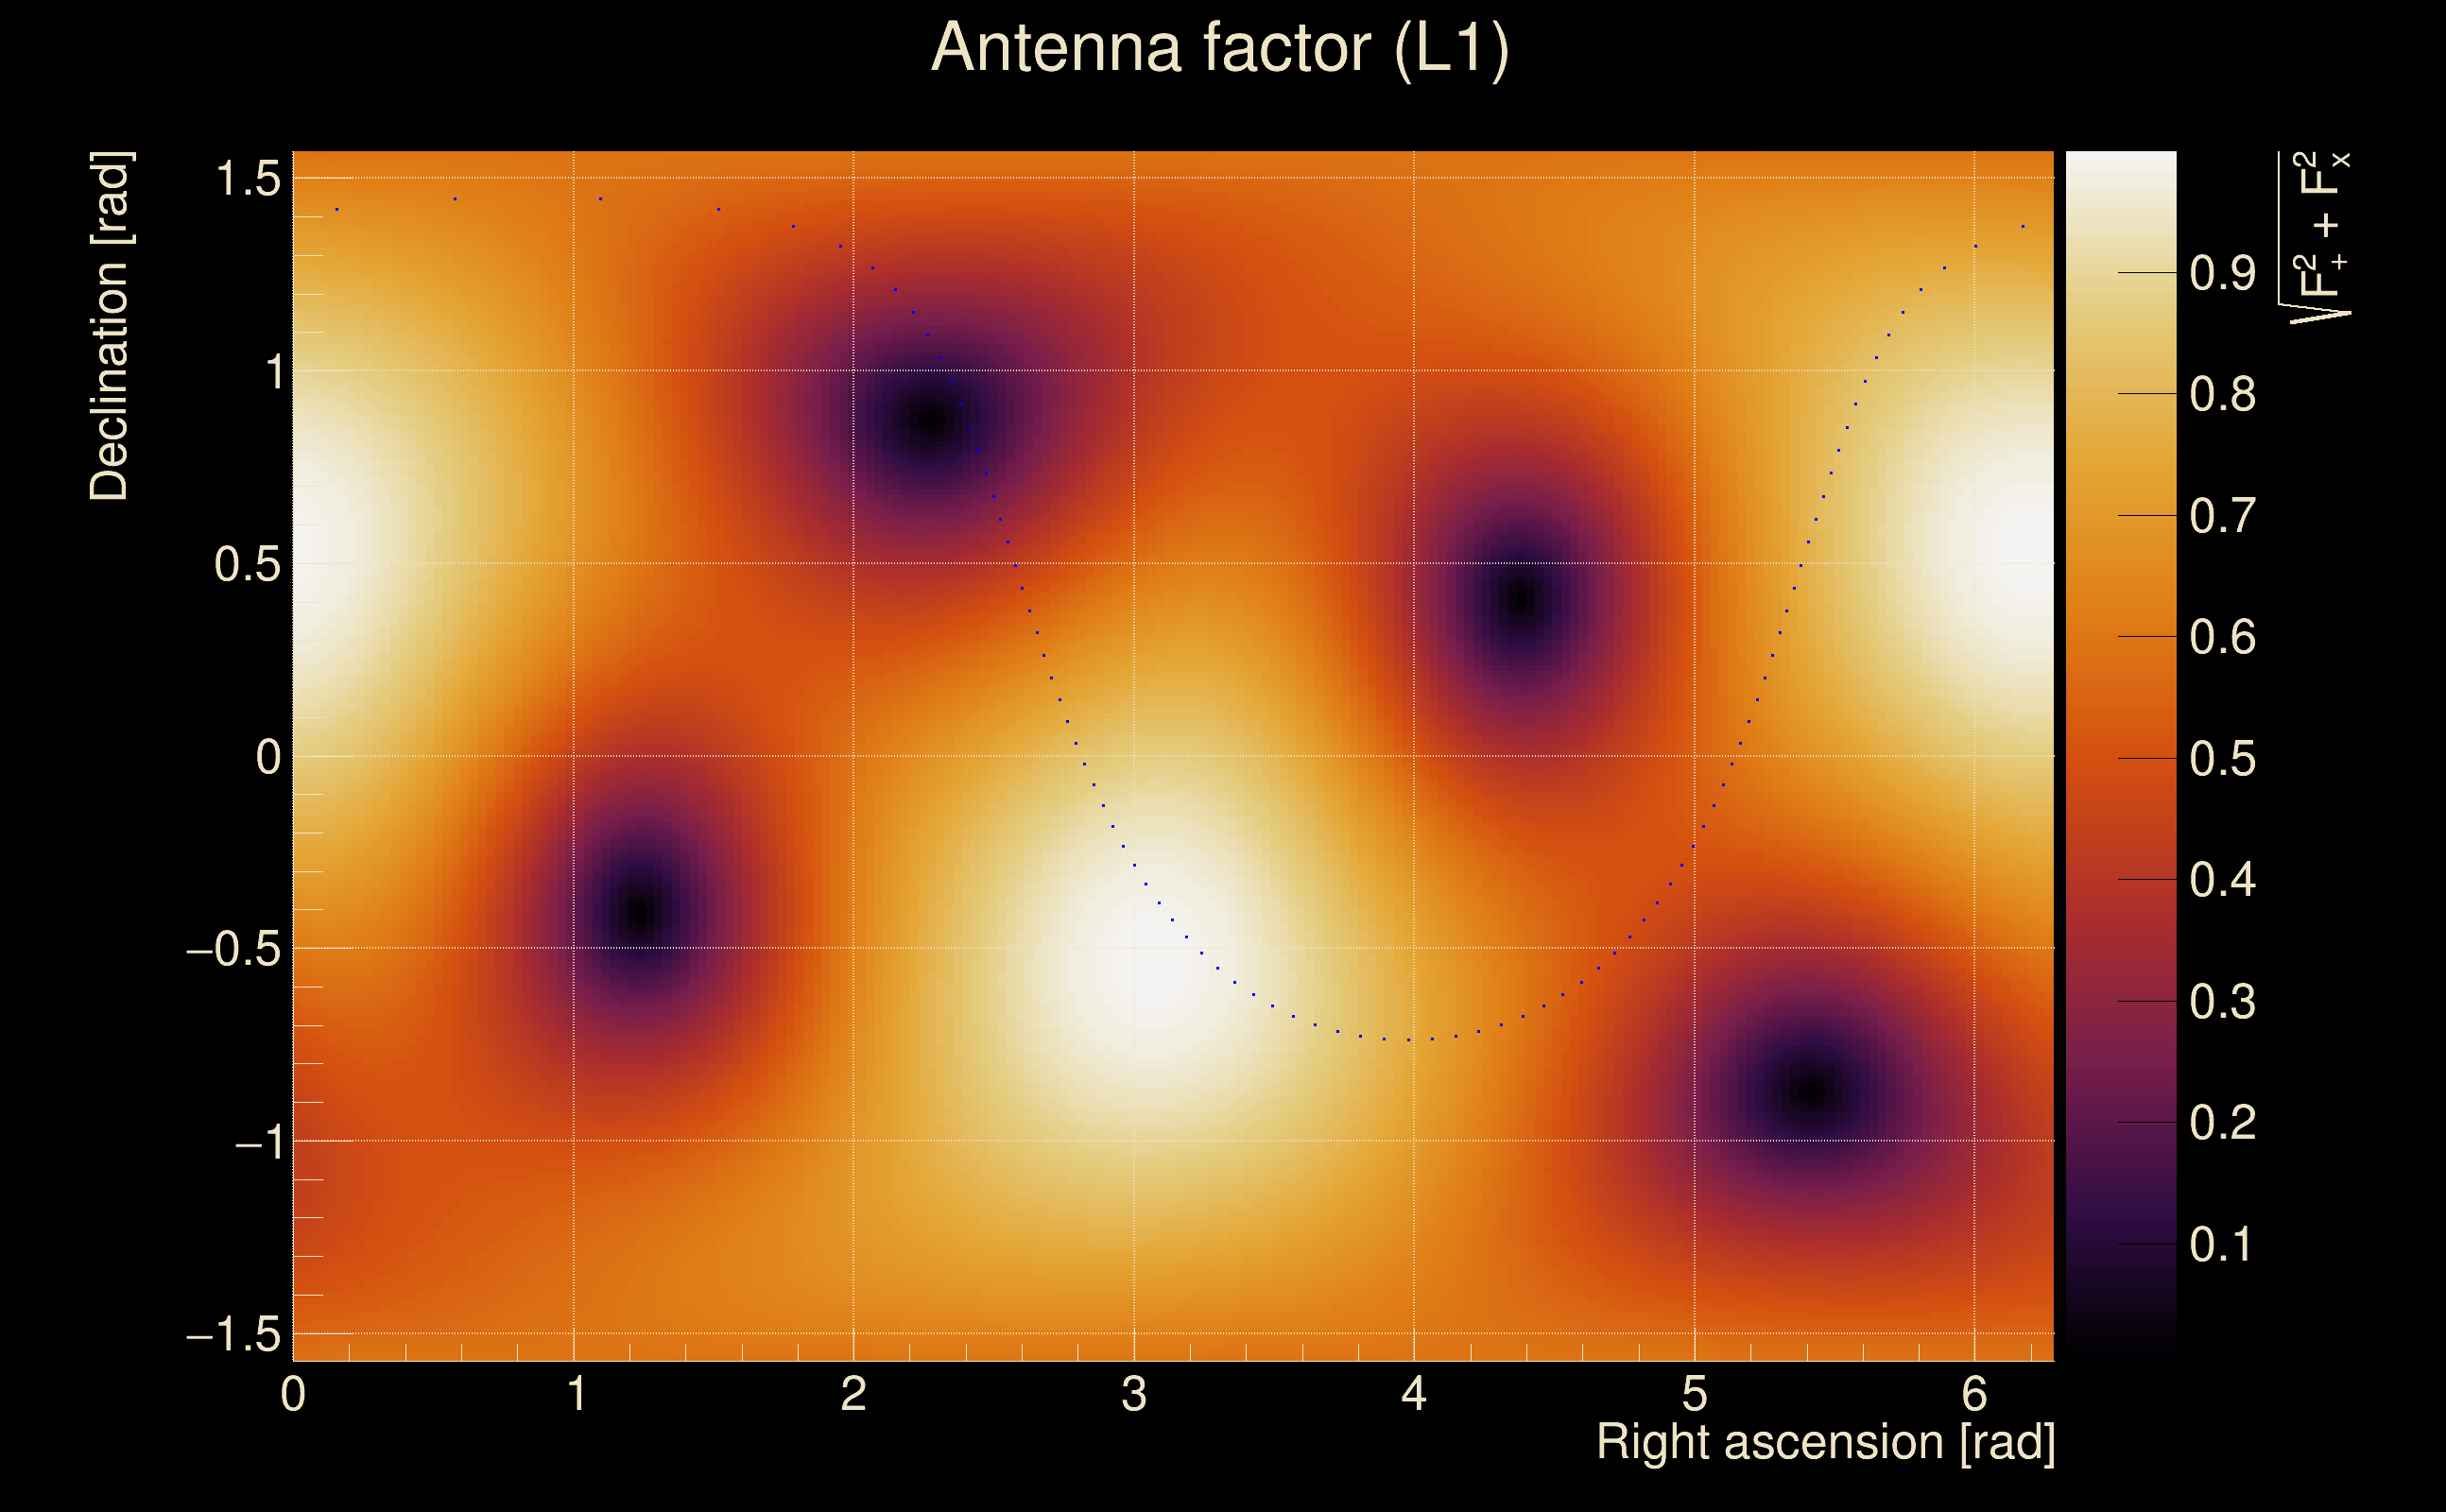
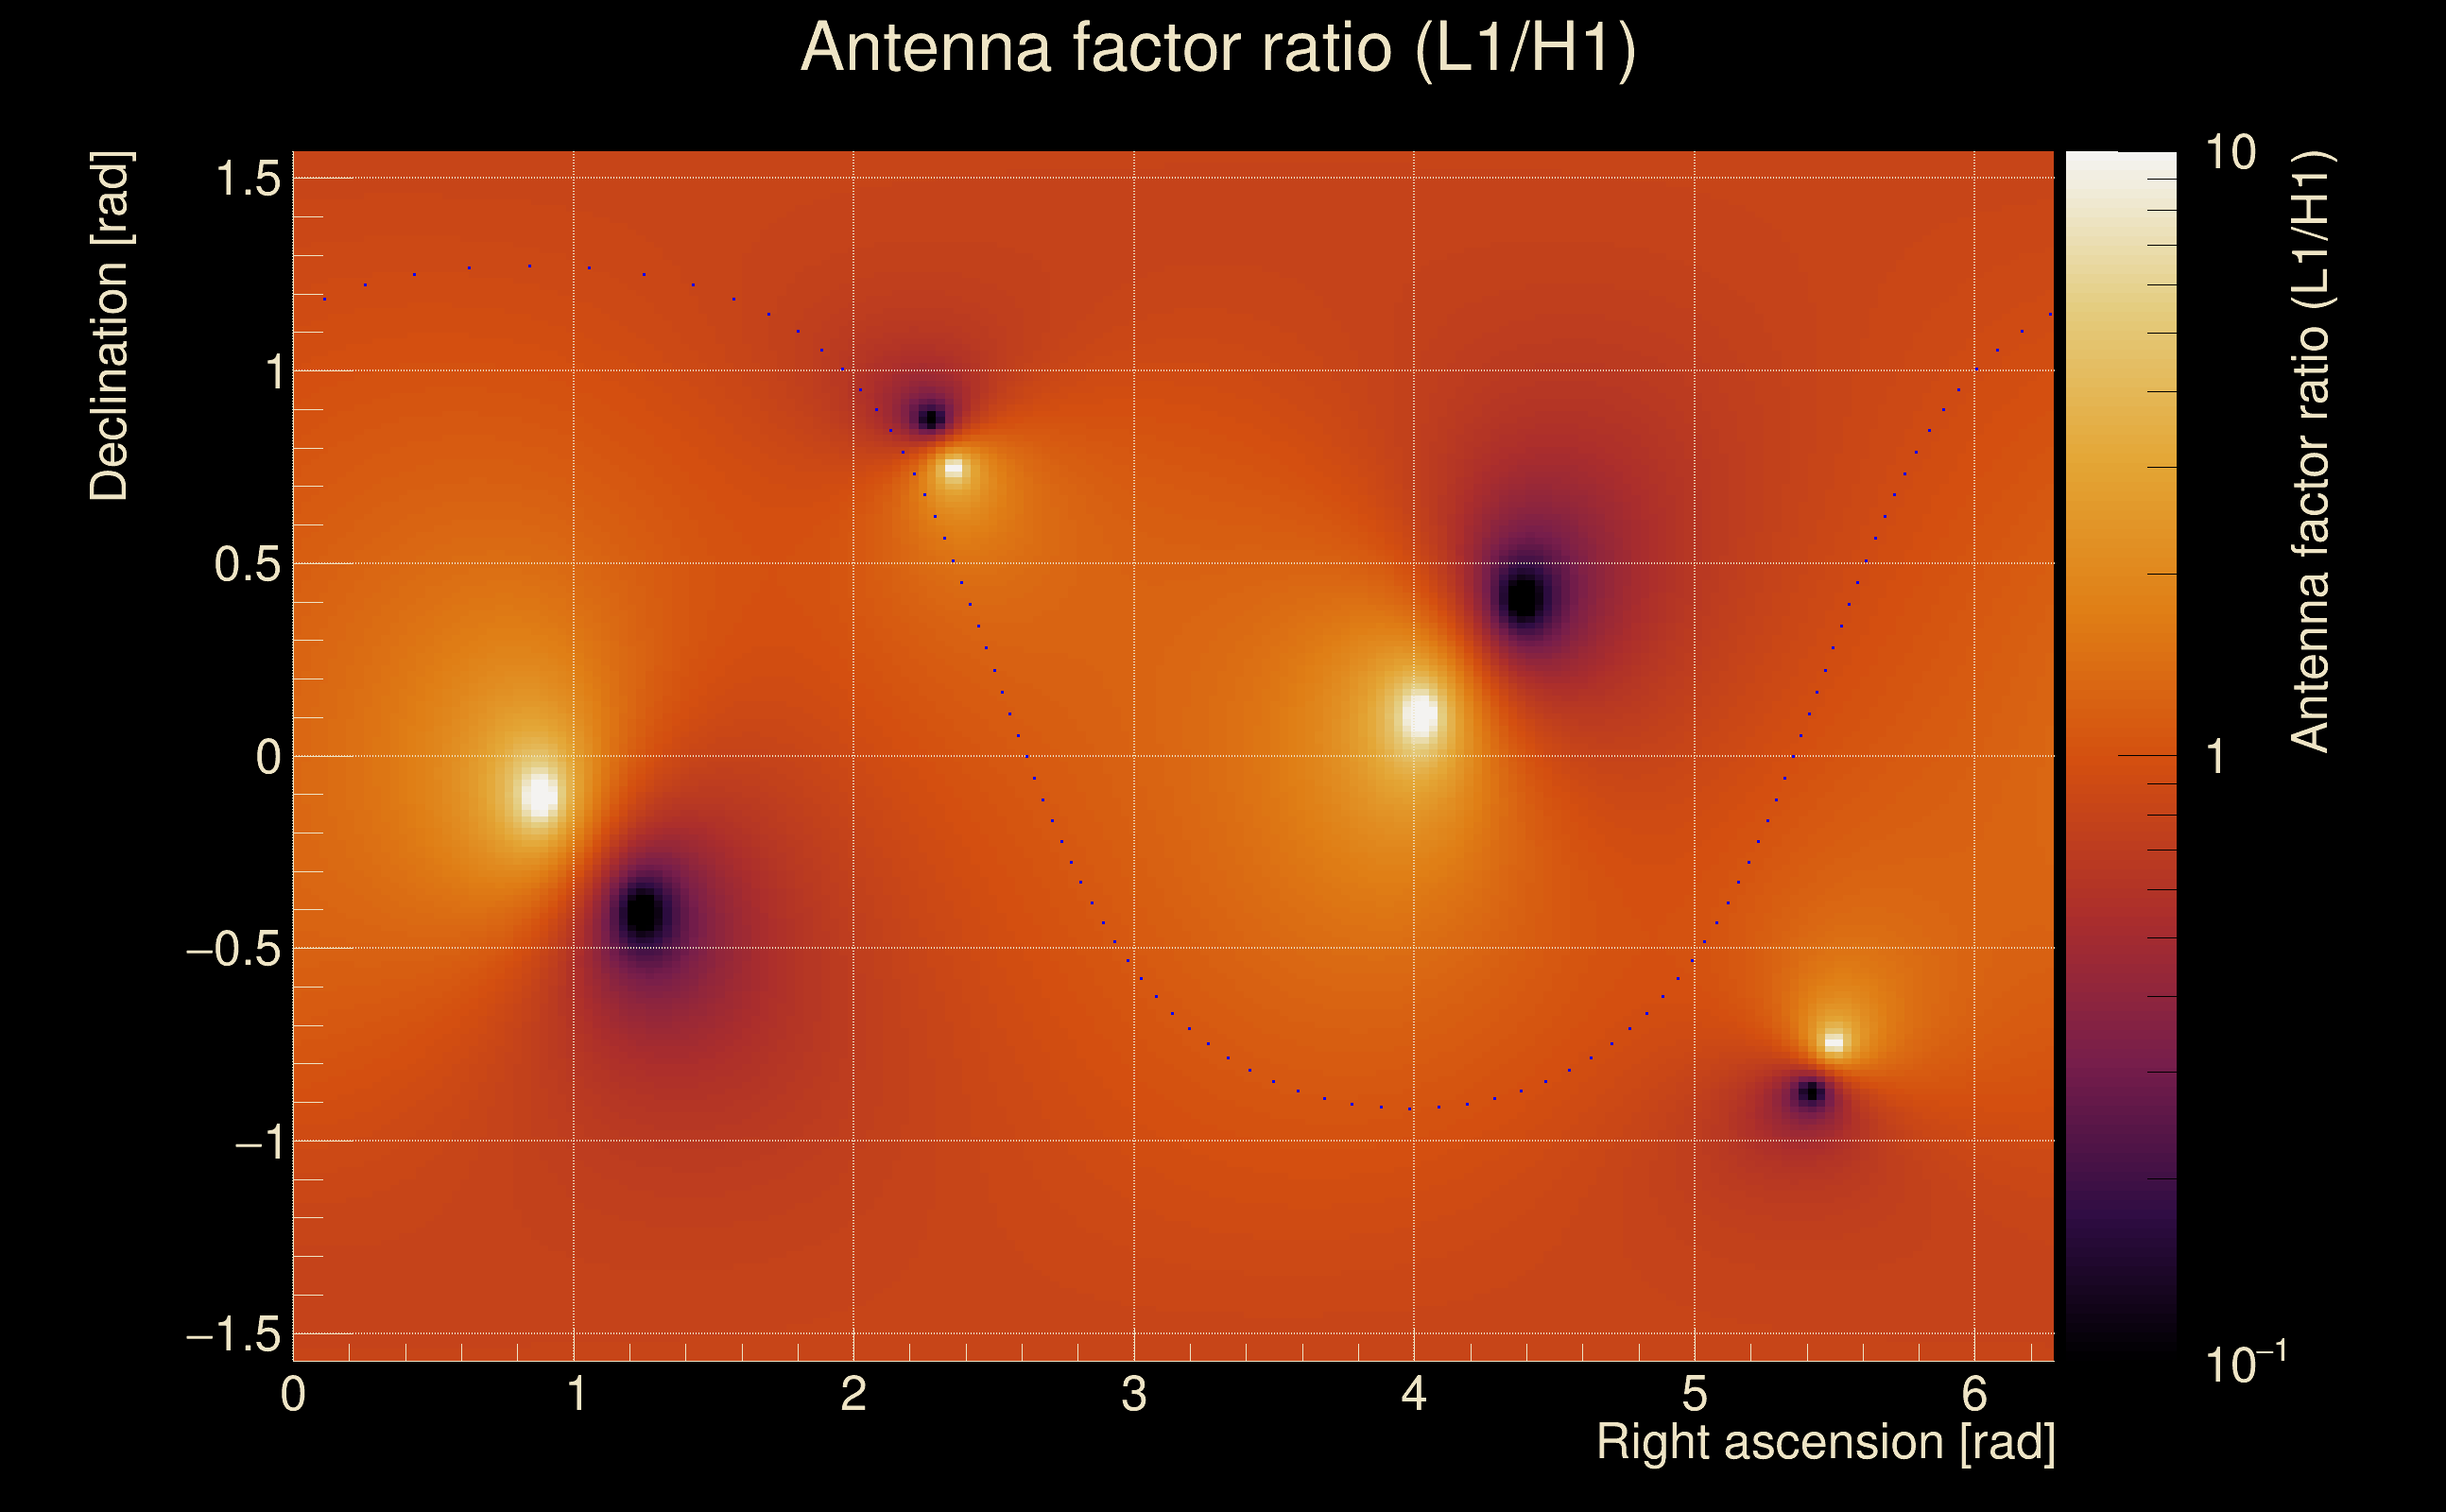
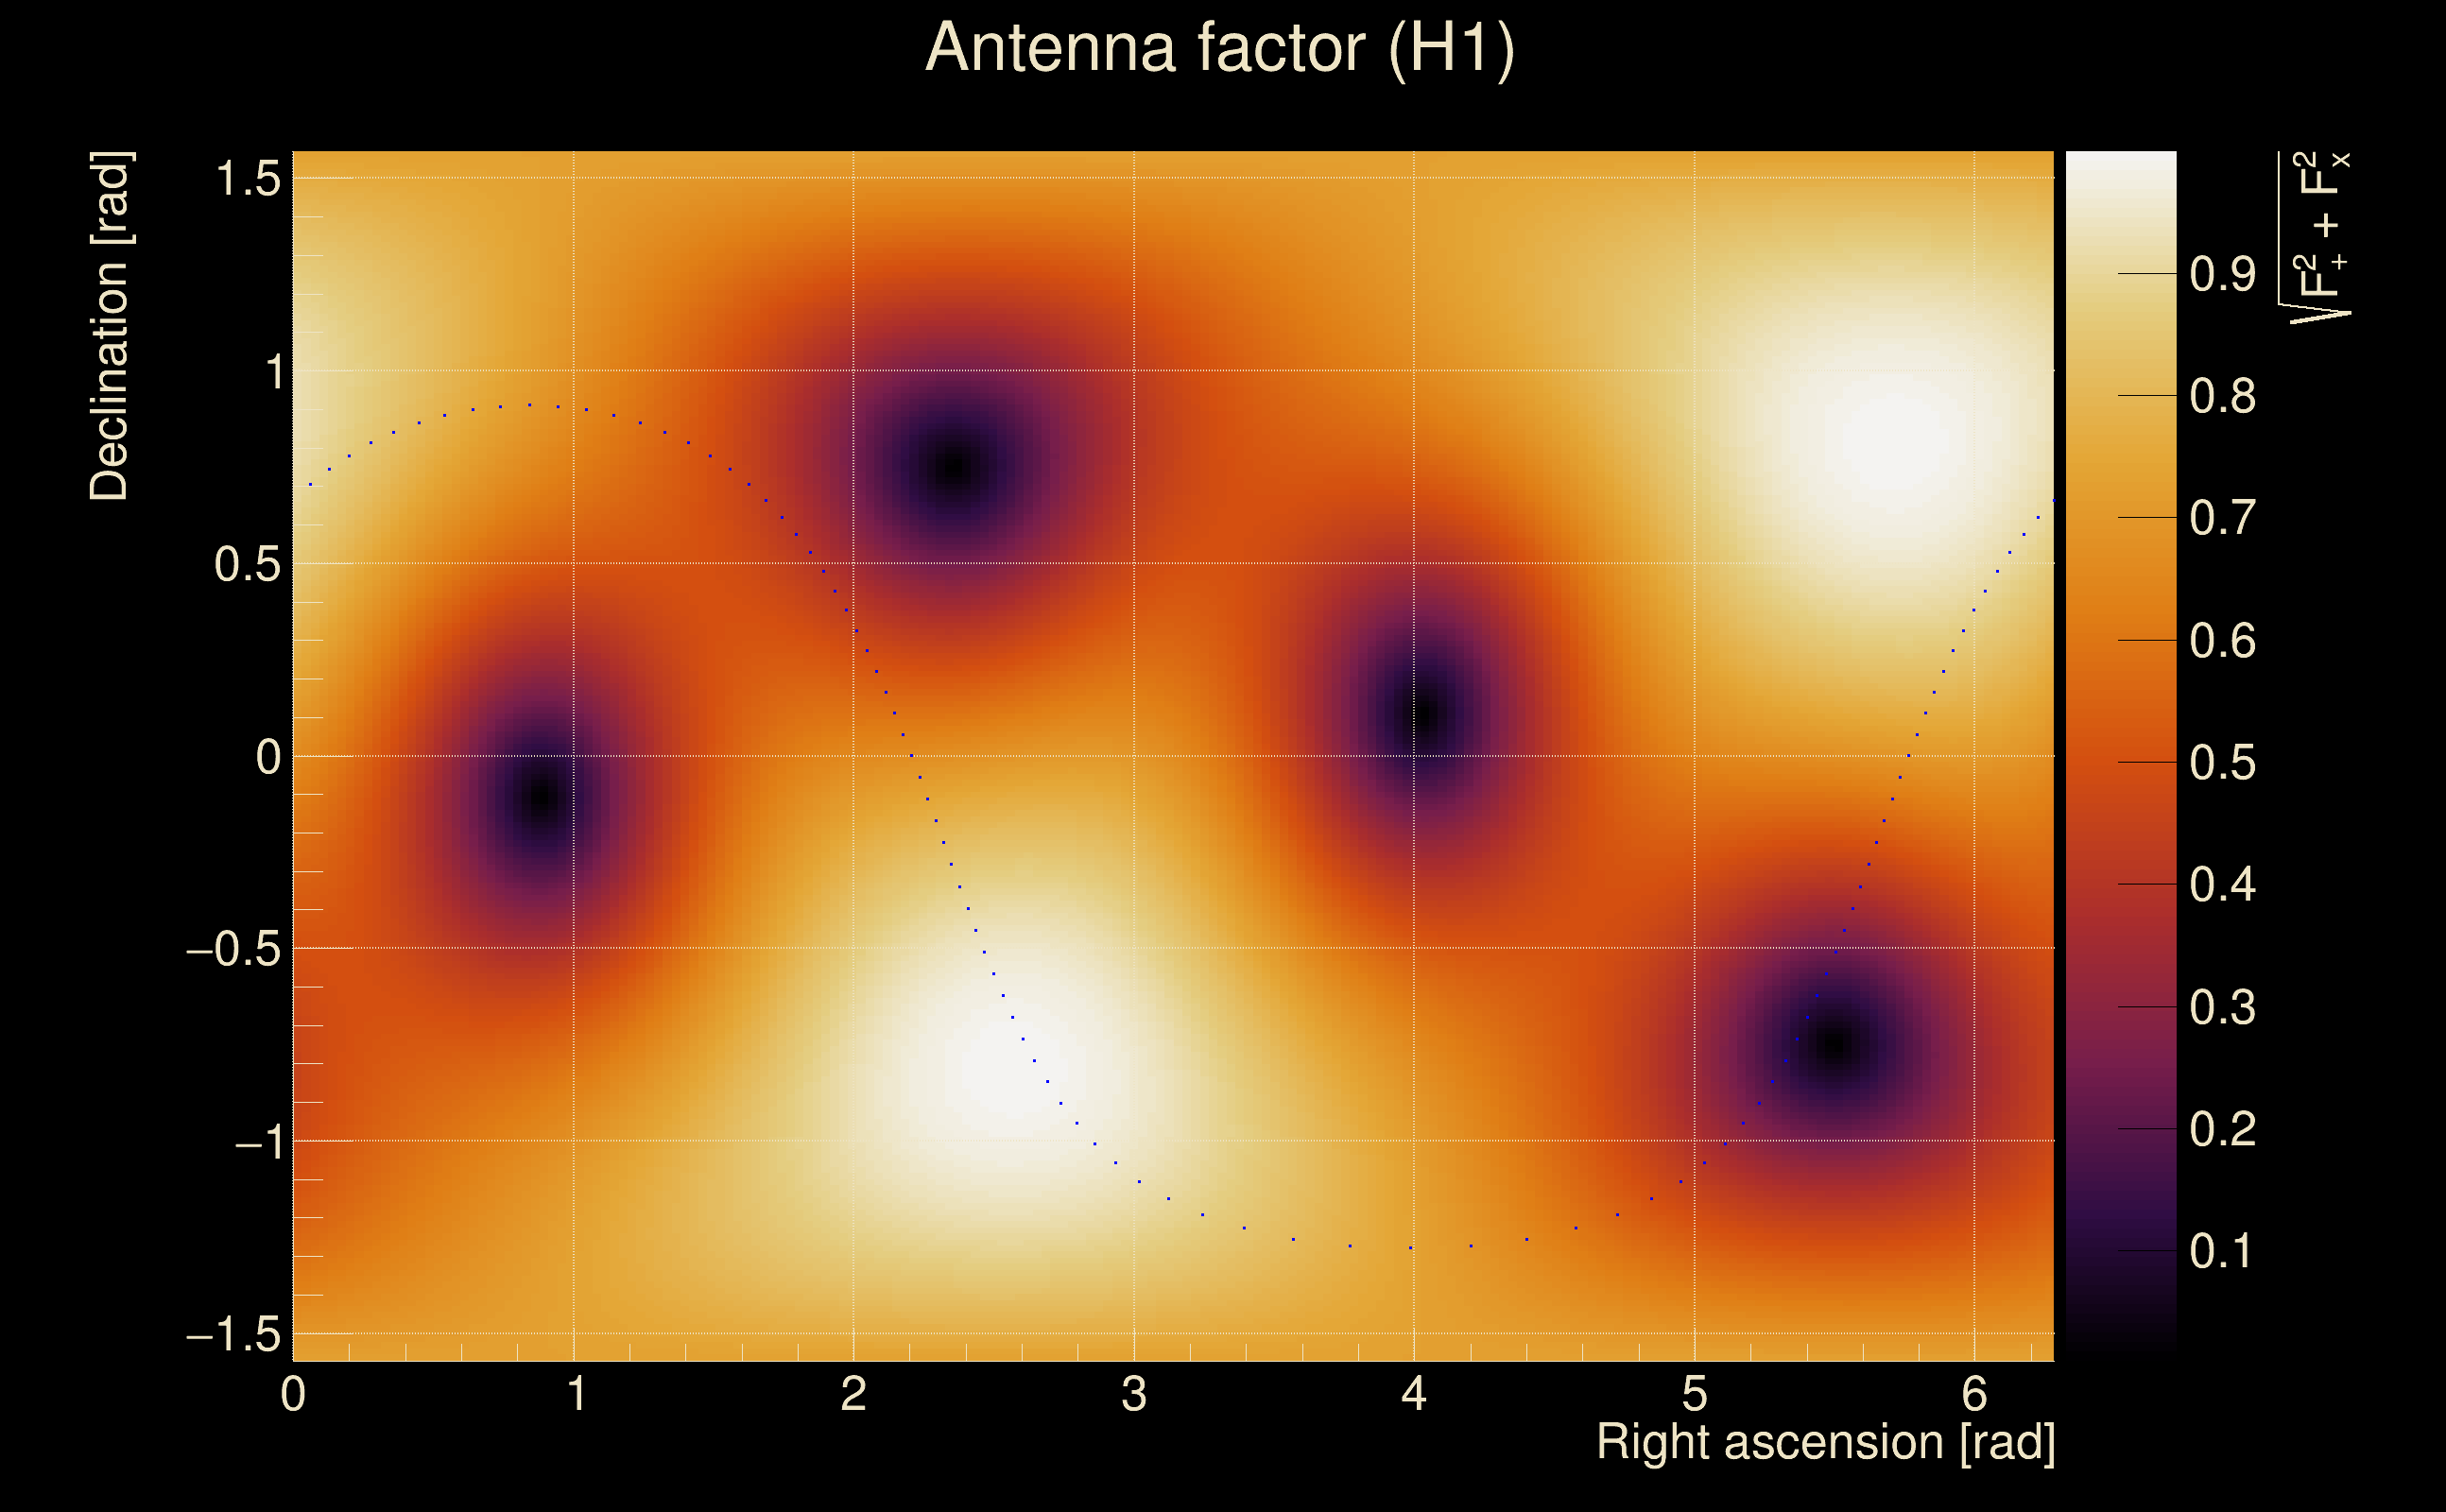
| Target sky positon: | Ra: 3.68109, Dec: 0.94792 [rad] |
| List of input Ox files: | Targeted_O4bw_2min_file_list.txt (1 files) |
| Analysis result file: | Targeted_O4bw_2min_results-0.root |
| Slice selected for the the fakeground: | slice index=41 (3.082 s), time lag = 0 s |
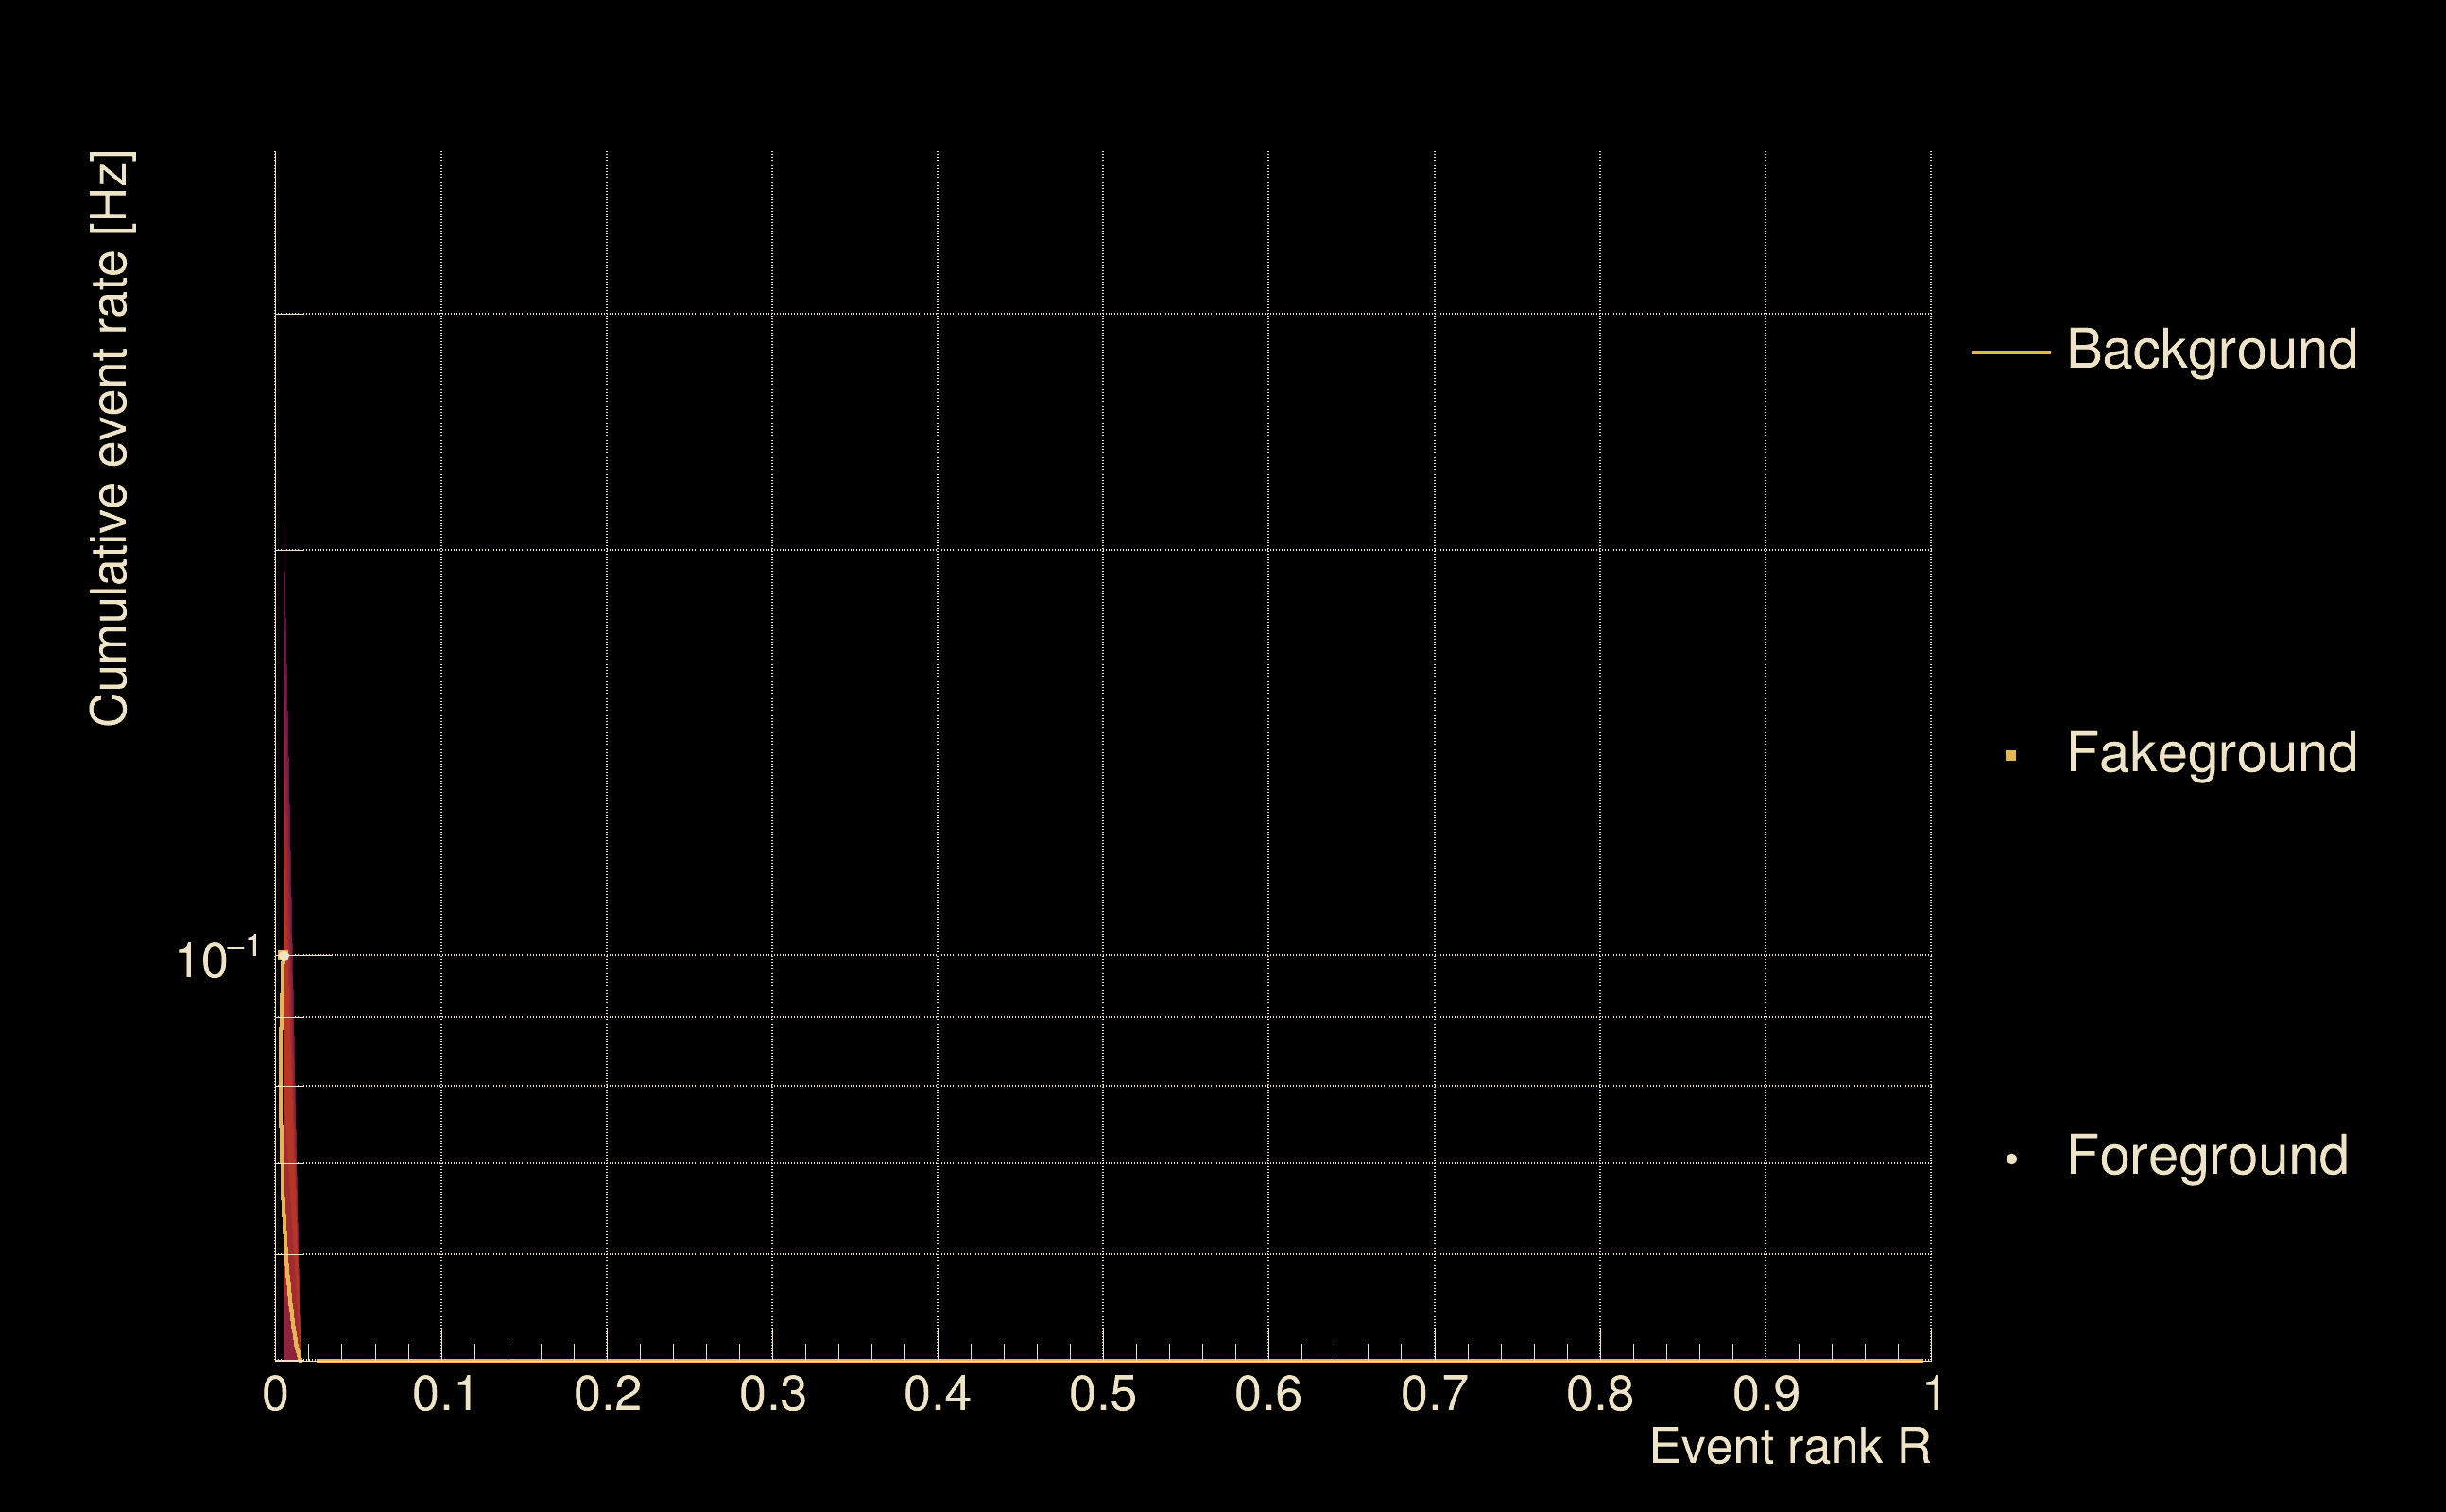
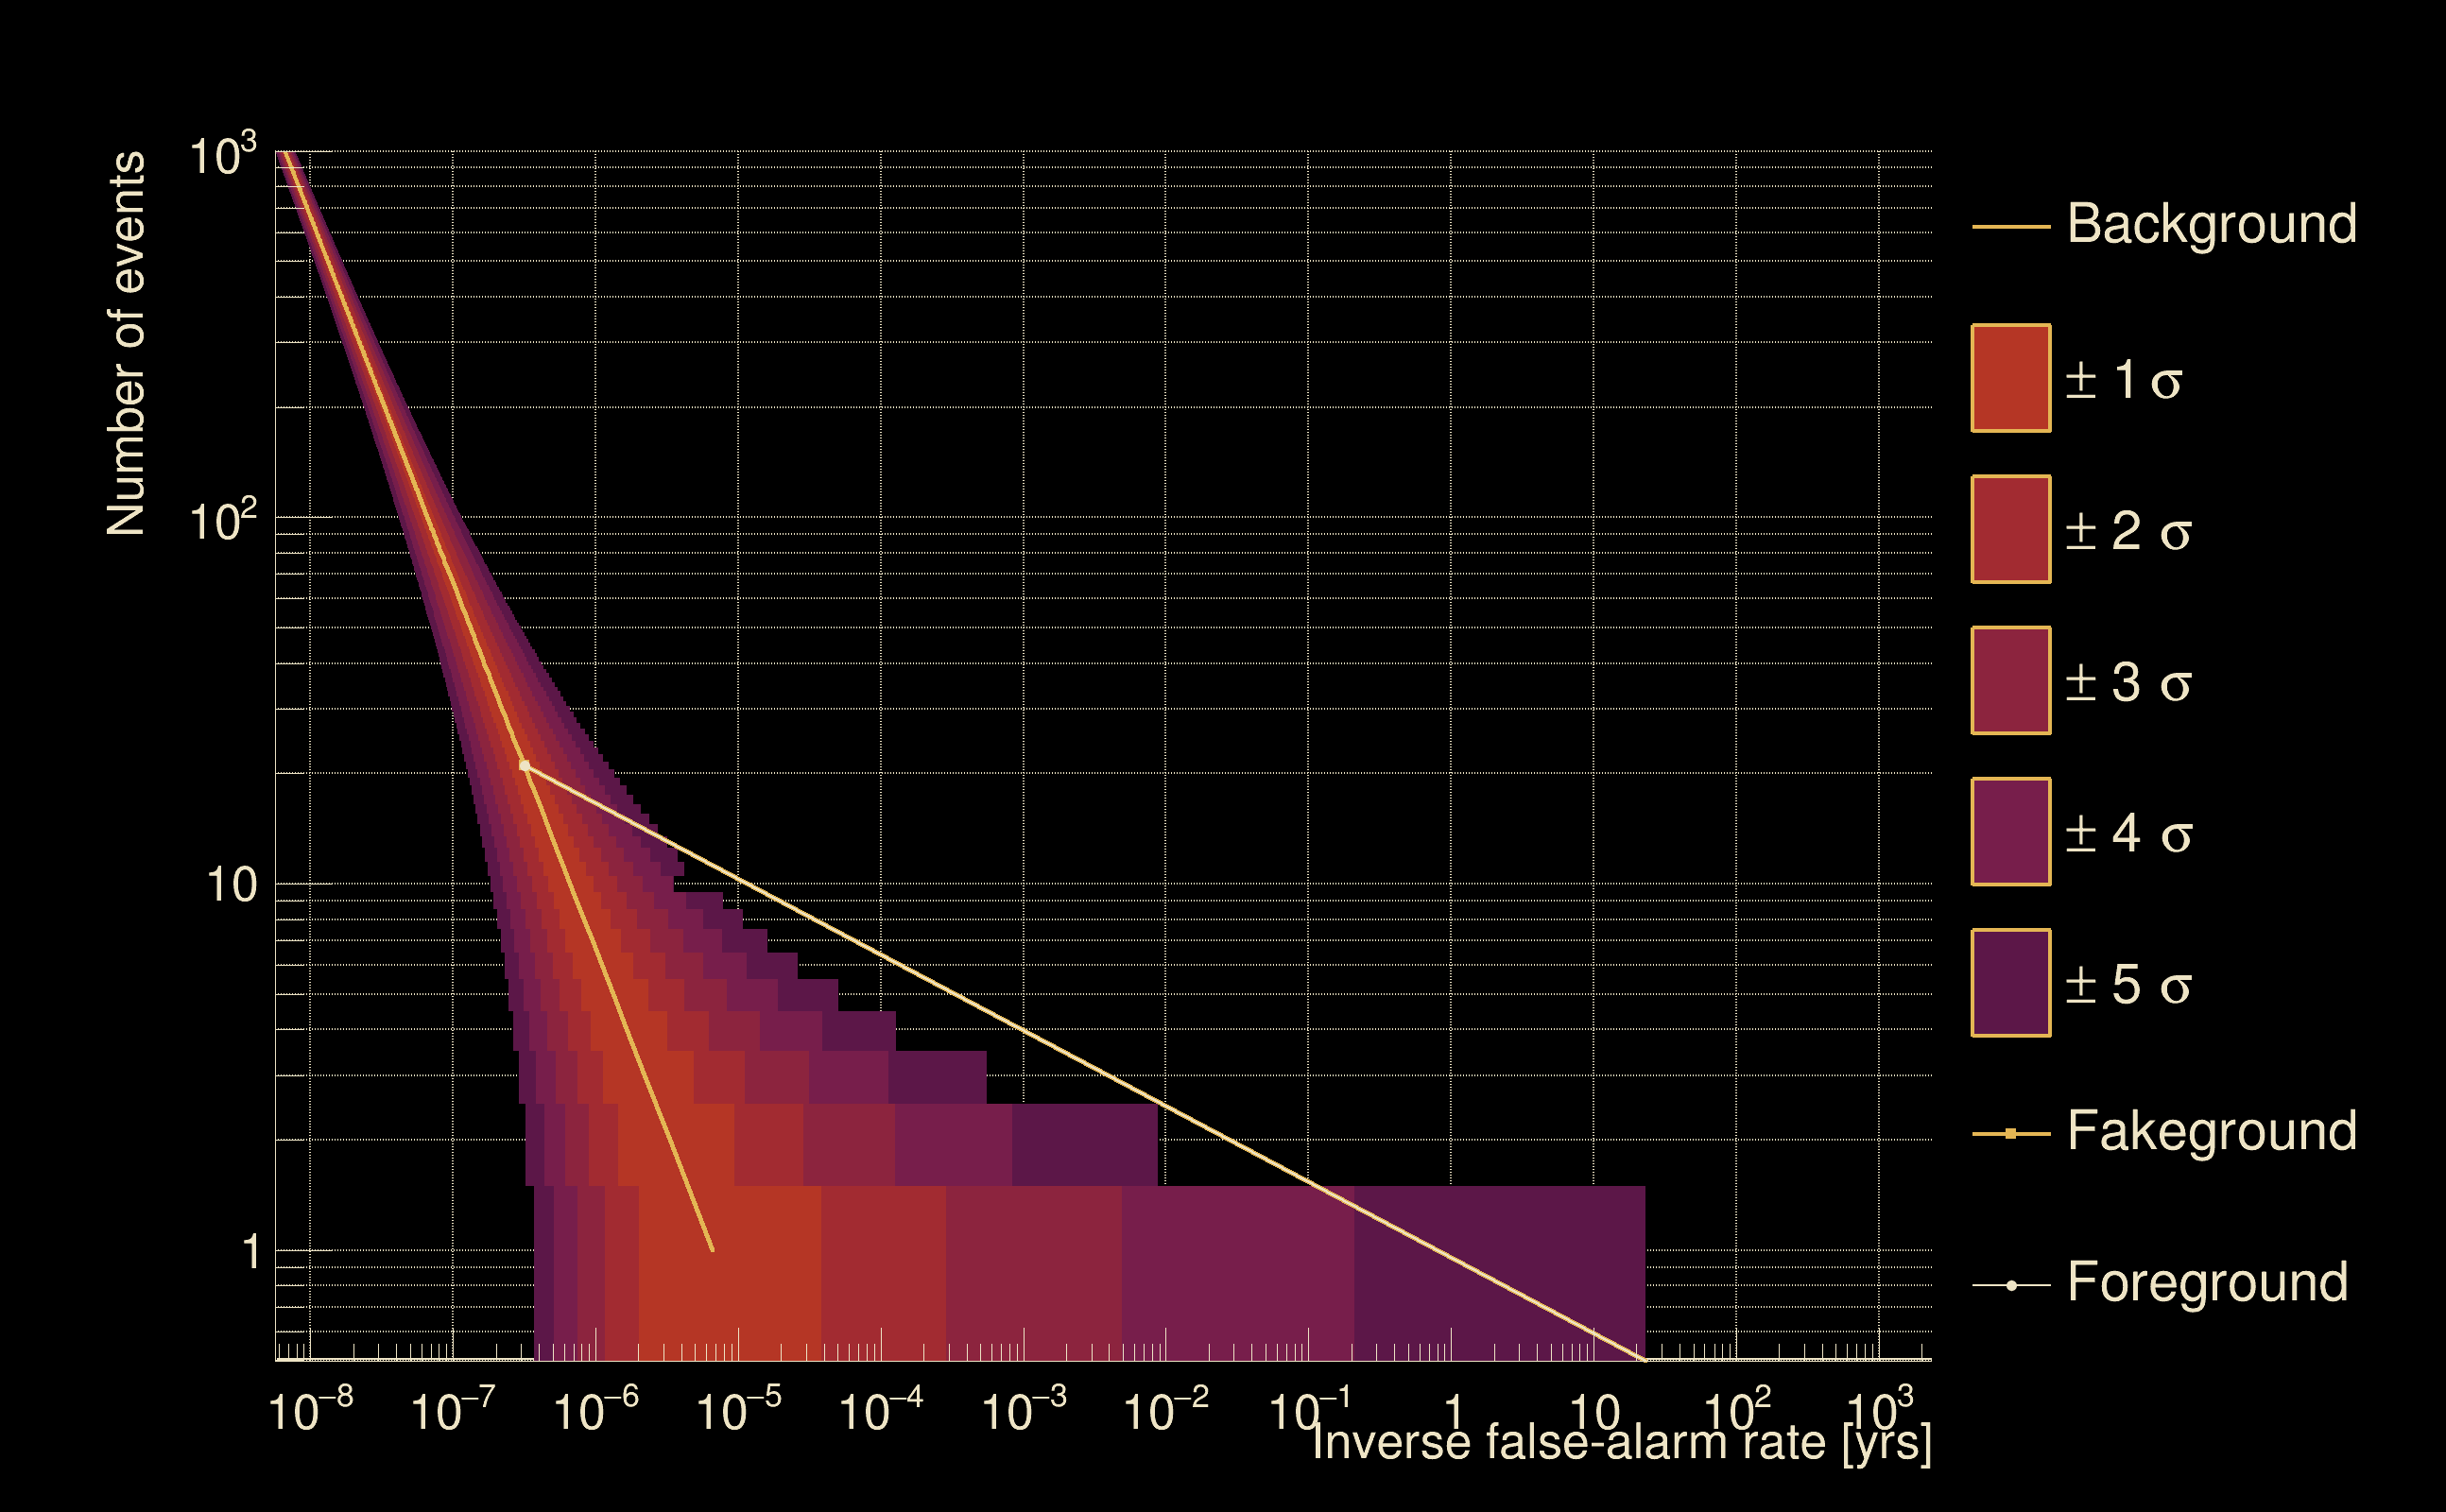
| Foreground | Fakeground | Background | ||
|---|---|---|---|---|
| Number of processed ox events | 21 | 21 | 4515 | |
| Start Date (detector 0) | Mon May 15 14:13:25 2023 UTC | Mon May 15 14:13:25 2023 UTC | Mon May 15 14:13:25 2023 UTC | |
| End Date (detector 0) | Mon May 15 14:15:15 2023 UTC | Mon May 15 14:15:15 2023 UTC | Mon May 15 14:15:15 2023 UTC | |
| Start GPS (detector 0) | 1368195223 | 1368195223 | 1368195223 | |
| End GPS (detector 0) | 1368195333 | 1368195333 | 1368195333 | |
| Used livetime (detector 0) | 110 s | 110 s | 110 s | |
| Start Date (detector 1) | Mon May 15 14:13:25 2023 UTC | Mon May 15 14:13:25 2023 UTC | Mon May 15 14:13:25 2023 UTC | |
| End Date (detector 1) | Mon May 15 14:15:15 2023 UTC | Mon May 15 14:15:15 2023 UTC | Mon May 15 14:15:15 2023 UTC | |
| Start GPS (detector 1) | 1368195223 | 1368195223 | 1368195223 | |
| End GPS (detector 1) | 1368195333 | 1368195333 | 1368195333 | |
| Used livetime (detector 1) | 110 s | 110 s | 110 s | |
| Cumulative livetime | 210 s | 210 s | 45150 s | |
| 0 years, 0 days, 0 hours, 3 min, 30 s | 0 years, 0 days, 0 hours, 3 min, 30 s | 0 years, 0 days, 12 hours, 32 min, 30 s |
|
|
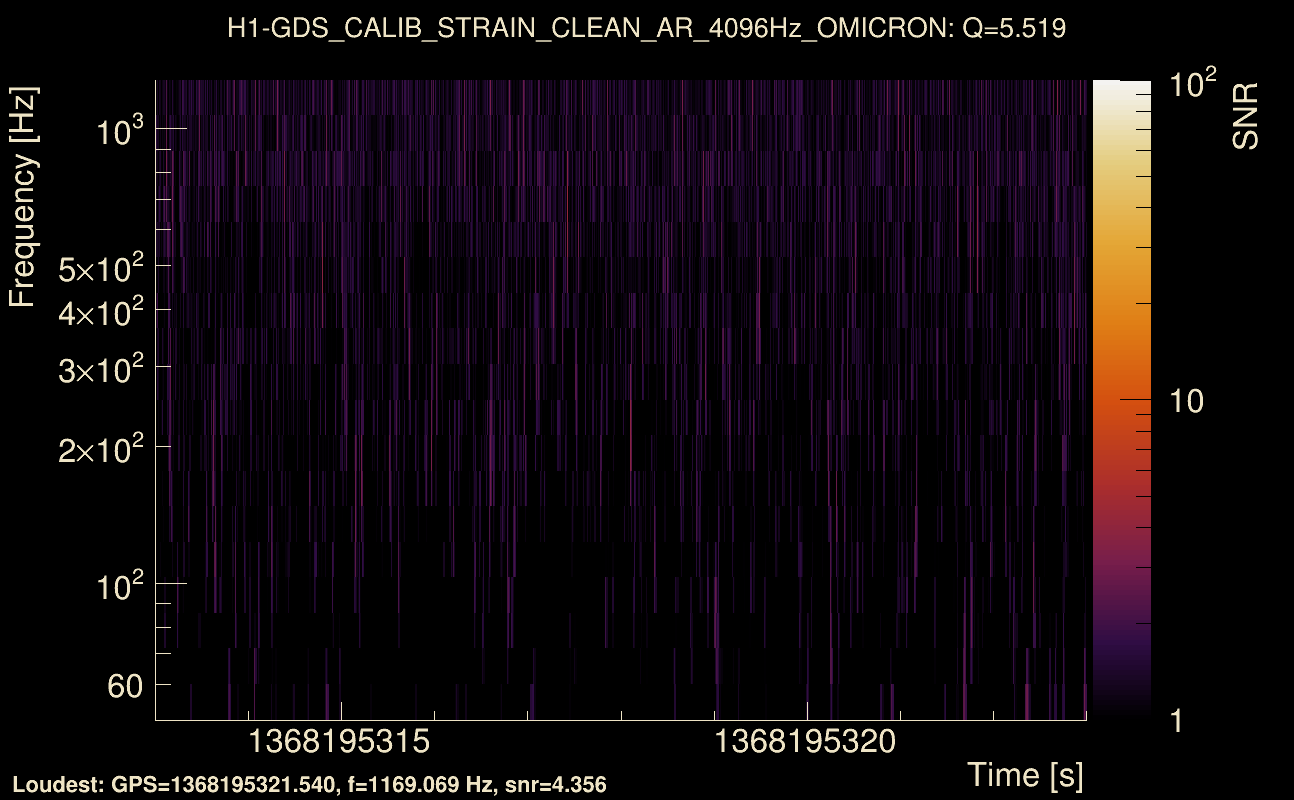
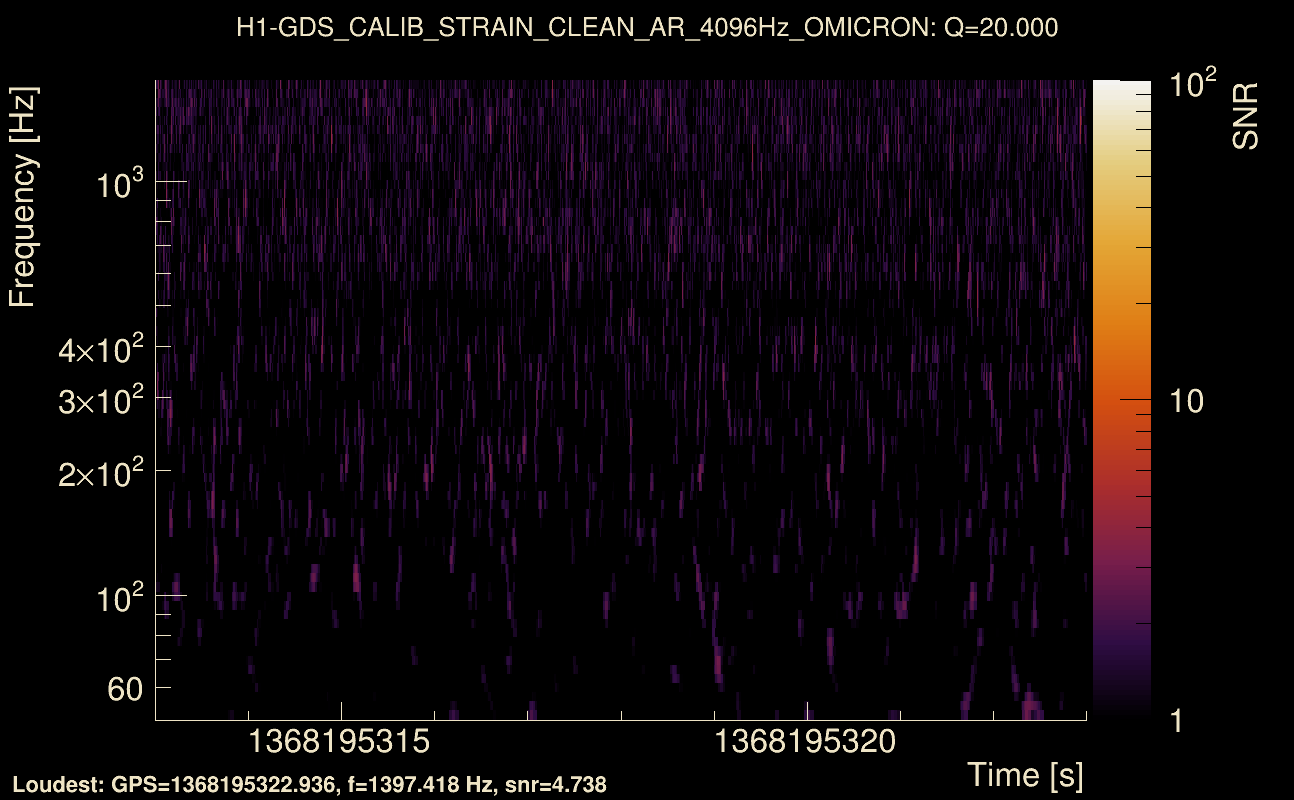
| Event time t(H1): | GPS = 1368195318 (Mon May 15 14:15:00 2023 ) → GPS = 1368195328 (Mon May 15 14:15:10 2023 ) |
| Event time t(L1): | GPS = 1368195318 (Mon May 15 14:15:10 2023 ) → GPS = 1368195328 (Mon May 15 14:15:10 2023 ) |
| Omicron analysis time window (H1): | GPS = 1368195315 → GPS = 1368195331 |
| Omicron analysis time window (L1): | GPS = 1368195315 → GPS = 1368195331 |
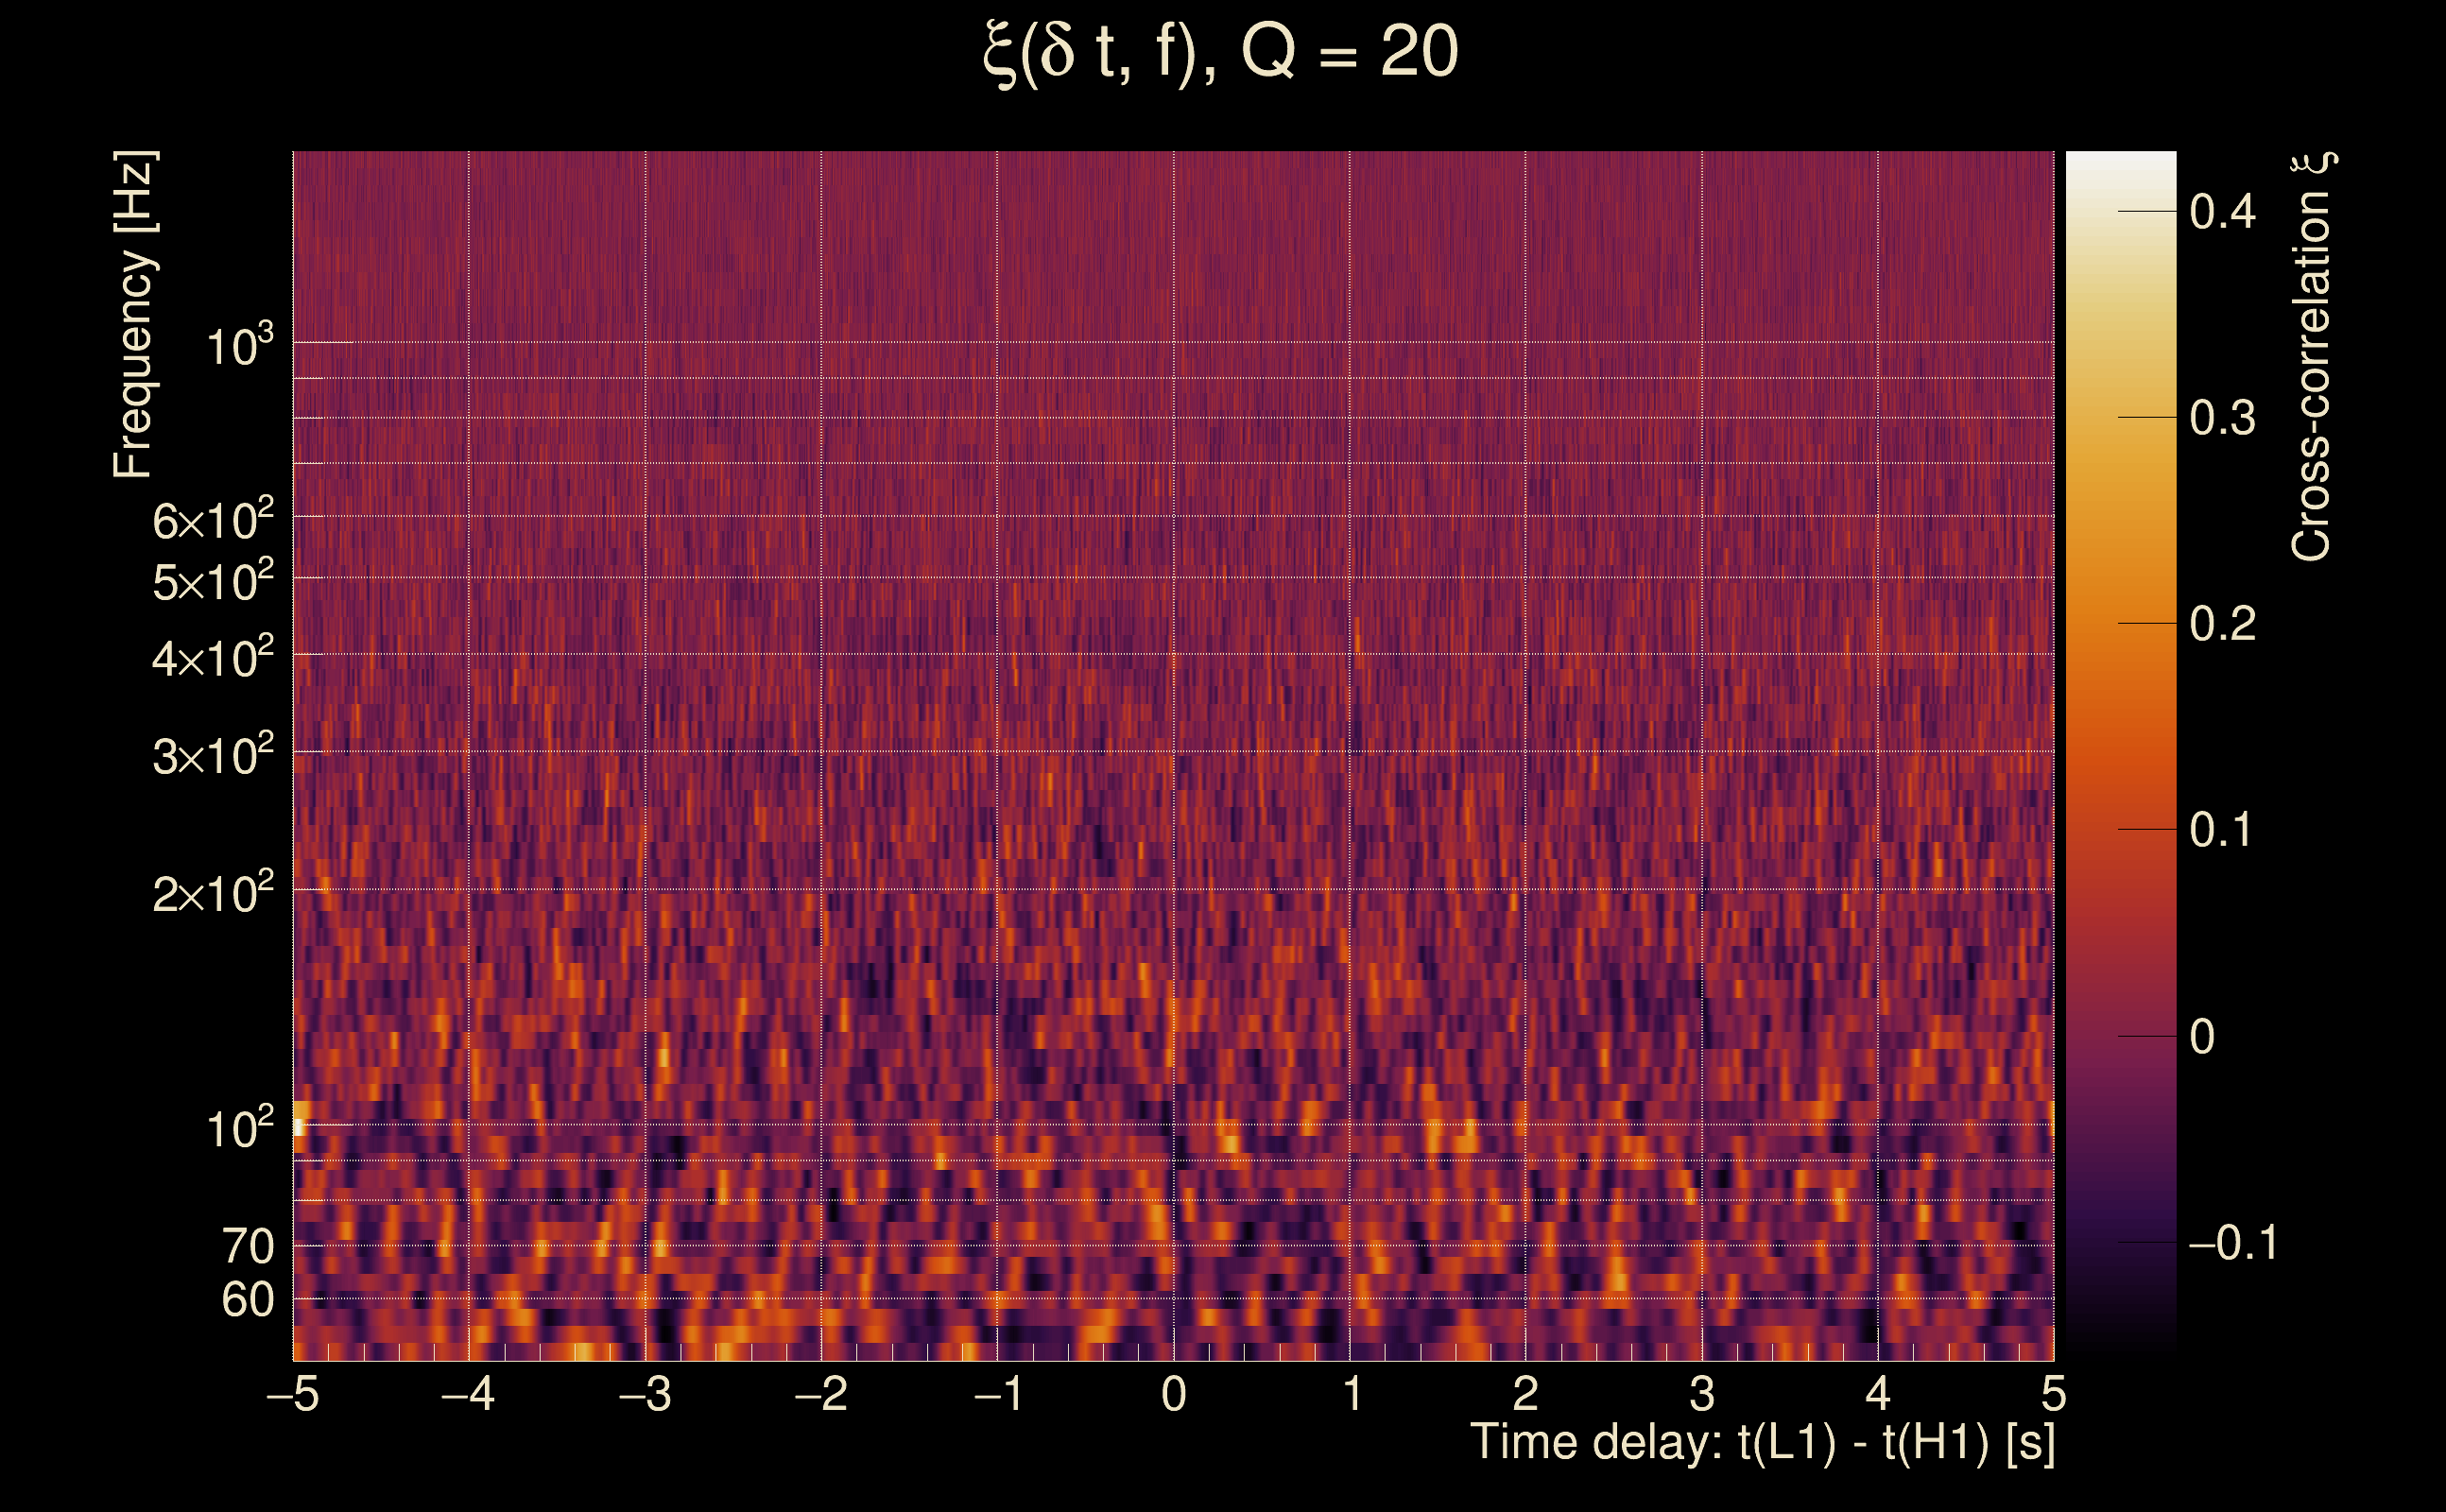
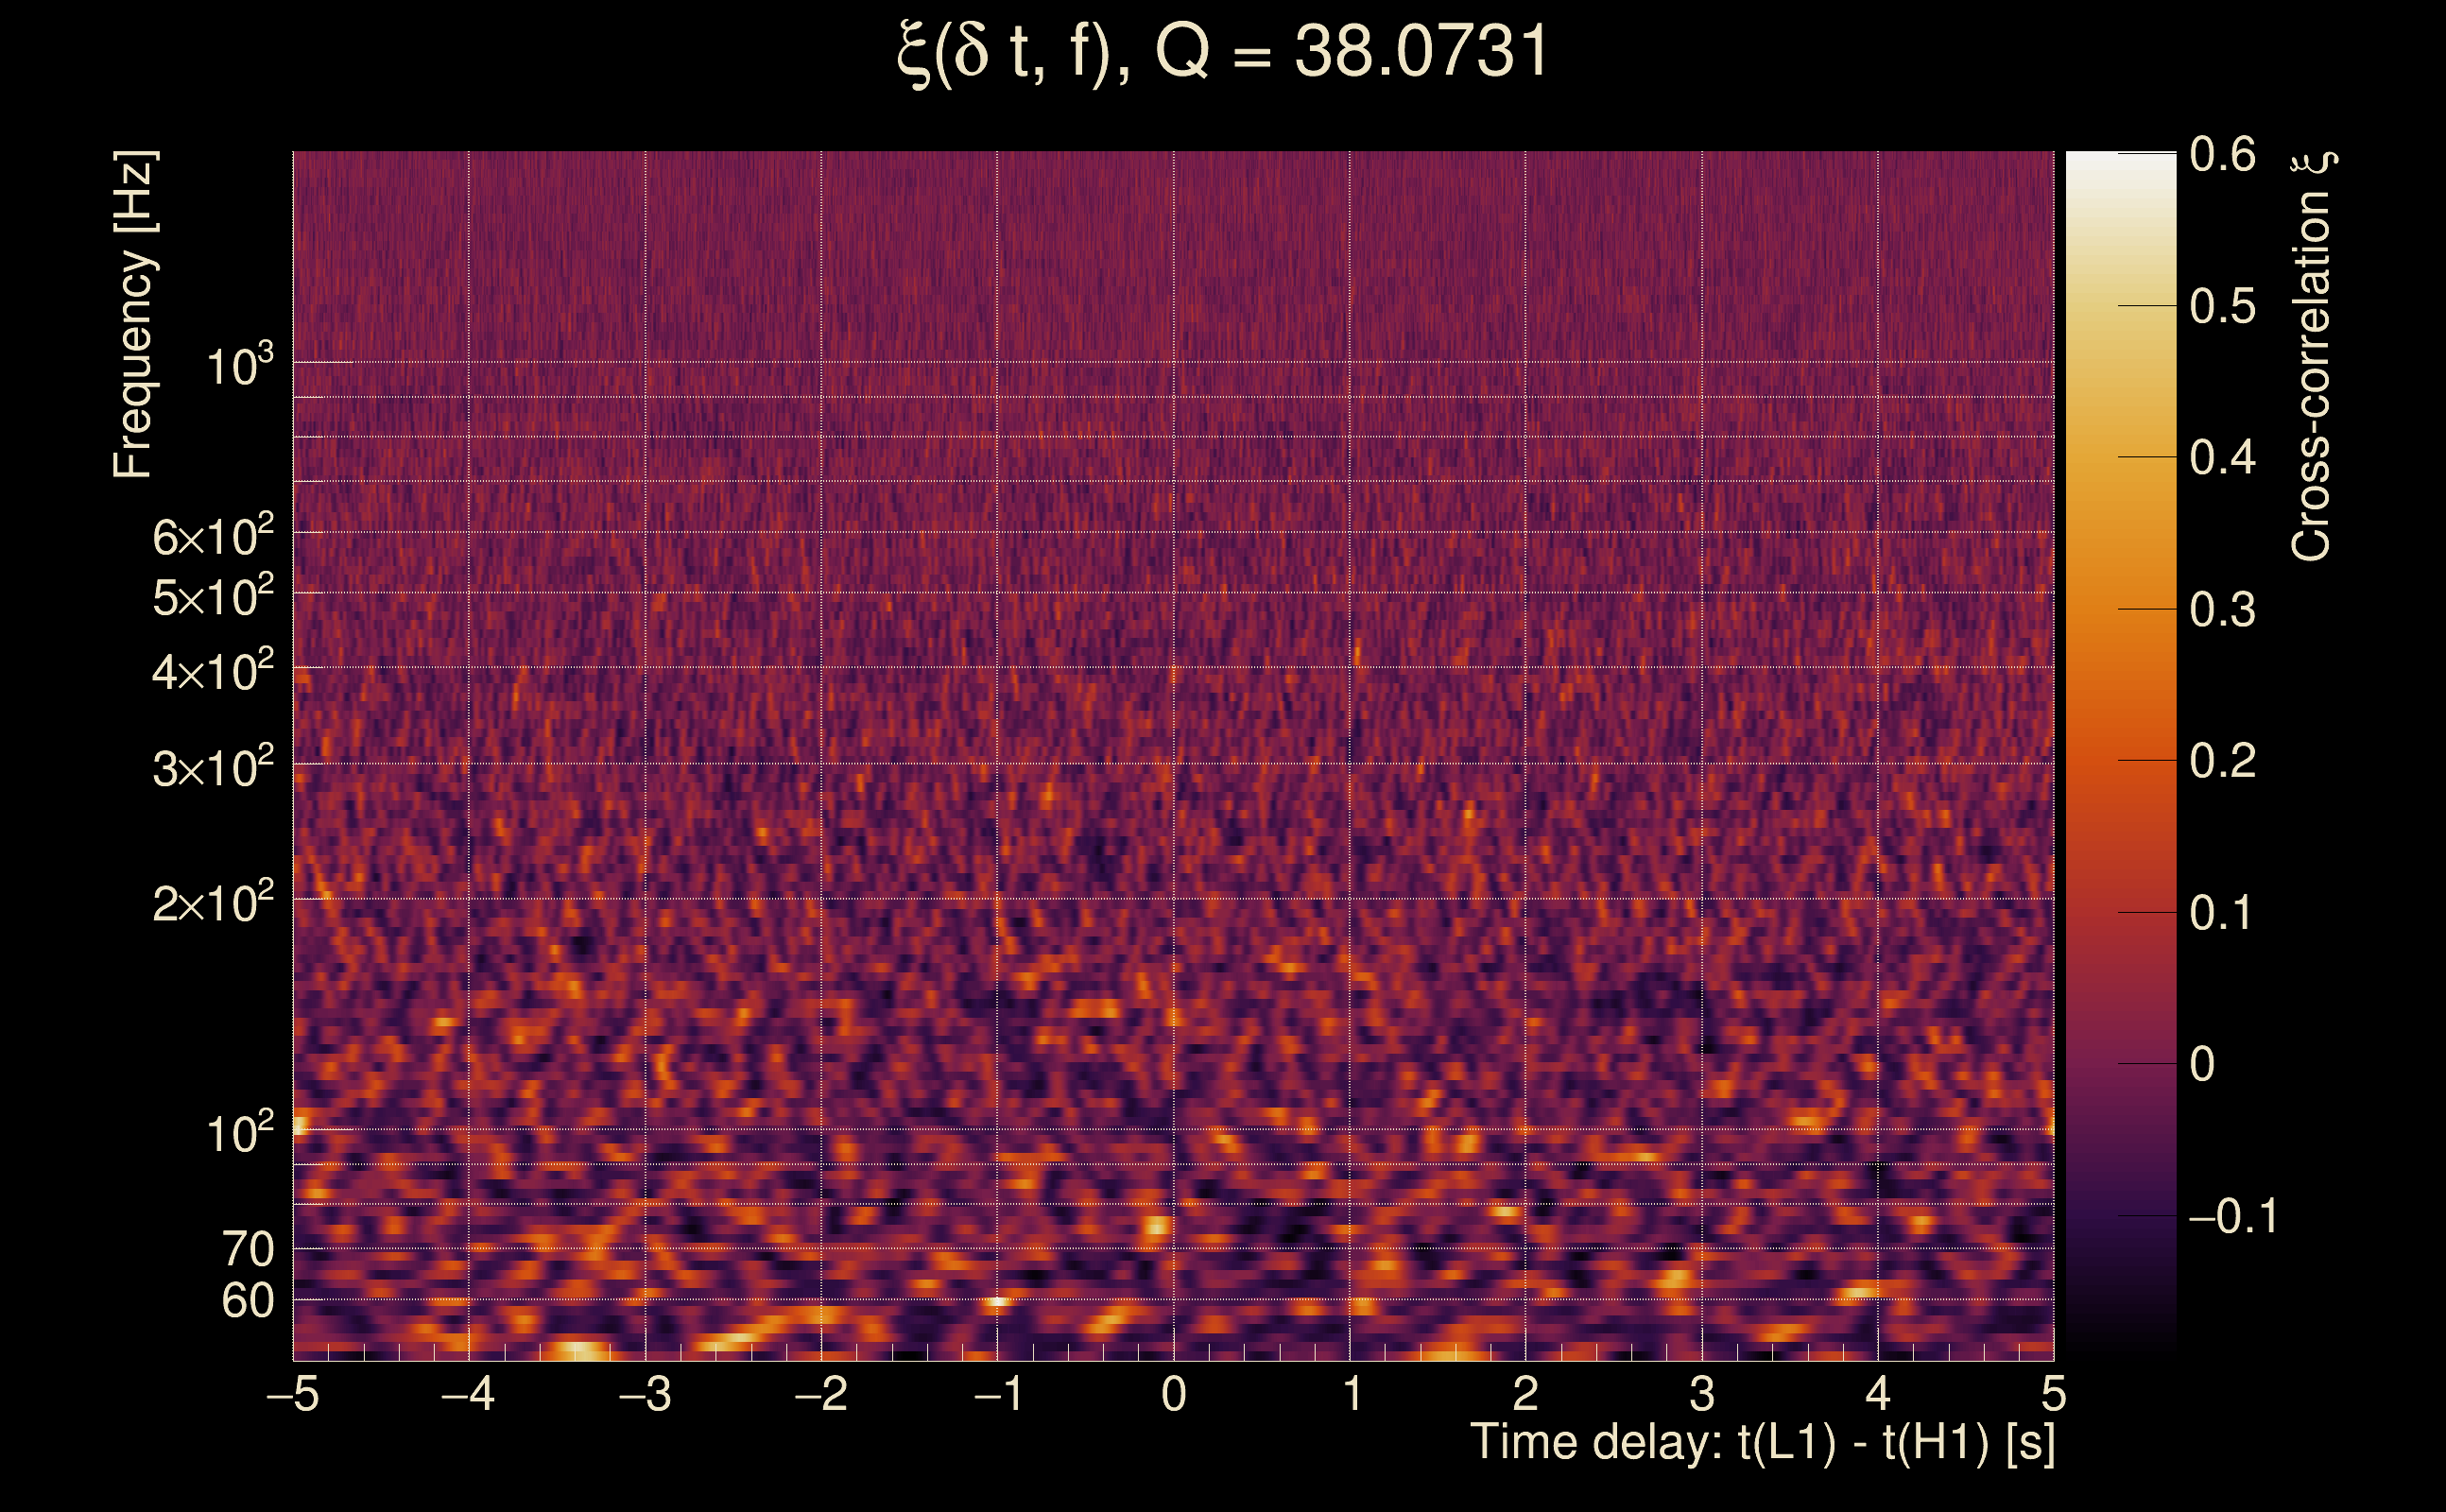
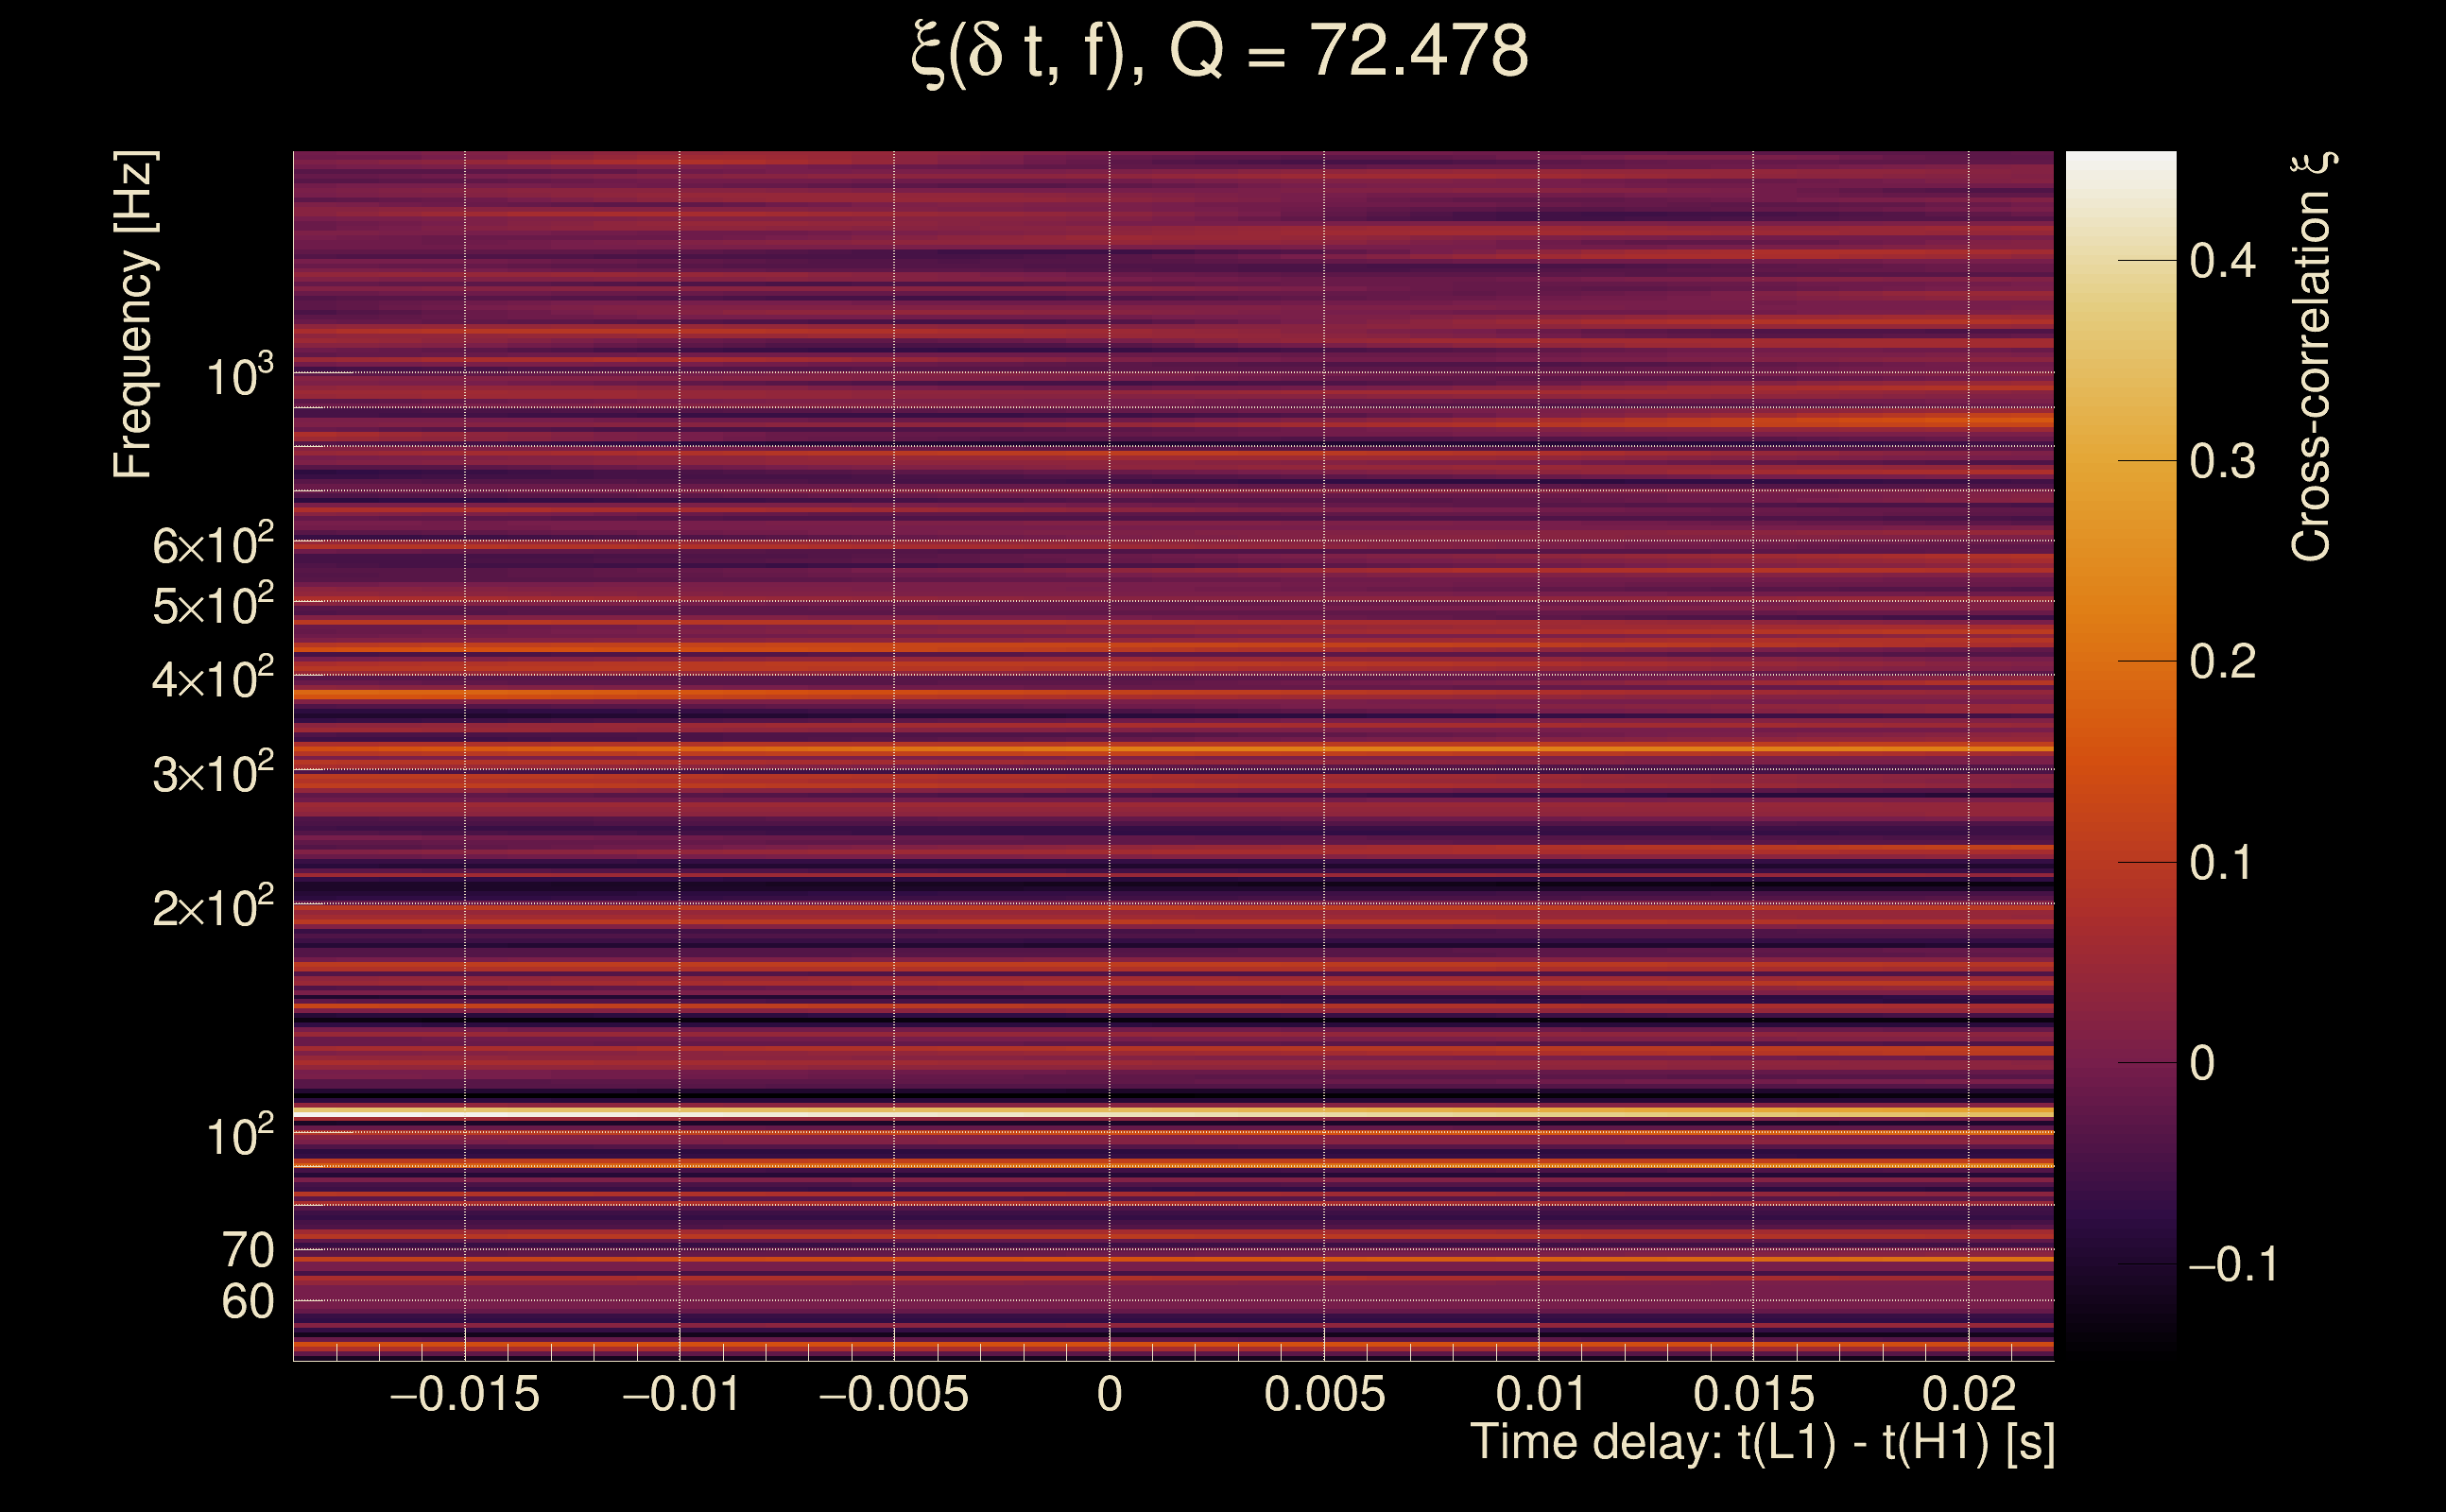
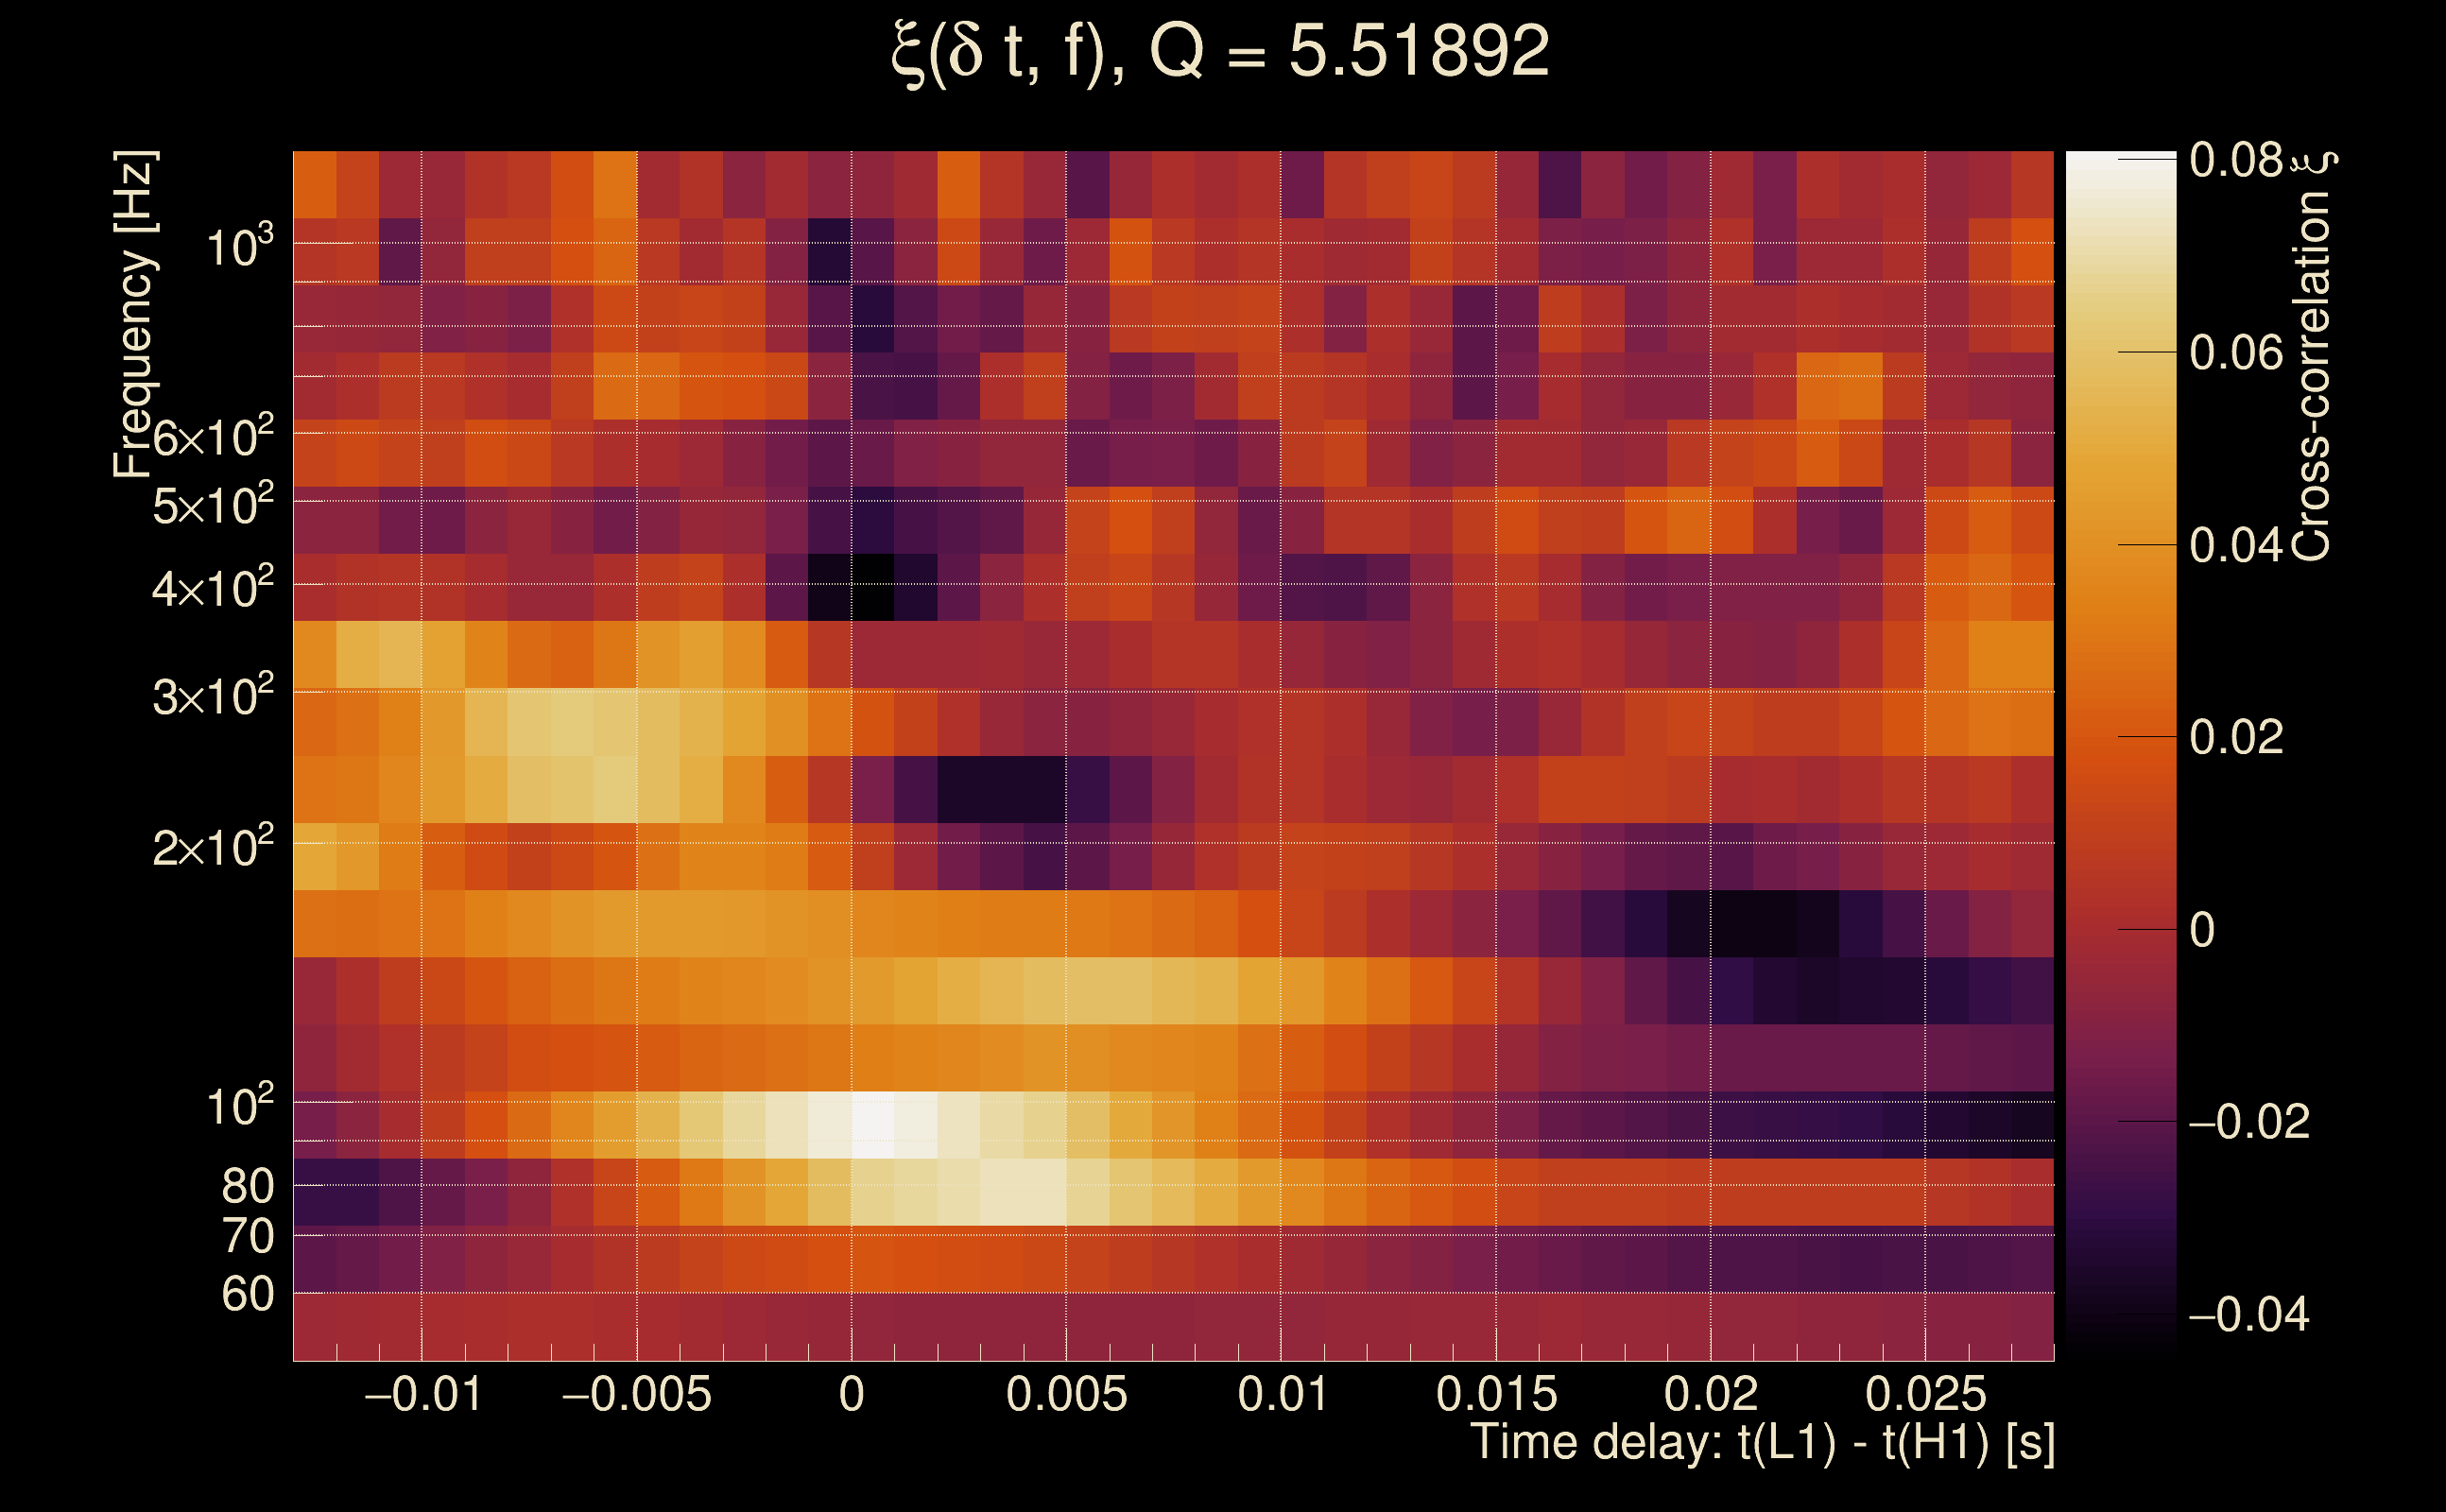
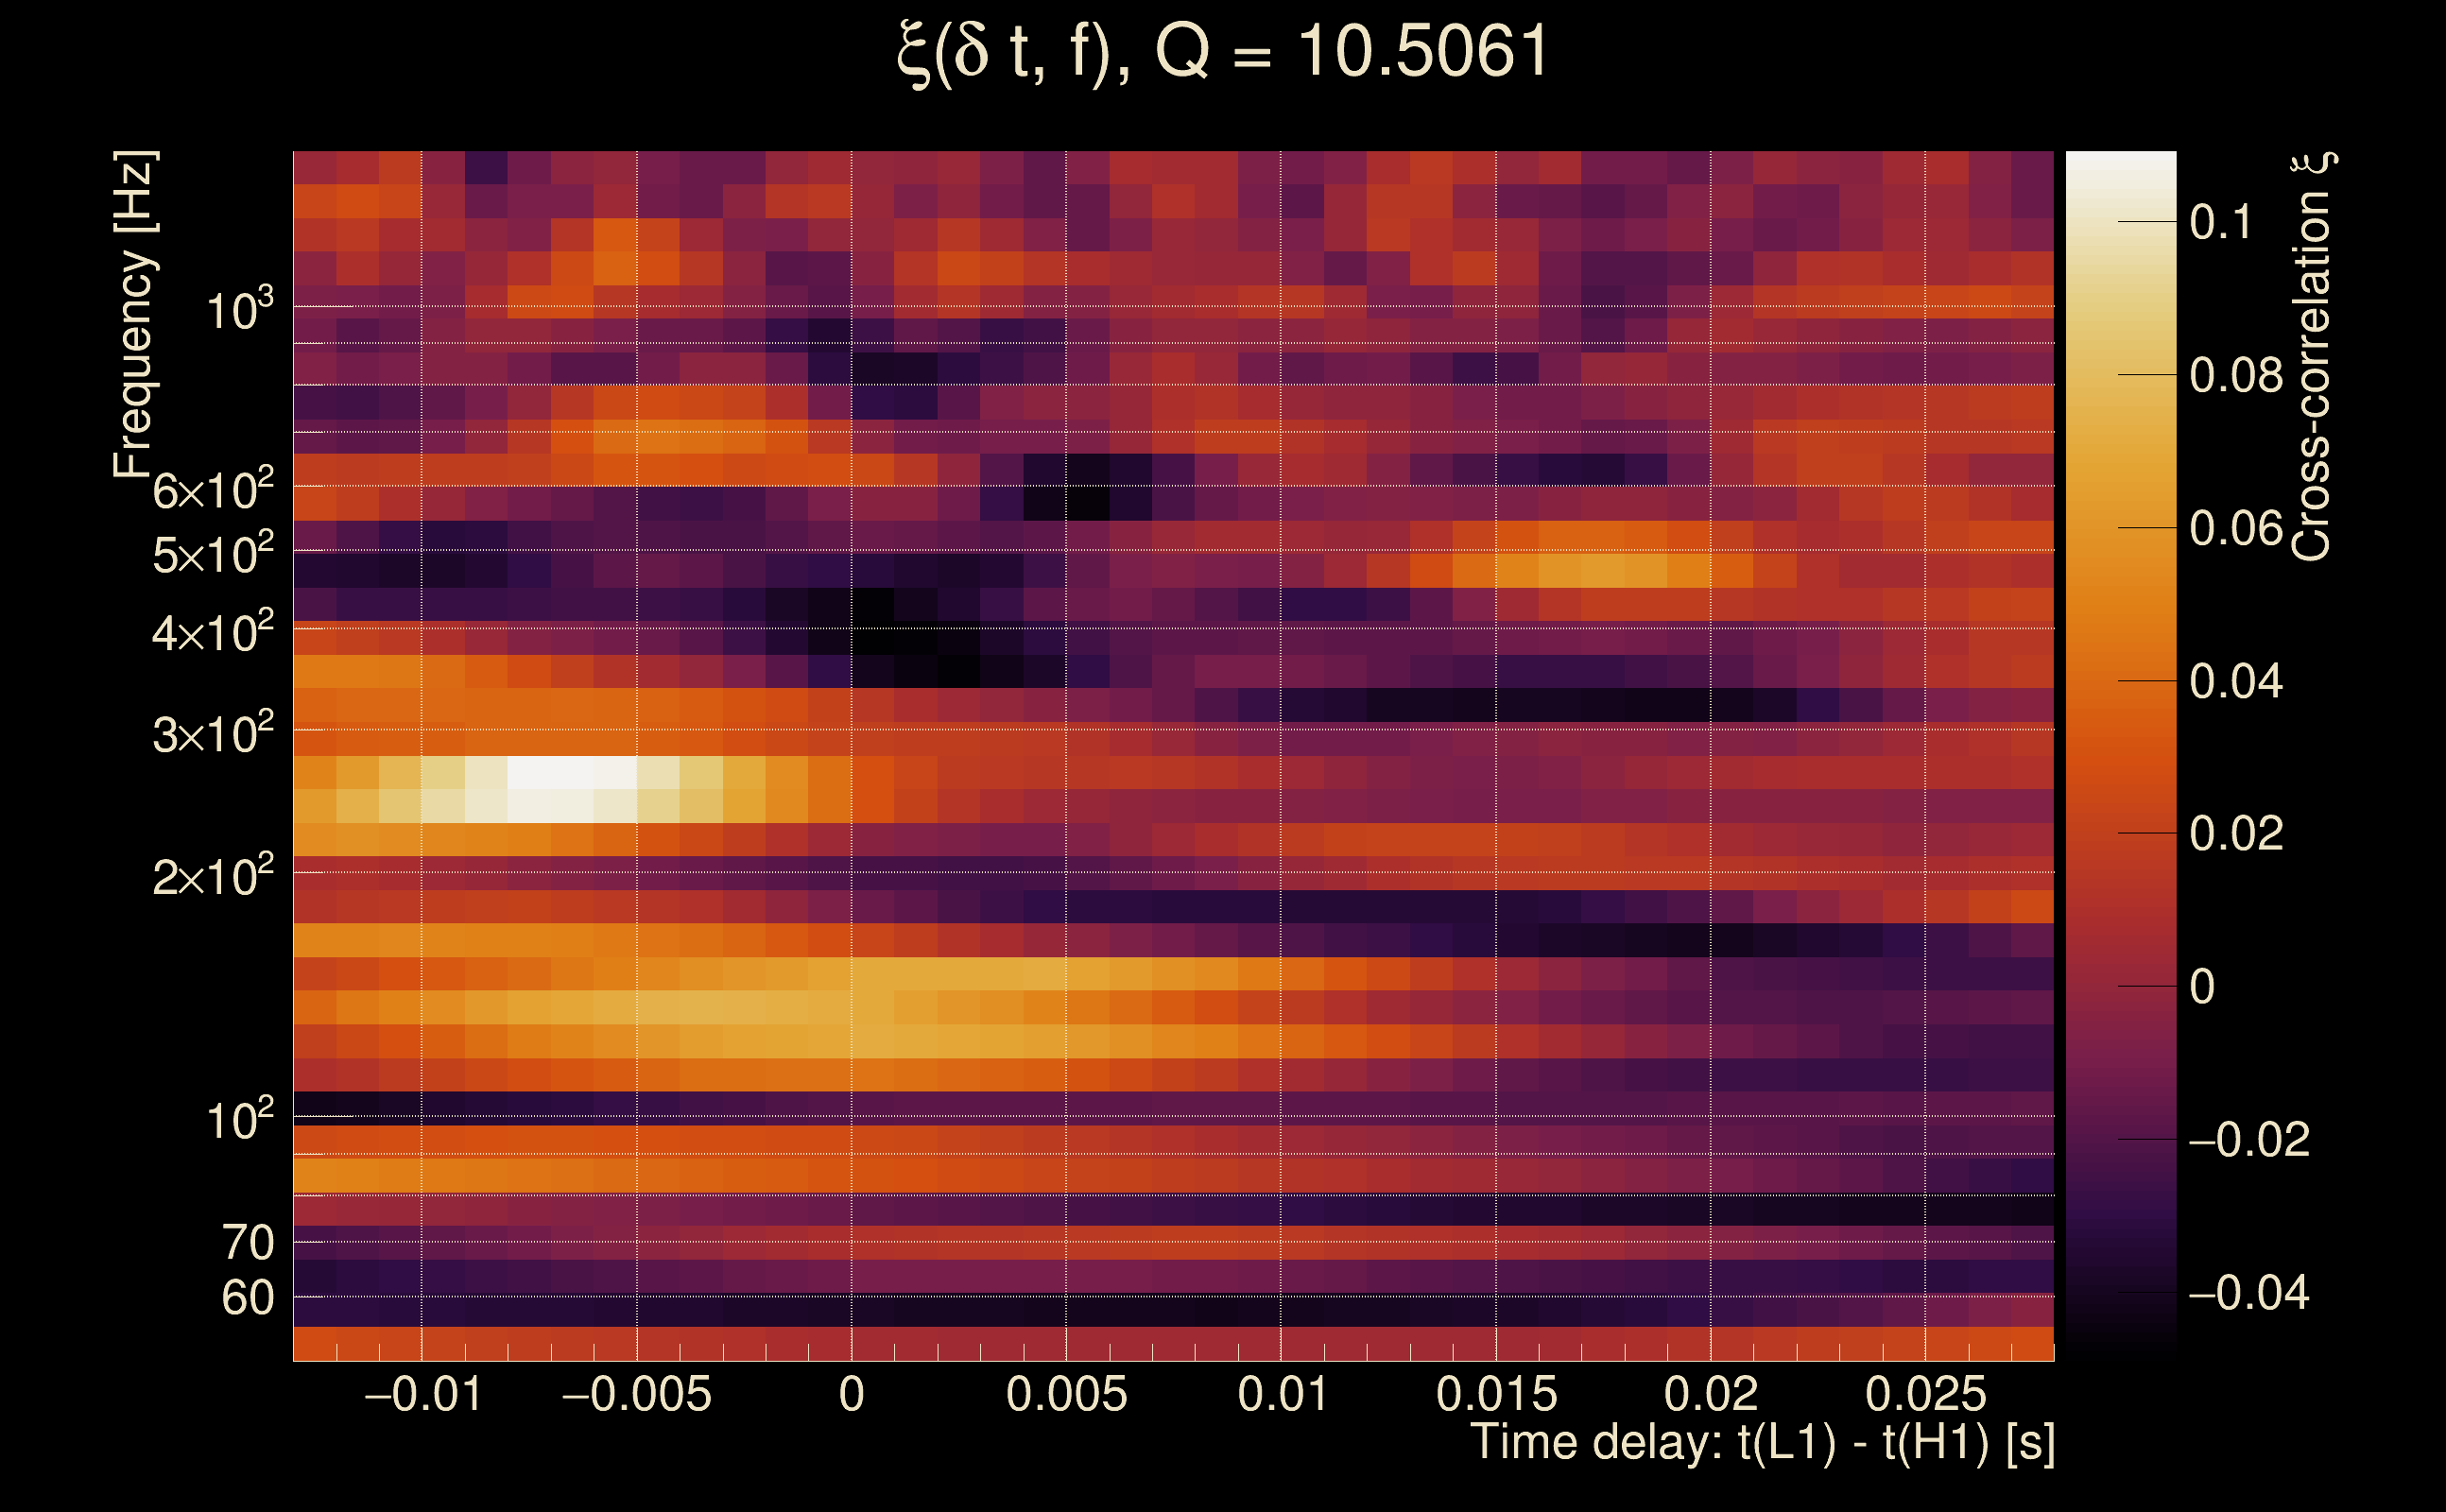
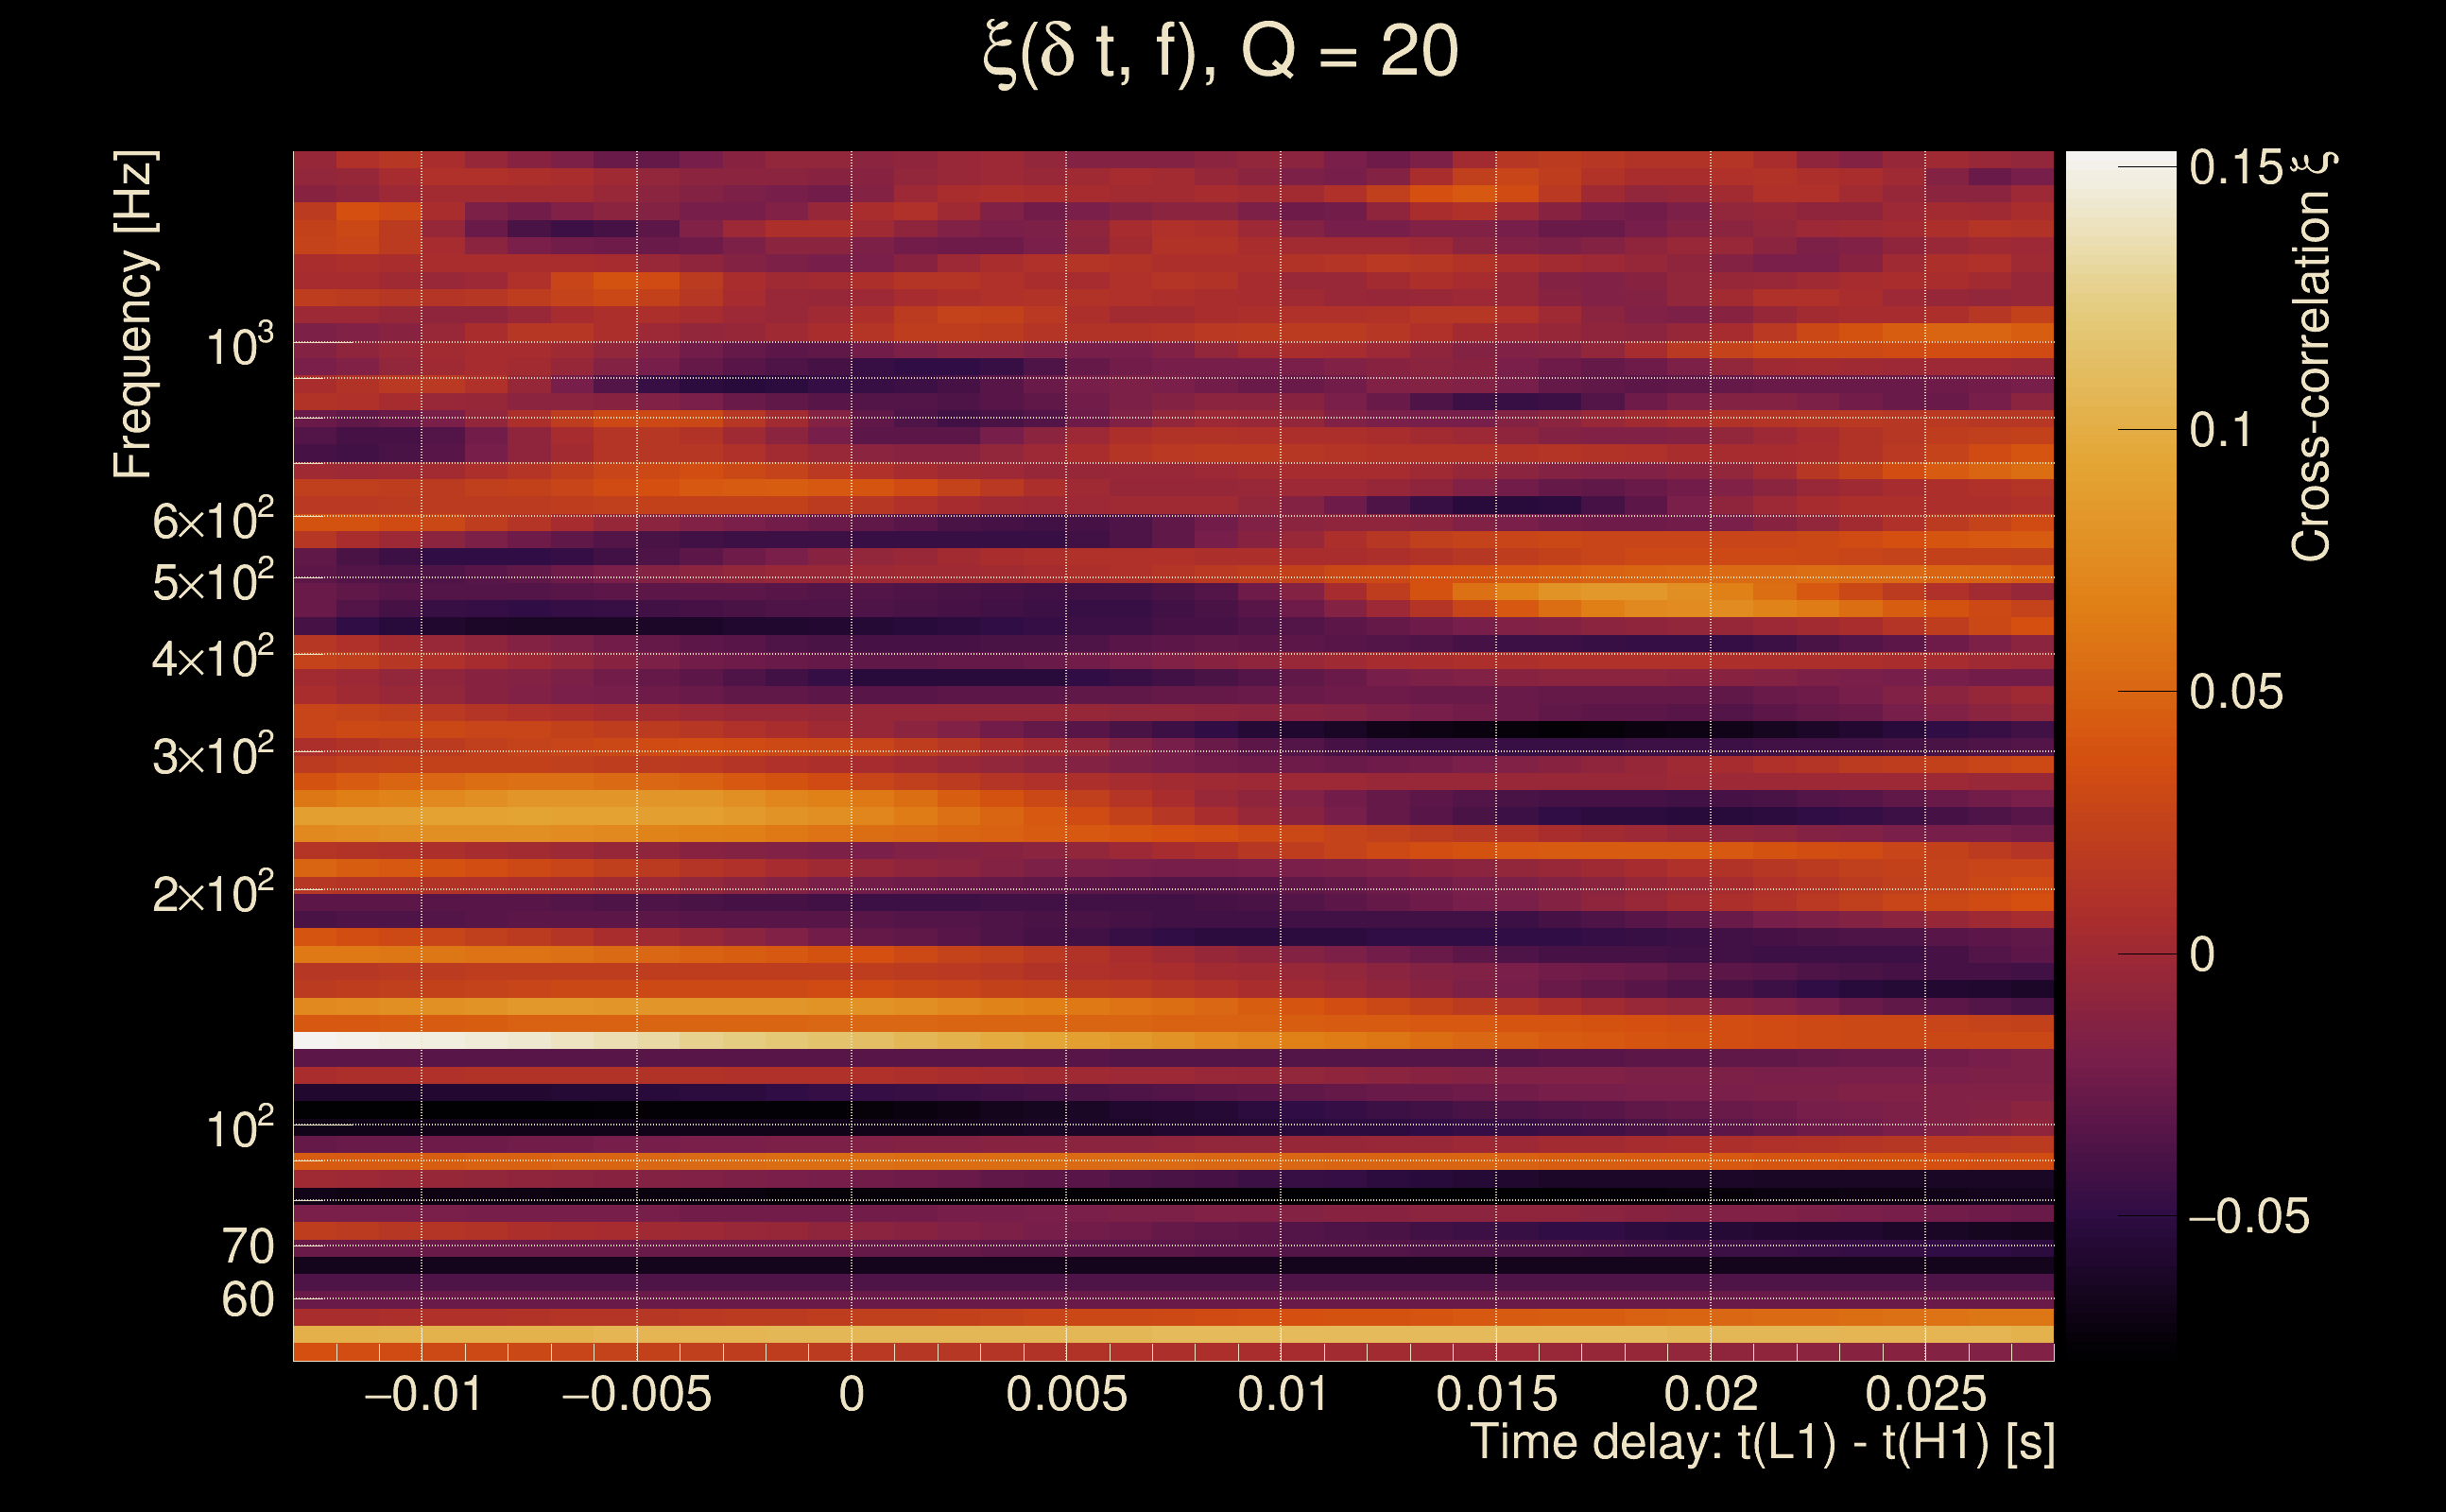
| Time delay between detectors t(L1) - t(H1): | 0.00245652 s (slice index = 108 / 217), δt_gw = 0.00245652 s |
| Time delay uncertainty: | 0.00641238 s |
| [targeted mode] Time delay probability: | 0.331546 (0.971004 sigmas), δt_target = 1.72247e+45 s |
| Frequency: | 656.069 Hz |
| Ξ: | 0.00136041 ± 0.0354355 (variance = 0.00125568): Q0: 0, Q1: 0.0371384, Q2: 0.0544277, Q3: 0.104924, Q4: 0.0760445 |
| Rank: | R_X = 0.00045104 |
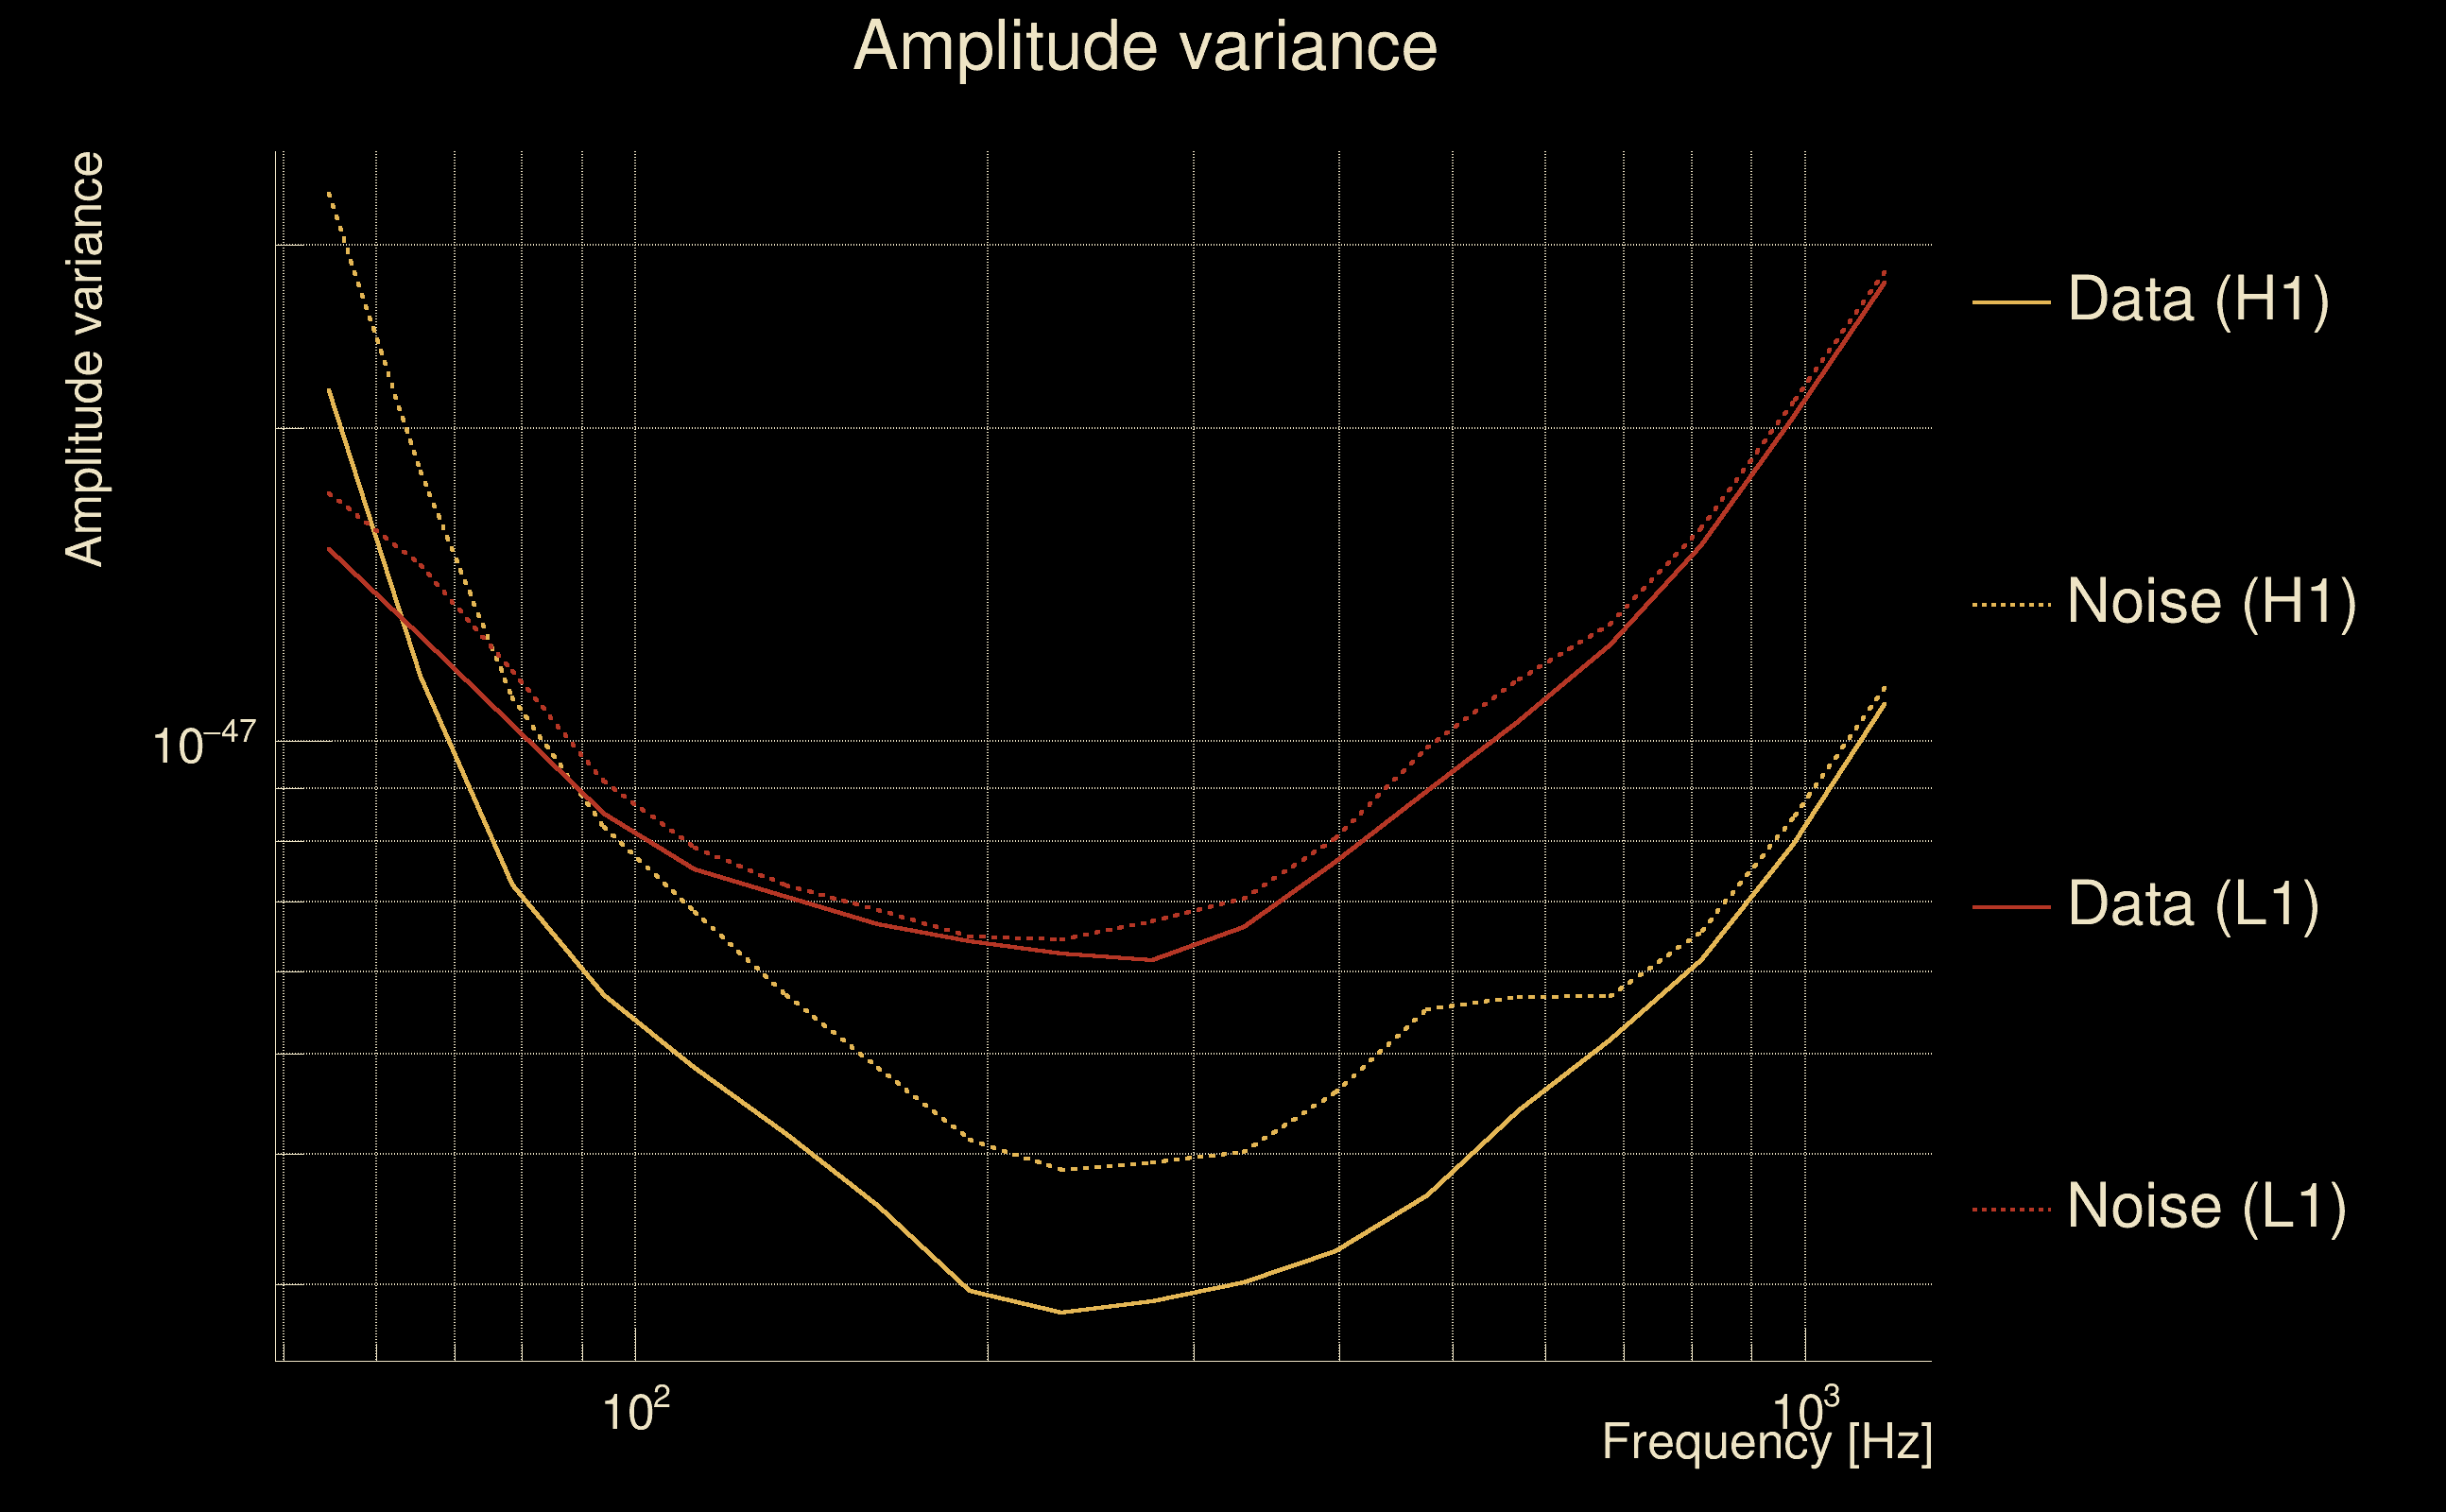
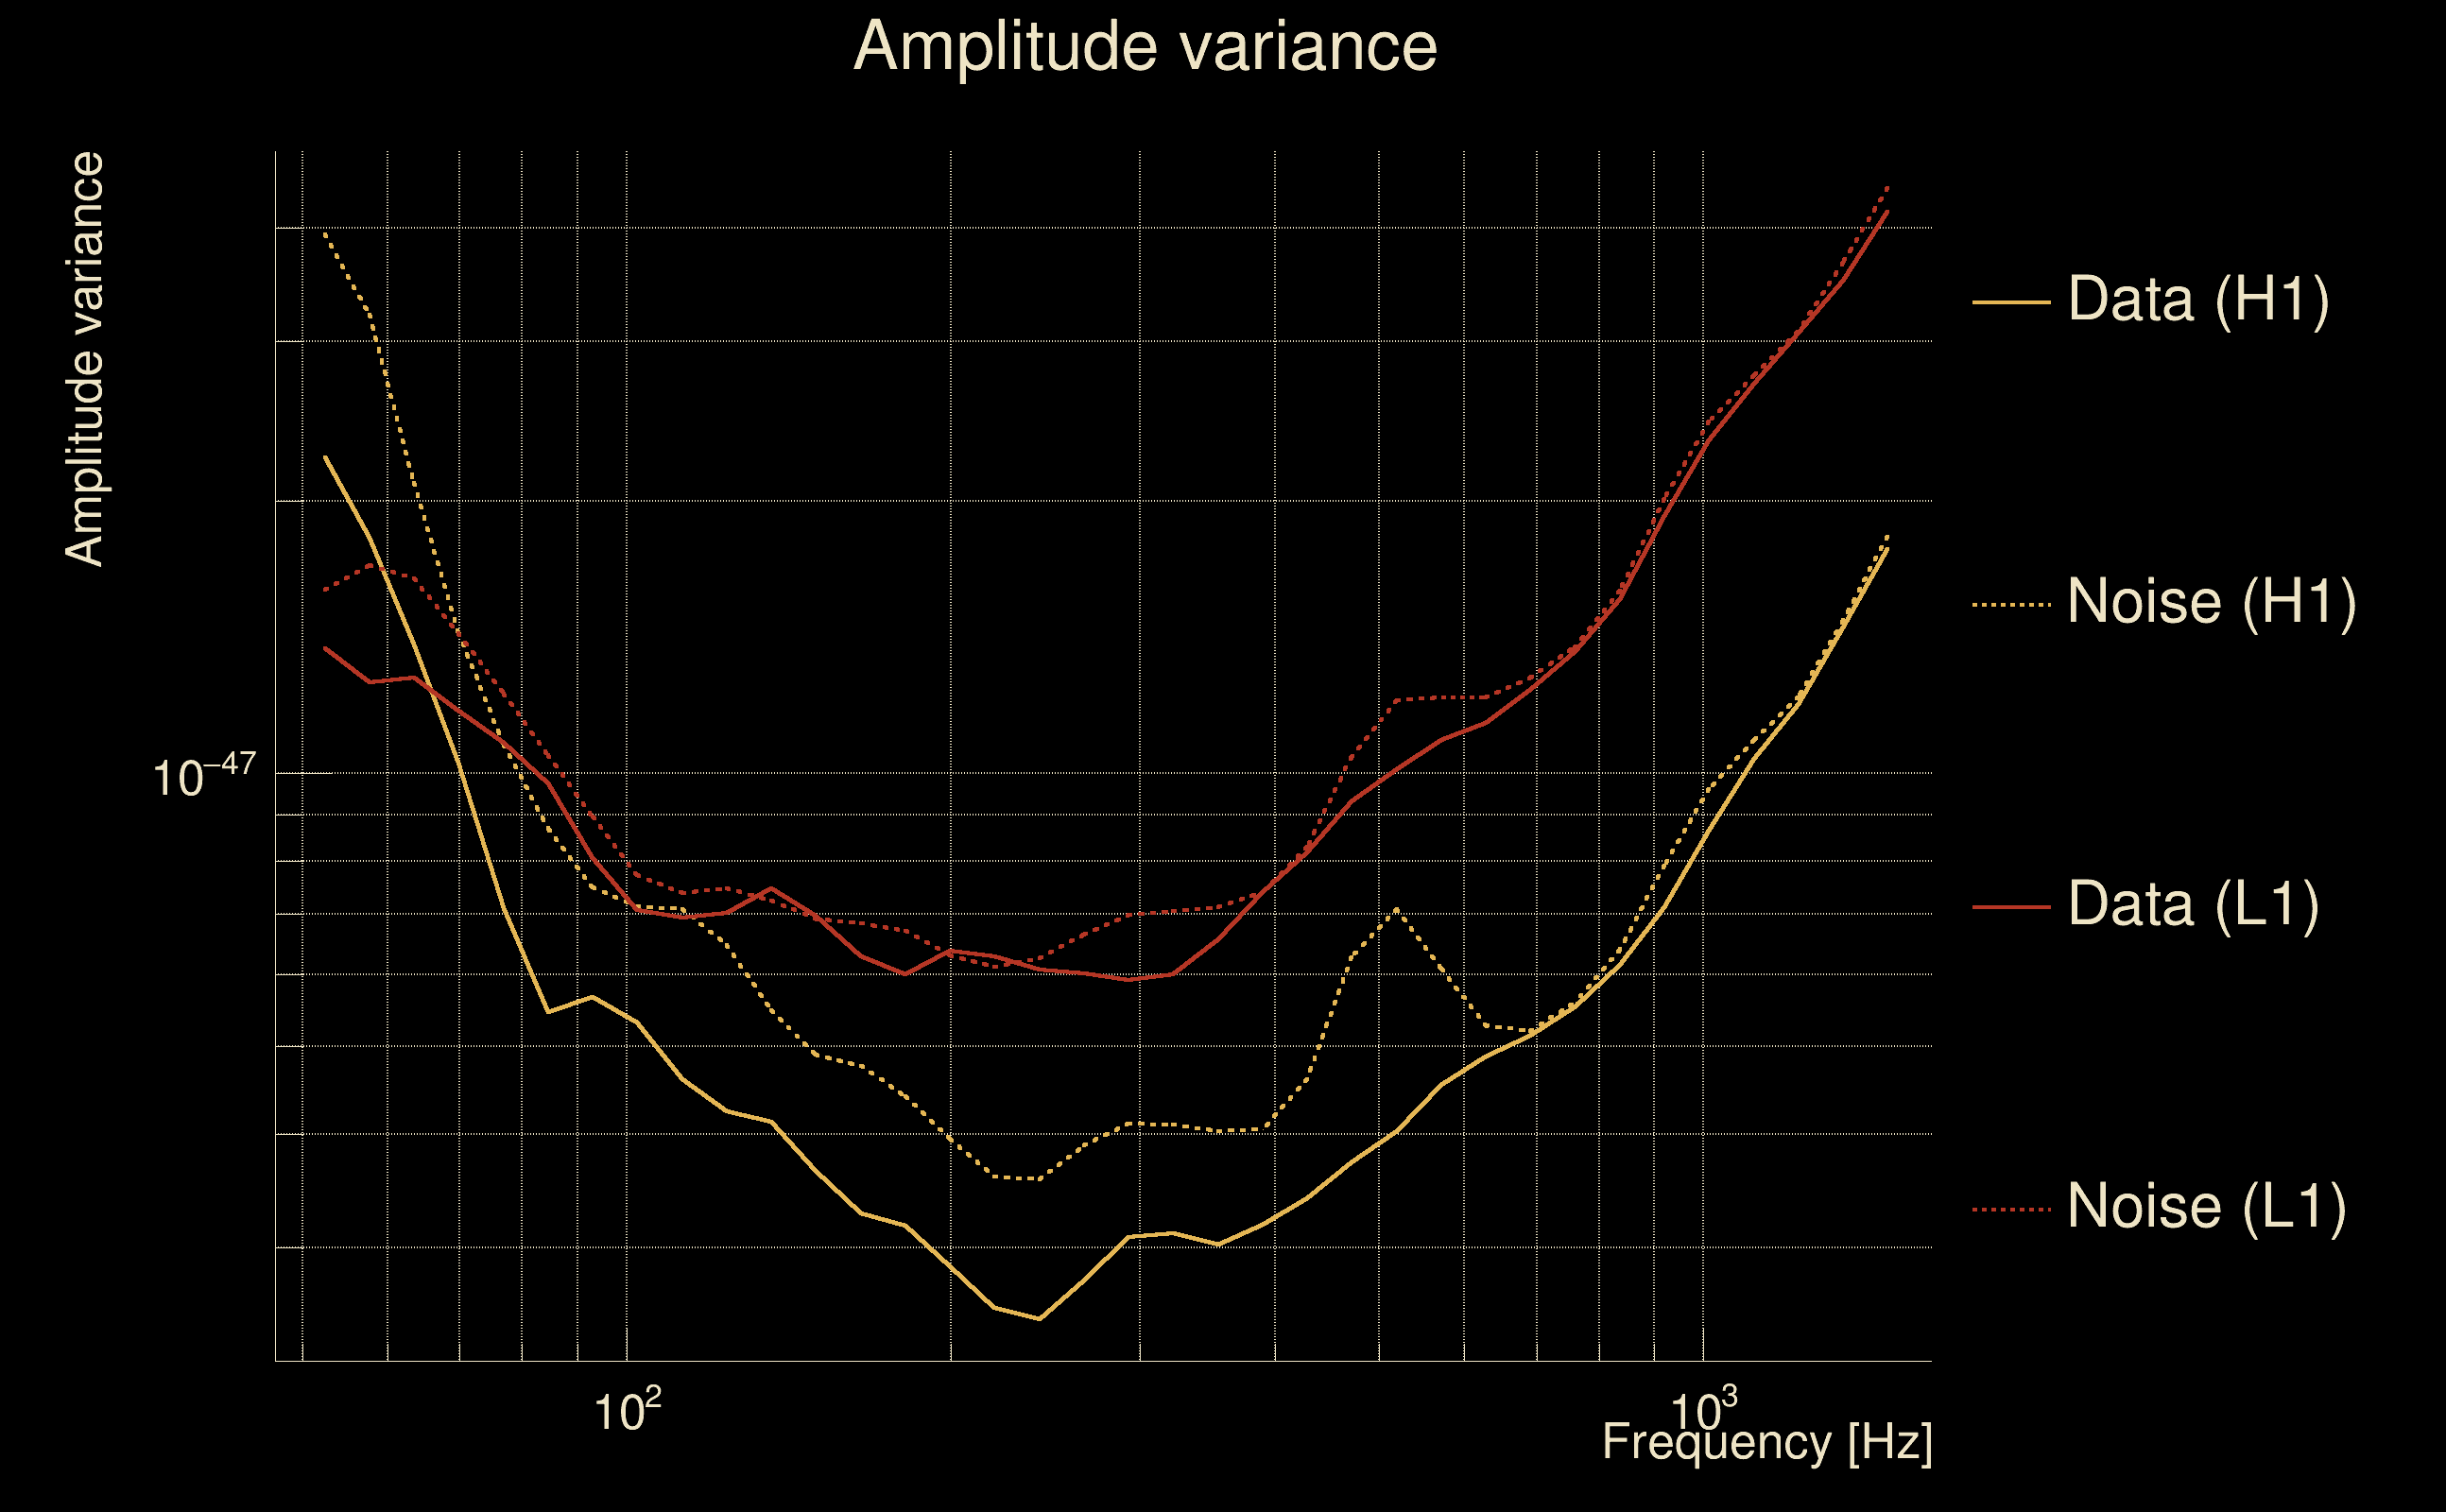
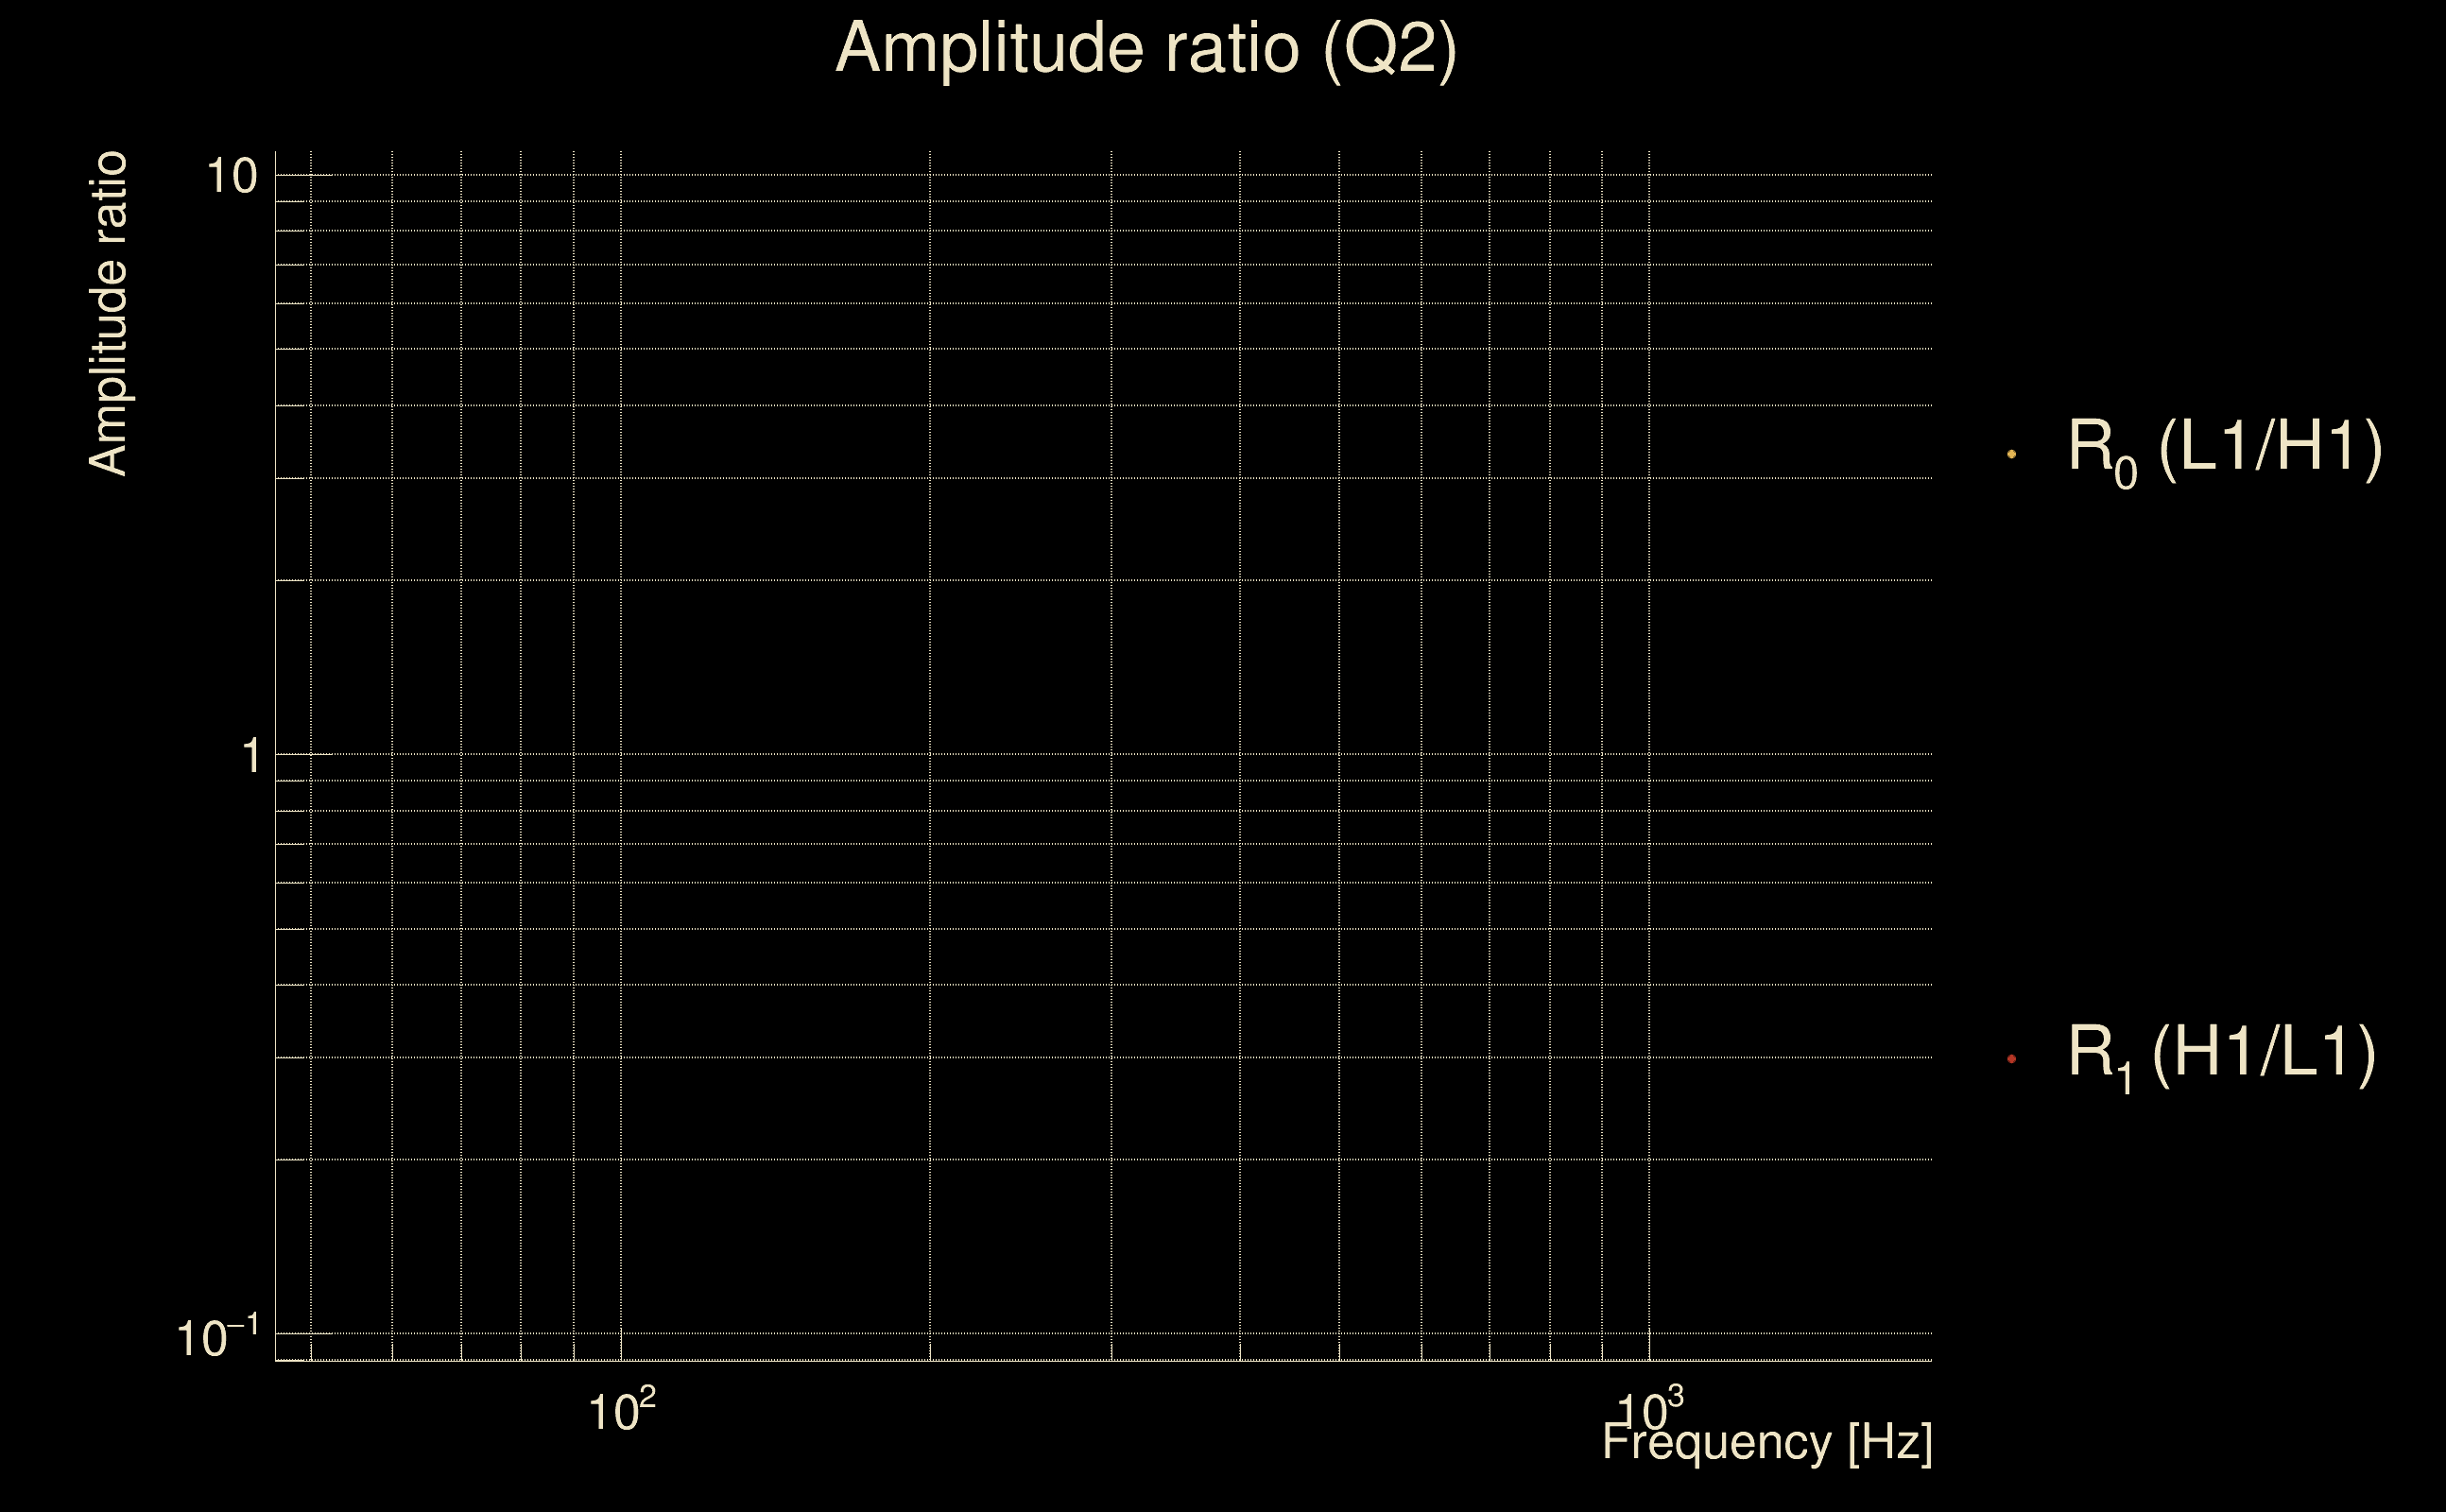
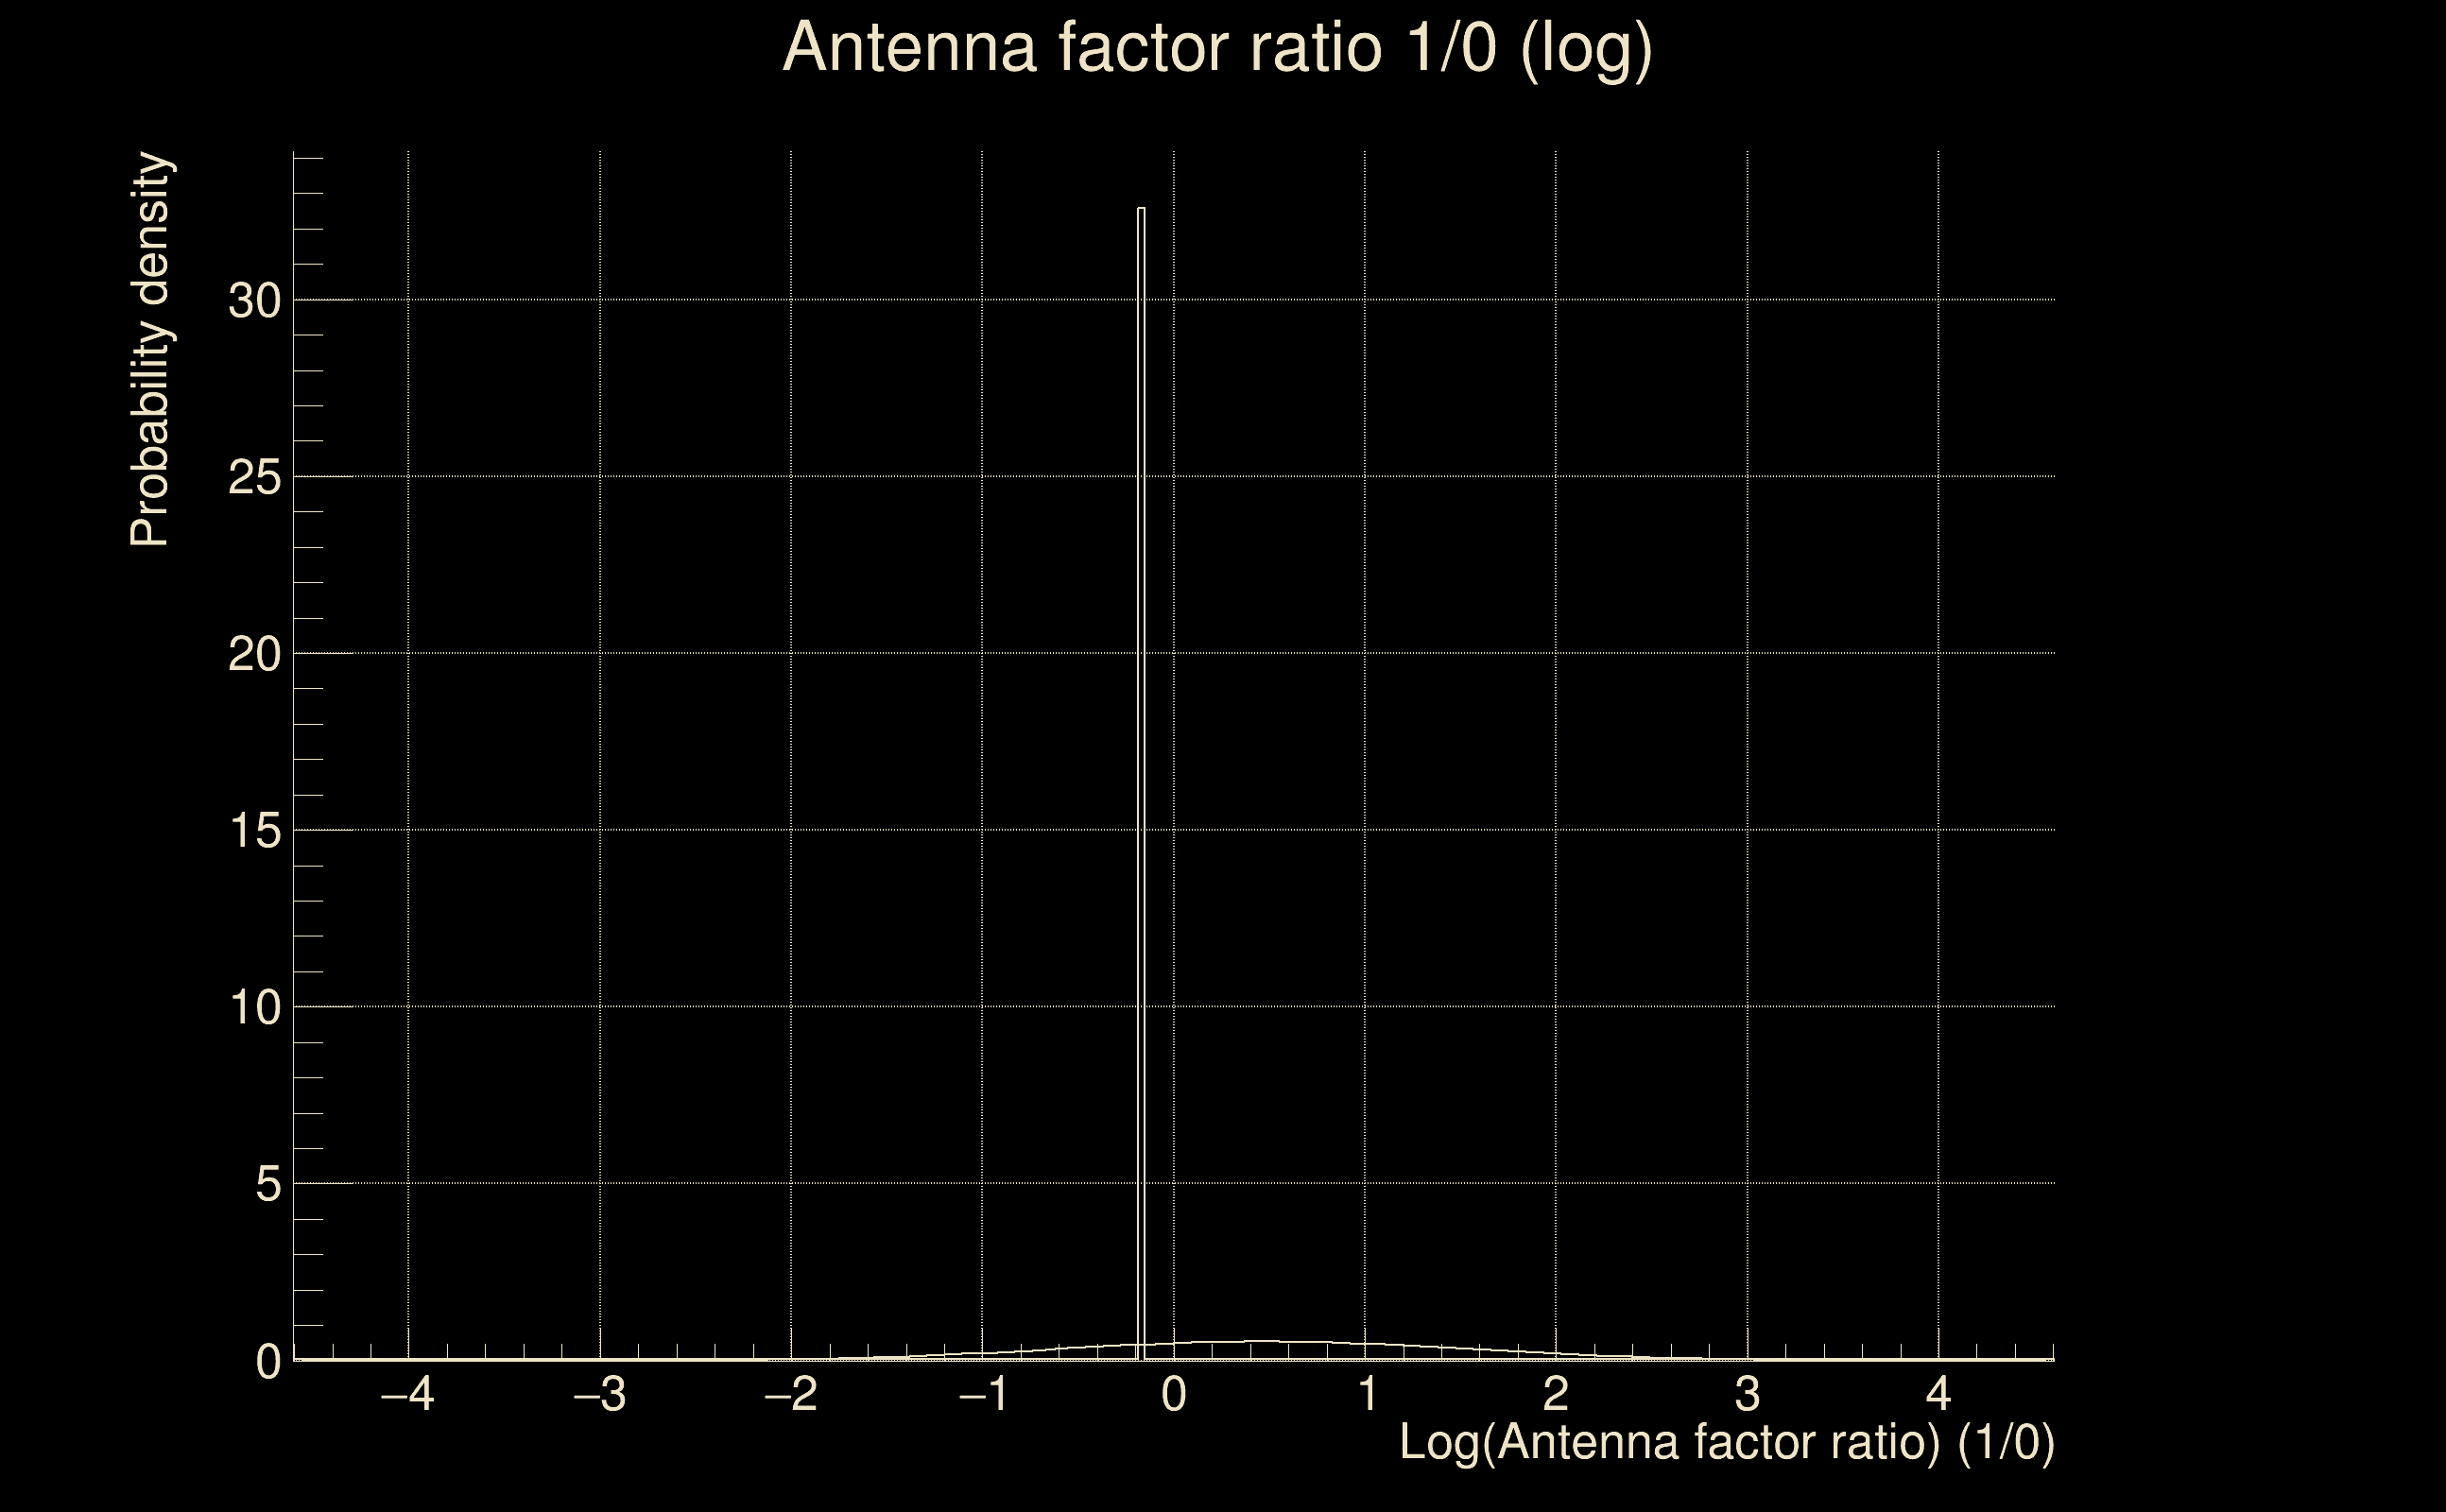
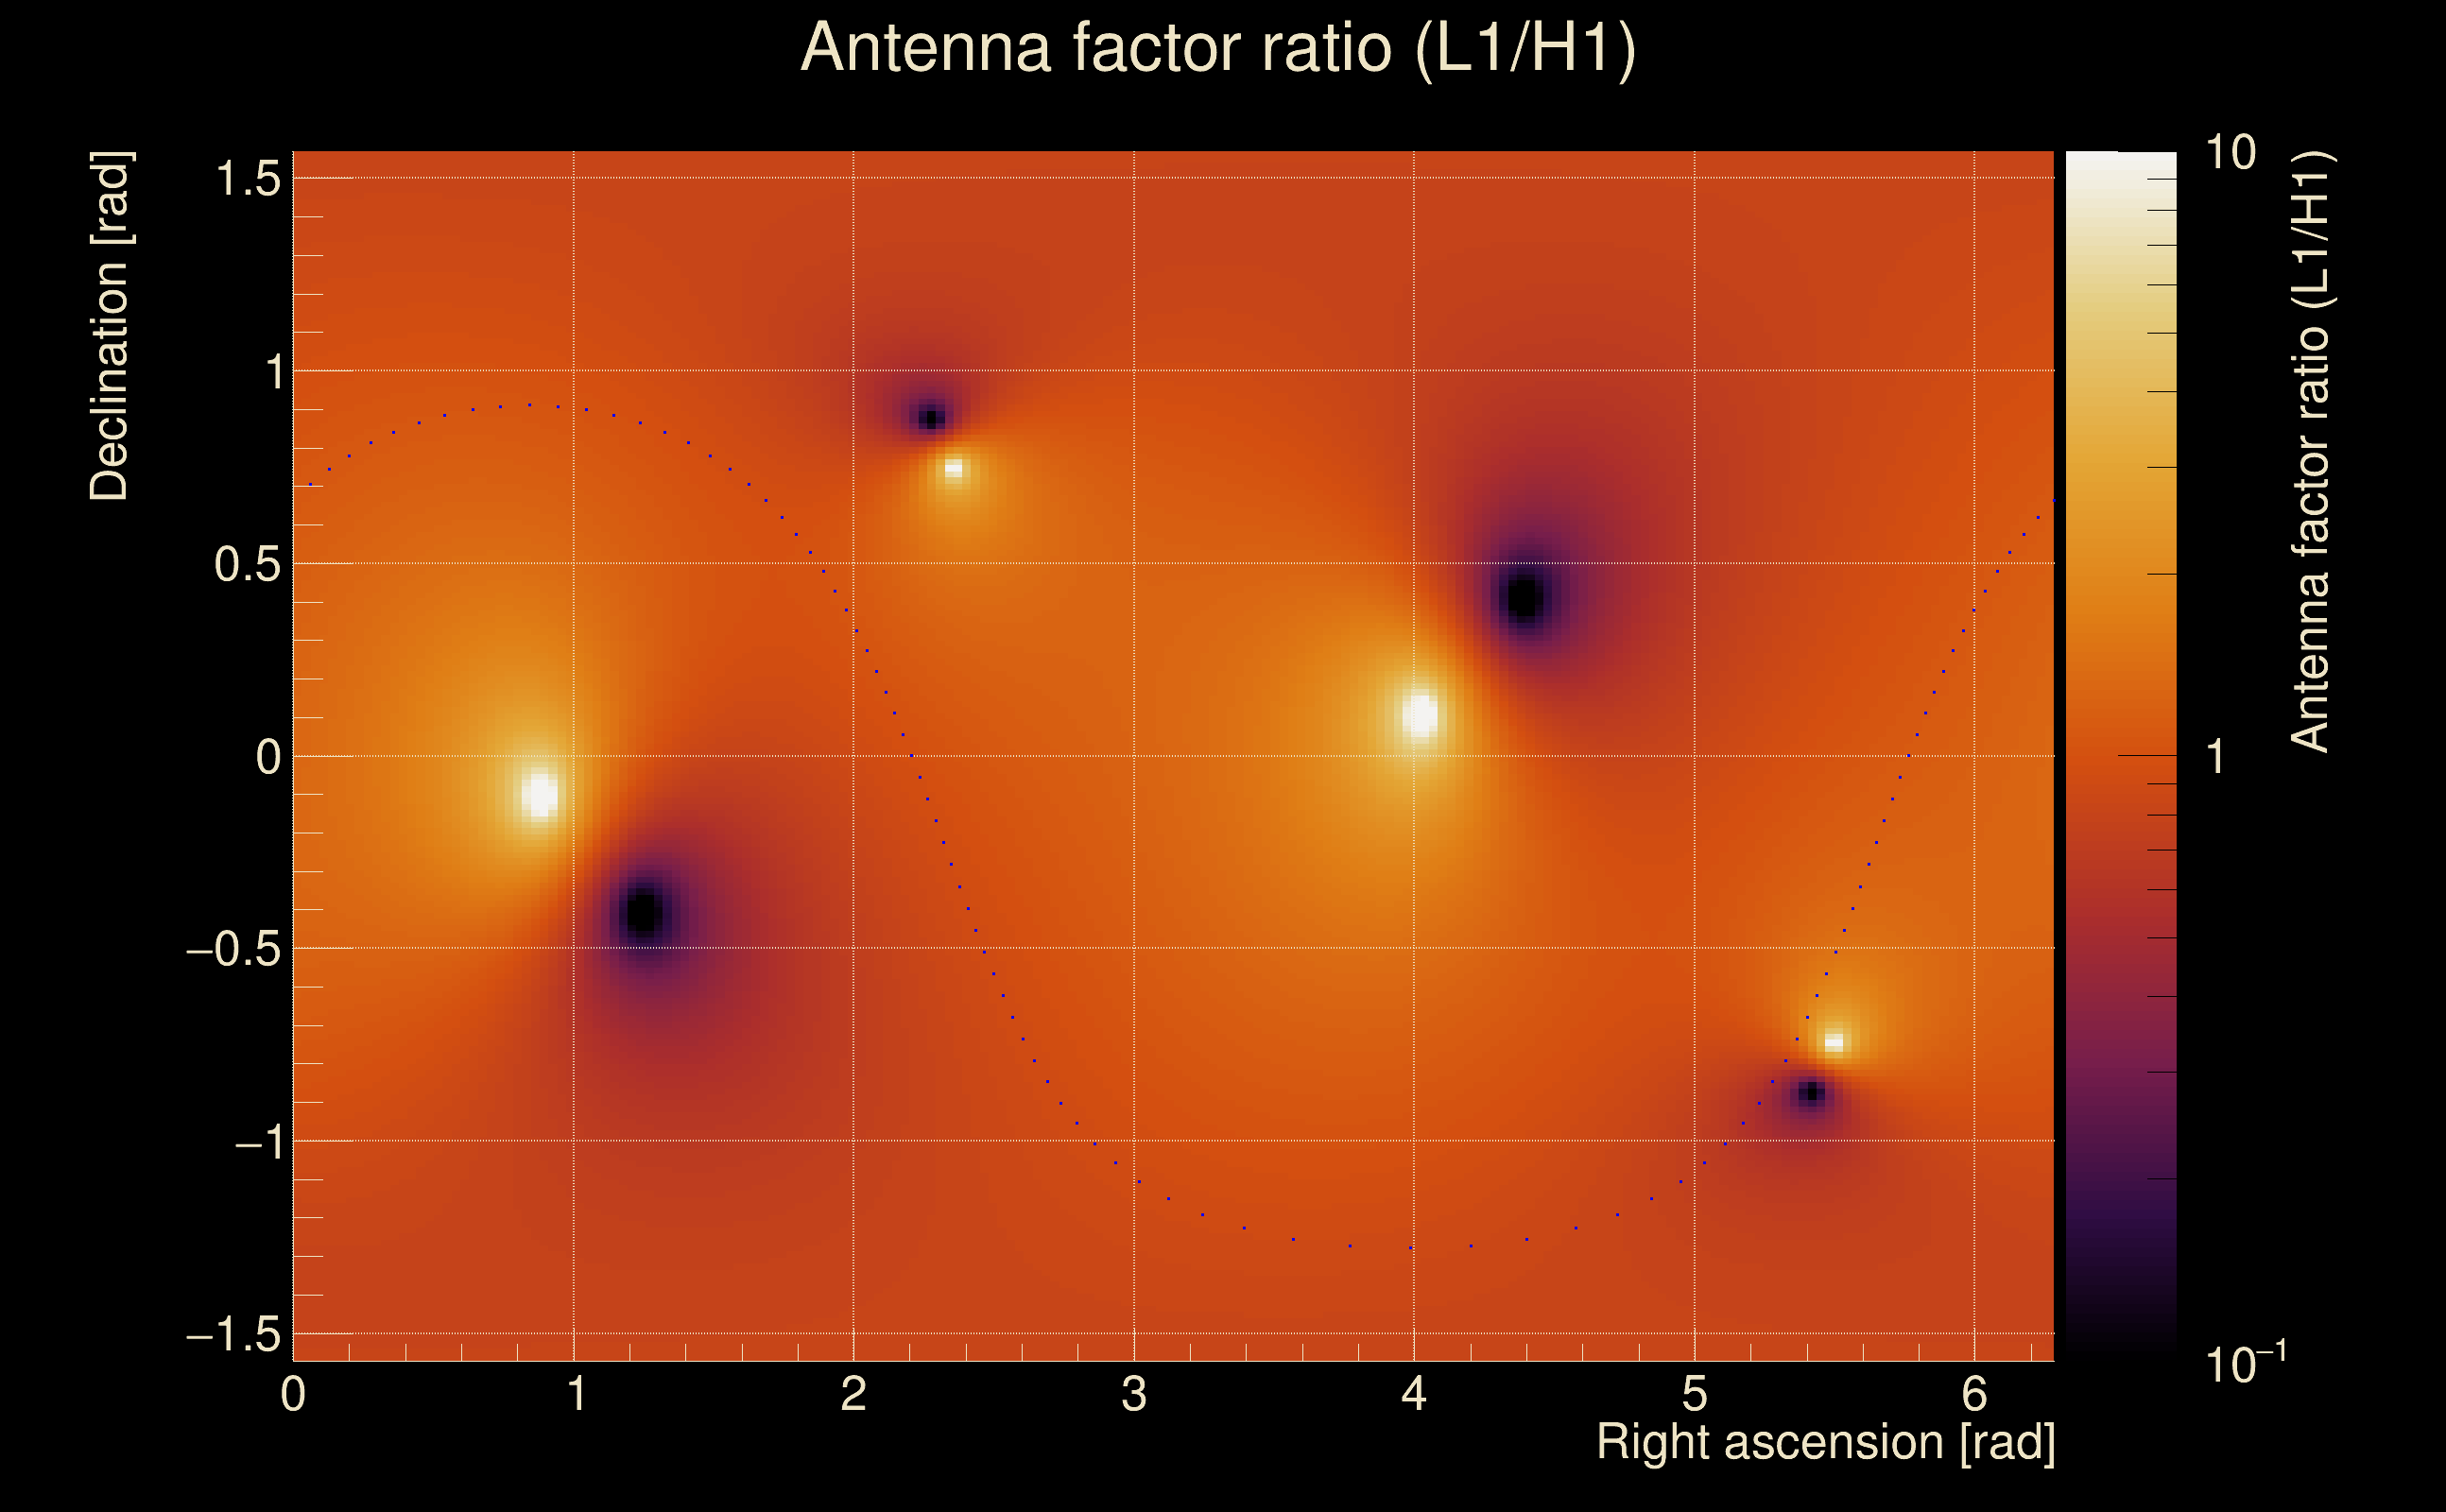
| Log of amplitude ratio (L1/H1): | 0.465256, variance = 0.555693 (L1/H1: 0.277992, variance = 1.1514, H1/L1: -0.641369, variance = 1.07403) |
| Amplitude ratio (L1/H1): | 1.59242 ⋇ 2.10739 (L1/H1: 1.32048 ⋇ 2.92423, H1/L1: 0.526571 ⋇ 2.81892) |
| Amplitude ratio H1|L1 compatibility (probability): | 0.807552 |
| Antenna factor probability: | 1 |
| Number of rejected frequency rows: | Q0: 18 / 18, Q1: 34 / 36, Q2: 66 / 70, Q3: 128 / 134, Q4: 248 / 258 |
| Maximum signal-to-noise ratio: | H1: 4.90349, L1: 5.05634 |
| SNR variance: | H1: 0.458614, L1: 0.492998 |
| Click here for a zoomed plot | Click here for a zoomed plot | Click here for a zoomed plot | Click here for a zoomed plot | Click here for a zoomed plot |
 |
 |
 |
 |
 |
 |
 |
 |
 |
 |
 |
 |
 |
 |
 |
 |
 |
 |
 |
 |
 |
 |
 |
 |
 |
 |
 |
 |
 |
 |
 |
 |
 |
 |
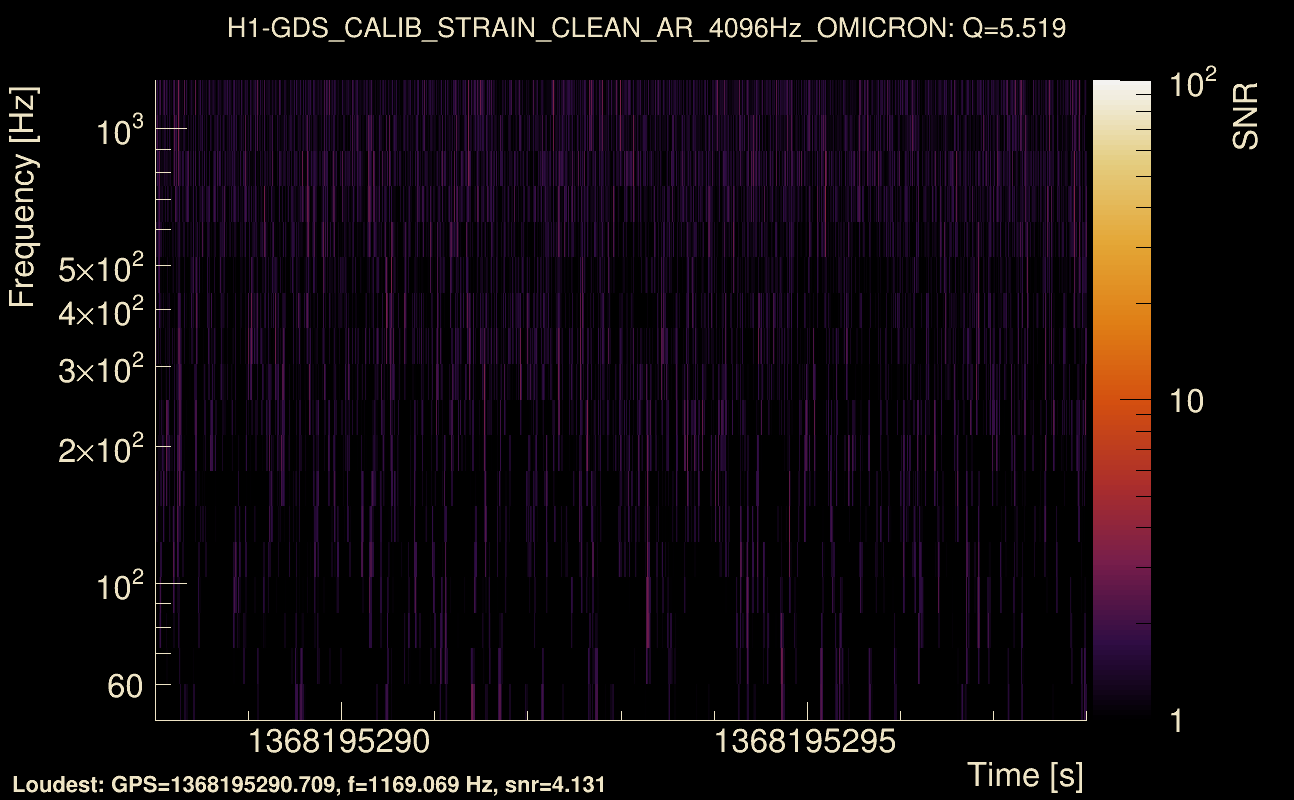
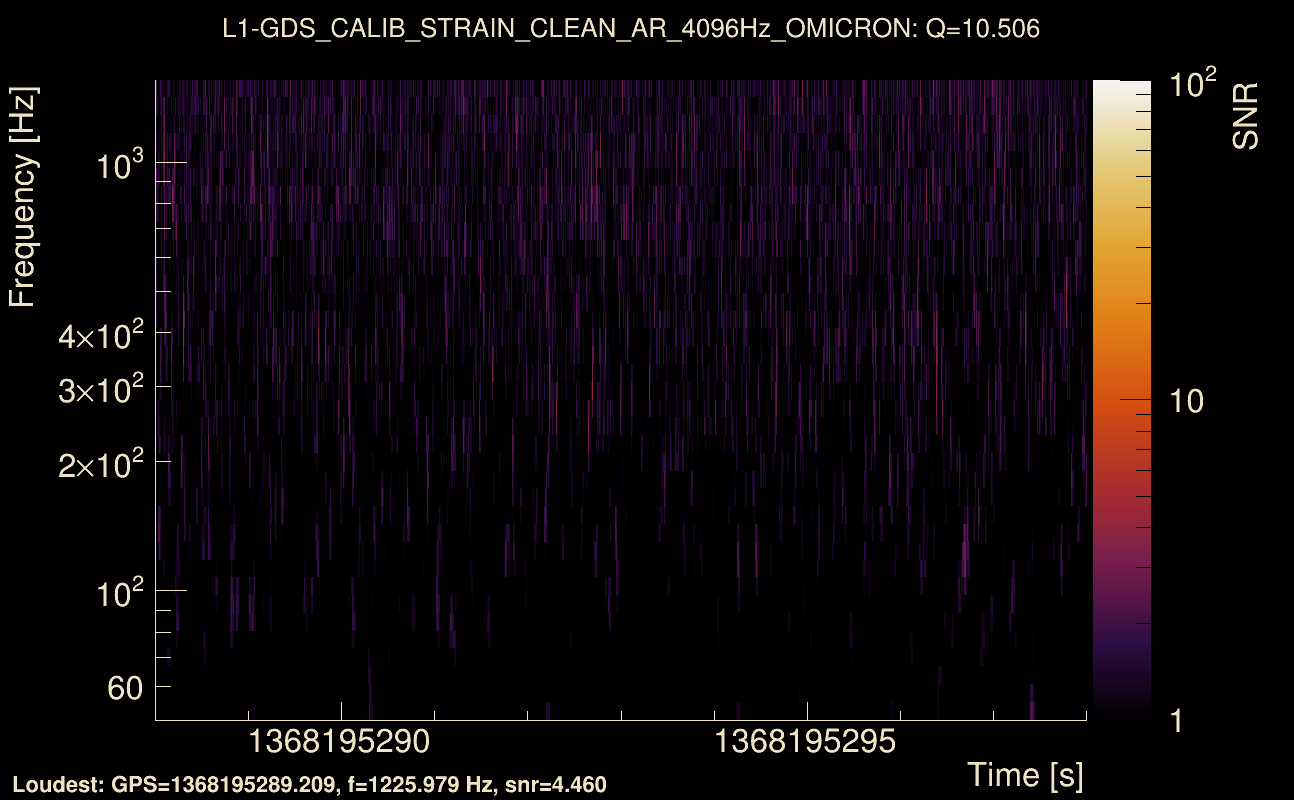
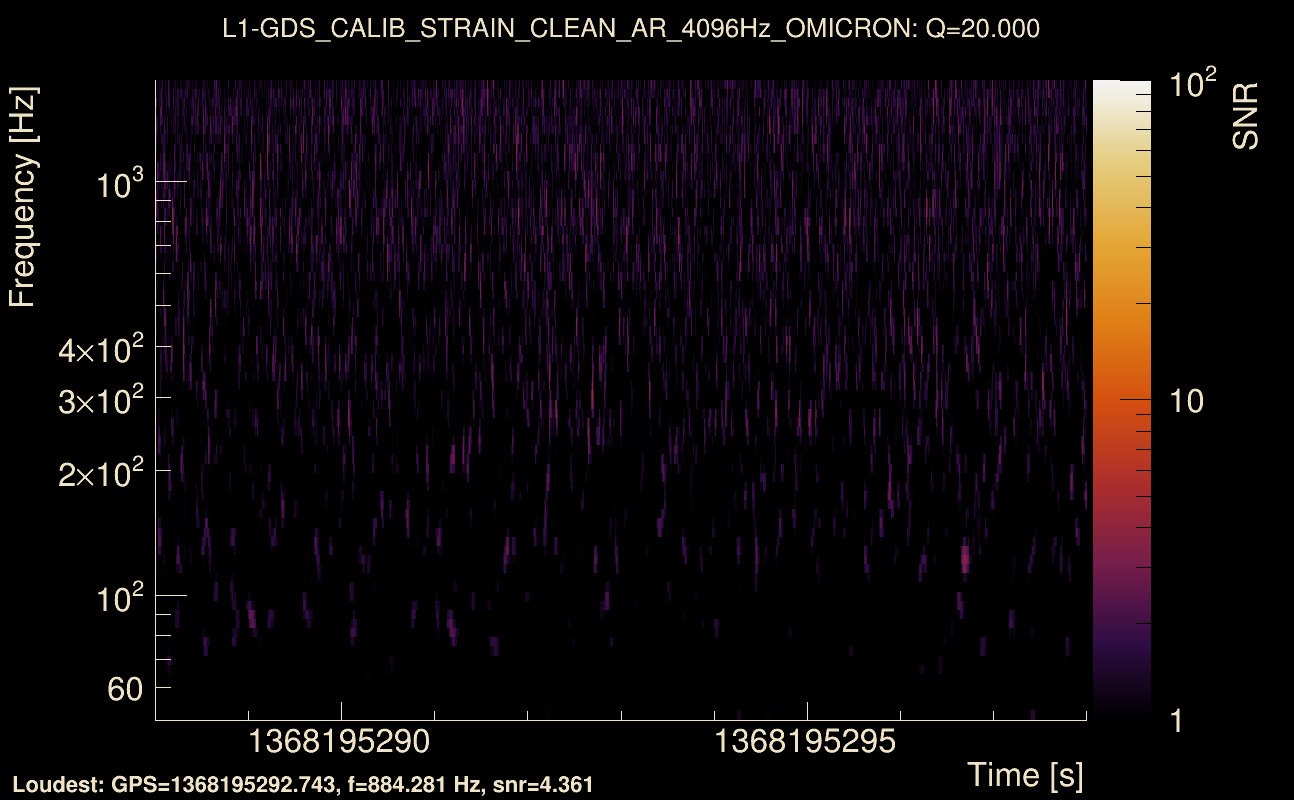
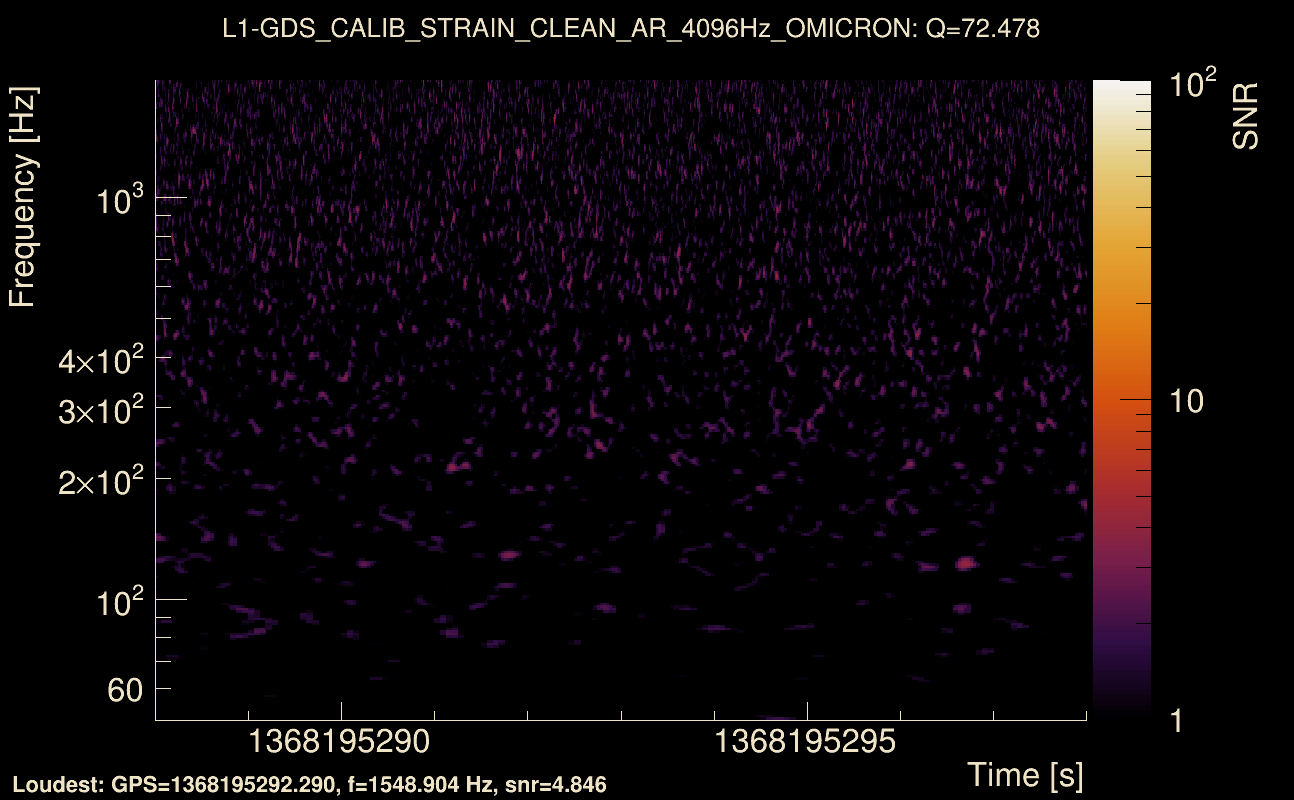
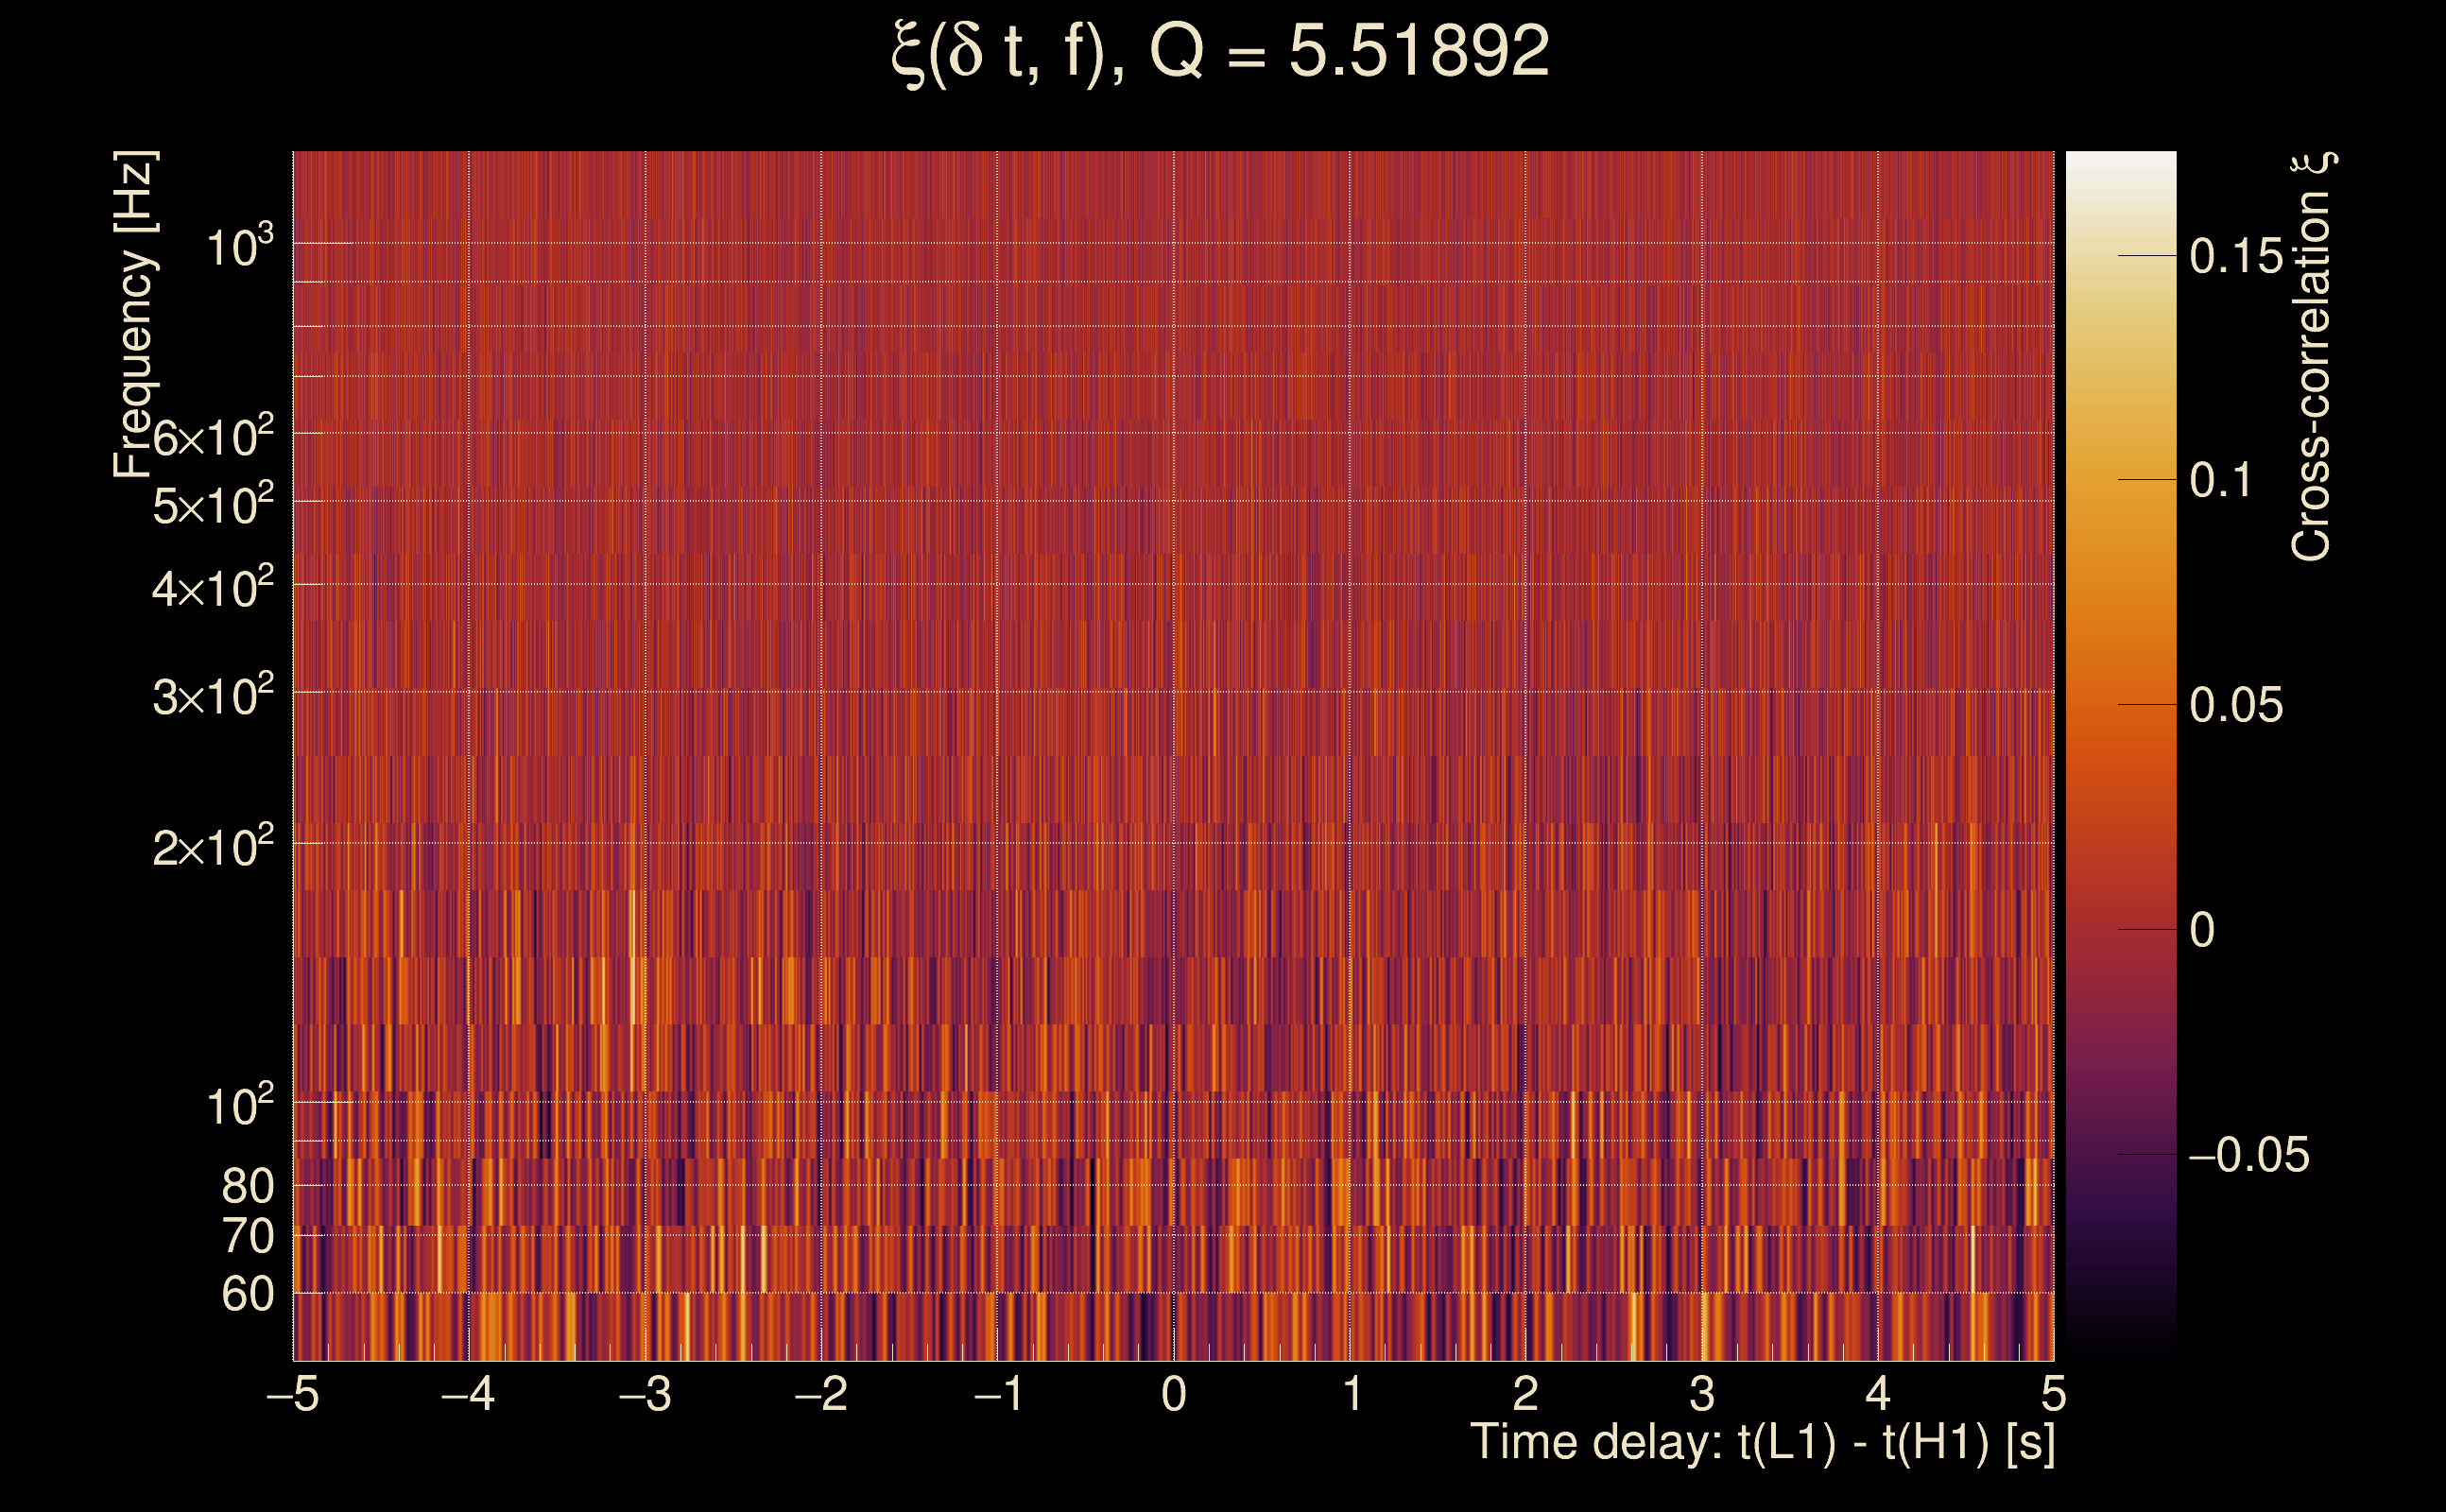
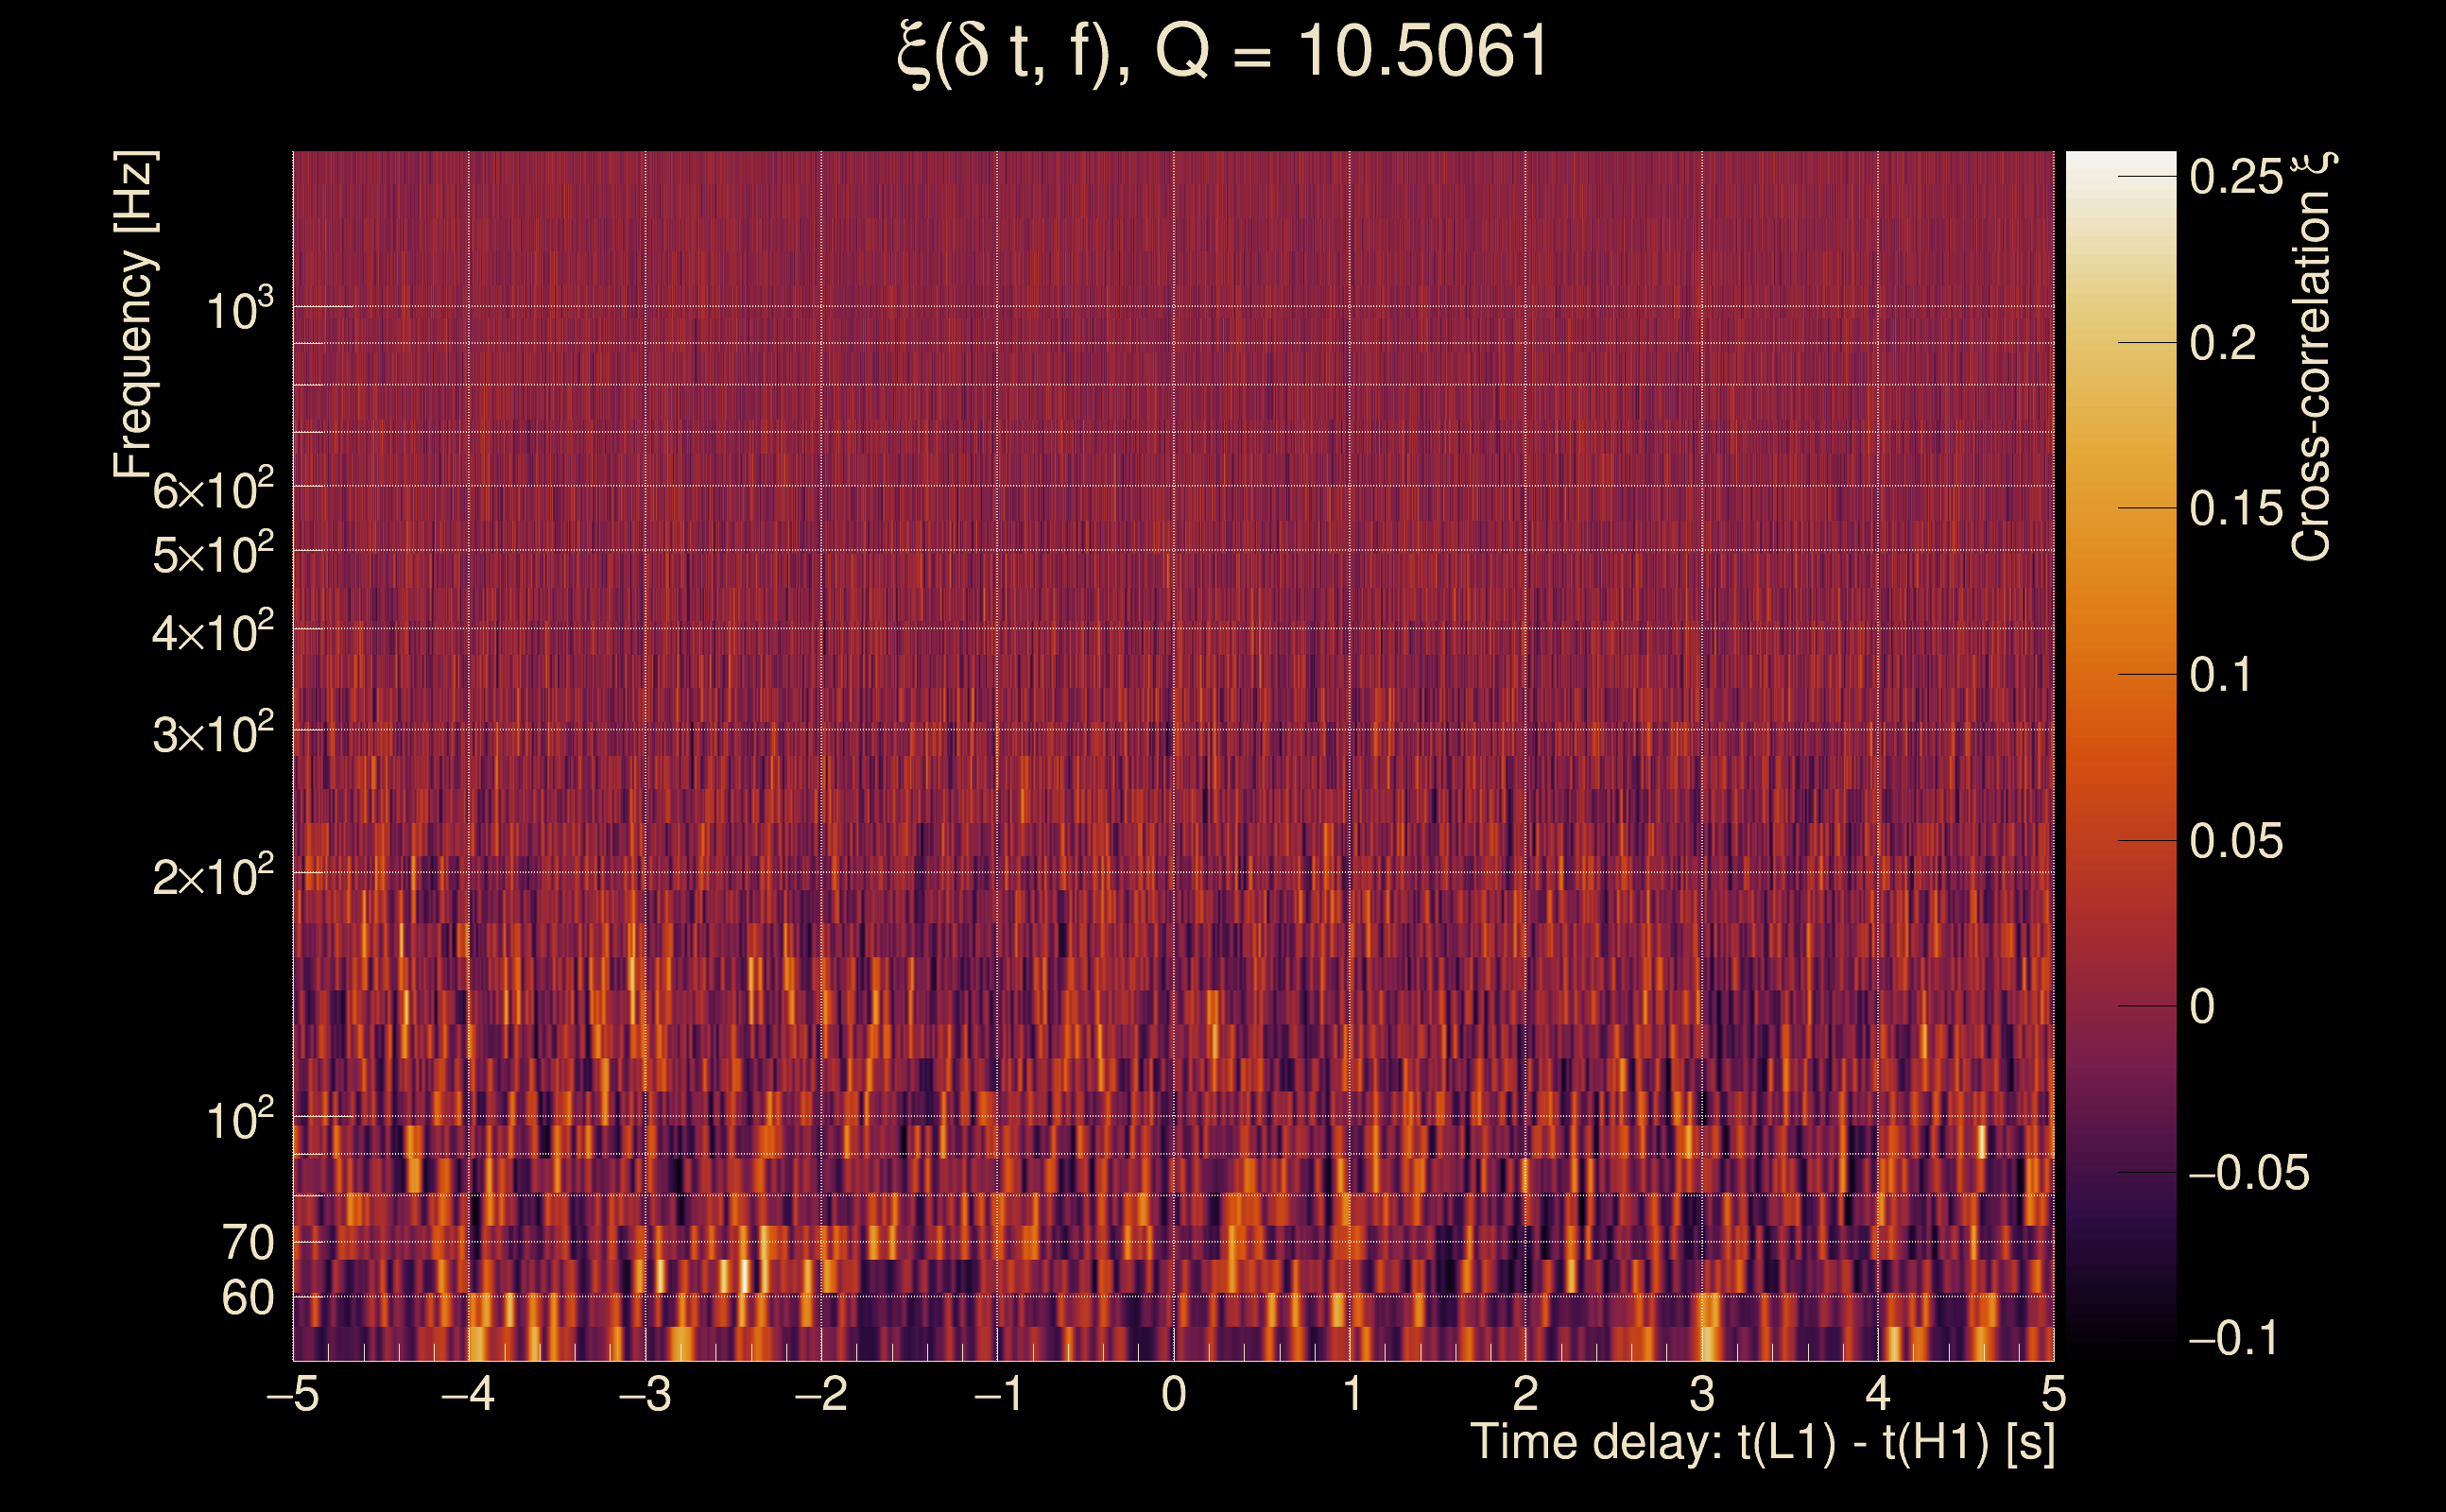
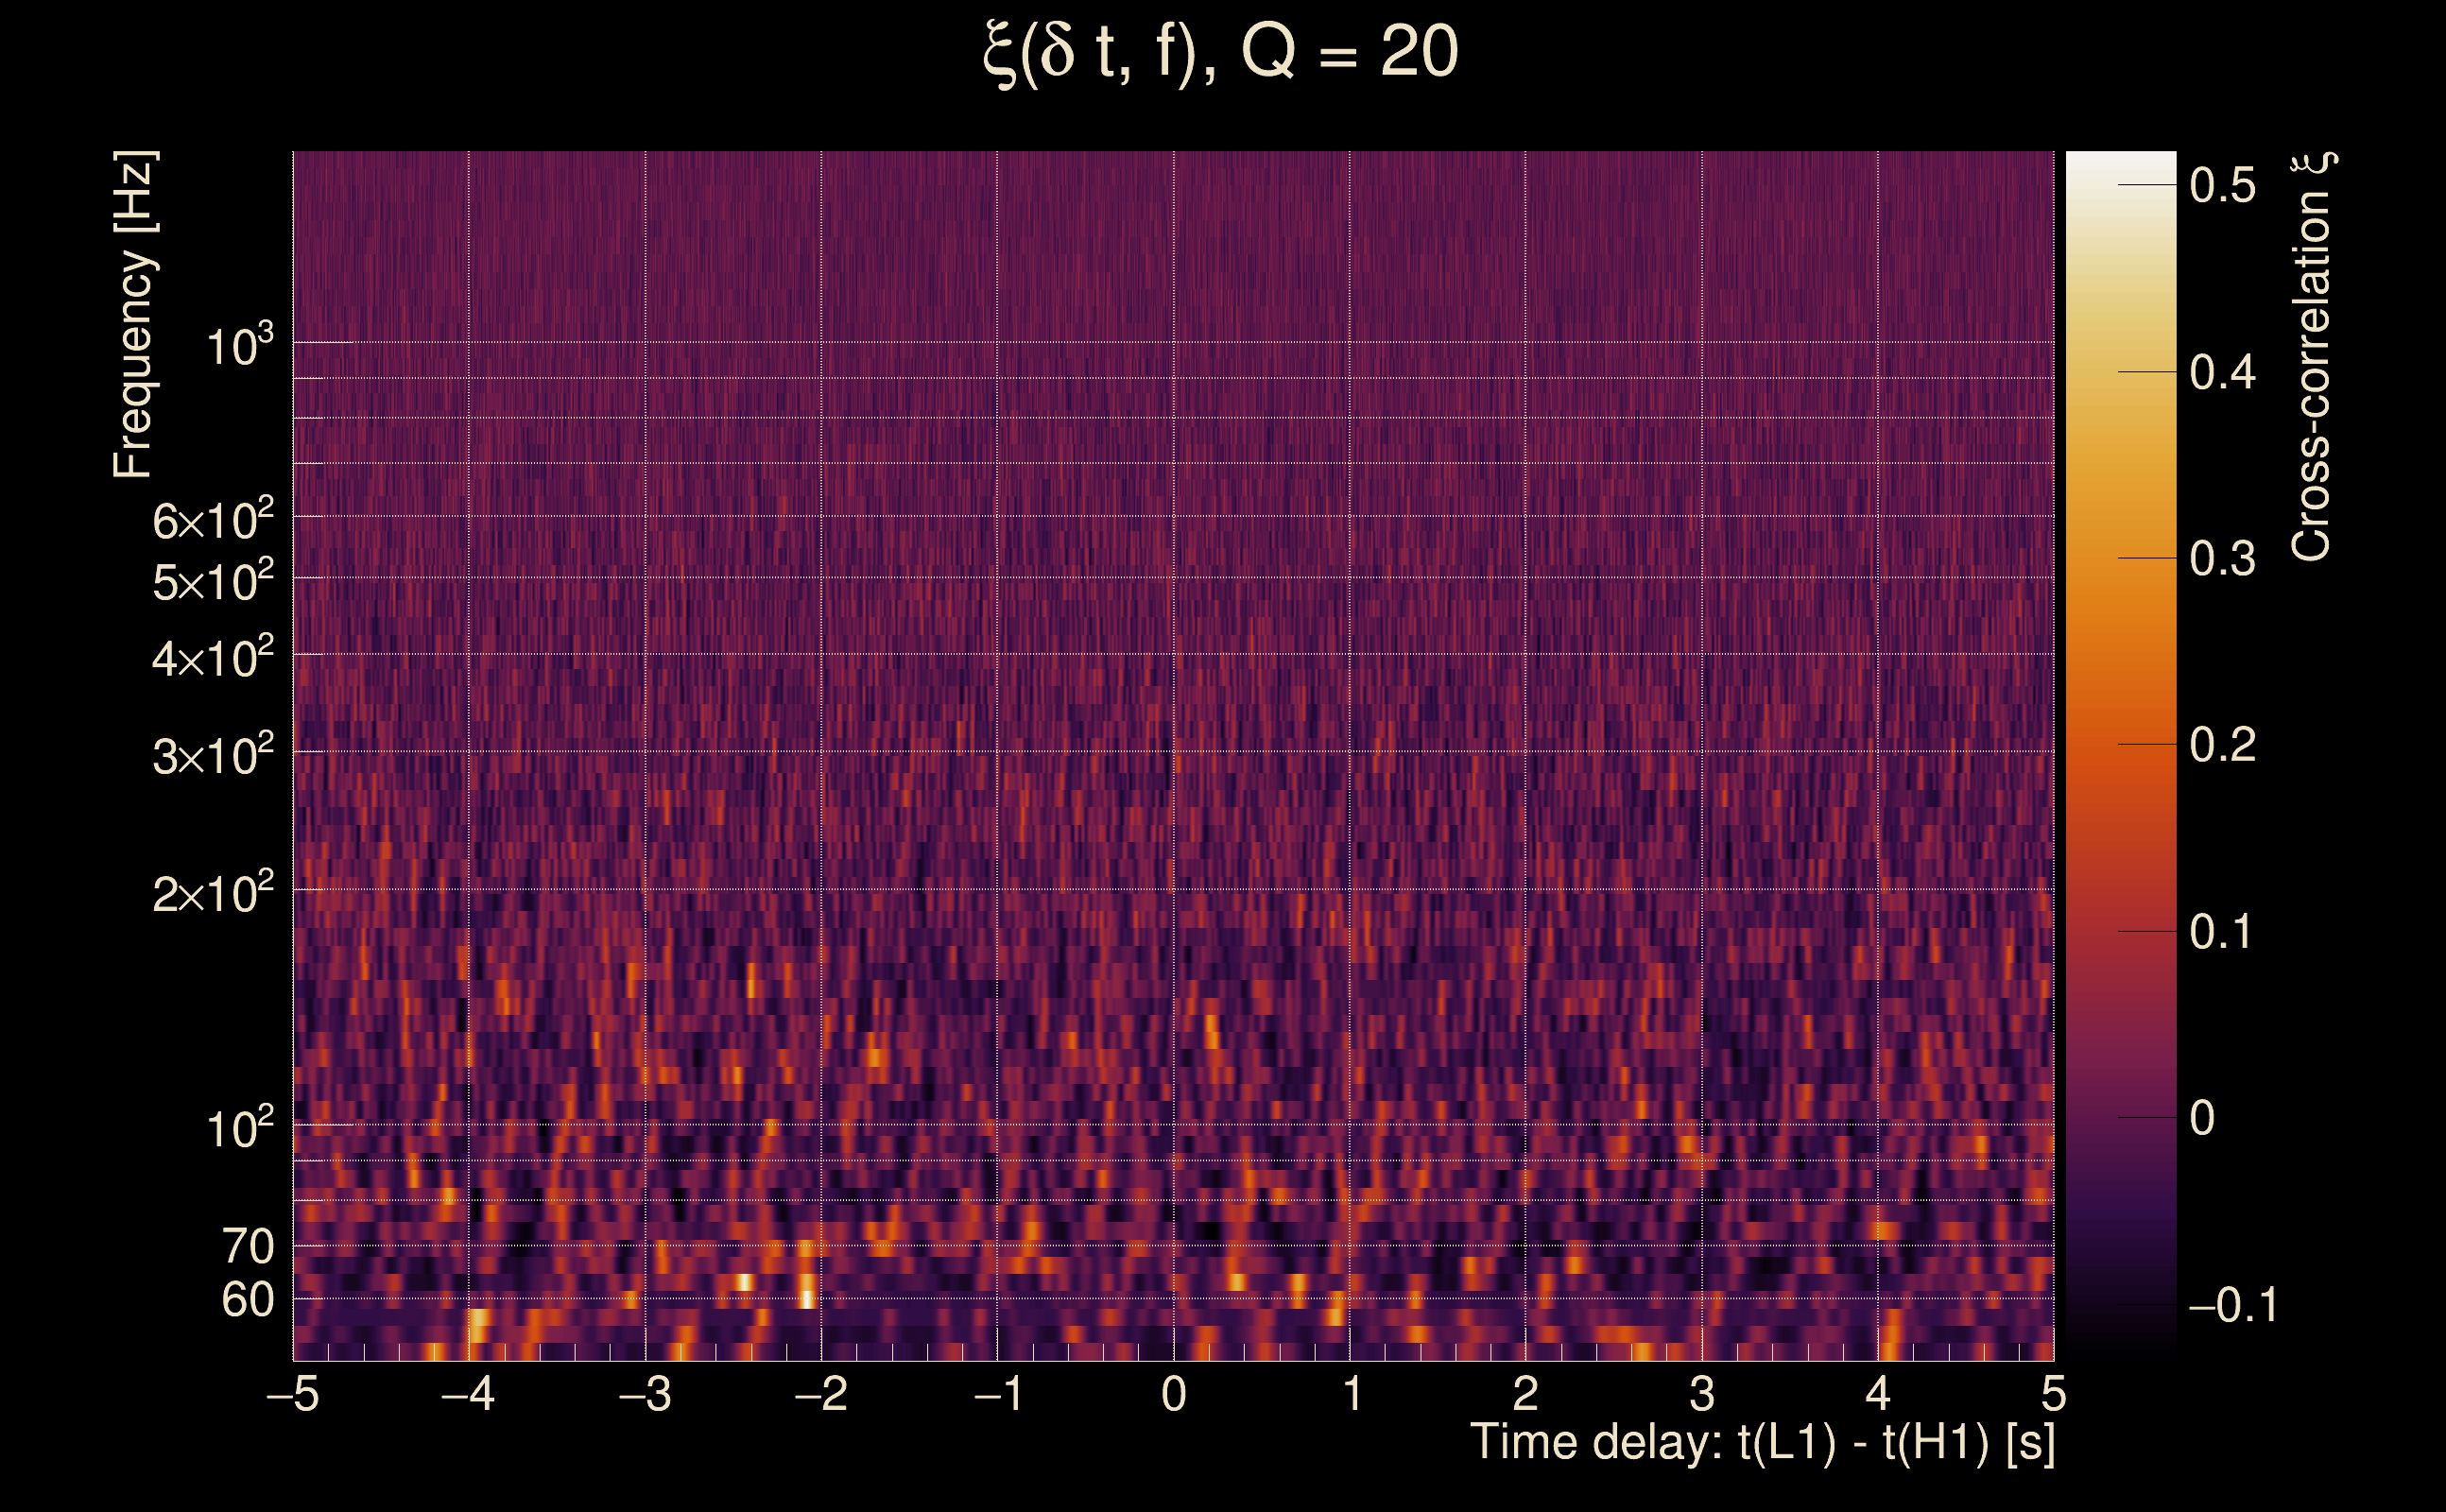
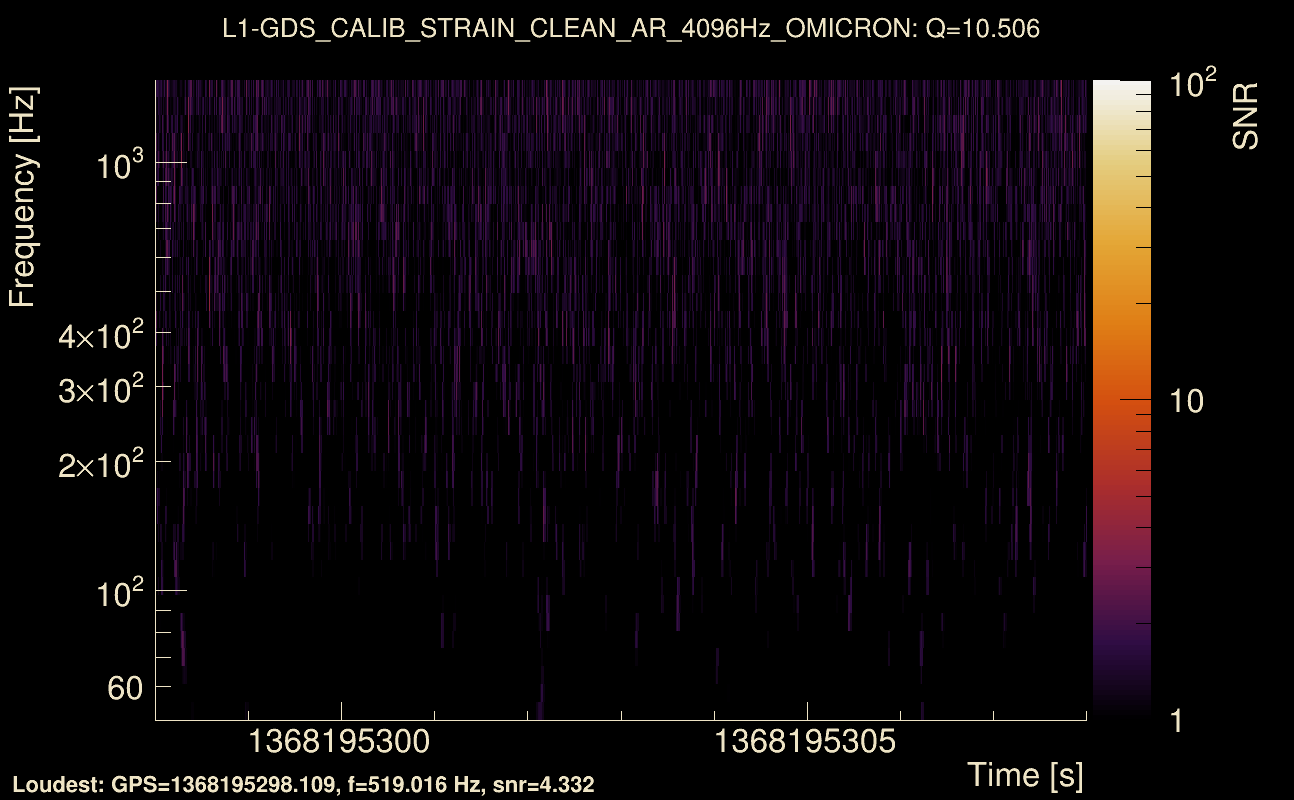
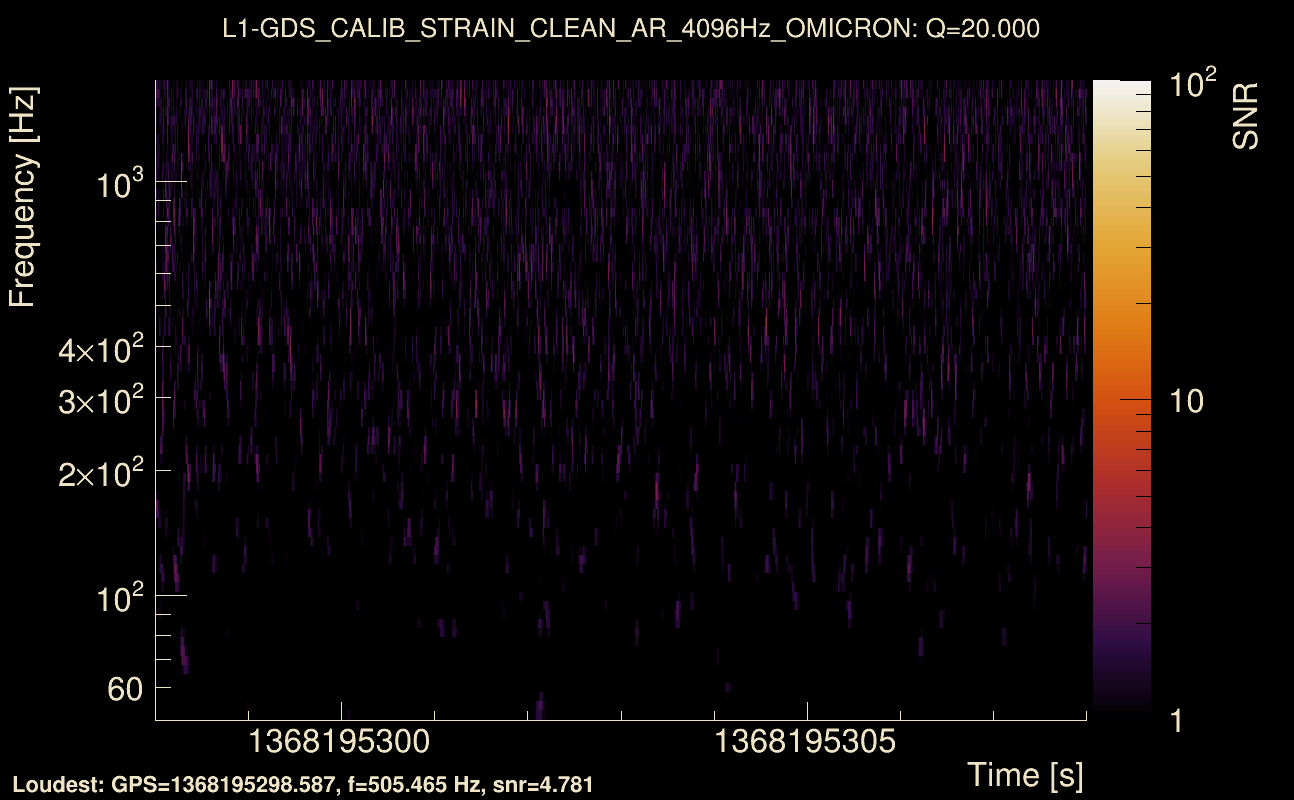
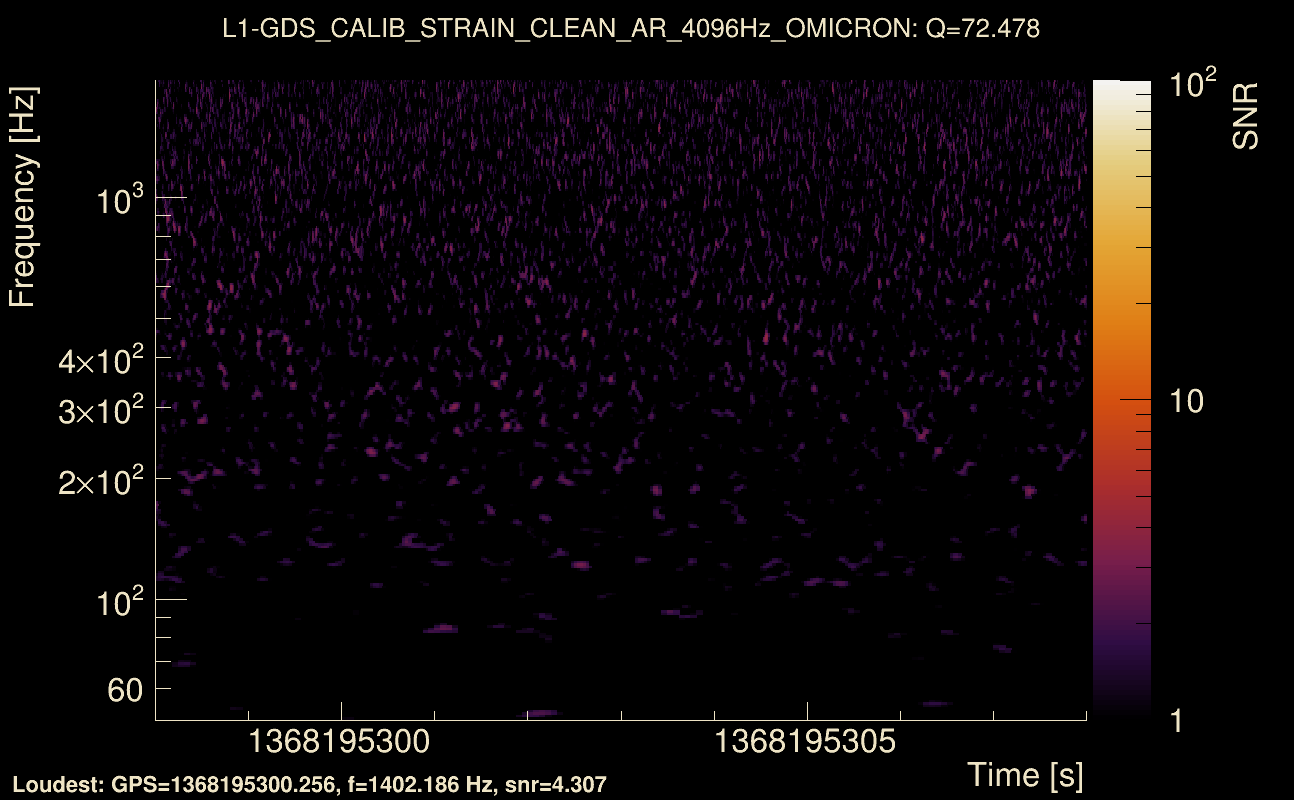
| Event time t(H1): | GPS = 1368195288 (Mon May 15 14:14:30 2023 ) → GPS = 1368195298 (Mon May 15 14:14:40 2023 ) |
| Event time t(L1): | GPS = 1368195288 (Mon May 15 14:14:40 2023 ) → GPS = 1368195298 (Mon May 15 14:14:40 2023 ) |
| Omicron analysis time window (H1): | GPS = 1368195285 → GPS = 1368195301 |
| Omicron analysis time window (L1): | GPS = 1368195285 → GPS = 1368195301 |
| Time delay between detectors t(L1) - t(H1): | 0.000916593 s (slice index = 108 / 217), δt_gw = 0.000916593 s |
| Time delay uncertainty: | 0.00767029 s |
| [targeted mode] Time delay probability: | 0.311079 (1.01296 sigmas), δt_target = 0.00868297 s |
| Frequency: | 650.617 Hz |
| Ξ: | 0.000956319 ± 0.0385769 (variance = 0.00148817): Q0: 0, Q1: 0.0270509, Q2: 0.0425965, Q3: 0.0624932, Q4: 0.114847 |
| Rank: | R_X = 0.00029749 |
| Log of amplitude ratio (L1/H1): | 1.04188, variance = 0.434153 (L1/H1: 0.513766, variance = 0.802872, H1/L1: -1.55198, variance = 0.928849) |
| Amplitude ratio (L1/H1): | 2.83453 ⋇ 1.93267 (L1/H1: 1.67157 ⋇ 2.44986, H1/L1: 0.211829 ⋇ 2.62156) |
| Amplitude ratio H1|L1 compatibility (probability): | 0.430145 |
| Antenna factor probability: | 1 |
| Number of rejected frequency rows: | Q0: 18 / 18, Q1: 34 / 36, Q2: 68 / 70, Q3: 127 / 134, Q4: 246 / 258 |
| Maximum signal-to-noise ratio: | H1: 4.94736, L1: 5.03394 |
| SNR variance: | H1: 0.447481, L1: 0.49169 |
| Click here for a zoomed plot | Click here for a zoomed plot | Click here for a zoomed plot | Click here for a zoomed plot | Click here for a zoomed plot |
 |
 |
 |
 |
 |
 |
 |
 |
 |
 |
 |
 |
 |
 |
 |
 |
 |
 |
 |
 |
 |
 |
 |
 |
 |
 |
 |
 |
 |
 |
 |
 |
 |
 |
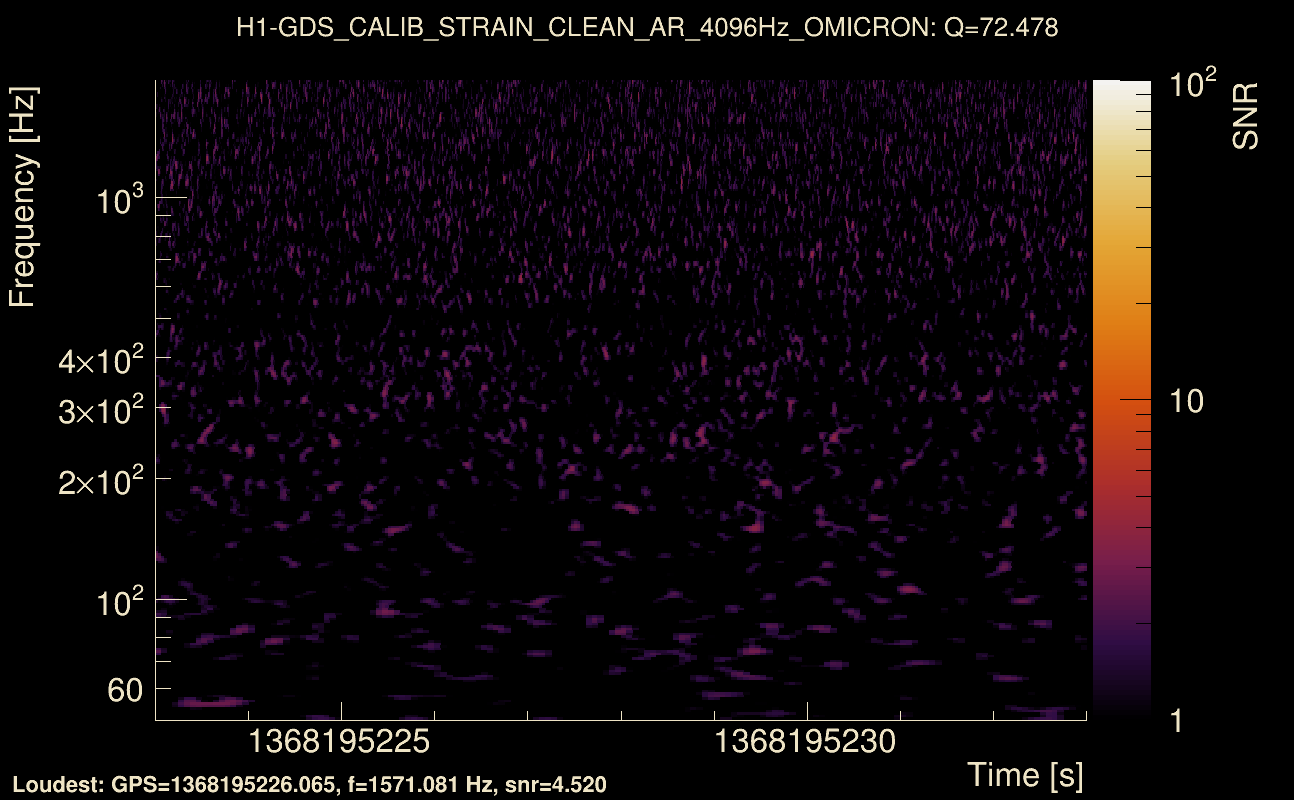
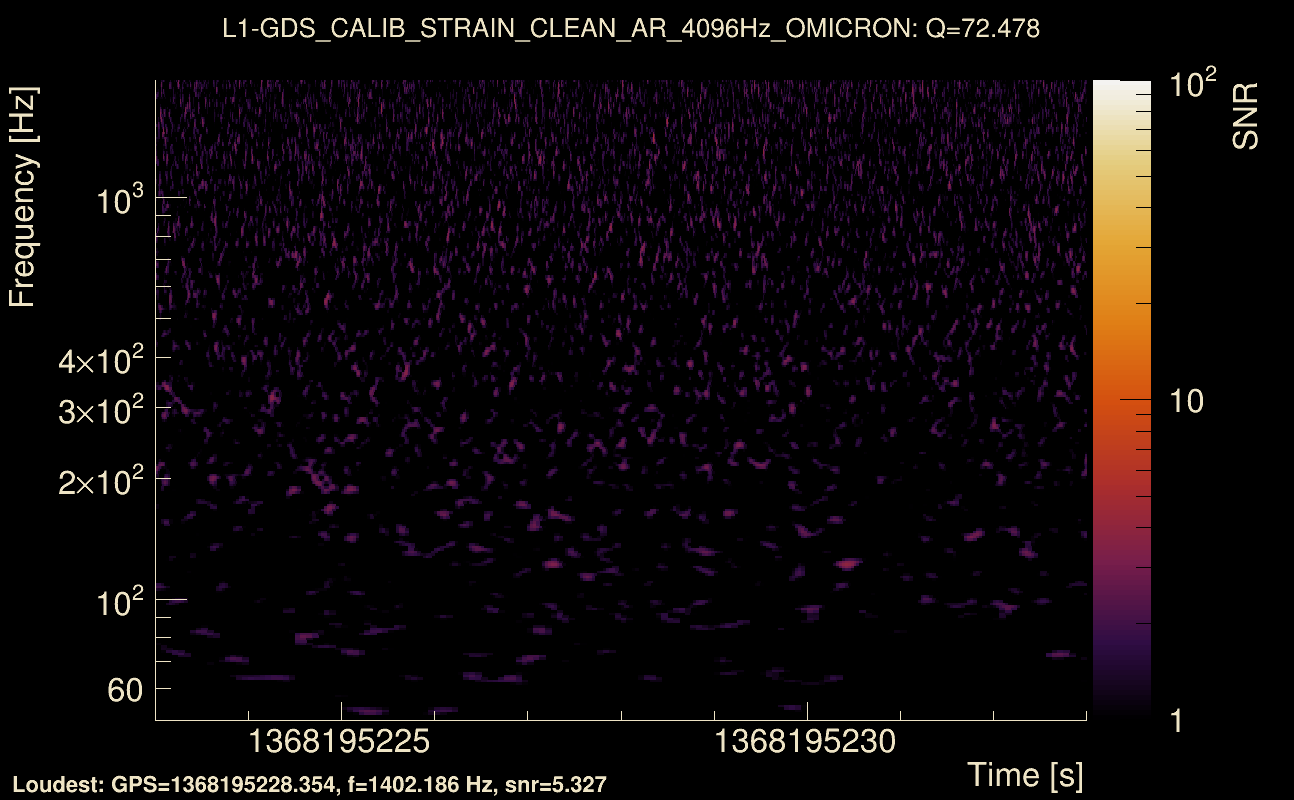
| Event time t(H1): | GPS = 1368195223 (Mon May 15 14:13:25 2023 ) → GPS = 1368195233 (Mon May 15 14:13:35 2023 ) |
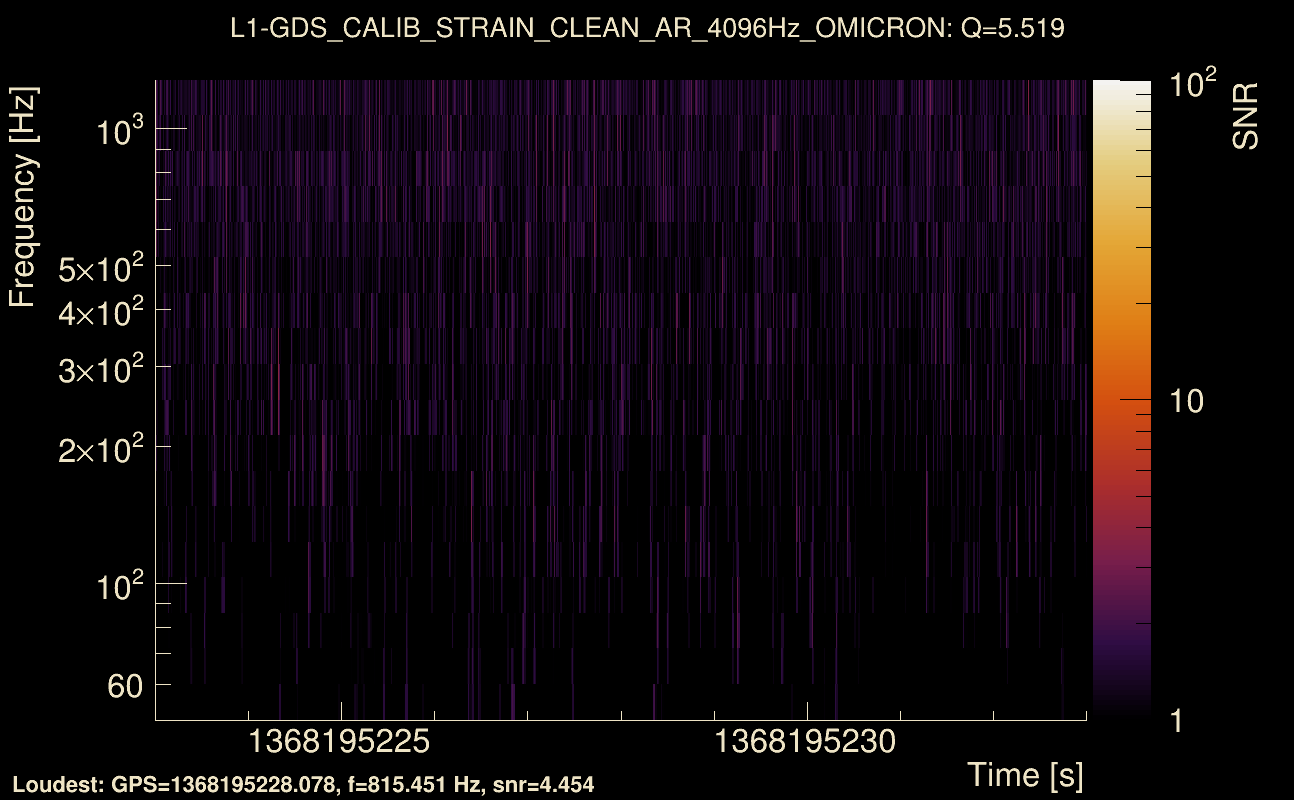
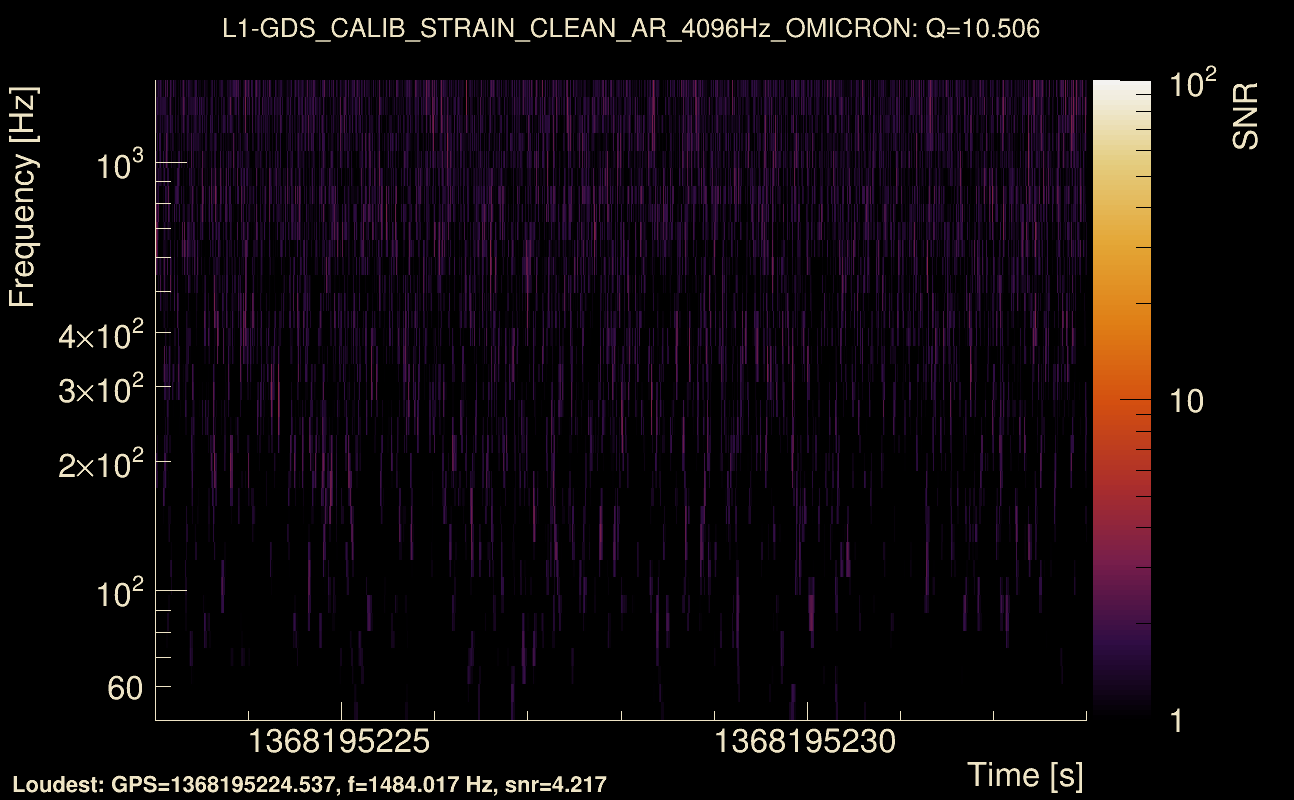
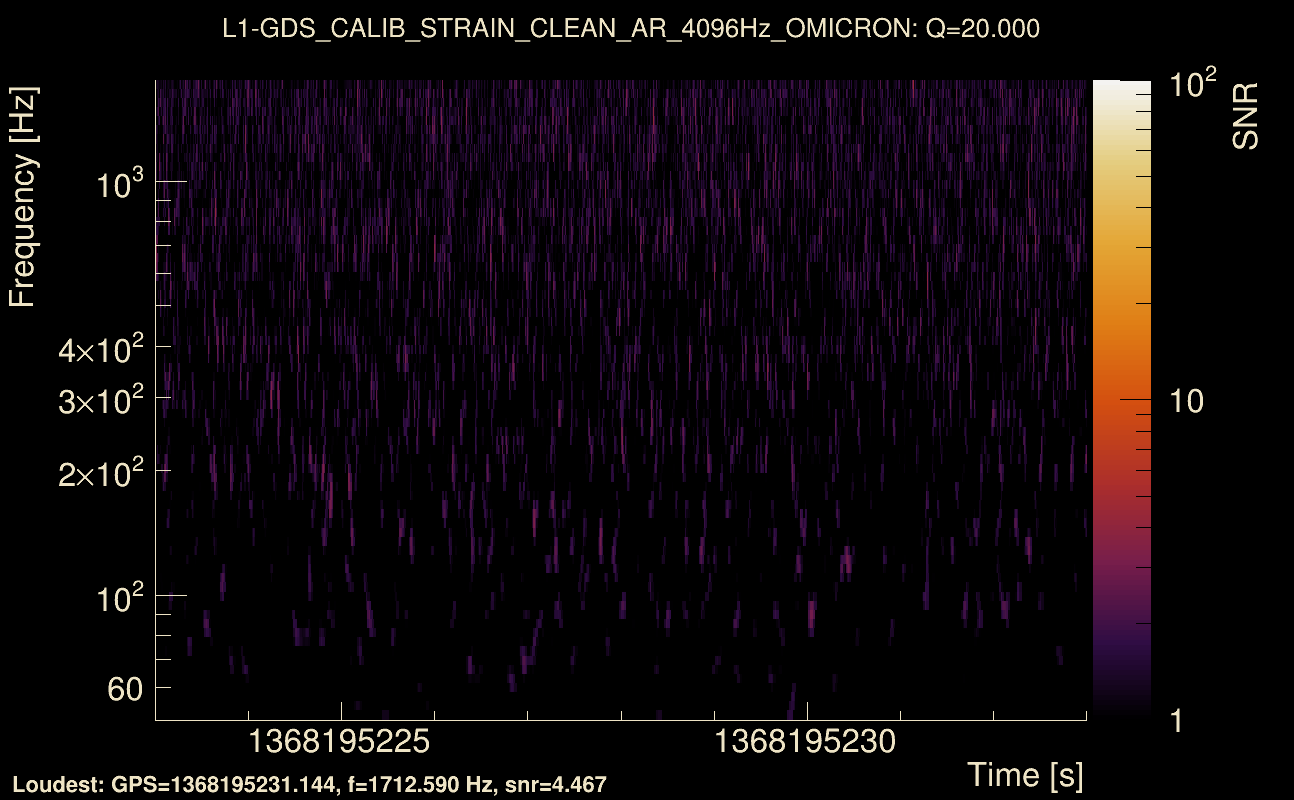
| Event time t(L1): | GPS = 1368195223 (Mon May 15 14:13:35 2023 ) → GPS = 1368195233 (Mon May 15 14:13:35 2023 ) |
| Omicron analysis time window (H1): | GPS = 1368195220 → GPS = 1368195236 |
| Omicron analysis time window (L1): | GPS = 1368195220 → GPS = 1368195236 |
| Time delay between detectors t(L1) - t(H1): | 0.00348971 s (slice index = 108 / 217), δt_gw = 0.00348971 s |
| Time delay uncertainty: | 0.00694055 s |
| [targeted mode] Time delay probability: | 0.453379 (0.749794 sigmas), δt_target = 0.0086863 s |
| Frequency: | 840.542 Hz |
| Ξ: | 0.000588883 ± 0.0284123 (variance = 0.00080726): Q0: 0, Q1: 0, Q2: 0.0409127, Q3: 0.0719414, Q4: 0.0497454 |
| Rank: | R_X = 0.000266987 |
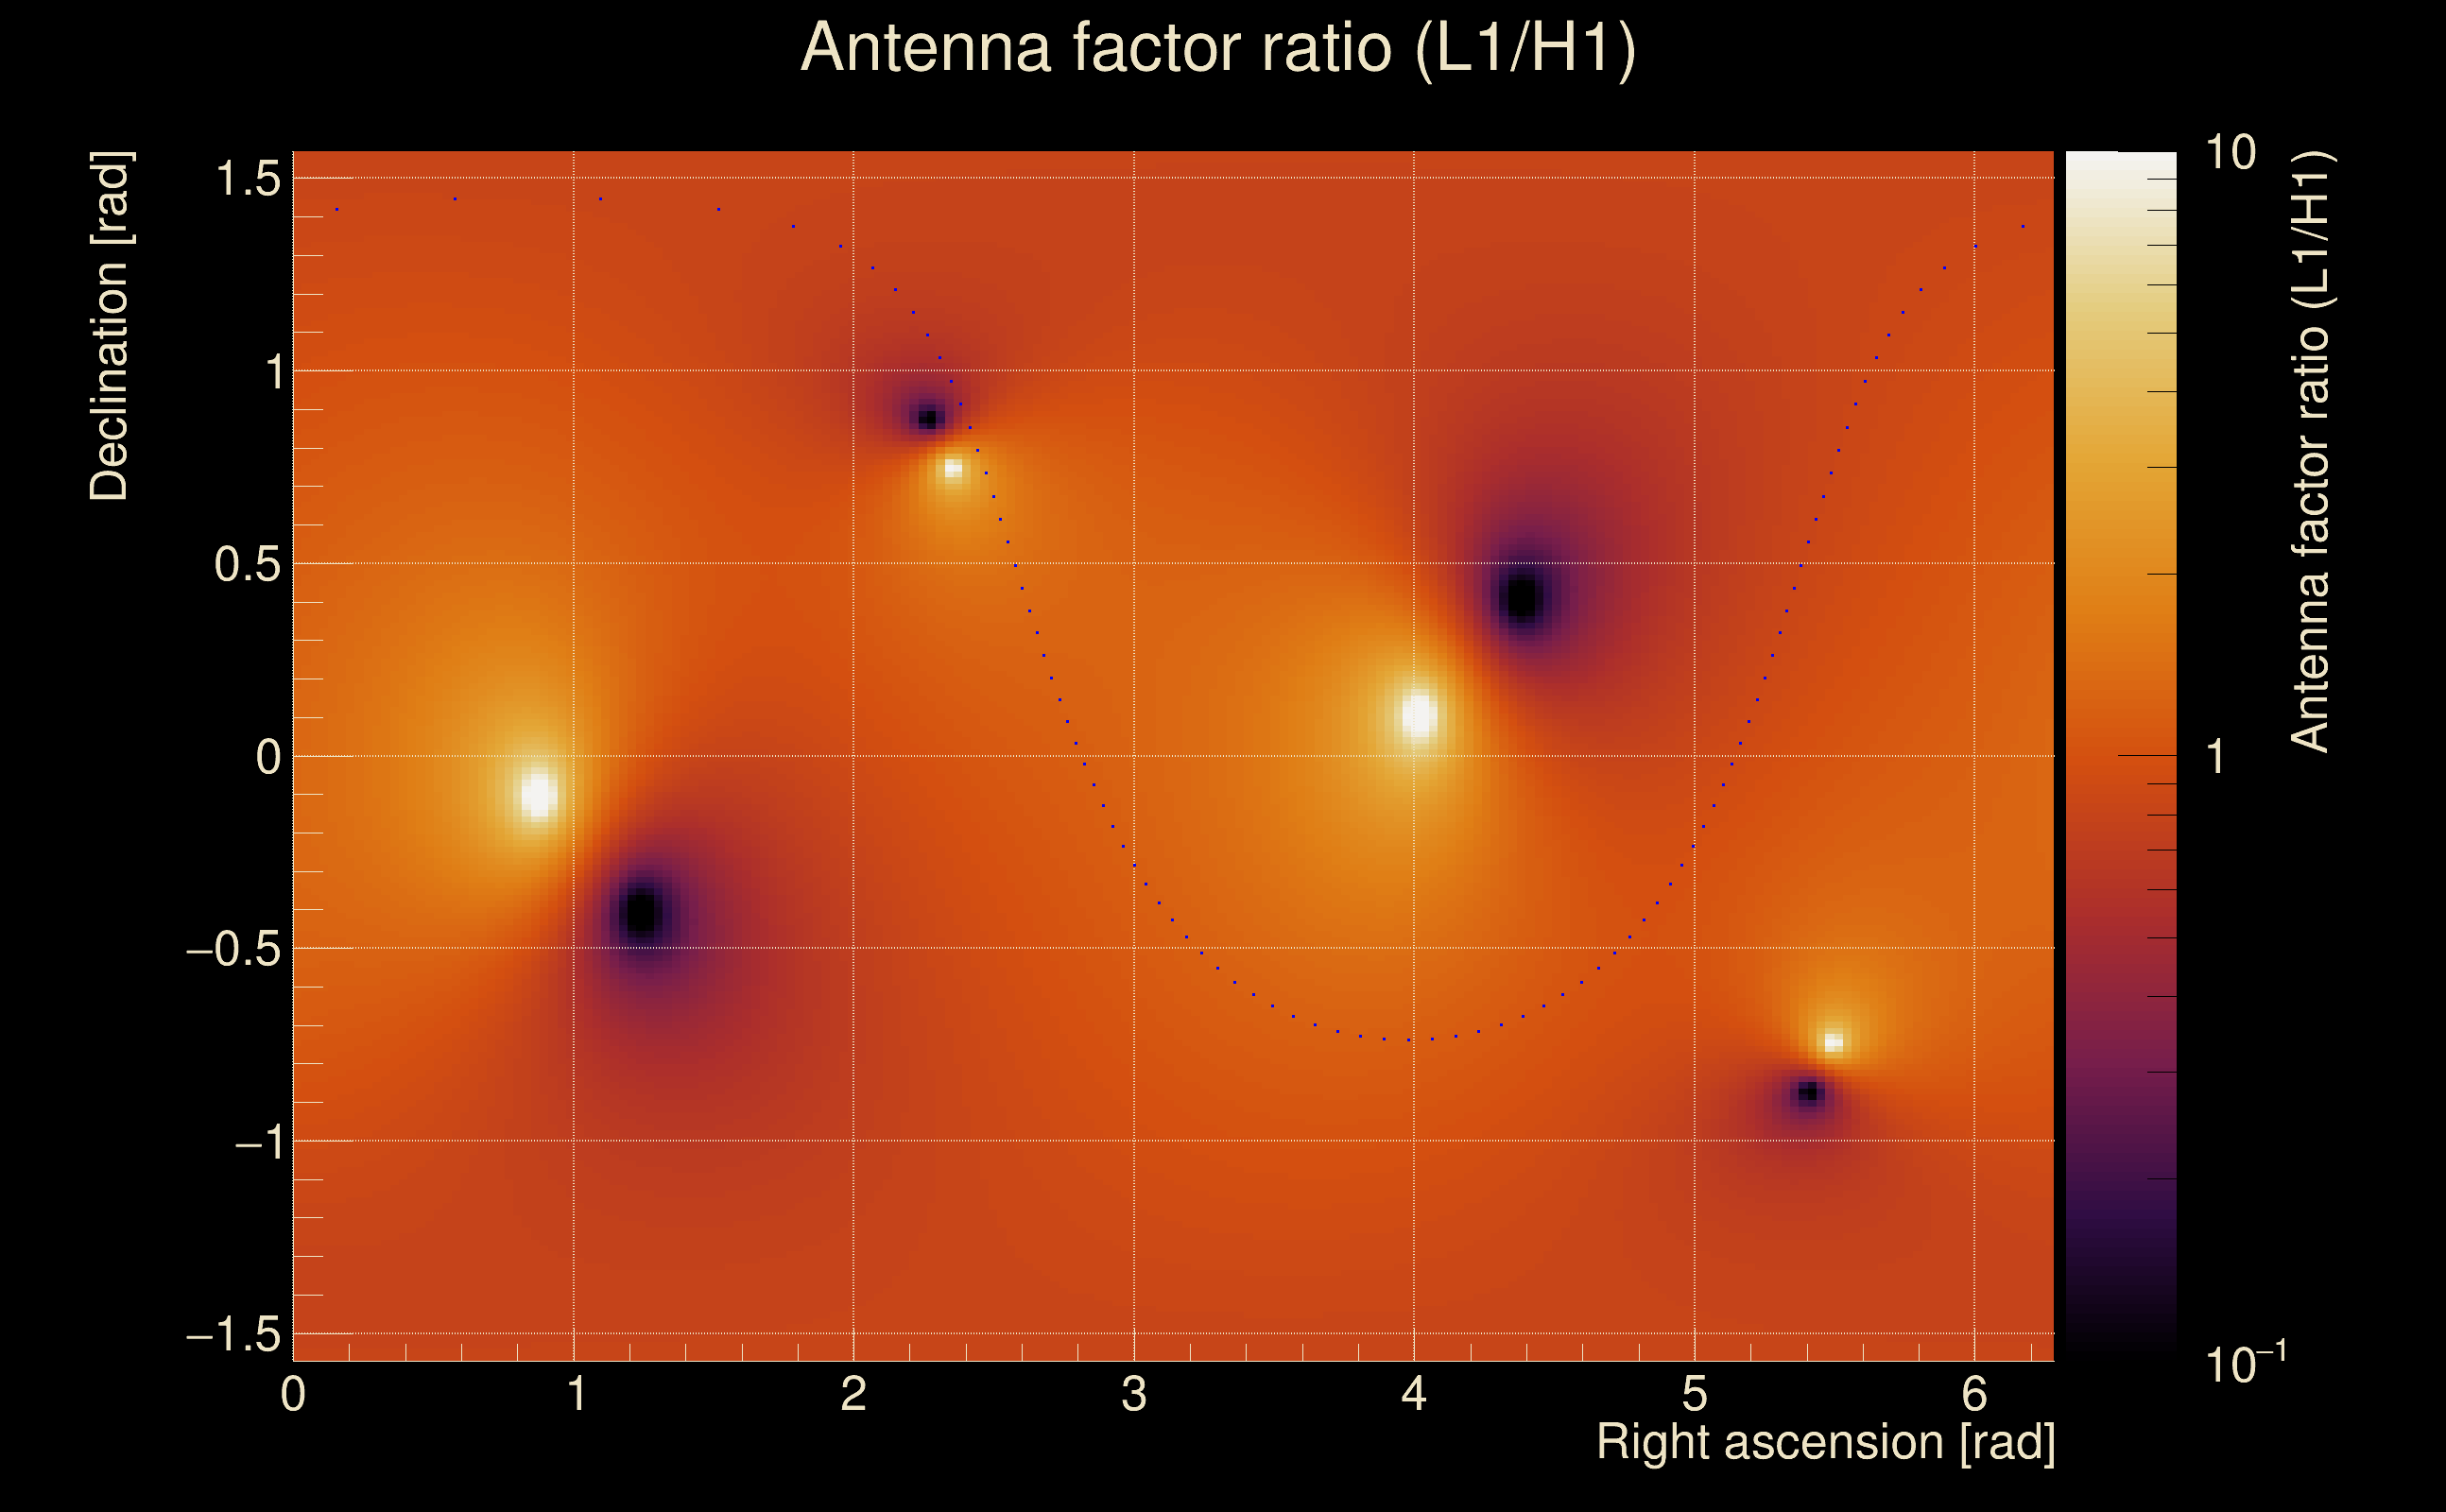
| Log of amplitude ratio (L1/H1): | 0.403931, variance = 0.54037 (L1/H1: -0.243727, variance = 1.41485, H1/L1: -0.9139, variance = 0.849164) |
| Amplitude ratio (L1/H1): | 1.4977 ⋇ 2.08569 (L1/H1: 0.783702 ⋇ 3.28536, H1/L1: 0.400958 ⋇ 2.51306) |
| Amplitude ratio H1|L1 compatibility (probability): | 0.441681 |
| Antenna factor probability: | 1 |
| Number of rejected frequency rows: | Q0: 18 / 18, Q1: 36 / 36, Q2: 66 / 70, Q3: 128 / 134, Q4: 249 / 258 |
| Maximum signal-to-noise ratio: | H1: 4.74751, L1: 5.35017 |
| SNR variance: | H1: 0, L1: 0 |
| Click here for a zoomed plot | Click here for a zoomed plot | Click here for a zoomed plot | Click here for a zoomed plot | Click here for a zoomed plot |
 |
 |
 |
 |
 |
 |
 |
 |
 |
 |
 |
 |
 |
 |
 |
 |
 |
 |
 |
 |
 |
 |
 |
 |
 |
 |
 |
 |
 |
 |
 |
 |
 |
 |
| Event time t(H1): | GPS = 1368195298 (Mon May 15 14:14:40 2023 ) → GPS = 1368195308 (Mon May 15 14:14:50 2023 ) |
| Event time t(L1): | GPS = 1368195298 (Mon May 15 14:14:50 2023 ) → GPS = 1368195308 (Mon May 15 14:14:50 2023 ) |
| Omicron analysis time window (H1): | GPS = 1368195295 → GPS = 1368195311 |
| Omicron analysis time window (L1): | GPS = 1368195295 → GPS = 1368195311 |
| Time delay between detectors t(L1) - t(H1): | 0.00177939 s (slice index = 108 / 217), δt_gw = 0.00177939 s |
| Time delay uncertainty: | 0.00779987 s |
| [targeted mode] Time delay probability: | 0.375944 (0.885394 sigmas), δt_target = 0.0086937 s |
| Frequency: | 614.236 Hz |
| Ξ: | 0.000308973 ± 0.032948 (variance = 0.00108557): Q0: 0, Q1: 0, Q2: 0.068087, Q3: 0.0530318, Q4: 0.0756541 |
| Rank: | R_X = 0.000116156 |
| Log of amplitude ratio (L1/H1): | 0.348167, variance = 0.496958 (L1/H1: -0.207351, variance = 0.854642, H1/L1: -0.924513, variance = 1.14313) |
| Amplitude ratio (L1/H1): | 1.41647 ⋇ 2.02375 (L1/H1: 0.812734 ⋇ 2.52053, H1/L1: 0.396725 ⋇ 2.91297) |
| Amplitude ratio H1|L1 compatibility (probability): | 0.42325 |
| Antenna factor probability: | 1 |
| Number of rejected frequency rows: | Q0: 18 / 18, Q1: 36 / 36, Q2: 69 / 70, Q3: 130 / 134, Q4: 251 / 258 |
| Maximum signal-to-noise ratio: | H1: 5.09311, L1: 5.00024 |
| SNR variance: | H1: 0.441209, L1: 0.493389 |
| Click here for a zoomed plot | Click here for a zoomed plot | Click here for a zoomed plot | Click here for a zoomed plot | Click here for a zoomed plot |
 |
 |
 |
 |
 |
 |
 |
 |
 |
 |
 |
 |
 |
 |
 |
 |
 |
 |
 |
 |
 |
 |
 |
 |
 |
 |
 |
 |
 |
 |
 |
 |
 |
 |
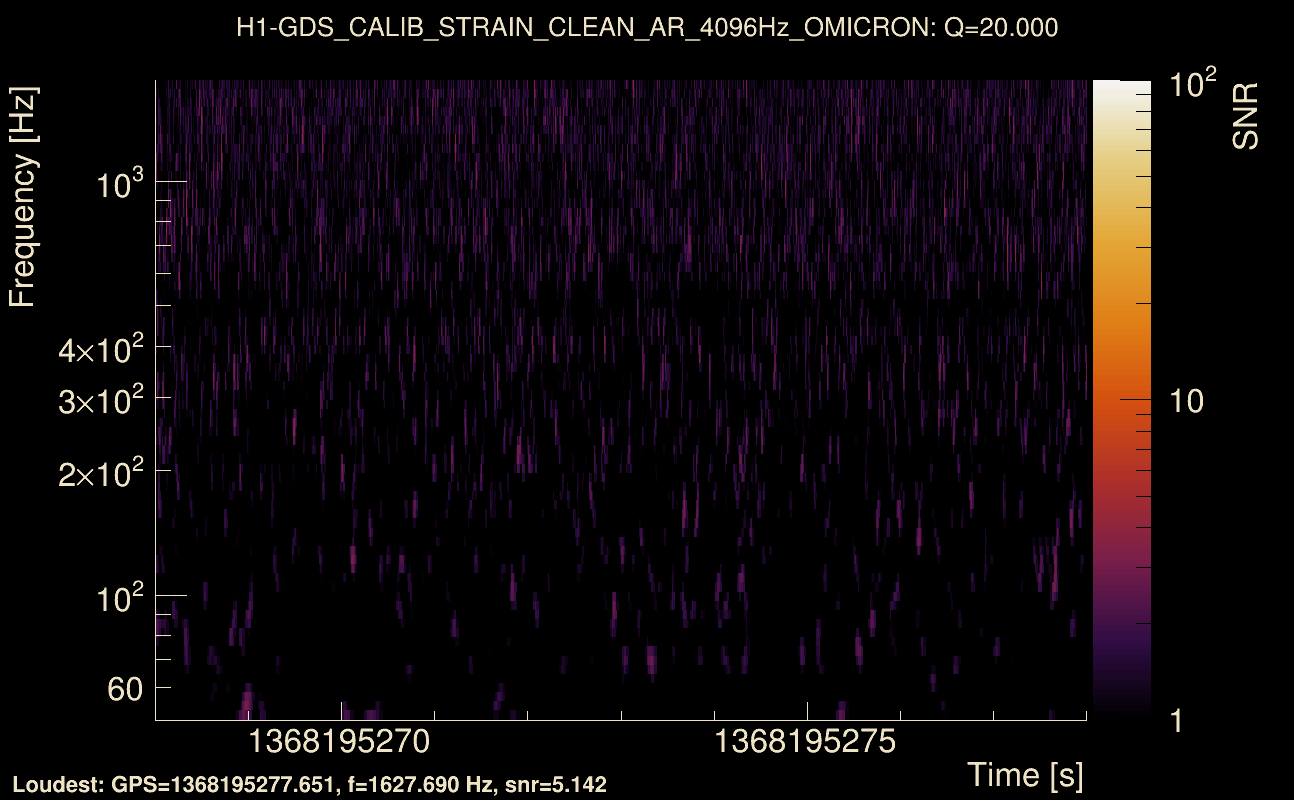
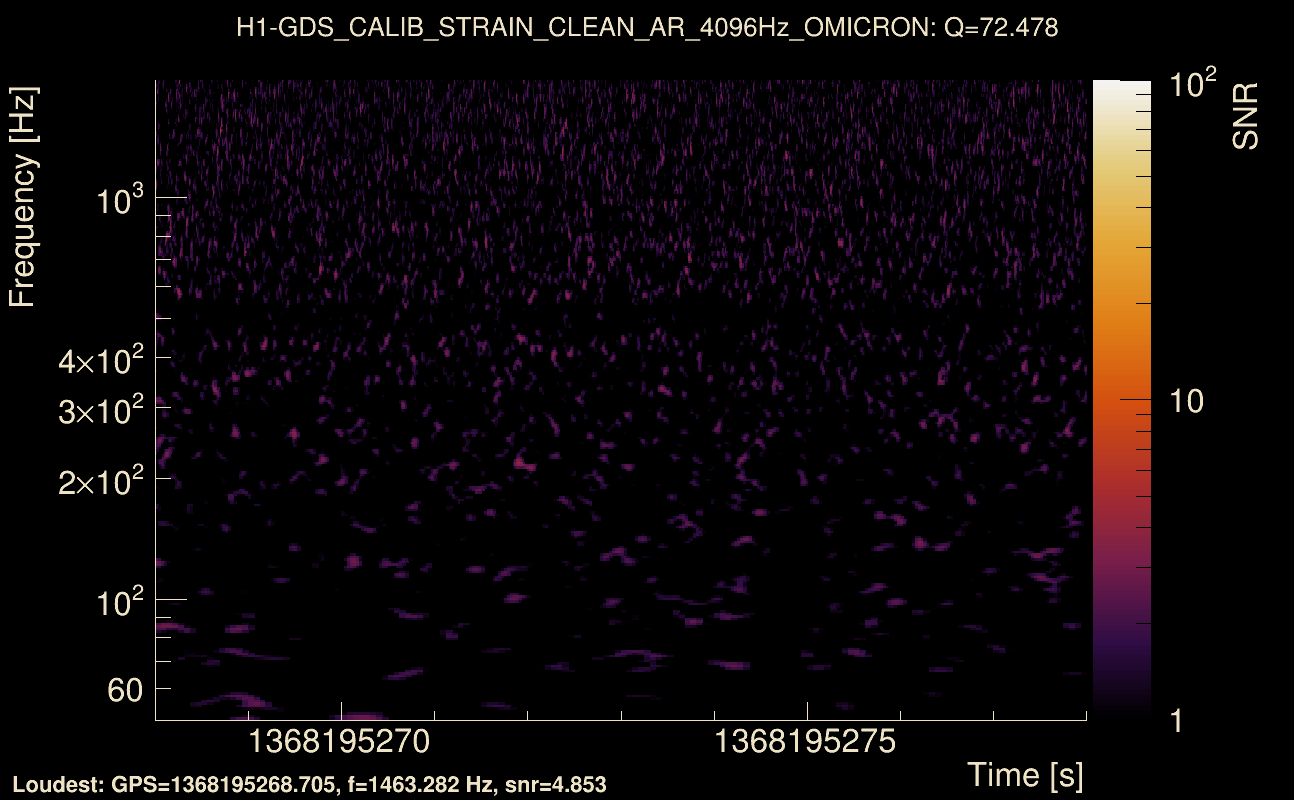
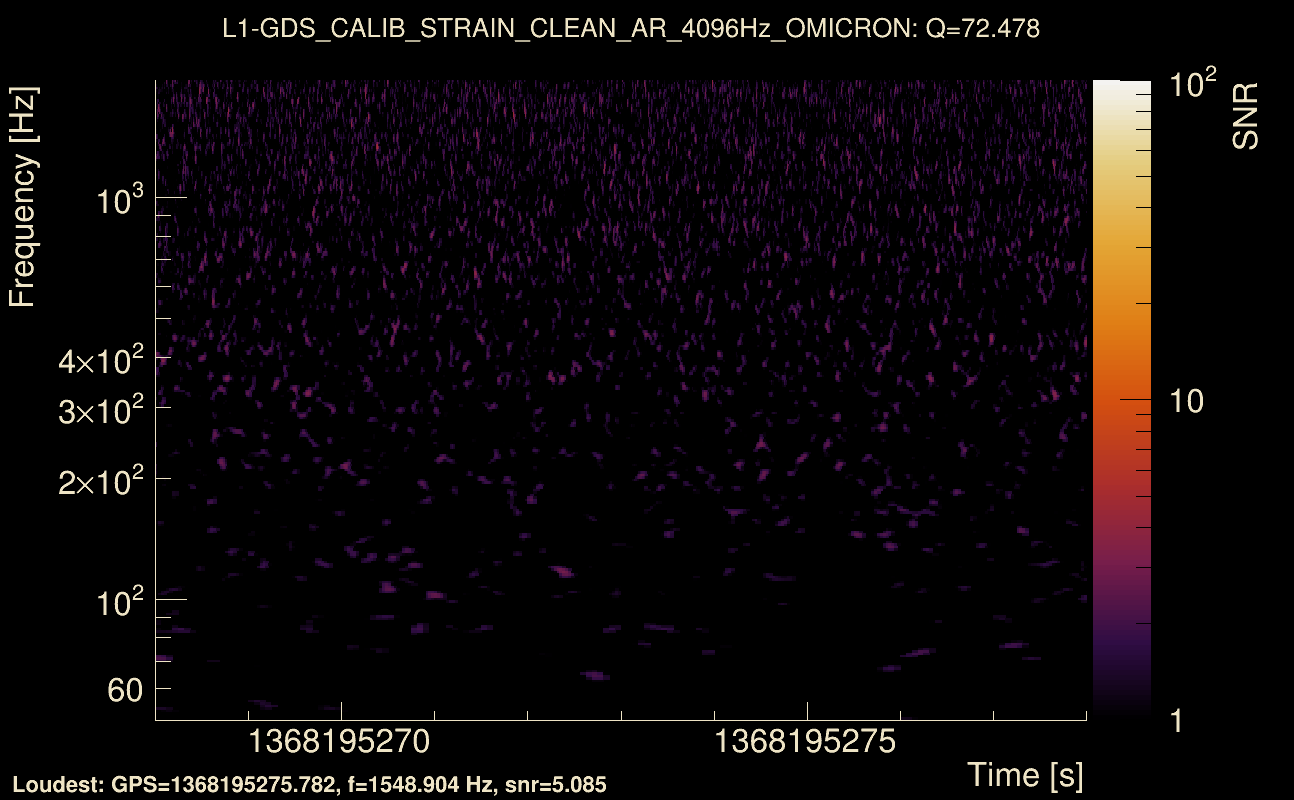
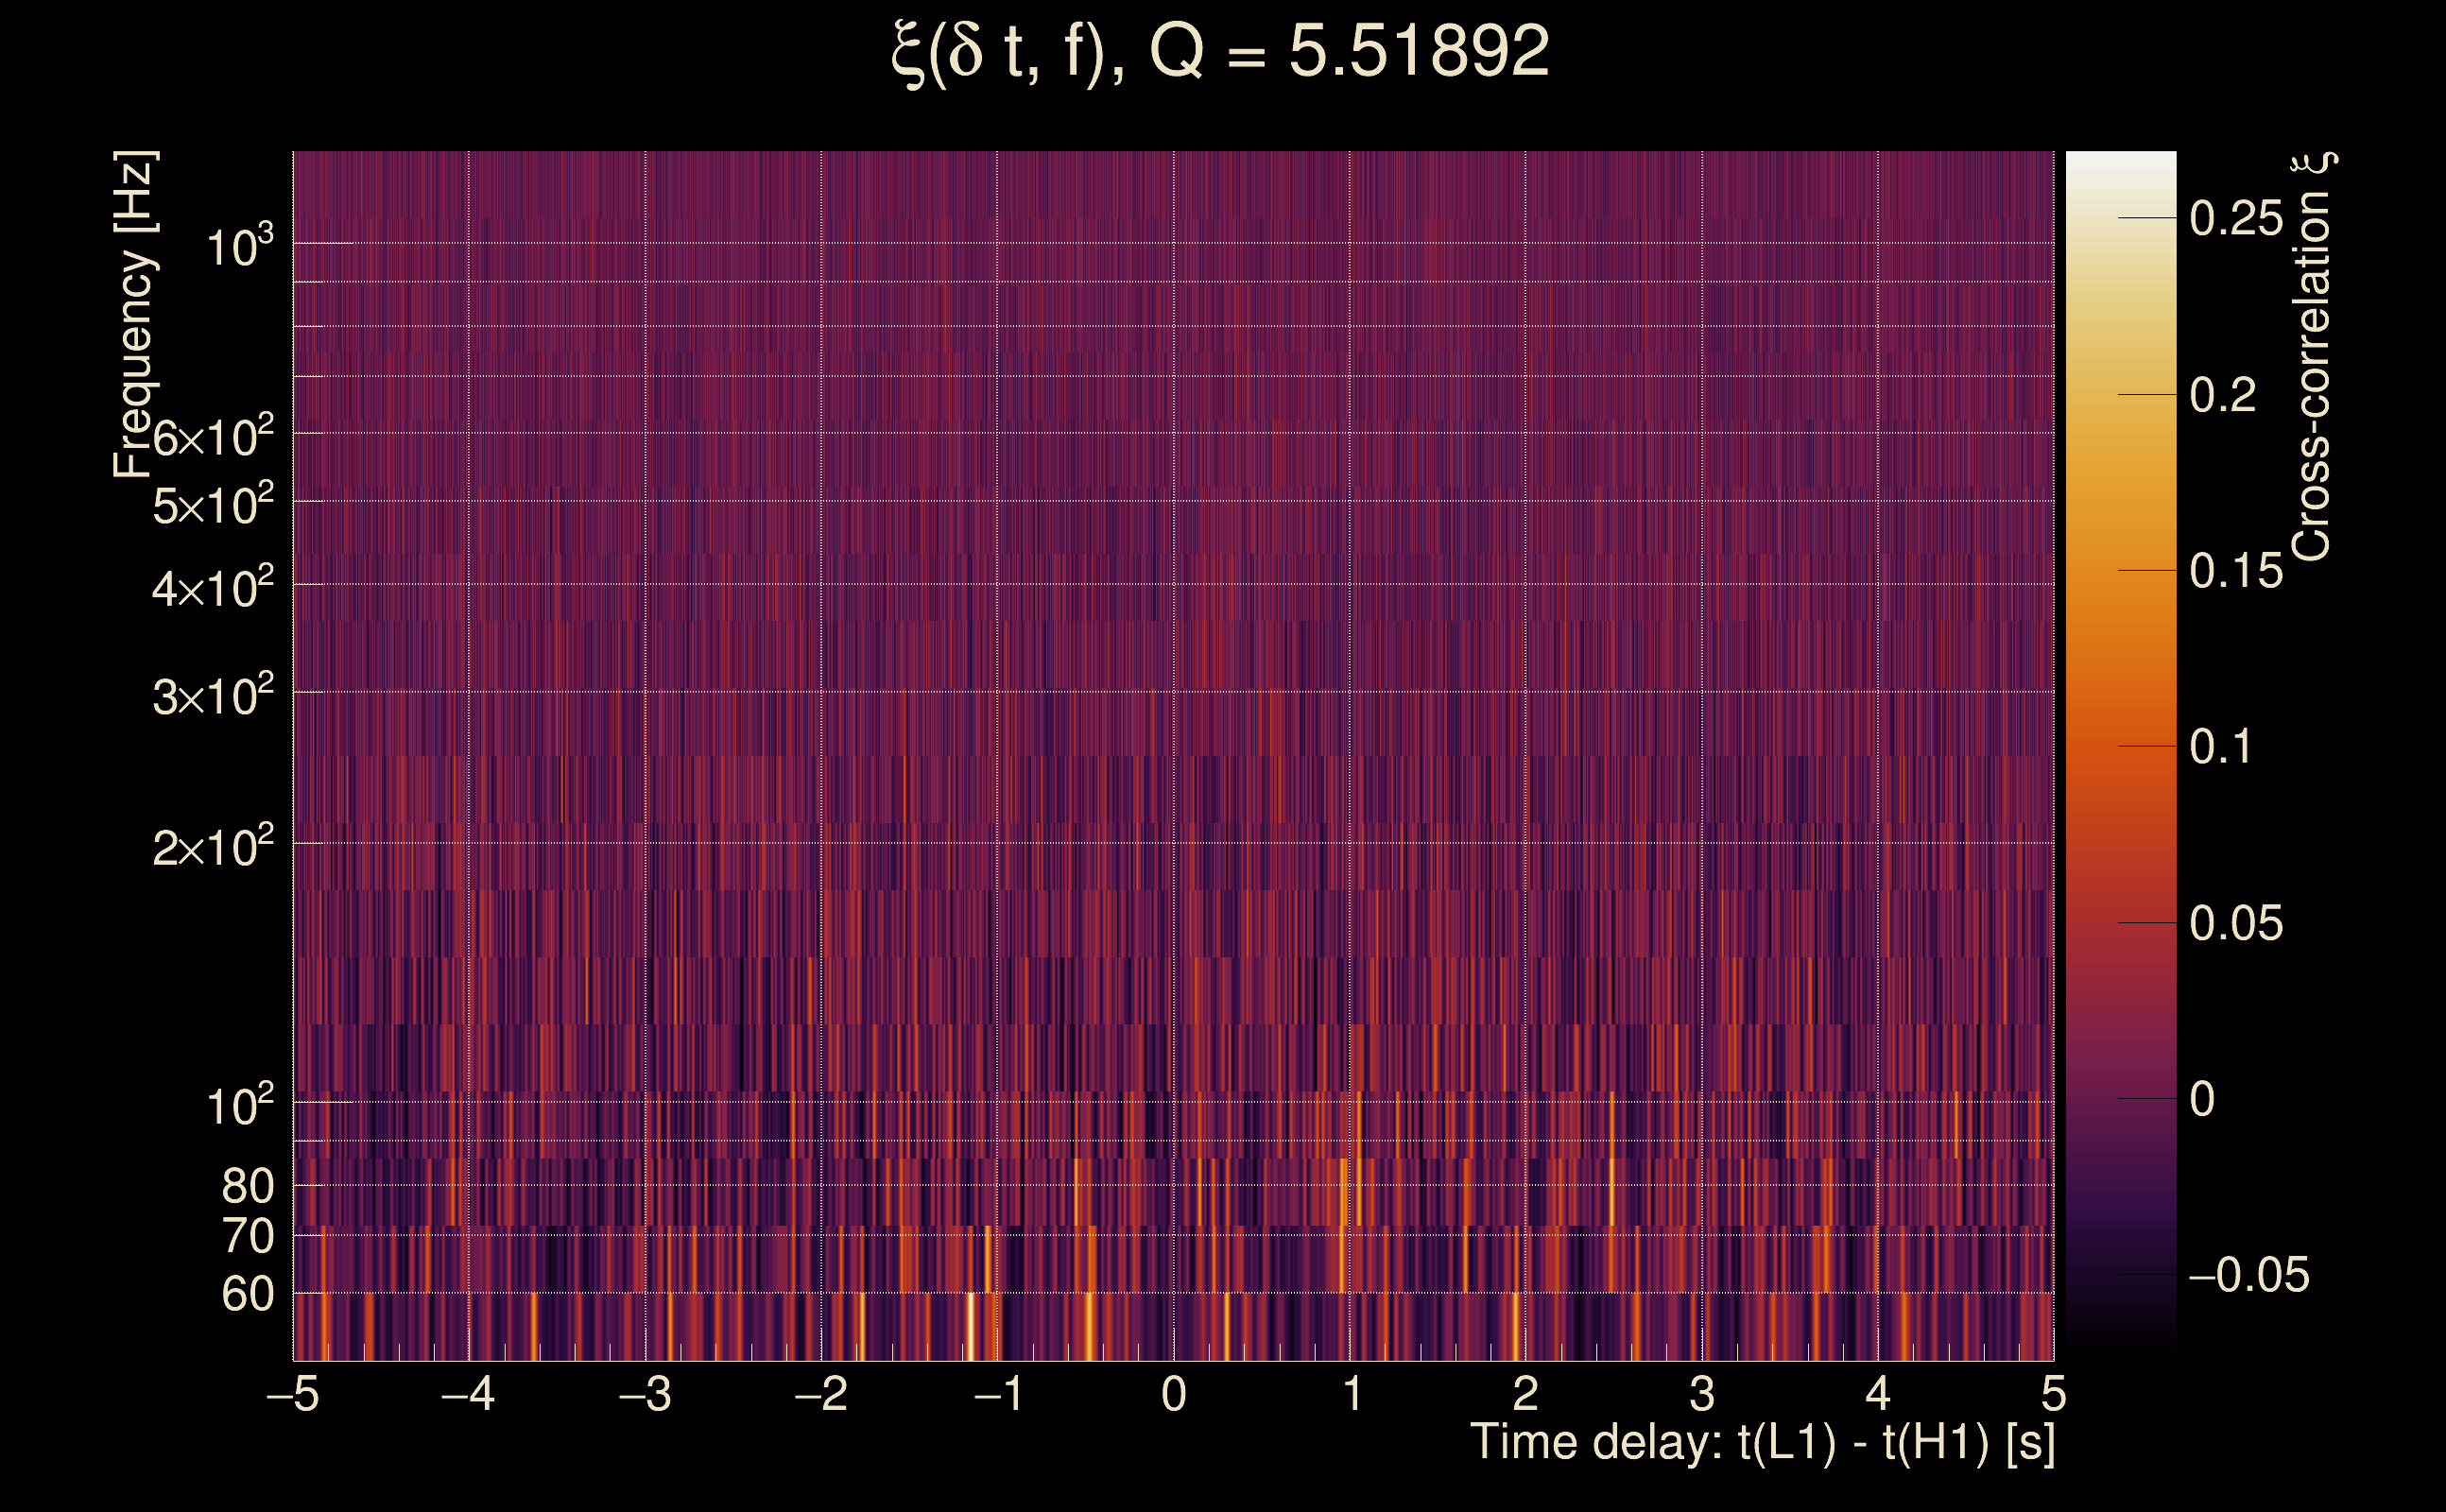
| Event time t(H1): | GPS = 1368195268 (Mon May 15 14:14:10 2023 ) → GPS = 1368195278 (Mon May 15 14:14:20 2023 ) |
| Event time t(L1): | GPS = 1368195268 (Mon May 15 14:14:20 2023 ) → GPS = 1368195278 (Mon May 15 14:14:20 2023 ) |
| Omicron analysis time window (H1): | GPS = 1368195265 → GPS = 1368195281 |
| Omicron analysis time window (L1): | GPS = 1368195265 → GPS = 1368195281 |
| Time delay between detectors t(L1) - t(H1): | 0.00728515 s (slice index = 108 / 217), δt_gw = 0.00728515 s |
| Time delay uncertainty: | 0.00654281 s |
| [targeted mode] Time delay probability: | 0.830145 (0.214516 sigmas), δt_target = 0.00868535 s |
| Frequency: | 795.11 Hz |
| Ξ: | 0.000122453 ± 0.0258321 (variance = 0.000667297): Q0: 0, Q1: 0, Q2: 0.0224782, Q3: 0.0177911, Q4: 0.0704835 |
| Rank: | R_X = 0.000101654 |
| Log of amplitude ratio (L1/H1): | 0.443958, variance = 0.281886 (L1/H1: -0.122578, variance = 0.553022, H1/L1: -1.08826, variance = 0.572366) |
| Amplitude ratio (L1/H1): | 1.55887 ⋇ 1.70051 (L1/H1: 0.884637 ⋇ 2.10361, H1/L1: 0.336803 ⋇ 2.13091) |
| Amplitude ratio H1|L1 compatibility (probability): | 0.253708 |
| Antenna factor probability: | 1 |
| Number of rejected frequency rows: | Q0: 18 / 18, Q1: 36 / 36, Q2: 68 / 70, Q3: 133 / 134, Q4: 255 / 258 |
| Maximum signal-to-noise ratio: | H1: 5.21819, L1: 4.89317 |
| SNR variance: | H1: 0.422244, L1: 0.467571 |
| Click here for a zoomed plot | Click here for a zoomed plot | Click here for a zoomed plot | Click here for a zoomed plot | Click here for a zoomed plot |
 |
 |
 |
 |
 |
 |
 |
 |
 |
 |
 |
 |
 |
 |
 |
 |
 |
 |
 |
 |
 |
 |
 |
 |
 |
 |
 |
 |
 |
 |
 |
 |
 |
 |
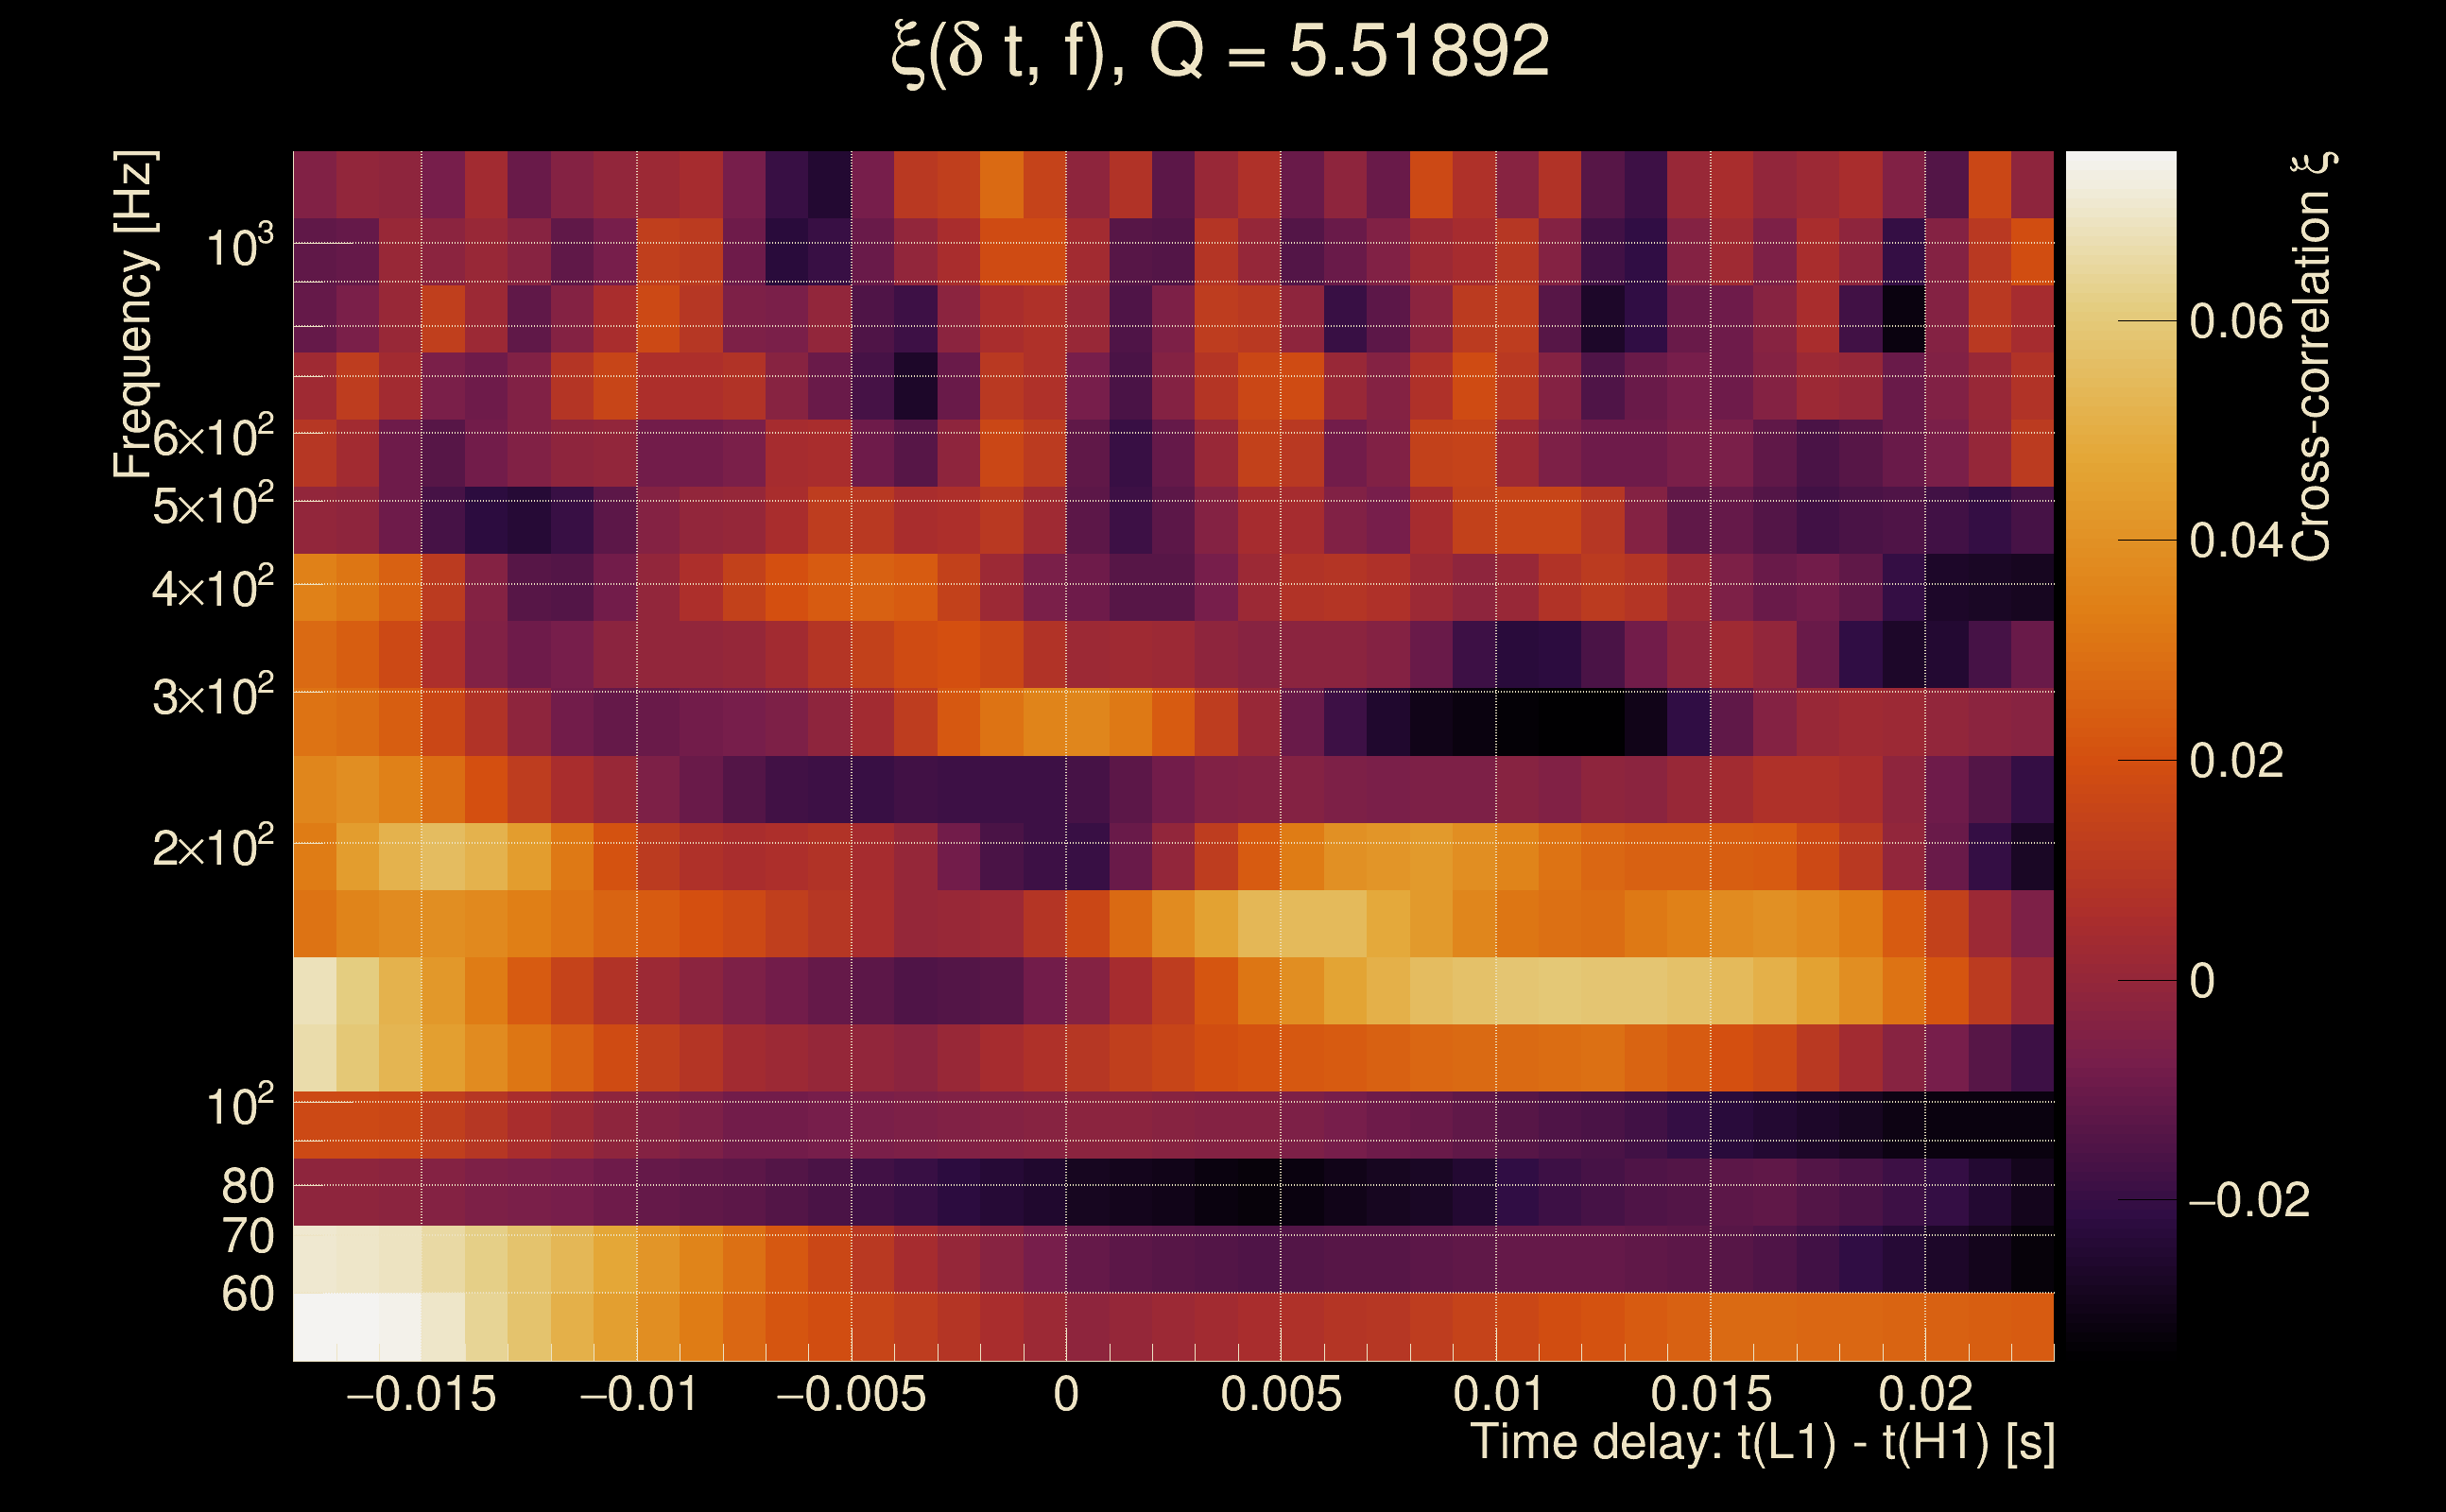
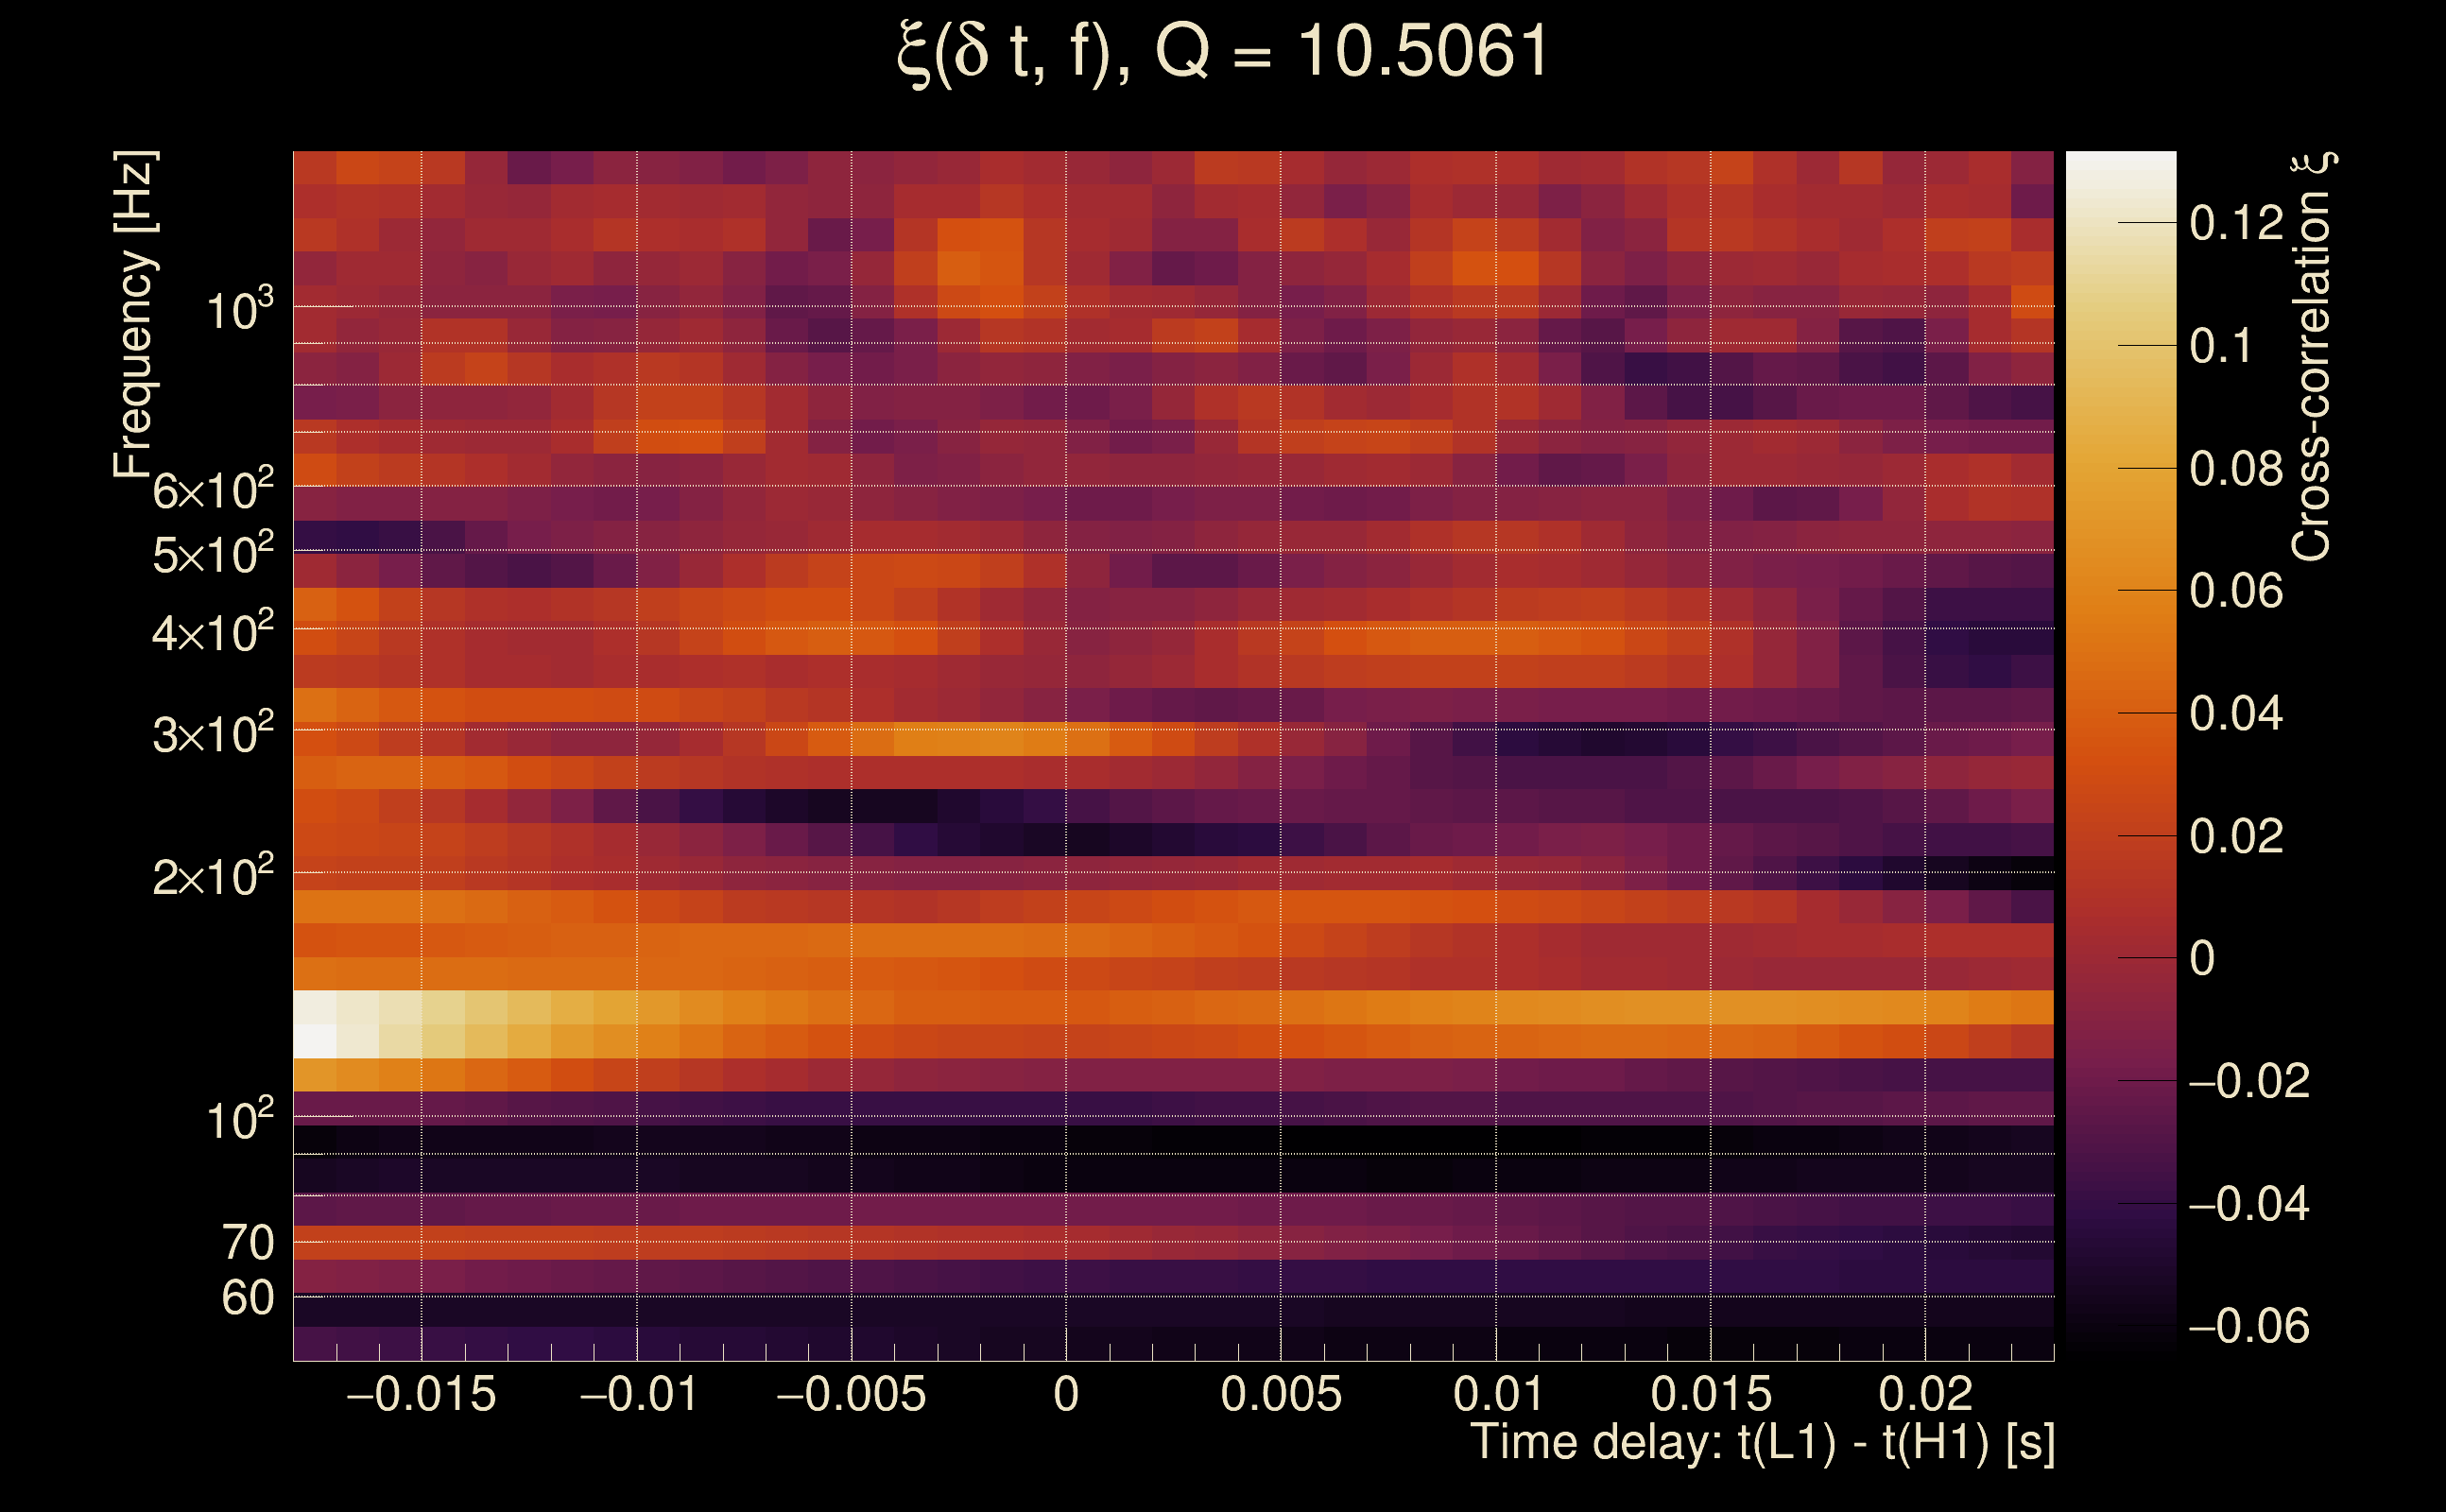
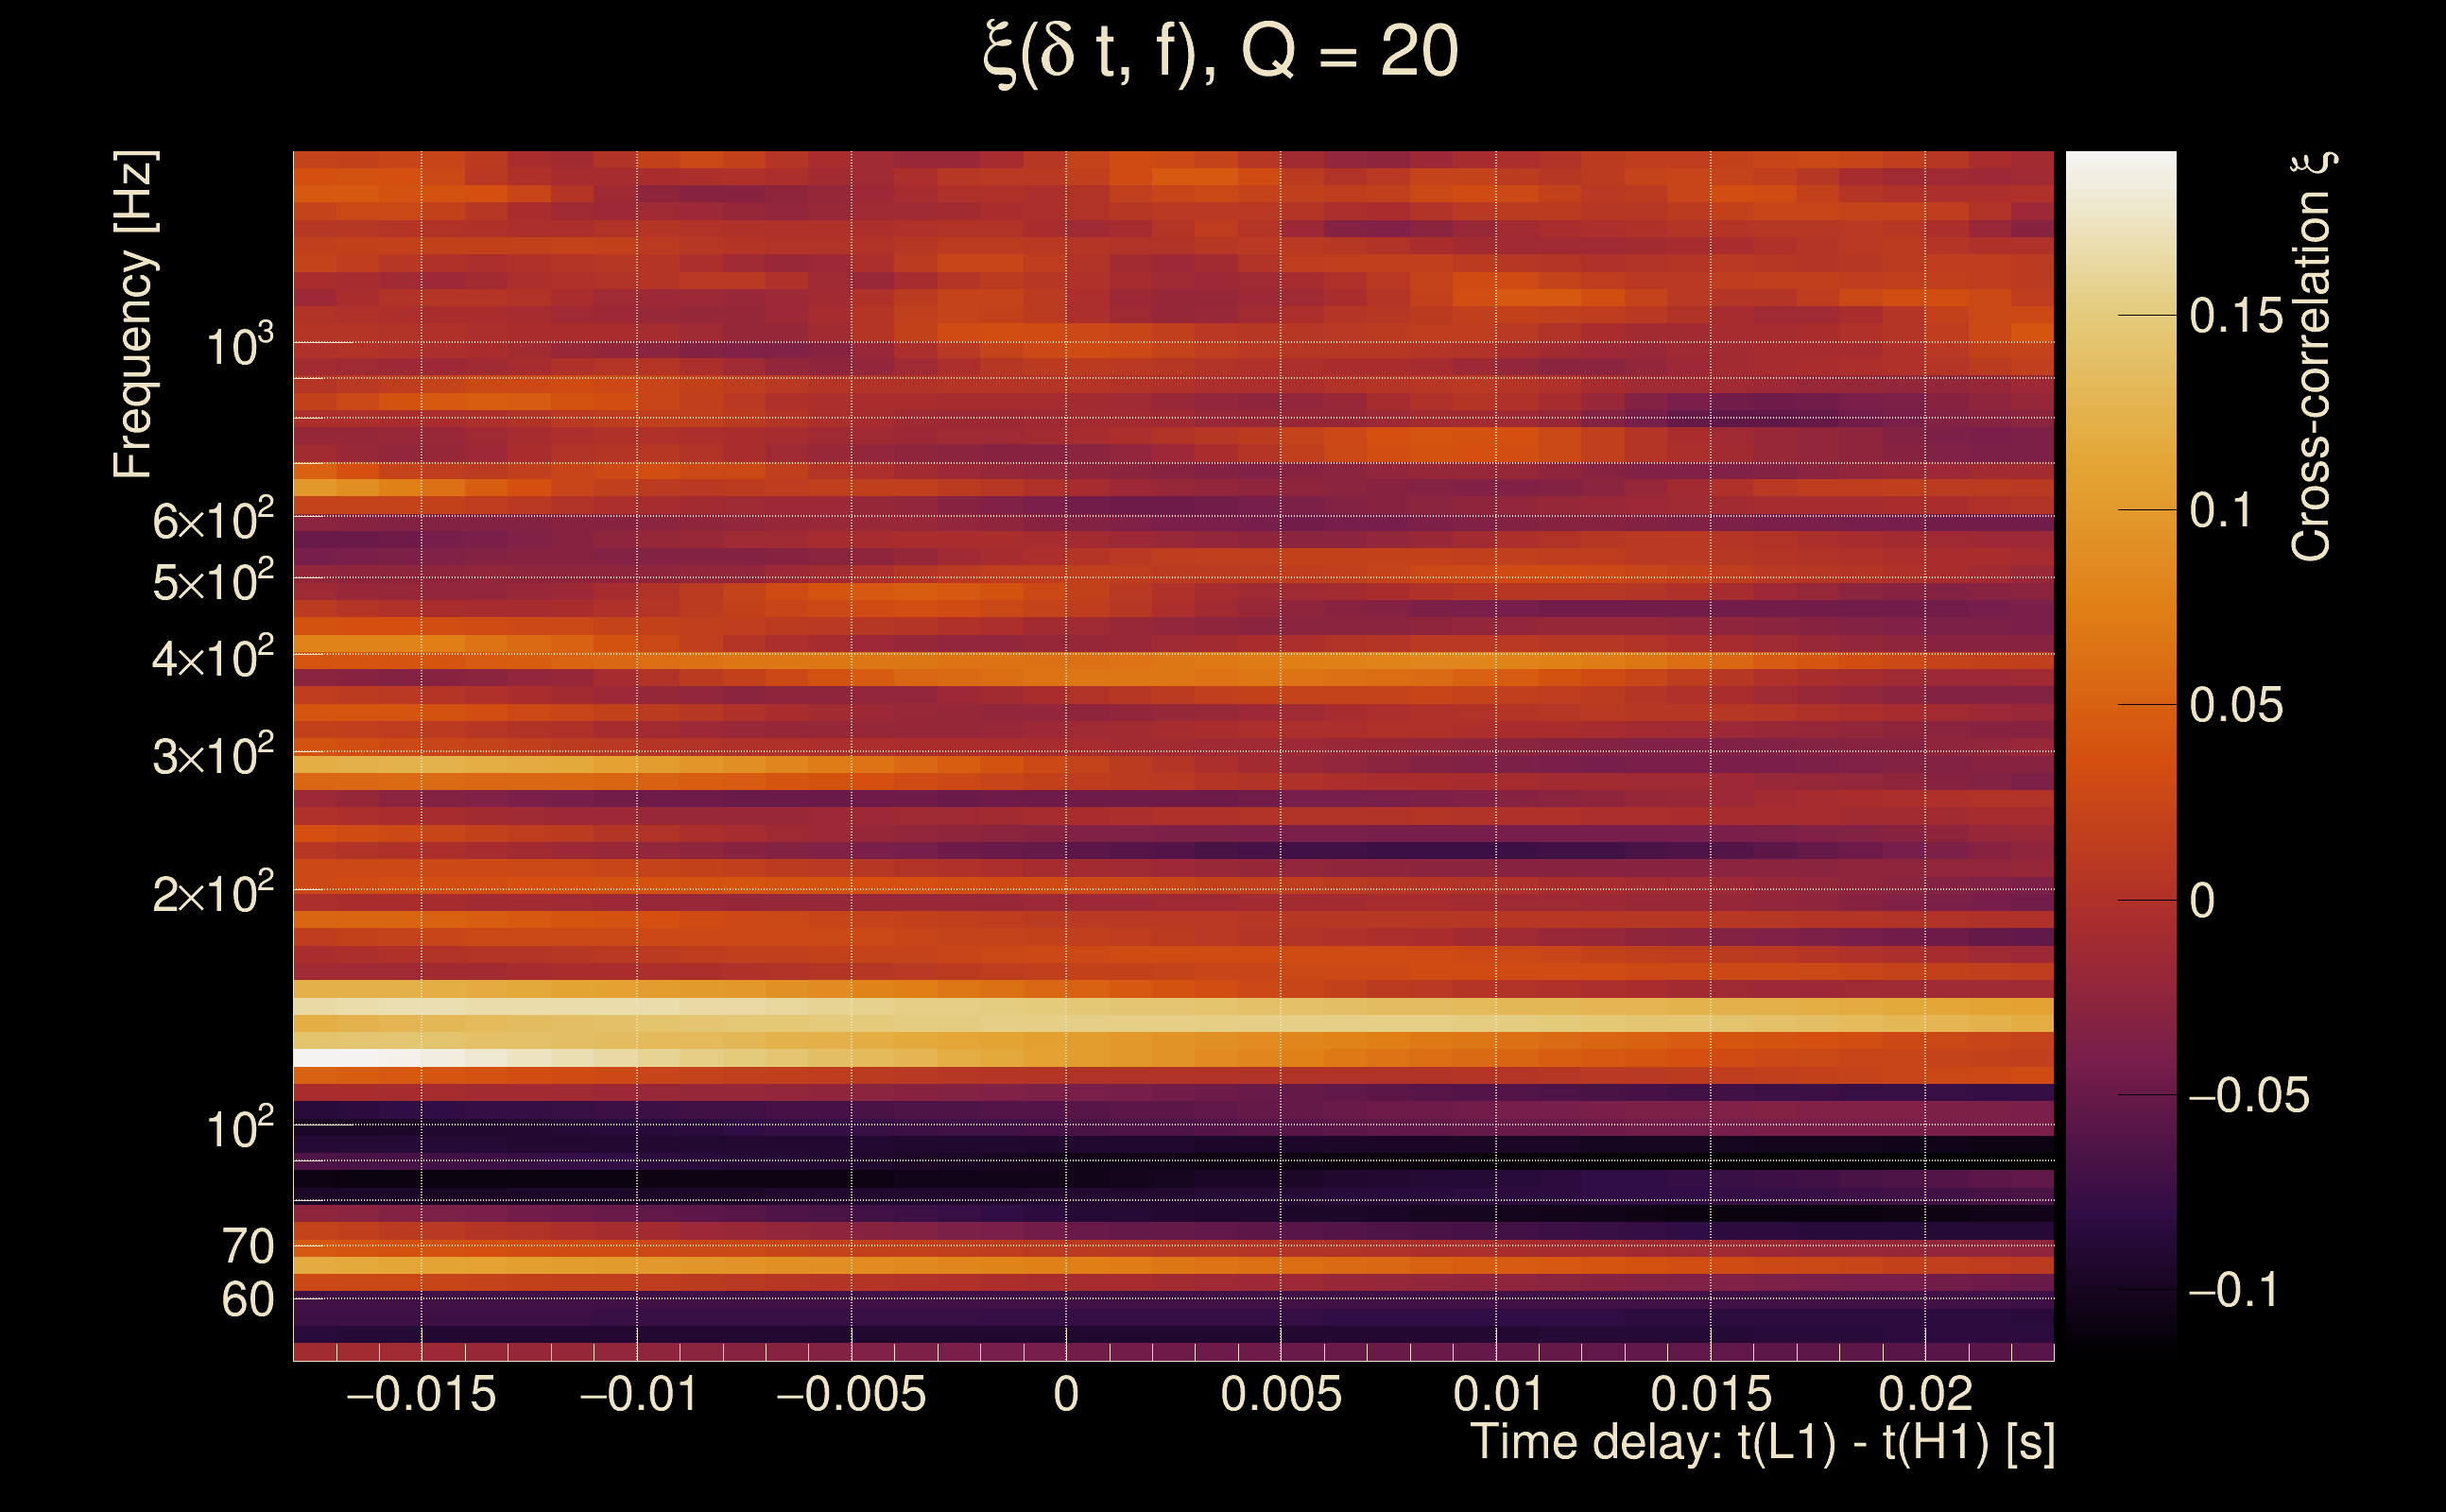
| Event time t(H1): | GPS = 1368195313 (Mon May 15 14:14:55 2023 ) → GPS = 1368195323 (Mon May 15 14:15:05 2023 ) |
| Event time t(L1): | GPS = 1368195313 (Mon May 15 14:15:05 2023 ) → GPS = 1368195323 (Mon May 15 14:15:05 2023 ) |
| Omicron analysis time window (H1): | GPS = 1368195310 → GPS = 1368195326 |
| Omicron analysis time window (L1): | GPS = 1368195310 → GPS = 1368195326 |
| Time delay between detectors t(L1) - t(H1): | -0.00182715 s (slice index = 108 / 217), δt_gw = -0.00182715 s |
| Time delay uncertainty: | 0.00600829 s |
| [targeted mode] Time delay probability: | 0.0802241 (1.74939 sigmas), δt_target = 0.00868869 s |
| Frequency: | 656.279 Hz |
| Ξ: | 0.00111449 ± 0.0286542 (variance = 0.00082106): Q0: 0, Q1: 0.0417308, Q2: 0.0566081, Q3: 0.0501396, Q4: 0.0890433 |
| Rank: | R_X = 8.94088e-05 |
| Log of amplitude ratio (L1/H1): | 0.445622, variance = 0.465109 (L1/H1: -0.360027, variance = 0.968149, H1/L1: -1.2305, variance = 0.893909) |
| Amplitude ratio (L1/H1): | 1.56146 ⋇ 1.97781 (L1/H1: 0.697658 ⋇ 2.67499, H1/L1: 0.292146 ⋇ 2.57402) |
| Amplitude ratio H1|L1 compatibility (probability): | 0.243781 |
| Antenna factor probability: | 1 |
| Number of rejected frequency rows: | Q0: 18 / 18, Q1: 35 / 36, Q2: 65 / 70, Q3: 128 / 134, Q4: 247 / 258 |
| Maximum signal-to-noise ratio: | H1: 4.95688, L1: 5.02203 |
| SNR variance: | H1: 0.447335, L1: 0.496313 |
| Click here for a zoomed plot | Click here for a zoomed plot | Click here for a zoomed plot | Click here for a zoomed plot | Click here for a zoomed plot |
 |
 |
 |
 |
 |
 |
 |
 |
 |
 |
 |
 |
 |
 |
 |
 |
 |
 |
 |
 |
 |
 |
 |
 |
 |
 |
 |
 |
 |
 |
 |
 |
 |
 |
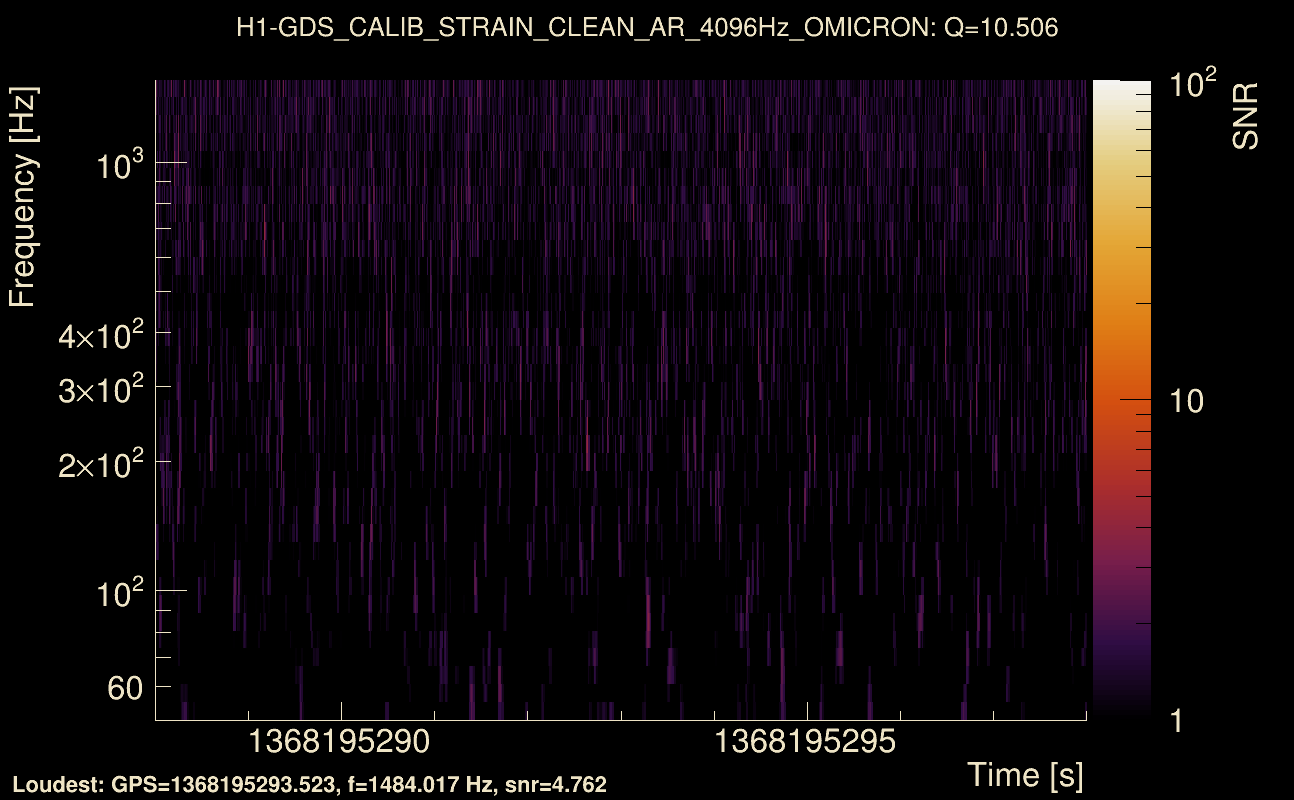
| Event time t(H1): | GPS = 1368195293 (Mon May 15 14:14:35 2023 ) → GPS = 1368195303 (Mon May 15 14:14:45 2023 ) |
| Event time t(L1): | GPS = 1368195293 (Mon May 15 14:14:45 2023 ) → GPS = 1368195303 (Mon May 15 14:14:45 2023 ) |
| Omicron analysis time window (H1): | GPS = 1368195290 → GPS = 1368195306 |
| Omicron analysis time window (L1): | GPS = 1368195290 → GPS = 1368195306 |
| Time delay between detectors t(L1) - t(H1): | 0.000430246 s (slice index = 108 / 217), δt_gw = 0.000430246 s |
| Time delay uncertainty: | 0.00700641 s |
| [targeted mode] Time delay probability: | 0.238668 (1.17832 sigmas), δt_target = 0.00868368 s |
| Frequency: | 850.523 Hz |
| Ξ: | 0.000372698 ± 0.0338301 (variance = 0.00114447): Q0: 0, Q1: 0, Q2: 0.0279337, Q3: 0.0596712, Q4: 0.0861281 |
| Rank: | R_X = 8.8951e-05 |
| Log of amplitude ratio (L1/H1): | 0.512862, variance = 0.4358 (L1/H1: -0.416356, variance = 1.00327, H1/L1: -1.48199, variance = 0.727574) |
| Amplitude ratio (L1/H1): | 1.67006 ⋇ 1.93509 (L1/H1: 0.659446 ⋇ 2.72273, H1/L1: 0.227186 ⋇ 2.34663) |
| Amplitude ratio H1|L1 compatibility (probability): | 0.14904 |
| Antenna factor probability: | 1 |
| Number of rejected frequency rows: | Q0: 18 / 18, Q1: 36 / 36, Q2: 69 / 70, Q3: 127 / 134, Q4: 249 / 258 |
| Maximum signal-to-noise ratio: | H1: 5.1313, L1: 5.02454 |
| SNR variance: | H1: 0.452627, L1: 0.483077 |