| Omicron version: | 4.2.0: documentation gitlab repository |
| Omicron run by: | unknown |
| Report produced on: | Sun Oct 26 08:12:07 2025 UTC |
| Ox option file: | Targeted_O4bw_2min_options.txt |
| Omicron option files: | detector 0, detector 1 |
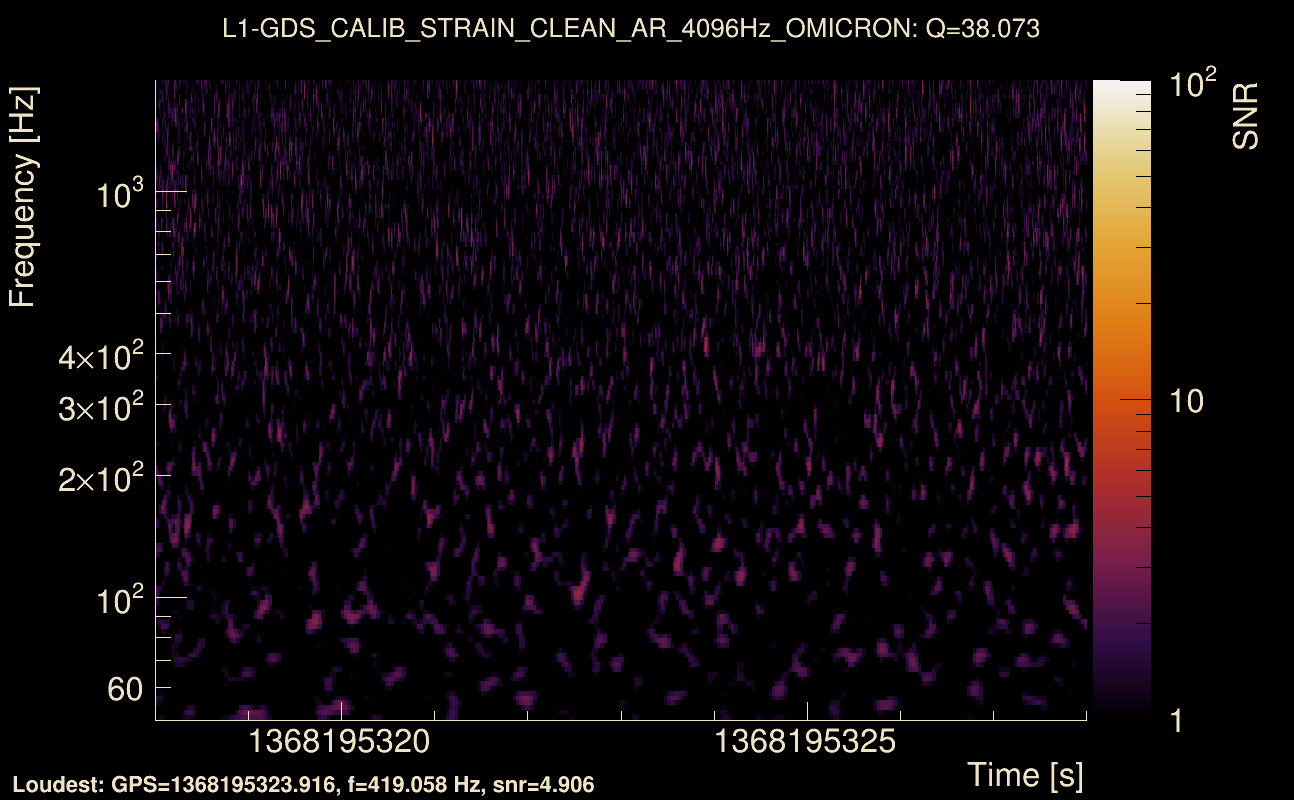
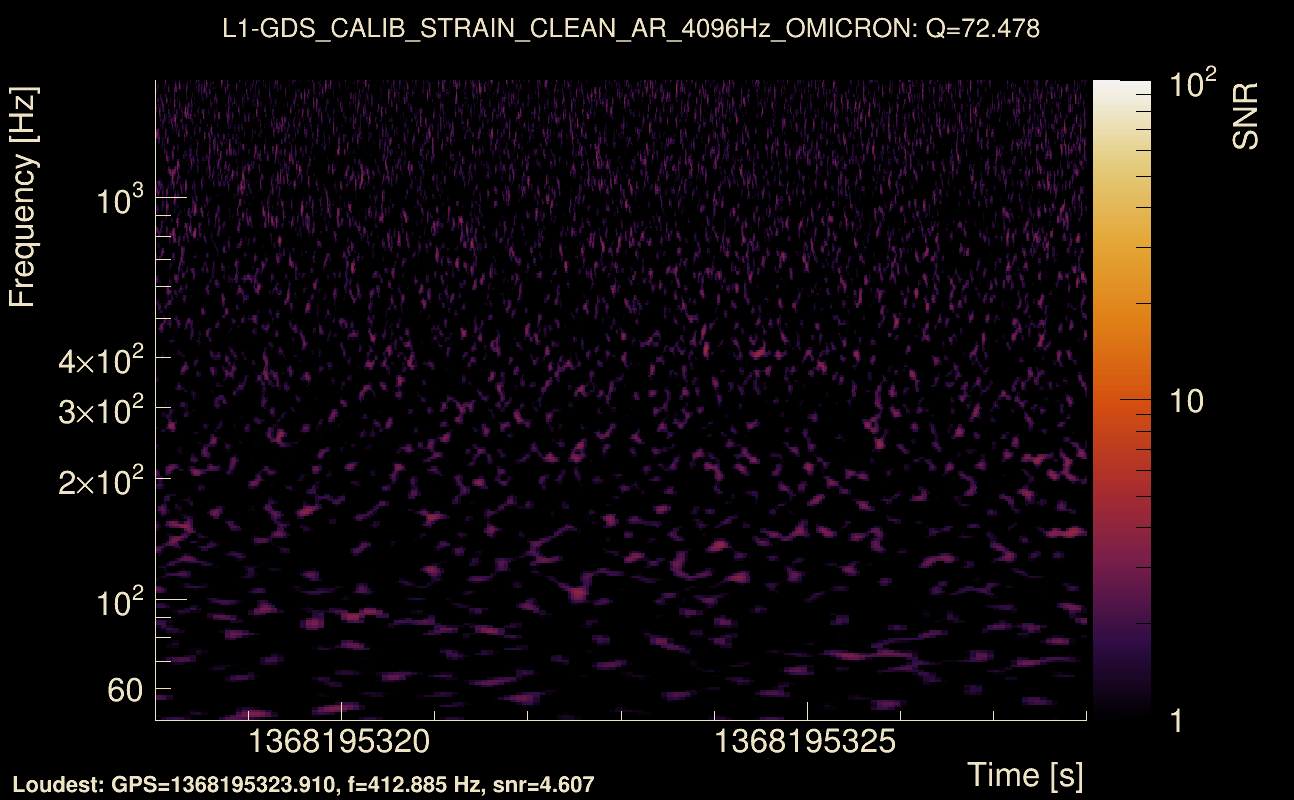
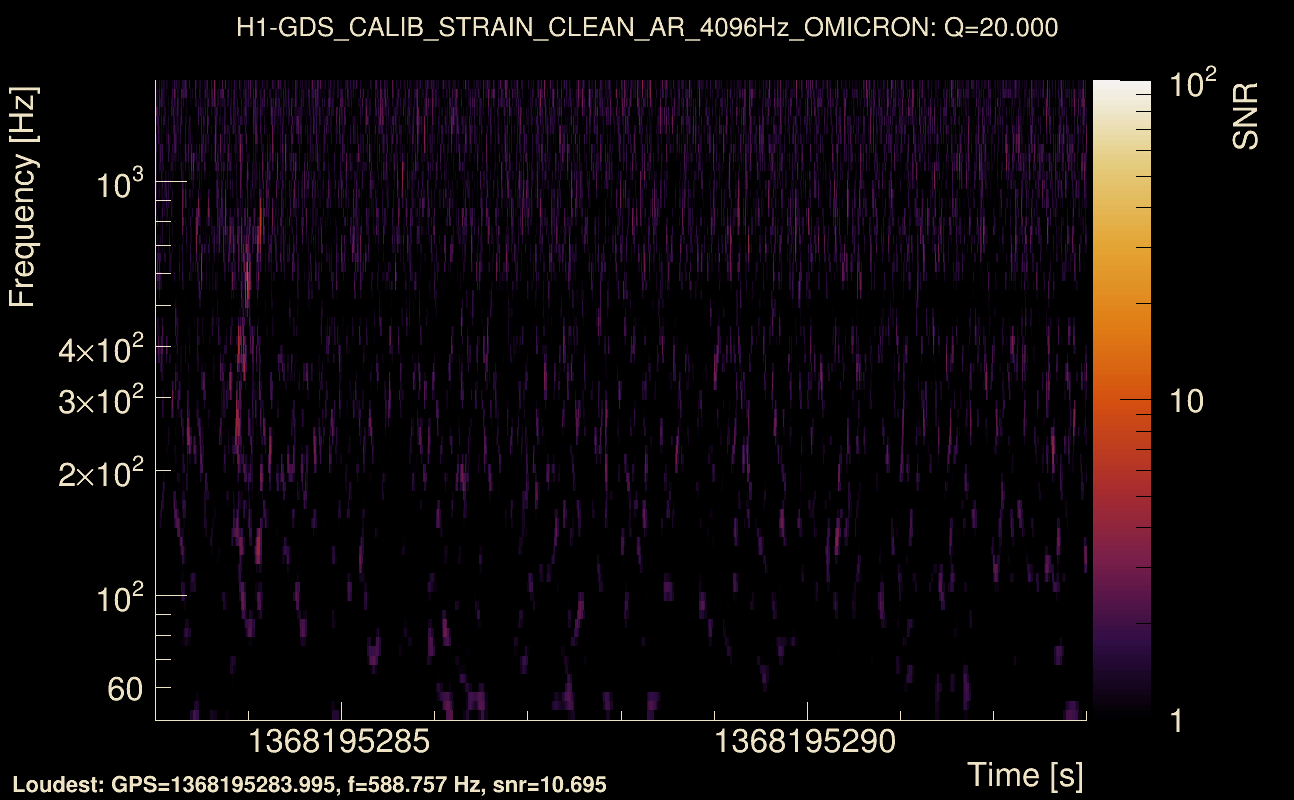
| Detector channel names: | H1:GDS-CALIB_STRAIN_CLEAN_AR_4096Hz, L1:GDS-CALIB_STRAIN_CLEAN_AR_4096Hz |
| Omicron analysis time window and overlap: | 16 s, 6 s |
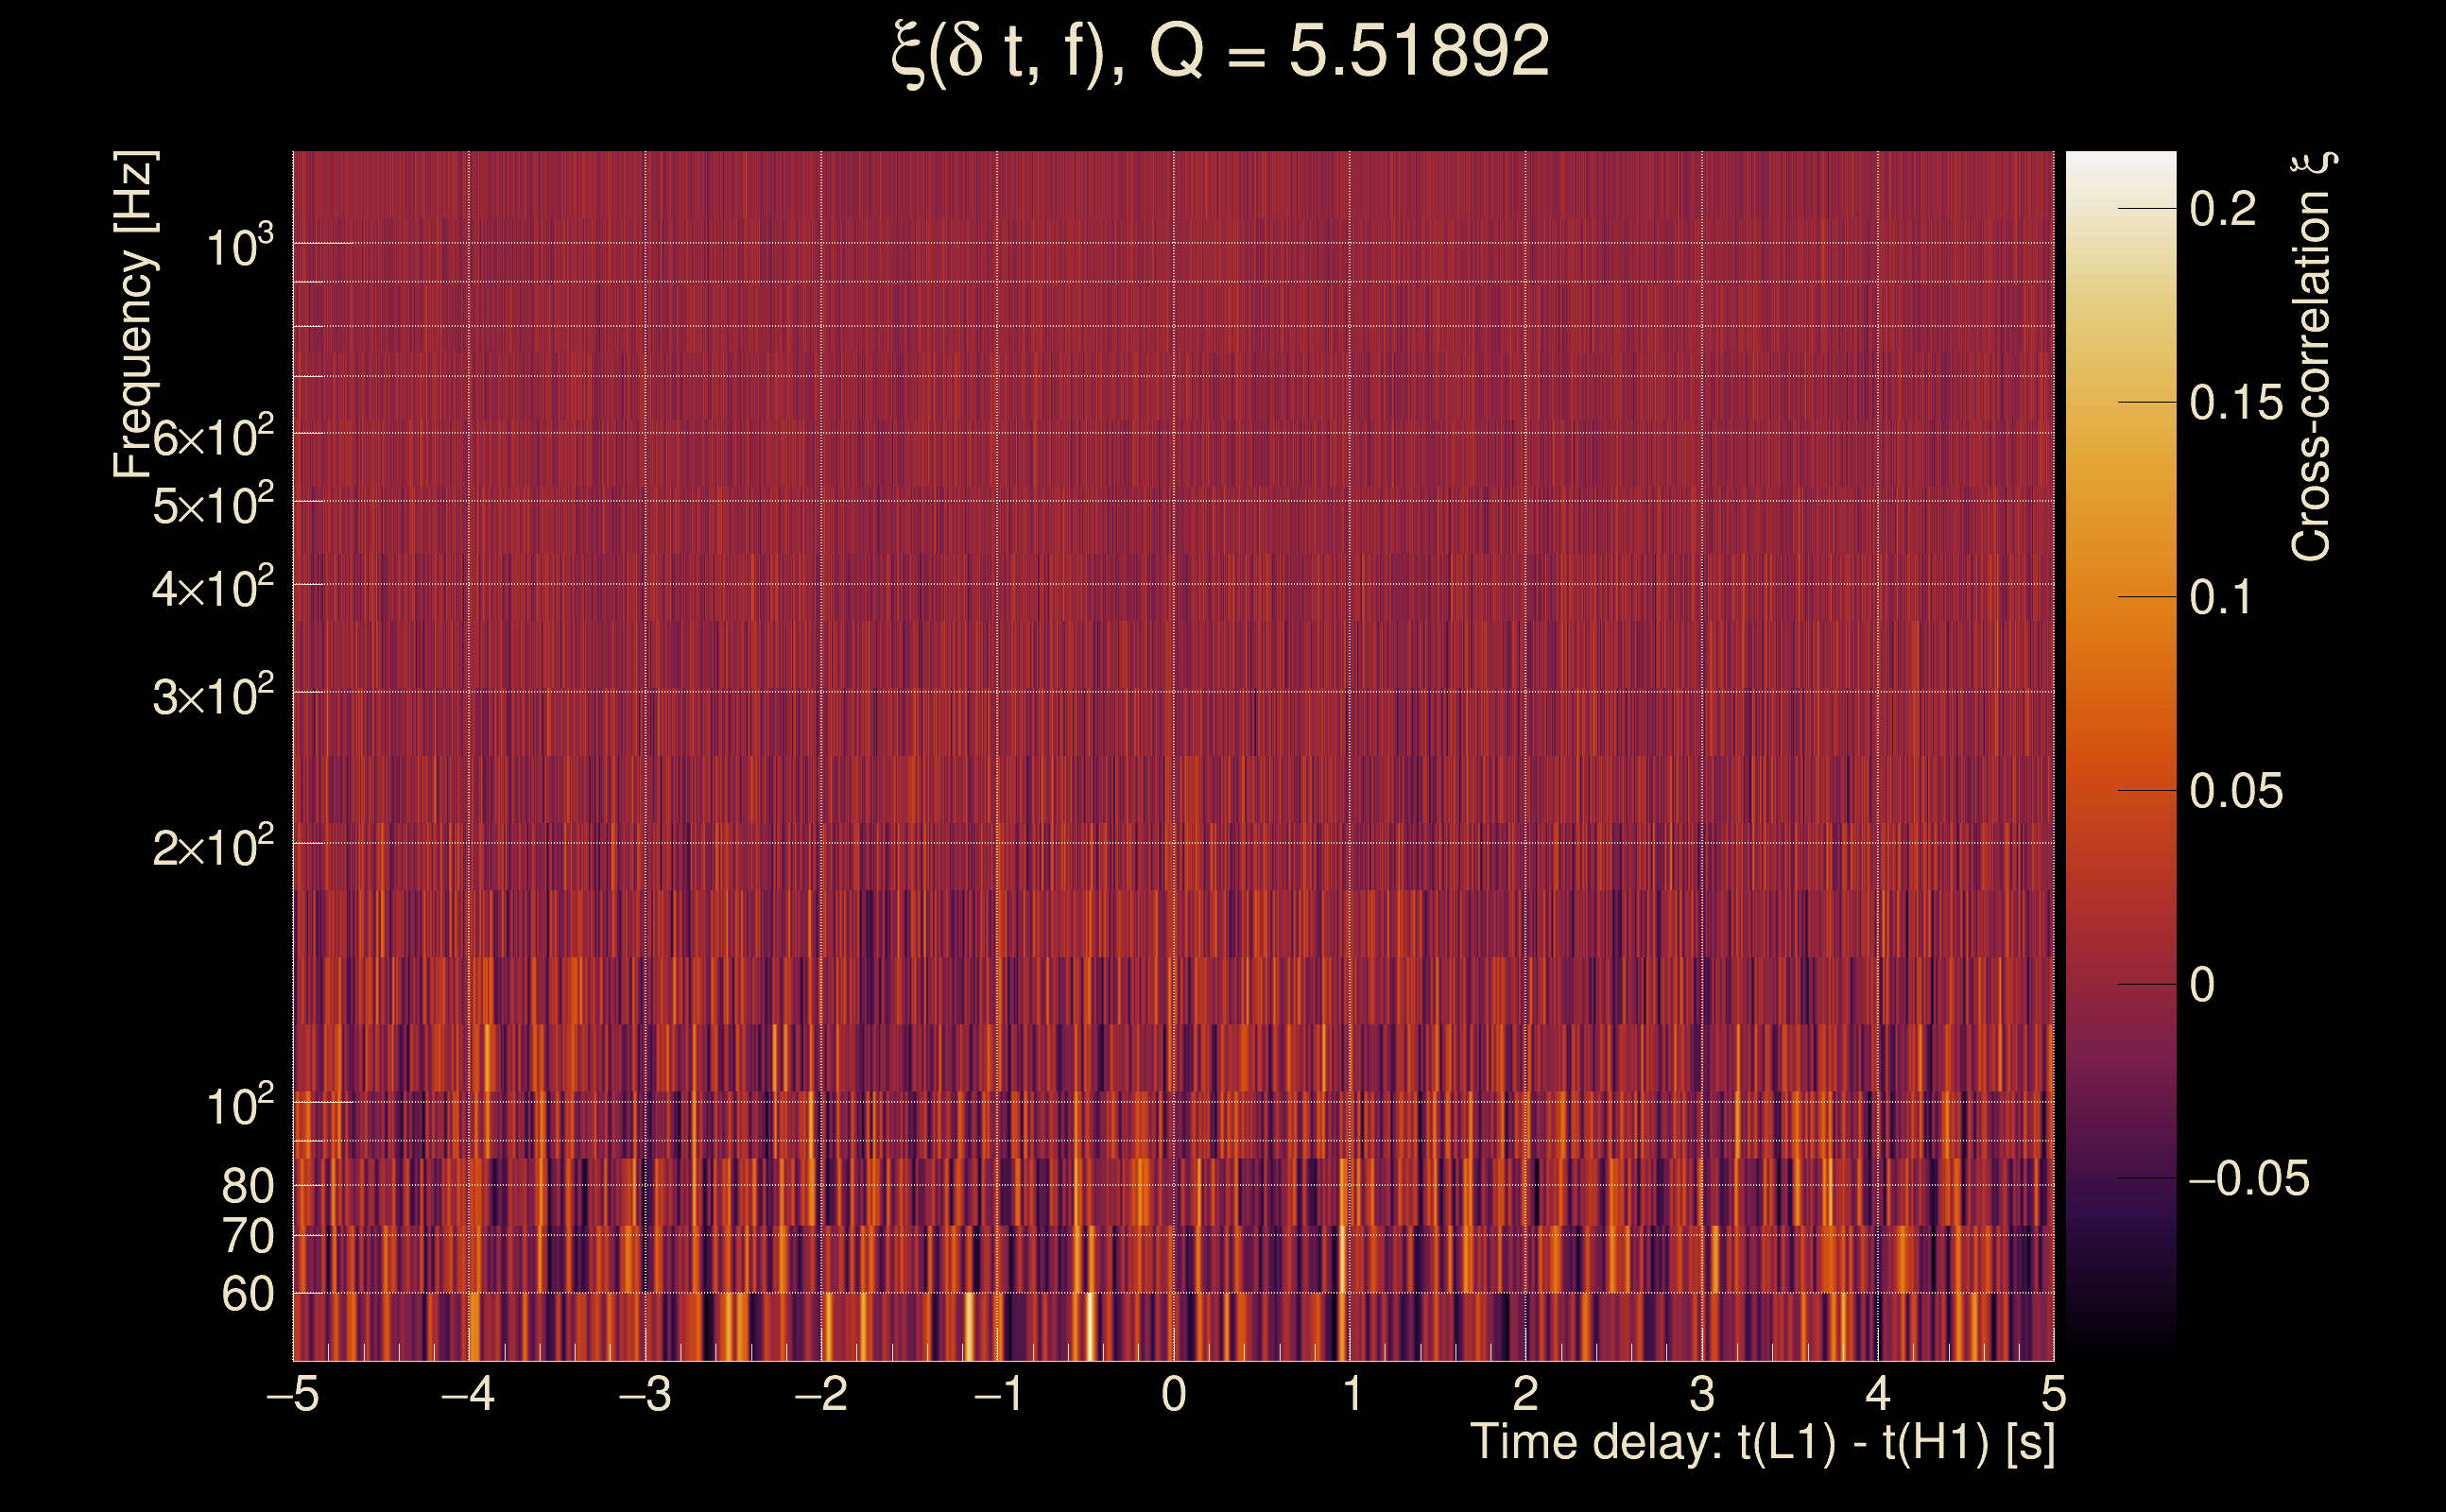
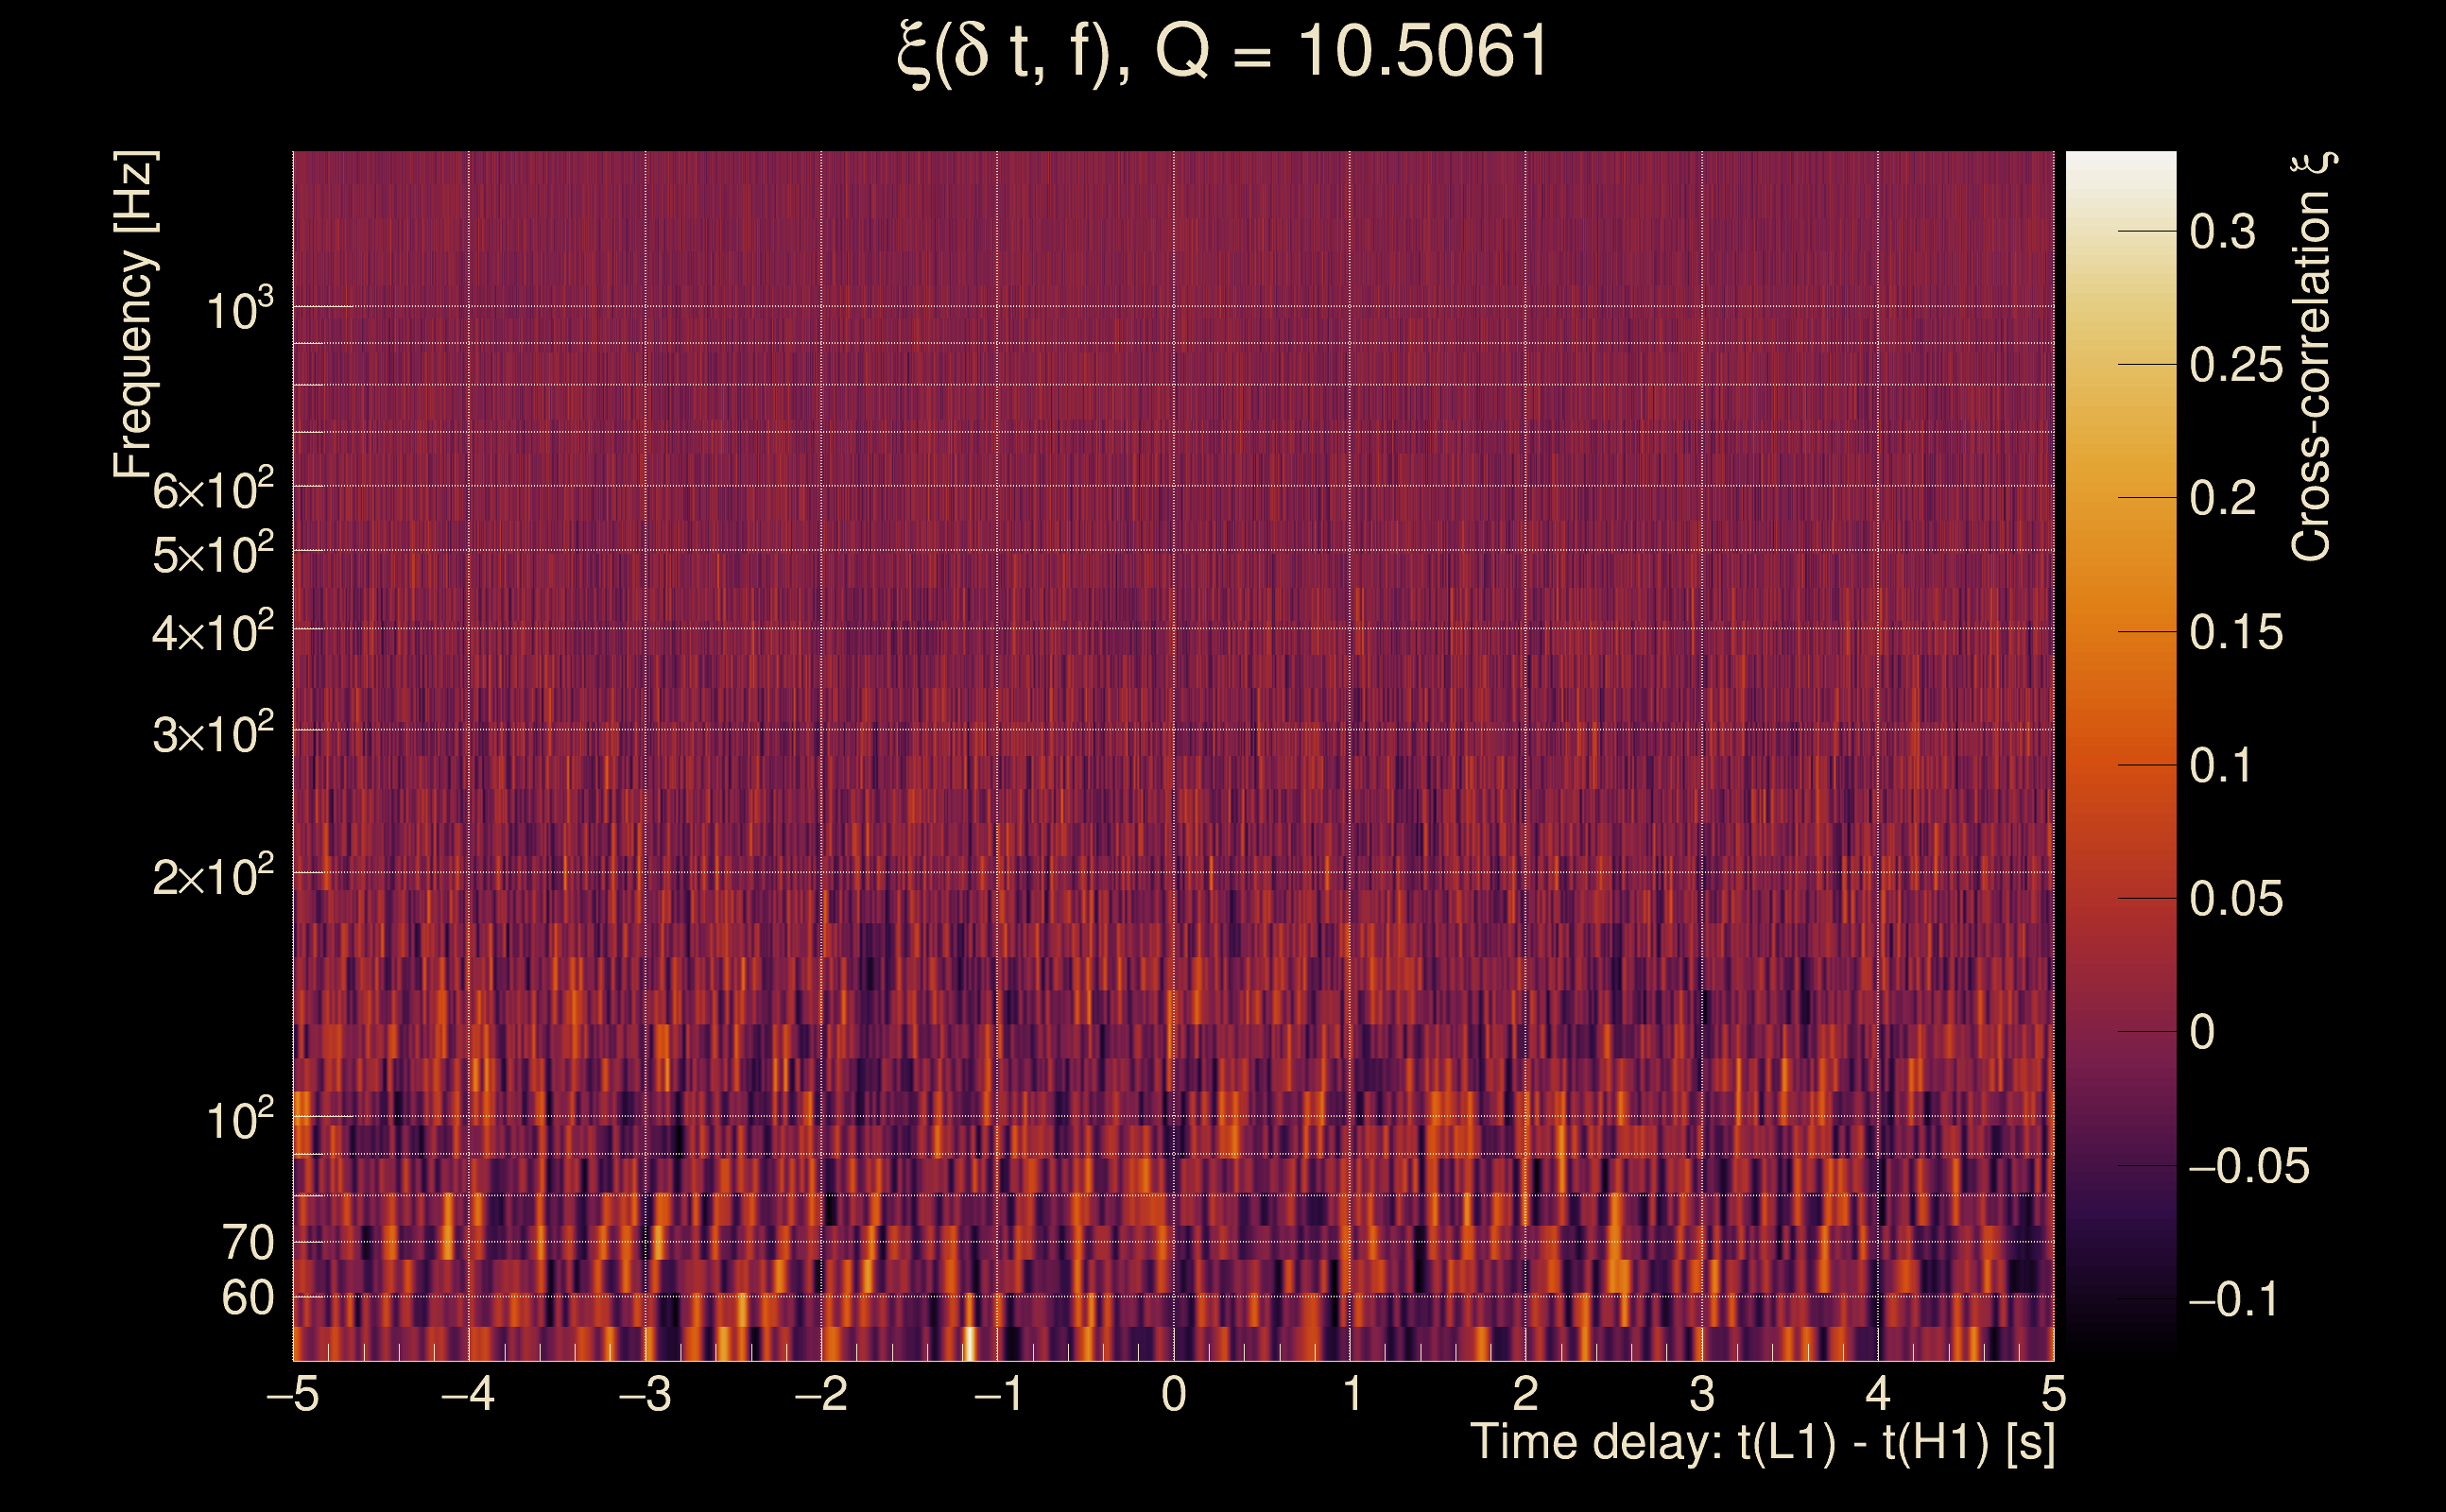
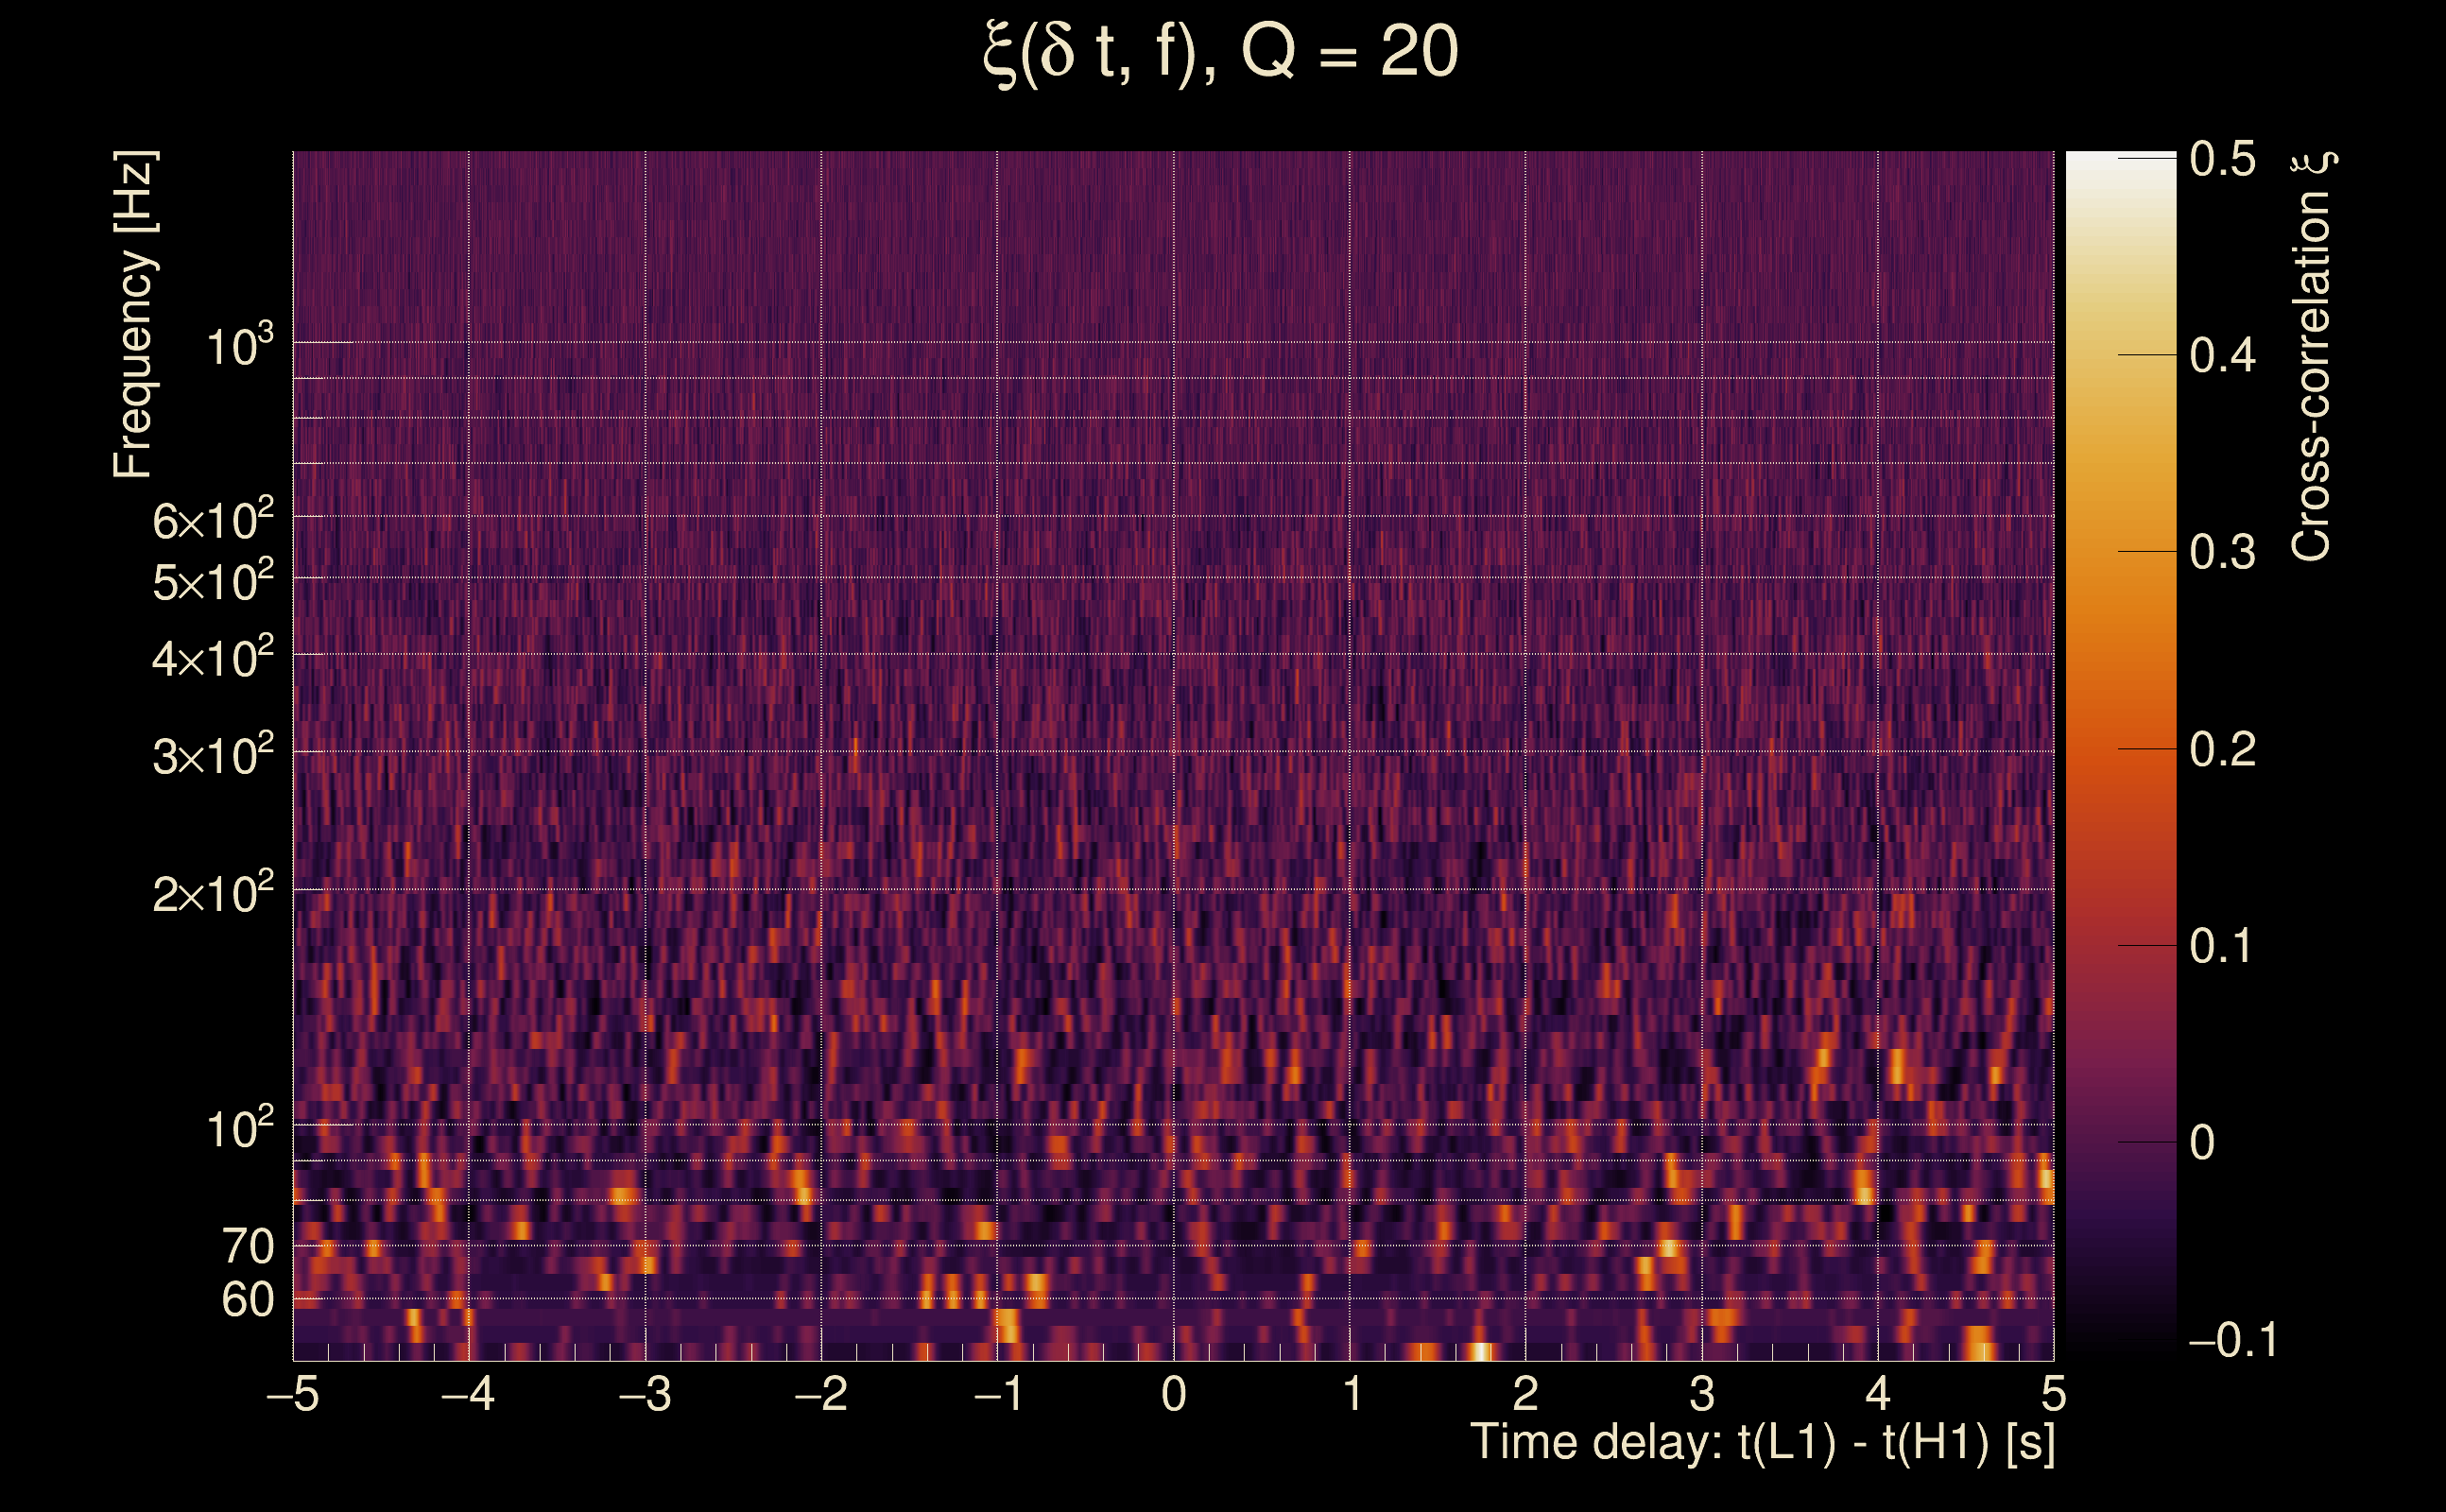
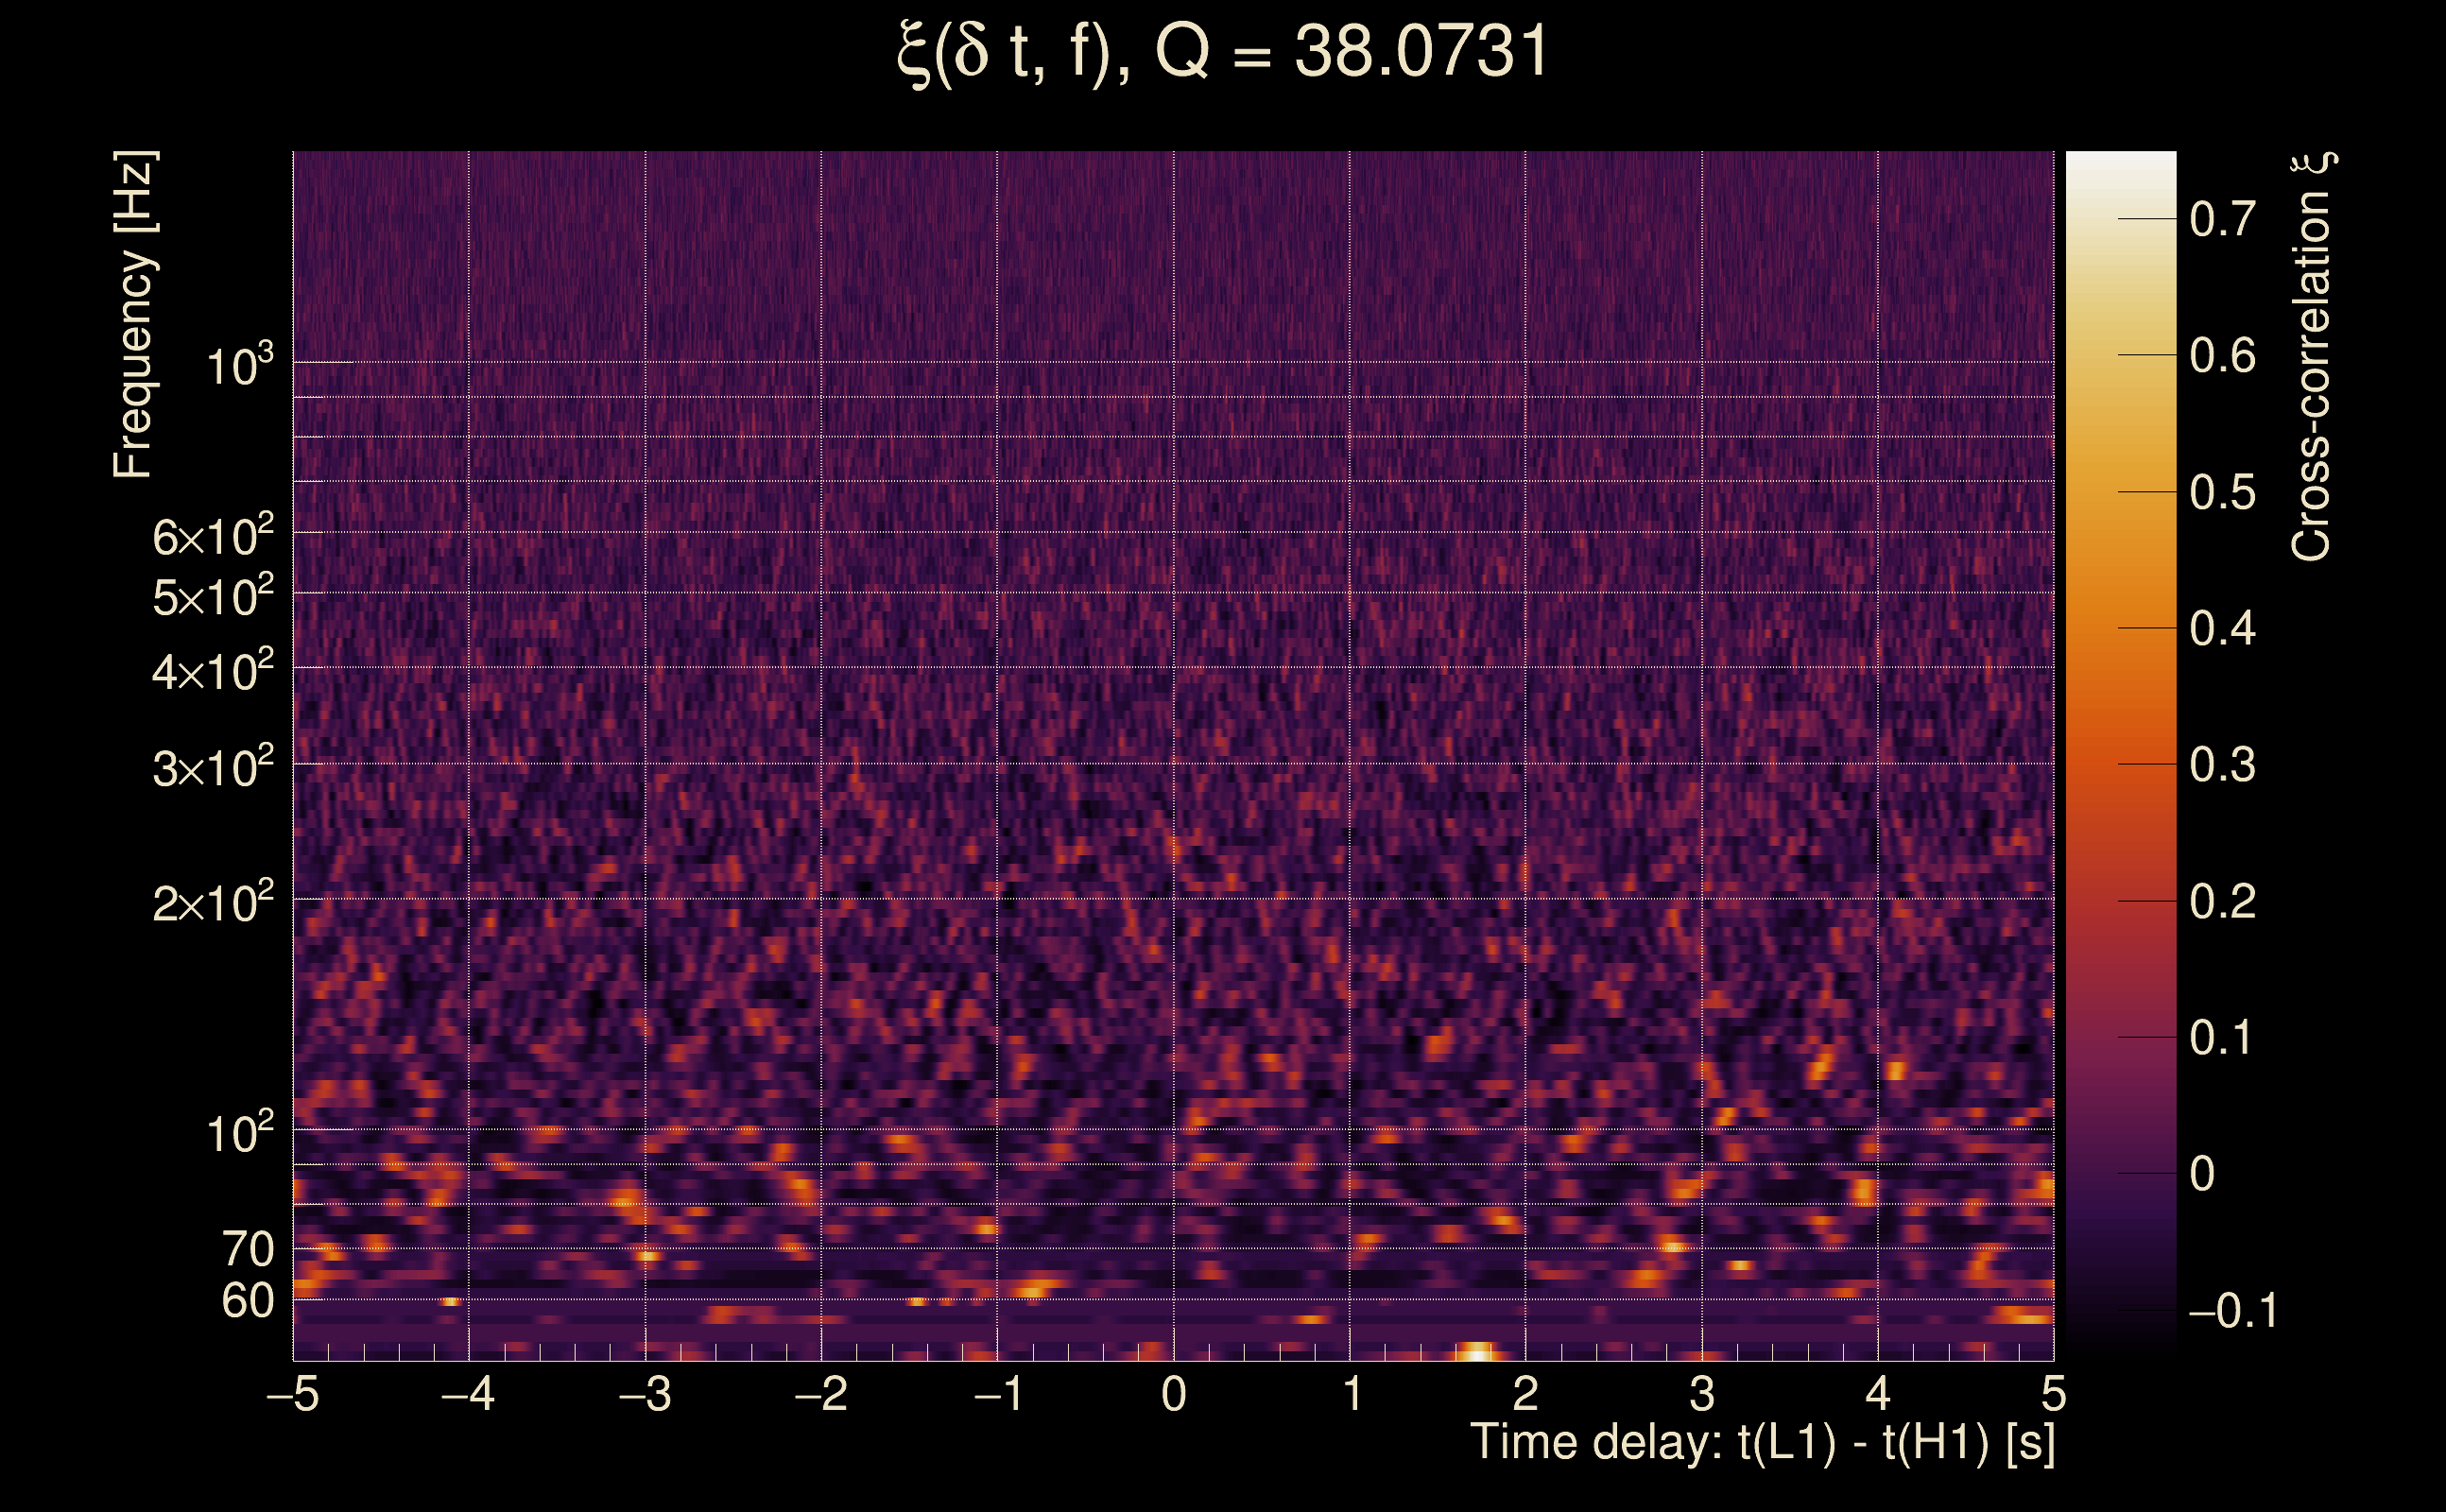
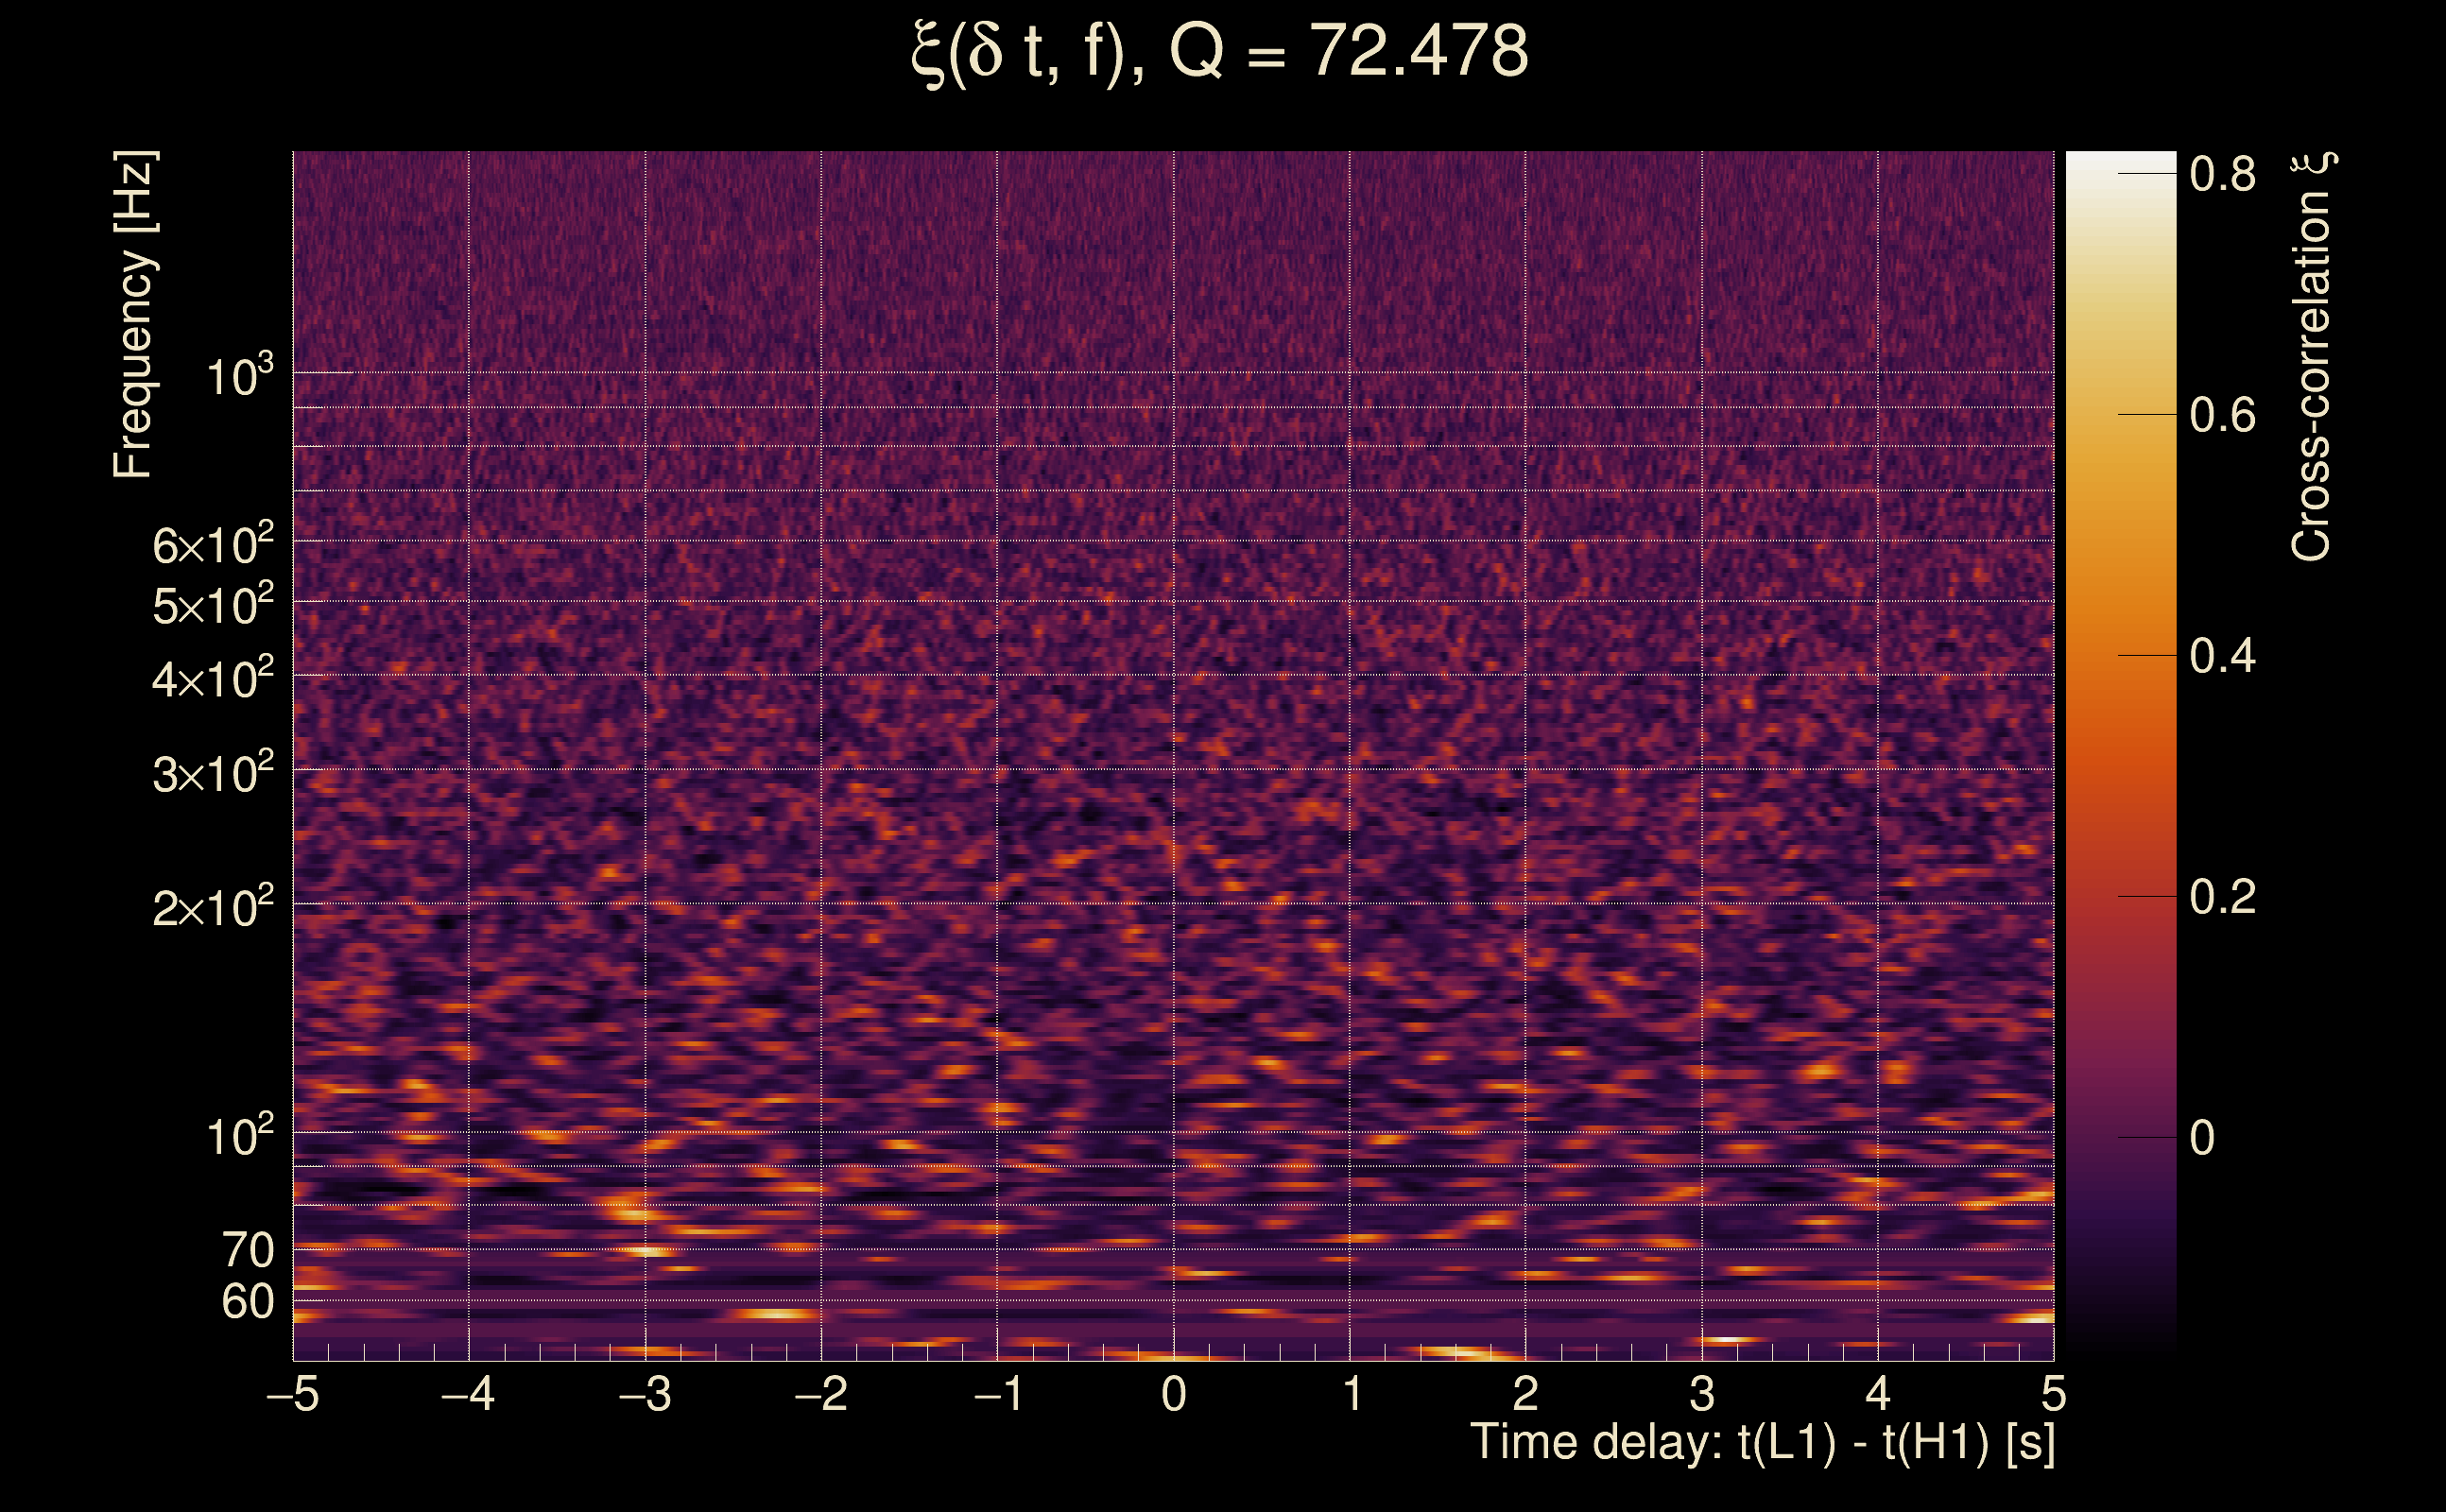
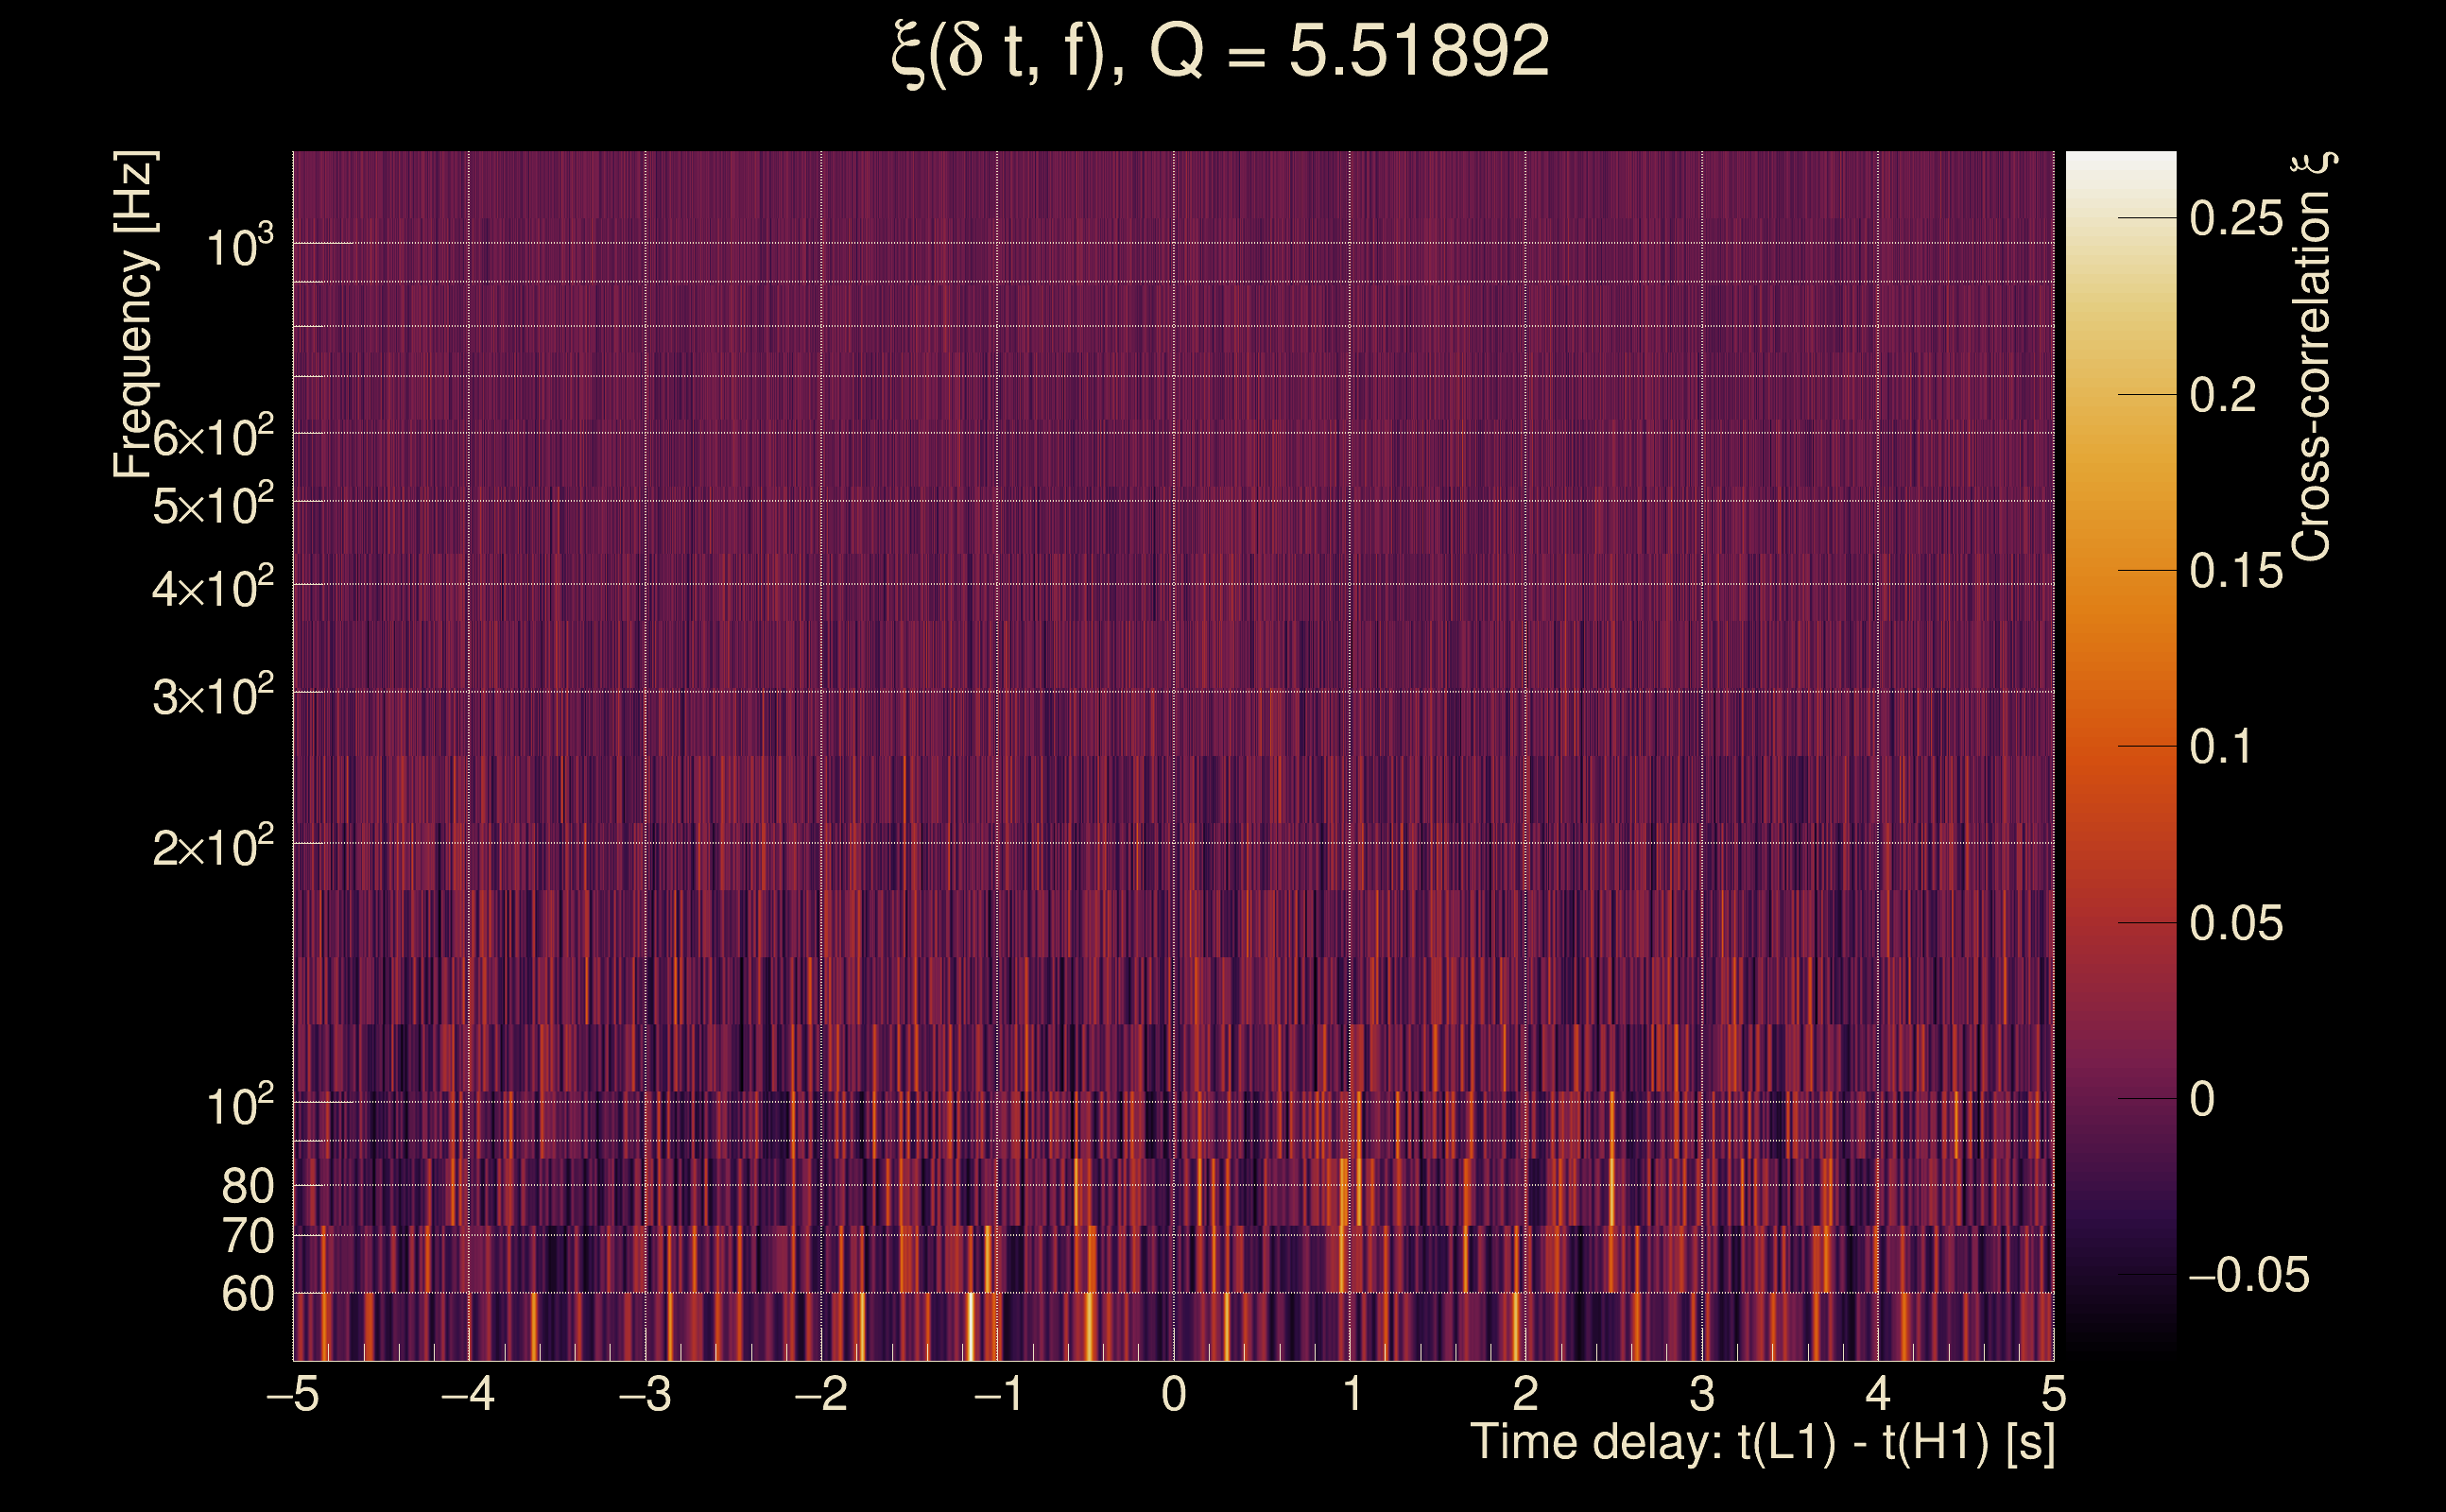
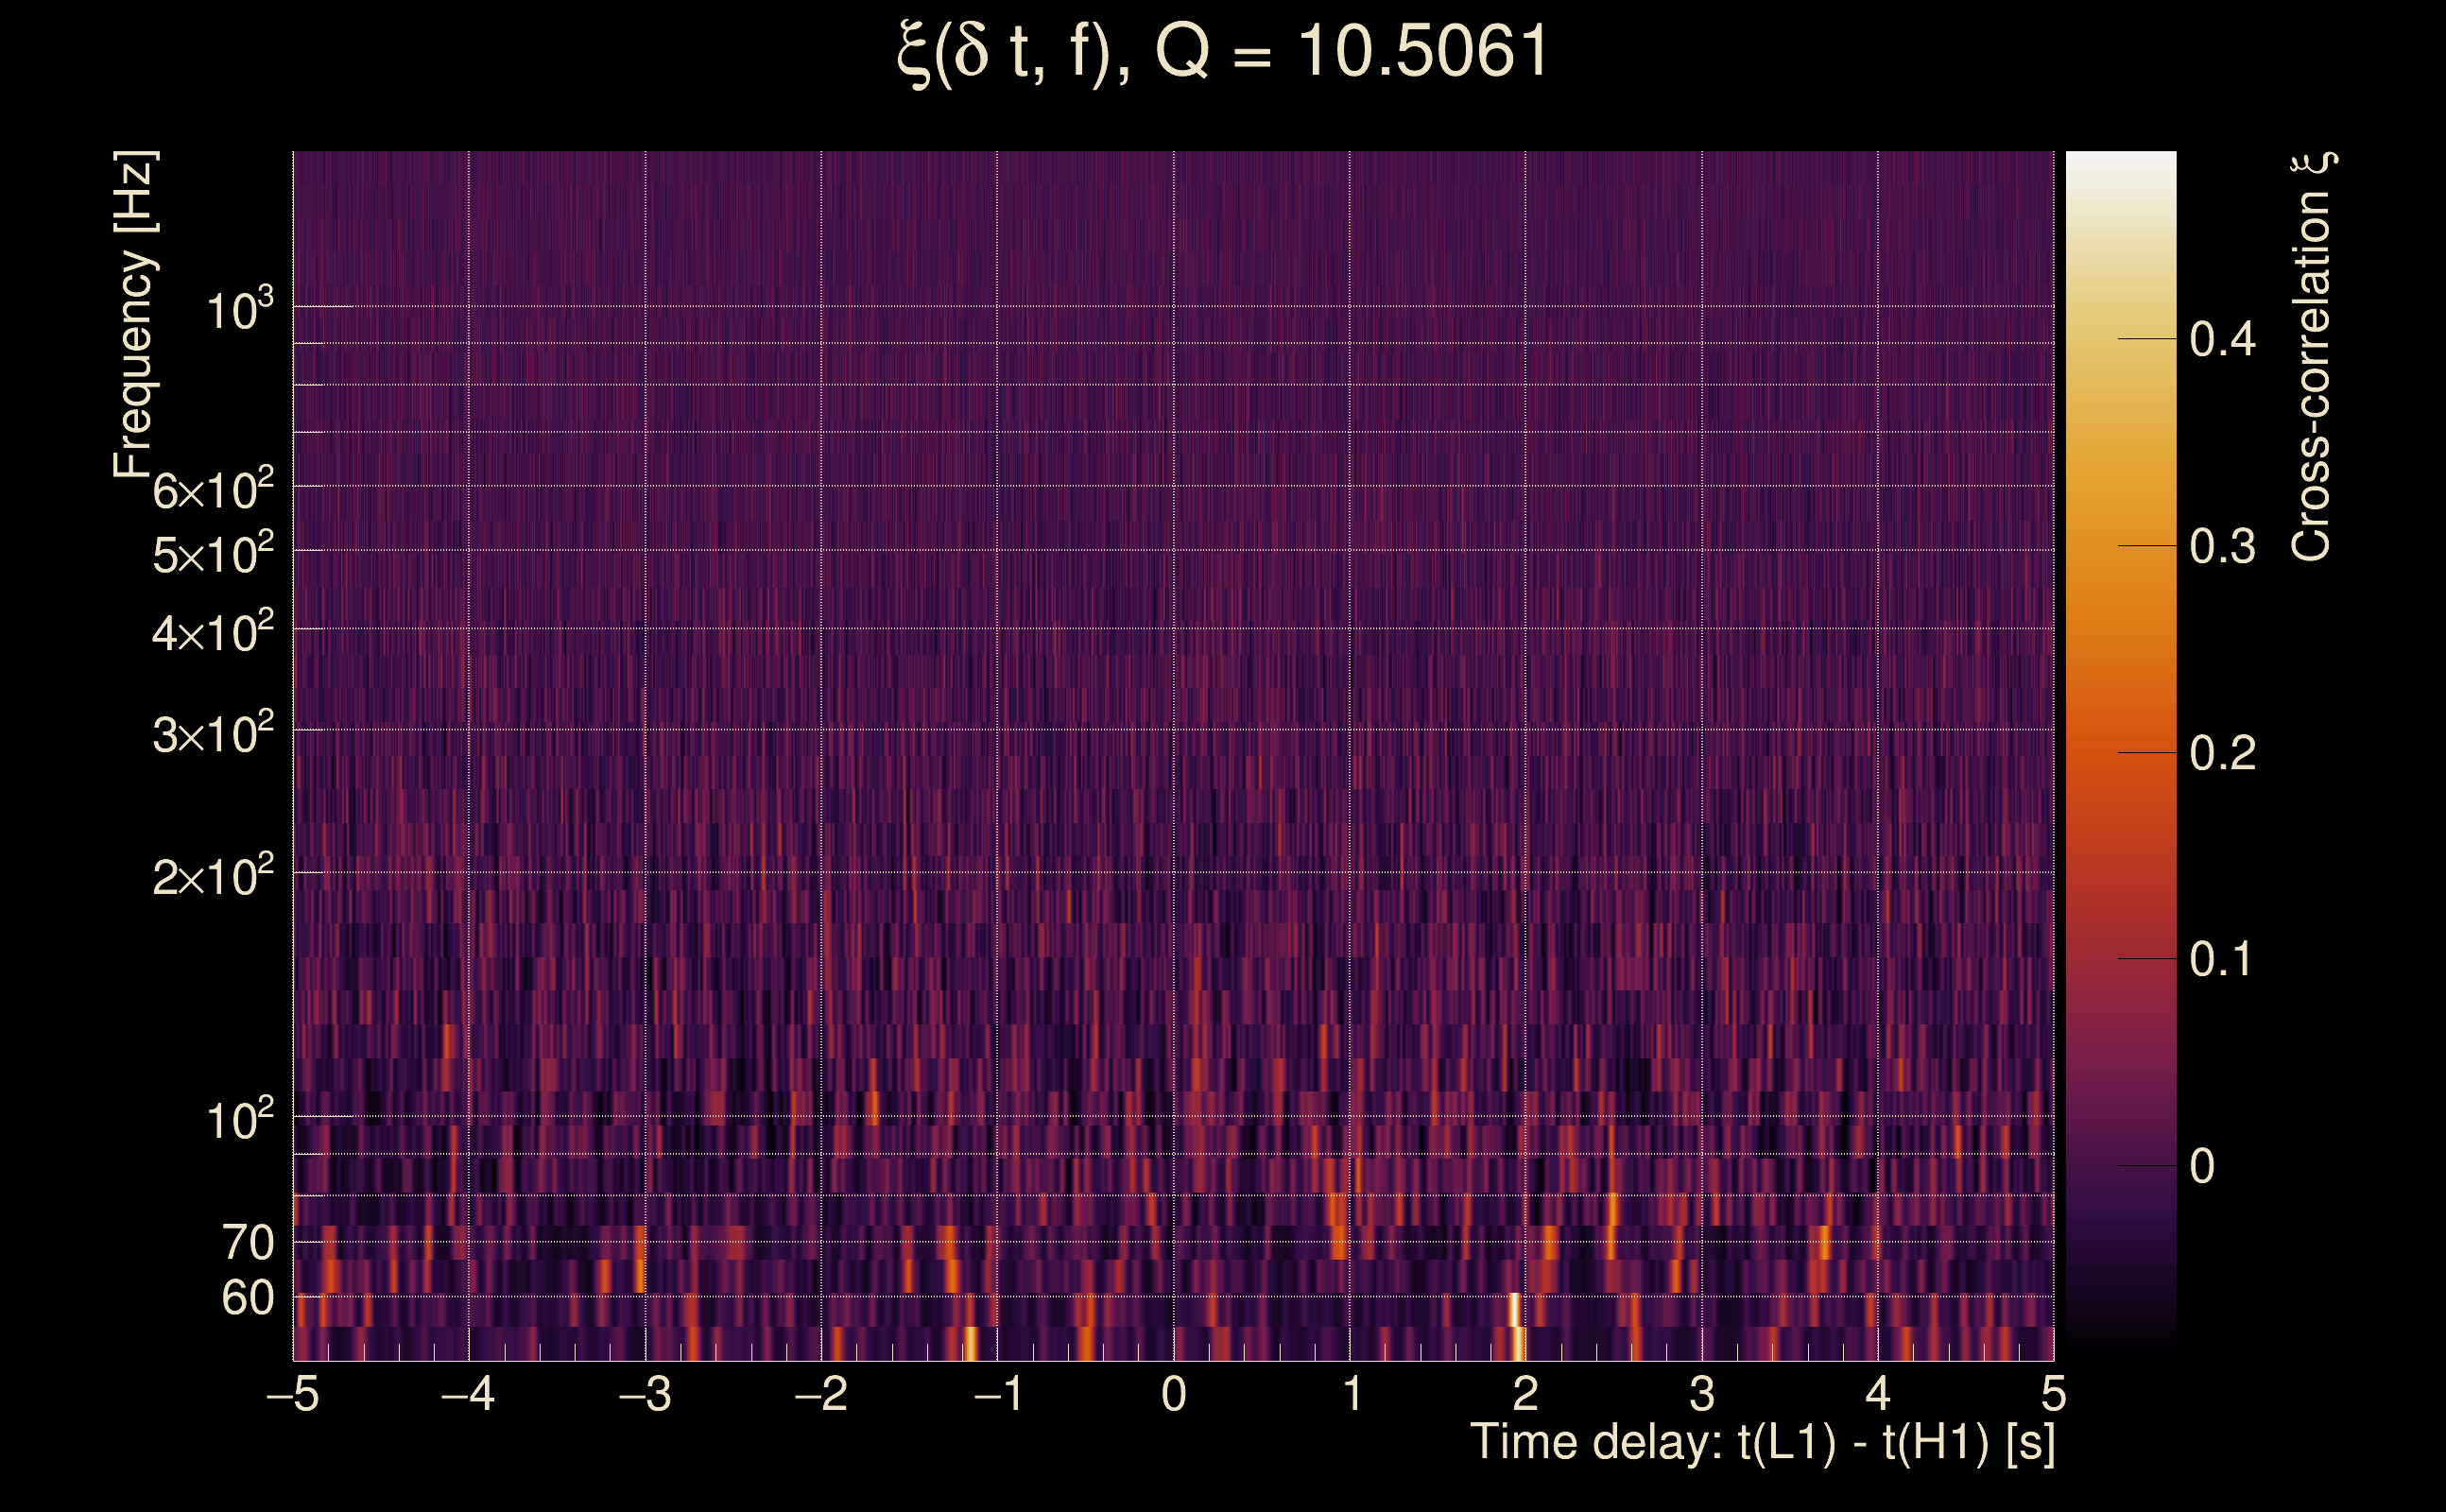
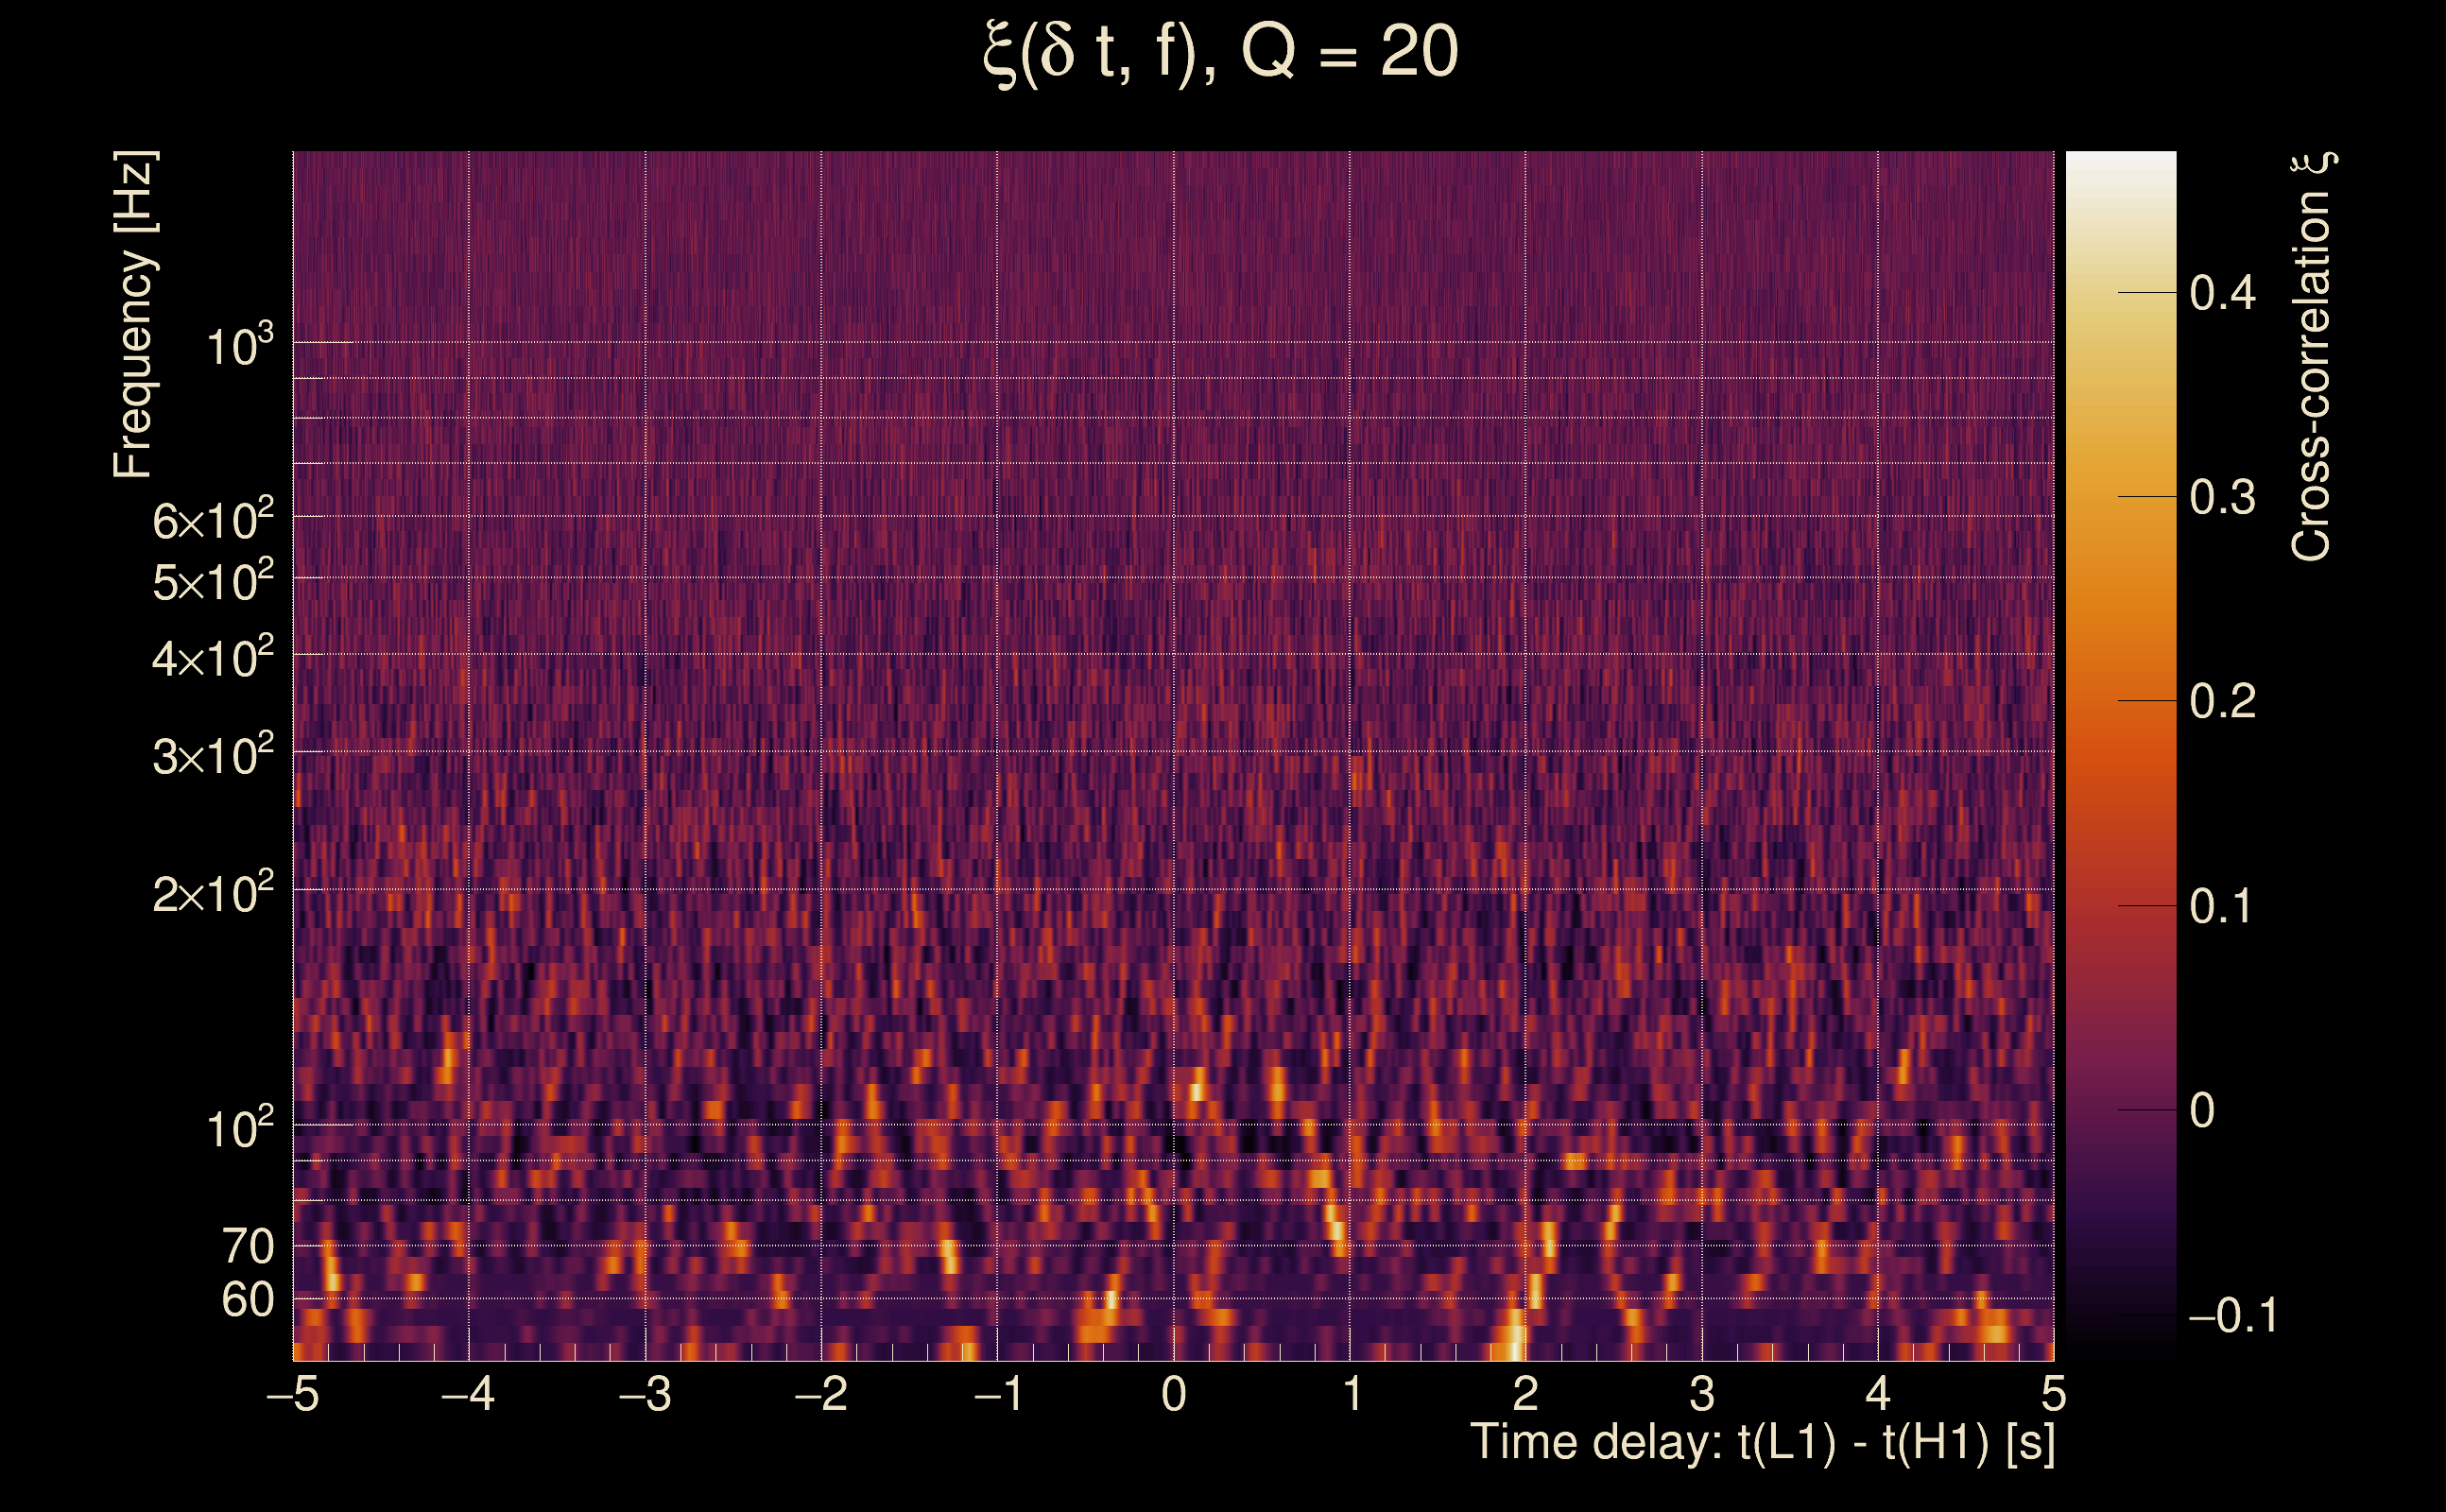
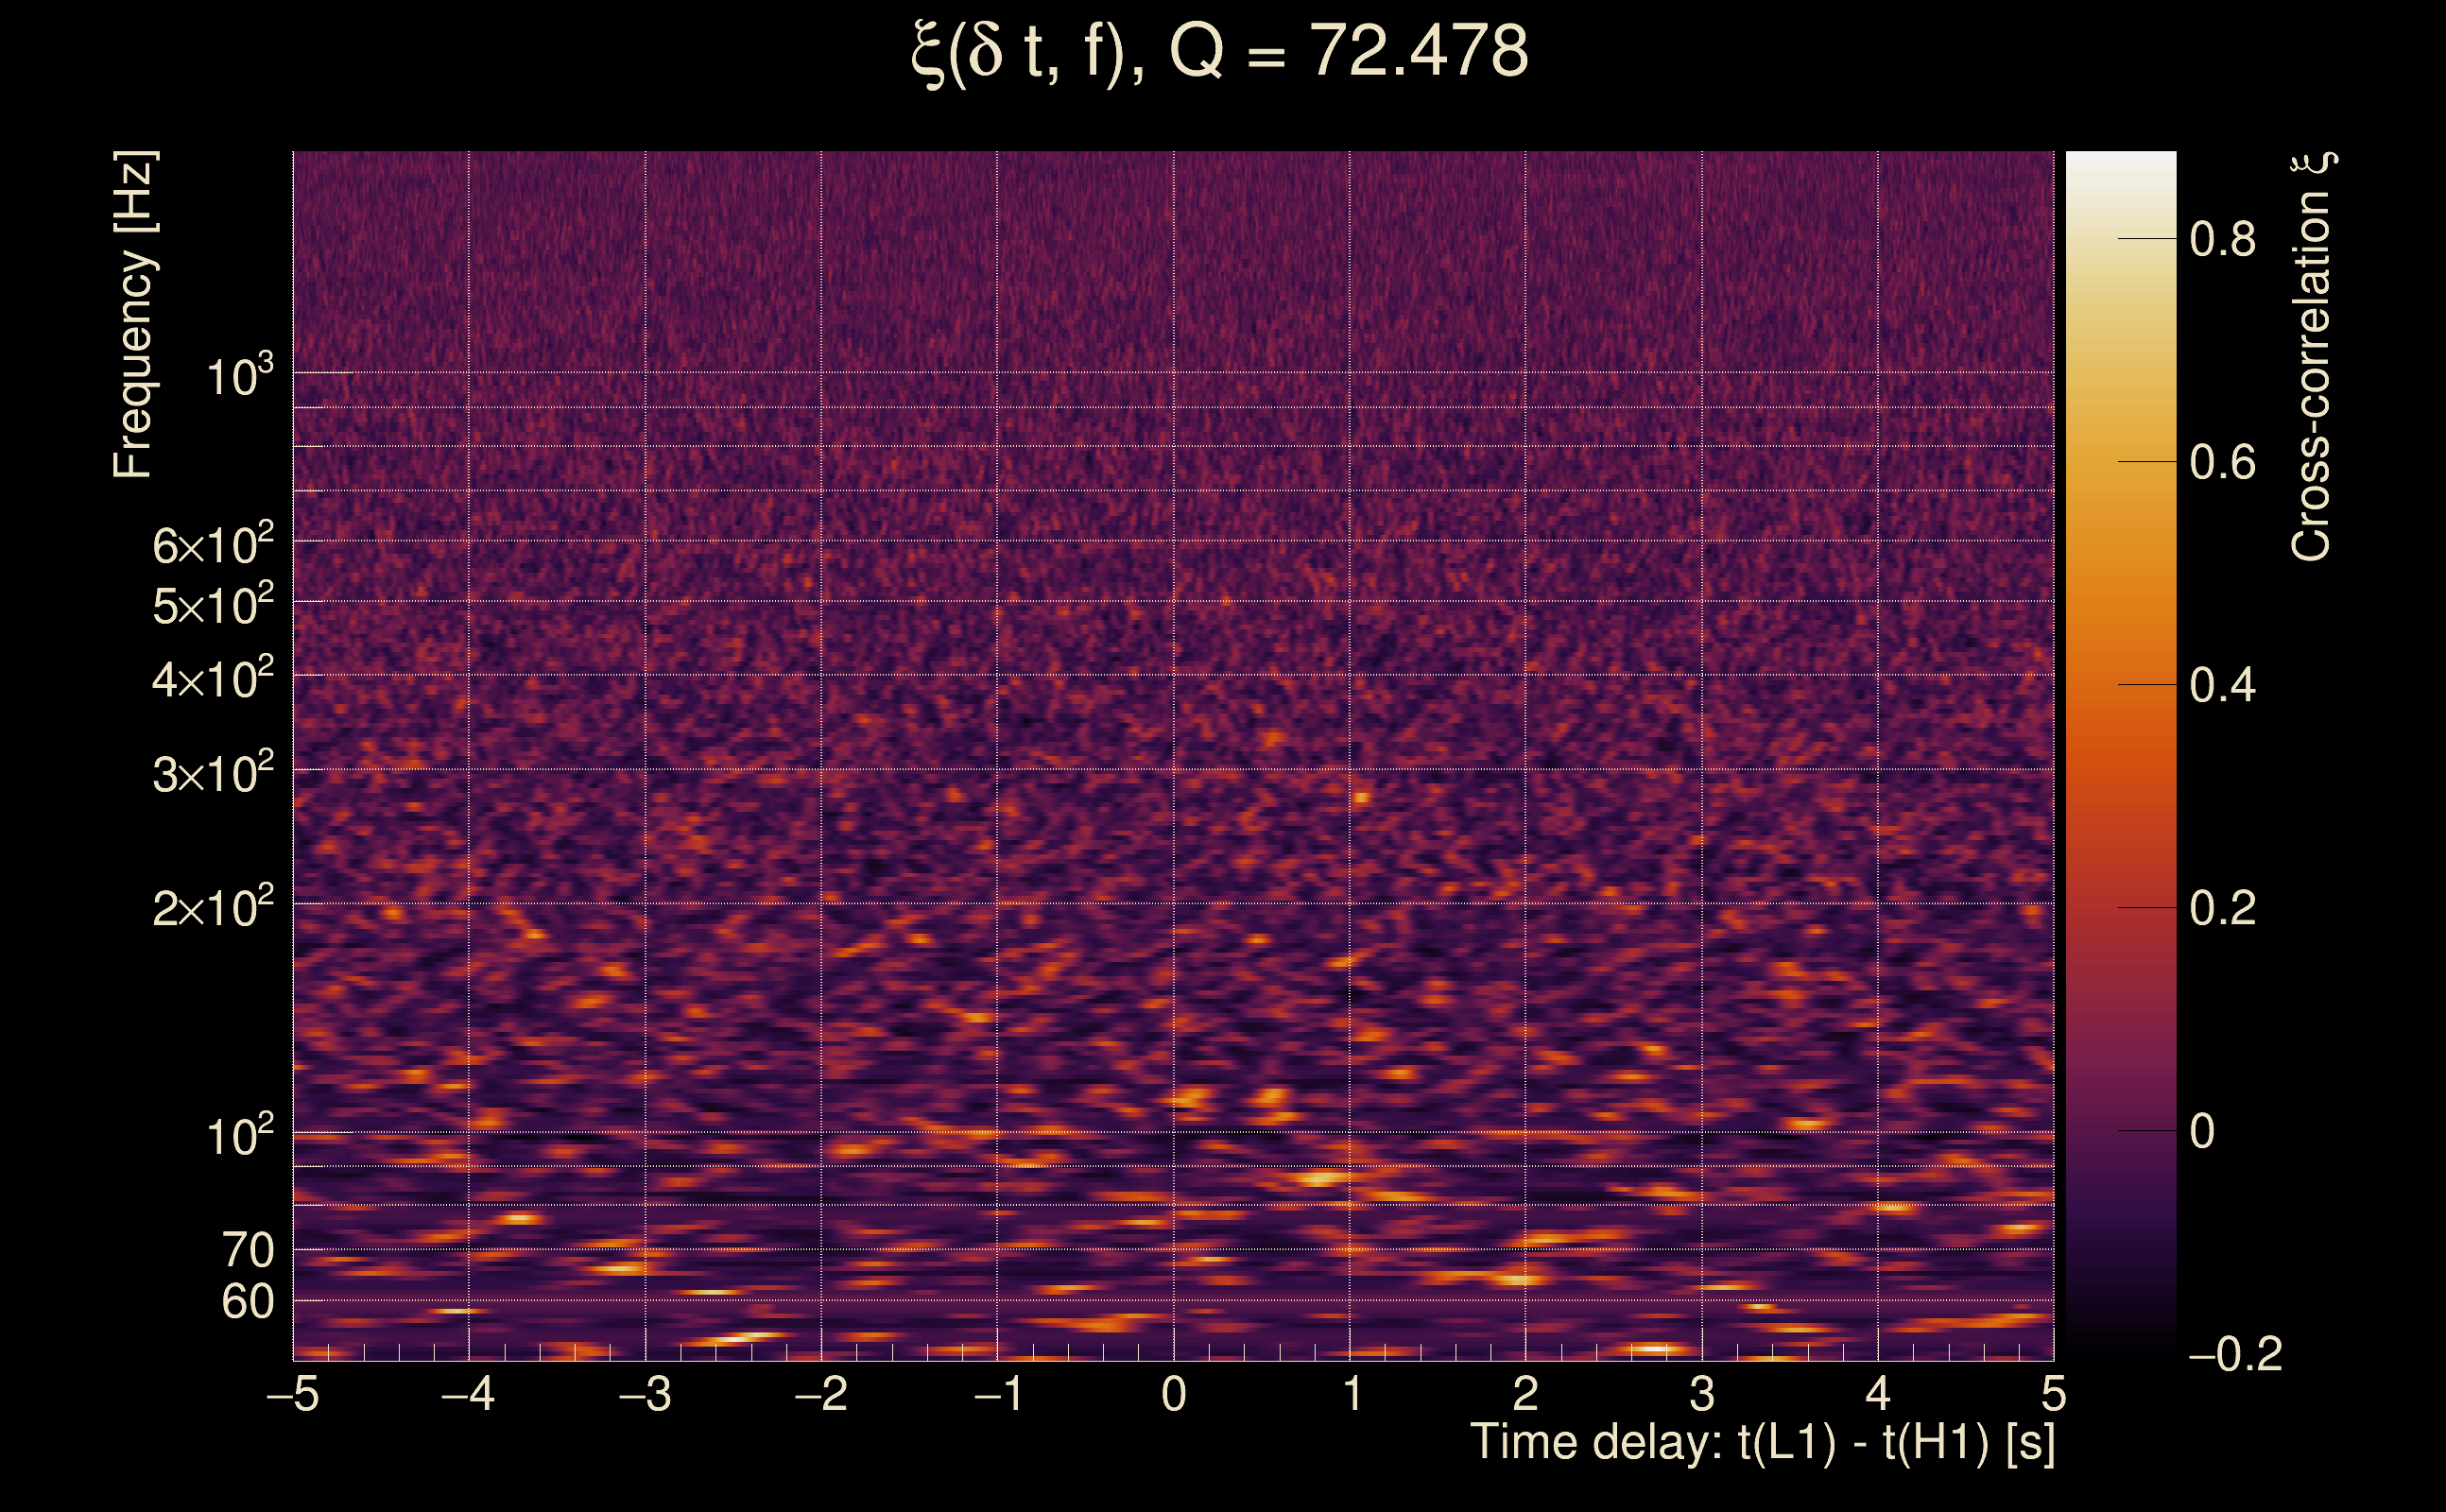
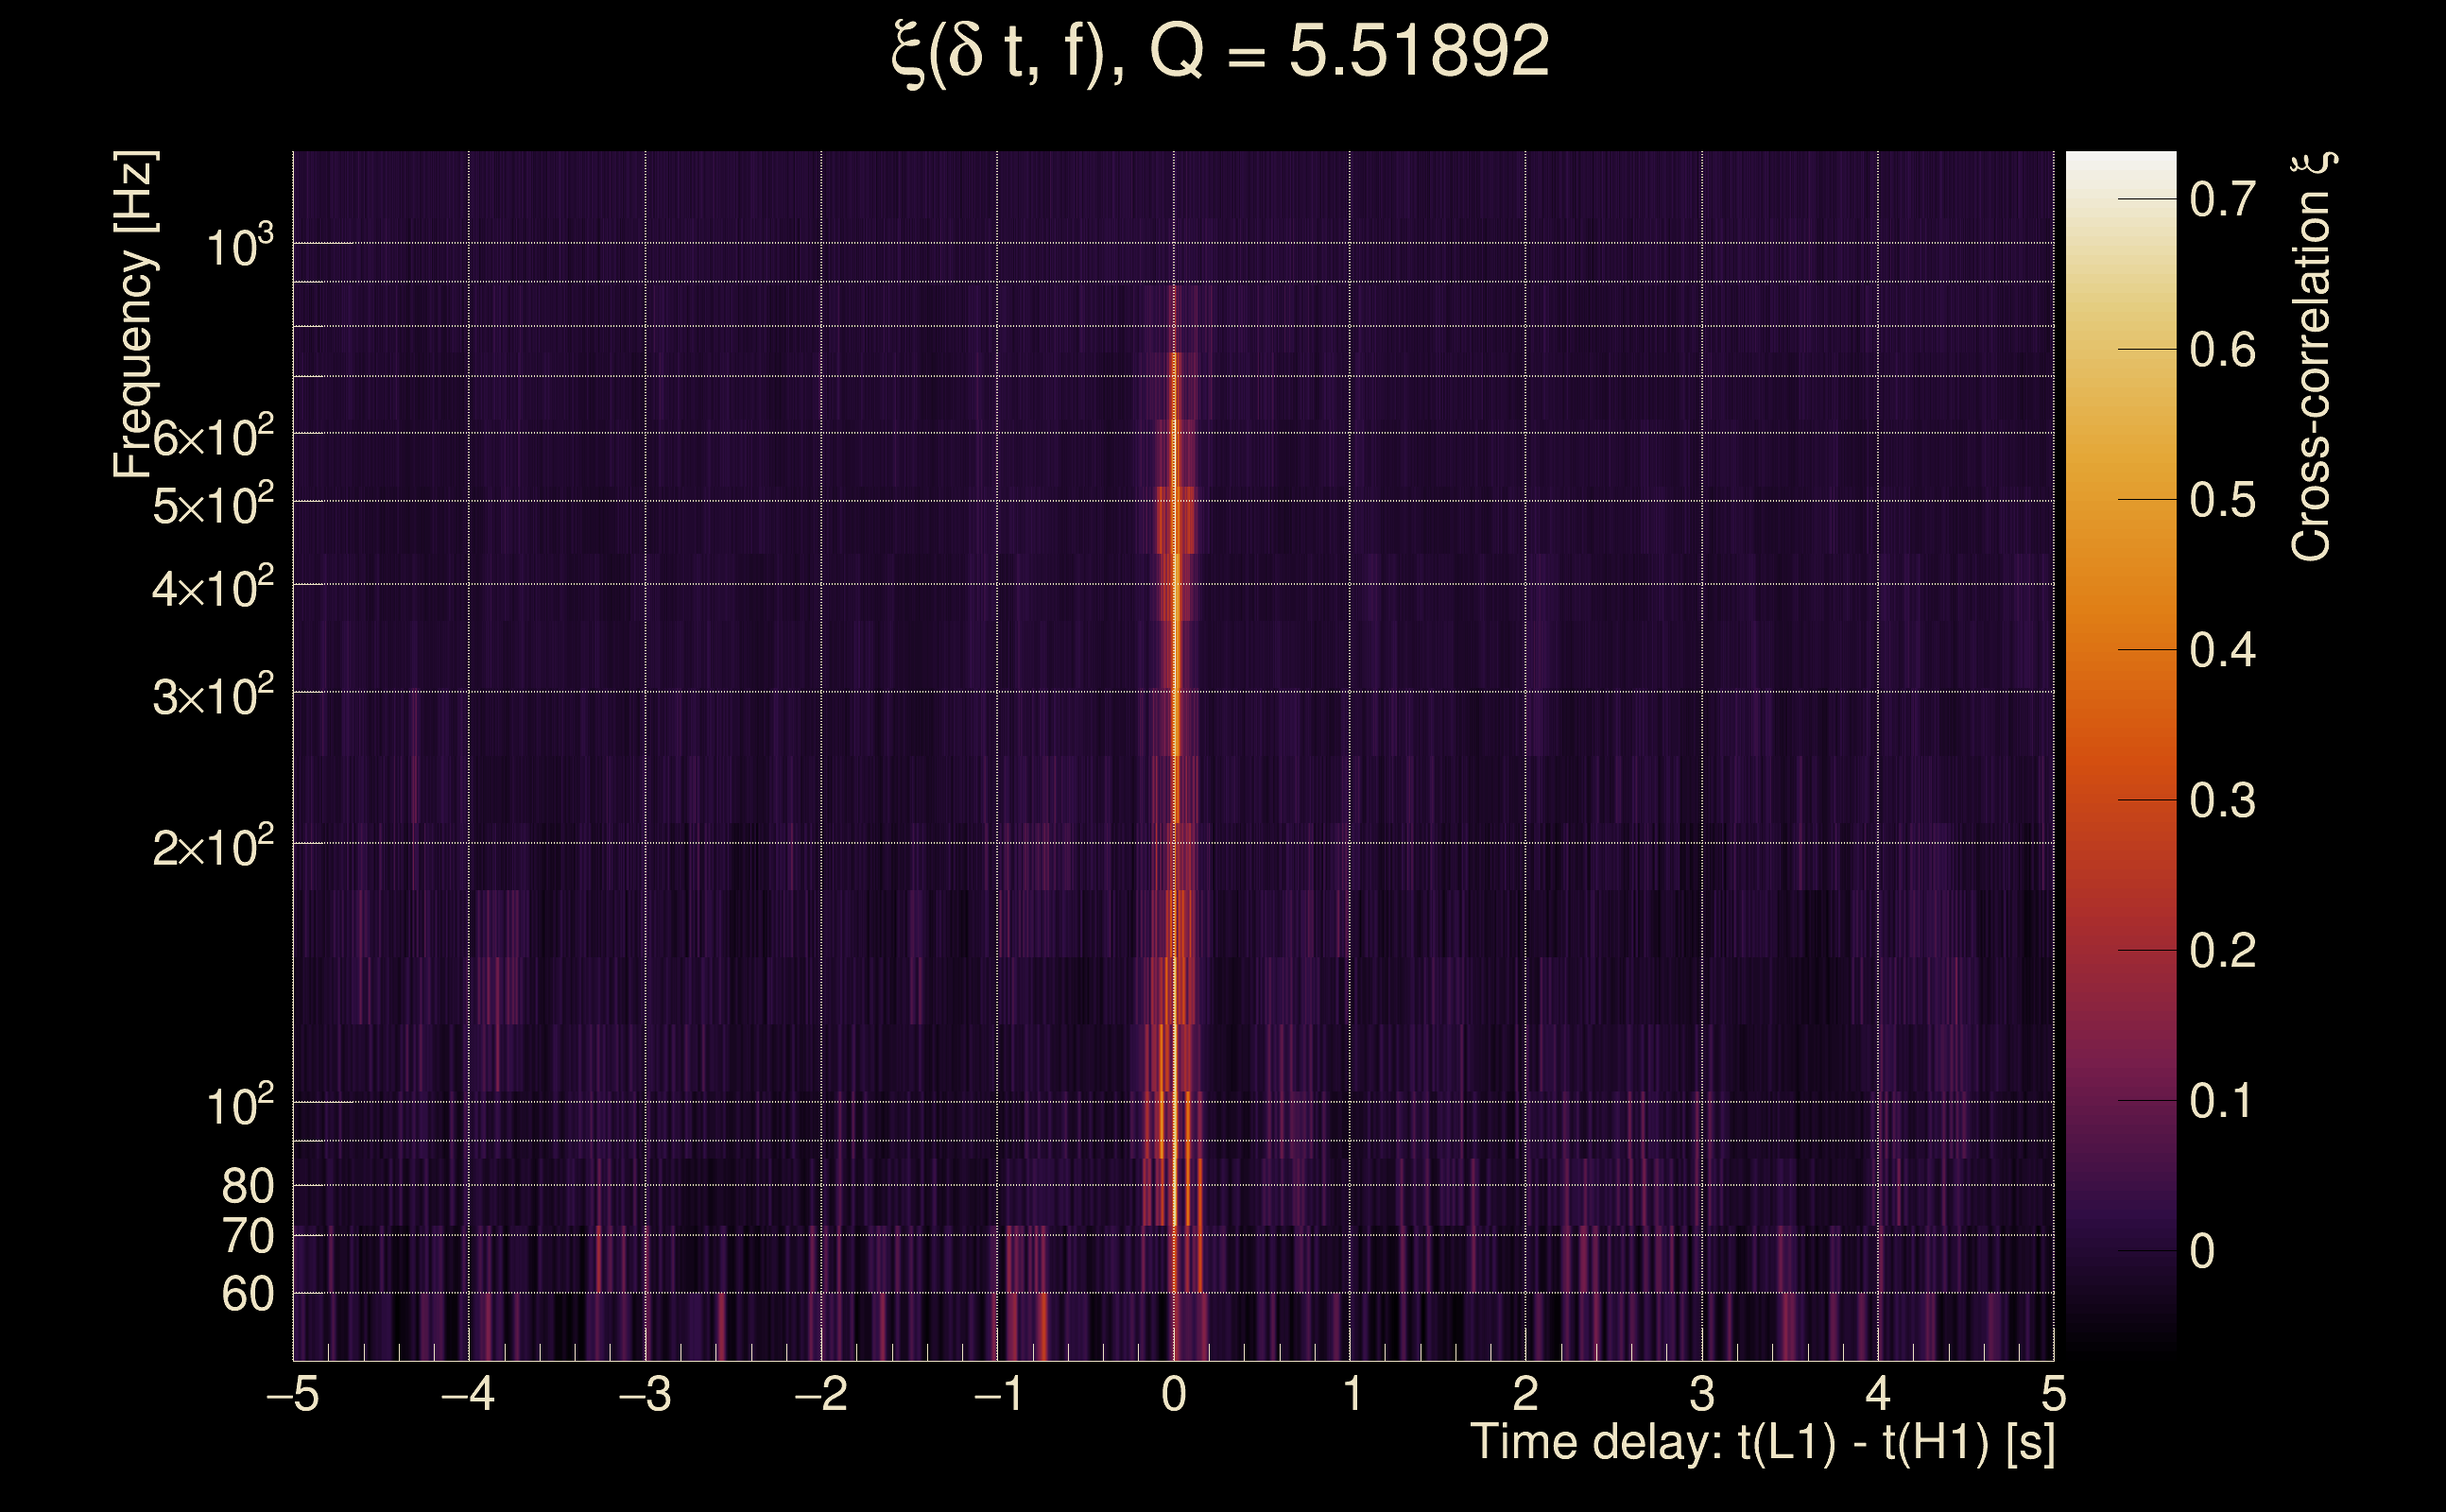
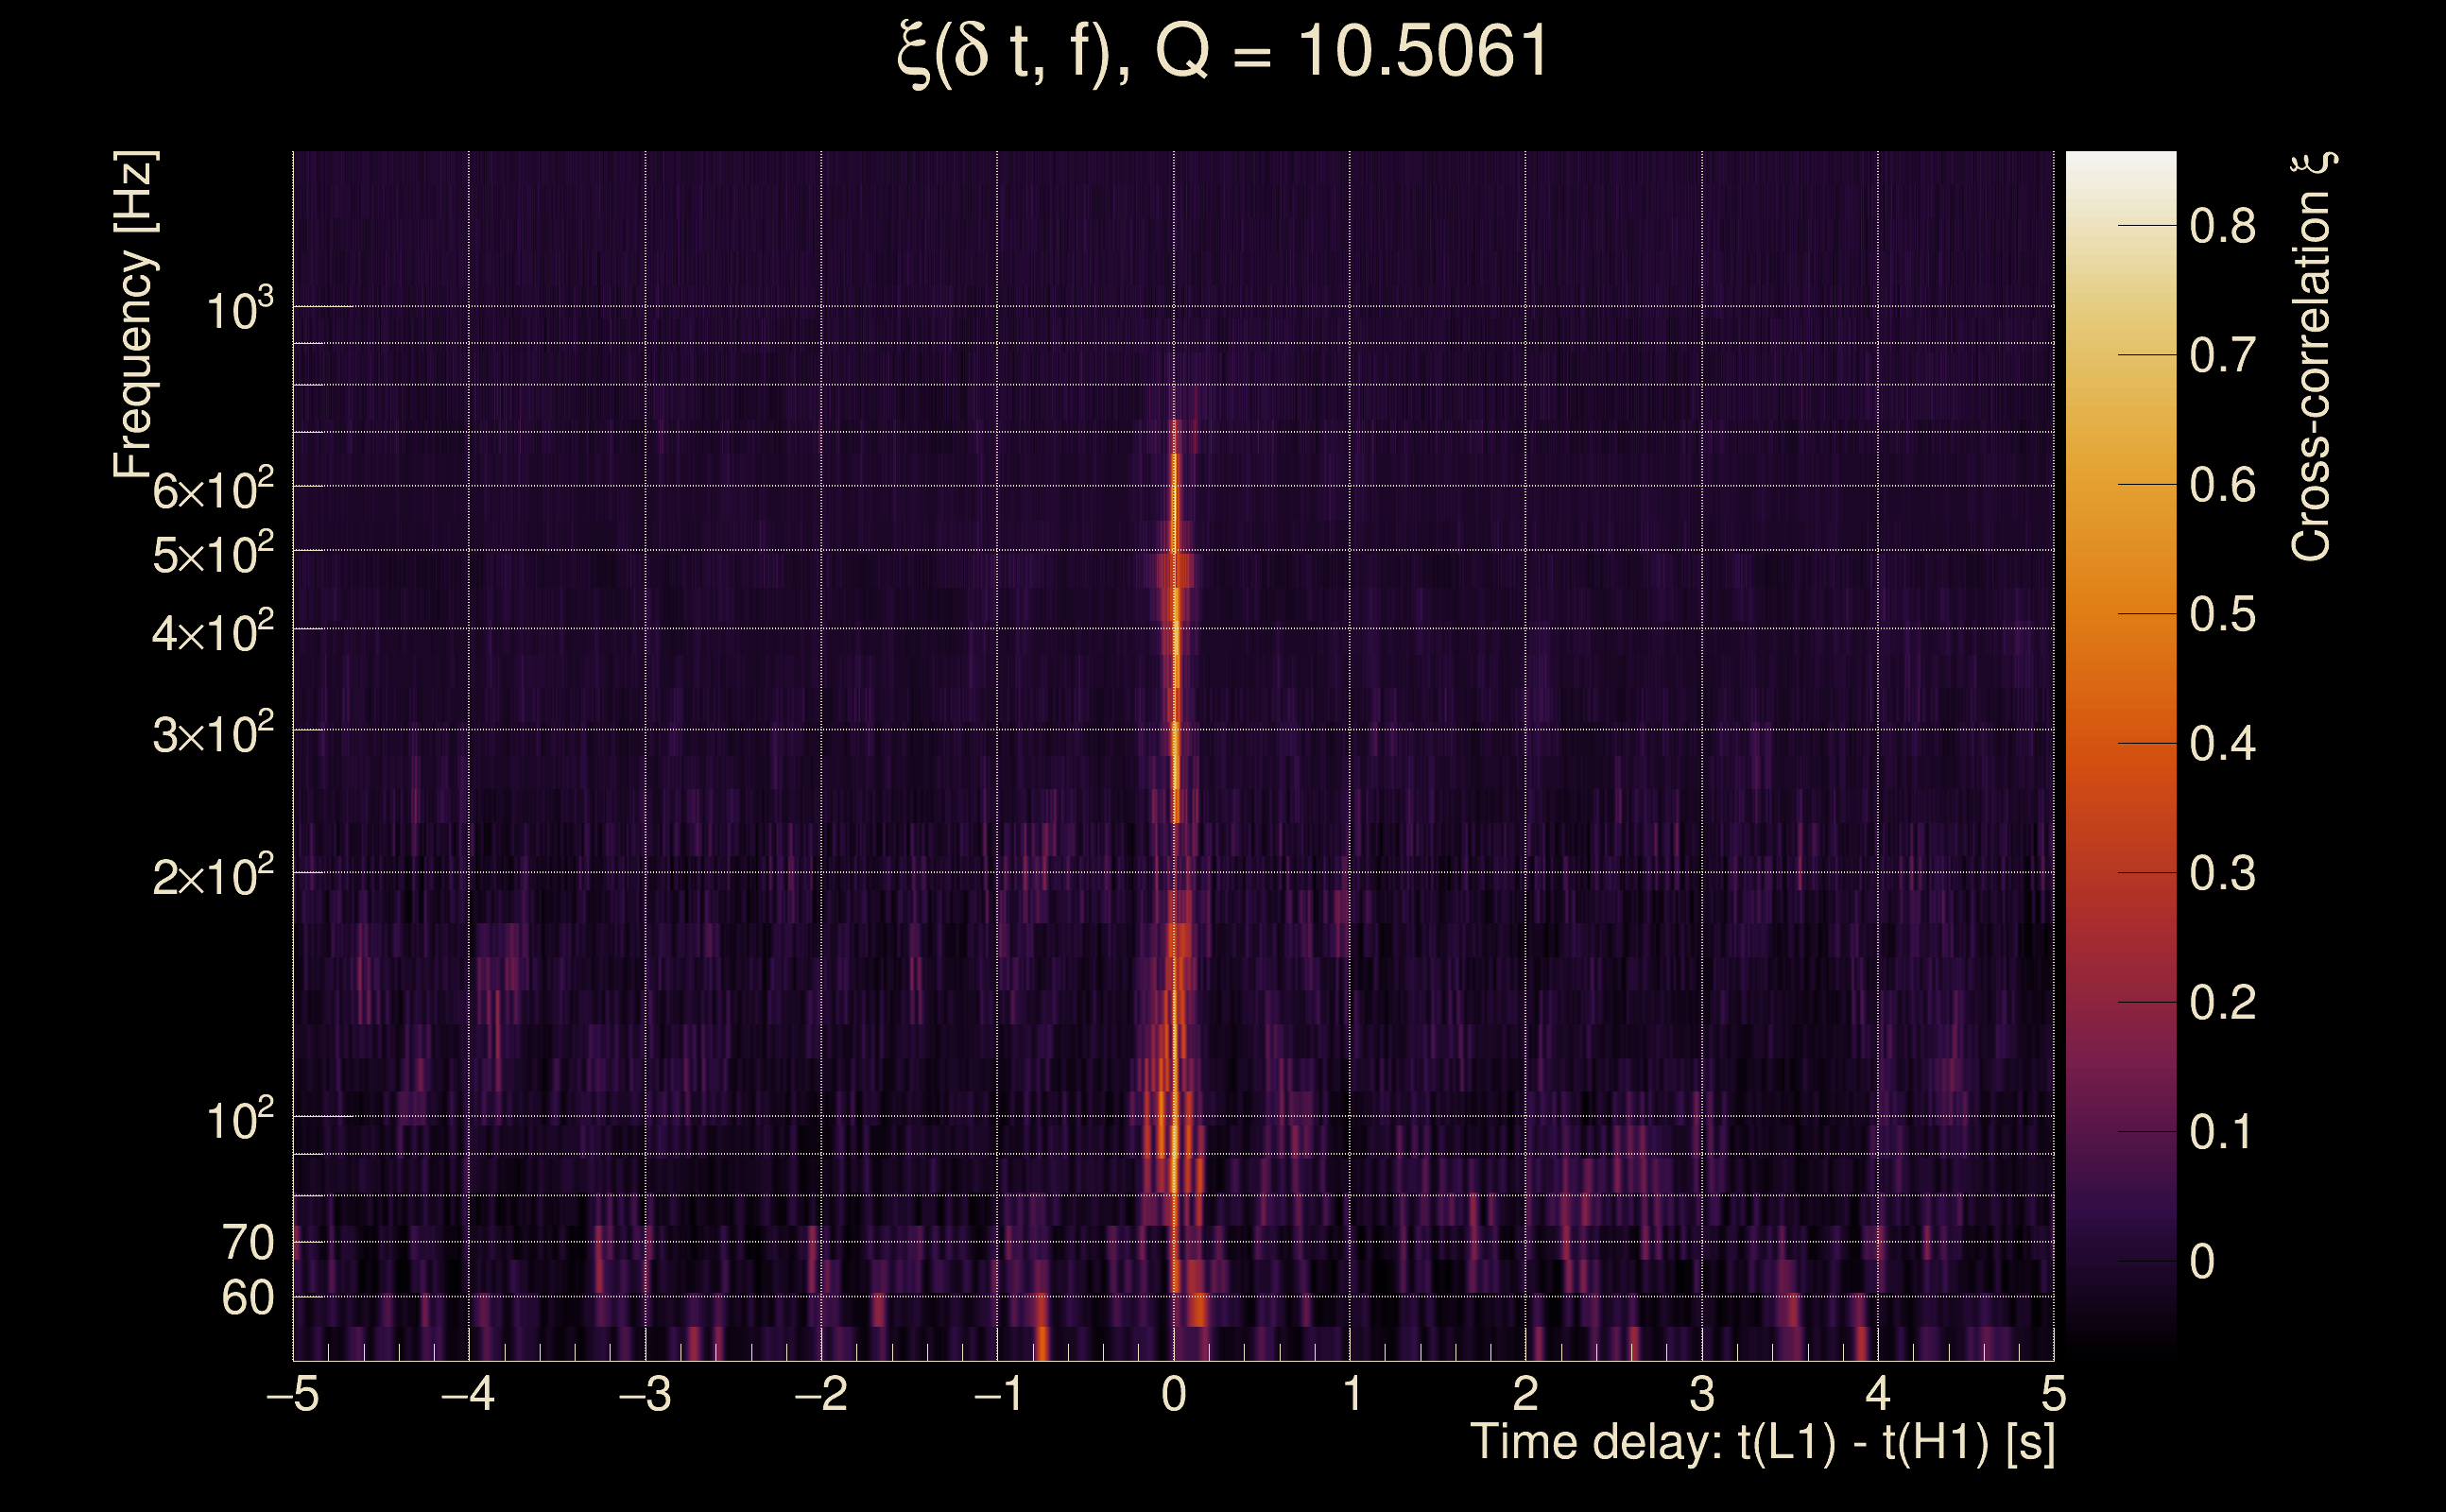
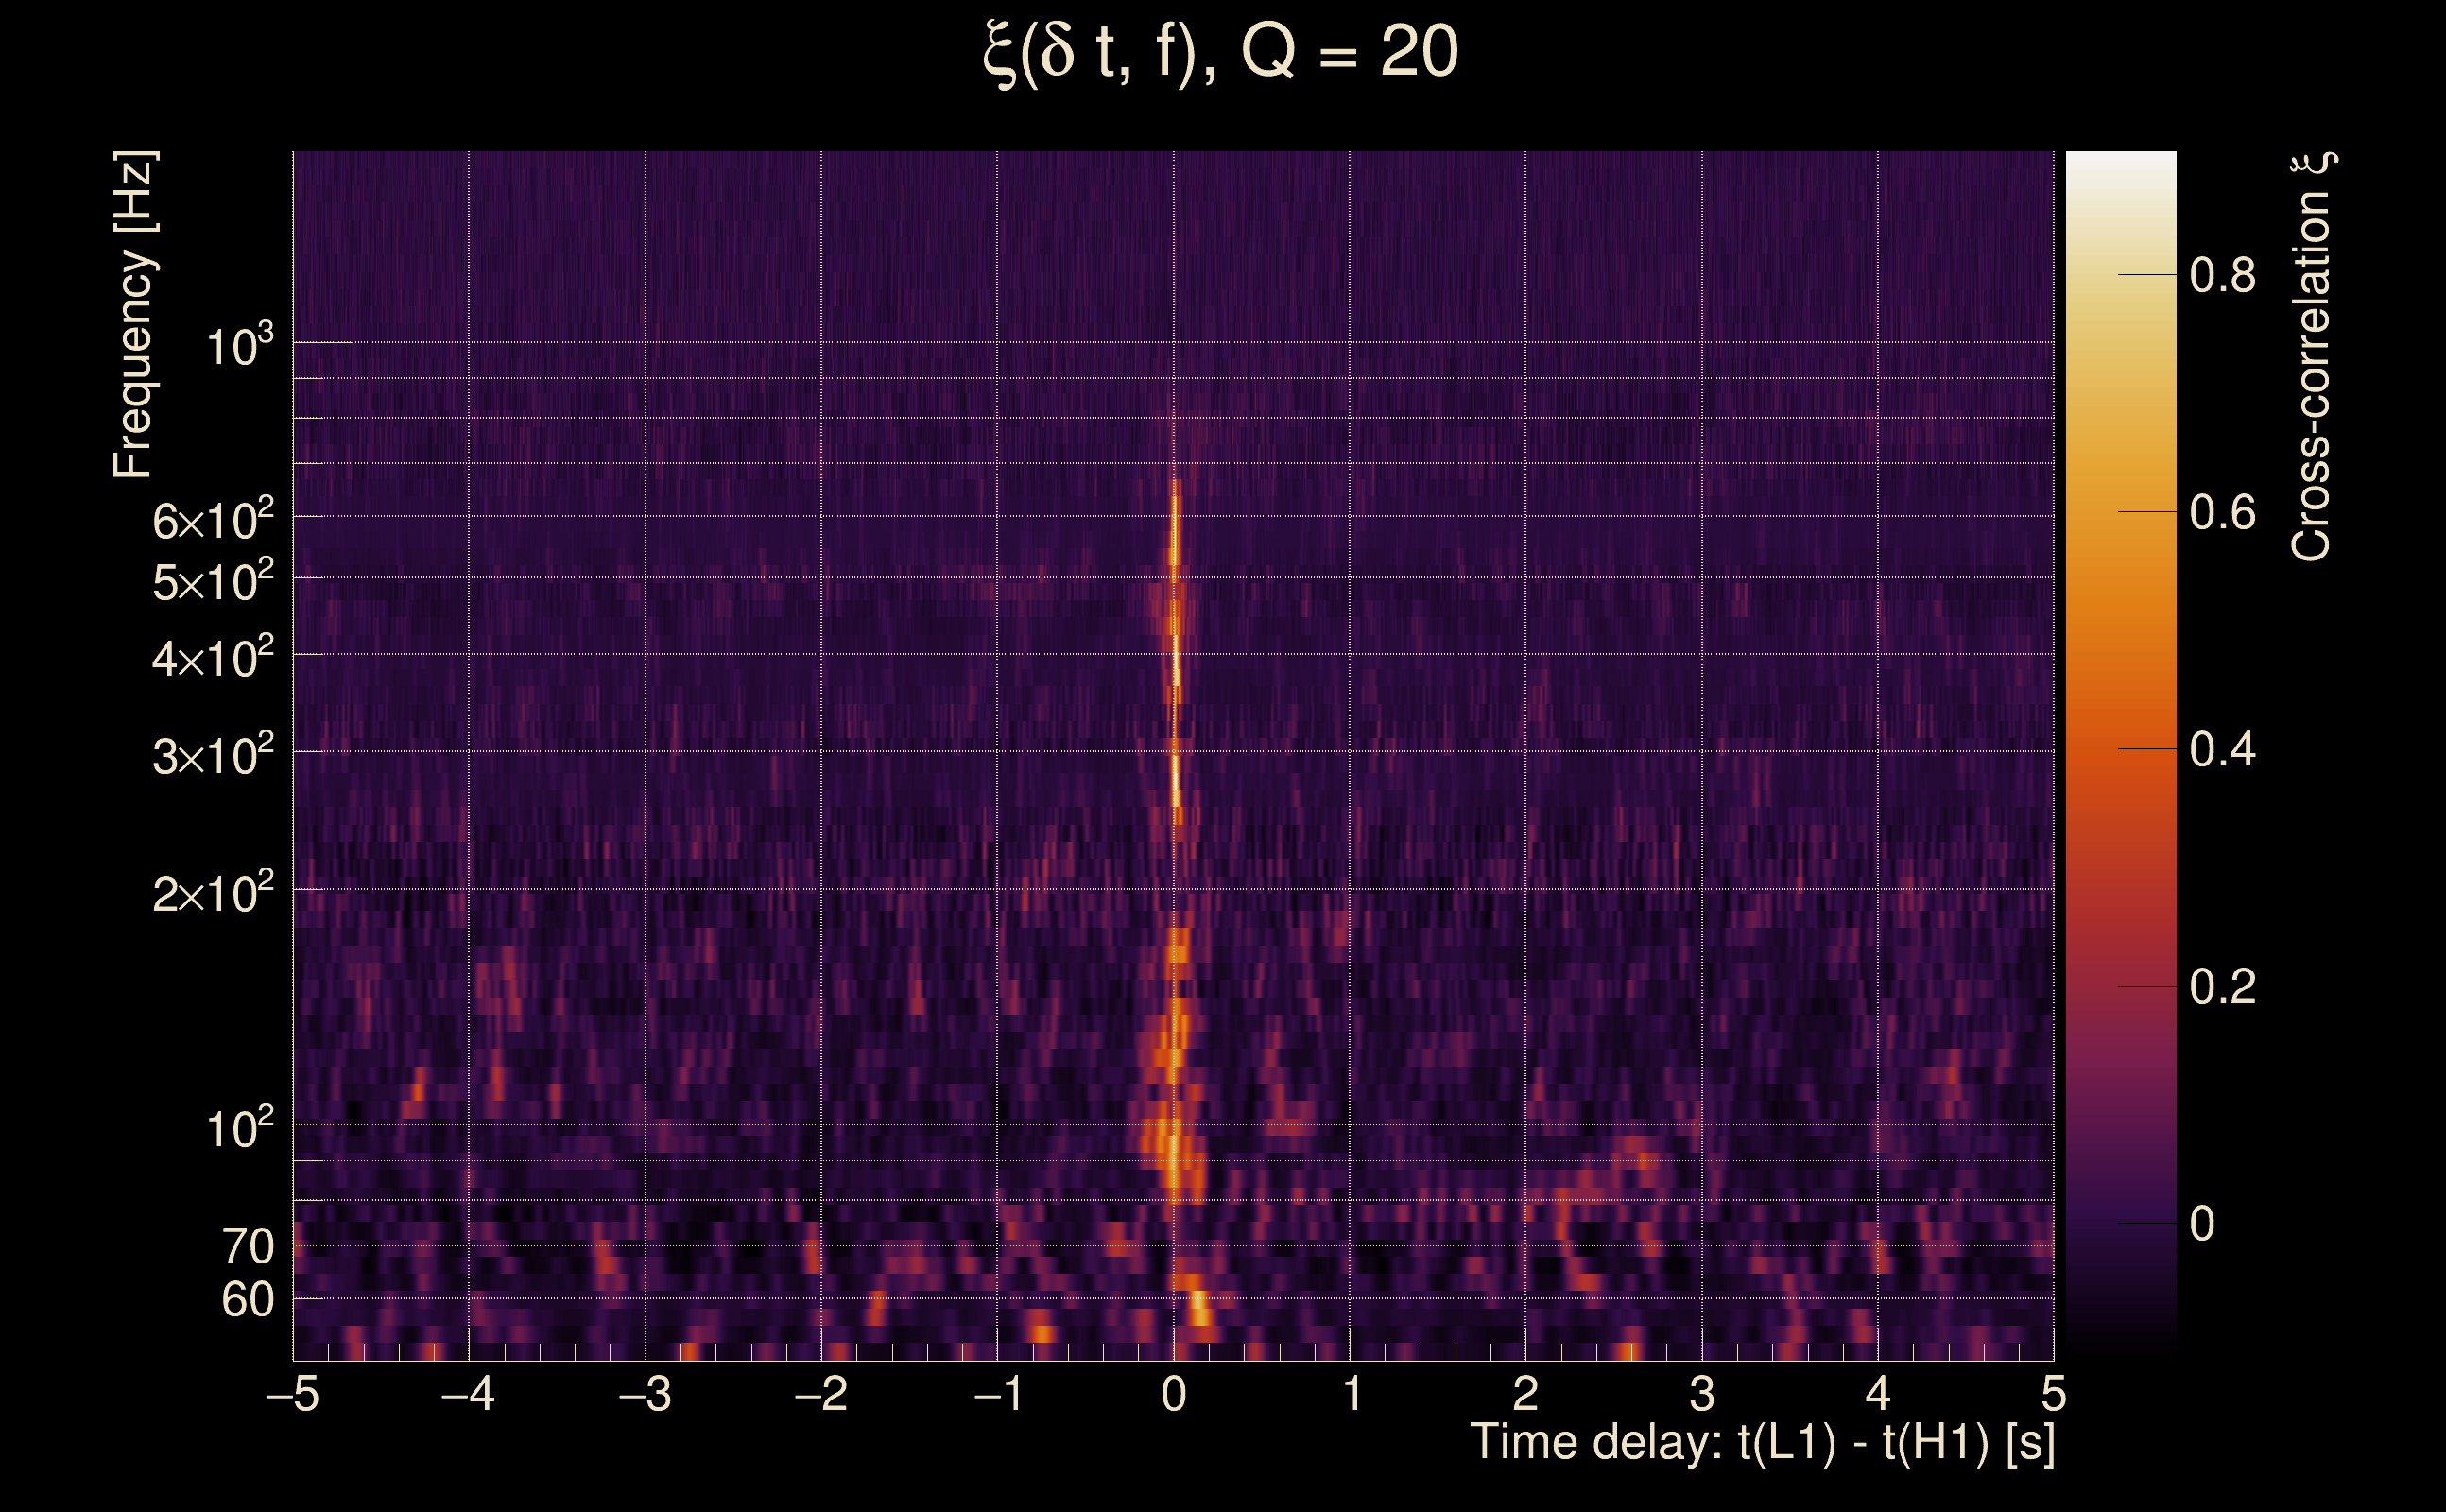
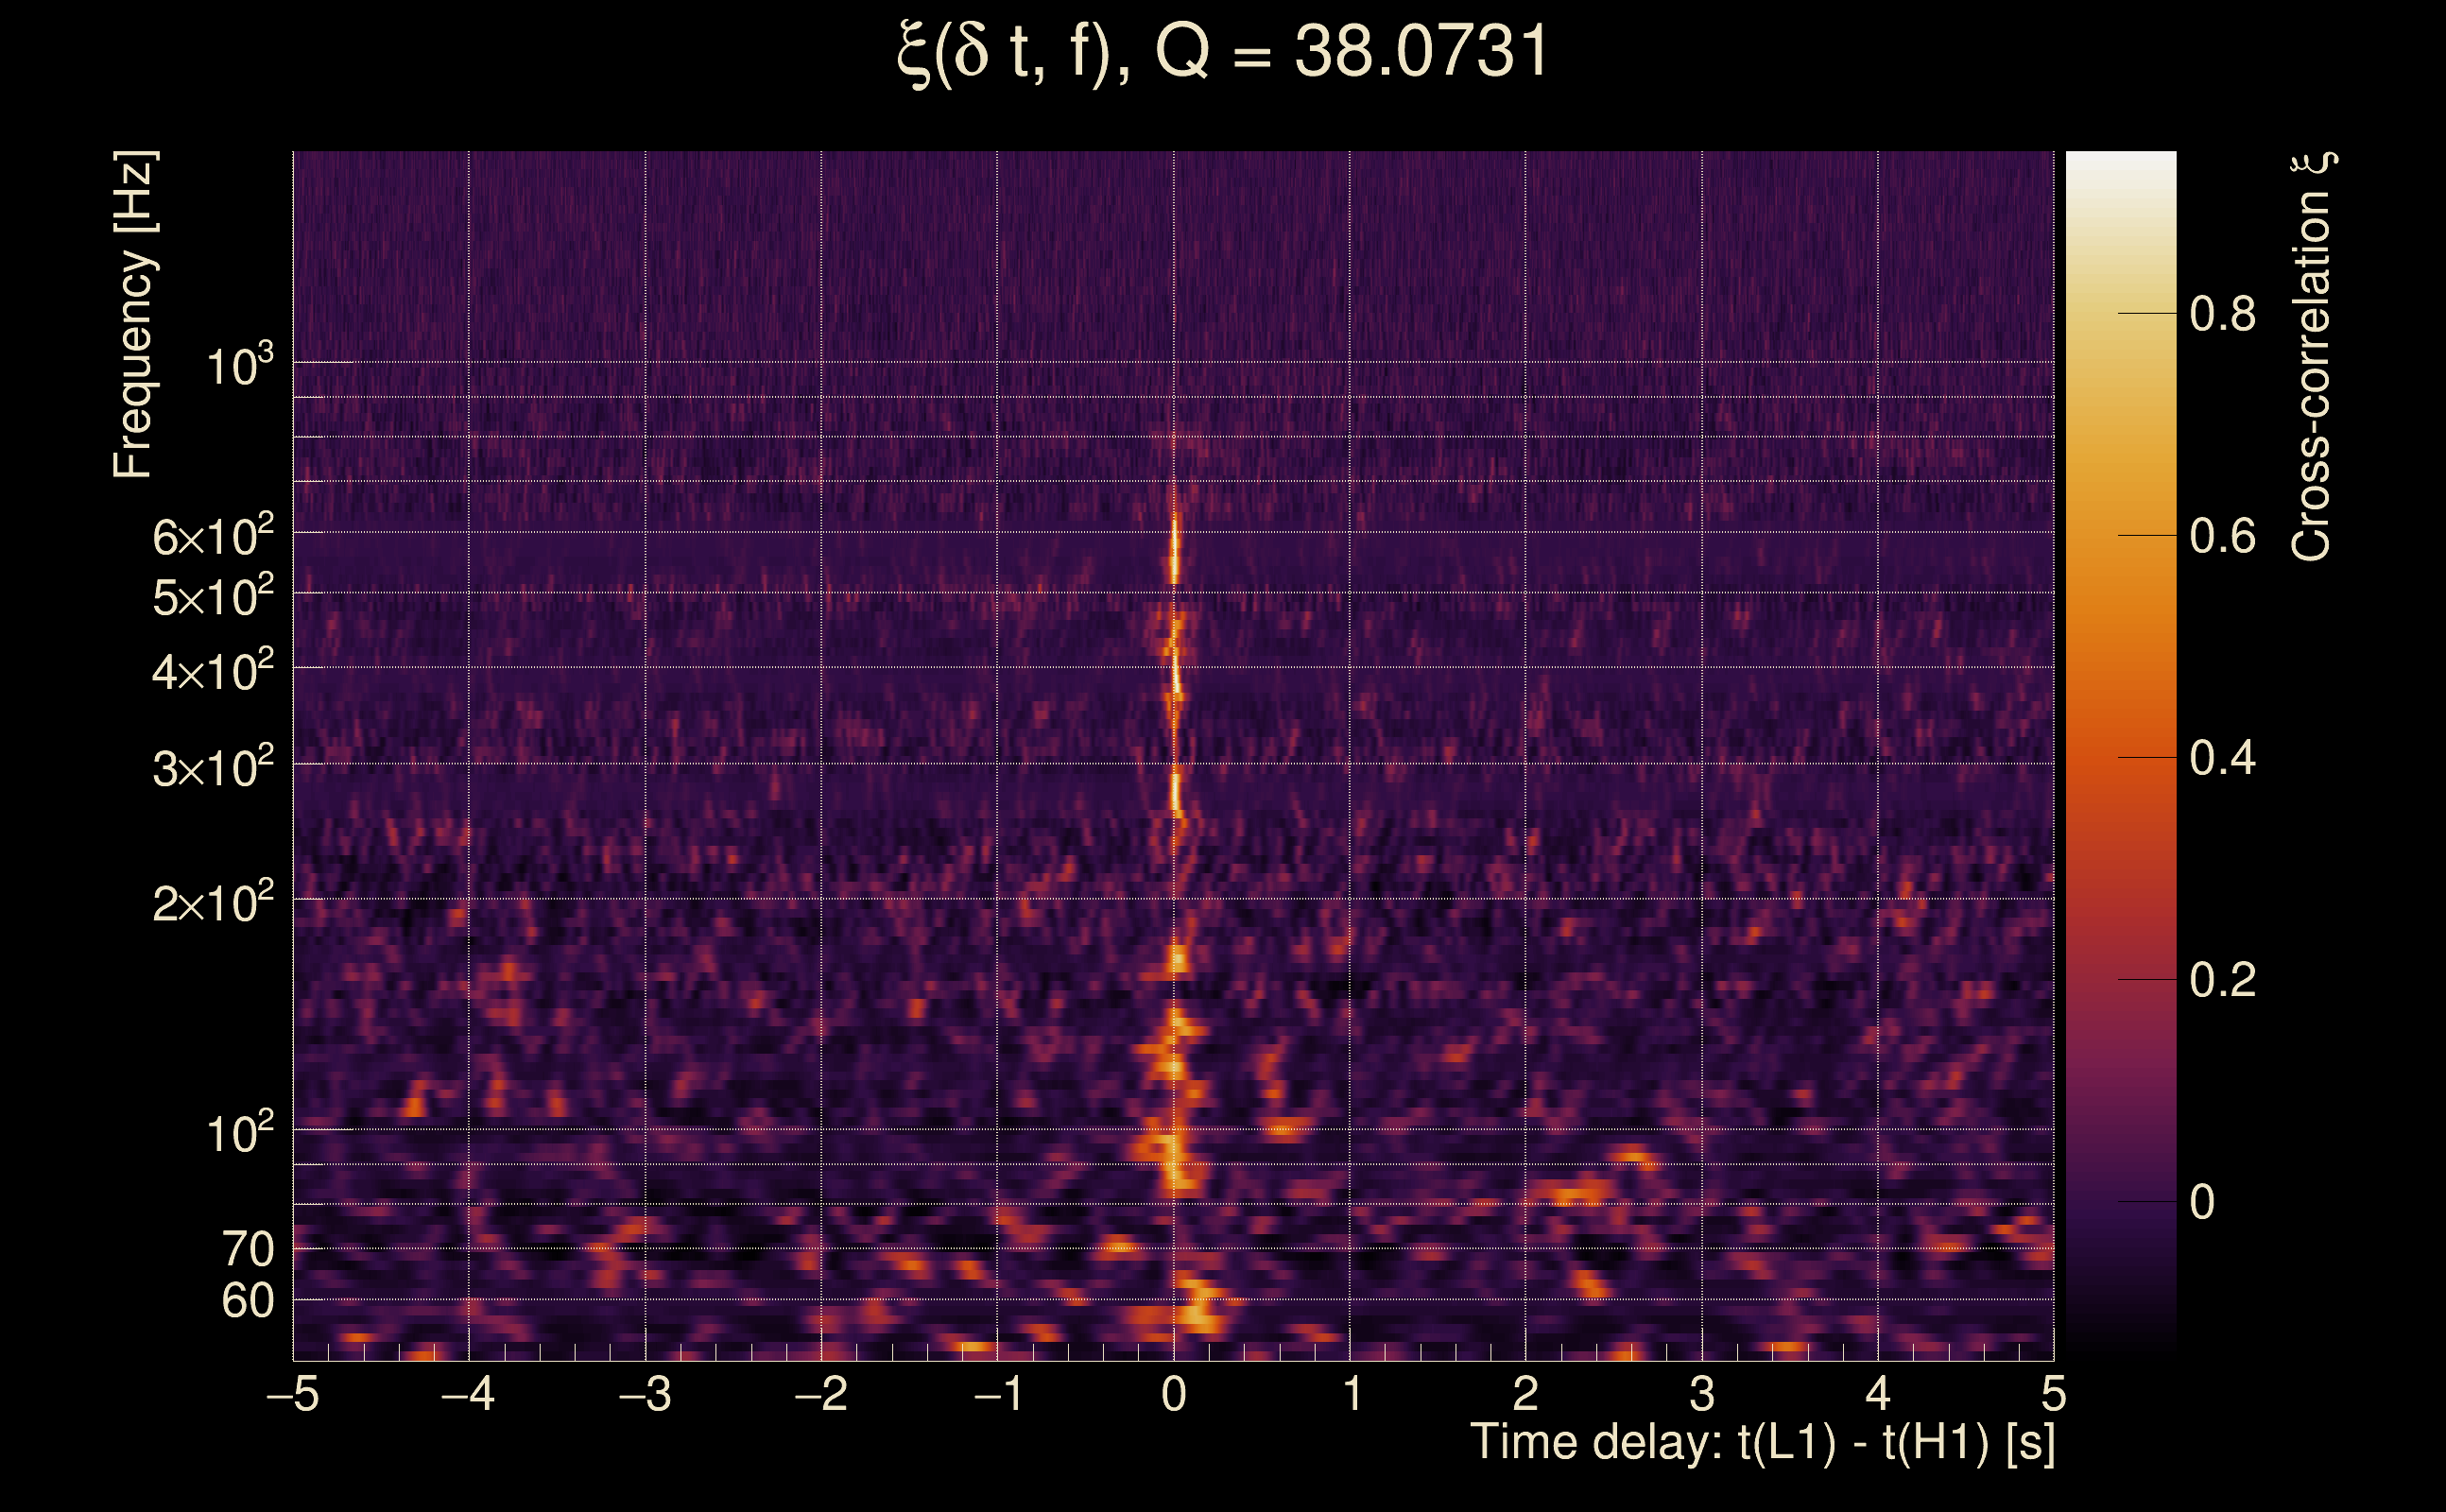
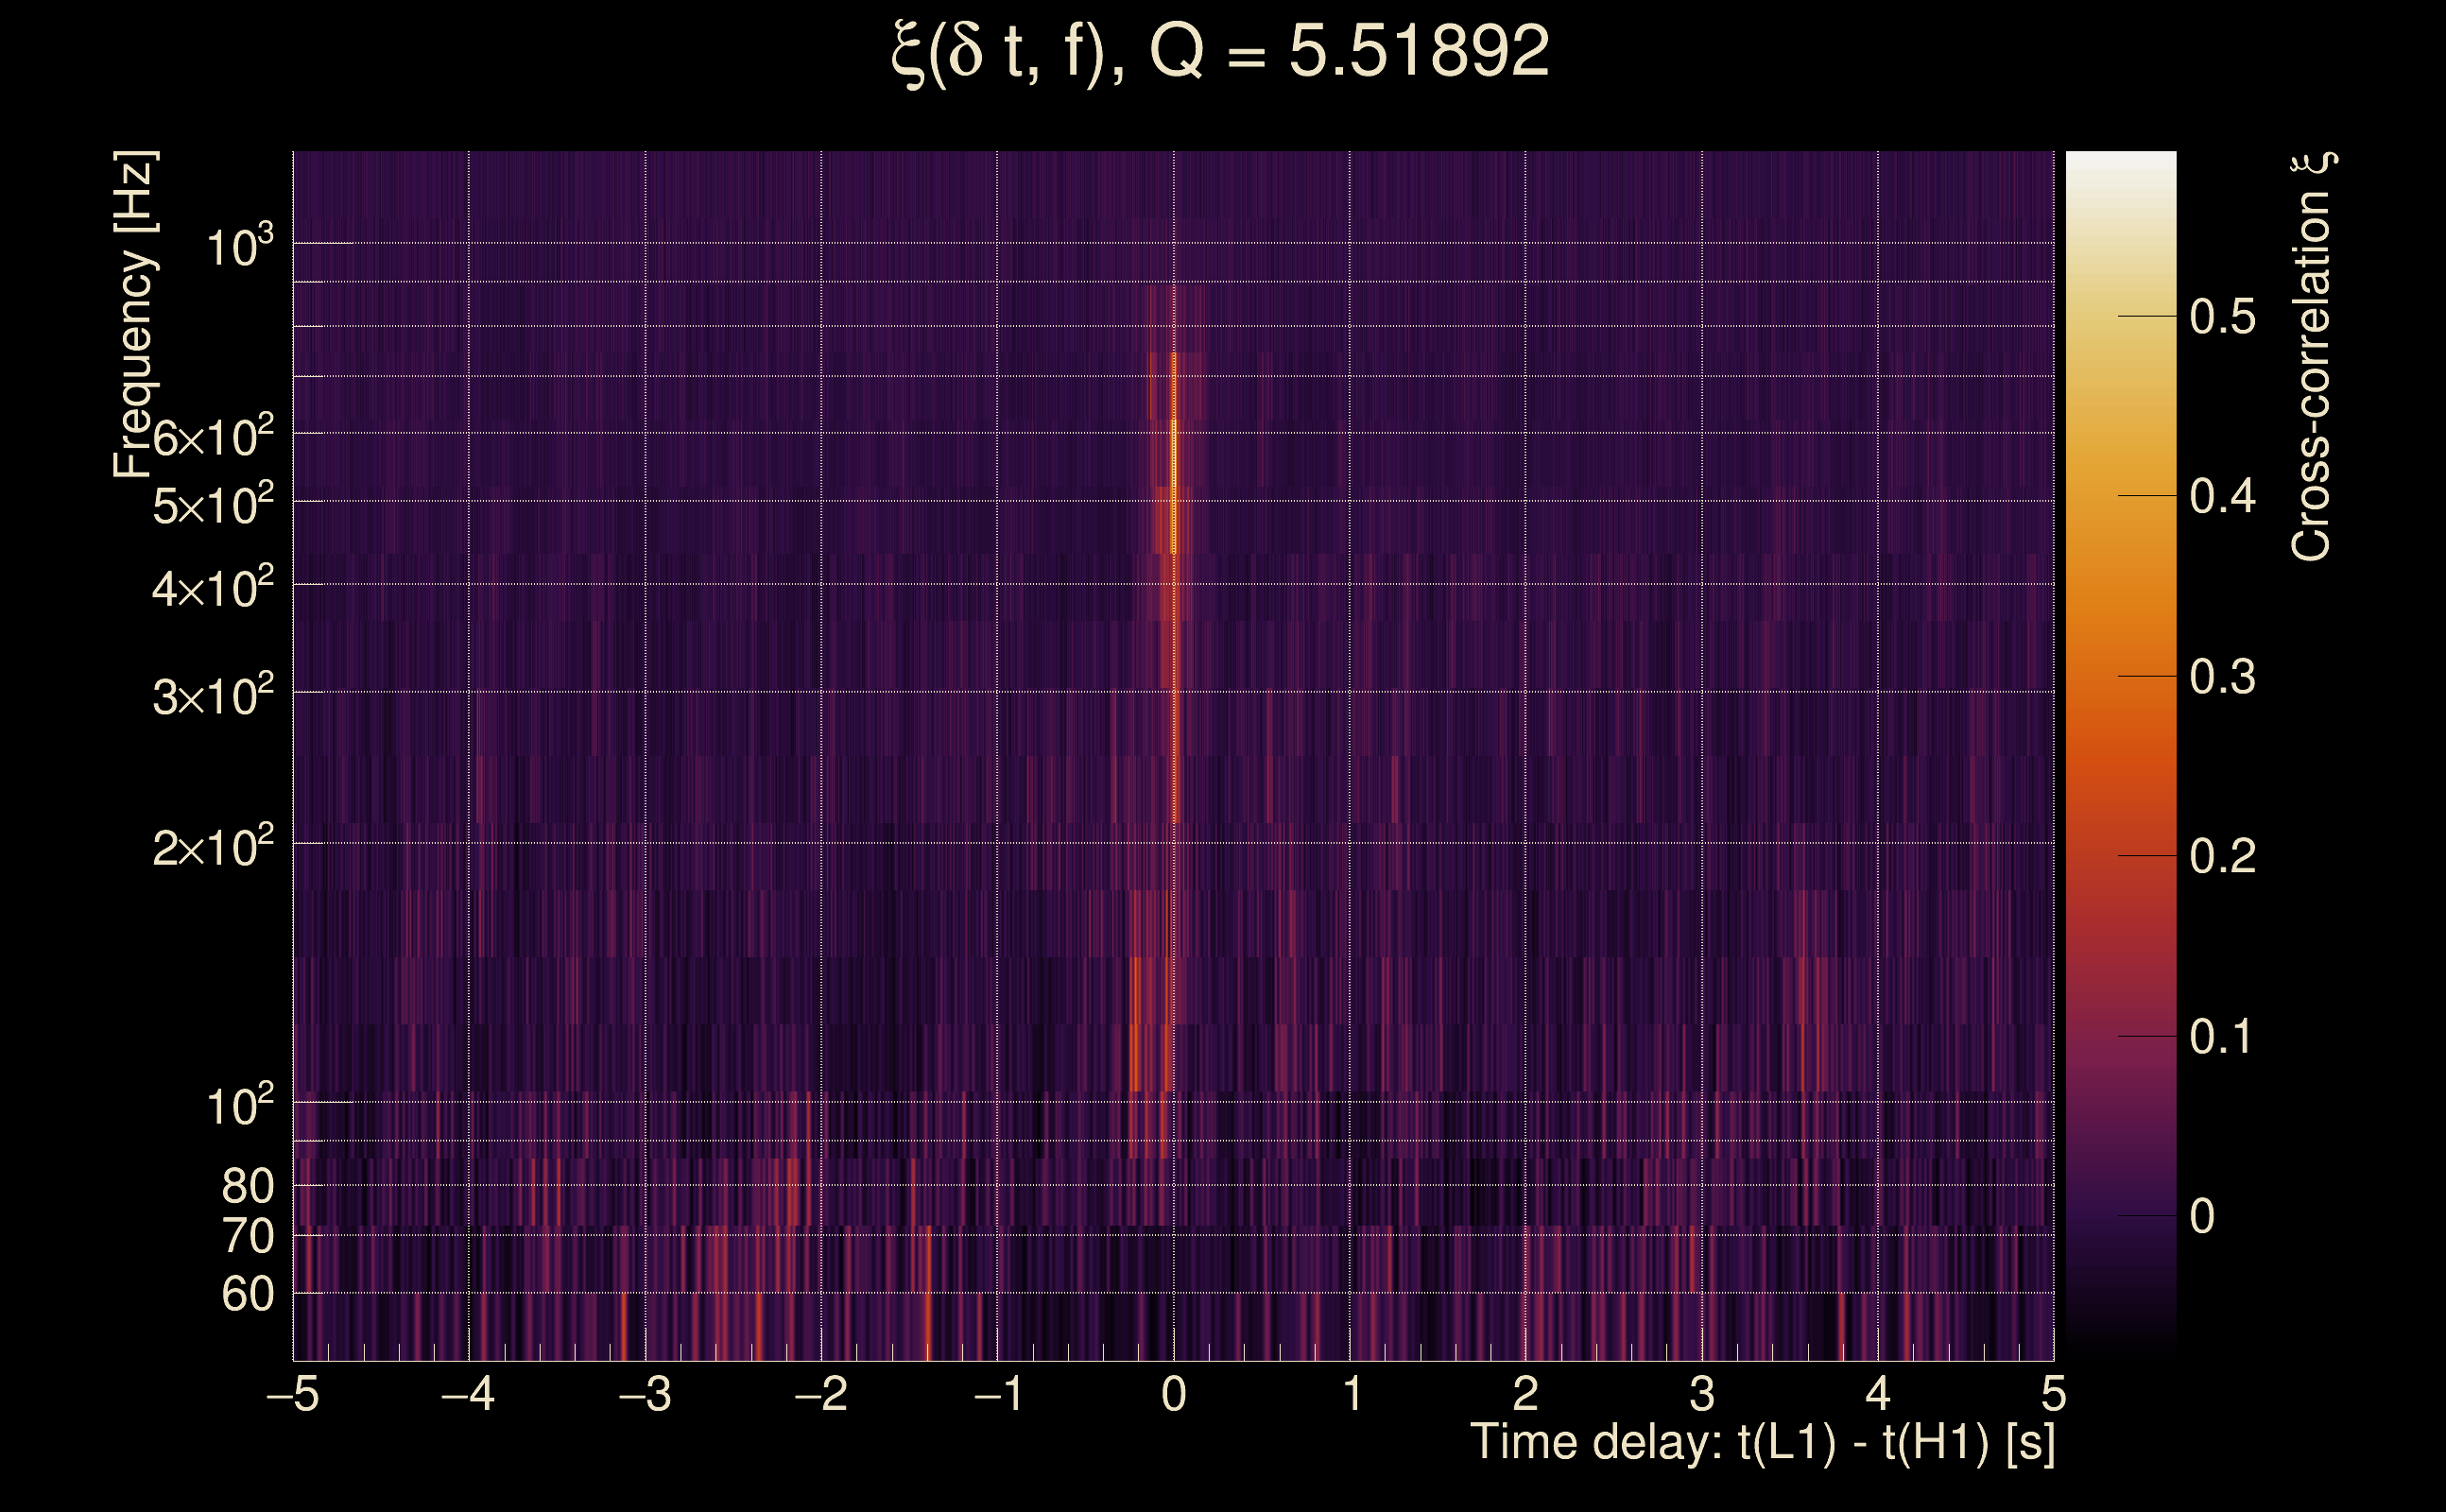
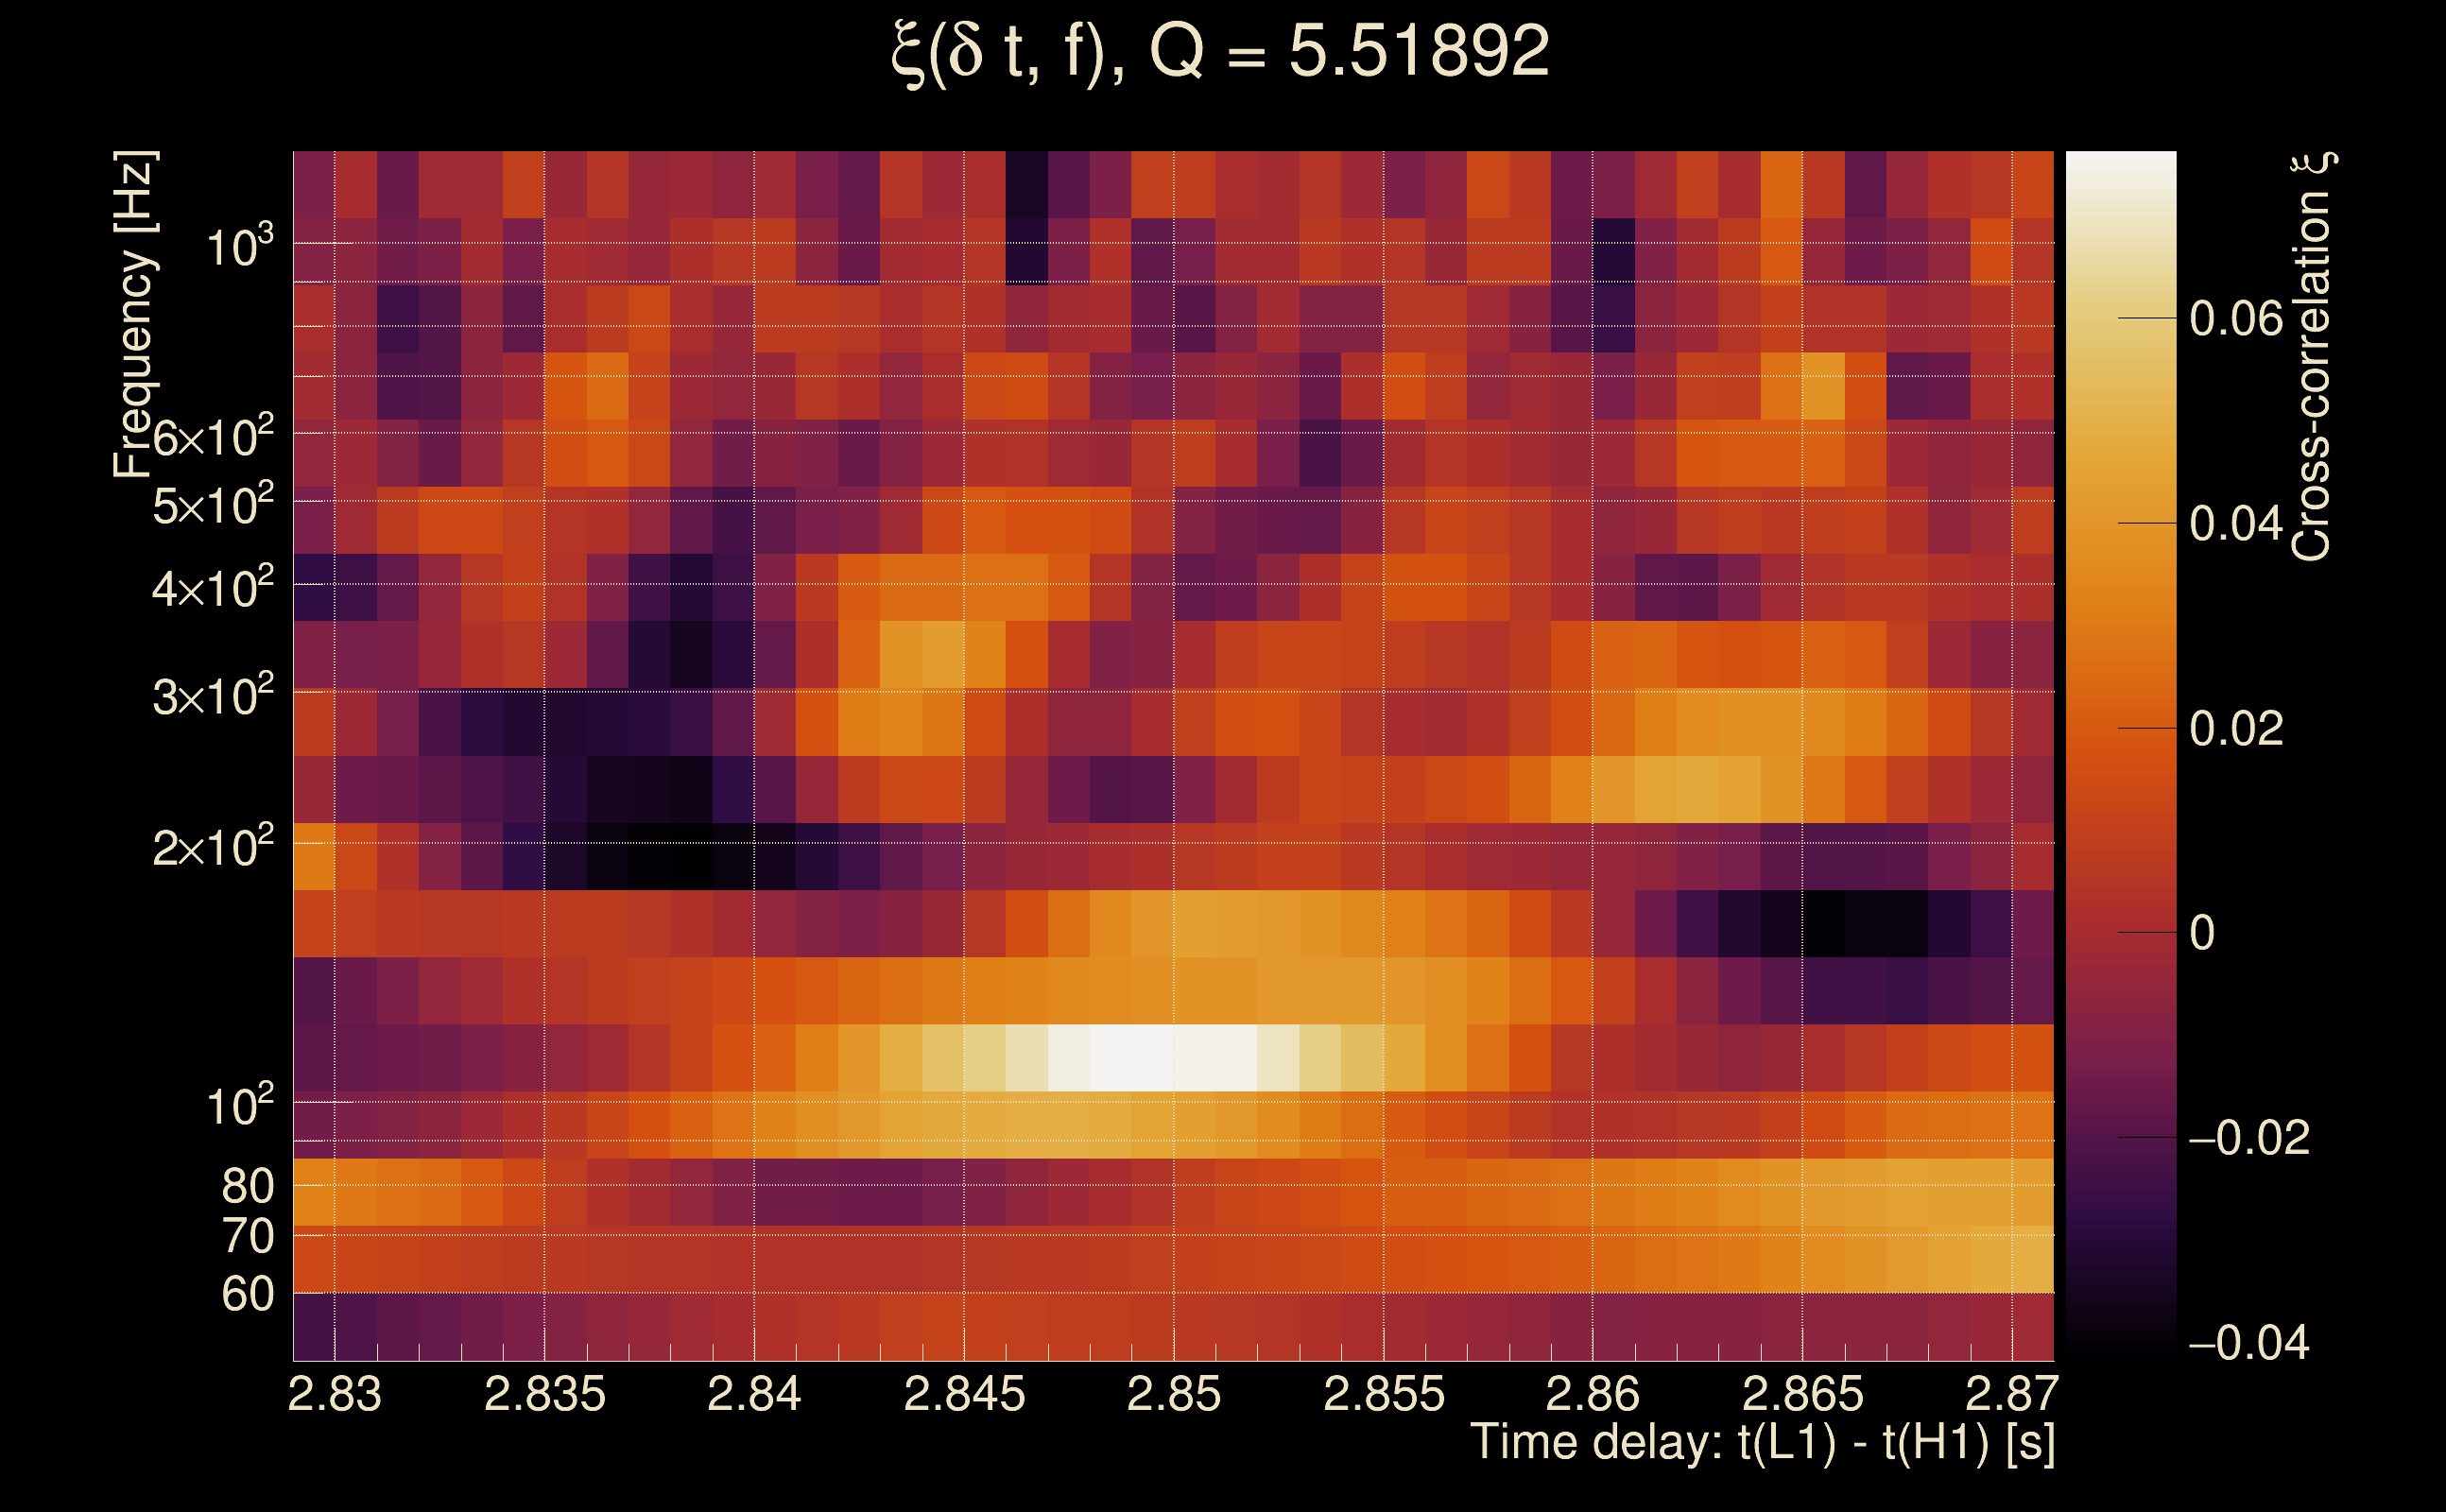
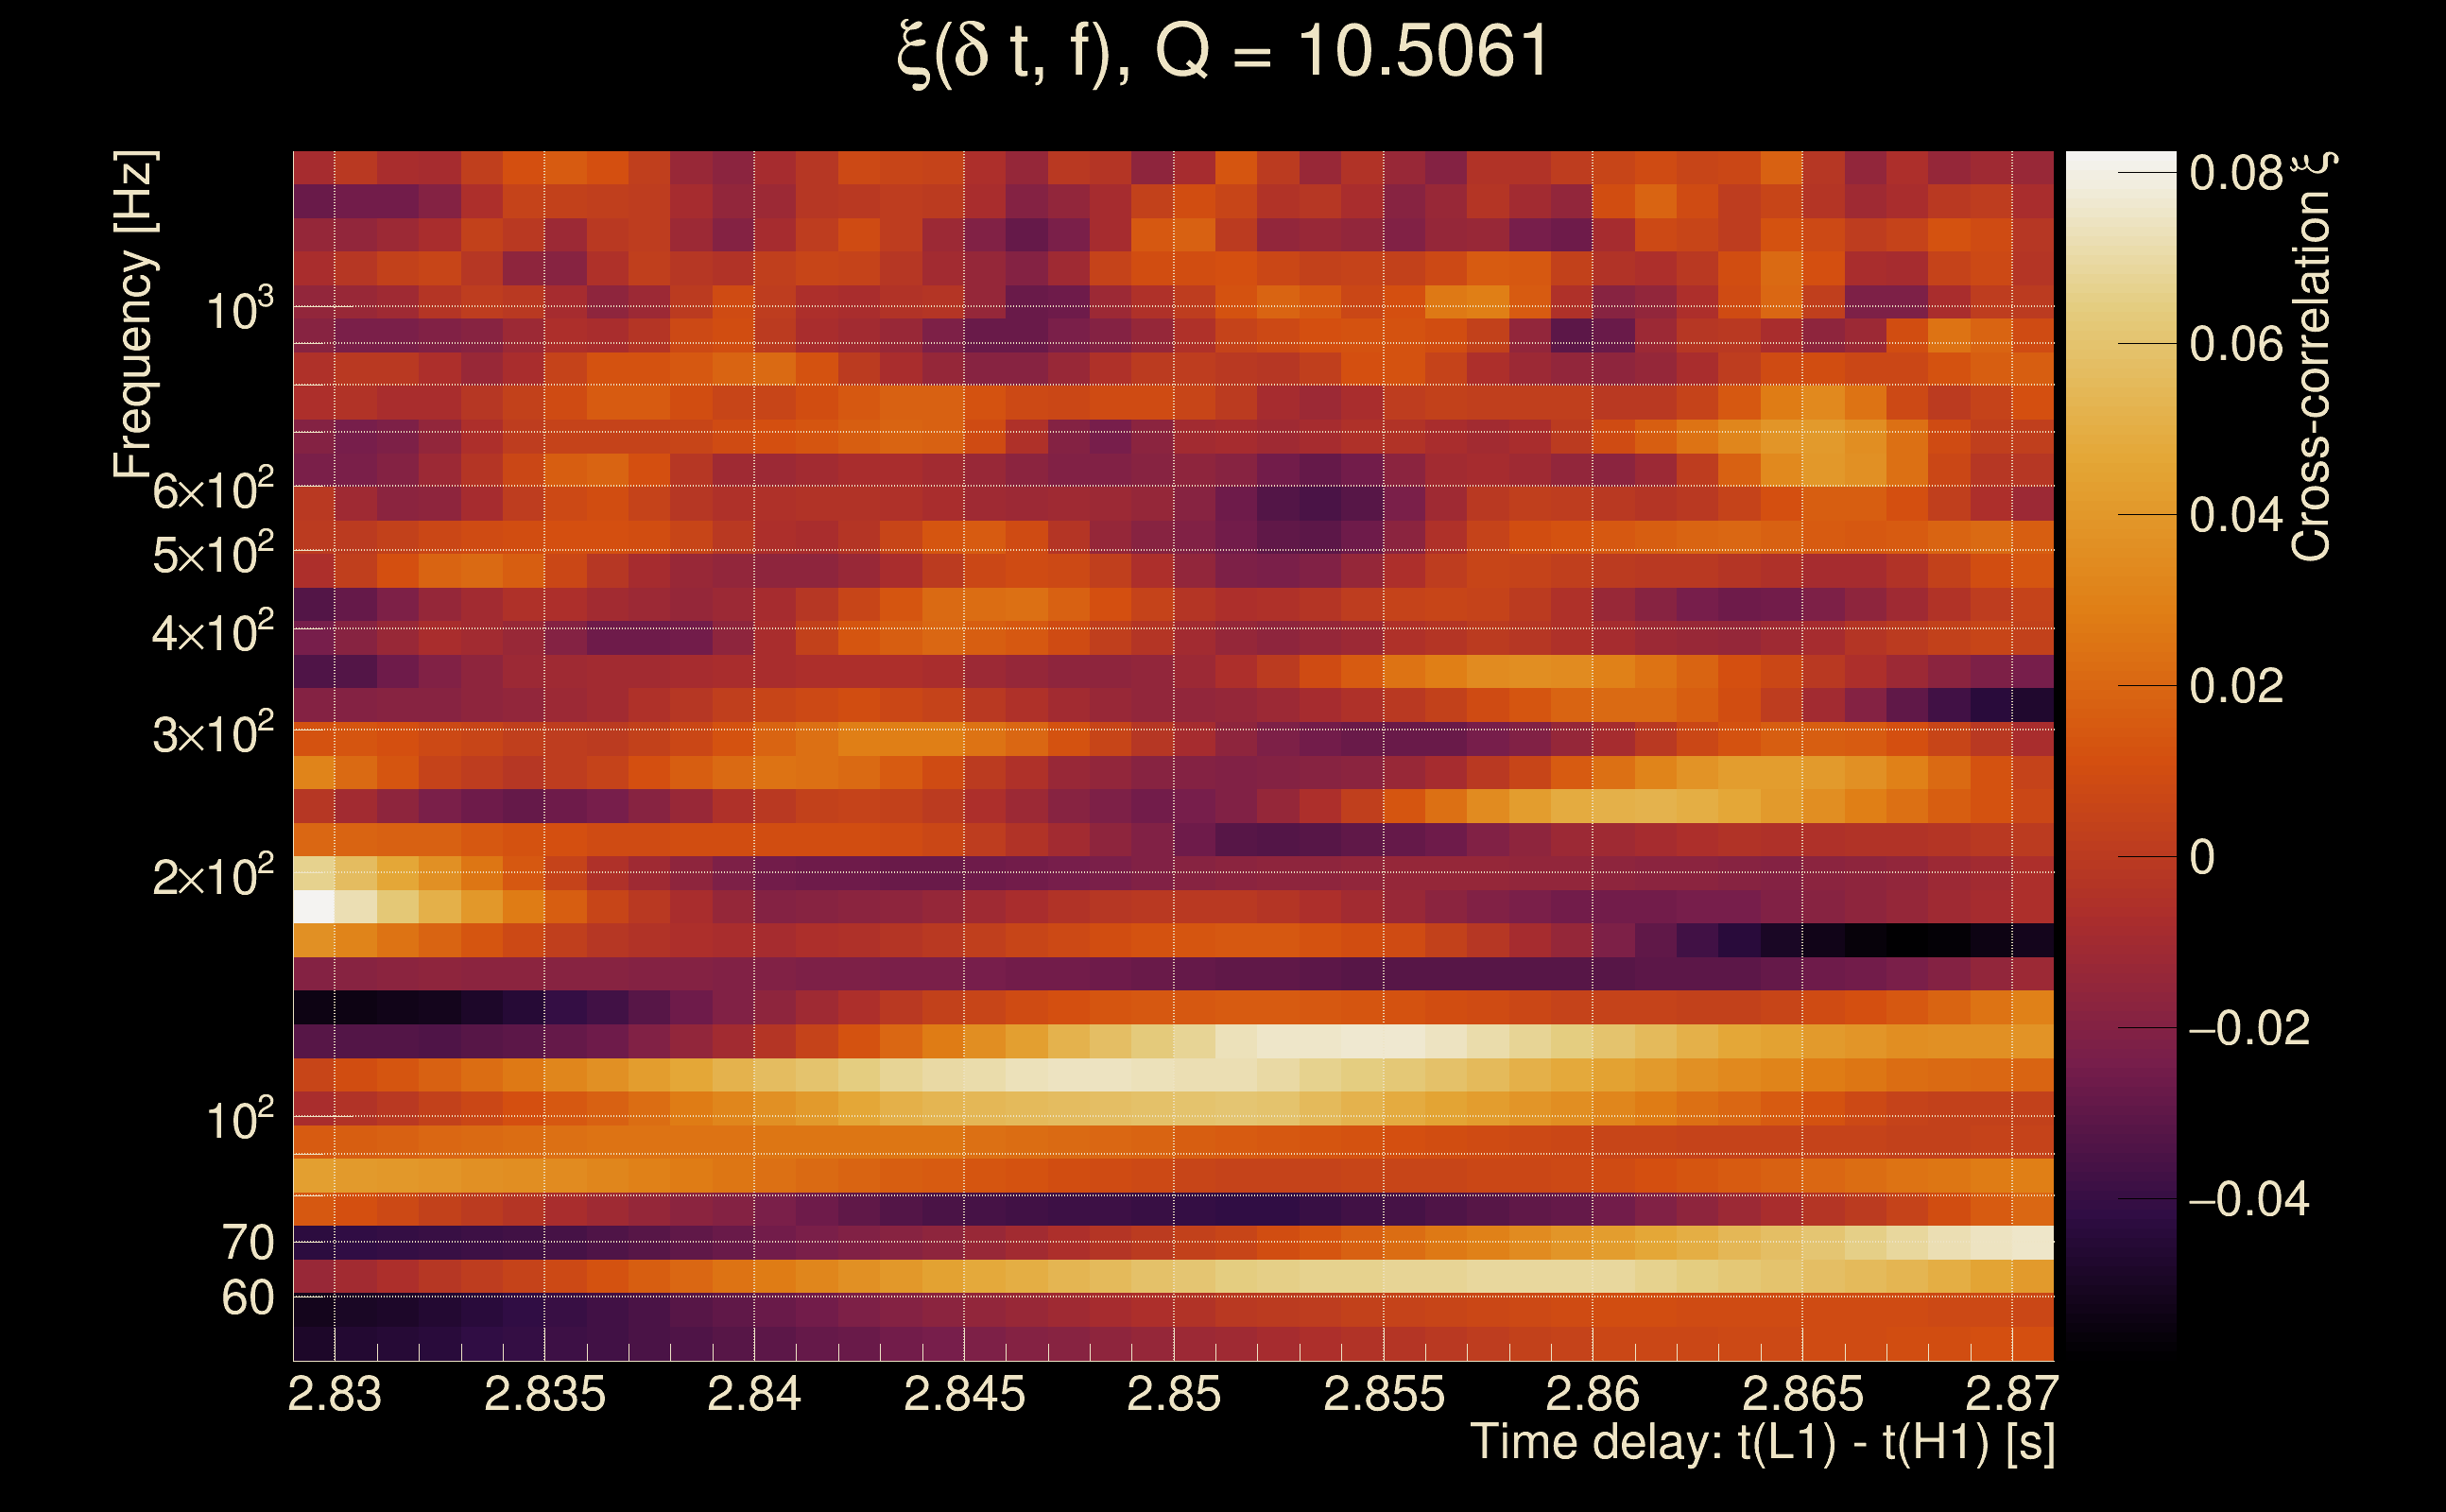
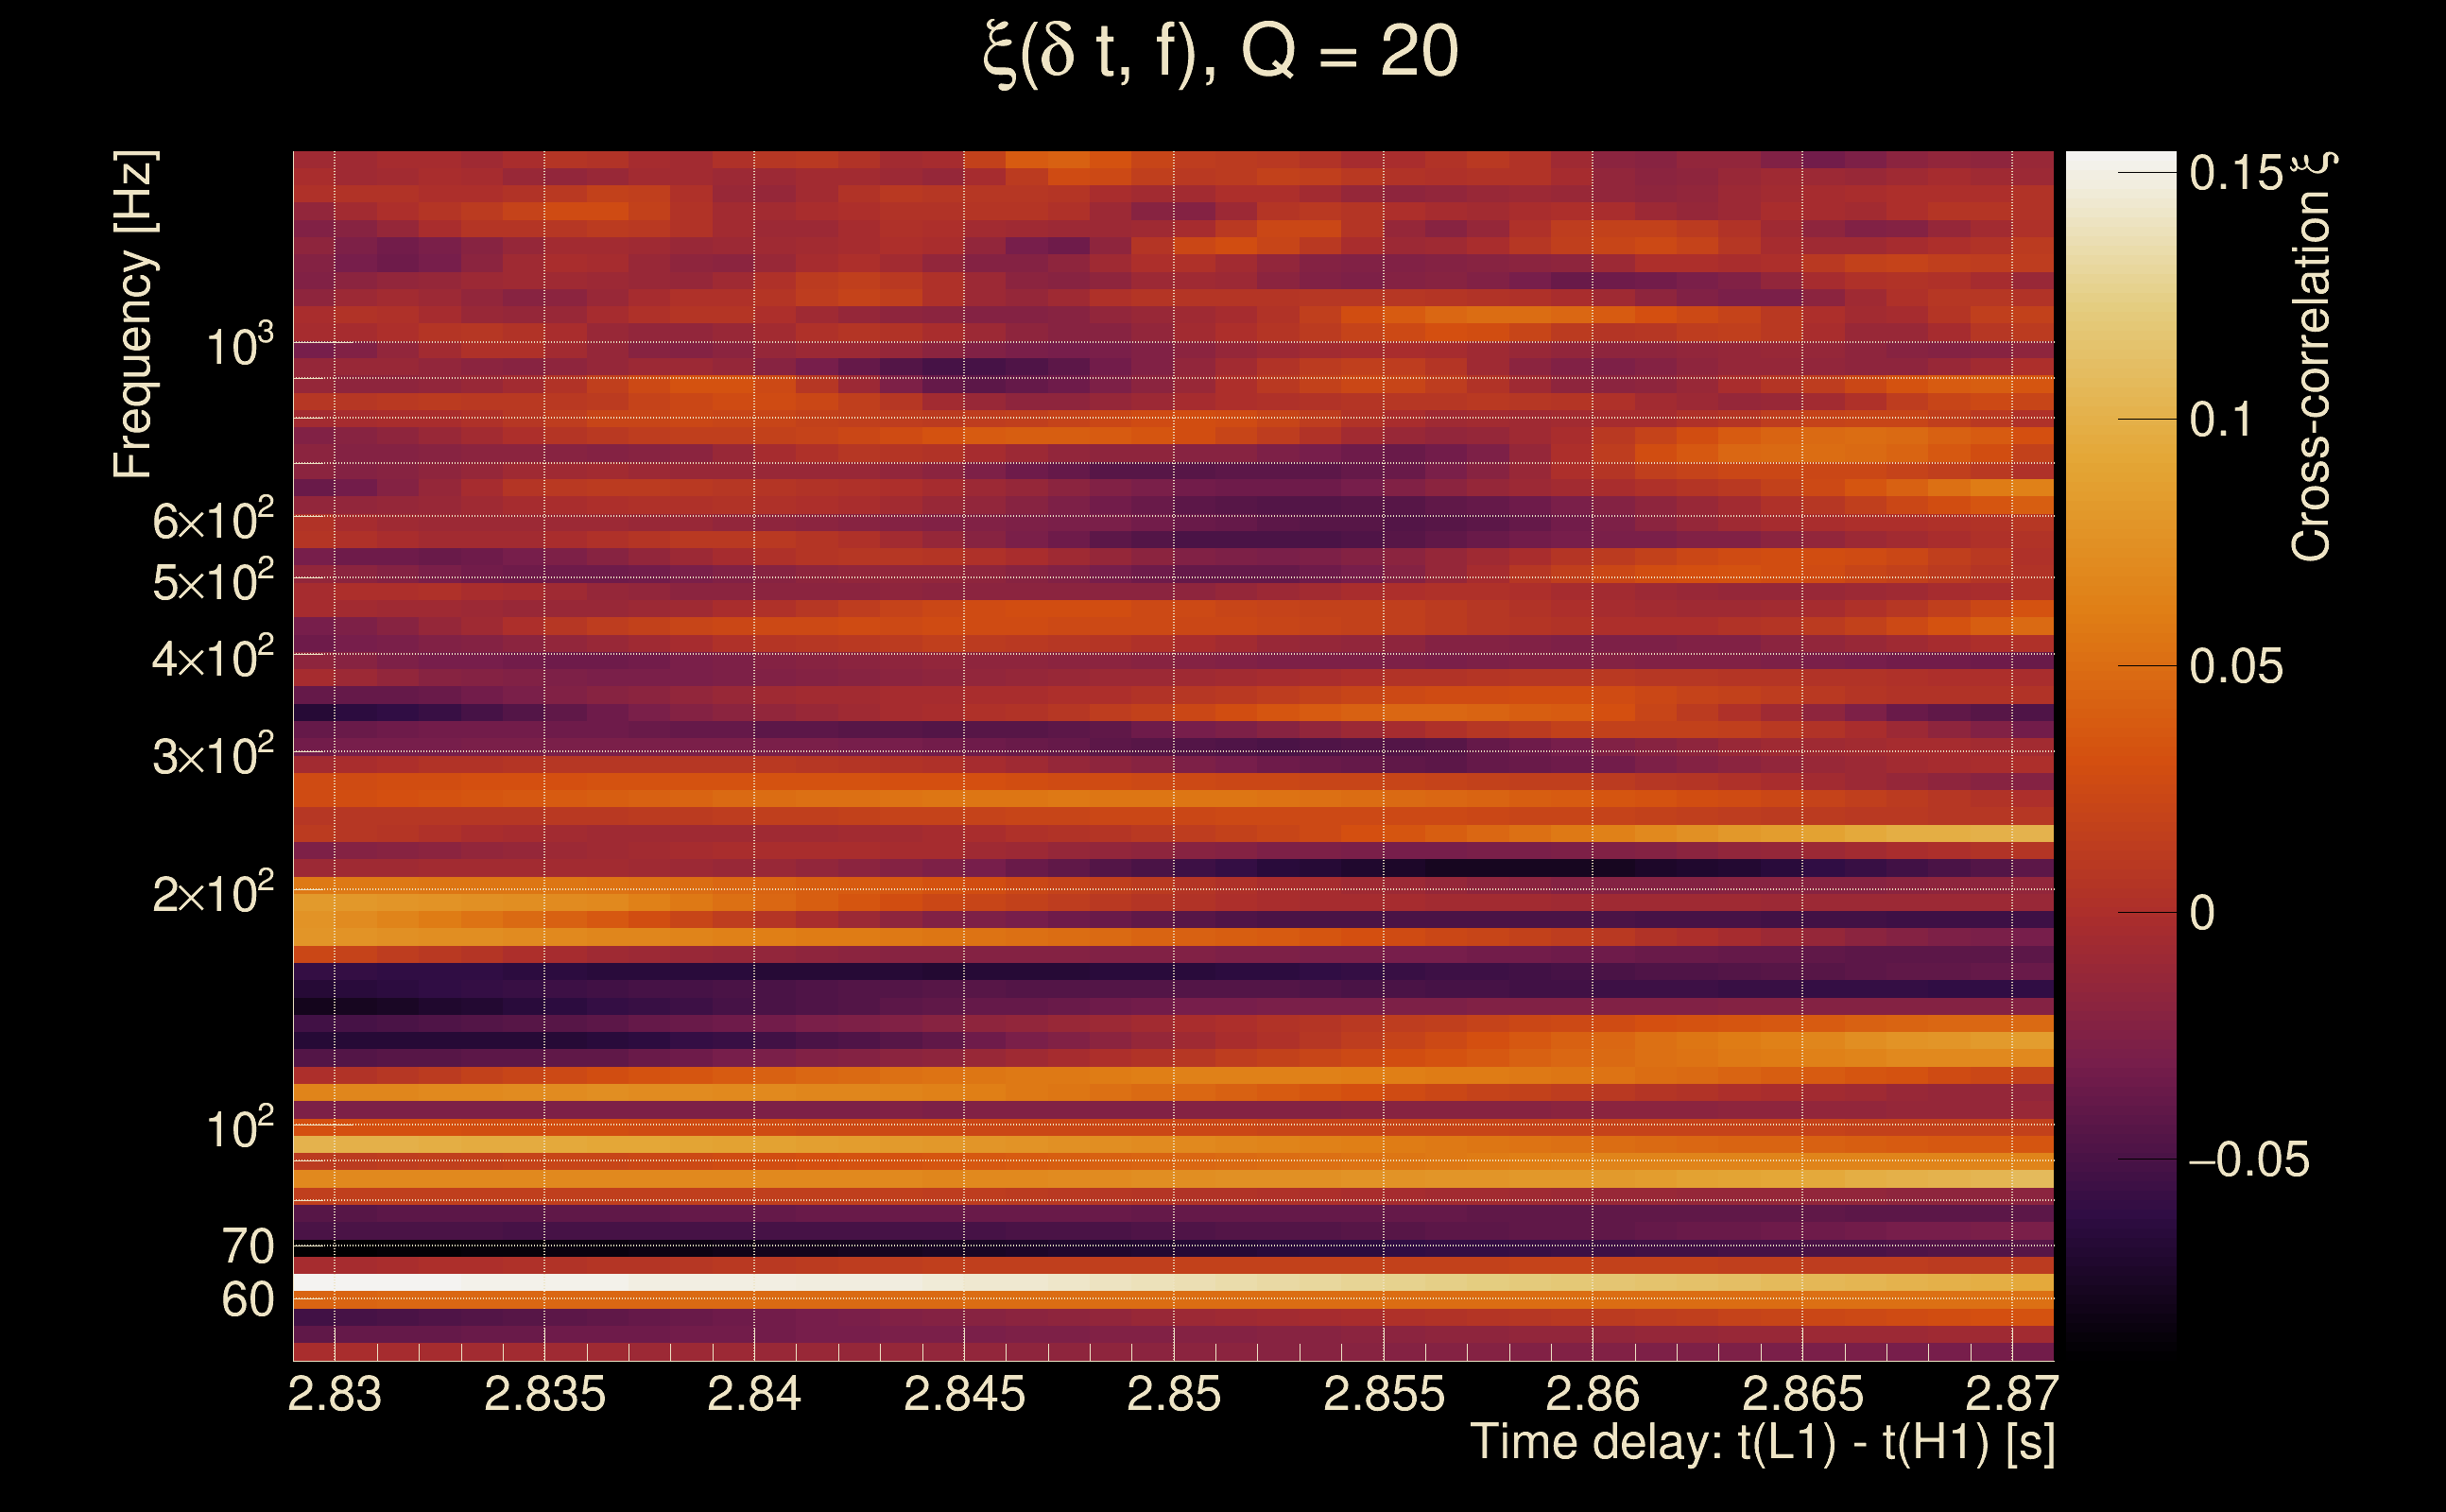
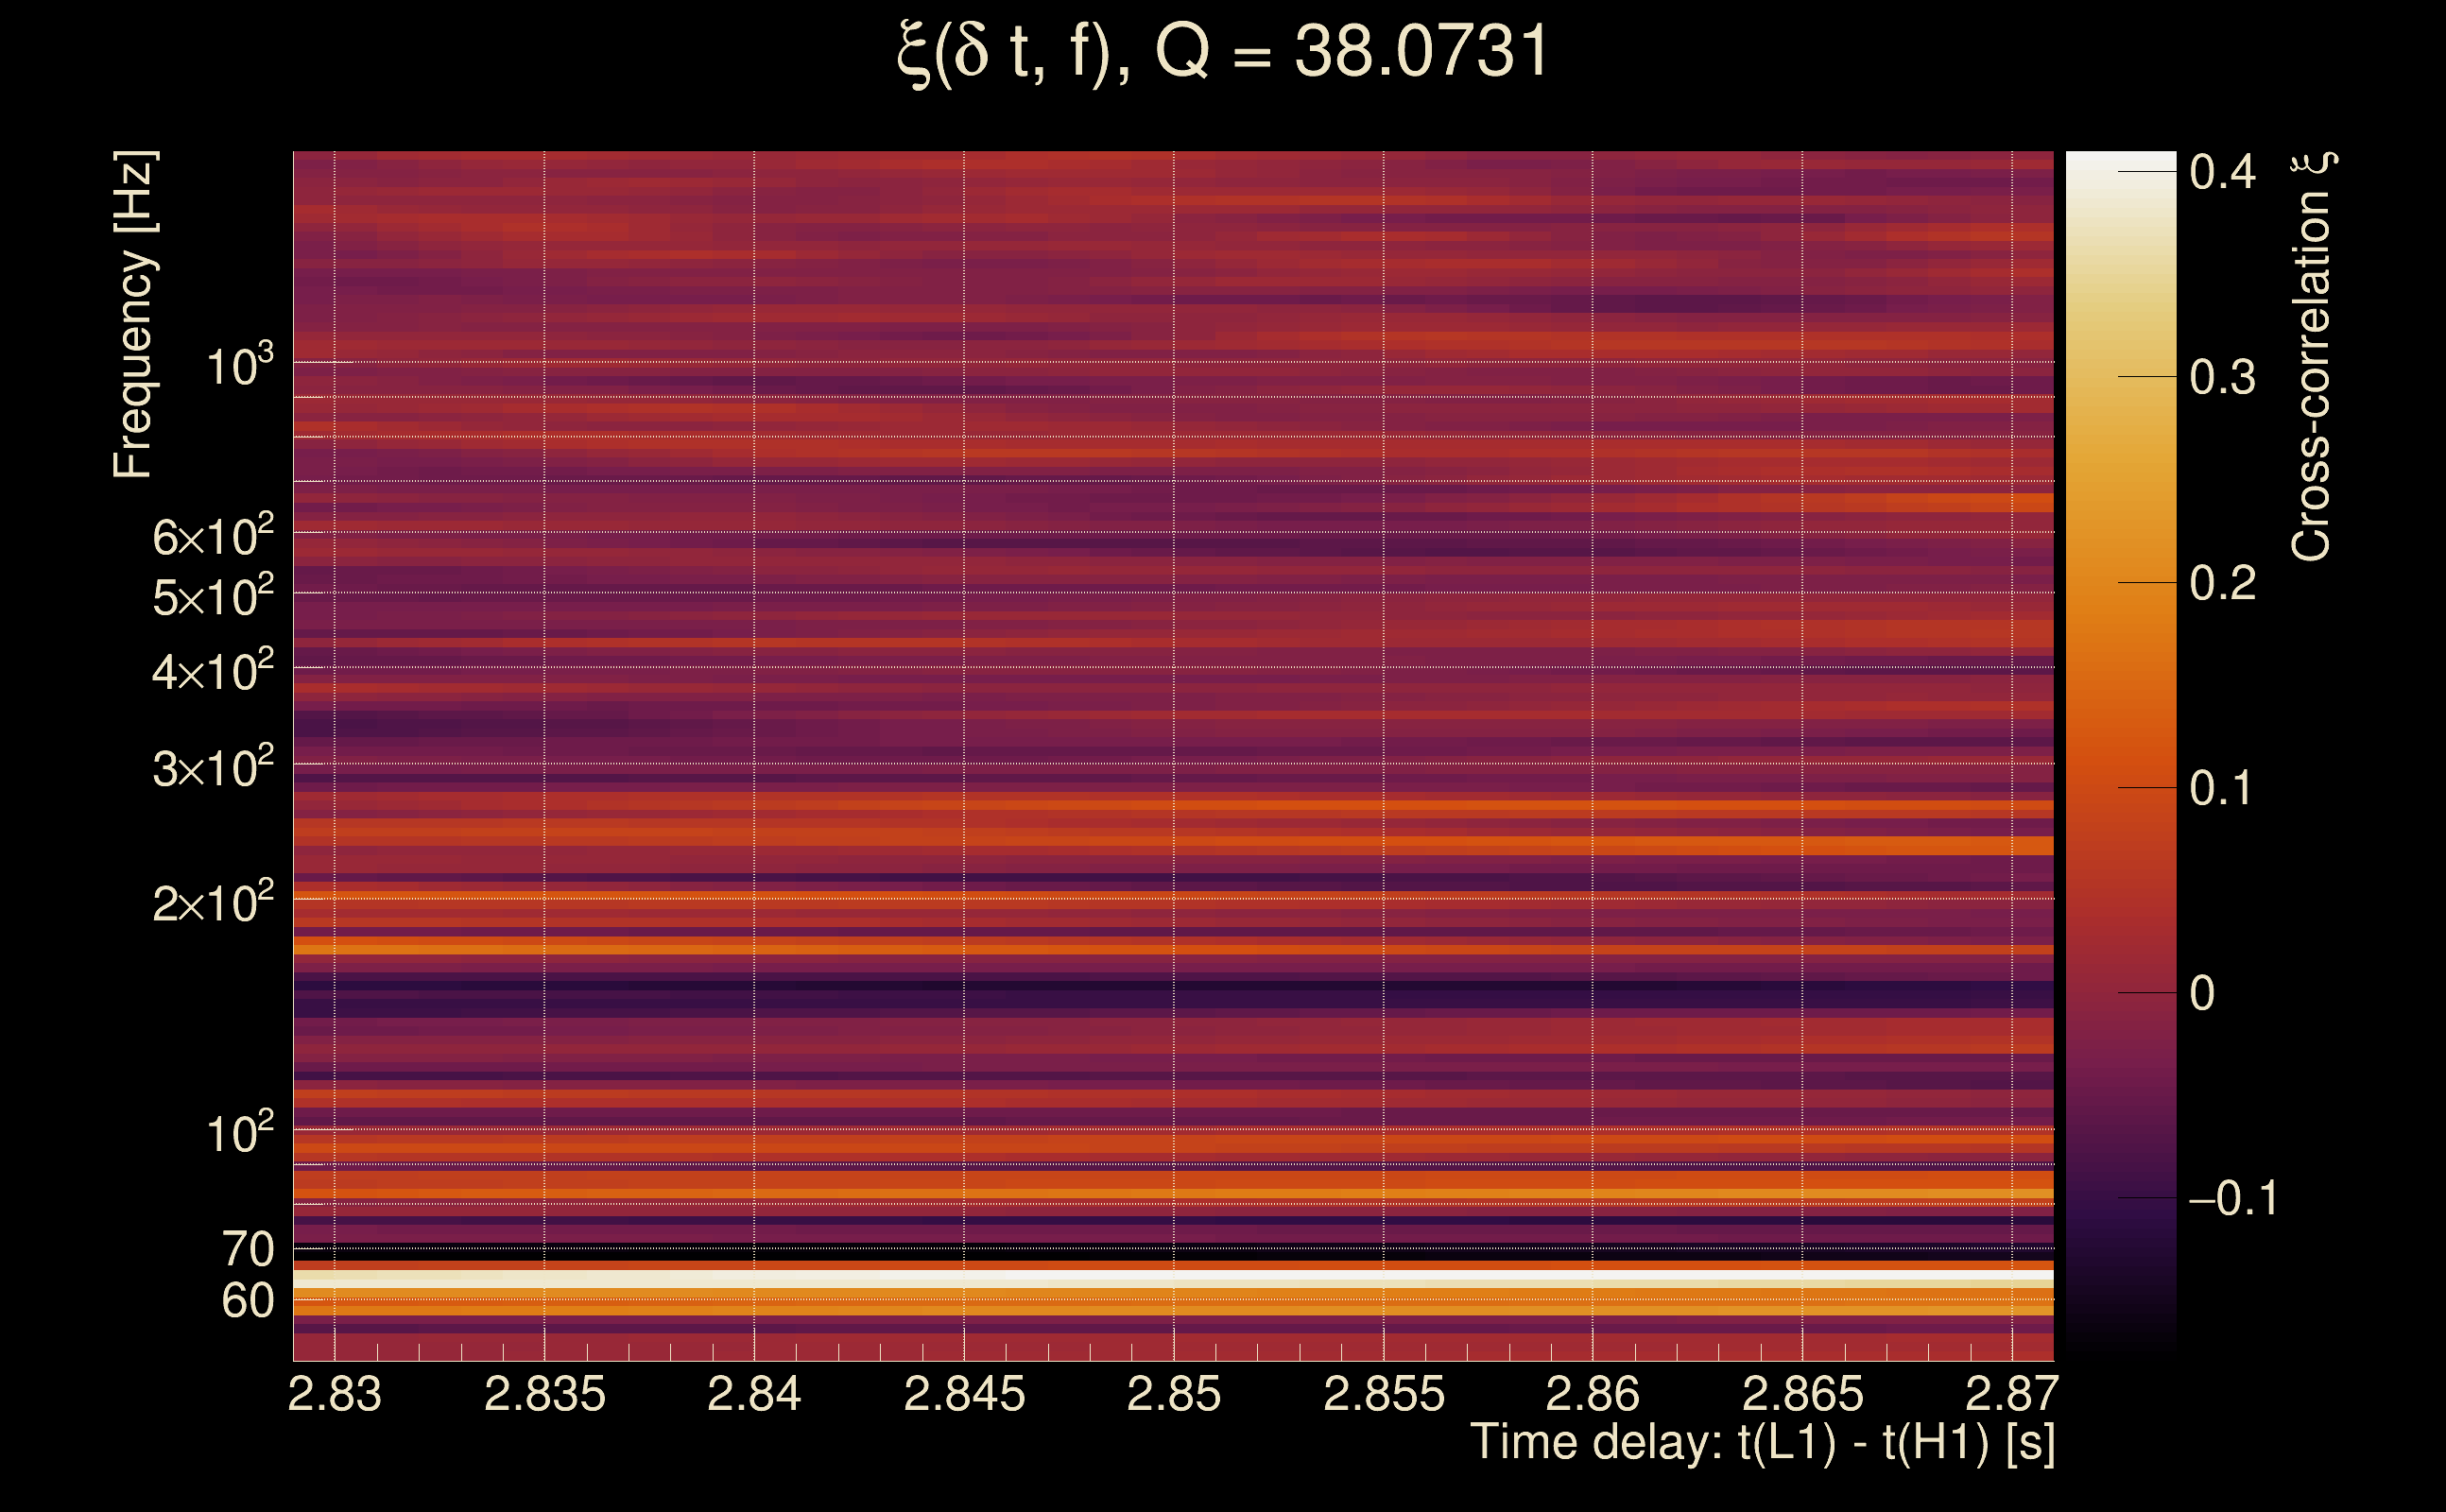
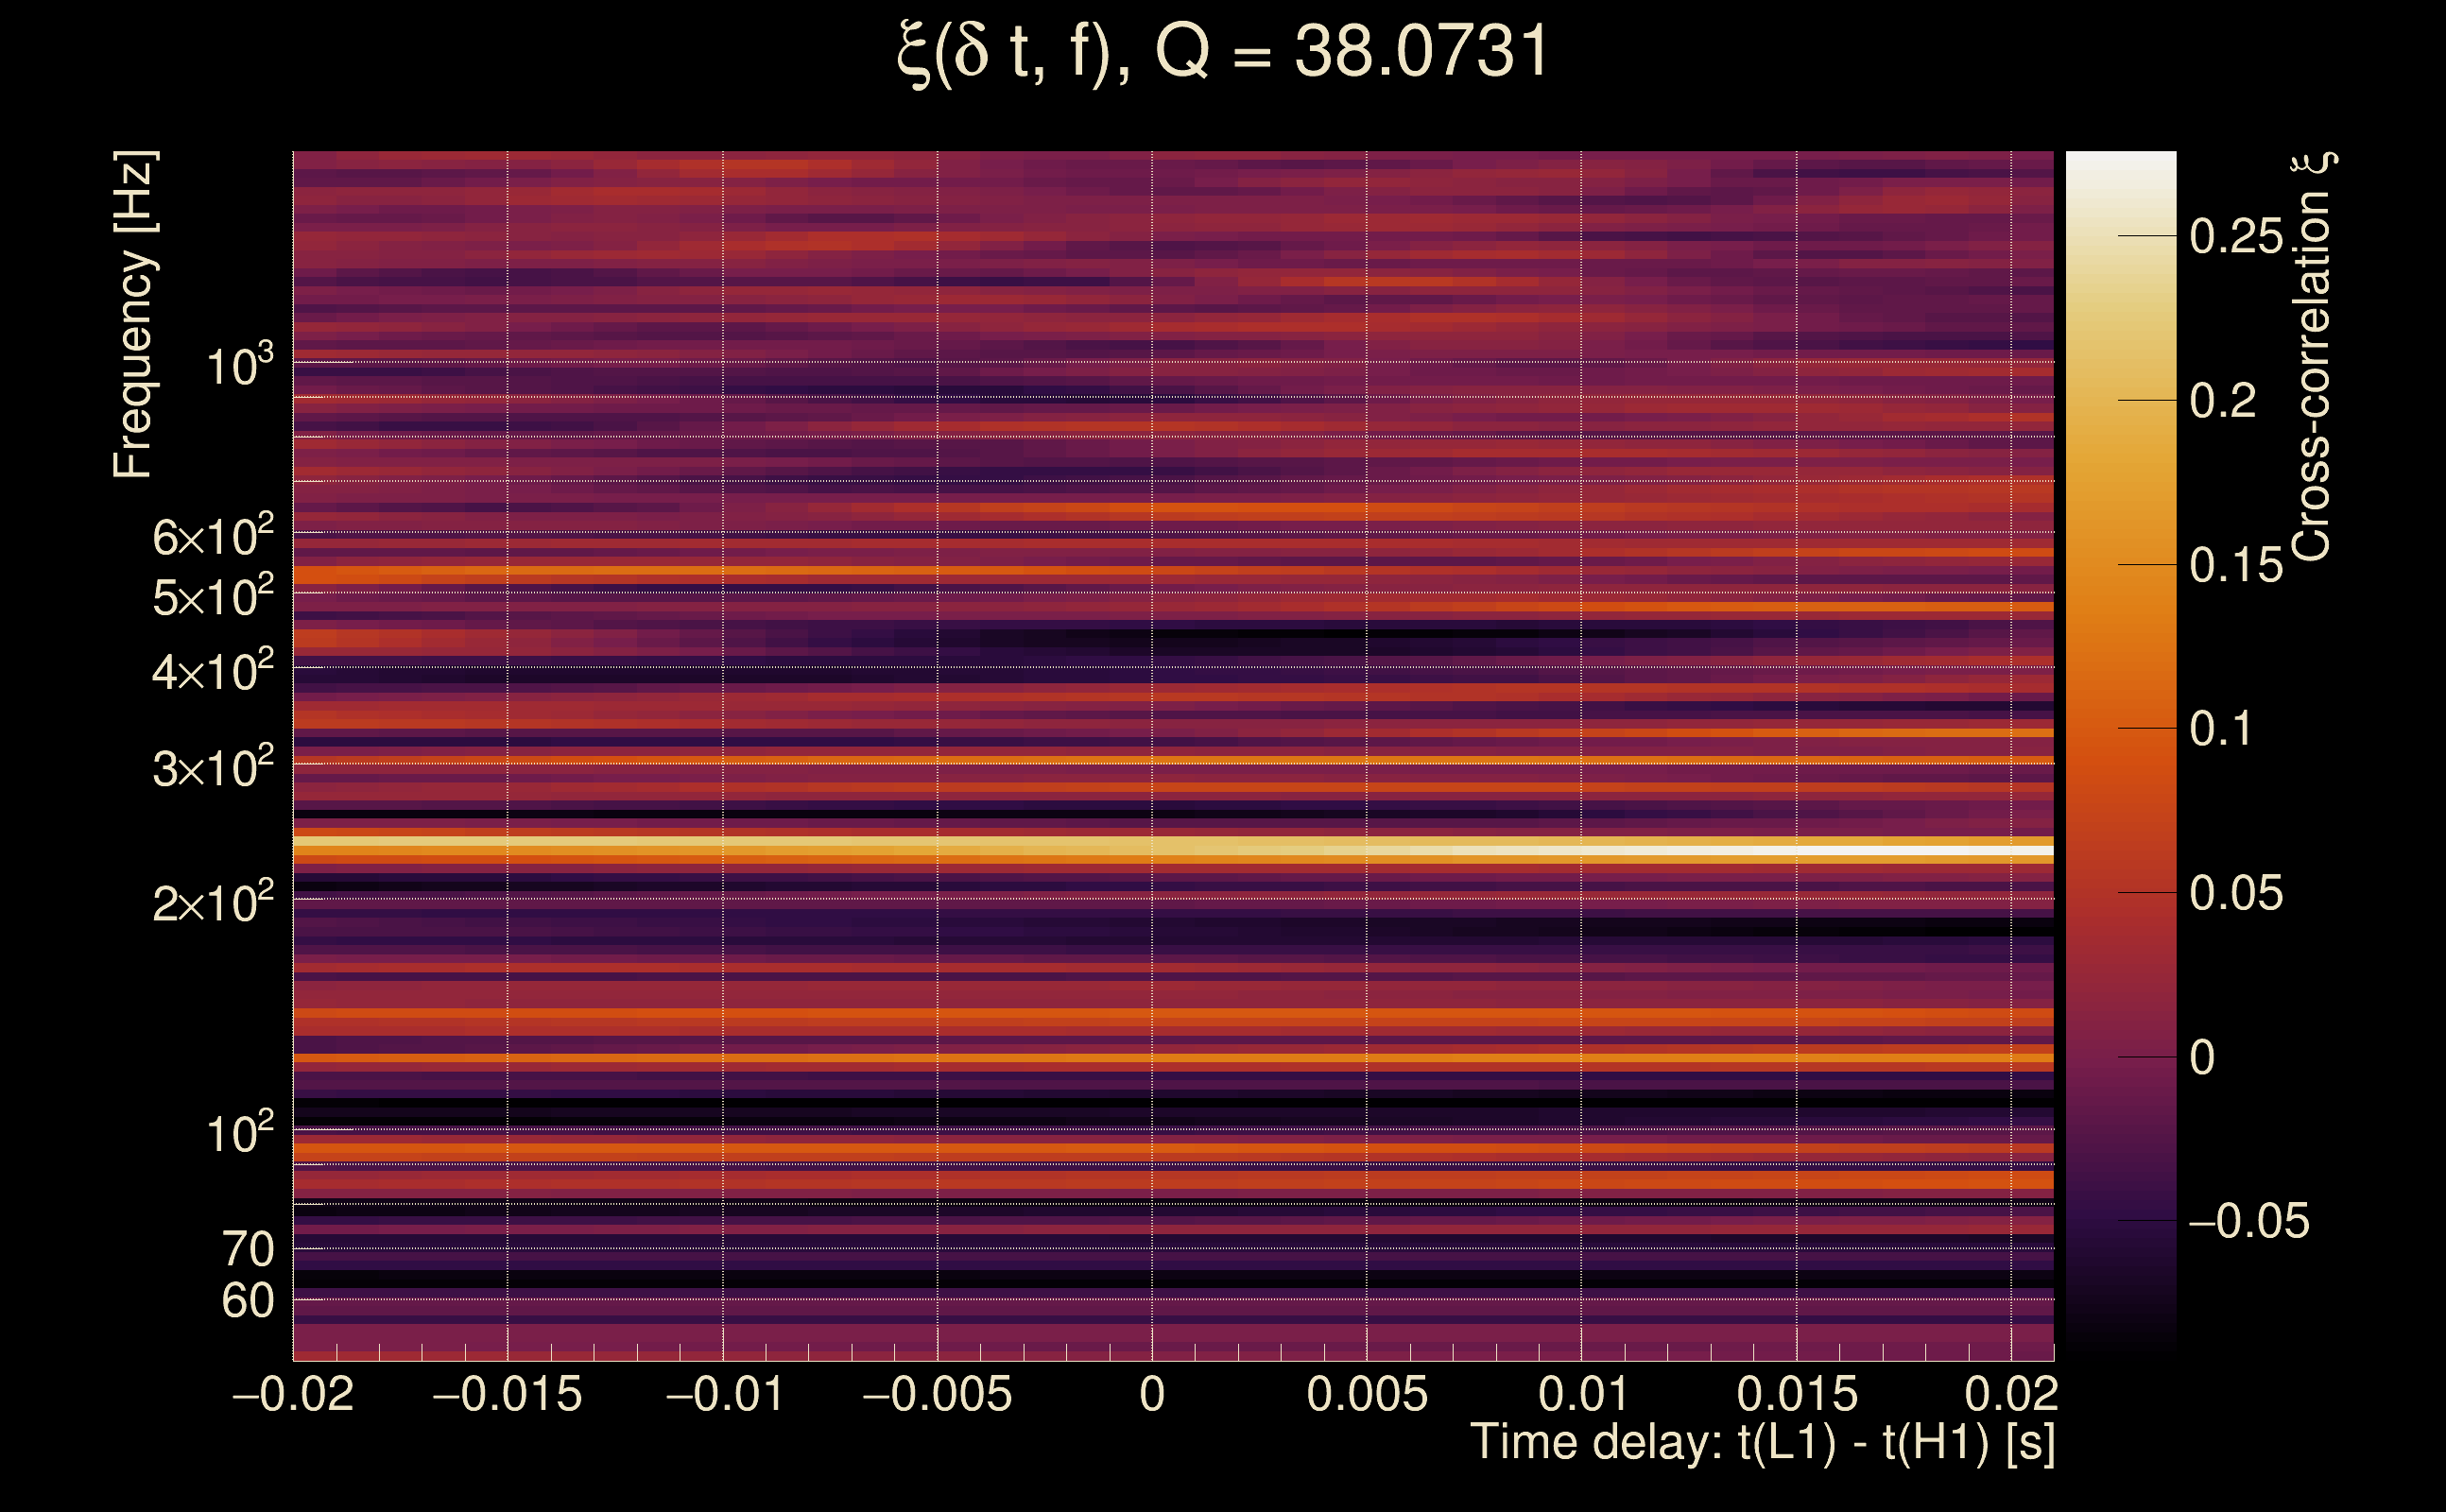
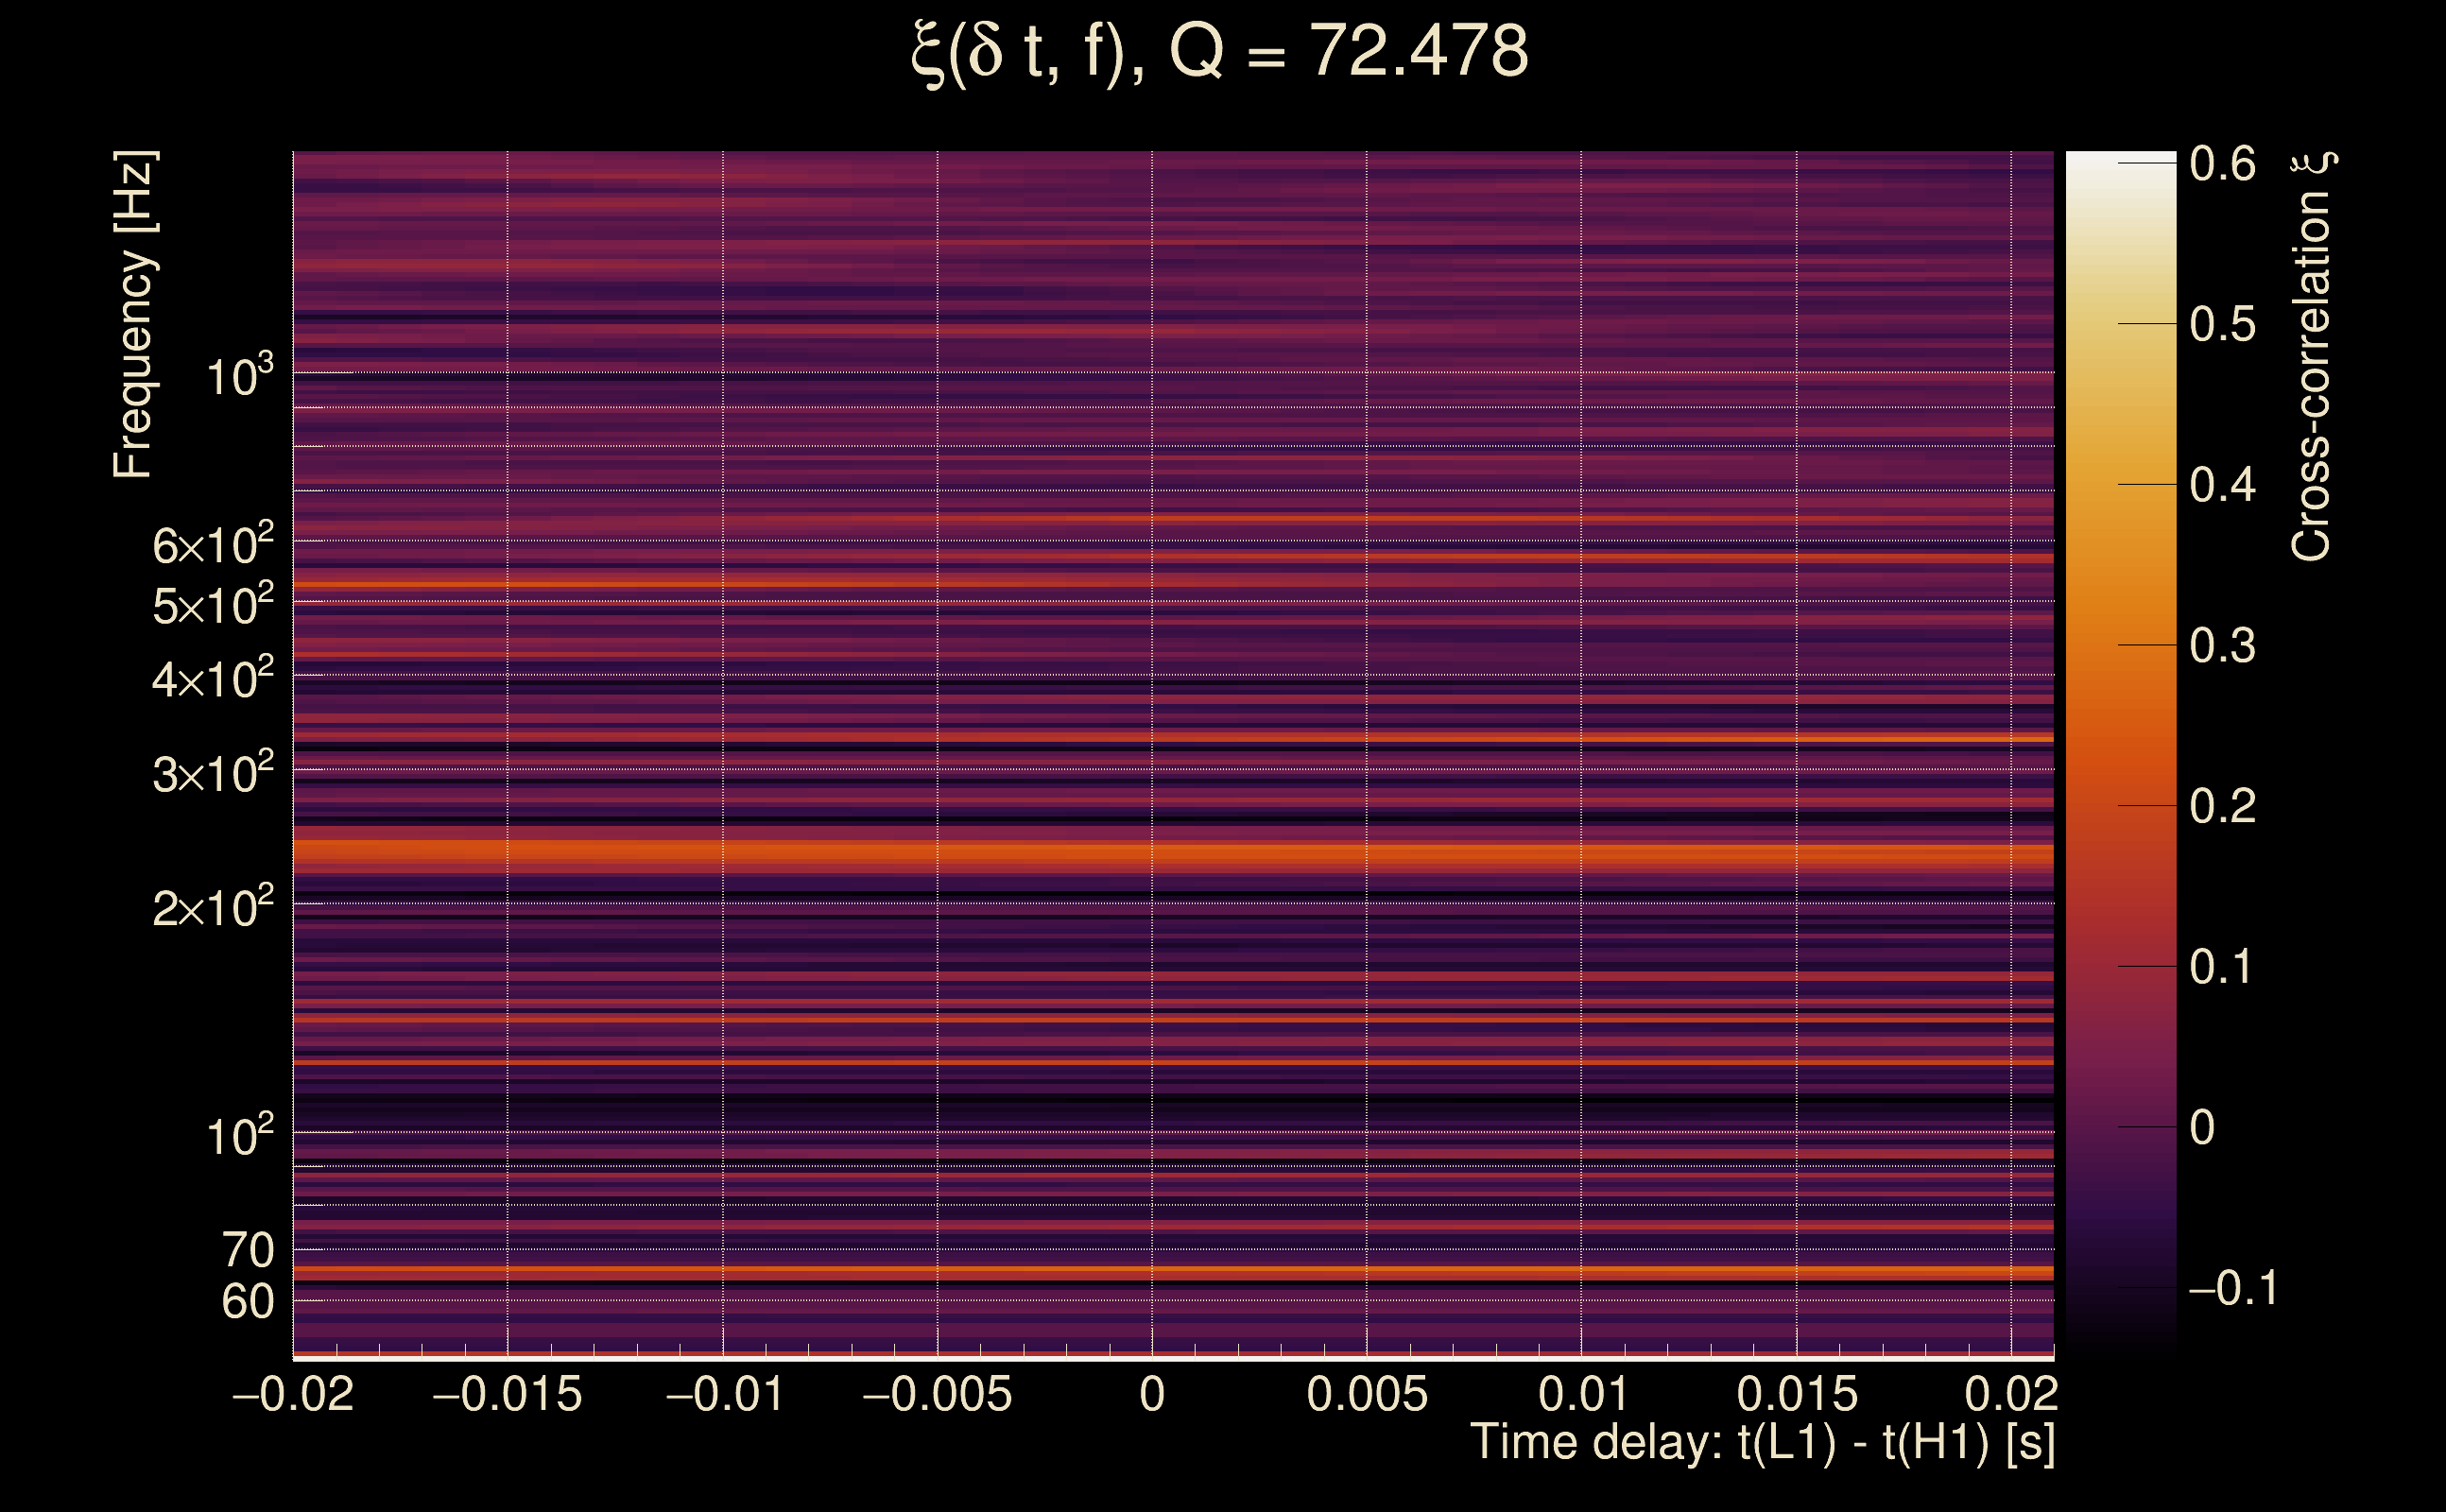
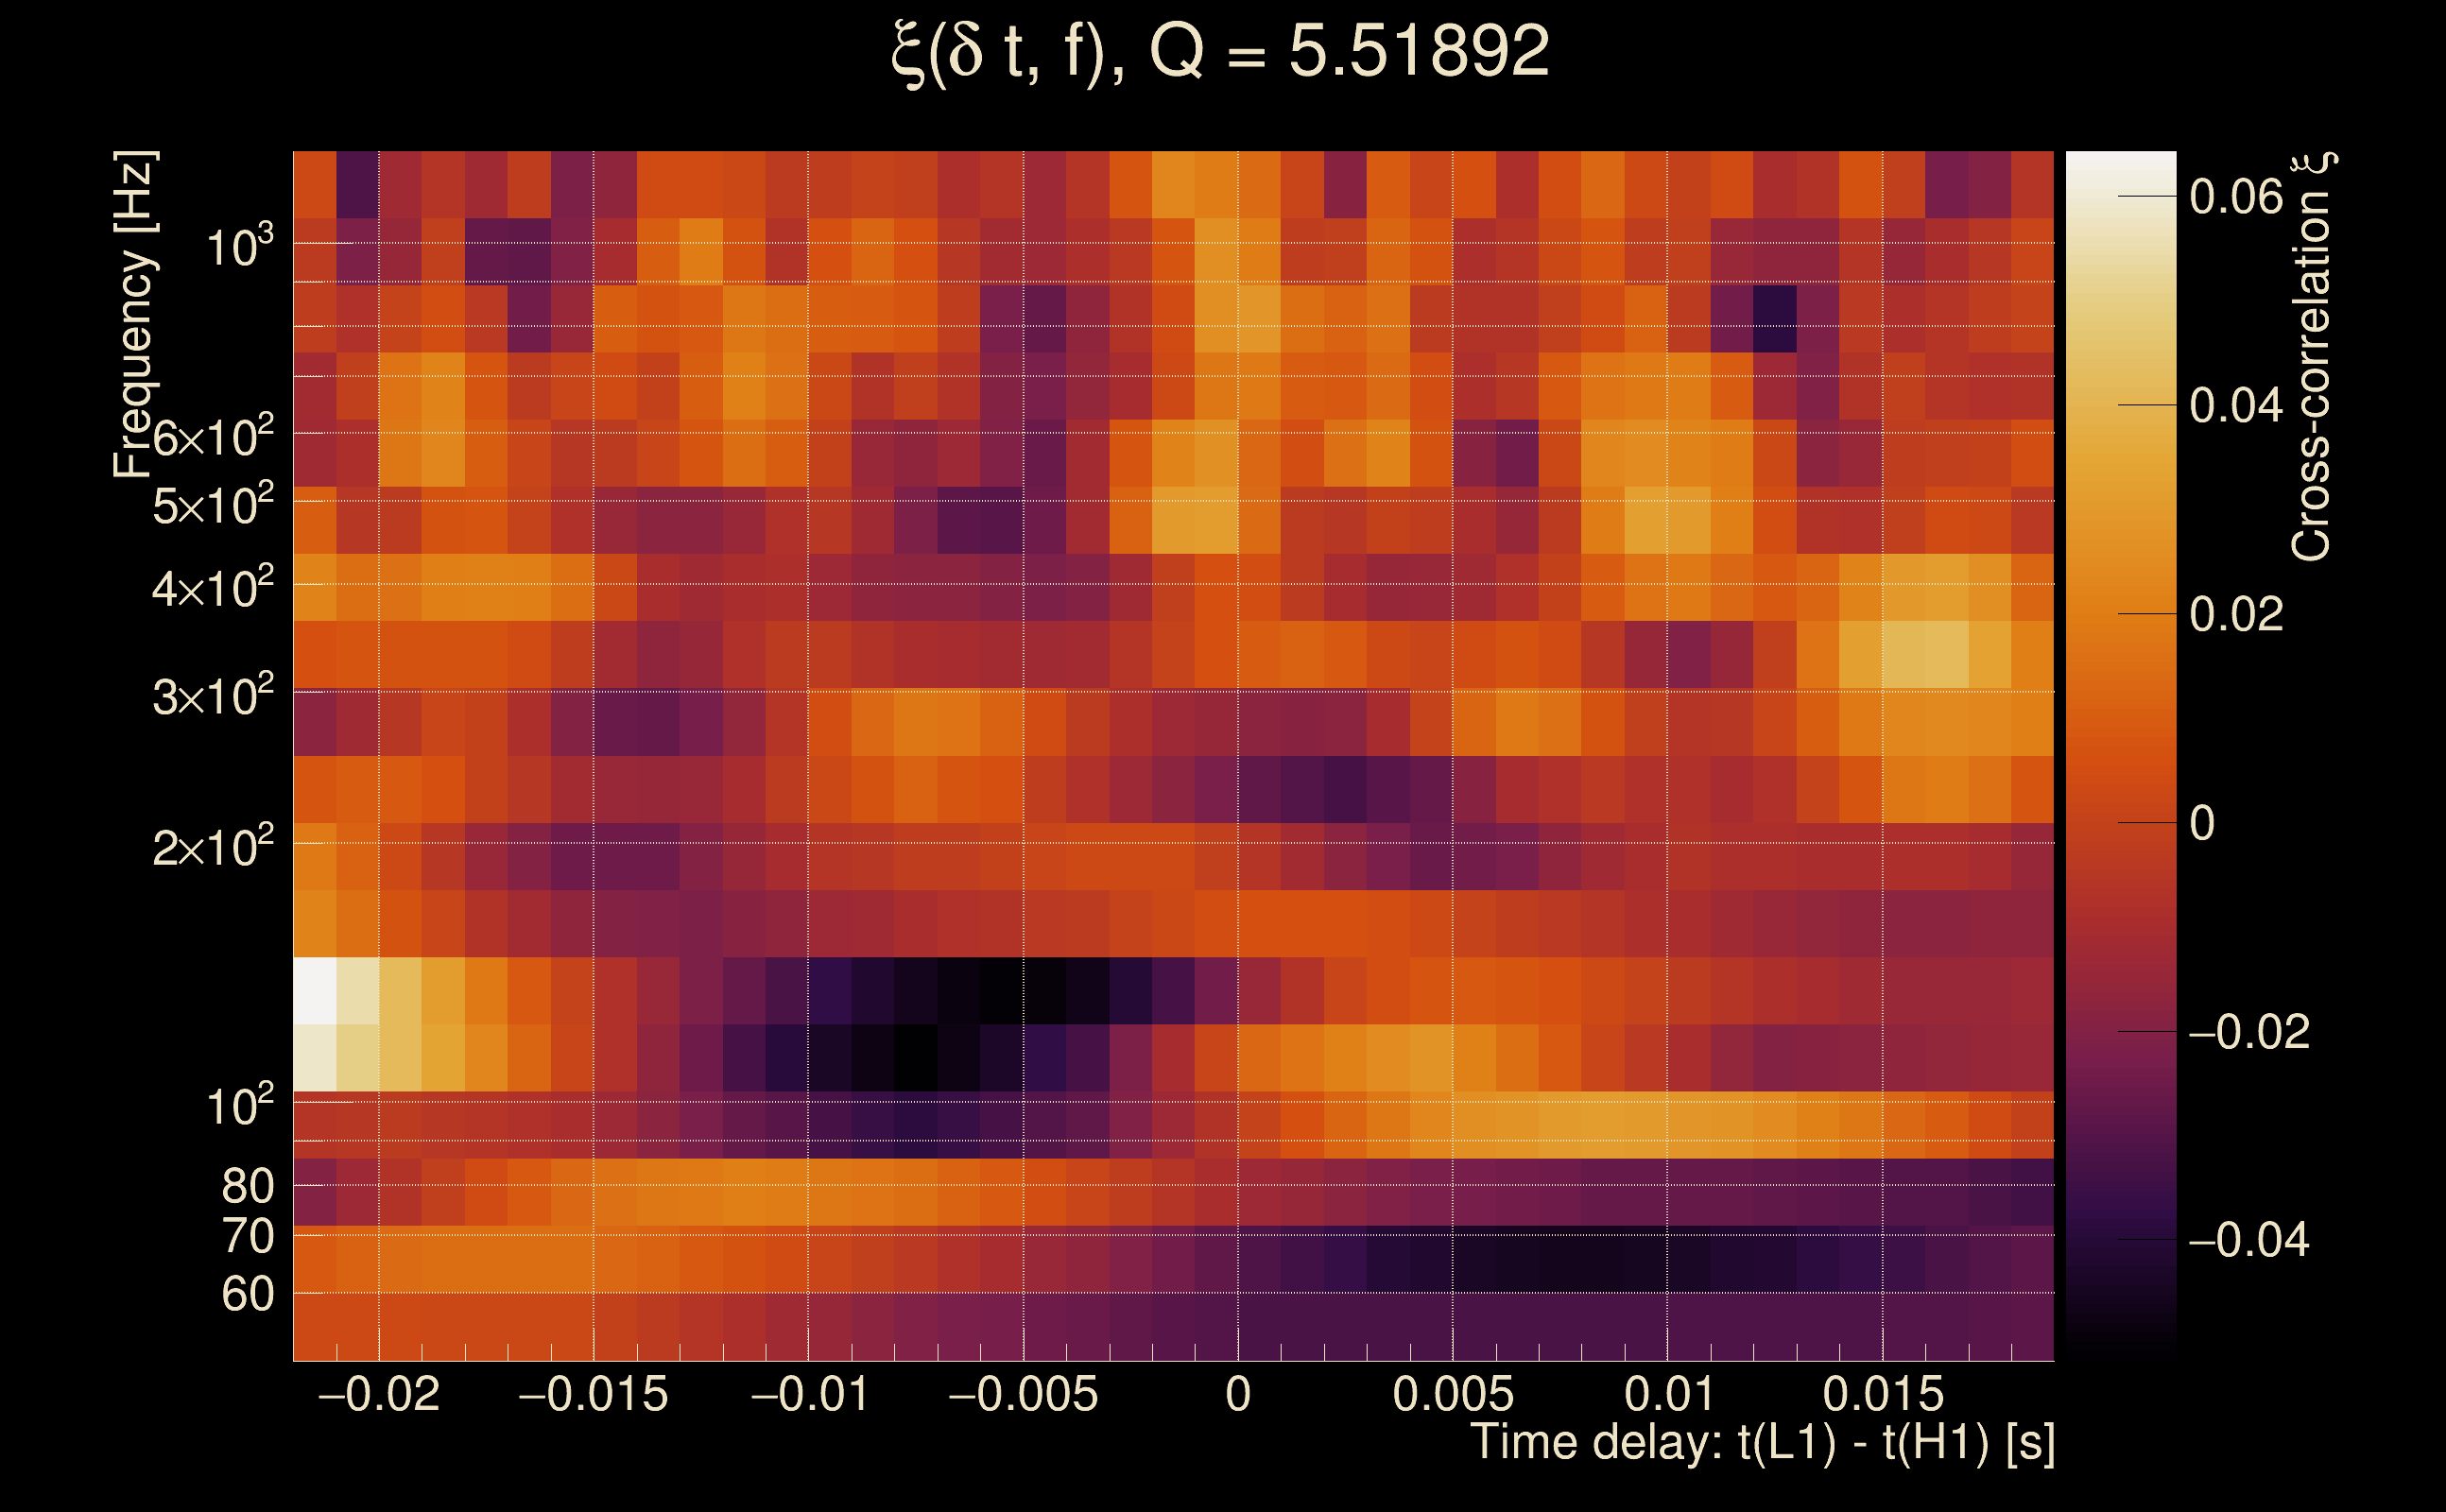
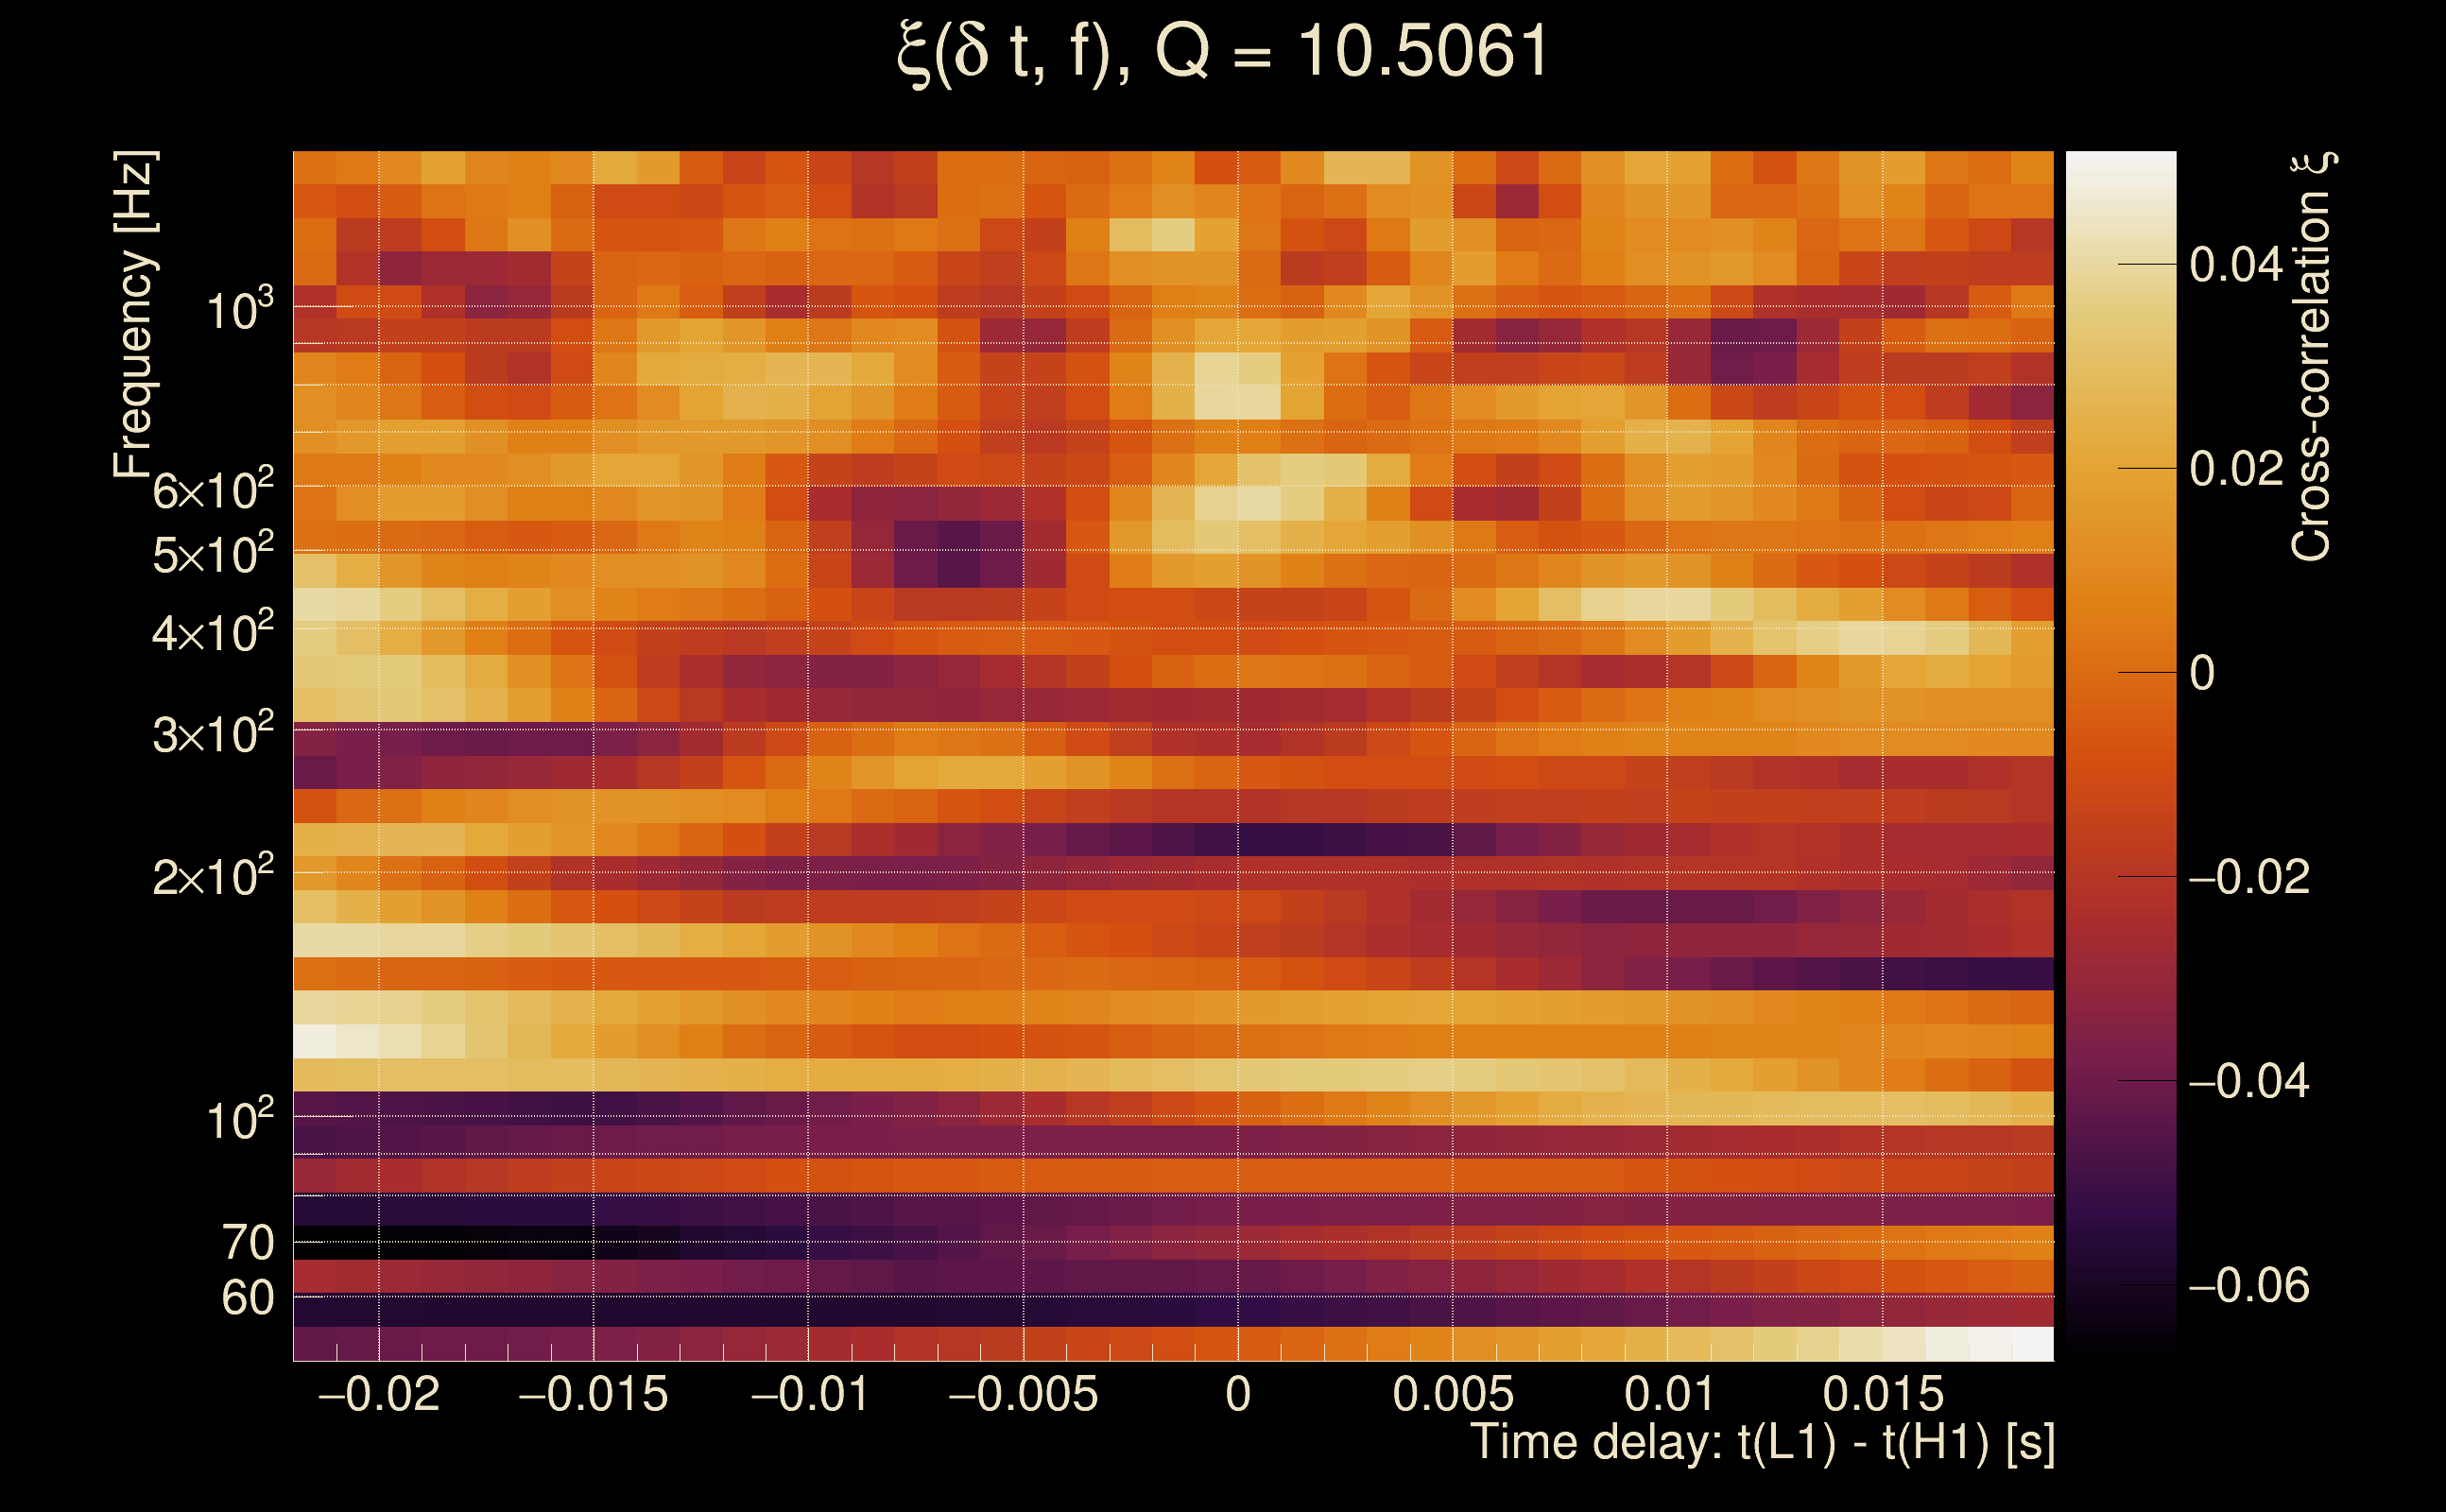
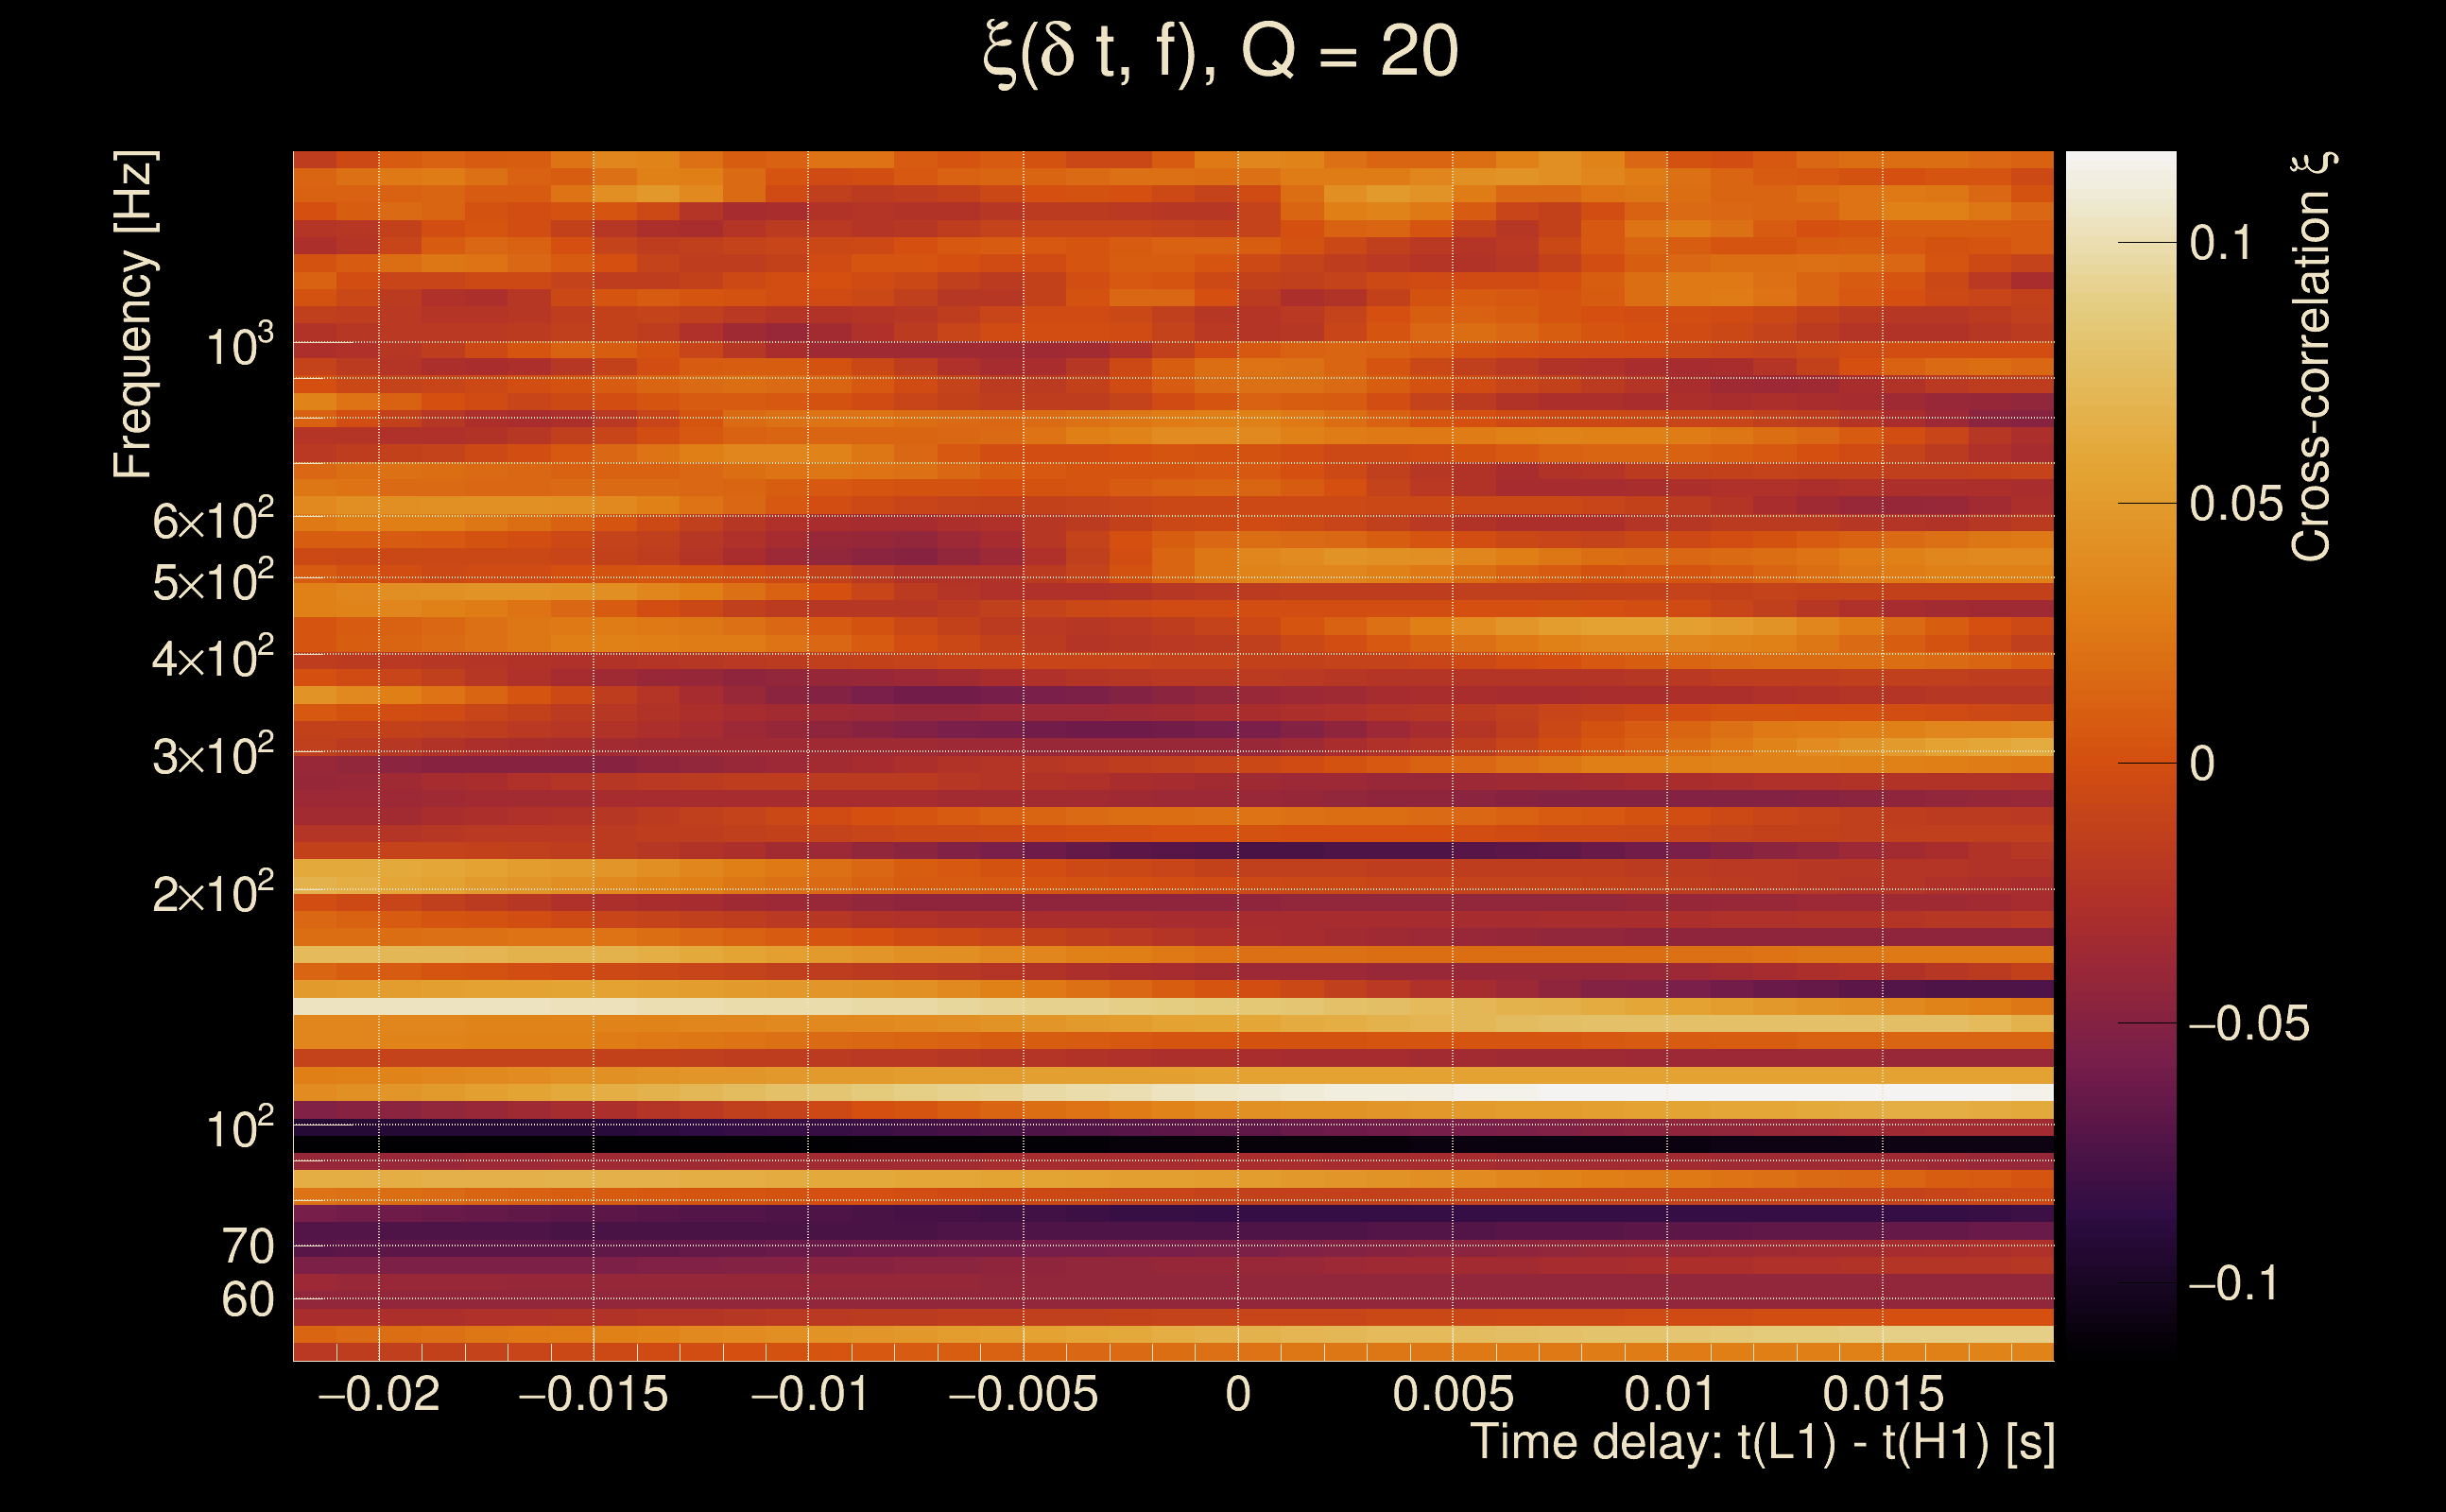
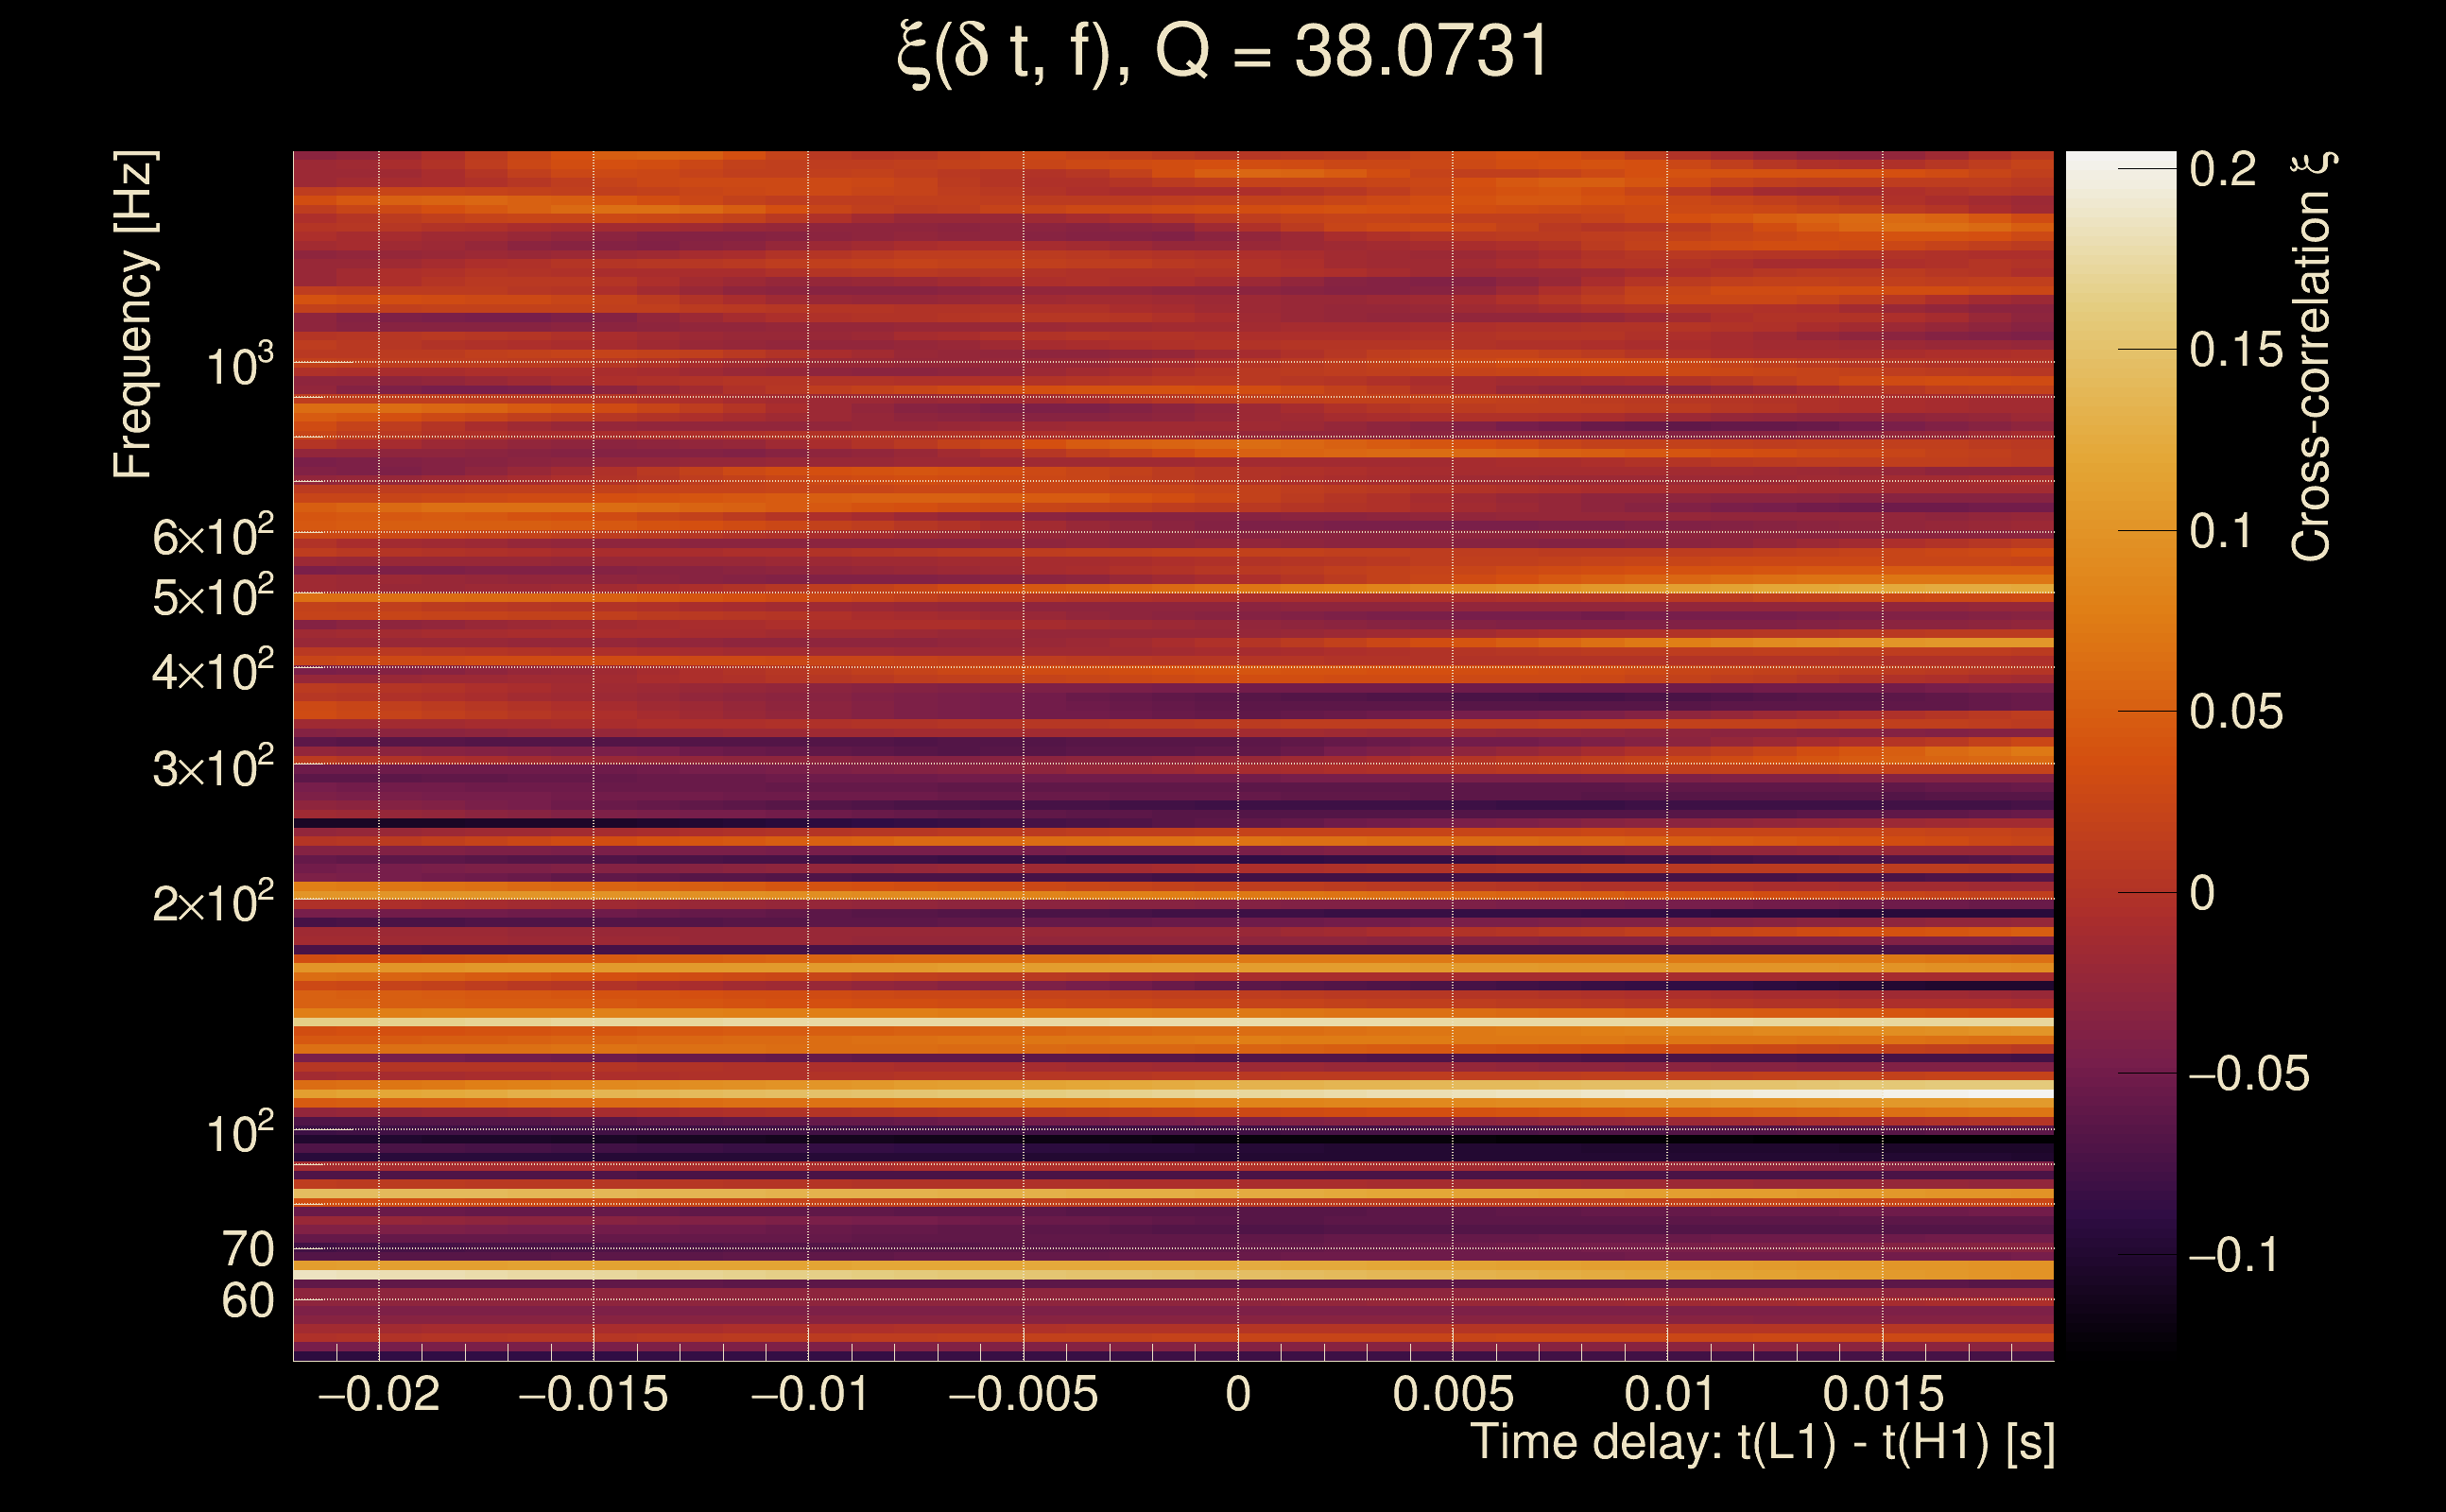
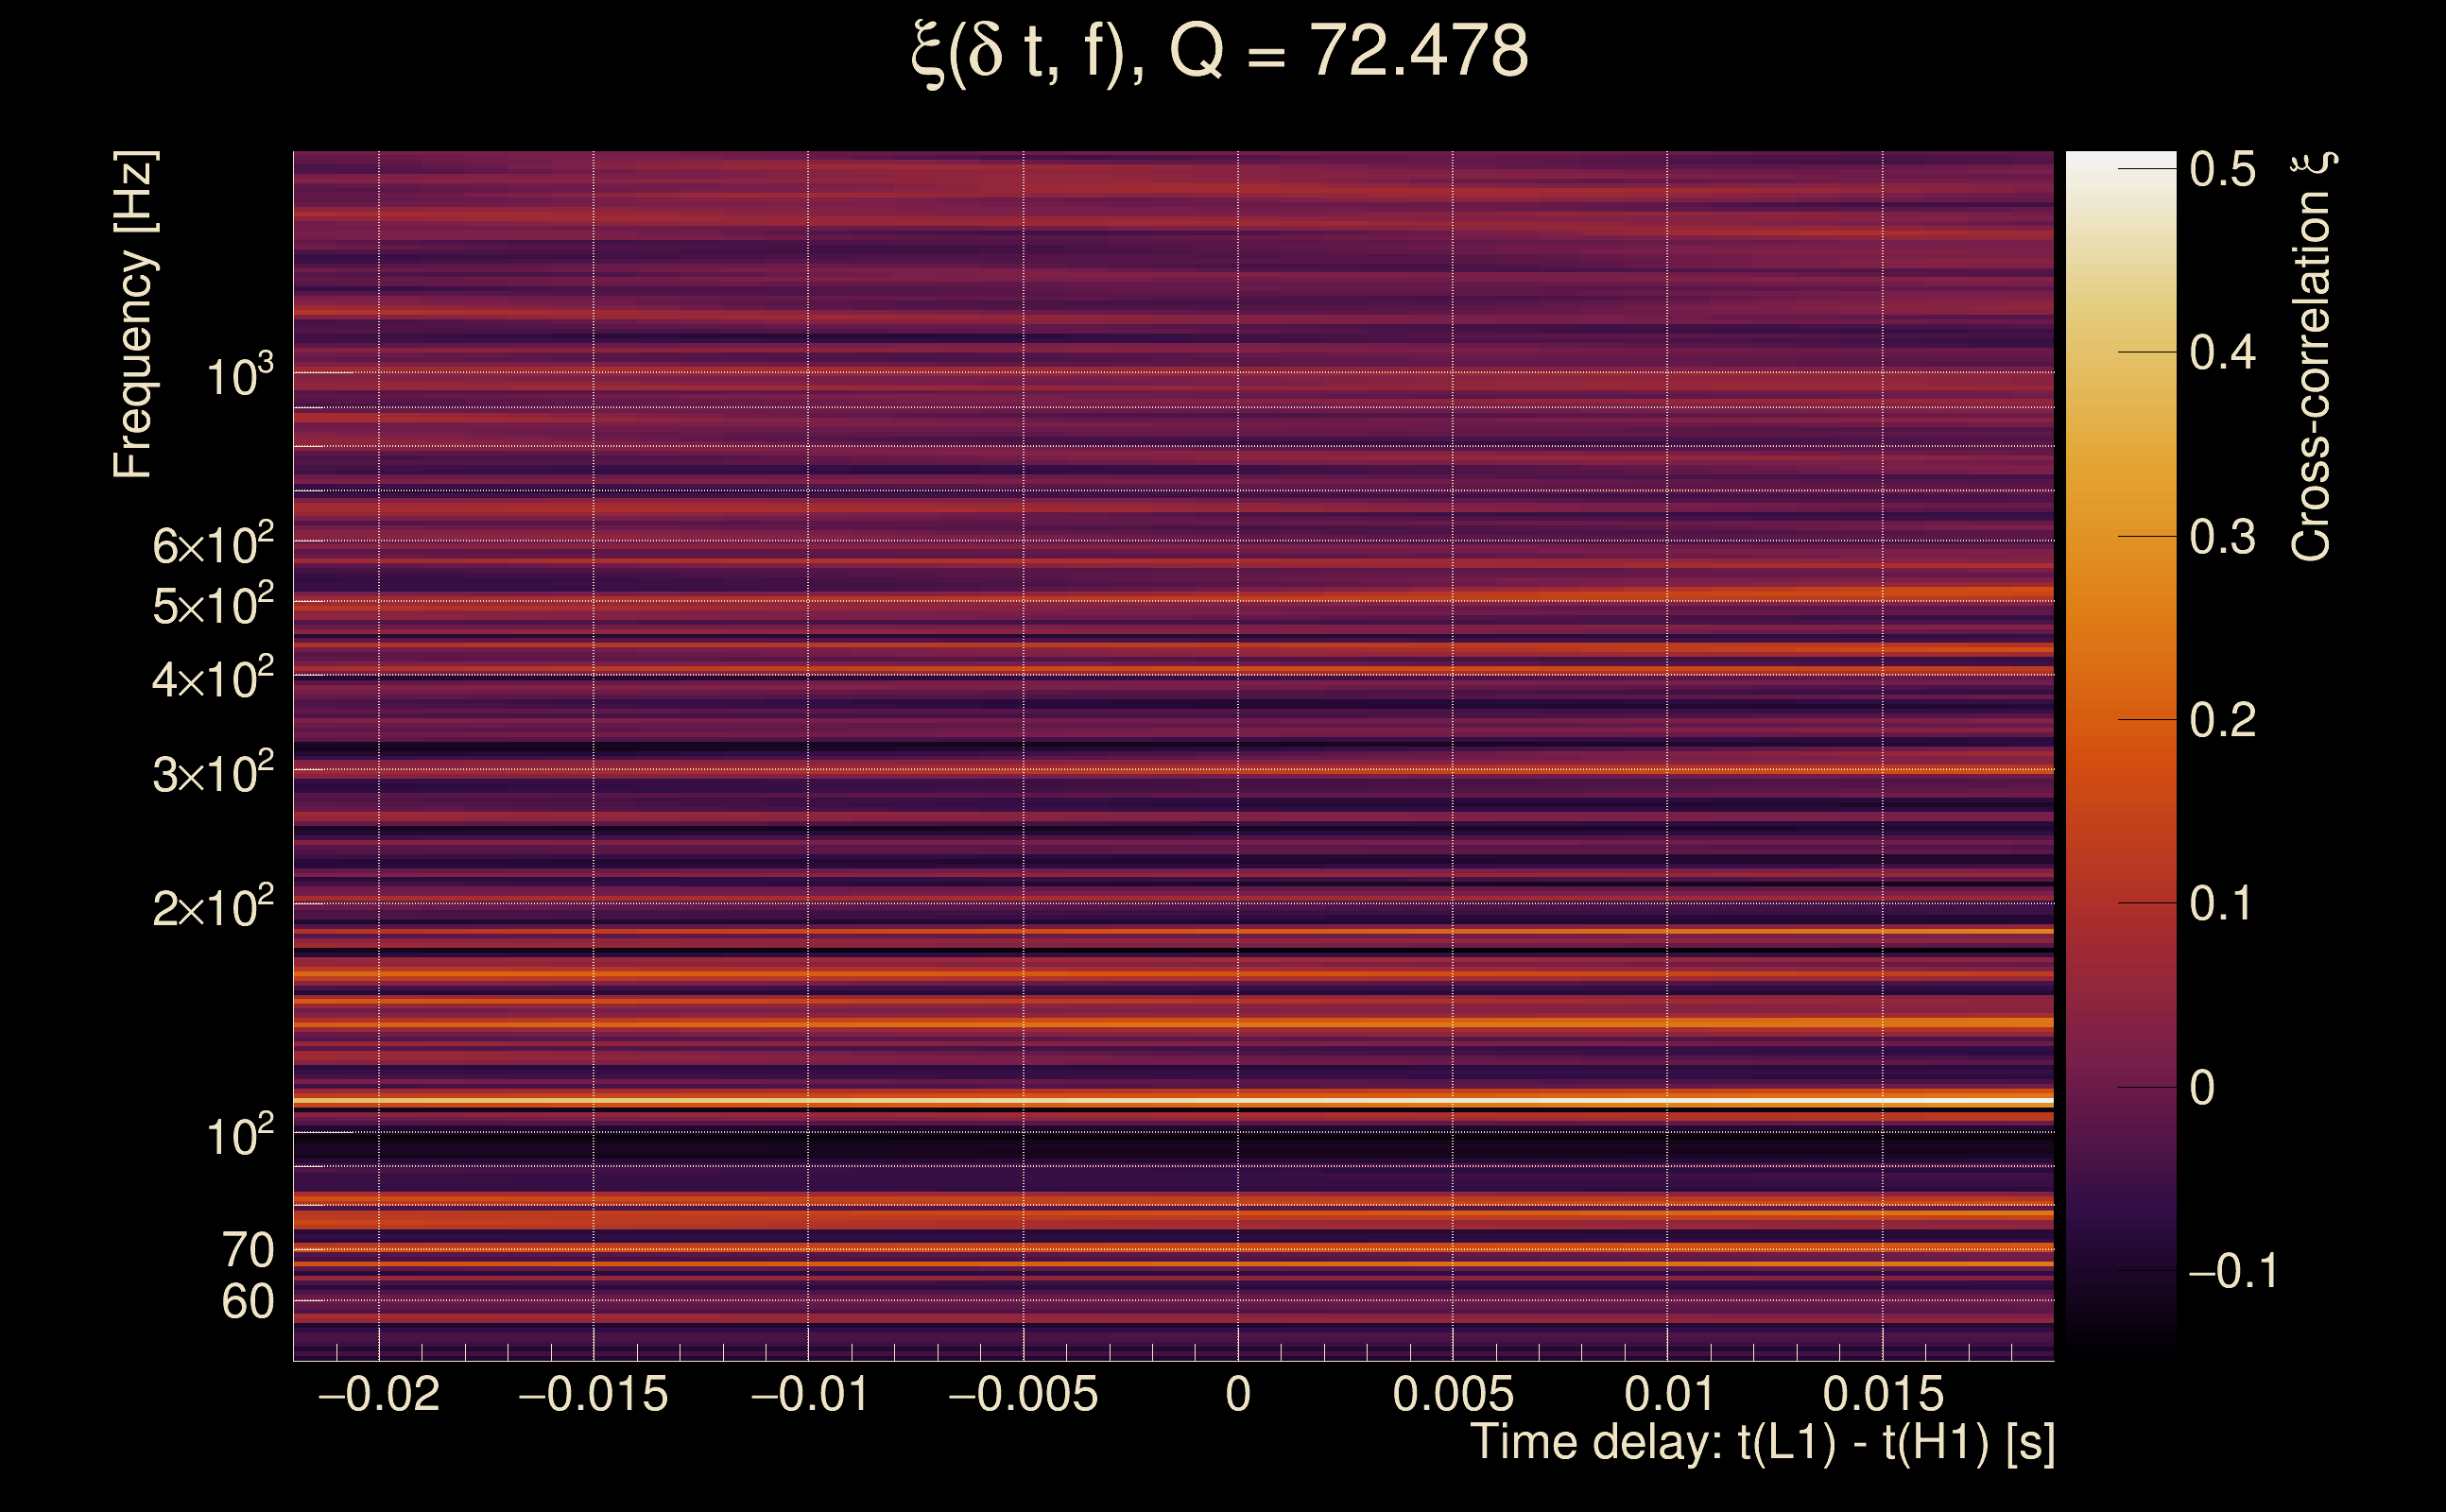
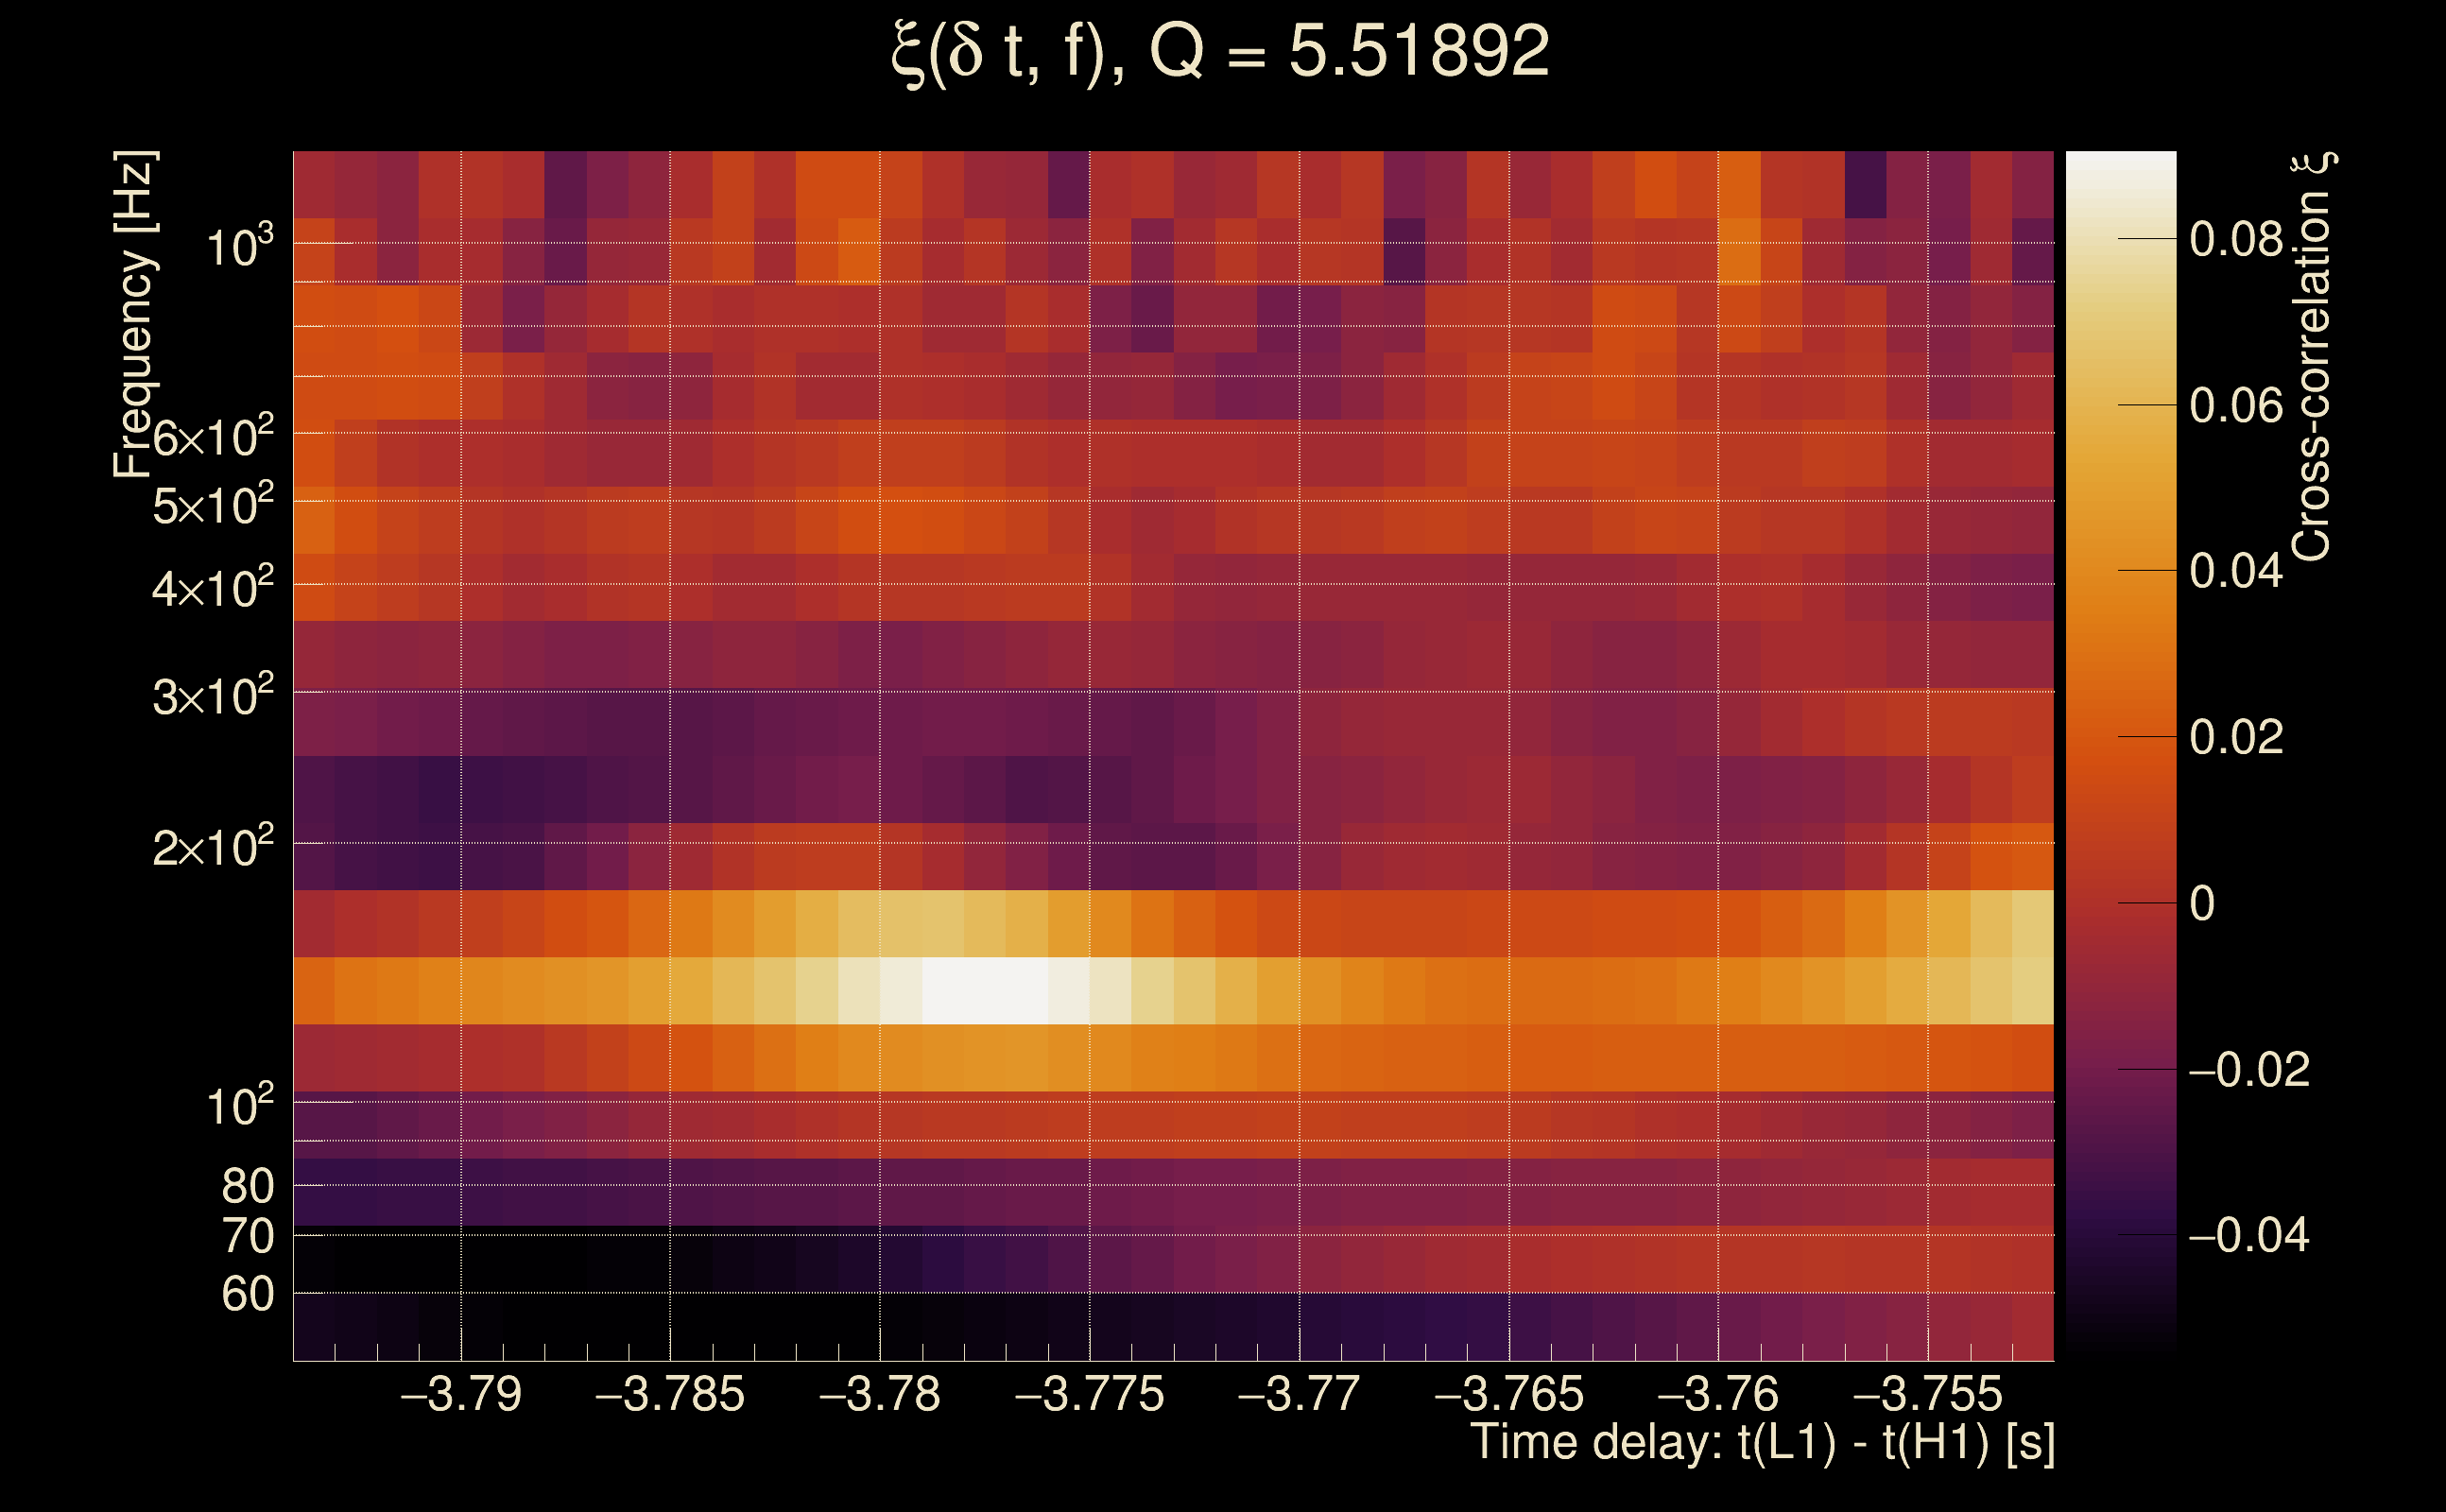
| Number of Q planes: | 5 (Q = 5.51892 → Q = 72.478) |
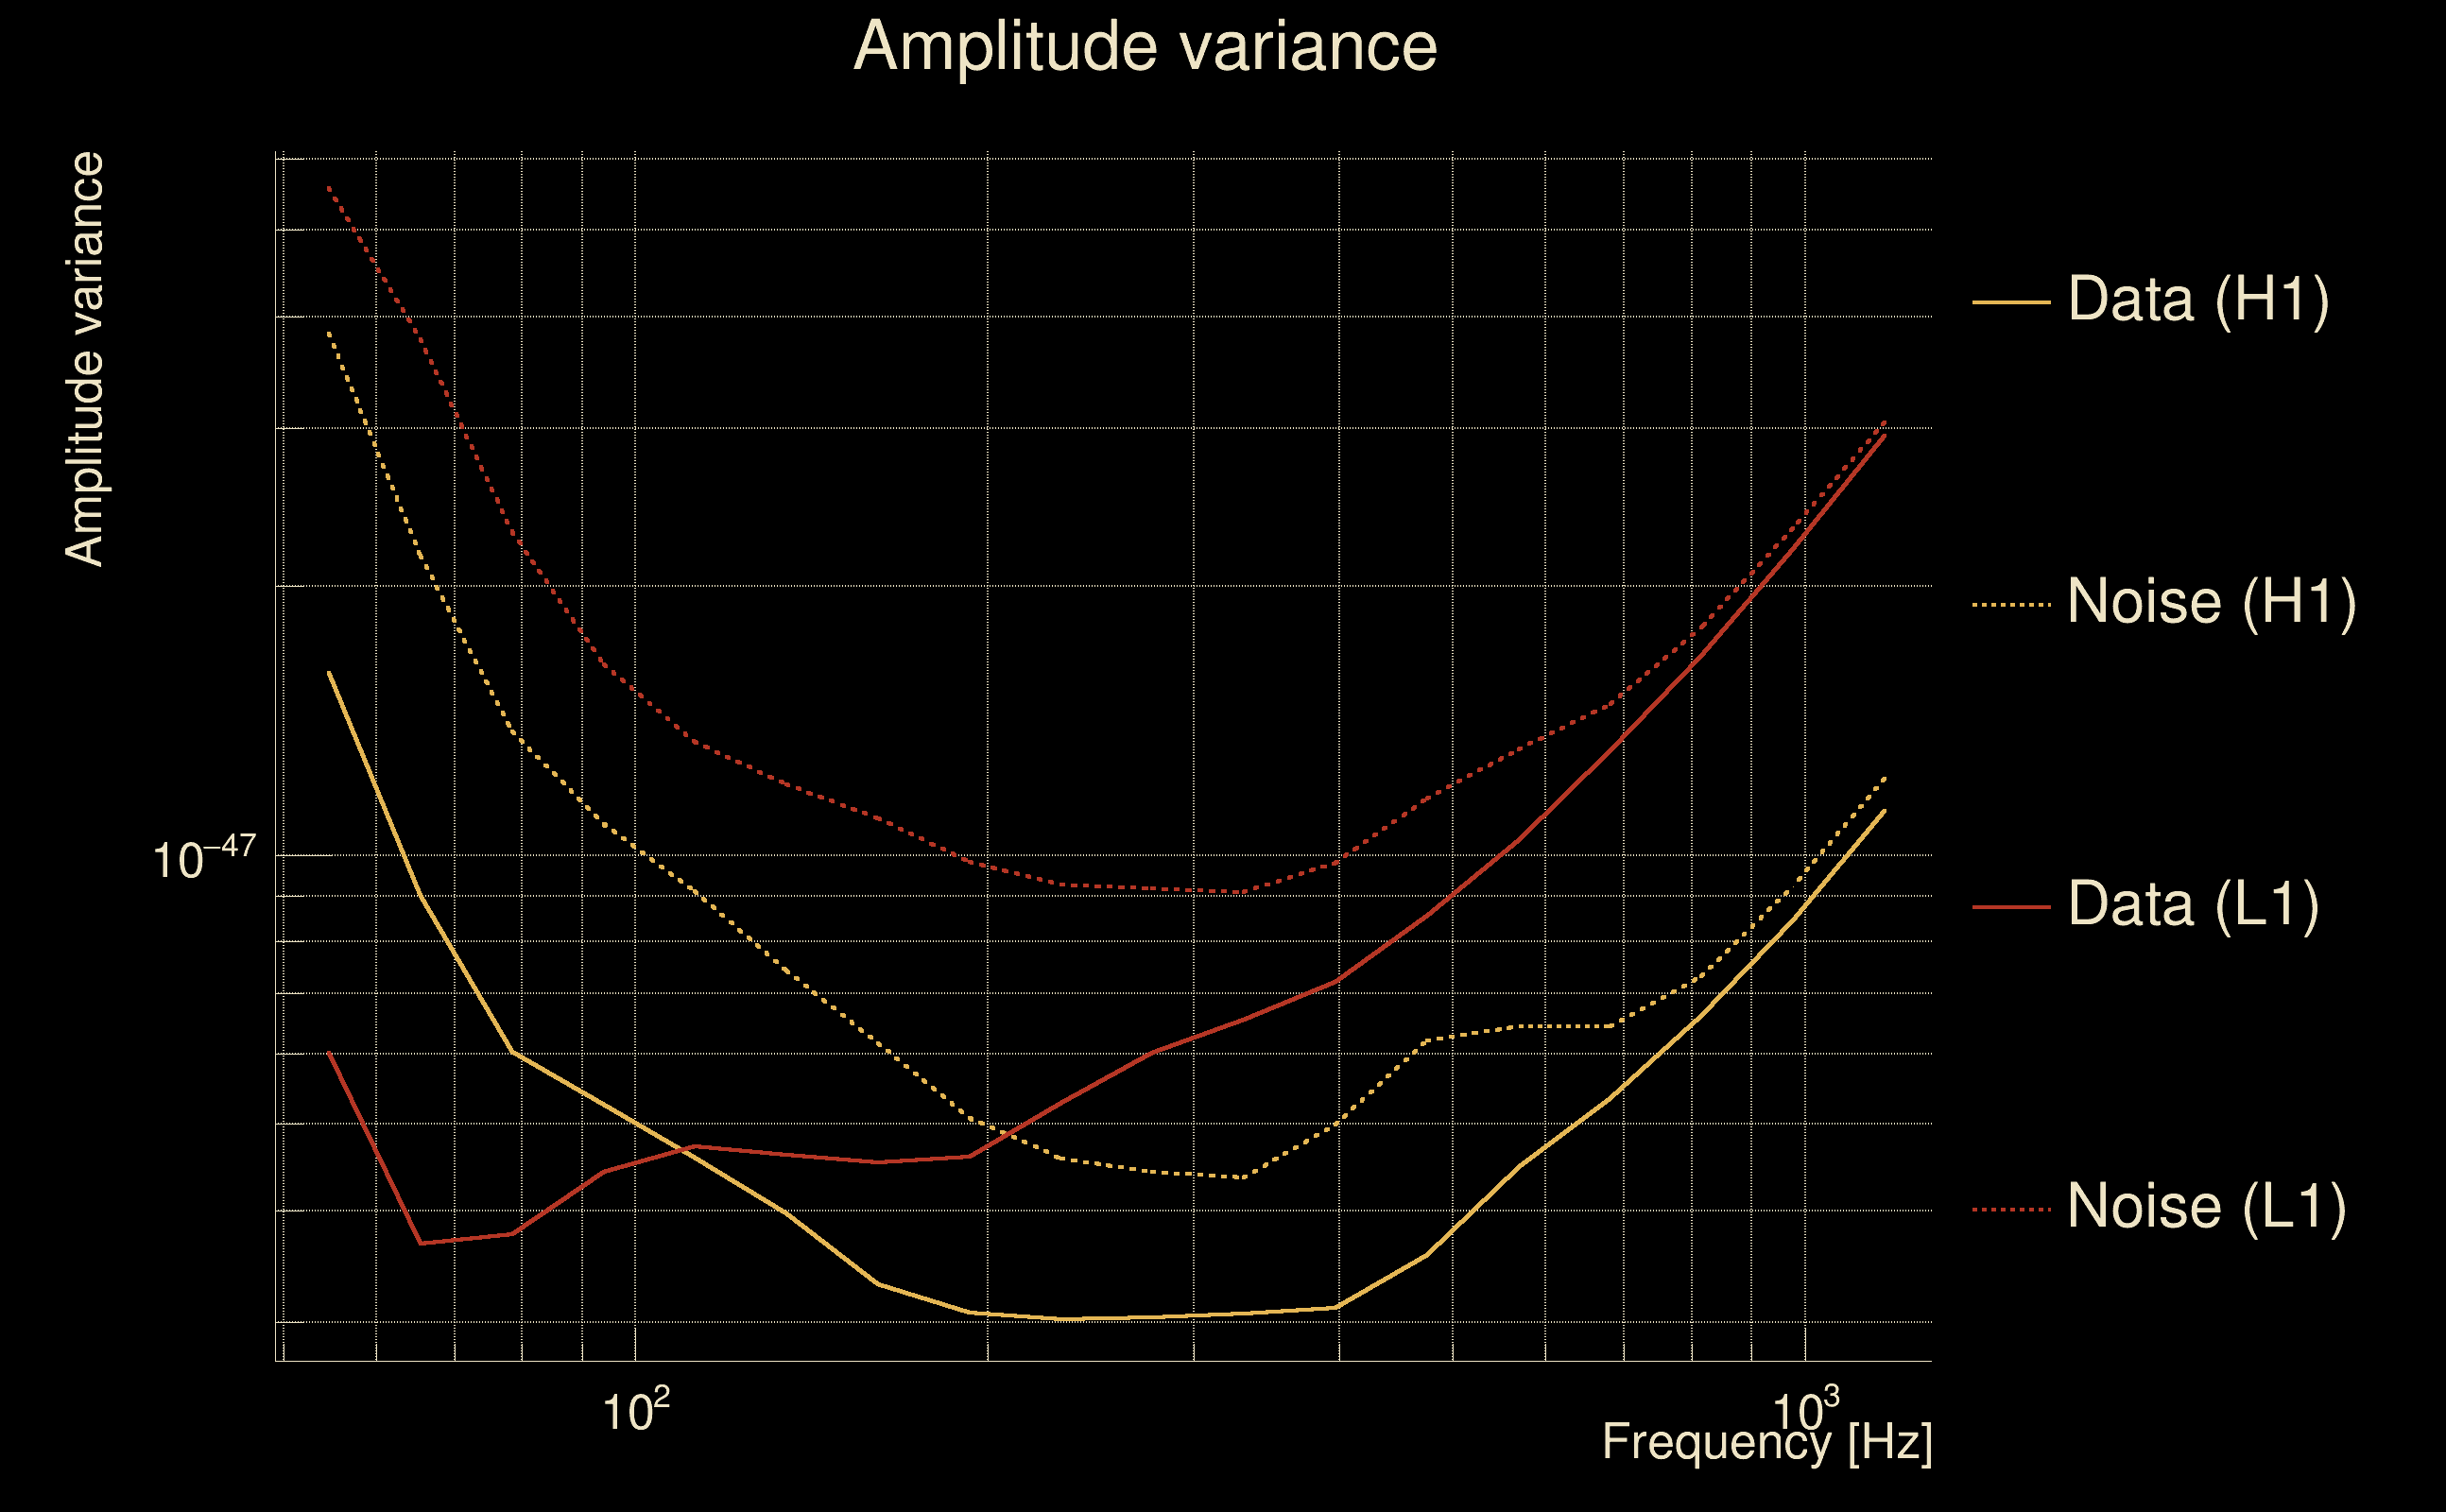
| Omicron frequency range: | 50 Hz → 1958.38 Hz |
| Light travel time between detectors: | 0.0100128 s |
| Slice extra-time (calibration uncertainty + slice veto): | 0.0129872 s |
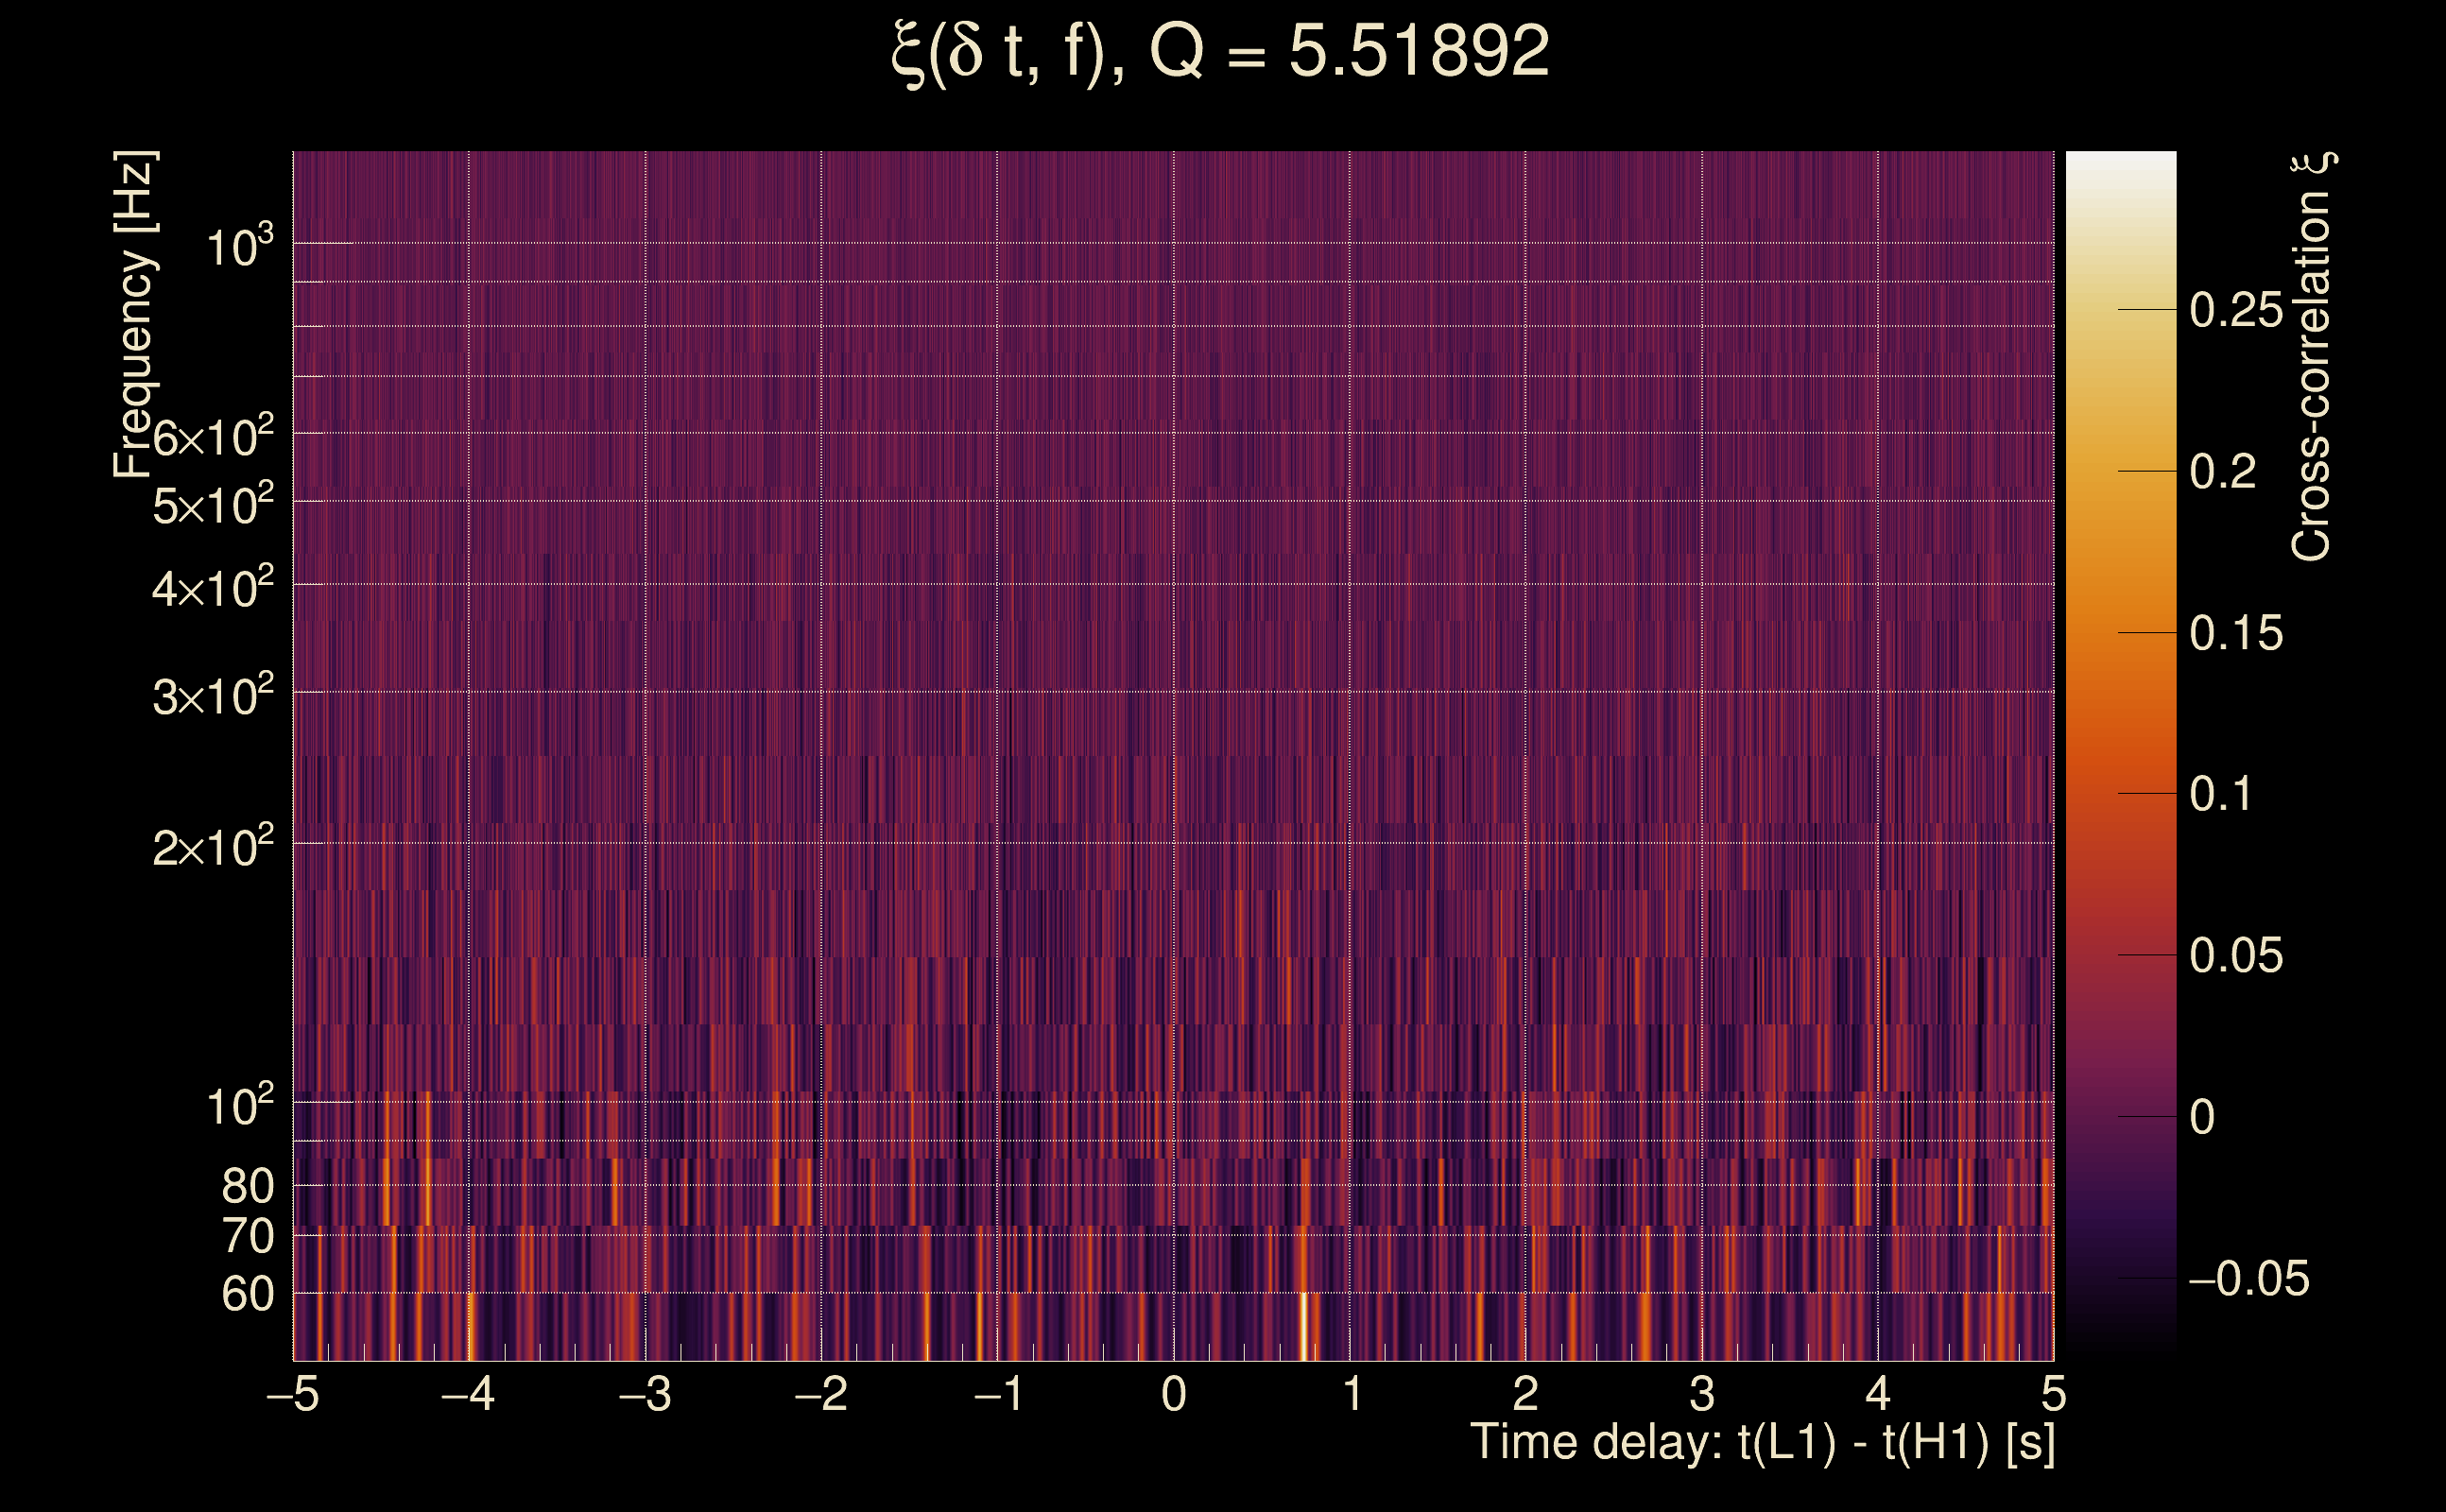
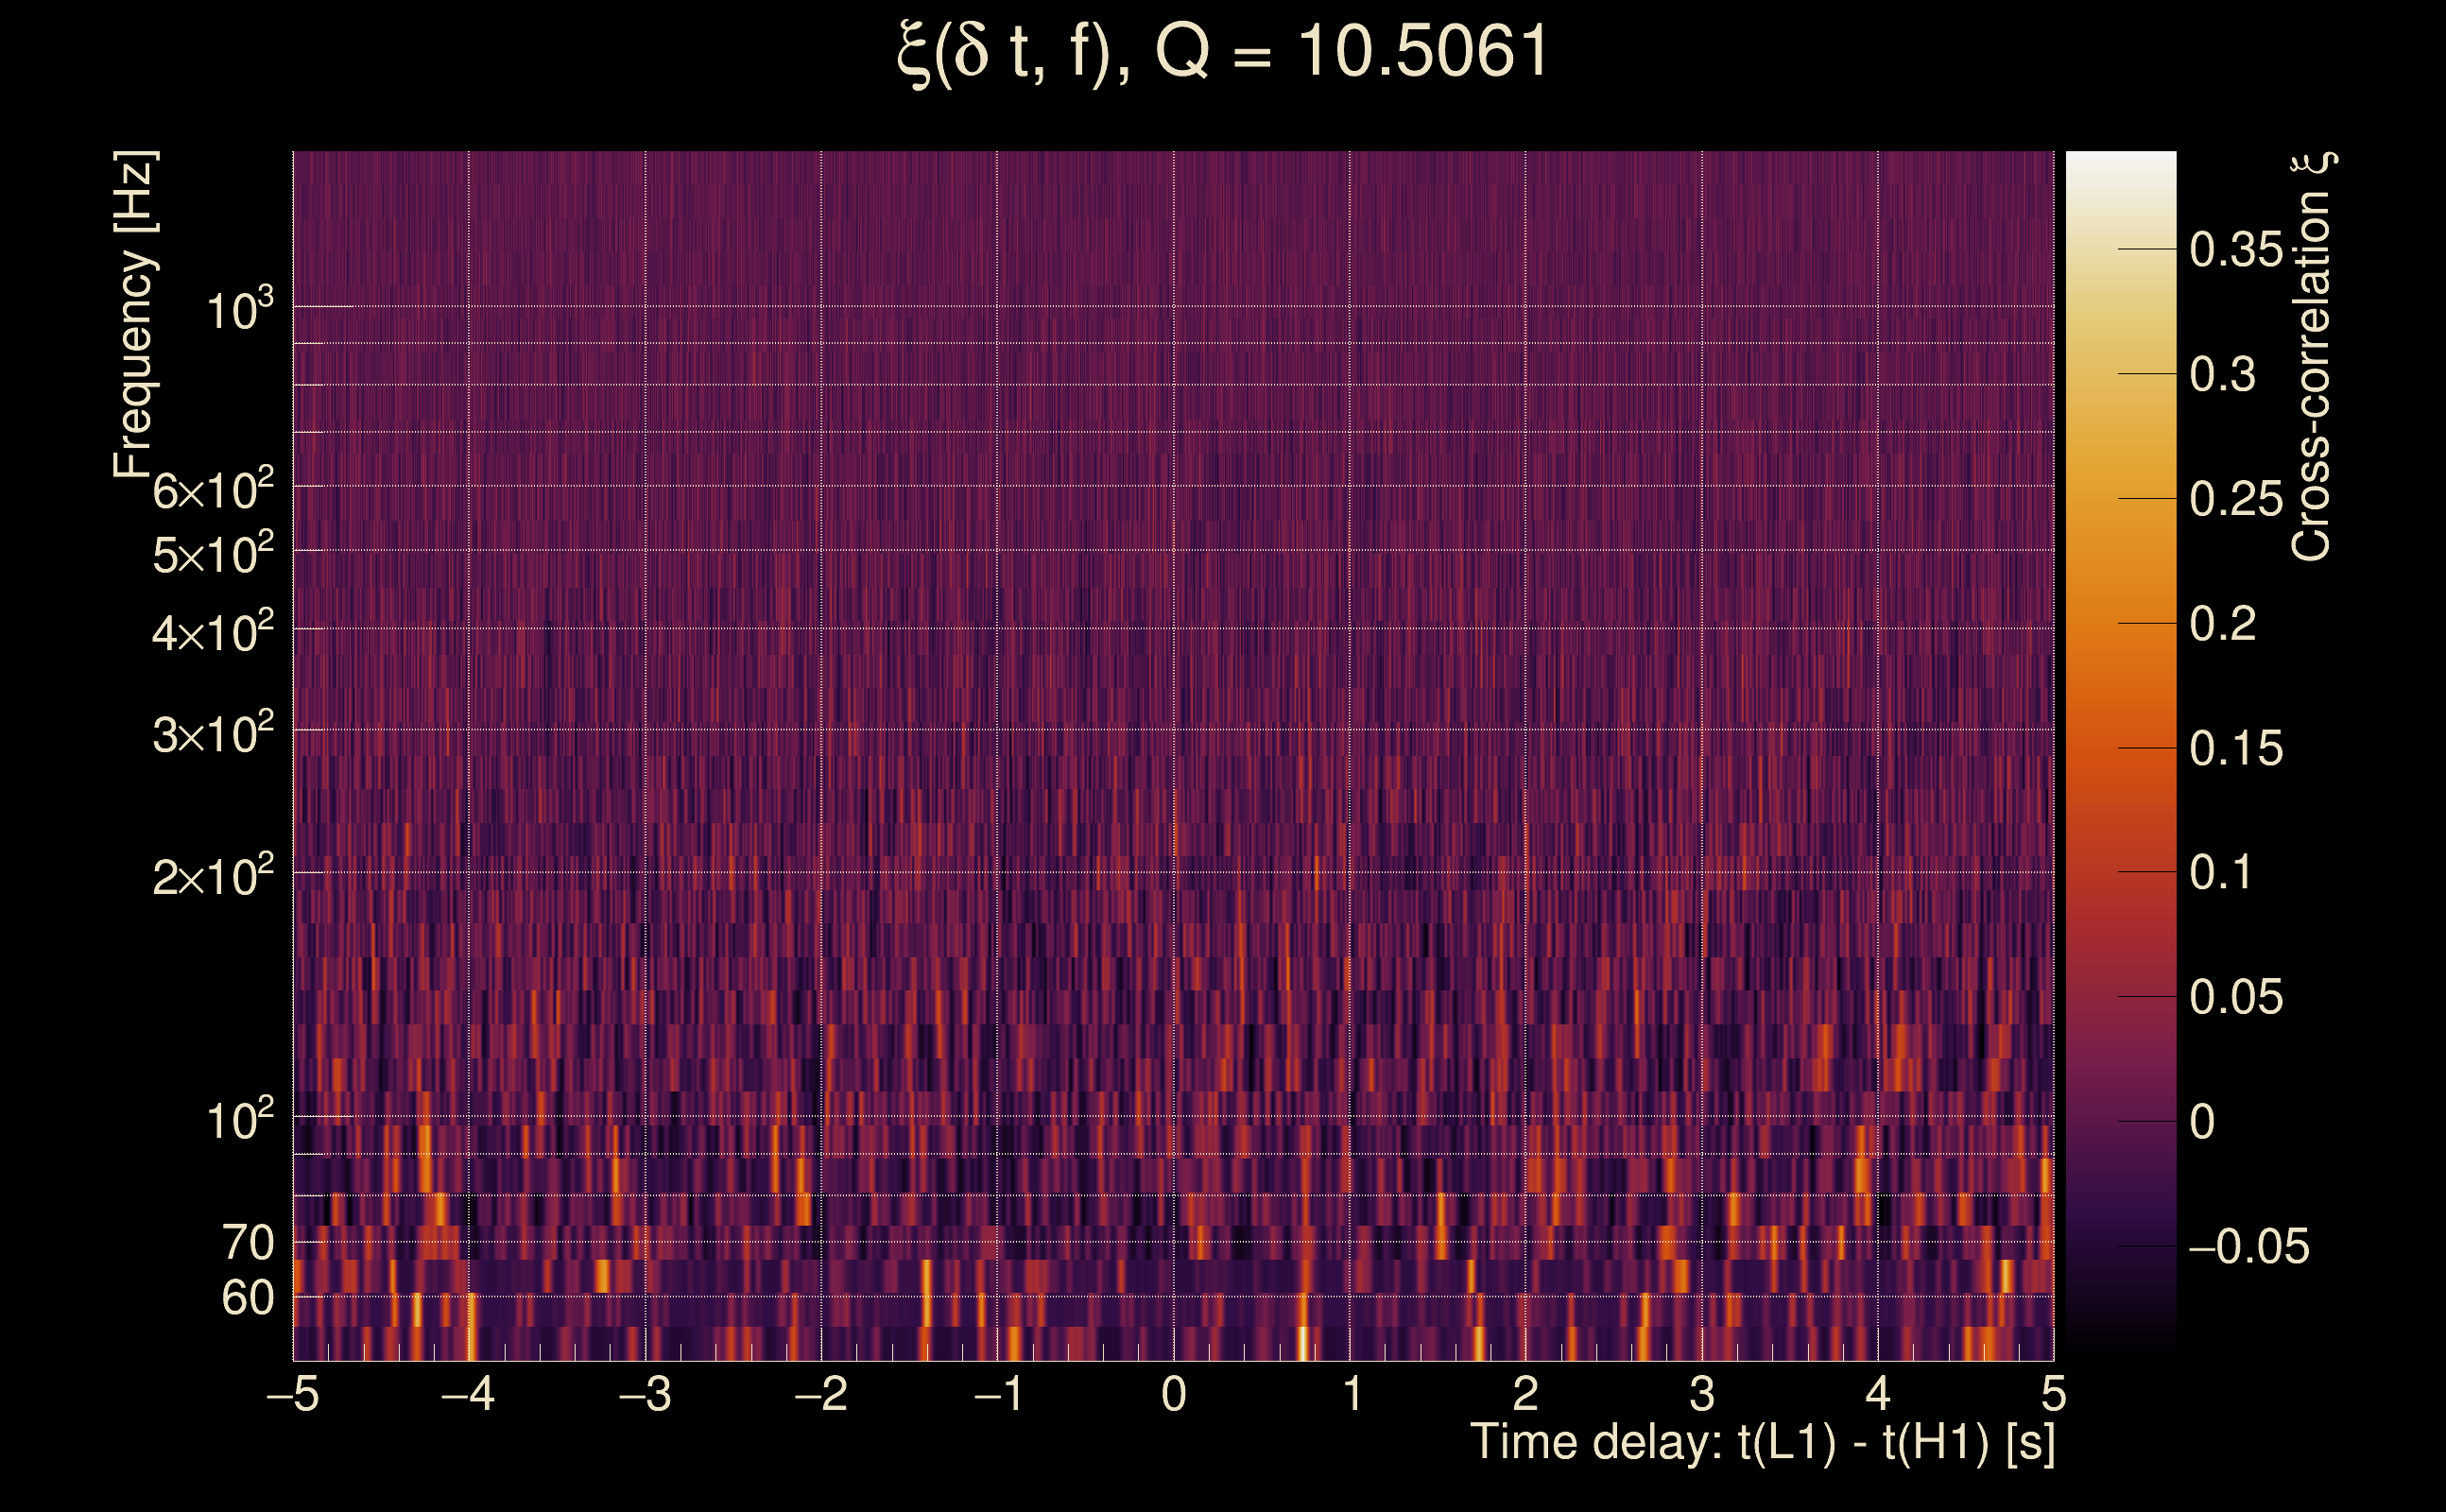
| Number of time-delay bins in a cross-correlation map: | 10000 |
| Number of slices in a cross-correlation map: | 217 |
| Number of time-delay bins in a slice: | 46 |
| SNR gating: | < 100 (detector 0), < 100 (detector 1) |
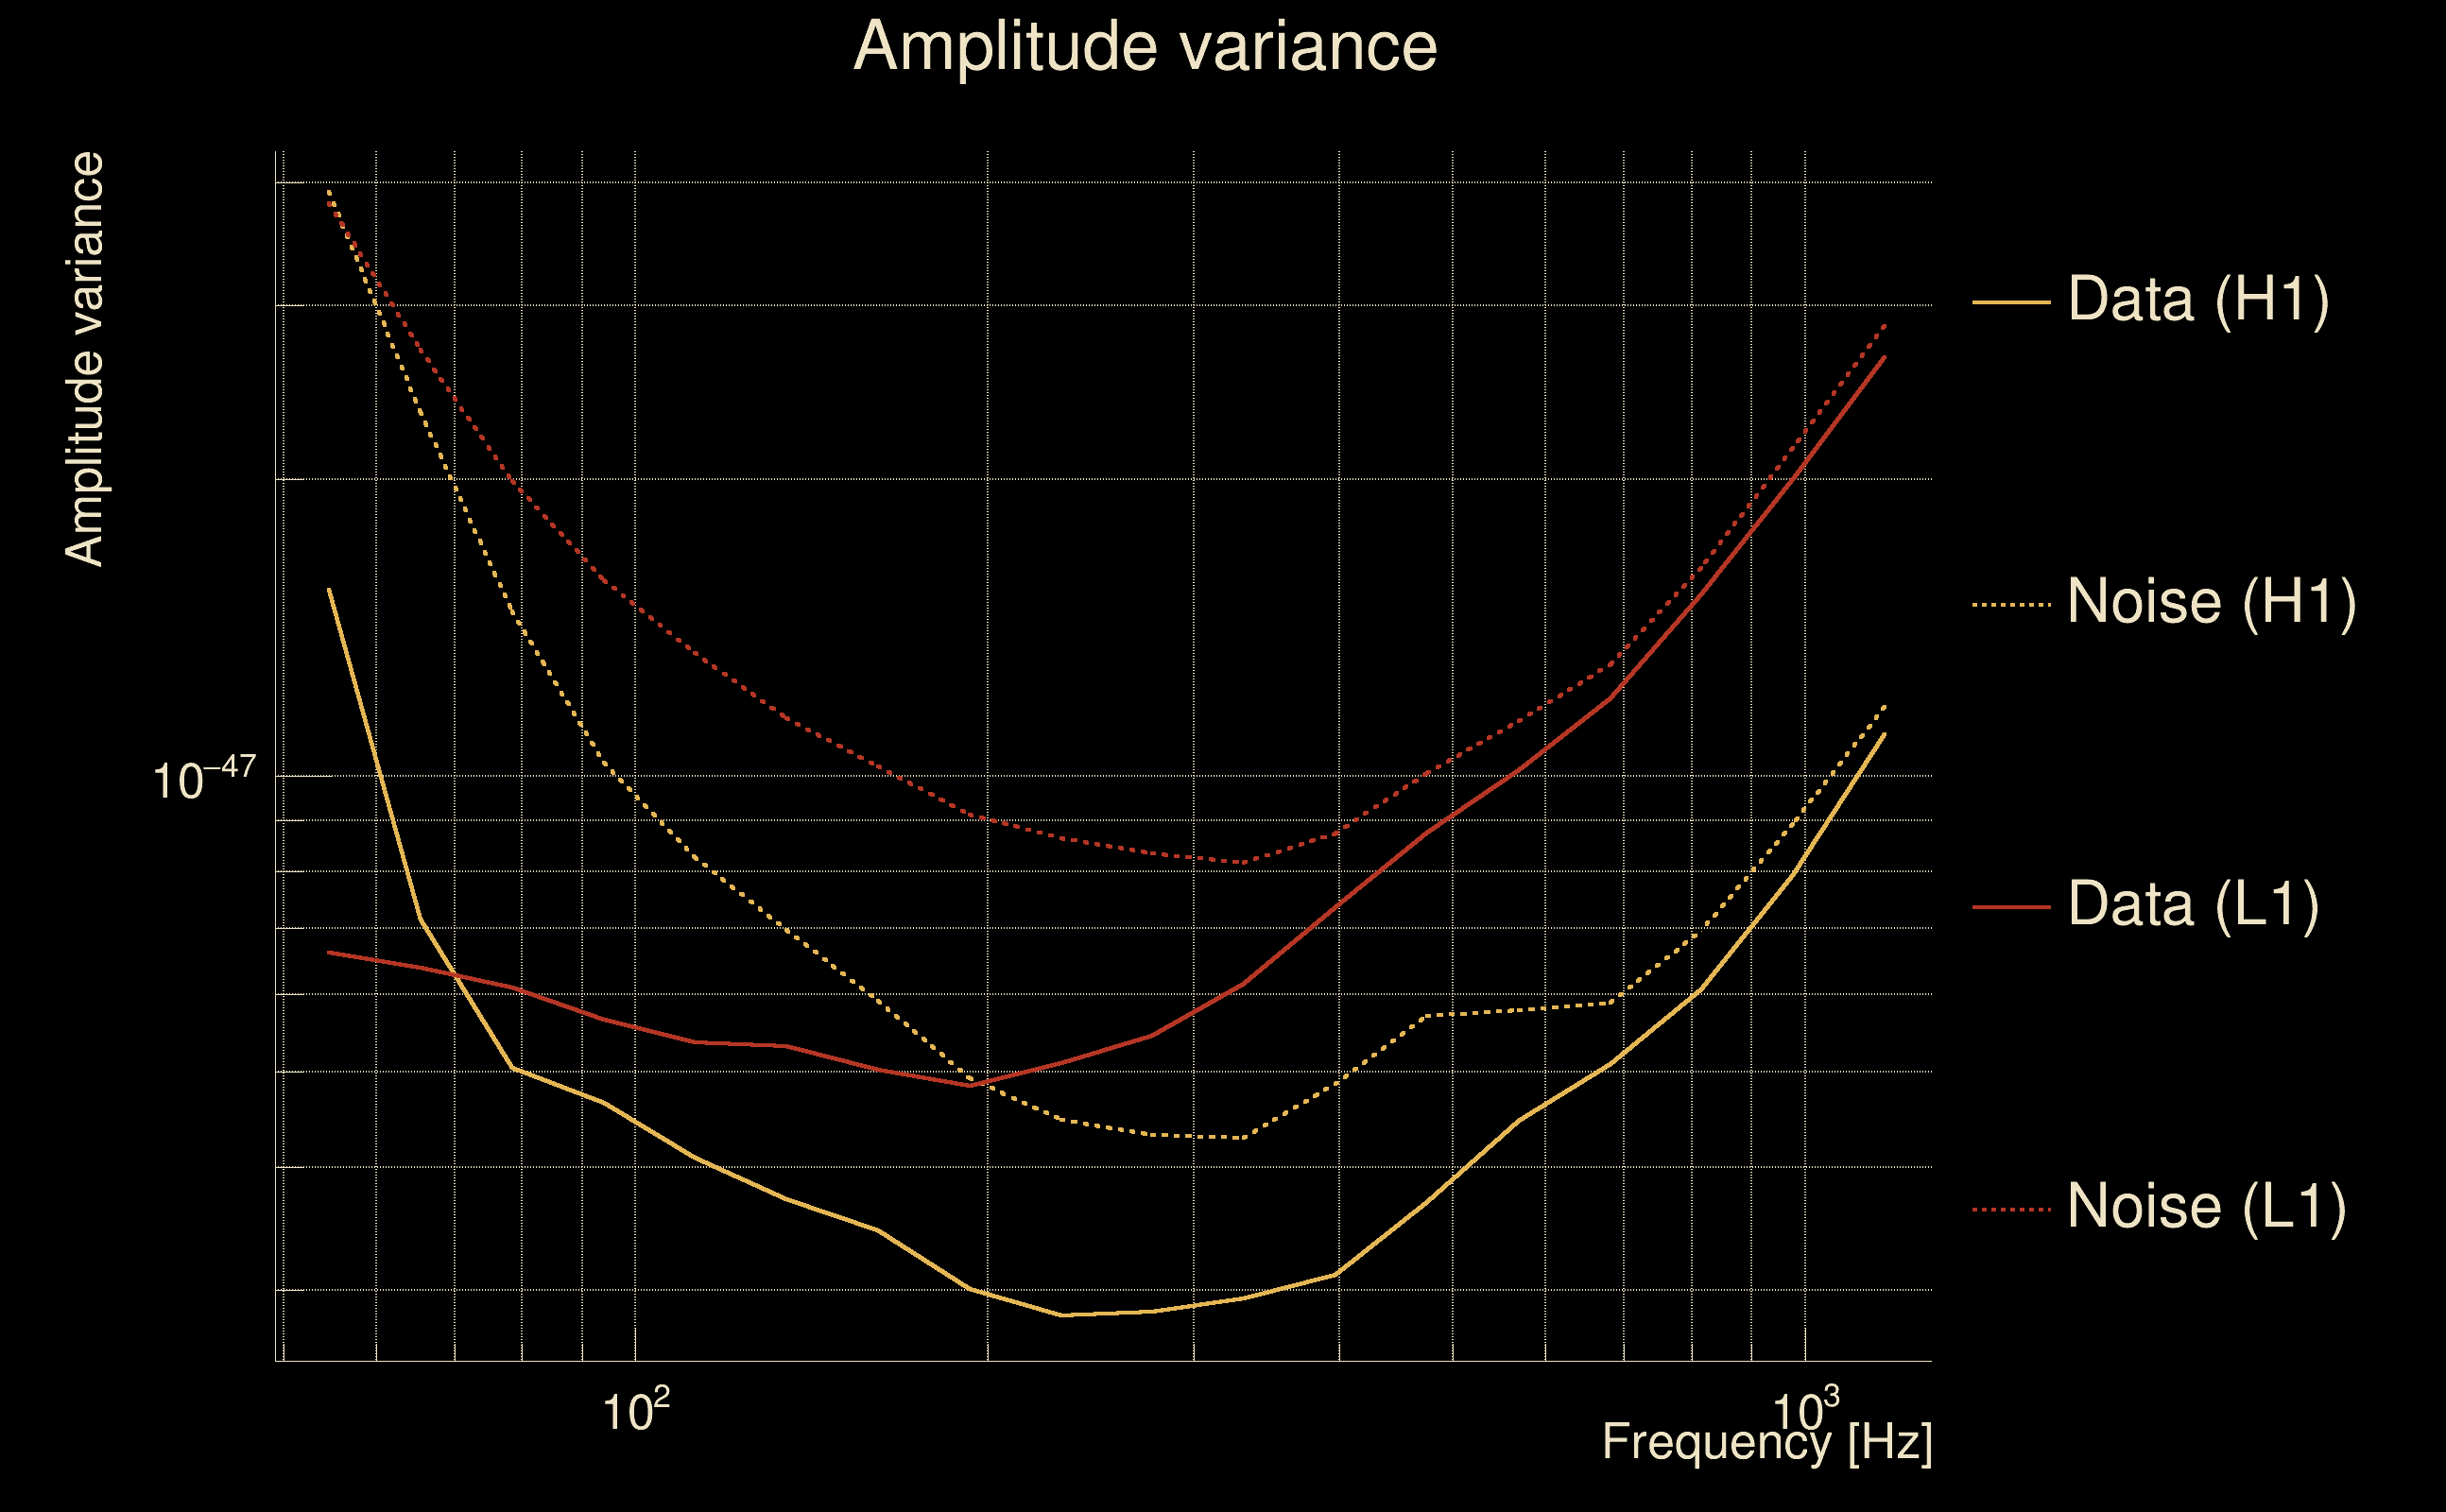
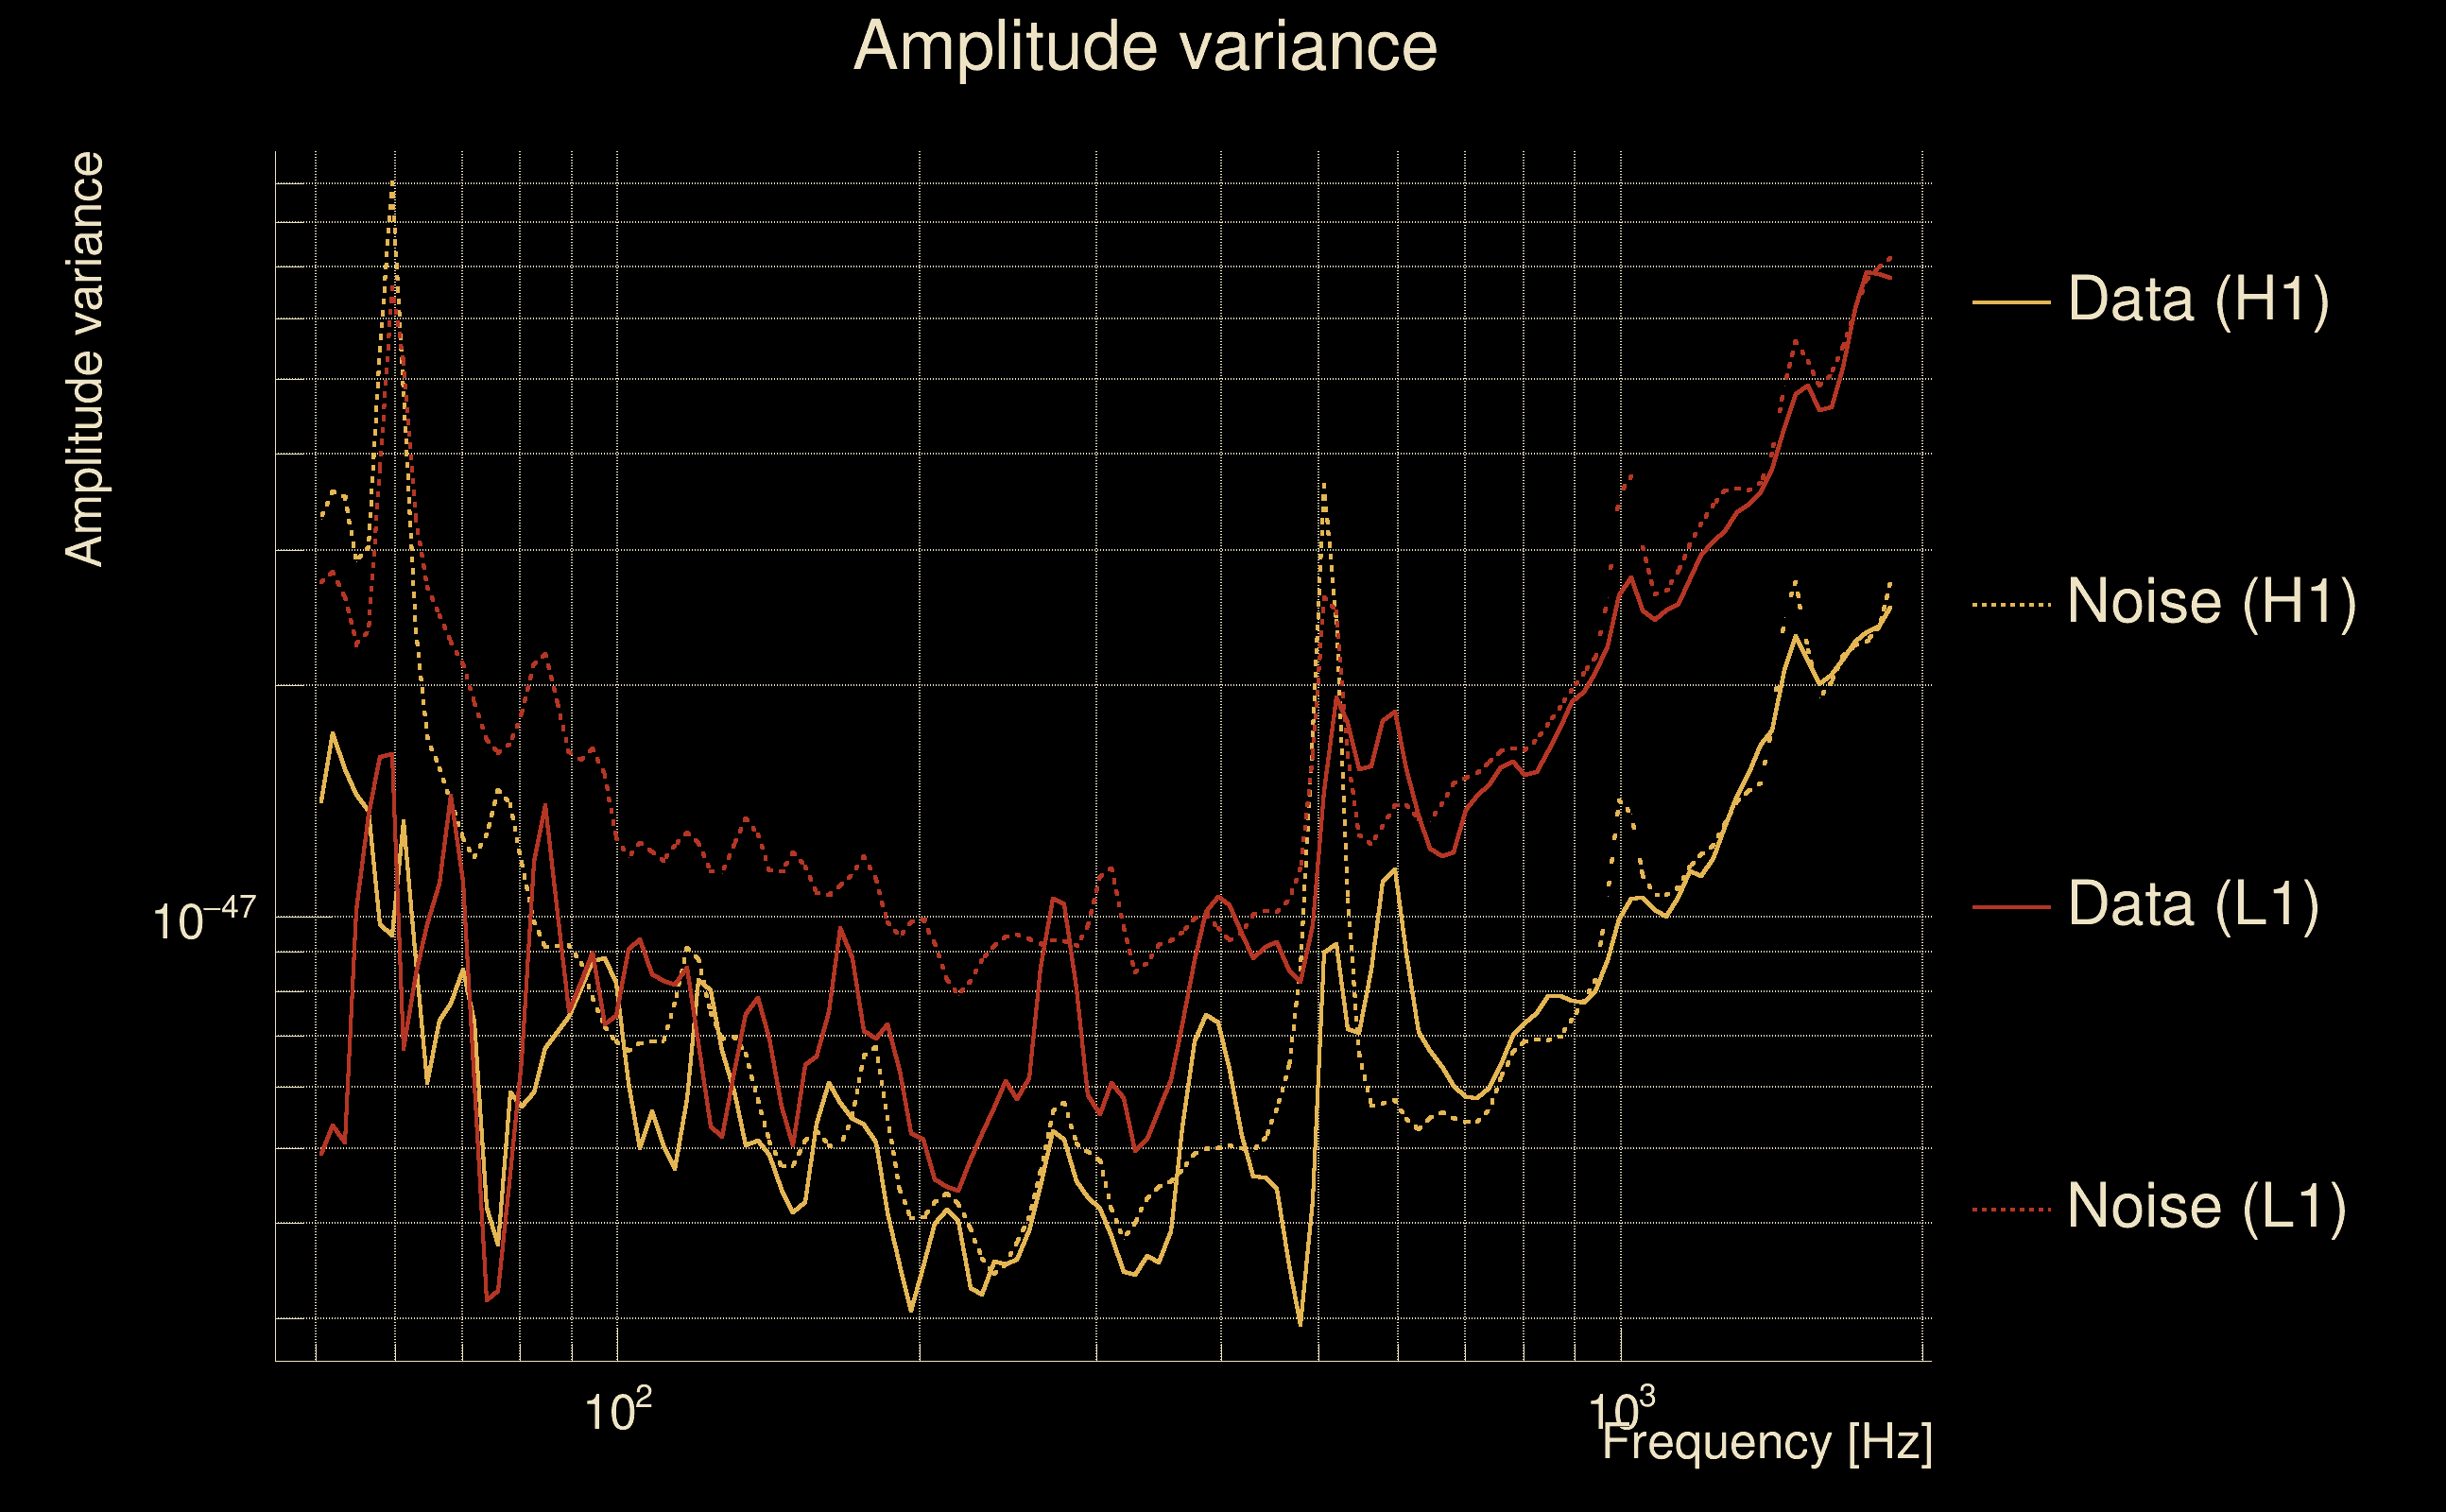
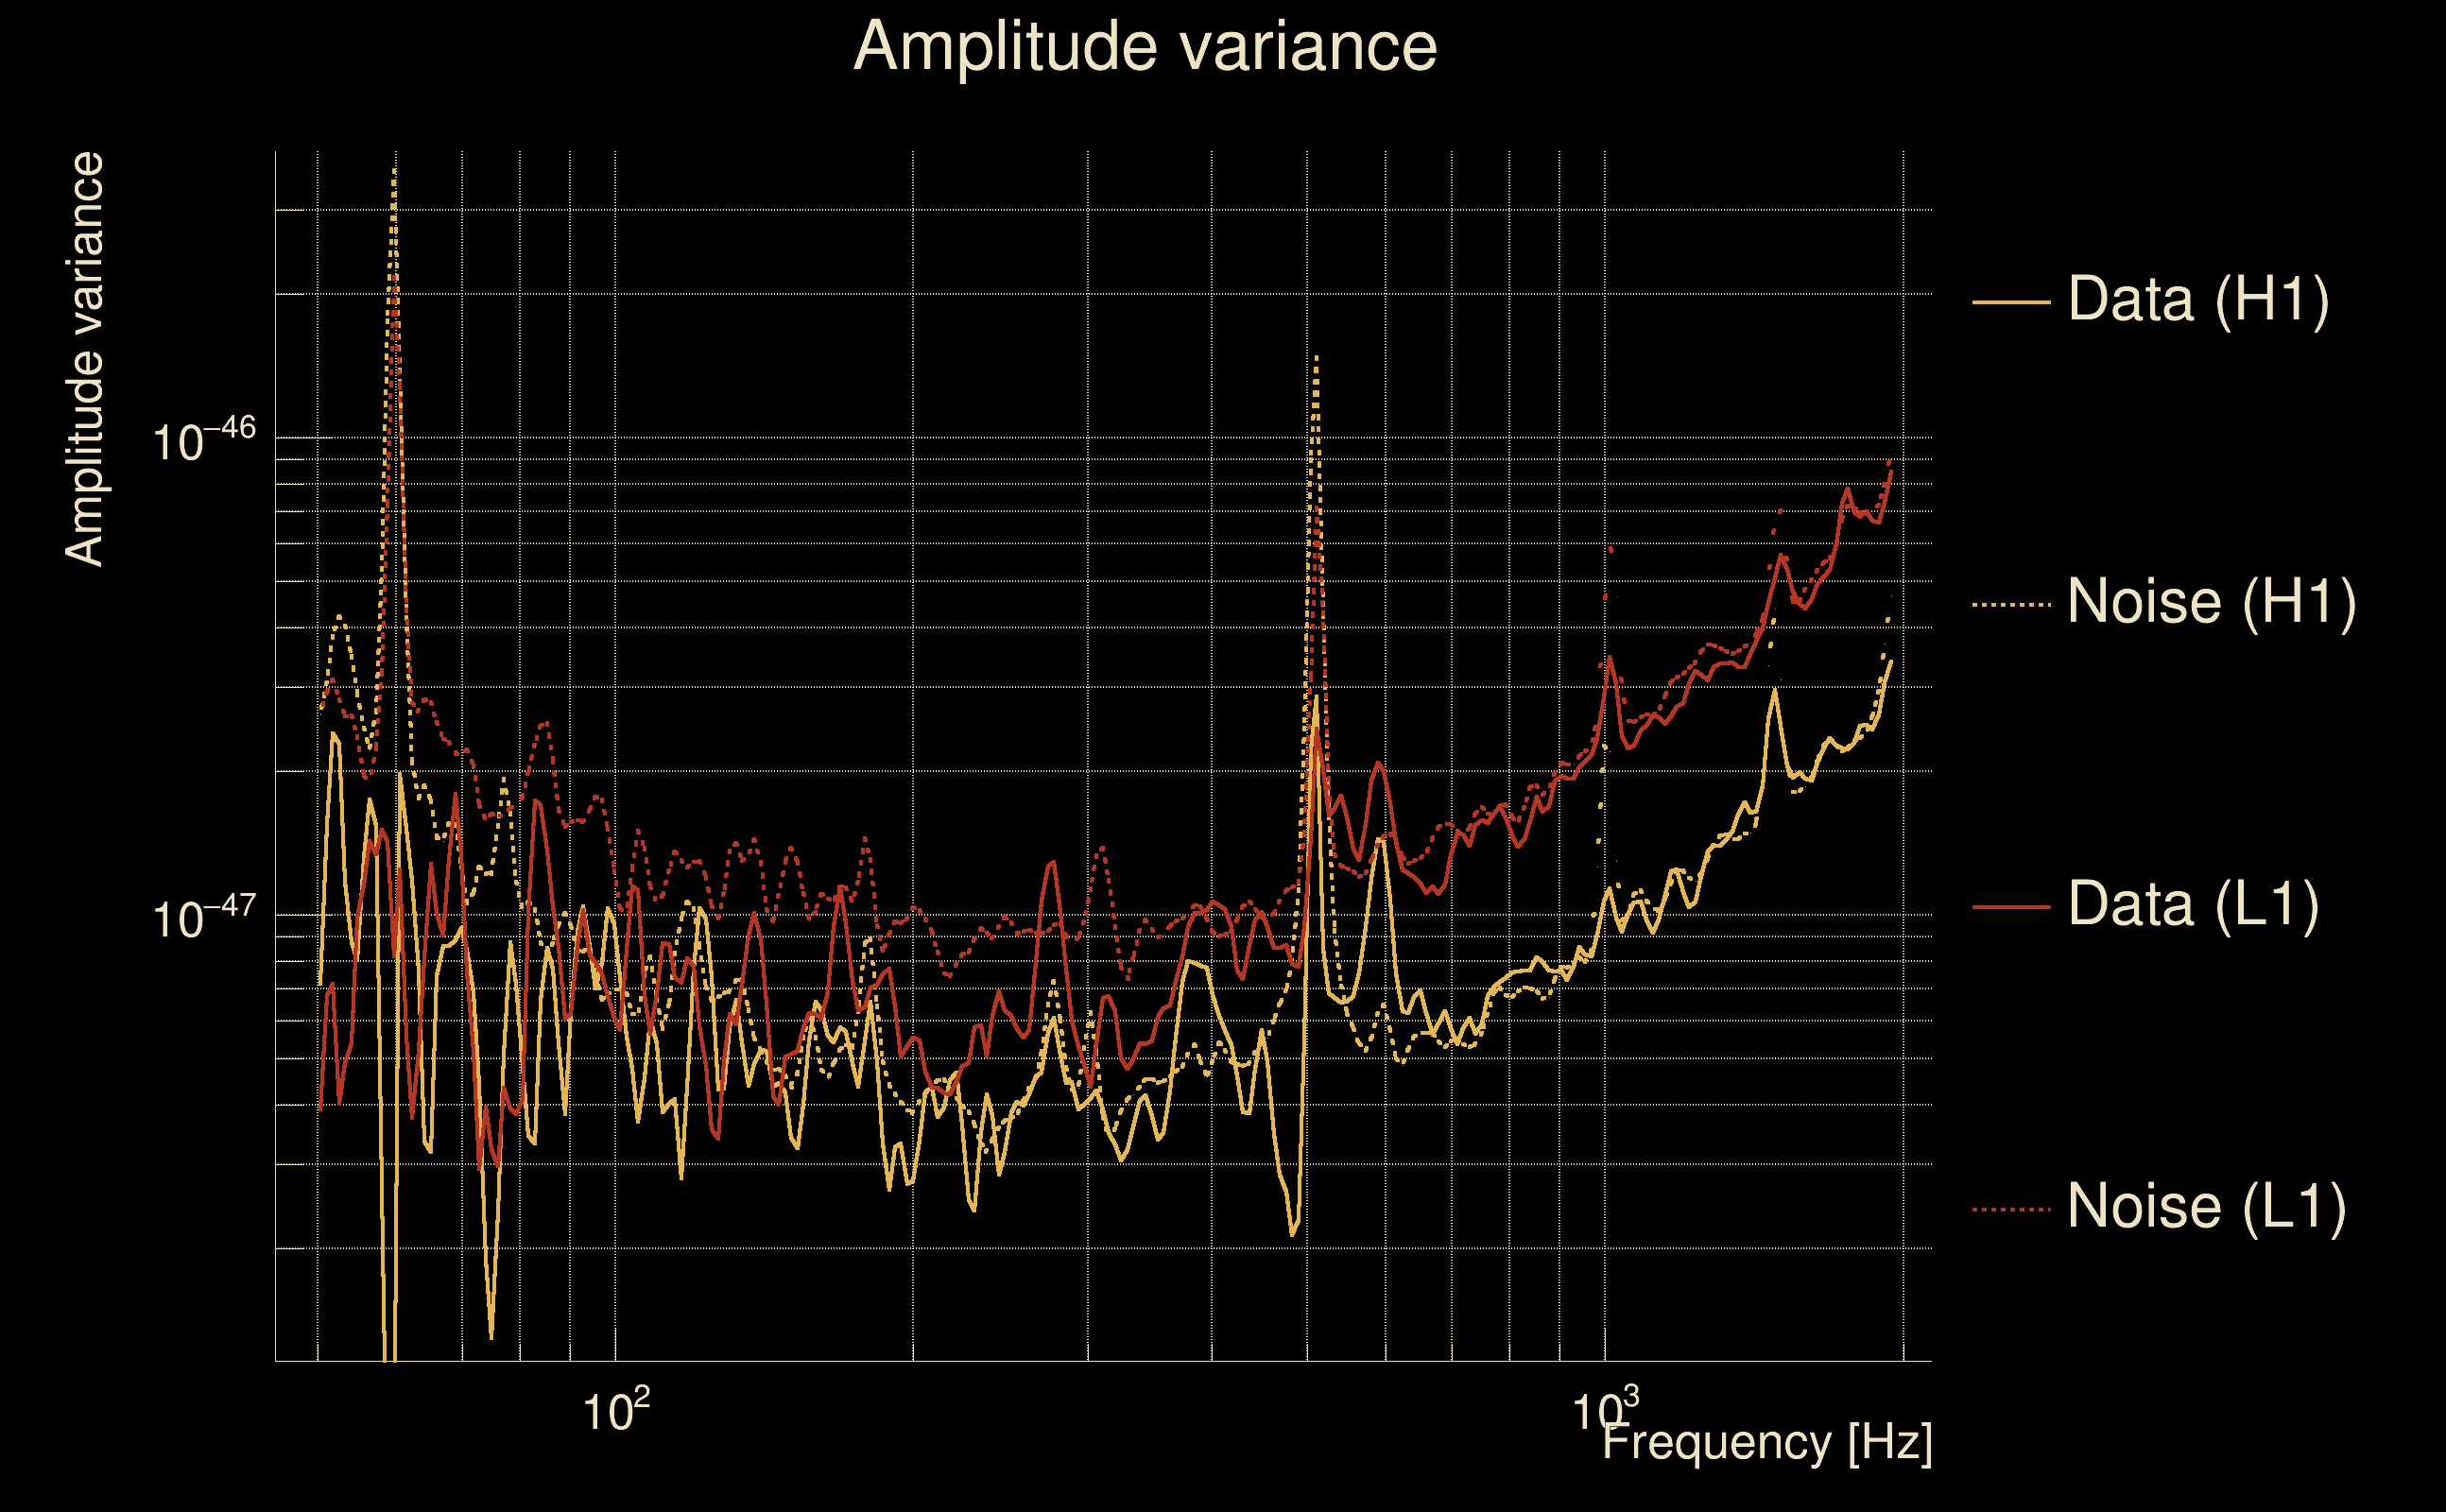
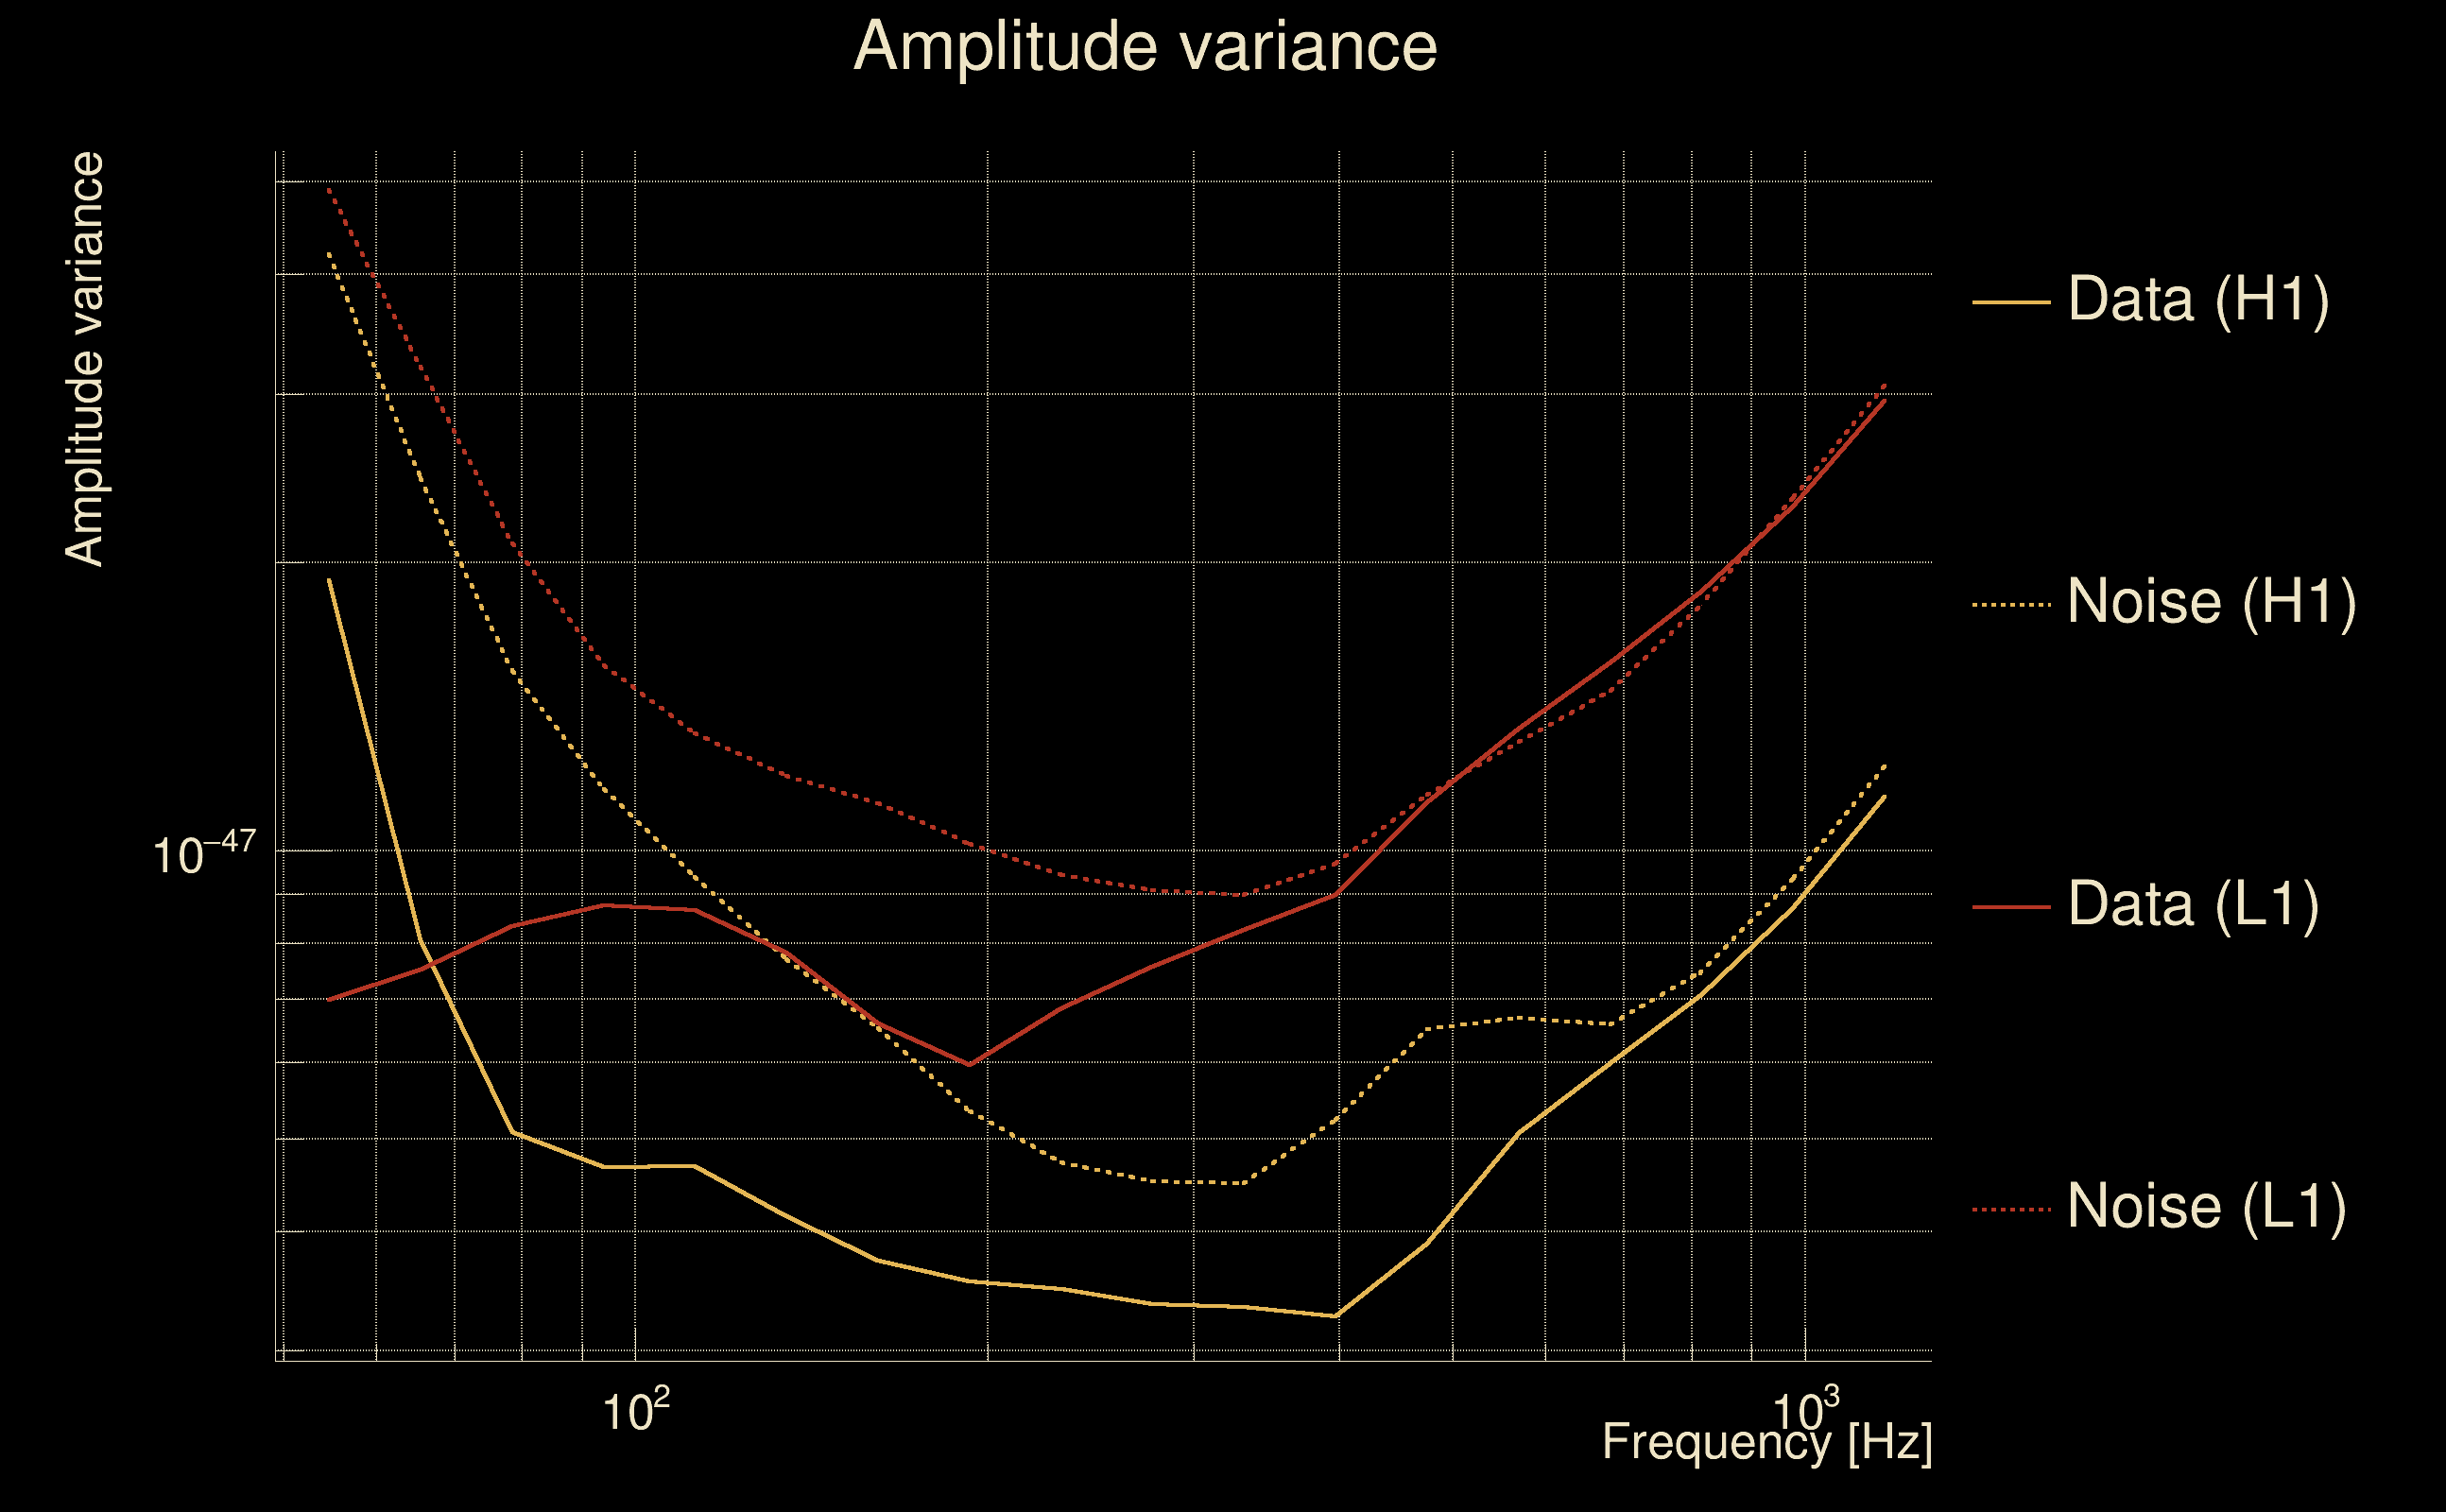
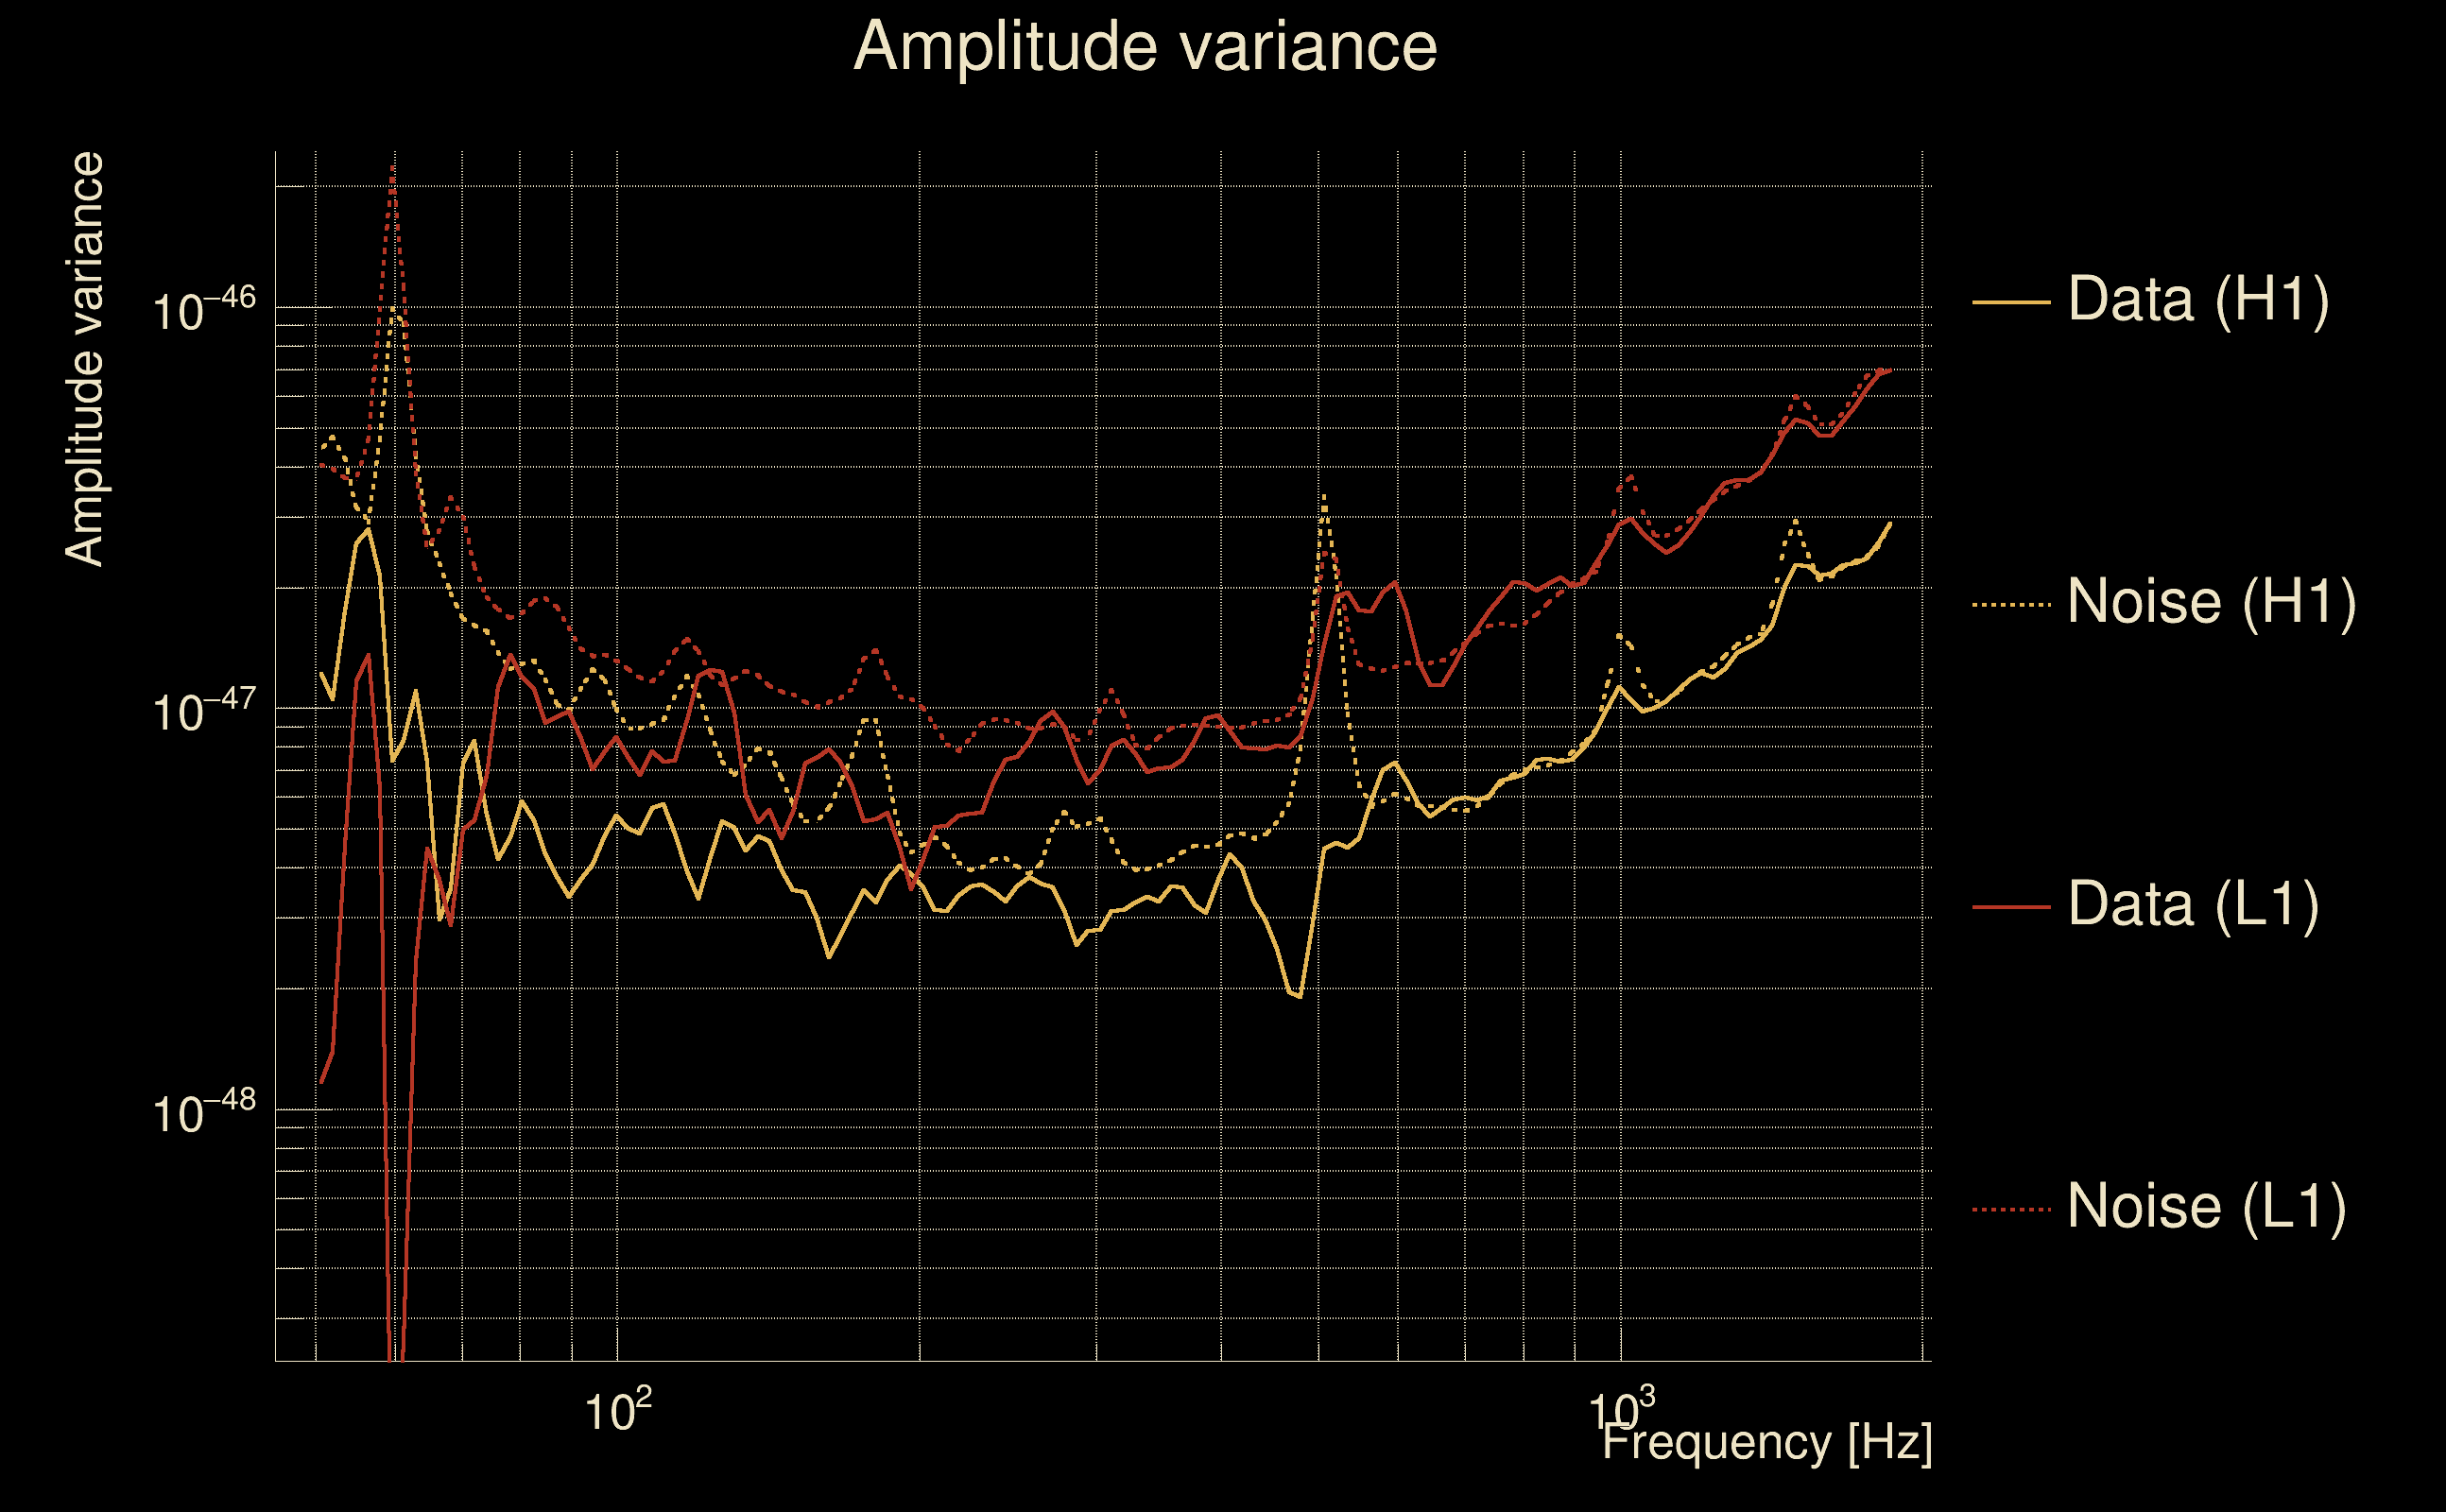
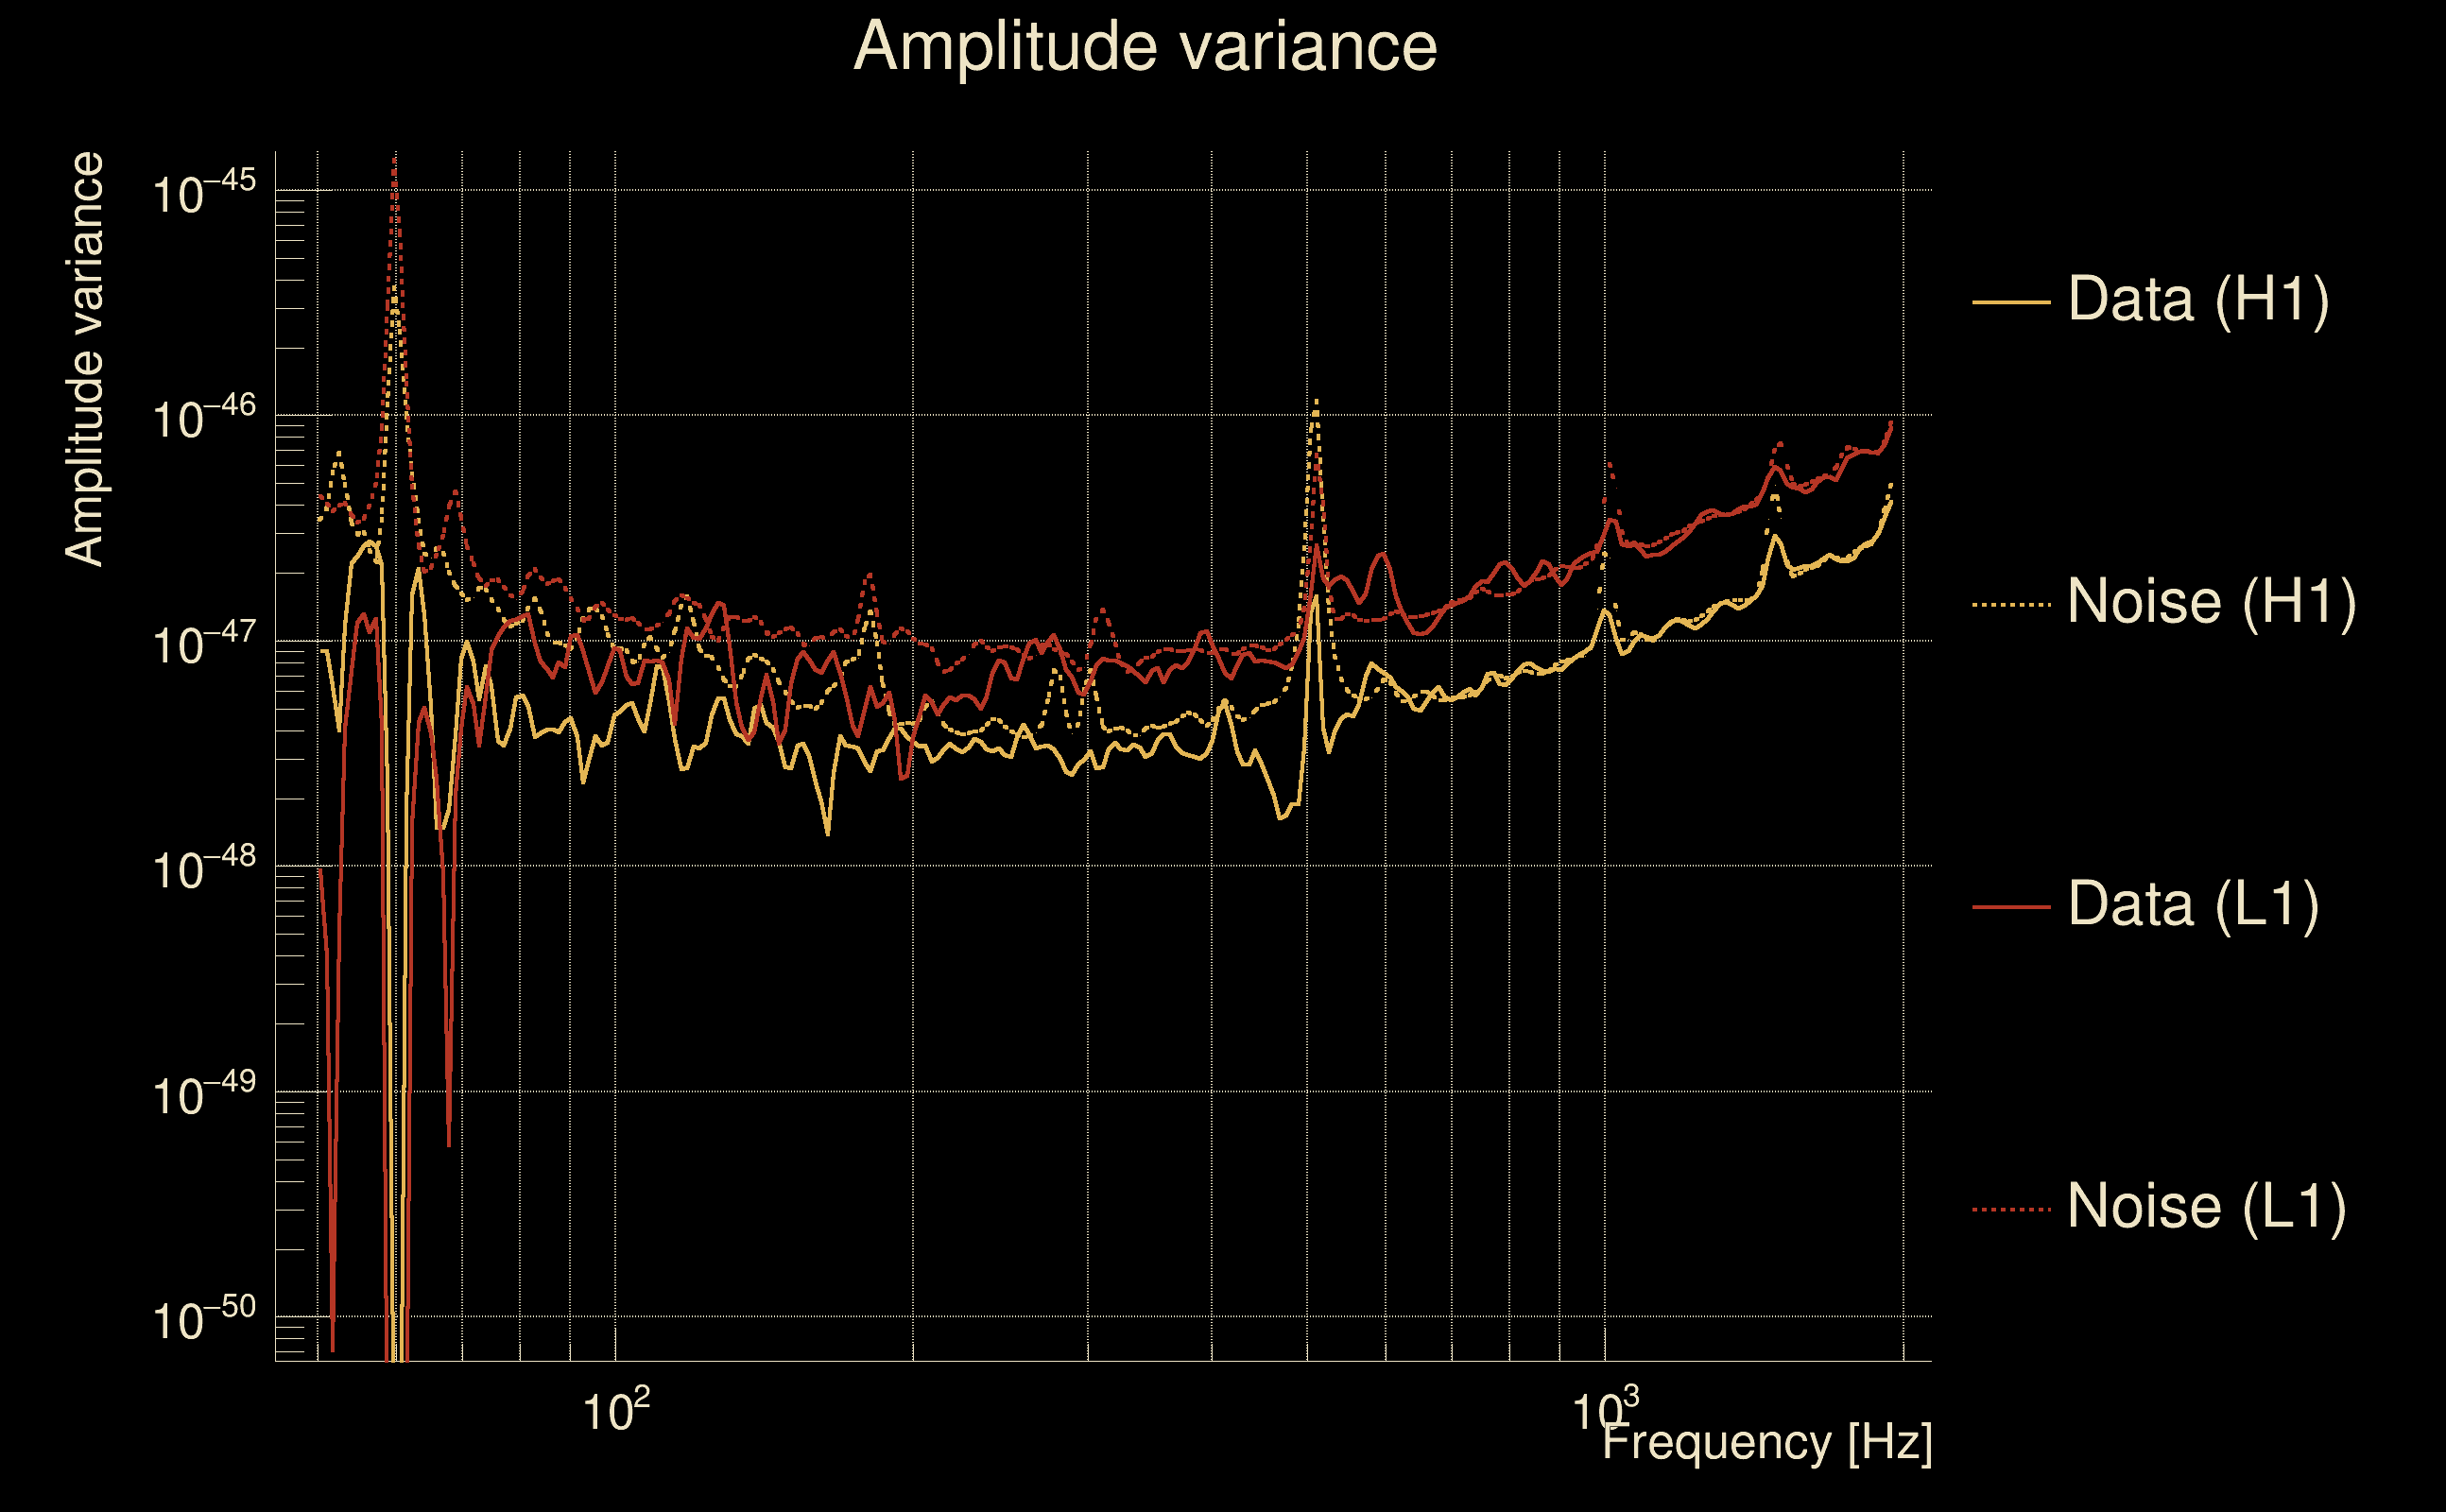
| Amplitude spectrograms: | normalization = 1e-22, power index = 2 |
| White noise SNR variance: | 0.523175 (after applying a correction factor = 1) |
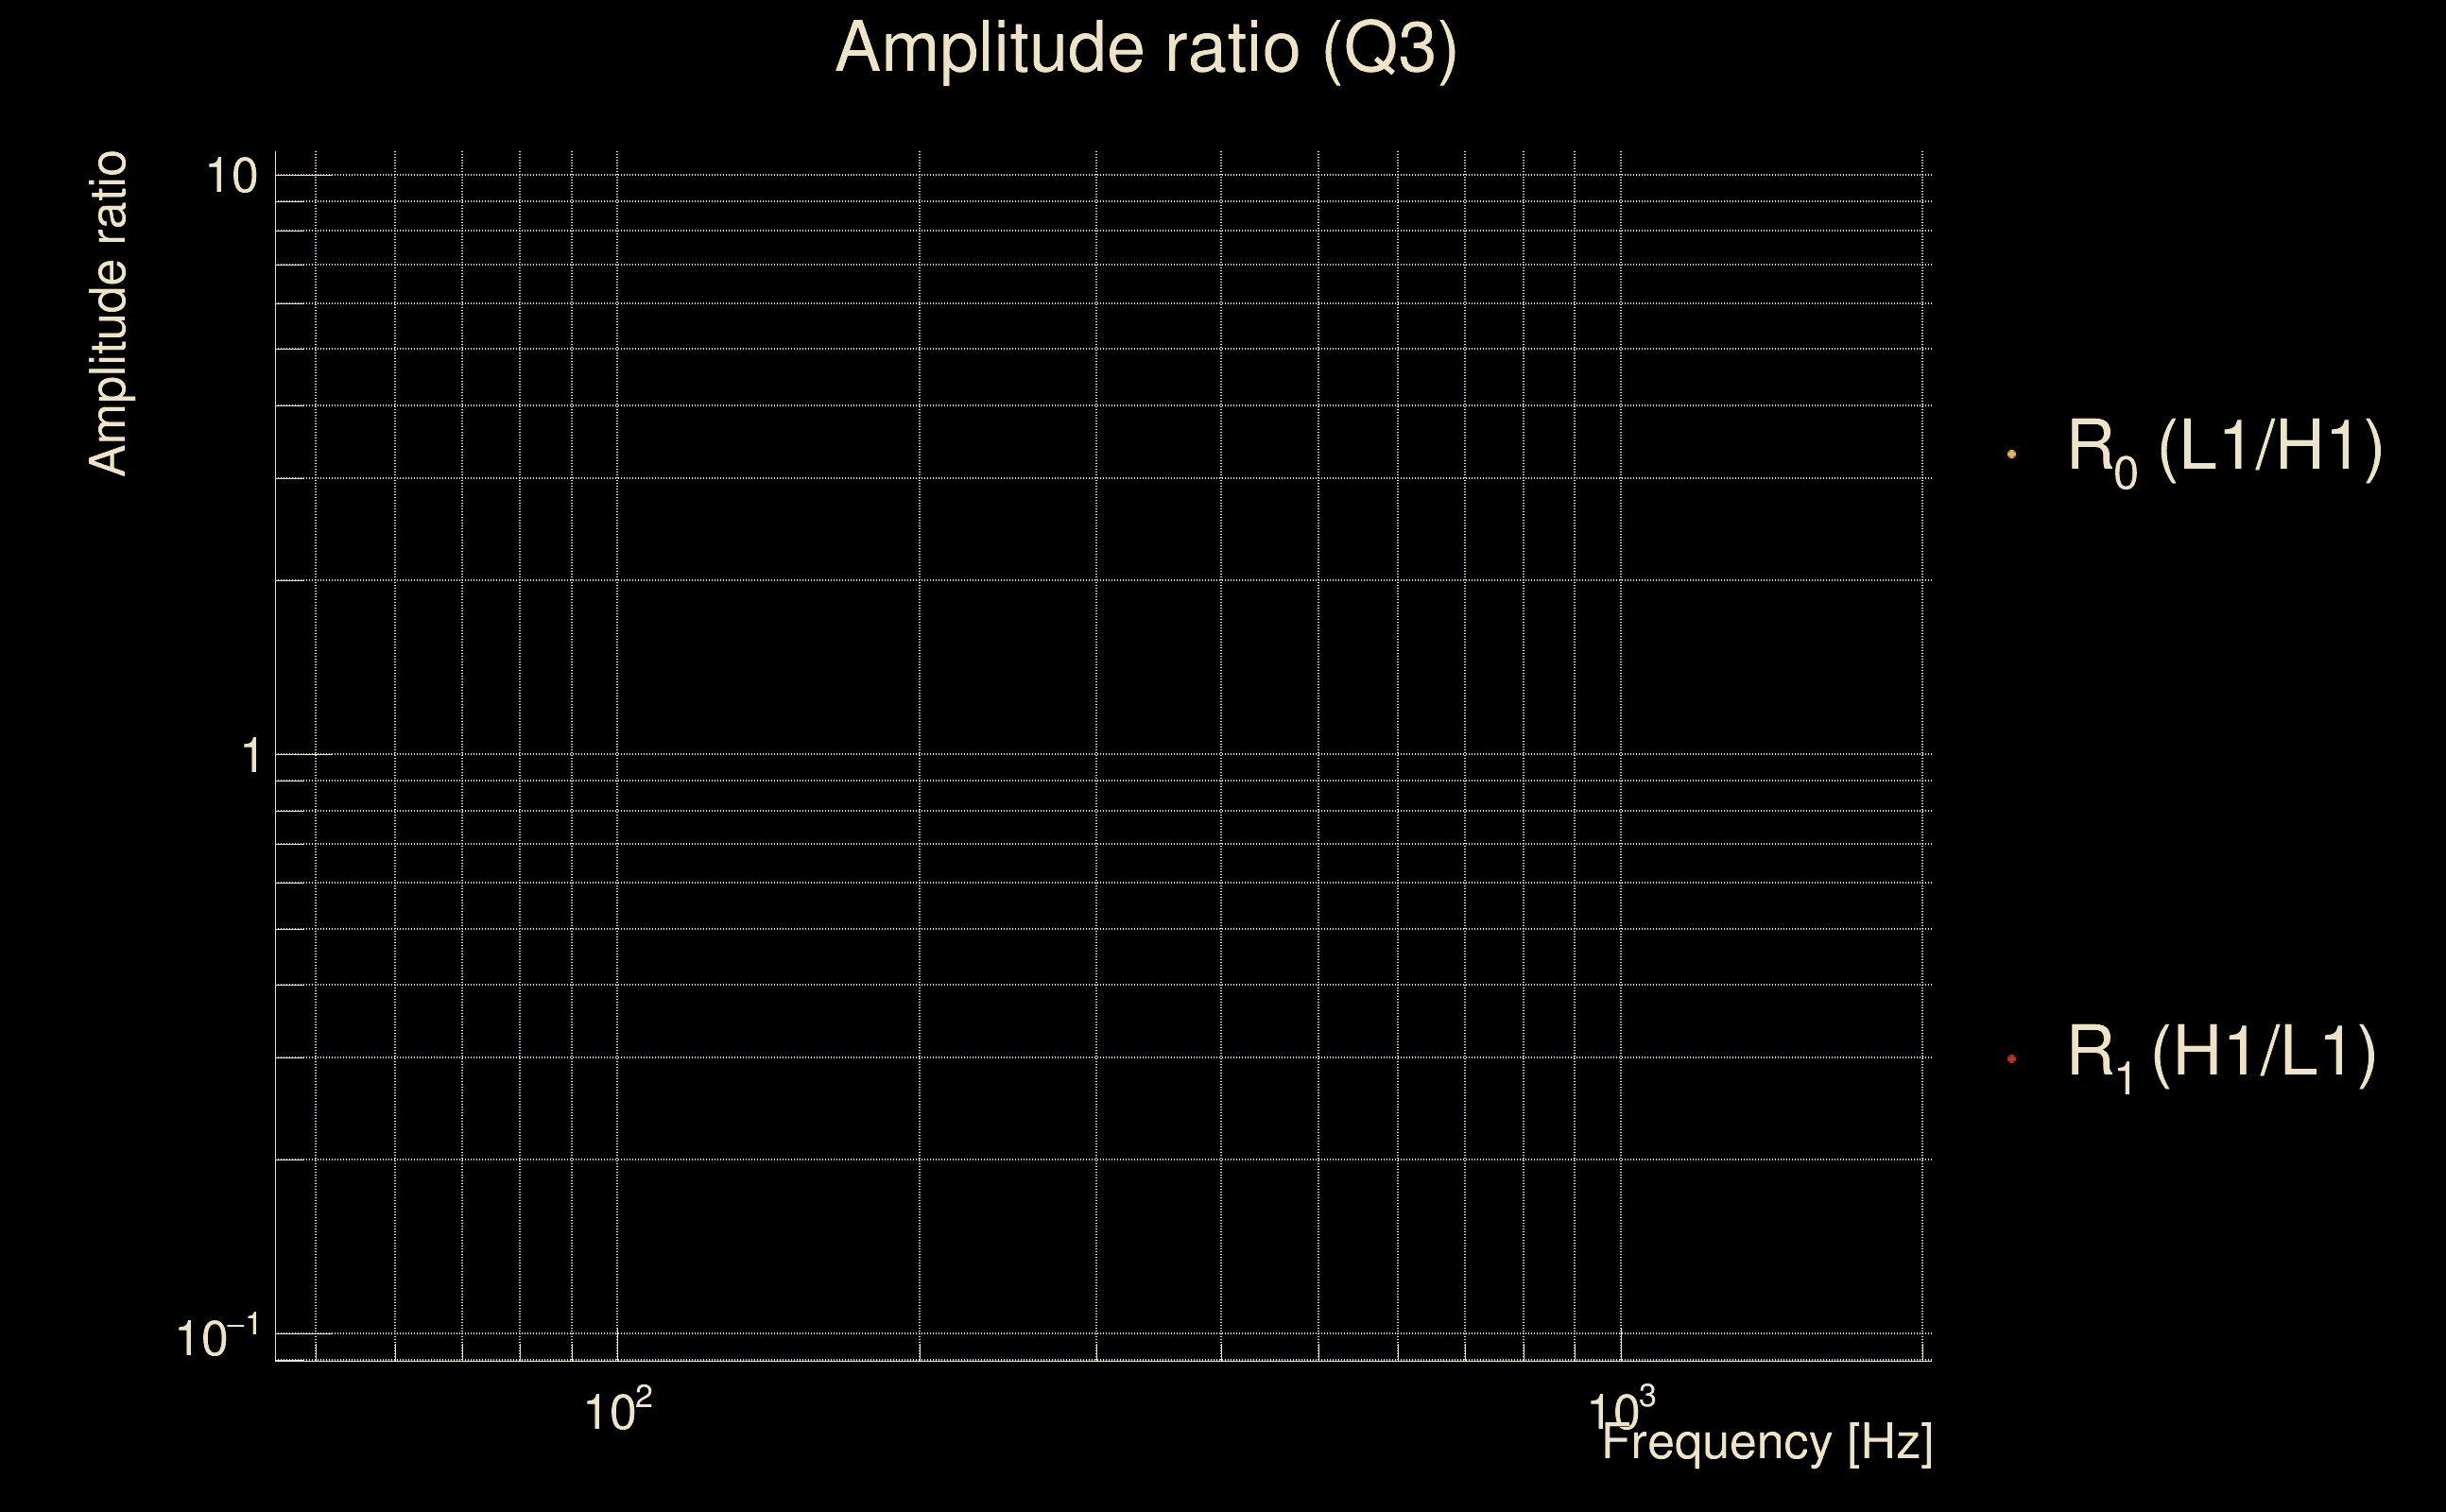
| Amplitude ratio confidence level: | 3 sigma |
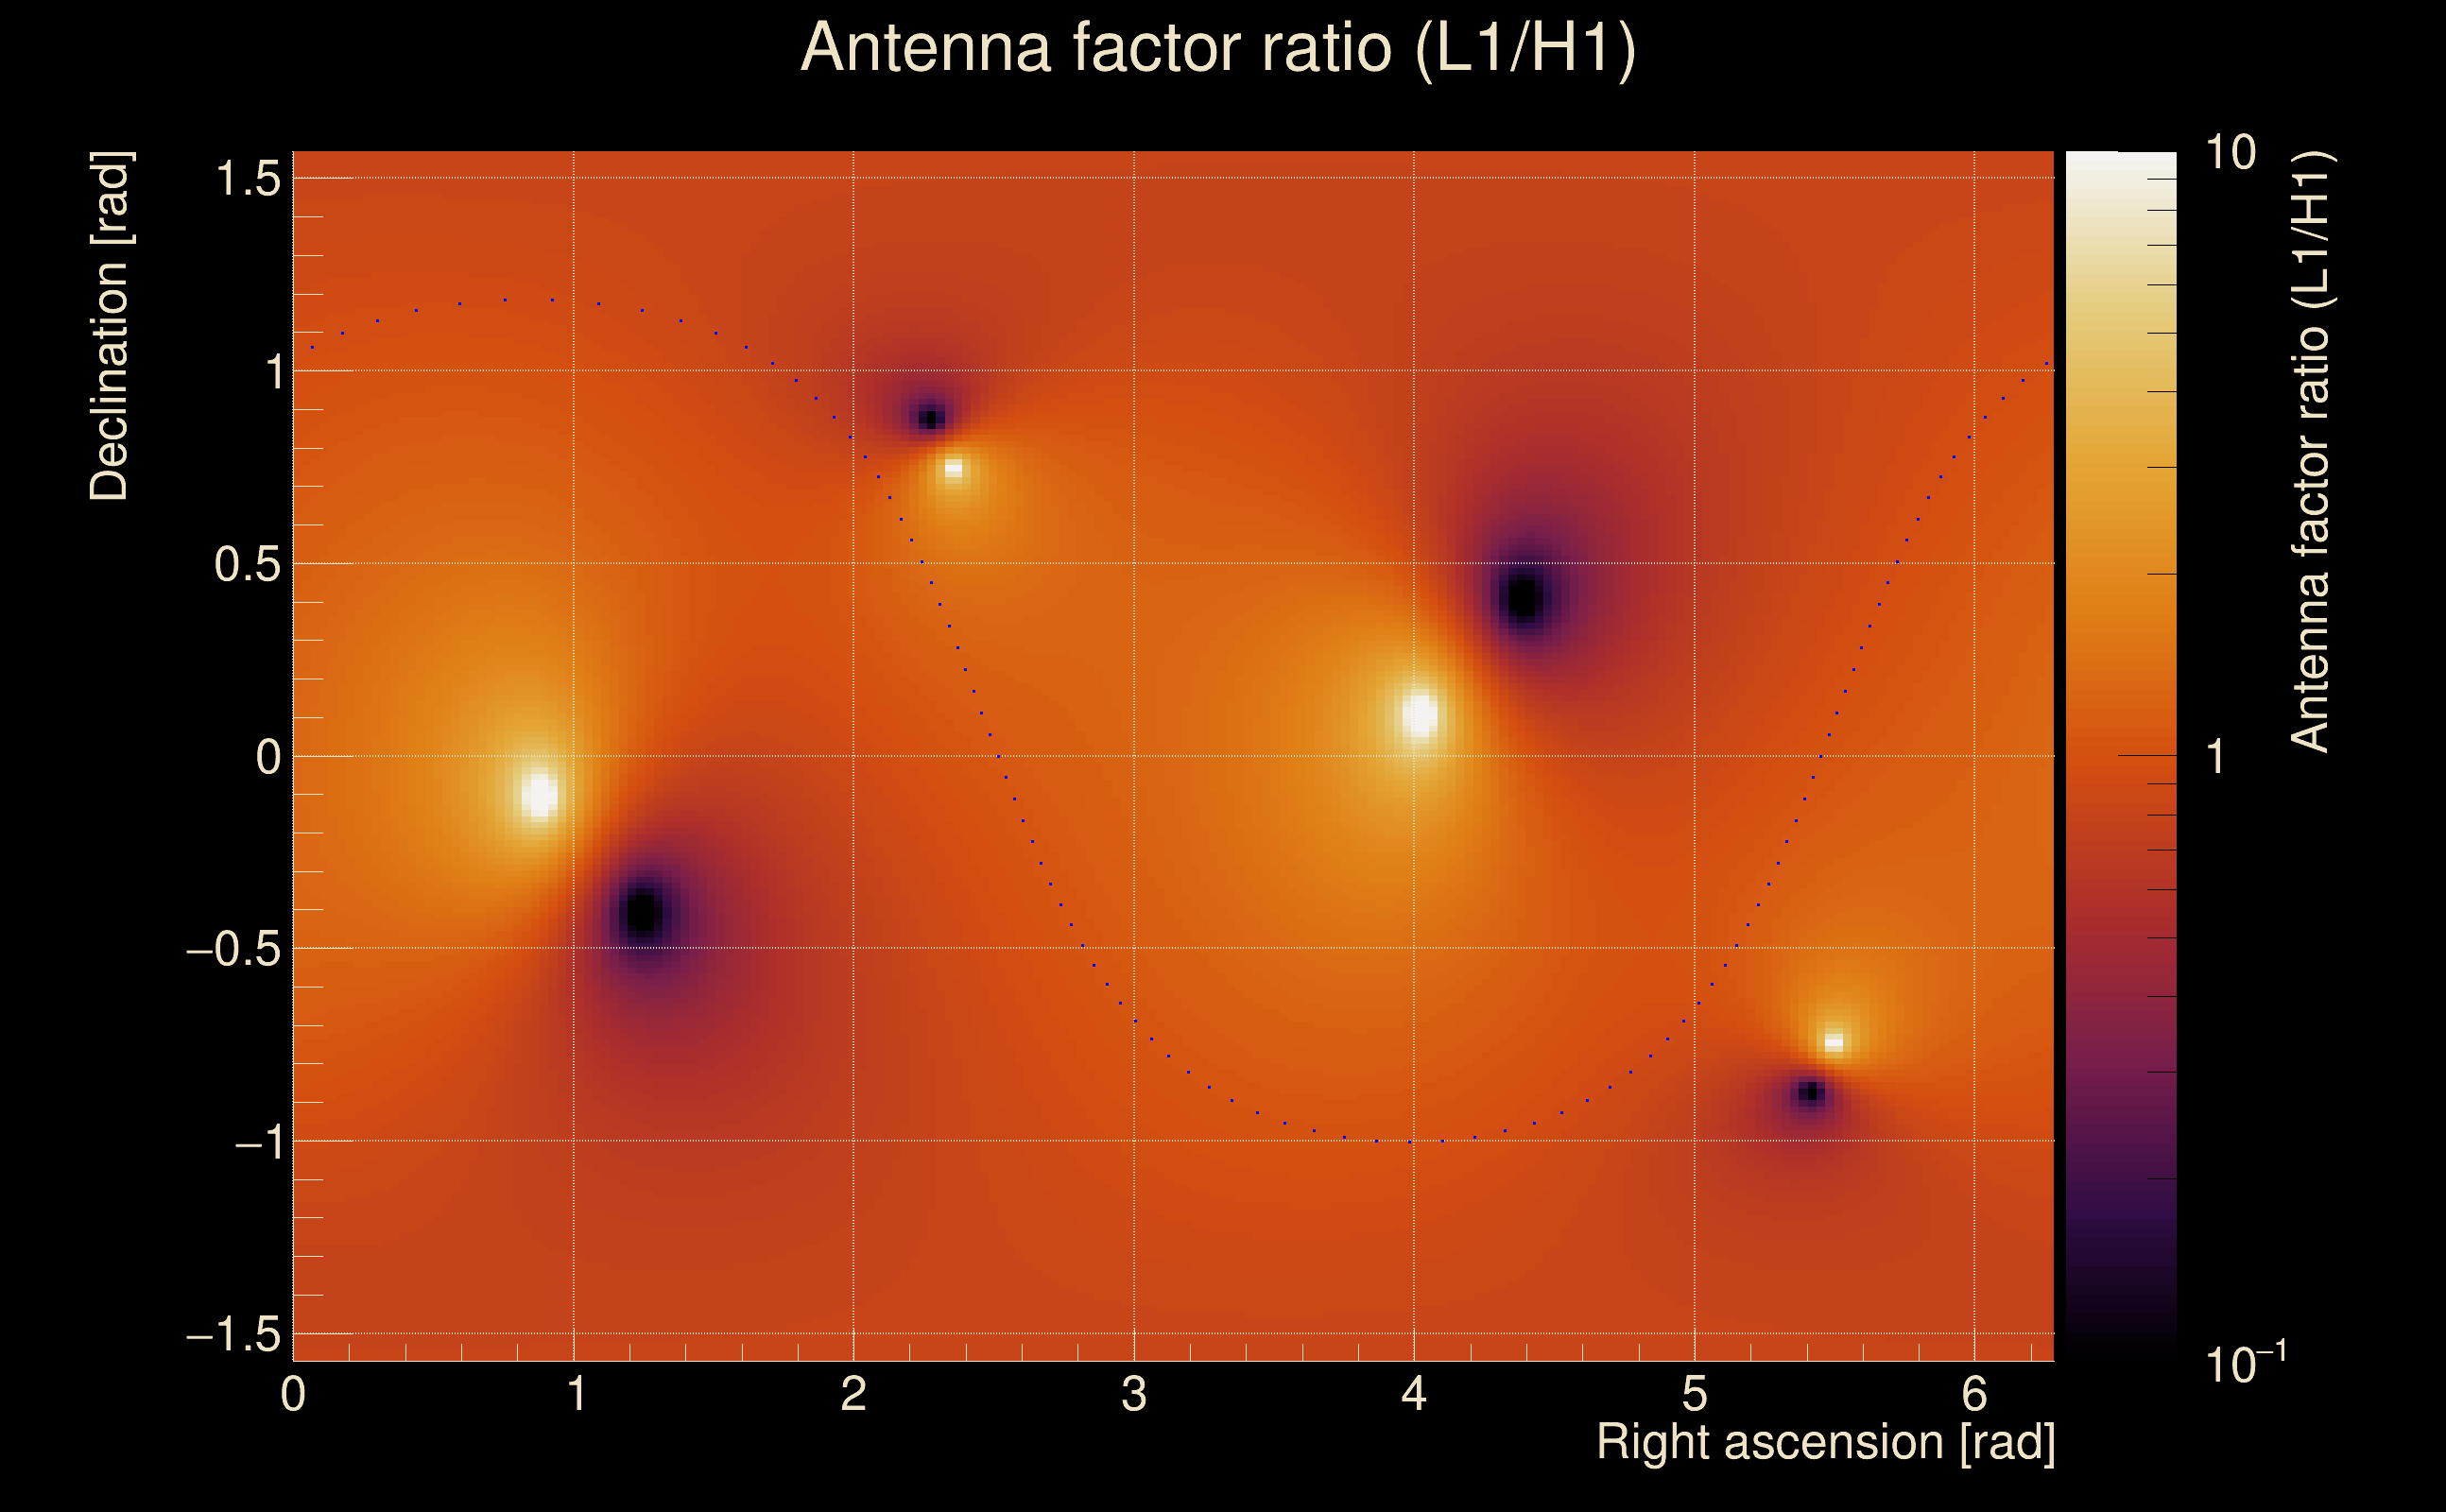
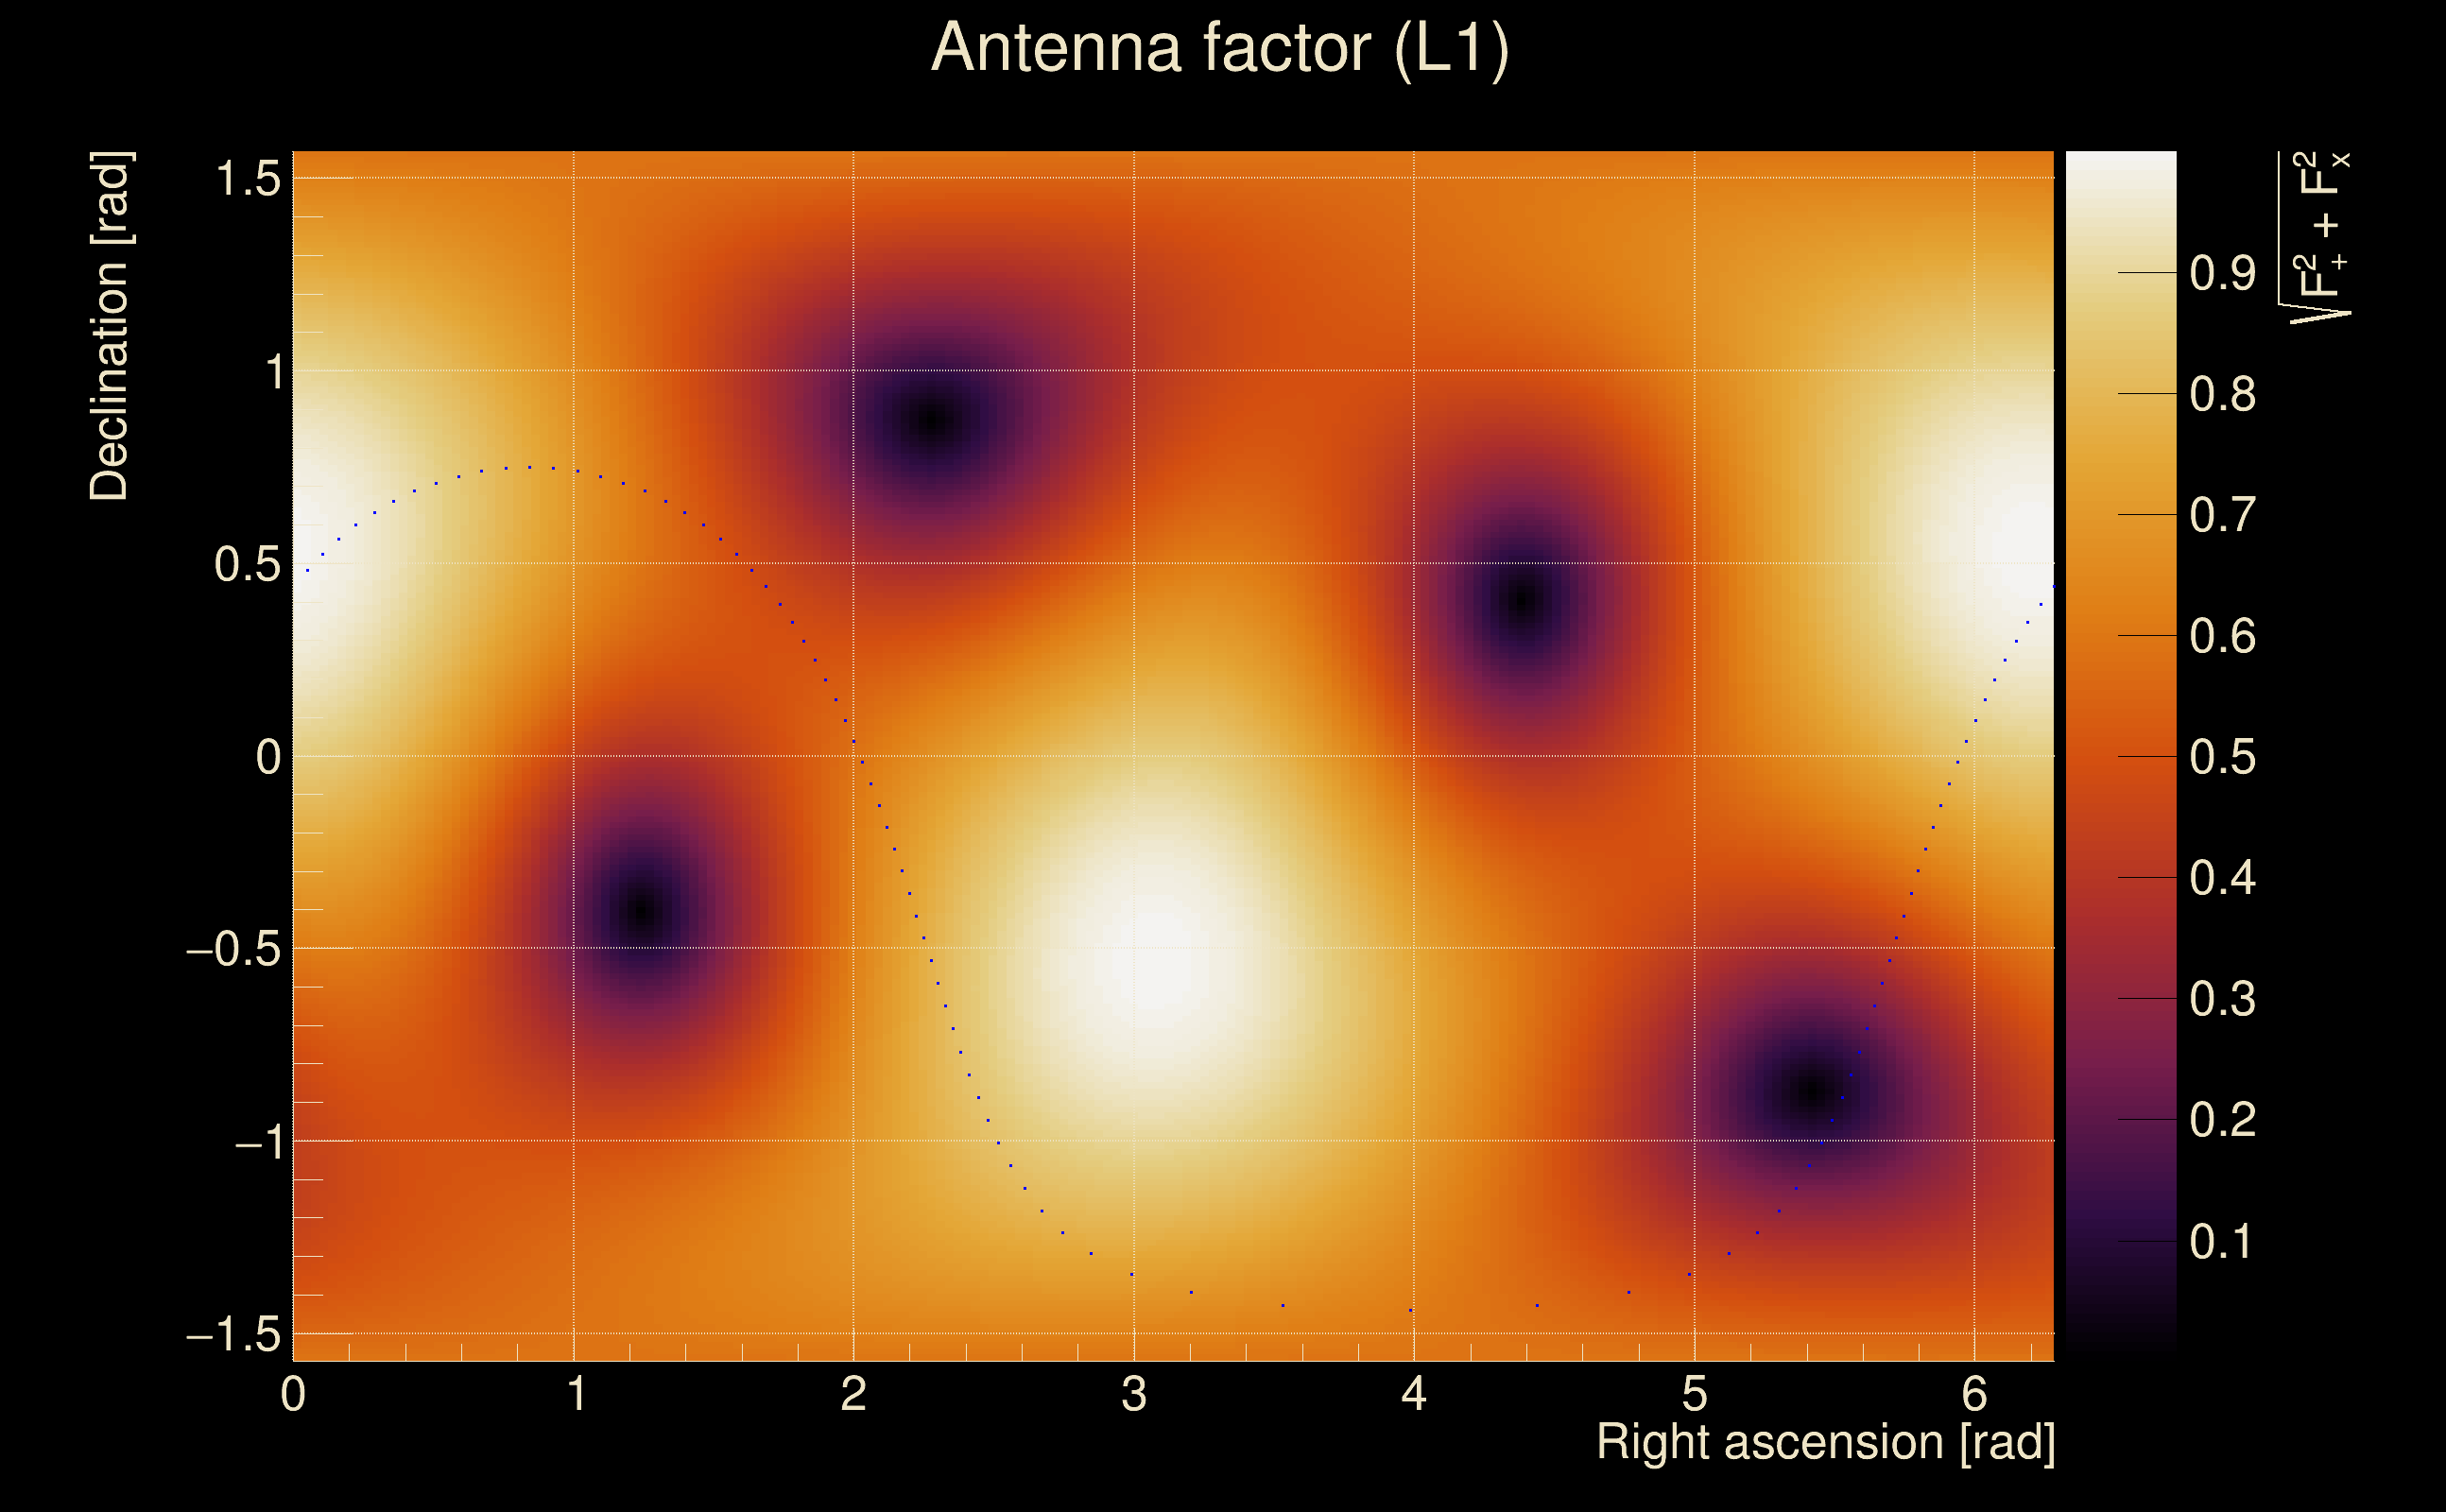
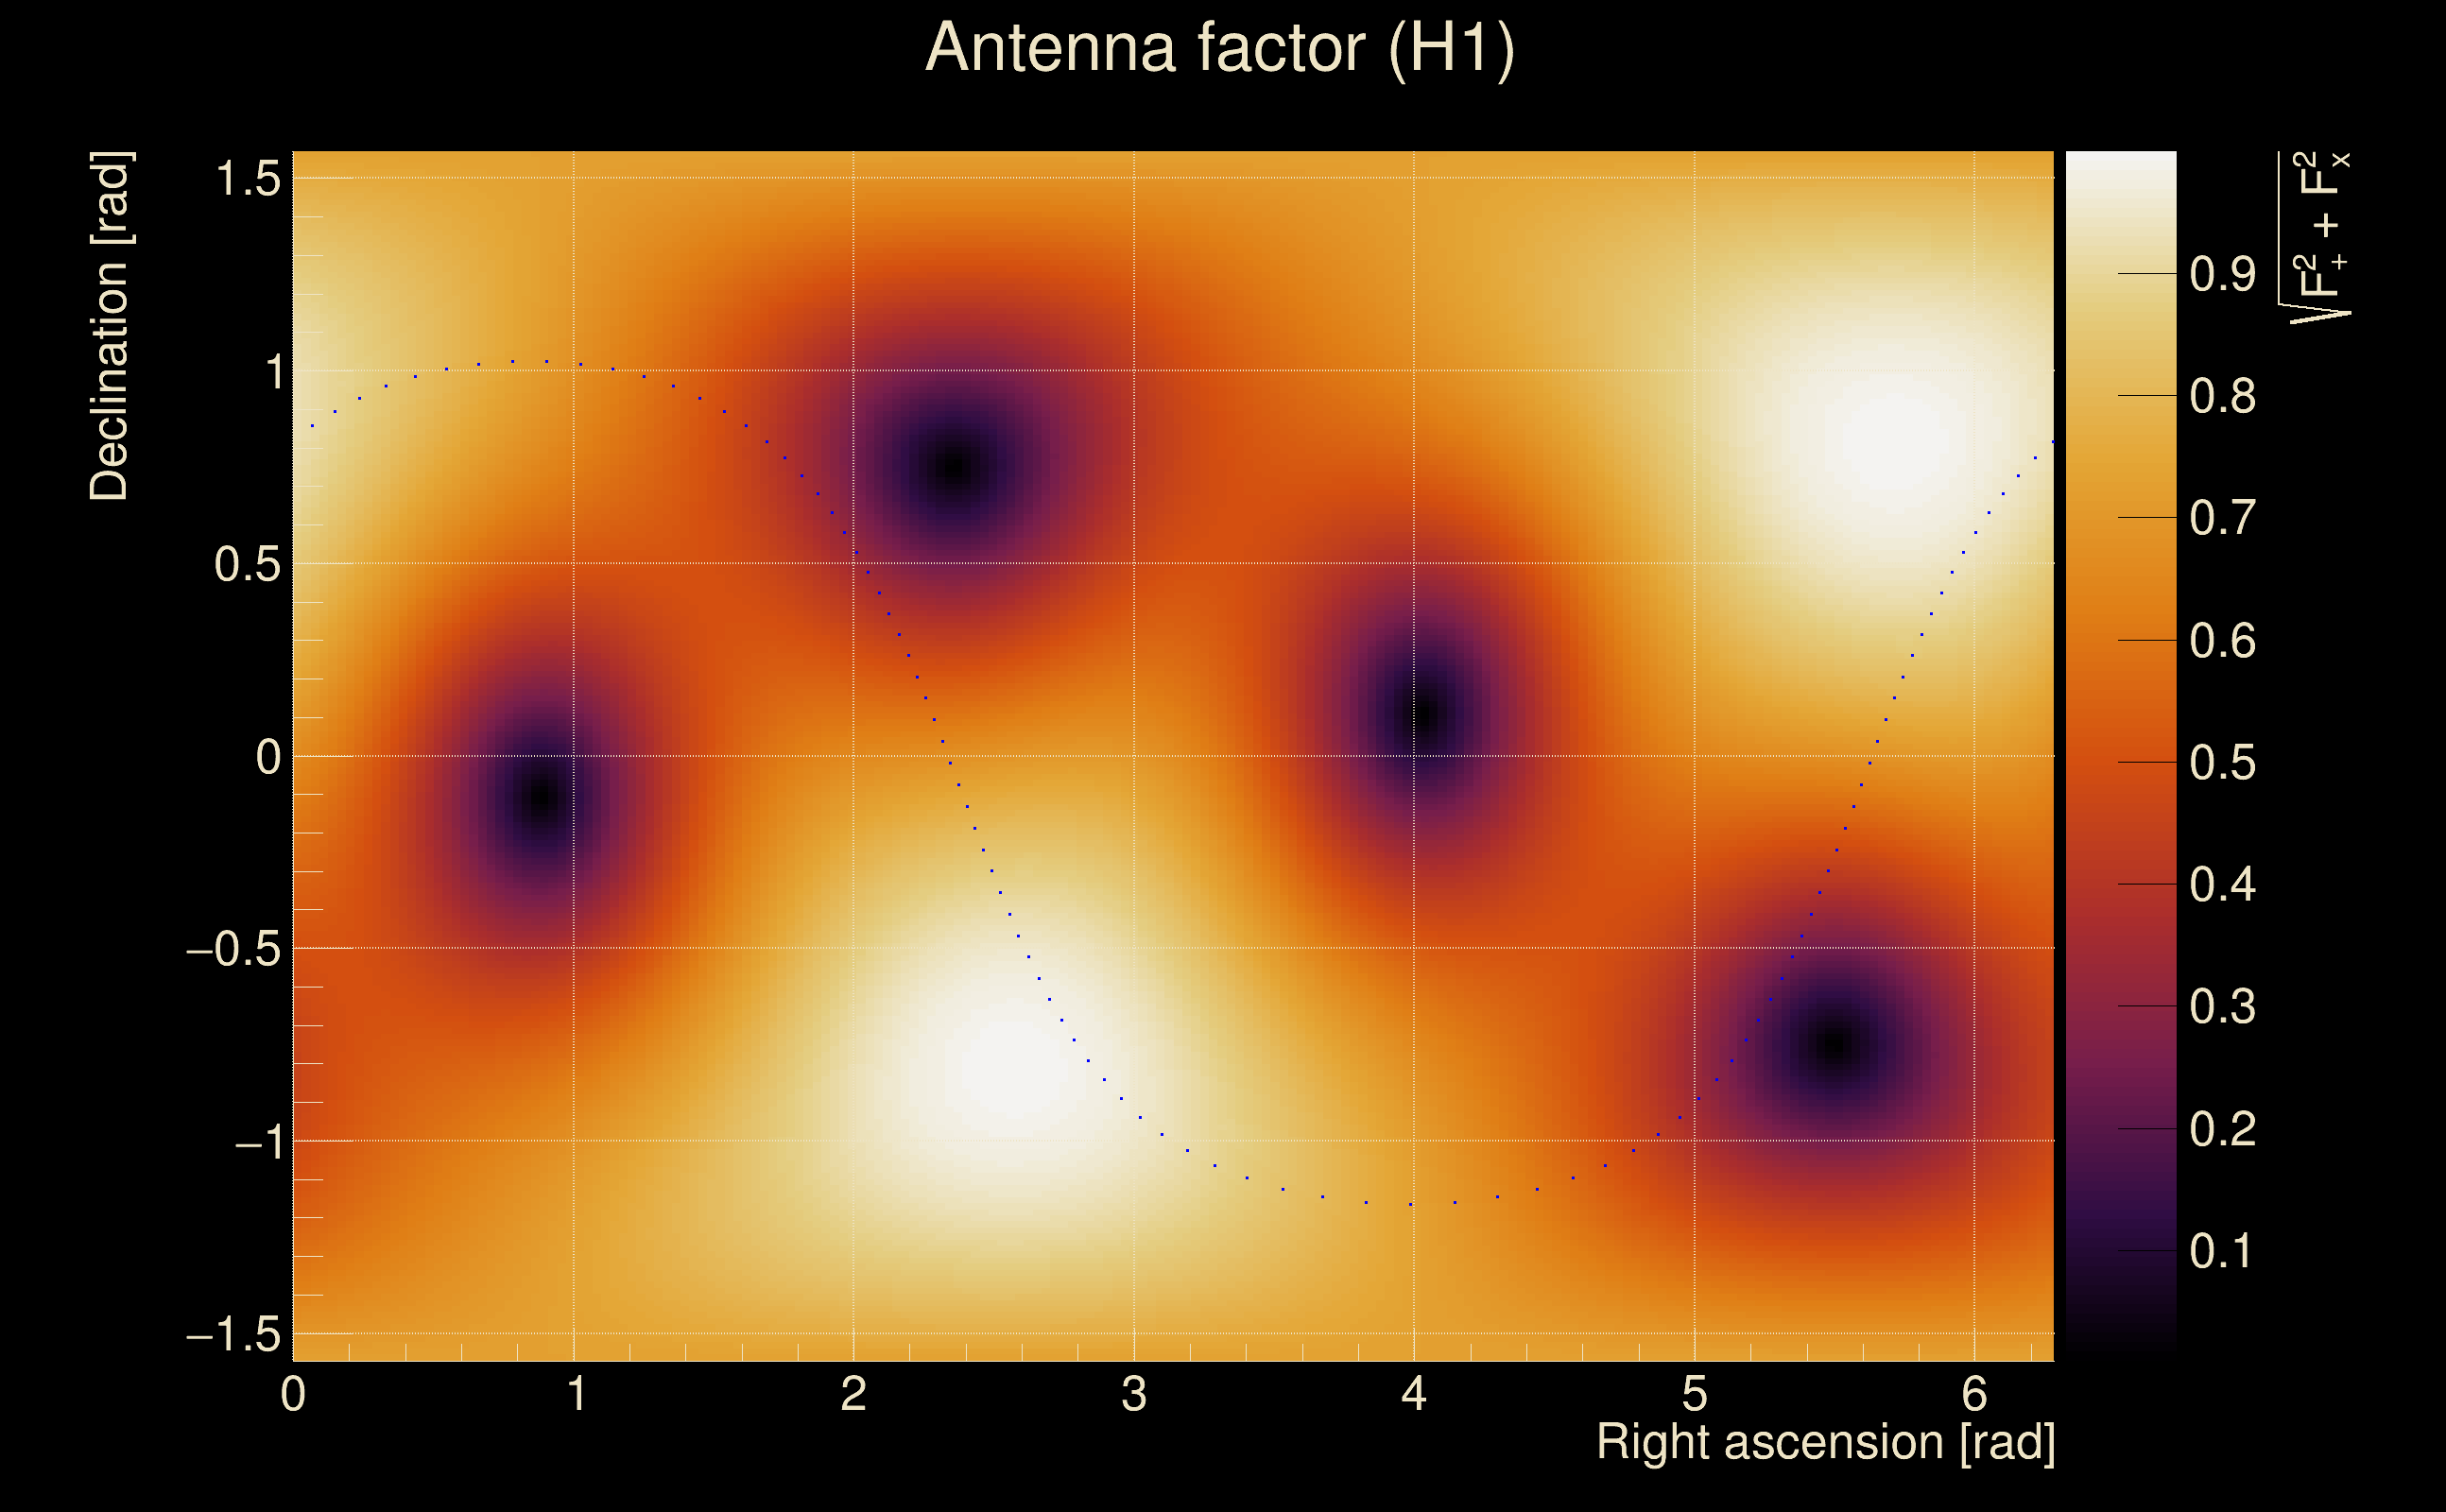
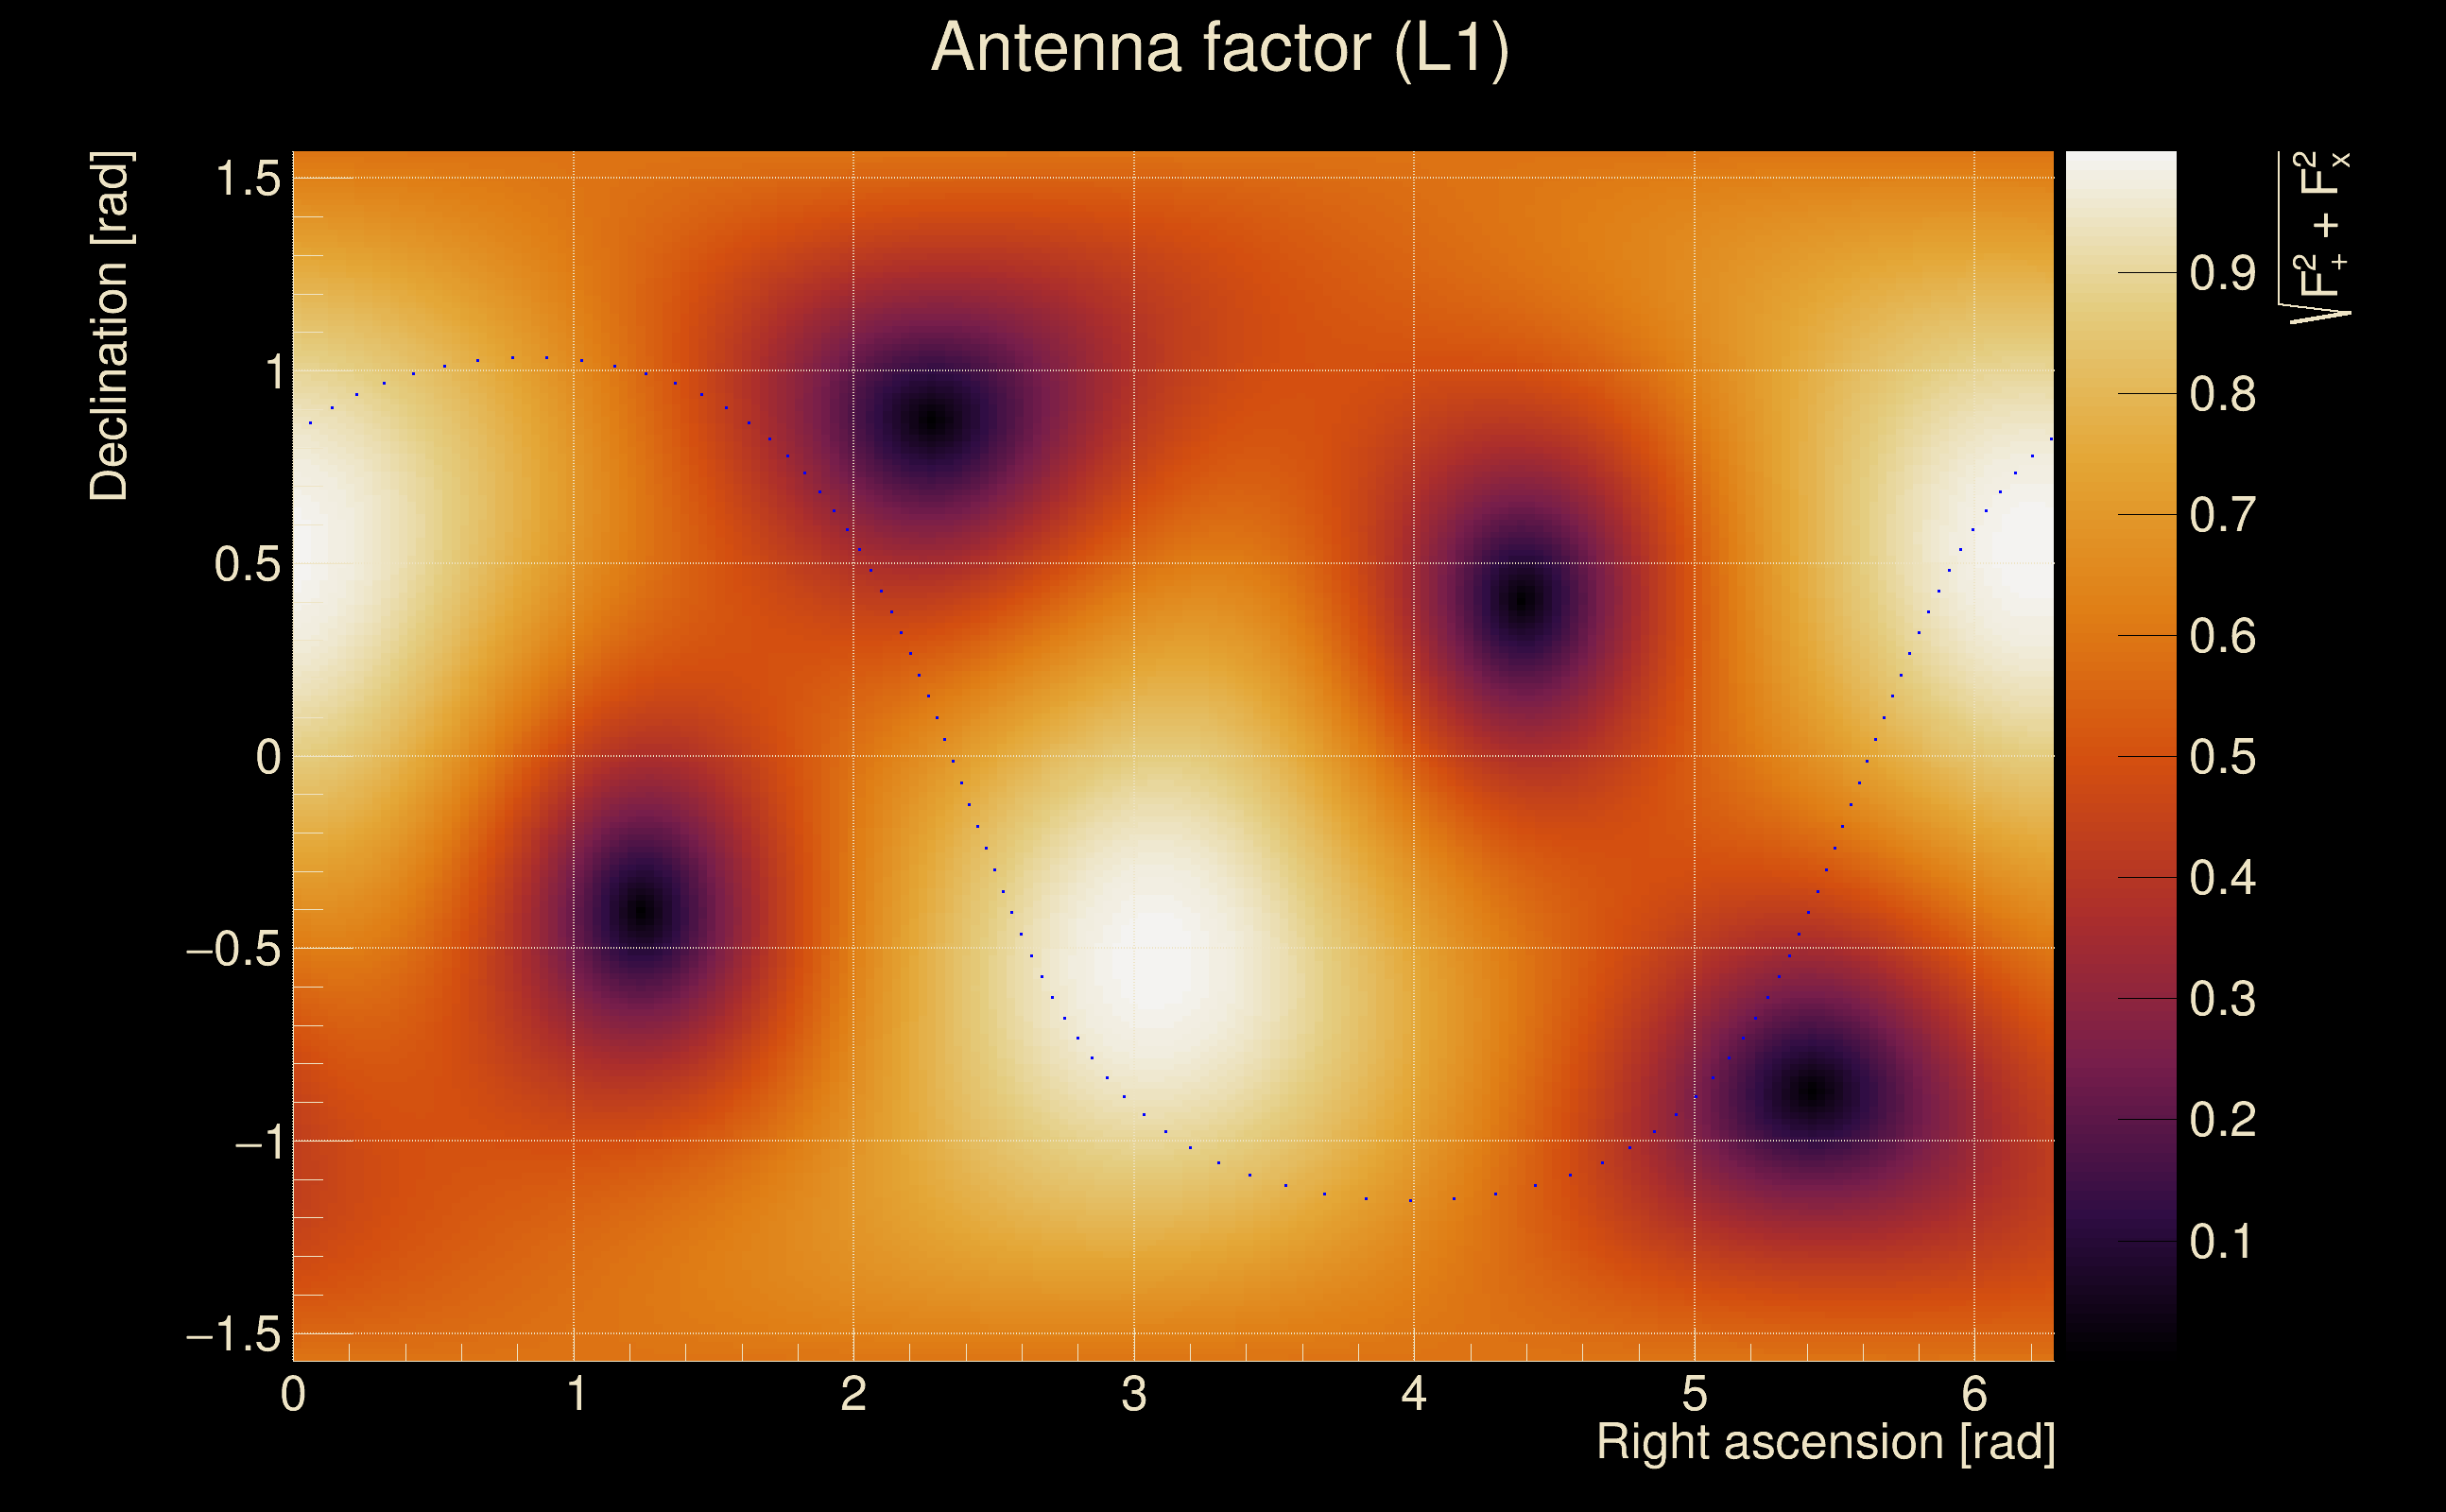
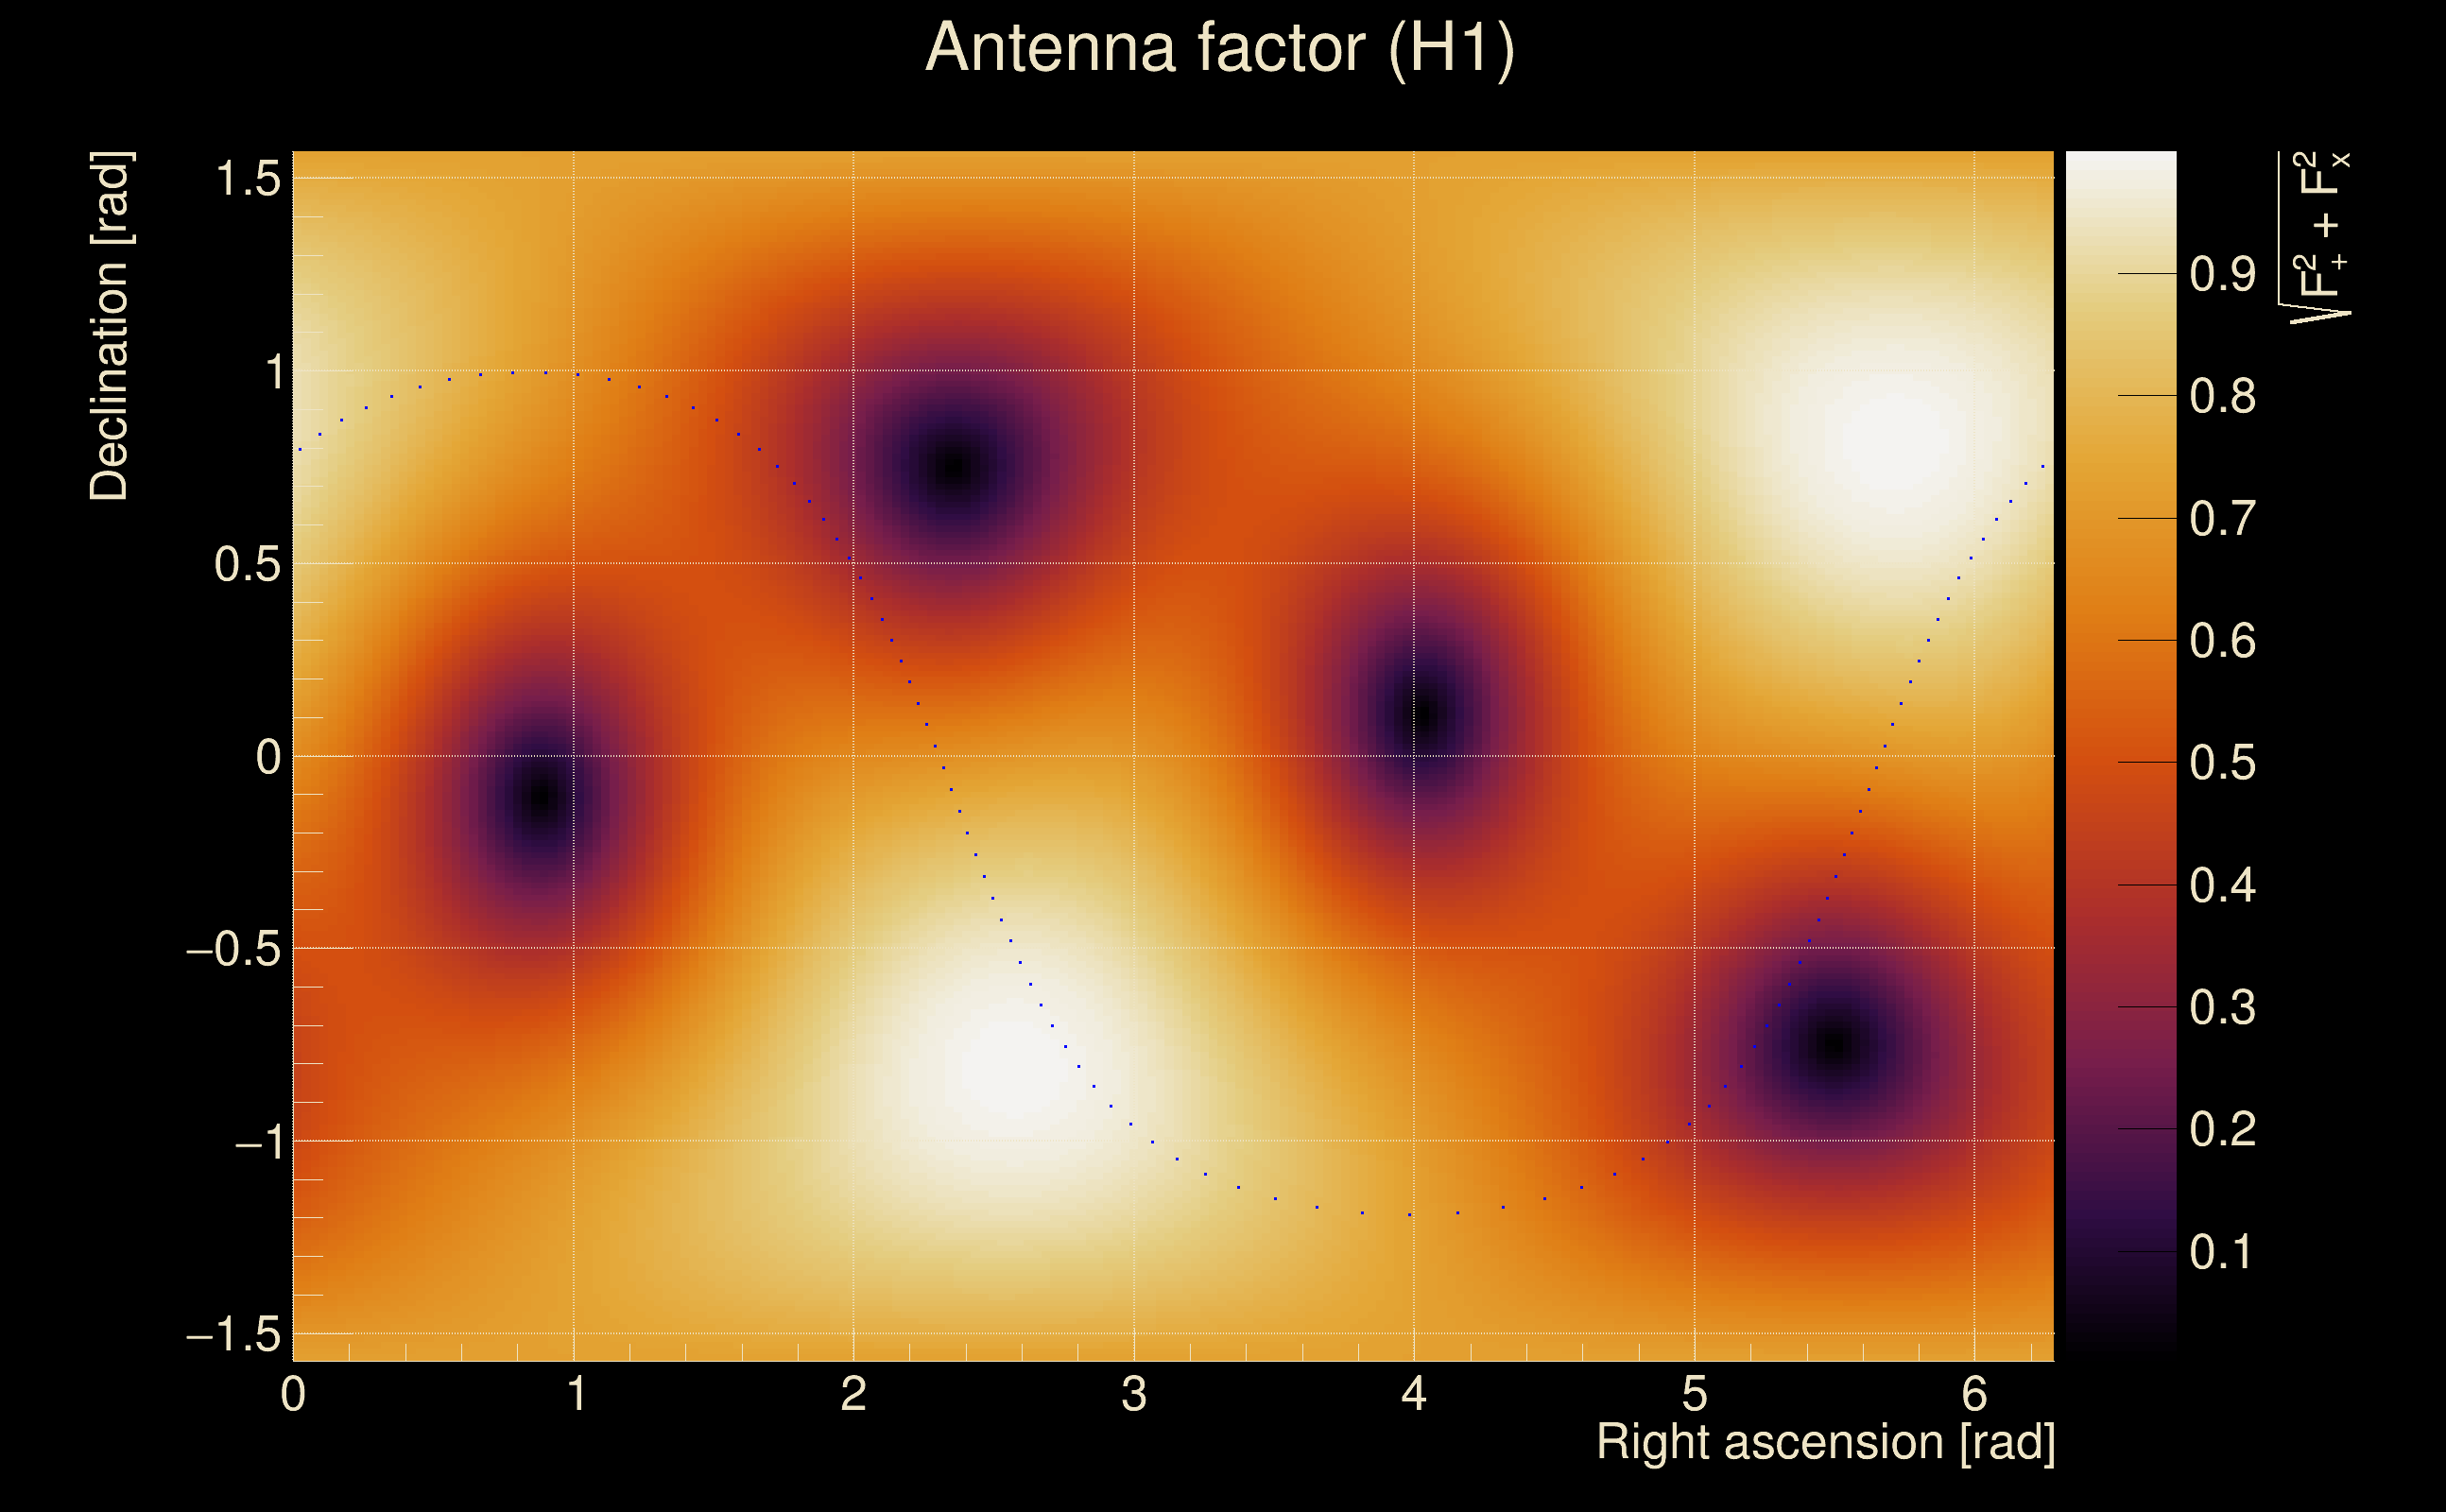
| Target sky positon: | Ra: 3.68109, Dec: 0.94792 [rad] |
| List of input Ox files: | Targeted_O4bw_2min_file_list.txt (1 files) |
| Analysis result file: | Targeted_O4bw_2min_results-1.root |
| Slice selected for the the fakeground: | slice index=57 (2.346 s), time lag = 0 s |
| Foreground | Fakeground | Background | ||
|---|---|---|---|---|
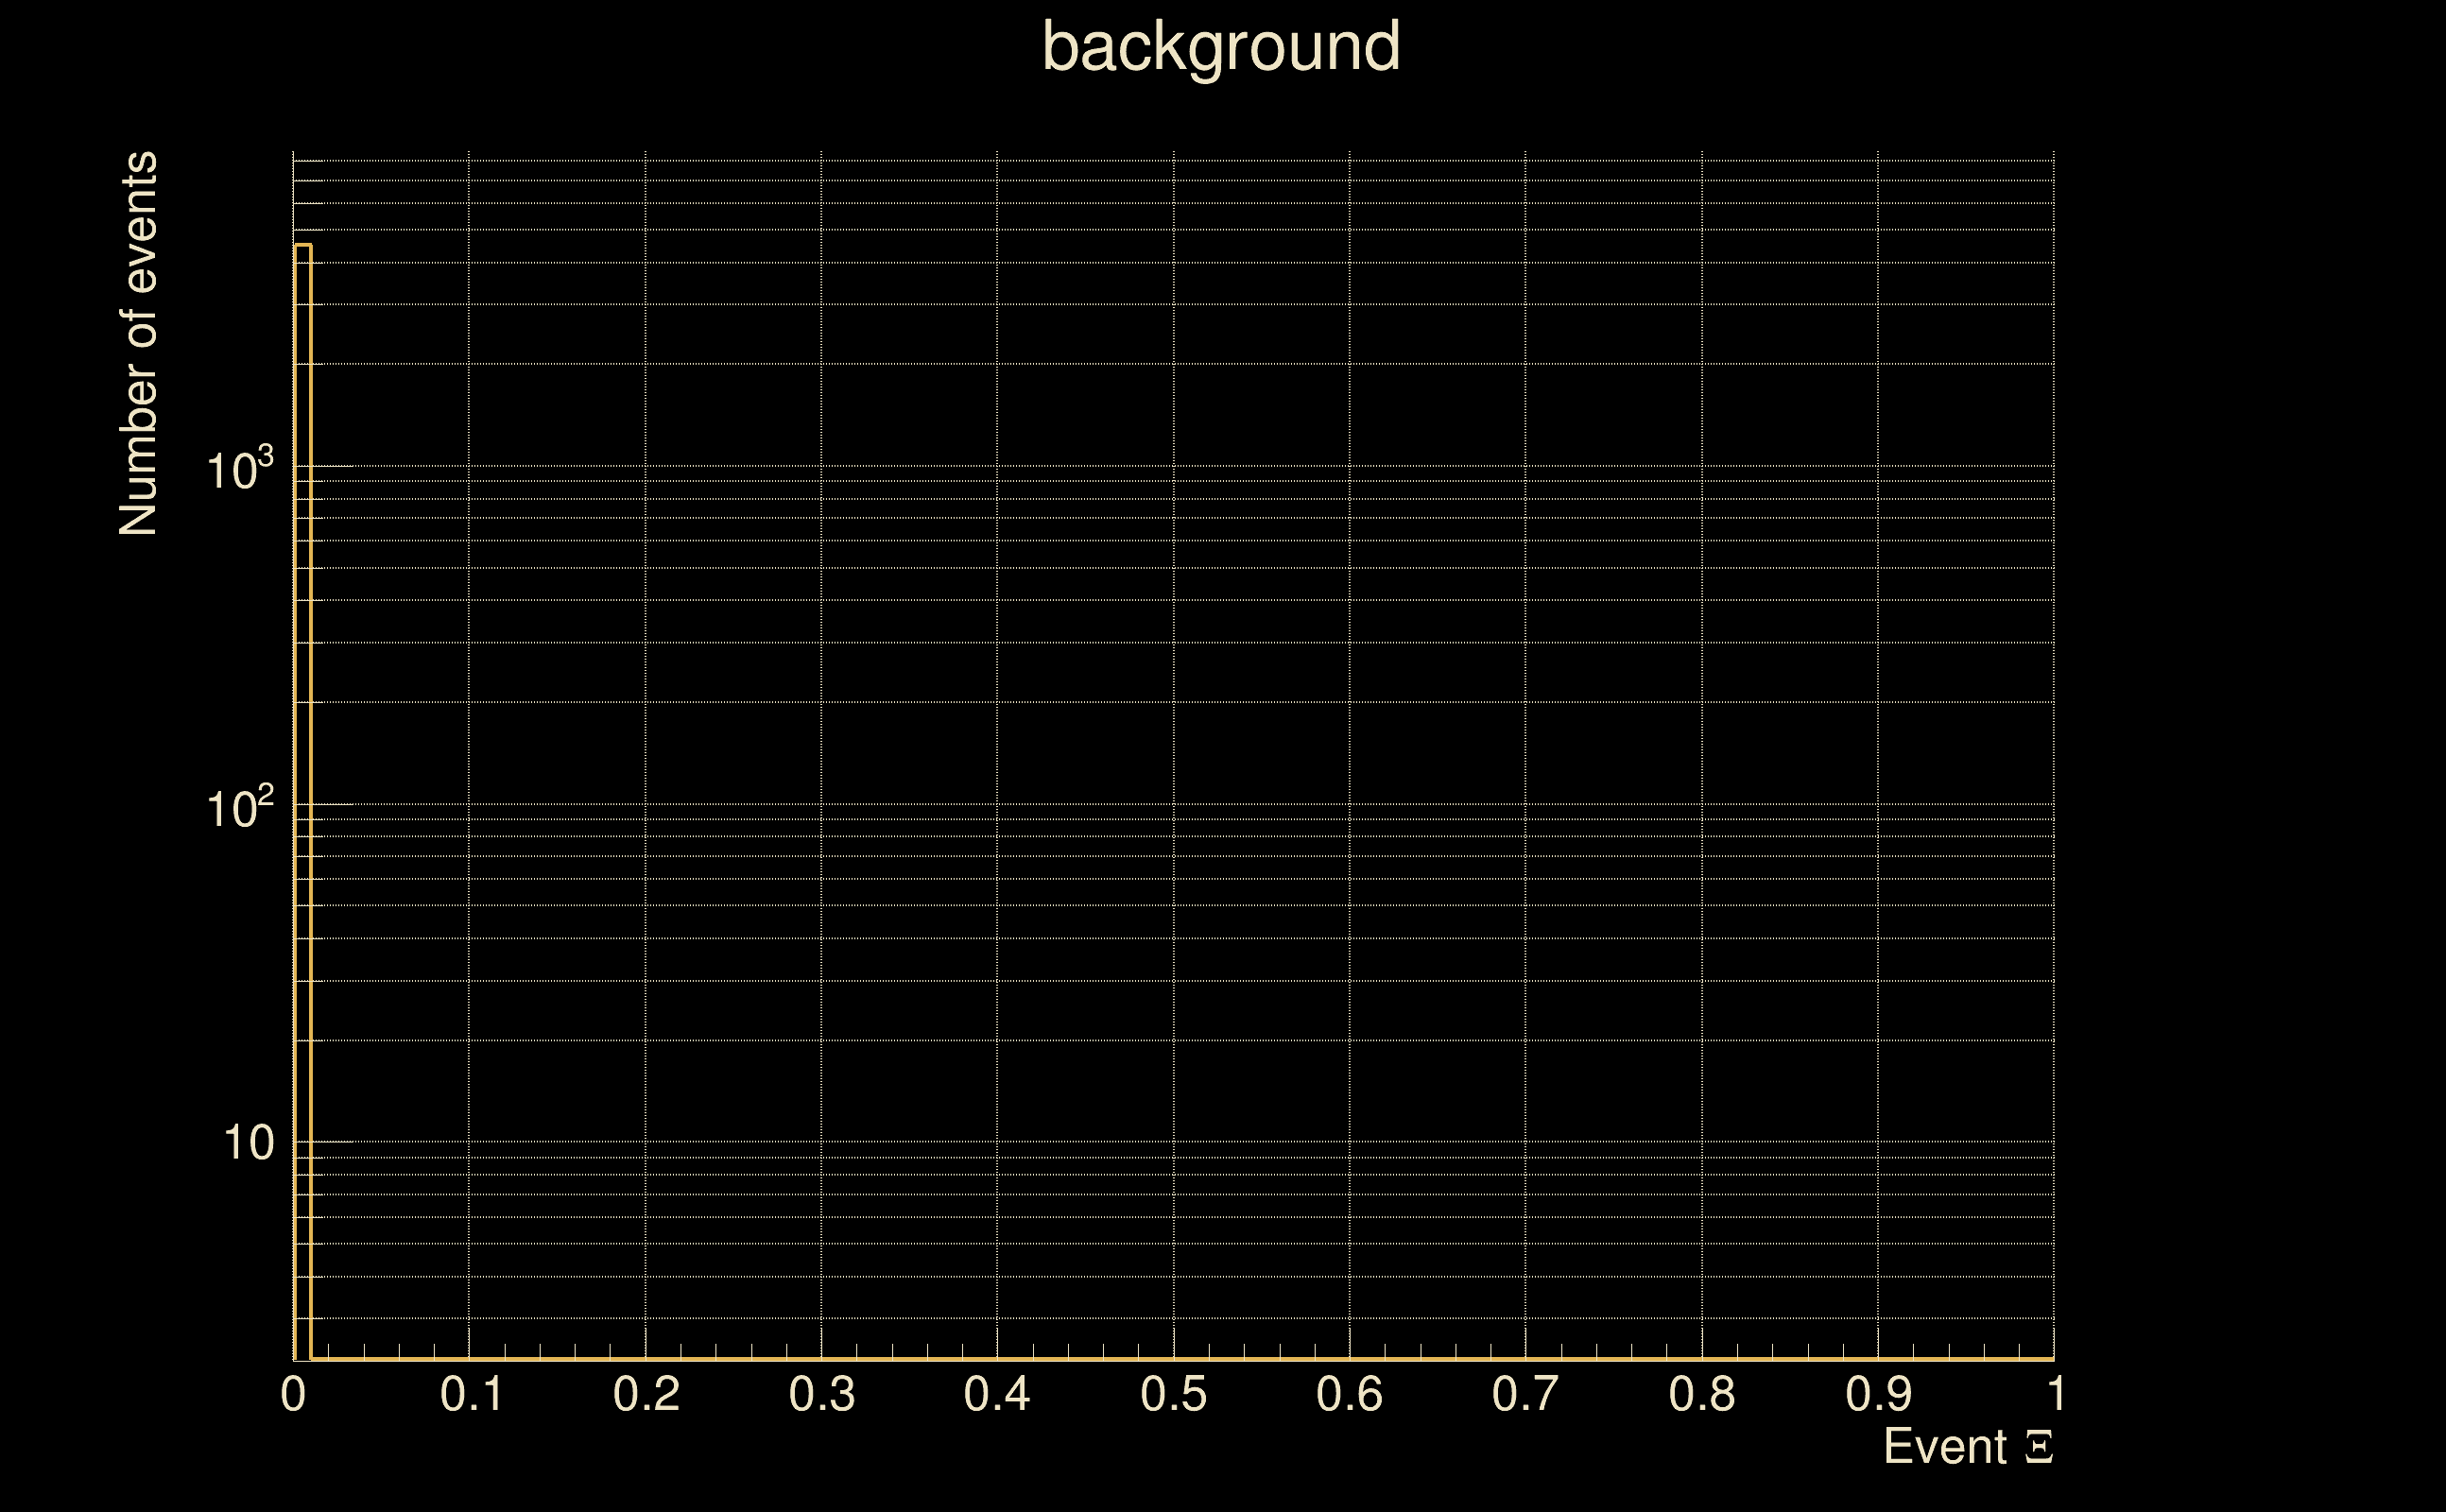
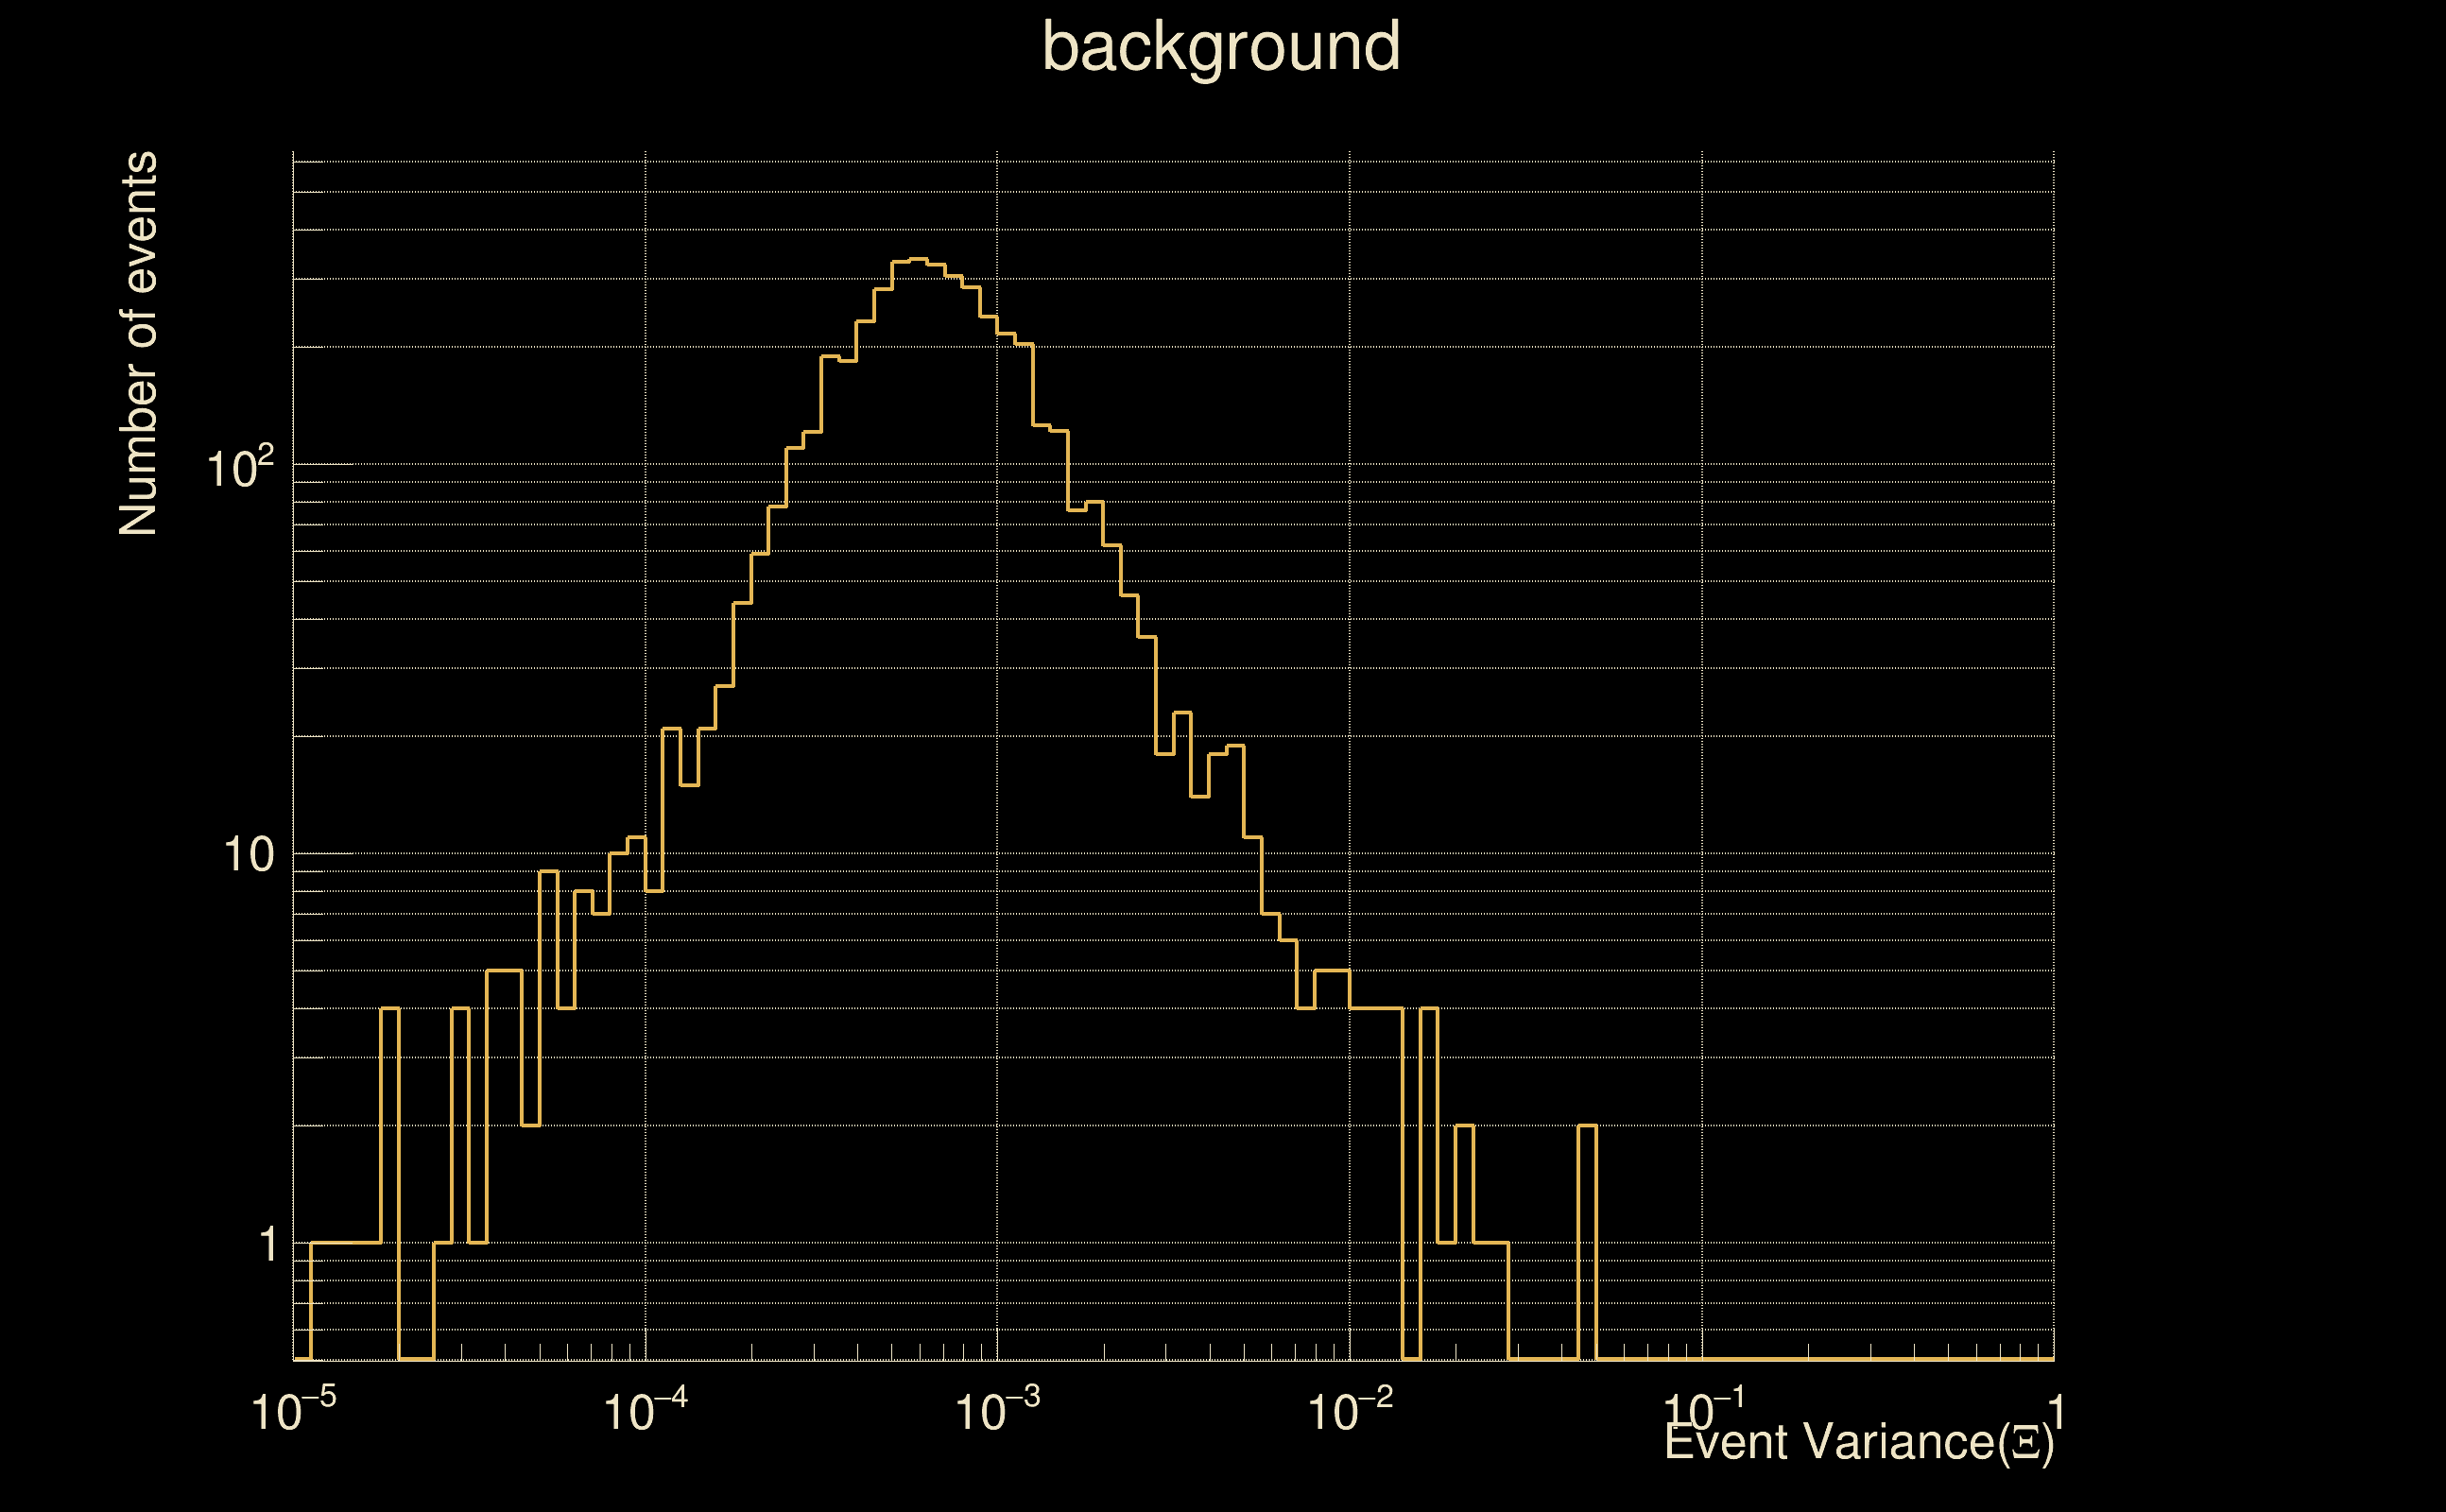
| Number of processed ox events | 21 | 21 | 4515 | |
| Start Date (detector 0) | Mon May 15 14:13:25 2023 UTC | Mon May 15 14:13:25 2023 UTC | Mon May 15 14:13:25 2023 UTC | |
| End Date (detector 0) | Mon May 15 14:15:15 2023 UTC | Mon May 15 14:15:15 2023 UTC | Mon May 15 14:15:15 2023 UTC | |
| Start GPS (detector 0) | 1368195223 | 1368195223 | 1368195223 | |
| End GPS (detector 0) | 1368195333 | 1368195333 | 1368195333 | |
| Used livetime (detector 0) | 110 s | 110 s | 110 s | |
| Start Date (detector 1) | Mon May 15 14:13:25 2023 UTC | Mon May 15 14:13:25 2023 UTC | Mon May 15 14:13:25 2023 UTC | |
| End Date (detector 1) | Mon May 15 14:15:15 2023 UTC | Mon May 15 14:15:15 2023 UTC | Mon May 15 14:15:15 2023 UTC | |
| Start GPS (detector 1) | 1368195223 | 1368195223 | 1368195223 | |
| End GPS (detector 1) | 1368195333 | 1368195333 | 1368195333 | |
| Used livetime (detector 1) | 110 s | 110 s | 110 s | |
| Cumulative livetime | 210 s | 210 s | 45150 s | |
| 0 years, 0 days, 0 hours, 3 min, 30 s | 0 years, 0 days, 0 hours, 3 min, 30 s | 0 years, 0 days, 12 hours, 32 min, 30 s |
|
|
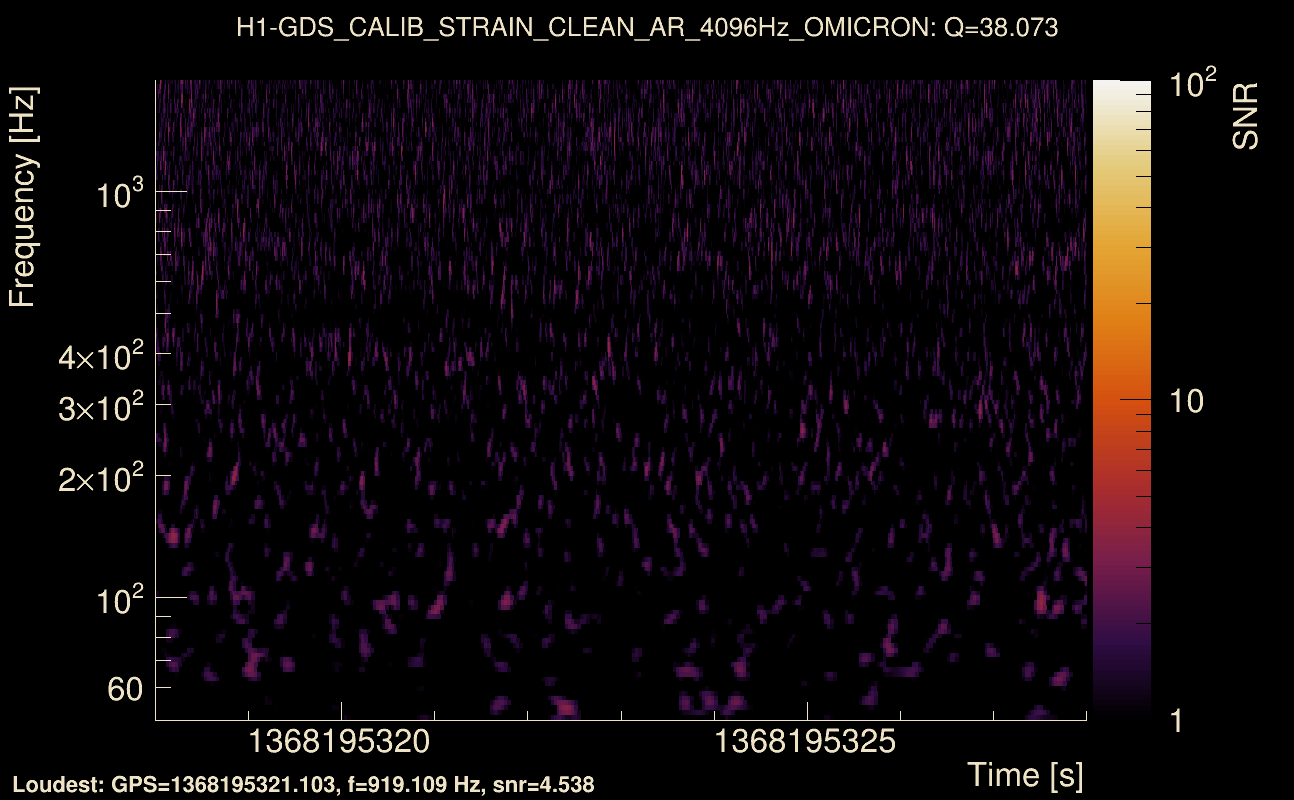
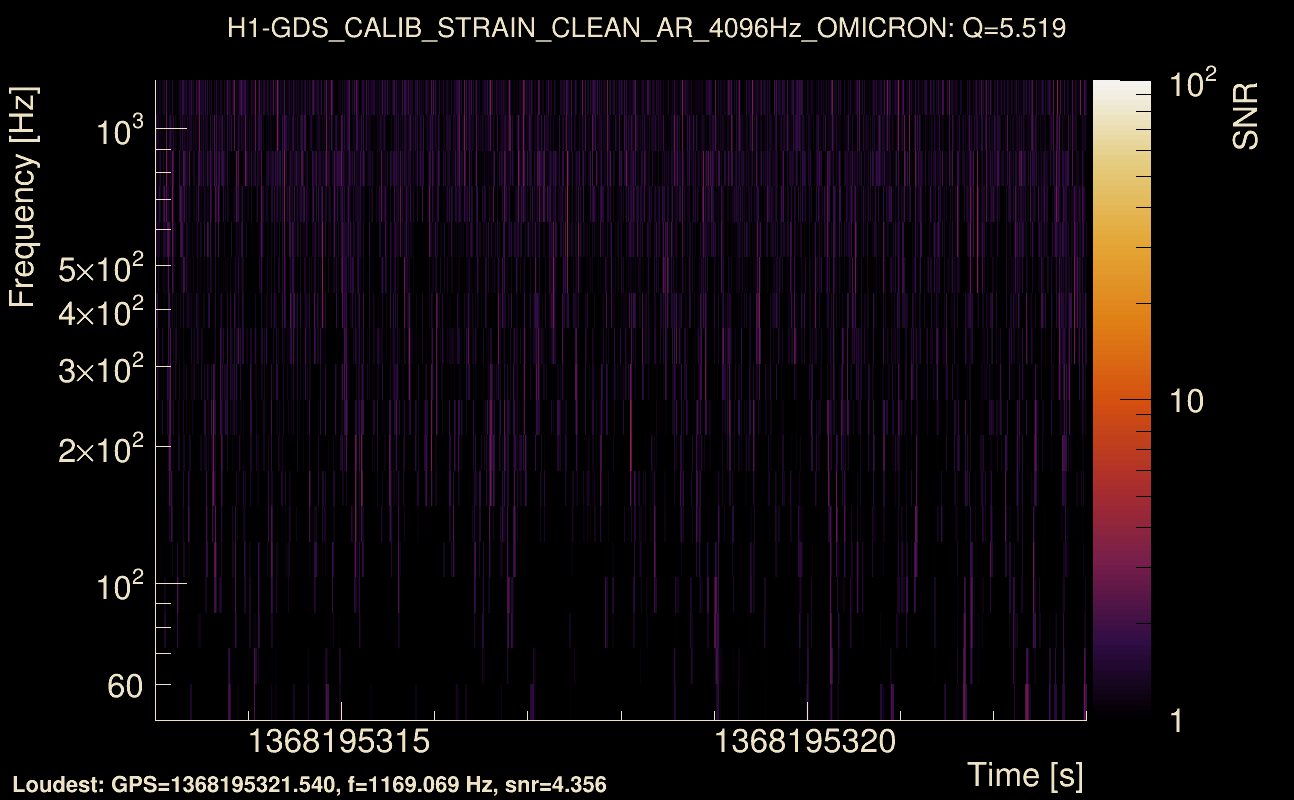
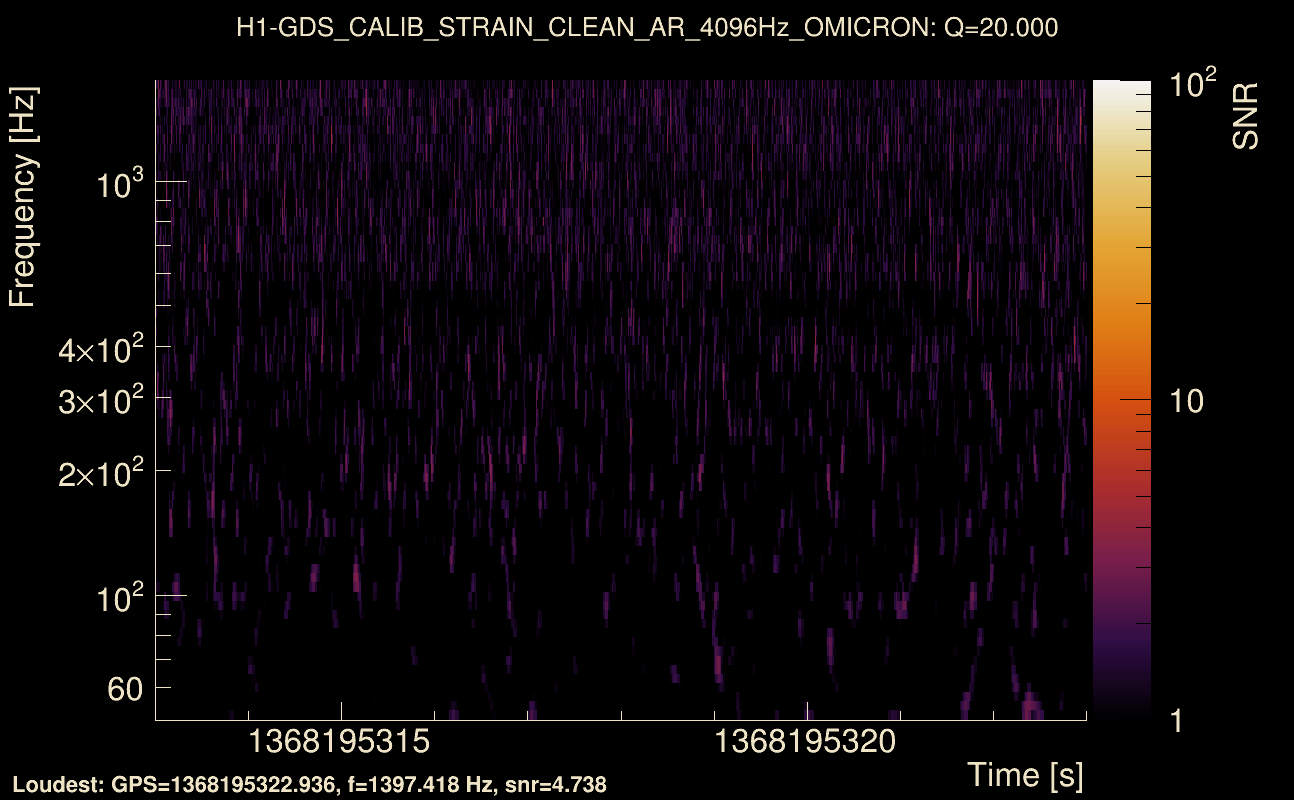
| Event time t(H1): | GPS = 1368195318 (Mon May 15 14:15:00 2023 ) → GPS = 1368195328 (Mon May 15 14:15:10 2023 ) |
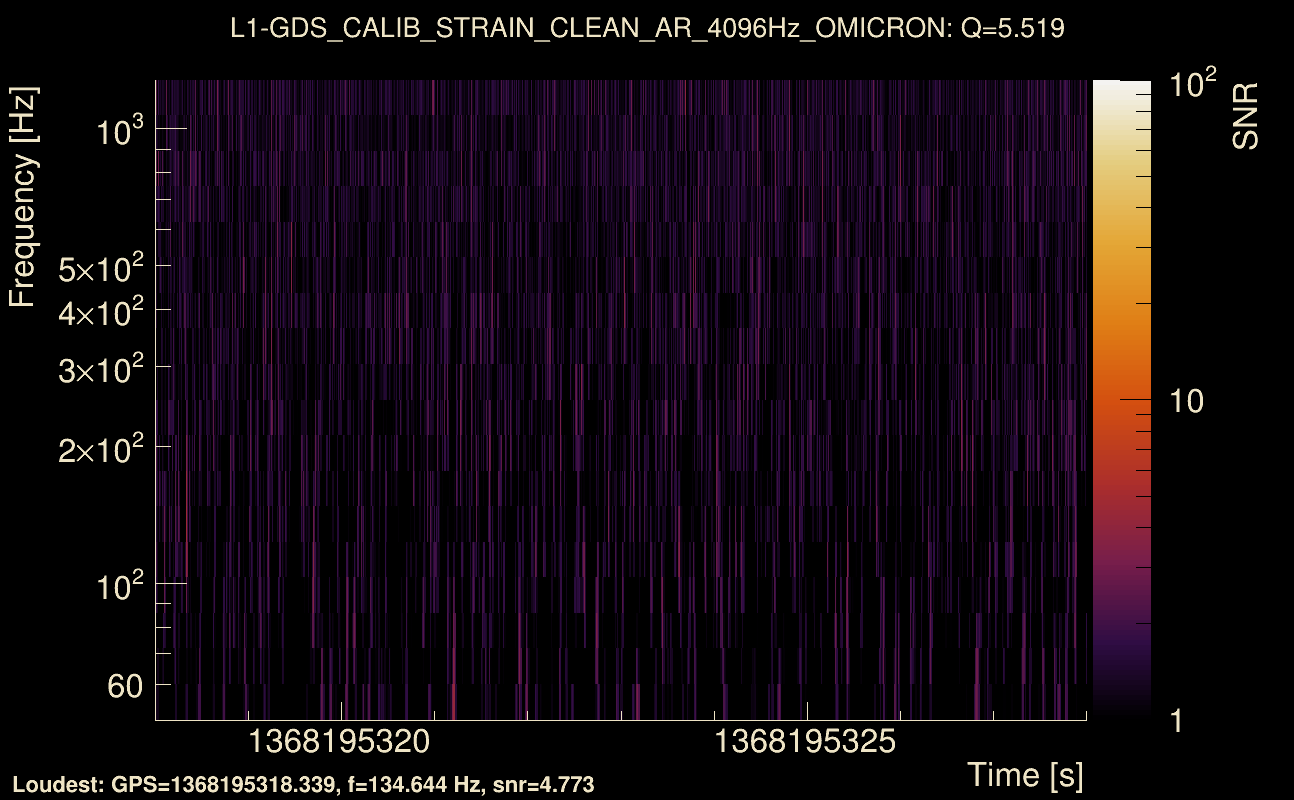
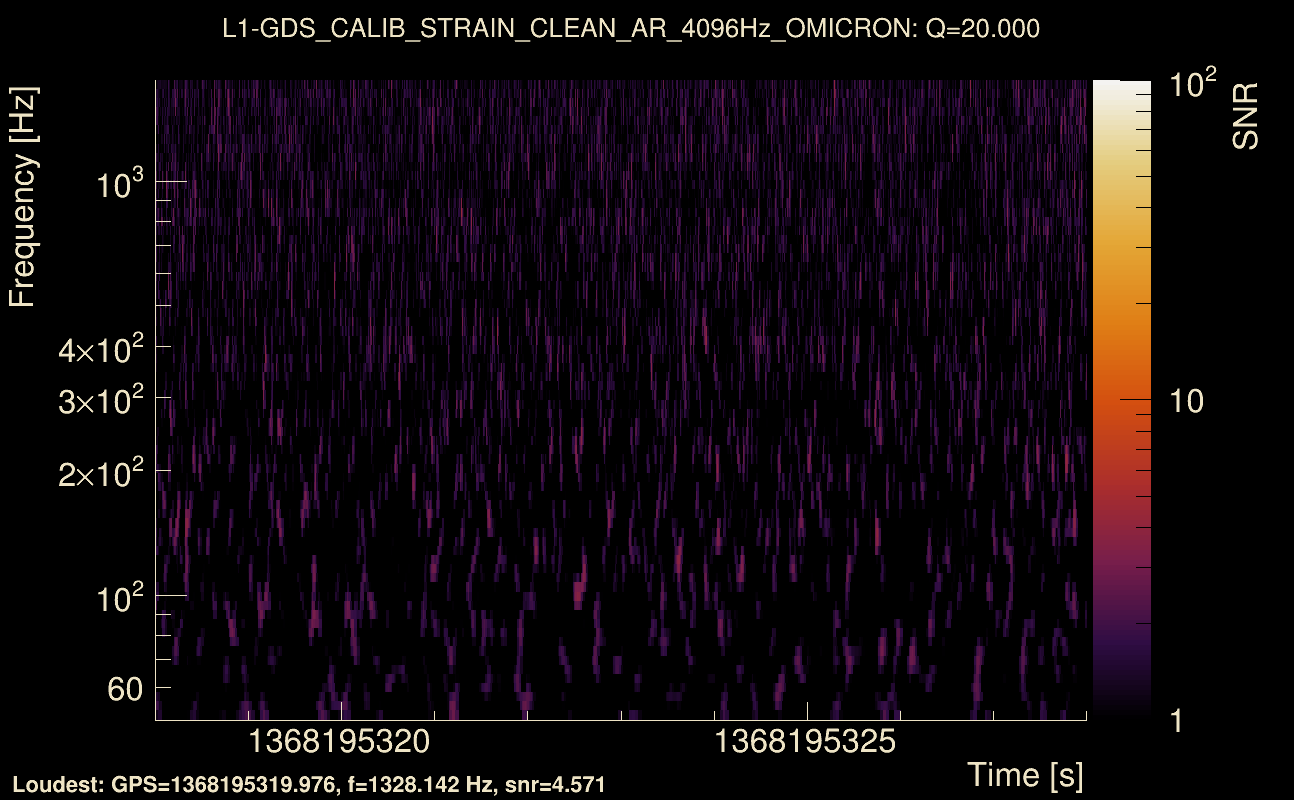
| Event time t(L1): | GPS = 1368195318 (Mon May 15 14:15:10 2023 ) → GPS = 1368195328 (Mon May 15 14:15:10 2023 ) |
| Omicron analysis time window (H1): | GPS = 1368195315 → GPS = 1368195331 |
| Omicron analysis time window (L1): | GPS = 1368195315 → GPS = 1368195331 |
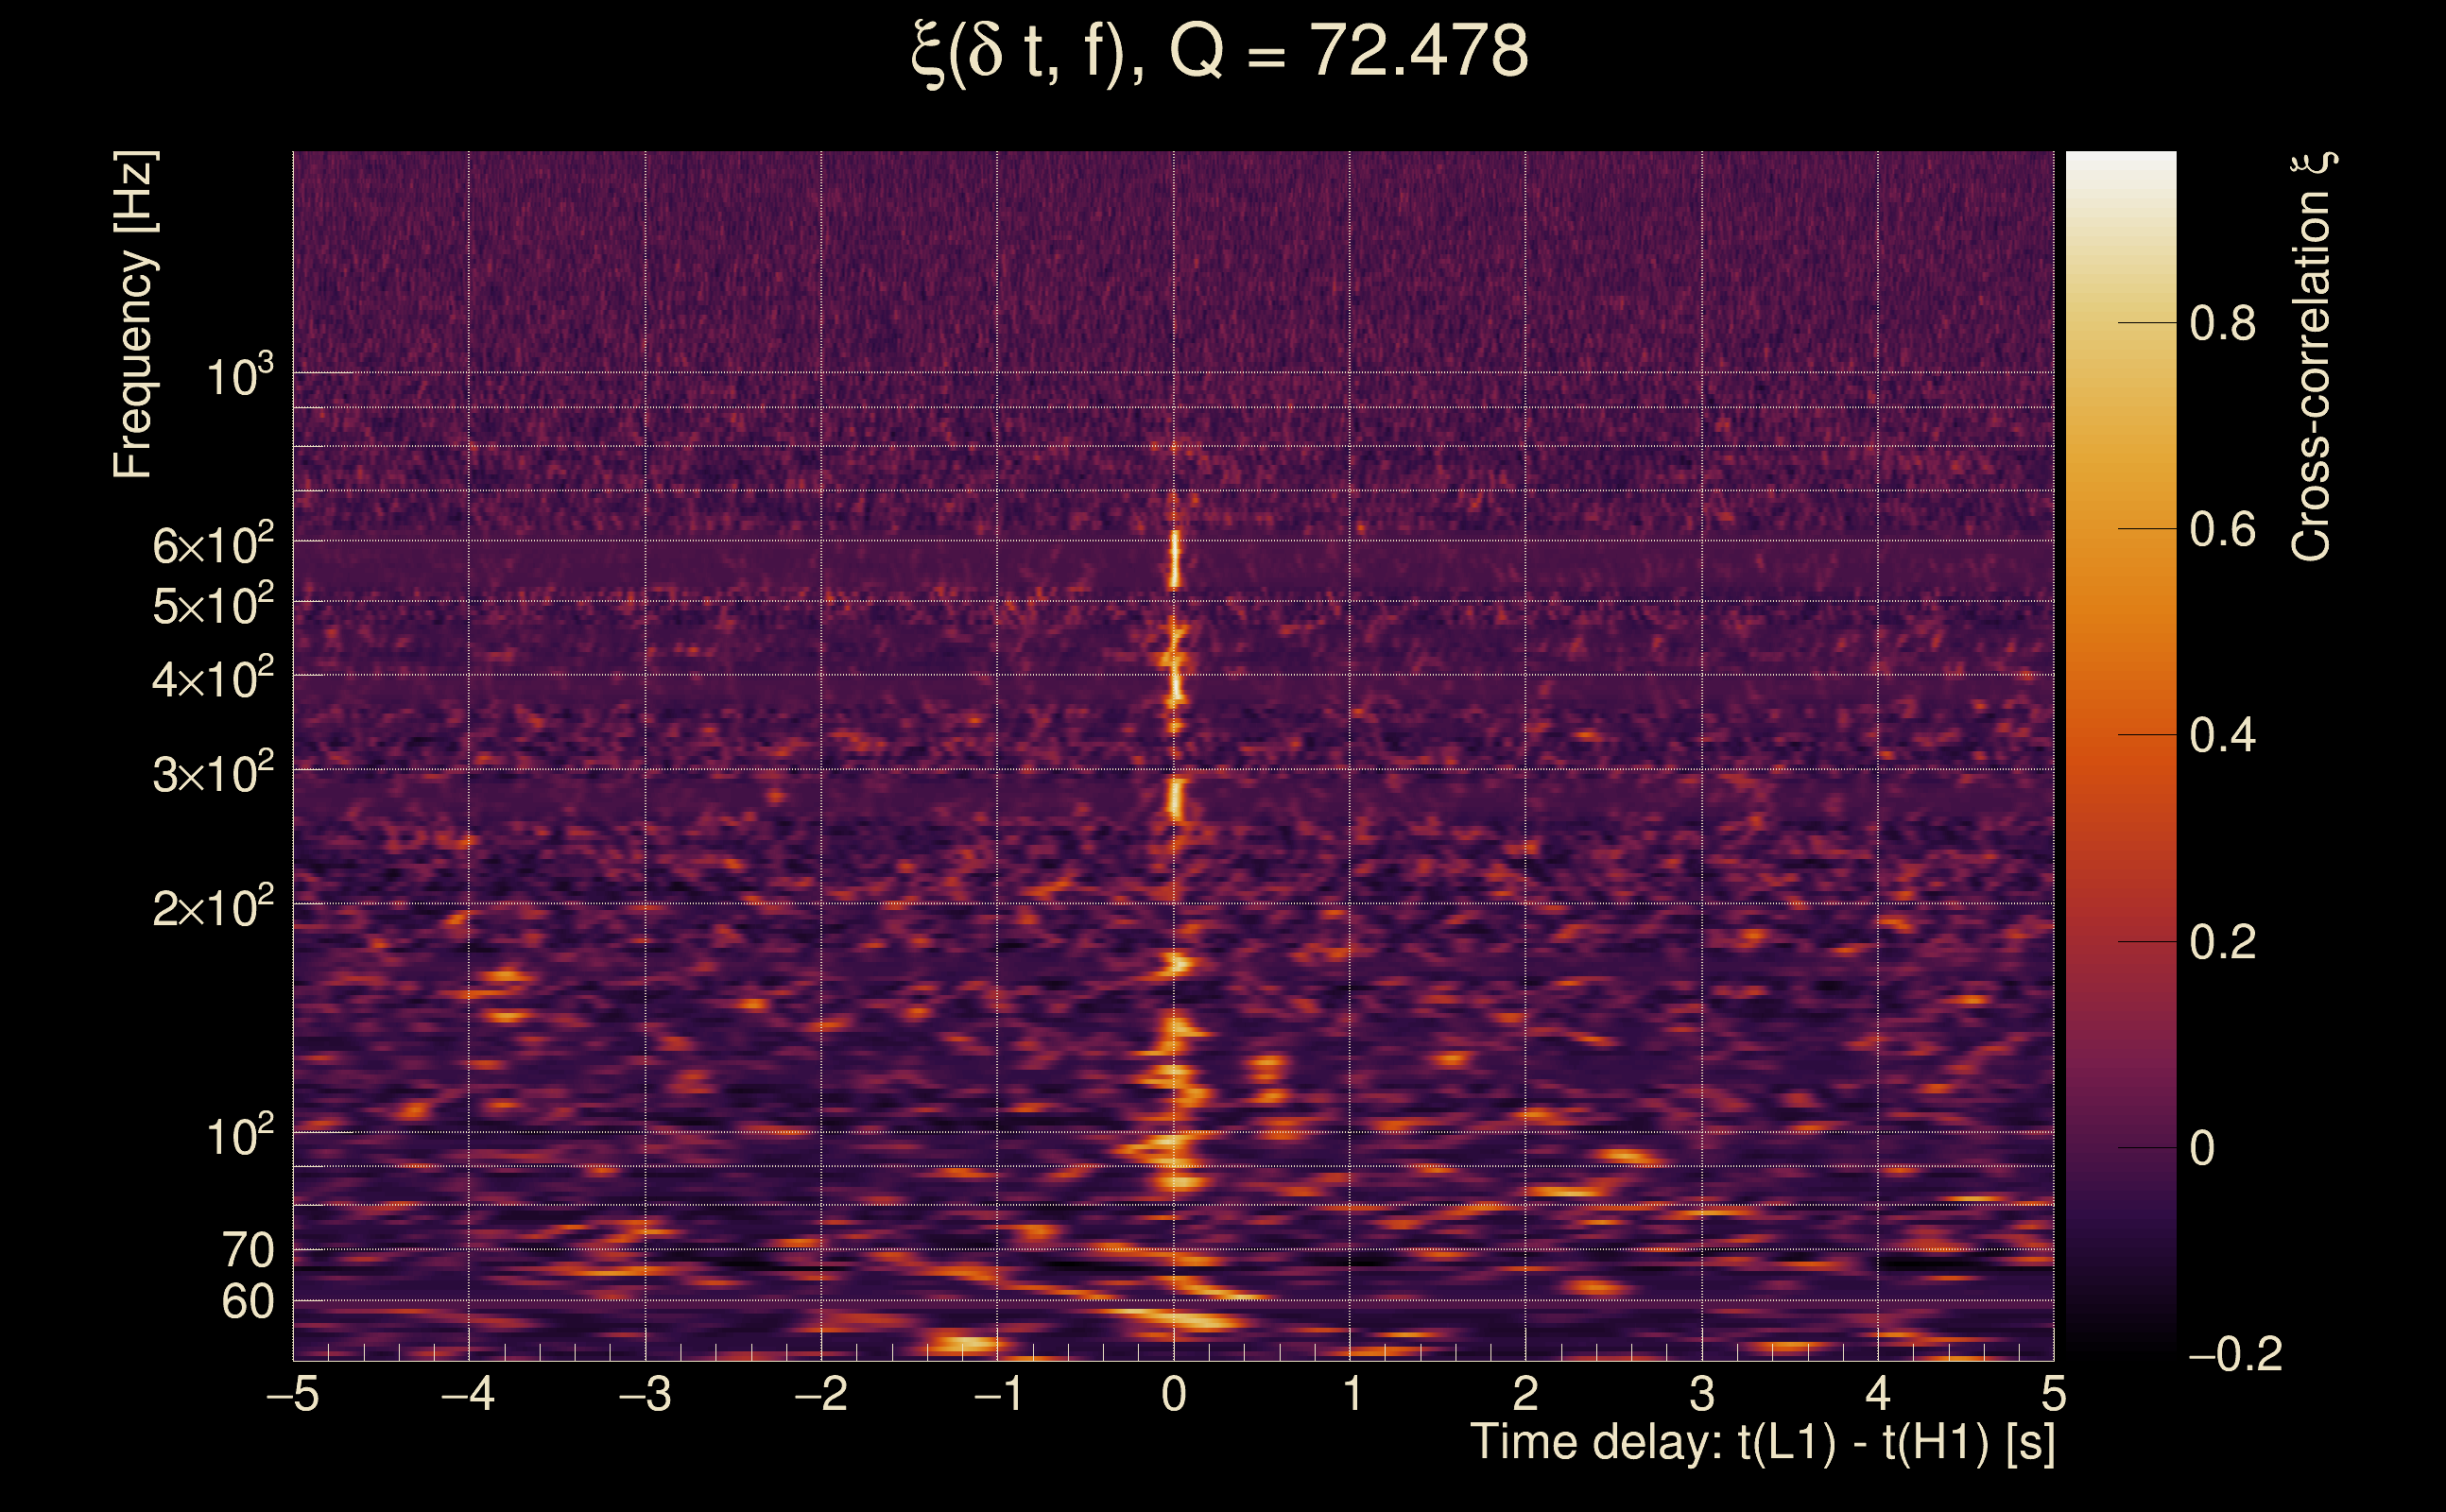
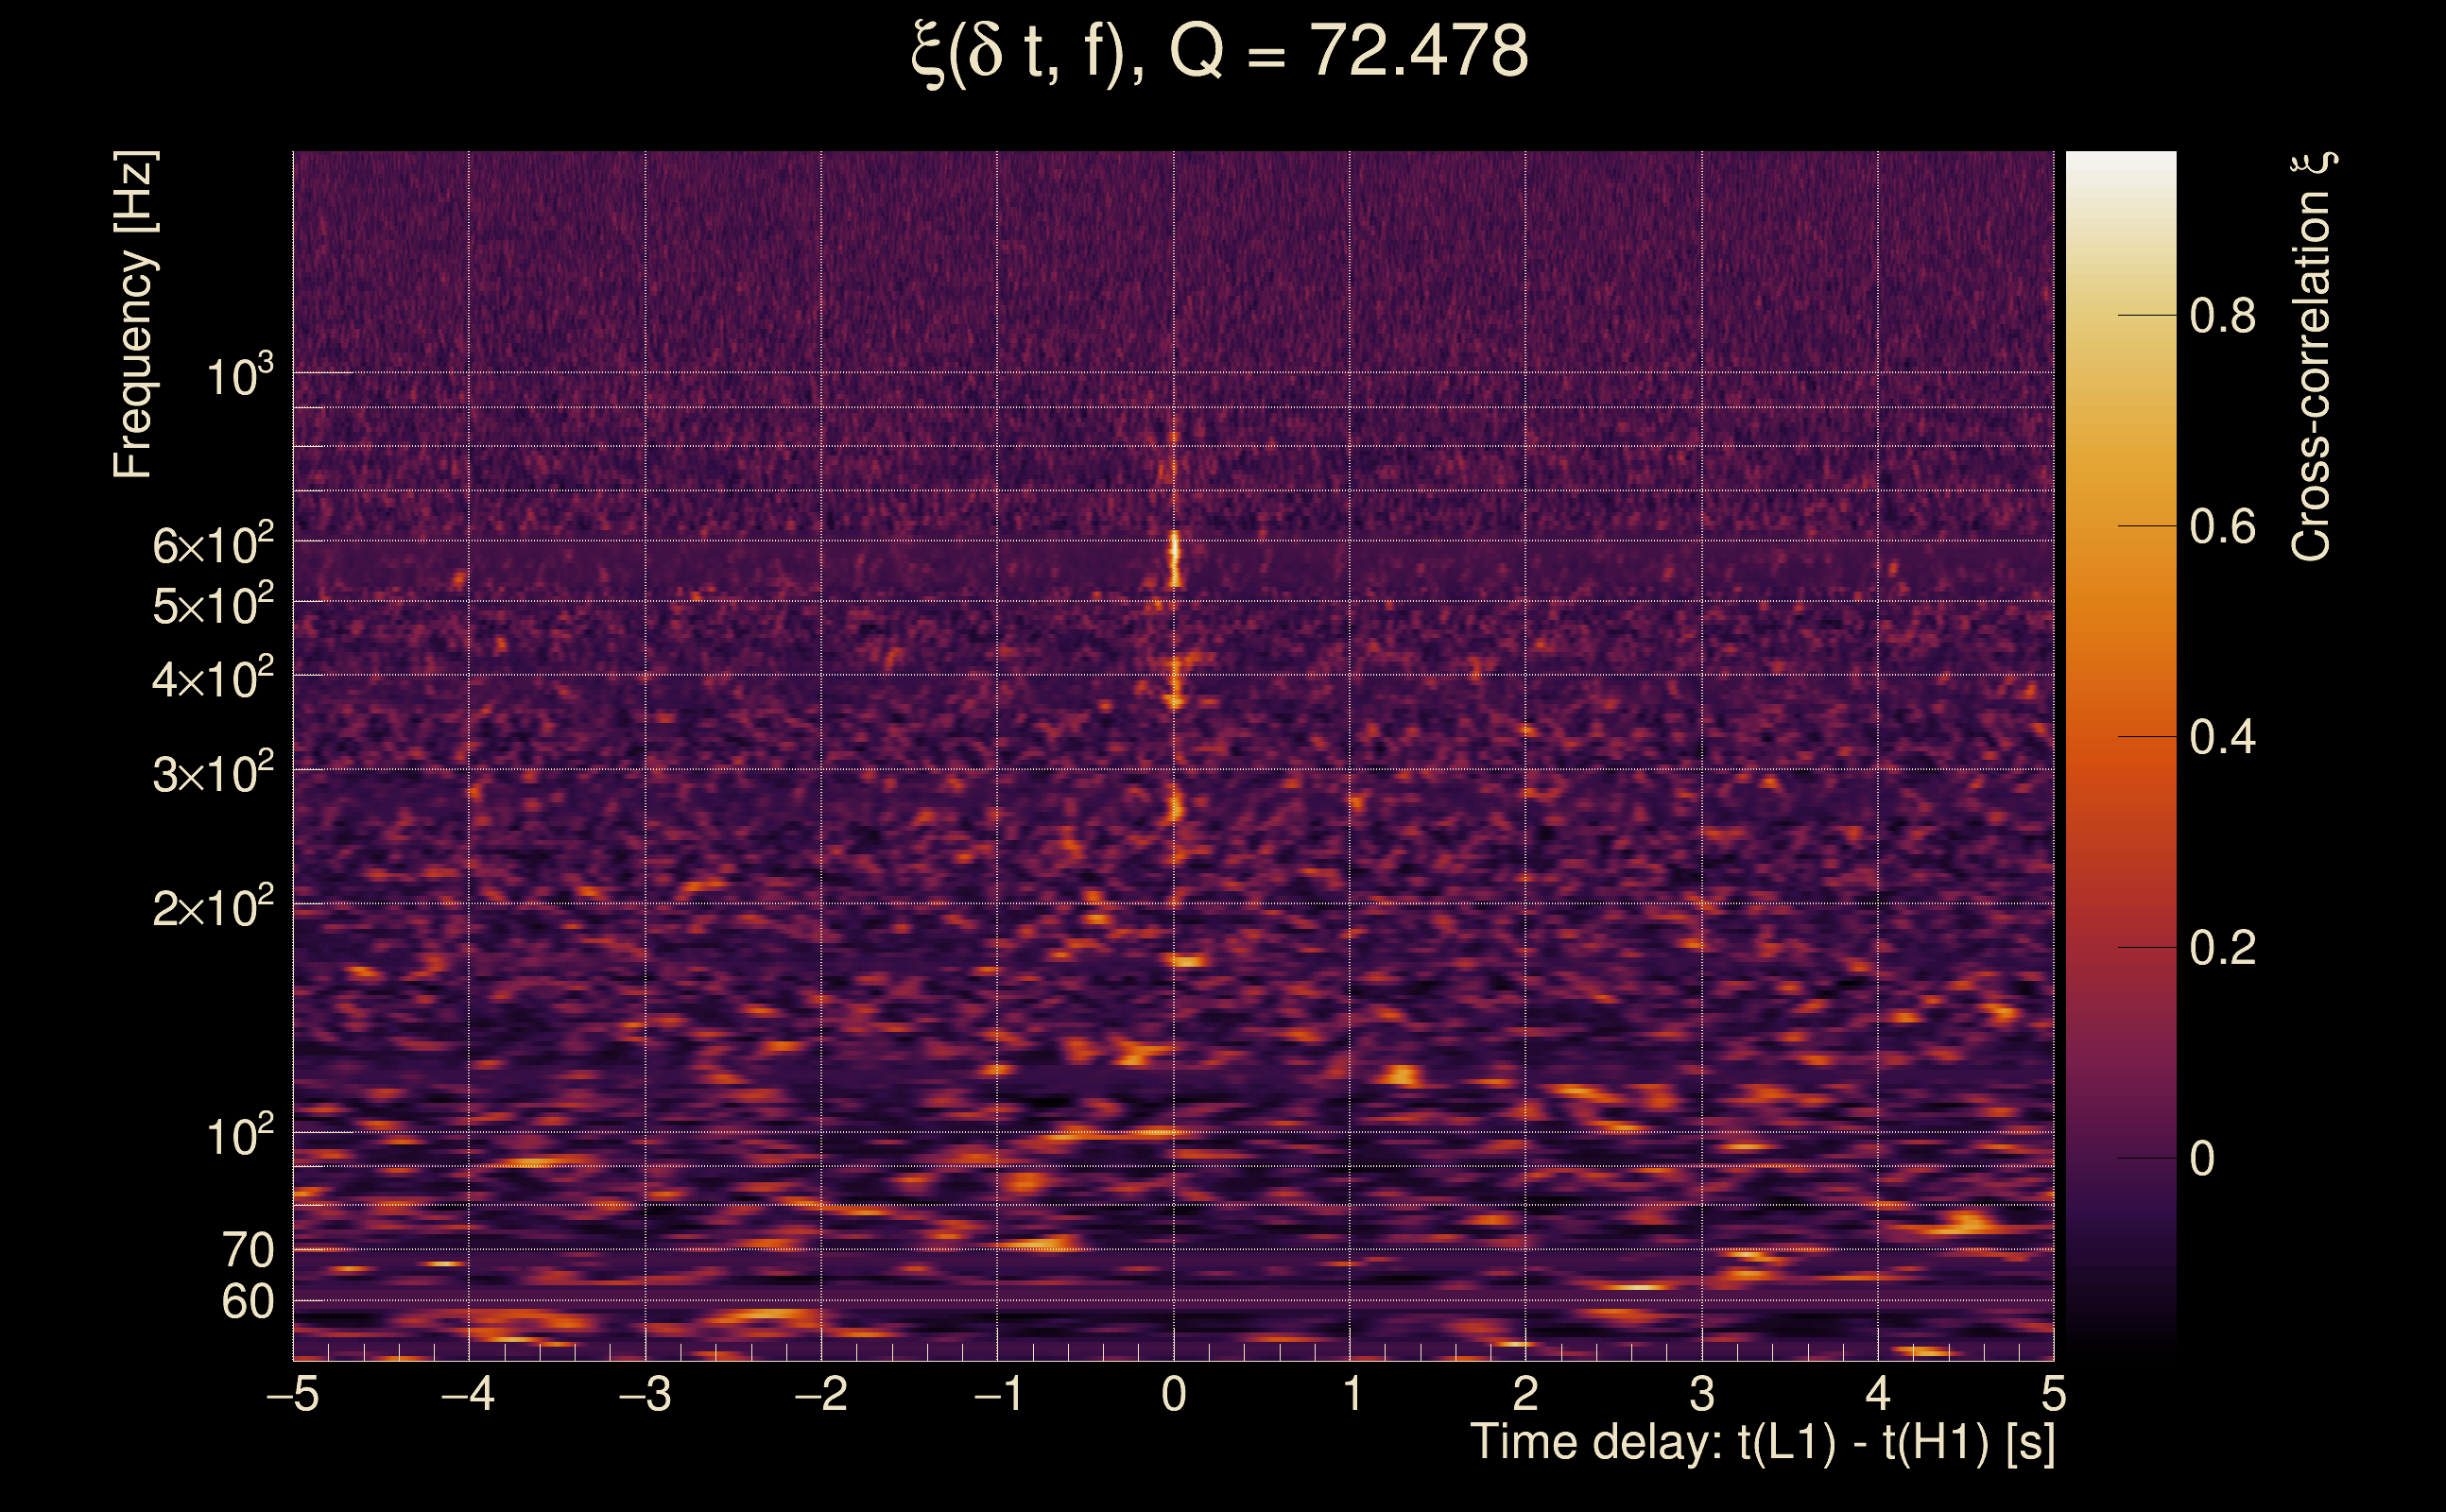
| Time delay between detectors t(L1) - t(H1): | 0.00245652 s (slice index = 108 / 217), δt_gw = 0.00245652 s |
| Time delay uncertainty: | 0.00641238 s |
| [targeted mode] Time delay probability: | 0.473366 (0.717013 sigmas), δt_target = 1.72247e+45 s |
| Frequency: | 656.069 Hz |
| Ξ: | 0.00136041 ± 0.0354355 (variance = 0.00125568): Q0: 0, Q1: 0.0371384, Q2: 0.0544277, Q3: 0.104924, Q4: 0.0760445 |
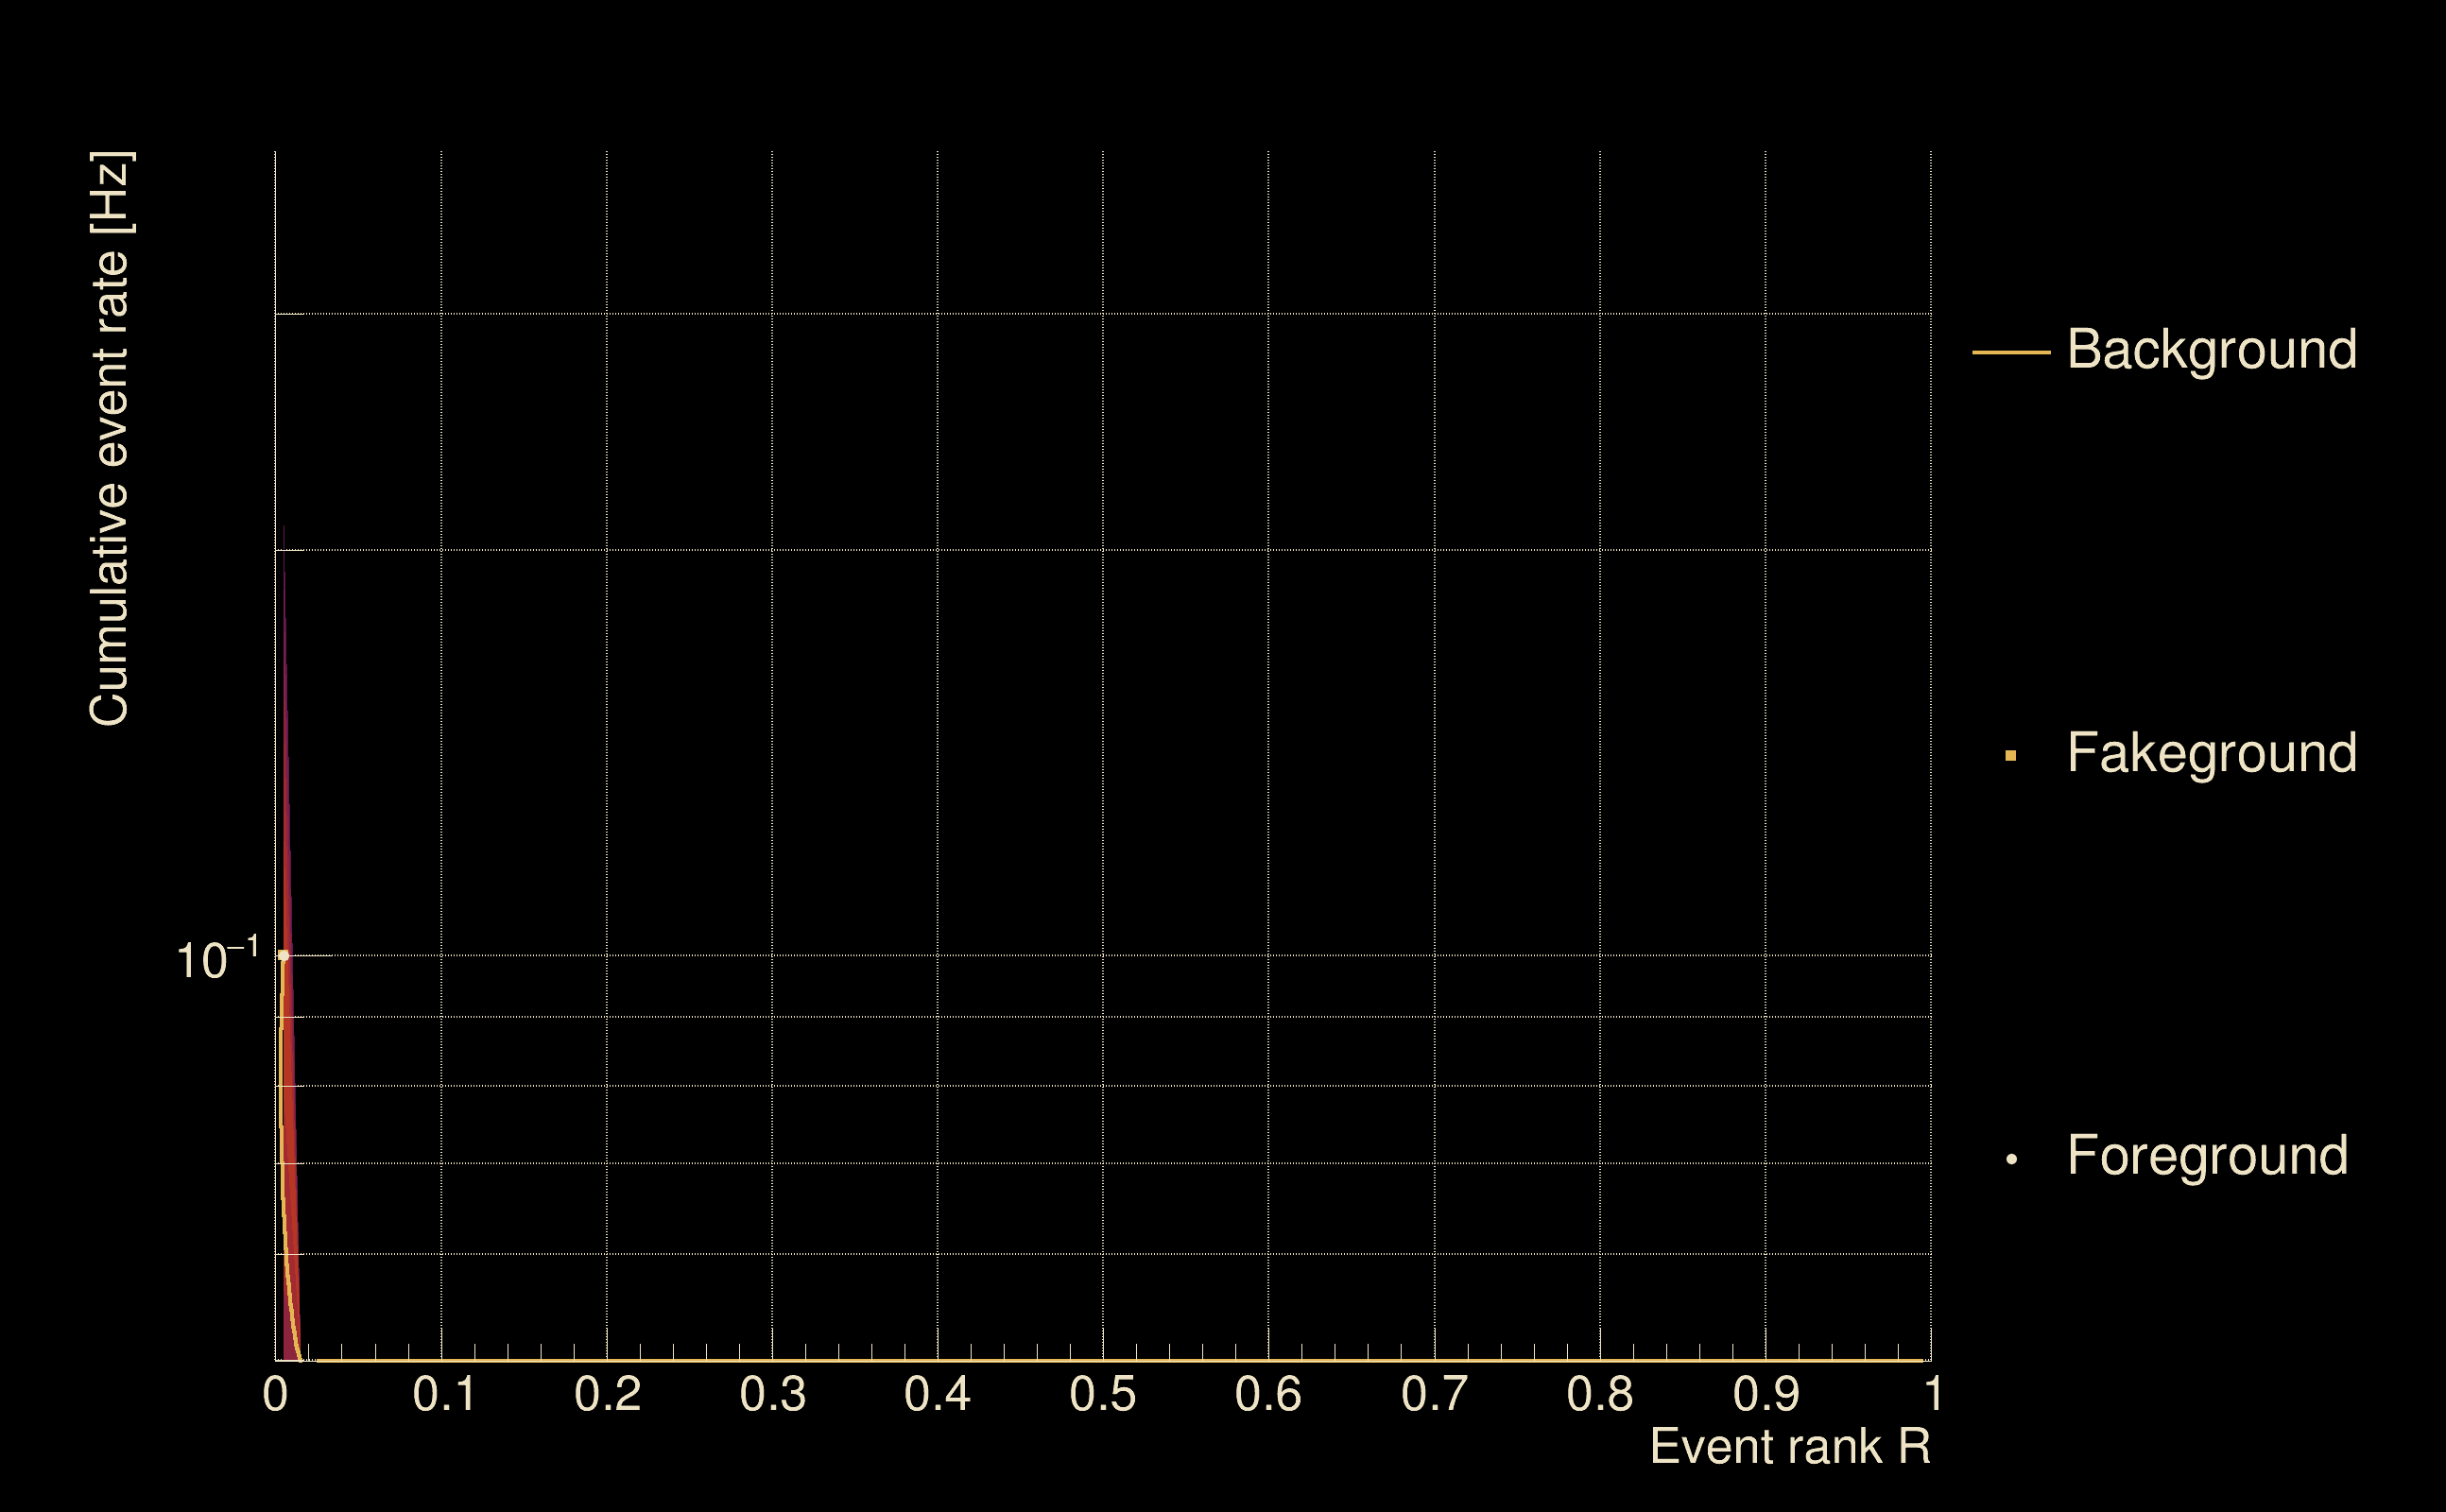
| Rank: | R_A = 0.000520043 |
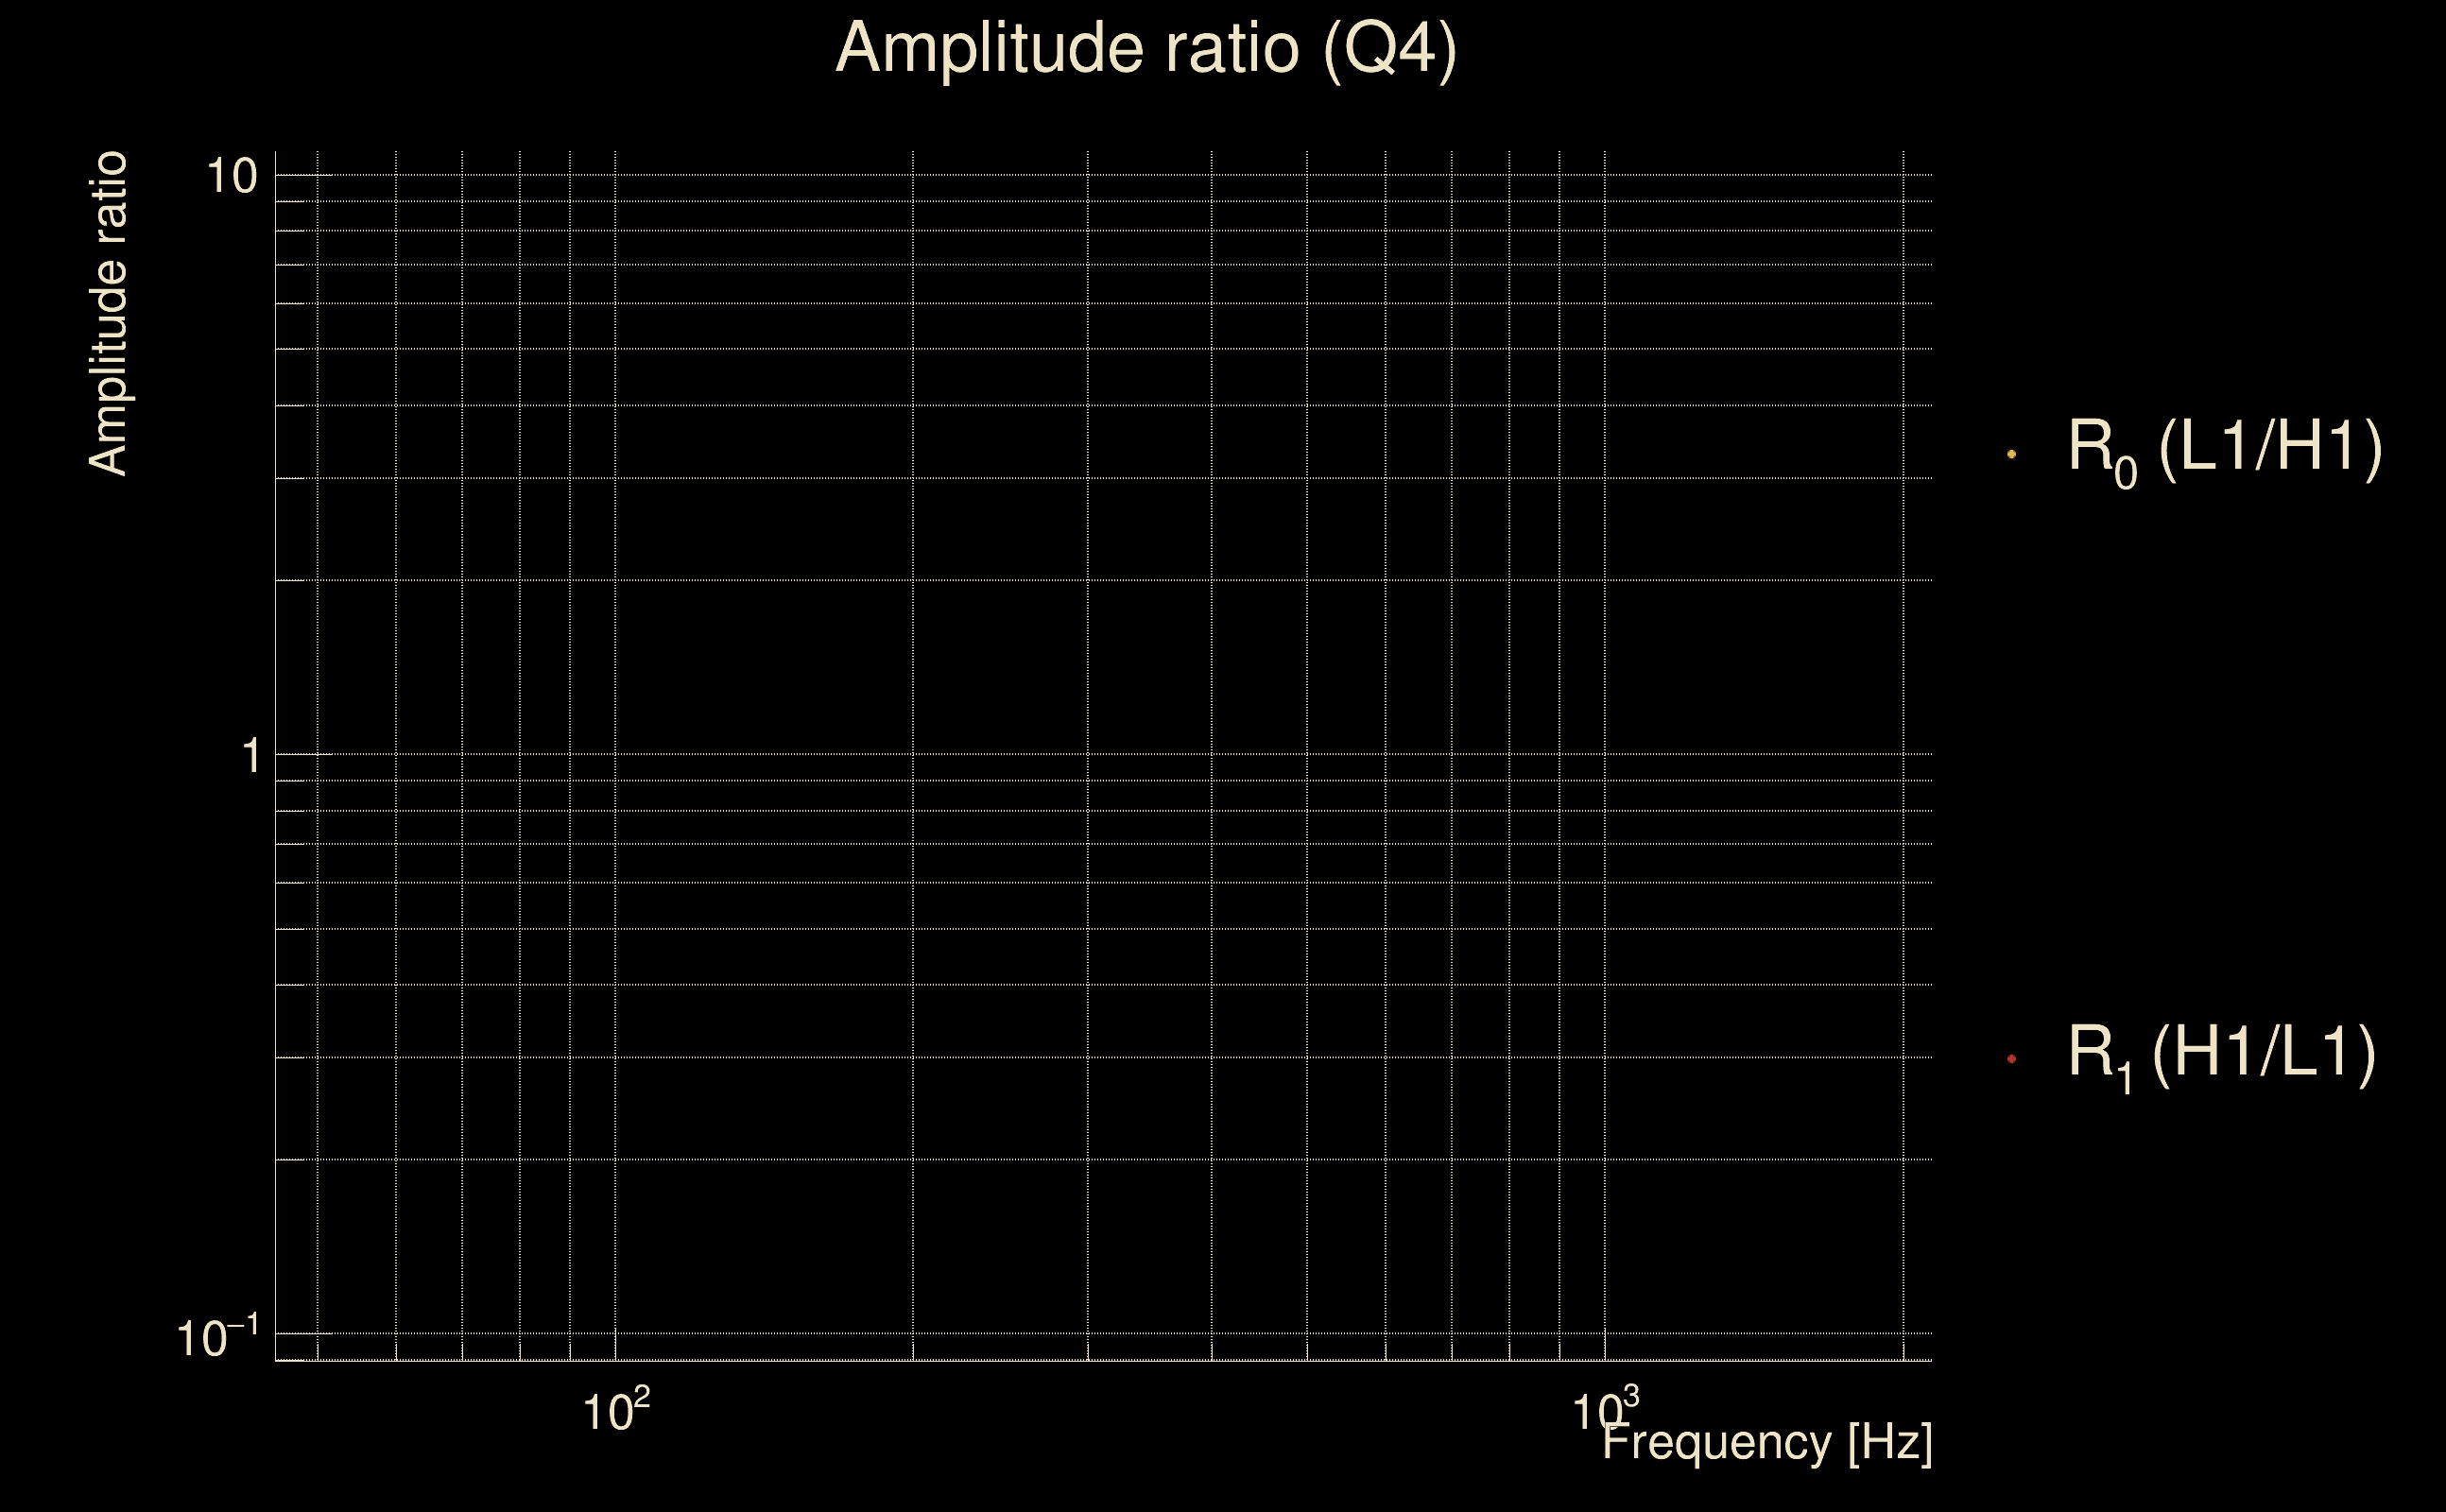
| Log of amplitude ratio (L1/H1): | 0.465256, variance = 0.555693 (L1/H1: 0.277992, variance = 1.1514, H1/L1: -0.641369, variance = 1.07403) |
| Amplitude ratio (L1/H1): | 1.59242 ⋇ 2.10739 (L1/H1: 1.32048 ⋇ 2.92423, H1/L1: 0.526571 ⋇ 2.81892) |
| Amplitude ratio H1|L1 compatibility (probability): | 0.807552 |
| Antenna factor probability: | 1 |
| Number of rejected frequency rows: | Q0: 18 / 18, Q1: 34 / 36, Q2: 66 / 70, Q3: 128 / 134, Q4: 248 / 258 |
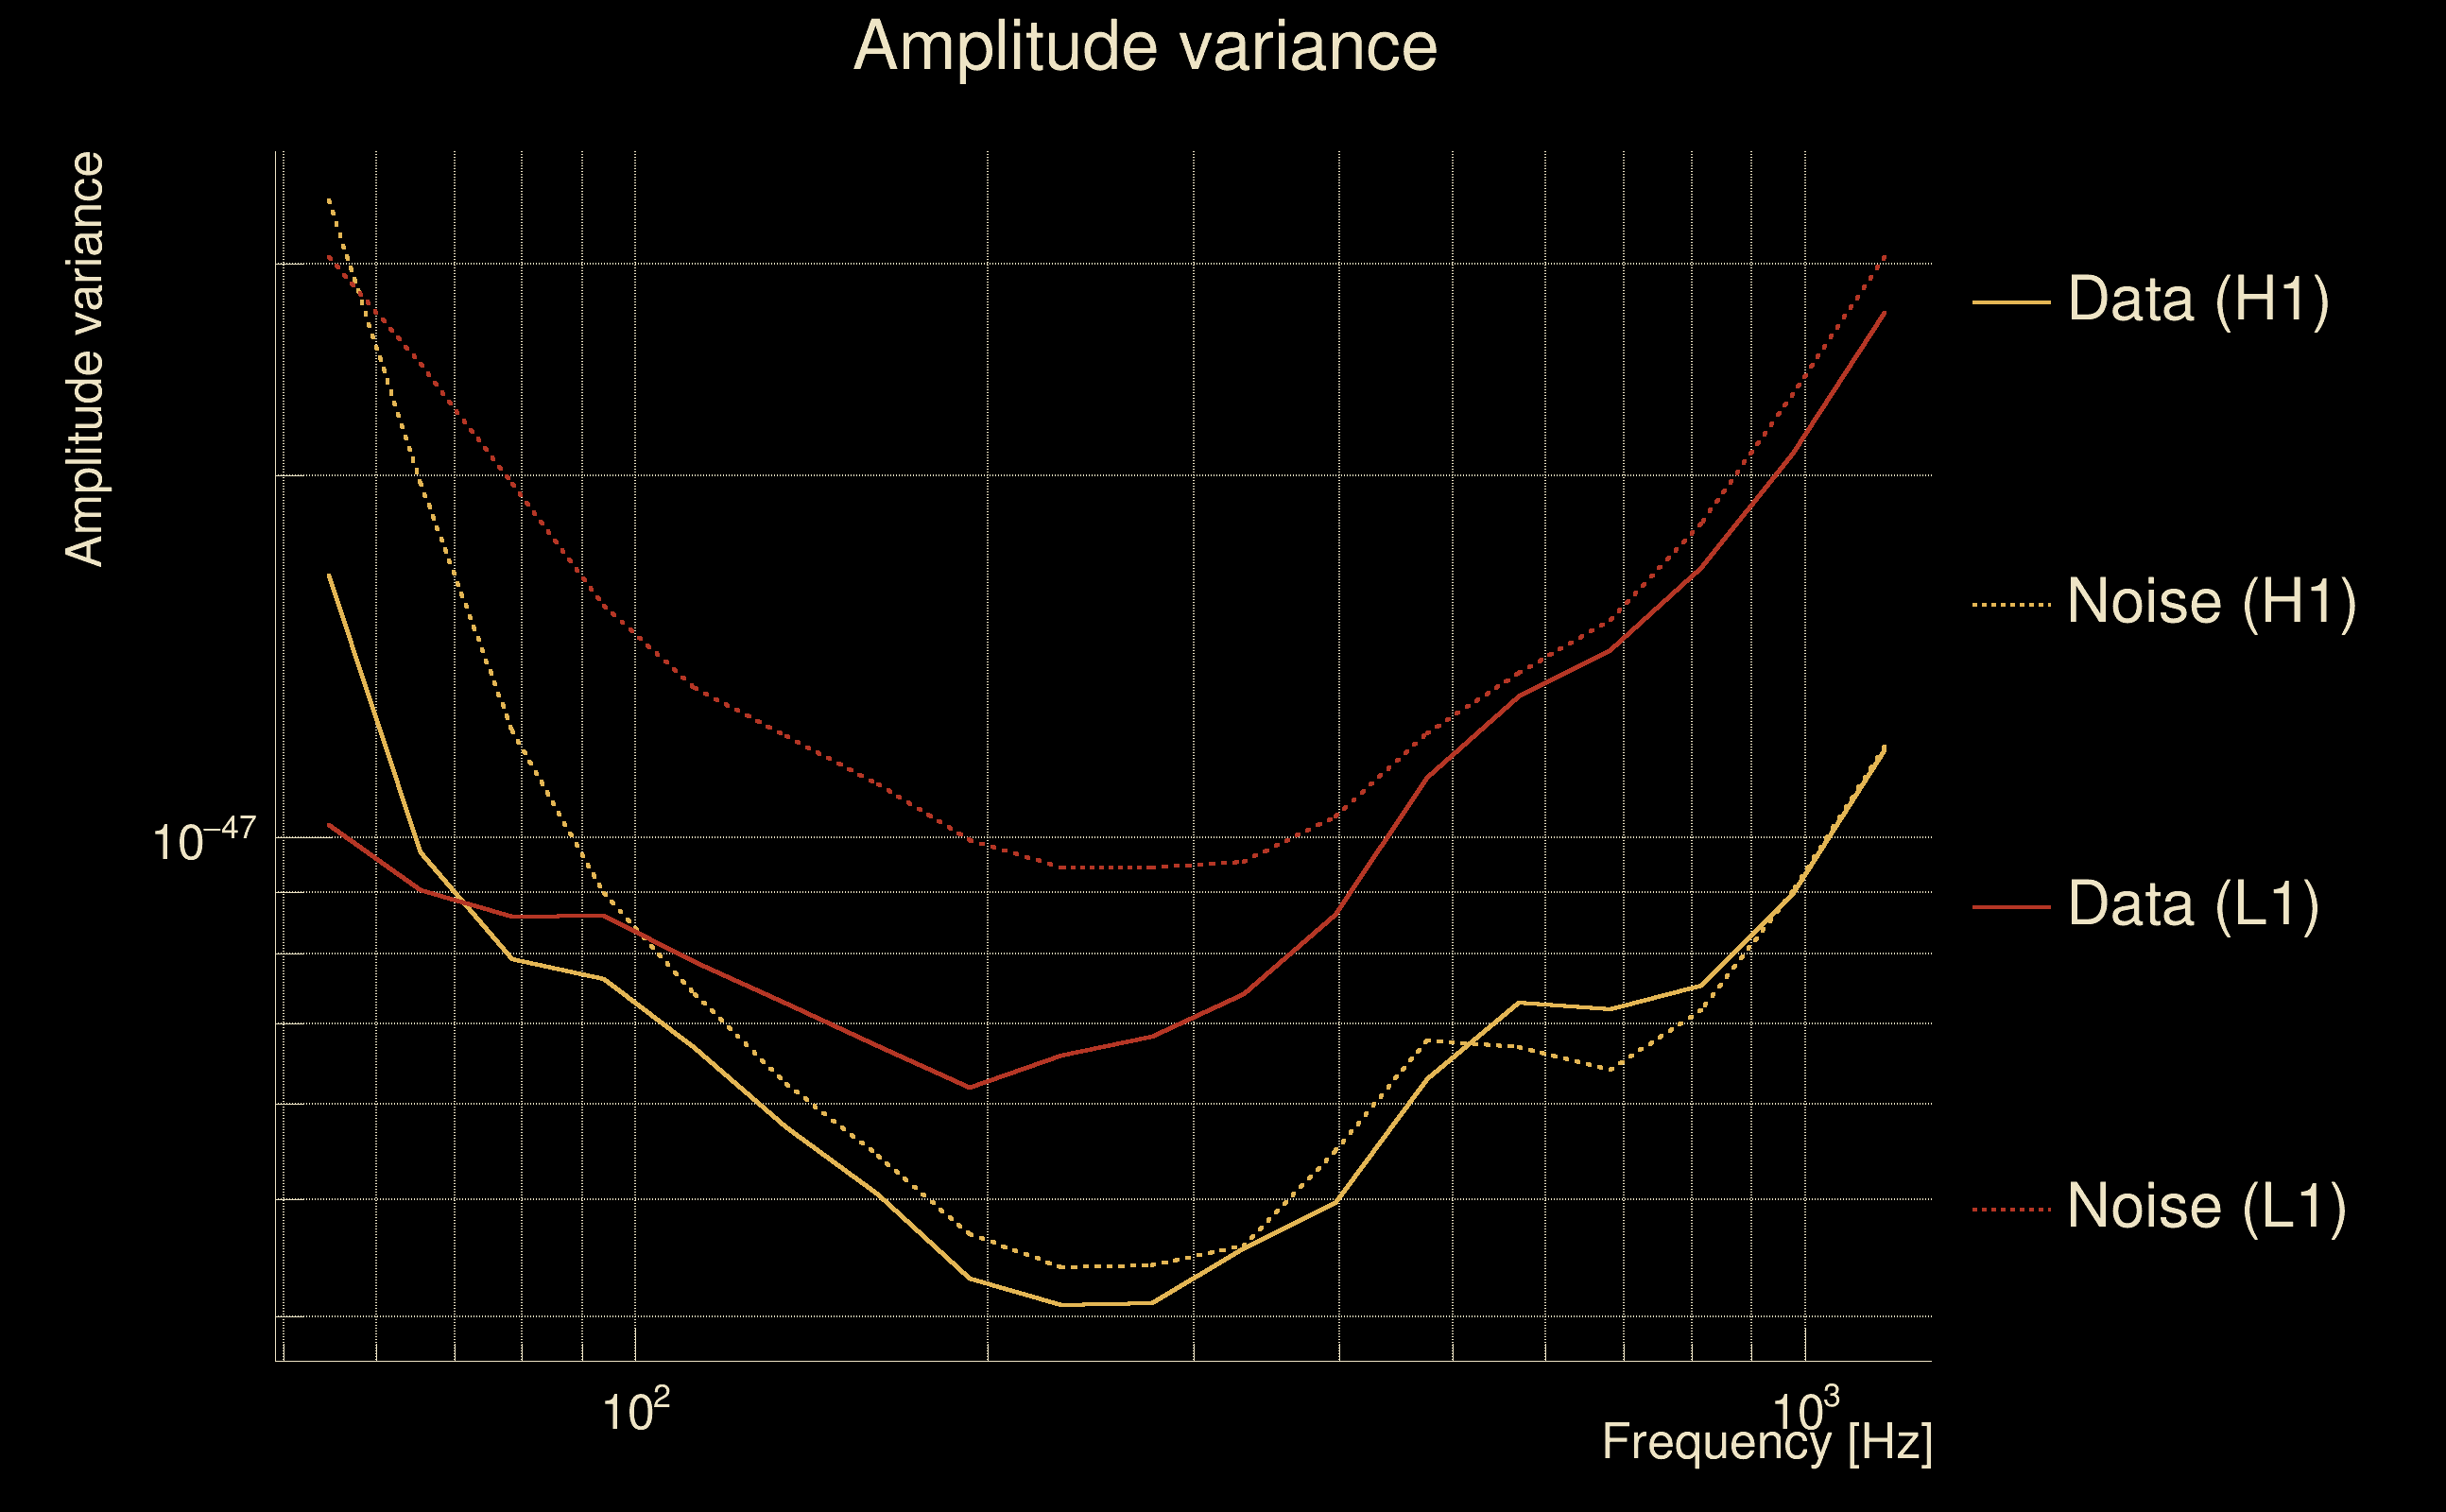
| Maximum signal-to-noise ratio: | H1: 4.90349, L1: 5.05634 |
| SNR variance: | H1: 0.458614, L1: 0.492998 |
| Click here for a zoomed plot | Click here for a zoomed plot | Click here for a zoomed plot | Click here for a zoomed plot | Click here for a zoomed plot |
 |
 |
 |
 |
 |
 |
 |
 |
 |
 |
 |
 |
 |
 |
 |
 |
 |
 |
 |
 |
 |
 |
 |
 |
 |
 |
 |
 |
 |
 |
 |
 |
 |
 |
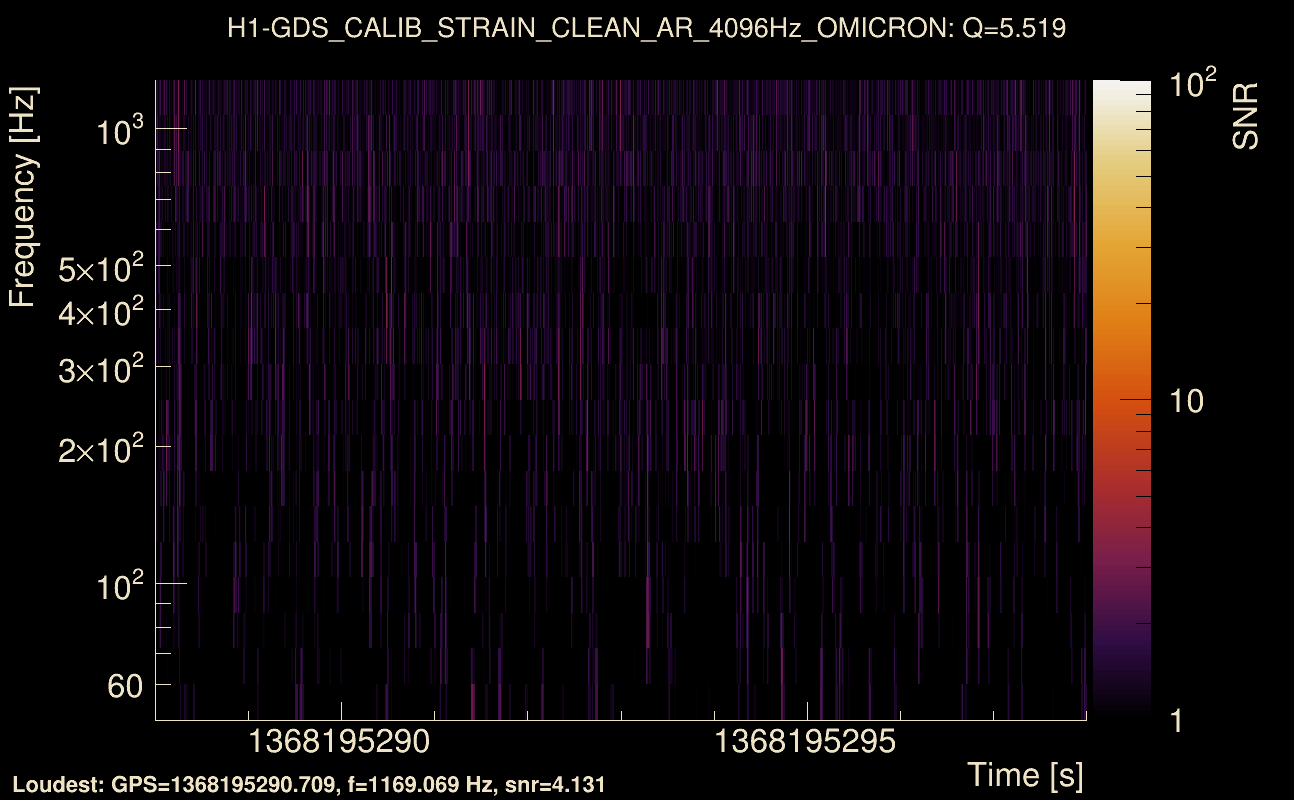
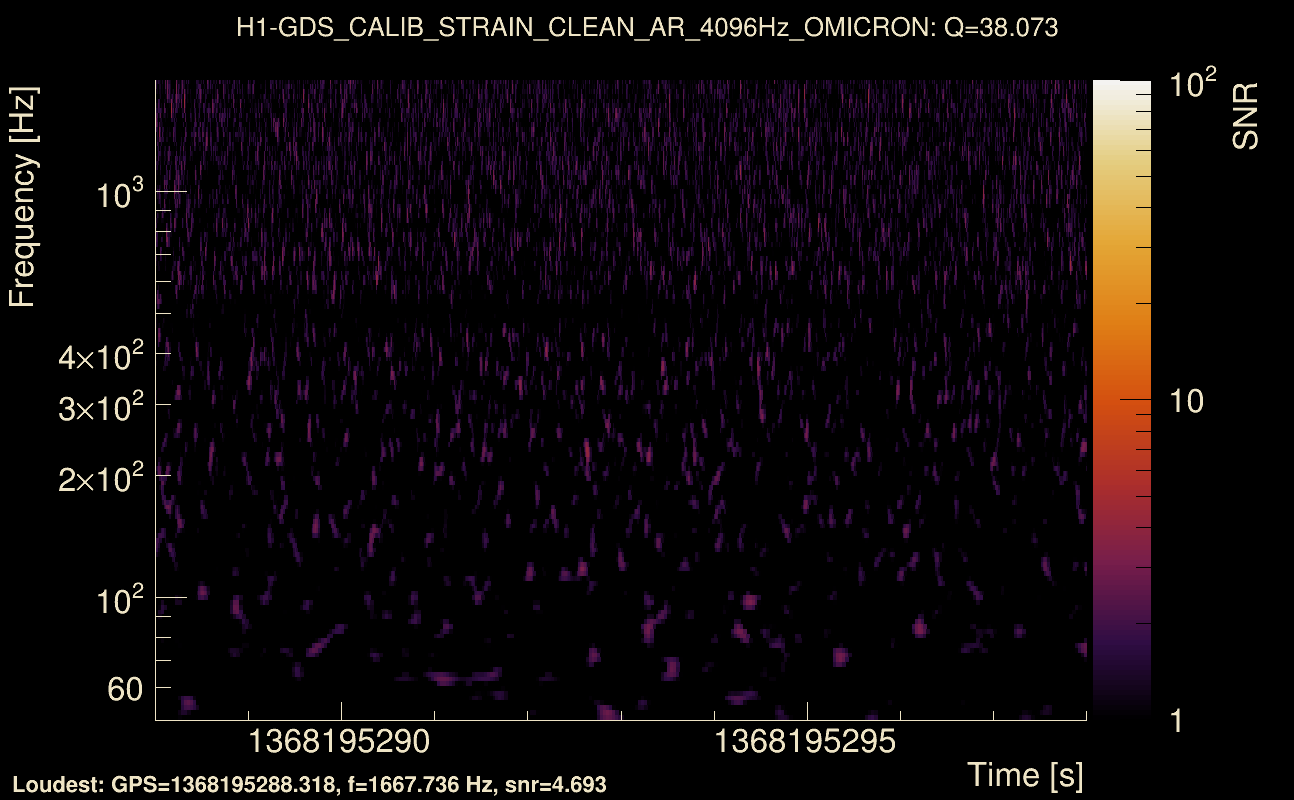
| Event time t(H1): | GPS = 1368195288 (Mon May 15 14:14:30 2023 ) → GPS = 1368195298 (Mon May 15 14:14:40 2023 ) |
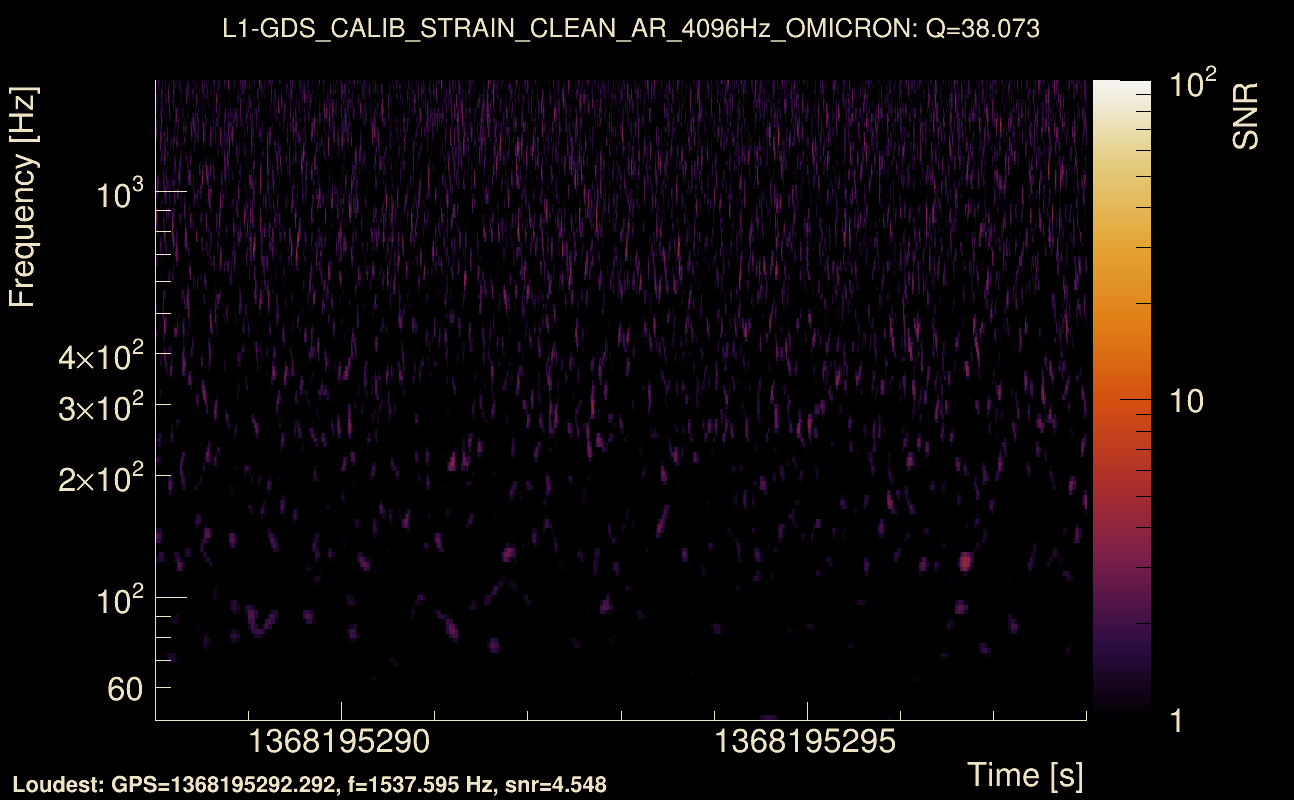
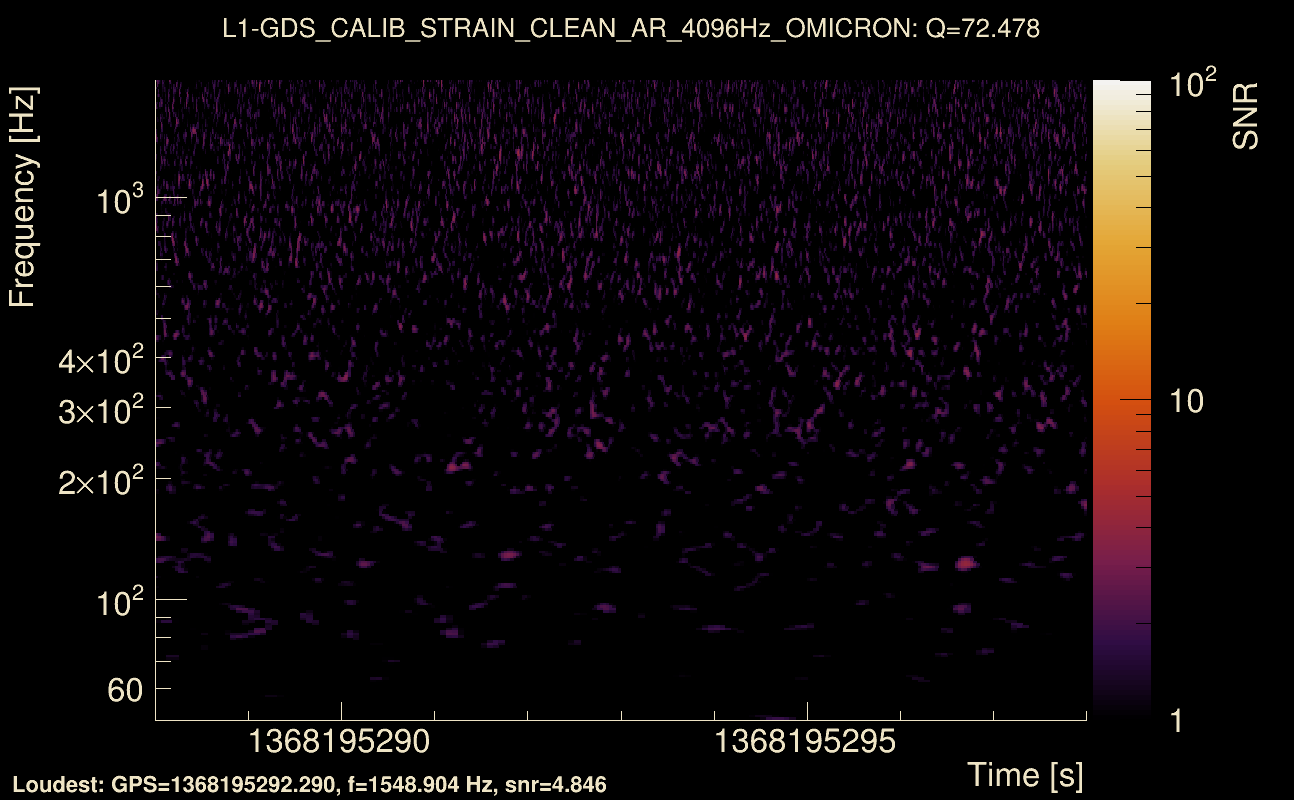
| Event time t(L1): | GPS = 1368195288 (Mon May 15 14:14:40 2023 ) → GPS = 1368195298 (Mon May 15 14:14:40 2023 ) |
| Omicron analysis time window (H1): | GPS = 1368195285 → GPS = 1368195301 |
| Omicron analysis time window (L1): | GPS = 1368195285 → GPS = 1368195301 |
| Time delay between detectors t(L1) - t(H1): | 0.000916593 s (slice index = 108 / 217), δt_gw = 0.000916593 s |
| Time delay uncertainty: | 0.00767029 s |
| [targeted mode] Time delay probability: | 0.688542 (0.400835 sigmas), δt_target = 0.00868297 s |
| Frequency: | 650.617 Hz |
| Ξ: | 0.000956319 ± 0.0385769 (variance = 0.00148817): Q0: 0, Q1: 0.0270509, Q2: 0.0425965, Q3: 0.0624932, Q4: 0.114847 |
| Rank: | R_A = 0.000283235 |
| Log of amplitude ratio (L1/H1): | 1.04188, variance = 0.434153 (L1/H1: 0.513766, variance = 0.802872, H1/L1: -1.55198, variance = 0.928849) |
| Amplitude ratio (L1/H1): | 2.83453 ⋇ 1.93267 (L1/H1: 1.67157 ⋇ 2.44986, H1/L1: 0.211829 ⋇ 2.62156) |
| Amplitude ratio H1|L1 compatibility (probability): | 0.430145 |
| Antenna factor probability: | 1 |
| Number of rejected frequency rows: | Q0: 18 / 18, Q1: 34 / 36, Q2: 68 / 70, Q3: 127 / 134, Q4: 246 / 258 |
| Maximum signal-to-noise ratio: | H1: 4.94736, L1: 5.03394 |
| SNR variance: | H1: 0.447481, L1: 0.49169 |
| Click here for a zoomed plot | Click here for a zoomed plot | Click here for a zoomed plot | Click here for a zoomed plot | Click here for a zoomed plot |
 |
 |
 |
 |
 |
 |
 |
 |
 |
 |
 |
 |
 |
 |
 |
 |
 |
 |
 |
 |
 |
 |
 |
 |
 |
 |
 |
 |
 |
 |
 |
 |
 |
 |
| Event time t(H1): | GPS = 1368195313 (Mon May 15 14:14:55 2023 ) → GPS = 1368195323 (Mon May 15 14:15:05 2023 ) |
| Event time t(L1): | GPS = 1368195313 (Mon May 15 14:15:05 2023 ) → GPS = 1368195323 (Mon May 15 14:15:05 2023 ) |
| Omicron analysis time window (H1): | GPS = 1368195310 → GPS = 1368195326 |
| Omicron analysis time window (L1): | GPS = 1368195310 → GPS = 1368195326 |
| Time delay between detectors t(L1) - t(H1): | -0.00182715 s (slice index = 108 / 217), δt_gw = -0.00182715 s |
| Time delay uncertainty: | 0.00600829 s |
| [targeted mode] Time delay probability: | 0.957898 (0.0527913 sigmas), δt_target = 0.0086863 s |
| Frequency: | 656.279 Hz |
| Ξ: | 0.00111449 ± 0.0286542 (variance = 0.00082106): Q0: 0, Q1: 0.0417308, Q2: 0.0566081, Q3: 0.0501396, Q4: 0.0890433 |
| Rank: | R_A = 0.000260253 |
| Log of amplitude ratio (L1/H1): | 0.445622, variance = 0.465109 (L1/H1: -0.360027, variance = 0.968149, H1/L1: -1.2305, variance = 0.893909) |
| Amplitude ratio (L1/H1): | 1.56146 ⋇ 1.97781 (L1/H1: 0.697658 ⋇ 2.67499, H1/L1: 0.292146 ⋇ 2.57402) |
| Amplitude ratio H1|L1 compatibility (probability): | 0.243781 |
| Antenna factor probability: | 1 |
| Number of rejected frequency rows: | Q0: 18 / 18, Q1: 35 / 36, Q2: 65 / 70, Q3: 128 / 134, Q4: 247 / 258 |
| Maximum signal-to-noise ratio: | H1: 4.95688, L1: 5.02203 |
| SNR variance: | H1: 0.447335, L1: 0.496313 |
| Click here for a zoomed plot | Click here for a zoomed plot | Click here for a zoomed plot | Click here for a zoomed plot | Click here for a zoomed plot |
 |
 |
 |
 |
 |
 |
 |
 |
 |
 |
 |
 |
 |
 |
 |
 |
 |
 |
 |
 |
 |
 |
 |
 |
 |
 |
 |
 |
 |
 |
 |
 |
 |
 |
| Event time t(H1): | GPS = 1368195253 (Mon May 15 14:13:55 2023 ) → GPS = 1368195263 (Mon May 15 14:14:05 2023 ) |
| Event time t(L1): | GPS = 1368195253 (Mon May 15 14:14:05 2023 ) → GPS = 1368195263 (Mon May 15 14:14:05 2023 ) |
| Omicron analysis time window (H1): | GPS = 1368195250 → GPS = 1368195266 |
| Omicron analysis time window (L1): | GPS = 1368195250 → GPS = 1368195266 |
| Time delay between detectors t(L1) - t(H1): | 0.00102767 s (slice index = 108 / 217), δt_gw = 0.00102767 s |
| Time delay uncertainty: | 0.00895289 s |
| [targeted mode] Time delay probability: | 0.720382 (0.357949 sigmas), δt_target = 0.00868368 s |
| Frequency: | 997.851 Hz |
| Ξ: | 0.000191842 ± 0.0379775 (variance = 0.00144229): Q0: 0, Q1: 0, Q2: 0.0217795, Q3: 0.0218468, Q4: 0.102665 |
| Rank: | R_A = 0.000120946 |
| Log of amplitude ratio (L1/H1): | 0.196799, variance = 0.56393 (L1/H1: 0.32934, variance = 1.51667, H1/L1: -0.0877787, variance = 0.847038) |
| Amplitude ratio (L1/H1): | 1.2175 ⋇ 2.11902 (L1/H1: 1.39005 ⋇ 3.42648, H1/L1: 0.915964 ⋇ 2.51016) |
| Amplitude ratio H1|L1 compatibility (probability): | 0.87515 |
| Antenna factor probability: | 1 |
| Number of rejected frequency rows: | Q0: 18 / 18, Q1: 36 / 36, Q2: 68 / 70, Q3: 133 / 134, Q4: 251 / 258 |
| Maximum signal-to-noise ratio: | H1: 4.87106, L1: 5.37086 |
| SNR variance: | H1: 0.394193, L1: 0.47297 |
| Event time t(H1): | GPS = 1368195223 (Mon May 15 14:13:25 2023 ) → GPS = 1368195233 (Mon May 15 14:13:35 2023 ) |
| Event time t(L1): | GPS = 1368195223 (Mon May 15 14:13:35 2023 ) → GPS = 1368195233 (Mon May 15 14:13:35 2023 ) |
| Omicron analysis time window (H1): | GPS = 1368195220 → GPS = 1368195236 |
| Omicron analysis time window (L1): | GPS = 1368195220 → GPS = 1368195236 |
| Time delay between detectors t(L1) - t(H1): | 0.00348971 s (slice index = 108 / 217), δt_gw = 0.00348971 s |
| Time delay uncertainty: | 0.00694055 s |
| [targeted mode] Time delay probability: | 0.4129 (0.818801 sigmas), δt_target = 0.00868368 s |
| Frequency: | 840.542 Hz |
| Ξ: | 0.000588883 ± 0.0284123 (variance = 0.00080726): Q0: 0, Q1: 0, Q2: 0.0409127, Q3: 0.0719414, Q4: 0.0497454 |
| Rank: | R_A = 0.000107395 |
| Log of amplitude ratio (L1/H1): | 0.403931, variance = 0.54037 (L1/H1: -0.243727, variance = 1.41485, H1/L1: -0.9139, variance = 0.849164) |
| Amplitude ratio (L1/H1): | 1.4977 ⋇ 2.08569 (L1/H1: 0.783702 ⋇ 3.28536, H1/L1: 0.400958 ⋇ 2.51306) |
| Amplitude ratio H1|L1 compatibility (probability): | 0.441681 |
| Antenna factor probability: | 1 |
| Number of rejected frequency rows: | Q0: 18 / 18, Q1: 36 / 36, Q2: 66 / 70, Q3: 128 / 134, Q4: 249 / 258 |
| Maximum signal-to-noise ratio: | H1: 4.74751, L1: 5.35017 |
| SNR variance: | H1: 0, L1: 0 |
| Event time t(H1): | GPS = 1368195323 (Mon May 15 14:15:05 2023 ) → GPS = 1368195333 (Mon May 15 14:15:15 2023 ) |
| Event time t(L1): | GPS = 1368195323 (Mon May 15 14:15:15 2023 ) → GPS = 1368195333 (Mon May 15 14:15:15 2023 ) |
| Omicron analysis time window (H1): | GPS = 1368195320 → GPS = 1368195336 |
| Omicron analysis time window (L1): | GPS = 1368195320 → GPS = 1368195336 |
| Time delay between detectors t(L1) - t(H1): | 2.34542 s (slice index = 57 / 217), δt_gw = -0.000580165 s |
| Time delay uncertainty: | 0.00686629 s |
| [targeted mode] Time delay probability: | 0.820446 (0.226971 sigmas), δt_target = 0.00868368 s |
| Frequency: | 1049.99 Hz |
| Ξ: | 0.000749537 ± 0.0207819 (variance = 0.000431888): Q0: 0, Q1: 0.0284289, Q2: 0.0420487, Q3: 0.0514748, Q4: 0.0590273 |
| Rank: | R_A = 0.000308756 |
| Log of amplitude ratio (L1/H1): | 0.665625, variance = 0.591223 (L1/H1: 0.220271, variance = 1.21117, H1/L1: -1.23784, variance = 1.08705) |
| Amplitude ratio (L1/H1): | 1.94571 ⋇ 2.15741 (L1/H1: 1.24641 ⋇ 3.00577, H1/L1: 0.290011 ⋇ 2.83663) |
| Amplitude ratio H1|L1 compatibility (probability): | 0.502079 |
| Antenna factor probability: | 1 |
| Number of rejected frequency rows: | Q0: 18 / 18, Q1: 35 / 36, Q2: 67 / 70, Q3: 124 / 134, Q4: 252 / 258 |
| Maximum signal-to-noise ratio: | H1: 5.7045, L1: 5.03259 |
| SNR variance: | H1: 0.481224, L1: 0.49914 |
| Event time t(H1): | GPS = 1368195278 (Mon May 15 14:14:20 2023 ) → GPS = 1368195288 (Mon May 15 14:14:30 2023 ) |
| Event time t(L1): | GPS = 1368195278 (Mon May 15 14:14:30 2023 ) → GPS = 1368195288 (Mon May 15 14:14:30 2023 ) |
| Omicron analysis time window (H1): | GPS = 1368195275 → GPS = 1368195291 |
| Omicron analysis time window (L1): | GPS = 1368195275 → GPS = 1368195291 |
| Time delay between detectors t(L1) - t(H1): | 2.34755 s (slice index = 57 / 217), δt_gw = 0.00155276 s |
| Time delay uncertainty: | 0.00782394 s |
| [targeted mode] Time delay probability: | 0.634805 (0.474974 sigmas), δt_target = 0.00868368 s |
| Frequency: | 690.995 Hz |
| Ξ: | 0.000252903 ± 0.0274422 (variance = 0.000753074): Q0: 0, Q1: 0, Q2: 0.0397151, Q3: 0.0636314, Q4: 0.0576417 |
| Rank: | R_A = 0.000156713 |
| Log of amplitude ratio (L1/H1): | 0.604615, variance = 0.57547 (L1/H1: 0.581864, variance = 0.86303, H1/L1: -0.627215, variance = 1.43499) |
| Amplitude ratio (L1/H1): | 1.83055 ⋇ 2.13528 (L1/H1: 1.78937 ⋇ 2.53196, H1/L1: 0.534077 ⋇ 3.31318) |
| Amplitude ratio H1|L1 compatibility (probability): | 0.976134 |
| Antenna factor probability: | 1 |
| Number of rejected frequency rows: | Q0: 18 / 18, Q1: 36 / 36, Q2: 69 / 70, Q3: 129 / 134, Q4: 256 / 258 |
| Maximum signal-to-noise ratio: | H1: 5.00189, L1: 5.01871 |
| SNR variance: | H1: 0.418605, L1: 0.459591 |
| Event time t(H1): | GPS = 1368195253 (Mon May 15 14:13:55 2023 ) → GPS = 1368195263 (Mon May 15 14:14:05 2023 ) |
| Event time t(L1): | GPS = 1368195253 (Mon May 15 14:14:05 2023 ) → GPS = 1368195263 (Mon May 15 14:14:05 2023 ) |
| Omicron analysis time window (H1): | GPS = 1368195250 → GPS = 1368195266 |
| Omicron analysis time window (L1): | GPS = 1368195250 → GPS = 1368195266 |
| Time delay between detectors t(L1) - t(H1): | 2.34693 s (slice index = 57 / 217), δt_gw = 0.000926767 s |
| Time delay uncertainty: | 0.00663327 s |
| [targeted mode] Time delay probability: | 0.63985 (0.467909 sigmas), δt_target = 0.00868368 s |
| Frequency: | 1015.53 Hz |
| Ξ: | 0.000248643 ± 0.0303484 (variance = 0.000921023): Q0: 0, Q1: 0, Q2: 0.0449298, Q3: 0.0517871, Q4: 0.0771304 |
| Rank: | R_A = 0.000153226 |
| Log of amplitude ratio (L1/H1): | 0.411627, variance = 0.453645 (L1/H1: 0.377936, variance = 0.792134, H1/L1: -0.43934, variance = 0.970917) |
| Amplitude ratio (L1/H1): | 1.50927 ⋇ 1.96115 (L1/H1: 1.45927 ⋇ 2.43518, H1/L1: 0.644462 ⋇ 2.67875) |
| Amplitude ratio H1|L1 compatibility (probability): | 0.963115 |
| Antenna factor probability: | 1 |
| Number of rejected frequency rows: | Q0: 18 / 18, Q1: 36 / 36, Q2: 69 / 70, Q3: 131 / 134, Q4: 250 / 258 |
| Maximum signal-to-noise ratio: | H1: 4.87106, L1: 5.37086 |
| SNR variance: | H1: 0.394193, L1: 0.47297 |
| Event time t(H1): | GPS = 1368195318 (Mon May 15 14:15:00 2023 ) → GPS = 1368195328 (Mon May 15 14:15:10 2023 ) |
| Event time t(L1): | GPS = 1368195318 (Mon May 15 14:15:10 2023 ) → GPS = 1368195328 (Mon May 15 14:15:10 2023 ) |
| Omicron analysis time window (H1): | GPS = 1368195315 → GPS = 1368195331 |
| Omicron analysis time window (L1): | GPS = 1368195315 → GPS = 1368195331 |
| Time delay between detectors t(L1) - t(H1): | 2.34722 s (slice index = 57 / 217), δt_gw = 0.00121676 s |
| Time delay uncertainty: | 0.00490668 s |
| [targeted mode] Time delay probability: | 0.49374 (0.684372 sigmas), δt_target = 0.00868368 s |
| Frequency: | 818.477 Hz |
| Ξ: | 0.000894048 ± 0.0314162 (variance = 0.000986975): Q0: 0, Q1: 0, Q2: 0.0342289, Q3: 0.0790806, Q4: 0.0583124 |
| Rank: | R_A = 0.000117581 |
| Log of amplitude ratio (L1/H1): | 0.455494, variance = 0.503506 (L1/H1: -0.355682, variance = 0.949455, H1/L1: -1.21837, variance = 1.05614) |
| Amplitude ratio (L1/H1): | 1.57695 ⋇ 2.03314 (L1/H1: 0.700695 ⋇ 2.64958, H1/L1: 0.295712 ⋇ 2.79459) |
| Amplitude ratio H1|L1 compatibility (probability): | 0.266366 |
| Antenna factor probability: | 1 |
| Number of rejected frequency rows: | Q0: 18 / 18, Q1: 36 / 36, Q2: 65 / 70, Q3: 122 / 134, Q4: 247 / 258 |
| Maximum signal-to-noise ratio: | H1: 4.90349, L1: 5.05634 |
| SNR variance: | H1: 0.458614, L1: 0.492998 |
| Event time t(H1): | GPS = 1368195288 (Mon May 15 14:14:30 2023 ) → GPS = 1368195298 (Mon May 15 14:14:40 2023 ) |
| Event time t(L1): | GPS = 1368195288 (Mon May 15 14:14:40 2023 ) → GPS = 1368195298 (Mon May 15 14:14:40 2023 ) |
| Omicron analysis time window (H1): | GPS = 1368195285 → GPS = 1368195301 |
| Omicron analysis time window (L1): | GPS = 1368195285 → GPS = 1368195301 |
| Time delay between detectors t(L1) - t(H1): | 2.34481 s (slice index = 57 / 217), δt_gw = -0.00118791 s |
| Time delay uncertainty: | 0.00534784 s |
| [targeted mode] Time delay probability: | 0.856065 (0.181385 sigmas), δt_target = 0.00868368 s |
| Frequency: | 689.627 Hz |
| Ξ: | 0.000543918 ± 0.0311163 (variance = 0.000968221): Q0: 0, Q1: 0.0294456, Q2: 0.0259731, Q3: 0.052641, Q4: 0.0926618 |
| Rank: | R_A = 0.000111889 |
| Log of amplitude ratio (L1/H1): | 0.966513, variance = 0.339075 (L1/H1: 0.268204, variance = 0.840238, H1/L1: -1.64101, variance = 0.526533) |
| Amplitude ratio (L1/H1): | 2.62876 ⋇ 1.79015 (L1/H1: 1.30761 ⋇ 2.50089, H1/L1: 0.193785 ⋇ 2.06602) |
| Amplitude ratio H1|L1 compatibility (probability): | 0.240295 |
| Antenna factor probability: | 1 |
| Number of rejected frequency rows: | Q0: 18 / 18, Q1: 35 / 36, Q2: 68 / 70, Q3: 128 / 134, Q4: 252 / 258 |
| Maximum signal-to-noise ratio: | H1: 4.94736, L1: 5.03394 |
| SNR variance: | H1: 0.447481, L1: 0.49169 |
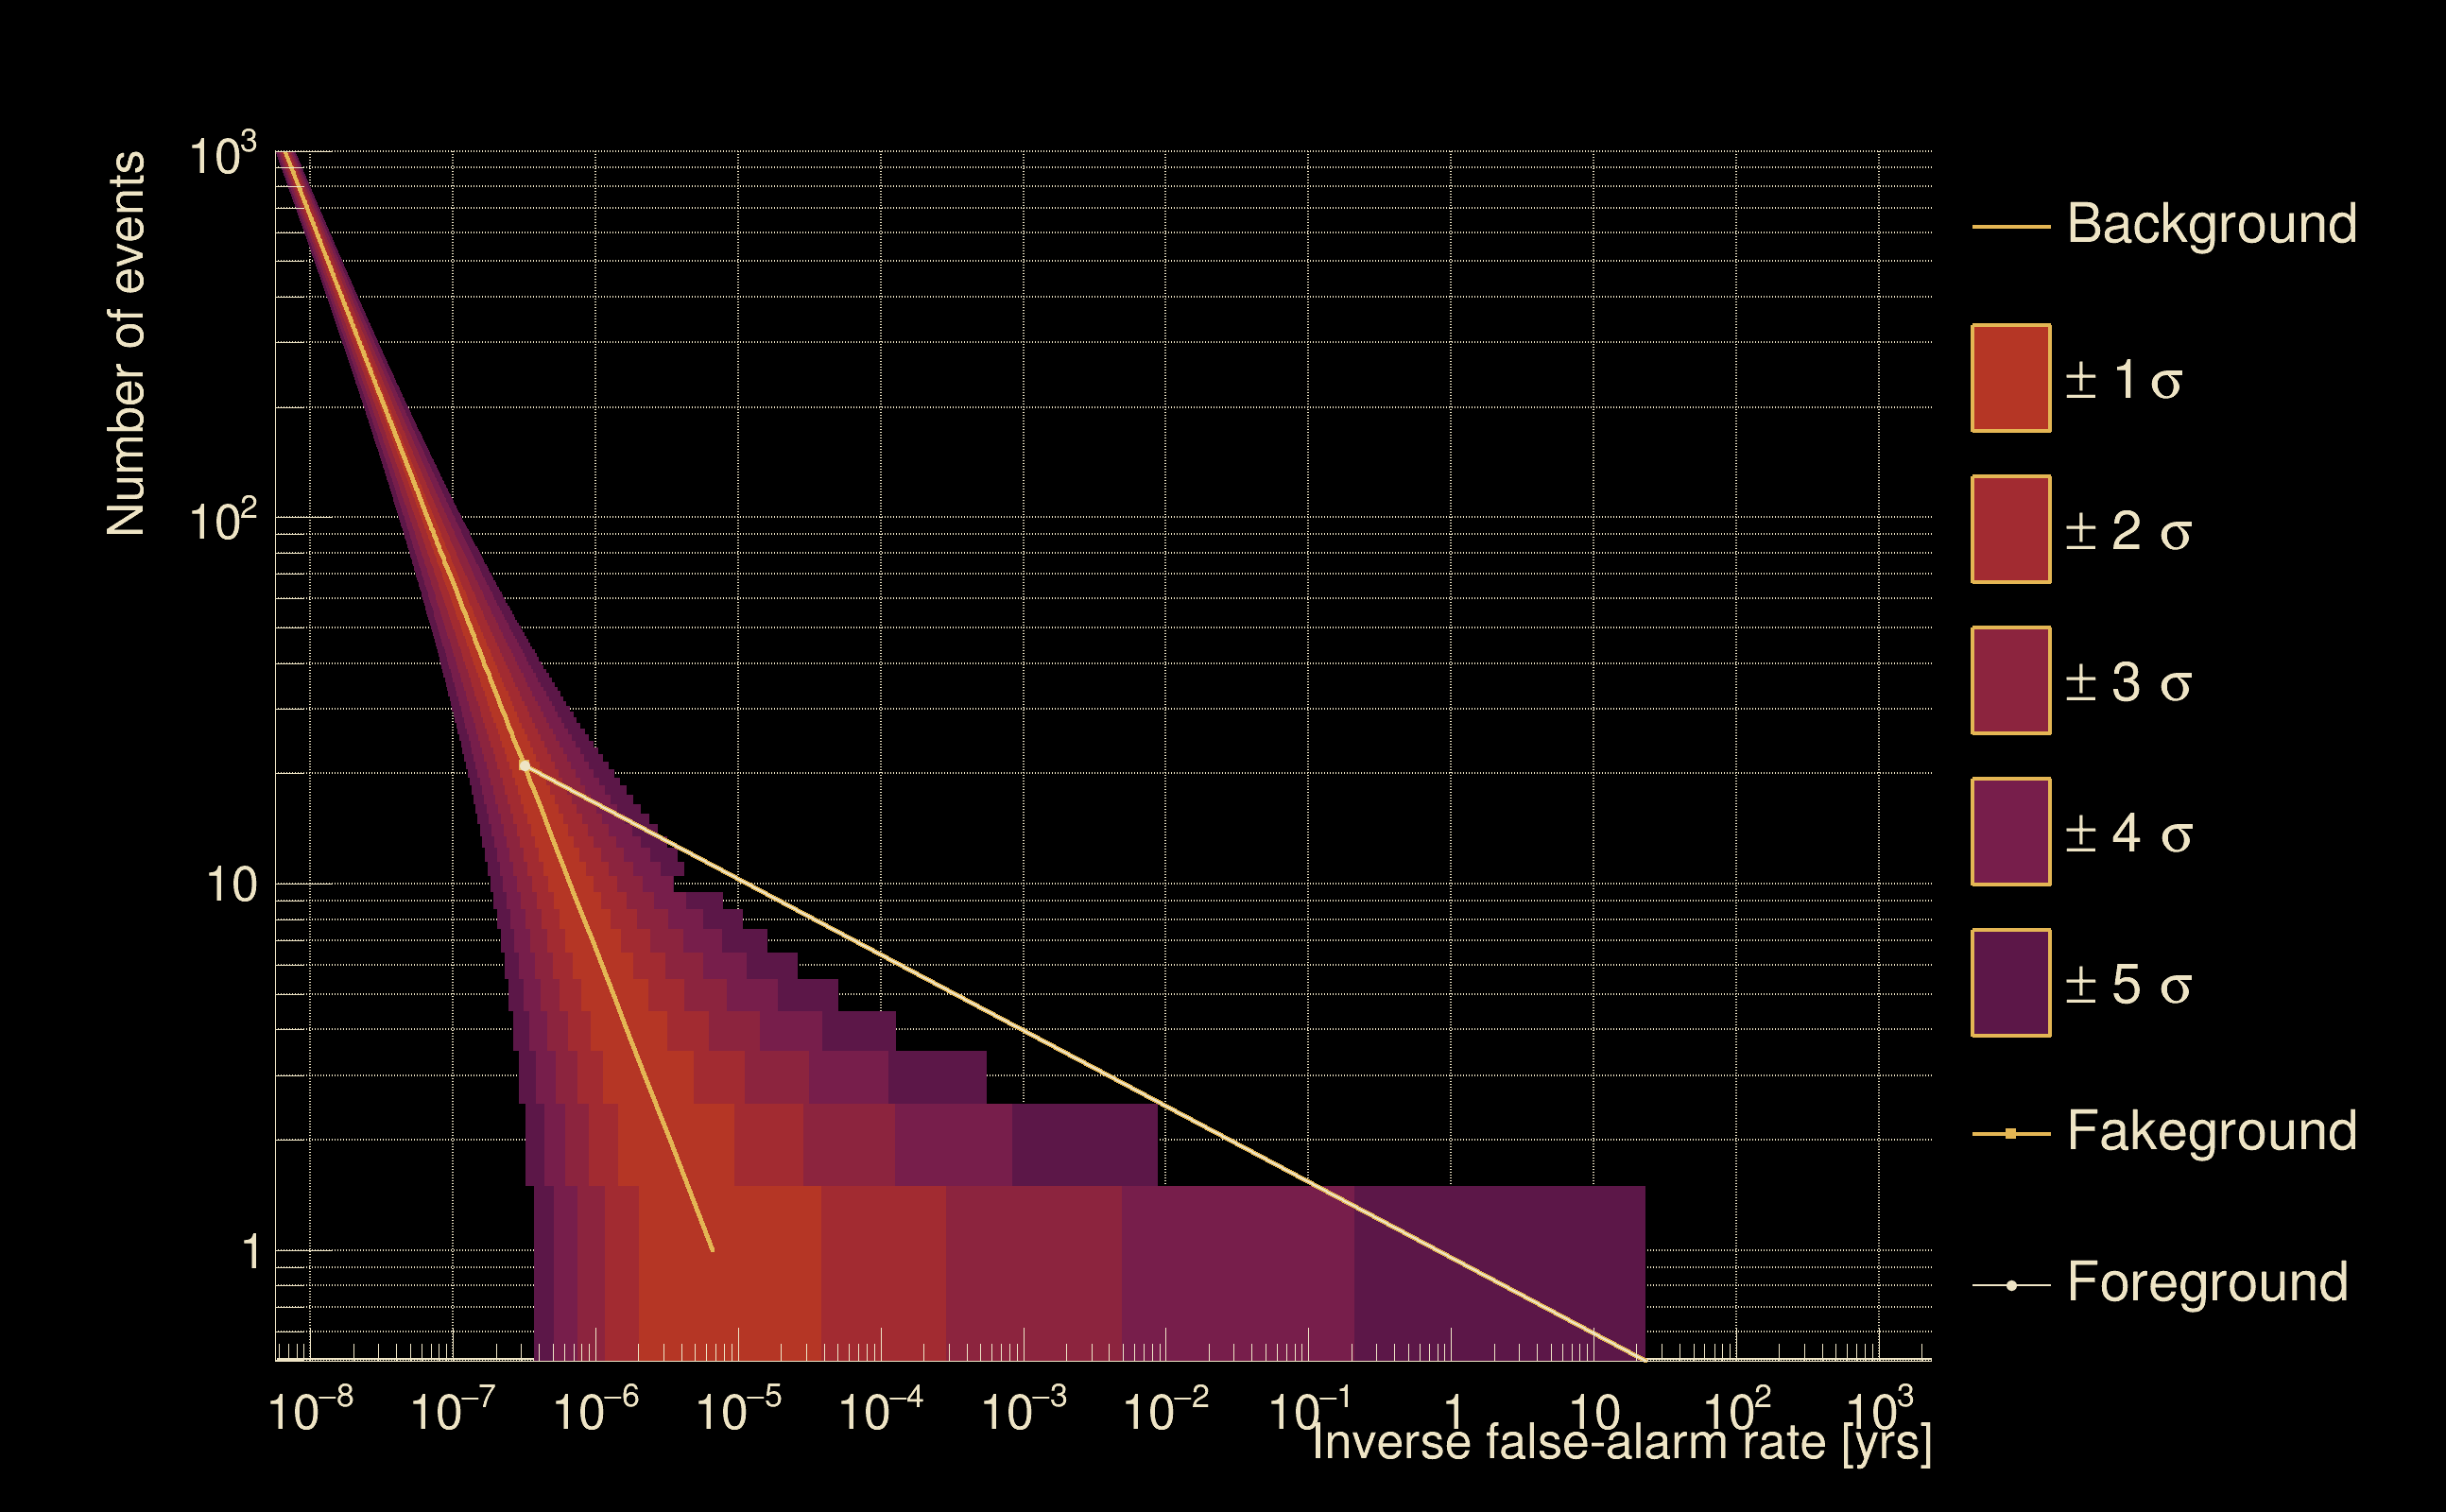
| Detection threshold: | R > 0.005 |
| False-alarm rate above that detection threshold: | 0.05 |
| Alternative threshold at 1/1000 yrs: | R > 0.005 |
| Alternative threshold at 1/100 yrs: | R > 0.005 |
| Alternative threshold at 1/10 yrs: | R > 0.005 |
| Alternative threshold at 1/1 yr: | R > 0.005 |
| Alternative threshold at 1/1 d: | R > 0.005 |
 |
|
 |
 |
 |
 |
 |
 |
 |
 |
| Event time t(H1): | GPS = 1368195318 (Mon May 15 14:15:00 2023 ) → GPS = 1368195328 (Mon May 15 14:15:10 2023 ) |
| Event time t(L1): | GPS = 1368195318 (Mon May 15 14:15:10 2023 ) → GPS = 1368195328 (Mon May 15 14:15:10 2023 ) |
| Omicron analysis time window (H1): | GPS = 1368195315 → GPS = 1368195331 |
| Omicron analysis time window (L1): | GPS = 1368195315 → GPS = 1368195331 |
| Time delay between detectors t(L1) - t(H1): | -4.55739 s (slice index = 207 / 217), δt_gw = -0.00339159 s |
| Time delay uncertainty: | 0.00672687 s |
| [targeted mode] Time delay probability: | 0.852543 (0.185875 sigmas), δt_target = 0.00868368 s |
| Frequency: | 646.791 Hz |
| Ξ: | 0.00200884 ± 0.0330923 (variance = 0.0010951): Q0: 0, Q1: 0.0395228, Q2: 0.0744641, Q3: 0.0745167, Q4: 0.0932127 |
| Rank: | R_A = 0.00120717 |
| Log of amplitude ratio (L1/H1): | 0.380654, variance = 0.425647 (L1/H1: 0.124789, variance = 1.00039, H1/L1: -0.621282, variance = 0.717916) |
| Amplitude ratio (L1/H1): | 1.46324 ⋇ 1.92017 (L1/H1: 1.13291 ⋇ 2.71881, H1/L1: 0.537255 ⋇ 2.33334) |
| Amplitude ratio H1|L1 compatibility (probability): | 0.704867 |
| Antenna factor probability: | 1 |
| Number of rejected frequency rows: | Q0: 18 / 18, Q1: 34 / 36, Q2: 64 / 70, Q3: 124 / 134, Q4: 240 / 258 |
| Maximum signal-to-noise ratio: | H1: 4.90349, L1: 5.05634 |
| SNR variance: | H1: 0.458614, L1: 0.492998 |
| Click here for a zoomed plot | Click here for a zoomed plot | Click here for a zoomed plot | Click here for a zoomed plot | Click here for a zoomed plot |
|
|
|
|
|
|
|
|
|
|
|
|
|
|
|
|
|
|
|
|
|
|
|
|
|
 |
 |
 |
 |
 |
 |
 |
 |
 |
| Event time t(H1): | GPS = 1368195318 (Mon May 15 14:15:00 2023 ) → GPS = 1368195328 (Mon May 15 14:15:10 2023 ) |
| Event time t(L1): | GPS = 1368195318 (Mon May 15 14:15:10 2023 ) → GPS = 1368195328 (Mon May 15 14:15:10 2023 ) |
| Omicron analysis time window (H1): | GPS = 1368195315 → GPS = 1368195331 |
| Omicron analysis time window (L1): | GPS = 1368195315 → GPS = 1368195331 |
| Time delay between detectors t(L1) - t(H1): | 1.93131 s (slice index = 66 / 217), δt_gw = -0.000694148 s |
| Time delay uncertainty: | 0.0072858 s |
| [targeted mode] Time delay probability: | 0.842562 (0.198618 sigmas), δt_target = 0.00868297 s |
| Frequency: | 274.454 Hz |
| Ξ: | 0.00167509 ± 0.106534 (variance = 0.0113496): Q0: 0, Q1: 0.0311244, Q2: 0.062748, Q3: 0.131923, Q4: 0.299307 |
| Rank: | R_A = 0.00114316 |
| Log of amplitude ratio (L1/H1): | 0.232935, variance = 0.441906 (L1/H1: 0.0678674, variance = 0.954275, H1/L1: -0.388173, variance = 0.819923) |
| Amplitude ratio (L1/H1): | 1.2623 ⋇ 1.94402 (L1/H1: 1.07022 ⋇ 2.65613, H1/L1: 0.678295 ⋇ 2.47316) |
| Amplitude ratio H1|L1 compatibility (probability): | 0.809965 |
| Antenna factor probability: | 1 |
| Number of rejected frequency rows: | Q0: 18 / 18, Q1: 35 / 36, Q2: 67 / 70, Q3: 125 / 134, Q4: 246 / 258 |
| Maximum signal-to-noise ratio: | H1: 4.90349, L1: 5.05634 |
| SNR variance: | H1: 0.458614, L1: 0.492998 |
| Click here for a zoomed plot | Click here for a zoomed plot | Click here for a zoomed plot | Click here for a zoomed plot | Click here for a zoomed plot |
|
|
|
|
|
|
|
|
|
|
|
|
|
|
|
|
|
|
|
|
|
|
|
|
|
 |
 |
 |
 |
 |
 |
 |
 |
 |
| Event time t(H1): | GPS = 1368195318 (Mon May 15 14:15:00 2023 ) → GPS = 1368195328 (Mon May 15 14:15:10 2023 ) |
| Event time t(L1): | GPS = 1368195318 (Mon May 15 14:15:10 2023 ) → GPS = 1368195328 (Mon May 15 14:15:10 2023 ) |
| Omicron analysis time window (H1): | GPS = 1368195315 → GPS = 1368195331 |
| Omicron analysis time window (L1): | GPS = 1368195315 → GPS = 1368195331 |
| Time delay between detectors t(L1) - t(H1): | 4.32248 s (slice index = 14 / 217), δt_gw = -0.00152386 s |
| Time delay uncertainty: | 0.00698848 s |
| [targeted mode] Time delay probability: | 0.929605 (0.0883421 sigmas), δt_target = 0.00868297 s |
| Frequency: | 614.329 Hz |
| Ξ: | 0.00163026 ± 0.0447419 (variance = 0.00200184): Q0: 0, Q1: 0.0492482, Q2: 0.0473809, Q3: 0.0639294, Q4: 0.138225 |
| Rank: | R_A = 0.00111898 |
| Log of amplitude ratio (L1/H1): | 0.486951, variance = 0.416355 (L1/H1: 0.264112, variance = 0.935254, H1/L1: -0.69652, variance = 0.740538) |
| Amplitude ratio (L1/H1): | 1.62735 ⋇ 1.90647 (L1/H1: 1.30227 ⋇ 2.63027, H1/L1: 0.498316 ⋇ 2.36445) |
| Amplitude ratio H1|L1 compatibility (probability): | 0.738358 |
| Antenna factor probability: | 1 |
| Number of rejected frequency rows: | Q0: 18 / 18, Q1: 34 / 36, Q2: 64 / 70, Q3: 127 / 134, Q4: 249 / 258 |
| Maximum signal-to-noise ratio: | H1: 4.90349, L1: 5.05634 |
| SNR variance: | H1: 0.458614, L1: 0.492998 |
| Click here for a zoomed plot | Click here for a zoomed plot | Click here for a zoomed plot | Click here for a zoomed plot | Click here for a zoomed plot |
|
|
|
|
|
|
|
|
|
|
|
|
|
|
|
|
|
|
|
|
|
|
|
|
|
 |
 |
 |
 |
 |
 |
 |
 |
 |
| Event time t(H1): | GPS = 1368195318 (Mon May 15 14:15:00 2023 ) → GPS = 1368195328 (Mon May 15 14:15:10 2023 ) |
| Event time t(L1): | GPS = 1368195318 (Mon May 15 14:15:10 2023 ) → GPS = 1368195328 (Mon May 15 14:15:10 2023 ) |
| Omicron analysis time window (H1): | GPS = 1368195315 → GPS = 1368195331 |
| Omicron analysis time window (L1): | GPS = 1368195315 → GPS = 1368195331 |
| Time delay between detectors t(L1) - t(H1): | -3.6806 s (slice index = 188 / 217), δt_gw = -0.000601148 s |
| Time delay uncertainty: | 0.00424648 s |
| [targeted mode] Time delay probability: | 0.716848 (0.362675 sigmas), δt_target = 0.00868297 s |
| Frequency: | 514.041 Hz |
| Ξ: | 0.00192472 ± 0.0566977 (variance = 0.00321462): Q0: 0, Q1: 0.0445616, Q2: 0.0682497, Q3: 0.171886, Q4: 0.0575821 |
| Rank: | R_A = 0.00109752 |
| Log of amplitude ratio (L1/H1): | 0.54418, variance = 0.663712 (L1/H1: 0.328064, variance = 1.02034, H1/L1: -0.747427, variance = 1.59667) |
| Amplitude ratio (L1/H1): | 1.72319 ⋇ 2.25846 (L1/H1: 1.38828 ⋇ 2.74593, H1/L1: 0.473583 ⋇ 3.53812) |
| Amplitude ratio H1|L1 compatibility (probability): | 0.795457 |
| Antenna factor probability: | 1 |
| Number of rejected frequency rows: | Q0: 18 / 18, Q1: 34 / 36, Q2: 66 / 70, Q3: 126 / 134, Q4: 248 / 258 |
| Maximum signal-to-noise ratio: | H1: 4.90349, L1: 5.05634 |
| SNR variance: | H1: 0.458614, L1: 0.492998 |
| Click here for a zoomed plot | Click here for a zoomed plot | Click here for a zoomed plot | Click here for a zoomed plot | Click here for a zoomed plot |
|
|
|
|
|
|
|
|
|
|
|
|
|
|
|
|
|
|
|
|
|
|
|
|
|
 |
 |
 |
 |
 |
 |
 |
 |
 |
| Event time t(H1): | GPS = 1368195308 (Mon May 15 14:14:50 2023 ) → GPS = 1368195318 (Mon May 15 14:15:00 2023 ) |
| Event time t(L1): | GPS = 1368195308 (Mon May 15 14:15:00 2023 ) → GPS = 1368195318 (Mon May 15 14:15:00 2023 ) |
| Omicron analysis time window (H1): | GPS = 1368195305 → GPS = 1368195321 |
| Omicron analysis time window (L1): | GPS = 1368195305 → GPS = 1368195321 |
| Time delay between detectors t(L1) - t(H1): | -3.77298 s (slice index = 190 / 217), δt_gw = -0.00097932 s |
| Time delay uncertainty: | 0.00812415 s |
| [targeted mode] Time delay probability: | 0.885718 (0.143724 sigmas), δt_target = 0.00868297 s |
| Frequency: | 490.101 Hz |
| Ξ: | 0.00125915 ± 0.0525495 (variance = 0.00276145): Q0: 0, Q1: 0, Q2: 0.0867887, Q3: 0.127762, Q4: 0.0963553 |
| Rank: | R_A = 0.000968058 |
| Log of amplitude ratio (L1/H1): | 0.706351, variance = 0.374487 (L1/H1: 0.594366, variance = 0.793997, H1/L1: -0.797922, variance = 0.706426) |
| Amplitude ratio (L1/H1): | 2.02658 ⋇ 1.84403 (L1/H1: 1.81188 ⋇ 2.43773, H1/L1: 0.450264 ⋇ 2.31751) |
| Amplitude ratio H1|L1 compatibility (probability): | 0.868016 |
| Antenna factor probability: | 1 |
| Number of rejected frequency rows: | Q0: 18 / 18, Q1: 36 / 36, Q2: 67 / 70, Q3: 123 / 134, Q4: 254 / 258 |
| Maximum signal-to-noise ratio: | H1: 4.86133, L1: 5.37595 |
| SNR variance: | H1: 0.458921, L1: 0.483131 |
| Click here for a zoomed plot | Click here for a zoomed plot | Click here for a zoomed plot | Click here for a zoomed plot | Click here for a zoomed plot |
 |
 |
 |
 |
 |
 |
 |
 |
 |
 |
 |
 |
 |
 |
 |
 |
 |
 |
 |
 |
 |
 |
 |
 |
 |
 |
 |
 |
 |
 |
 |
 |
 |
 |
| Event time t(H1): | GPS = 1368195318 (Mon May 15 14:15:00 2023 ) → GPS = 1368195328 (Mon May 15 14:15:10 2023 ) |
| Event time t(L1): | GPS = 1368195318 (Mon May 15 14:15:10 2023 ) → GPS = 1368195328 (Mon May 15 14:15:10 2023 ) |
| Omicron analysis time window (H1): | GPS = 1368195315 → GPS = 1368195331 |
| Omicron analysis time window (L1): | GPS = 1368195315 → GPS = 1368195331 |
| Time delay between detectors t(L1) - t(H1): | 2.15984 s (slice index = 61 / 217), δt_gw = -0.0021612 s |
| Time delay uncertainty: | 0.00397814 s |
| [targeted mode] Time delay probability: | 0.995996 (0.00501861 sigmas), δt_target = 0.00868416 s |
| Frequency: | 644.591 Hz |
| Ξ: | 0.00169735 ± 0.0314037 (variance = 0.000986195): Q0: 0, Q1: 0.0328143, Q2: 0.0750504, Q3: 0.0881501, Q4: 0.0574186 |
| Rank: | R_A = 0.000912509 |
| Log of amplitude ratio (L1/H1): | 0.413135, variance = 0.628217 (L1/H1: -0.0927184, variance = 1.70727, H1/L1: -0.888866, variance = 0.85546) |
| Amplitude ratio (L1/H1): | 1.51155 ⋇ 2.20914 (L1/H1: 0.91145 ⋇ 3.69369, H1/L1: 0.411122 ⋇ 2.52164) |
| Amplitude ratio H1|L1 compatibility (probability): | 0.539768 |
| Antenna factor probability: | 1 |
| Number of rejected frequency rows: | Q0: 18 / 18, Q1: 34 / 36, Q2: 65 / 70, Q3: 124 / 134, Q4: 248 / 258 |
| Maximum signal-to-noise ratio: | H1: 4.90349, L1: 5.05634 |
| SNR variance: | H1: 0.458614, L1: 0.492998 |
| Click here for a zoomed plot | Click here for a zoomed plot | Click here for a zoomed plot | Click here for a zoomed plot | Click here for a zoomed plot |
|
|
|
|
|
|
|
|
|
|
|
|
|
|
|
|
|
|
|
|
|
|
|
|
|
 |
 |
 |
 |
 |
 |
 |
 |
 |
| Event time t(H1): | GPS = 1368195318 (Mon May 15 14:15:00 2023 ) → GPS = 1368195328 (Mon May 15 14:15:10 2023 ) |
| Event time t(L1): | GPS = 1368195318 (Mon May 15 14:15:10 2023 ) → GPS = 1368195328 (Mon May 15 14:15:10 2023 ) |
| Omicron analysis time window (H1): | GPS = 1368195315 → GPS = 1368195331 |
| Omicron analysis time window (L1): | GPS = 1368195315 → GPS = 1368195331 |
| Time delay between detectors t(L1) - t(H1): | -2.20977 s (slice index = 156 / 217), δt_gw = -0.00176763 s |
| Time delay uncertainty: | 0.00521288 s |
| [targeted mode] Time delay probability: | 0.942865 (0.07167 sigmas), δt_target = 0.00868297 s |
| Frequency: | 642.075 Hz |
| Ξ: | 0.00132575 ± 0.0285483 (variance = 0.000815005): Q0: 0, Q1: 0.0264139, Q2: 0.0552133, Q3: 0.0582251, Q4: 0.082769 |
| Rank: | R_A = 0.000898857 |
| Log of amplitude ratio (L1/H1): | 0.474179, variance = 0.483686 (L1/H1: 0.21315, variance = 1.40095, H1/L1: -0.719665, variance = 0.582179) |
| Amplitude ratio (L1/H1): | 1.60669 ⋇ 2.00466 (L1/H1: 1.23757 ⋇ 3.26616, H1/L1: 0.486916 ⋇ 2.14472) |
| Amplitude ratio H1|L1 compatibility (probability): | 0.719086 |
| Antenna factor probability: | 1 |
| Number of rejected frequency rows: | Q0: 18 / 18, Q1: 34 / 36, Q2: 65 / 70, Q3: 124 / 134, Q4: 246 / 258 |
| Maximum signal-to-noise ratio: | H1: 4.90349, L1: 5.05634 |
| SNR variance: | H1: 0.458614, L1: 0.492998 |
| Click here for a zoomed plot | Click here for a zoomed plot | Click here for a zoomed plot | Click here for a zoomed plot | Click here for a zoomed plot |
|
|
|
|
|
|
|
|
|
|
|
|
|
|
|
|
|
|
|
|
|
|
|
|
|
 |
 |
 |
 |
 |
 |
 |
 |
 |
| Event time t(H1): | GPS = 1368195318 (Mon May 15 14:15:00 2023 ) → GPS = 1368195328 (Mon May 15 14:15:10 2023 ) |
| Event time t(L1): | GPS = 1368195318 (Mon May 15 14:15:10 2023 ) → GPS = 1368195328 (Mon May 15 14:15:10 2023 ) |
| Omicron analysis time window (H1): | GPS = 1368195315 → GPS = 1368195331 |
| Omicron analysis time window (L1): | GPS = 1368195315 → GPS = 1368195331 |
| Time delay between detectors t(L1) - t(H1): | -0.0927277 s (slice index = 110 / 217), δt_gw = -0.000727734 s |
| Time delay uncertainty: | 0.00899587 s |
| [targeted mode] Time delay probability: | 0.875144 (0.157128 sigmas), δt_target = 0.00868297 s |
| Frequency: | 476.748 Hz |
| Ξ: | 0.00204889 ± 0.0864987 (variance = 0.00748203): Q0: 0, Q1: 0.0129665, Q2: 0.0795753, Q3: 0.24299, Q4: 0.0801807 |
| Rank: | R_A = 0.000876418 |
| Log of amplitude ratio (L1/H1): | 0.487417, variance = 0.452281 (L1/H1: 0.00660742, variance = 0.98196, H1/L1: -0.939595, variance = 0.834504) |
| Amplitude ratio (L1/H1): | 1.6281 ⋇ 1.95917 (L1/H1: 1.00663 ⋇ 2.69376, H1/L1: 0.390786 ⋇ 2.49306) |
| Amplitude ratio H1|L1 compatibility (probability): | 0.488781 |
| Antenna factor probability: | 1 |
| Number of rejected frequency rows: | Q0: 18 / 18, Q1: 35 / 36, Q2: 67 / 70, Q3: 123 / 134, Q4: 245 / 258 |
| Maximum signal-to-noise ratio: | H1: 4.90349, L1: 5.05634 |
| SNR variance: | H1: 0.458614, L1: 0.492998 |
| Click here for a zoomed plot | Click here for a zoomed plot | Click here for a zoomed plot | Click here for a zoomed plot | Click here for a zoomed plot |
|
|
|
|
|
|
|
|
|
|
|
|
|
|
|
|
|
|
|
|
|
|
|
|
|
 |
 |
 |
 |
 |
 |
 |
 |
 |
| Event time t(H1): | GPS = 1368195283 (Mon May 15 14:14:25 2023 ) → GPS = 1368195293 (Mon May 15 14:14:35 2023 ) |
| Event time t(L1): | GPS = 1368195283 (Mon May 15 14:14:35 2023 ) → GPS = 1368195293 (Mon May 15 14:14:35 2023 ) |
| Omicron analysis time window (H1): | GPS = 1368195280 → GPS = 1368195296 |
| Omicron analysis time window (L1): | GPS = 1368195280 → GPS = 1368195296 |
| Time delay between detectors t(L1) - t(H1): | -1.05788 s (slice index = 131 / 217), δt_gw = 0.000118396 s |
| Time delay uncertainty: | 0.00593976 s |
| [targeted mode] Time delay probability: | 0.701218 (0.383676 sigmas), δt_target = 0.00868297 s |
| Frequency: | 506.722 Hz |
| Ξ: | 0.00190693 ± 0.0429012 (variance = 0.00184052): Q0: 0, Q1: 0.0317894, Q2: 0.0977274, Q3: 0.110724, Q4: 0.0918886 |
| Rank: | R_A = 0.000867202 |
| Log of amplitude ratio (L1/H1): | 1.34164, variance = 0.51182 (L1/H1: 0.989329, variance = 0.898859, H1/L1: -1.63266, variance = 1.09329) |
| Amplitude ratio (L1/H1): | 3.82531 ⋇ 2.04504 (L1/H1: 2.68943 ⋇ 2.58075, H1/L1: 0.195409 ⋇ 2.84512) |
| Amplitude ratio H1|L1 compatibility (probability): | 0.648535 |
| Antenna factor probability: | 1 |
| Number of rejected frequency rows: | Q0: 18 / 18, Q1: 34 / 36, Q2: 65 / 70, Q3: 126 / 134, Q4: 251 / 258 |
| Maximum signal-to-noise ratio: | H1: 4.63669, L1: 5.10162 |
| SNR variance: | H1: 0.430167, L1: 0.47788 |
| Click here for a zoomed plot | Click here for a zoomed plot | Click here for a zoomed plot | Click here for a zoomed plot | Click here for a zoomed plot |
 |
 |
 |
 |
 |
 |
 |
 |
 |
 |
 |
 |
 |
 |
 |
 |
 |
 |
 |
 |
 |
 |
 |
 |
 |
 |
 |
 |
 |
 |
 |
 |
 |
 |
| Event time t(H1): | GPS = 1368195318 (Mon May 15 14:15:00 2023 ) → GPS = 1368195328 (Mon May 15 14:15:10 2023 ) |
| Event time t(L1): | GPS = 1368195318 (Mon May 15 14:15:10 2023 ) → GPS = 1368195328 (Mon May 15 14:15:10 2023 ) |
| Omicron analysis time window (H1): | GPS = 1368195315 → GPS = 1368195331 |
| Omicron analysis time window (L1): | GPS = 1368195315 → GPS = 1368195331 |
| Time delay between detectors t(L1) - t(H1): | 2.84999 s (slice index = 46 / 217), δt_gw = -0.00201245 s |
| Time delay uncertainty: | 0.00659555 s |
| [targeted mode] Time delay probability: | 0.984421 (0.0195265 sigmas), δt_target = 0.00868702 s |
| Frequency: | 394.377 Hz |
| Ξ: | 0.00213467 ± 0.109153 (variance = 0.0119143): Q0: 0, Q1: 0.0353285, Q2: 0.0307875, Q3: 0.299564, Q4: 0.0548911 |
| Rank: | R_A = 0.000842141 |
| Log of amplitude ratio (L1/H1): | 0.489539, variance = 0.647786 (L1/H1: -0.202487, variance = 0.992863, H1/L1: -1.14036, variance = 1.56101) |
| Amplitude ratio (L1/H1): | 1.63156 ⋇ 2.23637 (L1/H1: 0.816697 ⋇ 2.70858, H1/L1: 0.319705 ⋇ 3.48826) |
| Amplitude ratio H1|L1 compatibility (probability): | 0.400749 |
| Antenna factor probability: | 1 |
| Number of rejected frequency rows: | Q0: 18 / 18, Q1: 34 / 36, Q2: 67 / 70, Q3: 125 / 134, Q4: 247 / 258 |
| Maximum signal-to-noise ratio: | H1: 4.90349, L1: 5.05634 |
| SNR variance: | H1: 0.458614, L1: 0.492998 |
| Click here for a zoomed plot | Click here for a zoomed plot | Click here for a zoomed plot | Click here for a zoomed plot | Click here for a zoomed plot |
|
|
|
|
|
|
|
|
|
|
|
|
|
|
|
|
|
|
|
|
|
|
|
|
|
 |
 |
 |
 |
 |
 |
 |
 |
 |
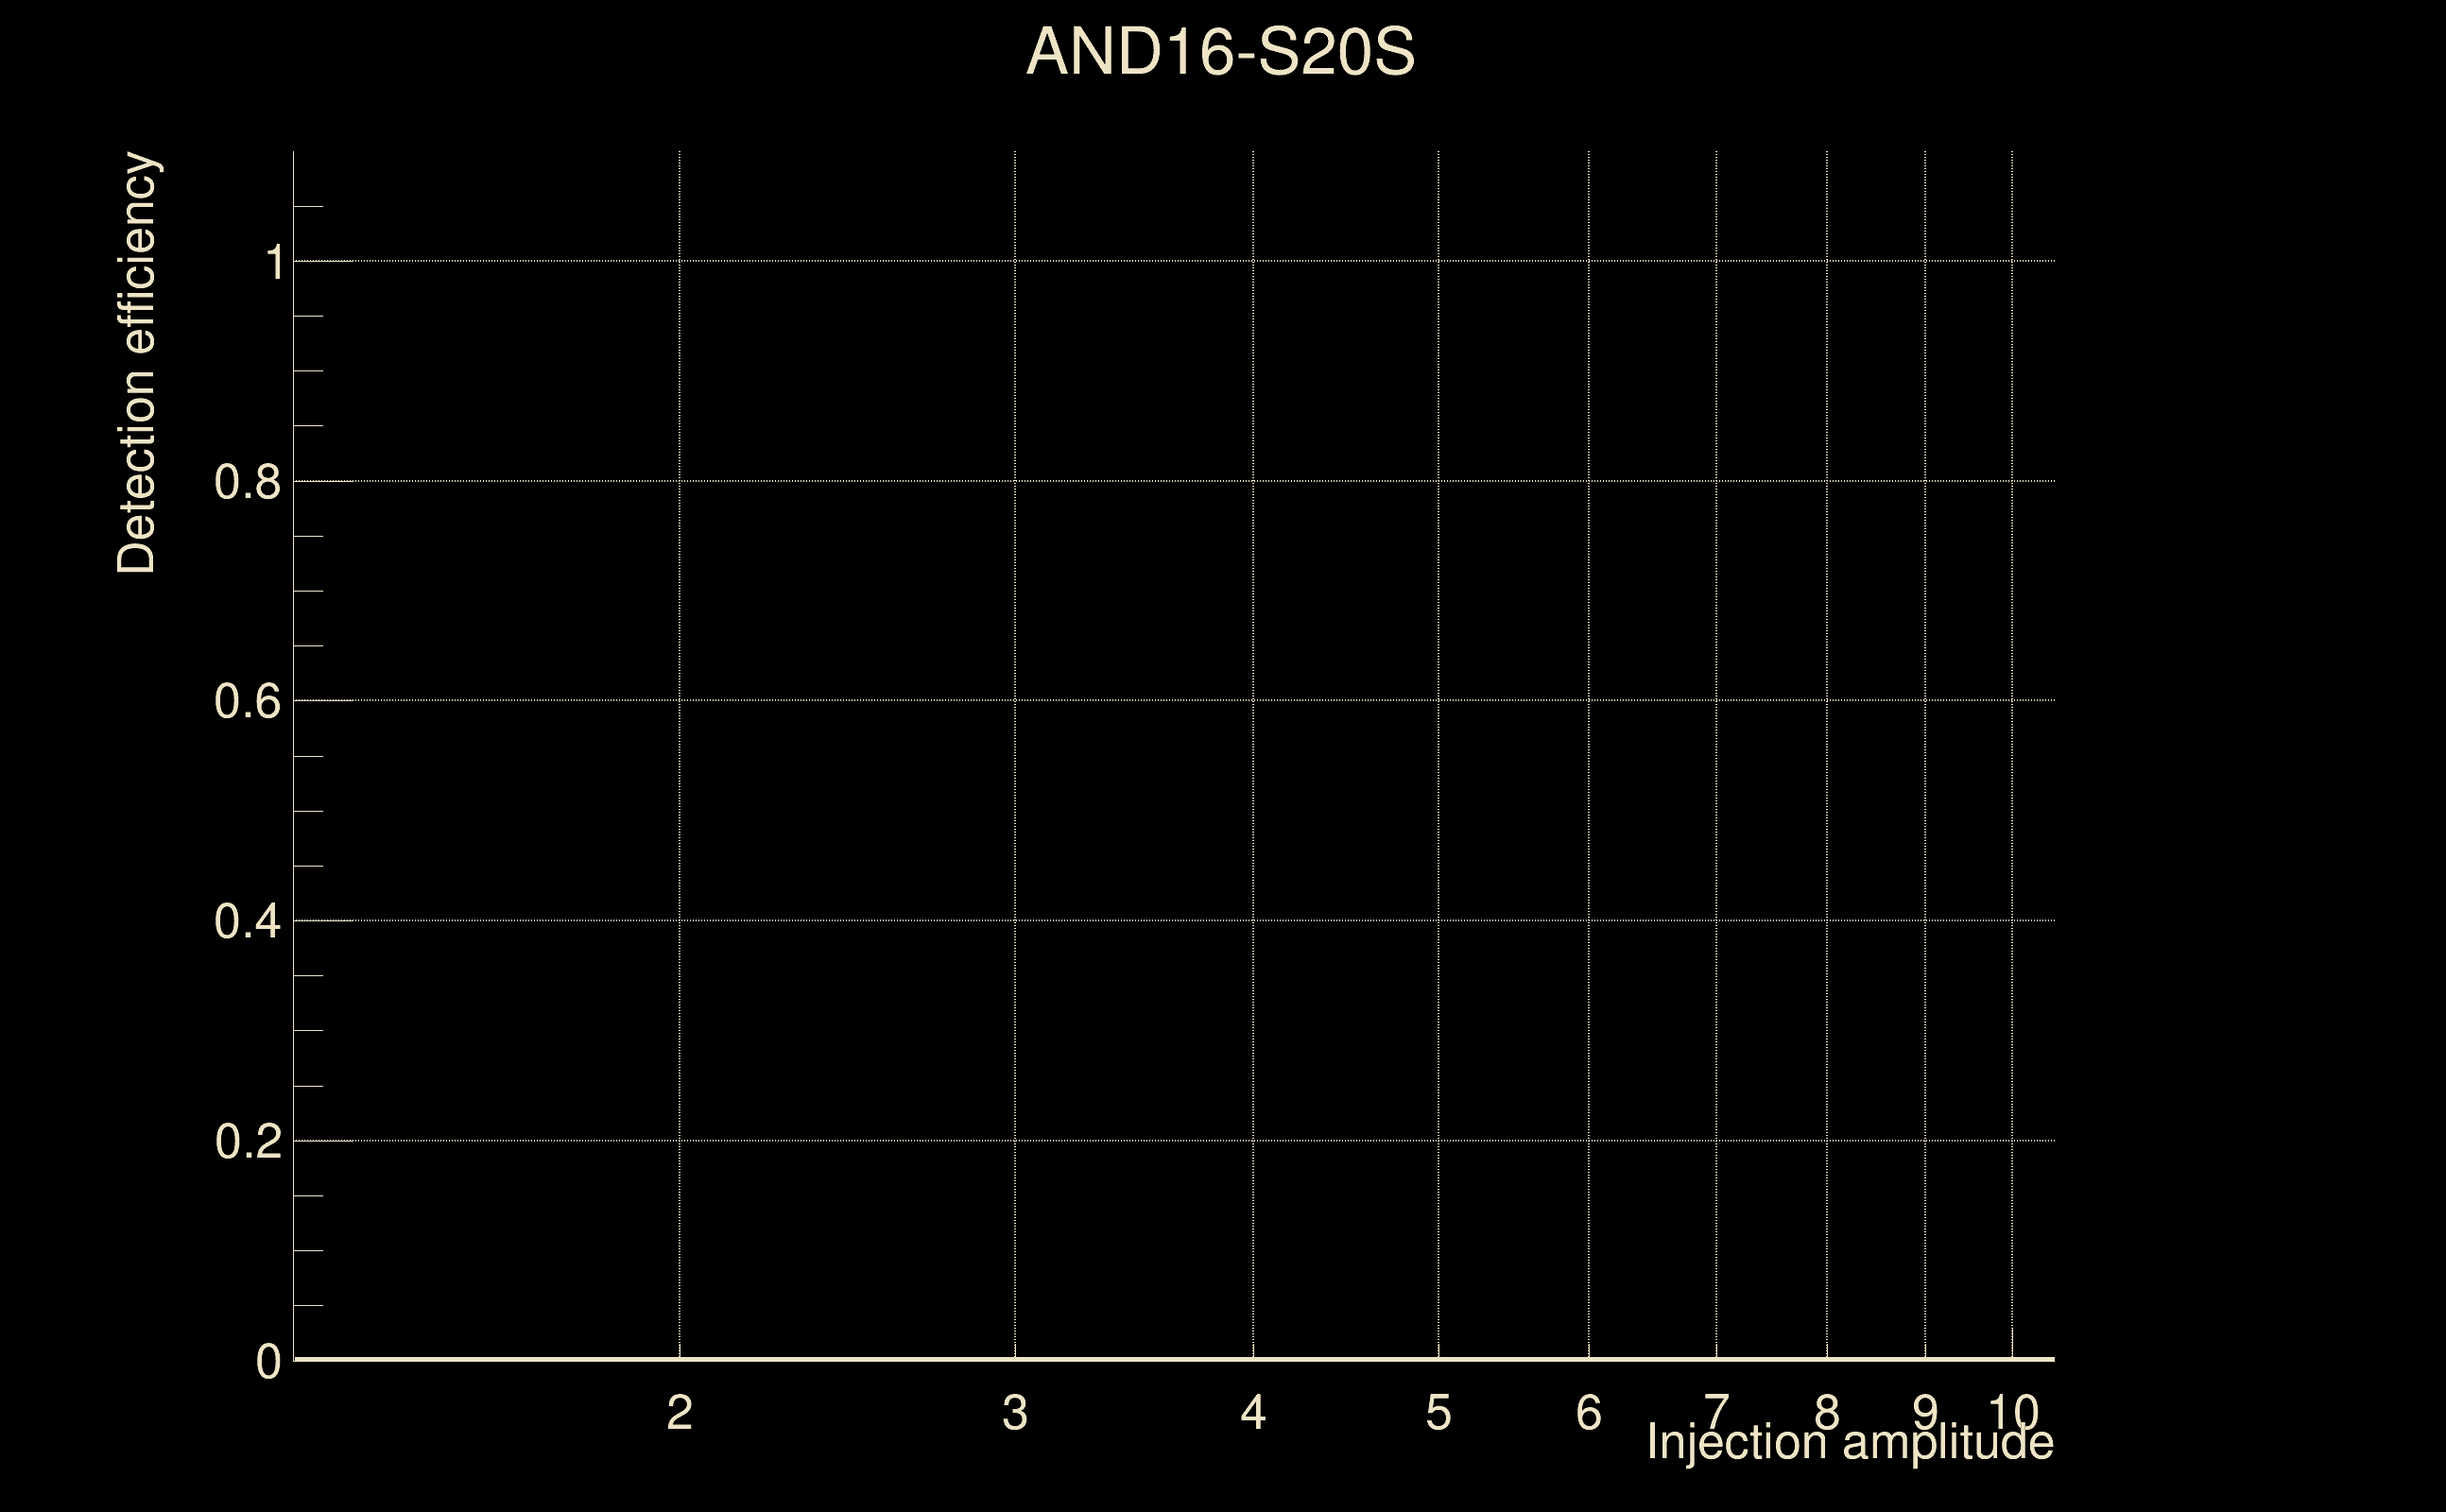
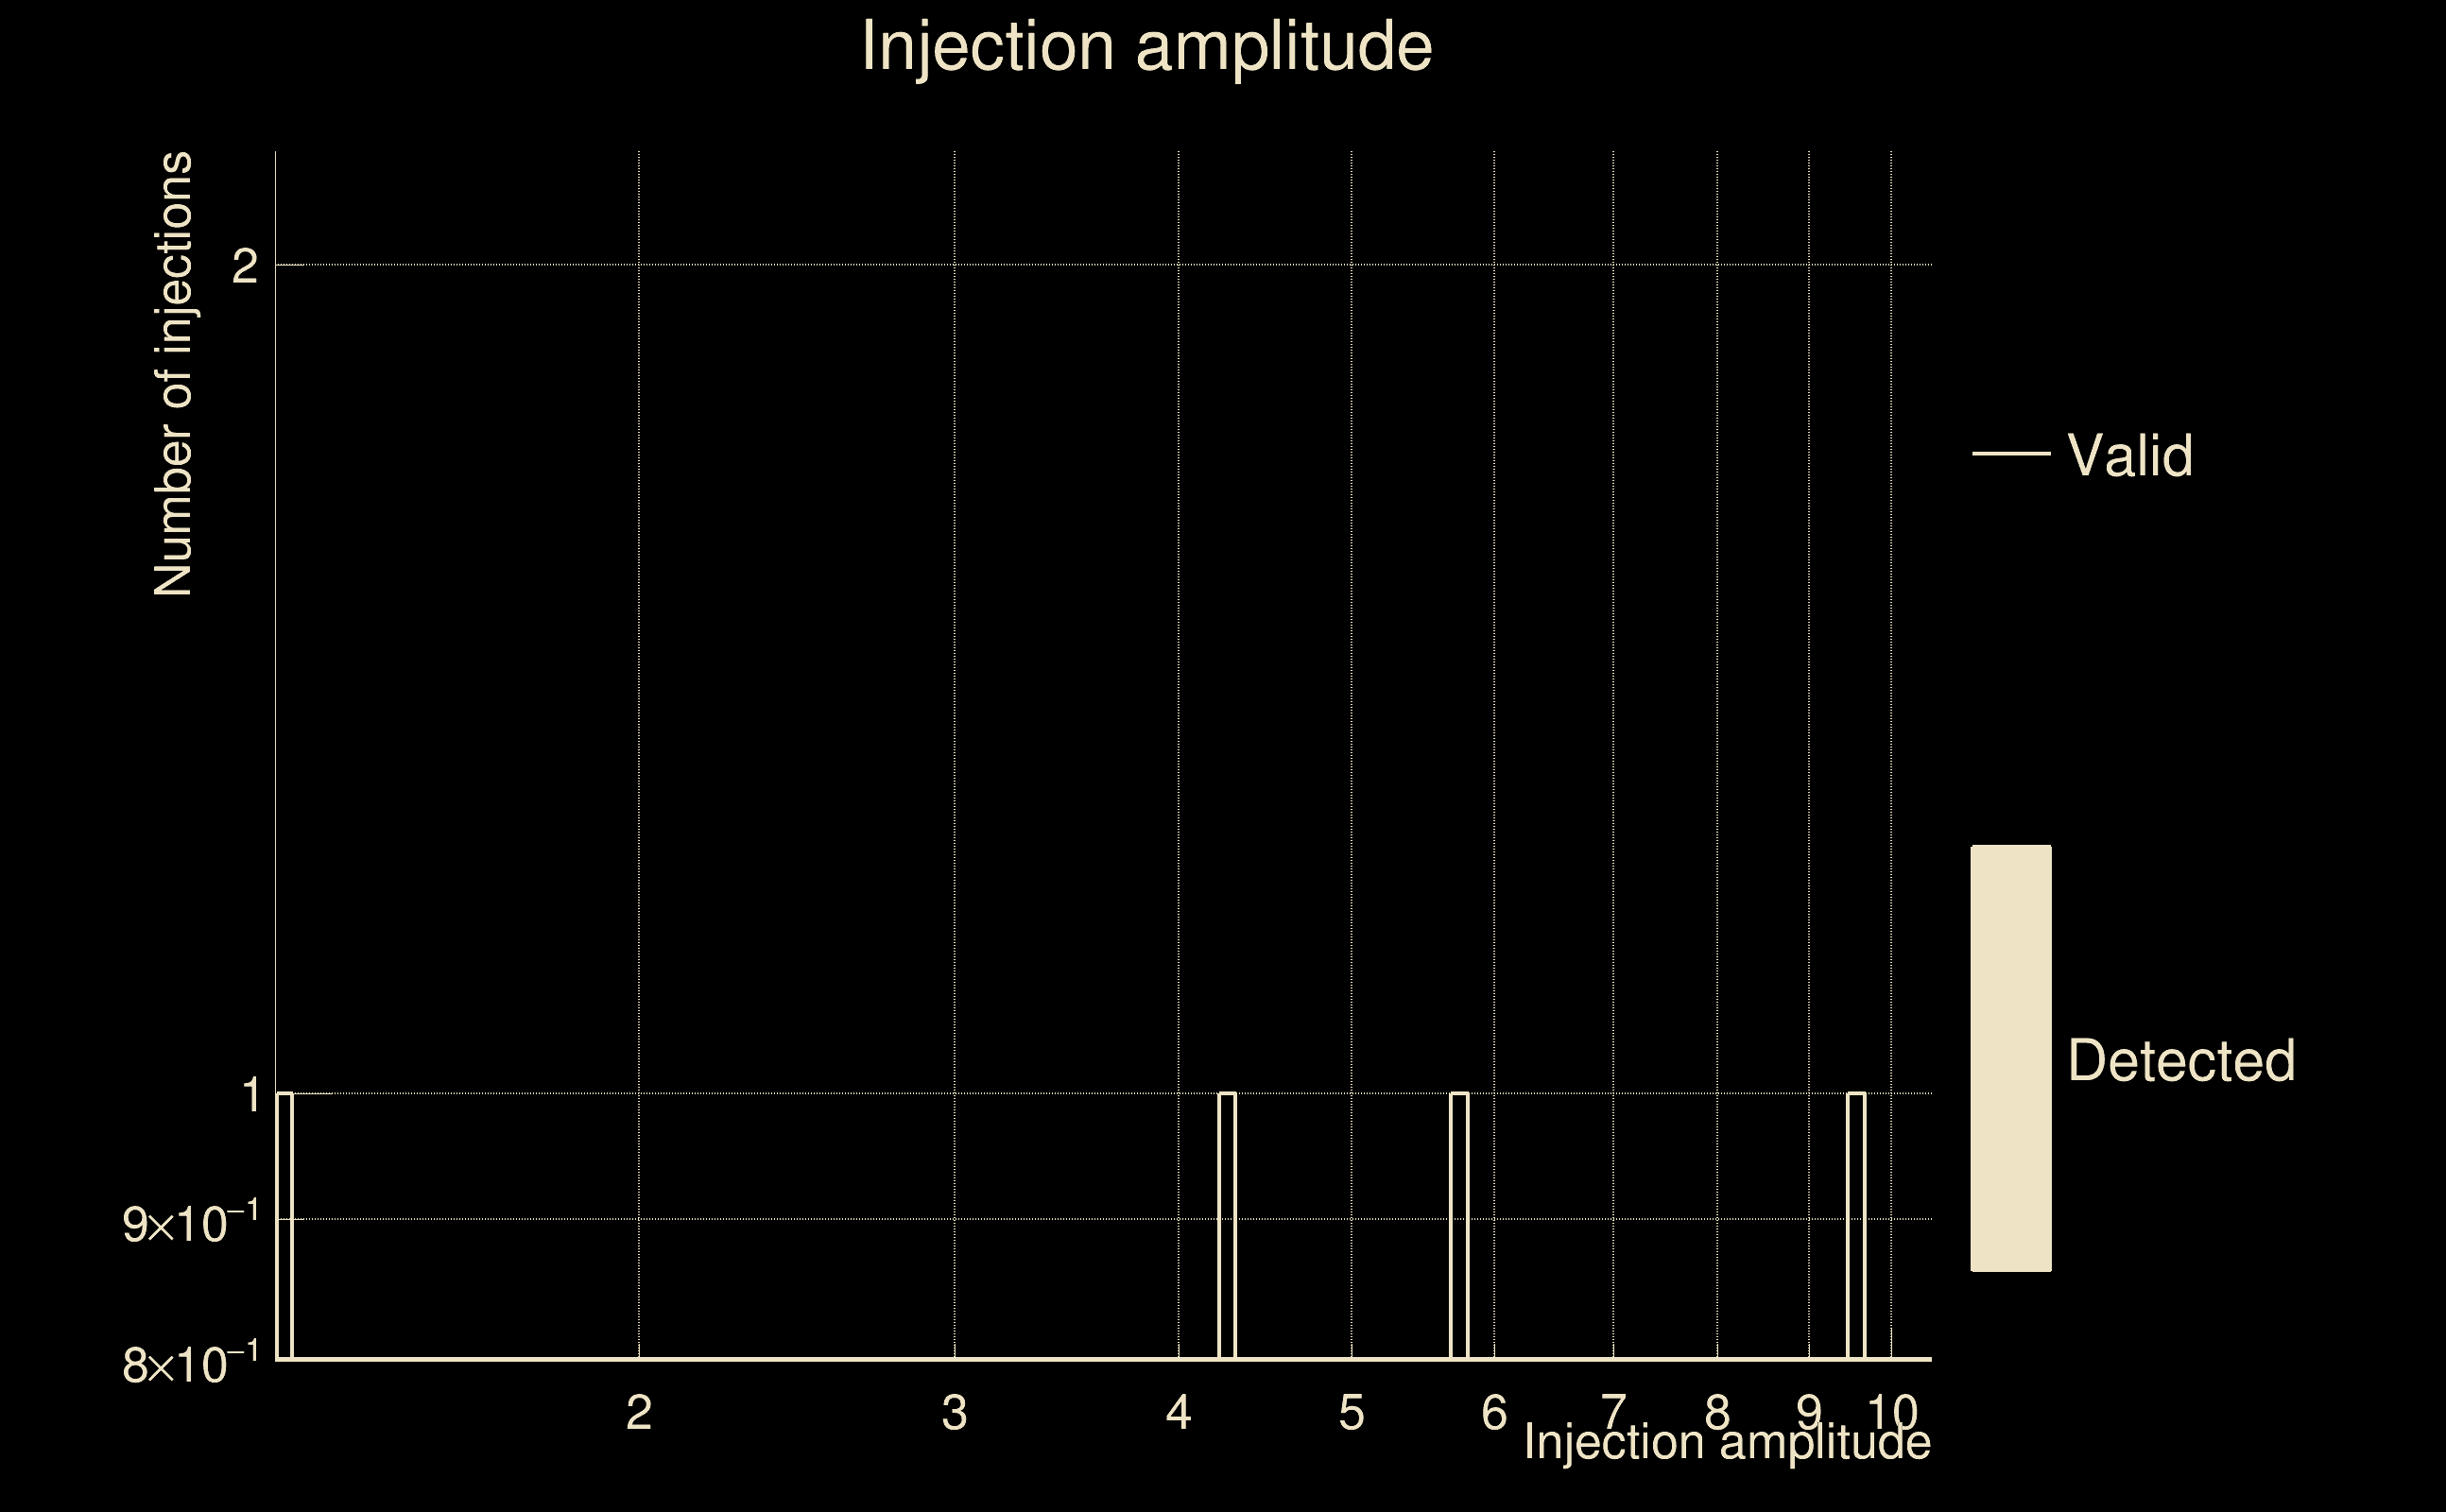
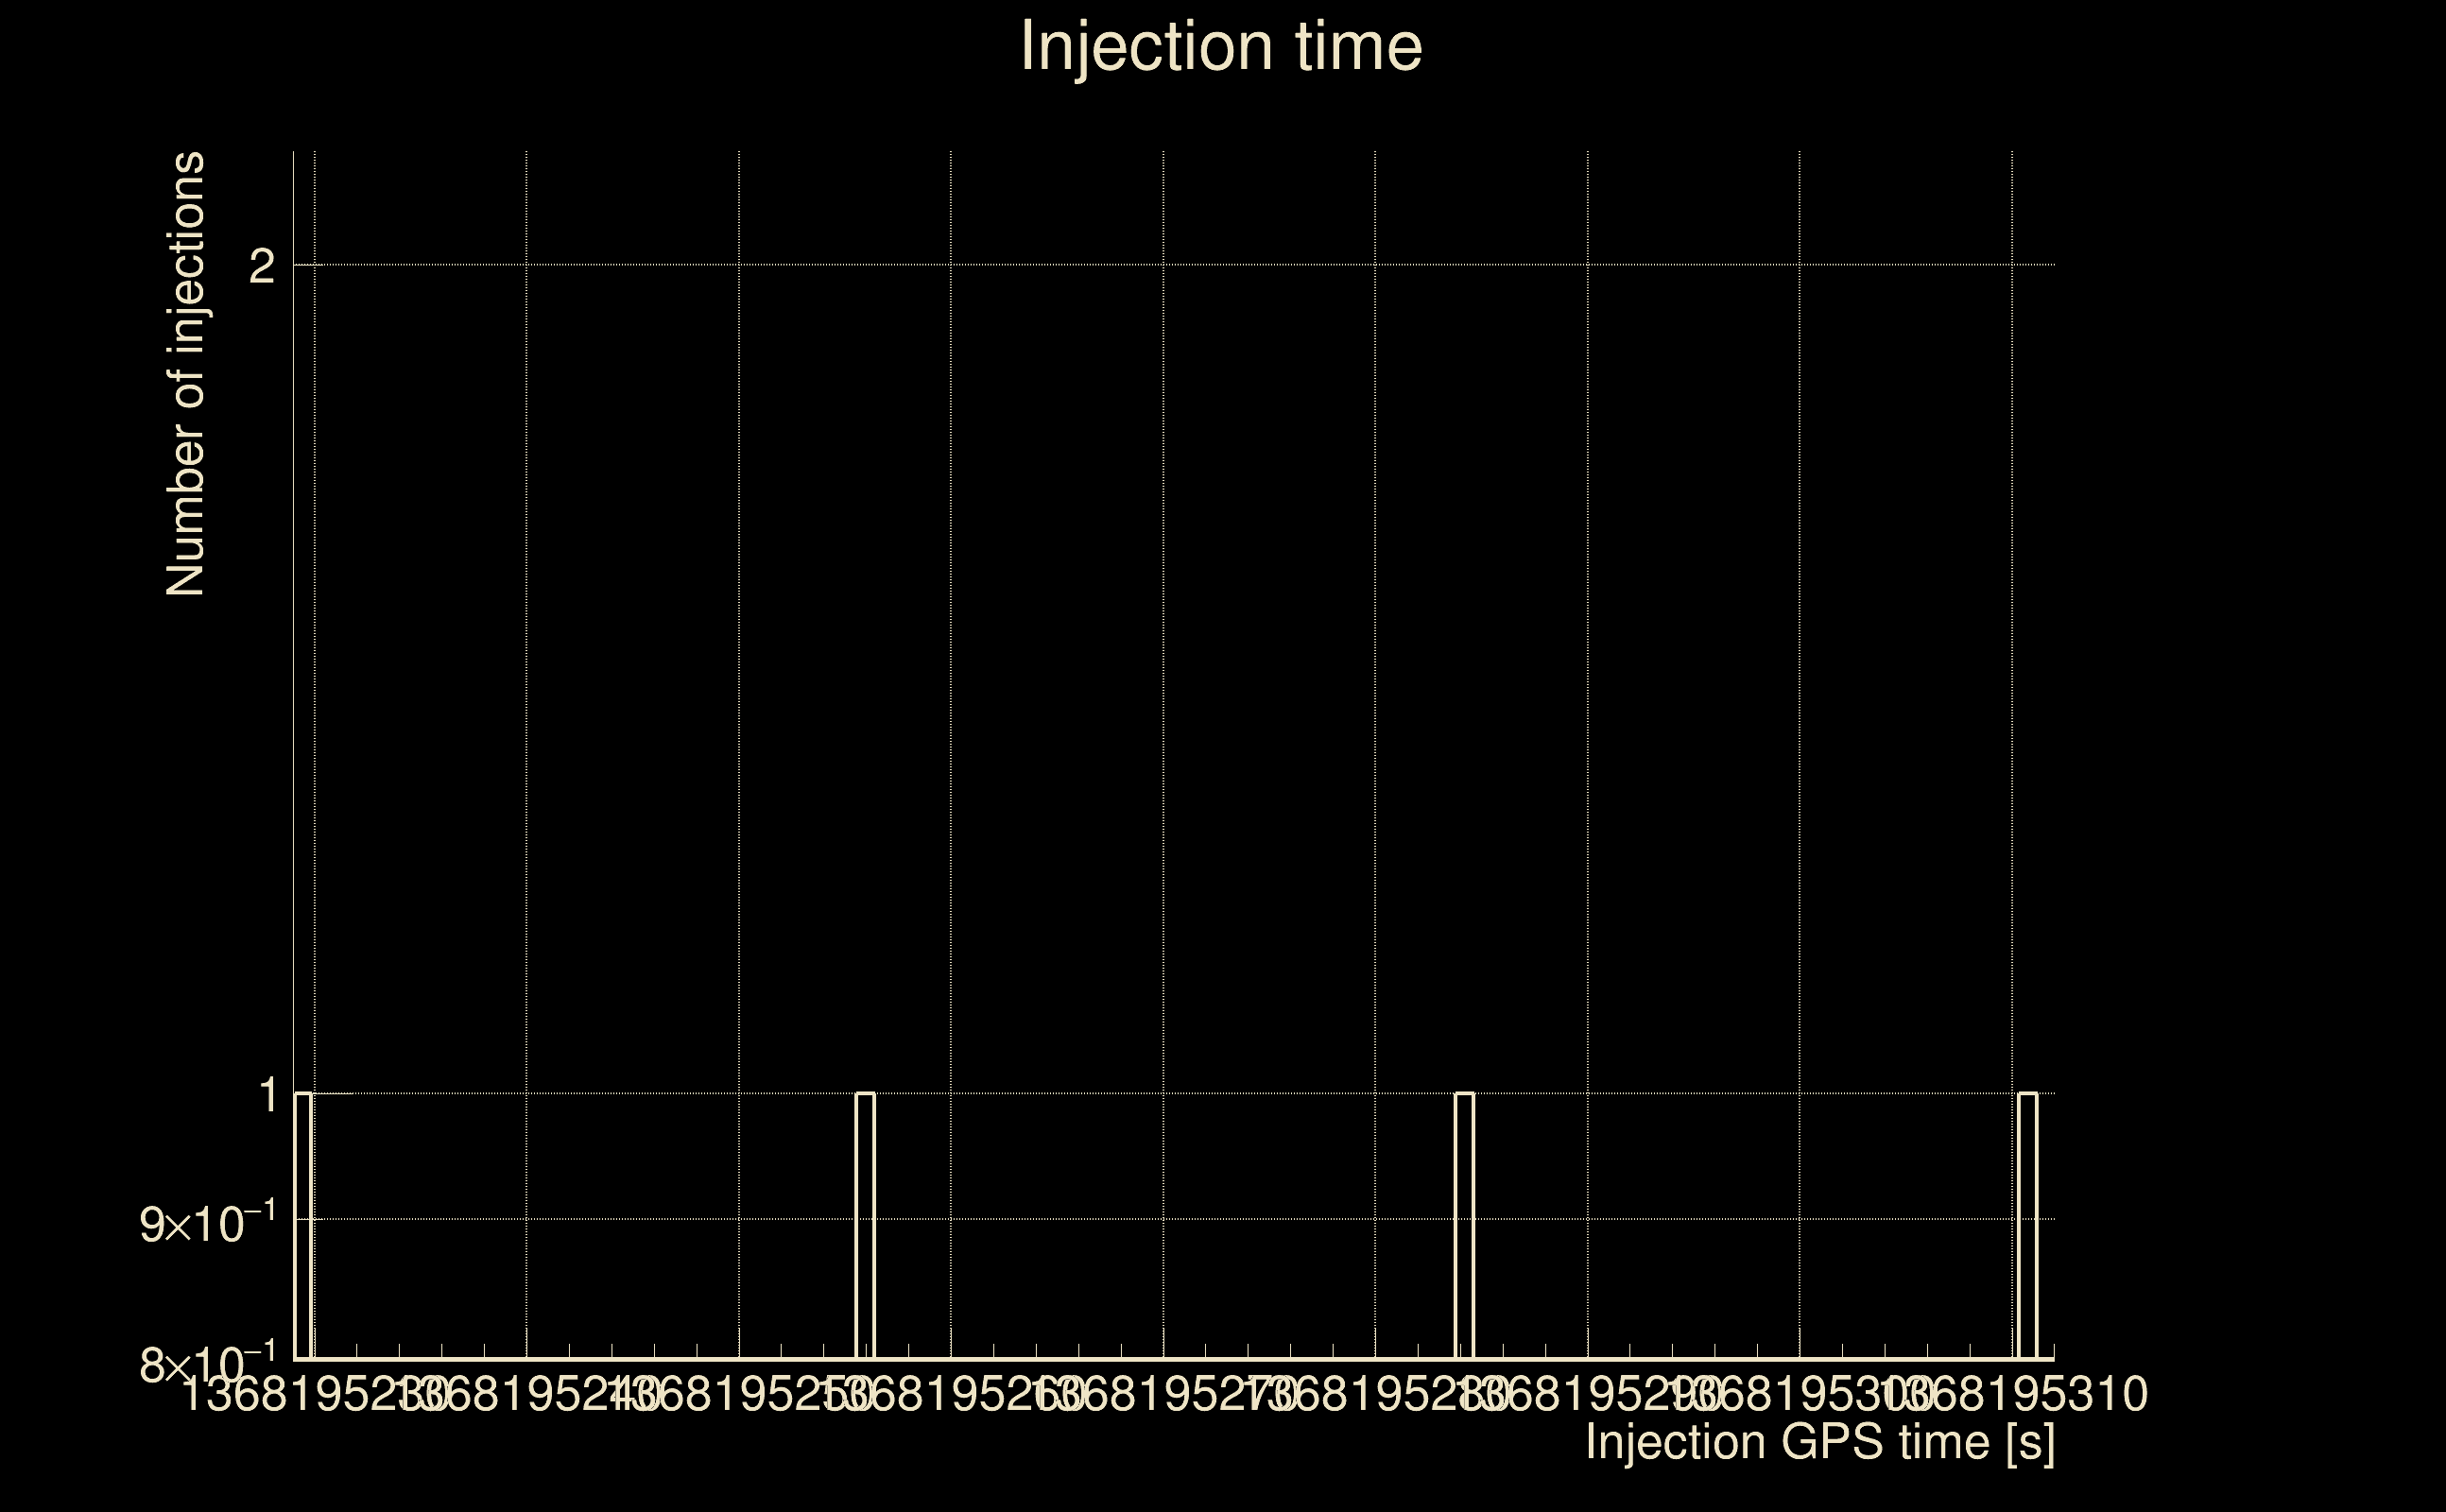
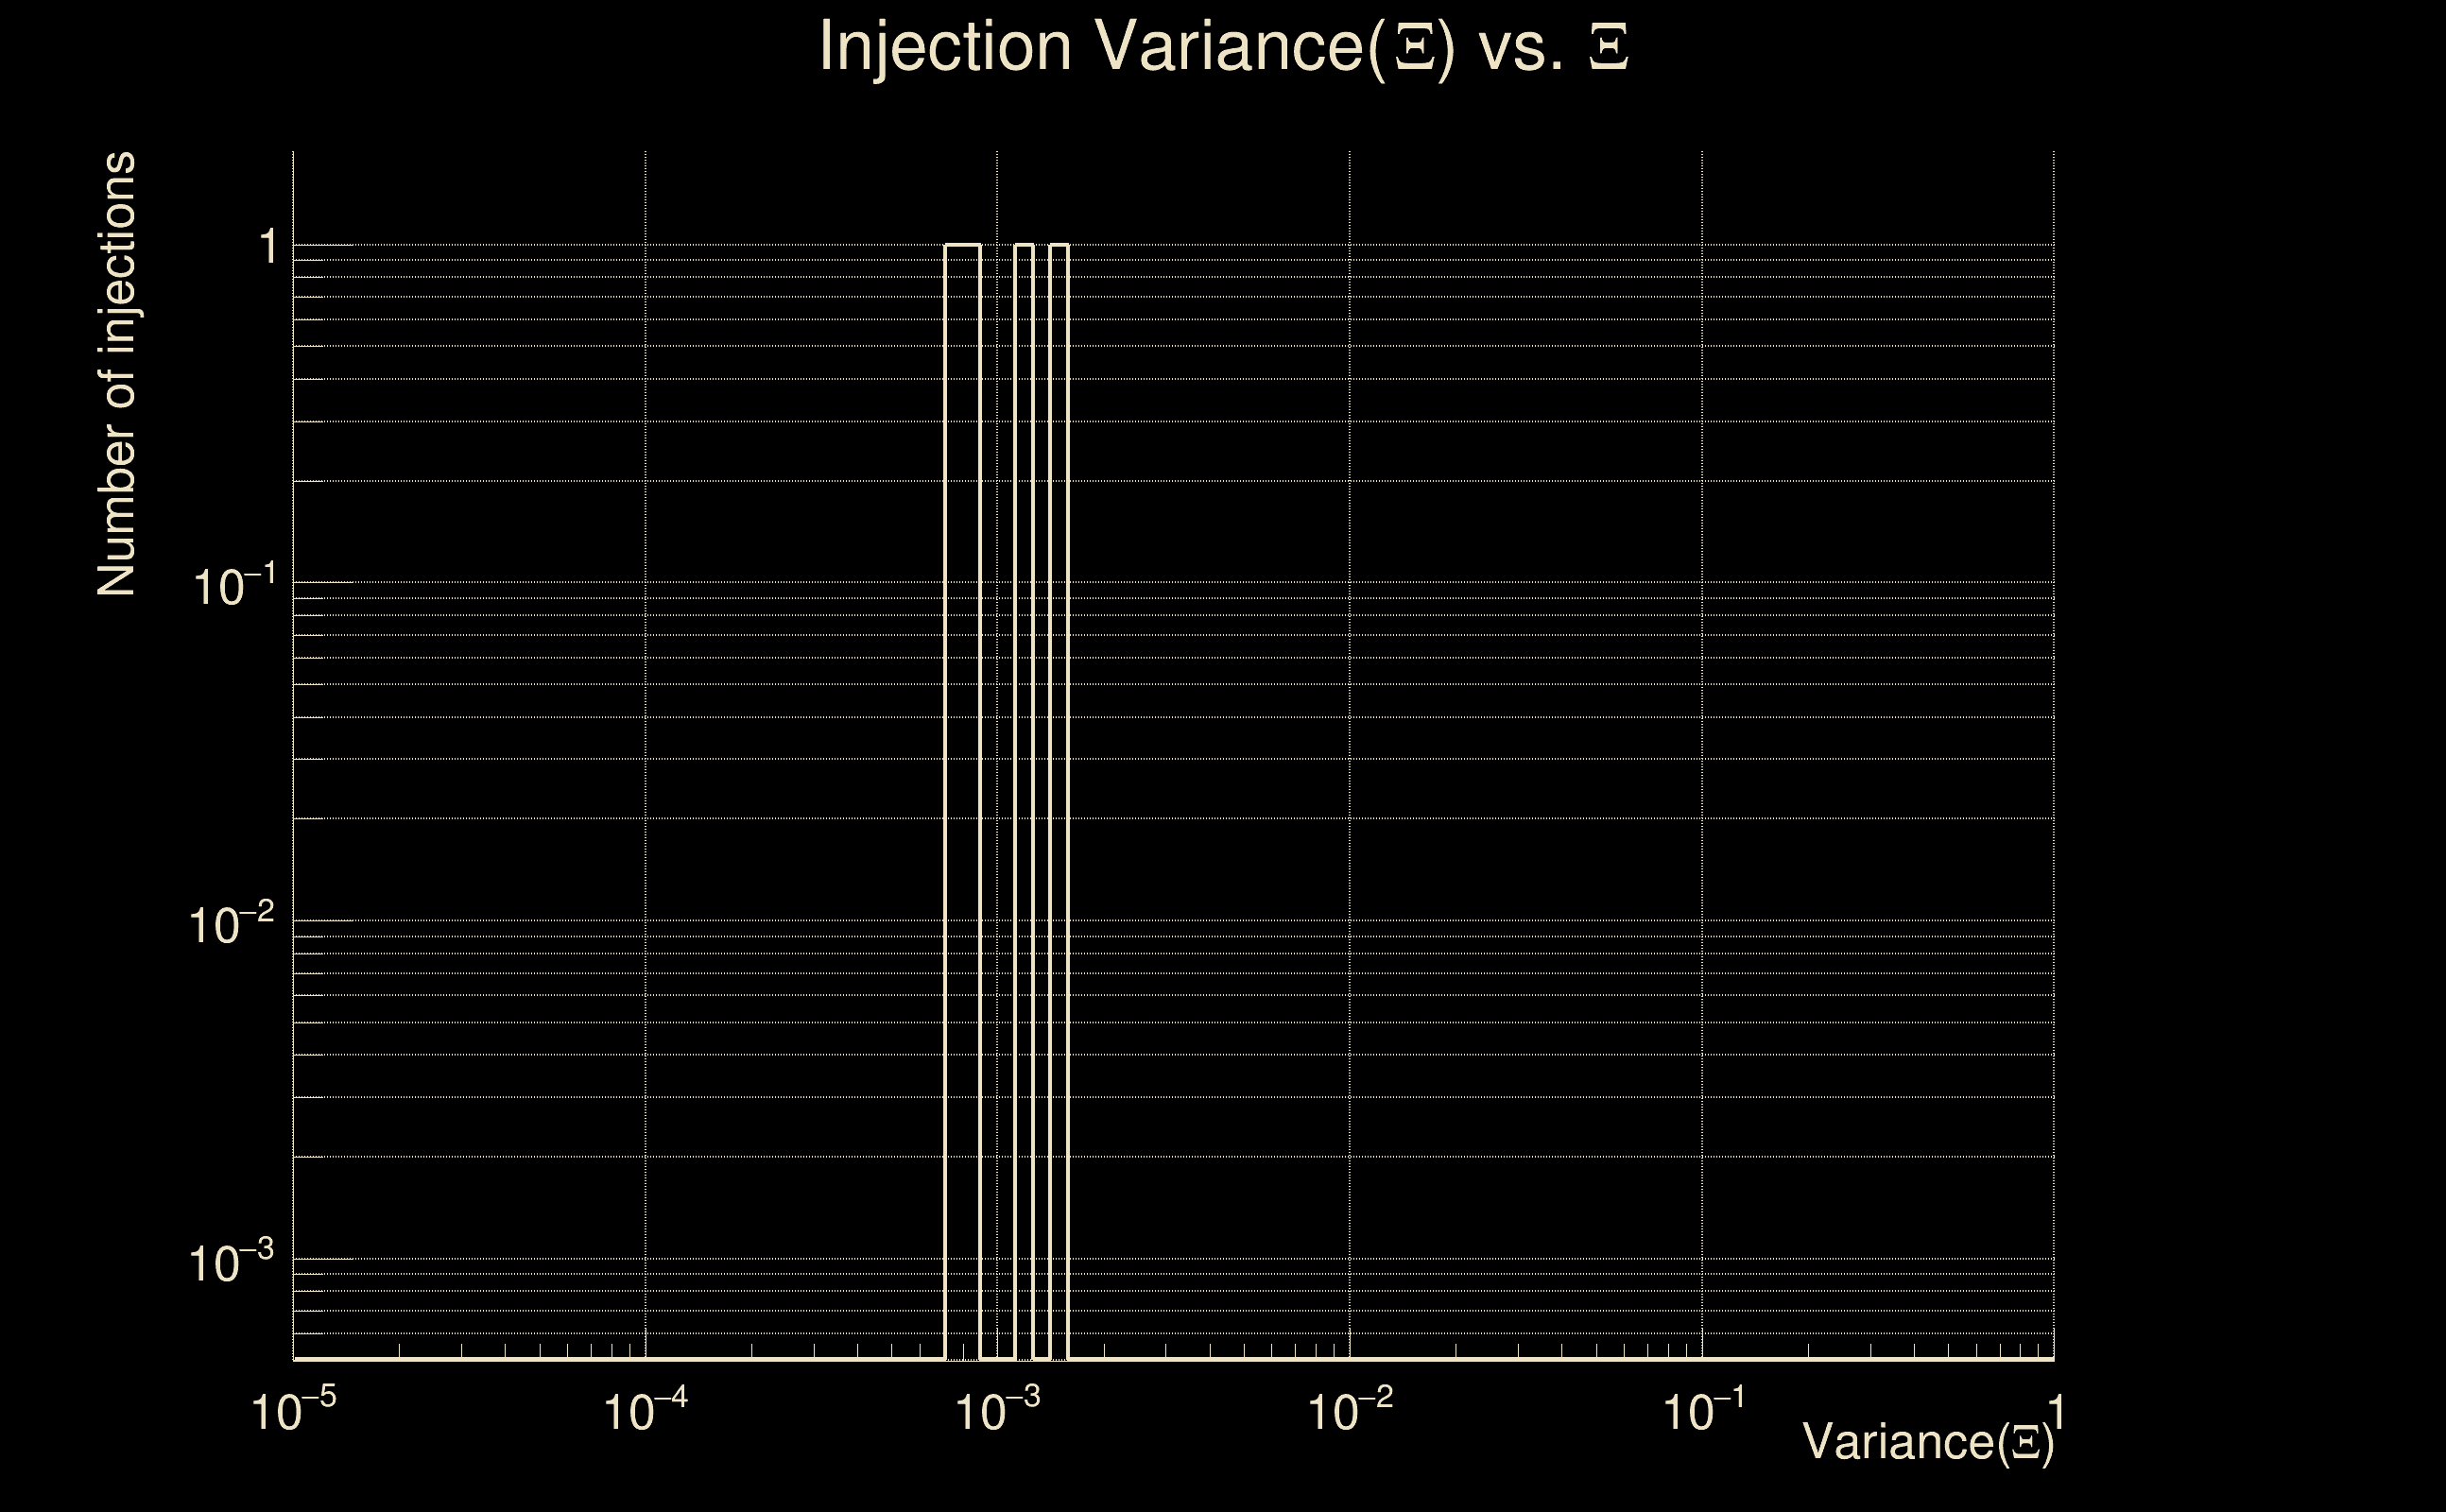
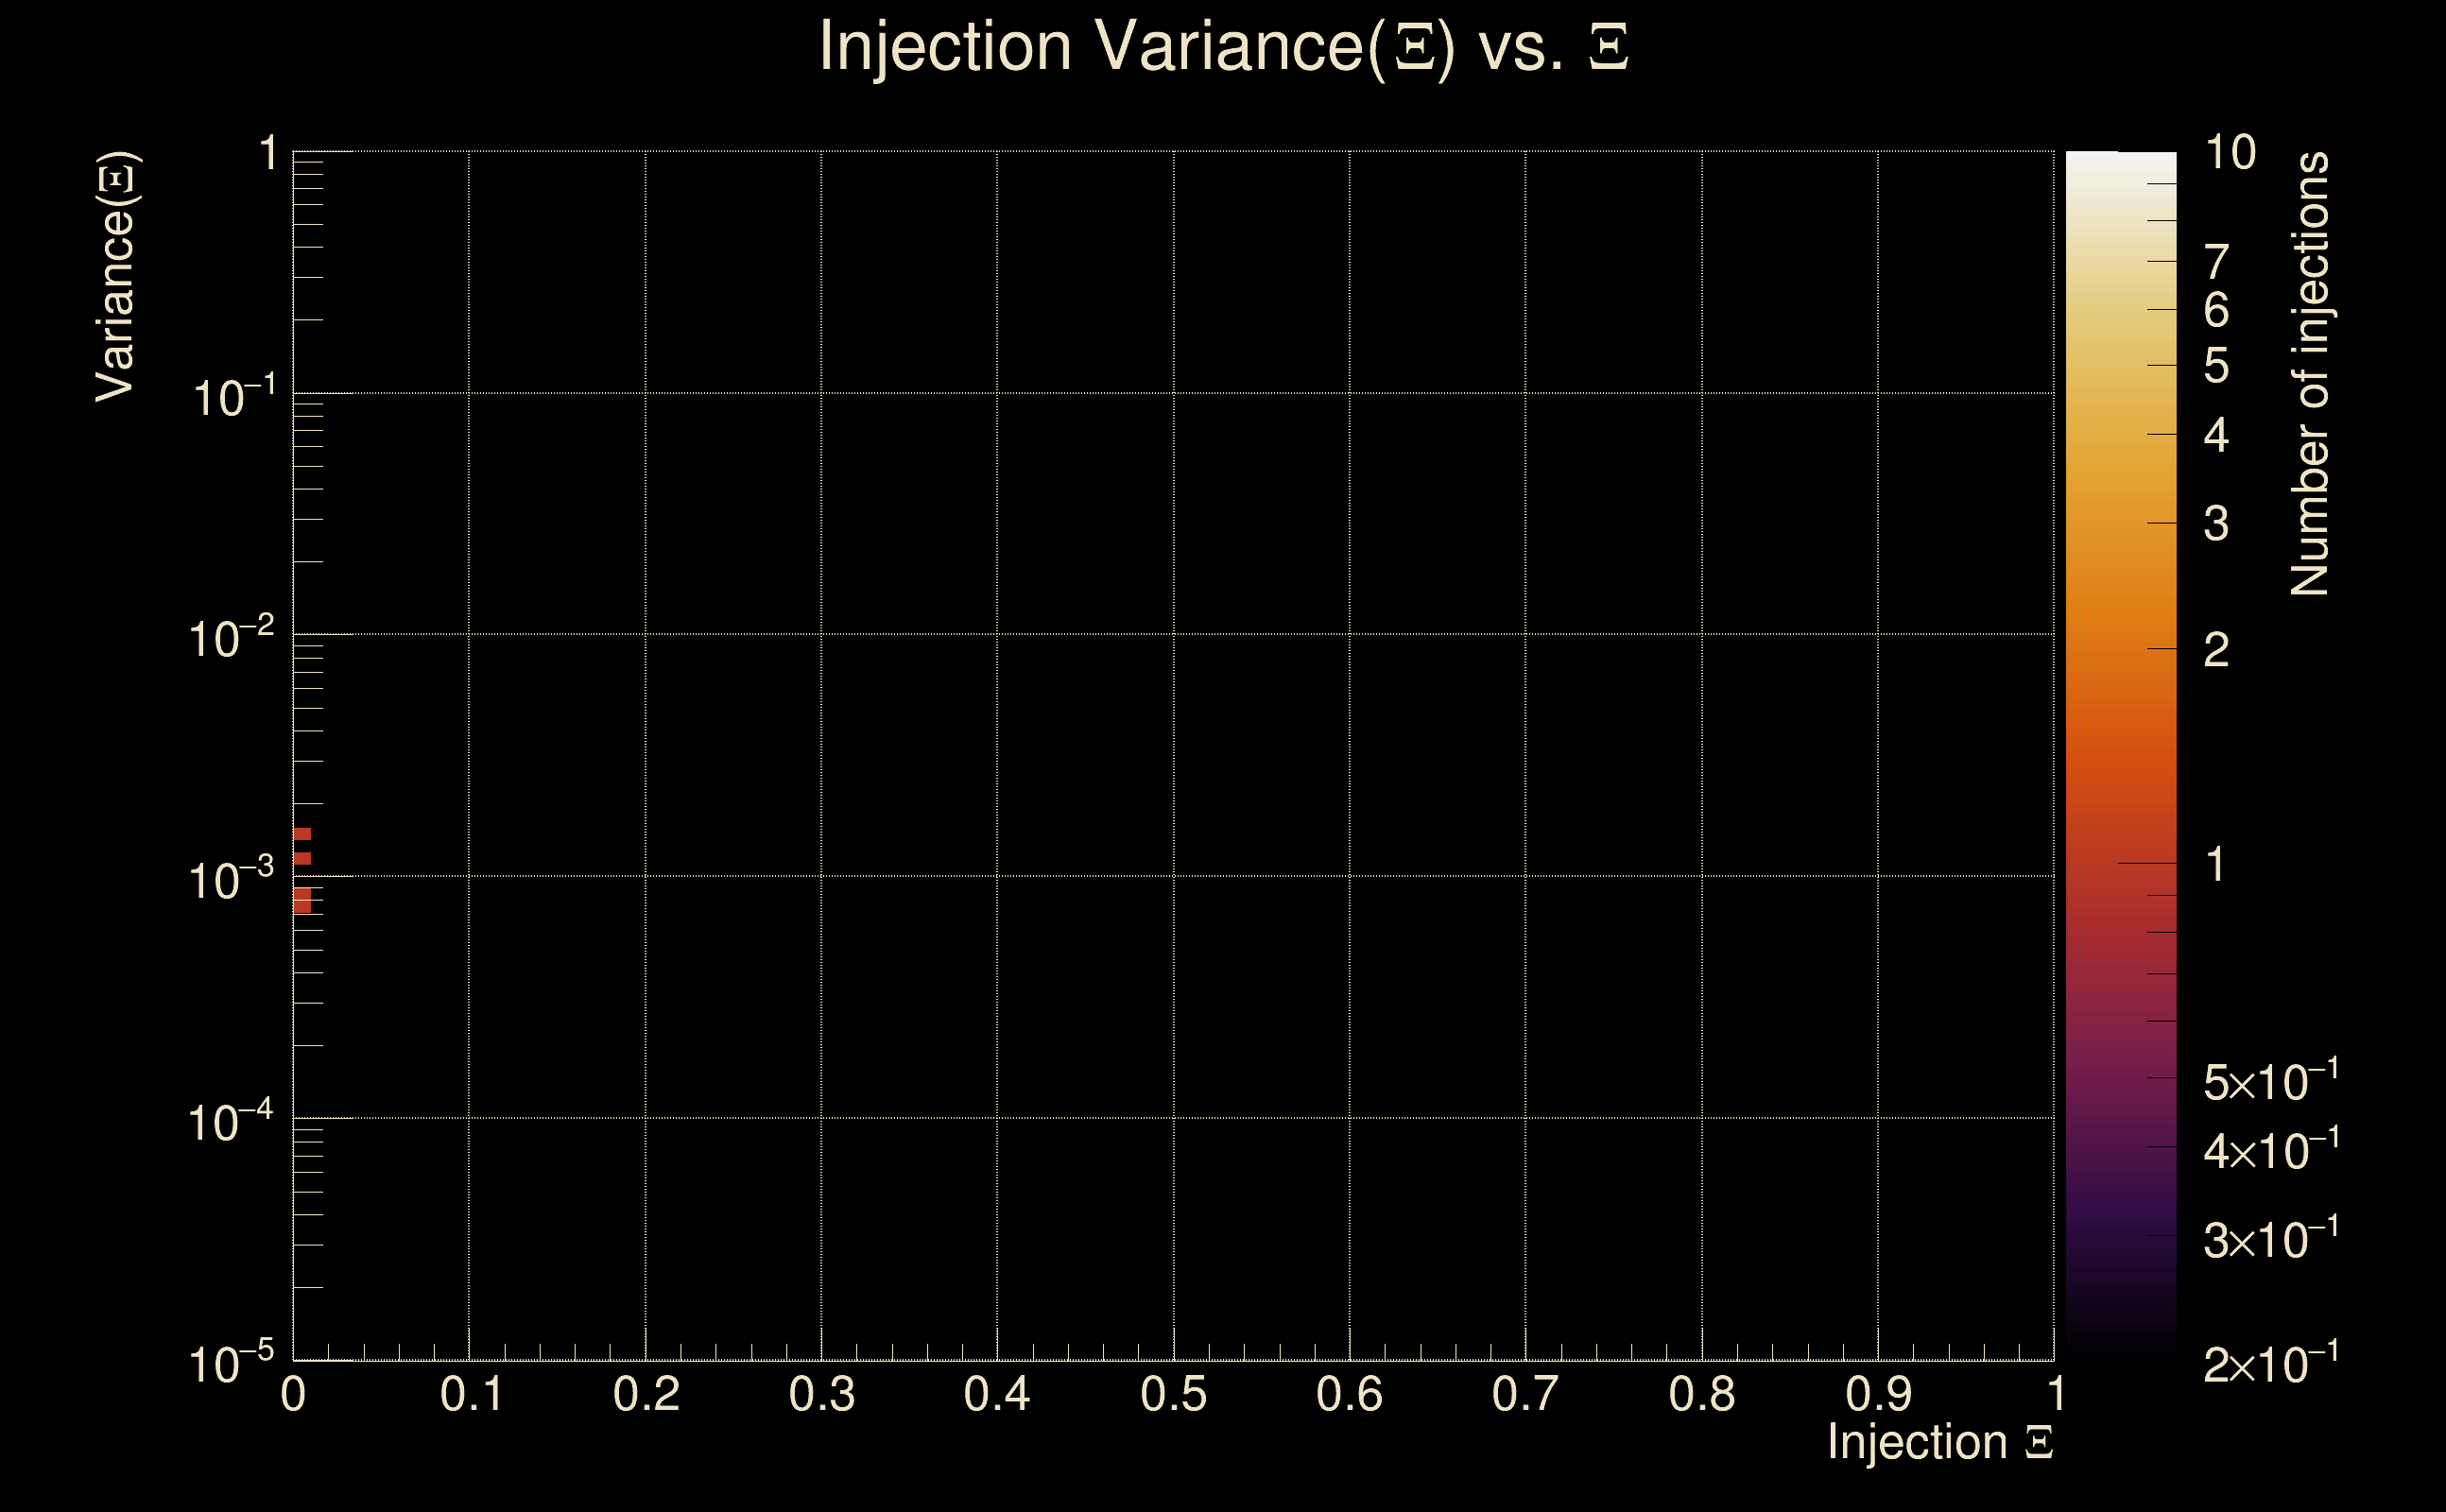
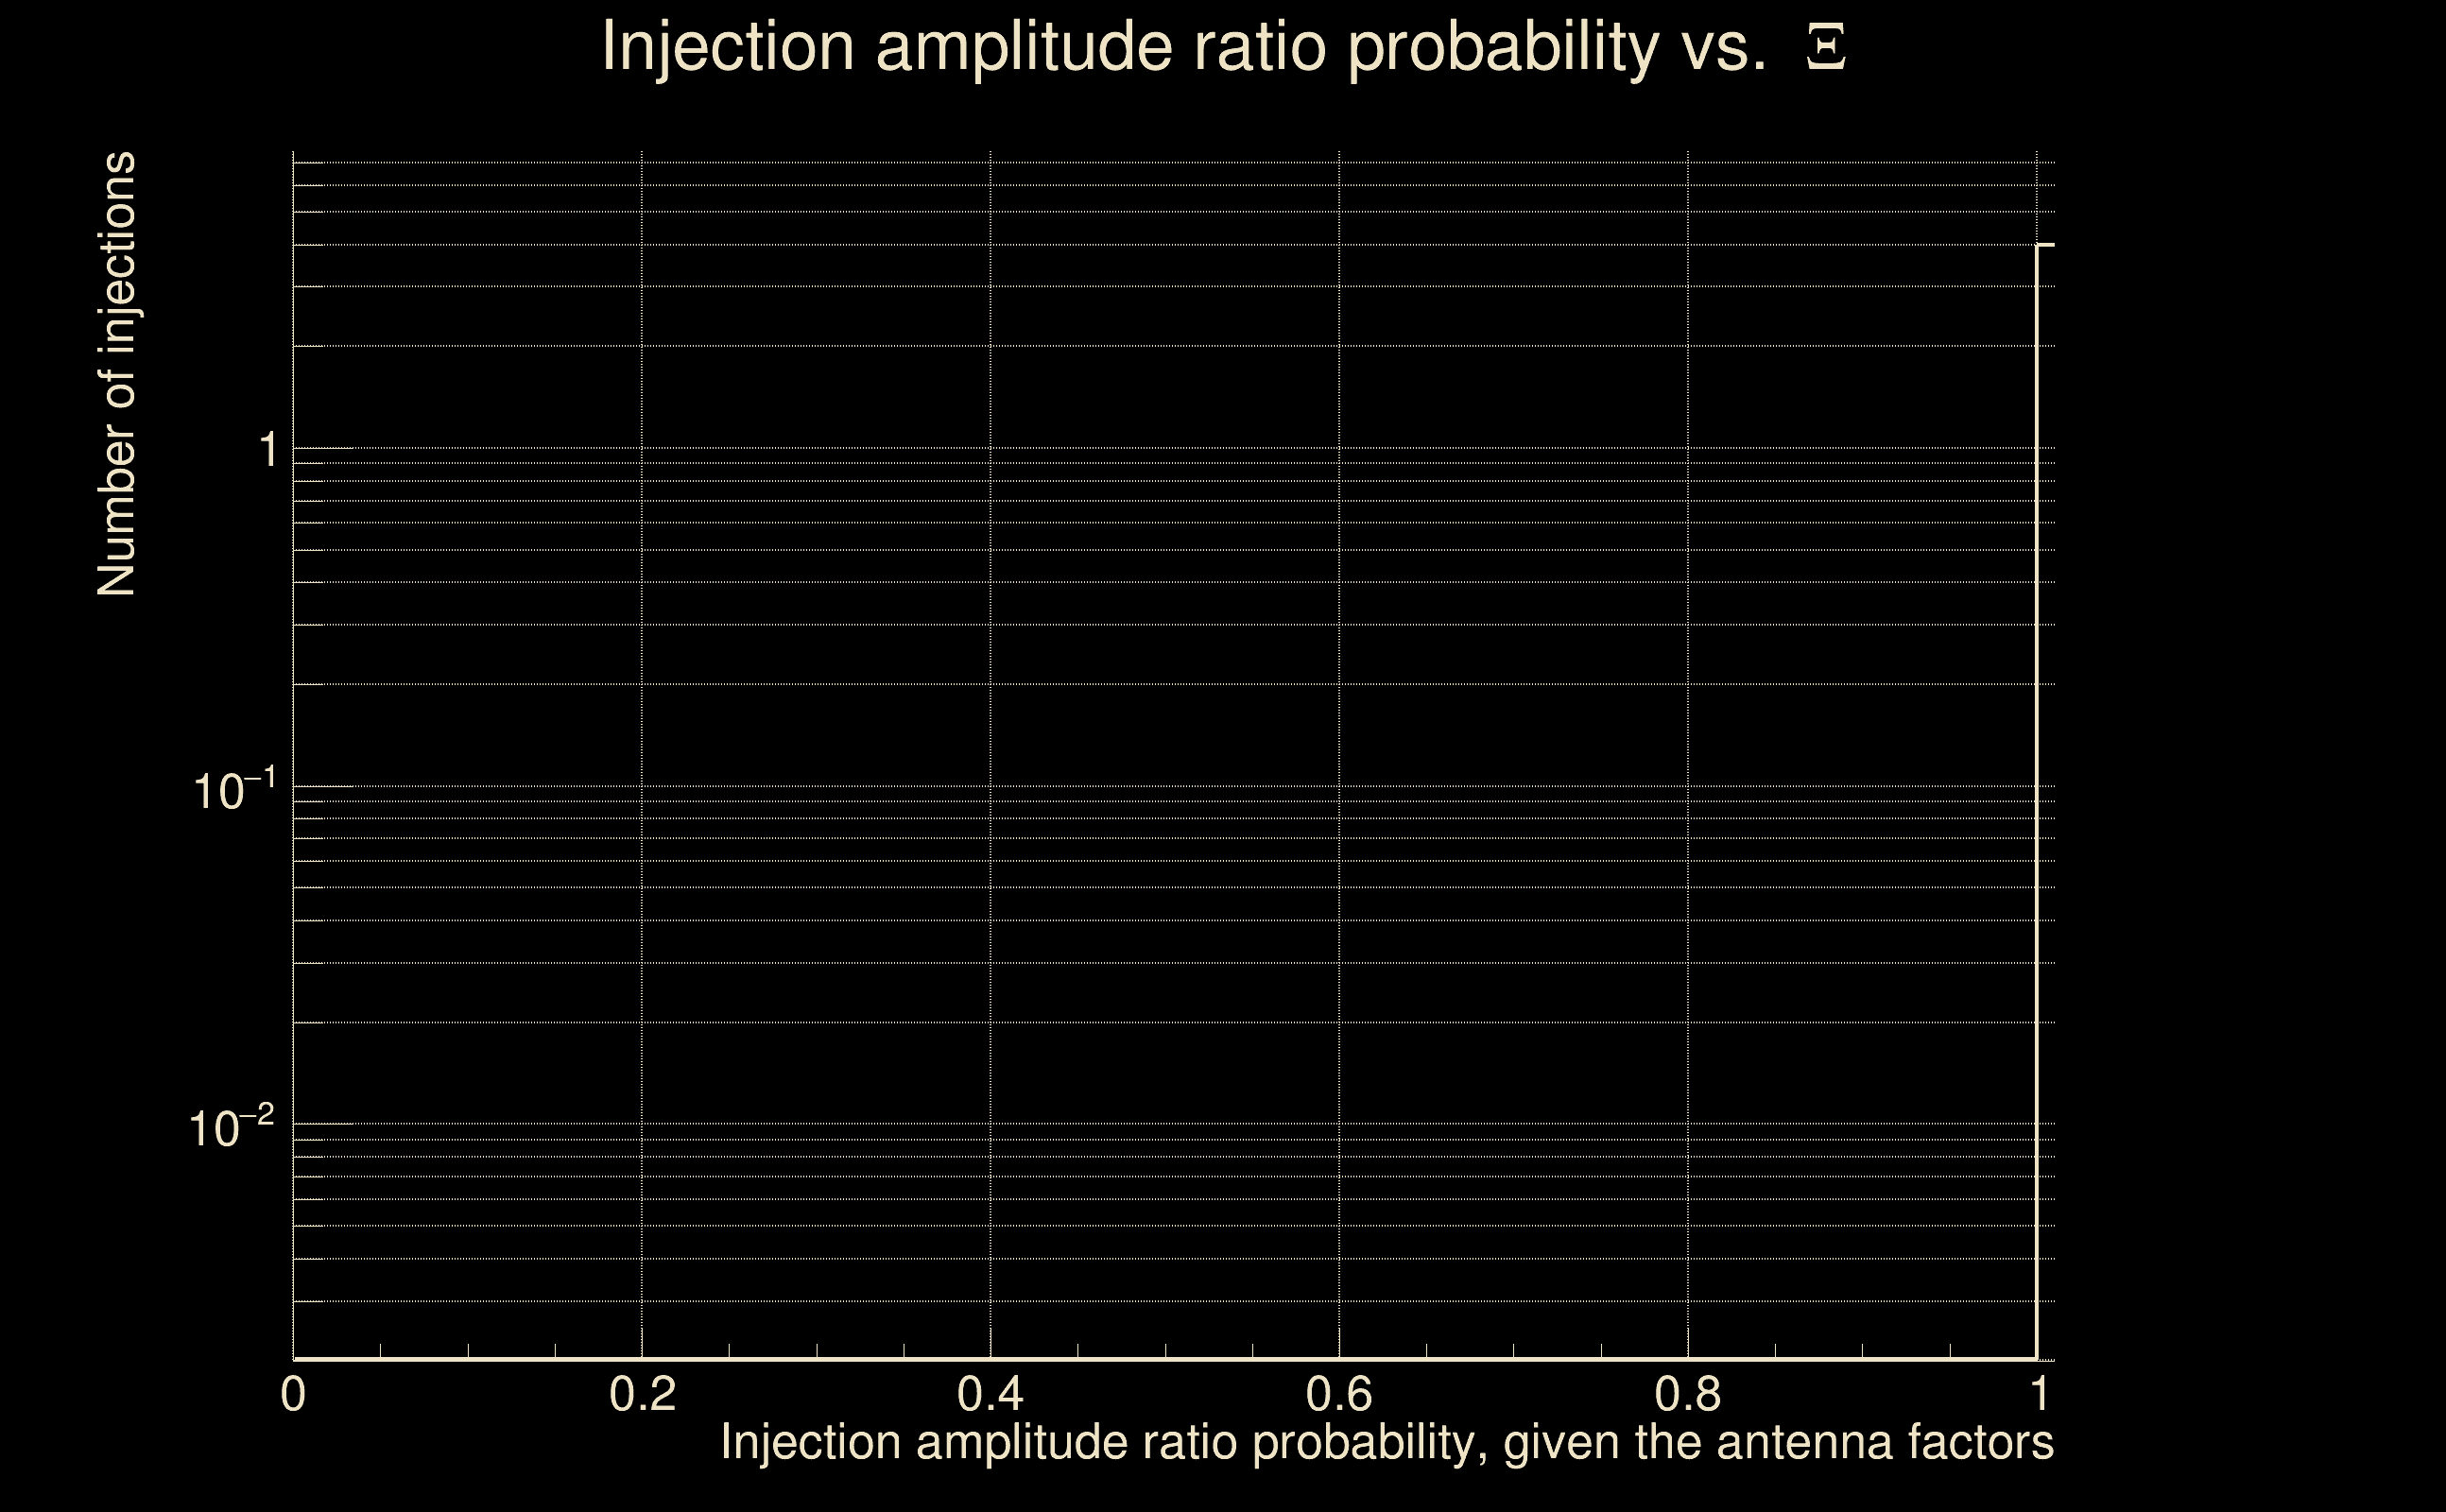
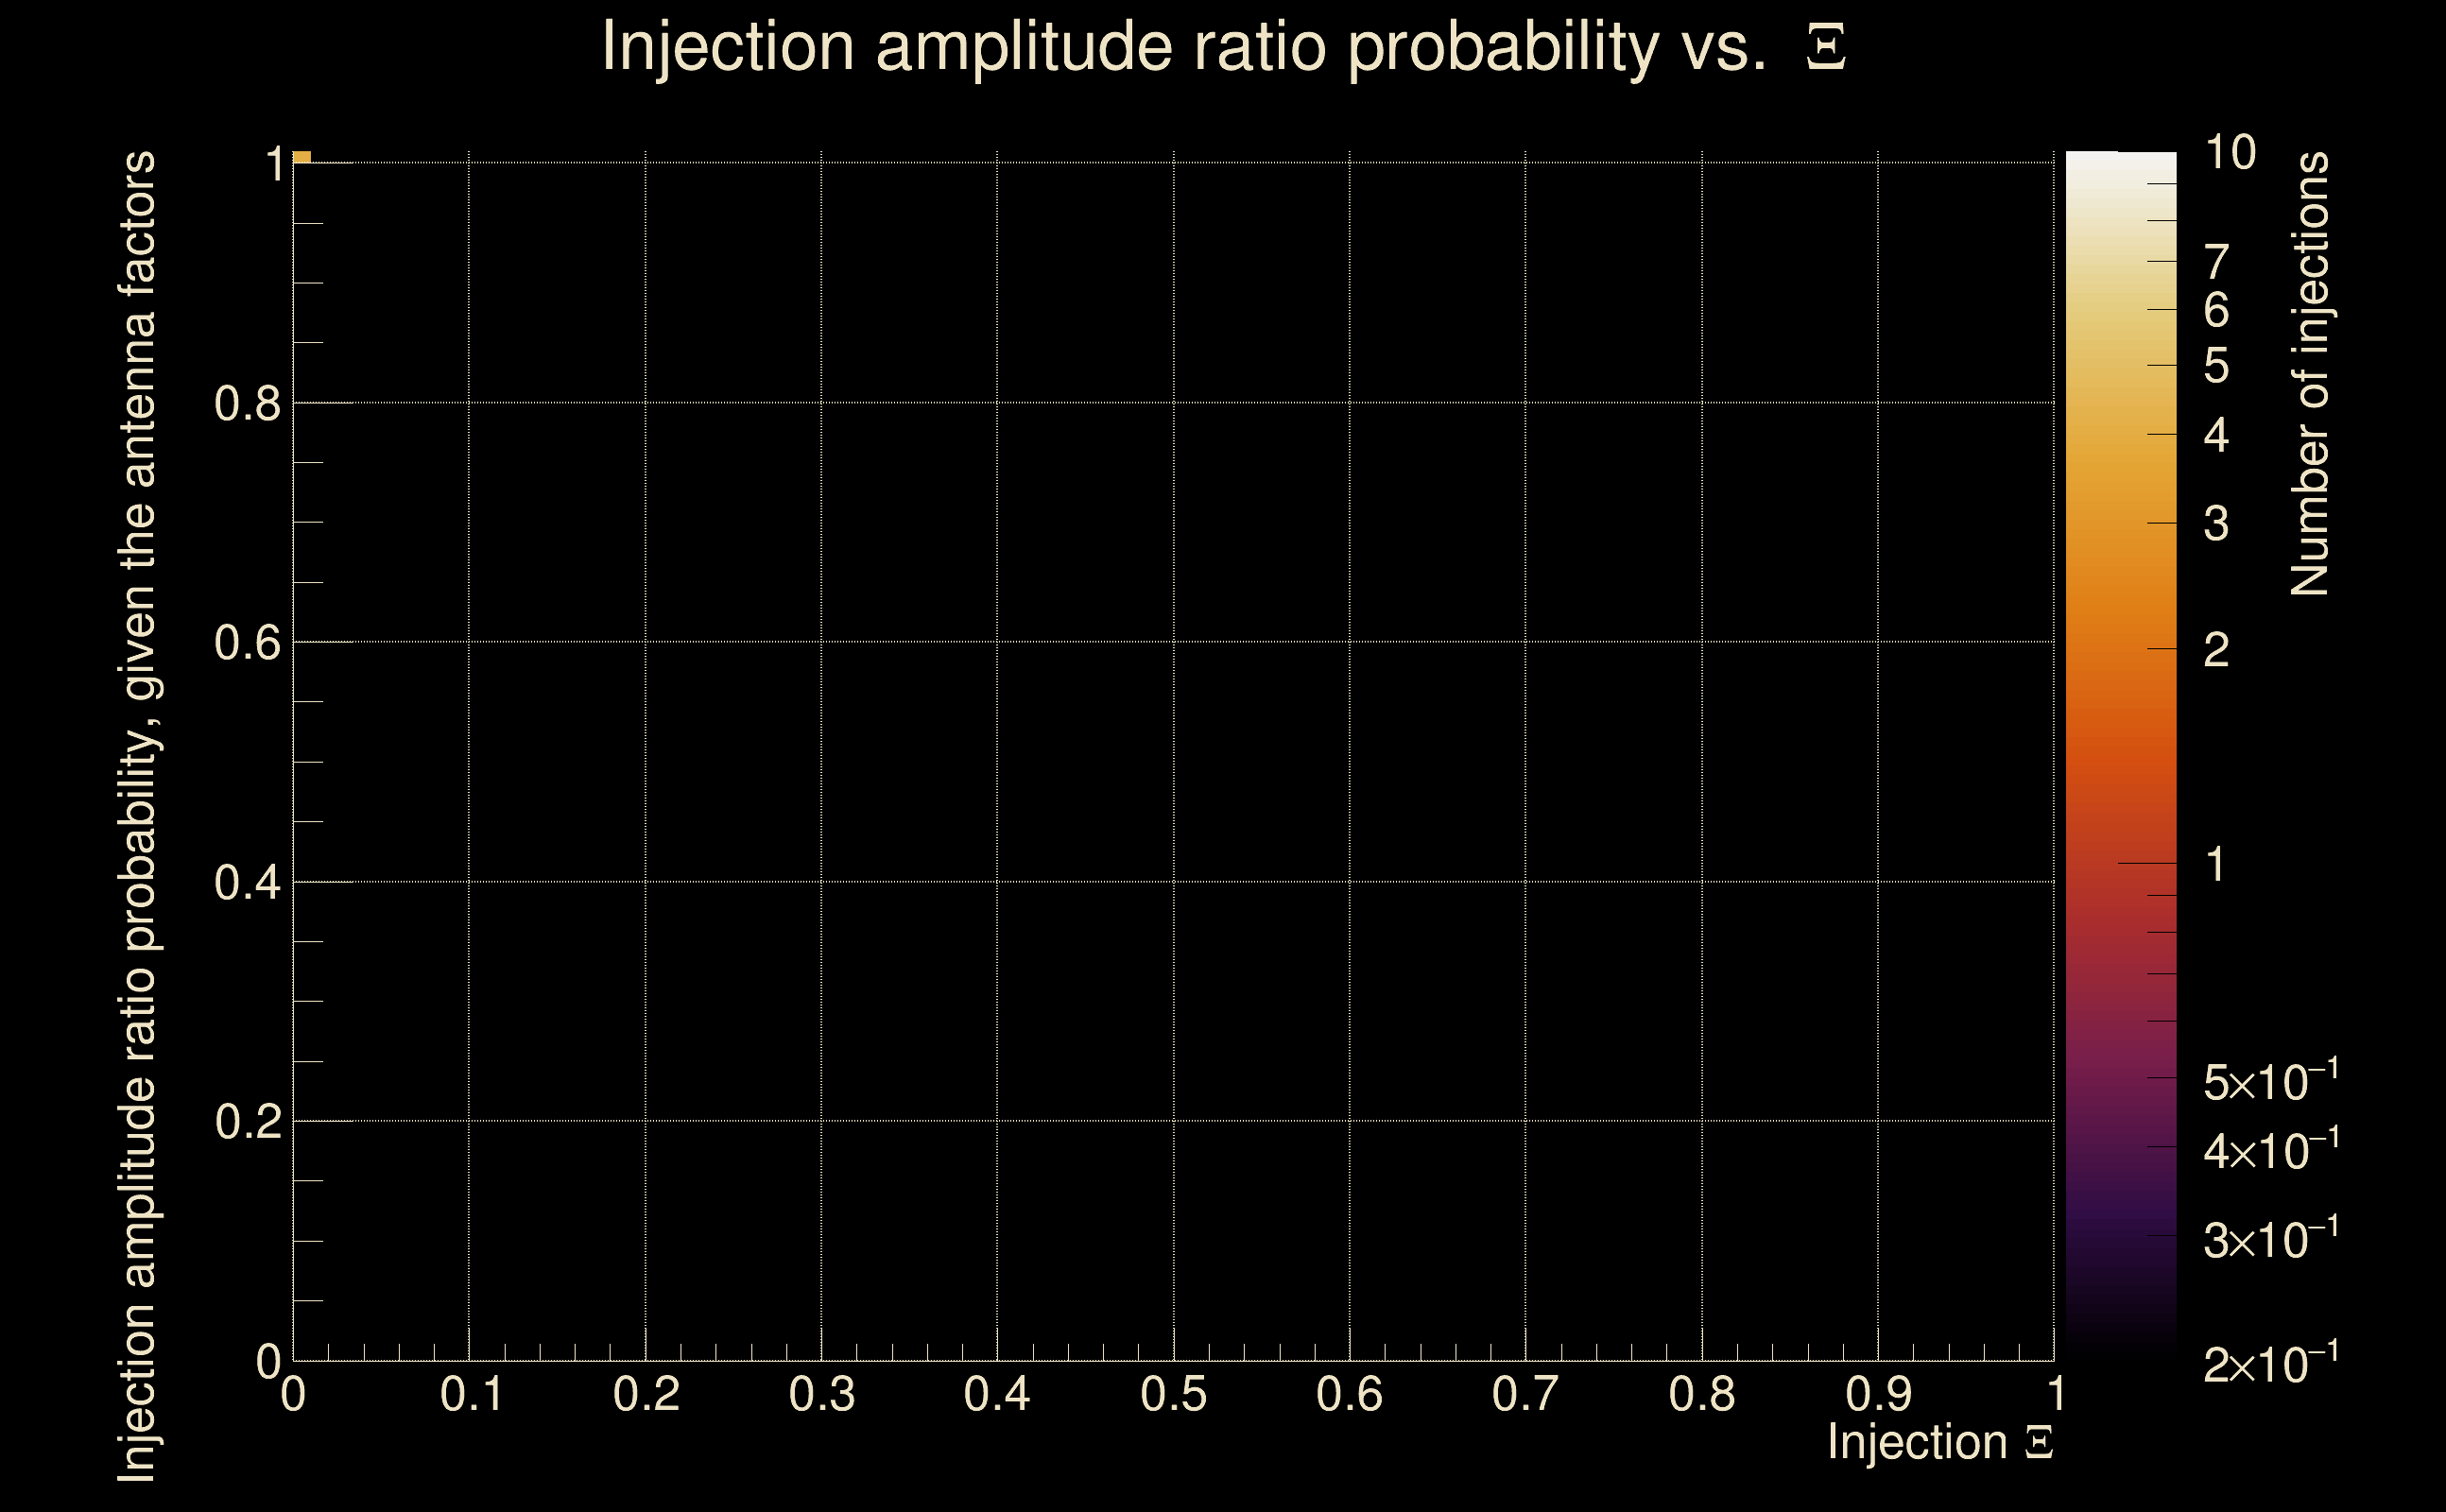
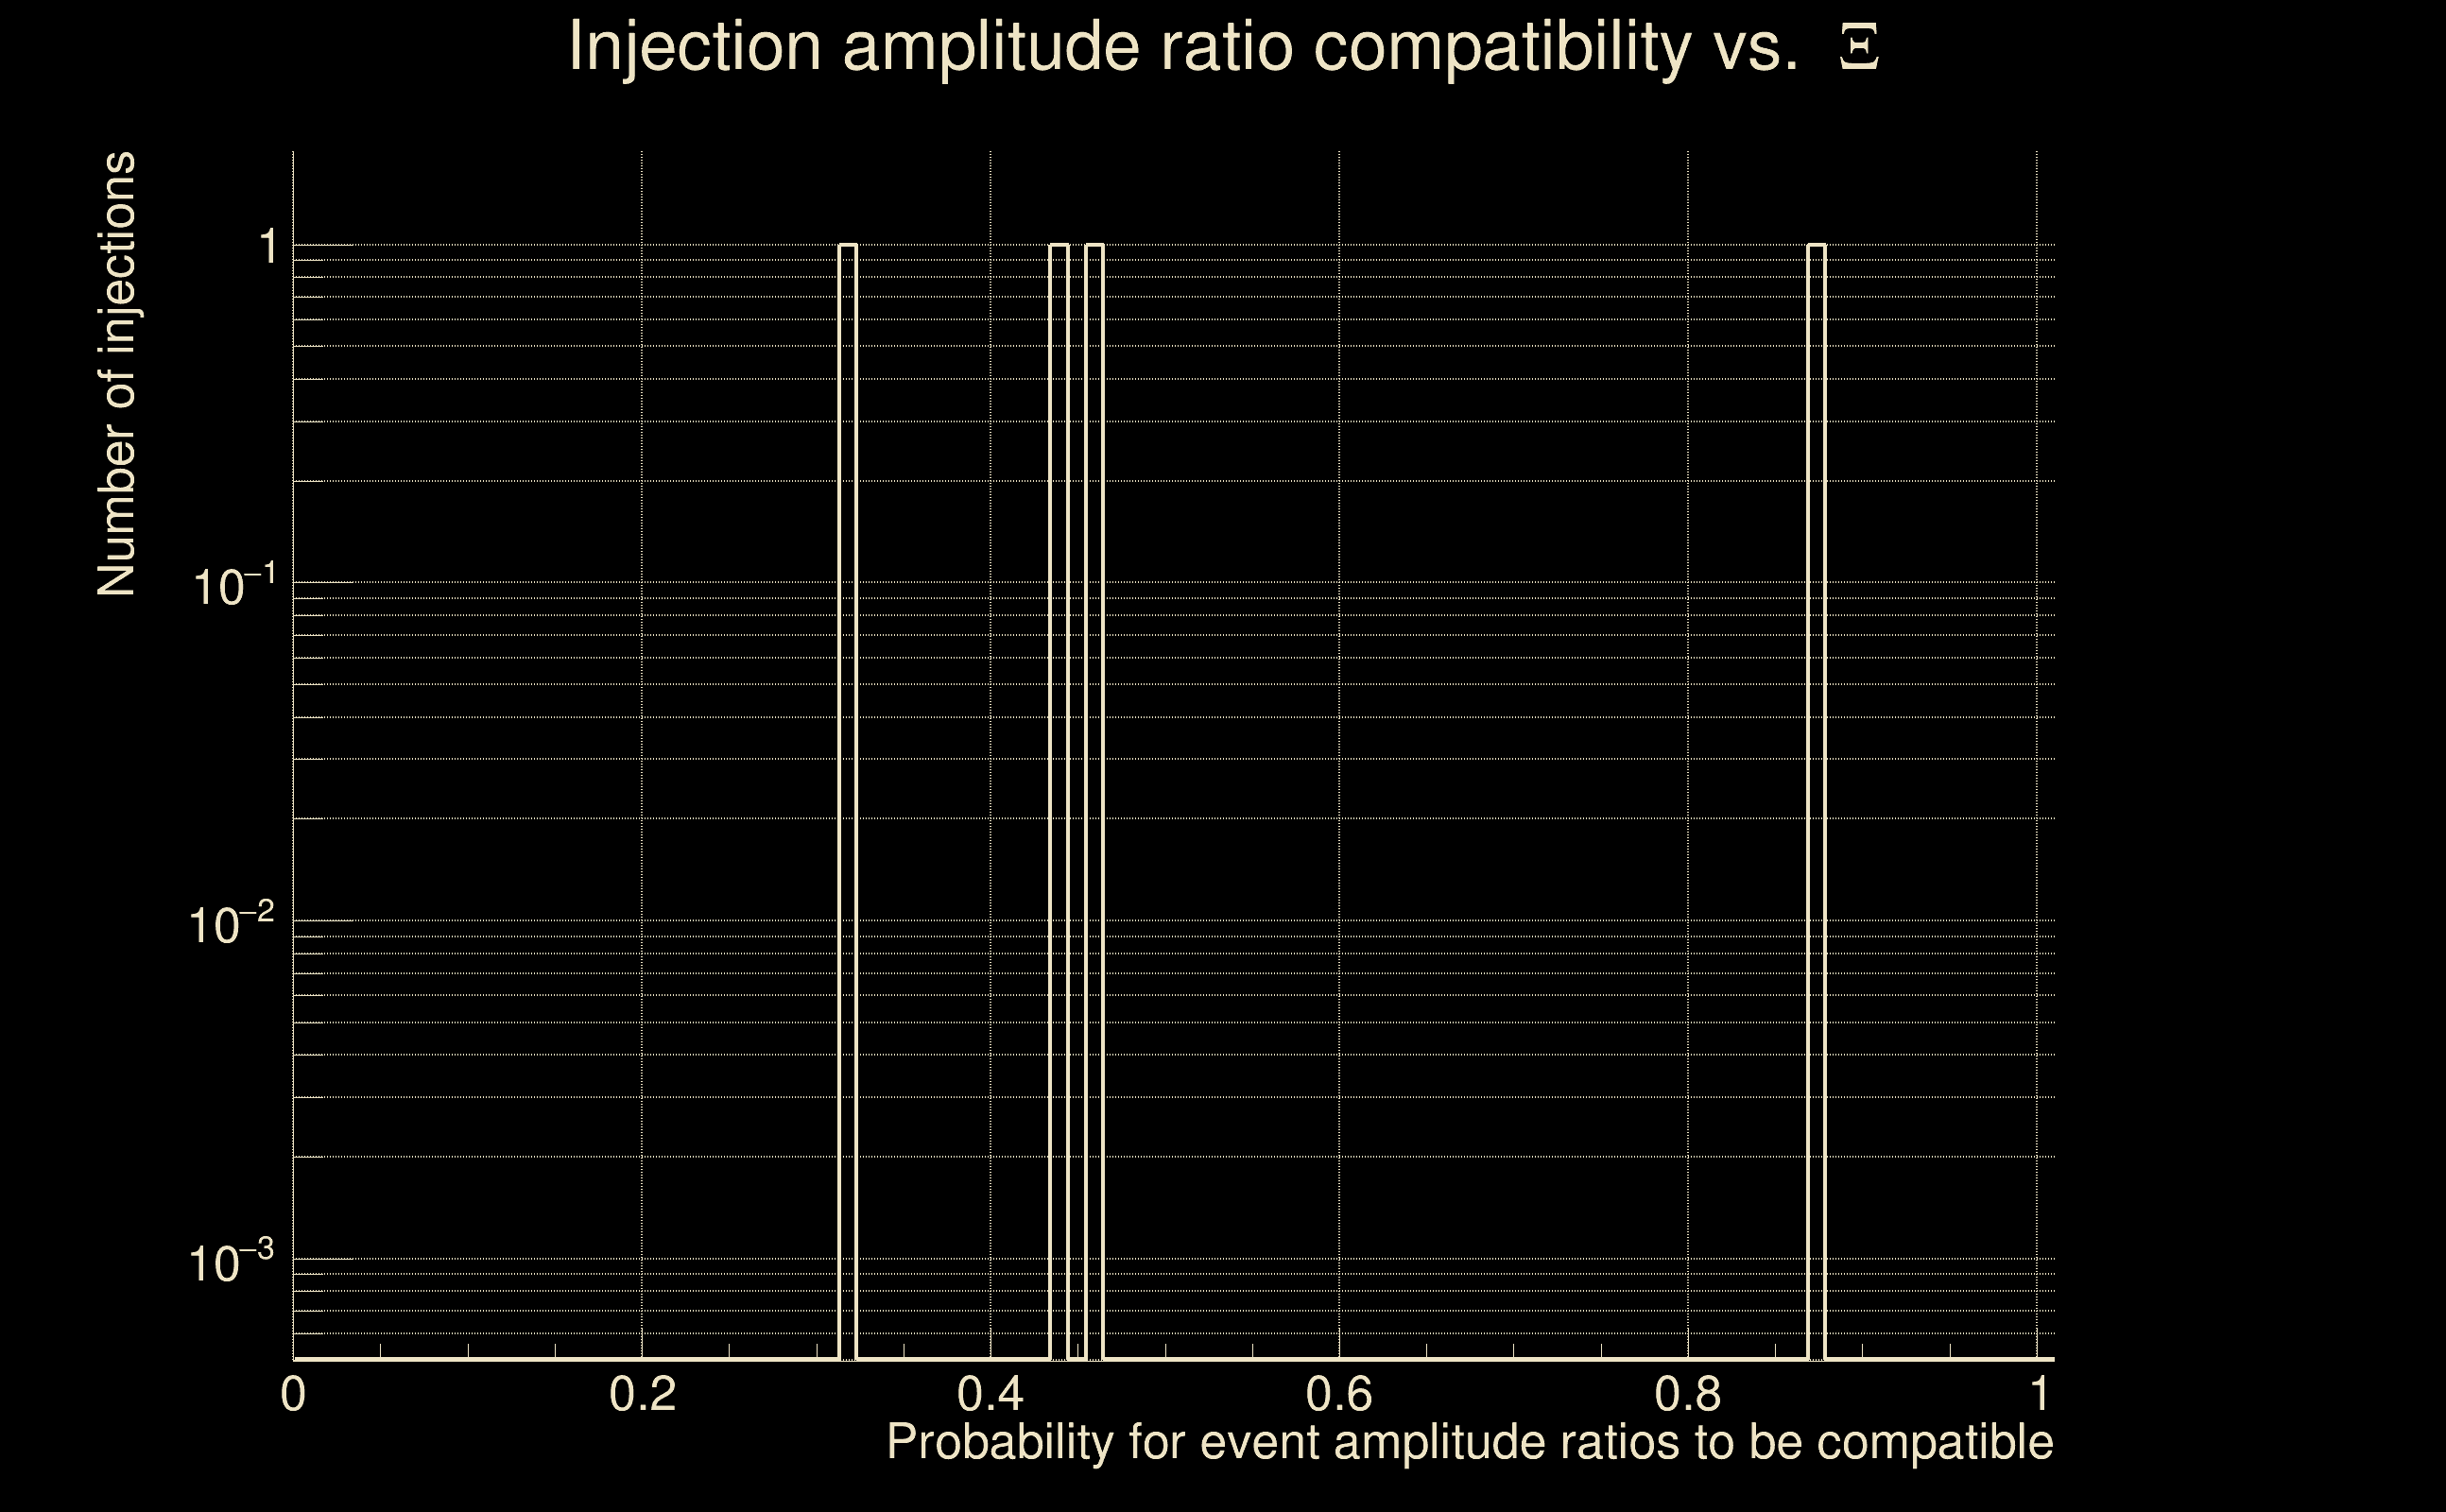
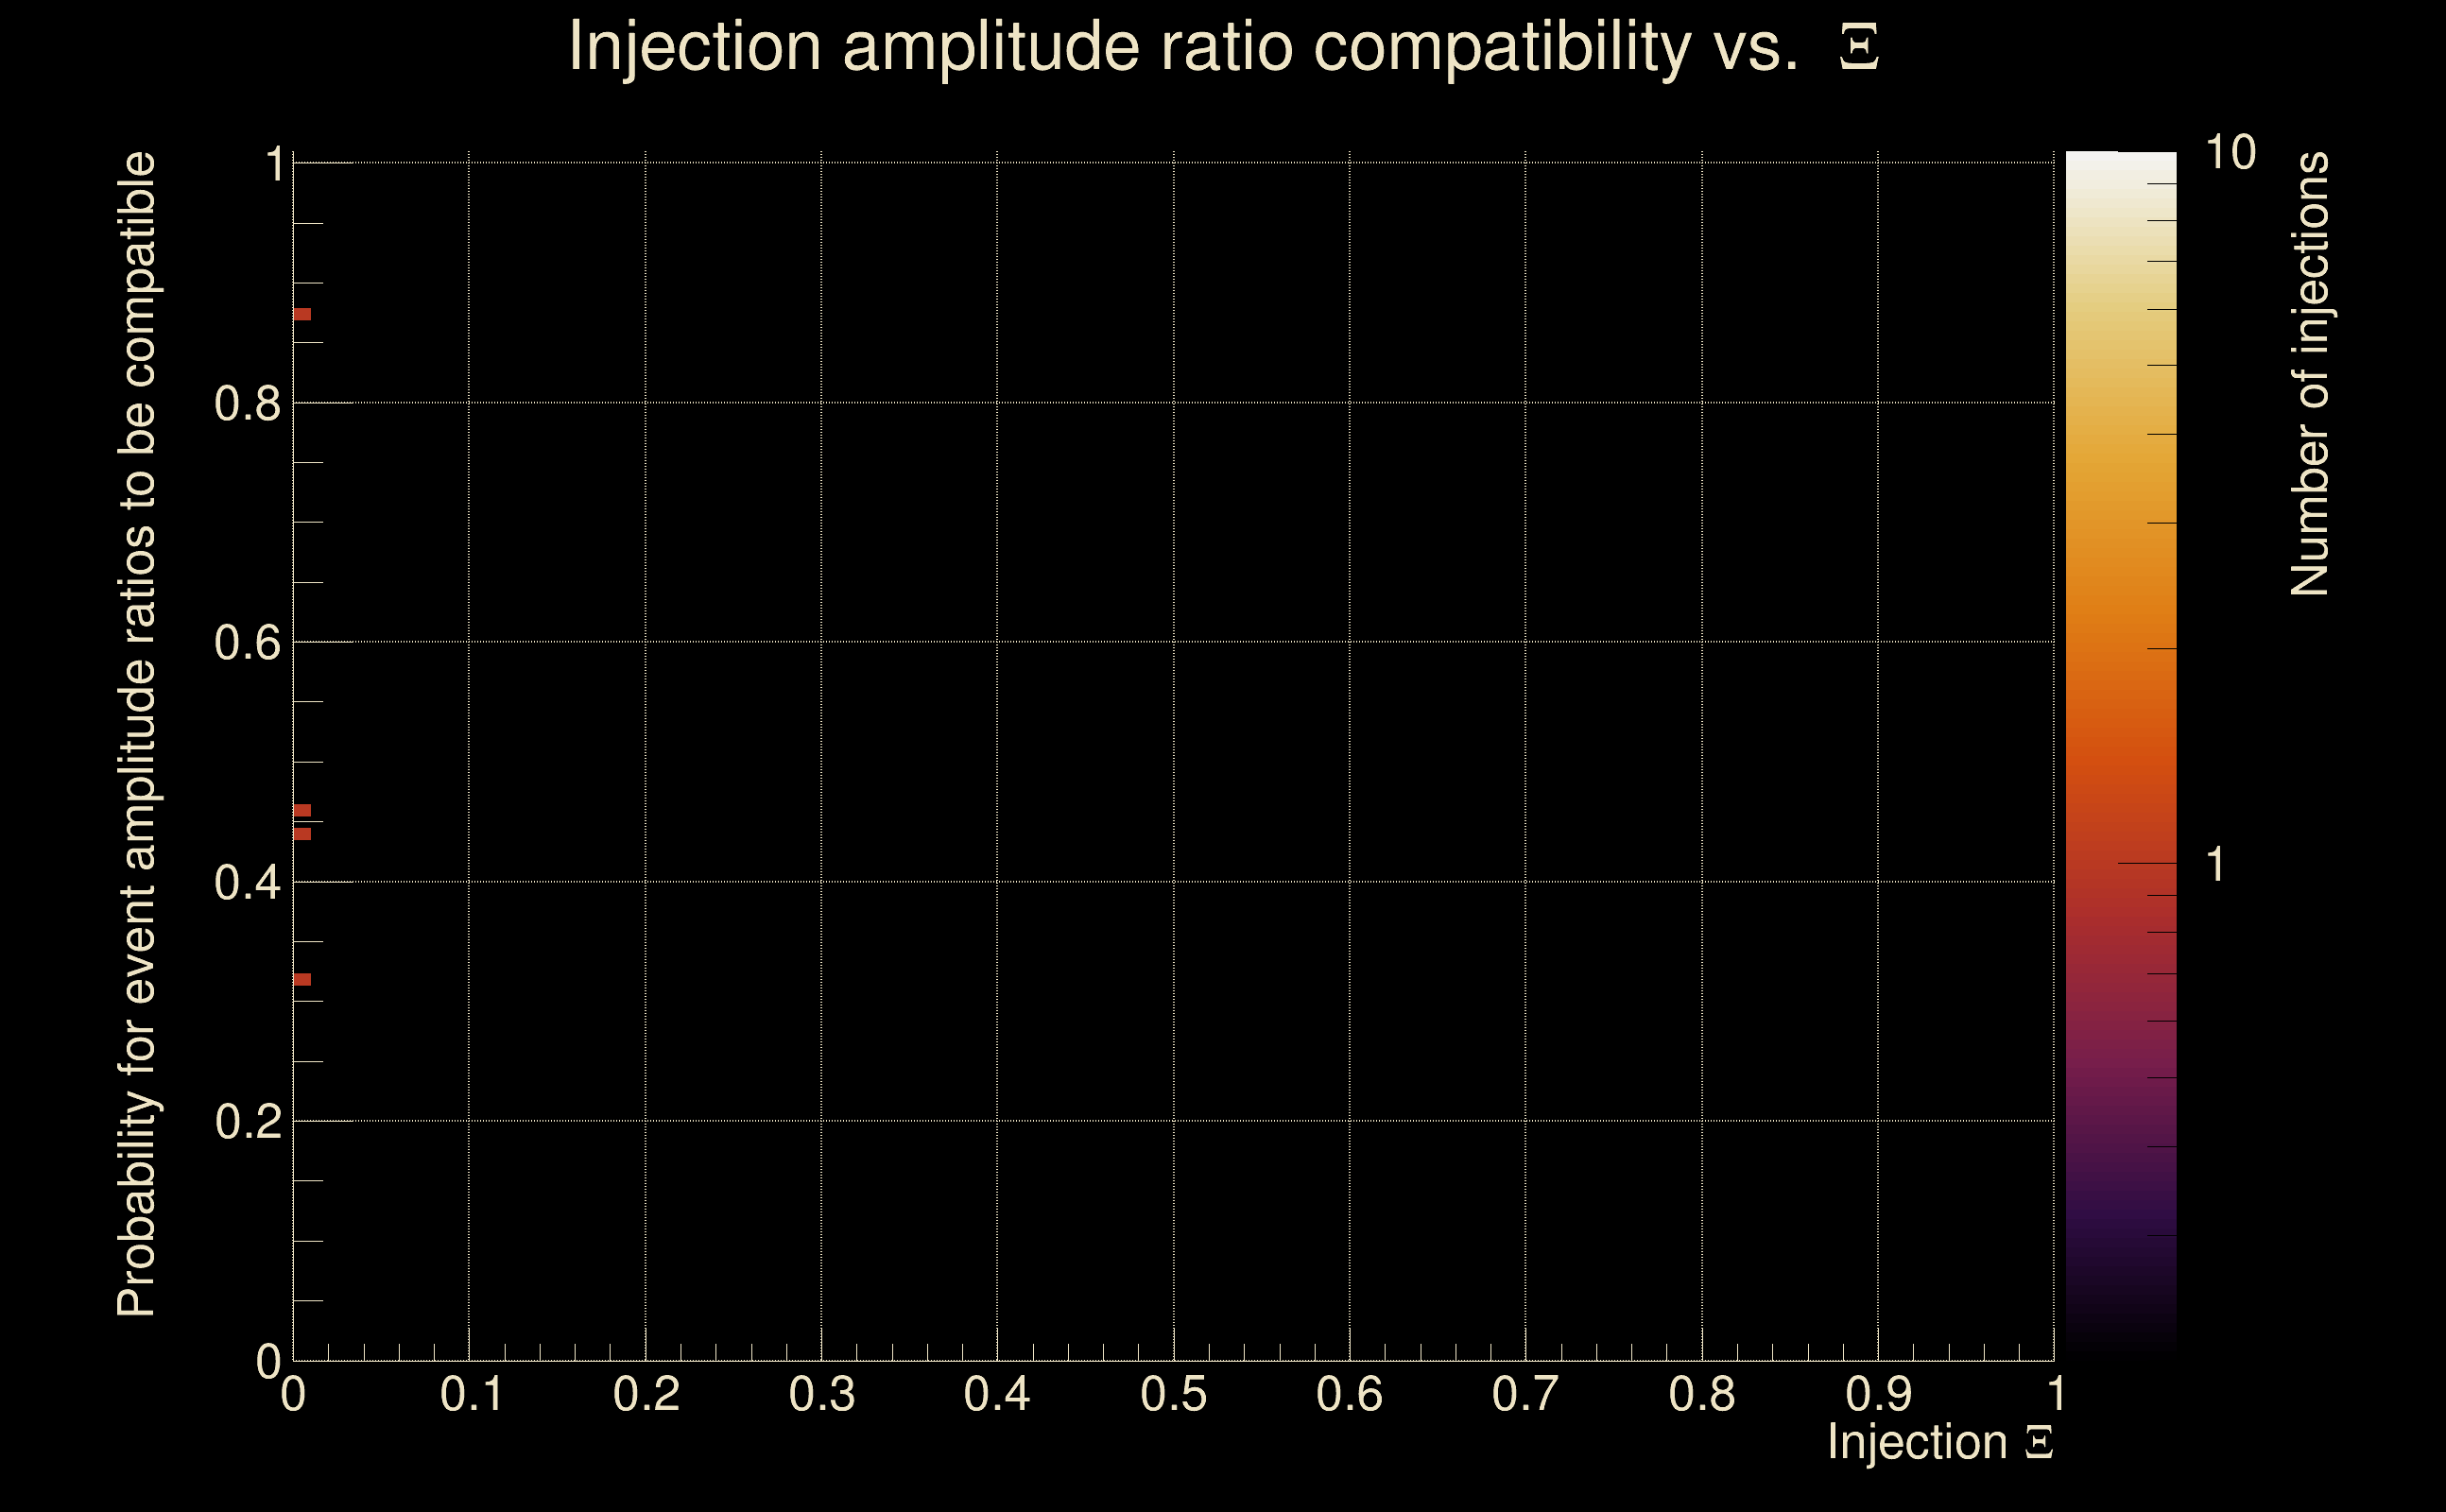
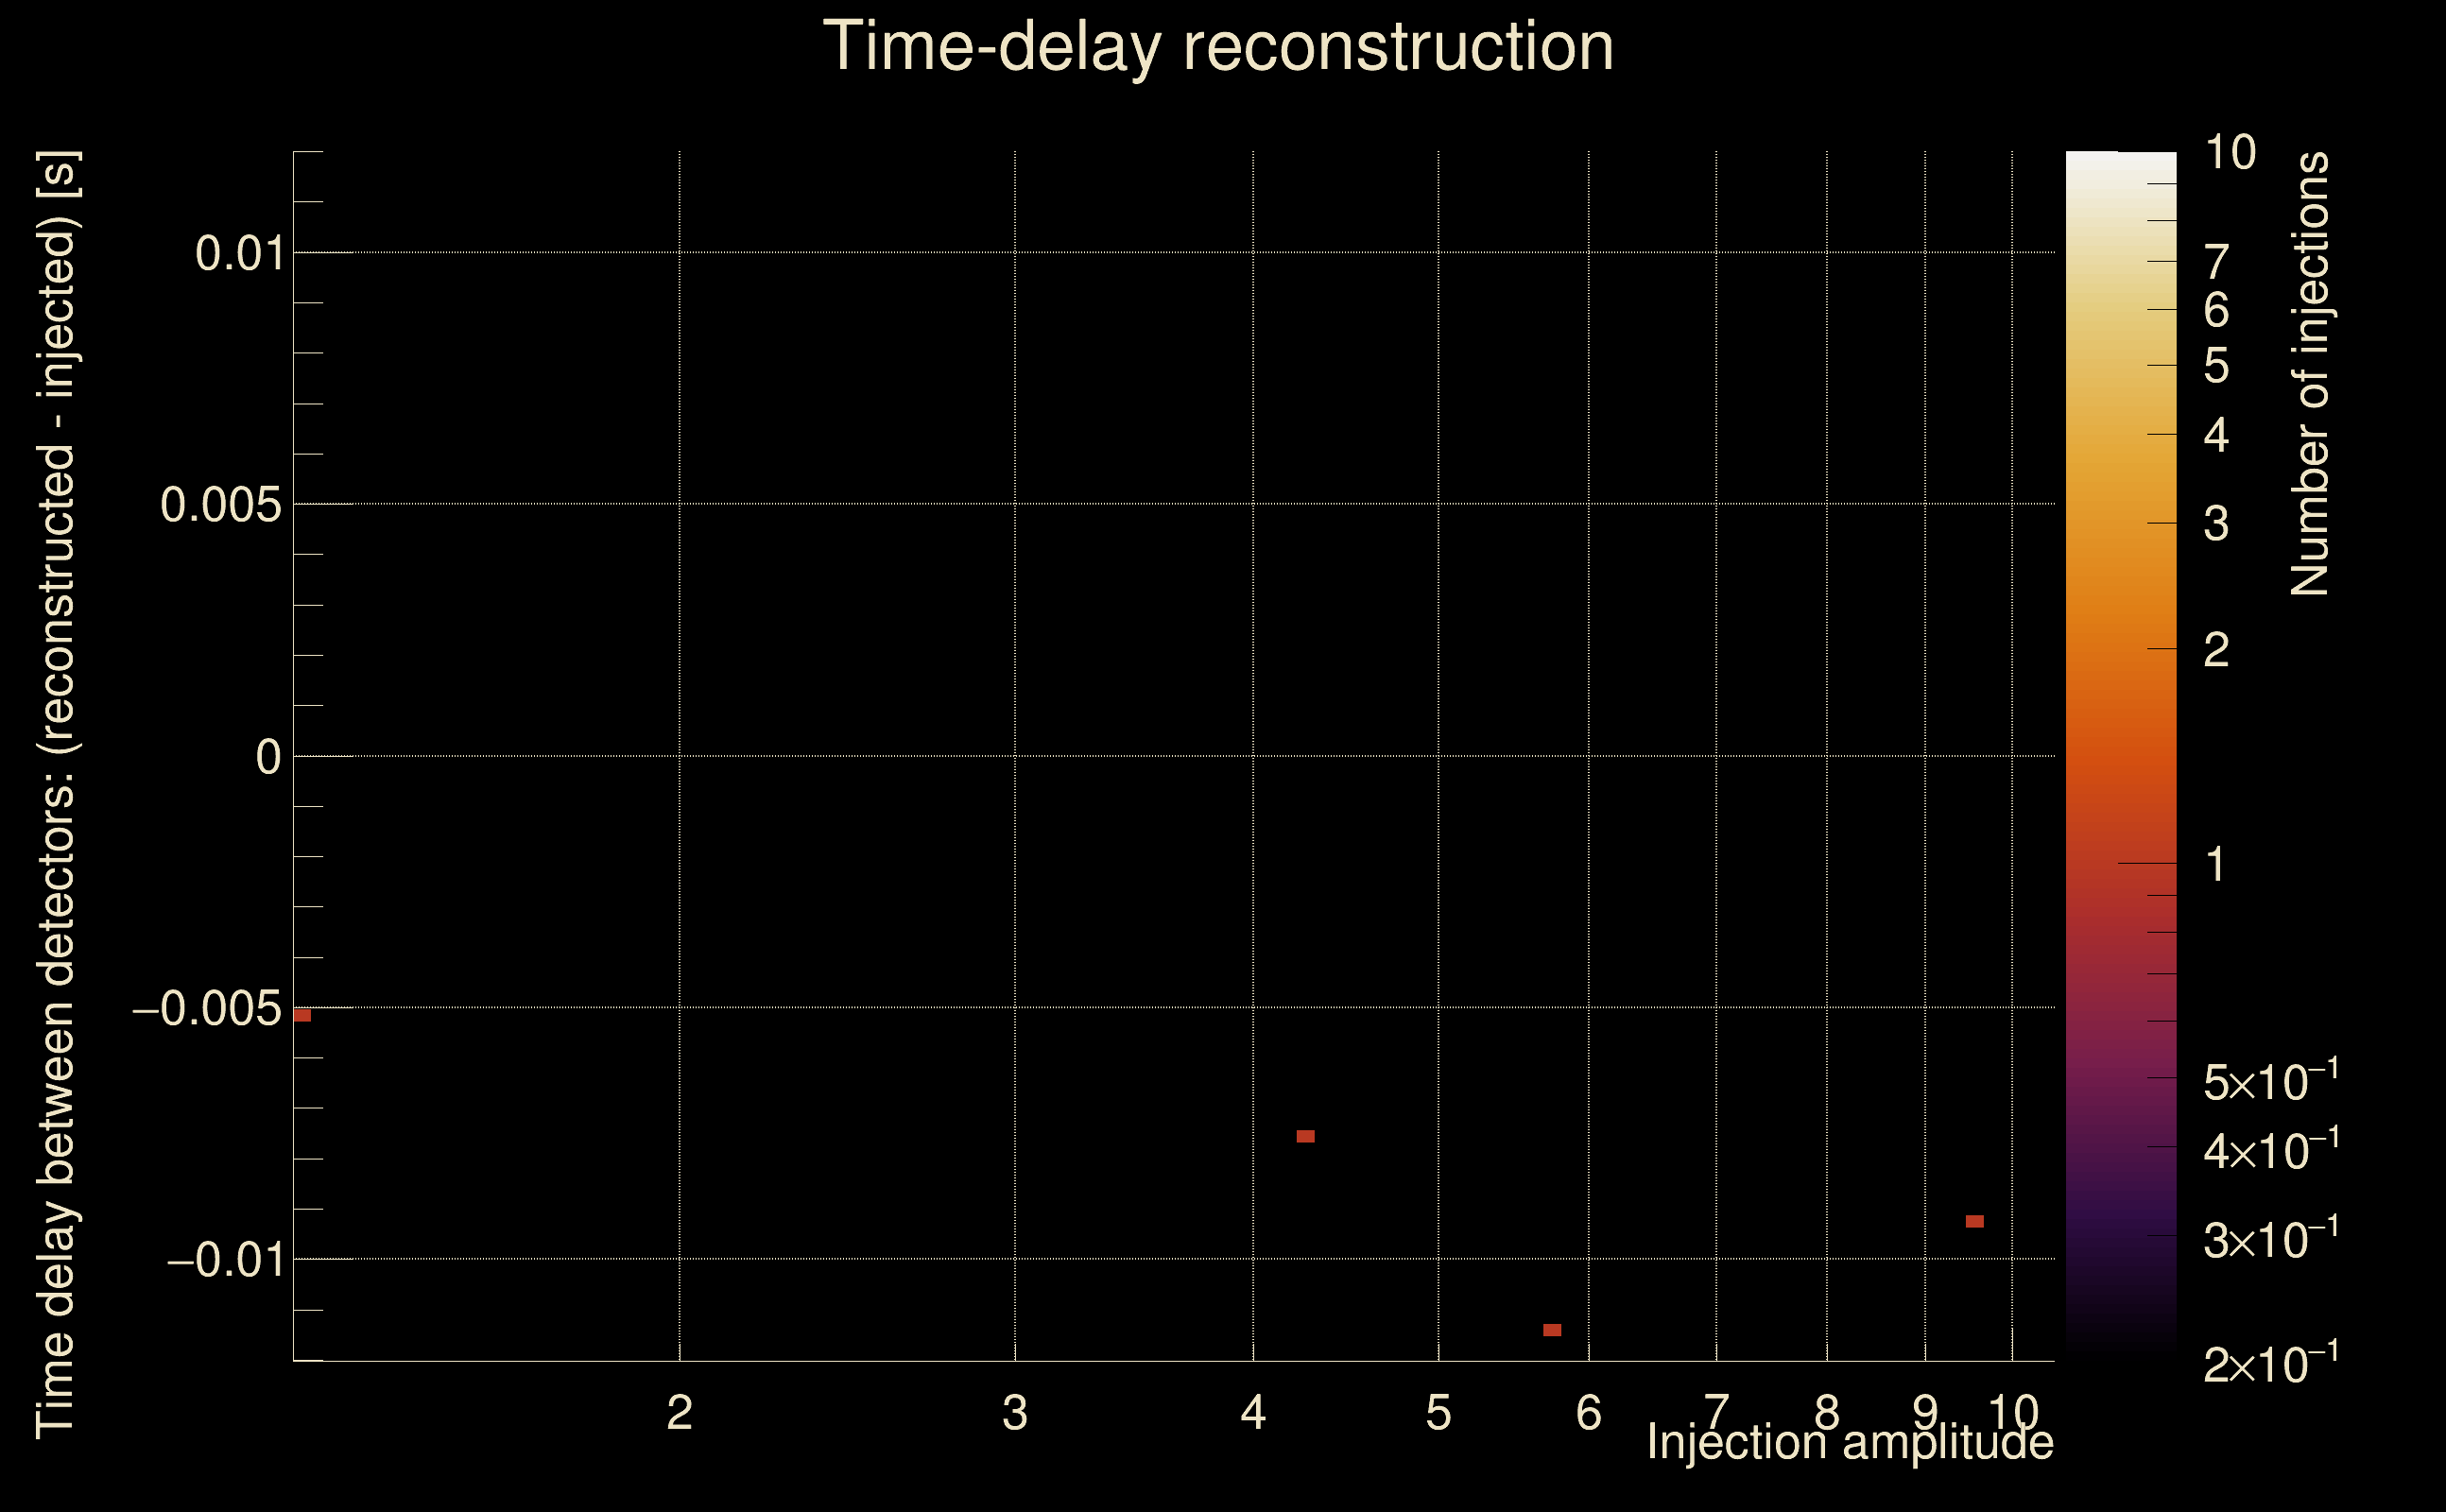
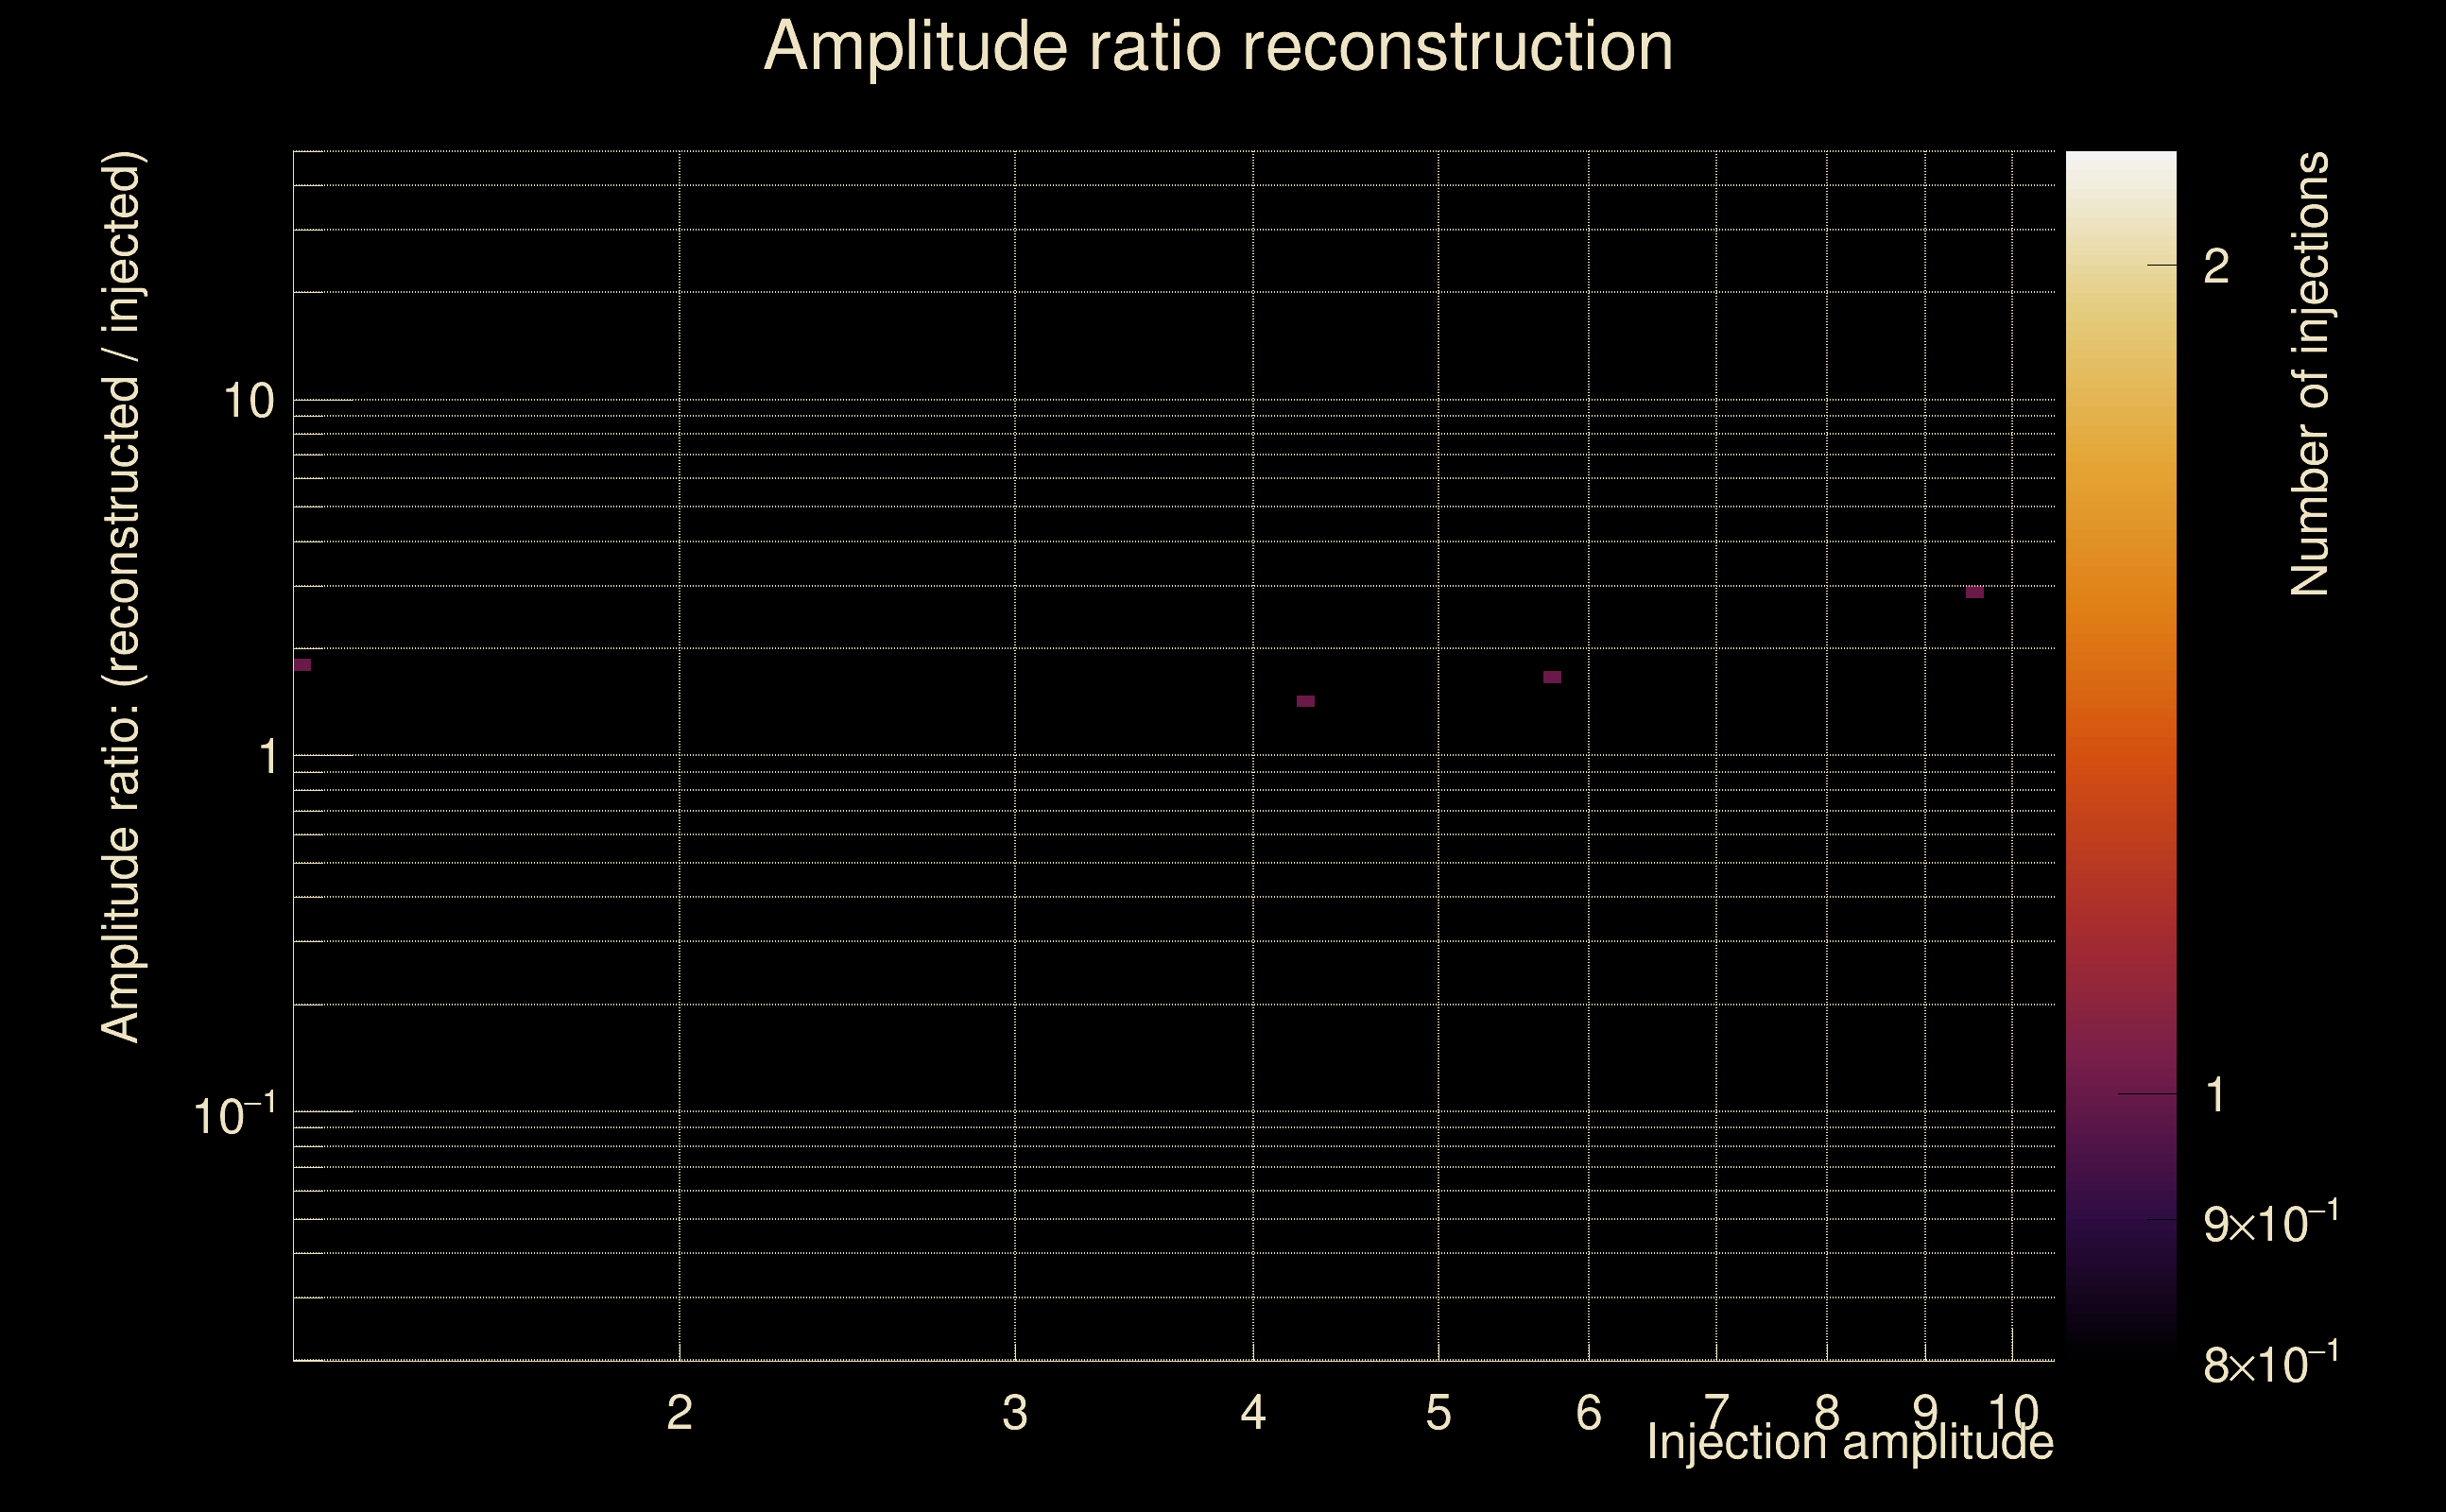
| Number of injections (total/valid/detected): | 4 / 4 / 0 |
| List of missed injections: | ./AND16-S20S_missed.txt |
| Injection amplitude at 90% detection efficiency: | -1 |
| Injection amplitude at 50% detection efficiency: | -1 |
| Injection amplitude at 10% detection efficiency: | -1 |
 |
 |
 |
 |
 |
 |
|
 |
 |
|
 |
 |
 |
 |
 |
 |
 |
 |
| florent.robinet@ijclab.in2p3.fr |