| Omicron version: | 4.2.0: documentation gitlab repository |
| Omicron run by: | unknown |
| Report produced on: | Thu Nov 13 14:25:34 2025 UTC |
| Ox option file: | Targeted_O4bw_2min_2_options.txt |
| Omicron option files: | detector 0, detector 1 |
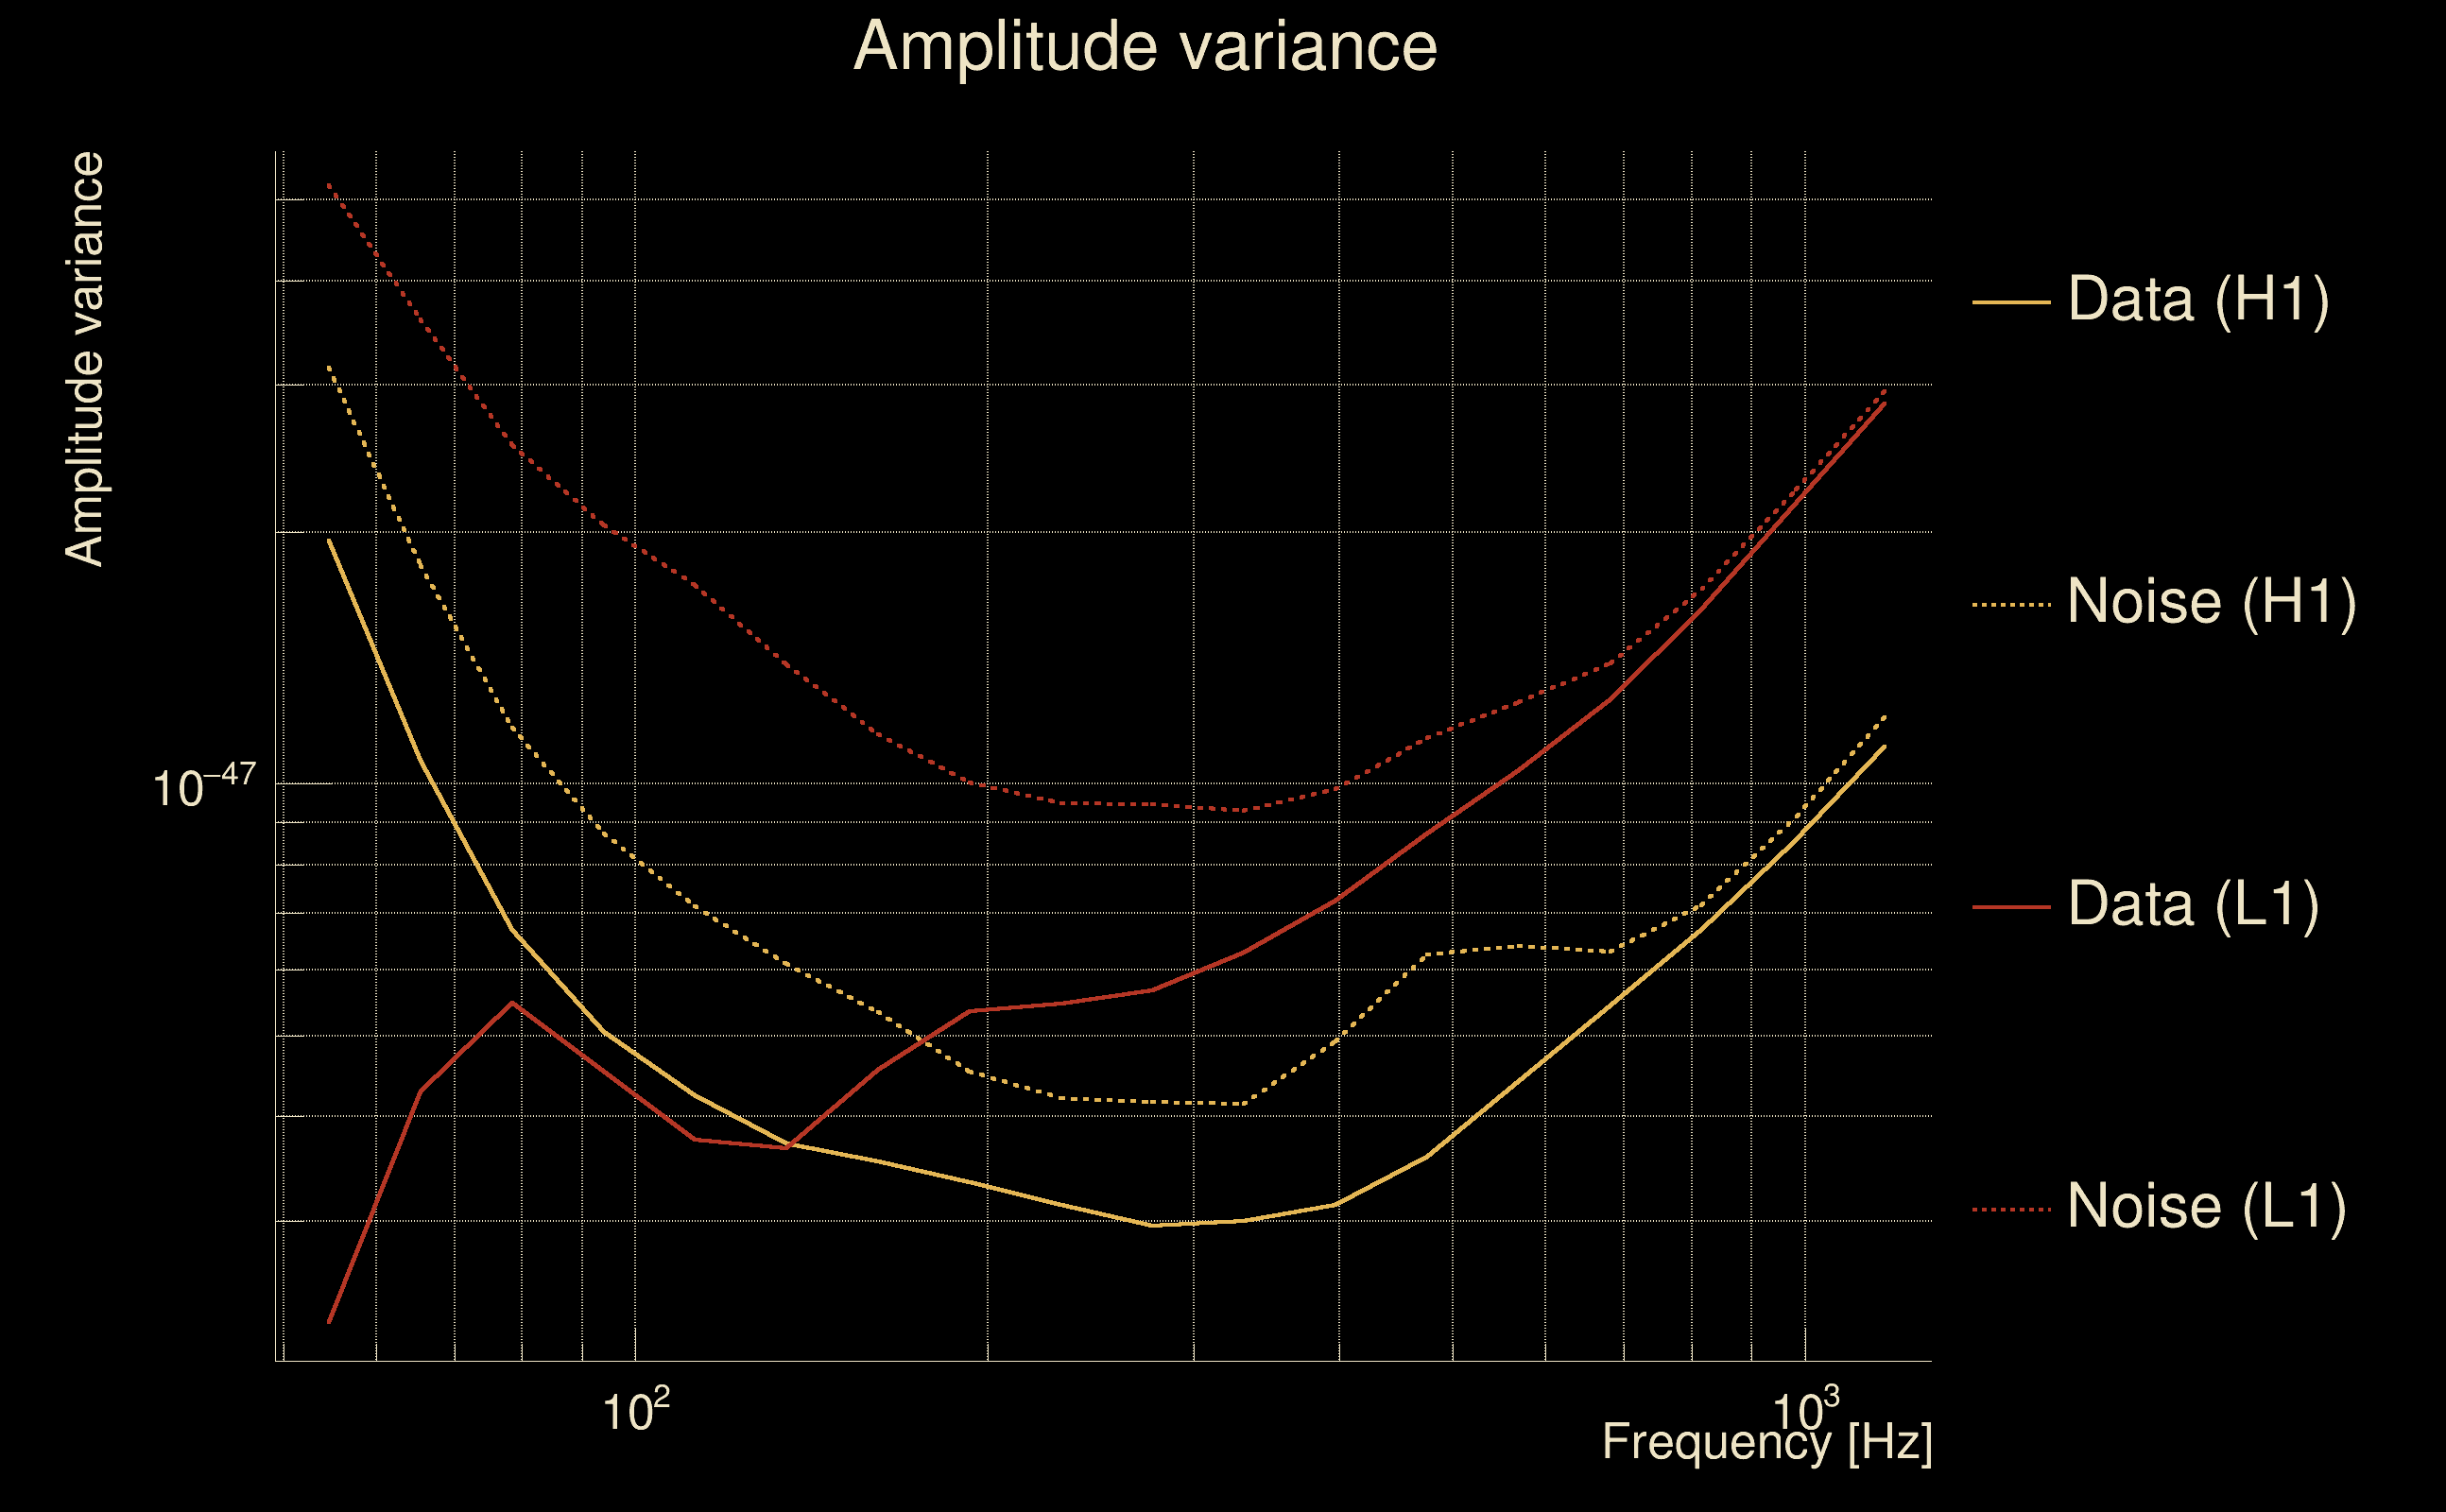
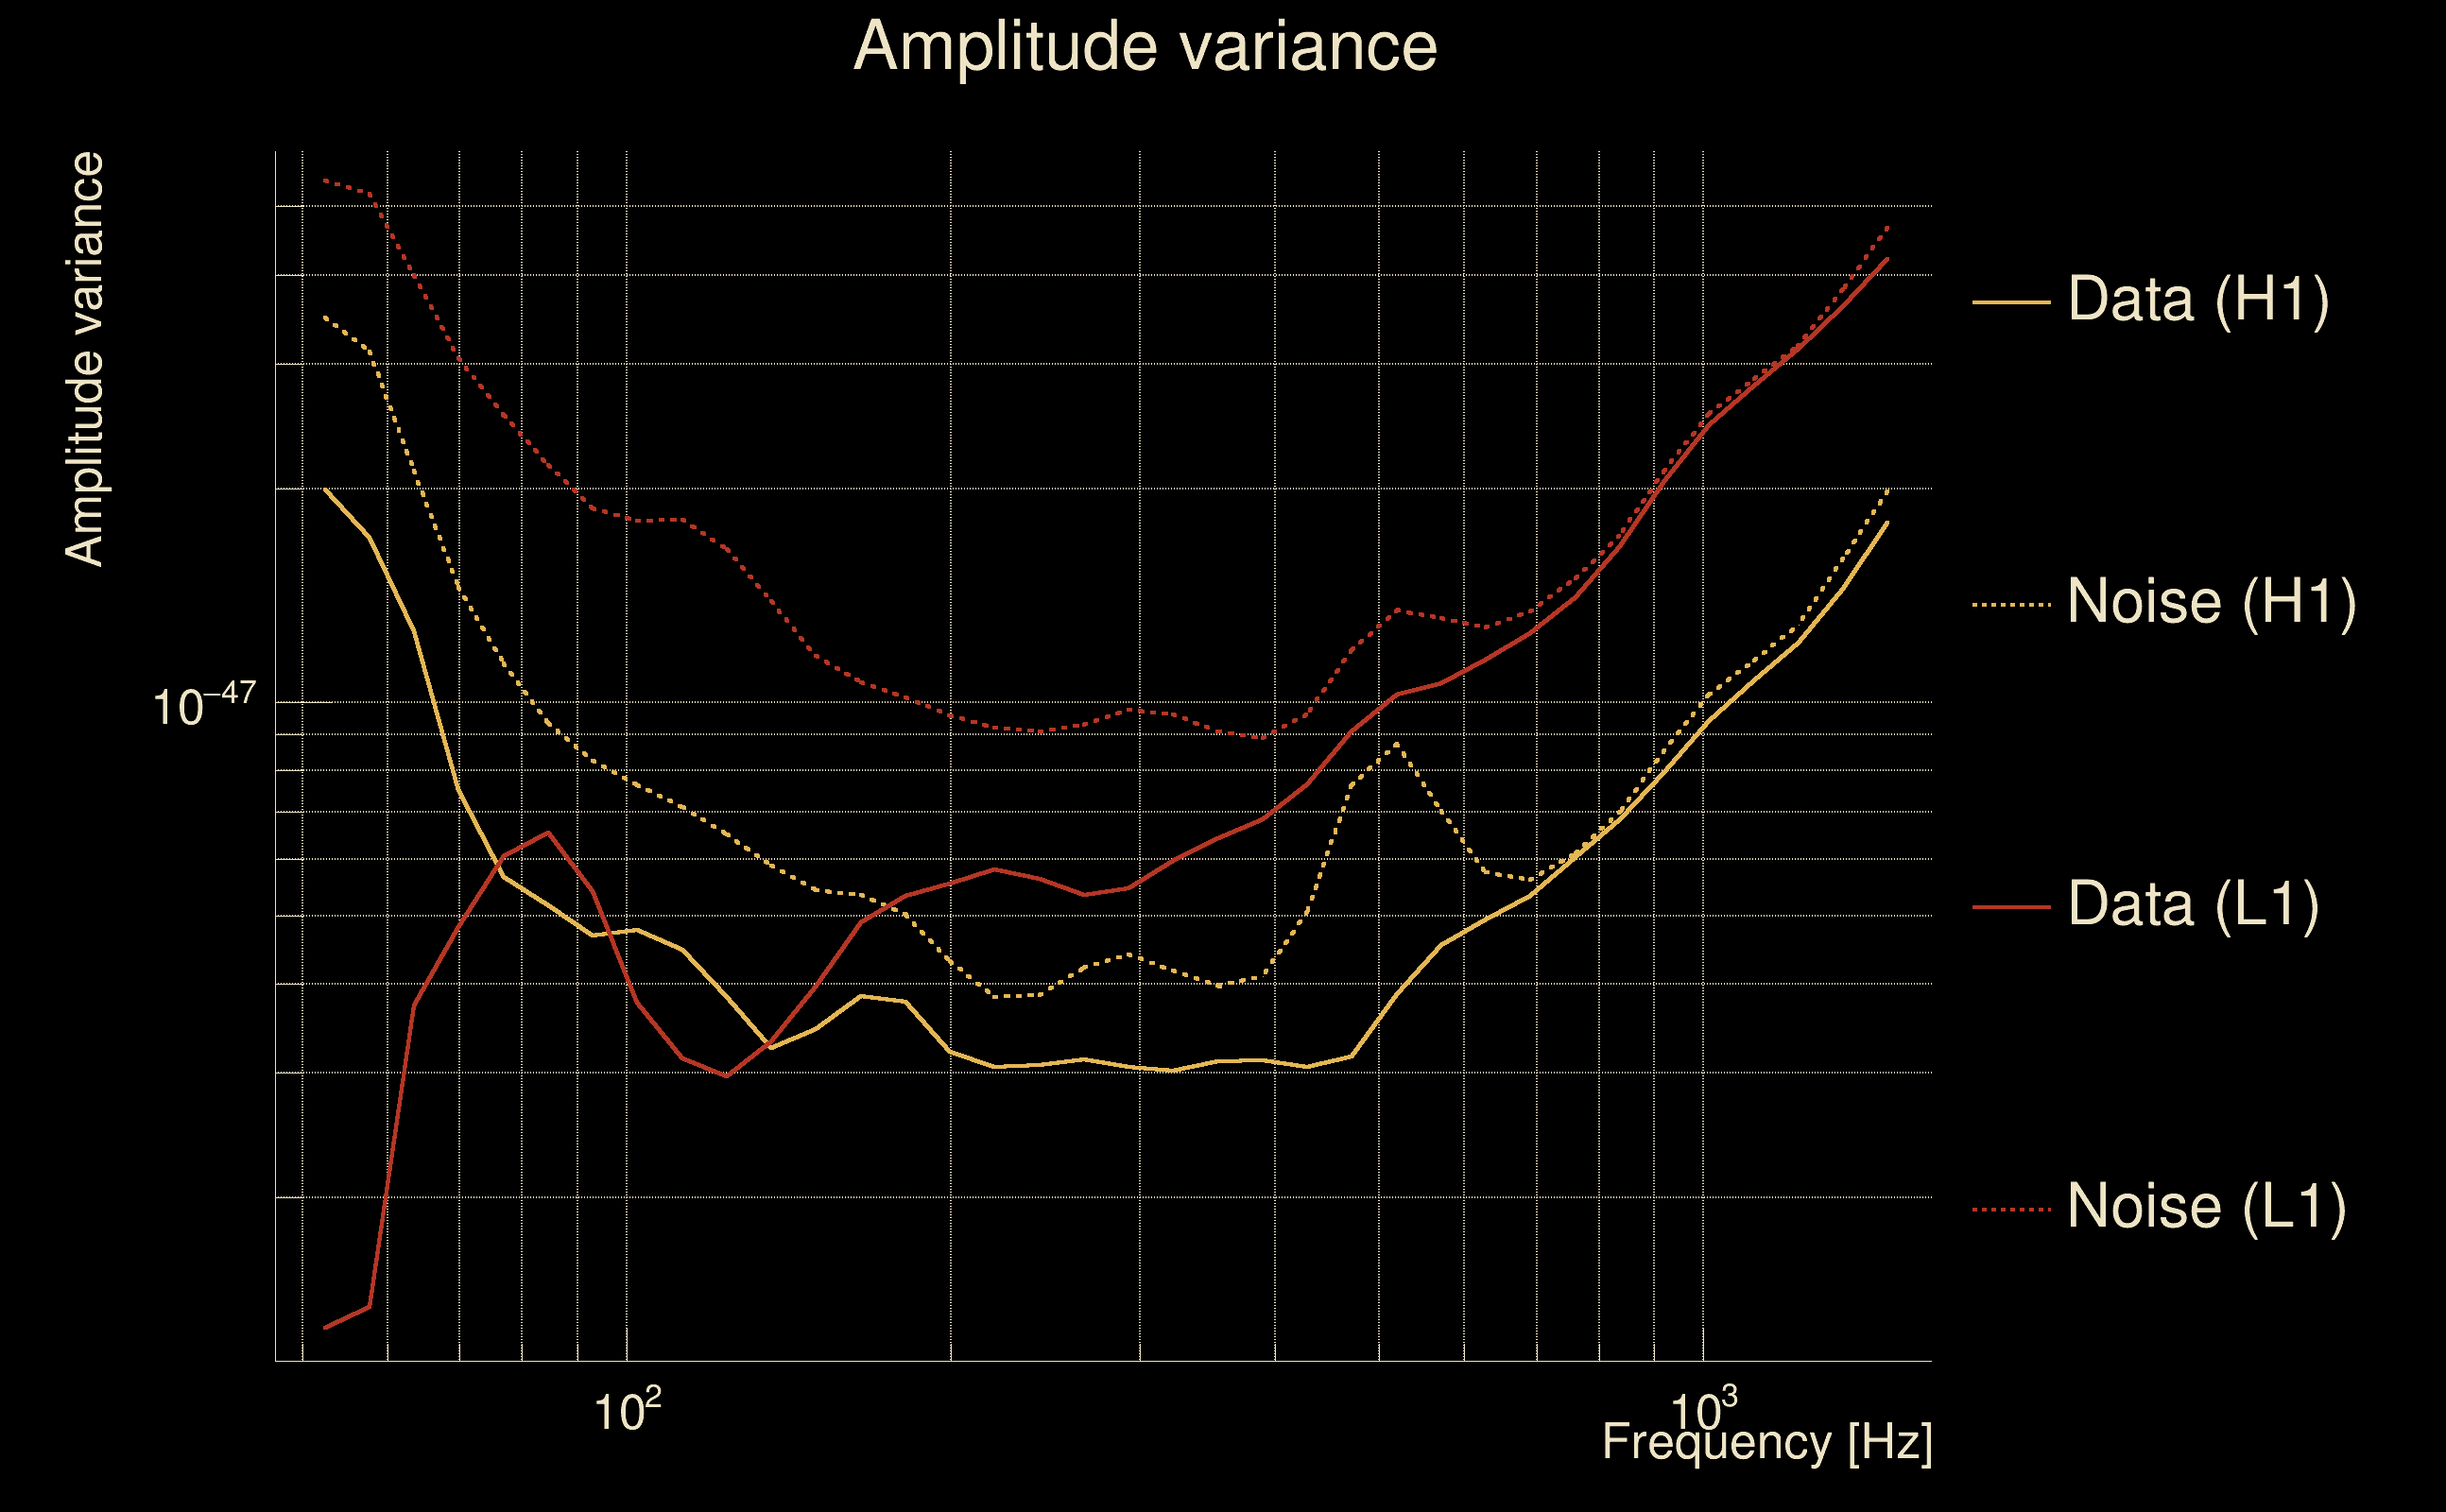
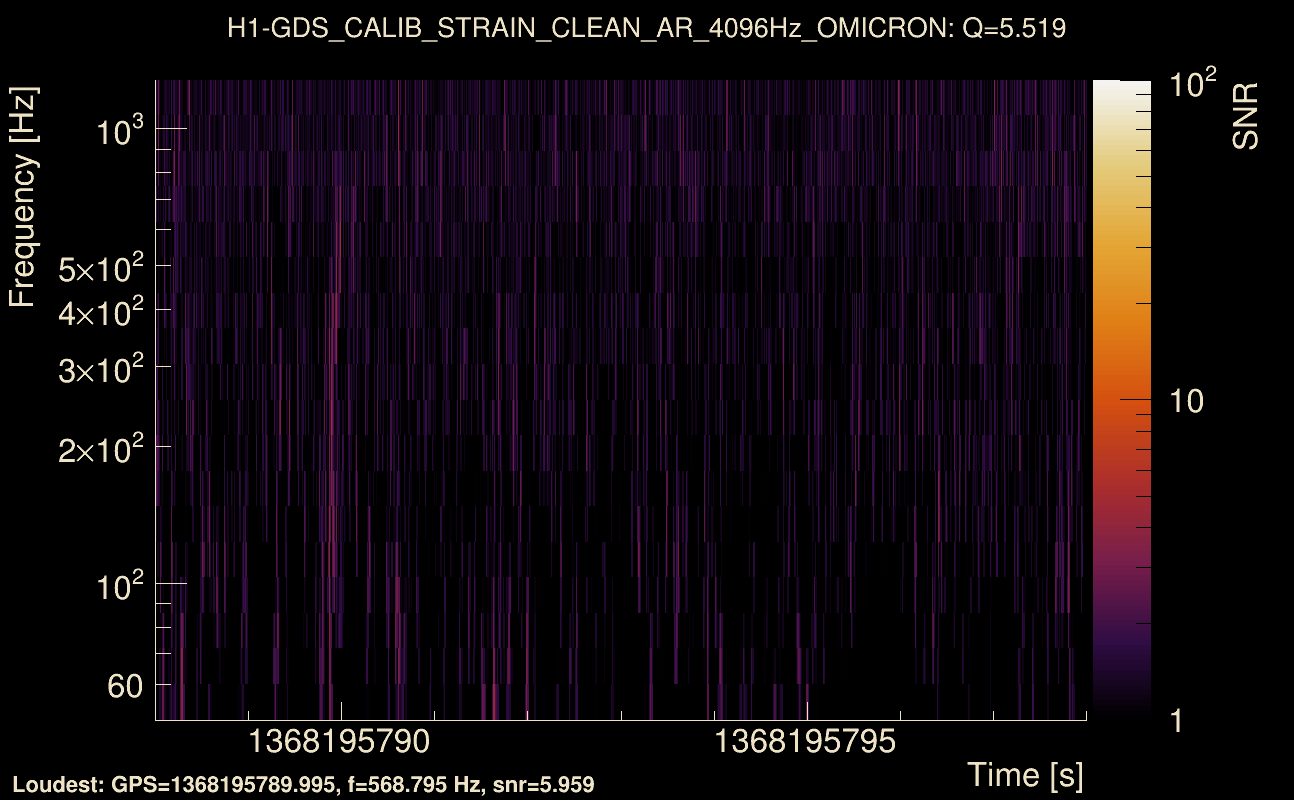
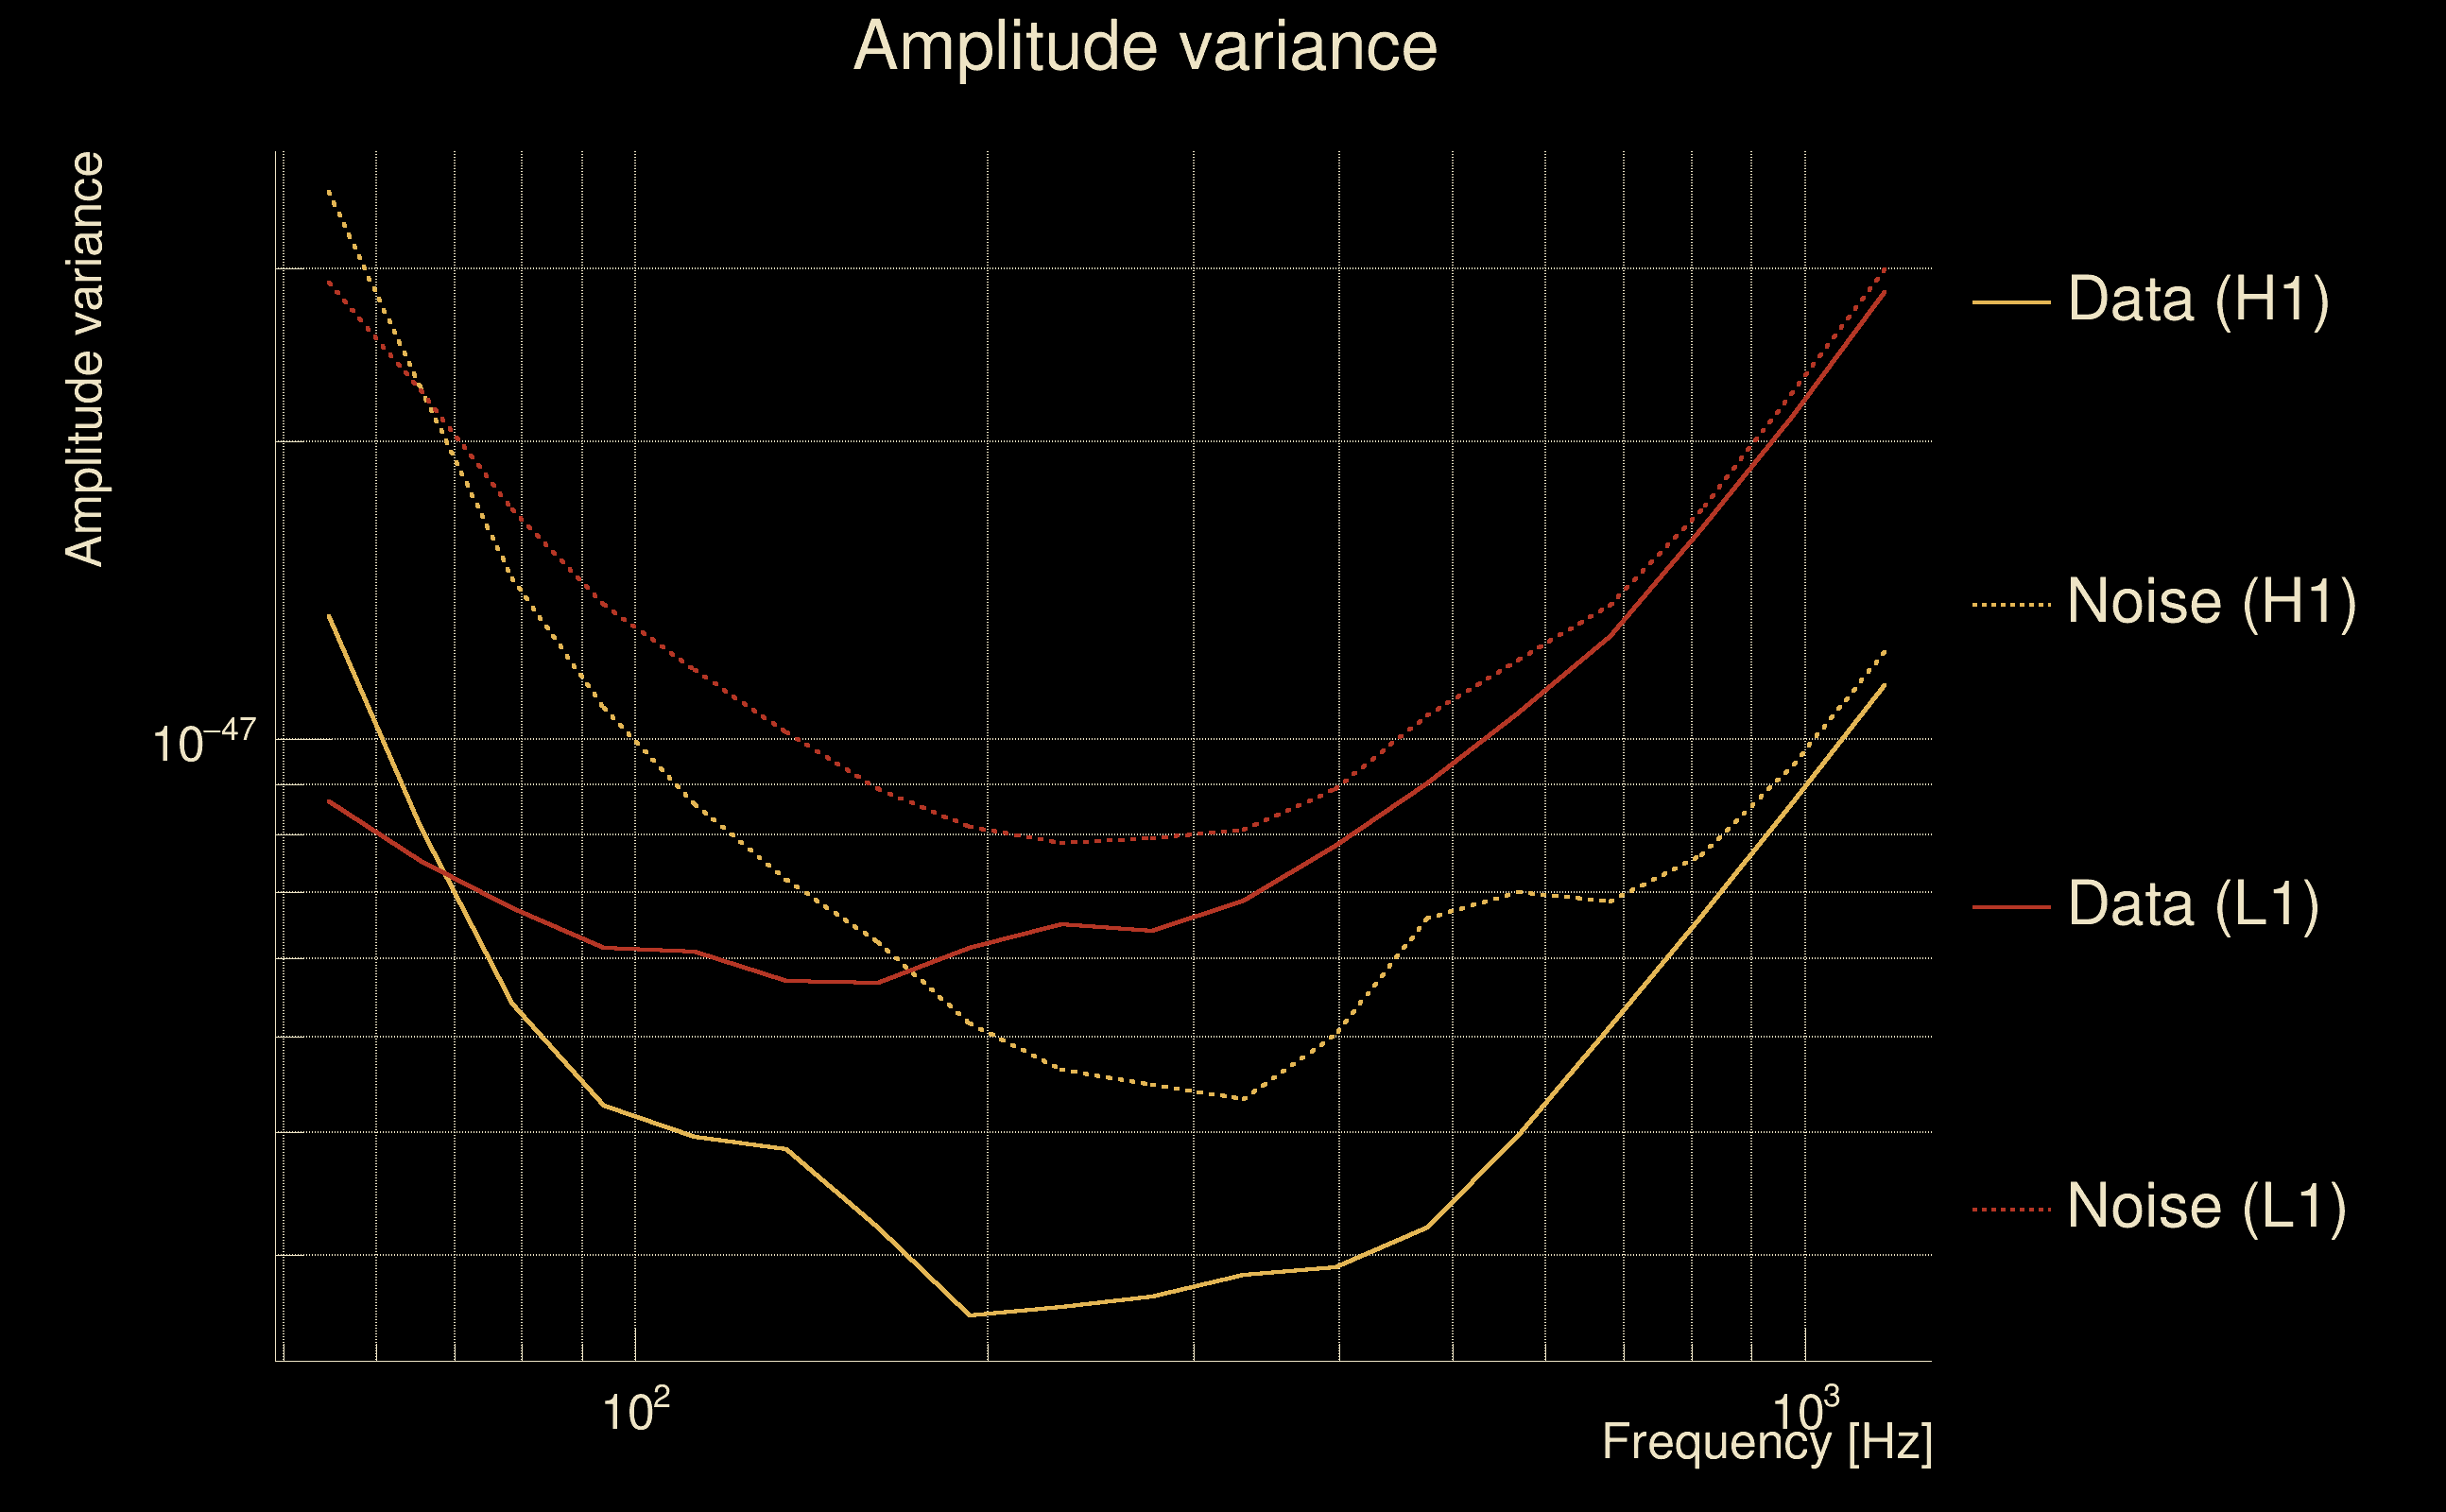
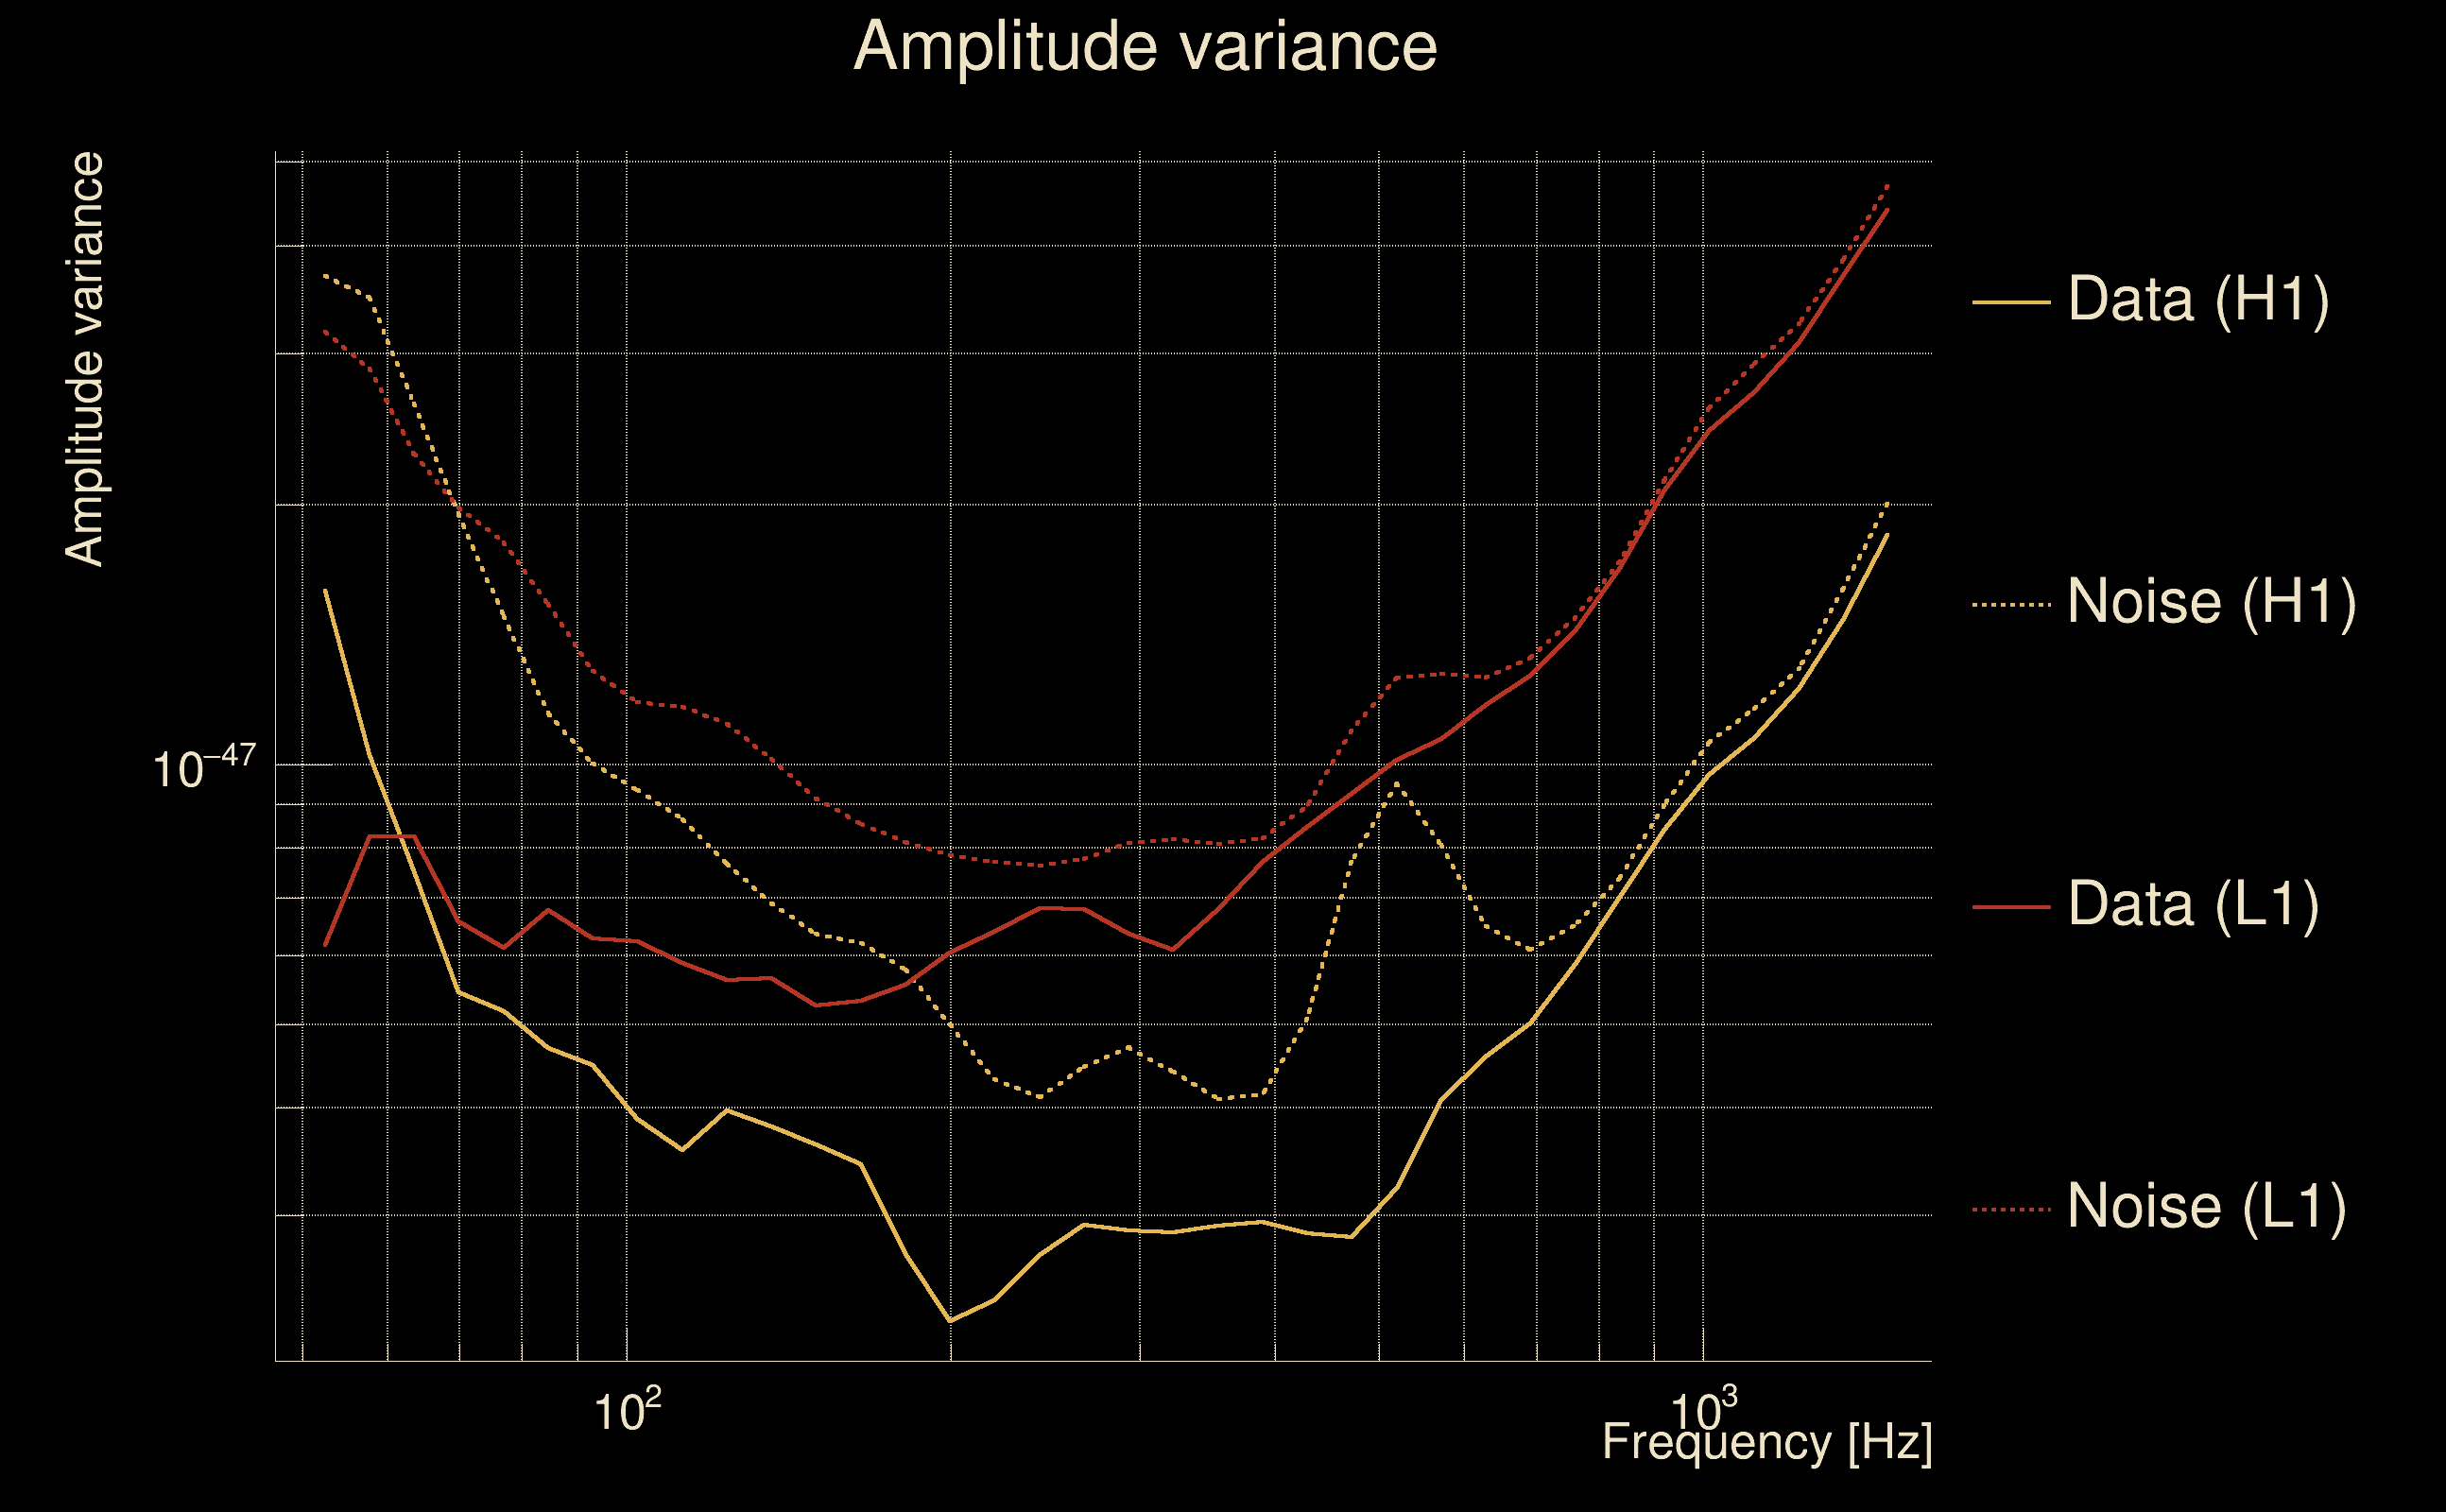
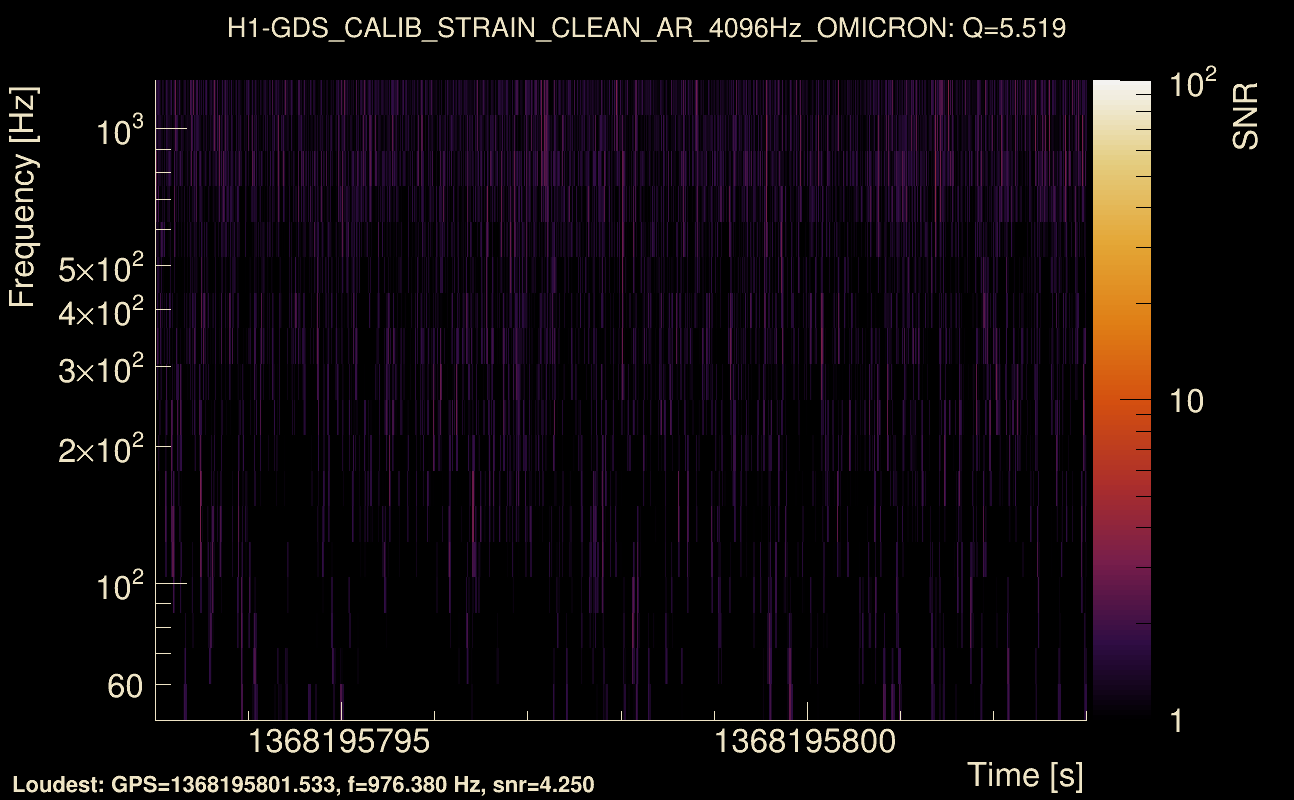
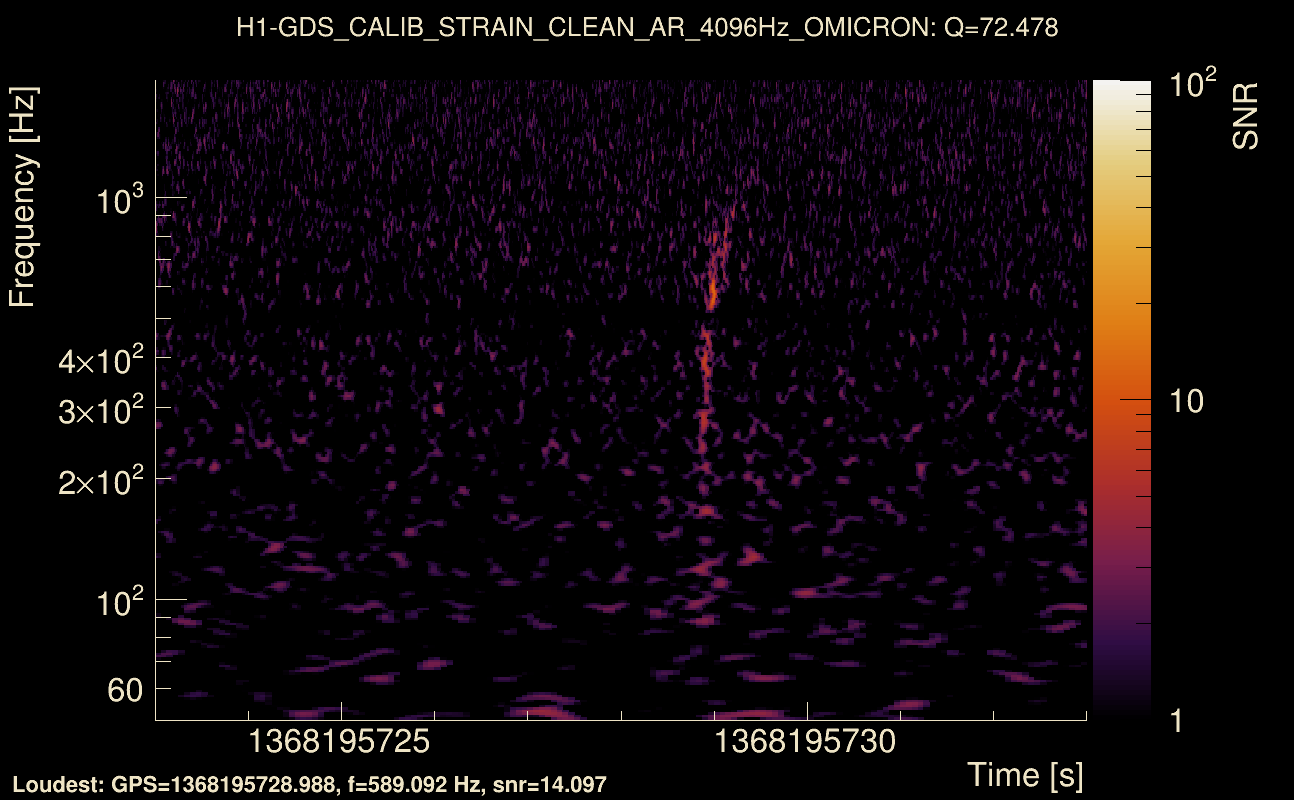
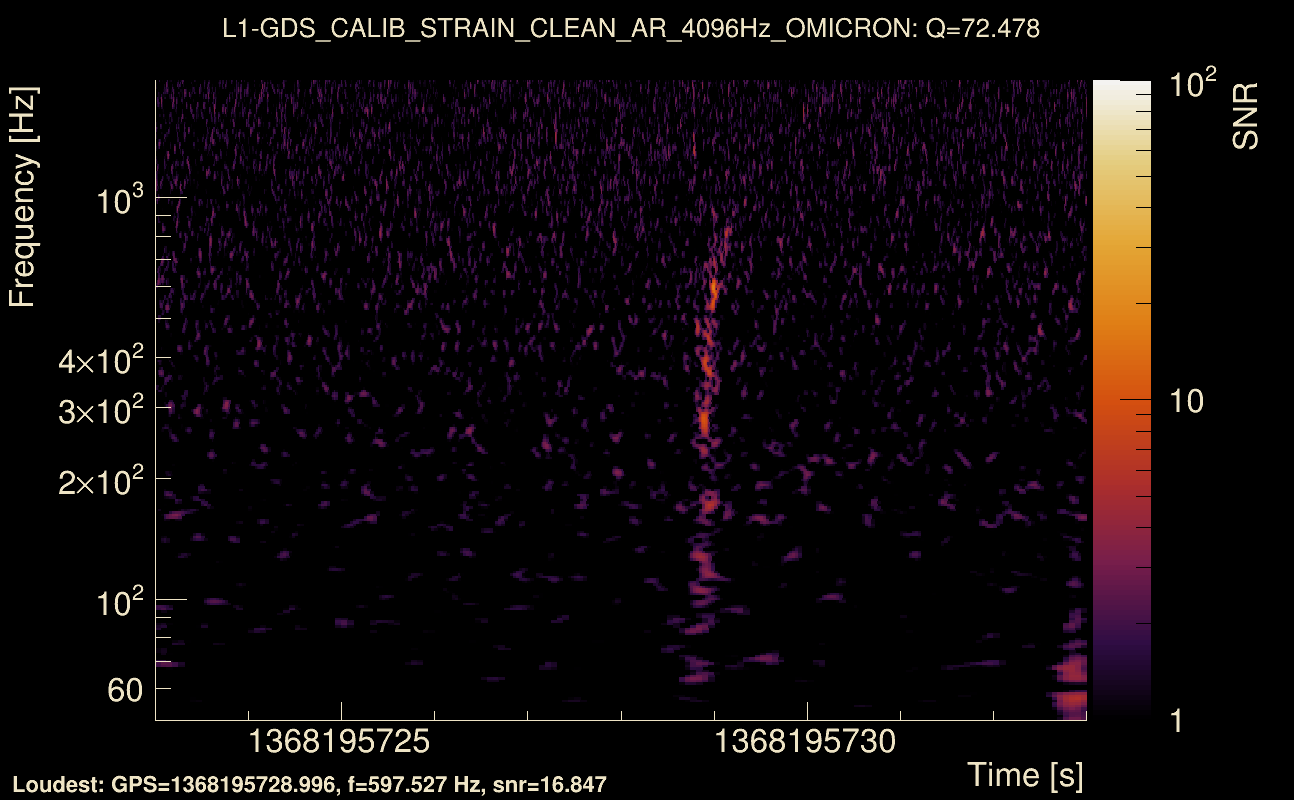
| Detector channel names: | H1:GDS-CALIB_STRAIN_CLEAN_AR_4096Hz, L1:GDS-CALIB_STRAIN_CLEAN_AR_4096Hz |
| Omicron analysis time window and overlap: | 16 s, 6 s |
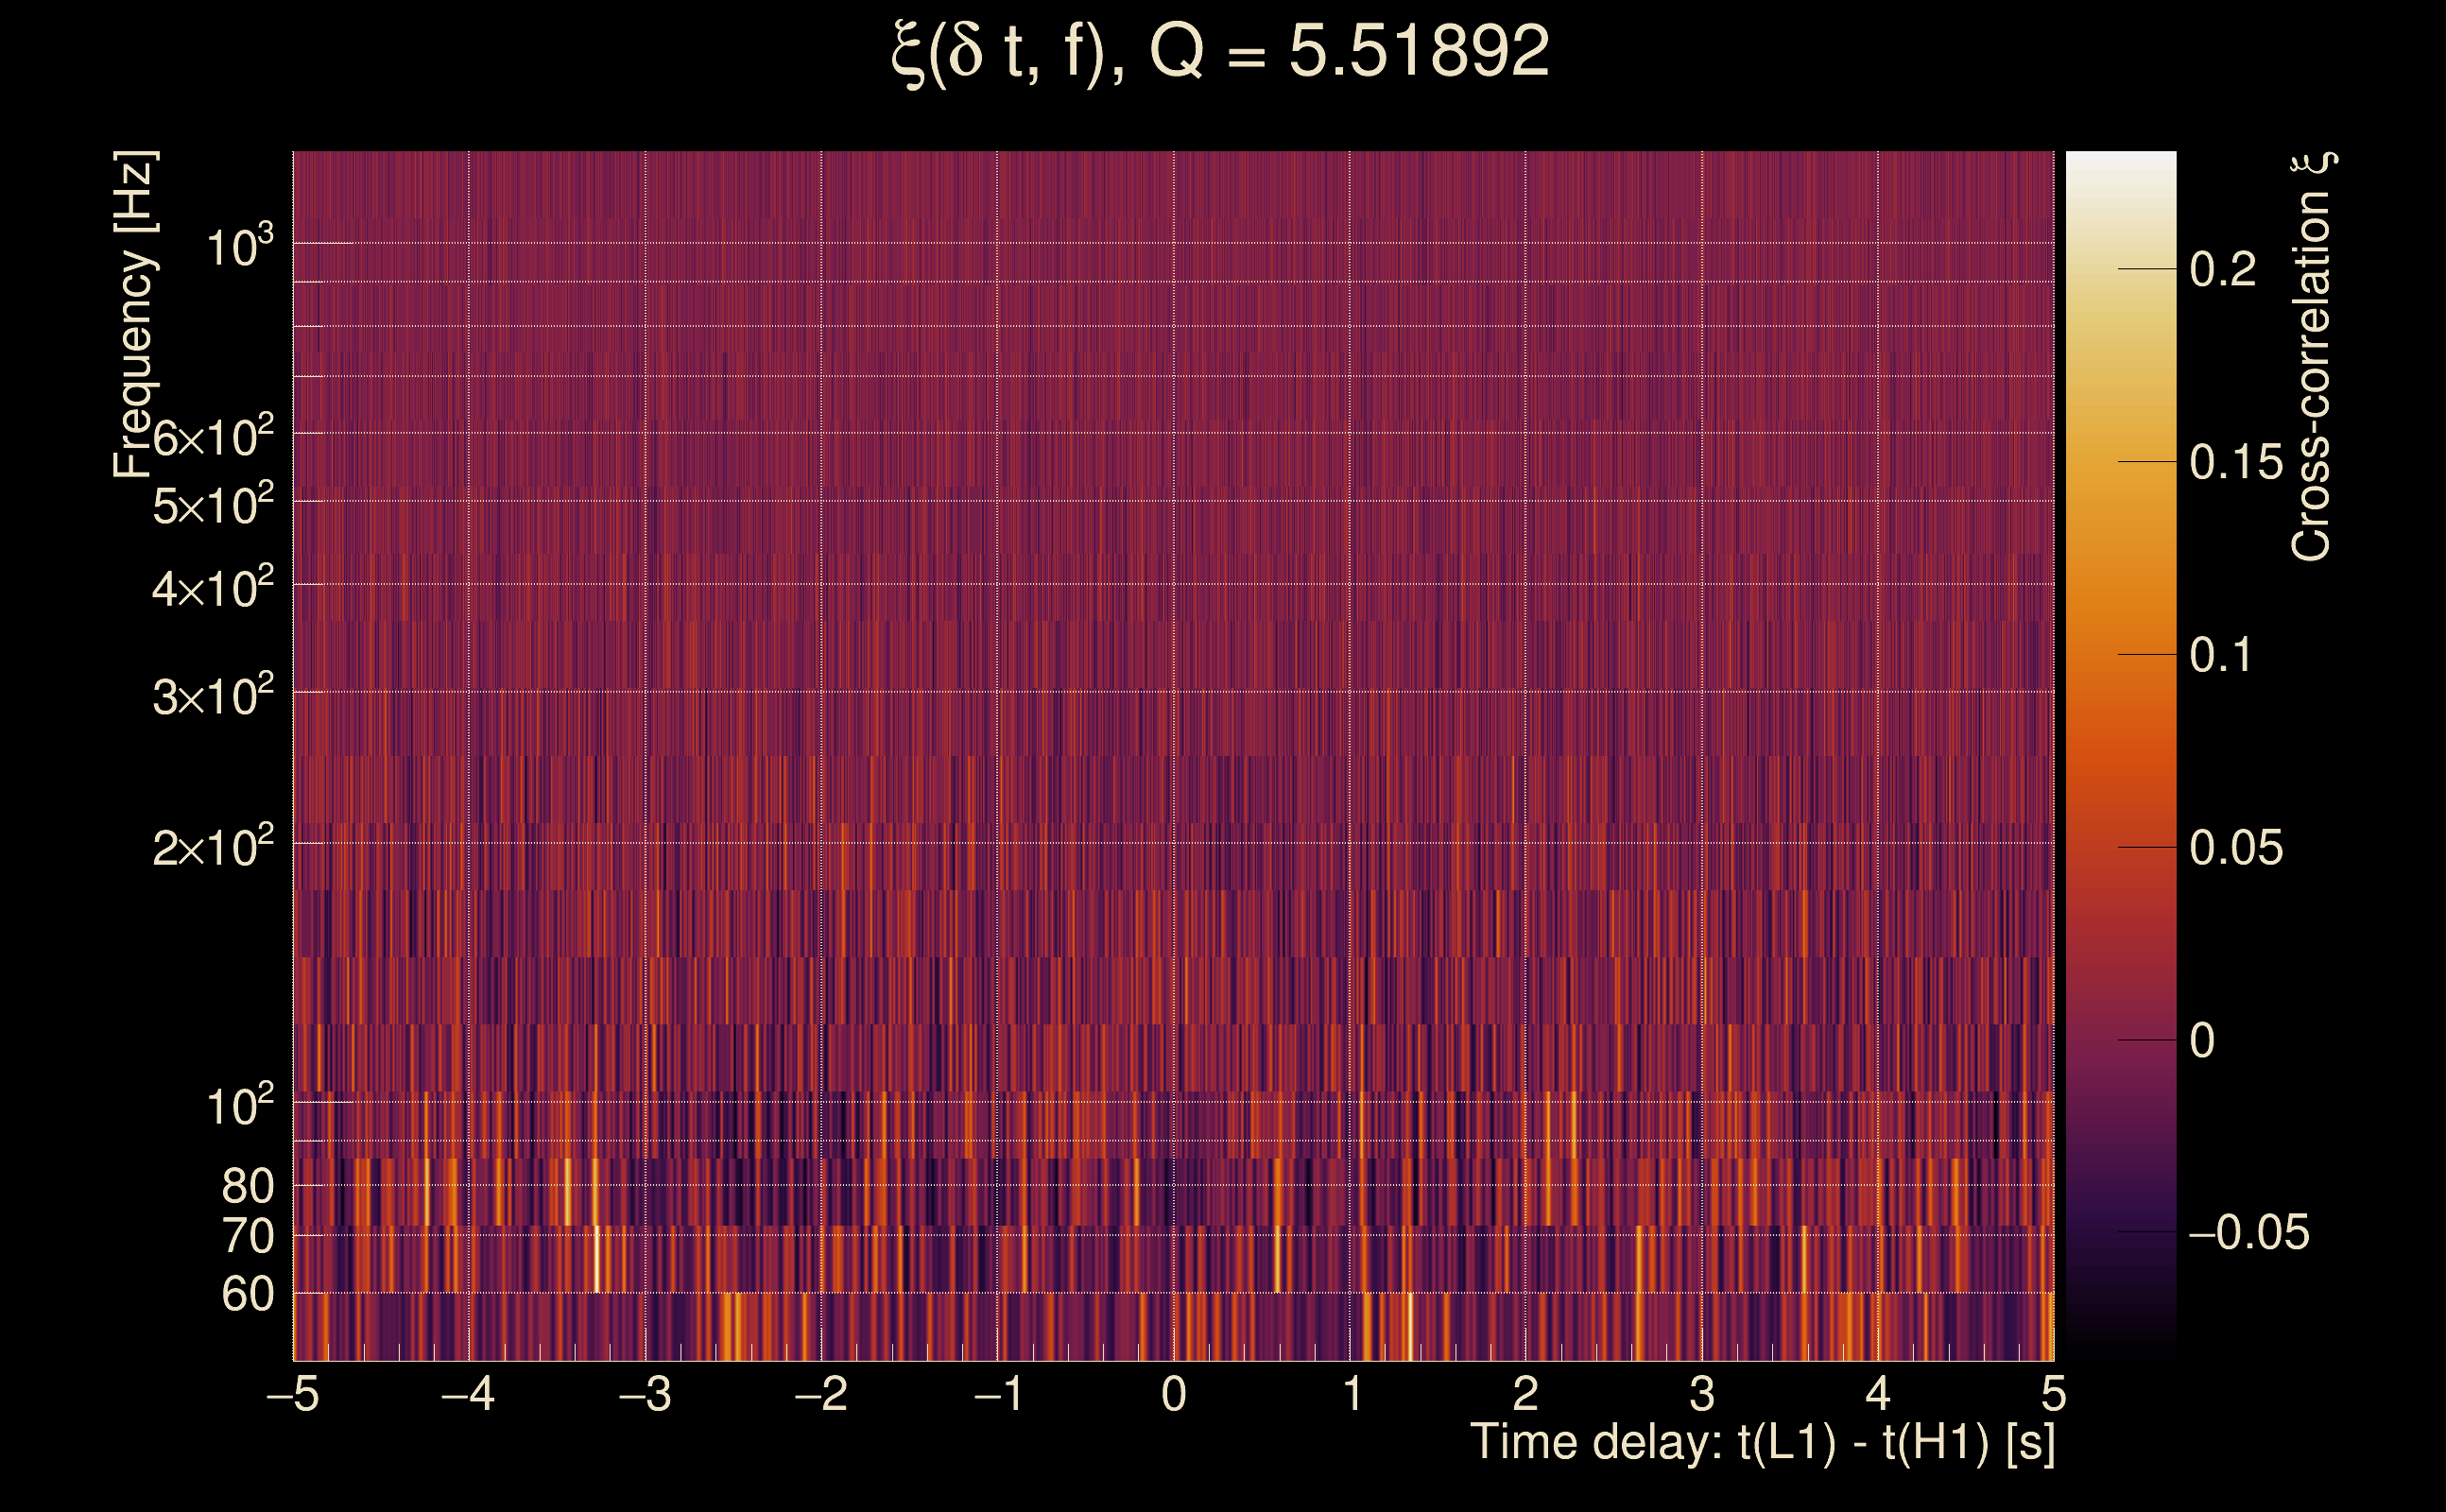
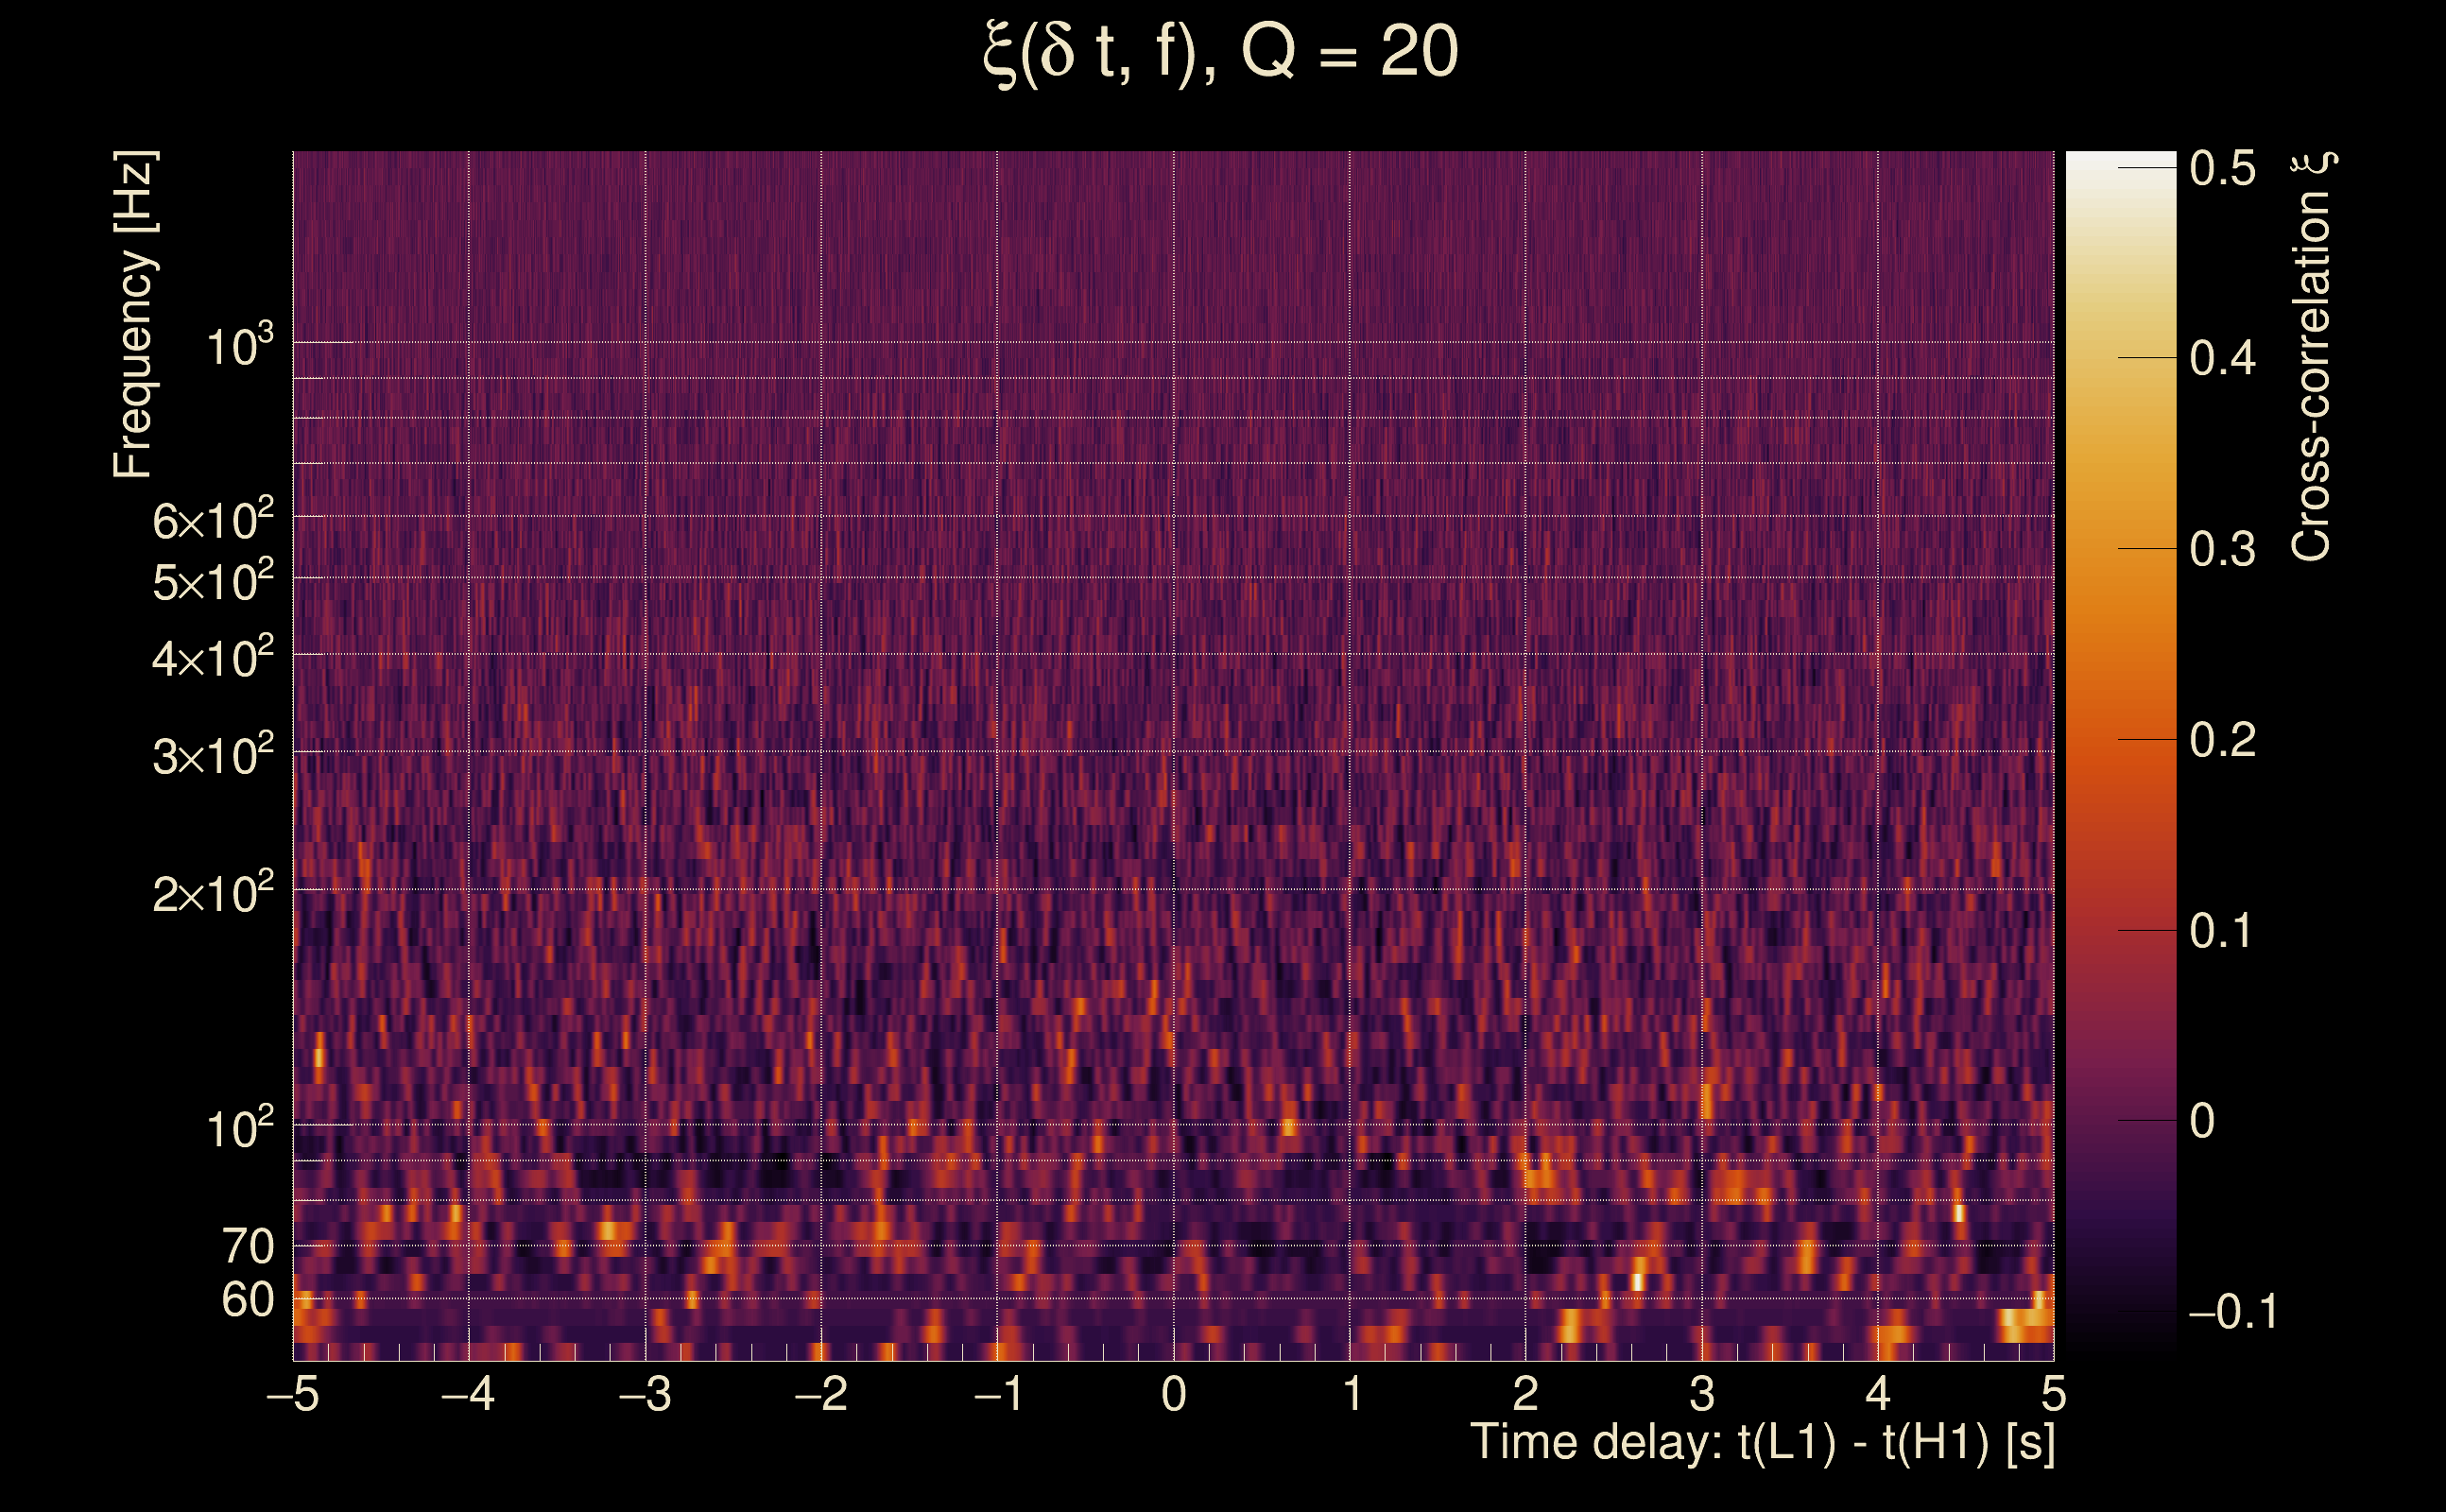
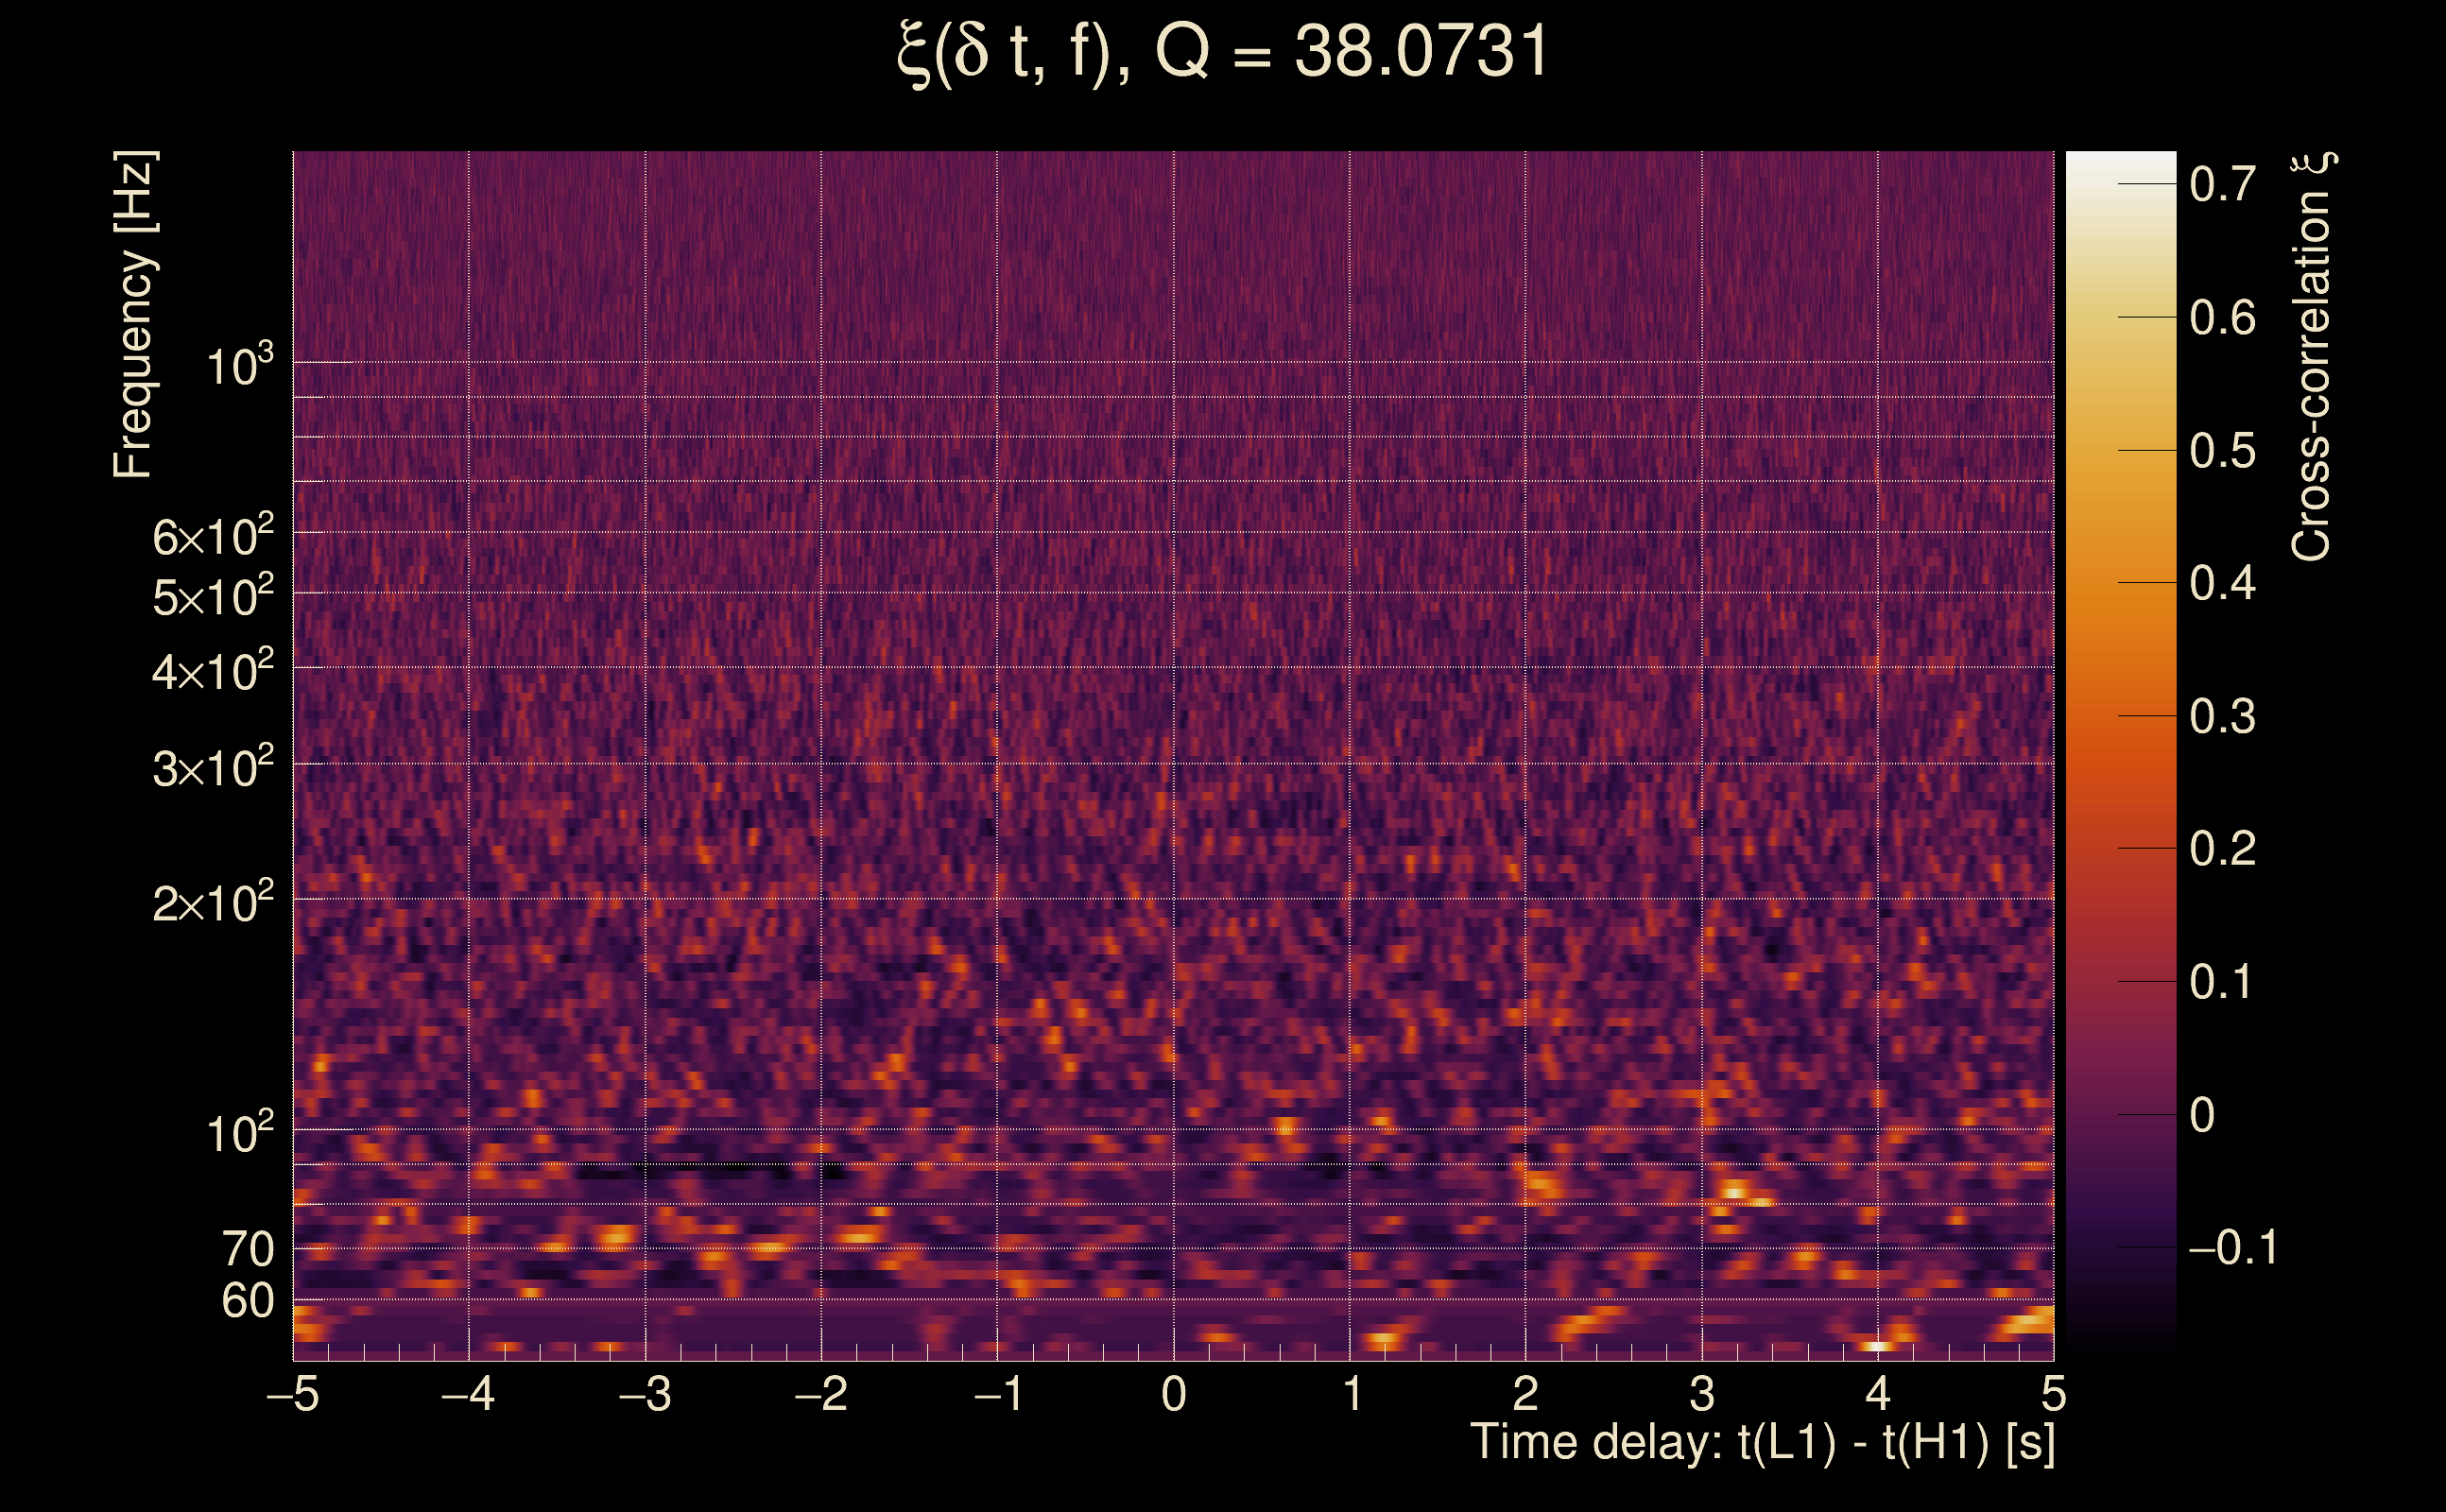
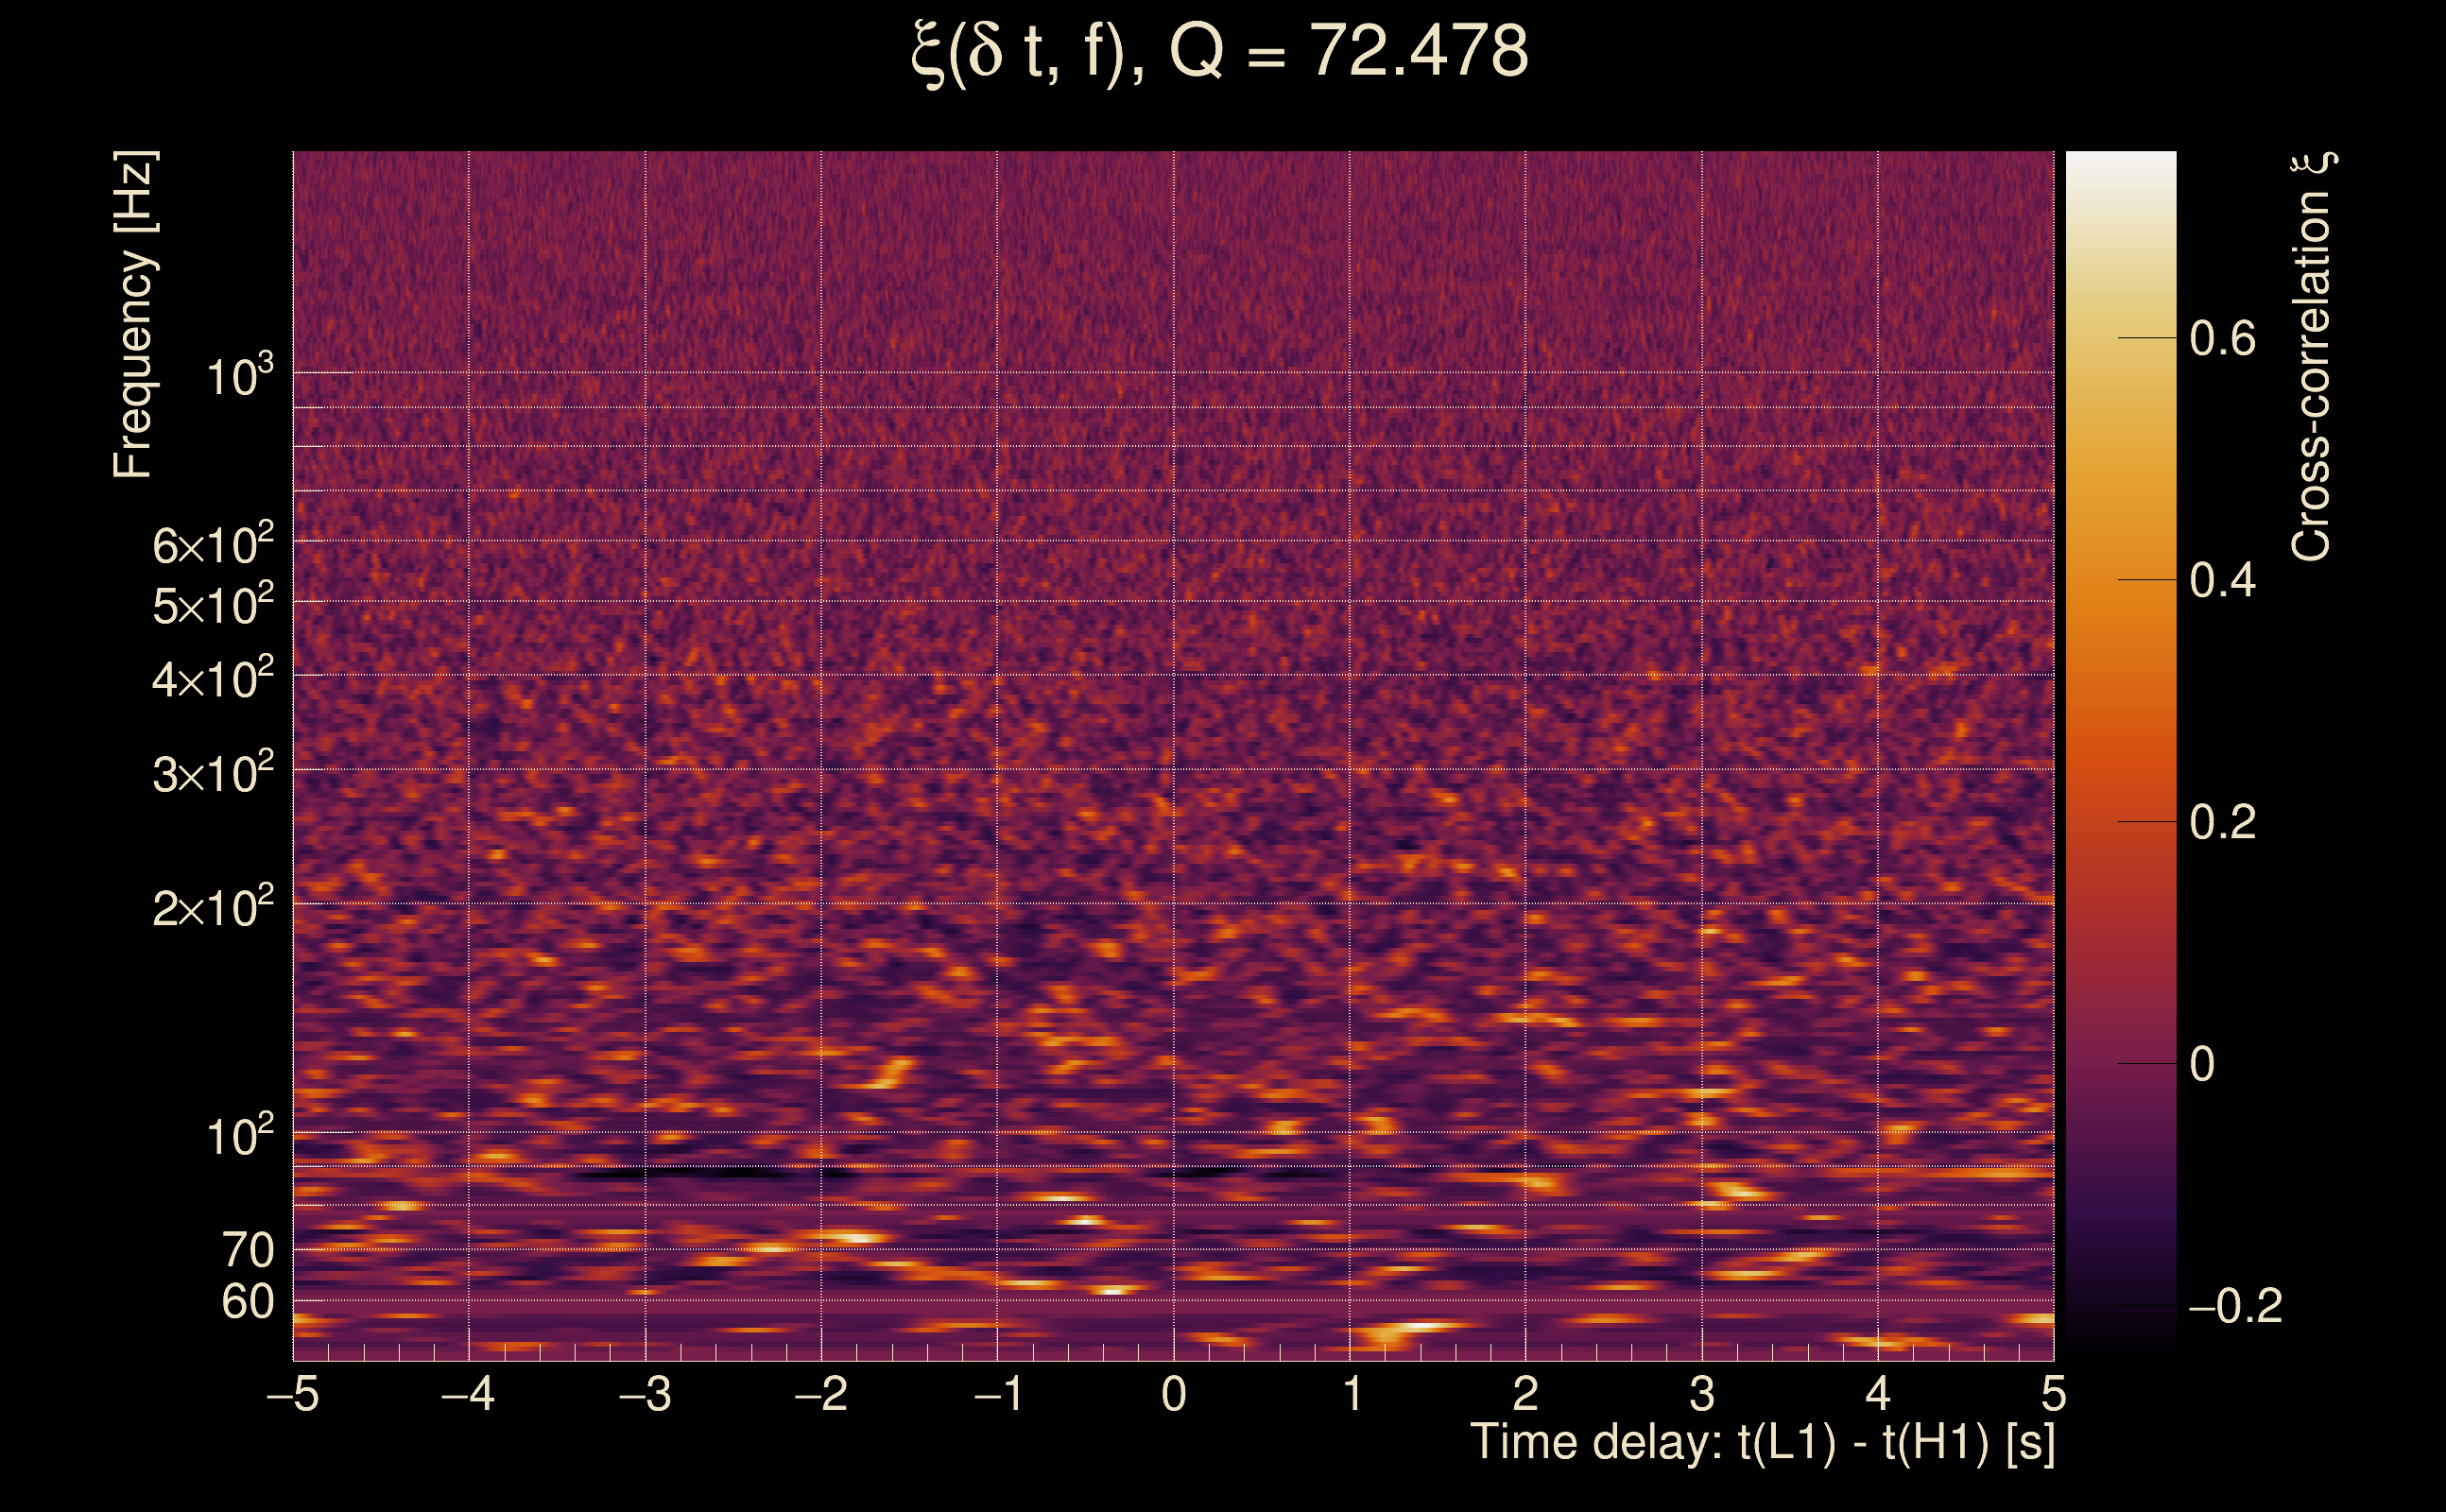
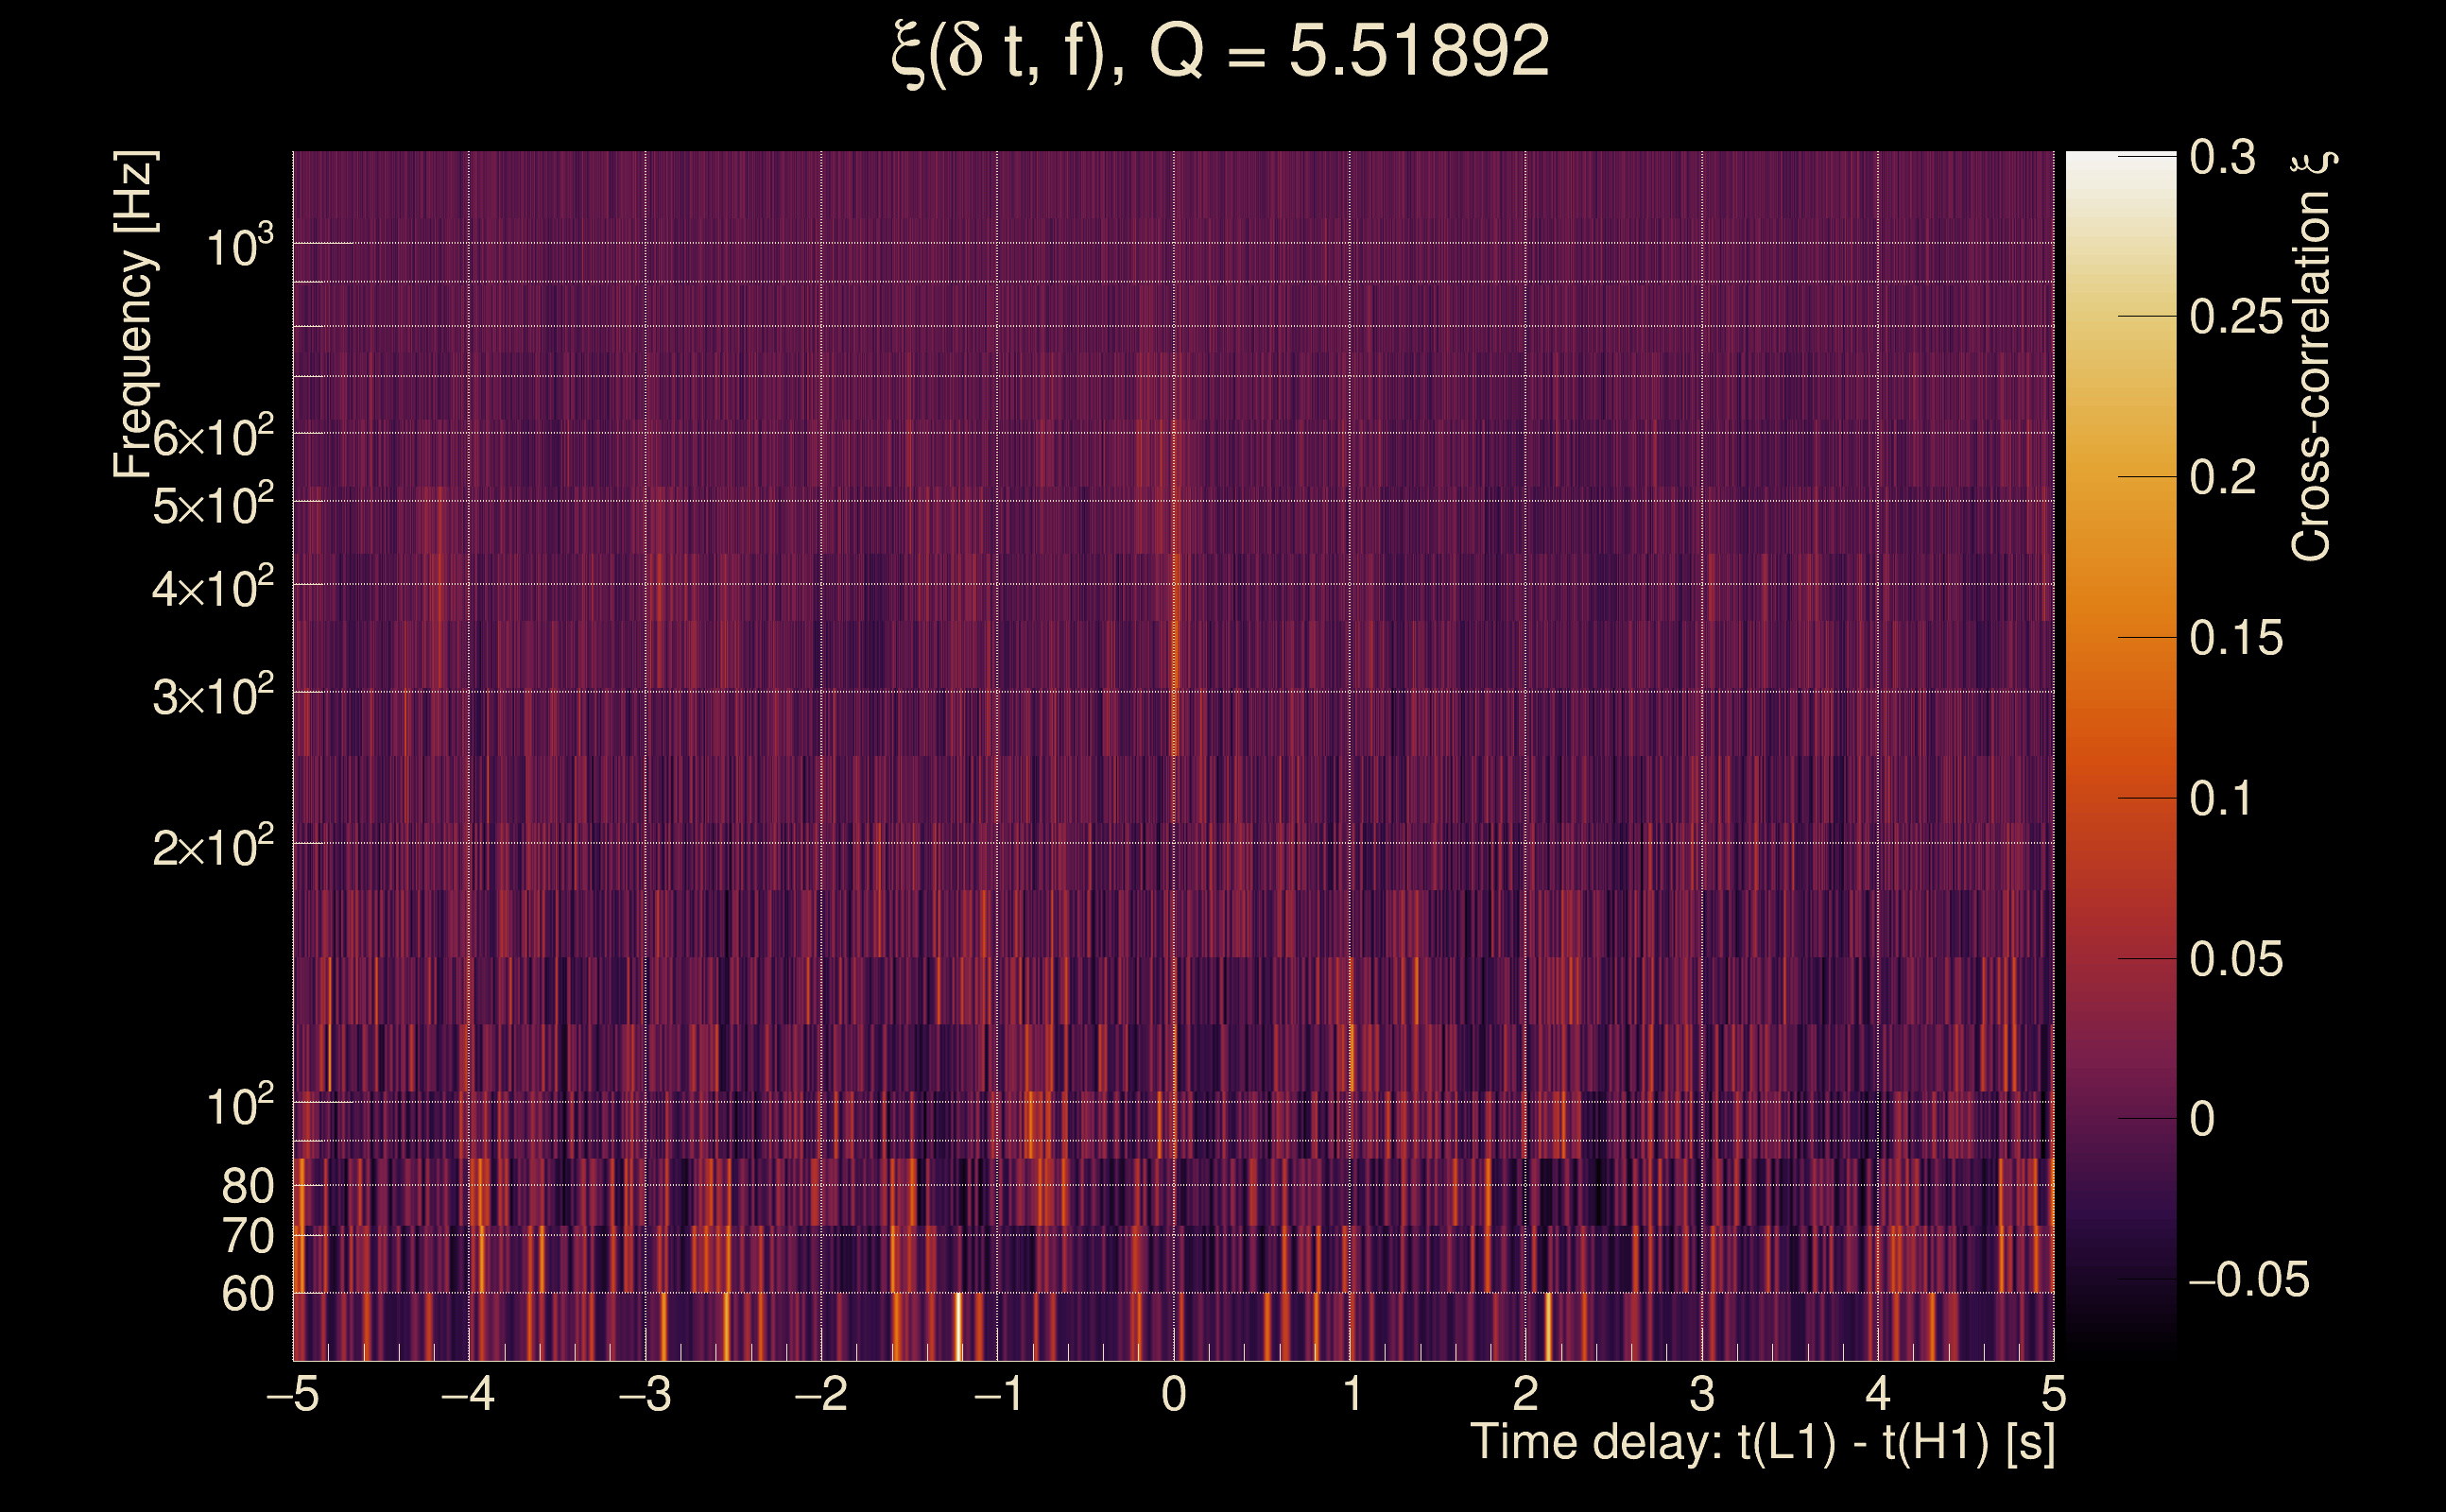
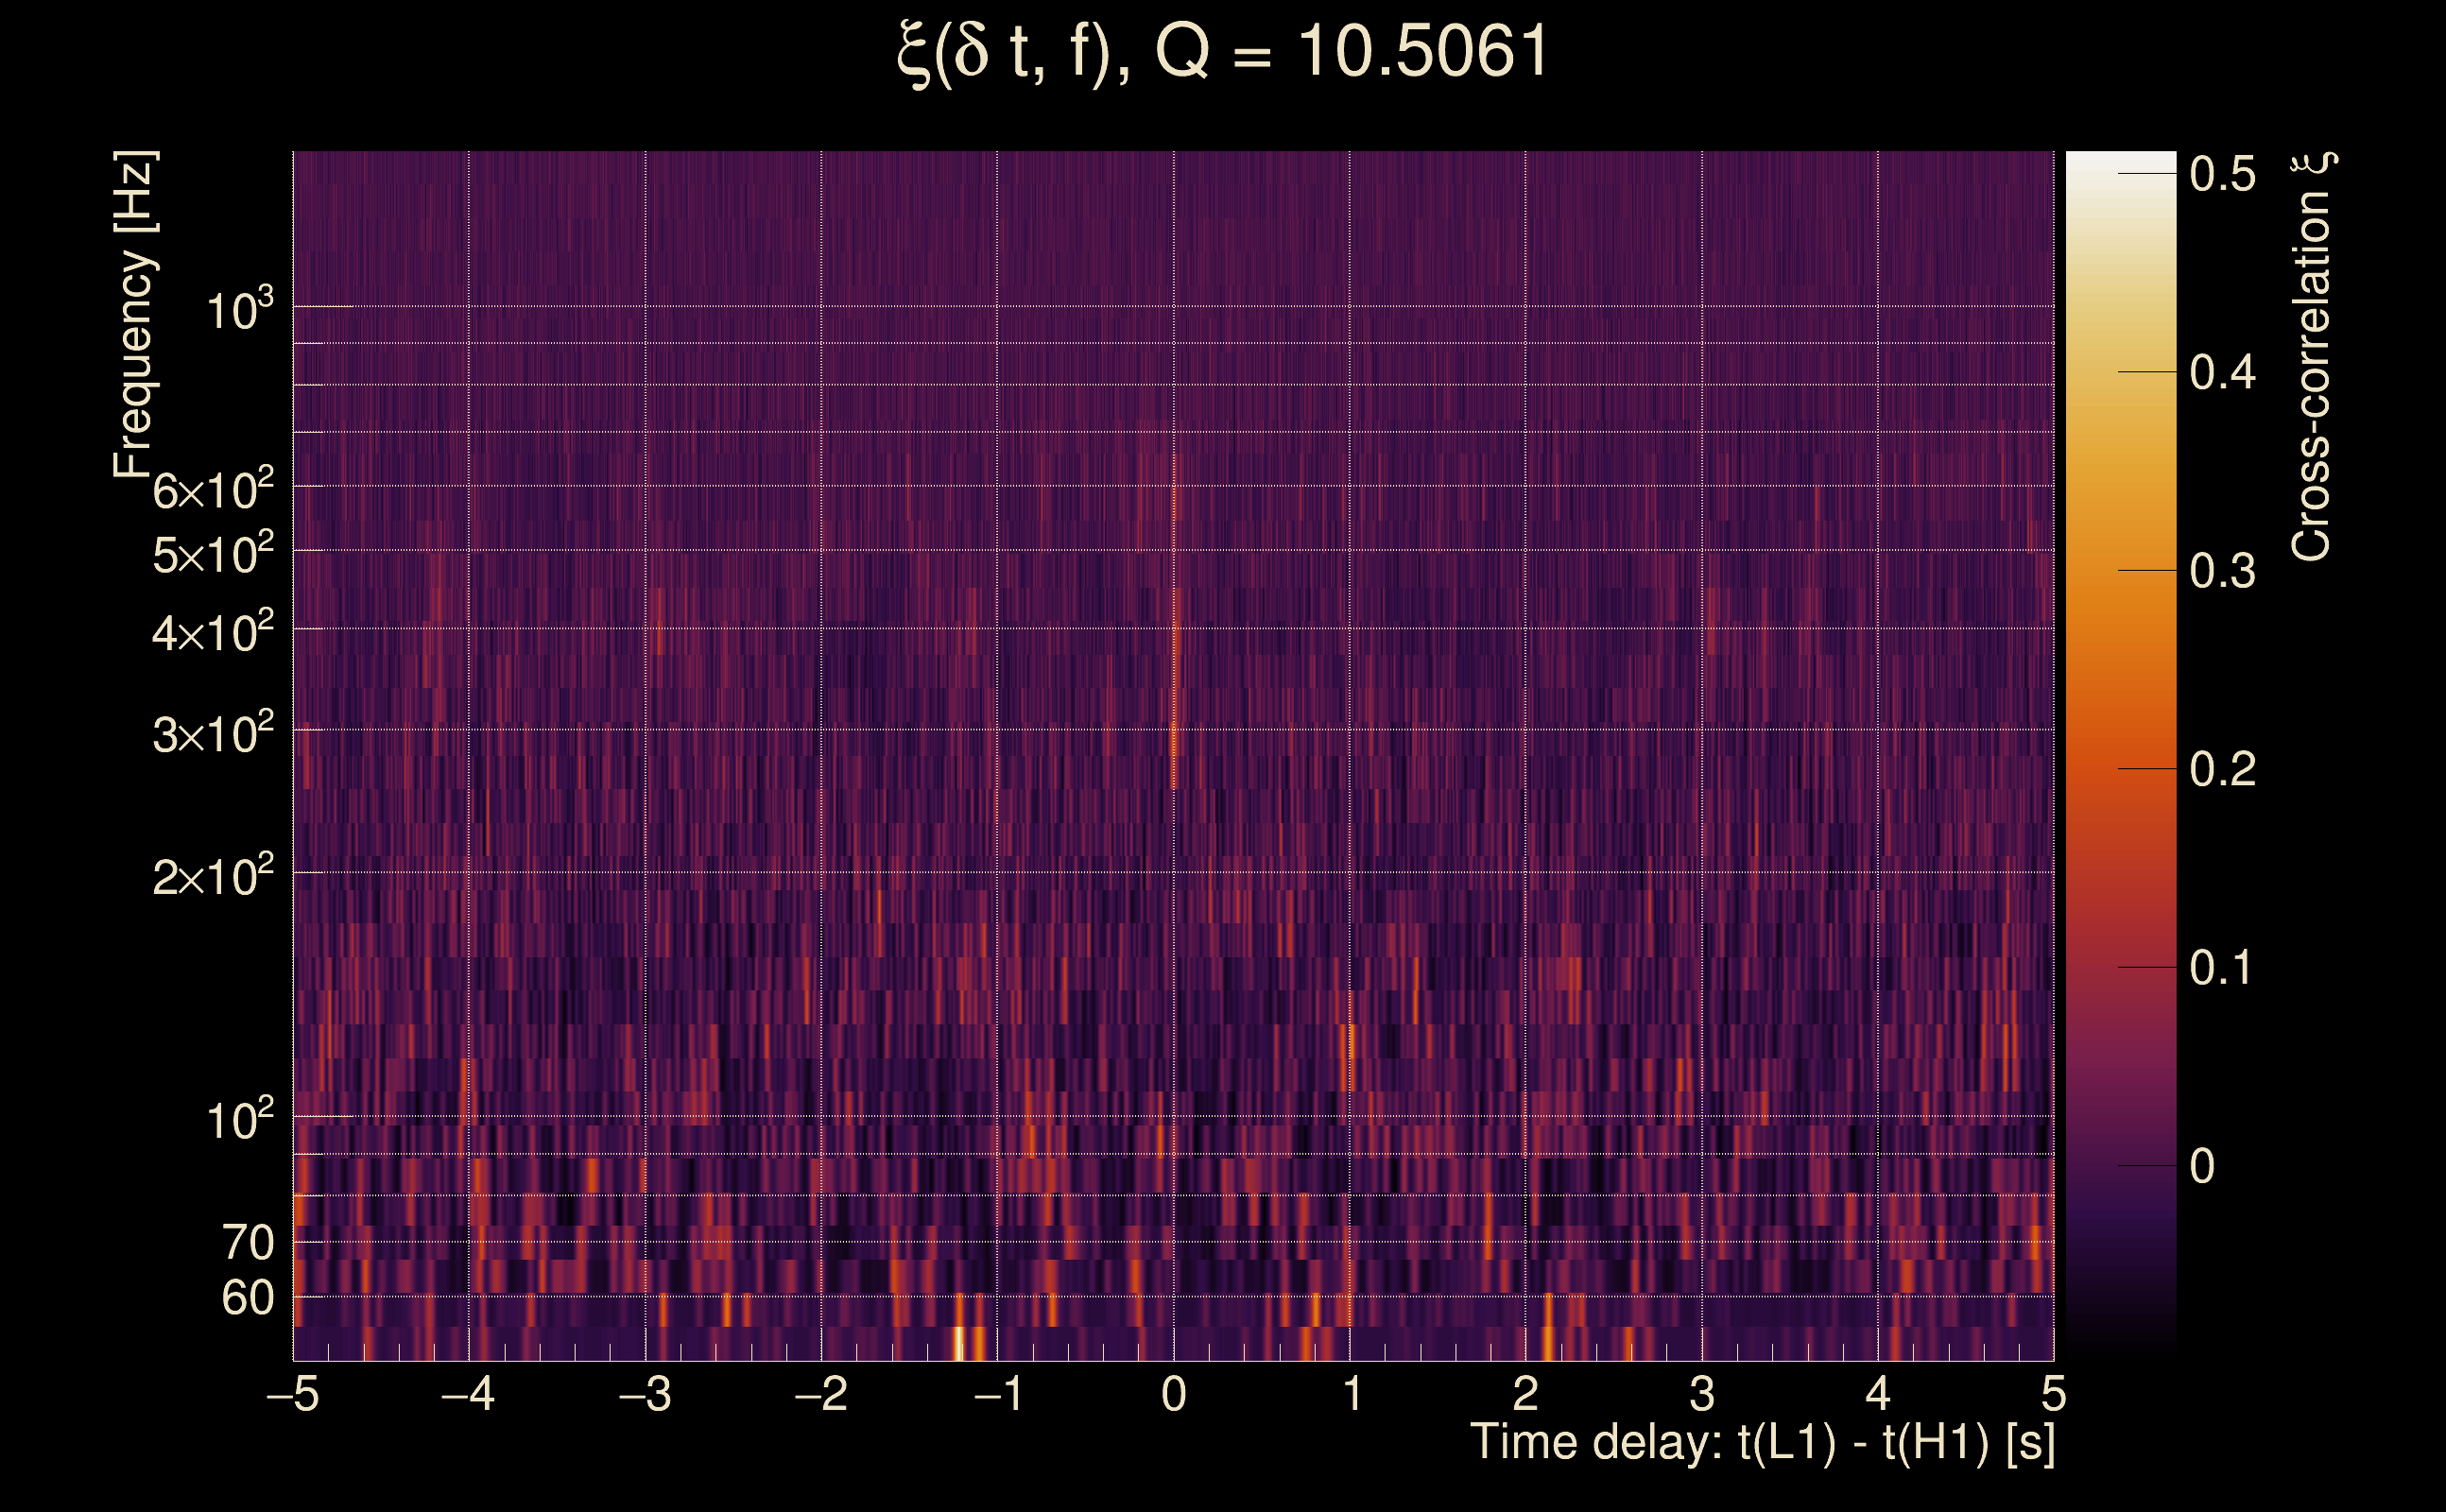
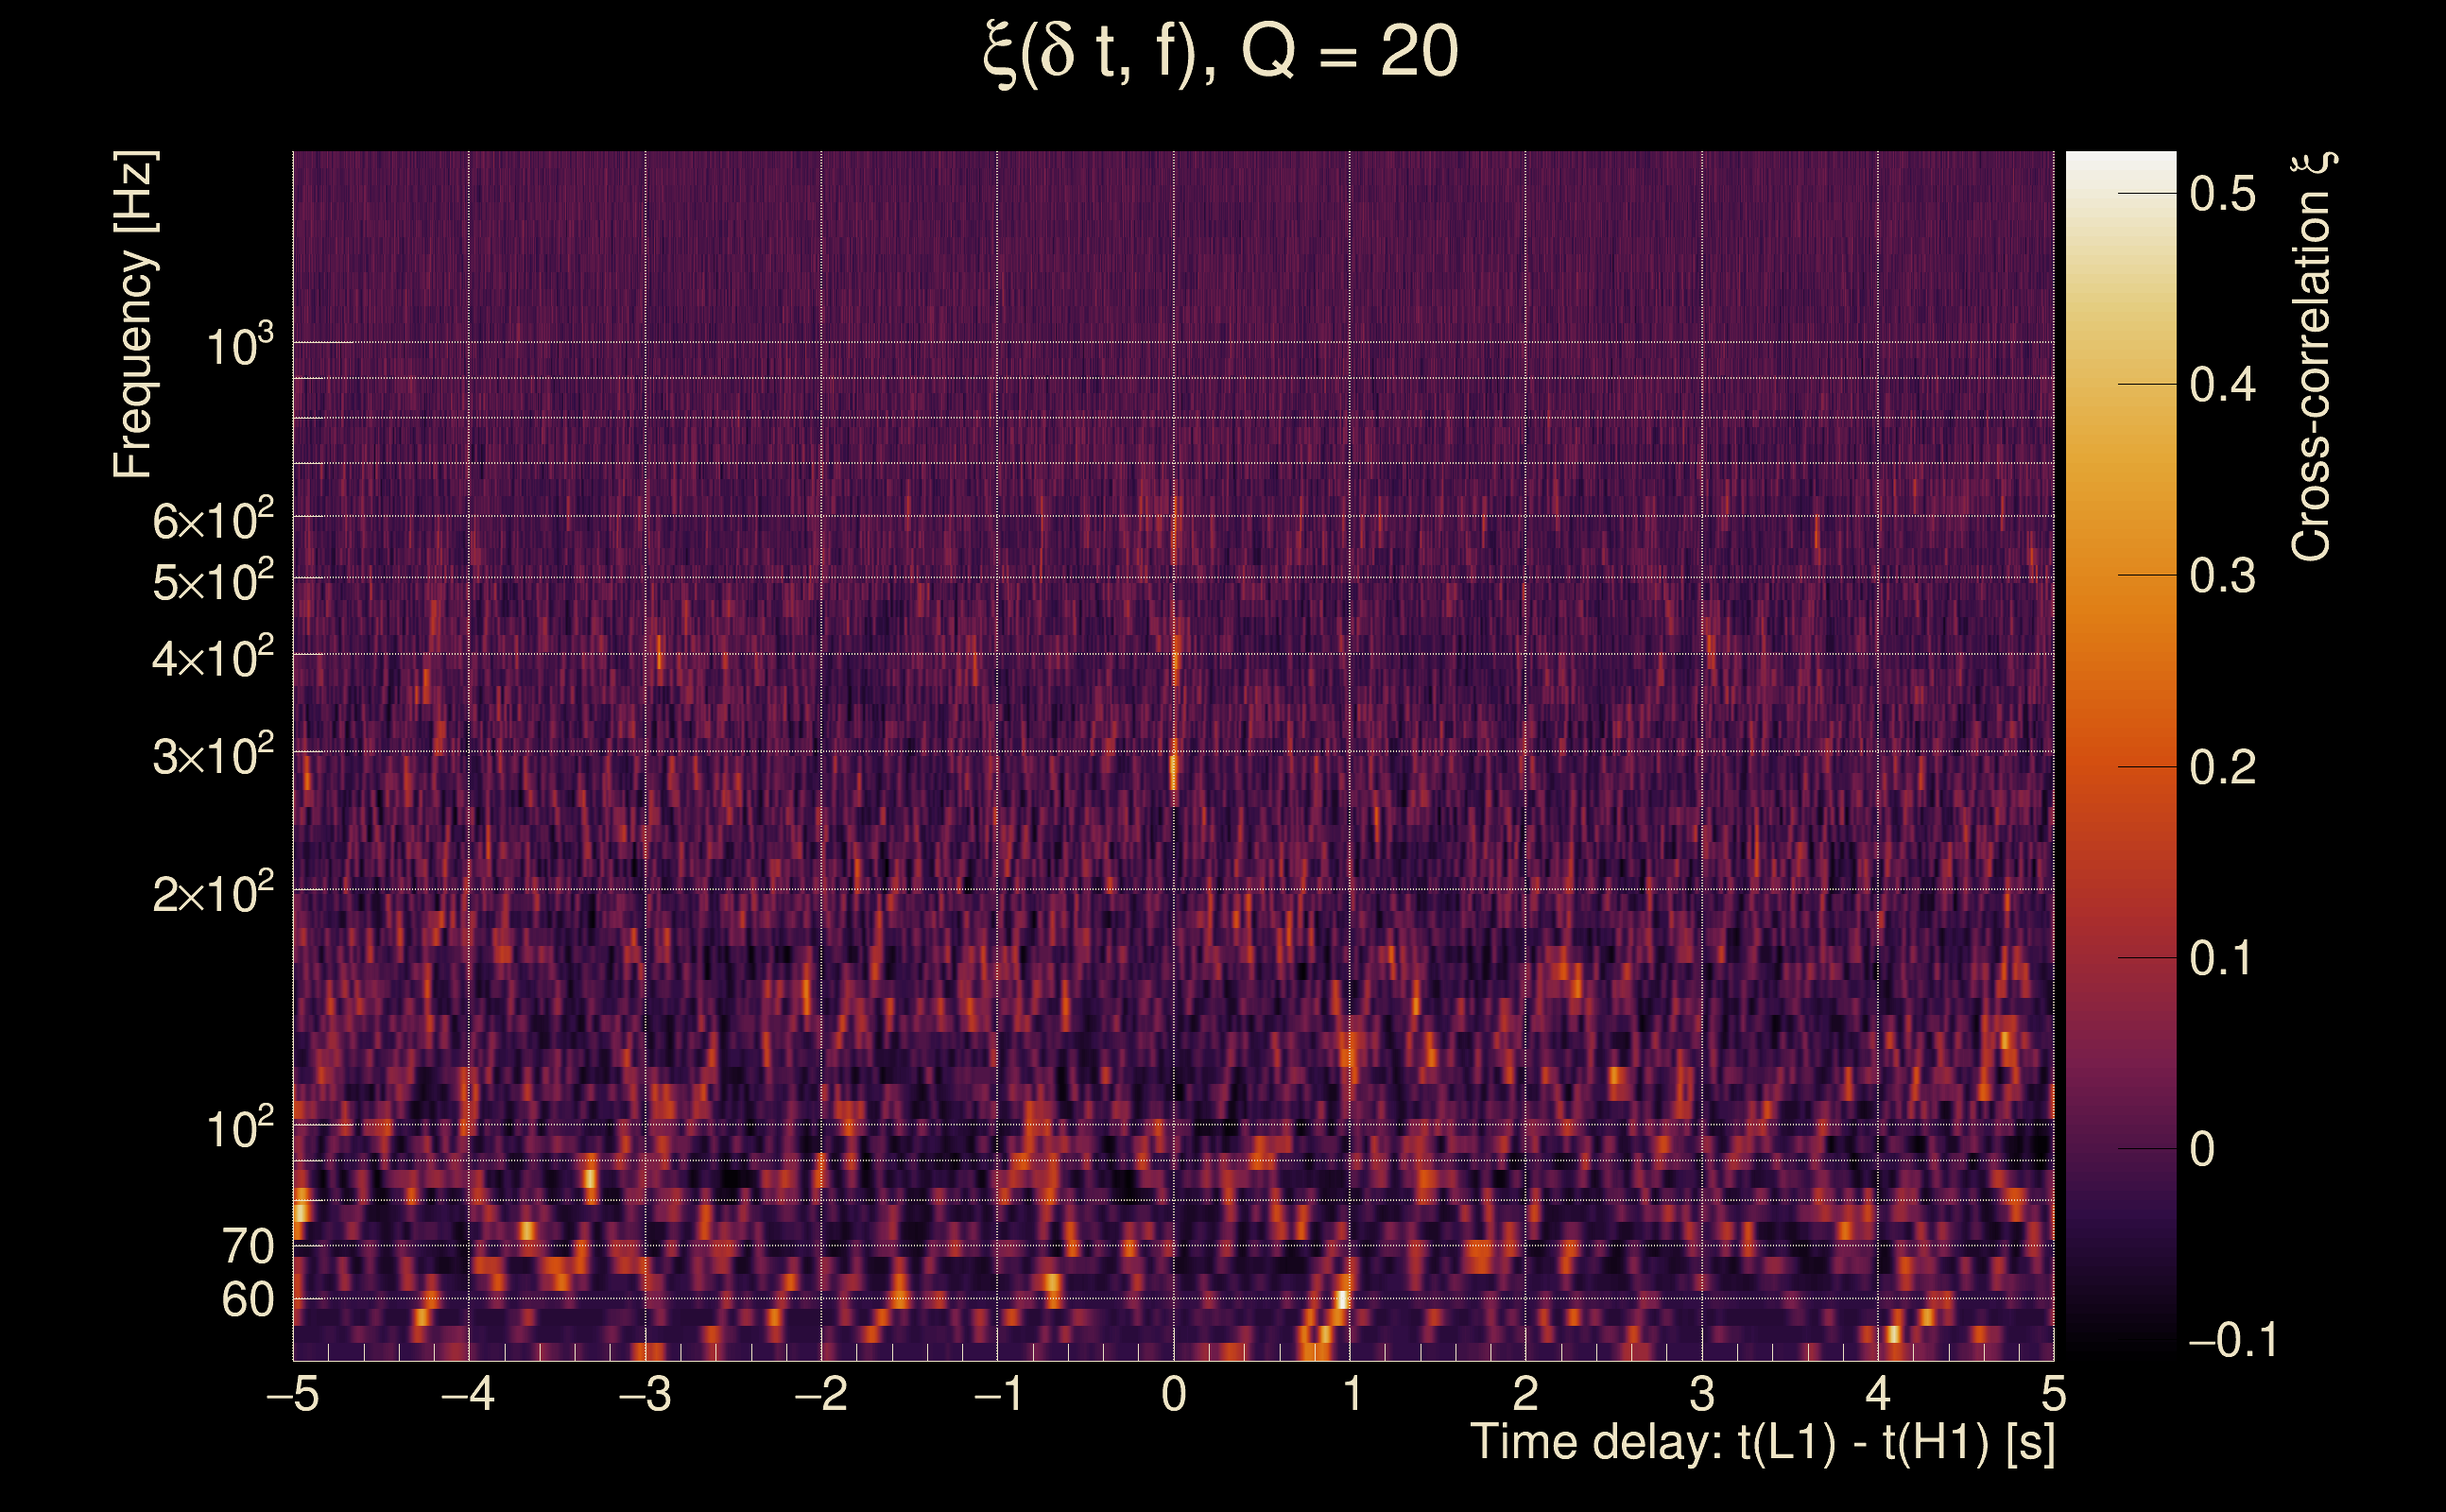
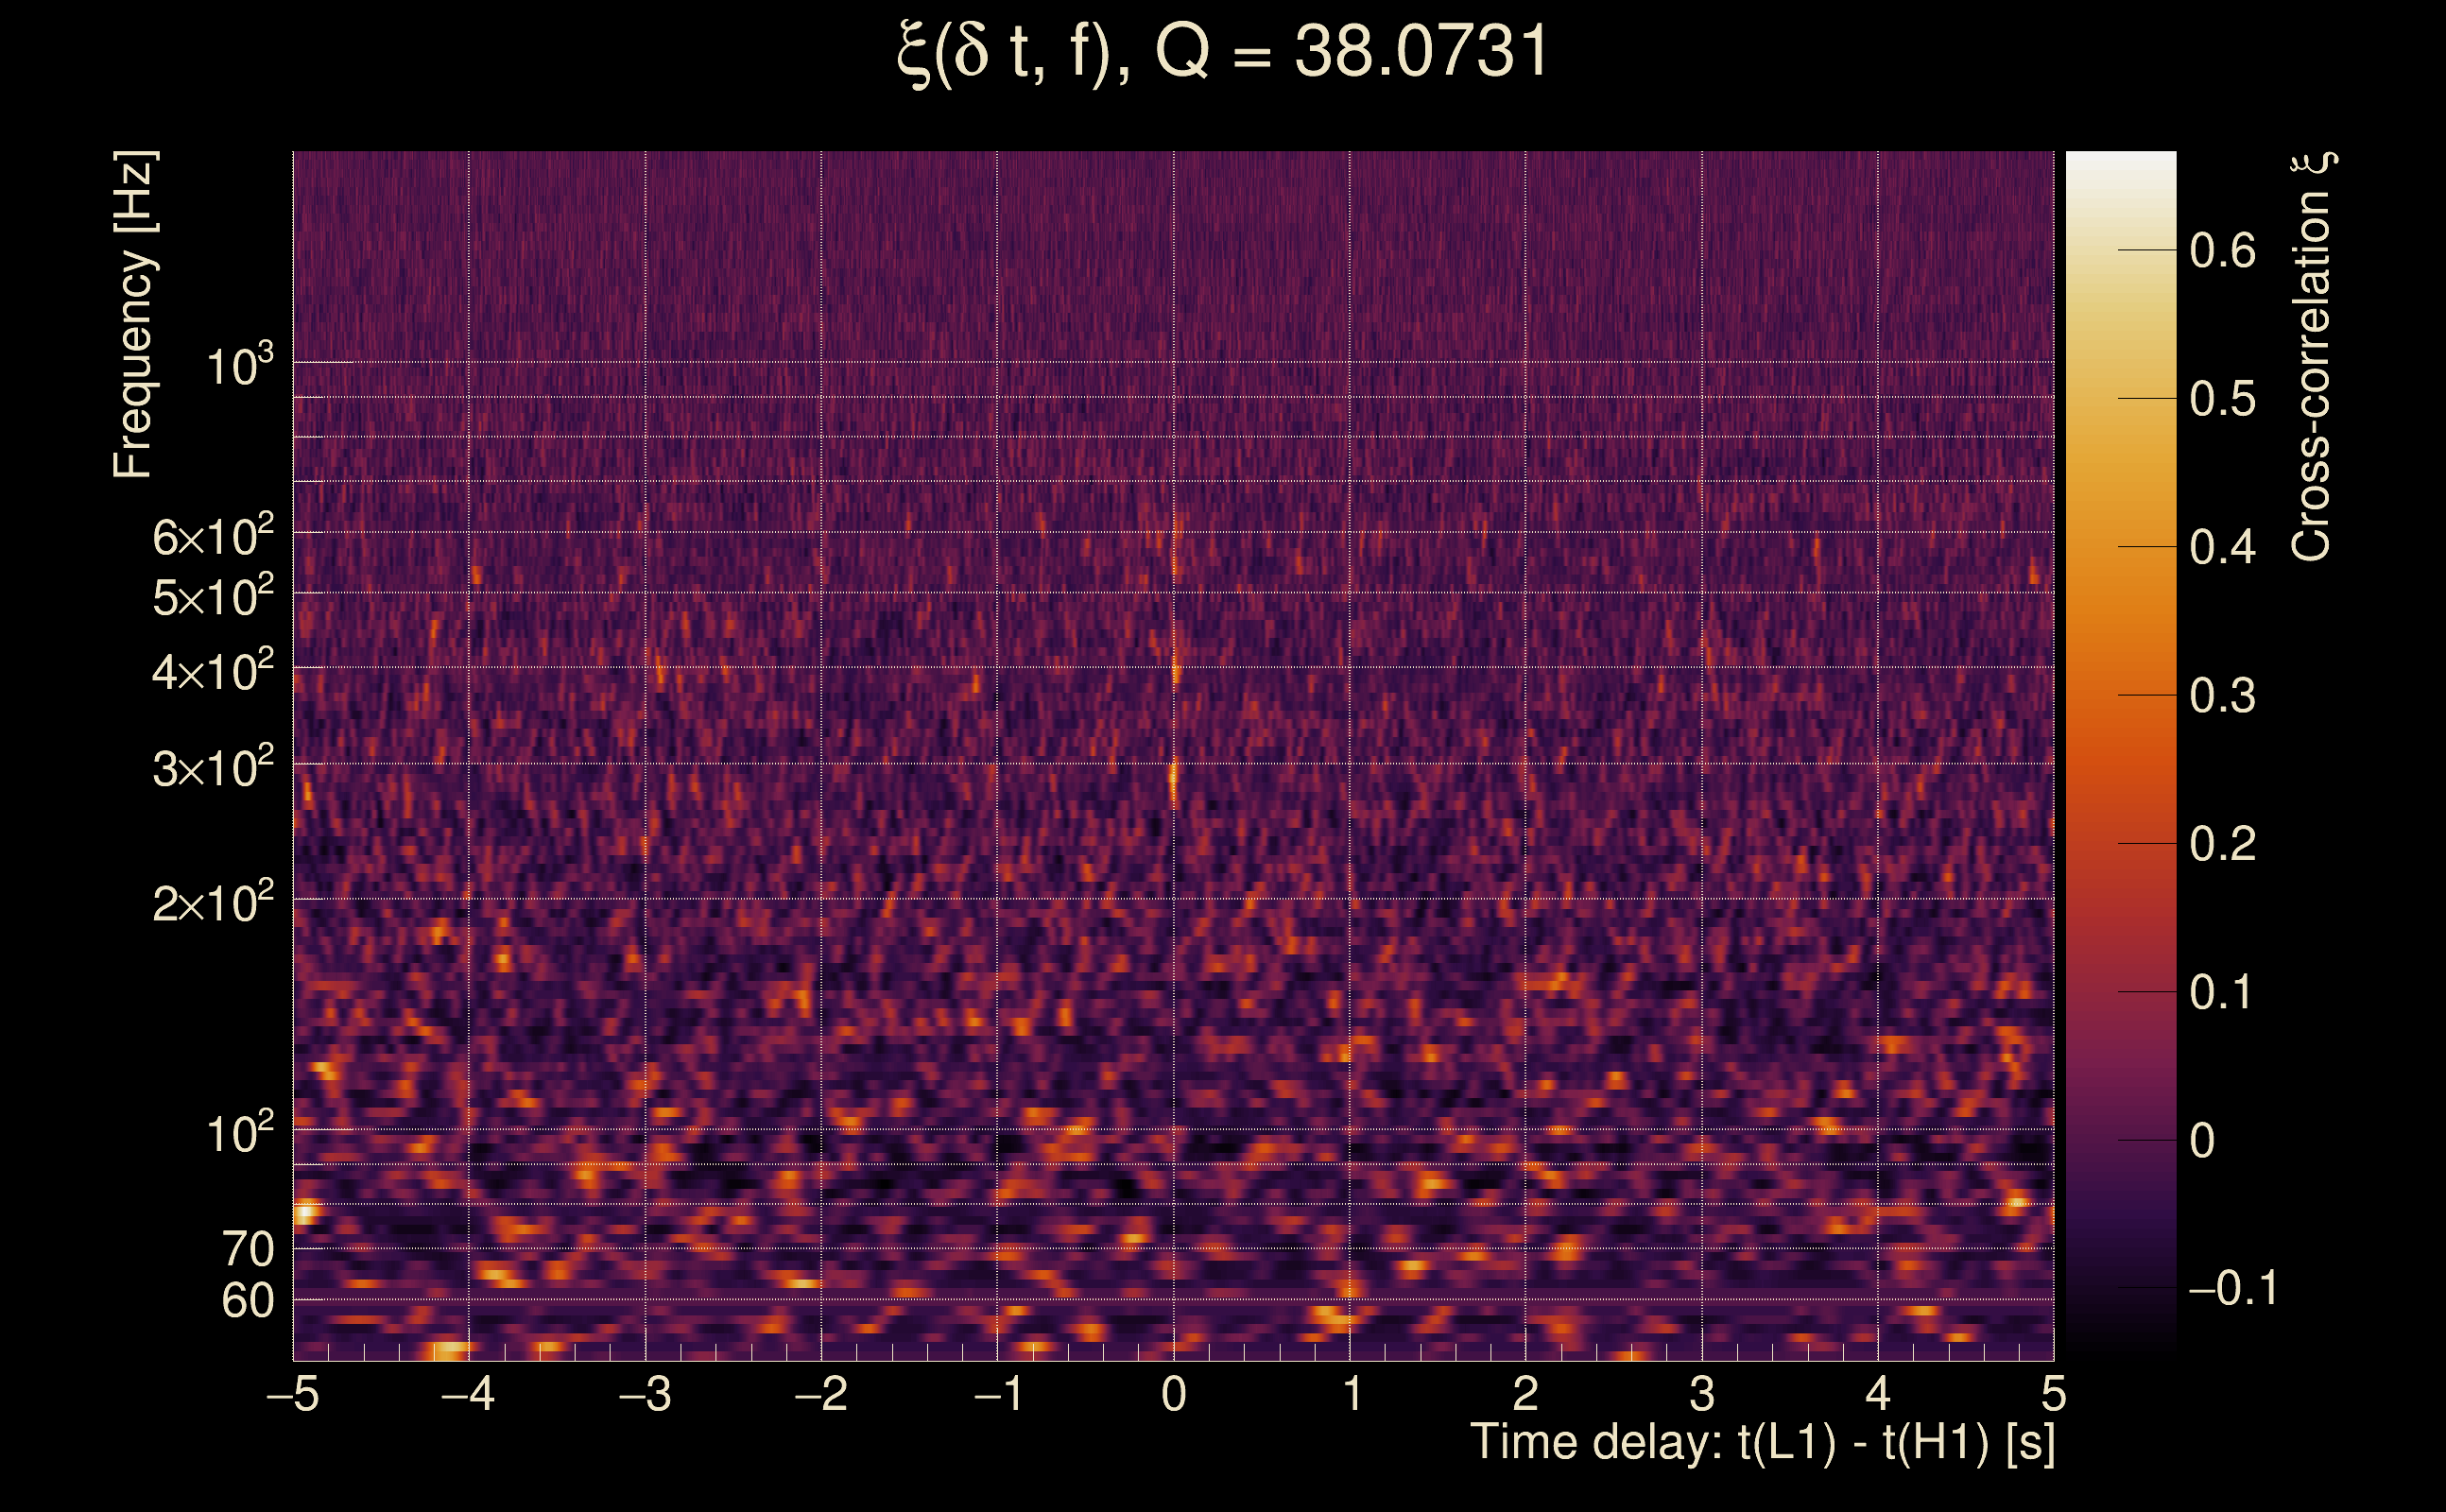
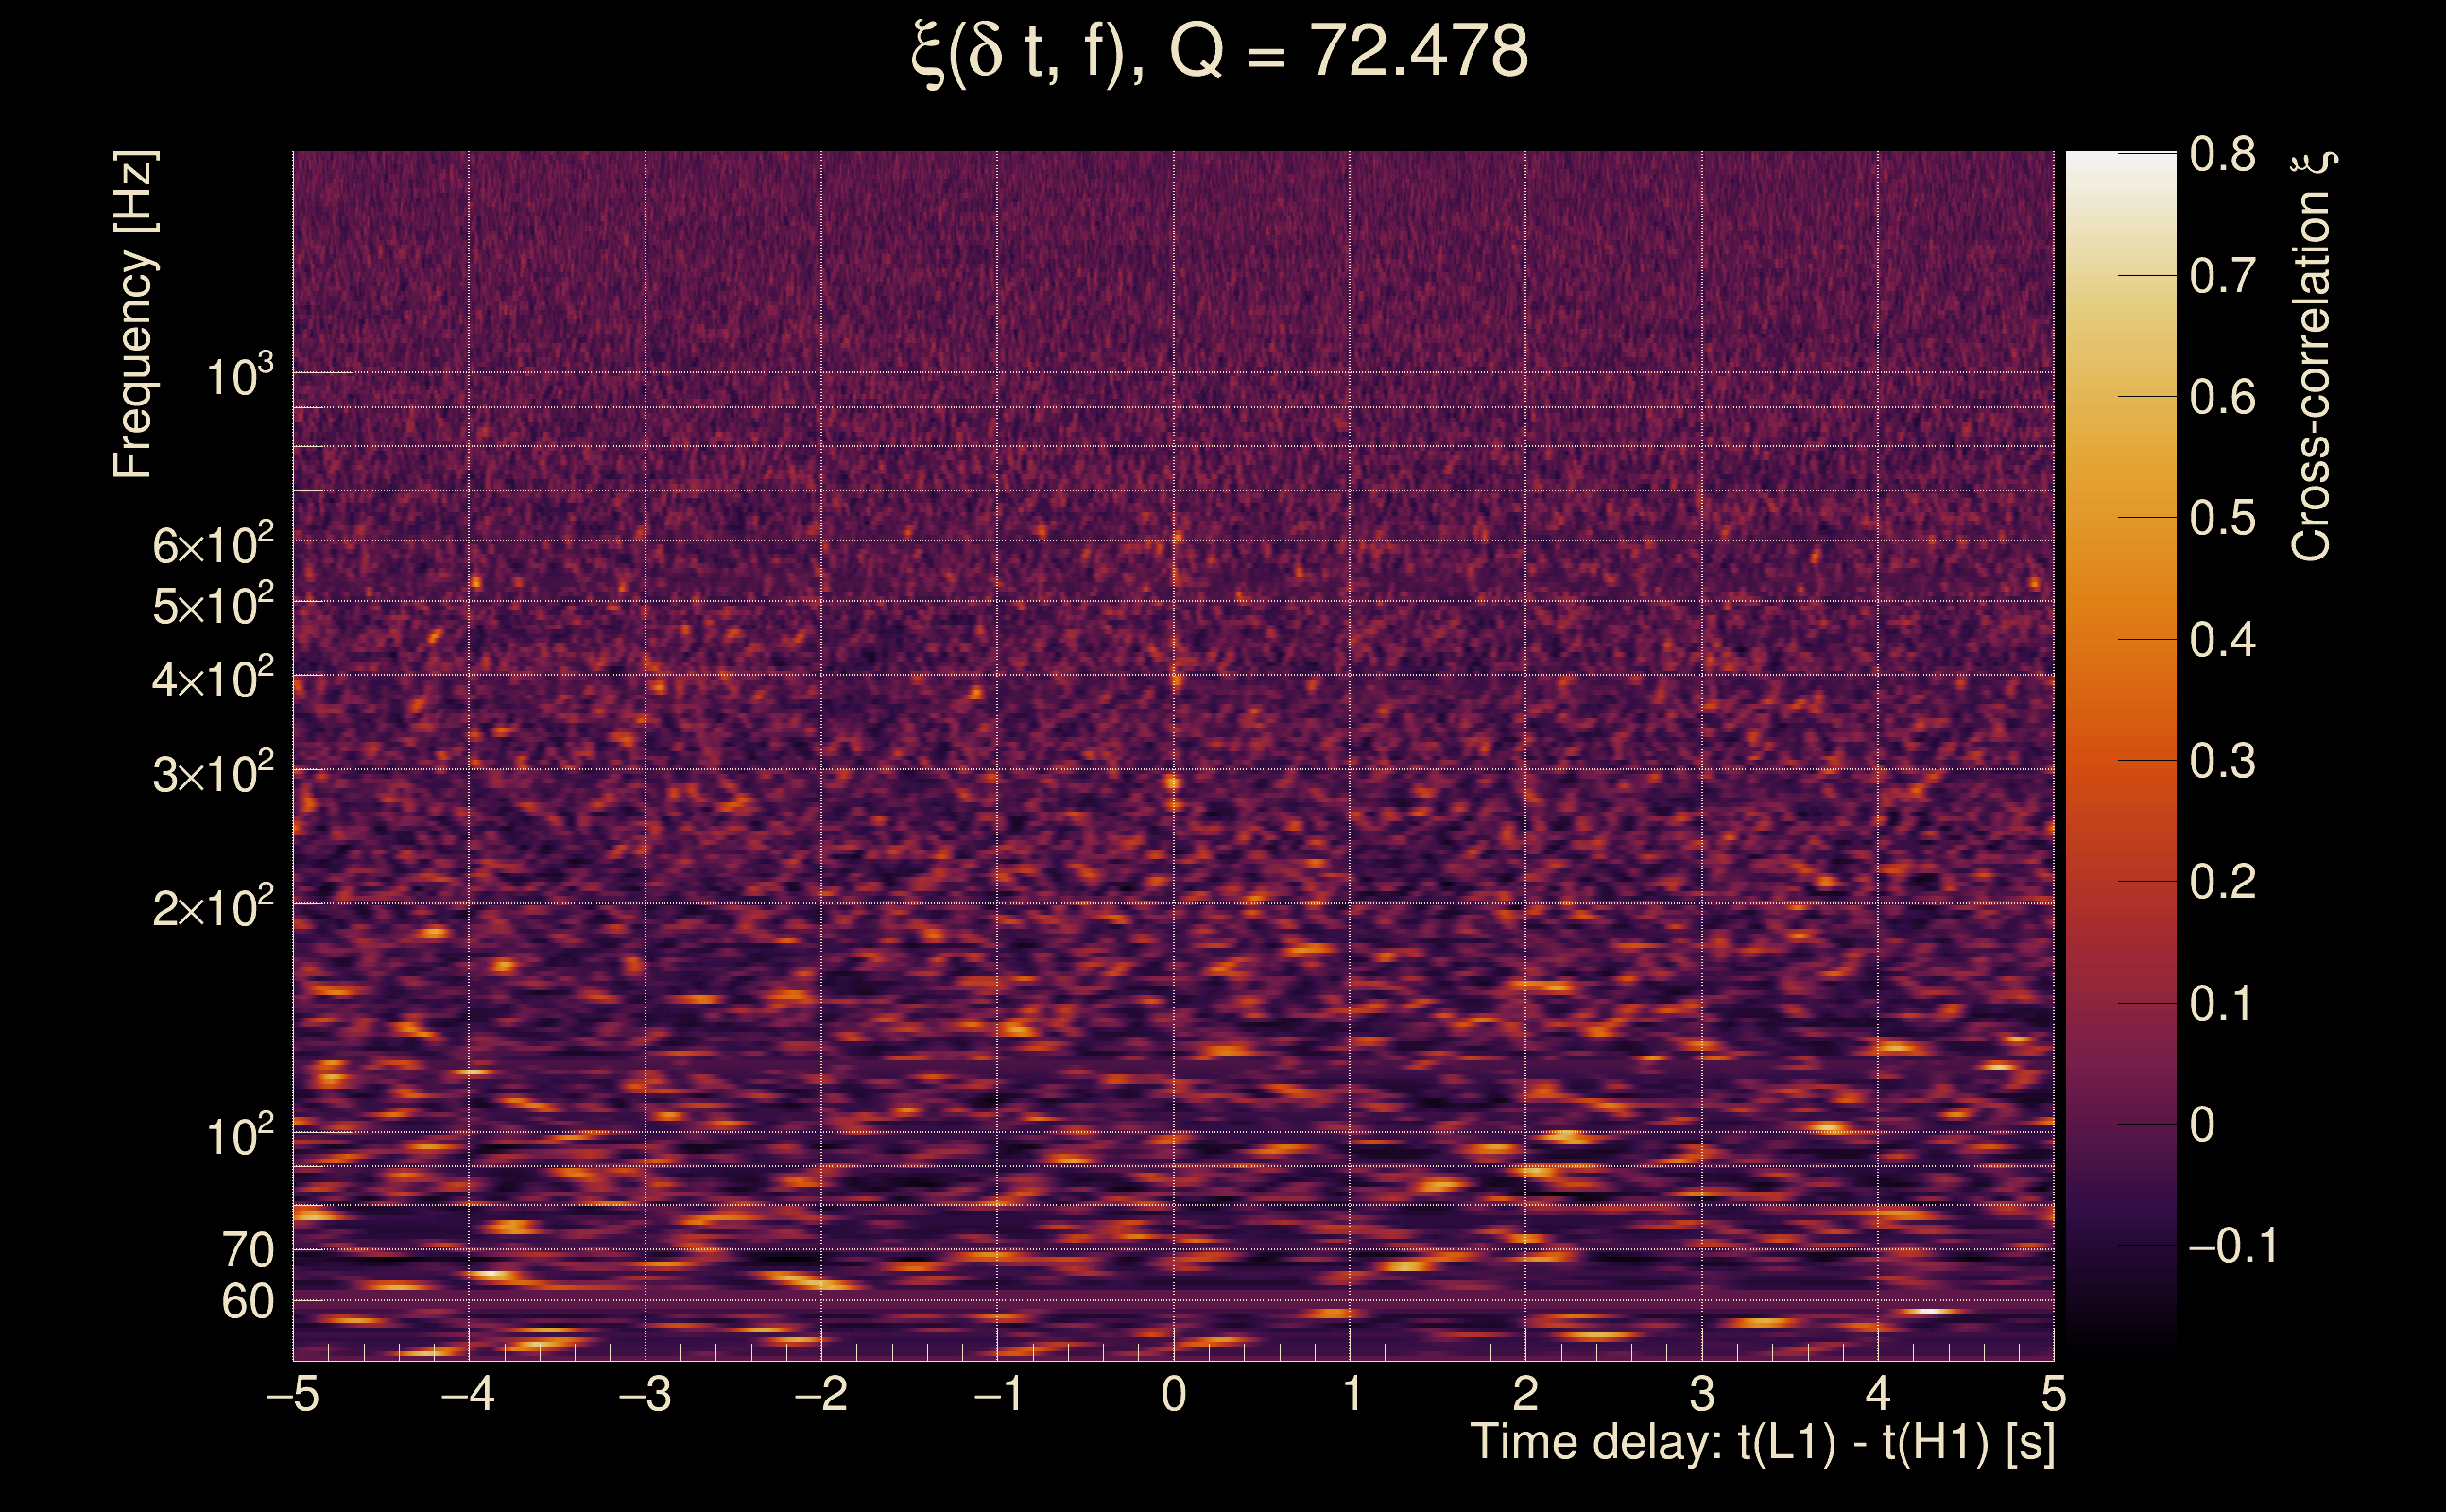
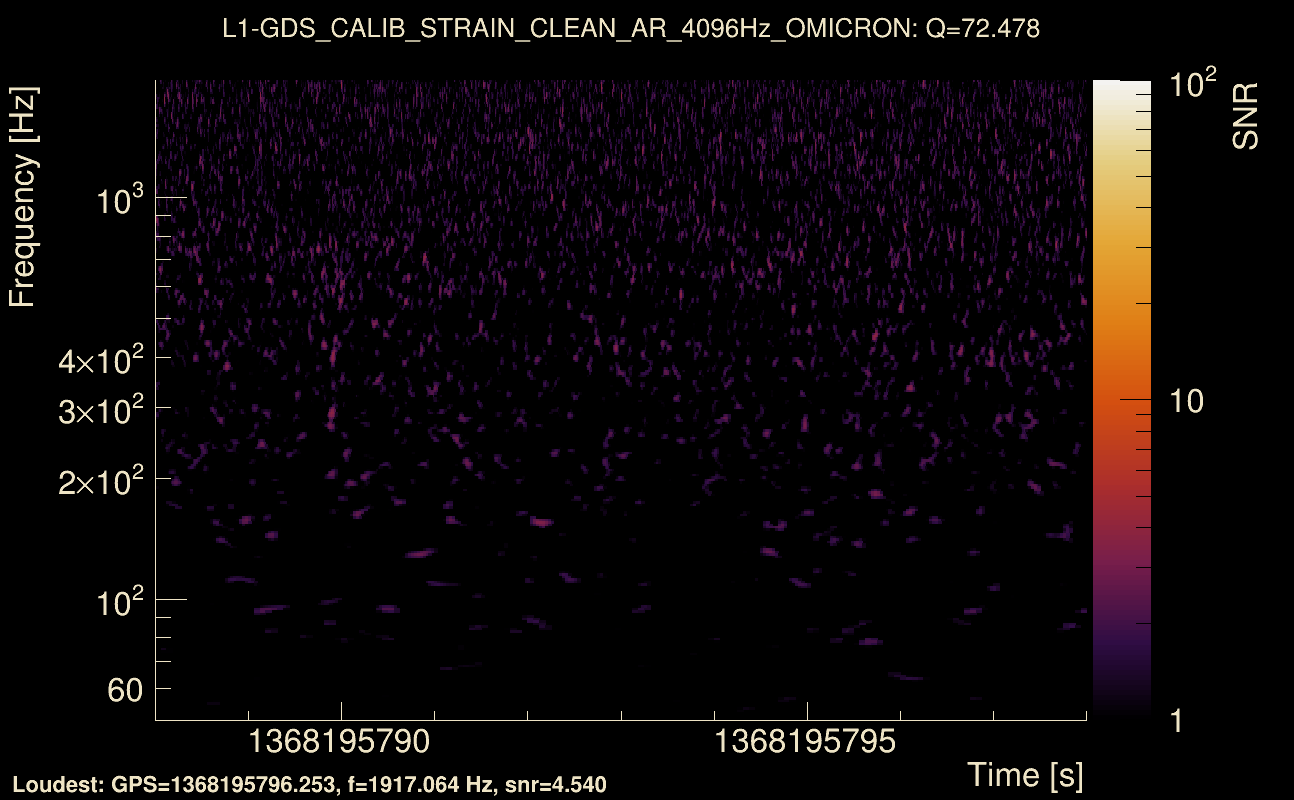
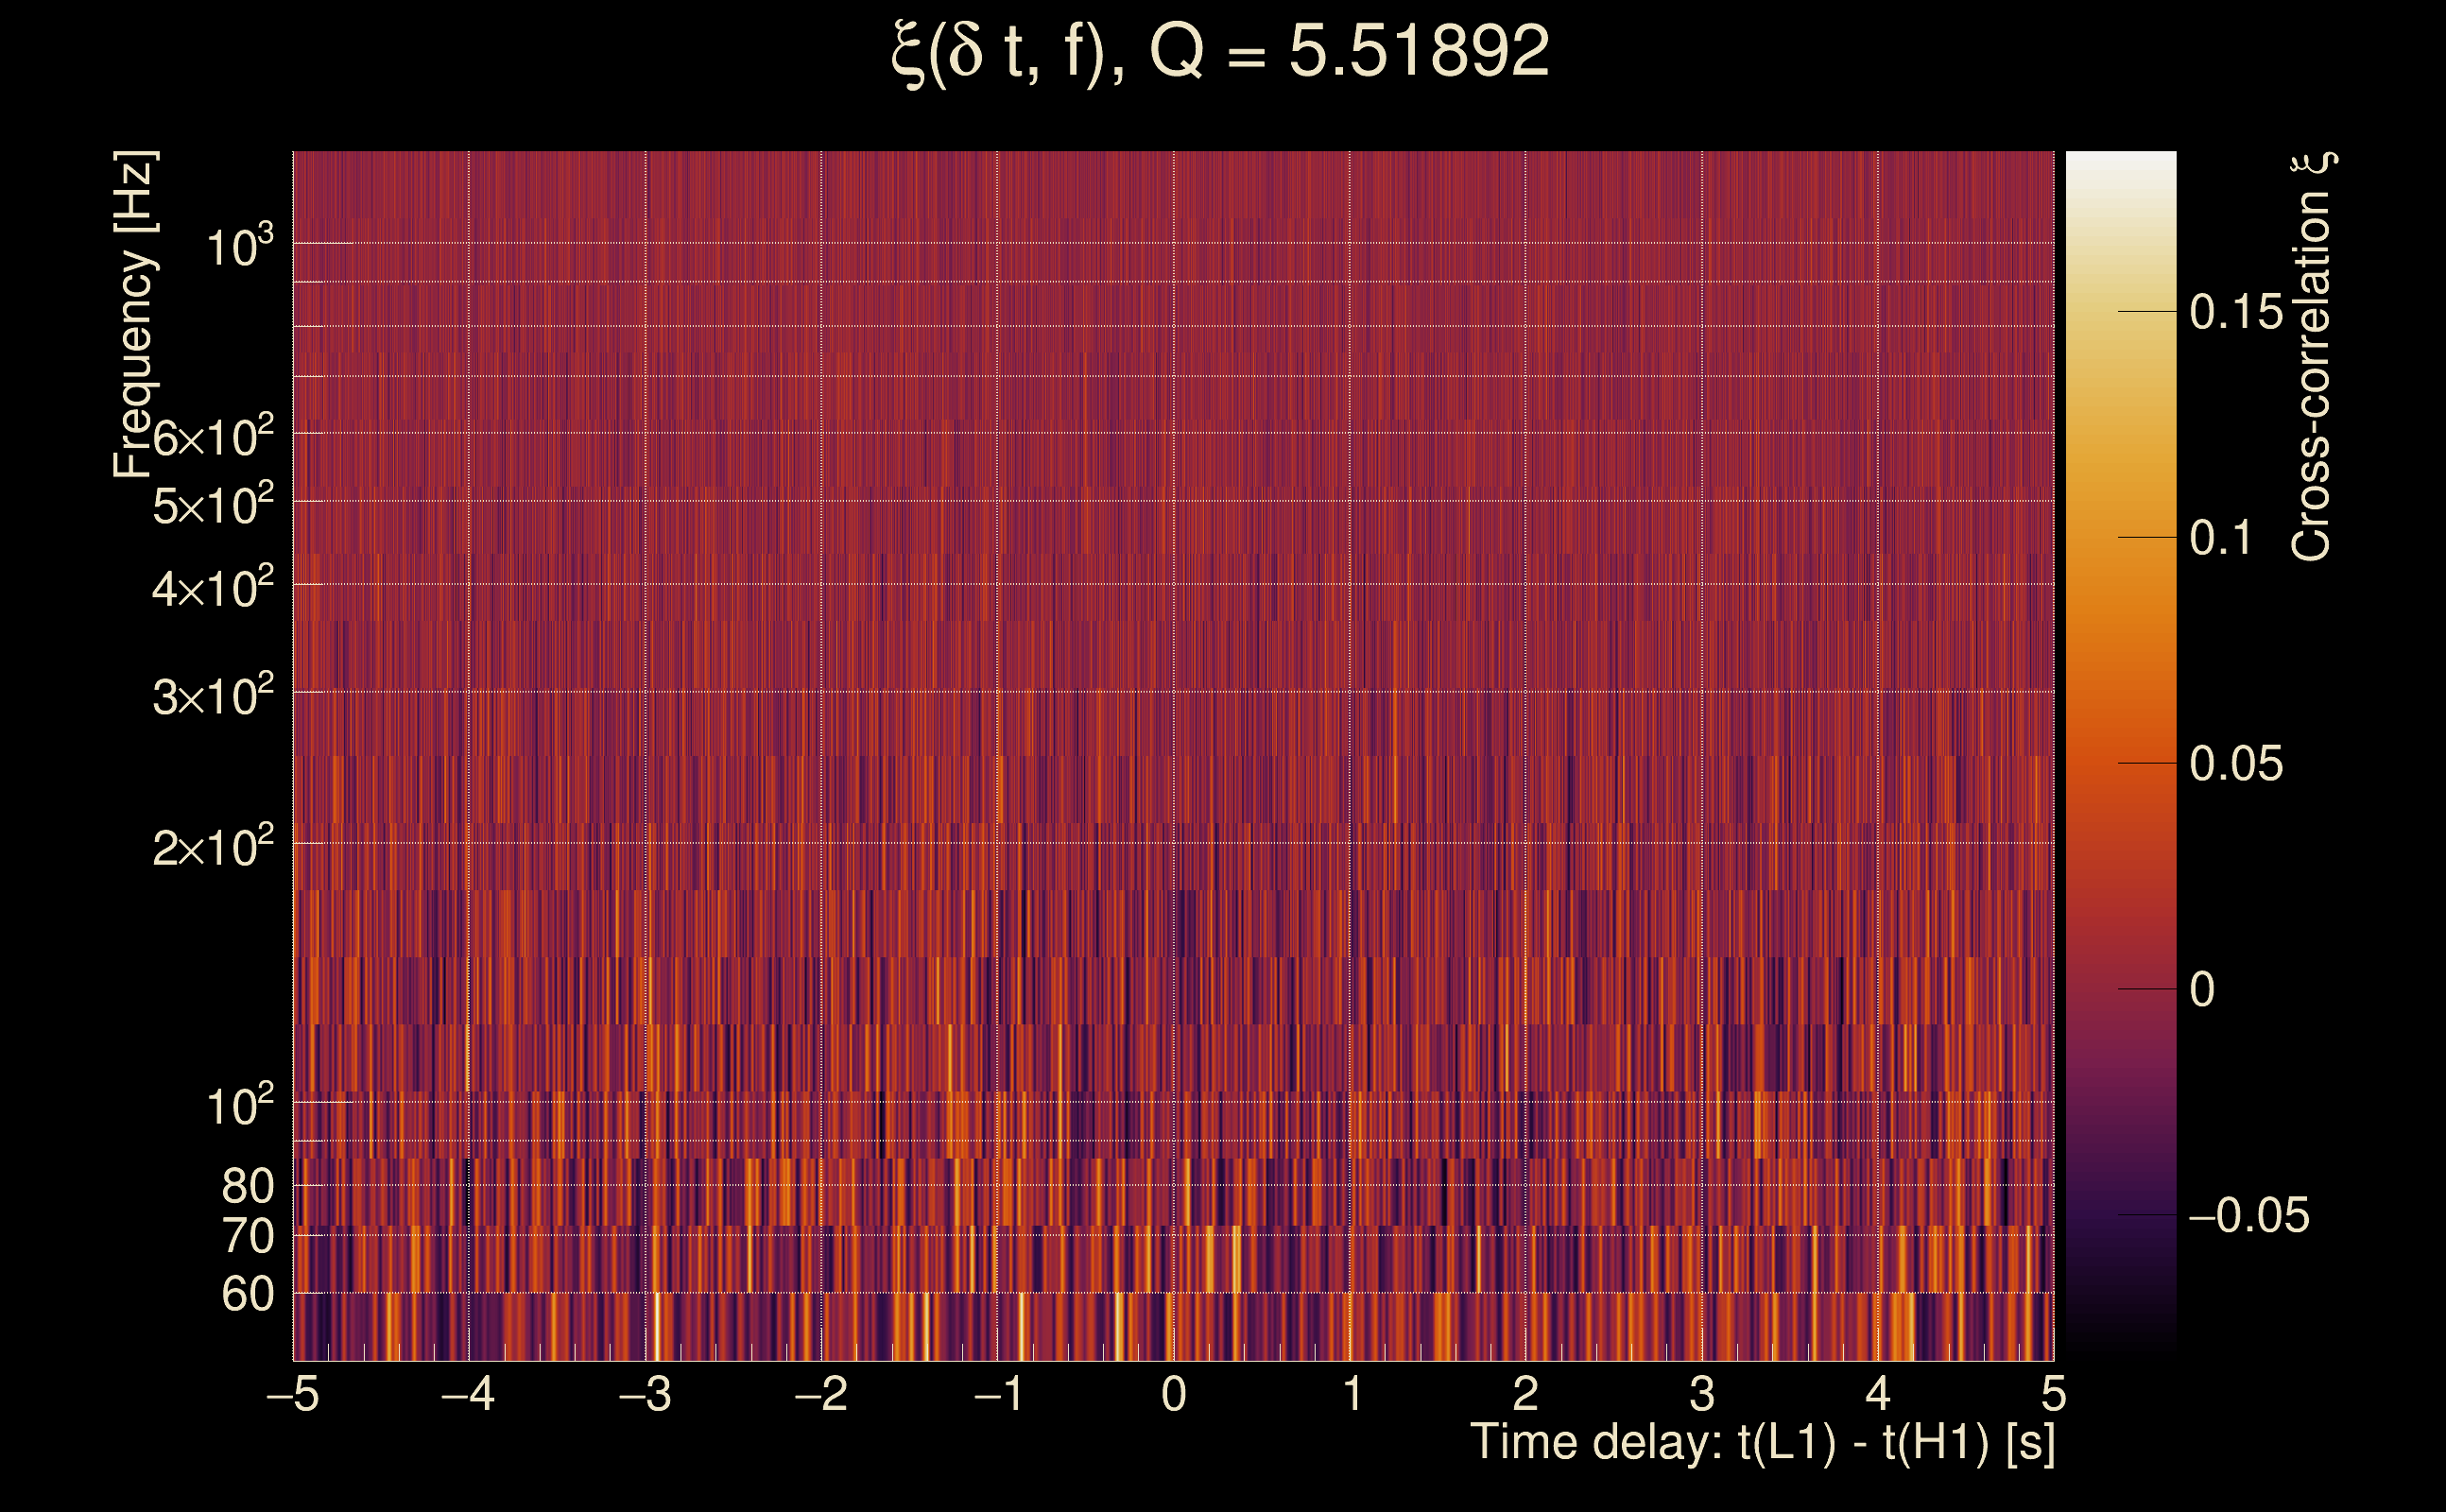
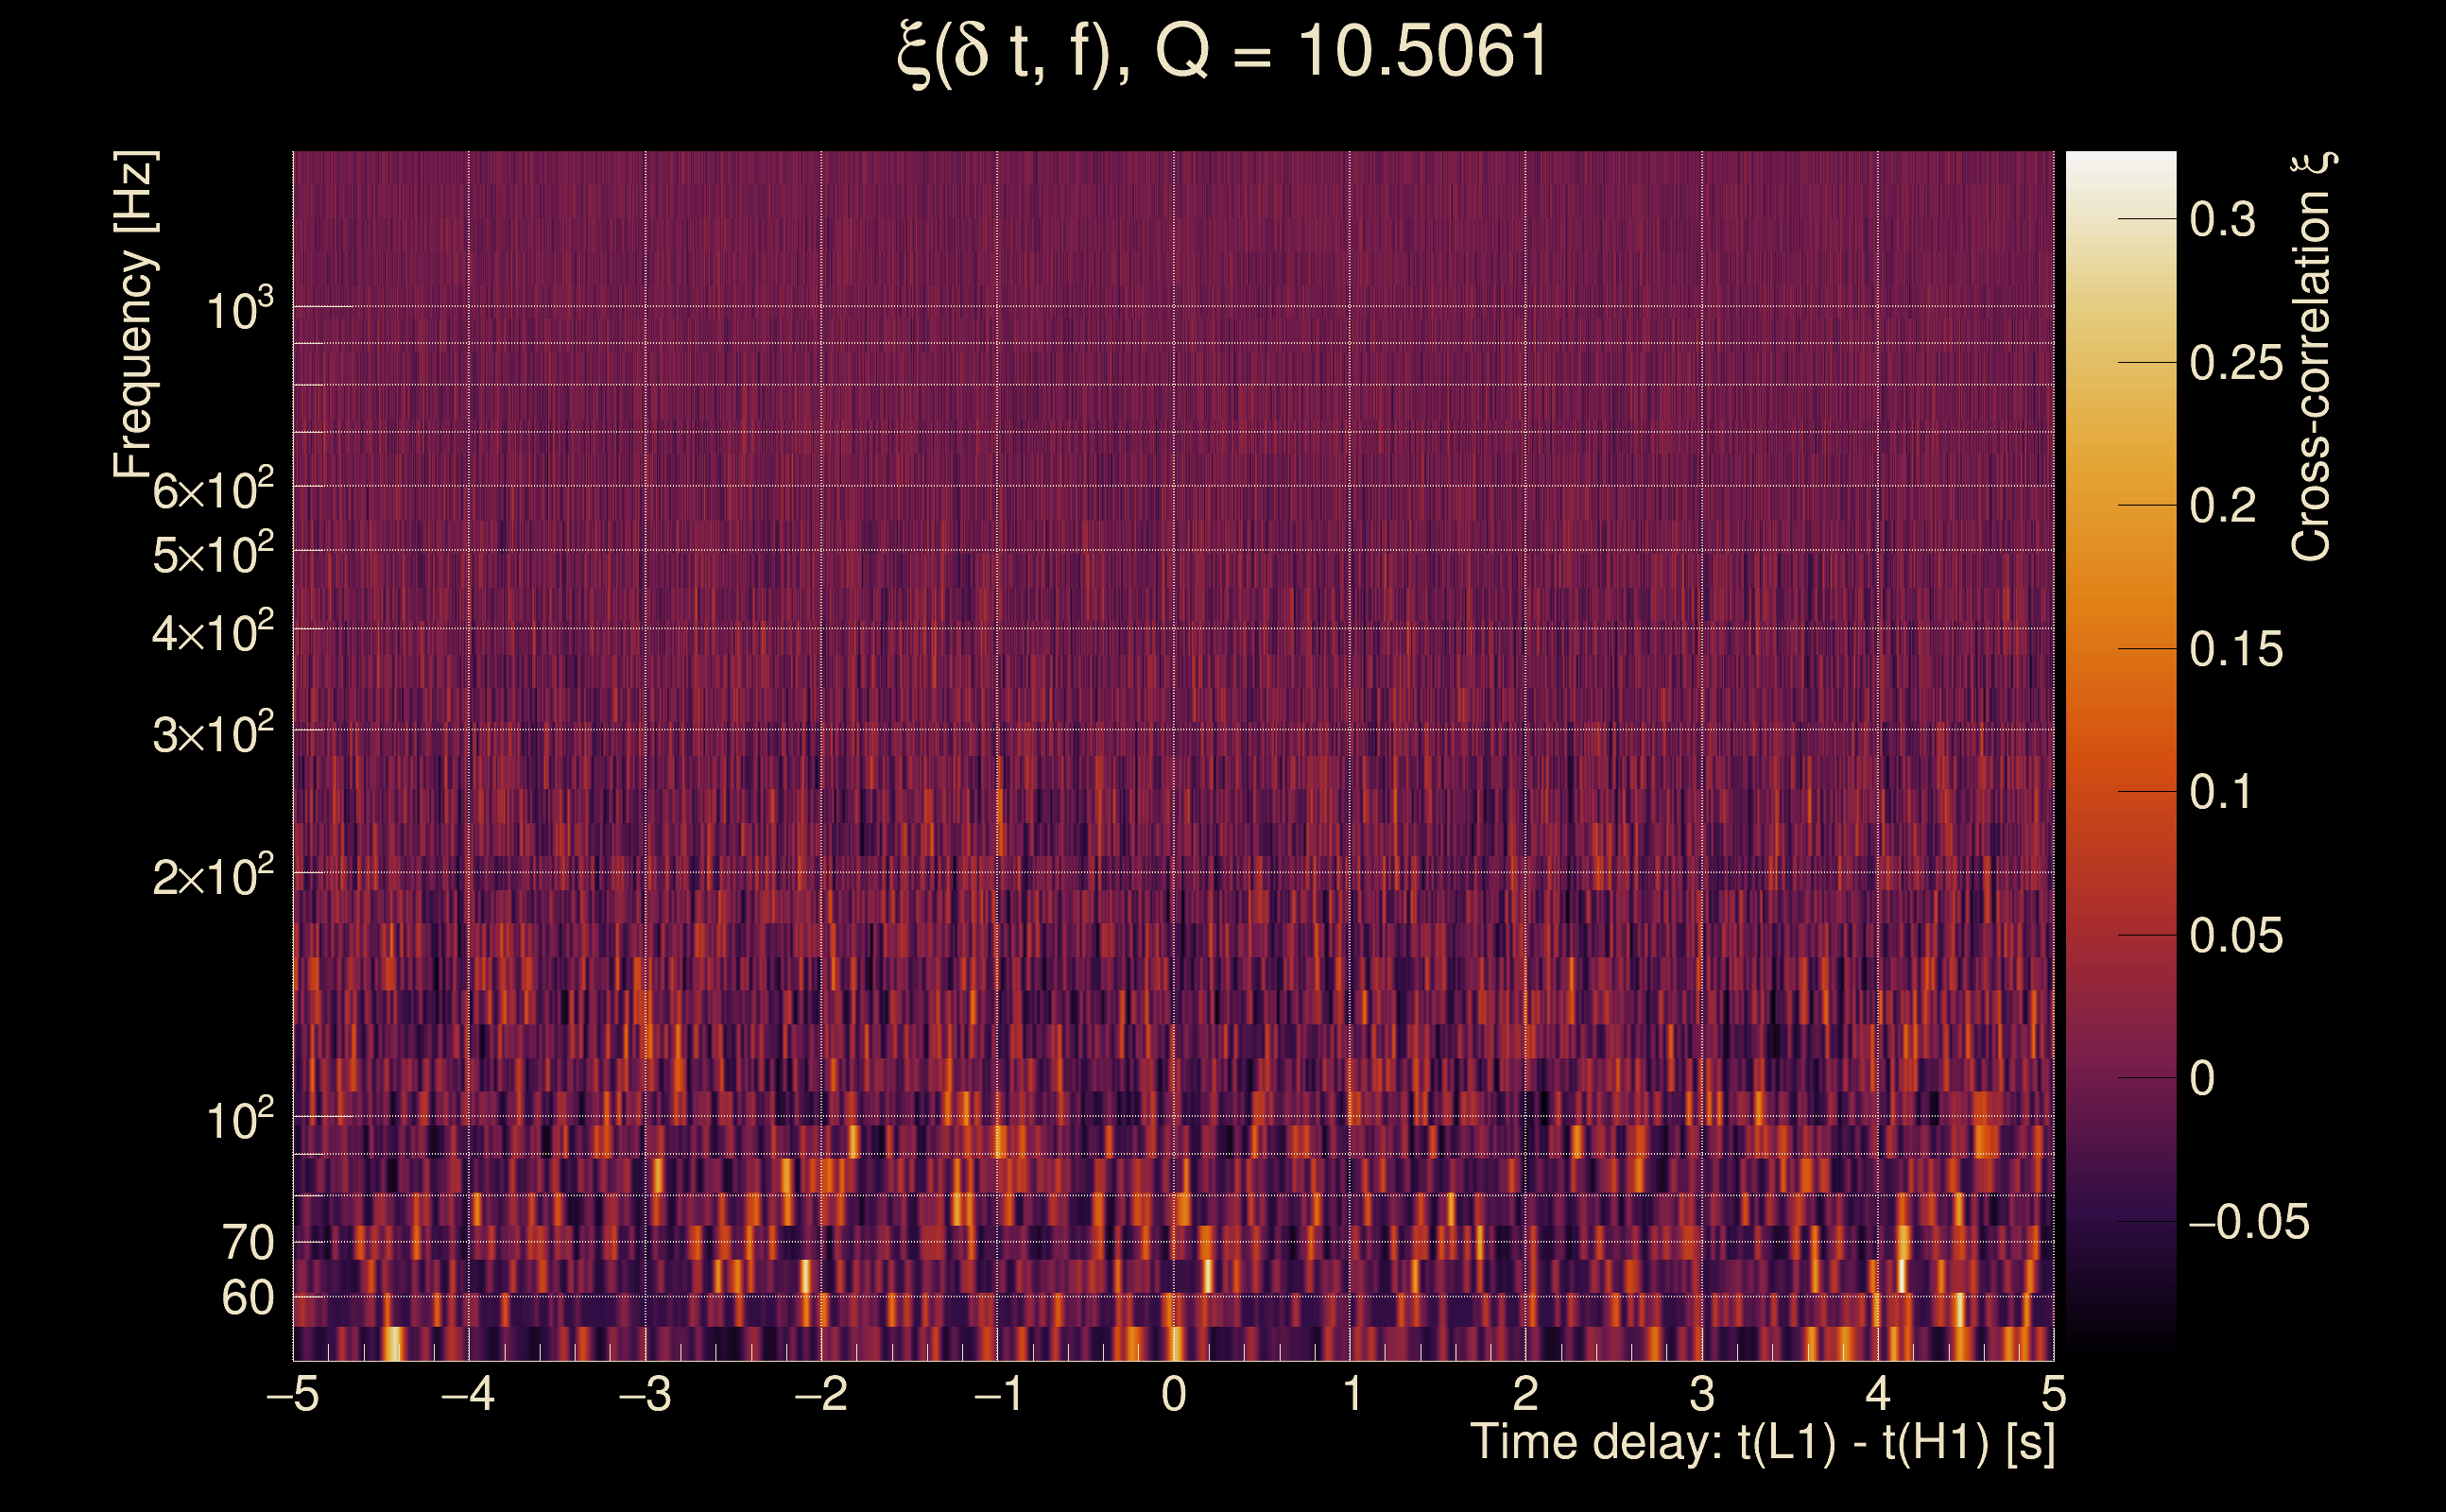
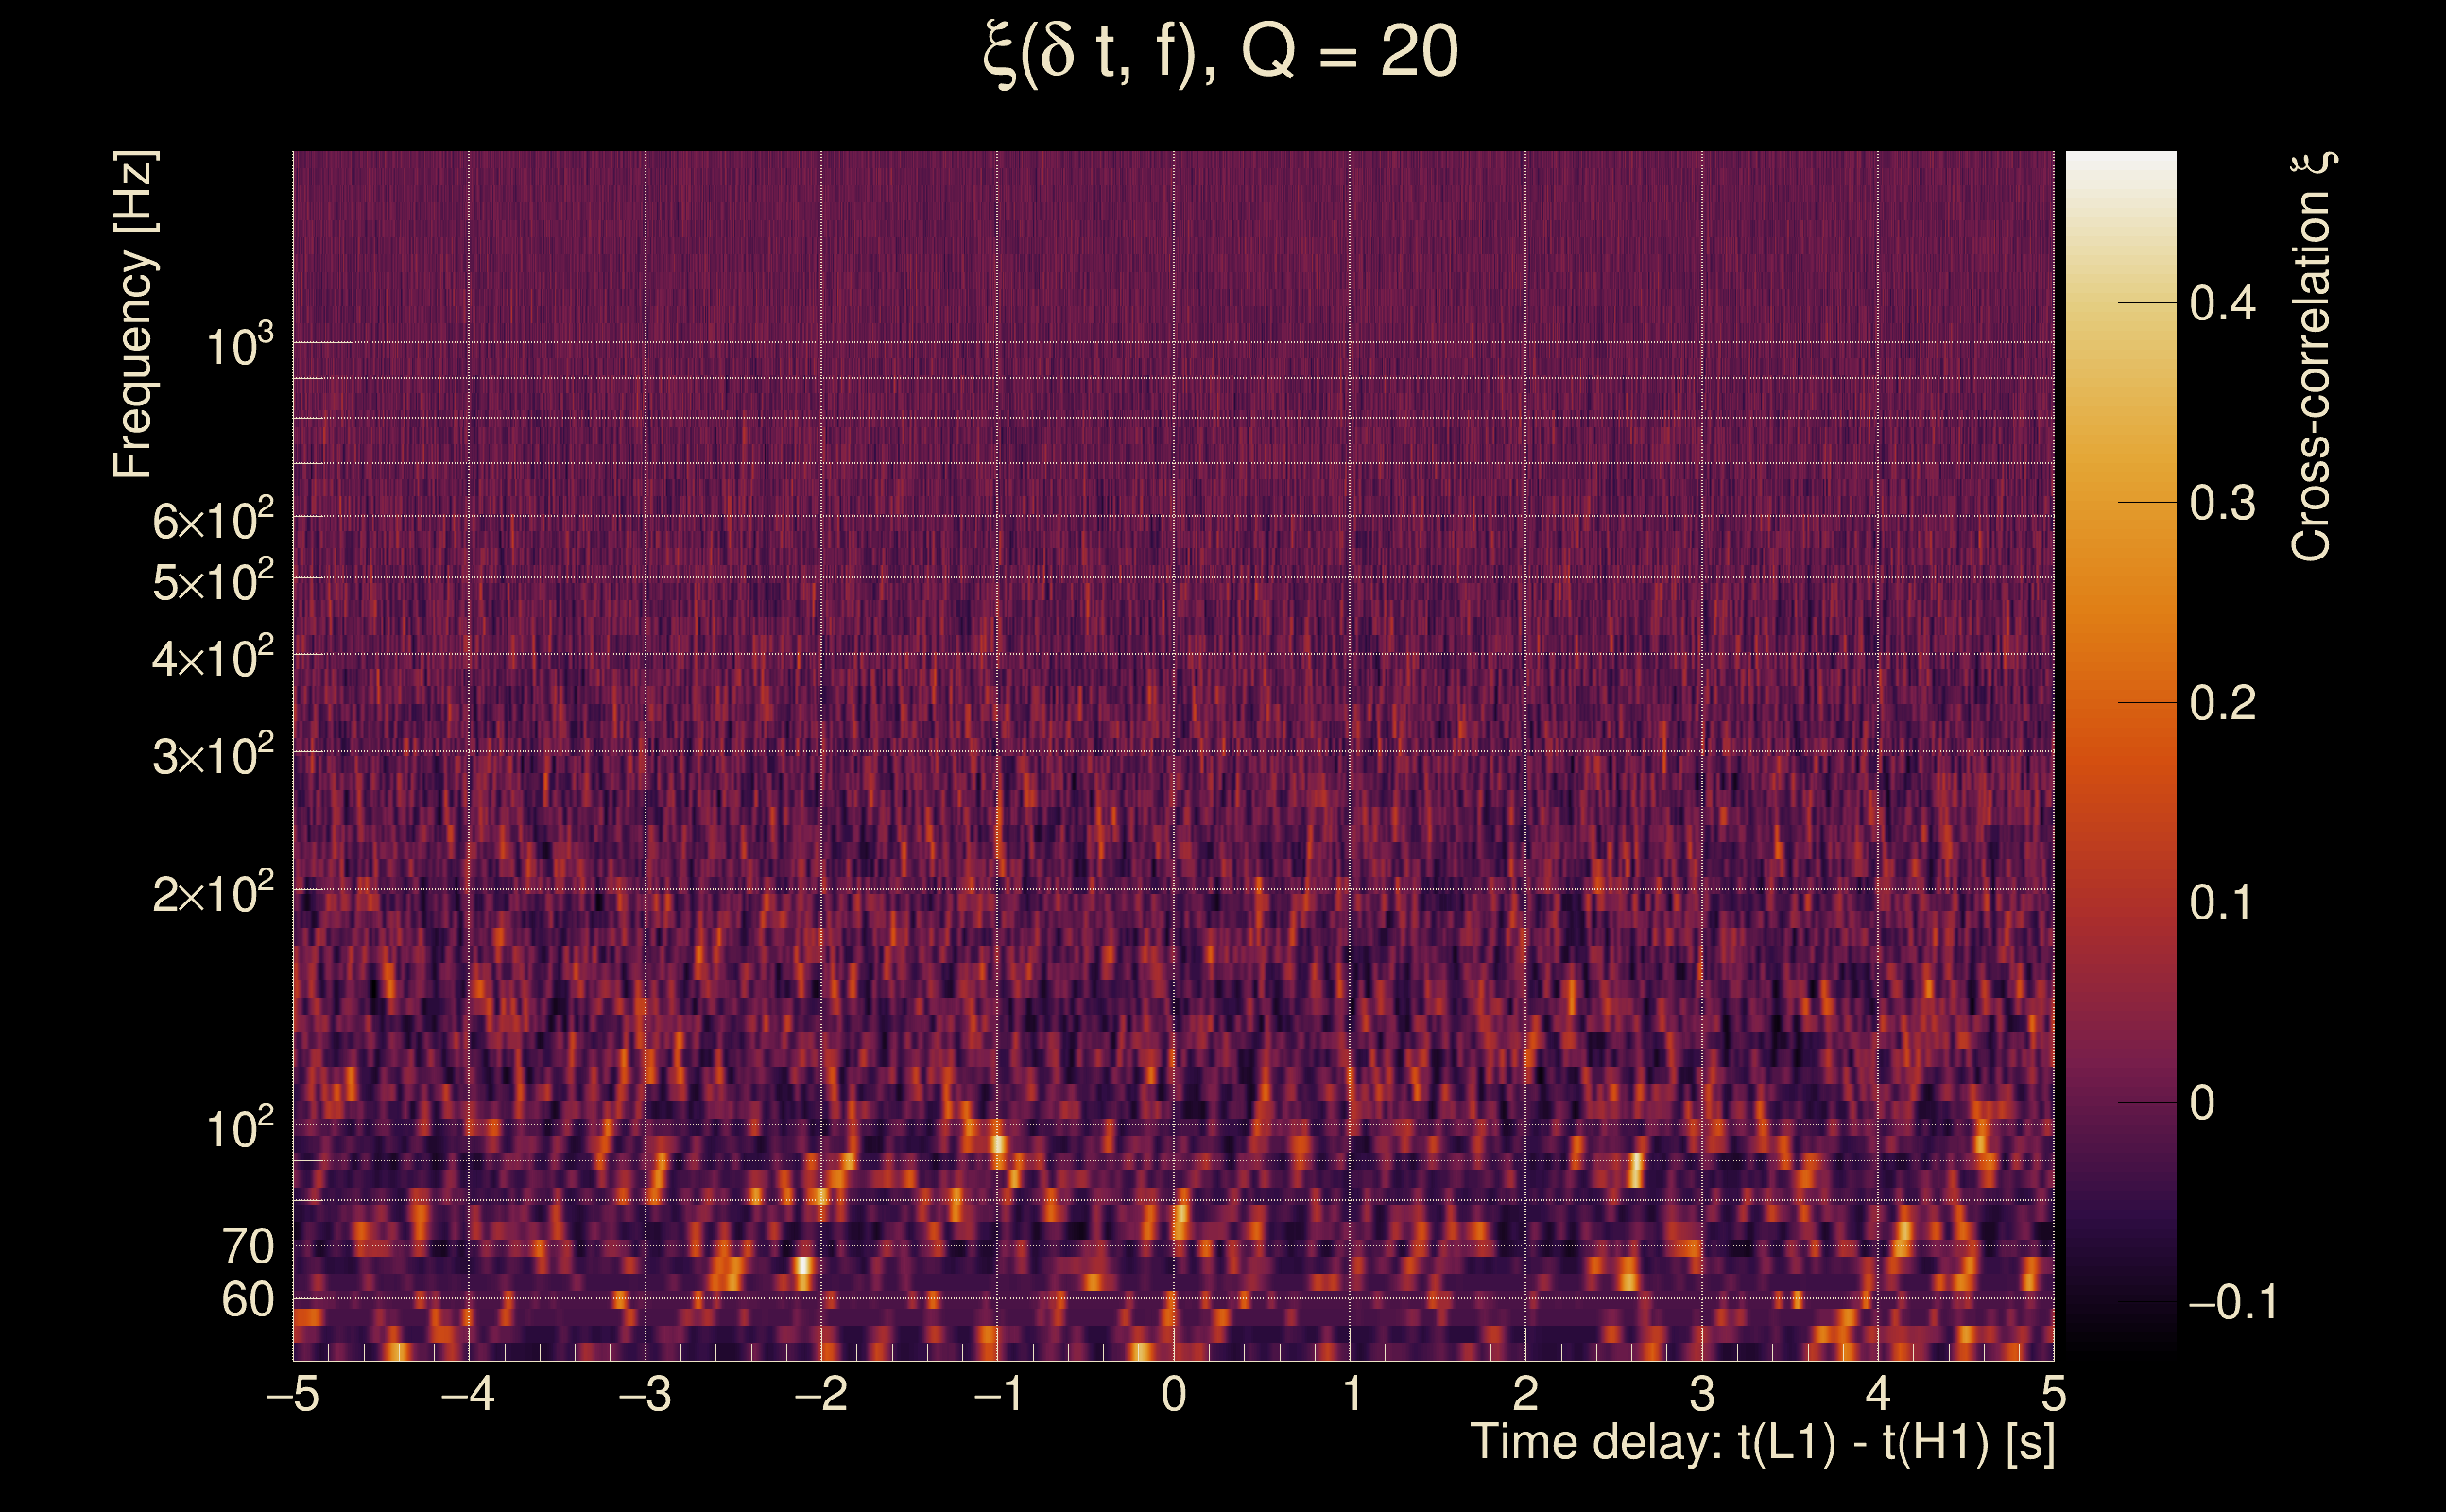
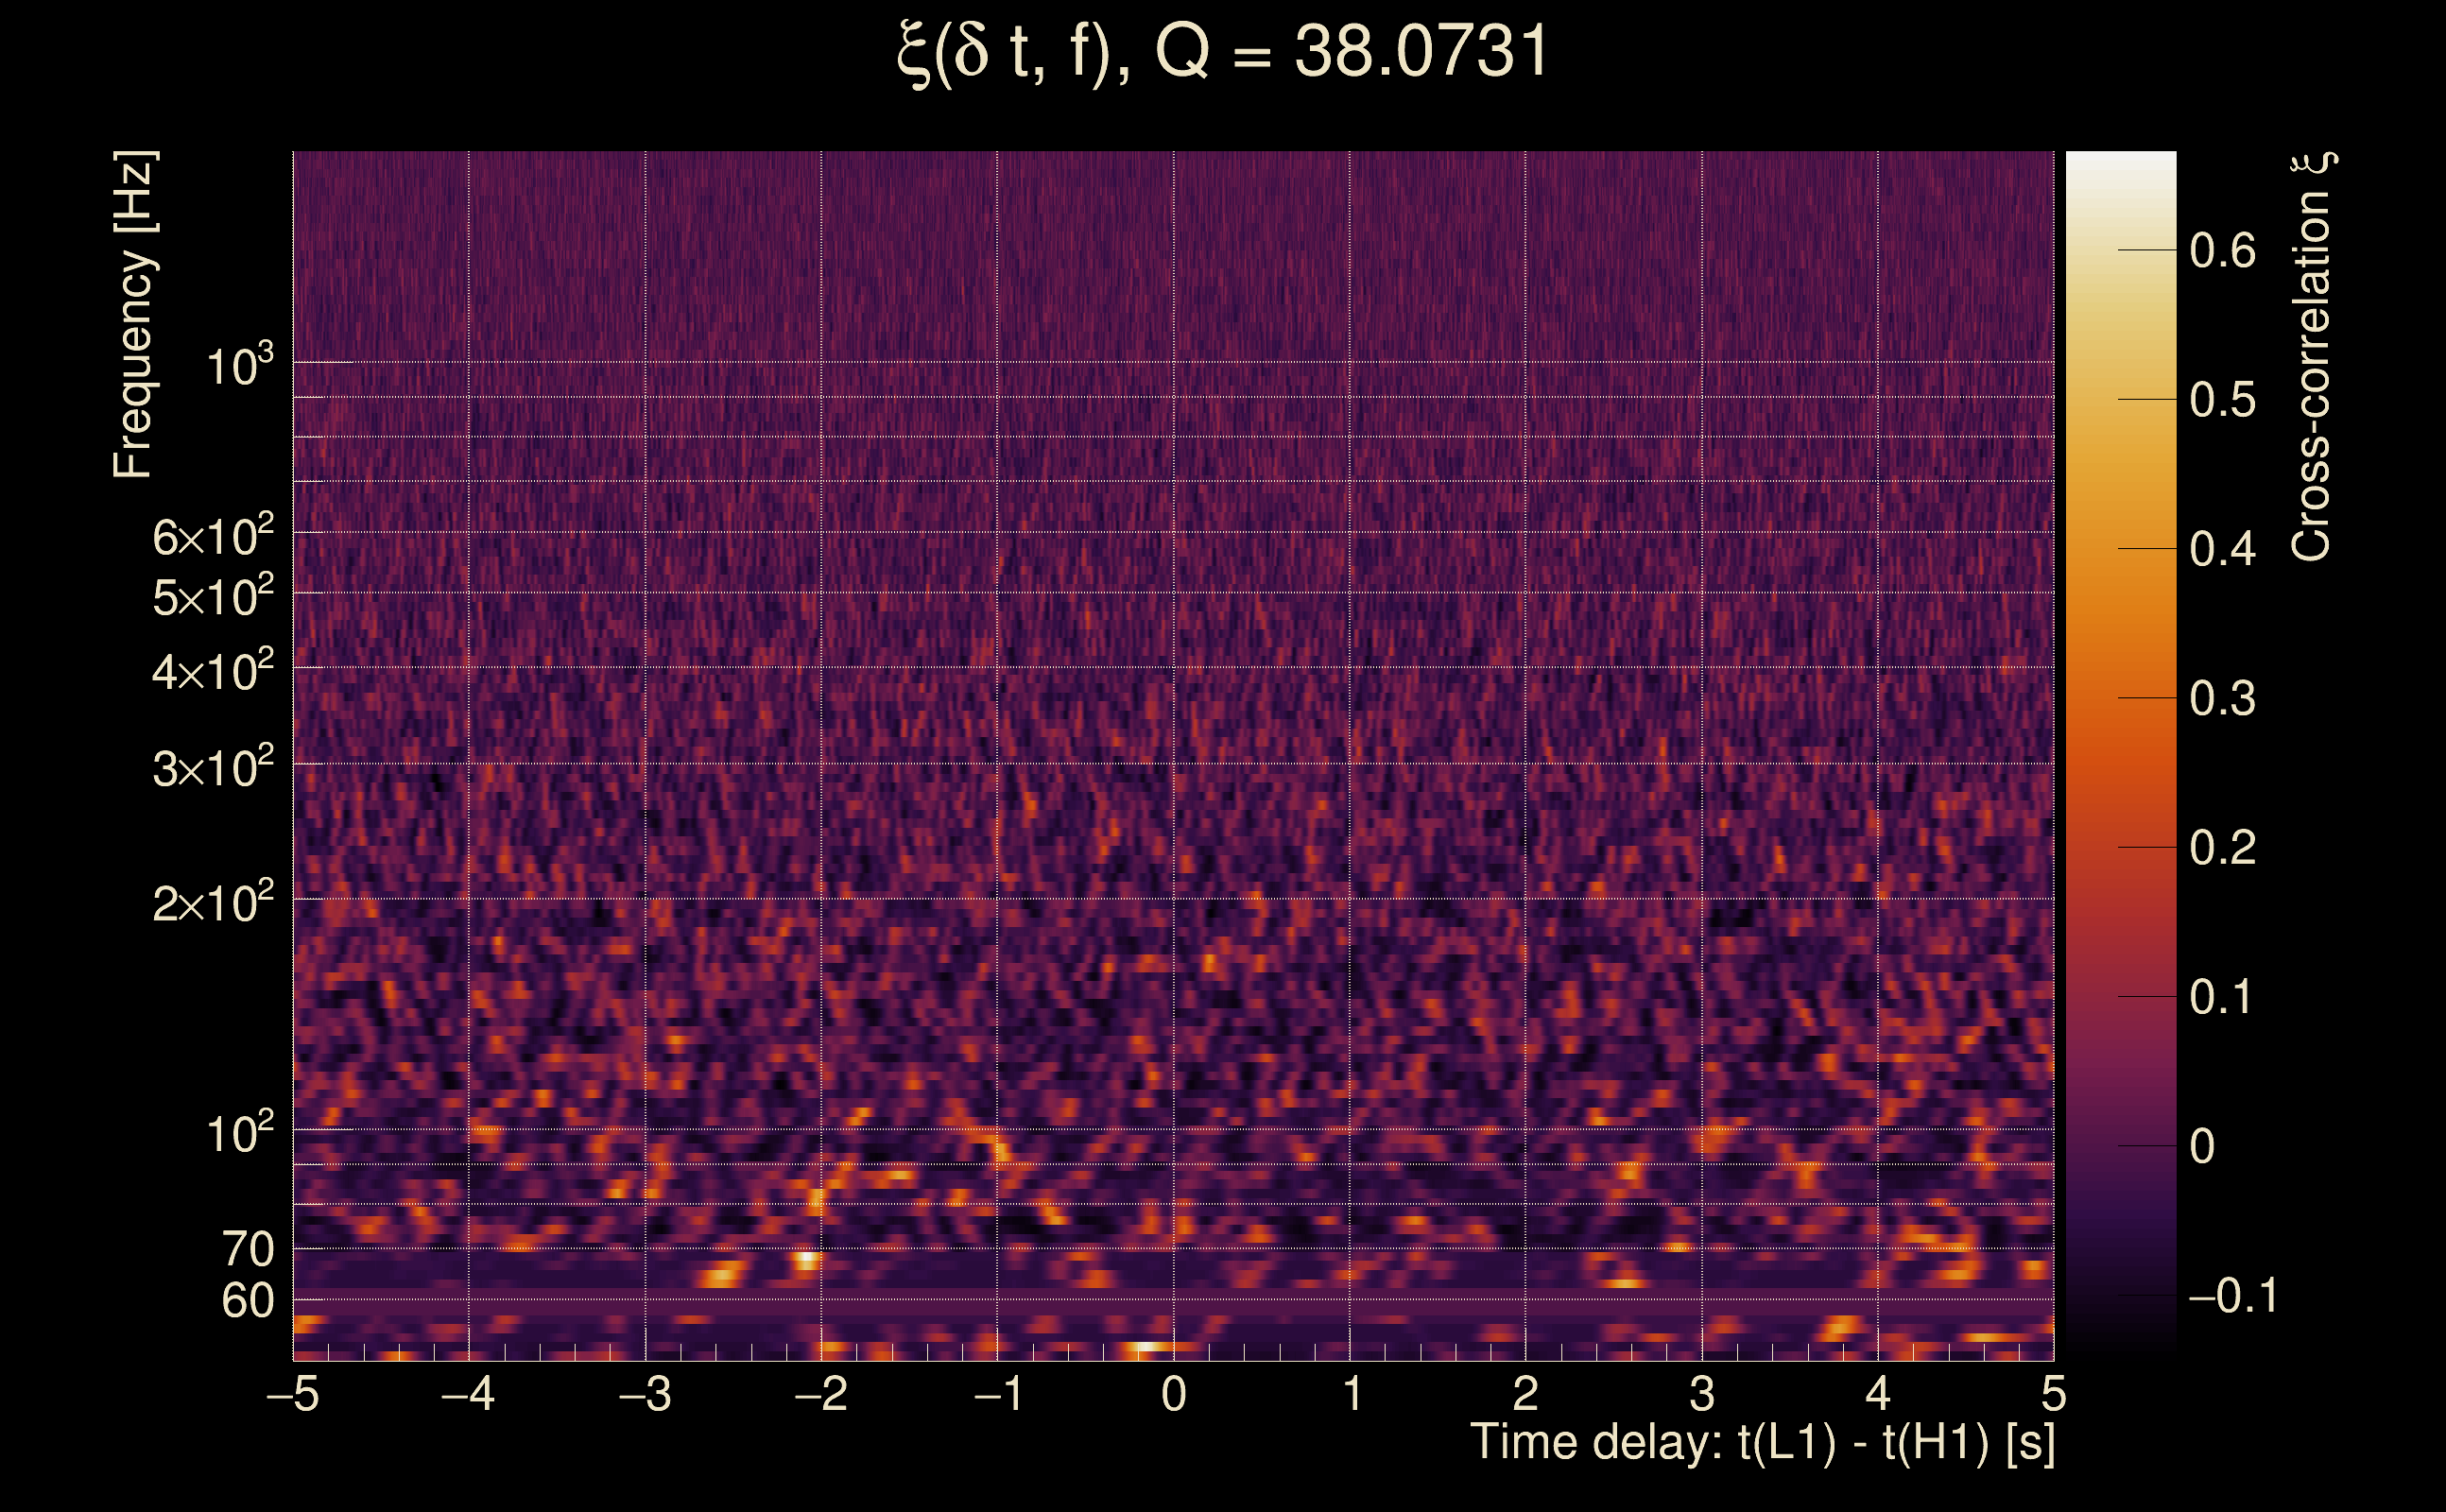
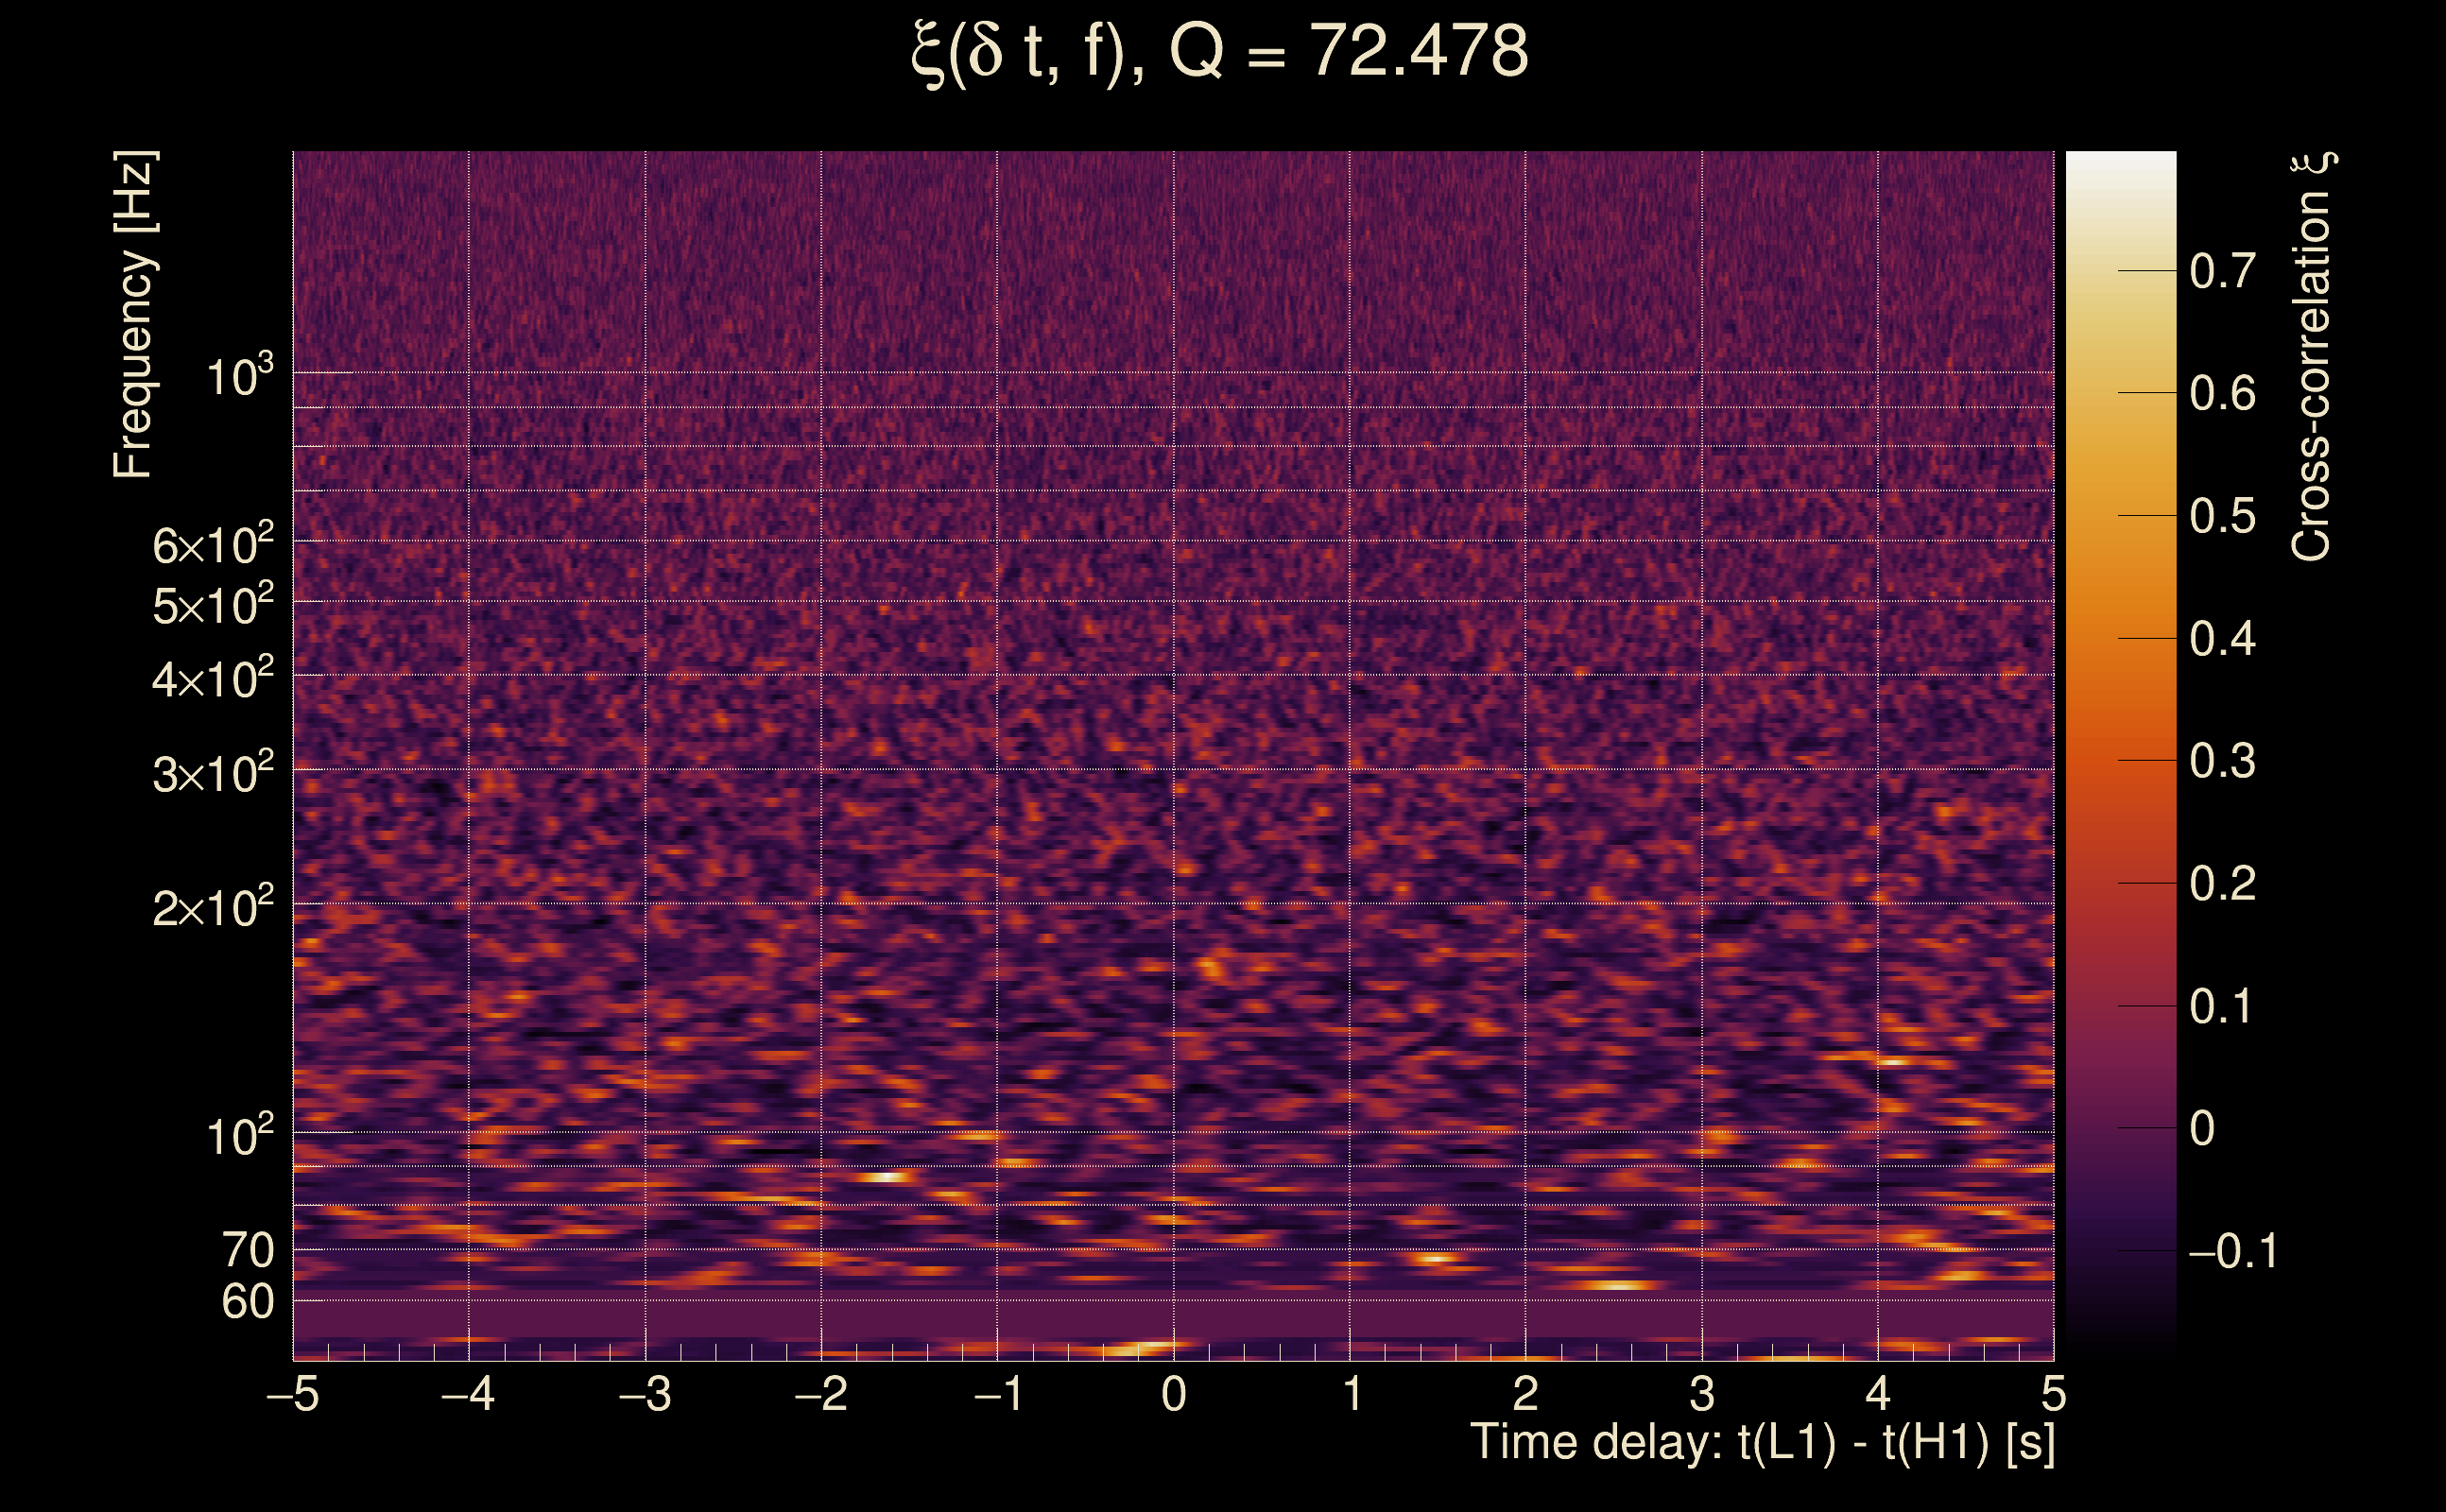
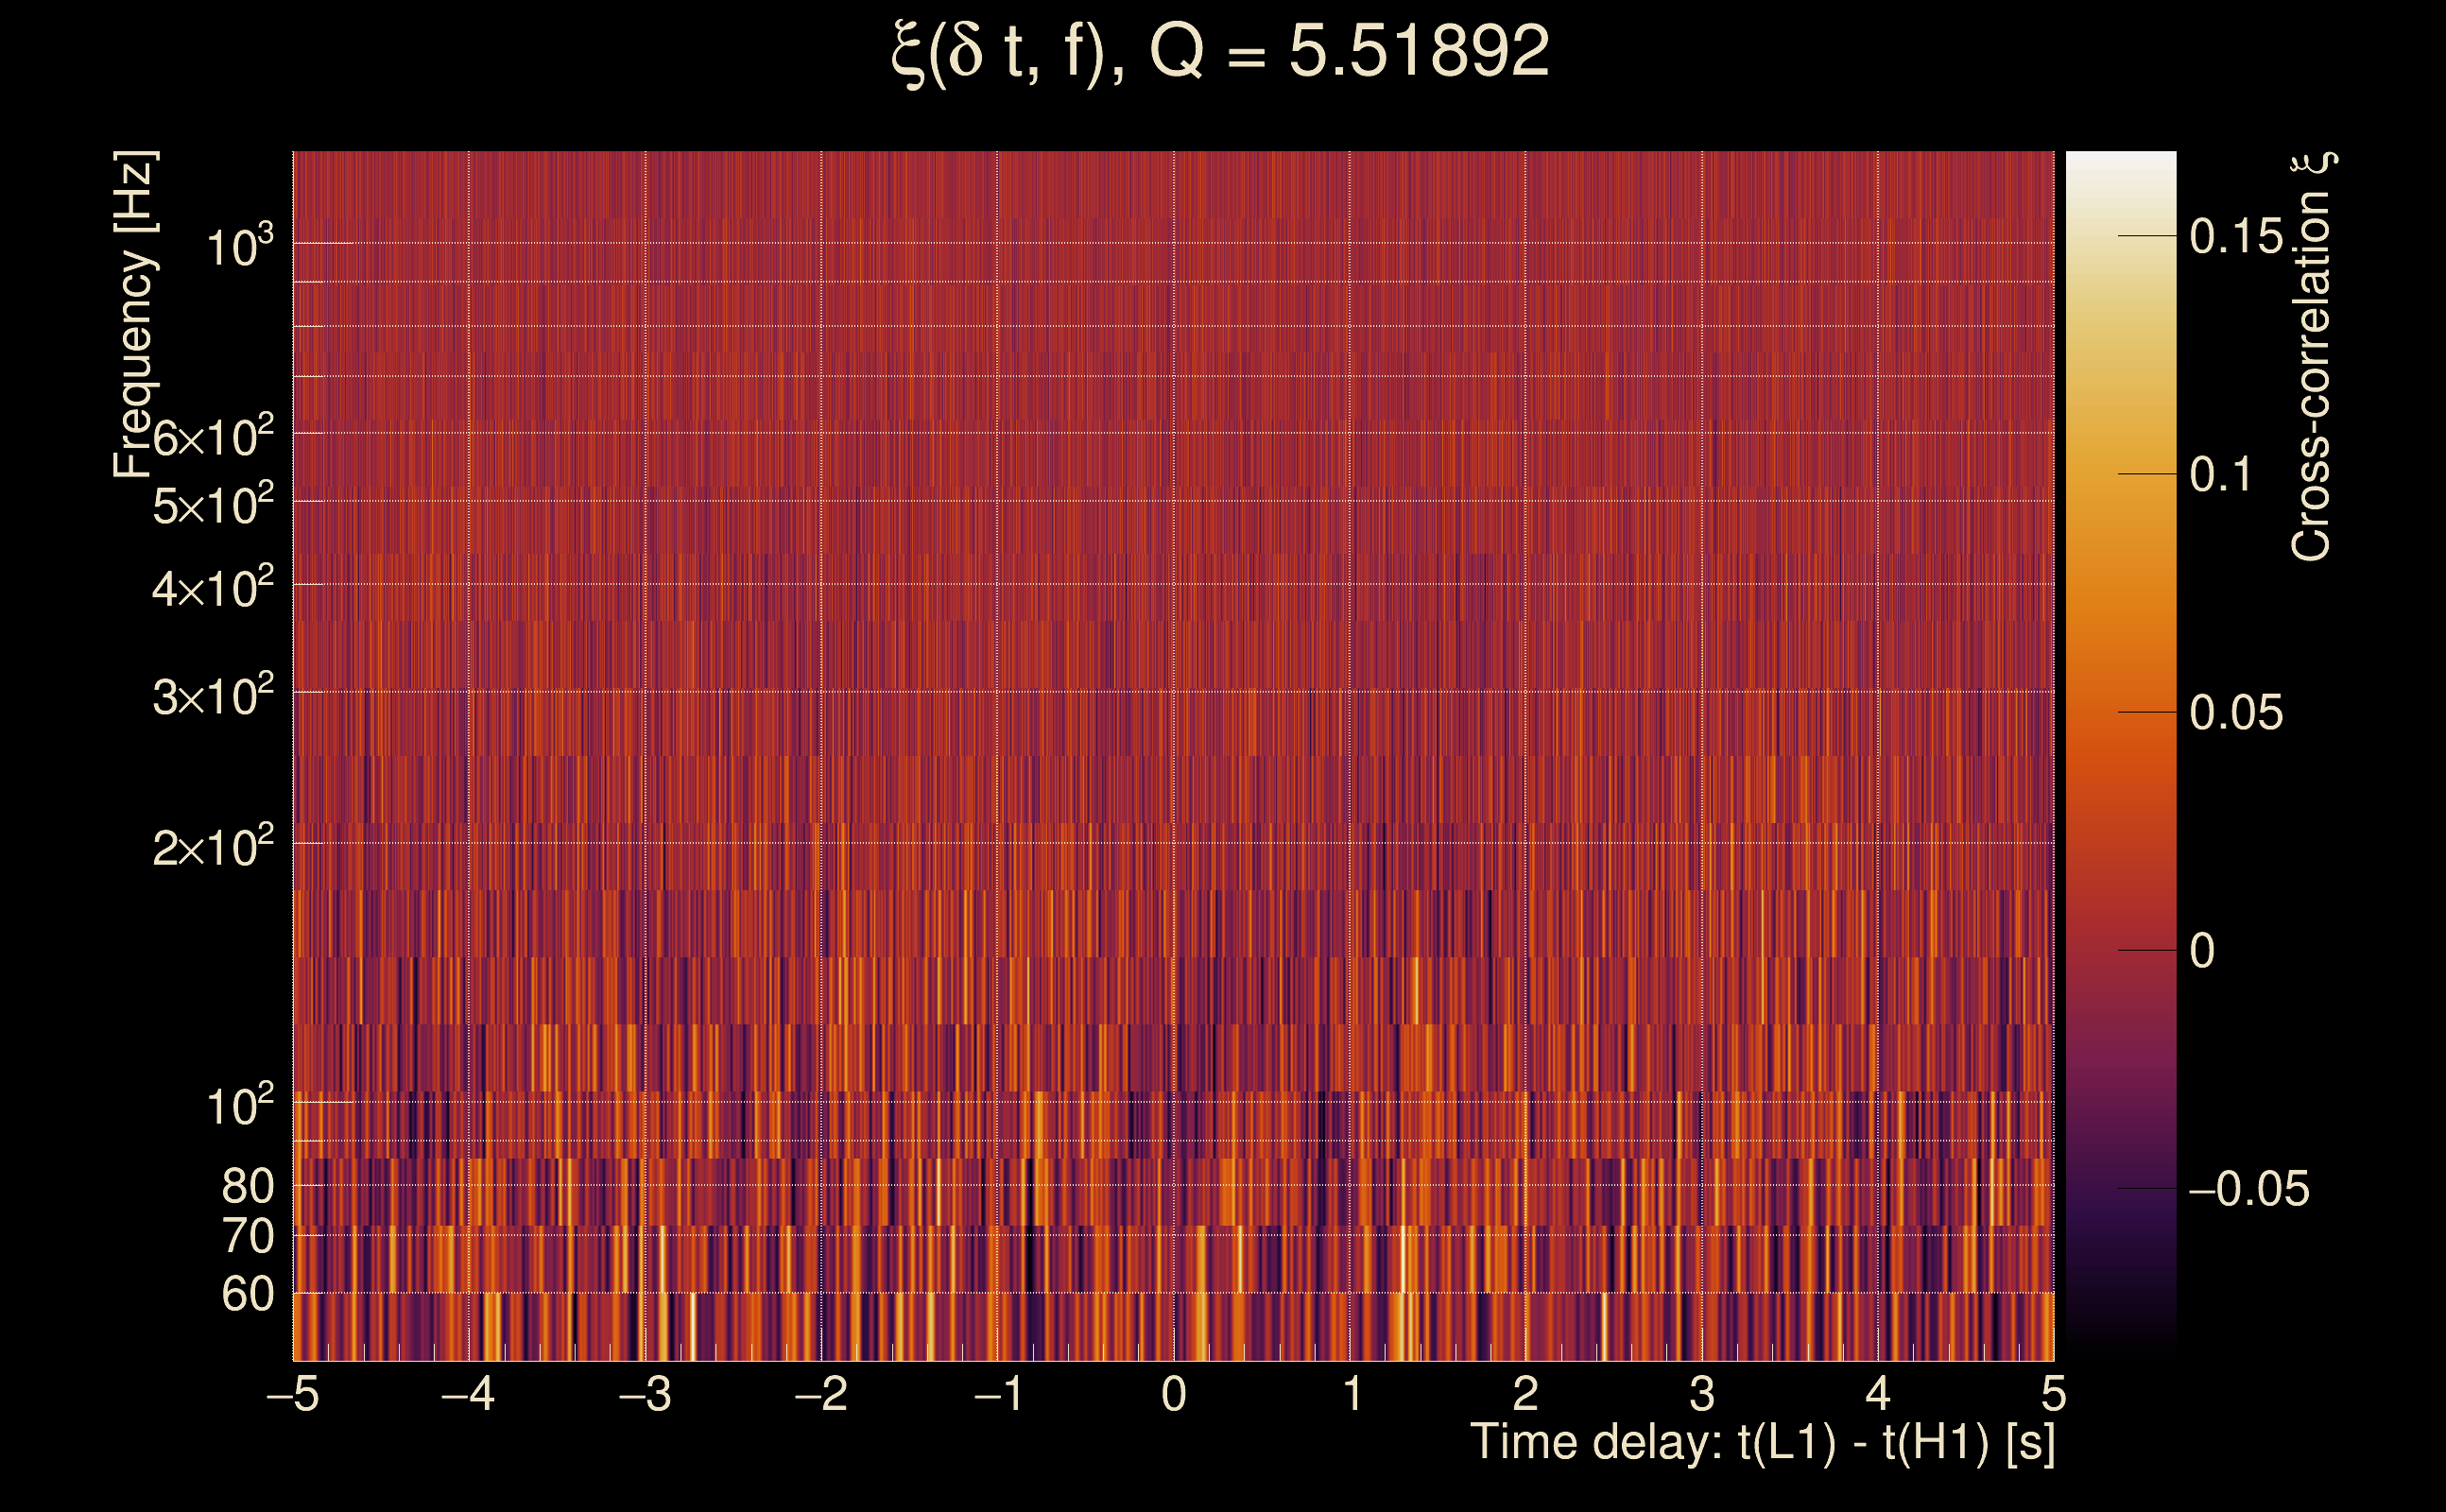
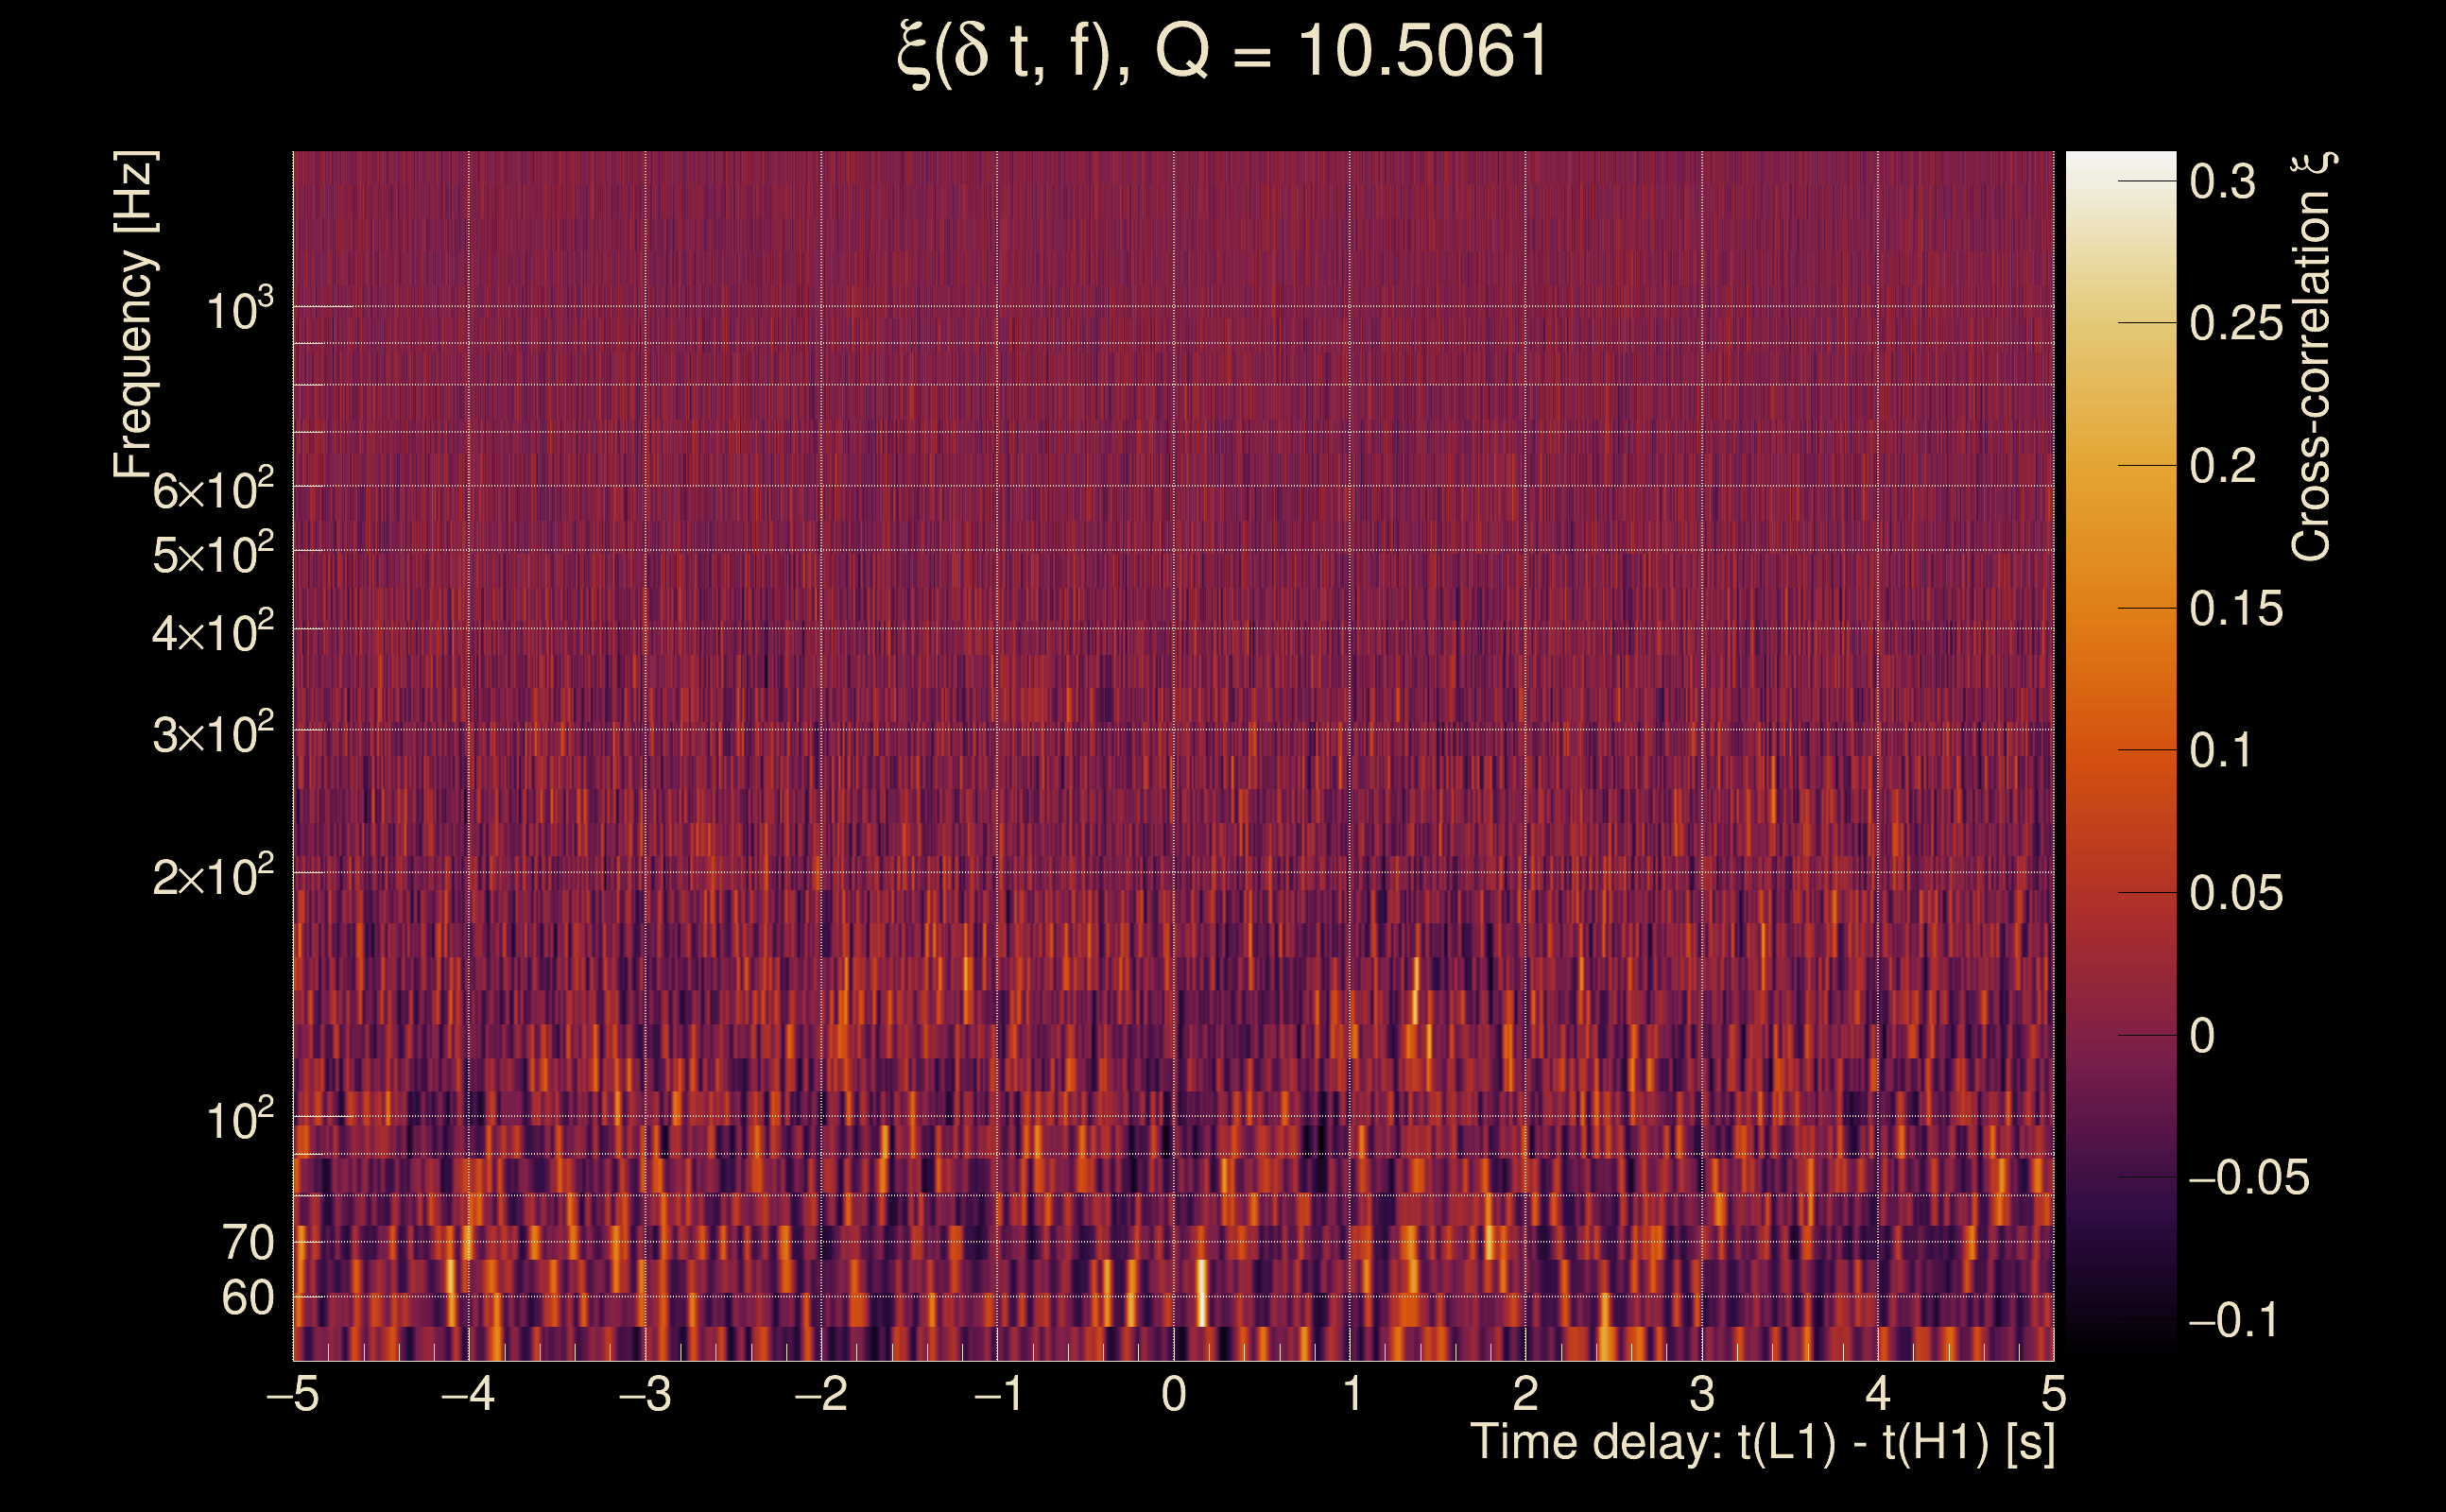
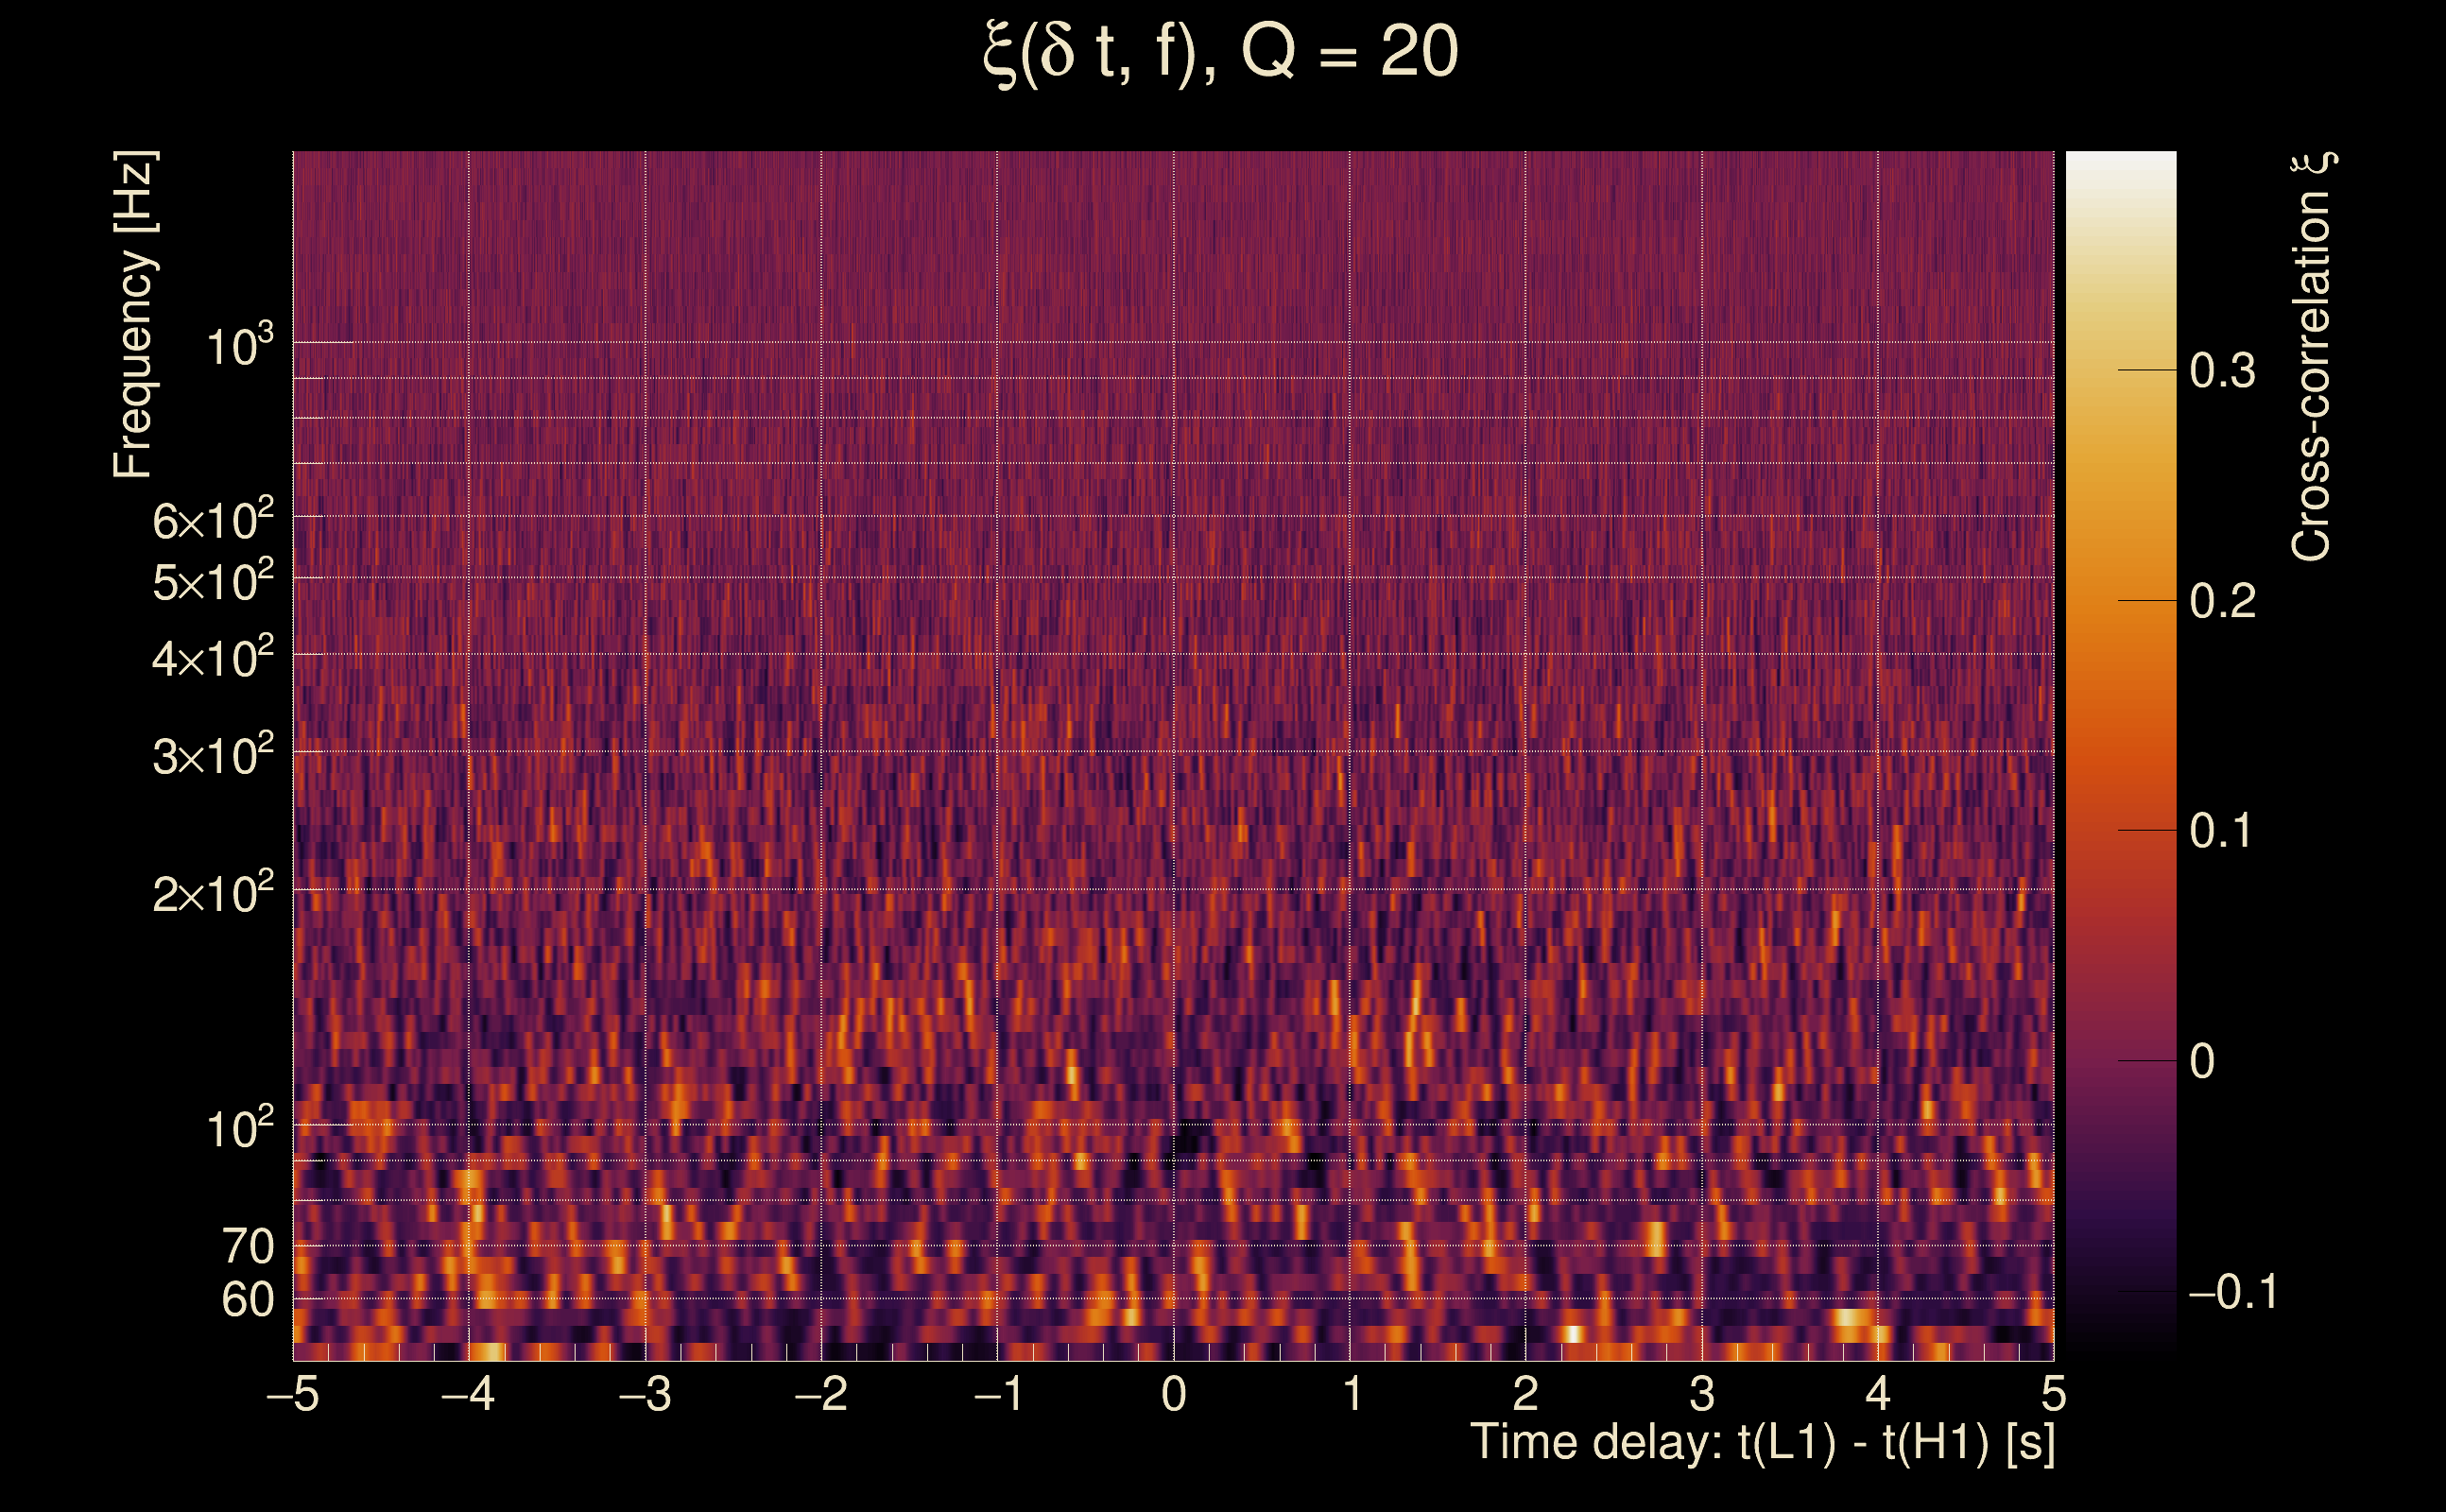
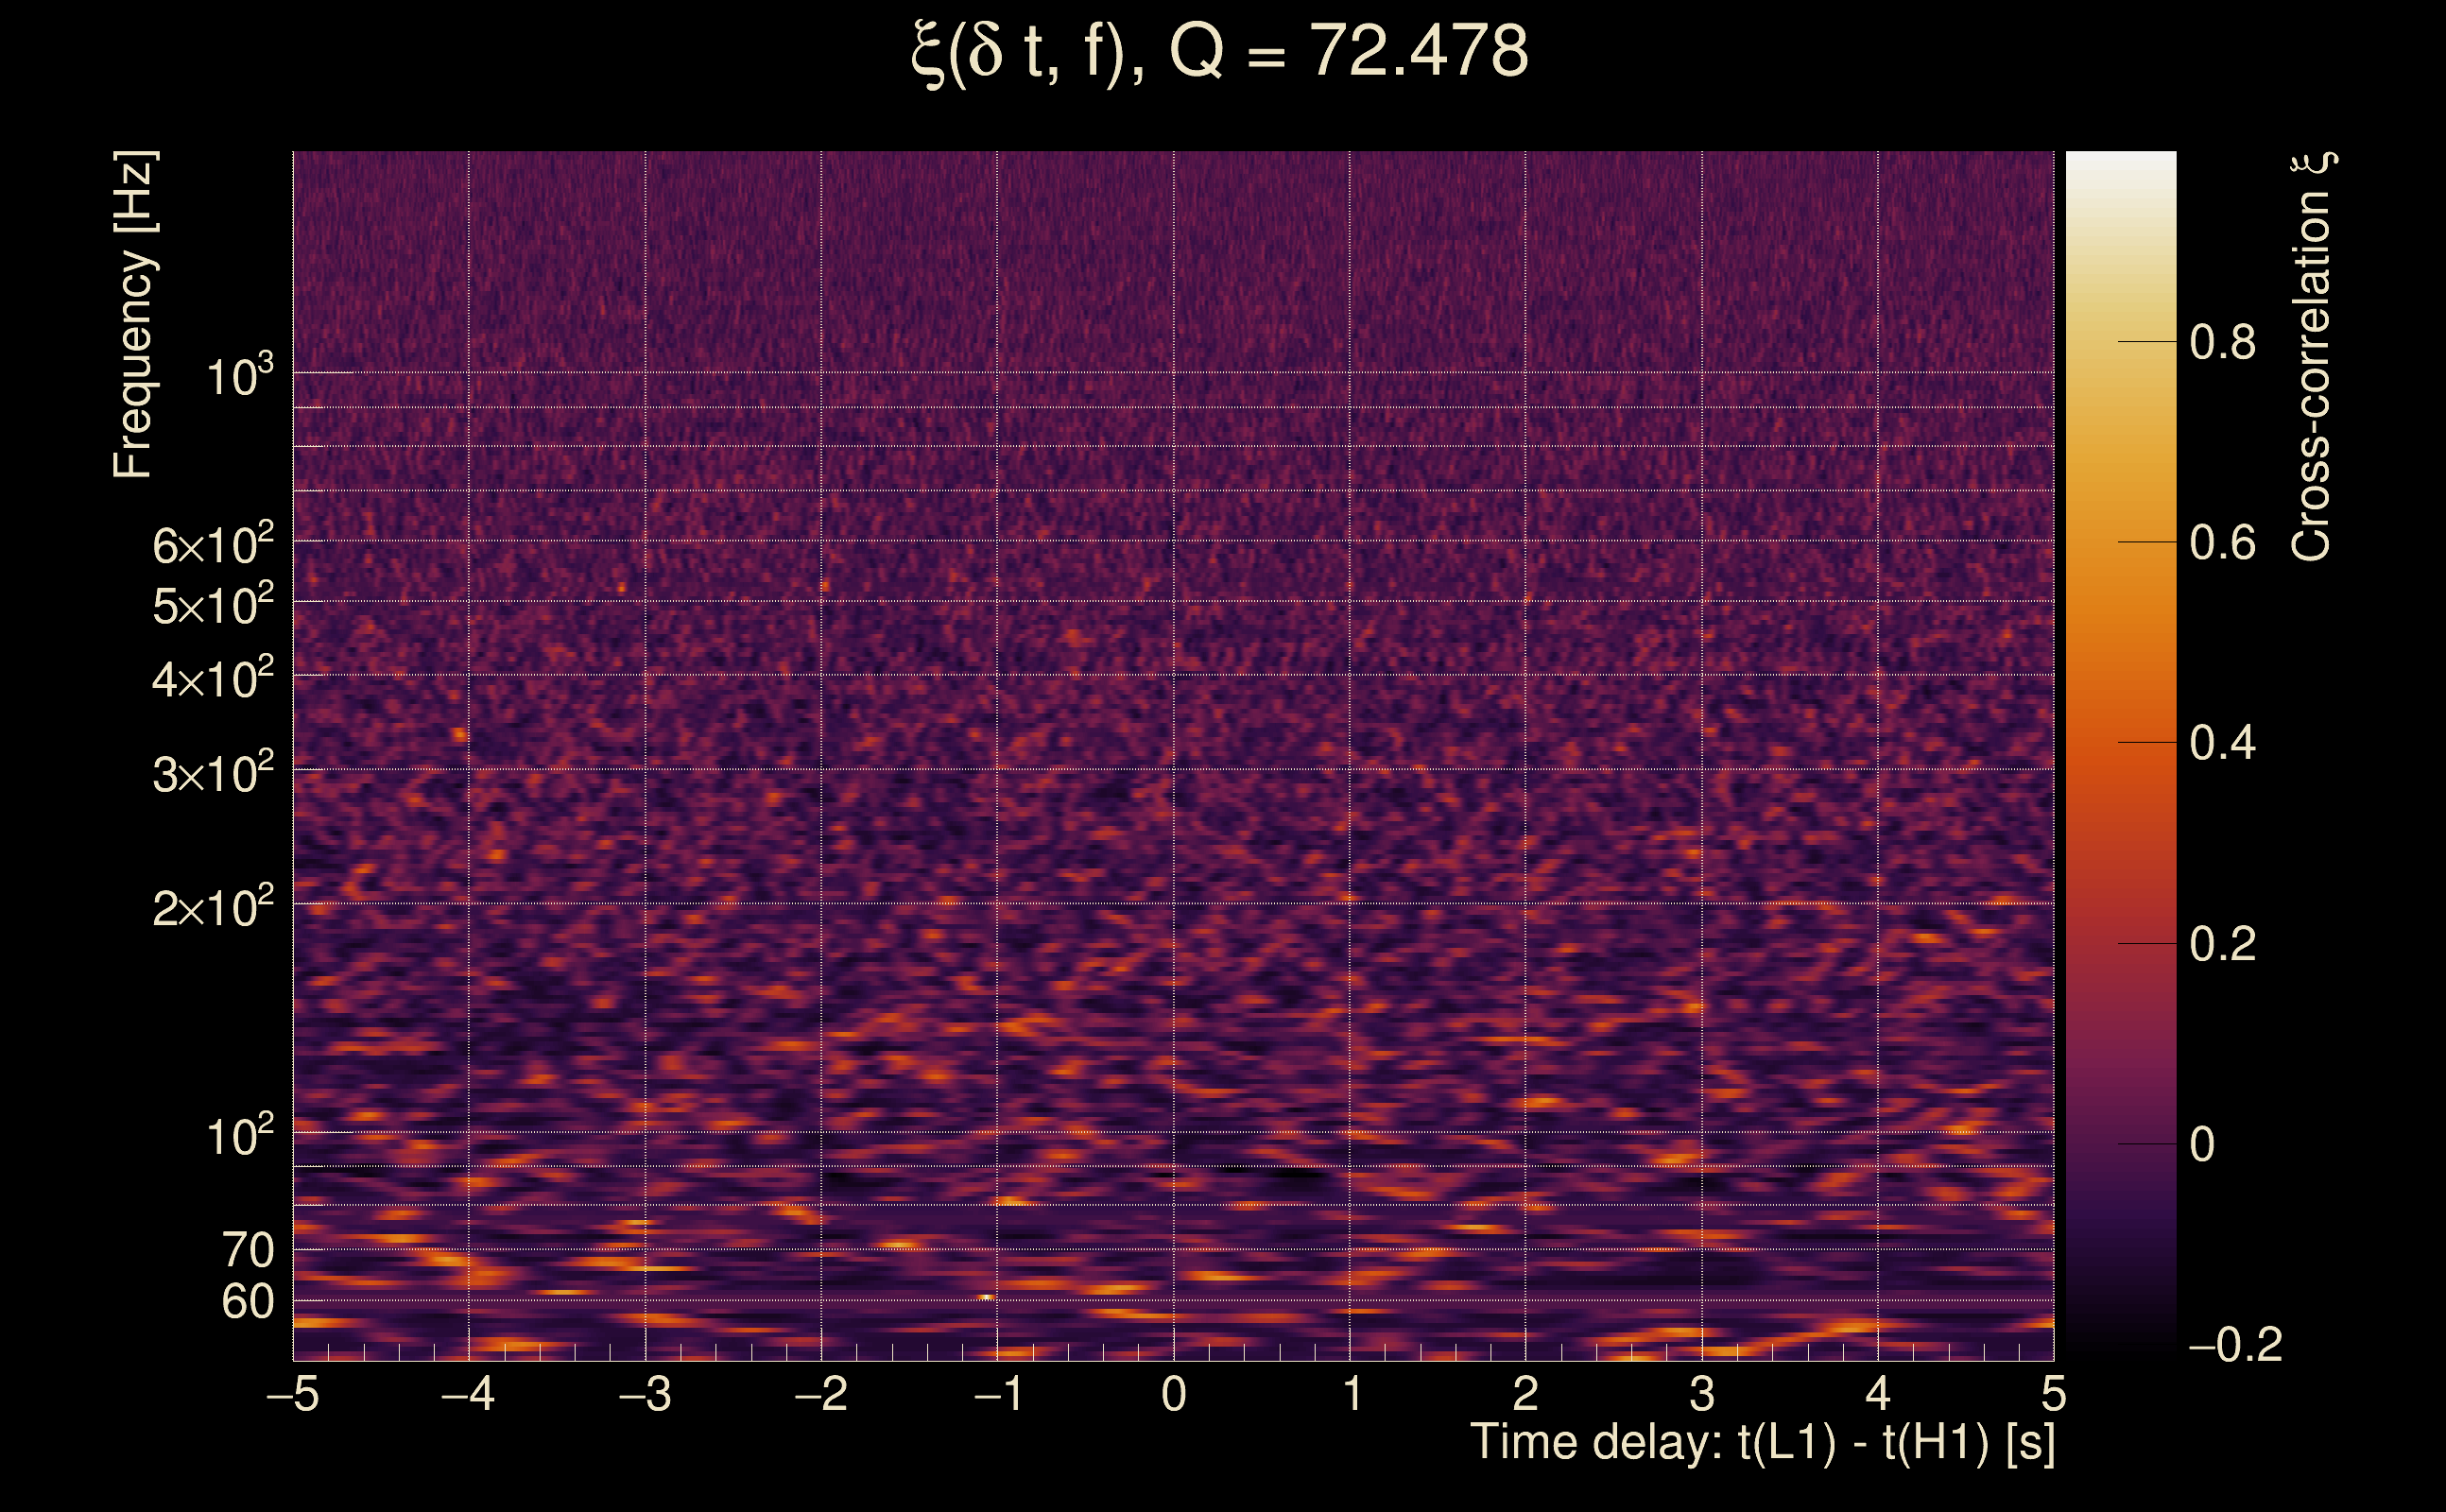
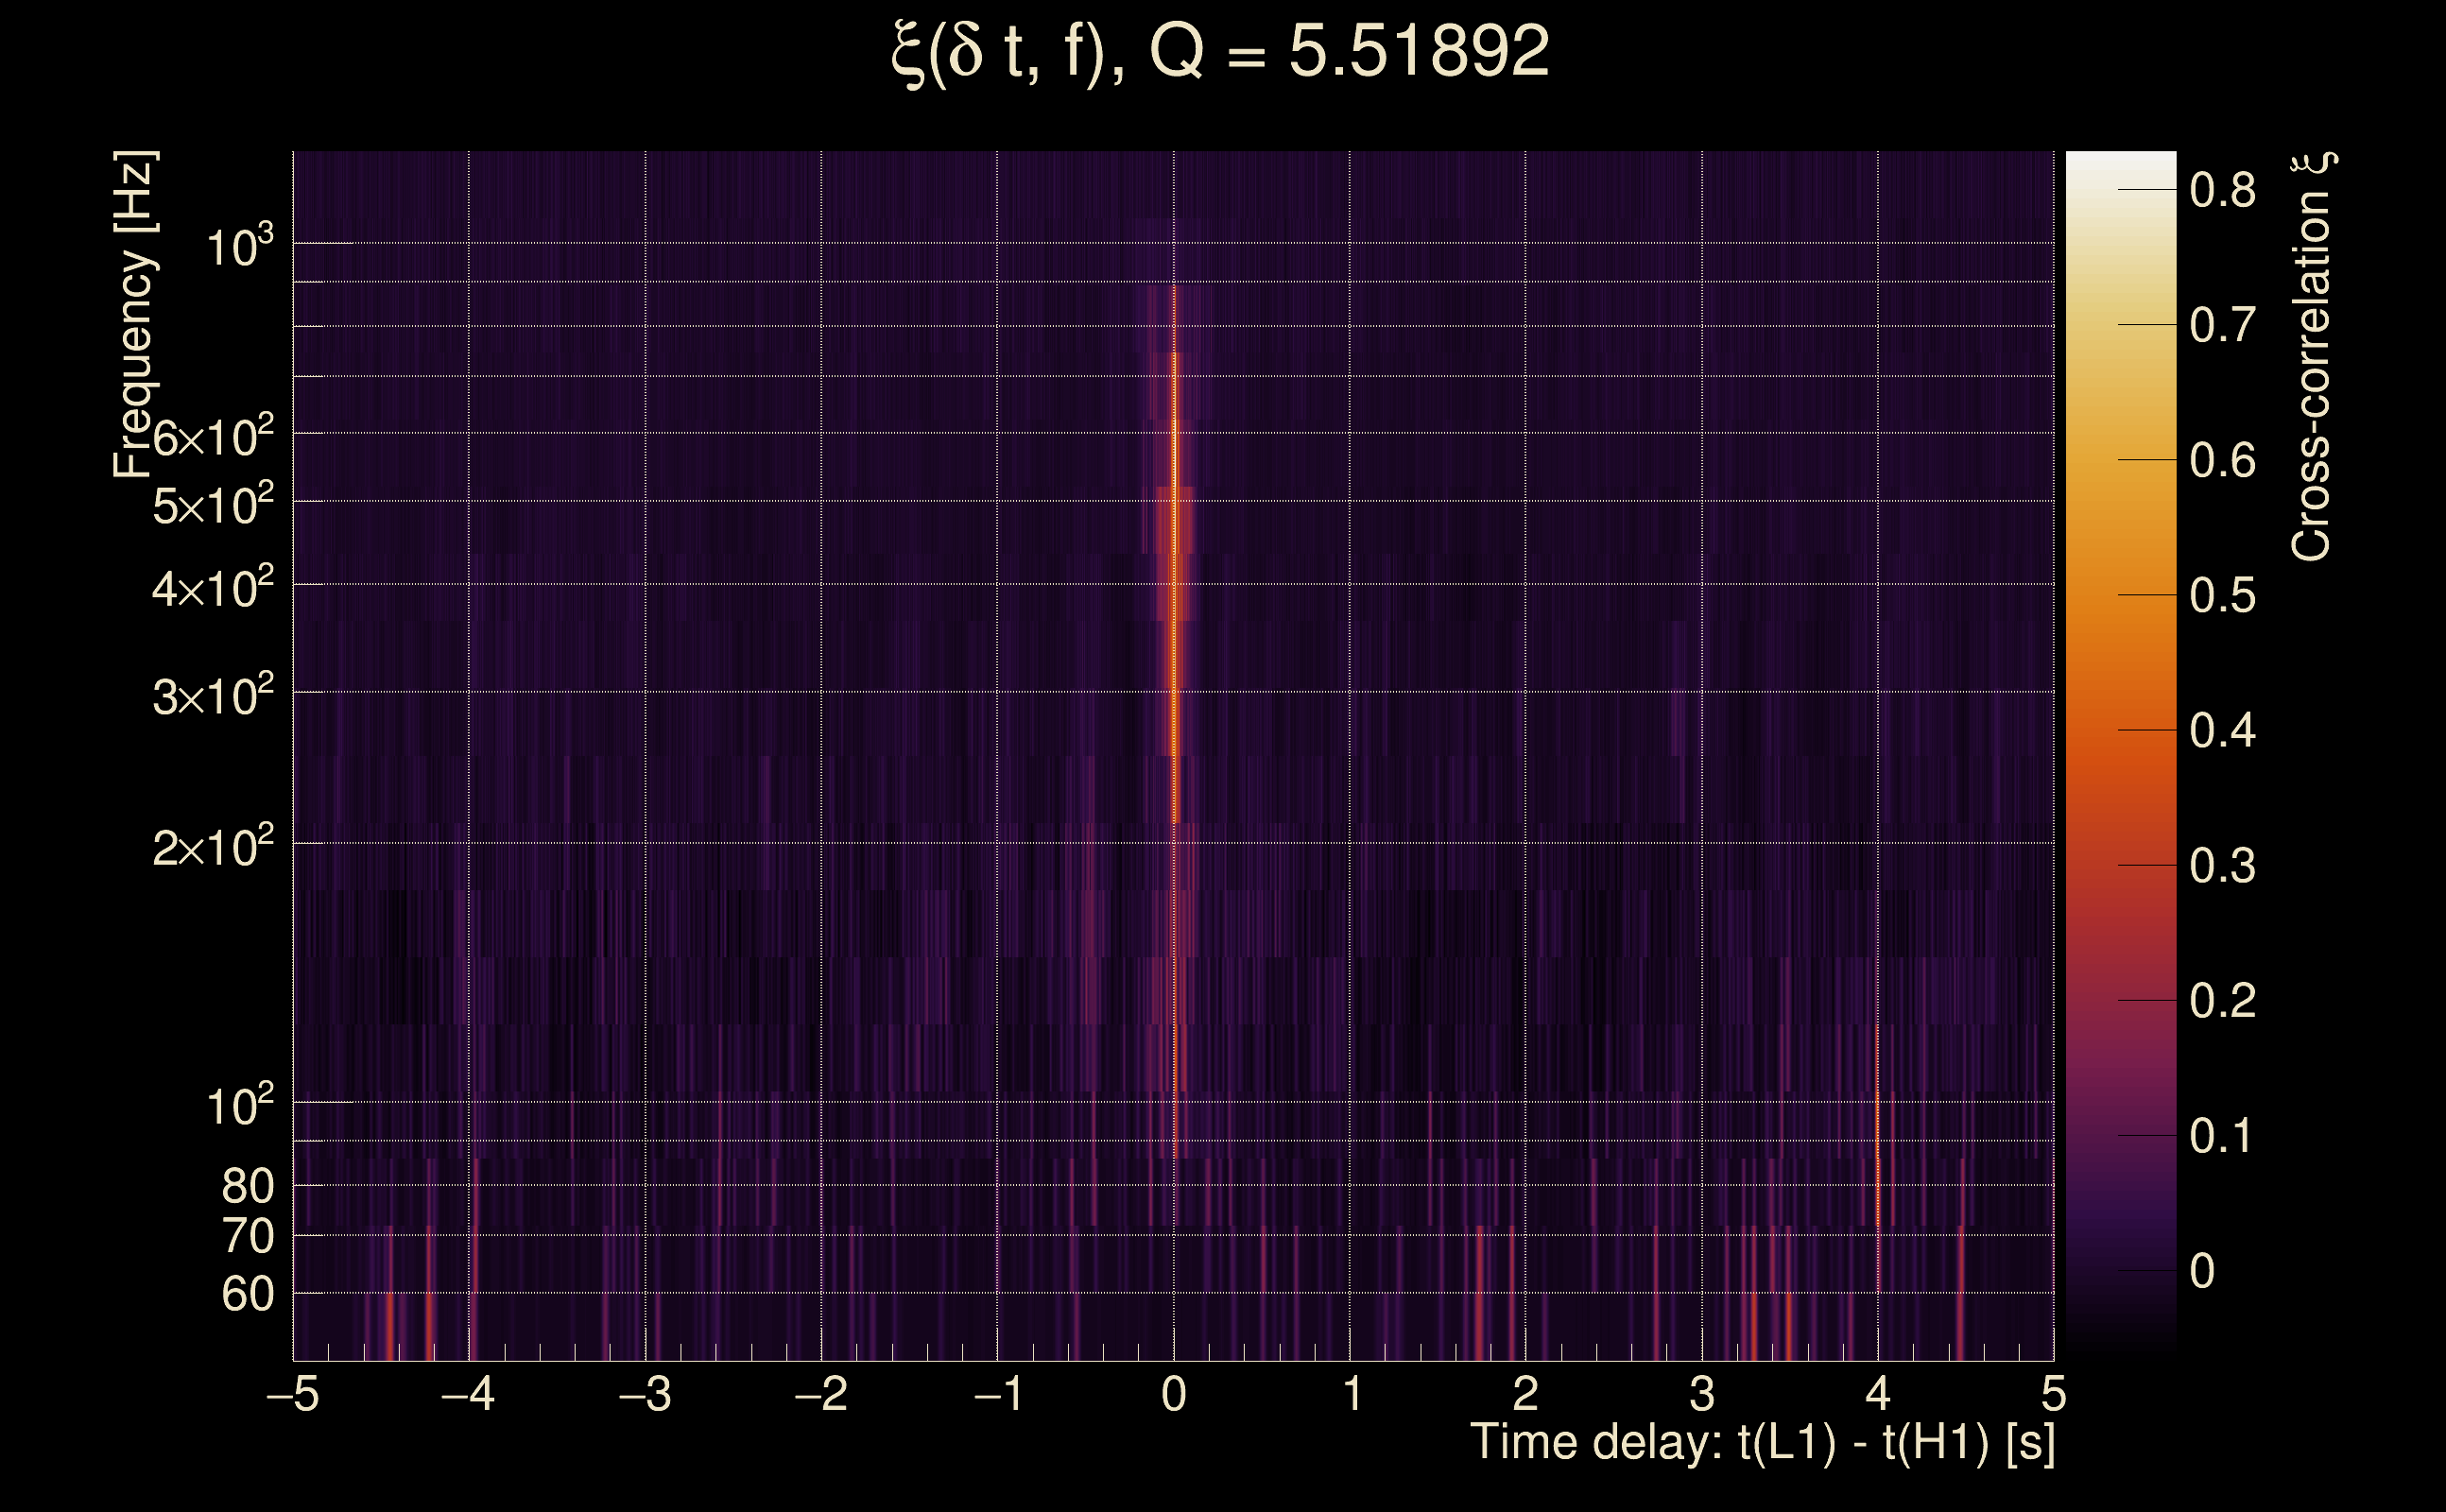
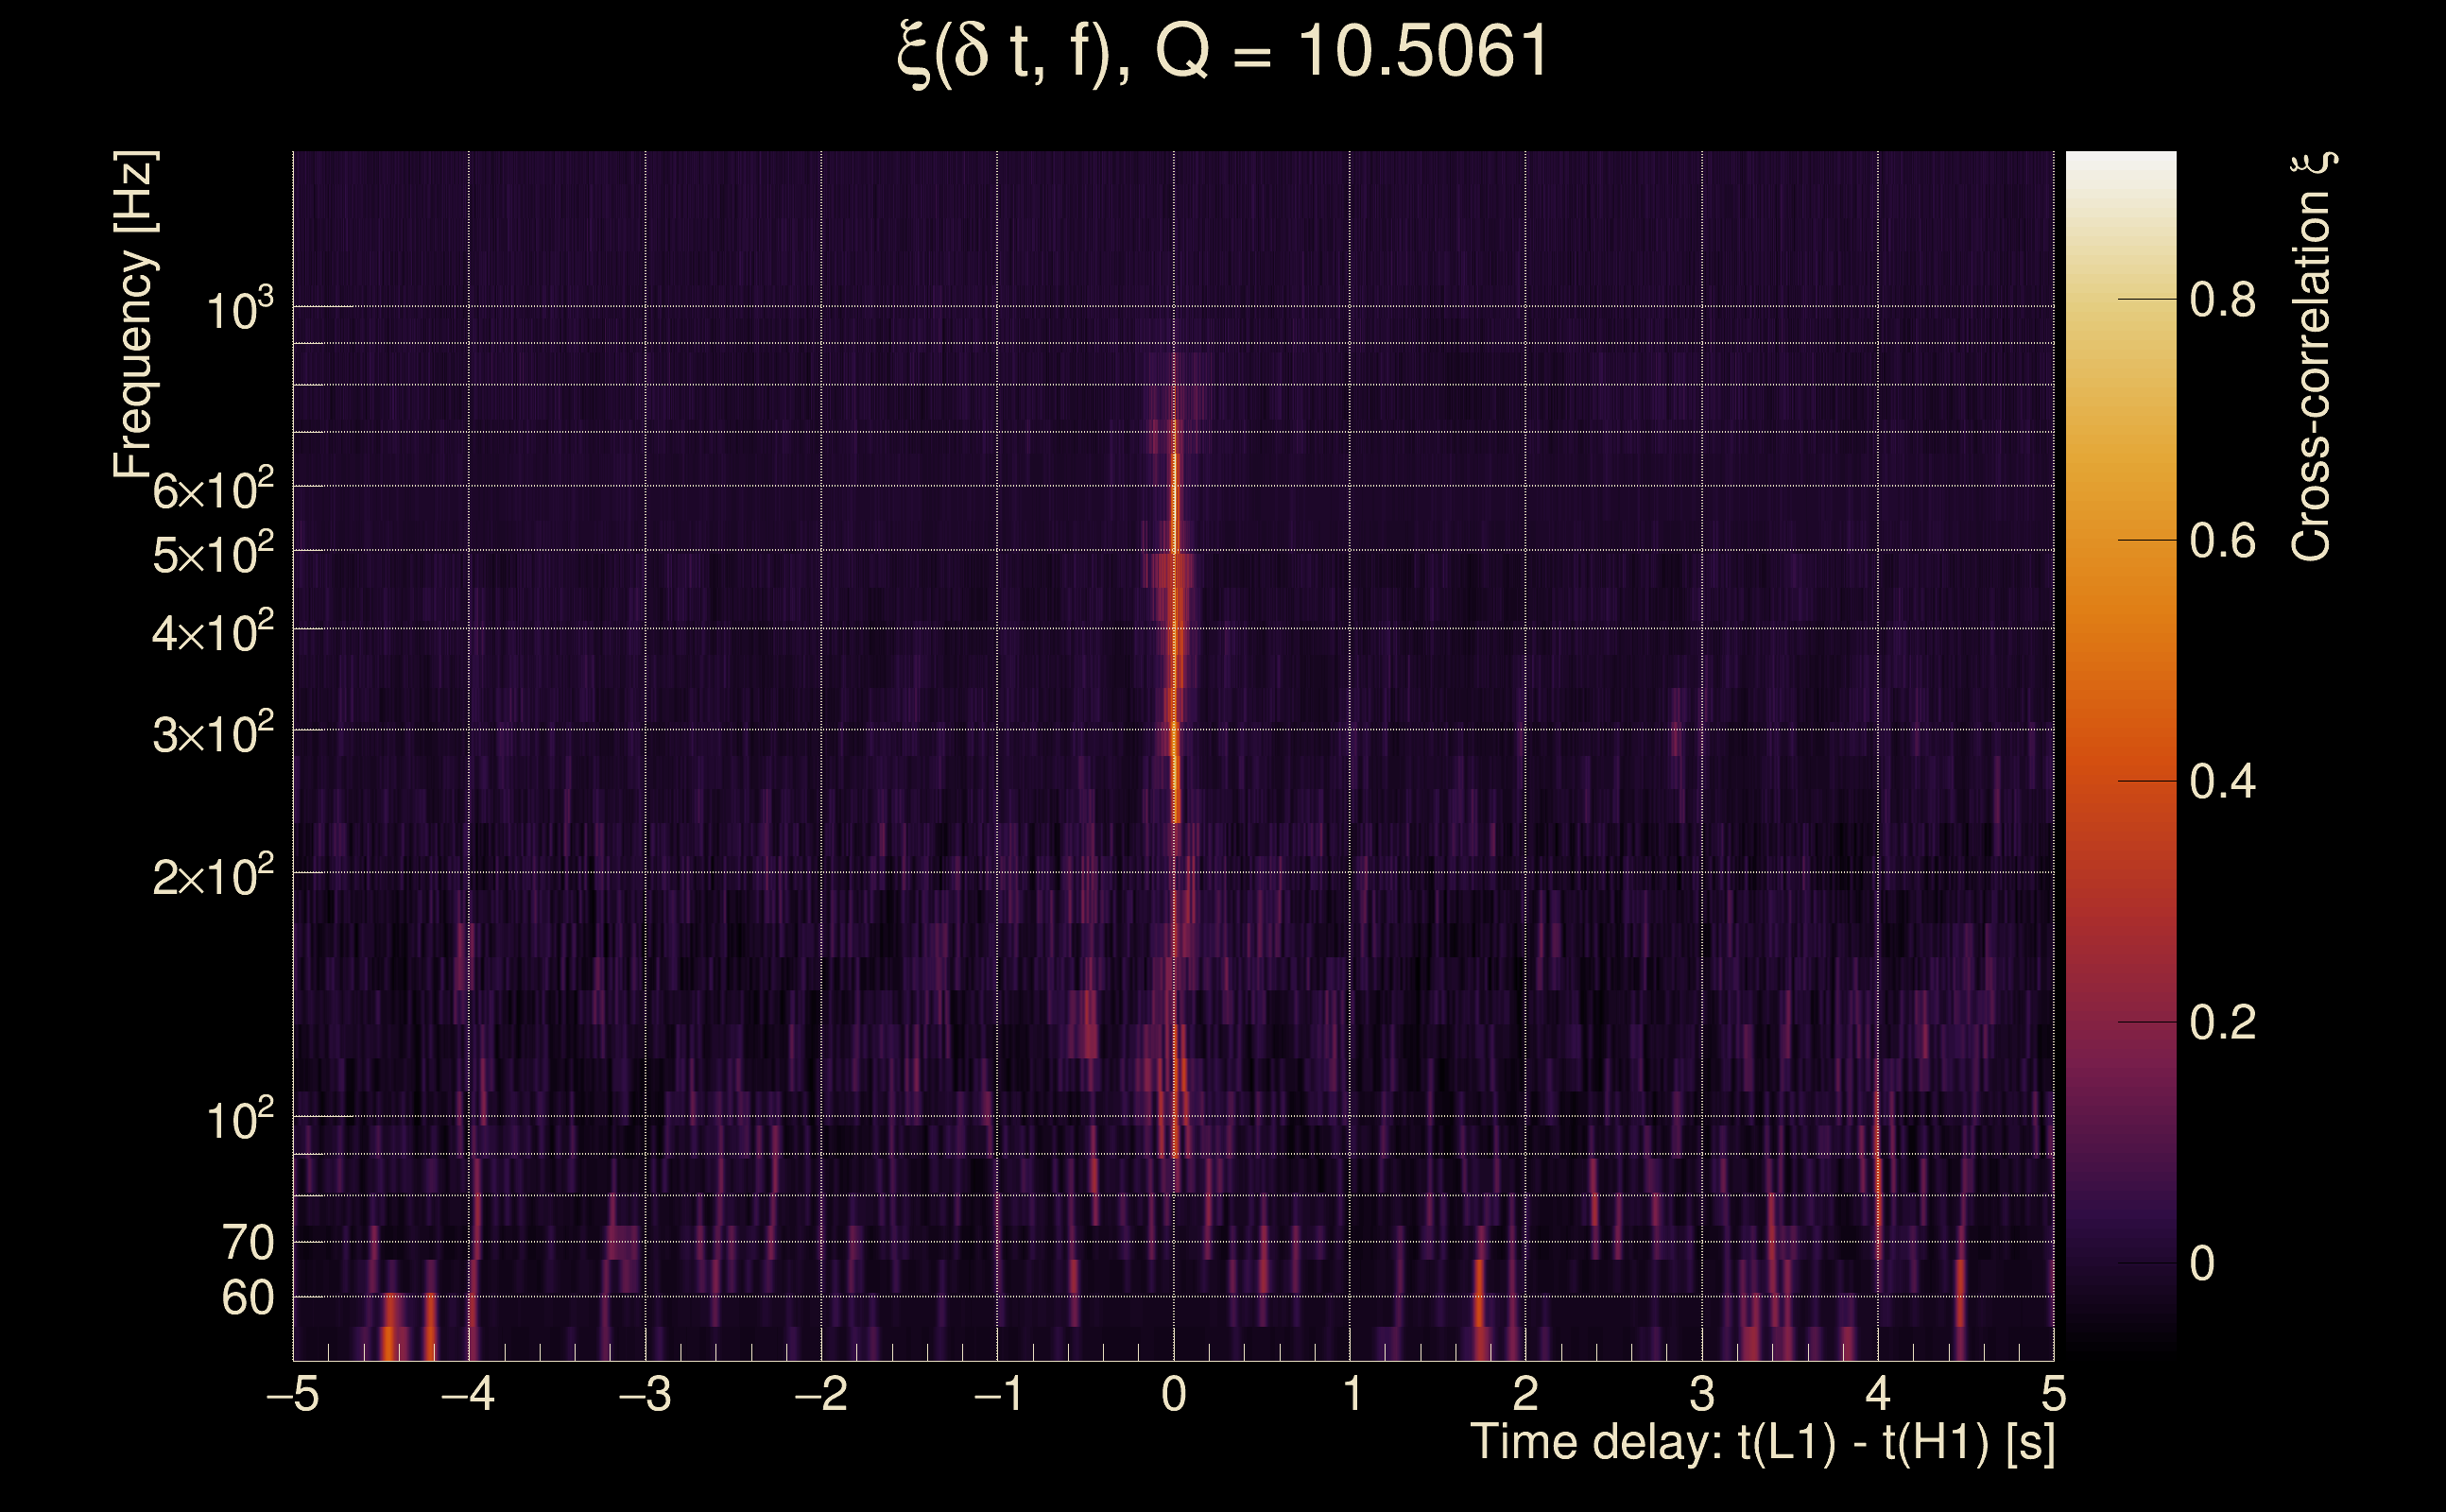
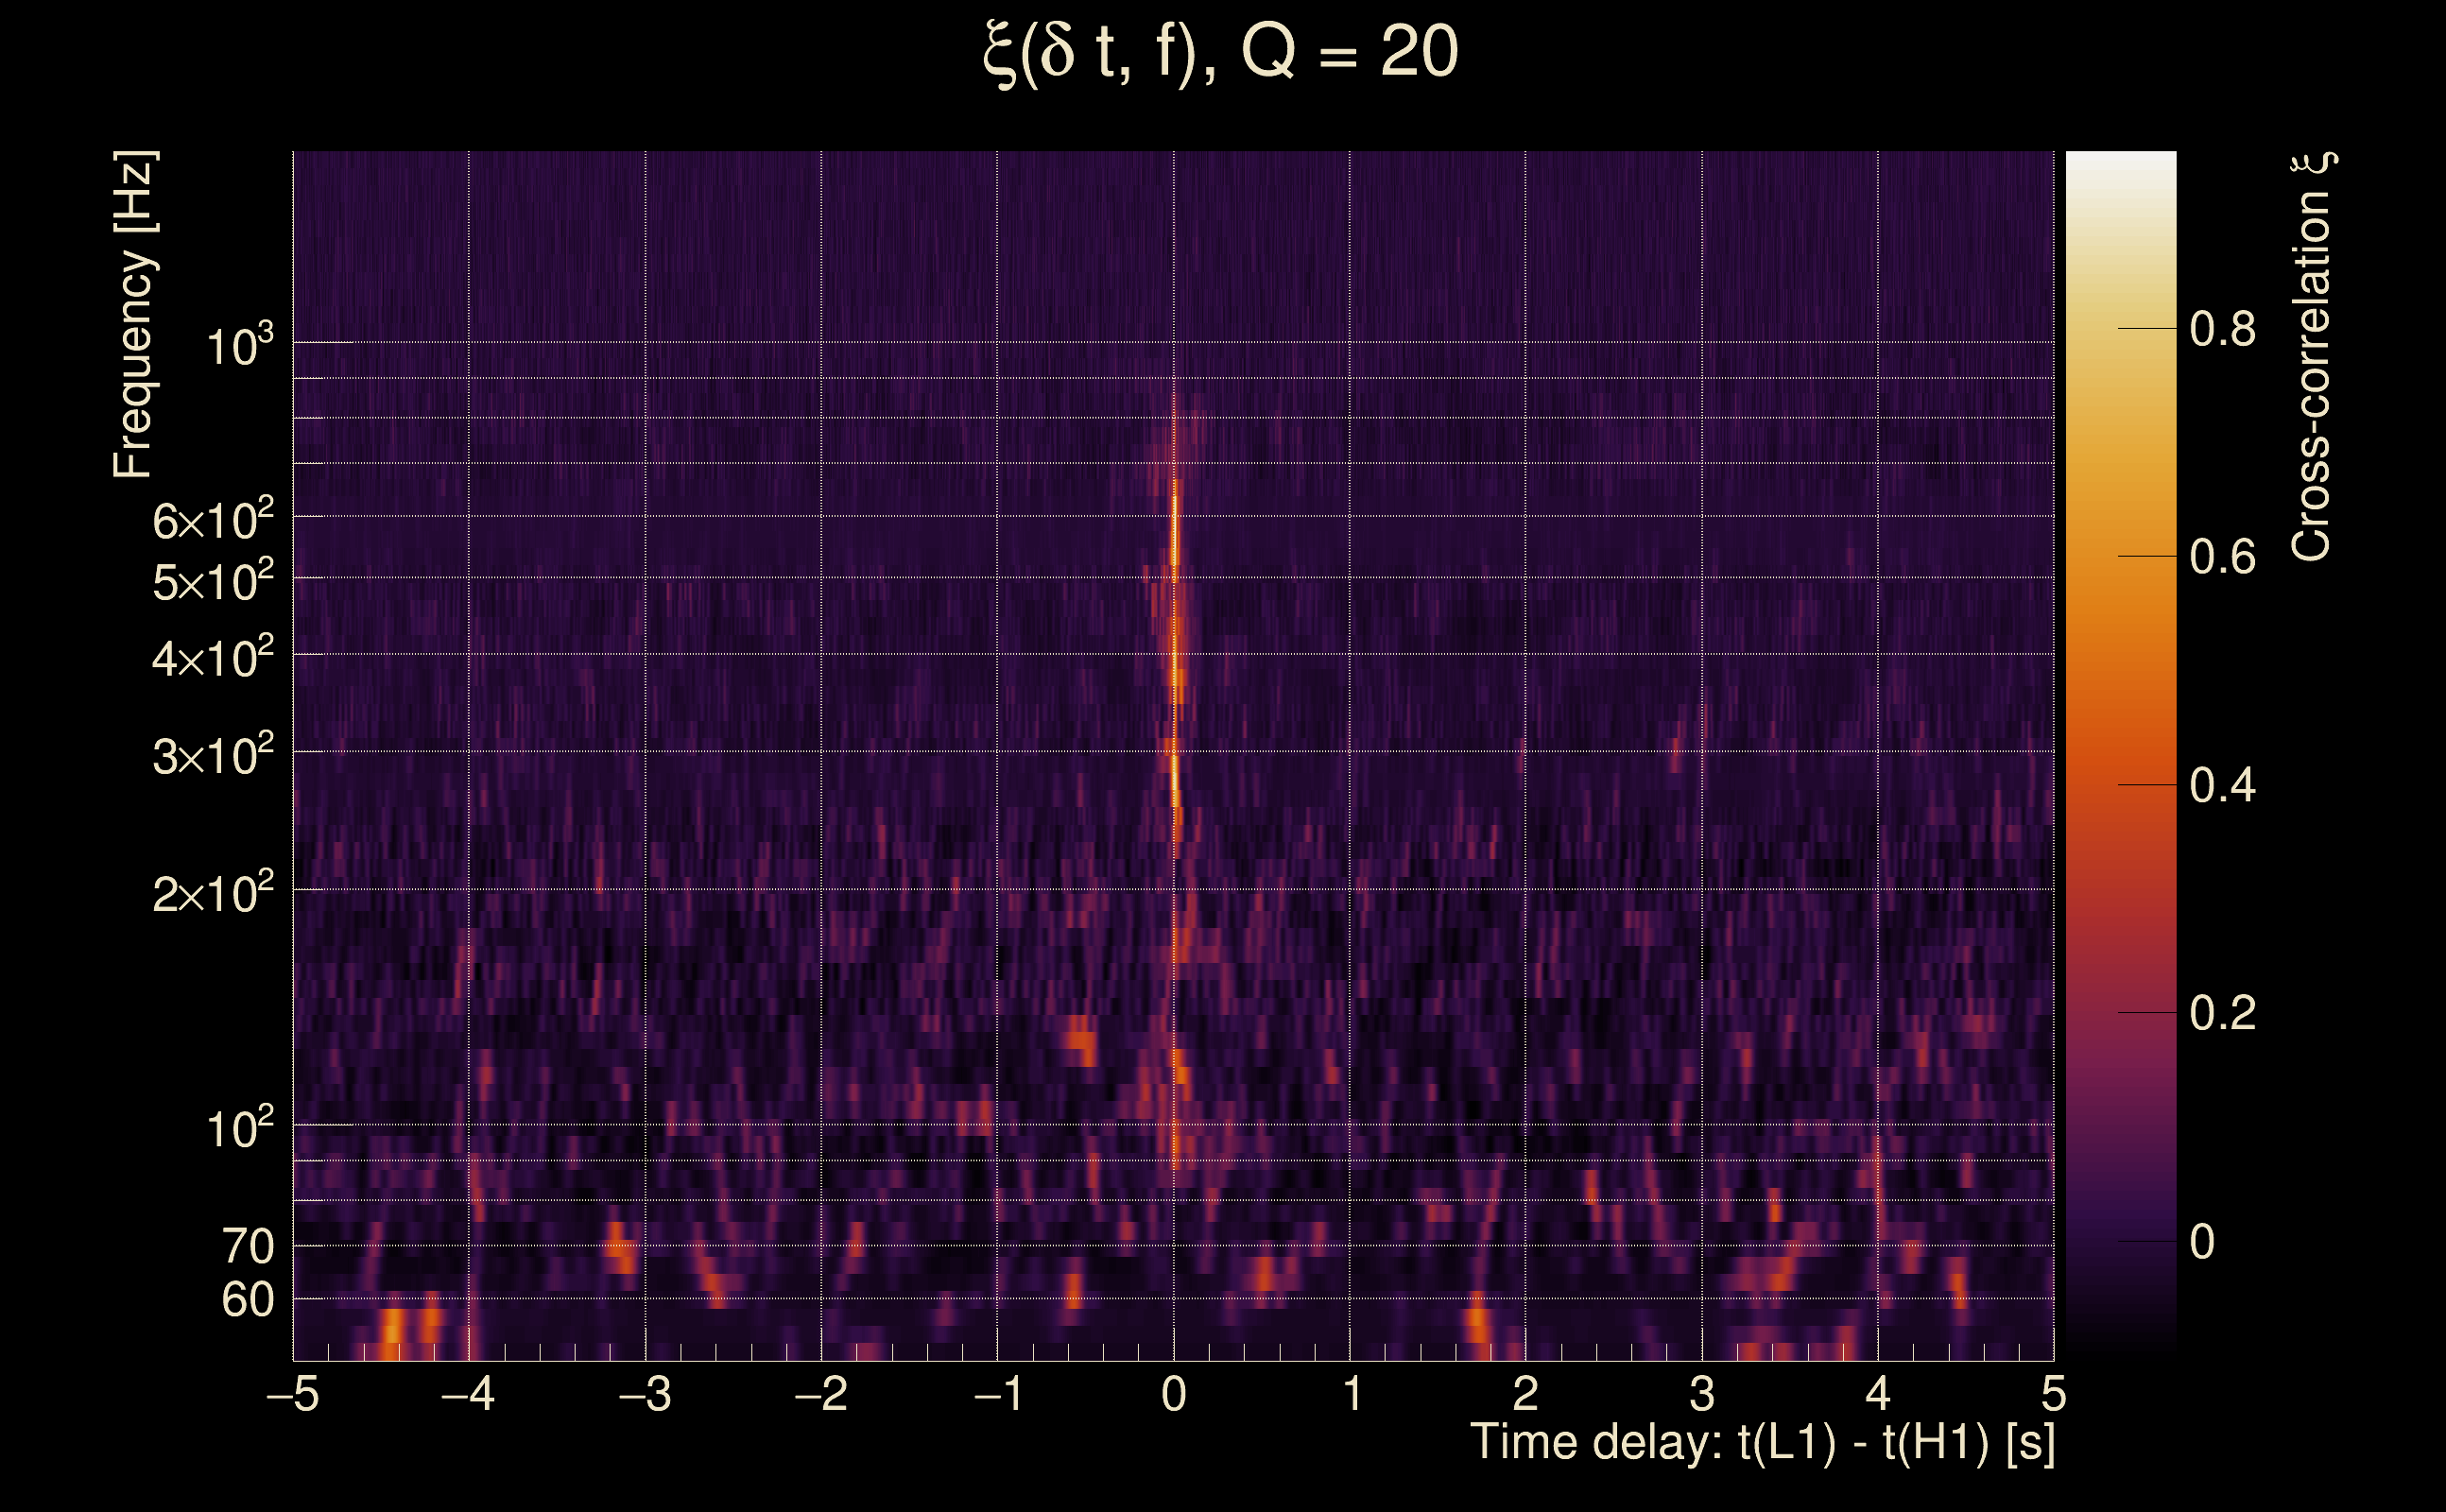
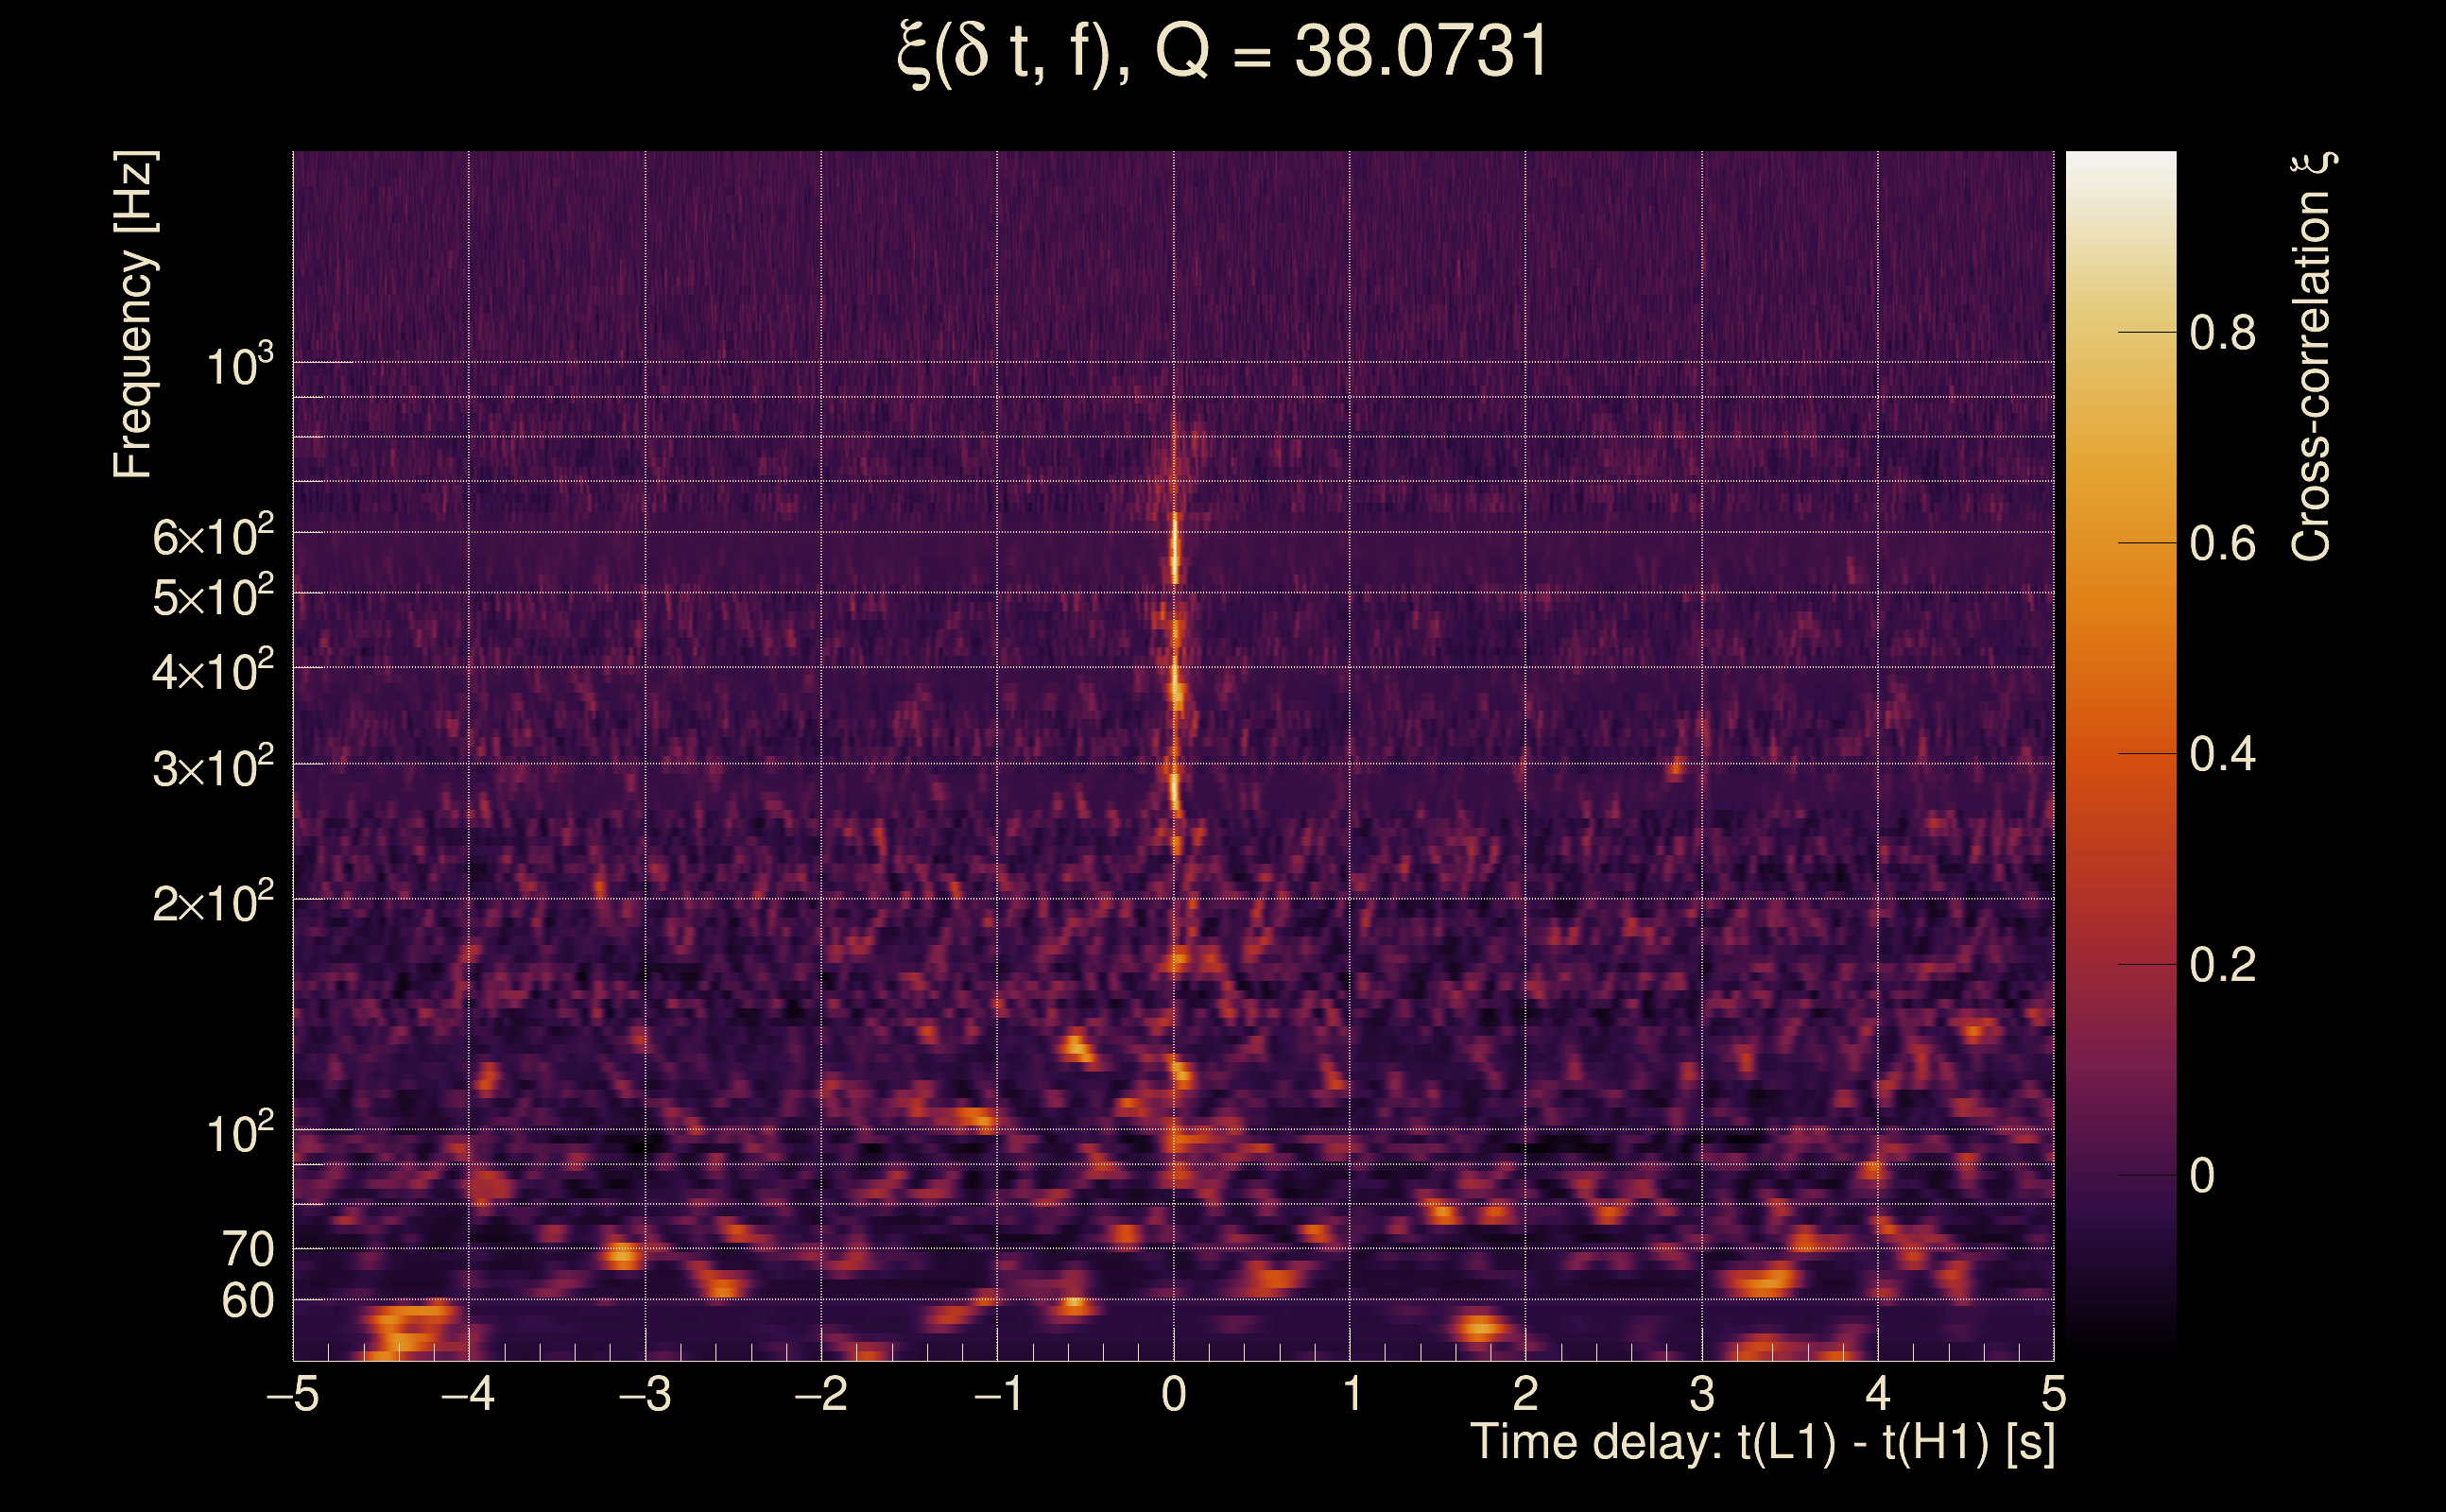
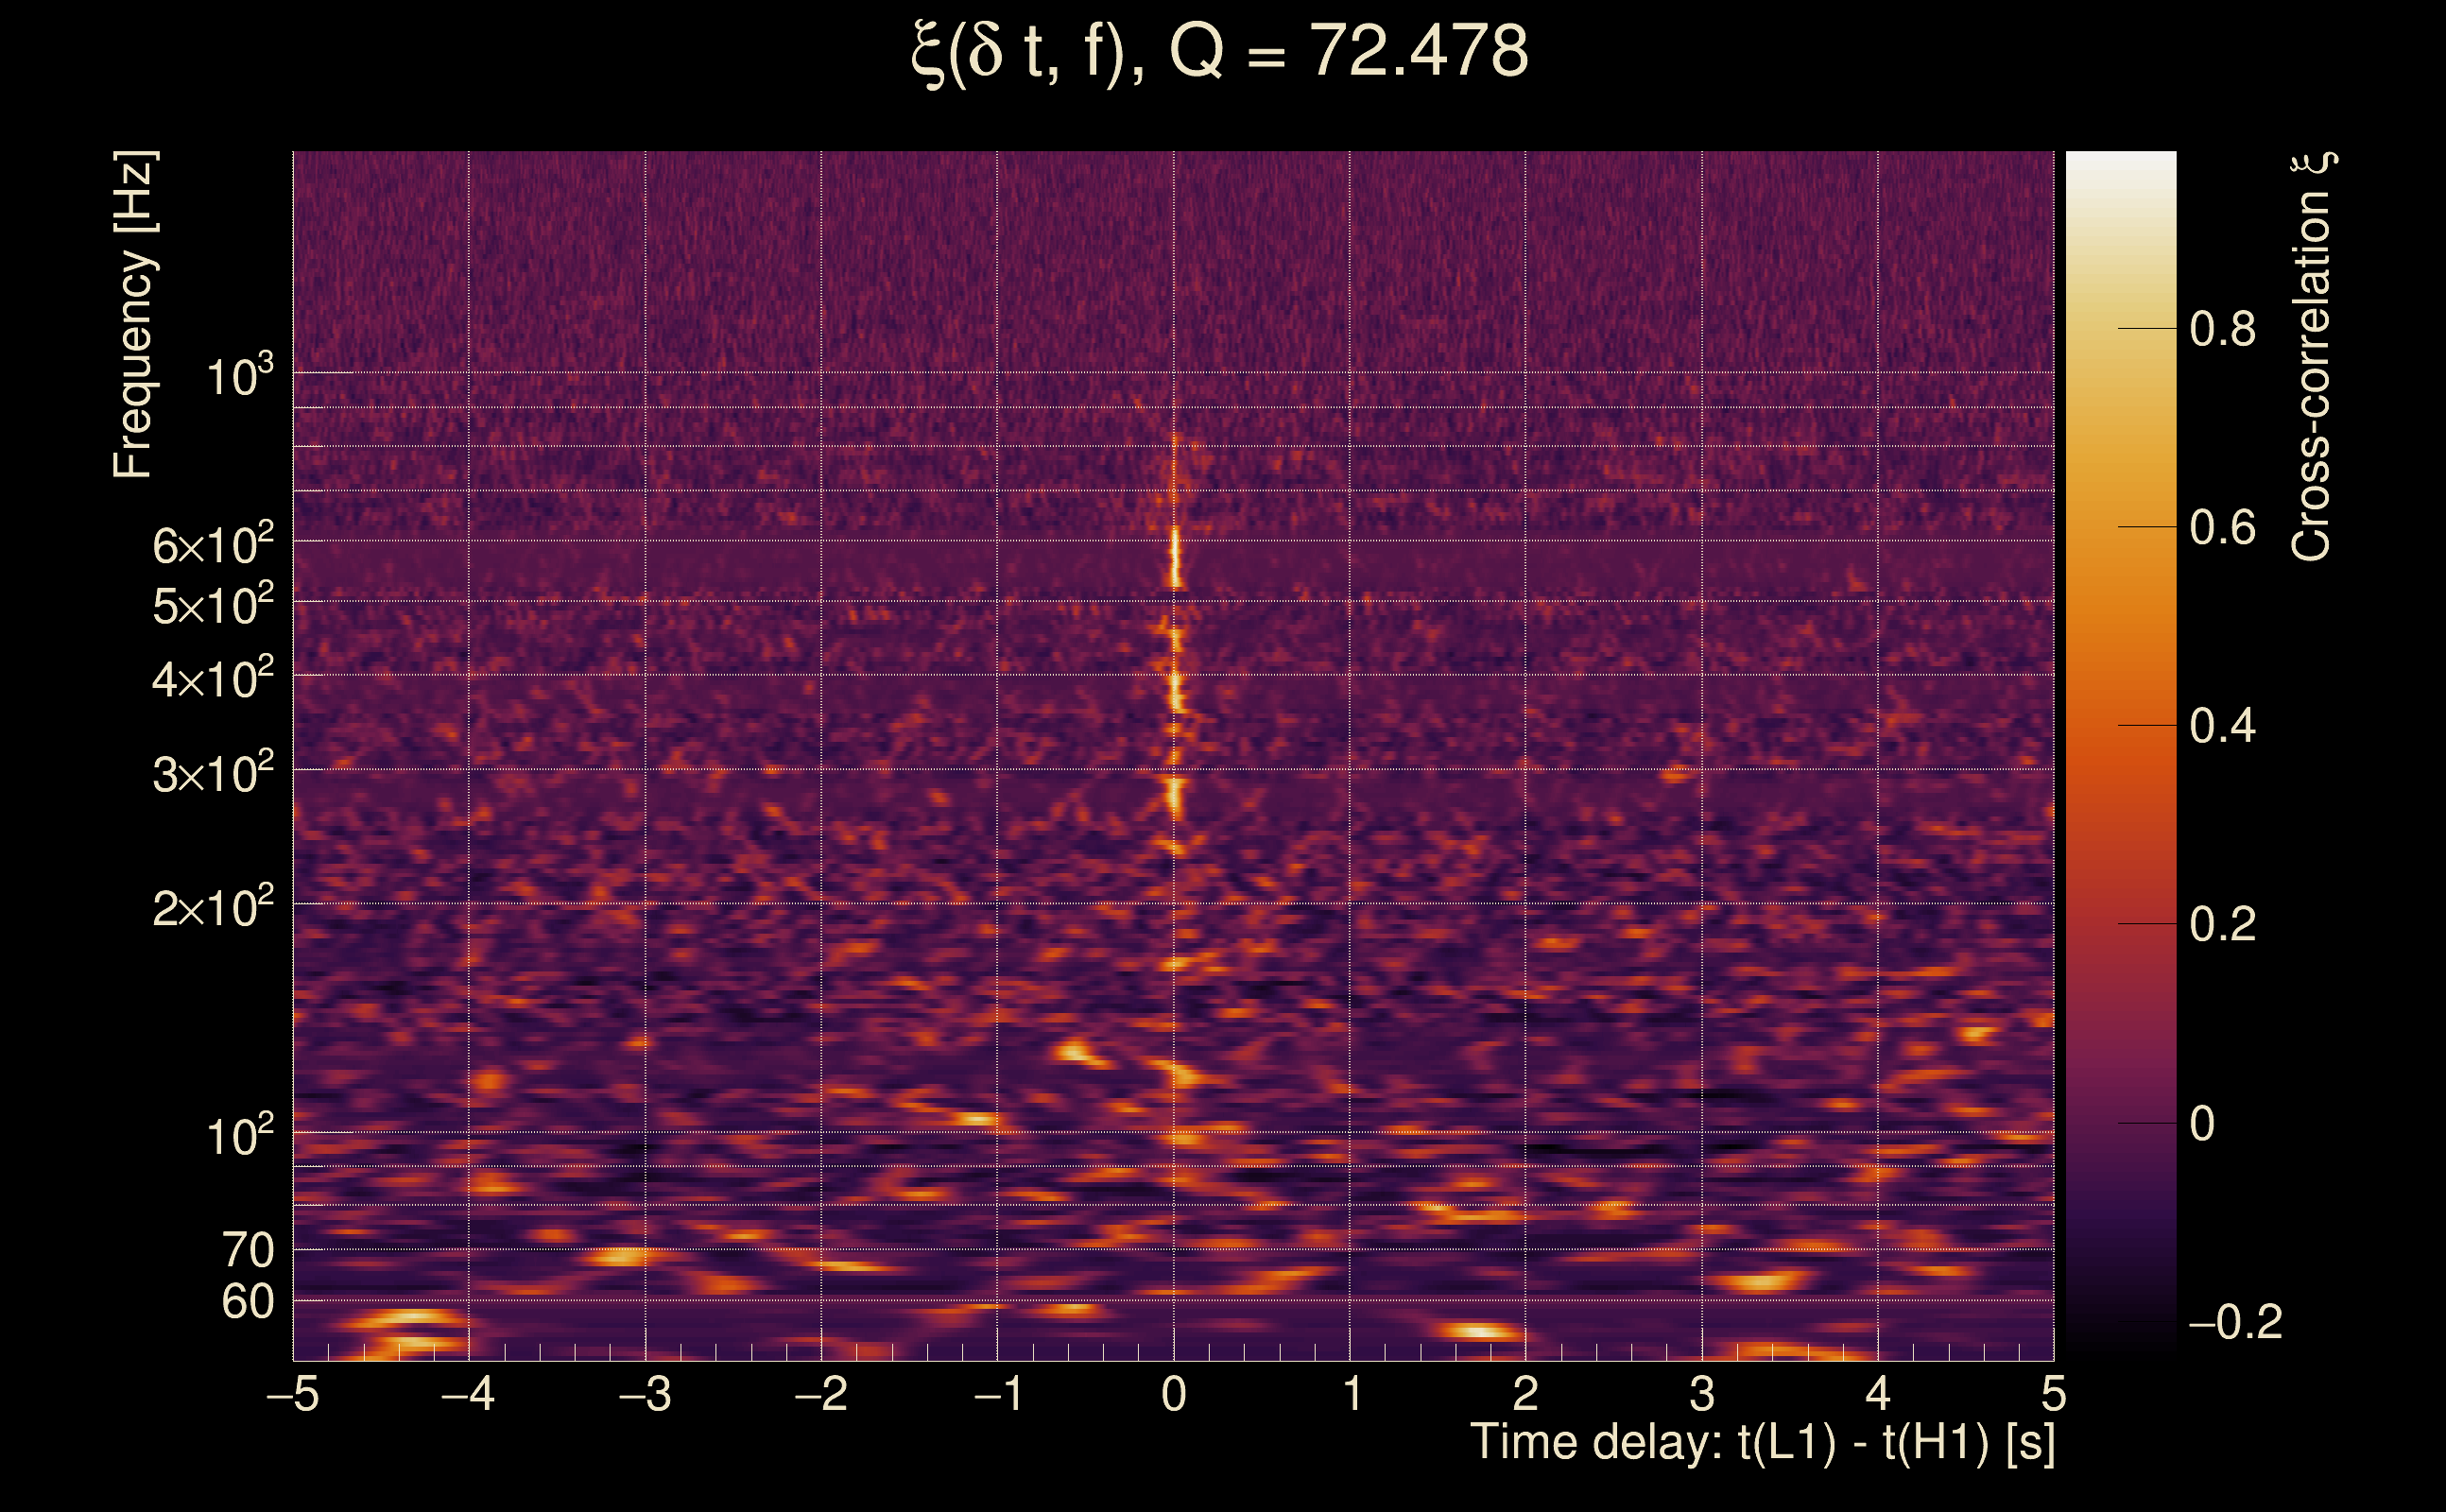
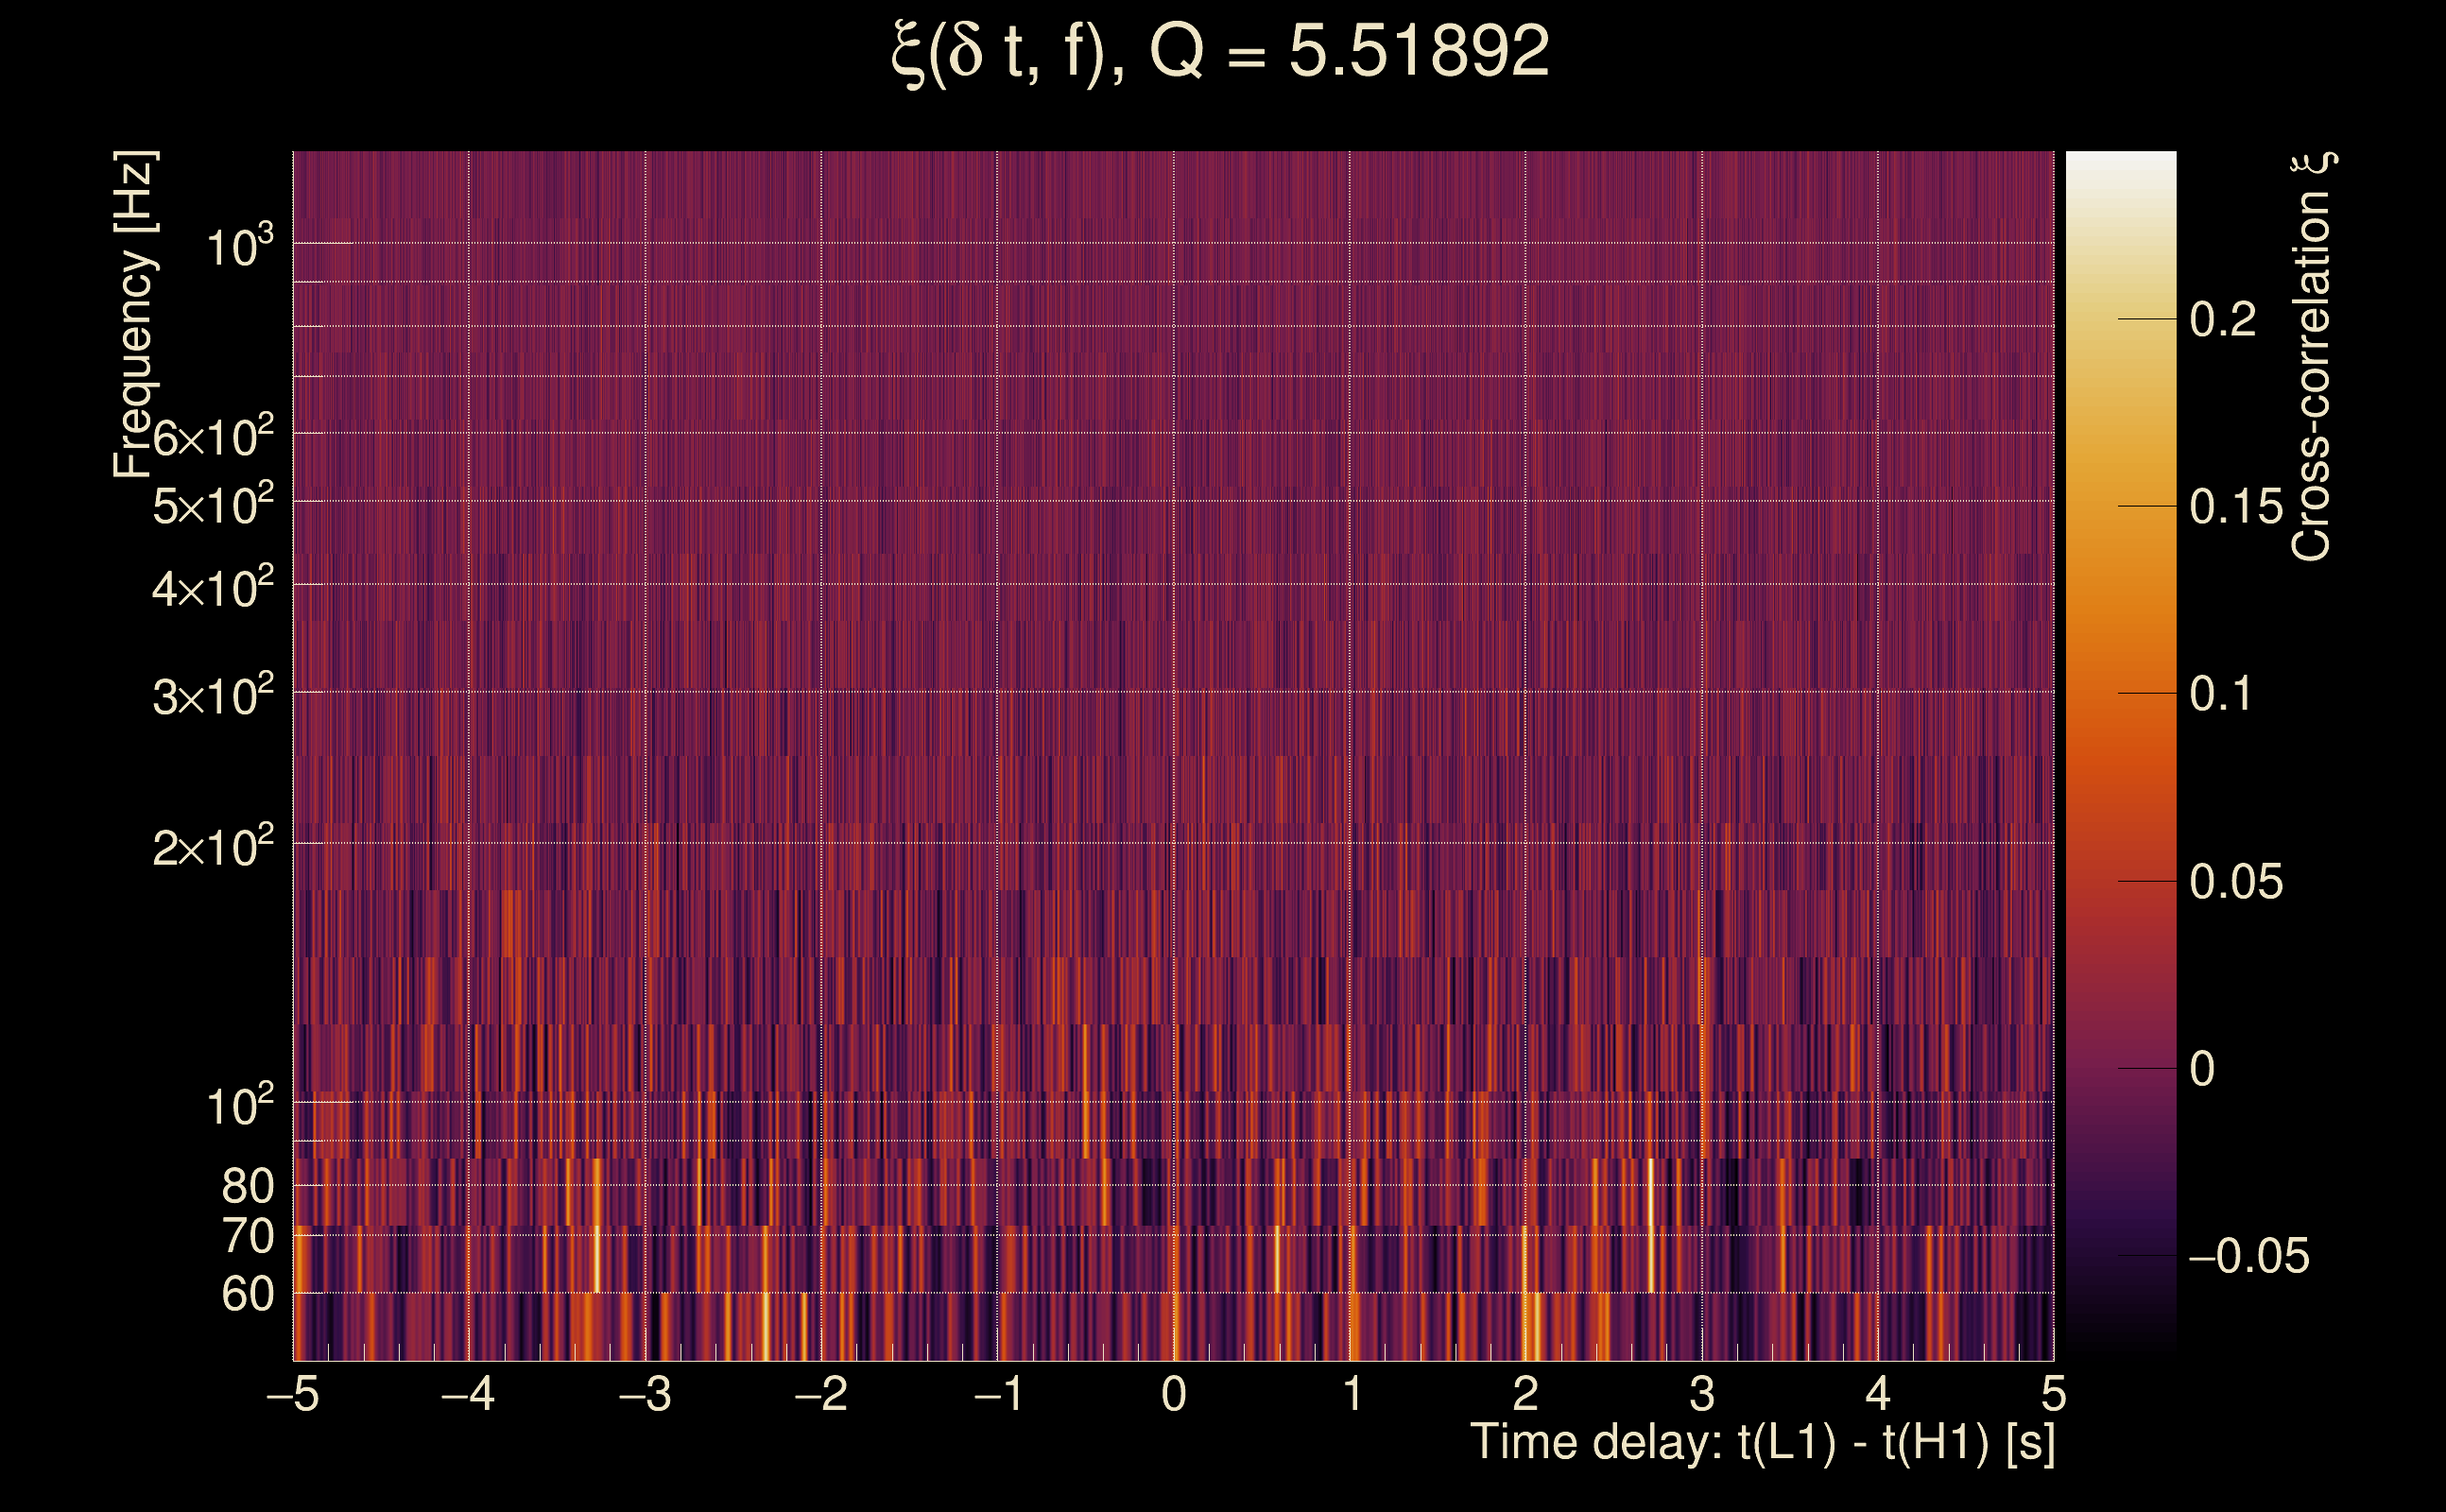
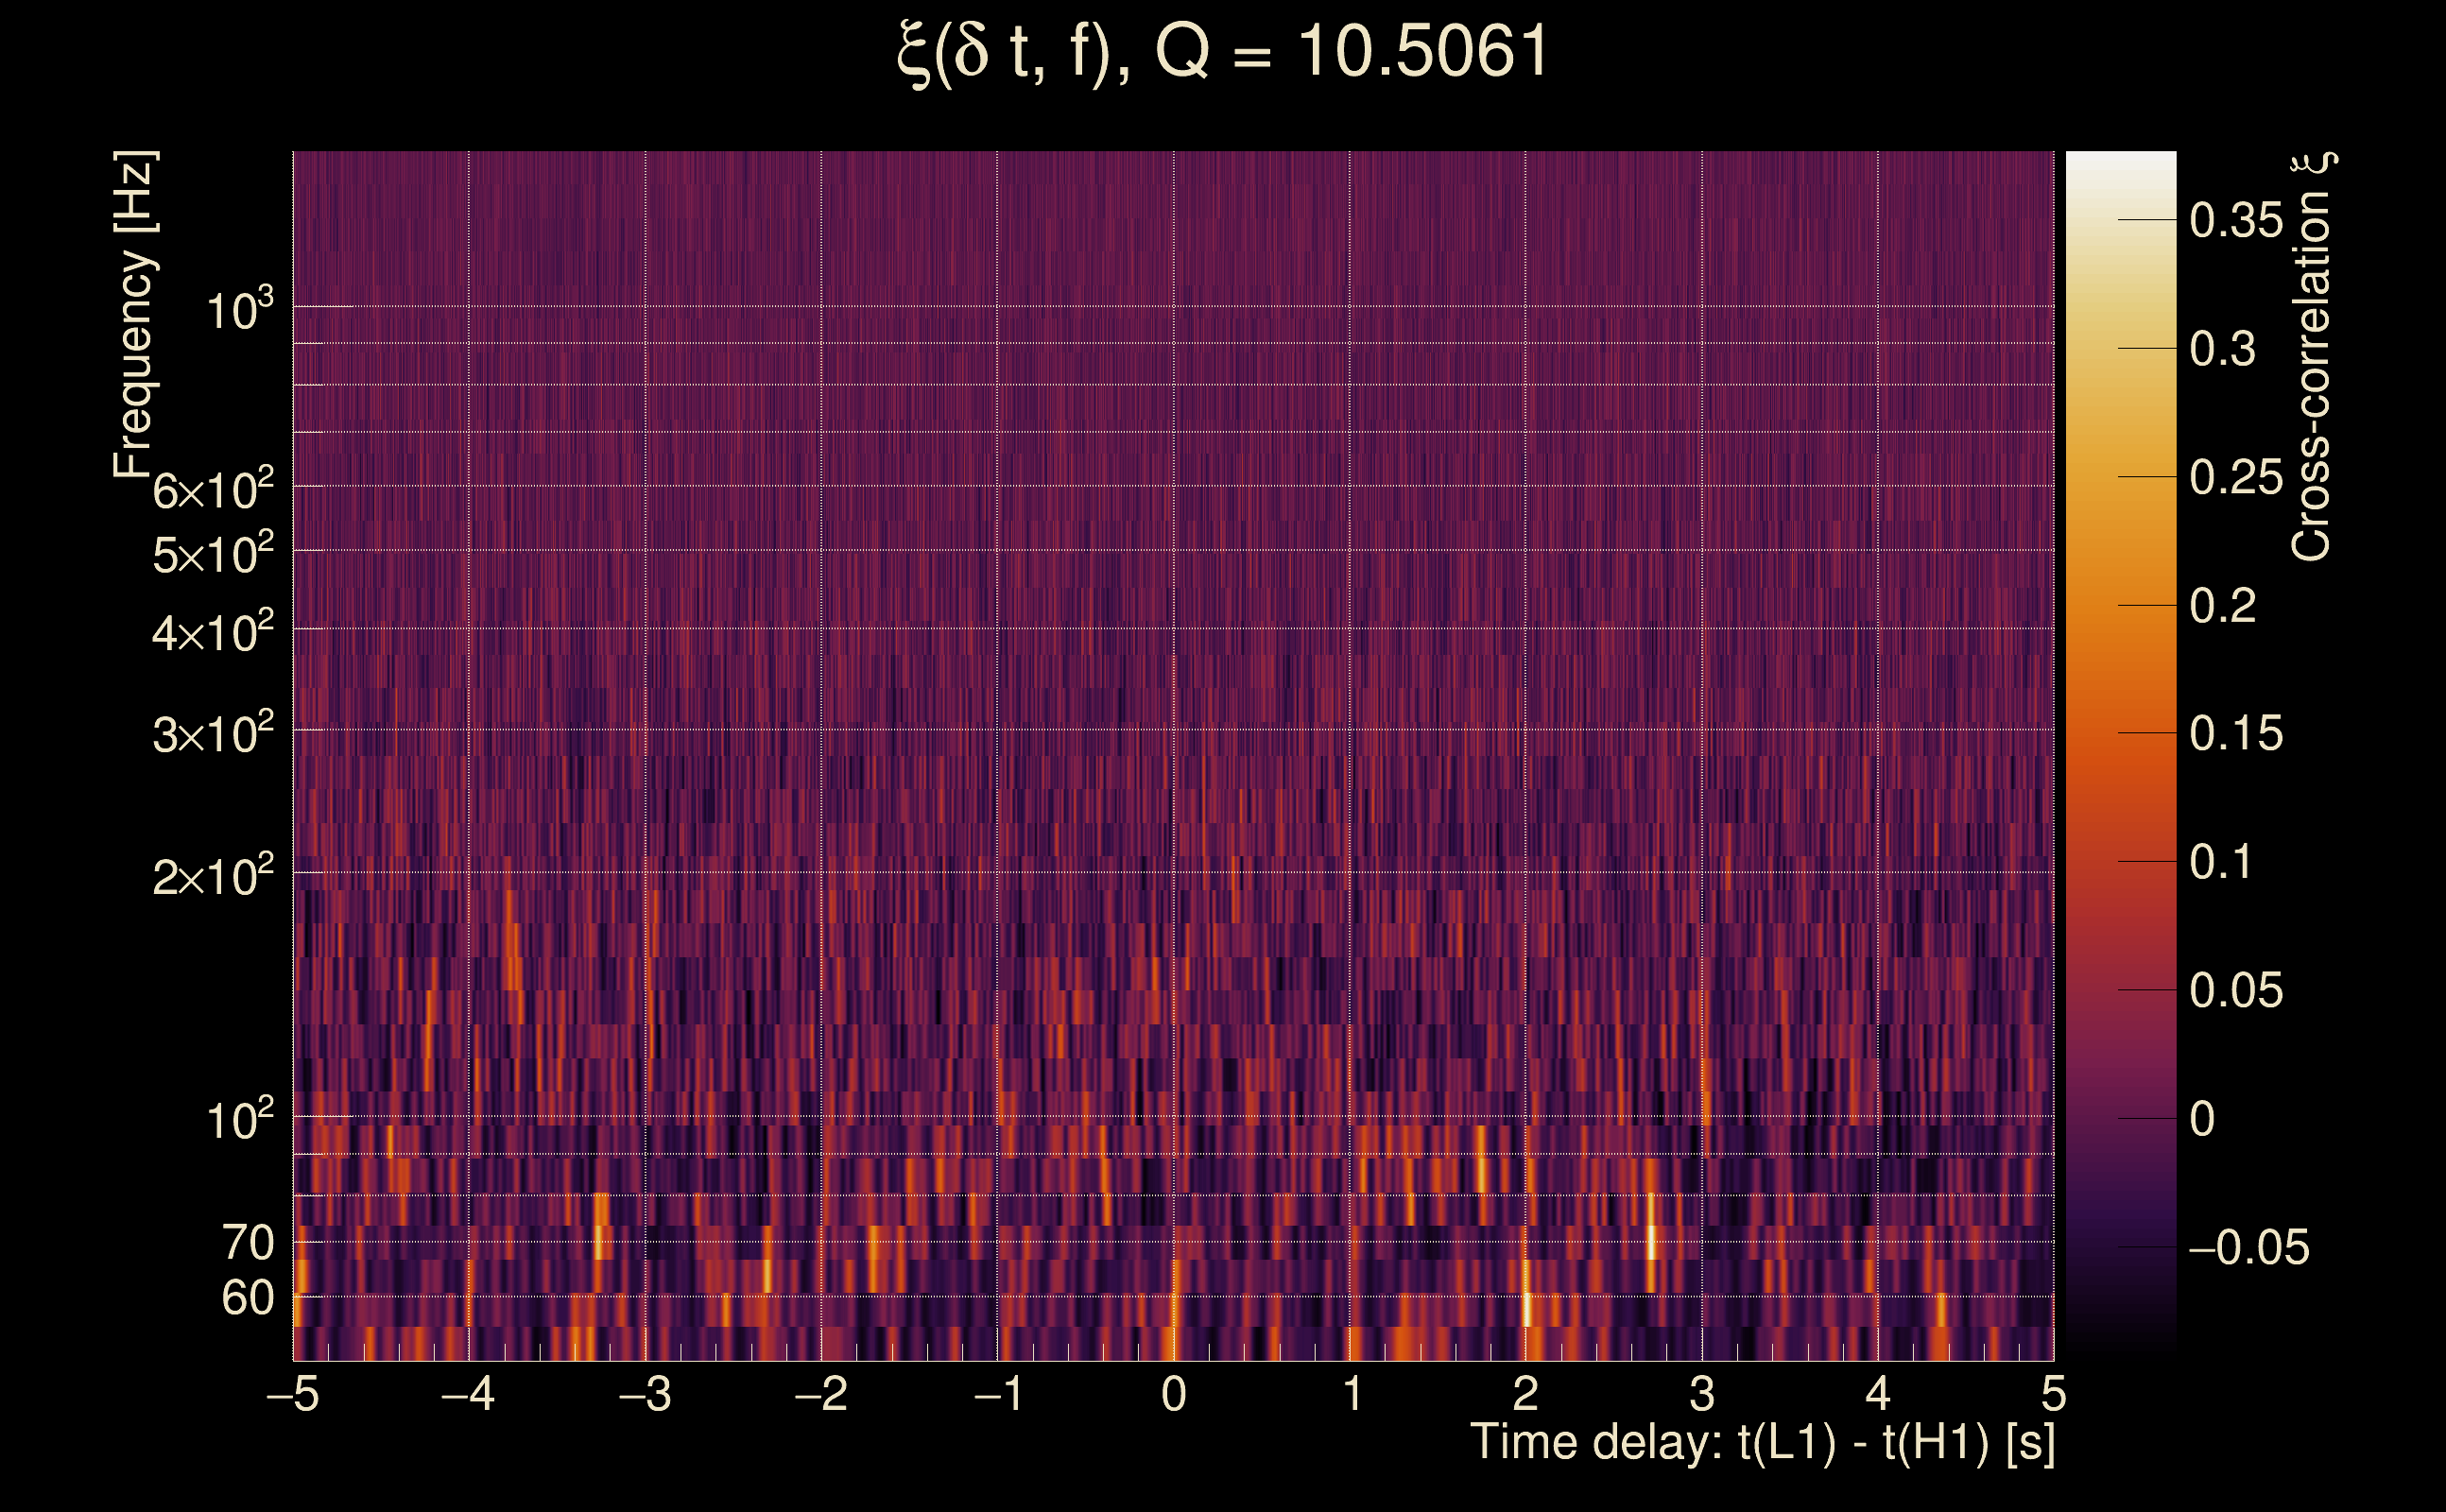
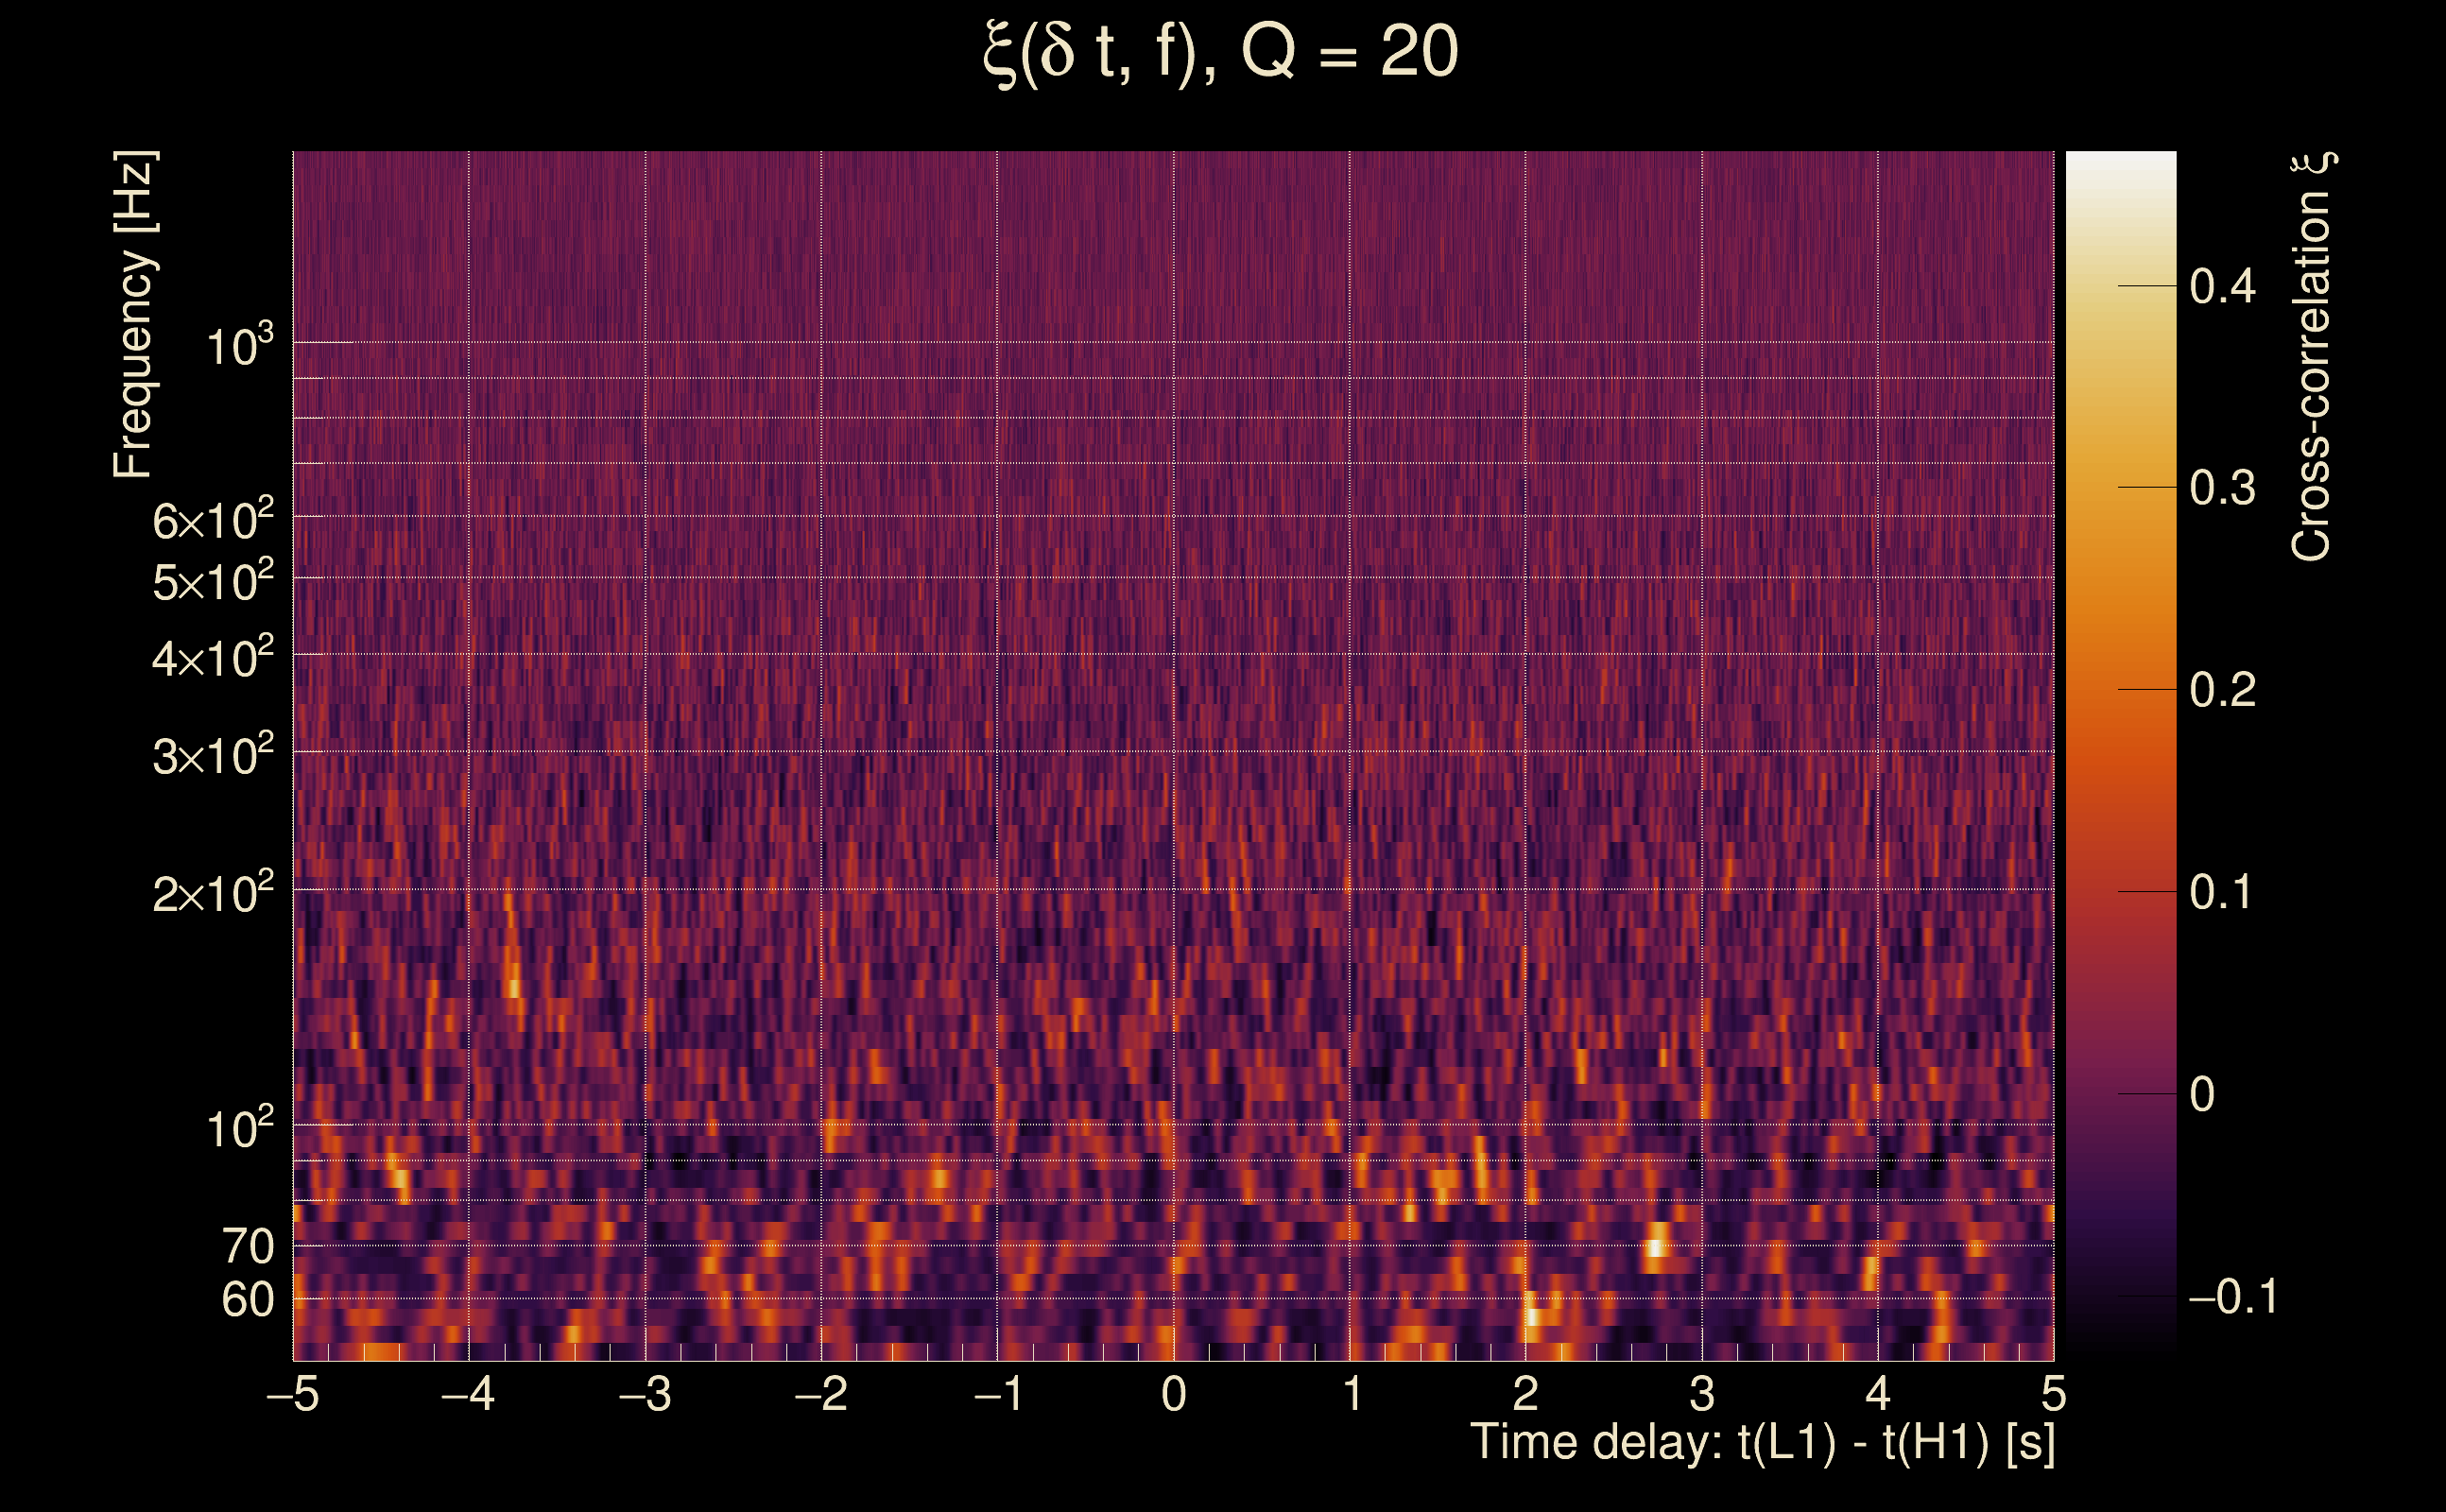
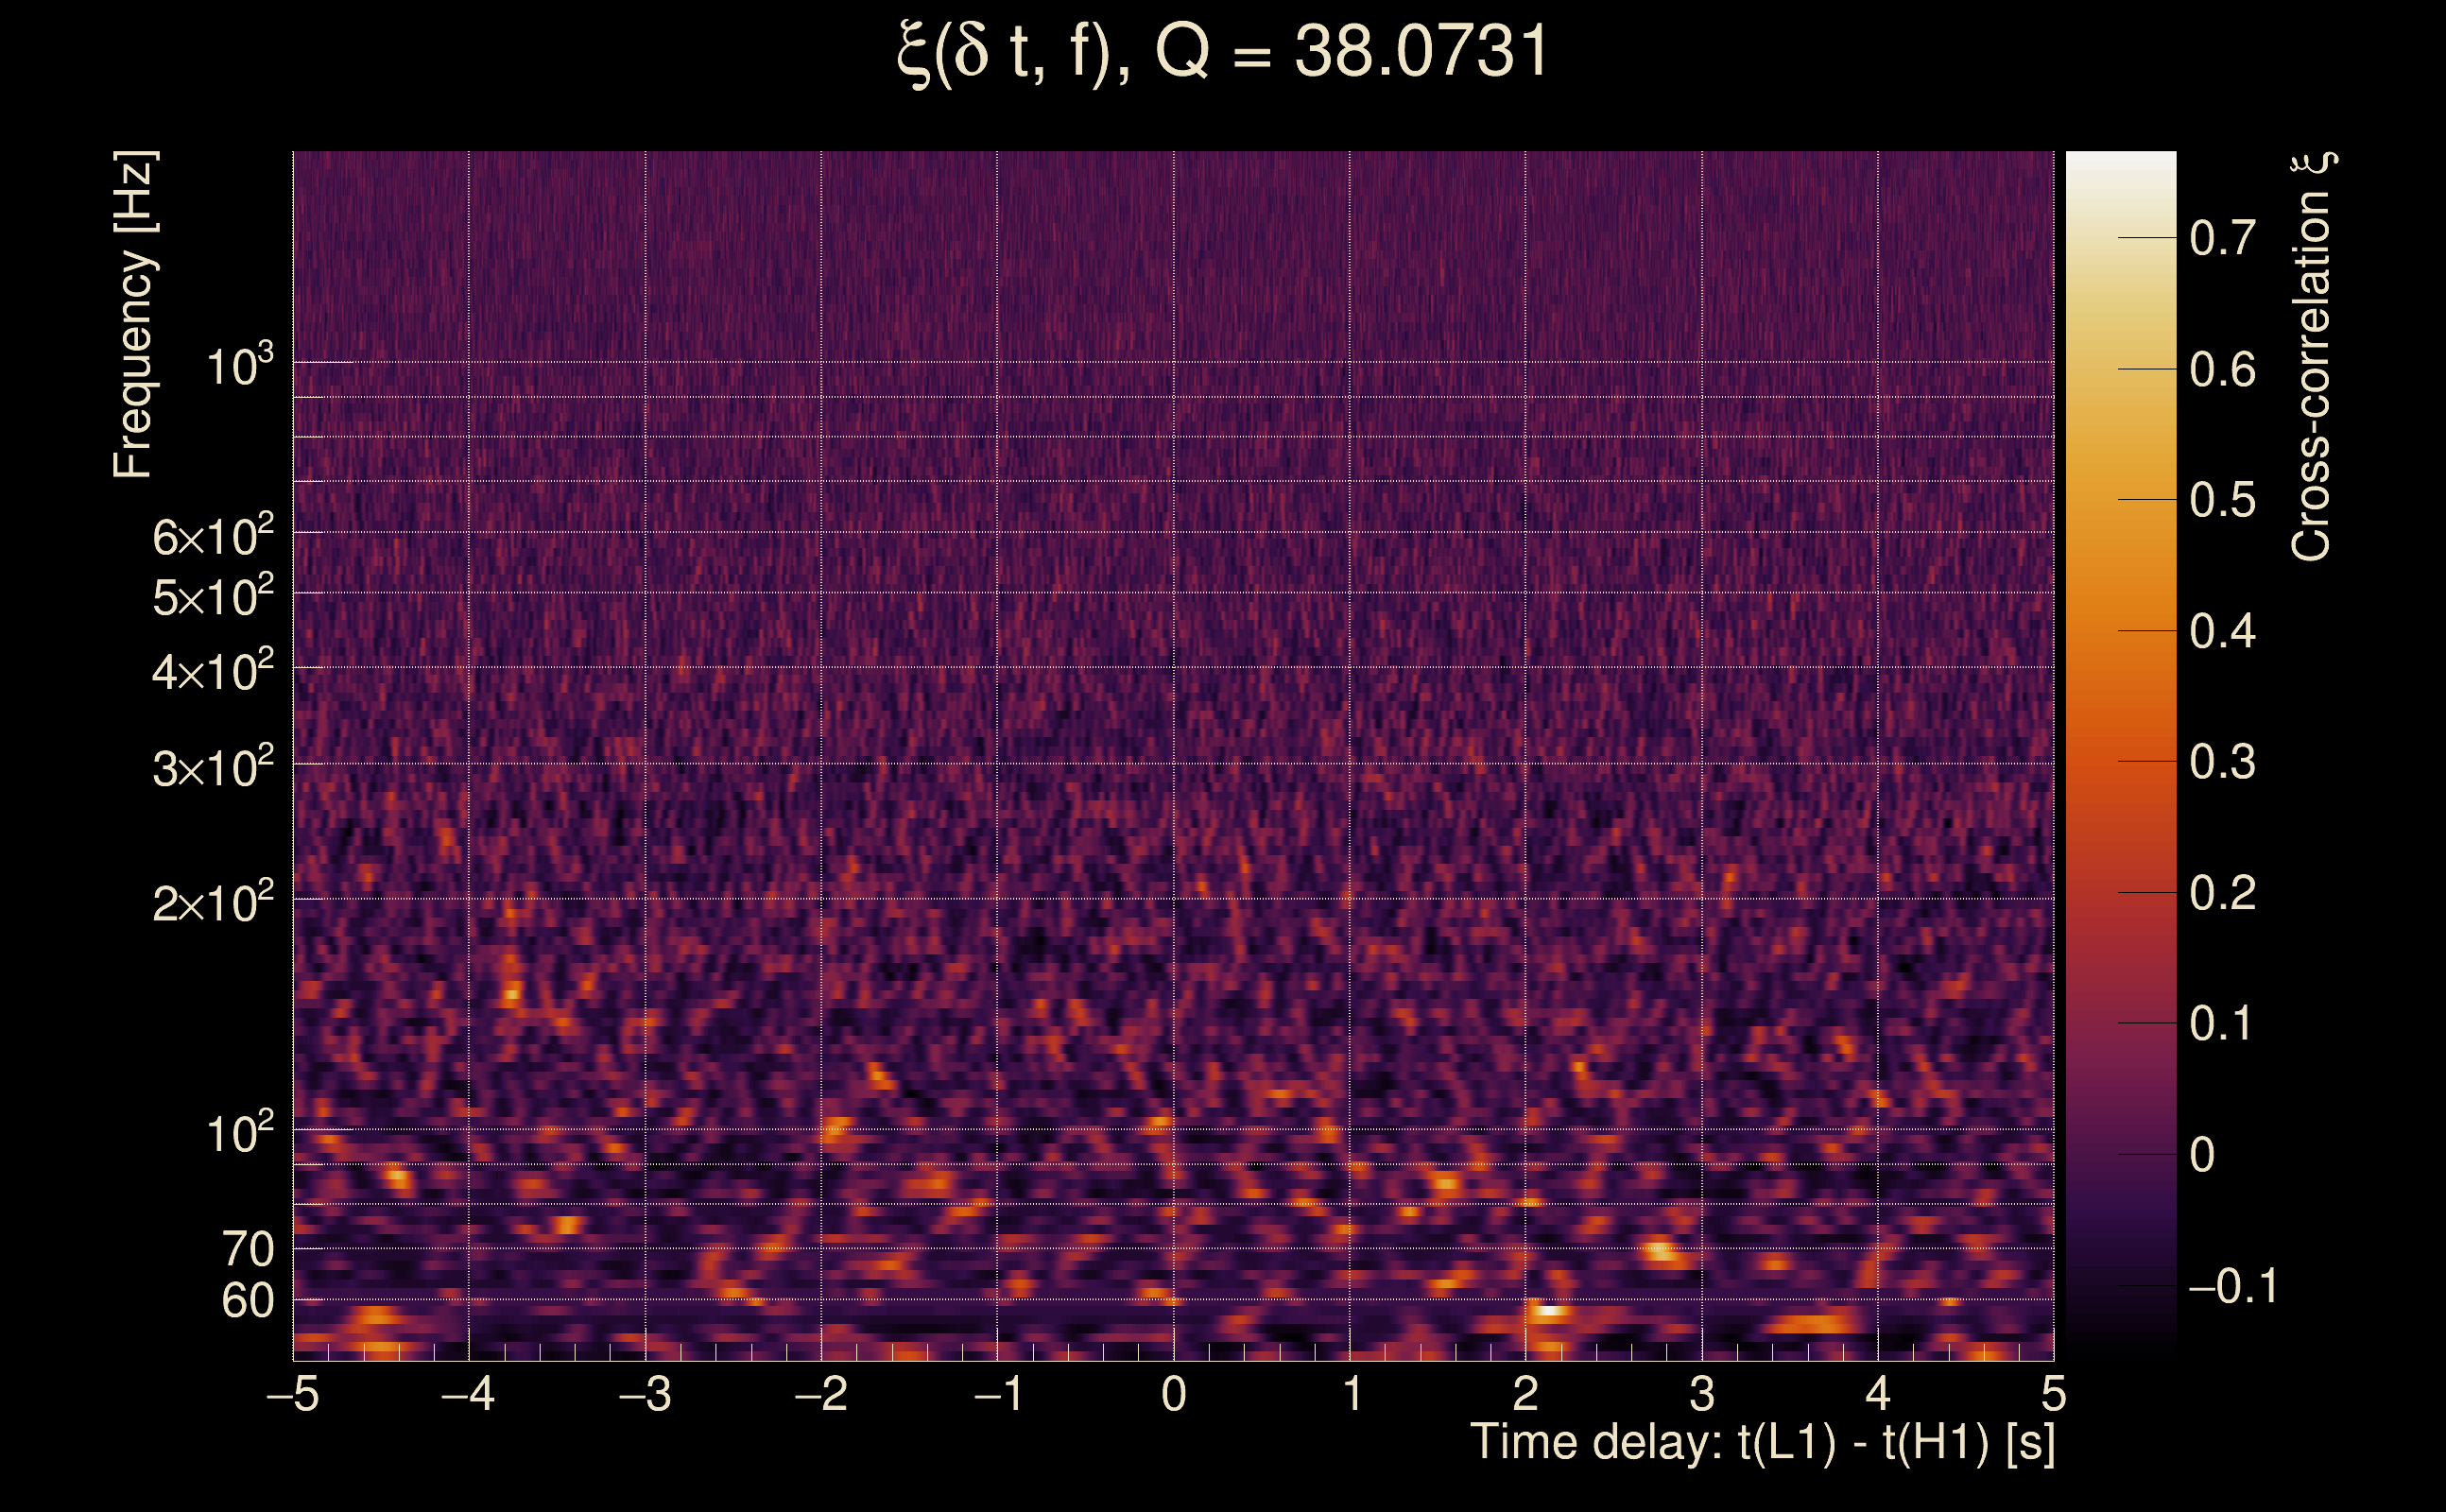
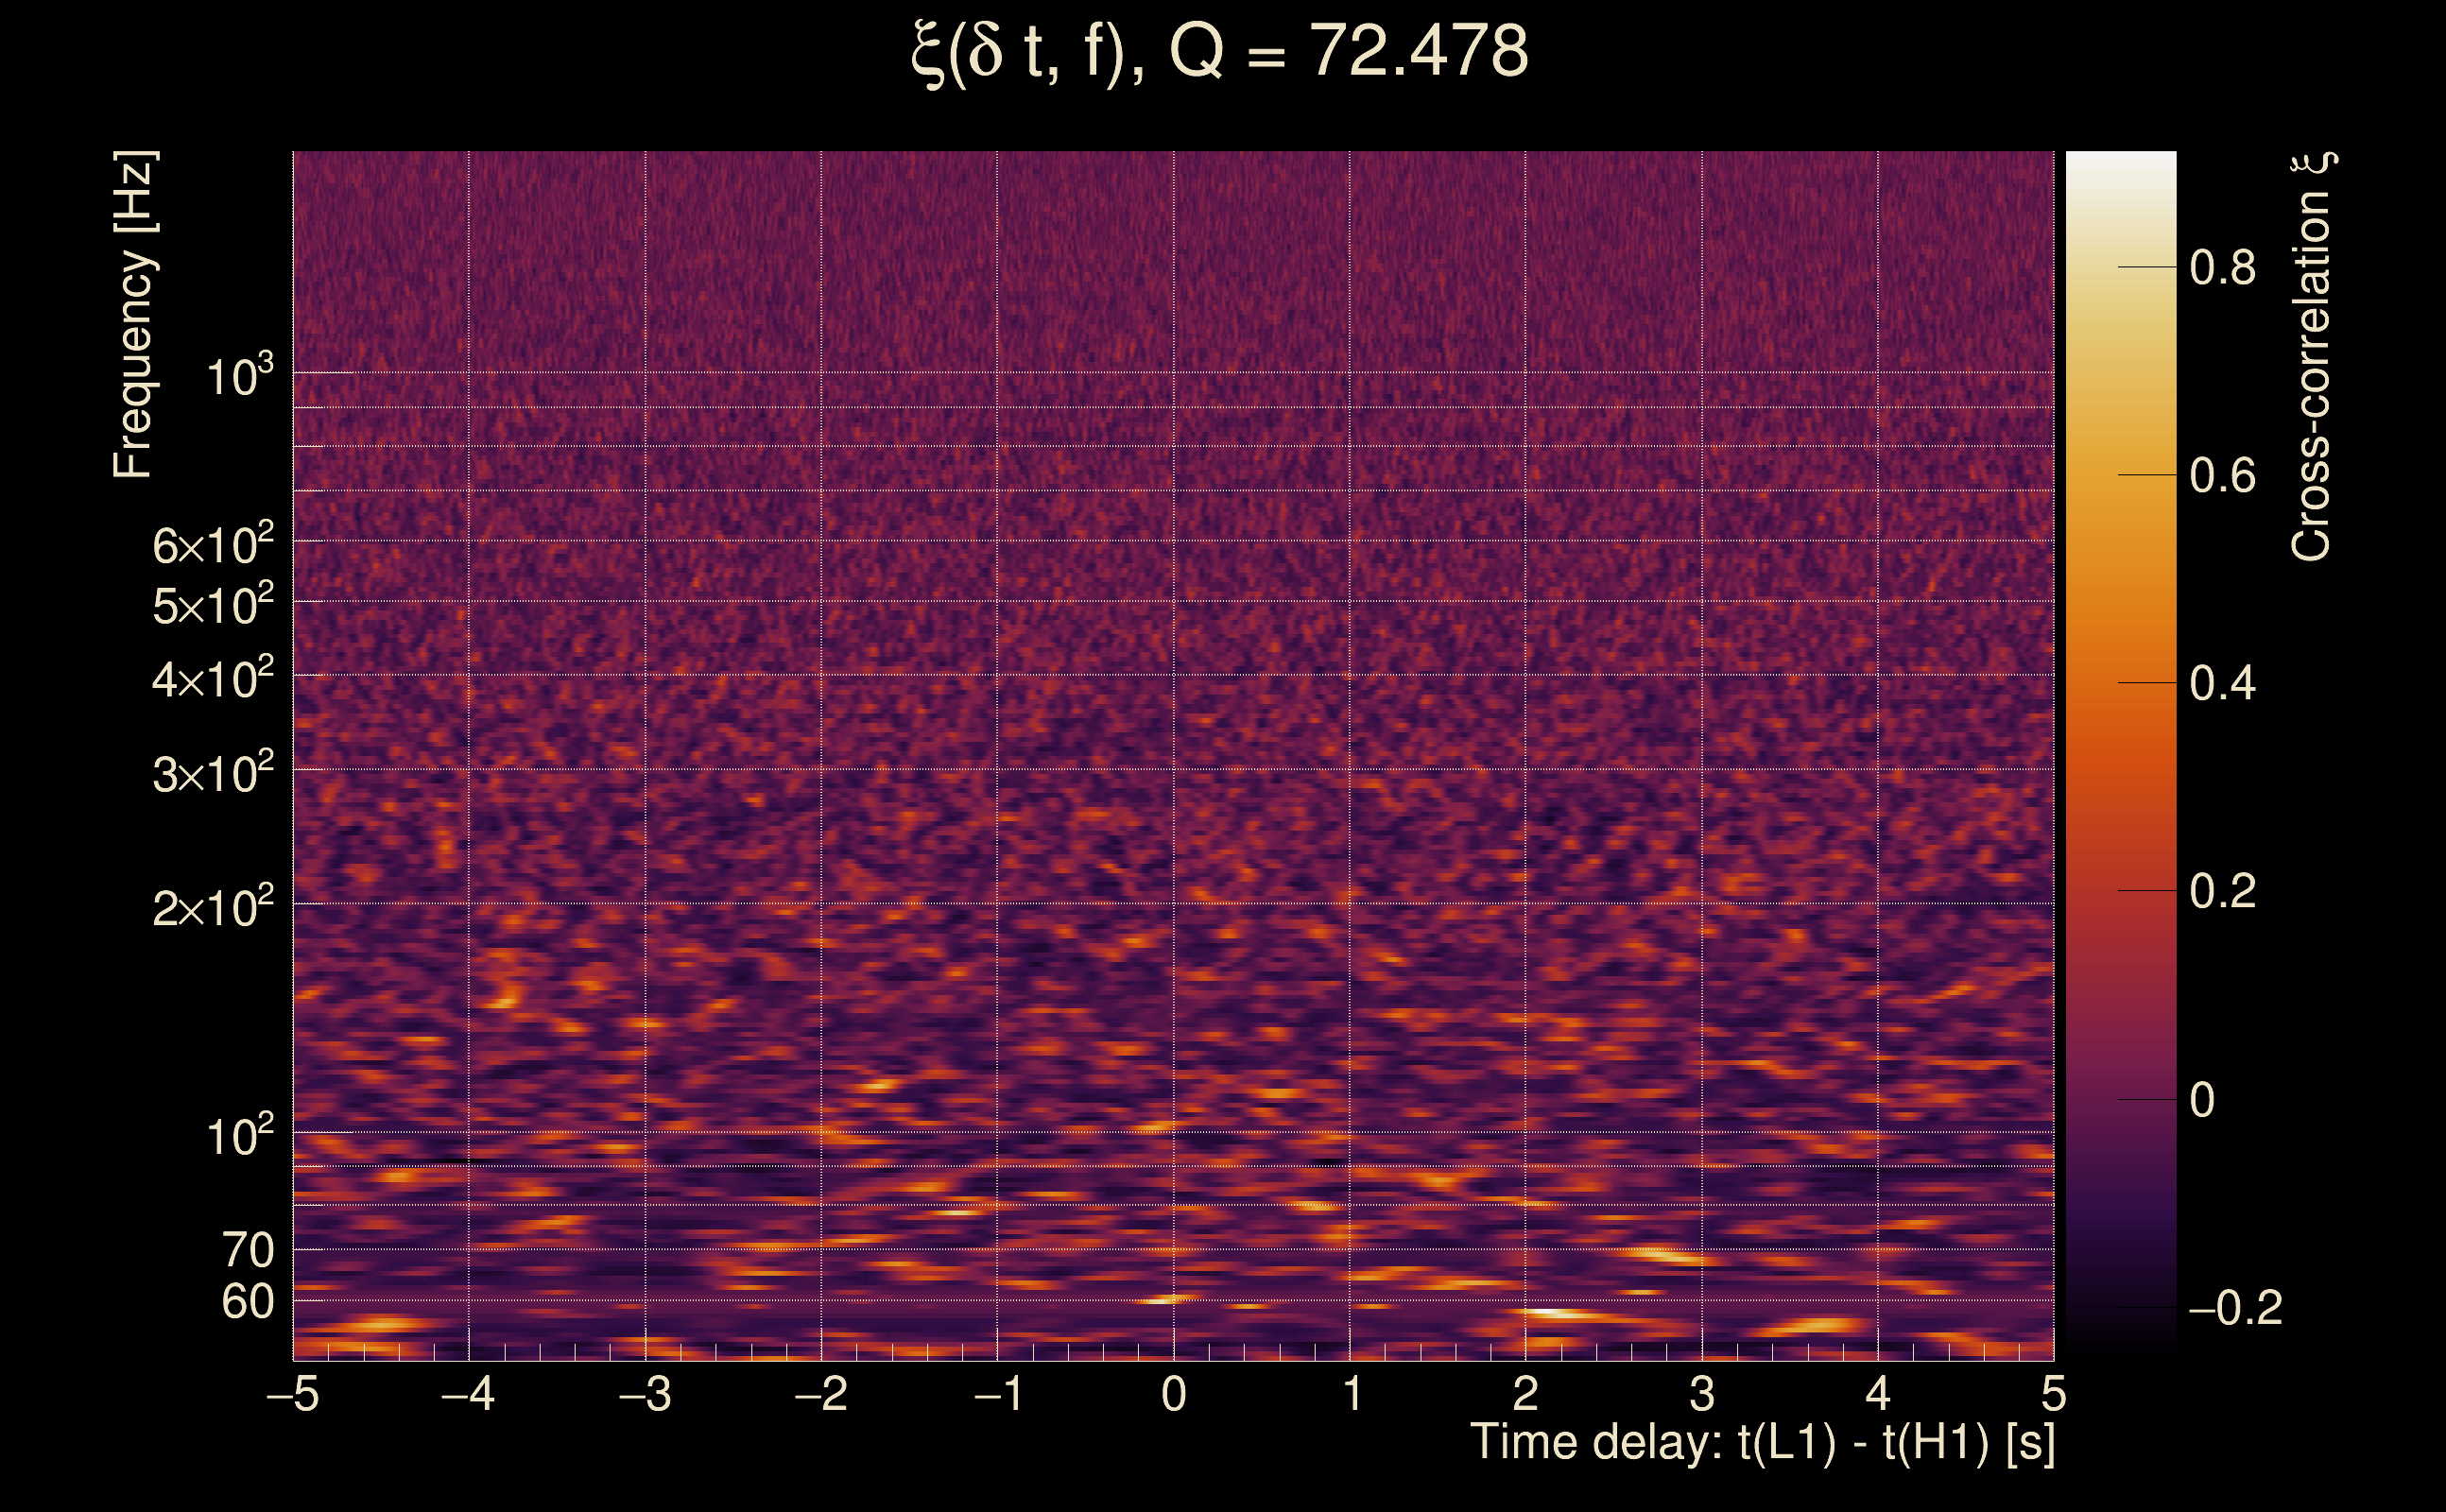
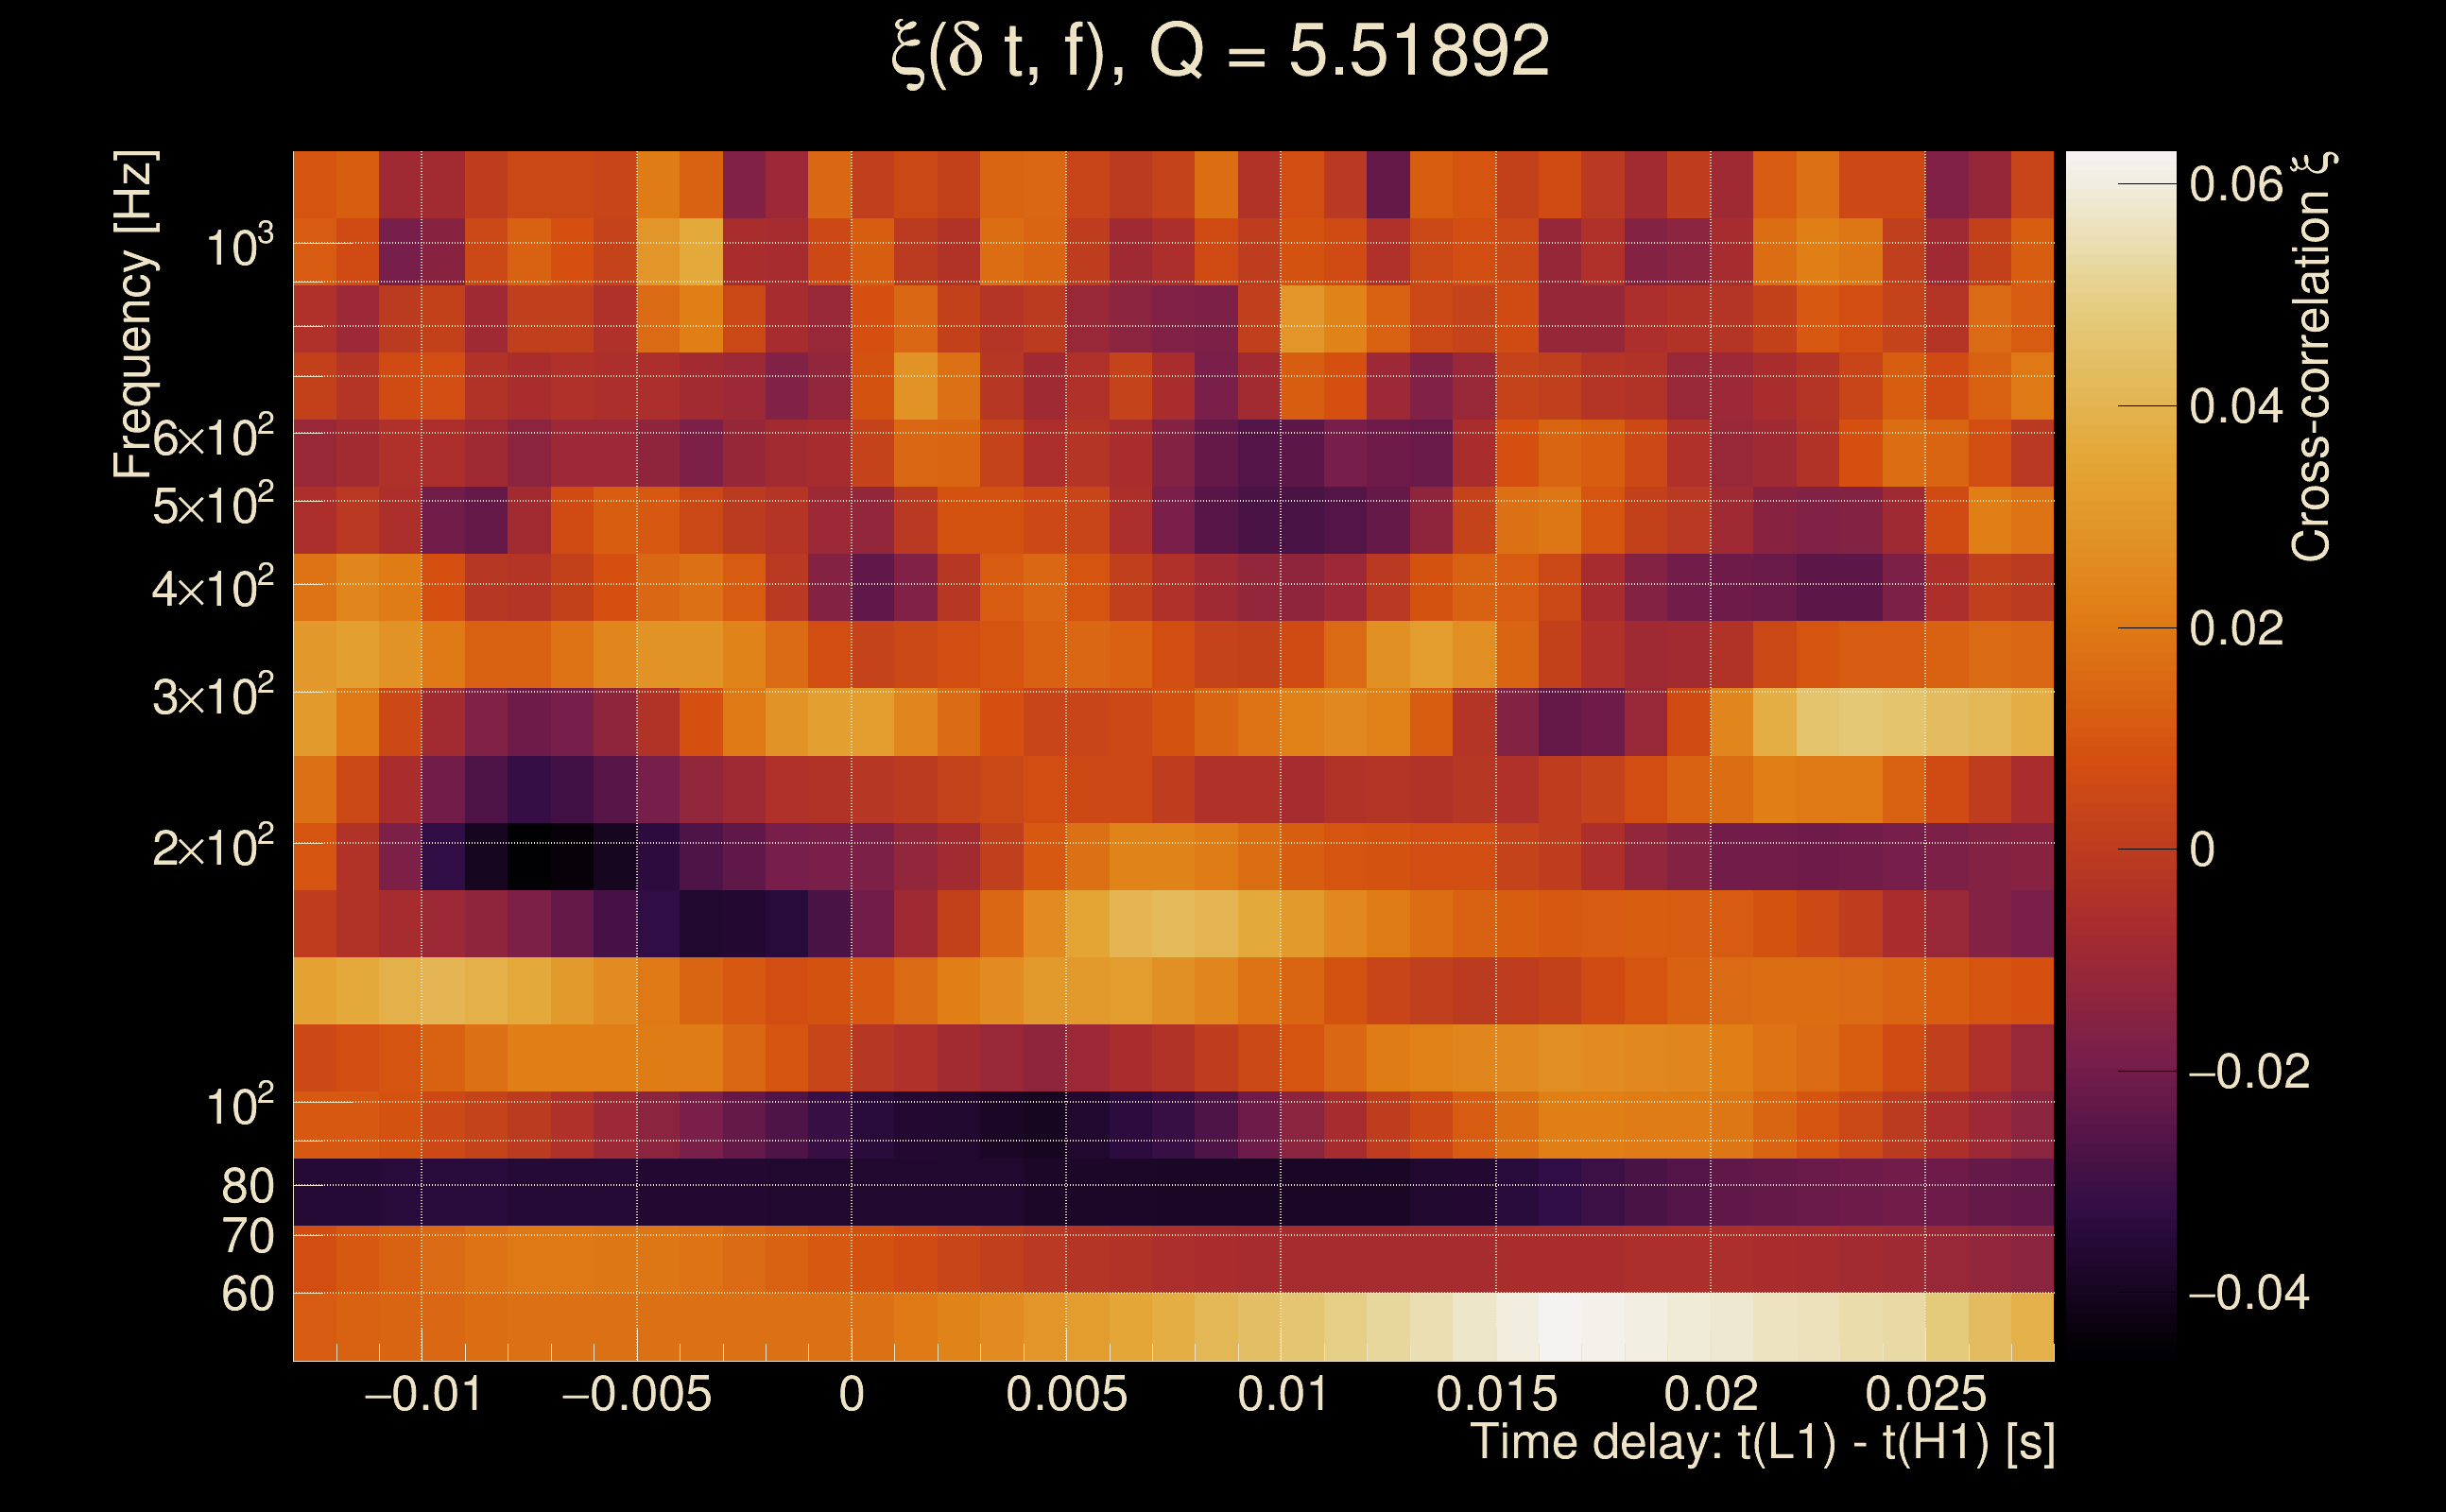
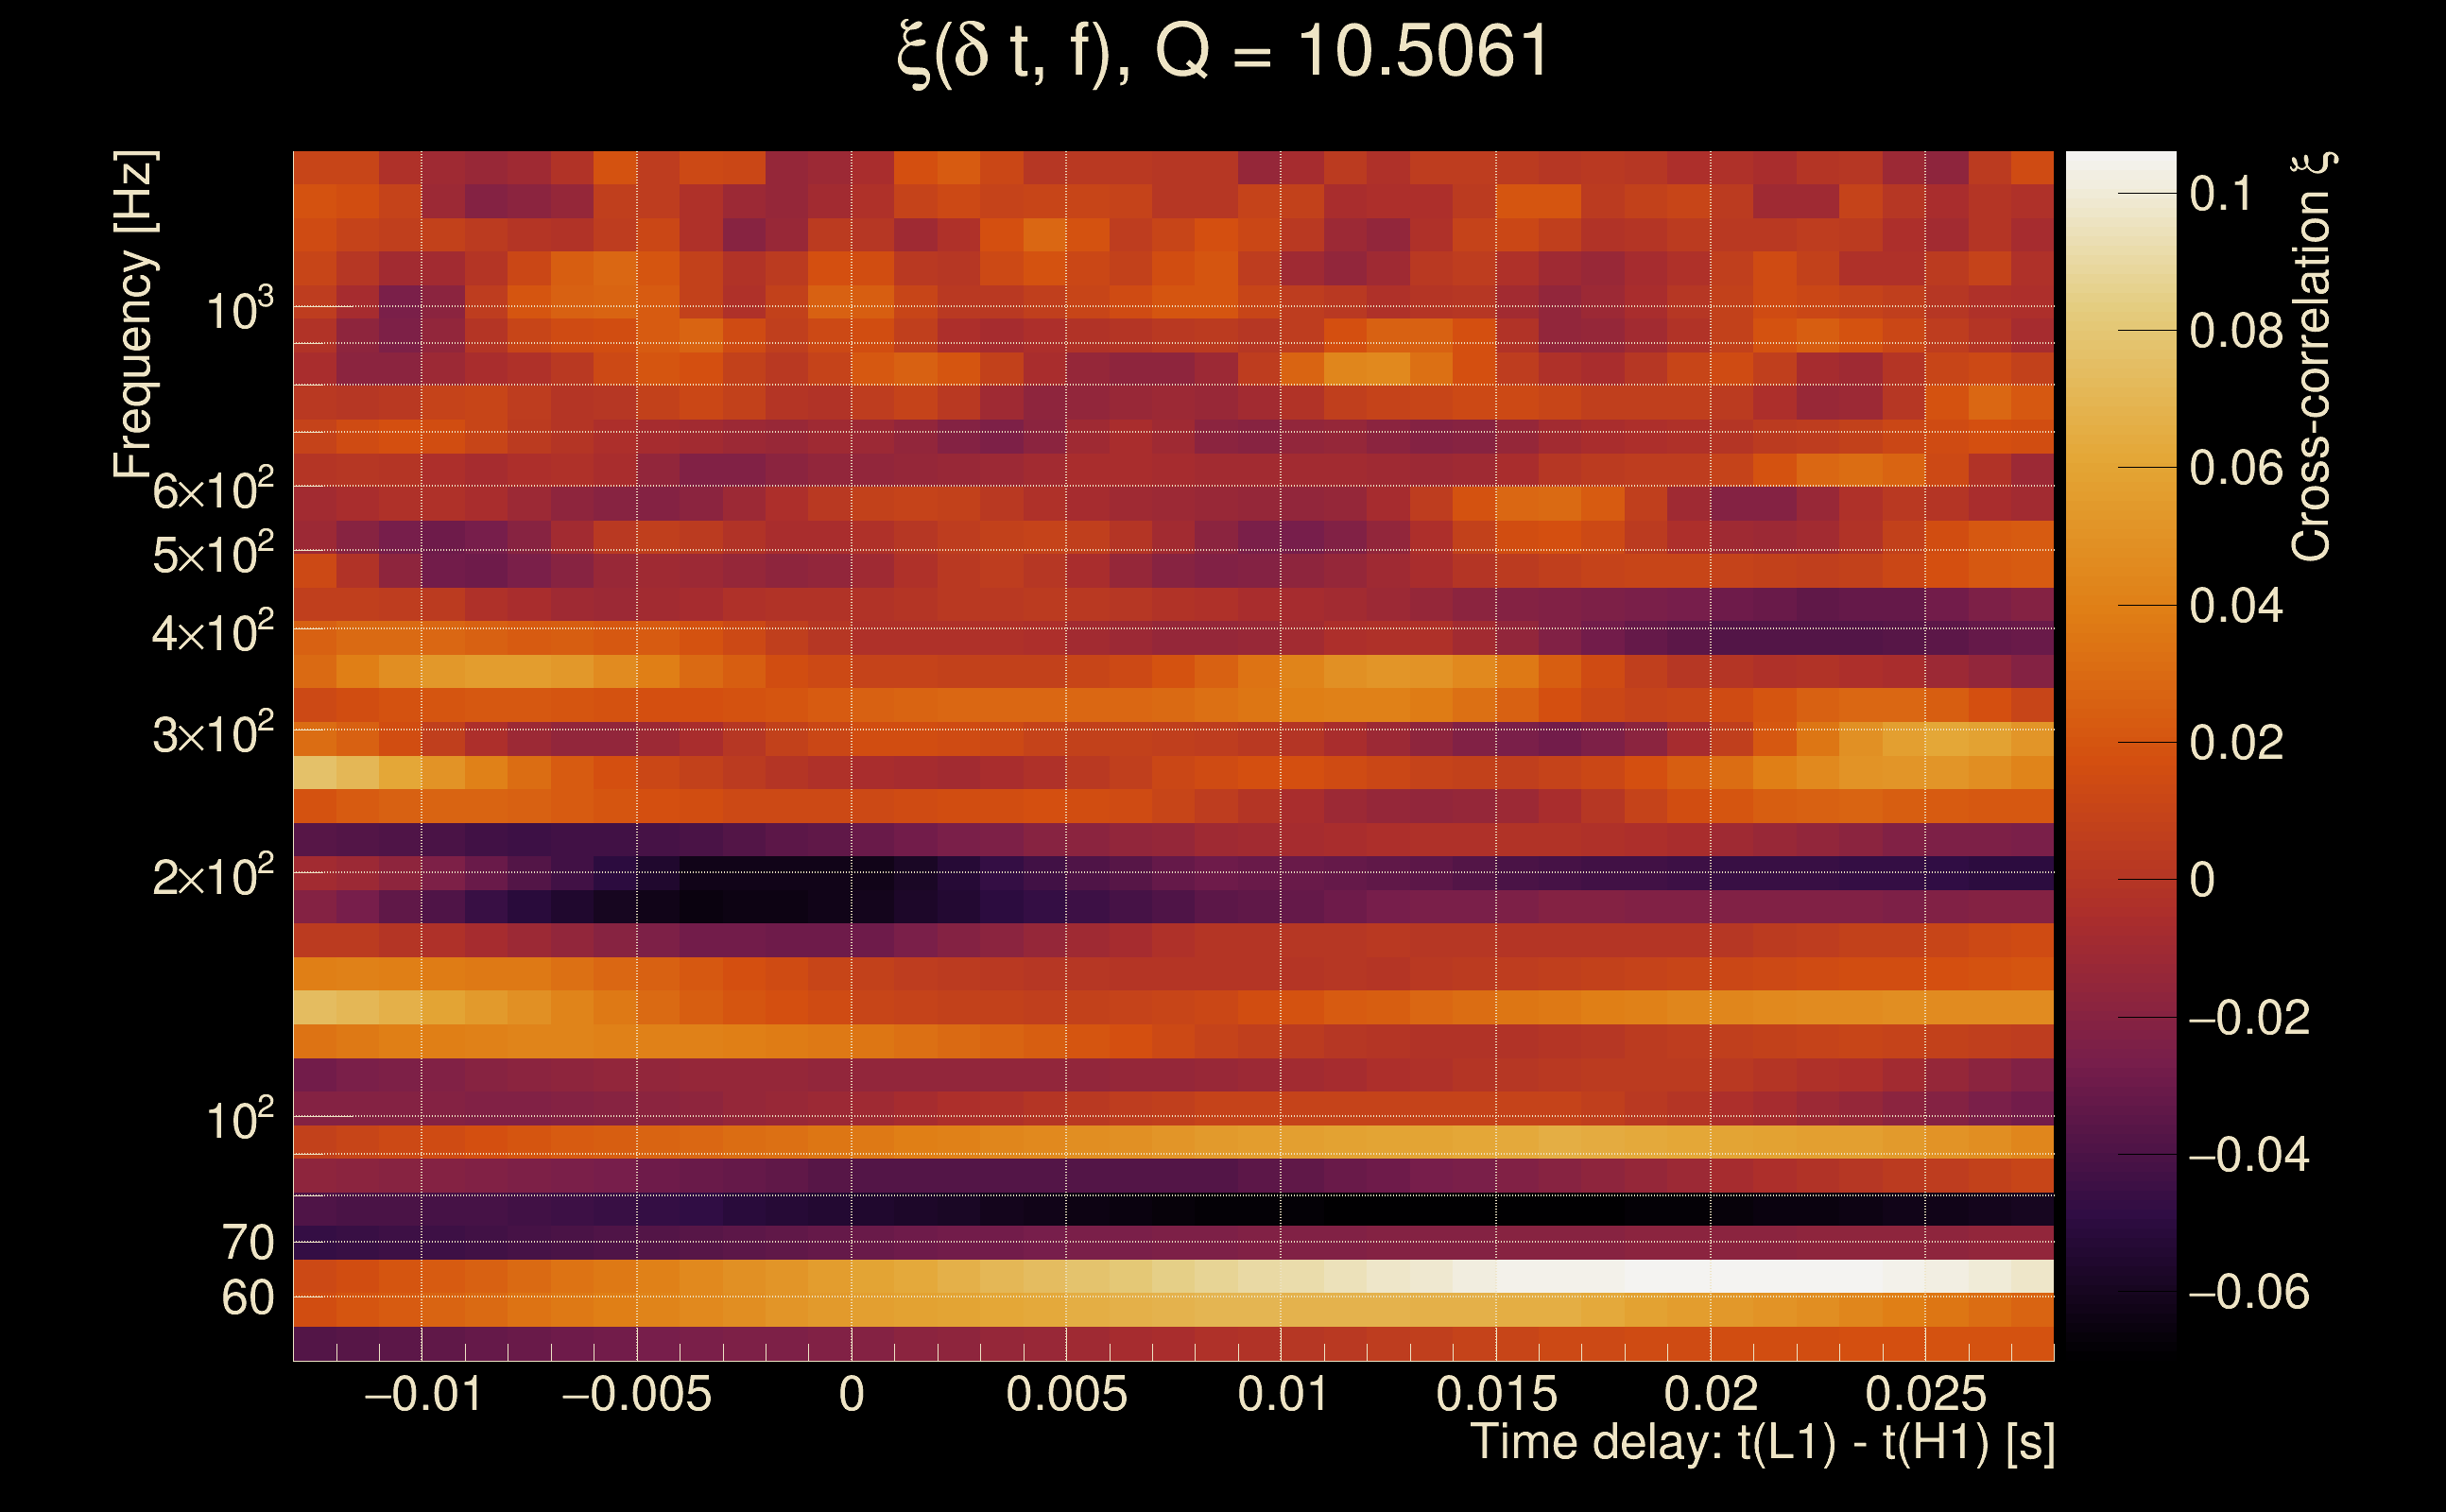
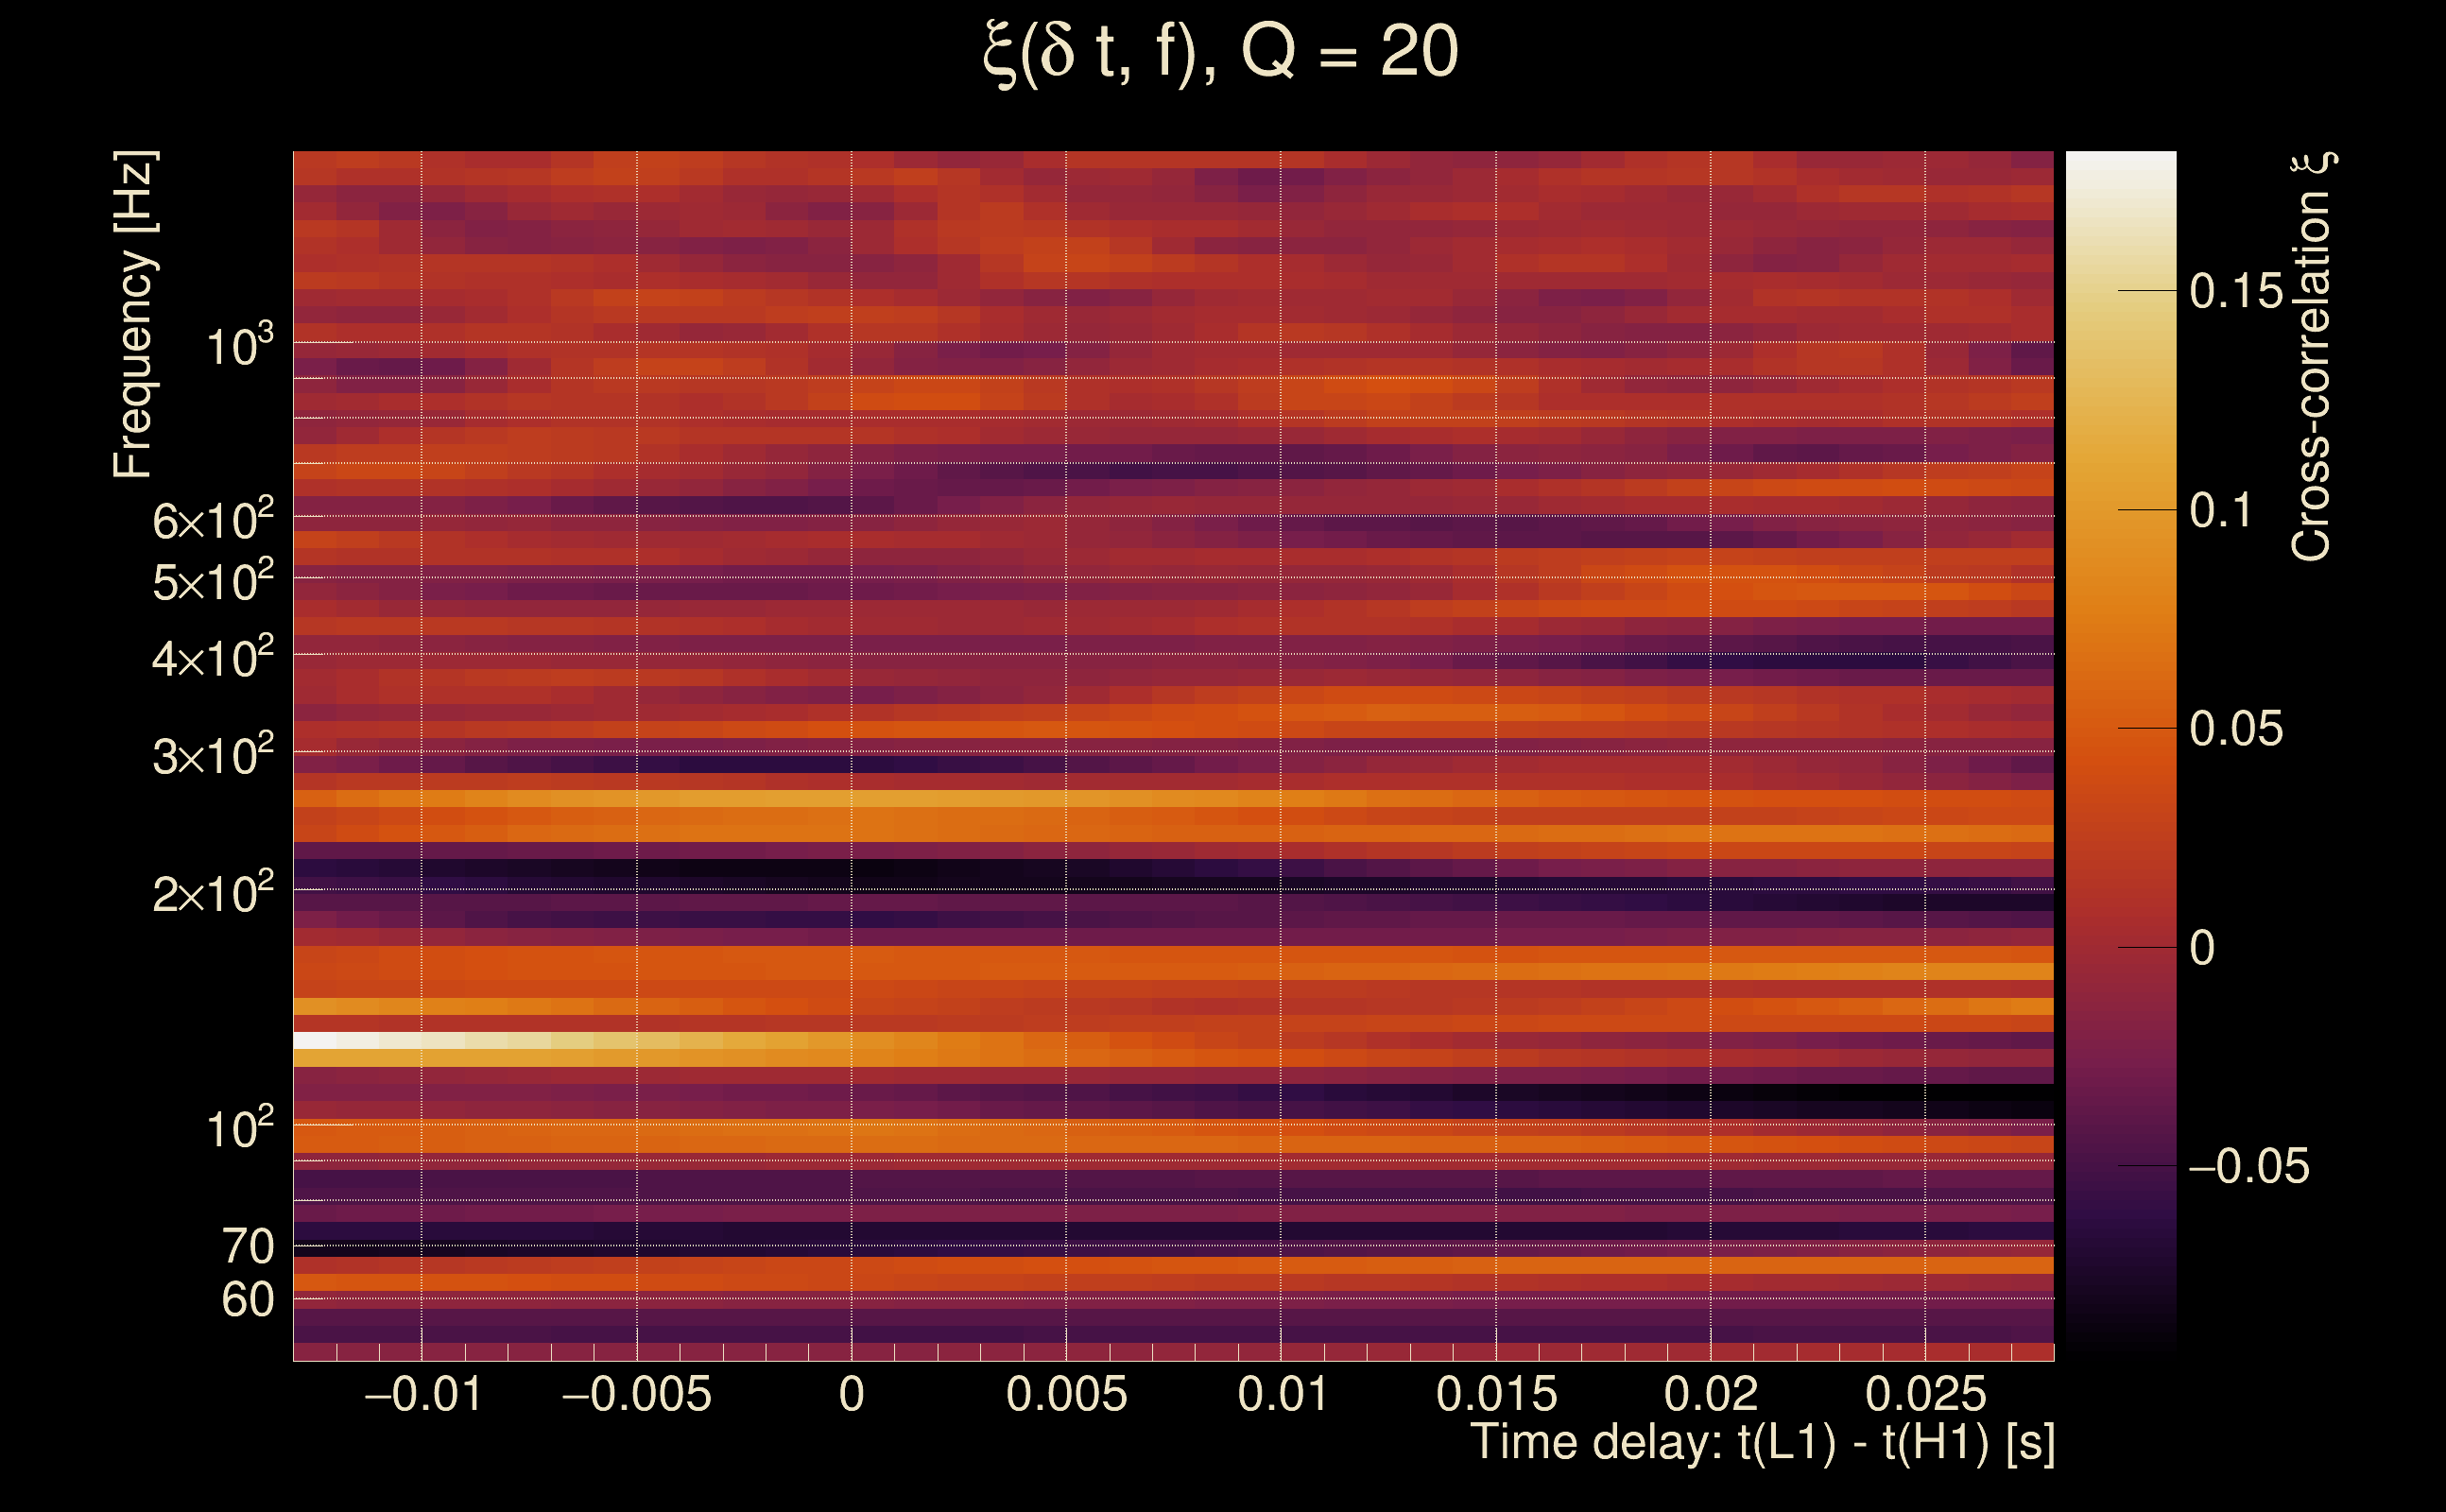
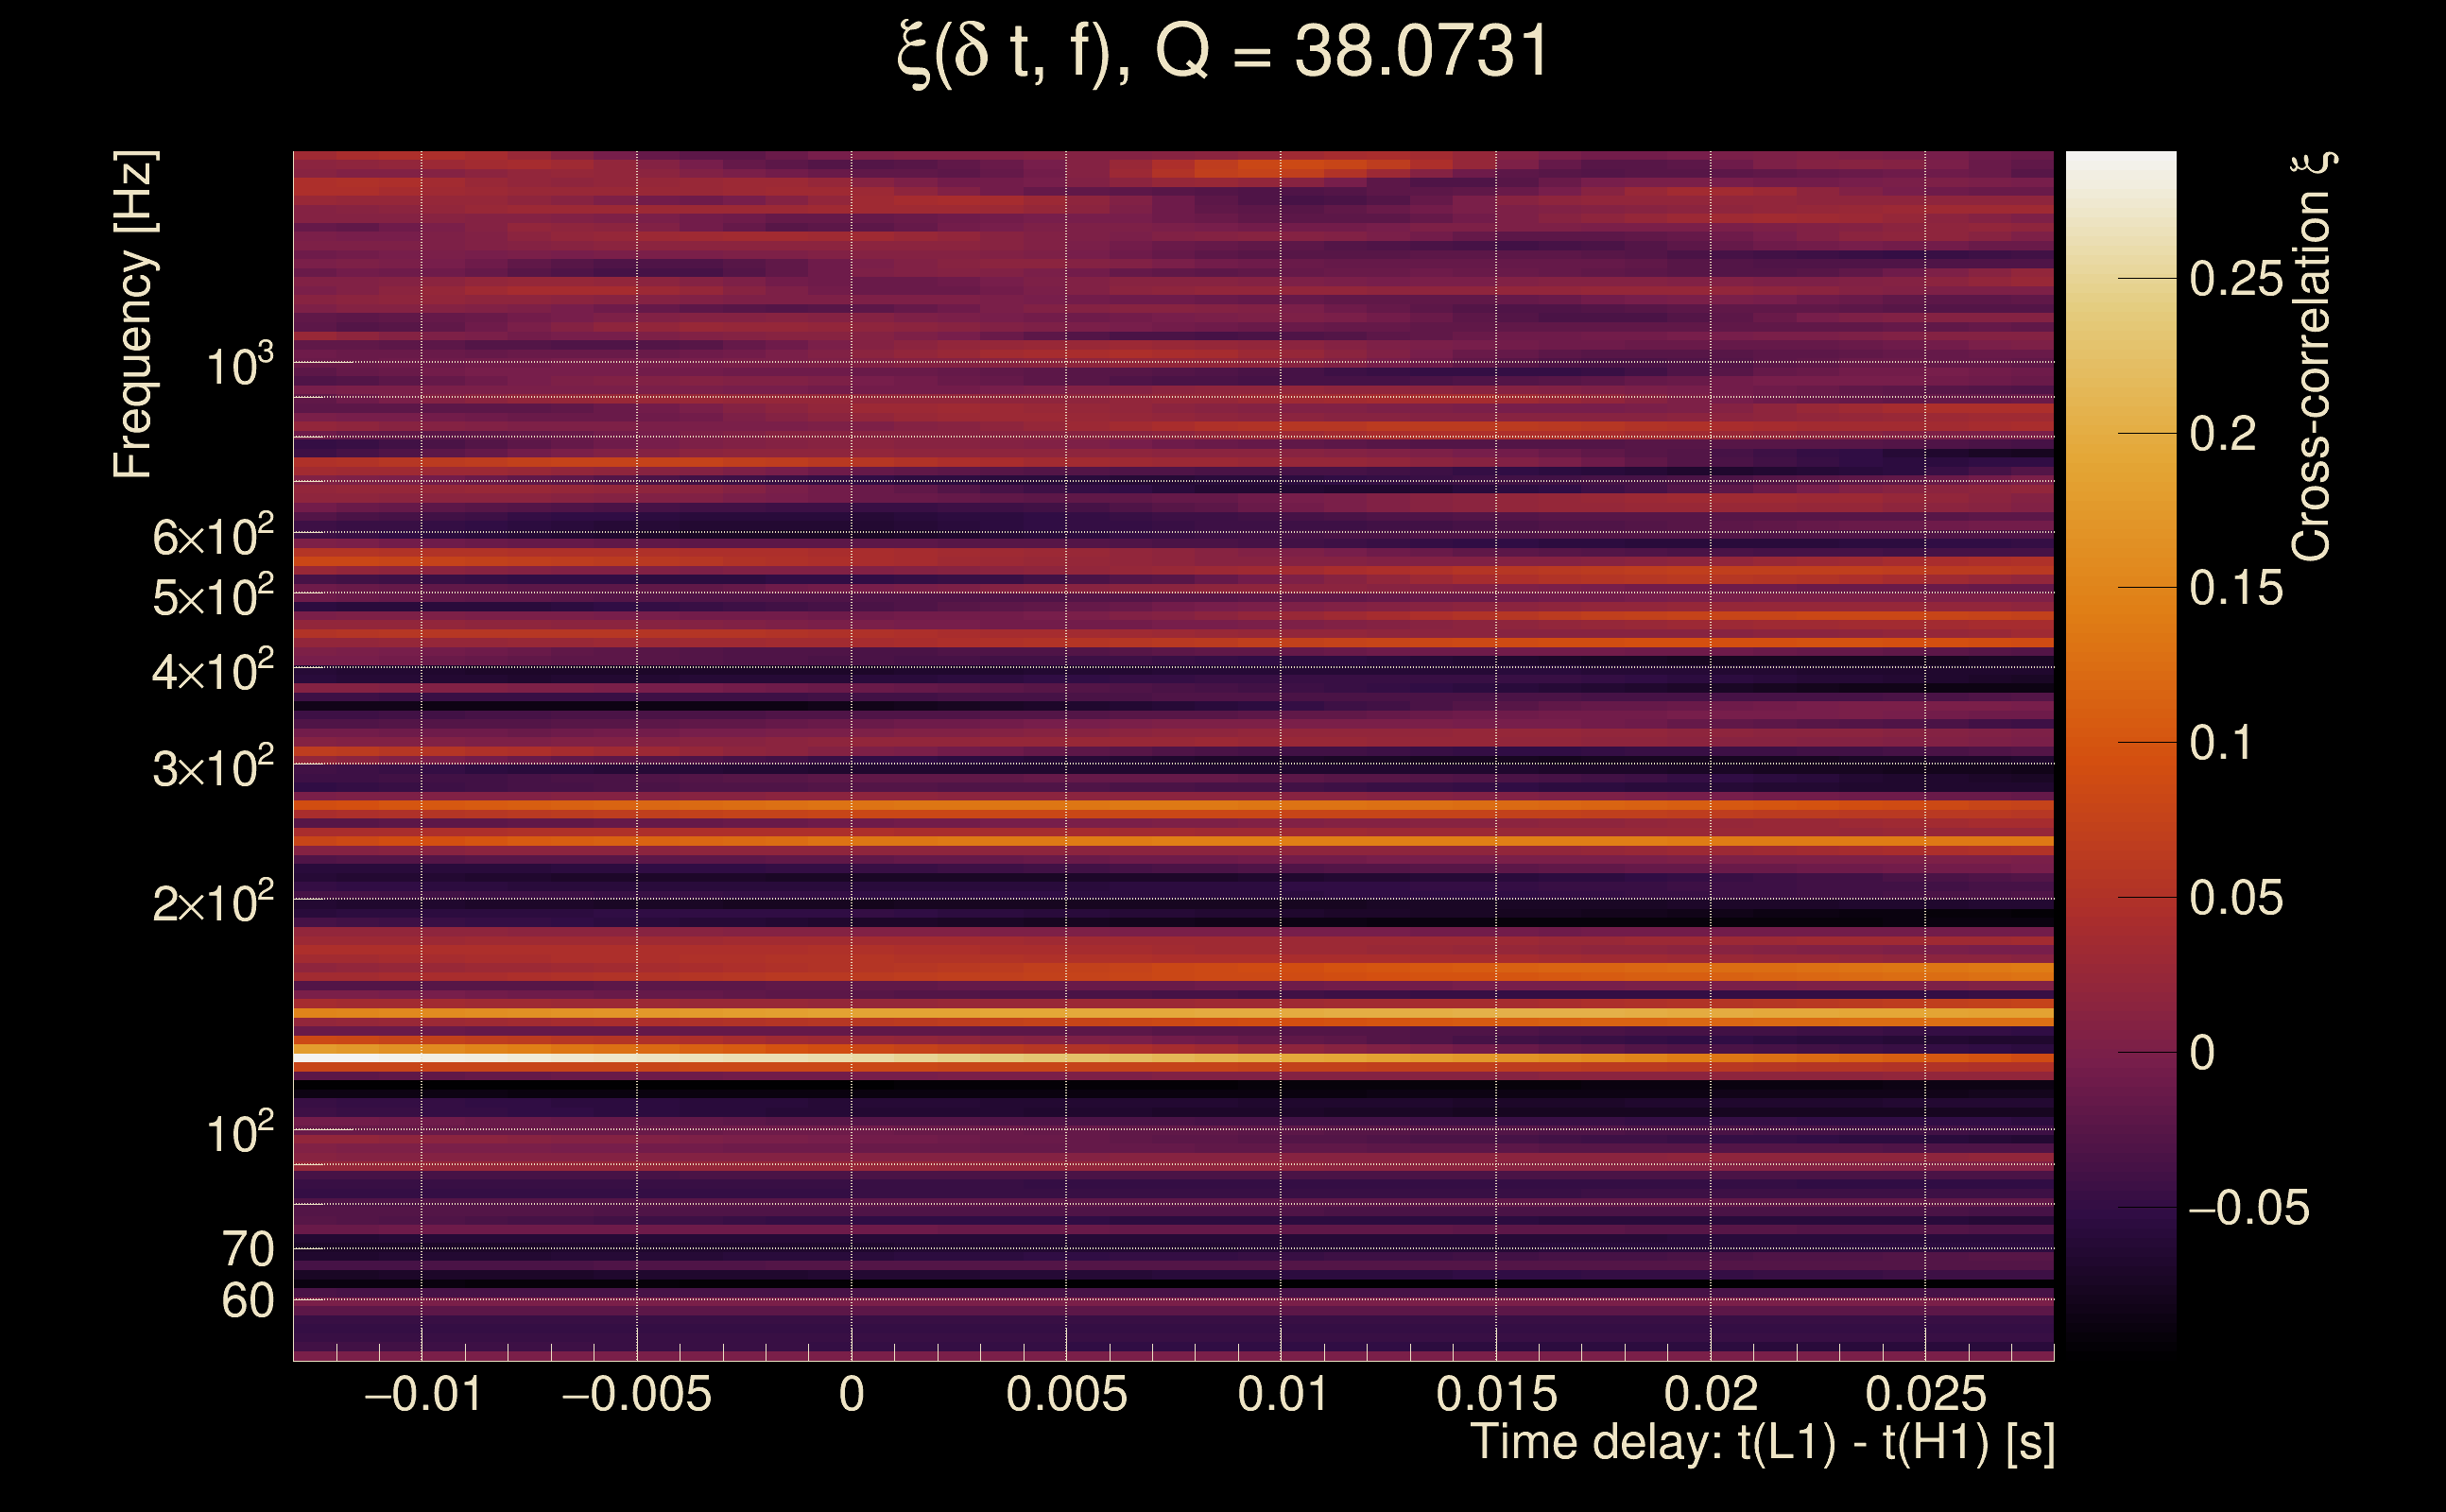
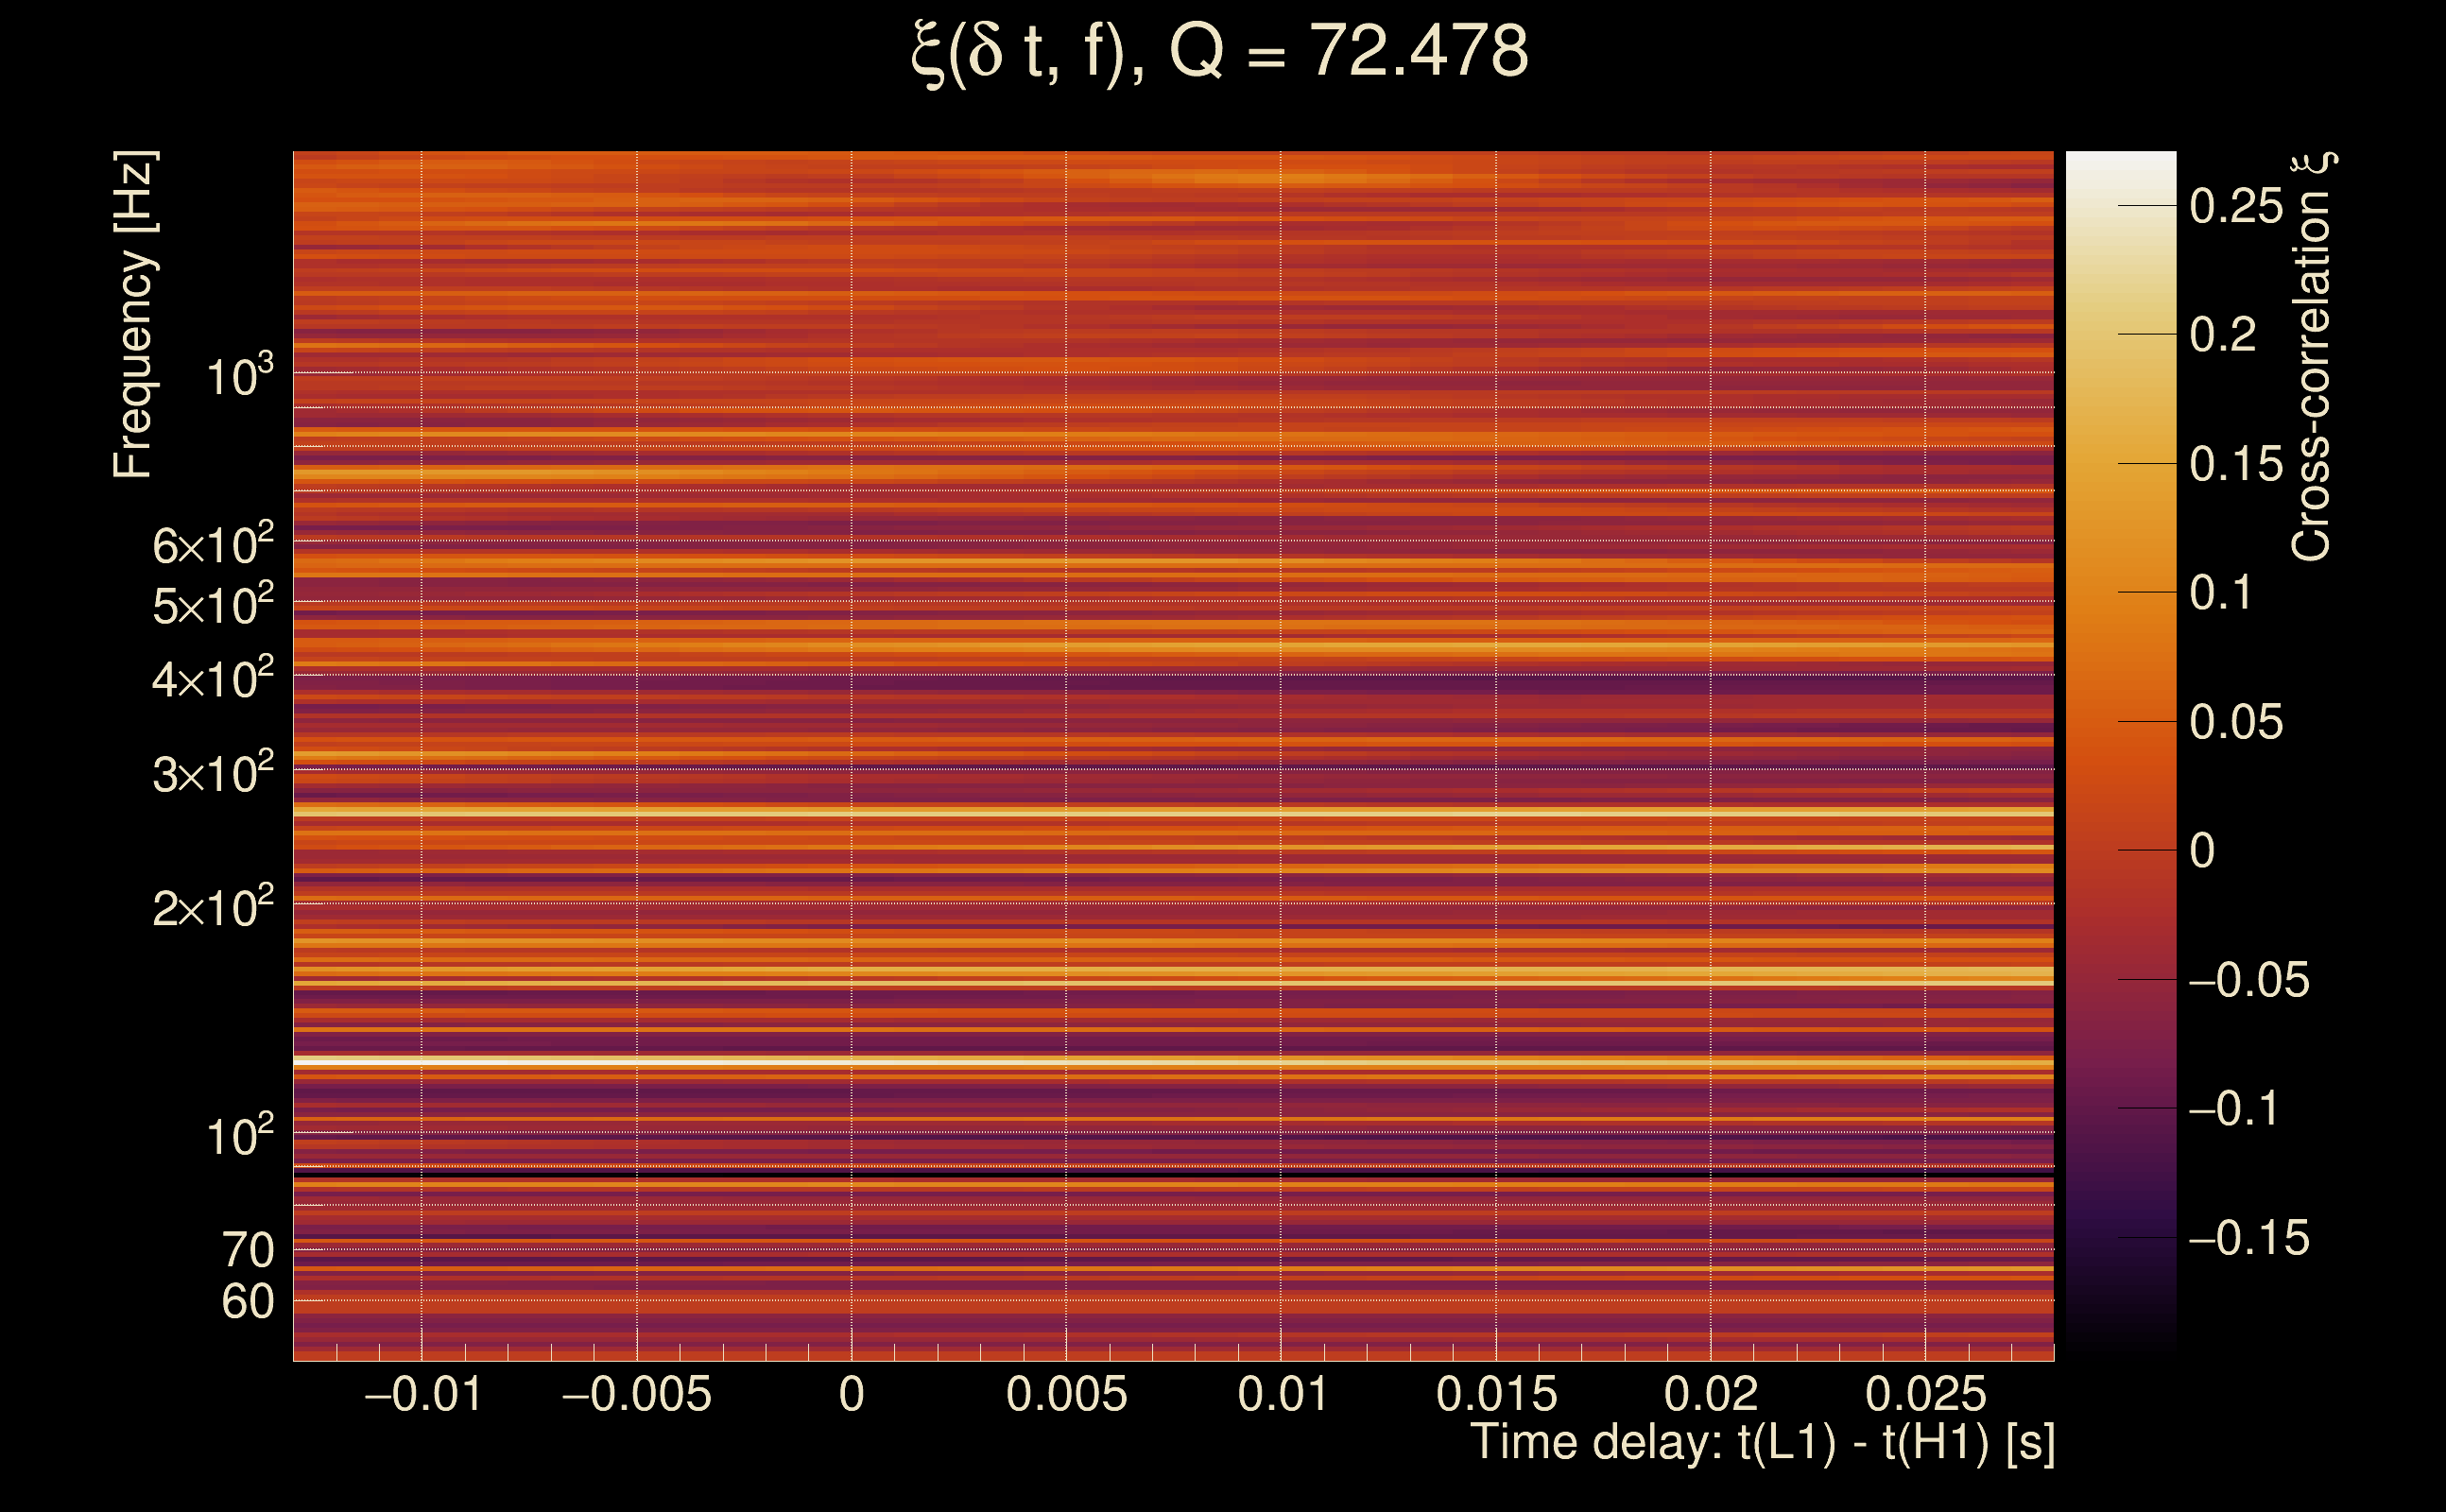
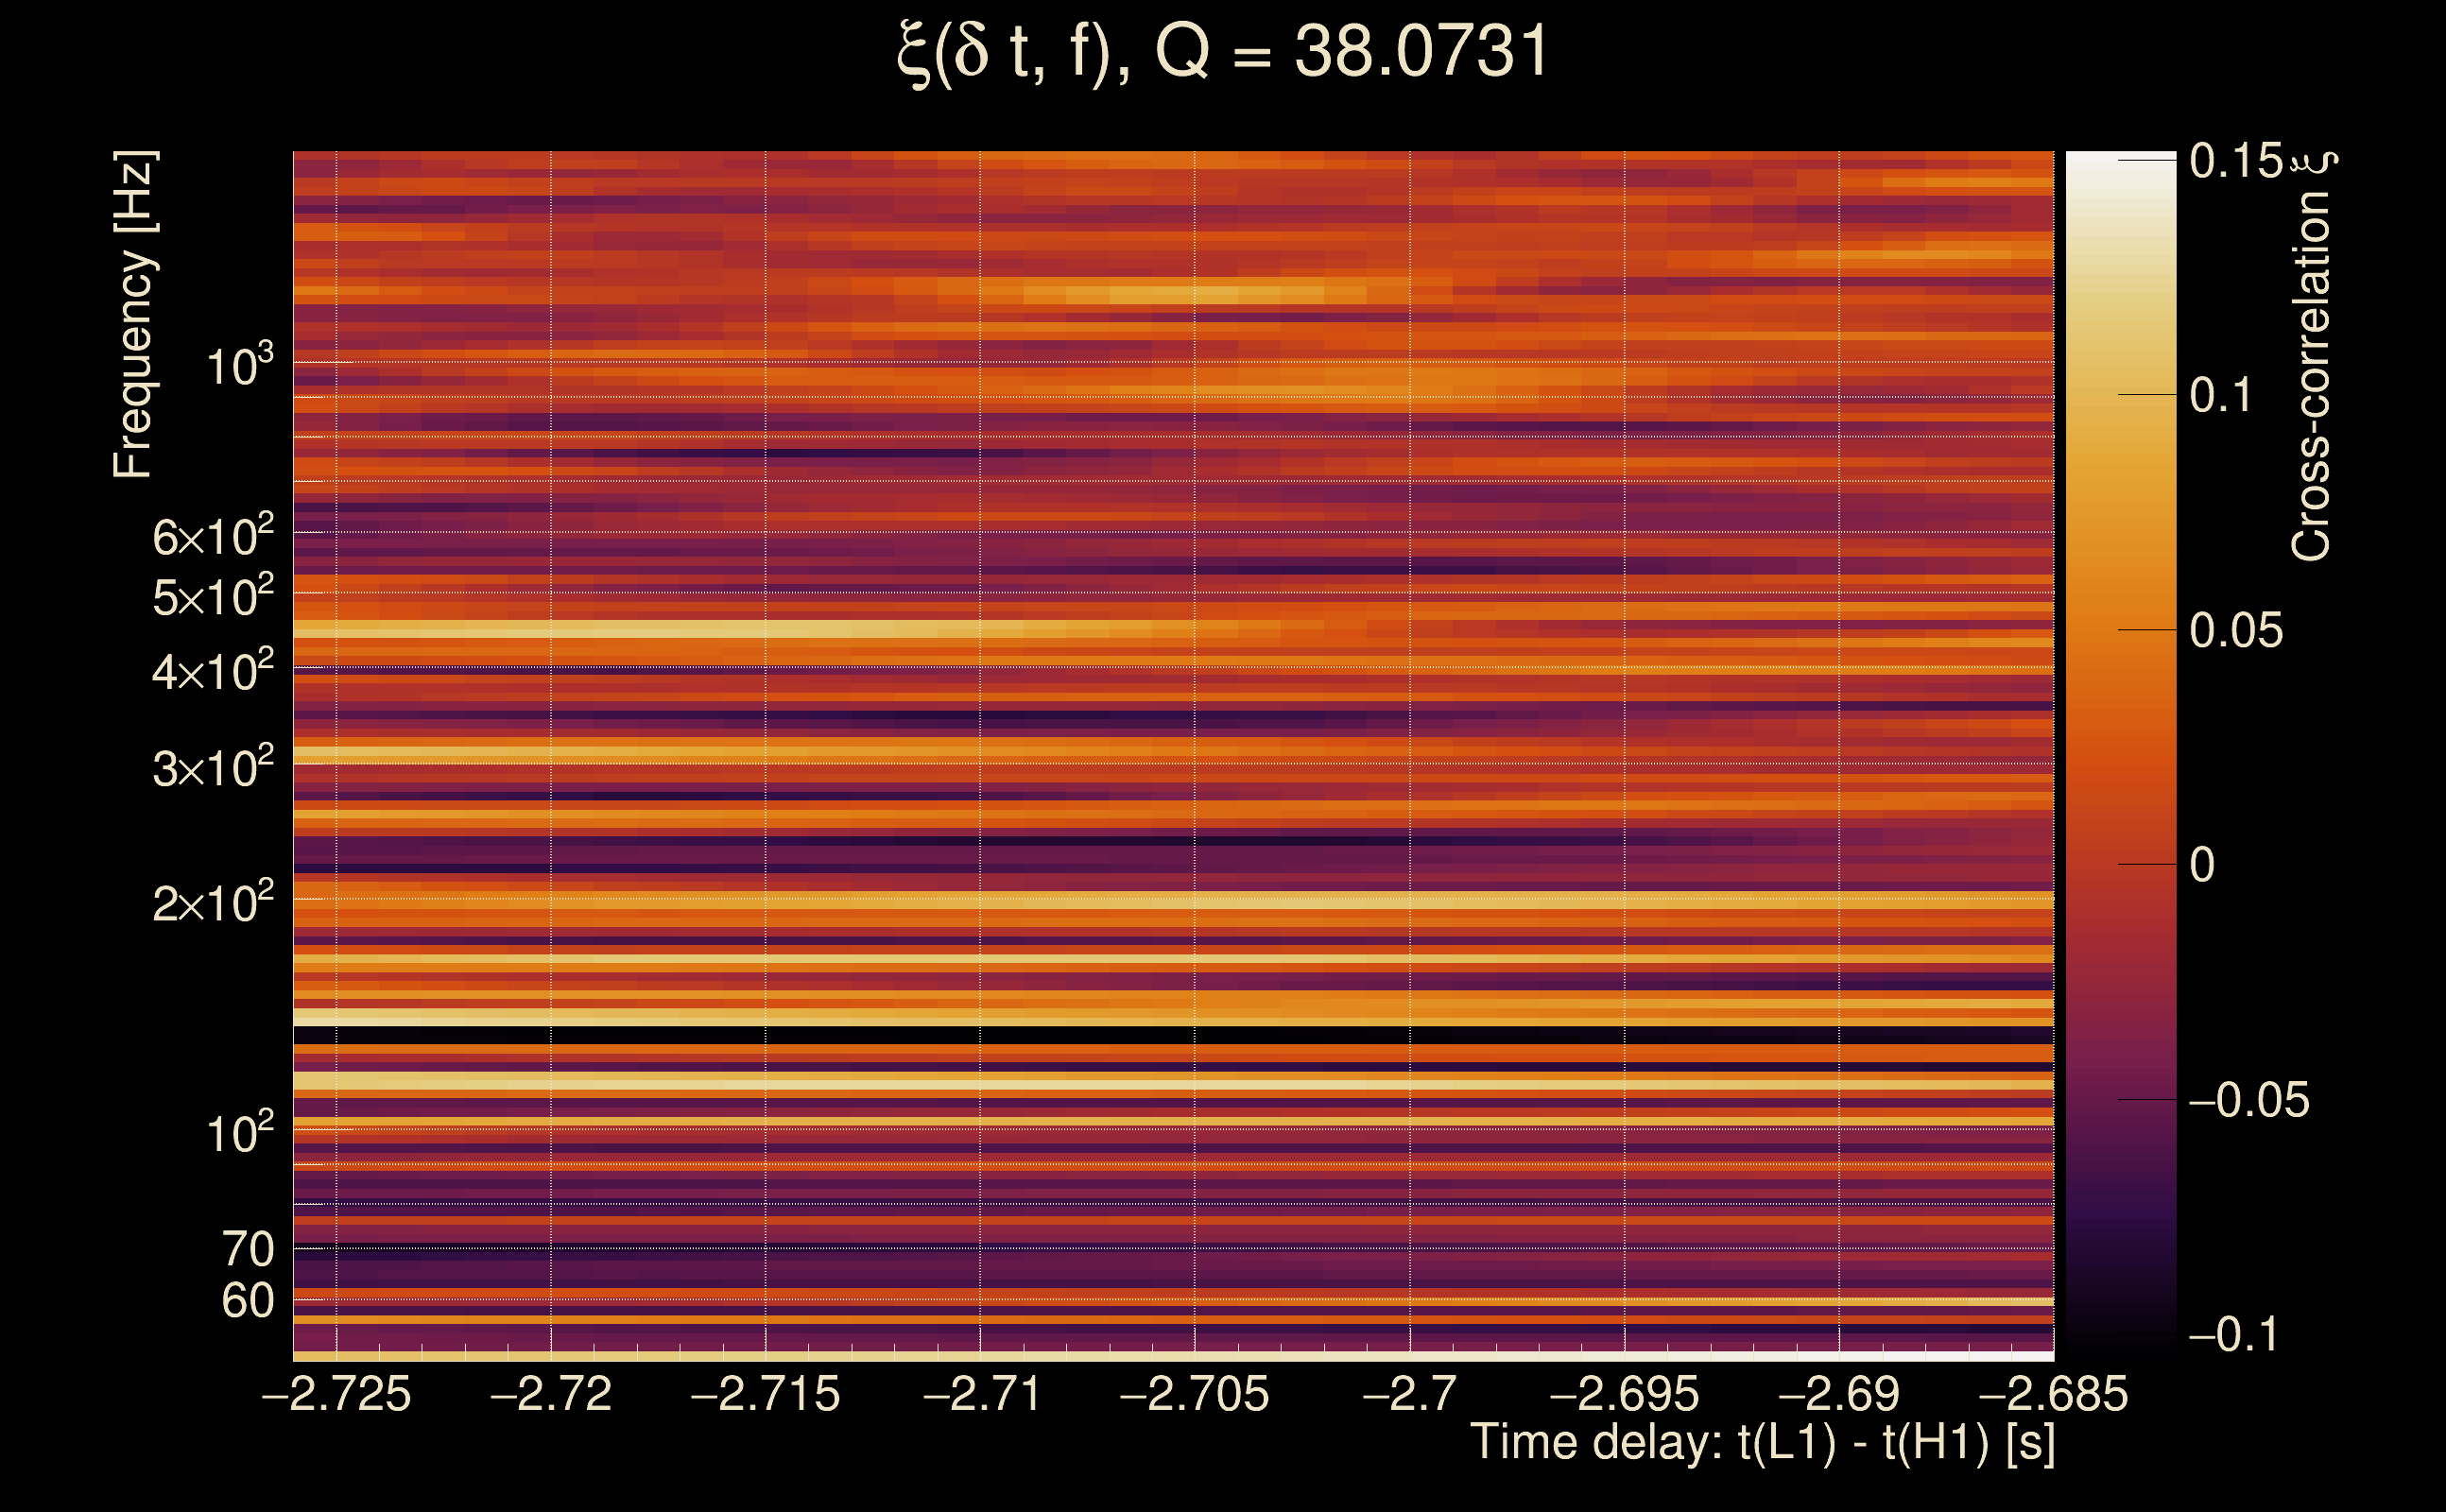
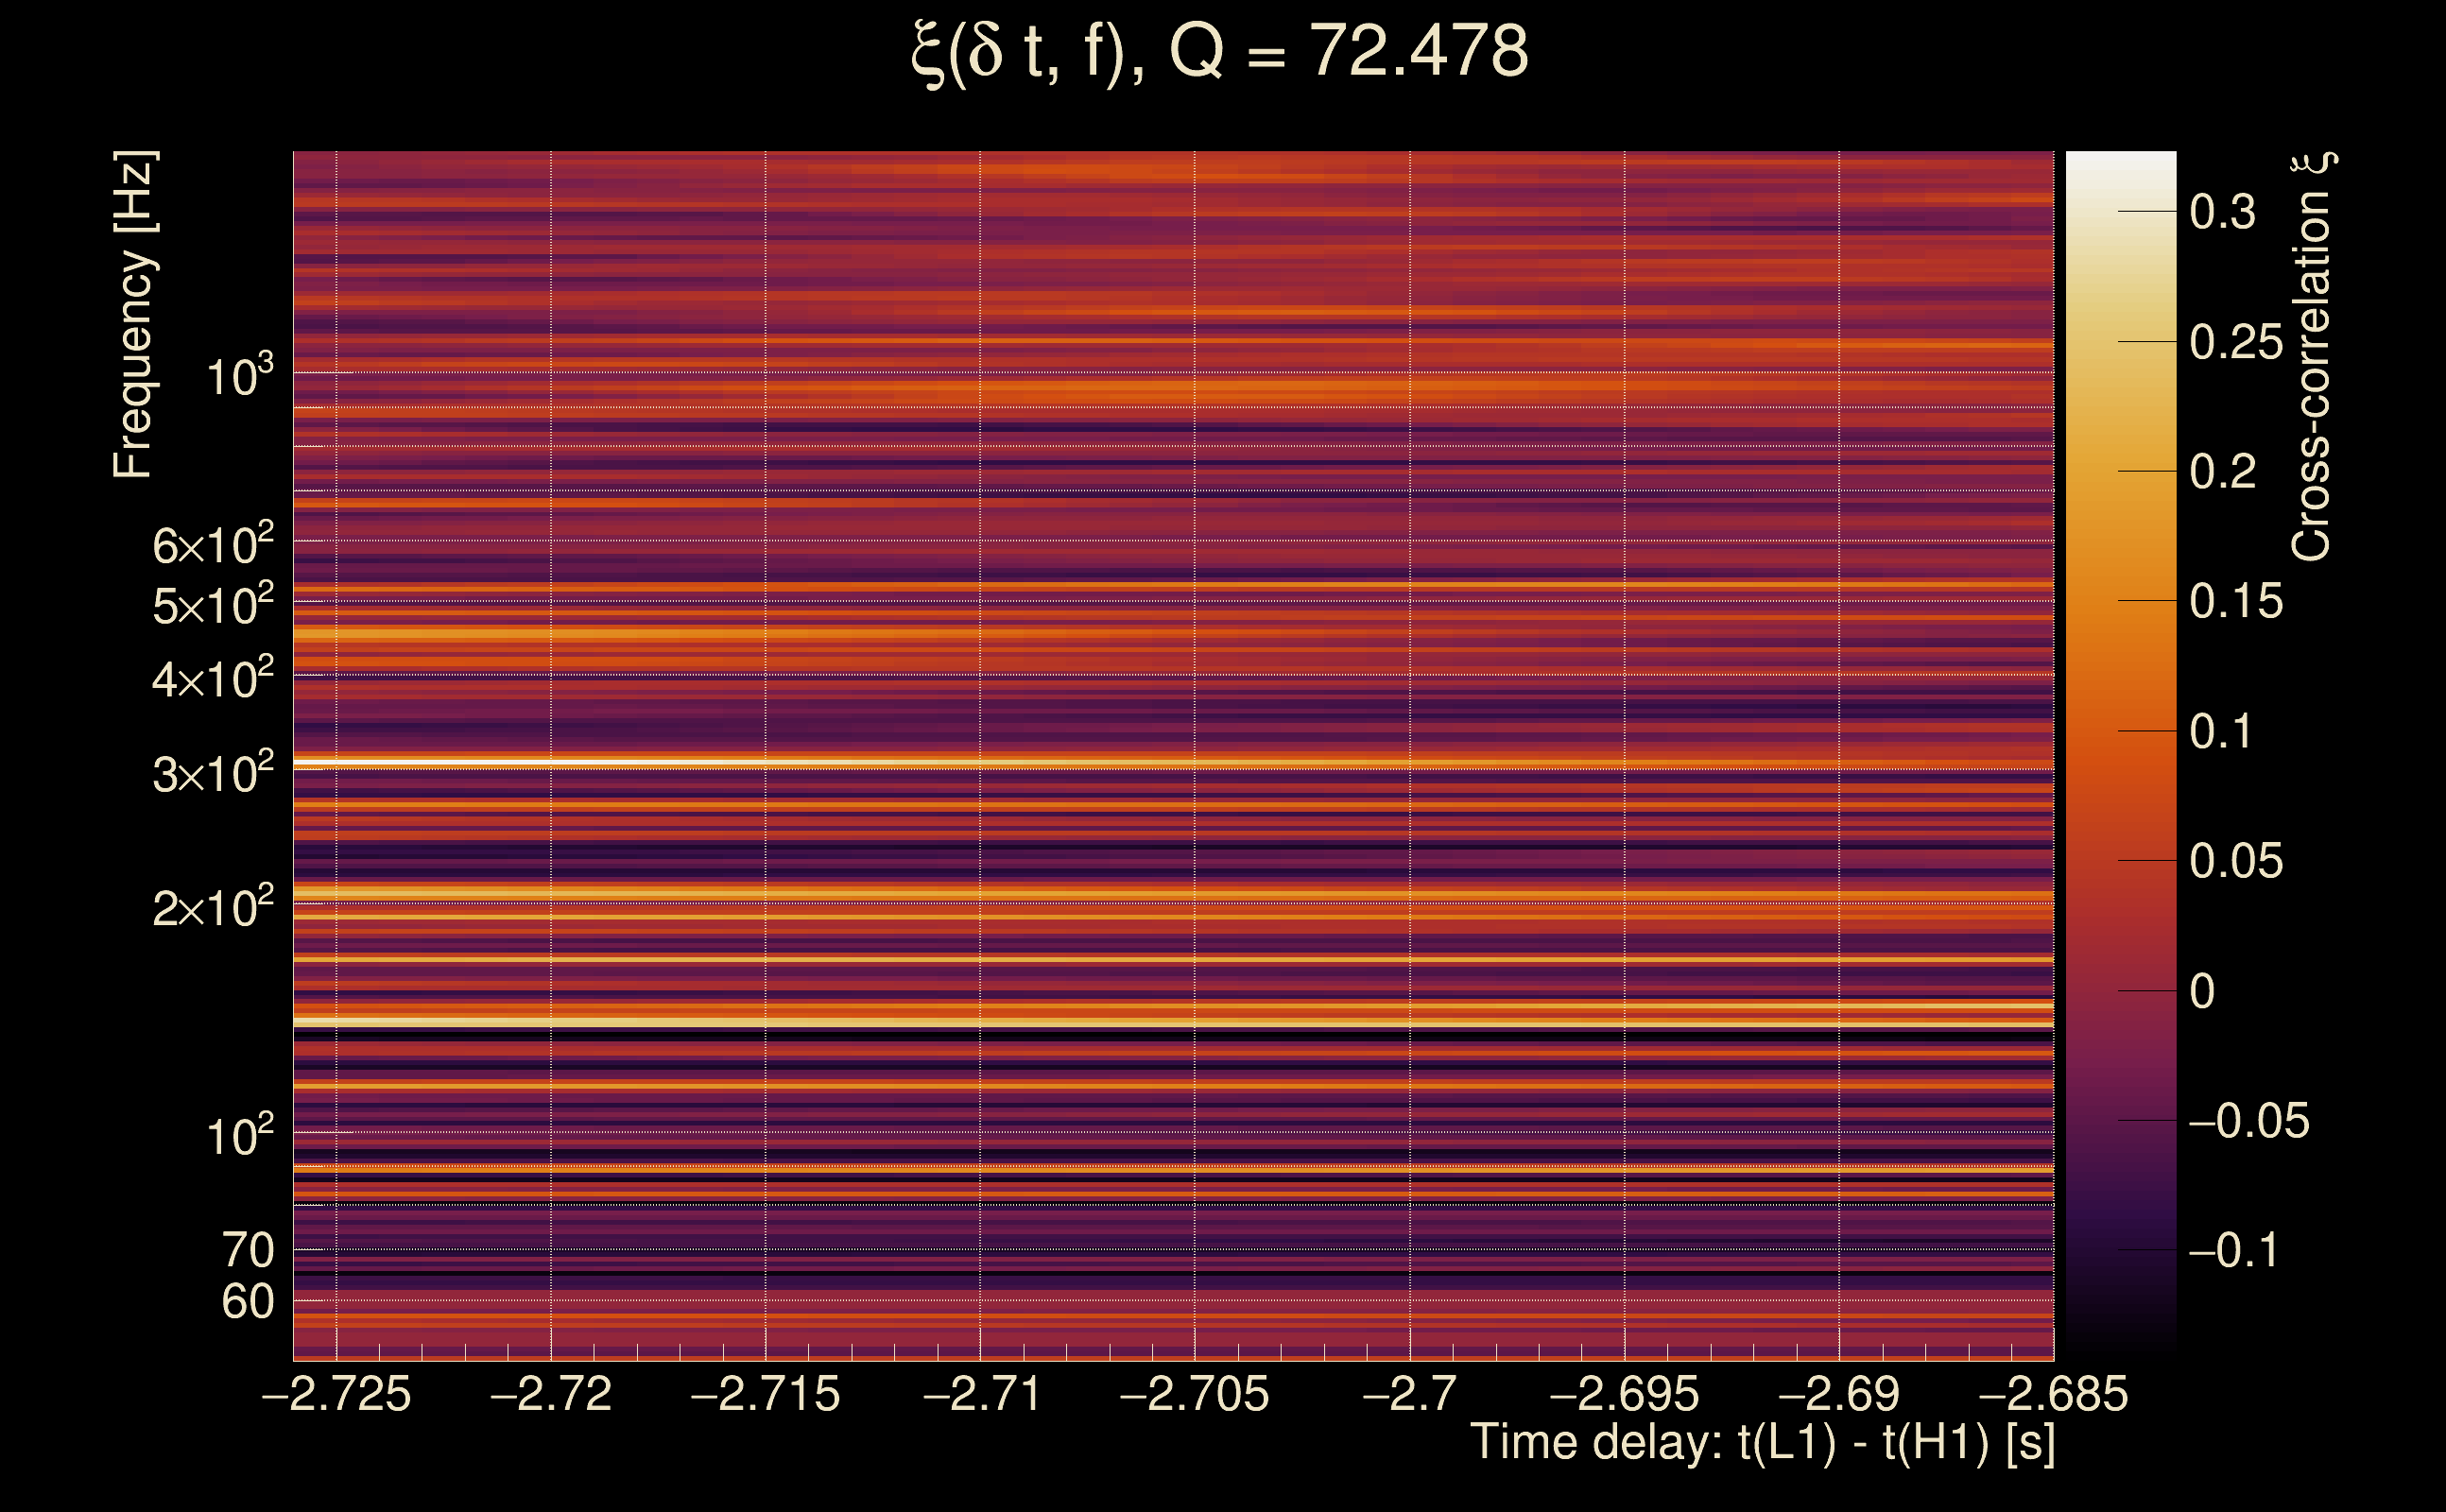
| Number of Q planes: | 5 (Q = 5.51892 → Q = 72.478) |
| Omicron frequency range: | 50 Hz → 1958.38 Hz |
| Light travel time between detectors: | 0.0100128 s |
| Slice extra-time (calibration uncertainty + slice veto): | 0.0129872 s |
| Number of time-delay bins in a cross-correlation map: | 10000 |
| Number of slices in a cross-correlation map: | 217 |
| Number of time-delay bins in a slice: | 46 |
| SNR gating: | < 100 (detector 0), < 100 (detector 1) |
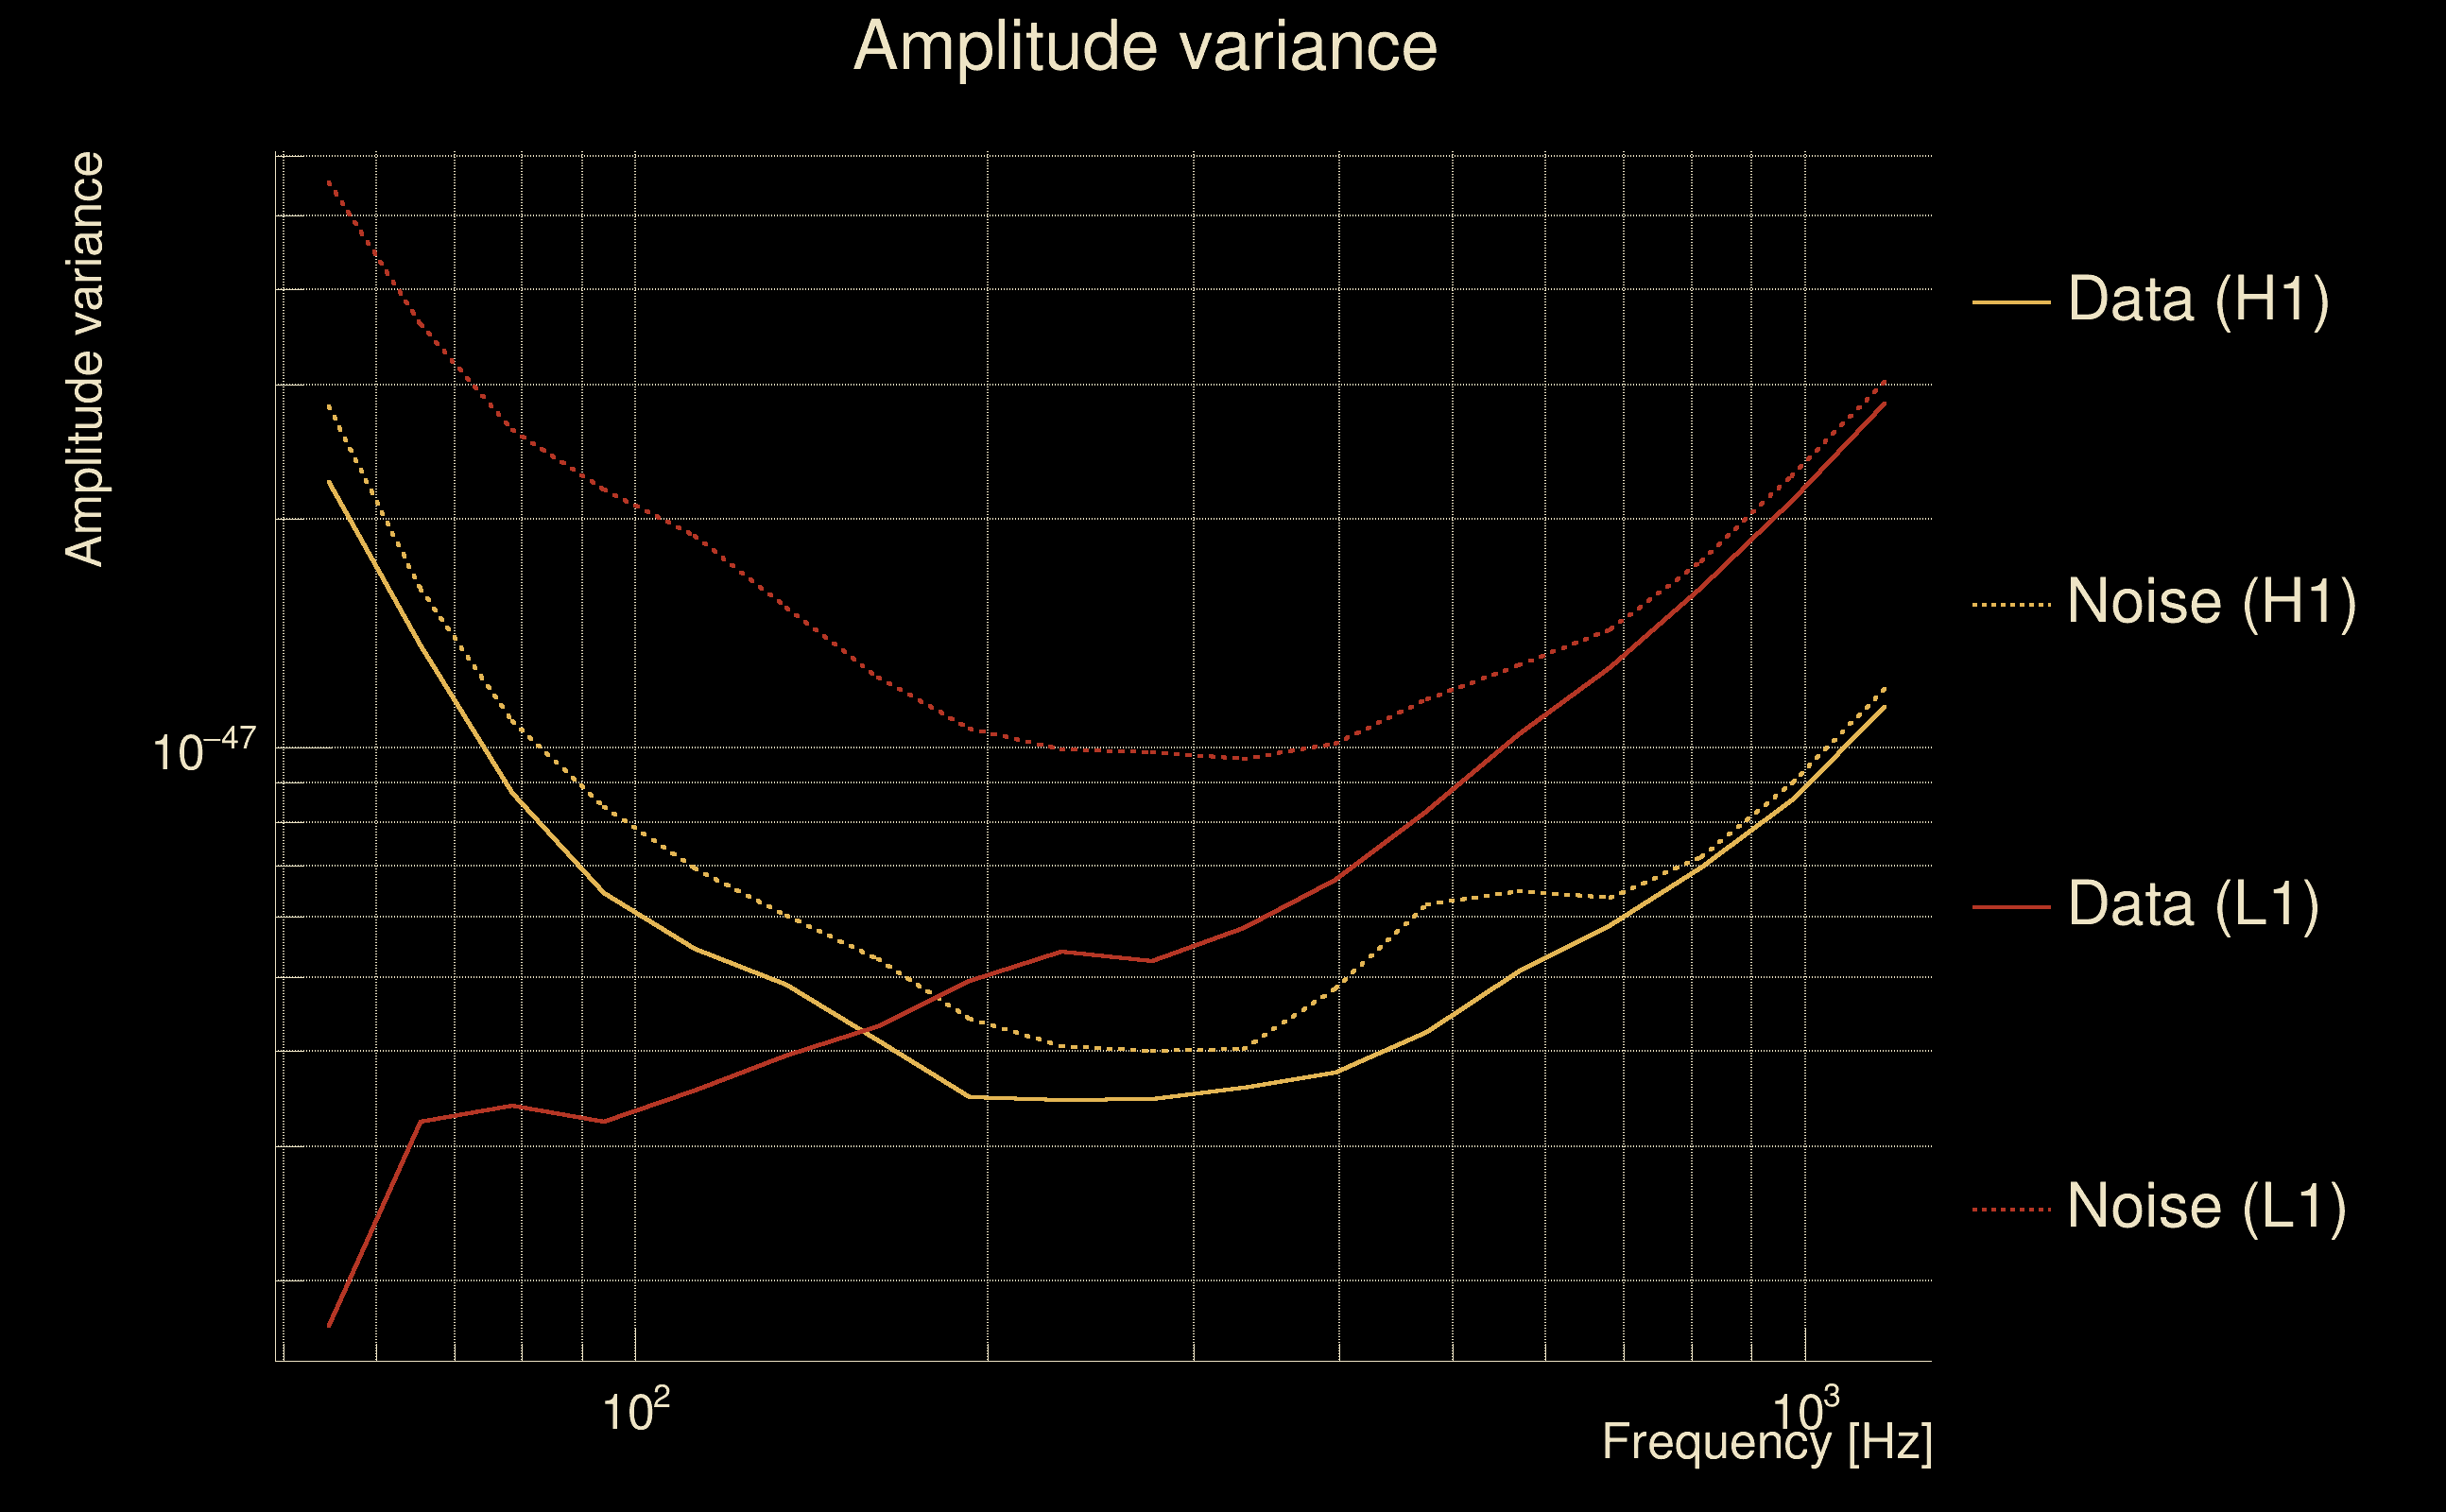
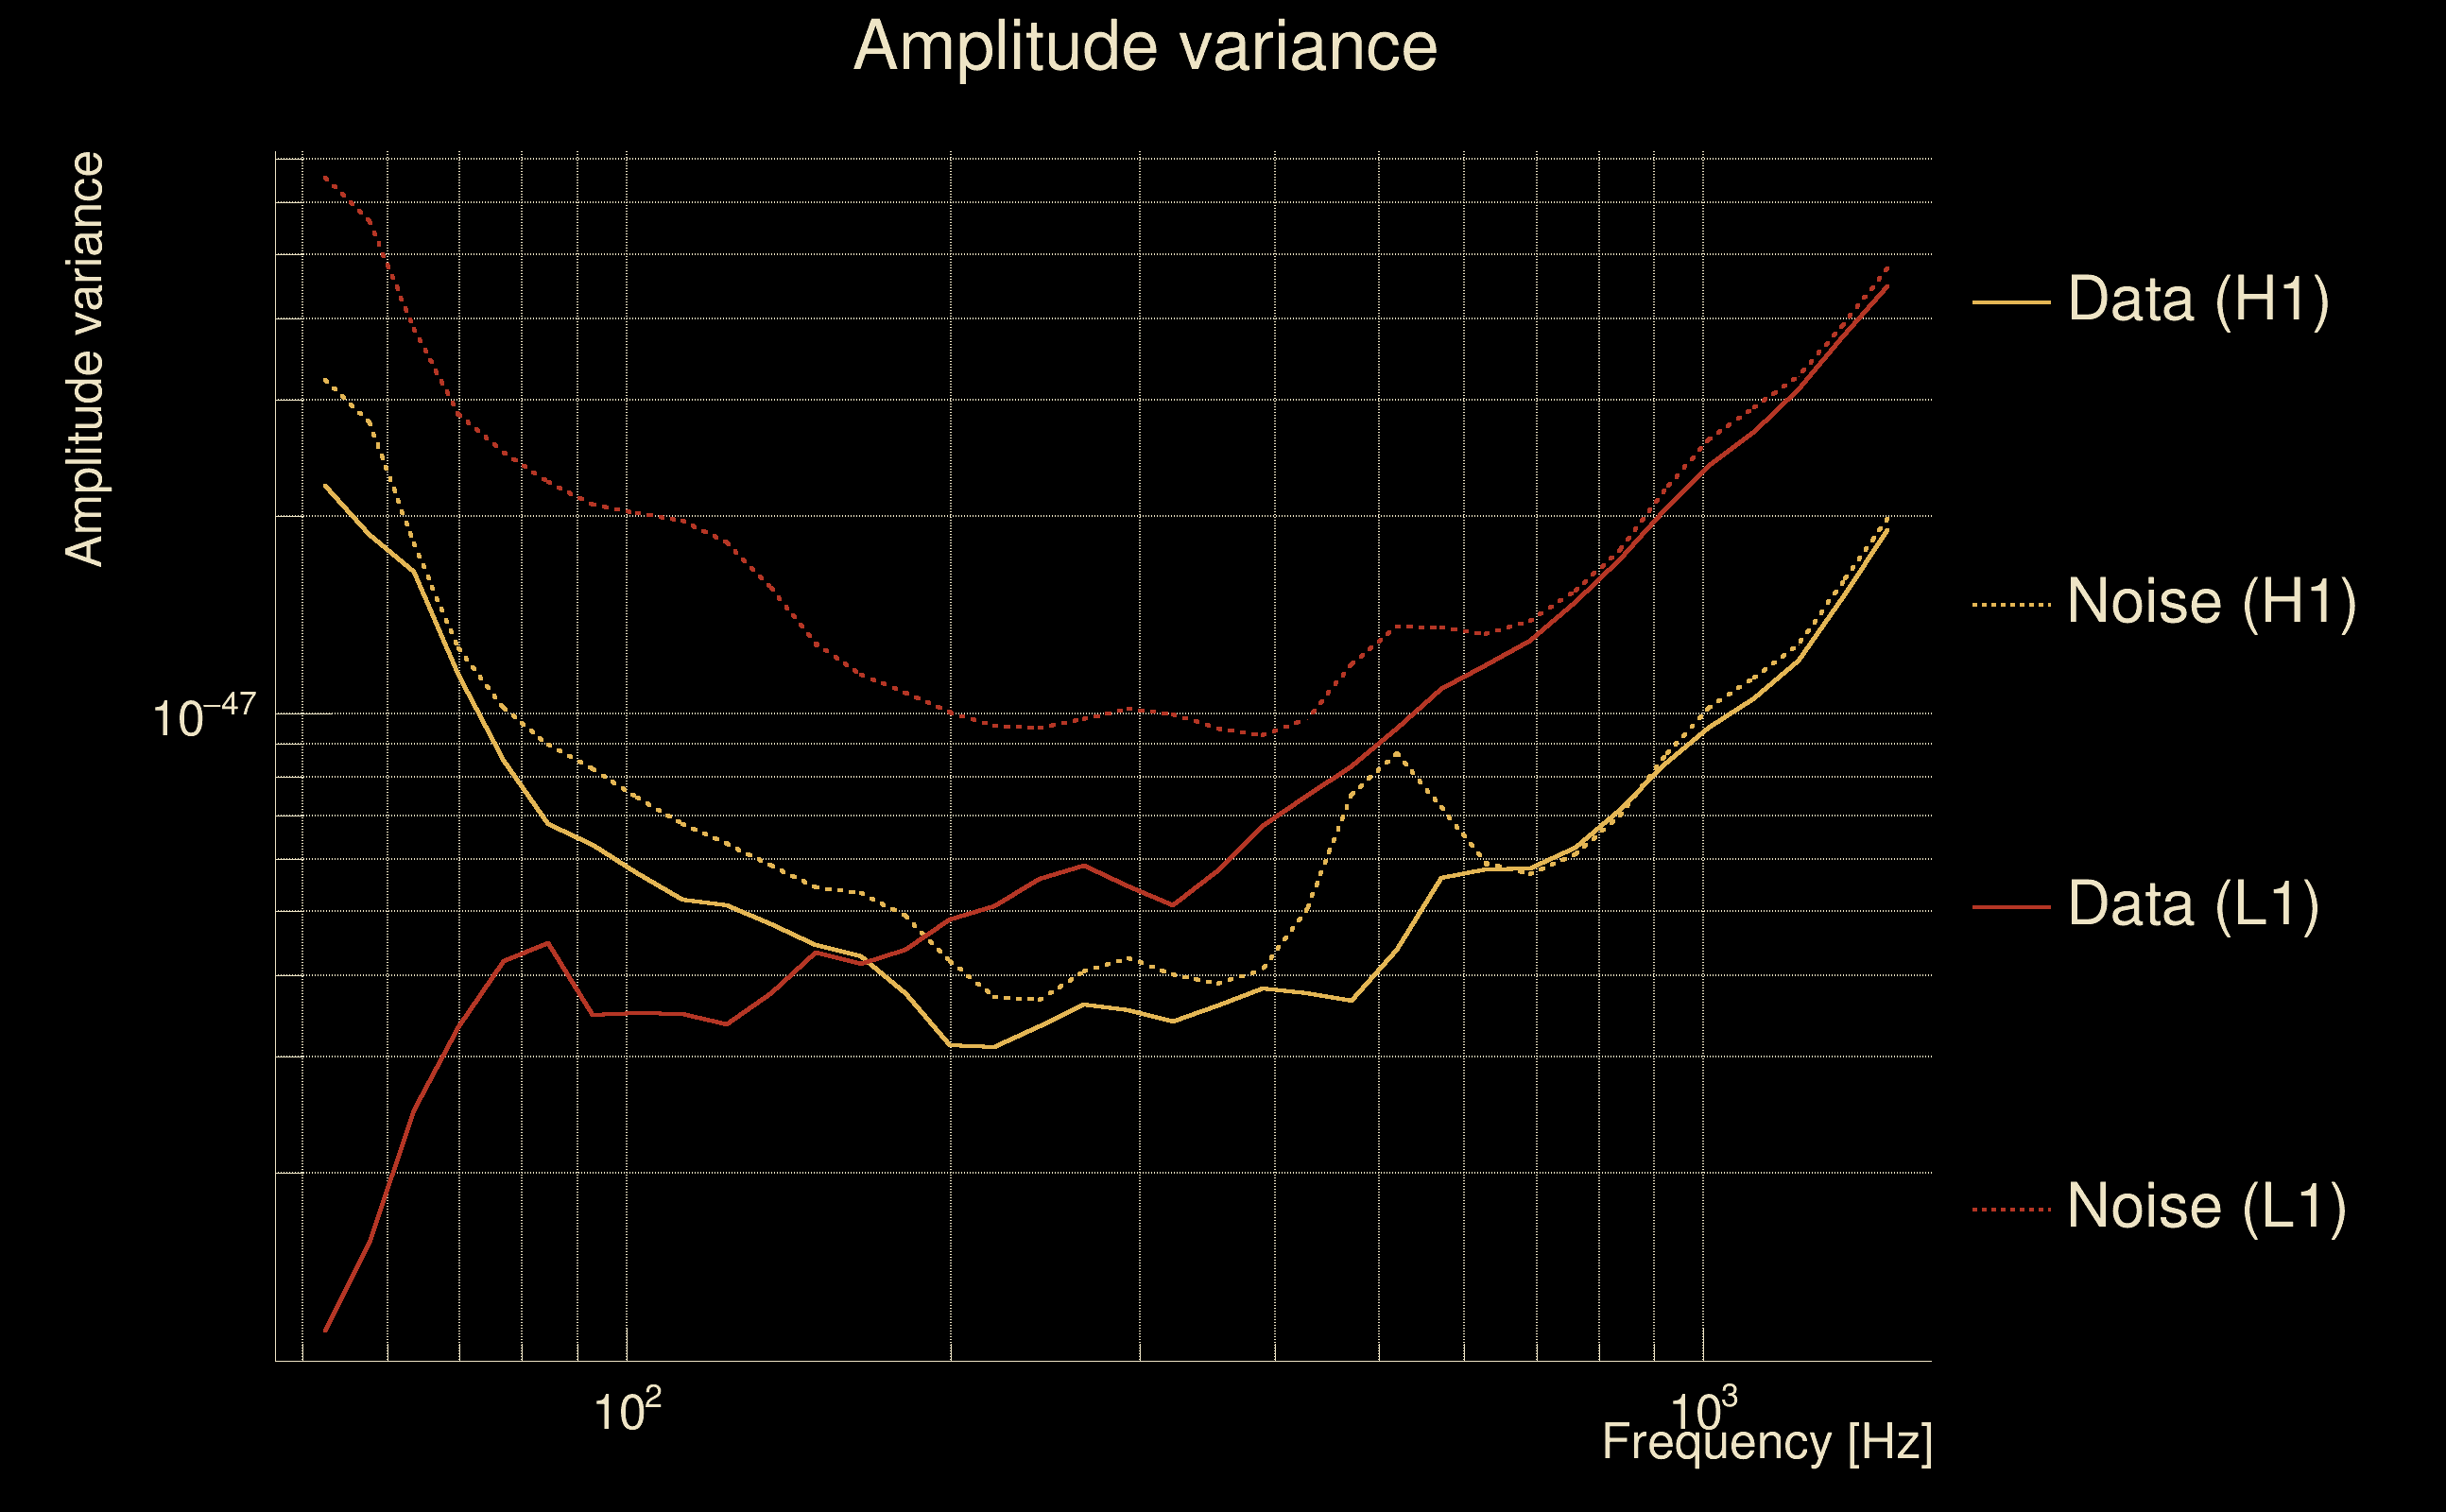
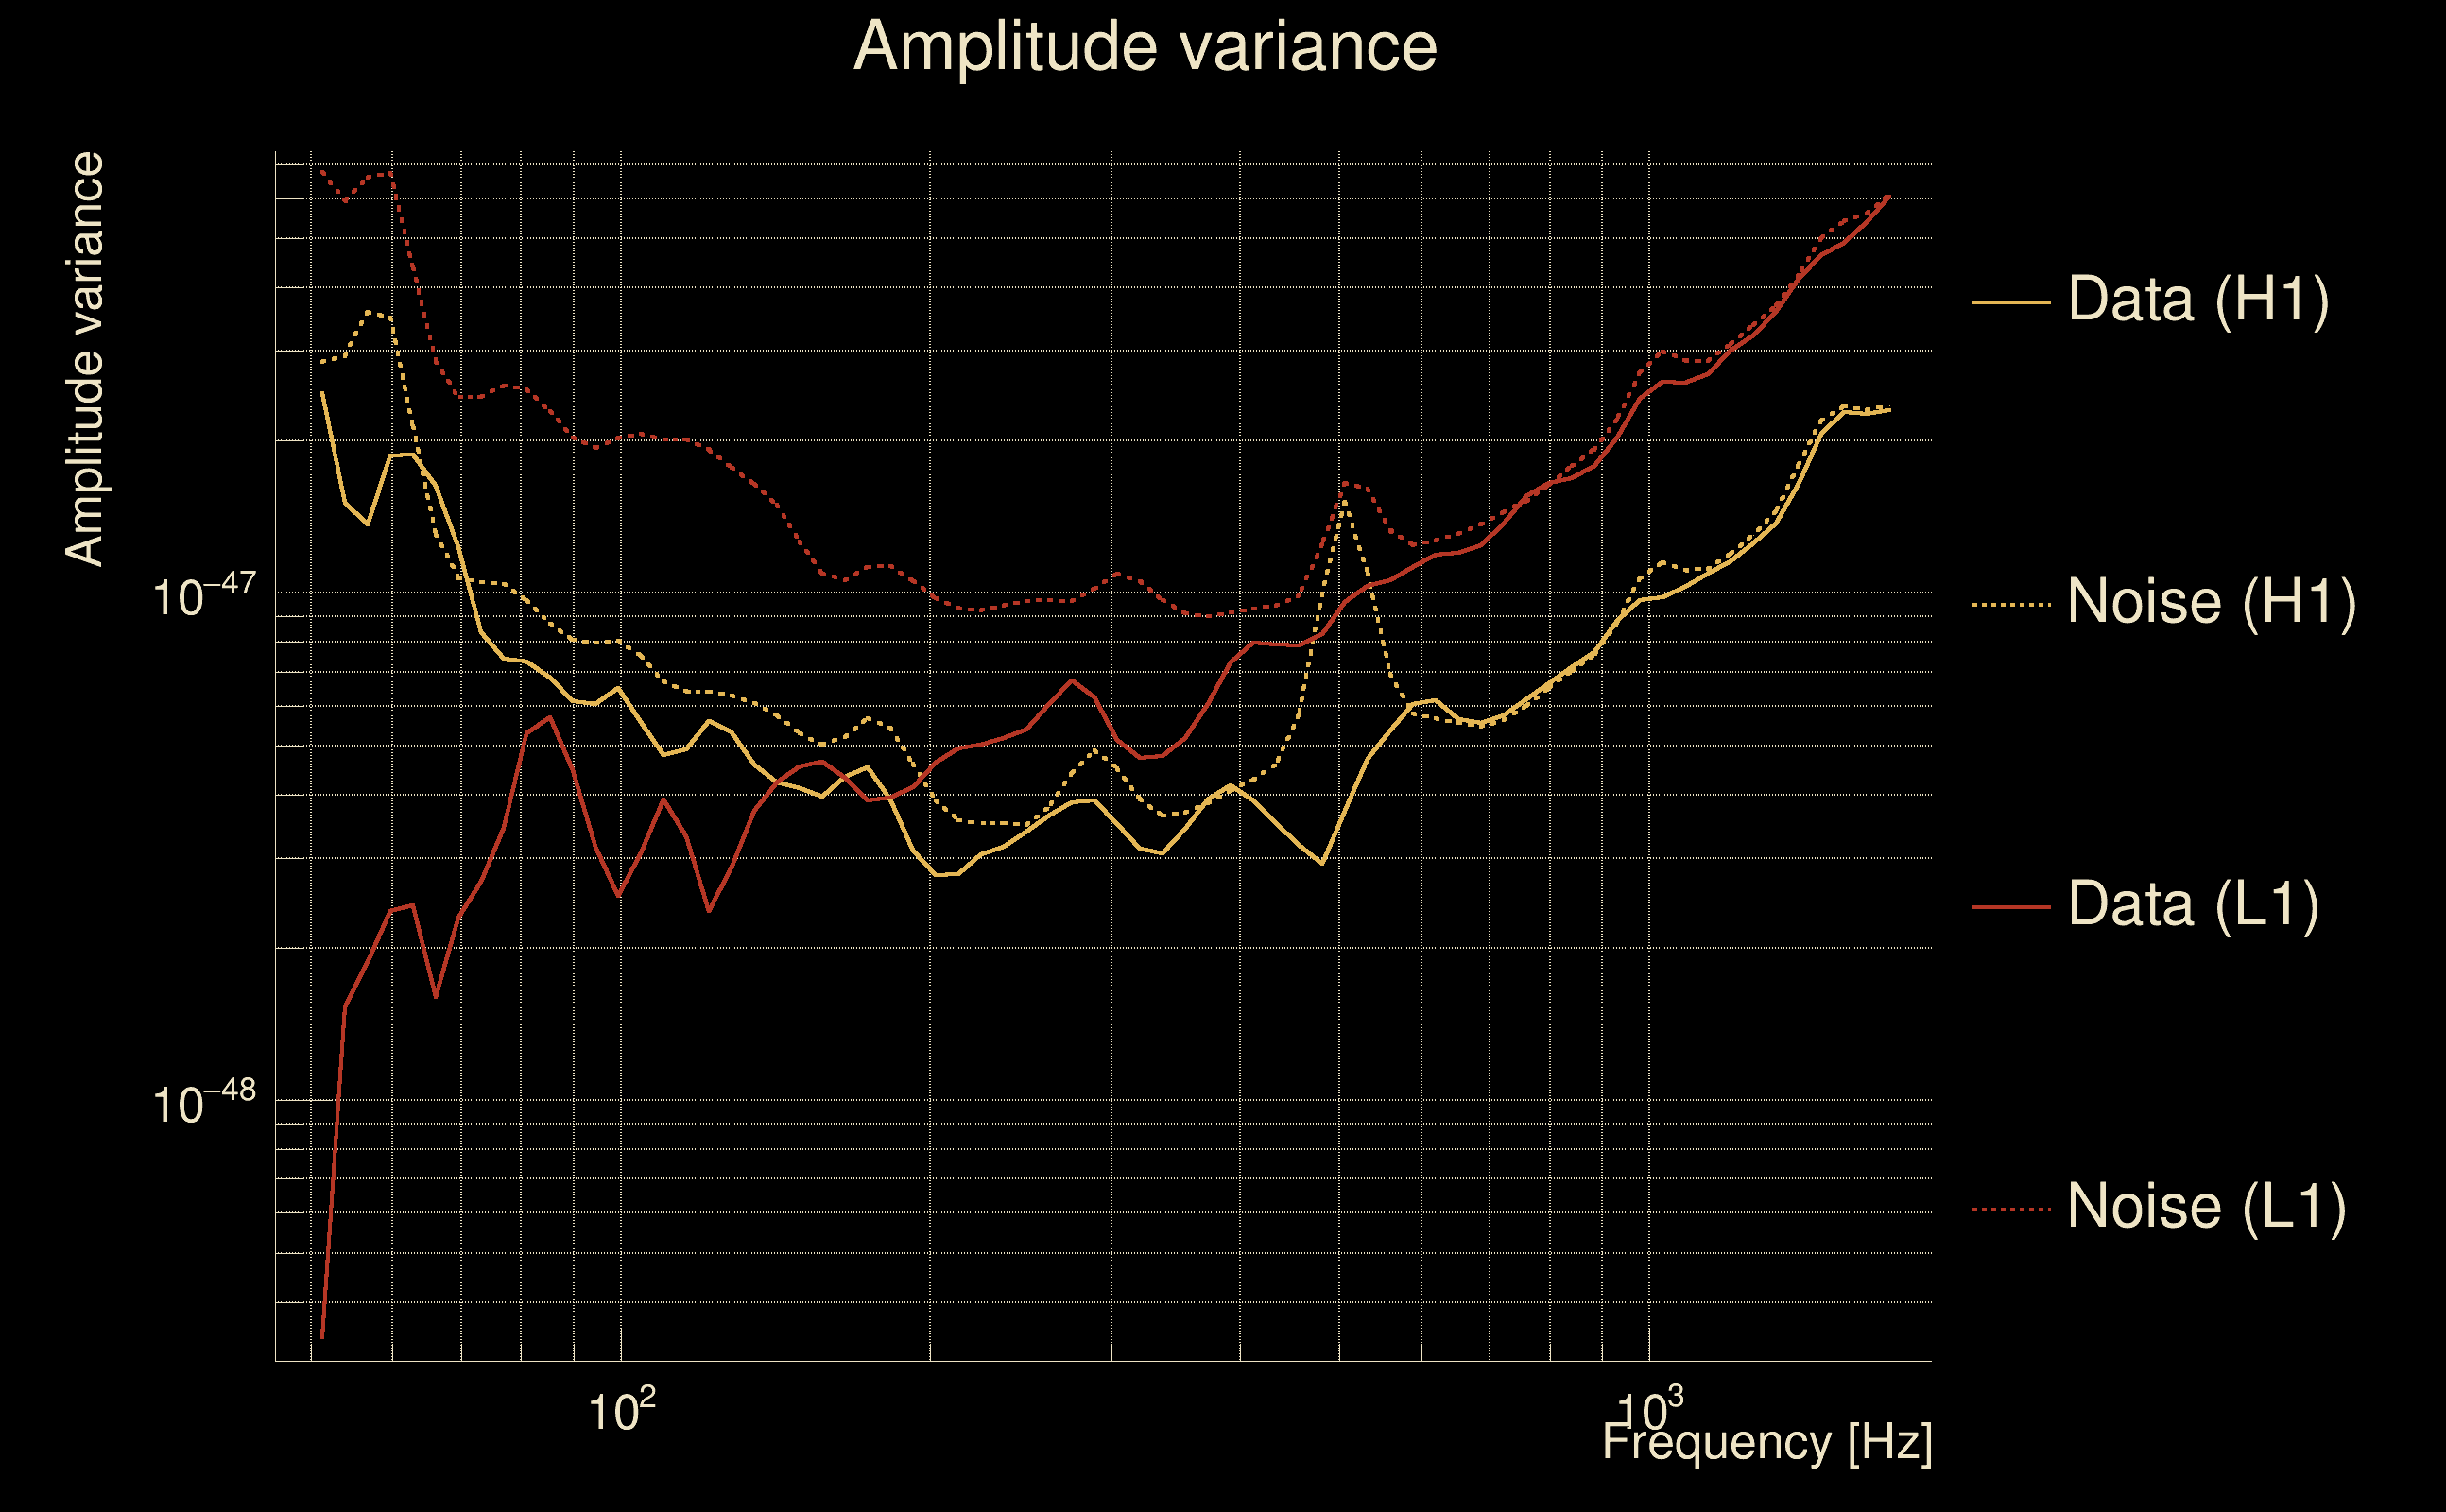
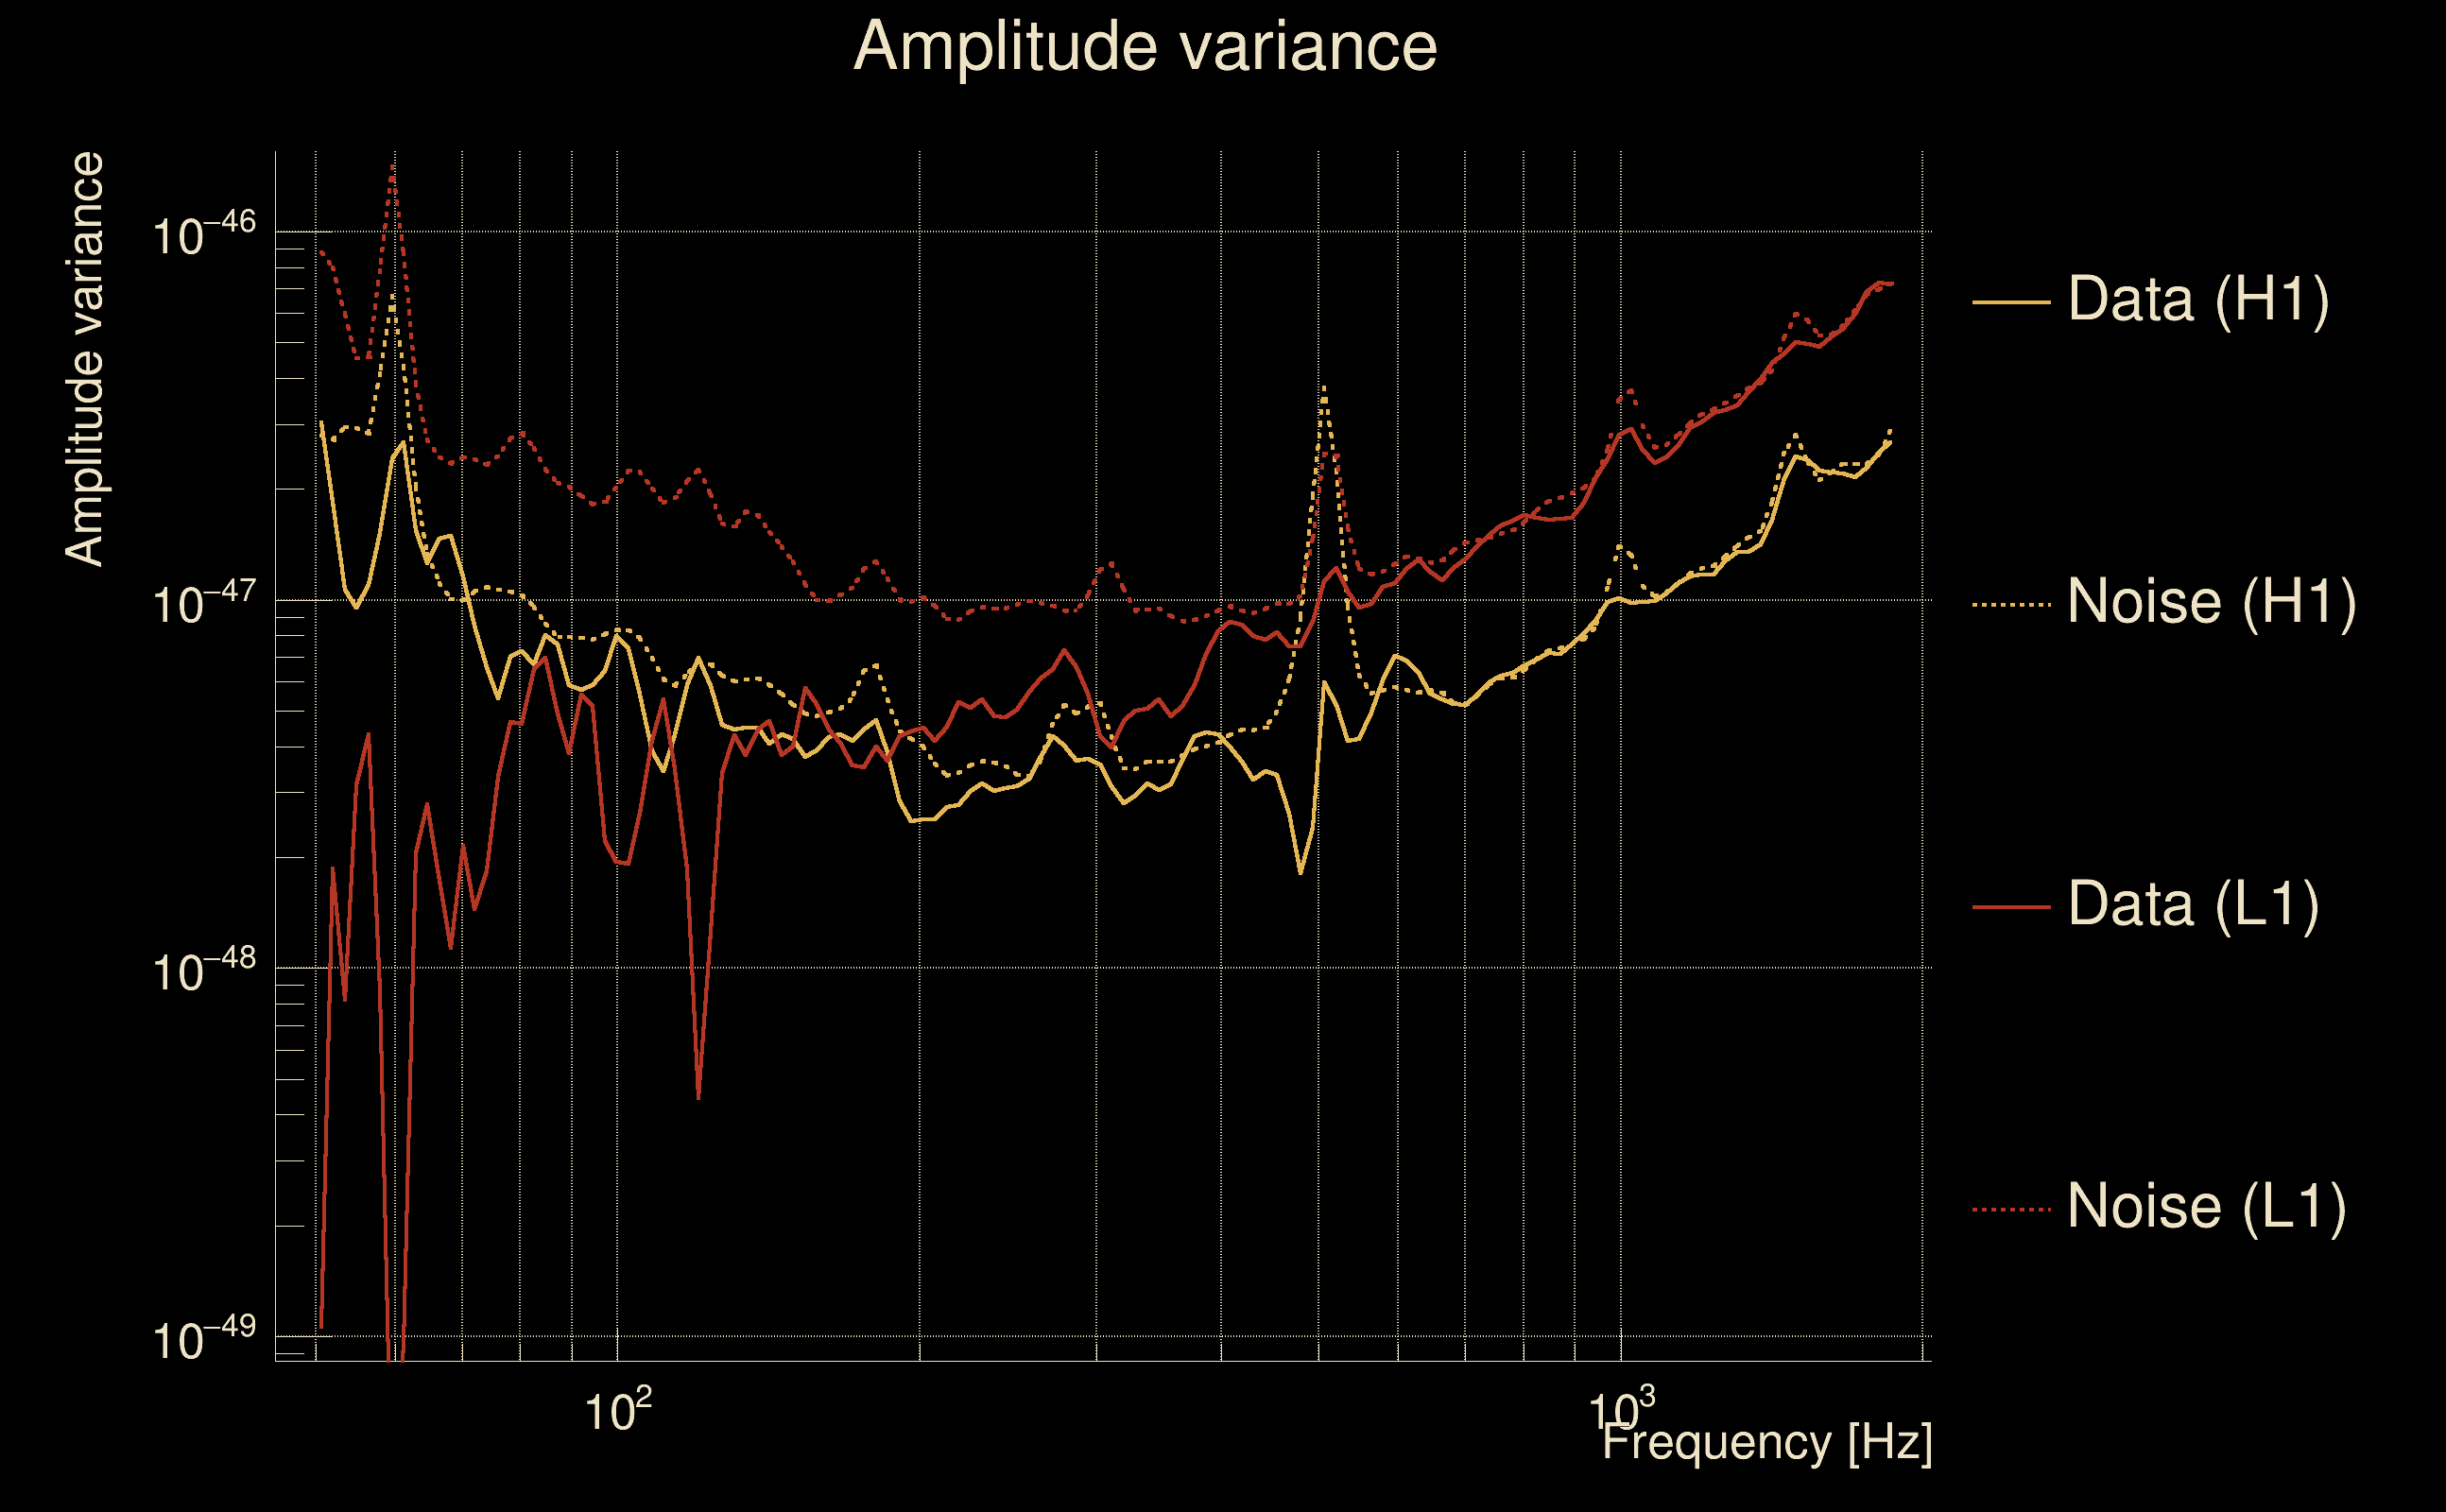
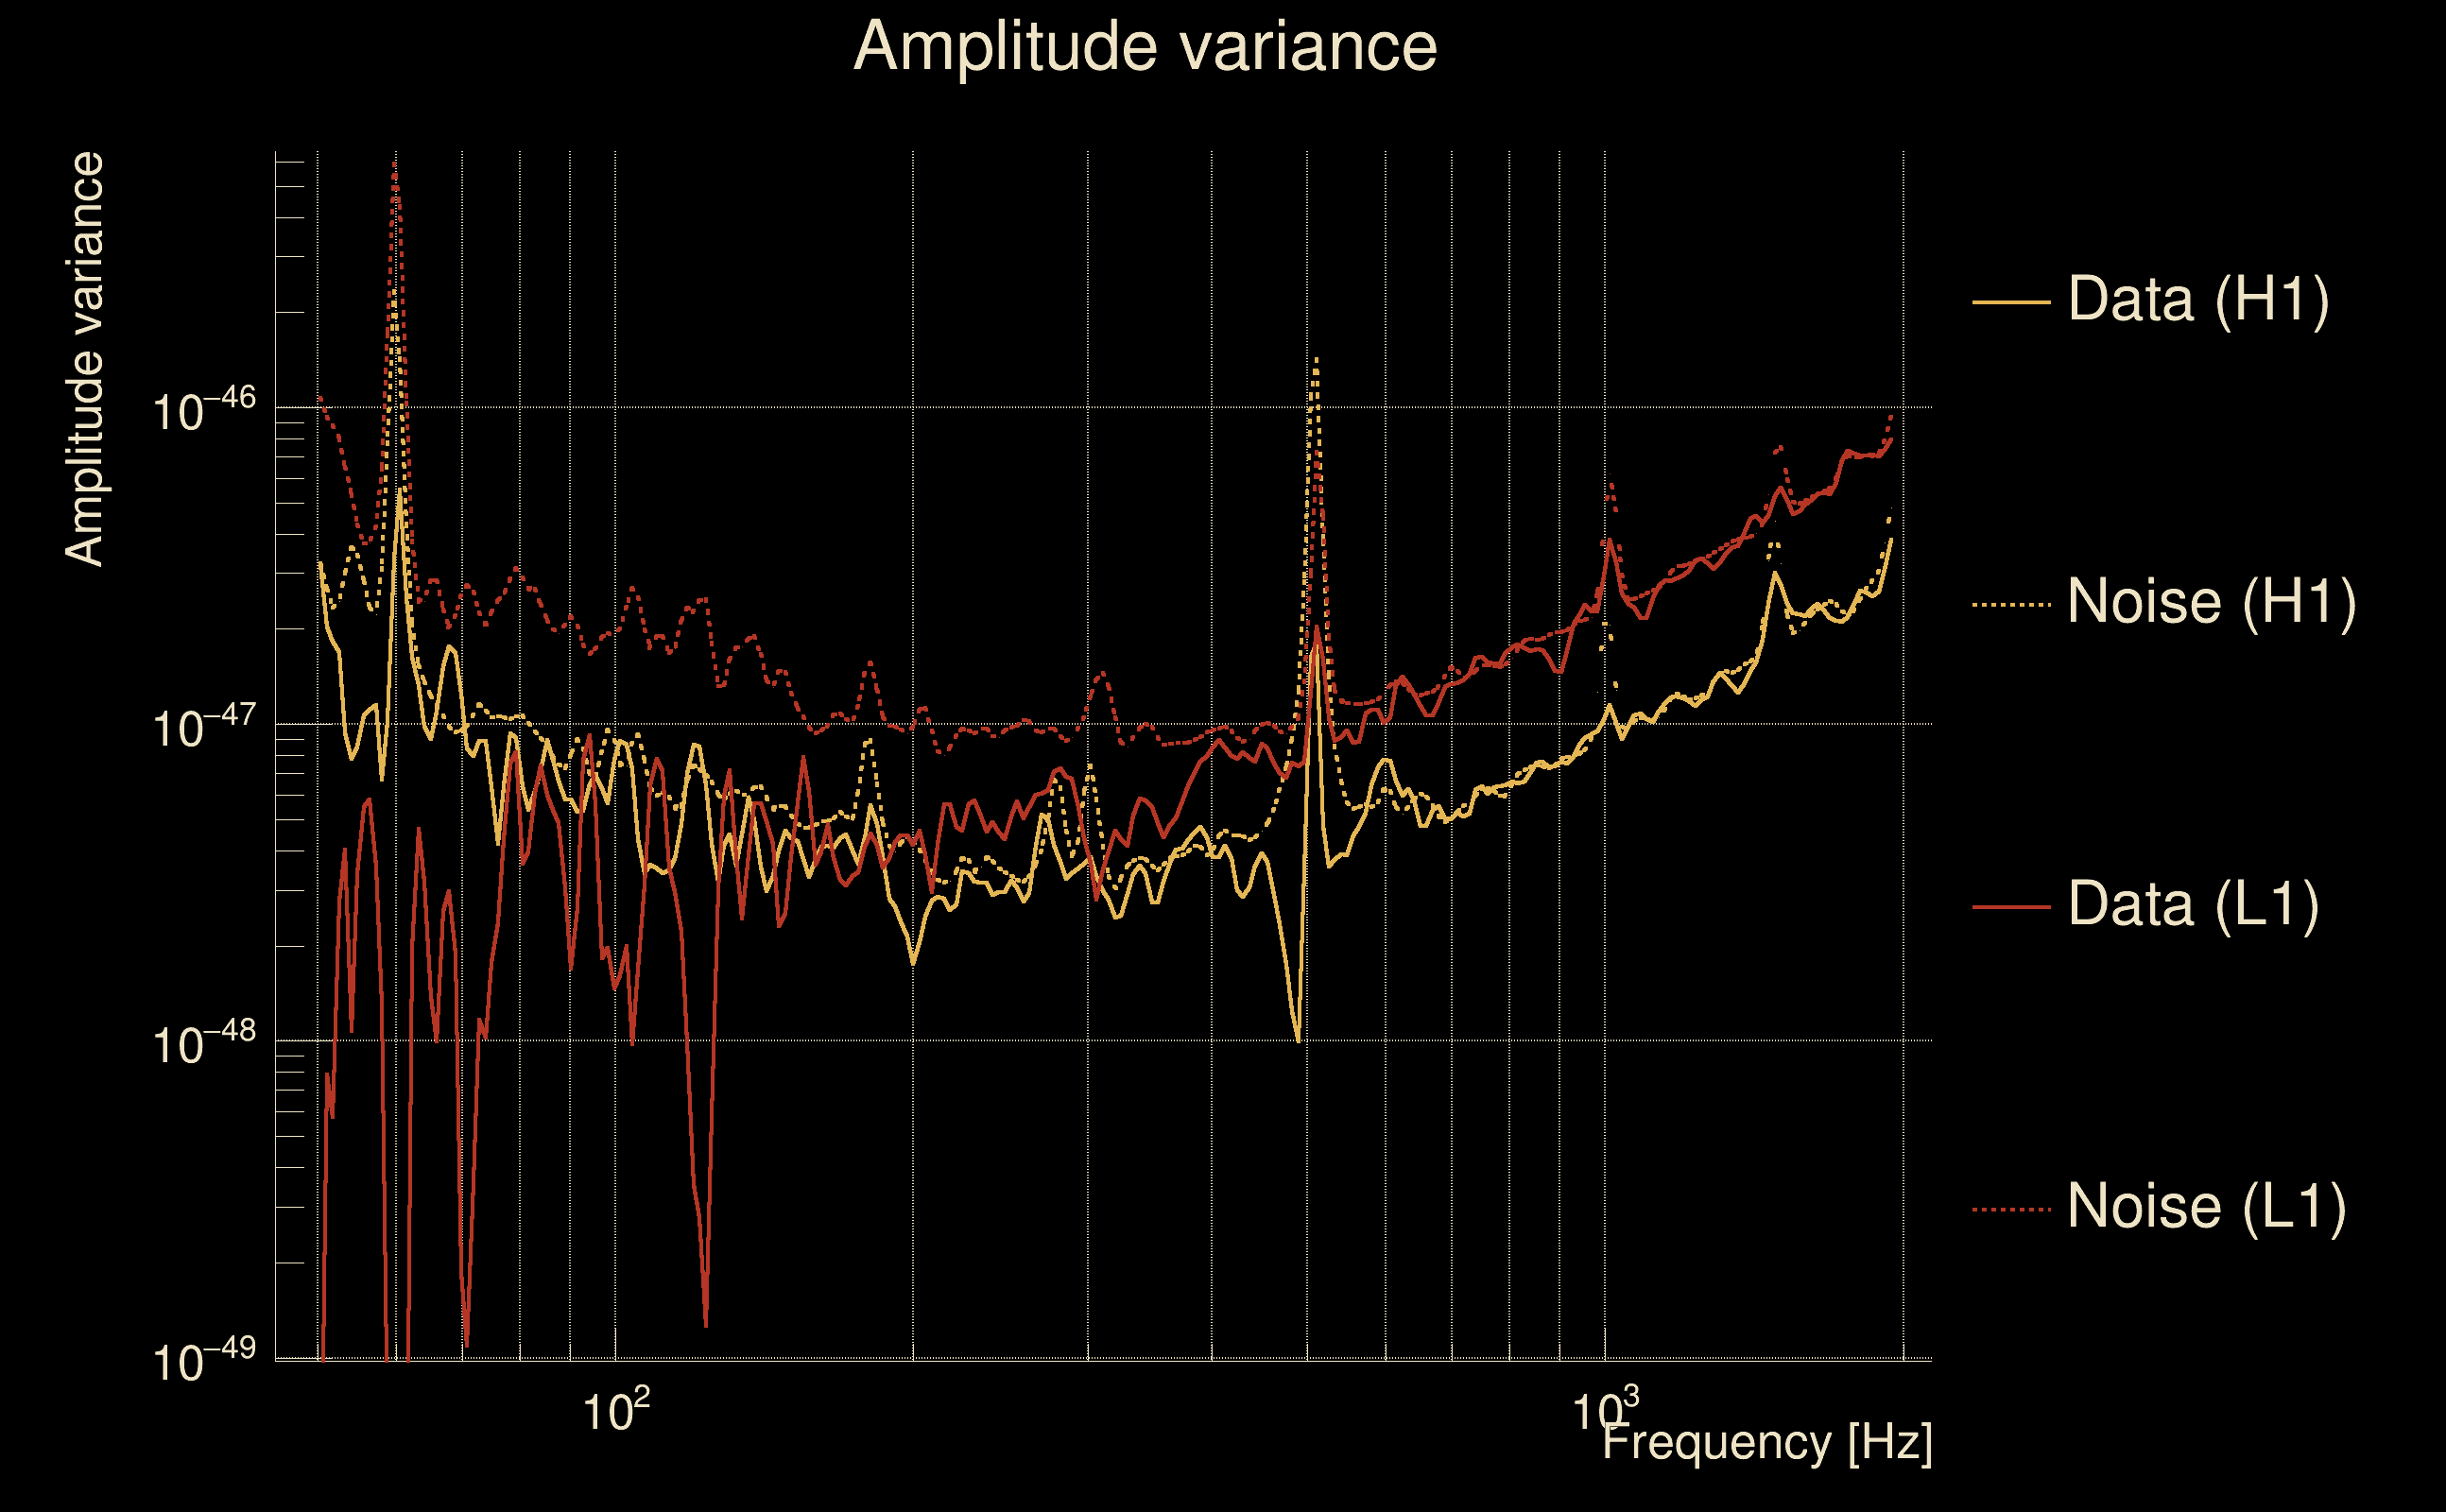
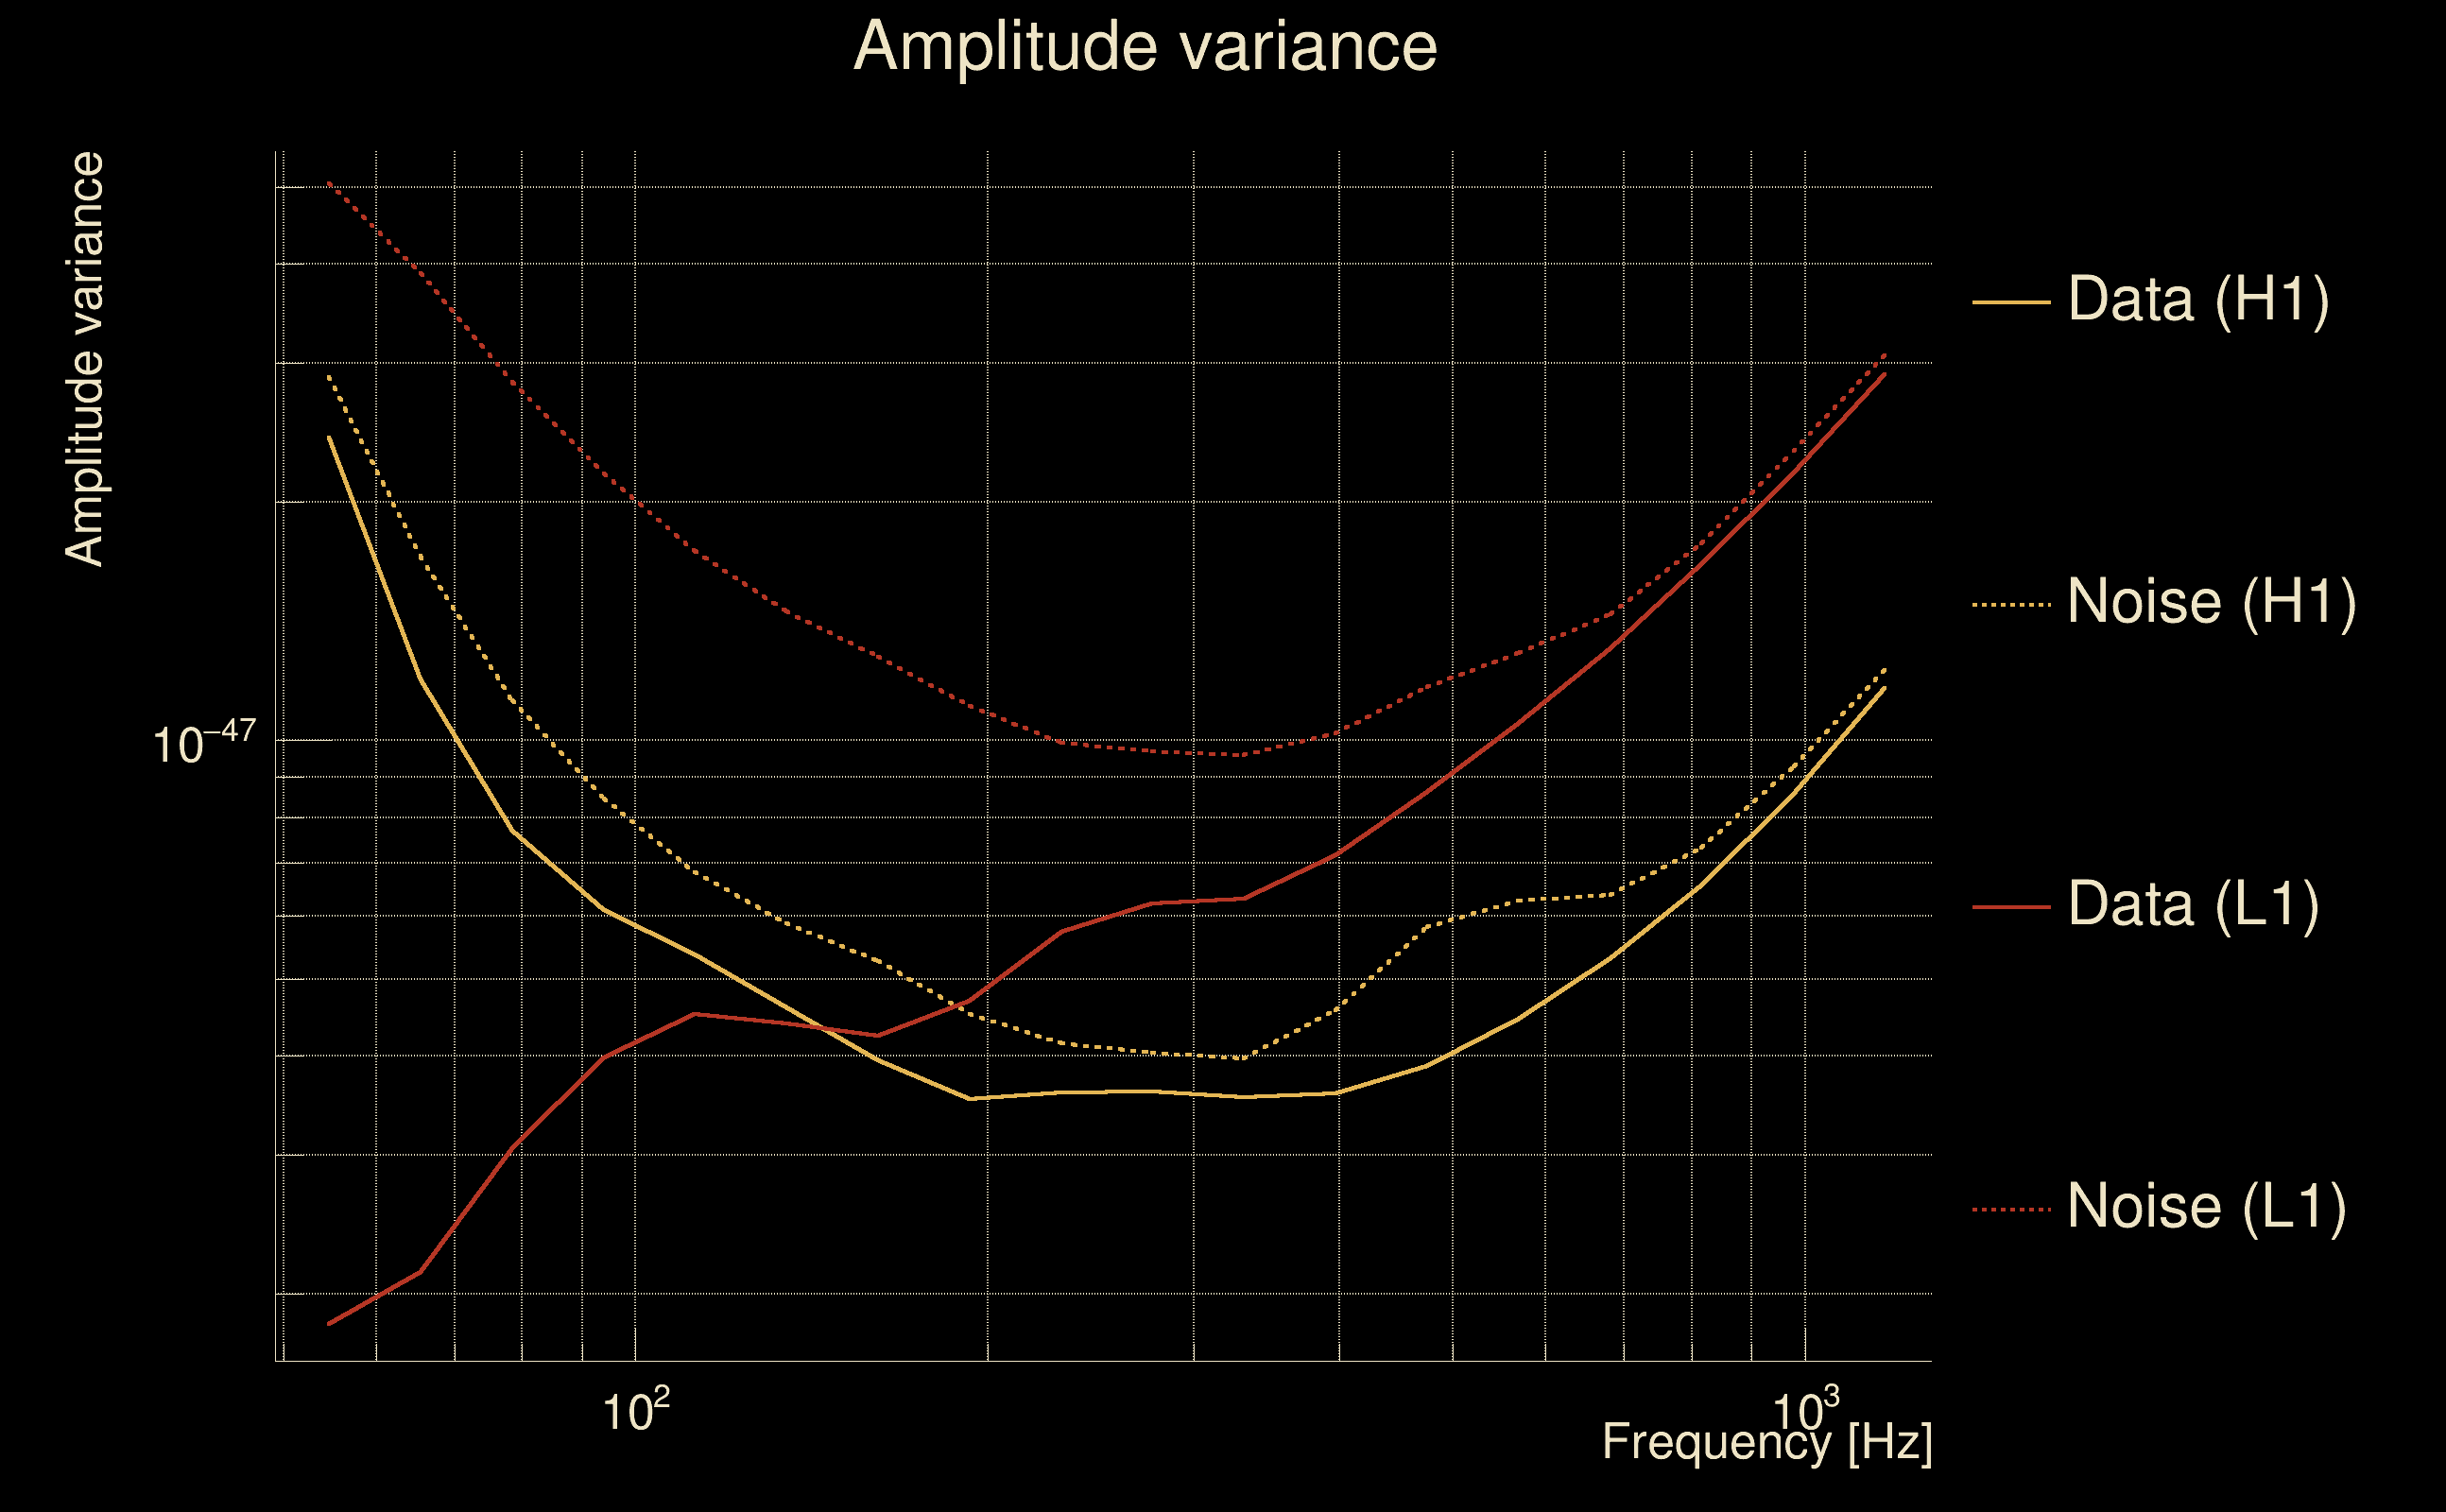
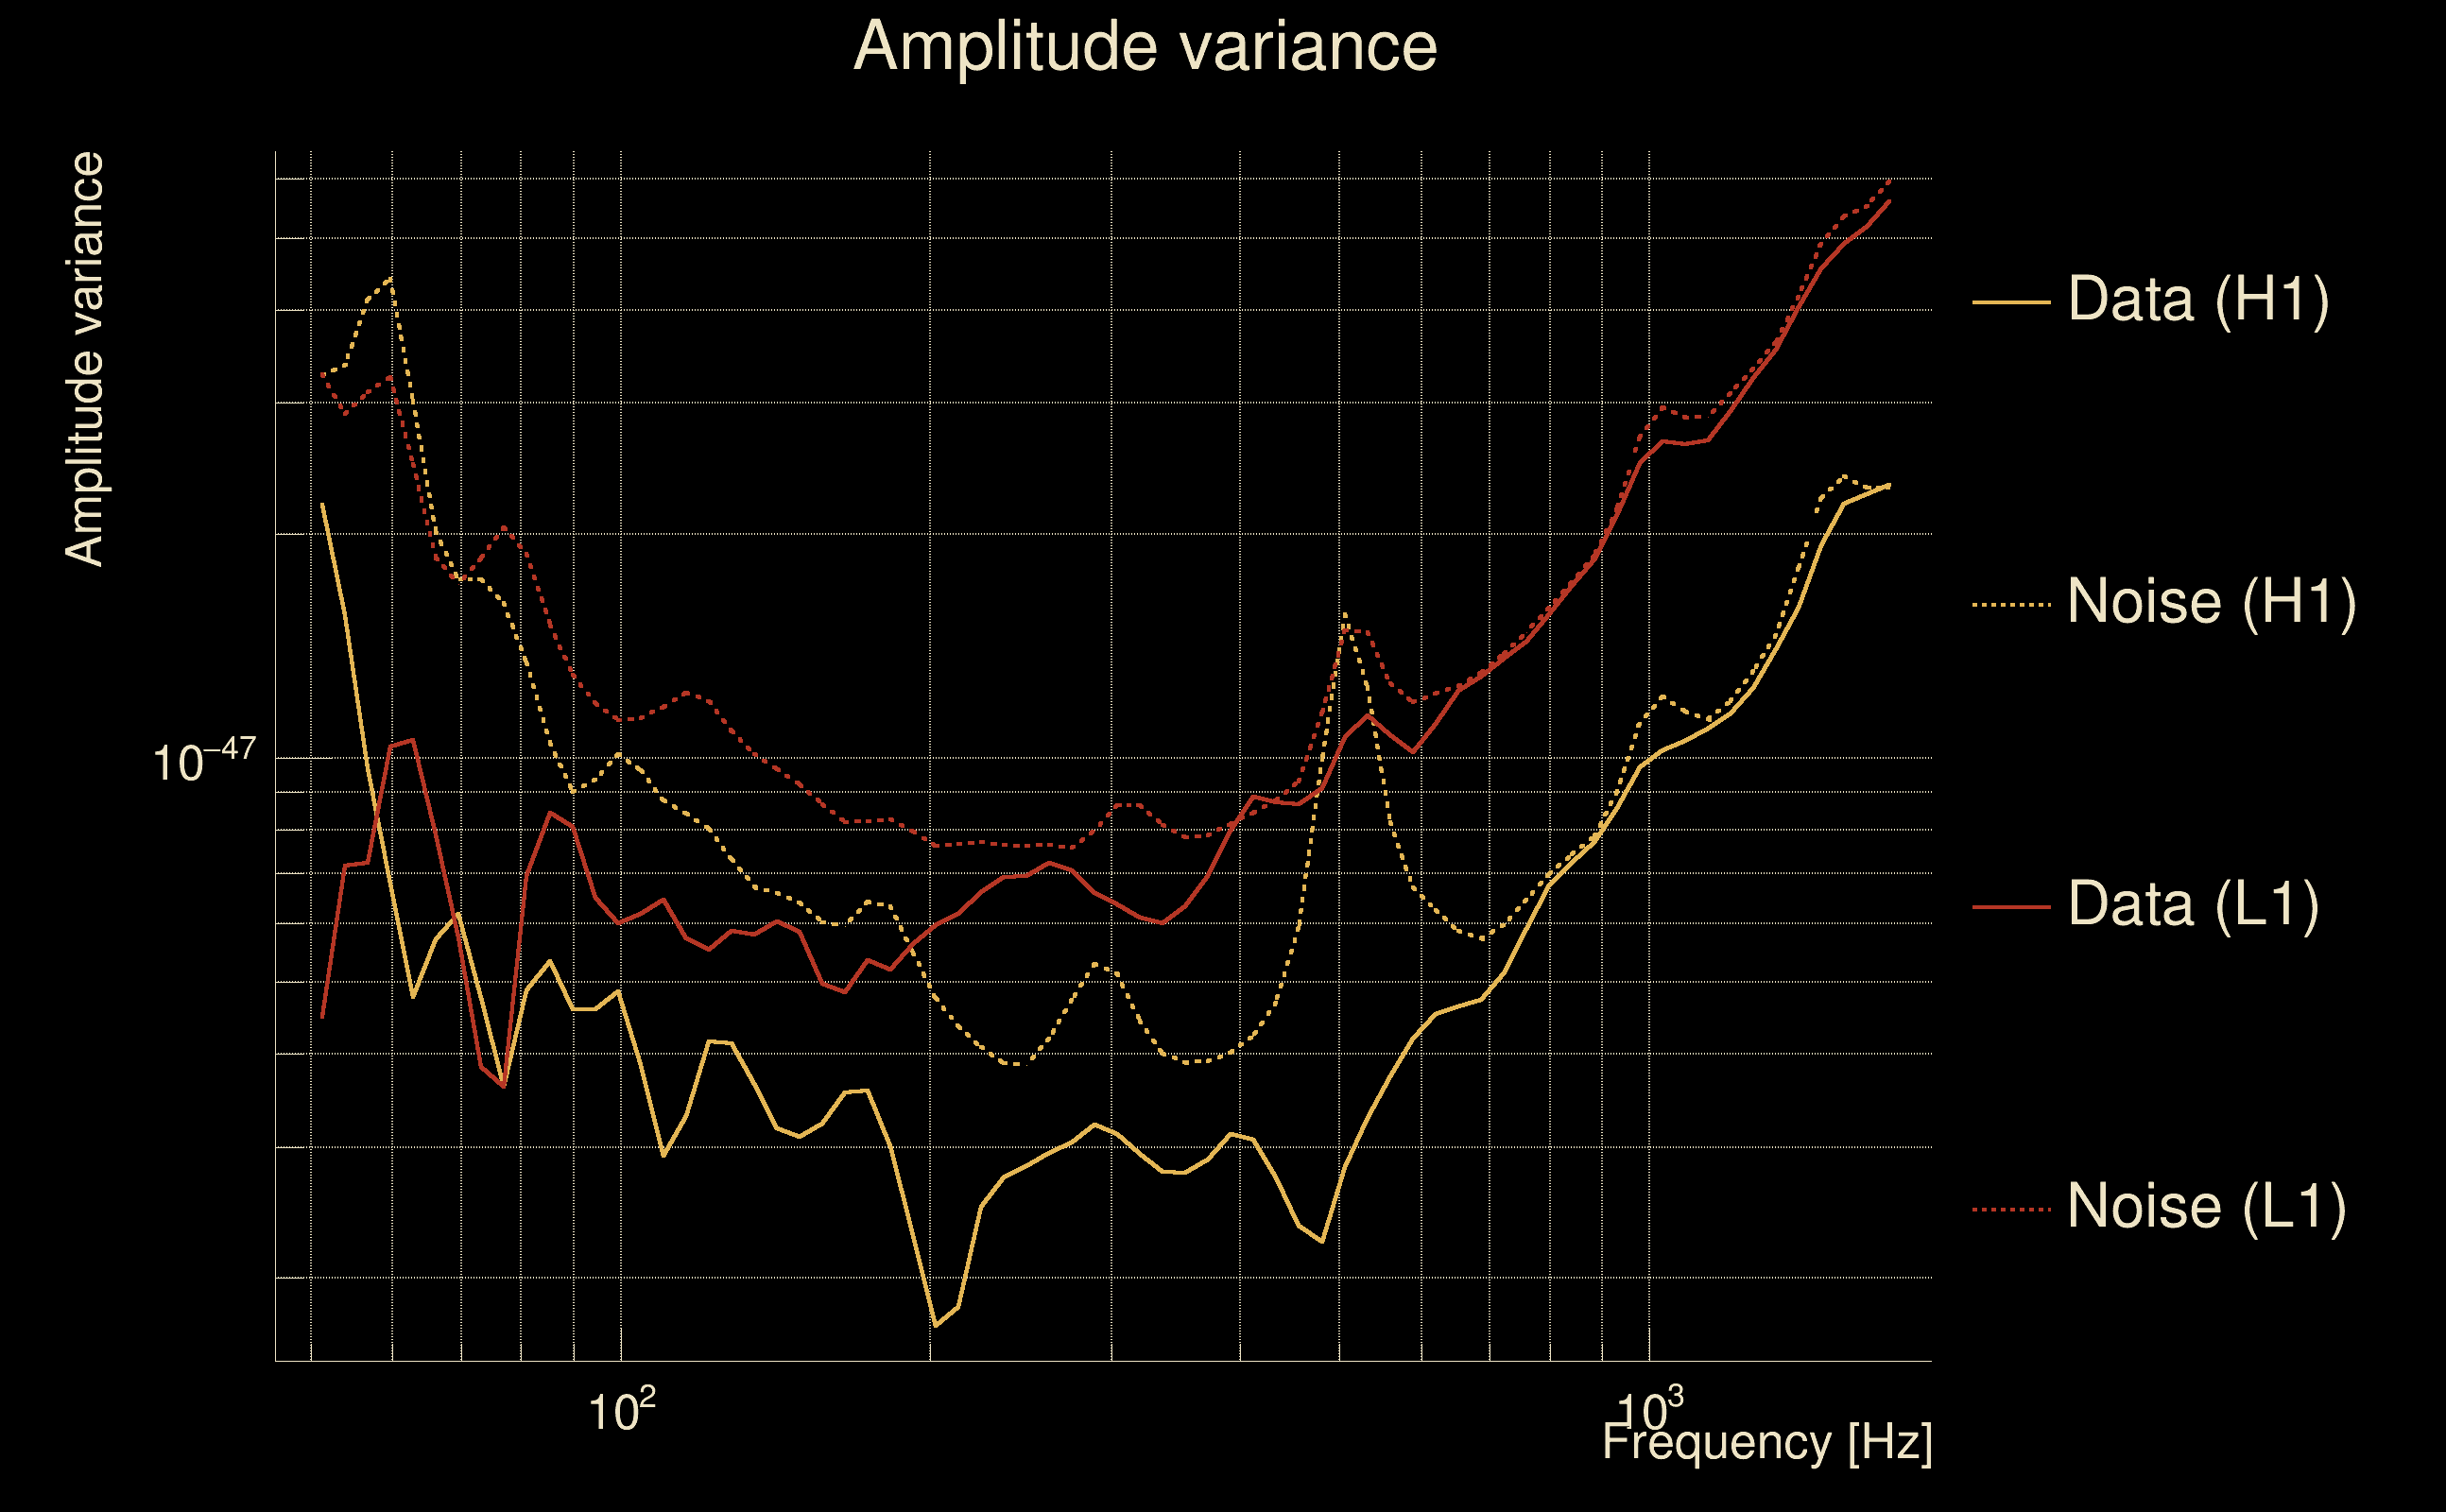
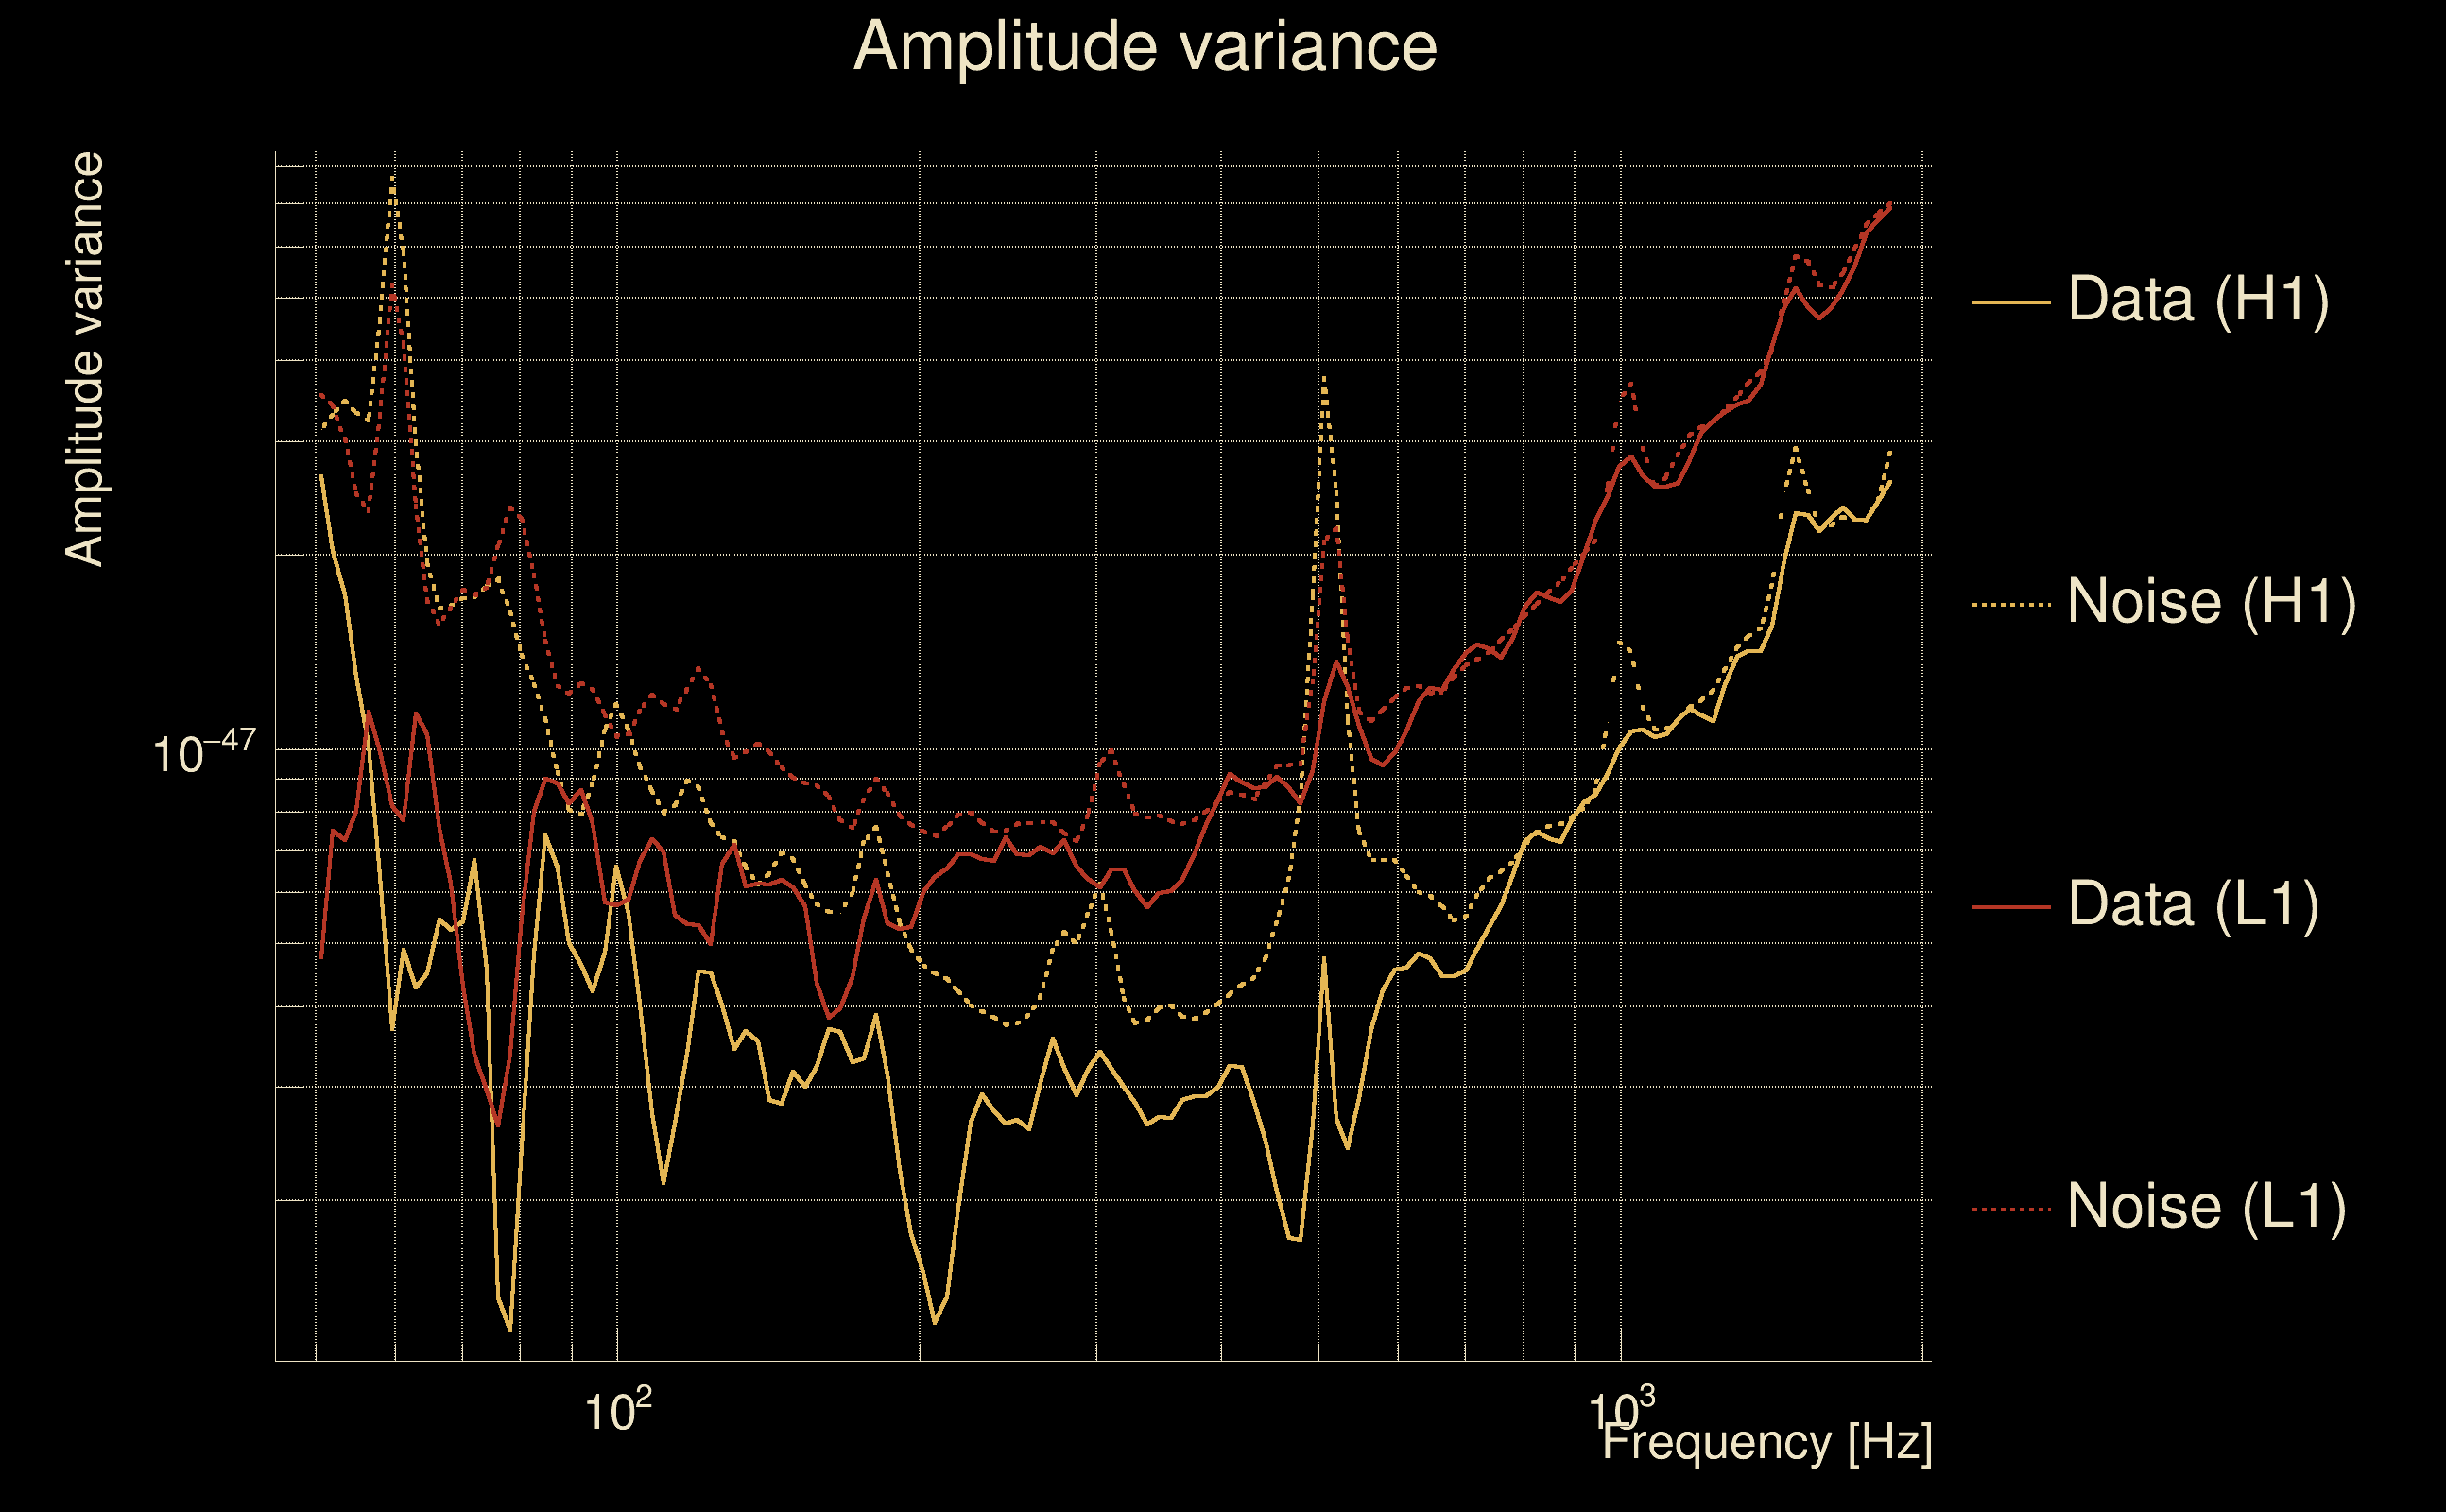
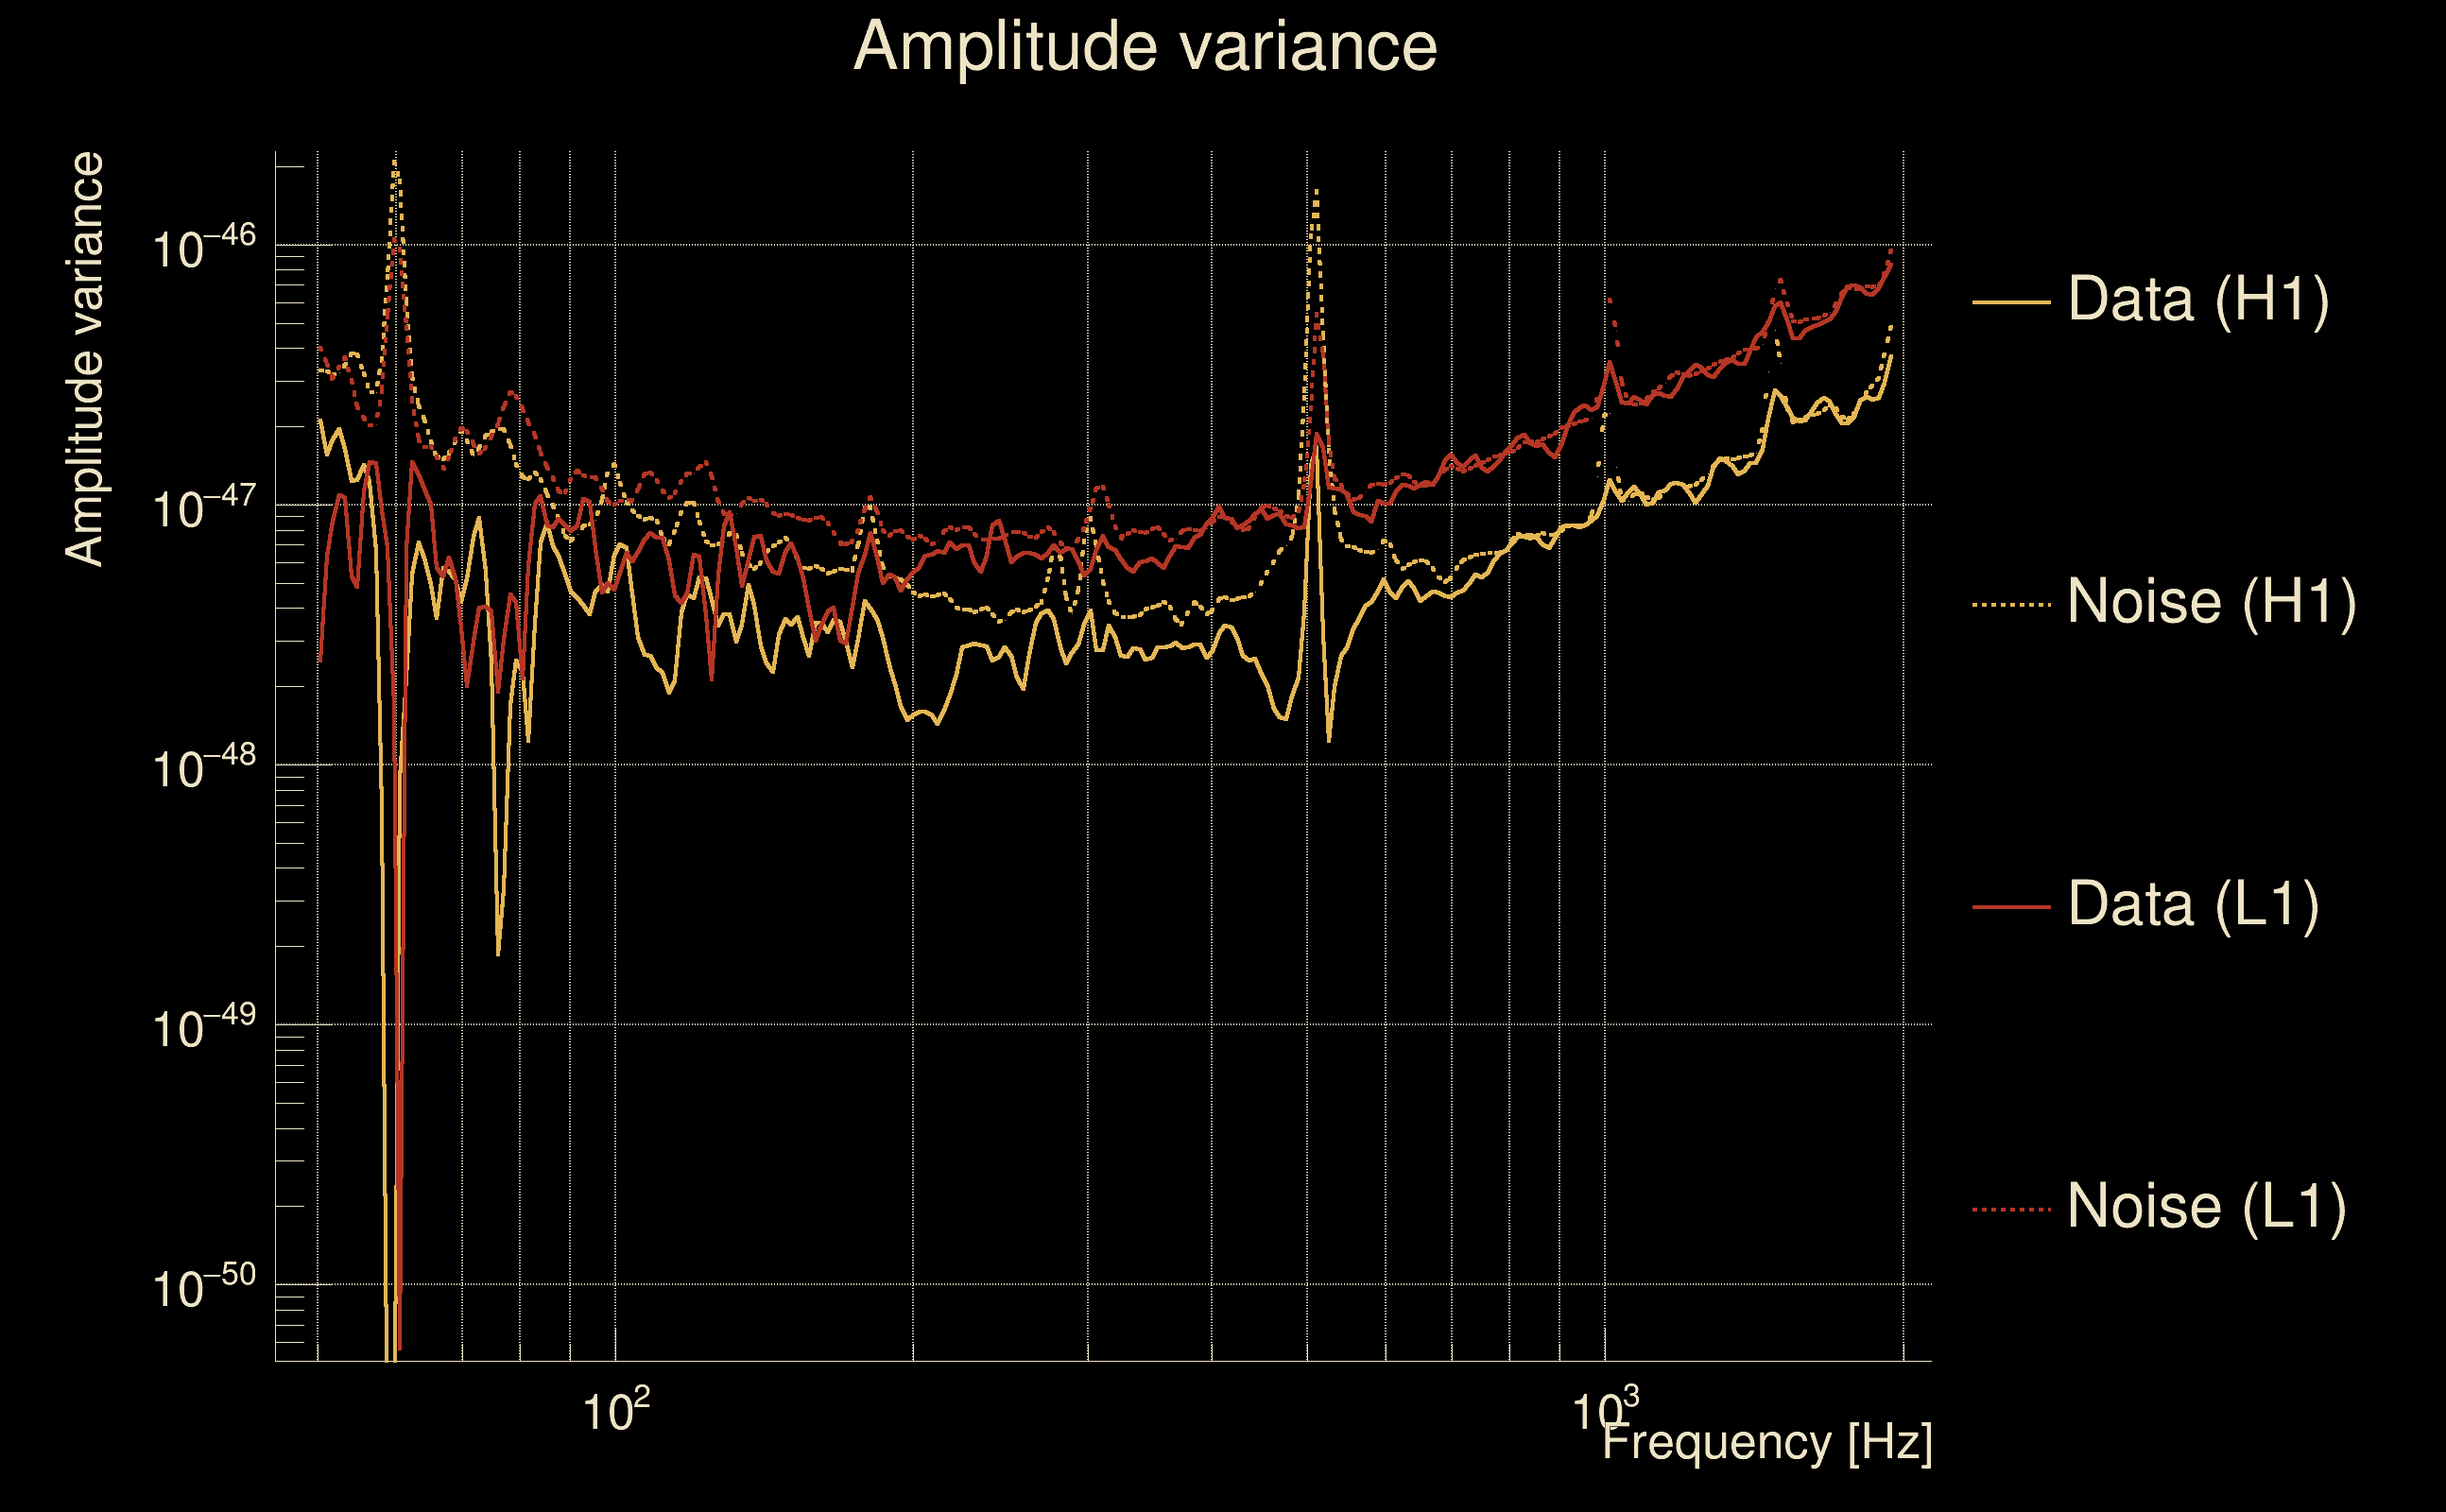
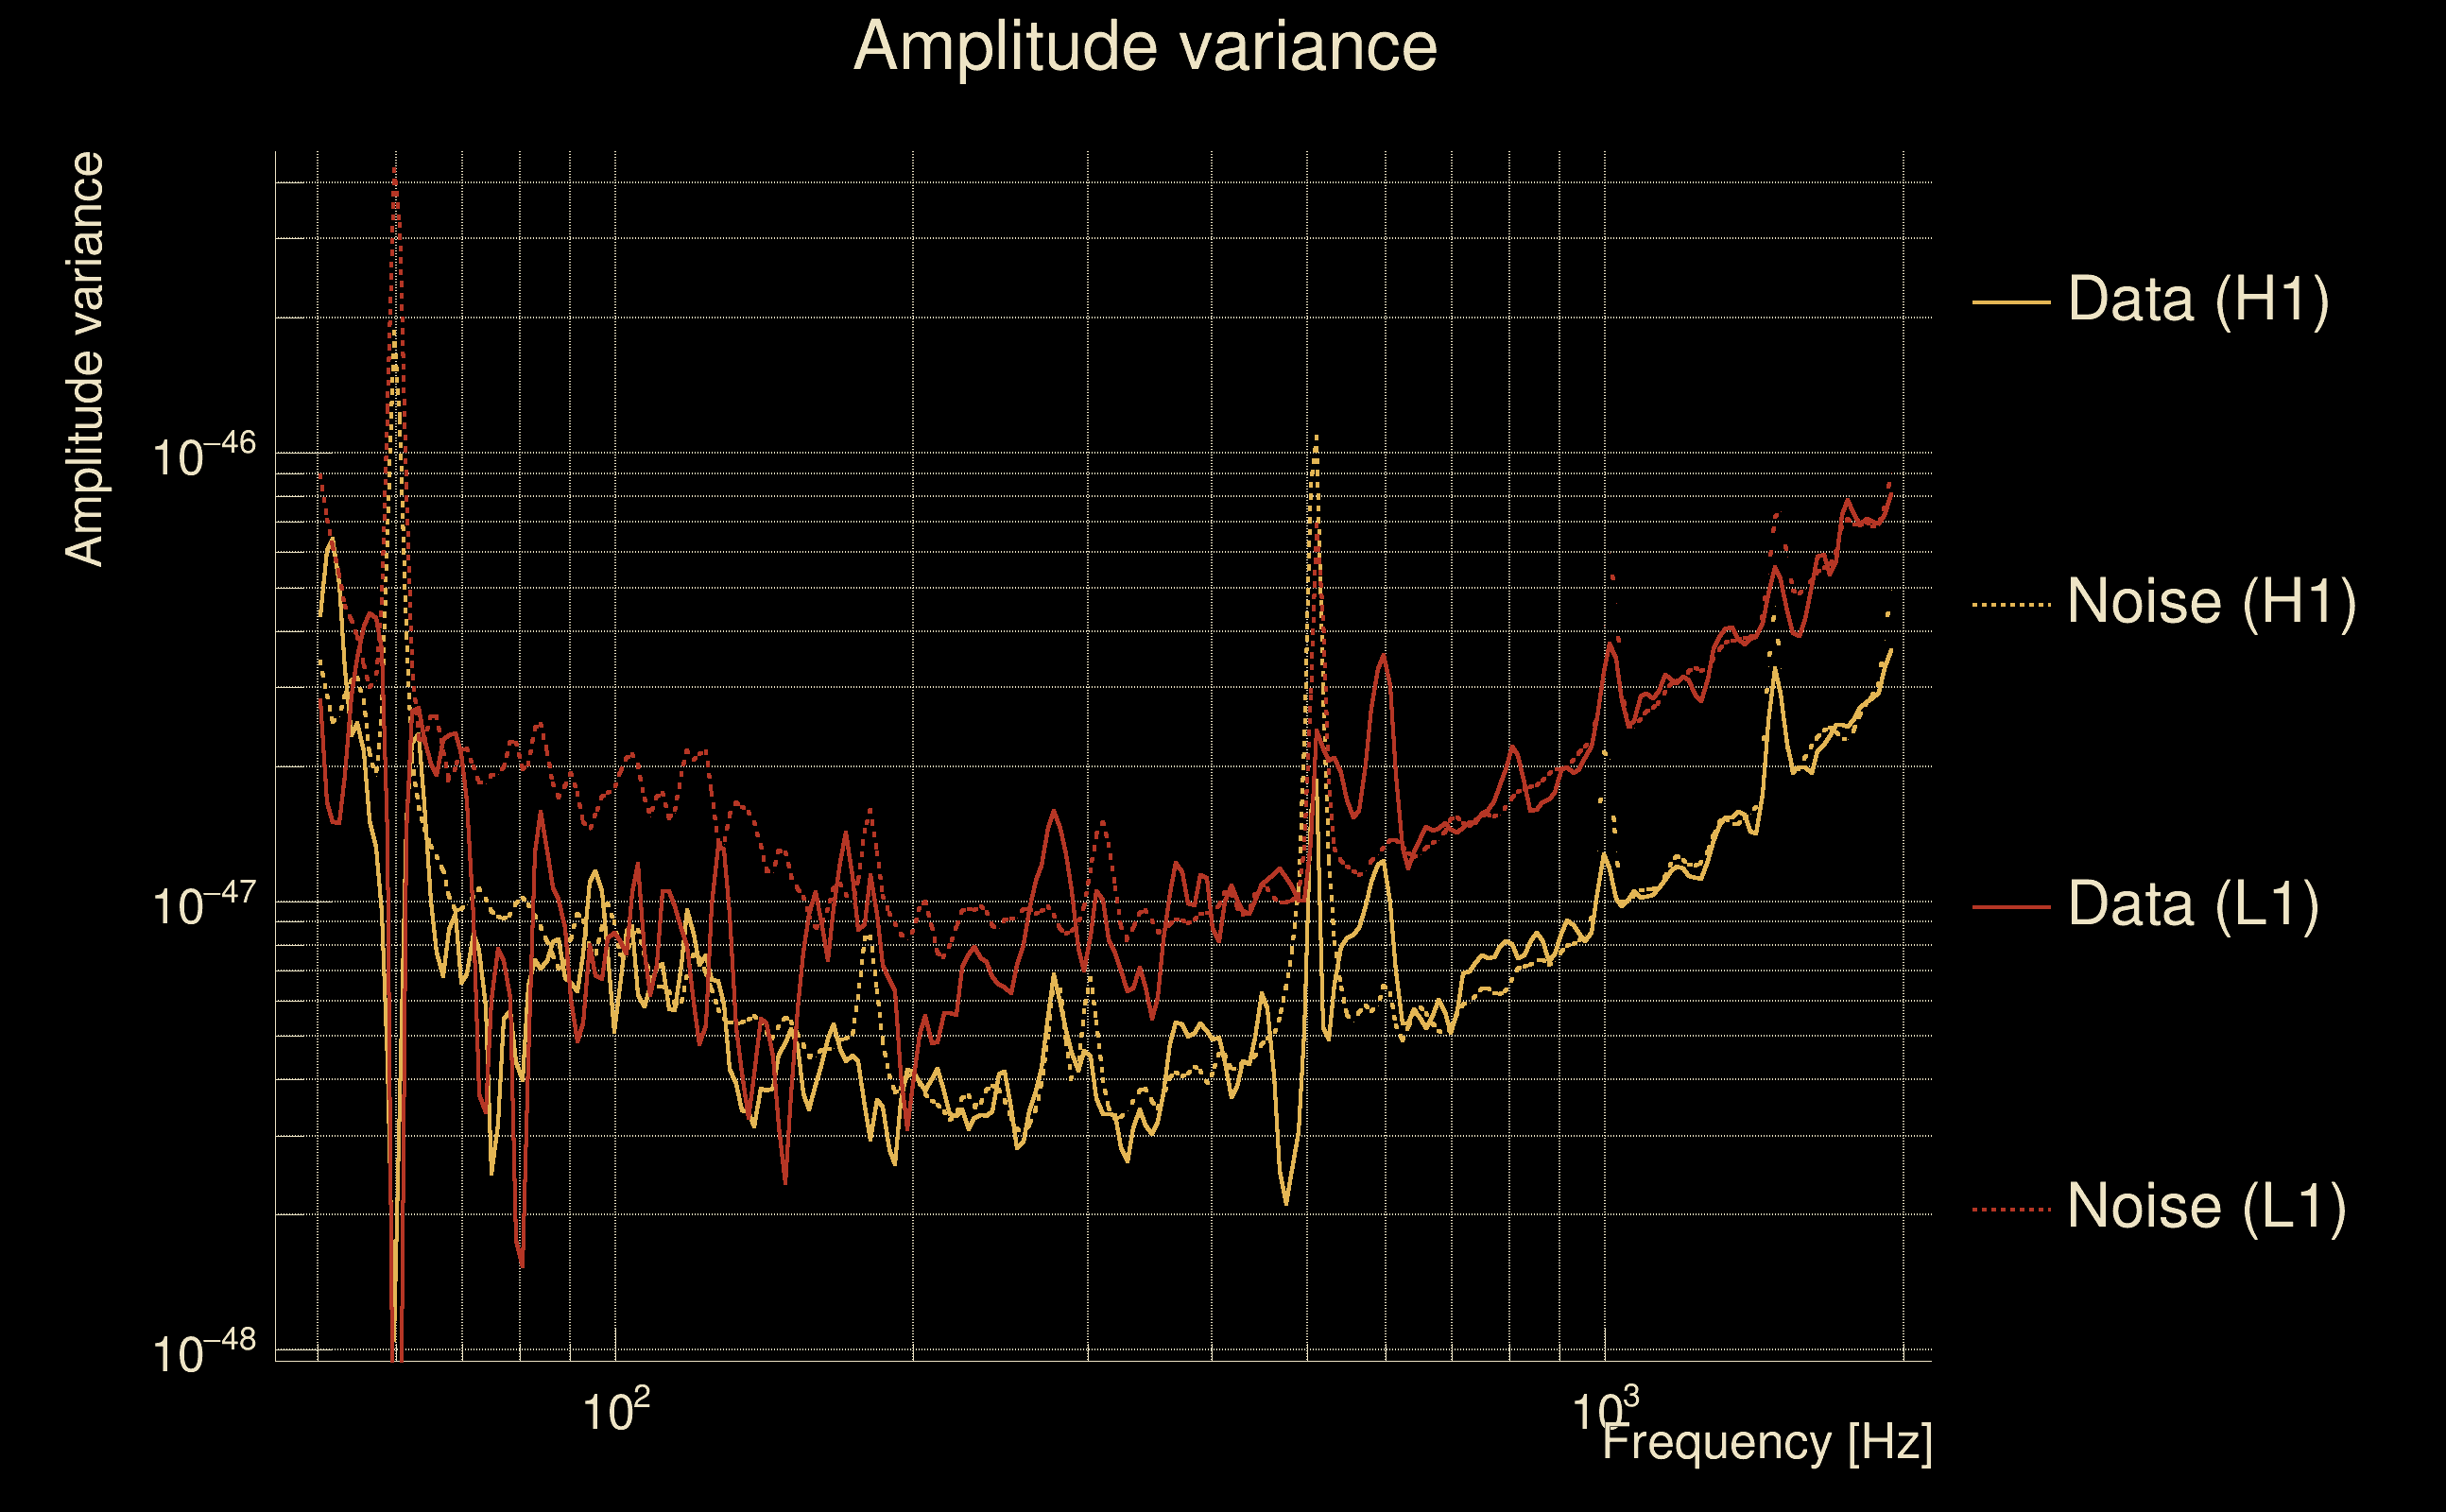
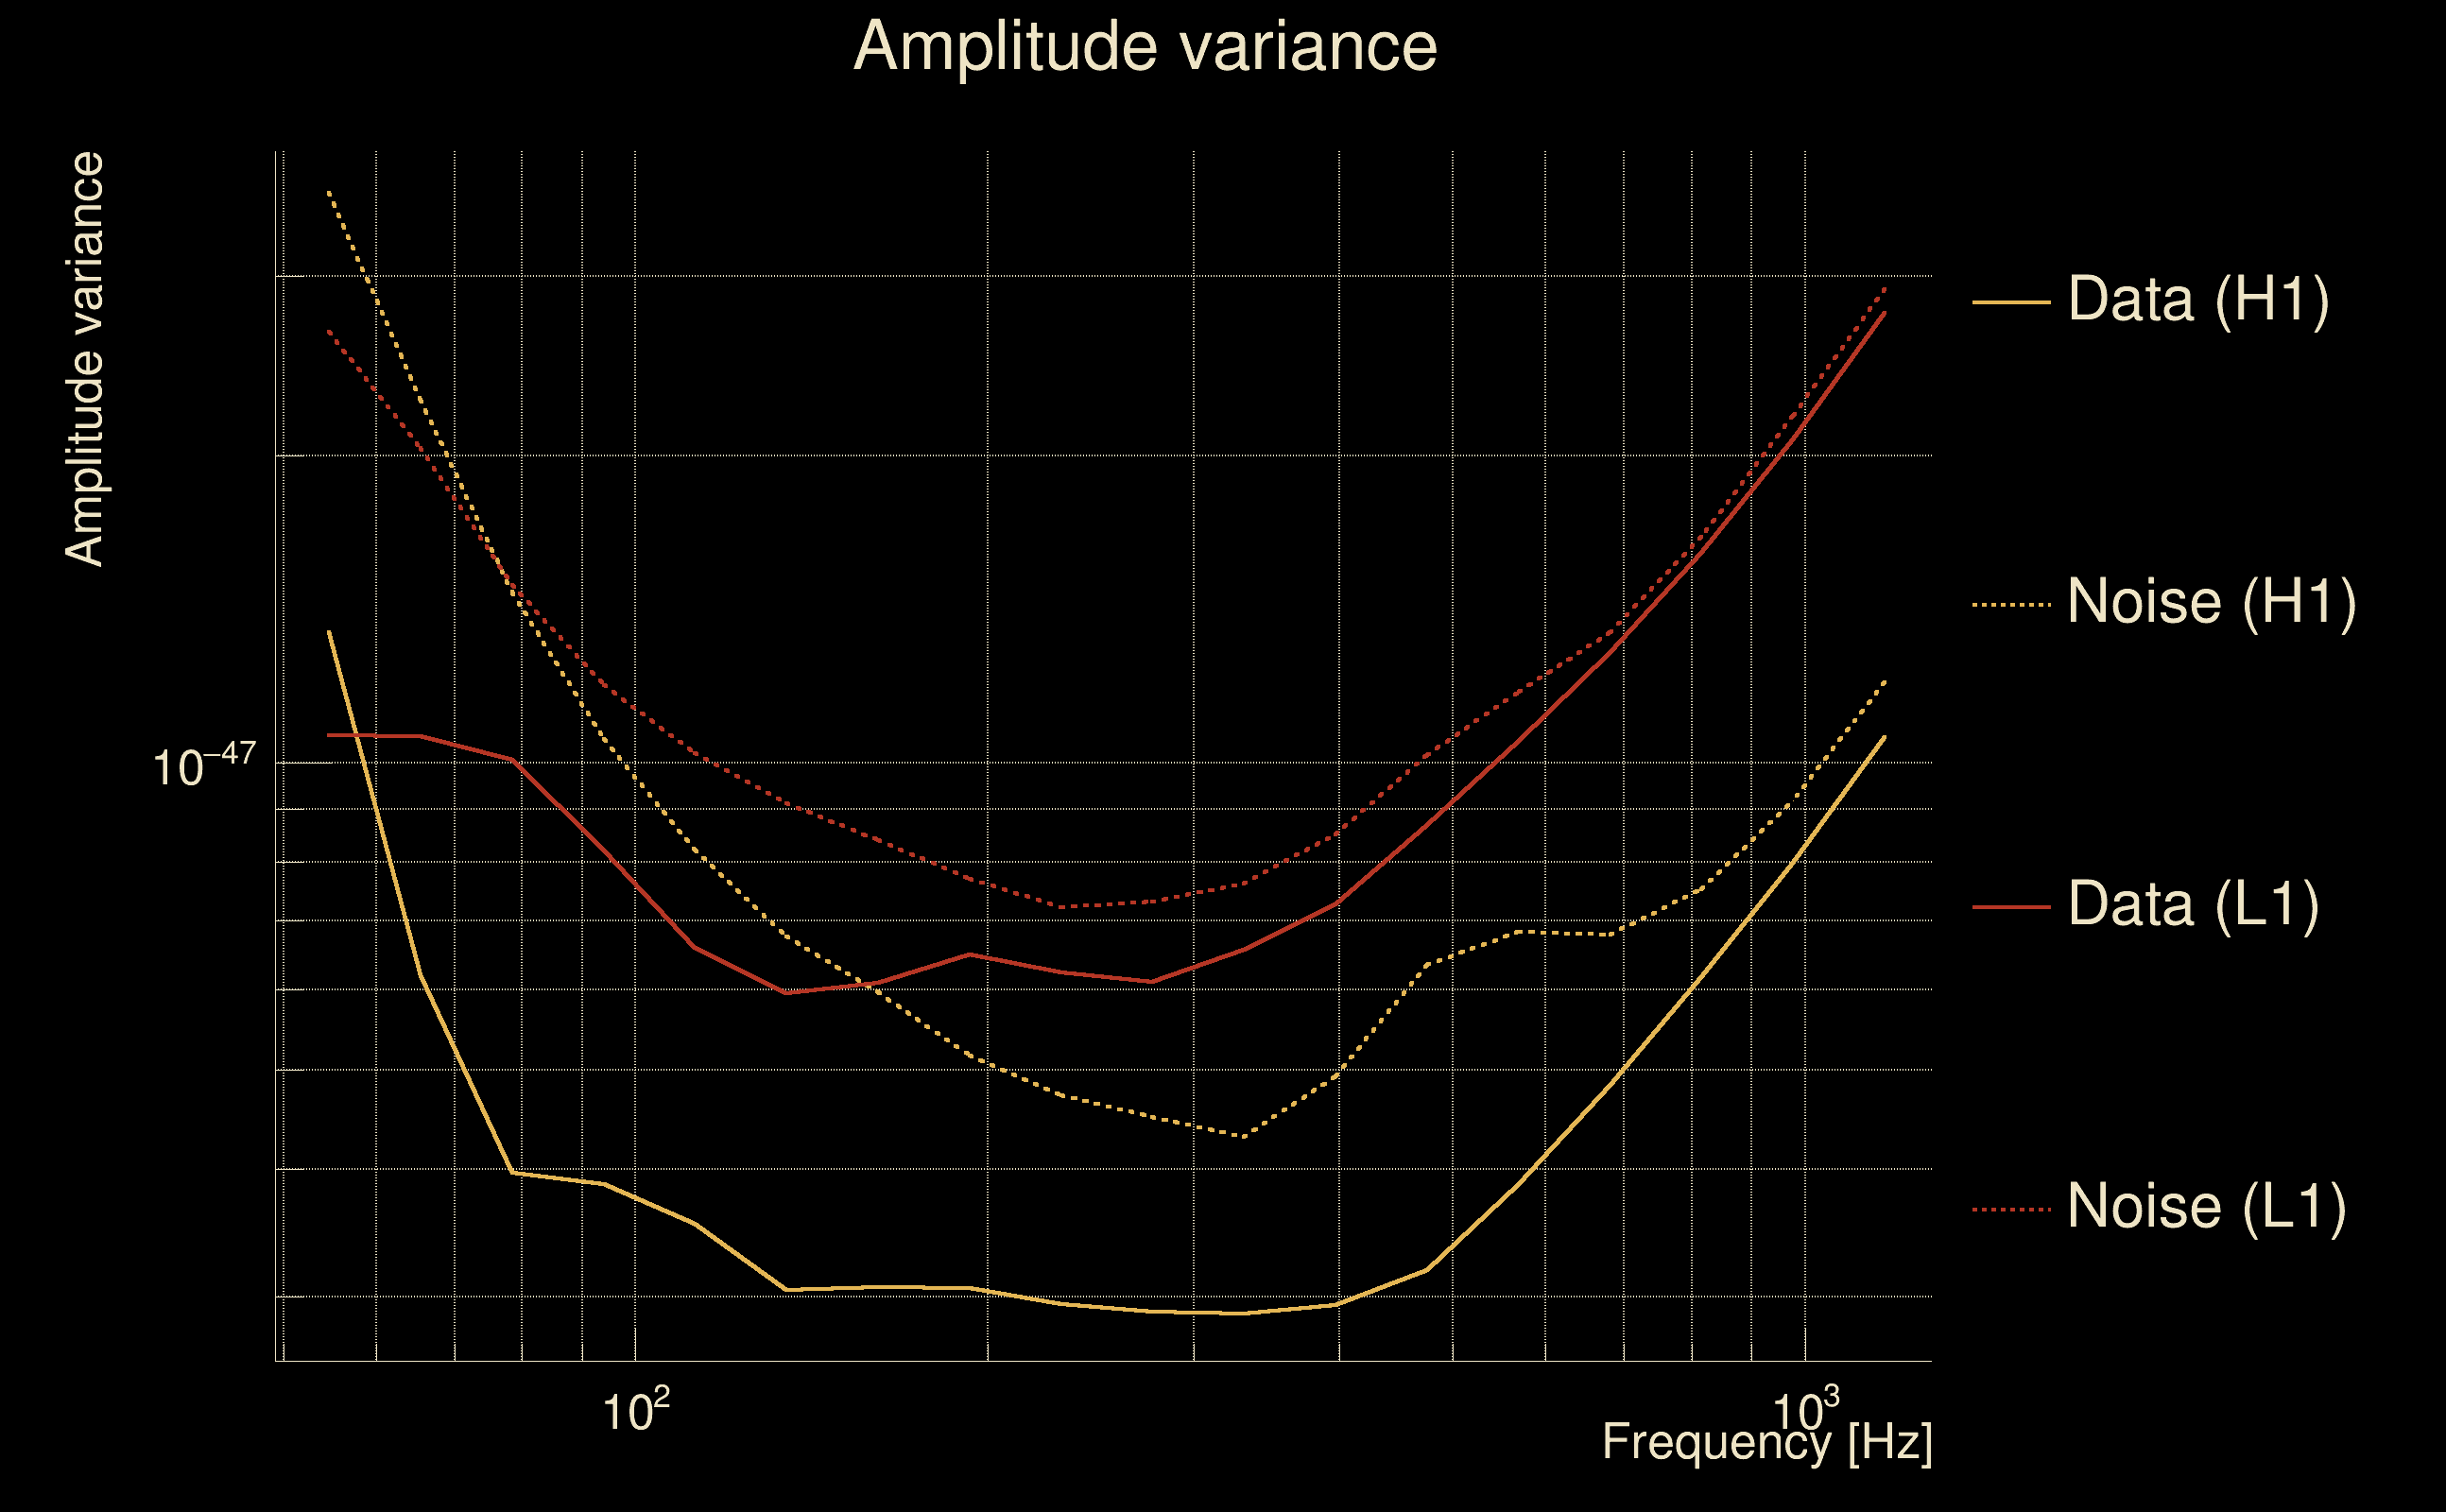
| Amplitude spectrograms: | normalization = 1e-22, power index = 2 |
| White noise SNR variance: | 0.523175 (after applying a correction factor = 1) |
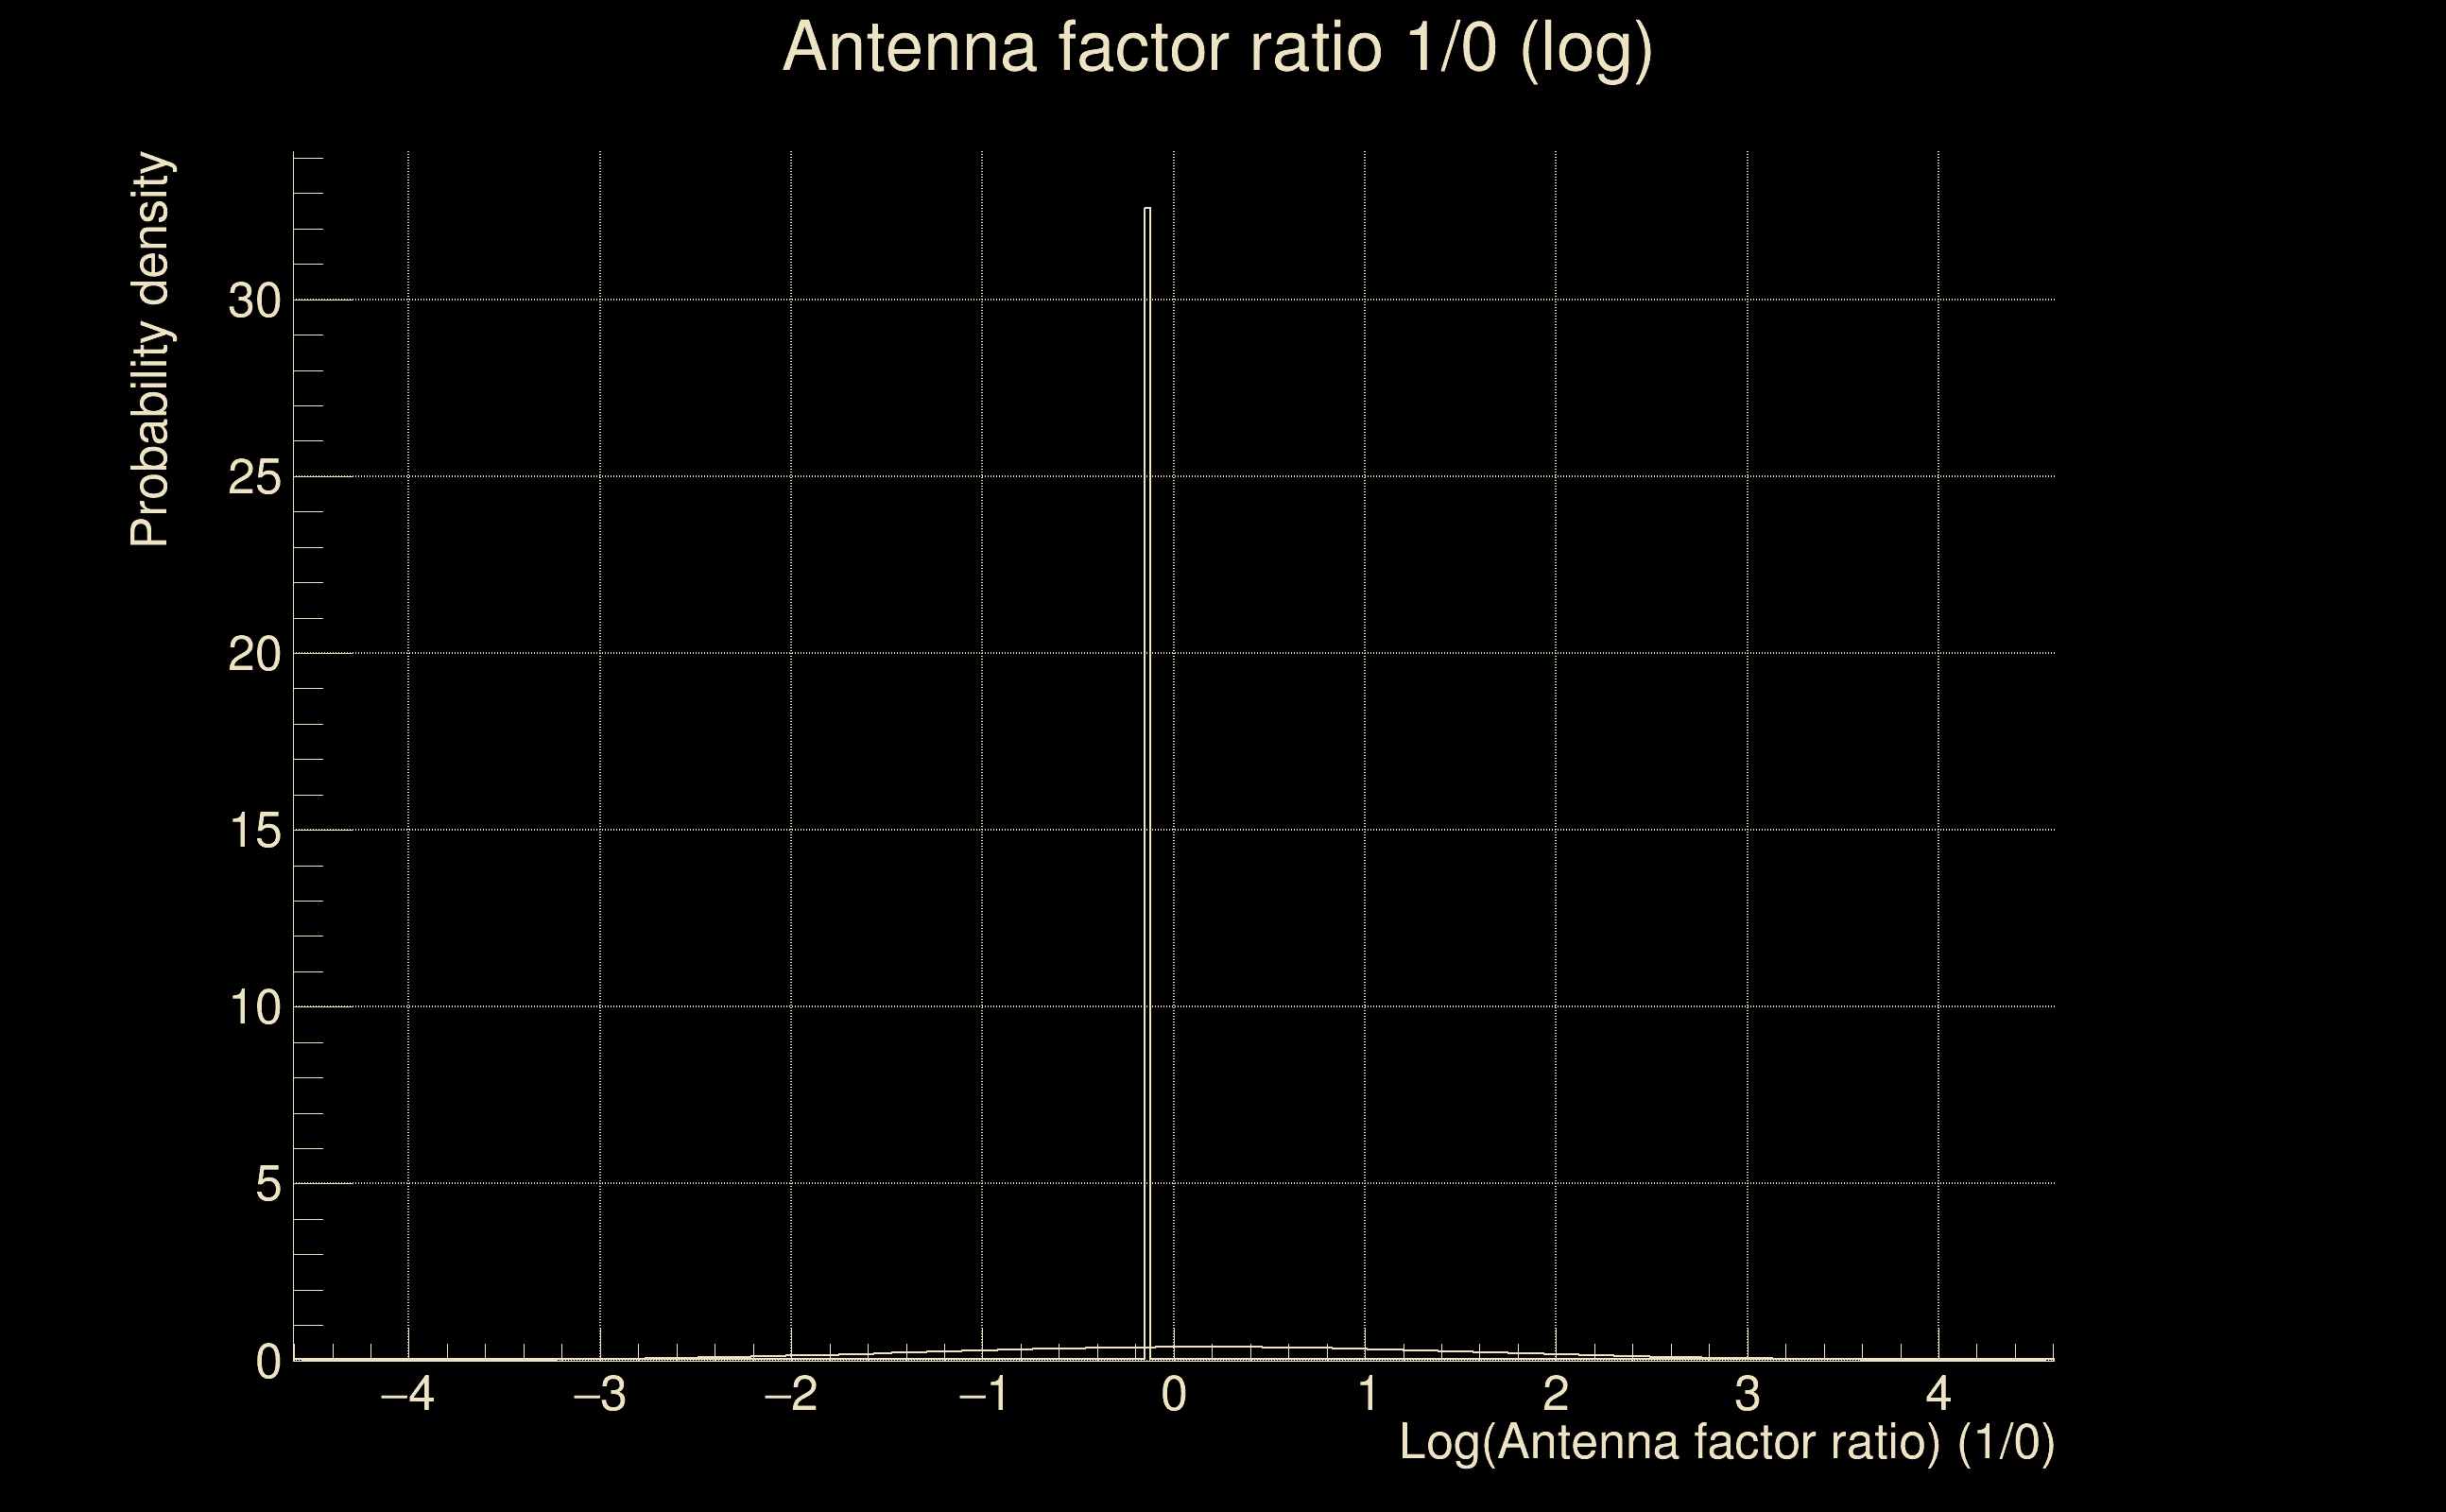
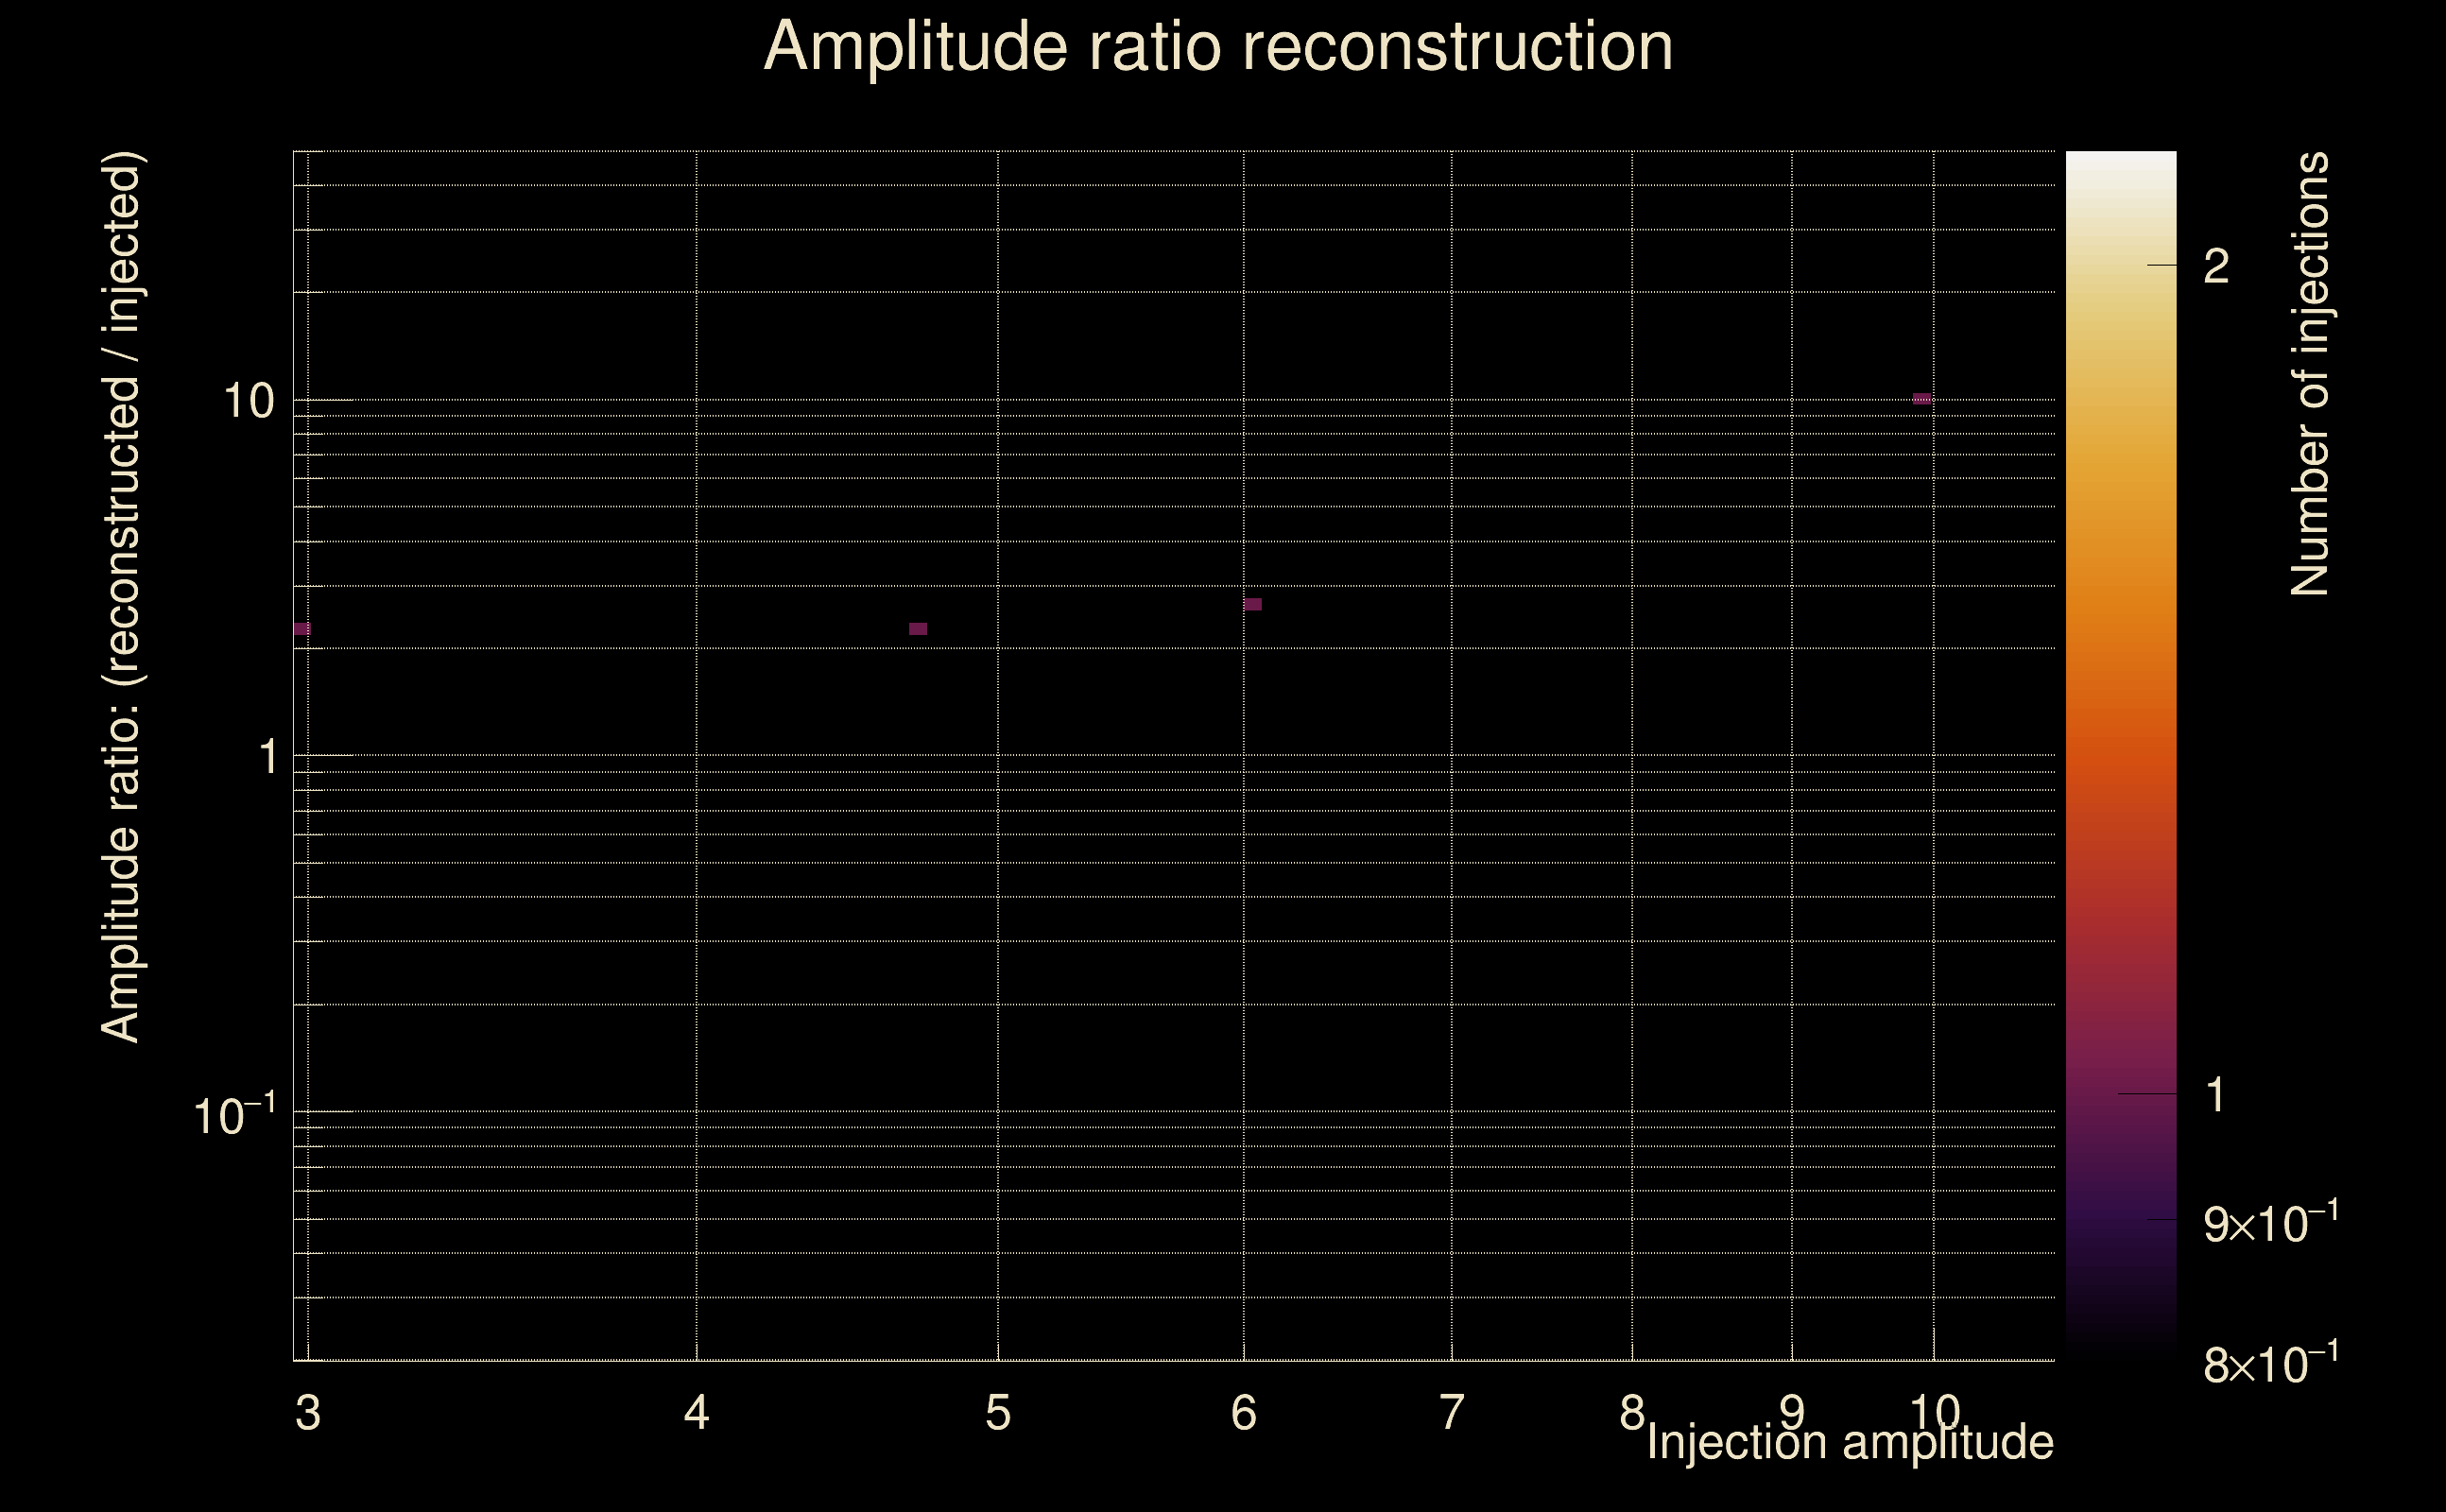
| Amplitude ratio confidence level: | 3 sigma |
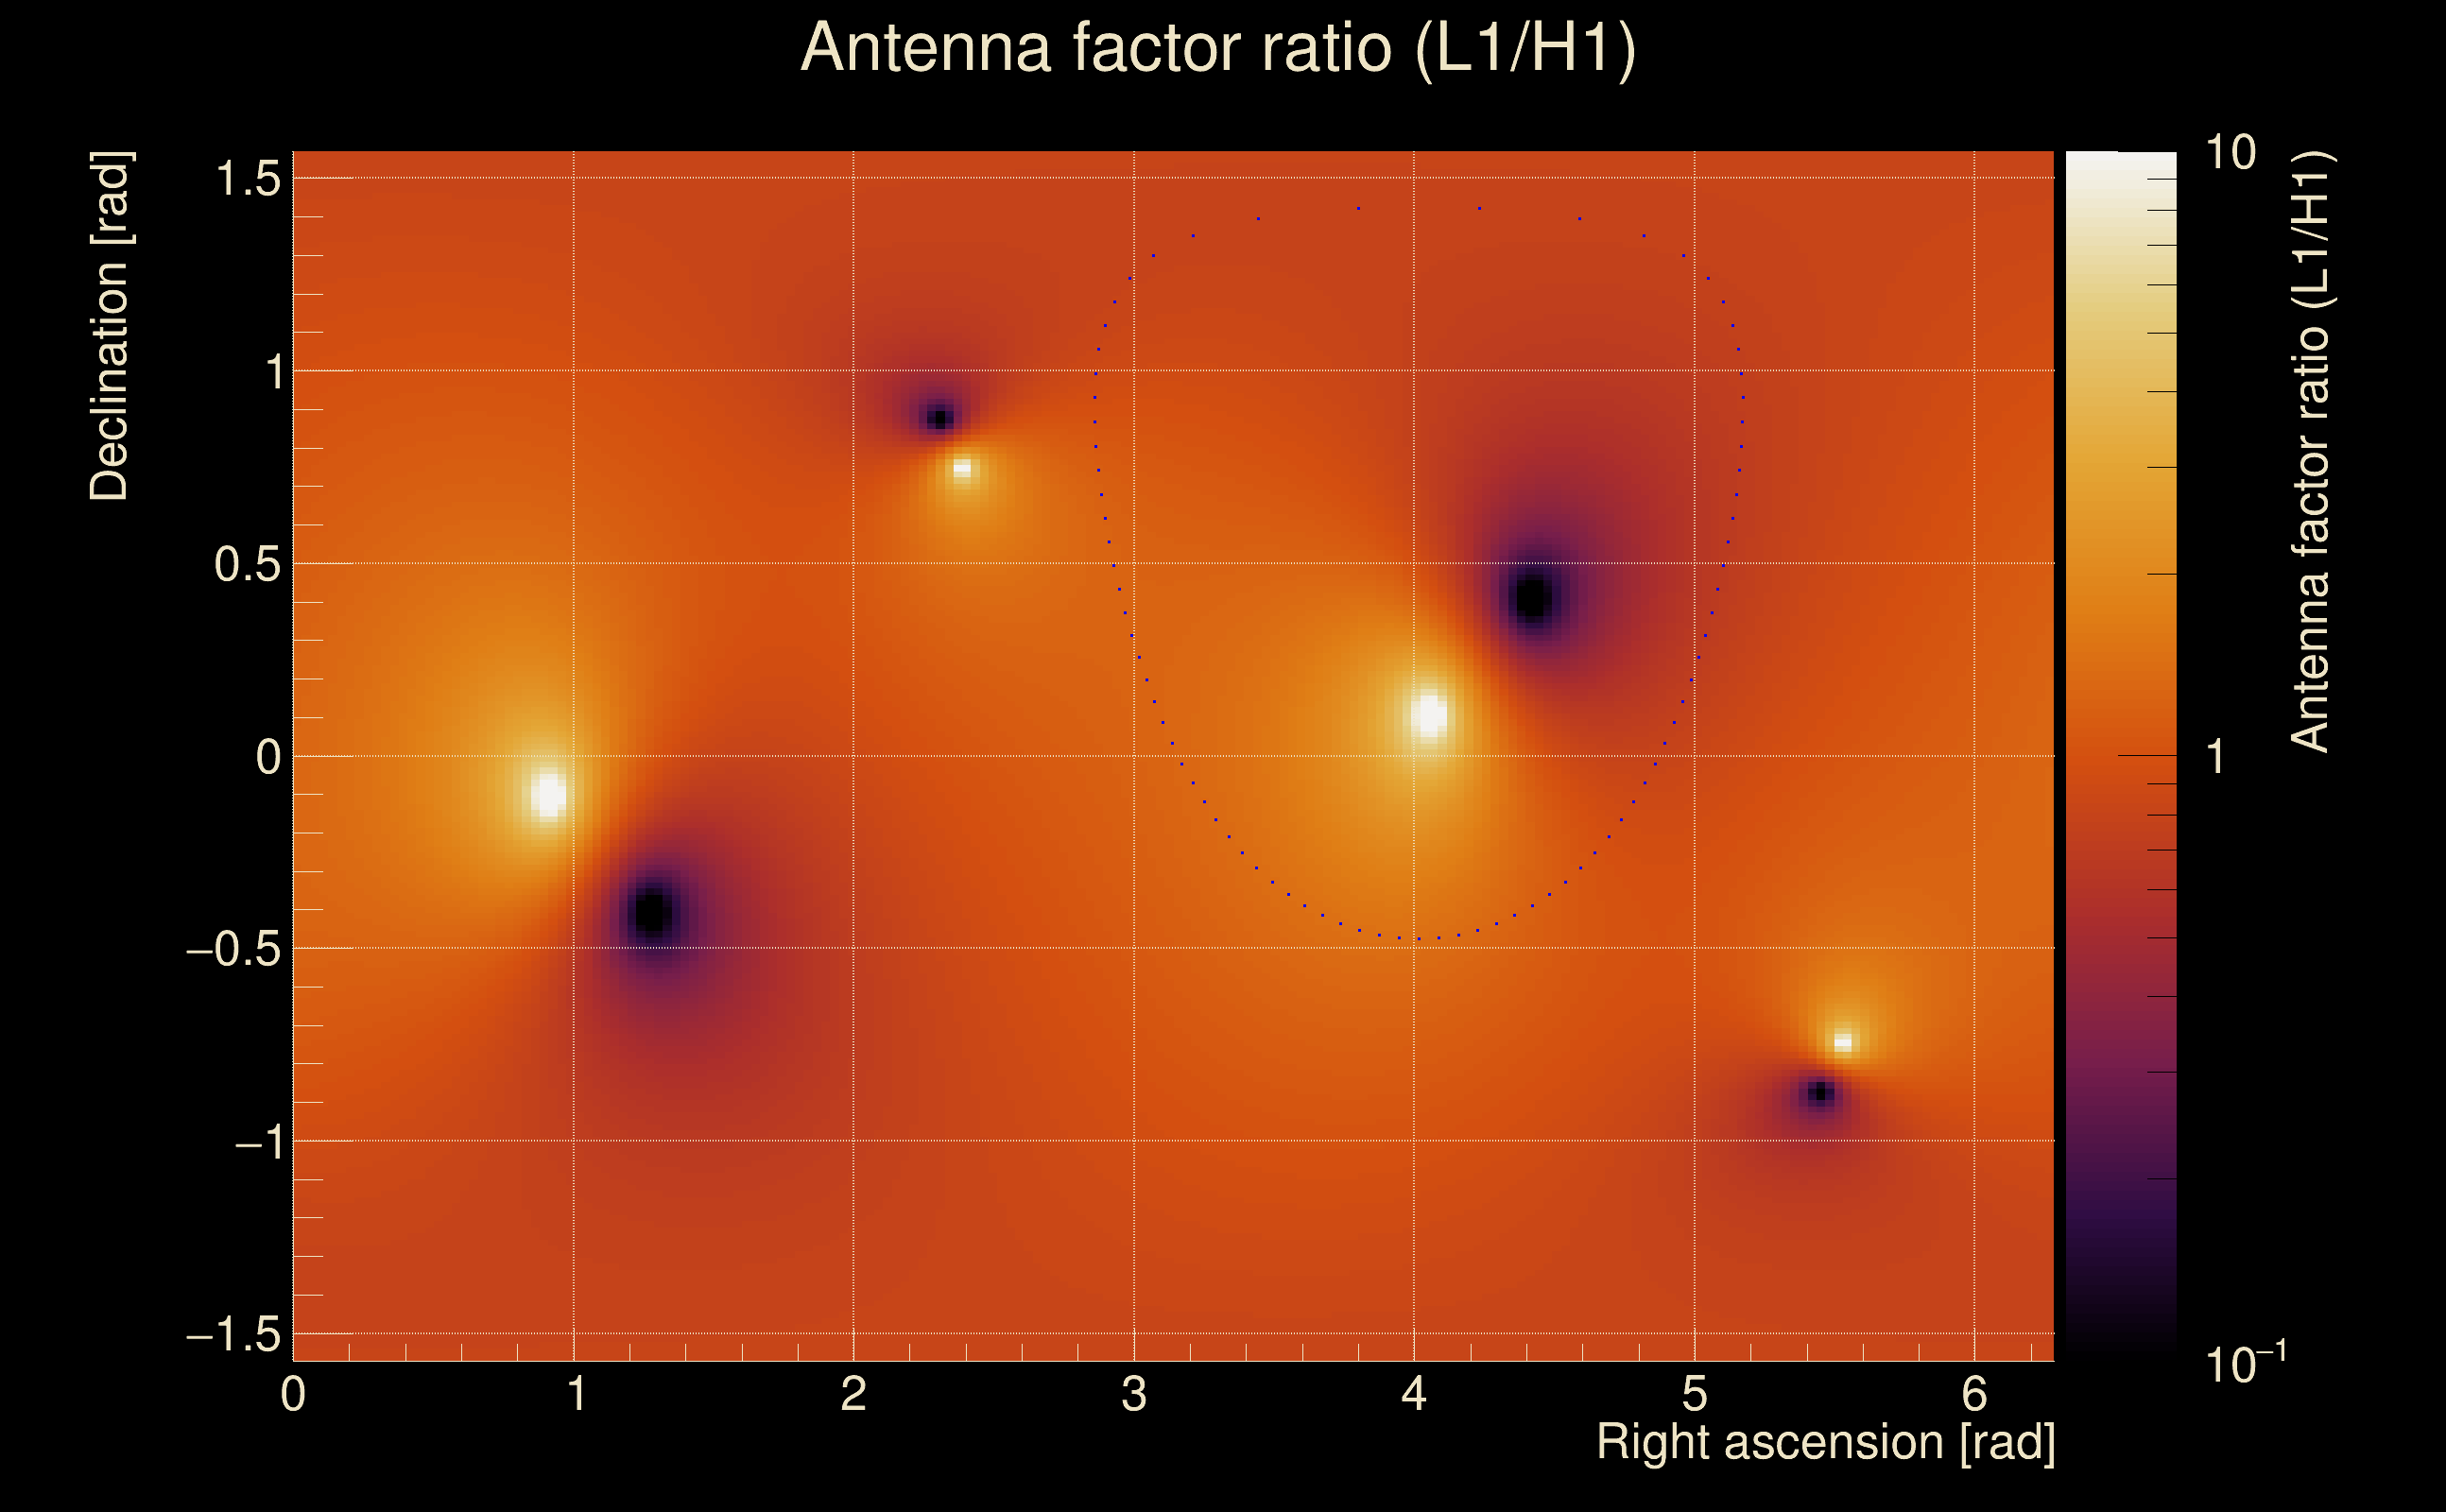
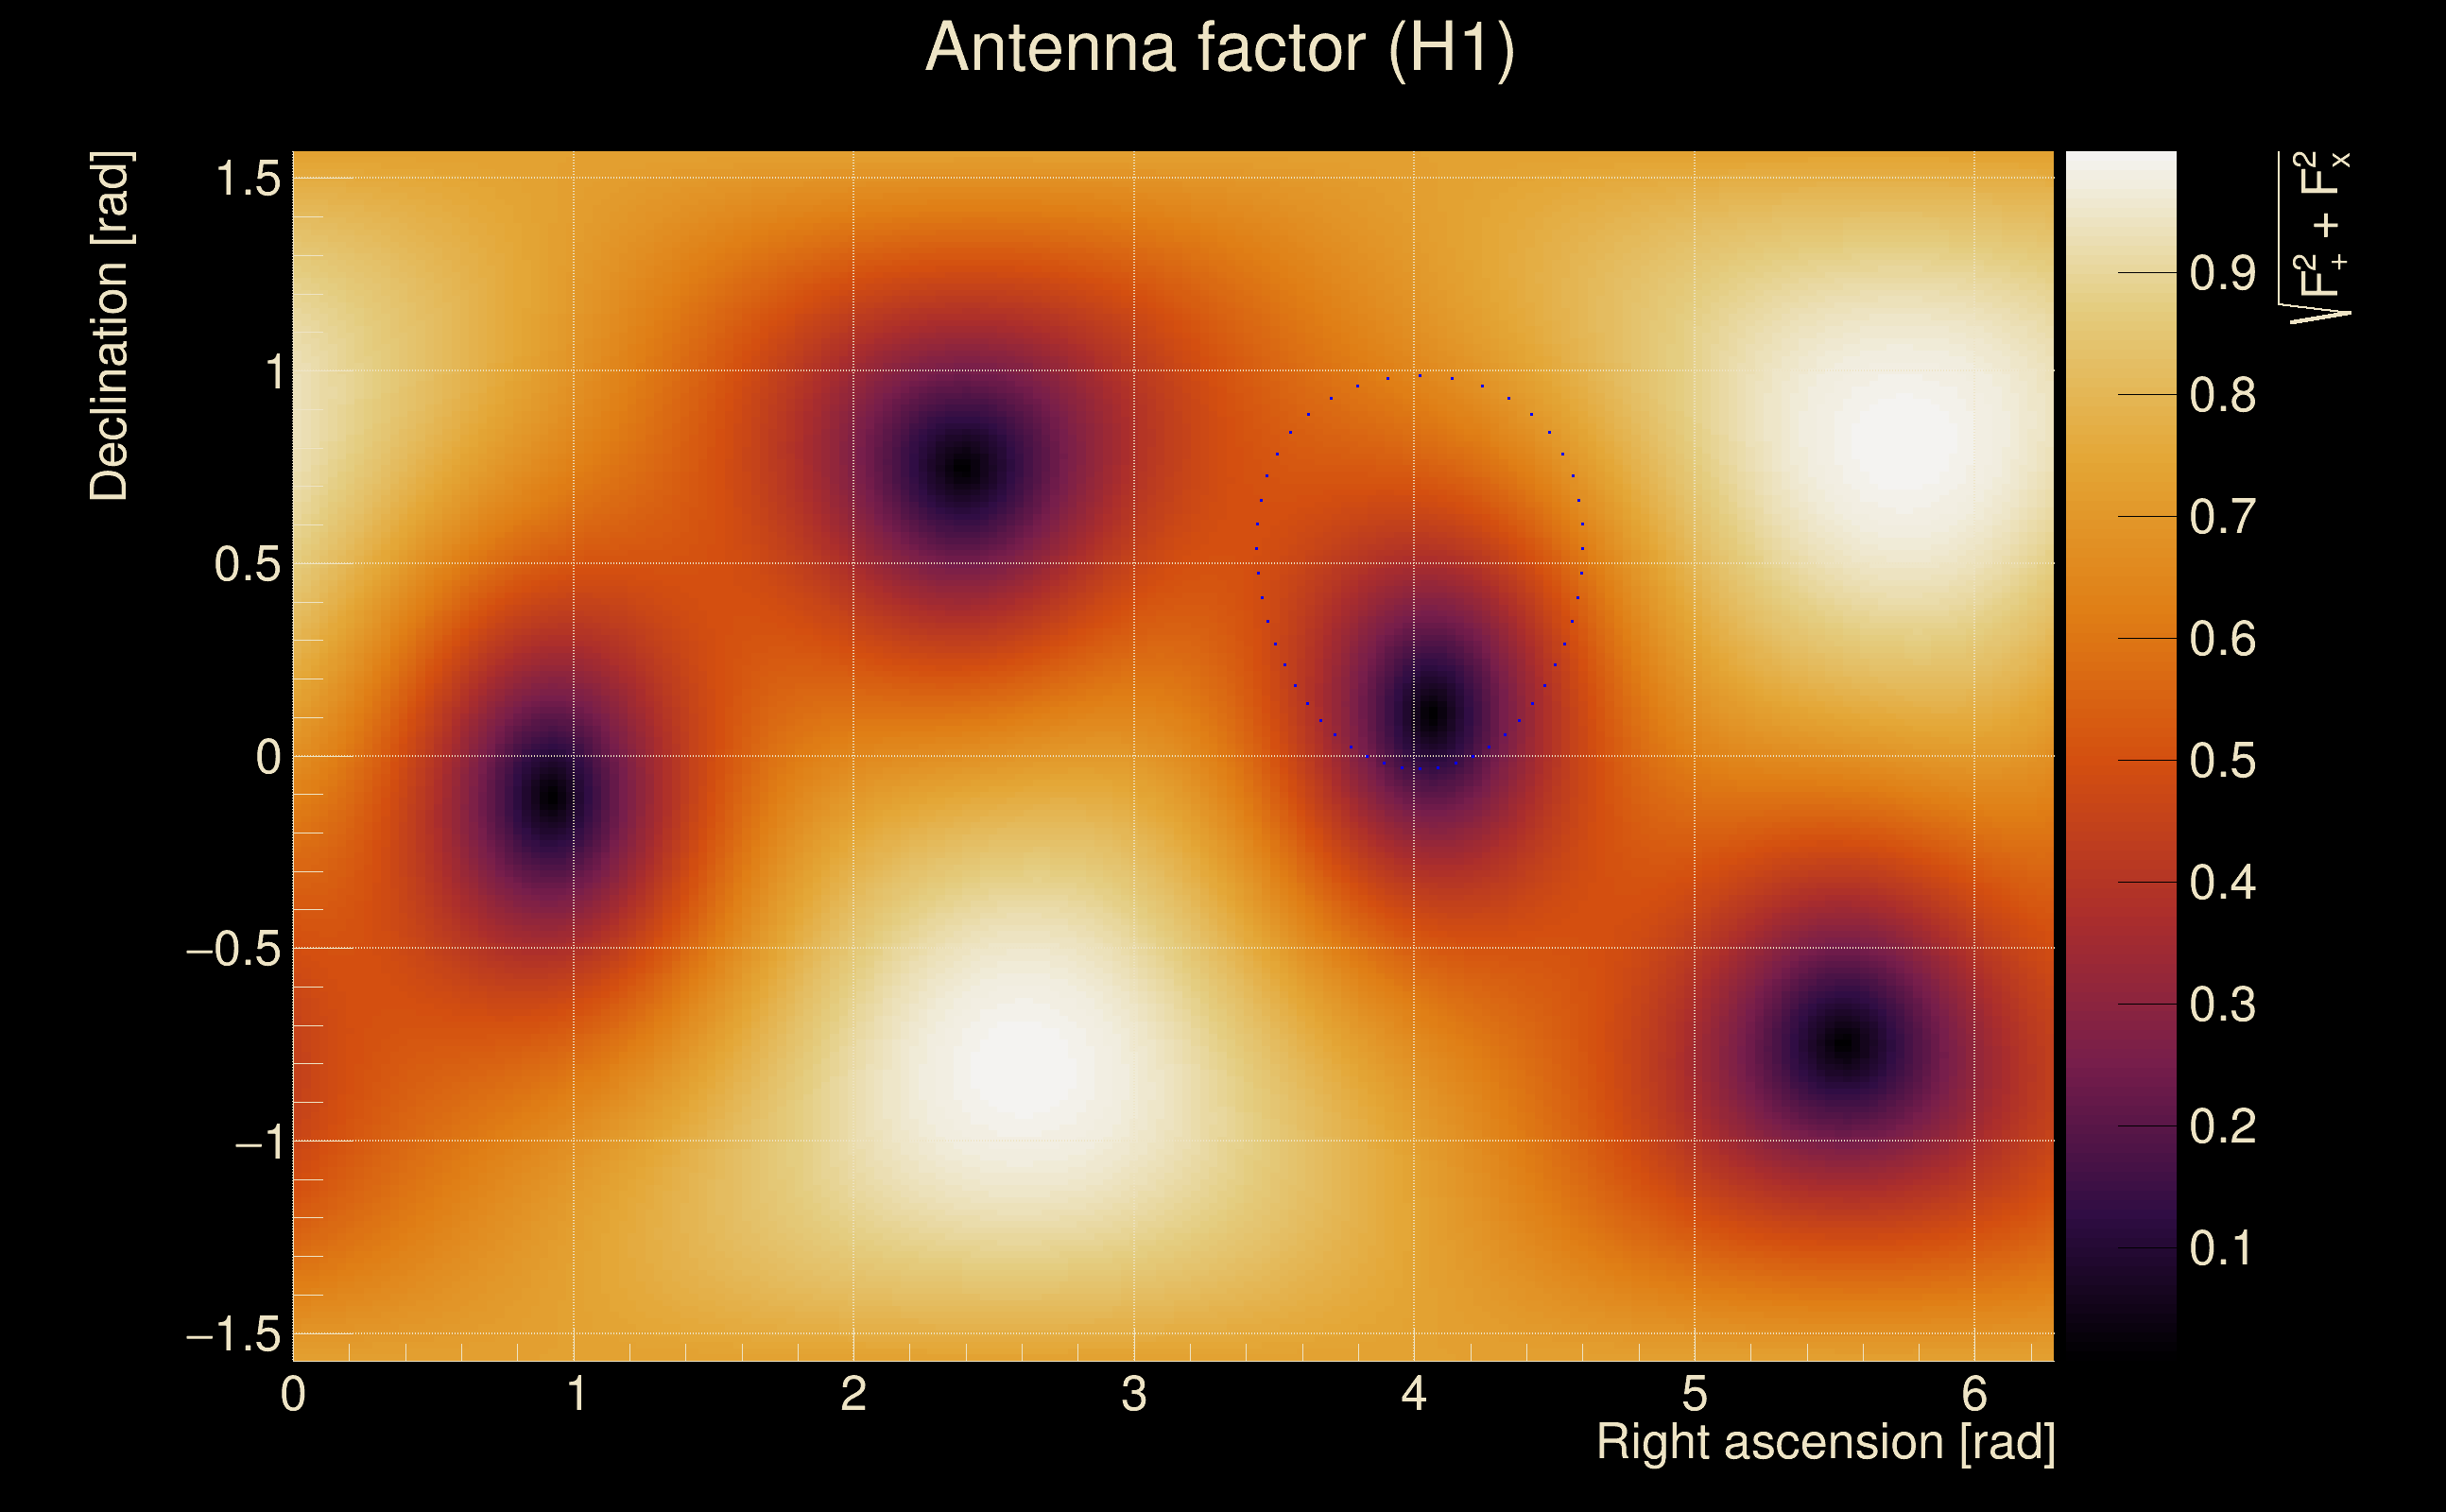
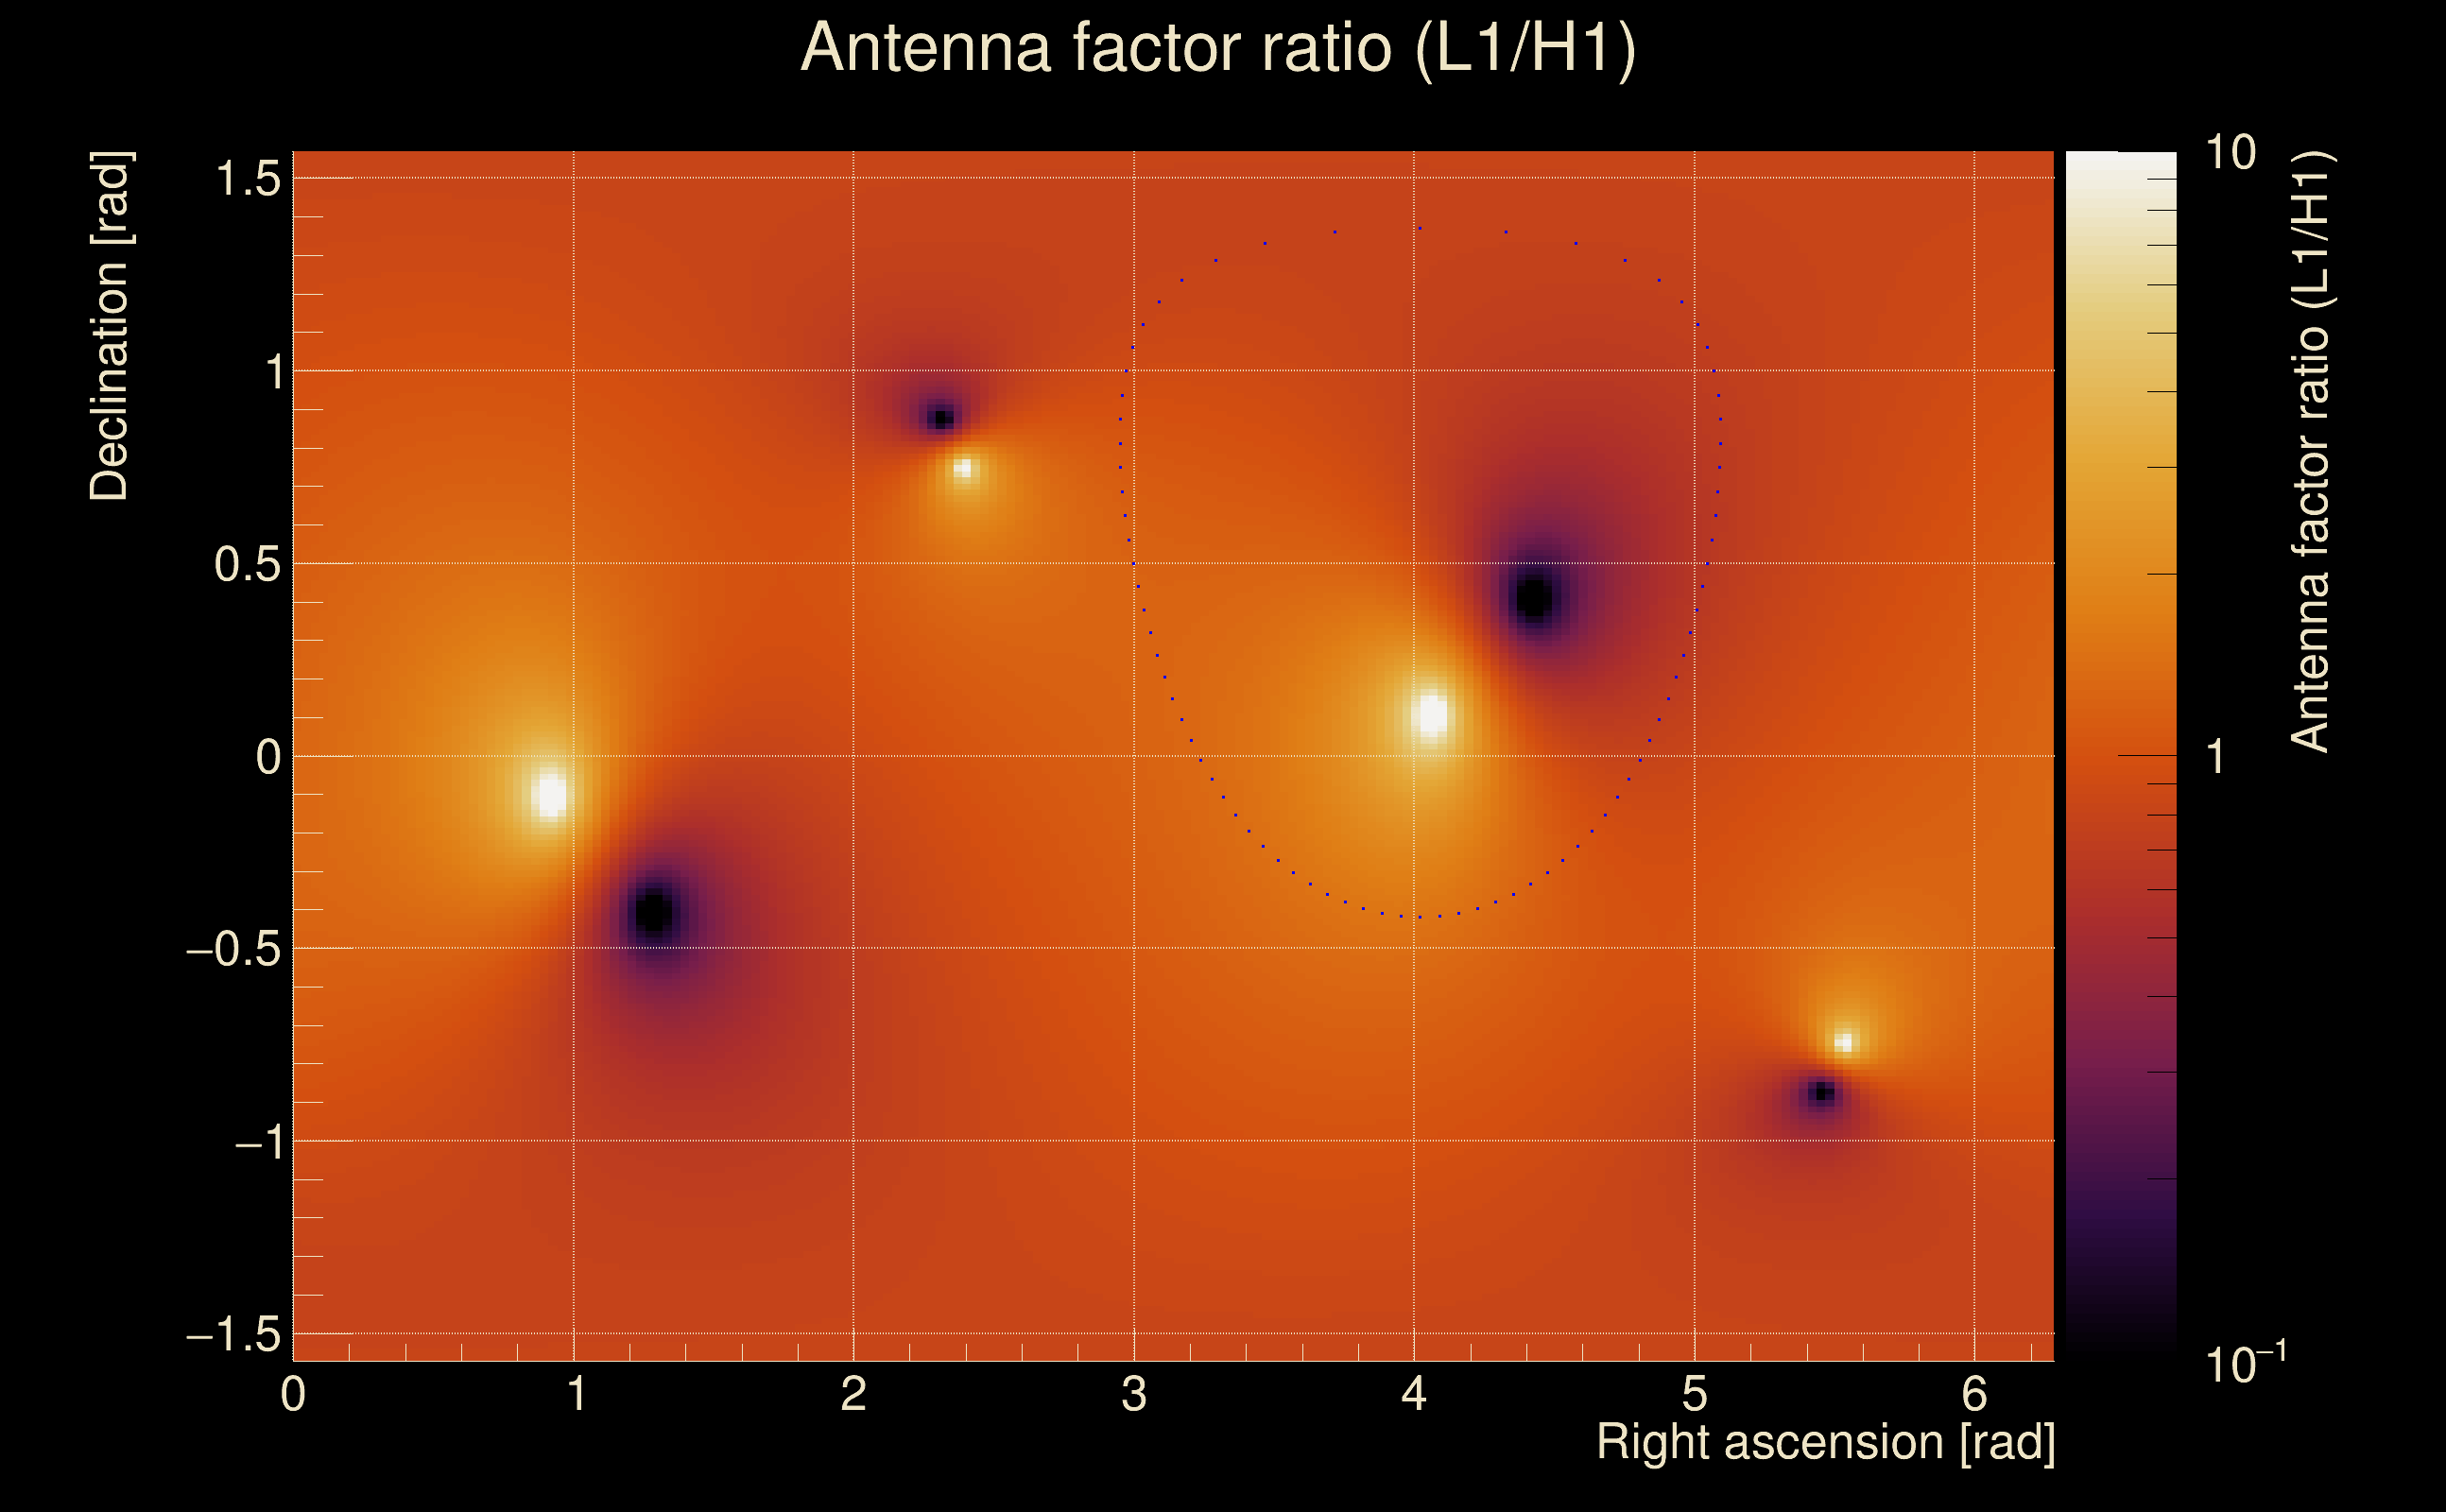
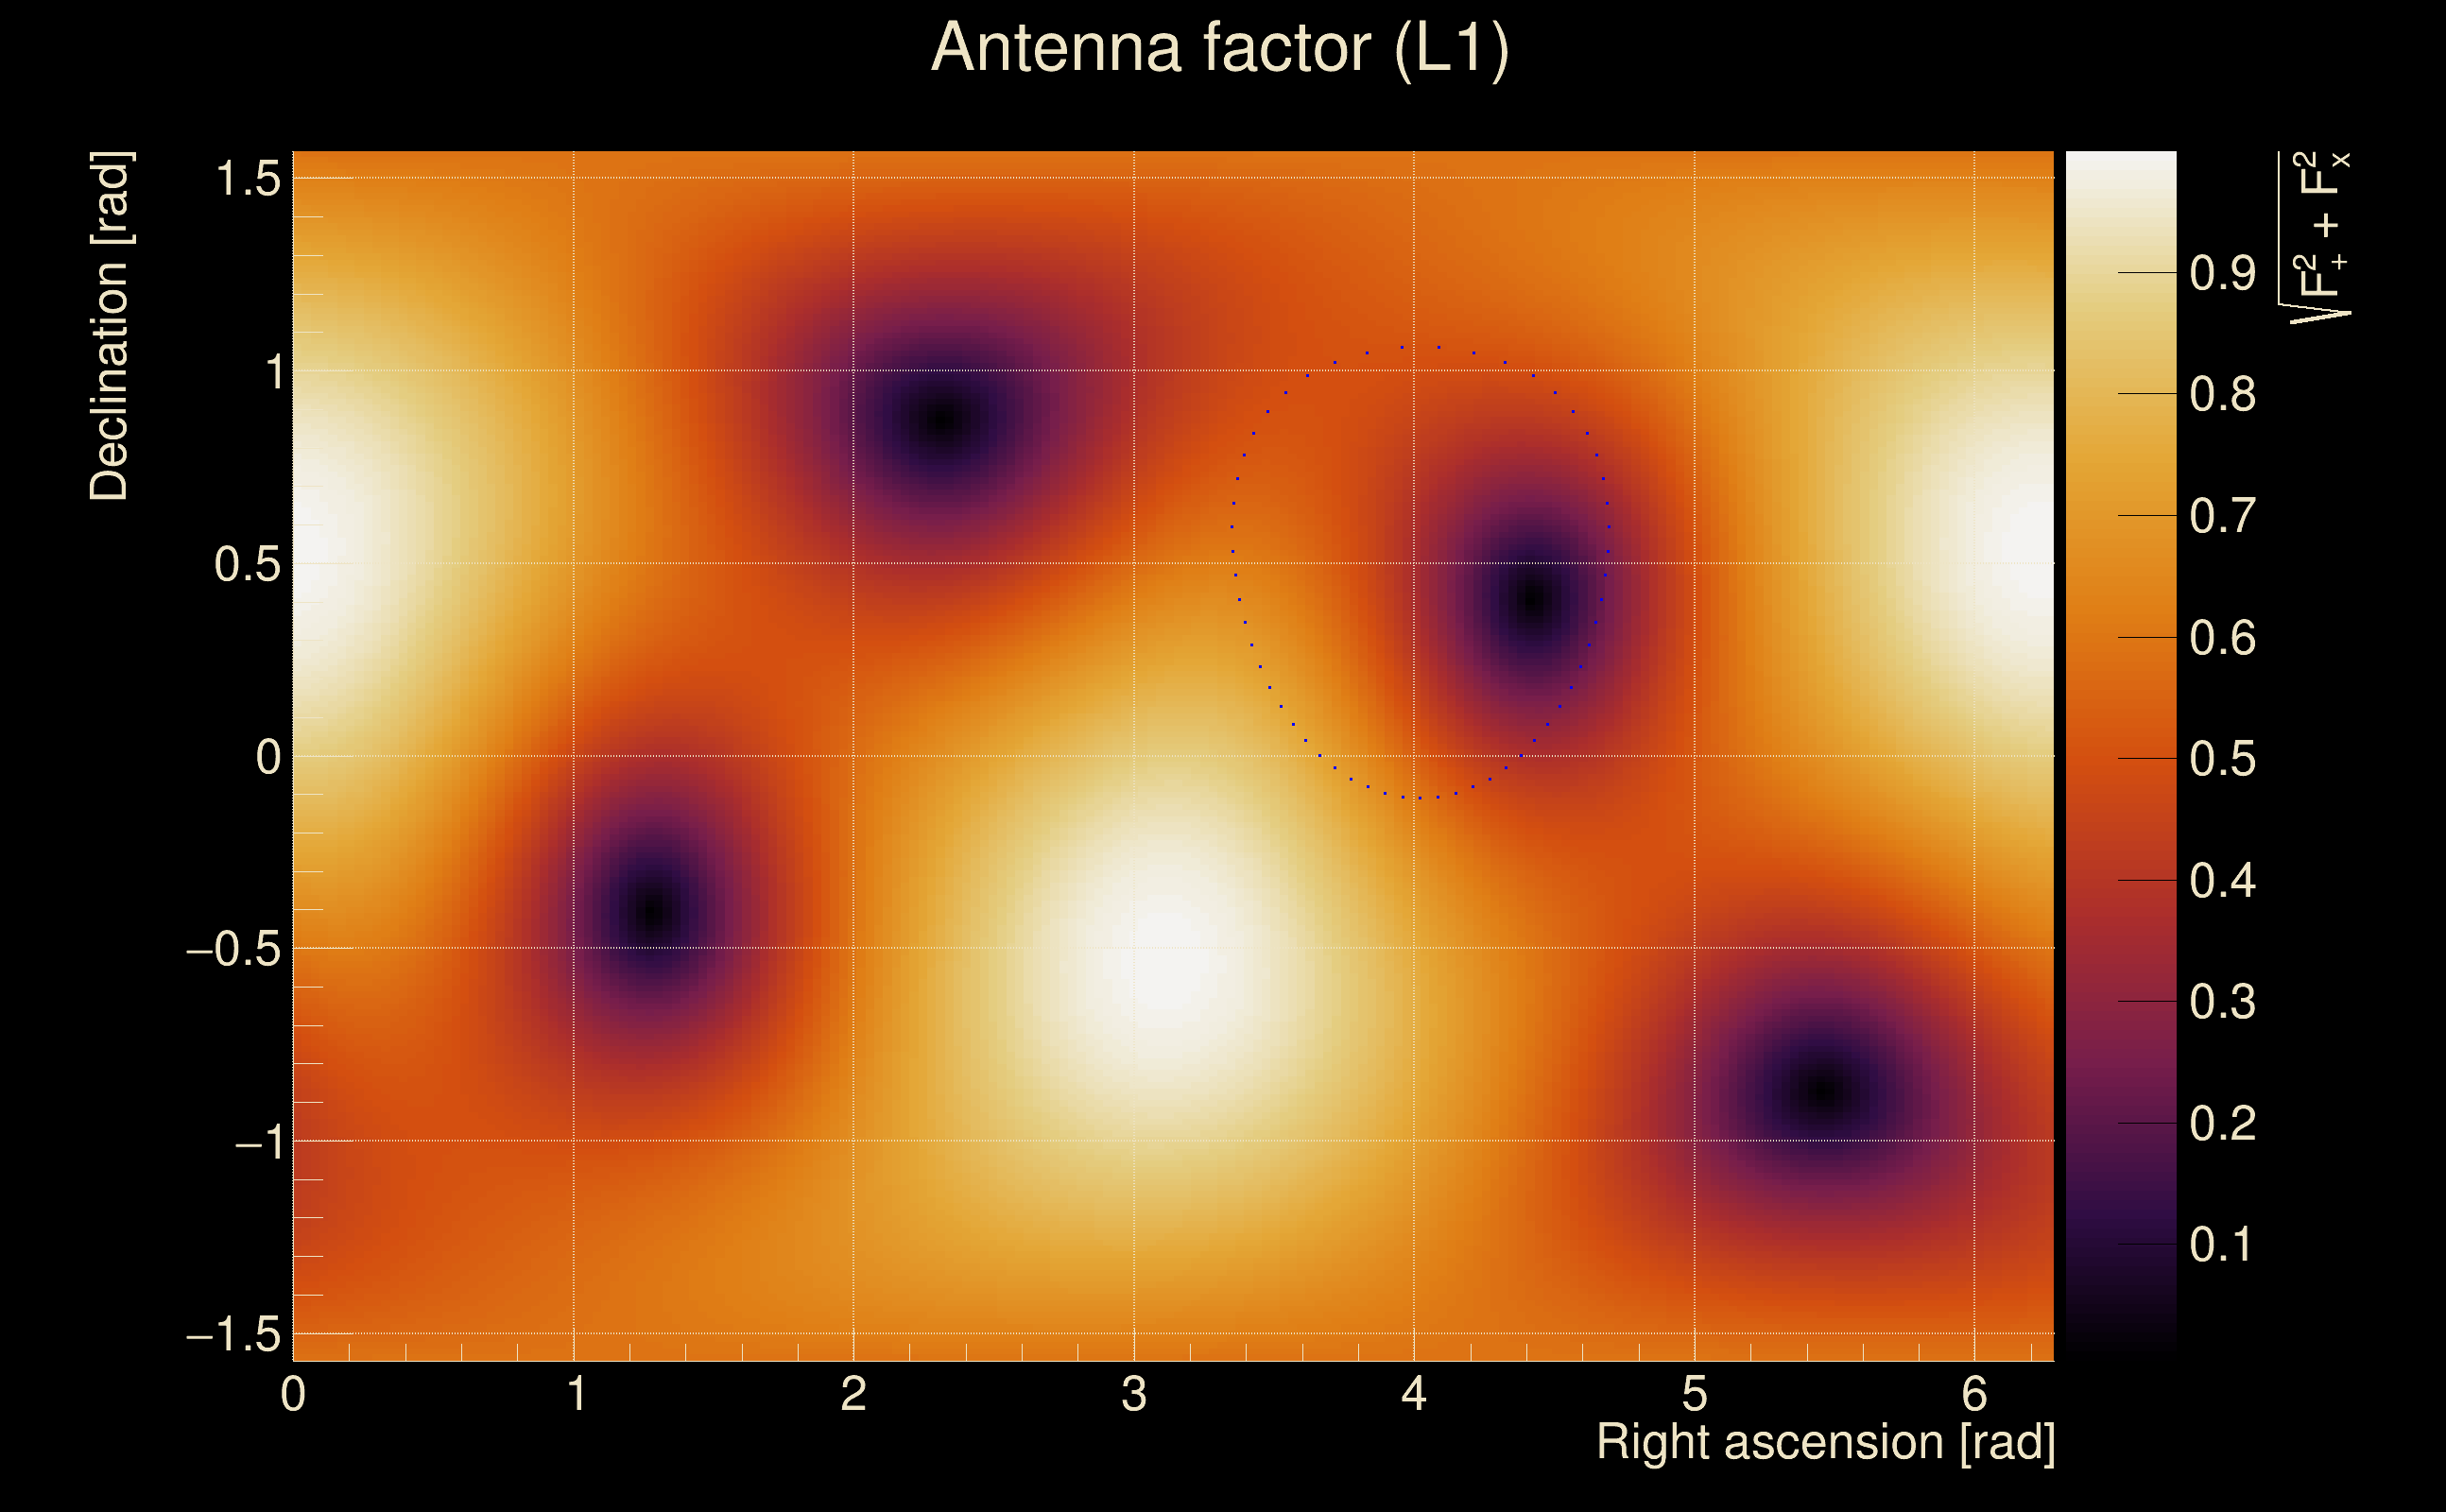
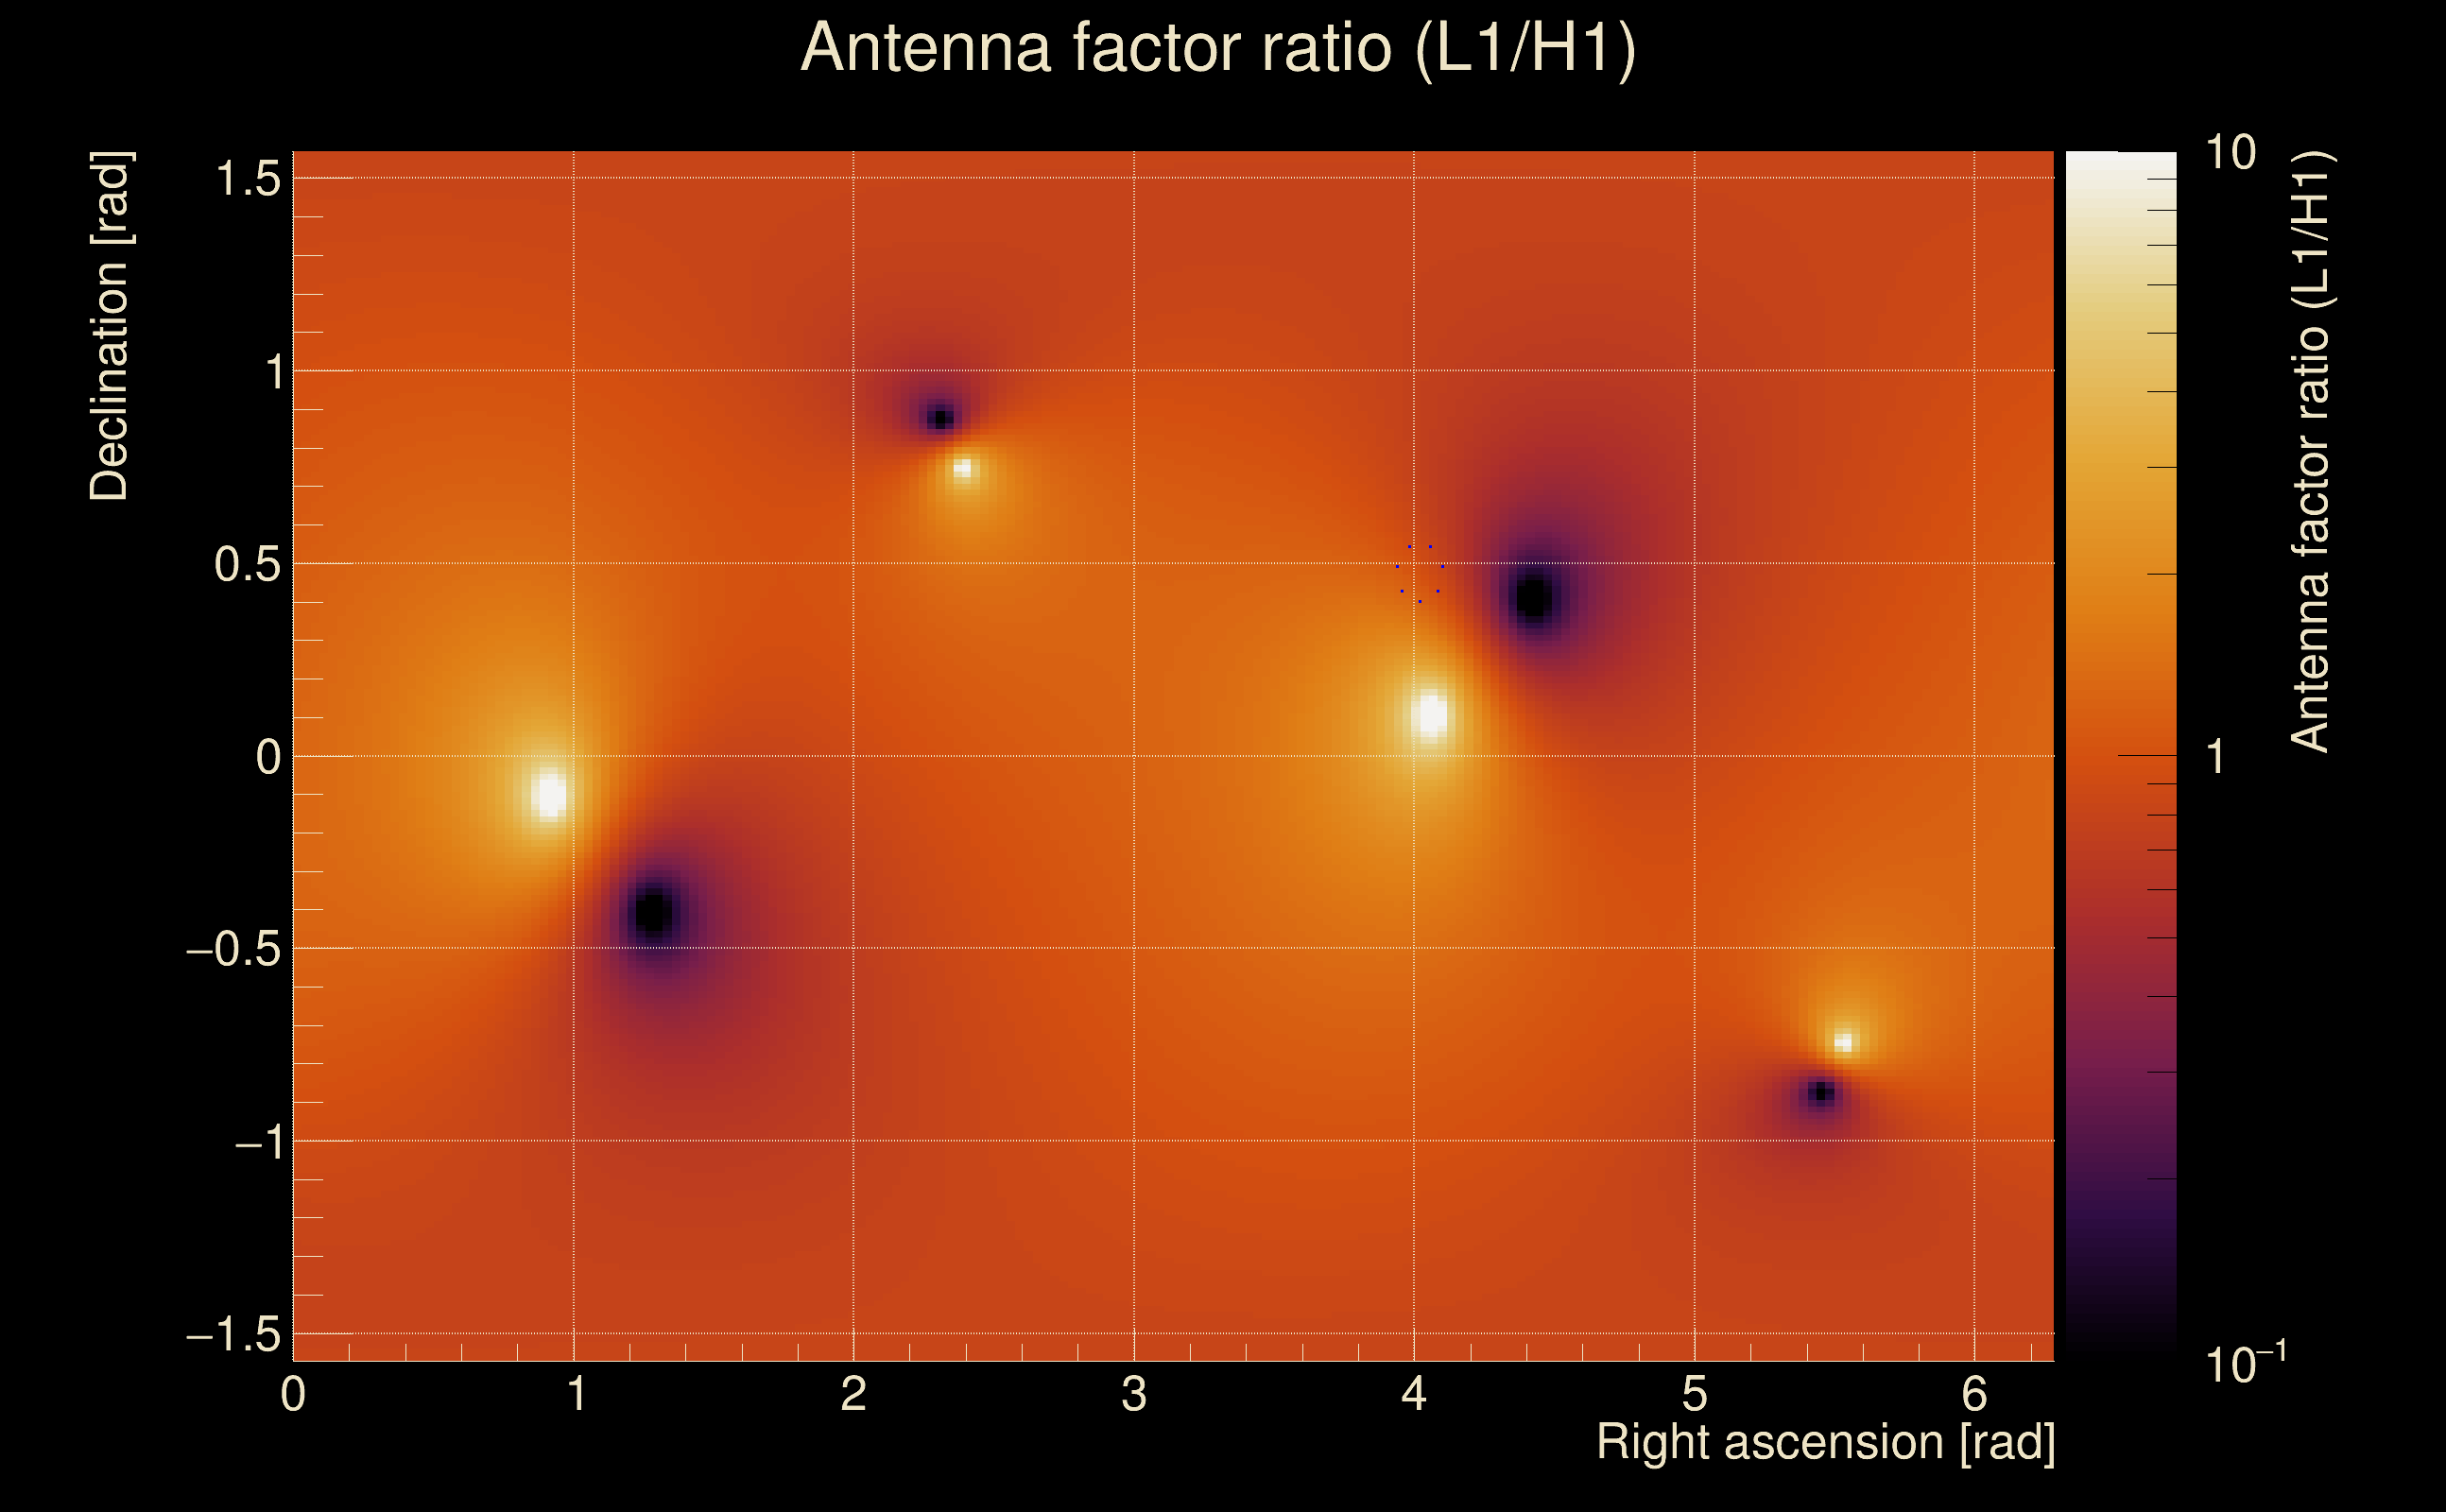
| Target sky positon: | Ra: 3.68109, Dec: 0.94792 [rad] |
| List of input Ox files: | Targeted_O4bw_2min_2_file_list.txt (1 files) |
| Analysis result file: | Targeted_O4bw_2min_2_results-0.root |
| Slice selected for the the fakeground: | slice index=65 (1.978 s), time lag = 0 s |
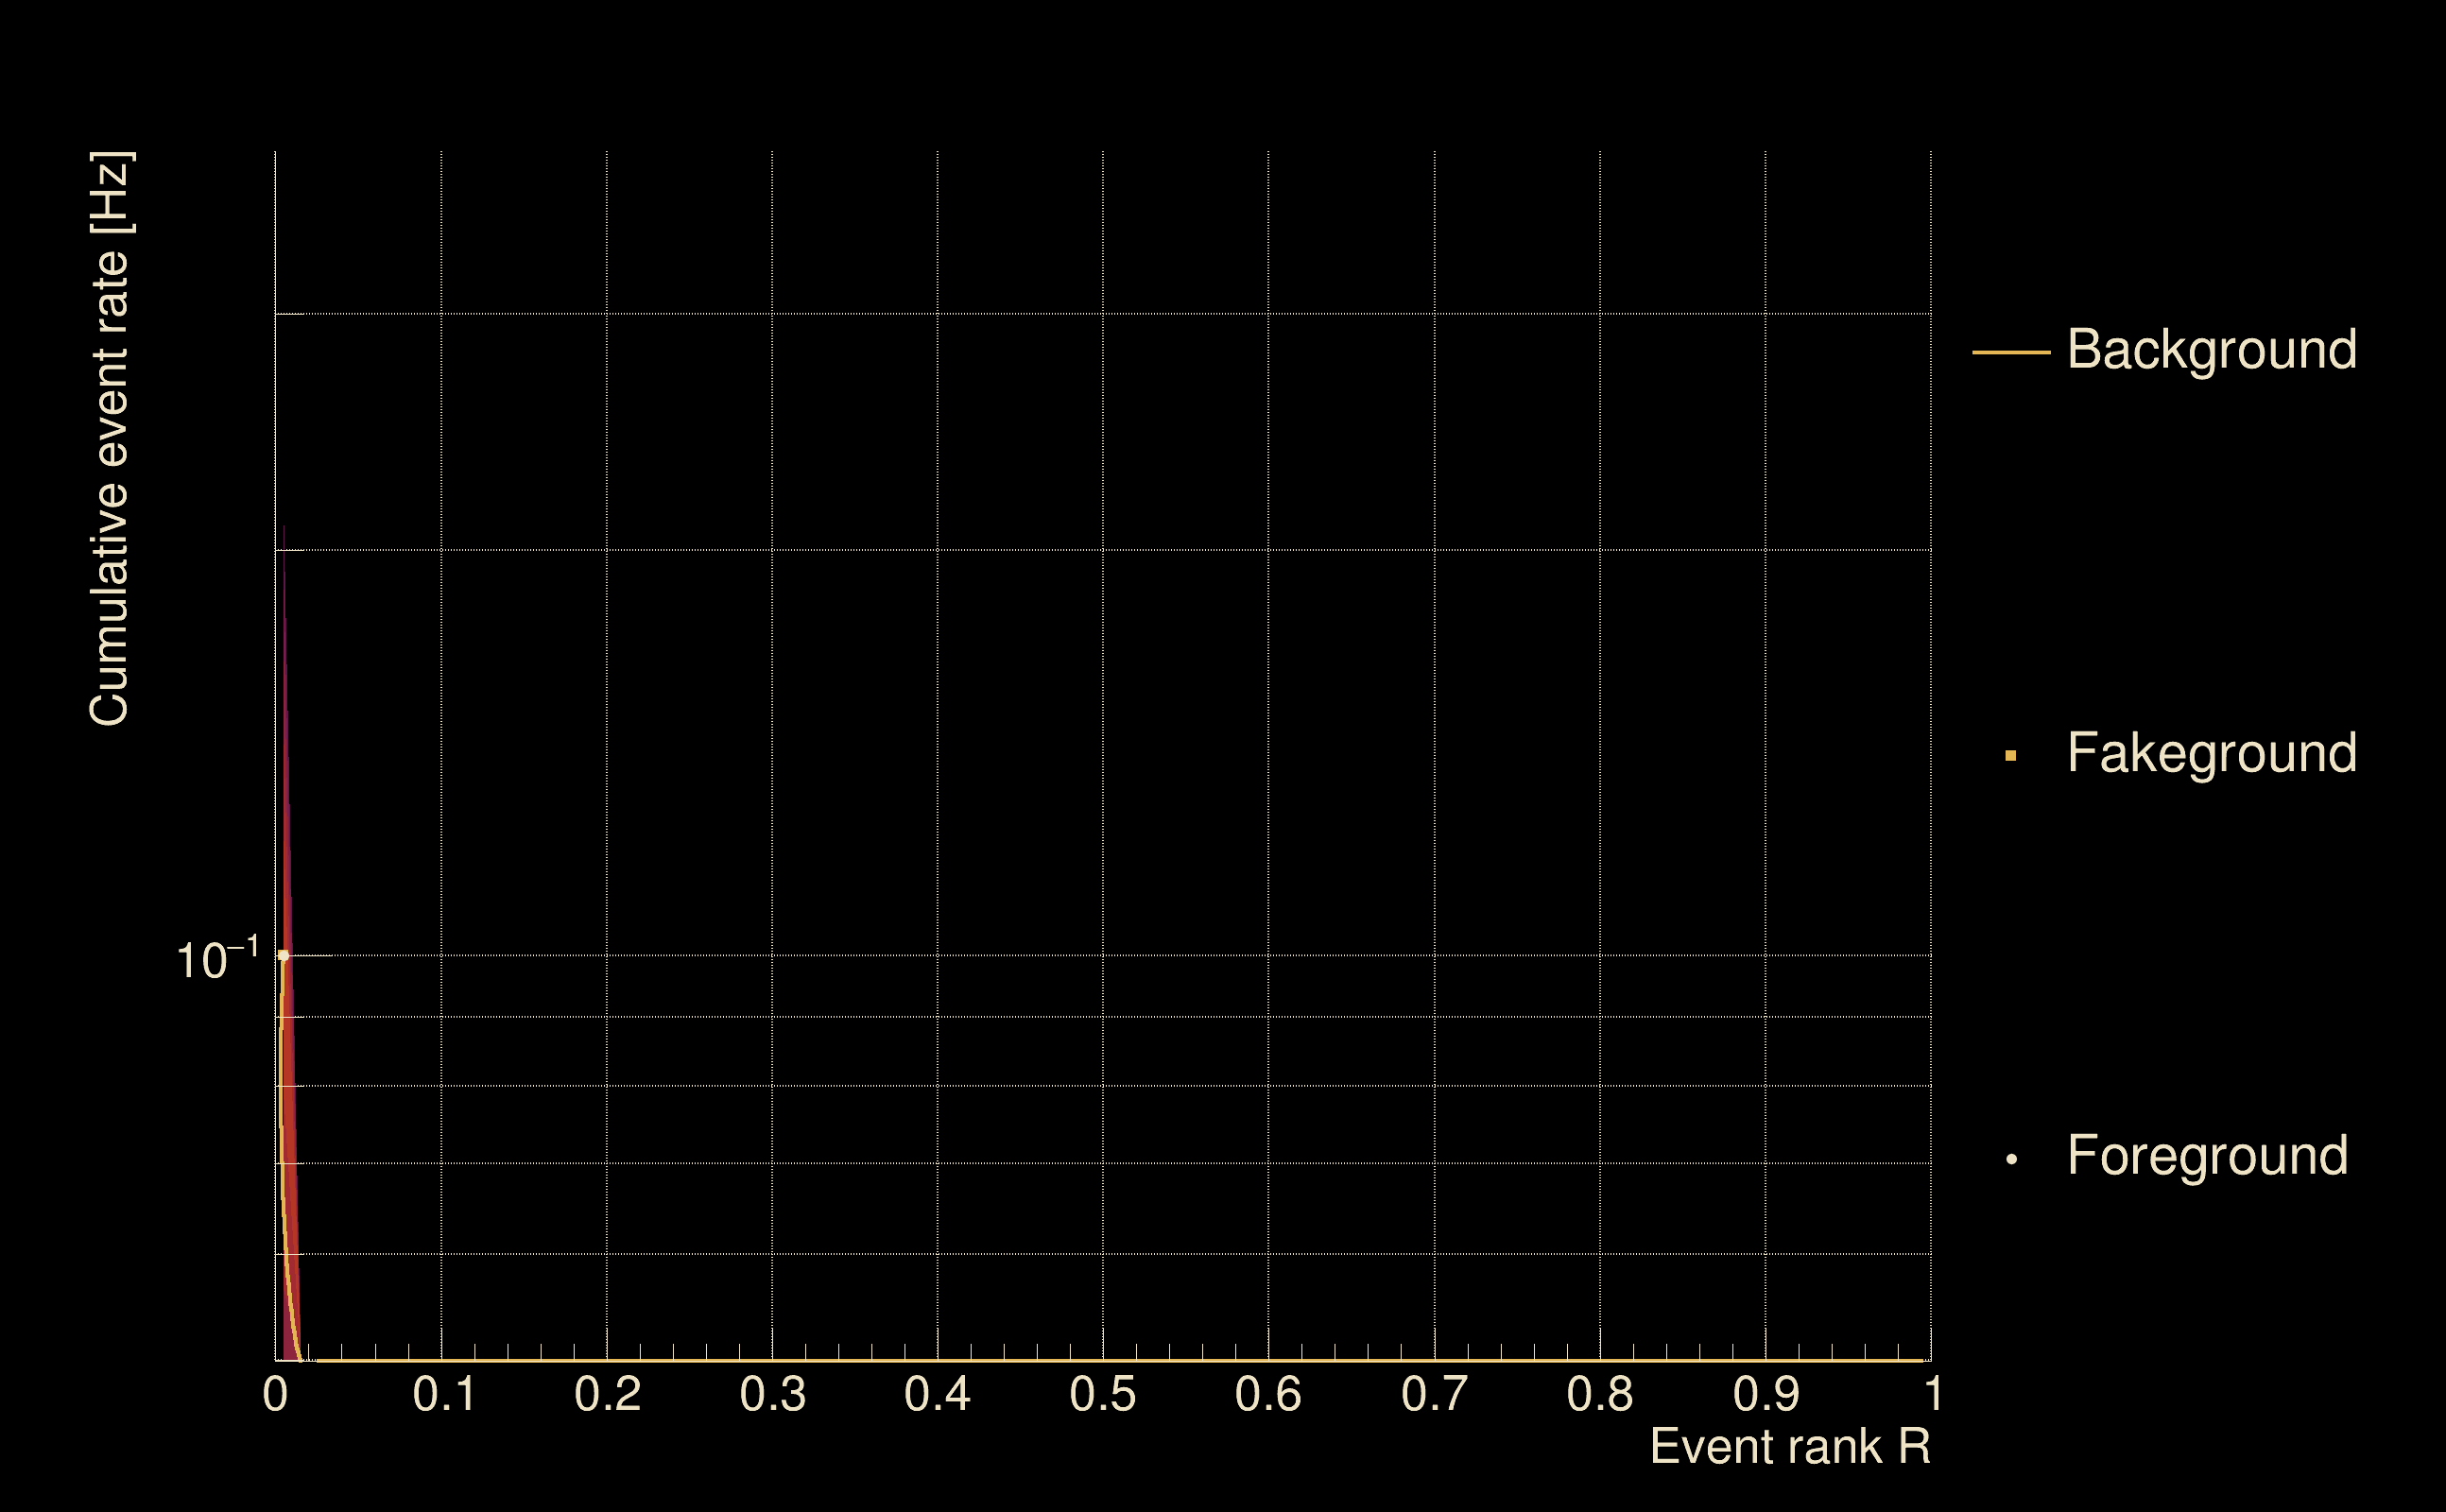
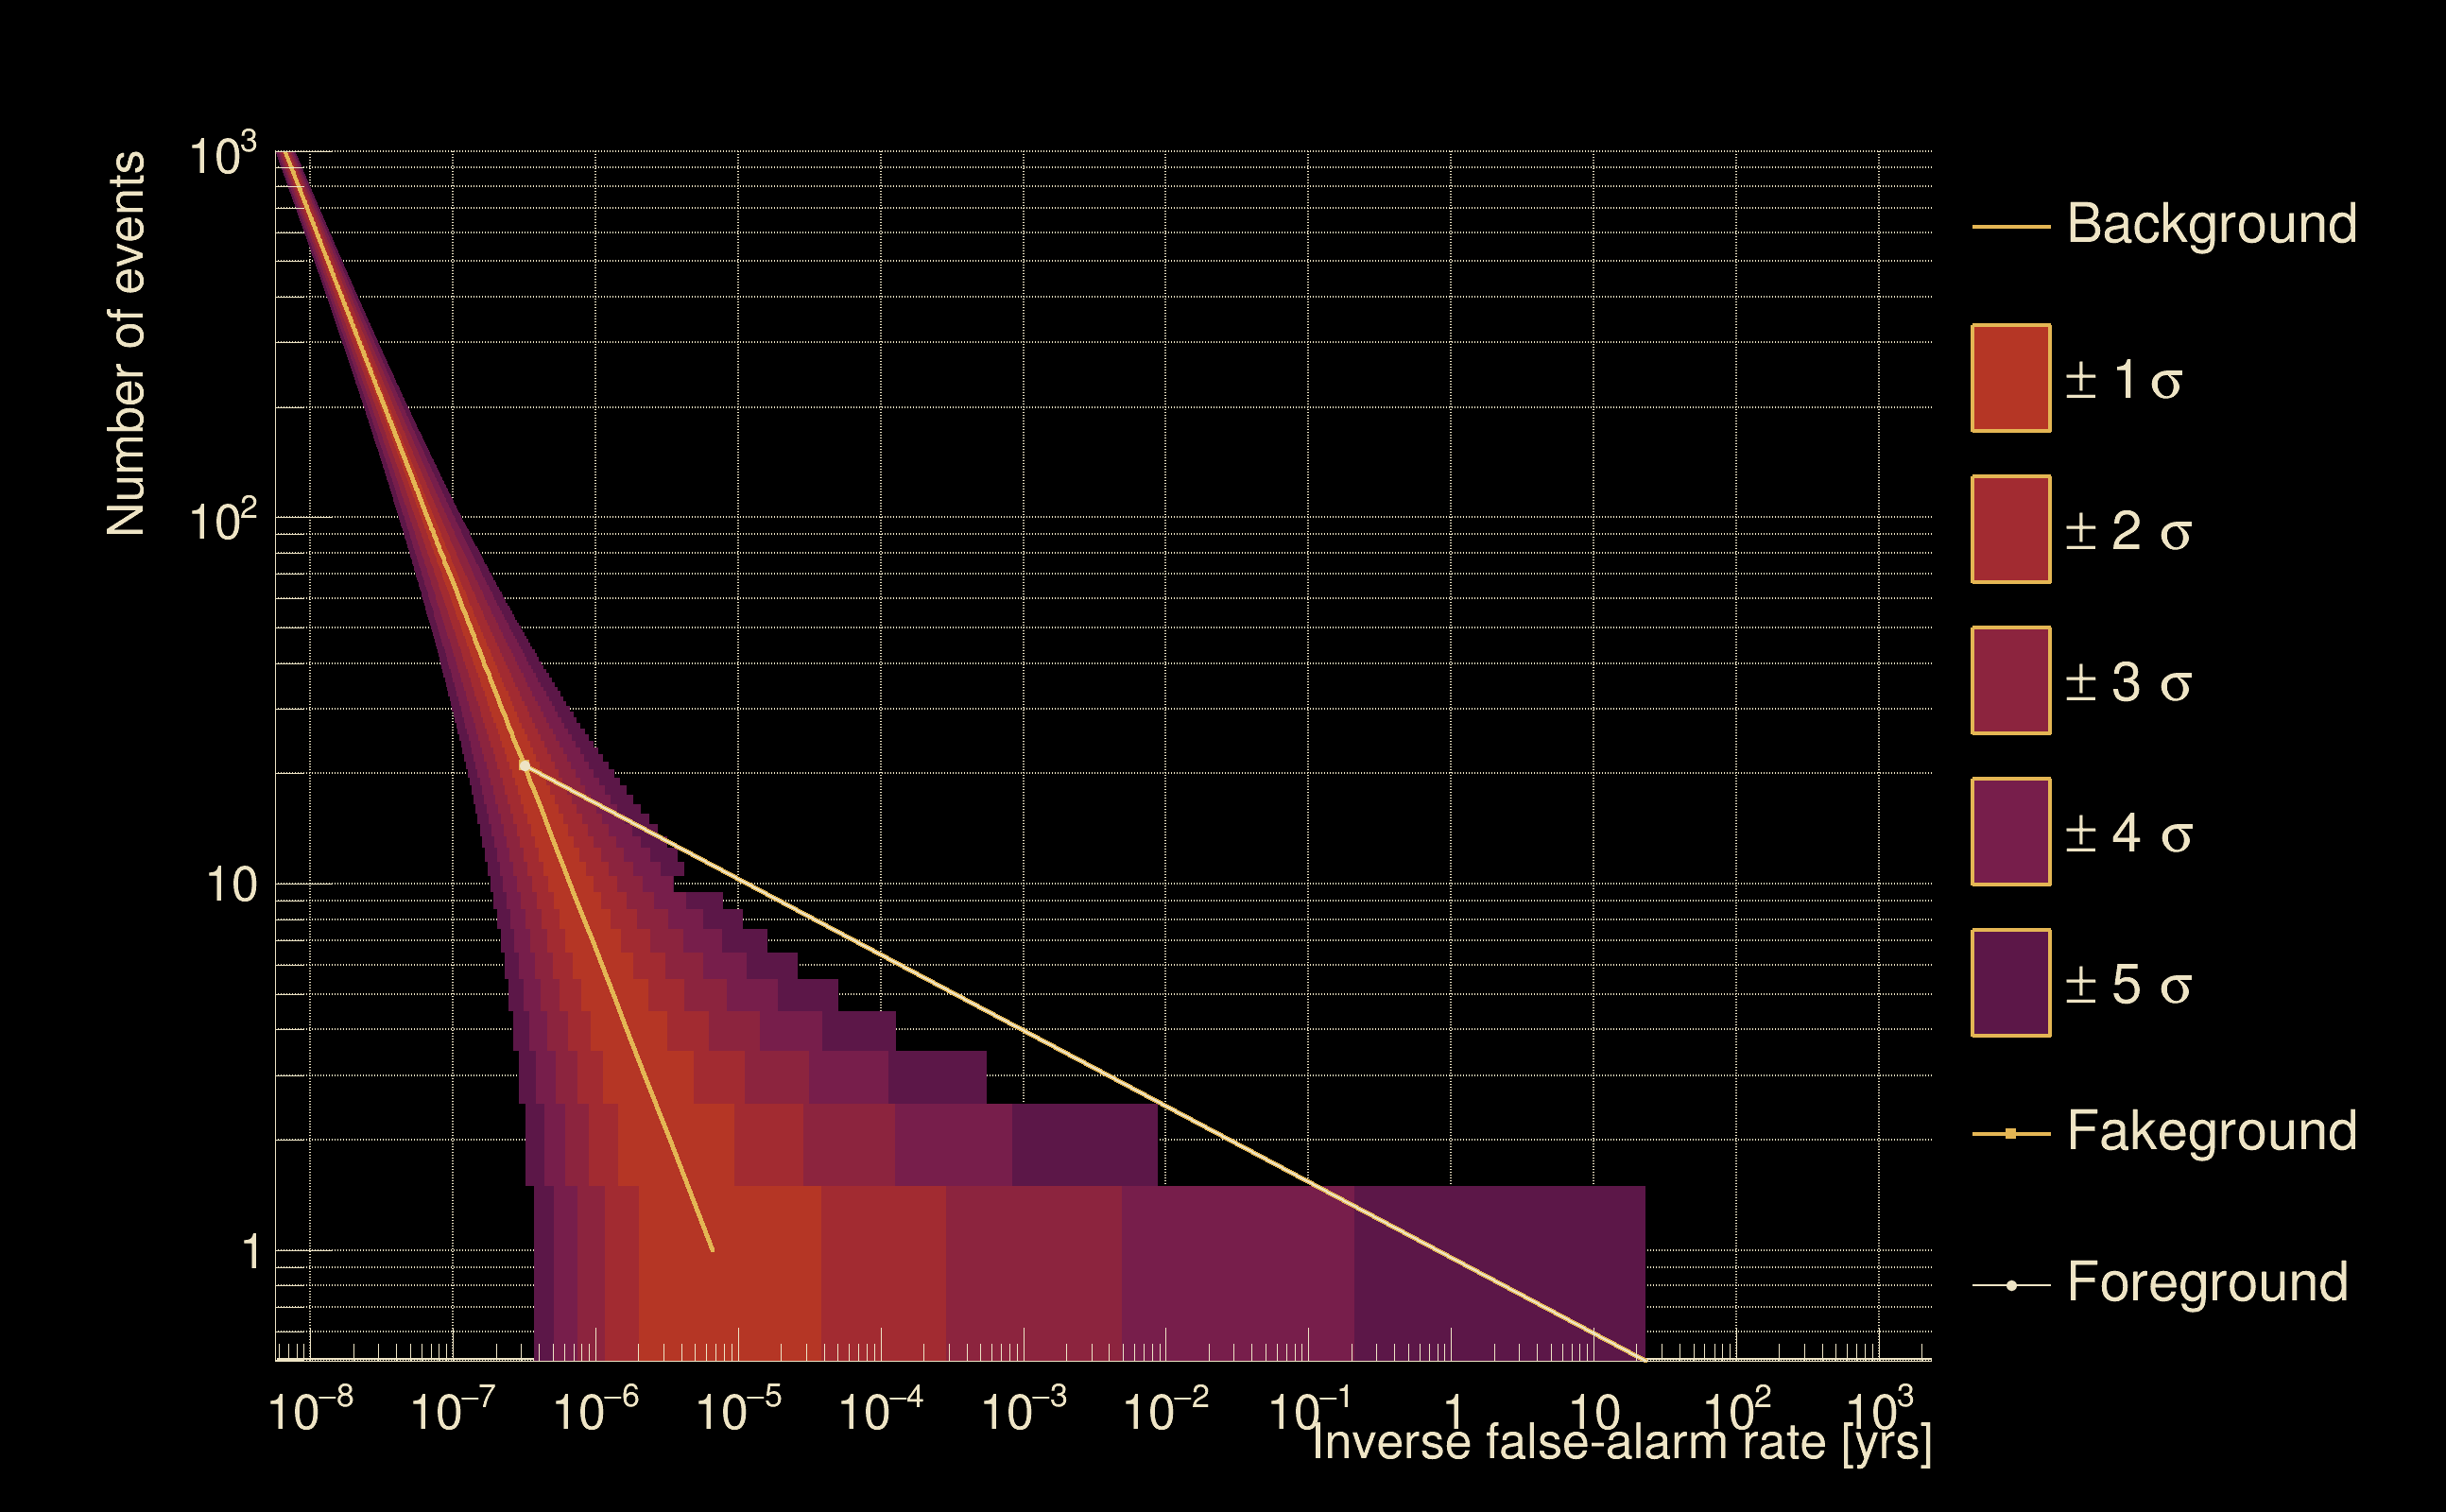
| Foreground | Fakeground | Background | ||
|---|---|---|---|---|
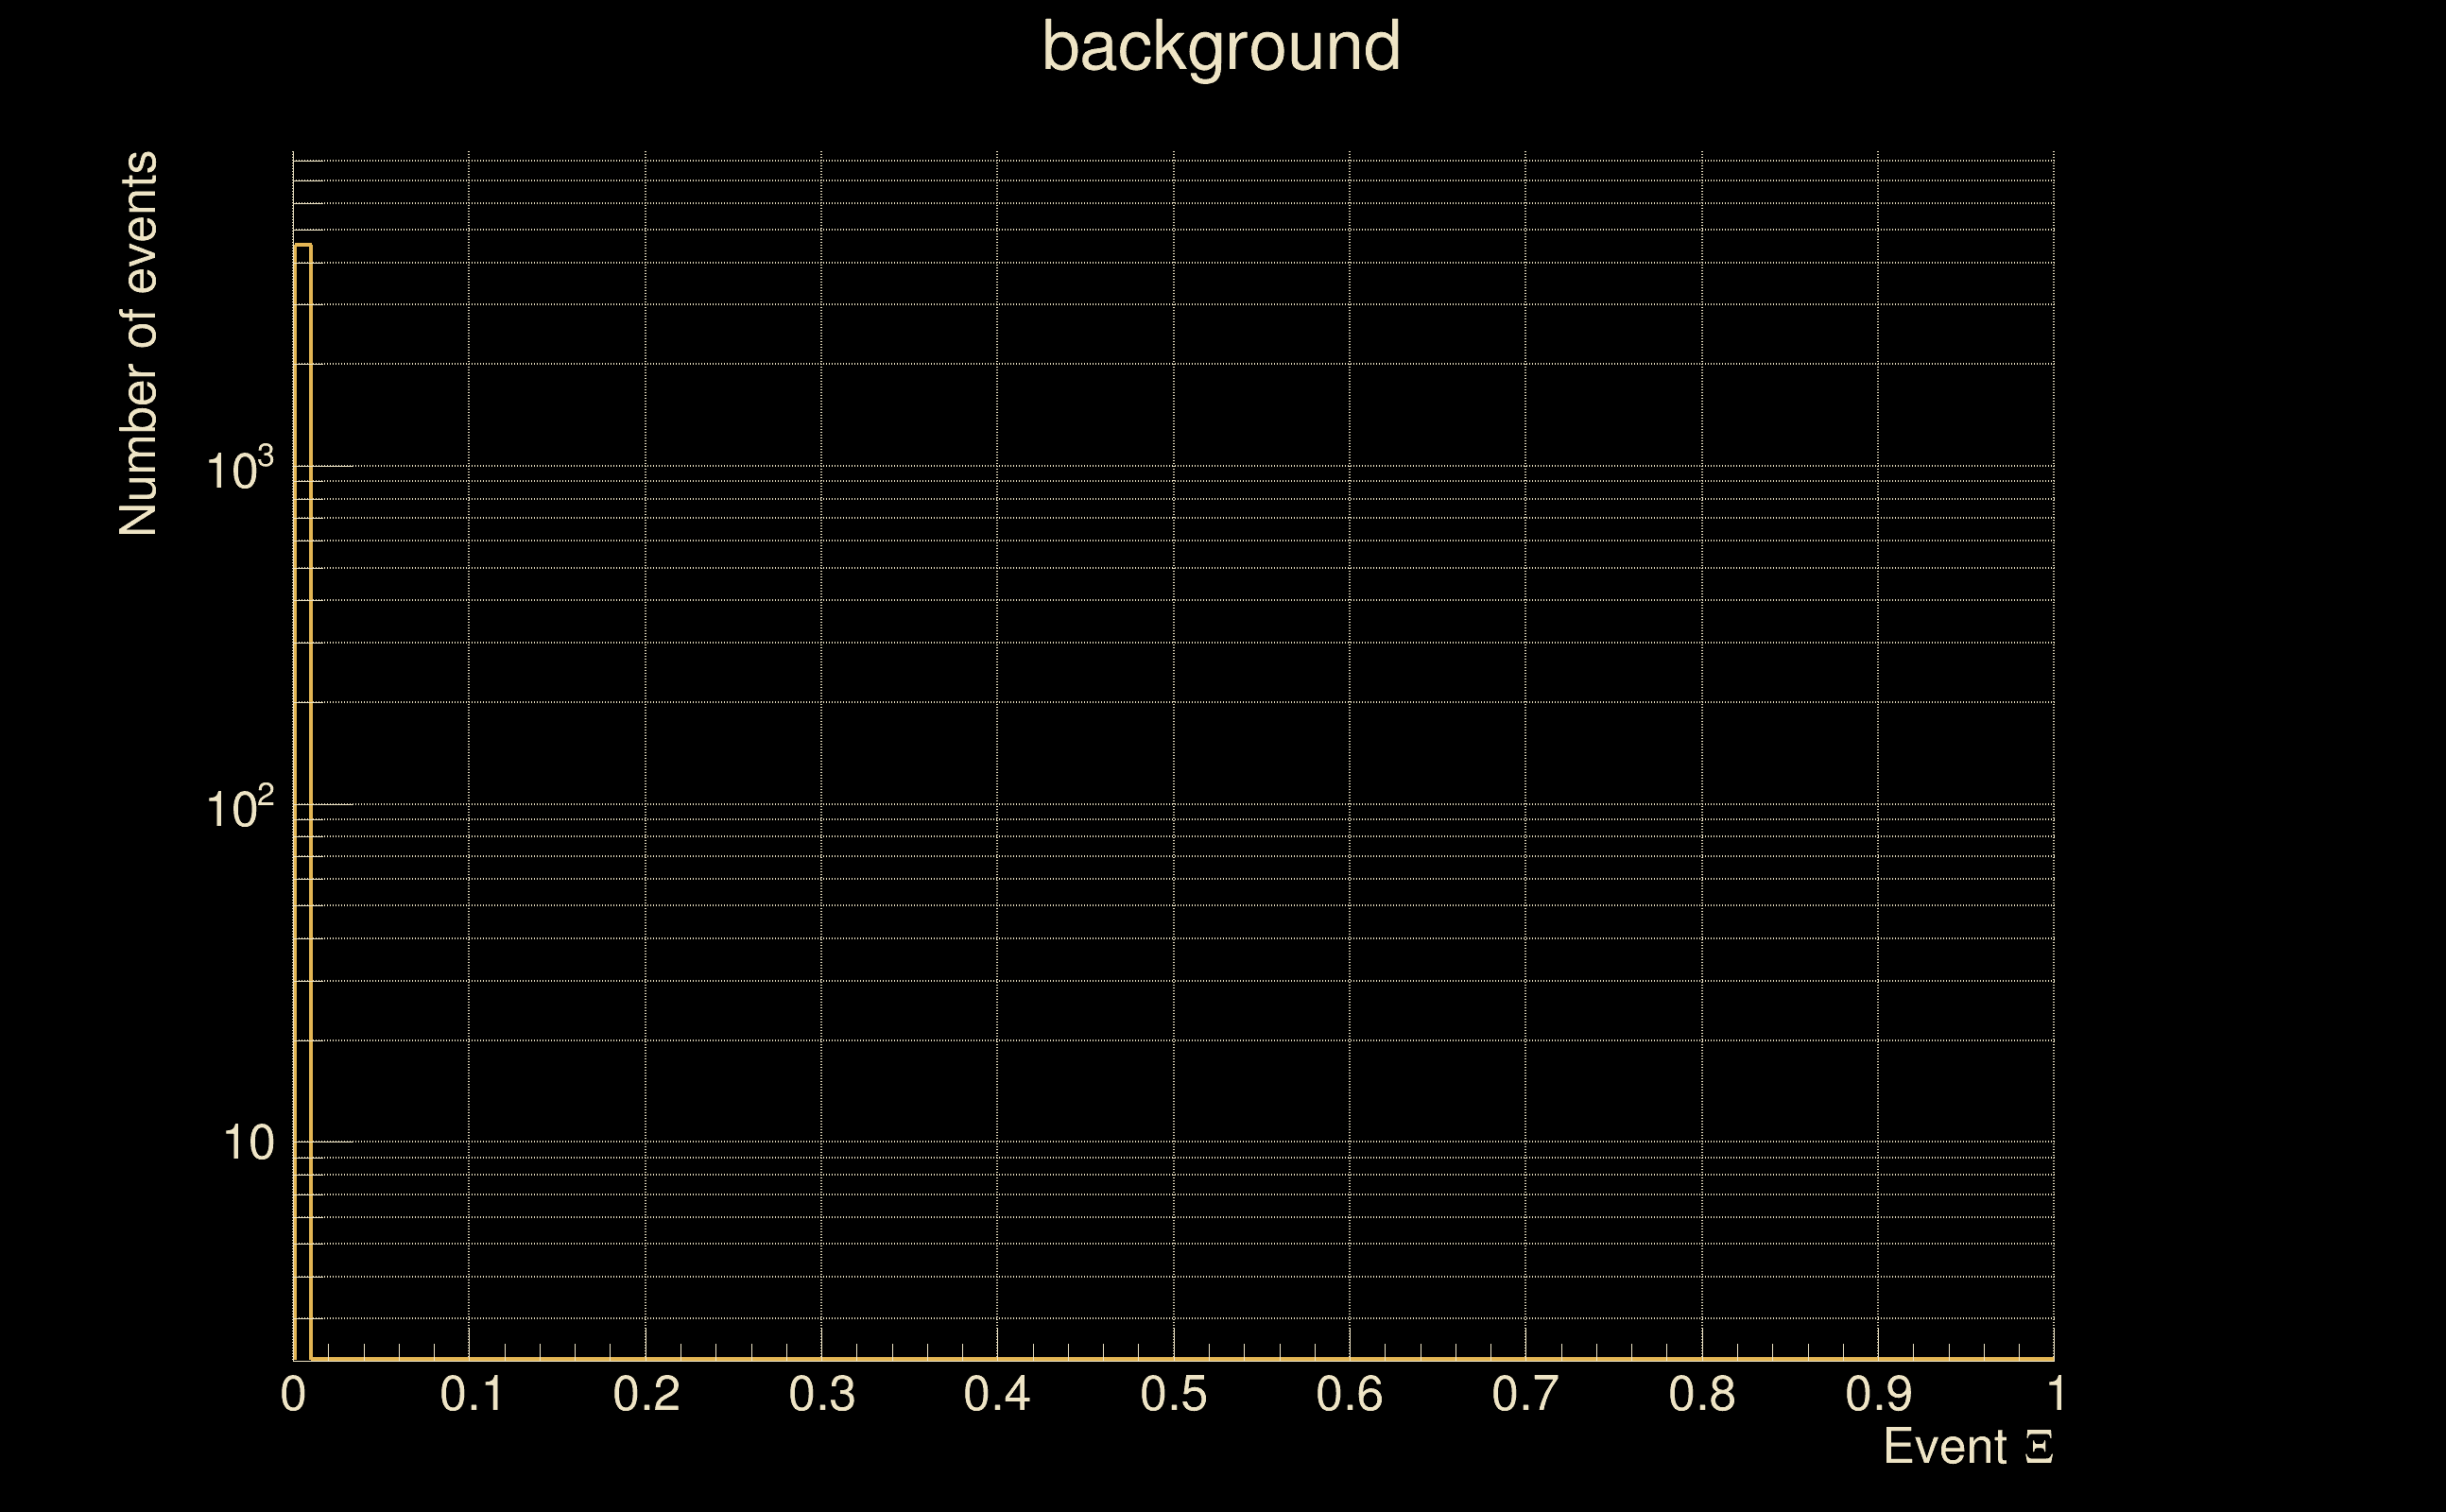
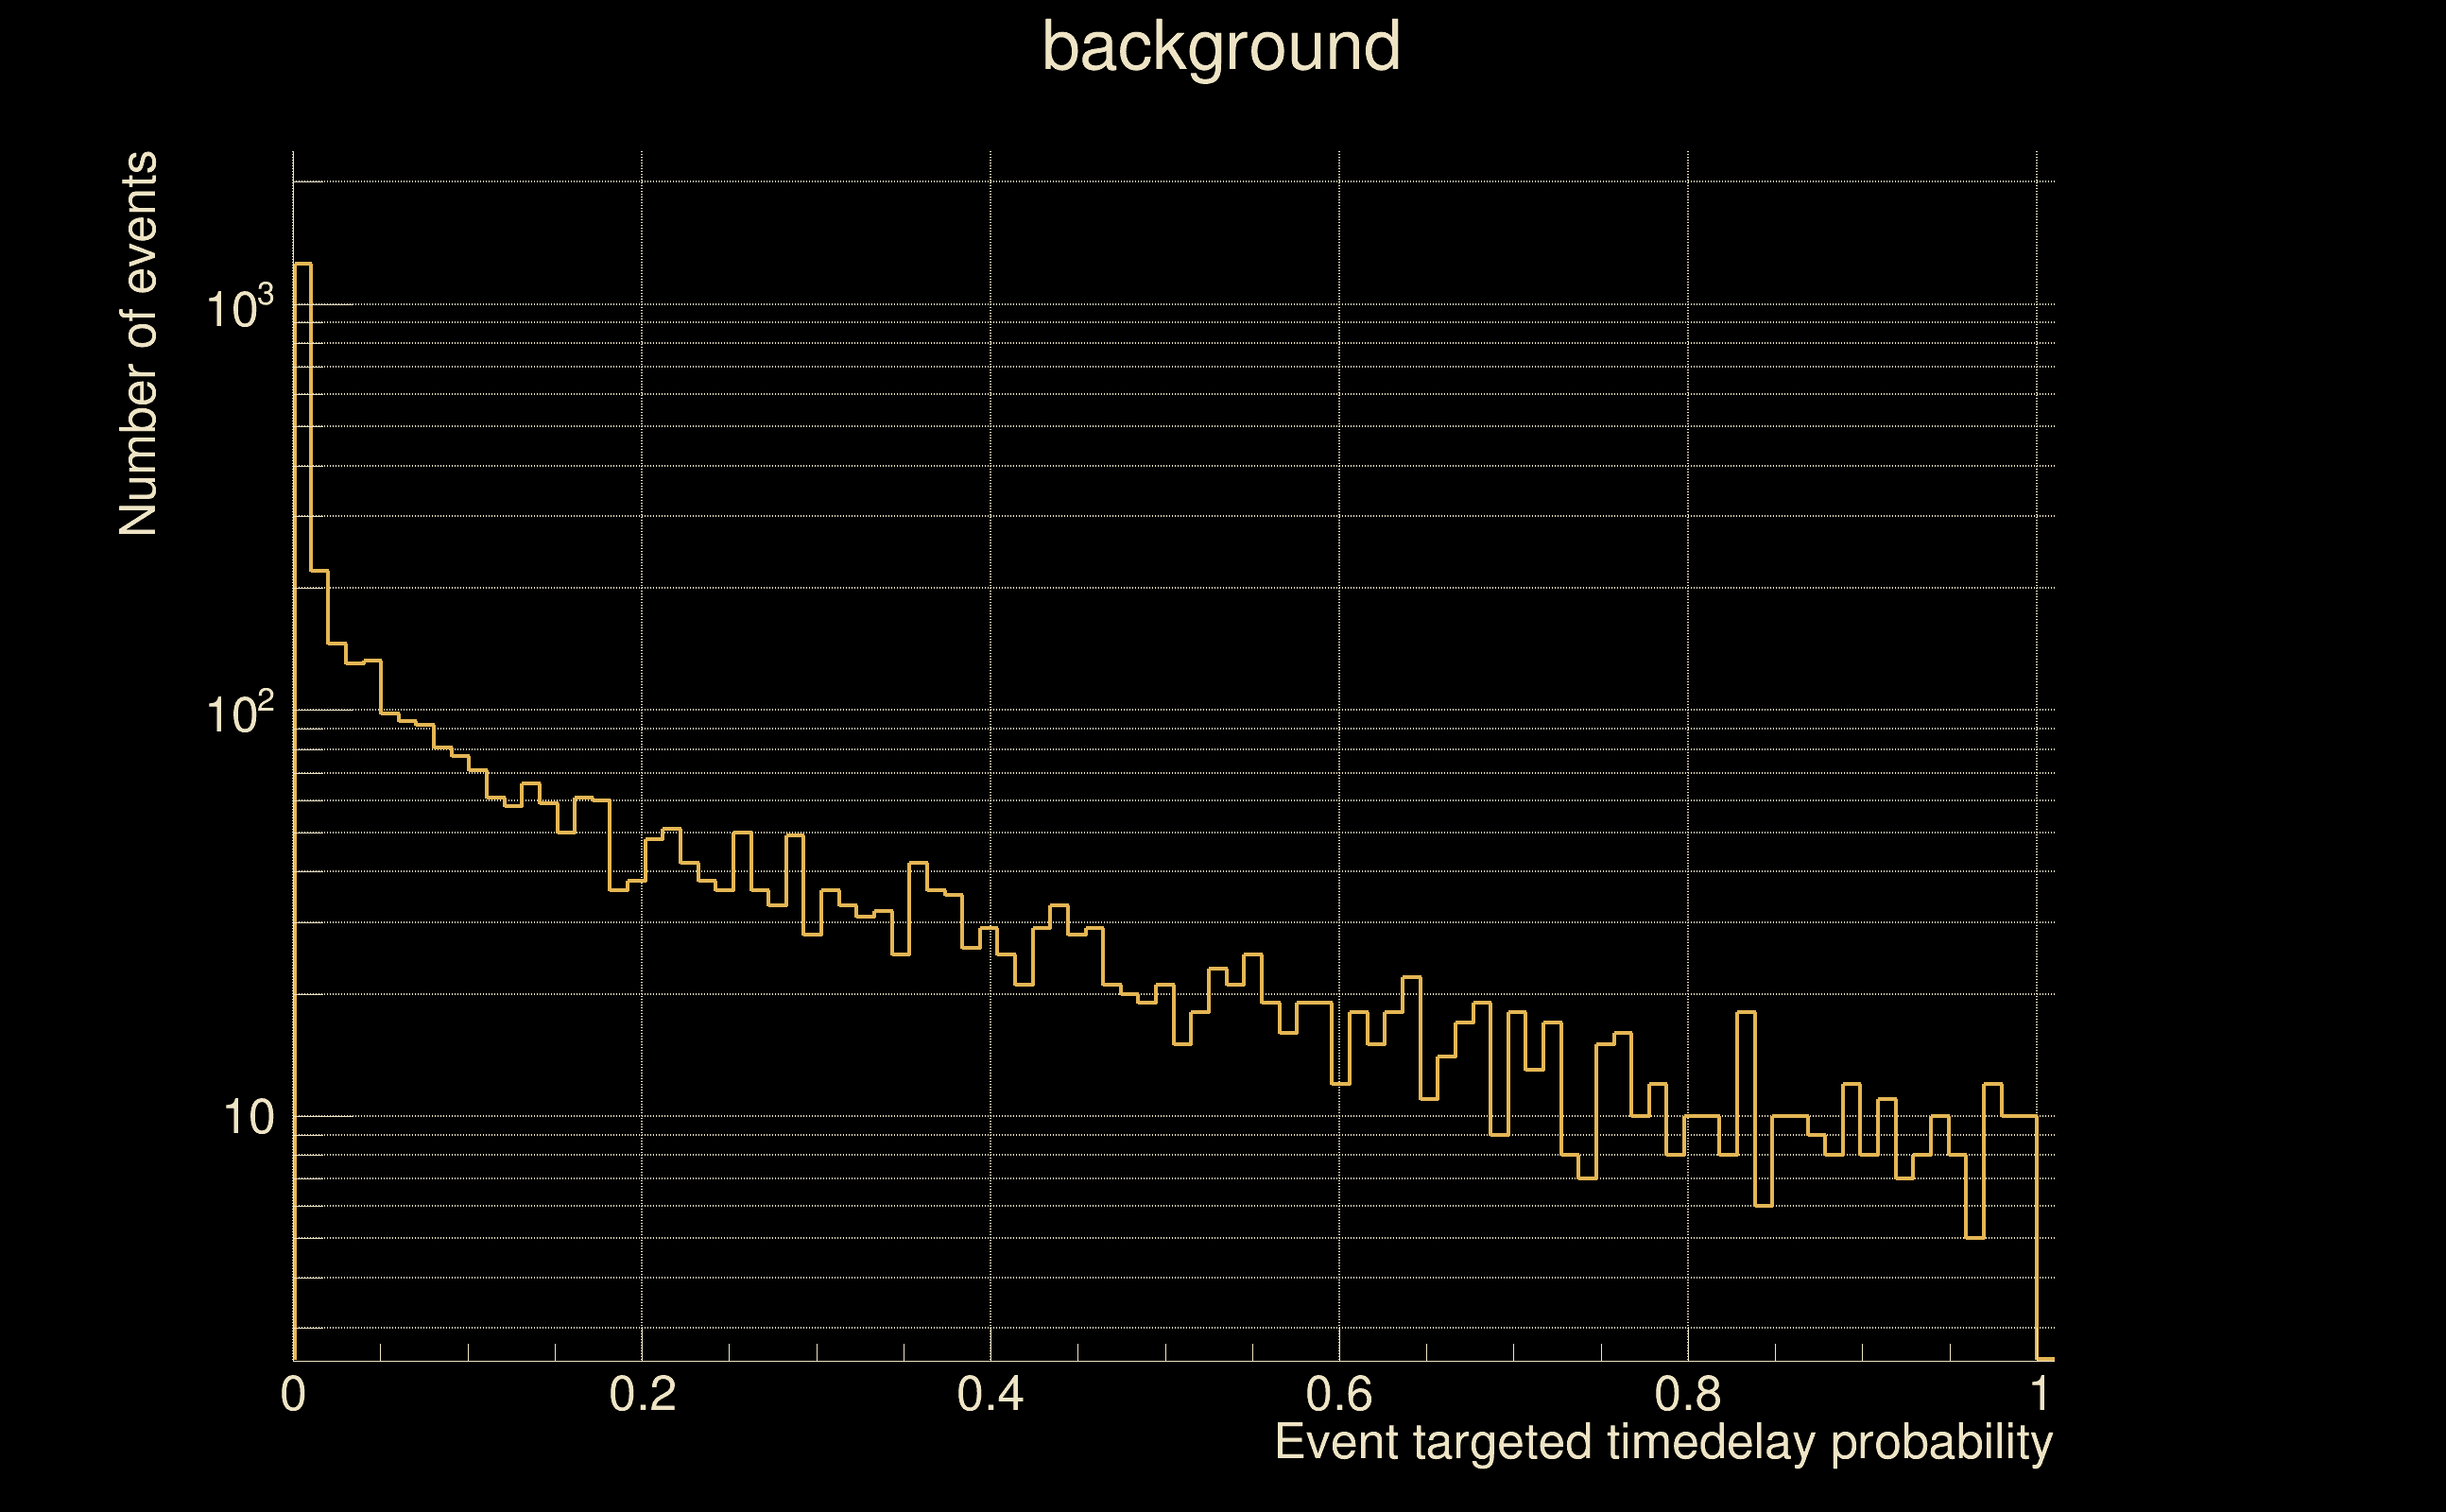
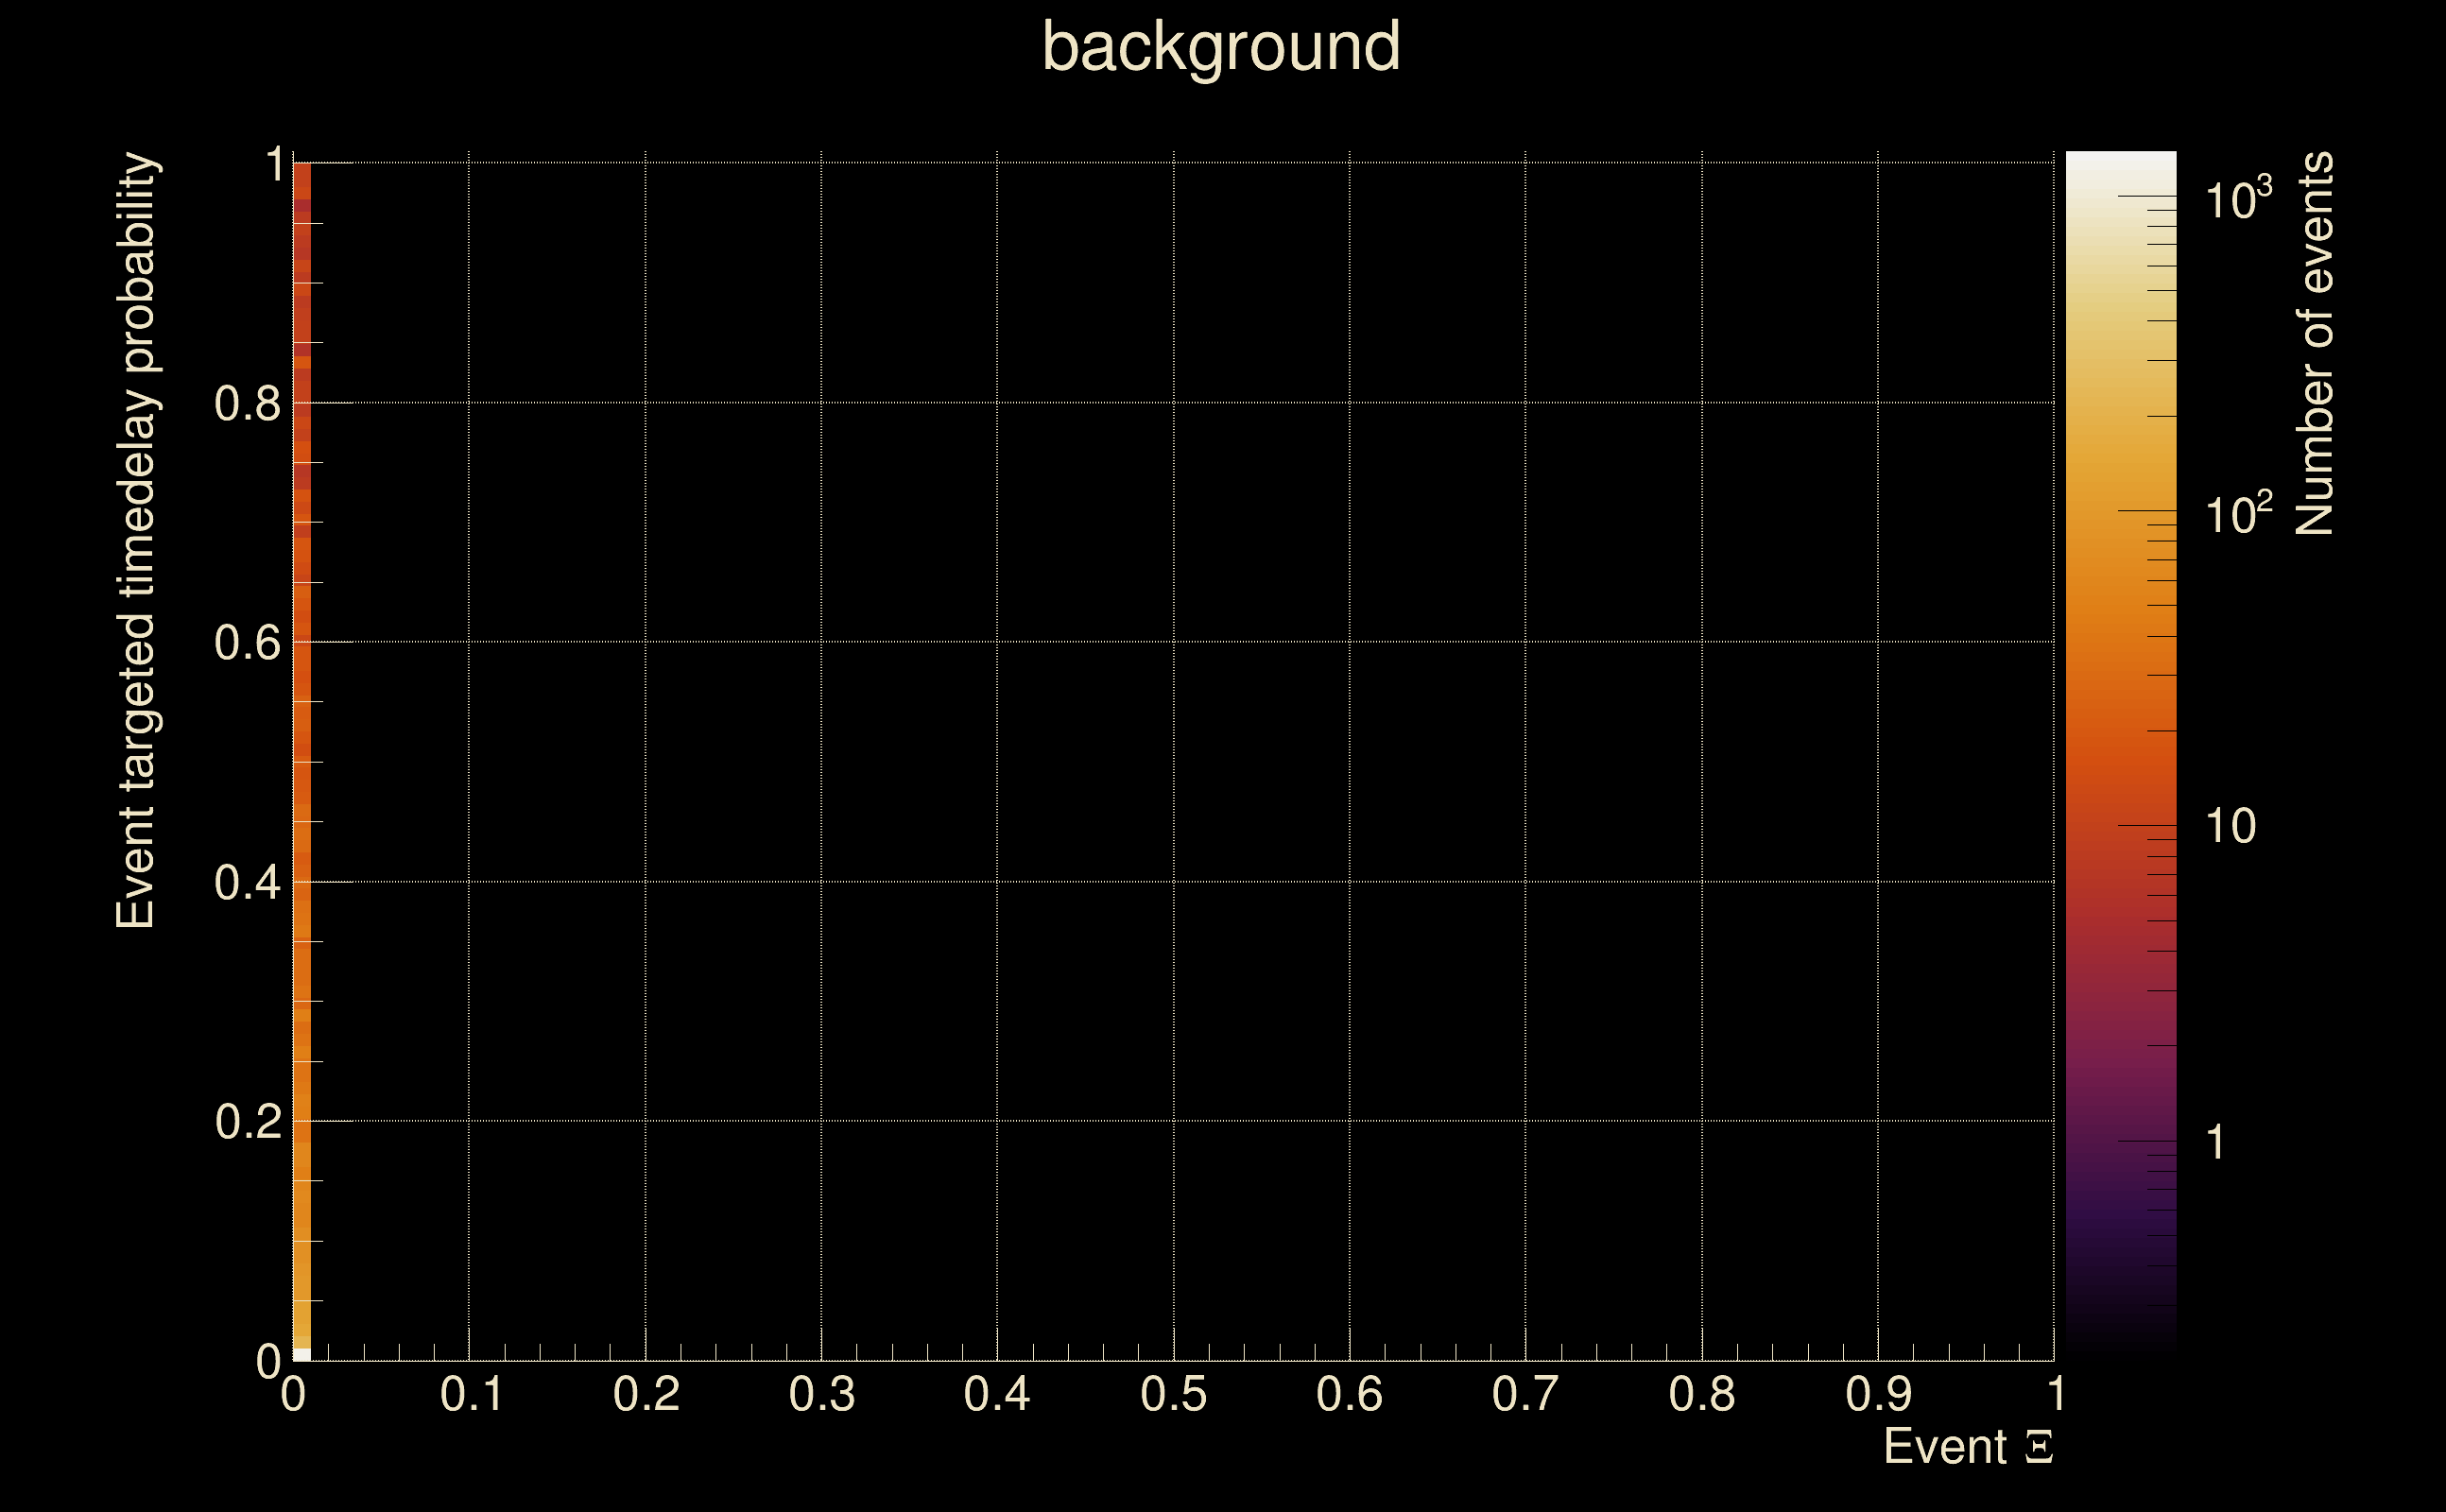
| Number of processed ox events | 21 | 21 | 4515 | |
| Start Date (detector 0) | Mon May 15 14:21:45 2023 UTC | Mon May 15 14:21:45 2023 UTC | Mon May 15 14:21:45 2023 UTC | |
| End Date (detector 0) | Mon May 15 14:23:35 2023 UTC | Mon May 15 14:23:35 2023 UTC | Mon May 15 14:23:35 2023 UTC | |
| Start GPS (detector 0) | 1368195723 | 1368195723 | 1368195723 | |
| End GPS (detector 0) | 1368195833 | 1368195833 | 1368195833 | |
| Used livetime (detector 0) | 110 s | 110 s | 110 s | |
| Start Date (detector 1) | Mon May 15 14:21:45 2023 UTC | Mon May 15 14:21:45 2023 UTC | Mon May 15 14:21:45 2023 UTC | |
| End Date (detector 1) | Mon May 15 14:23:35 2023 UTC | Mon May 15 14:23:35 2023 UTC | Mon May 15 14:23:35 2023 UTC | |
| Start GPS (detector 1) | 1368195723 | 1368195723 | 1368195723 | |
| End GPS (detector 1) | 1368195833 | 1368195833 | 1368195833 | |
| Used livetime (detector 1) | 110 s | 110 s | 110 s | |
| Cumulative livetime | 210 s | 210 s | 45150 s | |
| 0 years, 0 days, 0 hours, 3 min, 30 s | 0 years, 0 days, 0 hours, 3 min, 30 s | 0 years, 0 days, 12 hours, 32 min, 30 s |
|
|
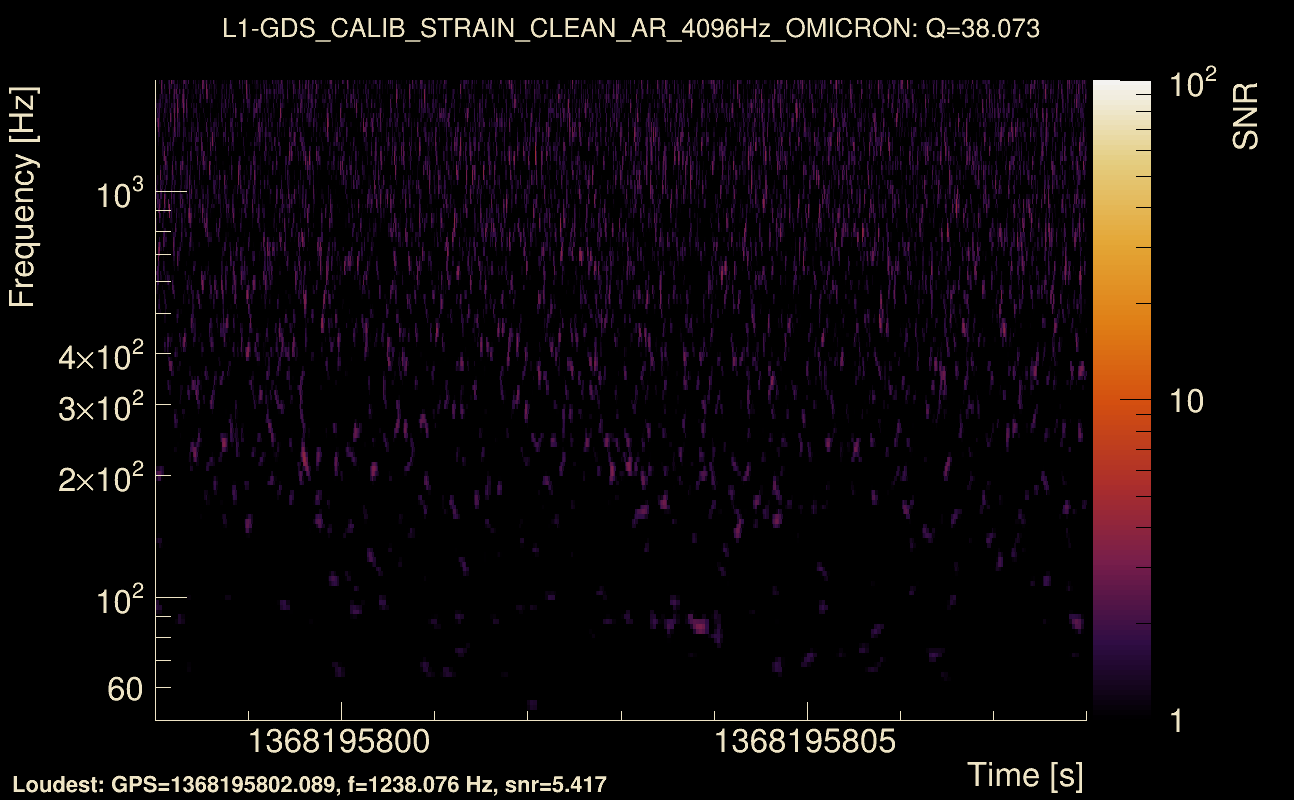
| Event time t(H1): | GPS = 1368195798 (Mon May 15 14:23:00 2023 ) → GPS = 1368195808 (Mon May 15 14:23:10 2023 ) |
| Event time t(L1): | GPS = 1368195798 (Mon May 15 14:23:10 2023 ) → GPS = 1368195808 (Mon May 15 14:23:10 2023 ) |
| Omicron analysis time window (H1): | GPS = 1368195795 → GPS = 1368195811 |
| Omicron analysis time window (L1): | GPS = 1368195795 → GPS = 1368195811 |
| Time delay between detectors t(L1) - t(H1): | 0.00769186 s (slice index = 108 / 217), δt_gw = 0.00769186 s |
| Time delay uncertainty: | 0.00752444 s |
| [targeted mode] Time delay probability: | 0.901225 (0.124114 sigmas), δt_target = 1.72247e+45 s |
| Frequency: | 551.628 Hz |
| Ξ: | 0.00129432 ± 0.0294596 (variance = 0.000867867): Q0: 0, Q1: 0.034985, Q2: 0.0535386, Q3: 0.0700599, Q4: 0.084754 |
| Rank: | R_A = 0.000525026 |
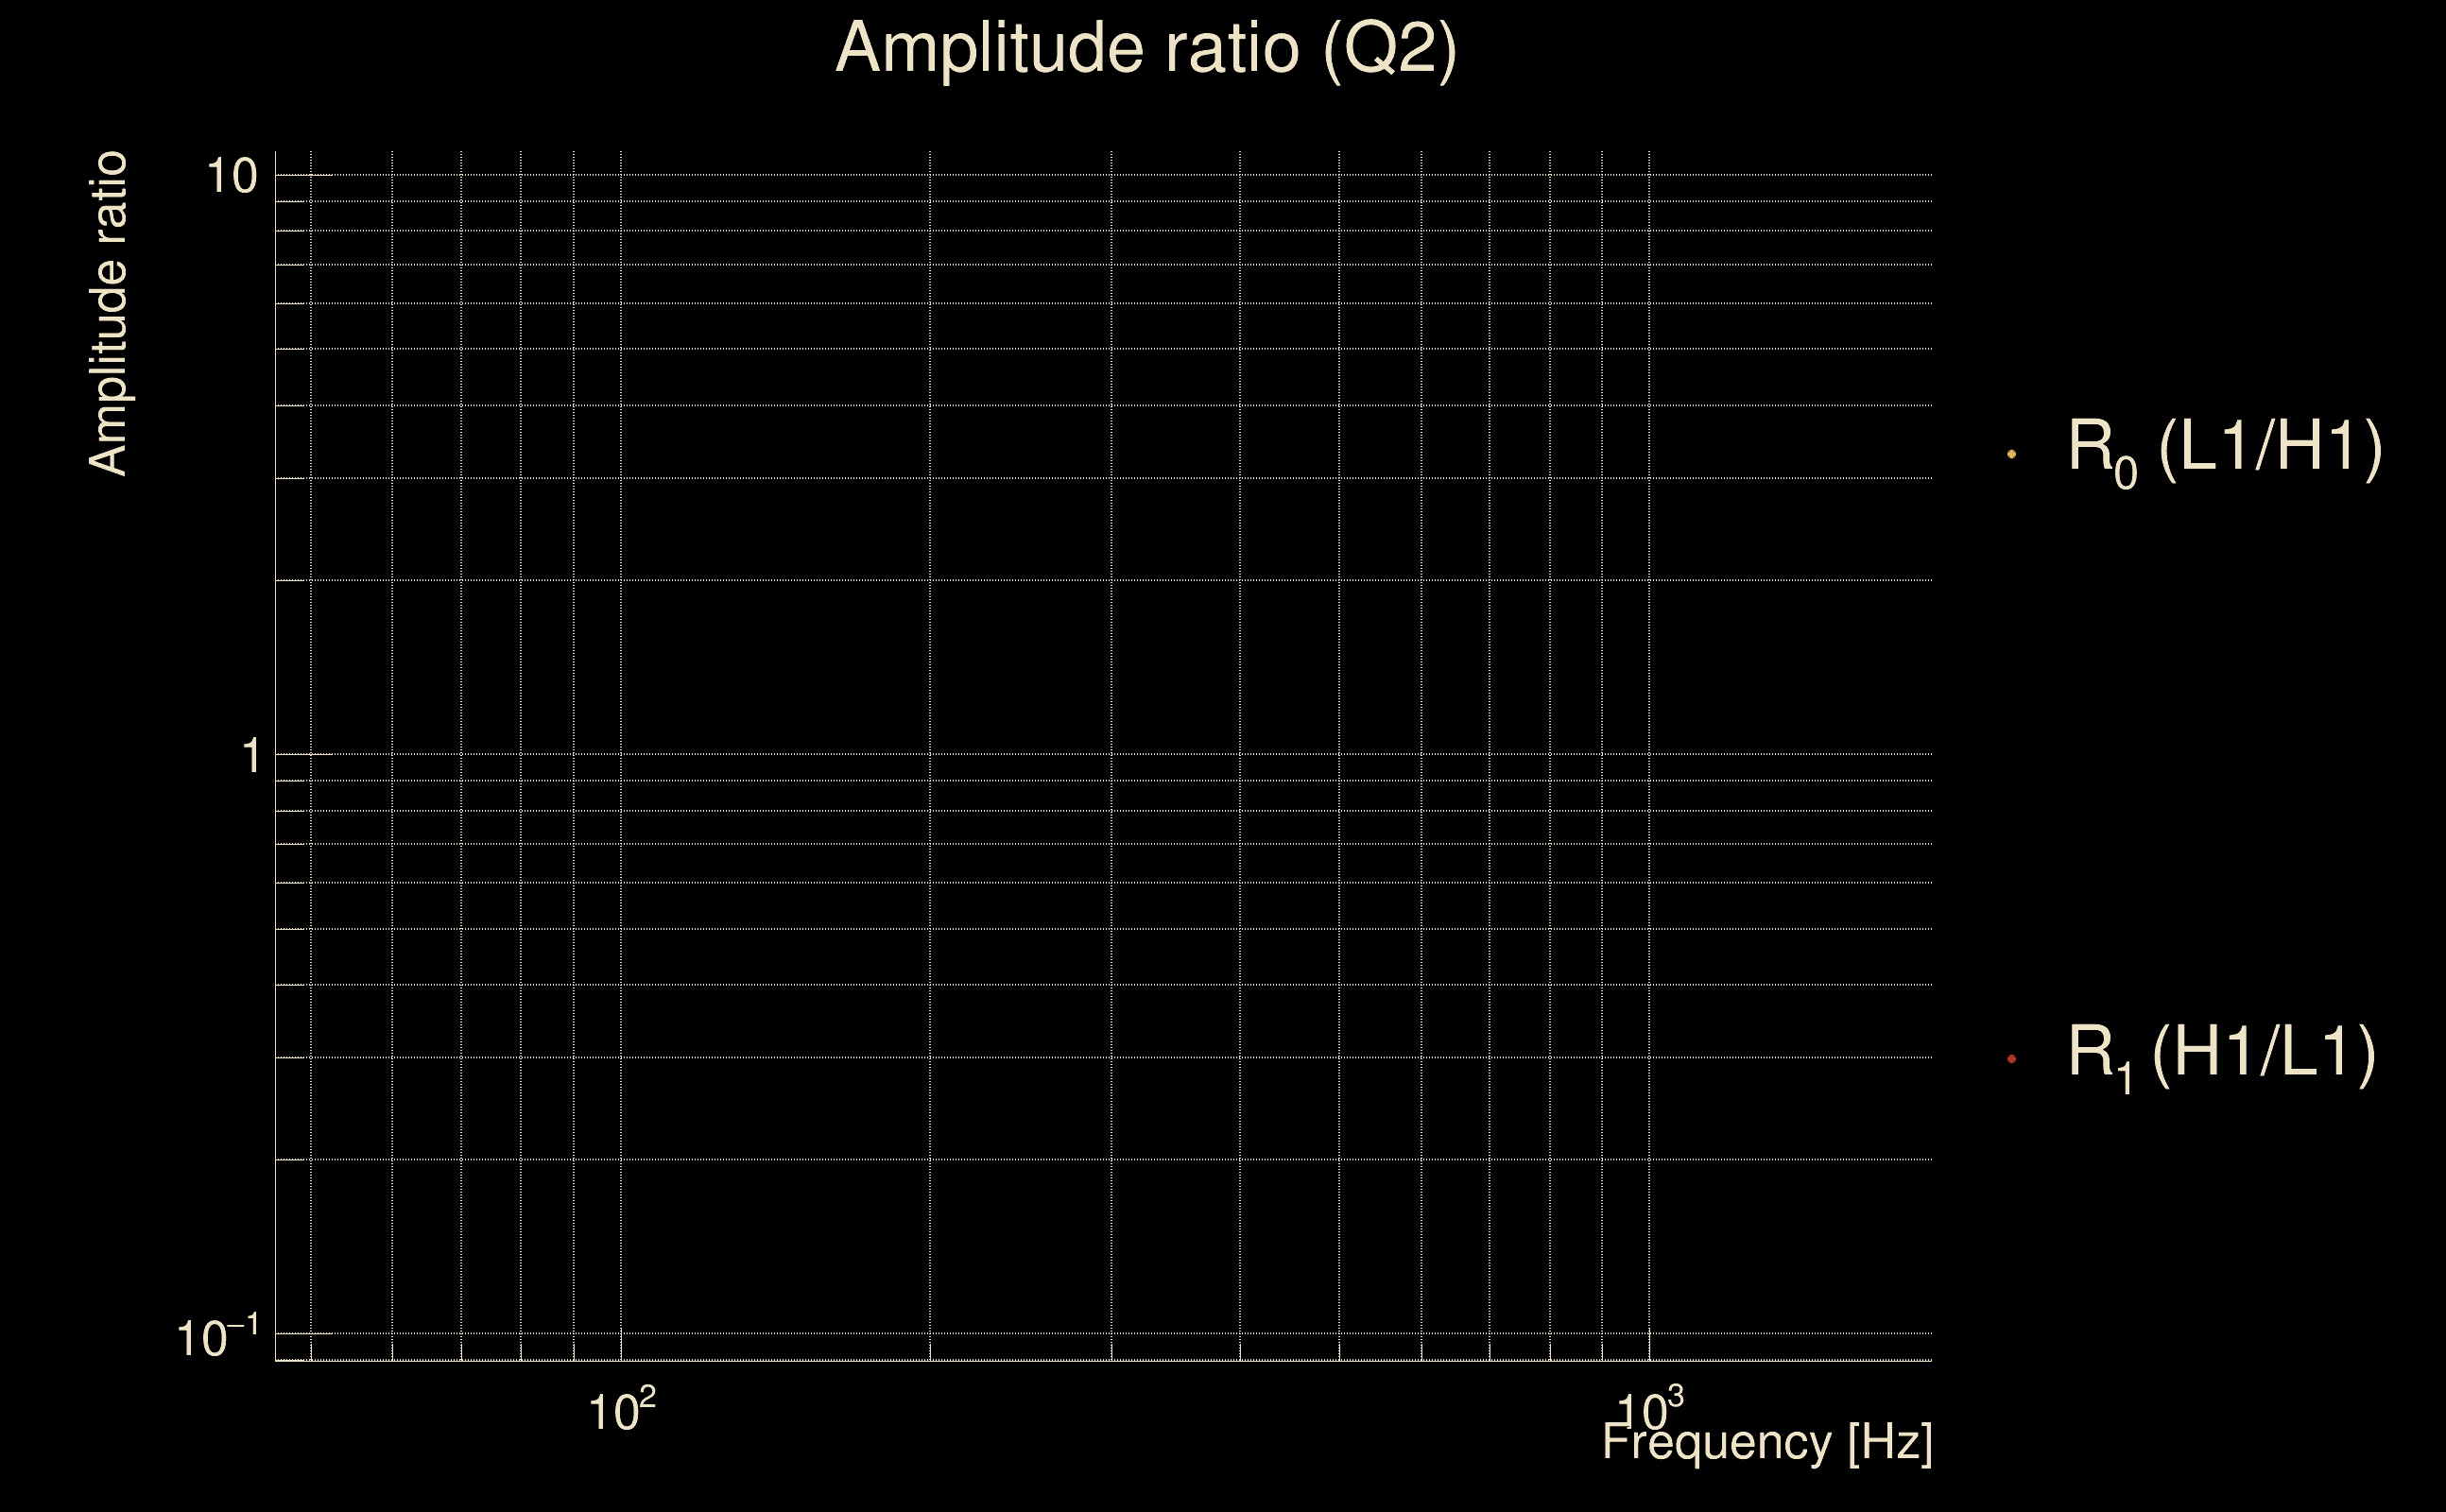
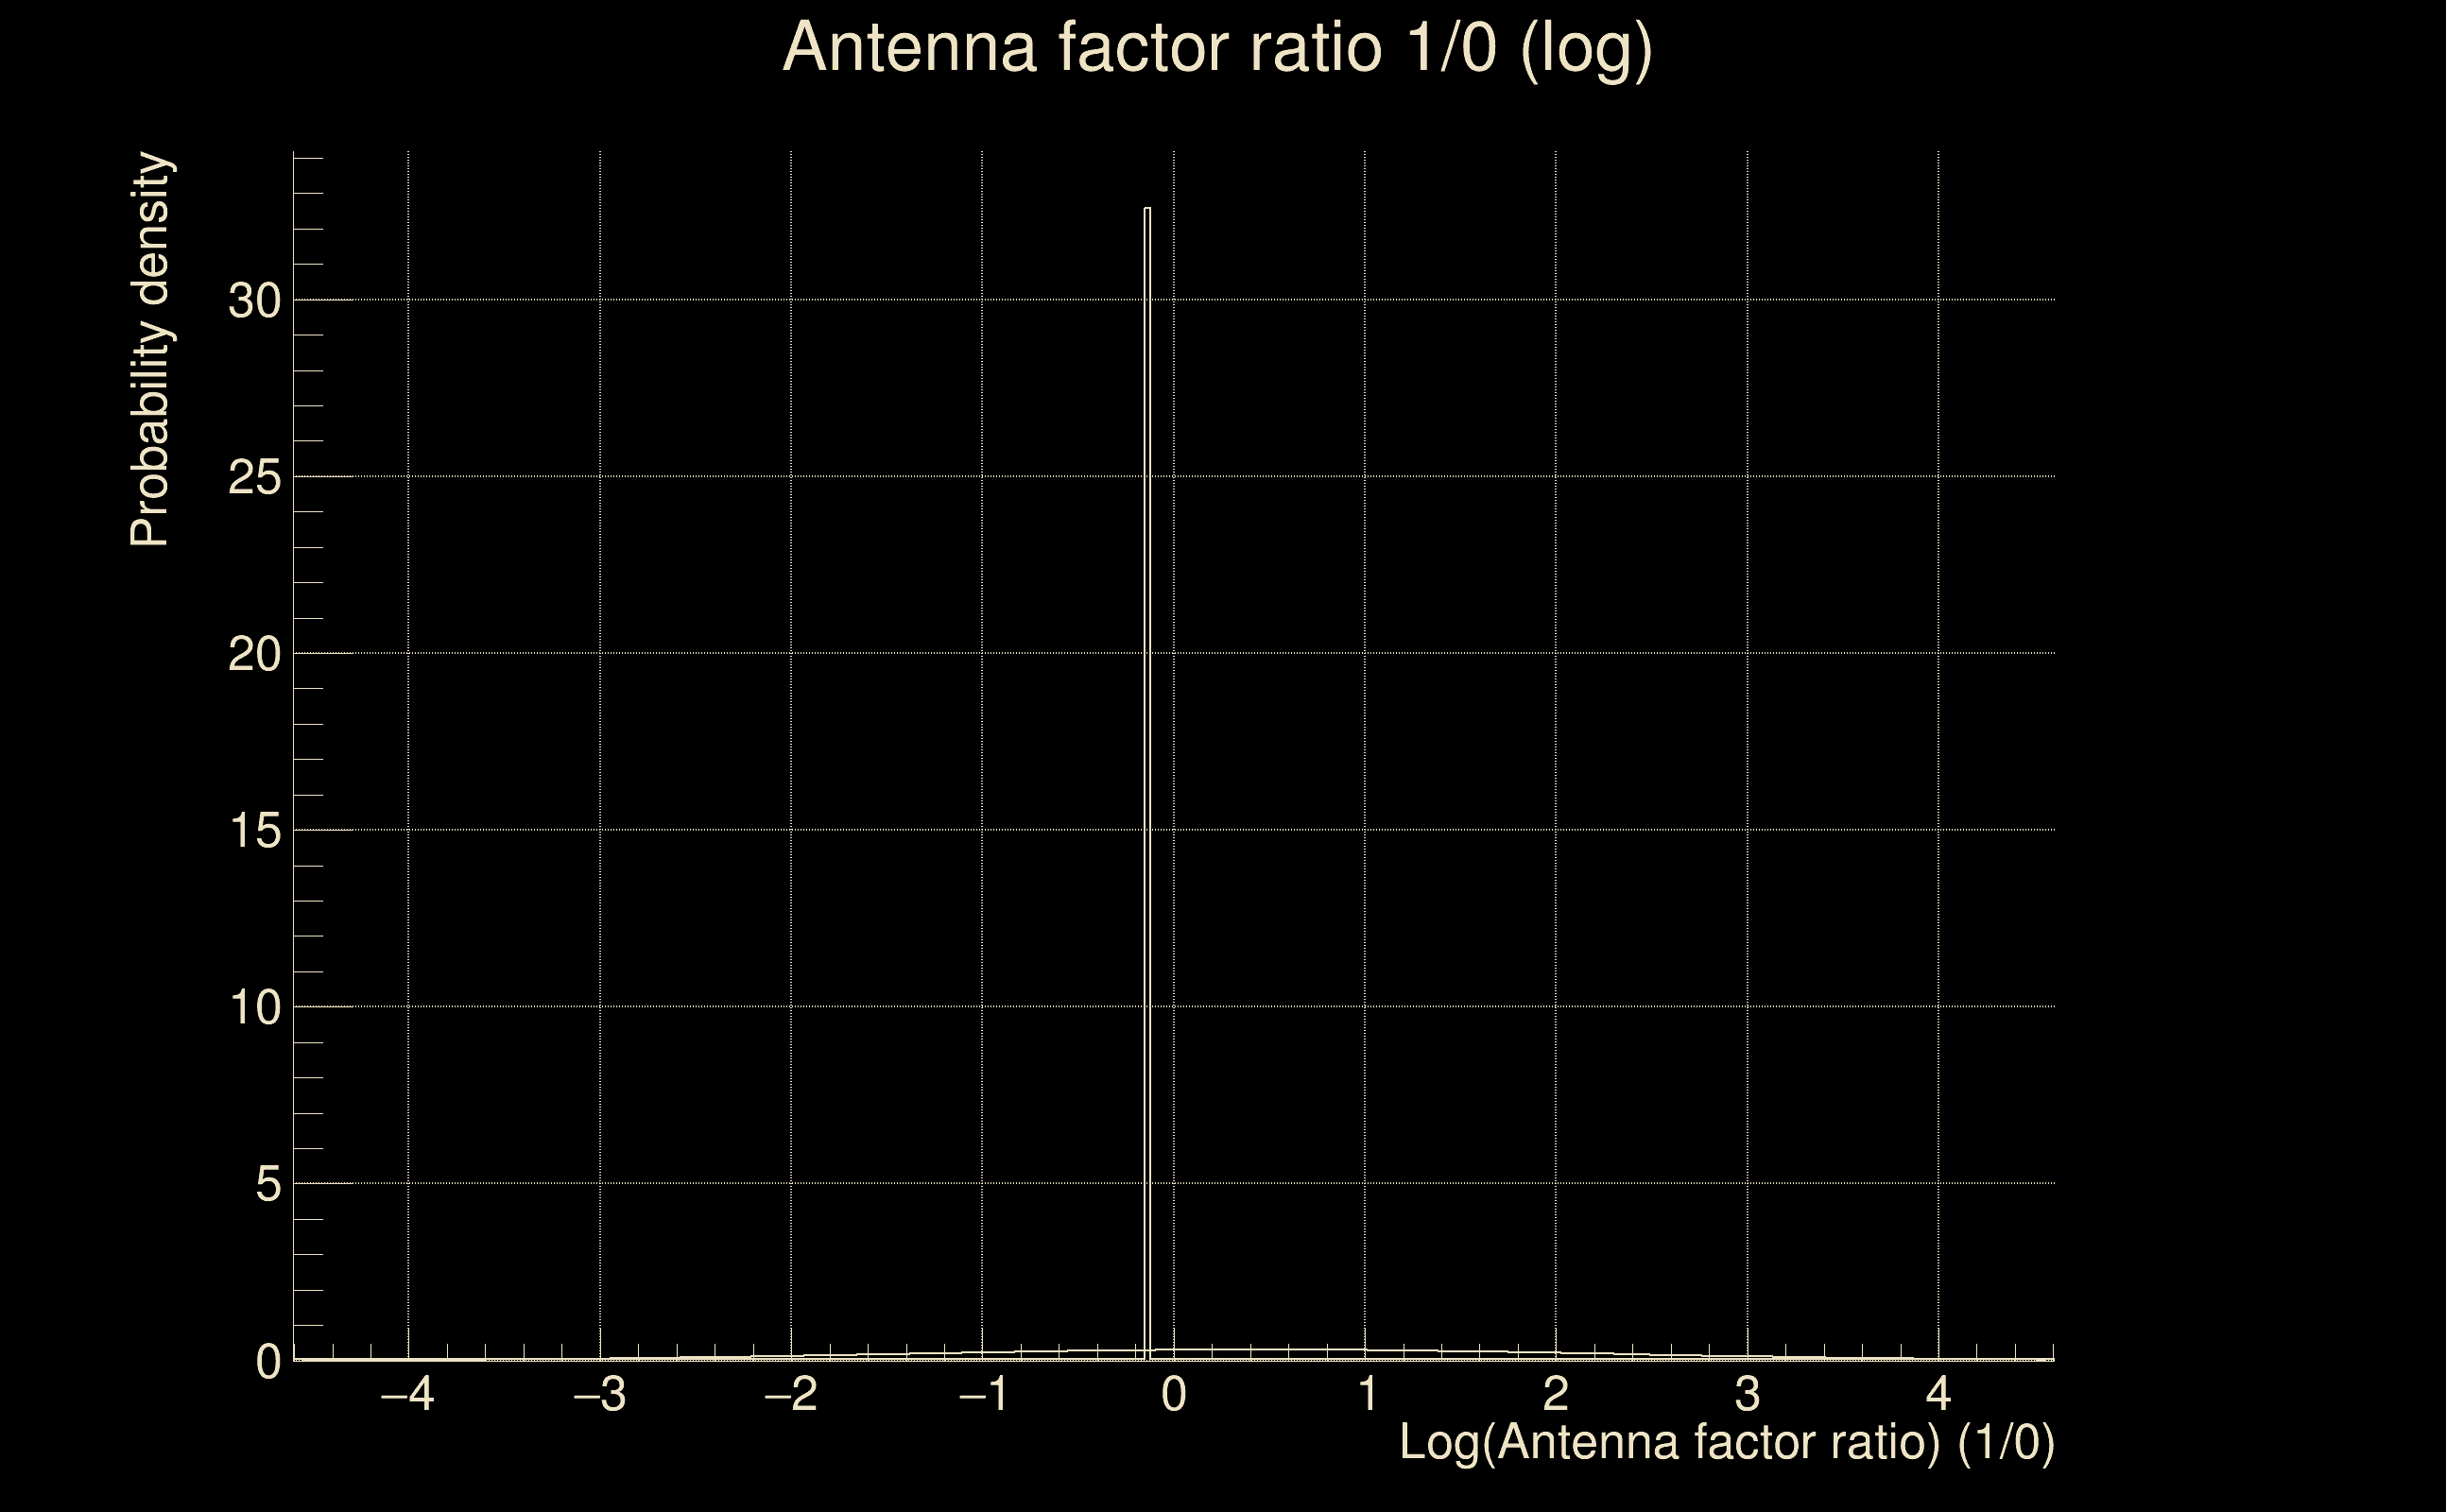
| Log of amplitude ratio (L1/H1): | 0.358635, variance = 0.478342 (L1/H1: -0.17537, variance = 0.930202, H1/L1: -0.868416, variance = 0.979832) |
| Amplitude ratio (L1/H1): | 1.43137 ⋇ 1.99695 (L1/H1: 0.839146 ⋇ 2.6234, H1/L1: 0.419616 ⋇ 2.69087) |
| Amplitude ratio H1|L1 compatibility (probability): | 0.450099 |
| Antenna factor probability: | 1 |
| Number of rejected frequency rows: | Q0: 18 / 18, Q1: 34 / 36, Q2: 65 / 70, Q3: 127 / 134, Q4: 254 / 258 |
| Maximum signal-to-noise ratio: | H1: 5.24554, L1: 5.36872 |
| SNR variance: | H1: 0.434473, L1: 0.470443 |
| Click here for a zoomed plot | Click here for a zoomed plot | Click here for a zoomed plot | Click here for a zoomed plot | Click here for a zoomed plot |
 |
 |
 |
 |
 |
 |
 |
 |
 |
 |
 |
 |
 |
 |
 |
 |
 |
 |
 |
 |
 |
 |
 |
 |
 |
 |
 |
 |
 |
| Event time t(H1): | GPS = 1368195788 (Mon May 15 14:22:50 2023 ) → GPS = 1368195798 (Mon May 15 14:23:00 2023 ) |
| Event time t(L1): | GPS = 1368195788 (Mon May 15 14:23:00 2023 ) → GPS = 1368195798 (Mon May 15 14:23:00 2023 ) |
| Omicron analysis time window (H1): | GPS = 1368195785 → GPS = 1368195801 |
| Omicron analysis time window (L1): | GPS = 1368195785 → GPS = 1368195801 |
| Time delay between detectors t(L1) - t(H1): | 0.00660661 s (slice index = 108 / 217), δt_gw = 0.00660661 s |
| Time delay uncertainty: | 0.00645248 s |
| [targeted mode] Time delay probability: | 0.754198 (0.313109 sigmas), δt_target = 0.00862575 s |
| Frequency: | 783.783 Hz |
| Ξ: | 0.00023373 ± 0.0196988 (variance = 0.000388043): Q0: 0, Q1: 0, Q2: 0.0220335, Q3: 0.0516679, Q4: 0.0318017 |
| Rank: | R_A = 6.6952e-05 |
| Log of amplitude ratio (L1/H1): | 0.64113, variance = 0.665544 (L1/H1: -0.182301, variance = 1.76598, H1/L1: -1.28692, variance = 1.03262) |
| Amplitude ratio (L1/H1): | 1.89862 ⋇ 2.261 (L1/H1: 0.833351 ⋇ 3.77689, H1/L1: 0.276119 ⋇ 2.76262) |
| Amplitude ratio H1|L1 compatibility (probability): | 0.379808 |
| Antenna factor probability: | 1 |
| Number of rejected frequency rows: | Q0: 18 / 18, Q1: 36 / 36, Q2: 67 / 70, Q3: 131 / 134, Q4: 251 / 258 |
| Maximum signal-to-noise ratio: | H1: 4.64234, L1: 5.24207 |
| SNR variance: | H1: 0.422178, L1: 0.457087 |
| Click here for a zoomed plot | Click here for a zoomed plot | Click here for a zoomed plot | Click here for a zoomed plot | Click here for a zoomed plot |
 |
 |
 |
 |
 |
 |
 |
 |
 |
 |
 |
 |
 |
 |
 |
 |
 |
 |
 |
 |
 |
 |
 |
 |
 |
 |
 |
 |
 |
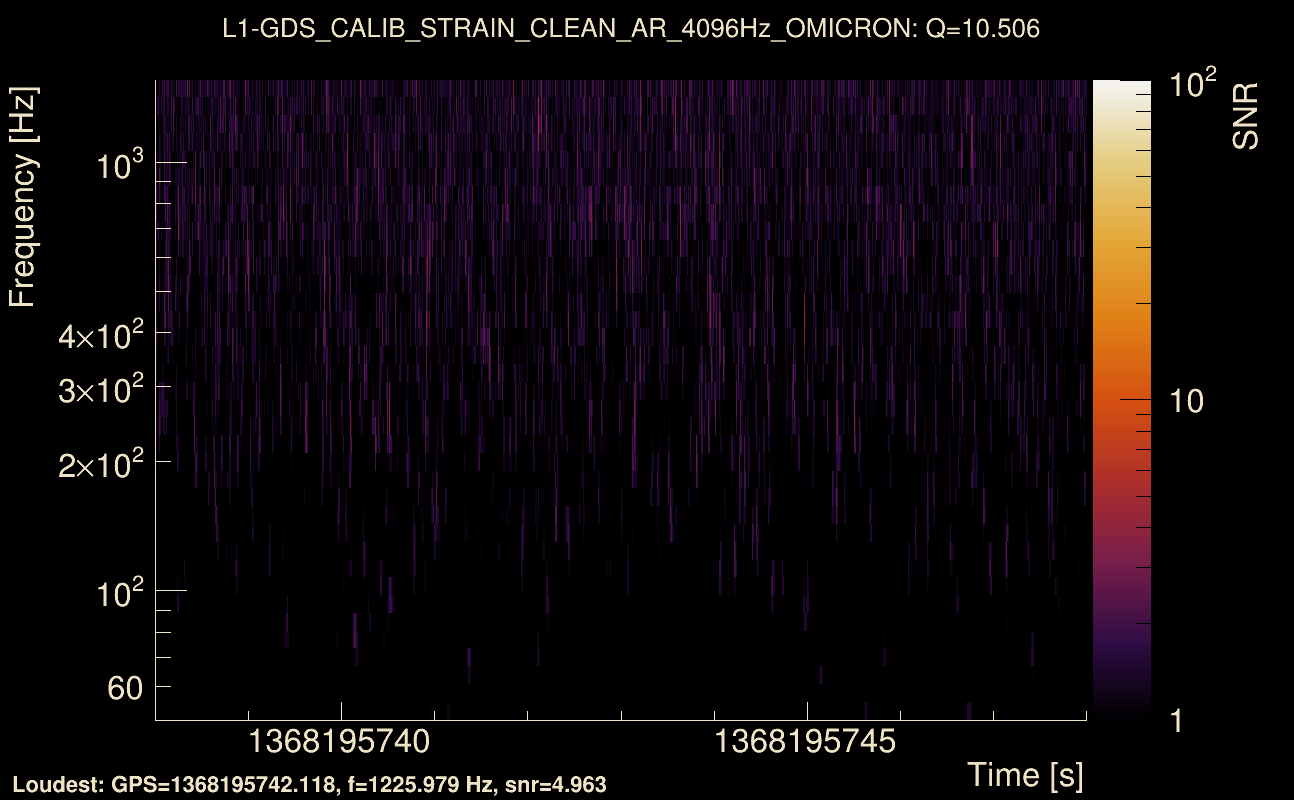
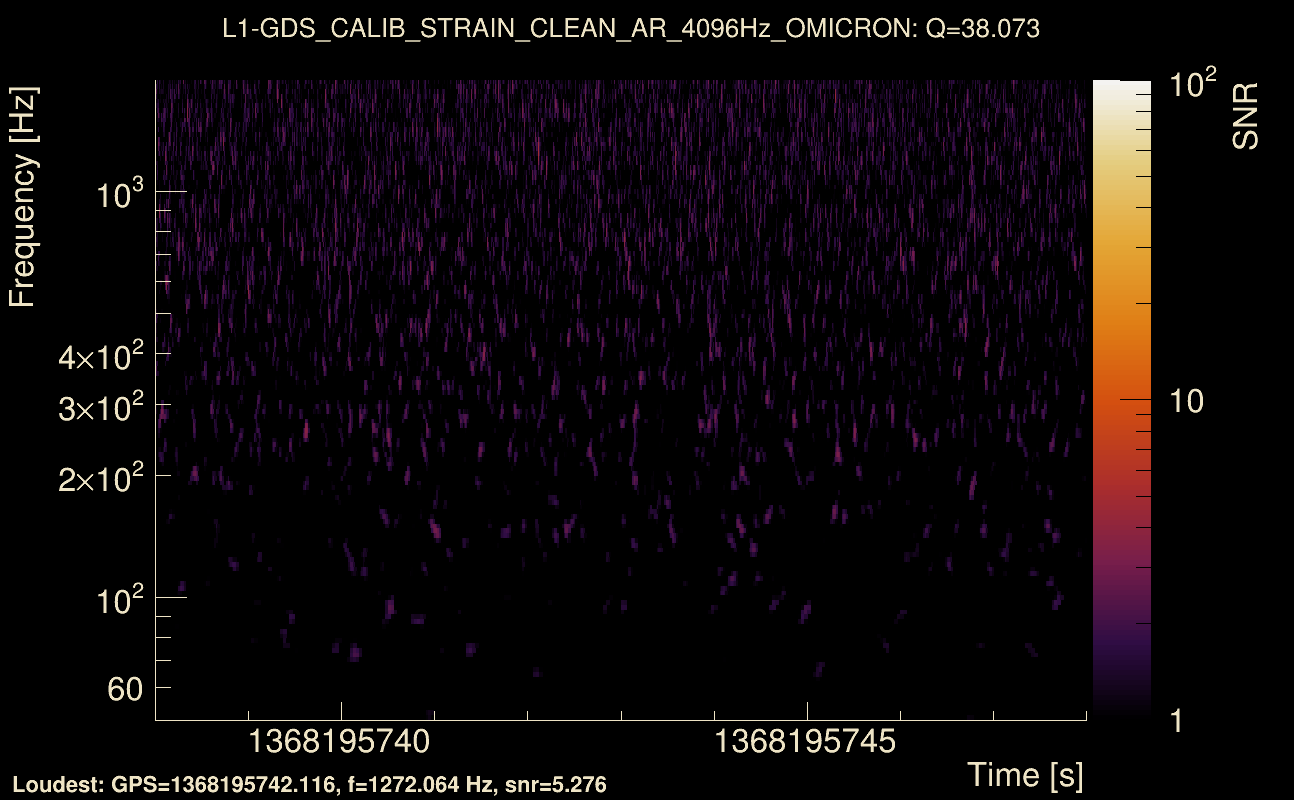
| Event time t(H1): | GPS = 1368195738 (Mon May 15 14:22:00 2023 ) → GPS = 1368195748 (Mon May 15 14:22:10 2023 ) |
| Event time t(L1): | GPS = 1368195738 (Mon May 15 14:22:10 2023 ) → GPS = 1368195748 (Mon May 15 14:22:10 2023 ) |
| Omicron analysis time window (H1): | GPS = 1368195735 → GPS = 1368195751 |
| Omicron analysis time window (L1): | GPS = 1368195735 → GPS = 1368195751 |
| Time delay between detectors t(L1) - t(H1): | 0.0058174 s (slice index = 108 / 217), δt_gw = 0.0058174 s |
| Time delay uncertainty: | 0.00431448 s |
| [targeted mode] Time delay probability: | 0.513963 (0.652679 sigmas), δt_target = 0.00862694 s |
| Frequency: | 1583.69 Hz |
| Ξ: | 0.000113813 ± 0.0255005 (variance = 0.000650276): Q0: 0, Q1: 0, Q2: 0.0181093, Q3: 0.0428453, Q4: 0.0654455 |
| Rank: | R_A = 5.40187e-05 |
| Log of amplitude ratio (L1/H1): | 0.426423, variance = 0.389867 (L1/H1: 0.357815, variance = 1.33338, H1/L1: -0.483689, variance = 0.38335) |
| Amplitude ratio (L1/H1): | 1.53177 ⋇ 1.86711 (L1/H1: 1.4302 ⋇ 3.17313, H1/L1: 0.616505 ⋇ 1.85735) |
| Amplitude ratio H1|L1 compatibility (probability): | 0.923465 |
| Antenna factor probability: | 1 |
| Number of rejected frequency rows: | Q0: 18 / 18, Q1: 36 / 36, Q2: 69 / 70, Q3: 132 / 134, Q4: 254 / 258 |
| Maximum signal-to-noise ratio: | H1: 5.07921, L1: 5.55947 |
| SNR variance: | H1: 0.399385, L1: 0.429868 |
| Click here for a zoomed plot | Click here for a zoomed plot | Click here for a zoomed plot | Click here for a zoomed plot | Click here for a zoomed plot |
 |
 |
 |
 |
 |
 |
 |
 |
 |
 |
 |
 |
 |
 |
 |
 |
 |
 |
 |
 |
 |
 |
 |
 |
 |
 |
 |
 |
 |
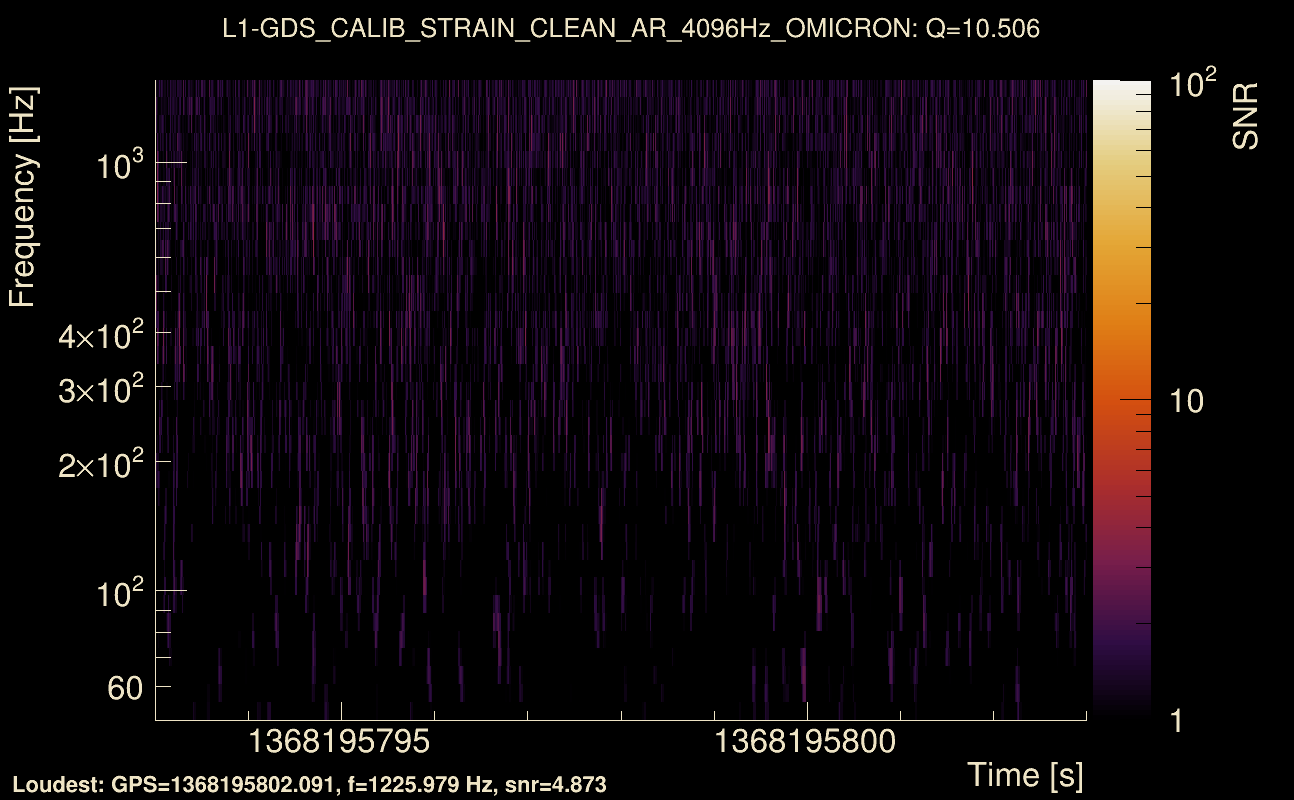
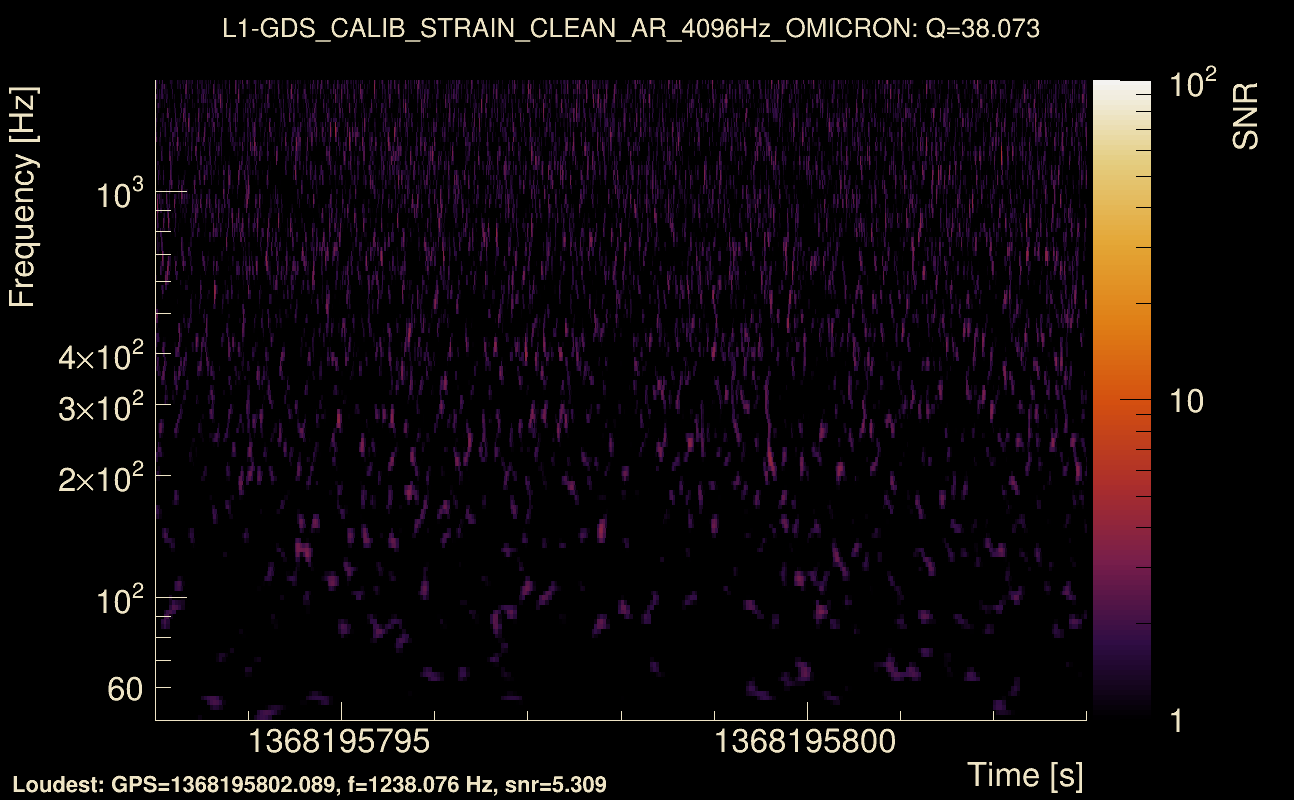
| Event time t(H1): | GPS = 1368195793 (Mon May 15 14:22:55 2023 ) → GPS = 1368195803 (Mon May 15 14:23:05 2023 ) |
| Event time t(L1): | GPS = 1368195793 (Mon May 15 14:23:05 2023 ) → GPS = 1368195803 (Mon May 15 14:23:05 2023 ) |
| Omicron analysis time window (H1): | GPS = 1368195790 → GPS = 1368195806 |
| Omicron analysis time window (L1): | GPS = 1368195790 → GPS = 1368195806 |
| Time delay between detectors t(L1) - t(H1): | 8.10452e-05 s (slice index = 108 / 217), δt_gw = 8.10452e-05 s |
| Time delay uncertainty: | 0.00719546 s |
| [targeted mode] Time delay probability: | 0.234986 (1.18761 sigmas), δt_target = 0.00863338 s |
| Frequency: | 821.788 Hz |
| Ξ: | 0.000659751 ± 0.022048 (variance = 0.000486113): Q0: 0, Q1: 0.023355, Q2: 0.0498673, Q3: 0.0576597, Q4: 0.0538228 |
| Rank: | R_A = 5.03663e-05 |
| Log of amplitude ratio (L1/H1): | 0.392276, variance = 0.412466 (L1/H1: -0.260228, variance = 0.975044, H1/L1: -1.00985, variance = 0.689281) |
| Amplitude ratio (L1/H1): | 1.48035 ⋇ 1.90072 (L1/H1: 0.770876 ⋇ 2.68436, H1/L1: 0.364275 ⋇ 2.29385) |
| Amplitude ratio H1|L1 compatibility (probability): | 0.324876 |
| Antenna factor probability: | 1 |
| Number of rejected frequency rows: | Q0: 18 / 18, Q1: 35 / 36, Q2: 67 / 70, Q3: 129 / 134, Q4: 249 / 258 |
| Maximum signal-to-noise ratio: | H1: 5.27812, L1: 5.42535 |
| SNR variance: | H1: 0.433491, L1: 0.451406 |
| Event time t(H1): | GPS = 1368195813 (Mon May 15 14:23:15 2023 ) → GPS = 1368195823 (Mon May 15 14:23:25 2023 ) |
| Event time t(L1): | GPS = 1368195813 (Mon May 15 14:23:25 2023 ) → GPS = 1368195823 (Mon May 15 14:23:25 2023 ) |
| Omicron analysis time window (H1): | GPS = 1368195810 → GPS = 1368195826 |
| Omicron analysis time window (L1): | GPS = 1368195810 → GPS = 1368195826 |
| Time delay between detectors t(L1) - t(H1): | 0.00106944 s (slice index = 108 / 217), δt_gw = 0.00106944 s |
| Time delay uncertainty: | 0.00848236 s |
| [targeted mode] Time delay probability: | 0.373128 (0.89063 sigmas), δt_target = 0.00863338 s |
| Frequency: | 1362.66 Hz |
| Ξ: | 0.000554704 ± 0.0149283 (variance = 0.000222854): Q0: 0, Q1: 0.0286025, Q2: 0.0242316, Q3: 0.0411674, Q4: 0.0402078 |
| Rank: | R_A = 4.46985e-05 |
| Log of amplitude ratio (L1/H1): | 0.647009, variance = 0.380952 (L1/H1: -0.240492, variance = 0.994588, H1/L1: -1.32443, variance = 0.604993) |
| Amplitude ratio (L1/H1): | 1.90982 ⋇ 1.85375 (L1/H1: 0.786241 ⋇ 2.71093, H1/L1: 0.265955 ⋇ 2.17671) |
| Amplitude ratio H1|L1 compatibility (probability): | 0.21596 |
| Antenna factor probability: | 1 |
| Number of rejected frequency rows: | Q0: 18 / 18, Q1: 35 / 36, Q2: 66 / 70, Q3: 128 / 134, Q4: 250 / 258 |
| Maximum signal-to-noise ratio: | H1: 4.4859, L1: 5.13458 |
| SNR variance: | H1: 0.444274, L1: 0.480099 |
| Event time t(H1): | GPS = 1368195798 (Mon May 15 14:23:00 2023 ) → GPS = 1368195808 (Mon May 15 14:23:10 2023 ) |
| Event time t(L1): | GPS = 1368195798 (Mon May 15 14:23:10 2023 ) → GPS = 1368195808 (Mon May 15 14:23:10 2023 ) |
| Omicron analysis time window (H1): | GPS = 1368195795 → GPS = 1368195811 |
| Omicron analysis time window (L1): | GPS = 1368195795 → GPS = 1368195811 |
| Time delay between detectors t(L1) - t(H1): | 1.98303 s (slice index = 65 / 217), δt_gw = 0.00502547 s |
| Time delay uncertainty: | 0.00400315 s |
| [targeted mode] Time delay probability: | 0.368461 (0.89936 sigmas), δt_target = 0.00863338 s |
| Frequency: | 815.64 Hz |
| Ξ: | 0.000839861 ± 0.0196386 (variance = 0.000385676): Q0: 0, Q1: 0.0325885, Q2: 0.0445015, Q3: 0.0497247, Q4: 0.008414 |
| Rank: | R_A = 0.000135018 |
| Log of amplitude ratio (L1/H1): | 0.485441, variance = 0.478355 (L1/H1: -0.0605195, variance = 0.583236, H1/L1: -1.00664, variance = 1.29608) |
| Amplitude ratio (L1/H1): | 1.62489 ⋇ 1.99697 (L1/H1: 0.941275 ⋇ 2.1462, H1/L1: 0.365446 ⋇ 3.12195) |
| Amplitude ratio H1|L1 compatibility (probability): | 0.436307 |
| Antenna factor probability: | 1 |
| Number of rejected frequency rows: | Q0: 18 / 18, Q1: 34 / 36, Q2: 67 / 70, Q3: 129 / 134, Q4: 257 / 258 |
| Maximum signal-to-noise ratio: | H1: 5.24554, L1: 5.36872 |
| SNR variance: | H1: 0.434473, L1: 0.470443 |
| Event time t(H1): | GPS = 1368195808 (Mon May 15 14:23:10 2023 ) → GPS = 1368195818 (Mon May 15 14:23:20 2023 ) |
| Event time t(L1): | GPS = 1368195808 (Mon May 15 14:23:20 2023 ) → GPS = 1368195818 (Mon May 15 14:23:20 2023 ) |
| Omicron analysis time window (H1): | GPS = 1368195805 → GPS = 1368195821 |
| Omicron analysis time window (L1): | GPS = 1368195805 → GPS = 1368195821 |
| Time delay between detectors t(L1) - t(H1): | 1.97833 s (slice index = 65 / 217), δt_gw = 0.000330244 s |
| Time delay uncertainty: | 0.00619452 s |
| [targeted mode] Time delay probability: | 0.180579 (1.33898 sigmas), δt_target = 0.00863338 s |
| Frequency: | 378.891 Hz |
| Ξ: | 0.000441275 ± 0.0484066 (variance = 0.0023432): Q0: 0, Q1: 0, Q2: 0.0817163, Q3: 0.11838, Q4: 0.0859788 |
| Rank: | R_A = 4.25842e-05 |
| Log of amplitude ratio (L1/H1): | 0.297075, variance = 0.70928 (L1/H1: -0.219877, variance = 1.30842, H1/L1: -0.827601, variance = 1.53407) |
| Amplitude ratio (L1/H1): | 1.34592 ⋇ 2.32144 (L1/H1: 0.802617 ⋇ 3.13887, H1/L1: 0.437096 ⋇ 3.45069) |
| Amplitude ratio H1|L1 compatibility (probability): | 0.534408 |
| Antenna factor probability: | 1 |
| Number of rejected frequency rows: | Q0: 18 / 18, Q1: 36 / 36, Q2: 69 / 70, Q3: 131 / 134, Q4: 249 / 258 |
| Maximum signal-to-noise ratio: | H1: 5.23979, L1: 5.17232 |
| SNR variance: | H1: 0.433961, L1: 0.479732 |
| Event time t(H1): | GPS = 1368195818 (Mon May 15 14:23:20 2023 ) → GPS = 1368195828 (Mon May 15 14:23:30 2023 ) |
| Event time t(L1): | GPS = 1368195818 (Mon May 15 14:23:30 2023 ) → GPS = 1368195828 (Mon May 15 14:23:30 2023 ) |
| Omicron analysis time window (H1): | GPS = 1368195815 → GPS = 1368195831 |
| Omicron analysis time window (L1): | GPS = 1368195815 → GPS = 1368195831 |
| Time delay between detectors t(L1) - t(H1): | 1.97914 s (slice index = 65 / 217), δt_gw = 0.00113881 s |
| Time delay uncertainty: | 0.00634314 s |
| [targeted mode] Time delay probability: | 0.238037 (1.17991 sigmas), δt_target = 0.00863338 s |
| Frequency: | 600.602 Hz |
| Ξ: | 0.000222154 ± 0.0452754 (variance = 0.00204986): Q0: 0, Q1: 0, Q2: 0.0336976, Q3: 0.0566449, Q4: 0.122245 |
| Rank: | R_A = 3.6031e-05 |
| Log of amplitude ratio (L1/H1): | 0.38242, variance = 0.802695 (L1/H1: 0.0163476, variance = 2.11538, H1/L1: -0.751219, variance = 1.08774) |
| Amplitude ratio (L1/H1): | 1.46583 ⋇ 2.44962 (L1/H1: 1.01648 ⋇ 4.28206, H1/L1: 0.471791 ⋇ 2.83756) |
| Amplitude ratio H1|L1 compatibility (probability): | 0.681362 |
| Antenna factor probability: | 1 |
| Number of rejected frequency rows: | Q0: 18 / 18, Q1: 36 / 36, Q2: 69 / 70, Q3: 132 / 134, Q4: 252 / 258 |
| Maximum signal-to-noise ratio: | H1: 4.83159, L1: 4.81371 |
| SNR variance: | H1: 0.455674, L1: 0.478713 |
| Event time t(H1): | GPS = 1368195738 (Mon May 15 14:22:00 2023 ) → GPS = 1368195748 (Mon May 15 14:22:10 2023 ) |
| Event time t(L1): | GPS = 1368195738 (Mon May 15 14:22:10 2023 ) → GPS = 1368195748 (Mon May 15 14:22:10 2023 ) |
| Omicron analysis time window (H1): | GPS = 1368195735 → GPS = 1368195751 |
| Omicron analysis time window (L1): | GPS = 1368195735 → GPS = 1368195751 |
| Time delay between detectors t(L1) - t(H1): | 1.98718 s (slice index = 65 / 217), δt_gw = 0.00917862 s |
| Time delay uncertainty: | 0.00567731 s |
| [targeted mode] Time delay probability: | 0.923489 (0.0960401 sigmas), δt_target = 0.00863338 s |
| Frequency: | 1206.46 Hz |
| Ξ: | 4.16576e-05 ± 0.0241703 (variance = 0.000584201): Q0: 0, Q1: 0, Q2: 0, Q3: 0, Q4: 0.0604256 |
| Rank: | R_A = 2.44643e-05 |
| Log of amplitude ratio (L1/H1): | 0.373585, variance = 0.798529 (L1/H1: -0.0813141, variance = 1.38551, H1/L1: -0.753286, variance = 1.72262) |
| Amplitude ratio (L1/H1): | 1.45293 ⋇ 2.44392 (L1/H1: 0.921904 ⋇ 3.24488, H1/L1: 0.470817 ⋇ 3.71541) |
| Amplitude ratio H1|L1 compatibility (probability): | 0.635928 |
| Antenna factor probability: | 1 |
| Number of rejected frequency rows: | Q0: 18 / 18, Q1: 36 / 36, Q2: 70 / 70, Q3: 134 / 134, Q4: 253 / 258 |
| Maximum signal-to-noise ratio: | H1: 5.07921, L1: 5.55947 |
| SNR variance: | H1: 0.399385, L1: 0.429868 |
| Event time t(H1): | GPS = 1368195733 (Mon May 15 14:21:55 2023 ) → GPS = 1368195743 (Mon May 15 14:22:05 2023 ) |
| Event time t(L1): | GPS = 1368195733 (Mon May 15 14:22:05 2023 ) → GPS = 1368195743 (Mon May 15 14:22:05 2023 ) |
| Omicron analysis time window (H1): | GPS = 1368195730 → GPS = 1368195746 |
| Omicron analysis time window (L1): | GPS = 1368195730 → GPS = 1368195746 |
| Time delay between detectors t(L1) - t(H1): | 1.98479 s (slice index = 65 / 217), δt_gw = 0.00678906 s |
| Time delay uncertainty: | 0.00689815 s |
| [targeted mode] Time delay probability: | 0.789136 (0.267433 sigmas), δt_target = 0.00863338 s |
| Frequency: | 1293.7 Hz |
| Ξ: | 4.76751e-05 ± 0.0197583 (variance = 0.000390392): Q0: 0, Q1: 0, Q2: 0, Q3: 0, Q4: 0.0493959 |
| Rank: | R_A = 1.9162e-05 |
| Log of amplitude ratio (L1/H1): | 1.00598, variance = 0.673892 (L1/H1: 0.44487, variance = 0.634992, H1/L1: -1.48648, variance = 1.85658) |
| Amplitude ratio (L1/H1): | 2.73458 ⋇ 2.27256 (L1/H1: 1.56029 ⋇ 2.21857, H1/L1: 0.226168 ⋇ 3.90619) |
| Amplitude ratio H1|L1 compatibility (probability): | 0.509328 |
| Antenna factor probability: | 1 |
| Number of rejected frequency rows: | Q0: 18 / 18, Q1: 36 / 36, Q2: 70 / 70, Q3: 134 / 134, Q4: 251 / 258 |
| Maximum signal-to-noise ratio: | H1: 5.1545, L1: 5.57011 |
| SNR variance: | H1: 0.395905, L1: 0.487032 |
| Detection threshold: | R > 0.005 |
| False-alarm rate above that detection threshold: | 0.05 |
| Alternative threshold at 1/1000 yrs: | R > 0.005 |
| Alternative threshold at 1/100 yrs: | R > 0.005 |
| Alternative threshold at 1/10 yrs: | R > 0.005 |
| Alternative threshold at 1/1 yr: | R > 0.005 |
| Alternative threshold at 1/1 d: | R > 0.005 |
 |
|
 |
 |
 |
 |
 |
 |
 |
 |
 |
 |
| Event time t(H1): | GPS = 1368195793 (Mon May 15 14:22:55 2023 ) → GPS = 1368195803 (Mon May 15 14:23:05 2023 ) |
| Event time t(L1): | GPS = 1368195793 (Mon May 15 14:23:05 2023 ) → GPS = 1368195803 (Mon May 15 14:23:05 2023 ) |
| Omicron analysis time window (H1): | GPS = 1368195790 → GPS = 1368195806 |
| Omicron analysis time window (L1): | GPS = 1368195790 → GPS = 1368195806 |
| Time delay between detectors t(L1) - t(H1): | 1.11274 s (slice index = 84 / 217), δt_gw = 0.00873753 s |
| Time delay uncertainty: | 0.00153065 s |
| [targeted mode] Time delay probability: | 0.942152 (0.0725656 sigmas), δt_target = 0.00863338 s |
| Frequency: | 822.857 Hz |
| Ξ: | 0.00164215 ± 0.0191857 (variance = 0.000368091): Q0: 0, Q1: 0.0552703, Q2: 0.0434797, Q3: 0.0462836, Q4: 0.0324378 |
| Rank: | R_A = 0.0010124 |
| Log of amplitude ratio (L1/H1): | 0.38533, variance = 0.445316 (L1/H1: 0.0812319, variance = 0.58321, H1/L1: -0.673147, variance = 1.16474) |
| Amplitude ratio (L1/H1): | 1.4701 ⋇ 1.94901 (L1/H1: 1.08462 ⋇ 2.14616, H1/L1: 0.510101 ⋇ 2.94242) |
| Amplitude ratio H1|L1 compatibility (probability): | 0.654364 |
| Antenna factor probability: | 1 |
| Number of rejected frequency rows: | Q0: 18 / 18, Q1: 33 / 36, Q2: 65 / 70, Q3: 132 / 134, Q4: 255 / 258 |
| Maximum signal-to-noise ratio: | H1: 5.27812, L1: 5.42535 |
| SNR variance: | H1: 0.433491, L1: 0.451406 |
| Click here for a zoomed plot | Click here for a zoomed plot | Click here for a zoomed plot | Click here for a zoomed plot | Click here for a zoomed plot |
 |
 |
 |
 |
 |
 |
 |
 |
 |
 |
 |
 |
 |
 |
 |
 |
 |
 |
 |
 |
 |
 |
 |
 |
 |
 |
 |
 |
 |
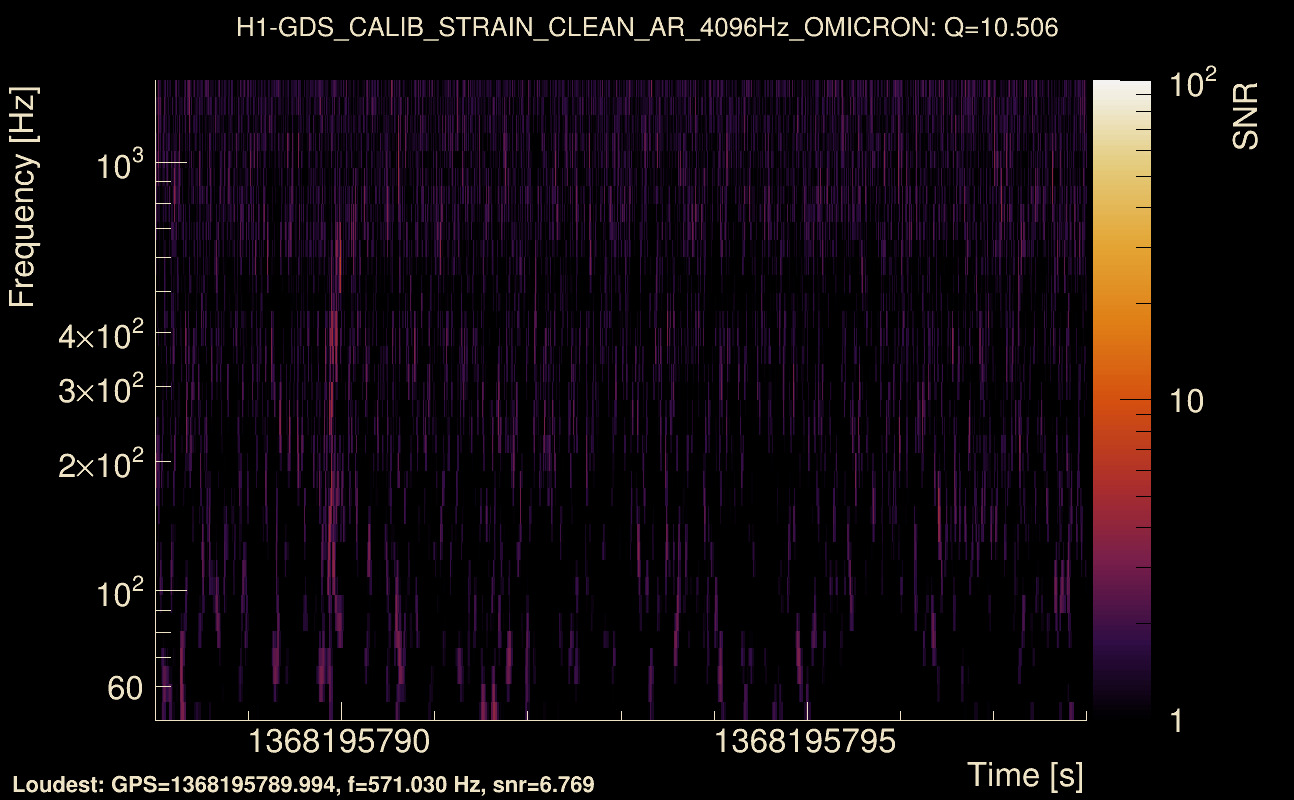
| Event time t(H1): | GPS = 1368195788 (Mon May 15 14:22:50 2023 ) → GPS = 1368195798 (Mon May 15 14:23:00 2023 ) |
| Event time t(L1): | GPS = 1368195788 (Mon May 15 14:23:00 2023 ) → GPS = 1368195798 (Mon May 15 14:23:00 2023 ) |
| Omicron analysis time window (H1): | GPS = 1368195785 → GPS = 1368195801 |
| Omicron analysis time window (L1): | GPS = 1368195785 → GPS = 1368195801 |
| Time delay between detectors t(L1) - t(H1): | 1.52608 s (slice index = 75 / 217), δt_gw = 0.00808049 s |
| Time delay uncertainty: | 0.00436316 s |
| [targeted mode] Time delay probability: | 0.900333 (0.125241 sigmas), δt_target = 0.00862646 s |
| Frequency: | 661.154 Hz |
| Ξ: | 0.000918593 ± 0.0297848 (variance = 0.000887132): Q0: 0, Q1: 0.042308, Q2: 0.0914037, Q3: 0.0518239, Q4: 0.0626321 |
| Rank: | R_A = 0.000658714 |
| Log of amplitude ratio (L1/H1): | 0.474344, variance = 0.649459 (L1/H1: 0.719136, variance = 2.07909, H1/L1: -0.28236, variance = 0.788823) |
| Amplitude ratio (L1/H1): | 1.60696 ⋇ 2.23869 (L1/H1: 2.05266 ⋇ 4.22874, H1/L1: 0.754002 ⋇ 2.43065) |
| Amplitude ratio H1|L1 compatibility (probability): | 0.796472 |
| Antenna factor probability: | 1 |
| Number of rejected frequency rows: | Q0: 18 / 18, Q1: 35 / 36, Q2: 67 / 70, Q3: 131 / 134, Q4: 255 / 258 |
| Maximum signal-to-noise ratio: | H1: 4.64234, L1: 5.24207 |
| SNR variance: | H1: 0.422178, L1: 0.457087 |
| Click here for a zoomed plot | Click here for a zoomed plot | Click here for a zoomed plot | Click here for a zoomed plot | Click here for a zoomed plot |
|
|
|
|
|
|
|
|
|
|
|
|
|
|
|
|
|
|
|
|
|
|
|
|
|
 |
 |
 |
 |
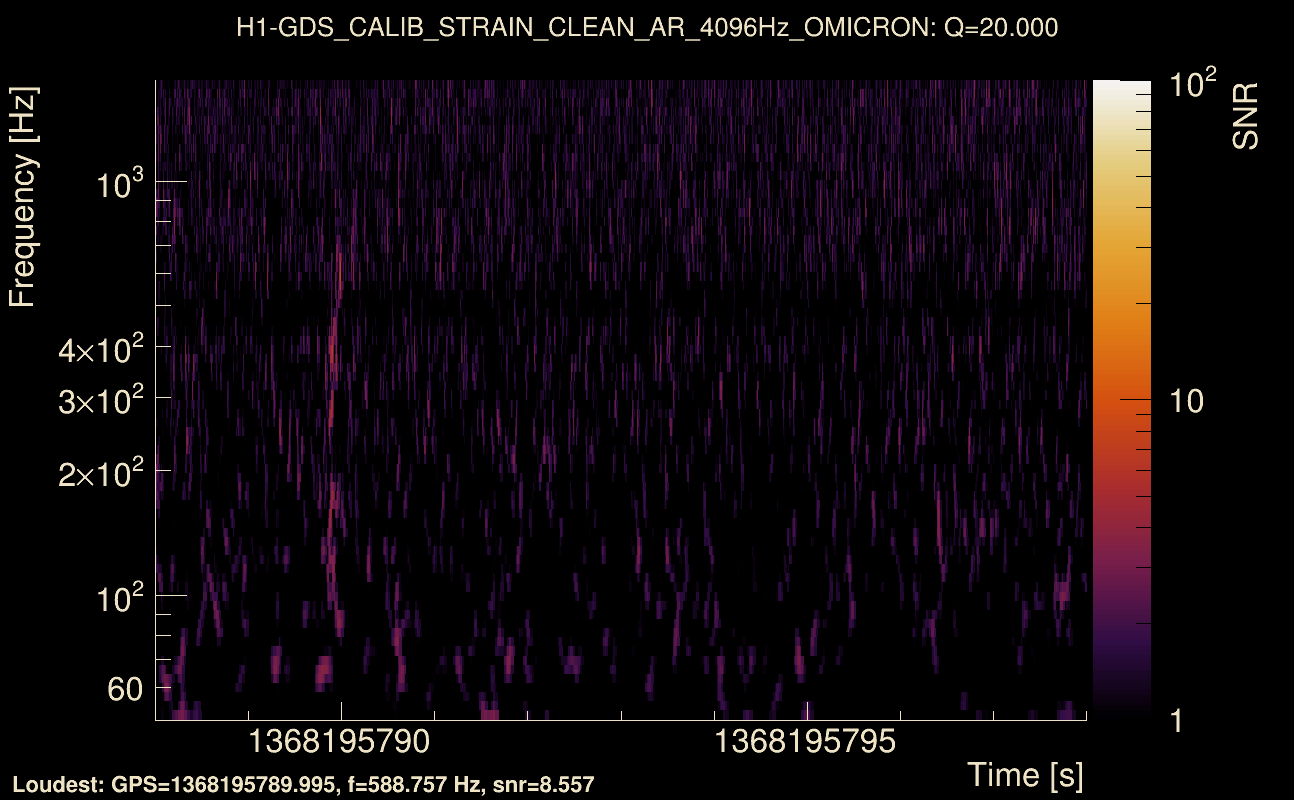
| Event time t(H1): | GPS = 1368195788 (Mon May 15 14:22:50 2023 ) → GPS = 1368195798 (Mon May 15 14:23:00 2023 ) |
| Event time t(L1): | GPS = 1368195788 (Mon May 15 14:23:00 2023 ) → GPS = 1368195798 (Mon May 15 14:23:00 2023 ) |
| Omicron analysis time window (H1): | GPS = 1368195785 → GPS = 1368195801 |
| Omicron analysis time window (L1): | GPS = 1368195785 → GPS = 1368195801 |
| Time delay between detectors t(L1) - t(H1): | 2.12292 s (slice index = 62 / 217), δt_gw = 0.00691695 s |
| Time delay uncertainty: | 0.00640464 s |
| [targeted mode] Time delay probability: | 0.789476 (0.266992 sigmas), δt_target = 0.00862694 s |
| Frequency: | 726.444 Hz |
| Ξ: | 0.000801945 ± 0.0223499 (variance = 0.000499517): Q0: 0, Q1: 0.0323159, Q2: 0.0592295, Q3: 0.061657, Q4: 0.0420575 |
| Rank: | R_A = 0.000621734 |
| Log of amplitude ratio (L1/H1): | 0.555387, variance = 0.707351 (L1/H1: 0.533287, variance = 2.10486, H1/L1: -0.57272, variance = 0.957274) |
| Amplitude ratio (L1/H1): | 1.74262 ⋇ 2.31878 (L1/H1: 1.70453 ⋇ 4.26659, H1/L1: 0.563989 ⋇ 2.66021) |
| Amplitude ratio H1|L1 compatibility (probability): | 0.982021 |
| Antenna factor probability: | 1 |
| Number of rejected frequency rows: | Q0: 18 / 18, Q1: 35 / 36, Q2: 66 / 70, Q3: 131 / 134, Q4: 252 / 258 |
| Maximum signal-to-noise ratio: | H1: 4.64234, L1: 5.24207 |
| SNR variance: | H1: 0.422178, L1: 0.457087 |
| Click here for a zoomed plot | Click here for a zoomed plot | Click here for a zoomed plot | Click here for a zoomed plot | Click here for a zoomed plot |
|
|
|
|
|
|
|
|
|
|
|
|
|
|
|
|
|
|
|
|
|
|
|
|
|
 |
 |
 |
 |
| Event time t(H1): | GPS = 1368195723 (Mon May 15 14:21:45 2023 ) → GPS = 1368195733 (Mon May 15 14:21:55 2023 ) |
| Event time t(L1): | GPS = 1368195723 (Mon May 15 14:21:55 2023 ) → GPS = 1368195733 (Mon May 15 14:21:55 2023 ) |
| Omicron analysis time window (H1): | GPS = 1368195720 → GPS = 1368195736 |
| Omicron analysis time window (L1): | GPS = 1368195720 → GPS = 1368195736 |
| Time delay between detectors t(L1) - t(H1): | -1.74099 s (slice index = 146 / 217), δt_gw = 0.00701006 s |
| Time delay uncertainty: | 0.00352168 s |
| [targeted mode] Time delay probability: | 0.644496 (0.461422 sigmas), δt_target = 0.00862694 s |
| Frequency: | 72.019 Hz |
| Ξ: | 0.00164968 ± 0.138746 (variance = 0.0192503): Q0: 0, Q1: 0, Q2: 0.189085, Q3: 0.321122, Q4: 0.295097 |
| Rank: | R_A = 0.000619092 |
| Log of amplitude ratio (L1/H1): | 0.601322, variance = 0.570381 (L1/H1: 0.0189819, variance = 0.611054, H1/L1: -0.631702, variance = 0.629782) |
| Amplitude ratio (L1/H1): | 1.82453 ⋇ 2.12811 (L1/H1: 1.01916 ⋇ 2.18518, H1/L1: 0.531686 ⋇ 2.21132) |
| Amplitude ratio H1|L1 compatibility (probability): | 0.582283 |
| Antenna factor probability: | 1 |
| Number of rejected frequency rows: | Q0: 18 / 18, Q1: 36 / 36, Q2: 68 / 70, Q3: 130 / 134, Q4: 251 / 258 |
| Maximum signal-to-noise ratio: | H1: 4.47763, L1: 19.604 |
| SNR variance: | H1: 0, L1: 0 |
| Click here for a zoomed plot | Click here for a zoomed plot | Click here for a zoomed plot | Click here for a zoomed plot | Click here for a zoomed plot |
 |
 |
 |
 |
 |
 |
 |
 |
 |
 |
 |
 |
 |
 |
 |
 |
 |
 |
 |
 |
 |
 |
 |
 |
 |
 |
 |
 |
 |
| Event time t(H1): | GPS = 1368195803 (Mon May 15 14:23:05 2023 ) → GPS = 1368195813 (Mon May 15 14:23:15 2023 ) |
| Event time t(L1): | GPS = 1368195803 (Mon May 15 14:23:15 2023 ) → GPS = 1368195813 (Mon May 15 14:23:15 2023 ) |
| Omicron analysis time window (H1): | GPS = 1368195800 → GPS = 1368195816 |
| Omicron analysis time window (L1): | GPS = 1368195800 → GPS = 1368195816 |
| Time delay between detectors t(L1) - t(H1): | 0.188581 s (slice index = 104 / 217), δt_gw = 0.00458071 s |
| Time delay uncertainty: | 0.00872873 s |
| [targeted mode] Time delay probability: | 0.643105 (0.463362 sigmas), δt_target = 0.00863504 s |
| Frequency: | 300.326 Hz |
| Ξ: | 0.000977949 ± 0.0593587 (variance = 0.00352345): Q0: 0, Q1: 0, Q2: 0.0787356, Q3: 0.124599, Q4: 0.139076 |
| Rank: | R_A = 0.000615364 |
| Log of amplitude ratio (L1/H1): | 0.516478, variance = 0.438405 (L1/H1: 0.499598, variance = 0.584923, H1/L1: -0.536394, variance = 1.26894) |
| Amplitude ratio (L1/H1): | 1.67611 ⋇ 1.9389 (L1/H1: 1.64806 ⋇ 2.14857, H1/L1: 0.584854 ⋇ 3.08475) |
| Amplitude ratio H1|L1 compatibility (probability): | 0.97844 |
| Antenna factor probability: | 1 |
| Number of rejected frequency rows: | Q0: 18 / 18, Q1: 36 / 36, Q2: 67 / 70, Q3: 128 / 134, Q4: 250 / 258 |
| Maximum signal-to-noise ratio: | H1: 5.25301, L1: 4.83616 |
| SNR variance: | H1: 0.442107, L1: 0.480707 |
| Click here for a zoomed plot | Click here for a zoomed plot | Click here for a zoomed plot | Click here for a zoomed plot | Click here for a zoomed plot |
 |
 |
 |
 |
 |
 |
 |
 |
 |
 |
 |
 |
 |
 |
 |
 |
 |
 |
 |
 |
 |
 |
 |
 |
 |
 |
 |
 |
 |
| Event time t(H1): | GPS = 1368195818 (Mon May 15 14:23:20 2023 ) → GPS = 1368195828 (Mon May 15 14:23:30 2023 ) |
| Event time t(L1): | GPS = 1368195818 (Mon May 15 14:23:30 2023 ) → GPS = 1368195828 (Mon May 15 14:23:30 2023 ) |
| Omicron analysis time window (H1): | GPS = 1368195815 → GPS = 1368195831 |
| Omicron analysis time window (L1): | GPS = 1368195815 → GPS = 1368195831 |
| Time delay between detectors t(L1) - t(H1): | -1.23481 s (slice index = 135 / 217), δt_gw = 0.00719463 s |
| Time delay uncertainty: | 0.00750825 s |
| [targeted mode] Time delay probability: | 0.849108 (0.190257 sigmas), δt_target = 0.00862527 s |
| Frequency: | 1159.08 Hz |
| Ξ: | 0.000716265 ± 0.0199867 (variance = 0.000399467): Q0: 0, Q1: 0.0254595, Q2: 0.0422925, Q3: 0.0482144, Q4: 0.0563301 |
| Rank: | R_A = 0.000602402 |
| Log of amplitude ratio (L1/H1): | 0.211935, variance = 0.401493 (L1/H1: 0.204402, variance = 0.590596, H1/L1: -0.219524, variance = 1.01853) |
| Amplitude ratio (L1/H1): | 1.23607 ⋇ 1.88445 (L1/H1: 1.22679 ⋇ 2.15653, H1/L1: 0.802901 ⋇ 2.74347) |
| Amplitude ratio H1|L1 compatibility (probability): | 0.990489 |
| Antenna factor probability: | 1 |
| Number of rejected frequency rows: | Q0: 18 / 18, Q1: 35 / 36, Q2: 66 / 70, Q3: 127 / 134, Q4: 252 / 258 |
| Maximum signal-to-noise ratio: | H1: 4.83159, L1: 4.81371 |
| SNR variance: | H1: 0.455674, L1: 0.478713 |
| Click here for a zoomed plot | Click here for a zoomed plot | Click here for a zoomed plot | Click here for a zoomed plot | Click here for a zoomed plot |
 |
 |
 |
 |
 |
 |
 |
 |
 |
 |
 |
 |
 |
 |
 |
 |
 |
 |
 |
 |
 |
 |
 |
 |
 |
 |
 |
 |
 |
| Event time t(H1): | GPS = 1368195818 (Mon May 15 14:23:20 2023 ) → GPS = 1368195828 (Mon May 15 14:23:30 2023 ) |
| Event time t(L1): | GPS = 1368195818 (Mon May 15 14:23:30 2023 ) → GPS = 1368195828 (Mon May 15 14:23:30 2023 ) |
| Omicron analysis time window (H1): | GPS = 1368195815 → GPS = 1368195831 |
| Omicron analysis time window (L1): | GPS = 1368195815 → GPS = 1368195831 |
| Time delay between detectors t(L1) - t(H1): | 3.68625 s (slice index = 28 / 217), δt_gw = 0.00625439 s |
| Time delay uncertainty: | 0.00697154 s |
| [targeted mode] Time delay probability: | 0.734028 (0.339772 sigmas), δt_target = 0.00862312 s |
| Frequency: | 776.525 Hz |
| Ξ: | 0.000815726 ± 0.0451066 (variance = 0.0020346): Q0: 0, Q1: 0.0329009, Q2: 0.0434036, Q3: 0.0680853, Q4: 0.134733 |
| Rank: | R_A = 0.000598731 |
| Log of amplitude ratio (L1/H1): | 0.282172, variance = 0.414262 (L1/H1: 0.282219, variance = 0.708111, H1/L1: -0.282124, variance = 0.950714) |
| Amplitude ratio (L1/H1): | 1.32601 ⋇ 1.90338 (L1/H1: 1.32607 ⋇ 2.31983, H1/L1: 0.75418 ⋇ 2.65129) |
| Amplitude ratio H1|L1 compatibility (probability): | 0.999941 |
| Antenna factor probability: | 1 |
| Number of rejected frequency rows: | Q0: 18 / 18, Q1: 35 / 36, Q2: 67 / 70, Q3: 128 / 134, Q4: 251 / 258 |
| Maximum signal-to-noise ratio: | H1: 4.83159, L1: 4.81371 |
| SNR variance: | H1: 0.455674, L1: 0.478713 |
| Click here for a zoomed plot | Click here for a zoomed plot | Click here for a zoomed plot | Click here for a zoomed plot | Click here for a zoomed plot |
|
|
|
|
|
|
|
|
|
|
|
|
|
|
|
|
|
|
|
|
|
|
|
|
|
 |
 |
 |
 |
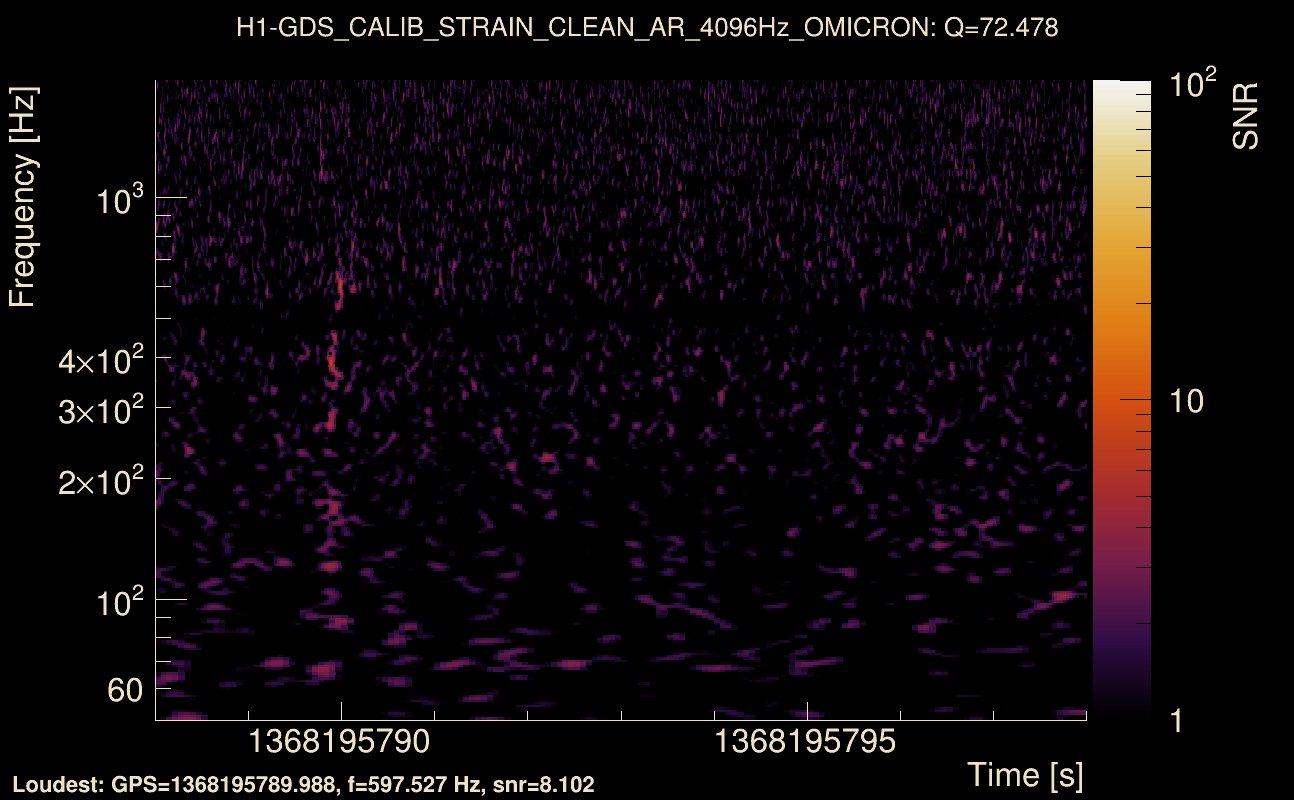
| Event time t(H1): | GPS = 1368195788 (Mon May 15 14:22:50 2023 ) → GPS = 1368195798 (Mon May 15 14:23:00 2023 ) |
| Event time t(L1): | GPS = 1368195788 (Mon May 15 14:23:00 2023 ) → GPS = 1368195798 (Mon May 15 14:23:00 2023 ) |
| Omicron analysis time window (H1): | GPS = 1368195785 → GPS = 1368195801 |
| Omicron analysis time window (L1): | GPS = 1368195785 → GPS = 1368195801 |
| Time delay between detectors t(L1) - t(H1): | -0.91484 s (slice index = 128 / 217), δt_gw = 0.00515957 s |
| Time delay uncertainty: | 0.009444 s |
| [targeted mode] Time delay probability: | 0.713507 (0.36715 sigmas), δt_target = 0.00862312 s |
| Frequency: | 725.895 Hz |
| Ξ: | 0.000889973 ± 0.0187035 (variance = 0.000349821): Q0: 0, Q1: 0.0449865, Q2: 0.0485945, Q3: 0.0480771, Q4: 0.0261111 |
| Rank: | R_A = 0.000598685 |
| Log of amplitude ratio (L1/H1): | 1.15448, variance = 0.710025 (L1/H1: 1.08875, variance = 1.07118, H1/L1: -1.20604, variance = 1.60159) |
| Amplitude ratio (L1/H1): | 3.17239 ⋇ 2.32247 (L1/H1: 2.97056 ⋇ 2.81505, H1/L1: 0.299381 ⋇ 3.545) |
| Amplitude ratio H1|L1 compatibility (probability): | 0.942808 |
| Antenna factor probability: | 1 |
| Number of rejected frequency rows: | Q0: 18 / 18, Q1: 35 / 36, Q2: 65 / 70, Q3: 130 / 134, Q4: 253 / 258 |
| Maximum signal-to-noise ratio: | H1: 4.64234, L1: 5.24207 |
| SNR variance: | H1: 0.422178, L1: 0.457087 |
| Click here for a zoomed plot | Click here for a zoomed plot | Click here for a zoomed plot | Click here for a zoomed plot | Click here for a zoomed plot |
|
|
|
|
|
|
|
|
|
|
|
|
|
|
|
|
|
|
|
|
|
|
|
|
|
 |
 |
 |
 |
| Event time t(H1): | GPS = 1368195818 (Mon May 15 14:23:20 2023 ) → GPS = 1368195828 (Mon May 15 14:23:30 2023 ) |
| Event time t(L1): | GPS = 1368195818 (Mon May 15 14:23:30 2023 ) → GPS = 1368195828 (Mon May 15 14:23:30 2023 ) |
| Omicron analysis time window (H1): | GPS = 1368195815 → GPS = 1368195831 |
| Omicron analysis time window (L1): | GPS = 1368195815 → GPS = 1368195831 |
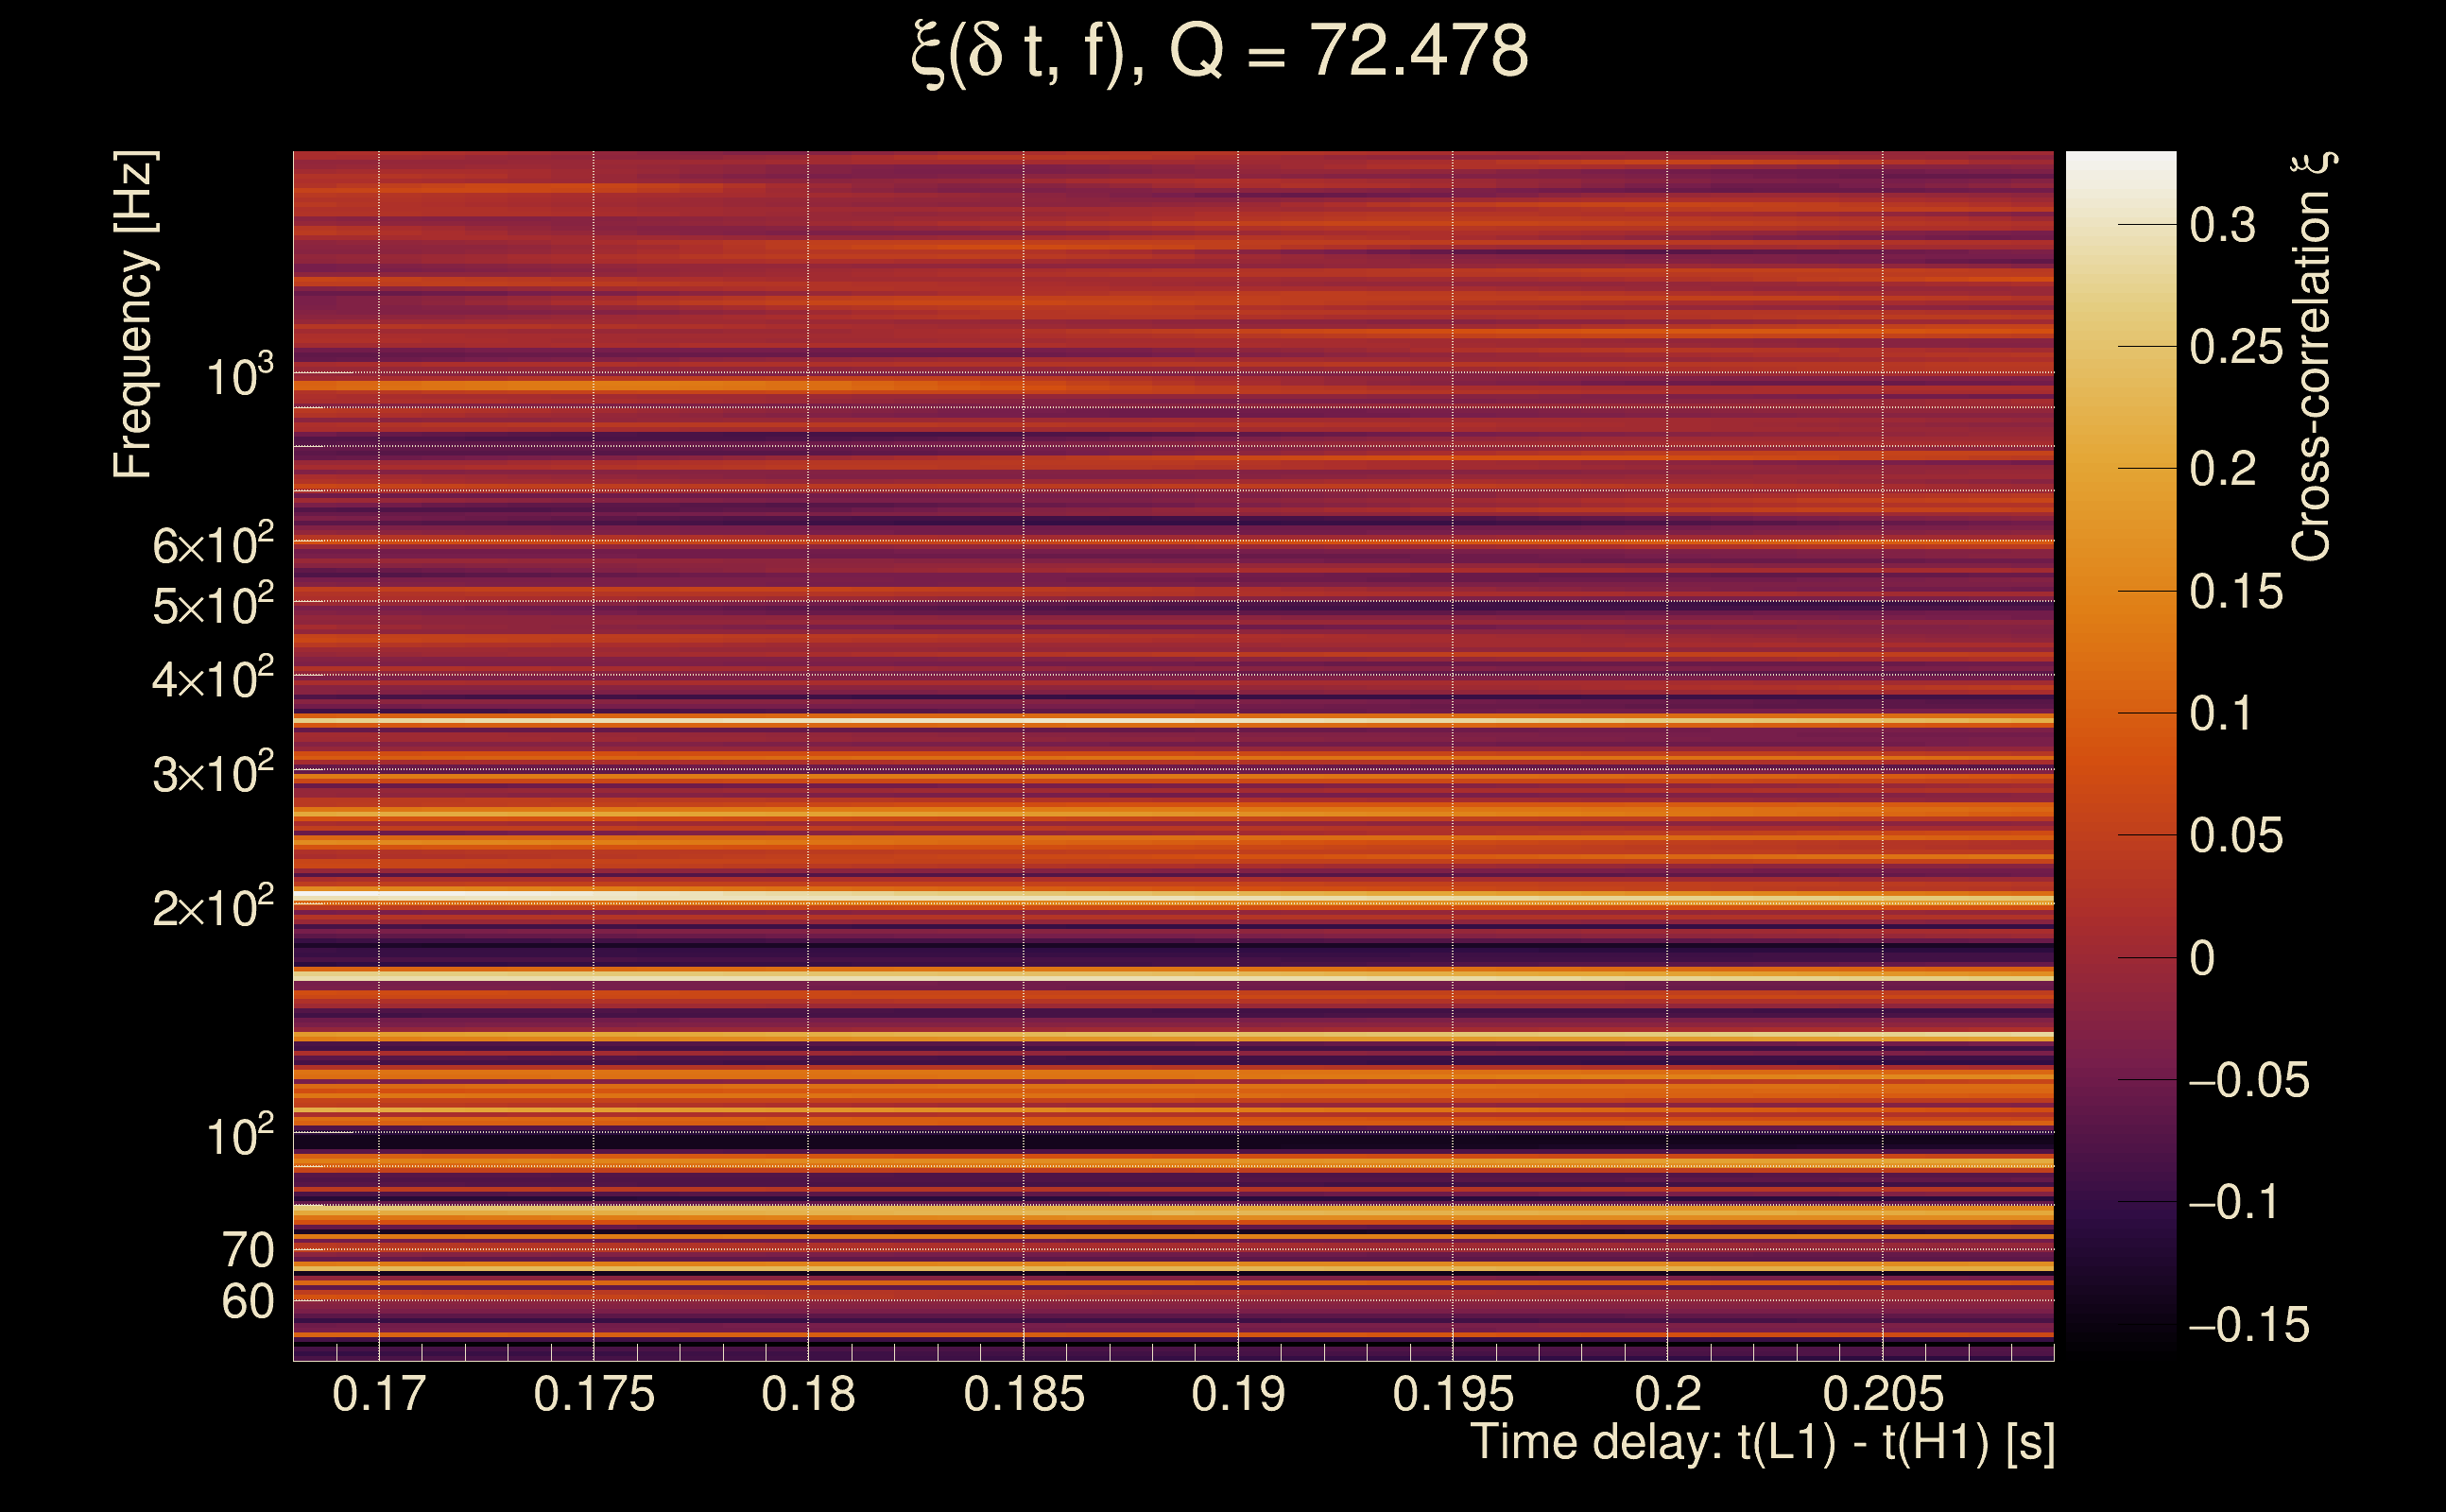
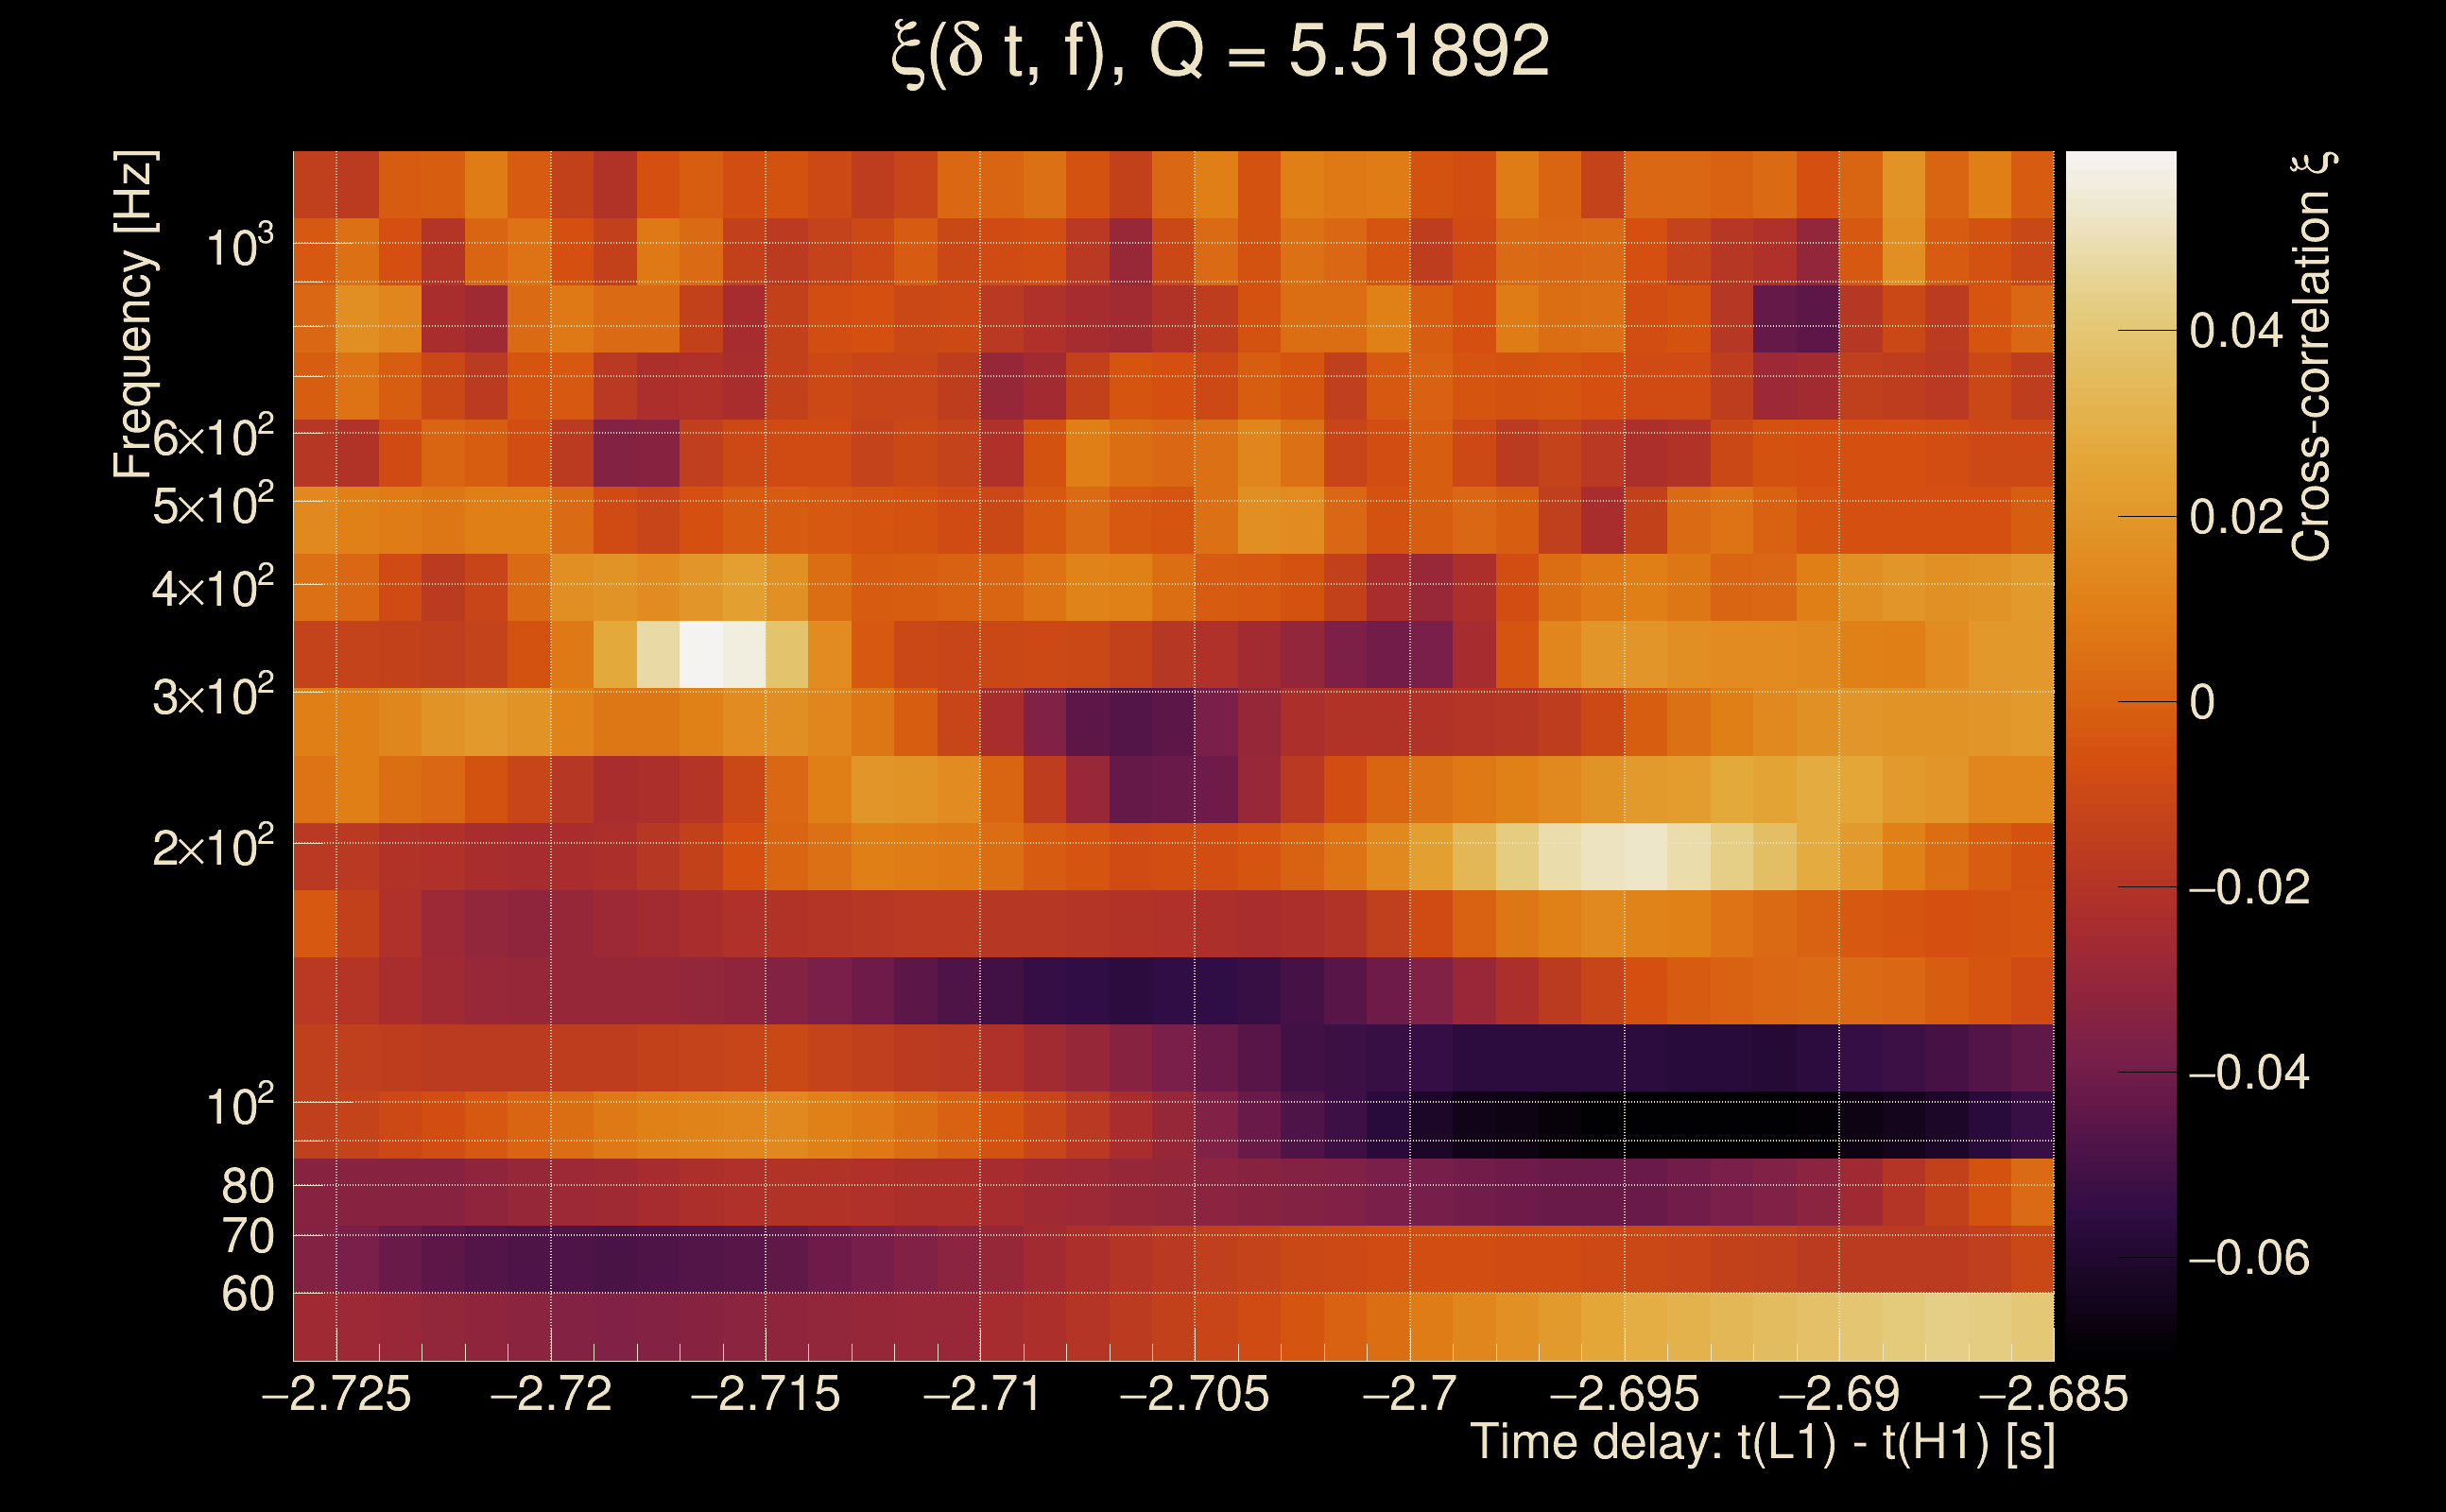
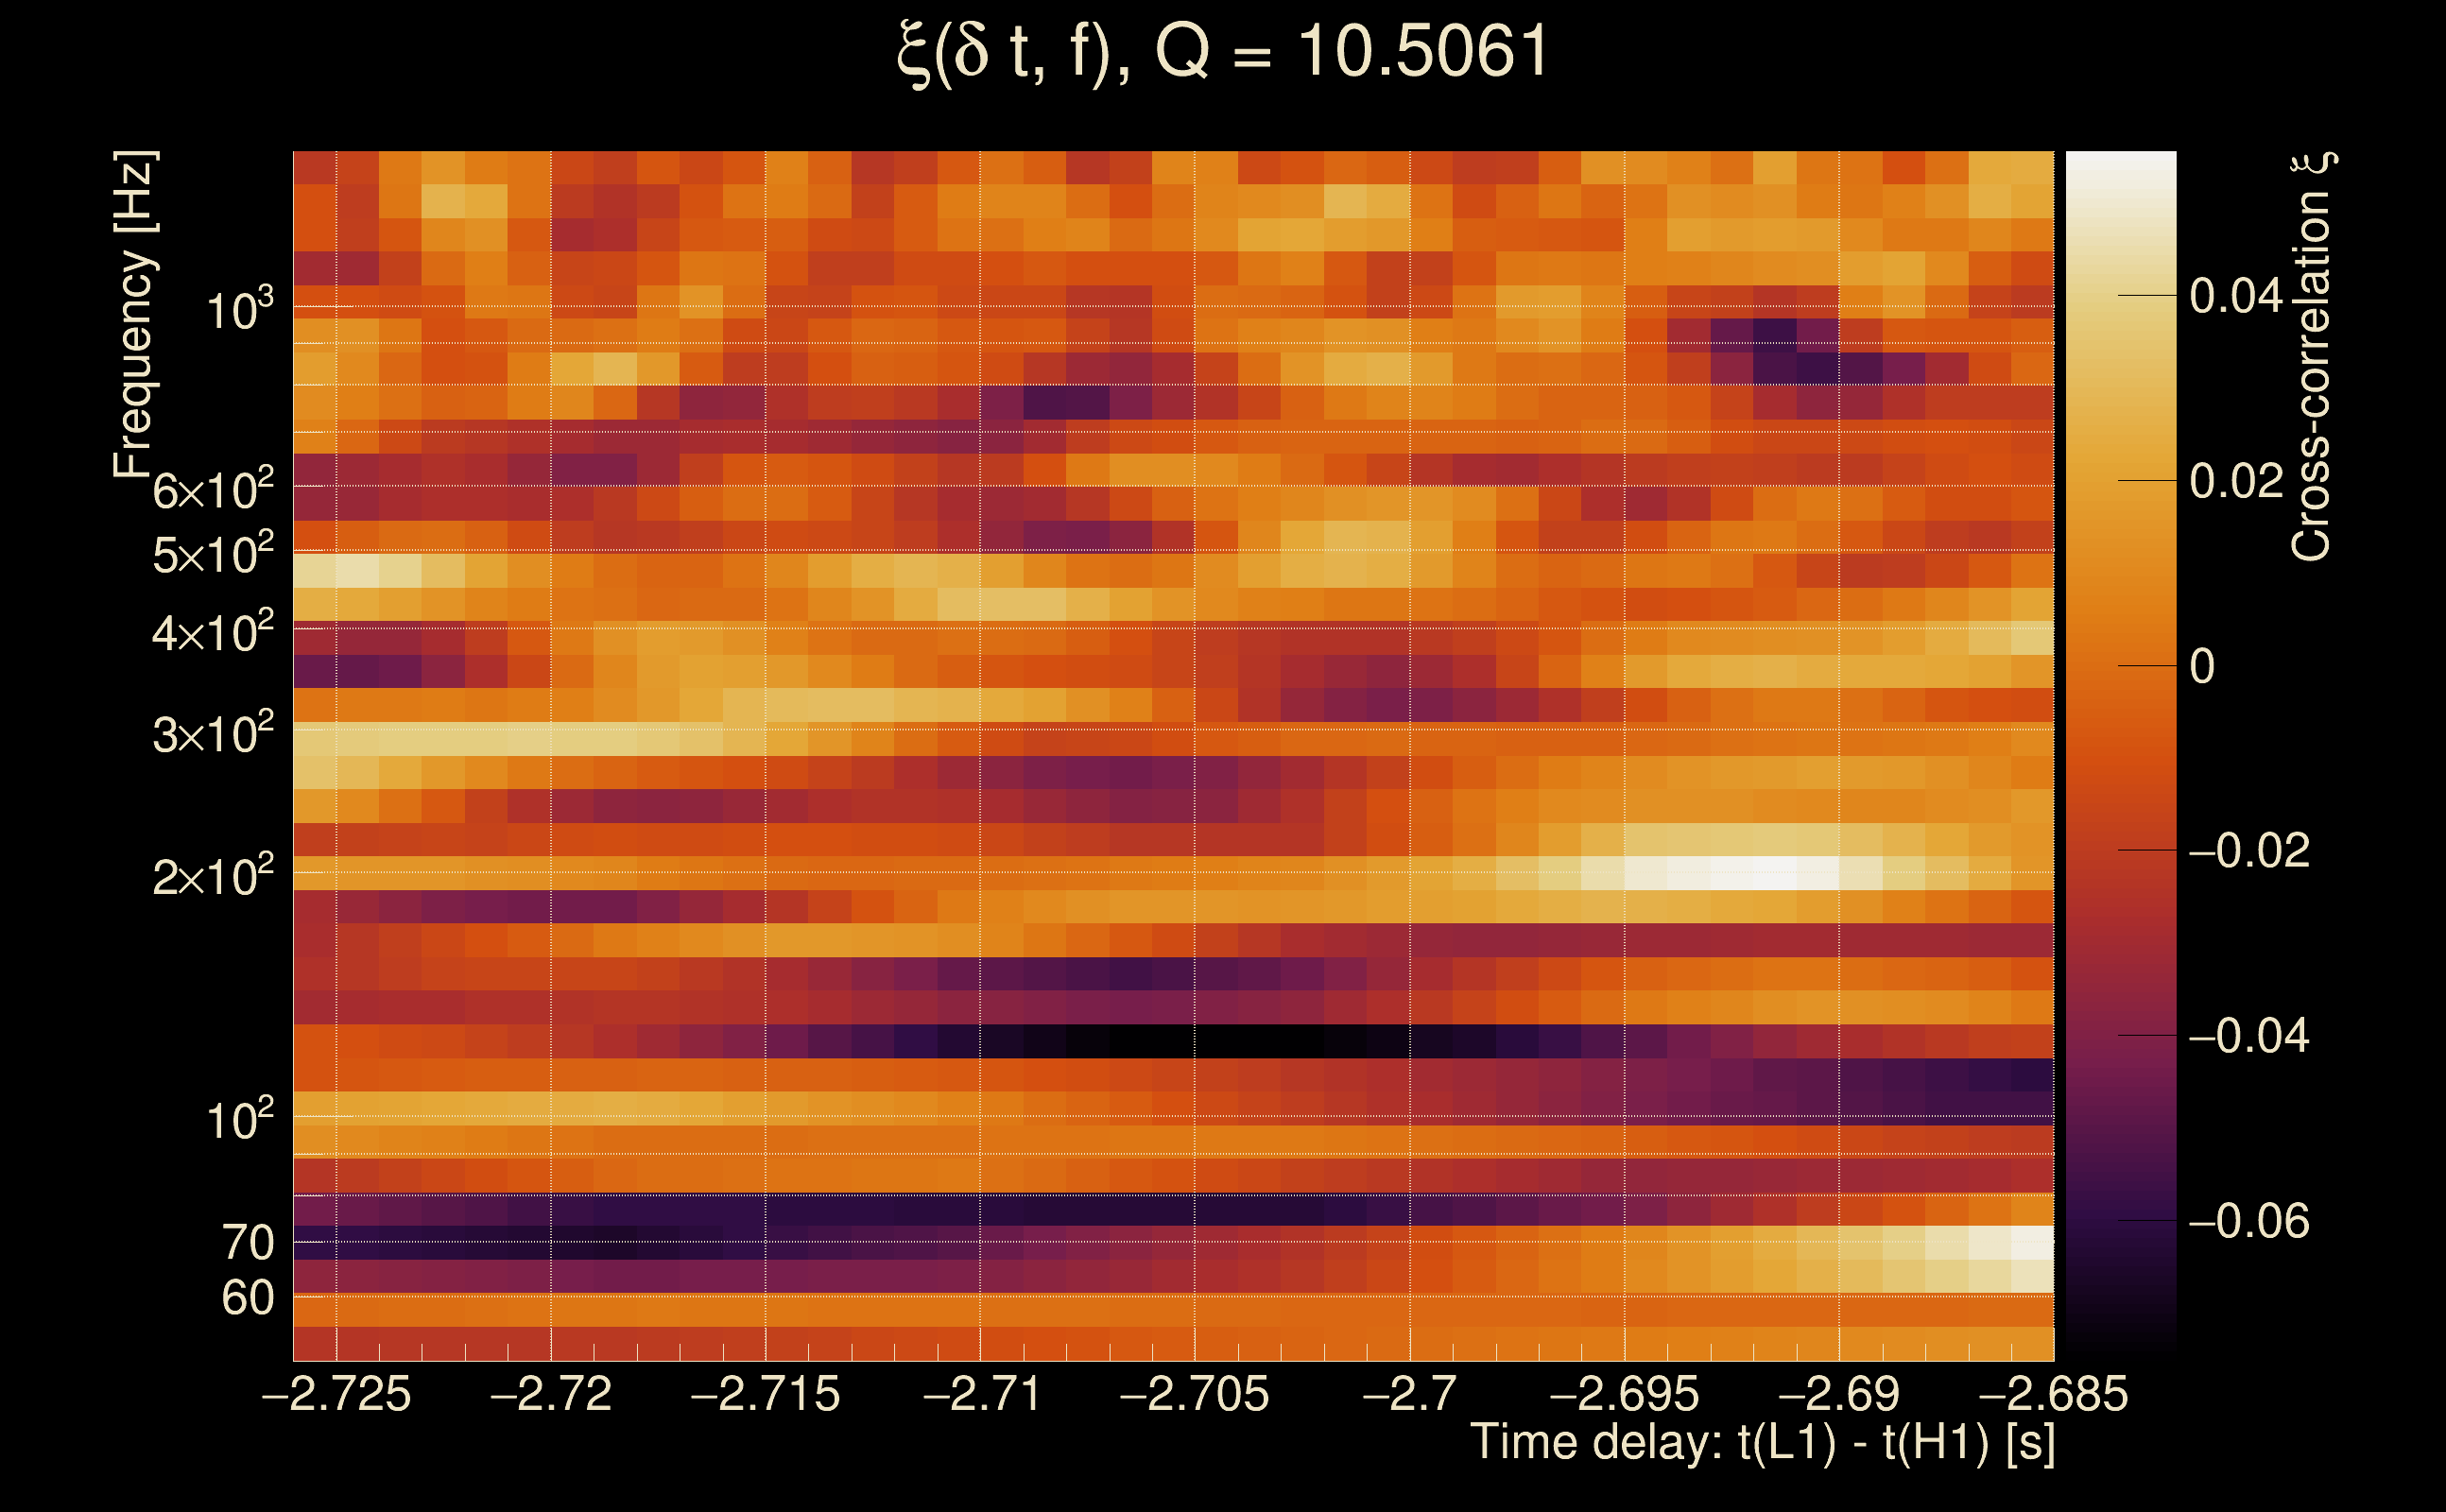
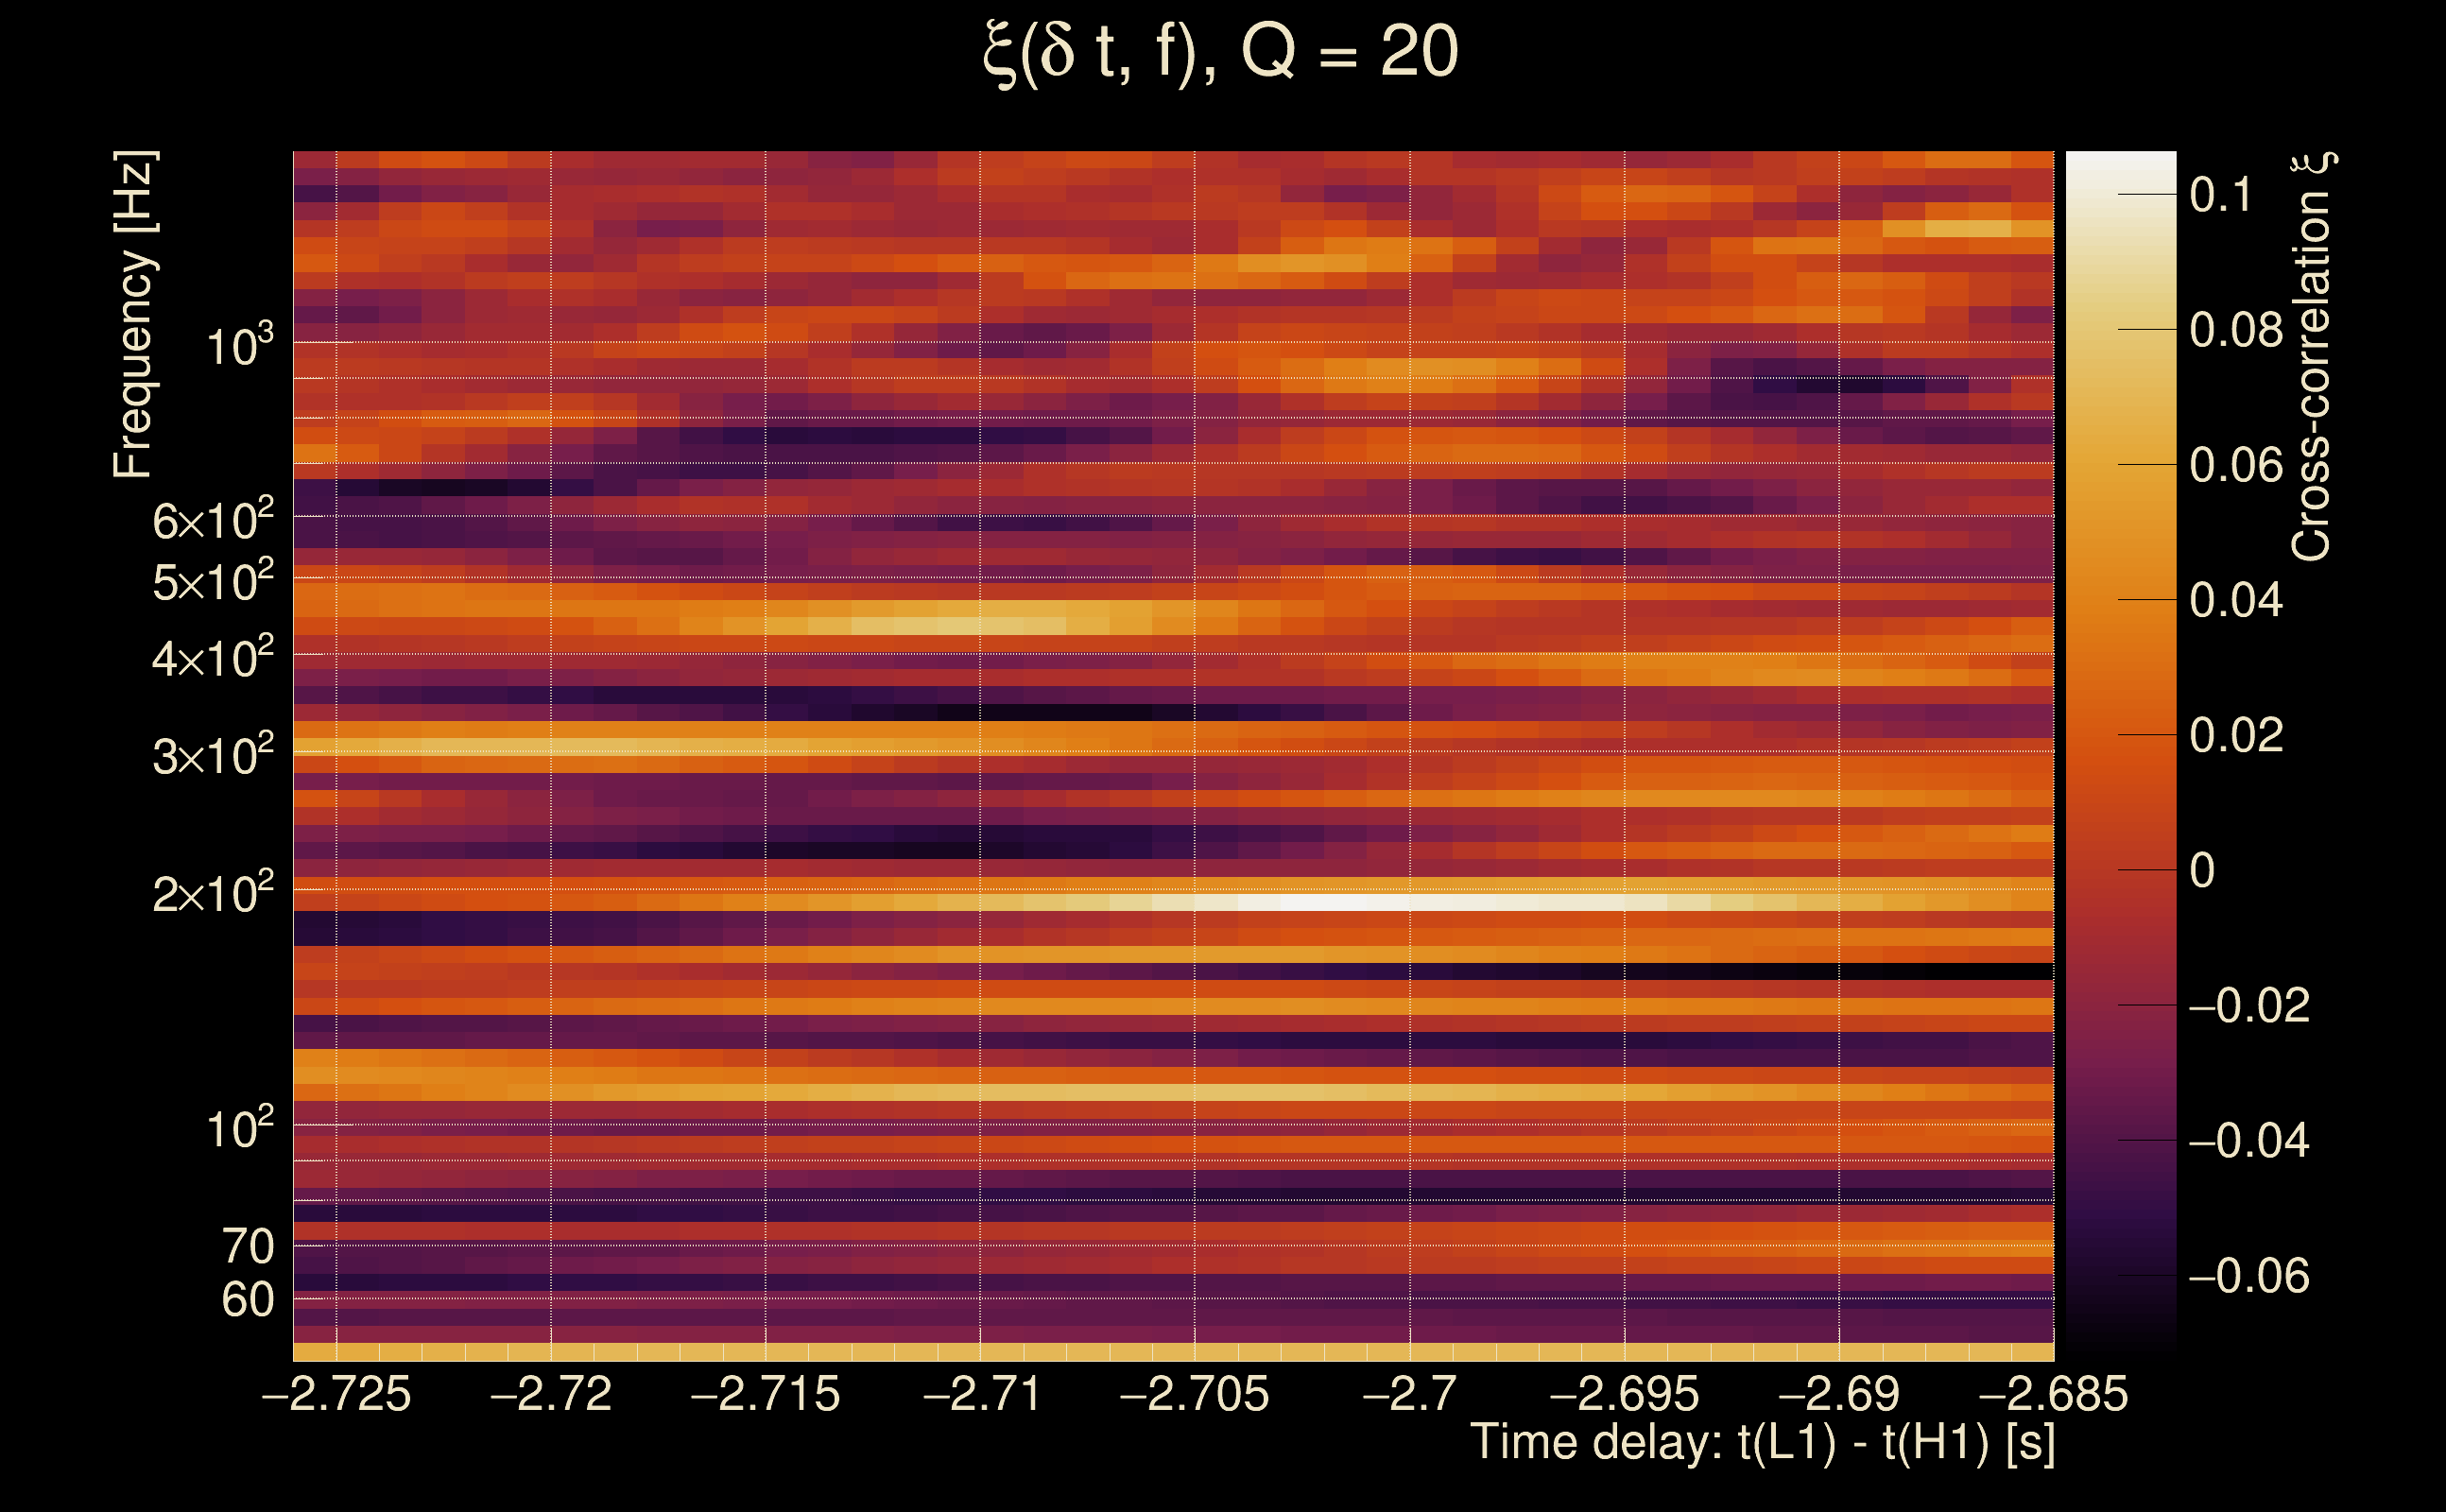
| Time delay between detectors t(L1) - t(H1): | -2.70566 s (slice index = 167 / 217), δt_gw = 0.00834093 s |
| Time delay uncertainty: | 0.00645984 s |
| [targeted mode] Time delay probability: | 0.965156 (0.0436842 sigmas), δt_target = 0.00862694 s |
| Frequency: | 977.878 Hz |
| Ξ: | 0.000655595 ± 0.026995 (variance = 0.000728728): Q0: 0, Q1: 0.035064, Q2: 0.0541816, Q3: 0.08199, Q4: 0.0532108 |
| Rank: | R_A = 0.000554083 |
| Log of amplitude ratio (L1/H1): | 0.449652, variance = 1.75902 (L1/H1: 0.242645, variance = 2.28402, H1/L1: -0.658199, variance = 4.77042) |
| Amplitude ratio (L1/H1): | 1.56777 ⋇ 3.76701 (L1/H1: 1.27462 ⋇ 4.53261, H1/L1: 0.517783 ⋇ 8.8829) |
| Amplitude ratio H1|L1 compatibility (probability): | 0.875672 |
| Antenna factor probability: | 1 |
| Number of rejected frequency rows: | Q0: 18 / 18, Q1: 35 / 36, Q2: 68 / 70, Q3: 130 / 134, Q4: 253 / 258 |
| Maximum signal-to-noise ratio: | H1: 4.83159, L1: 4.81371 |
| SNR variance: | H1: 0.455674, L1: 0.478713 |
| Click here for a zoomed plot | Click here for a zoomed plot | Click here for a zoomed plot | Click here for a zoomed plot | Click here for a zoomed plot |
|
|
|
|
|
|
|
|
|
|
|
|
|
|
|
|
|
|
|
|
|
|
|
|
|
 |
 |
 |
 |
| Event time t(H1): | GPS = 1368195793 (Mon May 15 14:22:55 2023 ) → GPS = 1368195803 (Mon May 15 14:23:05 2023 ) |
| Event time t(L1): | GPS = 1368195793 (Mon May 15 14:23:05 2023 ) → GPS = 1368195803 (Mon May 15 14:23:05 2023 ) |
| Omicron analysis time window (H1): | GPS = 1368195790 → GPS = 1368195806 |
| Omicron analysis time window (L1): | GPS = 1368195790 → GPS = 1368195806 |
| Time delay between detectors t(L1) - t(H1): | 2.17199 s (slice index = 61 / 217), δt_gw = 0.00998552 s |
| Time delay uncertainty: | 0.00299379 s |
| [targeted mode] Time delay probability: | 0.649857 (0.45396 sigmas), δt_target = 0.00862312 s |
| Frequency: | 835.953 Hz |
| Ξ: | 0.00134541 ± 0.0203098 (variance = 0.000412487): Q0: 0, Q1: 0.0458928, Q2: 0.0514058, Q3: 0.0277886, Q4: 0.0550737 |
| Rank: | R_A = 0.000546125 |
| Log of amplitude ratio (L1/H1): | 0.382135, variance = 0.637969 (L1/H1: -0.0155322, variance = 0.819162, H1/L1: -0.758511, variance = 1.68328) |
| Amplitude ratio (L1/H1): | 1.46541 ⋇ 2.22272 (L1/H1: 0.984588 ⋇ 2.47212, H1/L1: 0.468363 ⋇ 3.65982) |
| Amplitude ratio H1|L1 compatibility (probability): | 0.624623 |
| Antenna factor probability: | 1 |
| Number of rejected frequency rows: | Q0: 18 / 18, Q1: 33 / 36, Q2: 67 / 70, Q3: 132 / 134, Q4: 251 / 258 |
| Maximum signal-to-noise ratio: | H1: 5.27812, L1: 5.42535 |
| SNR variance: | H1: 0.433491, L1: 0.451406 |
| Click here for a zoomed plot | Click here for a zoomed plot | Click here for a zoomed plot | Click here for a zoomed plot | Click here for a zoomed plot |
|
|
|
|
|
|
|
|
|
|
|
|
|
|
|
|
|
|
|
|
|
|
|
|
|
 |
 |
 |
 |
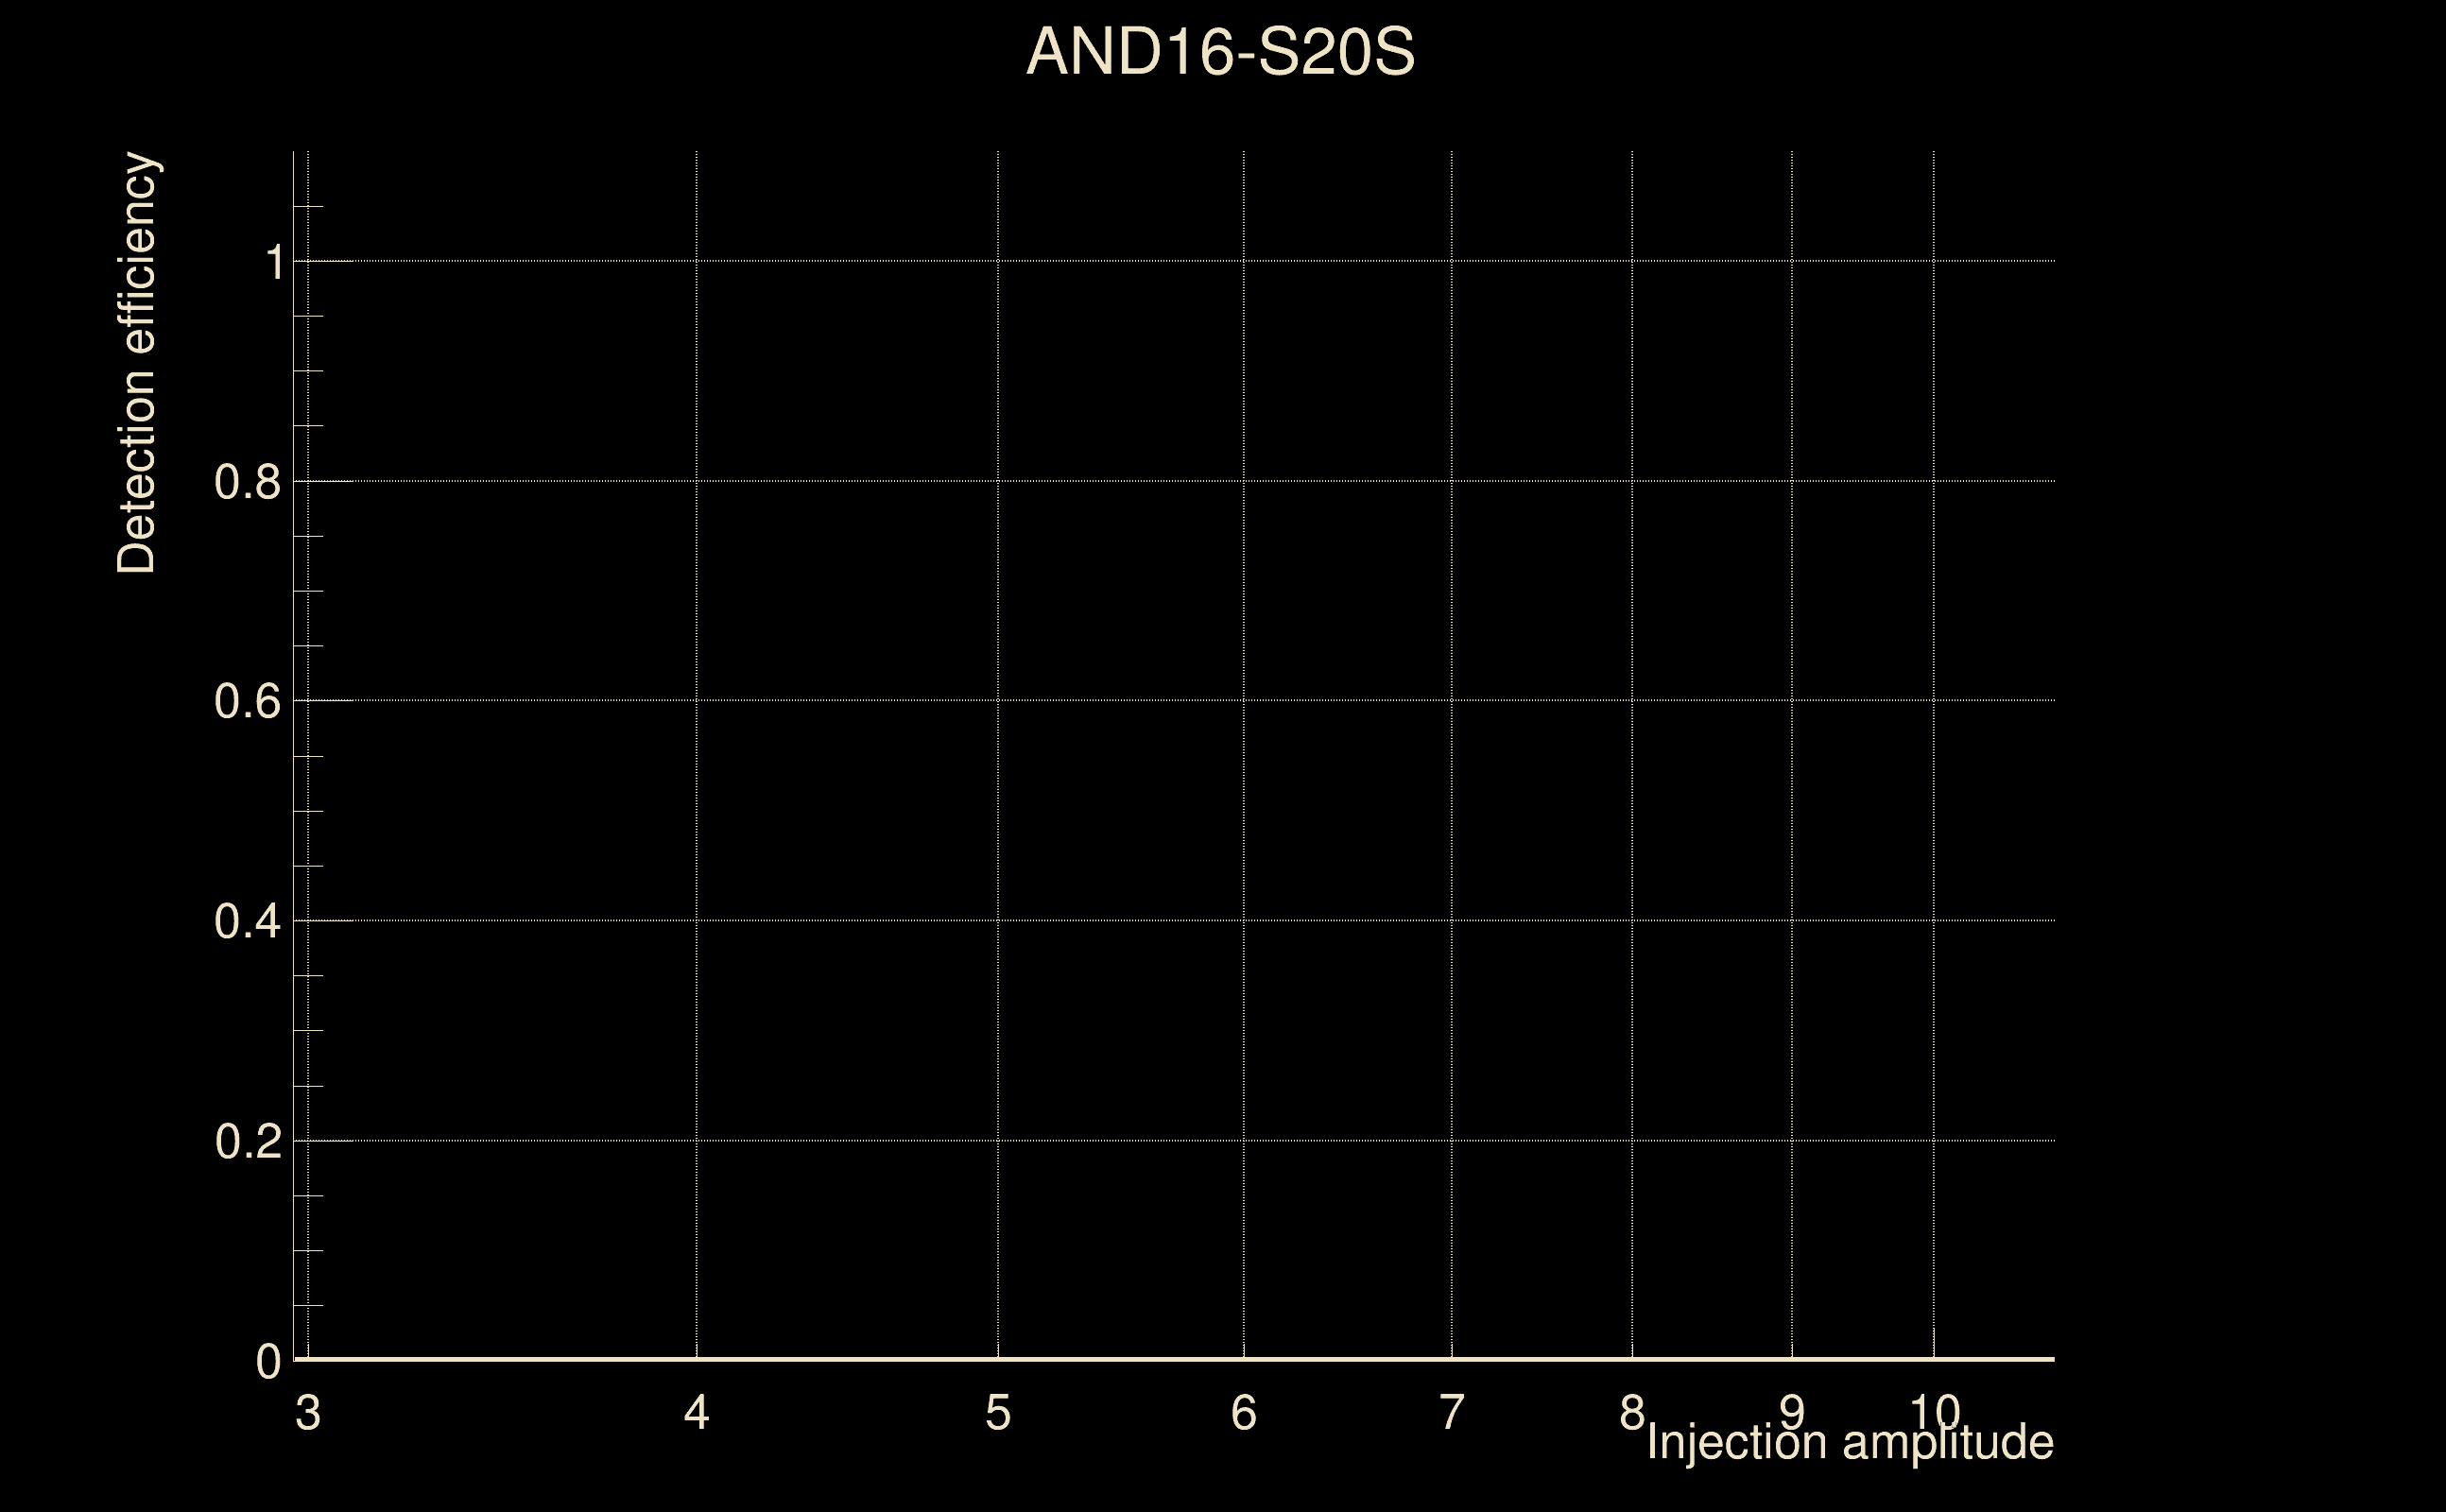
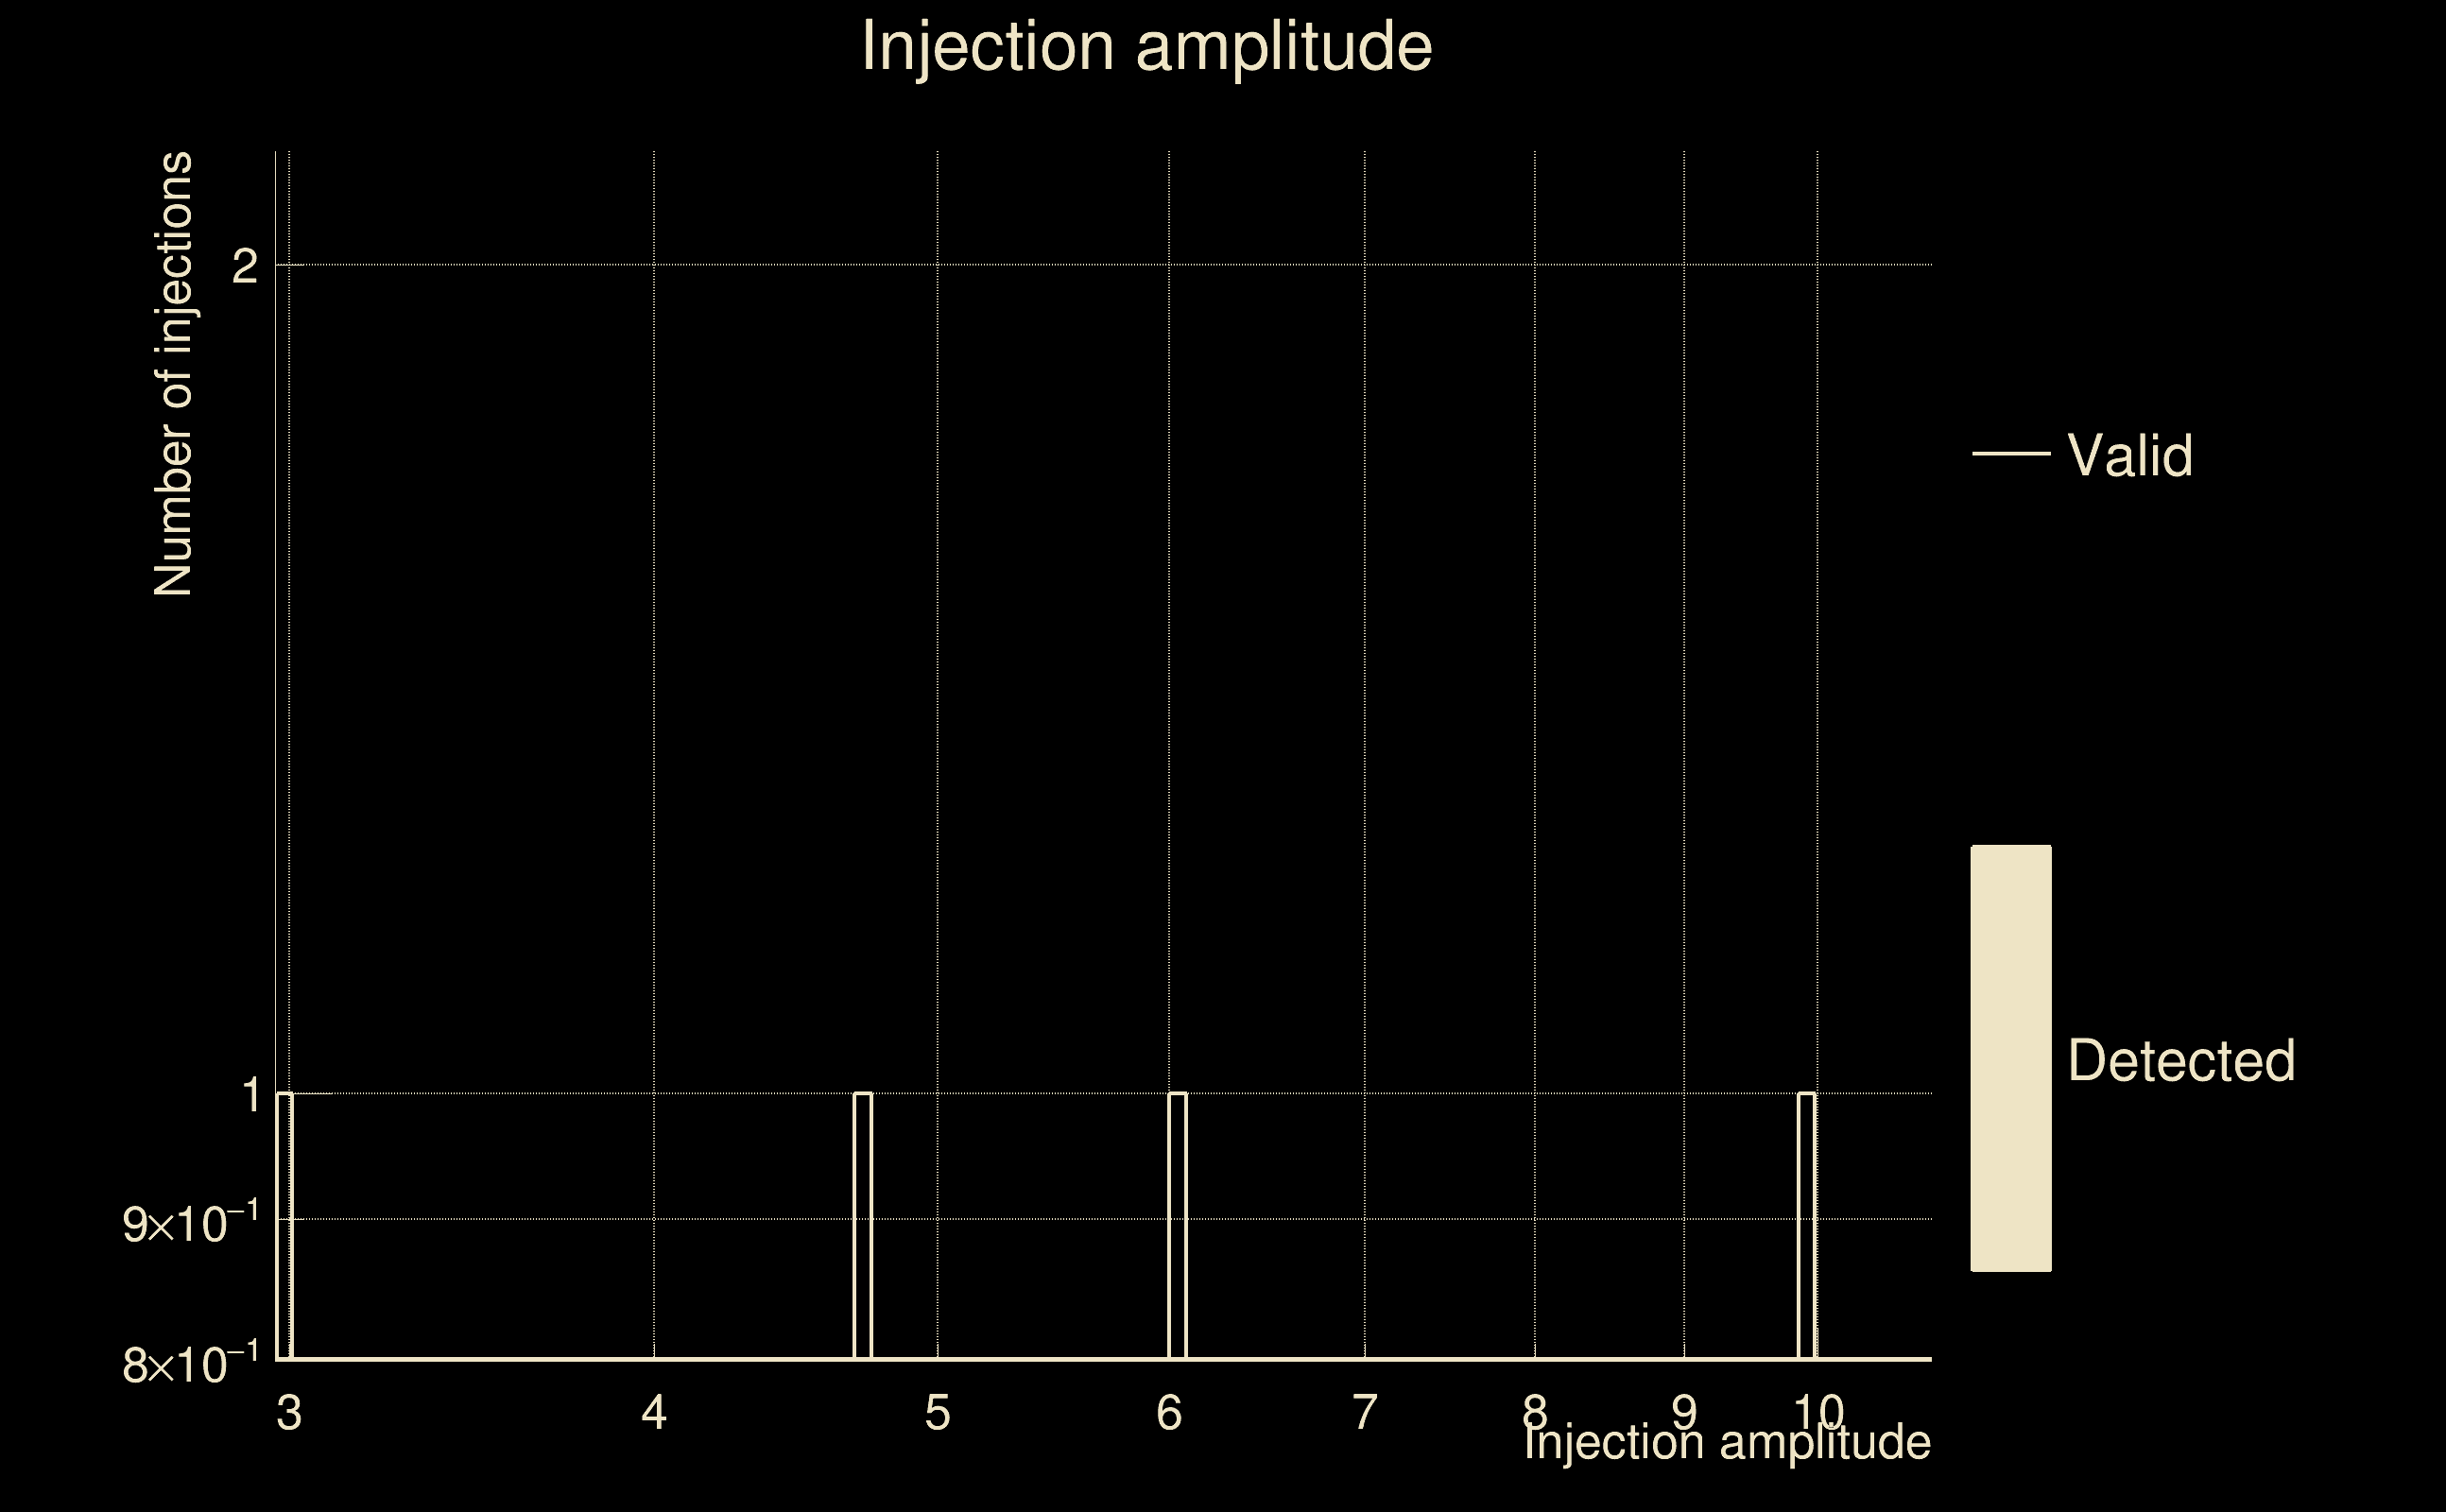
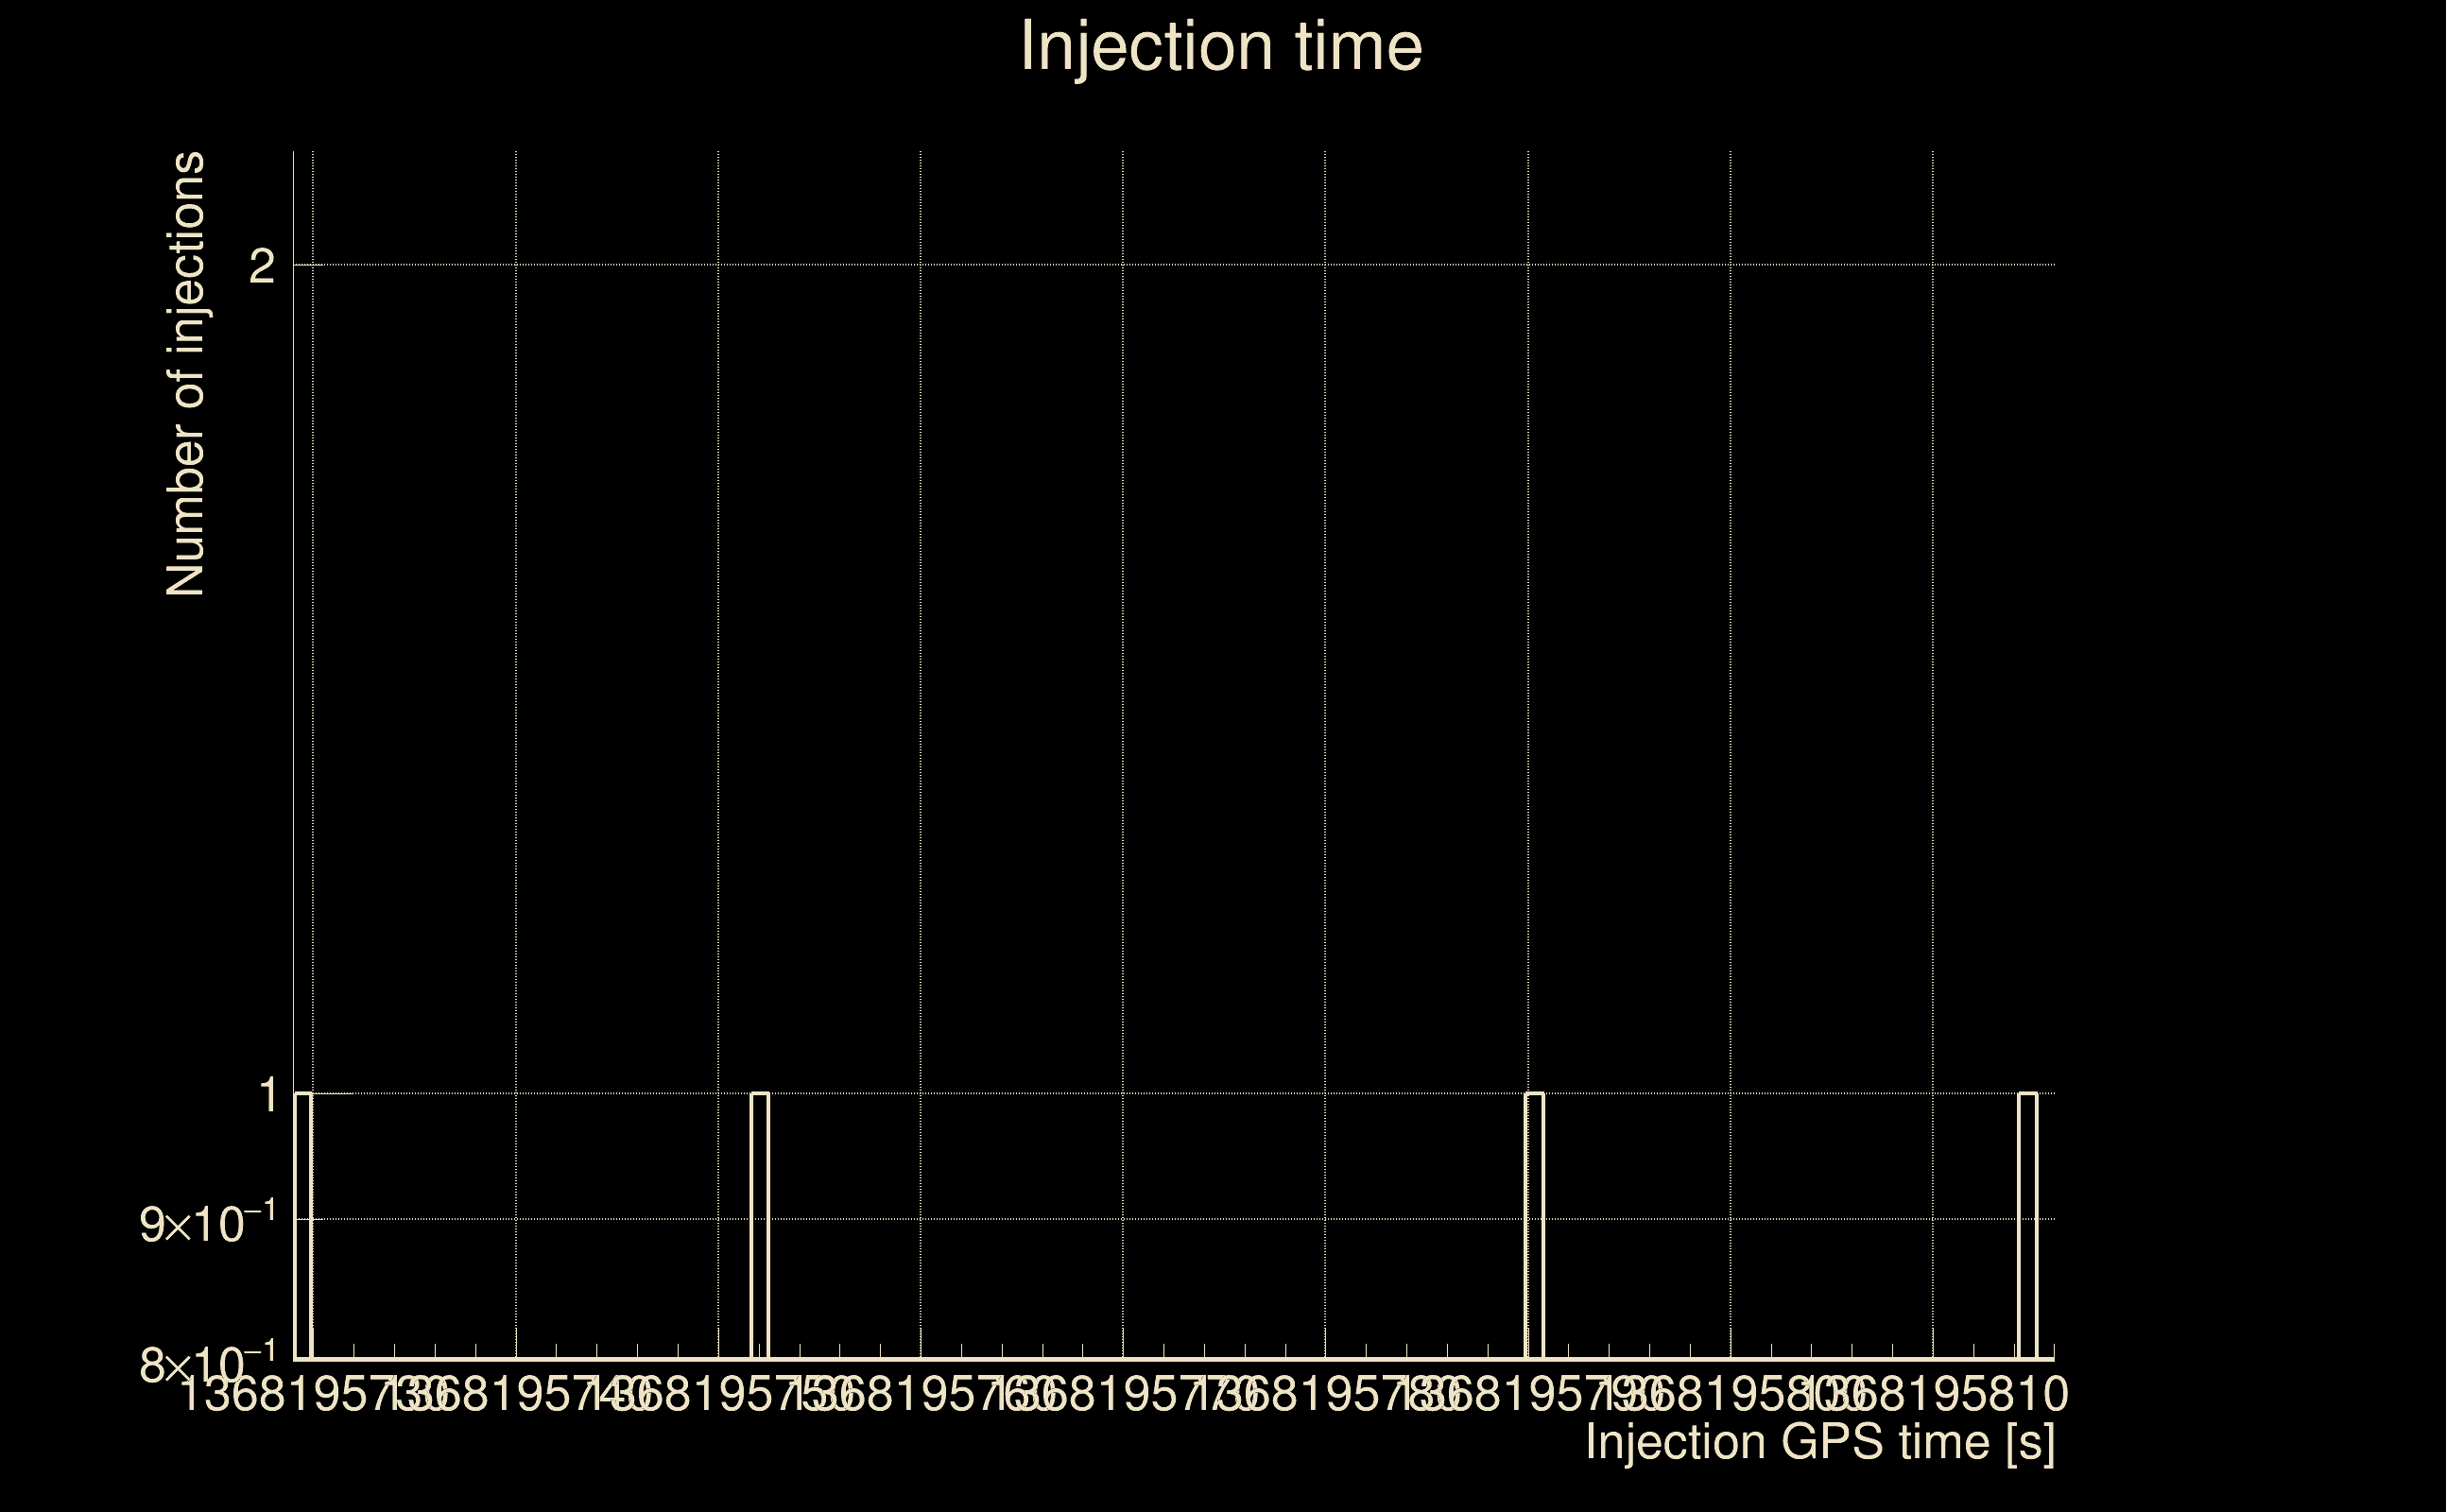
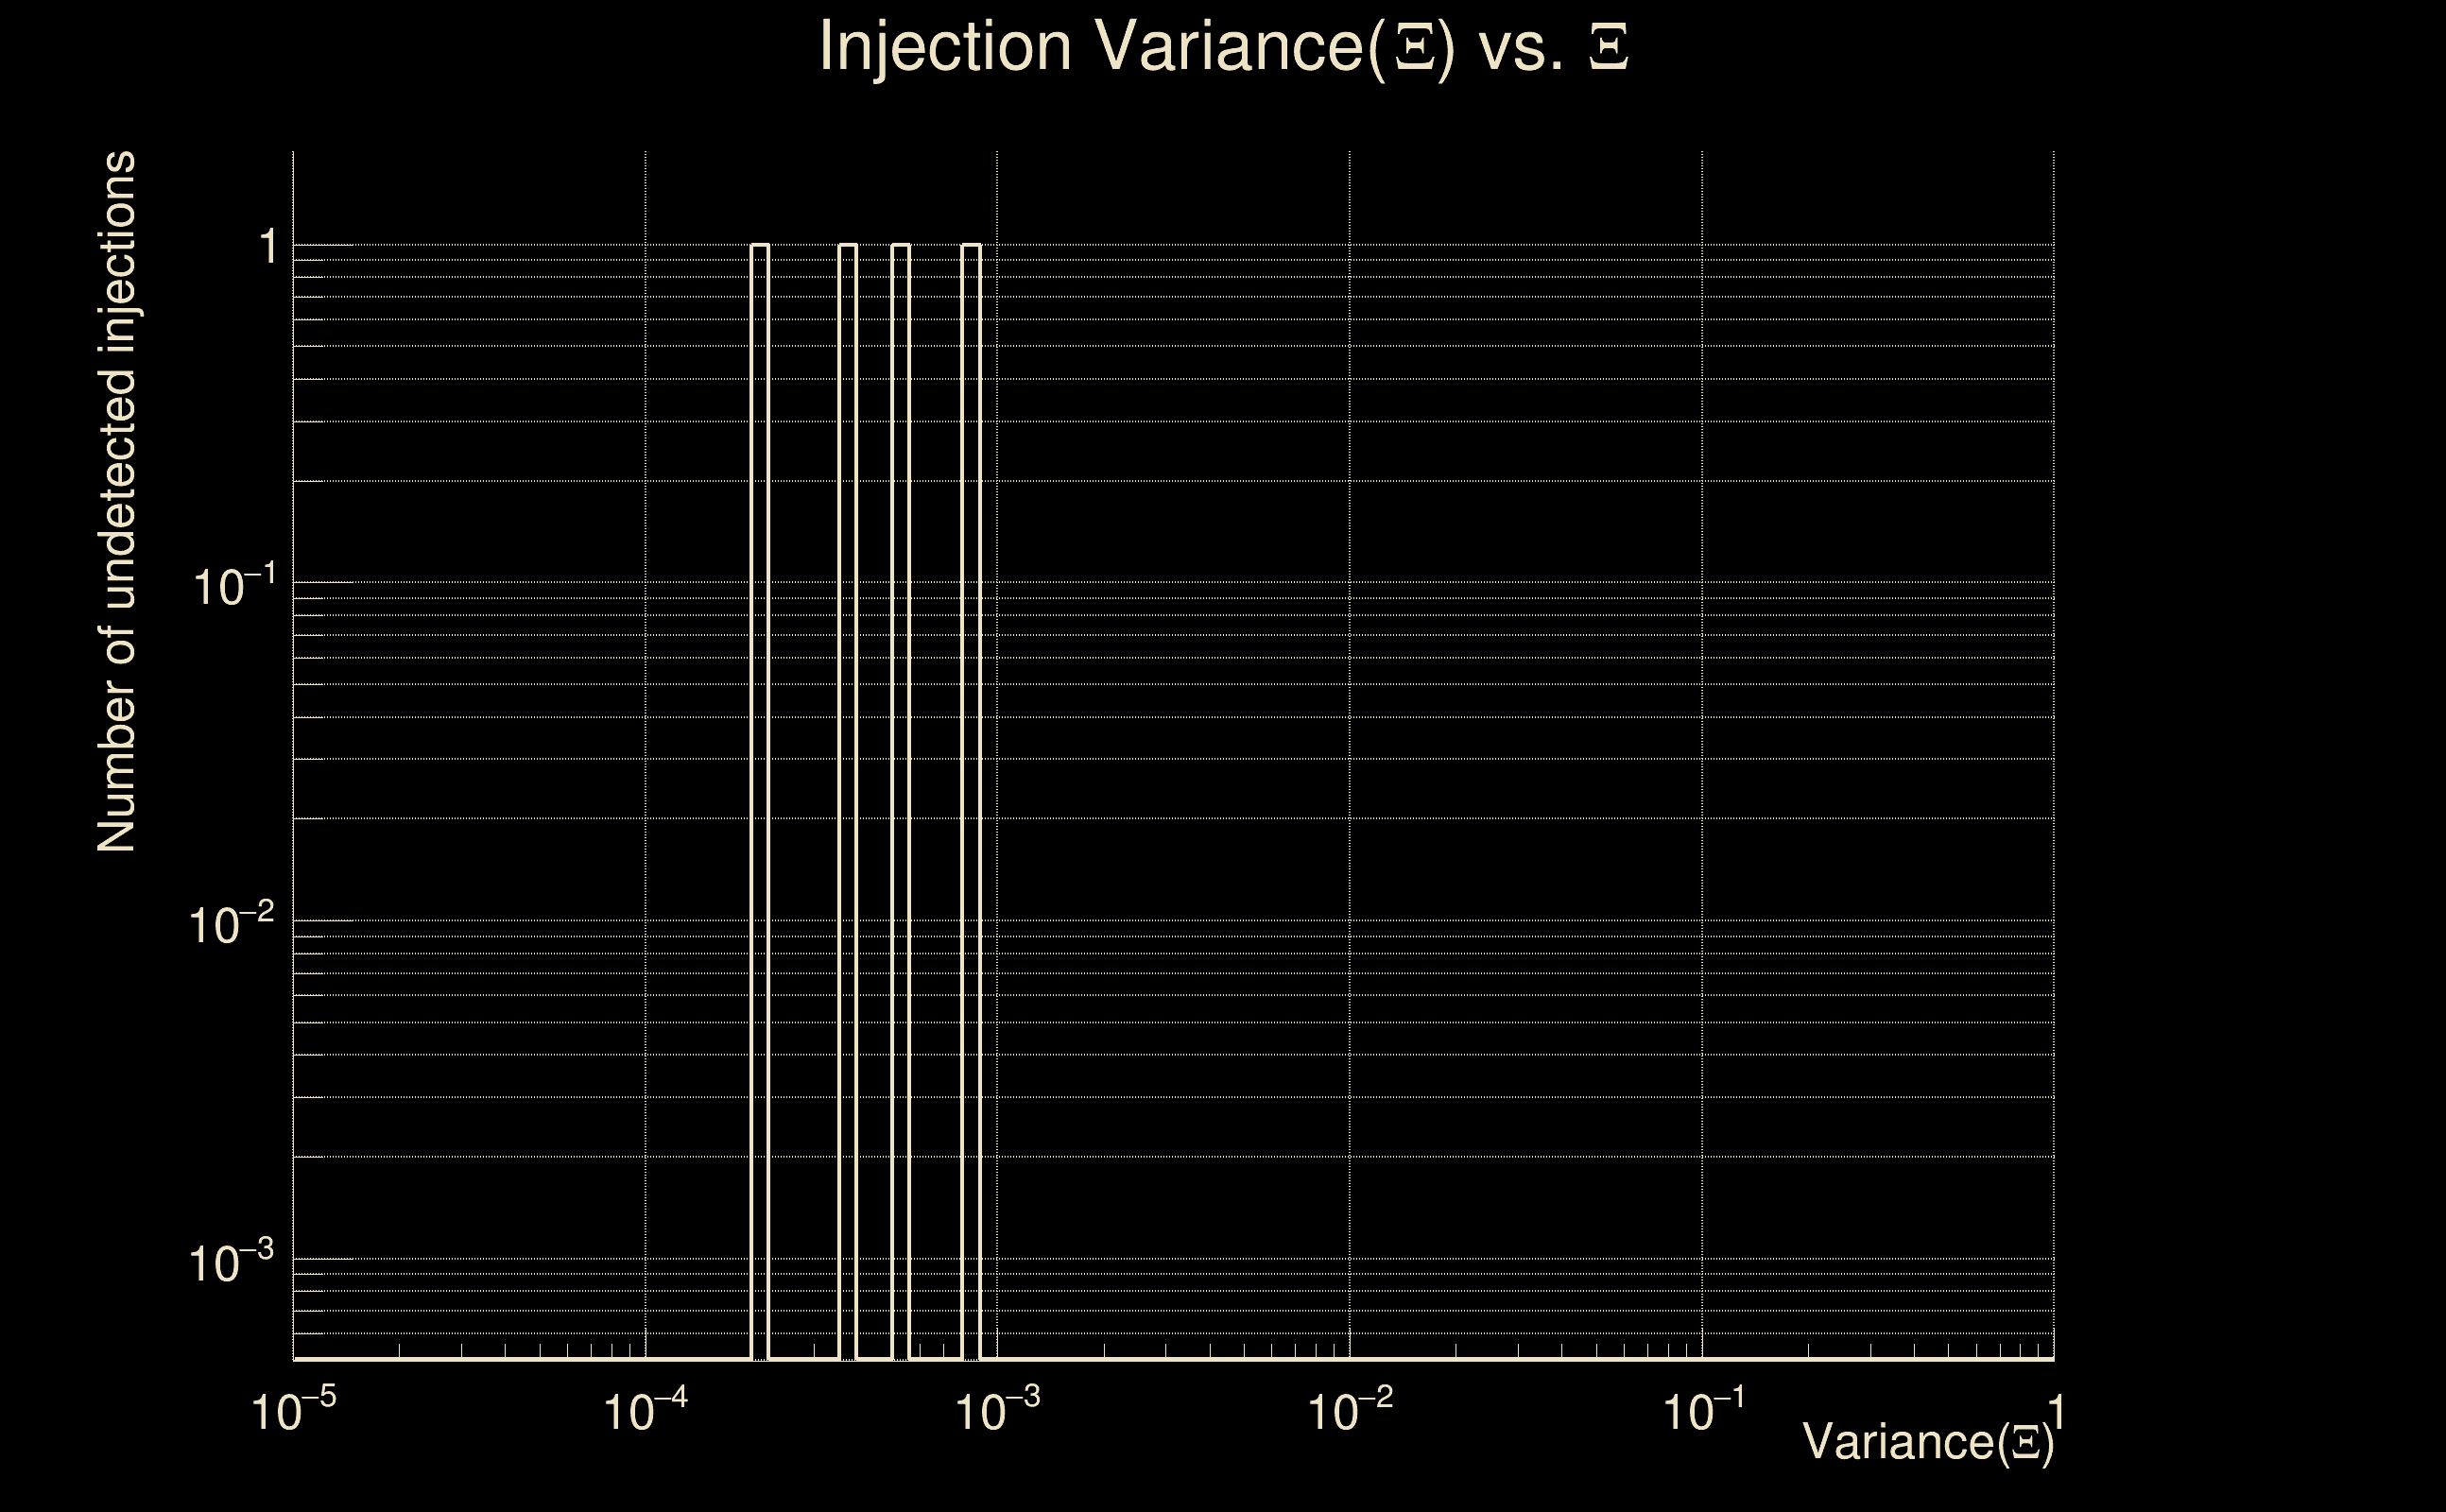
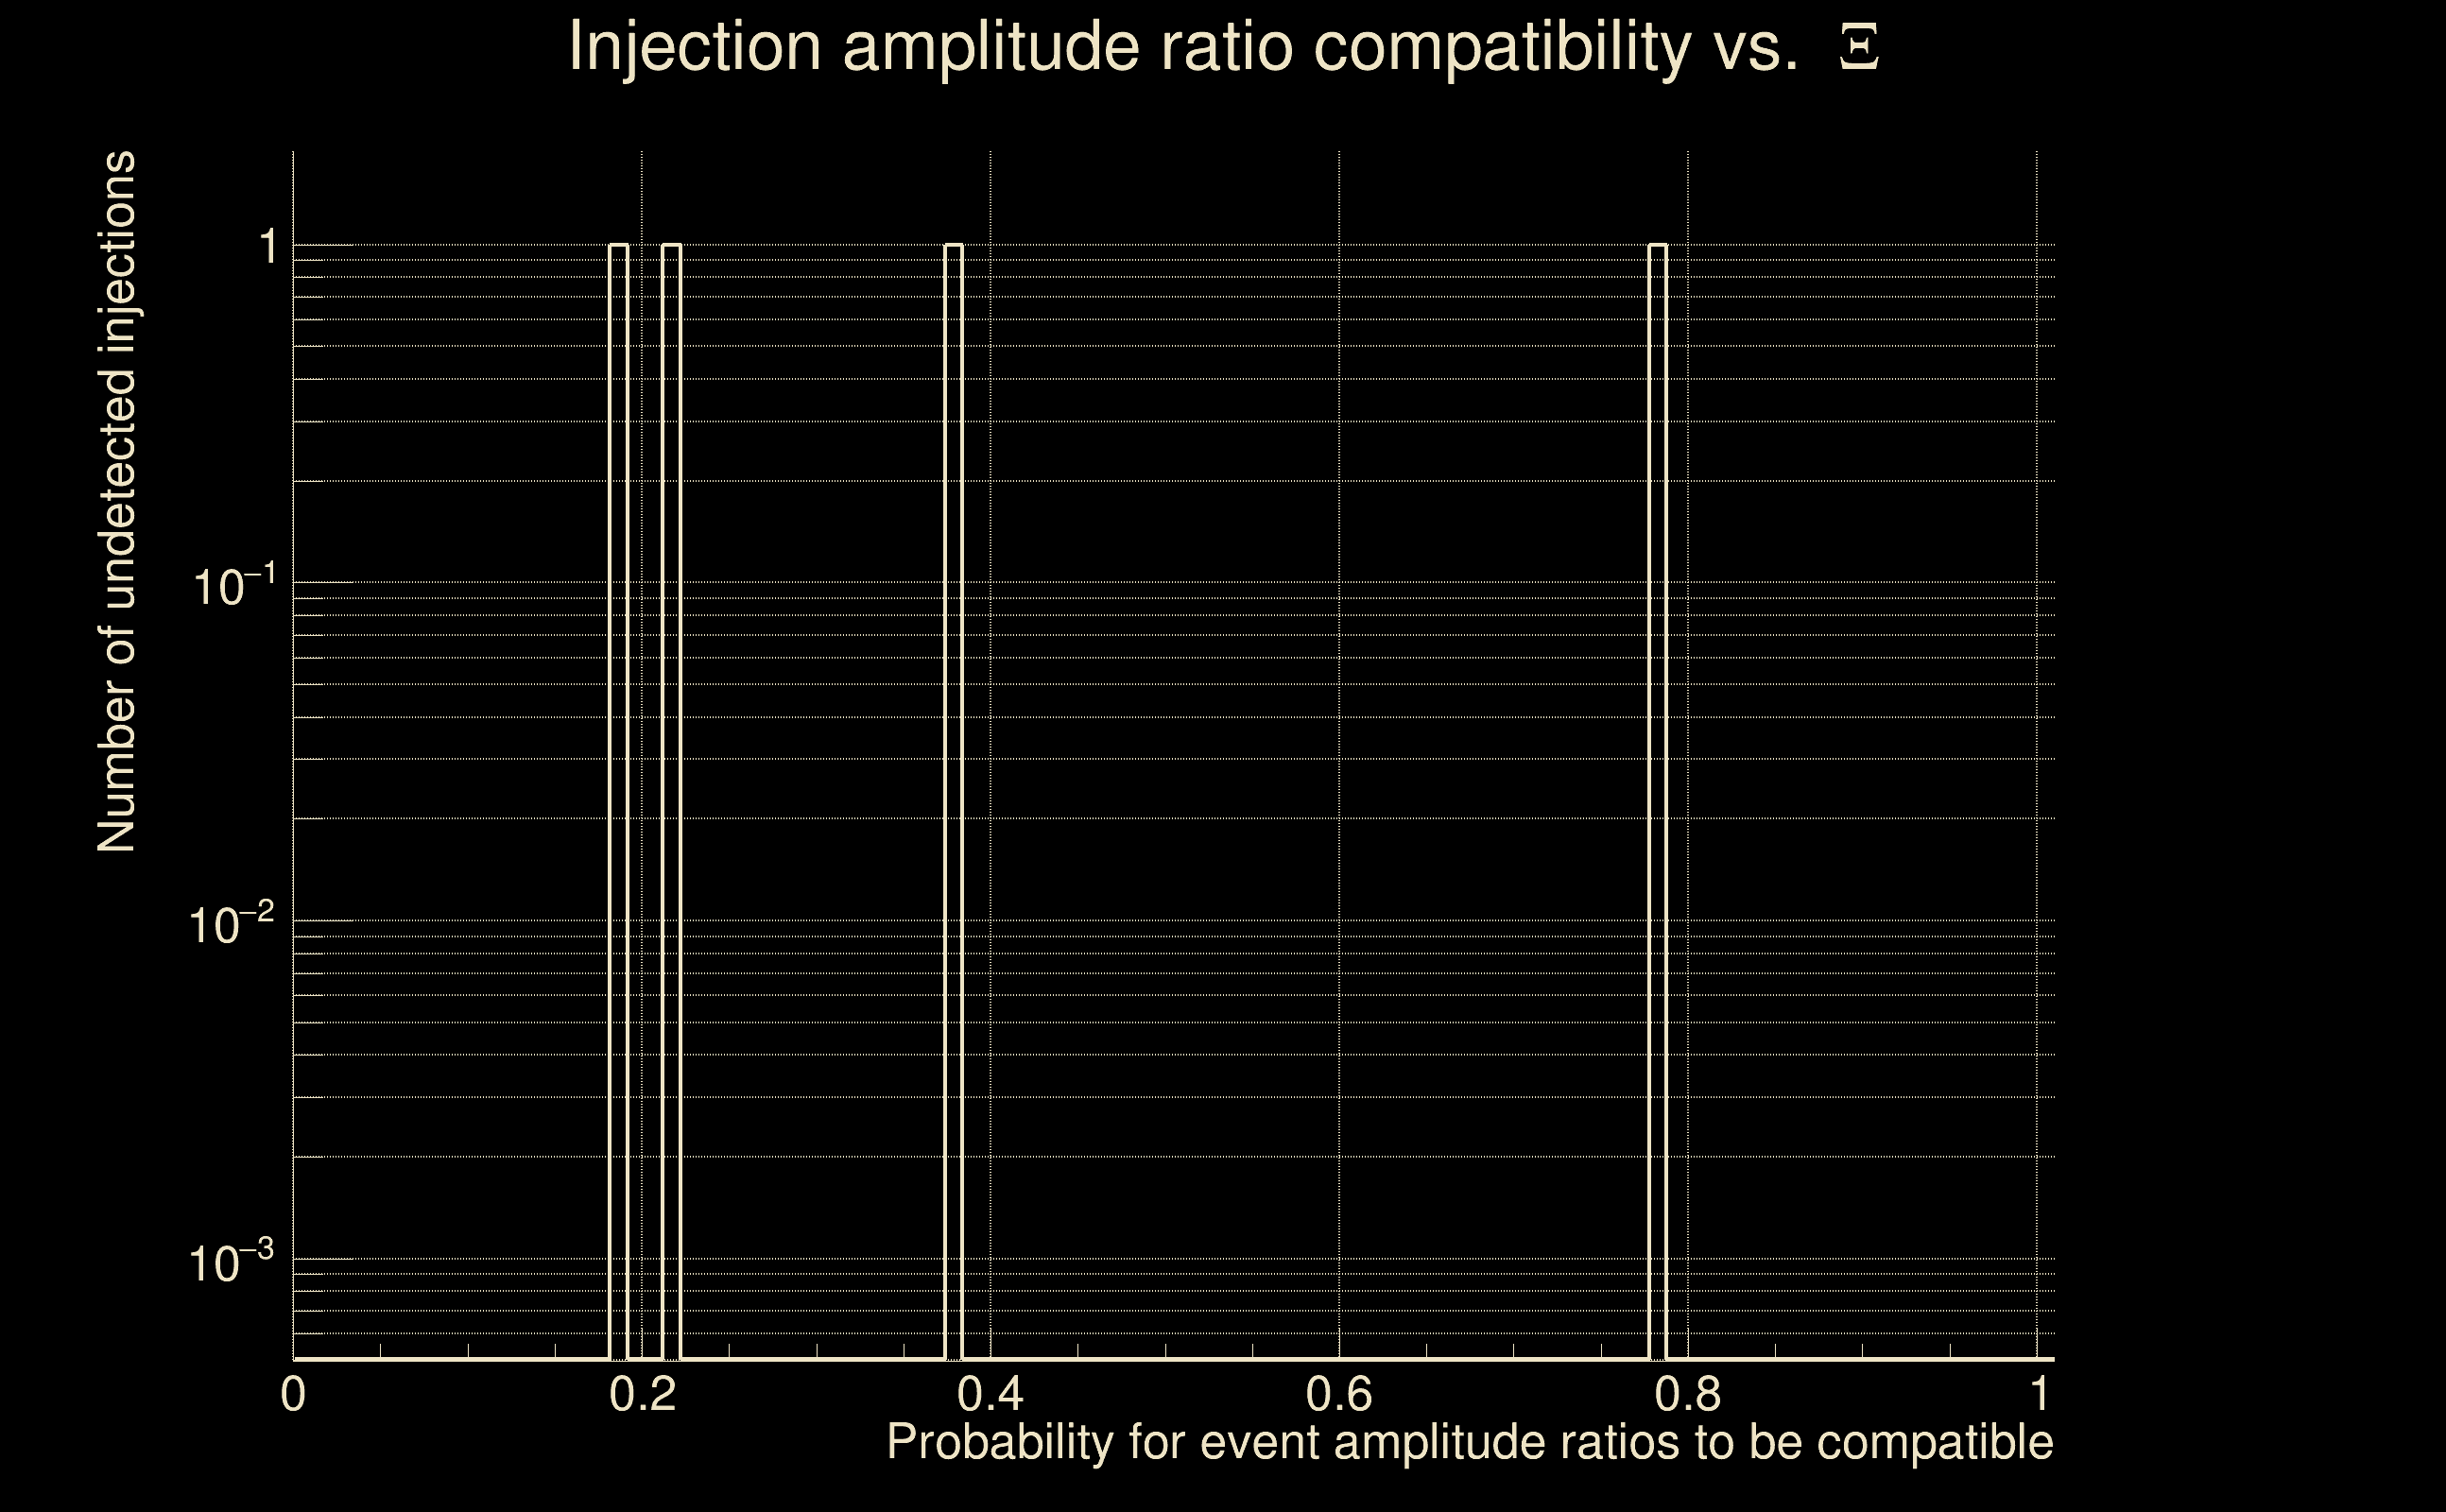
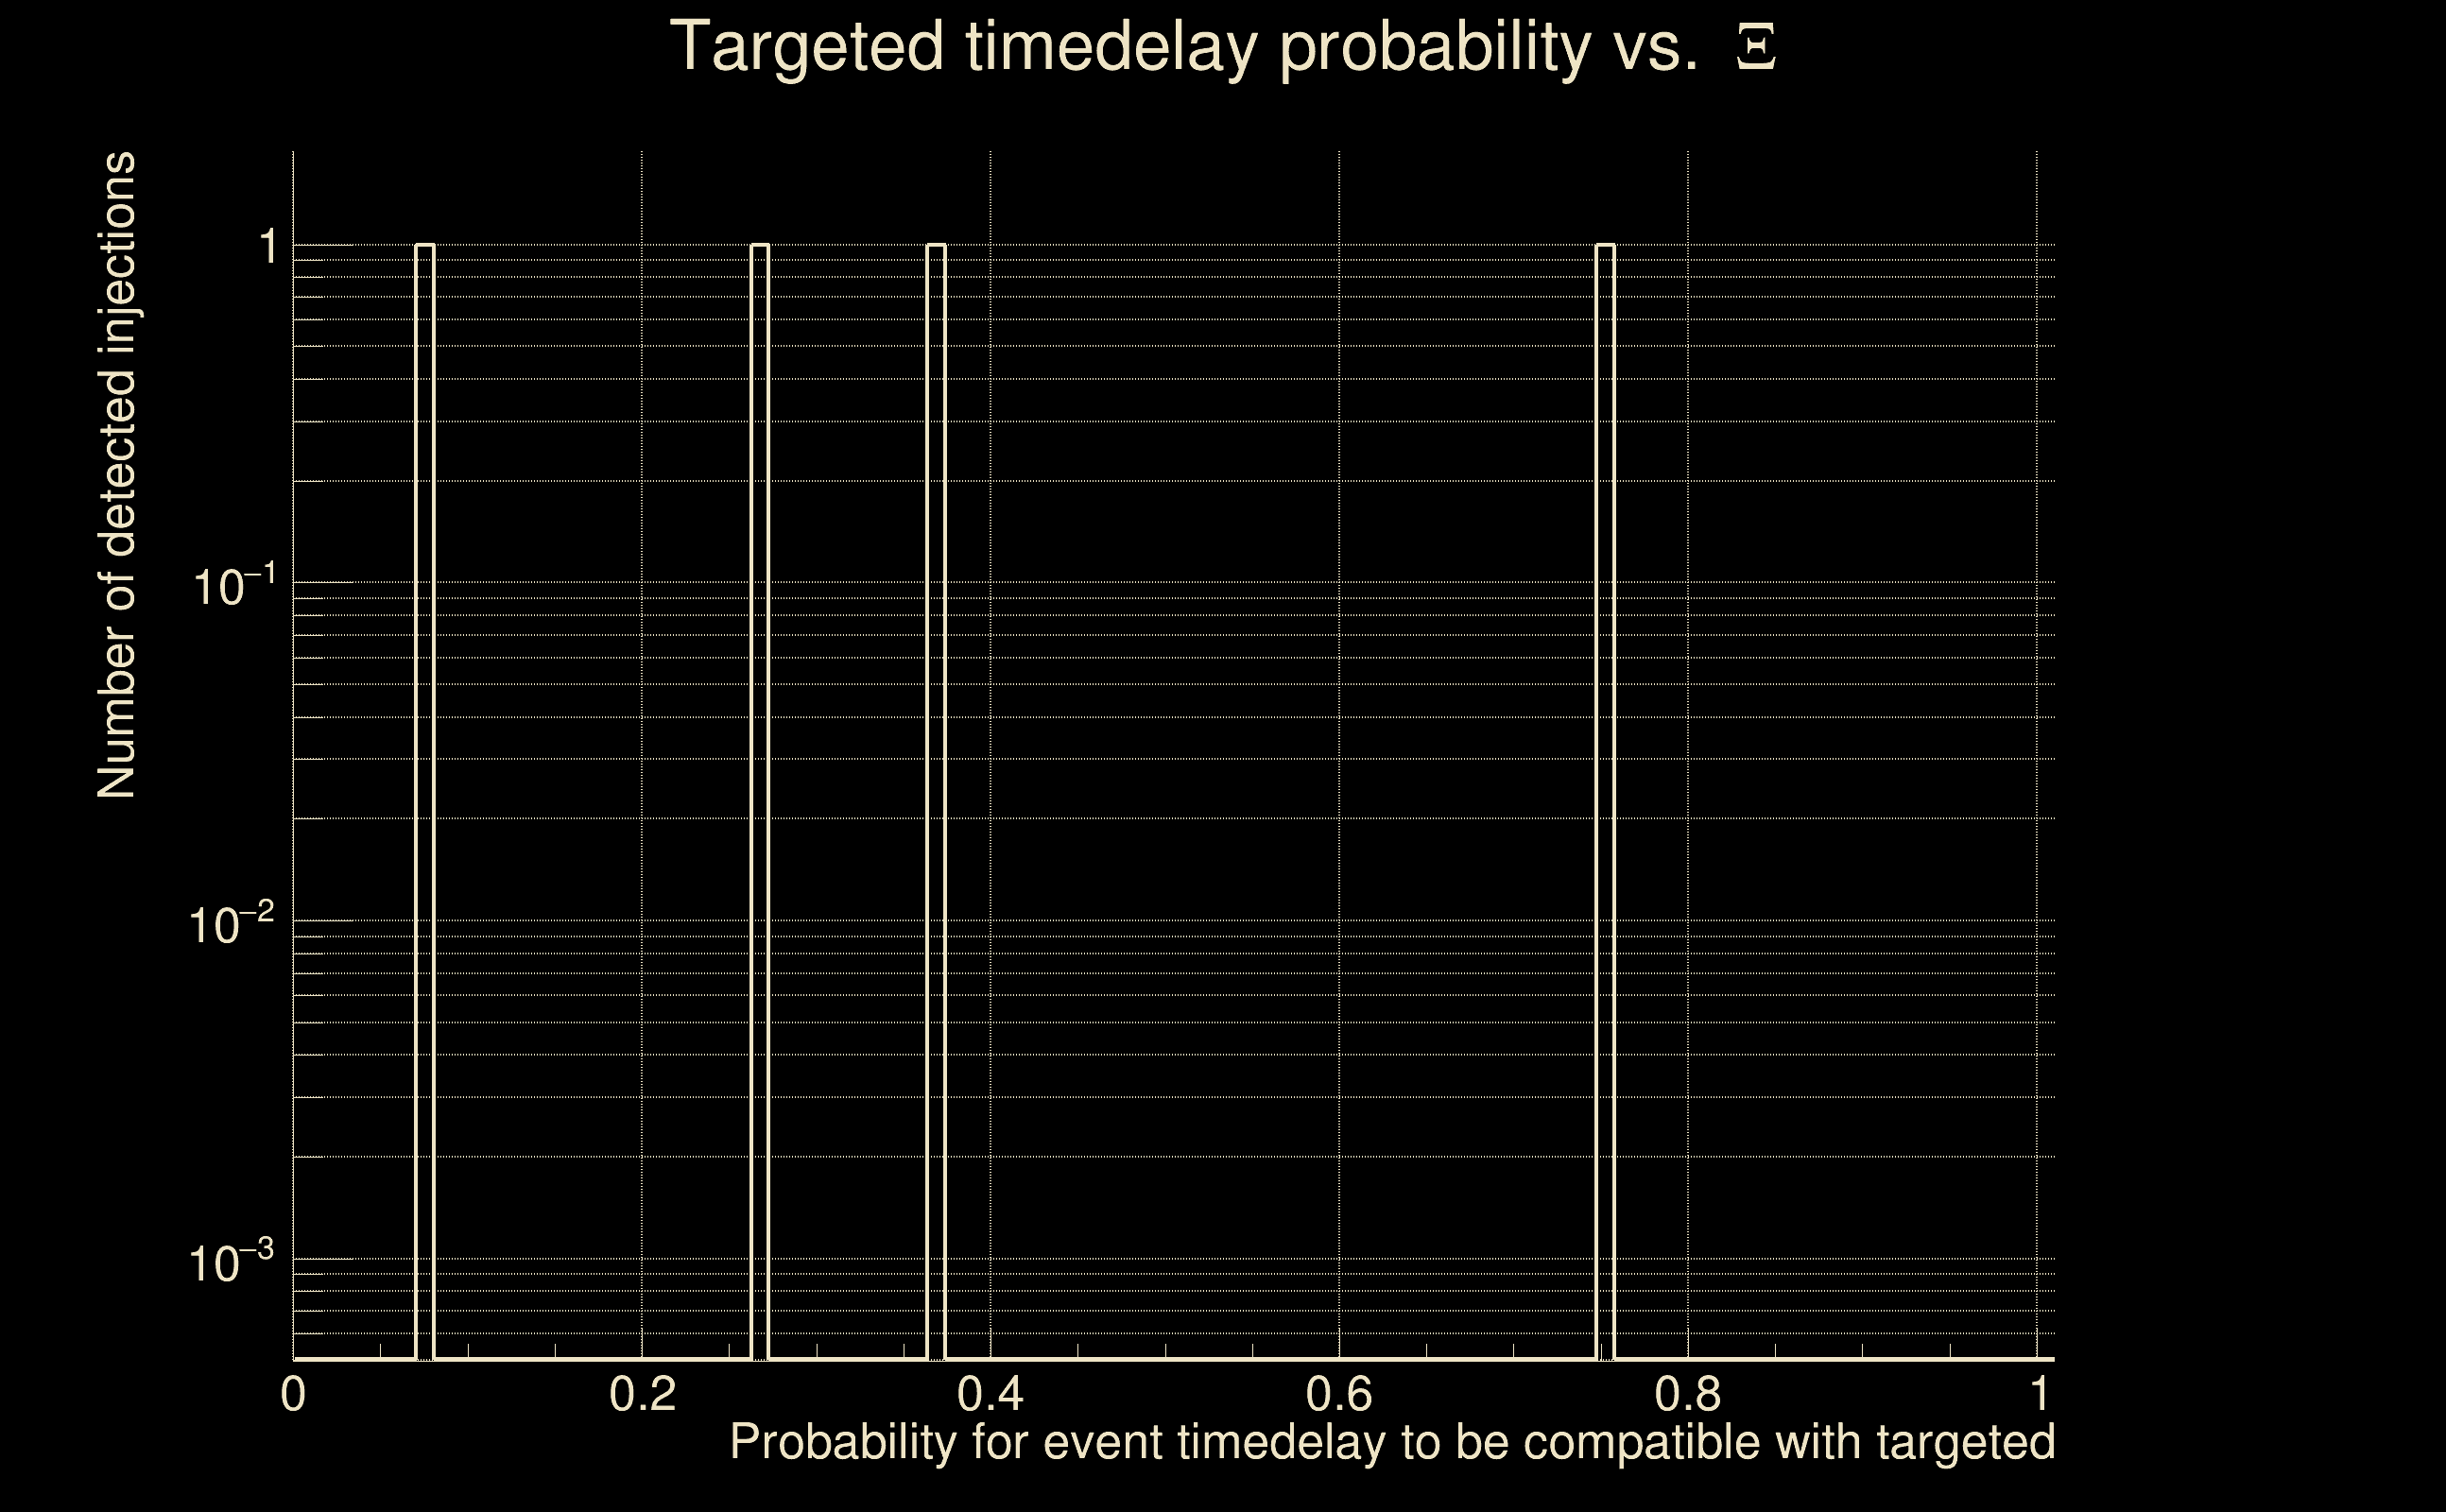
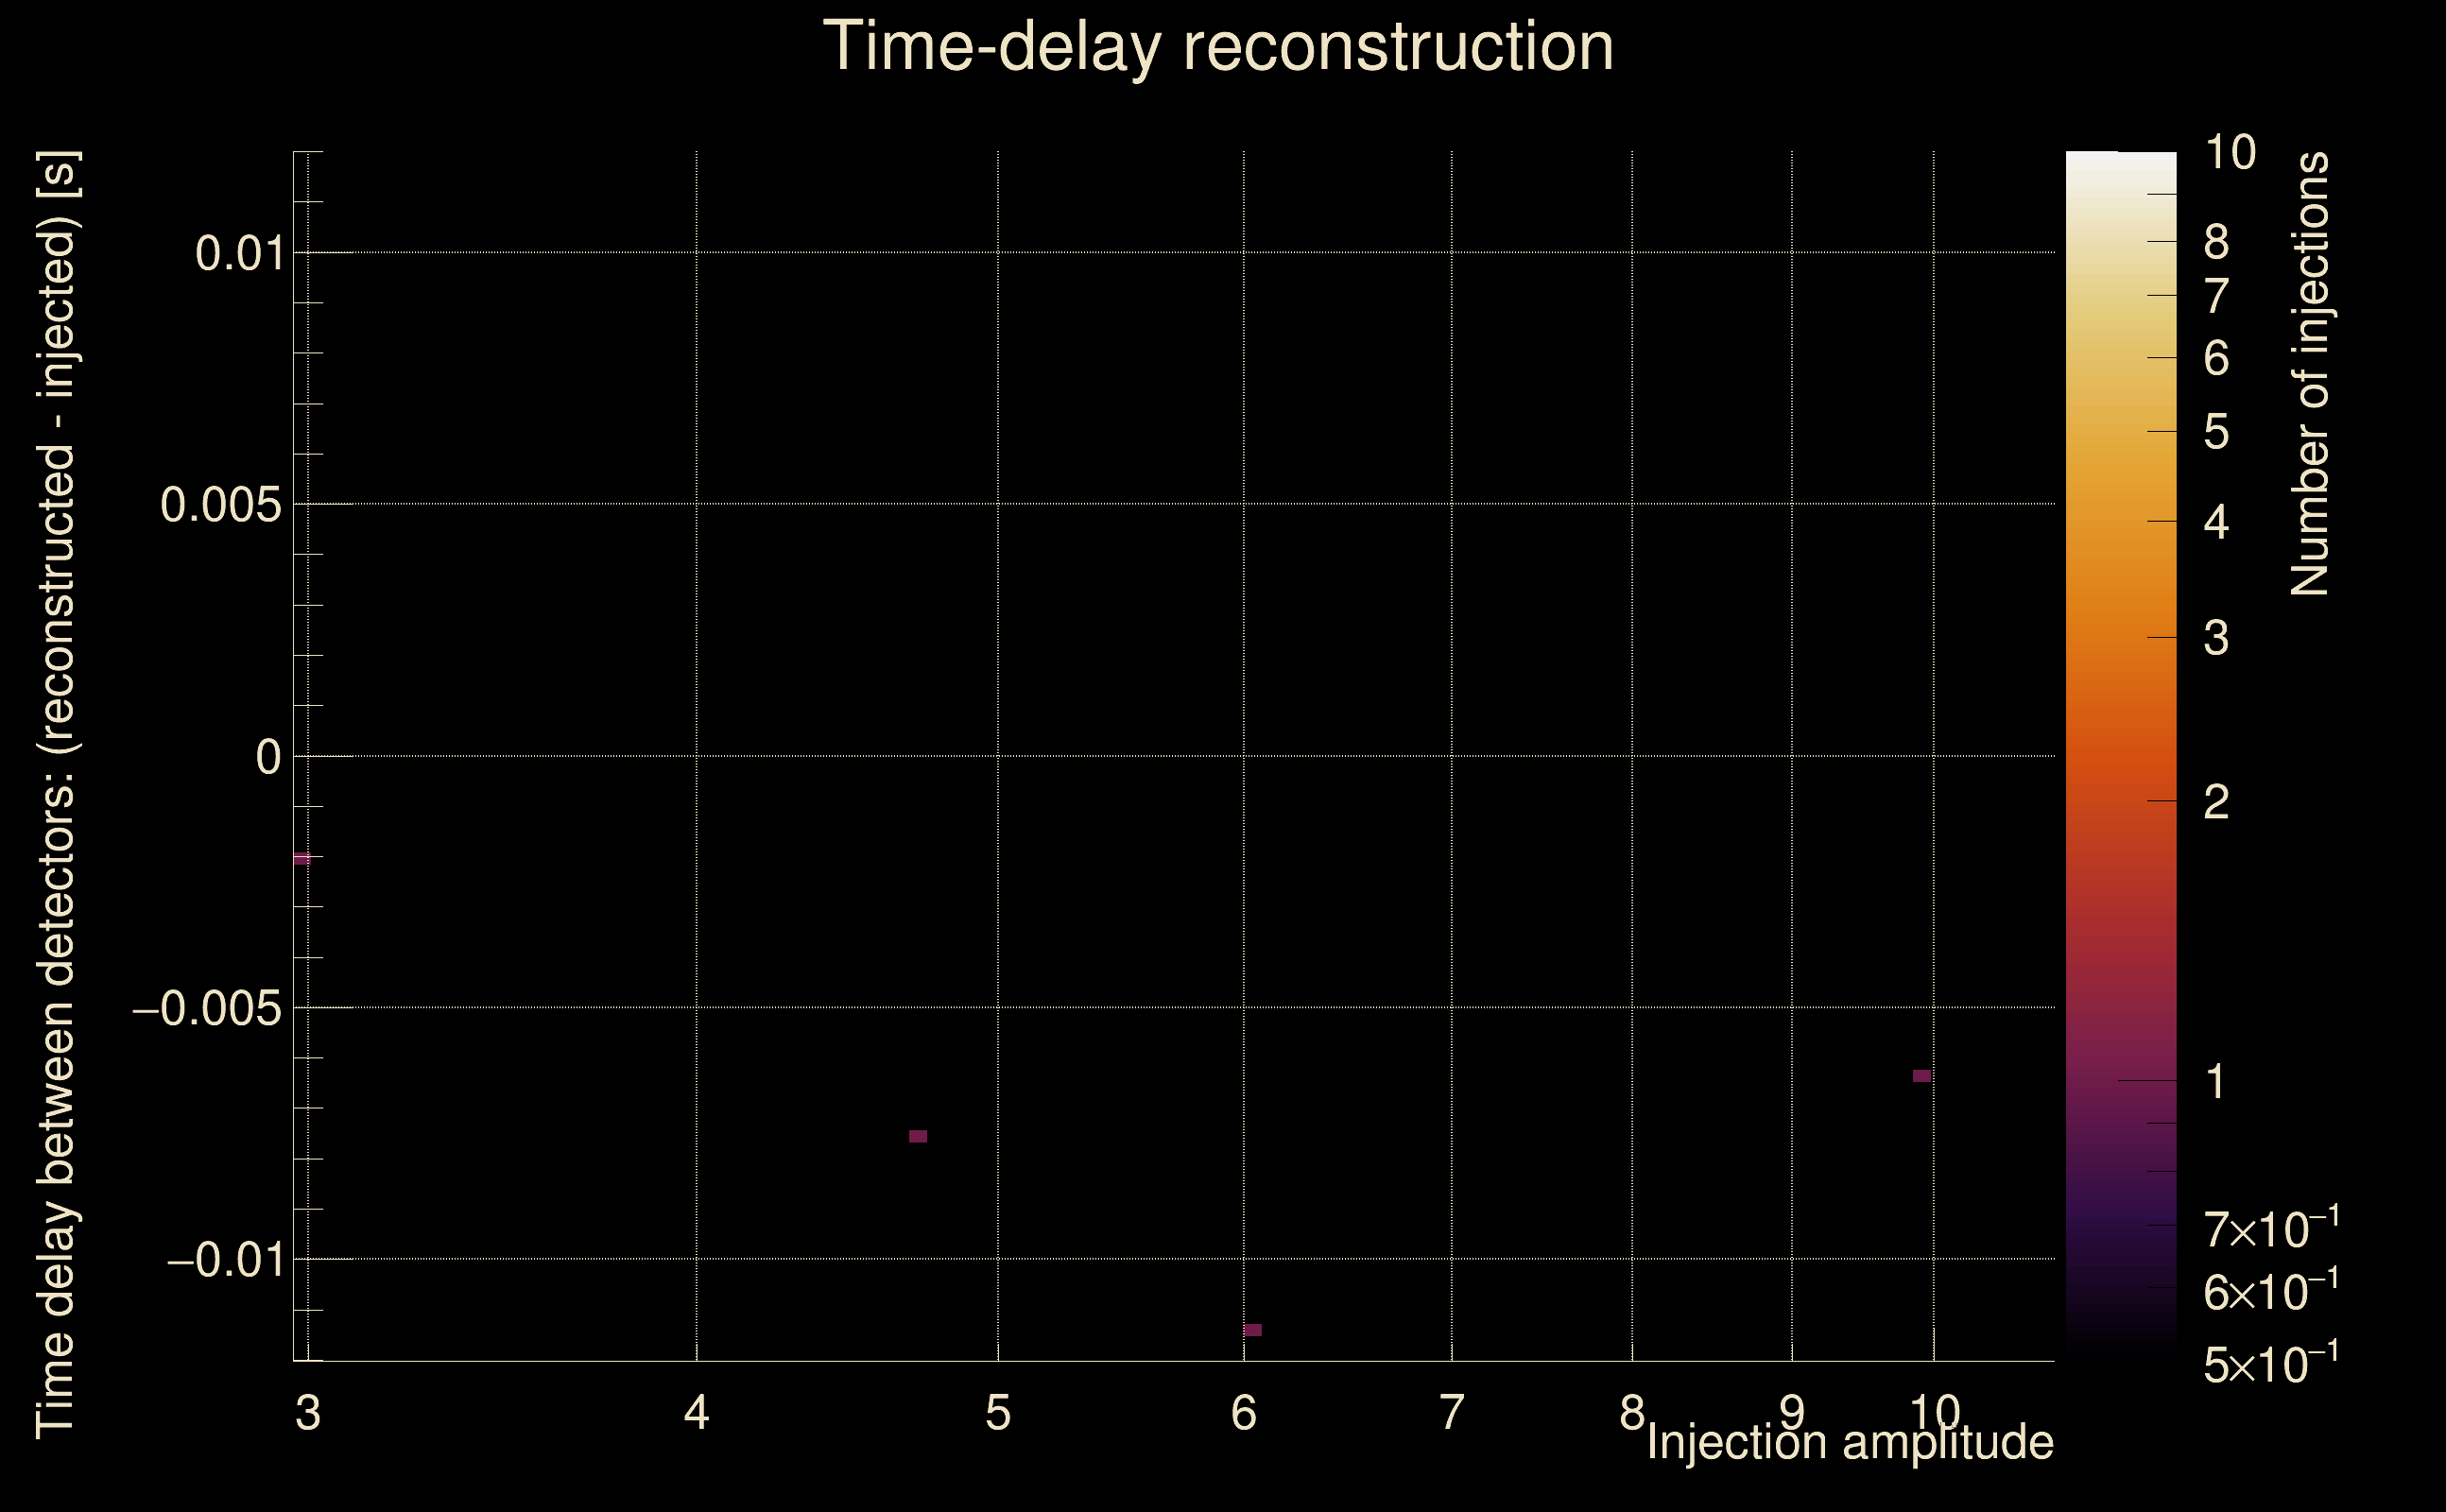
| Number of injections (total/valid/detected): | 4 / 4 / 0 |
| List of missed injections: | ./AND16-S20S_missed.txt |
| Injection amplitude at 90% detection efficiency: | -1 |
| Injection amplitude at 50% detection efficiency: | -1 |
| Injection amplitude at 10% detection efficiency: | -1 |
 |
 |
 |
 |
 |
 |
|
 |
 |
|
 |
 |
|
 |
 |
|
 |
 |
|
 |
 |
|
 |
 |
|
 |
 |
 |
 |
 |
 |
 |
 |
| florent.robinet@ijclab.in2p3.fr |