| Omicron version: | 4.2.0: documentation gitlab repository |
| Omicron run by: | unknown |
| Report produced on: | Mon Oct 27 13:41:07 2025 UTC |
| Ox option file: | Targeted_O4bw_2min_2_options.txt |
| Omicron option files: | detector 0, detector 1 |
| Detector channel names: | H1:GDS-CALIB_STRAIN_CLEAN_AR_4096Hz, L1:GDS-CALIB_STRAIN_CLEAN_AR_4096Hz |
| Omicron analysis time window and overlap: | 16 s, 6 s |
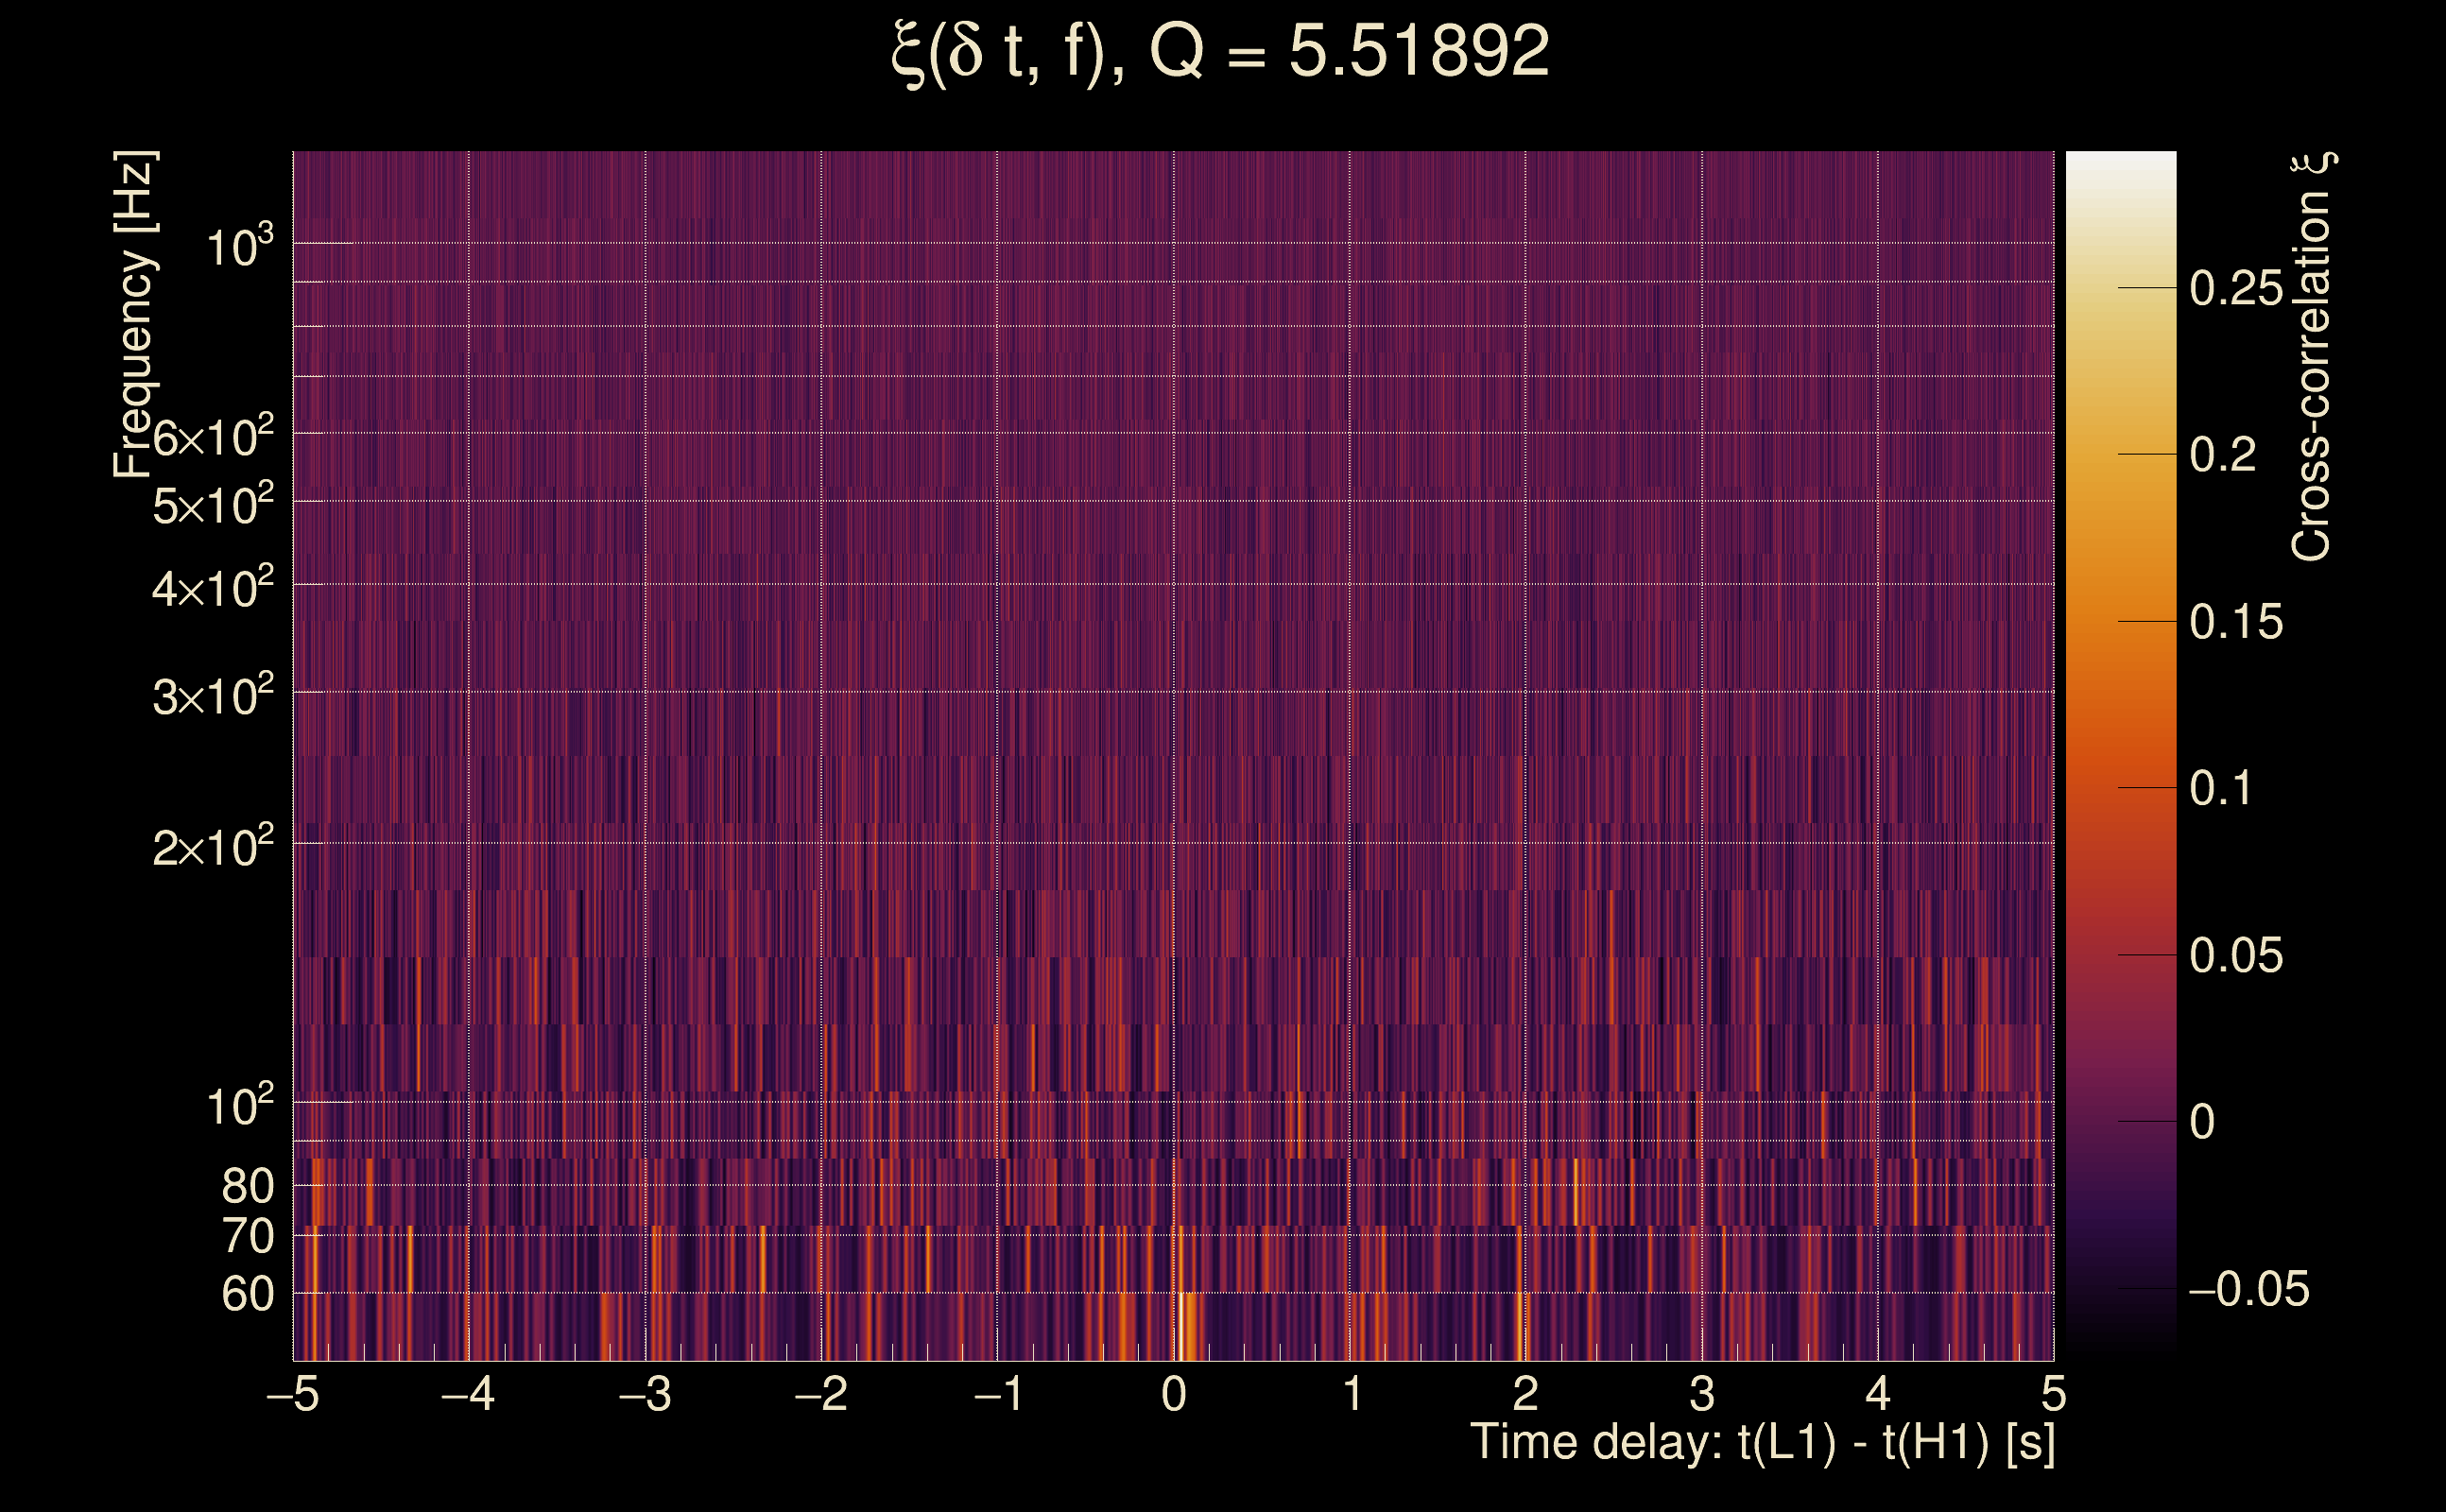
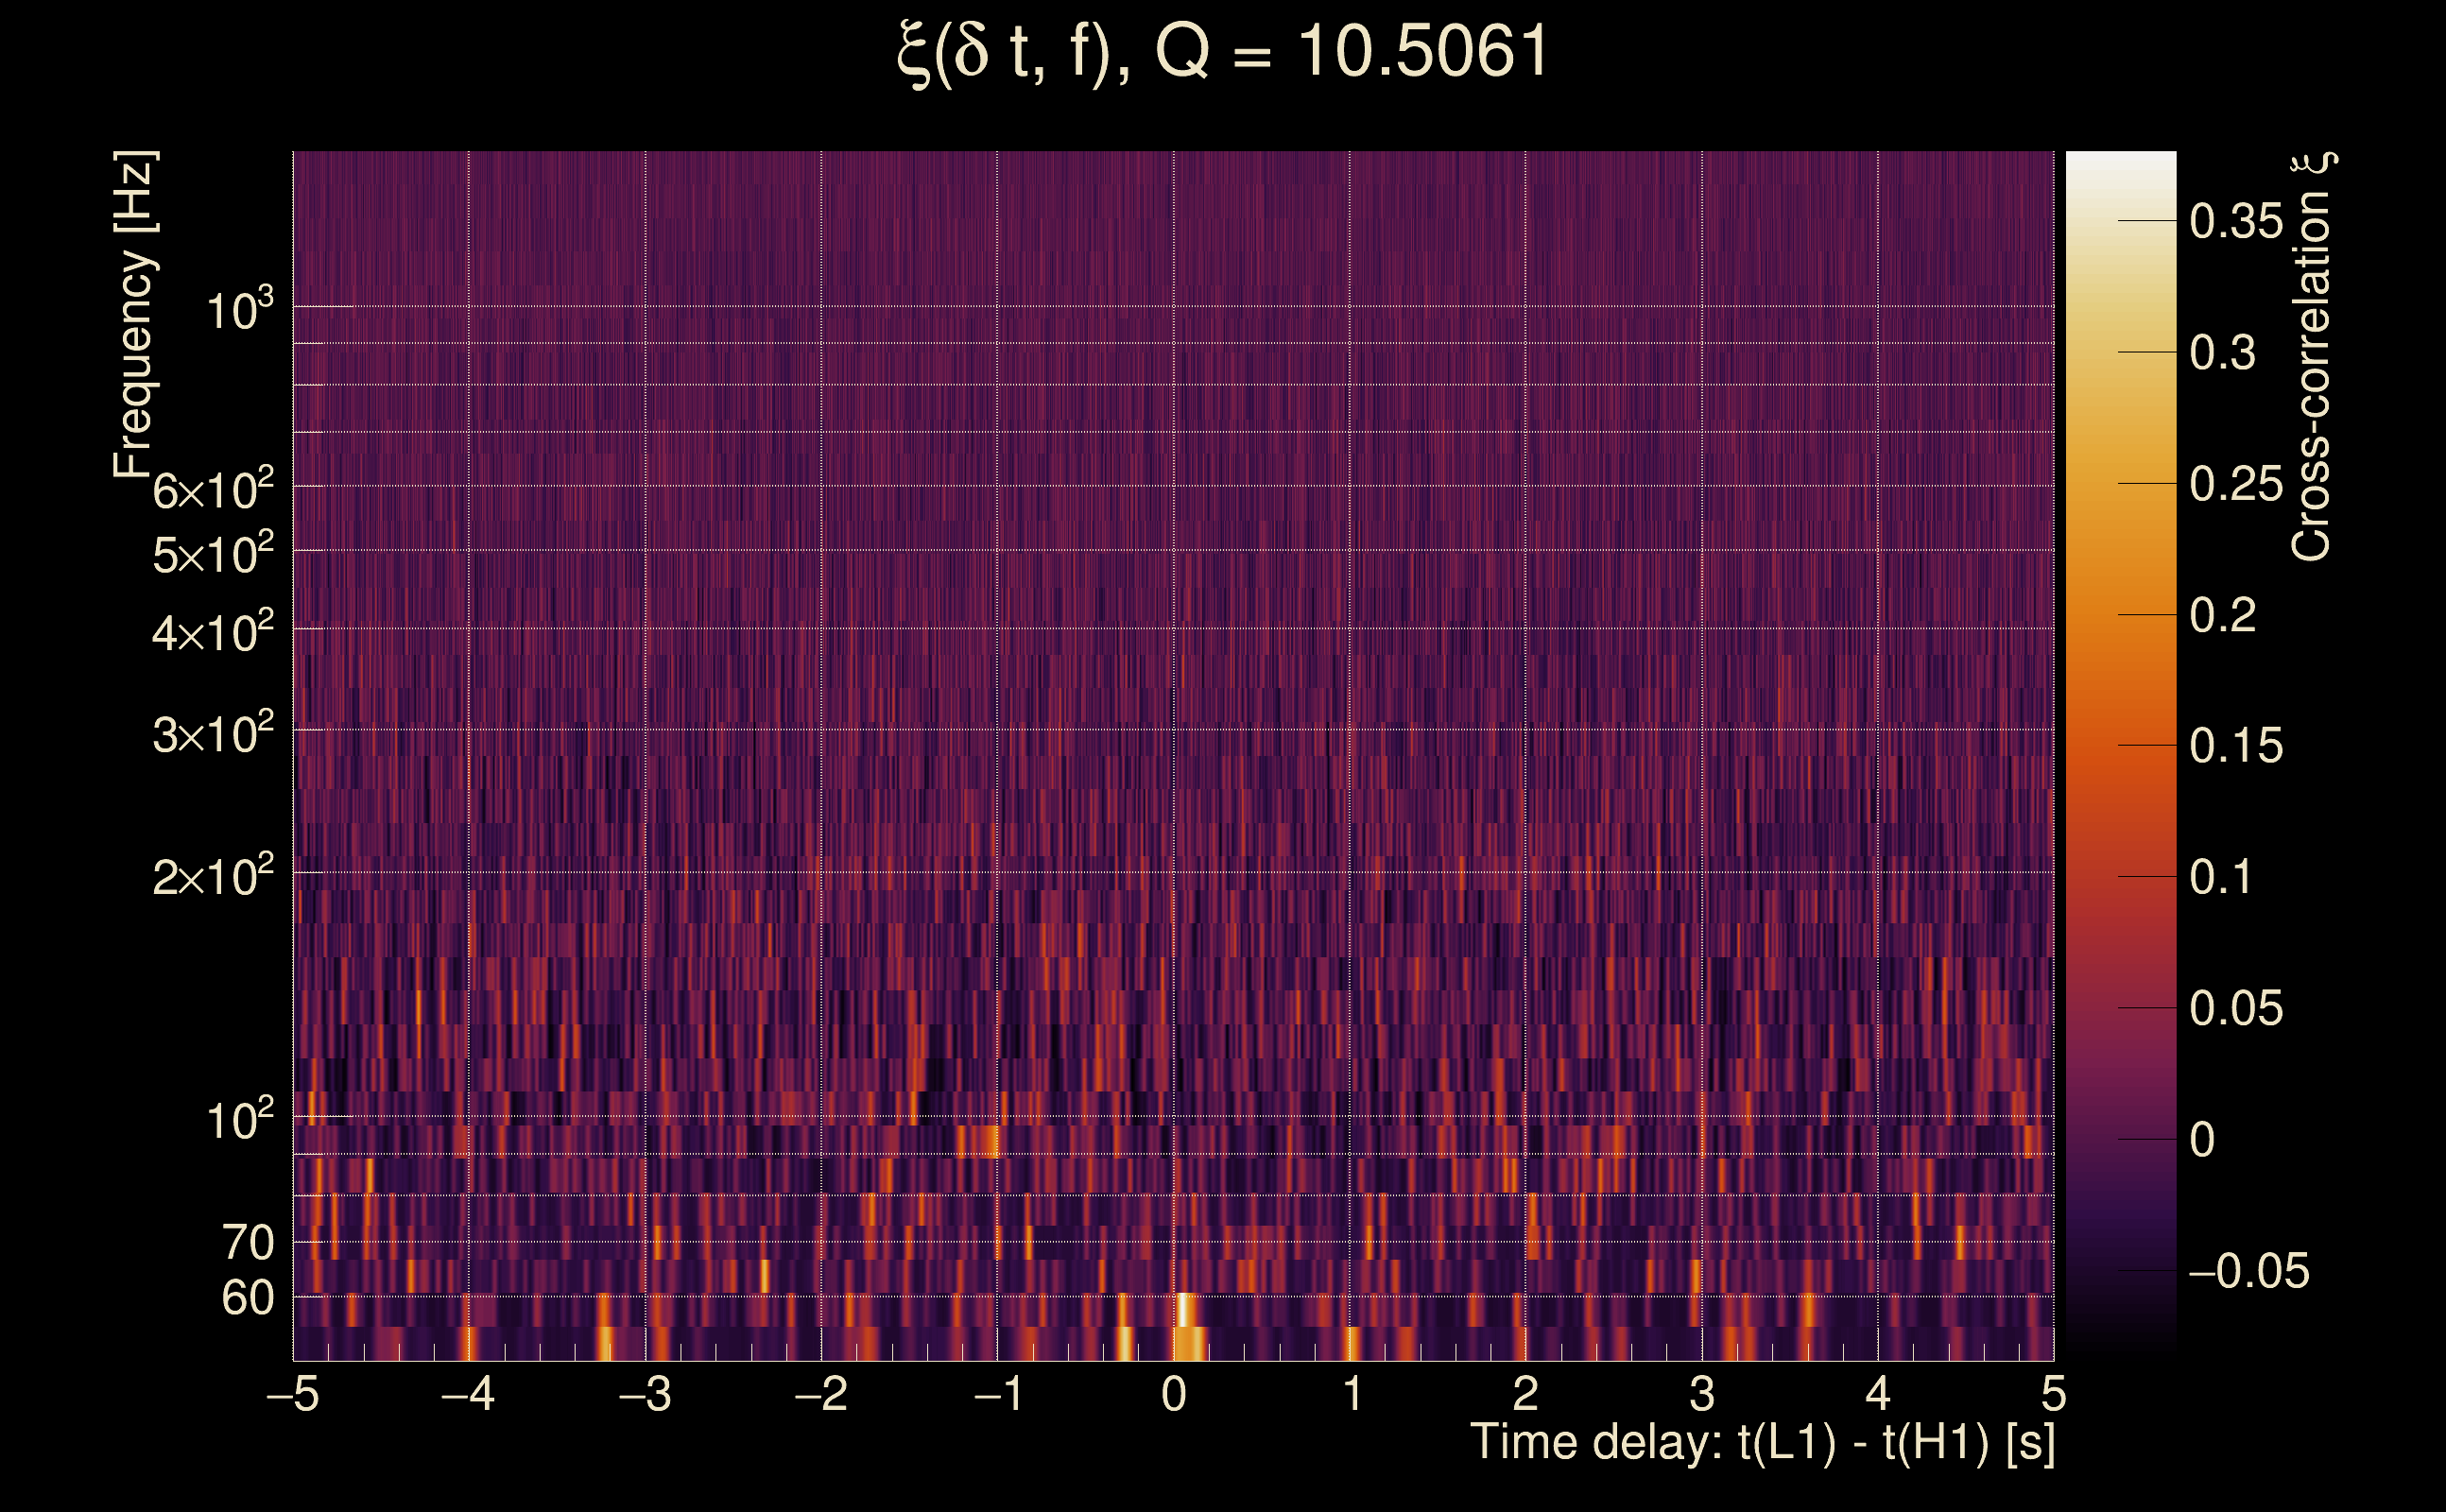
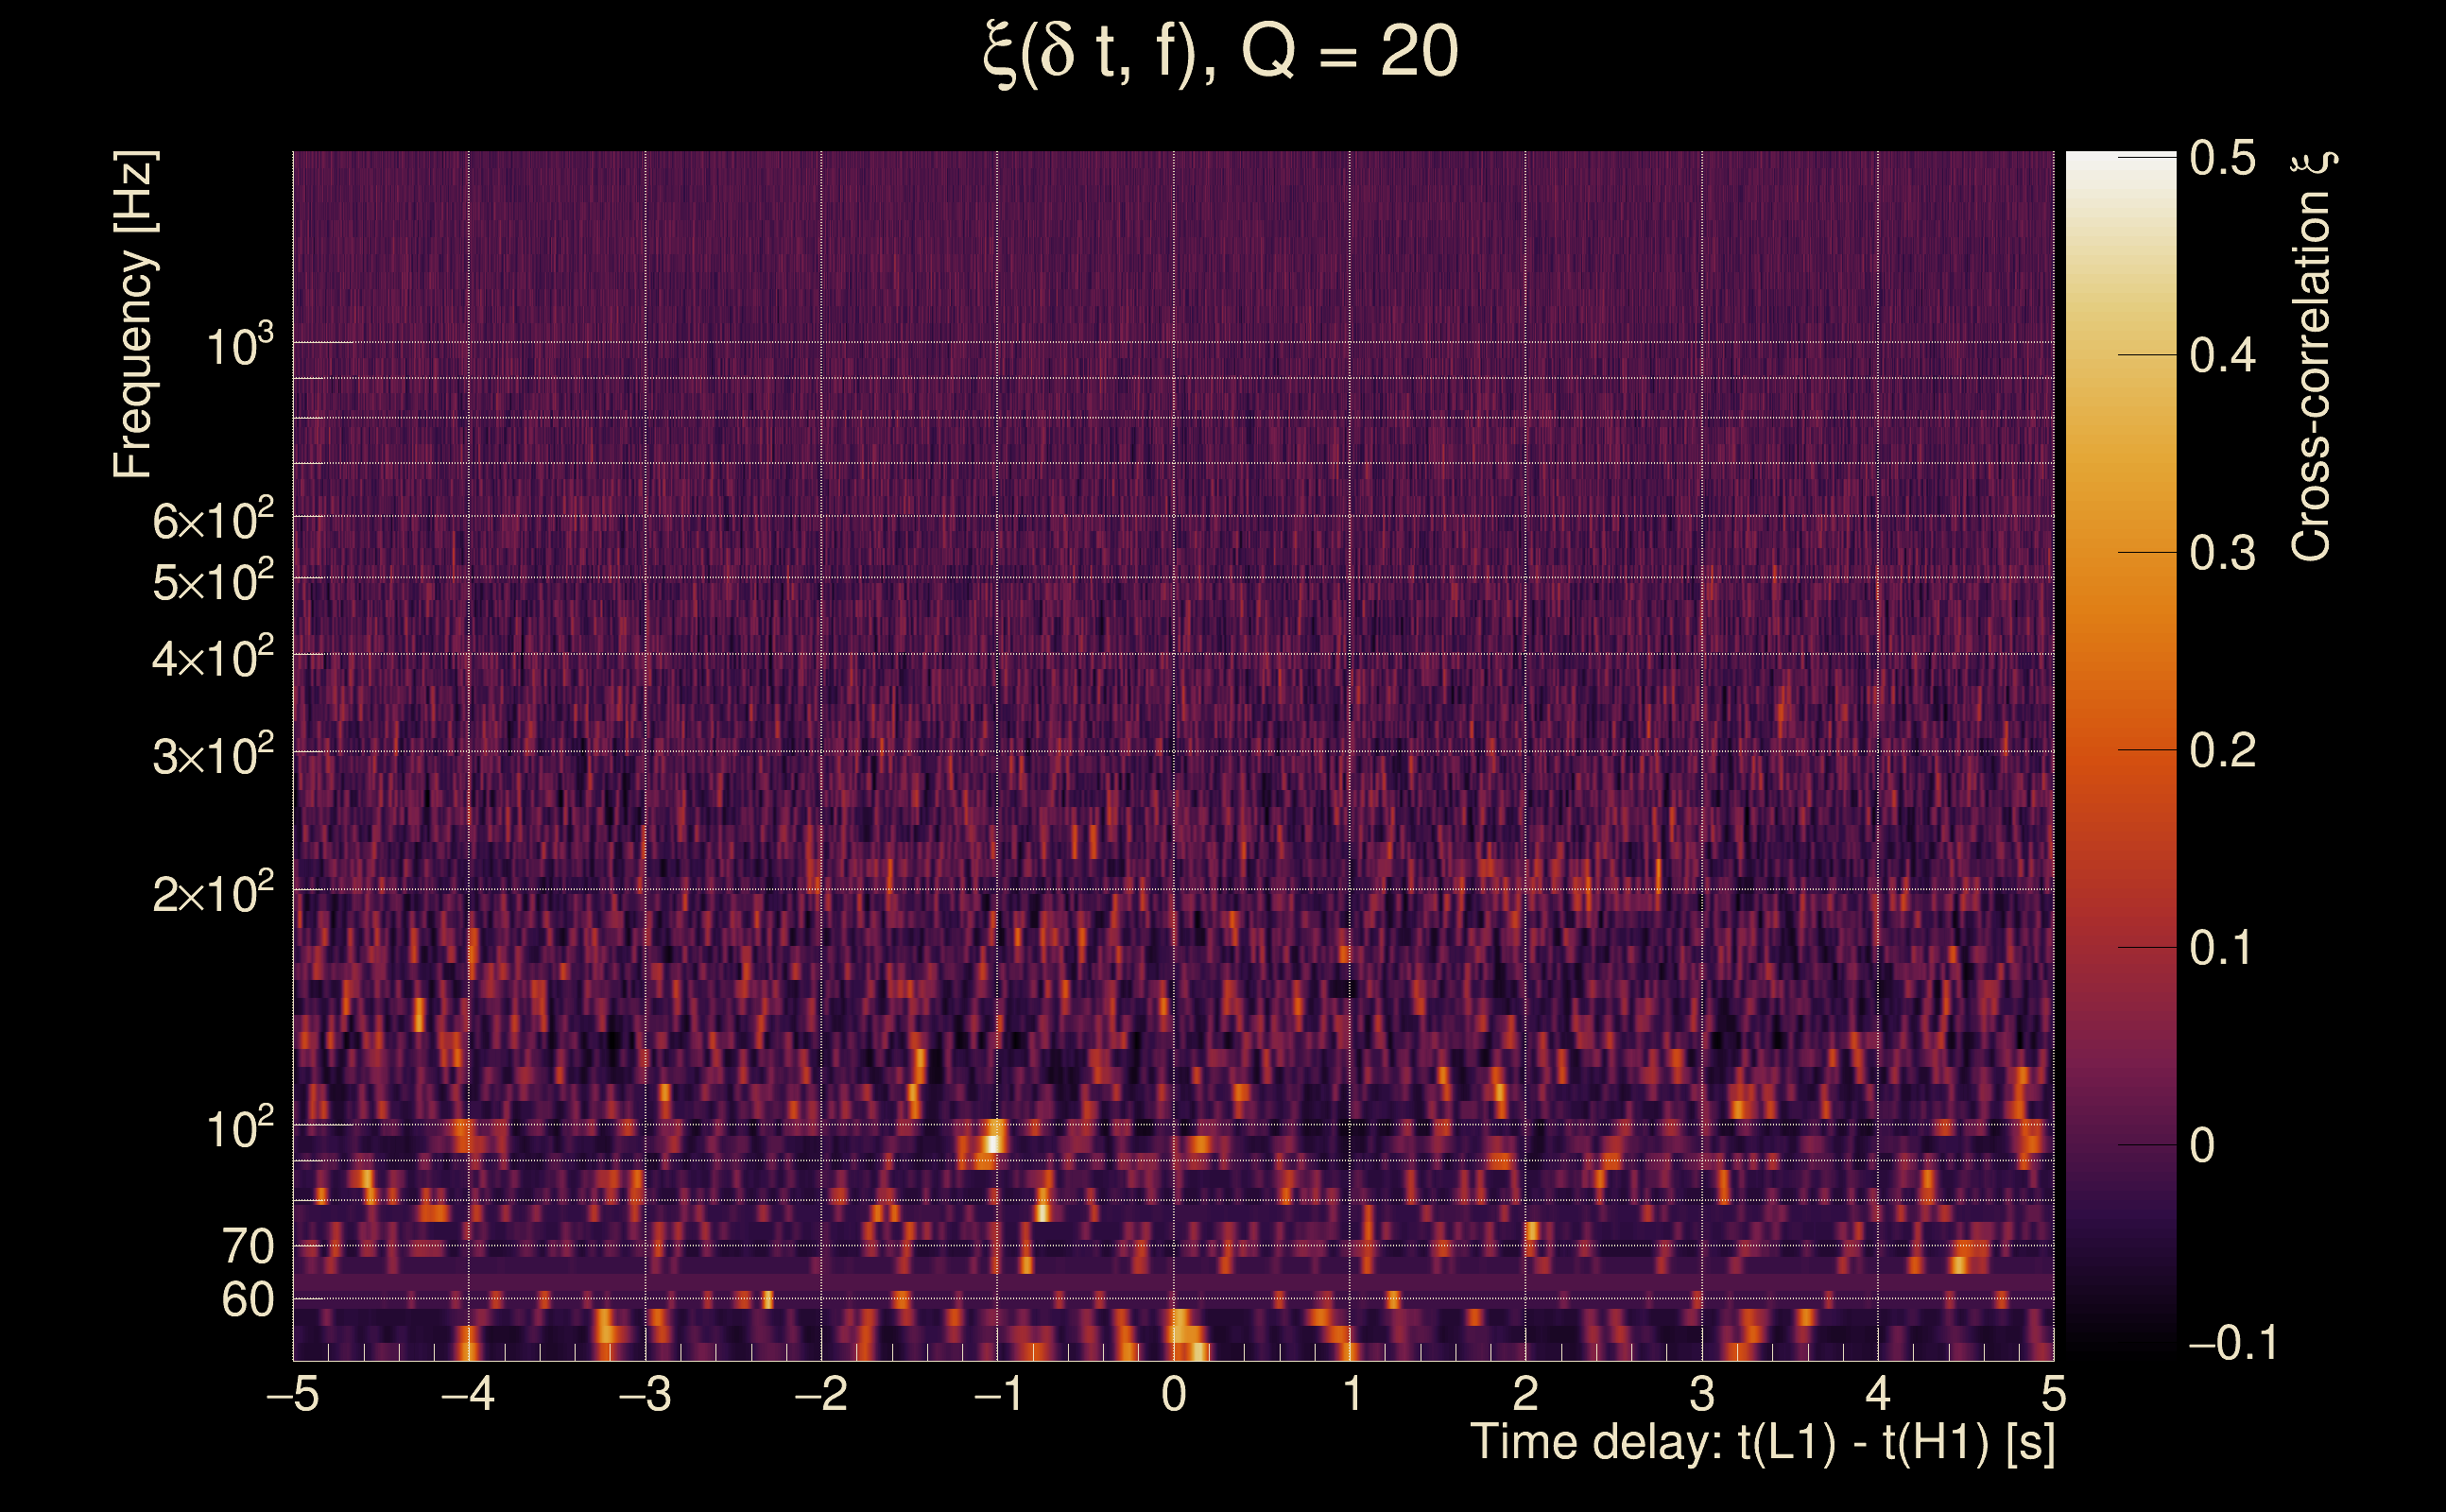
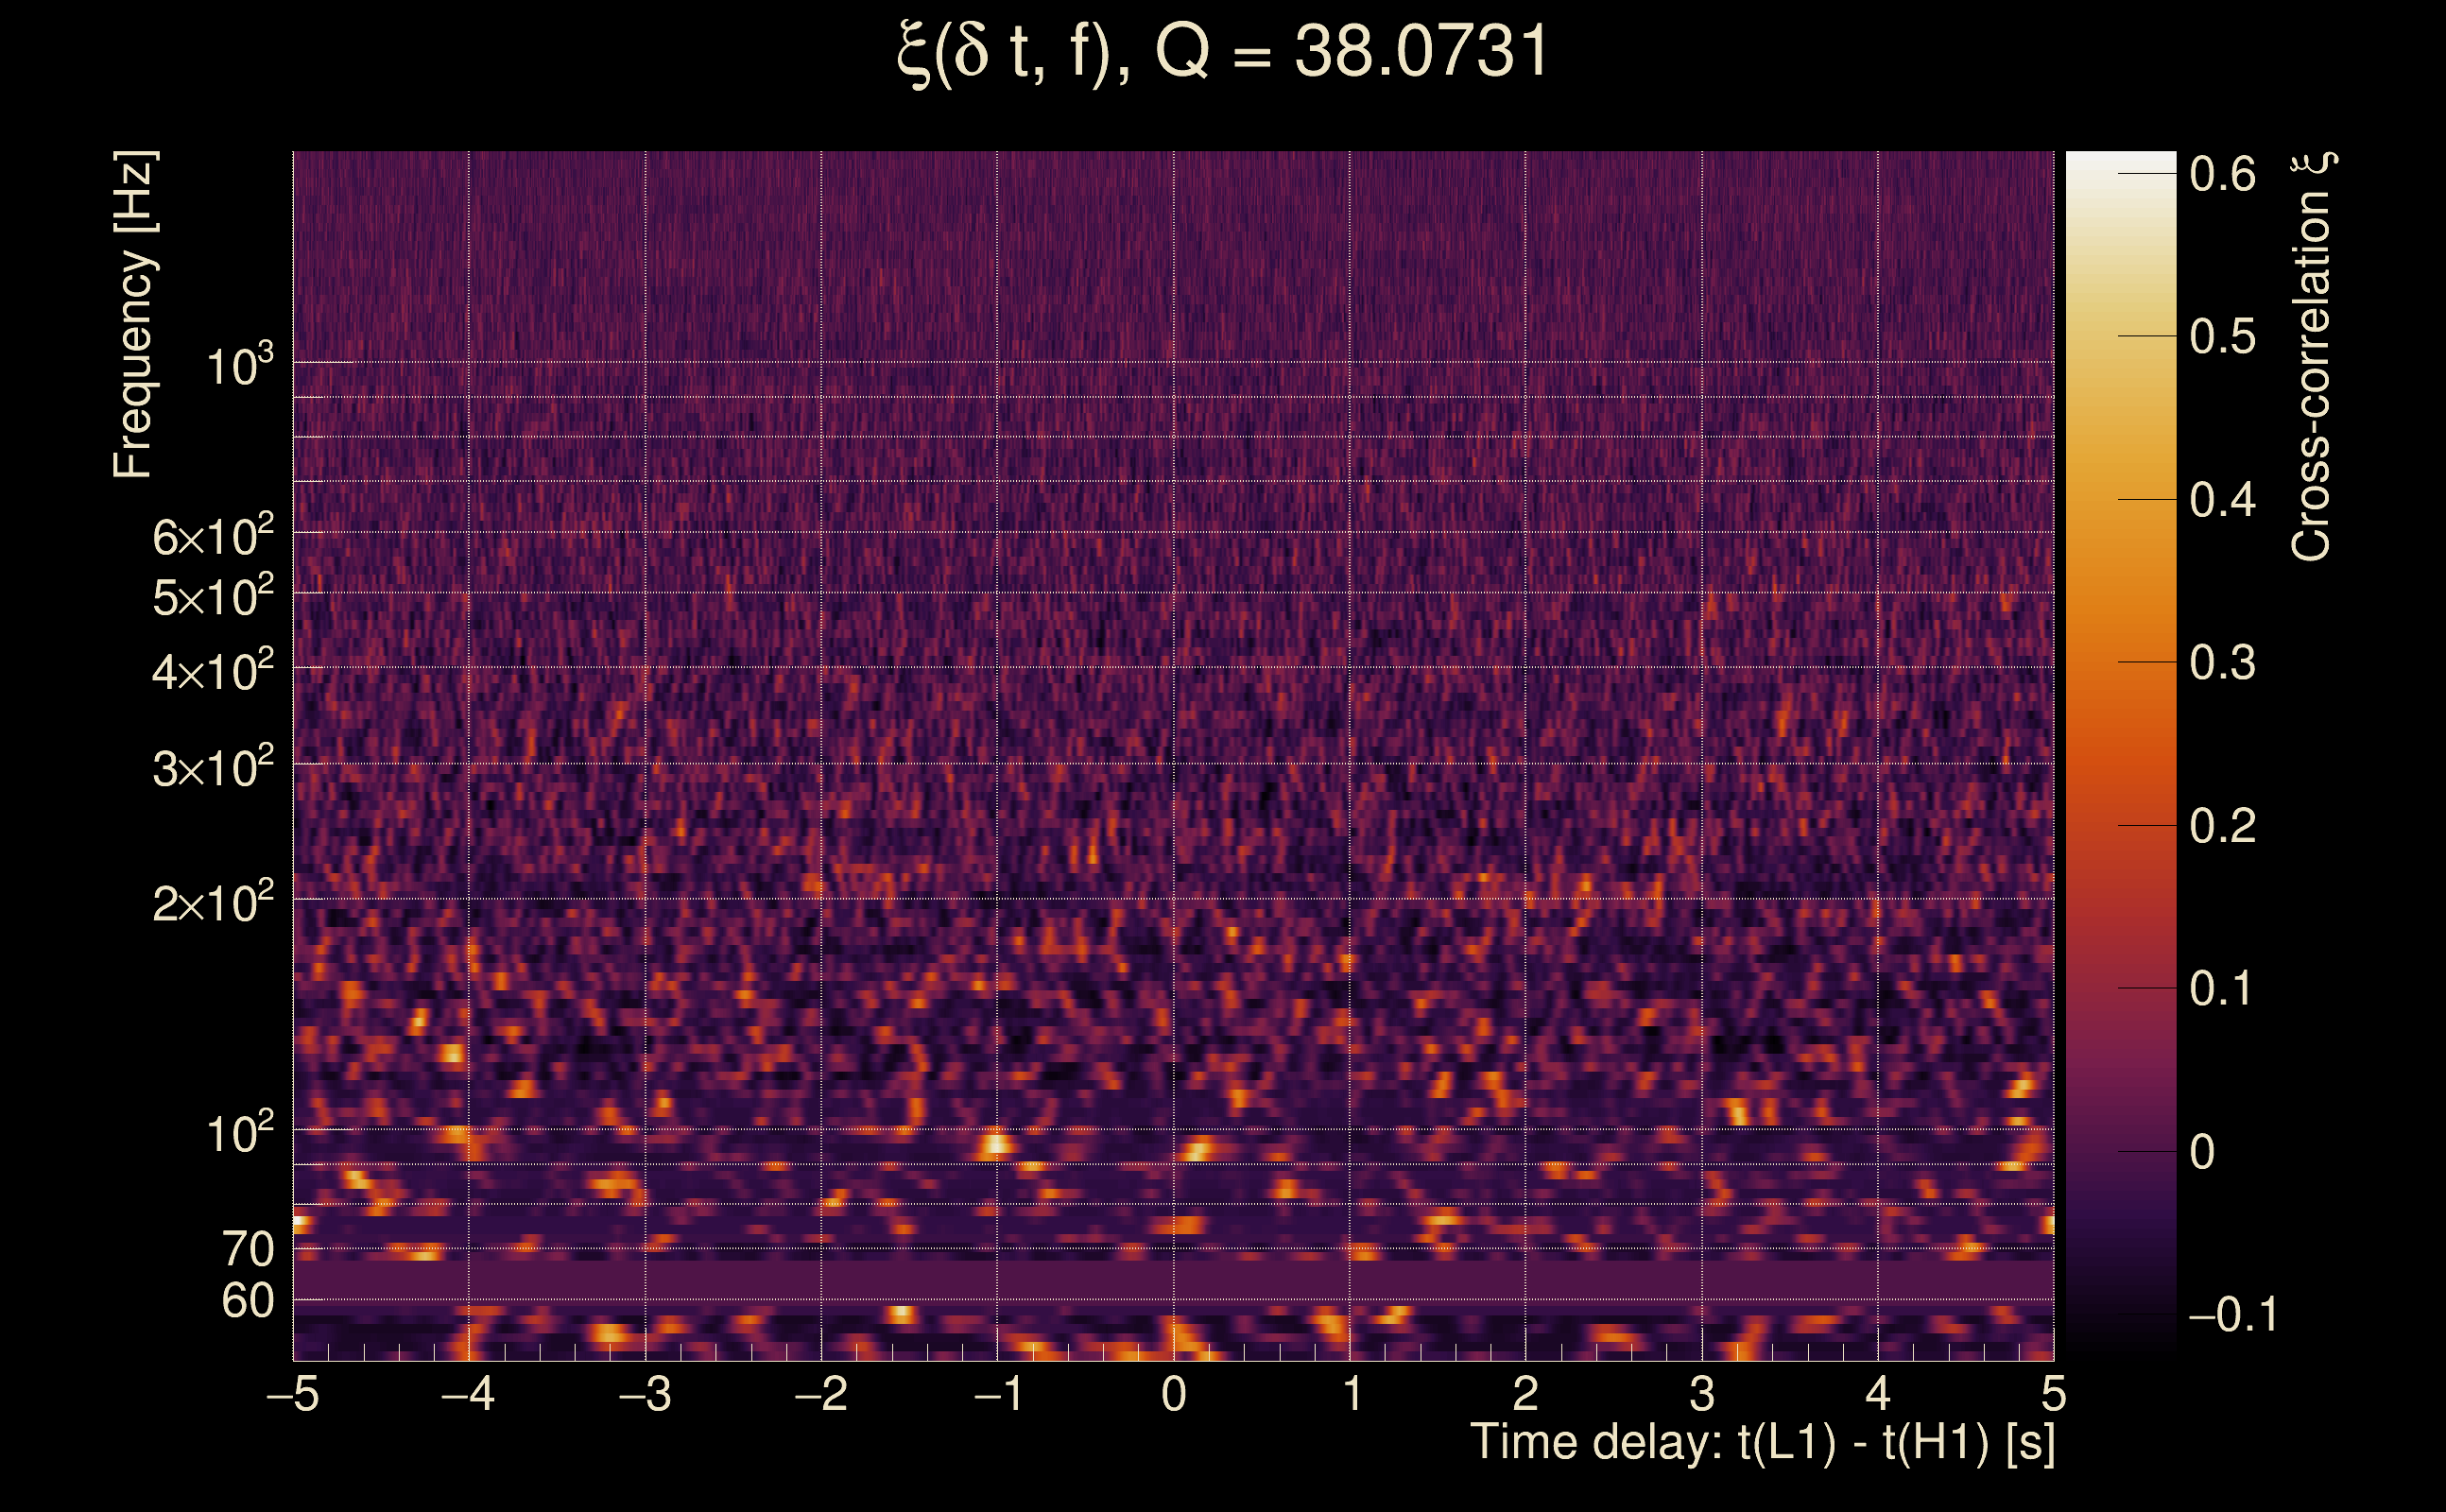
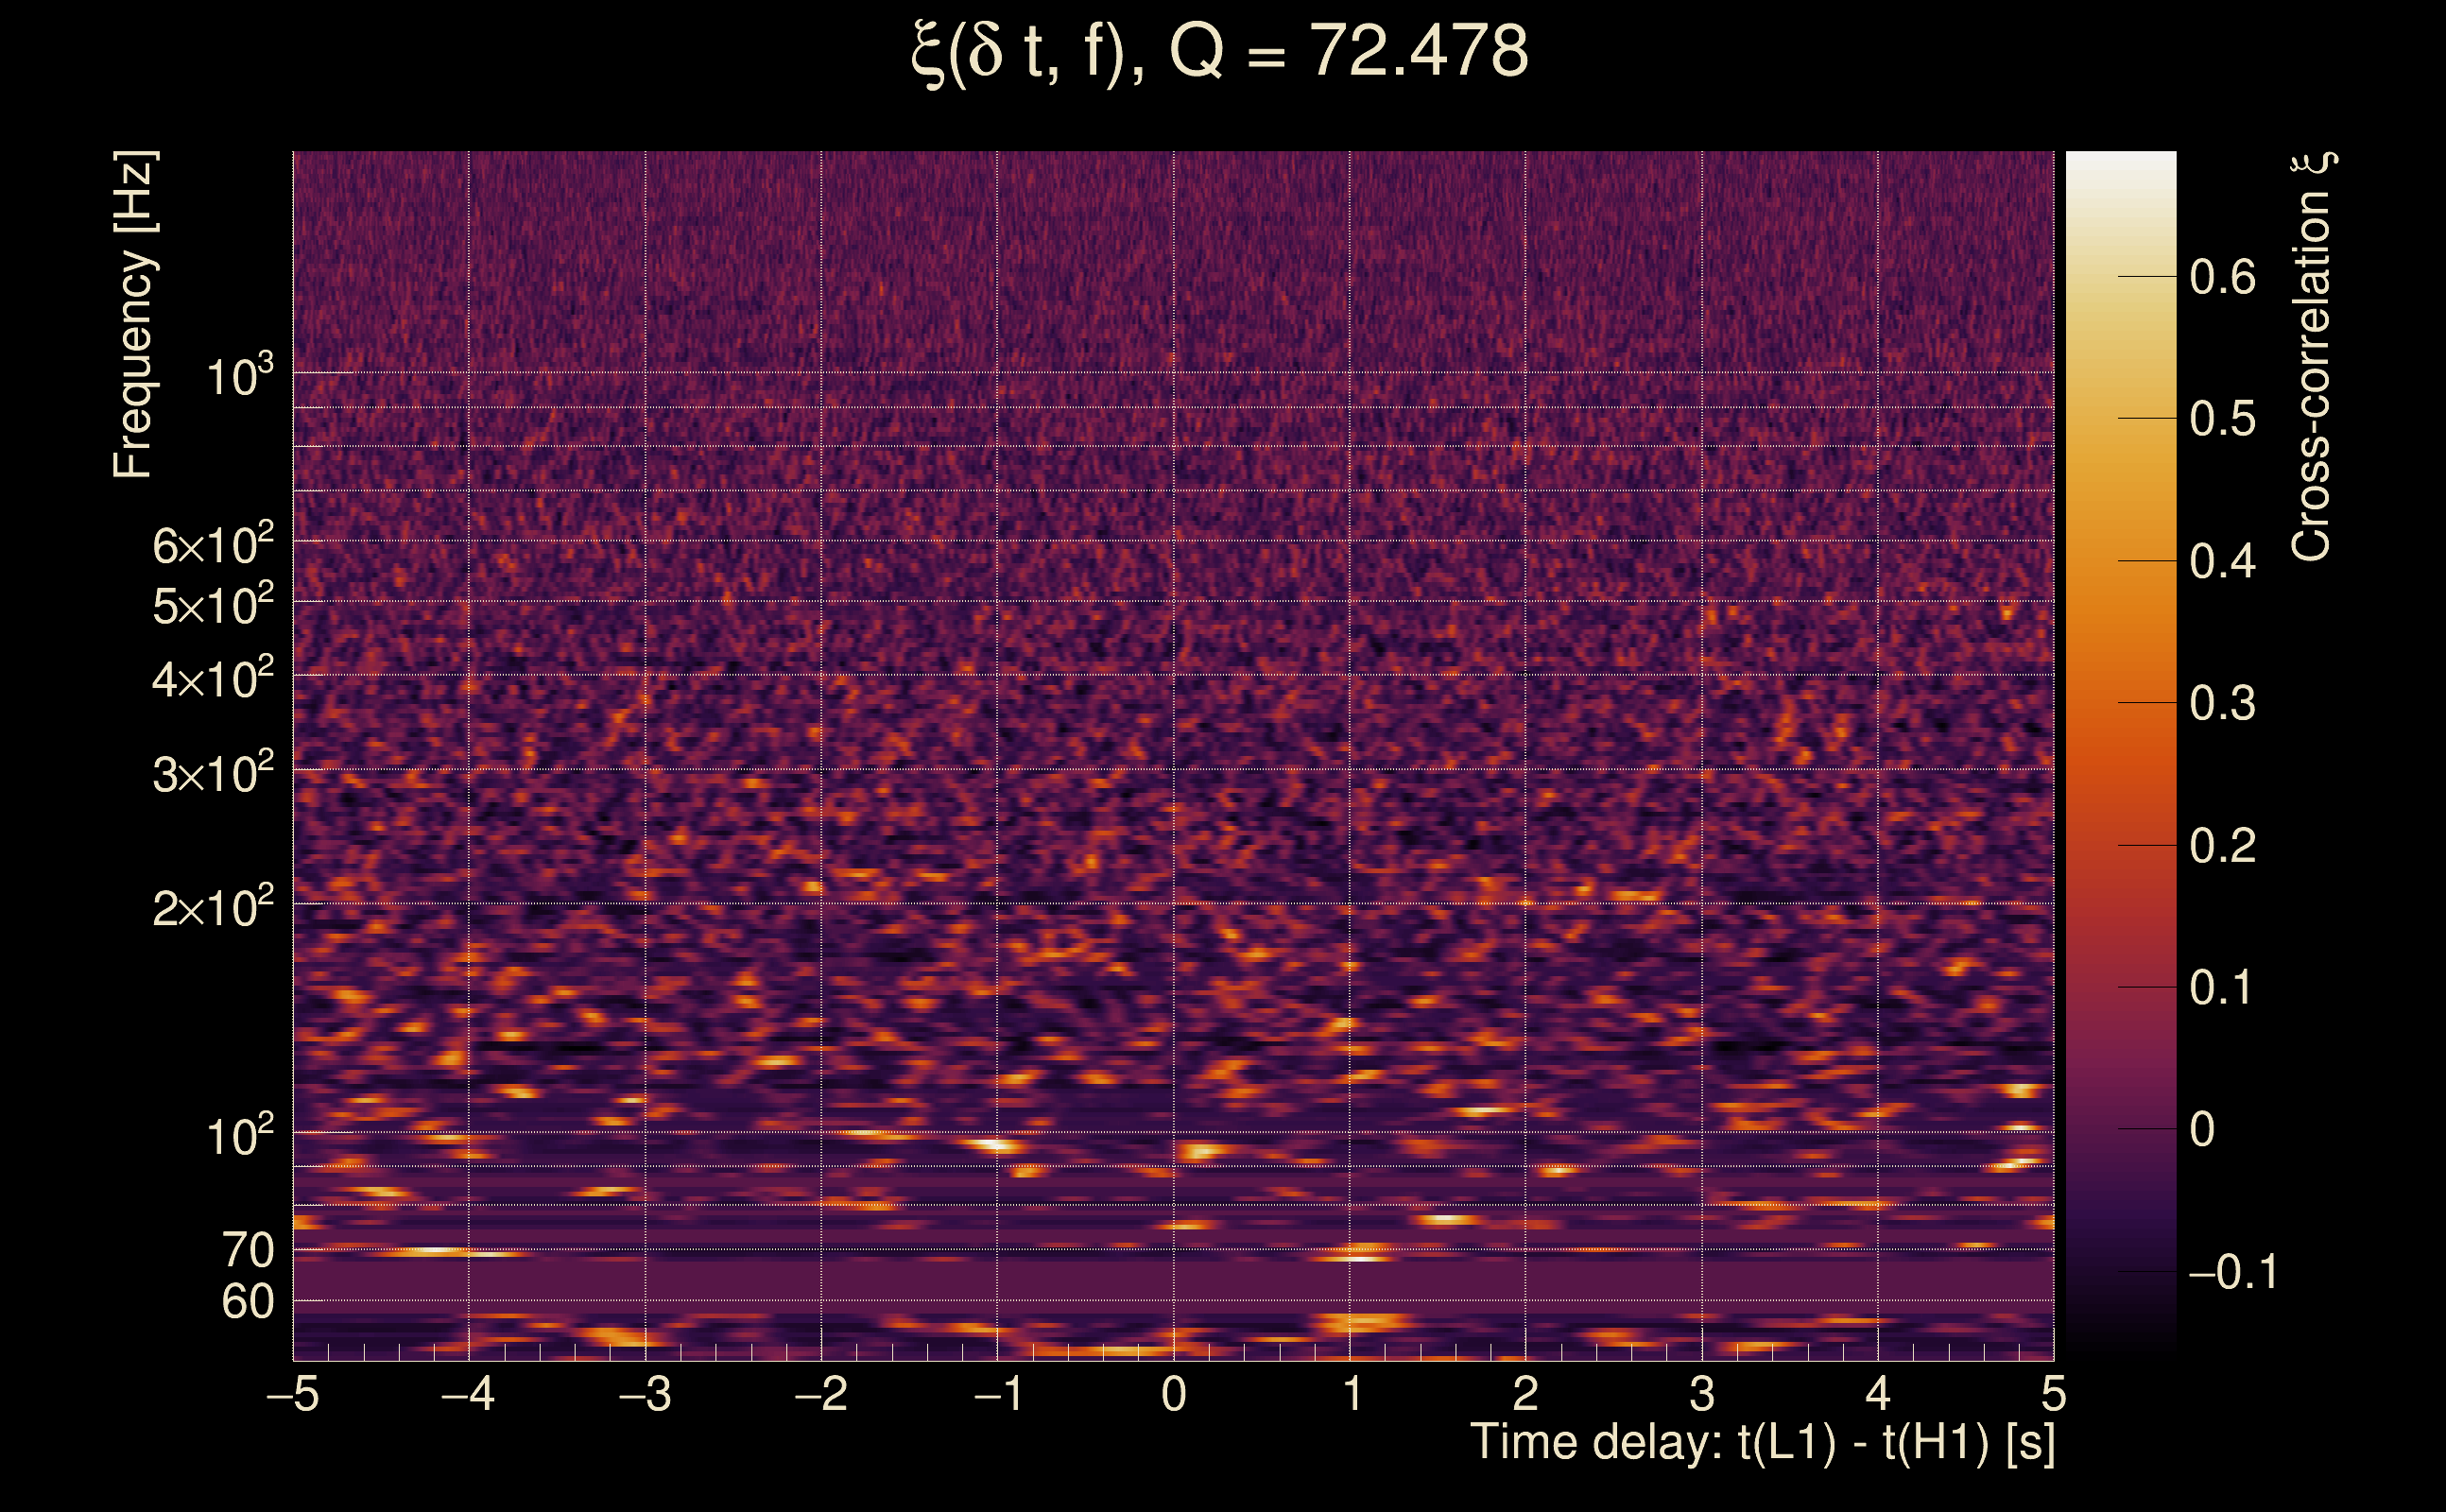
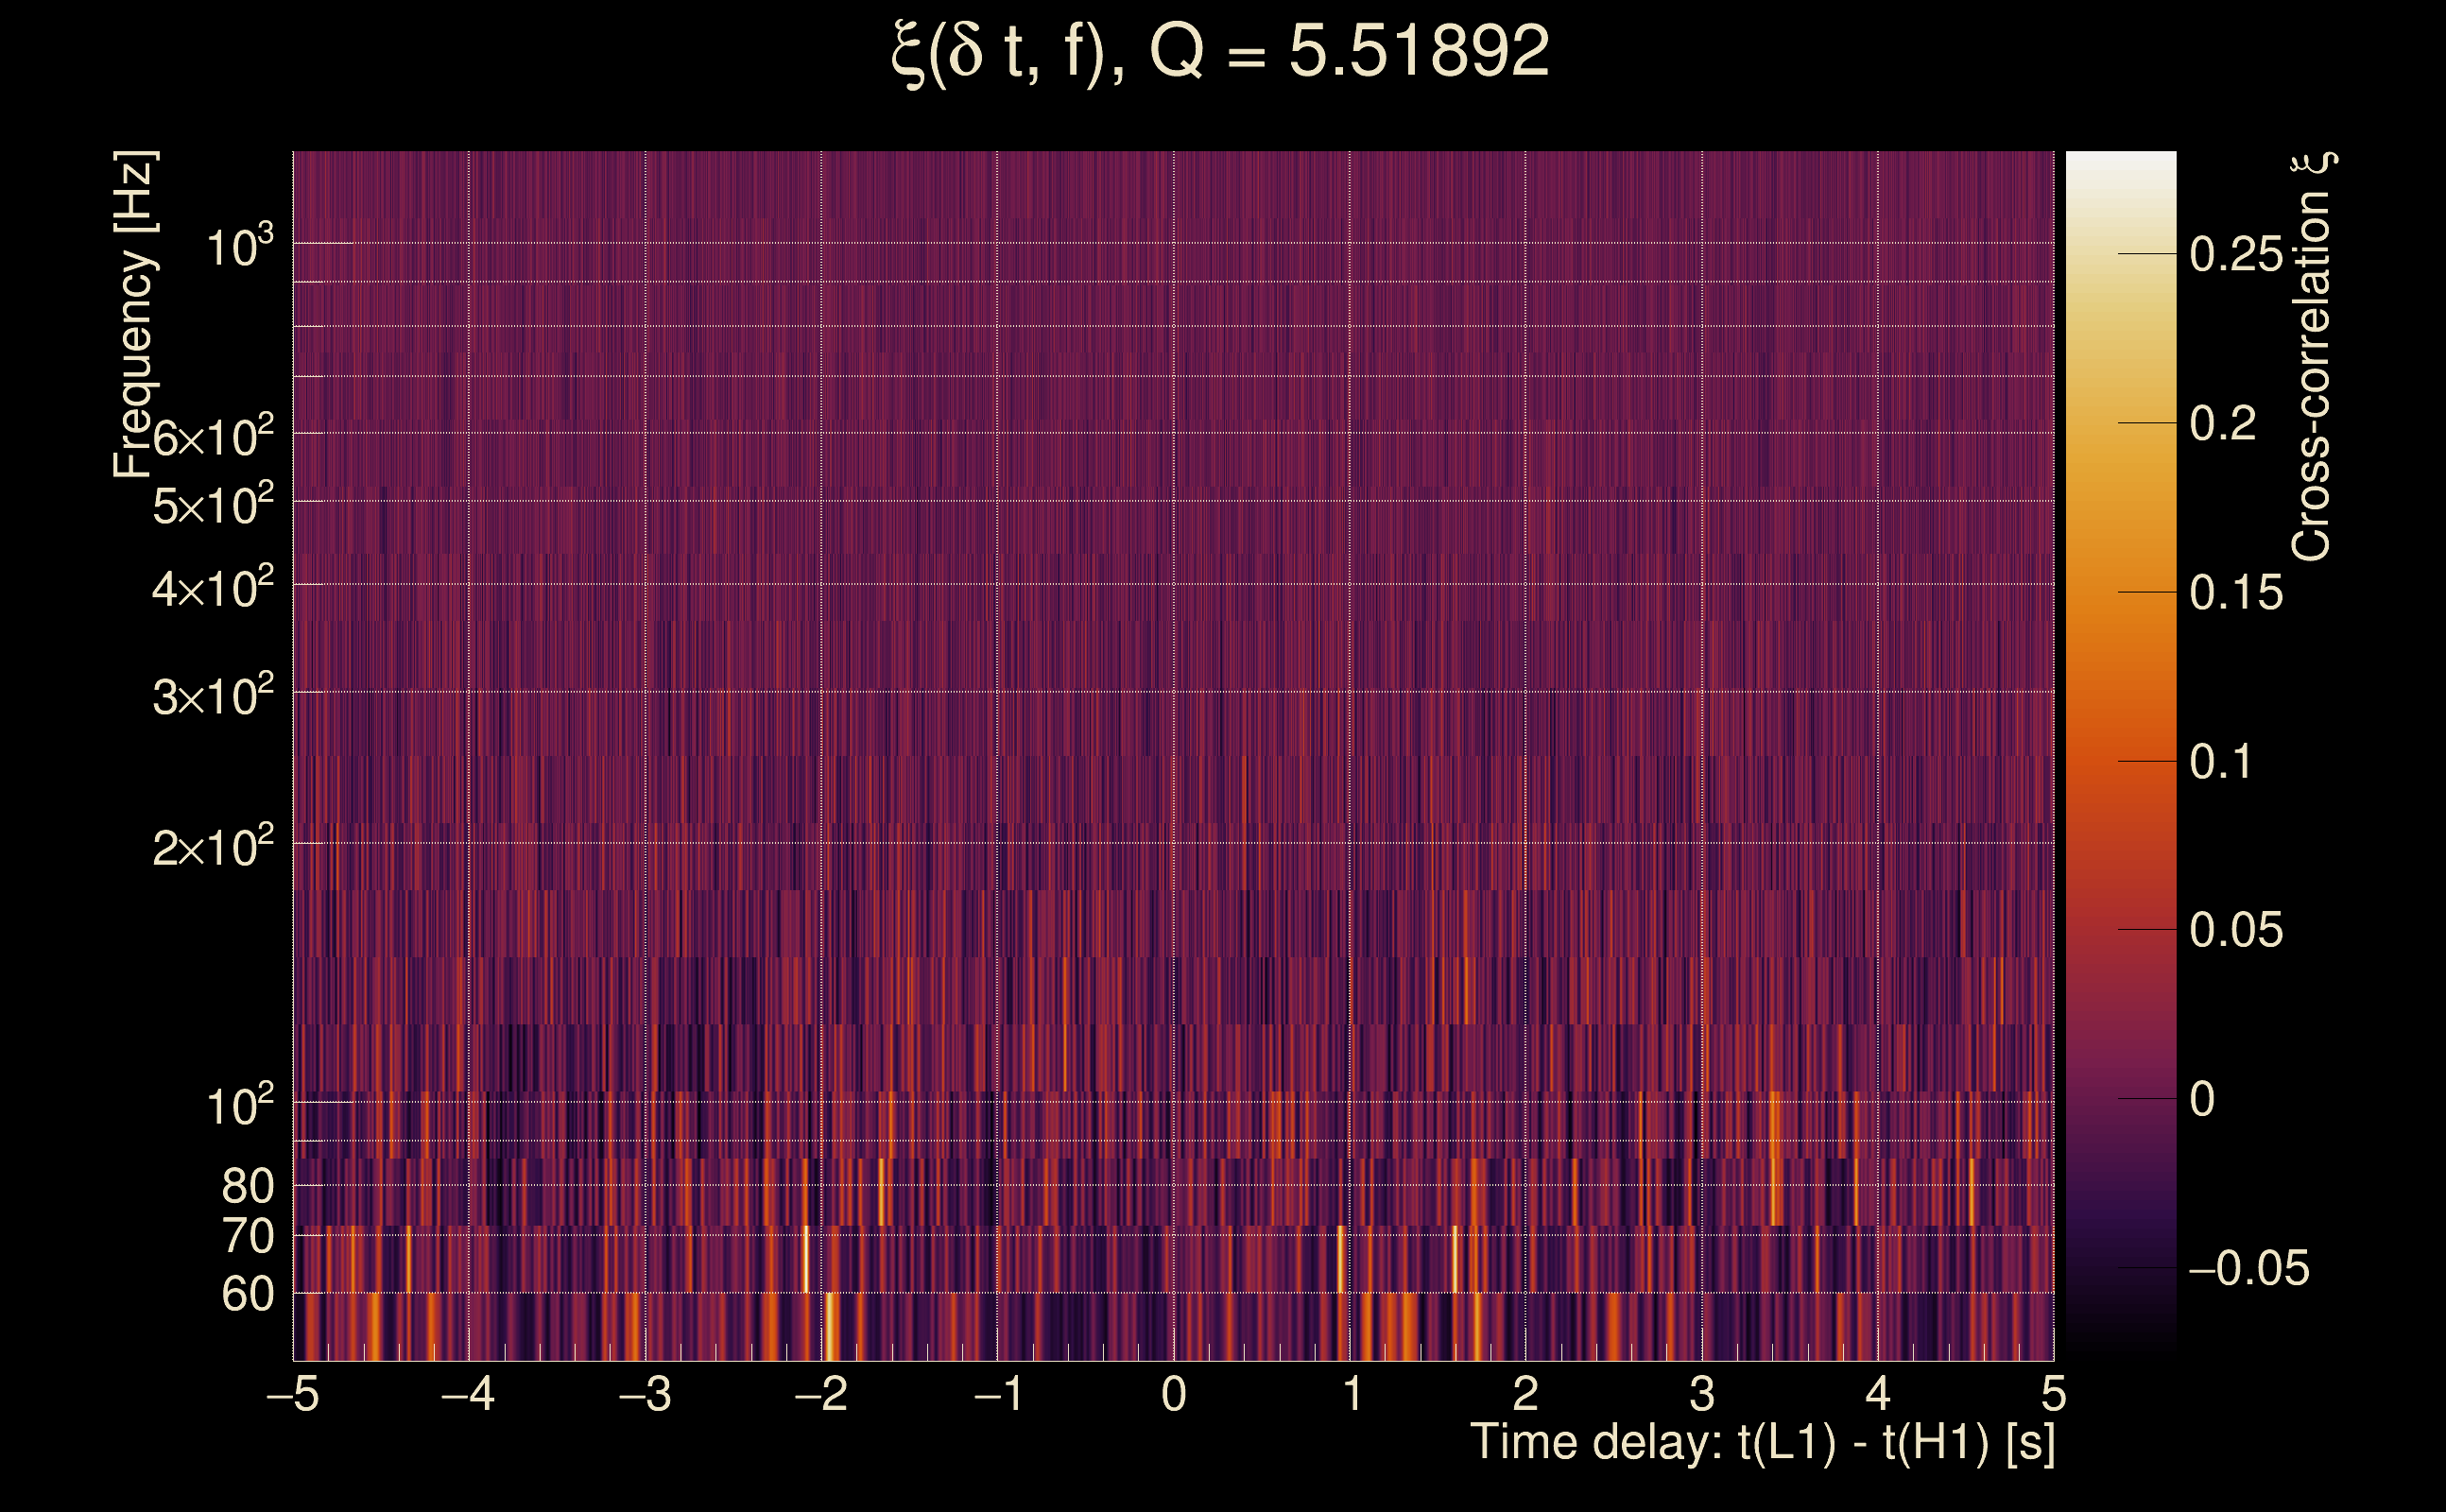
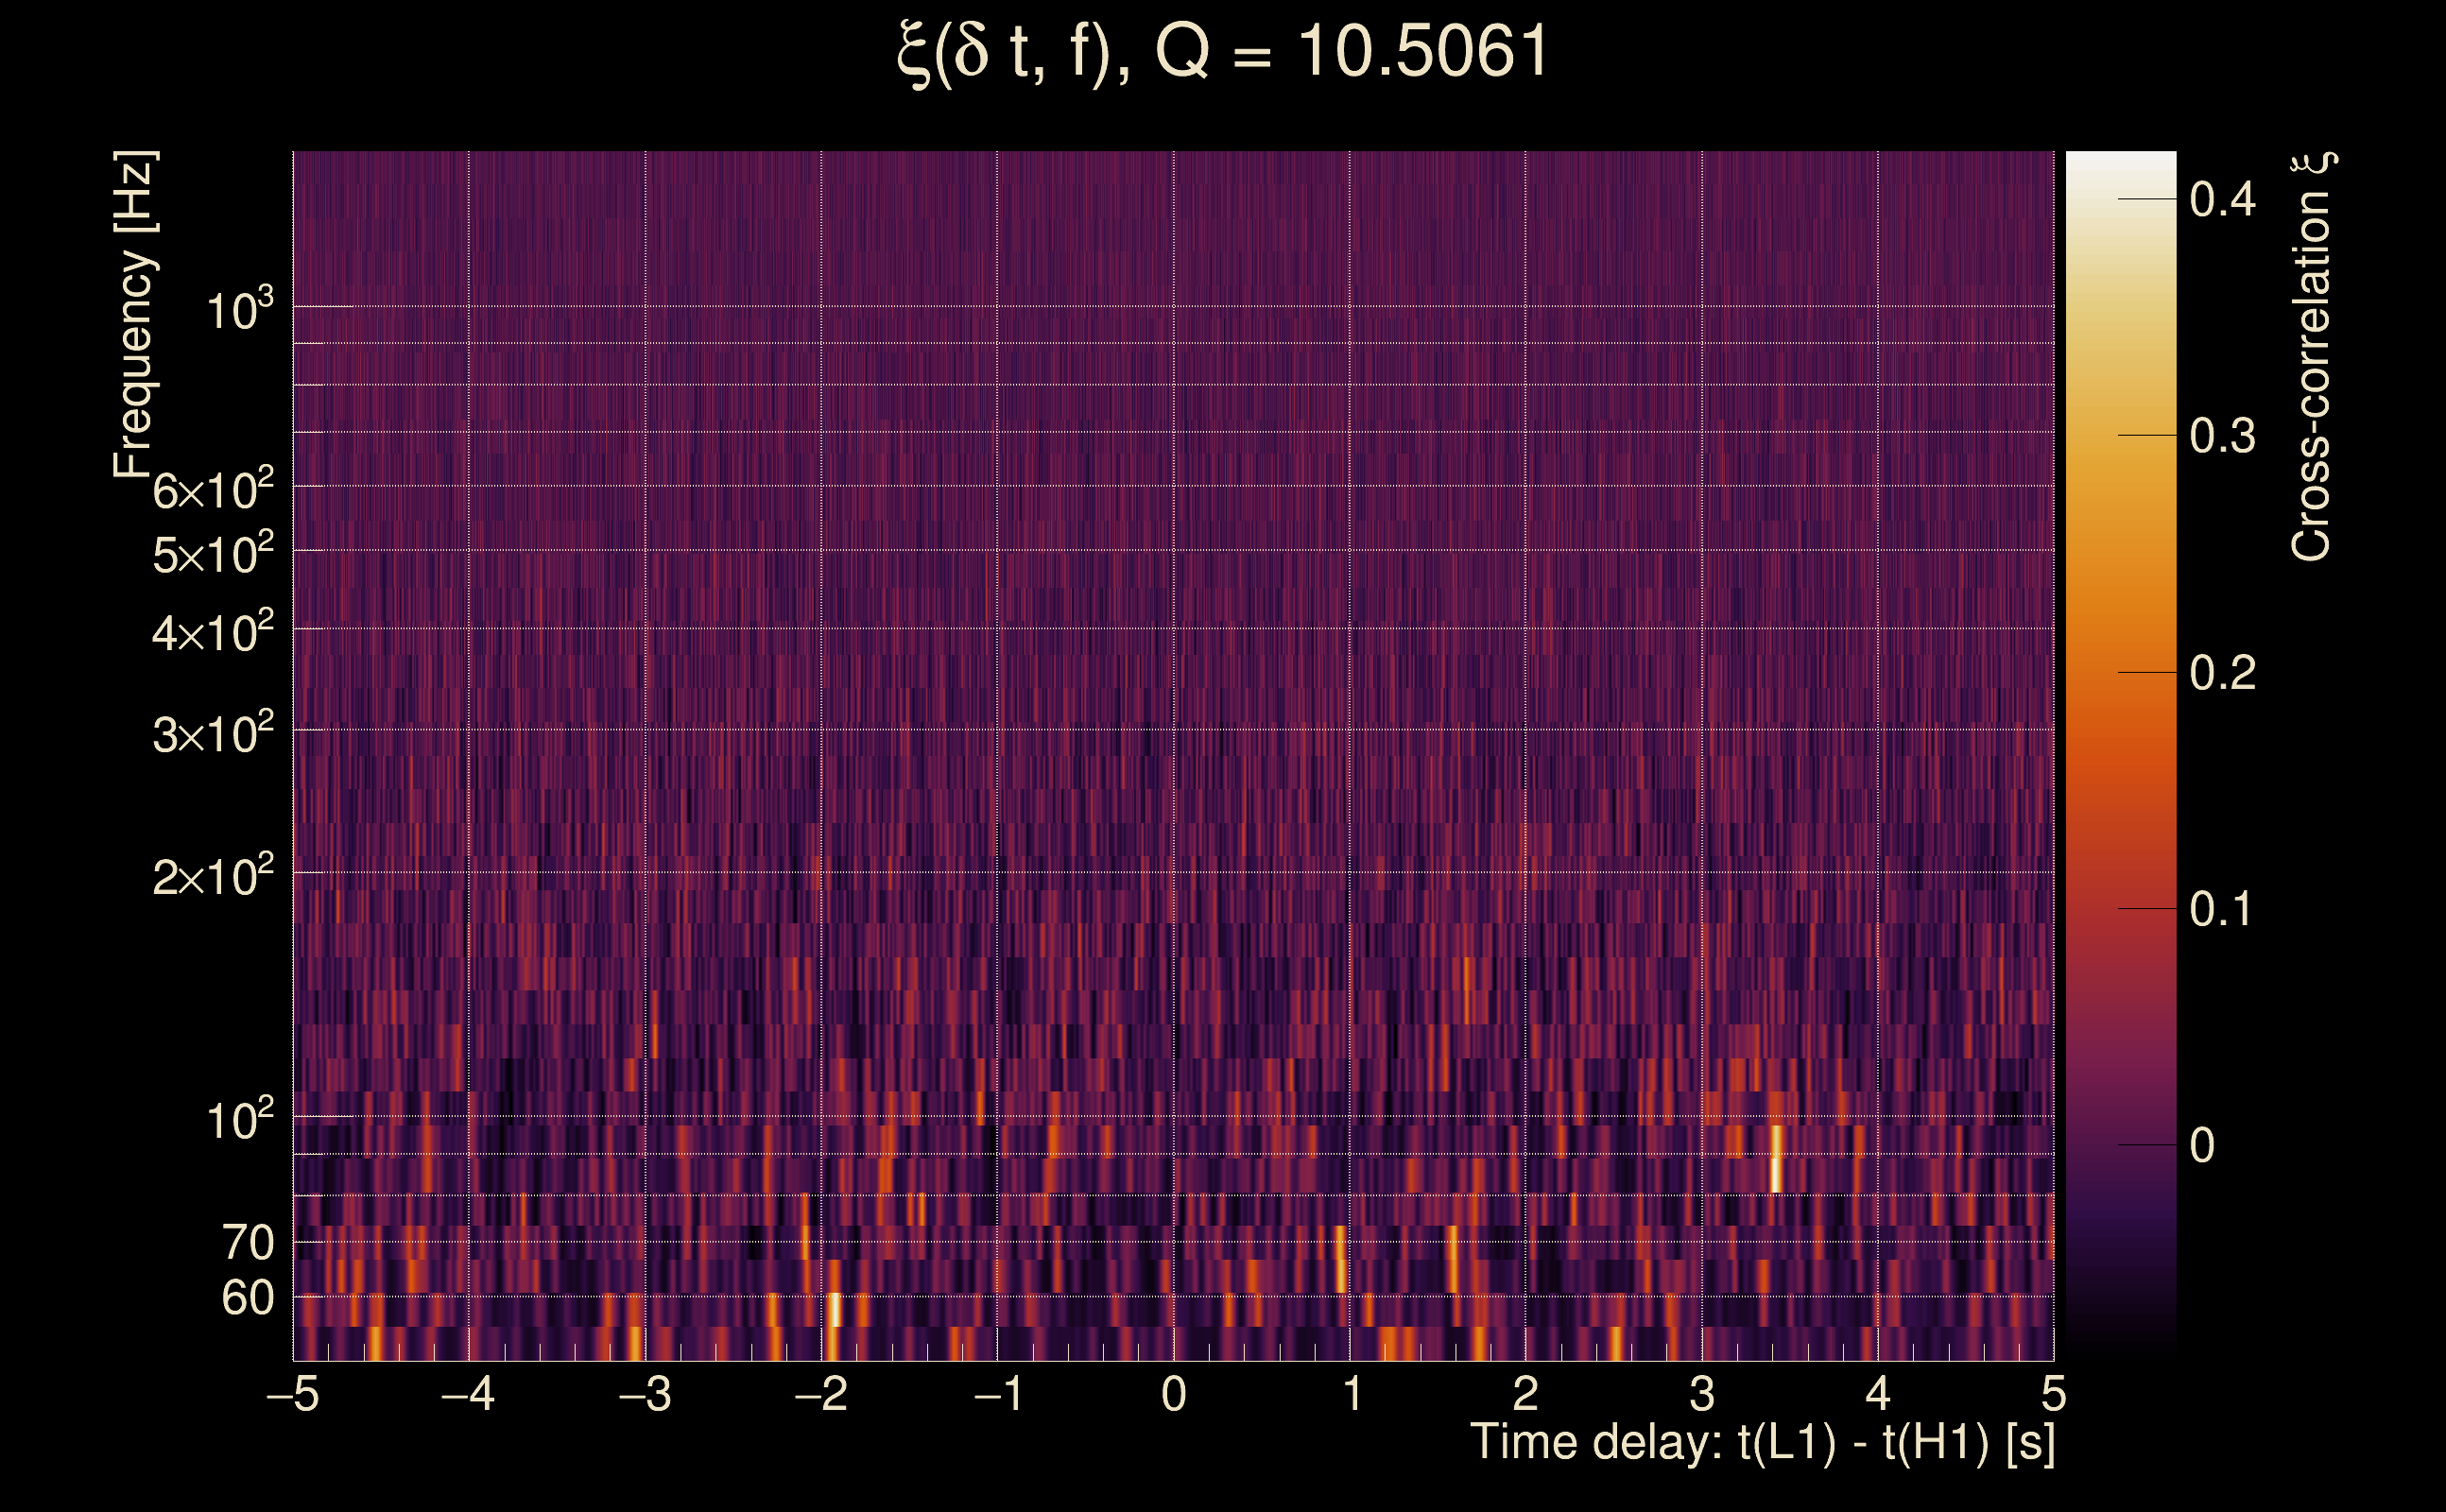
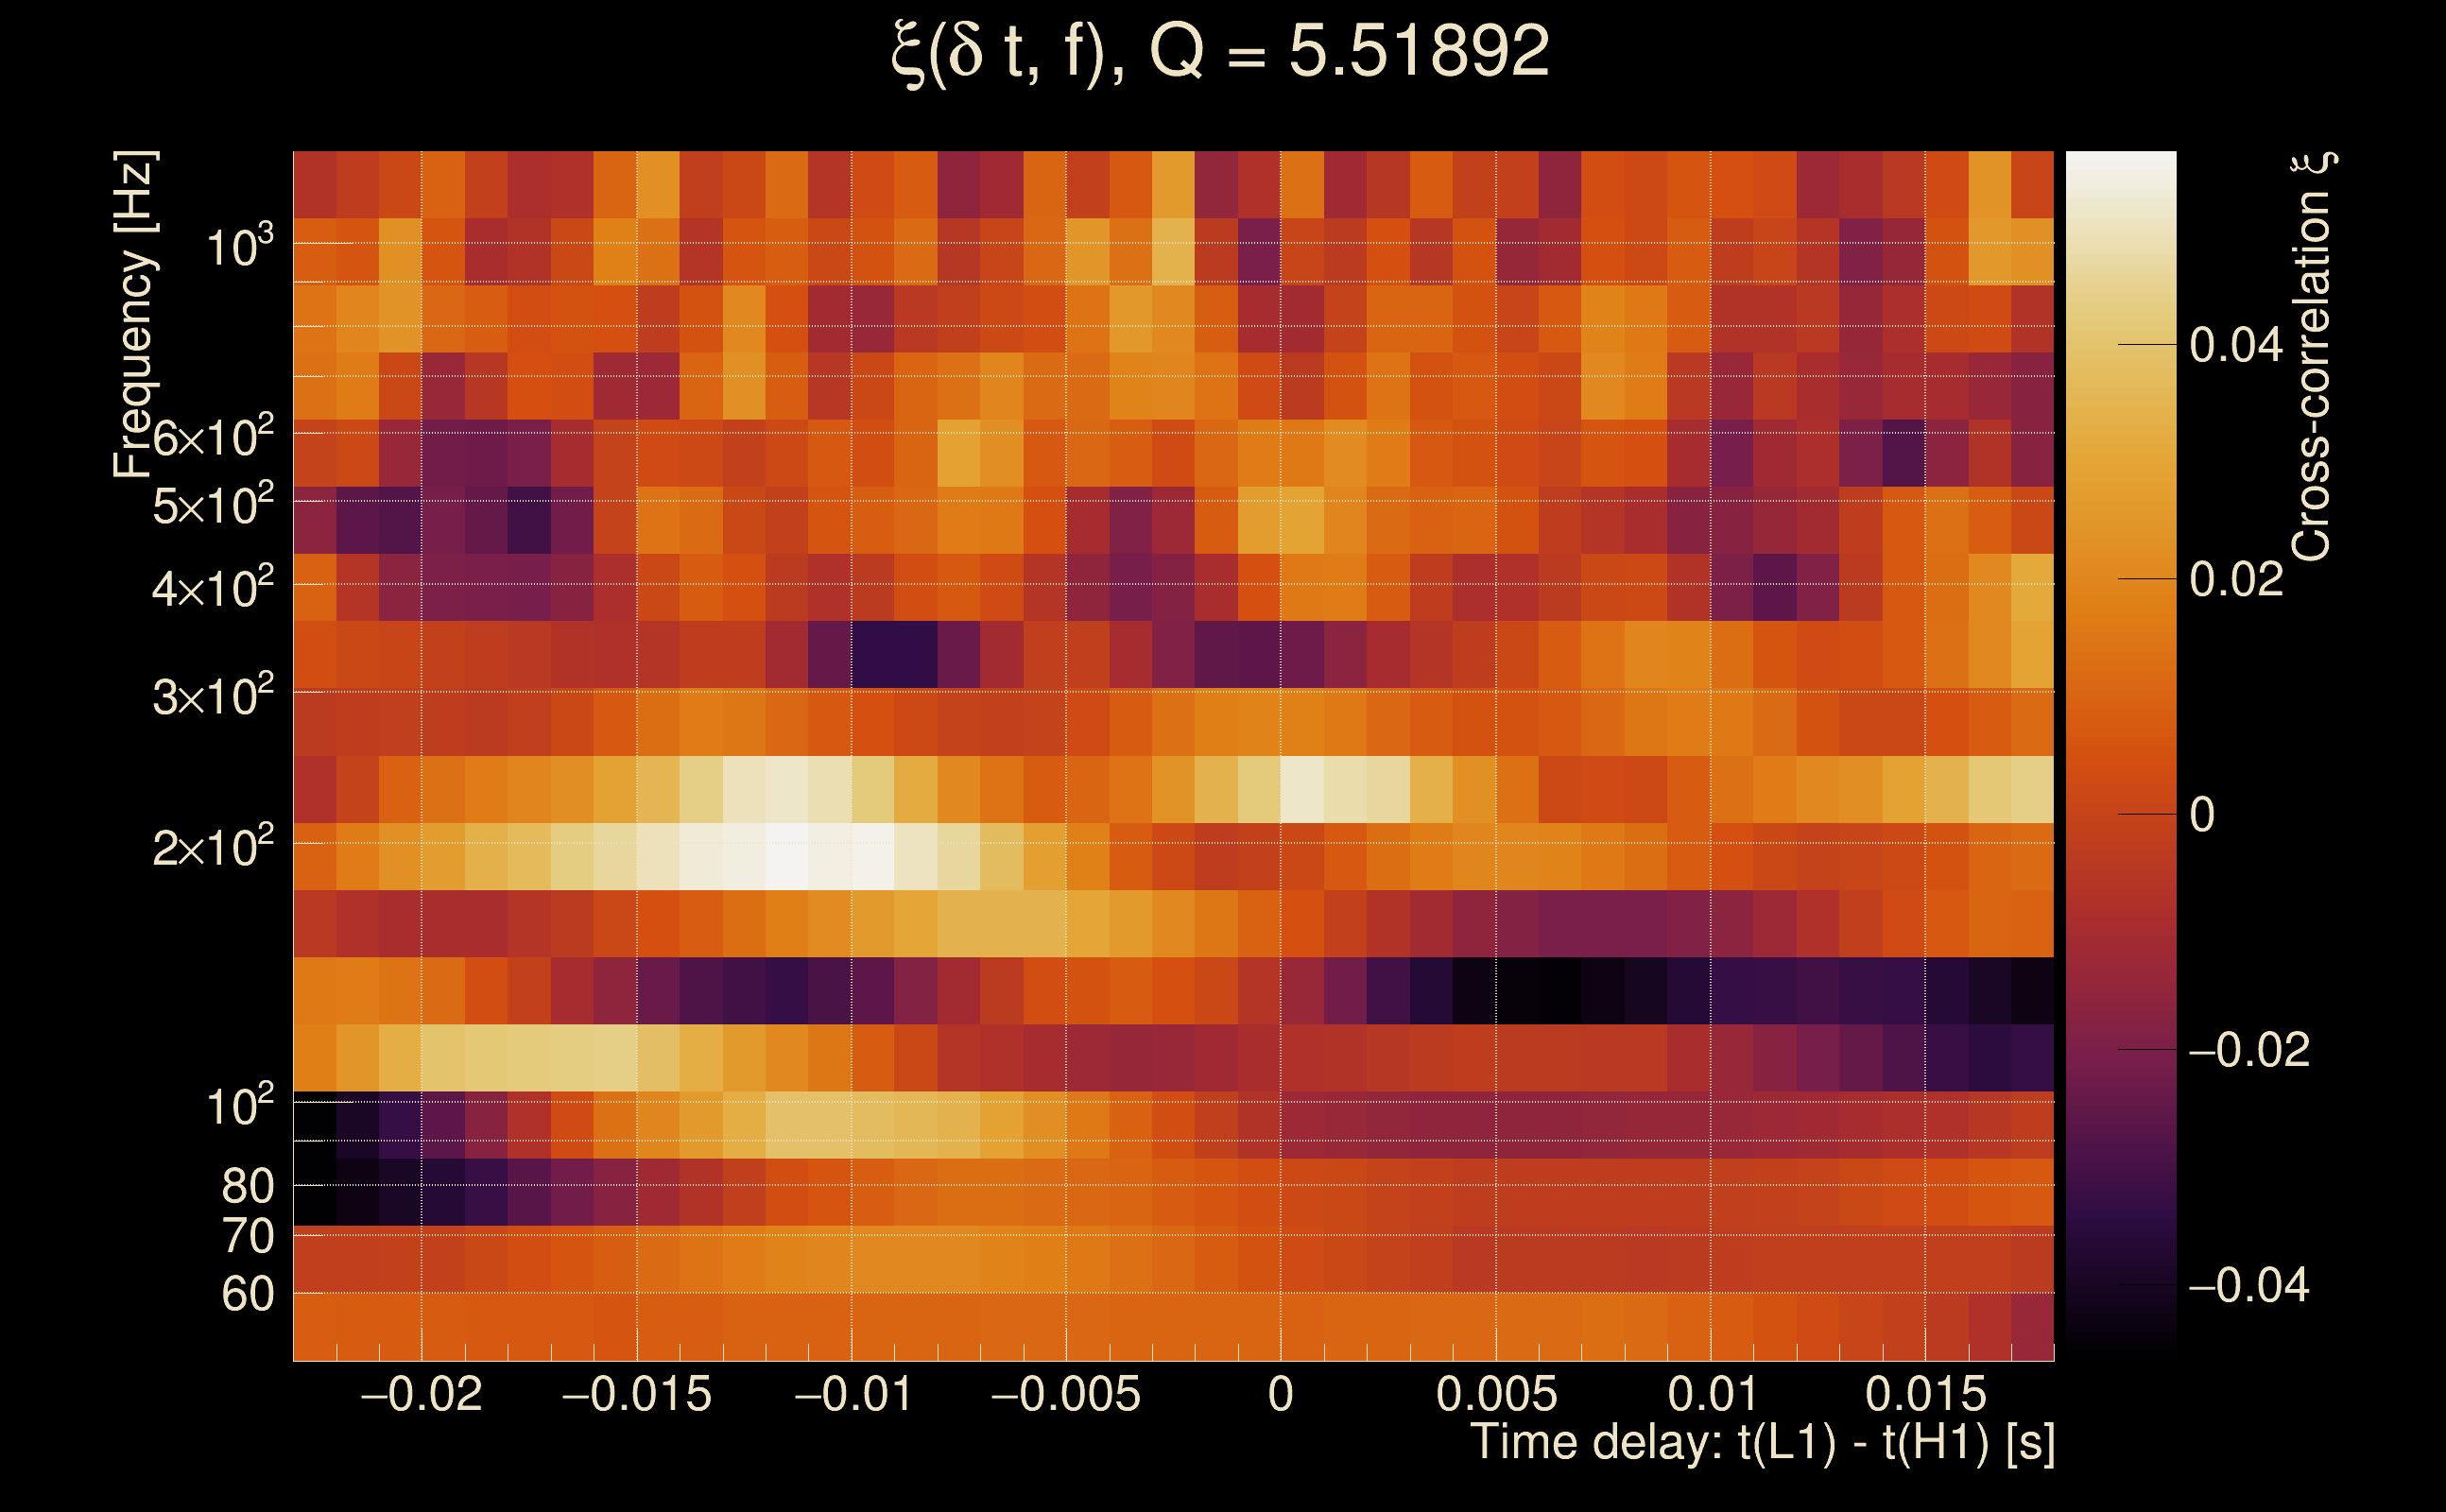
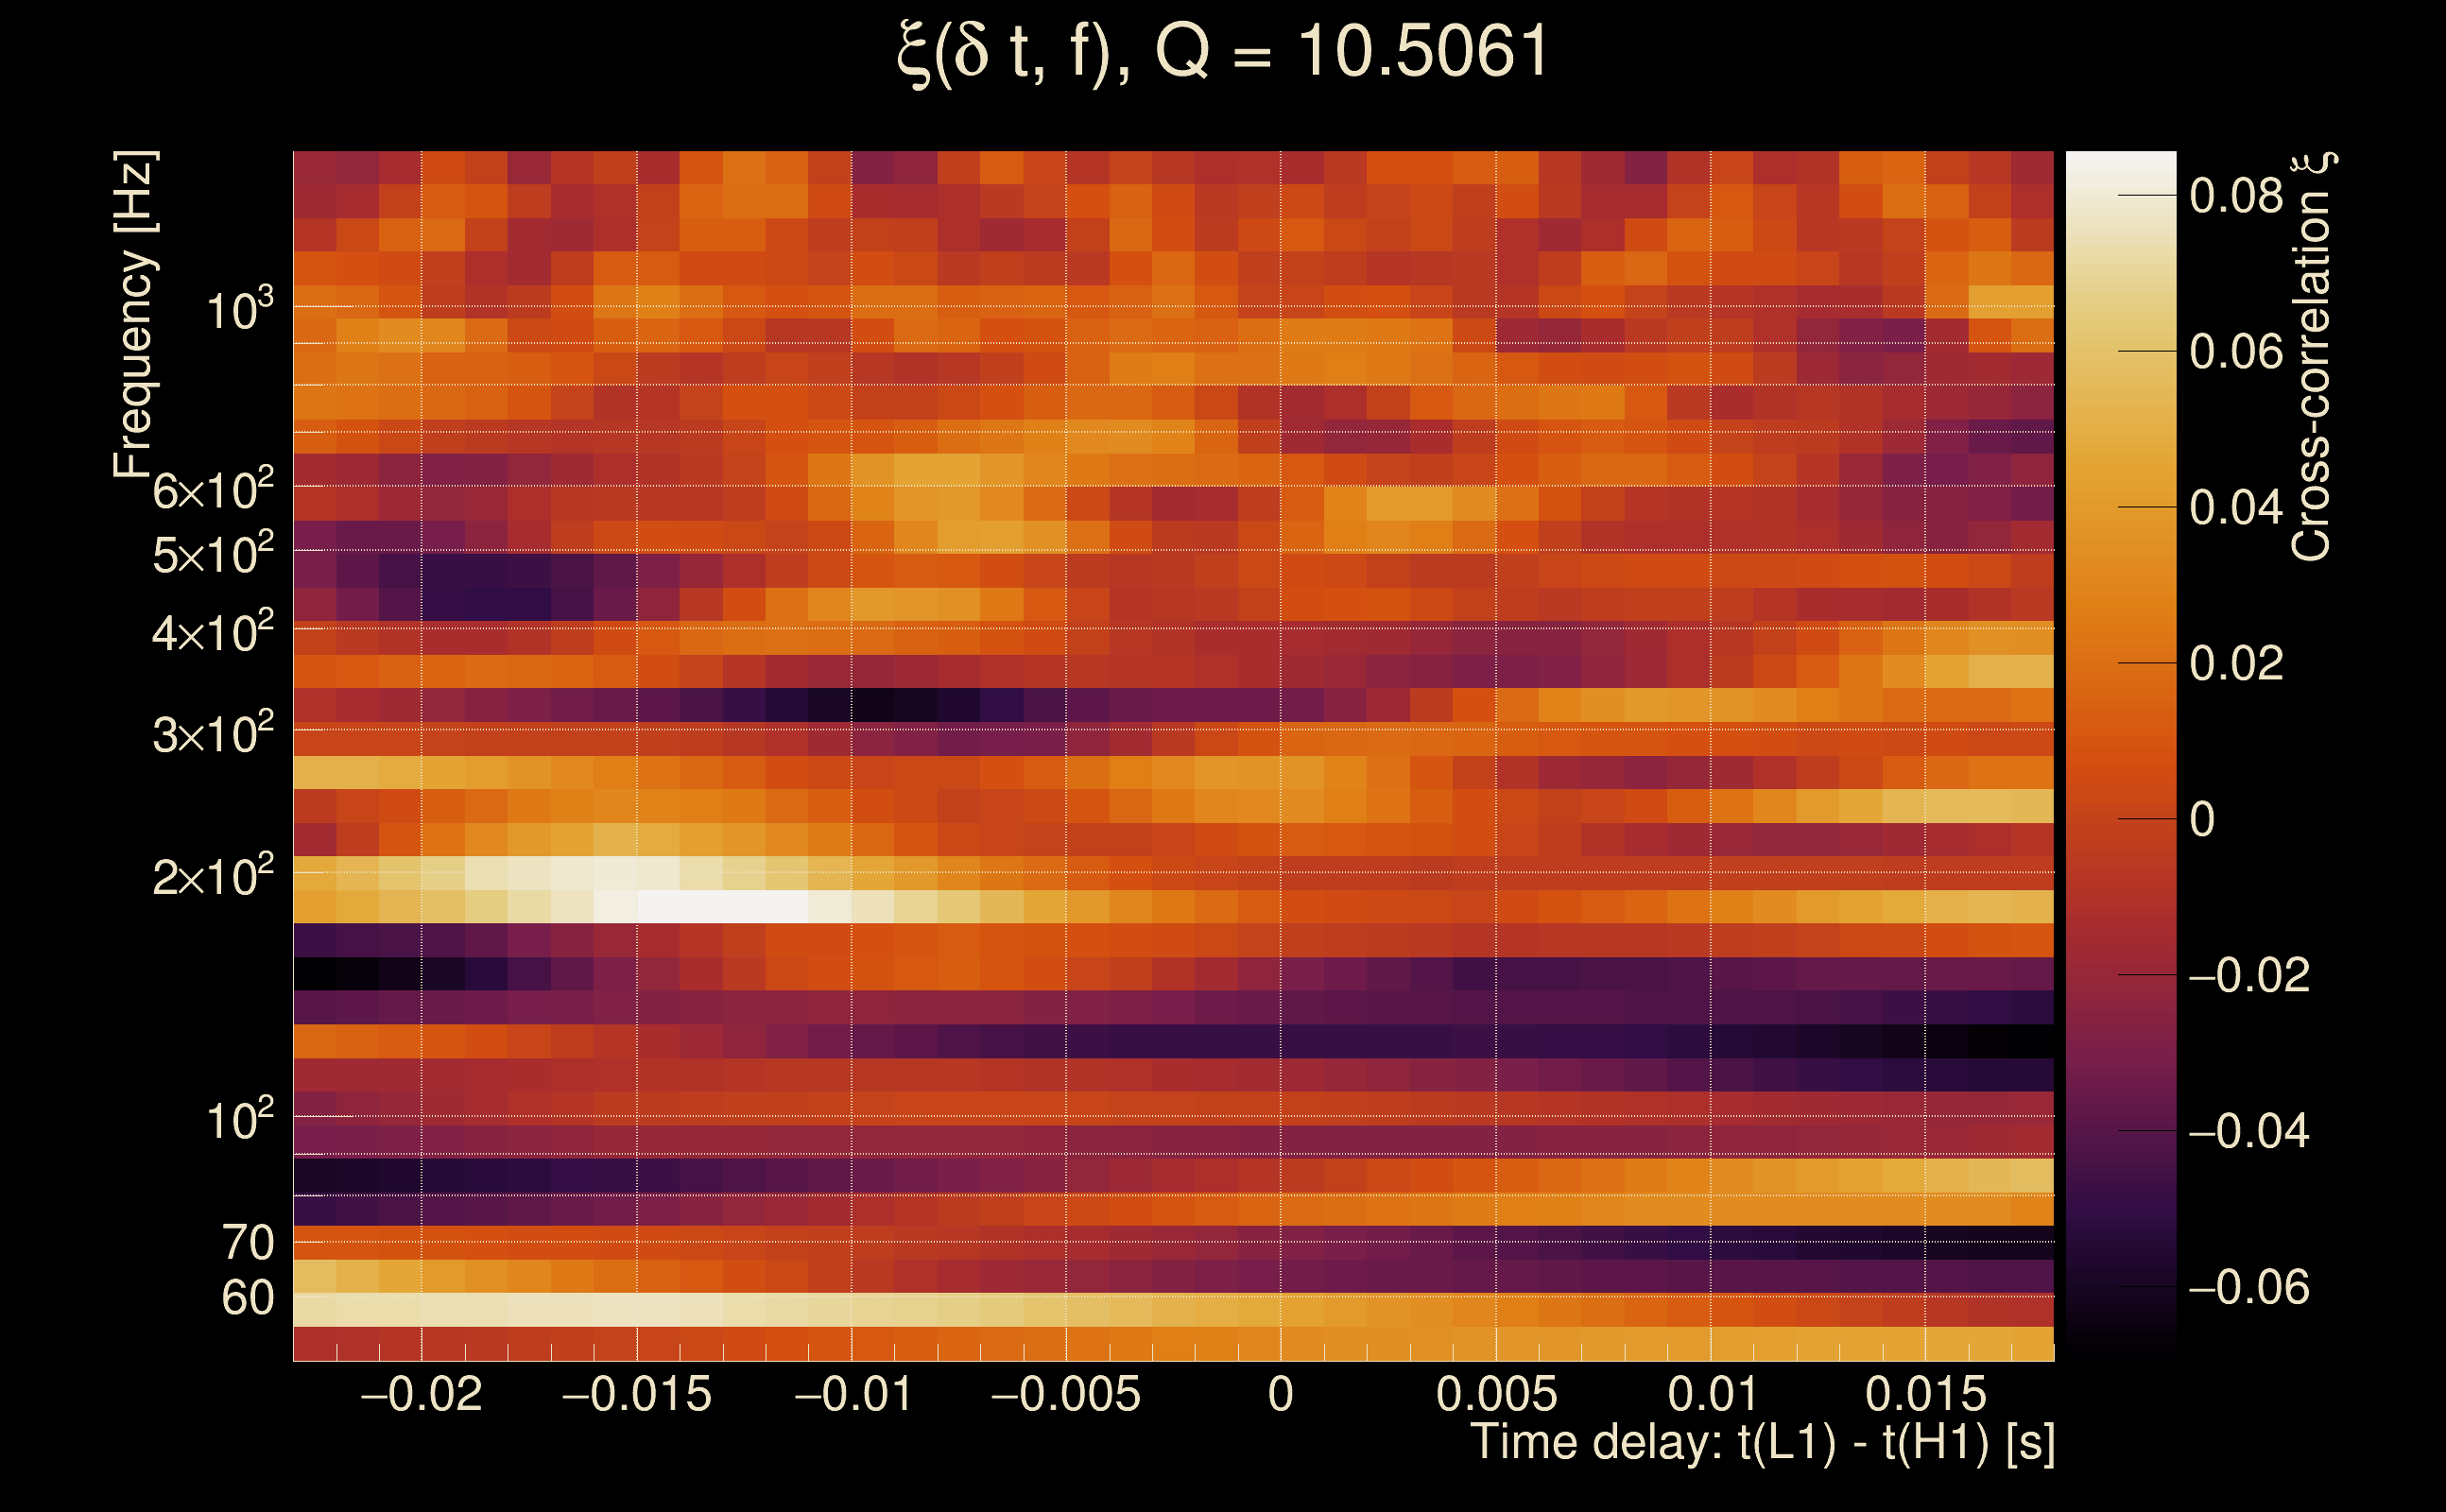
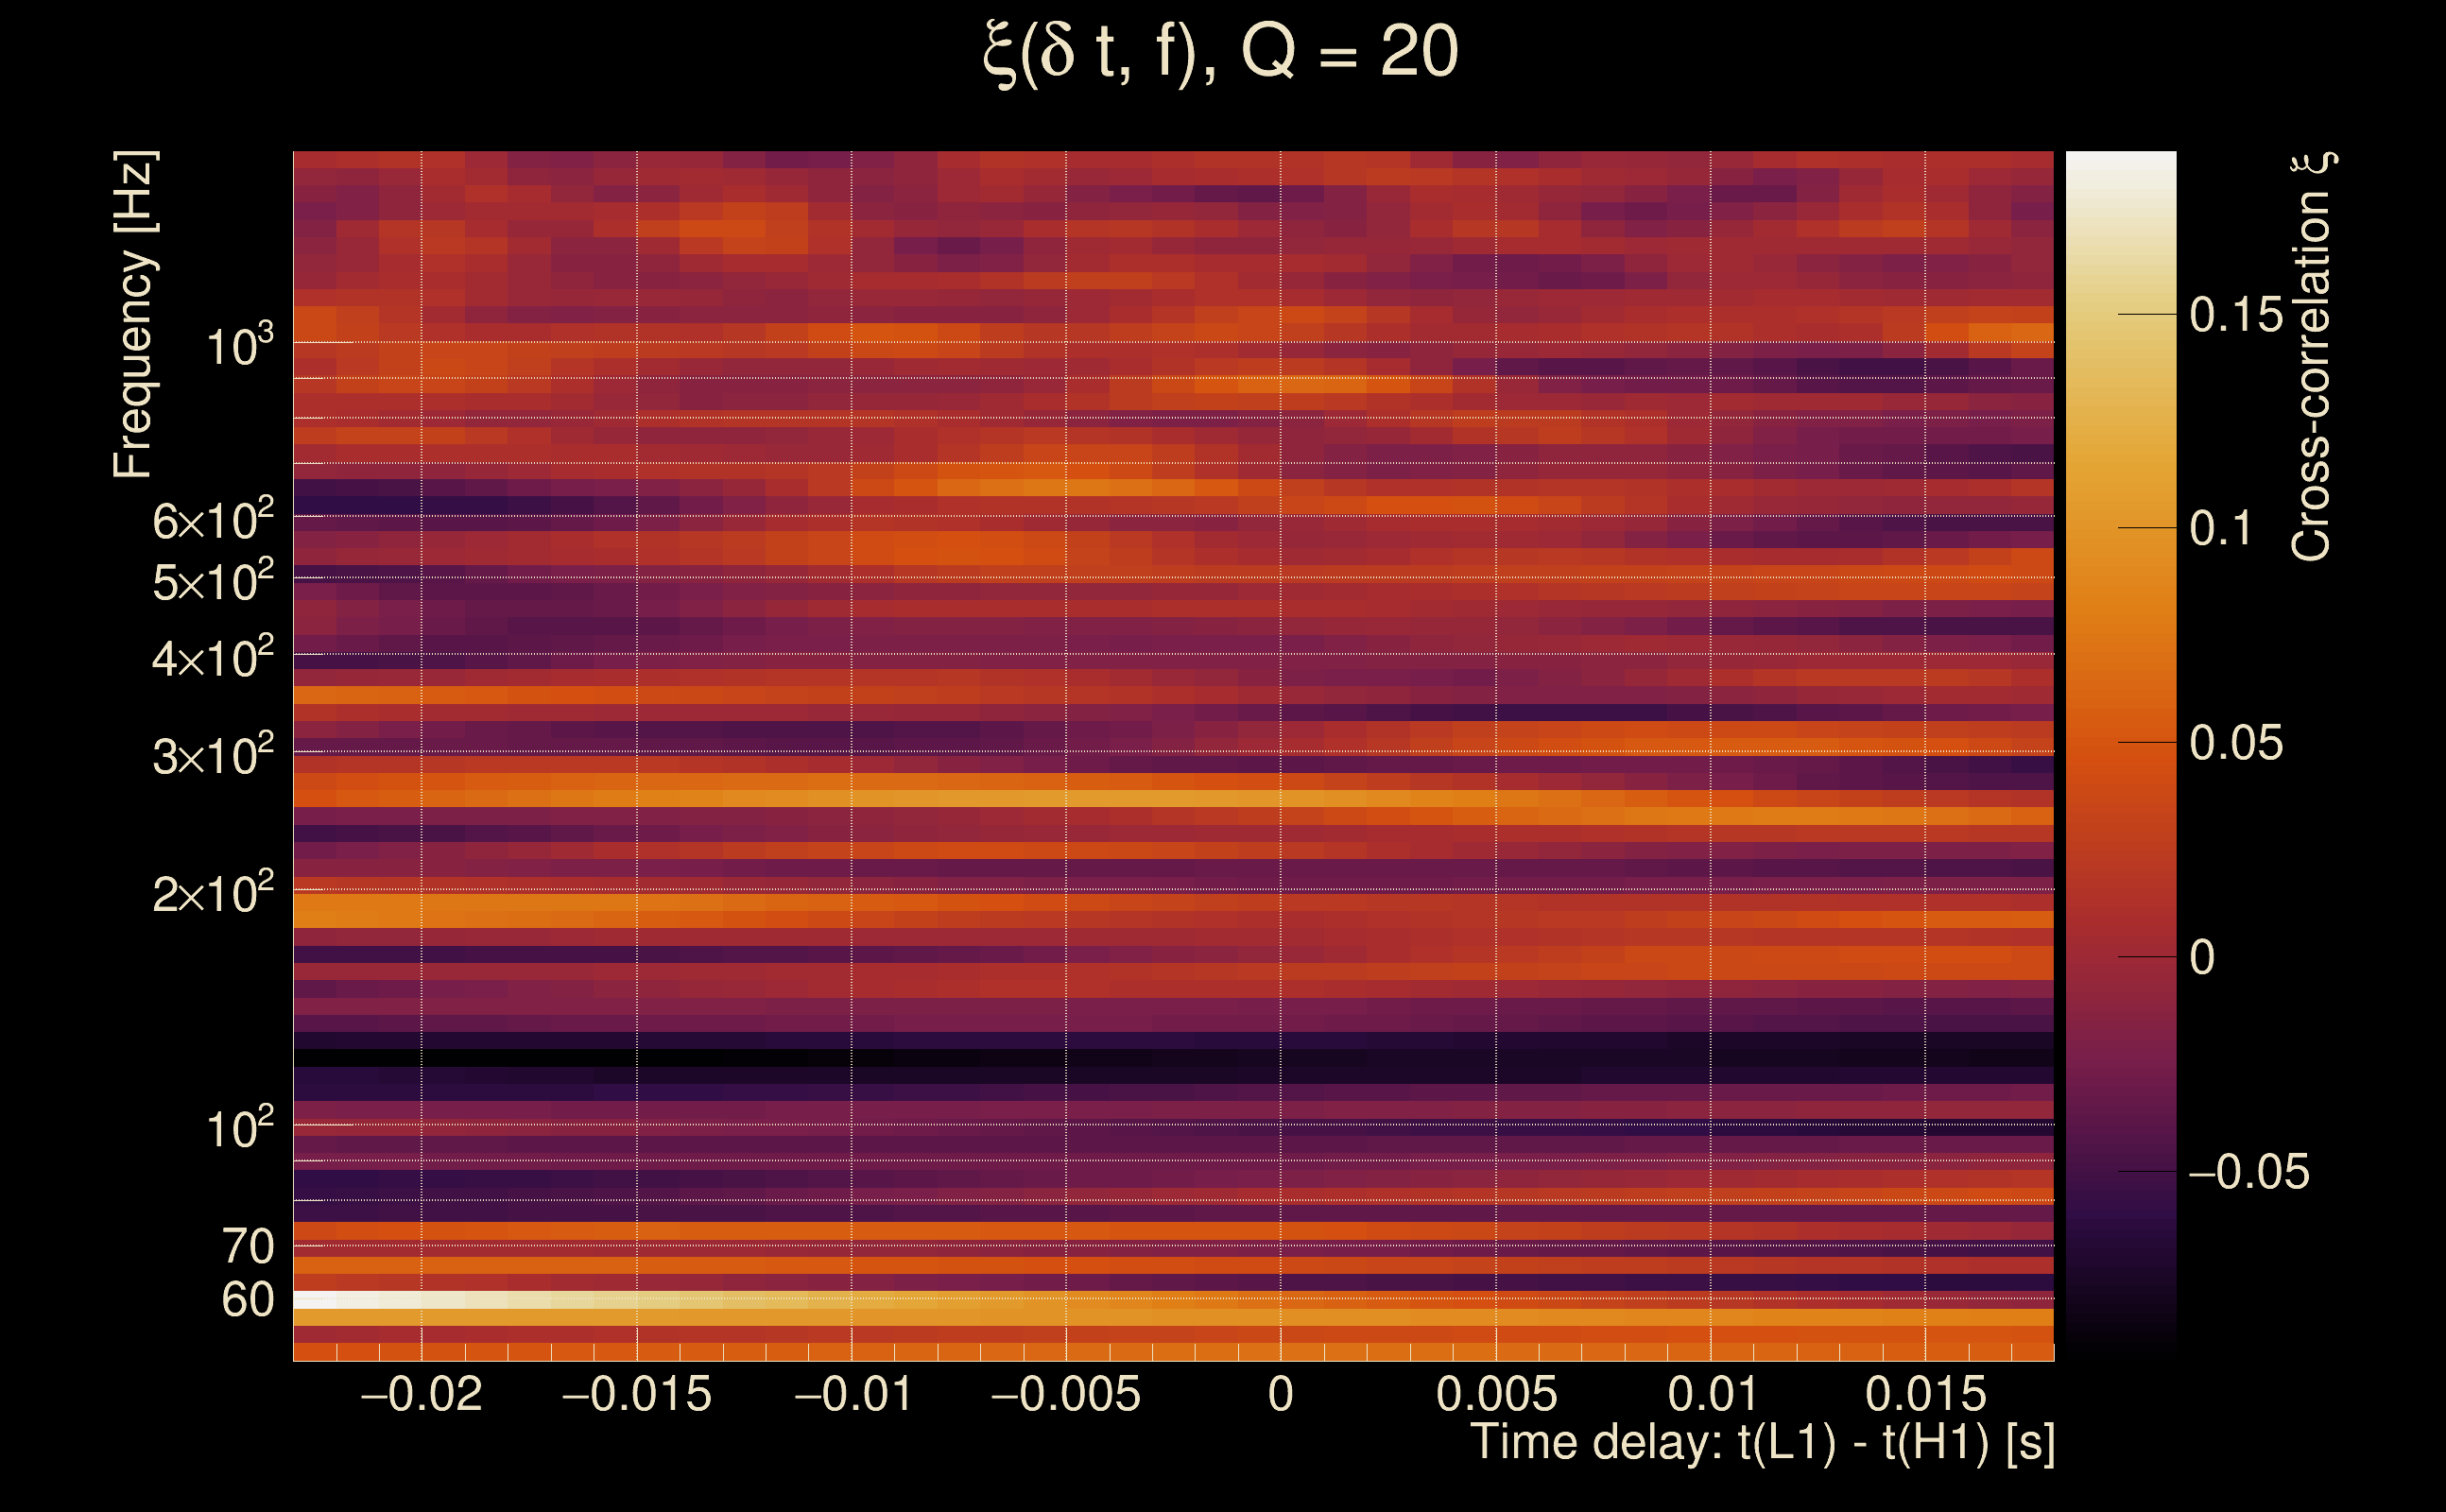
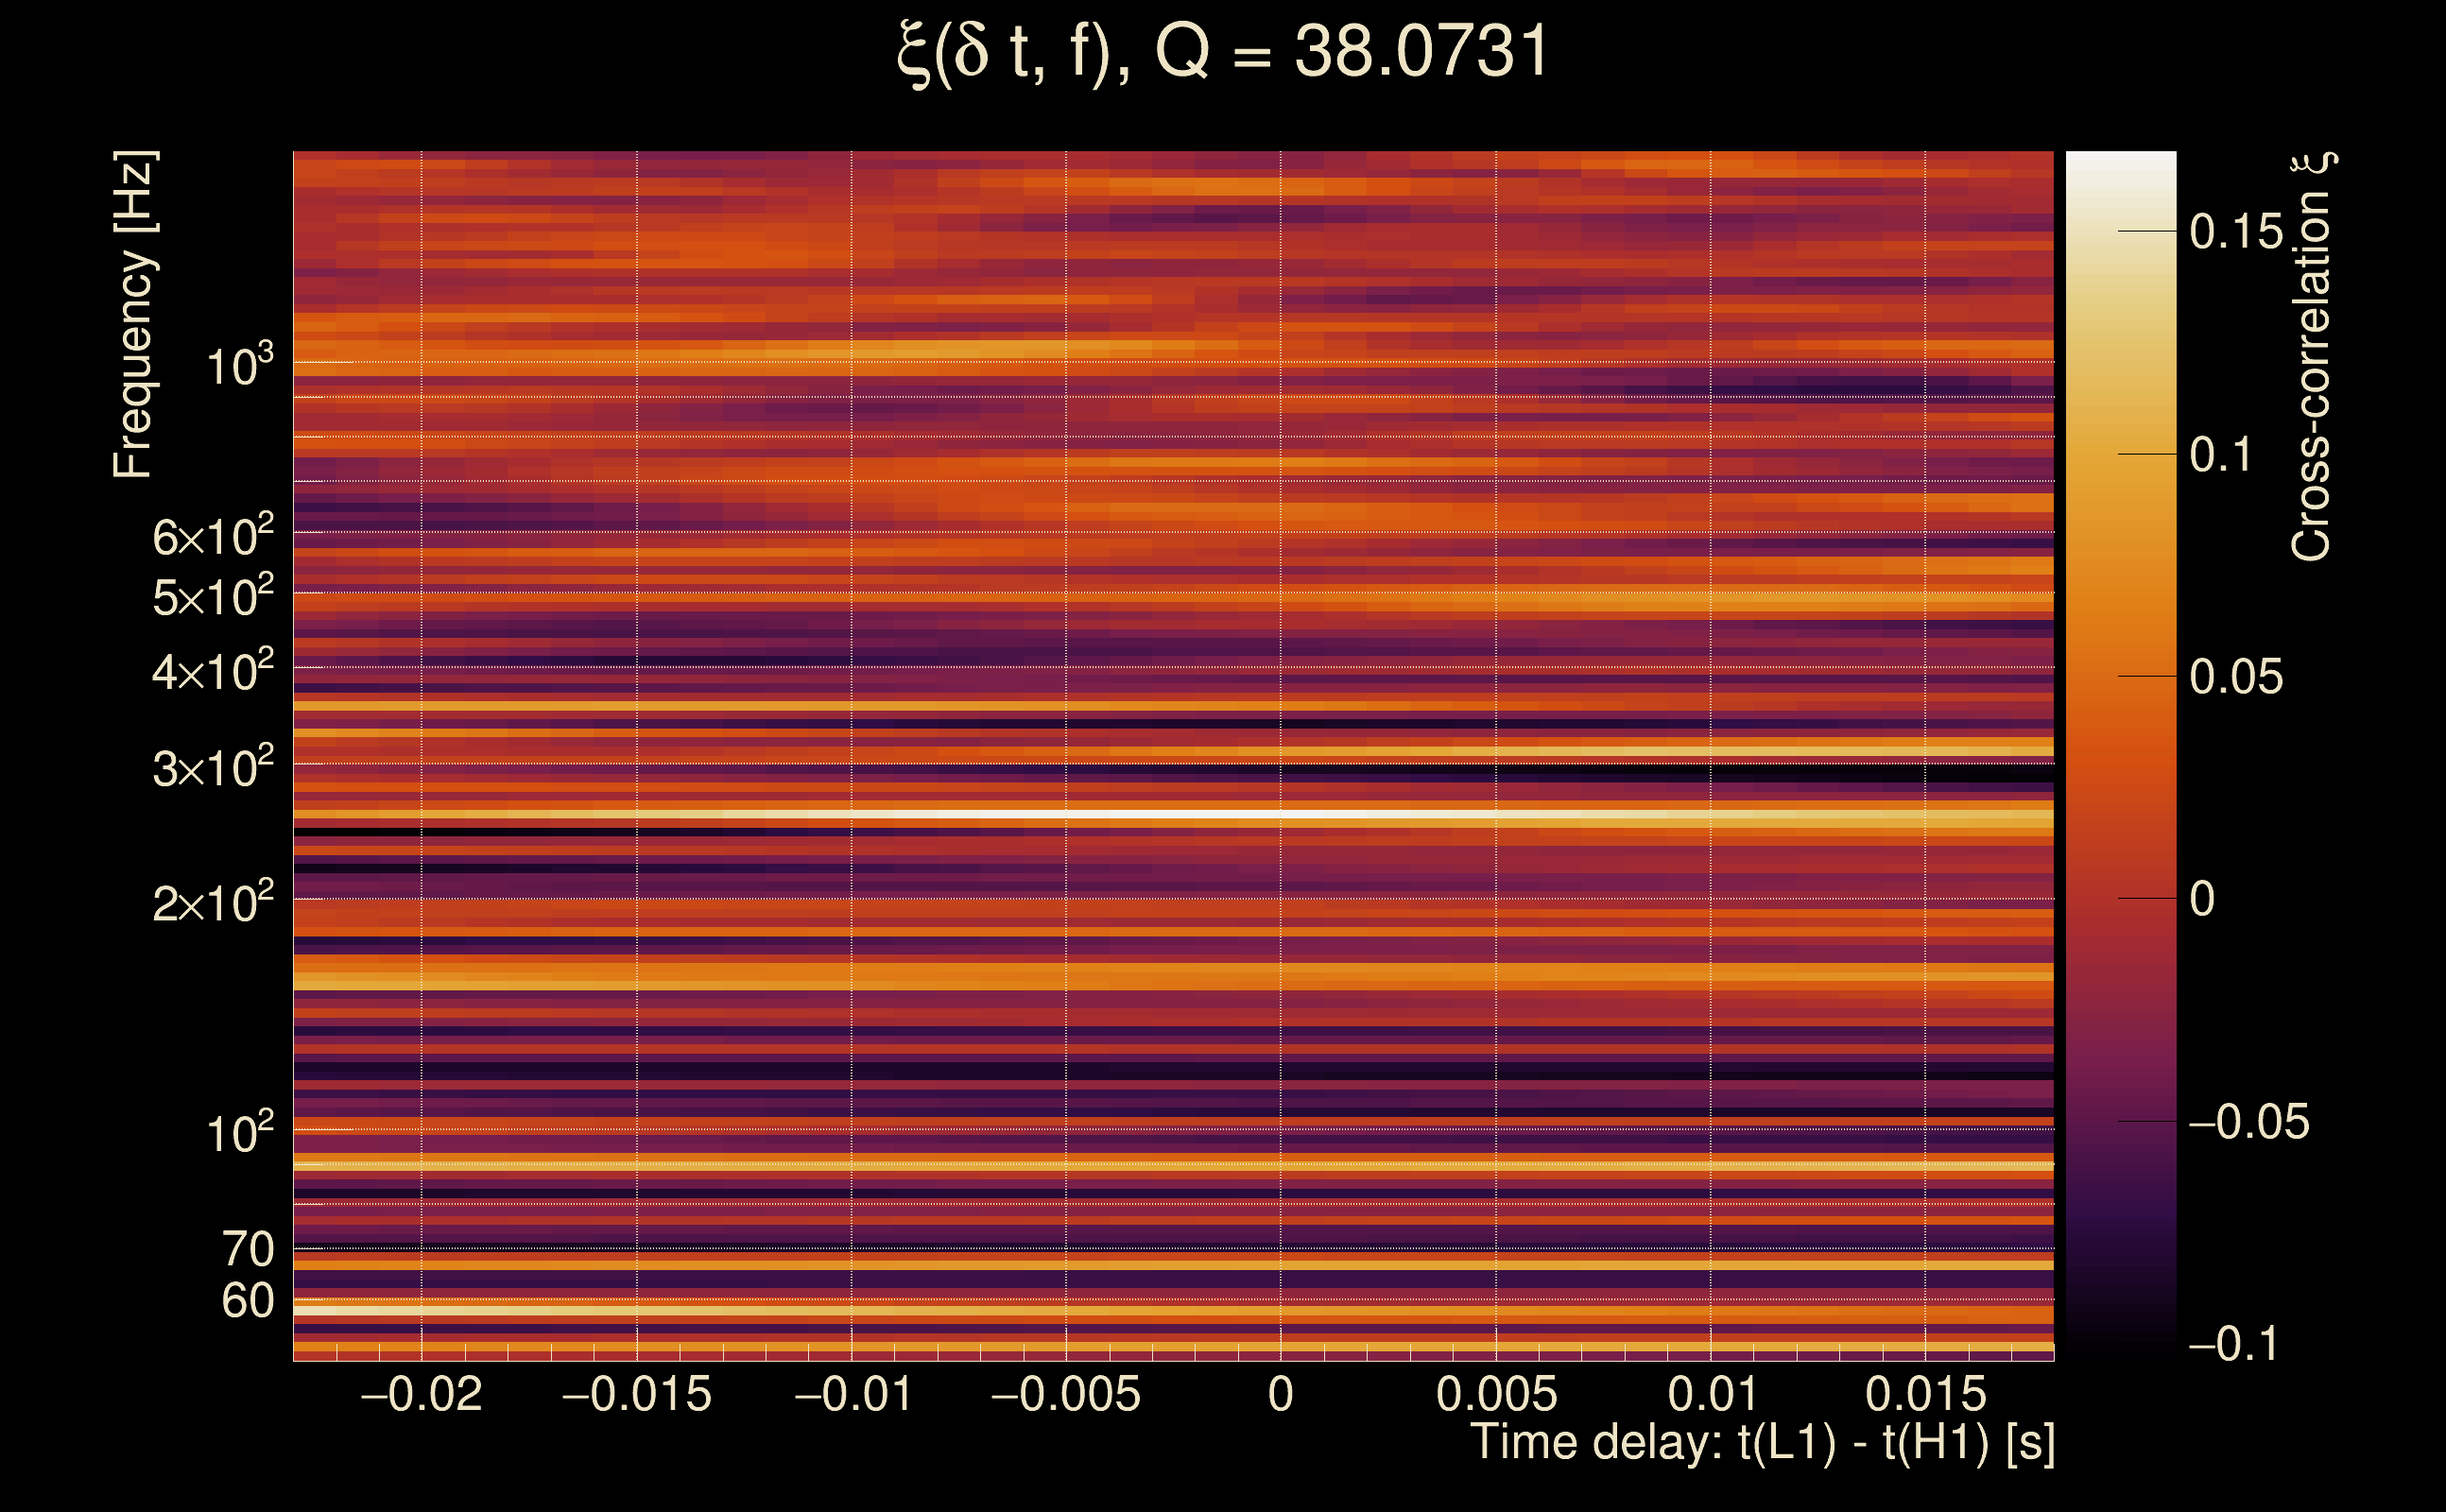
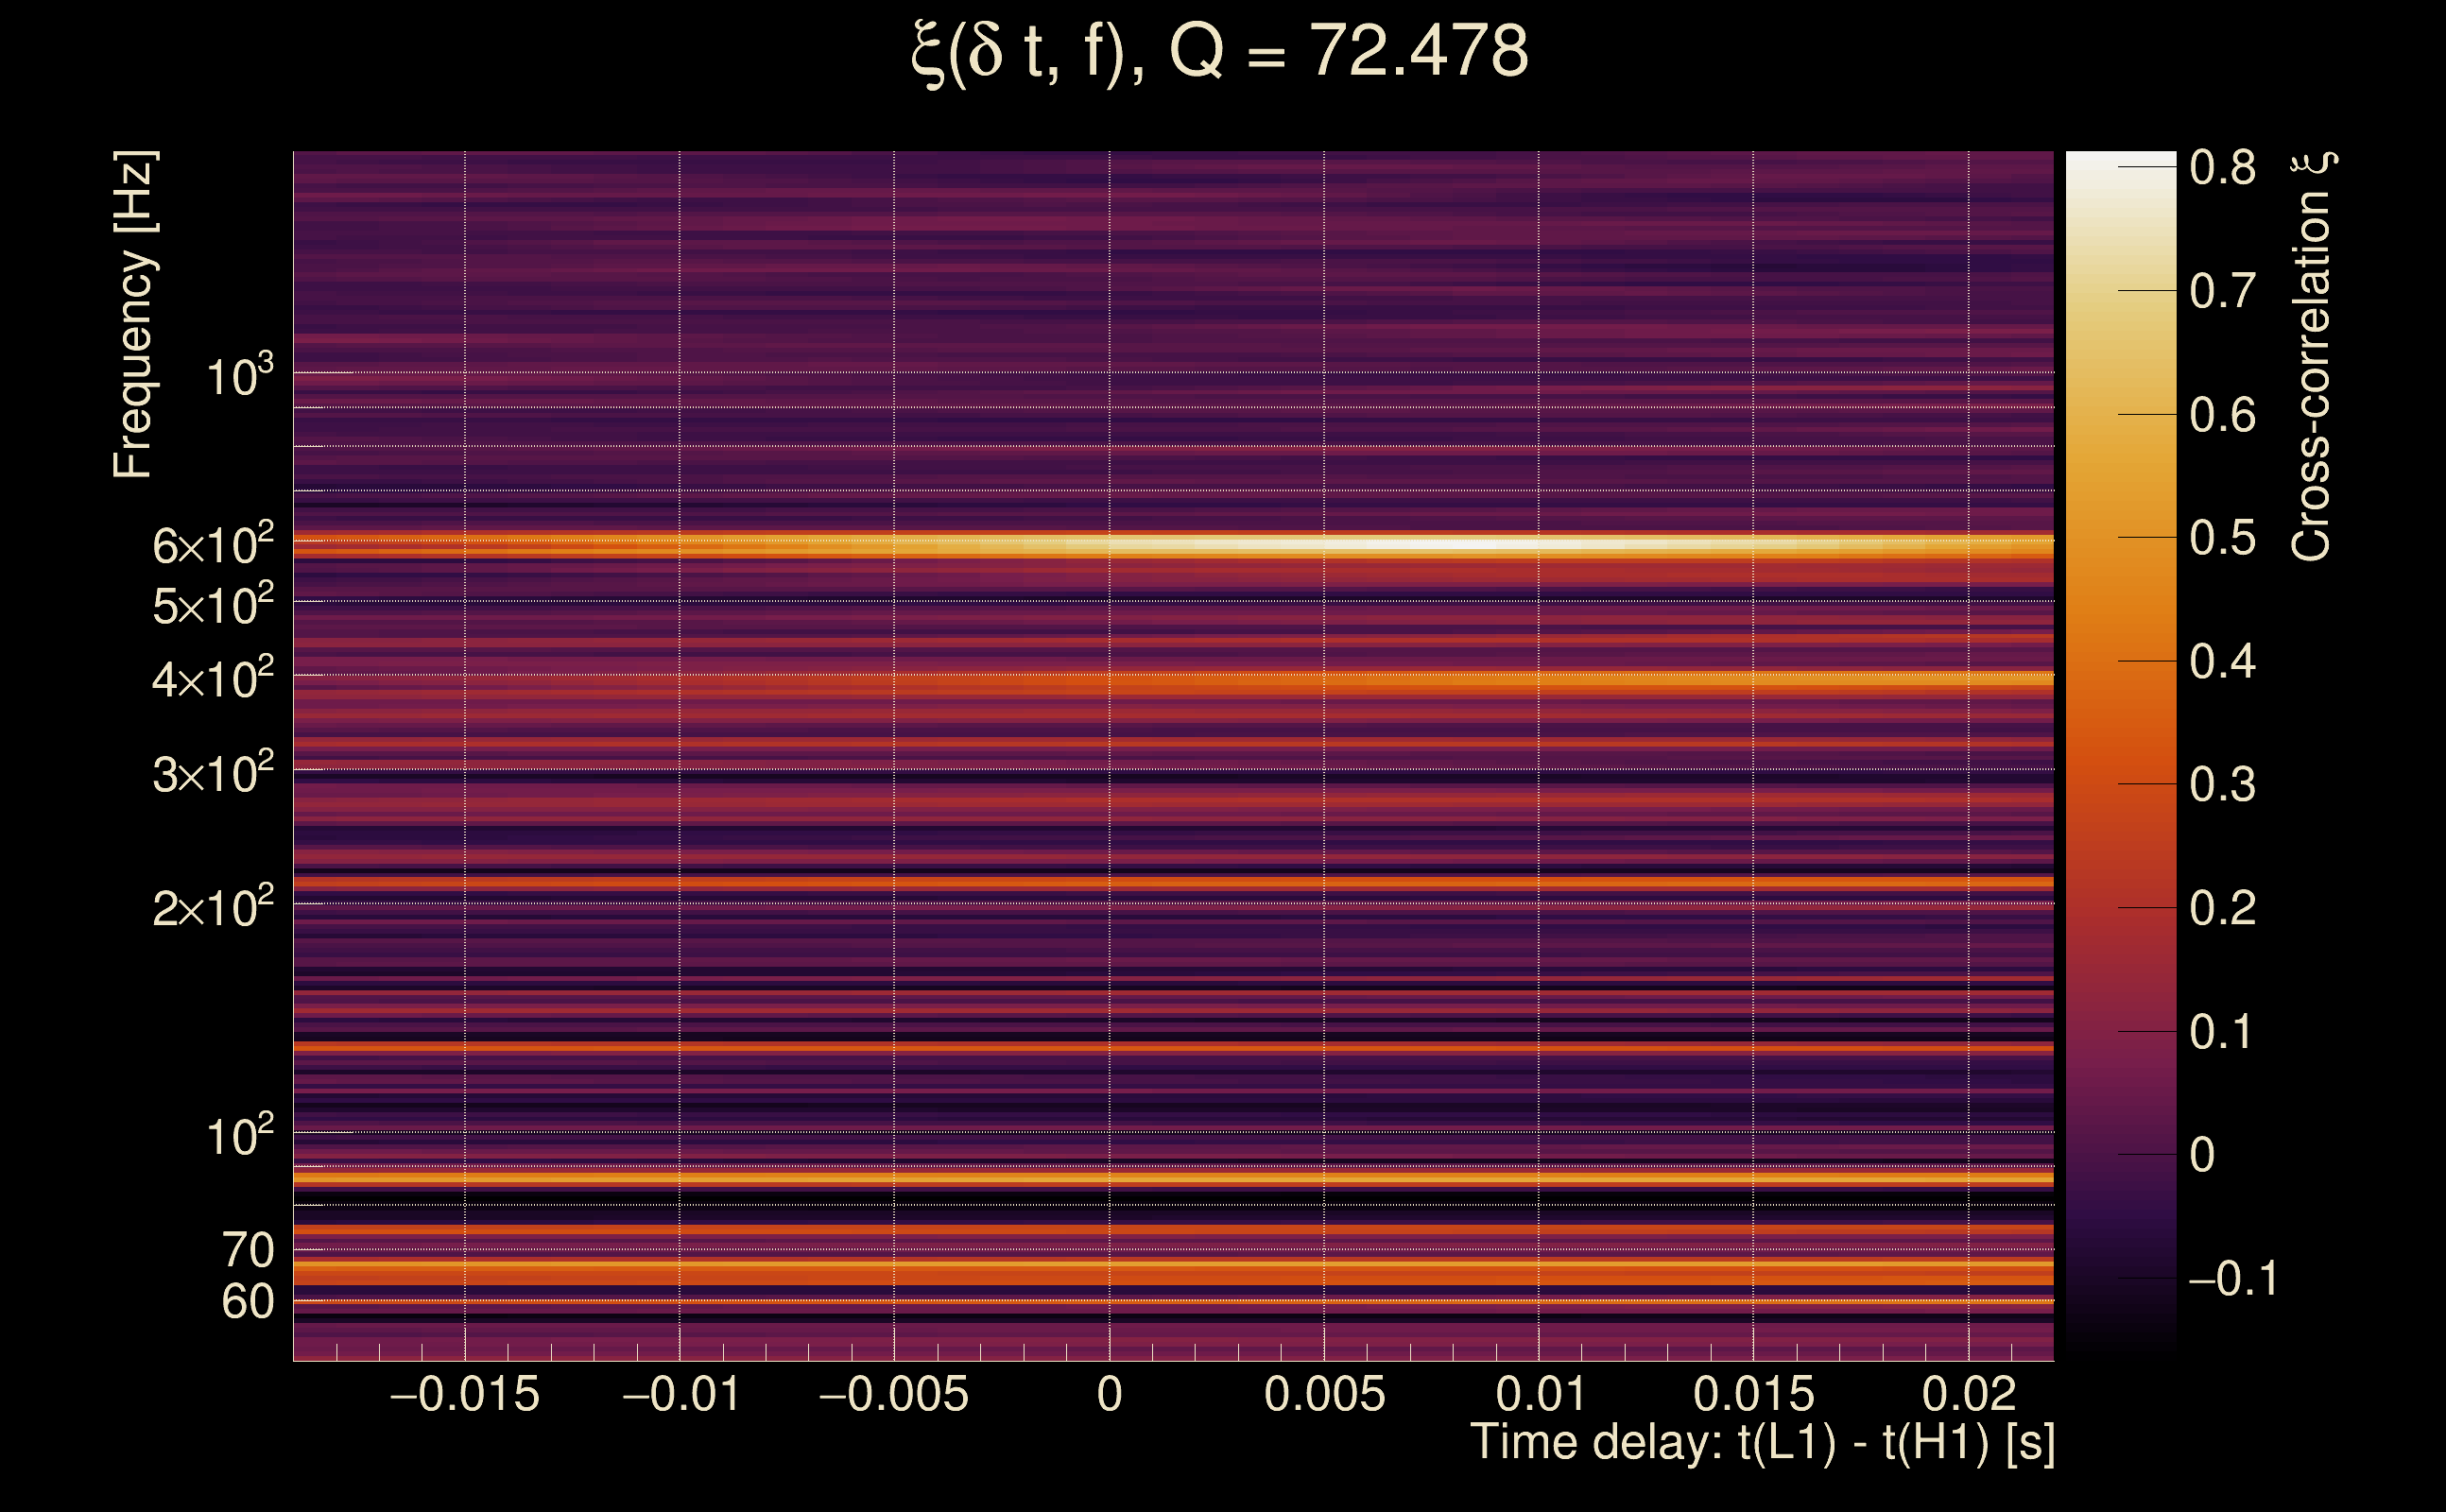
| Number of Q planes: | 5 (Q = 5.51892 → Q = 72.478) |
| Omicron frequency range: | 50 Hz → 1958.38 Hz |
| Light travel time between detectors: | 0.0100128 s |
| Slice extra-time (calibration uncertainty + slice veto): | 0.0129872 s |
| Number of time-delay bins in a cross-correlation map: | 10000 |
| Number of slices in a cross-correlation map: | 217 |
| Number of time-delay bins in a slice: | 46 |
| SNR gating: | < 100 (detector 0), < 100 (detector 1) |
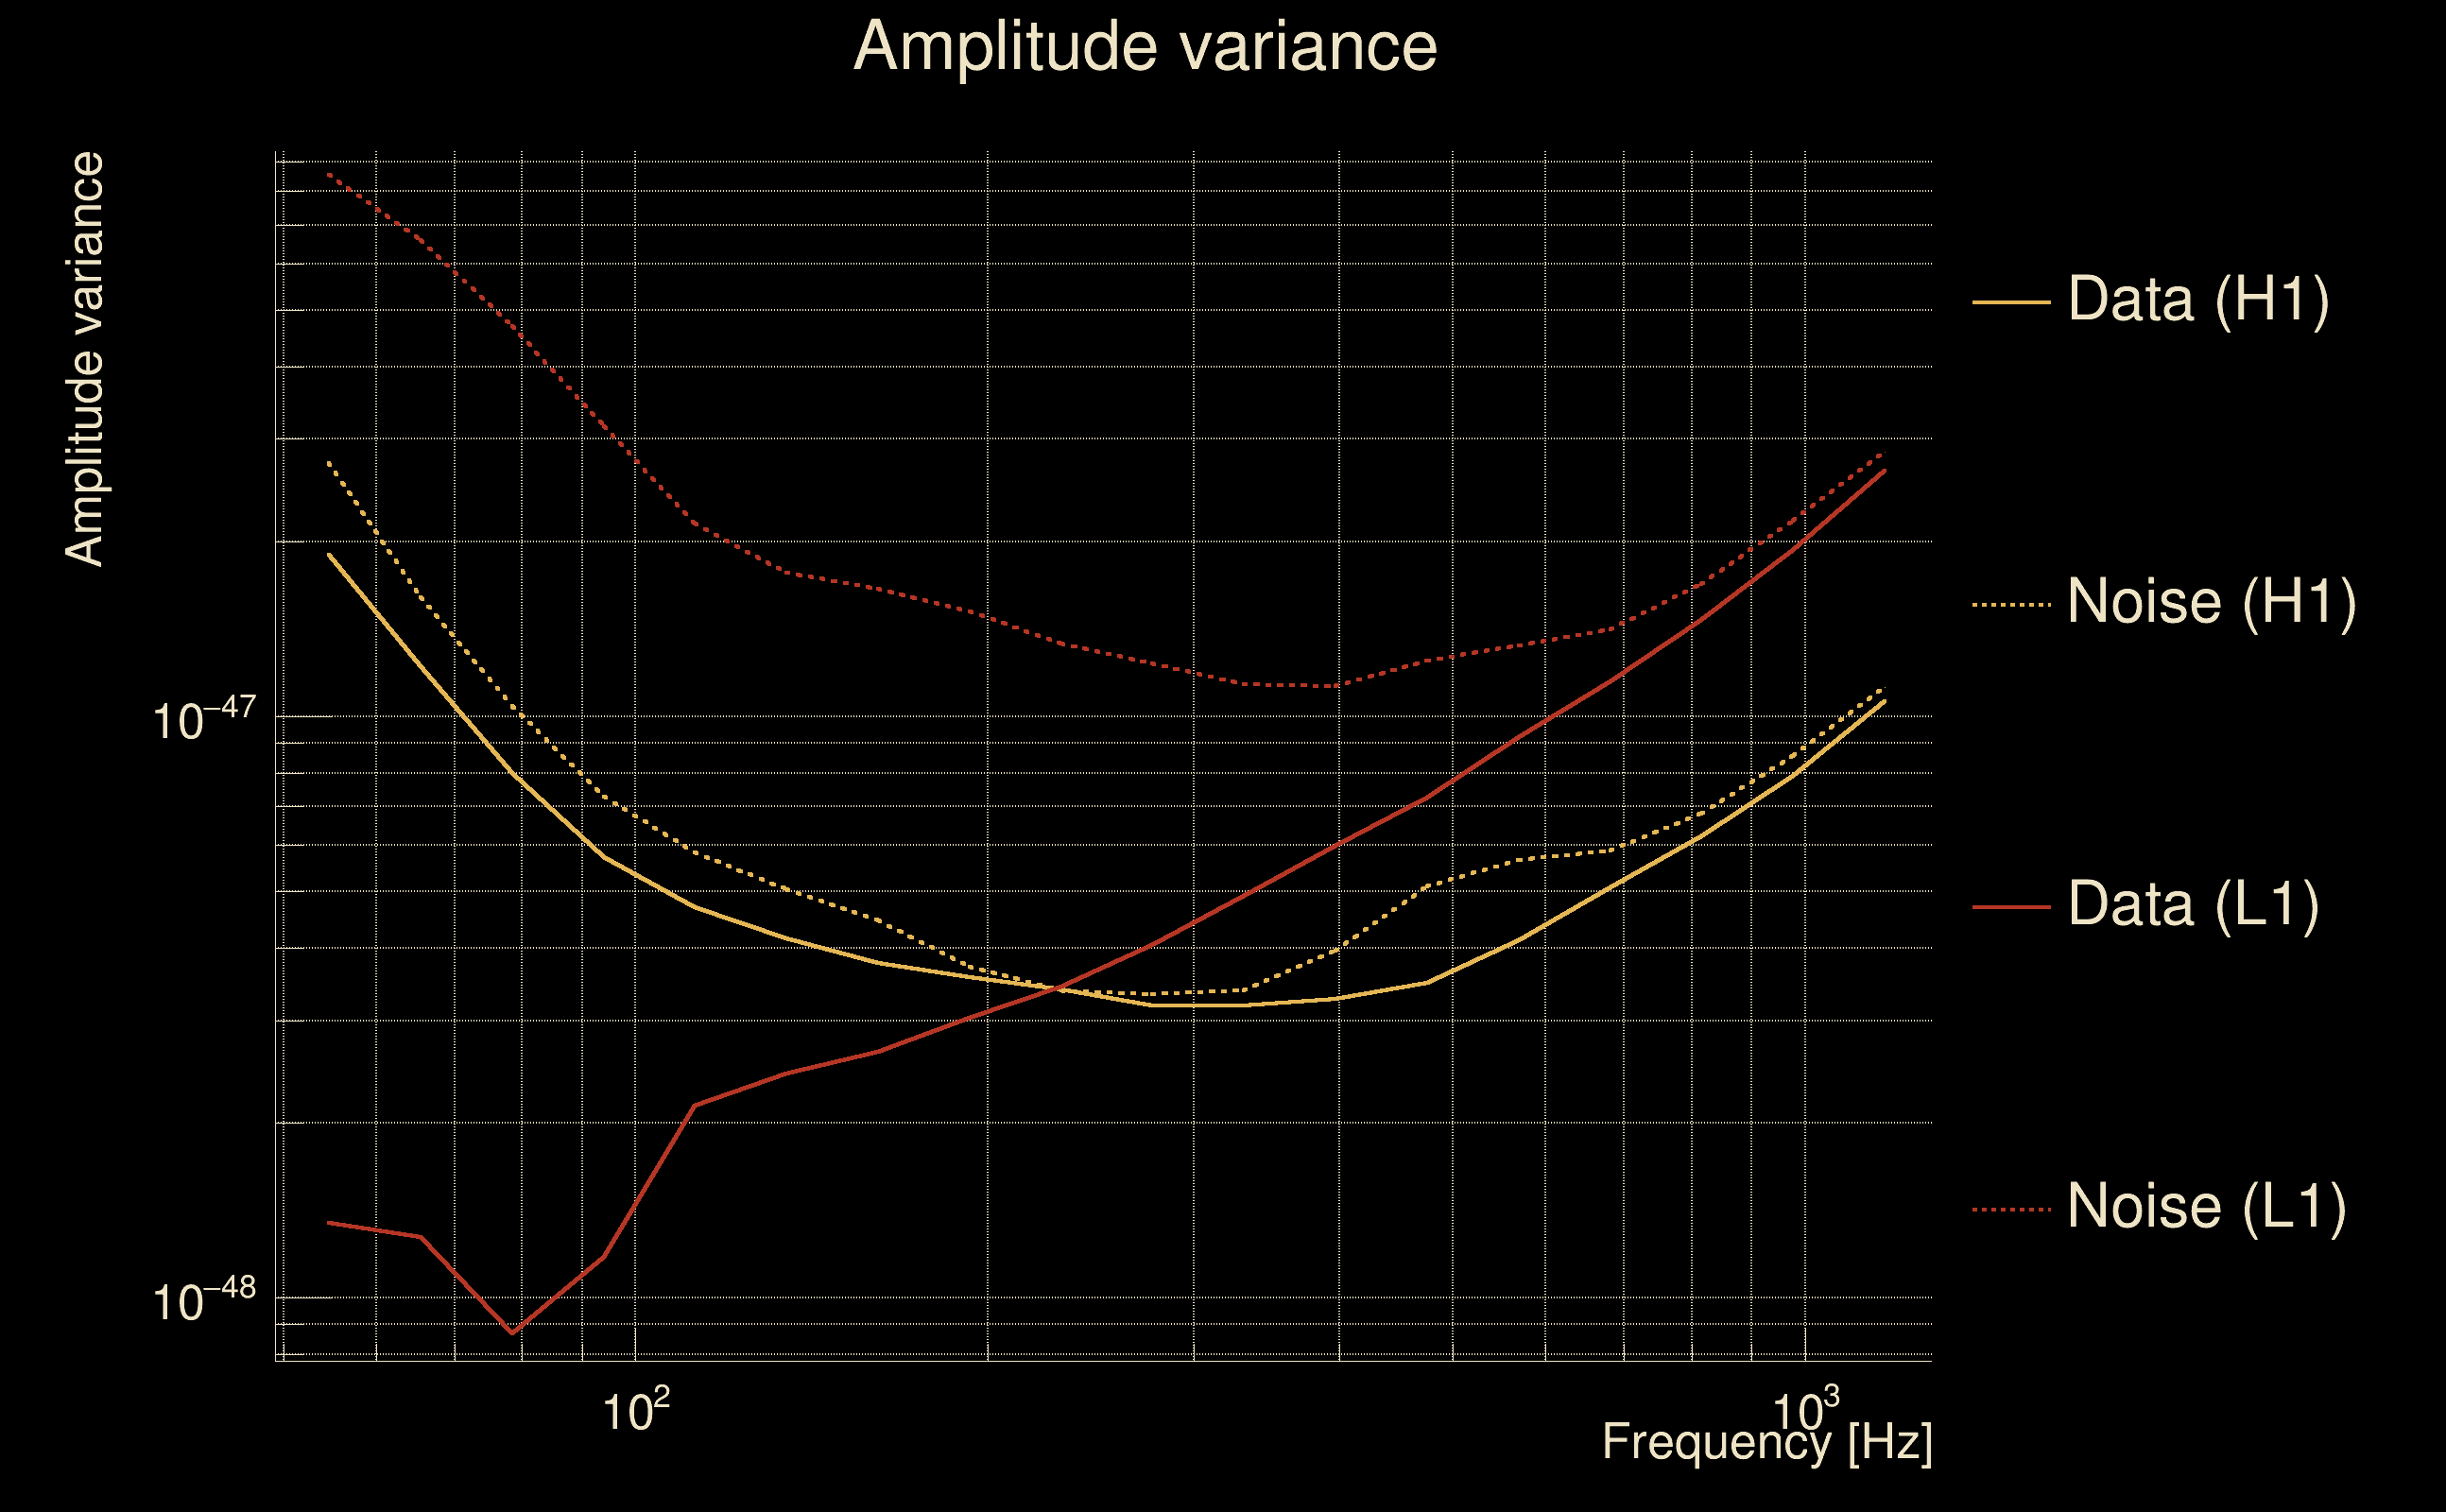
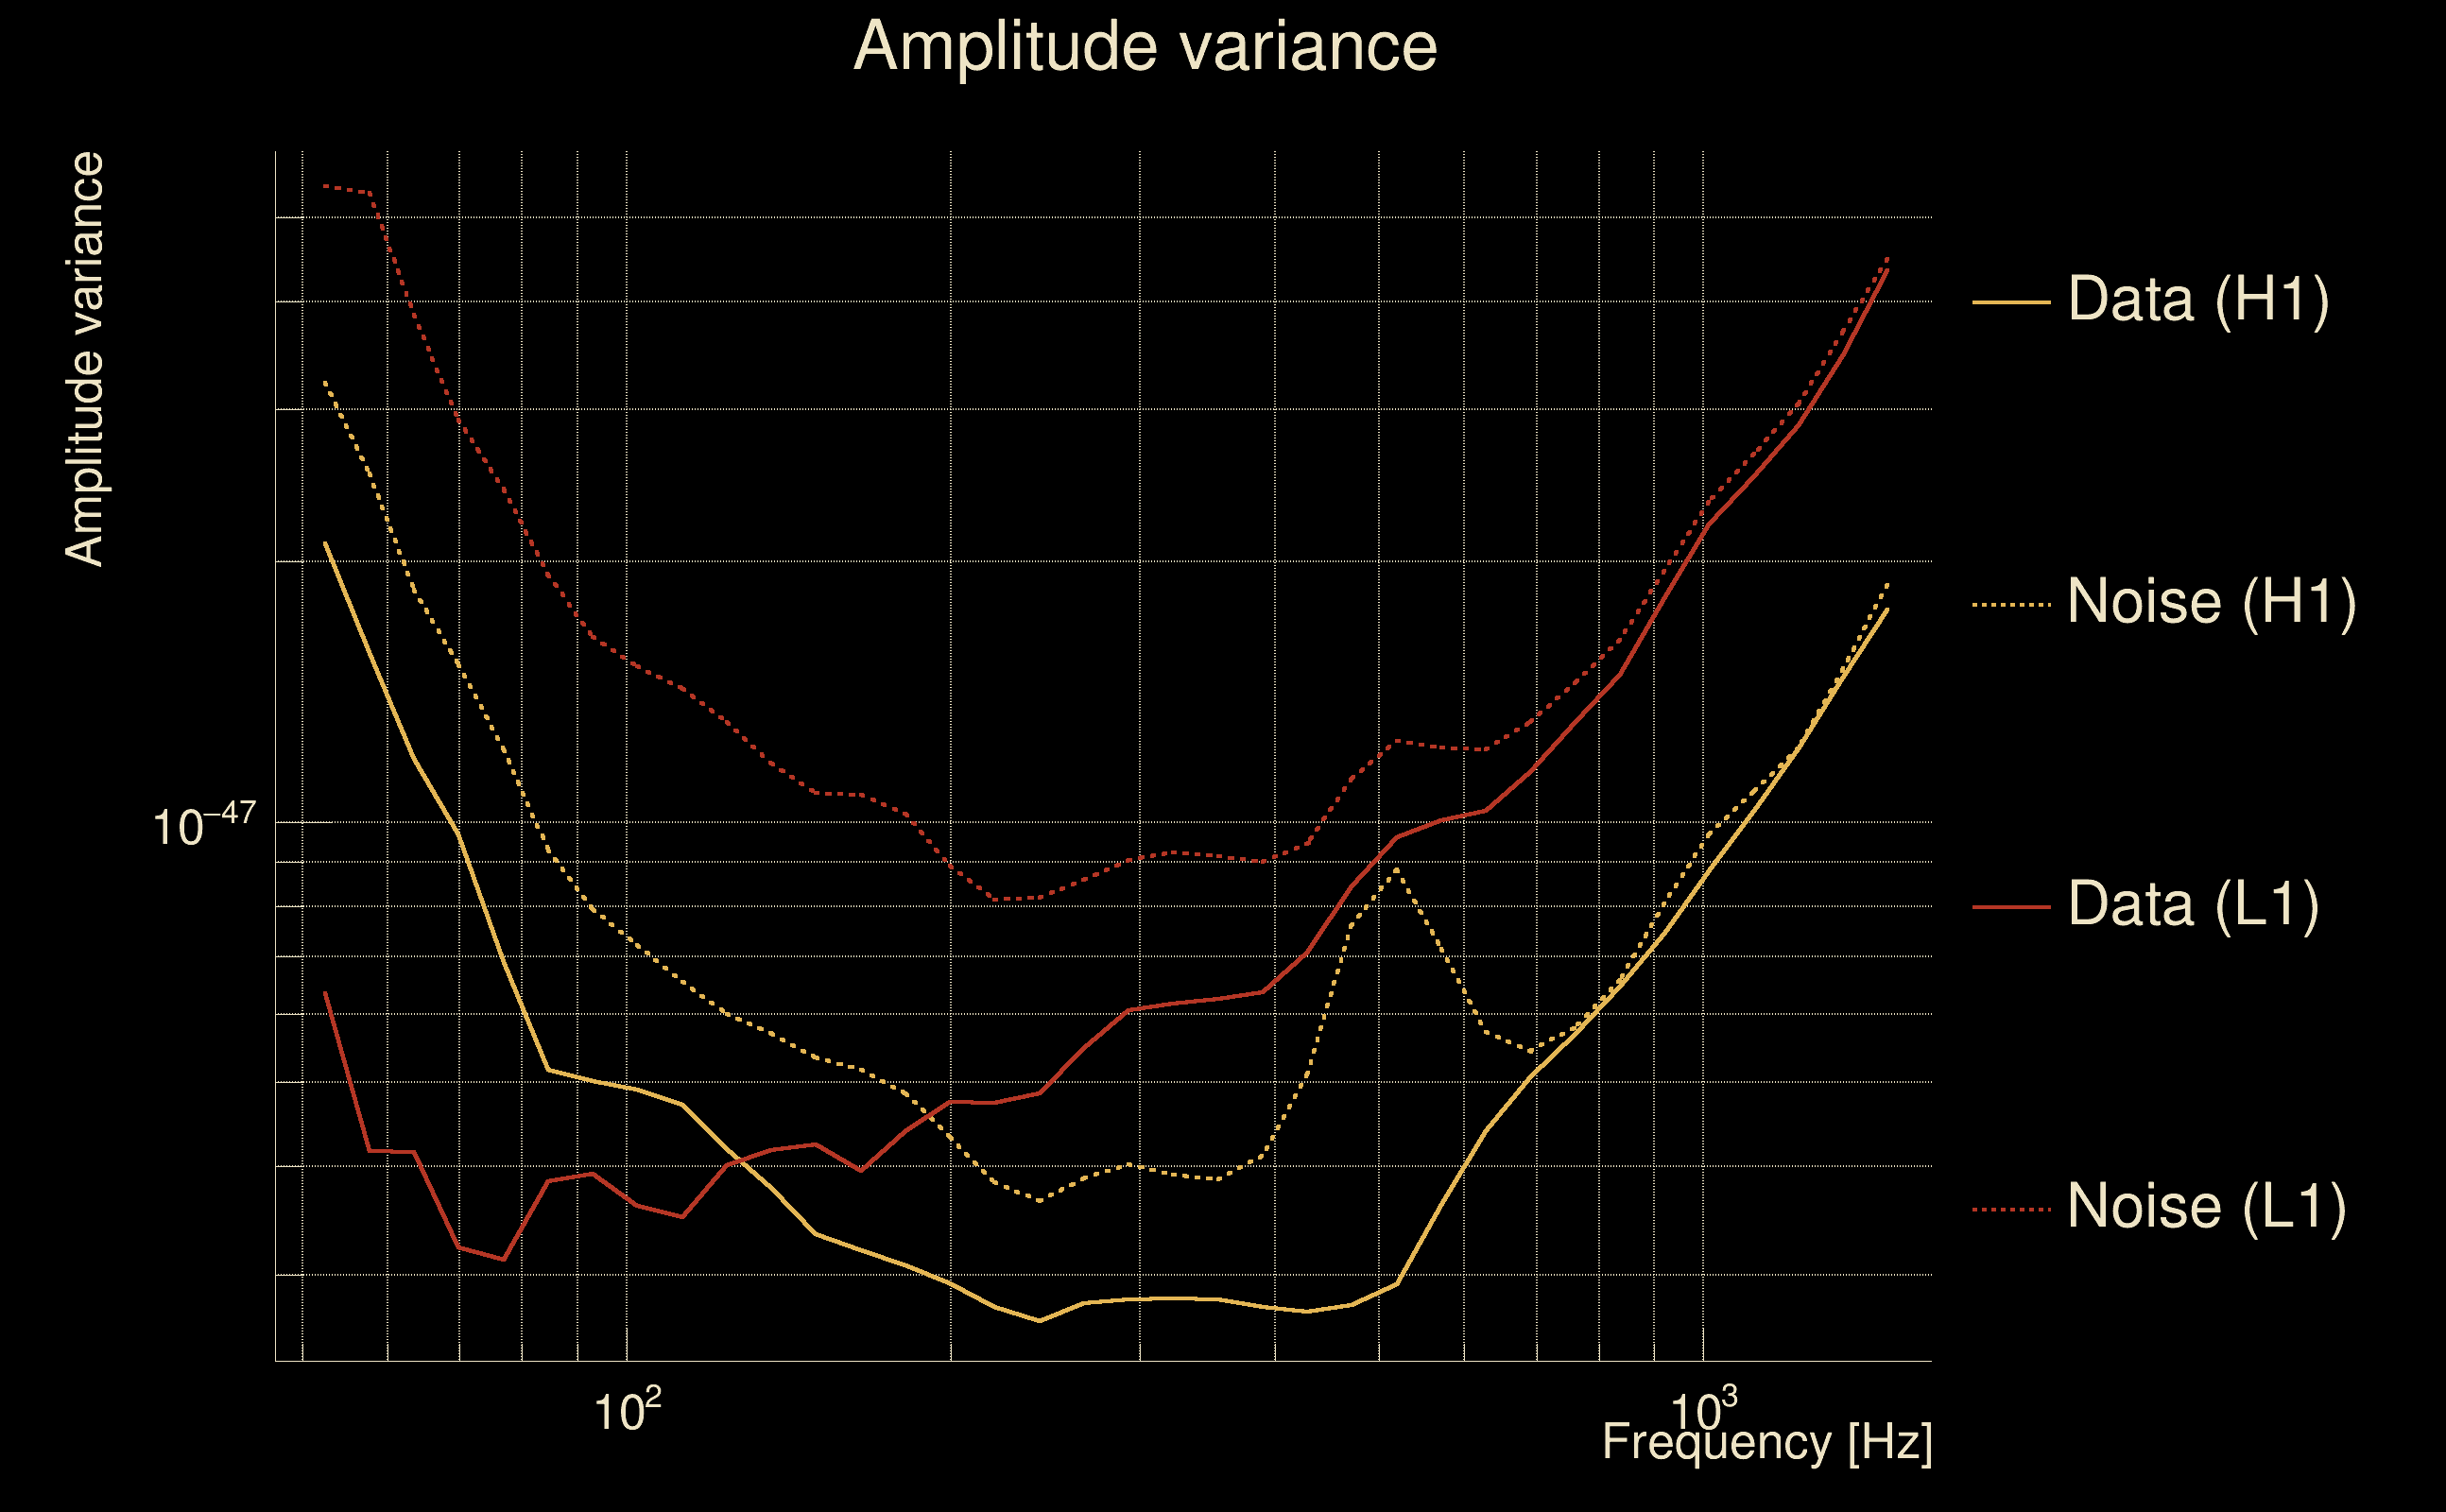
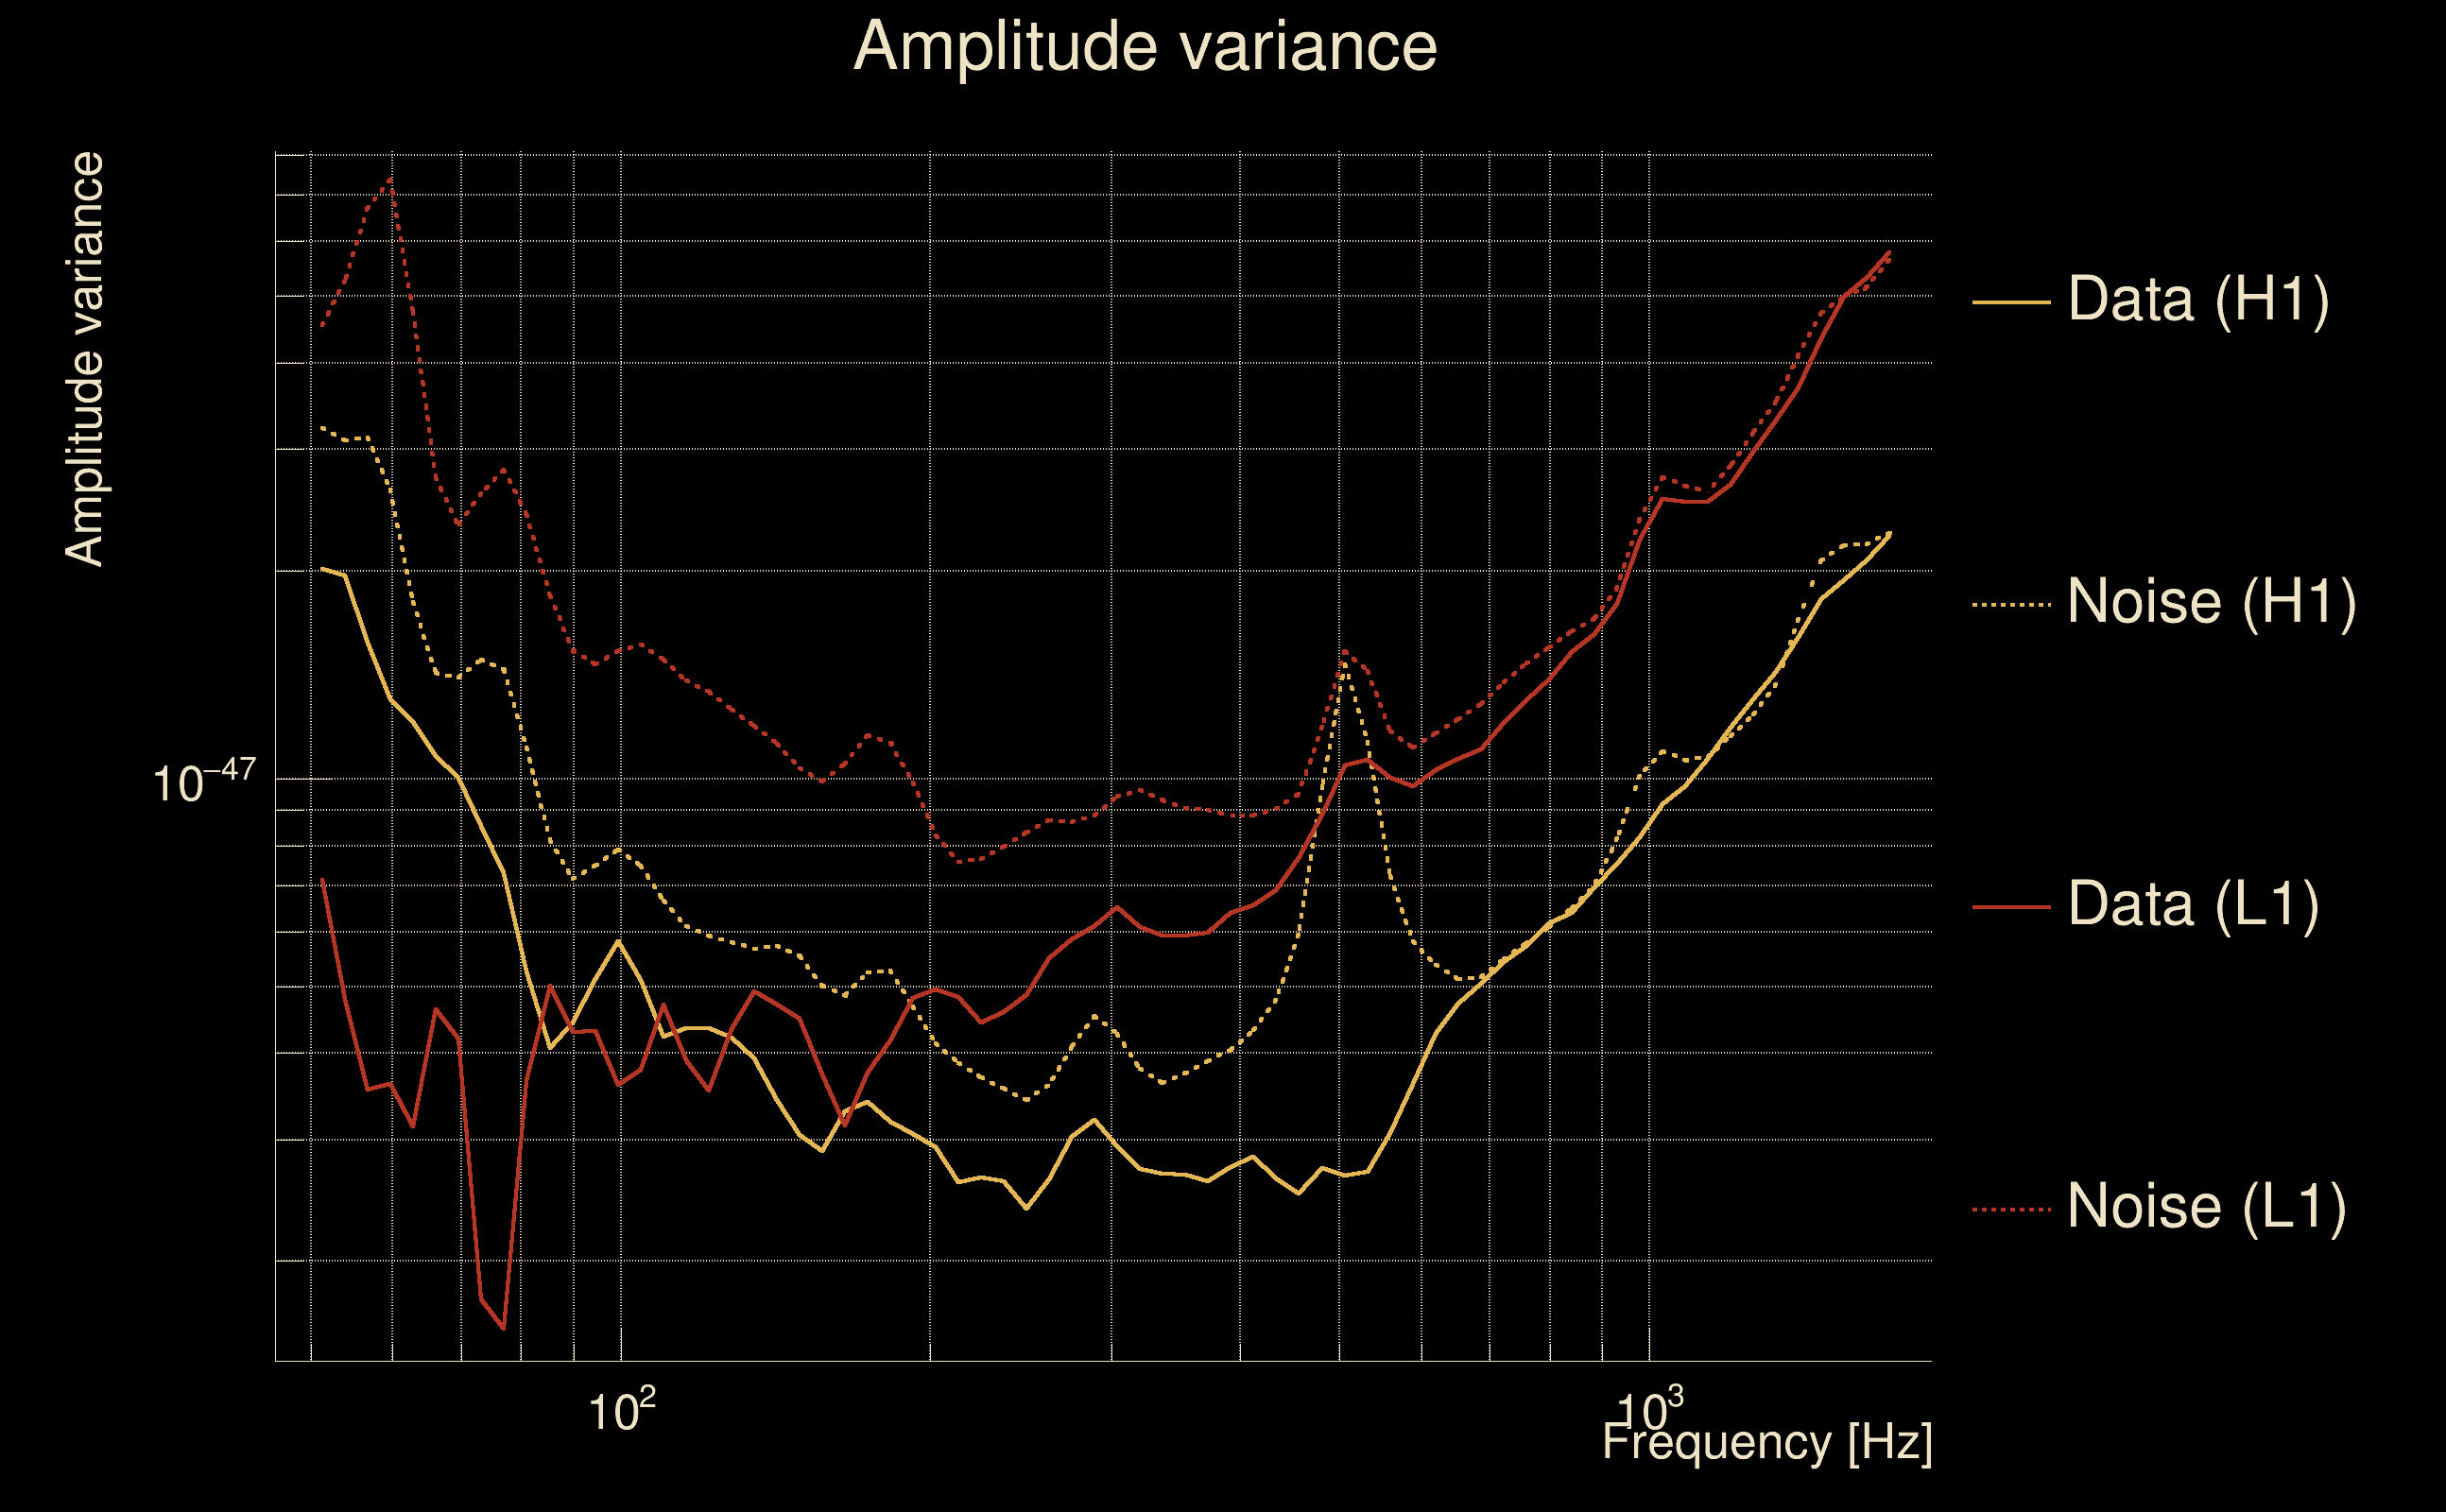
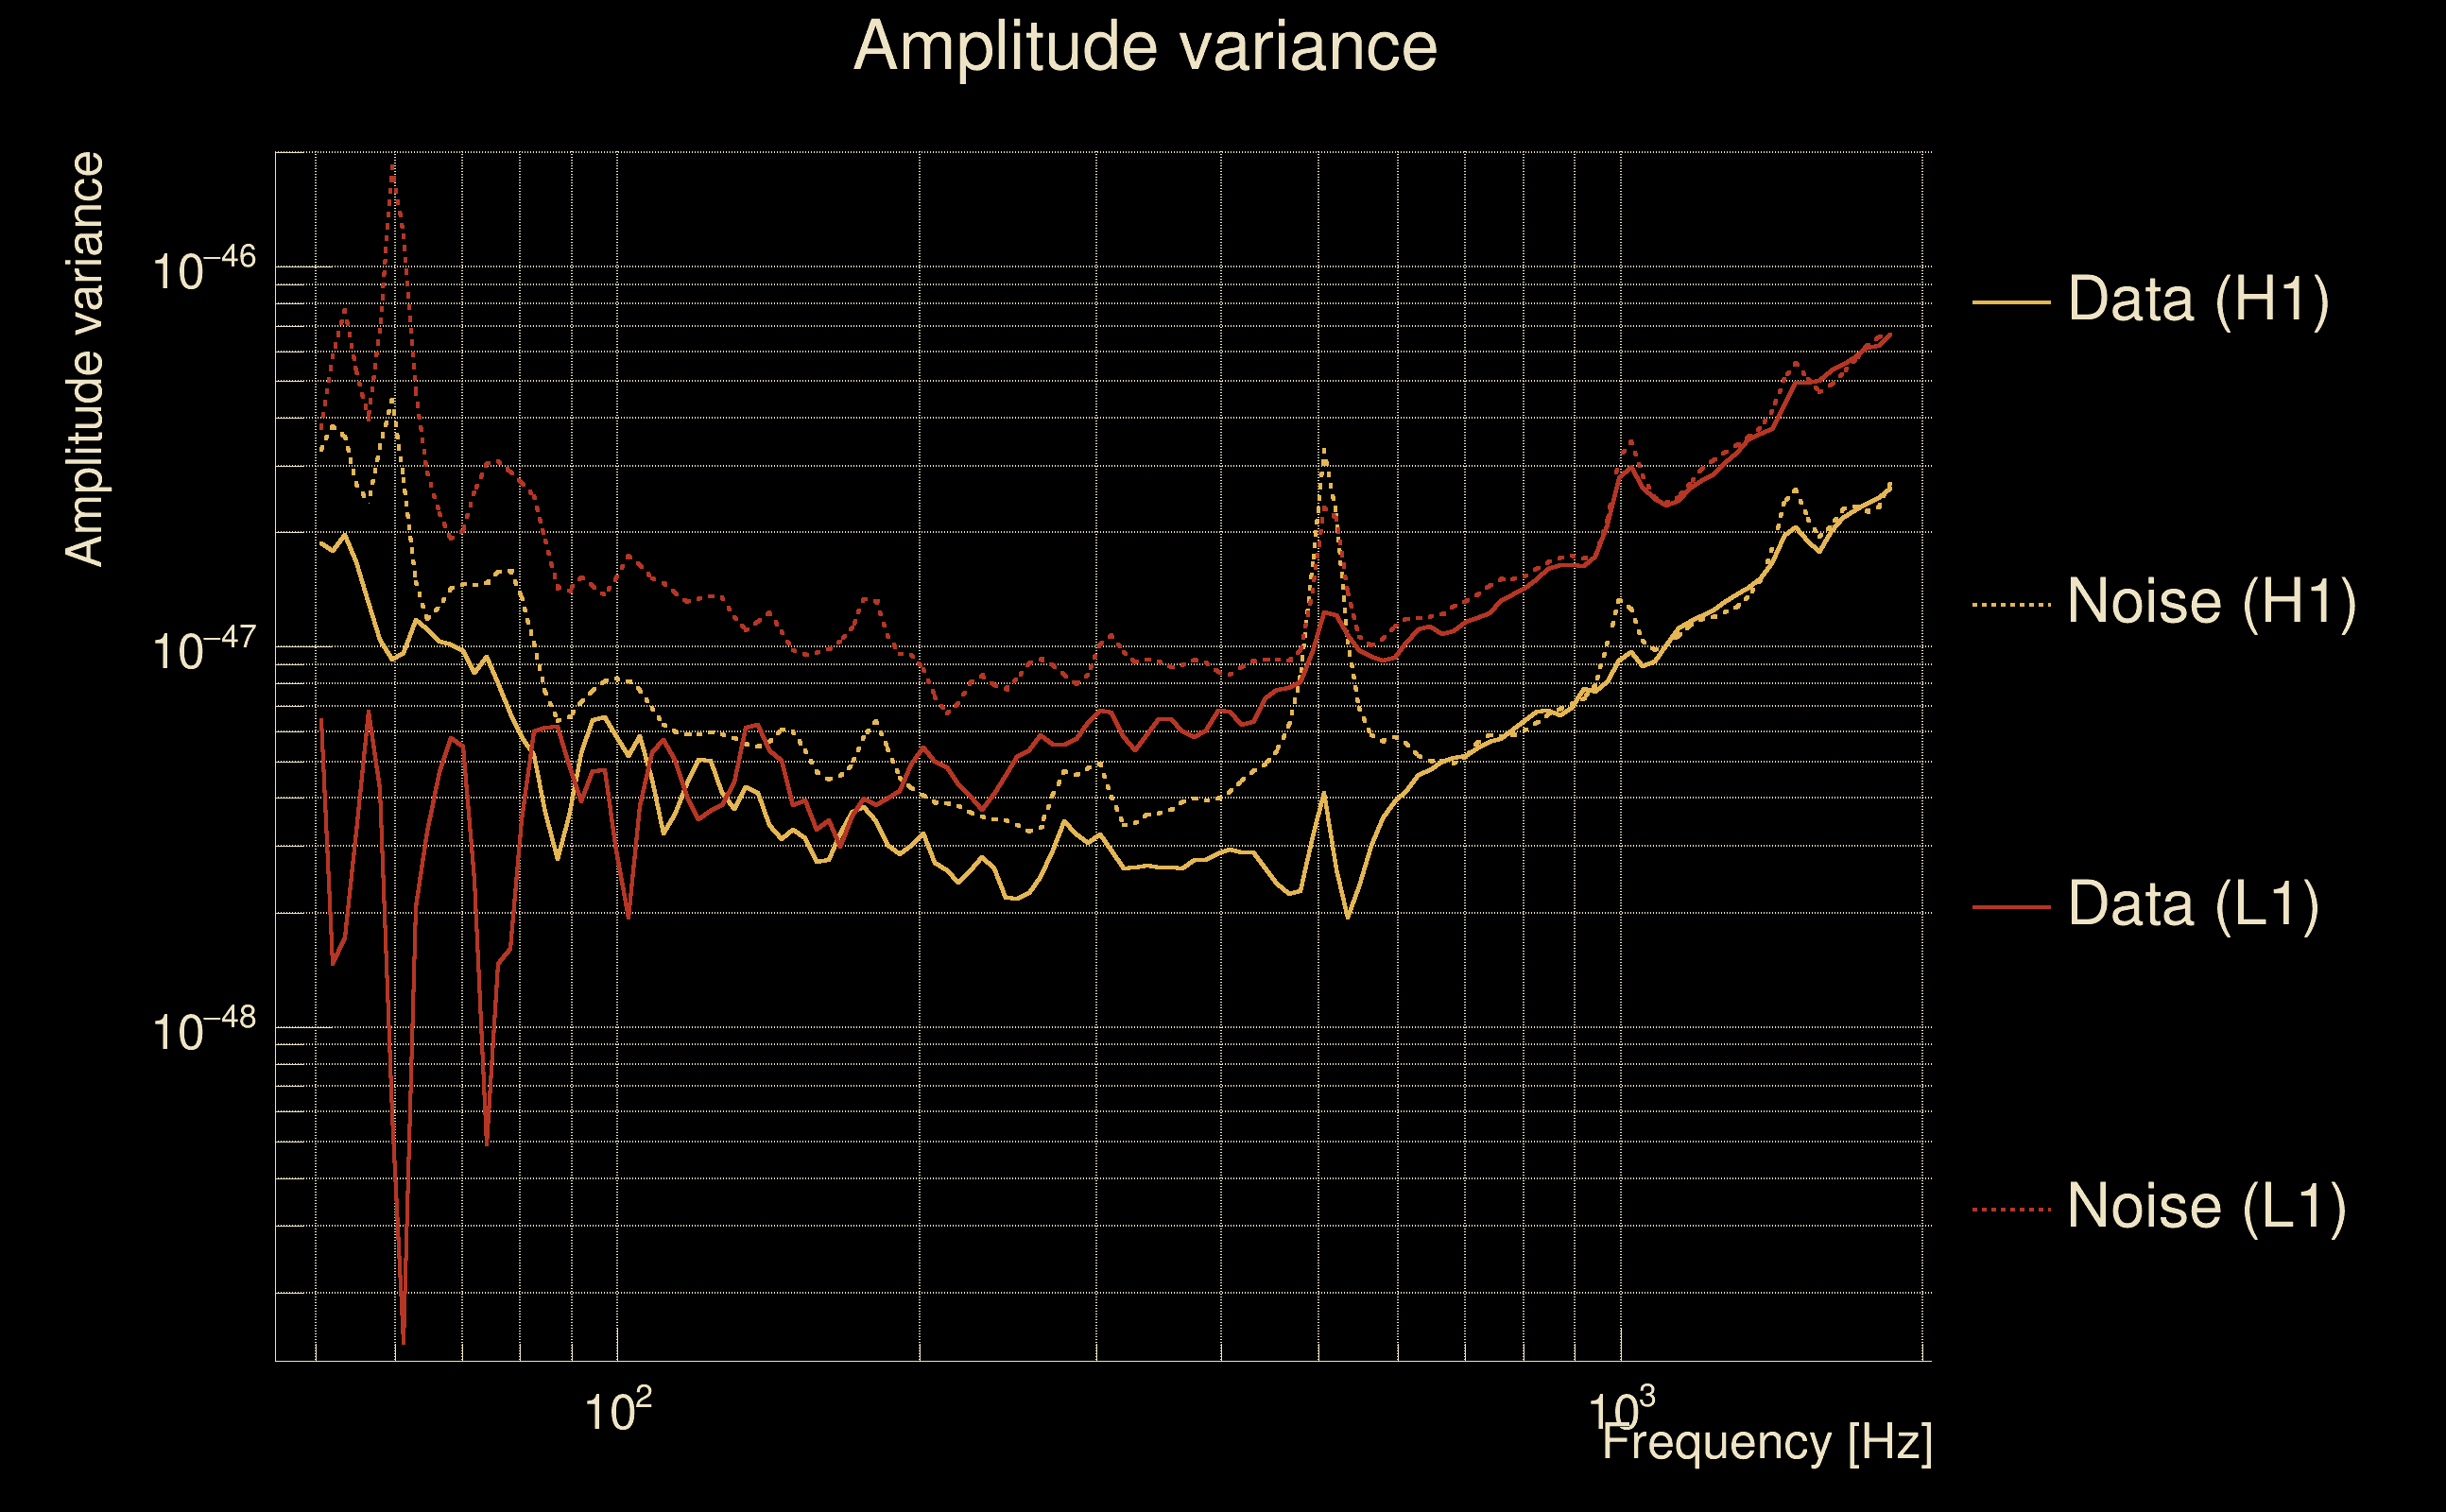
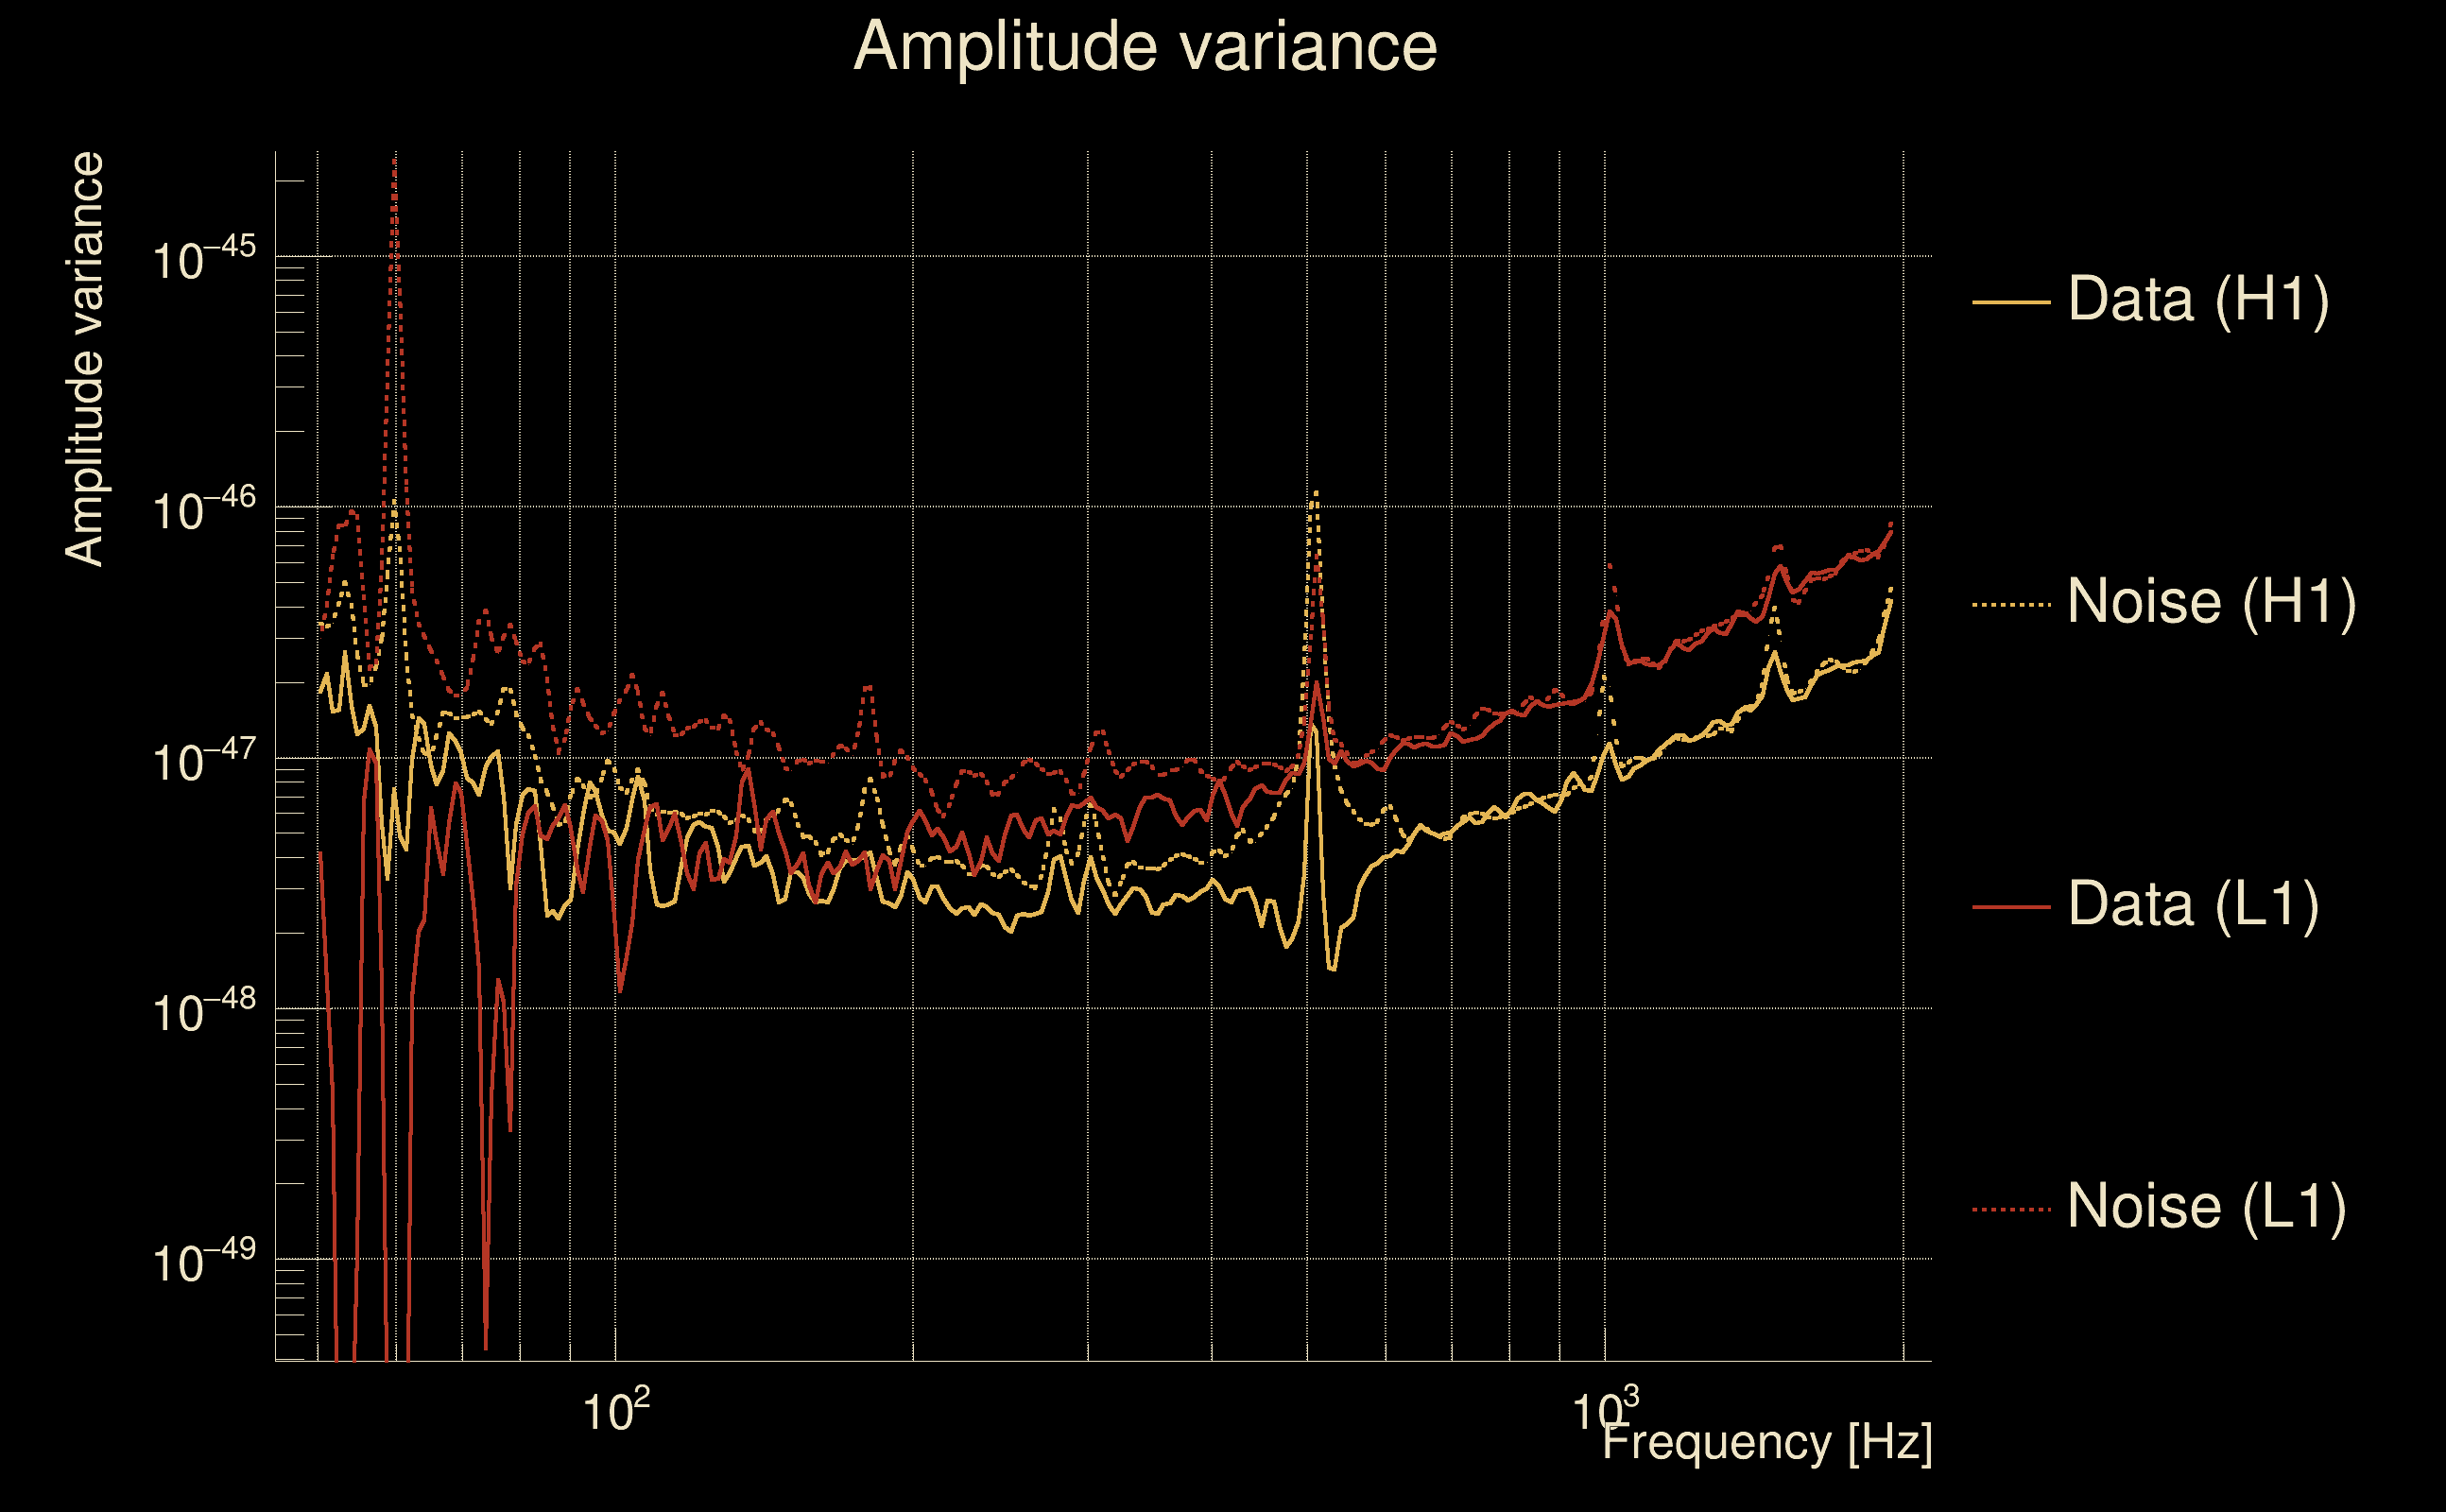
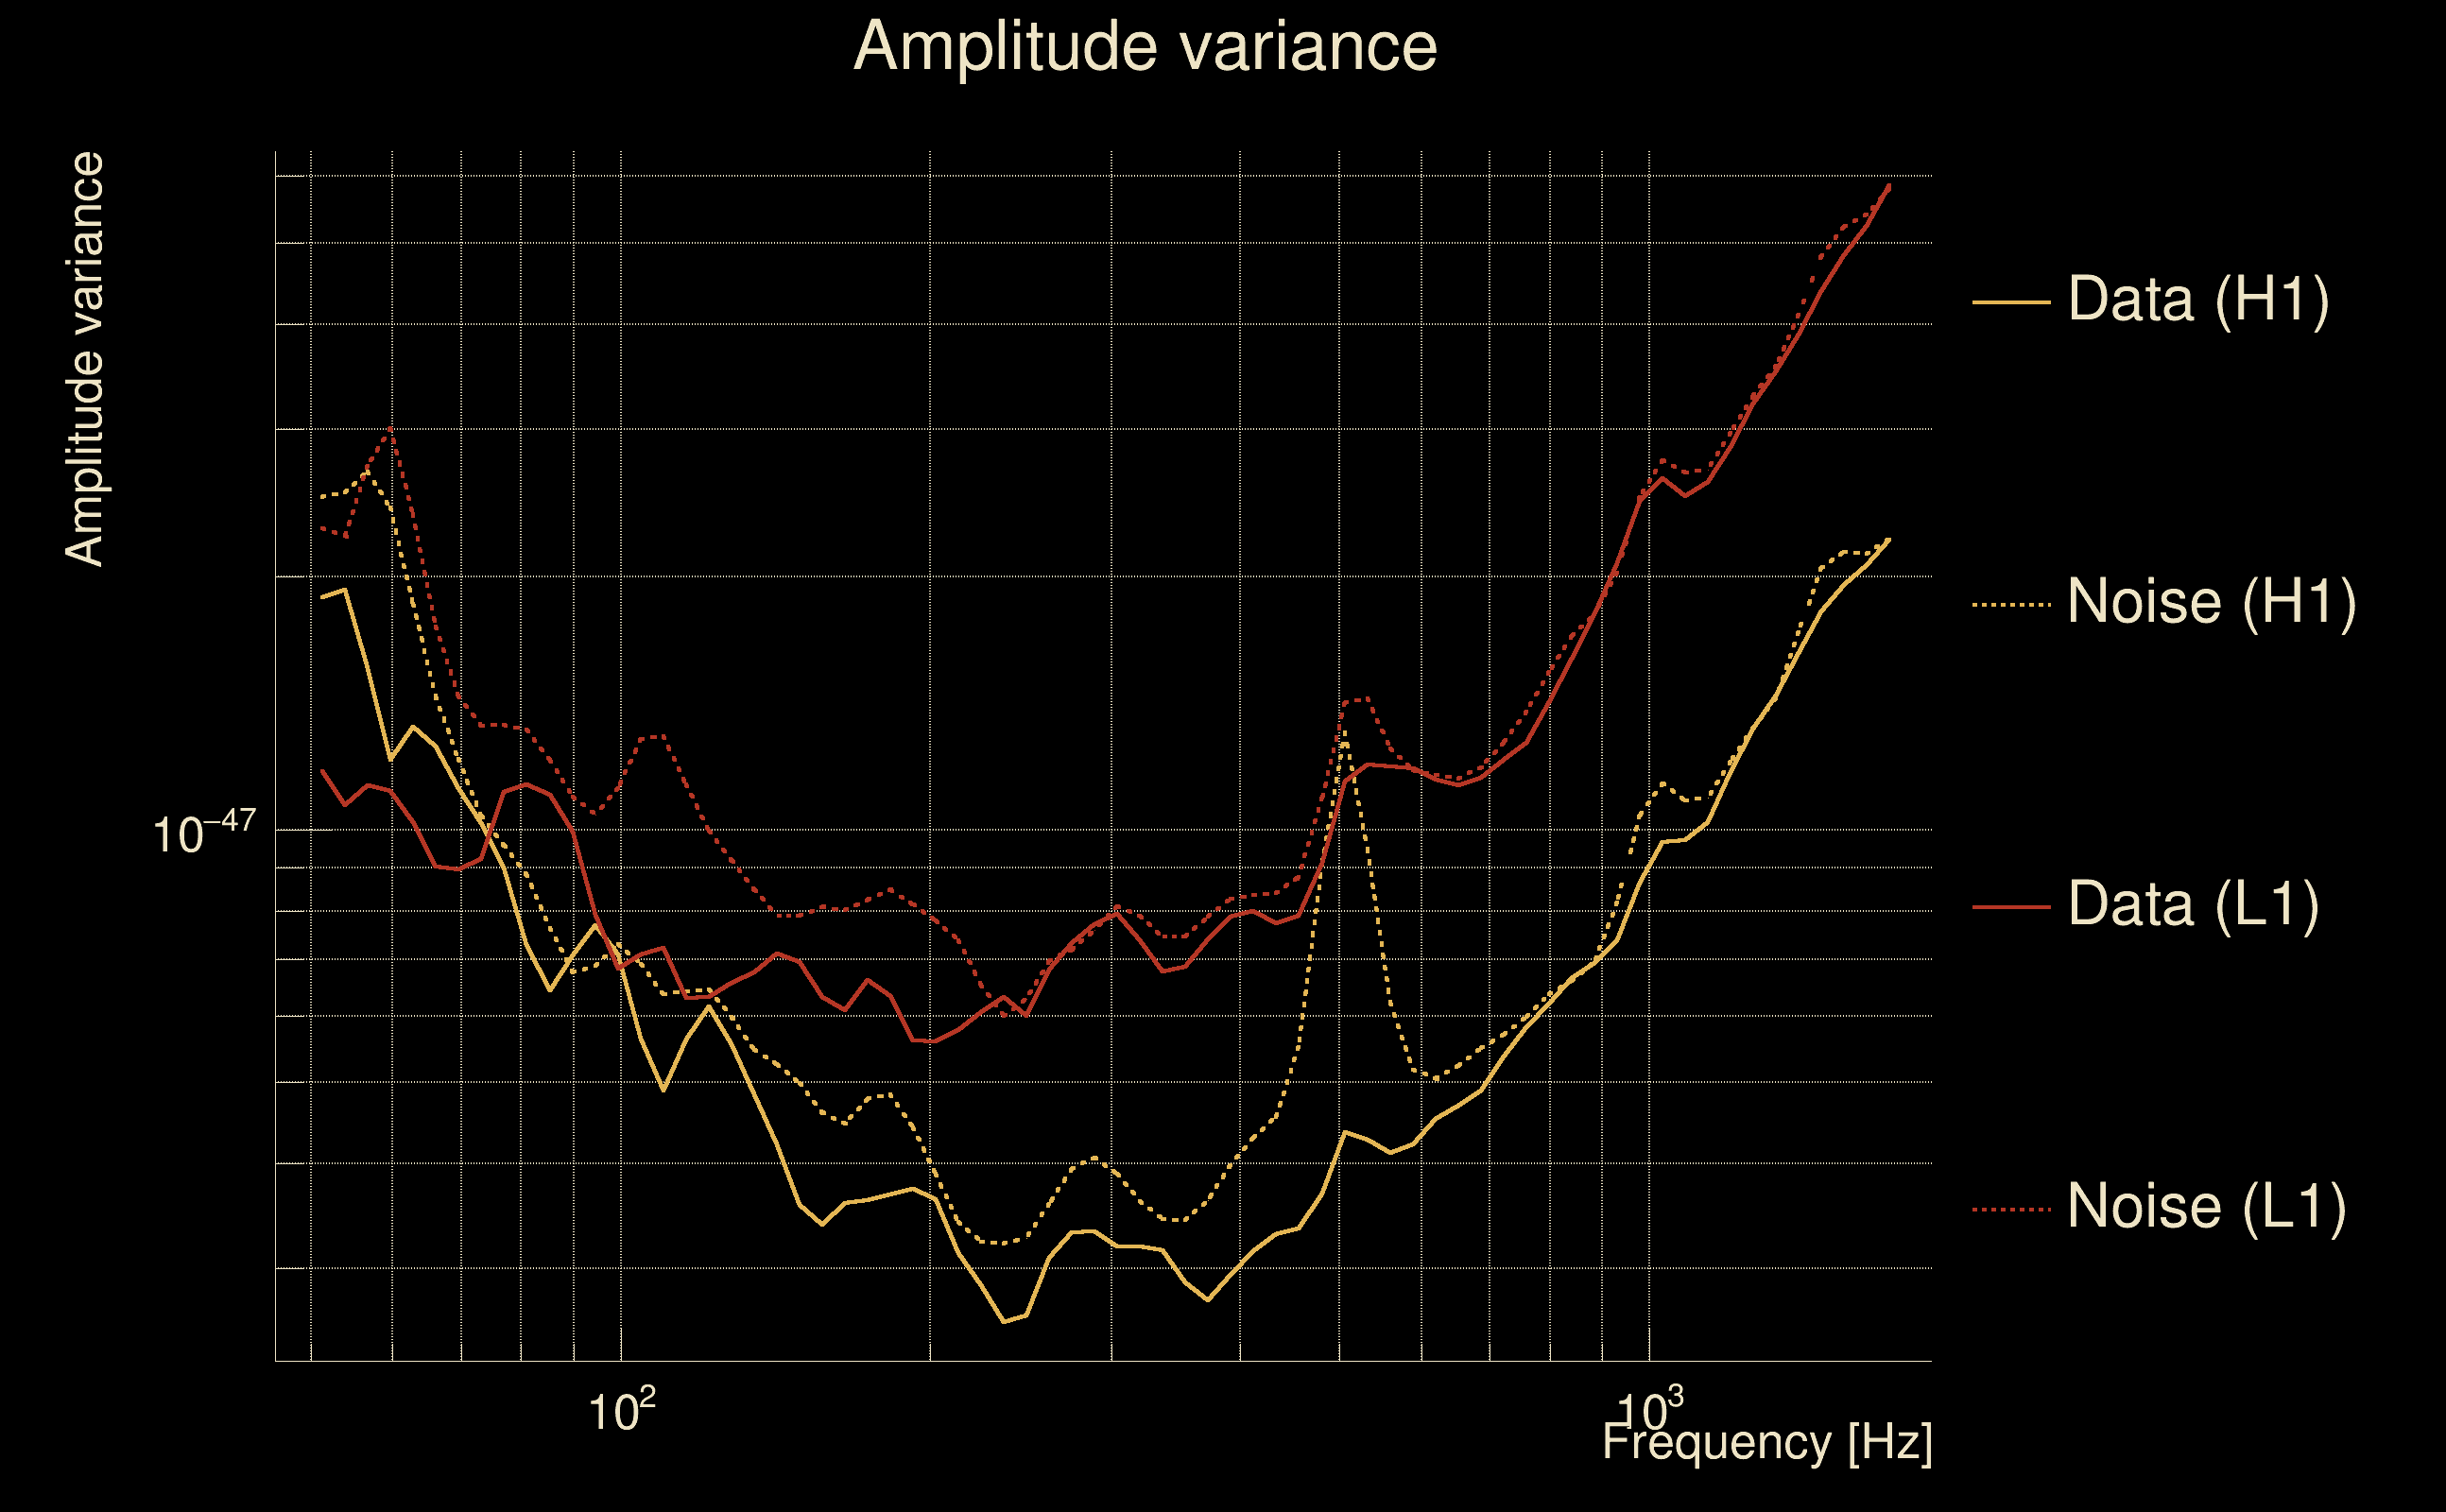
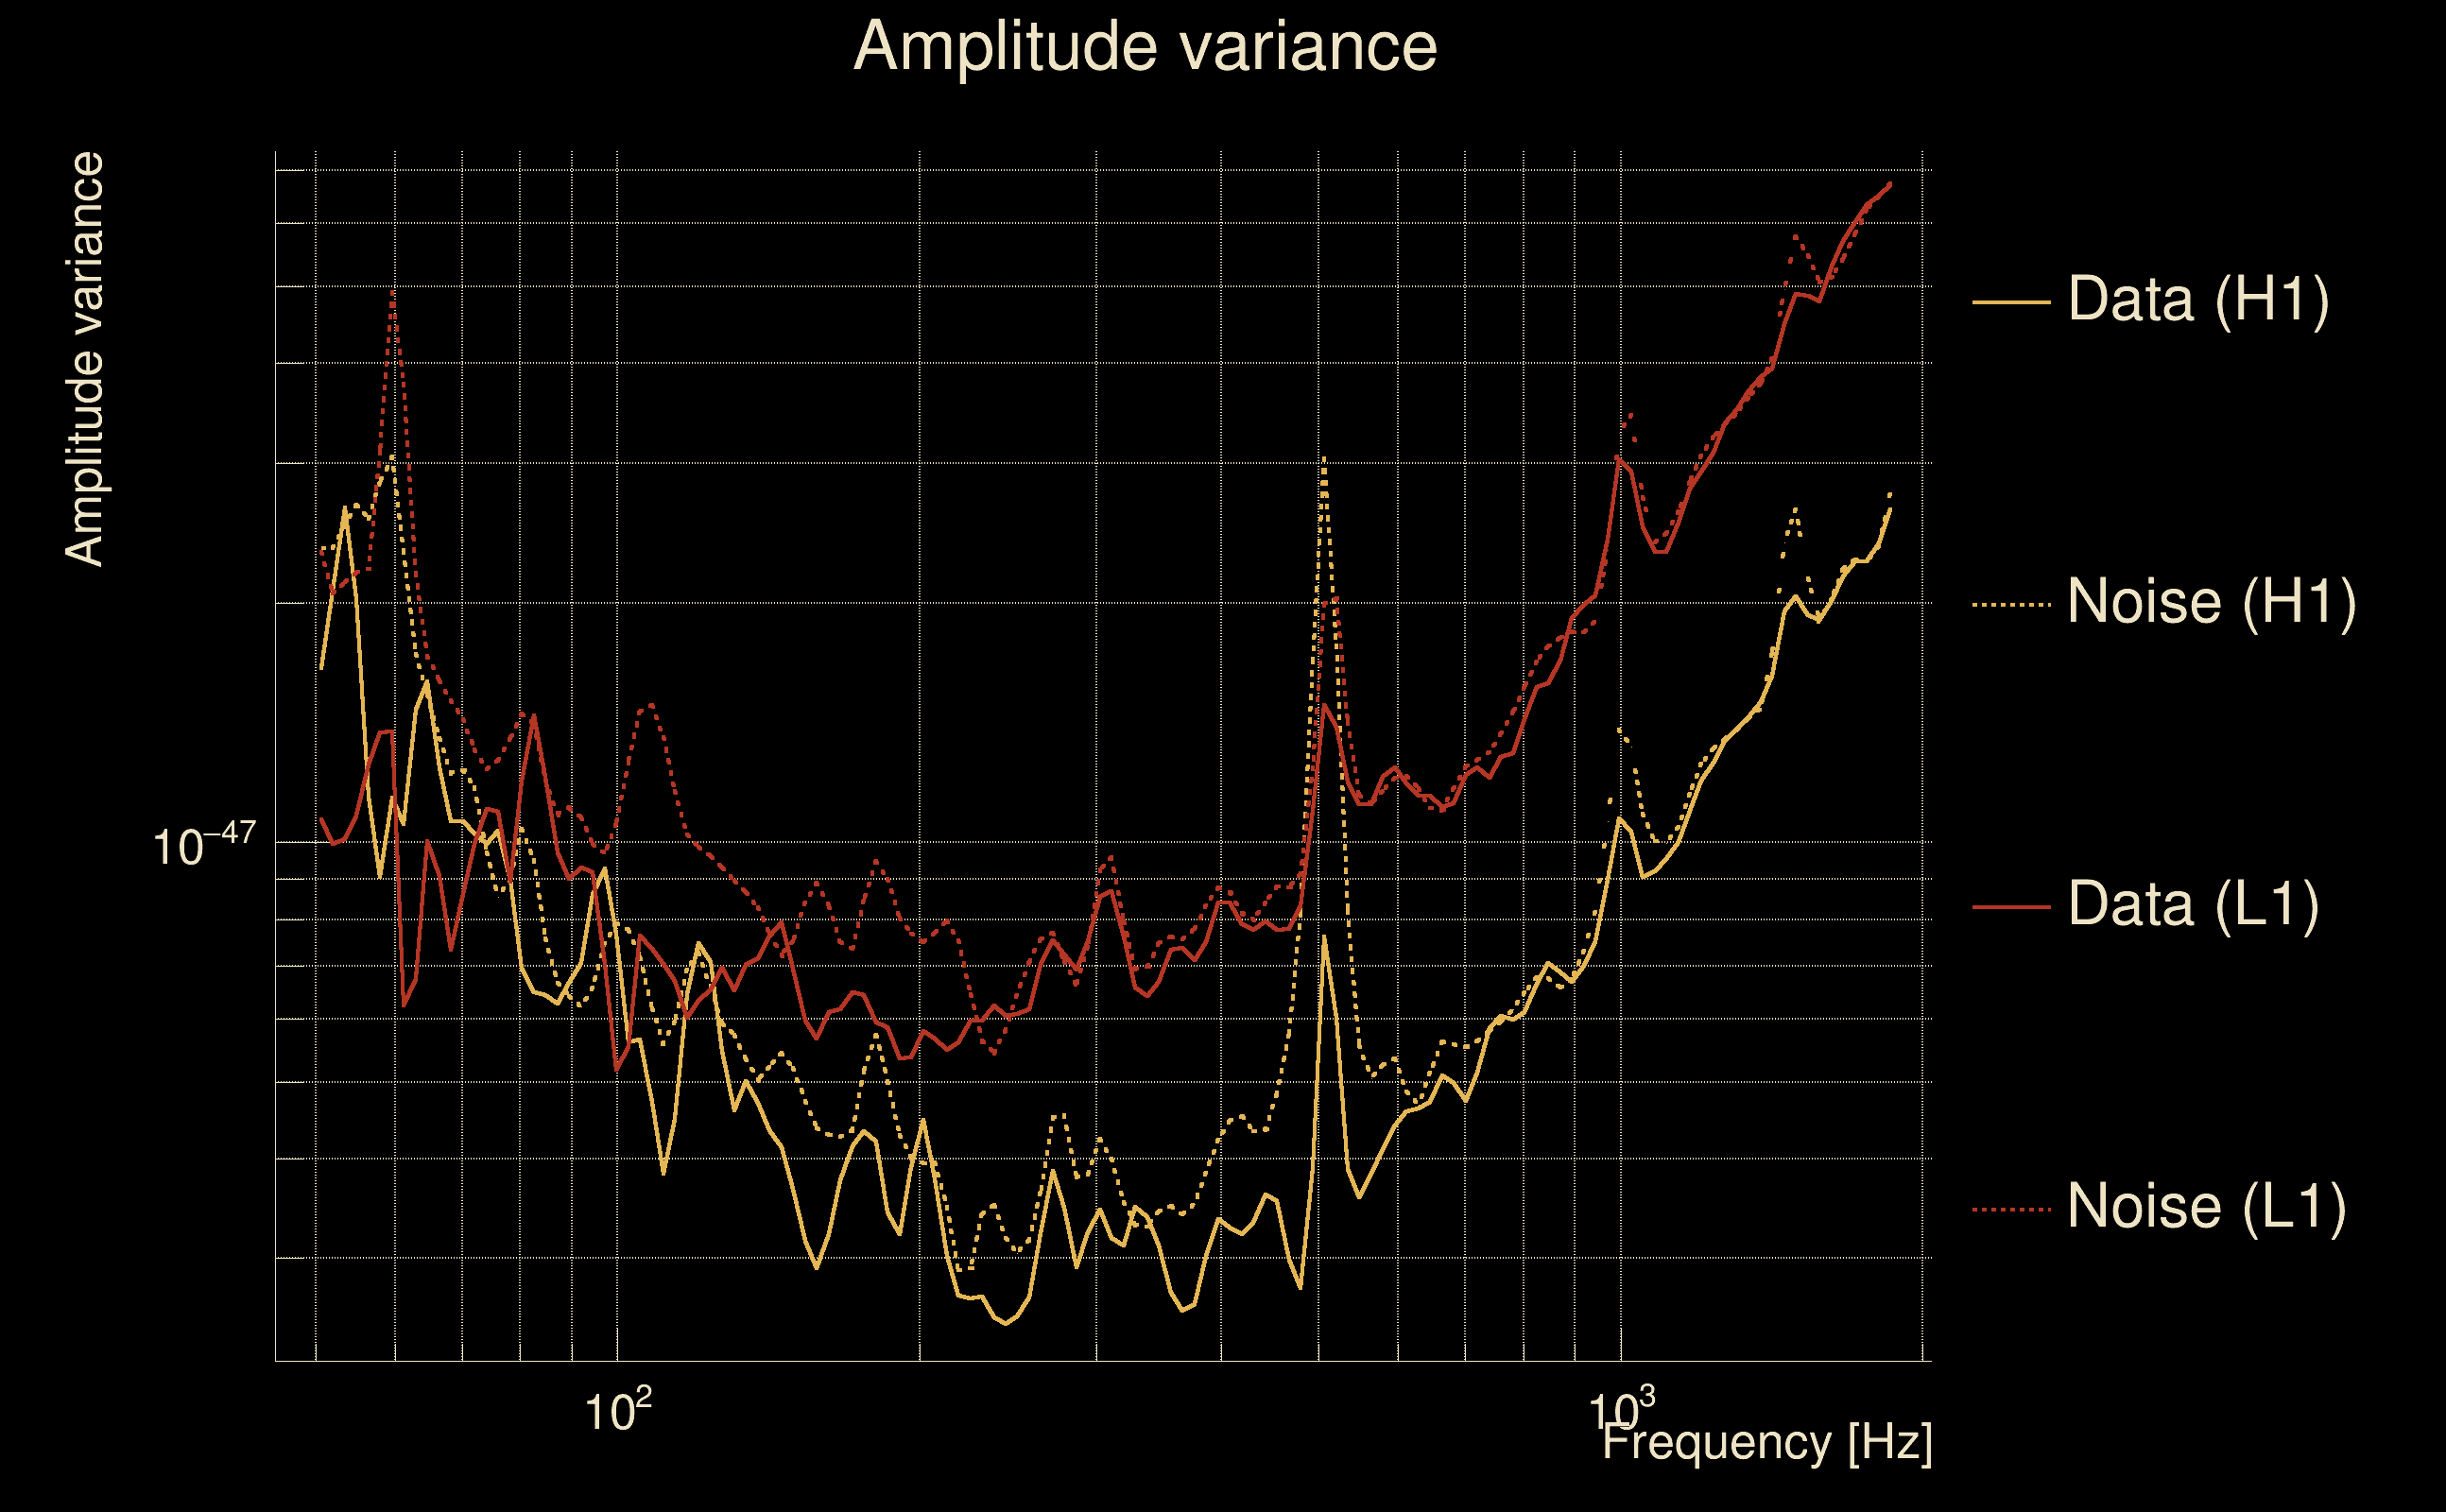
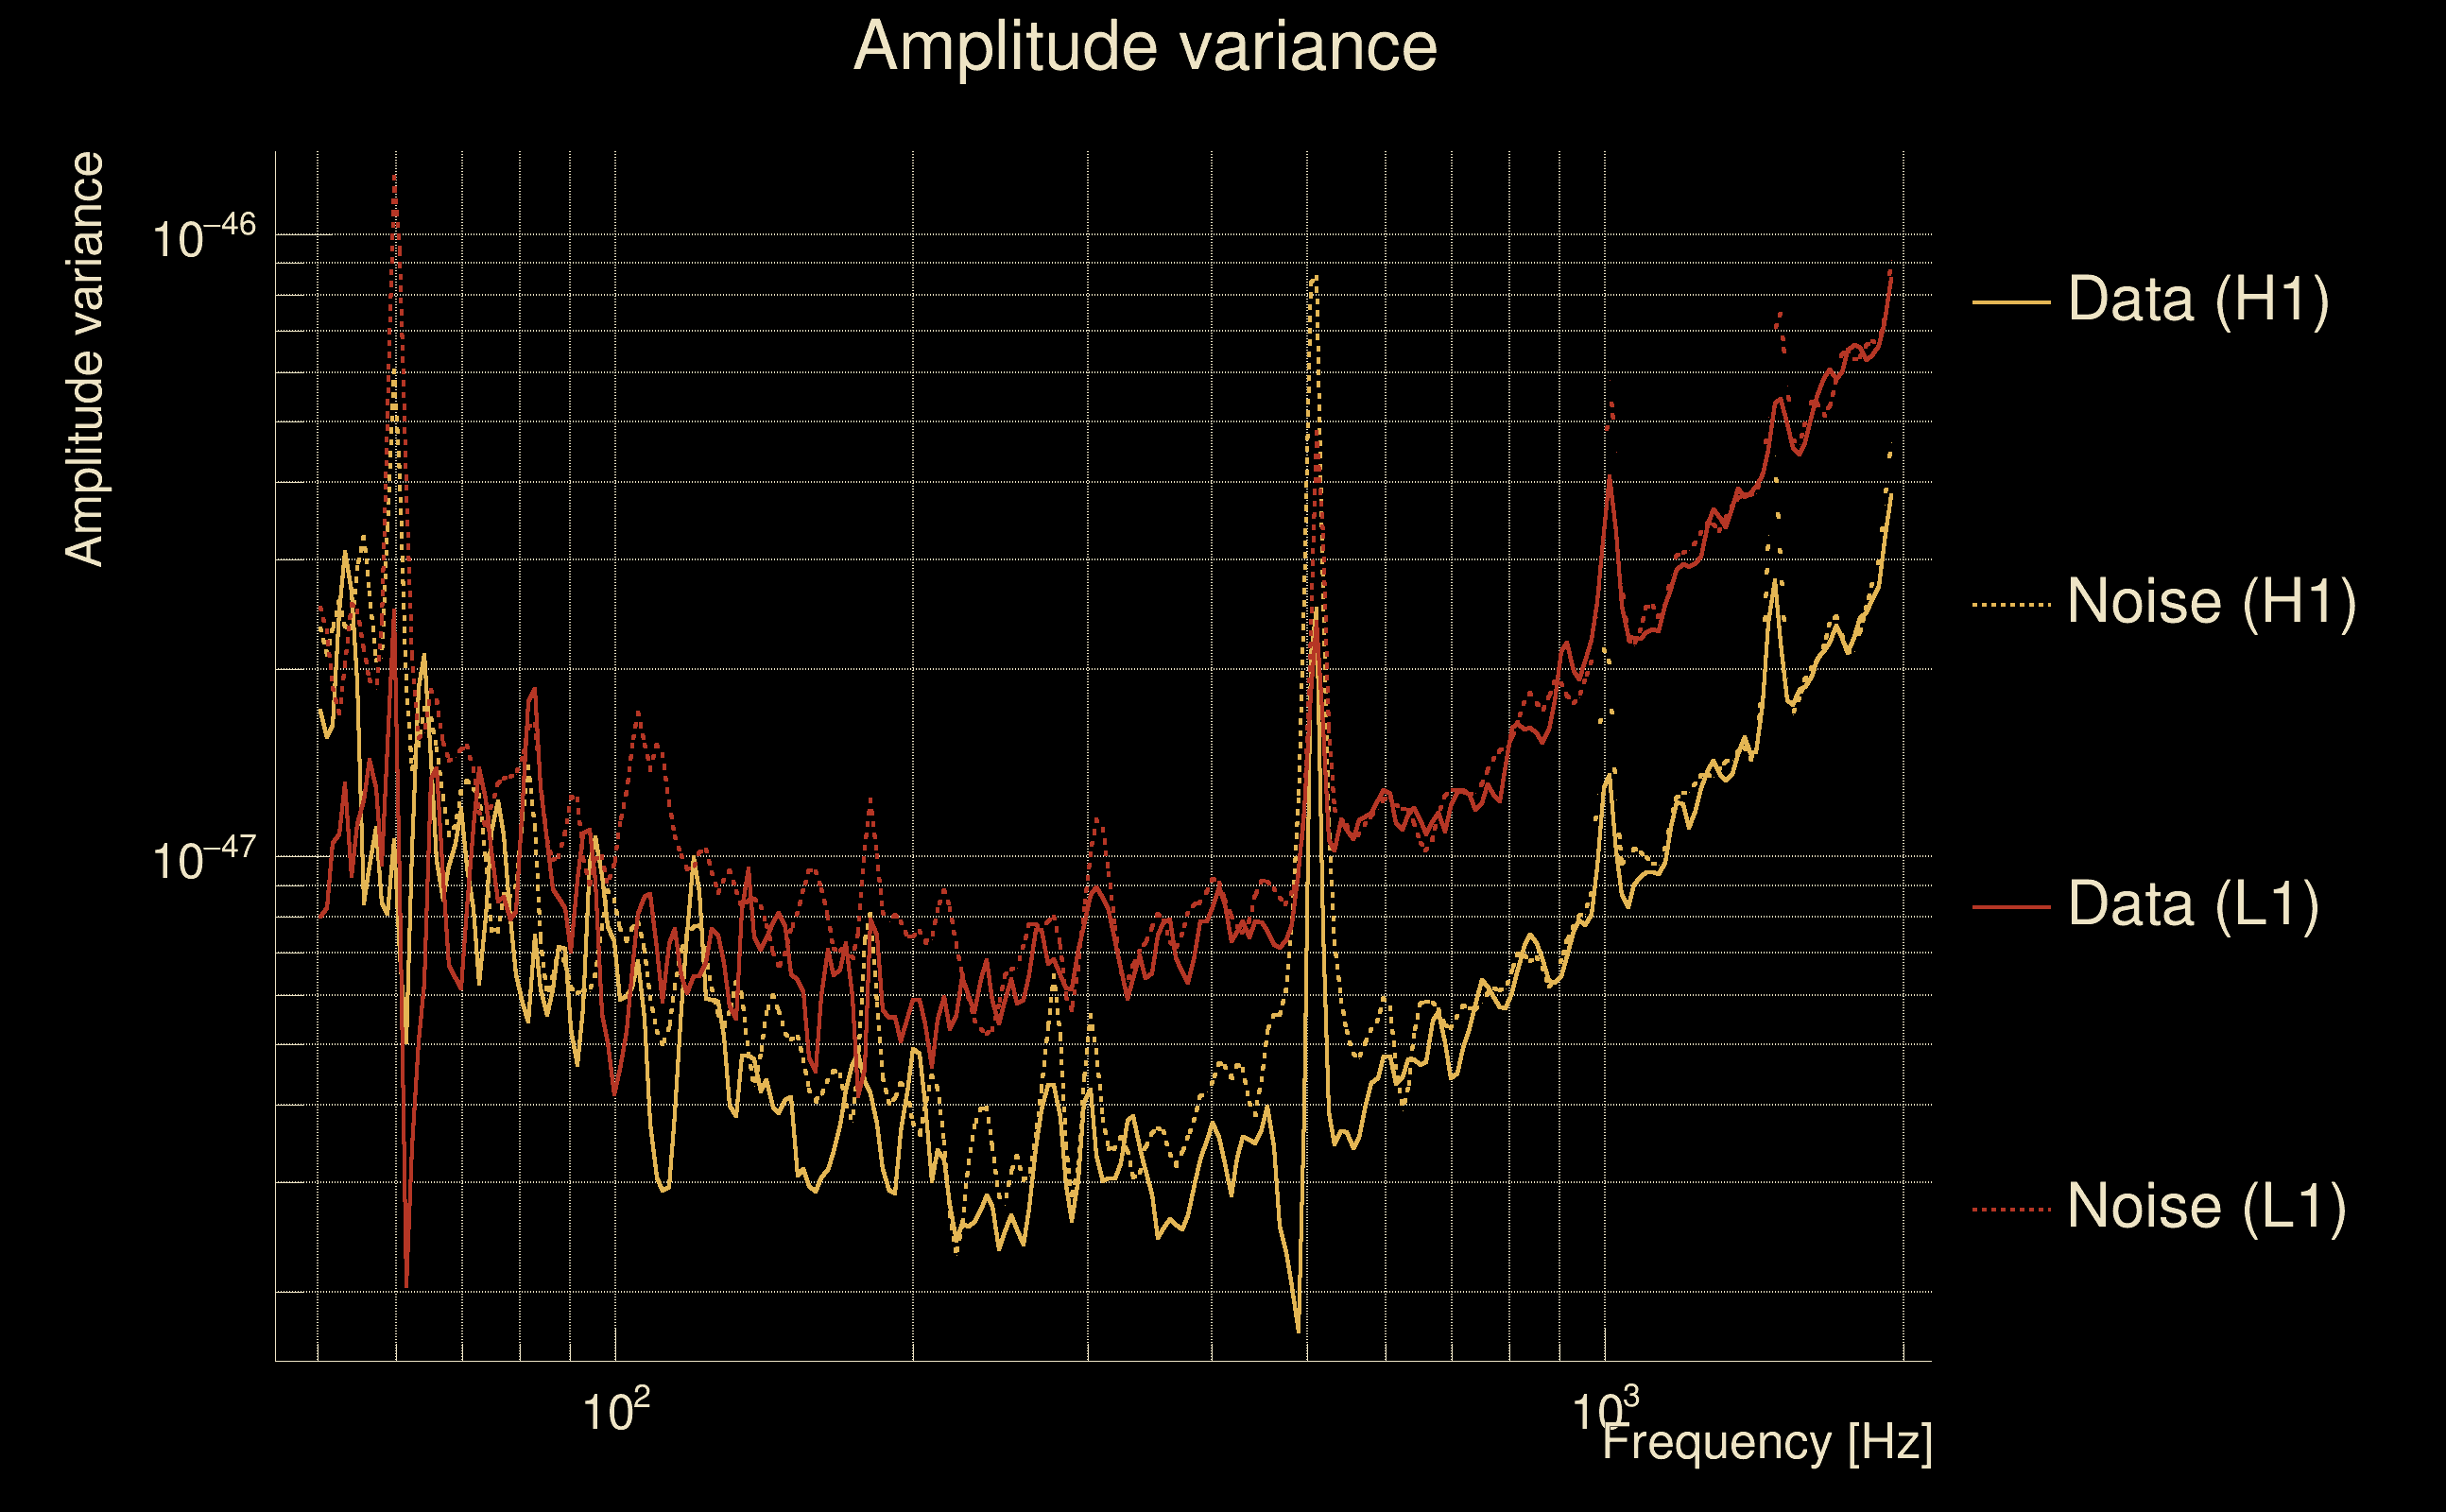
| Amplitude spectrograms: | normalization = 1e-22, power index = 2 |
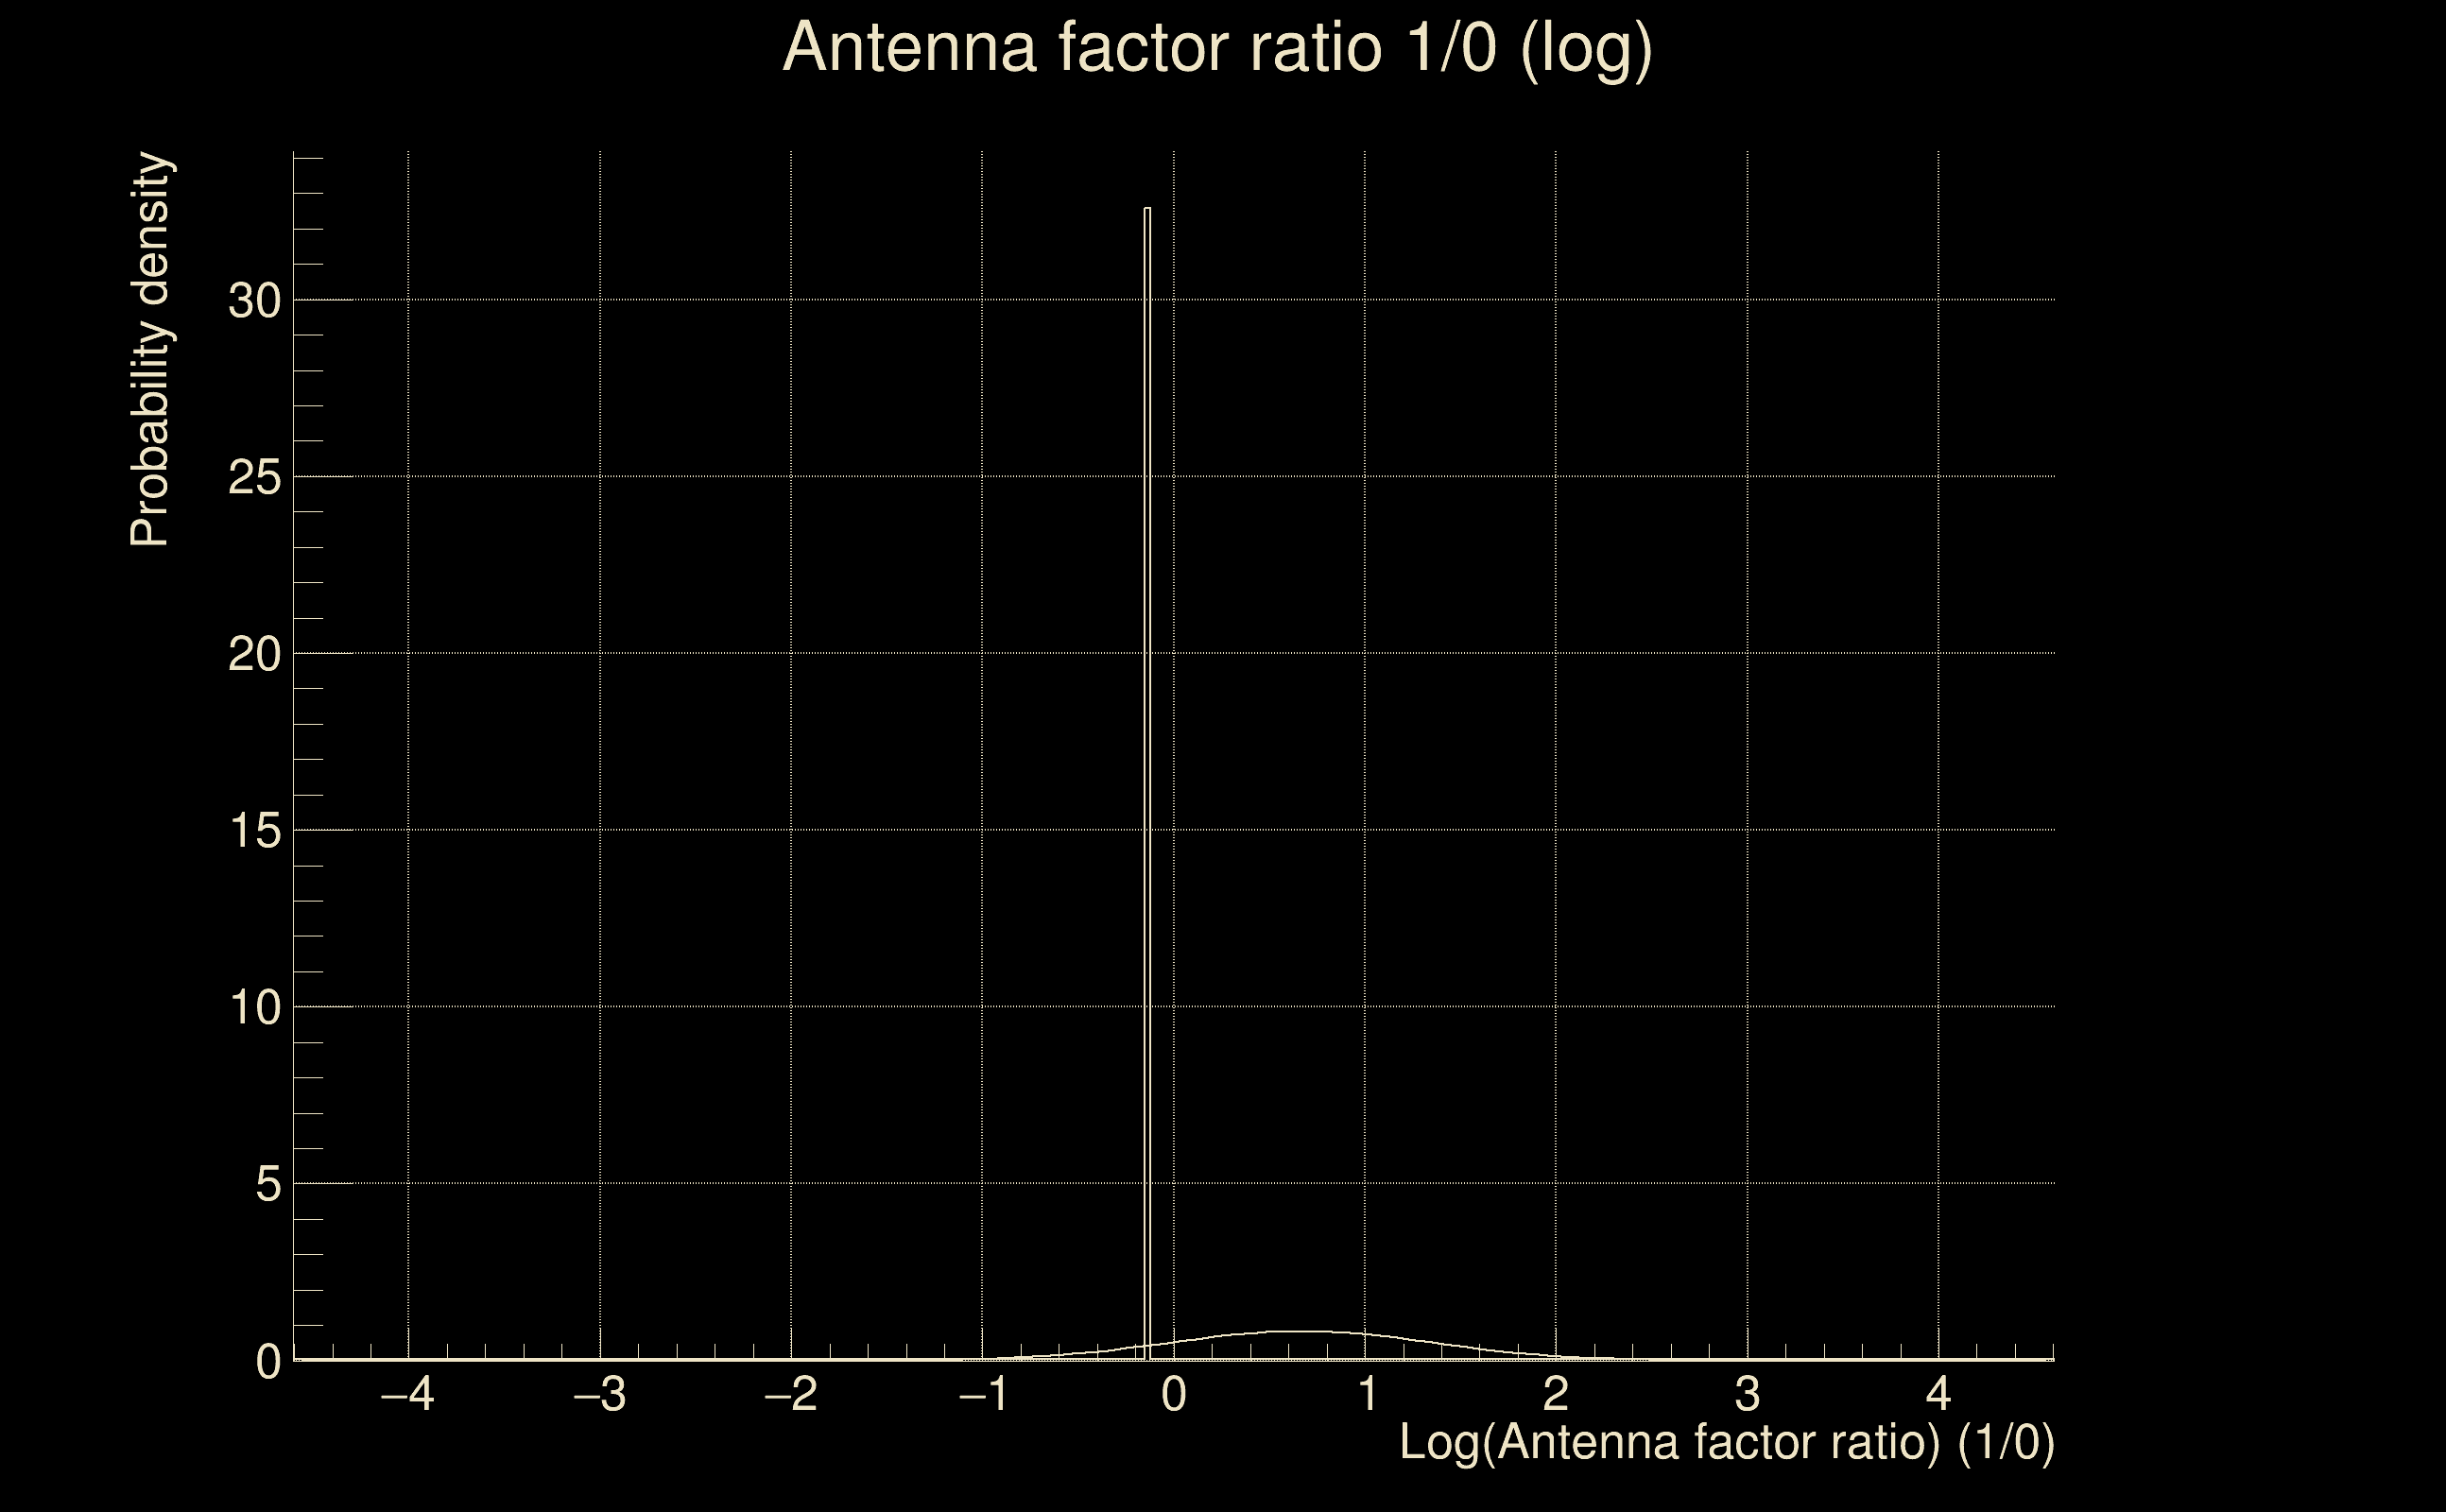
| White noise SNR variance: | 0.523175 (after applying a correction factor = 1) |
| Amplitude ratio confidence level: | 3 sigma |
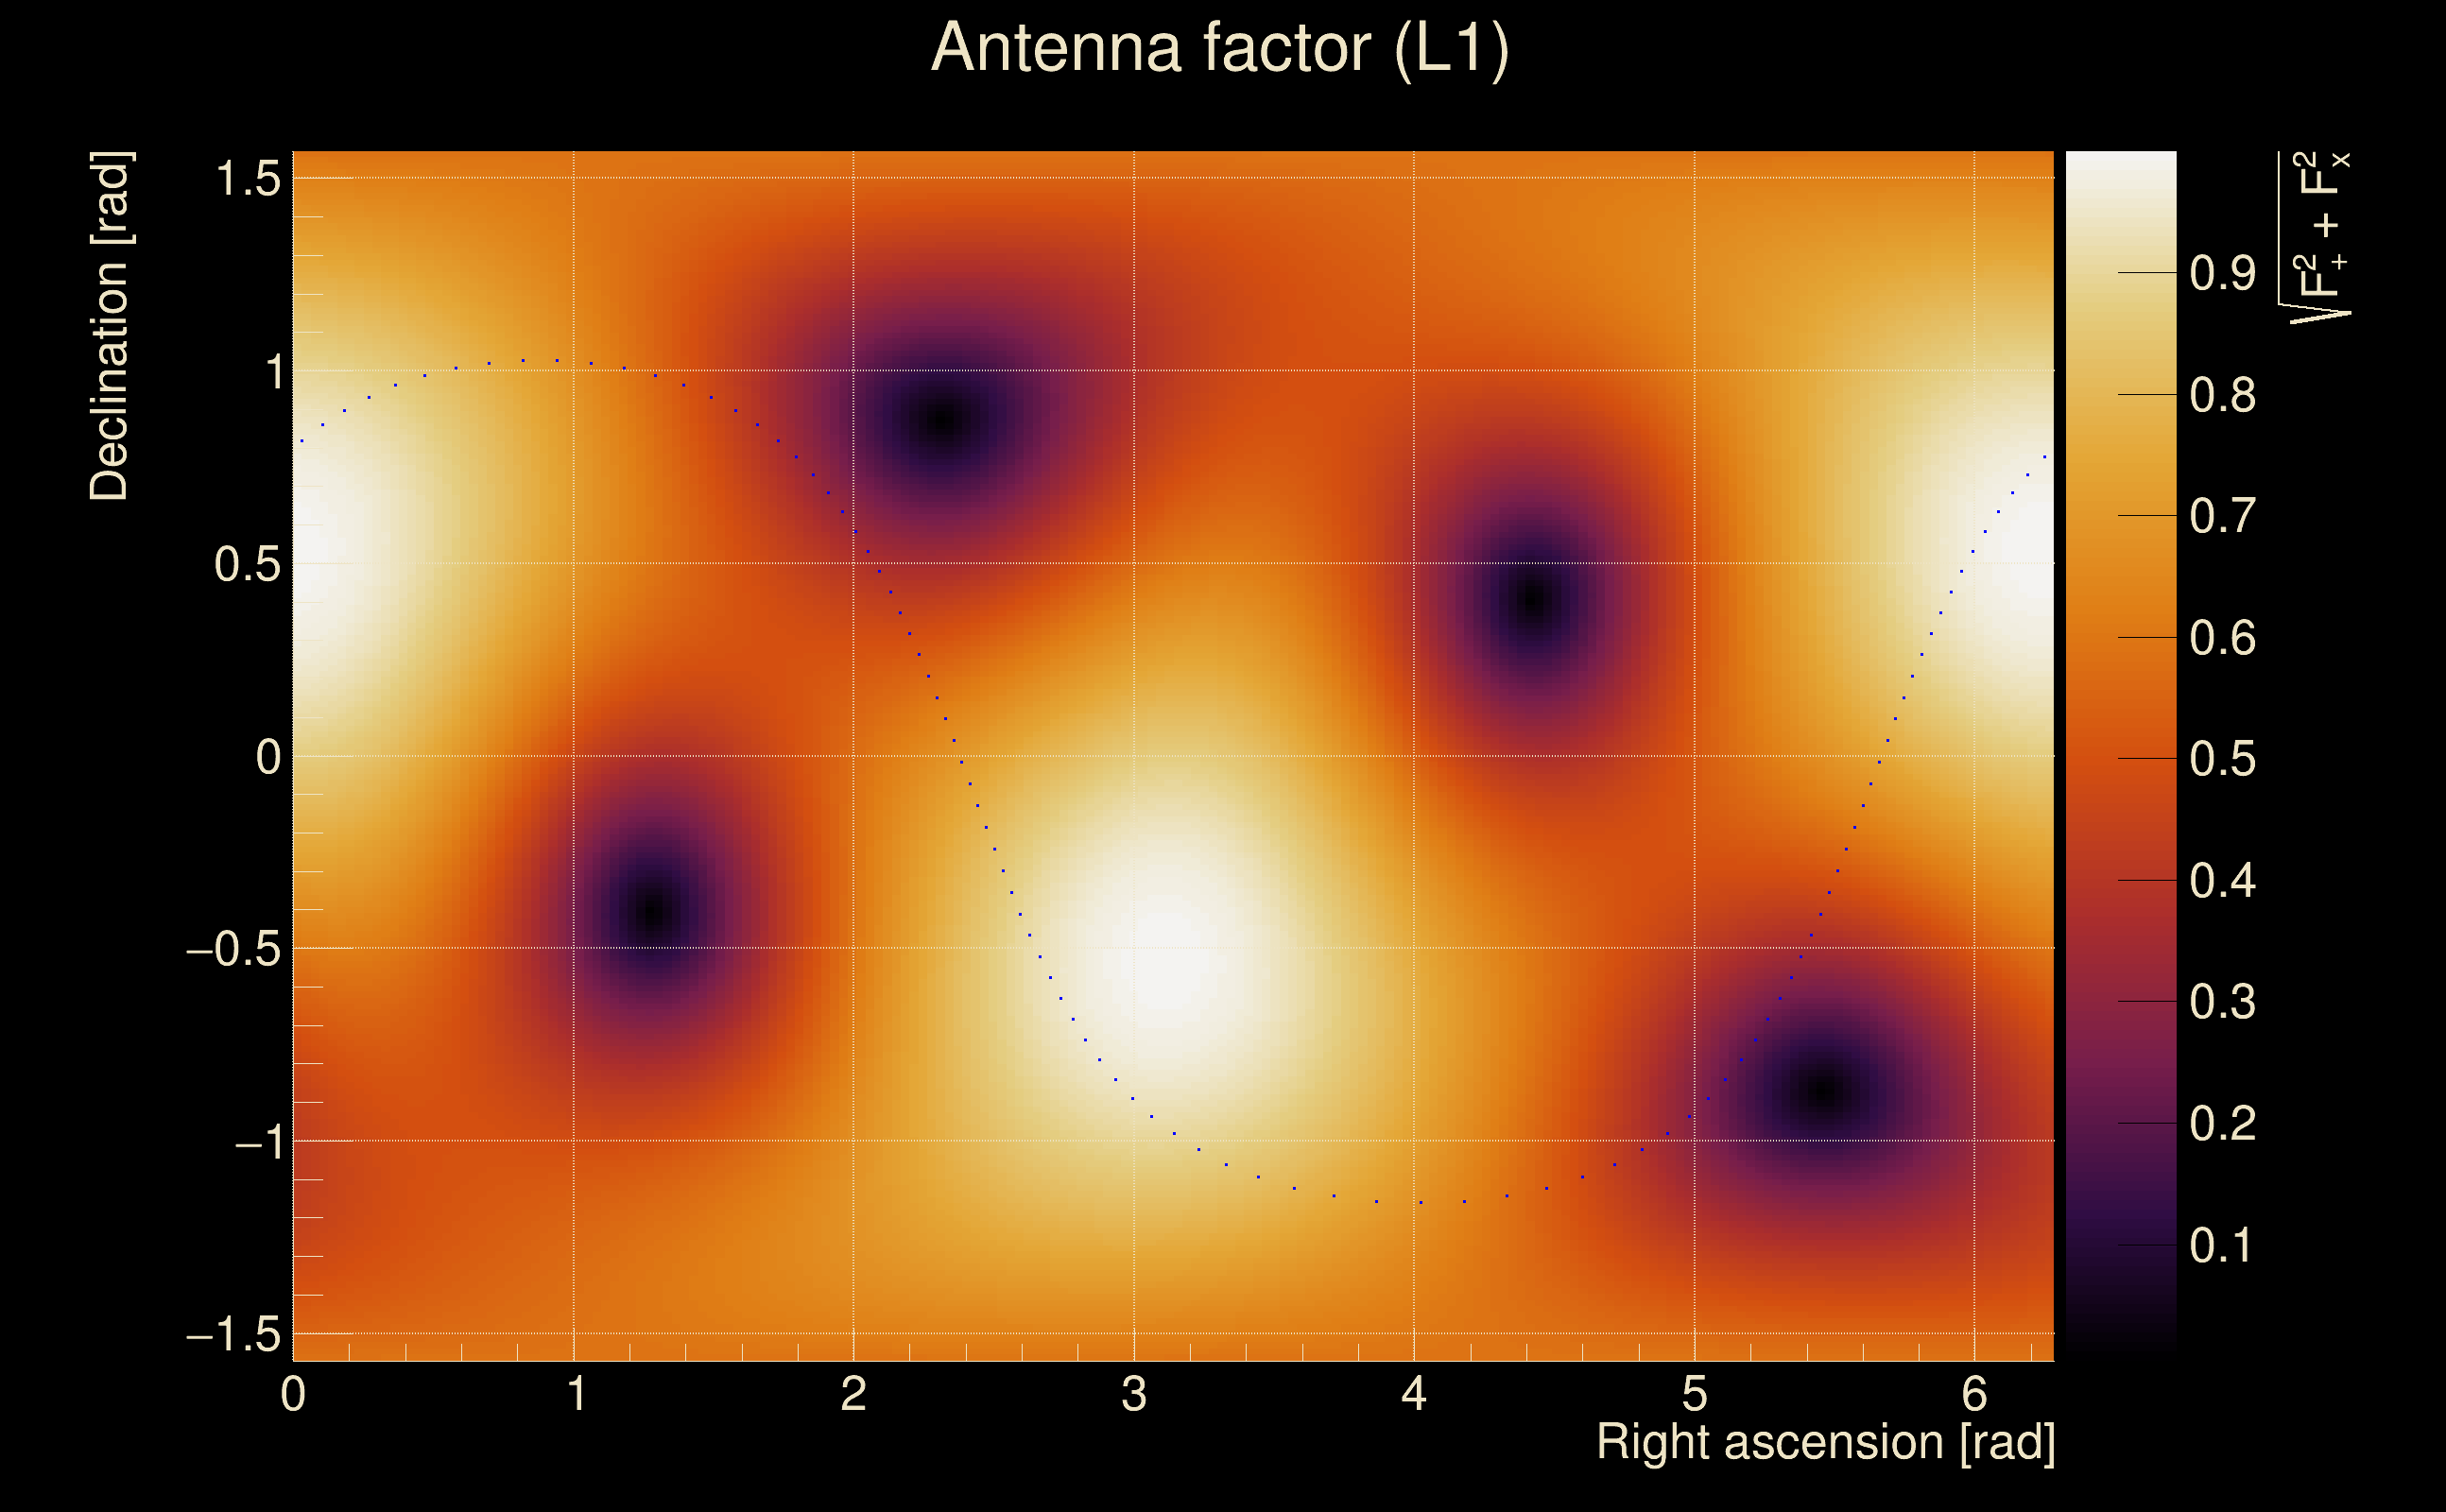
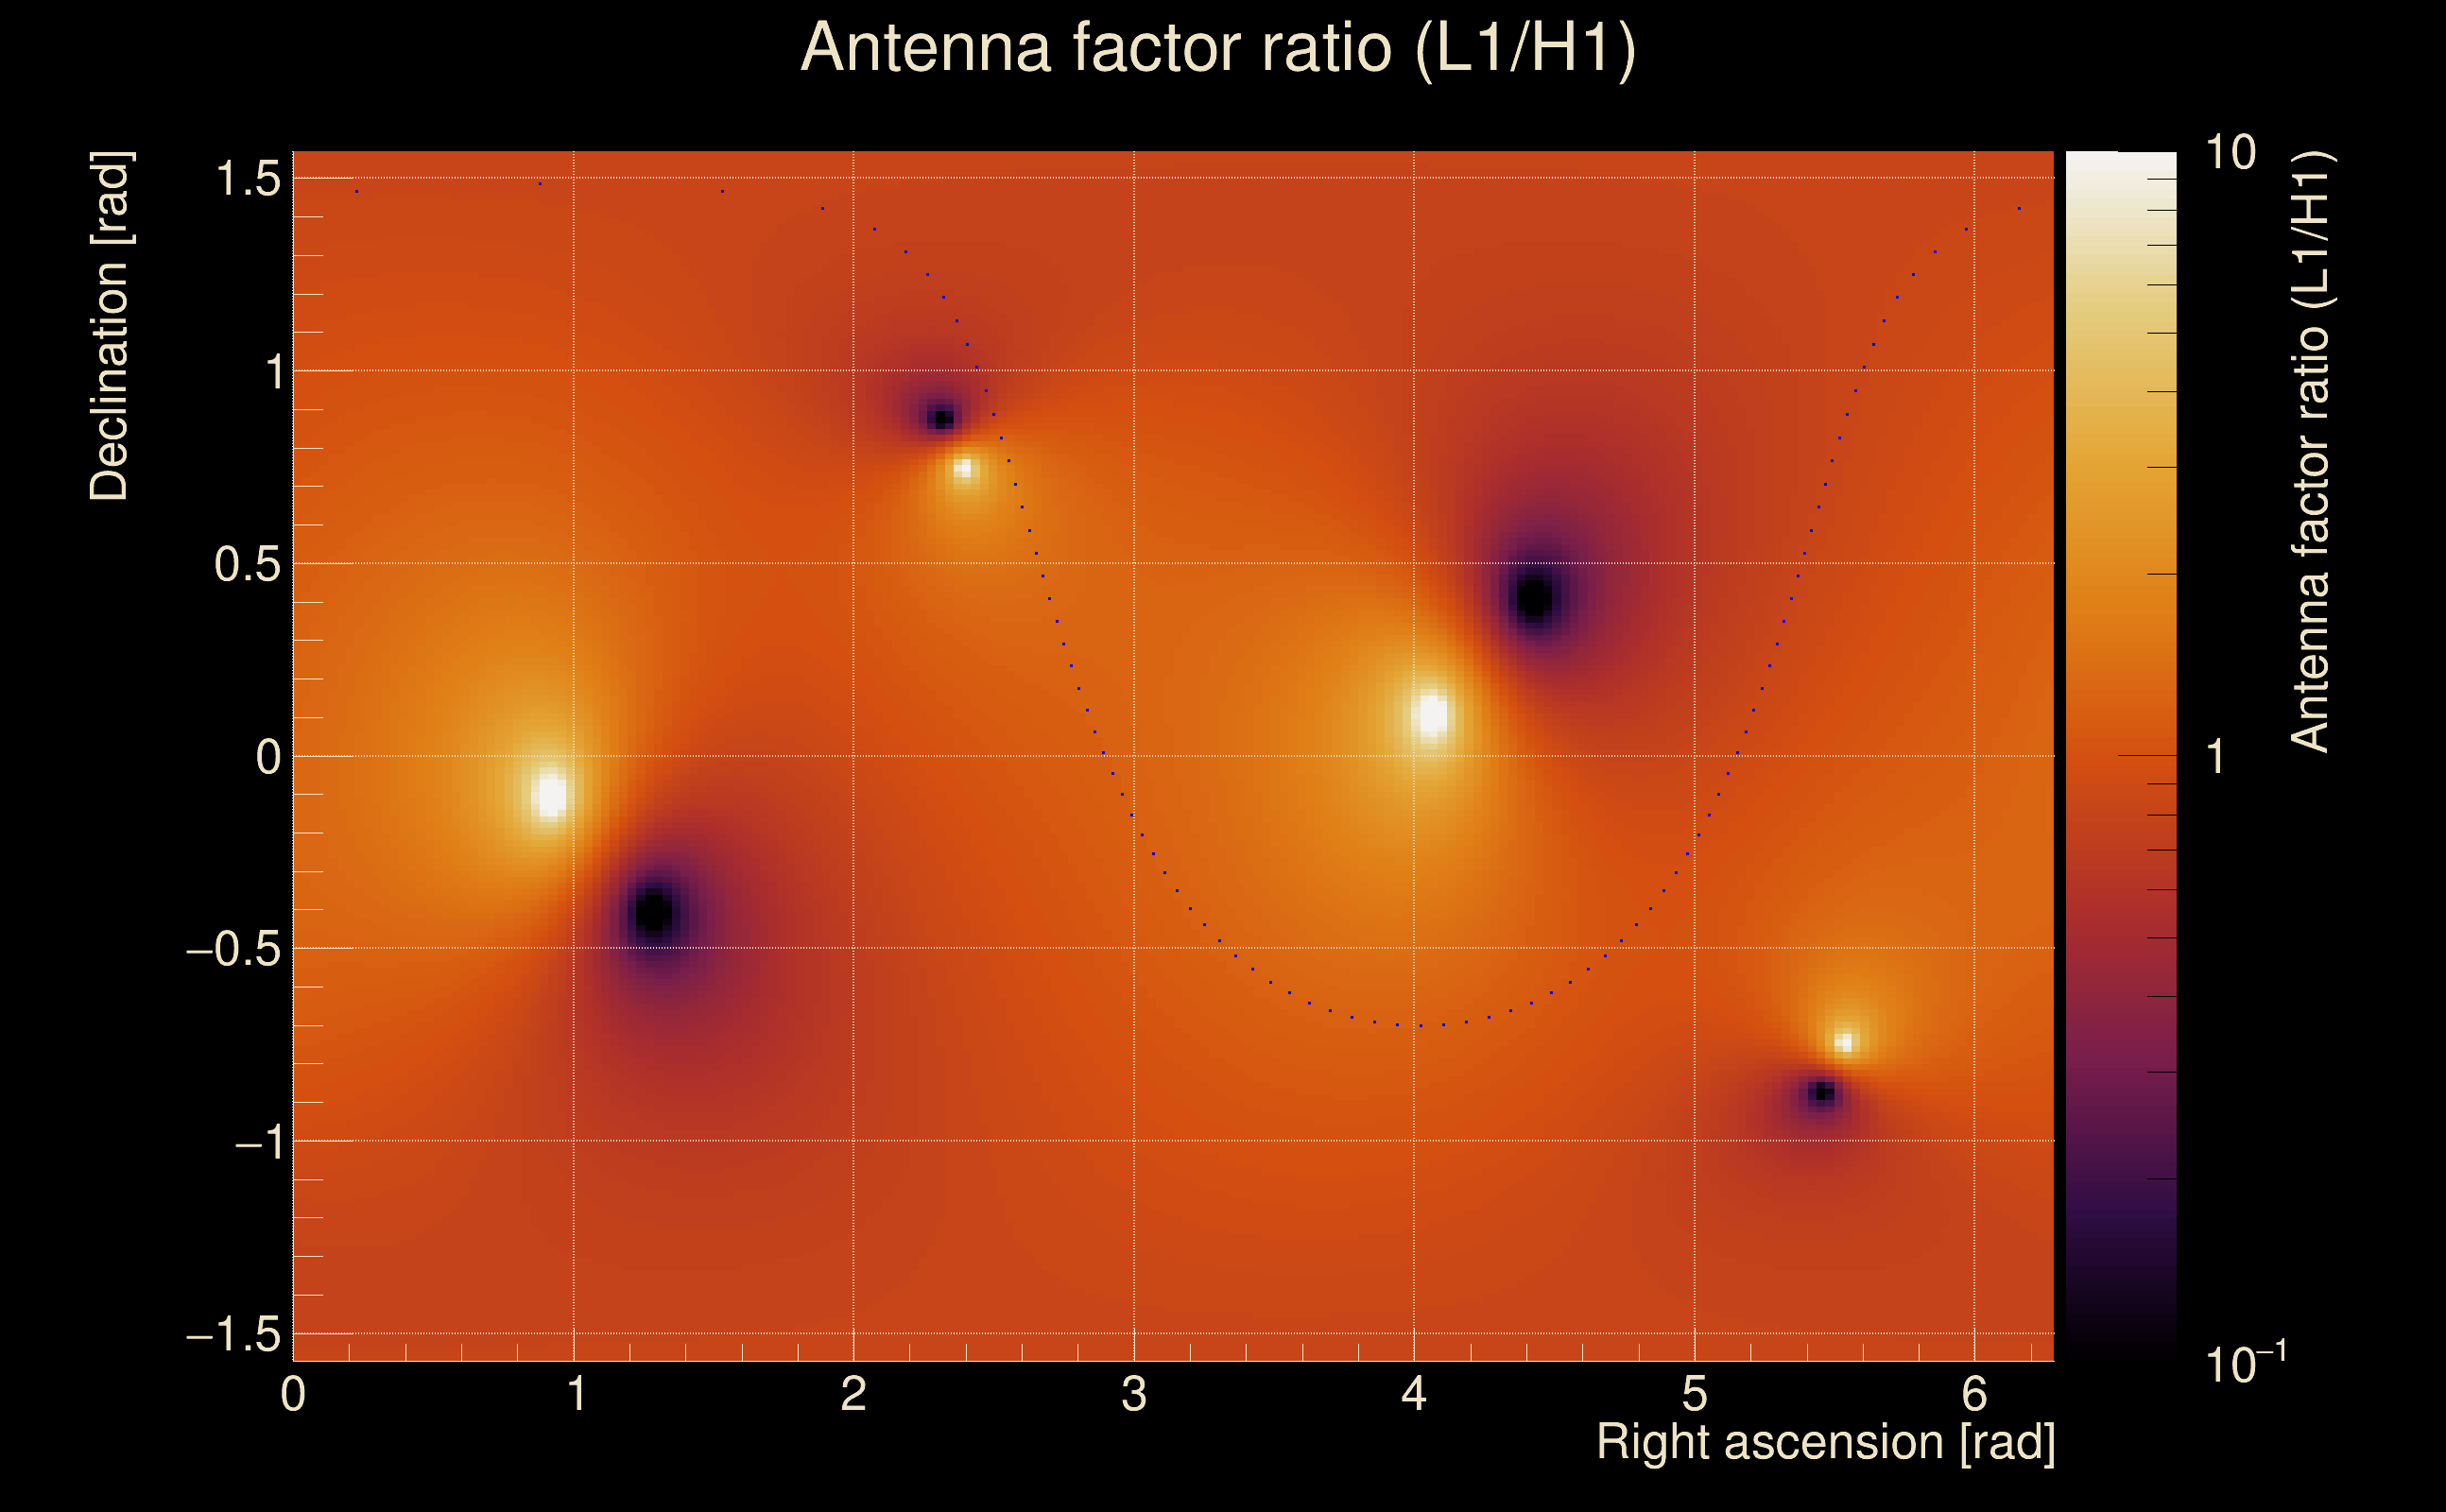
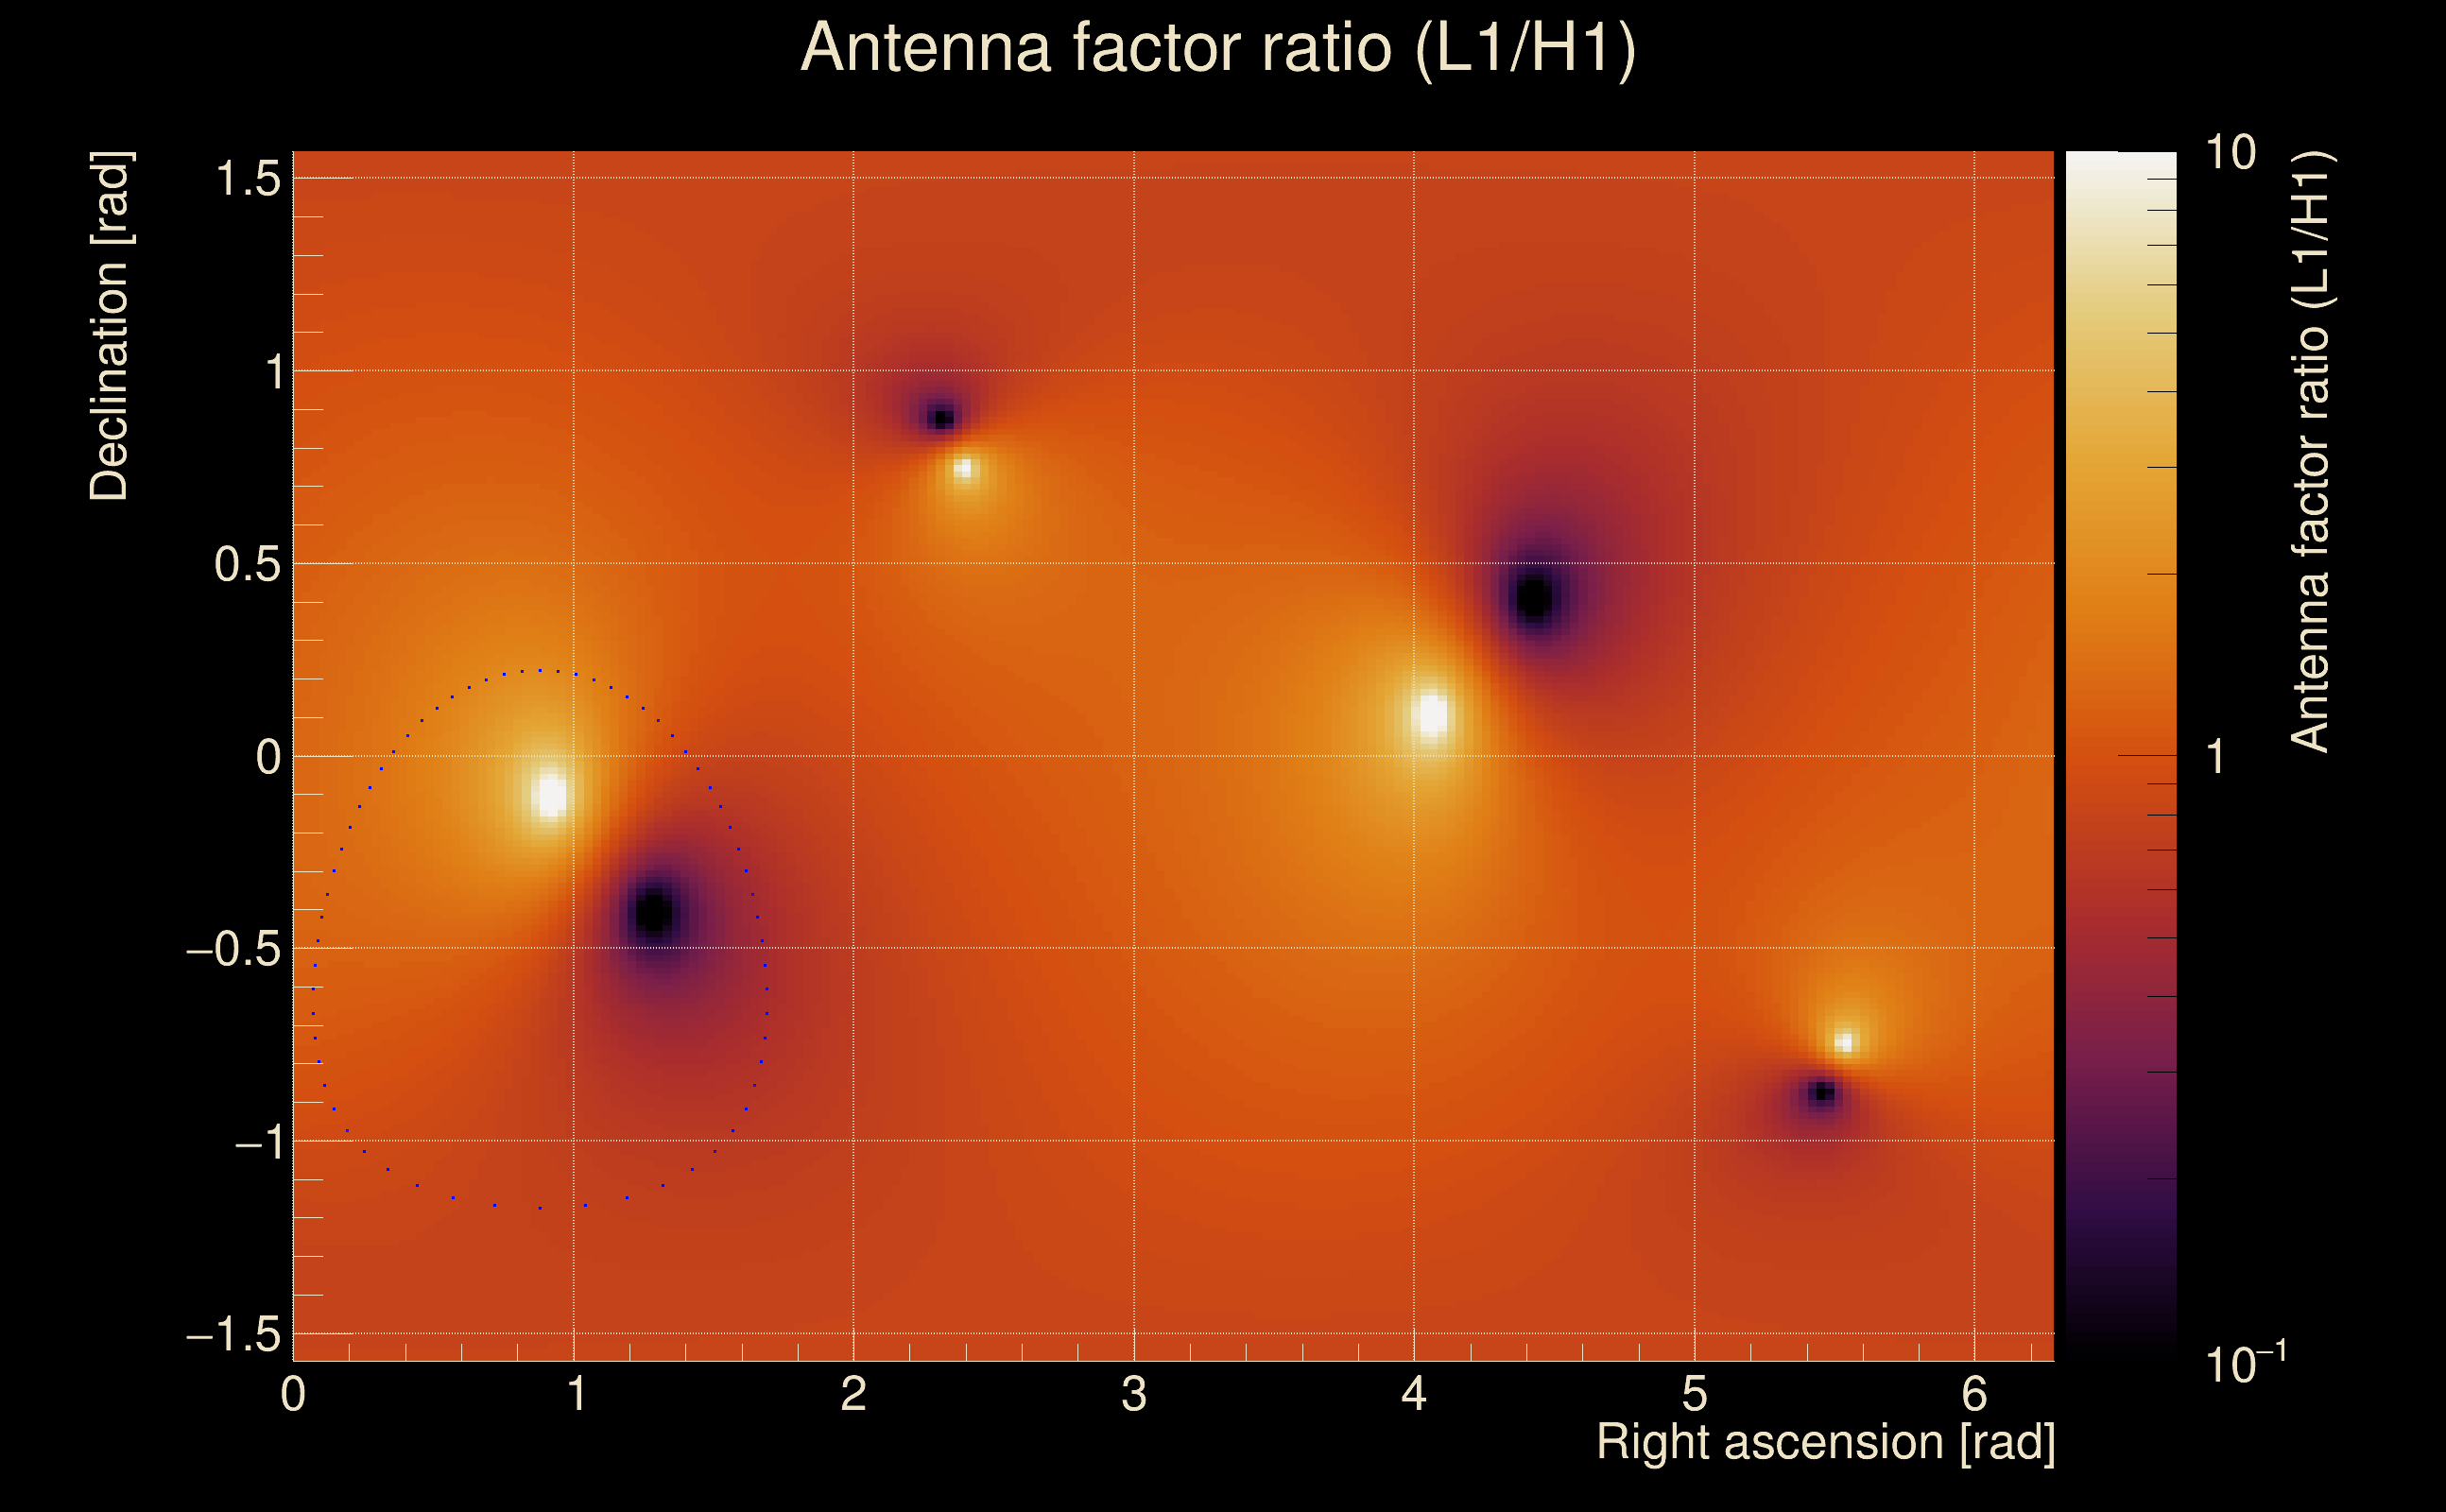
| Target sky positon: | Ra: 3.68109, Dec: 0.94792 [rad] |
| List of input Ox files: | Targeted_O4bw_2min_2_file_list.txt (1 files) |
| Analysis result file: | Targeted_O4bw_2min_2_results-1.root |
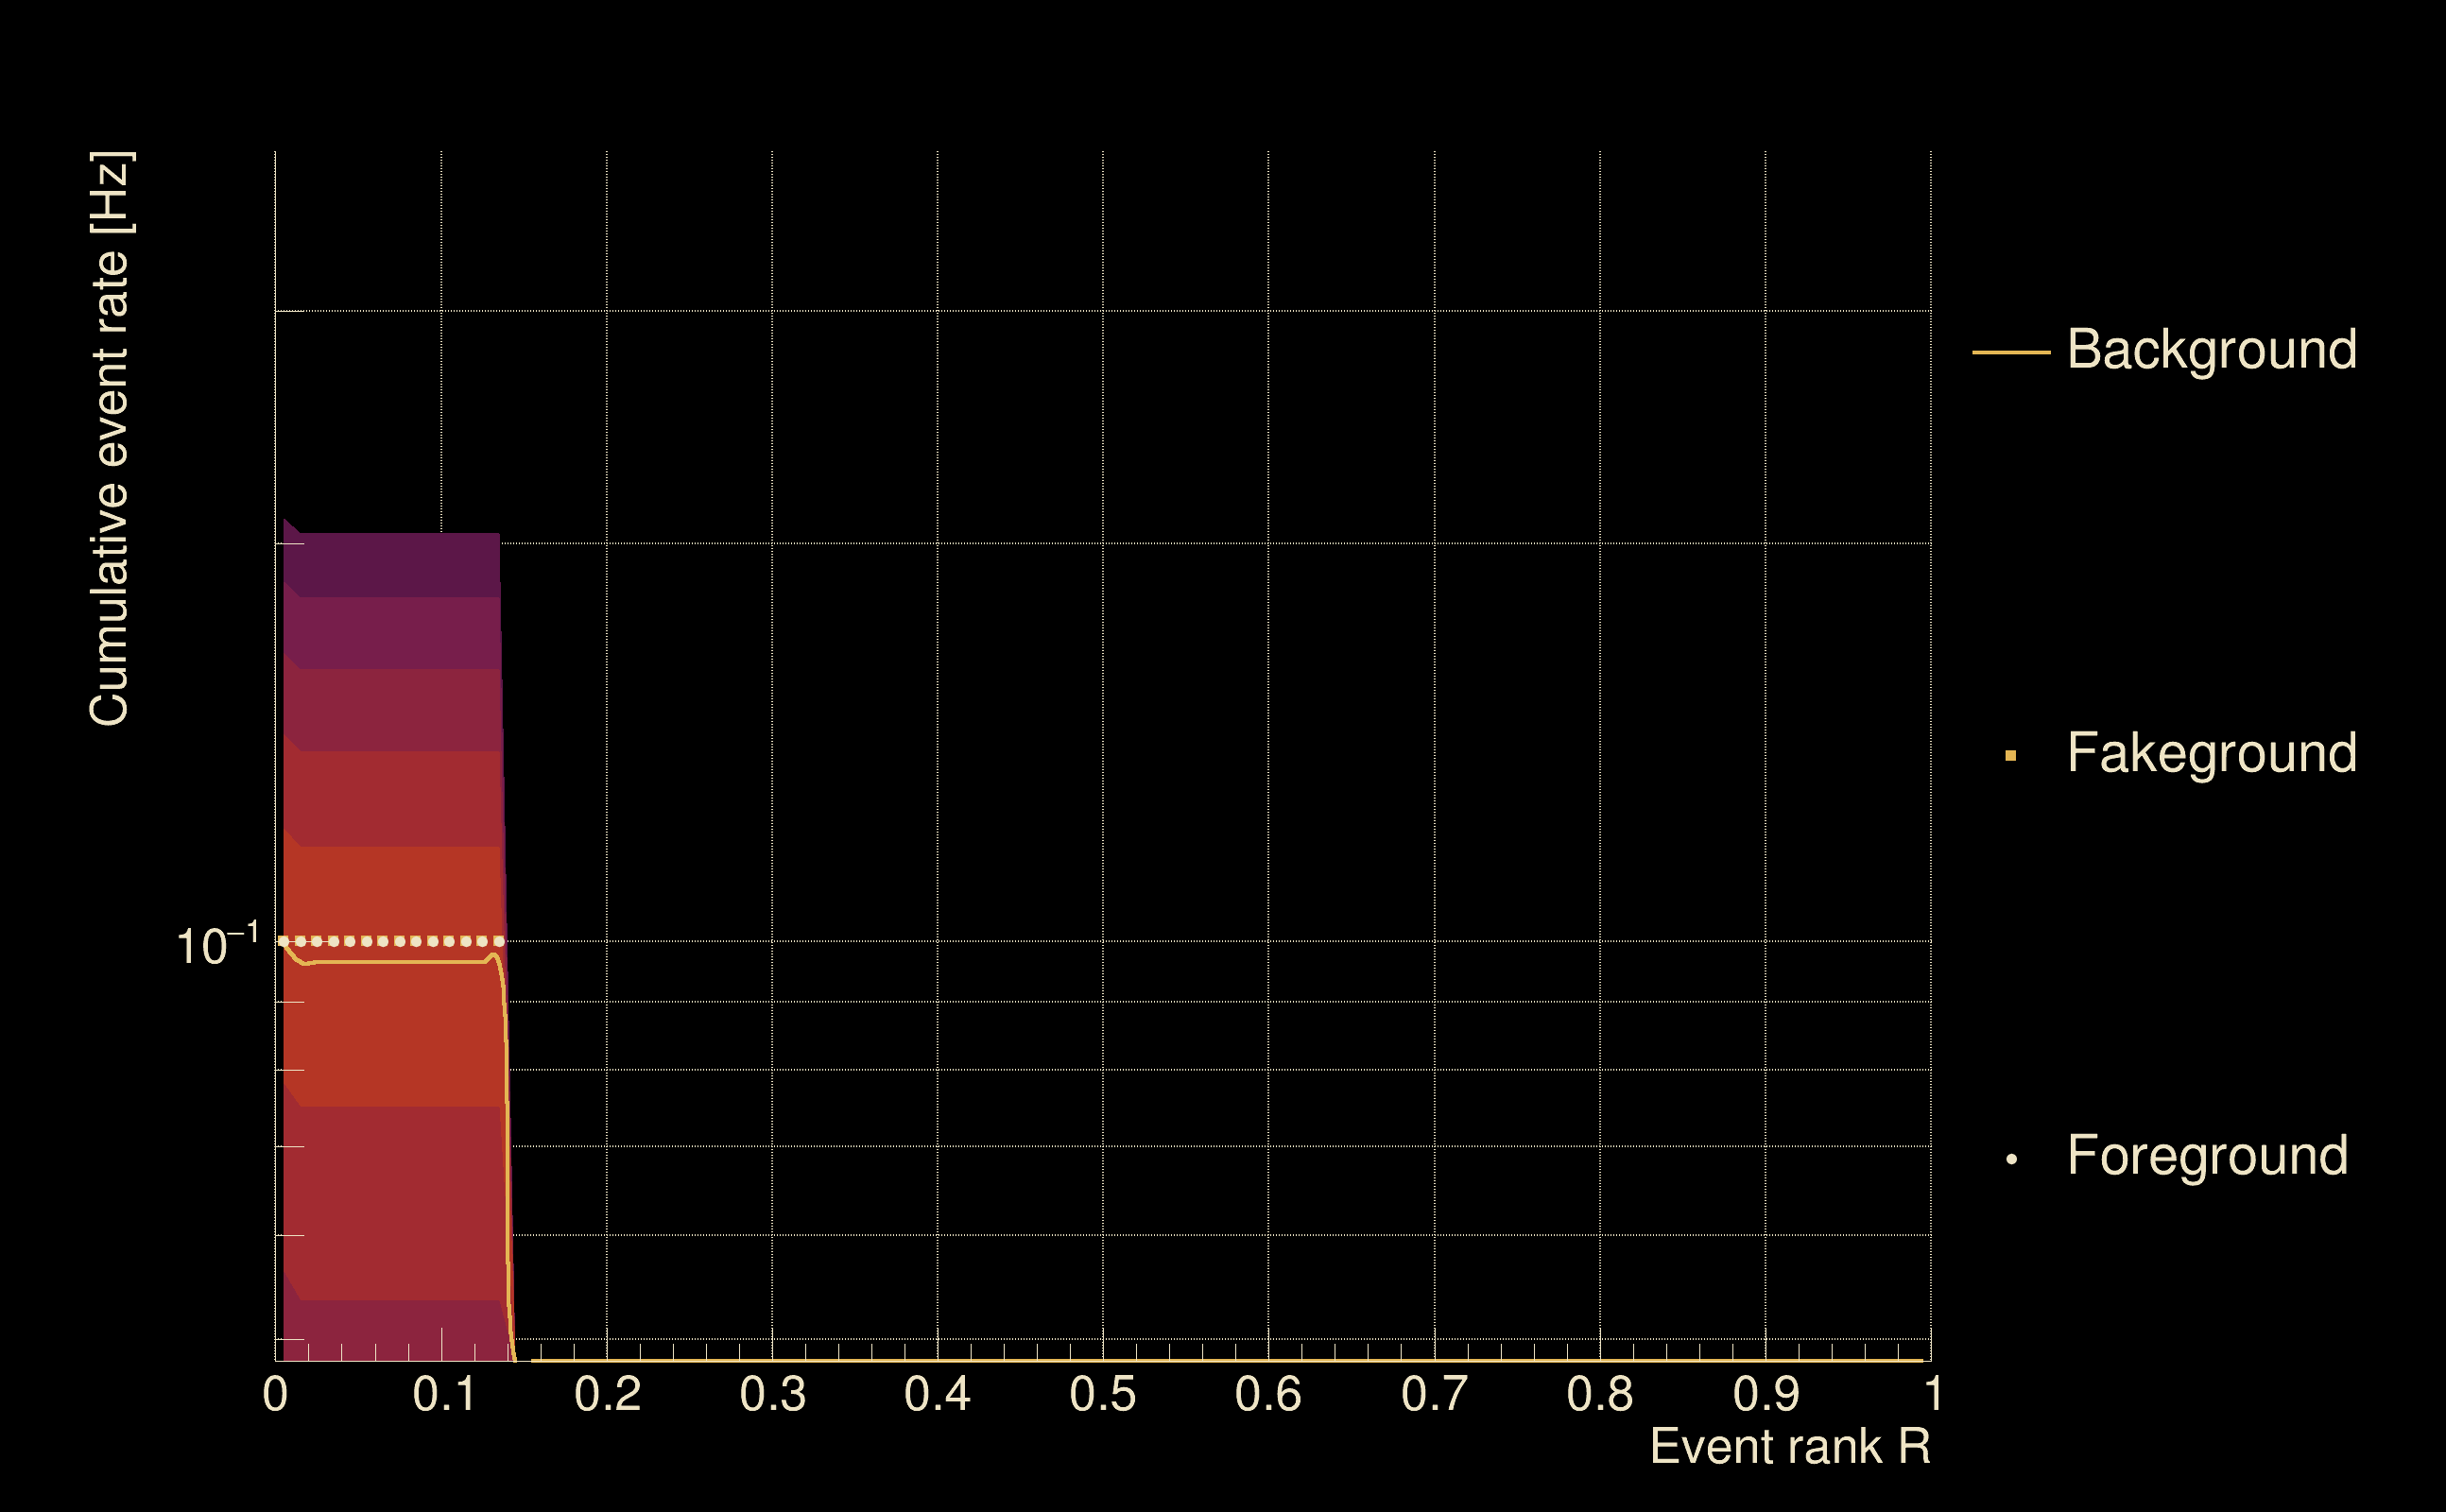
| Slice selected for the the fakeground: | slice index=94 (0.644 s), time lag = 0 s |
| Foreground | Fakeground | Background | ||
|---|---|---|---|---|
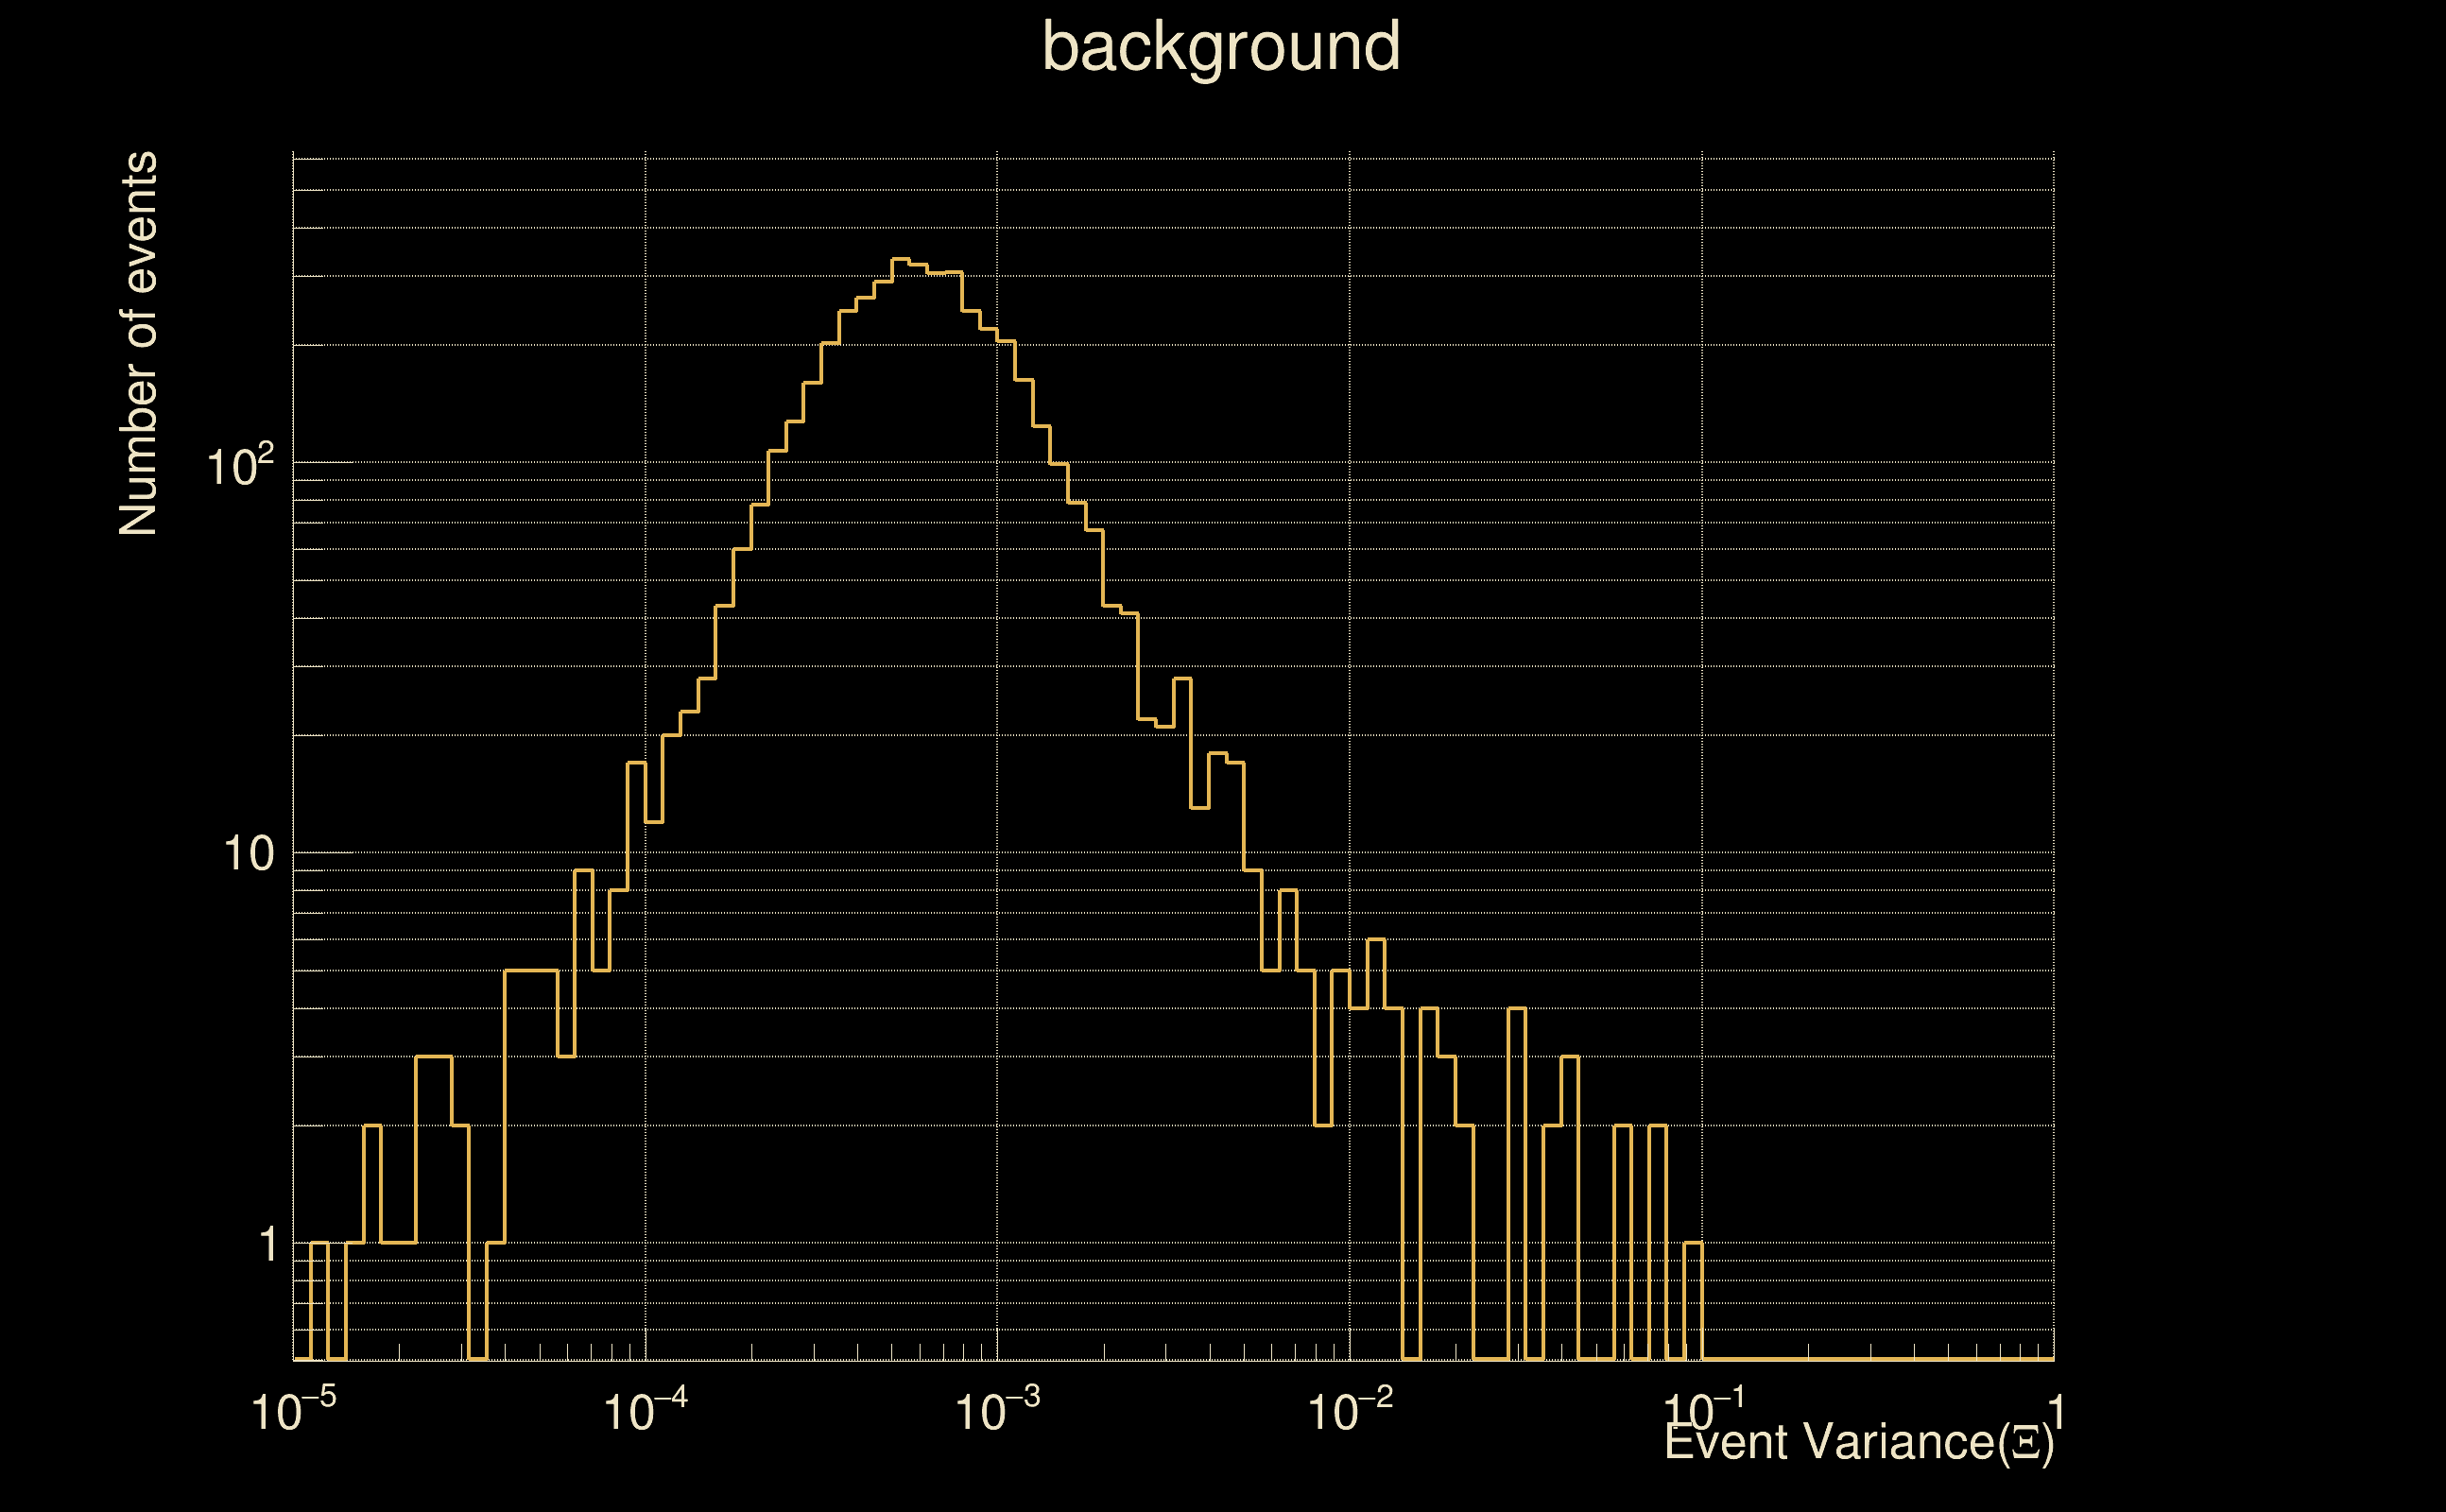
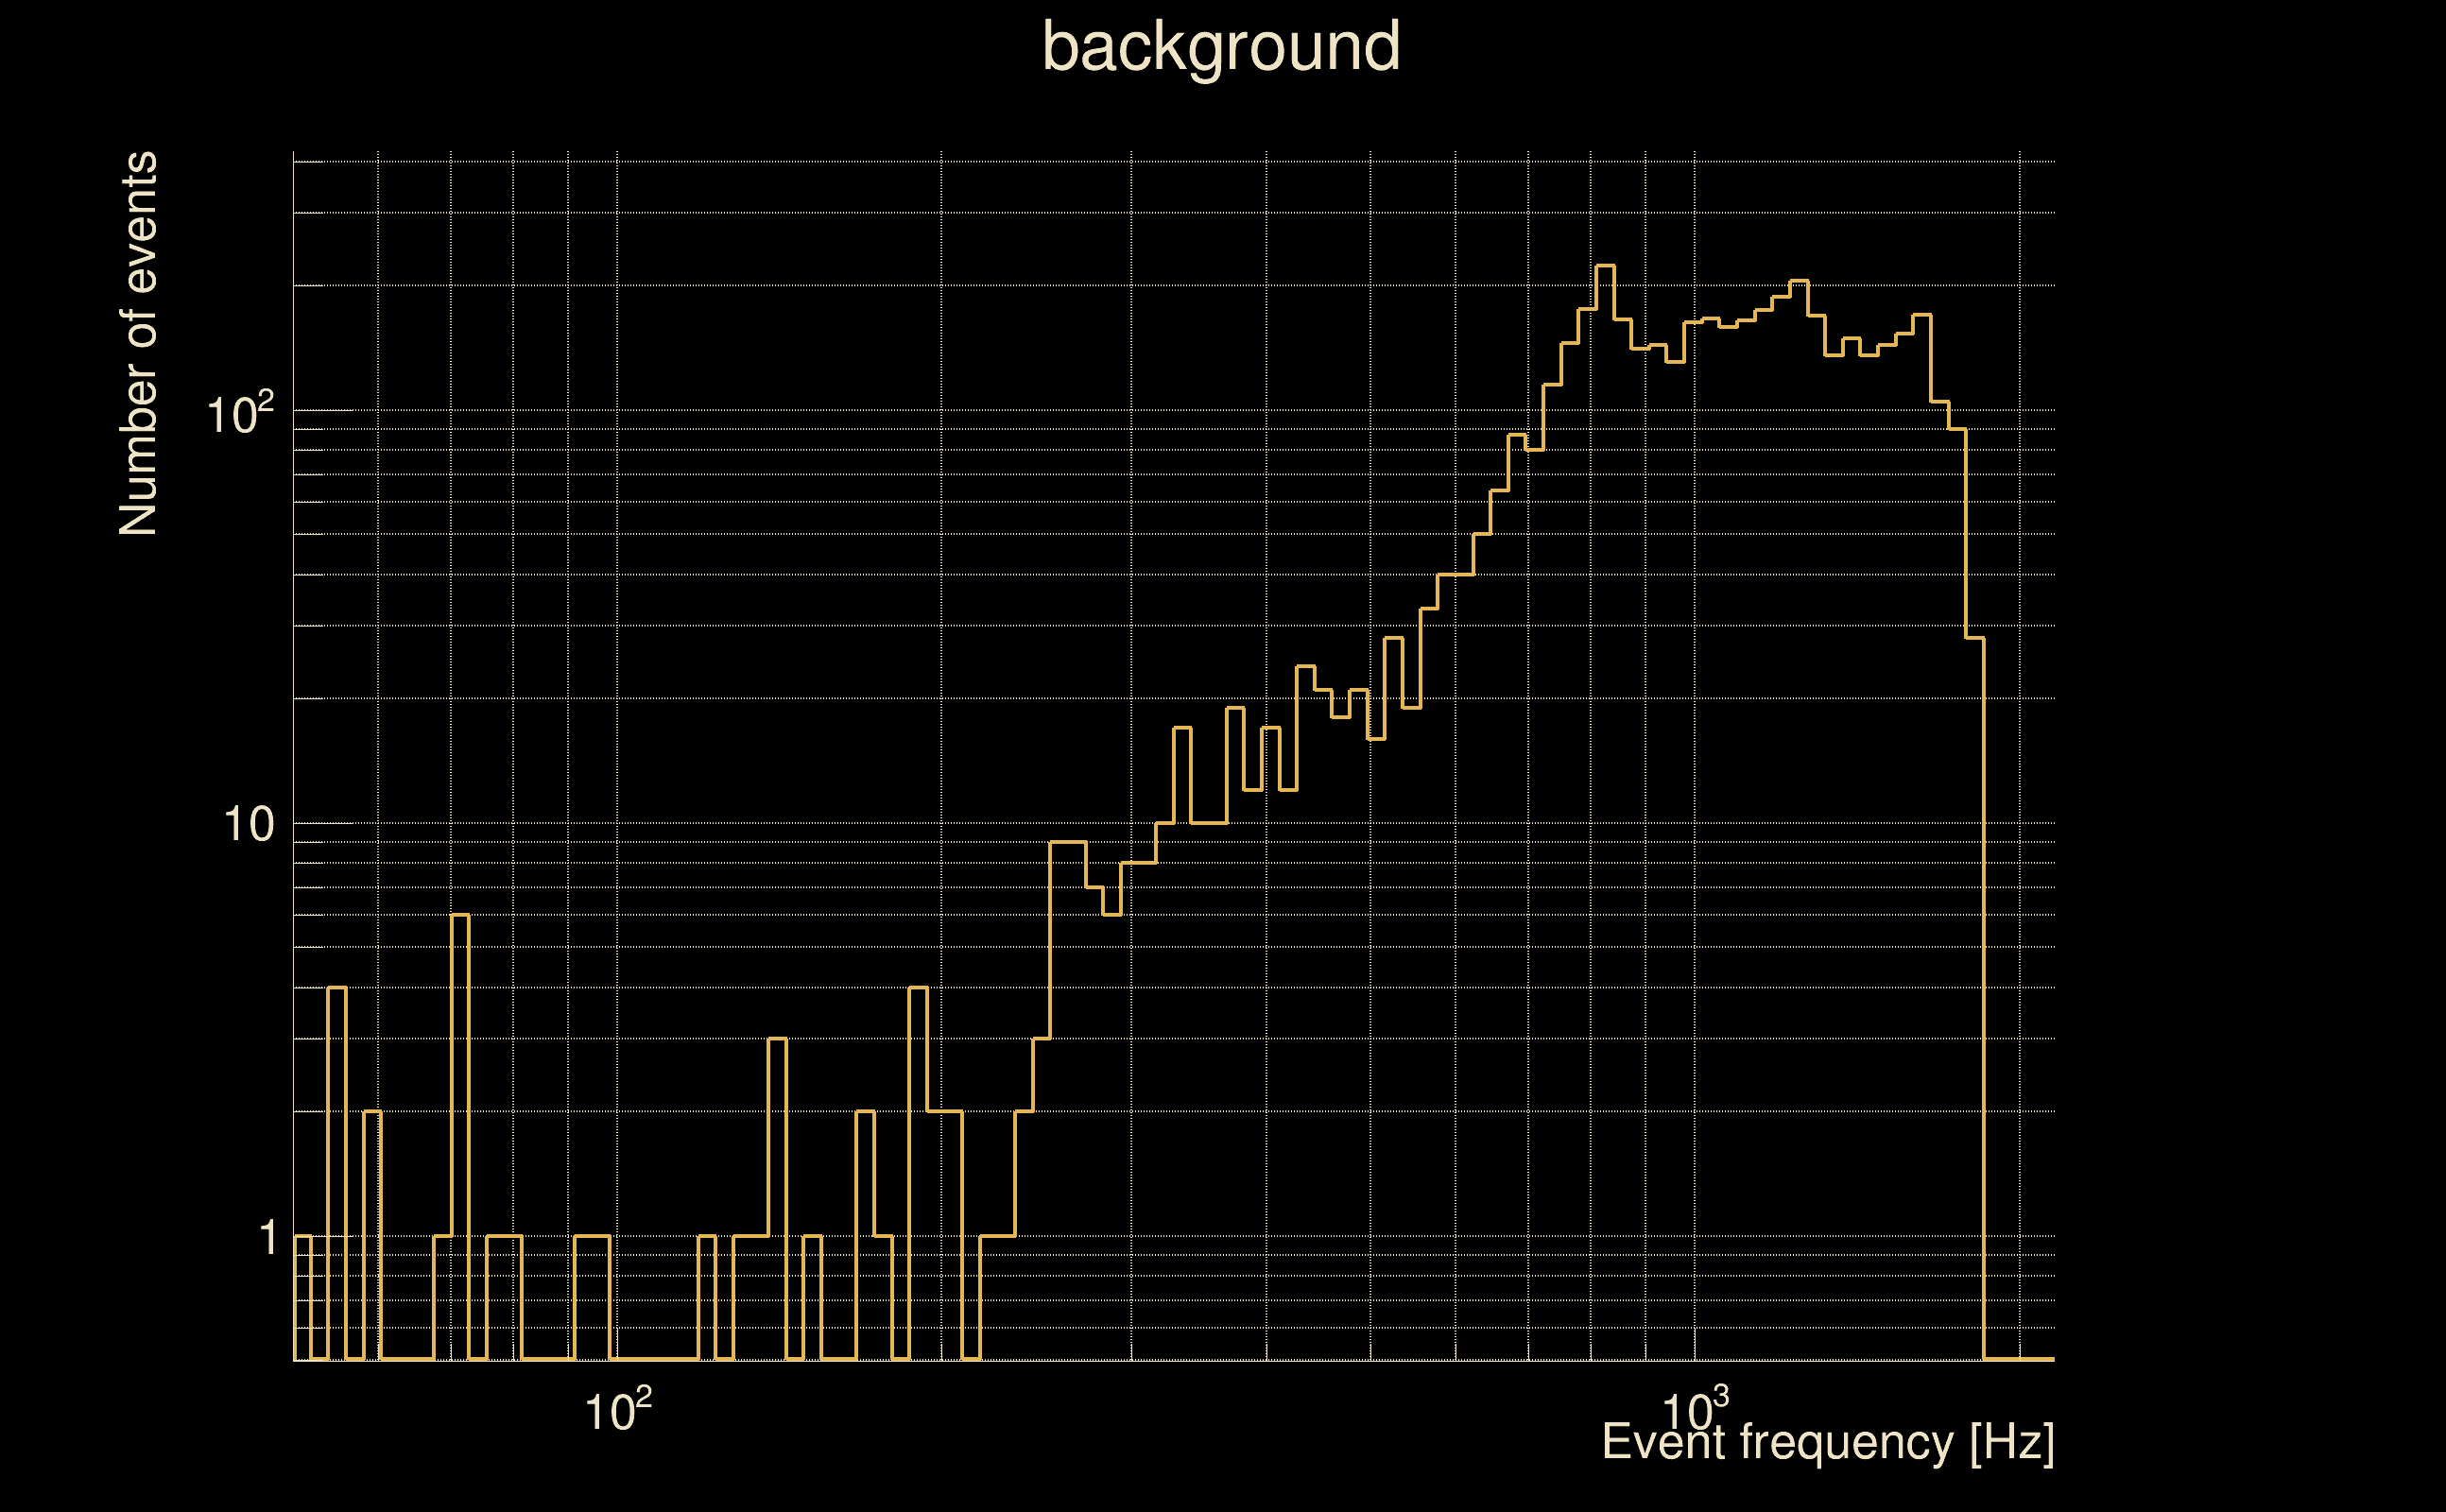
| Number of processed ox events | 21 | 21 | 4515 | |
| Start Date (detector 0) | Mon May 15 14:21:45 2023 UTC | Mon May 15 14:21:45 2023 UTC | Mon May 15 14:21:45 2023 UTC | |
| End Date (detector 0) | Mon May 15 14:23:35 2023 UTC | Mon May 15 14:23:35 2023 UTC | Mon May 15 14:23:35 2023 UTC | |
| Start GPS (detector 0) | 1368195723 | 1368195723 | 1368195723 | |
| End GPS (detector 0) | 1368195833 | 1368195833 | 1368195833 | |
| Used livetime (detector 0) | 110 s | 110 s | 110 s | |
| Start Date (detector 1) | Mon May 15 14:21:45 2023 UTC | Mon May 15 14:21:45 2023 UTC | Mon May 15 14:21:45 2023 UTC | |
| End Date (detector 1) | Mon May 15 14:23:35 2023 UTC | Mon May 15 14:23:35 2023 UTC | Mon May 15 14:23:35 2023 UTC | |
| Start GPS (detector 1) | 1368195723 | 1368195723 | 1368195723 | |
| End GPS (detector 1) | 1368195833 | 1368195833 | 1368195833 | |
| Used livetime (detector 1) | 110 s | 110 s | 110 s | |
| Cumulative livetime | 210 s | 210 s | 45150 s | |
| 0 years, 0 days, 0 hours, 3 min, 30 s | 0 years, 0 days, 0 hours, 3 min, 30 s | 0 years, 0 days, 12 hours, 32 min, 30 s |
|
|
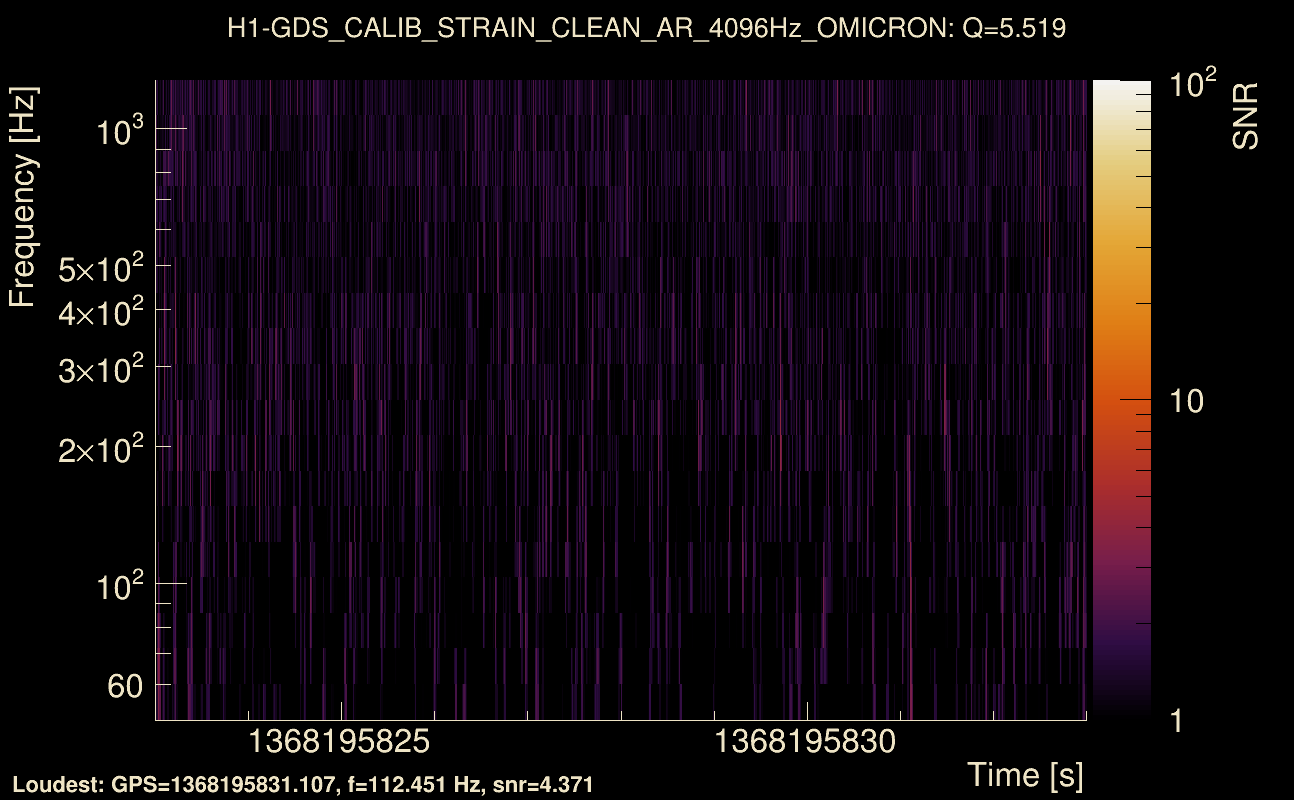
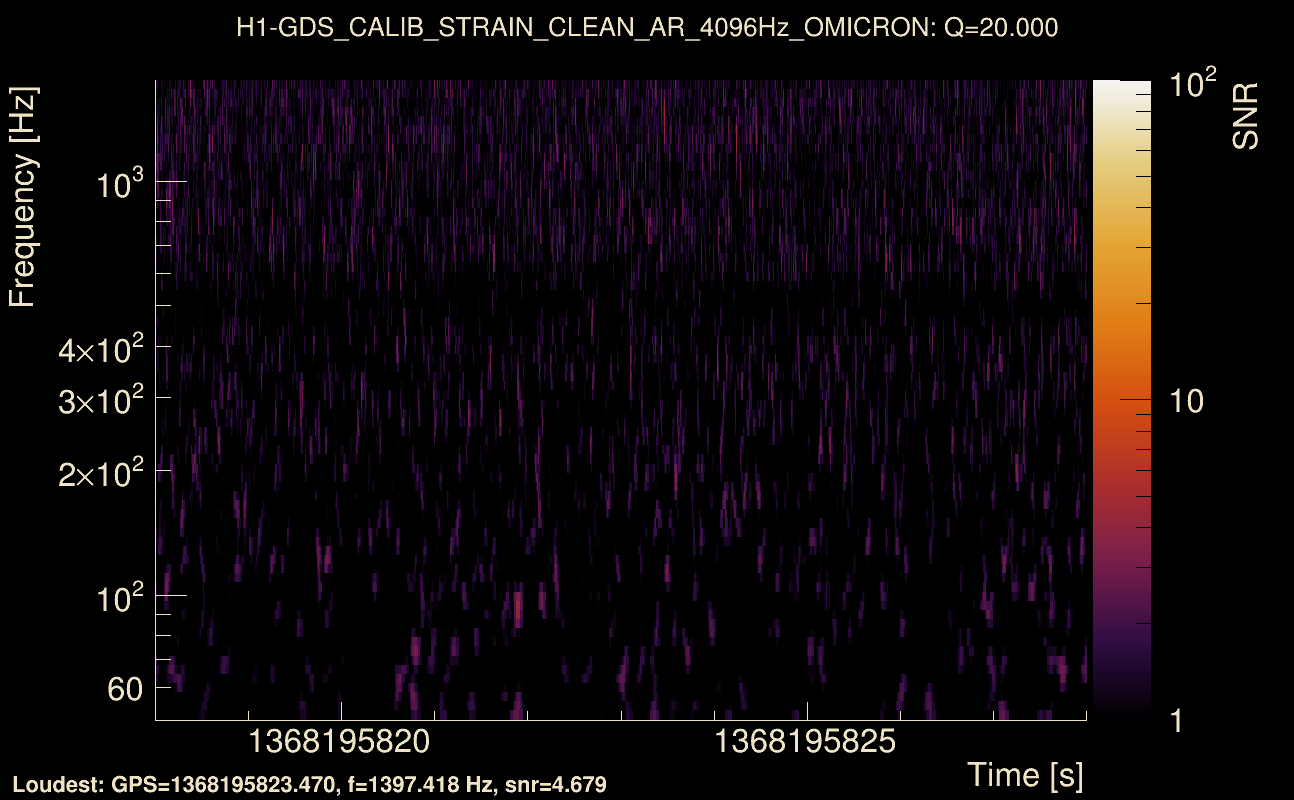
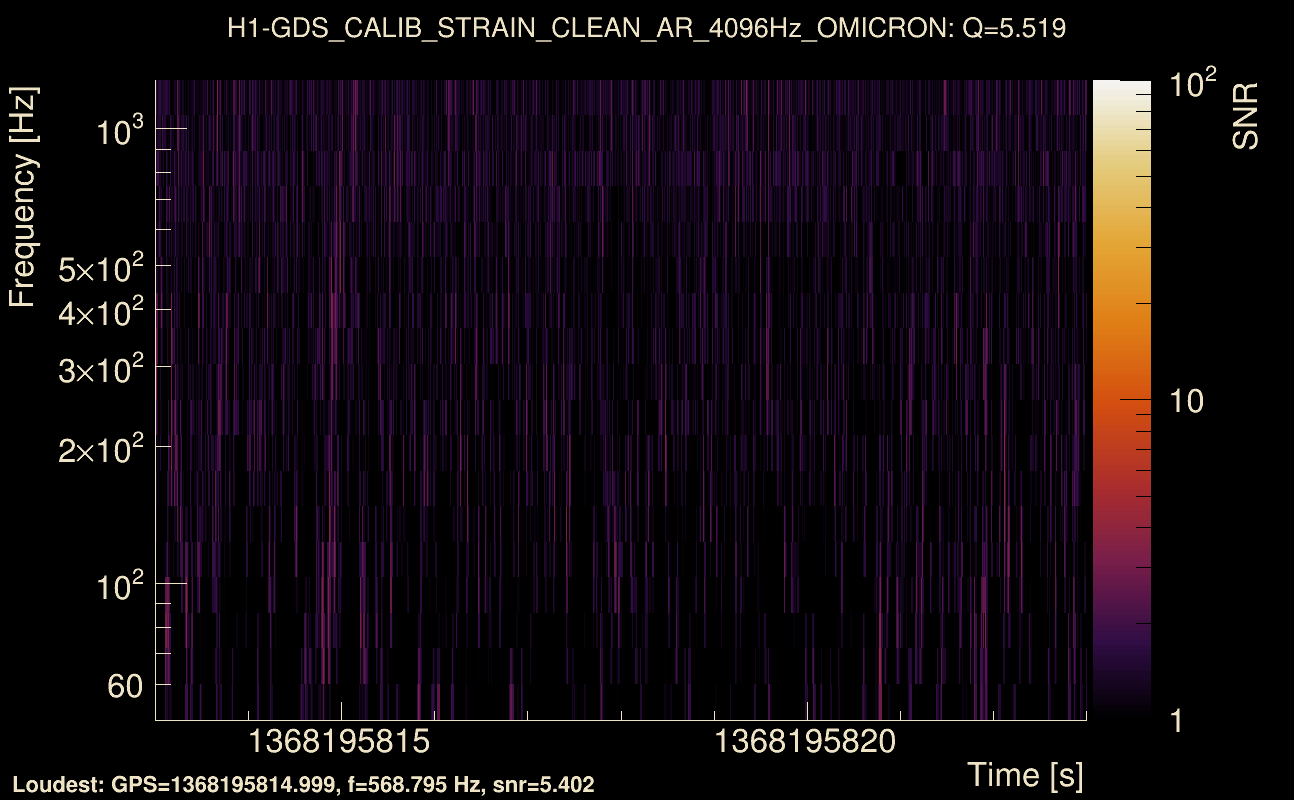
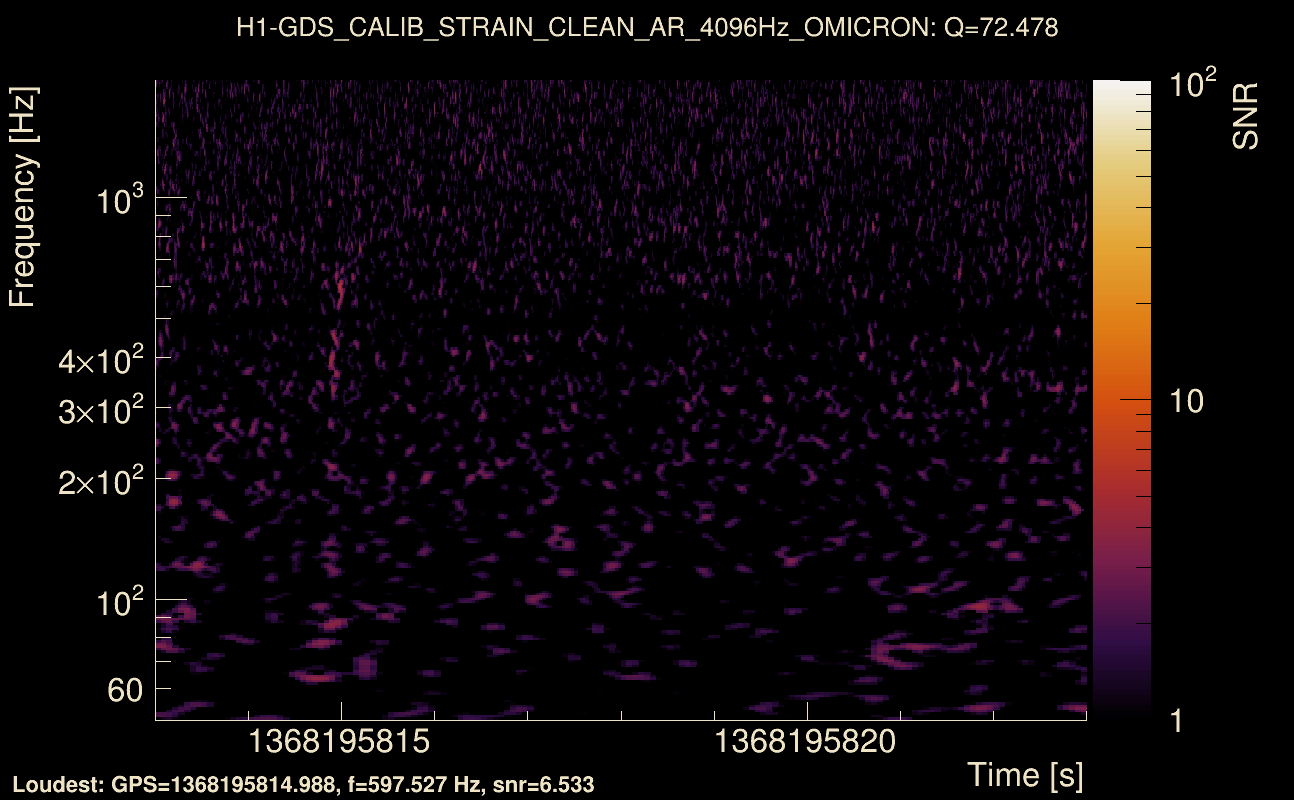
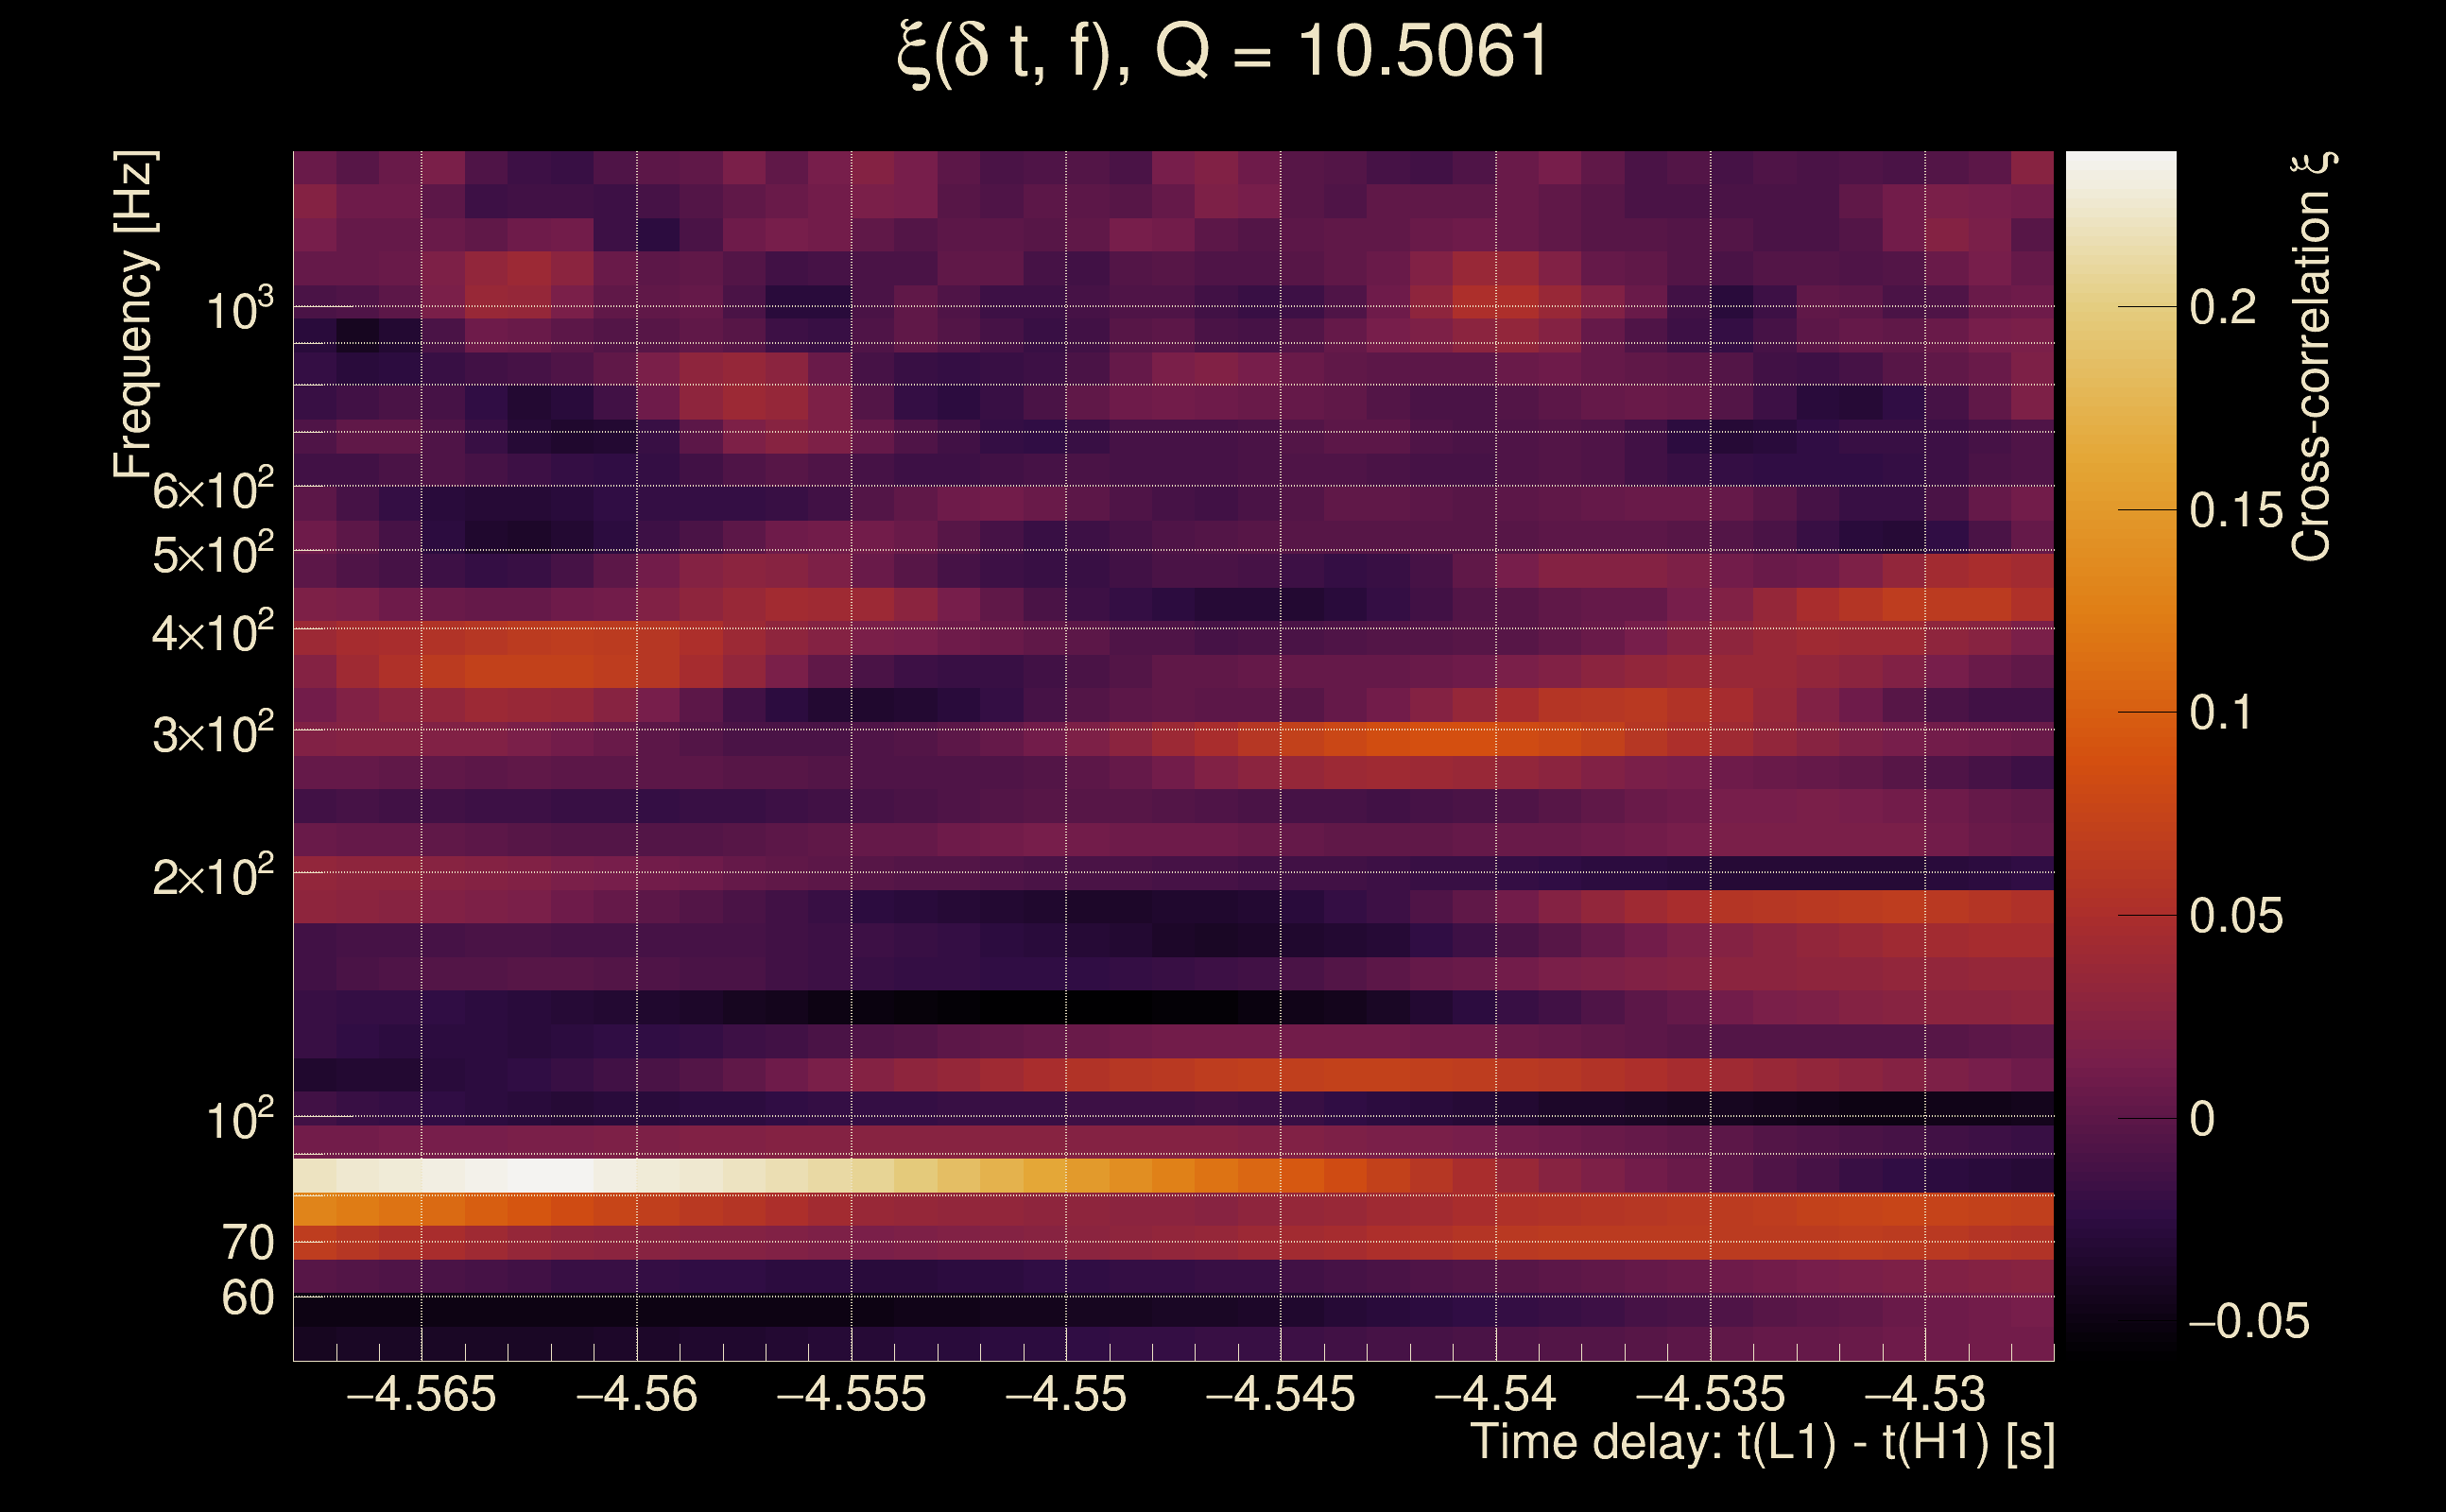
| Event time t(H1): | GPS = 1368195823 (Mon May 15 14:23:25 2023 ) → GPS = 1368195833 (Mon May 15 14:23:35 2023 ) |
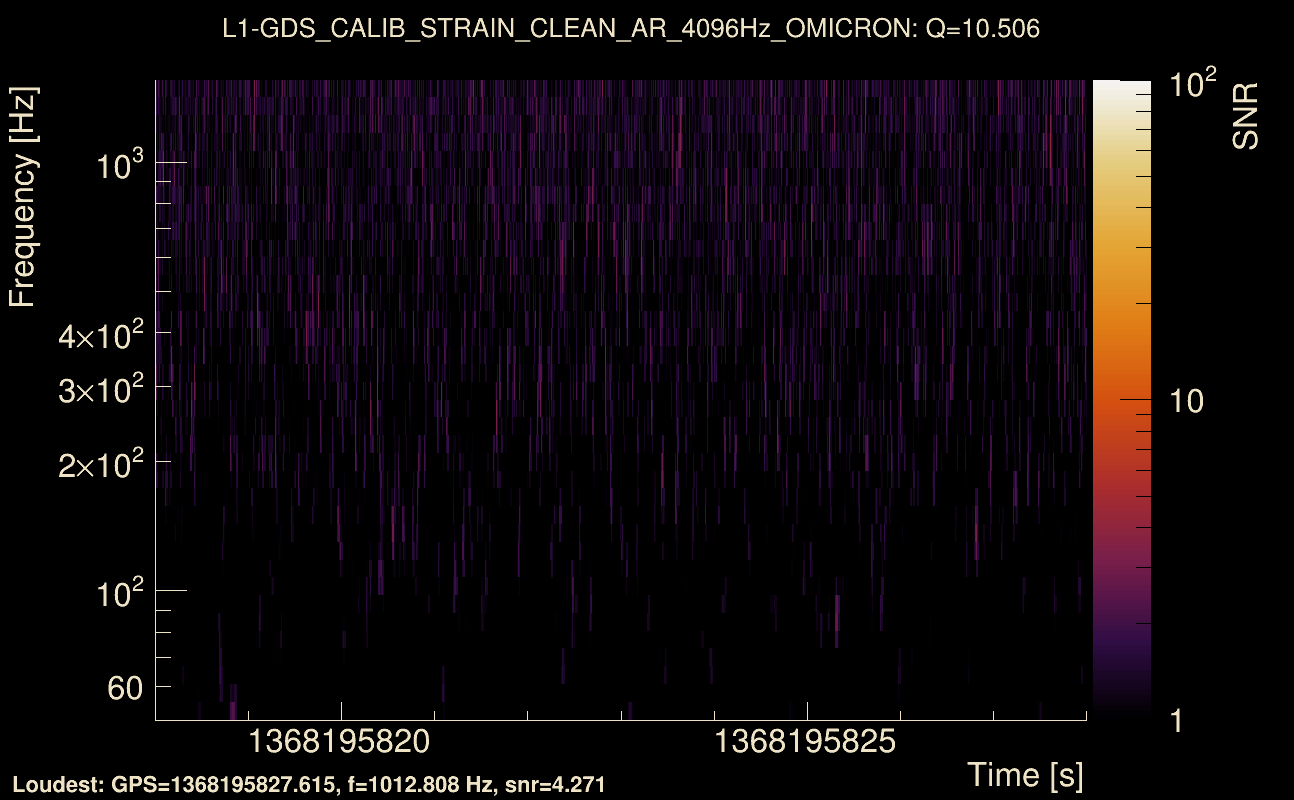
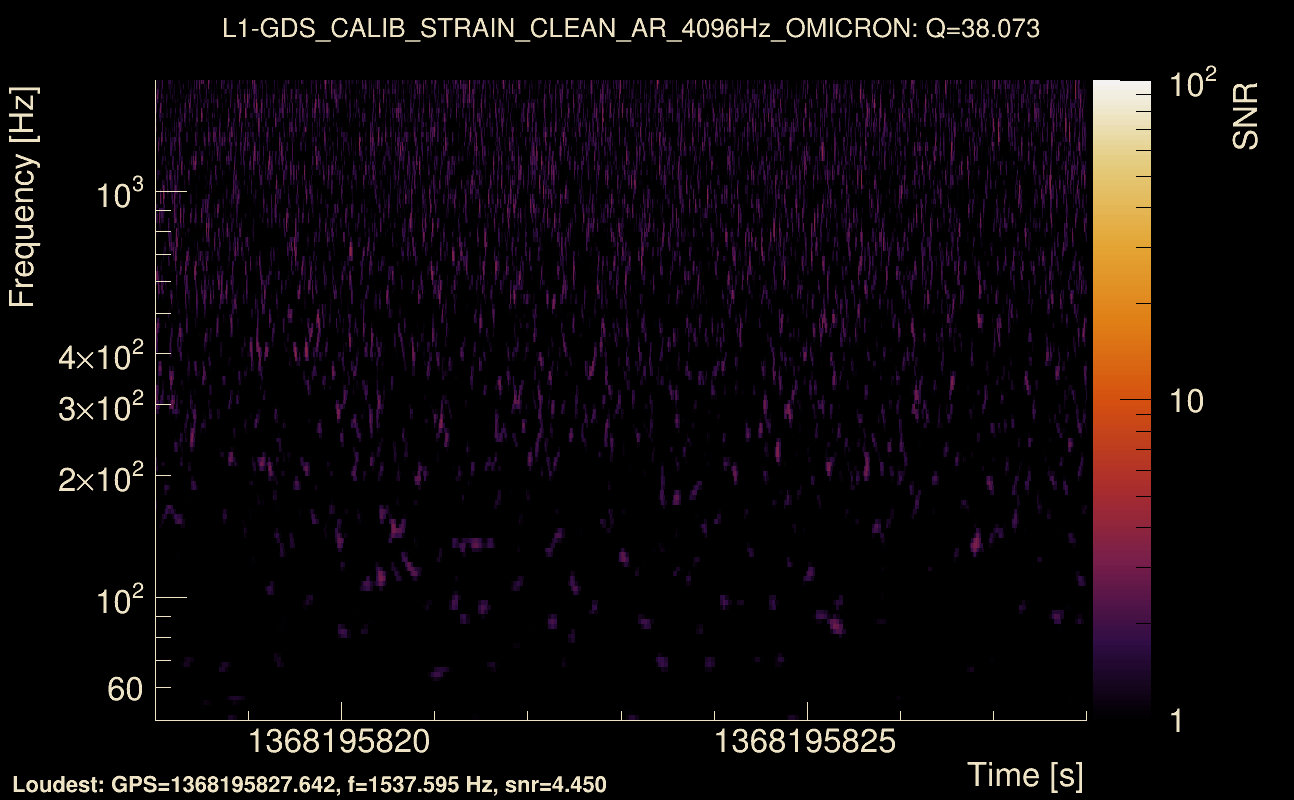
| Event time t(L1): | GPS = 1368195823 (Mon May 15 14:23:35 2023 ) → GPS = 1368195833 (Mon May 15 14:23:35 2023 ) |
| Omicron analysis time window (H1): | GPS = 1368195820 → GPS = 1368195836 |
| Omicron analysis time window (L1): | GPS = 1368195820 → GPS = 1368195836 |
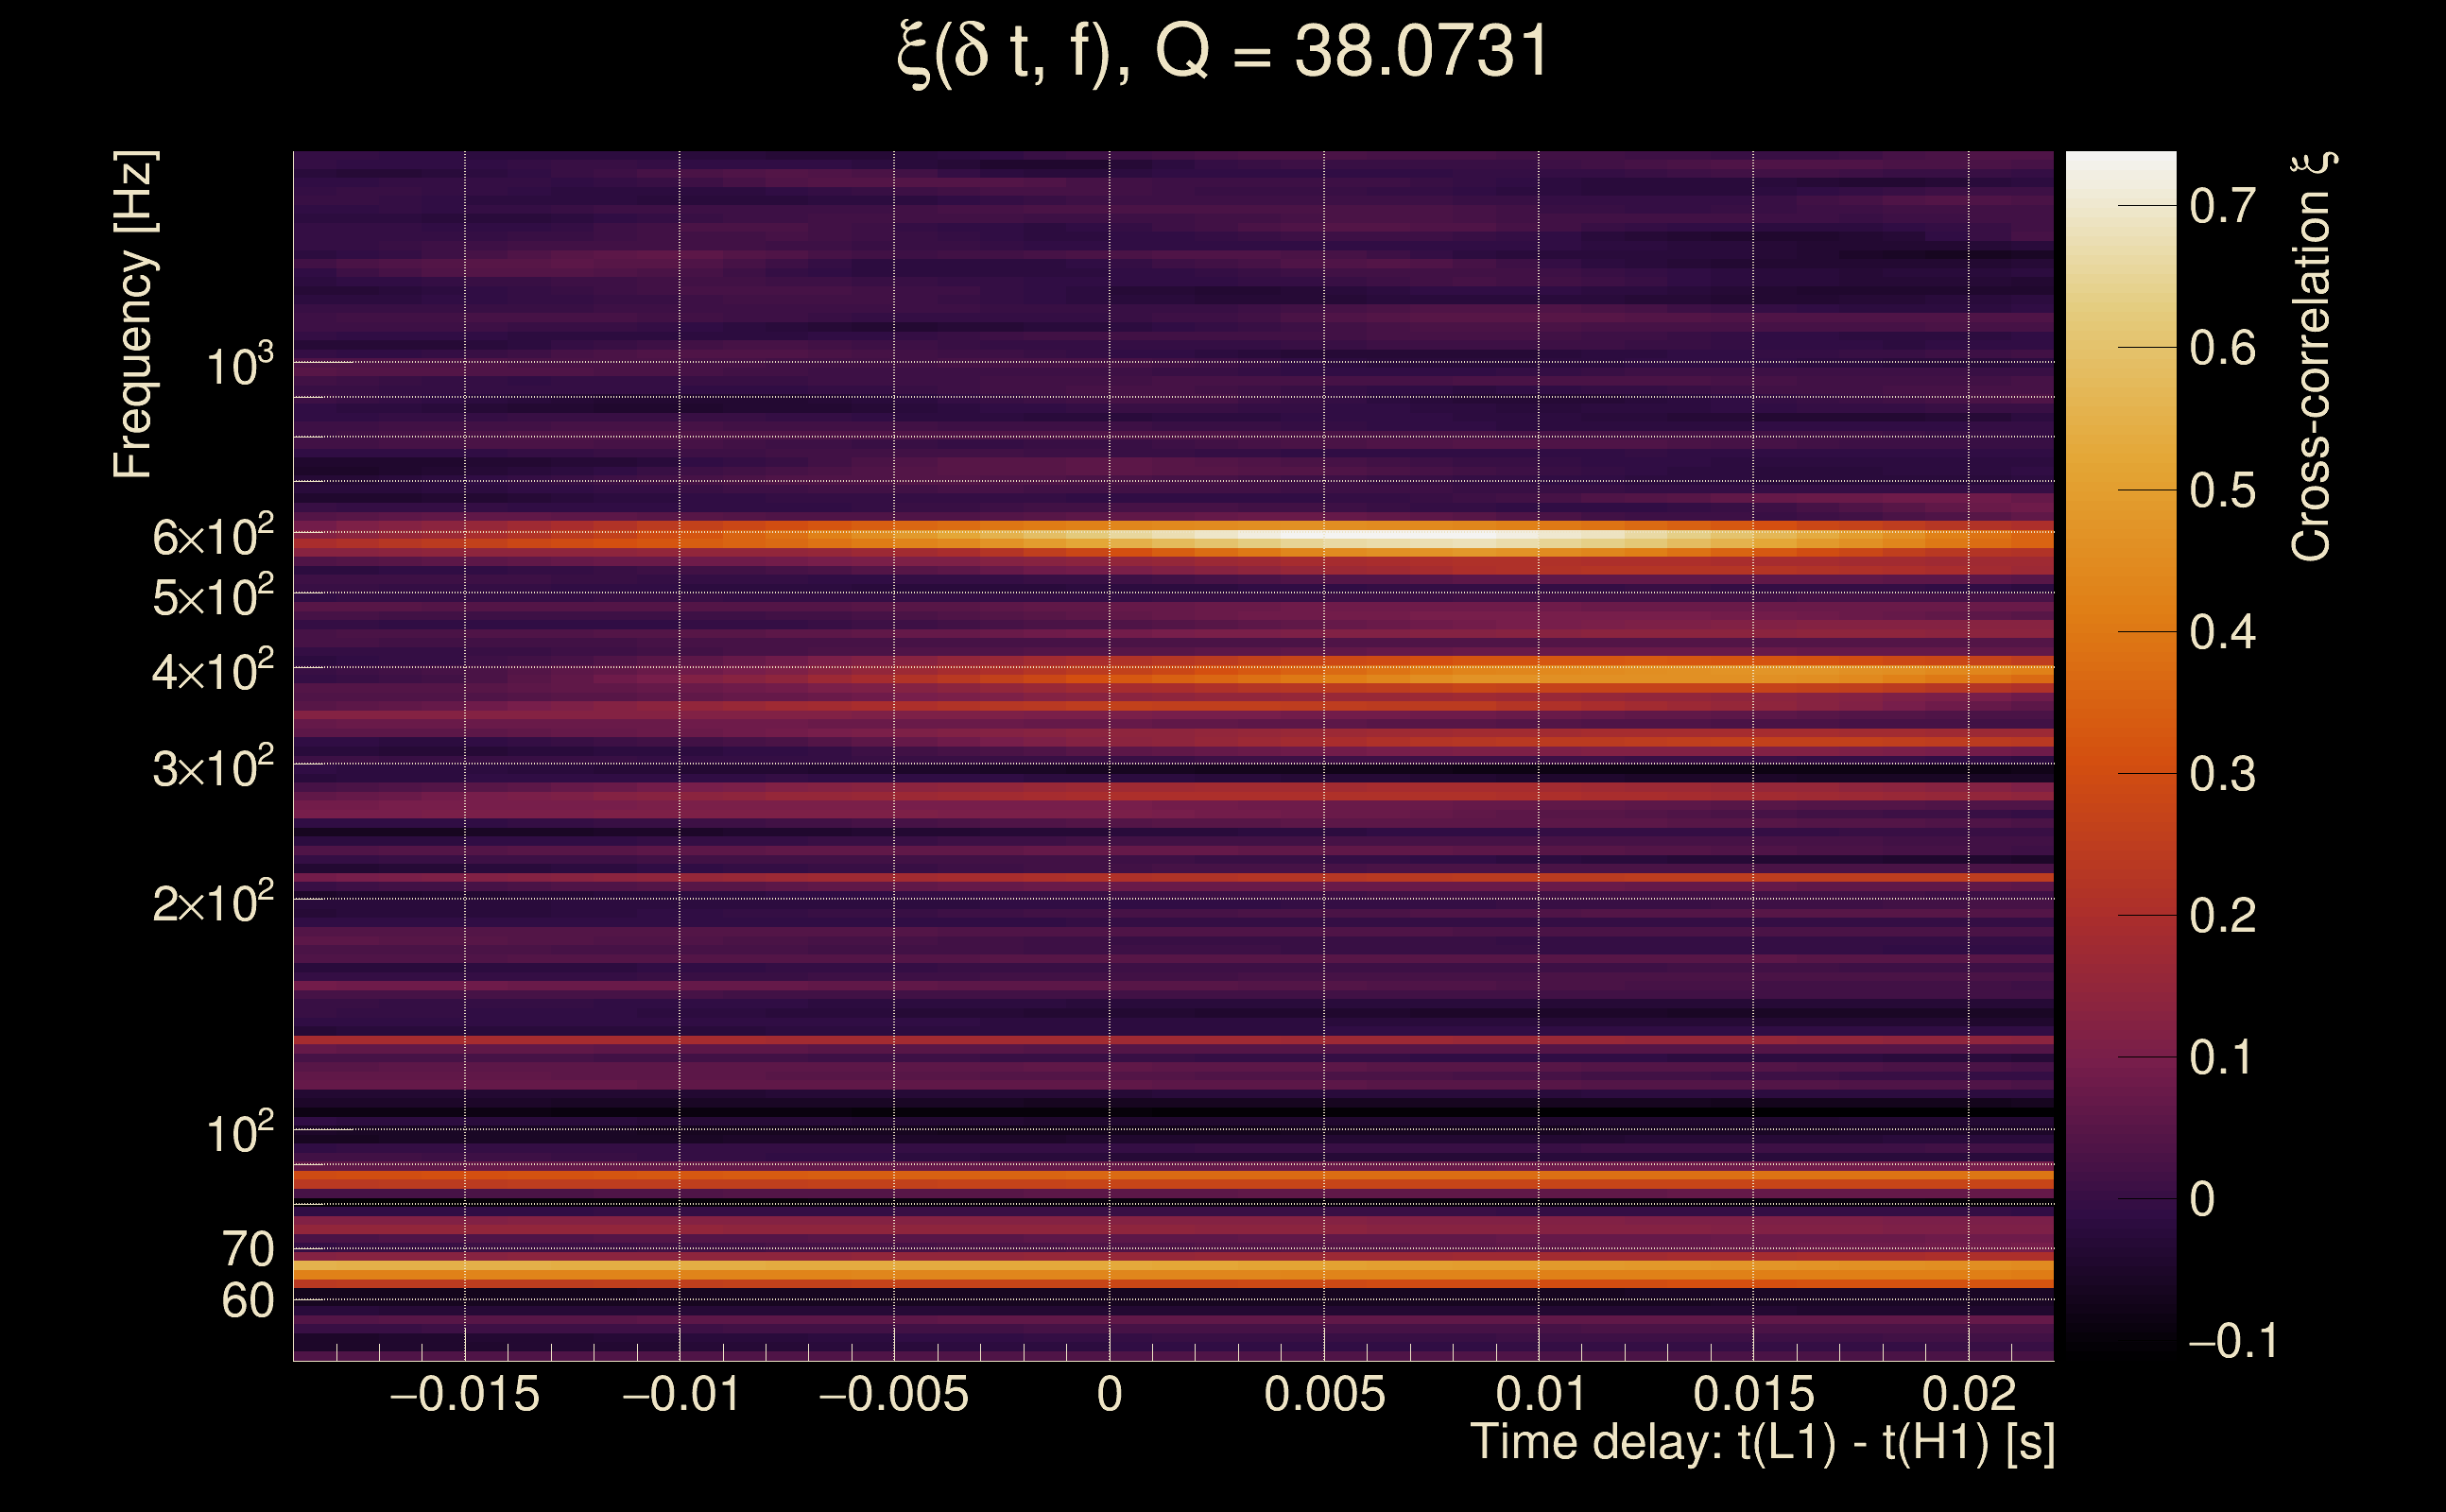
| Time delay between detectors t(L1) - t(H1): | -0.00628823 s (slice index = 108 / 217), δt_gw = -0.00628823 s |
| Time delay uncertainty: | 0.00500721 s |
| [targeted mode] Time delay probability: | 0.00290246 (2.97788 sigmas), δt_target = 1.72247e+45 s |
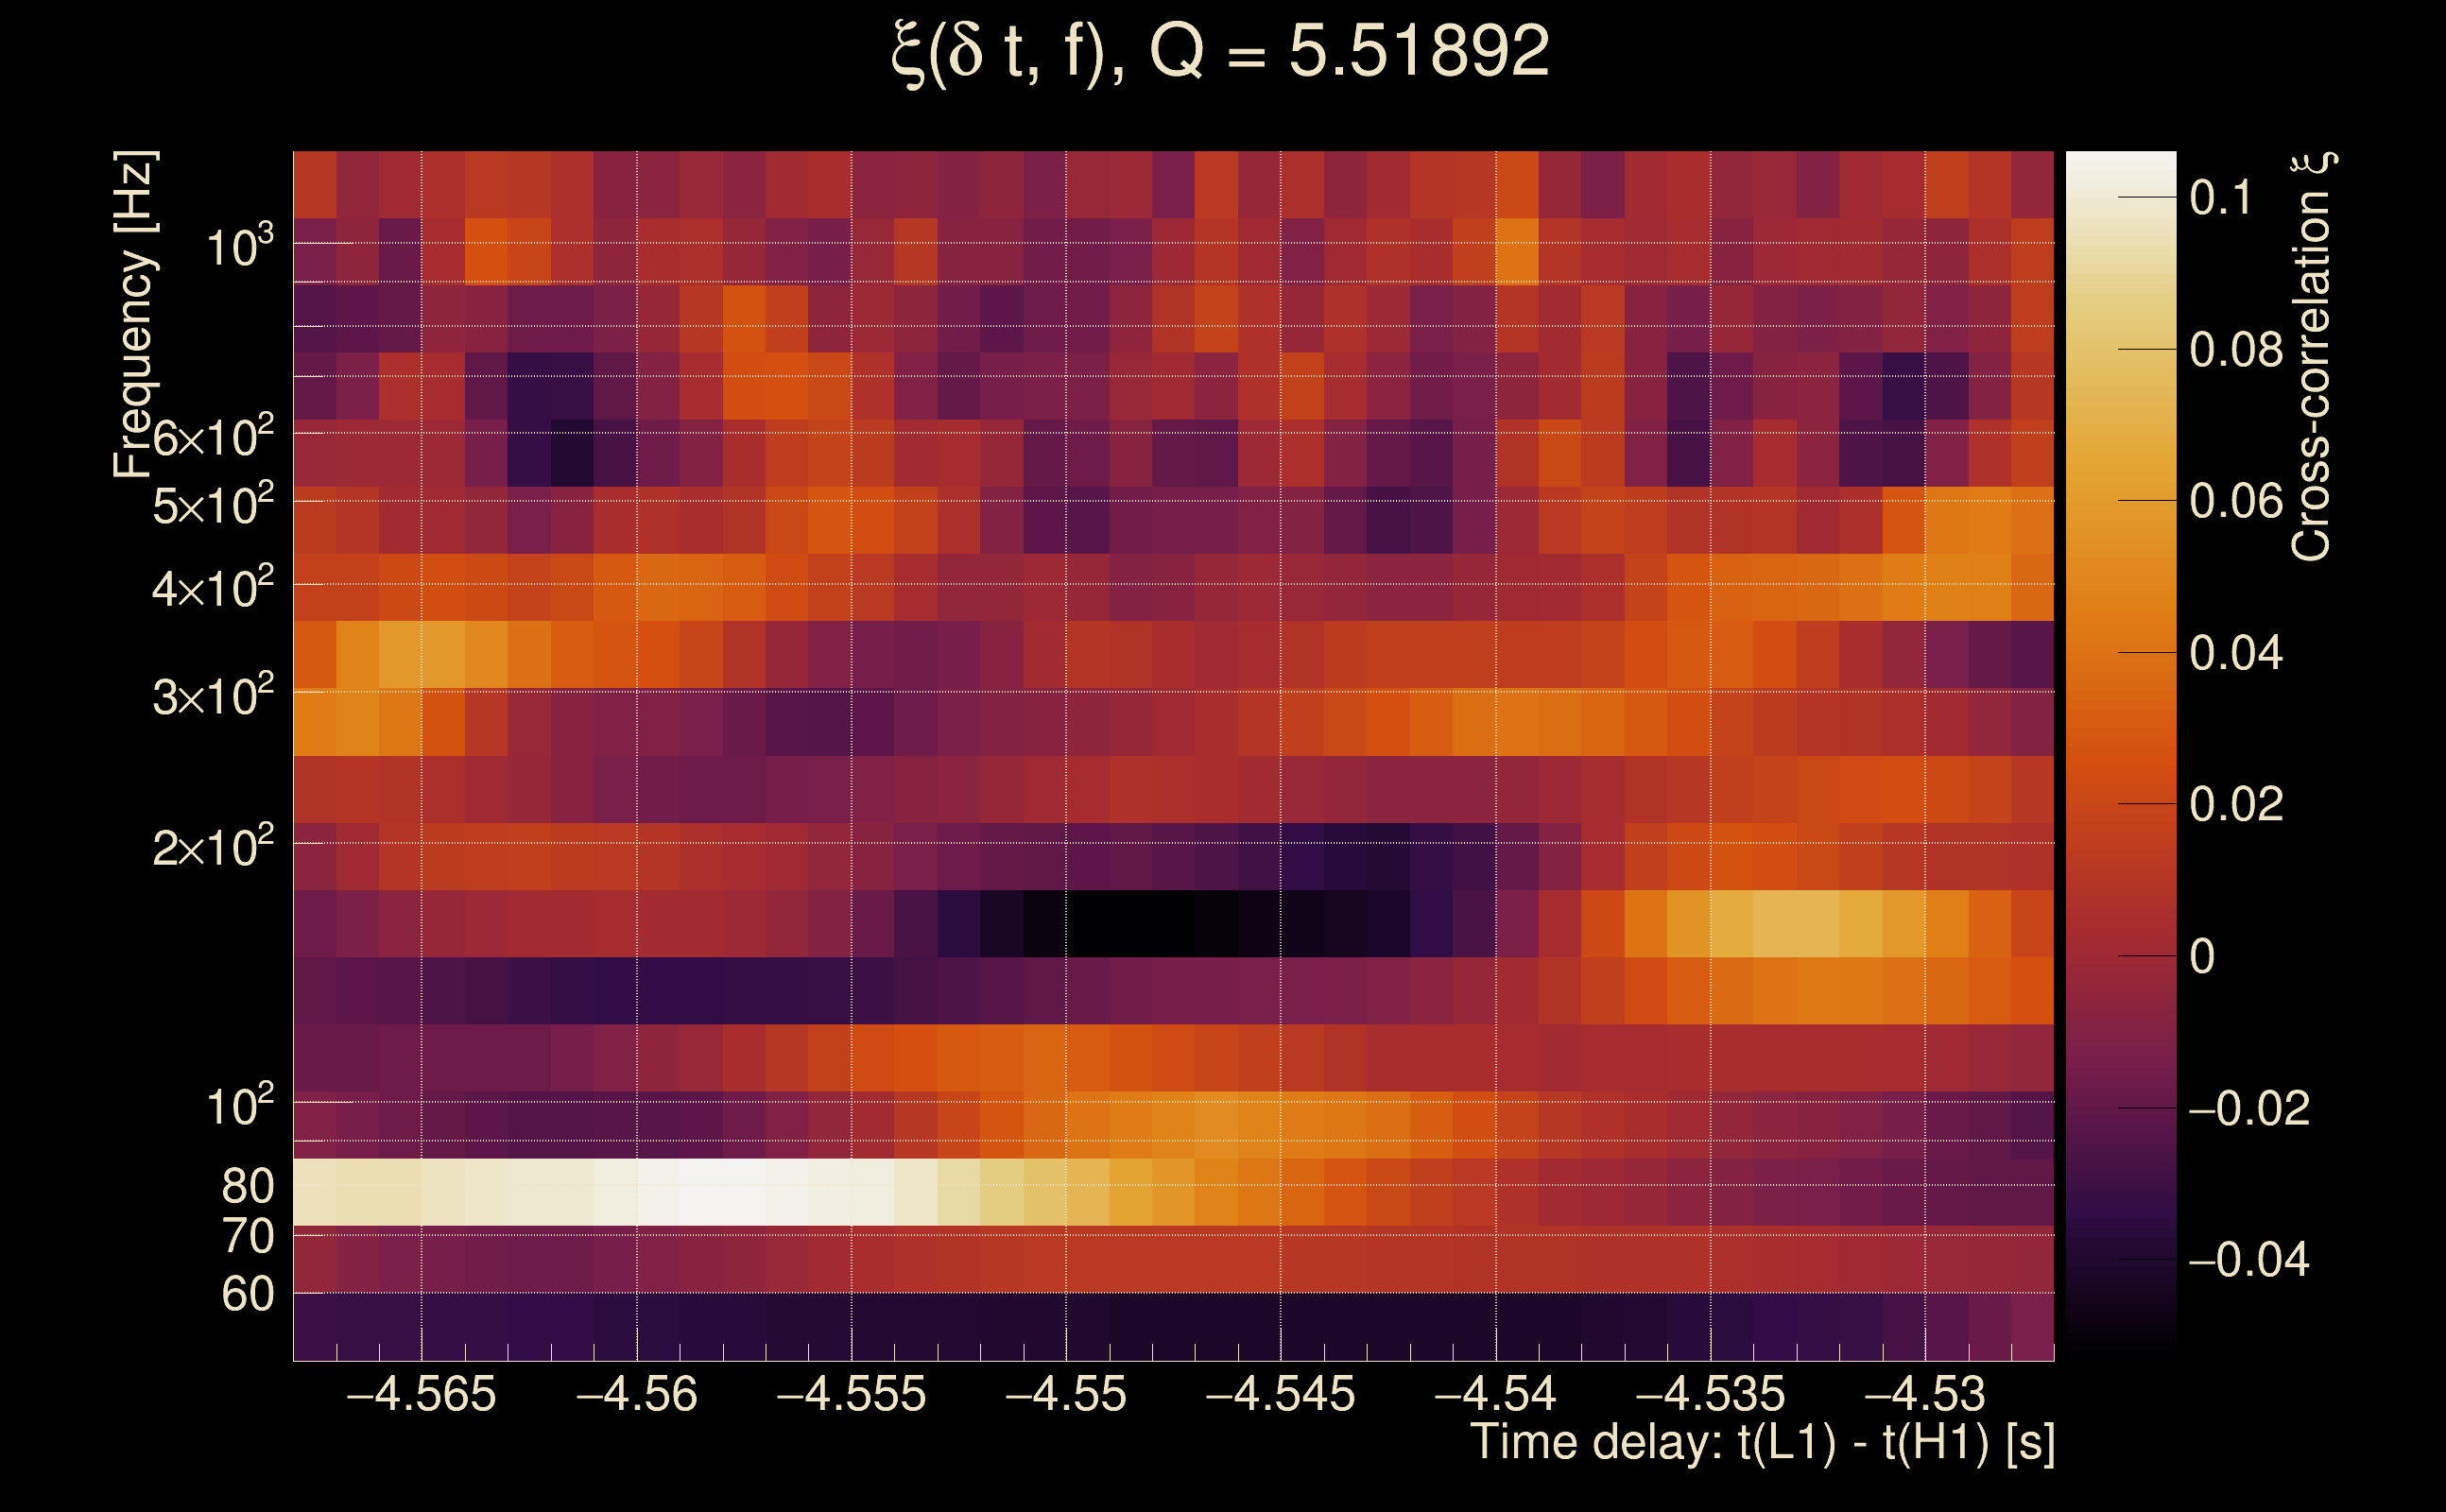
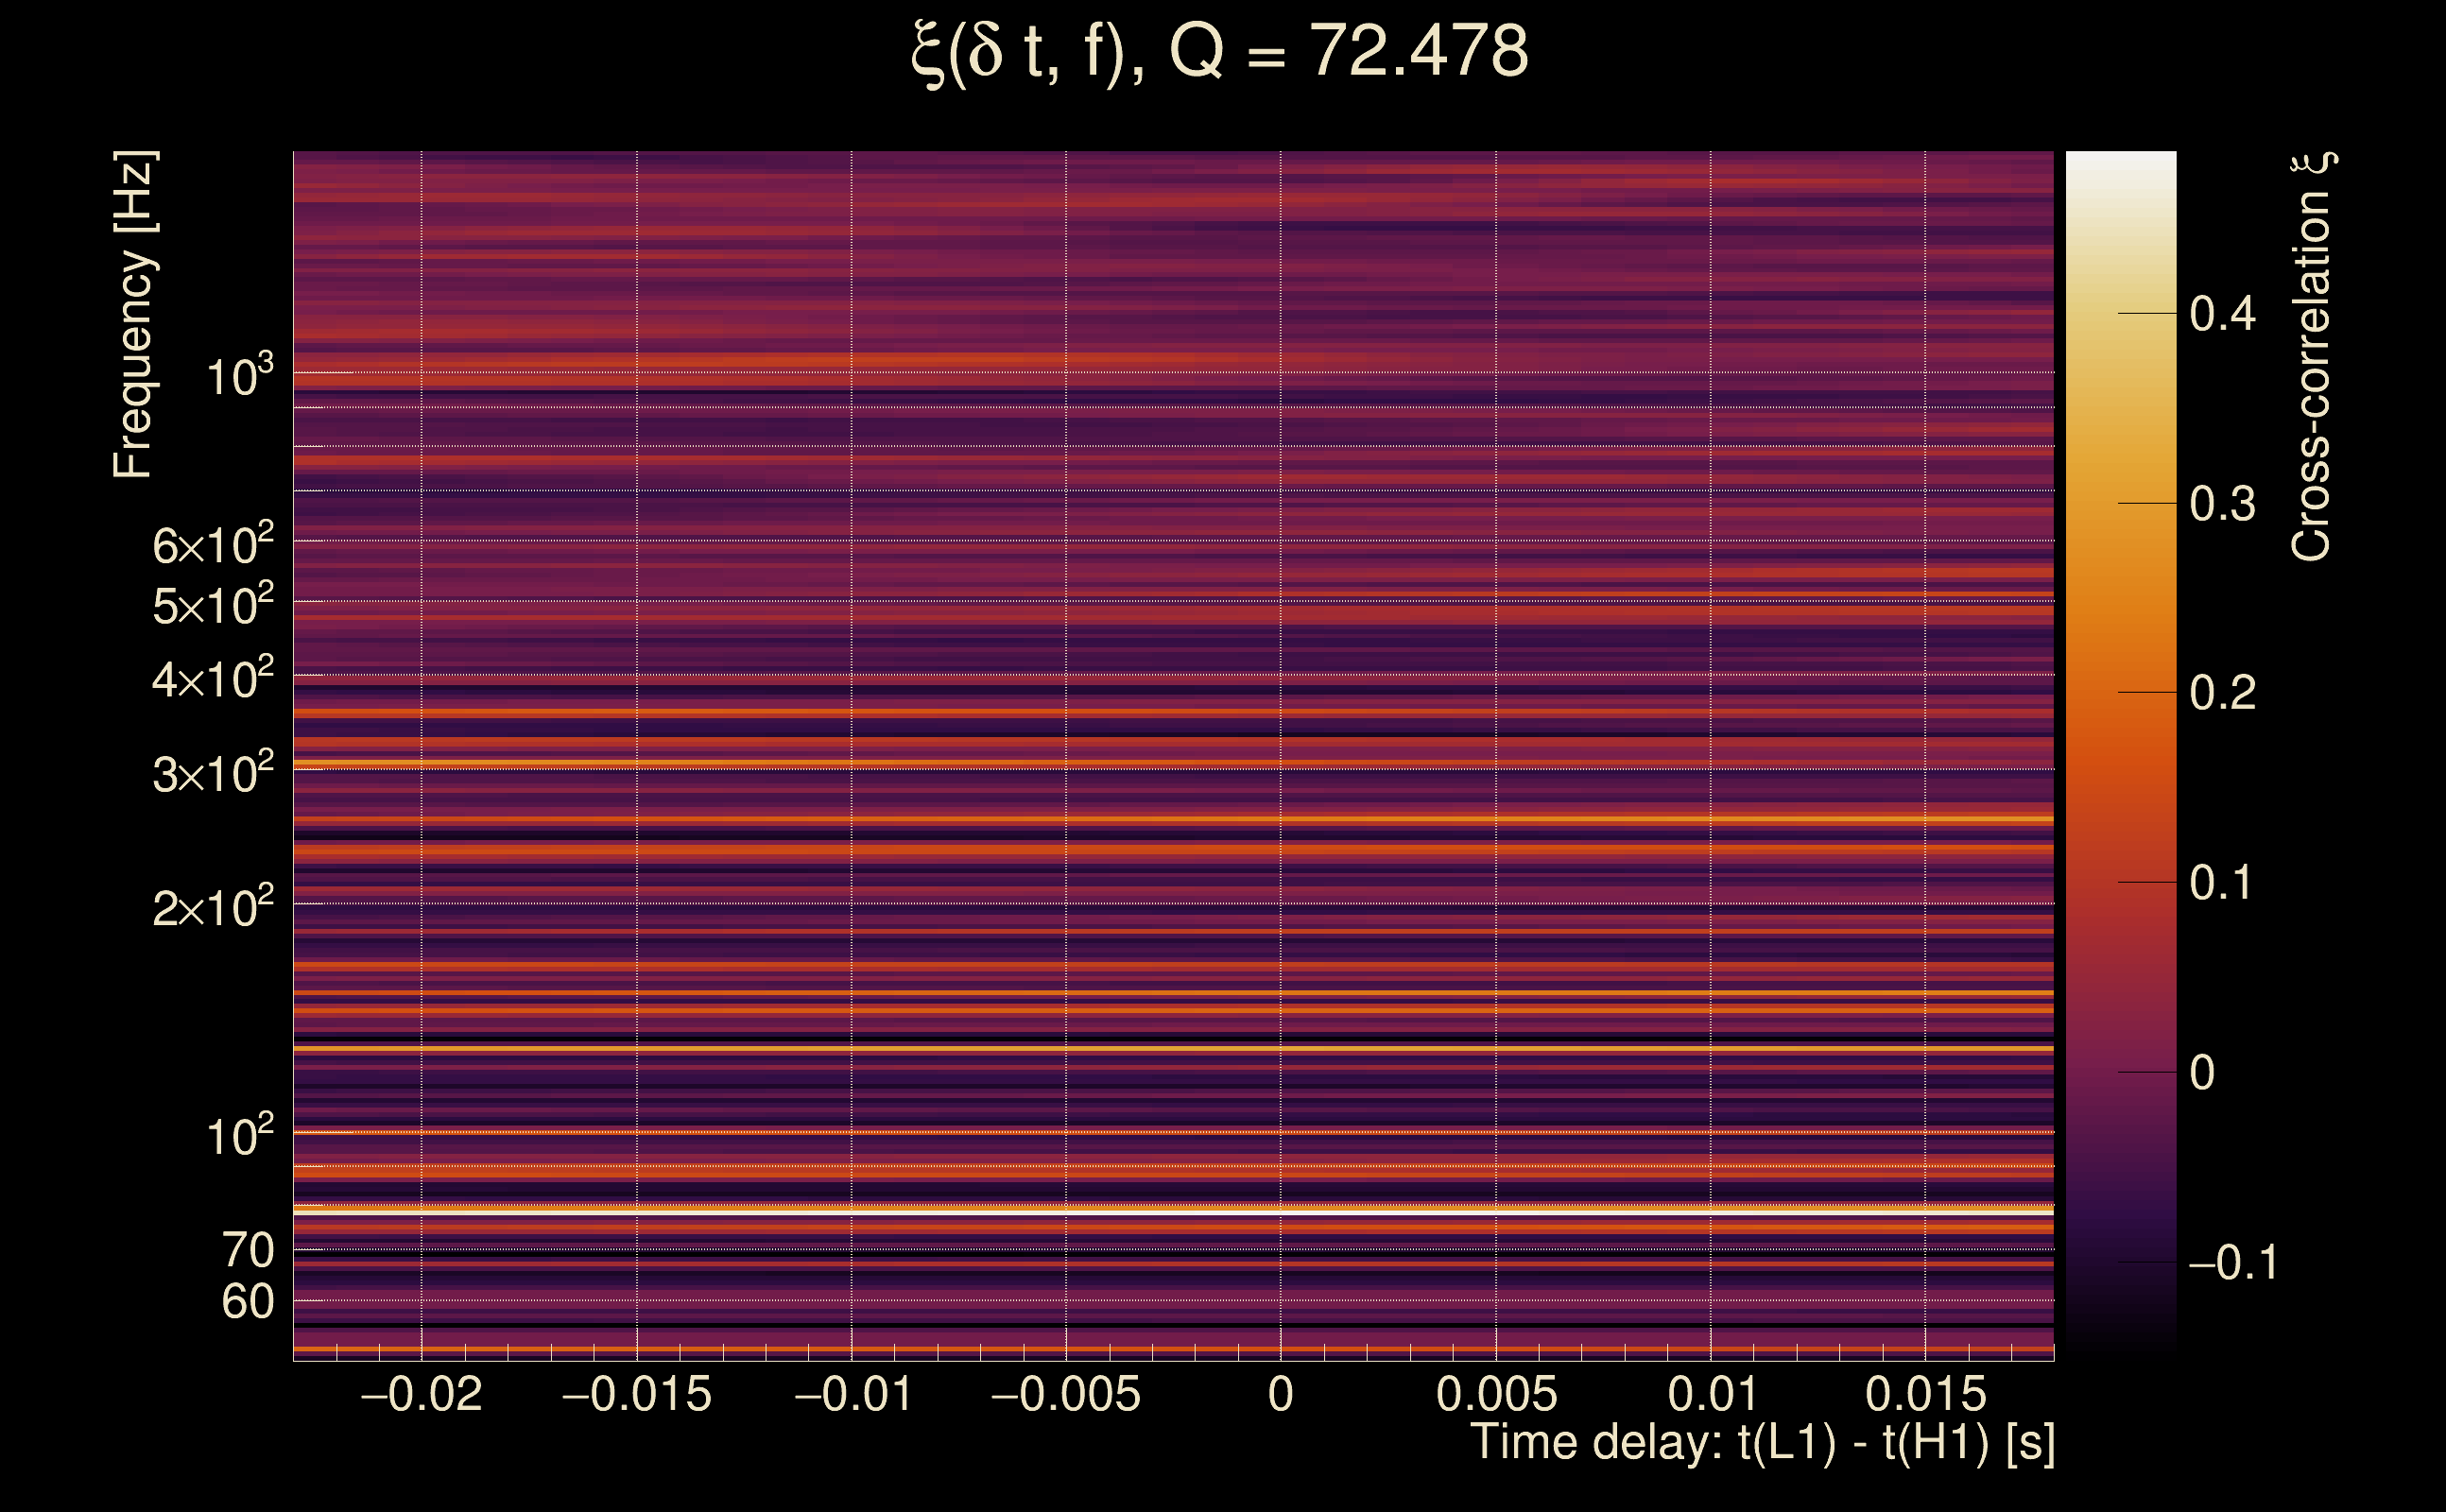
| Frequency: | 974.128 Hz |
| Ξ: | 0.000138711 ± 0.0167083 (variance = 0.000279168): Q0: 0, Q1: 0, Q2: 0.0250275, Q3: 0.0332085, Q4: 0.0399194 |
| Rank: | R_A = 0.13682 |
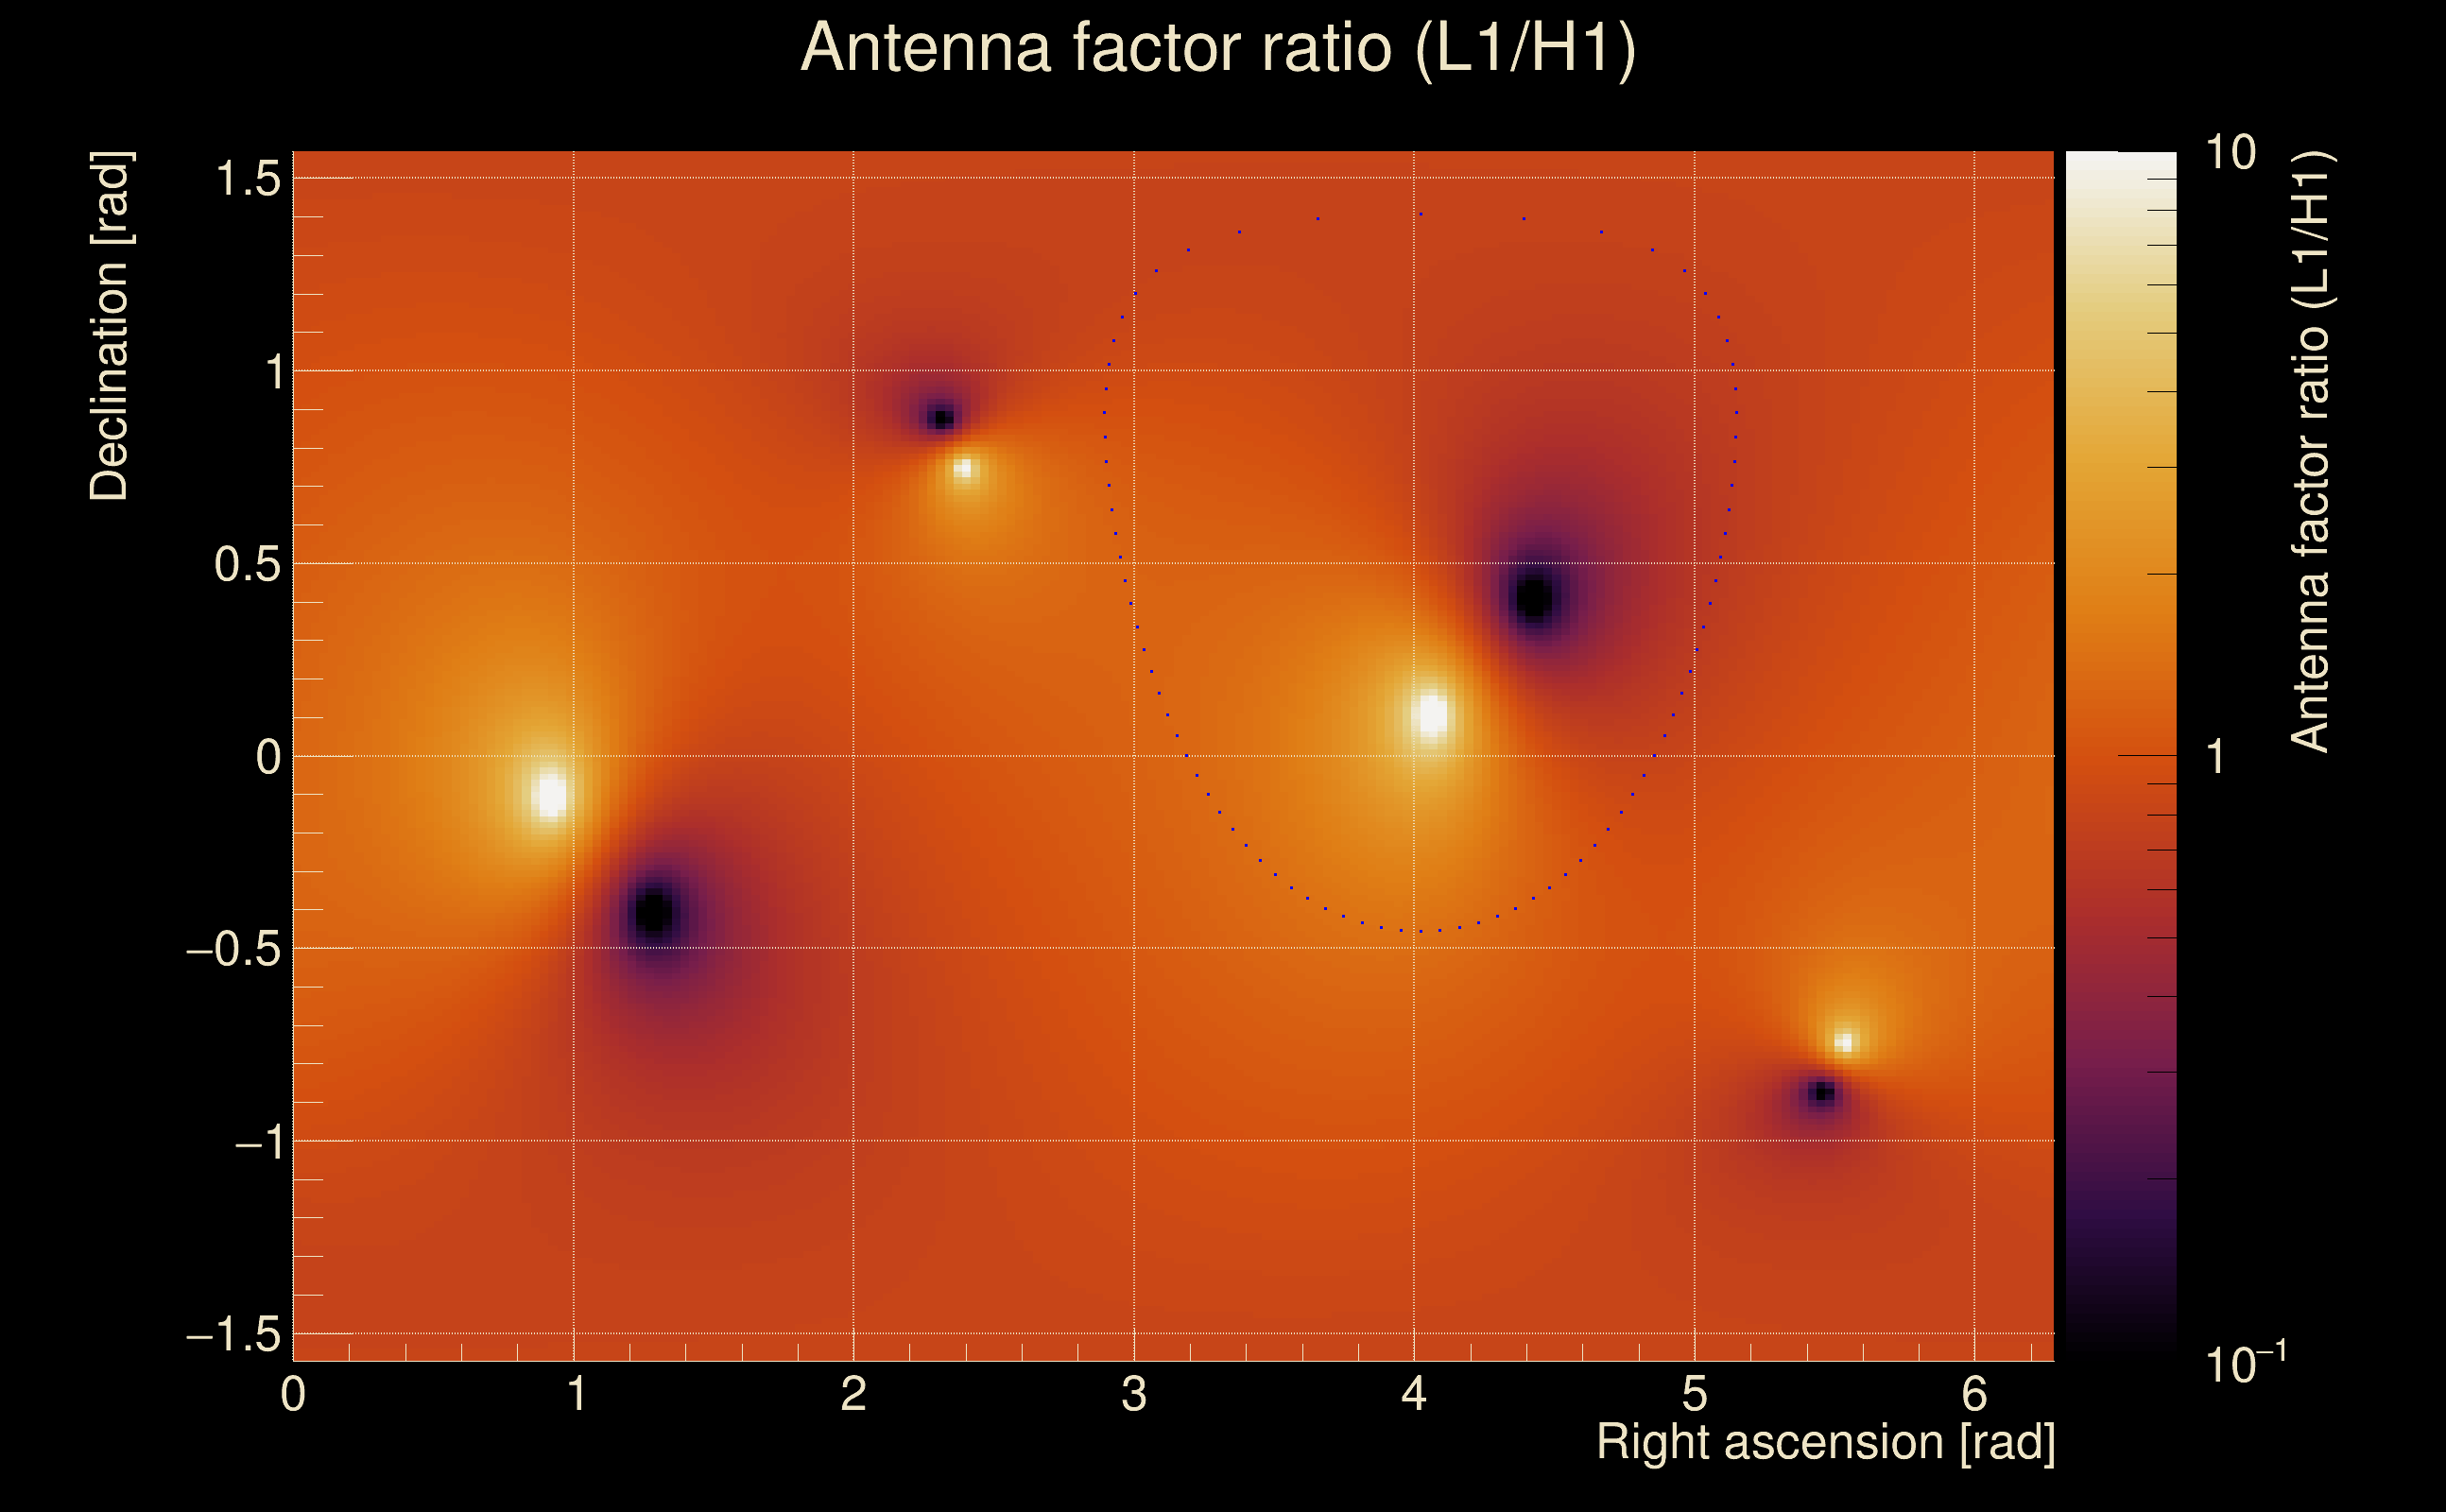
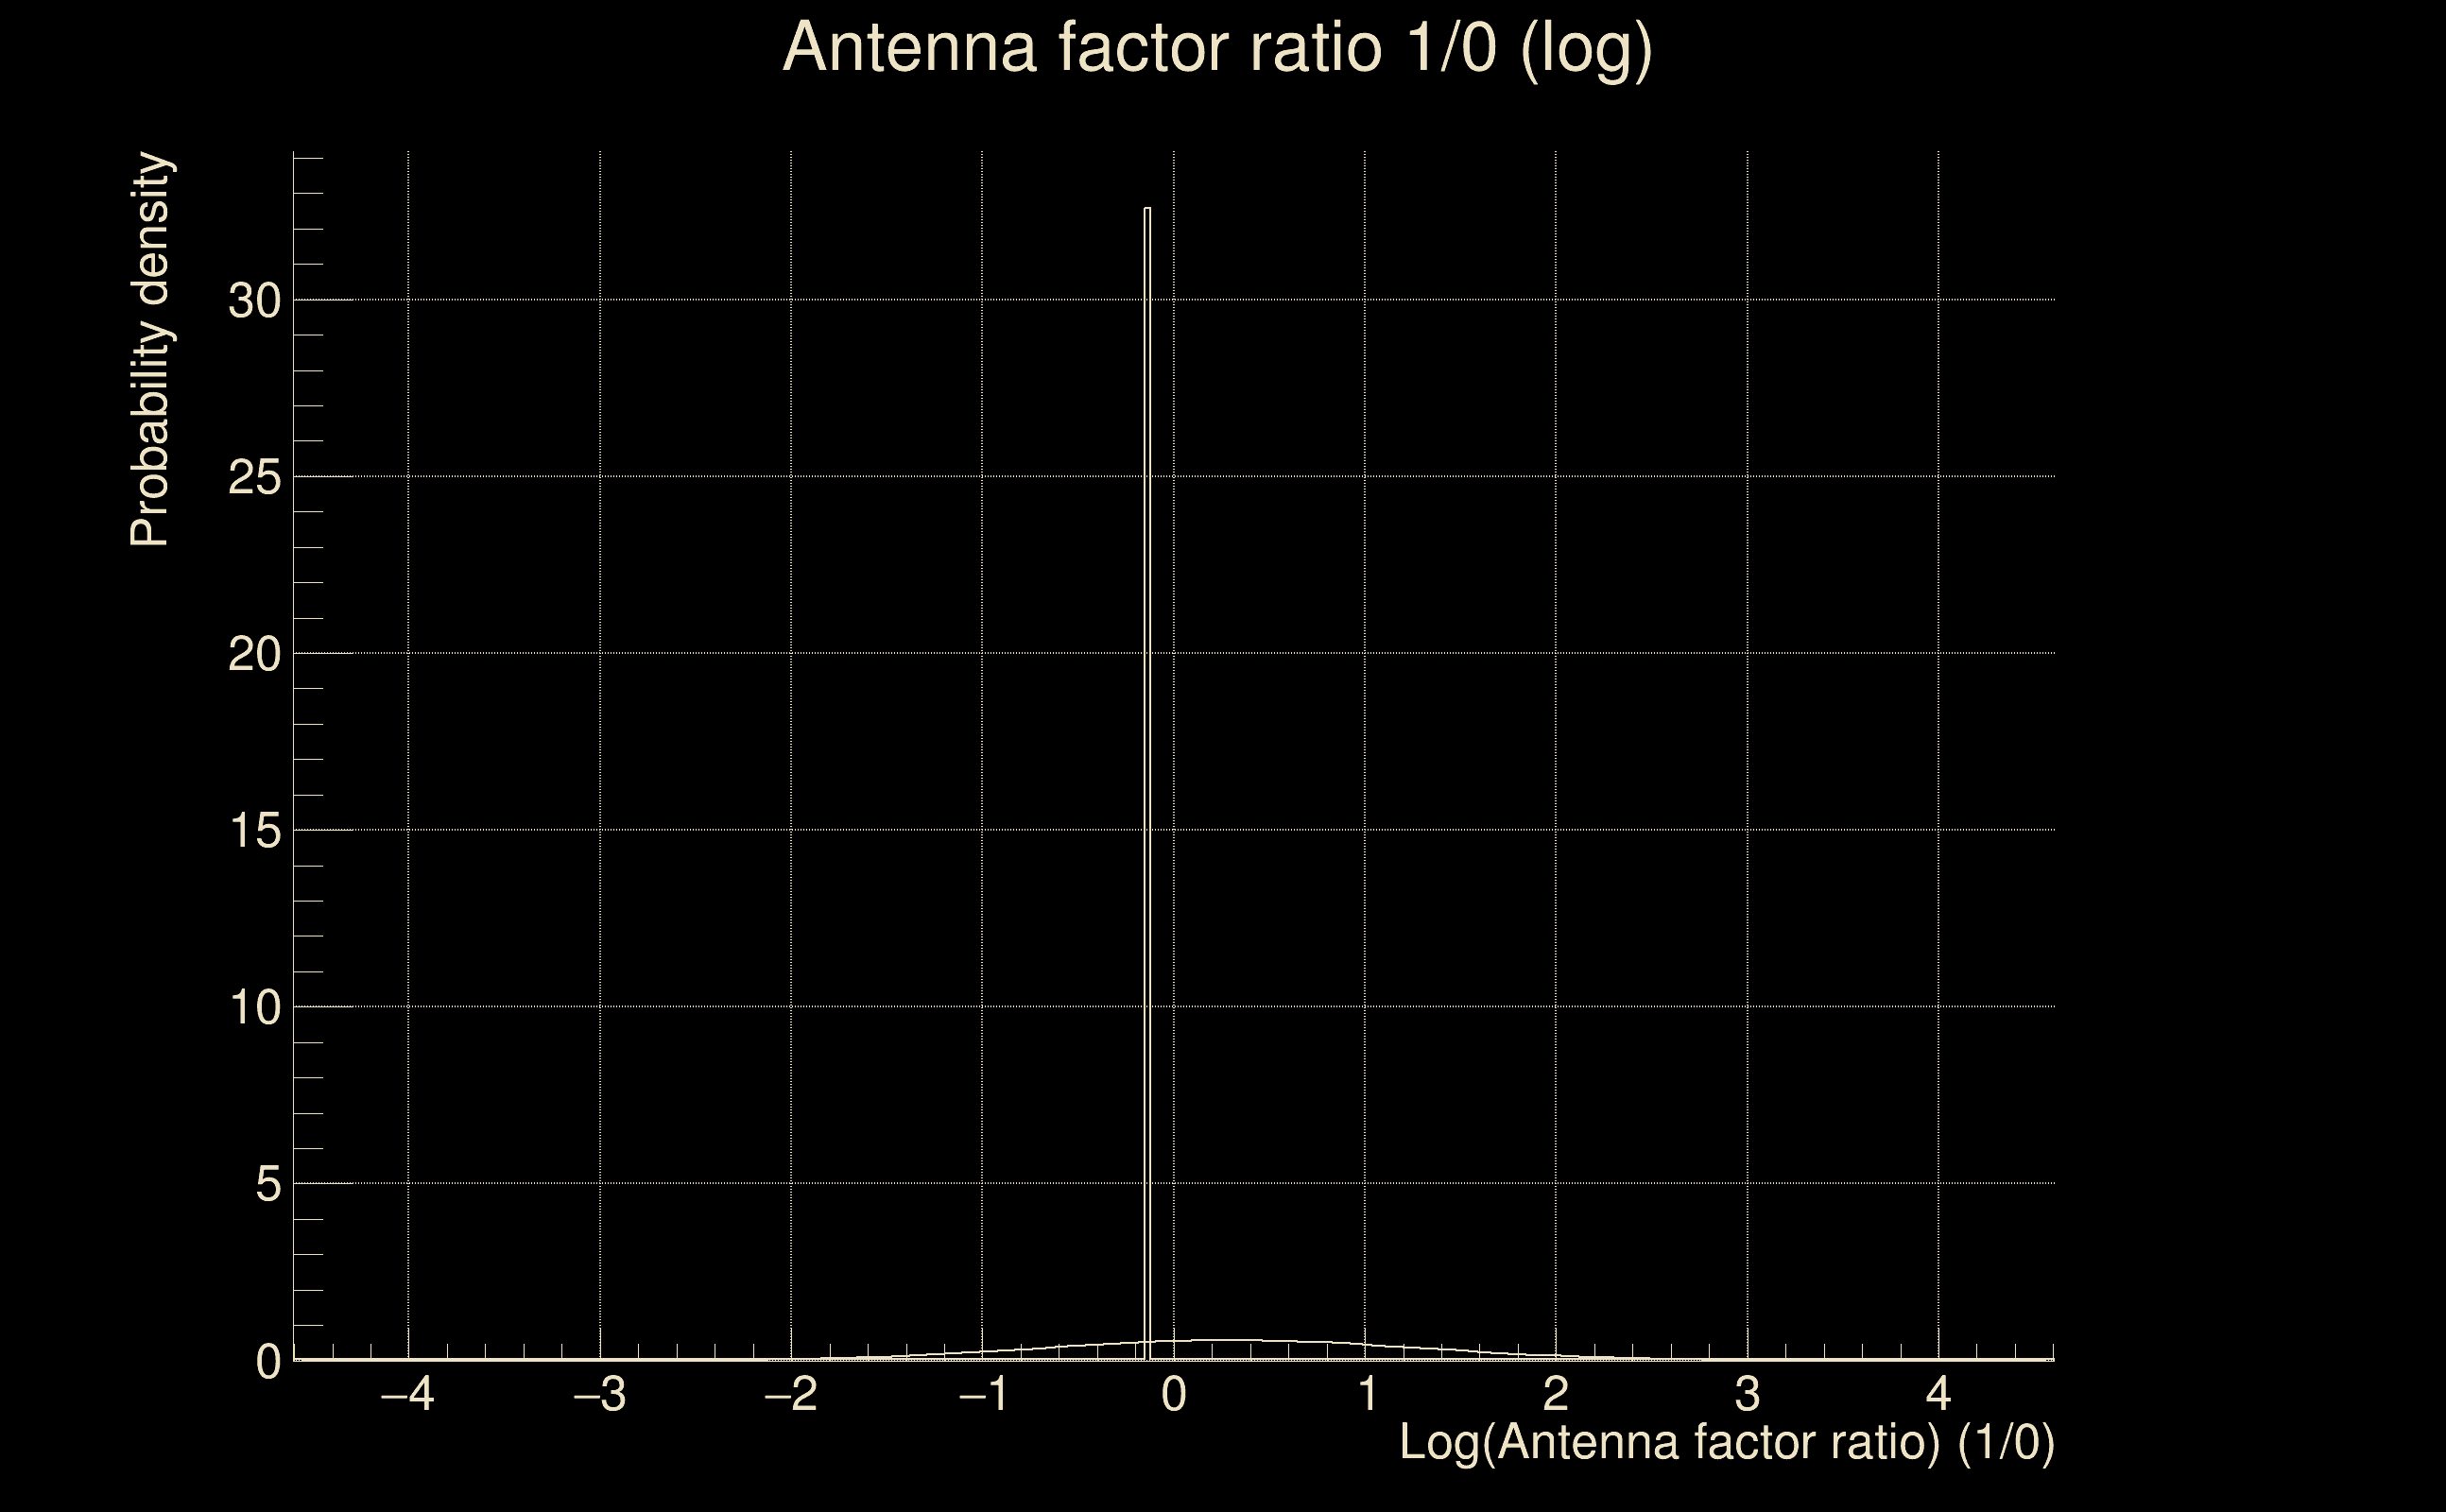
| Log of amplitude ratio (L1/H1): | 0.198739, variance = 0.569277 (L1/H1: -0.19661, variance = 1.18465, H1/L1: -0.569927, variance = 1.0958) |
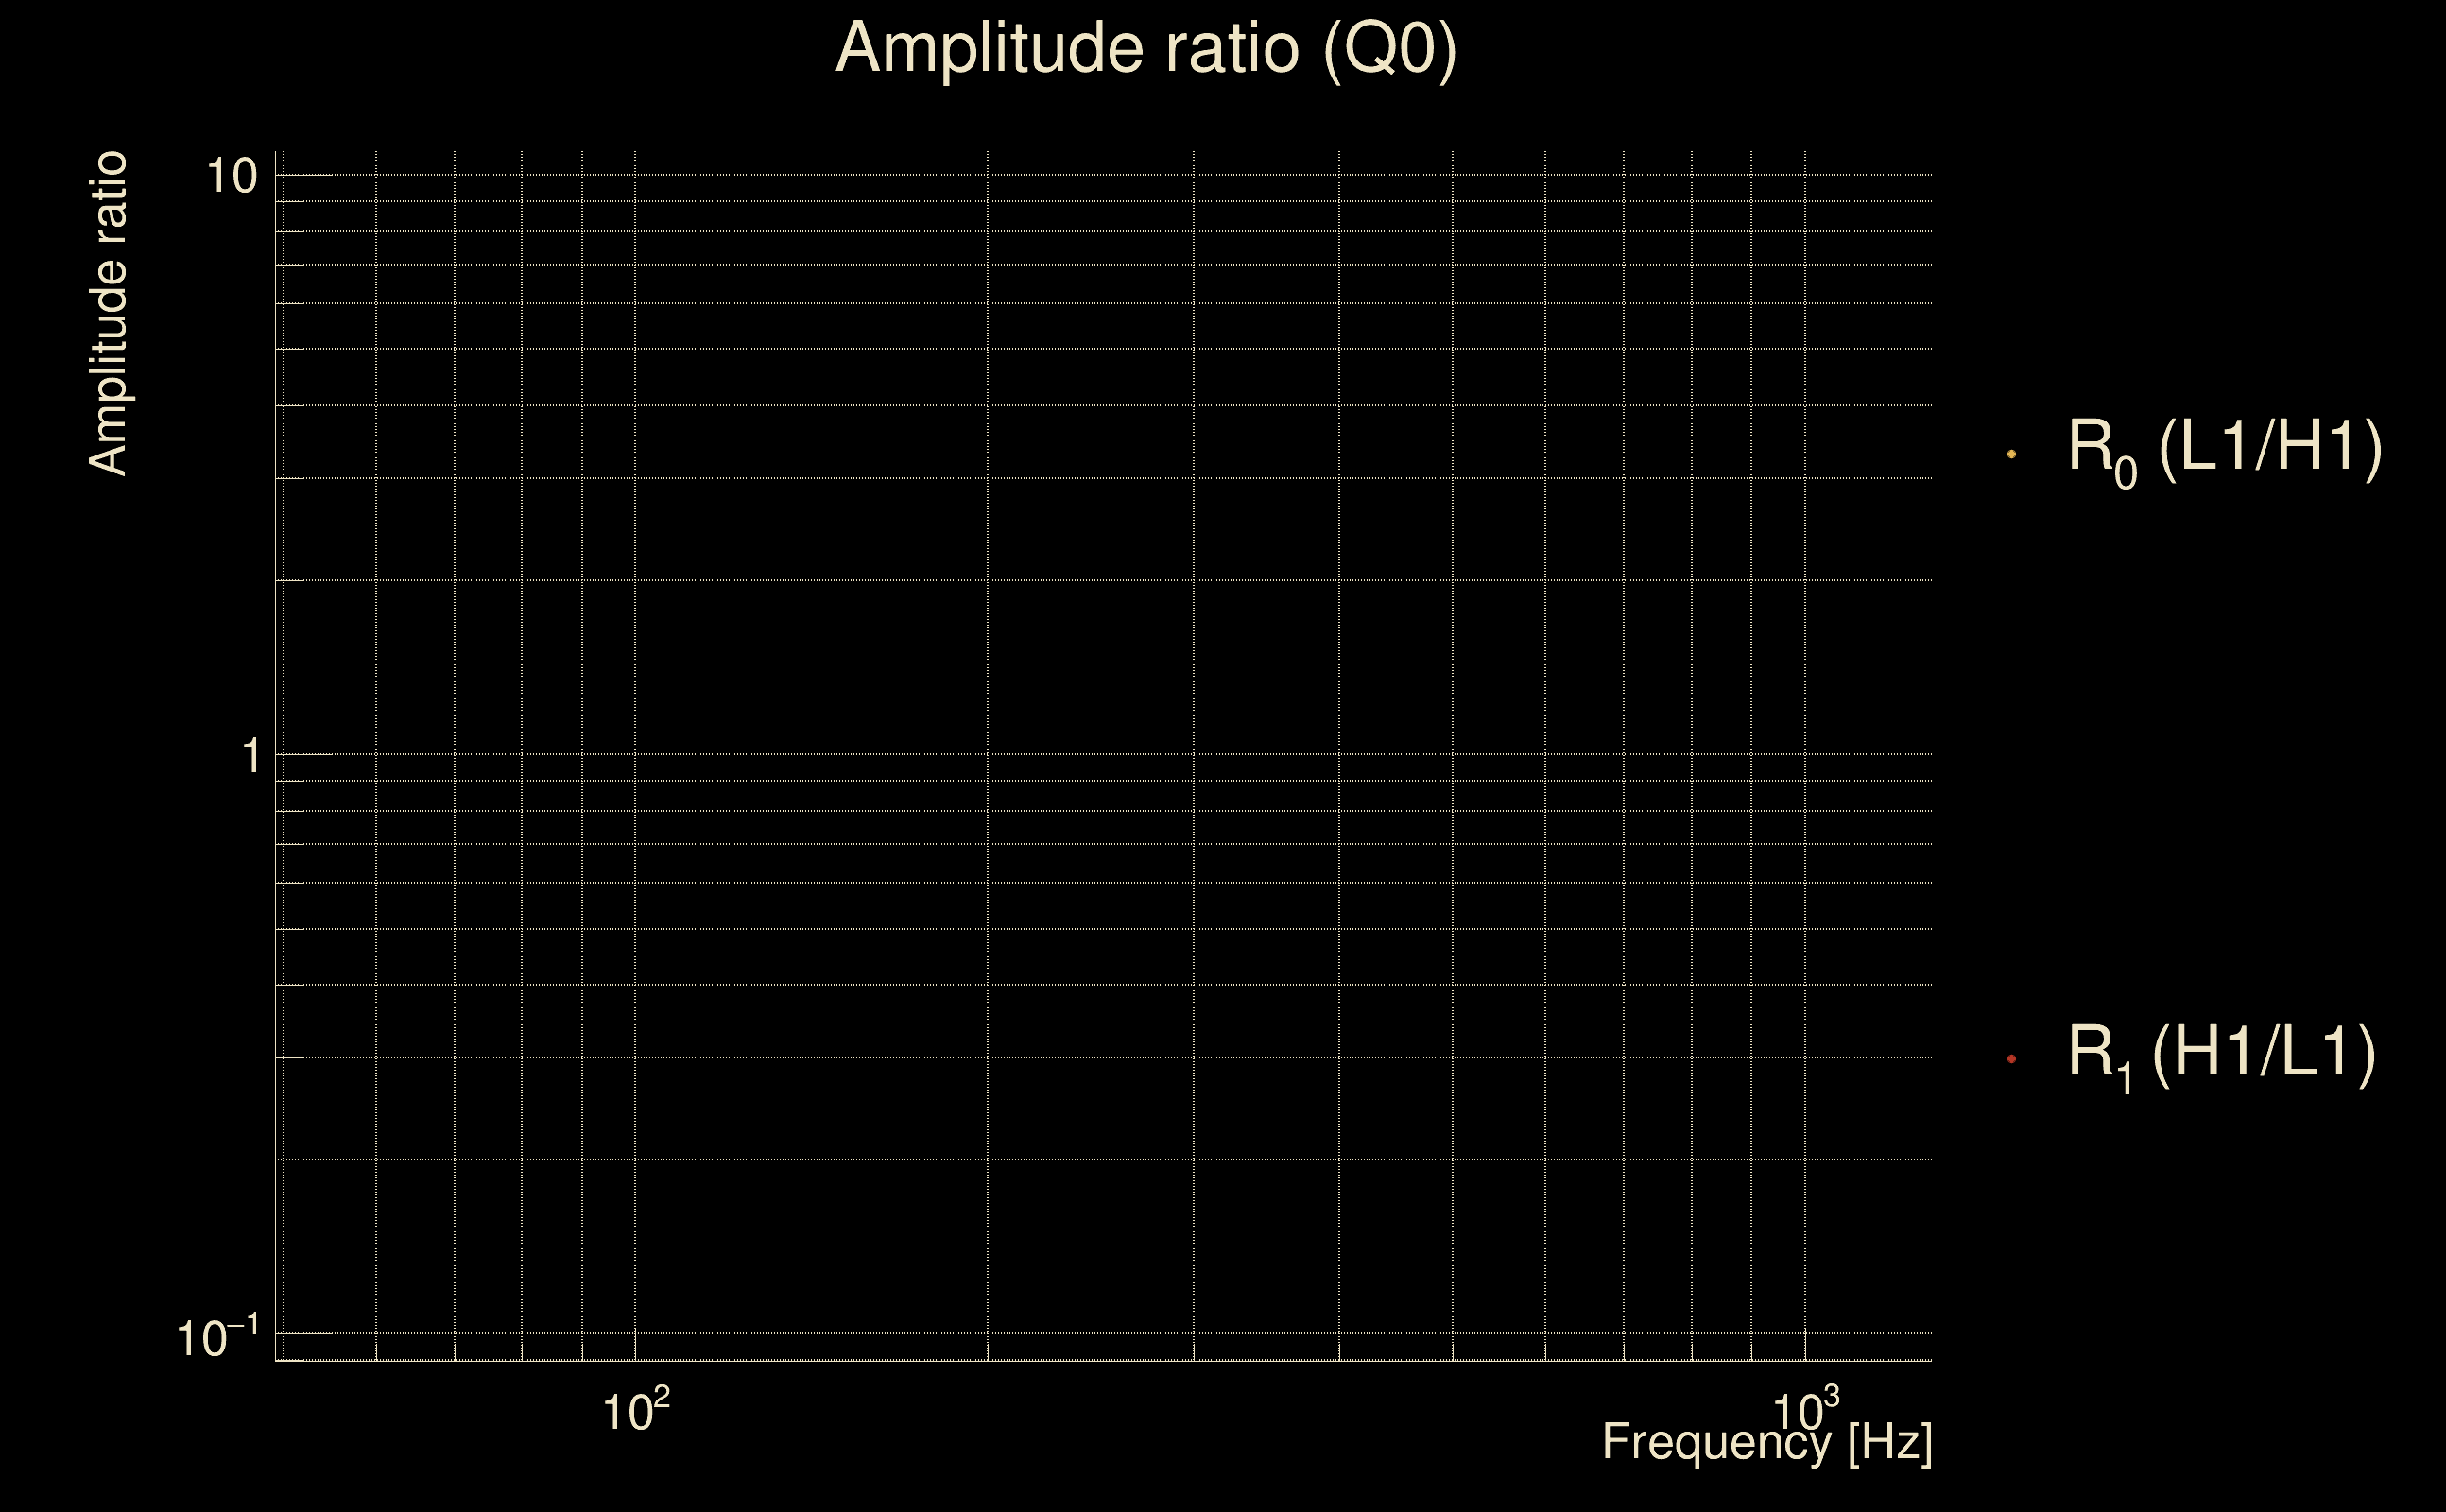
| Amplitude ratio (L1/H1): | 1.21986 ⋇ 2.12656 (L1/H1: 0.821511 ⋇ 2.96956, H1/L1: 0.565567 ⋇ 2.84853) |
| Amplitude ratio H1|L1 compatibility (probability): | 0.611733 |
| Antenna factor probability: | 1 |
| Number of rejected frequency rows: | Q0: 18 / 18, Q1: 36 / 36, Q2: 68 / 70, Q3: 132 / 134, Q4: 256 / 258 |
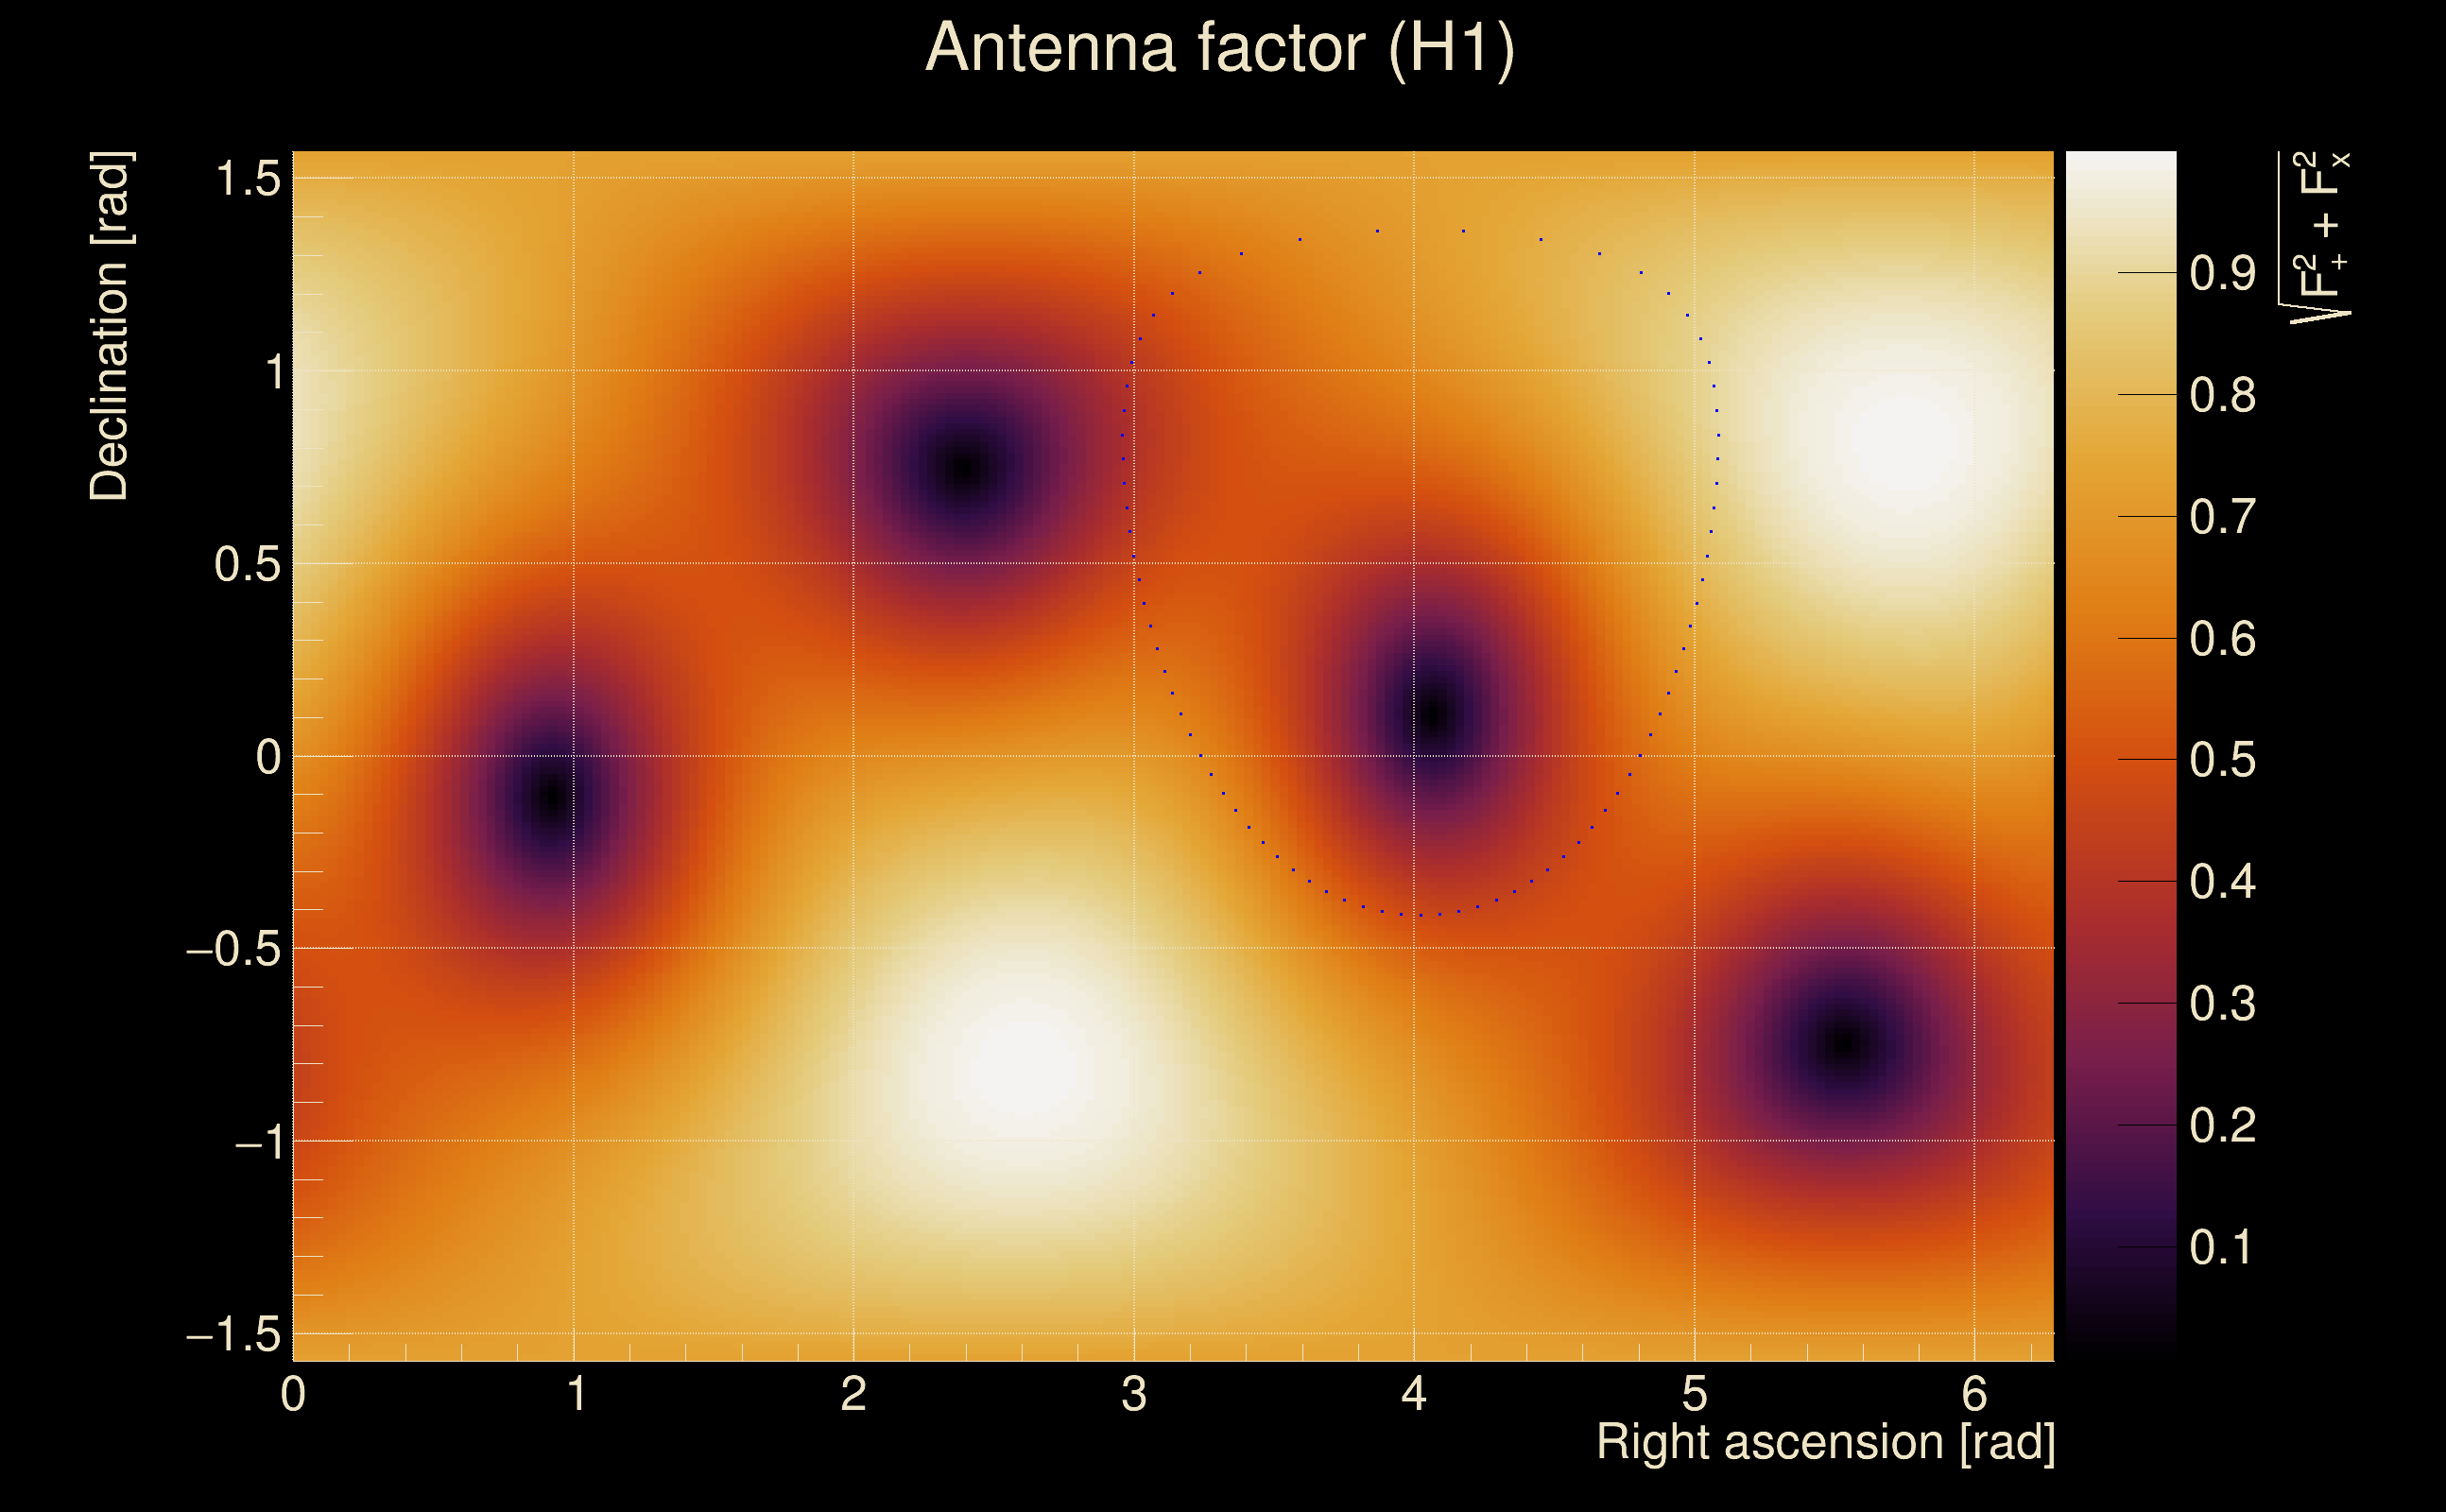
| Maximum signal-to-noise ratio: | H1: 4.87447, L1: 5.03061 |
| SNR variance: | H1: 0.462752, L1: 0.464598 |
| Click here for a zoomed plot | Click here for a zoomed plot | Click here for a zoomed plot | Click here for a zoomed plot | Click here for a zoomed plot |
 |
 |
 |
 |
 |
 |
 |
 |
 |
 |
 |
 |
 |
 |
 |
 |
 |
 |
 |
 |
 |
 |
 |
 |
 |
 |
 |
 |
 |
 |
 |
 |
 |
 |
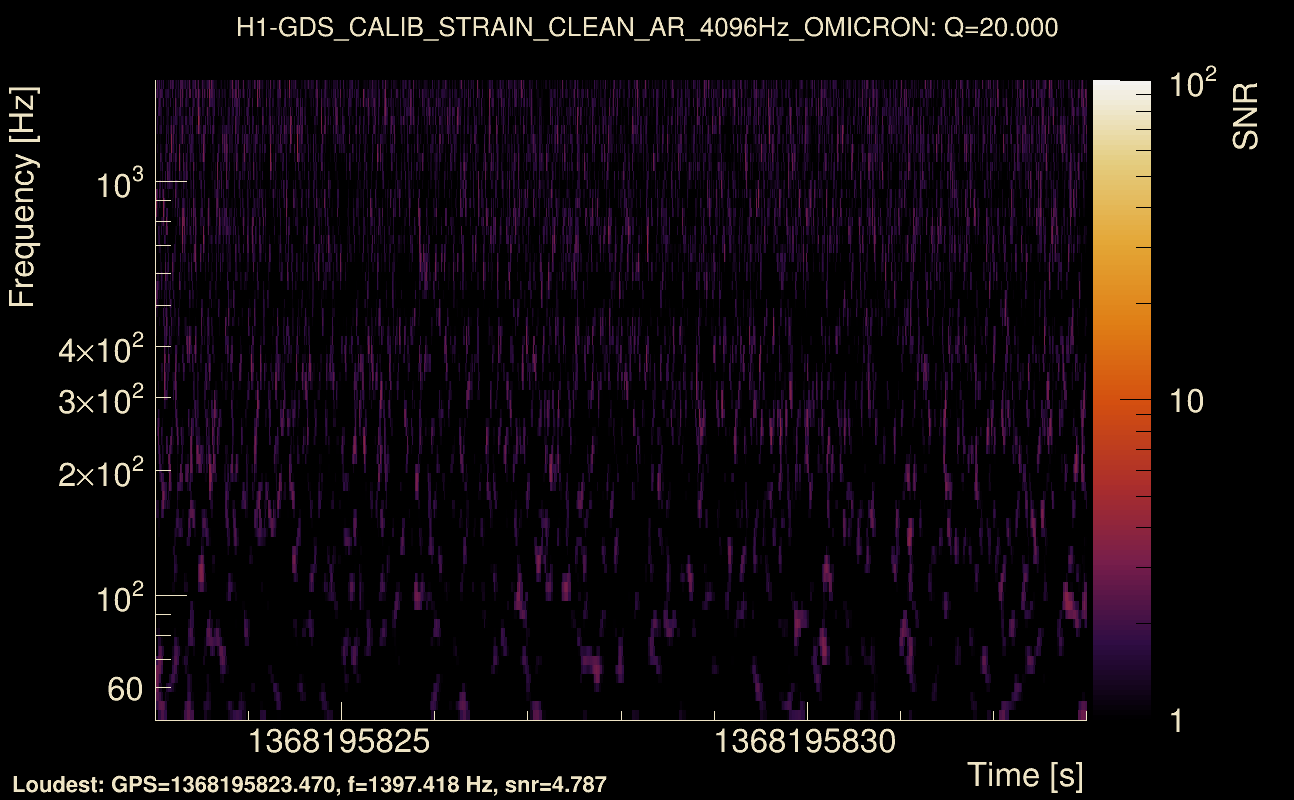
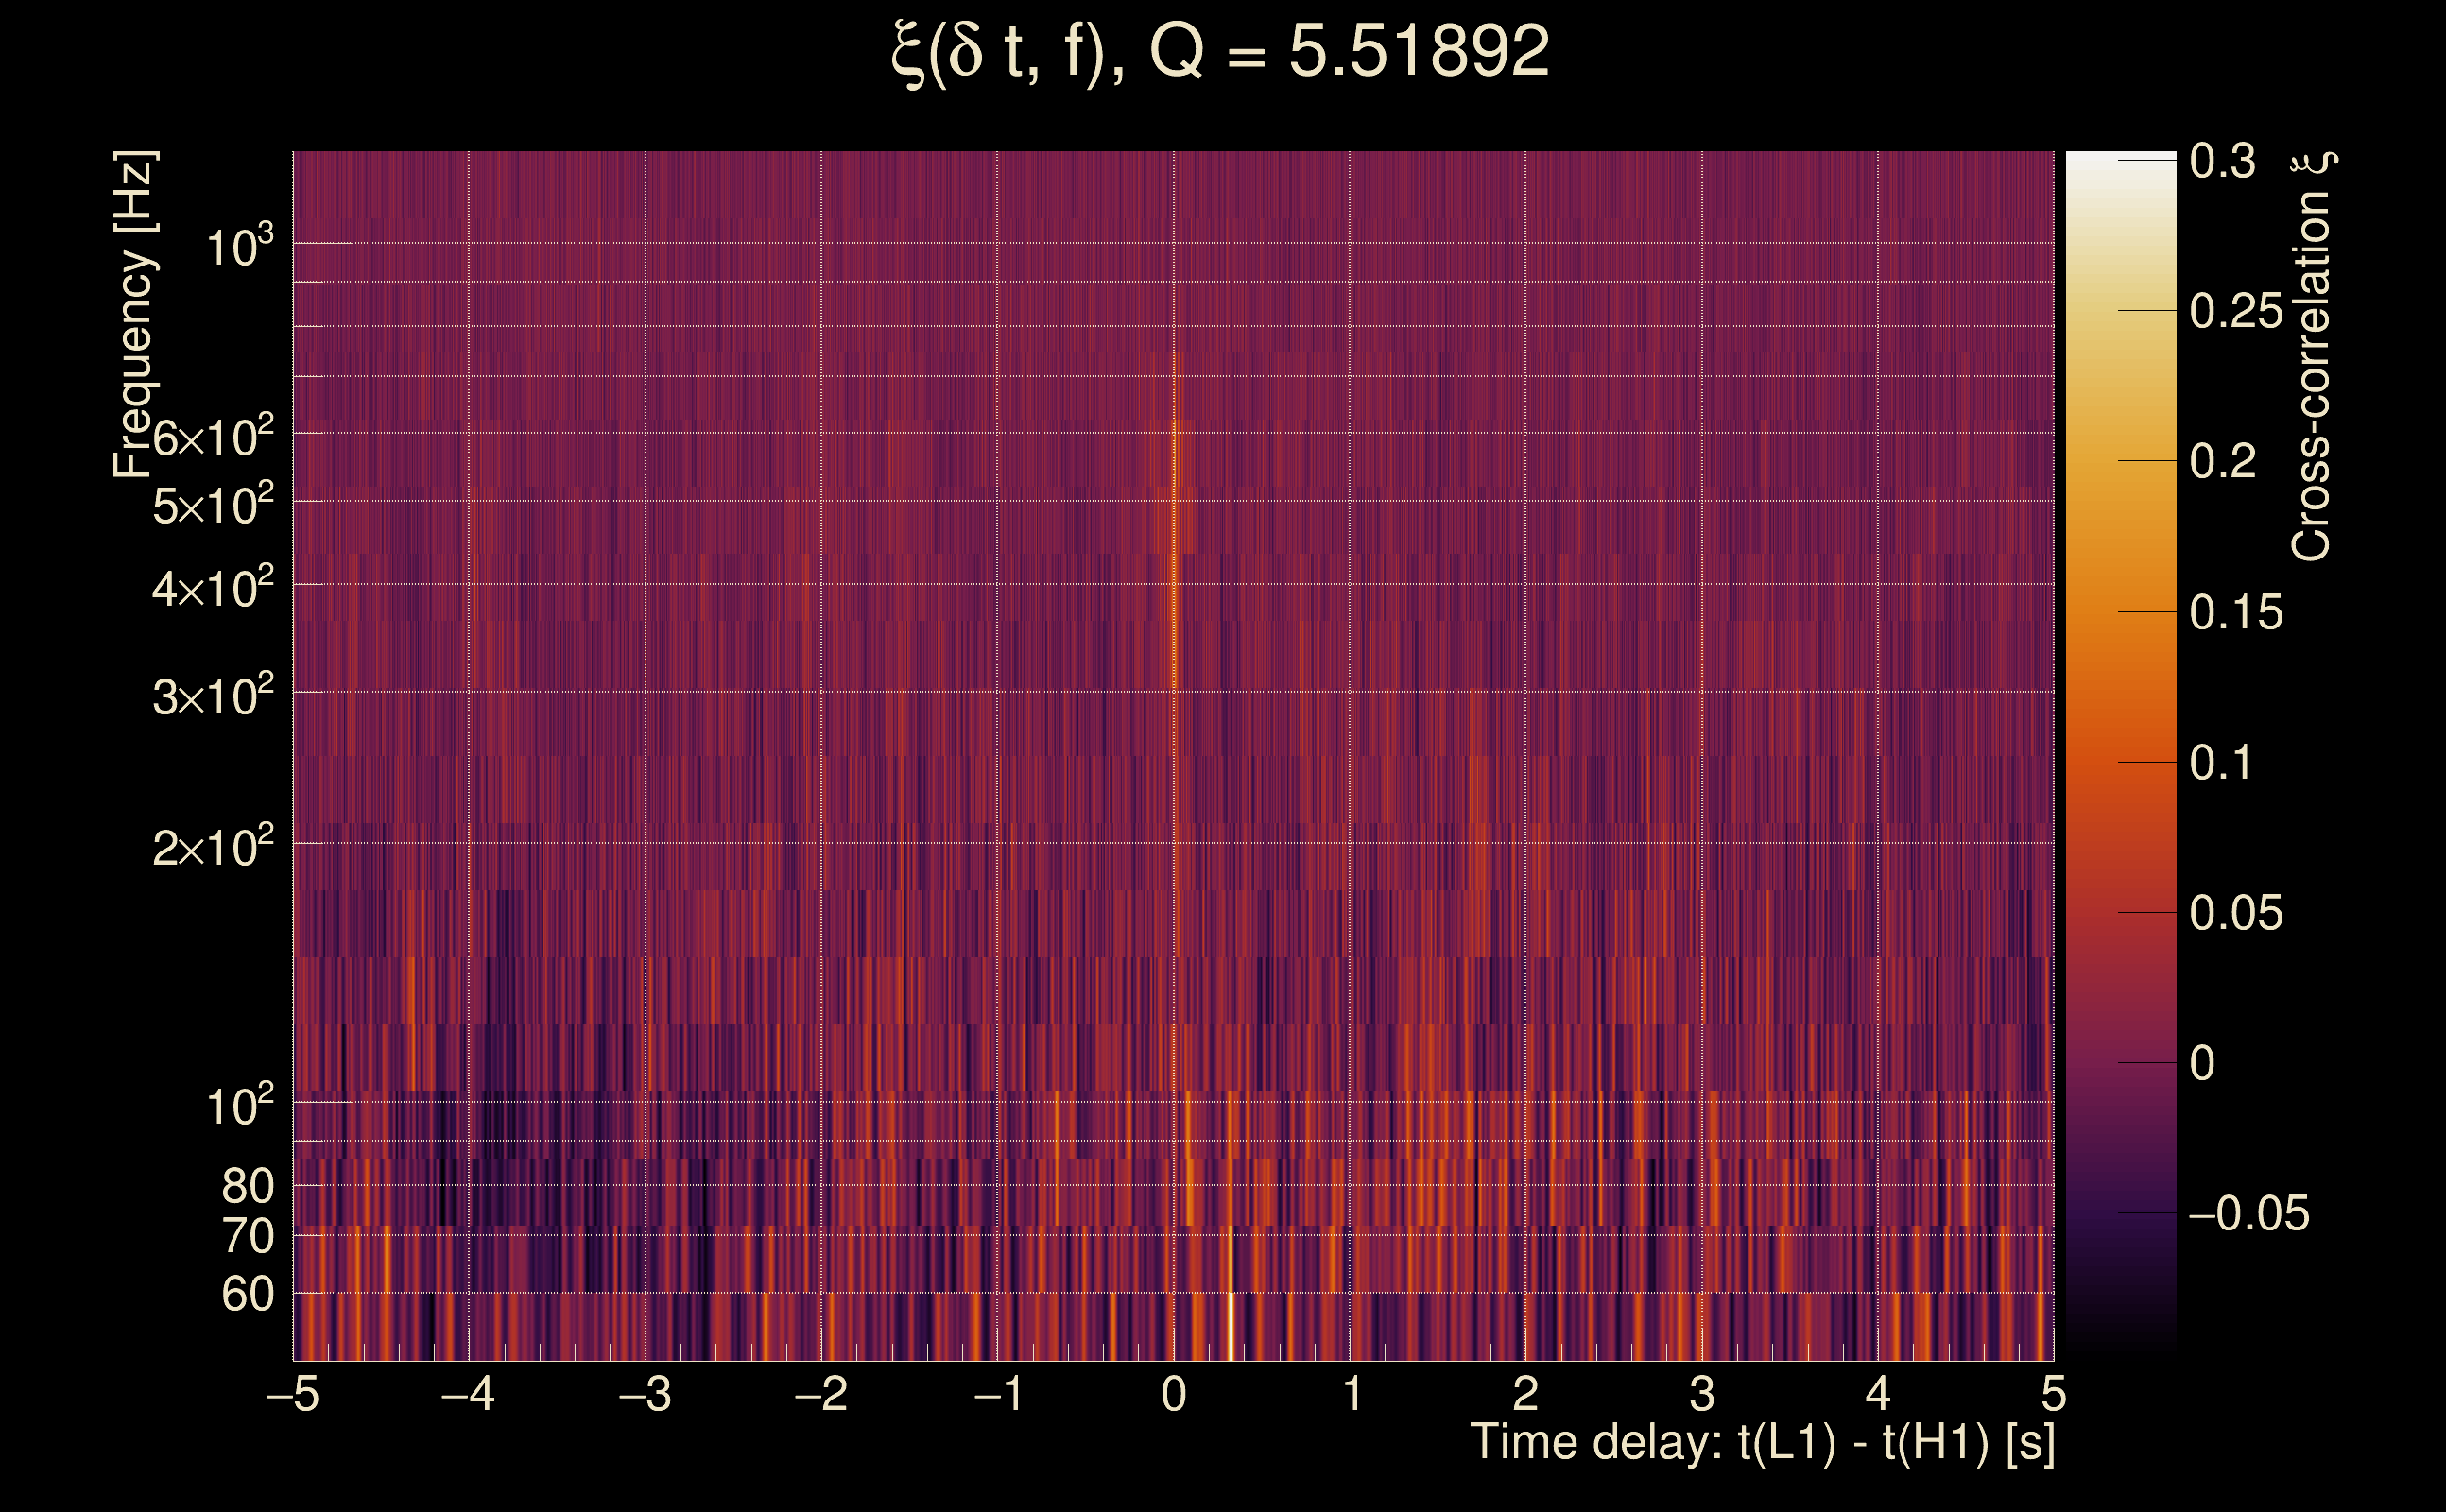
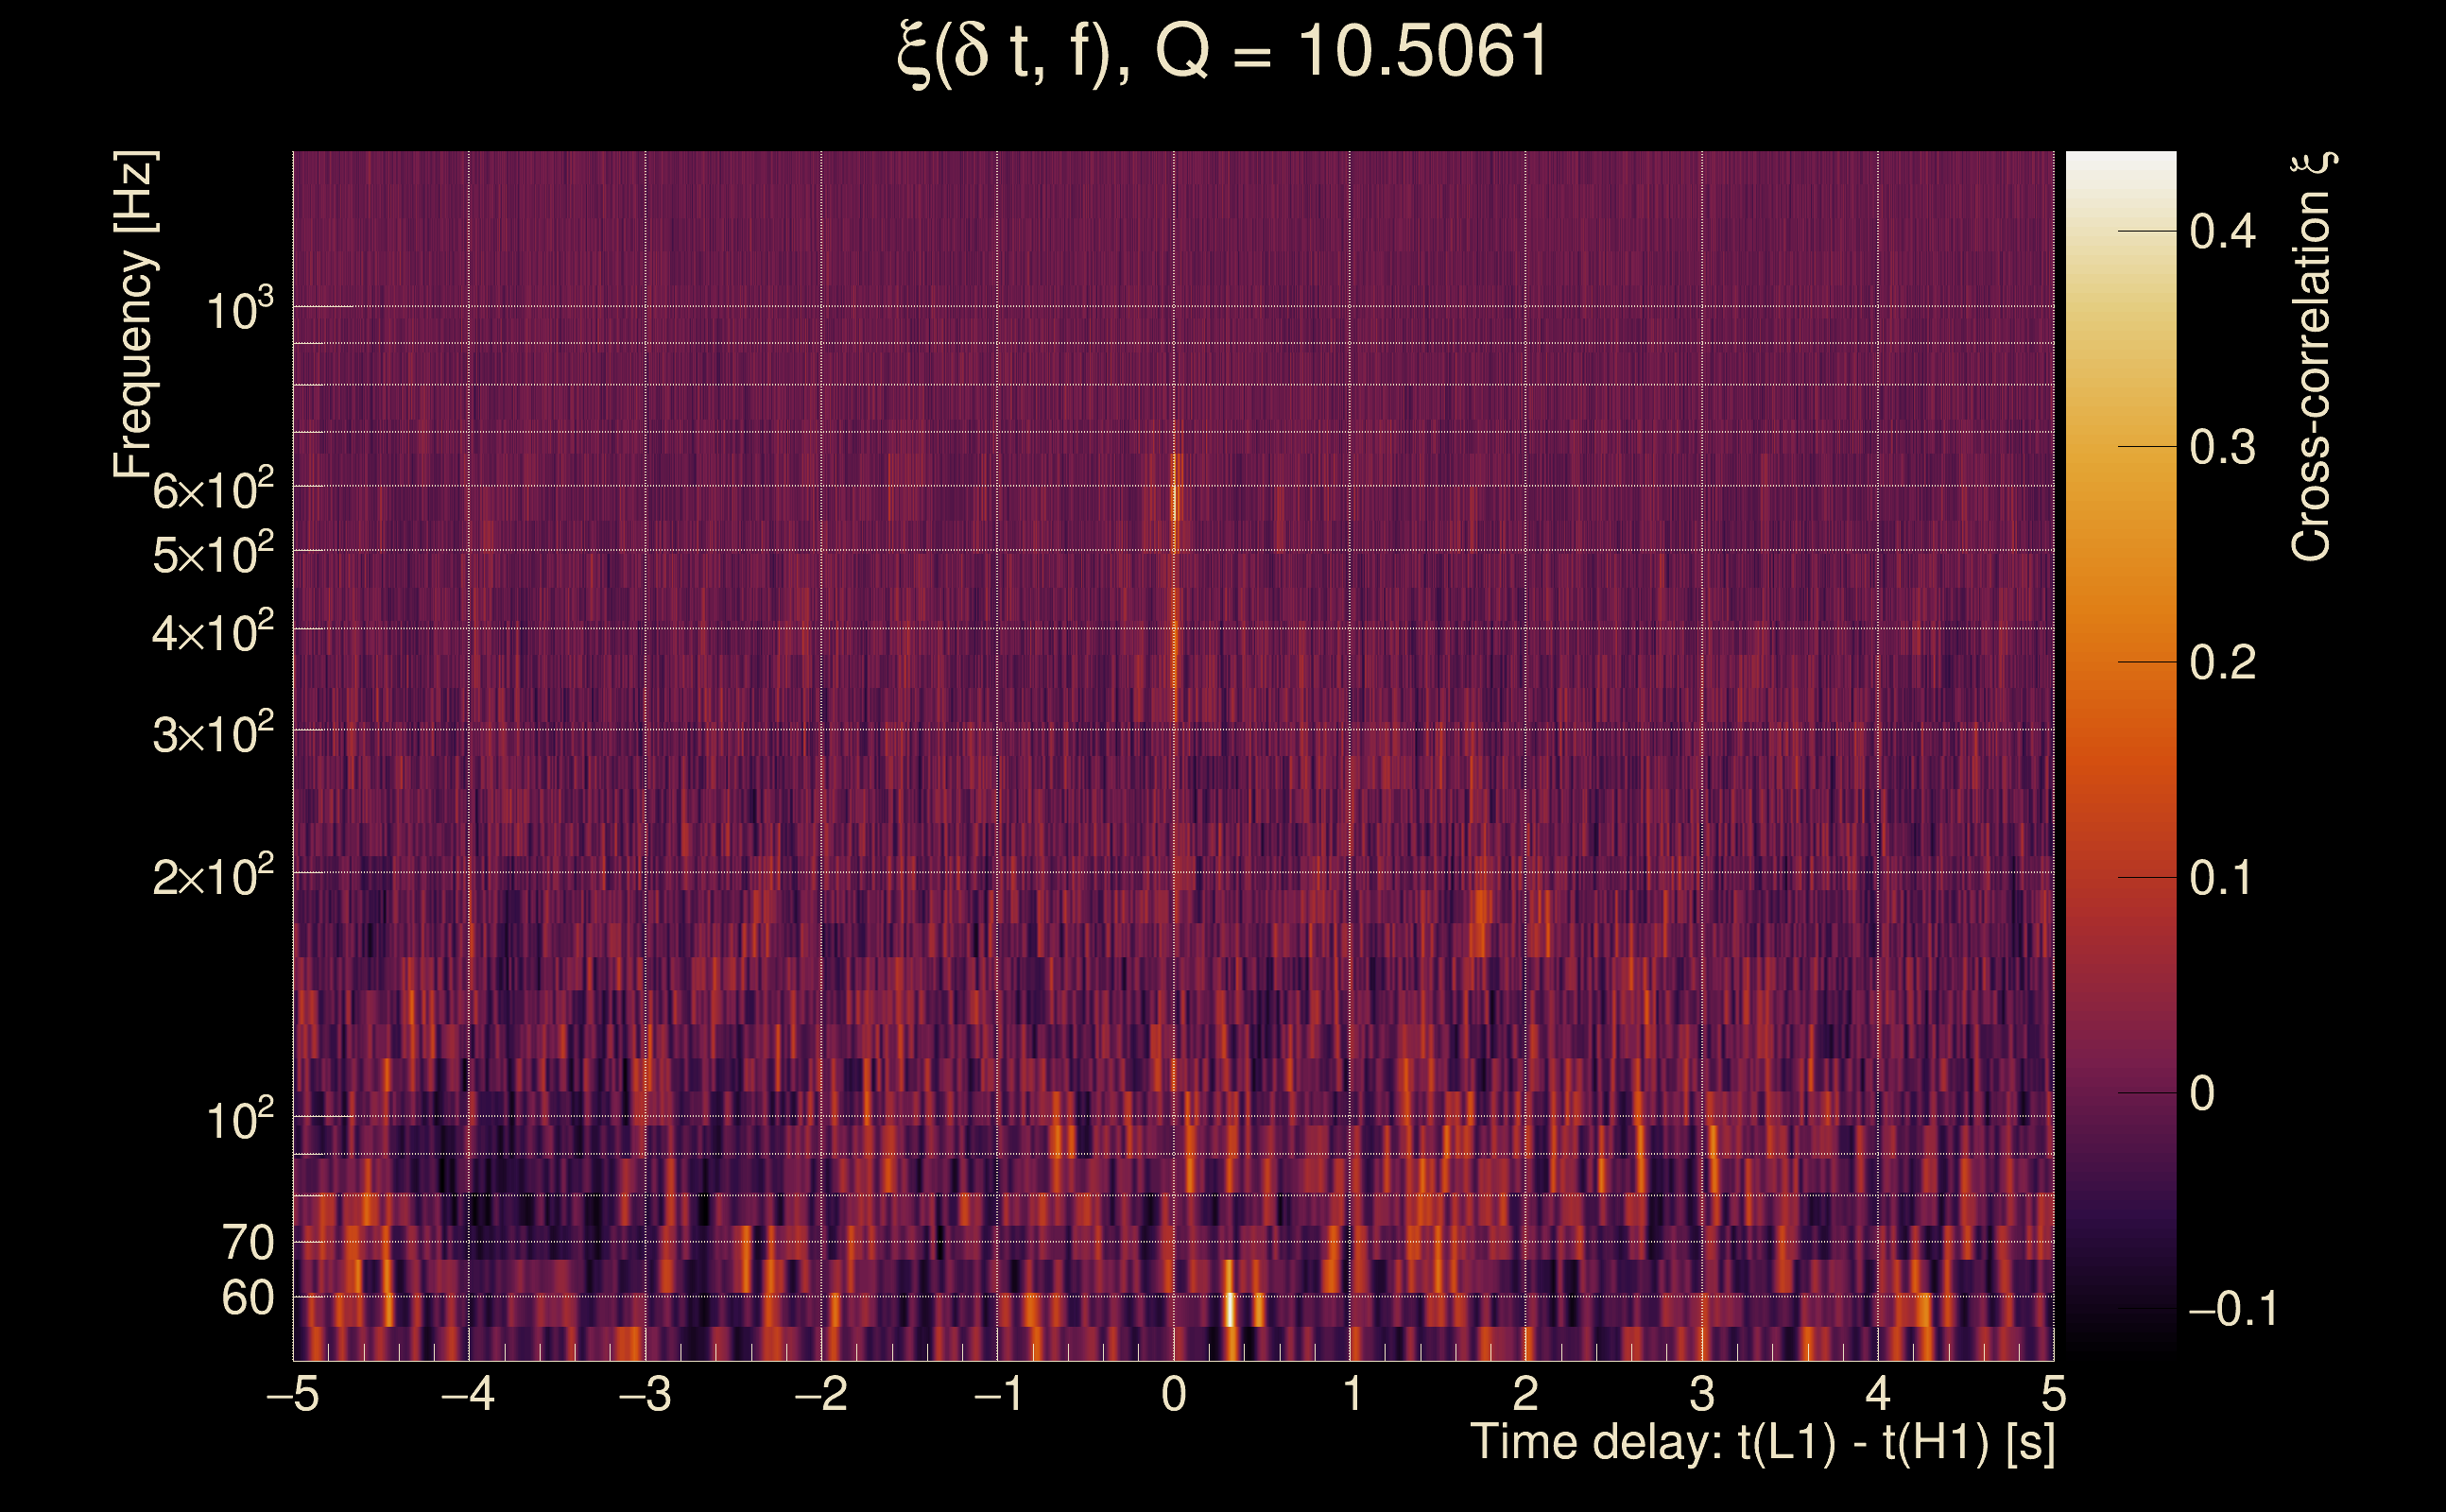
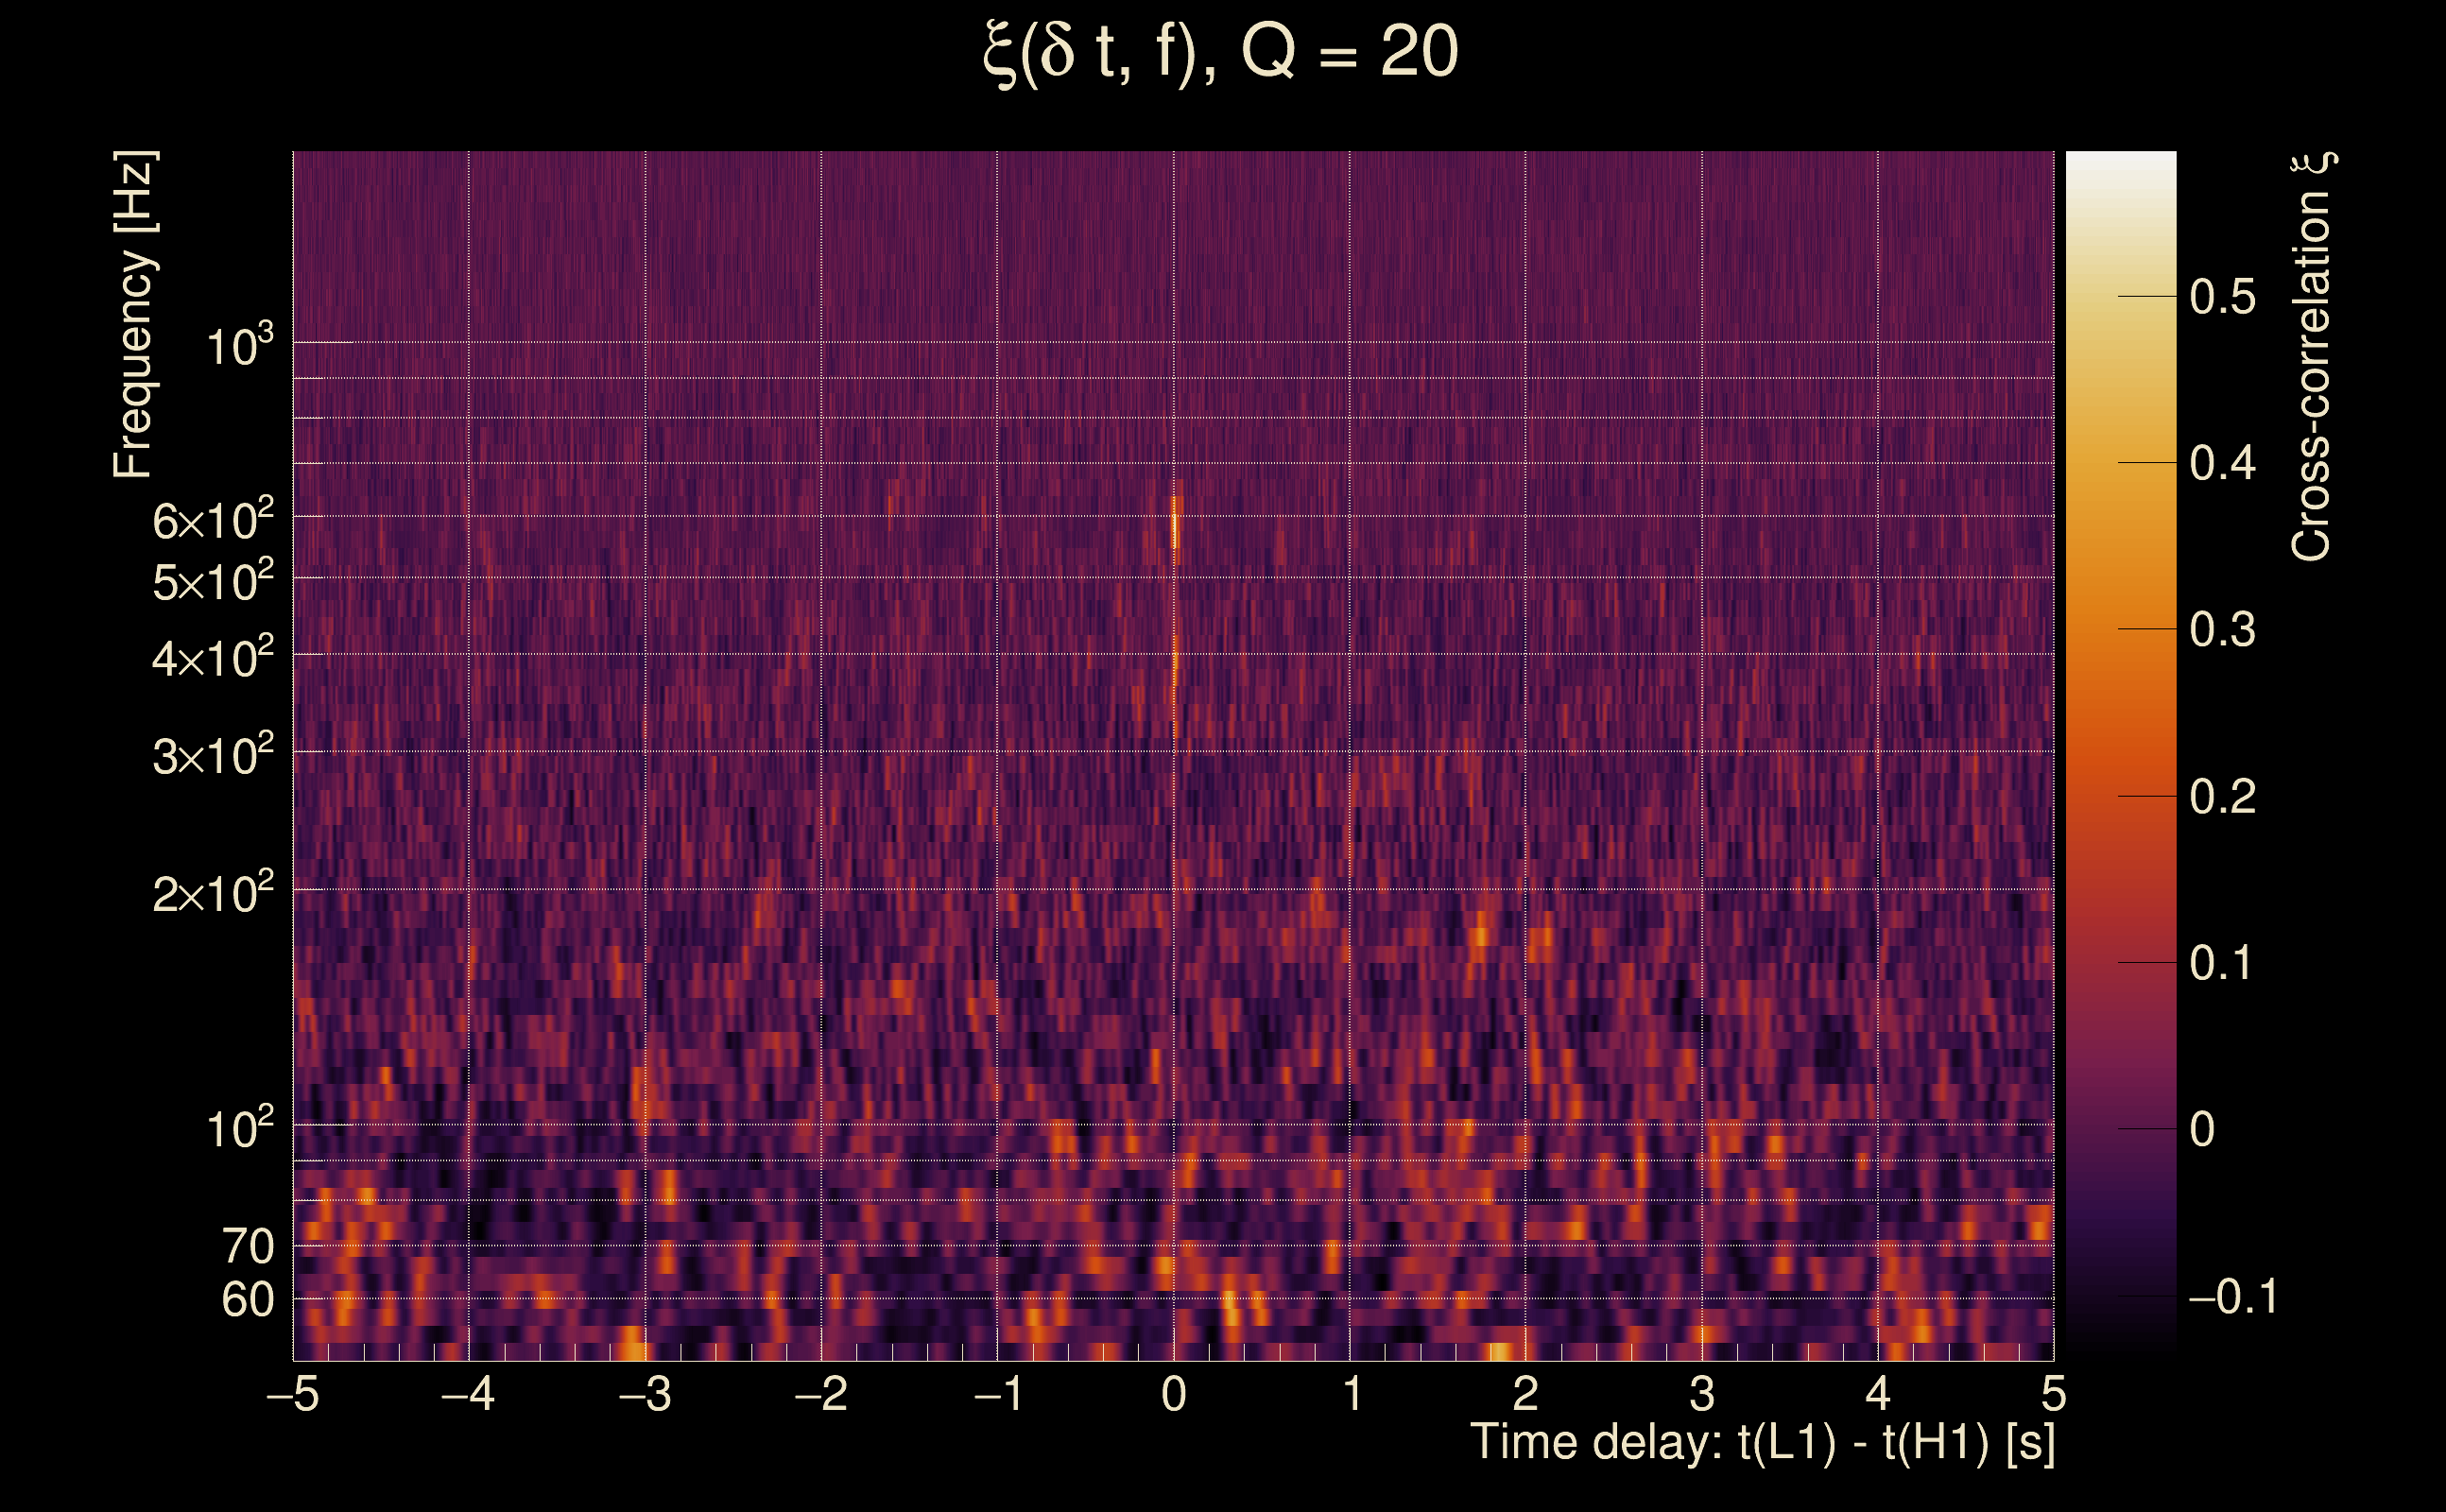
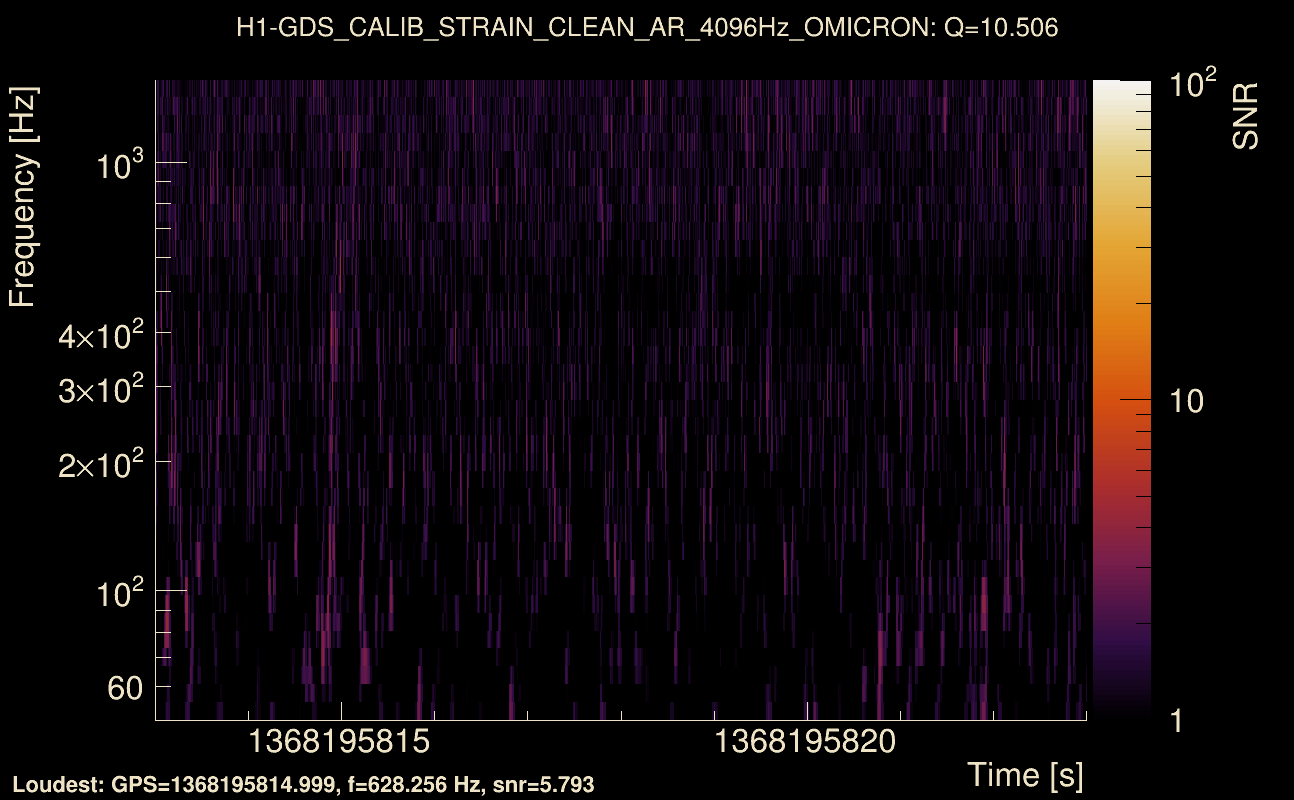
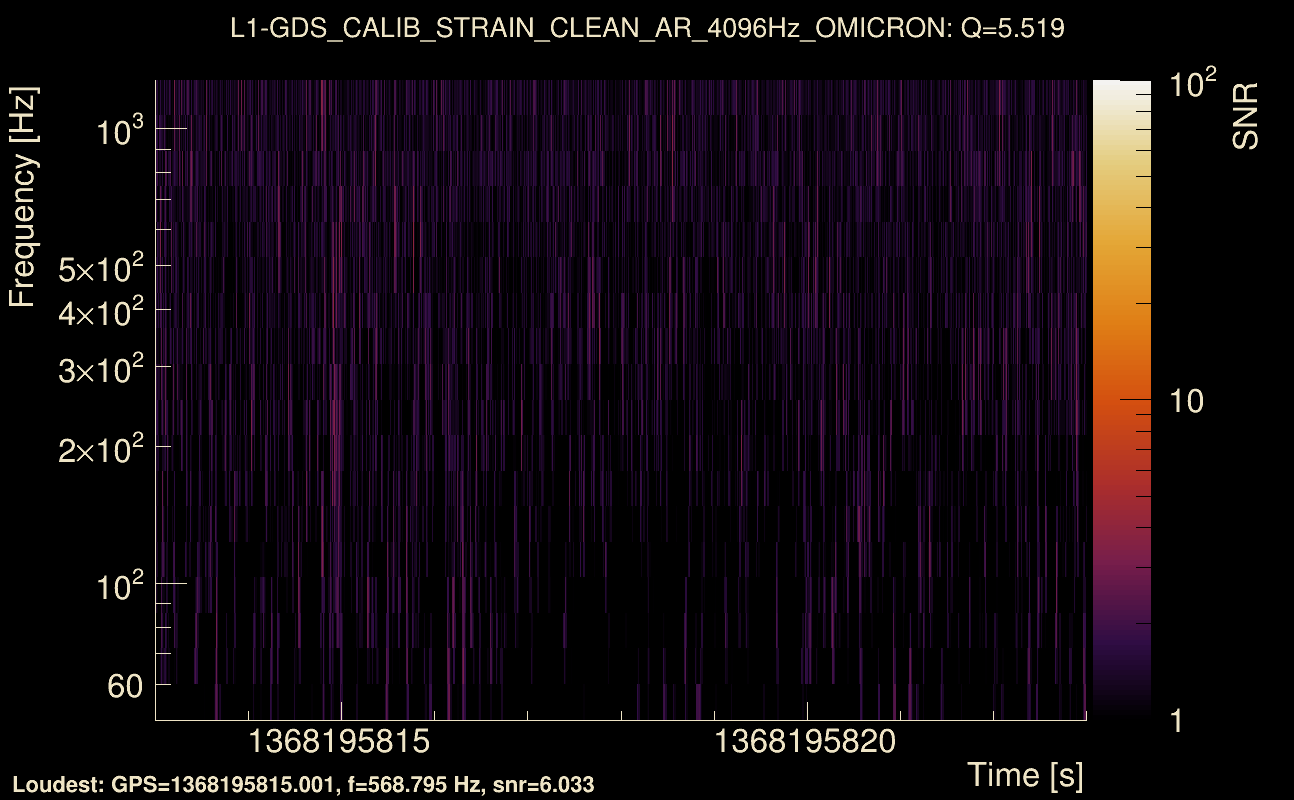
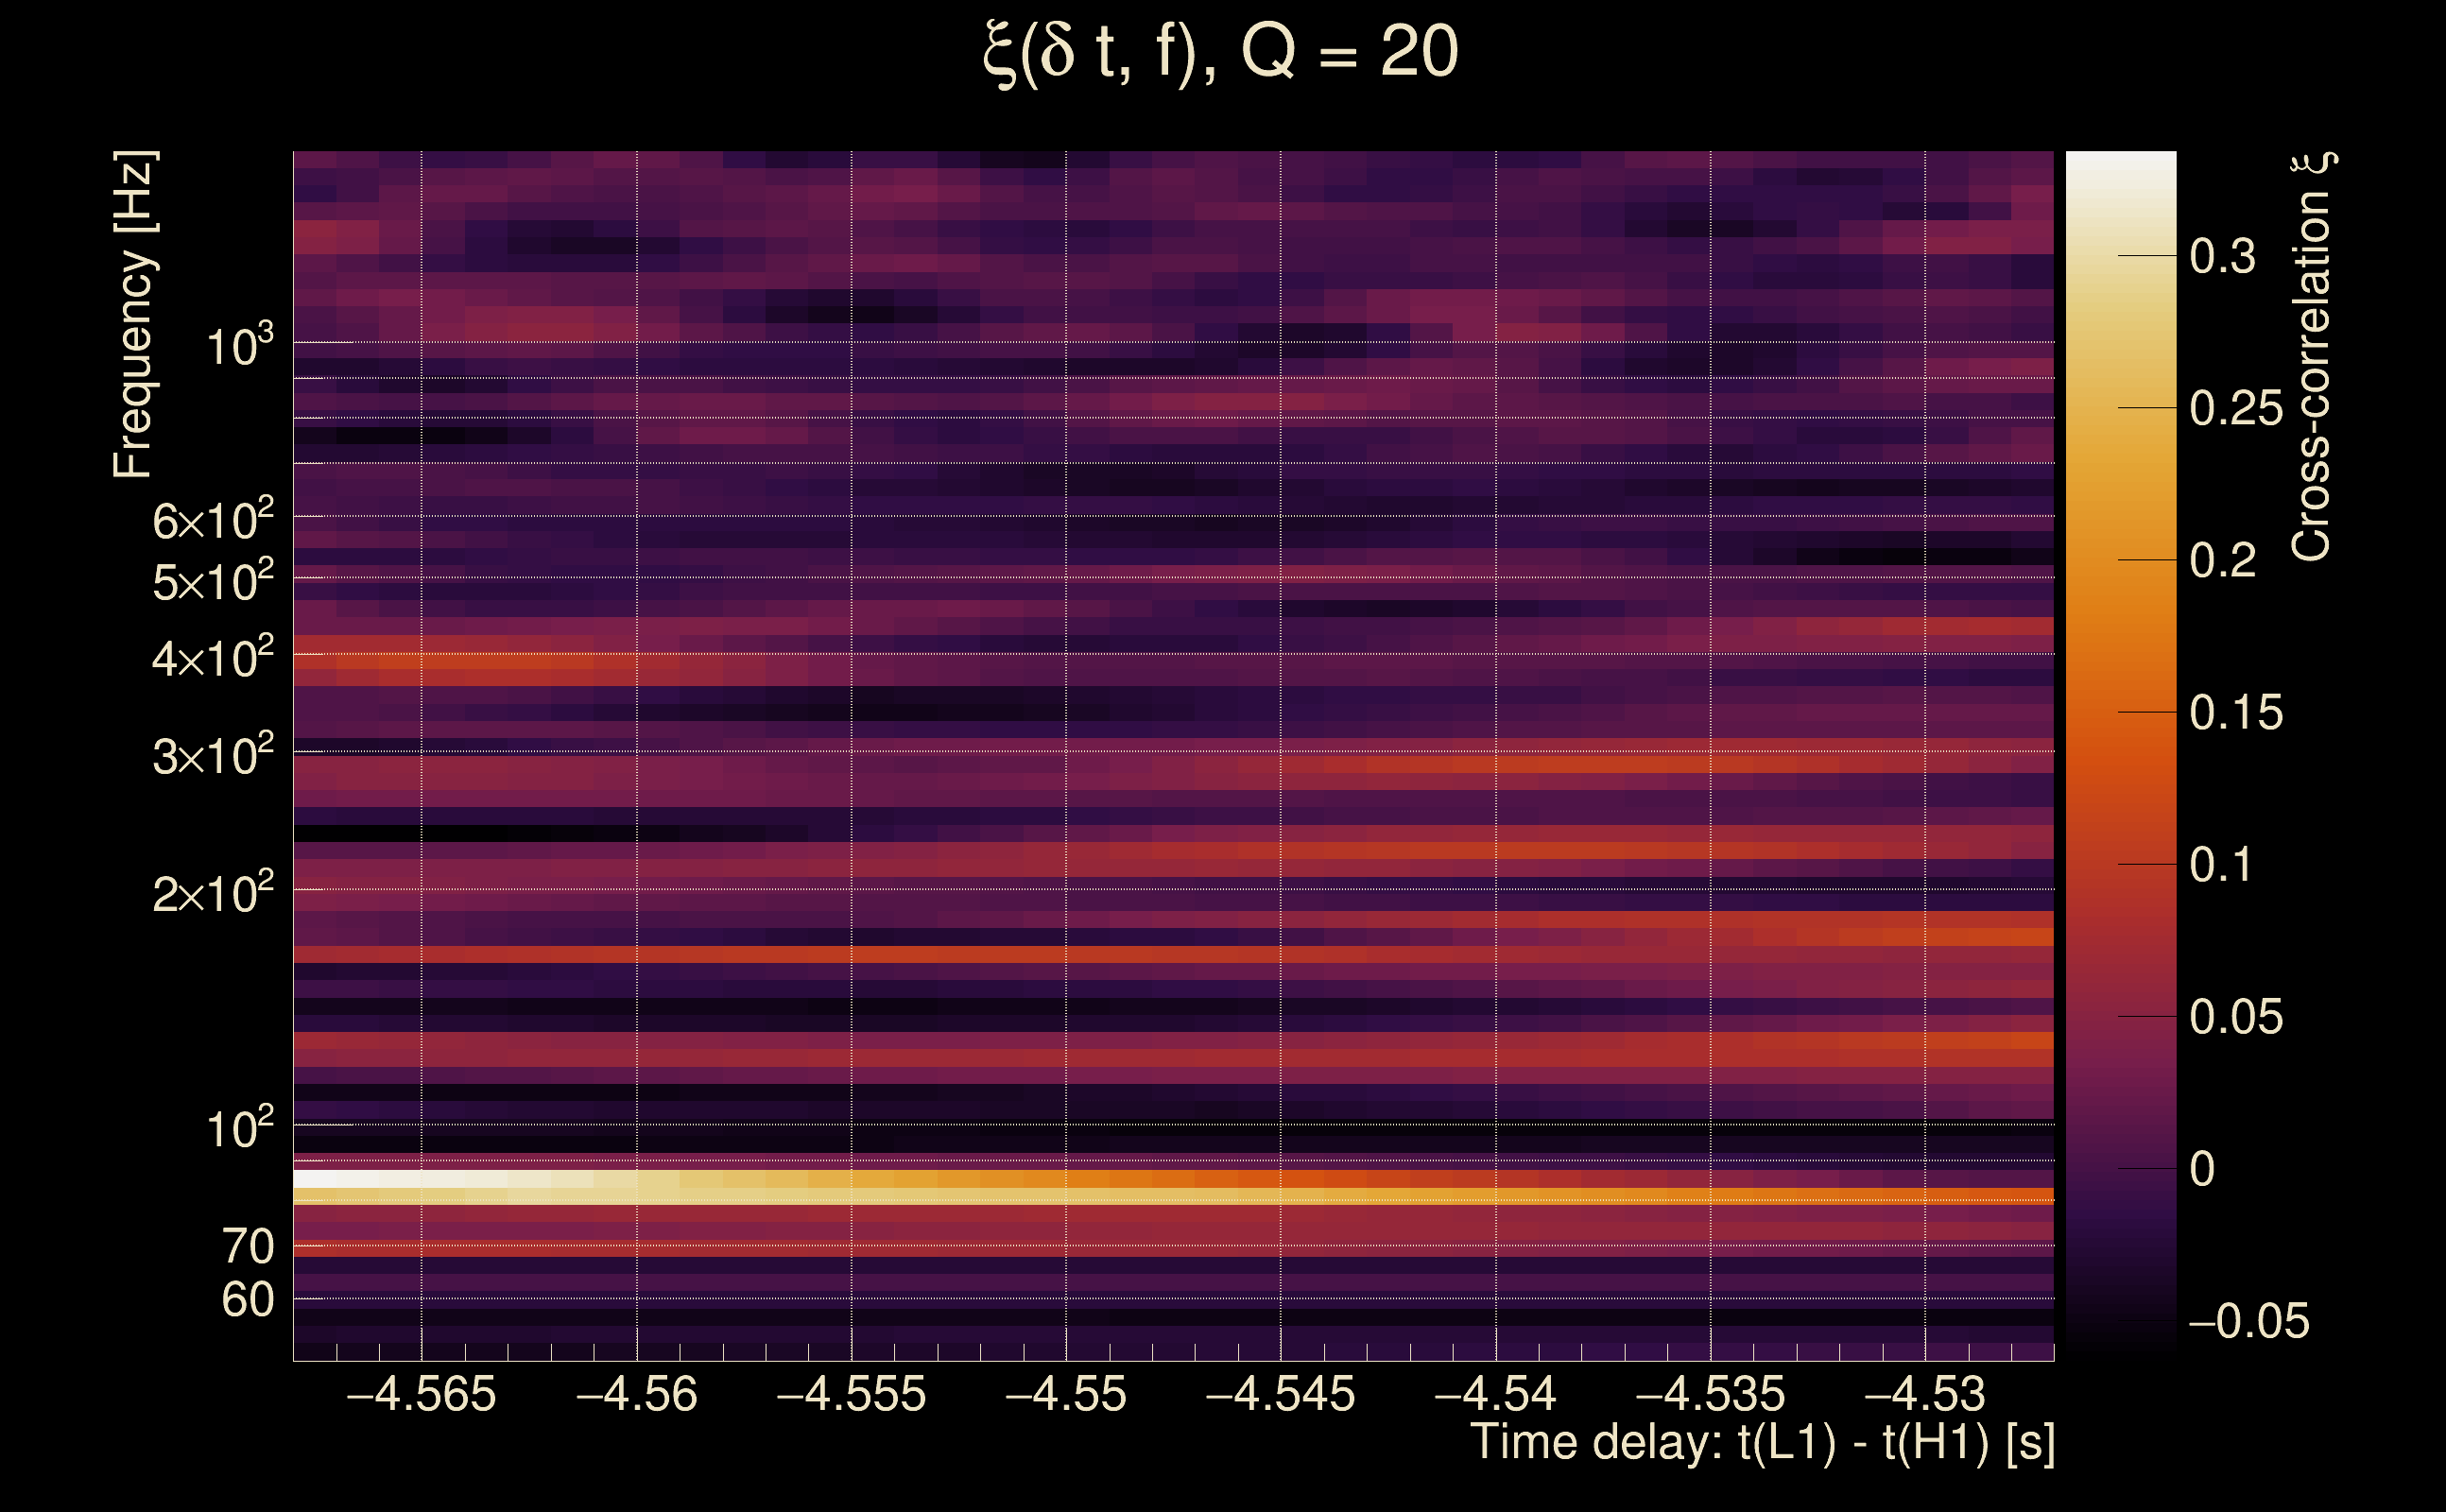
| Event time t(H1): | GPS = 1368195818 (Mon May 15 14:23:20 2023 ) → GPS = 1368195828 (Mon May 15 14:23:30 2023 ) |
| Event time t(L1): | GPS = 1368195818 (Mon May 15 14:23:30 2023 ) → GPS = 1368195828 (Mon May 15 14:23:30 2023 ) |
| Omicron analysis time window (H1): | GPS = 1368195815 → GPS = 1368195831 |
| Omicron analysis time window (L1): | GPS = 1368195815 → GPS = 1368195831 |
| Time delay between detectors t(L1) - t(H1): | -0.00296647 s (slice index = 108 / 217), δt_gw = -0.00296647 s |
| Time delay uncertainty: | 0.00513713 s |
| [targeted mode] Time delay probability: | 0.024068 (2.25604 sigmas), δt_target = 0.00862265 s |
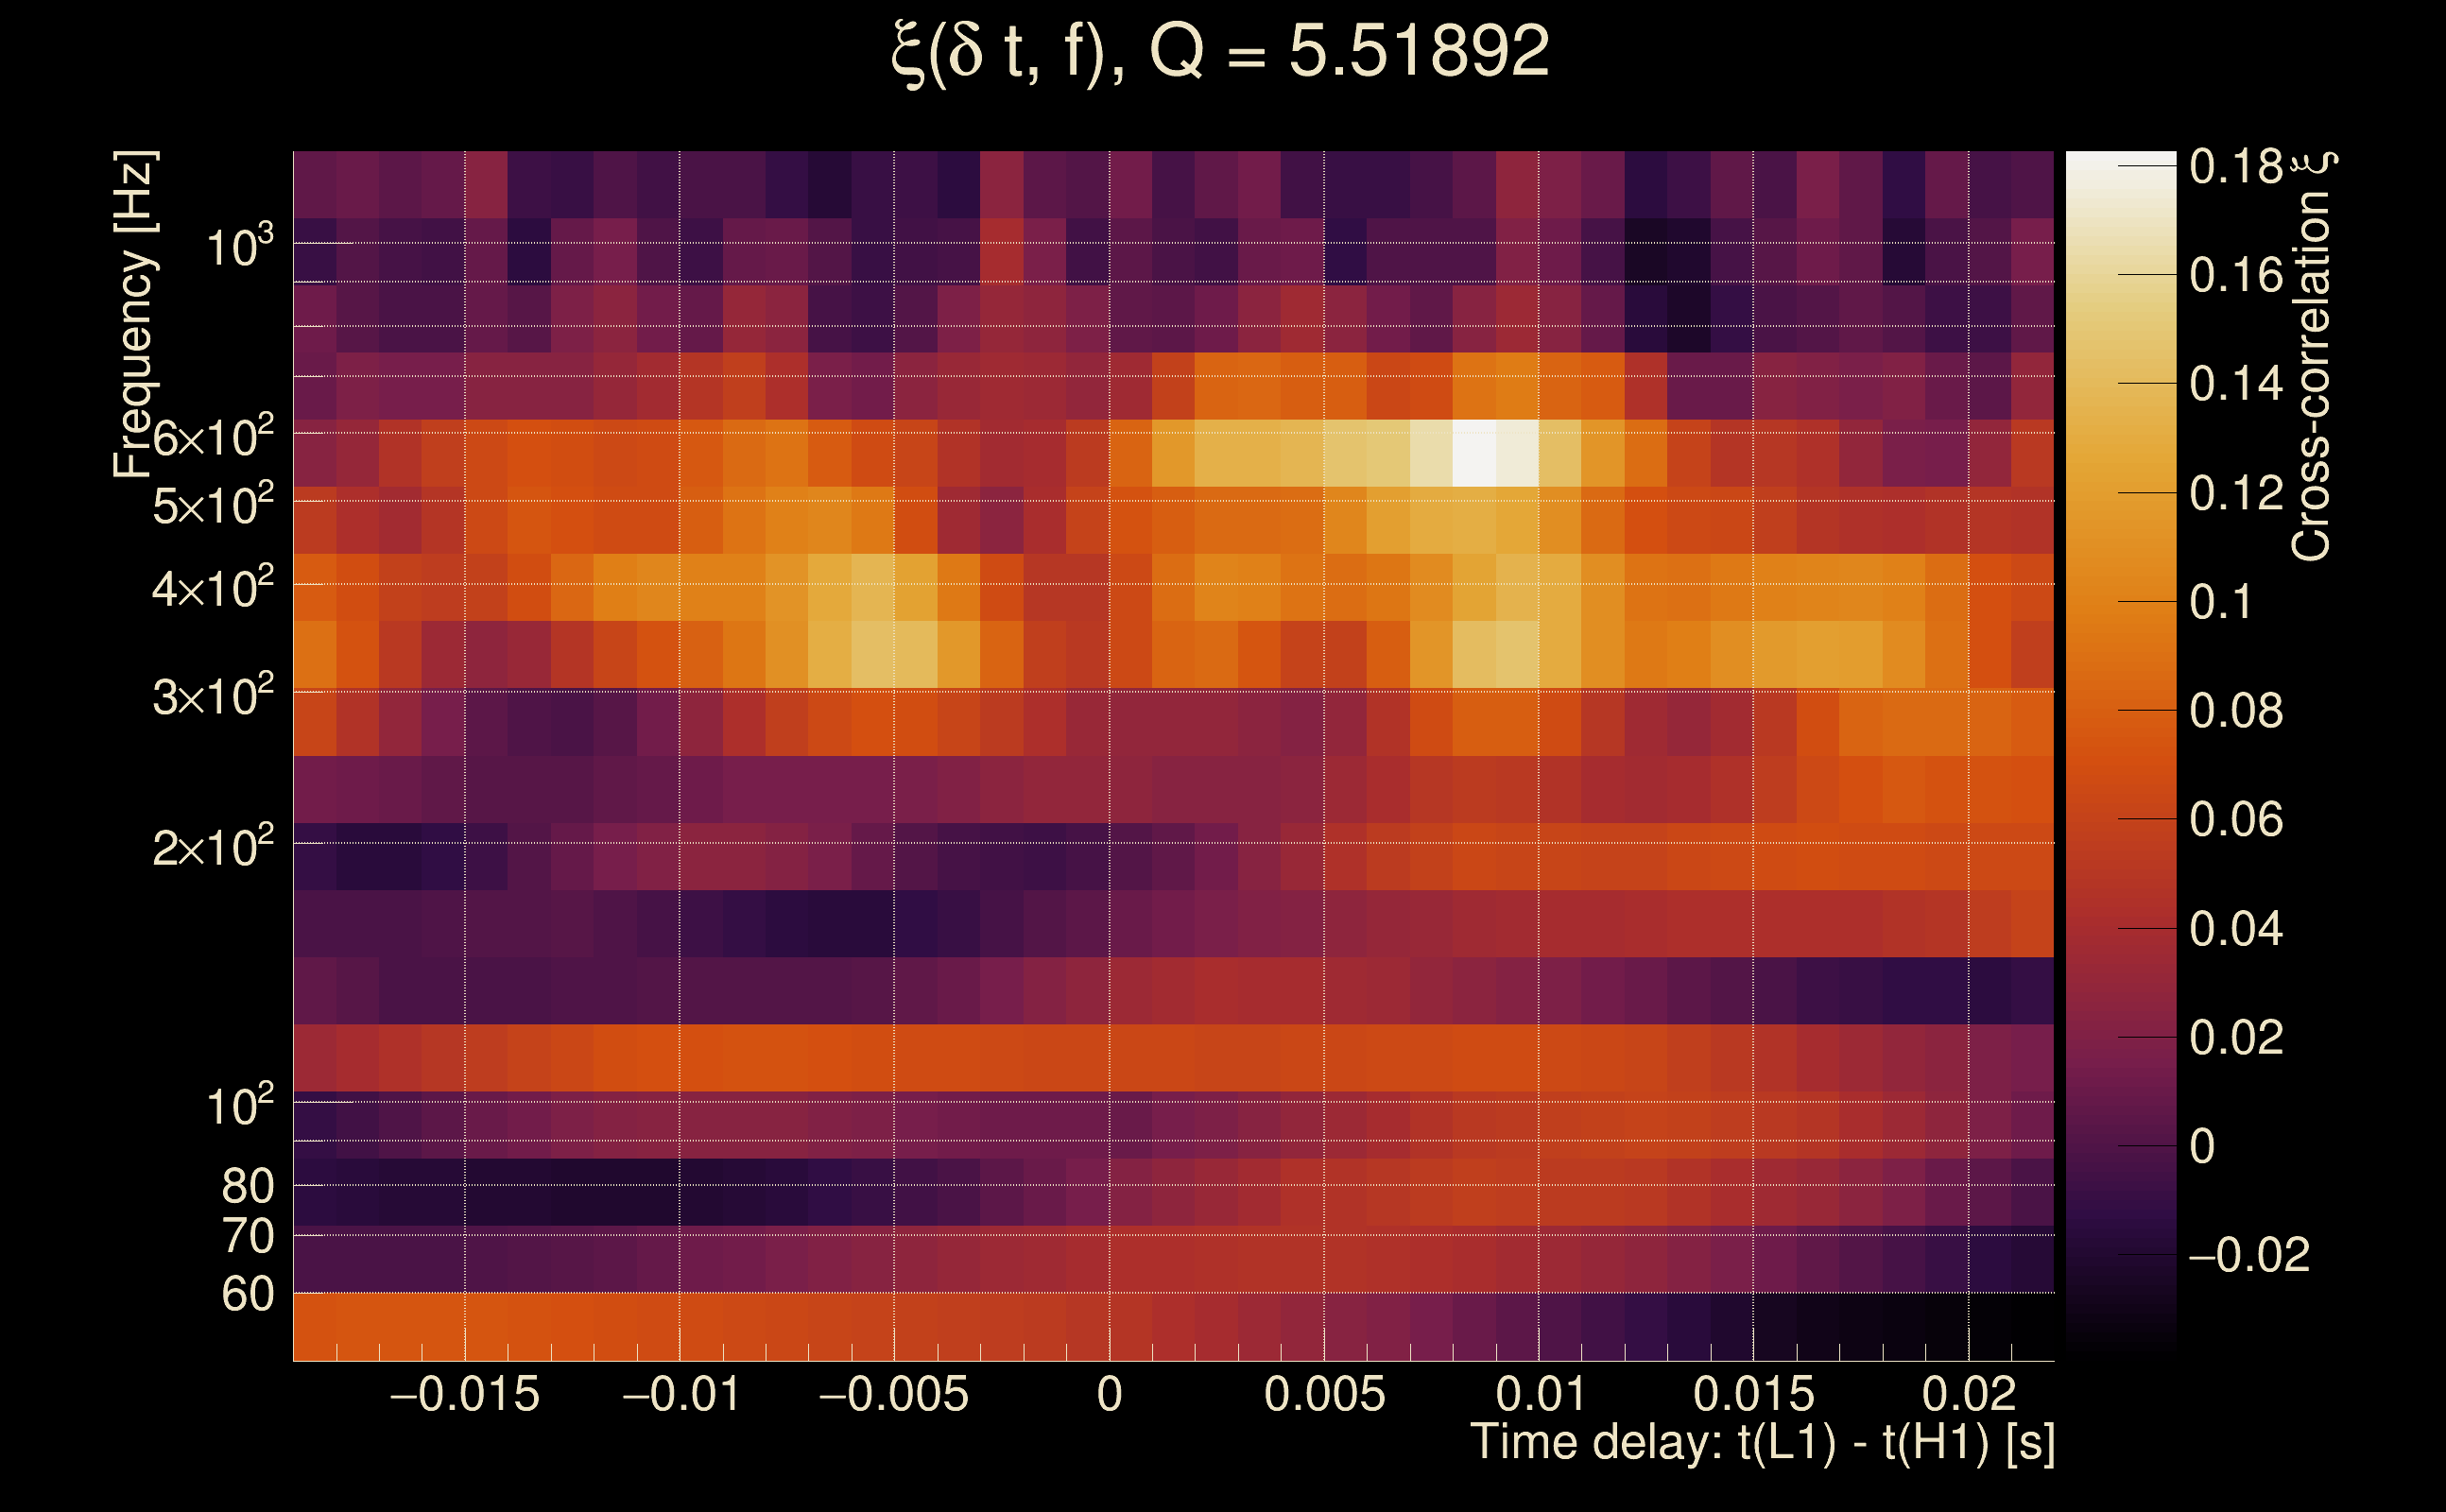
| Frequency: | 979.172 Hz |
| Ξ: | 0.000304891 ± 0.0191422 (variance = 0.000366425): Q0: 0, Q1: 0, Q2: 0.0342826, Q3: 0.0442321, Q4: 0.0370029 |
| Rank: | R_A = 0.13682 |
| Log of amplitude ratio (L1/H1): | -0.0224076, variance = 0.543317 (L1/H1: -0.629777, variance = 1.03436, H1/L1: -0.589484, variance = 1.13966) |
| Amplitude ratio (L1/H1): | 0.977842 ⋇ 2.08987 (L1/H1: 0.53271 ⋇ 2.76498, H1/L1: 0.554613 ⋇ 2.90824) |
| Amplitude ratio H1|L1 compatibility (probability): | 0.408281 |
| Antenna factor probability: | 1 |
| Number of rejected frequency rows: | Q0: 18 / 18, Q1: 36 / 36, Q2: 68 / 70, Q3: 128 / 134, Q4: 250 / 258 |
| Maximum signal-to-noise ratio: | H1: 4.83159, L1: 4.81371 |
| SNR variance: | H1: 0.455674, L1: 0.478713 |
| Click here for a zoomed plot | Click here for a zoomed plot | Click here for a zoomed plot | Click here for a zoomed plot | Click here for a zoomed plot |
 |
 |
 |
 |
 |
 |
 |
 |
 |
 |
 |
 |
 |
 |
 |
 |
 |
 |
 |
 |
 |
 |
 |
 |
 |
 |
 |
 |
 |
 |
 |
 |
 |
 |
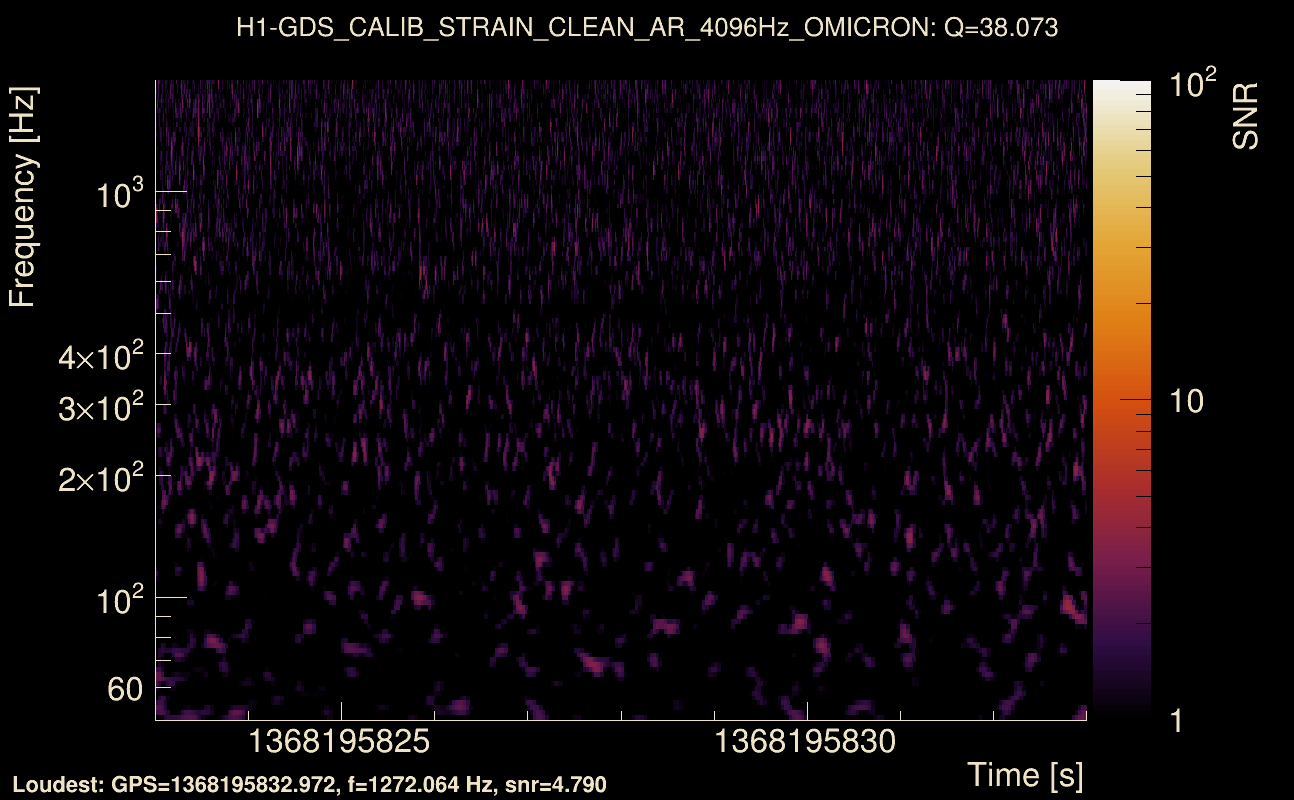
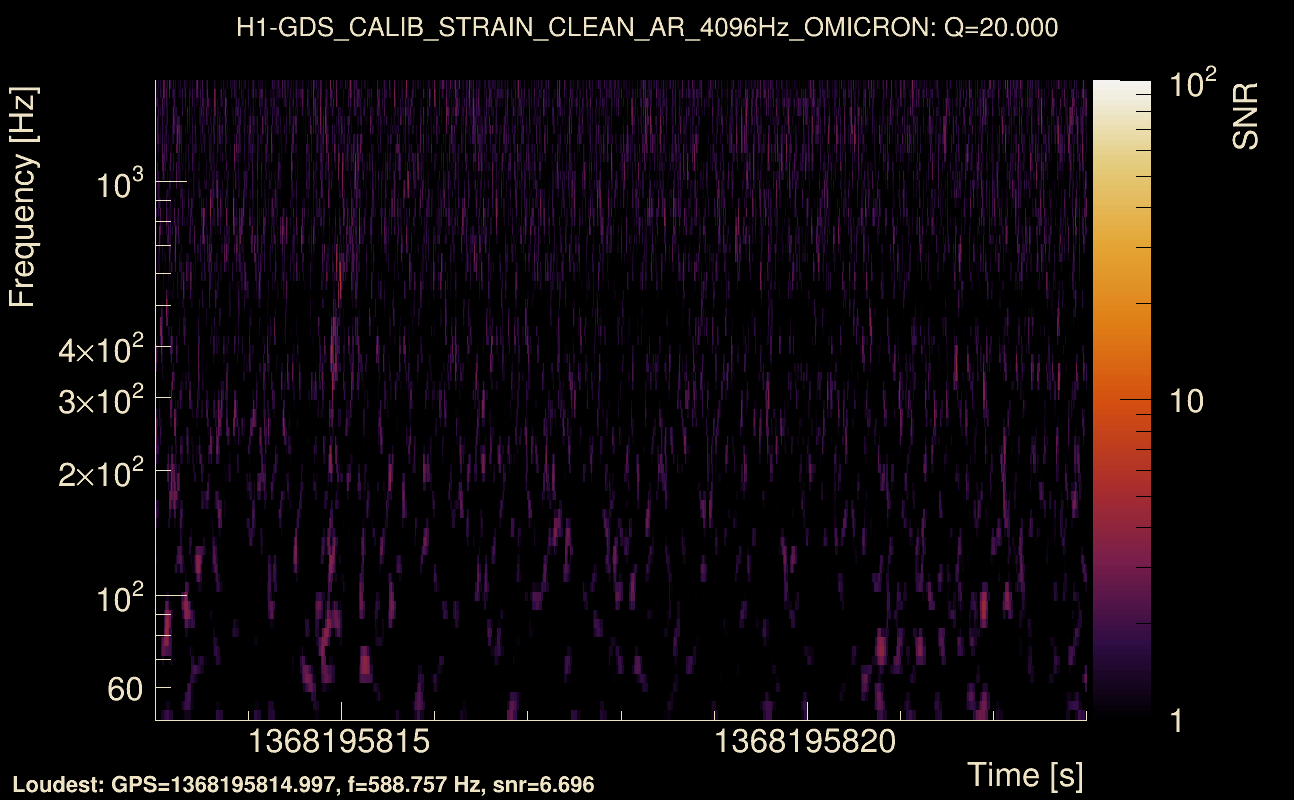
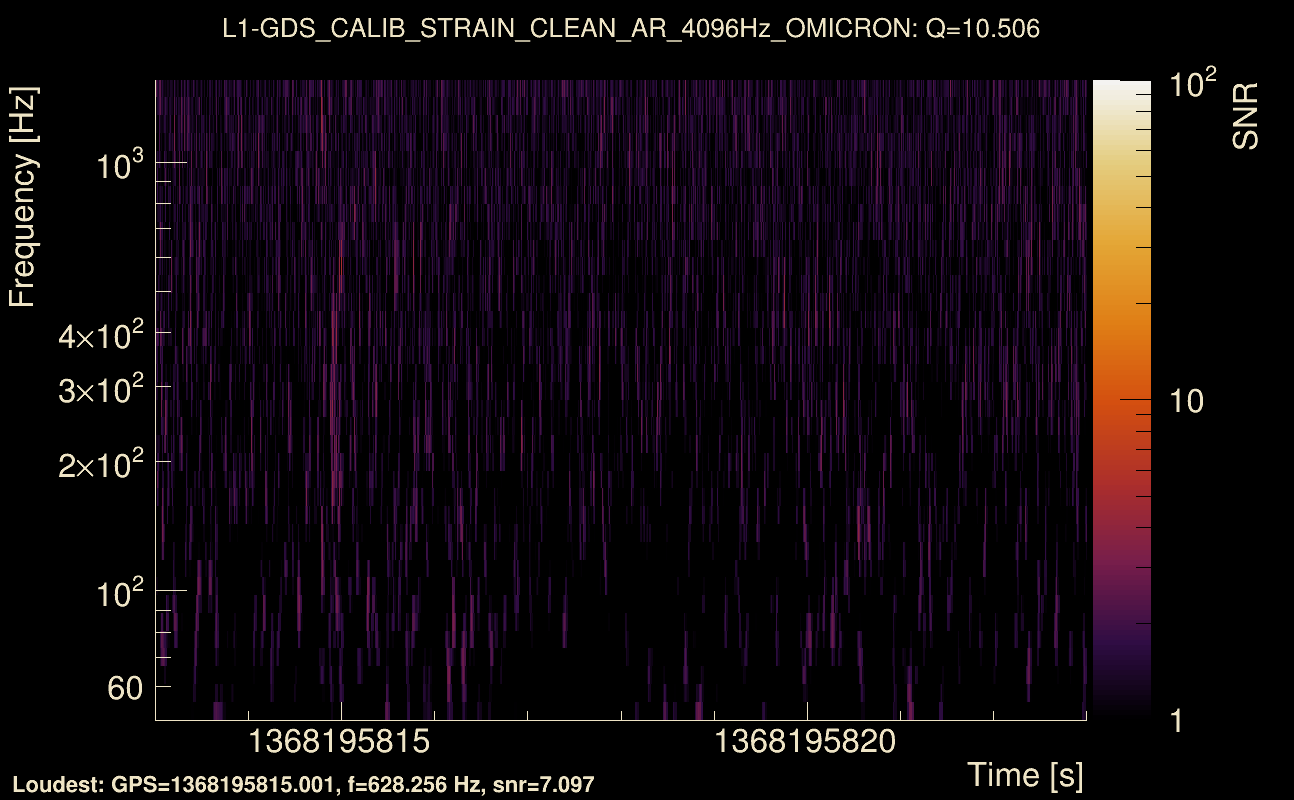
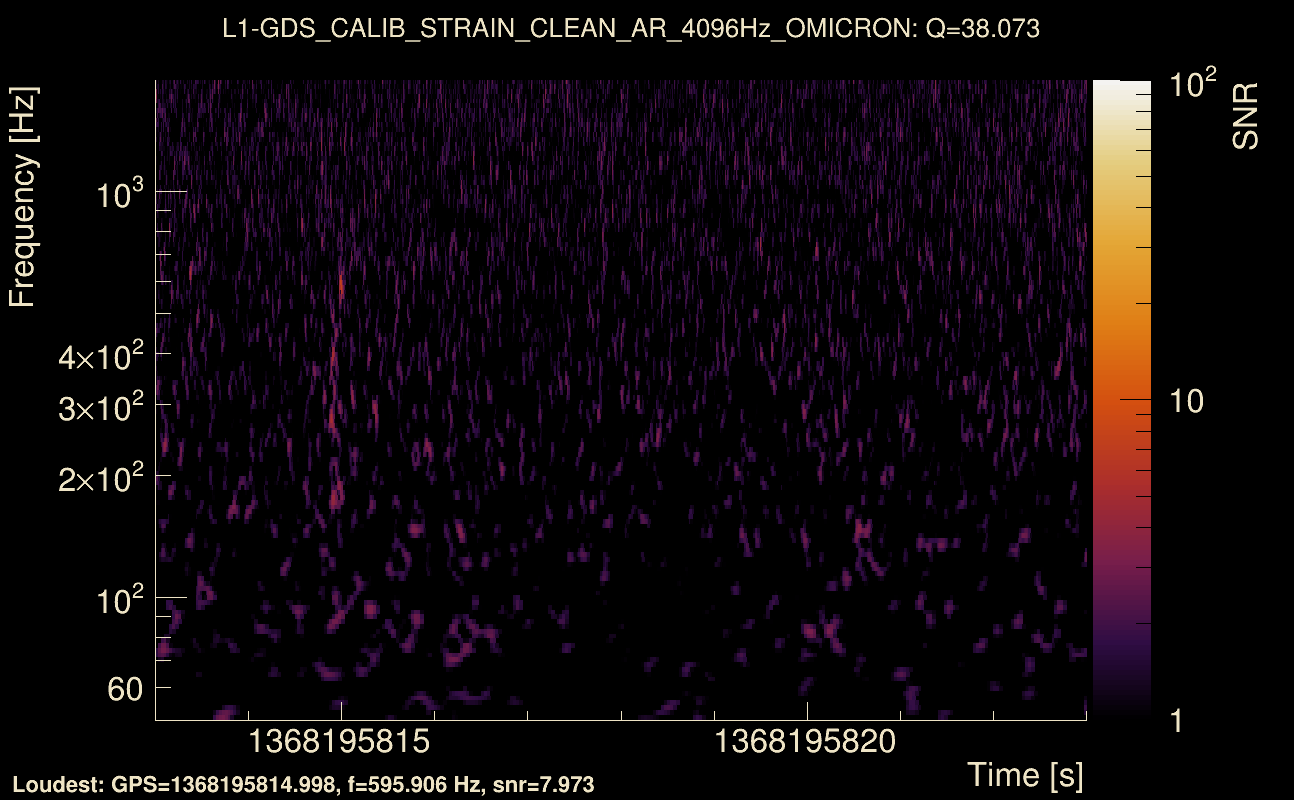
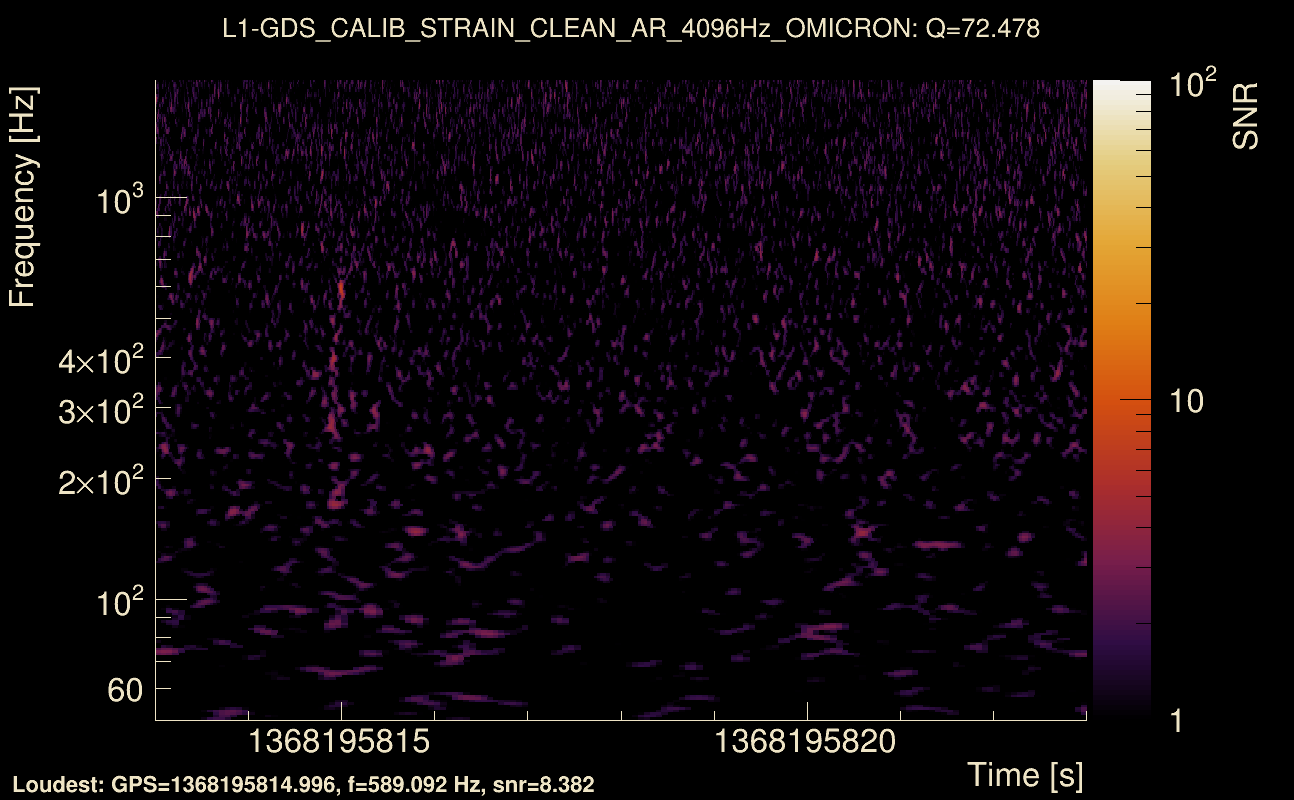
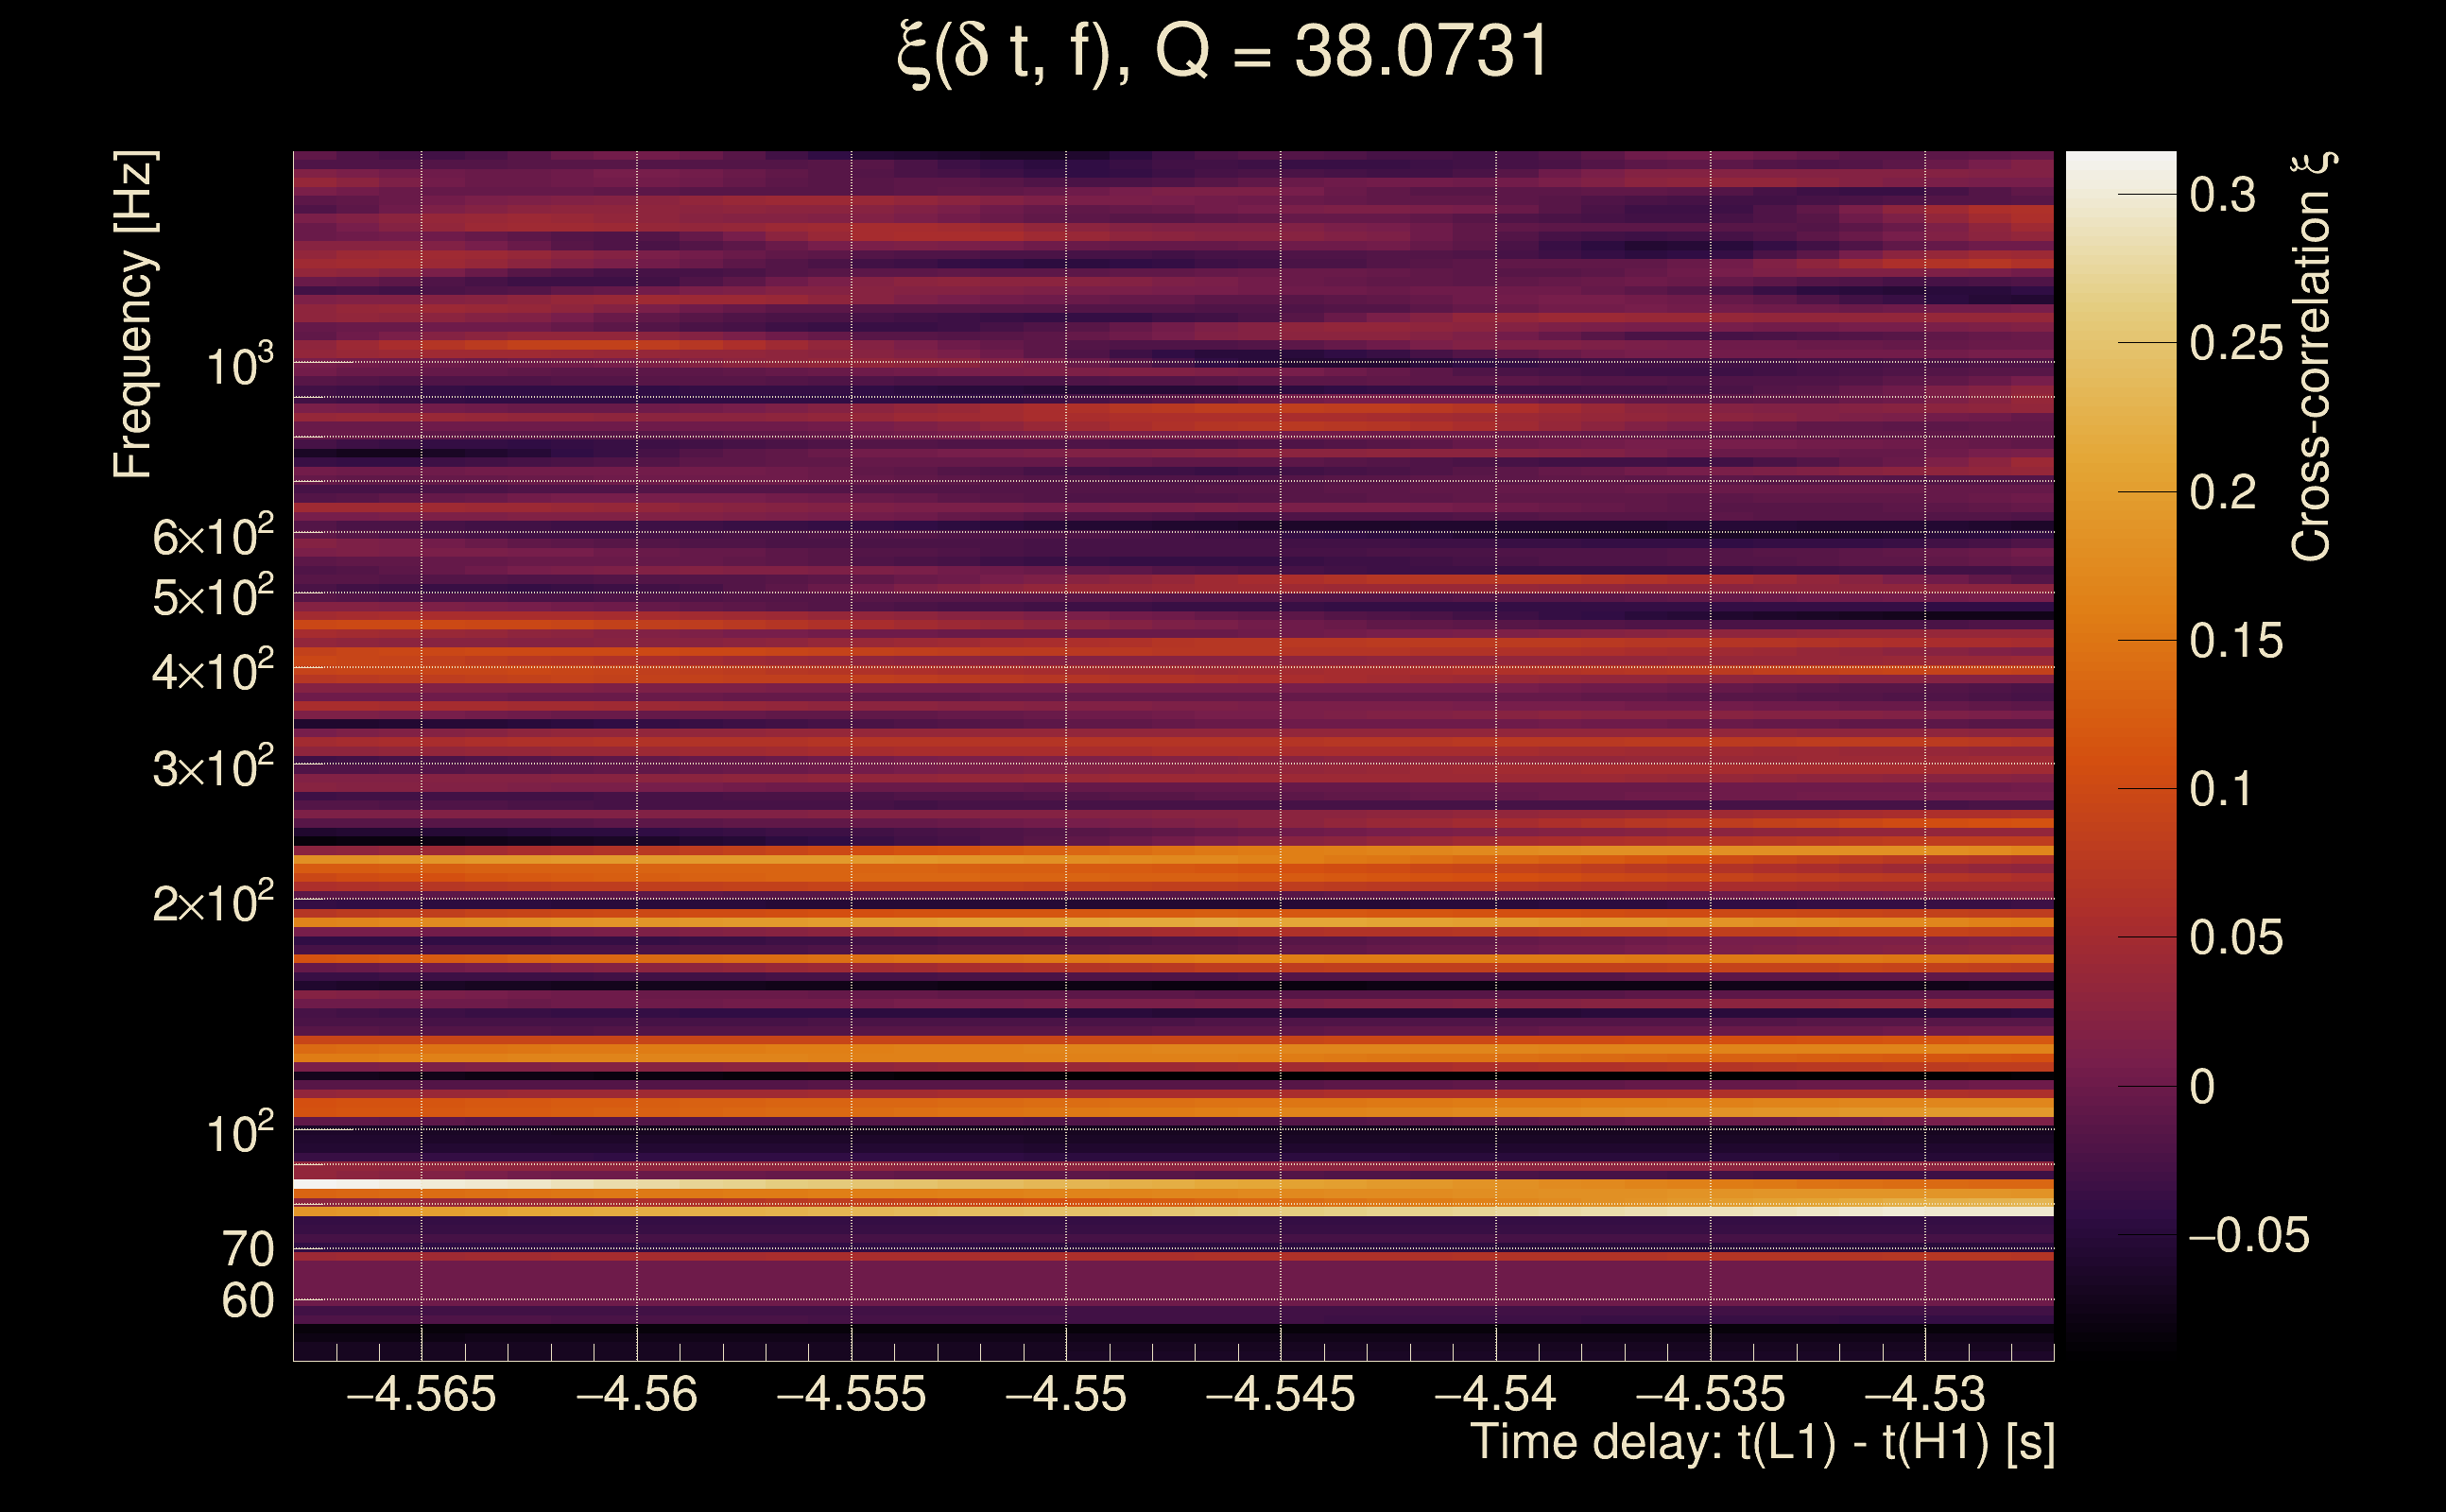
| Event time t(H1): | GPS = 1368195813 (Mon May 15 14:23:15 2023 ) → GPS = 1368195823 (Mon May 15 14:23:25 2023 ) |
| Event time t(L1): | GPS = 1368195813 (Mon May 15 14:23:25 2023 ) → GPS = 1368195823 (Mon May 15 14:23:25 2023 ) |
| Omicron analysis time window (H1): | GPS = 1368195810 → GPS = 1368195826 |
| Omicron analysis time window (L1): | GPS = 1368195810 → GPS = 1368195826 |
| Time delay between detectors t(L1) - t(H1): | 0.00106944 s (slice index = 108 / 217), δt_gw = 0.00106944 s |
| Time delay uncertainty: | 0.00848236 s |
| [targeted mode] Time delay probability: | 0.373128 (0.89063 sigmas), δt_target = 0.00862312 s |
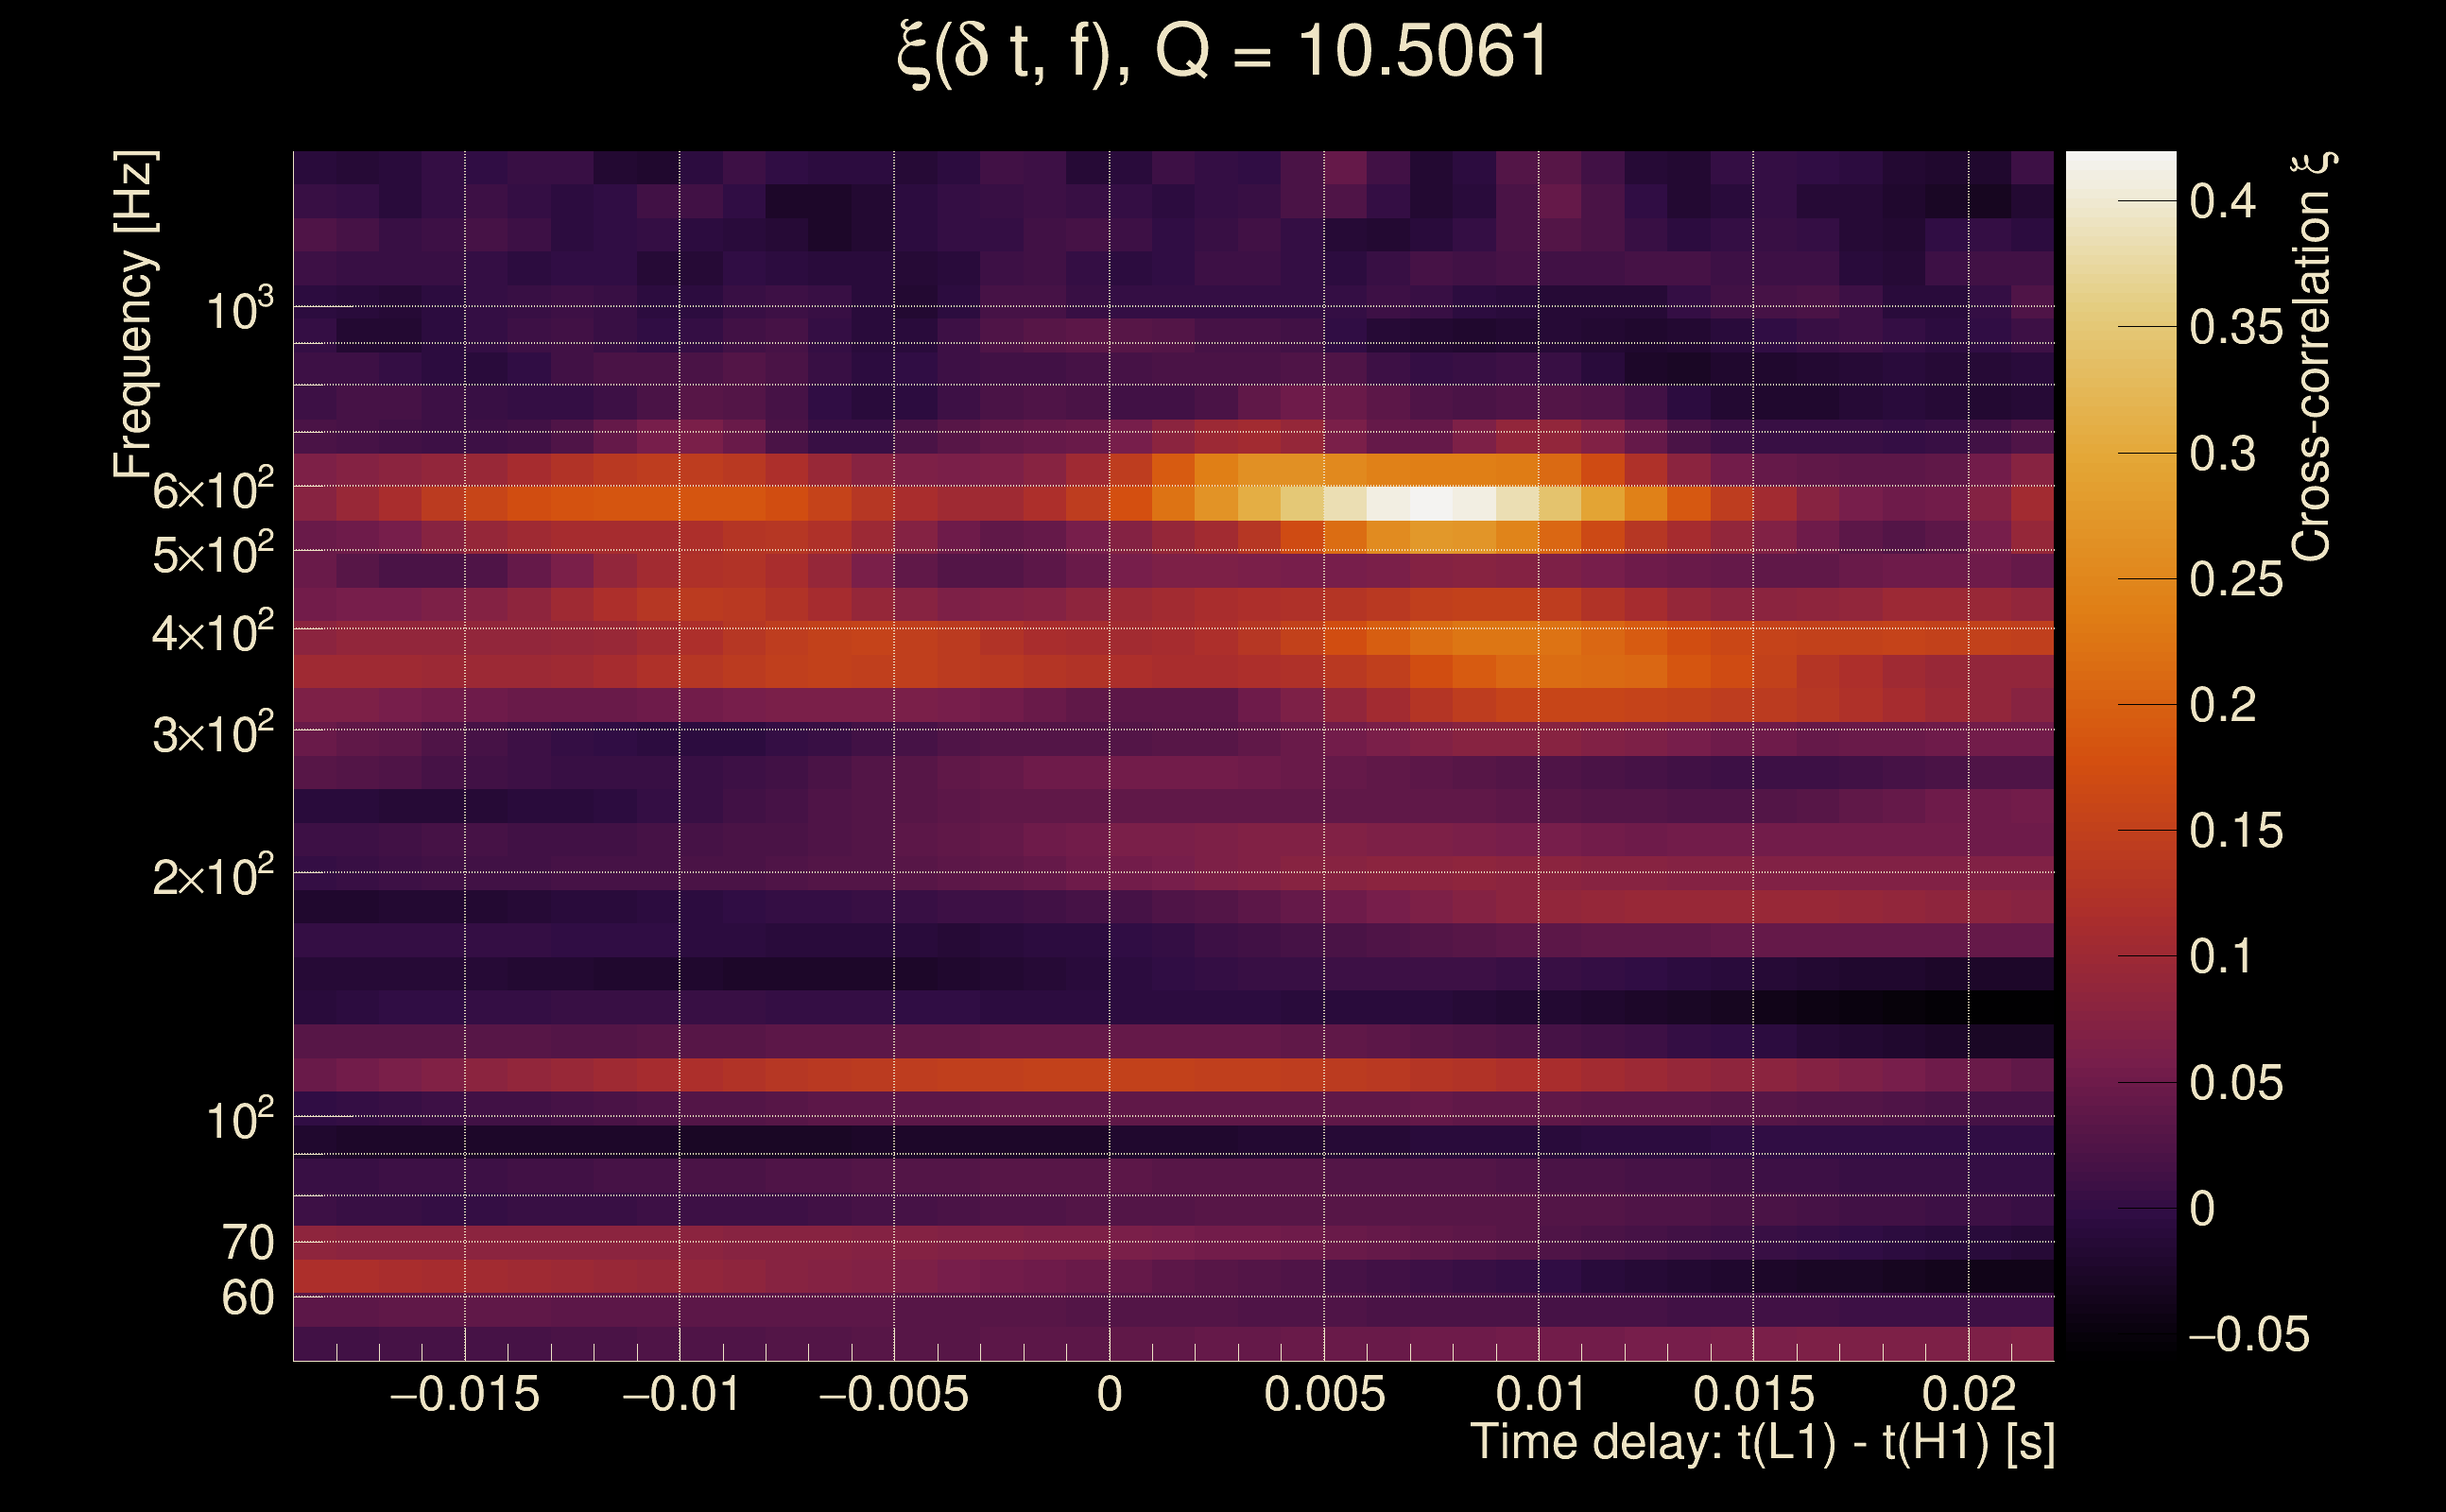
| Frequency: | 1362.66 Hz |
| Ξ: | 0.000554704 ± 0.0149283 (variance = 0.000222854): Q0: 0, Q1: 0.0286025, Q2: 0.0242316, Q3: 0.0411674, Q4: 0.0402078 |
| Rank: | R_A = 0.13682 |
| Log of amplitude ratio (L1/H1): | 0.647009, variance = 0.380952 (L1/H1: -0.240492, variance = 0.994588, H1/L1: -1.32443, variance = 0.604993) |
| Amplitude ratio (L1/H1): | 1.90982 ⋇ 1.85375 (L1/H1: 0.786241 ⋇ 2.71093, H1/L1: 0.265955 ⋇ 2.17671) |
| Amplitude ratio H1|L1 compatibility (probability): | 0.21596 |
| Antenna factor probability: | 1 |
| Number of rejected frequency rows: | Q0: 18 / 18, Q1: 35 / 36, Q2: 66 / 70, Q3: 128 / 134, Q4: 250 / 258 |
| Maximum signal-to-noise ratio: | H1: 4.4859, L1: 5.13458 |
| SNR variance: | H1: 0.444274, L1: 0.480099 |
| Click here for a zoomed plot | Click here for a zoomed plot | Click here for a zoomed plot | Click here for a zoomed plot | Click here for a zoomed plot |
 |
 |
 |
 |
 |
 |
 |
 |
 |
 |
 |
 |
 |
 |
 |
 |
 |
 |
 |
 |
 |
 |
 |
 |
 |
 |
 |
 |
 |
 |
 |
 |
 |
 |
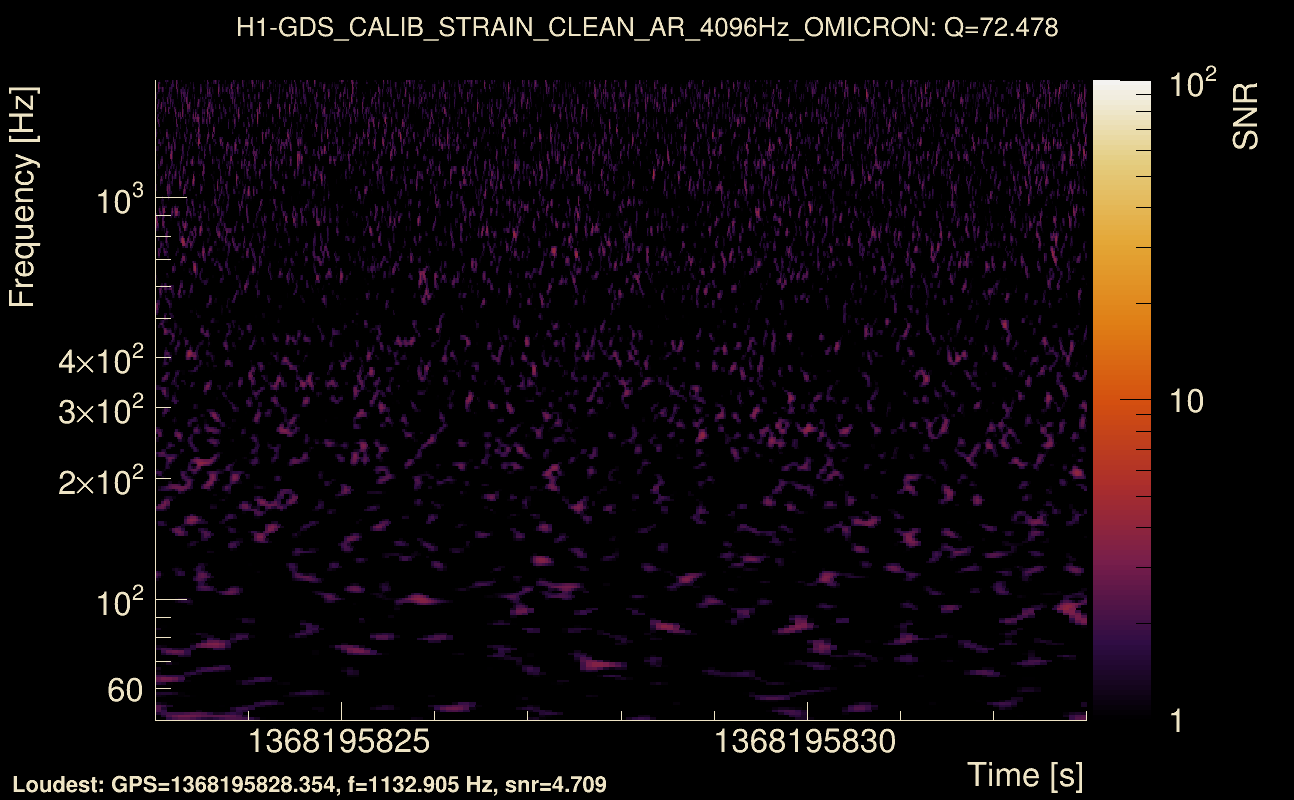
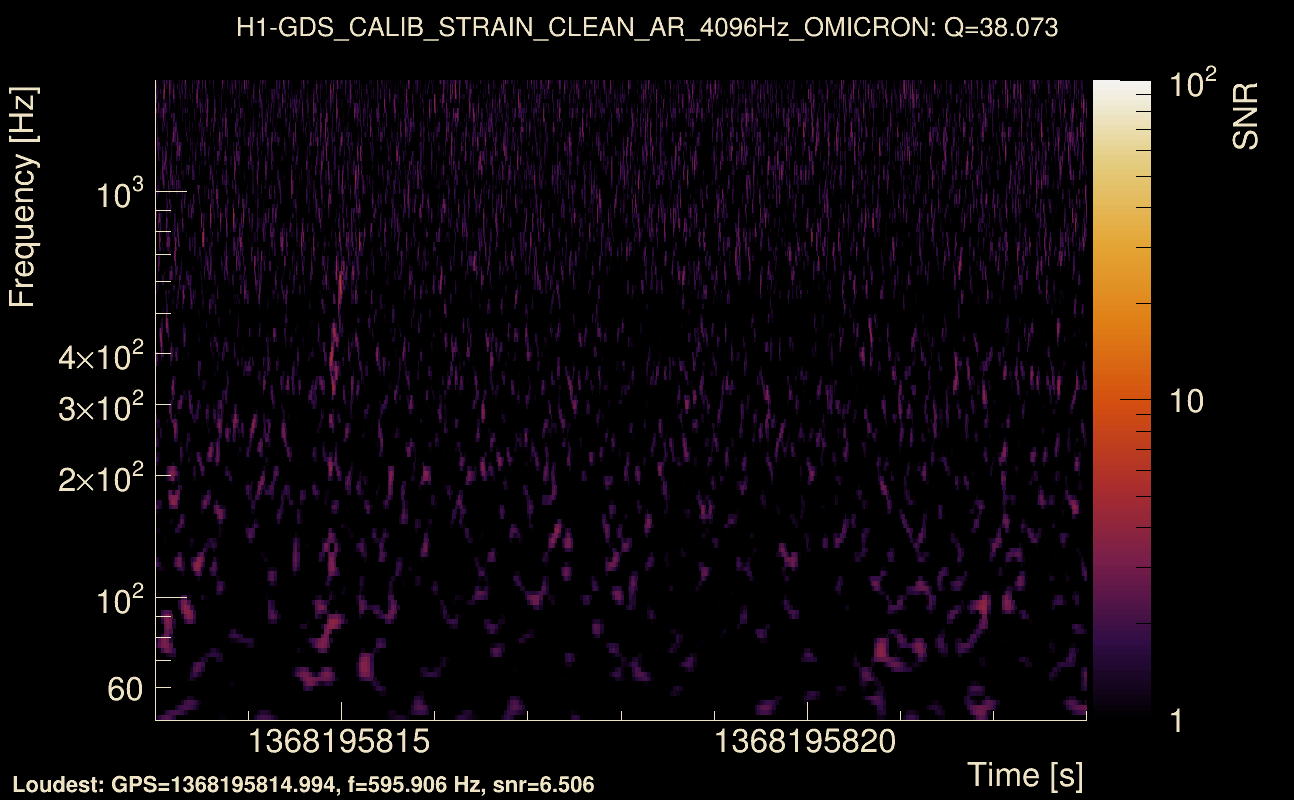
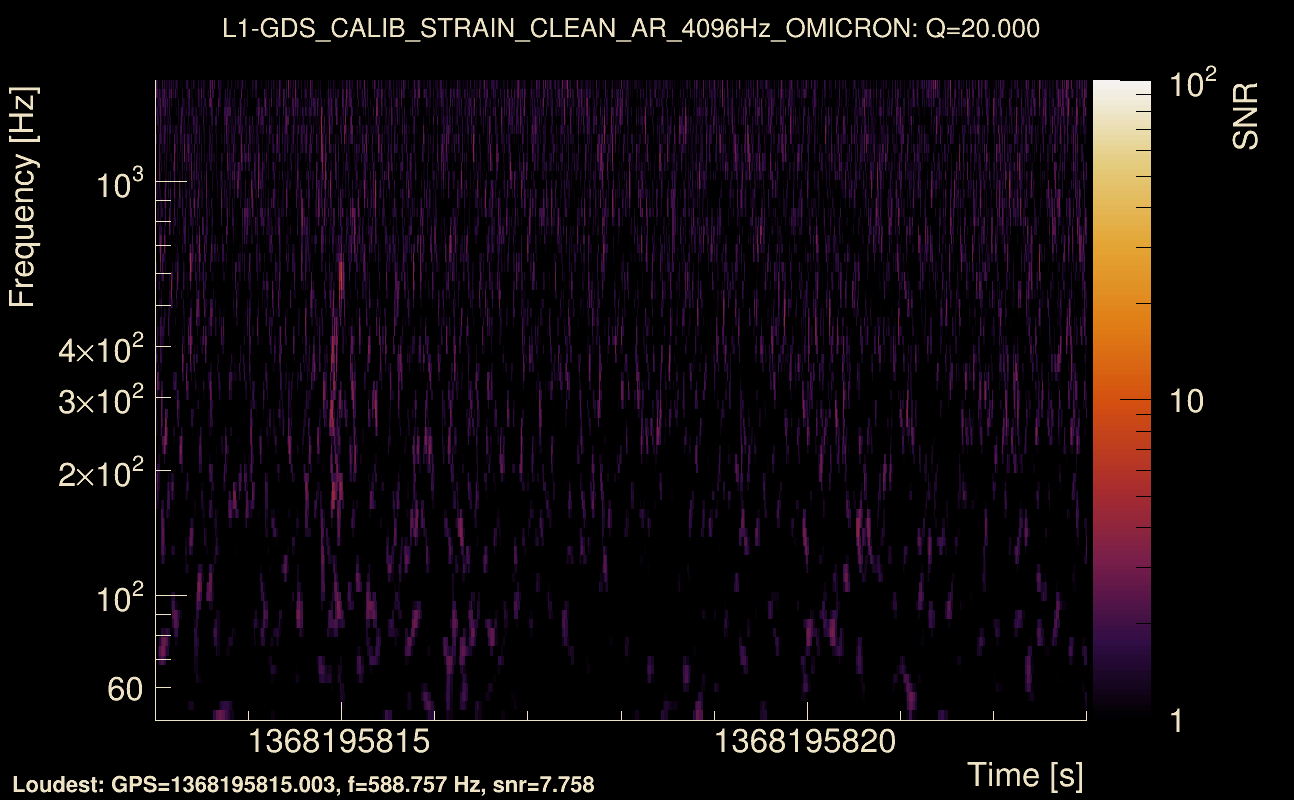
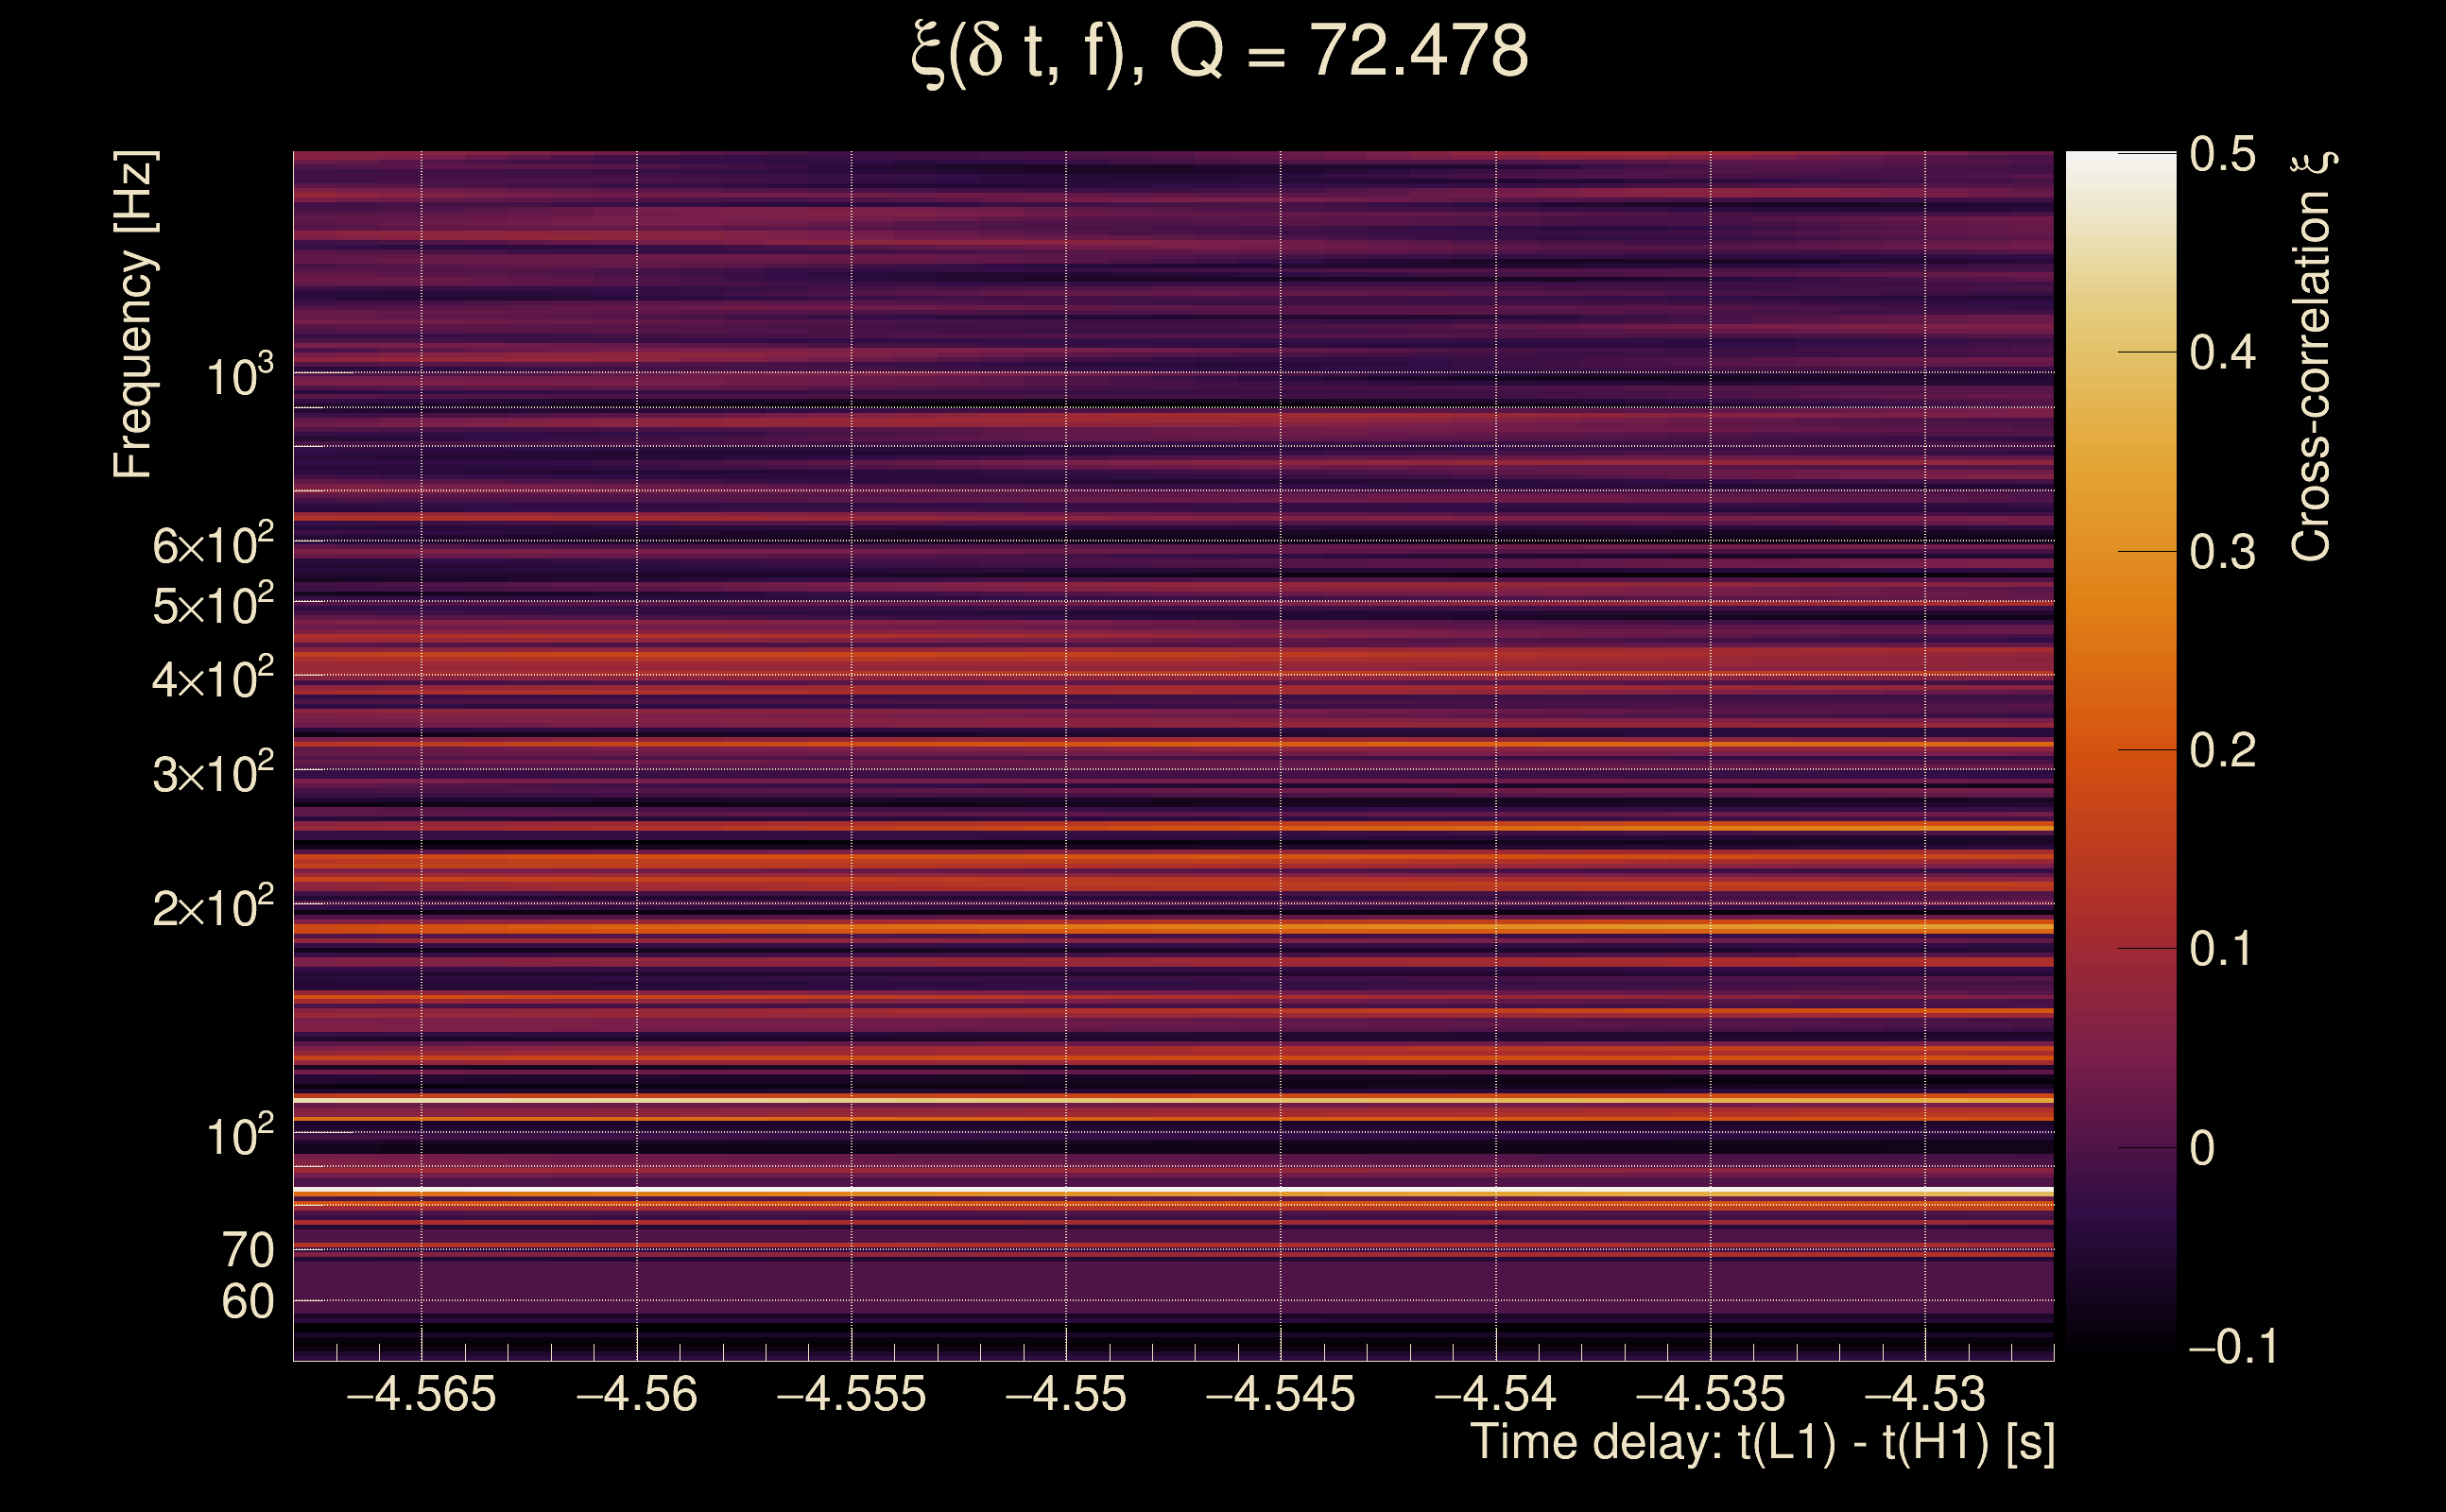
| Event time t(H1): | GPS = 1368195808 (Mon May 15 14:23:10 2023 ) → GPS = 1368195818 (Mon May 15 14:23:20 2023 ) |
| Event time t(L1): | GPS = 1368195808 (Mon May 15 14:23:20 2023 ) → GPS = 1368195818 (Mon May 15 14:23:20 2023 ) |
| Omicron analysis time window (H1): | GPS = 1368195805 → GPS = 1368195821 |
| Omicron analysis time window (L1): | GPS = 1368195805 → GPS = 1368195821 |
| Time delay between detectors t(L1) - t(H1): | -0.000659275 s (slice index = 108 / 217), δt_gw = -0.000659275 s |
| Time delay uncertainty: | 0.00986867 s |
| [targeted mode] Time delay probability: | 0.346839 (0.940738 sigmas), δt_target = 0.00862408 s |
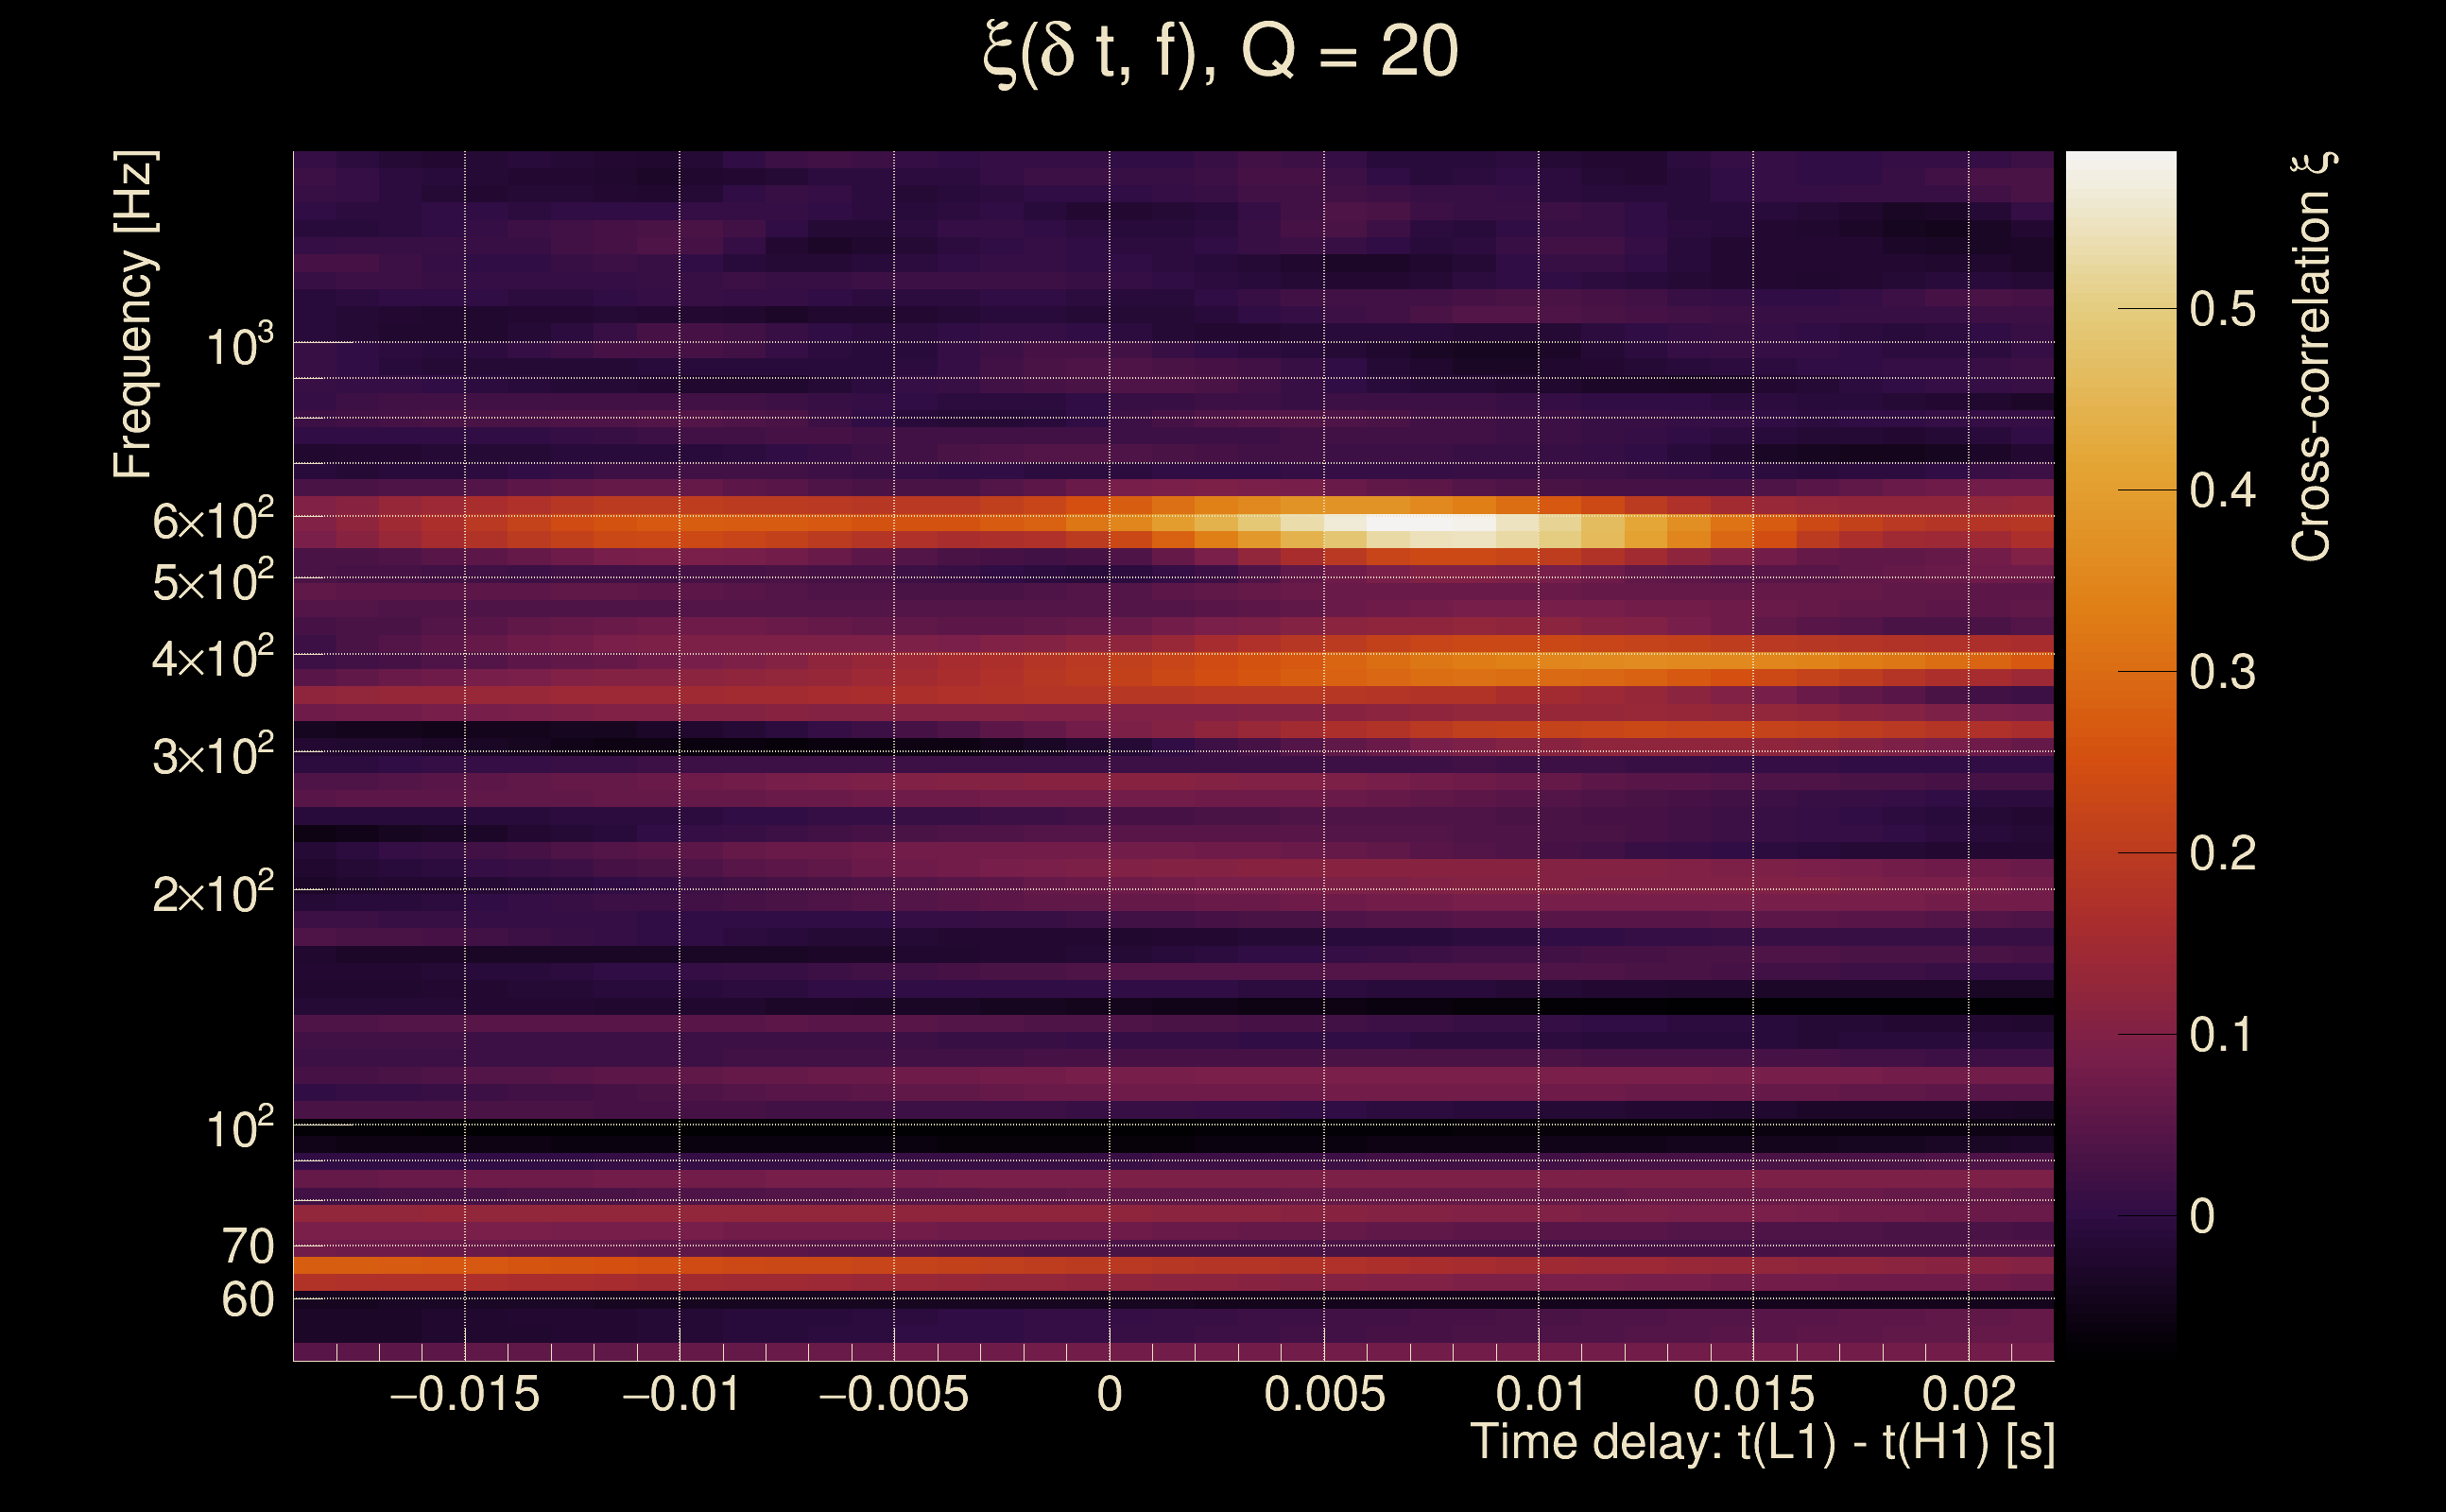
| Frequency: | 1187.66 Hz |
| Ξ: | 0.000229059 ± 0.0244614 (variance = 0.00059836): Q0: 0, Q1: 0, Q2: 0.0278382, Q3: 0.0495223, Q4: 0.0590349 |
| Rank: | R_A = 0.13682 |
| Log of amplitude ratio (L1/H1): | 0.30173, variance = 0.879396 (L1/H1: -0.309931, variance = 2.90754, H1/L1: -0.929453, variance = 0.54831) |
| Amplitude ratio (L1/H1): | 1.3522 ⋇ 2.55426 (L1/H1: 0.733498 ⋇ 5.50222, H1/L1: 0.39477 ⋇ 2.09694) |
| Amplitude ratio H1|L1 compatibility (probability): | 0.504966 |
| Antenna factor probability: | 1 |
| Number of rejected frequency rows: | Q0: 18 / 18, Q1: 36 / 36, Q2: 68 / 70, Q3: 131 / 134, Q4: 252 / 258 |
| Maximum signal-to-noise ratio: | H1: 5.23979, L1: 5.17232 |
| SNR variance: | H1: 0.433961, L1: 0.479732 |
| Event time t(H1): | GPS = 1368195803 (Mon May 15 14:23:05 2023 ) → GPS = 1368195813 (Mon May 15 14:23:15 2023 ) |
| Event time t(L1): | GPS = 1368195803 (Mon May 15 14:23:15 2023 ) → GPS = 1368195813 (Mon May 15 14:23:15 2023 ) |
| Omicron analysis time window (H1): | GPS = 1368195800 → GPS = 1368195816 |
| Omicron analysis time window (L1): | GPS = 1368195800 → GPS = 1368195816 |
| Time delay between detectors t(L1) - t(H1): | 0.00289348 s (slice index = 108 / 217), δt_gw = 0.00289348 s |
| Time delay uncertainty: | 0.00760281 s |
| [targeted mode] Time delay probability: | 0.450906 (0.753905 sigmas), δt_target = 0.00862408 s |
| Frequency: | 371.209 Hz |
| Ξ: | 0.000174458 ± 0.0276562 (variance = 0.000764863): Q0: 0, Q1: 0, Q2: 0.0716456, Q3: 0.0470394, Q4: 0.0294098 |
| Rank: | R_A = 0.13682 |
| Log of amplitude ratio (L1/H1): | 0.653811, variance = 0.412367 (L1/H1: 0.121433, variance = 0.380922, H1/L1: -1.28192, variance = 1.42917) |
| Amplitude ratio (L1/H1): | 1.92285 ⋇ 1.90058 (L1/H1: 1.12911 ⋇ 1.85371, H1/L1: 0.277503 ⋇ 3.30515) |
| Amplitude ratio H1|L1 compatibility (probability): | 0.388378 |
| Antenna factor probability: | 1 |
| Number of rejected frequency rows: | Q0: 18 / 18, Q1: 36 / 36, Q2: 69 / 70, Q3: 133 / 134, Q4: 254 / 258 |
| Maximum signal-to-noise ratio: | H1: 5.25301, L1: 4.83616 |
| SNR variance: | H1: 0.442107, L1: 0.480707 |
| Event time t(H1): | GPS = 1368195823 (Mon May 15 14:23:25 2023 ) → GPS = 1368195833 (Mon May 15 14:23:35 2023 ) |
| Event time t(L1): | GPS = 1368195823 (Mon May 15 14:23:35 2023 ) → GPS = 1368195833 (Mon May 15 14:23:35 2023 ) |
| Omicron analysis time window (H1): | GPS = 1368195820 → GPS = 1368195836 |
| Omicron analysis time window (L1): | GPS = 1368195820 → GPS = 1368195836 |
| Time delay between detectors t(L1) - t(H1): | 0.64559 s (slice index = 94 / 217), δt_gw = 0.00159022 s |
| Time delay uncertainty: | 0.00760957 s |
| [targeted mode] Time delay probability: | 0.355406 (0.924155 sigmas), δt_target = 0.00862408 s |
| Frequency: | 890.608 Hz |
| Ξ: | 0.000323838 ± 0.0297223 (variance = 0.000883414): Q0: 0, Q1: 0, Q2: 0.0533979, Q3: 0.0330825, Q4: 0.0757149 |
| Rank: | R_A = 0.13682 |
| Log of amplitude ratio (L1/H1): | 0.156006, variance = 0.757674 (L1/H1: 0.0390743, variance = 1.53309, H1/L1: -0.265792, variance = 1.49688) |
| Amplitude ratio (L1/H1): | 1.16883 ⋇ 2.38797 (L1/H1: 1.03985 ⋇ 3.44932, H1/L1: 0.766599 ⋇ 3.39897) |
| Amplitude ratio H1|L1 compatibility (probability): | 0.896371 |
| Antenna factor probability: | 1 |
| Number of rejected frequency rows: | Q0: 18 / 18, Q1: 36 / 36, Q2: 68 / 70, Q3: 131 / 134, Q4: 251 / 258 |
| Maximum signal-to-noise ratio: | H1: 4.87447, L1: 5.03061 |
| SNR variance: | H1: 0.462752, L1: 0.464598 |
| Event time t(H1): | GPS = 1368195818 (Mon May 15 14:23:20 2023 ) → GPS = 1368195828 (Mon May 15 14:23:30 2023 ) |
| Event time t(L1): | GPS = 1368195818 (Mon May 15 14:23:30 2023 ) → GPS = 1368195828 (Mon May 15 14:23:30 2023 ) |
| Omicron analysis time window (H1): | GPS = 1368195815 → GPS = 1368195831 |
| Omicron analysis time window (L1): | GPS = 1368195815 → GPS = 1368195831 |
| Time delay between detectors t(L1) - t(H1): | 0.636931 s (slice index = 94 / 217), δt_gw = -0.00706923 s |
| Time delay uncertainty: | 0.00350818 s |
| [targeted mode] Time delay probability: | 7.71033e-06 (4.47307 sigmas), δt_target = 0.00862408 s |
| Frequency: | 1194.41 Hz |
| Ξ: | 0.000669284 ± 0.0198853 (variance = 0.000395425): Q0: 0, Q1: 0.0332544, Q2: 0.0414488, Q3: 0.0446082, Q4: 0.0598732 |
| Rank: | R_A = 0.13682 |
| Log of amplitude ratio (L1/H1): | 0.272735, variance = 1.29482 (L1/H1: -0.119662, variance = 1.12864, H1/L1: -0.668054, variance = 4.07239) |
| Amplitude ratio (L1/H1): | 1.31355 ⋇ 3.12021 (L1/H1: 0.88722 ⋇ 2.89324, H1/L1: 0.512706 ⋇ 7.52338) |
| Amplitude ratio H1|L1 compatibility (probability): | 0.729792 |
| Antenna factor probability: | 1 |
| Number of rejected frequency rows: | Q0: 18 / 18, Q1: 35 / 36, Q2: 67 / 70, Q3: 127 / 134, Q4: 253 / 258 |
| Maximum signal-to-noise ratio: | H1: 4.83159, L1: 4.81371 |
| SNR variance: | H1: 0.455674, L1: 0.478713 |
| Event time t(H1): | GPS = 1368195813 (Mon May 15 14:23:15 2023 ) → GPS = 1368195823 (Mon May 15 14:23:25 2023 ) |
| Event time t(L1): | GPS = 1368195813 (Mon May 15 14:23:25 2023 ) → GPS = 1368195823 (Mon May 15 14:23:25 2023 ) |
| Omicron analysis time window (H1): | GPS = 1368195810 → GPS = 1368195826 |
| Omicron analysis time window (L1): | GPS = 1368195810 → GPS = 1368195826 |
| Time delay between detectors t(L1) - t(H1): | 0.649438 s (slice index = 94 / 217), δt_gw = 0.00543777 s |
| Time delay uncertainty: | 0.00469002 s |
| [targeted mode] Time delay probability: | 0.496897 (0.67938 sigmas), δt_target = 0.00862408 s |
| Frequency: | 1081.73 Hz |
| Ξ: | 0.00030631 ± 0.0255741 (variance = 0.000654033): Q0: 0, Q1: 0.0191292, Q2: 0.0170425, Q3: 0.0371424, Q4: 0.0750953 |
| Rank: | R_A = 0.13682 |
| Log of amplitude ratio (L1/H1): | 0.406663, variance = 0.468435 (L1/H1: -0.593728, variance = 1.39045, H1/L1: -1.17025, variance = 0.646362) |
| Amplitude ratio (L1/H1): | 1.5018 ⋇ 1.98263 (L1/H1: 0.552264 ⋇ 3.25168, H1/L1: 0.310289 ⋇ 2.23439) |
| Amplitude ratio H1|L1 compatibility (probability): | 0.216459 |
| Antenna factor probability: | 1 |
| Number of rejected frequency rows: | Q0: 18 / 18, Q1: 35 / 36, Q2: 68 / 70, Q3: 130 / 134, Q4: 255 / 258 |
| Maximum signal-to-noise ratio: | H1: 4.4859, L1: 5.13458 |
| SNR variance: | H1: 0.444274, L1: 0.480099 |
| Event time t(H1): | GPS = 1368195808 (Mon May 15 14:23:10 2023 ) → GPS = 1368195818 (Mon May 15 14:23:20 2023 ) |
| Event time t(L1): | GPS = 1368195808 (Mon May 15 14:23:20 2023 ) → GPS = 1368195818 (Mon May 15 14:23:20 2023 ) |
| Omicron analysis time window (H1): | GPS = 1368195805 → GPS = 1368195821 |
| Omicron analysis time window (L1): | GPS = 1368195805 → GPS = 1368195821 |
| Time delay between detectors t(L1) - t(H1): | 0.653606 s (slice index = 94 / 217), δt_gw = 0.00960596 s |
| Time delay uncertainty: | 0.00269951 s |
| [targeted mode] Time delay probability: | 0.716194 (0.36355 sigmas), δt_target = 0.00862408 s |
| Frequency: | 1451.6 Hz |
| Ξ: | 7.12697e-05 ± 0.0268743 (variance = 0.000722229): Q0: 0, Q1: 0, Q2: 0, Q3: 0.0549429, Q4: 0.0547708 |
| Rank: | R_A = 0.13682 |
| Log of amplitude ratio (L1/H1): | 0.412723, variance = 0.352188 (L1/H1: 0.556862, variance = 0.724685, H1/L1: -0.264798, variance = 0.682745) |
| Amplitude ratio (L1/H1): | 1.51093 ⋇ 1.81023 (L1/H1: 1.74519 ⋇ 2.34265, H1/L1: 0.767361 ⋇ 2.28481) |
| Amplitude ratio H1|L1 compatibility (probability): | 0.805537 |
| Antenna factor probability: | 1 |
| Number of rejected frequency rows: | Q0: 18 / 18, Q1: 36 / 36, Q2: 70 / 70, Q3: 132 / 134, Q4: 256 / 258 |
| Maximum signal-to-noise ratio: | H1: 5.23979, L1: 5.17232 |
| SNR variance: | H1: 0.433961, L1: 0.479732 |
| Event time t(H1): | GPS = 1368195803 (Mon May 15 14:23:05 2023 ) → GPS = 1368195813 (Mon May 15 14:23:15 2023 ) |
| Event time t(L1): | GPS = 1368195803 (Mon May 15 14:23:15 2023 ) → GPS = 1368195813 (Mon May 15 14:23:15 2023 ) |
| Omicron analysis time window (H1): | GPS = 1368195800 → GPS = 1368195816 |
| Omicron analysis time window (L1): | GPS = 1368195800 → GPS = 1368195816 |
| Time delay between detectors t(L1) - t(H1): | 0.633995 s (slice index = 94 / 217), δt_gw = -0.0100048 s |
| Time delay uncertainty: | 0.00416801 s |
| [targeted mode] Time delay probability: | 7.83001e-06 (4.46978 sigmas), δt_target = 0.00862408 s |
| Frequency: | 567.919 Hz |
| Ξ: | 0.000230924 ± 0.0306557 (variance = 0.000939771): Q0: 0, Q1: 0, Q2: 0.0338313, Q3: 0.0632322, Q4: 0.0731448 |
| Rank: | R_A = 0.13682 |
| Log of amplitude ratio (L1/H1): | 0.242905, variance = 0.557551 (L1/H1: -0.280917, variance = 1.3517, H1/L1: -0.860921, variance = 0.767728) |
| Amplitude ratio (L1/H1): | 1.27495 ⋇ 2.11001 (L1/H1: 0.755091 ⋇ 3.19833, H1/L1: 0.422772 ⋇ 2.40176) |
| Amplitude ratio H1|L1 compatibility (probability): | 0.432851 |
| Antenna factor probability: | 1 |
| Number of rejected frequency rows: | Q0: 18 / 18, Q1: 36 / 36, Q2: 69 / 70, Q3: 131 / 134, Q4: 251 / 258 |
| Maximum signal-to-noise ratio: | H1: 5.25301, L1: 4.83616 |
| SNR variance: | H1: 0.442107, L1: 0.480707 |
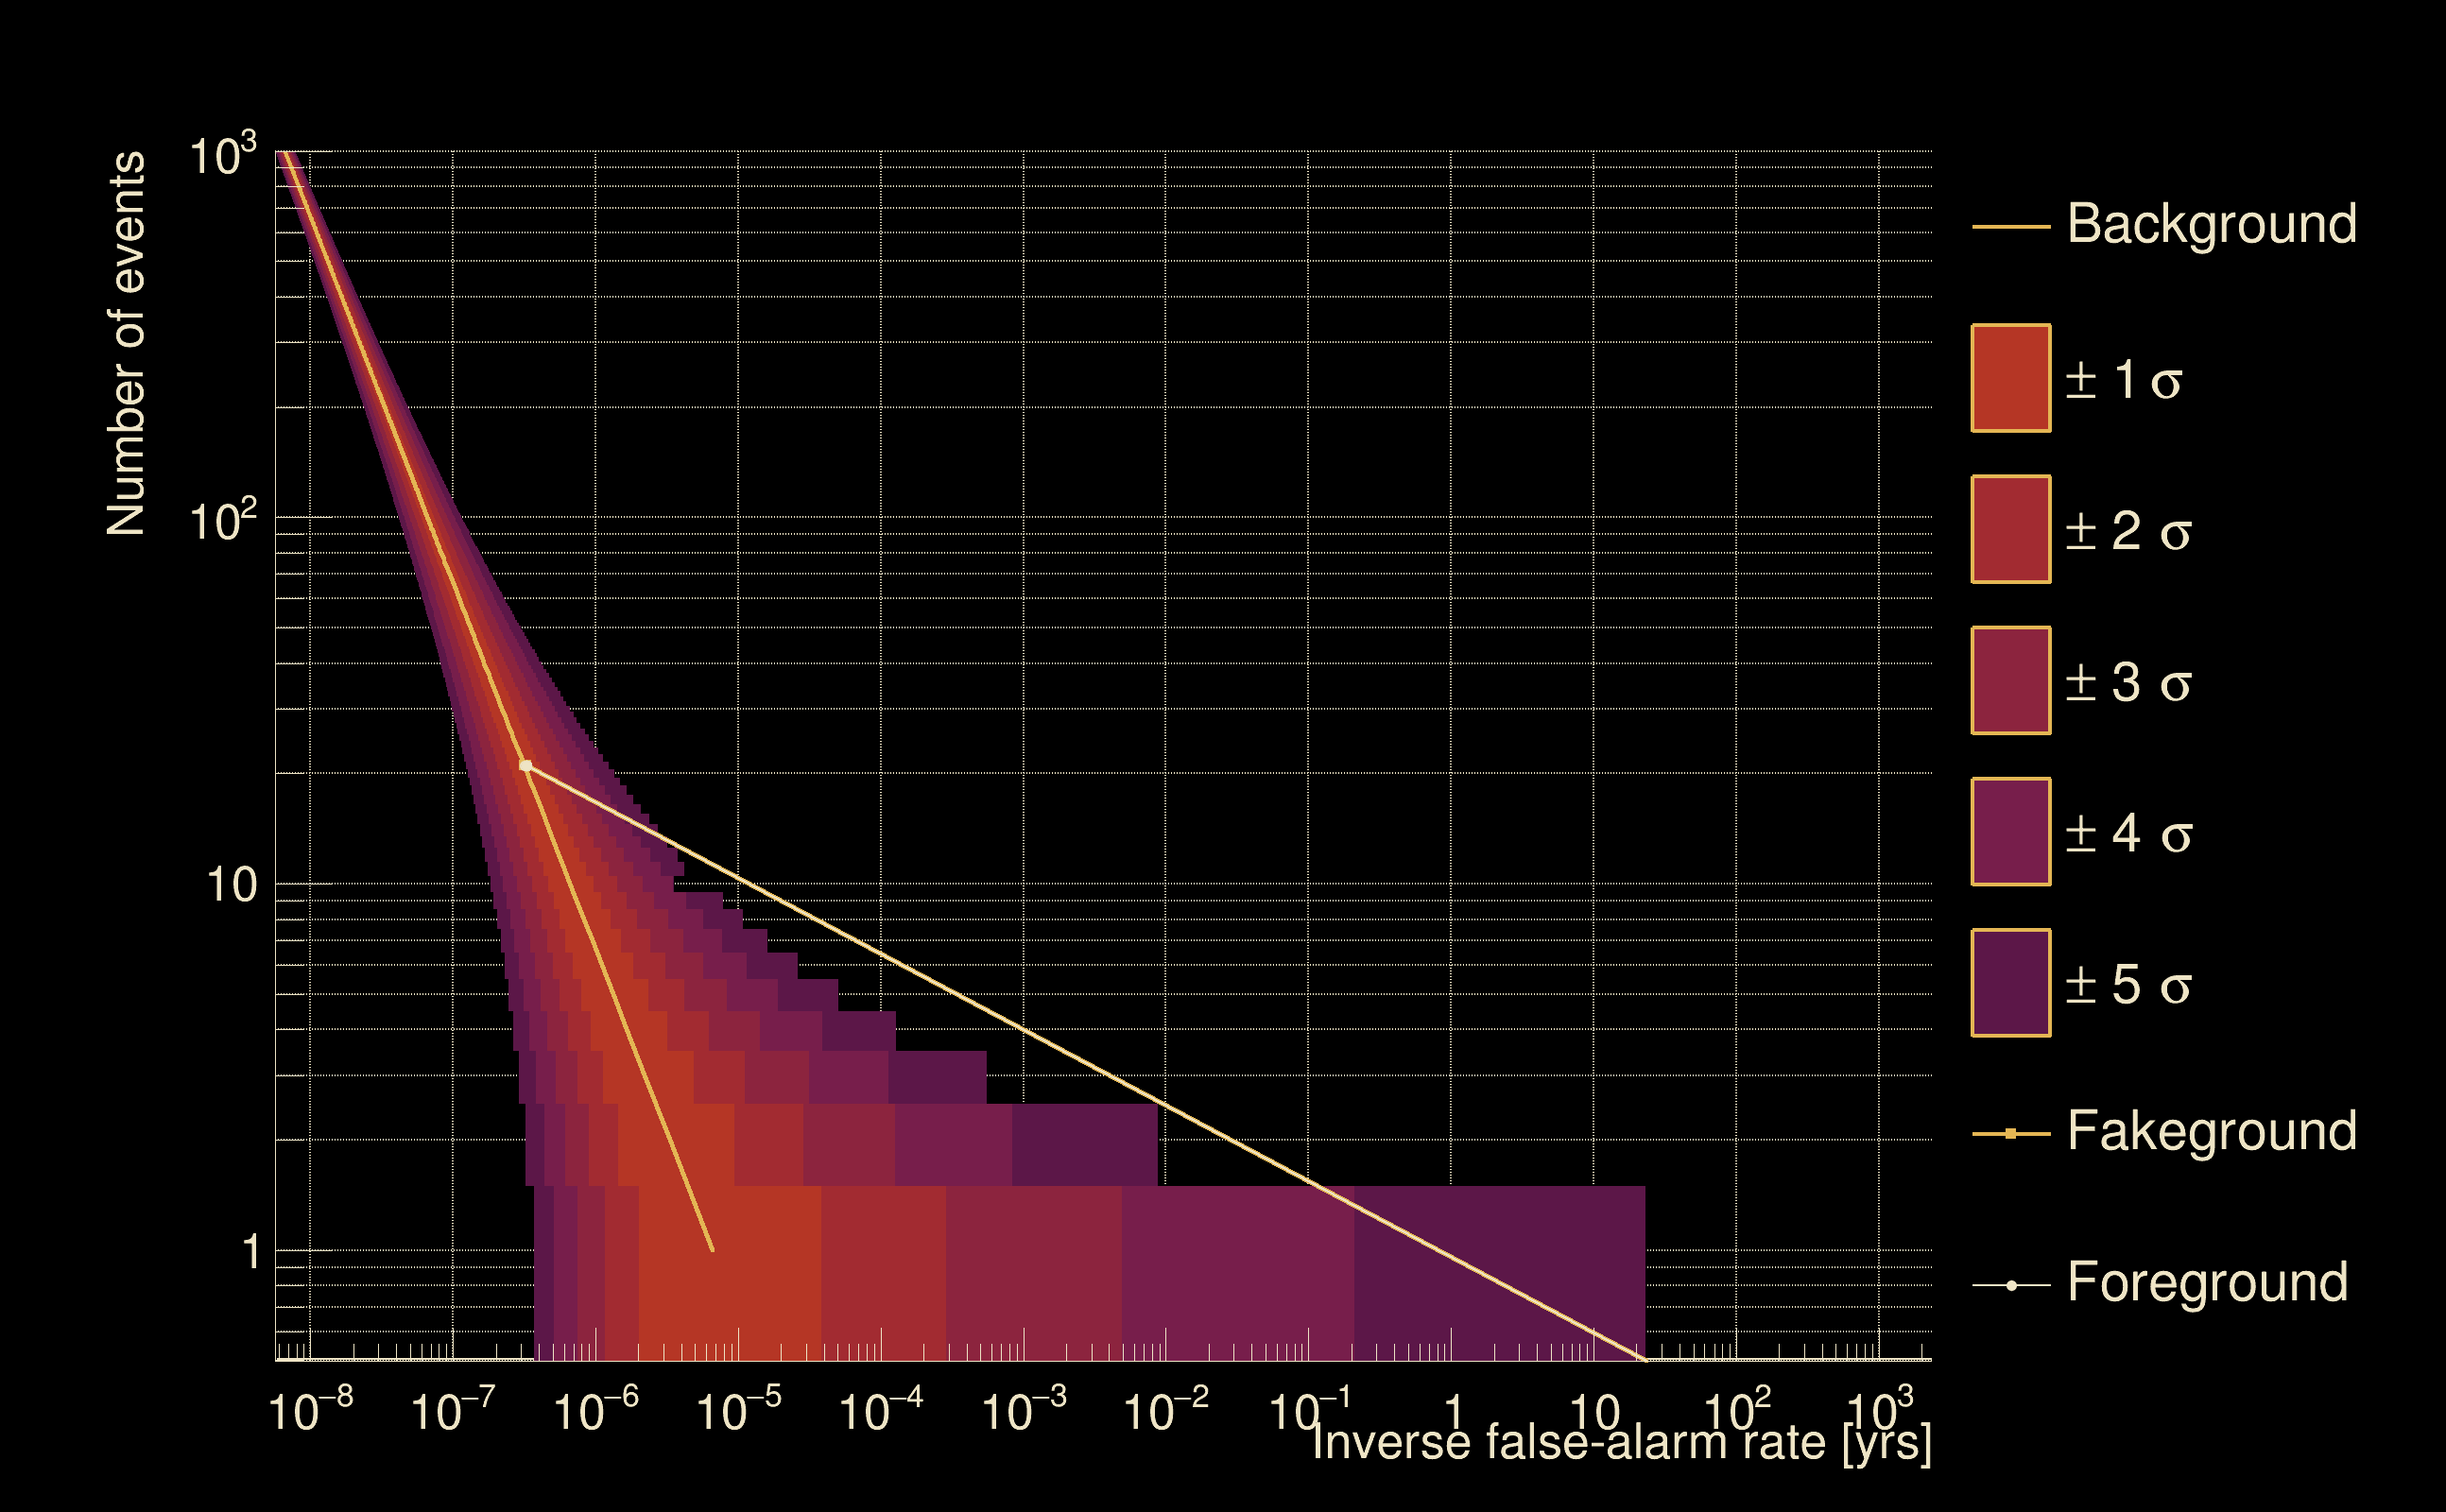
| Detection threshold: | R > 0.135 |
| False-alarm rate above that detection threshold: | 0.048206 |
| Alternative threshold at 1/1000 yrs: | R > 0.135 |
| Alternative threshold at 1/100 yrs: | R > 0.135 |
| Alternative threshold at 1/10 yrs: | R > 0.135 |
| Alternative threshold at 1/1 yr: | R > 0.135 |
| Alternative threshold at 1/1 d: | R > 0.135 |
 |
|
 |
 |
 |
 |
 |
 |
 |
 |
| Event time t(H1): | GPS = 1368195823 (Mon May 15 14:23:25 2023 ) → GPS = 1368195833 (Mon May 15 14:23:35 2023 ) |
| Event time t(L1): | GPS = 1368195823 (Mon May 15 14:23:35 2023 ) → GPS = 1368195833 (Mon May 15 14:23:35 2023 ) |
| Omicron analysis time window (H1): | GPS = 1368195820 → GPS = 1368195836 |
| Omicron analysis time window (L1): | GPS = 1368195820 → GPS = 1368195836 |
| Time delay between detectors t(L1) - t(H1): | -4.97129 s (slice index = 216 / 217), δt_gw = -0.00328856 s |
| Time delay uncertainty: | 0.00734623 s |
| [targeted mode] Time delay probability: | 0.104931 (1.6214 sigmas), δt_target = 0.00862408 s |
| Frequency: | 681.059 Hz |
| Ξ: | 0.000286983 ± 0.0352234 (variance = 0.00124069): Q0: 0, Q1: 0, Q2: 0.0261674, Q3: 0.0575776, Q4: 0.0912642 |
| Rank: | R_A = 0.13682 |
| Log of amplitude ratio (L1/H1): | 0.365857, variance = 1.06272 (L1/H1: -0.100347, variance = 2.06319, H1/L1: -0.80357, variance = 2.17636) |
| Amplitude ratio (L1/H1): | 1.44175 ⋇ 2.80354 (L1/H1: 0.904523 ⋇ 4.20545, H1/L1: 0.447728 ⋇ 4.37212) |
| Amplitude ratio H1|L1 compatibility (probability): | 0.660658 |
| Antenna factor probability: | 1 |
| Number of rejected frequency rows: | Q0: 18 / 18, Q1: 36 / 36, Q2: 68 / 70, Q3: 131 / 134, Q4: 250 / 258 |
| Maximum signal-to-noise ratio: | H1: 4.87447, L1: 5.03061 |
| SNR variance: | H1: 0.462752, L1: 0.464598 |
| Click here for a zoomed plot | Click here for a zoomed plot | Click here for a zoomed plot | Click here for a zoomed plot | Click here for a zoomed plot |
|
|
|
|
|
|
|
|
|
|
|
|
|
|
|
|
|
|
|
|
|
|
|
|
|
 |
 |
 |
 |
 |
 |
 |
 |
 |
| Event time t(H1): | GPS = 1368195823 (Mon May 15 14:23:25 2023 ) → GPS = 1368195833 (Mon May 15 14:23:35 2023 ) |
| Event time t(L1): | GPS = 1368195823 (Mon May 15 14:23:35 2023 ) → GPS = 1368195833 (Mon May 15 14:23:35 2023 ) |
| Omicron analysis time window (H1): | GPS = 1368195820 → GPS = 1368195836 |
| Omicron analysis time window (L1): | GPS = 1368195820 → GPS = 1368195836 |
| Time delay between detectors t(L1) - t(H1): | -4.92265 s (slice index = 215 / 217), δt_gw = -0.000654732 s |
| Time delay uncertainty: | 0.00484654 s |
| [targeted mode] Time delay probability: | 0.0555912 (1.91423 sigmas), δt_target = 0.00862265 s |
| Frequency: | 908.82 Hz |
| Ξ: | 0.000215766 ± 0.0316954 (variance = 0.0010046): Q0: 0, Q1: 0, Q2: 0.0262374, Q3: 0.0539852, Q4: 0.0815893 |
| Rank: | R_A = 0.13682 |
| Log of amplitude ratio (L1/H1): | 0.161814, variance = 0.241951 (L1/H1: 0.461525, variance = 0.479904, H1/L1: 0.11958, variance = 0.486521) |
| Amplitude ratio (L1/H1): | 1.17564 ⋇ 1.6354 (L1/H1: 1.58649 ⋇ 1.99921, H1/L1: 1.12702 ⋇ 2.00875) |
| Amplitude ratio H1|L1 compatibility (probability): | 0.554444 |
| Antenna factor probability: | 1 |
| Number of rejected frequency rows: | Q0: 18 / 18, Q1: 36 / 36, Q2: 69 / 70, Q3: 130 / 134, Q4: 253 / 258 |
| Maximum signal-to-noise ratio: | H1: 4.87447, L1: 5.03061 |
| SNR variance: | H1: 0.462752, L1: 0.464598 |
| Click here for a zoomed plot | Click here for a zoomed plot | Click here for a zoomed plot | Click here for a zoomed plot | Click here for a zoomed plot |
|
|
|
|
|
|
|
|
|
|
|
|
|
|
|
|
|
|
|
|
|
|
|
|
|
 |
 |
 |
 |
 |
 |
 |
 |
 |
| Event time t(H1): | GPS = 1368195823 (Mon May 15 14:23:25 2023 ) → GPS = 1368195833 (Mon May 15 14:23:35 2023 ) |
| Event time t(L1): | GPS = 1368195823 (Mon May 15 14:23:35 2023 ) → GPS = 1368195833 (Mon May 15 14:23:35 2023 ) |
| Omicron analysis time window (H1): | GPS = 1368195820 → GPS = 1368195836 |
| Omicron analysis time window (L1): | GPS = 1368195820 → GPS = 1368195836 |
| Time delay between detectors t(L1) - t(H1): | -4.87182 s (slice index = 214 / 217), δt_gw = 0.00417836 s |
| Time delay uncertainty: | 0.00849384 s |
| [targeted mode] Time delay probability: | 0.60081 (0.523236 sigmas), δt_target = 0.00862265 s |
| Frequency: | 794.113 Hz |
| Ξ: | 7.204e-05 ± 0.0335012 (variance = 0.00112233): Q0: 0, Q1: 0, Q2: 0, Q3: 0.0588, Q4: 0.0761265 |
| Rank: | R_A = 0.13682 |
| Log of amplitude ratio (L1/H1): | 0.0214725, variance = 0.845384 (L1/H1: -0.136695, variance = 2.26129, H1/L1: -0.169974, variance = 1.18469) |
| Amplitude ratio (L1/H1): | 1.0217 ⋇ 2.5079 (L1/H1: 0.872236 ⋇ 4.49856, H1/L1: 0.843686 ⋇ 2.96963) |
| Amplitude ratio H1|L1 compatibility (probability): | 0.868785 |
| Antenna factor probability: | 1 |
| Number of rejected frequency rows: | Q0: 18 / 18, Q1: 36 / 36, Q2: 70 / 70, Q3: 133 / 134, Q4: 254 / 258 |
| Maximum signal-to-noise ratio: | H1: 4.87447, L1: 5.03061 |
| SNR variance: | H1: 0.462752, L1: 0.464598 |
| Click here for a zoomed plot | Click here for a zoomed plot | Click here for a zoomed plot | Click here for a zoomed plot | Click here for a zoomed plot |
|
|
|
|
|
|
|
|
|
|
|
|
|
|
|
|
|
|
|
|
|
|
|
|
|
 |
 |
 |
 |
 |
 |
 |
 |
 |
| Event time t(H1): | GPS = 1368195823 (Mon May 15 14:23:25 2023 ) → GPS = 1368195833 (Mon May 15 14:23:35 2023 ) |
| Event time t(L1): | GPS = 1368195823 (Mon May 15 14:23:35 2023 ) → GPS = 1368195833 (Mon May 15 14:23:35 2023 ) |
| Omicron analysis time window (H1): | GPS = 1368195820 → GPS = 1368195836 |
| Omicron analysis time window (L1): | GPS = 1368195820 → GPS = 1368195836 |
| Time delay between detectors t(L1) - t(H1): | -4.83 s (slice index = 213 / 217), δt_gw = -4.19648e-06 s |
| Time delay uncertainty: | 0.00593275 s |
| [targeted mode] Time delay probability: | 0.145917 (1.4541 sigmas), δt_target = 0.00862265 s |
| Frequency: | 872.339 Hz |
| Ξ: | 0.000186454 ± 0.0176194 (variance = 0.000310445): Q0: 0, Q1: 0, Q2: 0.0433537, Q3: 0.0315627, Q4: 0.0287036 |
| Rank: | R_A = 0.13682 |
| Log of amplitude ratio (L1/H1): | 0.525413, variance = 0.355144 (L1/H1: 0.971756, variance = 0.603978, H1/L1: -0.106347, variance = 0.802674) |
| Amplitude ratio (L1/H1): | 1.69116 ⋇ 1.81474 (L1/H1: 2.64258 ⋇ 2.17529, H1/L1: 0.899112 ⋇ 2.44959) |
| Amplitude ratio H1|L1 compatibility (probability): | 0.465591 |
| Antenna factor probability: | 1 |
| Number of rejected frequency rows: | Q0: 18 / 18, Q1: 36 / 36, Q2: 68 / 70, Q3: 133 / 134, Q4: 256 / 258 |
| Maximum signal-to-noise ratio: | H1: 4.87447, L1: 5.03061 |
| SNR variance: | H1: 0.462752, L1: 0.464598 |
| Click here for a zoomed plot | Click here for a zoomed plot | Click here for a zoomed plot | Click here for a zoomed plot | Click here for a zoomed plot |
|
|
|
|
|
|
|
|
|
|
|
|
|
|
|
|
|
|
|
|
|
|
|
|
|
 |
 |
 |
 |
 |
 |
 |
 |
 |
| Event time t(H1): | GPS = 1368195823 (Mon May 15 14:23:25 2023 ) → GPS = 1368195833 (Mon May 15 14:23:35 2023 ) |
| Event time t(L1): | GPS = 1368195823 (Mon May 15 14:23:35 2023 ) → GPS = 1368195833 (Mon May 15 14:23:35 2023 ) |
| Omicron analysis time window (H1): | GPS = 1368195820 → GPS = 1368195836 |
| Omicron analysis time window (L1): | GPS = 1368195820 → GPS = 1368195836 |
| Time delay between detectors t(L1) - t(H1): | -4.78052 s (slice index = 212 / 217), δt_gw = 0.003481 s |
| Time delay uncertainty: | 0.00752981 s |
| [targeted mode] Time delay probability: | 0.494709 (0.682839 sigmas), δt_target = 0.00862265 s |
| Frequency: | 816.934 Hz |
| Ξ: | 0.000573112 ± 0.0178281 (variance = 0.000317843): Q0: 0, Q1: 0.0263582, Q2: 0.0493788, Q3: 0.047358, Q4: 0.0294014 |
| Rank: | R_A = 0.13682 |
| Log of amplitude ratio (L1/H1): | 0.303473, variance = 0.814299 (L1/H1: 0.420142, variance = 1.62412, H1/L1: -0.193935, variance = 1.6295) |
| Amplitude ratio (L1/H1): | 1.35456 ⋇ 2.46548 (L1/H1: 1.52218 ⋇ 3.57659, H1/L1: 0.823712 ⋇ 3.58415) |
| Amplitude ratio H1|L1 compatibility (probability): | 0.900201 |
| Antenna factor probability: | 1 |
| Number of rejected frequency rows: | Q0: 18 / 18, Q1: 35 / 36, Q2: 67 / 70, Q3: 130 / 134, Q4: 255 / 258 |
| Maximum signal-to-noise ratio: | H1: 4.87447, L1: 5.03061 |
| SNR variance: | H1: 0.462752, L1: 0.464598 |
| Click here for a zoomed plot | Click here for a zoomed plot | Click here for a zoomed plot | Click here for a zoomed plot | Click here for a zoomed plot |
|
|
|
|
|
|
|
|
|
|
|
|
|
|
|
|
|
|
|
|
|
|
|
|
|
 |
 |
 |
 |
 |
 |
 |
 |
 |
| Event time t(H1): | GPS = 1368195823 (Mon May 15 14:23:25 2023 ) → GPS = 1368195833 (Mon May 15 14:23:35 2023 ) |
| Event time t(L1): | GPS = 1368195823 (Mon May 15 14:23:35 2023 ) → GPS = 1368195833 (Mon May 15 14:23:35 2023 ) |
| Omicron analysis time window (H1): | GPS = 1368195820 → GPS = 1368195836 |
| Omicron analysis time window (L1): | GPS = 1368195820 → GPS = 1368195836 |
| Time delay between detectors t(L1) - t(H1): | -4.73418 s (slice index = 211 / 217), δt_gw = 0.00382485 s |
| Time delay uncertainty: | 0.00477616 s |
| [targeted mode] Time delay probability: | 0.315123 (1.00453 sigmas), δt_target = 0.00862265 s |
| Frequency: | 760.844 Hz |
| Ξ: | 0.000502813 ± 0.0232928 (variance = 0.000542556): Q0: 0, Q1: 0.0356299, Q2: 0.0249944, Q3: 0.0327034, Q4: 0.0724055 |
| Rank: | R_A = 0.13682 |
| Log of amplitude ratio (L1/H1): | 0.784352, variance = 1.98522 (L1/H1: -0.39484, variance = 4.04371, H1/L1: -1.89148, variance = 3.89845) |
| Amplitude ratio (L1/H1): | 2.19099 ⋇ 4.09178 (L1/H1: 0.673788 ⋇ 7.47003, H1/L1: 0.150848 ⋇ 7.20265) |
| Amplitude ratio H1|L1 compatibility (probability): | 0.417208 |
| Antenna factor probability: | 1 |
| Number of rejected frequency rows: | Q0: 18 / 18, Q1: 35 / 36, Q2: 67 / 70, Q3: 131 / 134, Q4: 252 / 258 |
| Maximum signal-to-noise ratio: | H1: 4.87447, L1: 5.03061 |
| SNR variance: | H1: 0.462752, L1: 0.464598 |
| Click here for a zoomed plot | Click here for a zoomed plot | Click here for a zoomed plot | Click here for a zoomed plot | Click here for a zoomed plot |
|
|
|
|
|
|
|
|
|
|
|
|
|
|
|
|
|
|
|
|
|
|
|
|
|
 |
 |
 |
 |
 |
 |
 |
 |
 |
| Event time t(H1): | GPS = 1368195823 (Mon May 15 14:23:25 2023 ) → GPS = 1368195833 (Mon May 15 14:23:35 2023 ) |
| Event time t(L1): | GPS = 1368195823 (Mon May 15 14:23:35 2023 ) → GPS = 1368195833 (Mon May 15 14:23:35 2023 ) |
| Omicron analysis time window (H1): | GPS = 1368195820 → GPS = 1368195836 |
| Omicron analysis time window (L1): | GPS = 1368195820 → GPS = 1368195836 |
| Time delay between detectors t(L1) - t(H1): | -4.69524 s (slice index = 210 / 217), δt_gw = -0.00323538 s |
| Time delay uncertainty: | 0.00380766 s |
| [targeted mode] Time delay probability: | 0.00184412 (3.11425 sigmas), δt_target = 0.00862265 s |
| Frequency: | 335.446 Hz |
| Ξ: | 0.000237143 ± 0.108788 (variance = 0.0118348): Q0: 0, Q1: 0, Q2: 0.0134258, Q3: 0.0342885, Q4: 0.282085 |
| Rank: | R_A = 0.13682 |
| Log of amplitude ratio (L1/H1): | 0.00103223, variance = 0.461119 (L1/H1: 0.52691, variance = 0.702024, H1/L1: 0.492708, variance = 1.11464) |
| Amplitude ratio (L1/H1): | 1.00103 ⋇ 1.97202 (L1/H1: 1.69369 ⋇ 2.31144, H1/L1: 1.63674 ⋇ 2.87417) |
| Amplitude ratio H1|L1 compatibility (probability): | 0.449358 |
| Antenna factor probability: | 1 |
| Number of rejected frequency rows: | Q0: 18 / 18, Q1: 36 / 36, Q2: 69 / 70, Q3: 133 / 134, Q4: 253 / 258 |
| Maximum signal-to-noise ratio: | H1: 4.87447, L1: 5.03061 |
| SNR variance: | H1: 0.462752, L1: 0.464598 |
| Click here for a zoomed plot | Click here for a zoomed plot | Click here for a zoomed plot | Click here for a zoomed plot | Click here for a zoomed plot |
|
|
|
|
|
|
|
|
|
|
|
|
|
|
|
|
|
|
|
|
|
|
|
|
|
 |
 |
 |
 |
 |
 |
 |
 |
 |
| Event time t(H1): | GPS = 1368195823 (Mon May 15 14:23:25 2023 ) → GPS = 1368195833 (Mon May 15 14:23:35 2023 ) |
| Event time t(L1): | GPS = 1368195823 (Mon May 15 14:23:35 2023 ) → GPS = 1368195833 (Mon May 15 14:23:35 2023 ) |
| Omicron analysis time window (H1): | GPS = 1368195820 → GPS = 1368195836 |
| Omicron analysis time window (L1): | GPS = 1368195820 → GPS = 1368195836 |
| Time delay between detectors t(L1) - t(H1): | -4.65366 s (slice index = 209 / 217), δt_gw = -0.00766292 s |
| Time delay uncertainty: | 0.00574879 s |
| [targeted mode] Time delay probability: | 0.00461326 (2.83287 sigmas), δt_target = 0.00862265 s |
| Frequency: | 806.214 Hz |
| Ξ: | 0.000146091 ± 0.023162 (variance = 0.000536477): Q0: 0, Q1: 0, Q2: 0.0369834, Q3: 0, Q4: 0.0547507 |
| Rank: | R_A = 0.13682 |
| Log of amplitude ratio (L1/H1): | 0.642041, variance = 0.249212 (L1/H1: 0.894768, variance = 0.336657, H1/L1: -0.404759, variance = 0.640093) |
| Amplitude ratio (L1/H1): | 1.90036 ⋇ 1.64742 (L1/H1: 2.44677 ⋇ 1.78643, H1/L1: 0.667138 ⋇ 2.22567) |
| Amplitude ratio H1|L1 compatibility (probability): | 0.620031 |
| Antenna factor probability: | 1 |
| Number of rejected frequency rows: | Q0: 18 / 18, Q1: 36 / 36, Q2: 68 / 70, Q3: 134 / 134, Q4: 257 / 258 |
| Maximum signal-to-noise ratio: | H1: 4.87447, L1: 5.03061 |
| SNR variance: | H1: 0.462752, L1: 0.464598 |
| Click here for a zoomed plot | Click here for a zoomed plot | Click here for a zoomed plot | Click here for a zoomed plot | Click here for a zoomed plot |
|
|
|
|
|
|
|
|
|
|
|
|
|
|
|
|
|
|
|
|
|
|
|
|
|
 |
 |
 |
 |
 |
 |
 |
 |
 |
| Event time t(H1): | GPS = 1368195823 (Mon May 15 14:23:25 2023 ) → GPS = 1368195833 (Mon May 15 14:23:35 2023 ) |
| Event time t(L1): | GPS = 1368195823 (Mon May 15 14:23:35 2023 ) → GPS = 1368195833 (Mon May 15 14:23:35 2023 ) |
| Omicron analysis time window (H1): | GPS = 1368195820 → GPS = 1368195836 |
| Omicron analysis time window (L1): | GPS = 1368195820 → GPS = 1368195836 |
| Time delay between detectors t(L1) - t(H1): | -4.59402 s (slice index = 208 / 217), δt_gw = 0.00597882 s |
| Time delay uncertainty: | 0.00510405 s |
| [targeted mode] Time delay probability: | 0.604467 (0.517987 sigmas), δt_target = 0.00862265 s |
| Frequency: | 762.09 Hz |
| Ξ: | 0.000264358 ± 0.0289457 (variance = 0.000837856): Q0: 0, Q1: 0, Q2: 0.0364016, Q3: 0, Q4: 0.0723012 |
| Rank: | R_A = 0.13682 |
| Log of amplitude ratio (L1/H1): | 0.344117, variance = 0.474156 (L1/H1: -0.0129201, variance = 1.08417, H1/L1: -0.679335, variance = 0.826785) |
| Amplitude ratio (L1/H1): | 1.41074 ⋇ 1.99091 (L1/H1: 0.987163 ⋇ 2.83271, H1/L1: 0.506954 ⋇ 2.48253) |
| Amplitude ratio H1|L1 compatibility (probability): | 0.61653 |
| Antenna factor probability: | 1 |
| Number of rejected frequency rows: | Q0: 18 / 18, Q1: 36 / 36, Q2: 67 / 70, Q3: 134 / 134, Q4: 252 / 258 |
| Maximum signal-to-noise ratio: | H1: 4.87447, L1: 5.03061 |
| SNR variance: | H1: 0.462752, L1: 0.464598 |
| Click here for a zoomed plot | Click here for a zoomed plot | Click here for a zoomed plot | Click here for a zoomed plot | Click here for a zoomed plot |
|
|
|
|
|
|
|
|
|
|
|
|
|
|
|
|
|
|
|
|
|
|
|
|
|
 |
 |
 |
 |
 |
 |
 |
 |
 |
| Event time t(H1): | GPS = 1368195823 (Mon May 15 14:23:25 2023 ) → GPS = 1368195833 (Mon May 15 14:23:35 2023 ) |
| Event time t(L1): | GPS = 1368195823 (Mon May 15 14:23:35 2023 ) → GPS = 1368195833 (Mon May 15 14:23:35 2023 ) |
| Omicron analysis time window (H1): | GPS = 1368195820 → GPS = 1368195836 |
| Omicron analysis time window (L1): | GPS = 1368195820 → GPS = 1368195836 |
| Time delay between detectors t(L1) - t(H1): | -4.54769 s (slice index = 207 / 217), δt_gw = 0.00631032 s |
| Time delay uncertainty: | 0.00567246 s |
| [targeted mode] Time delay probability: | 0.683537 (0.407642 sigmas), δt_target = 0.00862265 s |
| Frequency: | 550.434 Hz |
| Ξ: | 0.000236173 ± 0.0551987 (variance = 0.0030469): Q0: 0, Q1: 0.0138393, Q2: 0, Q3: 0.0783186, Q4: 0.140473 |
| Rank: | R_A = 0.13682 |
| Log of amplitude ratio (L1/H1): | 0.0417908, variance = 1.37295 (L1/H1: -0.648362, variance = 3.482, H1/L1: -0.689767, variance = 2.09188) |
| Amplitude ratio (L1/H1): | 1.04268 ⋇ 3.22757 (L1/H1: 0.522901 ⋇ 6.46246, H1/L1: 0.501693 ⋇ 4.24752) |
| Amplitude ratio H1|L1 compatibility (probability): | 0.570859 |
| Antenna factor probability: | 1 |
| Number of rejected frequency rows: | Q0: 18 / 18, Q1: 35 / 36, Q2: 70 / 70, Q3: 132 / 134, Q4: 255 / 258 |
| Maximum signal-to-noise ratio: | H1: 4.87447, L1: 5.03061 |
| SNR variance: | H1: 0.462752, L1: 0.464598 |
| Click here for a zoomed plot | Click here for a zoomed plot | Click here for a zoomed plot | Click here for a zoomed plot | Click here for a zoomed plot |
|
|
|
|
|
|
|
|
|
|
|
|
|
|
|
|
|
|
|
|
|
|
|
|
|
 |
 |
 |
 |
 |
 |
 |
 |
 |
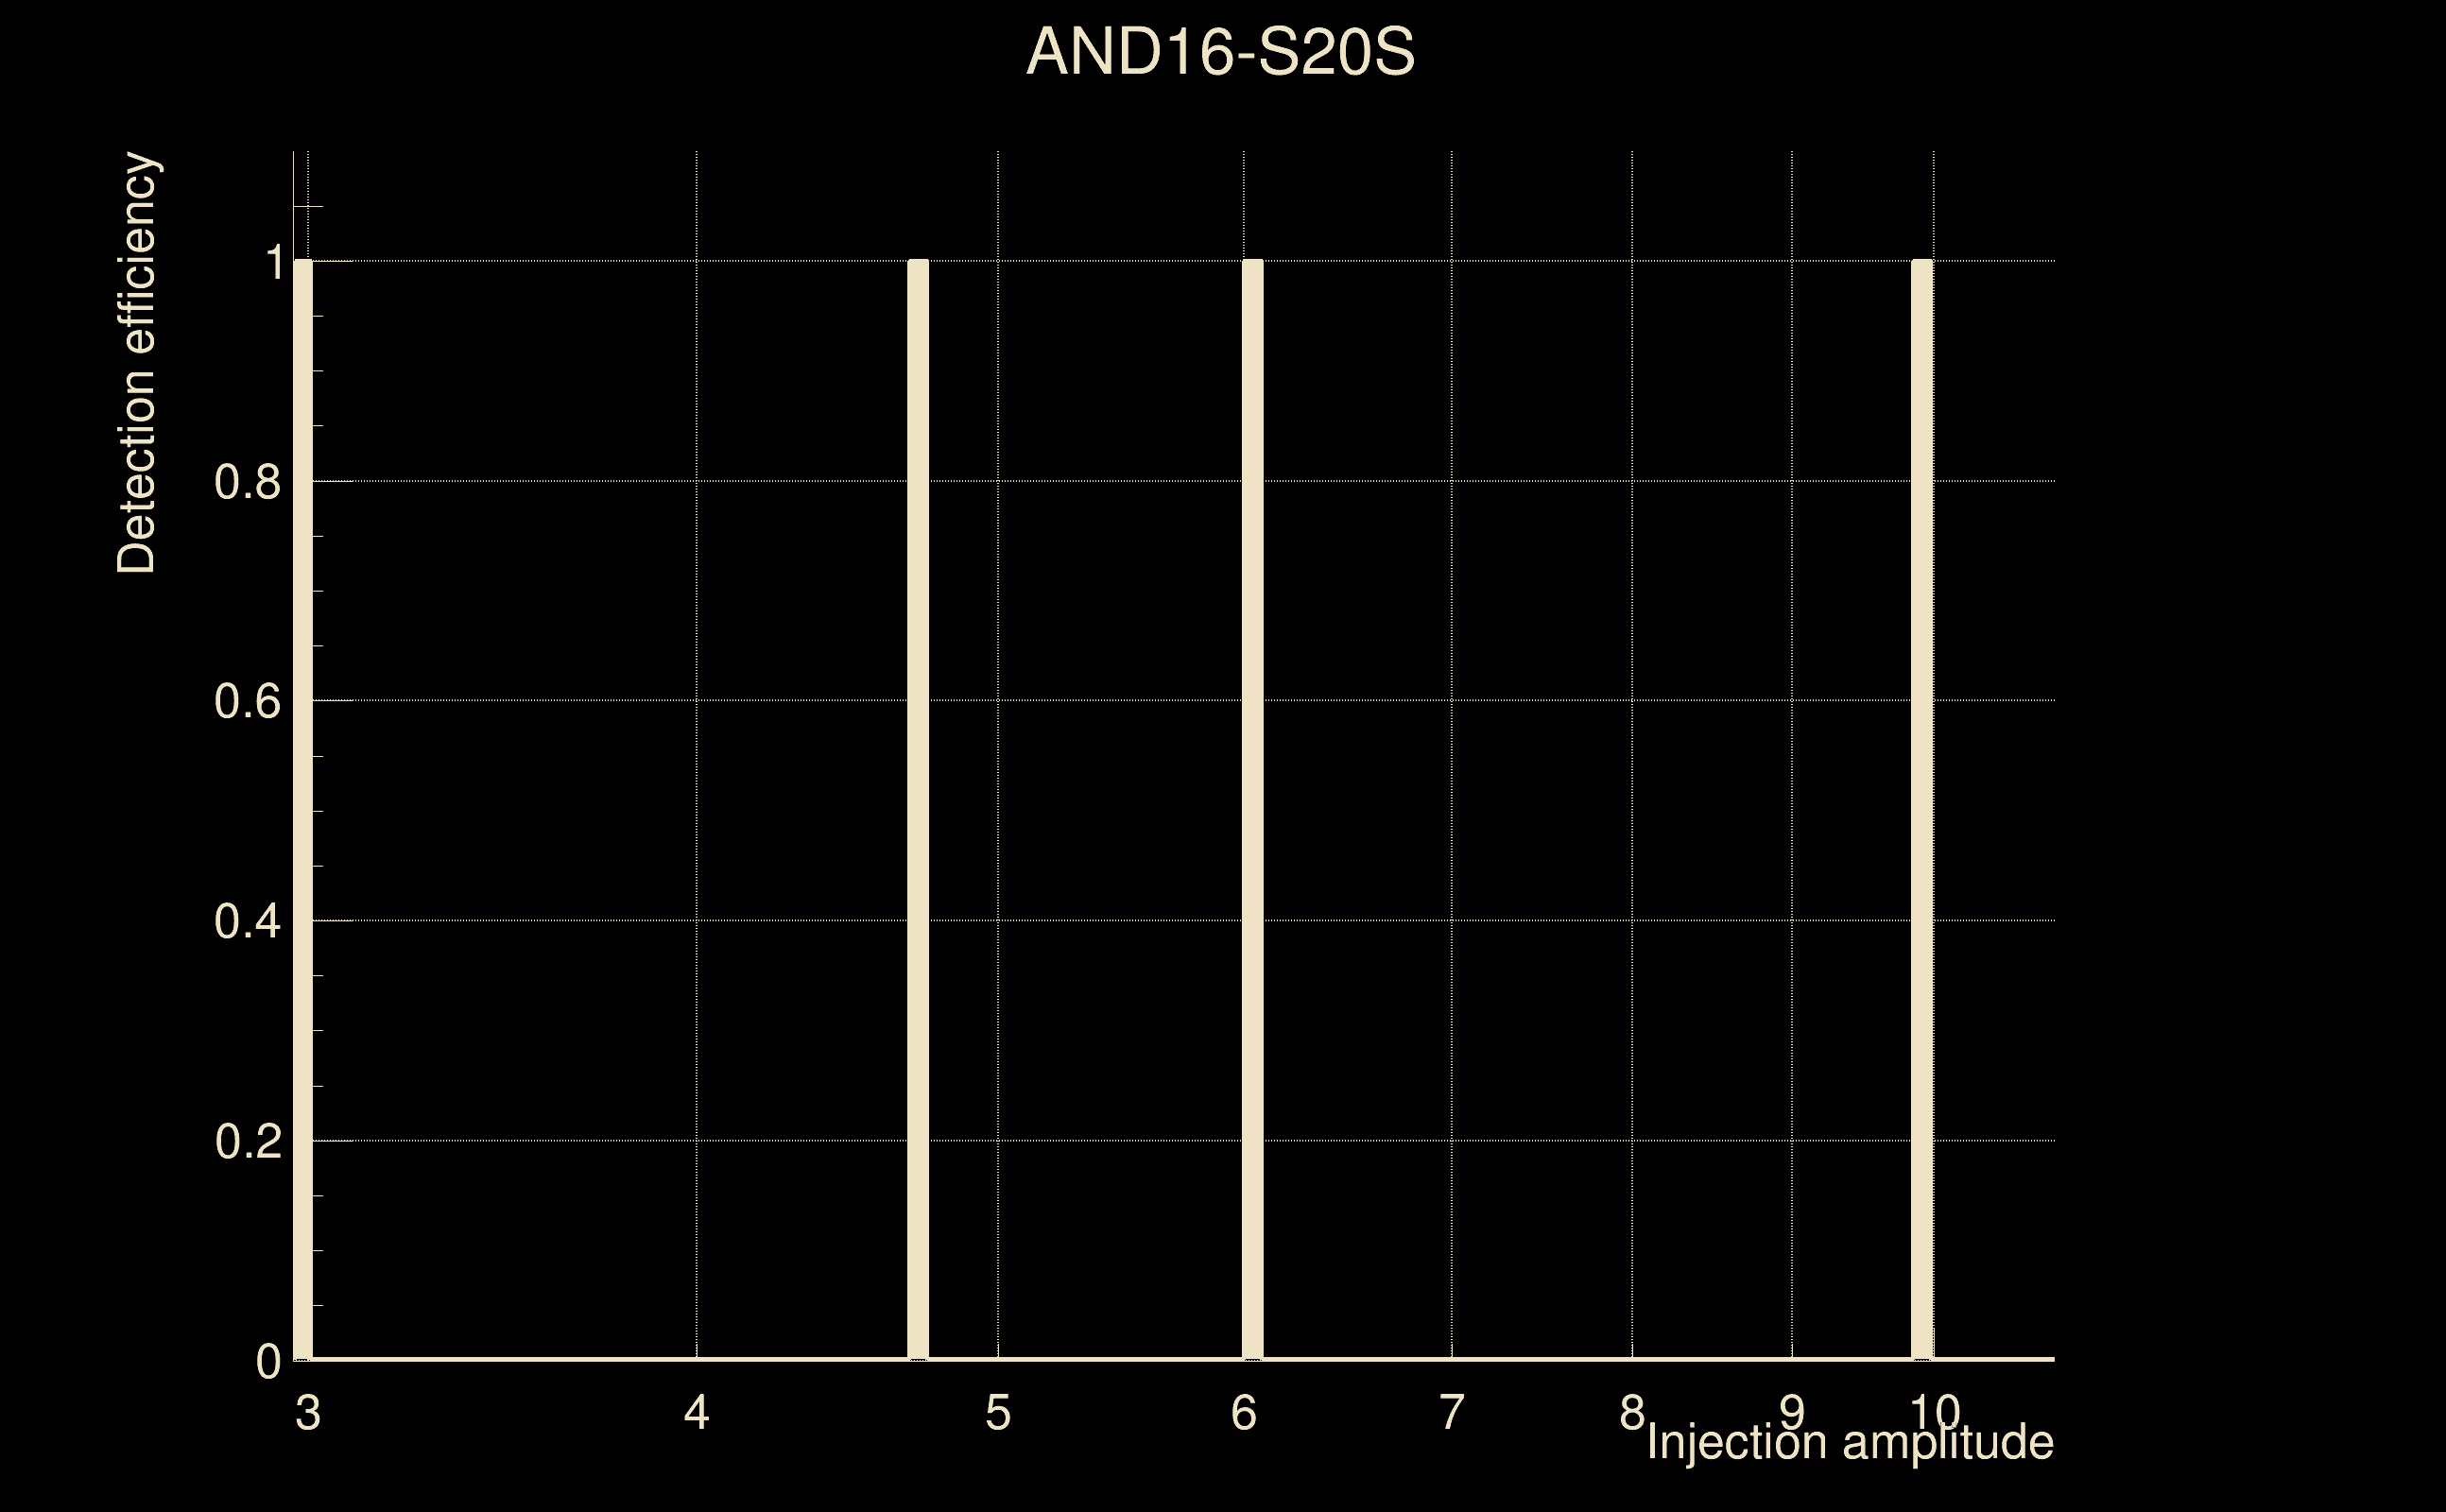
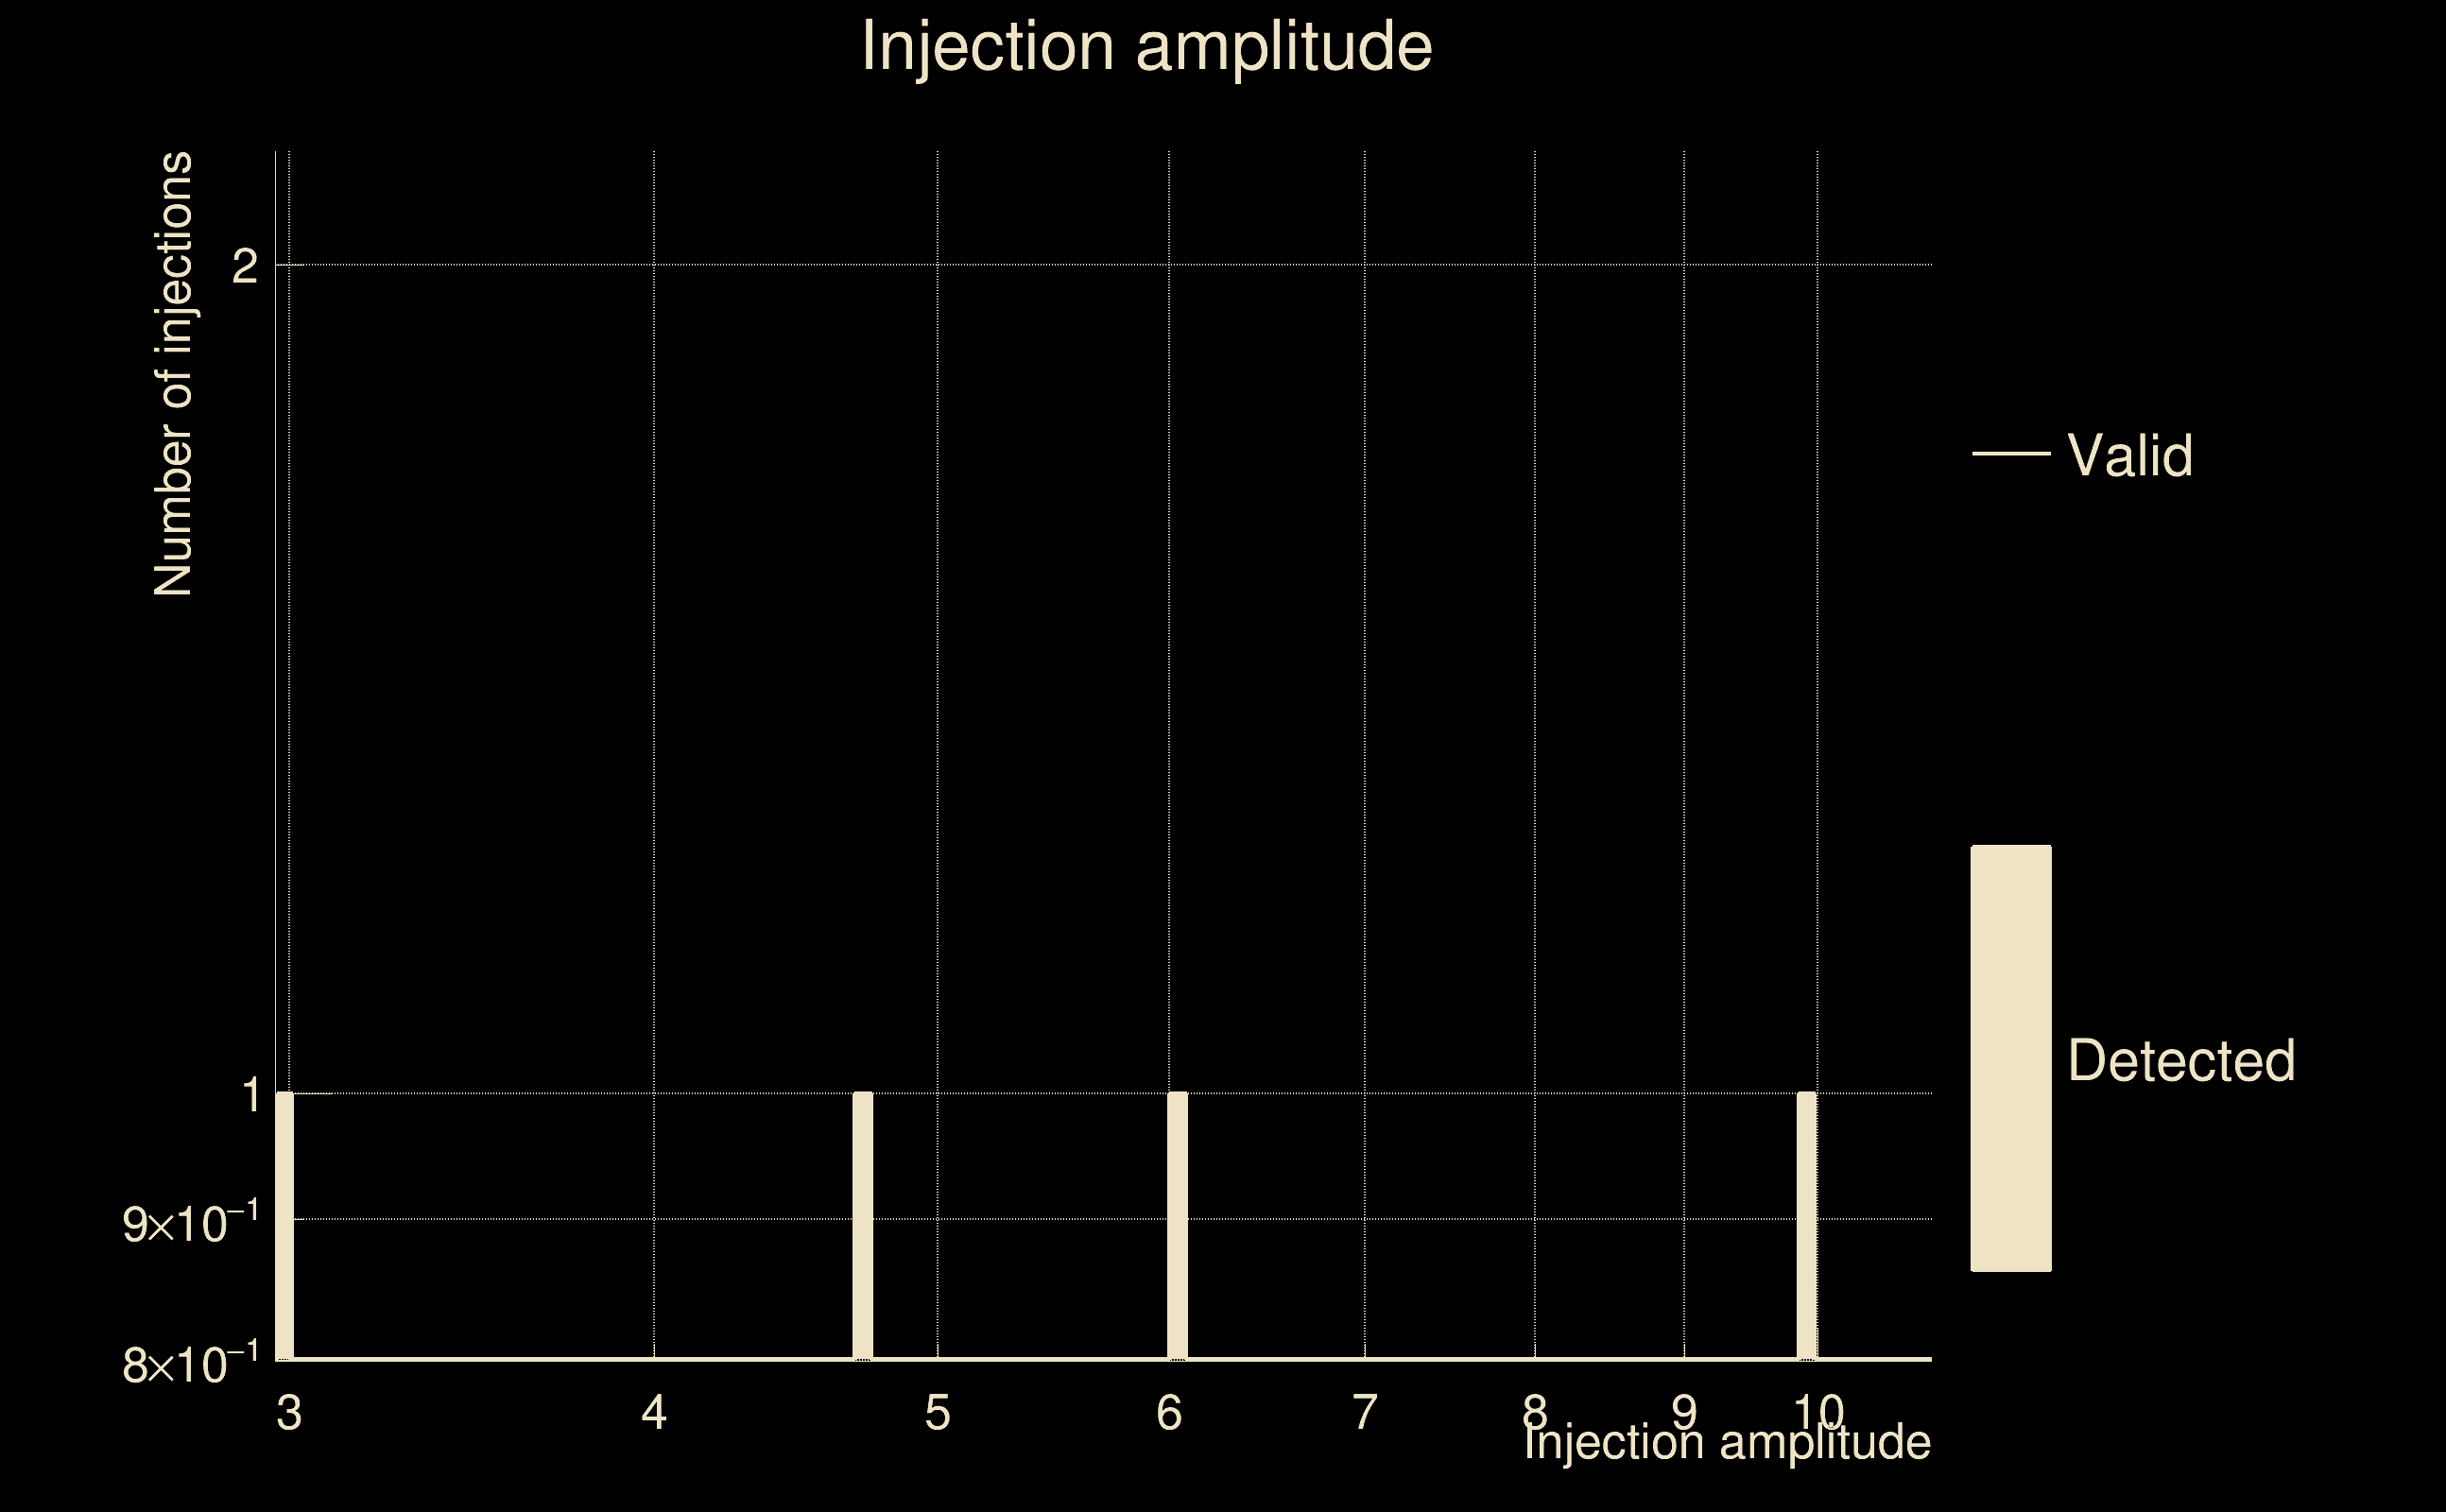
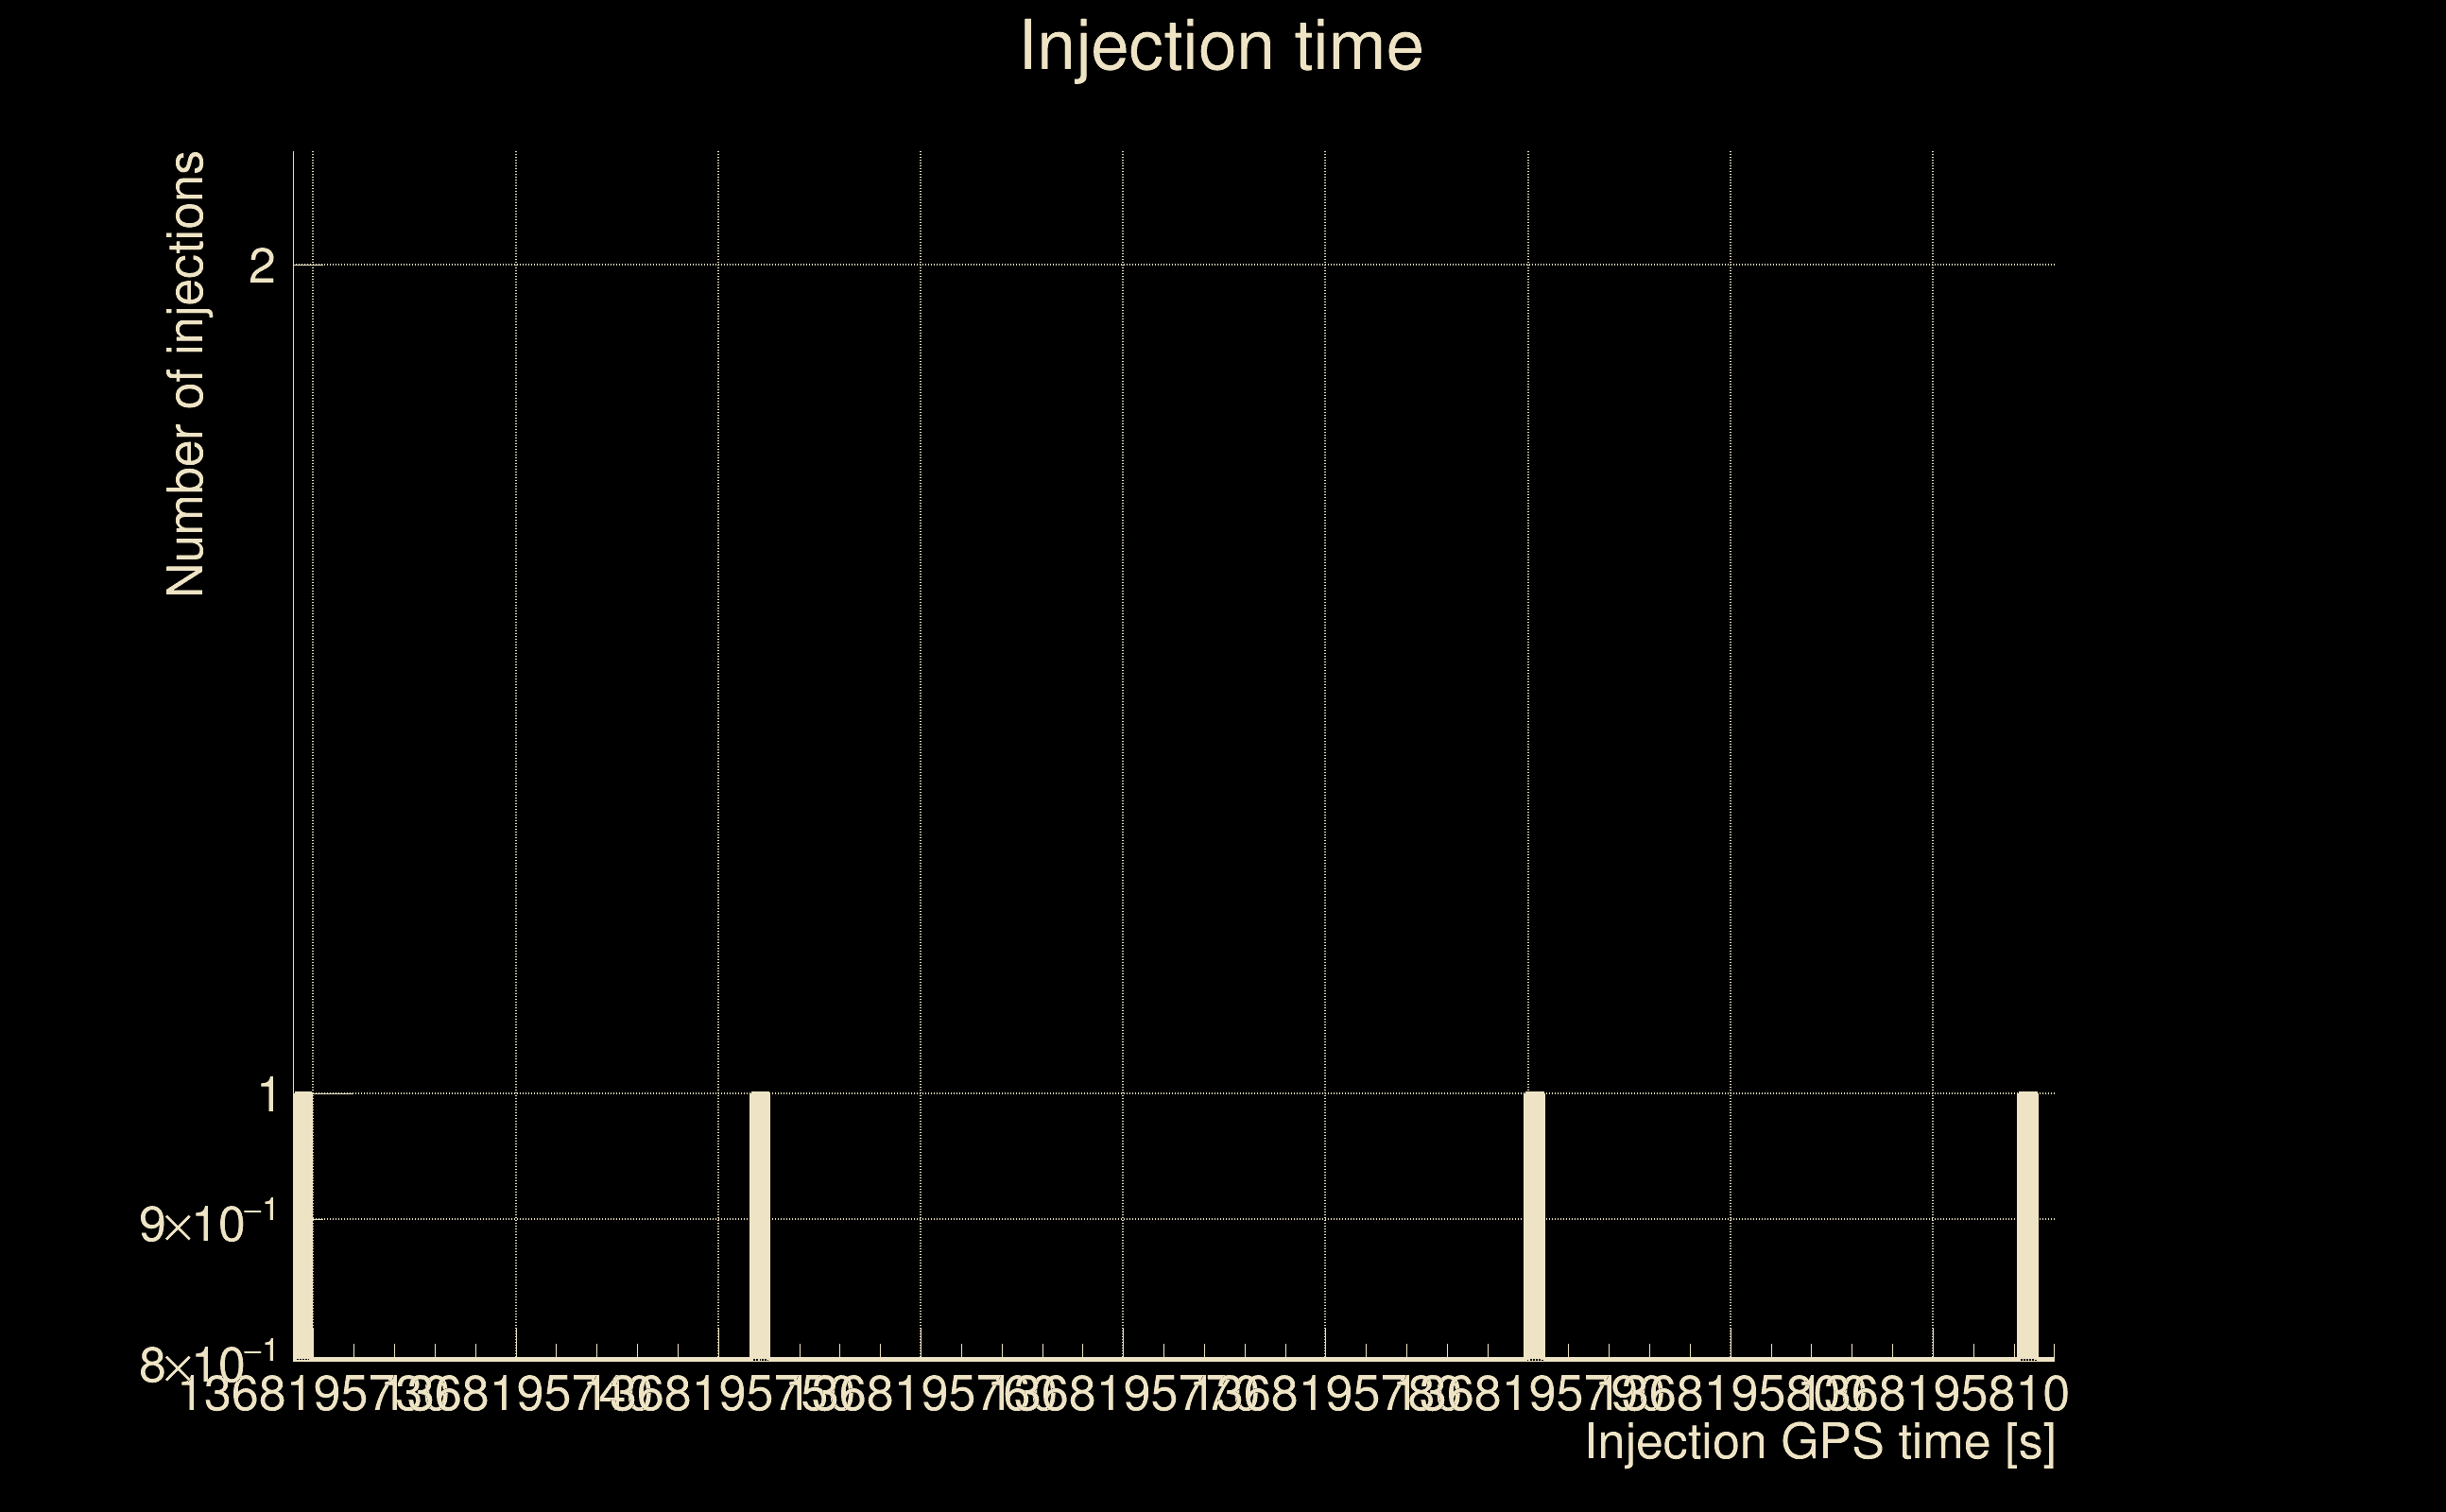
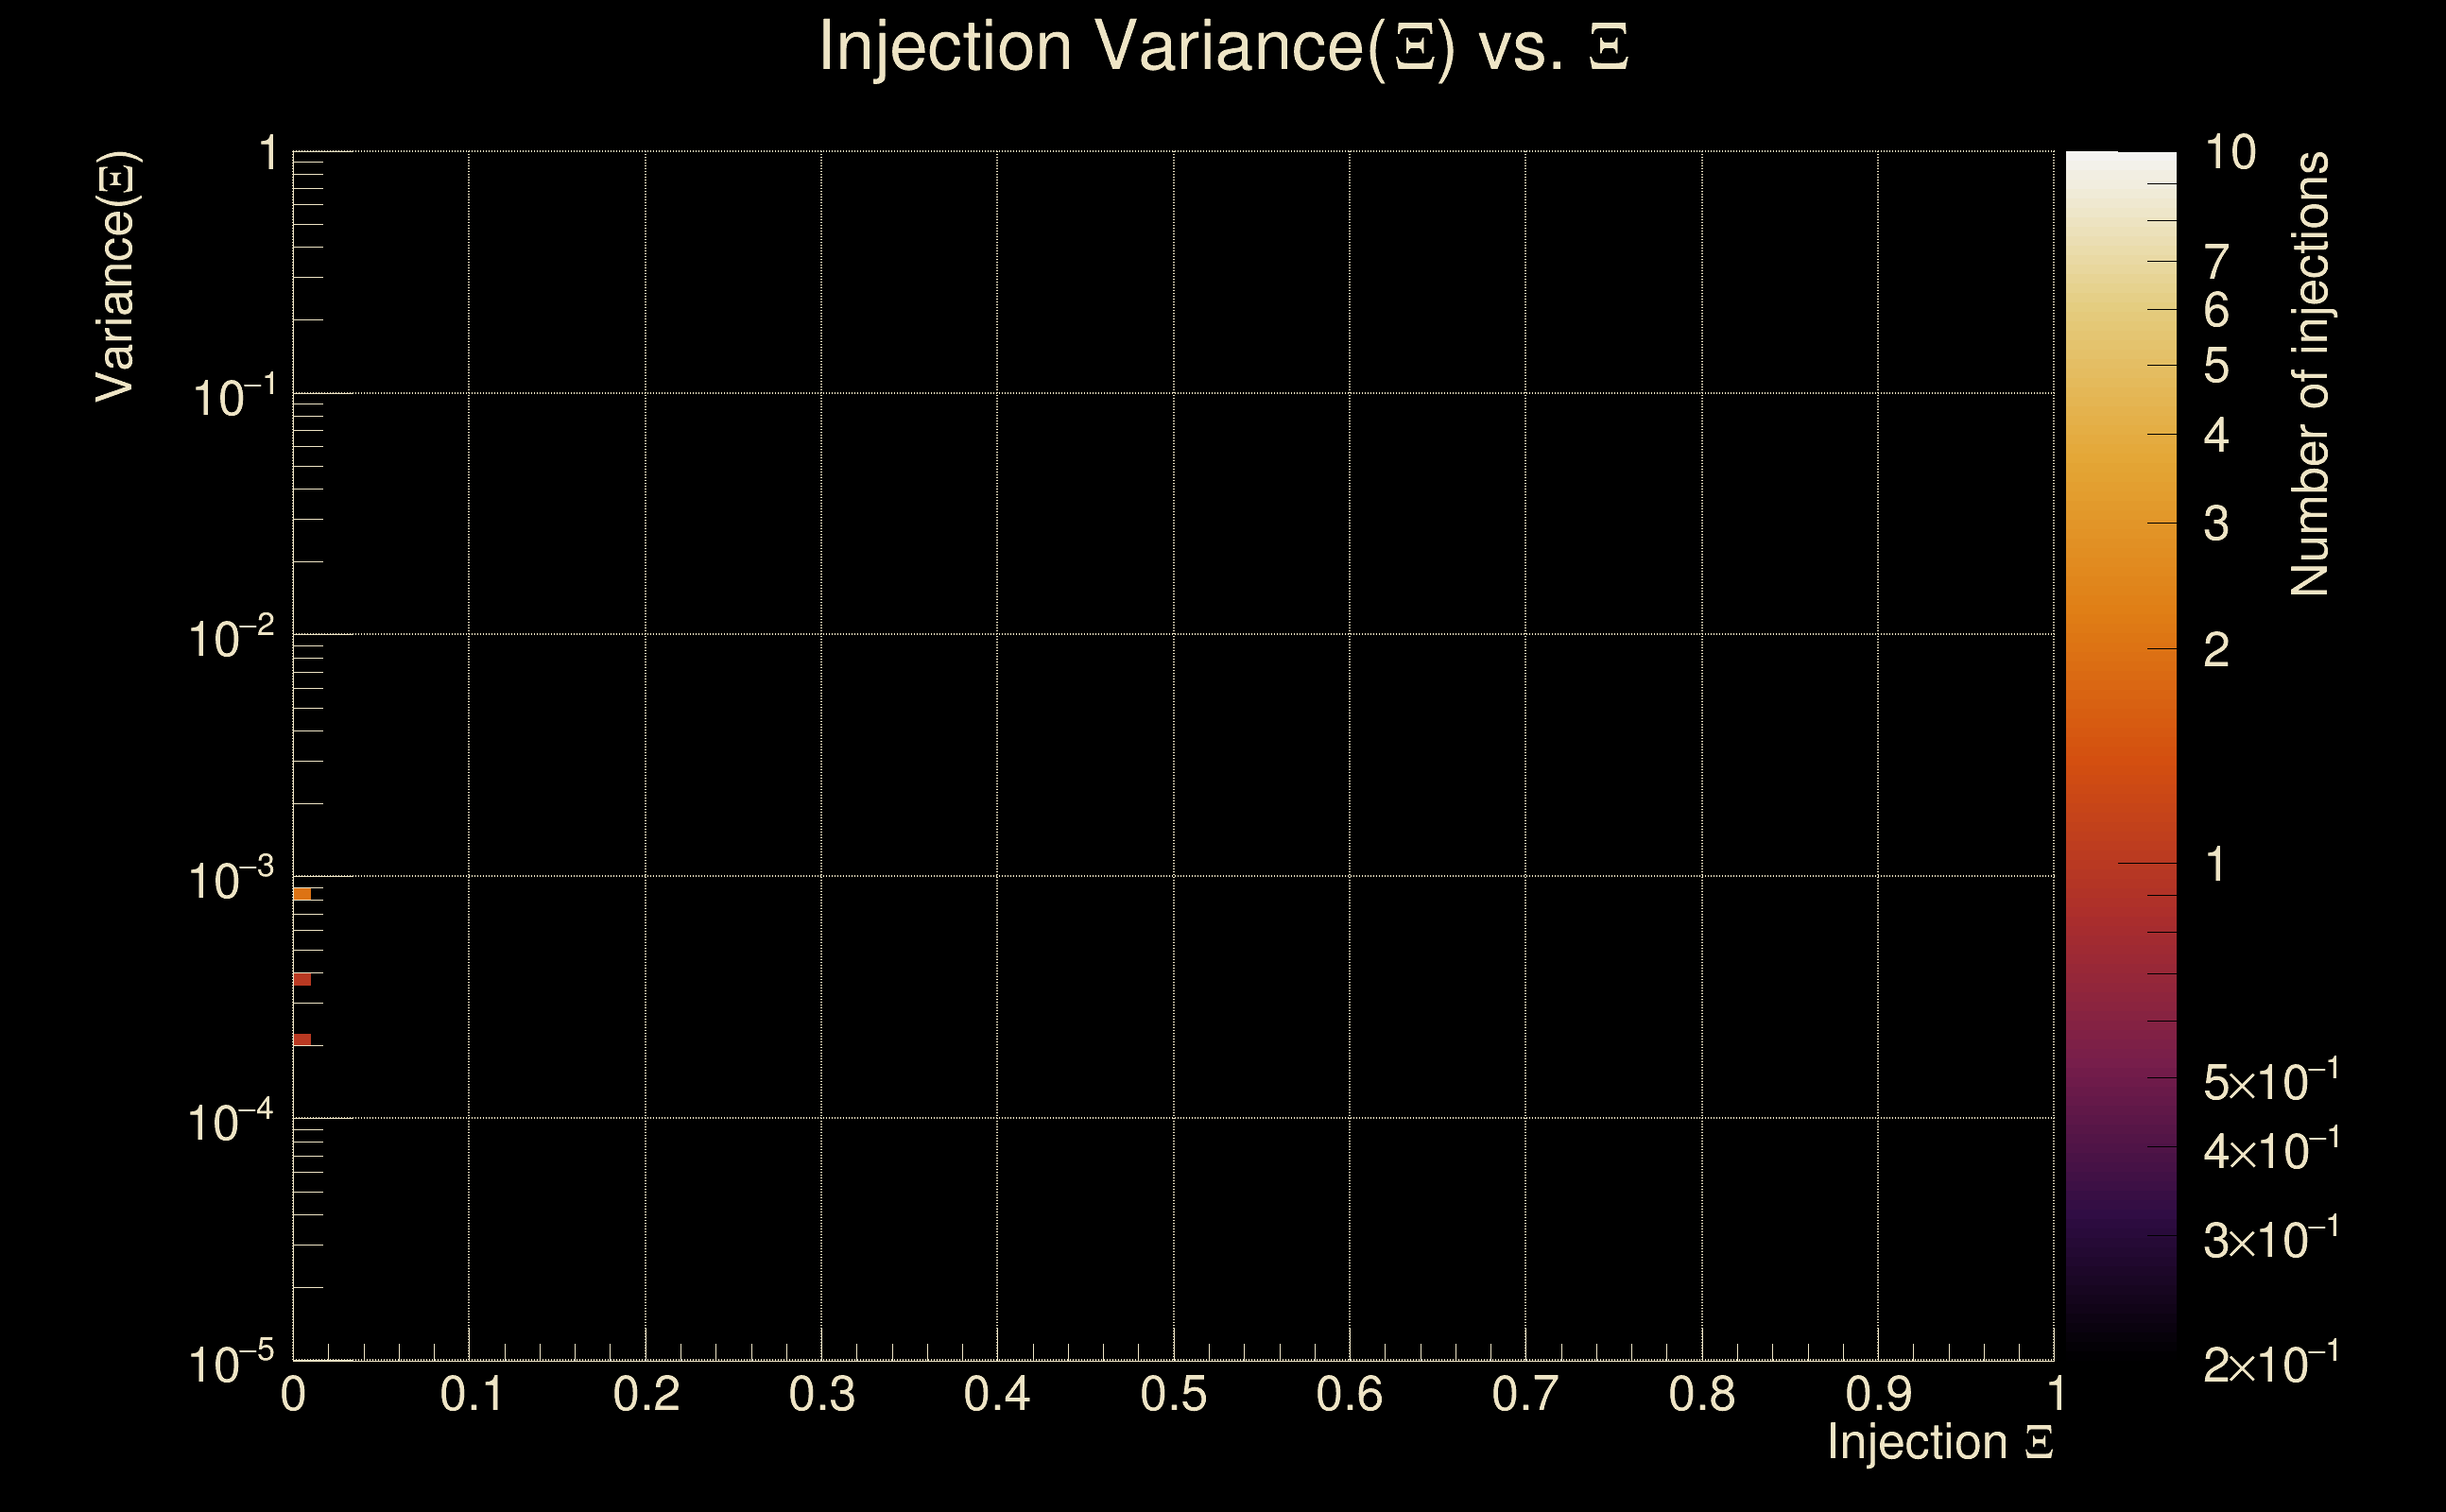
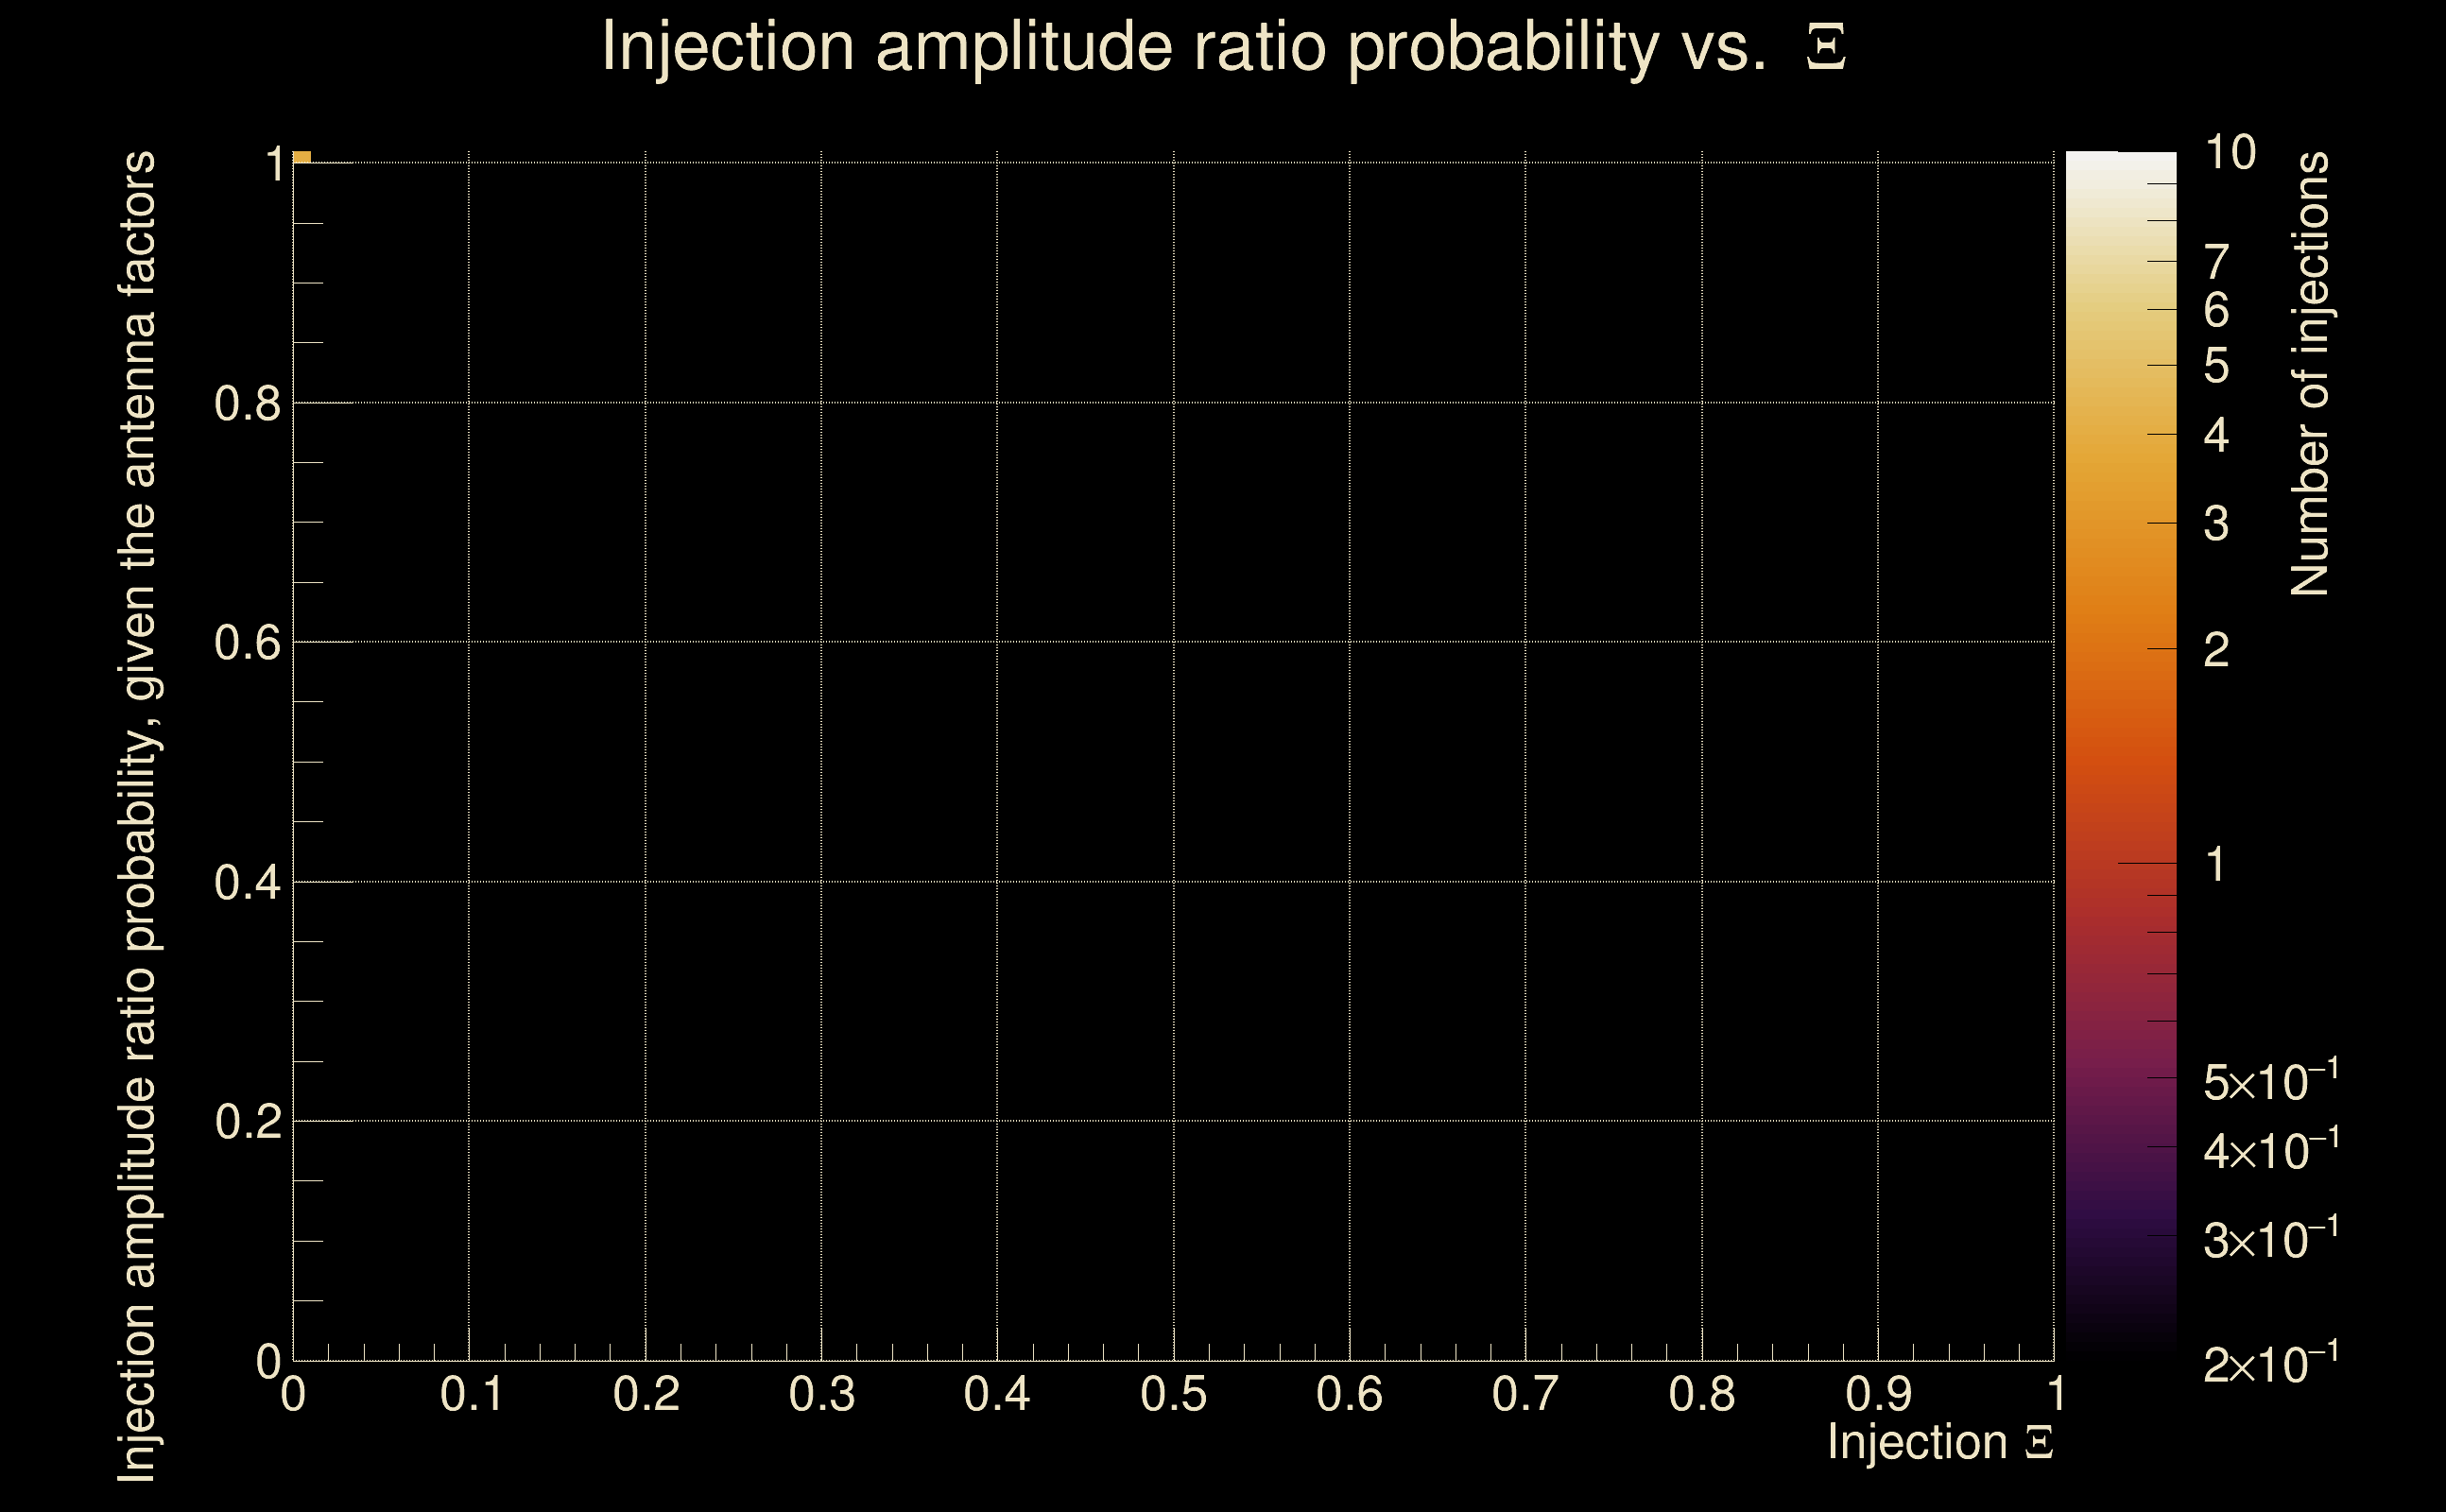
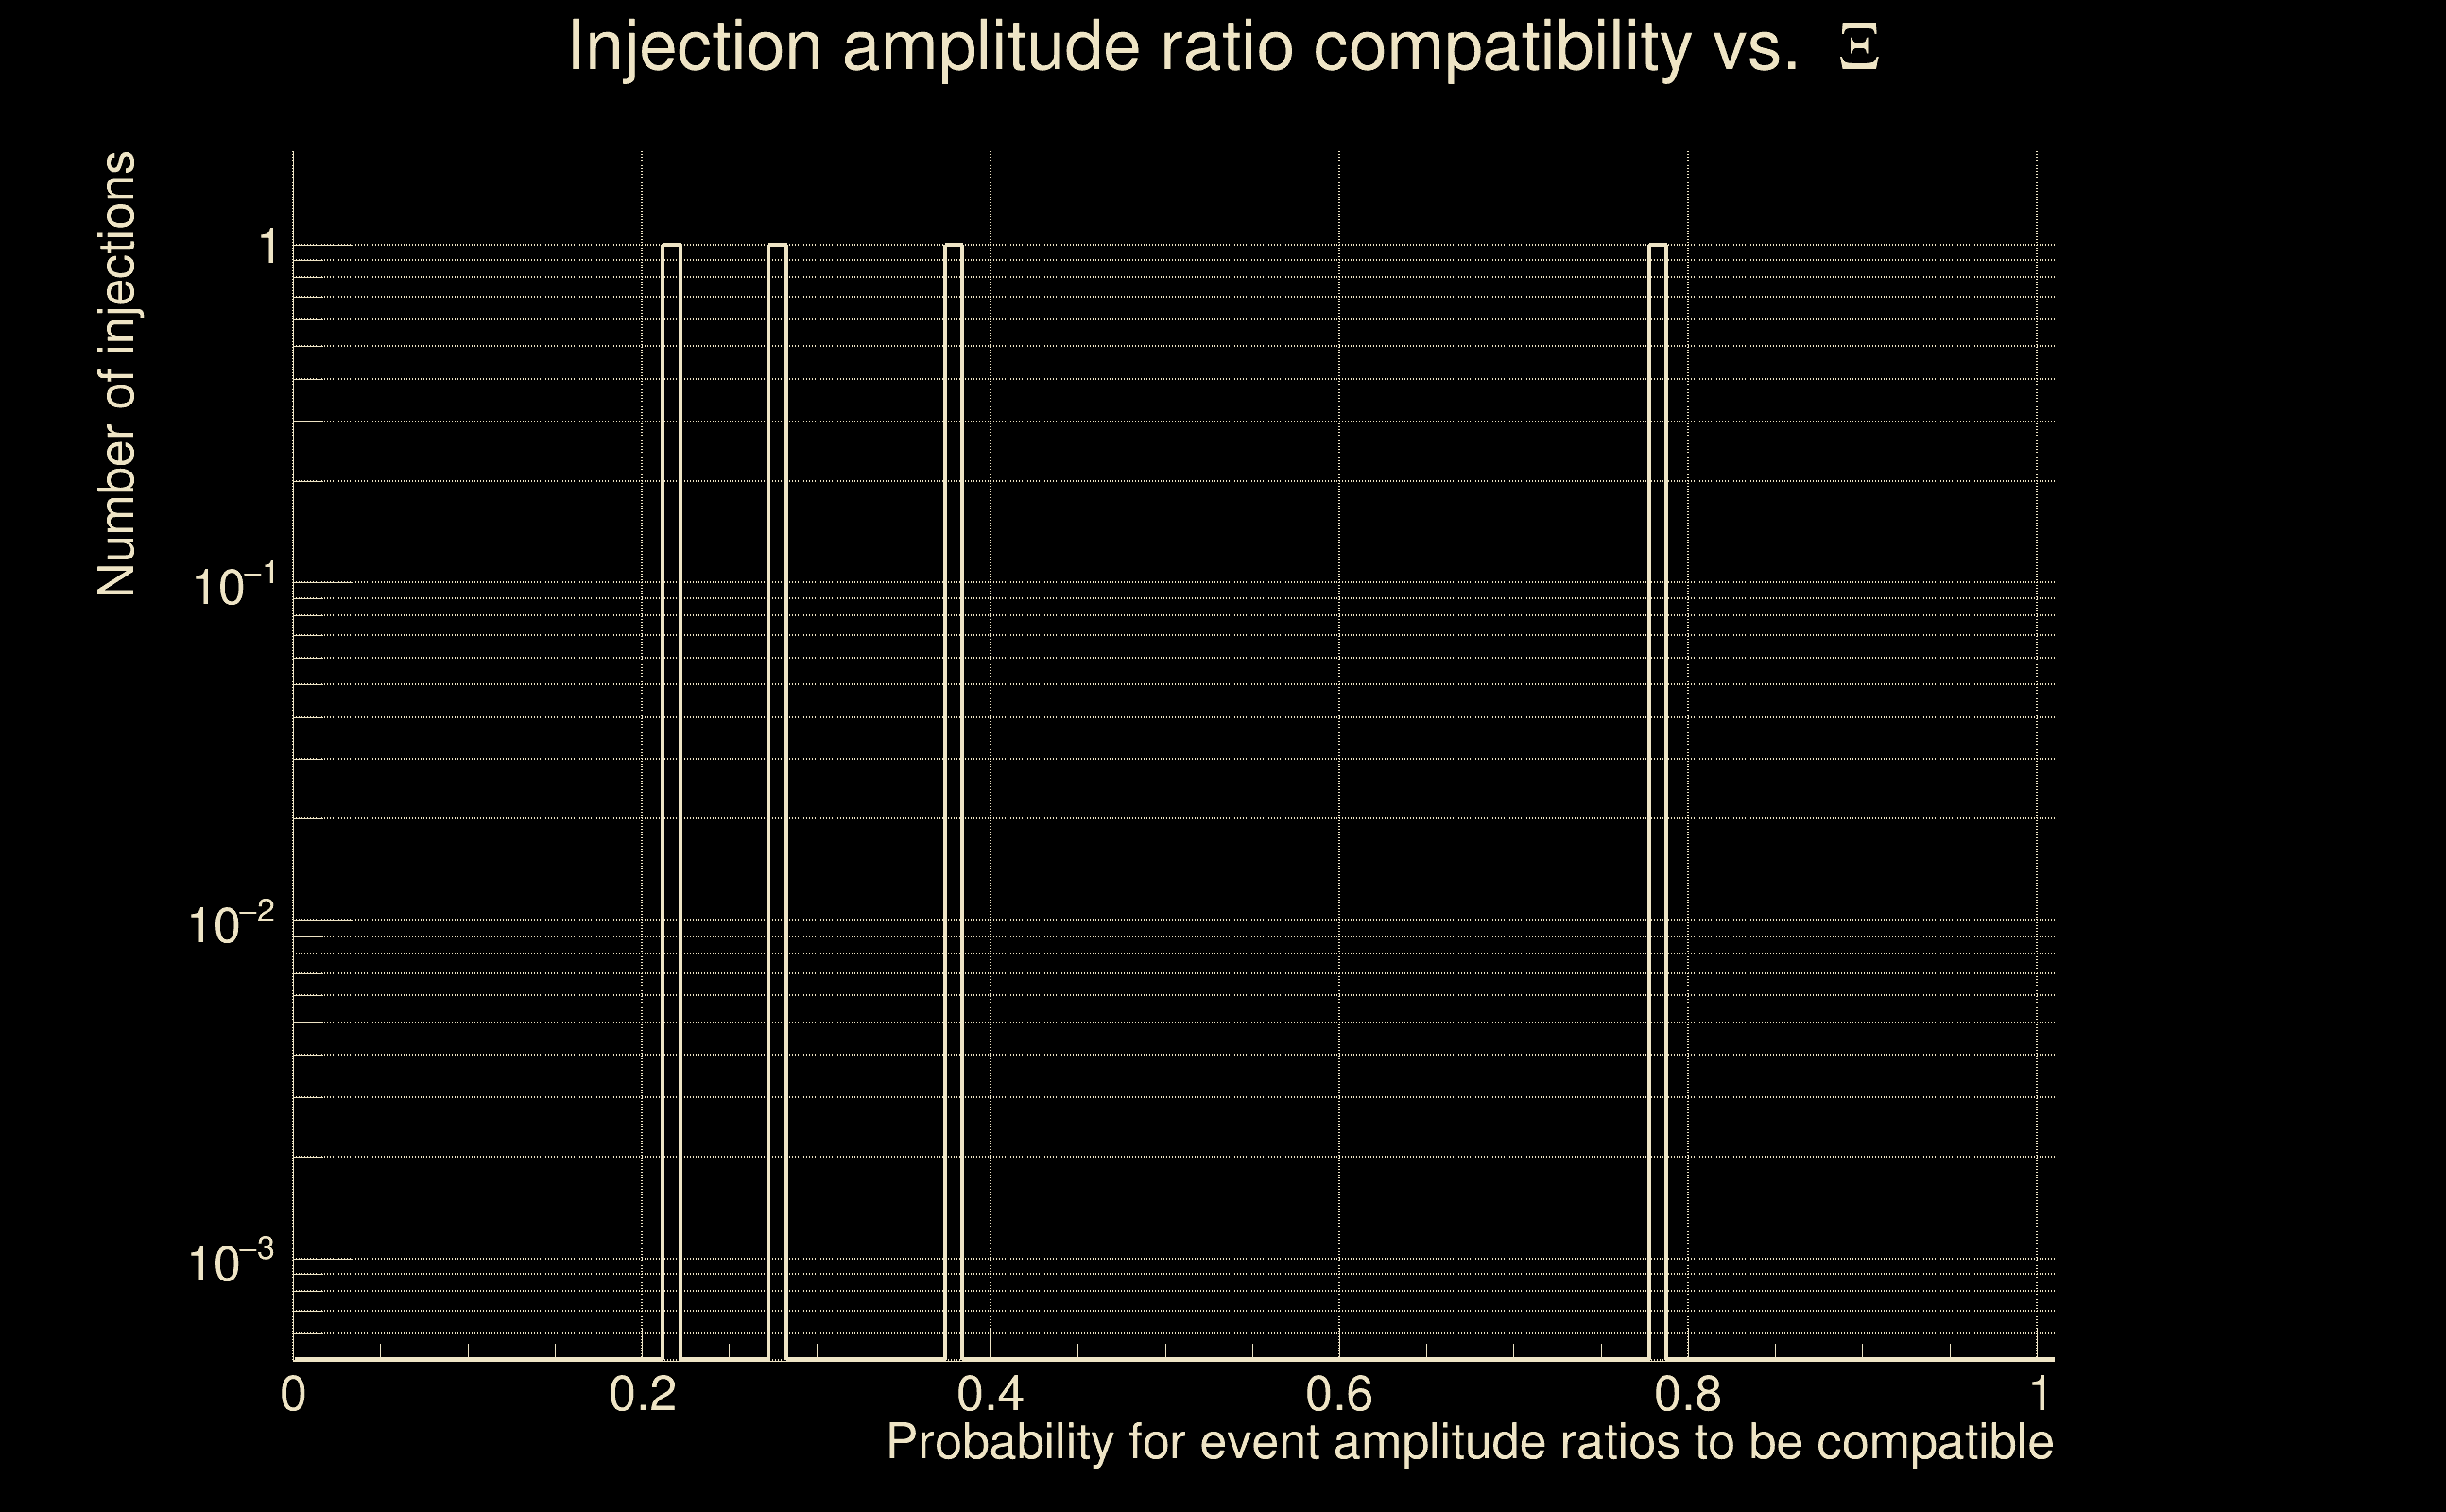
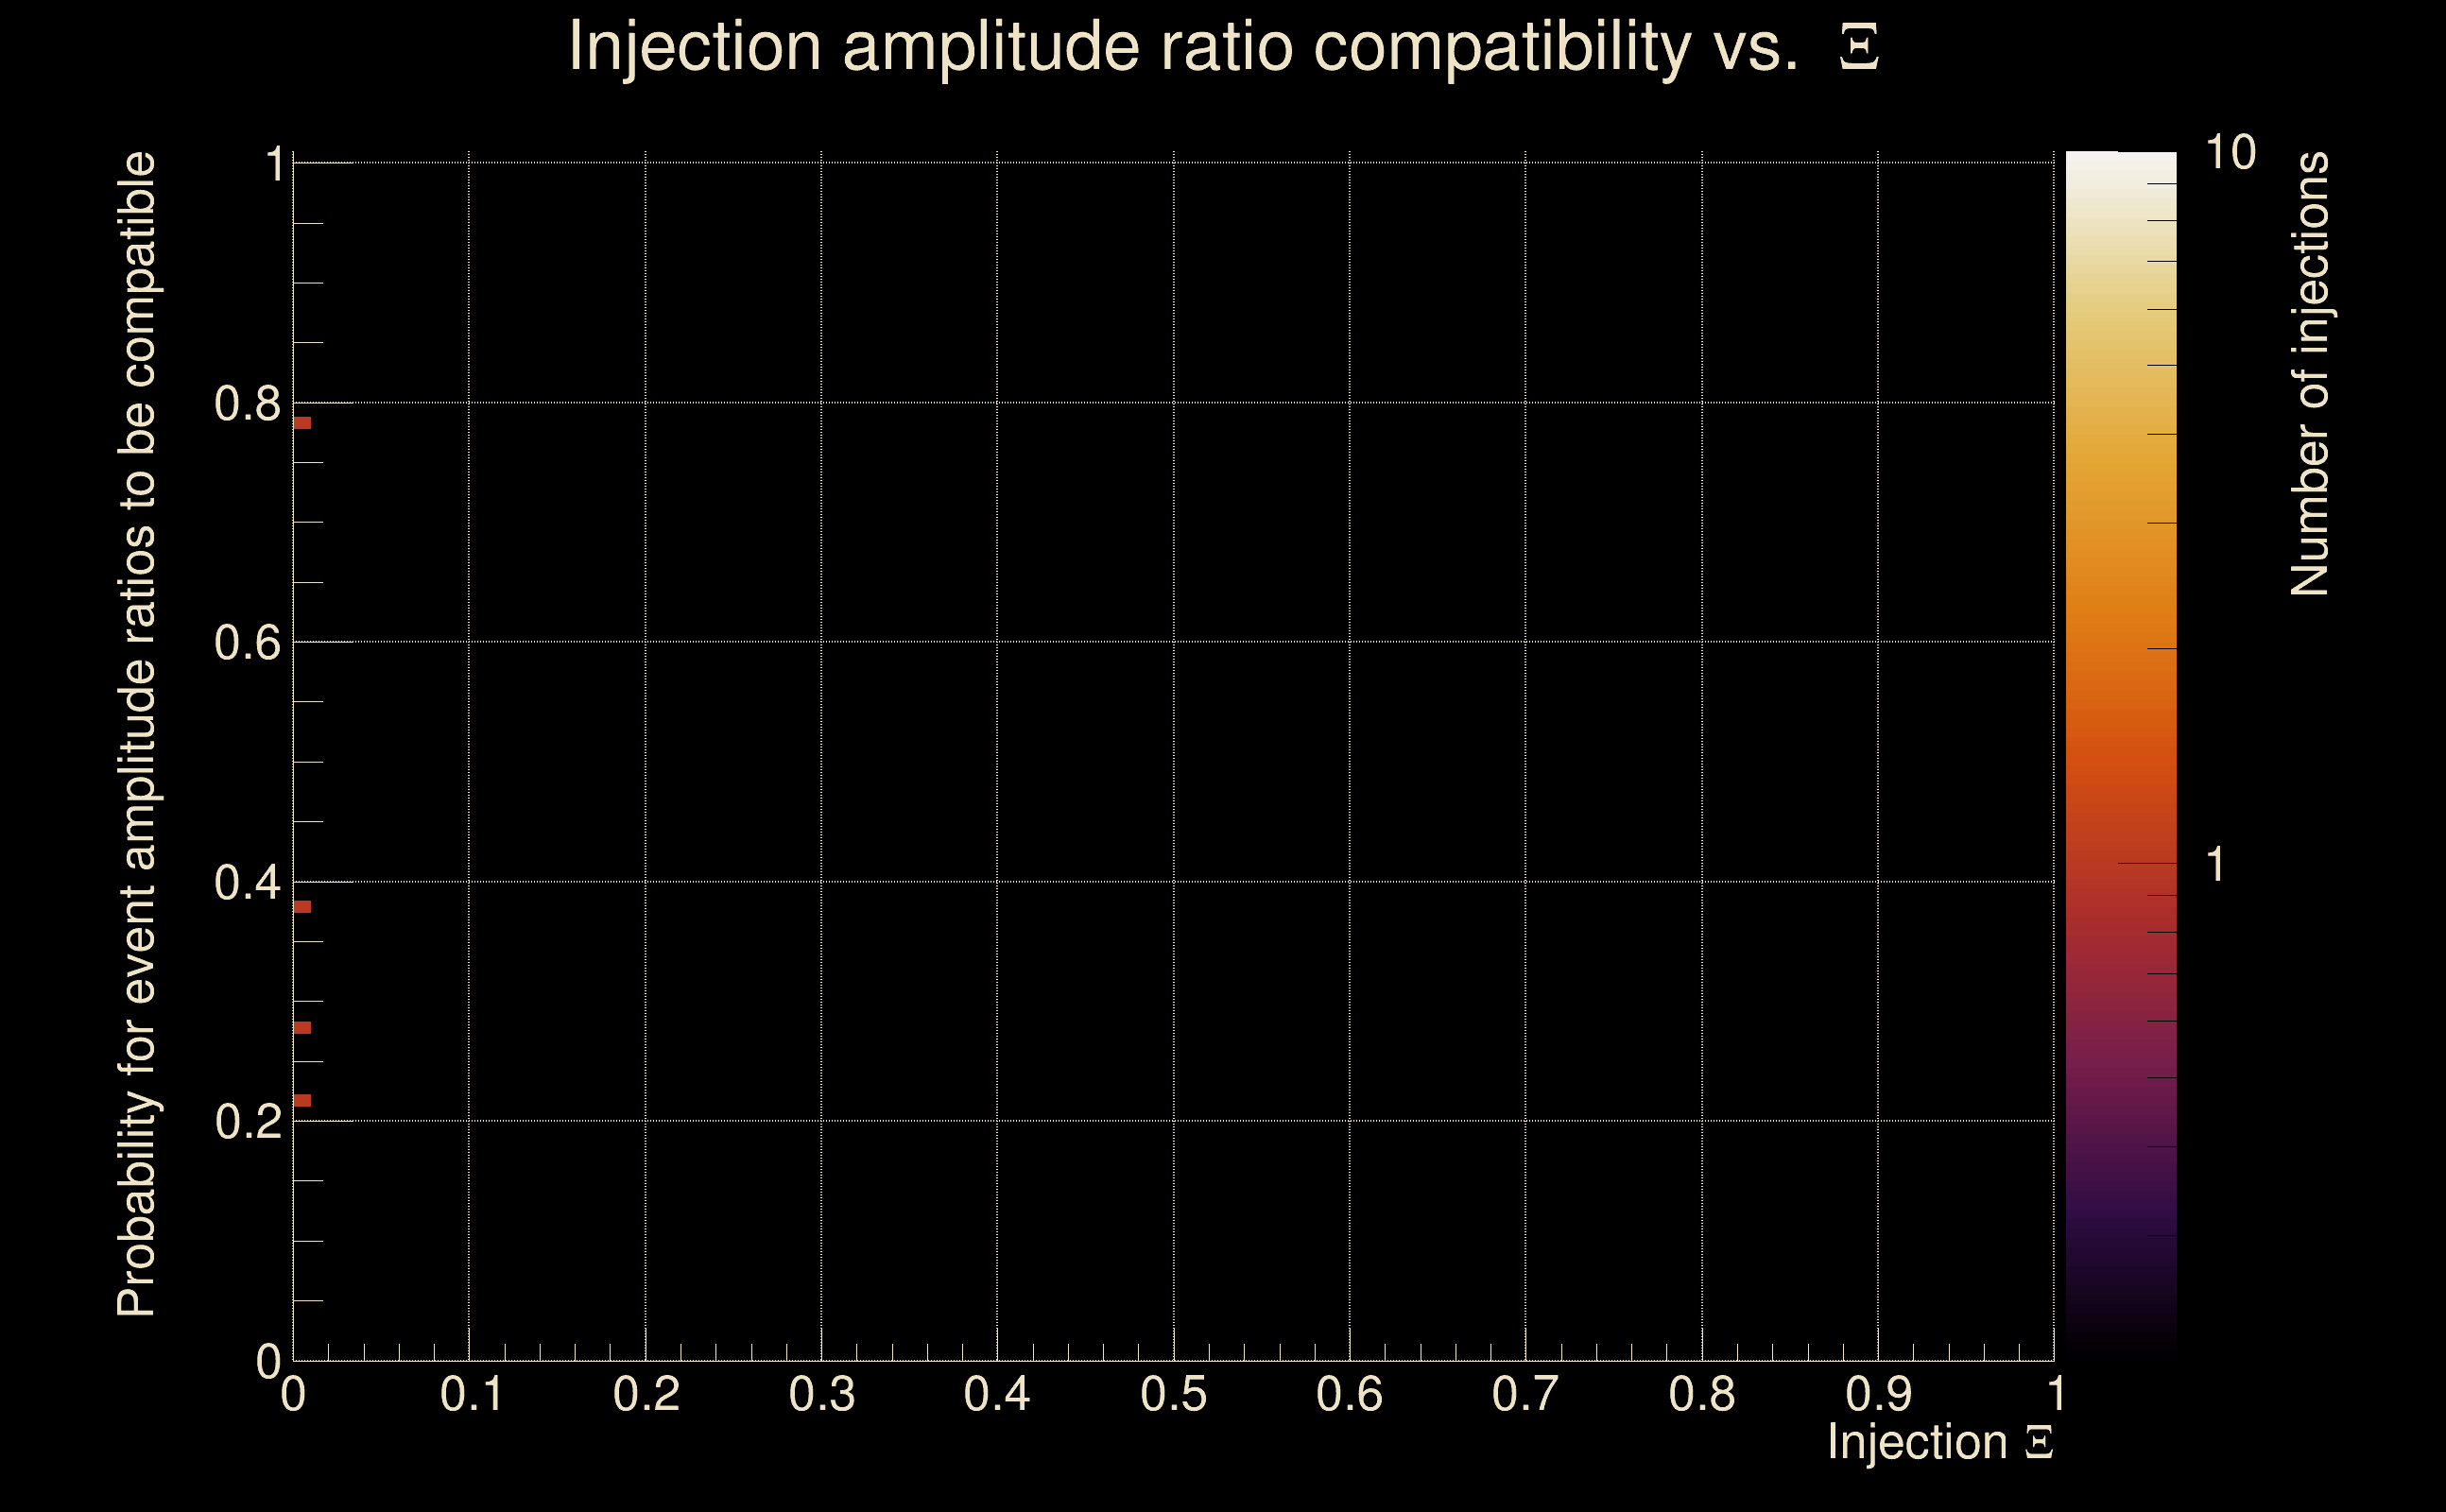
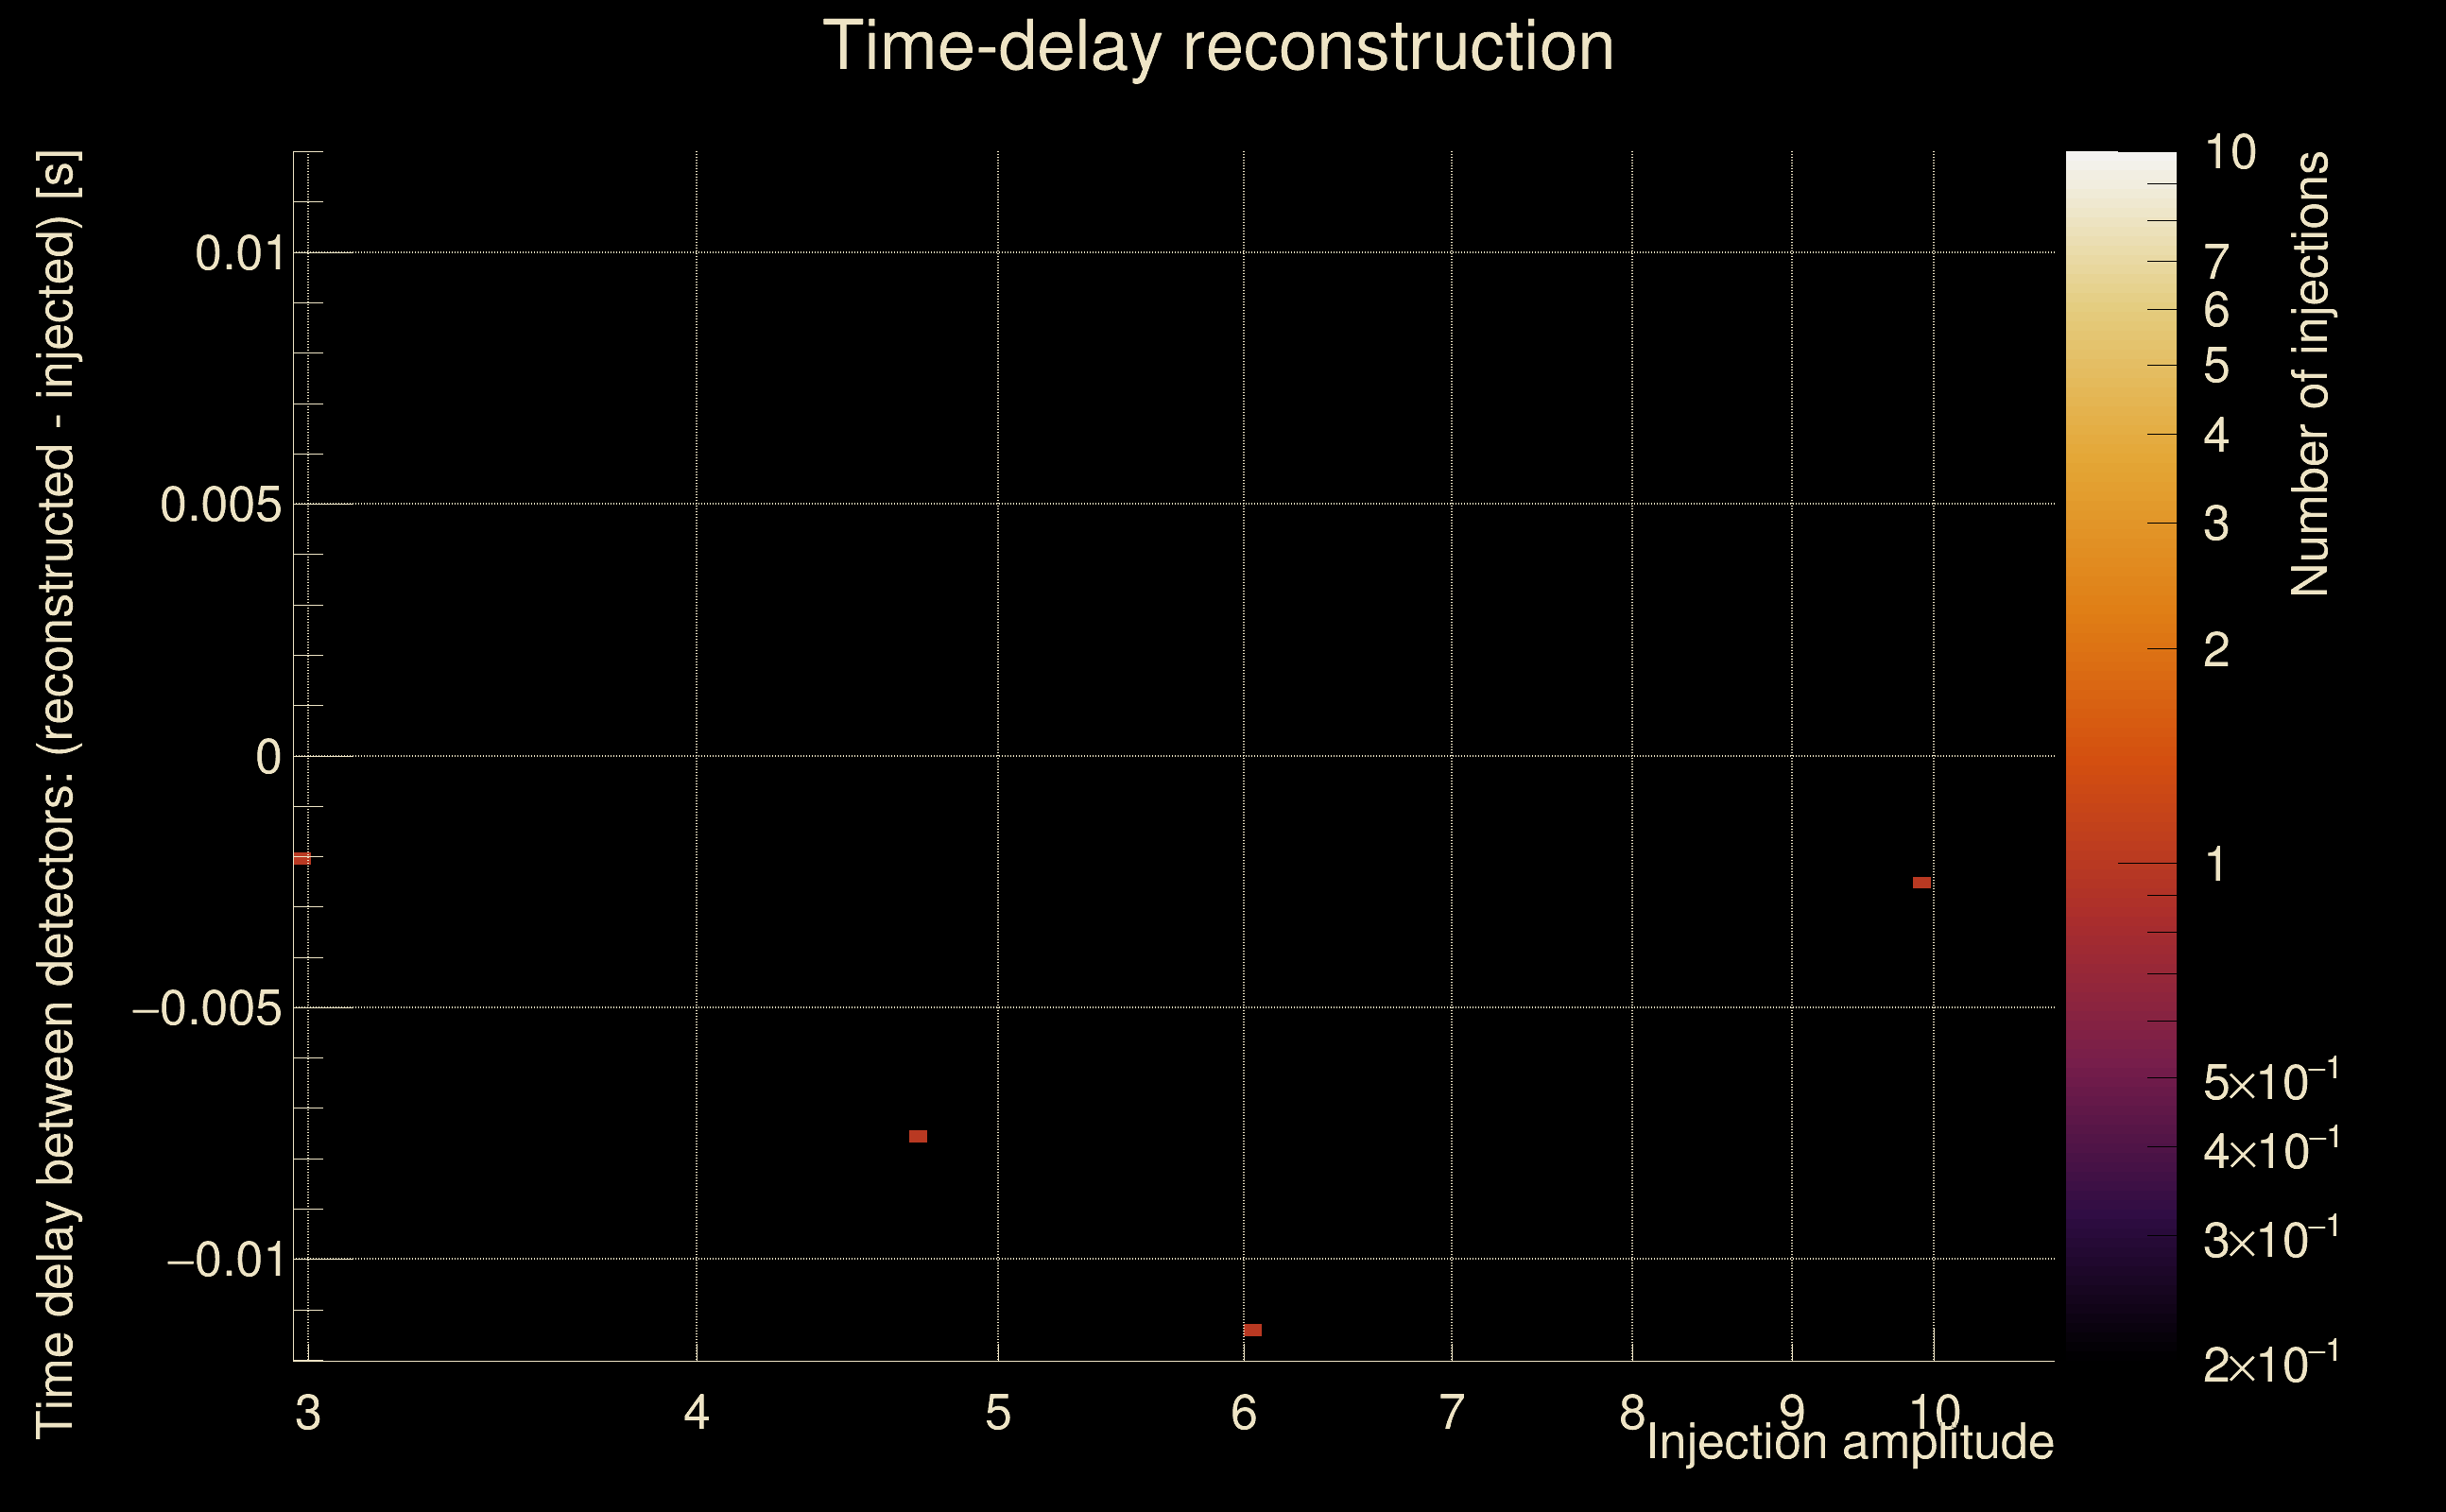
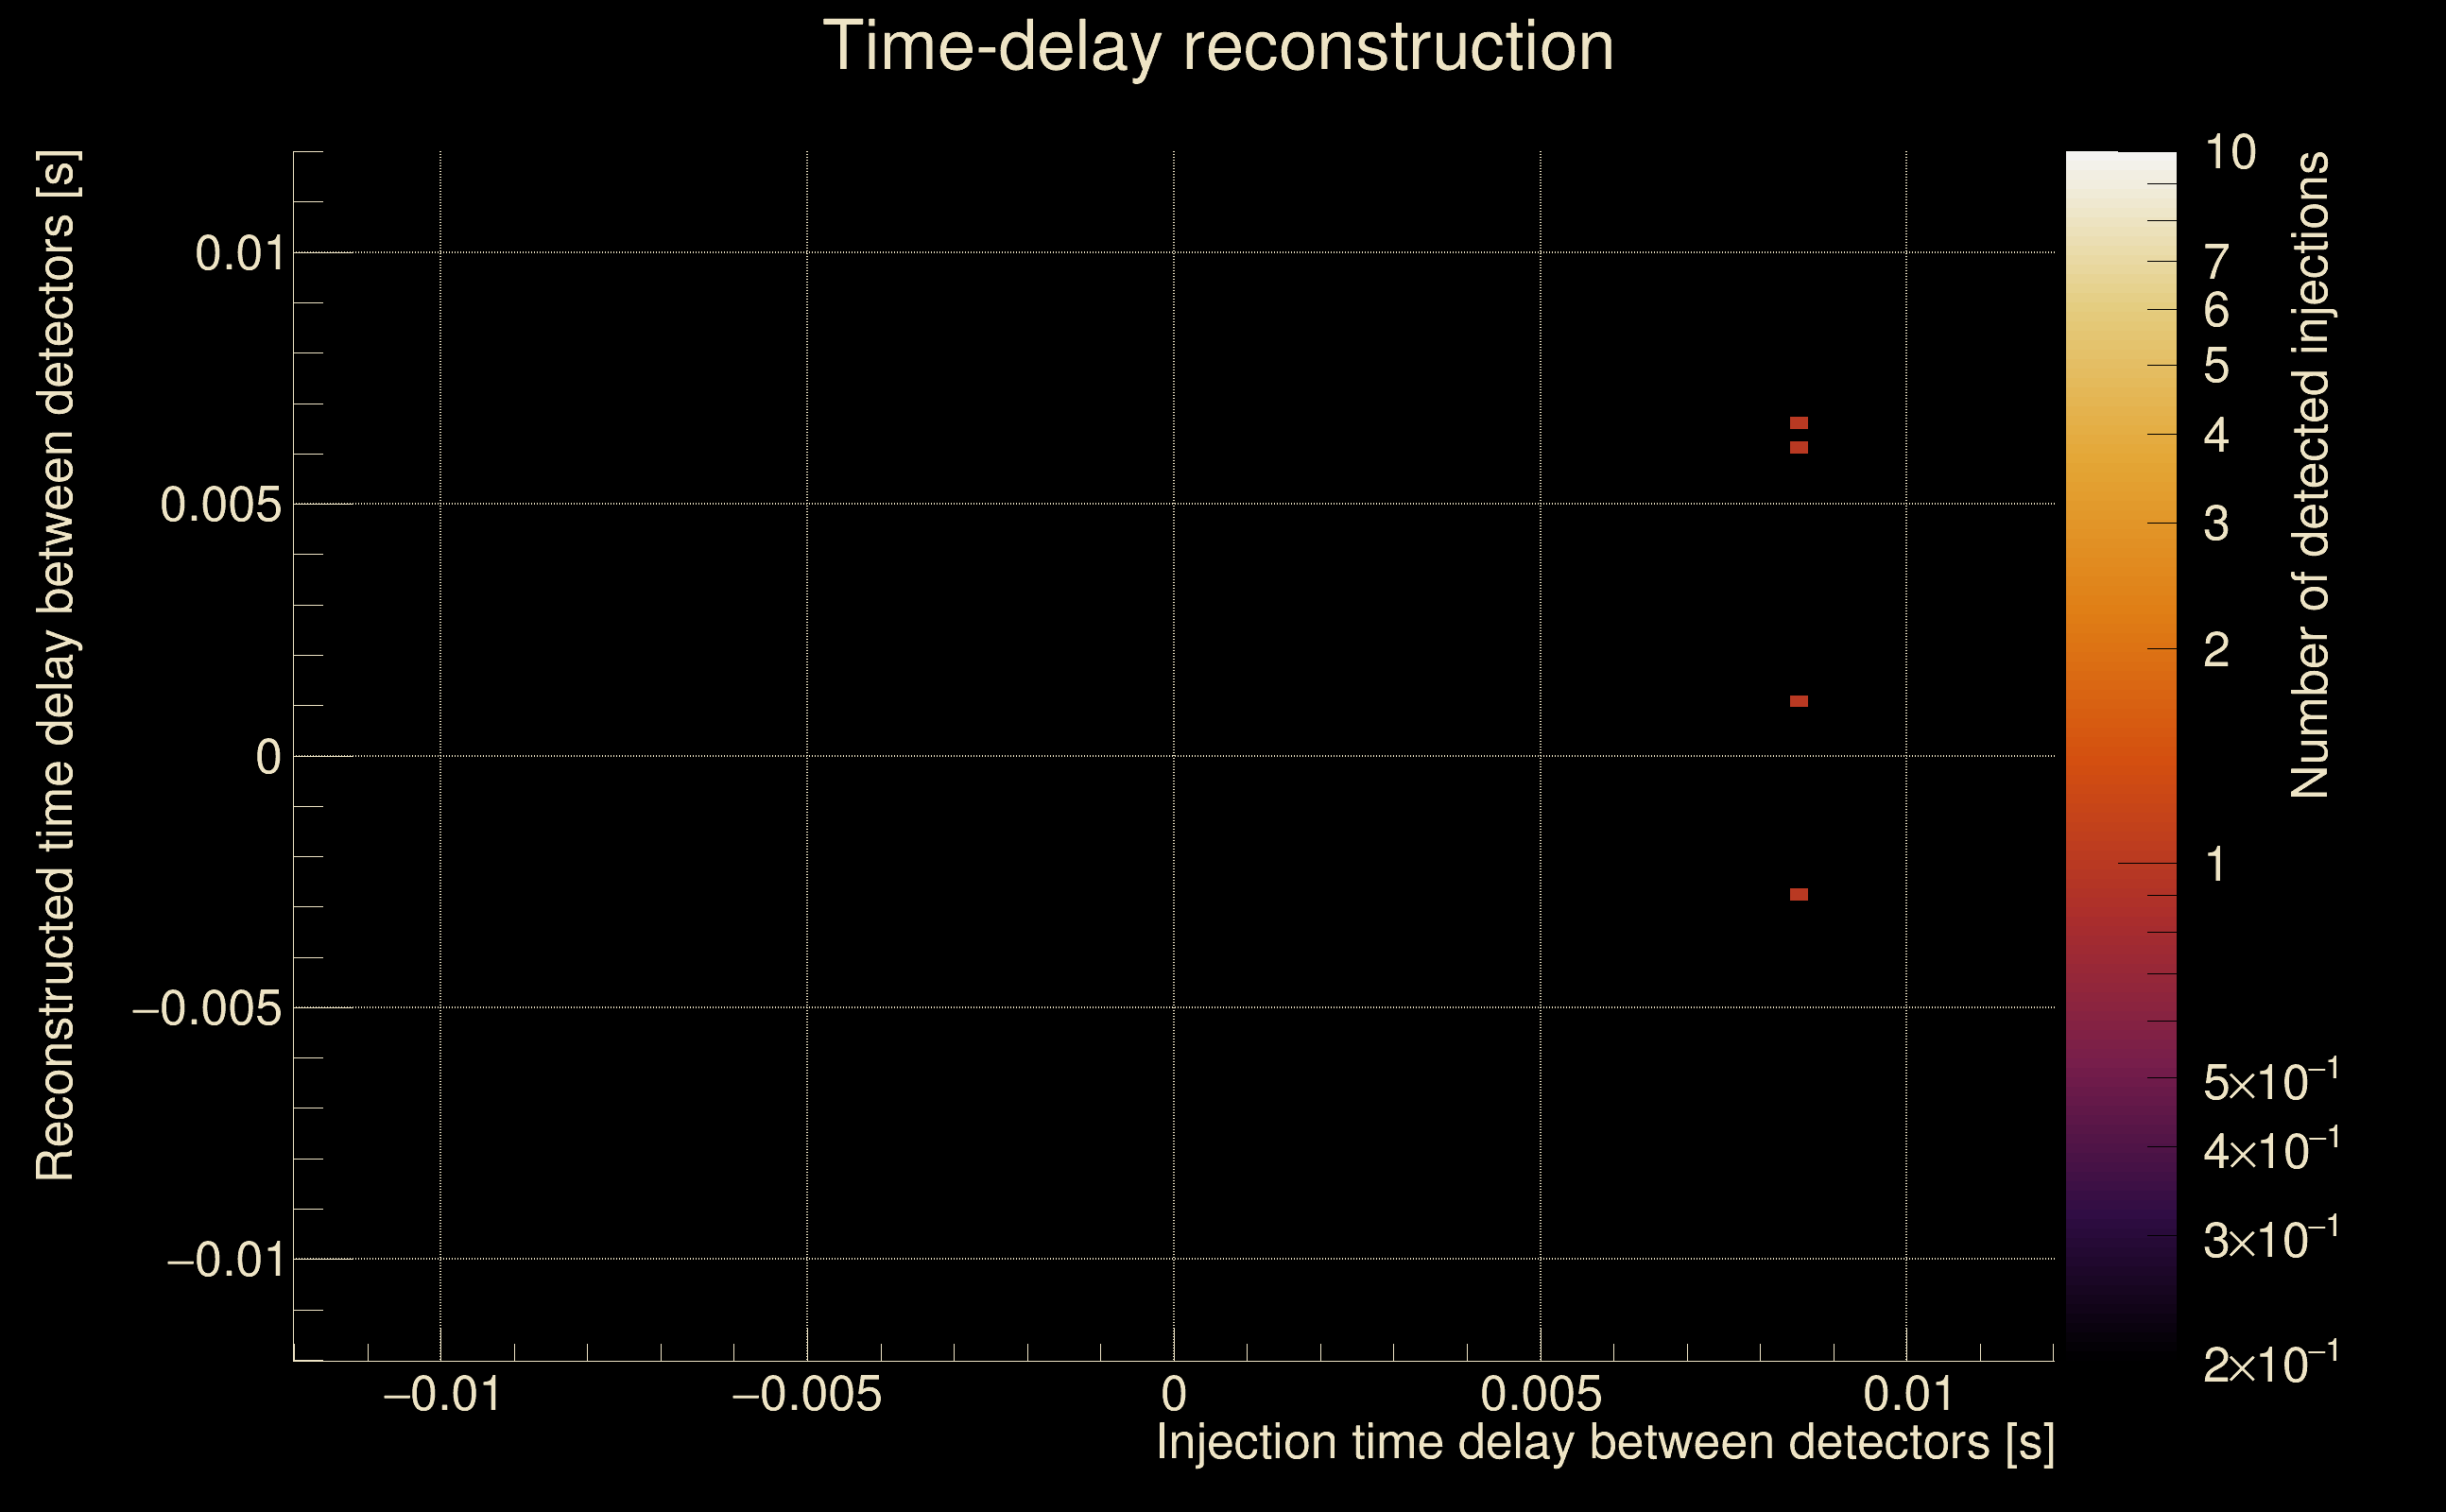
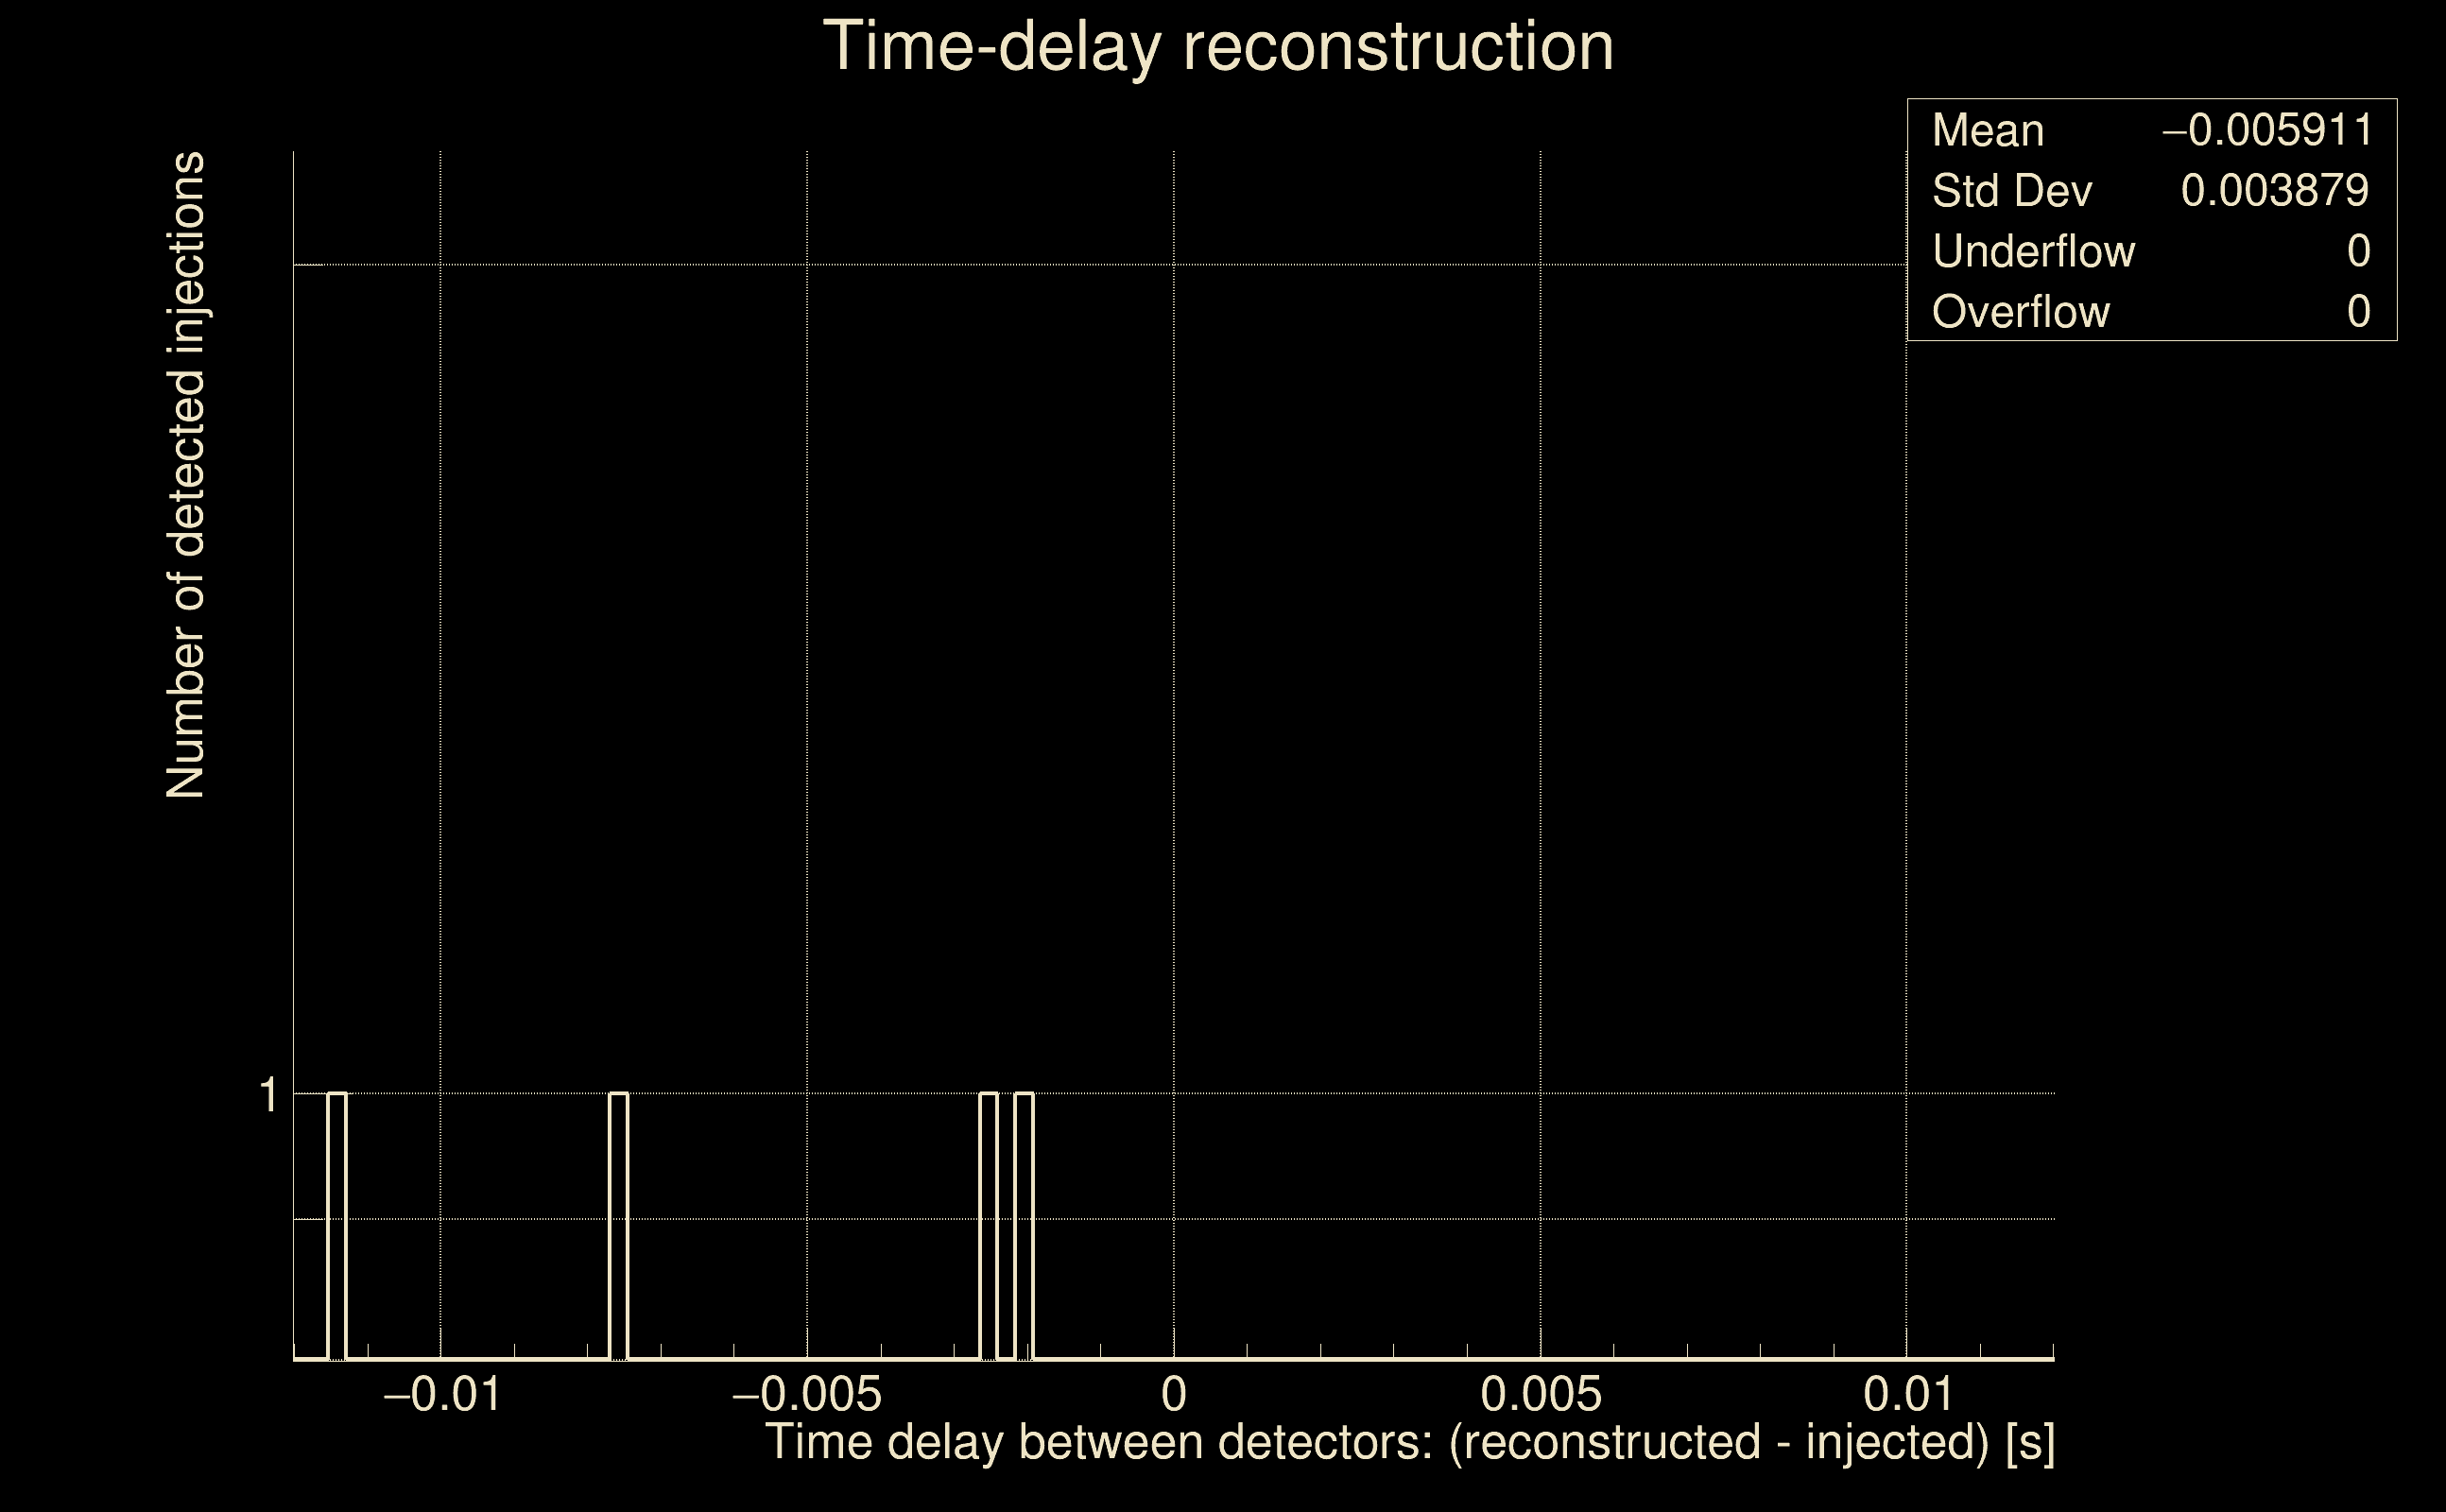
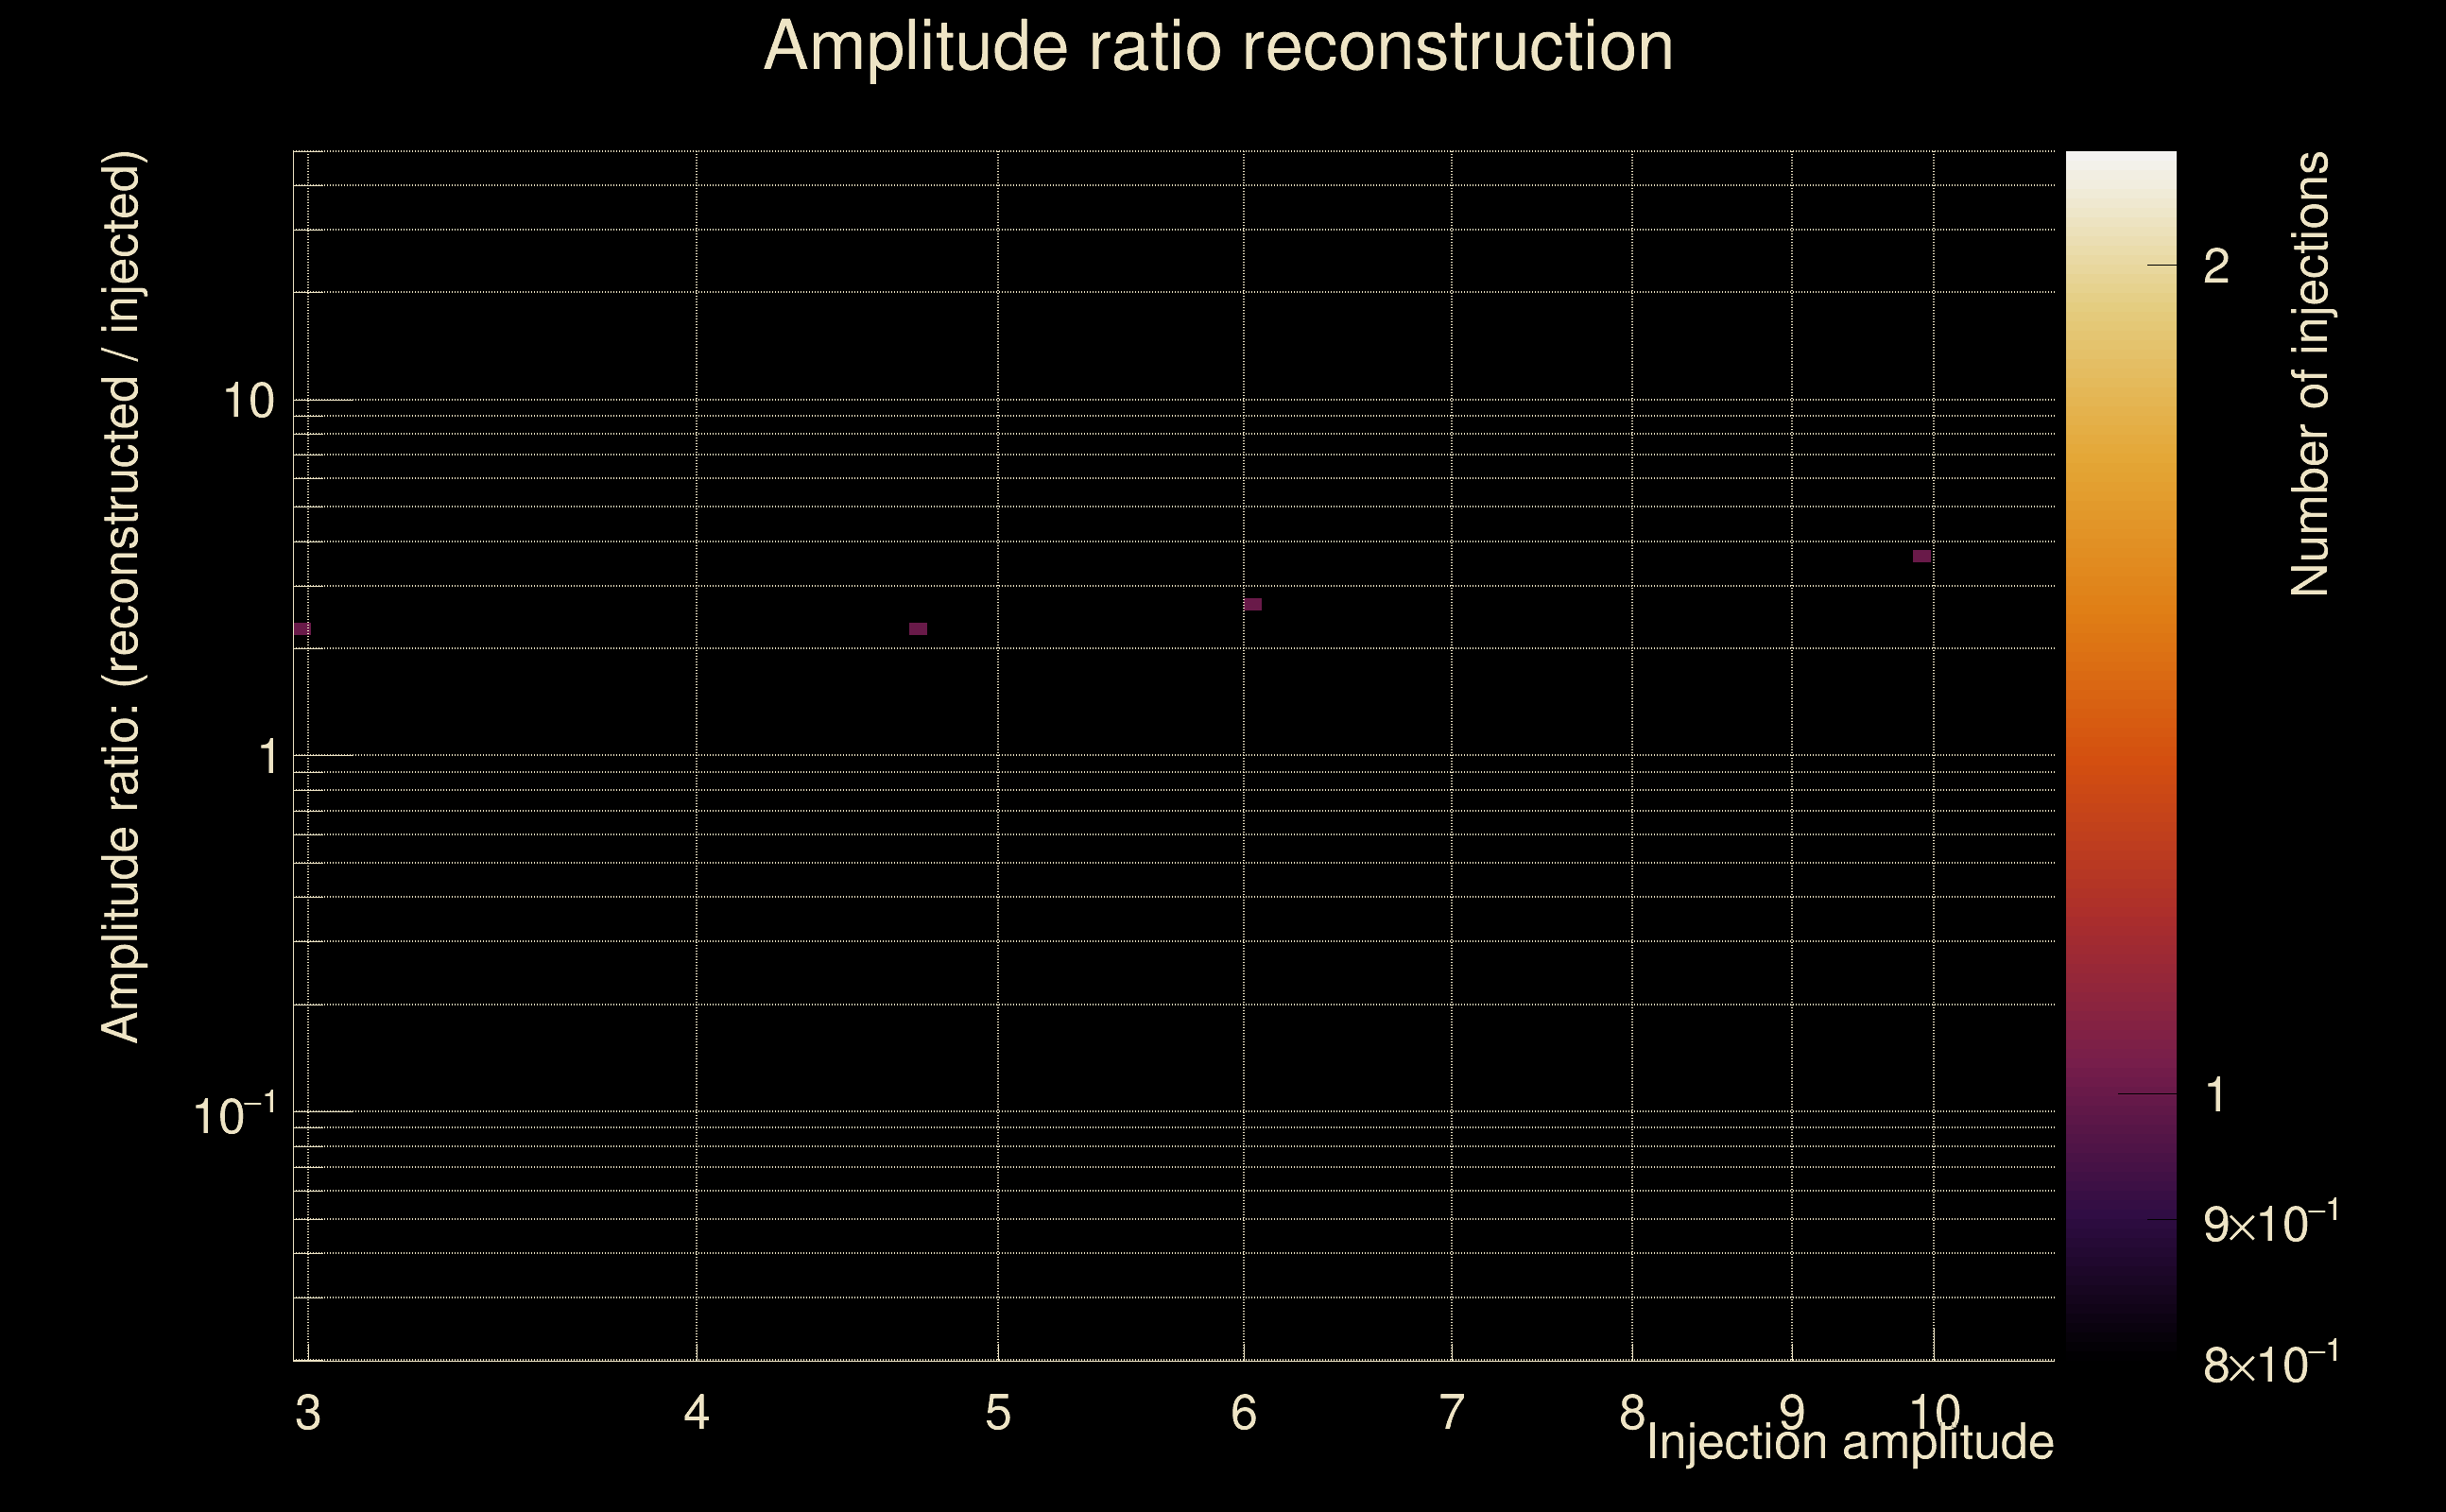
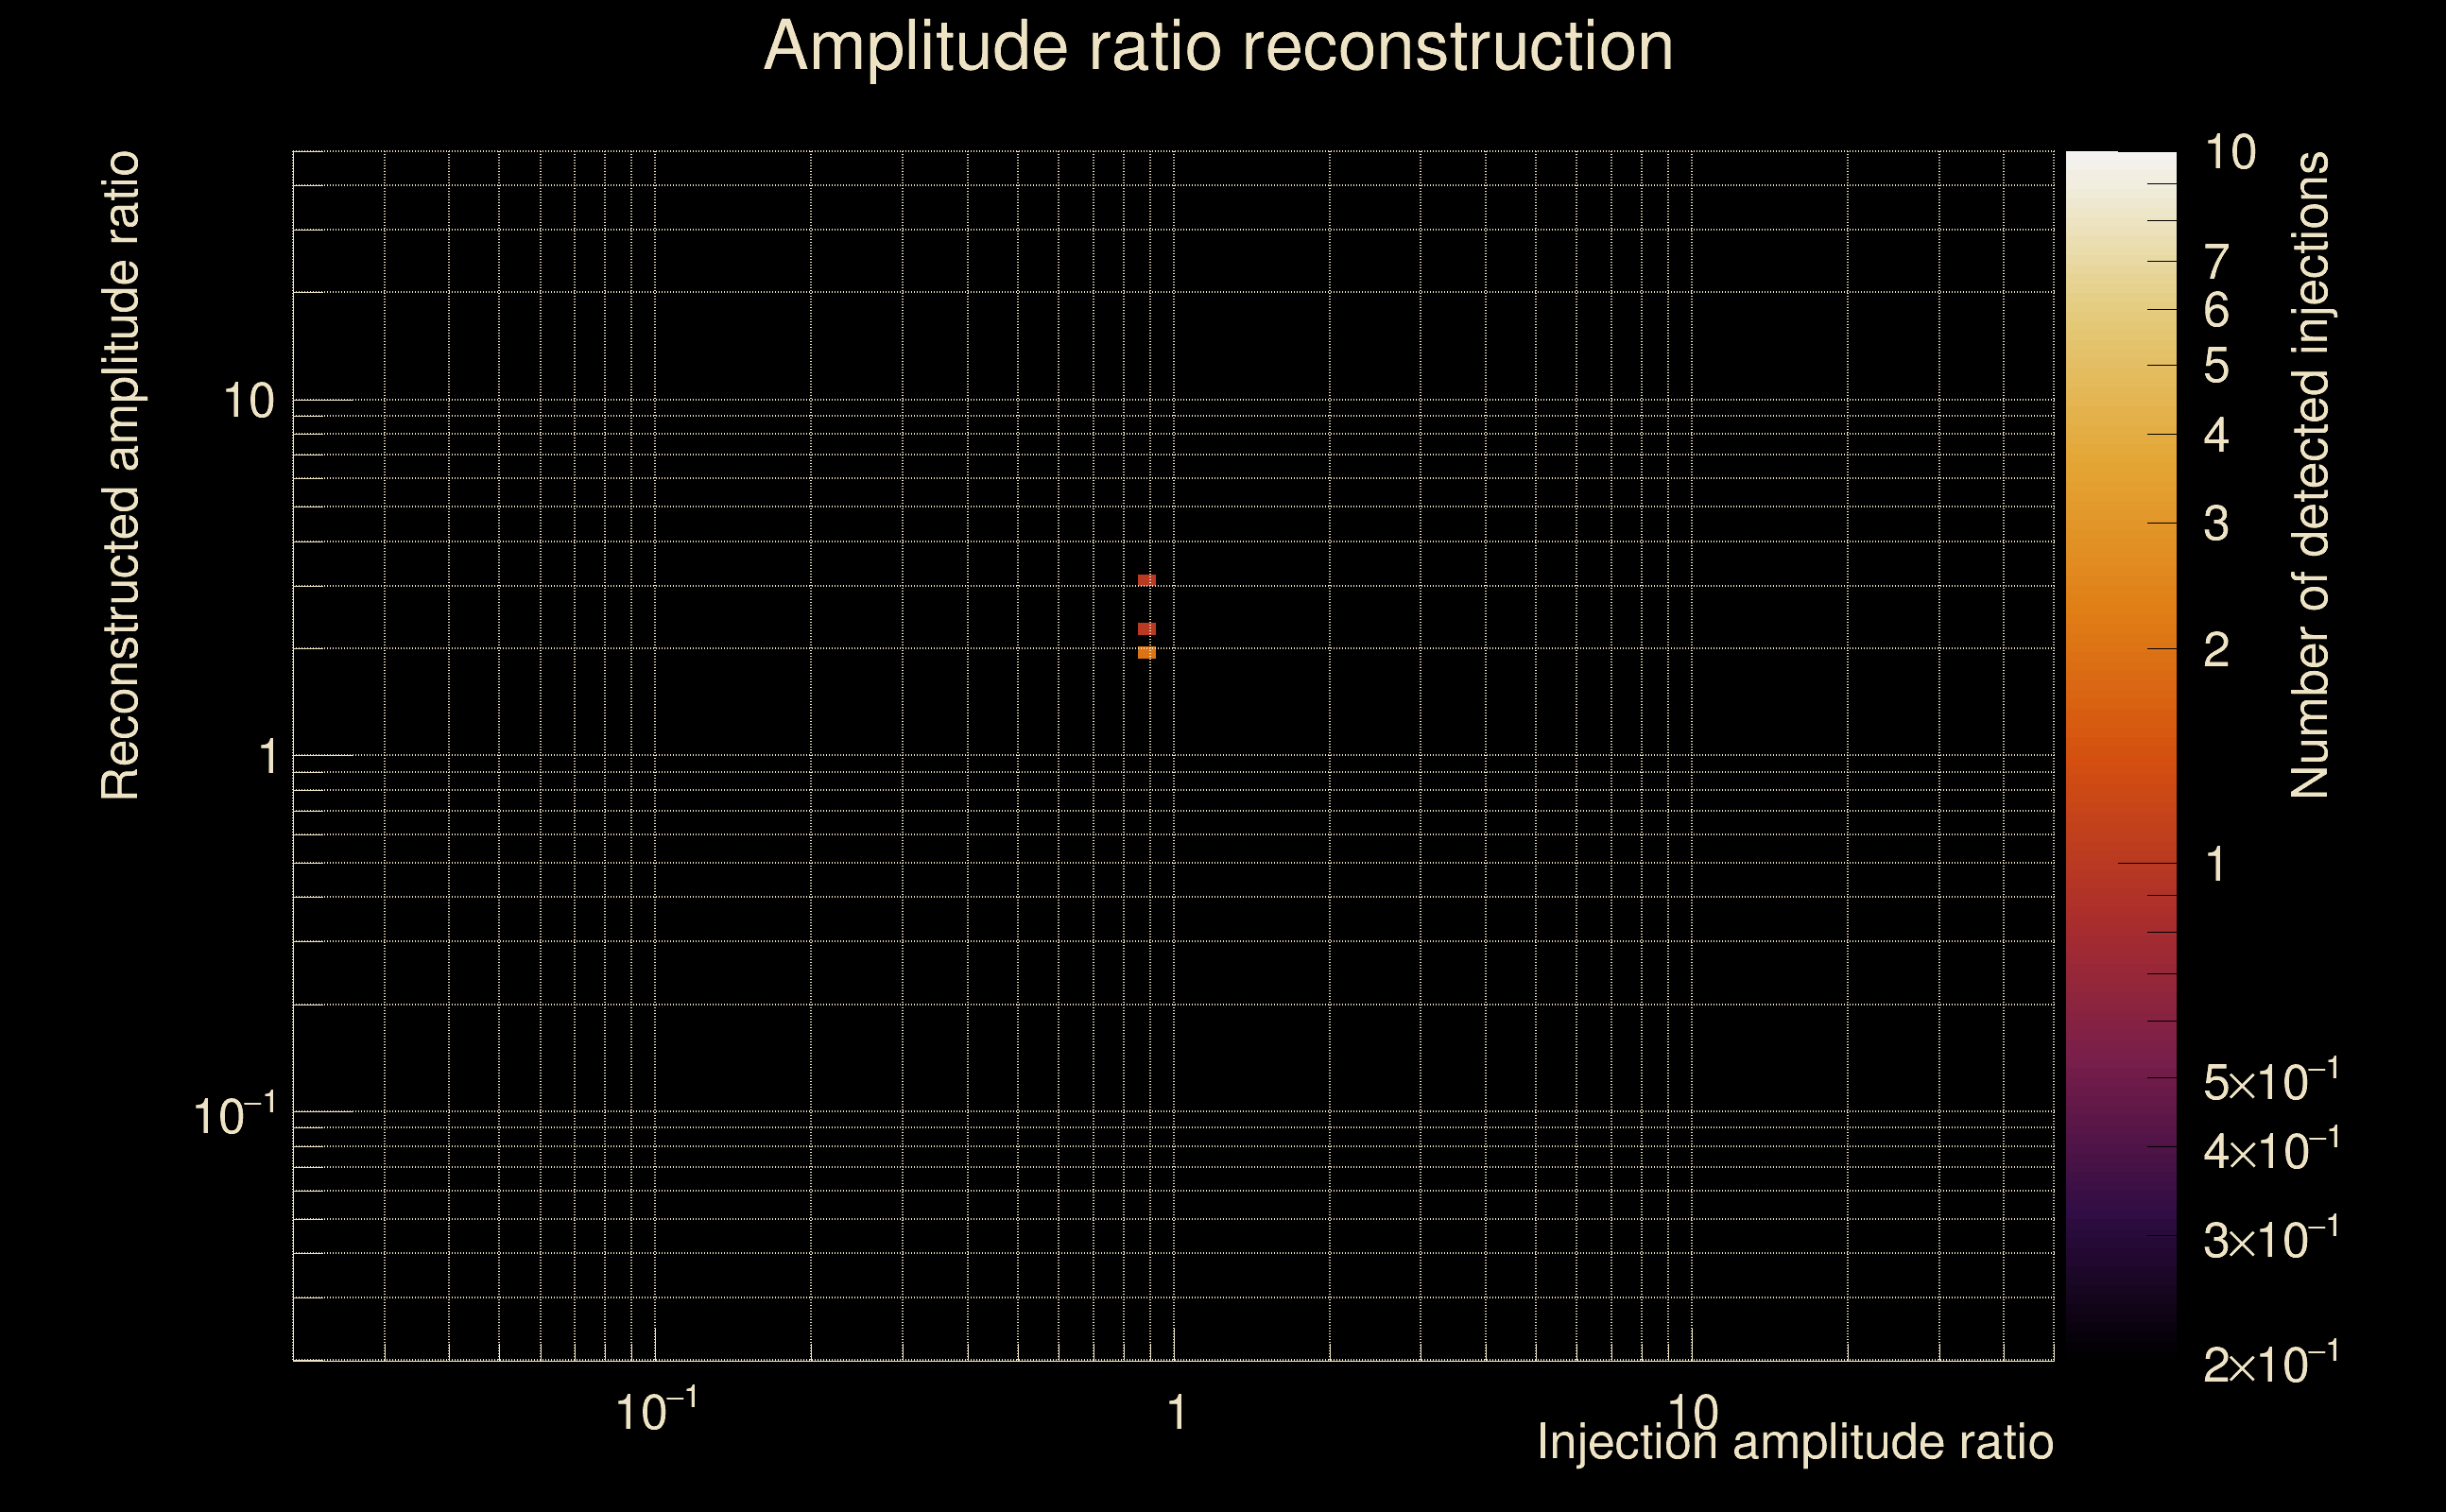
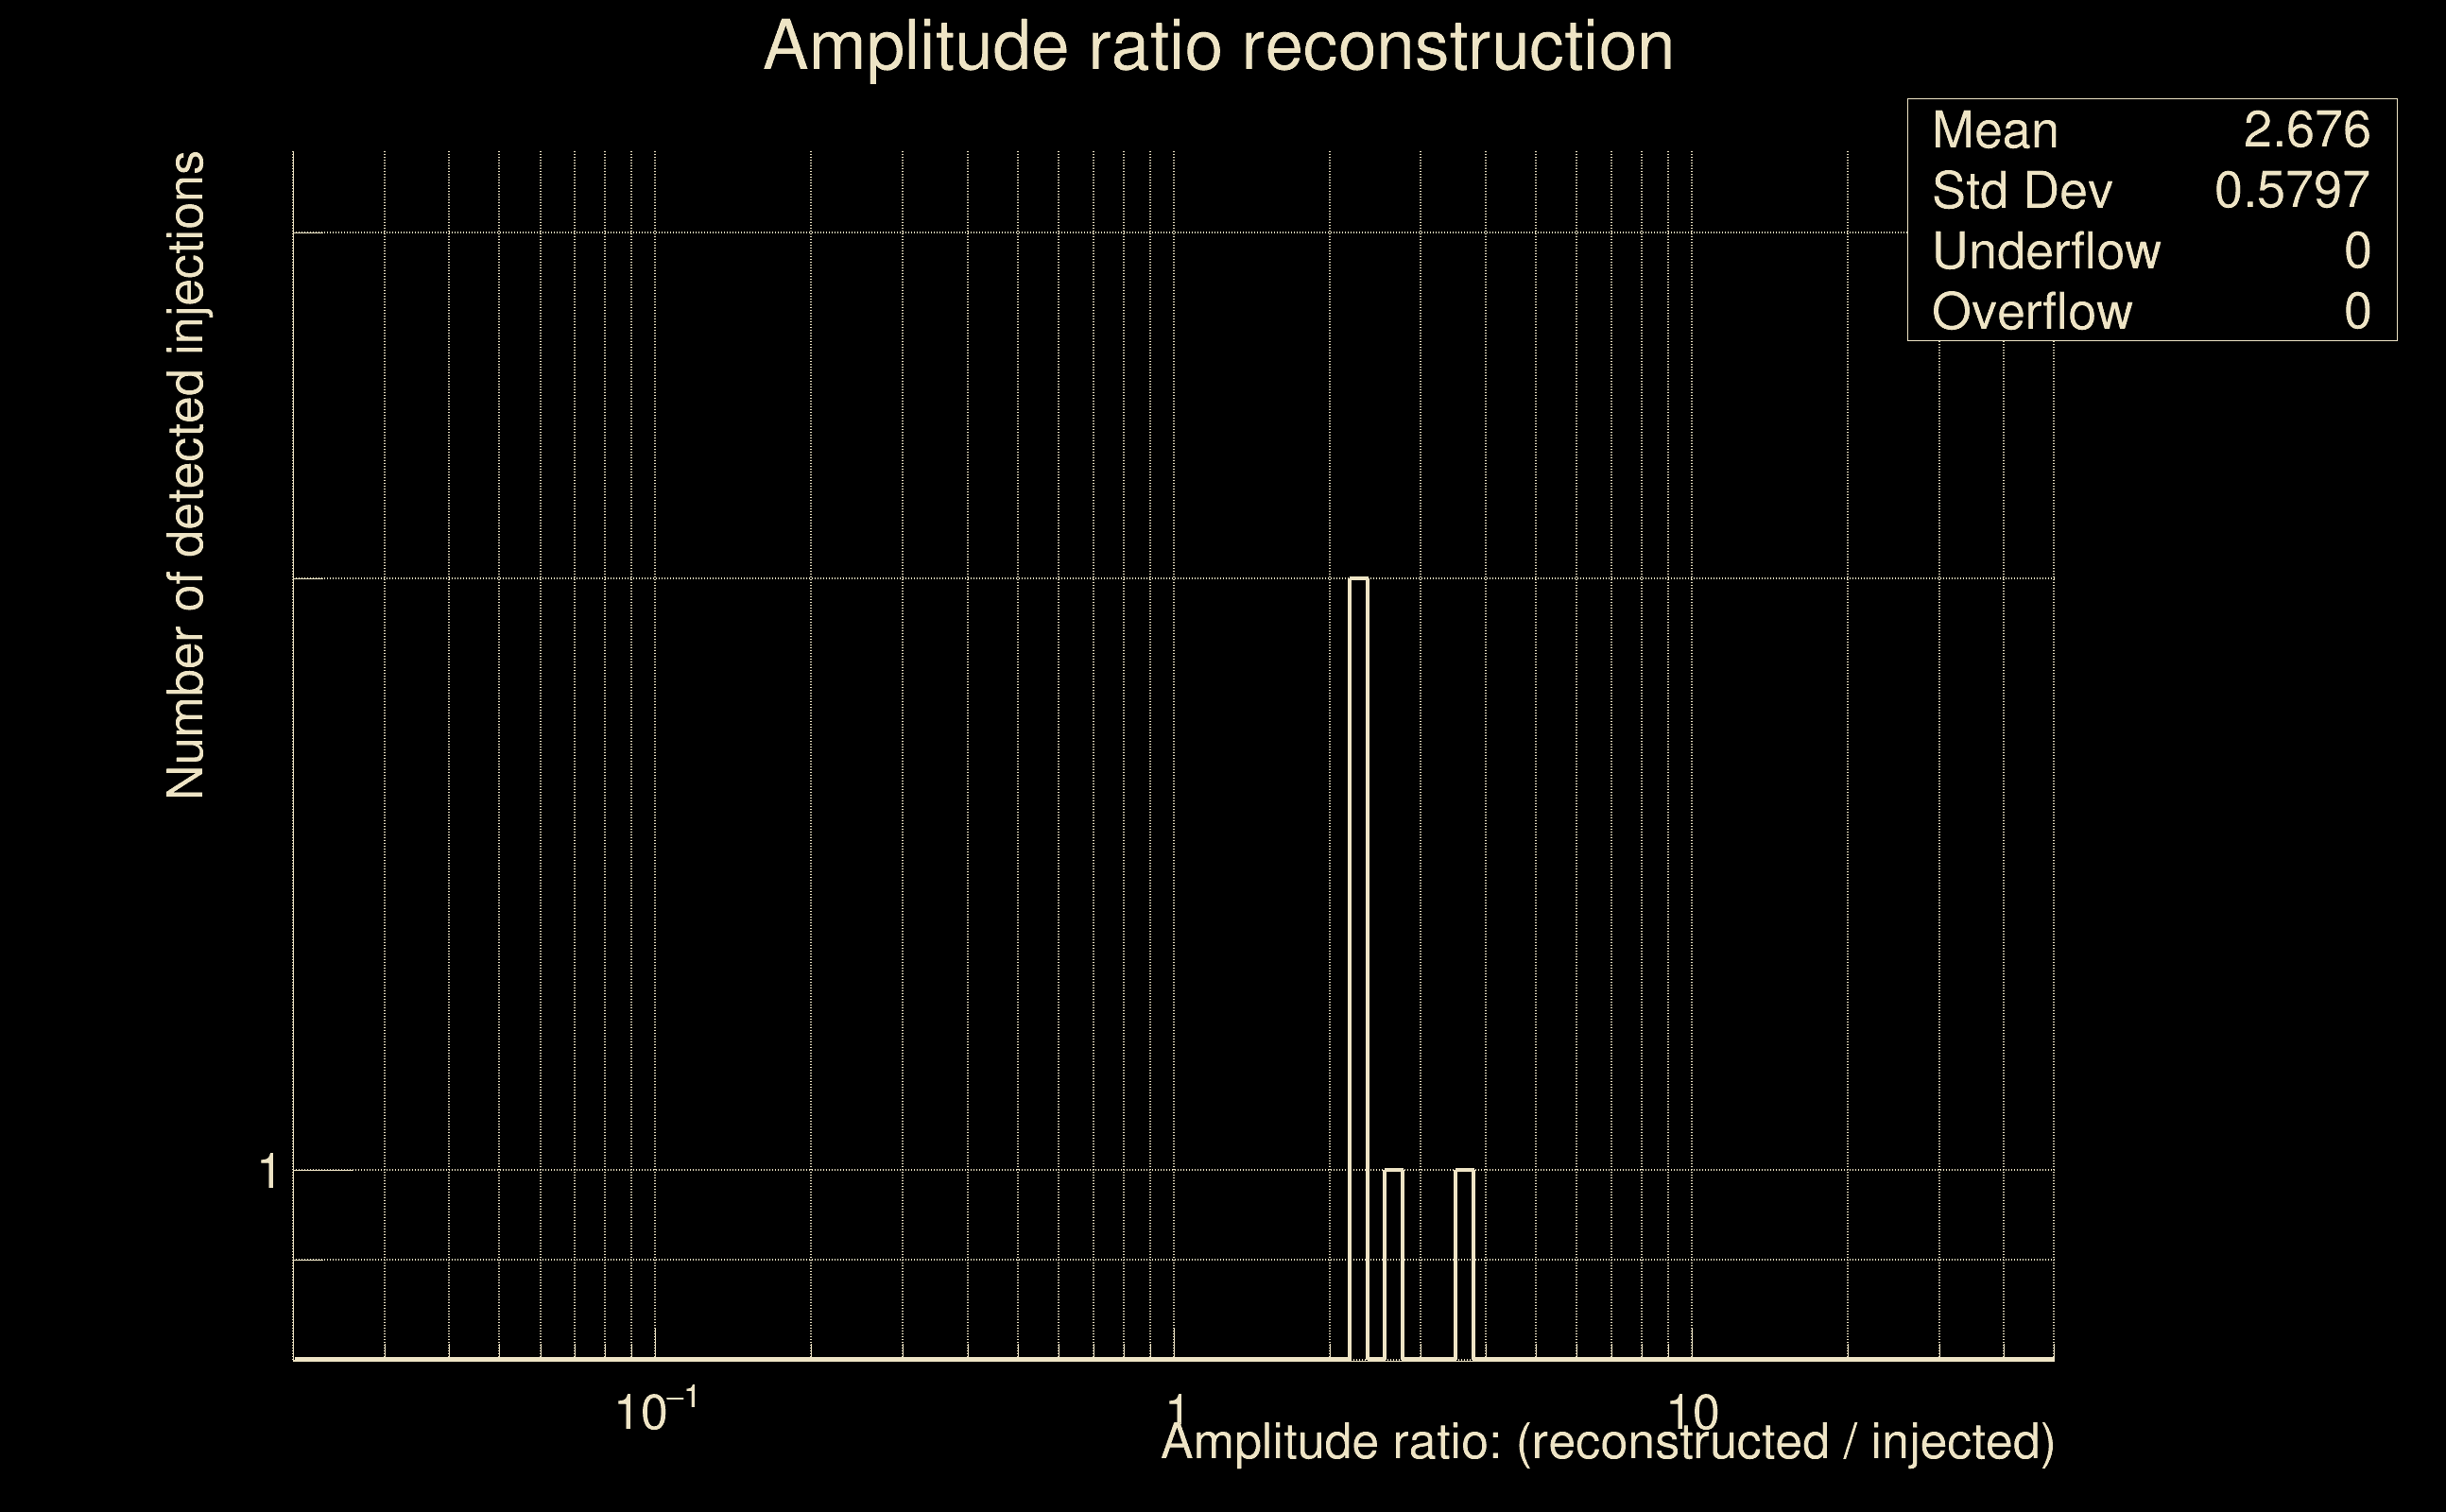
| Number of injections (total/valid/detected): | 4 / 4 / 4 |
| List of missed injections: | ./AND16-S20S_missed.txt |
| Injection amplitude at 90% detection efficiency: | -1 |
| Injection amplitude at 50% detection efficiency: | -1 |
| Injection amplitude at 10% detection efficiency: | -1 |
 |
 |
 |
 |
 |
 |
|
 |
 |
|
 |
 |
 |
 |
 |
 |
 |
 |
| florent.robinet@ijclab.in2p3.fr |