| Omicron version: | 4.2.0: documentation gitlab repository |
| Omicron run by: | unknown |
| Report produced on: | Mon Oct 27 14:32:38 2025 UTC |
| Ox option file: | Targeted_O4bw_10min_options.txt |
| Omicron option files: | detector 0, detector 1 |
| Detector channel names: | H1:GDS-CALIB_STRAIN_CLEAN_AR_4096Hz, L1:GDS-CALIB_STRAIN_CLEAN_AR_4096Hz |
| Omicron analysis time window and overlap: | 16 s, 6 s |
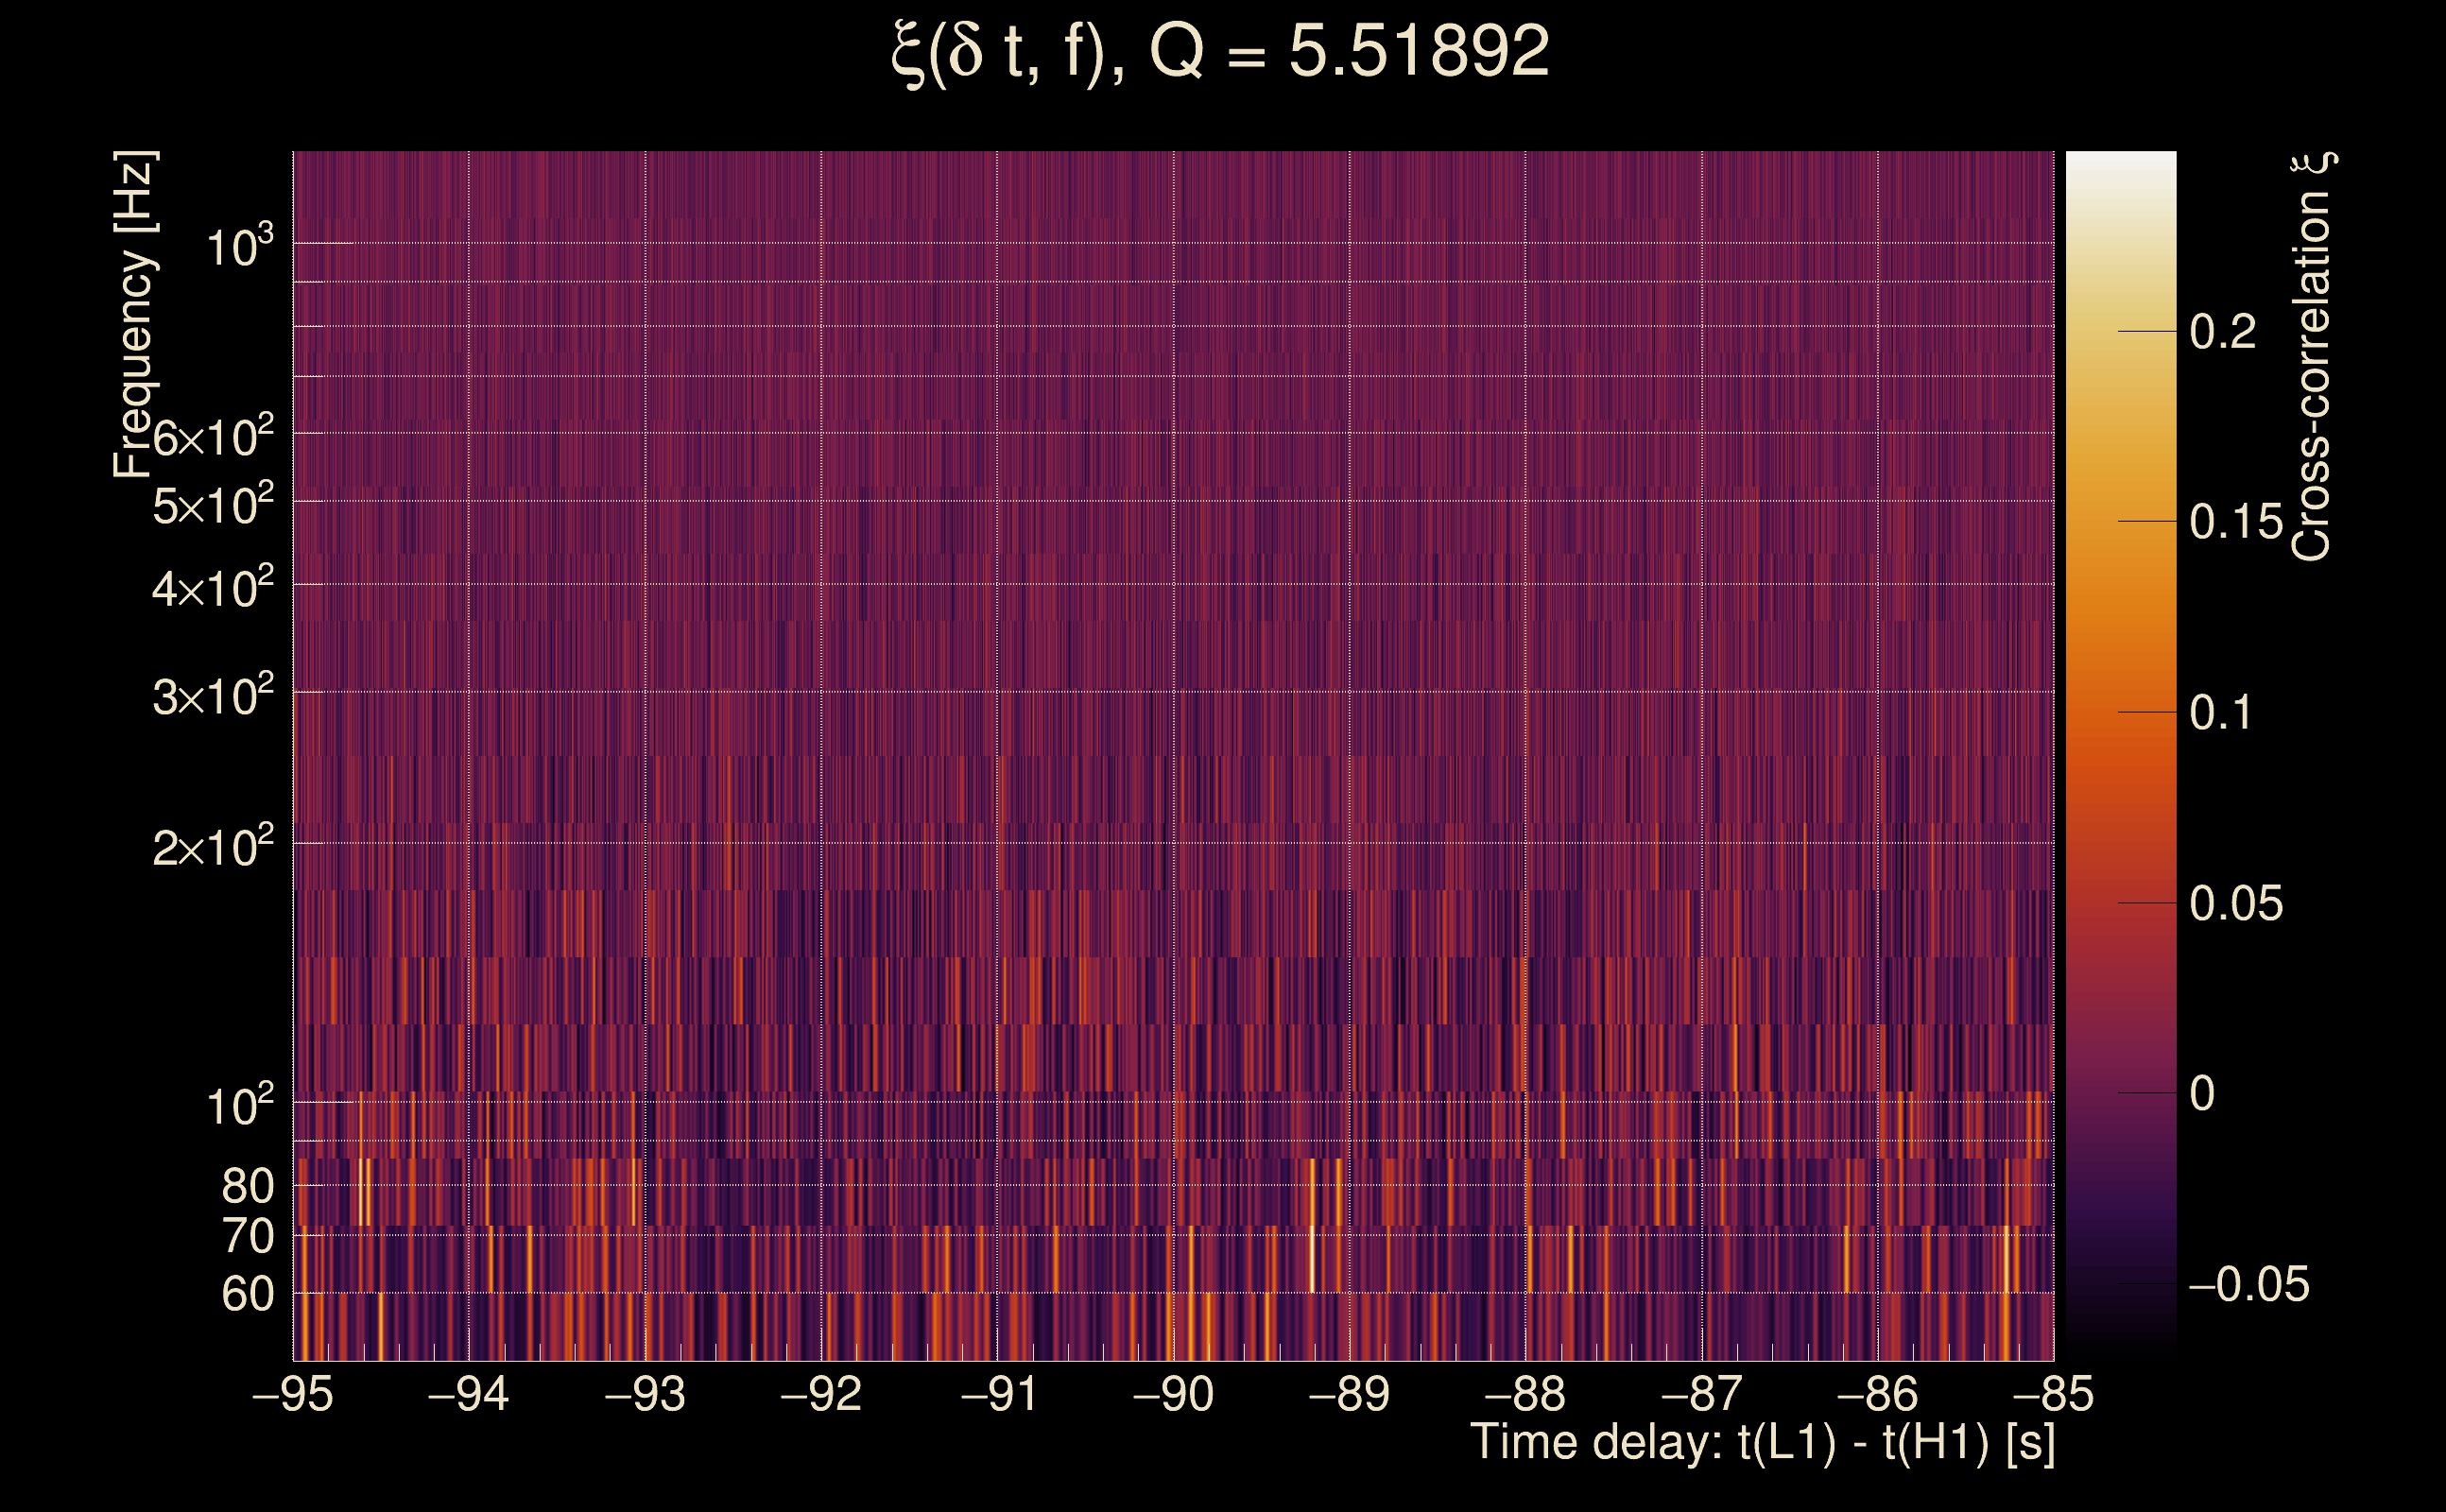
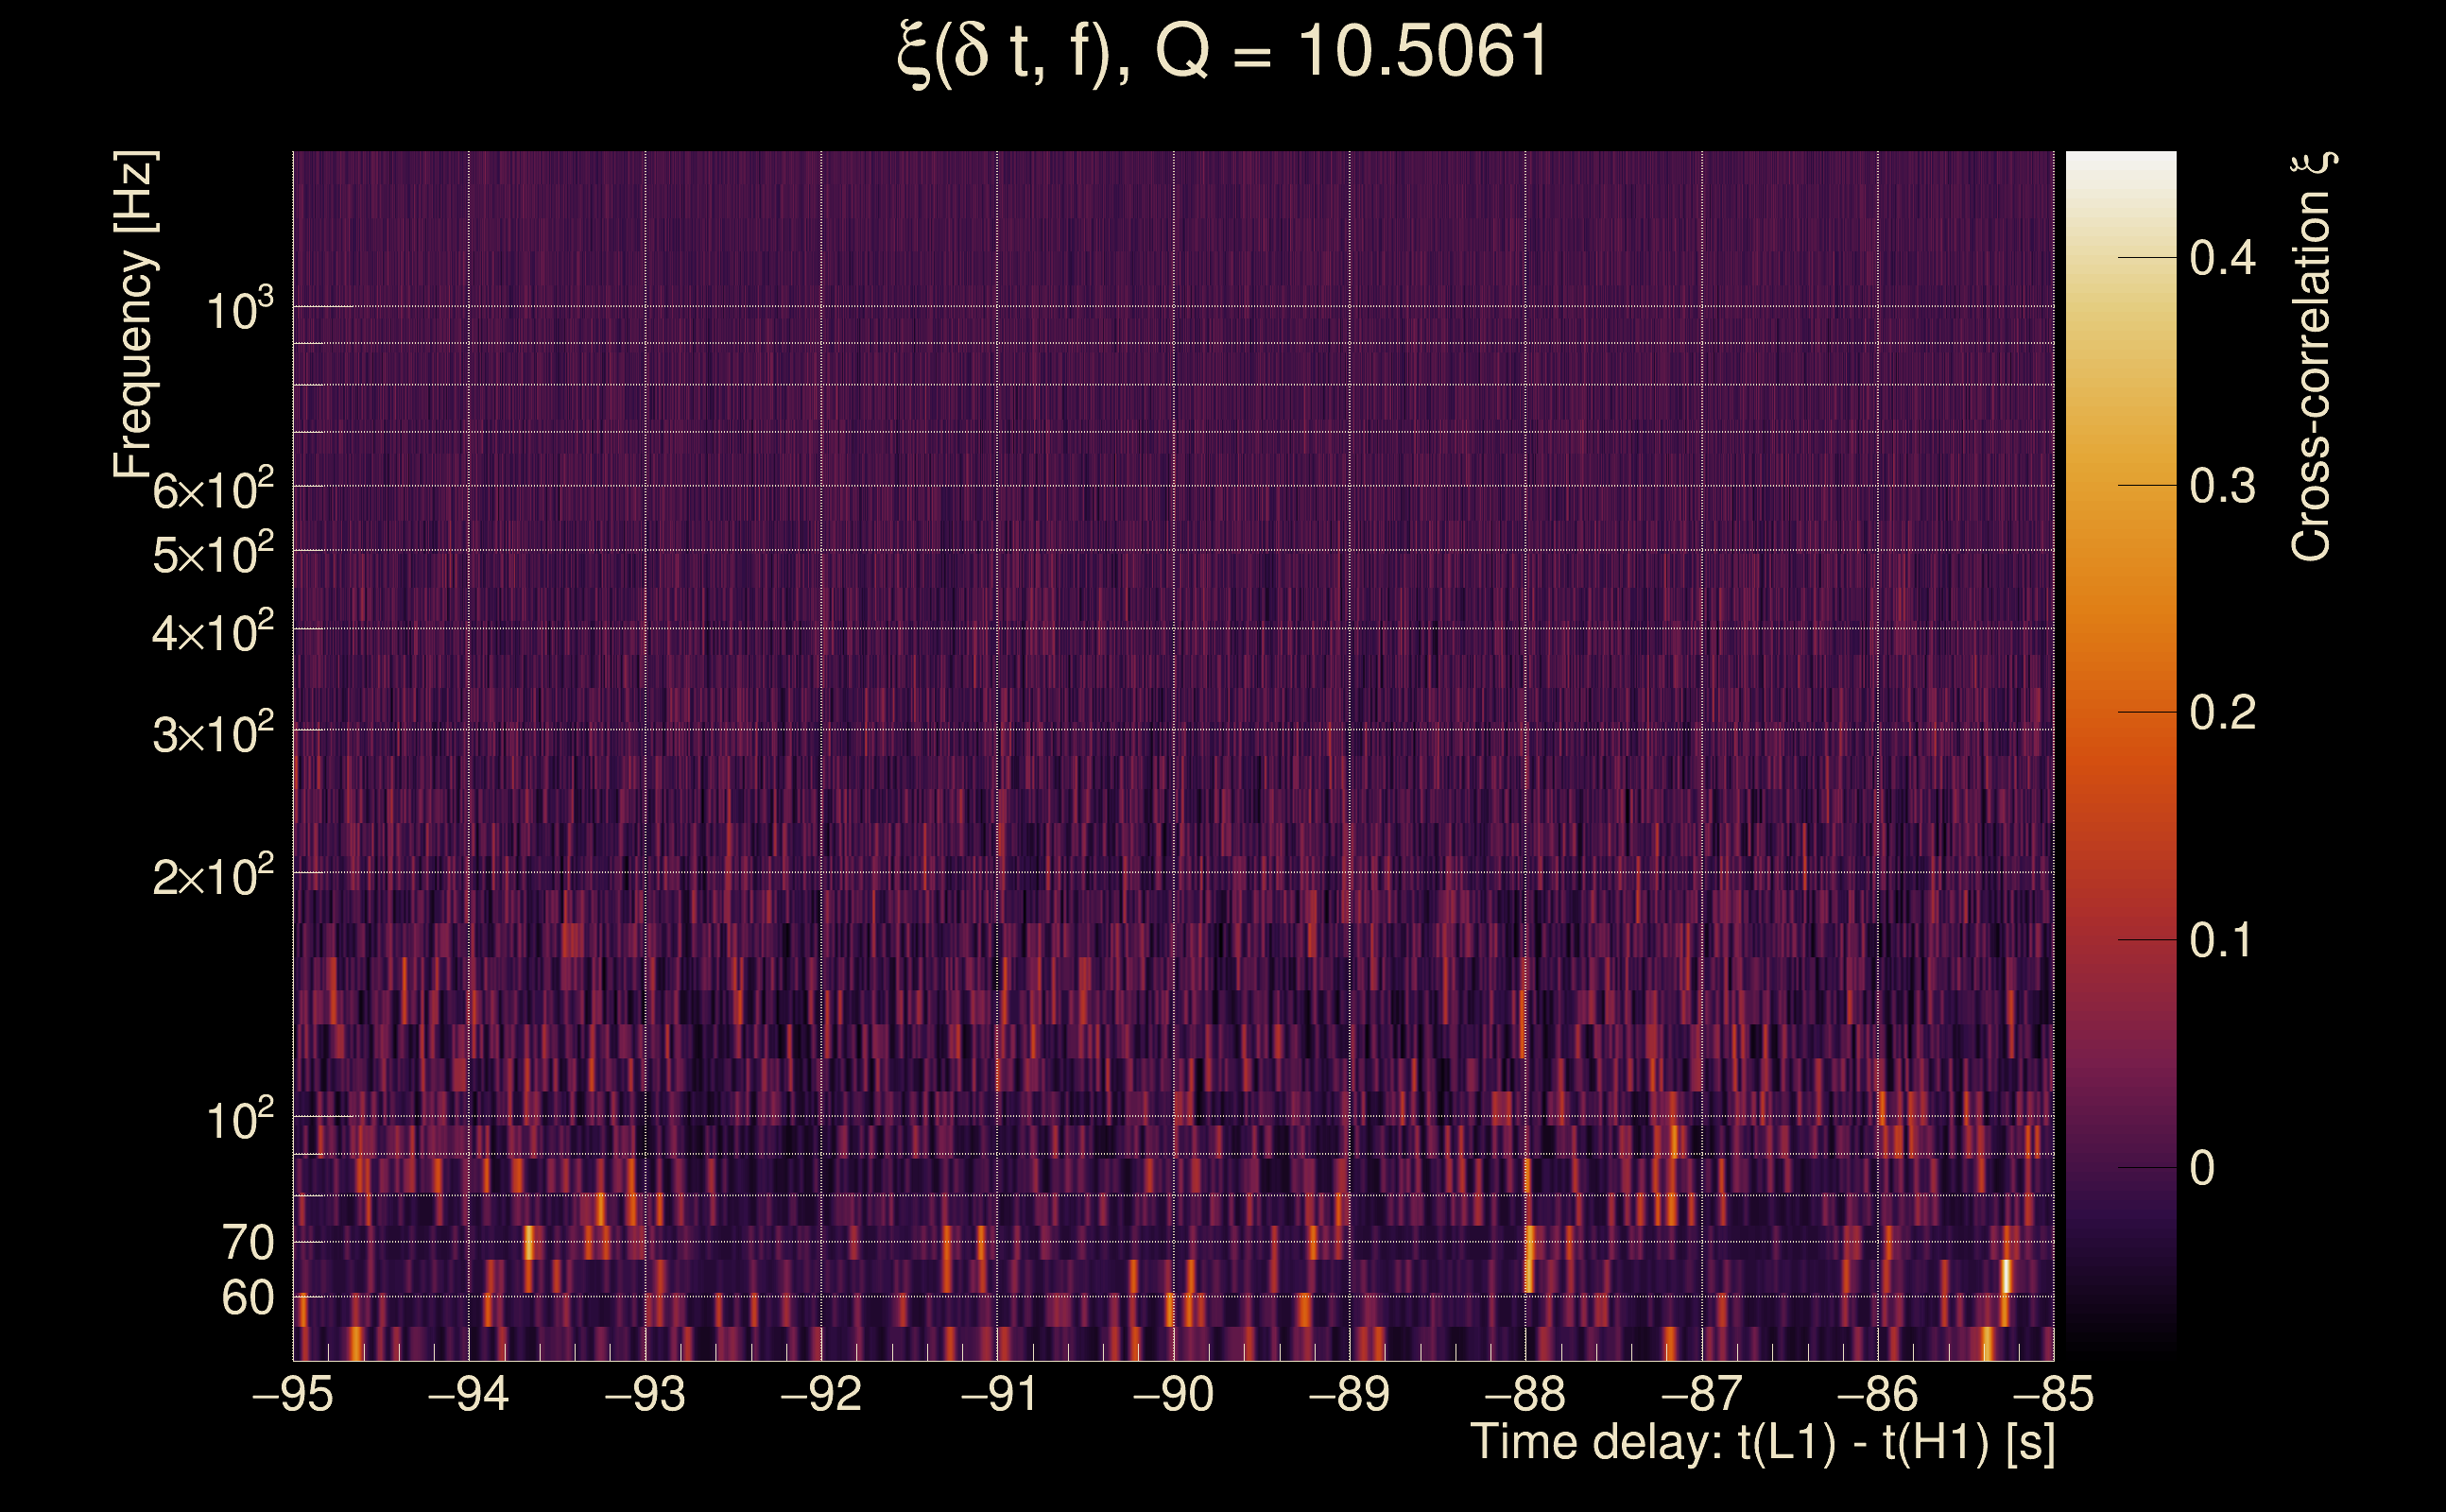
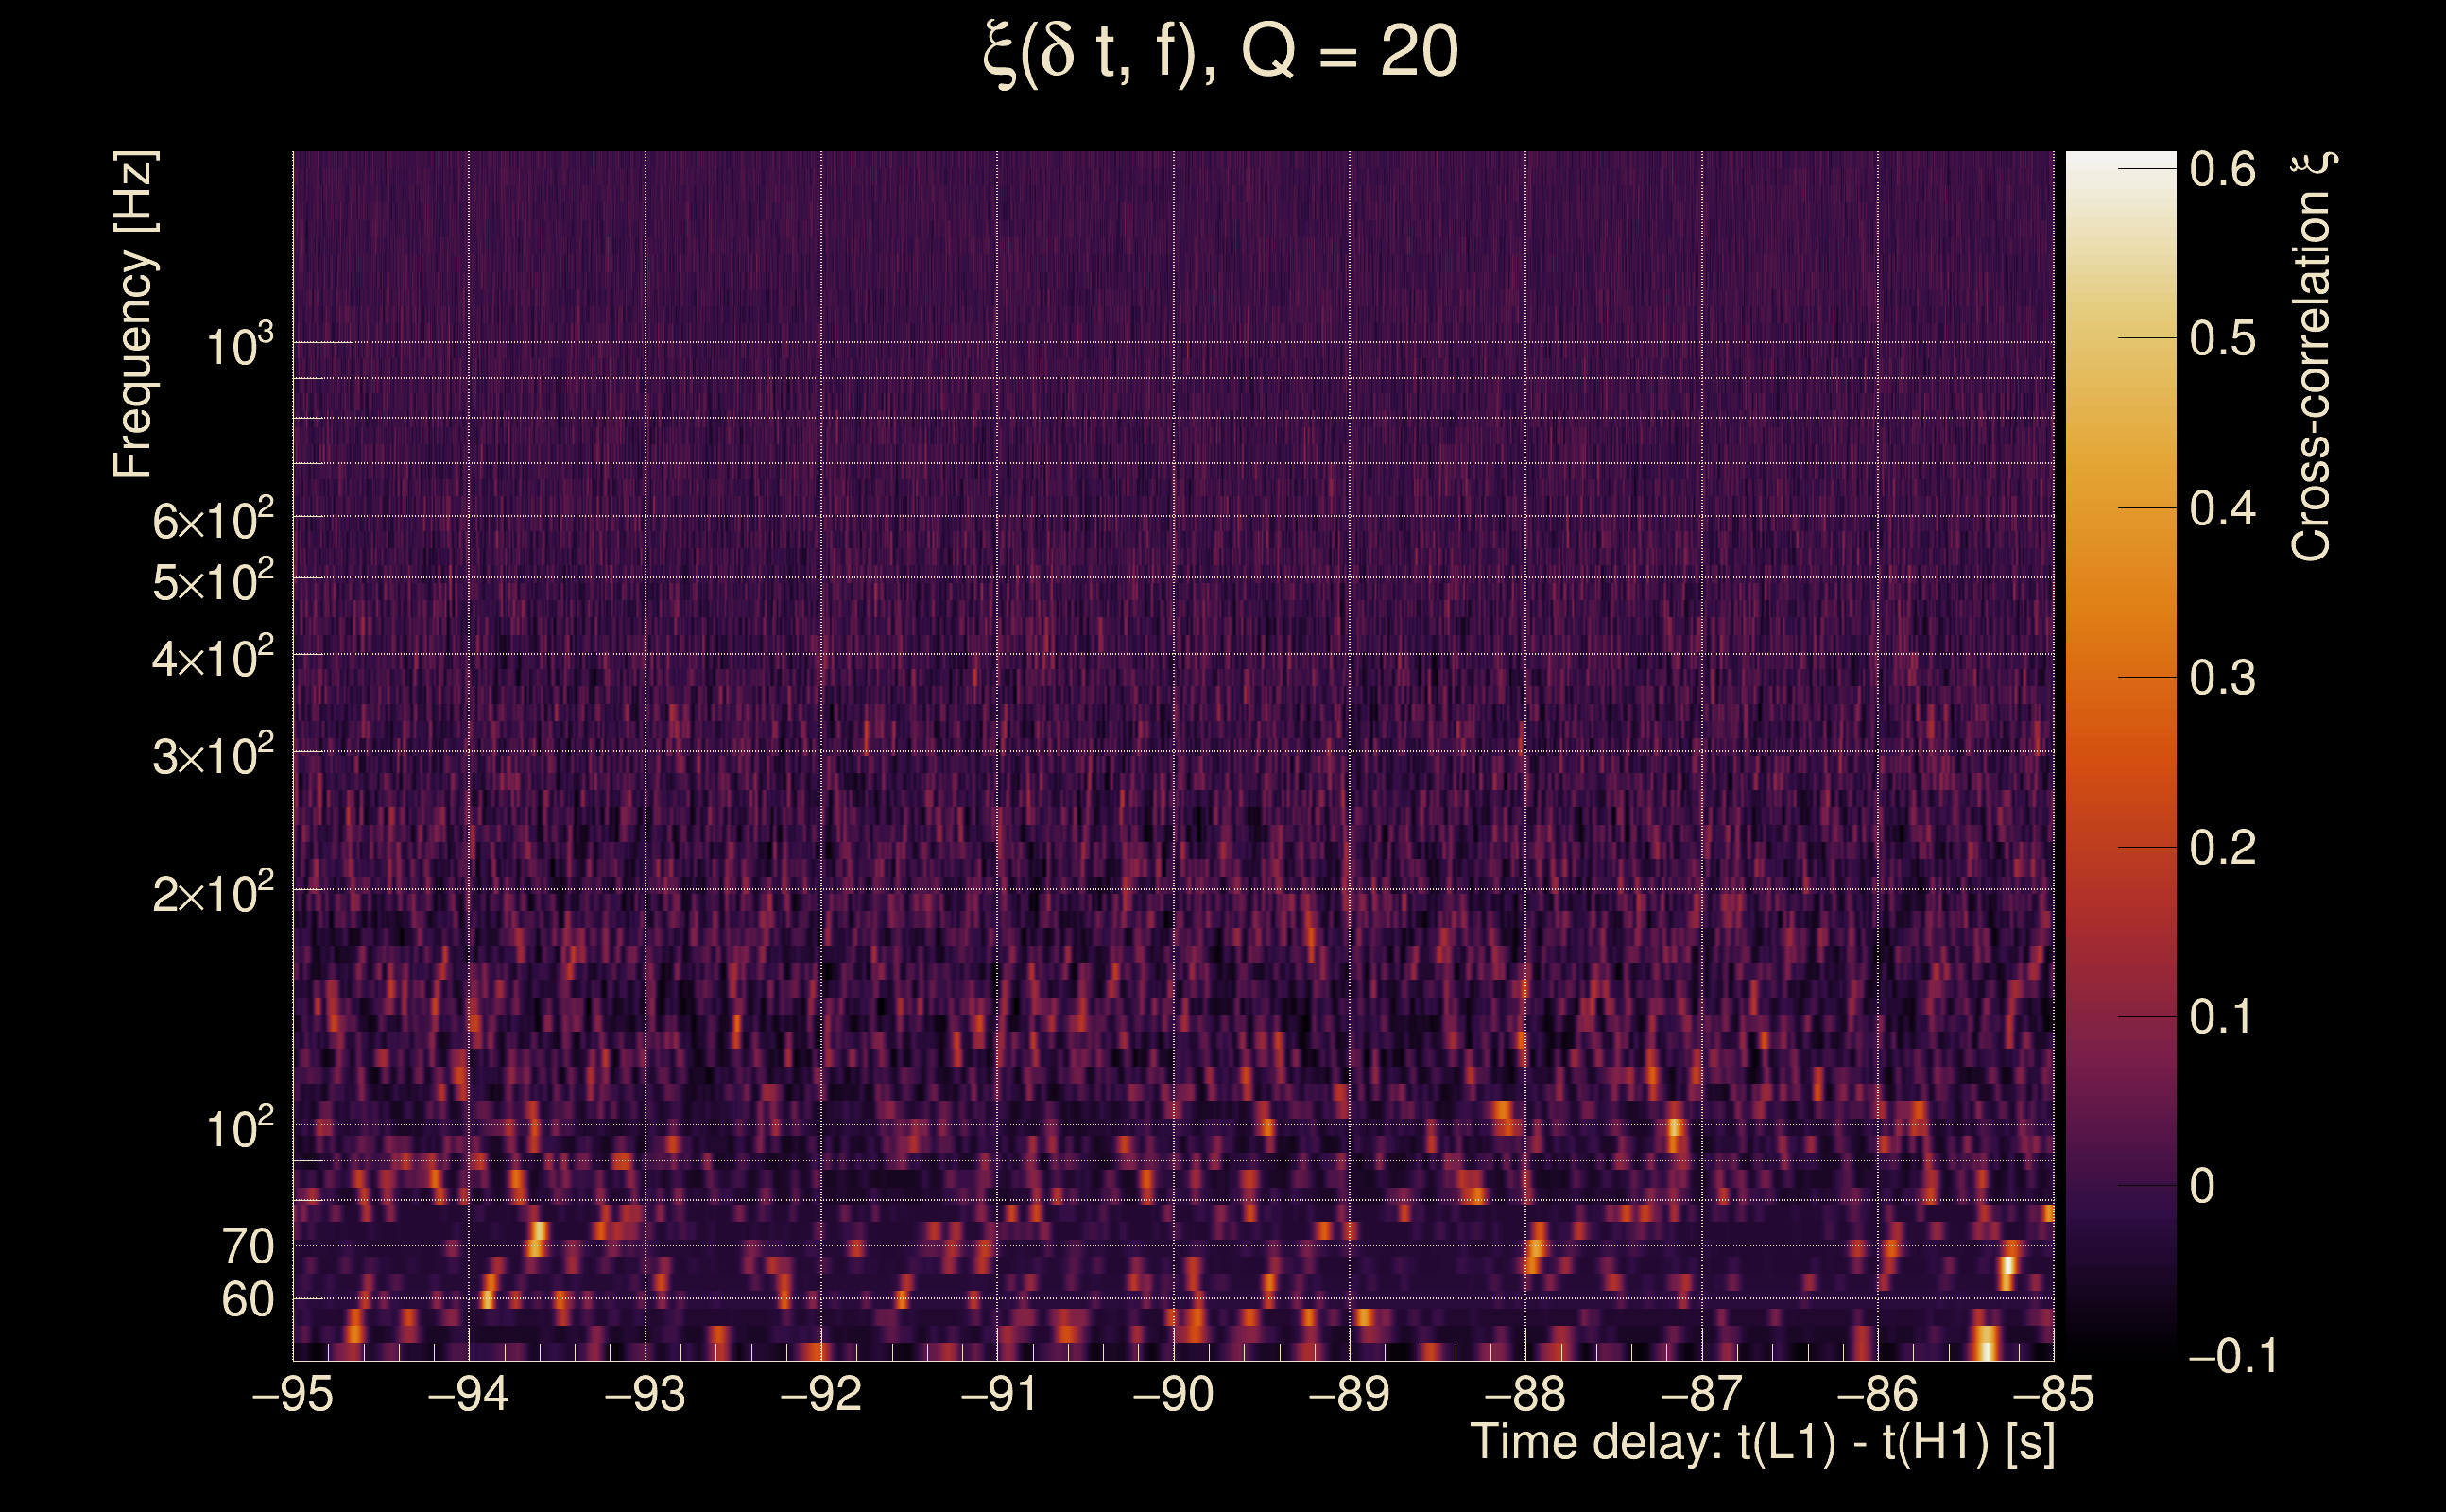
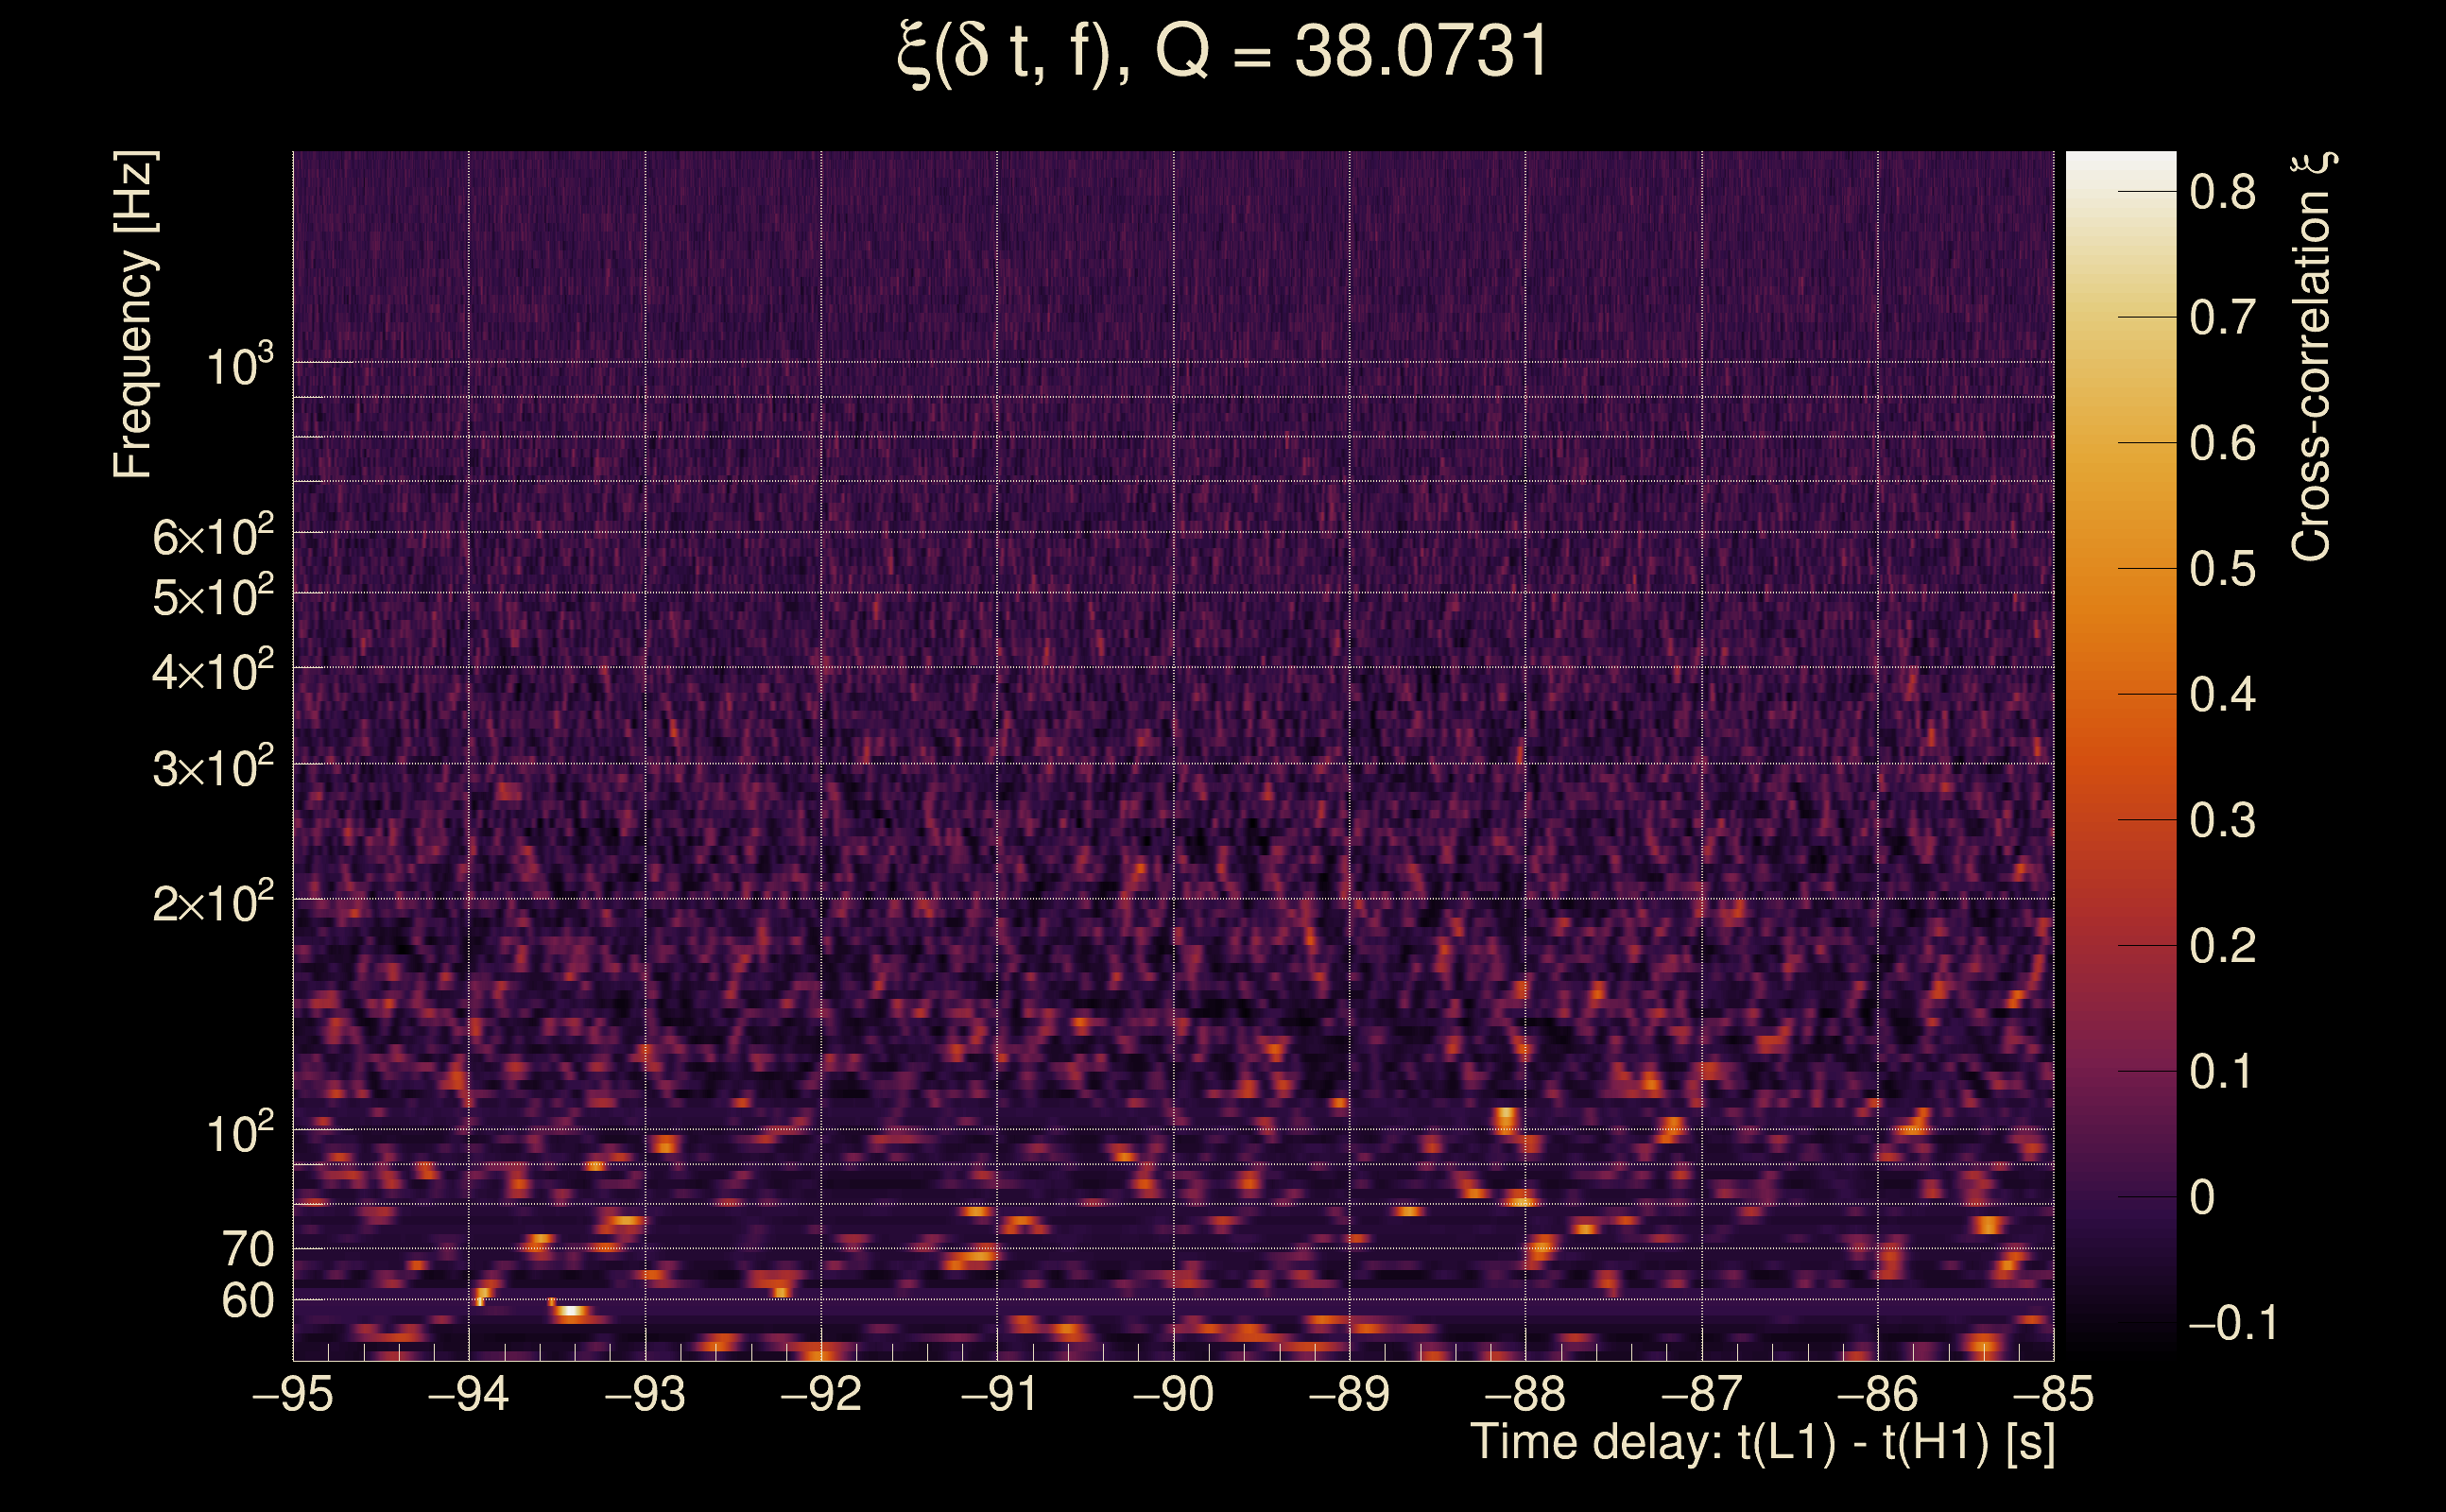
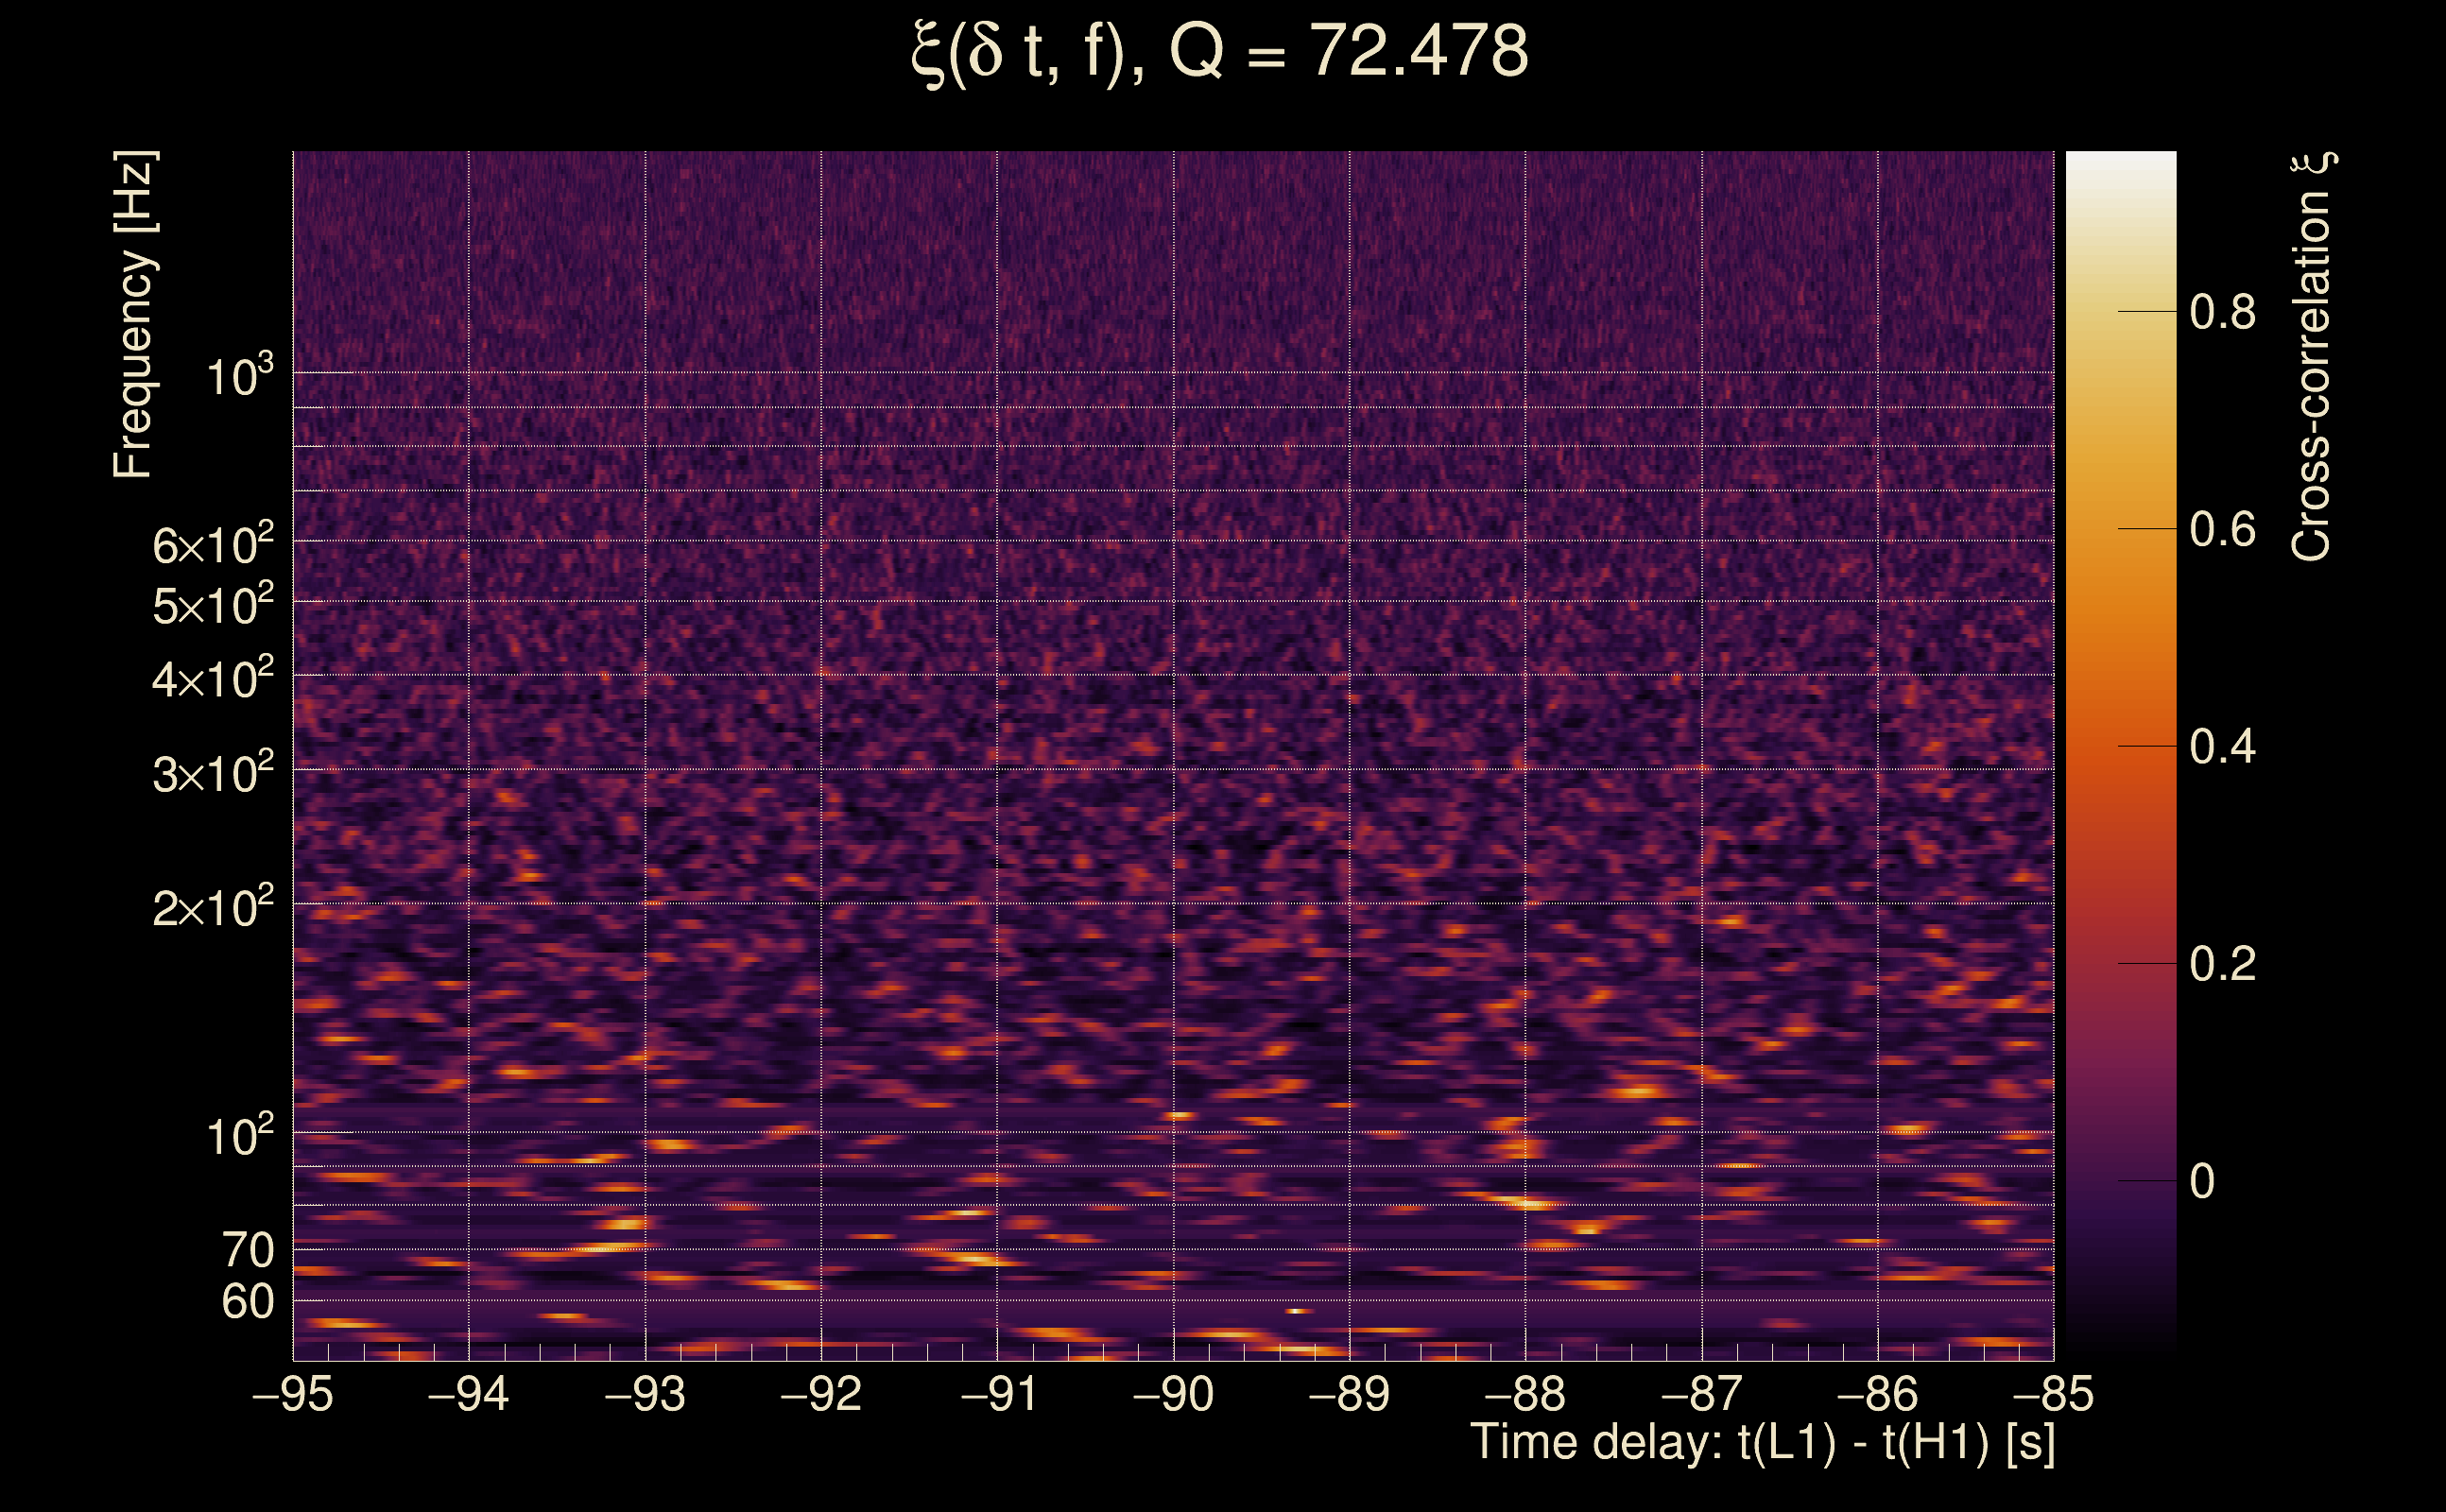
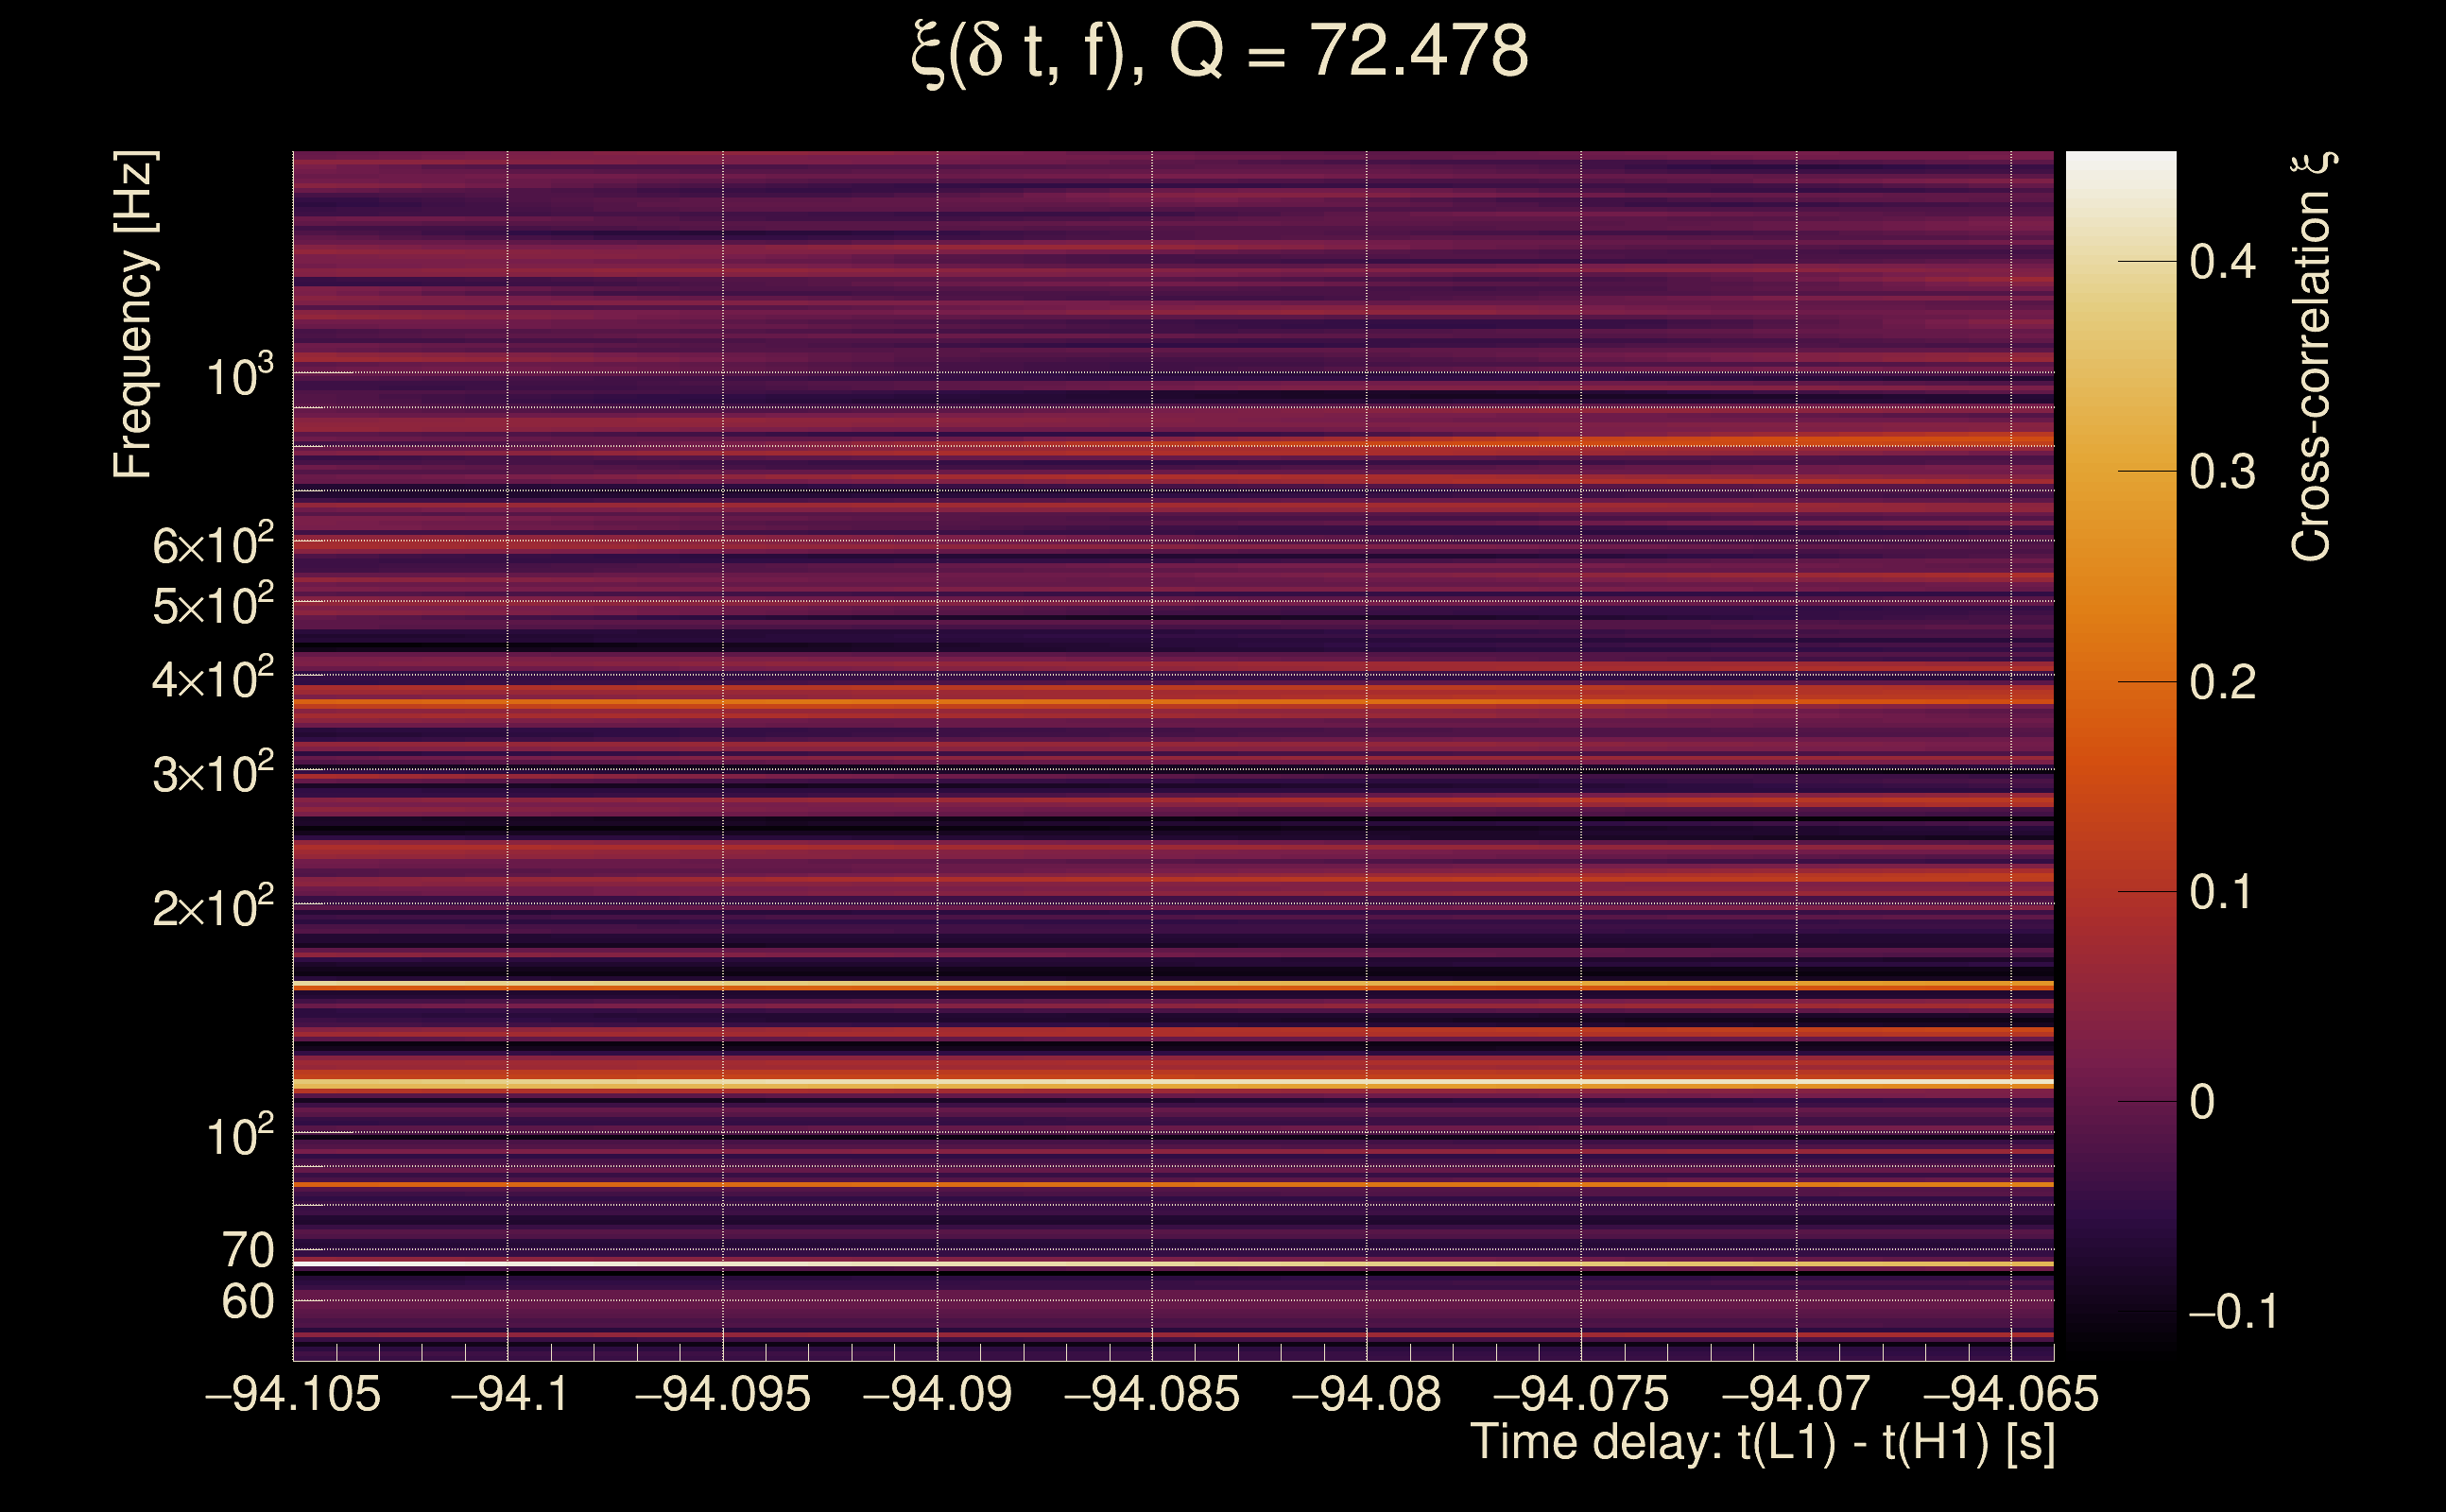
| Number of Q planes: | 5 (Q = 5.51892 → Q = 72.478) |
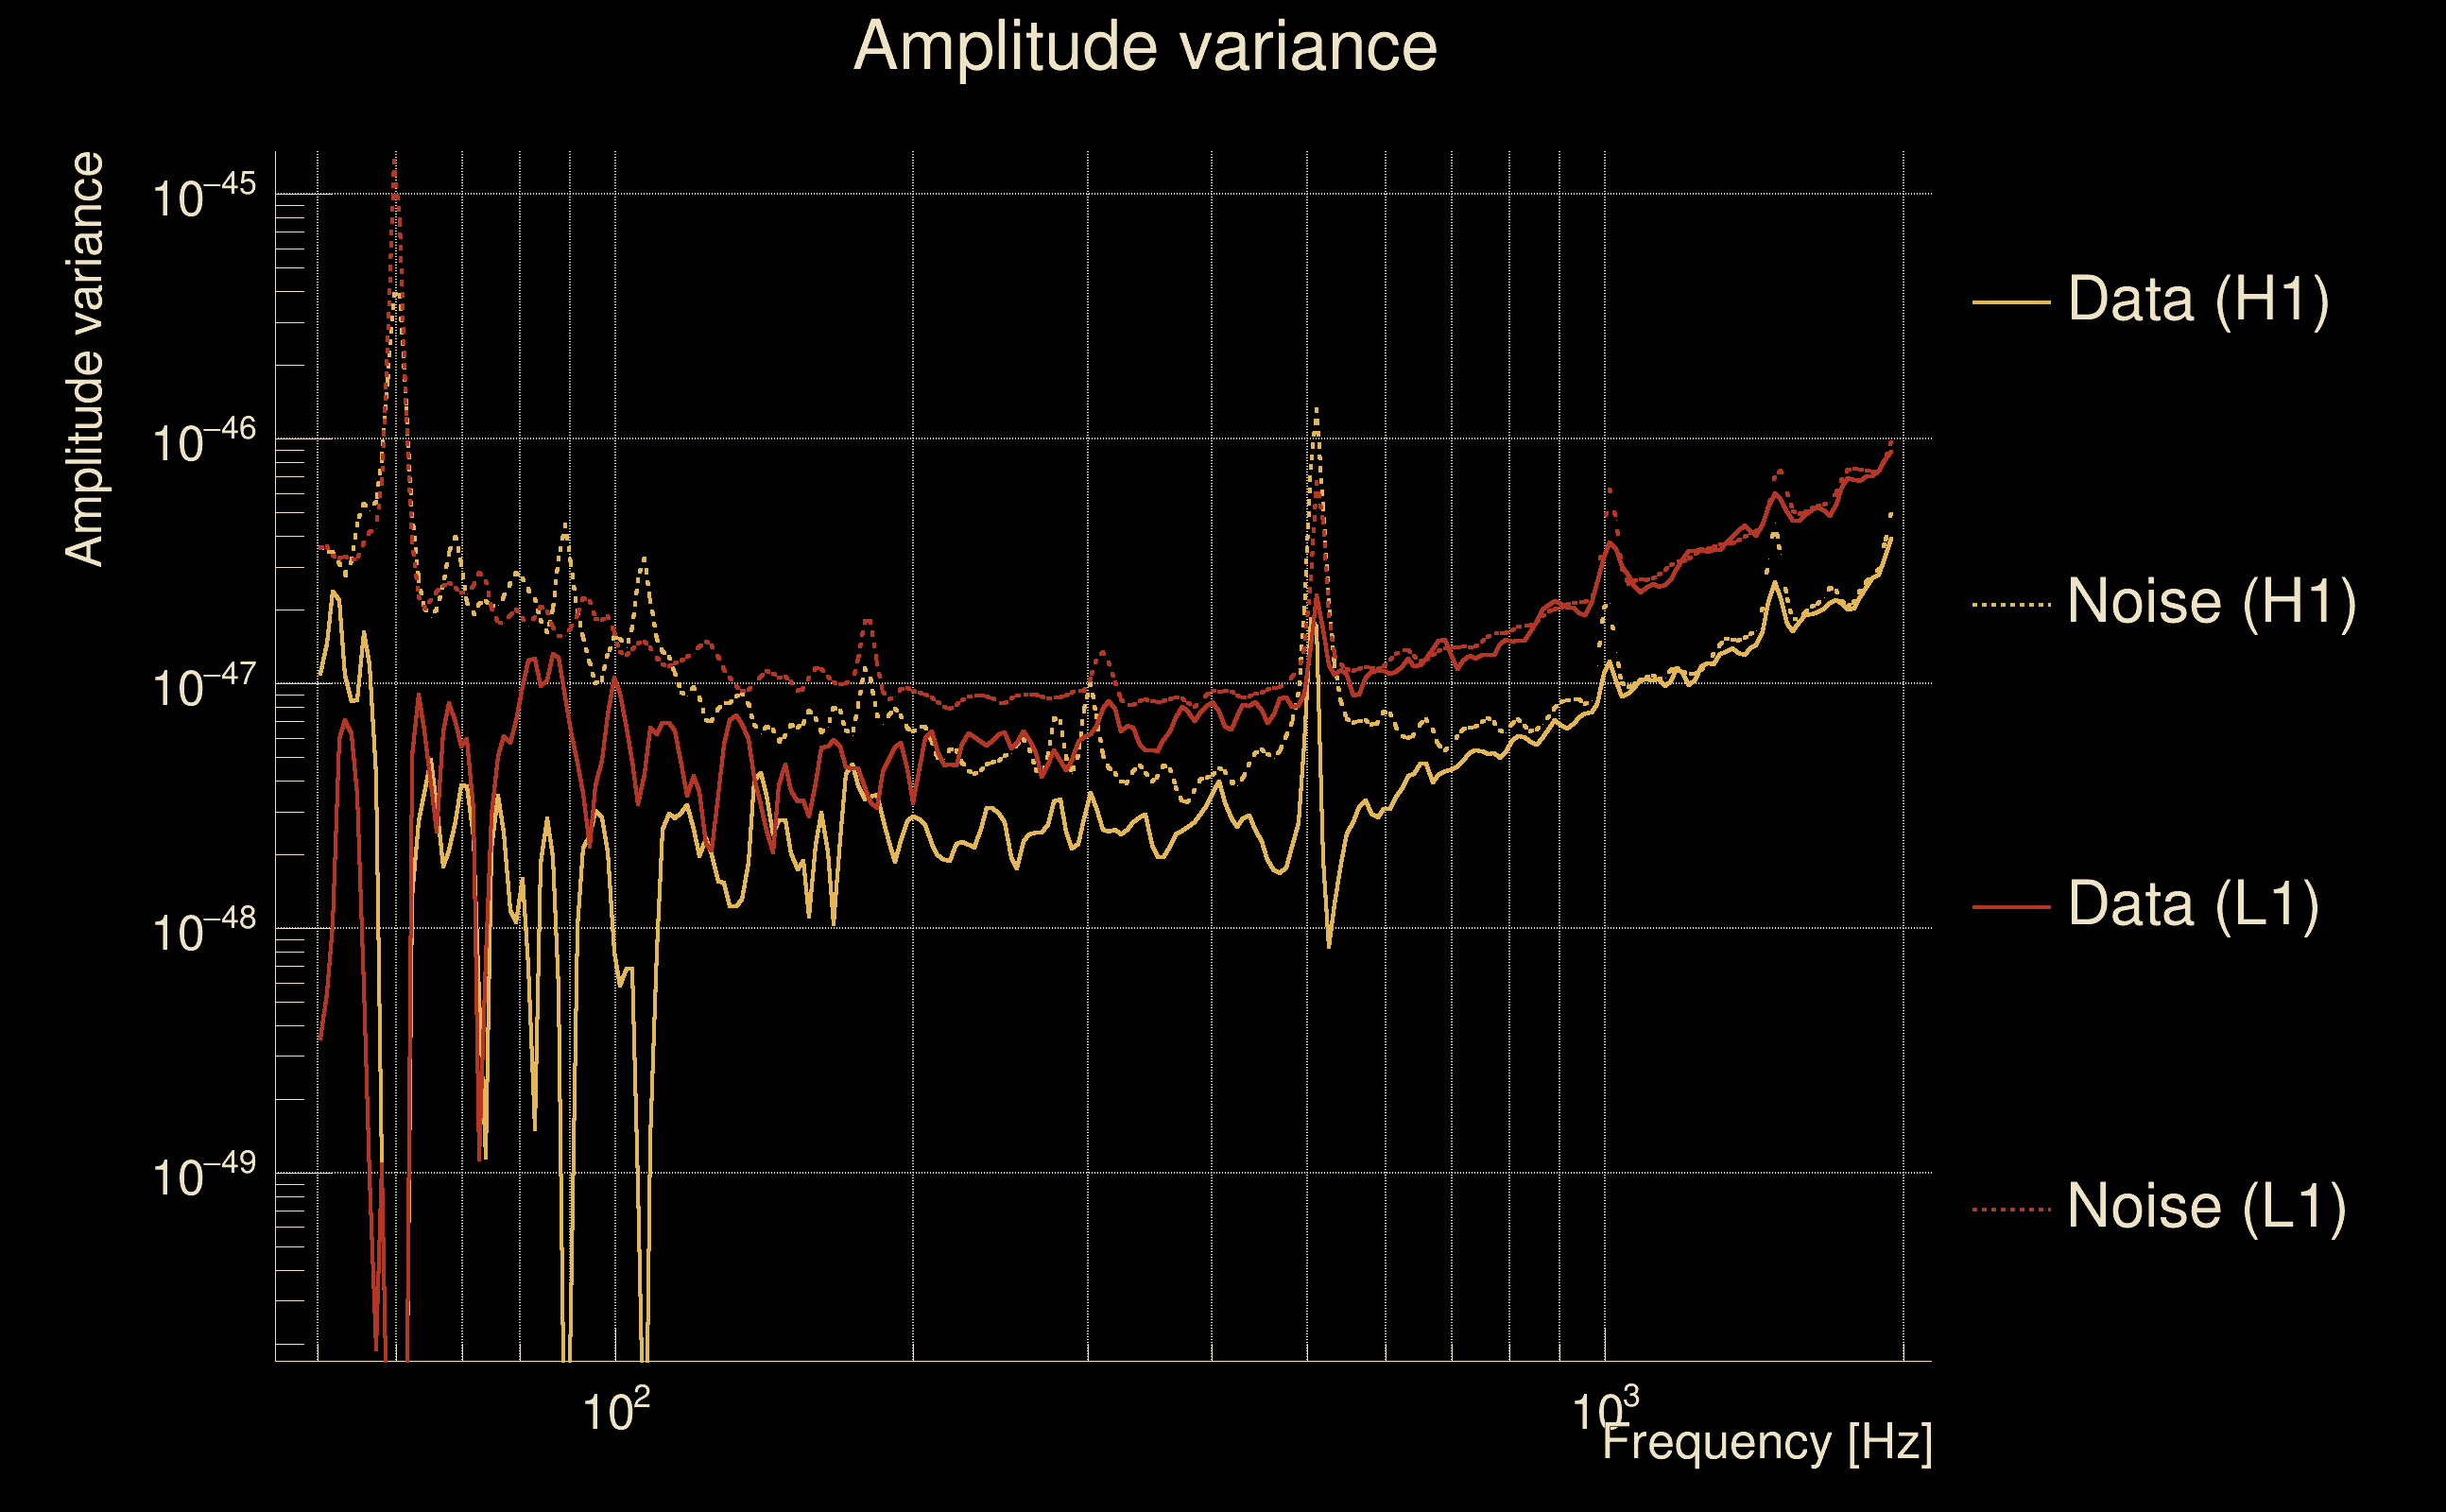
| Omicron frequency range: | 50 Hz → 1958.38 Hz |
| Light travel time between detectors: | 0.0100128 s |
| Slice extra-time (calibration uncertainty + slice veto): | 0.0129872 s |
| Number of time-delay bins in a cross-correlation map: | 10000 |
| Number of slices in a cross-correlation map: | 217 |
| Number of time-delay bins in a slice: | 46 |
| SNR gating: | < 100 (detector 0), < 100 (detector 1) |
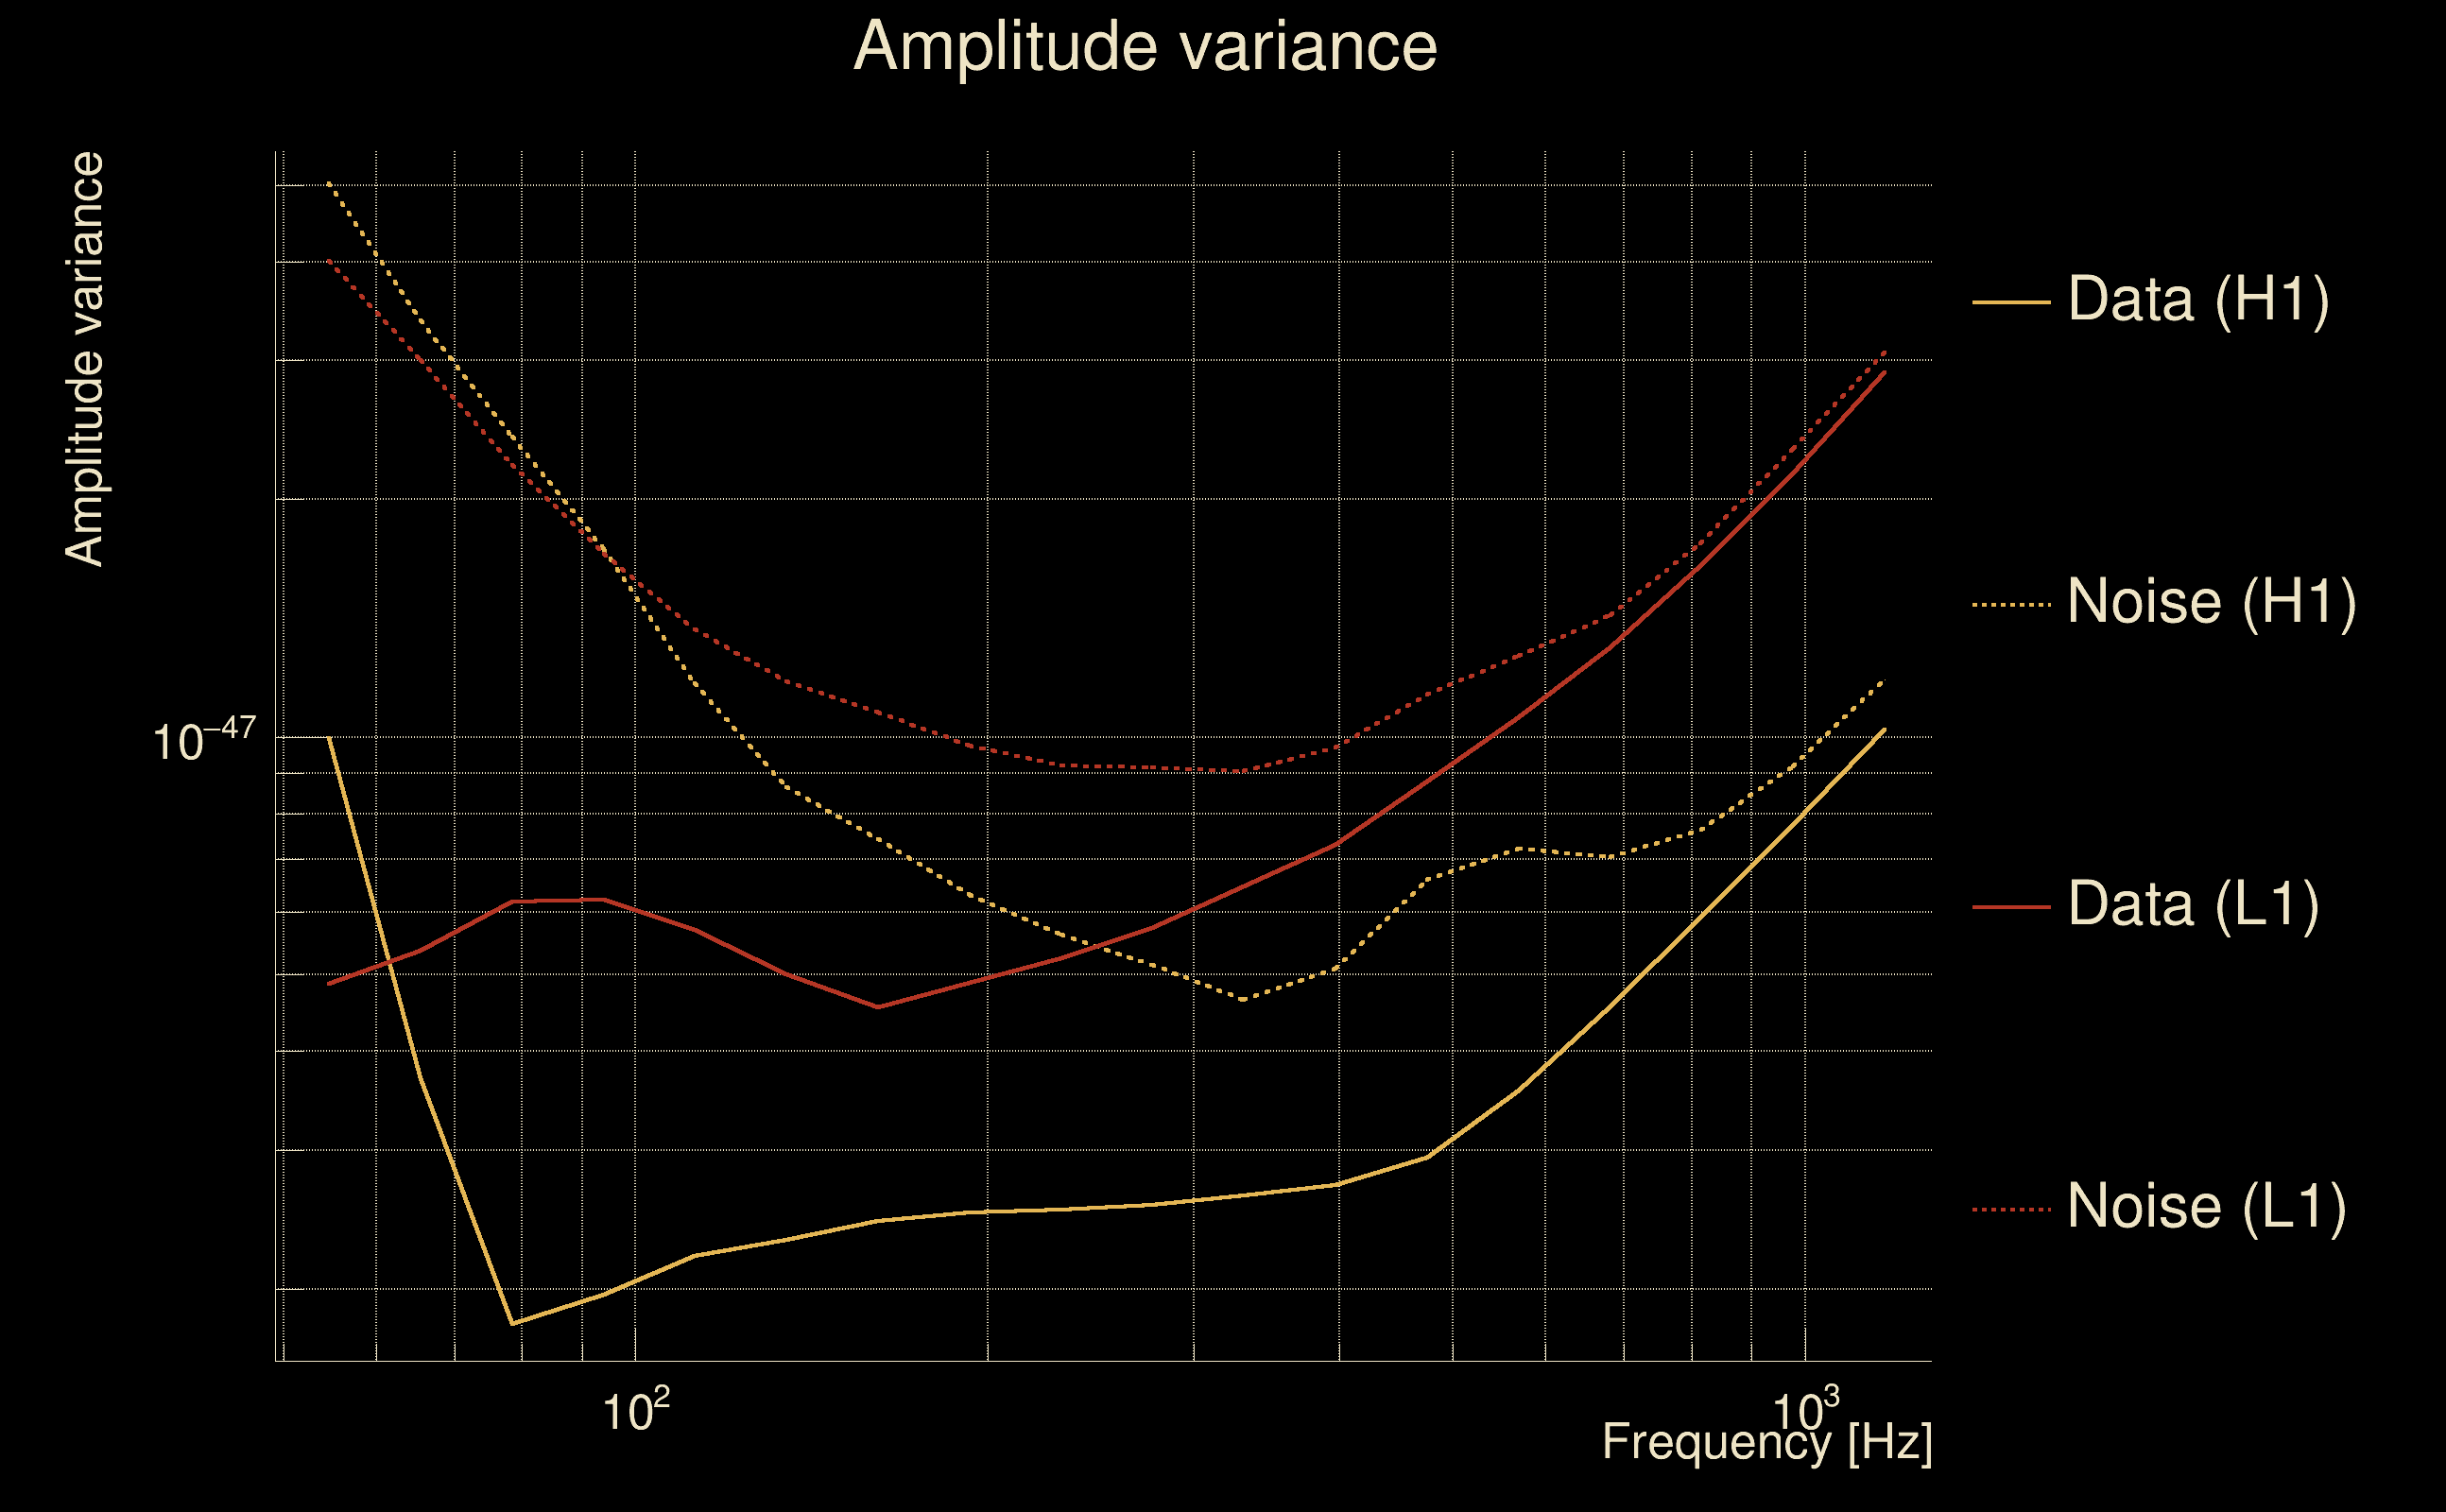
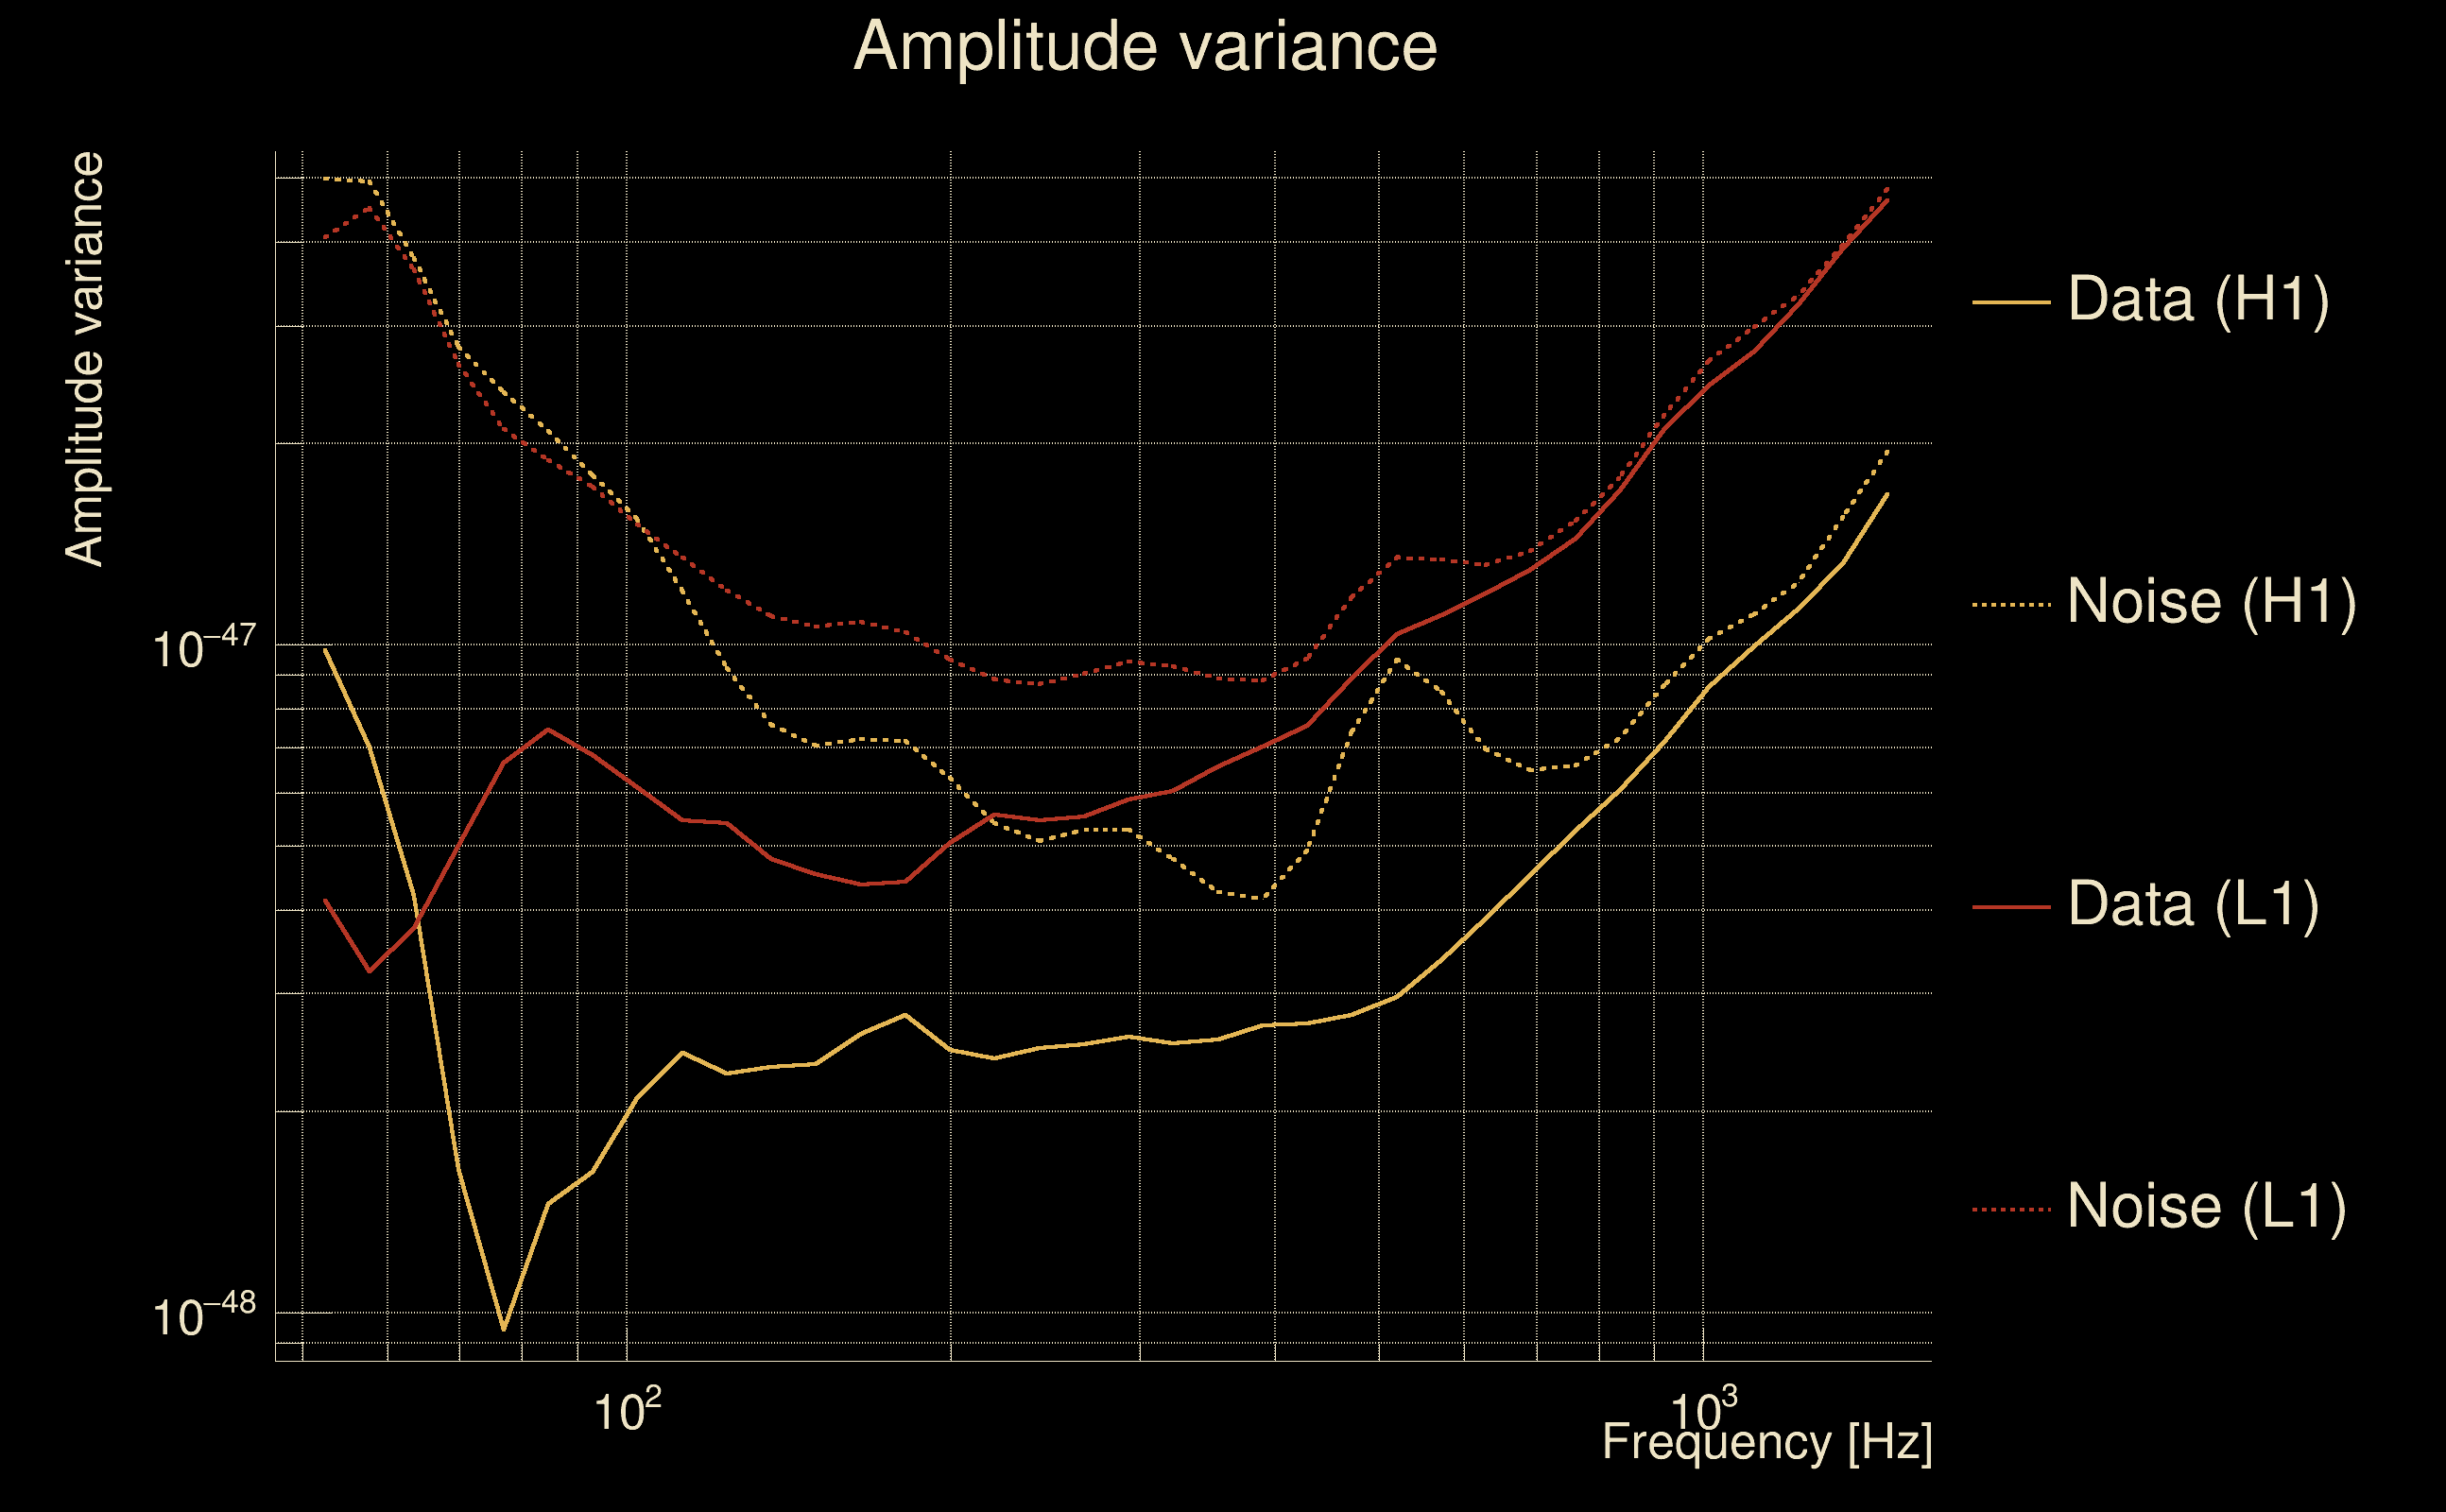
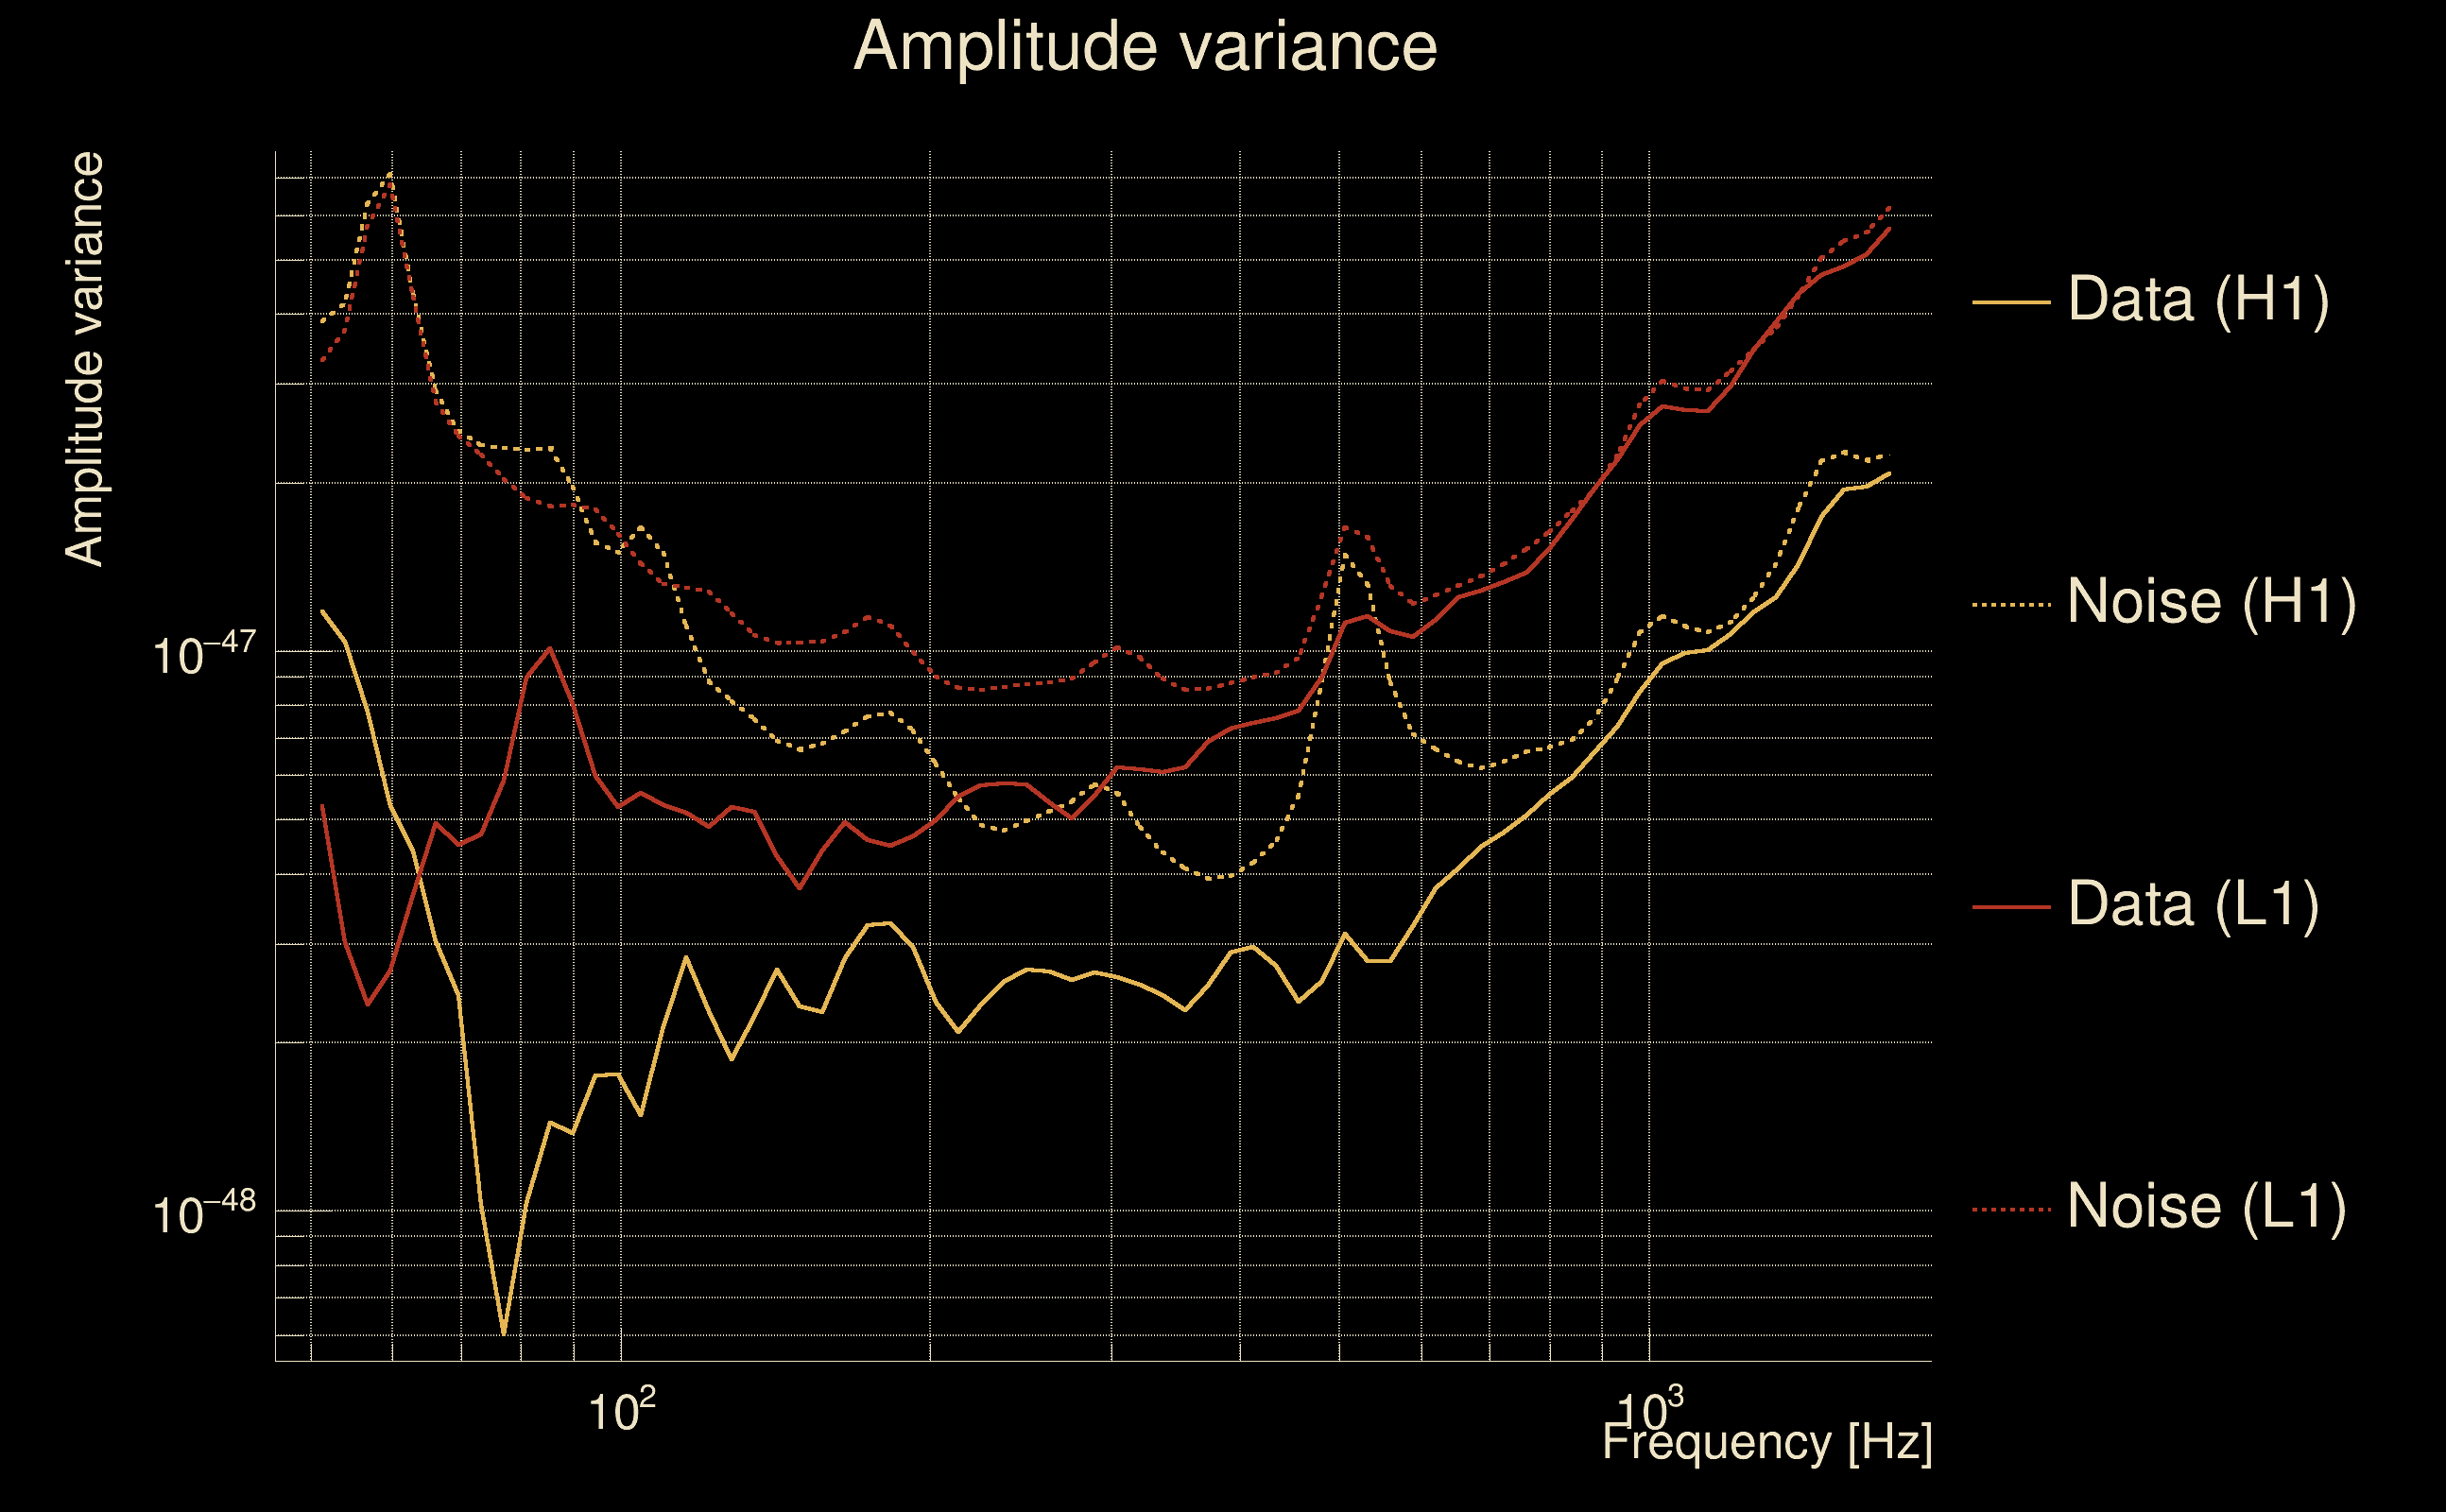
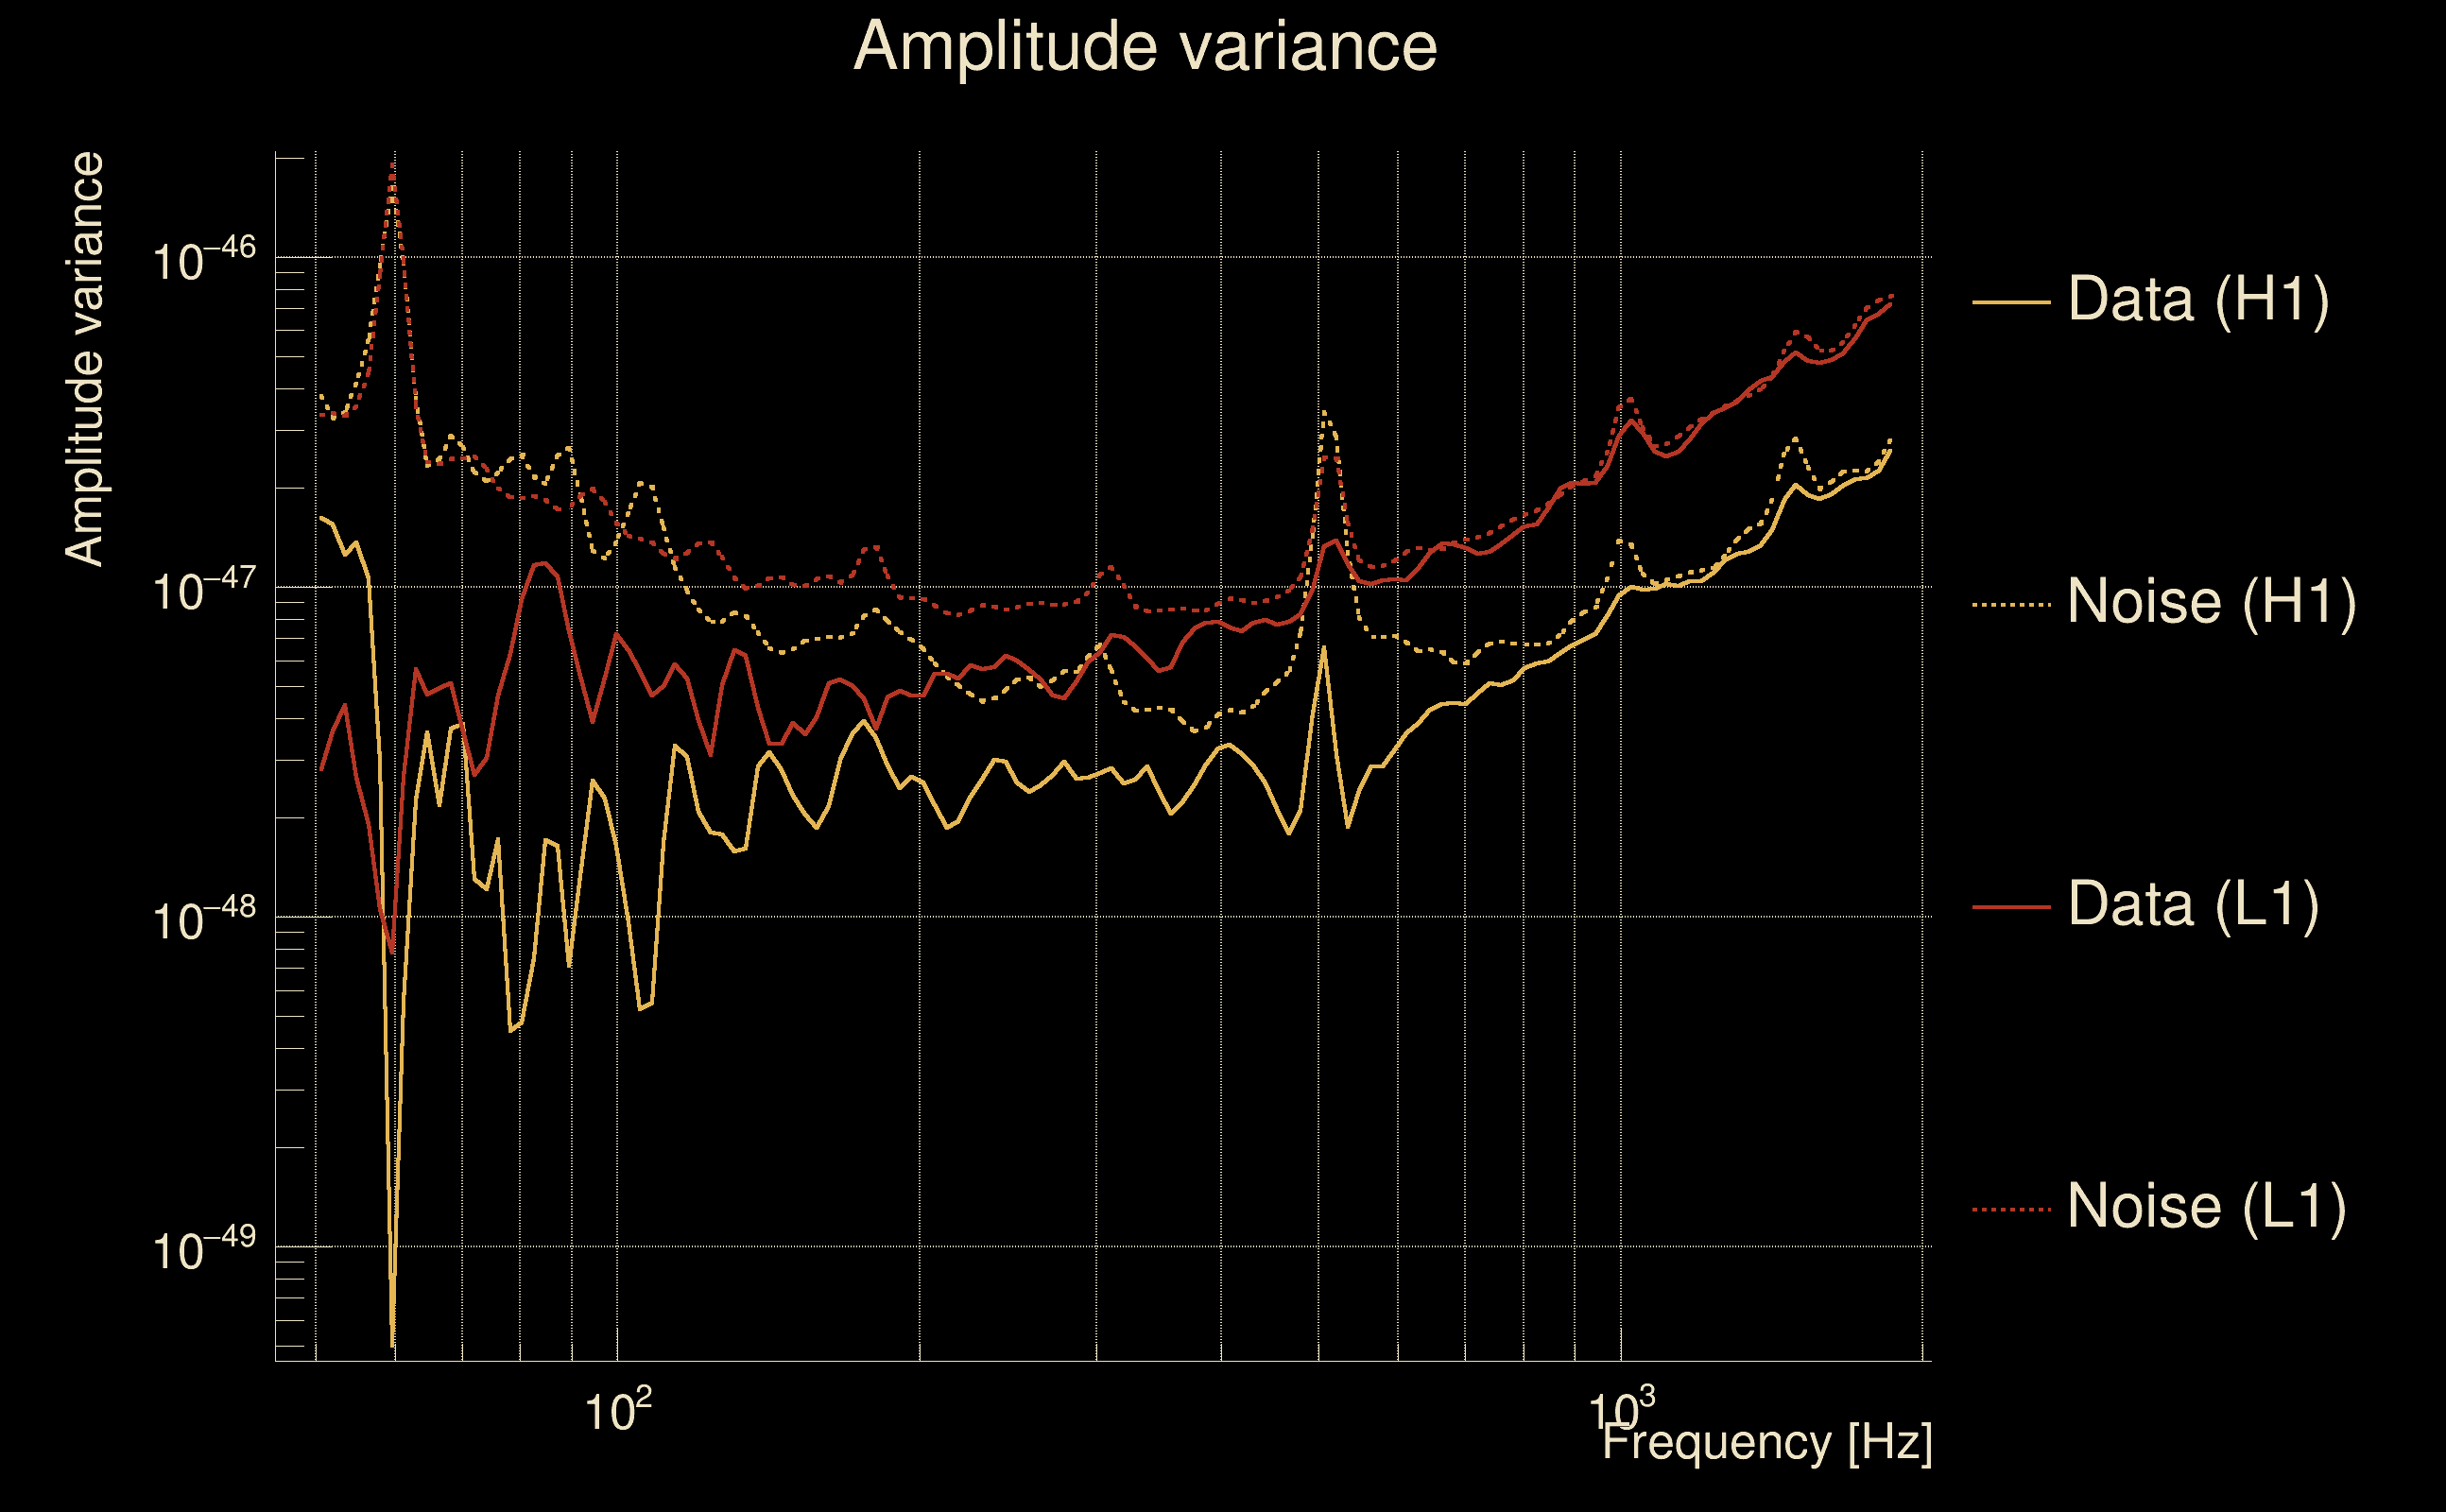
| Amplitude spectrograms: | normalization = 1e-22, power index = 2 |
| White noise SNR variance: | 0.523175 (after applying a correction factor = 1) |
| Amplitude ratio confidence level: | 3 sigma |
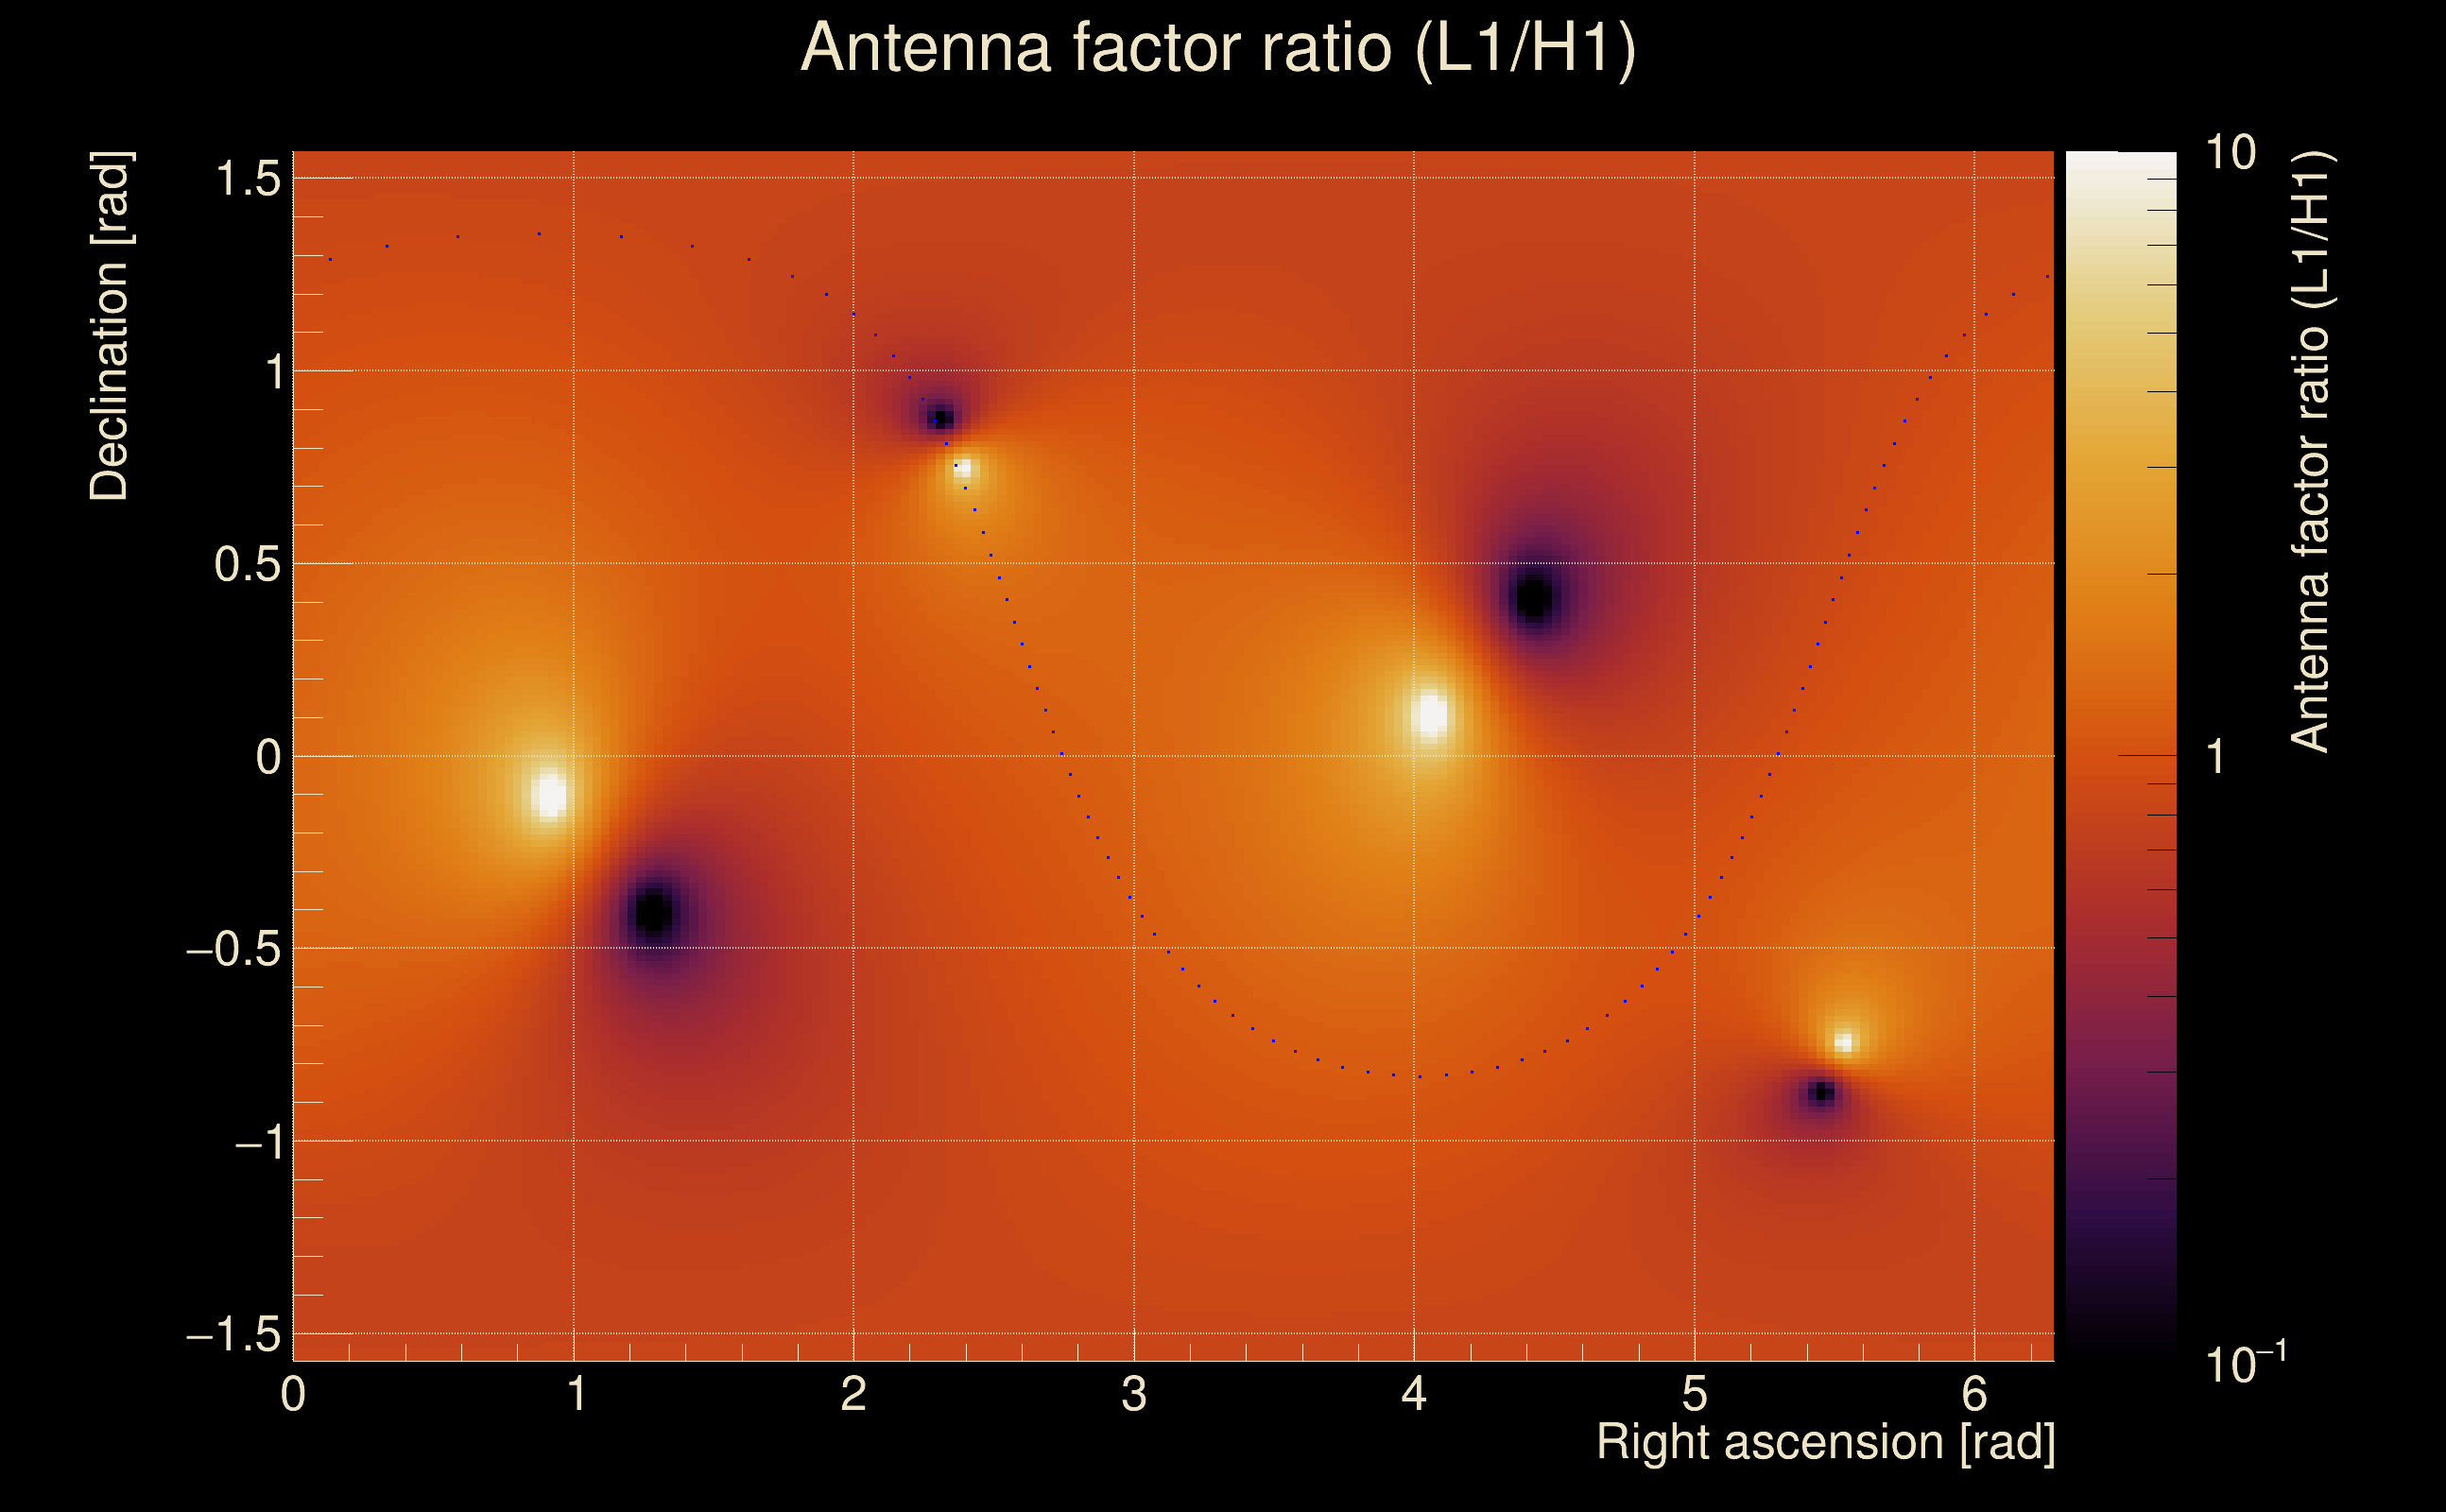
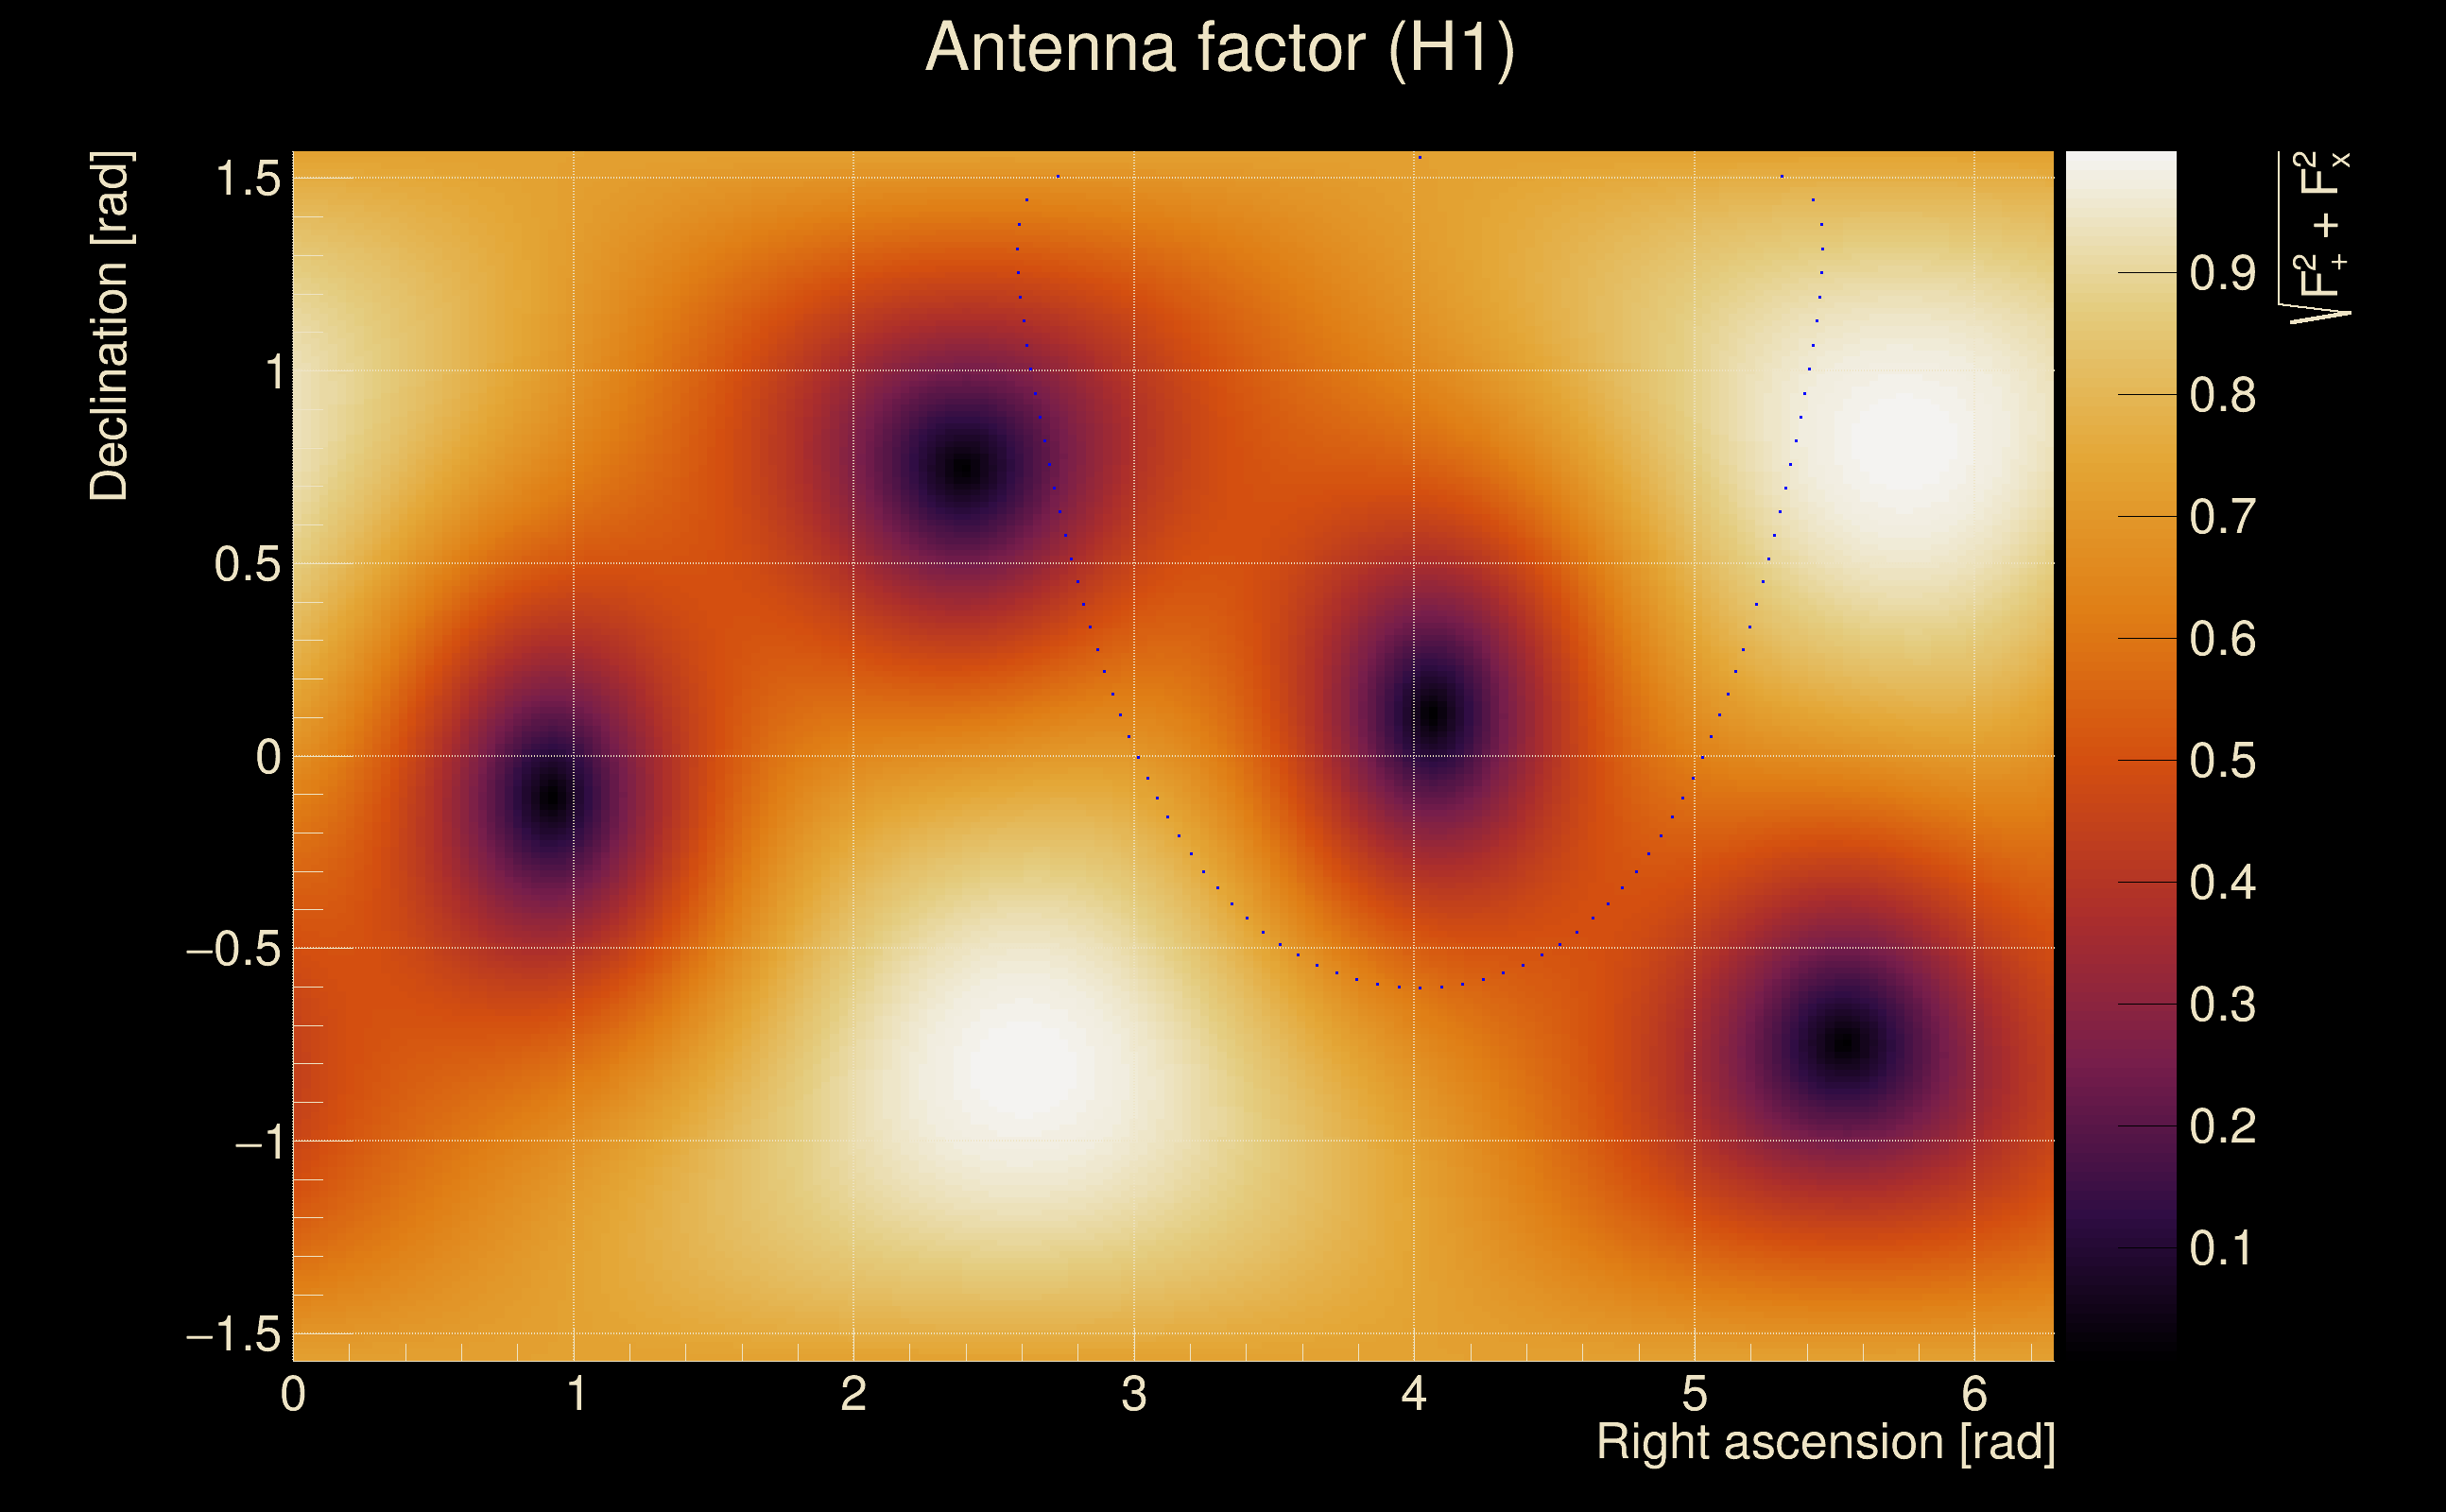
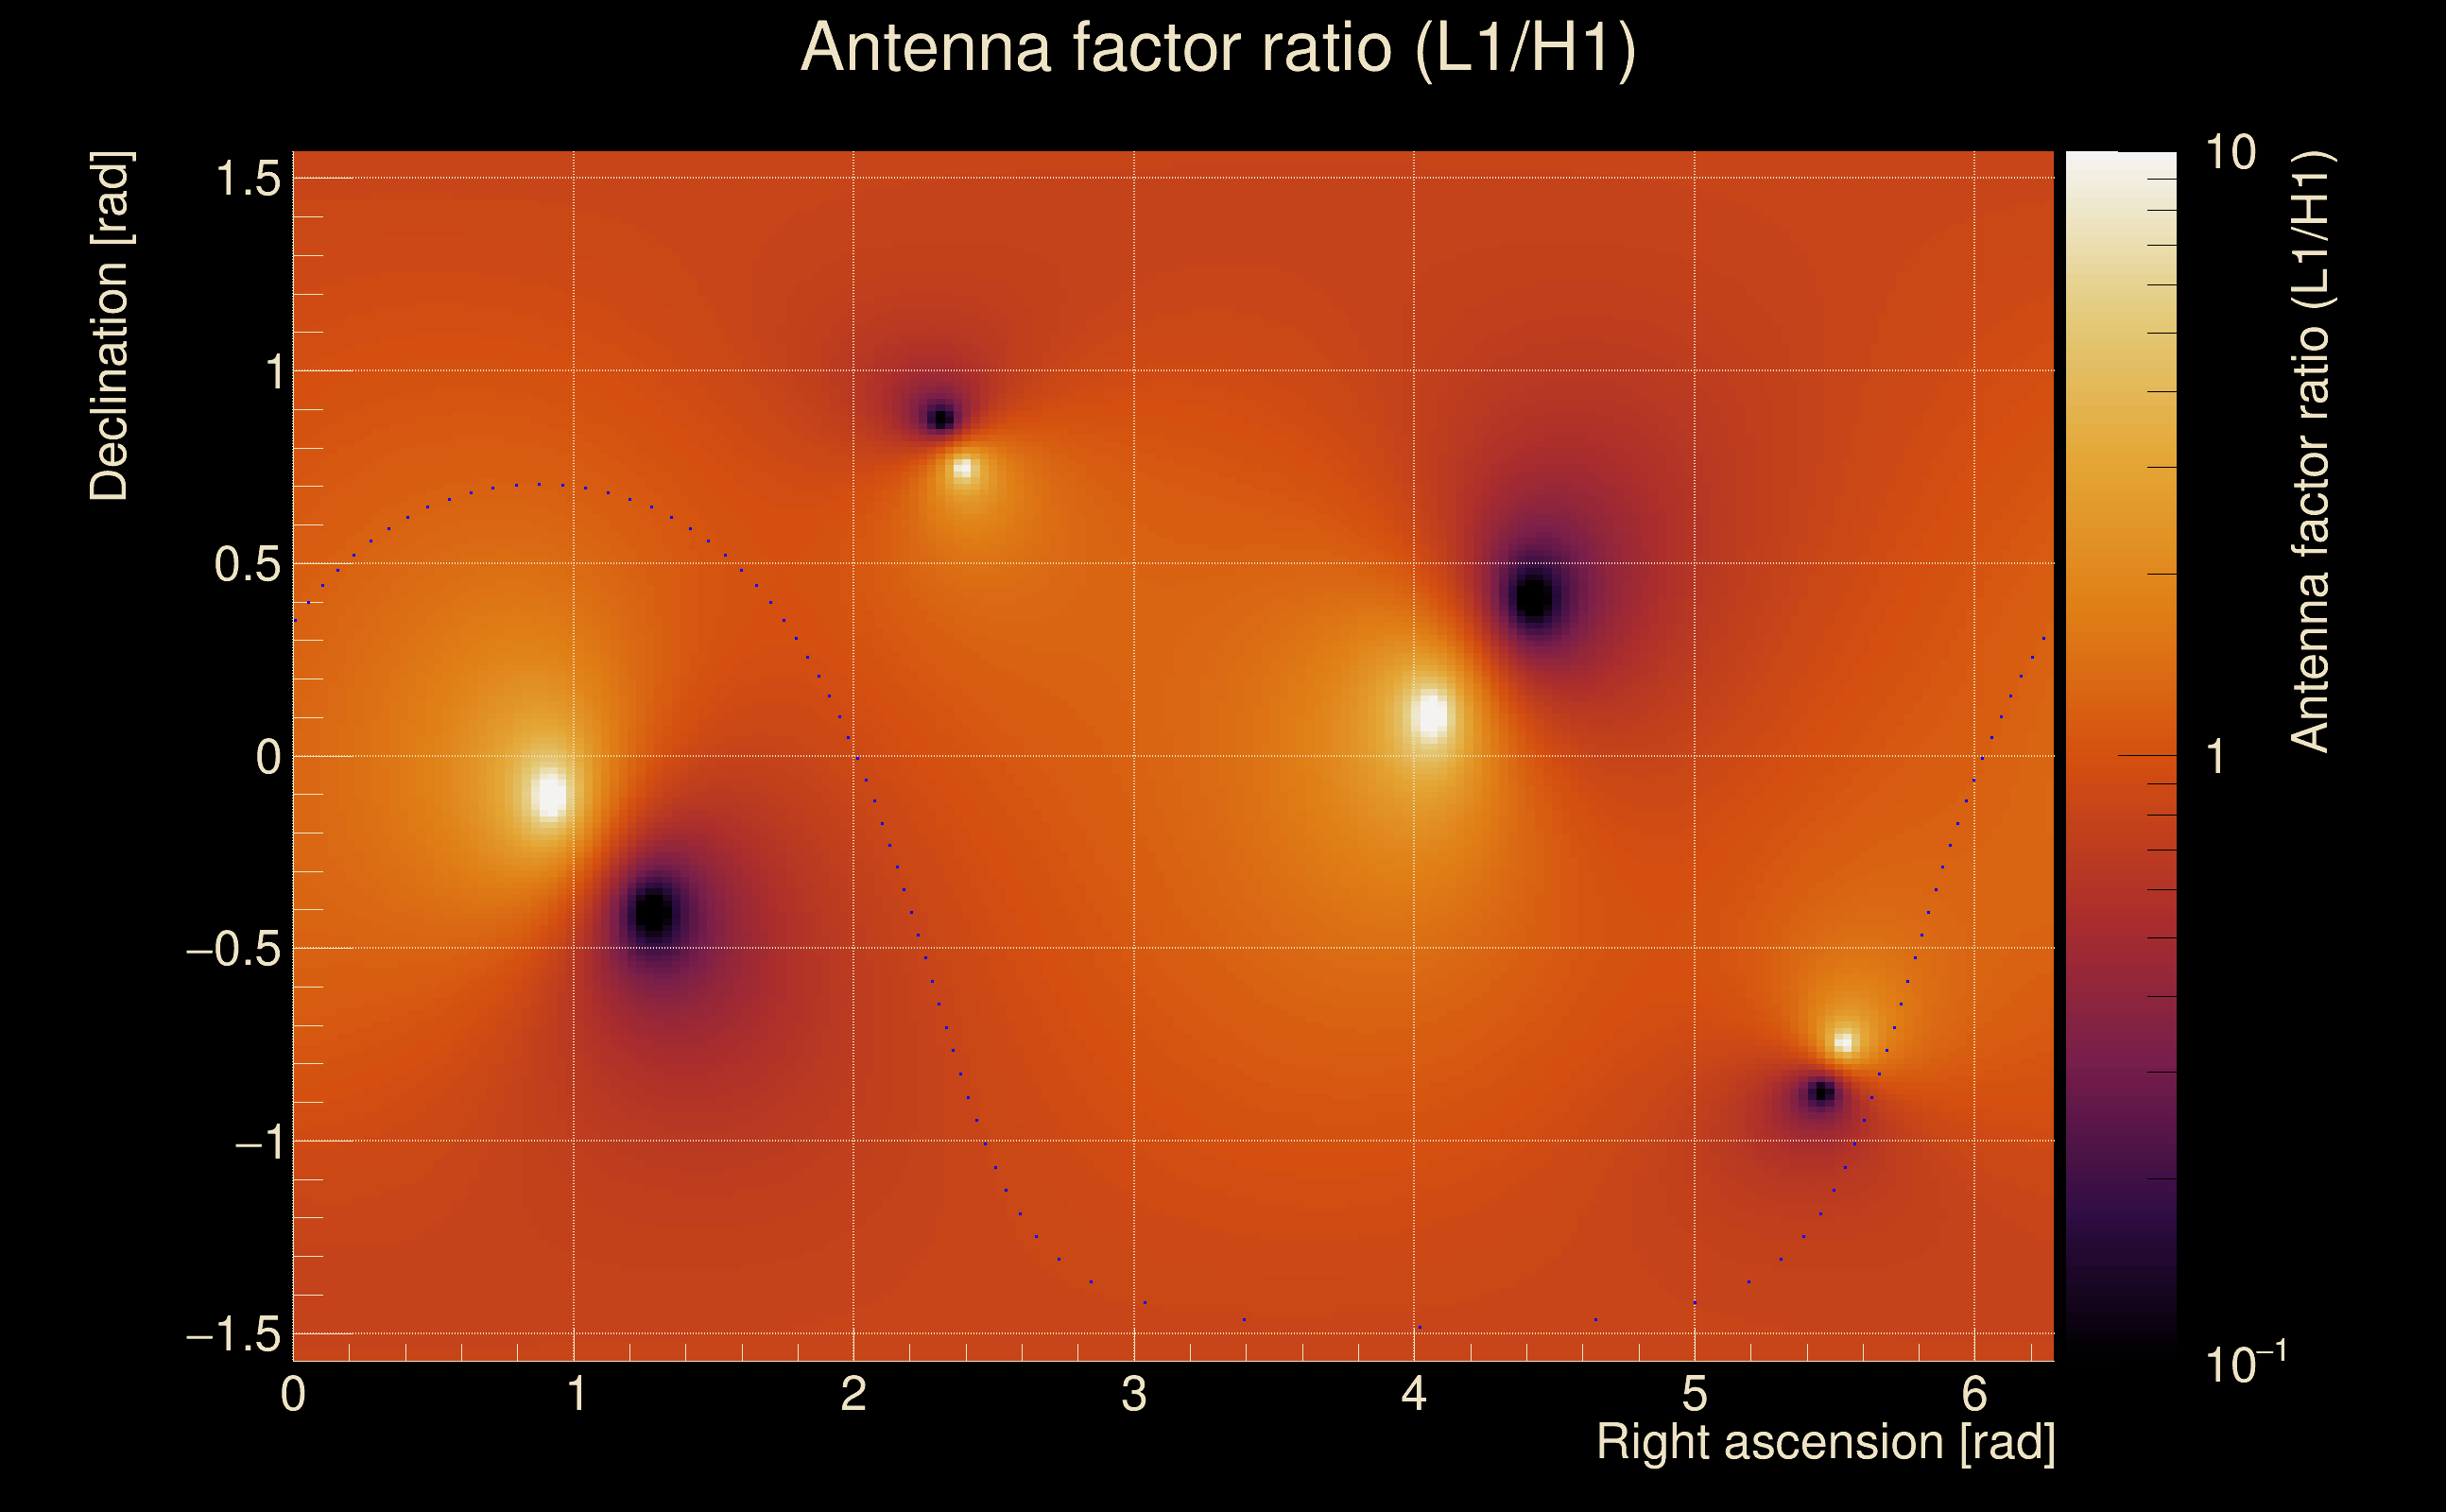
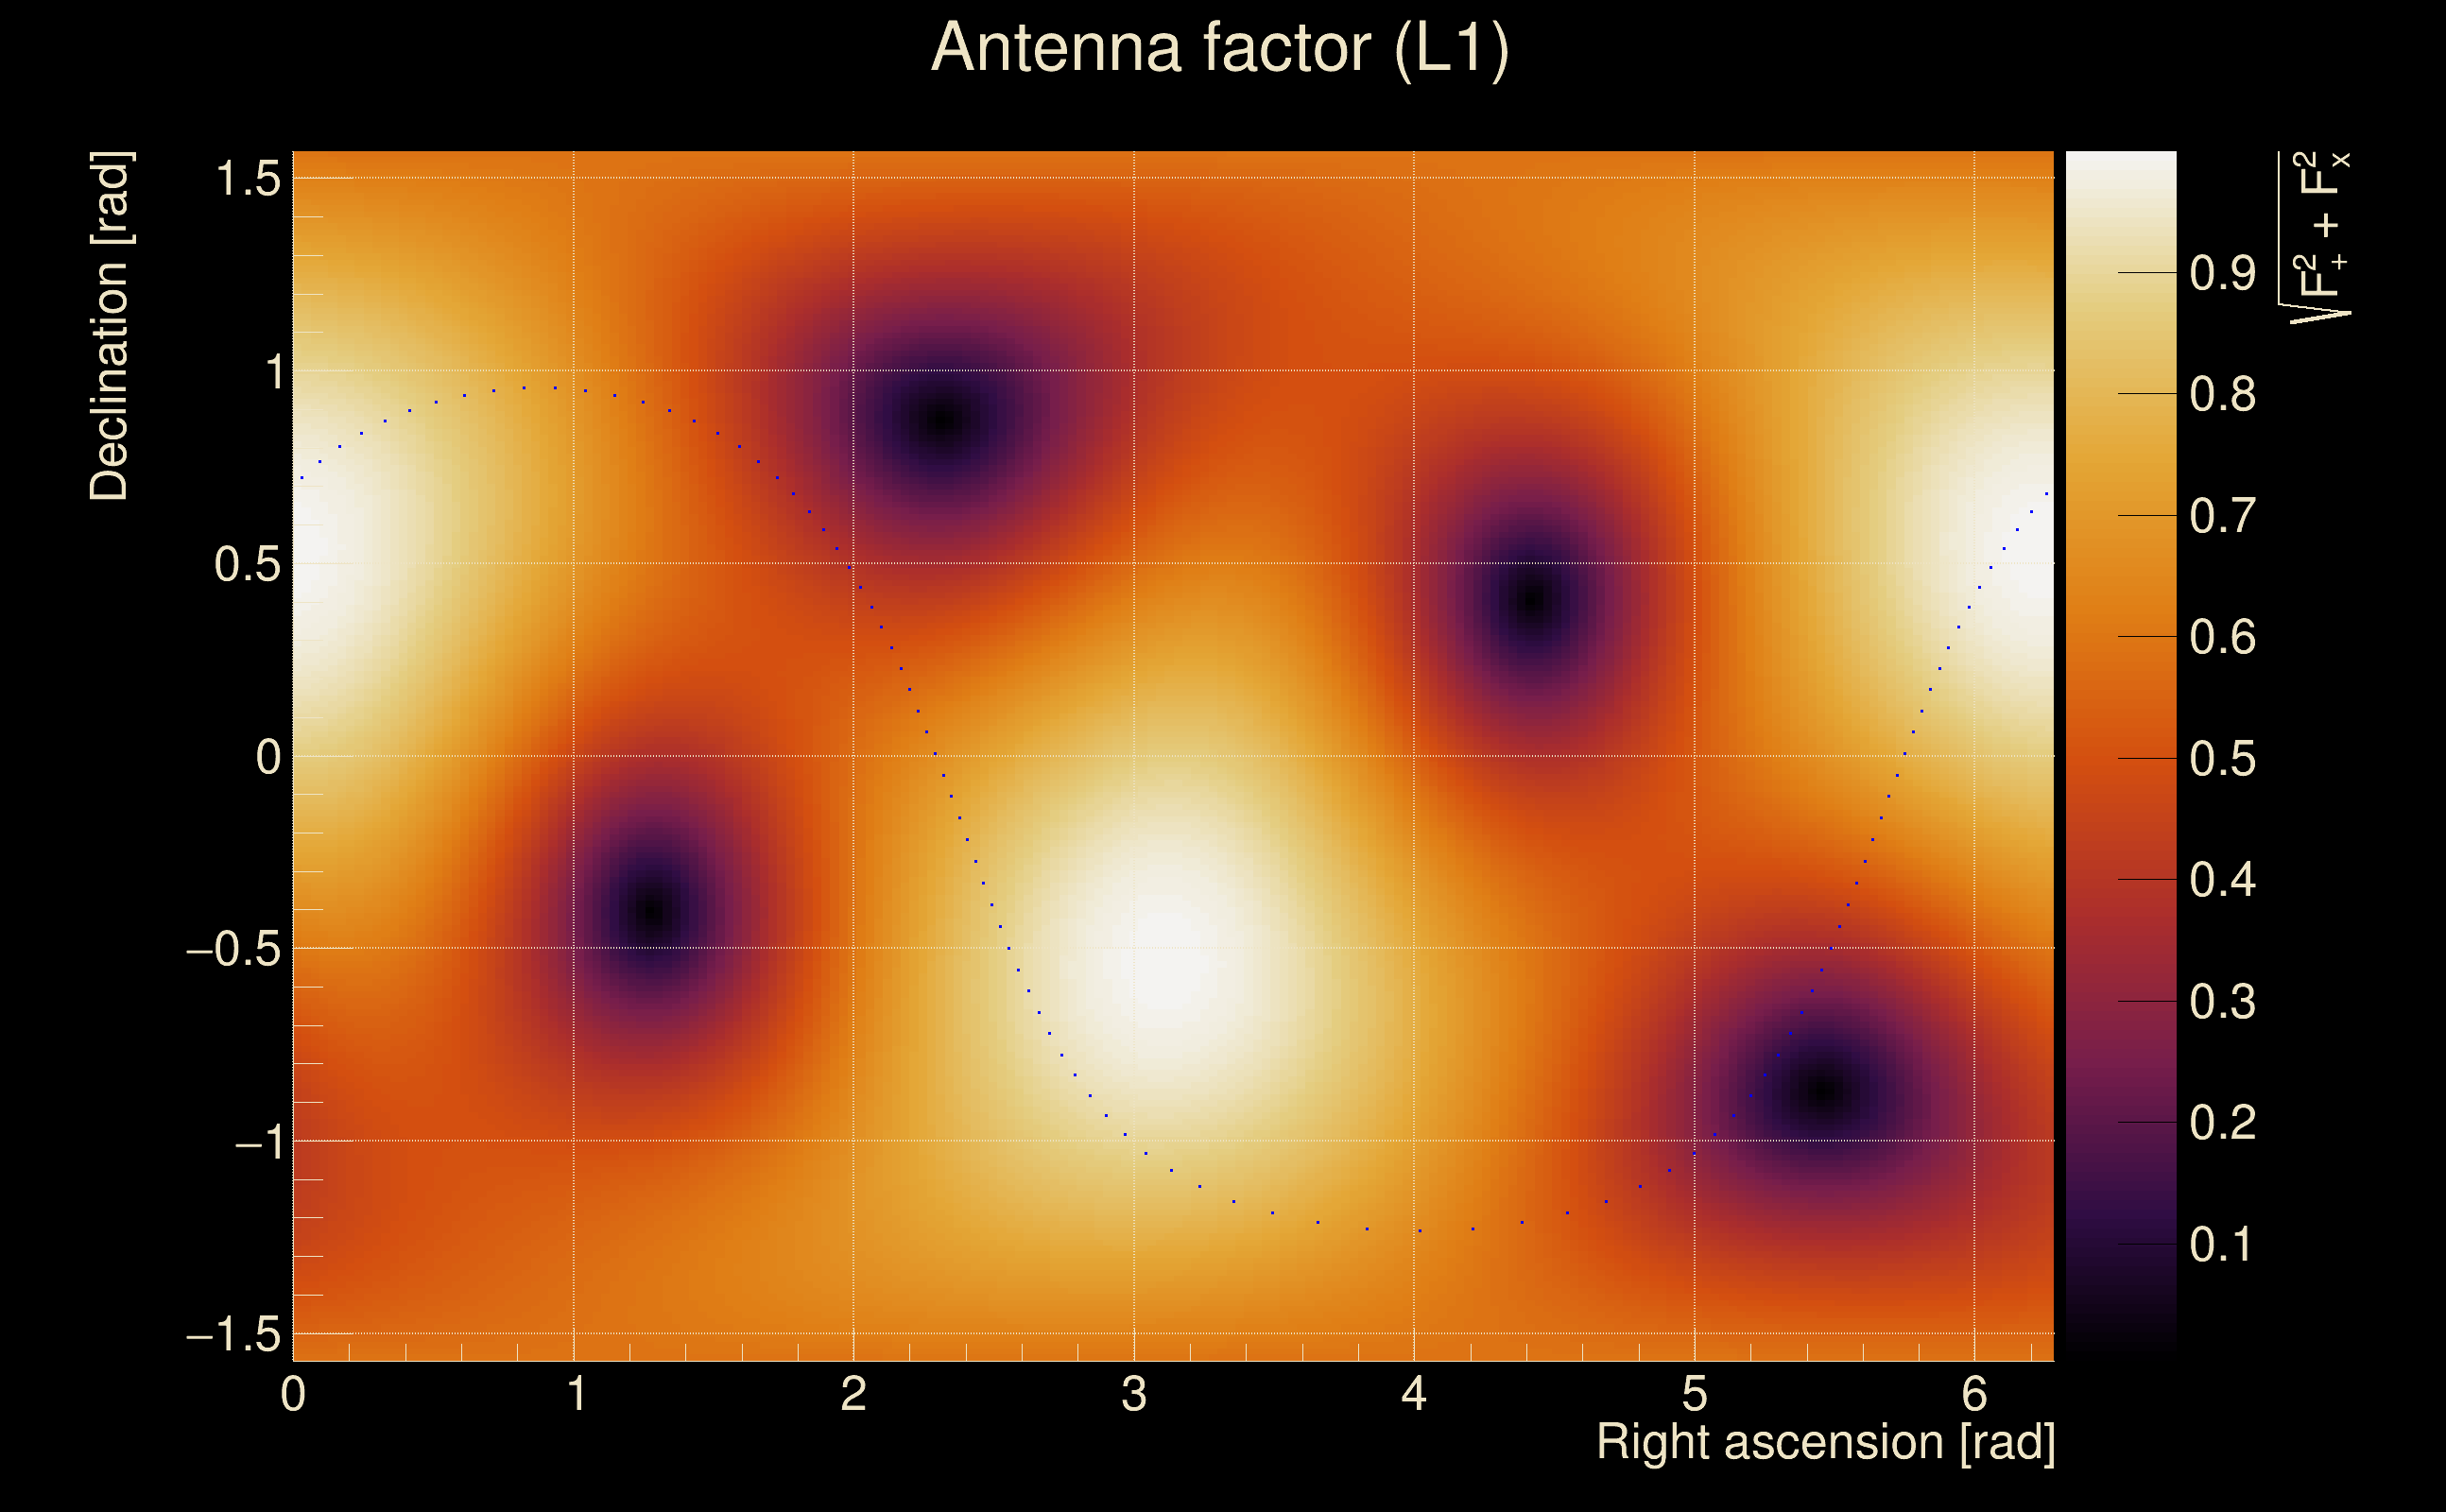
| Target sky positon: | Ra: 6.0135, Dec: 0.3475 [rad] |
| List of input Ox files: | Targeted_O4bw_10min_file_list.txt (11 files) |
| Analysis result file: | Targeted_O4bw_10min_results-0.root |
| Slice selected for the the fakeground: | slice index=48 (-87.24 s), time lag = -10 s |
| Foreground | Fakeground | Background | ||
|---|---|---|---|---|
| Number of processed ox events | 0 | 115 | 250520 | |
| Start Date (detector 0) | - | Mon May 15 14:13:35 2023 UTC | Mon May 15 14:13:35 2023 UTC | |
| End Date (detector 0) | - | Mon May 15 14:23:15 2023 UTC | Mon May 15 14:23:15 2023 UTC | |
| Start GPS (detector 0) | - | 1368195233 | 1368195233 | |
| End GPS (detector 0) | - | 1368195813 | 1368195813 | |
| Used livetime (detector 0) | 0 s | 580 s | 580 s | |
| Start Date (detector 1) | - | Mon May 15 14:13:25 2023 UTC | Mon May 15 14:13:25 2023 UTC | |
| End Date (detector 1) | - | Mon May 15 14:23:05 2023 UTC | Mon May 15 14:23:05 2023 UTC | |
| Start GPS (detector 1) | - | 1368195223 | 1368195223 | |
| End GPS (detector 1) | - | 1368195803 | 1368195803 | |
| Used livetime (detector 1) | 0 s | 580 s | 580 s | |
| Cumulative livetime | 0 s | 1150 s | 2505200 s | |
| 0 years, 0 days, 0 hours, 0 min, 0 s | 0 years, 0 days, 0 hours, 19 min, 10 s | 0 years, 28 days, 23 hours, 53 min, 20 s |
|
|
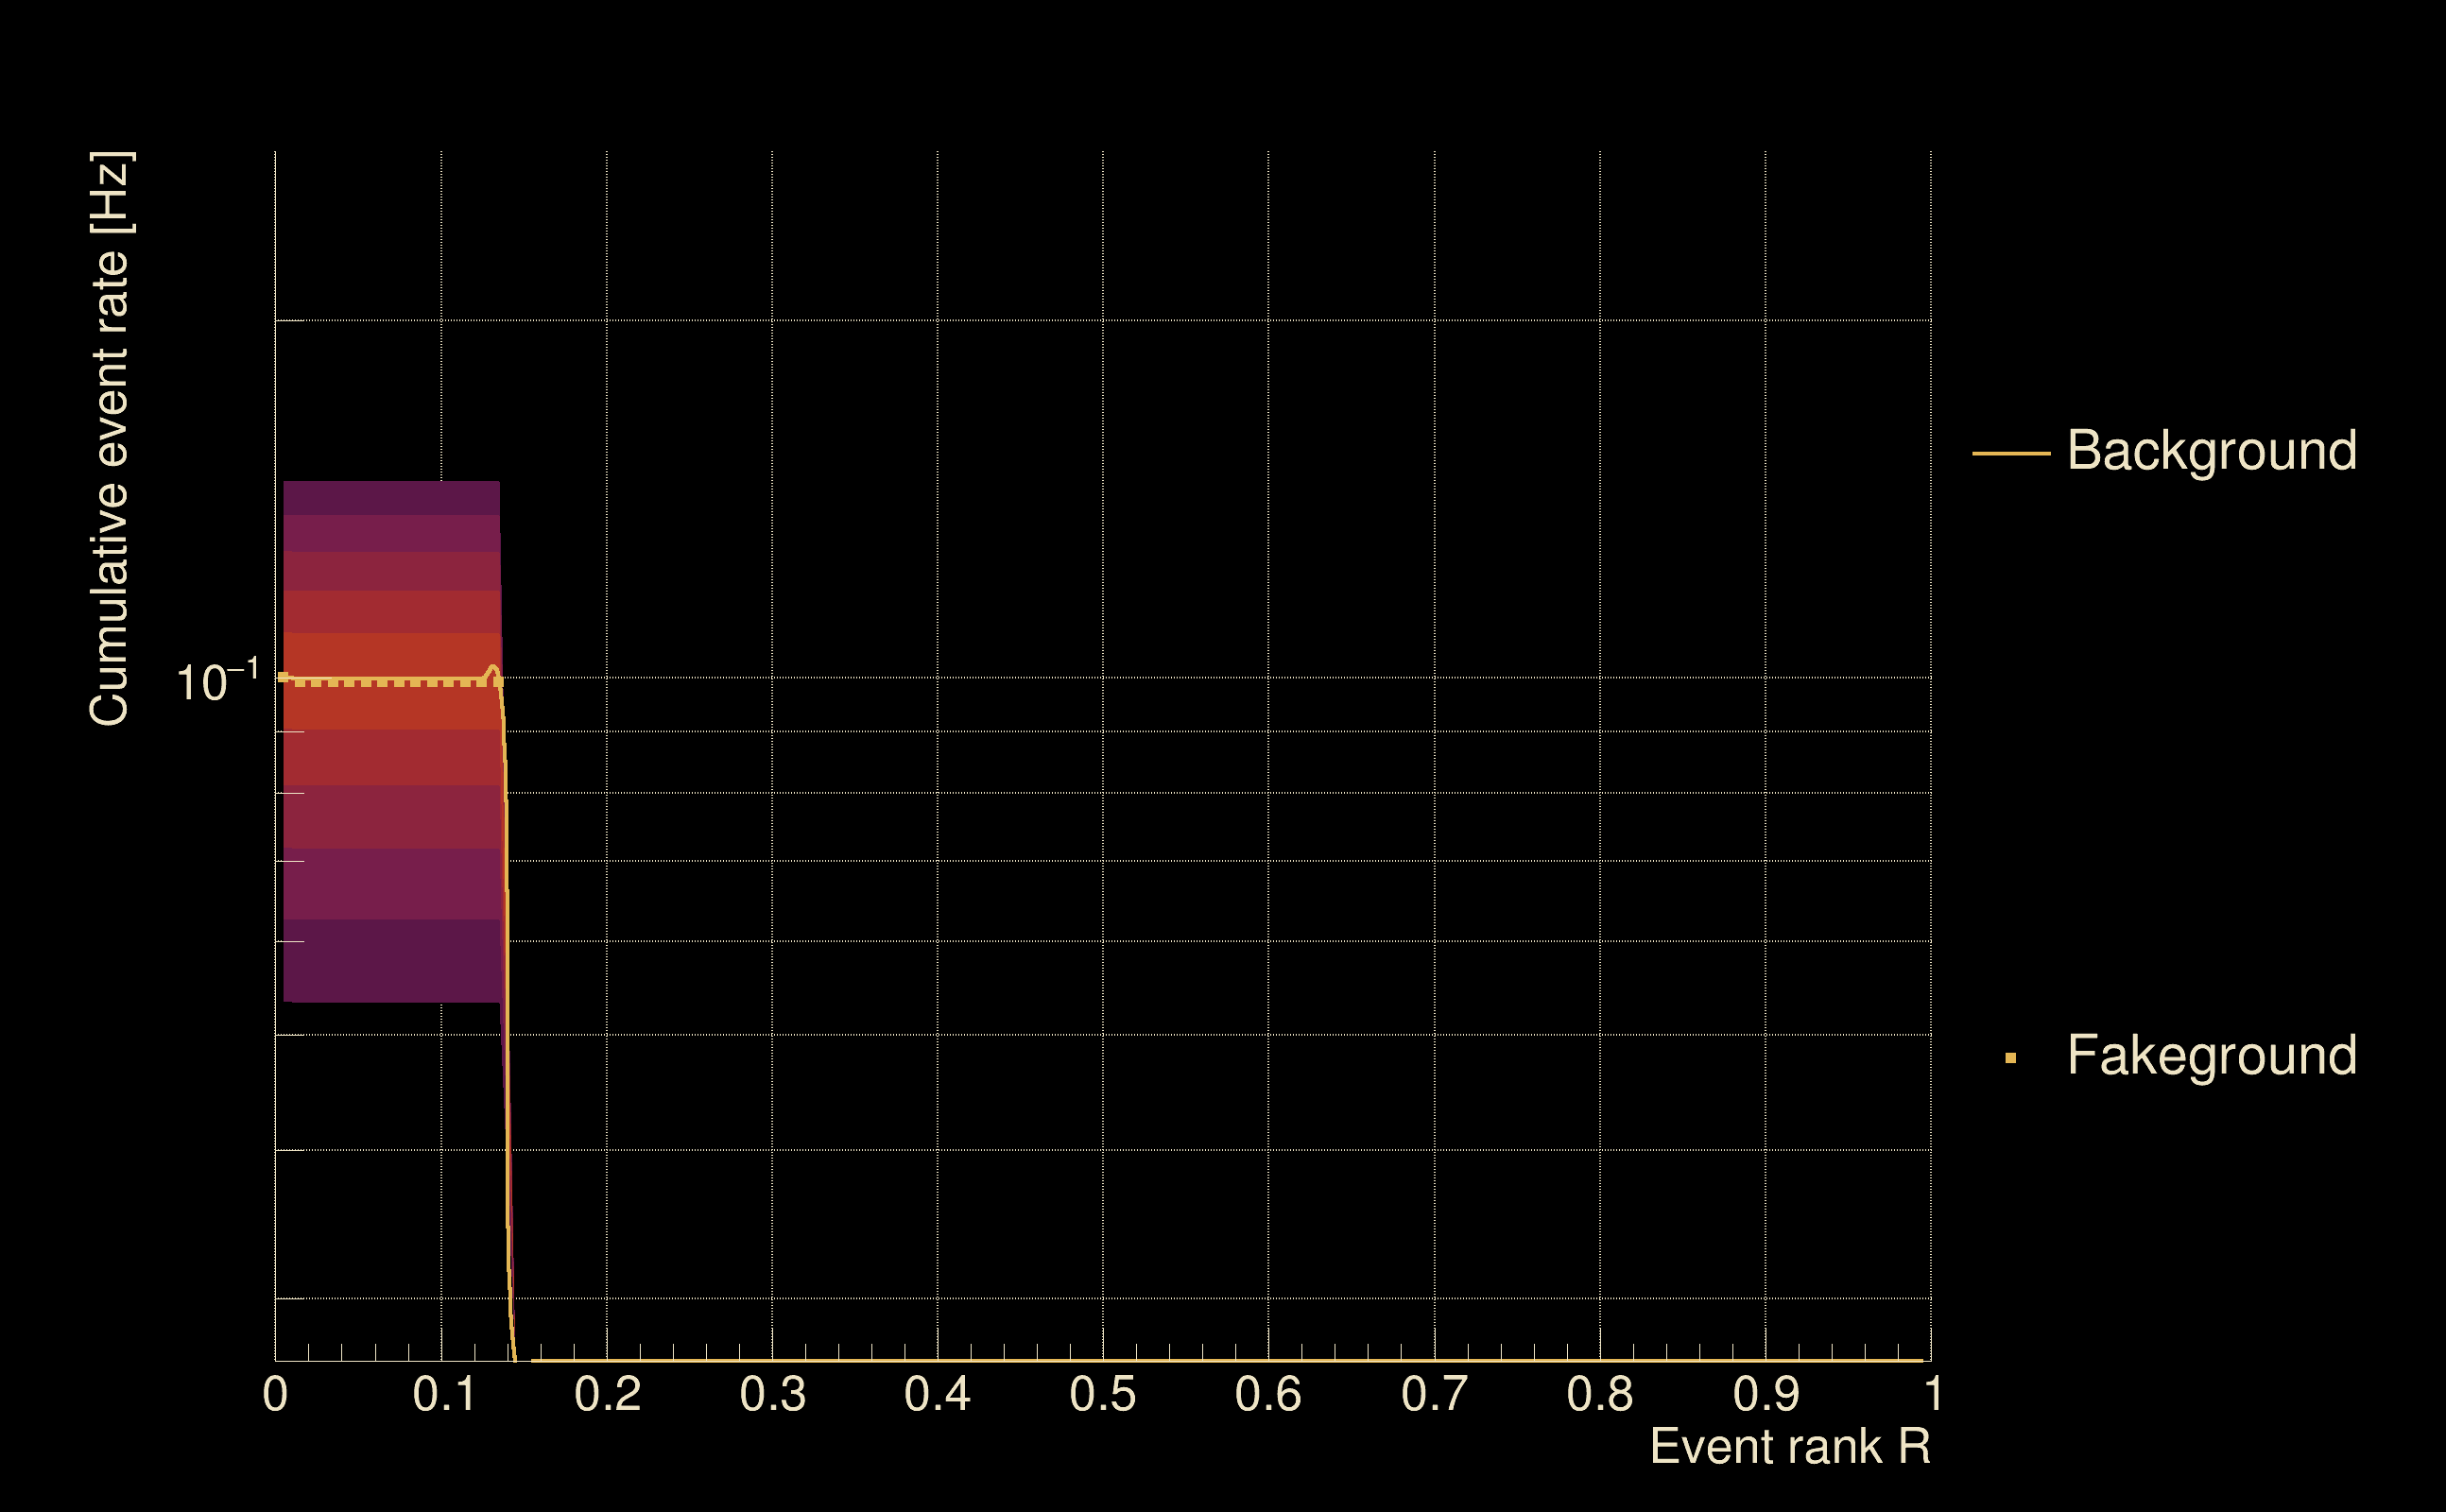
| Detection threshold: | R > 0.135 |
| False-alarm rate above that detection threshold: | 0.0498737 |
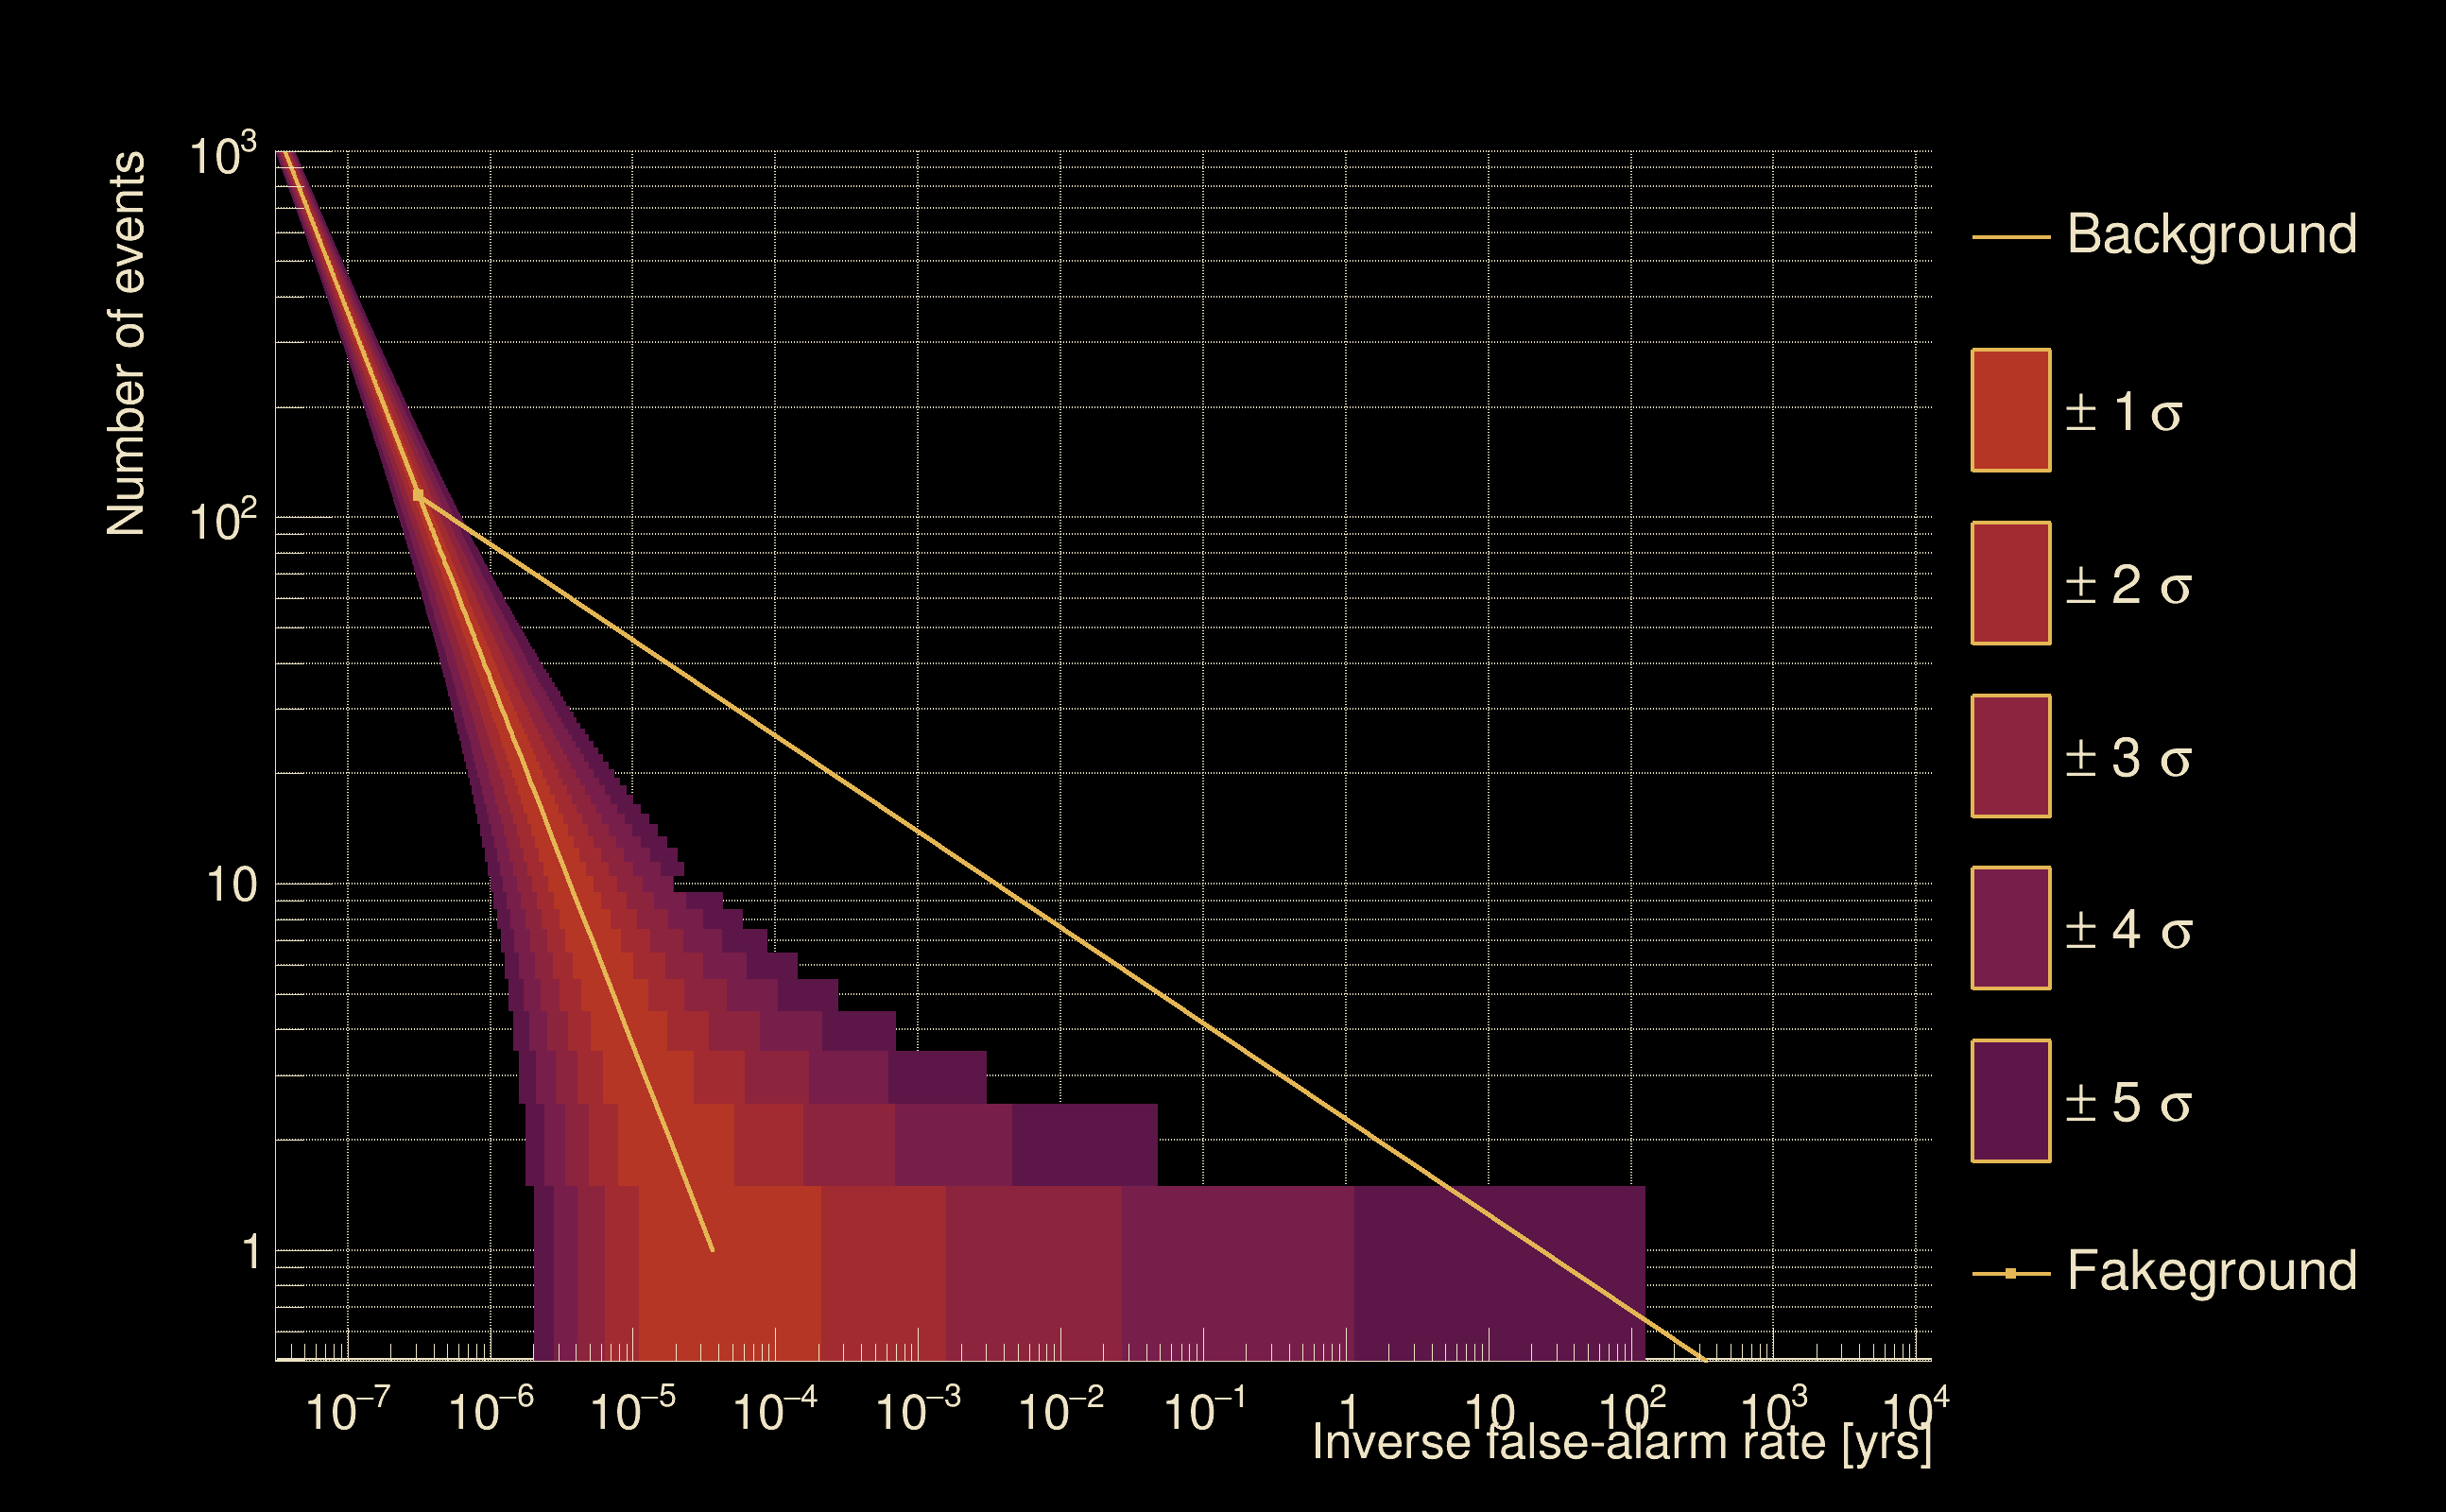
| Alternative threshold at 1/1000 yrs: | R > 0.135 |
| Alternative threshold at 1/100 yrs: | R > 0.135 |
| Alternative threshold at 1/10 yrs: | R > 0.135 |
| Alternative threshold at 1/1 yr: | R > 0.135 |
| Alternative threshold at 1/1 d: | R > 0.135 |
 |
|
 |
 |
 |
 |
 |
 |
 |
 |
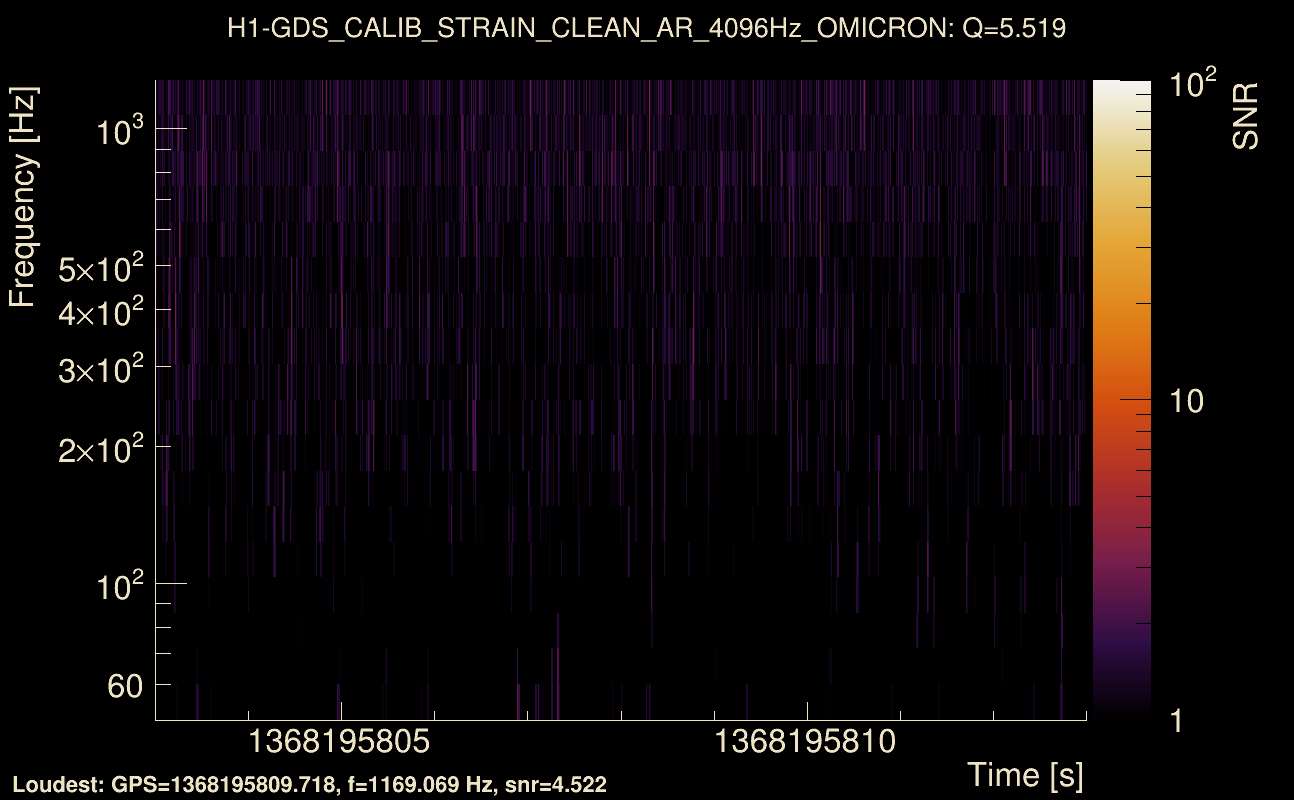
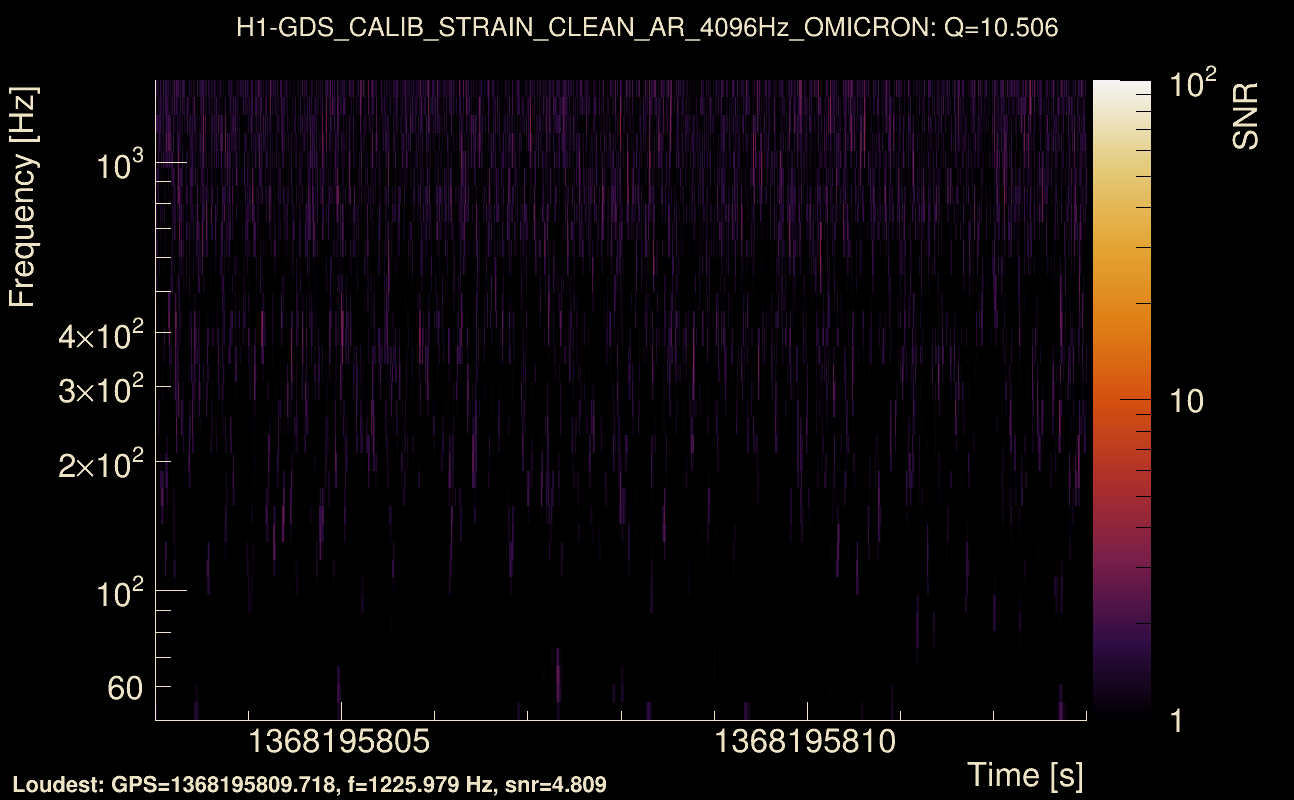
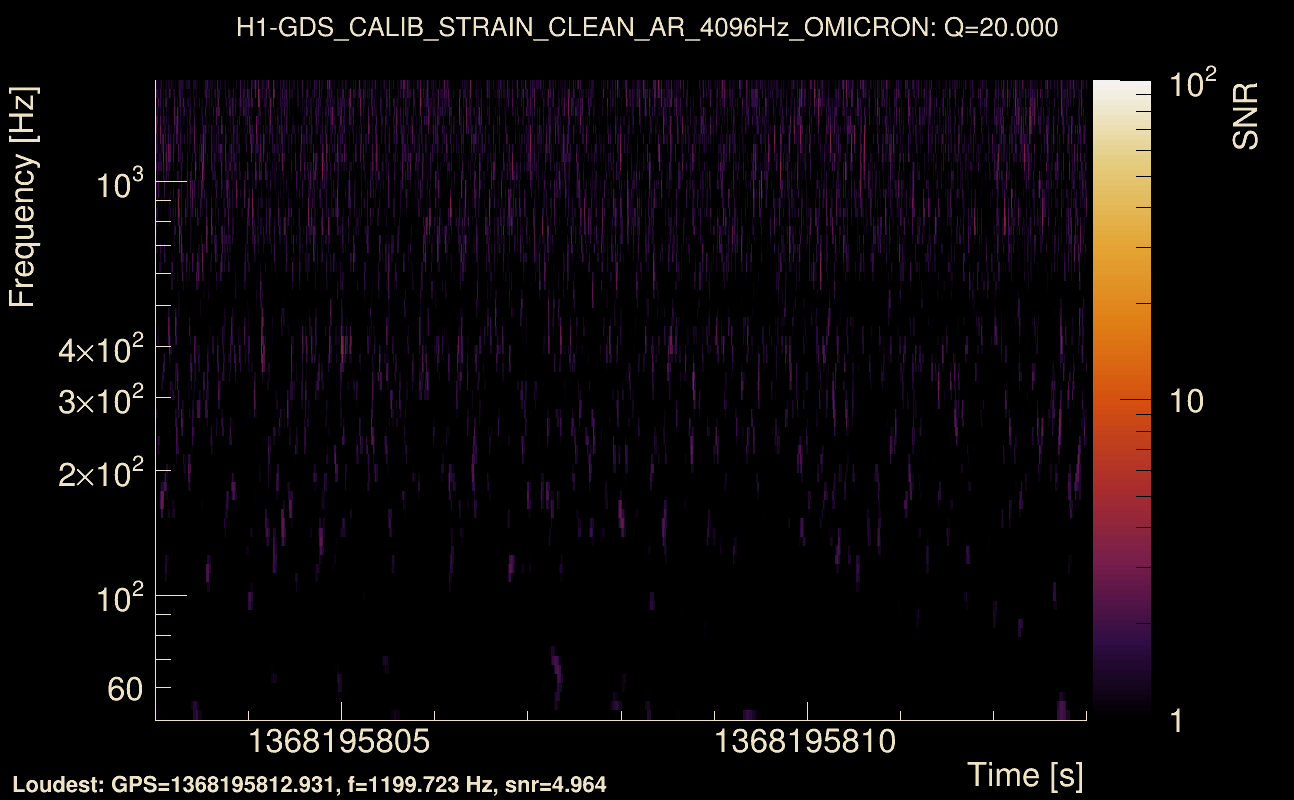
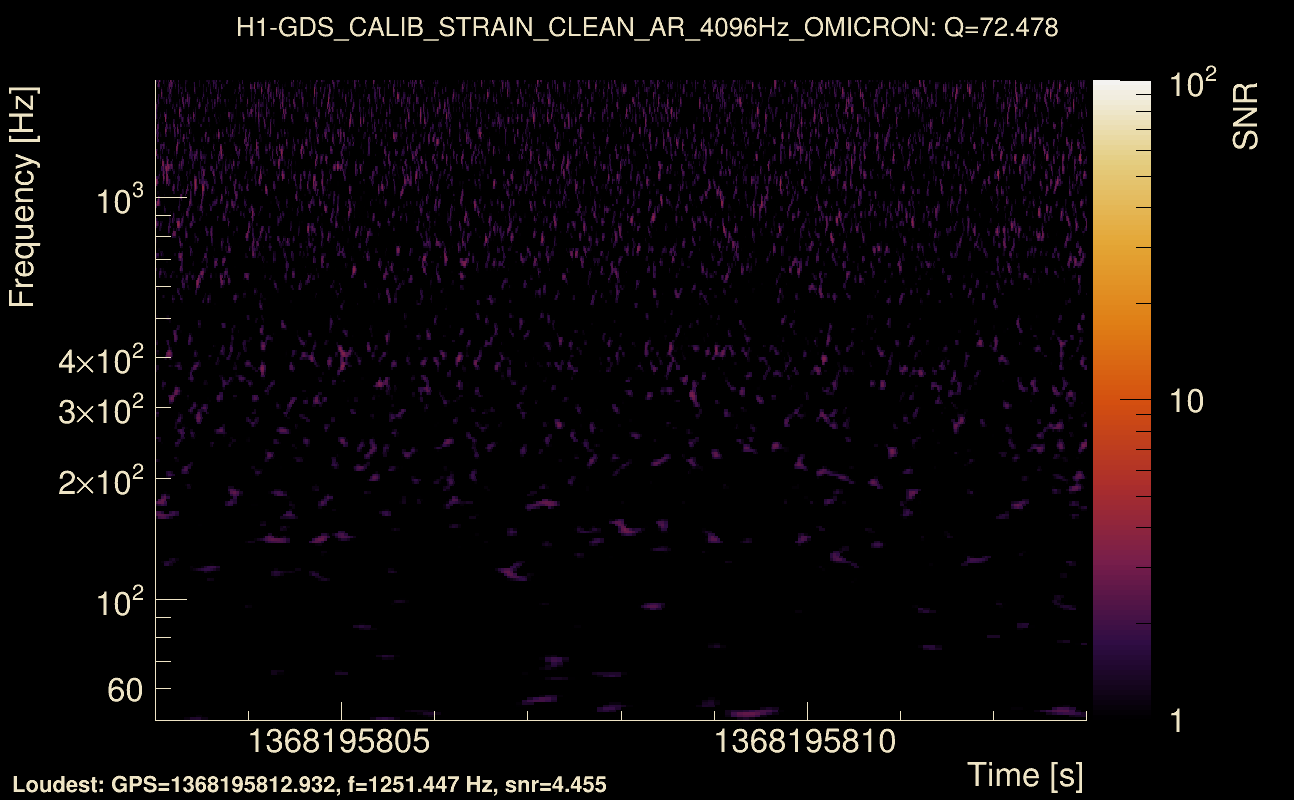
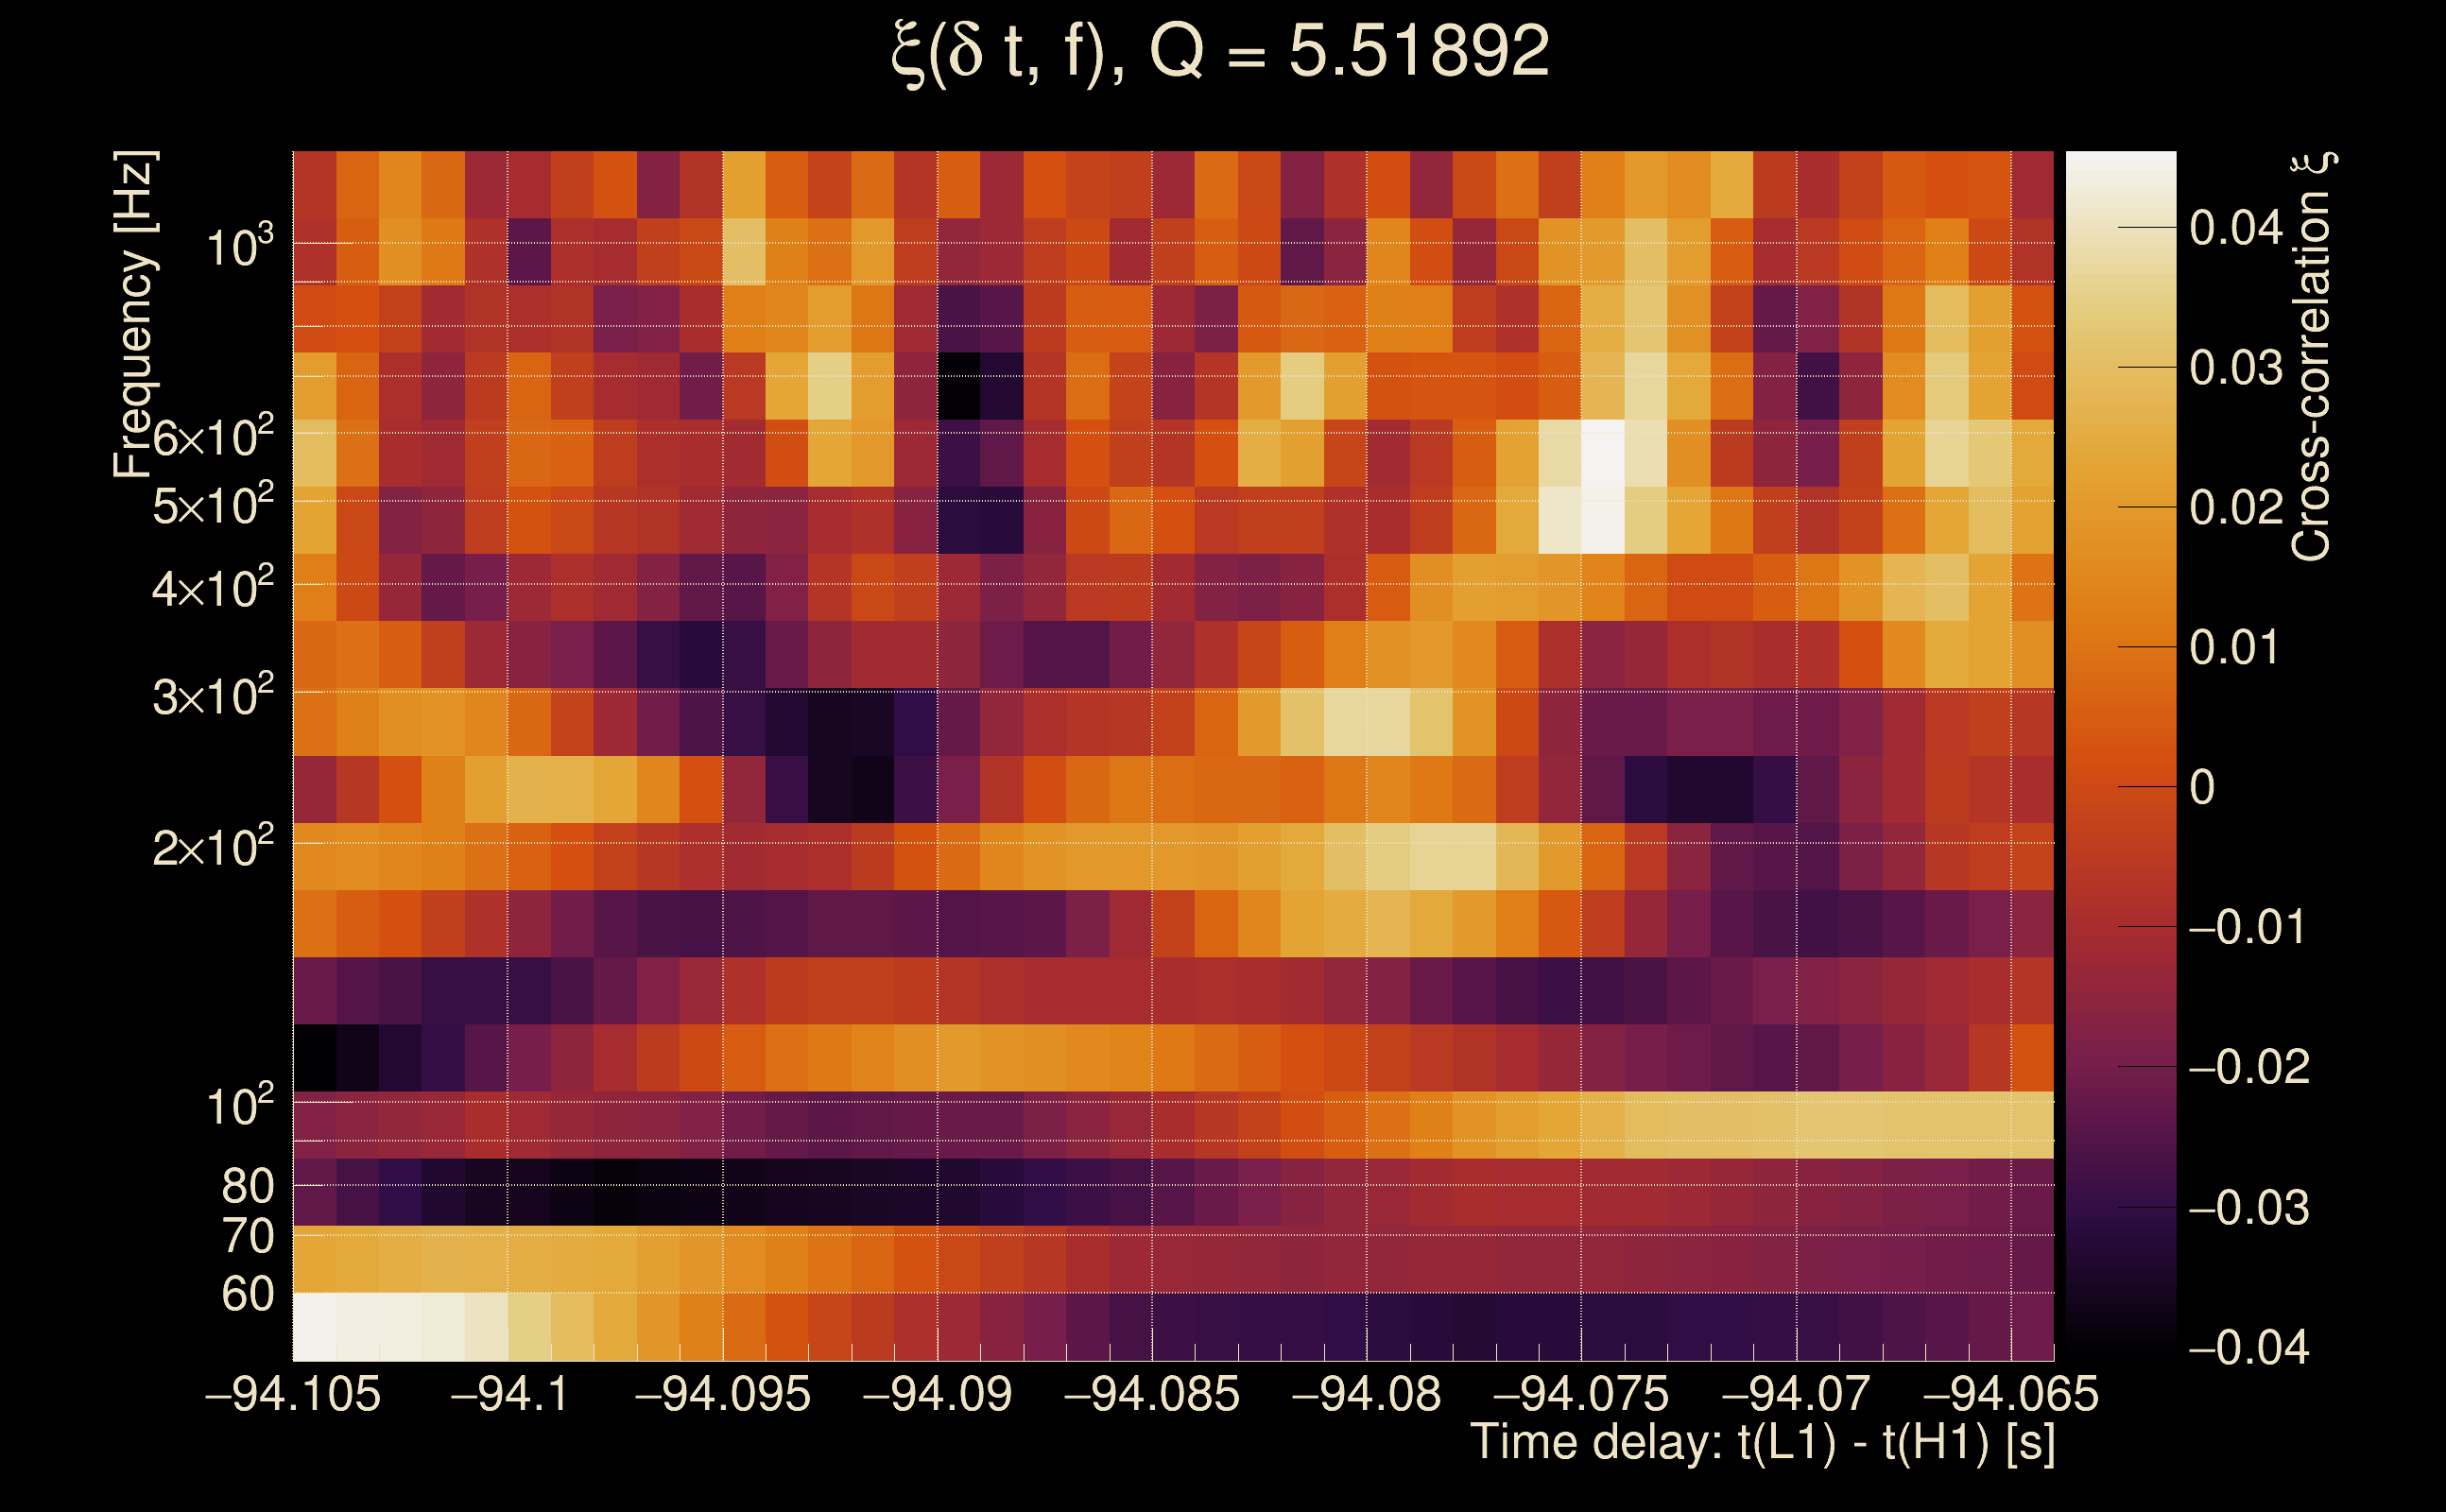
| Event time t(H1): | GPS = 1368195803 (Mon May 15 14:23:05 2023 ) → GPS = 1368195813 (Mon May 15 14:23:15 2023 ) |
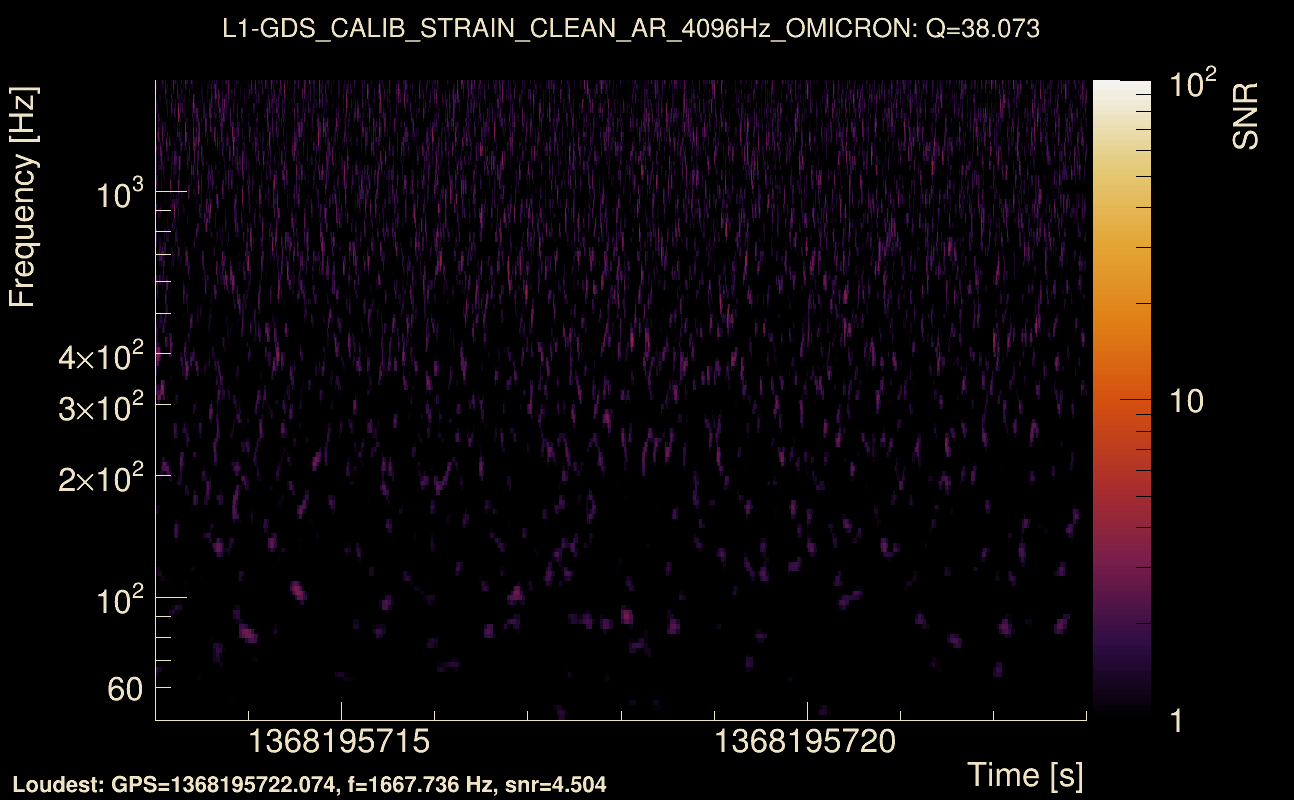
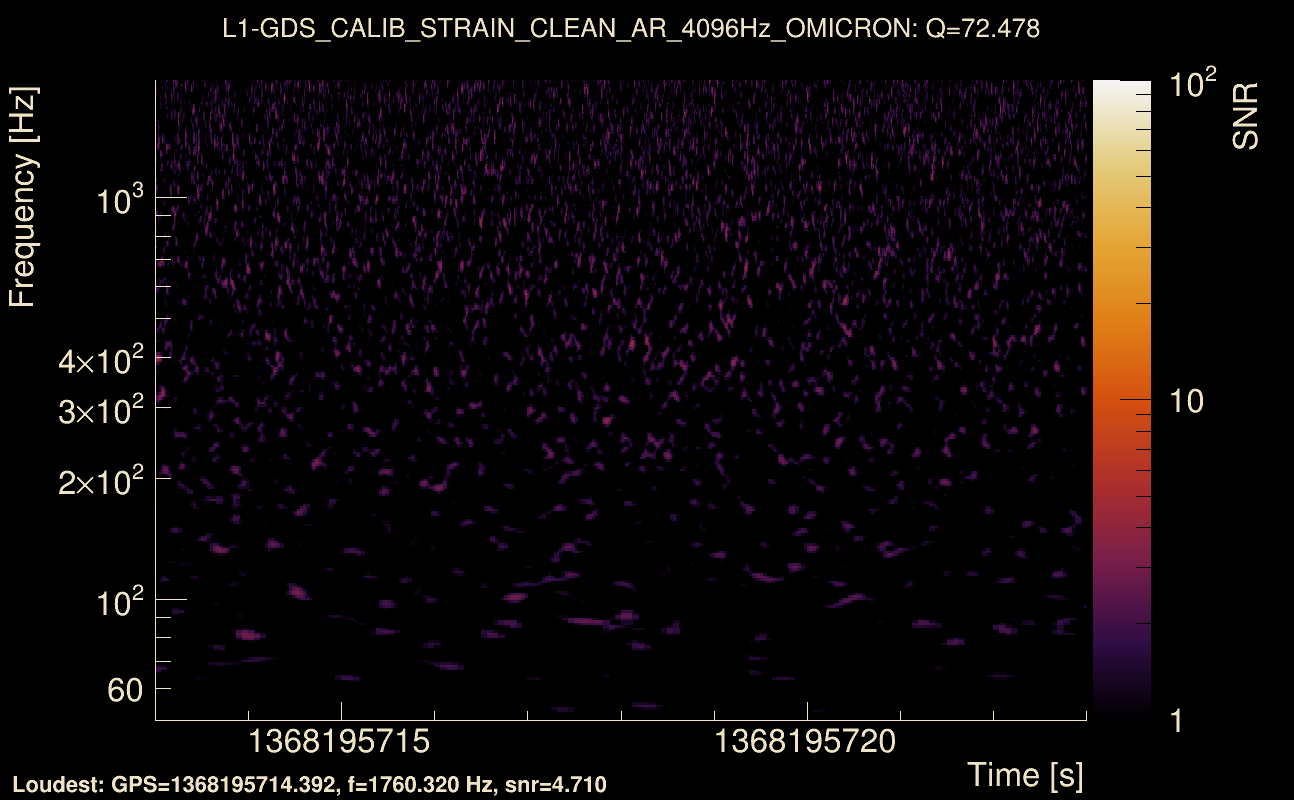
| Event time t(L1): | GPS = 1368195713 (Mon May 15 14:23:15 2023 ) → GPS = 1368195723 (Mon May 15 14:21:45 2023 ) |
| Omicron analysis time window (H1): | GPS = 1368195800 → GPS = 1368195816 |
| Omicron analysis time window (L1): | GPS = 1368195710 → GPS = 1368195726 |
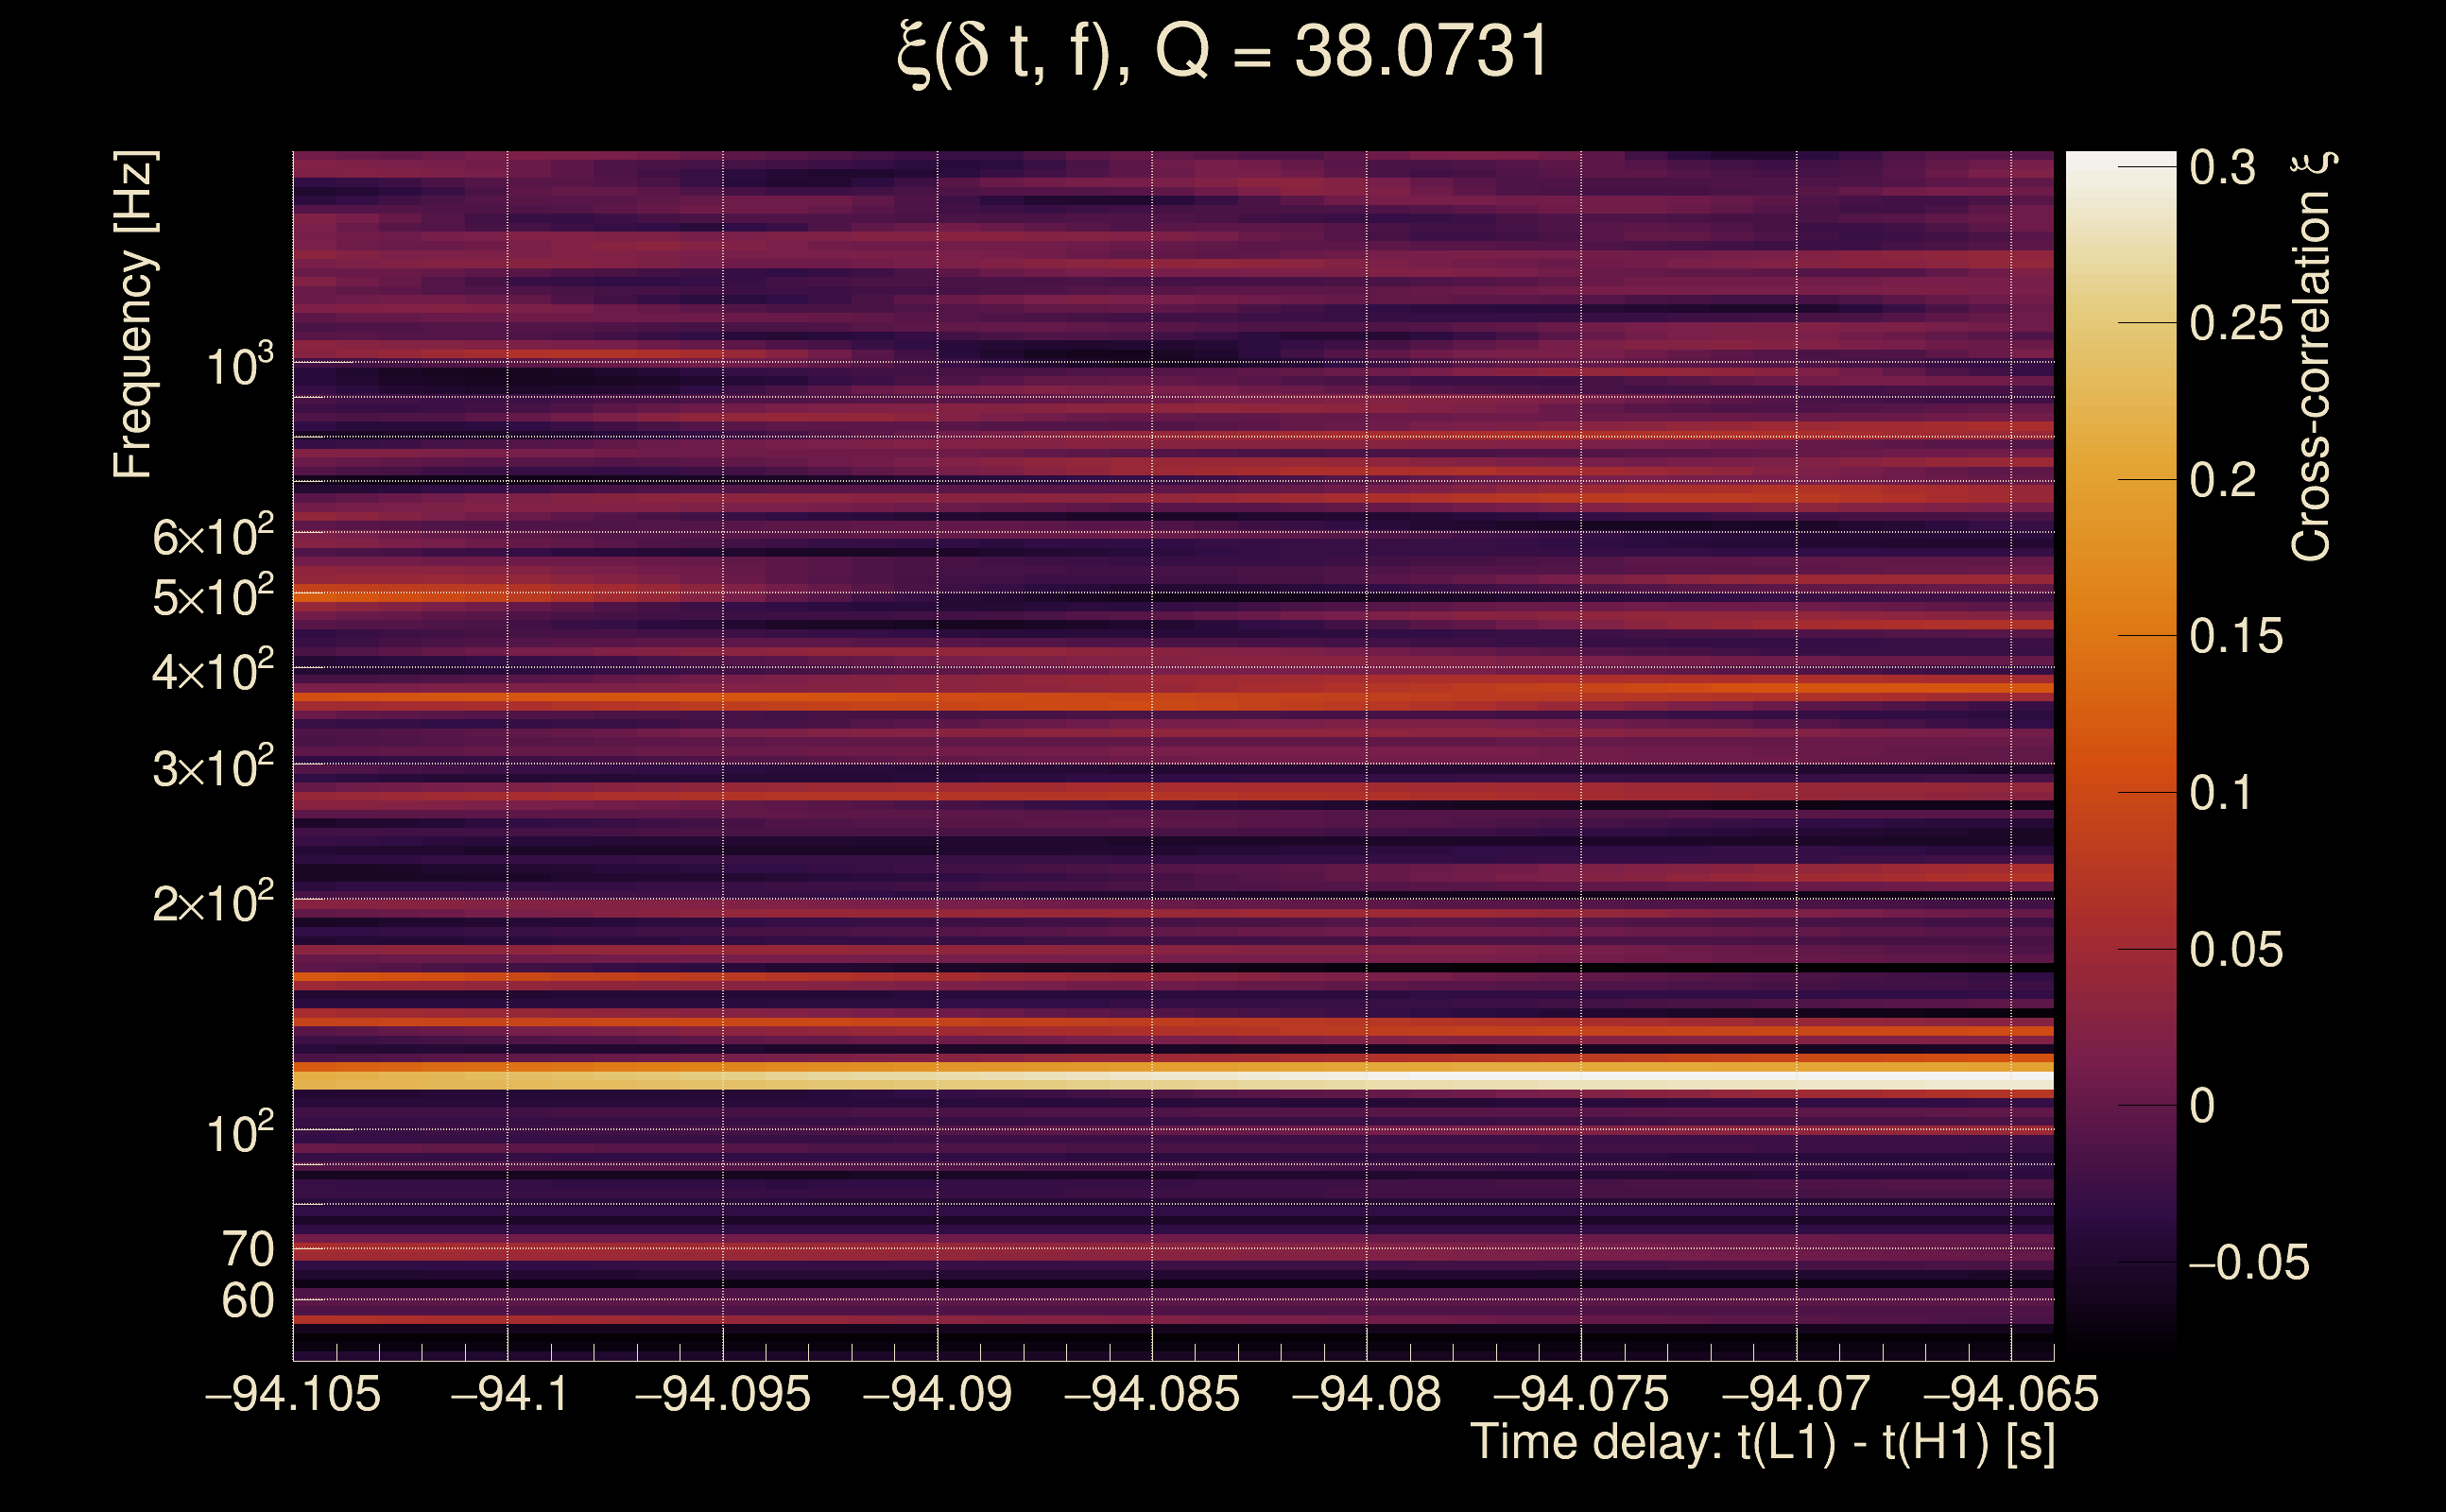
| Time delay between detectors t(L1) - t(H1): | -94.9654 s (slice index = 216 / 217), δt_gw = 0.00259953 s |
| Time delay uncertainty: | 0.00686614 s |
| [targeted mode] Time delay probability: | 0.514704 (0.651531 sigmas), δt_target = 1.72247e+45 s |
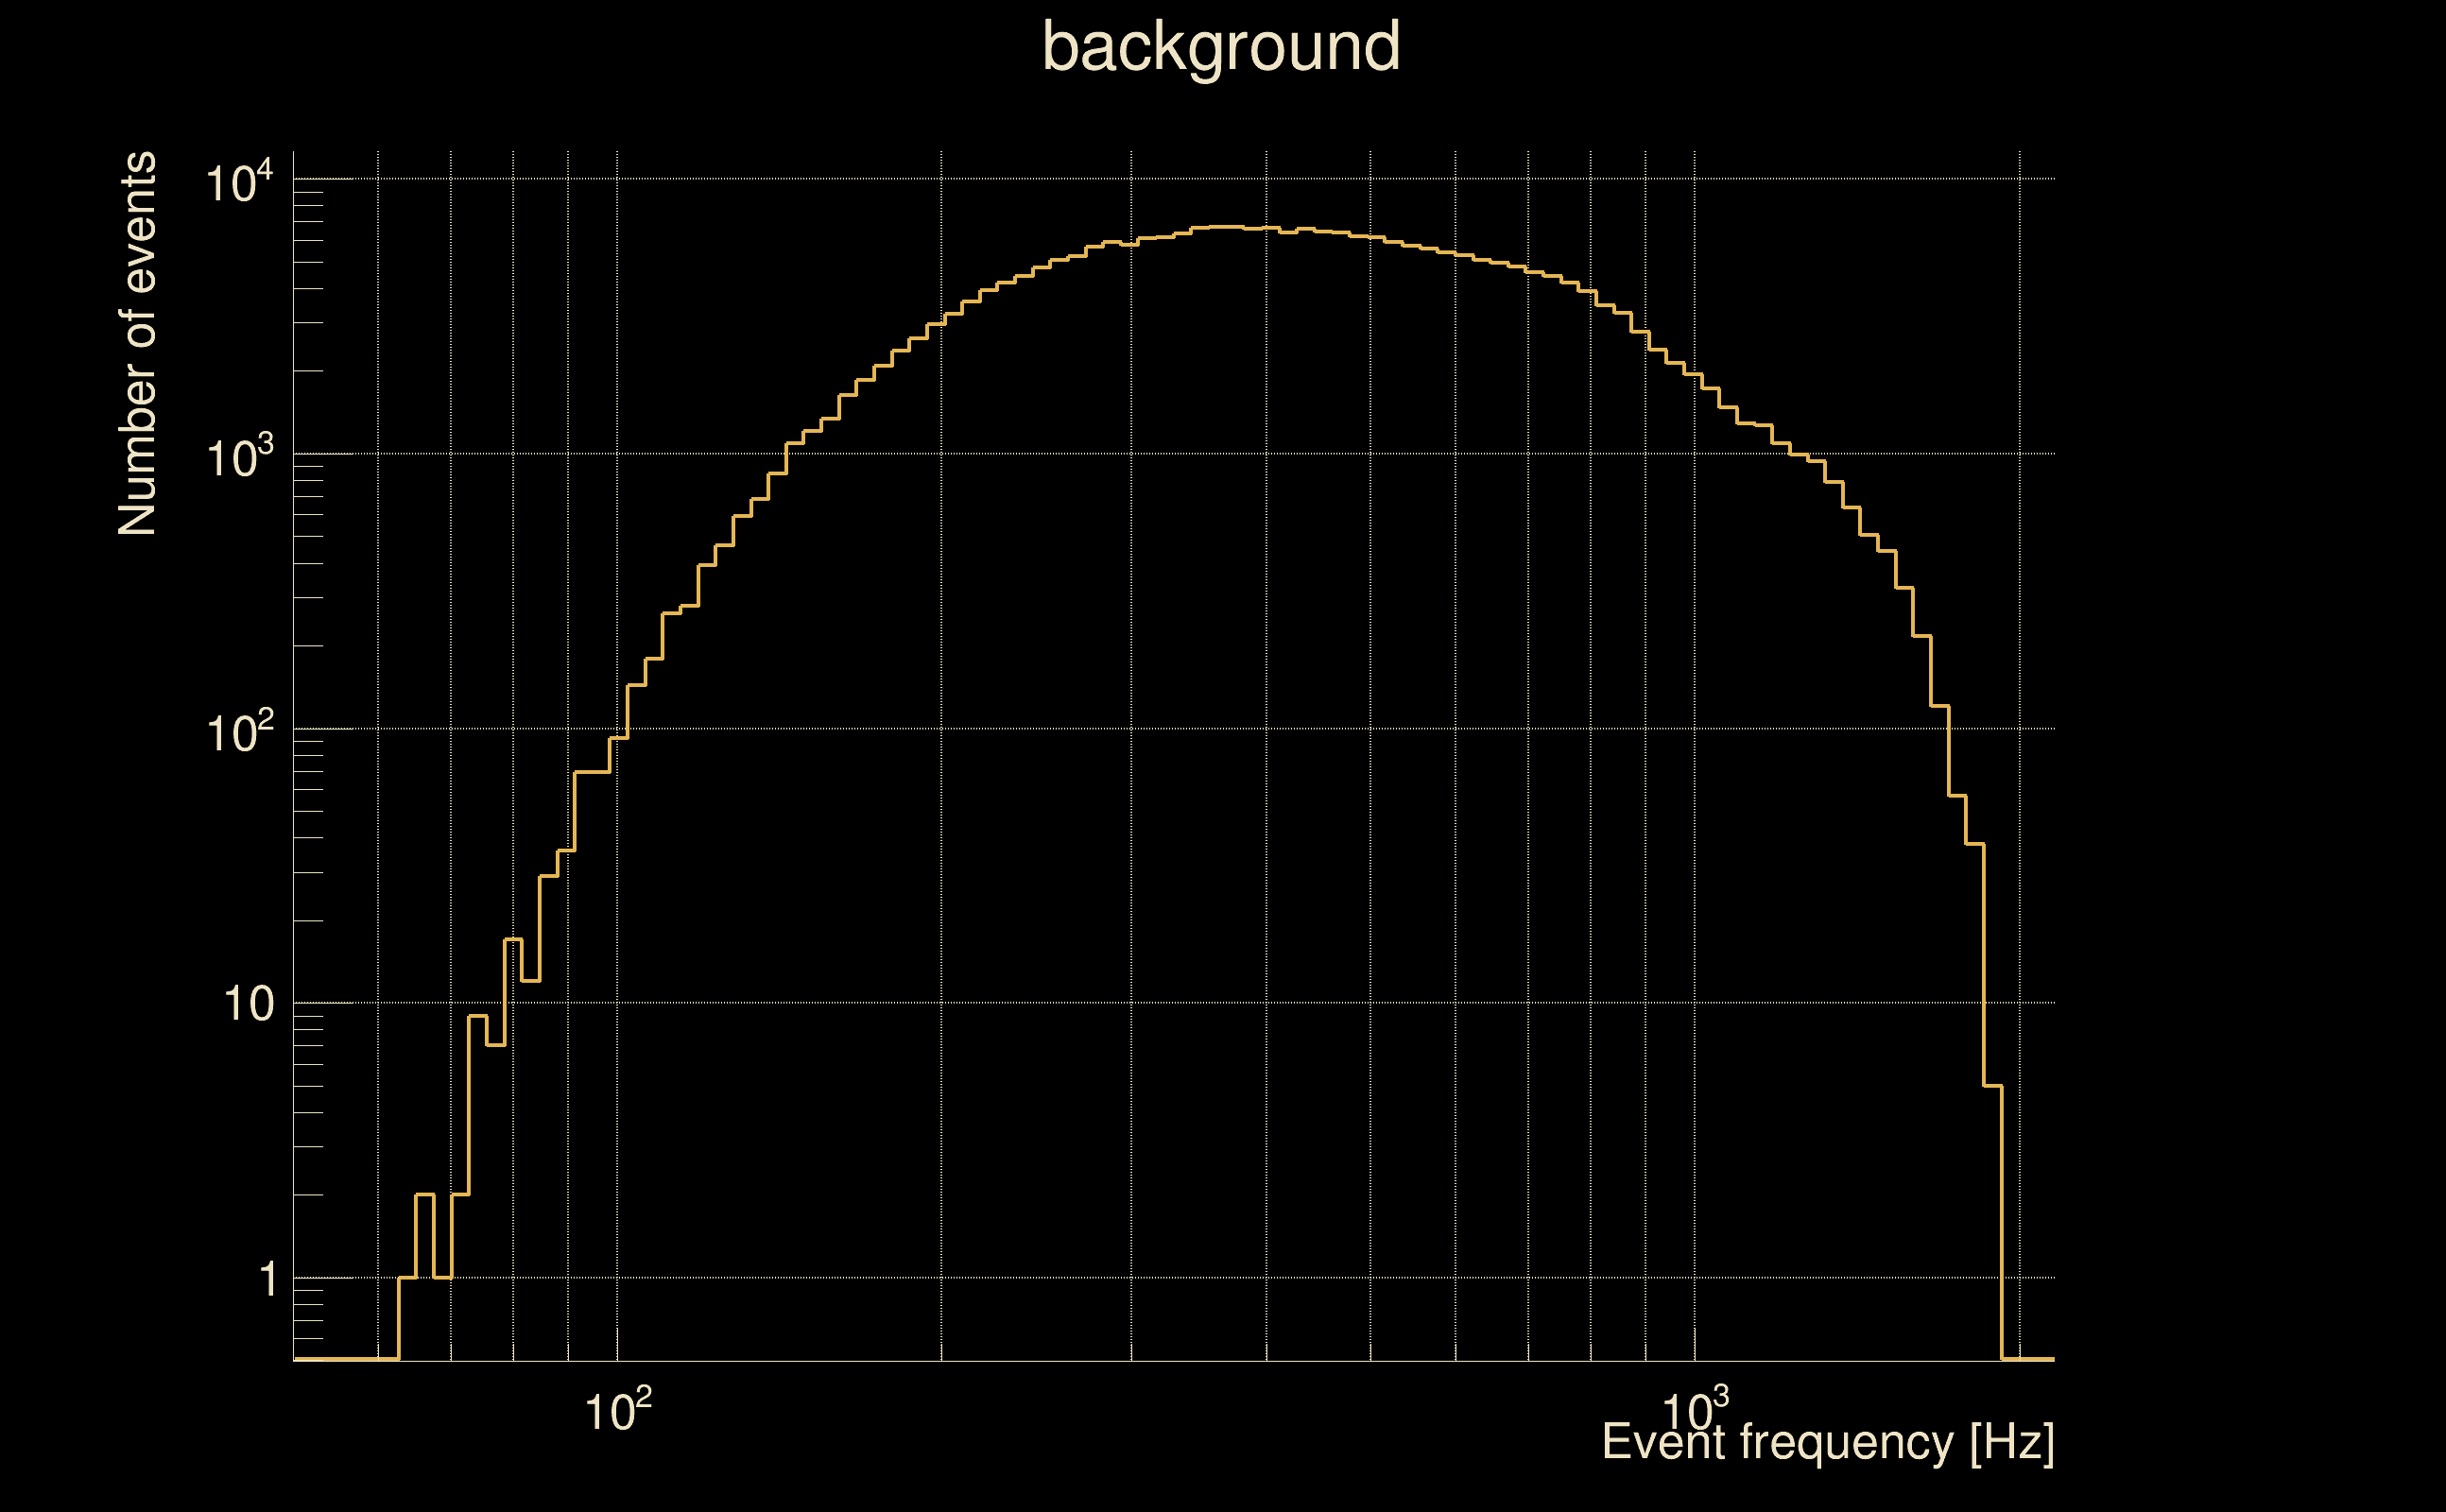
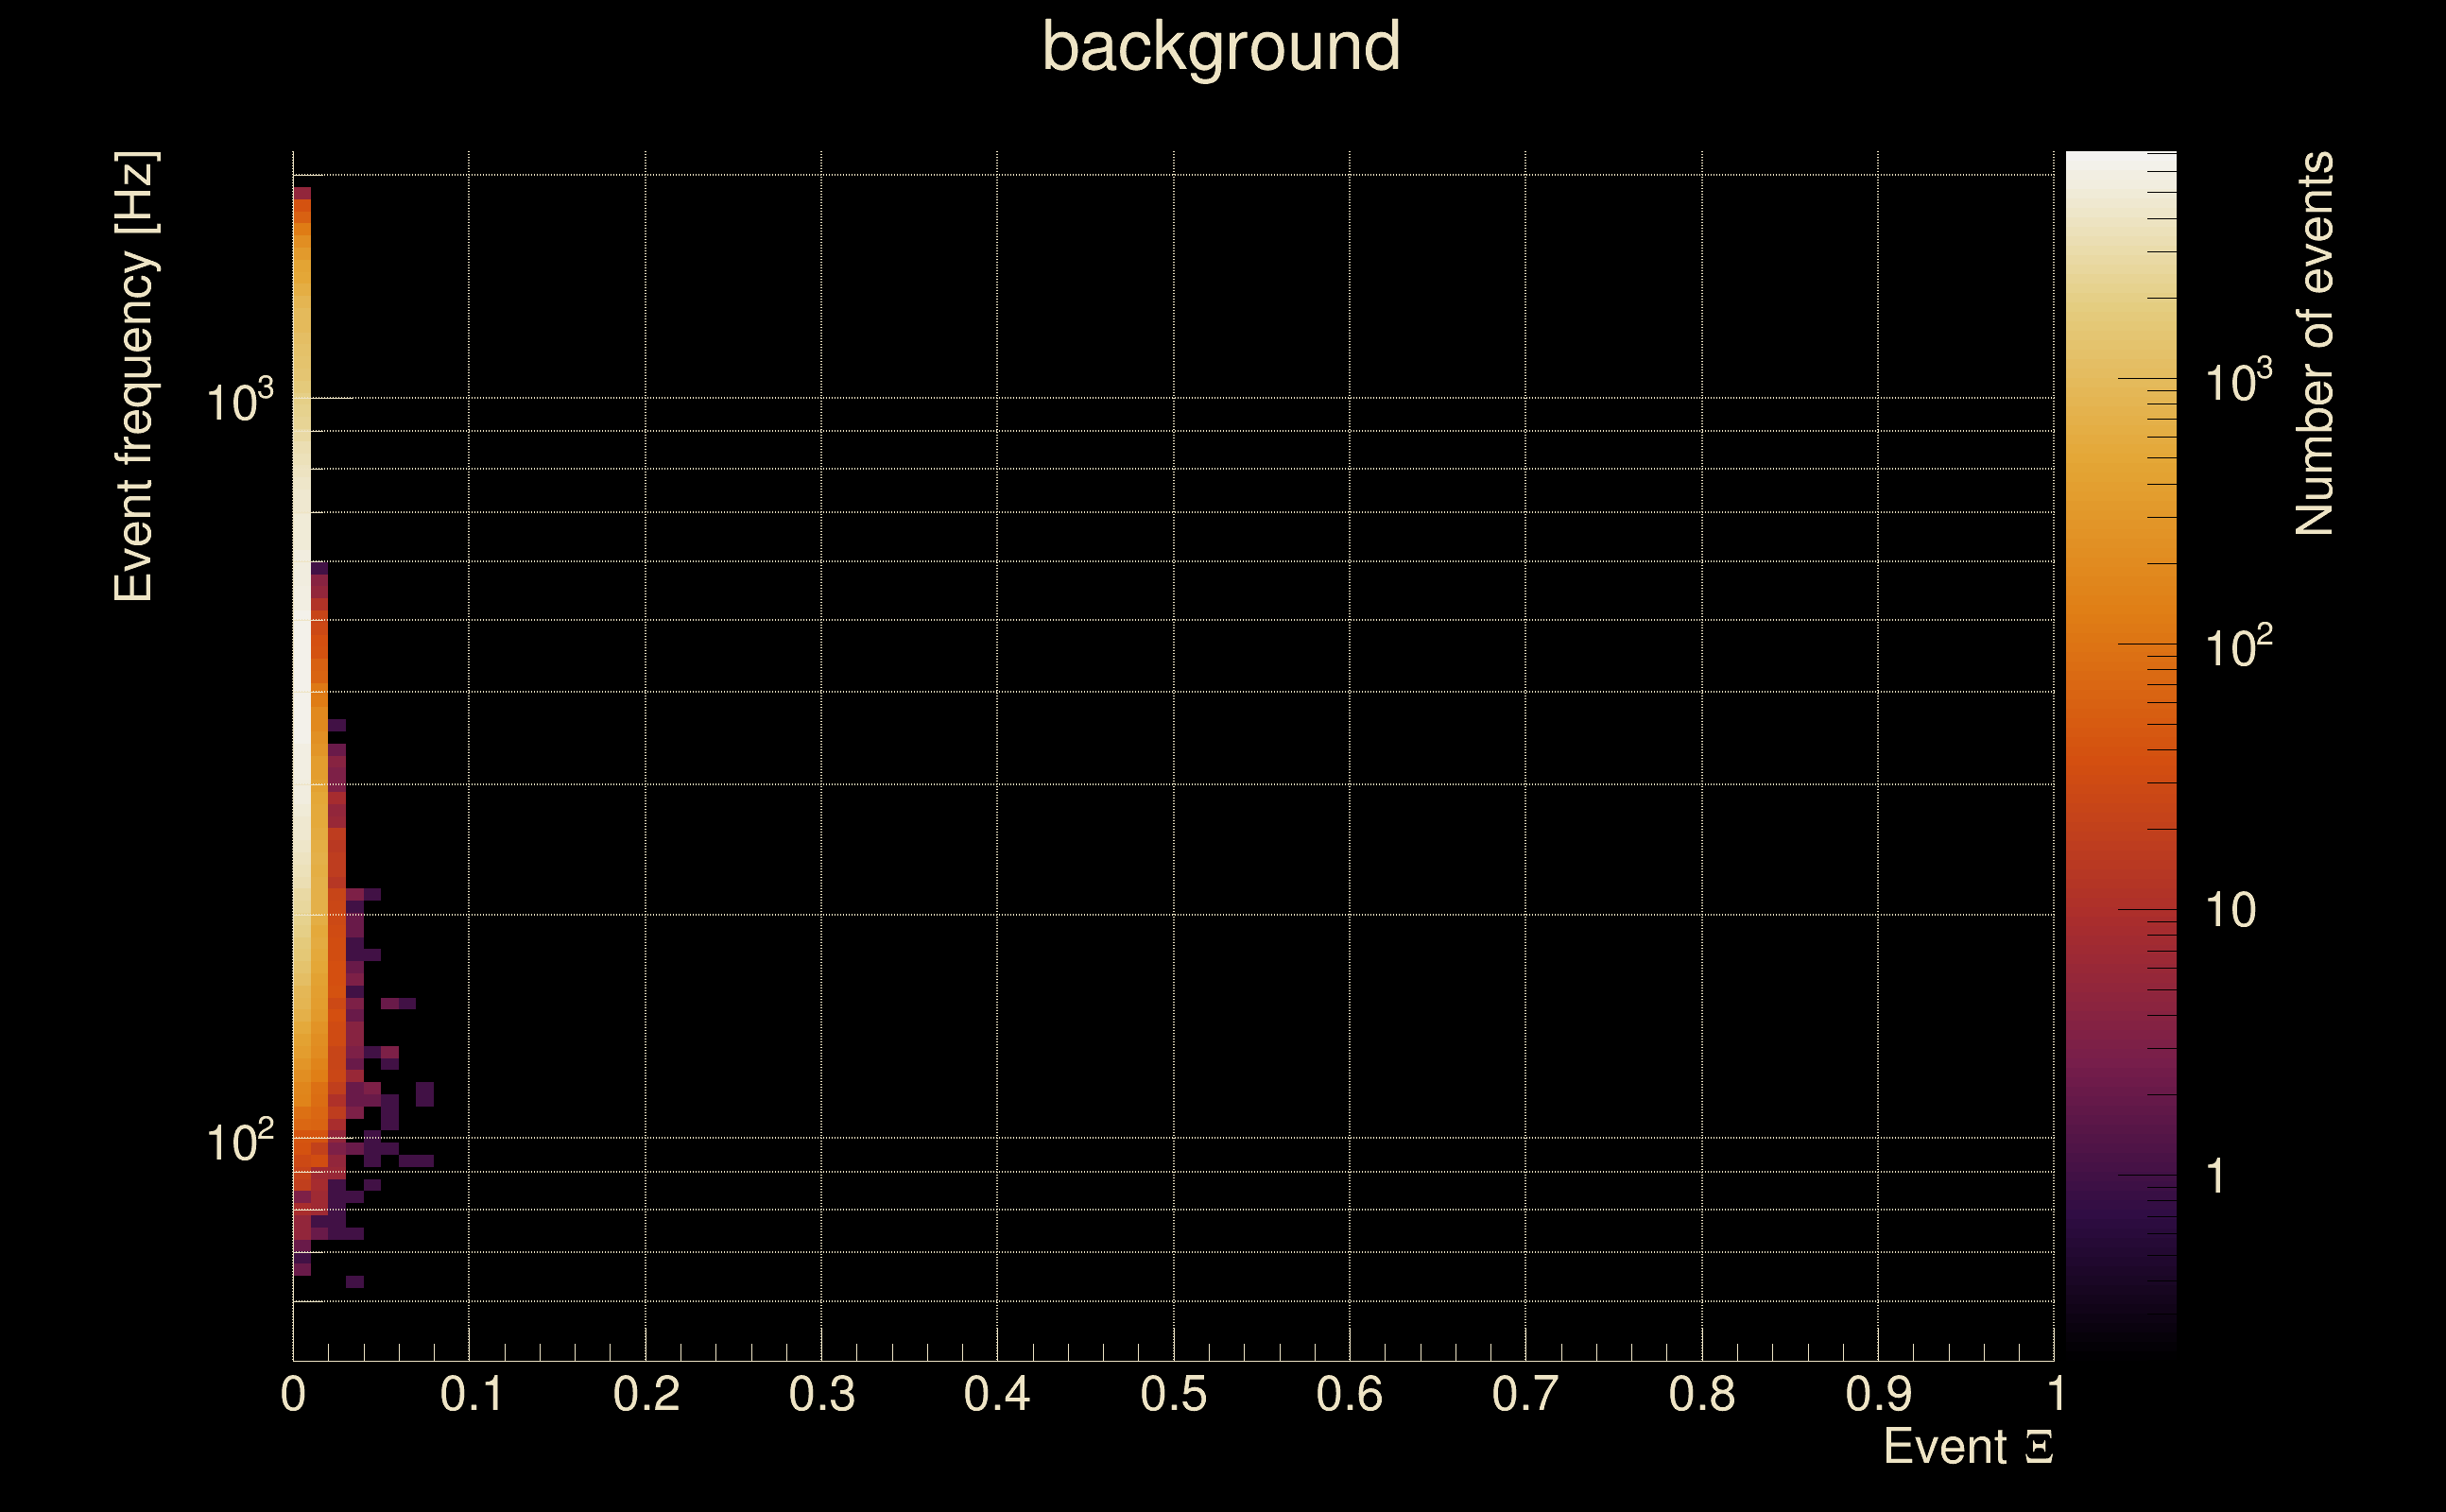
| Frequency: | 921.545 Hz |
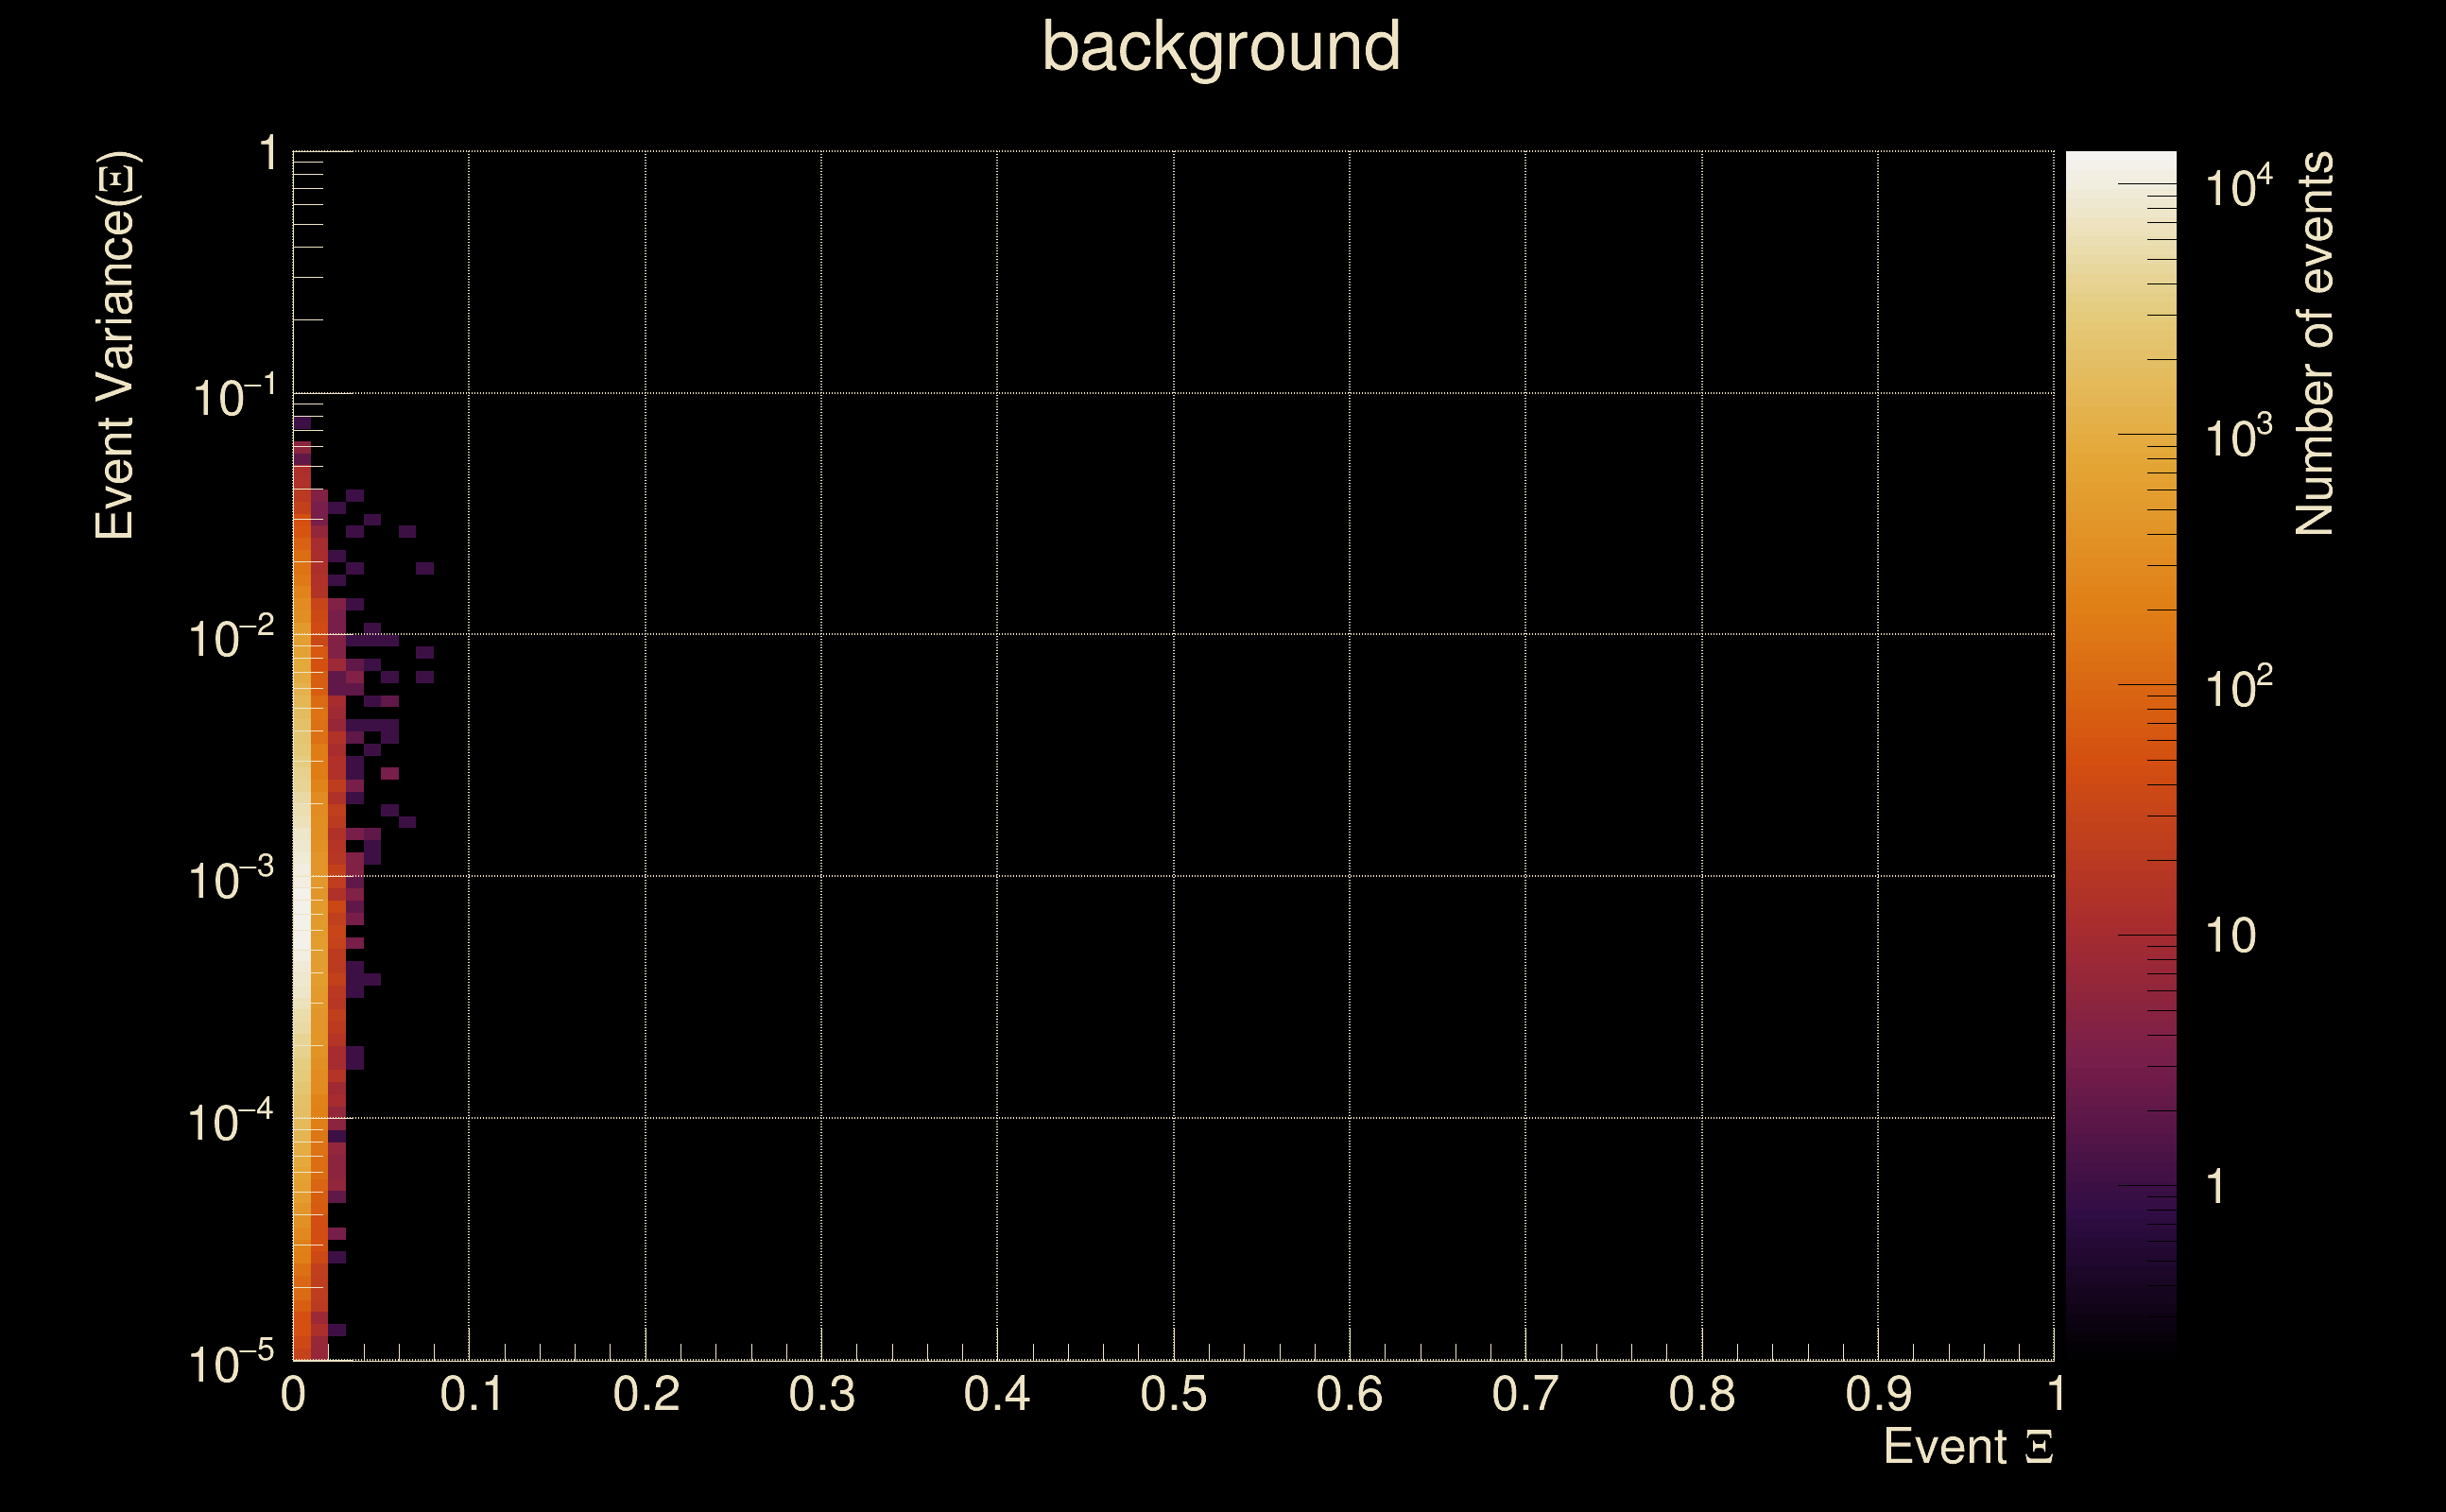
| Ξ: | 0.000844145 ± 0.0252568 (variance = 0.000637906): Q0: 0, Q1: 0.0501687, Q2: 0, Q3: 0.0480074, Q4: 0.05572 |
| Rank: | R_A = 0.13682 |
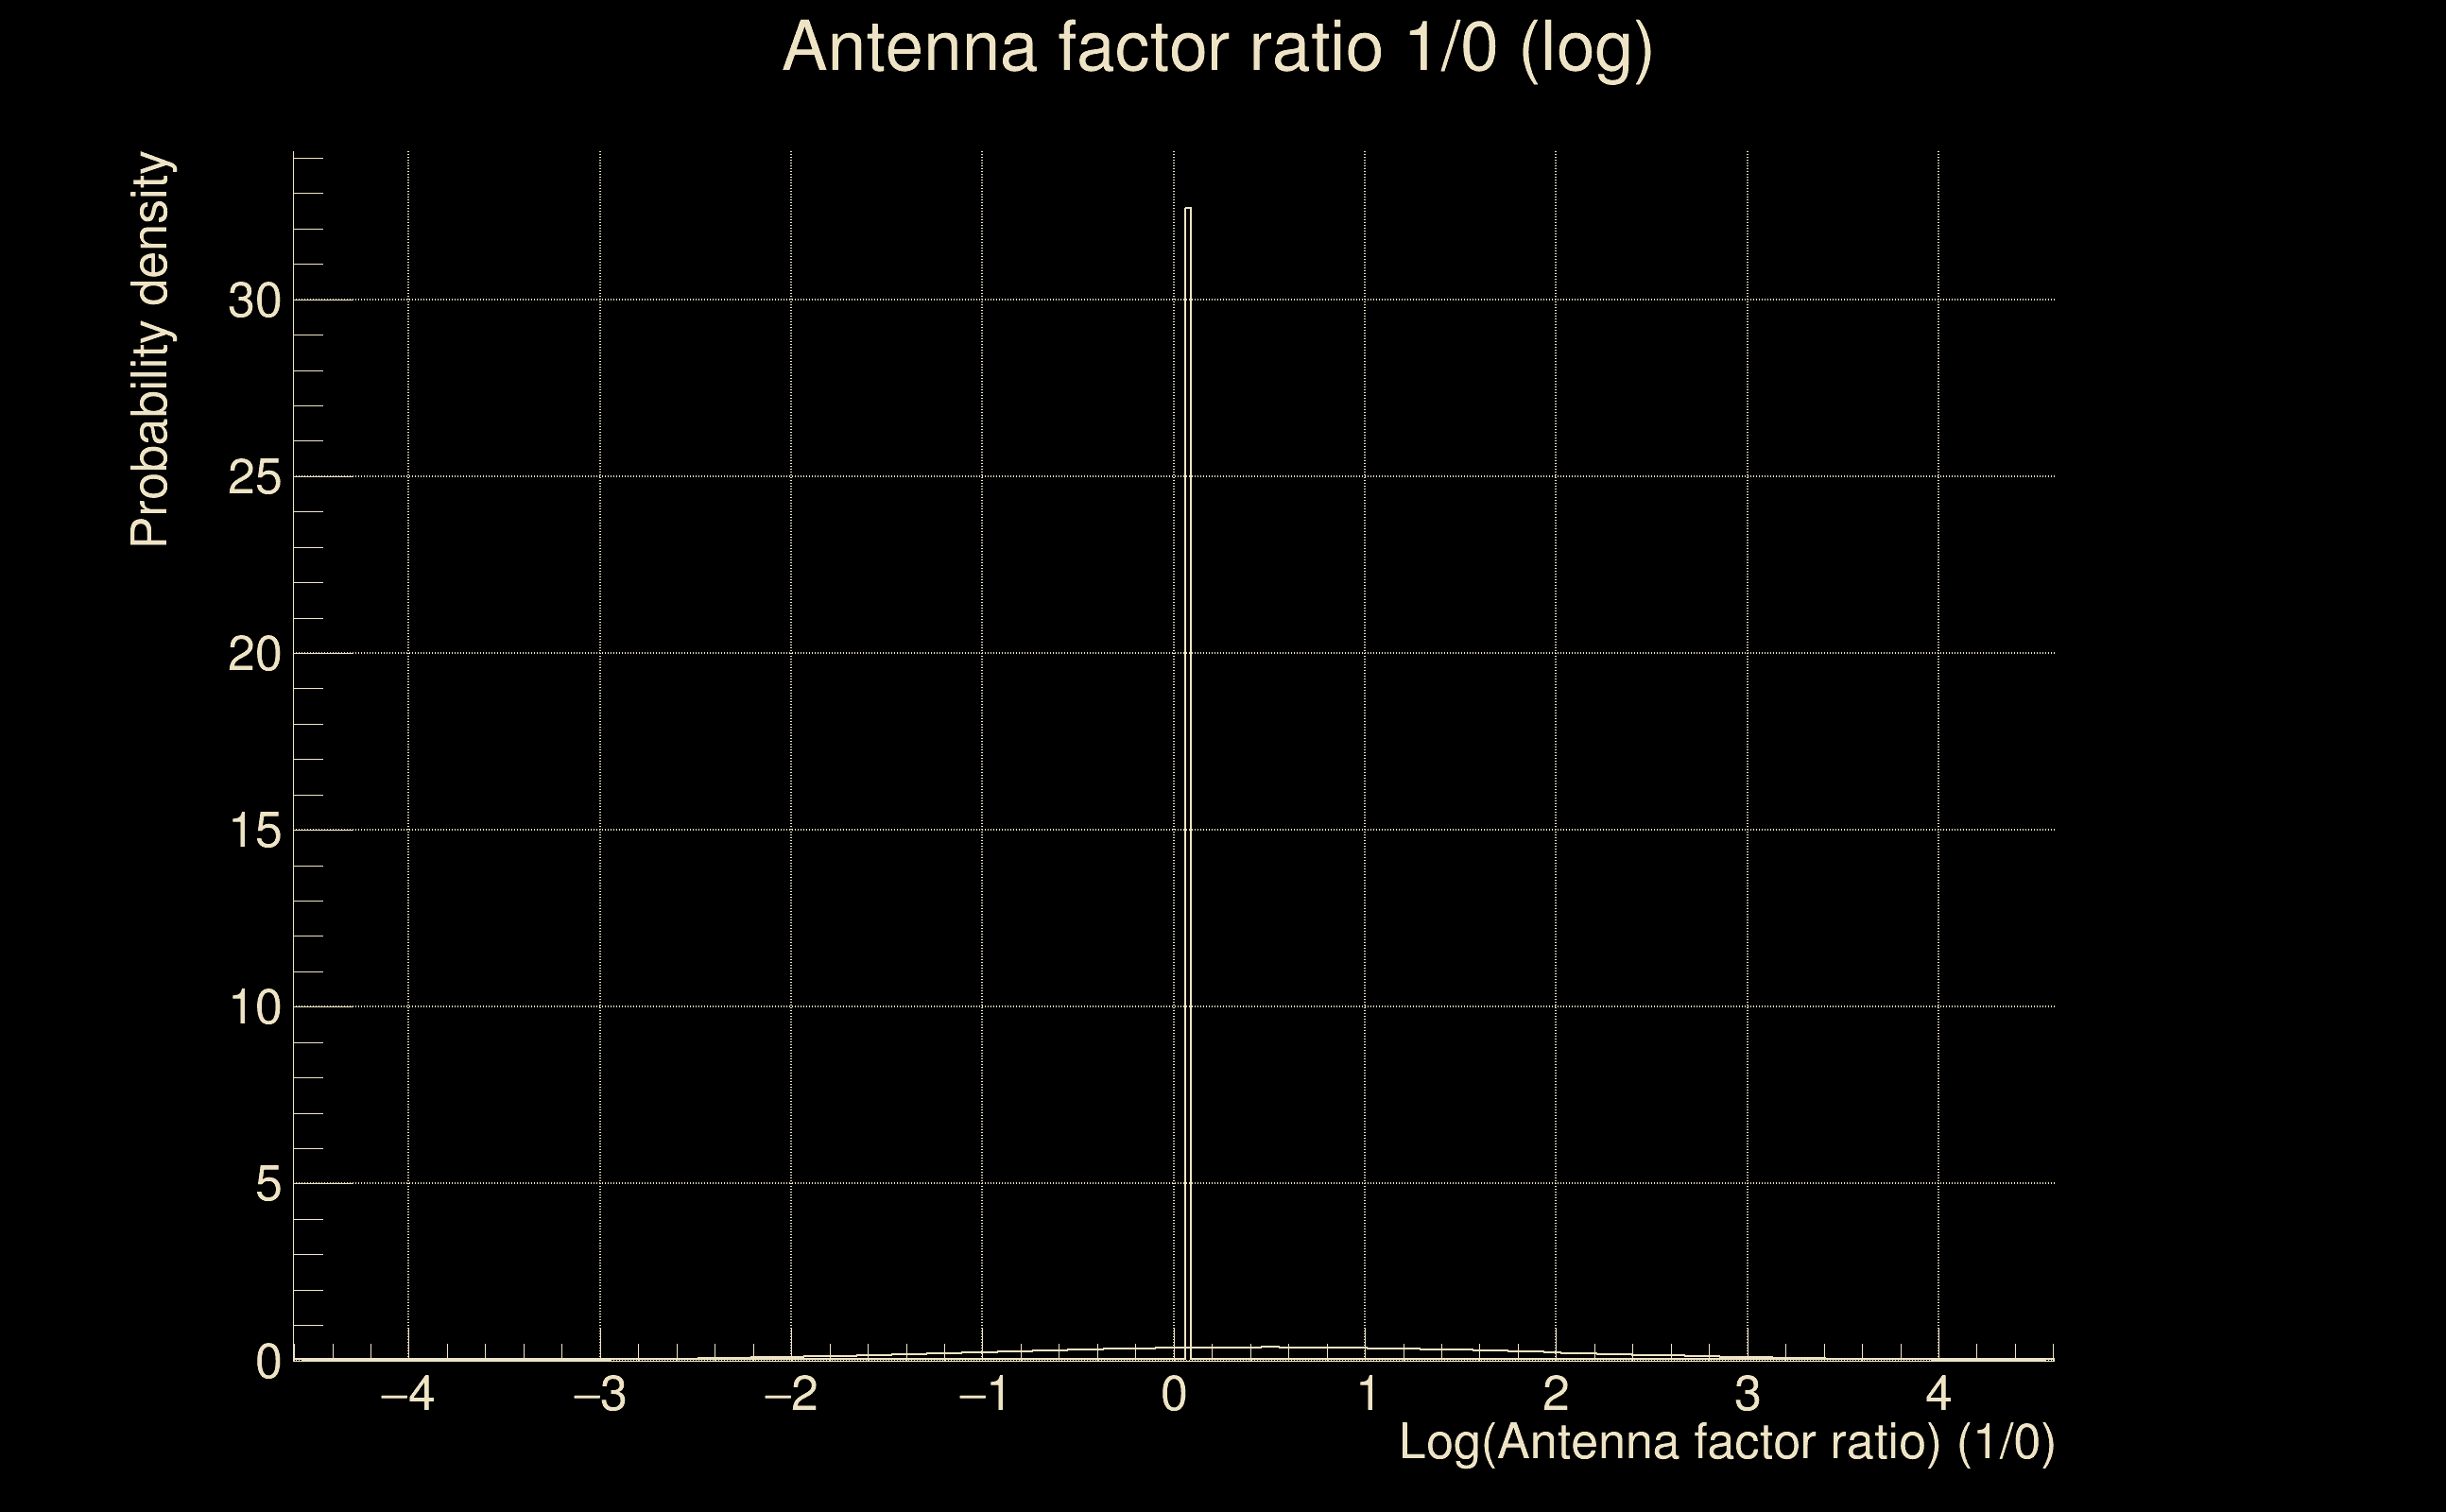
| Log of amplitude ratio (L1/H1): | 0.518504, variance = 0.76667 (L1/H1: -0.00304935, variance = 1.76493, H1/L1: -1.15409, variance = 1.15277) |
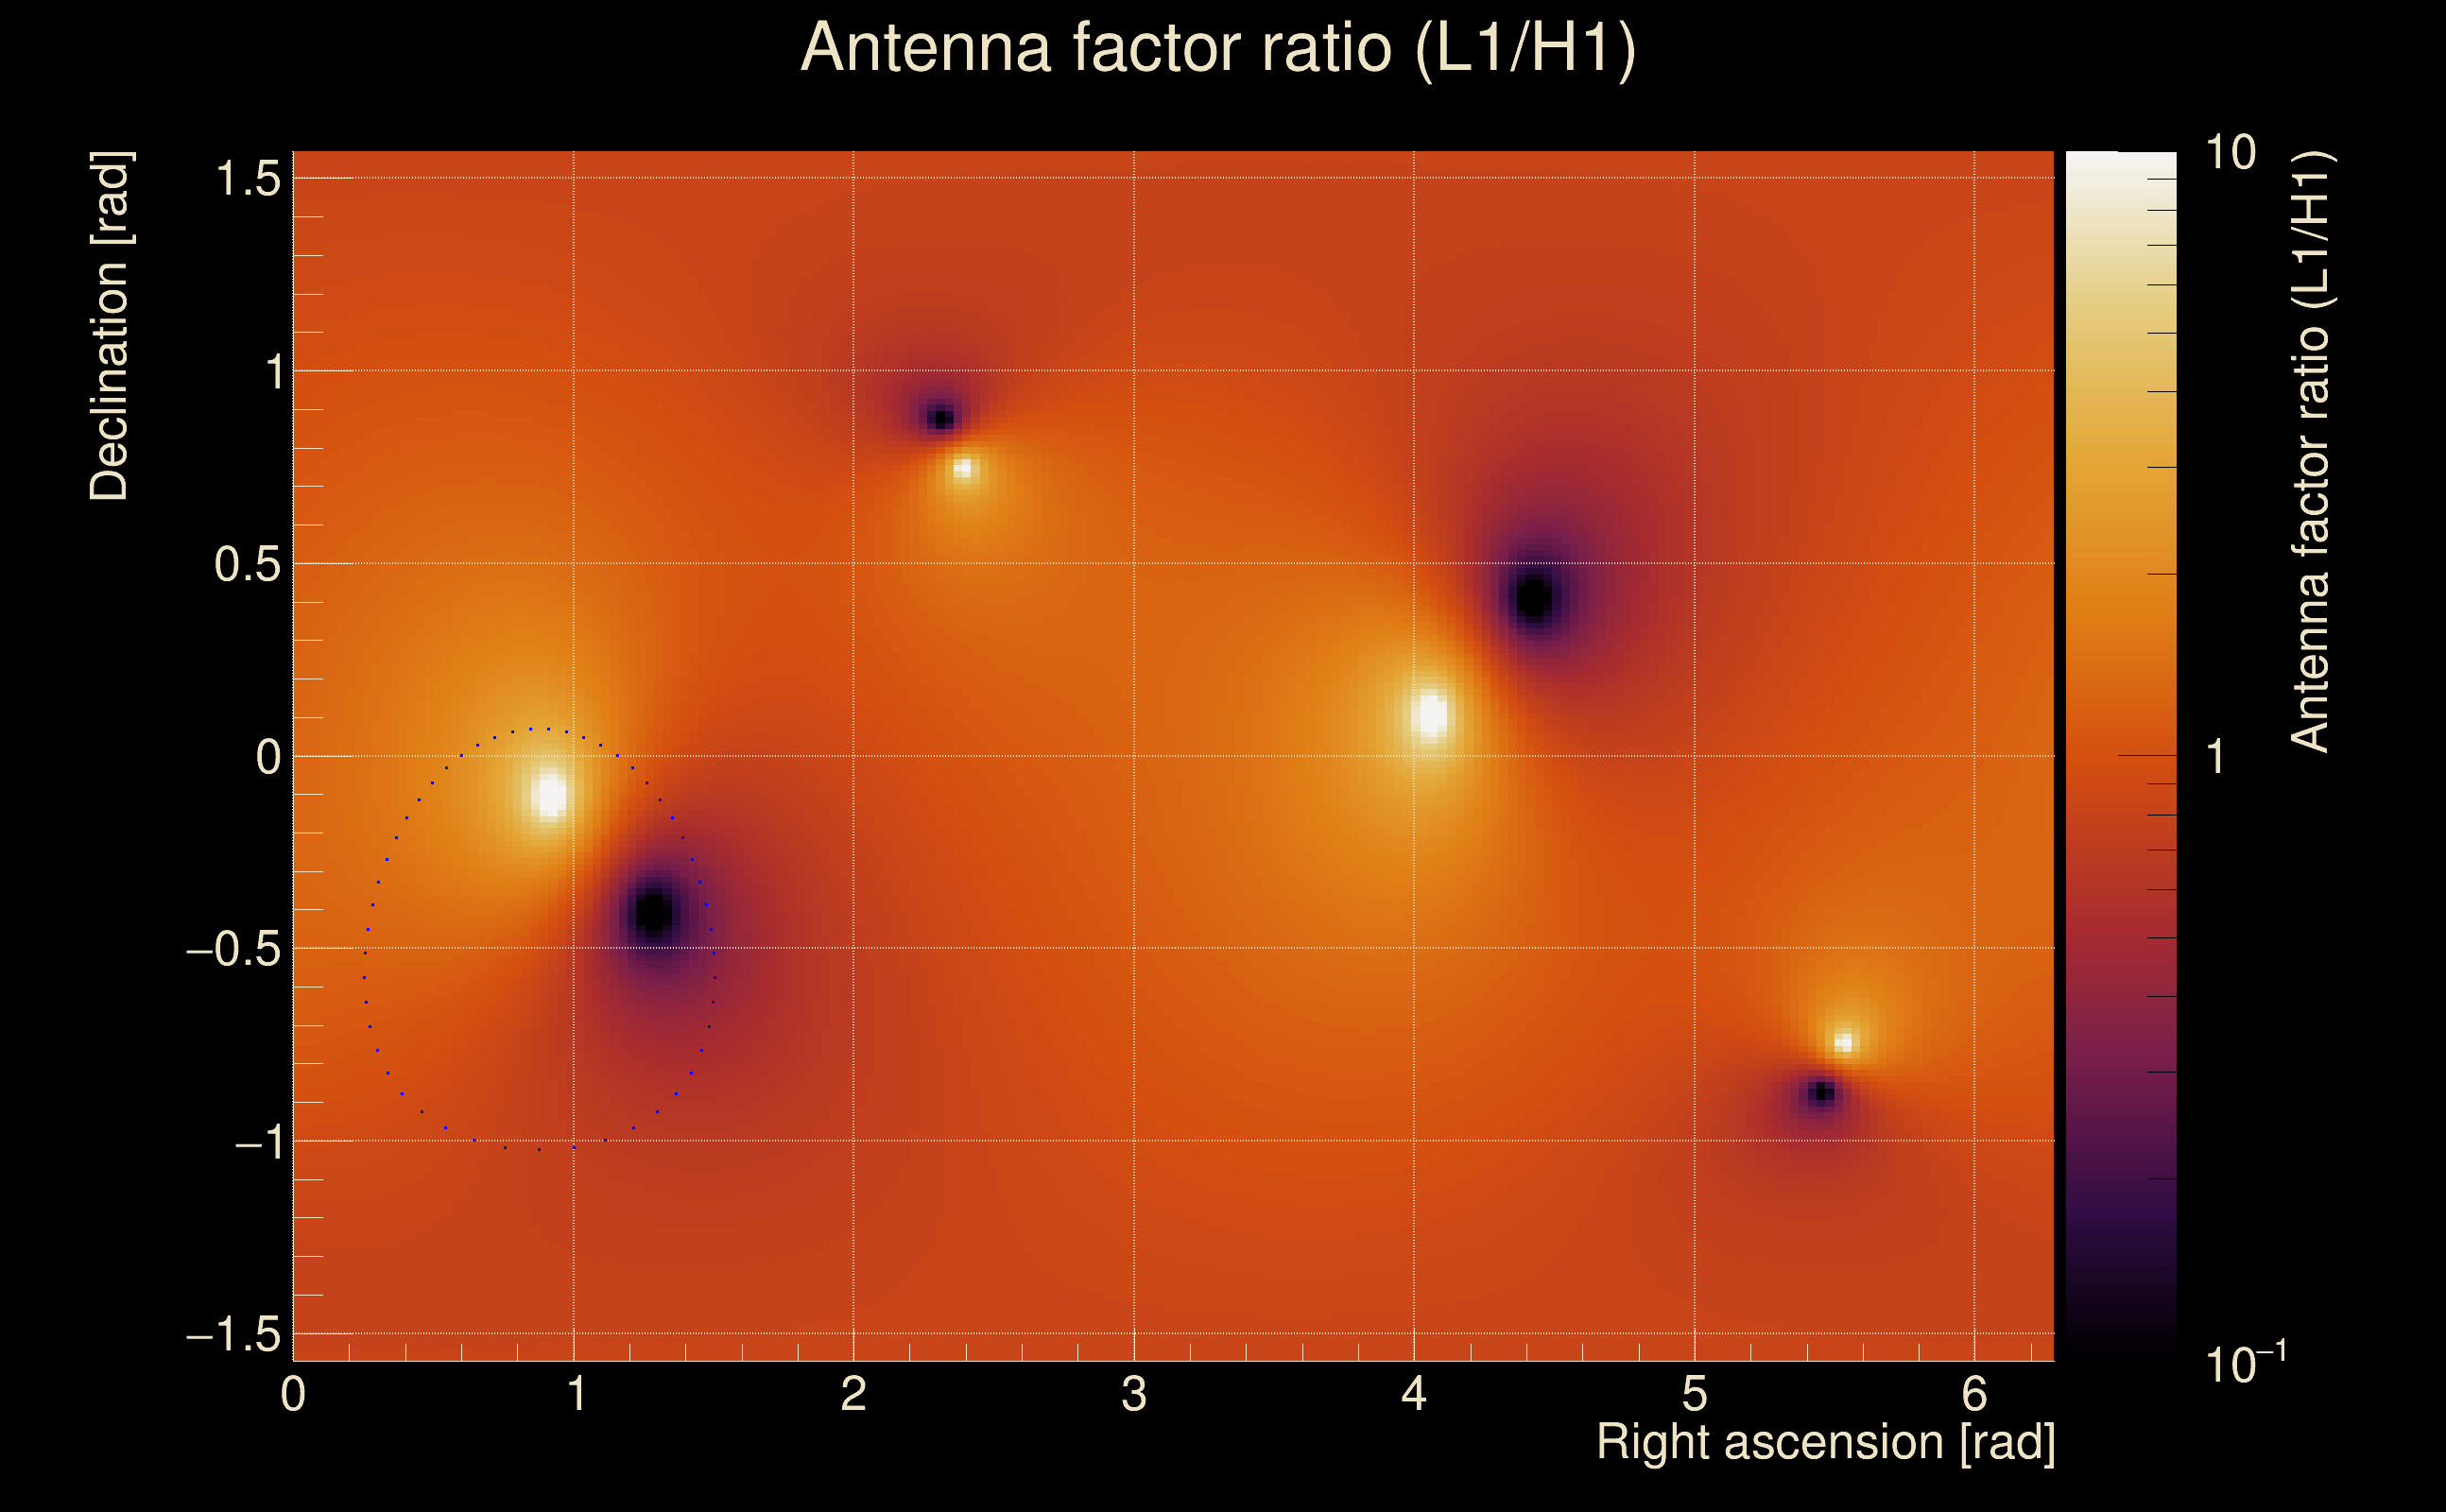
| Amplitude ratio (L1/H1): | 1.67951 ⋇ 2.40031 (L1/H1: 0.996955 ⋇ 3.7754, H1/L1: 0.315346 ⋇ 2.9261) |
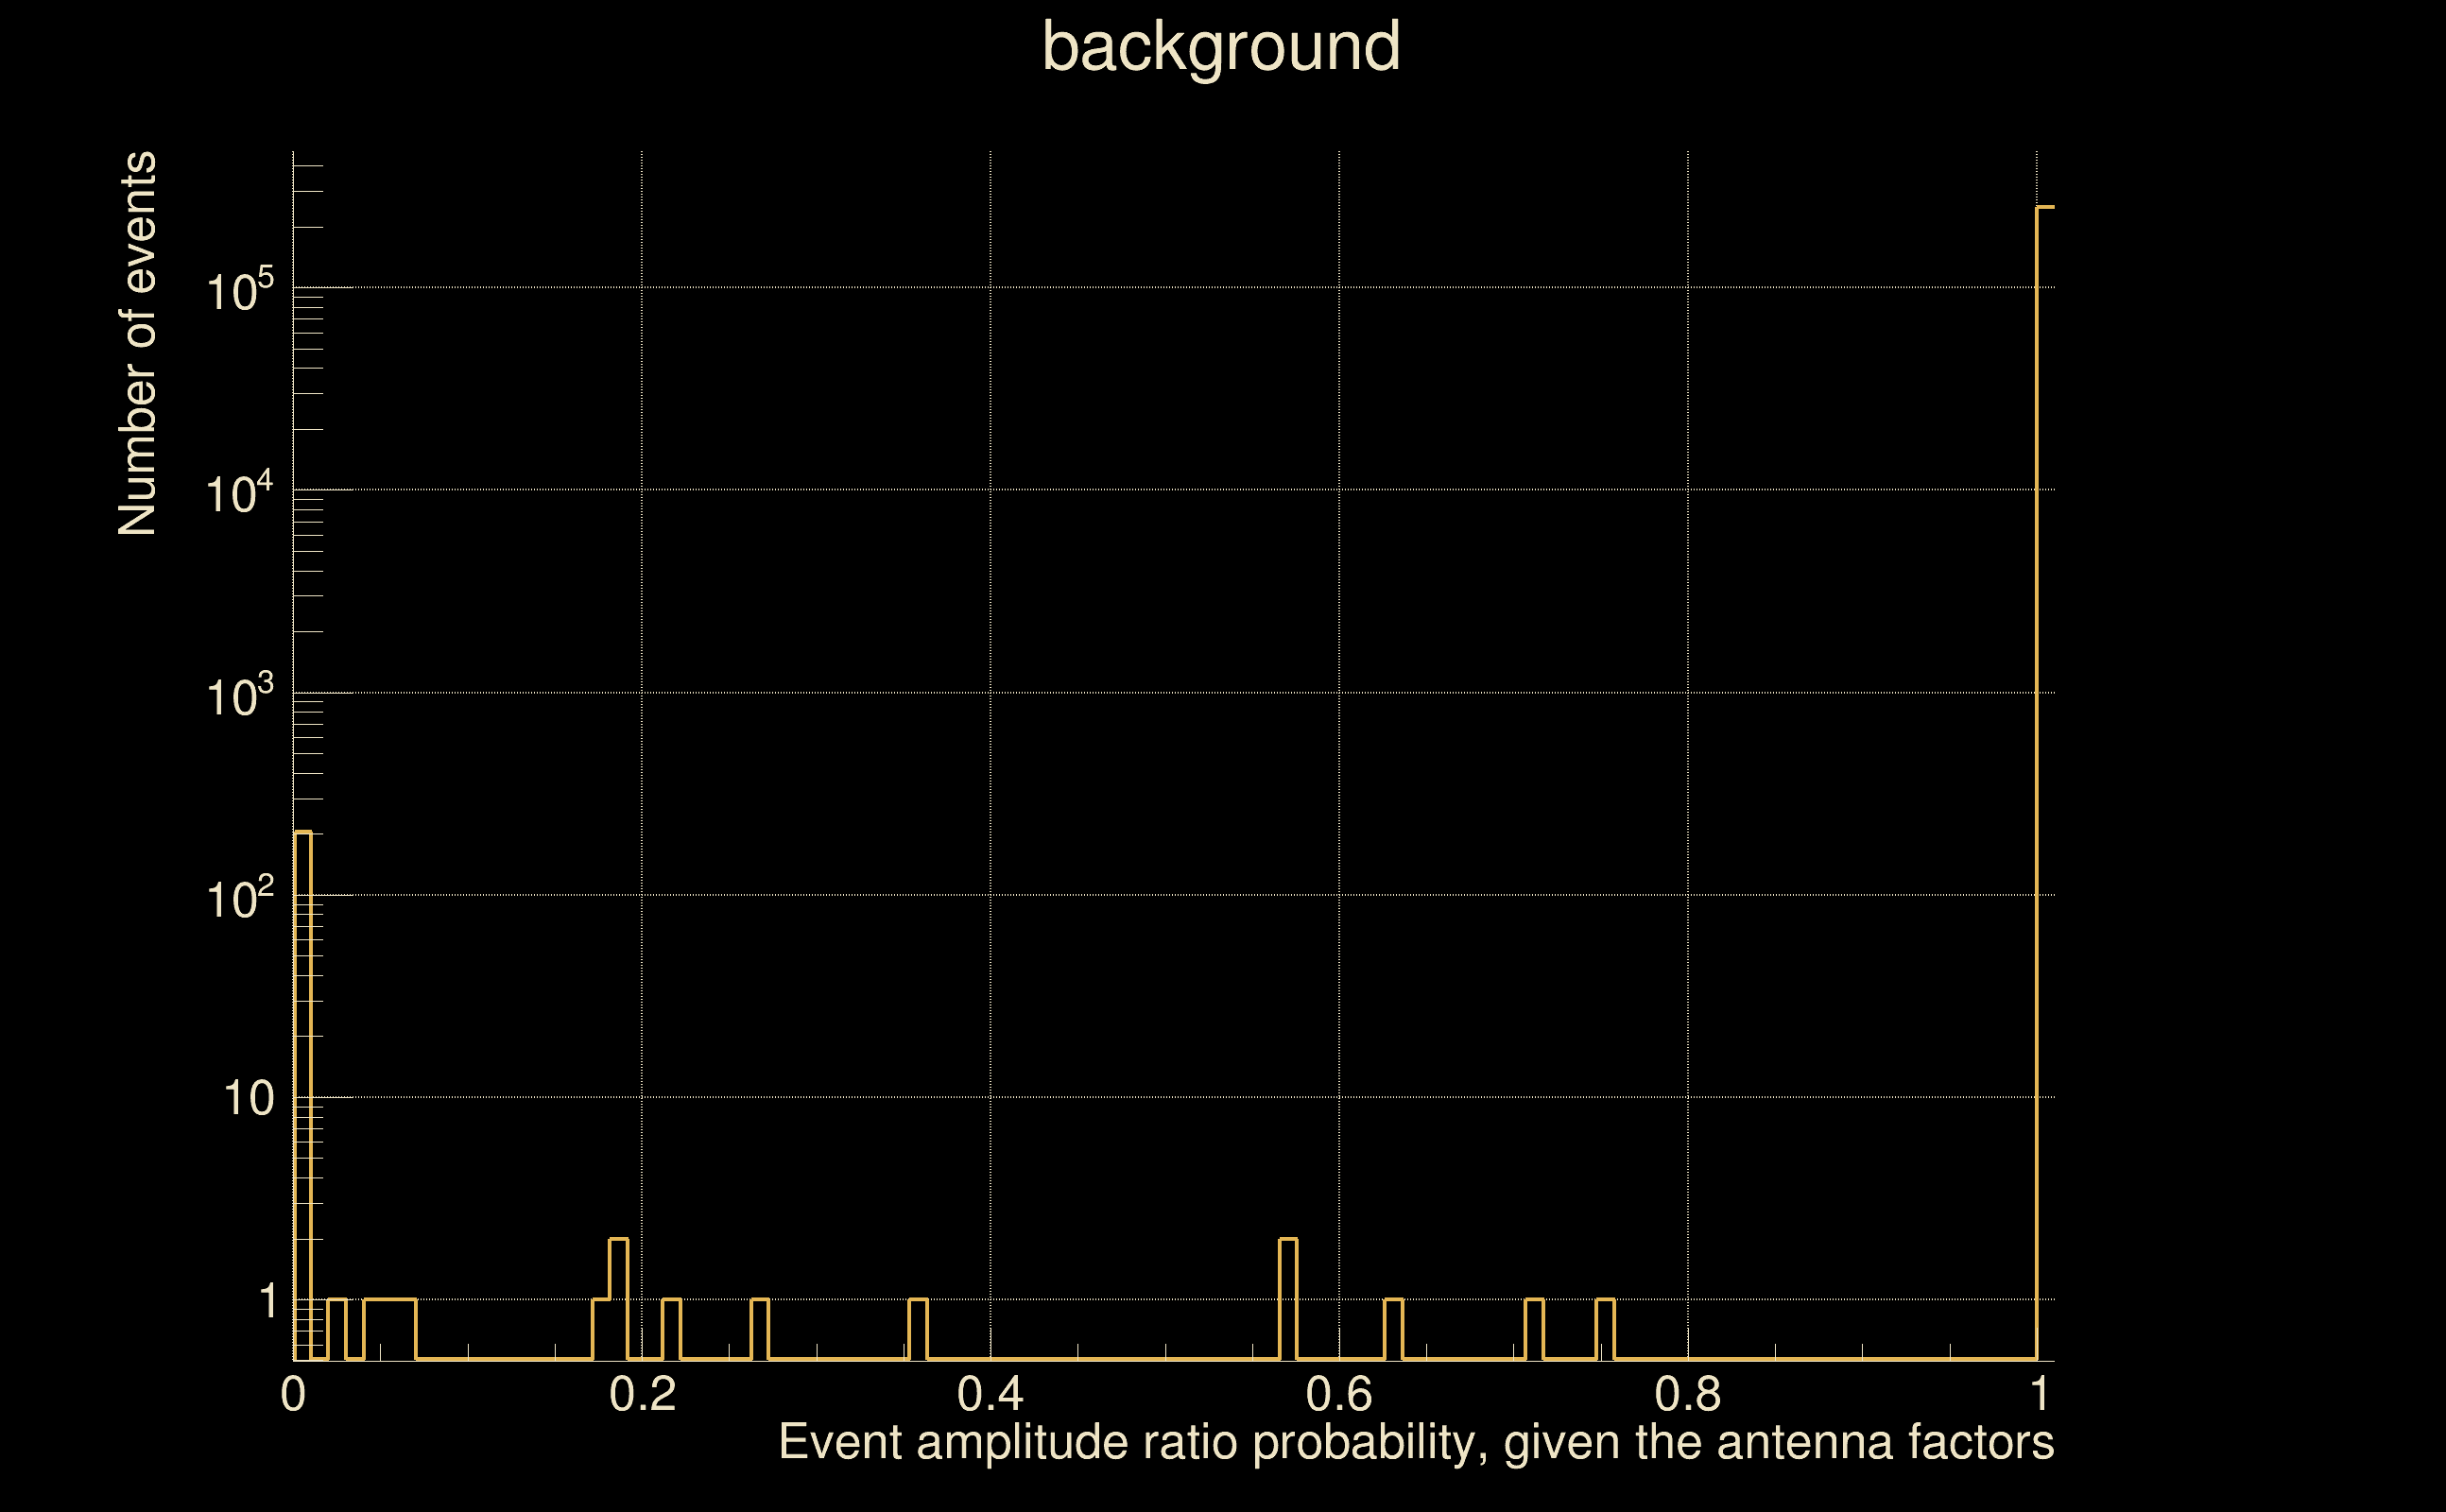
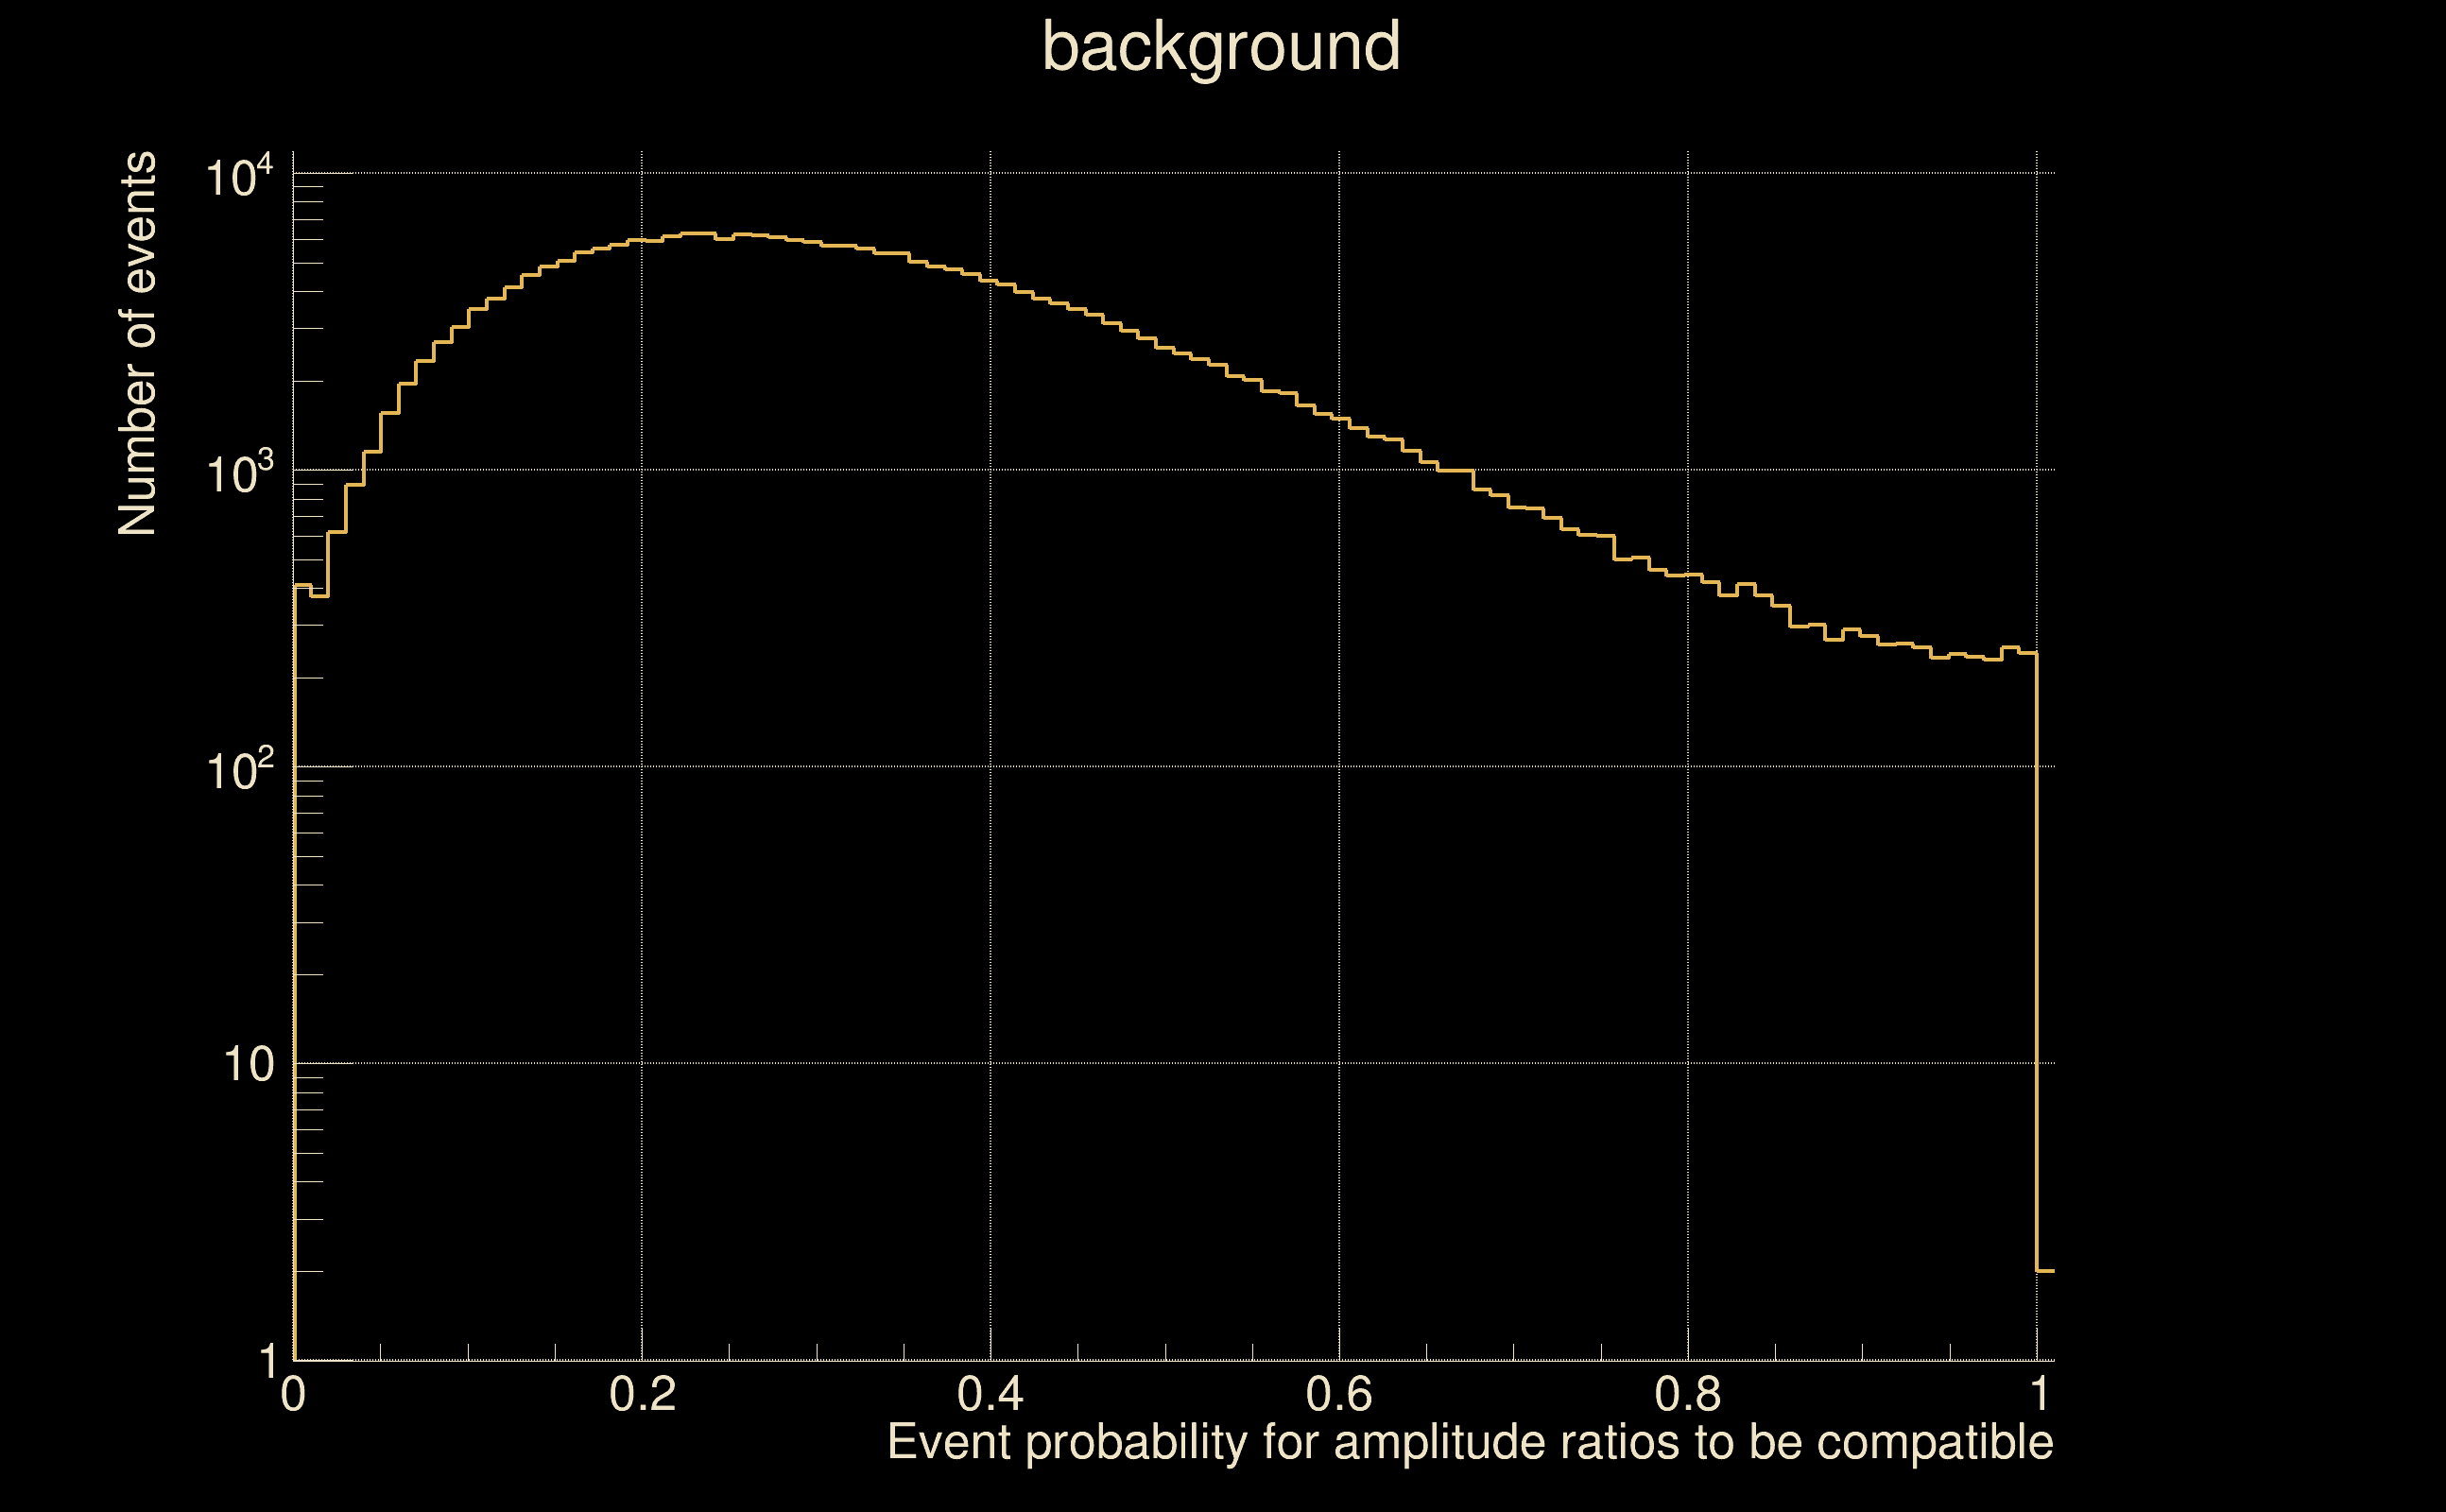
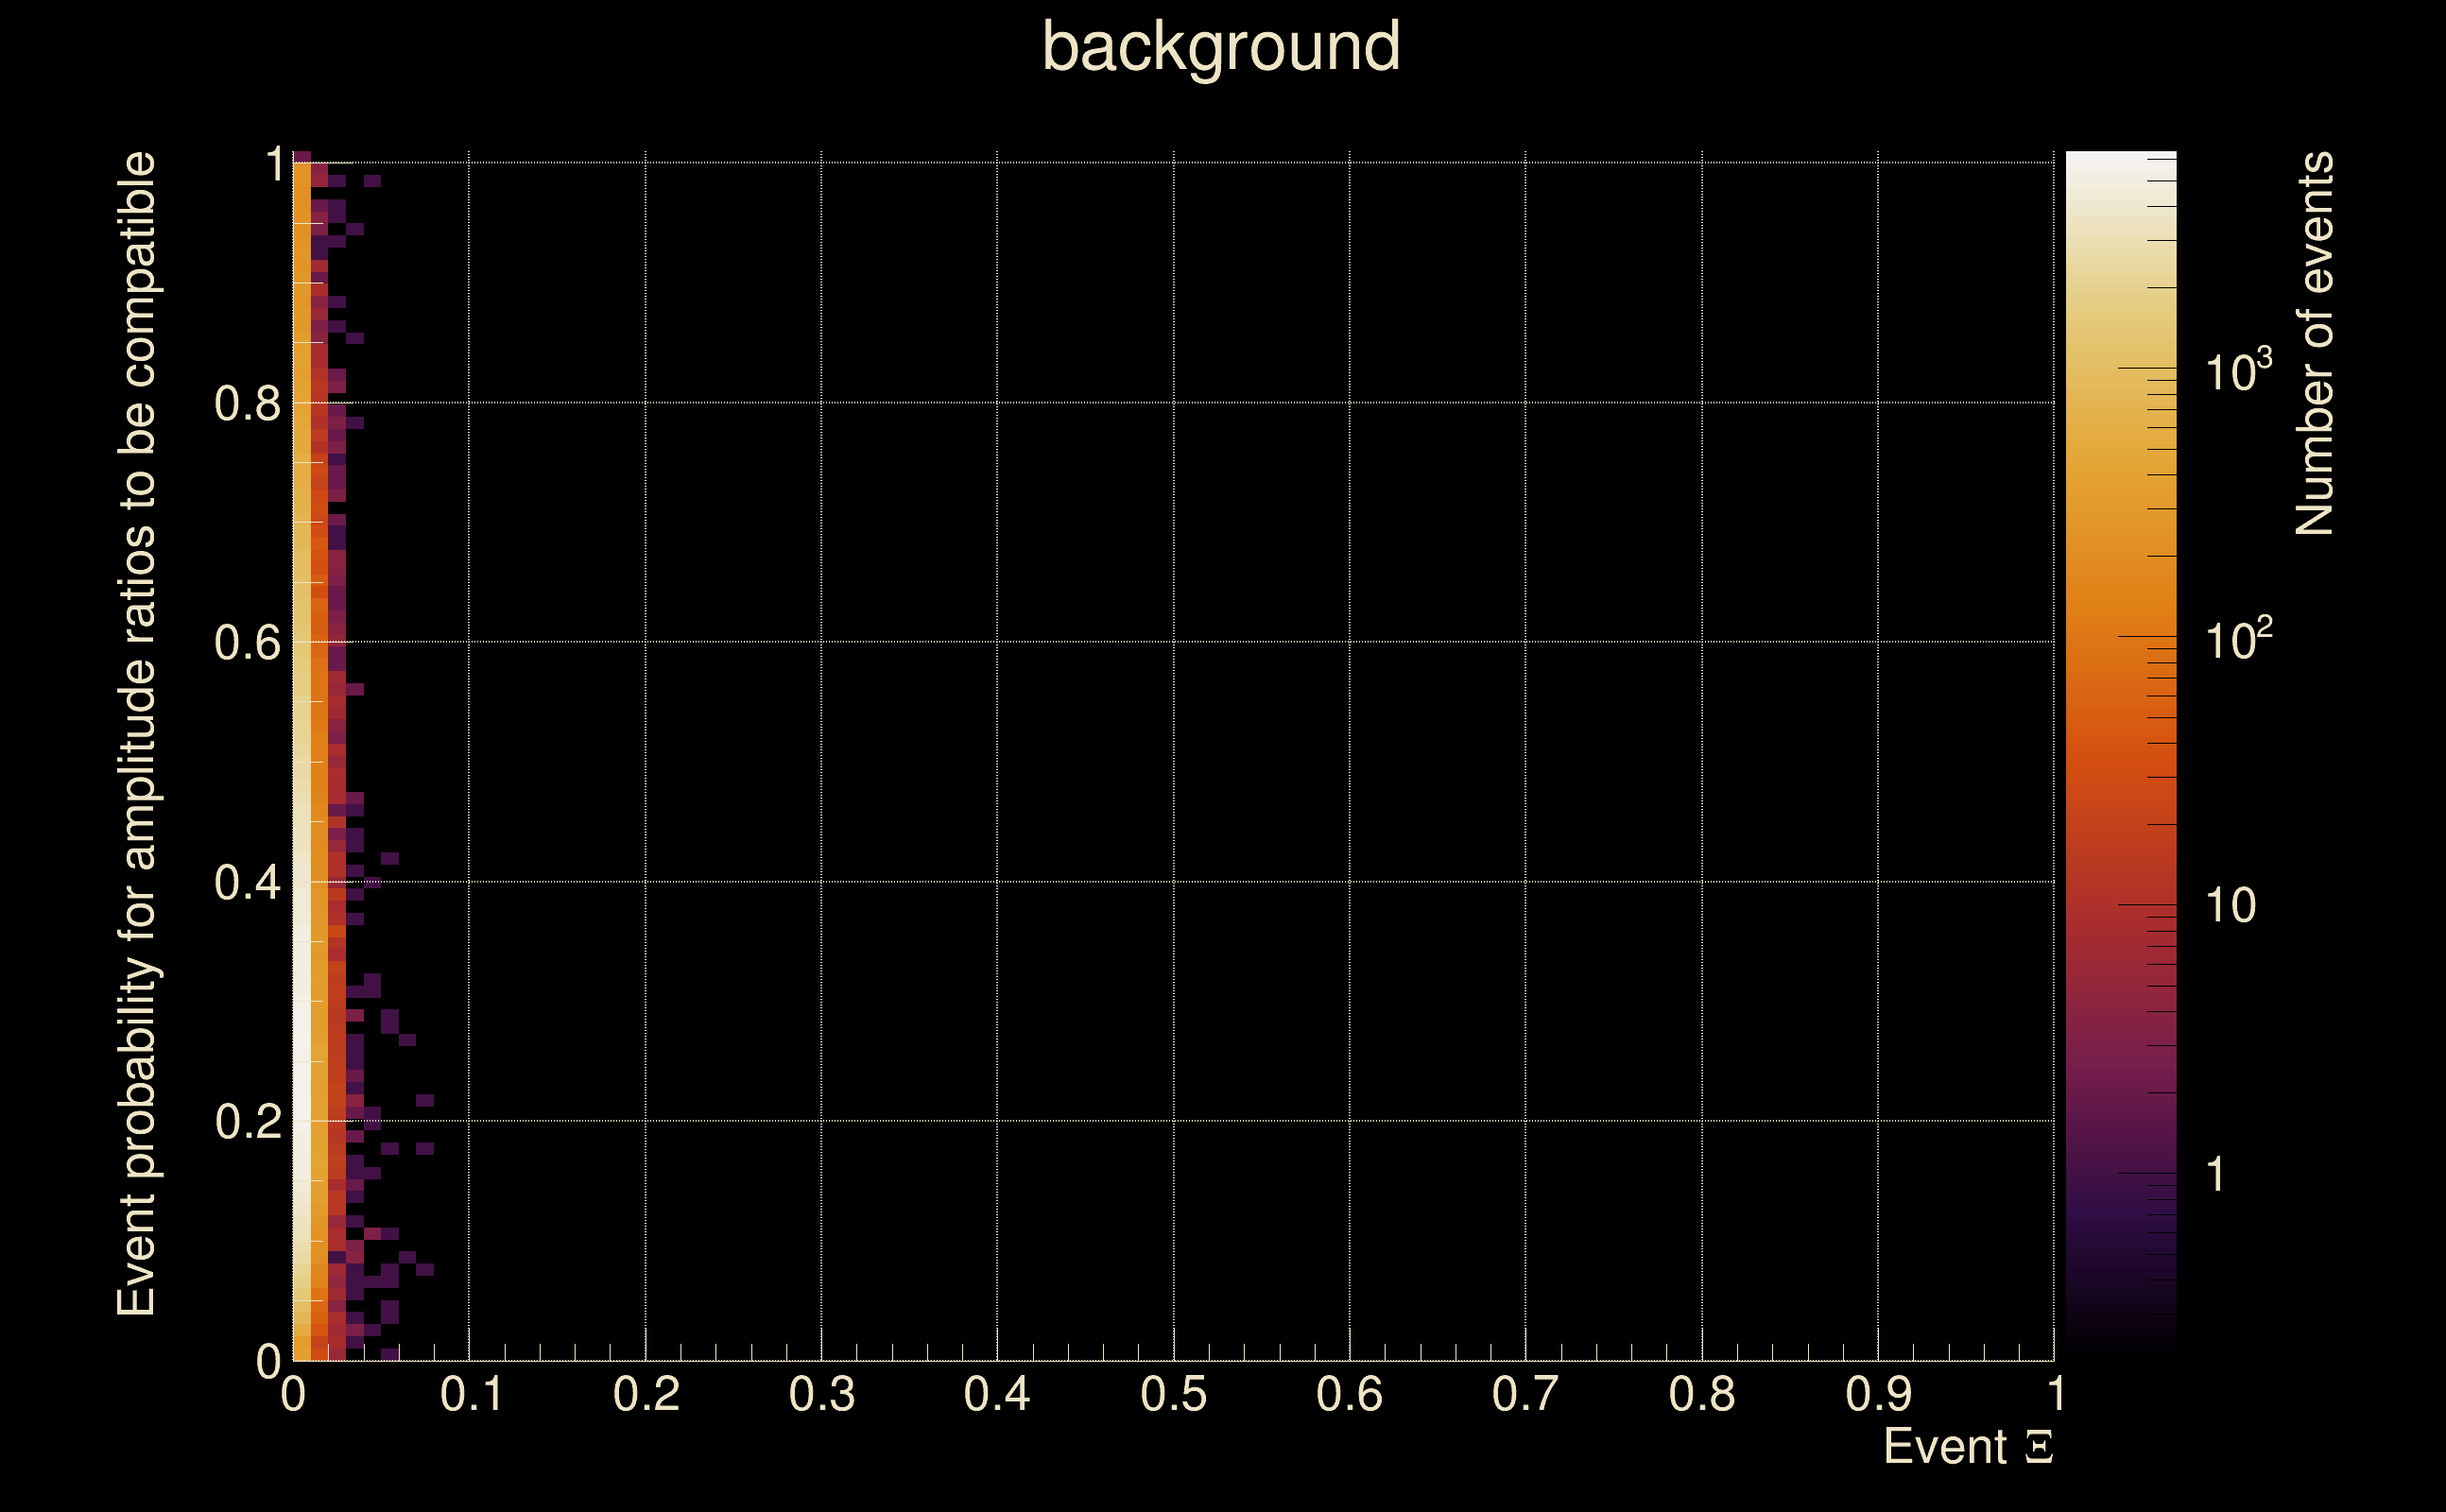
| Amplitude ratio H1|L1 compatibility (probability): | 0.498134 |
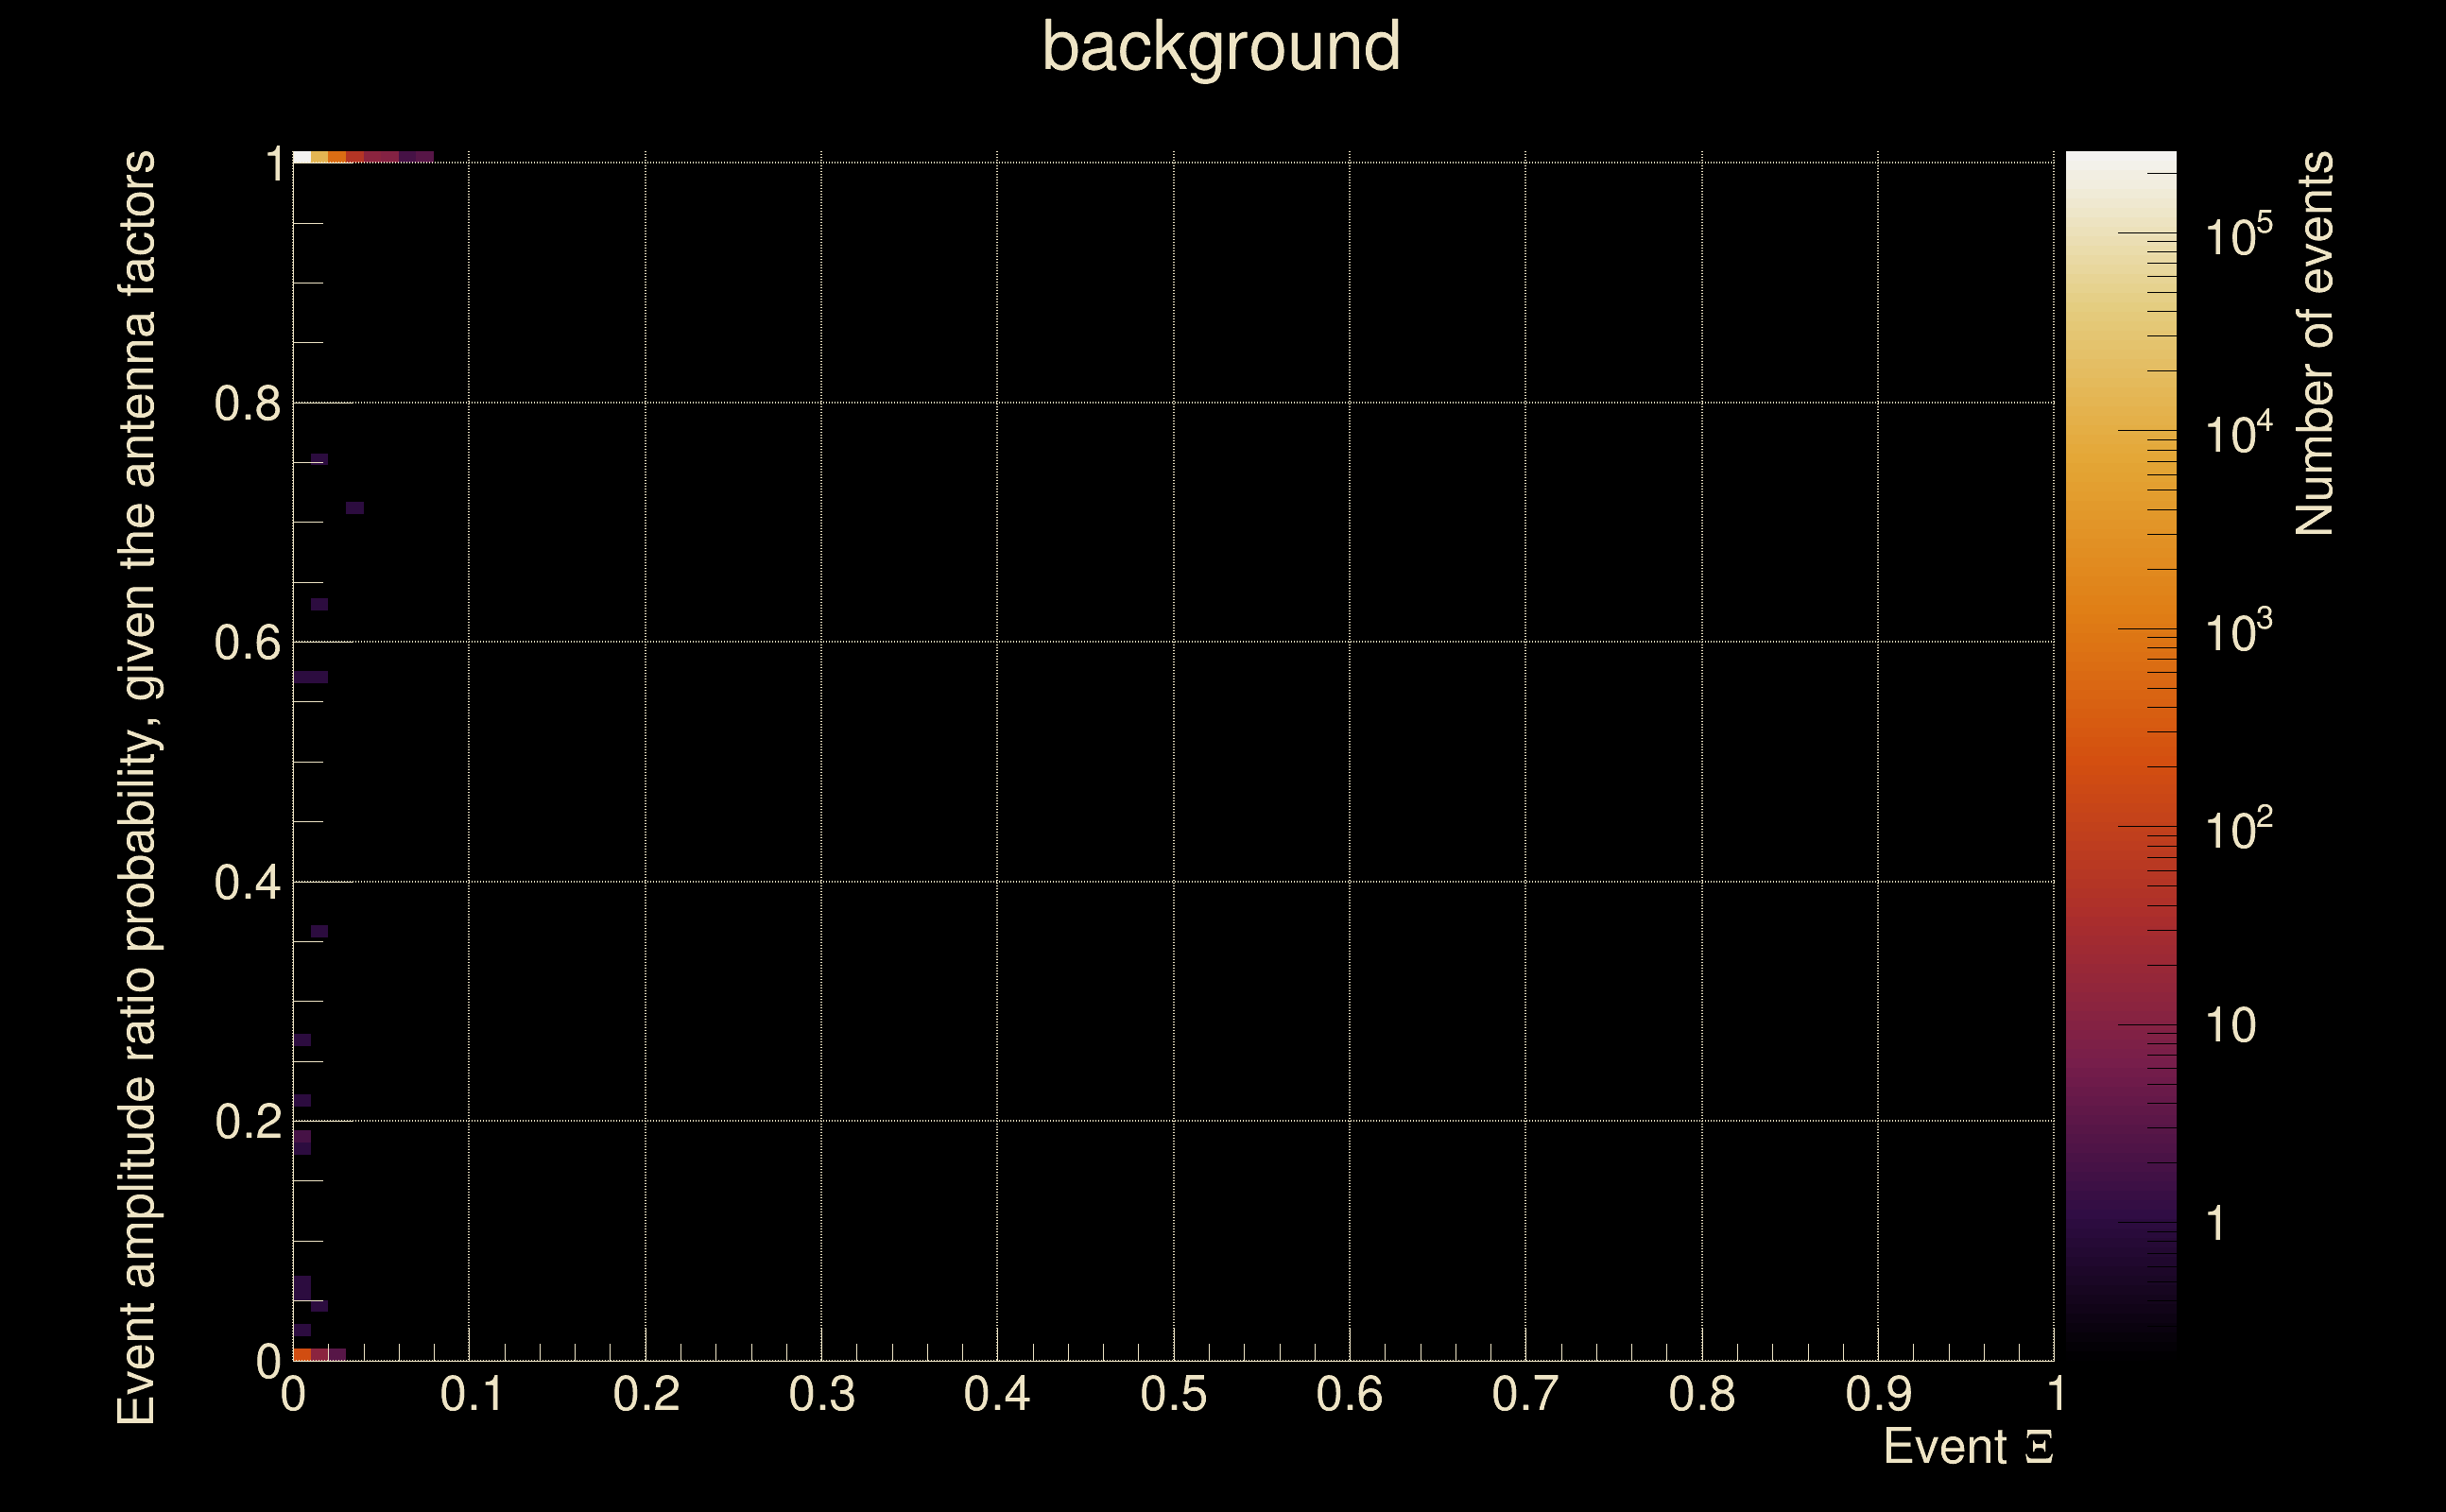
| Antenna factor probability: | 1 |
| Number of rejected frequency rows: | Q0: 18 / 18, Q1: 34 / 36, Q2: 70 / 70, Q3: 132 / 134, Q4: 247 / 258 |
| Maximum signal-to-noise ratio: | H1: 5.31491, L1: 4.81459 |
| SNR variance: | H1: 0.512659, L1: 0.528598 |
| Click here for a zoomed plot | Click here for a zoomed plot | Click here for a zoomed plot | Click here for a zoomed plot | Click here for a zoomed plot |
 |
 |
 |
 |
 |
 |
 |
 |
 |
 |
 |
 |
 |
 |
 |
 |
 |
 |
 |
 |
 |
 |
 |
 |
 |
 |
 |
 |
 |
 |
 |
 |
 |
 |
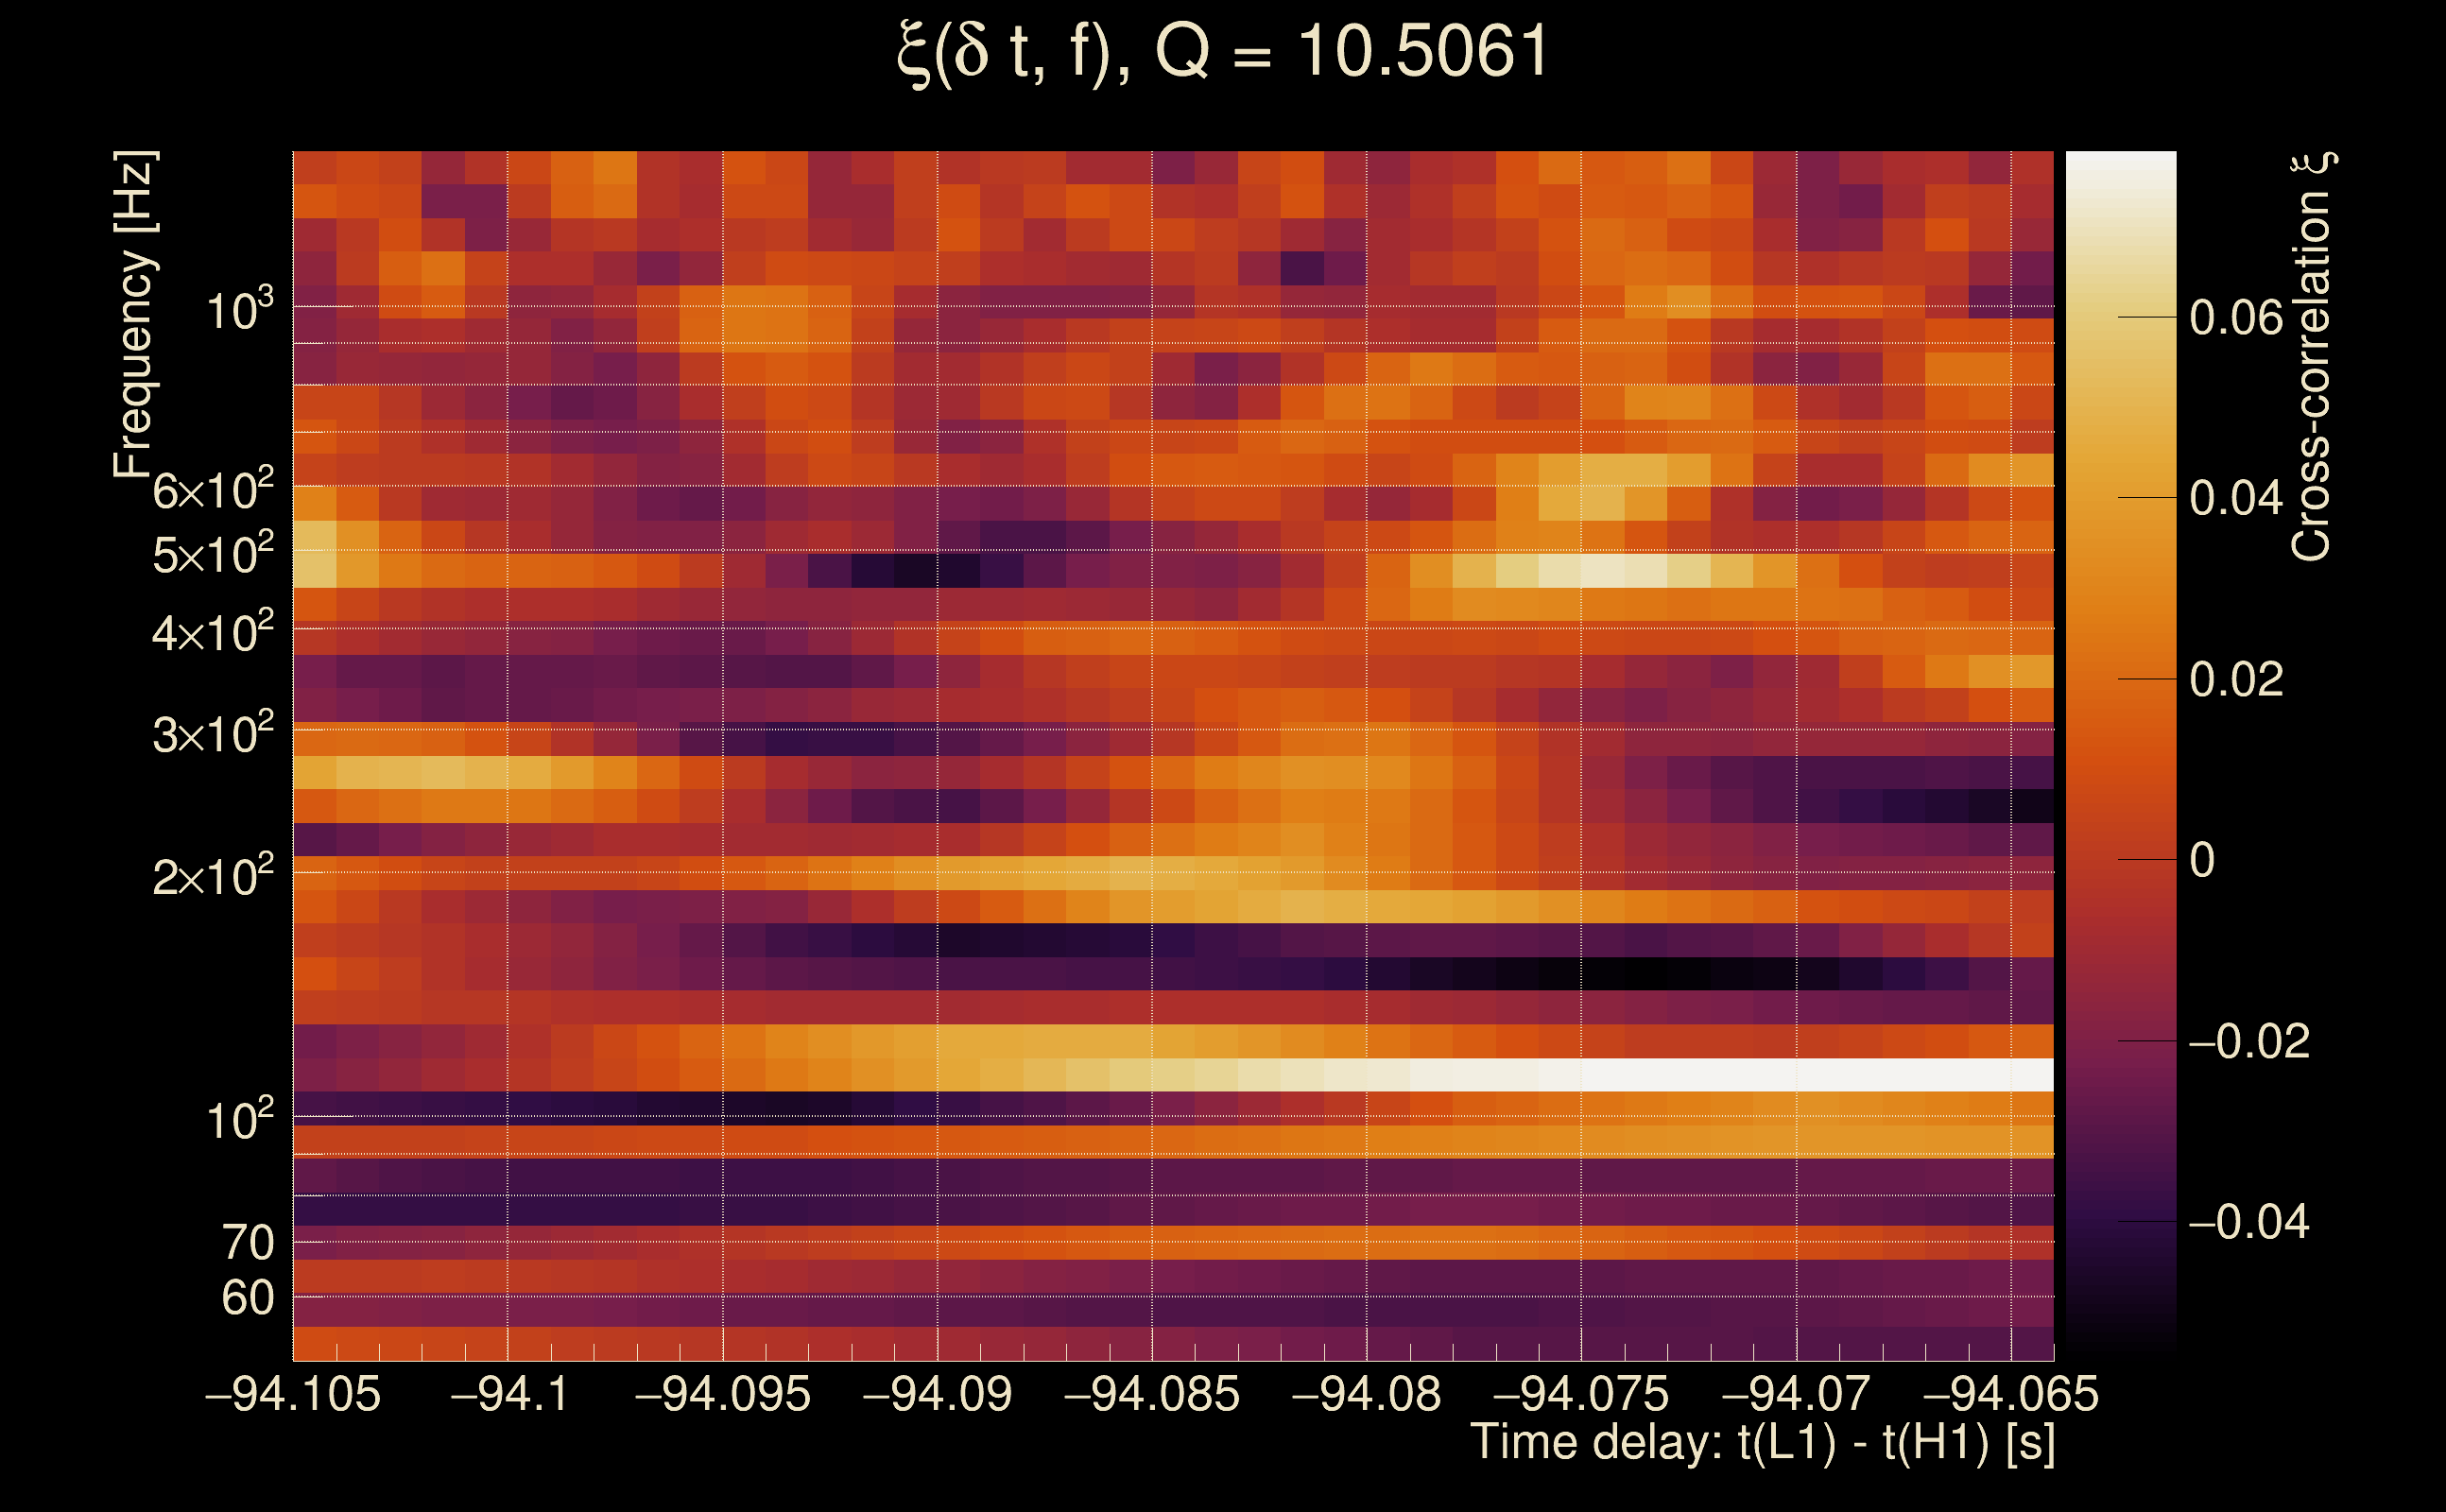
| Event time t(H1): | GPS = 1368195803 (Mon May 15 14:23:05 2023 ) → GPS = 1368195813 (Mon May 15 14:23:15 2023 ) |
| Event time t(L1): | GPS = 1368195713 (Mon May 15 14:23:15 2023 ) → GPS = 1368195723 (Mon May 15 14:21:45 2023 ) |
| Omicron analysis time window (H1): | GPS = 1368195800 → GPS = 1368195816 |
| Omicron analysis time window (L1): | GPS = 1368195710 → GPS = 1368195726 |
| Time delay between detectors t(L1) - t(H1): | -94.9208 s (slice index = 215 / 217), δt_gw = 0.00124715 s |
| Time delay uncertainty: | 0.00387556 s |
| [targeted mode] Time delay probability: | 0.420627 (0.805334 sigmas), δt_target = -0.00187397 s |
| Frequency: | 795.399 Hz |
| Ξ: | 0.000500589 ± 0.0245463 (variance = 0.000602522): Q0: 0, Q1: 0.0437337, Q2: 0, Q3: 0.0349187, Q4: 0.0619006 |
| Rank: | R_A = 0.13682 |
| Log of amplitude ratio (L1/H1): | 0.429337, variance = 0.565097 (L1/H1: -0.316745, variance = 1.20447, H1/L1: -1.33854, variance = 0.992881) |
| Amplitude ratio (L1/H1): | 1.53624 ⋇ 2.12066 (L1/H1: 0.728517 ⋇ 2.99661, H1/L1: 0.262229 ⋇ 2.70861) |
| Amplitude ratio H1|L1 compatibility (probability): | 0.264138 |
| Antenna factor probability: | 1 |
| Number of rejected frequency rows: | Q0: 18 / 18, Q1: 35 / 36, Q2: 70 / 70, Q3: 130 / 134, Q4: 244 / 258 |
| Maximum signal-to-noise ratio: | H1: 5.31491, L1: 4.81459 |
| SNR variance: | H1: 0.512659, L1: 0.528598 |
| Click here for a zoomed plot | Click here for a zoomed plot | Click here for a zoomed plot | Click here for a zoomed plot | Click here for a zoomed plot |
|
|
|
|
|
|
|
|
|
|
|
|
|
|
|
|
|
|
|
|
|
|
|
|
|
 |
 |
 |
 |
 |
 |
 |
 |
 |
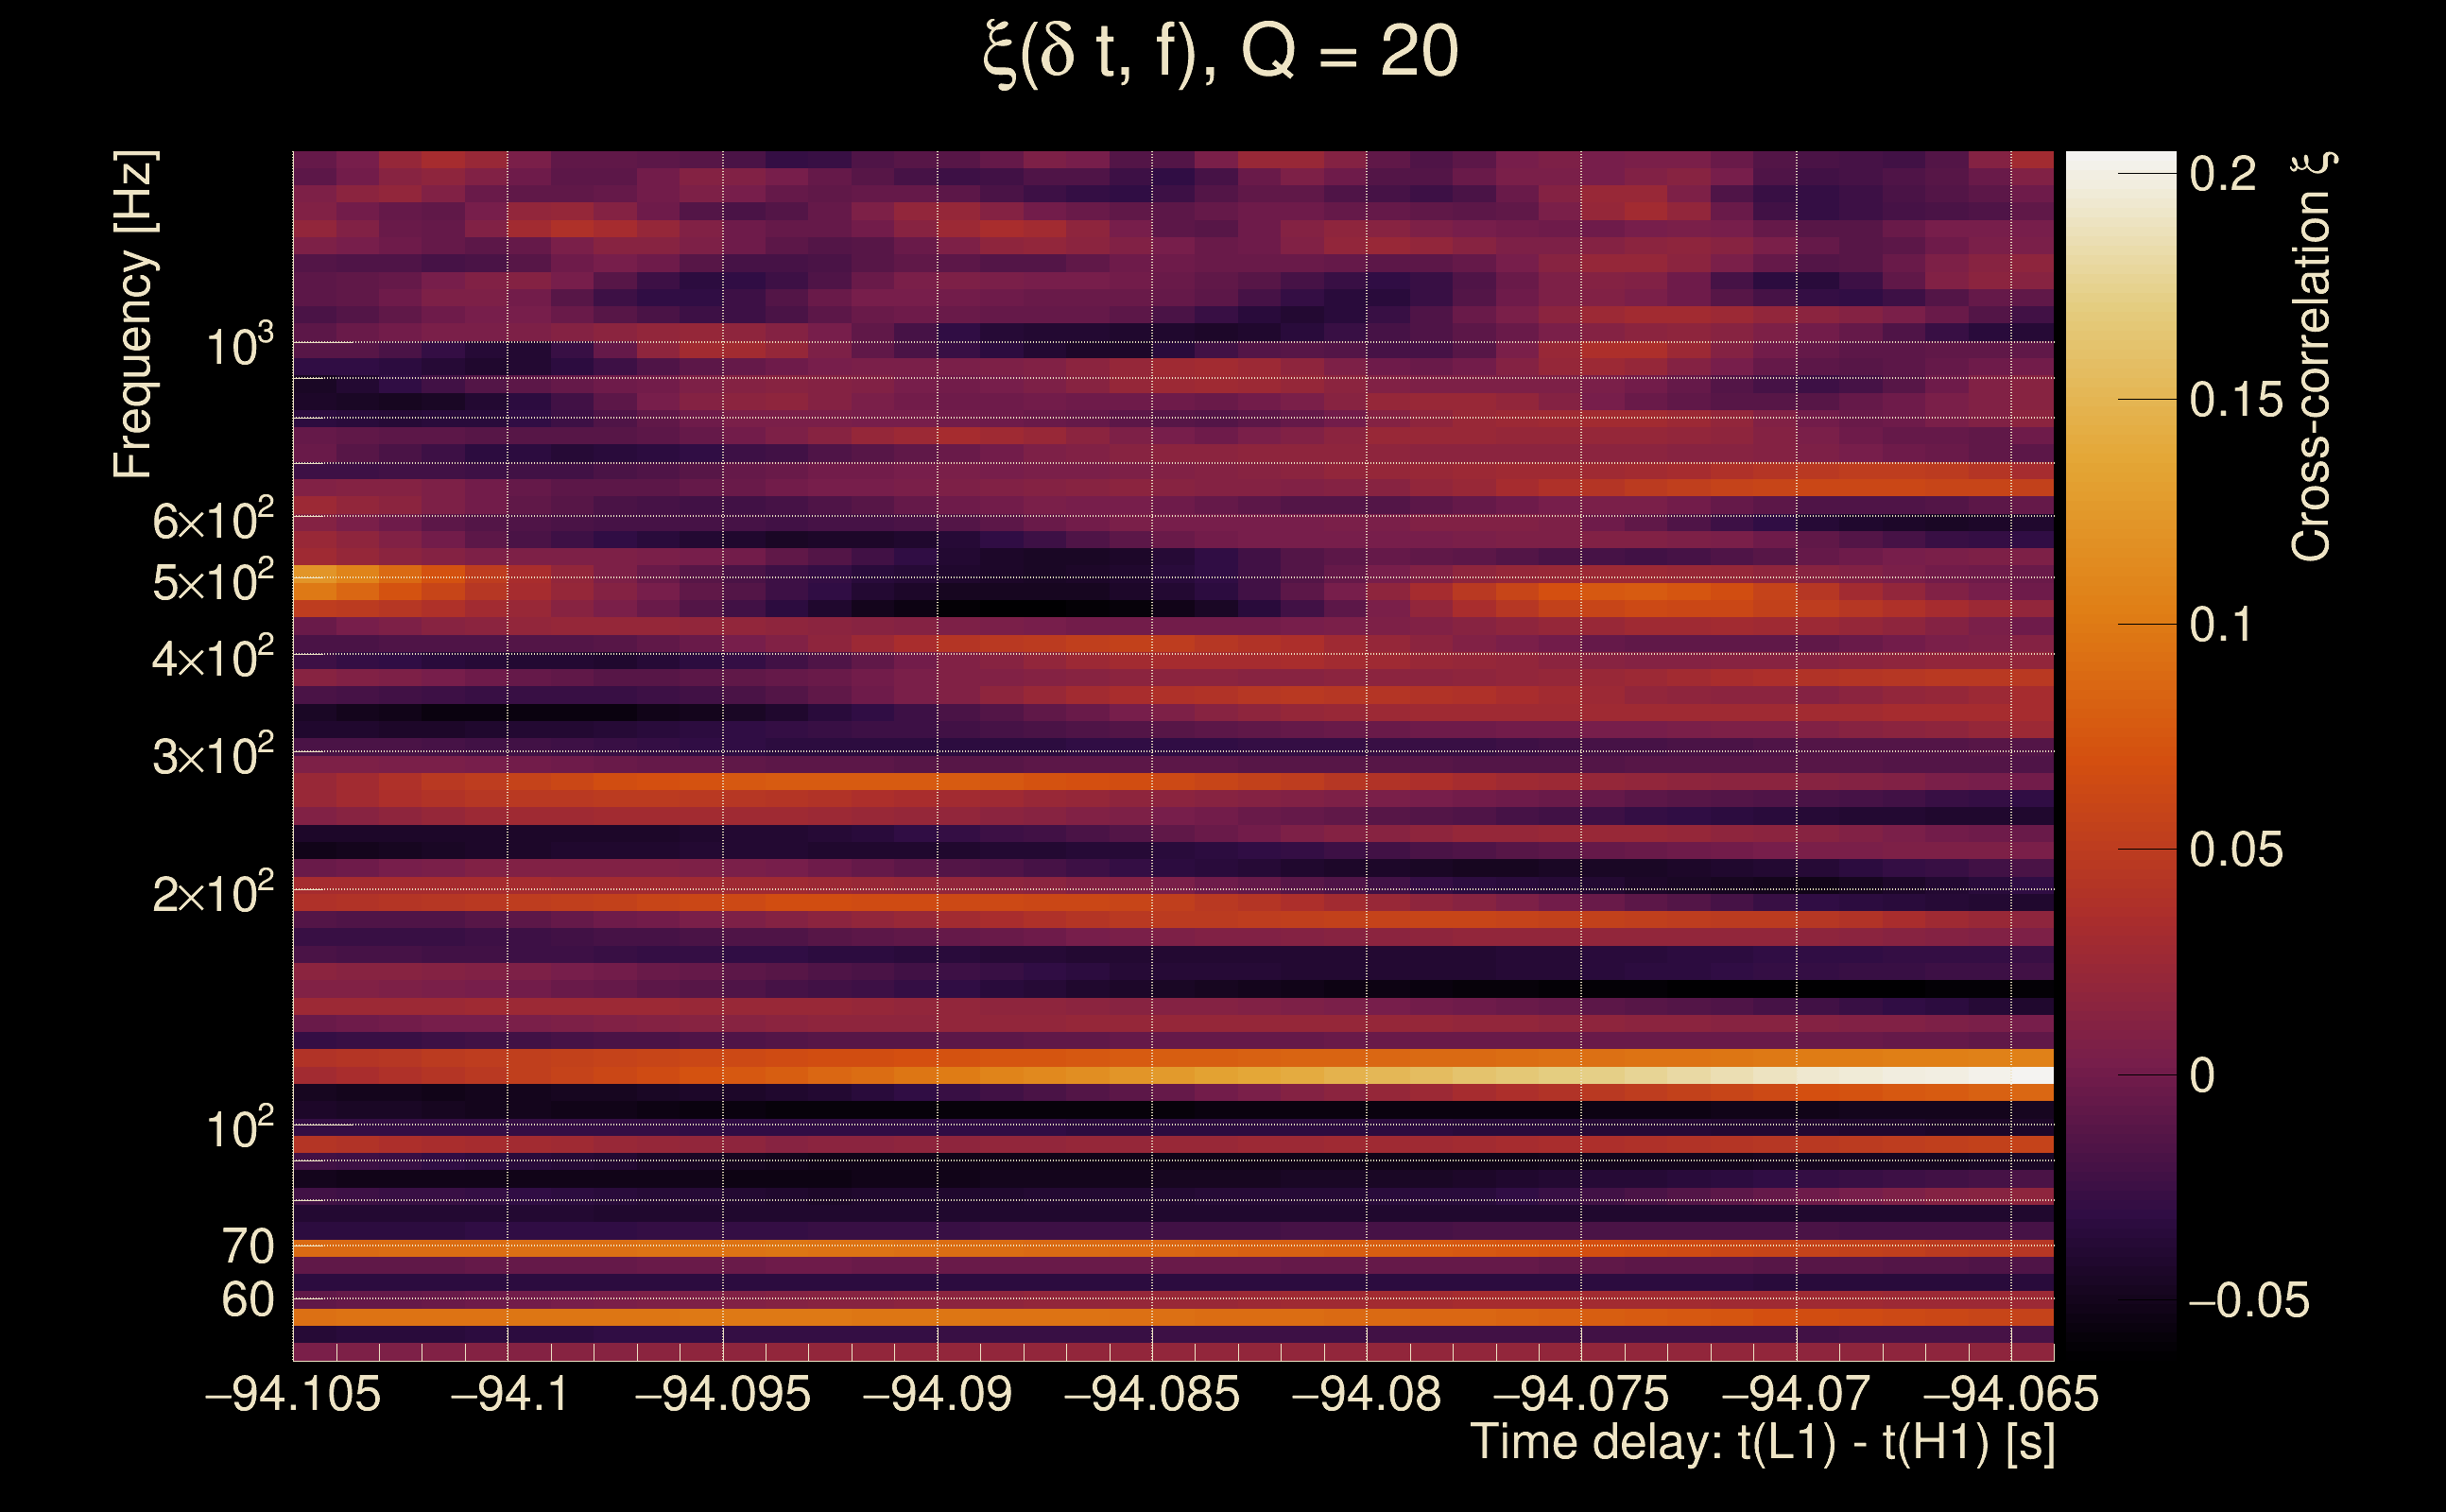
| Event time t(H1): | GPS = 1368195803 (Mon May 15 14:23:05 2023 ) → GPS = 1368195813 (Mon May 15 14:23:15 2023 ) |
| Event time t(L1): | GPS = 1368195713 (Mon May 15 14:23:15 2023 ) → GPS = 1368195723 (Mon May 15 14:21:45 2023 ) |
| Omicron analysis time window (H1): | GPS = 1368195800 → GPS = 1368195816 |
| Omicron analysis time window (L1): | GPS = 1368195710 → GPS = 1368195726 |
| Time delay between detectors t(L1) - t(H1): | -94.8799 s (slice index = 214 / 217), δt_gw = -0.00387802 s |
| Time delay uncertainty: | 0.00608973 s |
| [targeted mode] Time delay probability: | 0.74209 (0.329087 sigmas), δt_target = -0.00187397 s |
| Frequency: | 807.72 Hz |
| Ξ: | 0.000570849 ± 0.0199267 (variance = 0.000397072): Q0: 0, Q1: 0.0185071, Q2: 0.0256515, Q3: 0.0384084, Q4: 0.0595964 |
| Rank: | R_A = 0.13682 |
| Log of amplitude ratio (L1/H1): | 0.553959, variance = 1.38624 (L1/H1: -0.85931, variance = 2.86975, H1/L1: -2.27622, variance = 2.56176) |
| Amplitude ratio (L1/H1): | 1.74013 ⋇ 3.24588 (L1/H1: 0.423454 ⋇ 5.44139, H1/L1: 0.102672 ⋇ 4.95576) |
| Amplitude ratio H1|L1 compatibility (probability): | 0.178498 |
| Antenna factor probability: | 1 |
| Number of rejected frequency rows: | Q0: 18 / 18, Q1: 34 / 36, Q2: 69 / 70, Q3: 127 / 134, Q4: 243 / 258 |
| Maximum signal-to-noise ratio: | H1: 5.31491, L1: 4.81459 |
| SNR variance: | H1: 0.512659, L1: 0.528598 |
| Click here for a zoomed plot | Click here for a zoomed plot | Click here for a zoomed plot | Click here for a zoomed plot | Click here for a zoomed plot |
|
|
|
|
|
|
|
|
|
|
|
|
|
|
|
|
|
|
|
|
|
|
|
|
|
 |
 |
 |
 |
 |
 |
 |
 |
 |
| Event time t(H1): | GPS = 1368195803 (Mon May 15 14:23:05 2023 ) → GPS = 1368195813 (Mon May 15 14:23:15 2023 ) |
| Event time t(L1): | GPS = 1368195713 (Mon May 15 14:23:15 2023 ) → GPS = 1368195723 (Mon May 15 14:21:45 2023 ) |
| Omicron analysis time window (H1): | GPS = 1368195800 → GPS = 1368195816 |
| Omicron analysis time window (L1): | GPS = 1368195710 → GPS = 1368195726 |
| Time delay between detectors t(L1) - t(H1): | -94.8253 s (slice index = 213 / 217), δt_gw = 0.00473839 s |
| Time delay uncertainty: | 0.00432036 s |
| [targeted mode] Time delay probability: | 0.125891 (1.53051 sigmas), δt_target = -0.00187397 s |
| Frequency: | 759.948 Hz |
| Ξ: | 0.000504893 ± 0.0331167 (variance = 0.00109671): Q0: 0, Q1: 0.0261843, Q2: 0.0687641, Q3: 0.0146263, Q4: 0.0871554 |
| Rank: | R_A = 0.13682 |
| Log of amplitude ratio (L1/H1): | 0.517104, variance = 1.02315 (L1/H1: -0.655772, variance = 1.56325, H1/L1: -1.94641, variance = 2.71474) |
| Amplitude ratio (L1/H1): | 1.67716 ⋇ 2.74974 (L1/H1: 0.519041 ⋇ 3.49139, H1/L1: 0.142786 ⋇ 5.19474) |
| Amplitude ratio H1|L1 compatibility (probability): | 0.208353 |
| Antenna factor probability: | 1 |
| Number of rejected frequency rows: | Q0: 18 / 18, Q1: 35 / 36, Q2: 69 / 70, Q3: 131 / 134, Q4: 244 / 258 |
| Maximum signal-to-noise ratio: | H1: 5.31491, L1: 4.81459 |
| SNR variance: | H1: 0.512659, L1: 0.528598 |
| Click here for a zoomed plot | Click here for a zoomed plot | Click here for a zoomed plot | Click here for a zoomed plot | Click here for a zoomed plot |
|
|
|
|
|
|
|
|
|
|
|
|
|
|
|
|
|
|
|
|
|
|
|
|
|
 |
 |
 |
 |
 |
 |
 |
 |
 |
| Event time t(H1): | GPS = 1368195803 (Mon May 15 14:23:05 2023 ) → GPS = 1368195813 (Mon May 15 14:23:15 2023 ) |
| Event time t(L1): | GPS = 1368195713 (Mon May 15 14:23:15 2023 ) → GPS = 1368195723 (Mon May 15 14:21:45 2023 ) |
| Omicron analysis time window (H1): | GPS = 1368195800 → GPS = 1368195816 |
| Omicron analysis time window (L1): | GPS = 1368195710 → GPS = 1368195726 |
| Time delay between detectors t(L1) - t(H1): | -94.7864 s (slice index = 212 / 217), δt_gw = -0.00242907 s |
| Time delay uncertainty: | 0.00936438 s |
| [targeted mode] Time delay probability: | 0.952731 (0.0592781 sigmas), δt_target = -0.00187397 s |
| Frequency: | 467.632 Hz |
| Ξ: | 0.00082443 ± 0.0235027 (variance = 0.000552377): Q0: 0, Q1: 0.0221094, Q2: 0.0633092, Q3: 0.0487331, Q4: 0.0555963 |
| Rank: | R_A = 0.13682 |
| Log of amplitude ratio (L1/H1): | 0.69403, variance = 0.489753 (L1/H1: -0.234994, variance = 1.06649, H1/L1: -1.82617, variance = 0.826916) |
| Amplitude ratio (L1/H1): | 2.00177 ⋇ 2.0134 (L1/H1: 0.790575 ⋇ 2.80867, H1/L1: 0.161029 ⋇ 2.48271) |
| Amplitude ratio H1|L1 compatibility (probability): | 0.134153 |
| Antenna factor probability: | 1 |
| Number of rejected frequency rows: | Q0: 18 / 18, Q1: 35 / 36, Q2: 66 / 70, Q3: 129 / 134, Q4: 249 / 258 |
| Maximum signal-to-noise ratio: | H1: 5.31491, L1: 4.81459 |
| SNR variance: | H1: 0.512659, L1: 0.528598 |
| Click here for a zoomed plot | Click here for a zoomed plot | Click here for a zoomed plot | Click here for a zoomed plot | Click here for a zoomed plot |
|
|
|
|
|
|
|
|
|
|
|
|
|
|
|
|
|
|
|
|
|
|
|
|
|
 |
 |
 |
 |
 |
 |
 |
 |
 |
| Event time t(H1): | GPS = 1368195803 (Mon May 15 14:23:05 2023 ) → GPS = 1368195813 (Mon May 15 14:23:15 2023 ) |
| Event time t(L1): | GPS = 1368195713 (Mon May 15 14:23:15 2023 ) → GPS = 1368195723 (Mon May 15 14:21:45 2023 ) |
| Omicron analysis time window (H1): | GPS = 1368195800 → GPS = 1368195816 |
| Omicron analysis time window (L1): | GPS = 1368195710 → GPS = 1368195726 |
| Time delay between detectors t(L1) - t(H1): | -94.7398 s (slice index = 211 / 217), δt_gw = -0.00183844 s |
| Time delay uncertainty: | 0.00658151 s |
| [targeted mode] Time delay probability: | 0.995693 (0.00539849 sigmas), δt_target = -0.00187397 s |
| Frequency: | 402.943 Hz |
| Ξ: | 0.00131784 ± 0.0487641 (variance = 0.00237794): Q0: 0, Q1: 0.024535, Q2: 0.0705127, Q3: 0.141354, Q4: 0.0786631 |
| Rank: | R_A = 0.13682 |
| Log of amplitude ratio (L1/H1): | 0.793561, variance = 0.323422 (L1/H1: 0.559063, variance = 0.629149, H1/L1: -1.07933, variance = 0.657661) |
| Amplitude ratio (L1/H1): | 2.21126 ⋇ 1.76597 (L1/H1: 1.74903 ⋇ 2.21043, H1/L1: 0.339824 ⋇ 2.25007) |
| Amplitude ratio H1|L1 compatibility (probability): | 0.646497 |
| Antenna factor probability: | 1 |
| Number of rejected frequency rows: | Q0: 18 / 18, Q1: 35 / 36, Q2: 67 / 70, Q3: 125 / 134, Q4: 249 / 258 |
| Maximum signal-to-noise ratio: | H1: 5.31491, L1: 4.81459 |
| SNR variance: | H1: 0.512659, L1: 0.528598 |
| Click here for a zoomed plot | Click here for a zoomed plot | Click here for a zoomed plot | Click here for a zoomed plot | Click here for a zoomed plot |
|
|
|
|
|
|
|
|
|
|
|
|
|
|
|
|
|
|
|
|
|
|
|
|
|
 |
 |
 |
 |
 |
 |
 |
 |
 |
| Event time t(H1): | GPS = 1368195803 (Mon May 15 14:23:05 2023 ) → GPS = 1368195813 (Mon May 15 14:23:15 2023 ) |
| Event time t(L1): | GPS = 1368195713 (Mon May 15 14:23:15 2023 ) → GPS = 1368195723 (Mon May 15 14:21:45 2023 ) |
| Omicron analysis time window (H1): | GPS = 1368195800 → GPS = 1368195816 |
| Omicron analysis time window (L1): | GPS = 1368195710 → GPS = 1368195726 |
| Time delay between detectors t(L1) - t(H1): | -94.6954 s (slice index = 210 / 217), δt_gw = -0.003391 s |
| Time delay uncertainty: | 0.00781514 s |
| [targeted mode] Time delay probability: | 0.846086 (0.194115 sigmas), δt_target = -0.00187397 s |
| Frequency: | 395.7 Hz |
| Ξ: | 0.000873848 ± 0.0973557 (variance = 0.00947814): Q0: 0, Q1: 0.0268405, Q2: 0.019444, Q3: 0.0644422, Q4: 0.265391 |
| Rank: | R_A = 0.13682 |
| Log of amplitude ratio (L1/H1): | 0.525065, variance = 0.486642 (L1/H1: 0.182974, variance = 0.752947, H1/L1: -0.941948, variance = 1.27724) |
| Amplitude ratio (L1/H1): | 1.69057 ⋇ 2.00892 (L1/H1: 1.20078 ⋇ 2.38149, H1/L1: 0.389868 ⋇ 3.09612) |
| Amplitude ratio H1|L1 compatibility (probability): | 0.594261 |
| Antenna factor probability: | 1 |
| Number of rejected frequency rows: | Q0: 18 / 18, Q1: 35 / 36, Q2: 67 / 70, Q3: 131 / 134, Q4: 245 / 258 |
| Maximum signal-to-noise ratio: | H1: 5.31491, L1: 4.81459 |
| SNR variance: | H1: 0.512659, L1: 0.528598 |
| Click here for a zoomed plot | Click here for a zoomed plot | Click here for a zoomed plot | Click here for a zoomed plot | Click here for a zoomed plot |
|
|
|
|
|
|
|
|
|
|
|
|
|
|
|
|
|
|
|
|
|
|
|
|
|
 |
 |
 |
 |
 |
 |
 |
 |
 |
| Event time t(H1): | GPS = 1368195803 (Mon May 15 14:23:05 2023 ) → GPS = 1368195813 (Mon May 15 14:23:15 2023 ) |
| Event time t(L1): | GPS = 1368195713 (Mon May 15 14:23:15 2023 ) → GPS = 1368195723 (Mon May 15 14:21:45 2023 ) |
| Omicron analysis time window (H1): | GPS = 1368195800 → GPS = 1368195816 |
| Omicron analysis time window (L1): | GPS = 1368195710 → GPS = 1368195726 |
| Time delay between detectors t(L1) - t(H1): | -94.6465 s (slice index = 209 / 217), δt_gw = -0.000512167 s |
| Time delay uncertainty: | 0.00522035 s |
| [targeted mode] Time delay probability: | 0.794197 (0.260864 sigmas), δt_target = -0.00187397 s |
| Frequency: | 503.763 Hz |
| Ξ: | 0.000873506 ± 0.0533121 (variance = 0.00284218): Q0: 0, Q1: 0.0196503, Q2: 0.064591, Q3: 0.0493335, Q4: 0.154222 |
| Rank: | R_A = 0.13682 |
| Log of amplitude ratio (L1/H1): | 0.7227, variance = 0.509556 (L1/H1: 0.121588, variance = 0.775926, H1/L1: -1.45524, variance = 1.3559) |
| Amplitude ratio (L1/H1): | 2.05999 ⋇ 2.0418 (L1/H1: 1.12929 ⋇ 2.41299, H1/L1: 0.233345 ⋇ 3.20411) |
| Amplitude ratio H1|L1 compatibility (probability): | 0.361028 |
| Antenna factor probability: | 1 |
| Number of rejected frequency rows: | Q0: 18 / 18, Q1: 34 / 36, Q2: 69 / 70, Q3: 127 / 134, Q4: 244 / 258 |
| Maximum signal-to-noise ratio: | H1: 5.31491, L1: 4.81459 |
| SNR variance: | H1: 0.512659, L1: 0.528598 |
| Click here for a zoomed plot | Click here for a zoomed plot | Click here for a zoomed plot | Click here for a zoomed plot | Click here for a zoomed plot |
|
|
|
|
|
|
|
|
|
|
|
|
|
|
|
|
|
|
|
|
|
|
|
|
|
 |
 |
 |
 |
 |
 |
 |
 |
 |
| Event time t(H1): | GPS = 1368195803 (Mon May 15 14:23:05 2023 ) → GPS = 1368195813 (Mon May 15 14:23:15 2023 ) |
| Event time t(L1): | GPS = 1368195713 (Mon May 15 14:23:15 2023 ) → GPS = 1368195723 (Mon May 15 14:21:45 2023 ) |
| Omicron analysis time window (H1): | GPS = 1368195800 → GPS = 1368195816 |
| Omicron analysis time window (L1): | GPS = 1368195710 → GPS = 1368195726 |
| Time delay between detectors t(L1) - t(H1): | -94.6017 s (slice index = 208 / 217), δt_gw = -0.00169611 s |
| Time delay uncertainty: | 0.00794638 s |
| [targeted mode] Time delay probability: | 0.982143 (0.0223823 sigmas), δt_target = -0.00187397 s |
| Frequency: | 577.569 Hz |
| Ξ: | 0.00190991 ± 0.0561499 (variance = 0.00315281): Q0: 0.0249397, Q1: 0.0281441, Q2: 0.0337393, Q3: 0.109909, Q4: 0.165413 |
| Rank: | R_A = 0.13682 |
| Log of amplitude ratio (L1/H1): | 0.714083, variance = 0.415502 (L1/H1: 0.279457, variance = 0.738339, H1/L1: -1.24373, variance = 0.948756) |
| Amplitude ratio (L1/H1): | 2.04231 ⋇ 1.90521 (L1/H1: 1.32241 ⋇ 2.36143, H1/L1: 0.288306 ⋇ 2.64863) |
| Amplitude ratio H1|L1 compatibility (probability): | 0.457851 |
| Antenna factor probability: | 1 |
| Number of rejected frequency rows: | Q0: 17 / 18, Q1: 33 / 36, Q2: 69 / 70, Q3: 128 / 134, Q4: 249 / 258 |
| Maximum signal-to-noise ratio: | H1: 5.31491, L1: 4.81459 |
| SNR variance: | H1: 0.512659, L1: 0.528598 |
| Click here for a zoomed plot | Click here for a zoomed plot | Click here for a zoomed plot | Click here for a zoomed plot | Click here for a zoomed plot |
|
|
|
|
|
|
|
|
|
|
|
|
|
|
|
|
|
|
|
|
|
|
|
|
|
 |
 |
 |
 |
 |
 |
 |
 |
 |
| Event time t(H1): | GPS = 1368195803 (Mon May 15 14:23:05 2023 ) → GPS = 1368195813 (Mon May 15 14:23:15 2023 ) |
| Event time t(L1): | GPS = 1368195713 (Mon May 15 14:23:15 2023 ) → GPS = 1368195723 (Mon May 15 14:21:45 2023 ) |
| Omicron analysis time window (H1): | GPS = 1368195800 → GPS = 1368195816 |
| Omicron analysis time window (L1): | GPS = 1368195710 → GPS = 1368195726 |
| Time delay between detectors t(L1) - t(H1): | -94.5578 s (slice index = 207 / 217), δt_gw = -0.00379087 s |
| Time delay uncertainty: | 0.0083211 s |
| [targeted mode] Time delay probability: | 0.817807 (0.230367 sigmas), δt_target = -0.00187397 s |
| Frequency: | 640.305 Hz |
| Ξ: | 0.00230325 ± 0.0306073 (variance = 0.000936804): Q0: 0.0303562, Q1: 0.0349703, Q2: 0.0373245, Q3: 0.0714326, Q4: 0.11079 |
| Rank: | R_A = 0.13682 |
| Log of amplitude ratio (L1/H1): | 0.759666, variance = 0.530737 (L1/H1: 0.338894, variance = 1.01162, H1/L1: -1.27243, variance = 1.11013) |
| Amplitude ratio (L1/H1): | 2.13756 ⋇ 2.072 (L1/H1: 1.40339 ⋇ 2.73408, H1/L1: 0.280149 ⋇ 2.86804) |
| Amplitude ratio H1|L1 compatibility (probability): | 0.521593 |
| Antenna factor probability: | 1 |
| Number of rejected frequency rows: | Q0: 17 / 18, Q1: 33 / 36, Q2: 67 / 70, Q3: 126 / 134, Q4: 245 / 258 |
| Maximum signal-to-noise ratio: | H1: 5.31491, L1: 4.81459 |
| SNR variance: | H1: 0.512659, L1: 0.528598 |
| Click here for a zoomed plot | Click here for a zoomed plot | Click here for a zoomed plot | Click here for a zoomed plot | Click here for a zoomed plot |
|
|
|
|
|
|
|
|
|
|
|
|
|
|
|
|
|
|
|
|
|
|
|
|
|
 |
 |
 |
 |
 |
 |
 |
 |
 |
| Event time t(H1): | GPS = 1368195803 (Mon May 15 14:23:05 2023 ) → GPS = 1368195813 (Mon May 15 14:23:15 2023 ) |
| Event time t(L1): | GPS = 1368195713 (Mon May 15 14:23:15 2023 ) → GPS = 1368195723 (Mon May 15 14:21:45 2023 ) |
| Omicron analysis time window (H1): | GPS = 1368195800 → GPS = 1368195816 |
| Omicron analysis time window (L1): | GPS = 1368195710 → GPS = 1368195726 |
| Time delay between detectors t(L1) - t(H1): | -94.5059 s (slice index = 206 / 217), δt_gw = 0.00209431 s |
| Time delay uncertainty: | 0.00802167 s |
| [targeted mode] Time delay probability: | 0.620815 (0.494695 sigmas), δt_target = -0.00187397 s |
| Frequency: | 591.889 Hz |
| Ξ: | 0.000313087 ± 0.0286512 (variance = 0.00082089): Q0: 0, Q1: 0, Q2: 0.0269612, Q3: 0.056621, Q4: 0.0698612 |
| Rank: | R_A = 0.13682 |
| Log of amplitude ratio (L1/H1): | 0.6085, variance = 0.355011 (L1/H1: -0.19169, variance = 0.75085, H1/L1: -1.58364, variance = 0.632421) |
| Amplitude ratio (L1/H1): | 1.83767 ⋇ 1.81453 (L1/H1: 0.825563 ⋇ 2.37861, H1/L1: 0.205227 ⋇ 2.21499) |
| Amplitude ratio H1|L1 compatibility (probability): | 0.131178 |
| Antenna factor probability: | 1 |
| Number of rejected frequency rows: | Q0: 18 / 18, Q1: 36 / 36, Q2: 68 / 70, Q3: 130 / 134, Q4: 248 / 258 |
| Maximum signal-to-noise ratio: | H1: 5.31491, L1: 4.81459 |
| SNR variance: | H1: 0.512659, L1: 0.528598 |
| Click here for a zoomed plot | Click here for a zoomed plot | Click here for a zoomed plot | Click here for a zoomed plot | Click here for a zoomed plot |
|
|
|
|
|
|
|
|
|
|
|
|
|
|
|
|
|
|
|
|
|
|
|
|
|
 |
 |
 |
 |
 |
 |
 |
 |
 |
| Event time t(H1): | GPS = 1368195803 (Mon May 15 14:23:05 2023 ) → GPS = 1368195813 (Mon May 15 14:23:15 2023 ) |
| Event time t(L1): | GPS = 1368195713 (Mon May 15 14:23:15 2023 ) → GPS = 1368195723 (Mon May 15 14:21:45 2023 ) |
| Omicron analysis time window (H1): | GPS = 1368195800 → GPS = 1368195816 |
| Omicron analysis time window (L1): | GPS = 1368195710 → GPS = 1368195726 |
| Time delay between detectors t(L1) - t(H1): | -94.4645 s (slice index = 205 / 217), δt_gw = -0.00245073 s |
| Time delay uncertainty: | 0.00642644 s |
| [targeted mode] Time delay probability: | 0.928488 (0.0897476 sigmas), δt_target = -0.00187397 s |
| Frequency: | 383.587 Hz |
| Ξ: | 0.00133392 ± 0.0293896 (variance = 0.000863751): Q0: 0.021534, Q1: 0.0091153, Q2: 0.0652737, Q3: 0.0895545, Q4: 0.0570794 |
| Rank: | R_A = 0.13682 |
| Log of amplitude ratio (L1/H1): | 0.84094, variance = 0.420441 (L1/H1: 0.0985032, variance = 0.780728, H1/L1: -1.7457, variance = 0.910116) |
| Amplitude ratio (L1/H1): | 2.31854 ⋇ 1.91251 (L1/H1: 1.10352 ⋇ 2.41957, H1/L1: 0.174523 ⋇ 2.59607) |
| Amplitude ratio H1|L1 compatibility (probability): | 0.205242 |
| Antenna factor probability: | 1 |
| Number of rejected frequency rows: | Q0: 17 / 18, Q1: 35 / 36, Q2: 68 / 70, Q3: 127 / 134, Q4: 246 / 258 |
| Maximum signal-to-noise ratio: | H1: 5.31491, L1: 4.81459 |
| SNR variance: | H1: 0.512659, L1: 0.528598 |
| Click here for a zoomed plot | Click here for a zoomed plot | Click here for a zoomed plot | Click here for a zoomed plot | Click here for a zoomed plot |
|
|
|
|
|
|
|
|
|
|
|
|
|
|
|
|
|
|
|
|
|
|
|
|
|
 |
 |
 |
 |
 |
 |
 |
 |
 |
| Event time t(H1): | GPS = 1368195803 (Mon May 15 14:23:05 2023 ) → GPS = 1368195813 (Mon May 15 14:23:15 2023 ) |
| Event time t(L1): | GPS = 1368195713 (Mon May 15 14:23:15 2023 ) → GPS = 1368195723 (Mon May 15 14:21:45 2023 ) |
| Omicron analysis time window (H1): | GPS = 1368195800 → GPS = 1368195816 |
| Omicron analysis time window (L1): | GPS = 1368195710 → GPS = 1368195726 |
| Time delay between detectors t(L1) - t(H1): | -94.4141 s (slice index = 204 / 217), δt_gw = 0.0019277 s |
| Time delay uncertainty: | 0.00651541 s |
| [targeted mode] Time delay probability: | 0.559563 (0.58349 sigmas), δt_target = -0.00187397 s |
| Frequency: | 870.479 Hz |
| Ξ: | 0.000612527 ± 0.027779 (variance = 0.000771675): Q0: 0, Q1: 0.0424205, Q2: 0.0575632, Q3: 0.0684336, Q4: 0.0800729 |
| Rank: | R_A = 0.13682 |
| Log of amplitude ratio (L1/H1): | 0.58947, variance = 0.54407 (L1/H1: 0.246898, variance = 0.929277, H1/L1: -1.00694, variance = 1.29805) |
| Amplitude ratio (L1/H1): | 1.80303 ⋇ 2.09093 (L1/H1: 1.28005 ⋇ 2.62214, H1/L1: 0.365335 ⋇ 3.12465) |
| Amplitude ratio H1|L1 compatibility (probability): | 0.610565 |
| Antenna factor probability: | 1 |
| Number of rejected frequency rows: | Q0: 18 / 18, Q1: 35 / 36, Q2: 69 / 70, Q3: 131 / 134, Q4: 249 / 258 |
| Maximum signal-to-noise ratio: | H1: 5.31491, L1: 4.81459 |
| SNR variance: | H1: 0.512659, L1: 0.528598 |
| Click here for a zoomed plot | Click here for a zoomed plot | Click here for a zoomed plot | Click here for a zoomed plot | Click here for a zoomed plot |
|
|
|
|
|
|
|
|
|
|
|
|
|
|
|
|
|
|
|
|
|
|
|
|
|
 |
 |
 |
 |
 |
 |
 |
 |
 |
| Event time t(H1): | GPS = 1368195803 (Mon May 15 14:23:05 2023 ) → GPS = 1368195813 (Mon May 15 14:23:15 2023 ) |
| Event time t(L1): | GPS = 1368195713 (Mon May 15 14:23:15 2023 ) → GPS = 1368195723 (Mon May 15 14:21:45 2023 ) |
| Omicron analysis time window (H1): | GPS = 1368195800 → GPS = 1368195816 |
| Omicron analysis time window (L1): | GPS = 1368195710 → GPS = 1368195726 |
| Time delay between detectors t(L1) - t(H1): | -94.3714 s (slice index = 203 / 217), δt_gw = -0.00138388 s |
| Time delay uncertainty: | 0.00709124 s |
| [targeted mode] Time delay probability: | 0.9449 (0.0691126 sigmas), δt_target = -0.00187397 s |
| Frequency: | 495.602 Hz |
| Ξ: | 0.00208713 ± 0.0275692 (variance = 0.000760059): Q0: 0.0230818, Q1: 0.0332665, Q2: 0.100157, Q3: 0.0718944, Q4: 0.0587784 |
| Rank: | R_A = 0.13682 |
| Log of amplitude ratio (L1/H1): | 0.841189, variance = 0.83785 (L1/H1: 0.22531, variance = 1.20466, H1/L1: -1.59172, variance = 2.33517) |
| Amplitude ratio (L1/H1): | 2.31912 ⋇ 2.49763 (L1/H1: 1.25271 ⋇ 2.99688, H1/L1: 0.203575 ⋇ 4.60953) |
| Amplitude ratio H1|L1 compatibility (probability): | 0.467682 |
| Antenna factor probability: | 1 |
| Number of rejected frequency rows: | Q0: 17 / 18, Q1: 34 / 36, Q2: 67 / 70, Q3: 126 / 134, Q4: 245 / 258 |
| Maximum signal-to-noise ratio: | H1: 5.31491, L1: 4.81459 |
| SNR variance: | H1: 0.512659, L1: 0.528598 |
| Click here for a zoomed plot | Click here for a zoomed plot | Click here for a zoomed plot | Click here for a zoomed plot | Click here for a zoomed plot |
|
|
|
|
|
|
|
|
|
|
|
|
|
|
|
|
|
|
|
|
|
|
|
|
|
 |
 |
 |
 |
 |
 |
 |
 |
 |
| Event time t(H1): | GPS = 1368195803 (Mon May 15 14:23:05 2023 ) → GPS = 1368195813 (Mon May 15 14:23:15 2023 ) |
| Event time t(L1): | GPS = 1368195713 (Mon May 15 14:23:15 2023 ) → GPS = 1368195723 (Mon May 15 14:21:45 2023 ) |
| Omicron analysis time window (H1): | GPS = 1368195800 → GPS = 1368195816 |
| Omicron analysis time window (L1): | GPS = 1368195710 → GPS = 1368195726 |
| Time delay between detectors t(L1) - t(H1): | -94.3326 s (slice index = 202 / 217), δt_gw = -0.00855182 s |
| Time delay uncertainty: | 0.00584447 s |
| [targeted mode] Time delay probability: | 0.253207 (1.14259 sigmas), δt_target = -0.00187397 s |
| Frequency: | 689.931 Hz |
| Ξ: | 0.00140011 ± 0.0187693 (variance = 0.000352285): Q0: 0.0275039, Q1: 0.0248027, Q2: 0.0180816, Q3: 0.0388056, Q4: 0.0711418 |
| Rank: | R_A = 0.13682 |
| Log of amplitude ratio (L1/H1): | 0.482428, variance = 0.531753 (L1/H1: -0.137912, variance = 1.18496, H1/L1: -1.2384, variance = 0.85772) |
| Amplitude ratio (L1/H1): | 1.62 ⋇ 2.07345 (L1/H1: 0.871176 ⋇ 2.96999, H1/L1: 0.289849 ⋇ 2.52472) |
| Amplitude ratio H1|L1 compatibility (probability): | 0.33556 |
| Antenna factor probability: | 1 |
| Number of rejected frequency rows: | Q0: 17 / 18, Q1: 34 / 36, Q2: 69 / 70, Q3: 132 / 134, Q4: 238 / 258 |
| Maximum signal-to-noise ratio: | H1: 5.31491, L1: 4.81459 |
| SNR variance: | H1: 0.512659, L1: 0.528598 |
| Click here for a zoomed plot | Click here for a zoomed plot | Click here for a zoomed plot | Click here for a zoomed plot | Click here for a zoomed plot |
|
|
|
|
|
|
|
|
|
|
|
|
|
|
|
|
|
|
|
|
|
|
|
|
|
 |
 |
 |
 |
 |
 |
 |
 |
 |
| Event time t(H1): | GPS = 1368195803 (Mon May 15 14:23:05 2023 ) → GPS = 1368195813 (Mon May 15 14:23:15 2023 ) |
| Event time t(L1): | GPS = 1368195713 (Mon May 15 14:23:15 2023 ) → GPS = 1368195723 (Mon May 15 14:21:45 2023 ) |
| Omicron analysis time window (H1): | GPS = 1368195800 → GPS = 1368195816 |
| Omicron analysis time window (L1): | GPS = 1368195710 → GPS = 1368195726 |
| Time delay between detectors t(L1) - t(H1): | -94.279 s (slice index = 201 / 217), δt_gw = -0.000971089 s |
| Time delay uncertainty: | 0.00766722 s |
| [targeted mode] Time delay probability: | 0.906259 (0.117759 sigmas), δt_target = -0.00187397 s |
| Frequency: | 856.41 Hz |
| Ξ: | 0.000353201 ± 0.0181414 (variance = 0.00032911): Q0: 0, Q1: 0, Q2: 0.0360234, Q3: 0.0321813, Q4: 0.0414233 |
| Rank: | R_A = 0.13682 |
| Log of amplitude ratio (L1/H1): | 0.700141, variance = 0.35194 (L1/H1: 0.117936, variance = 0.709587, H1/L1: -1.40963, variance = 0.678579) |
| Amplitude ratio (L1/H1): | 2.01404 ⋇ 1.80985 (L1/H1: 1.12517 ⋇ 2.32186, H1/L1: 0.244233 ⋇ 2.27905) |
| Amplitude ratio H1|L1 compatibility (probability): | 0.272935 |
| Antenna factor probability: | 1 |
| Number of rejected frequency rows: | Q0: 18 / 18, Q1: 36 / 36, Q2: 67 / 70, Q3: 129 / 134, Q4: 246 / 258 |
| Maximum signal-to-noise ratio: | H1: 5.31491, L1: 4.81459 |
| SNR variance: | H1: 0.512659, L1: 0.528598 |
| Click here for a zoomed plot | Click here for a zoomed plot | Click here for a zoomed plot | Click here for a zoomed plot | Click here for a zoomed plot |
|
|
|
|
|
|
|
|
|
|
|
|
|
|
|
|
|
|
|
|
|
|
|
|
|
 |
 |
 |
 |
 |
 |
 |
 |
 |
| Event time t(H1): | GPS = 1368195803 (Mon May 15 14:23:05 2023 ) → GPS = 1368195813 (Mon May 15 14:23:15 2023 ) |
| Event time t(L1): | GPS = 1368195713 (Mon May 15 14:23:15 2023 ) → GPS = 1368195723 (Mon May 15 14:21:45 2023 ) |
| Omicron analysis time window (H1): | GPS = 1368195800 → GPS = 1368195816 |
| Omicron analysis time window (L1): | GPS = 1368195710 → GPS = 1368195726 |
| Time delay between detectors t(L1) - t(H1): | -94.2365 s (slice index = 200 / 217), δt_gw = -0.0044691 s |
| Time delay uncertainty: | 0.00773077 s |
| [targeted mode] Time delay probability: | 0.737105 (0.335689 sigmas), δt_target = -0.00187397 s |
| Frequency: | 369.649 Hz |
| Ξ: | 0.000464992 ± 0.0559139 (variance = 0.00312636): Q0: 0, Q1: 0, Q2: 0.148339, Q3: 0.0470201, Q4: 0.08344 |
| Rank: | R_A = 0.13682 |
| Log of amplitude ratio (L1/H1): | 0.538202, variance = 0.484183 (L1/H1: -0.364999, variance = 0.90787, H1/L1: -1.63887, variance = 1.03506) |
| Amplitude ratio (L1/H1): | 1.71292 ⋇ 2.00538 (L1/H1: 0.694198 ⋇ 2.59302, H1/L1: 0.194199 ⋇ 2.76594) |
| Amplitude ratio H1|L1 compatibility (probability): | 0.150545 |
| Antenna factor probability: | 1 |
| Number of rejected frequency rows: | Q0: 18 / 18, Q1: 36 / 36, Q2: 69 / 70, Q3: 131 / 134, Q4: 248 / 258 |
| Maximum signal-to-noise ratio: | H1: 5.31491, L1: 4.81459 |
| SNR variance: | H1: 0.512659, L1: 0.528598 |
| Click here for a zoomed plot | Click here for a zoomed plot | Click here for a zoomed plot | Click here for a zoomed plot | Click here for a zoomed plot |
|
|
|
|
|
|
|
|
|
|
|
|
|
|
|
|
|
|
|
|
|
|
|
|
|
 |
 |
 |
 |
 |
 |
 |
 |
 |
| Event time t(H1): | GPS = 1368195803 (Mon May 15 14:23:05 2023 ) → GPS = 1368195813 (Mon May 15 14:23:15 2023 ) |
| Event time t(L1): | GPS = 1368195713 (Mon May 15 14:23:15 2023 ) → GPS = 1368195723 (Mon May 15 14:21:45 2023 ) |
| Omicron analysis time window (H1): | GPS = 1368195800 → GPS = 1368195816 |
| Omicron analysis time window (L1): | GPS = 1368195710 → GPS = 1368195726 |
| Time delay between detectors t(L1) - t(H1): | -94.1929 s (slice index = 199 / 217), δt_gw = -0.00689768 s |
| Time delay uncertainty: | 0.0029599 s |
| [targeted mode] Time delay probability: | 0.0896484 (1.69726 sigmas), δt_target = -0.00187397 s |
| Frequency: | 580.622 Hz |
| Ξ: | 0.00150981 ± 0.0236008 (variance = 0.000557): Q0: 0.0194996, Q1: 0.0380648, Q2: 0.0512147, Q3: 0.0433085, Q4: 0.090936 |
| Rank: | R_A = 0.13682 |
| Log of amplitude ratio (L1/H1): | 0.412456, variance = 0.773537 (L1/H1: -0.023249, variance = 1.8907, H1/L1: -0.943422, variance = 0.999796) |
| Amplitude ratio (L1/H1): | 1.51052 ⋇ 2.40972 (L1/H1: 0.977019 ⋇ 3.95518, H1/L1: 0.389294 ⋇ 2.718) |
| Amplitude ratio H1|L1 compatibility (probability): | 0.56964 |
| Antenna factor probability: | 1 |
| Number of rejected frequency rows: | Q0: 17 / 18, Q1: 34 / 36, Q2: 68 / 70, Q3: 130 / 134, Q4: 247 / 258 |
| Maximum signal-to-noise ratio: | H1: 5.31491, L1: 4.81459 |
| SNR variance: | H1: 0.512659, L1: 0.528598 |
| Click here for a zoomed plot | Click here for a zoomed plot | Click here for a zoomed plot | Click here for a zoomed plot | Click here for a zoomed plot |
|
|
|
|
|
|
|
|
|
|
|
|
|
|
|
|
|
|
|
|
|
|
|
|
|
 |
 |
 |
 |
 |
 |
 |
 |
 |
| Event time t(H1): | GPS = 1368195803 (Mon May 15 14:23:05 2023 ) → GPS = 1368195813 (Mon May 15 14:23:15 2023 ) |
| Event time t(L1): | GPS = 1368195713 (Mon May 15 14:23:15 2023 ) → GPS = 1368195723 (Mon May 15 14:21:45 2023 ) |
| Omicron analysis time window (H1): | GPS = 1368195800 → GPS = 1368195816 |
| Omicron analysis time window (L1): | GPS = 1368195710 → GPS = 1368195726 |
| Time delay between detectors t(L1) - t(H1): | -94.1369 s (slice index = 198 / 217), δt_gw = 0.00306601 s |
| Time delay uncertainty: | 0.00448415 s |
| [targeted mode] Time delay probability: | 0.270612 (1.10165 sigmas), δt_target = -0.00187397 s |
| Frequency: | 732.949 Hz |
| Ξ: | 0.000388872 ± 0.0273131 (variance = 0.000746008): Q0: 0, Q1: 0, Q2: 0.0209328, Q3: 0.061608, Q4: 0.0593579 |
| Rank: | R_A = 0.13682 |
| Log of amplitude ratio (L1/H1): | 0.62986, variance = 0.574629 (L1/H1: -0.00173917, variance = 0.846482, H1/L1: -1.39955, variance = 1.57144) |
| Amplitude ratio (L1/H1): | 1.87735 ⋇ 2.1341 (L1/H1: 0.998262 ⋇ 2.5094, H1/L1: 0.246708 ⋇ 3.50282) |
| Amplitude ratio H1|L1 compatibility (probability): | 0.367498 |
| Antenna factor probability: | 1 |
| Number of rejected frequency rows: | Q0: 18 / 18, Q1: 36 / 36, Q2: 68 / 70, Q3: 127 / 134, Q4: 247 / 258 |
| Maximum signal-to-noise ratio: | H1: 5.31491, L1: 4.81459 |
| SNR variance: | H1: 0.512659, L1: 0.528598 |
| Click here for a zoomed plot | Click here for a zoomed plot | Click here for a zoomed plot | Click here for a zoomed plot | Click here for a zoomed plot |
|
|
|
|
|
|
|
|
|
|
|
|
|
|
|
|
|
|
|
|
|
|
|
|
|
 |
 |
 |
 |
 |
 |
 |
 |
 |
| Event time t(H1): | GPS = 1368195803 (Mon May 15 14:23:05 2023 ) → GPS = 1368195813 (Mon May 15 14:23:15 2023 ) |
| Event time t(L1): | GPS = 1368195713 (Mon May 15 14:23:15 2023 ) → GPS = 1368195723 (Mon May 15 14:21:45 2023 ) |
| Omicron analysis time window (H1): | GPS = 1368195800 → GPS = 1368195816 |
| Omicron analysis time window (L1): | GPS = 1368195710 → GPS = 1368195726 |
| Time delay between detectors t(L1) - t(H1): | -94.0844 s (slice index = 197 / 217), δt_gw = 0.00963633 s |
| Time delay uncertainty: | 0.00676173 s |
| [targeted mode] Time delay probability: | 0.0887047 (1.70227 sigmas), δt_target = -0.00187397 s |
| Frequency: | 748.193 Hz |
| Ξ: | 0.00163172 ± 0.00492952 (variance = 2.43001e-05): Q0: 0.0422405, Q1: 0.0370366, Q2: 0.04276, Q3: 0.034341, Q4: 0.0485376 |
| Rank: | R_A = 0.13682 |
| Log of amplitude ratio (L1/H1): | 0.438829, variance = 1.1506 (L1/H1: -0.228461, variance = 2.40097, H1/L1: -1.25201, variance = 2.09806) |
| Amplitude ratio (L1/H1): | 1.55089 ⋇ 2.92315 (L1/H1: 0.795757 ⋇ 4.70914, H1/L1: 0.285929 ⋇ 4.25659) |
| Amplitude ratio H1|L1 compatibility (probability): | 0.485191 |
| Antenna factor probability: | 1 |
| Number of rejected frequency rows: | Q0: 17 / 18, Q1: 35 / 36, Q2: 69 / 70, Q3: 131 / 134, Q4: 252 / 258 |
| Maximum signal-to-noise ratio: | H1: 5.31491, L1: 4.81459 |
| SNR variance: | H1: 0.512659, L1: 0.528598 |
| Click here for a zoomed plot | Click here for a zoomed plot | Click here for a zoomed plot | Click here for a zoomed plot | Click here for a zoomed plot |
|
|
|
|
|
|
|
|
|
|
|
|
|
|
|
|
|
|
|
|
|
|
|
|
|
 |
 |
 |
 |
 |
 |
 |
 |
 |
| florent.robinet@ijclab.in2p3.fr |