| Omicron version: | 4.2.0: documentation gitlab repository |
| Omicron run by: | unknown |
| Report produced on: | Sat Nov 1 18:50:14 2025 UTC |
| Ox option file: | Targ_FirstTest_O4bw_14days_options.txt |
| Omicron option files: | detector 0, detector 1 |
| Detector channel names: | H1:GDS-CALIB_STRAIN_CLEAN_AR_4096Hz, L1:GDS-CALIB_STRAIN_CLEAN_AR_4096Hz |
| Omicron analysis time window and overlap: | 16 s, 6 s |
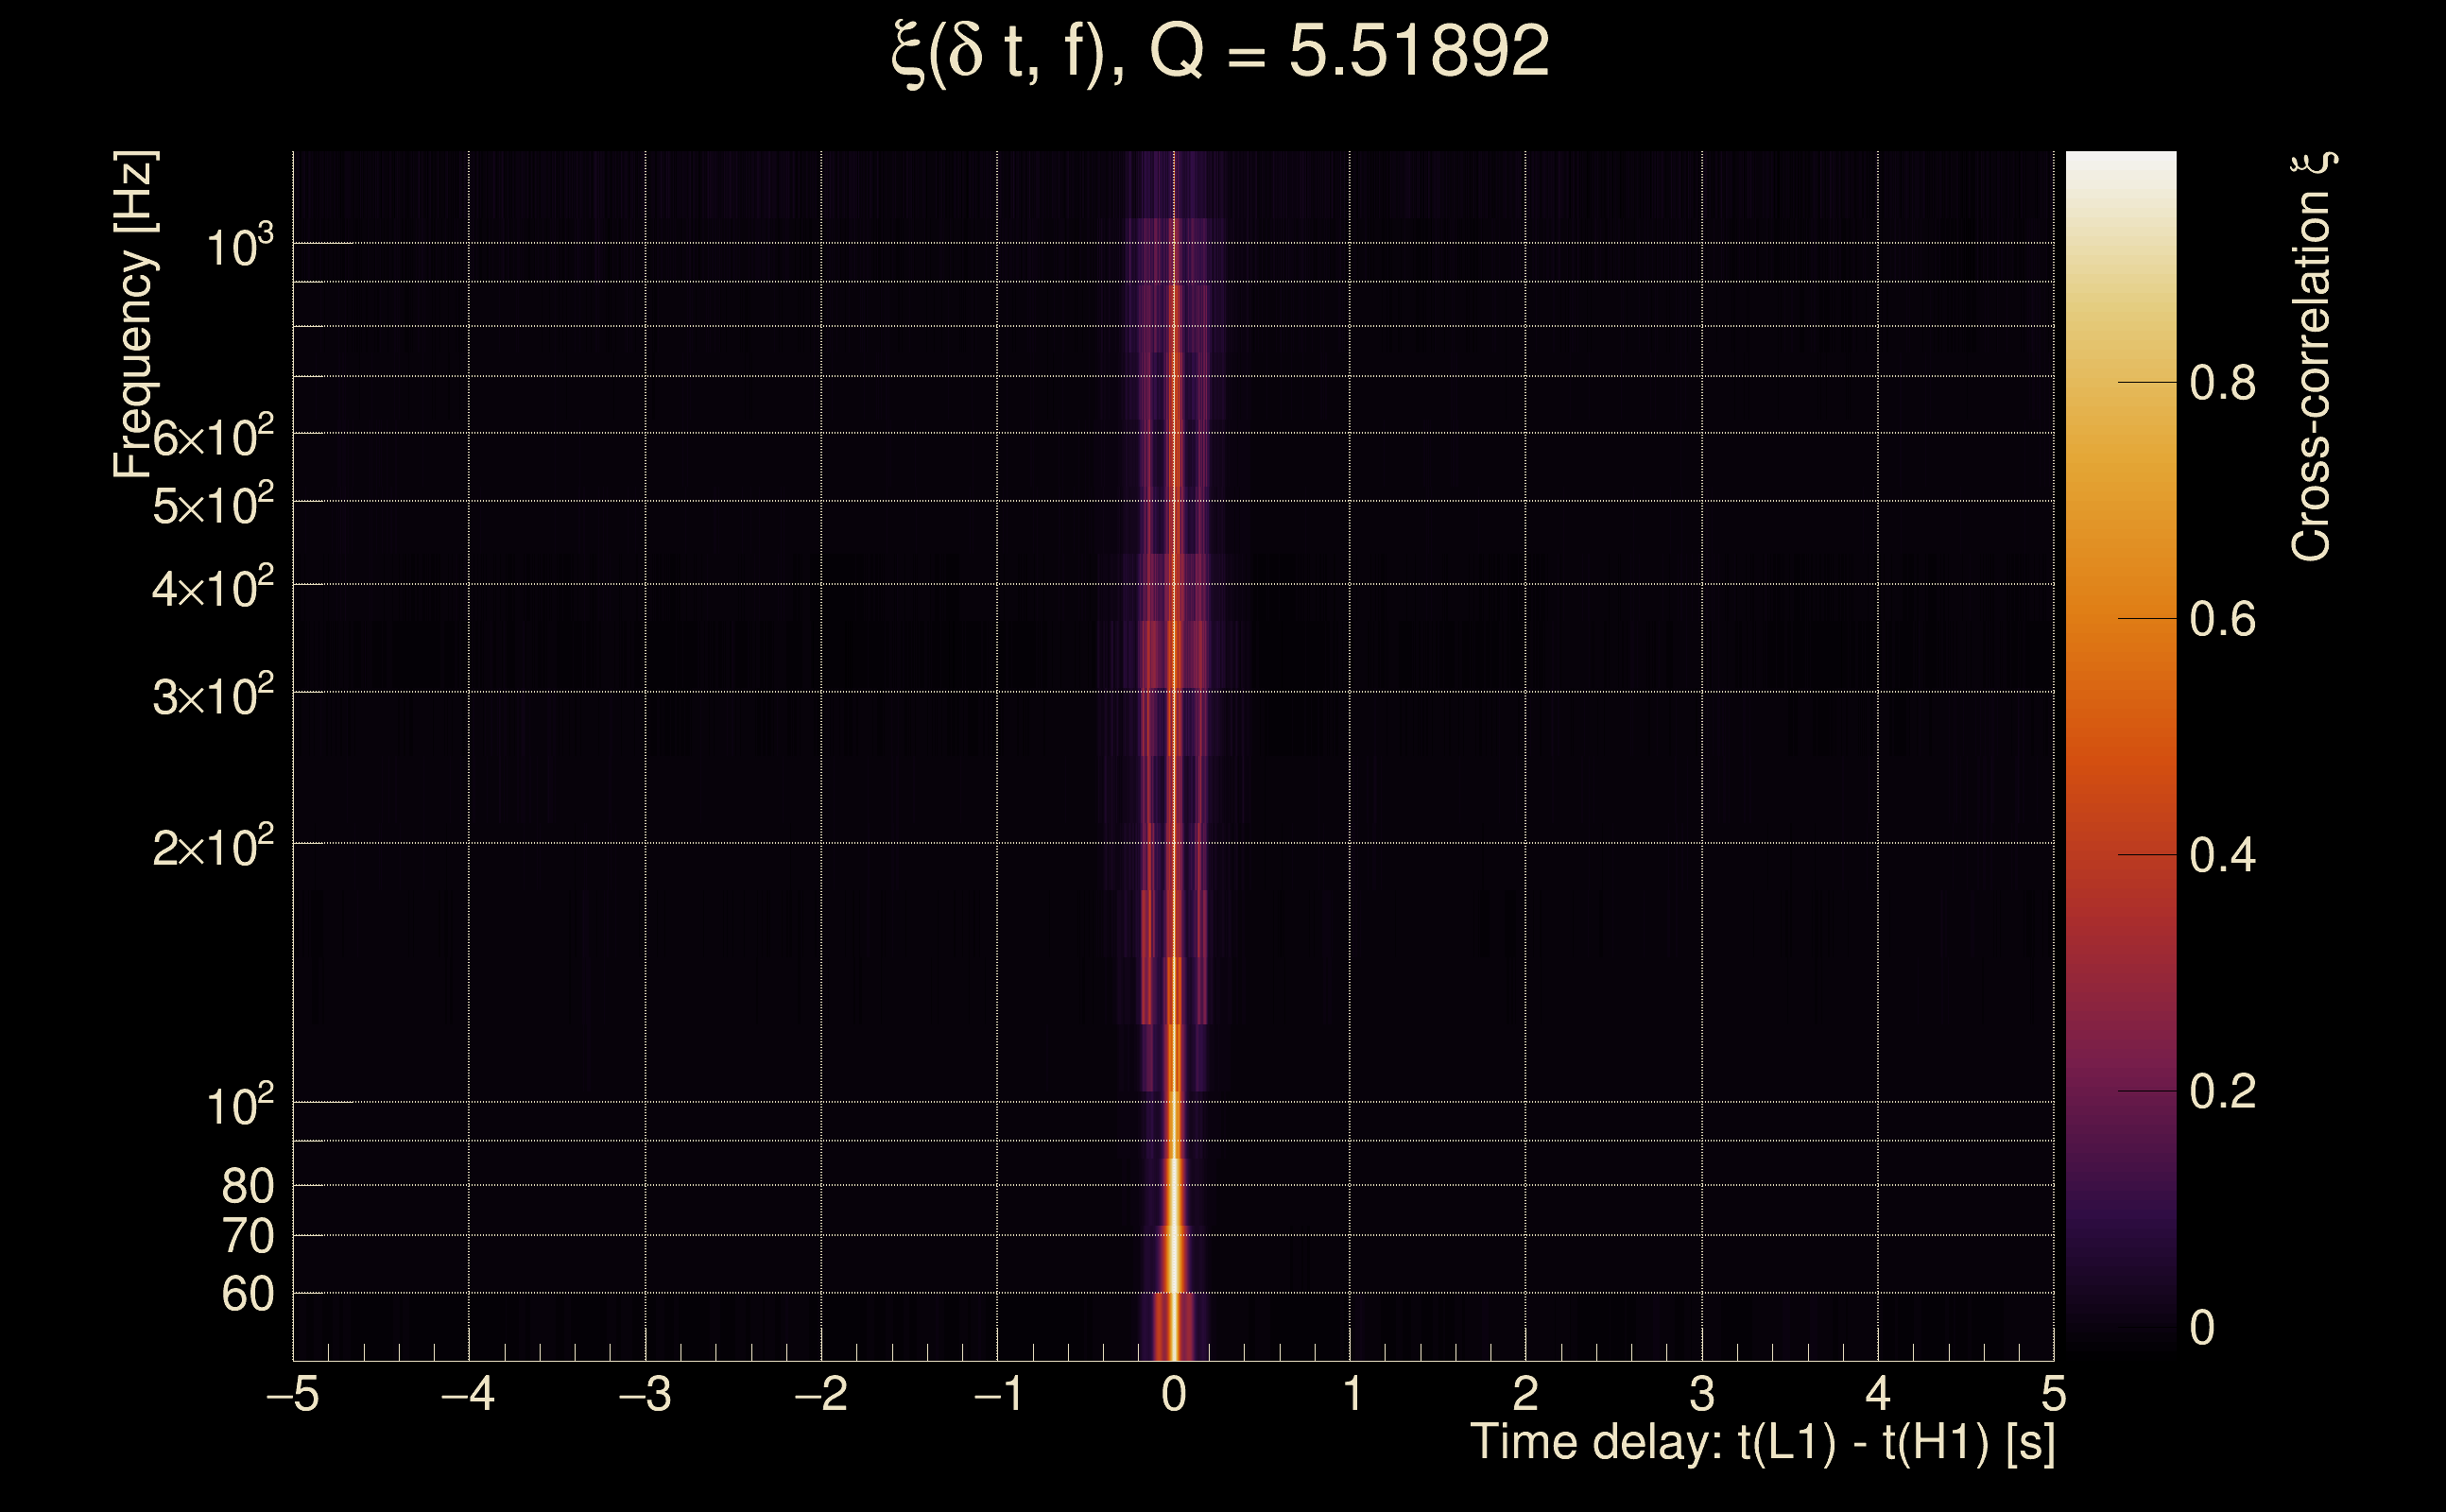
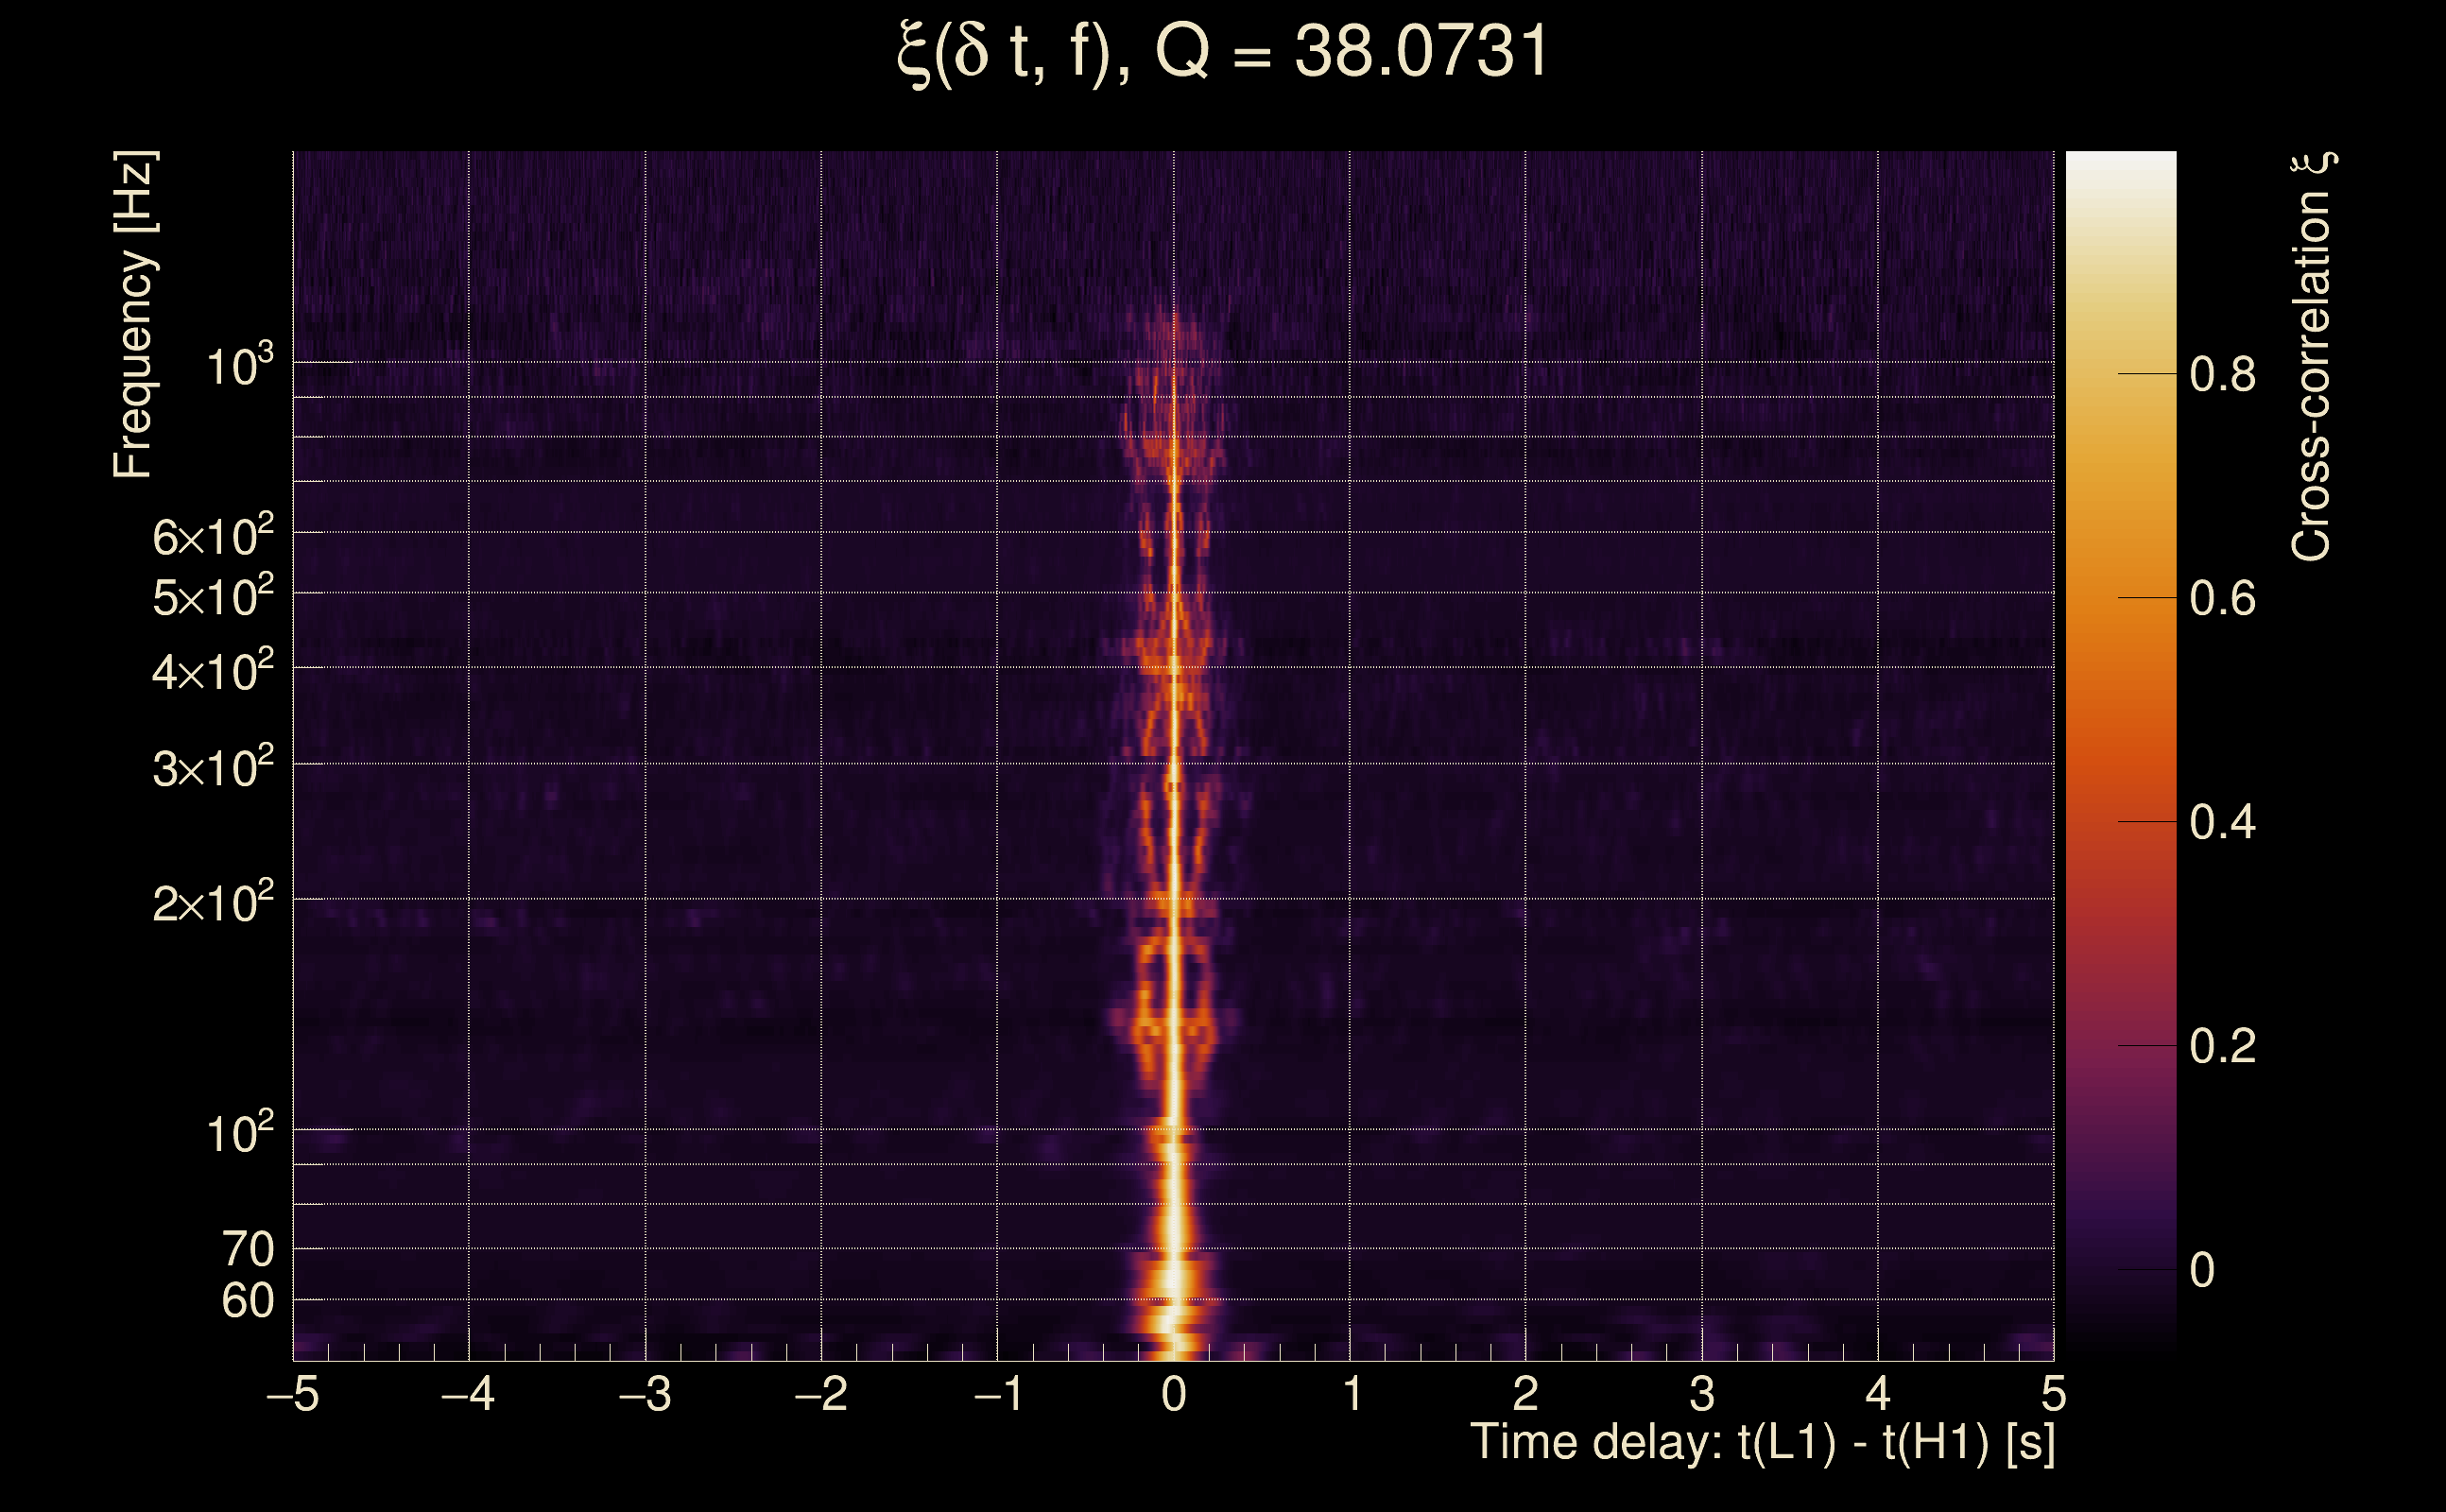
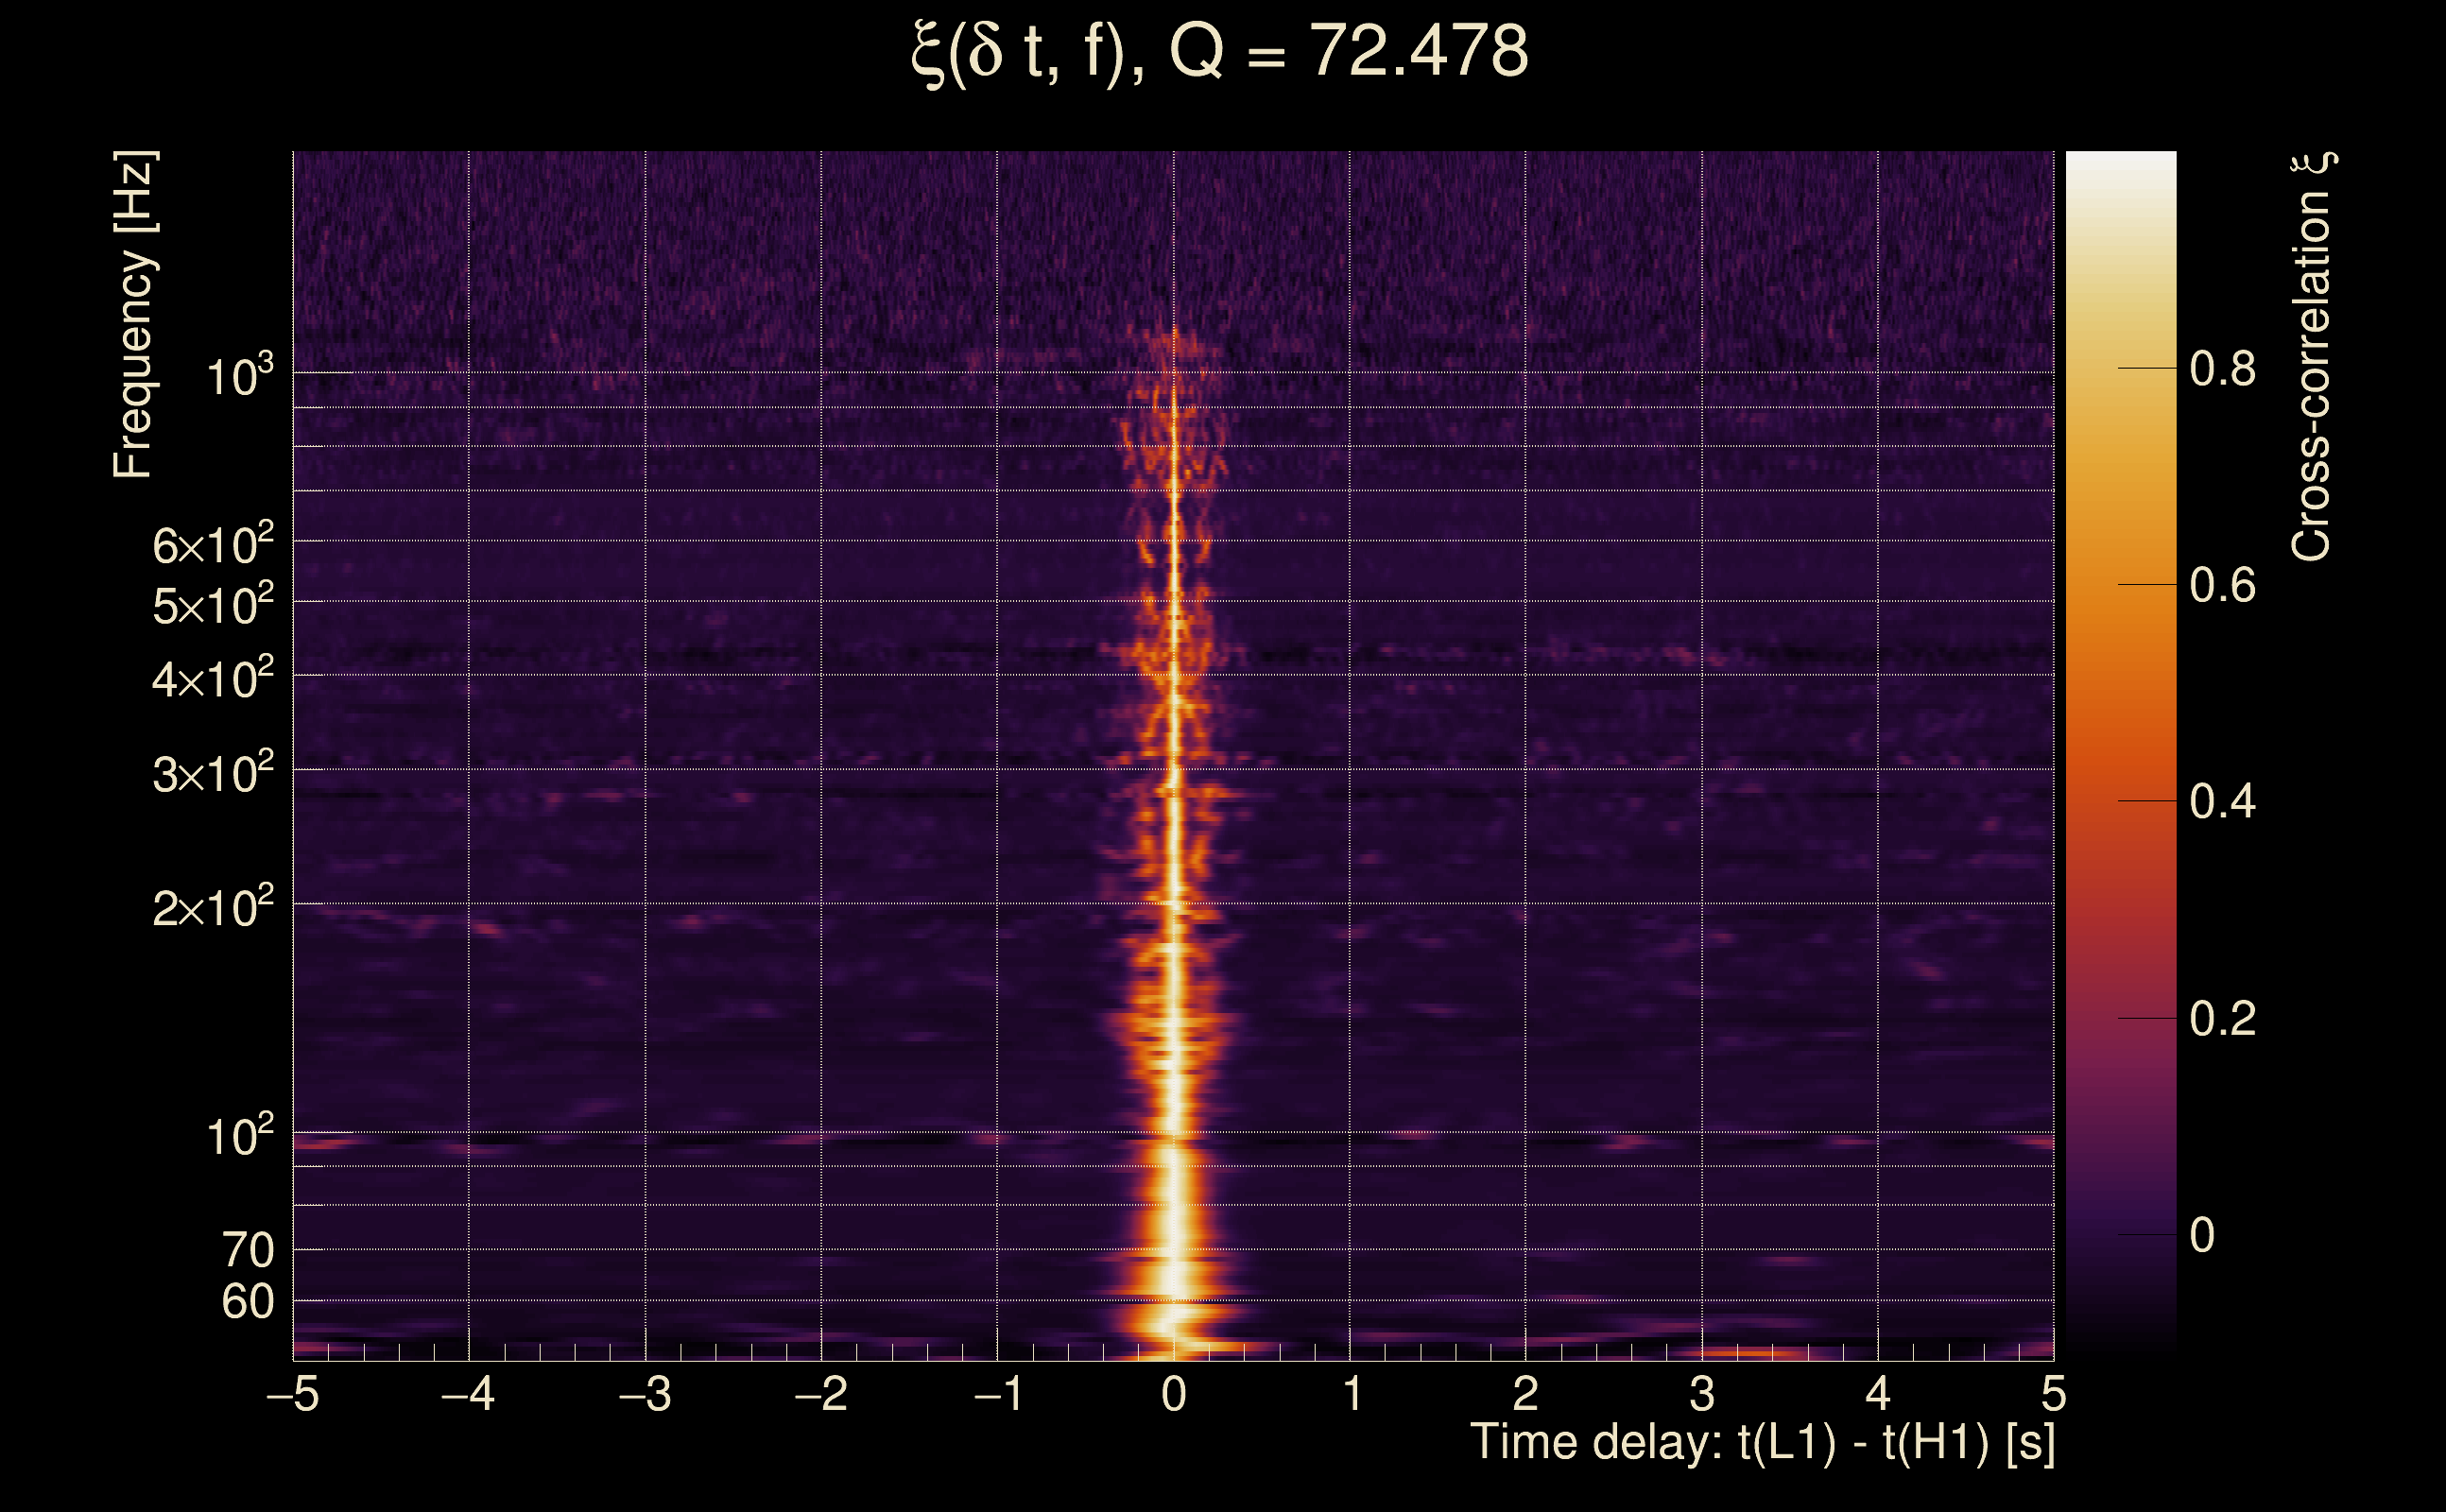
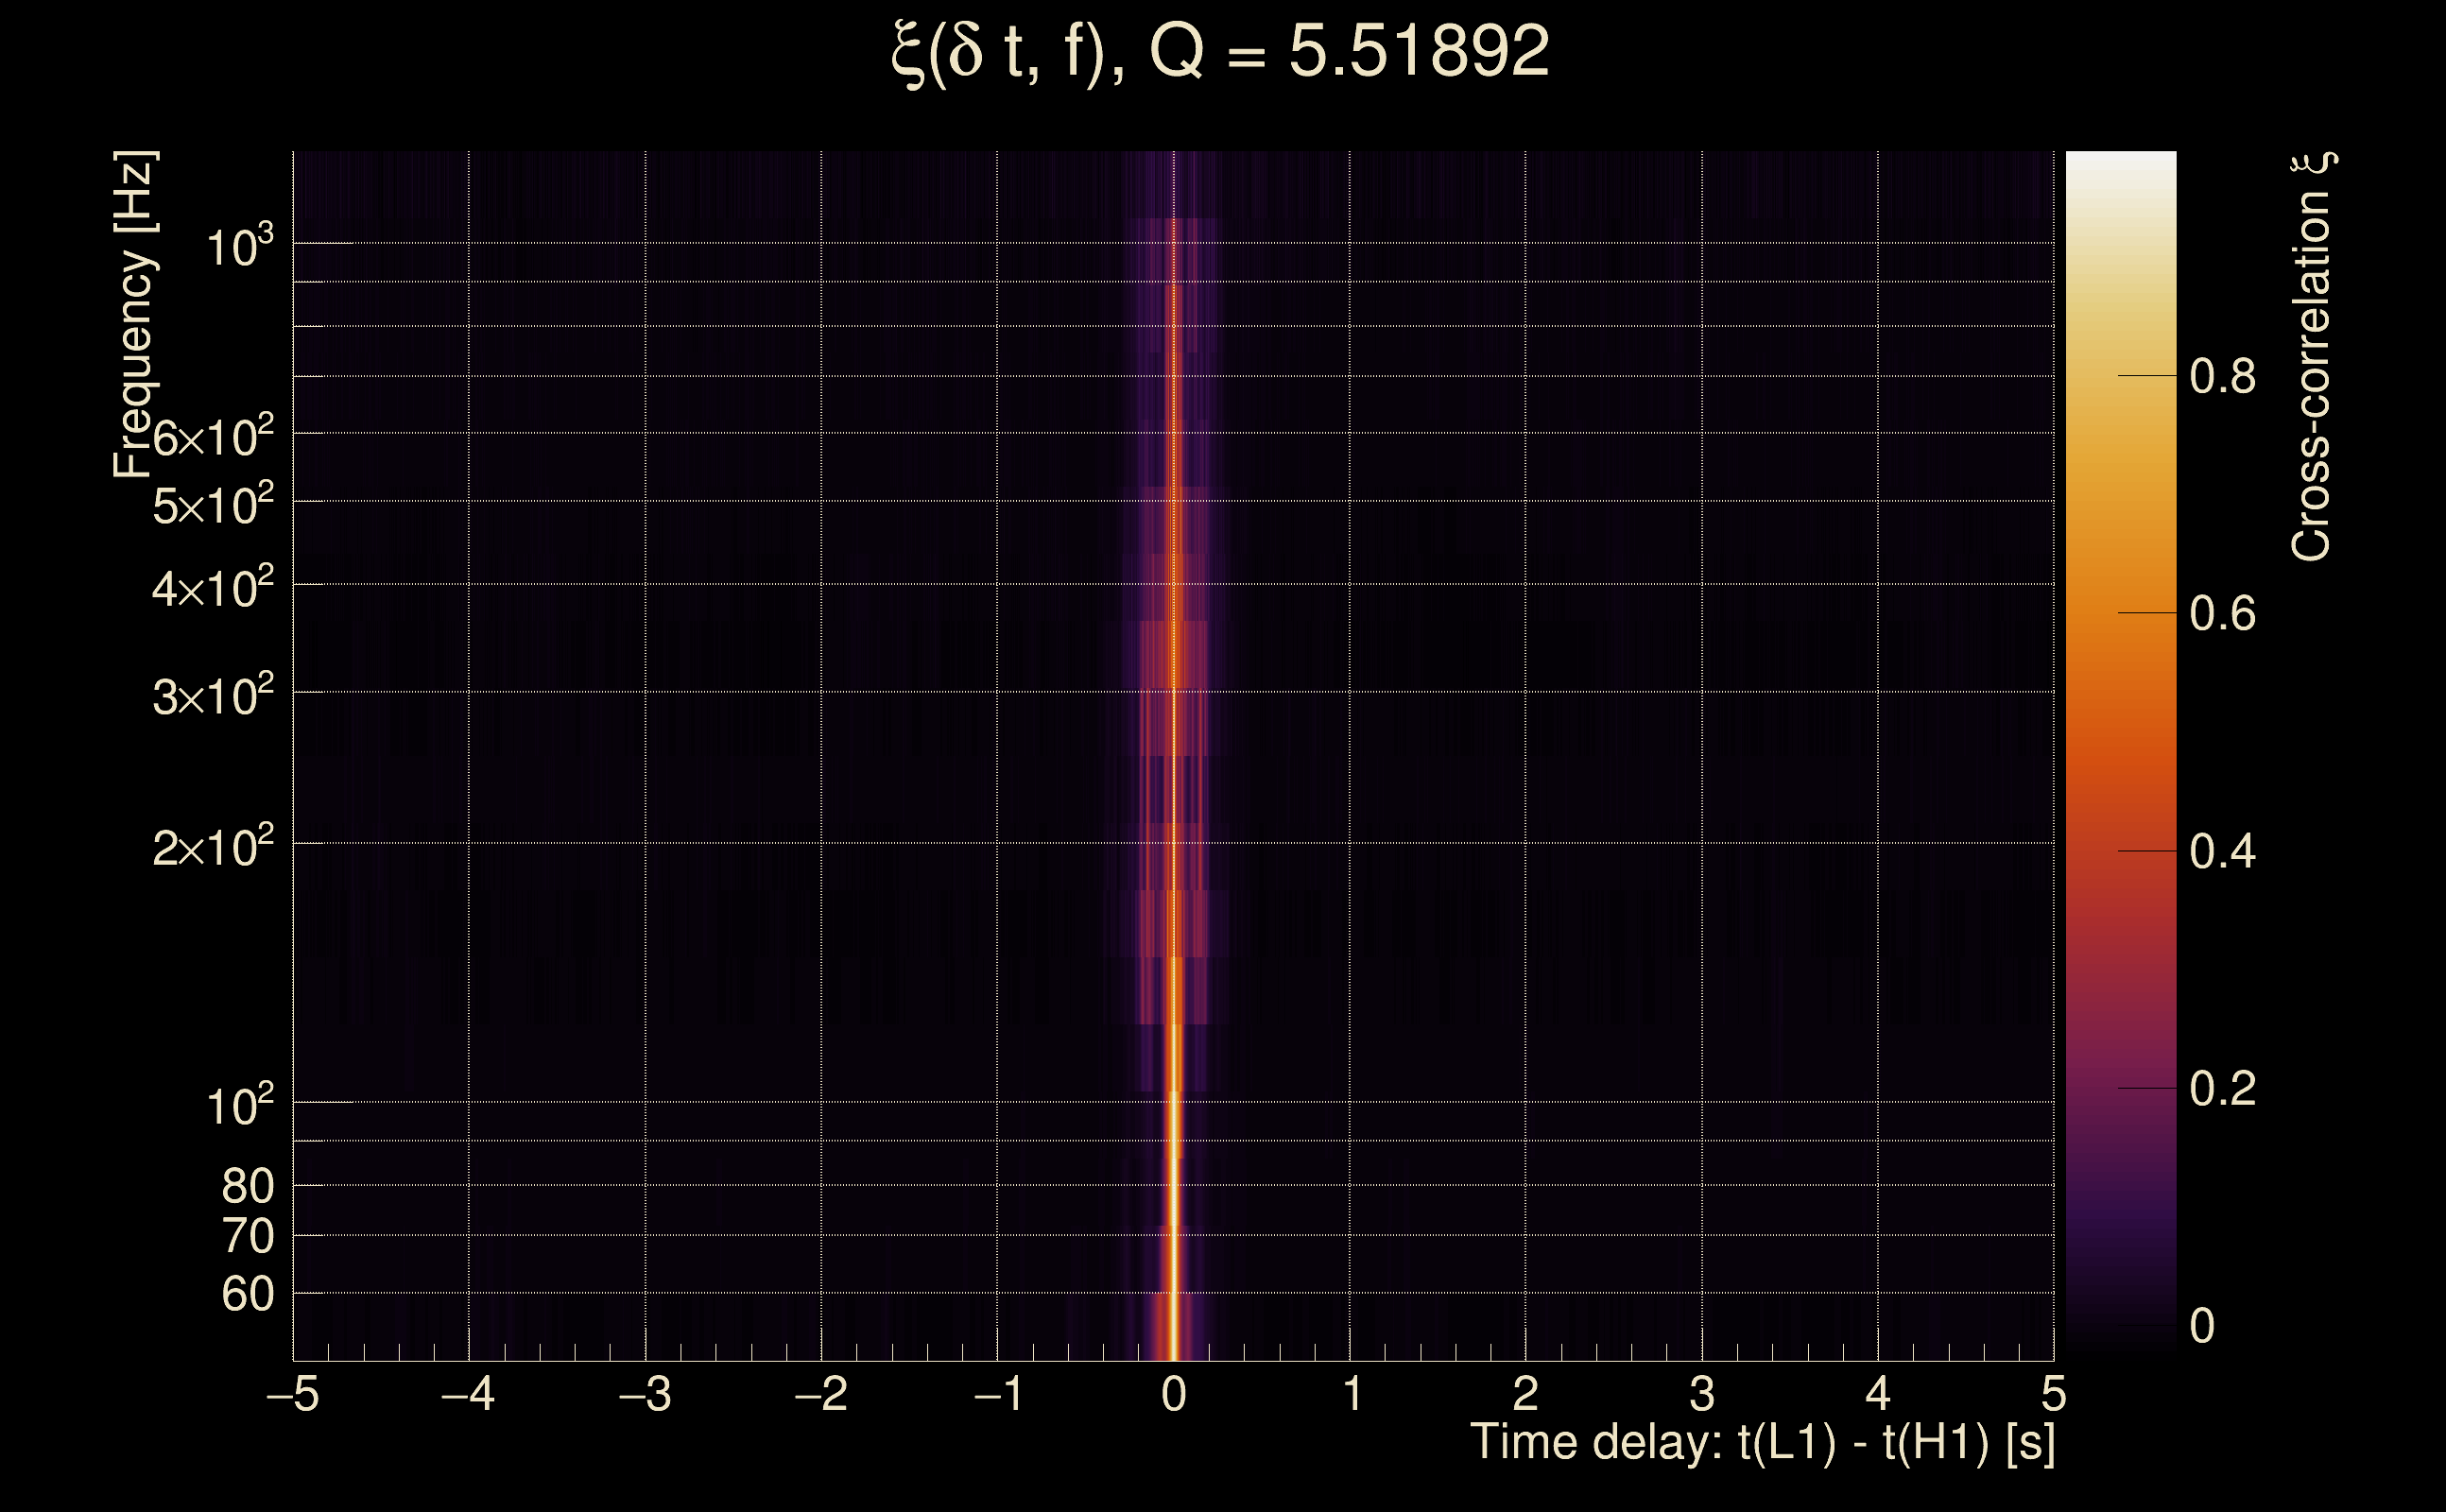
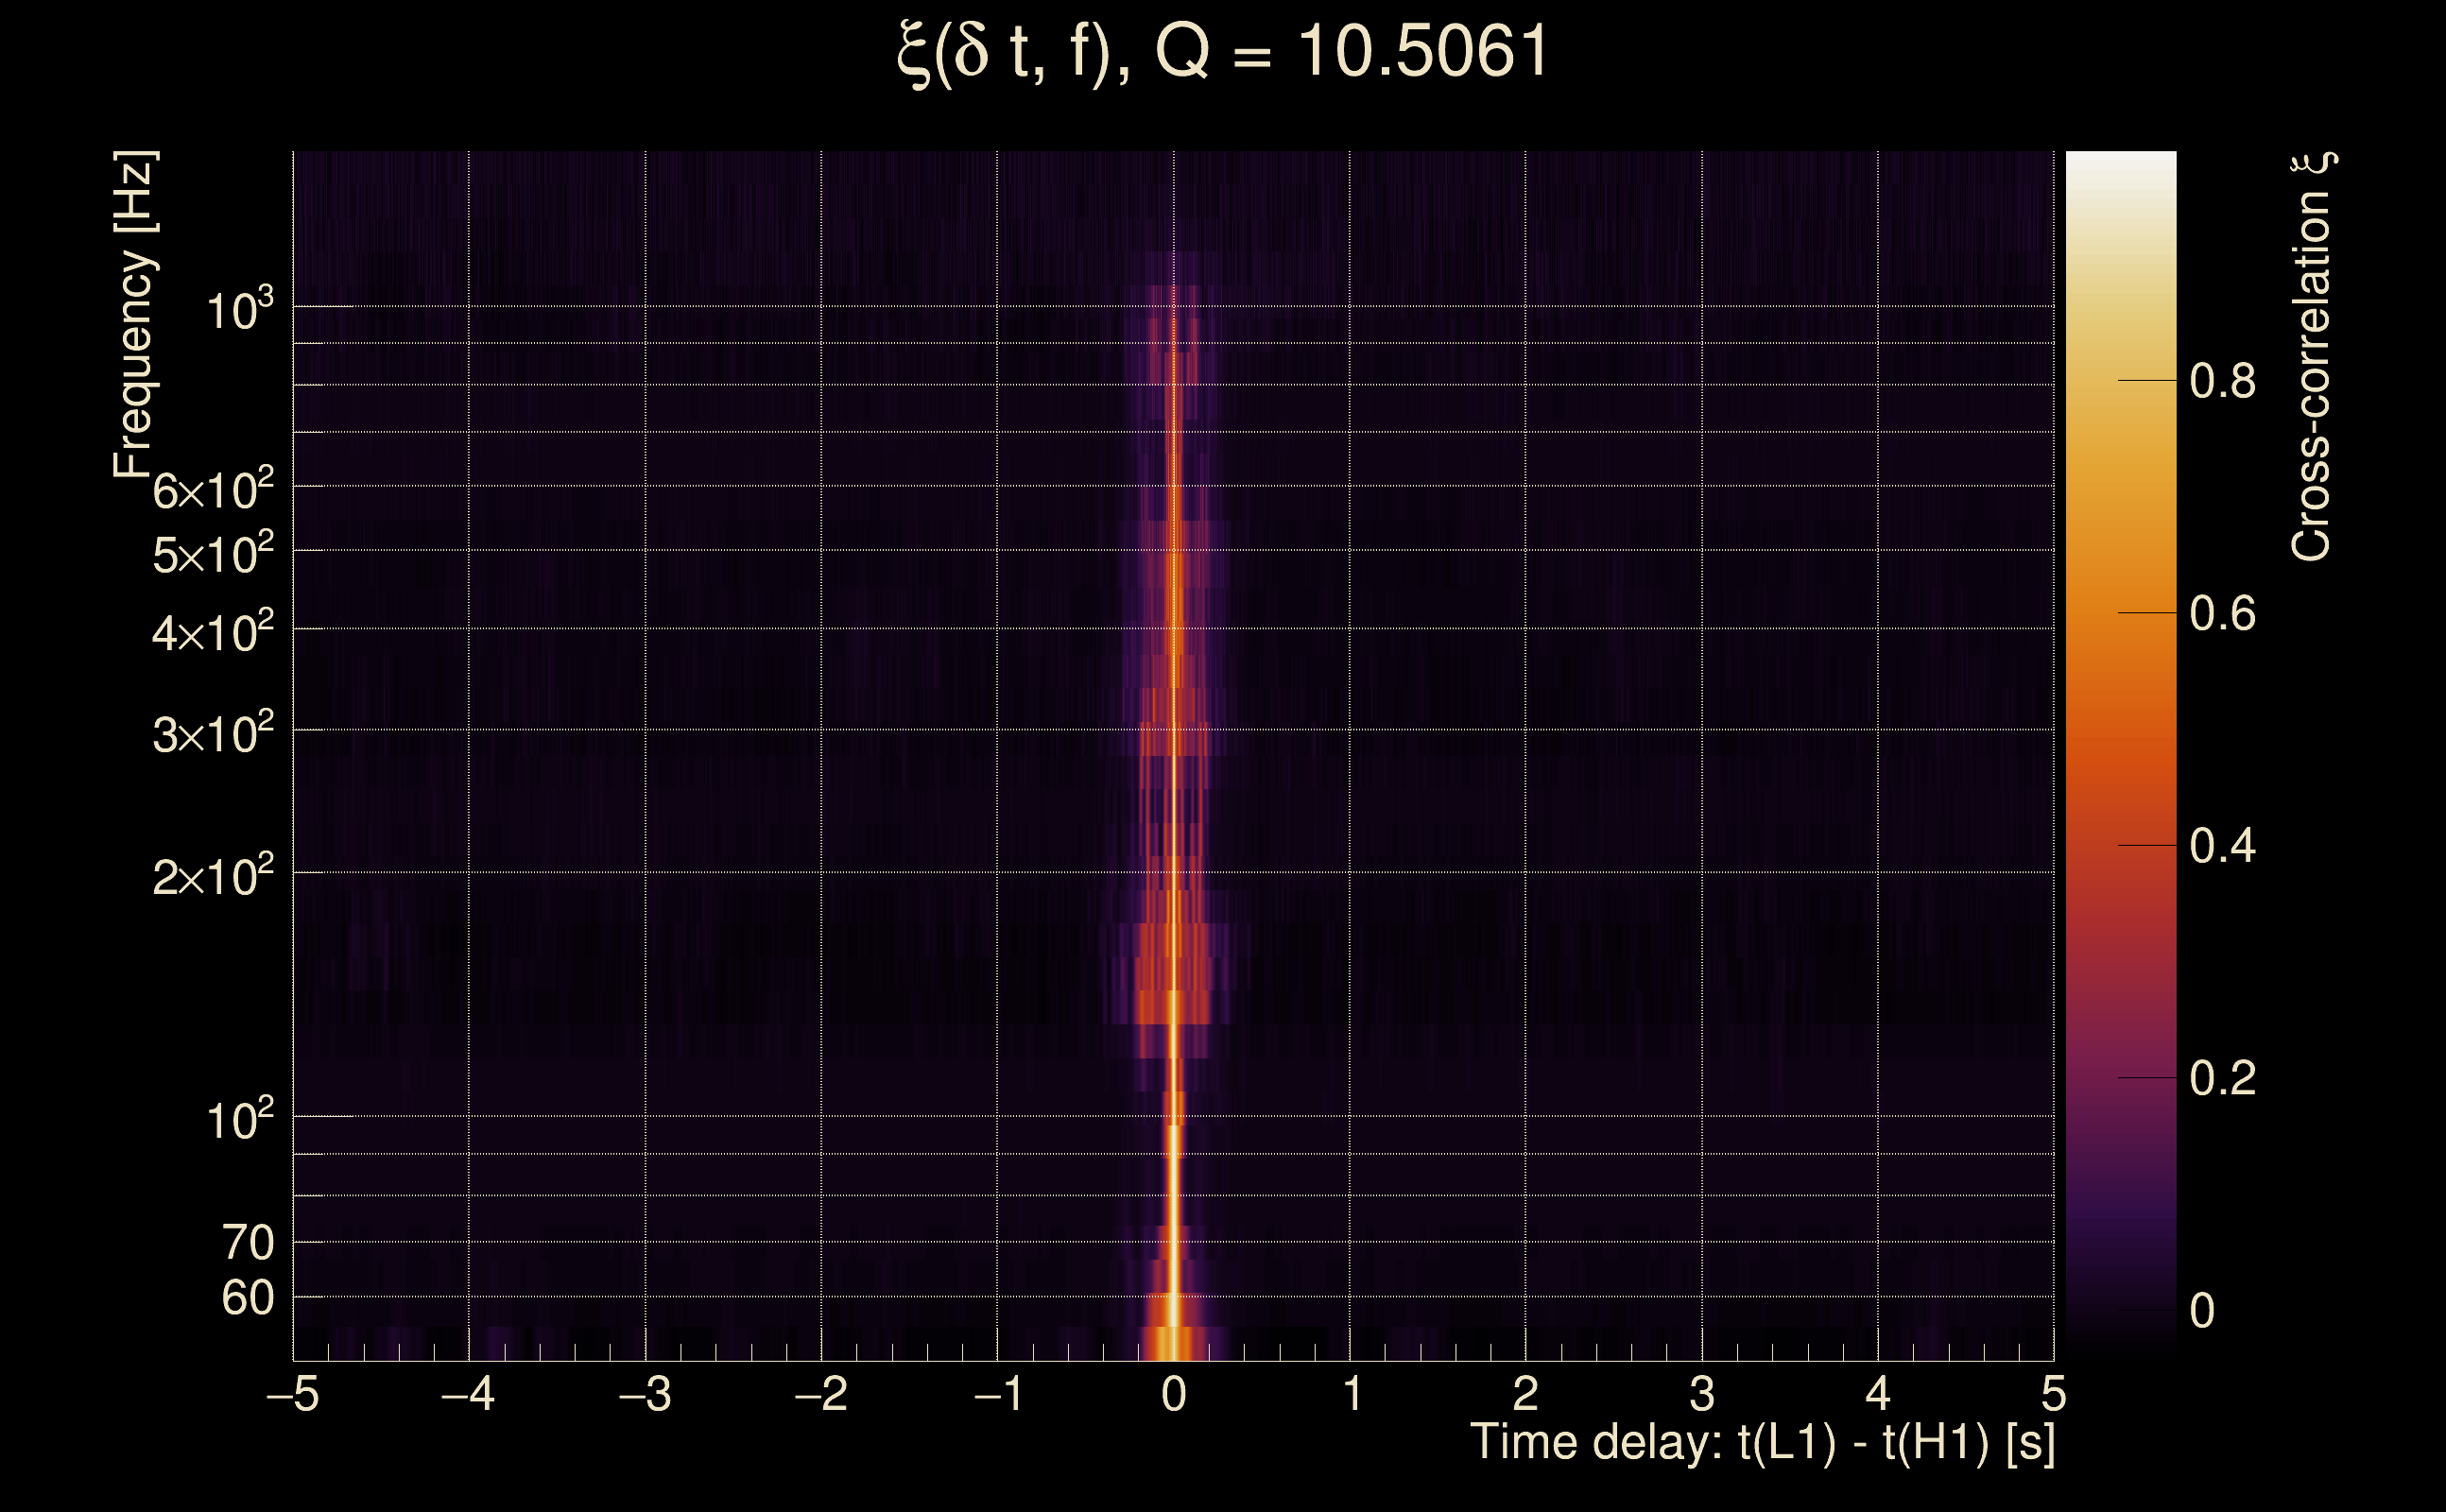
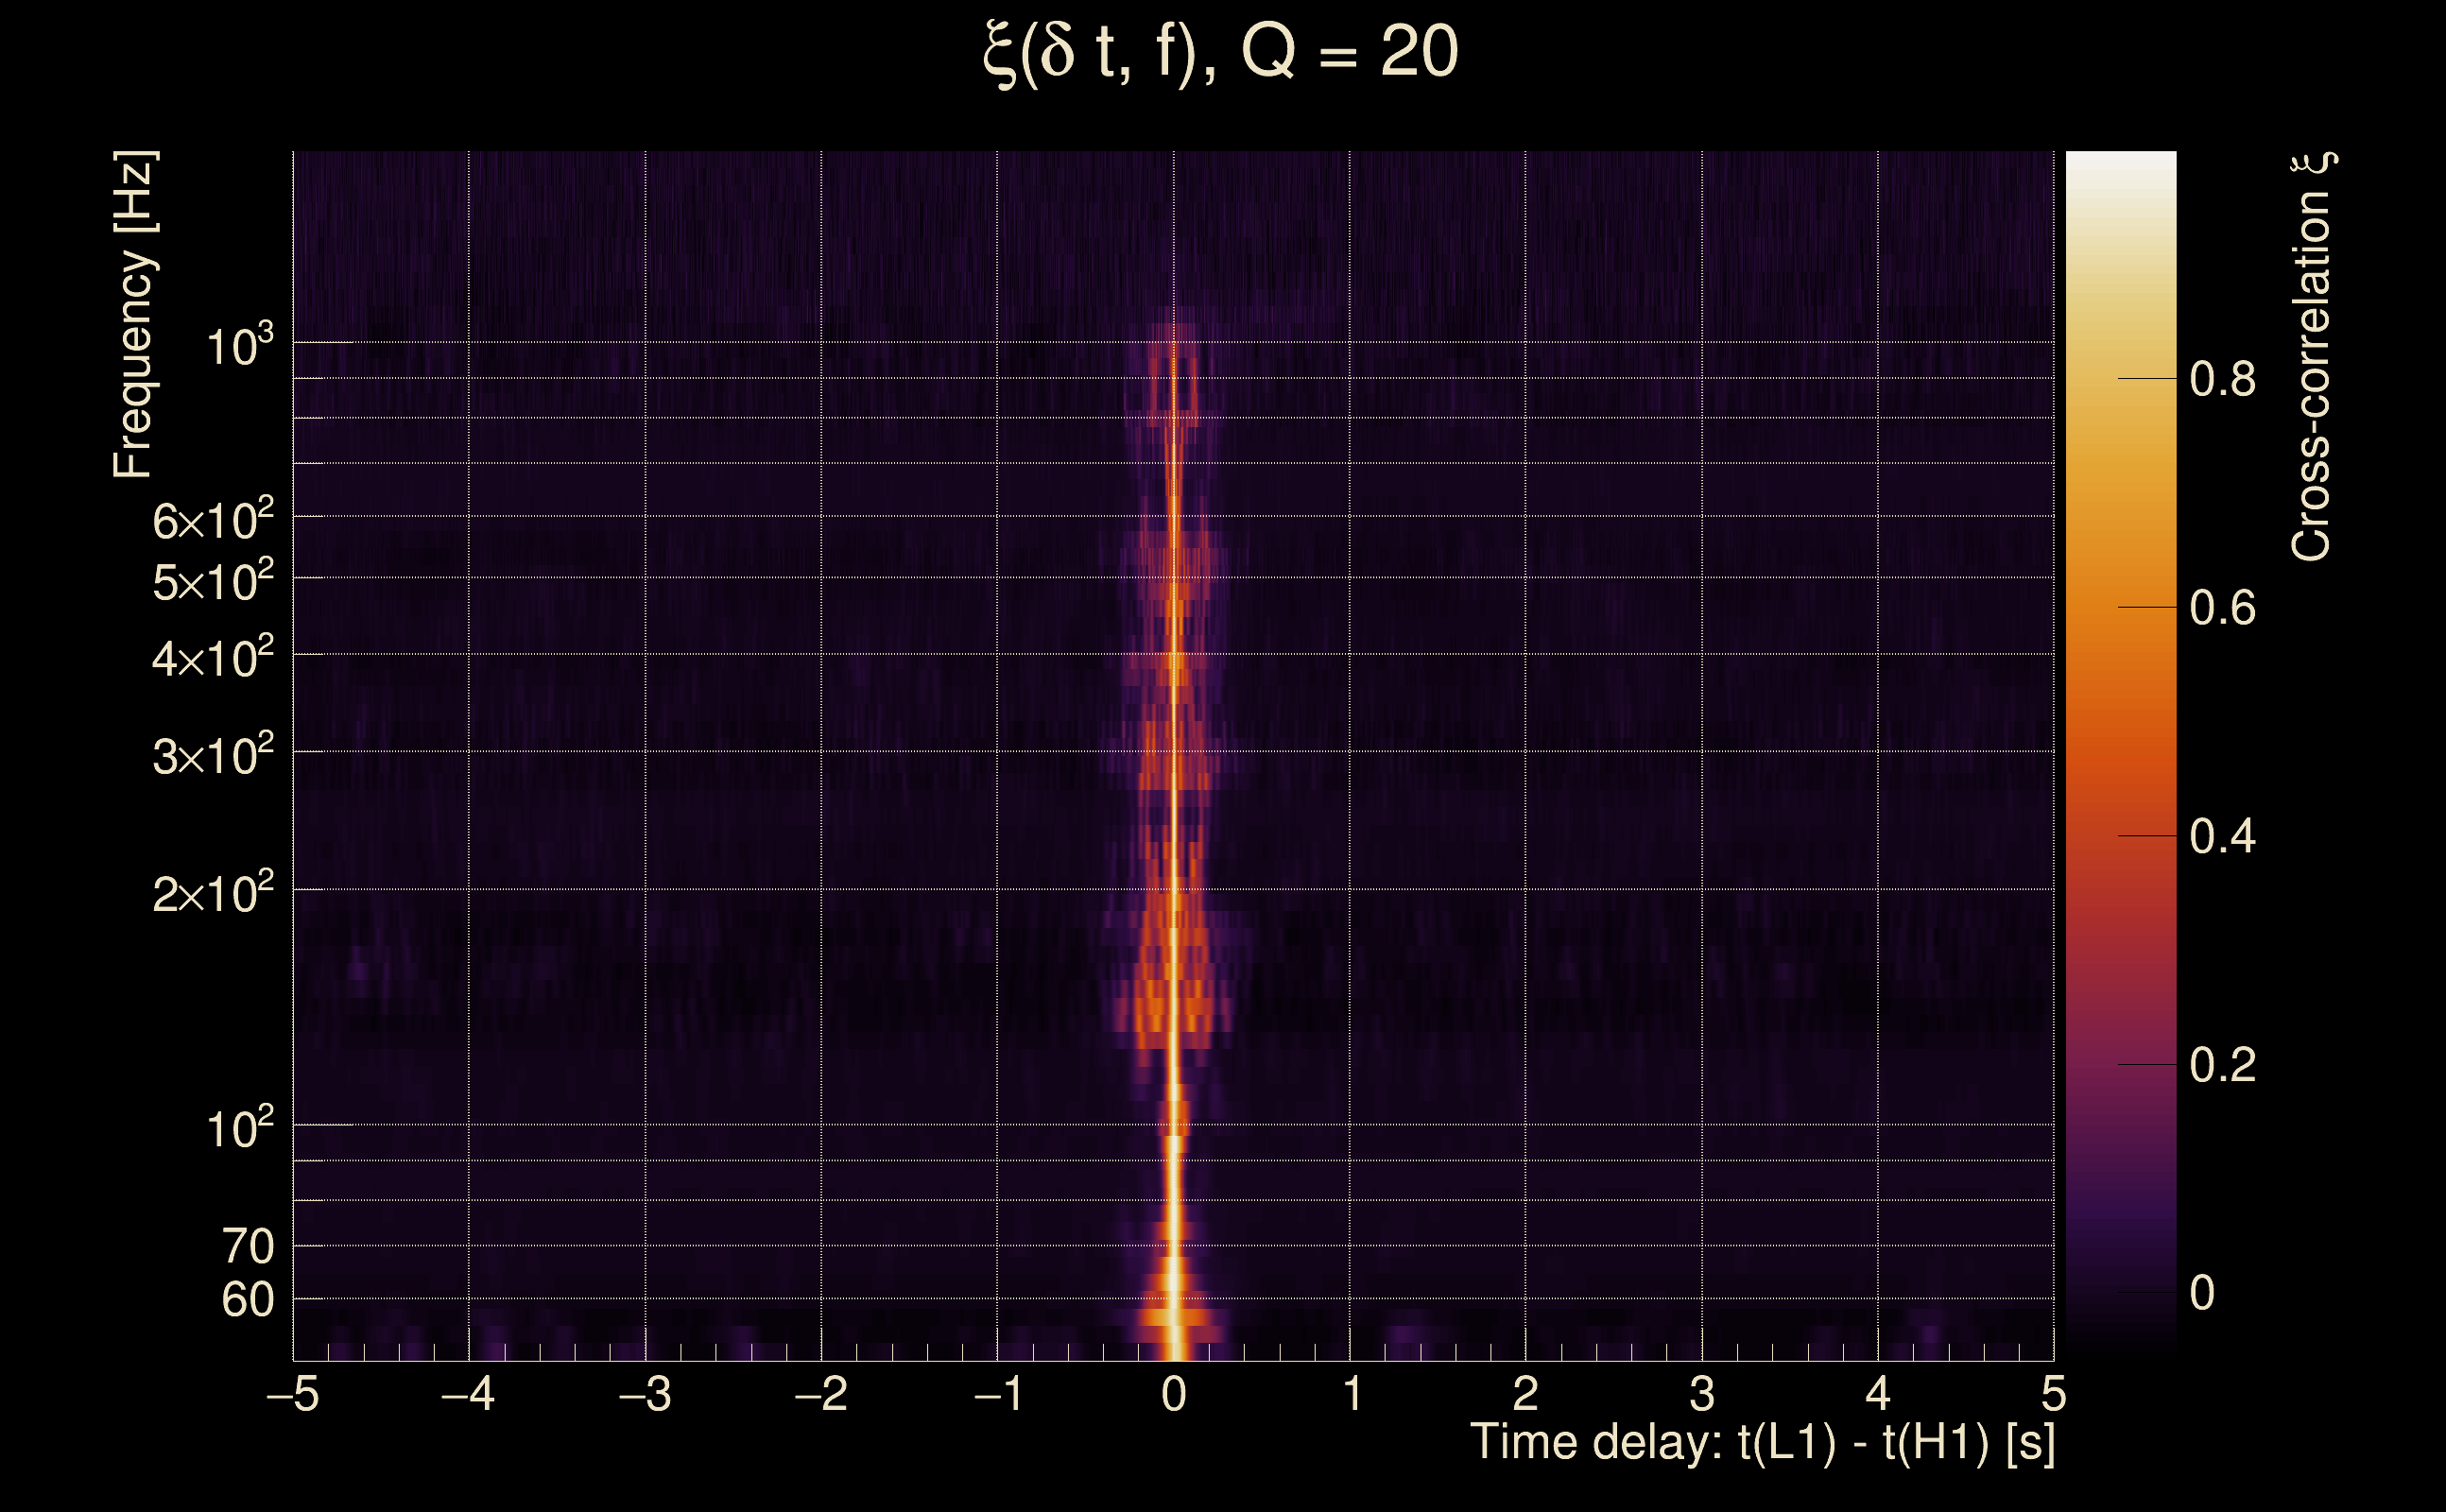
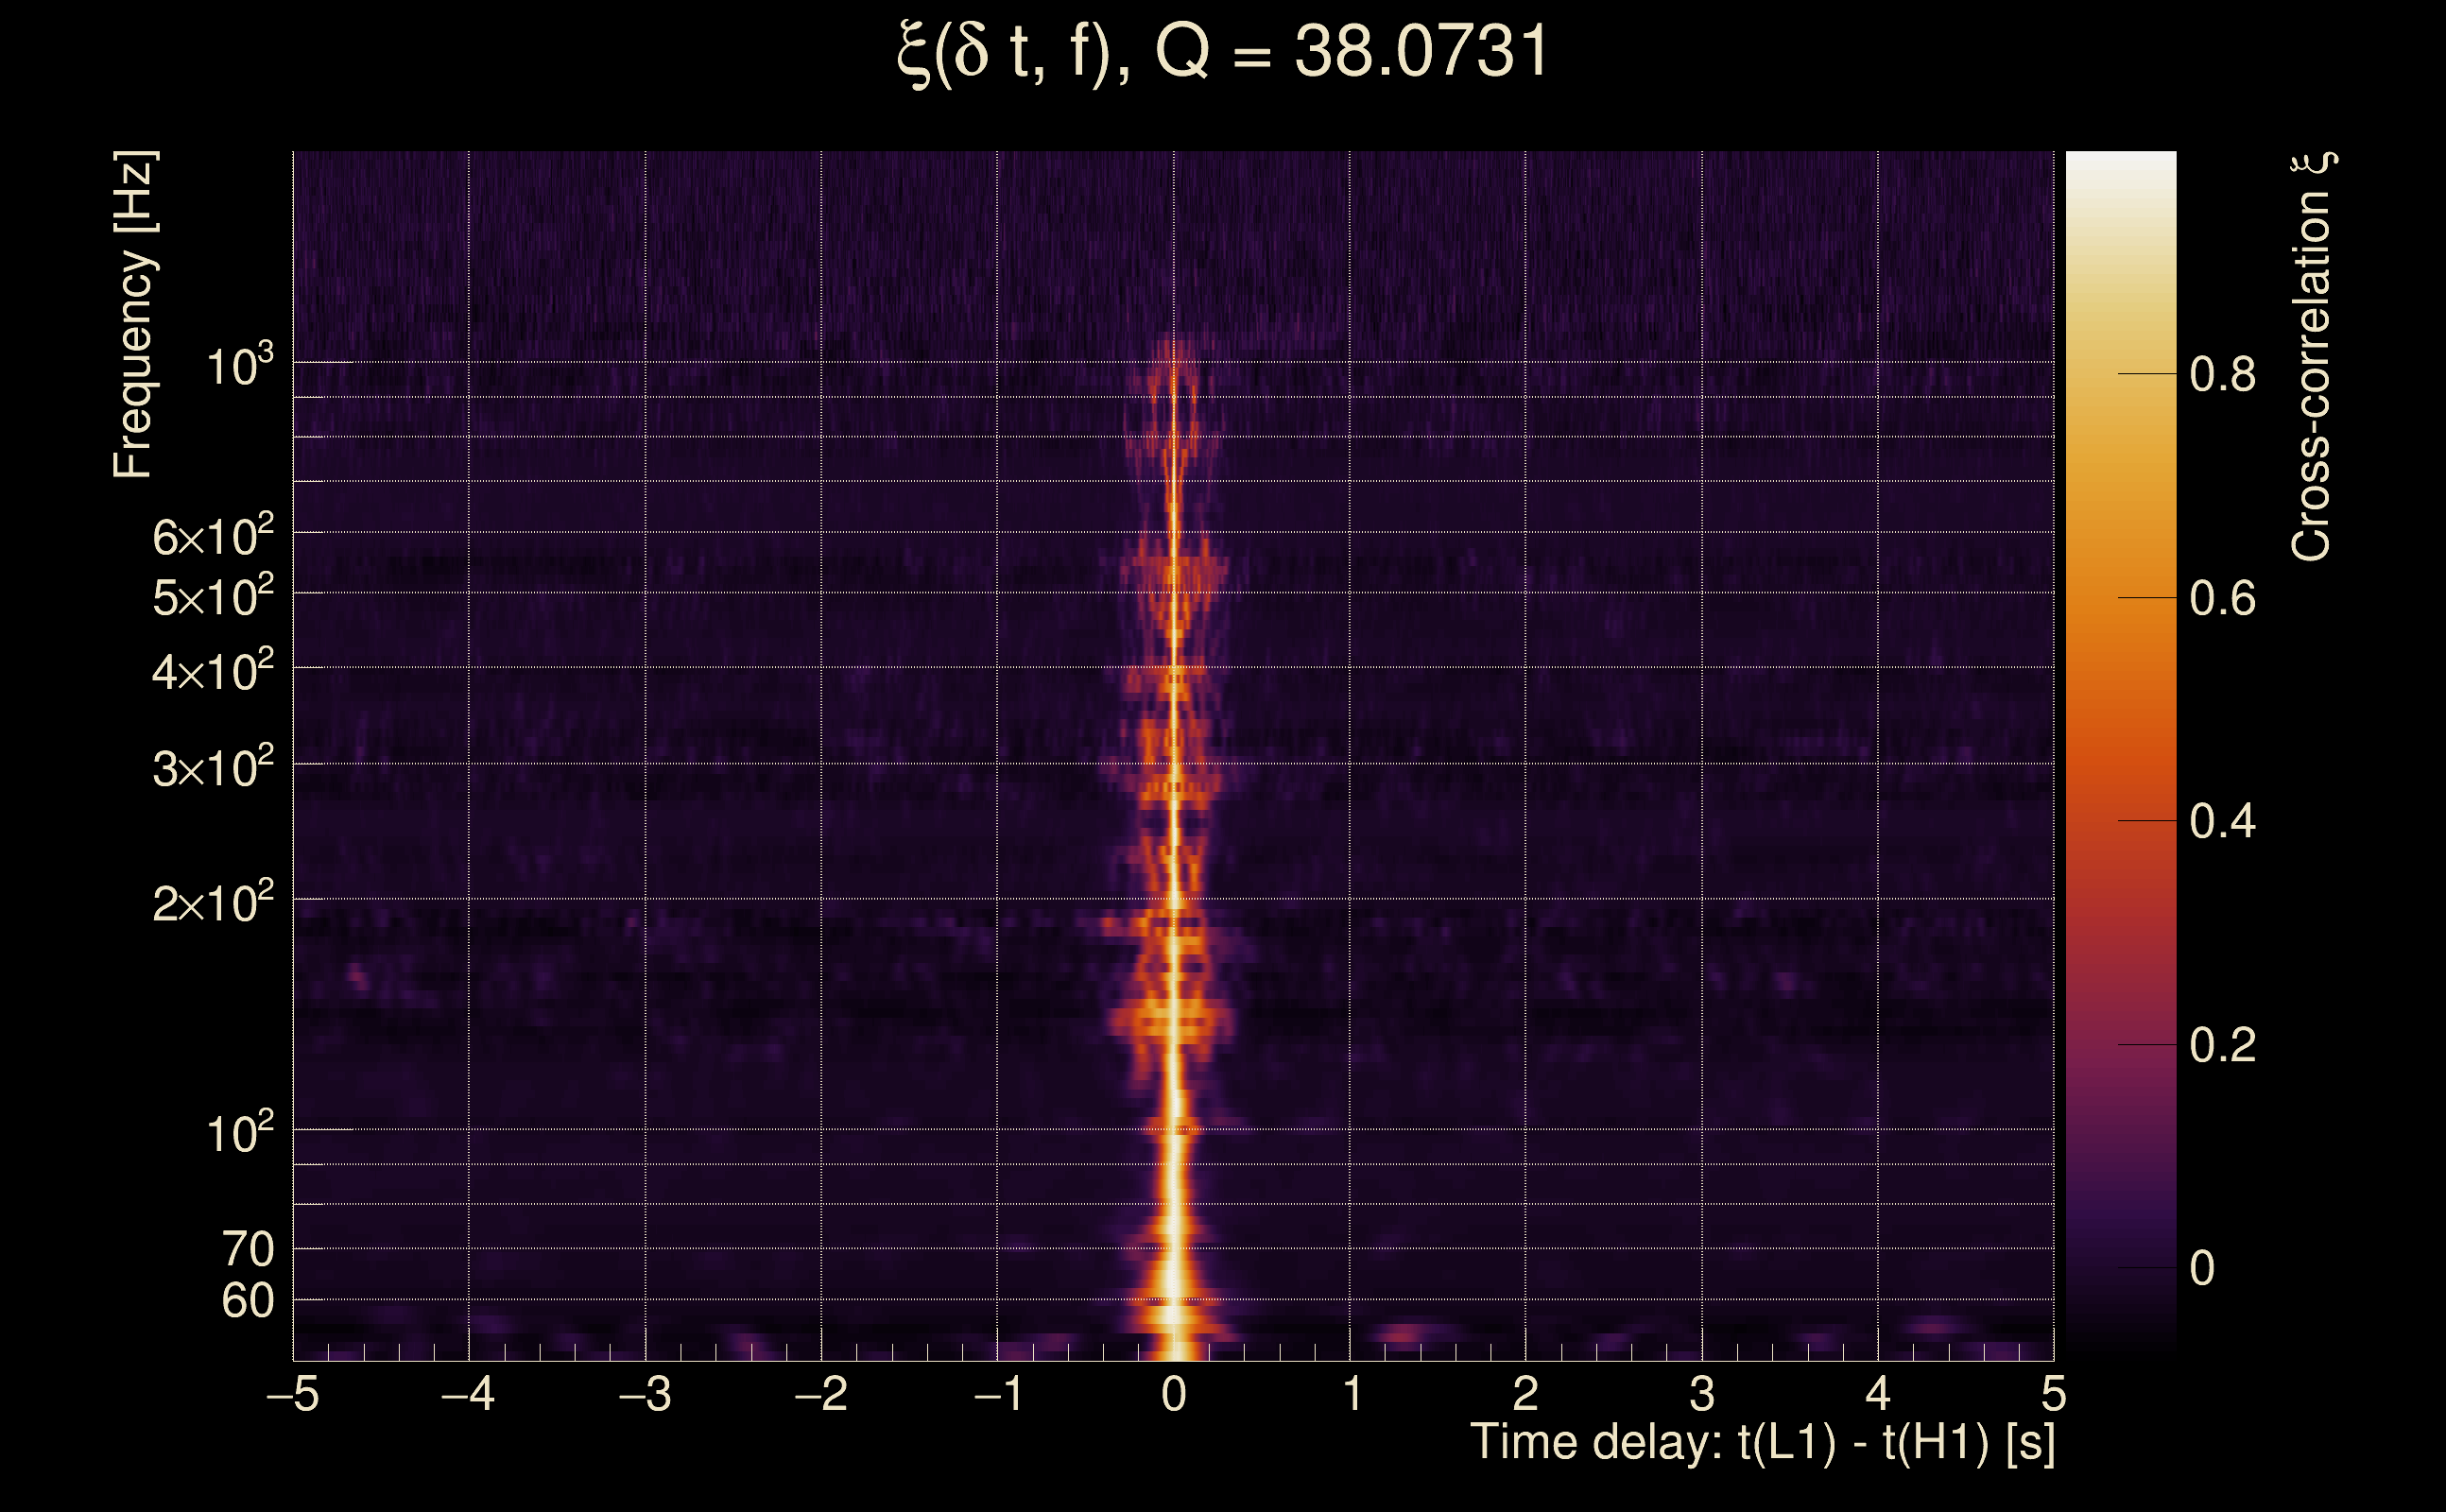
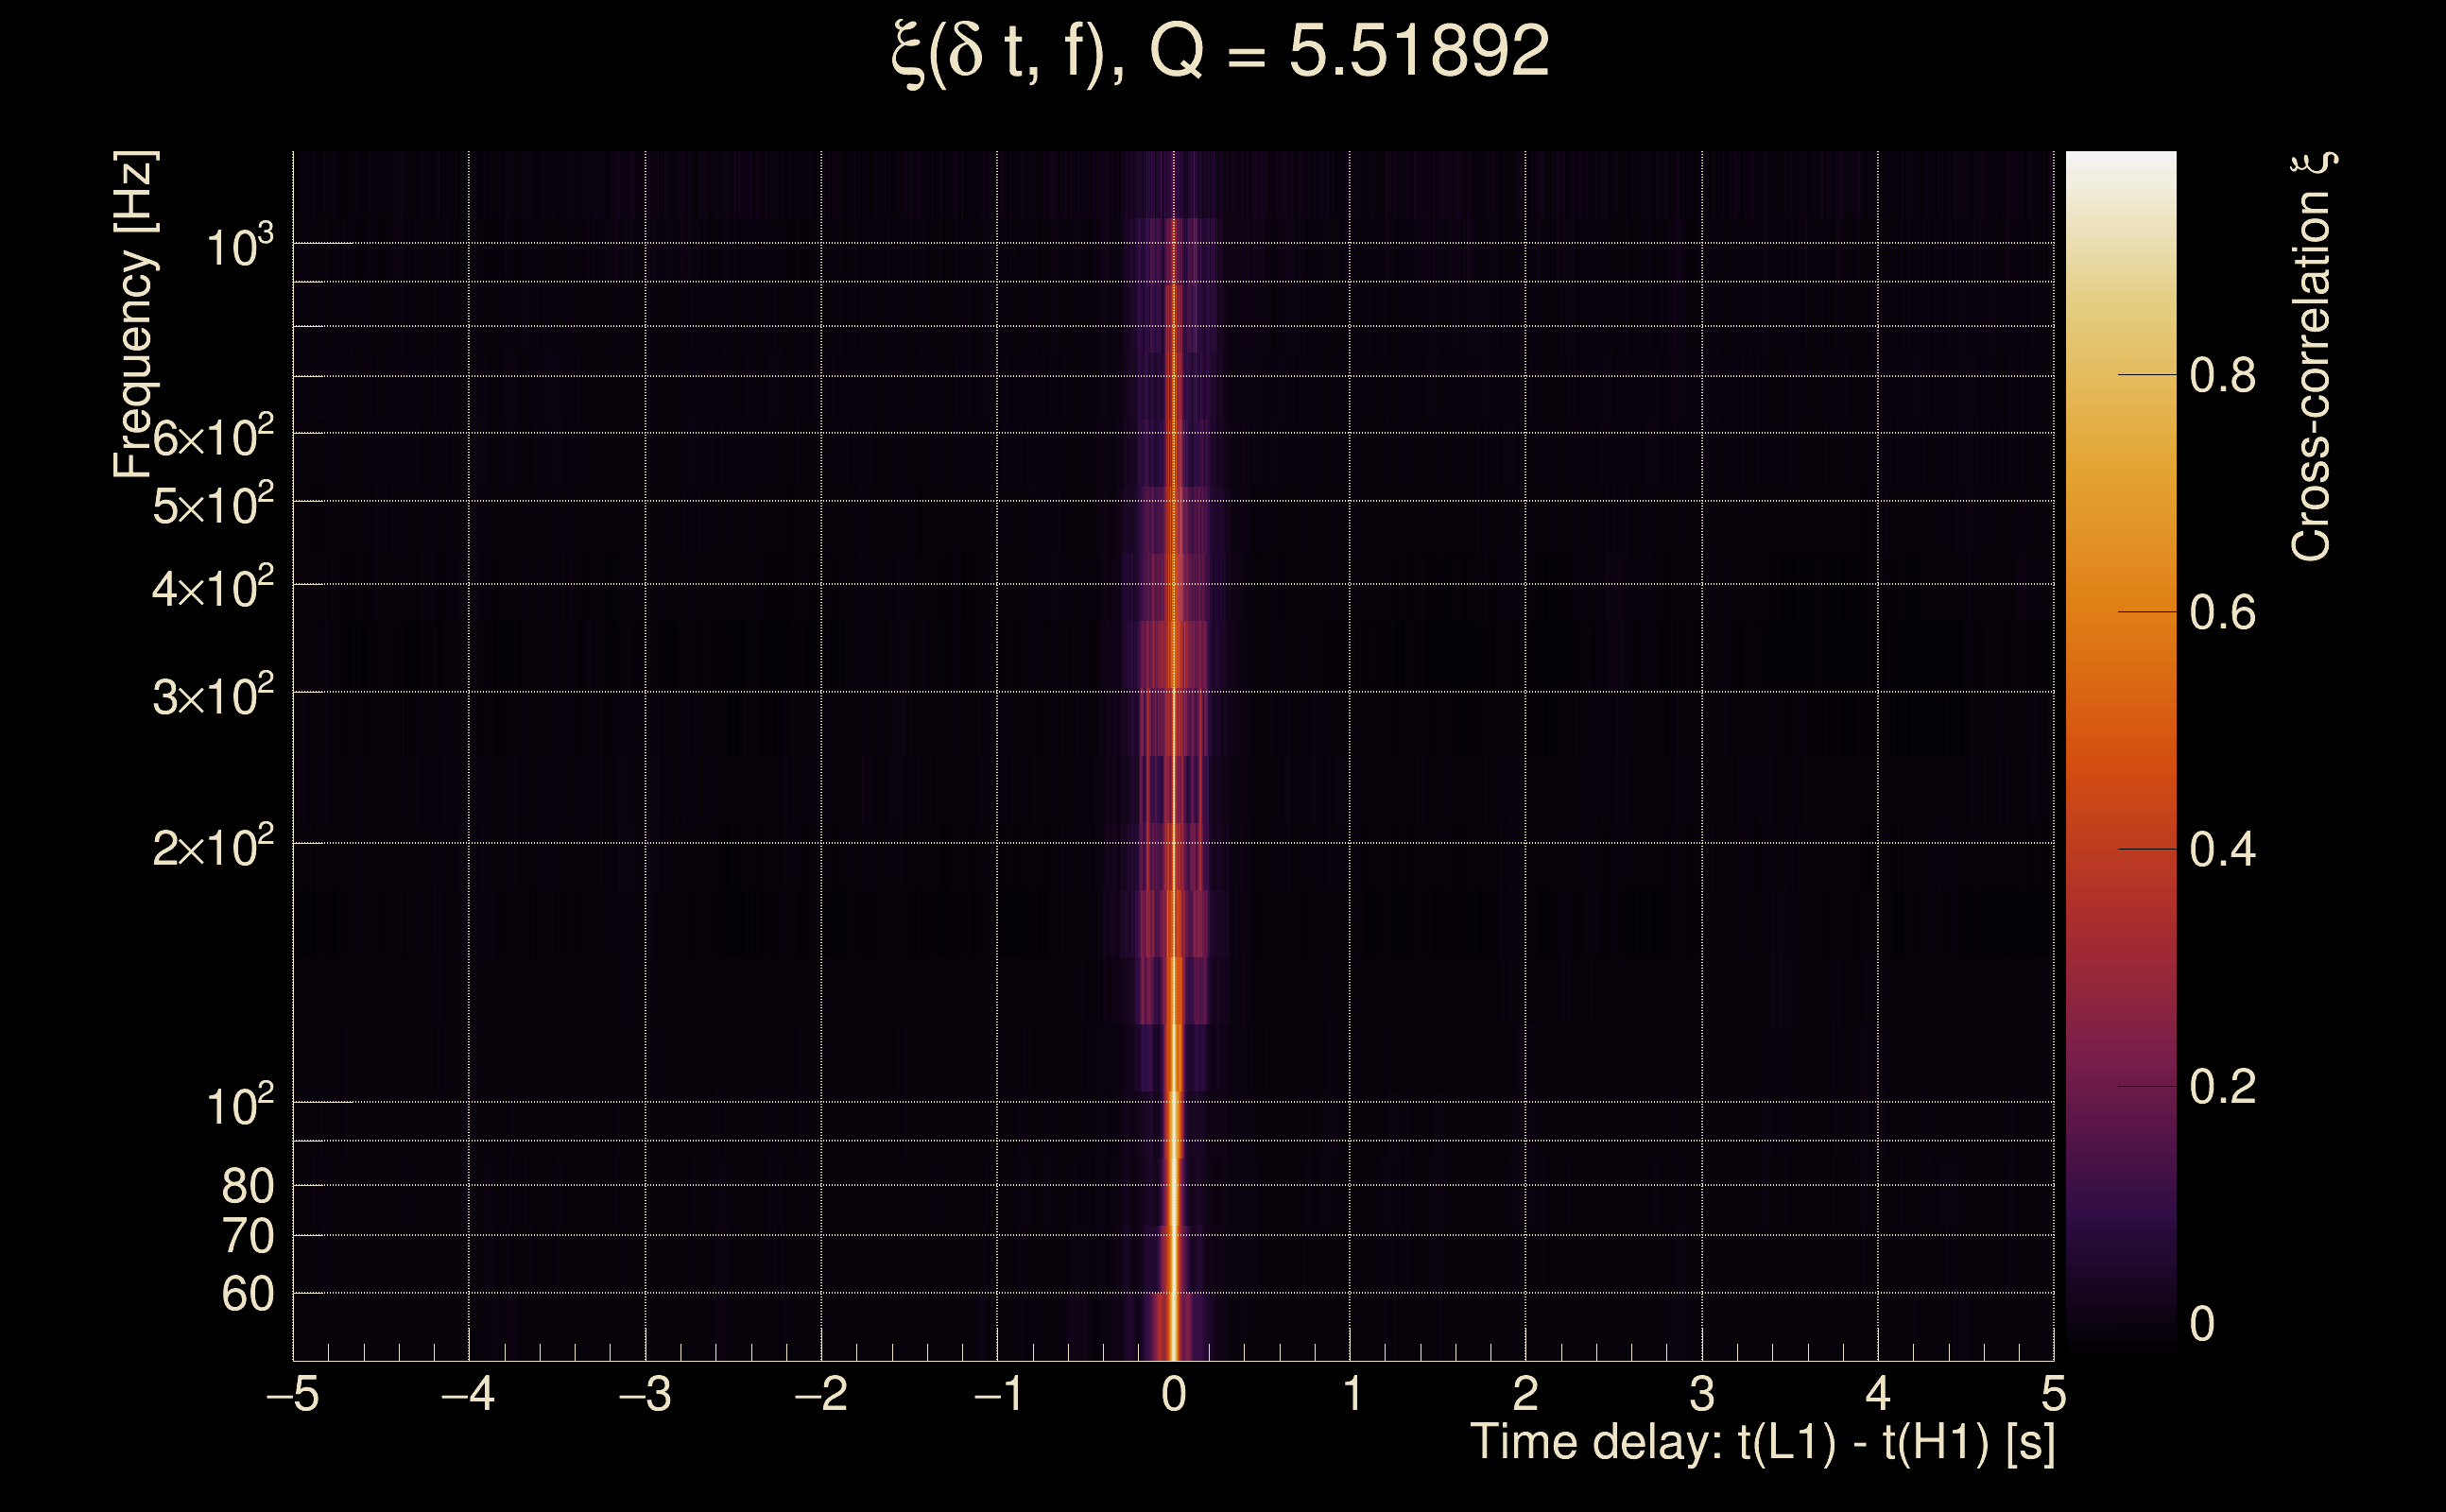
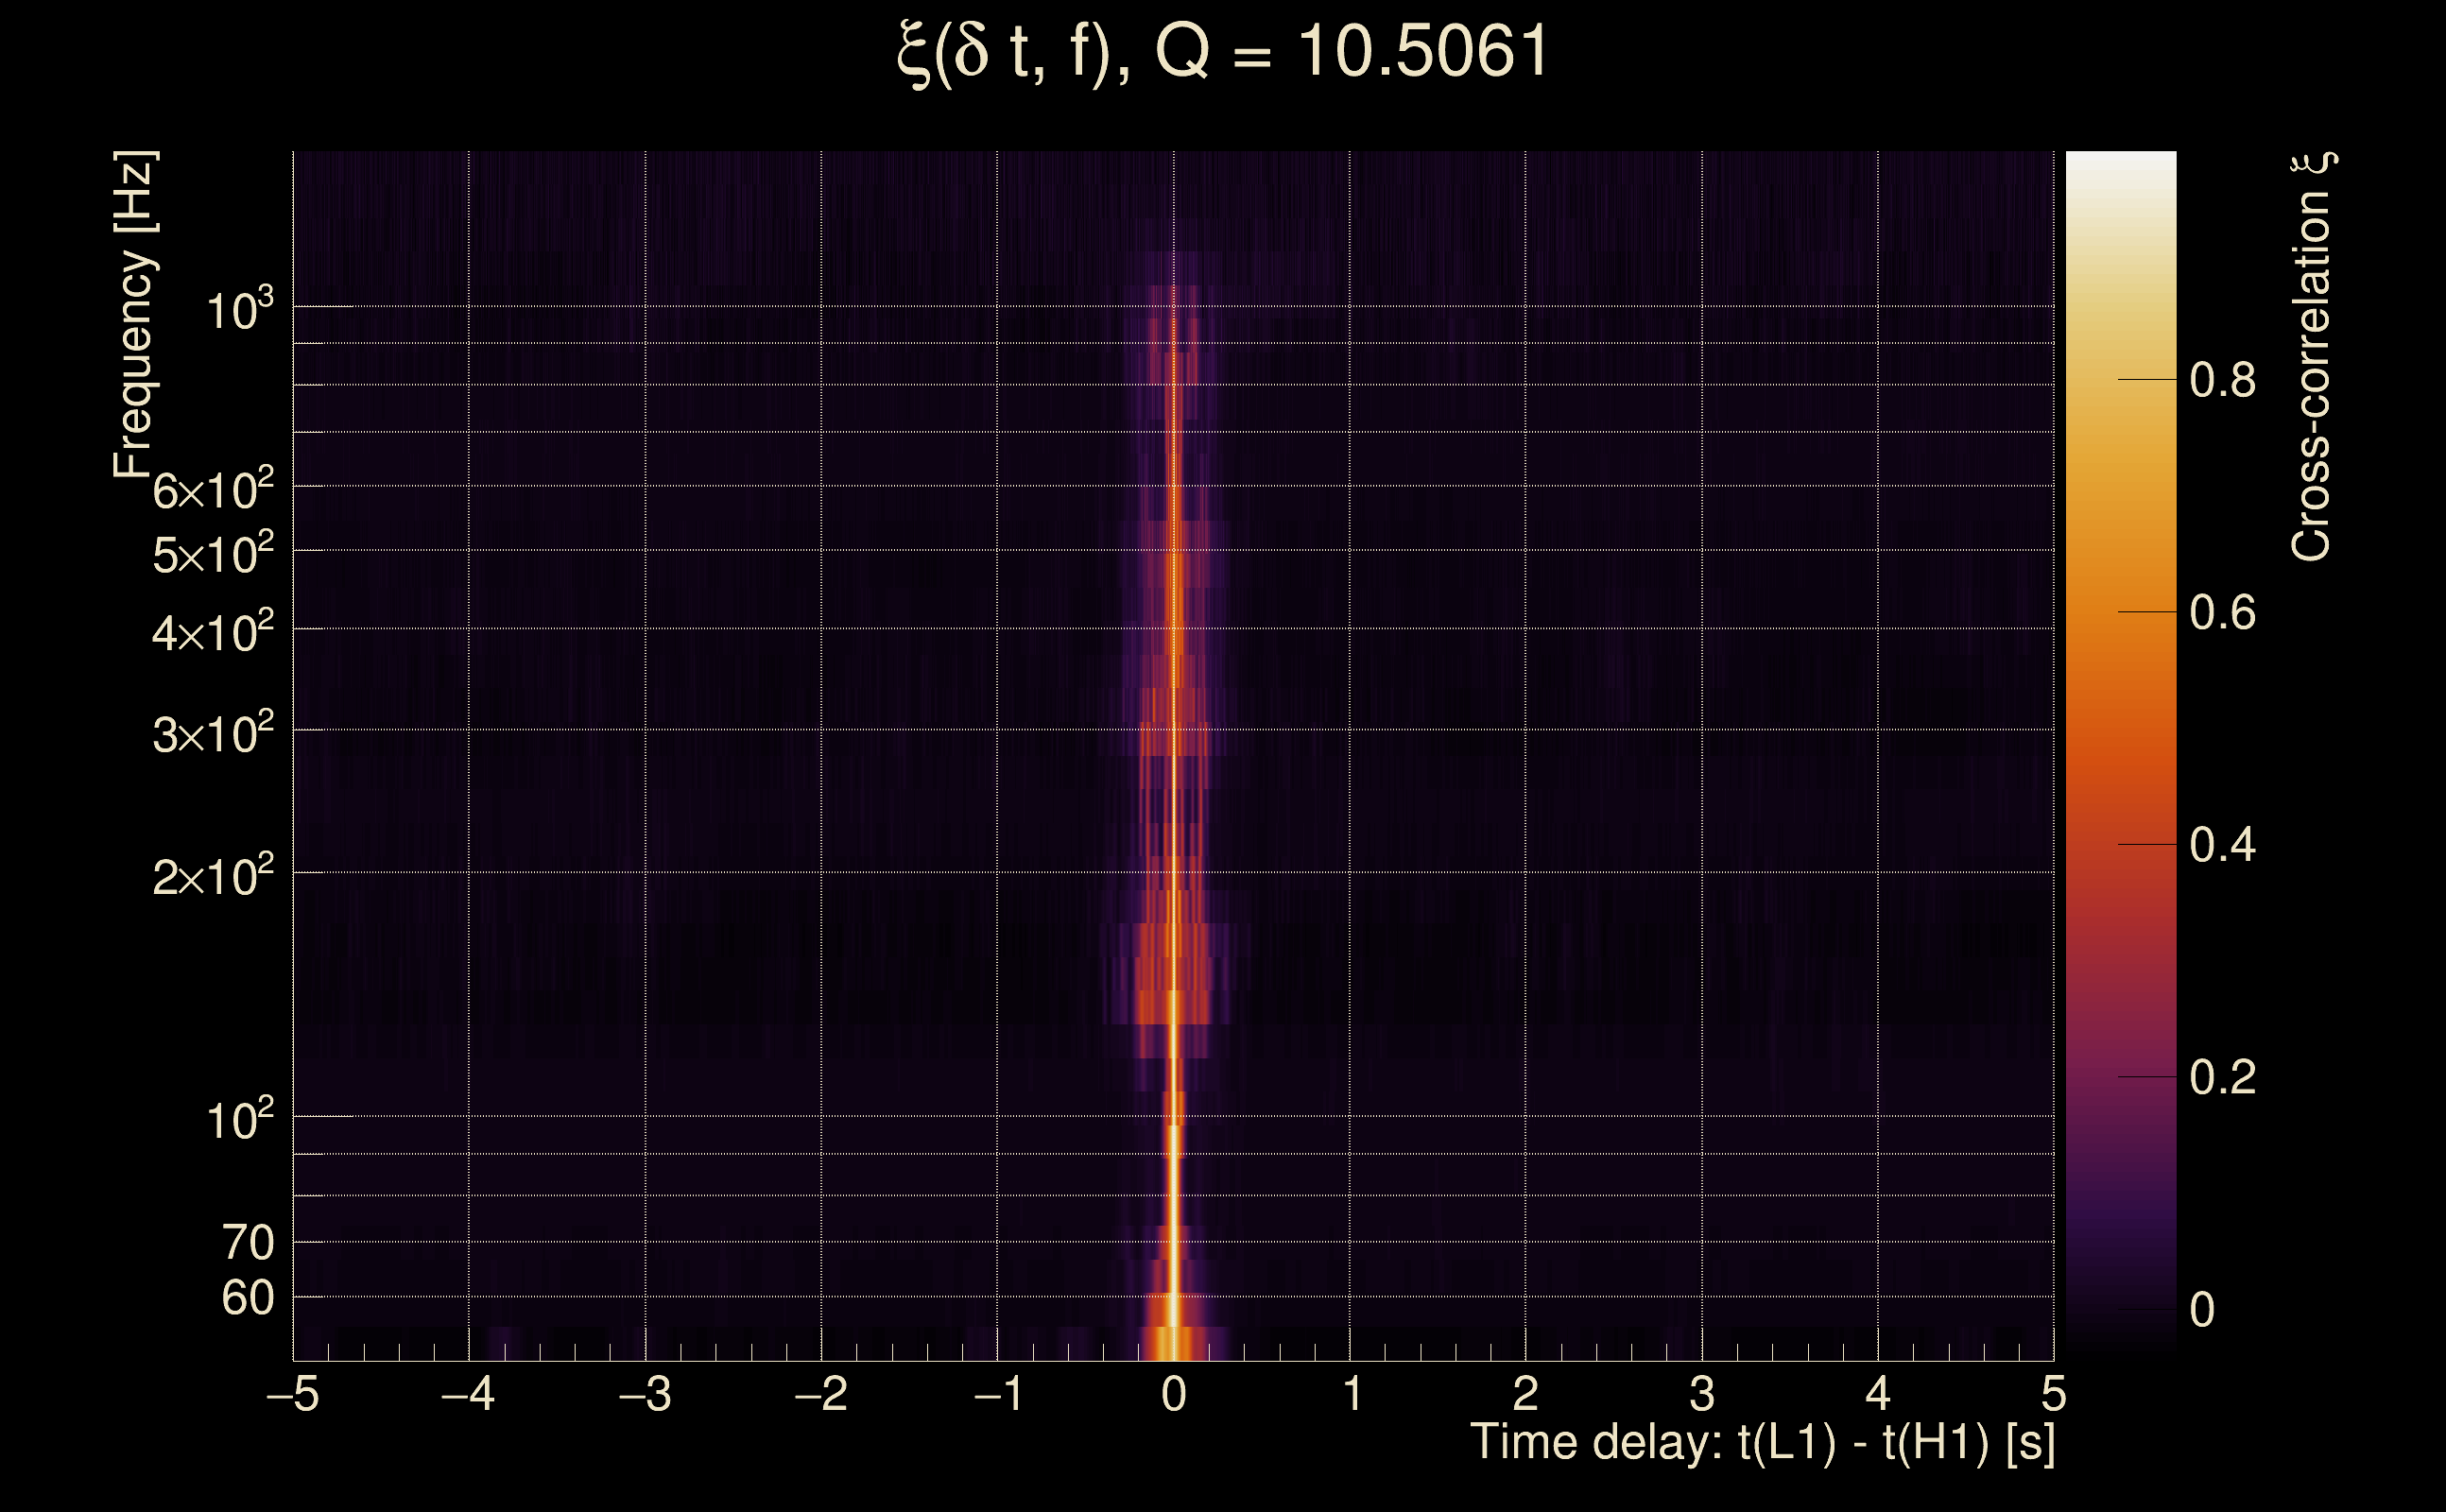
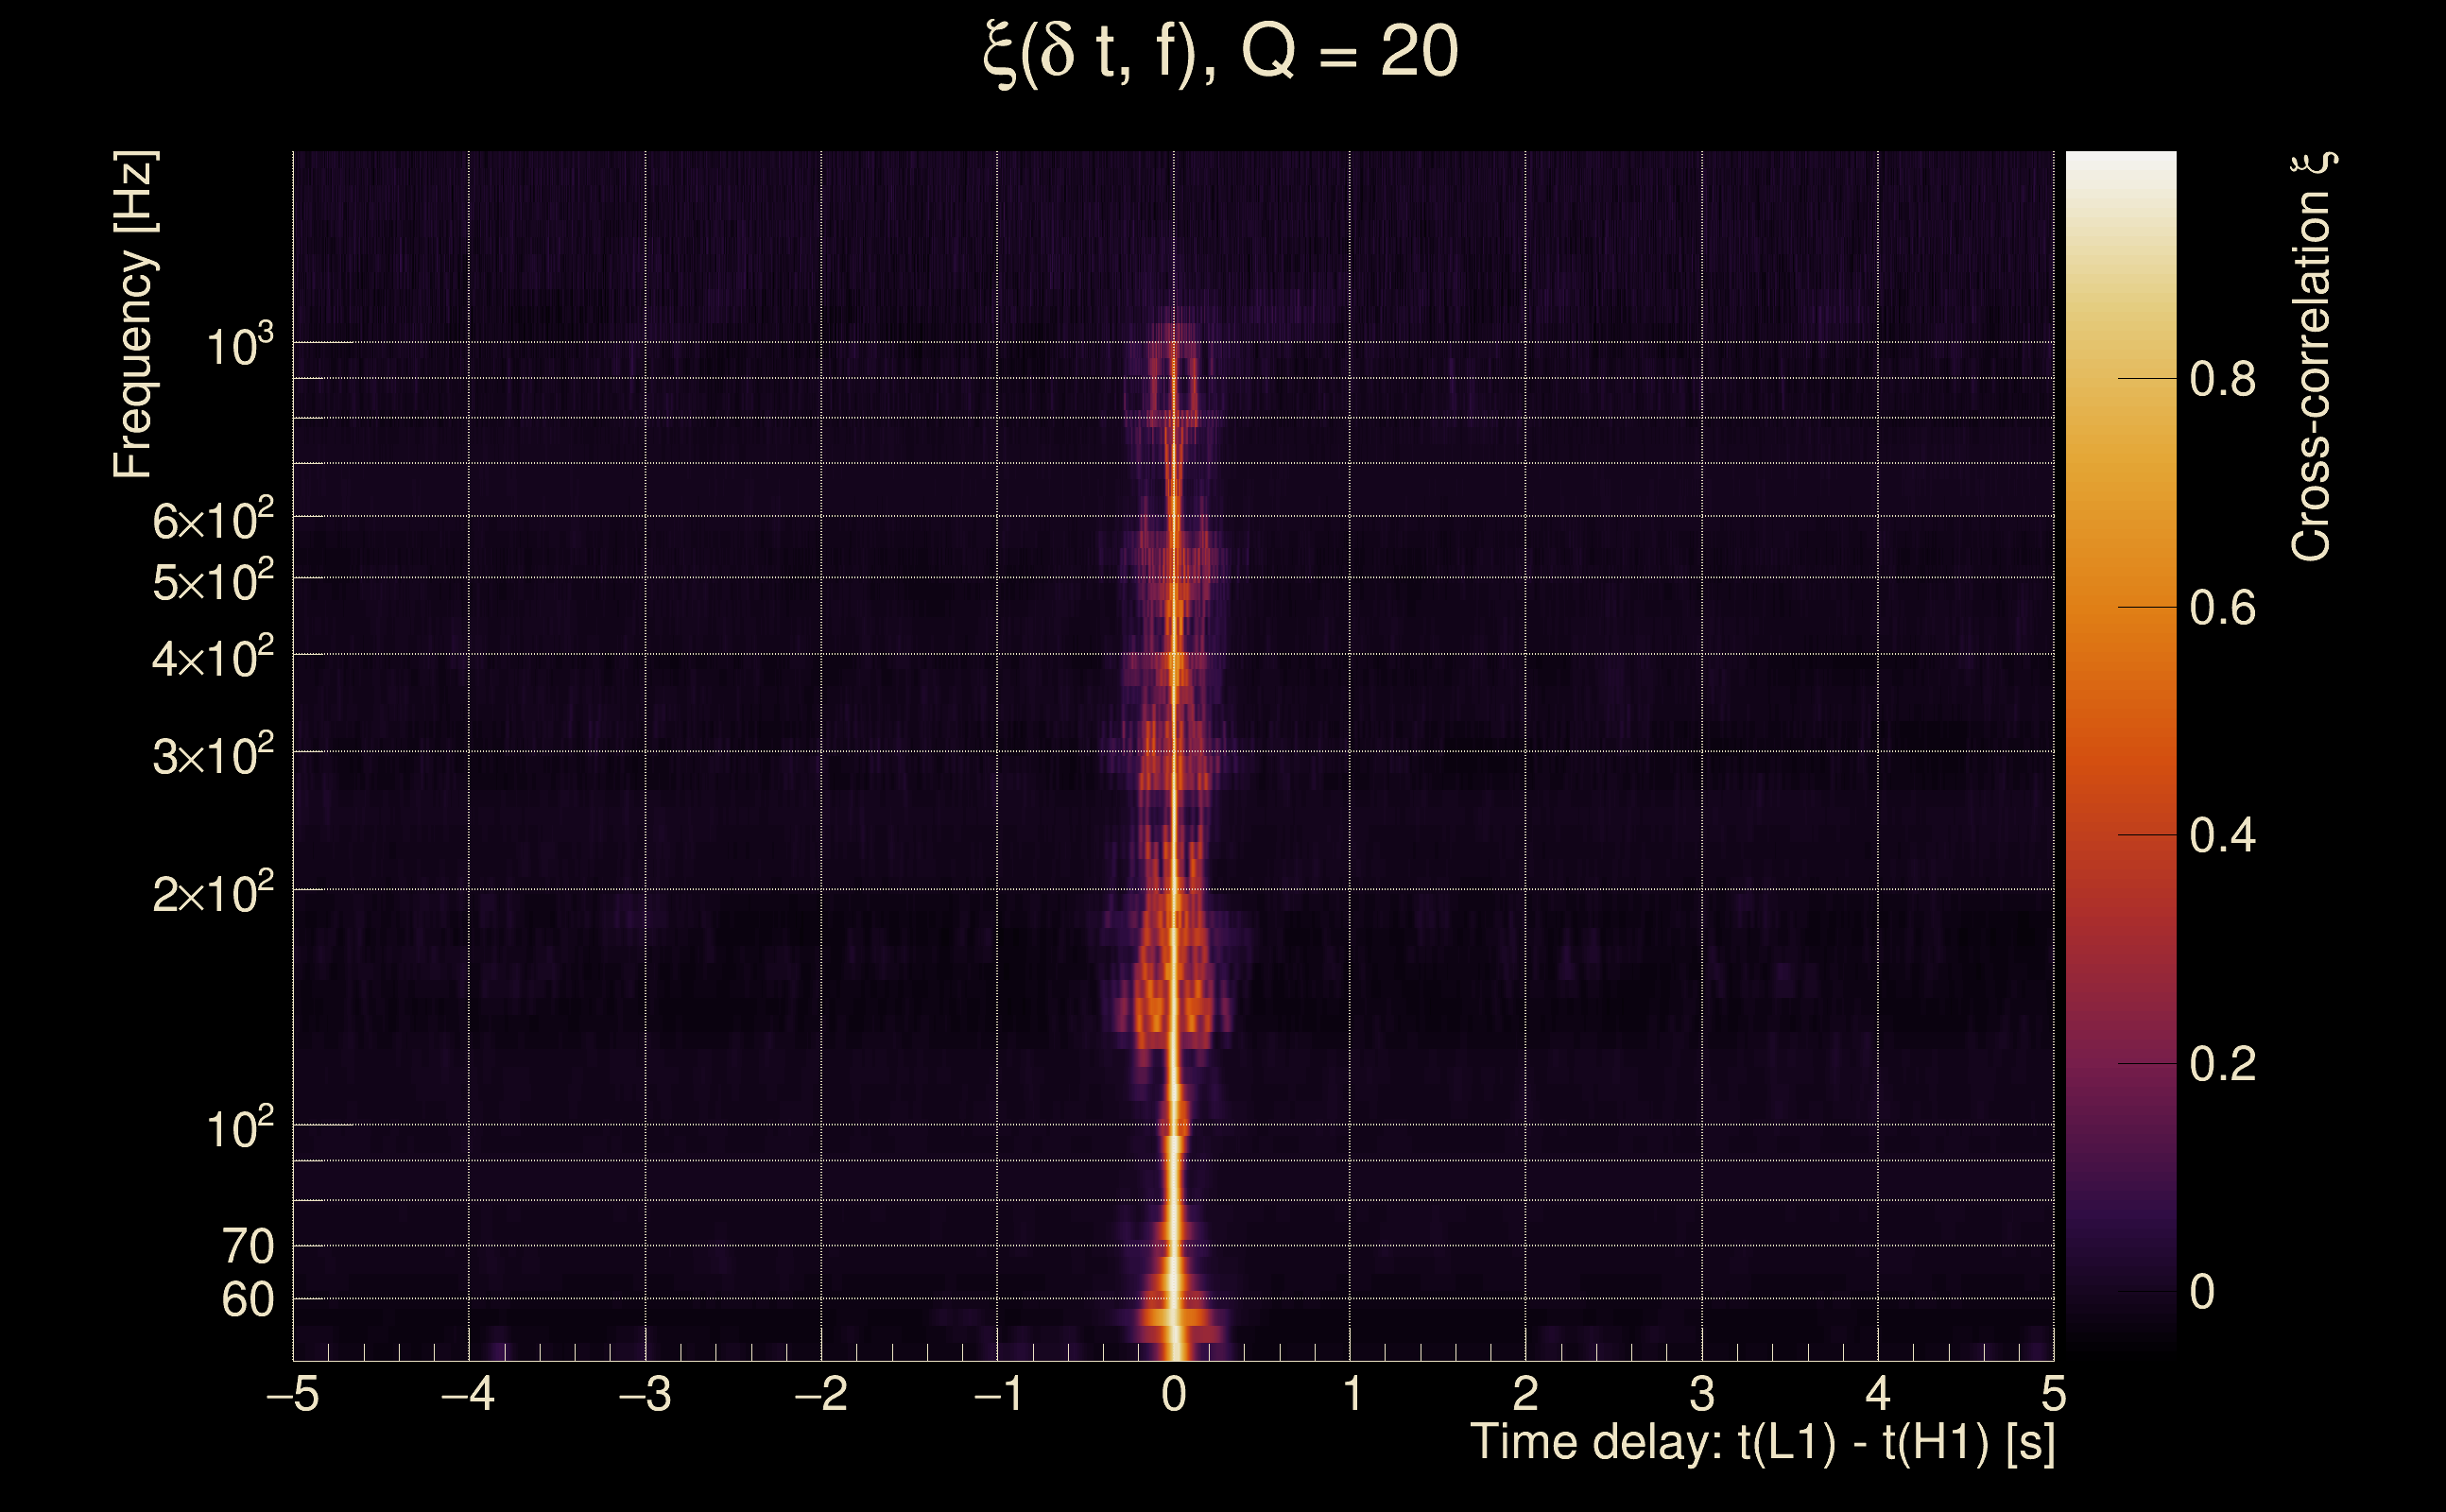
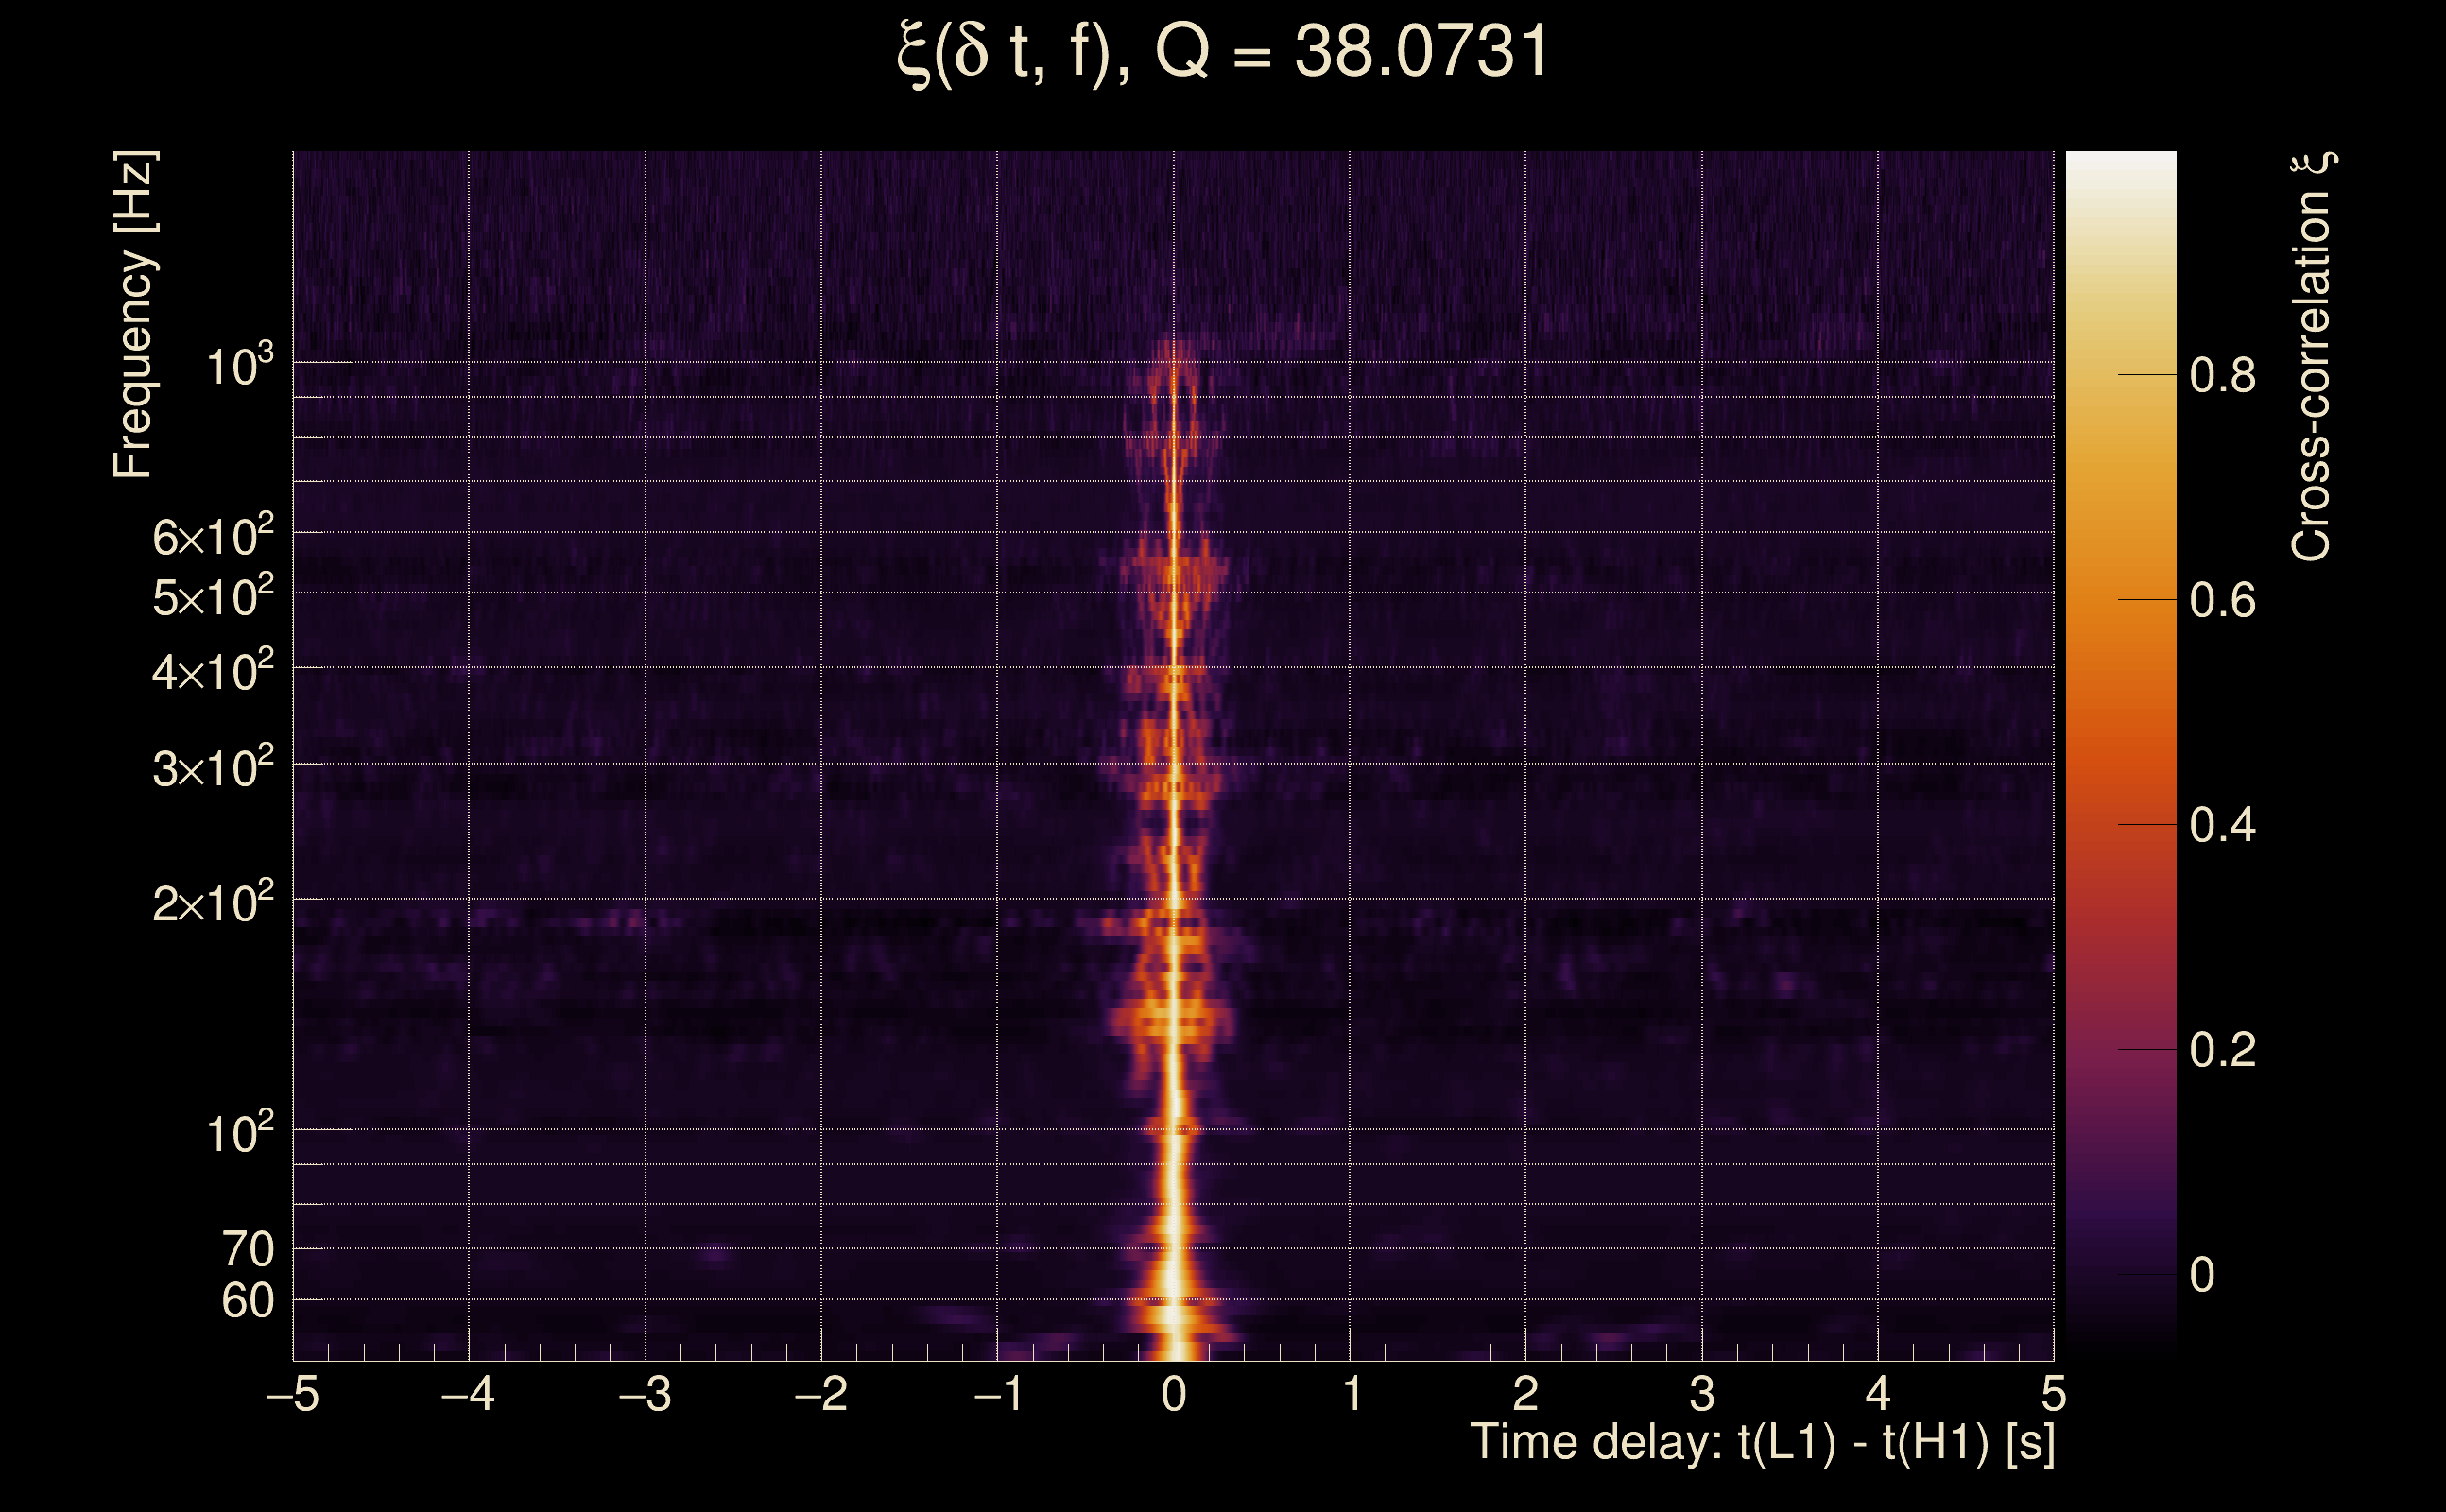
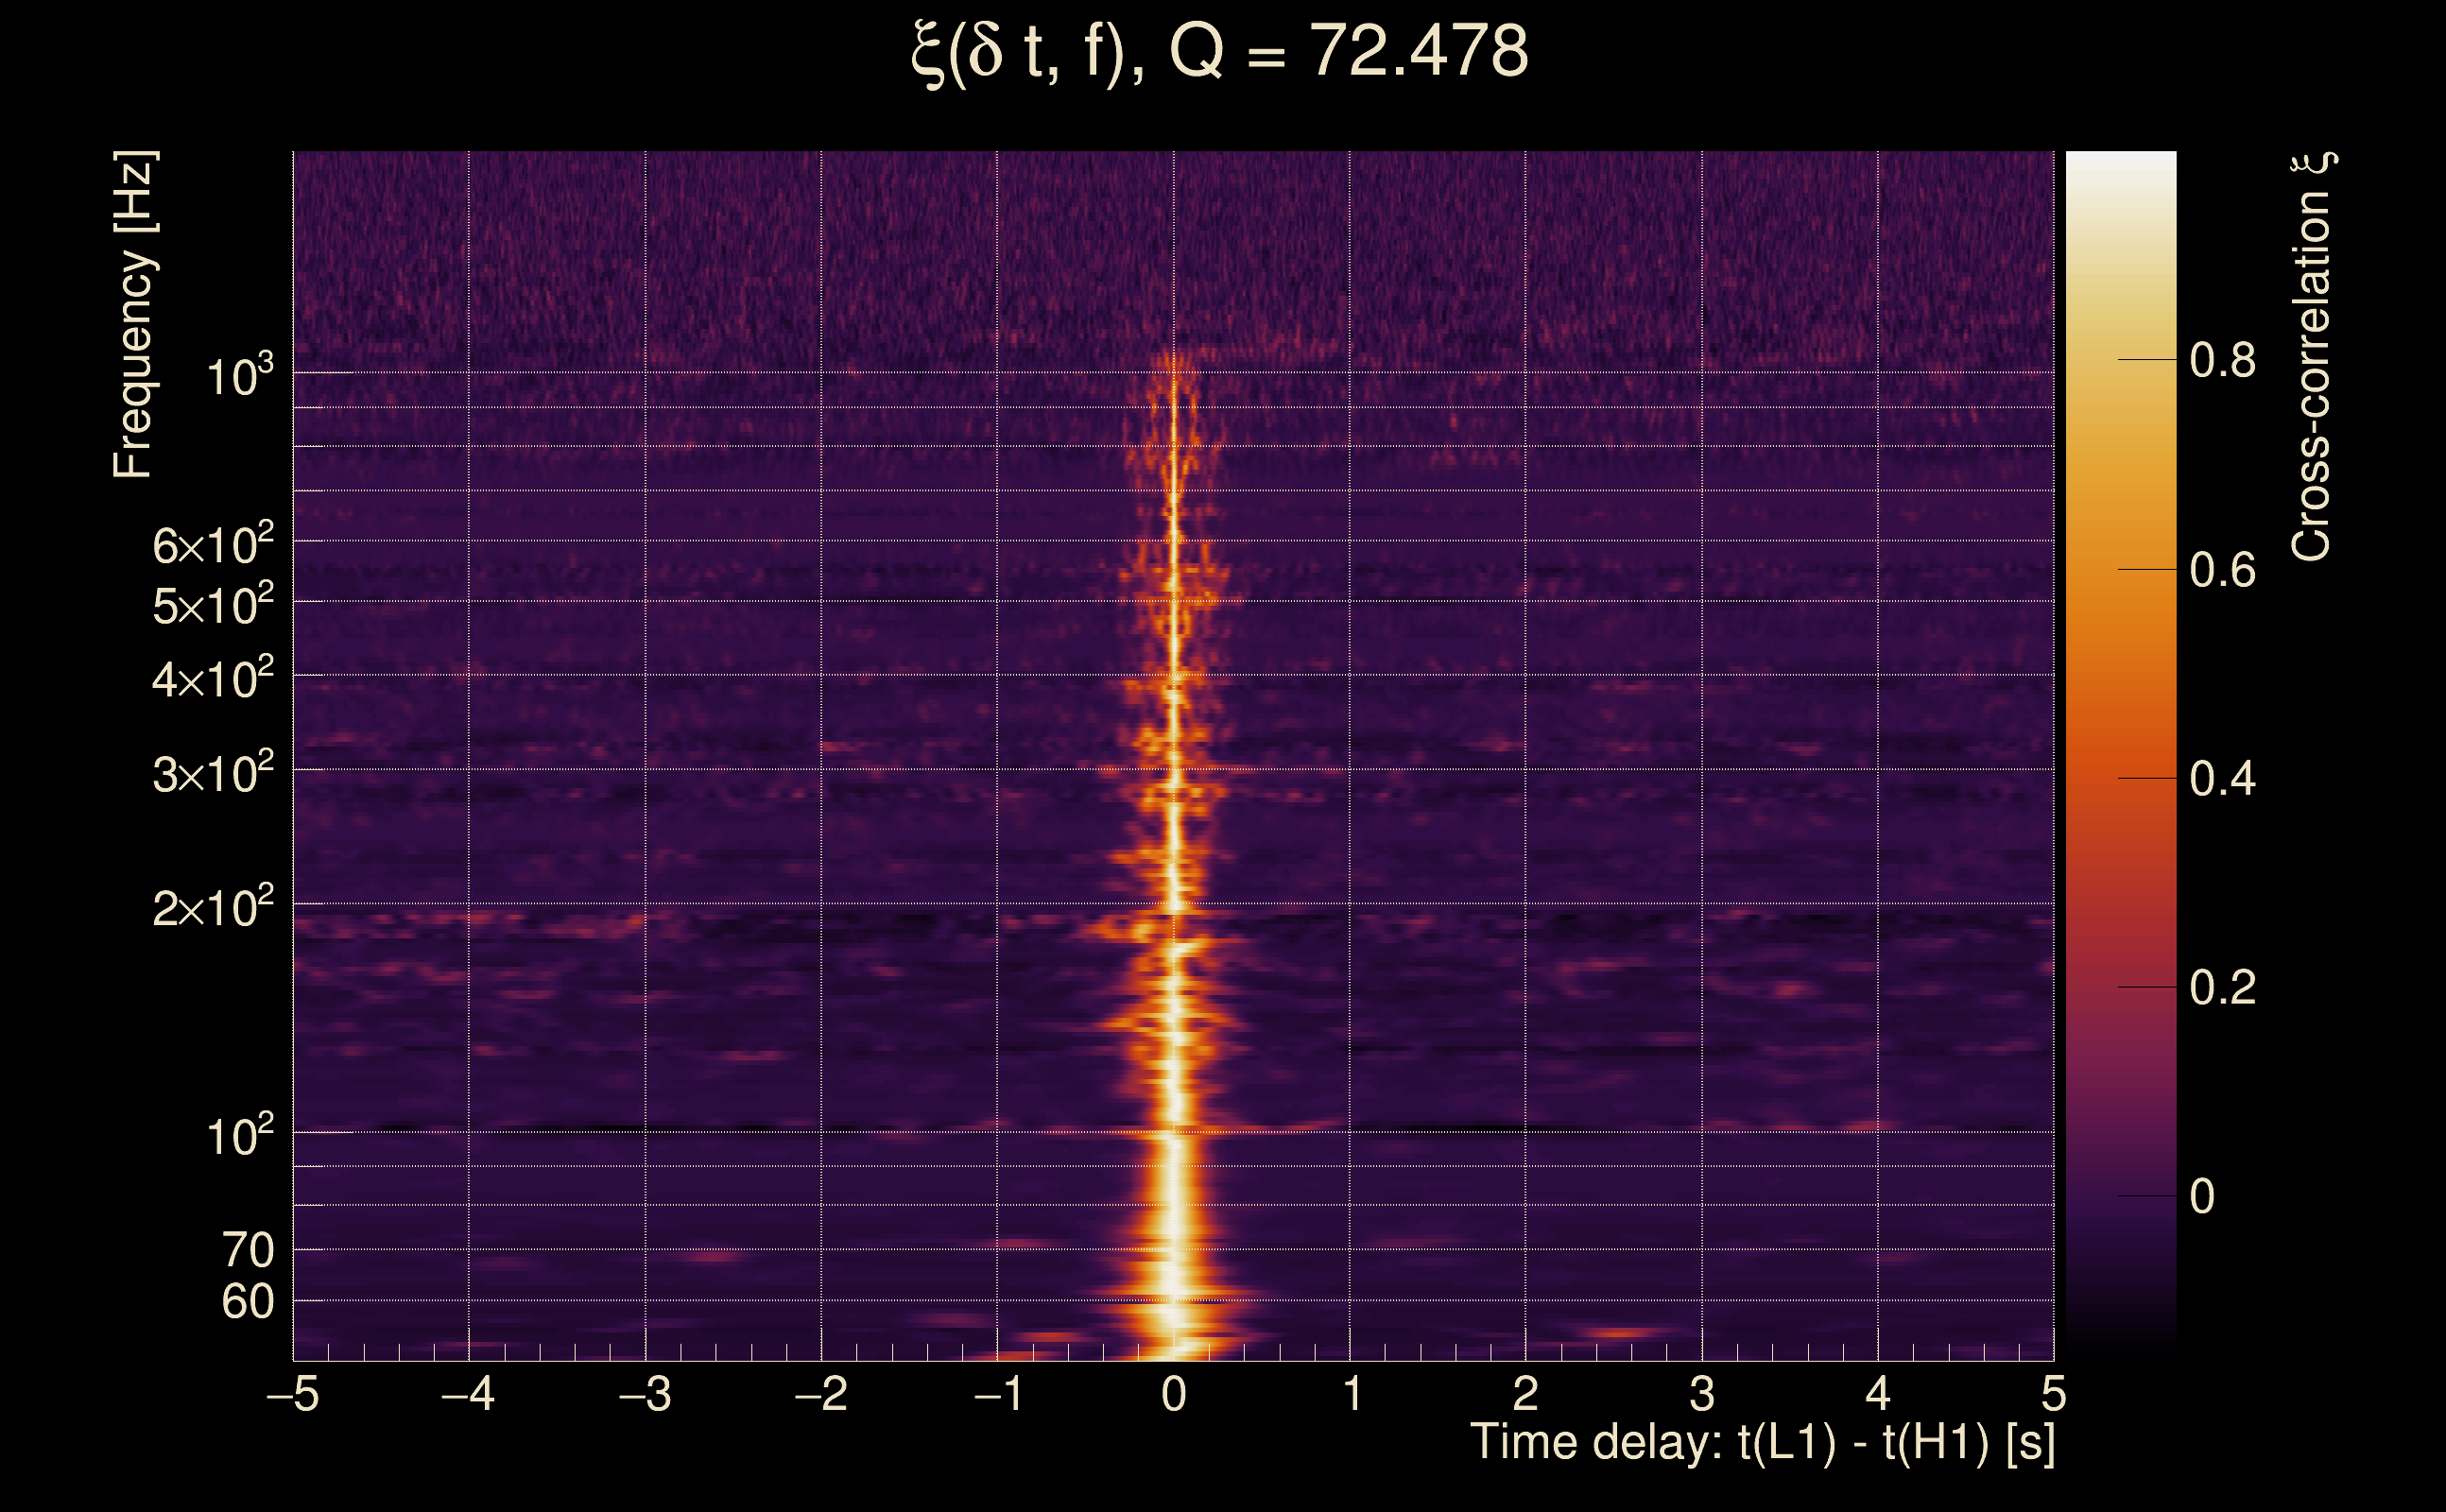
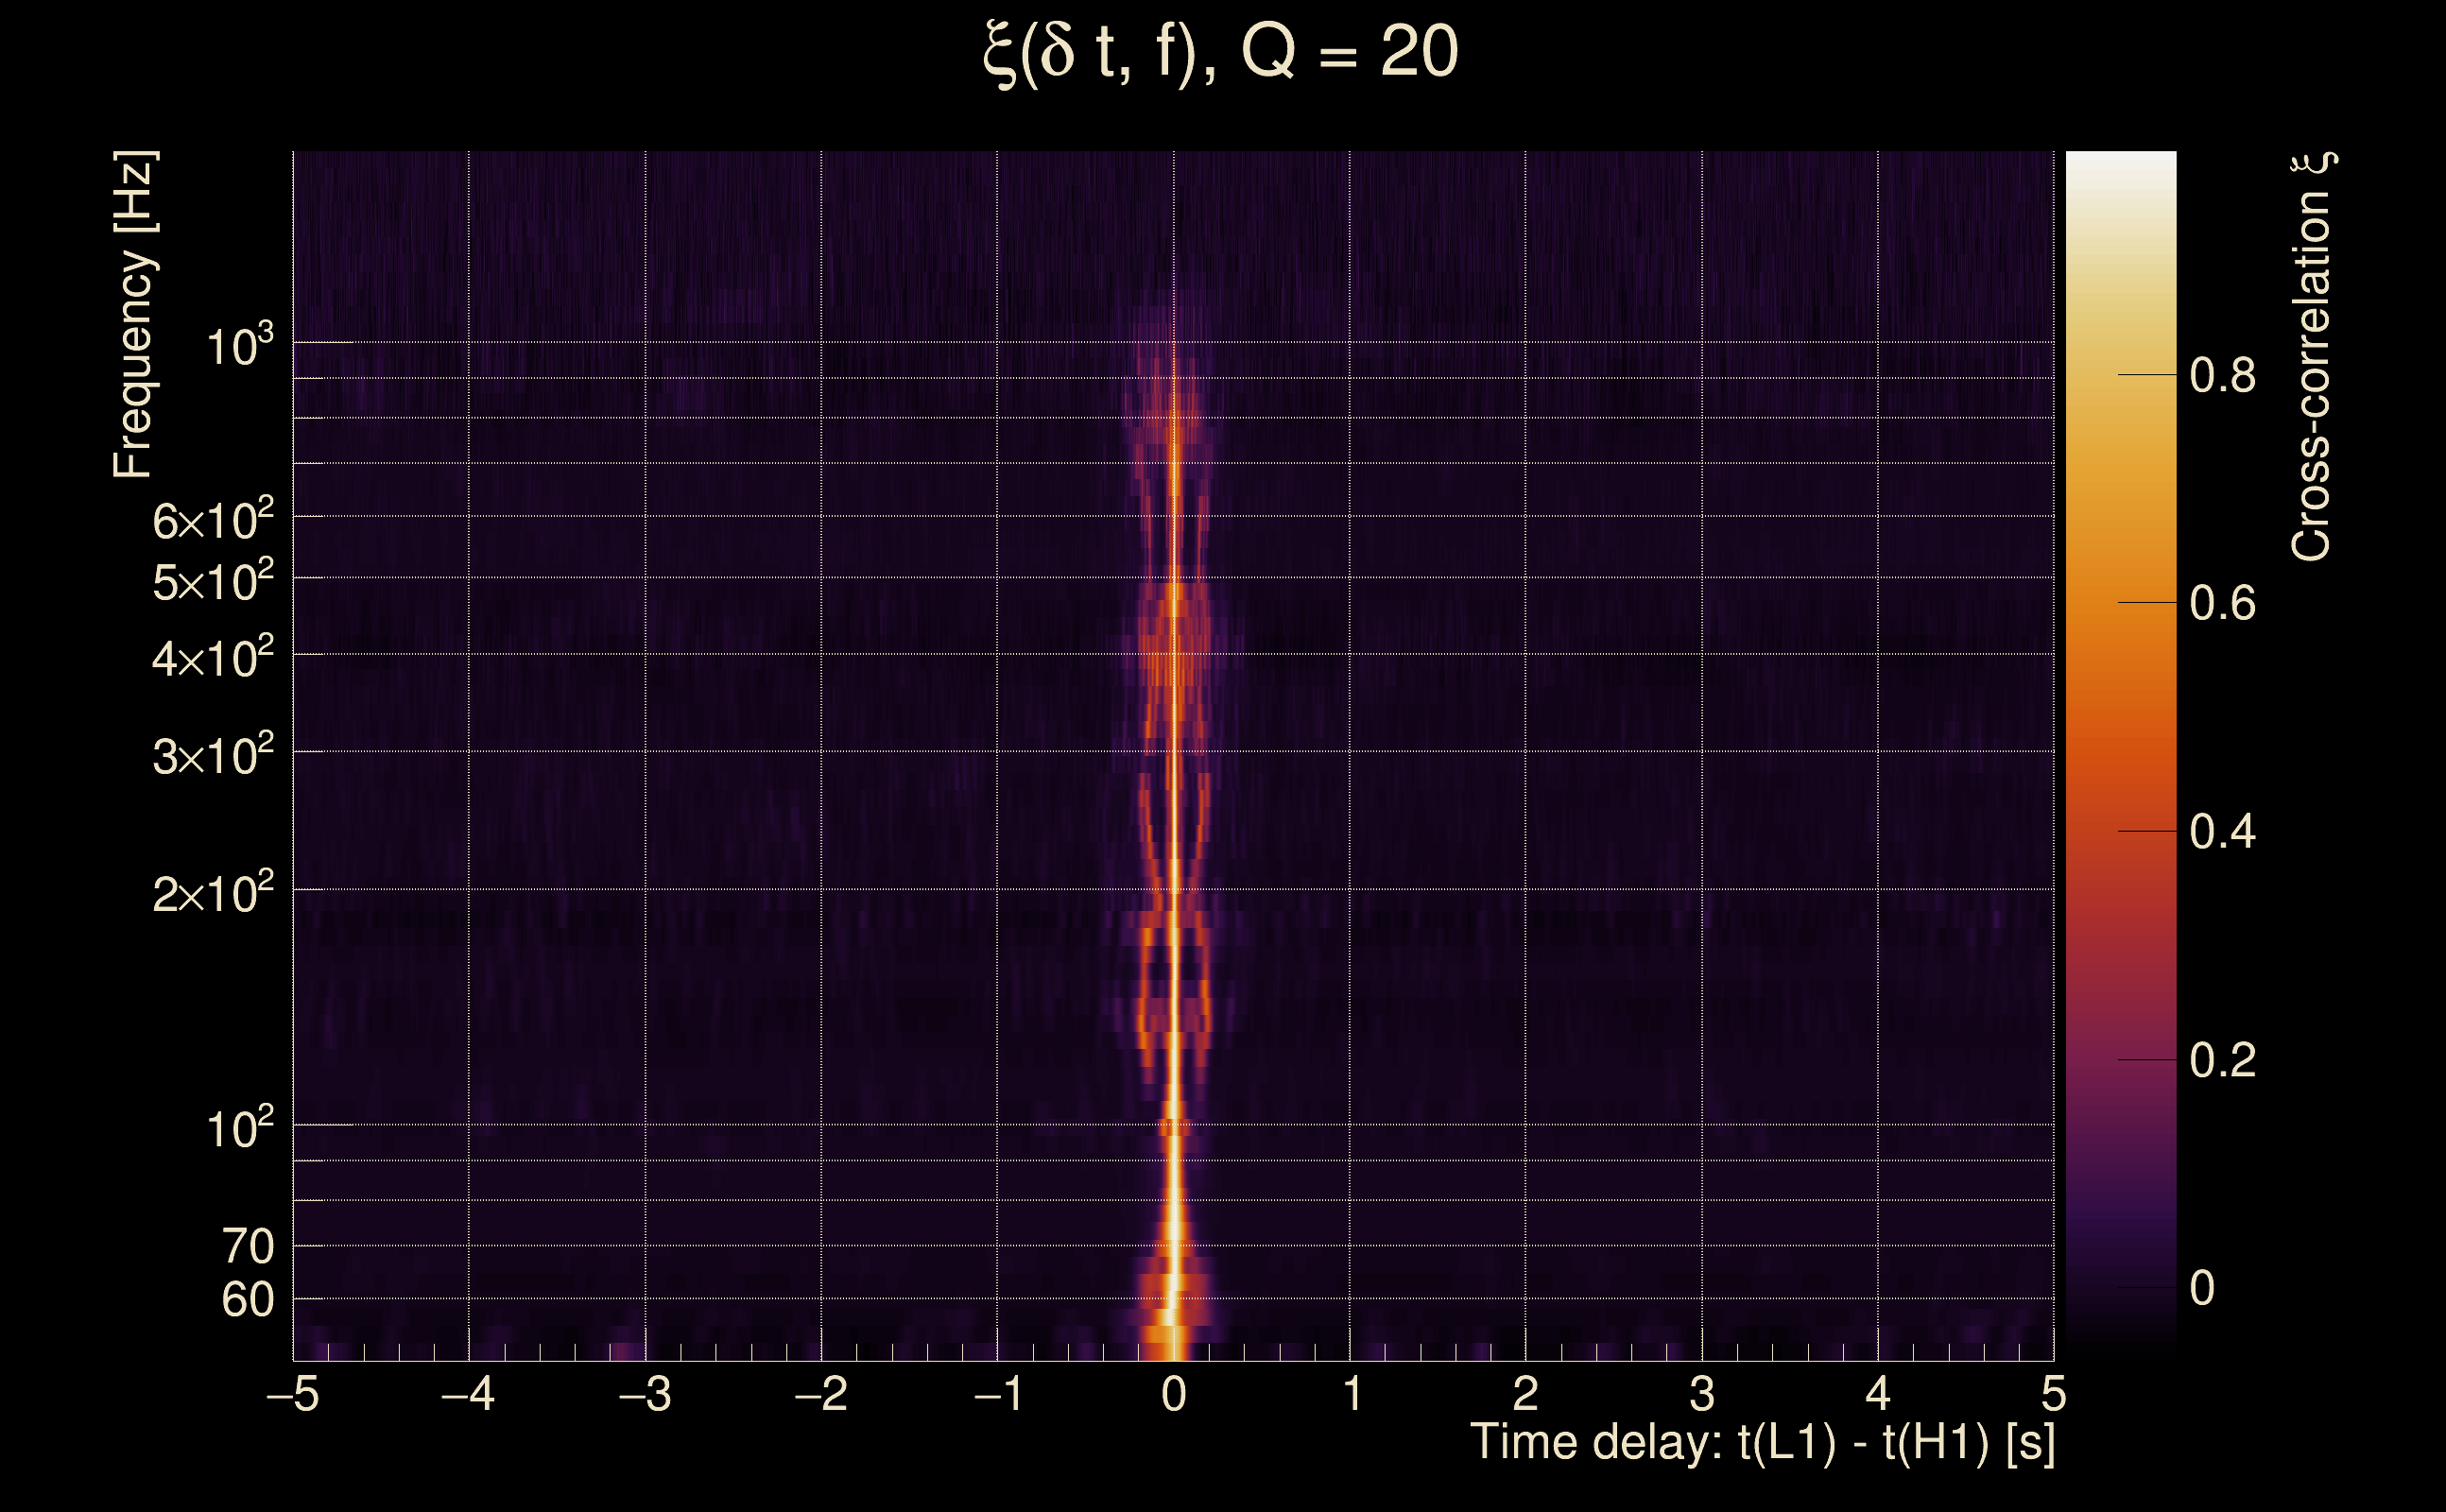
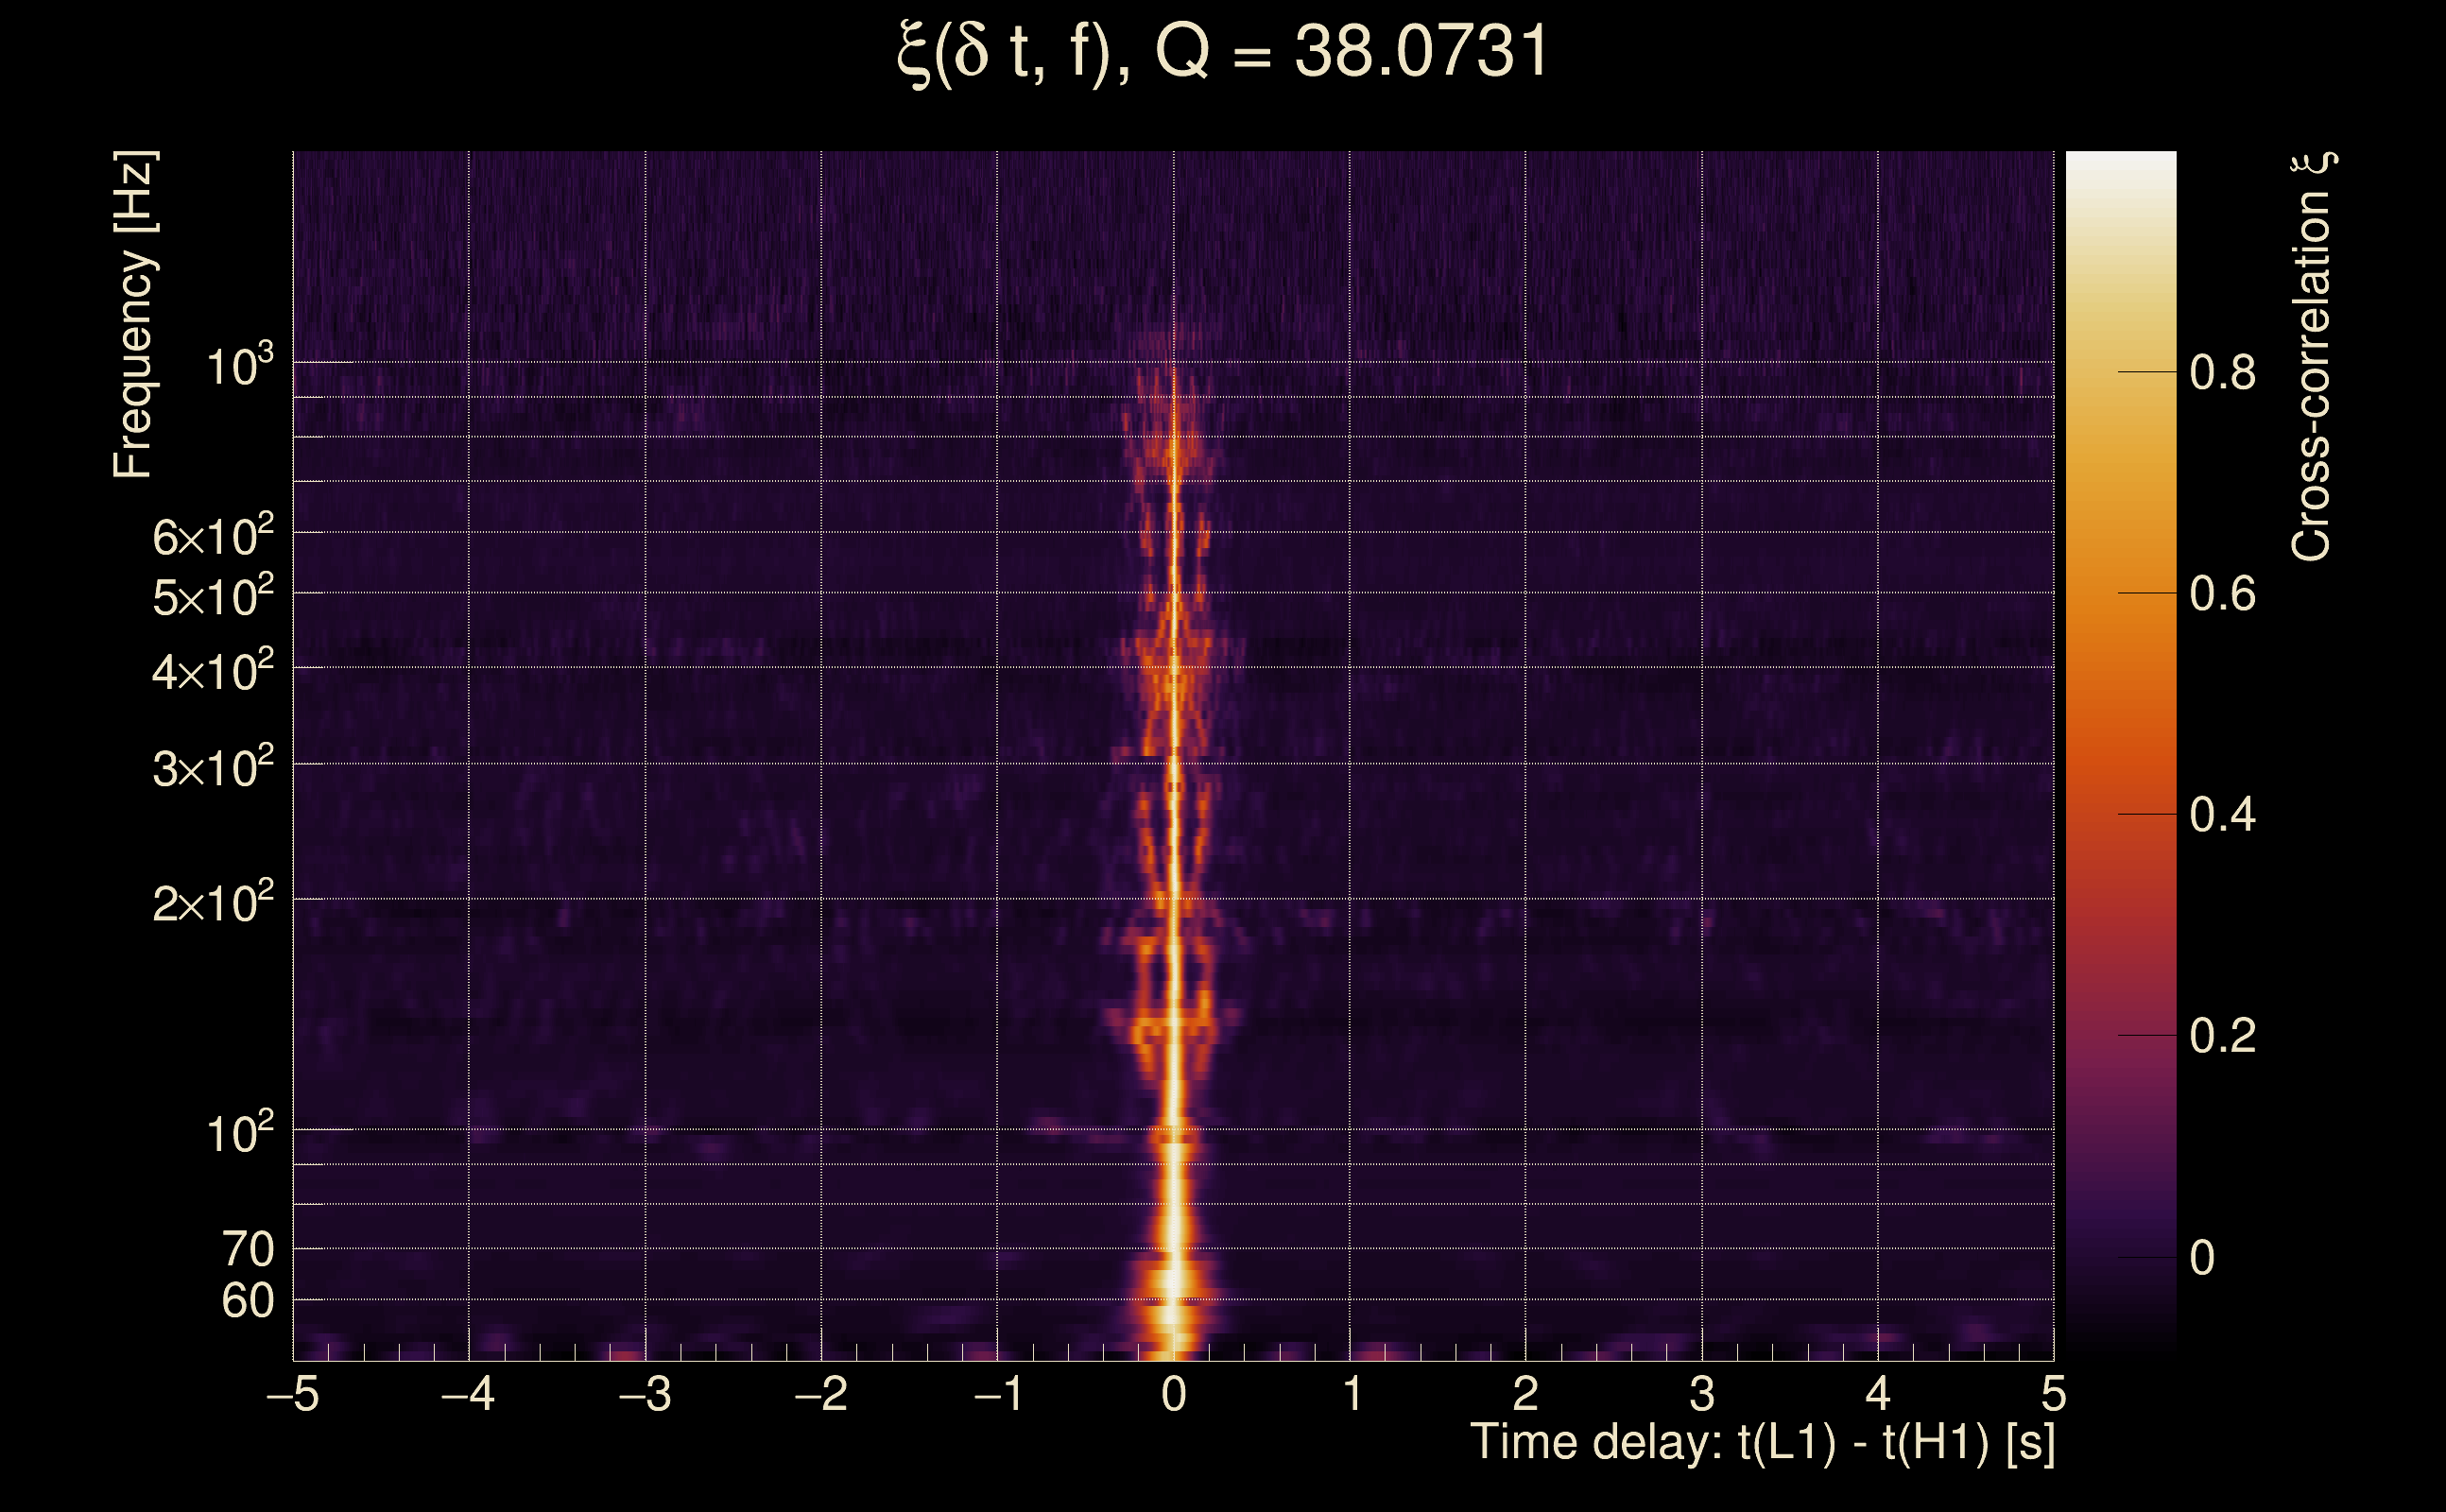
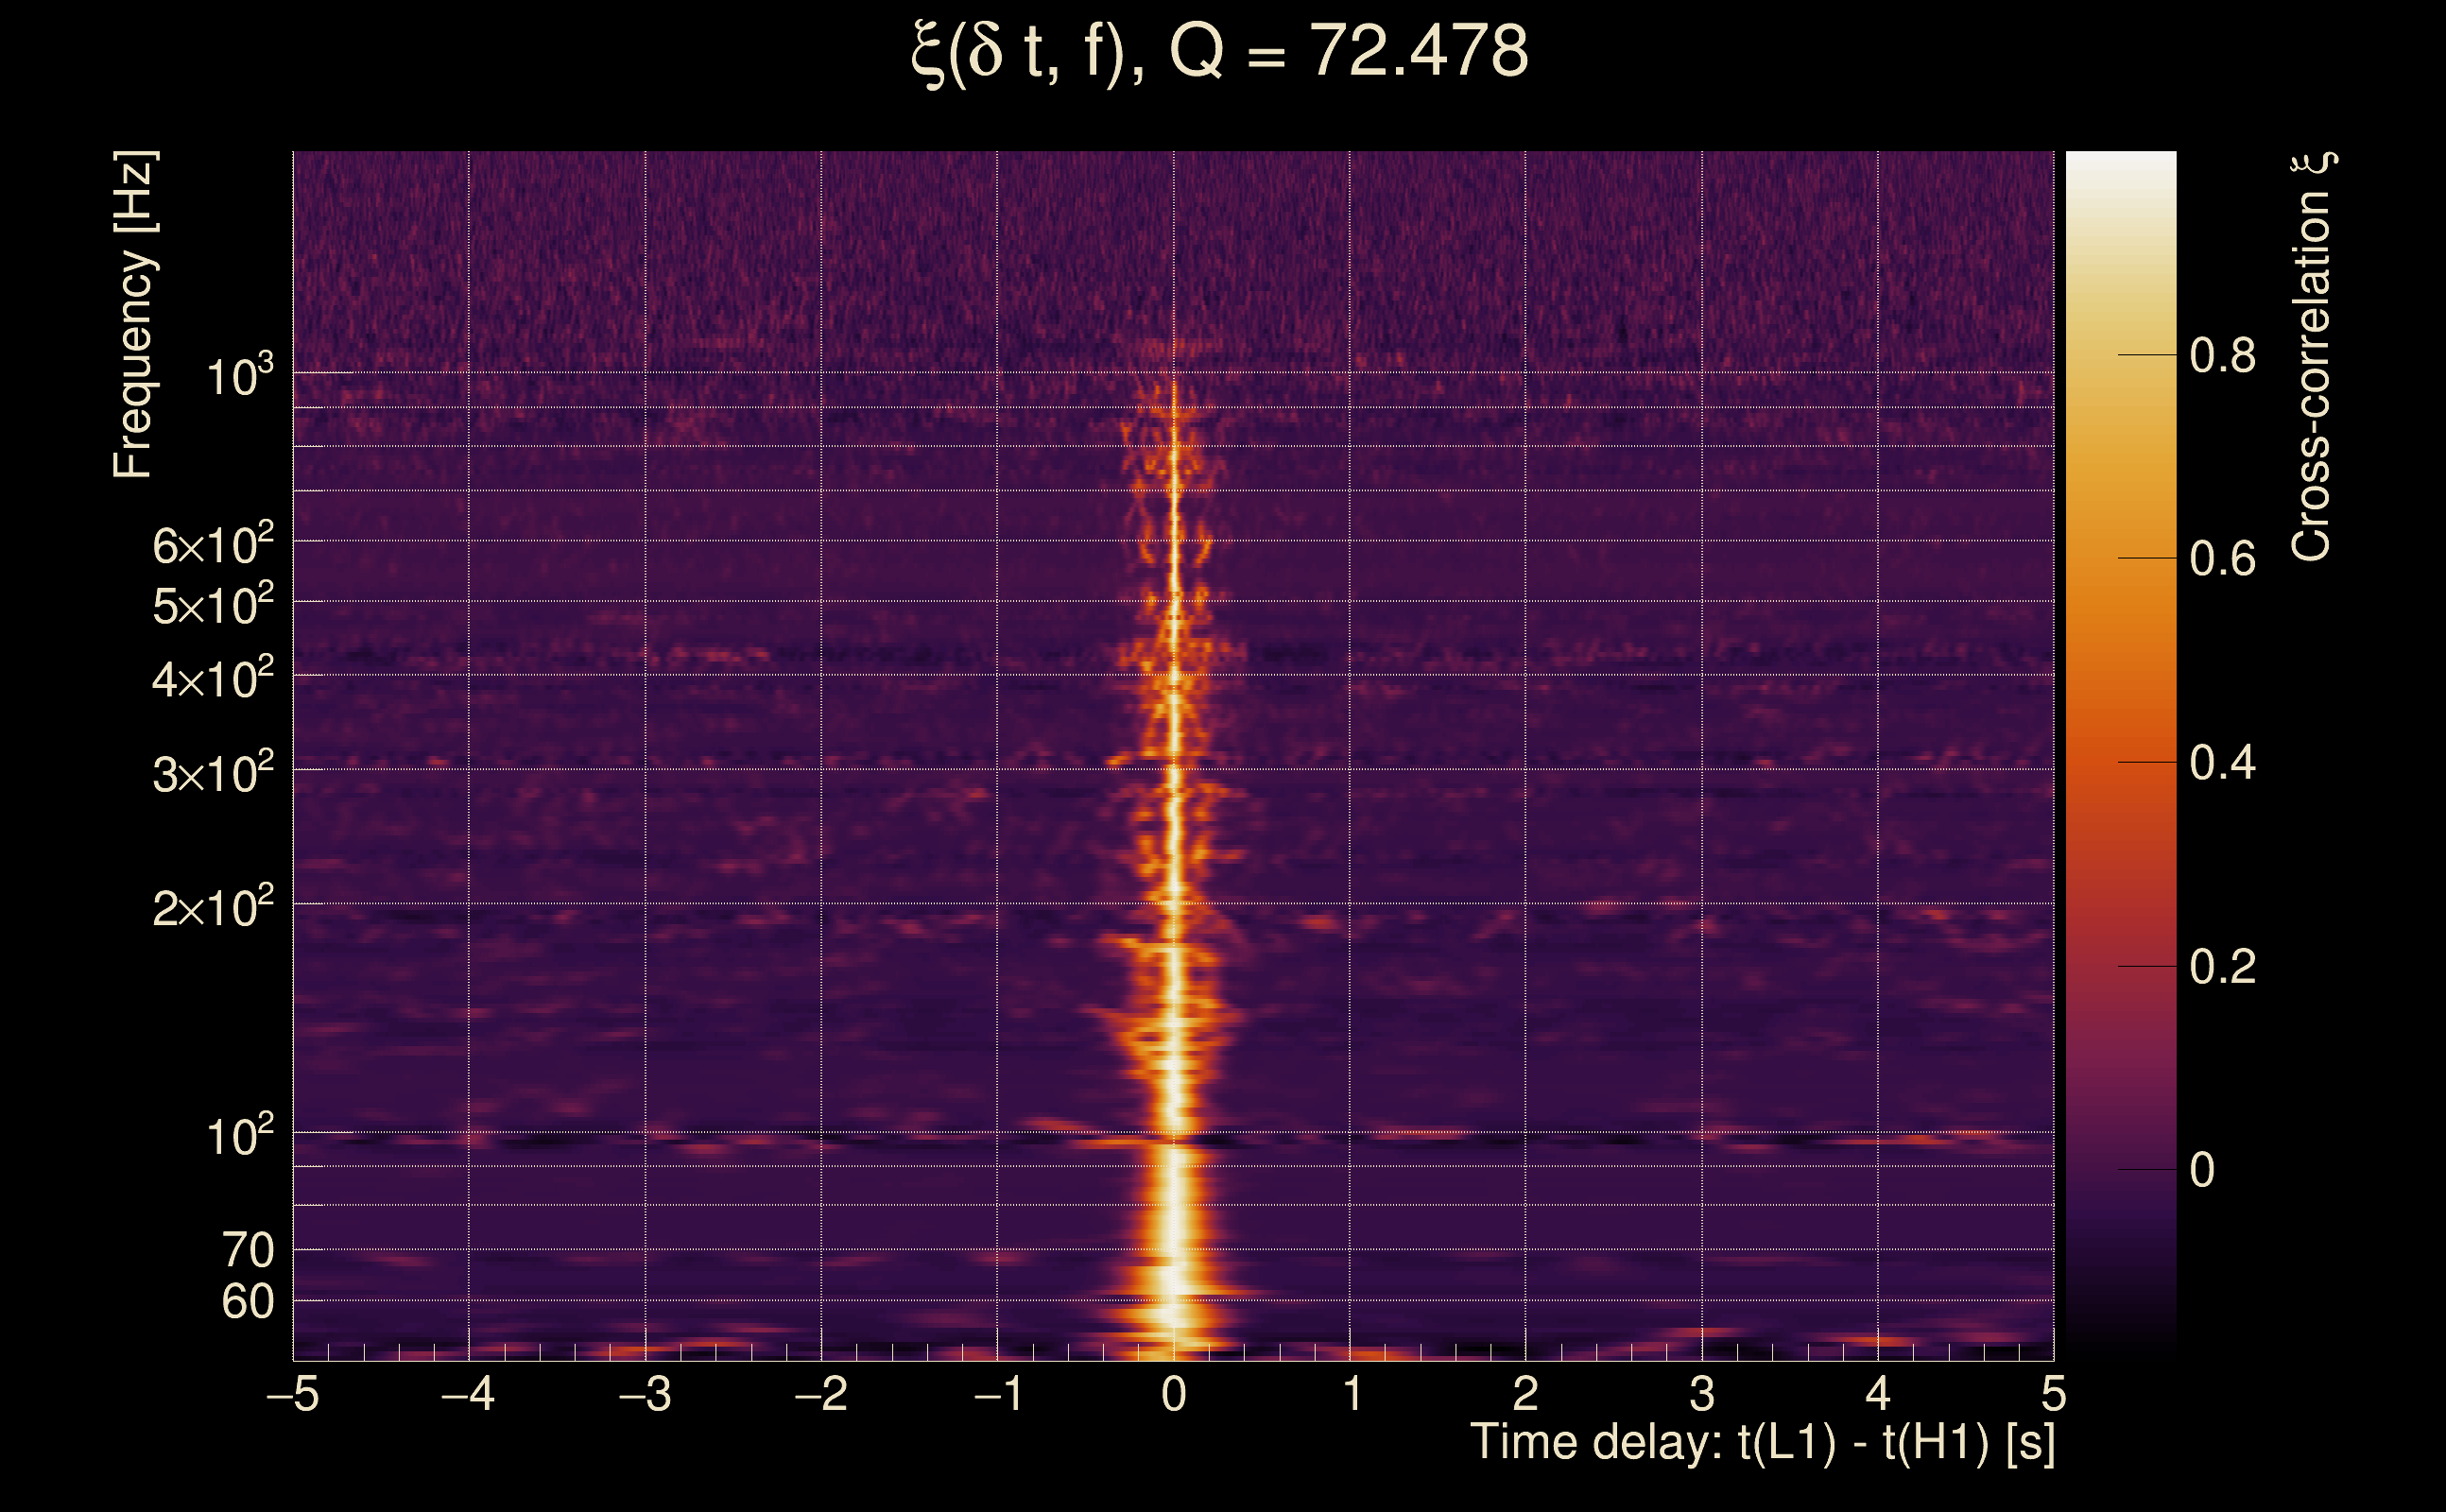
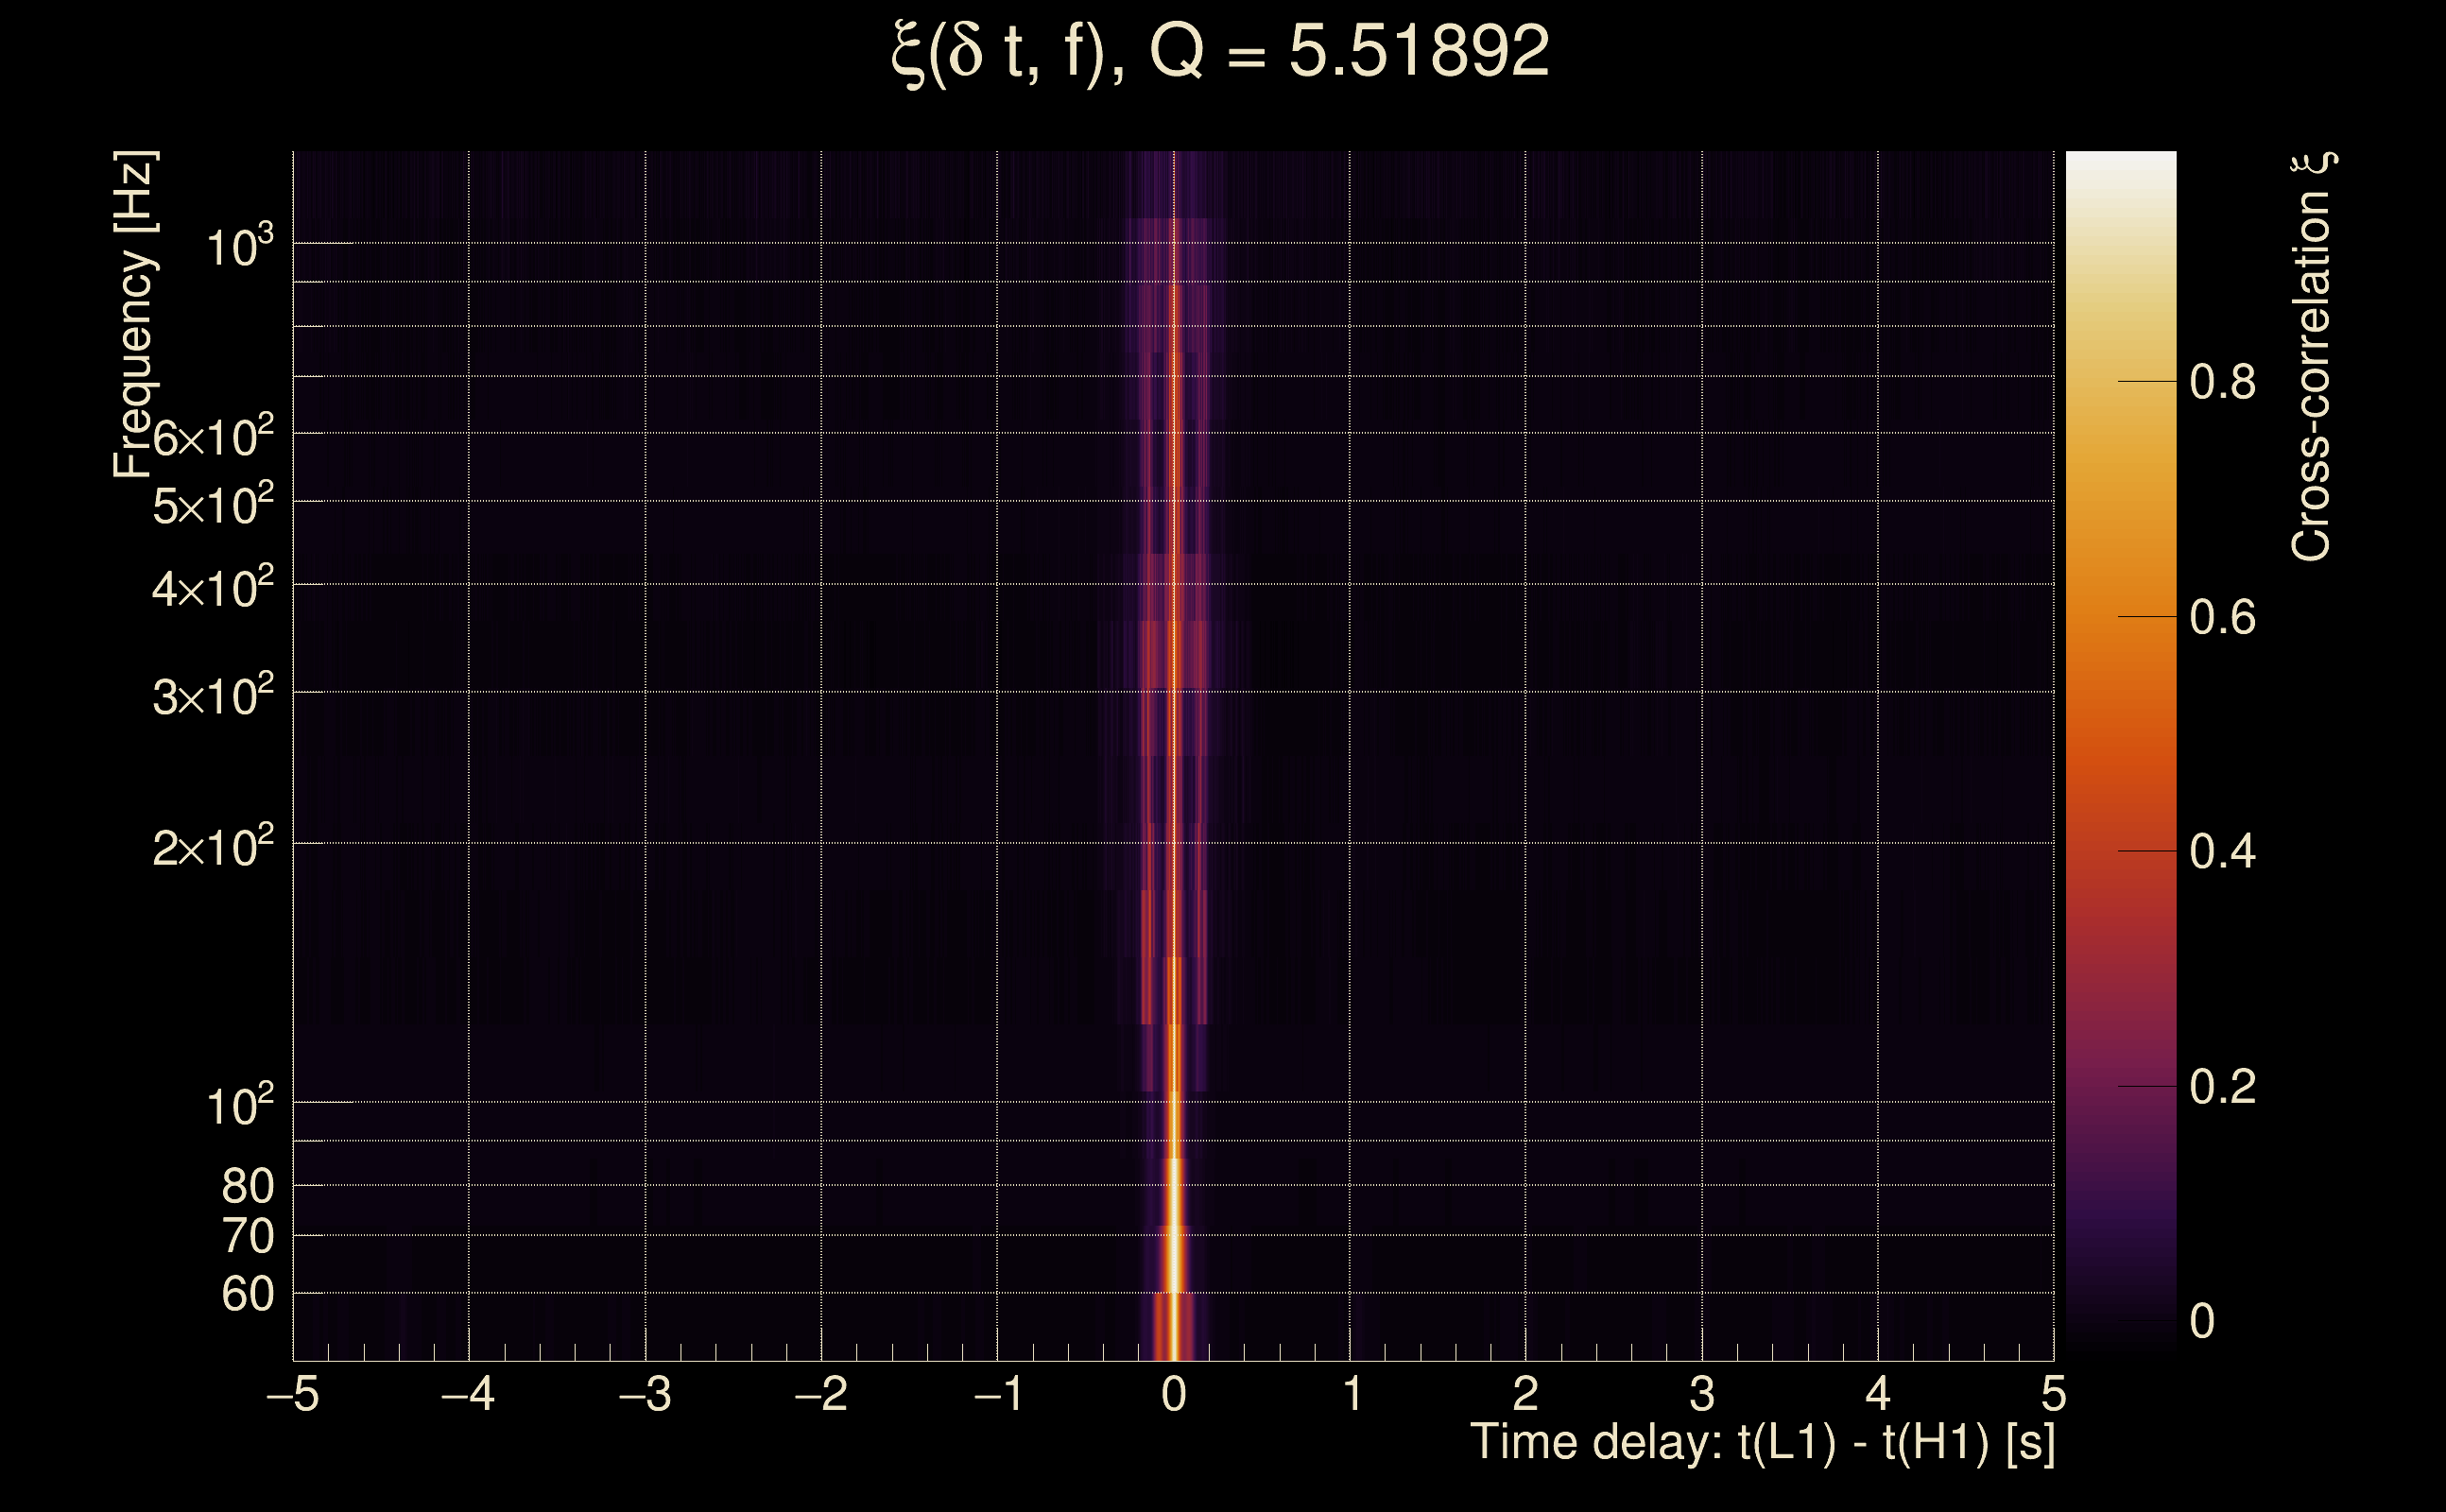
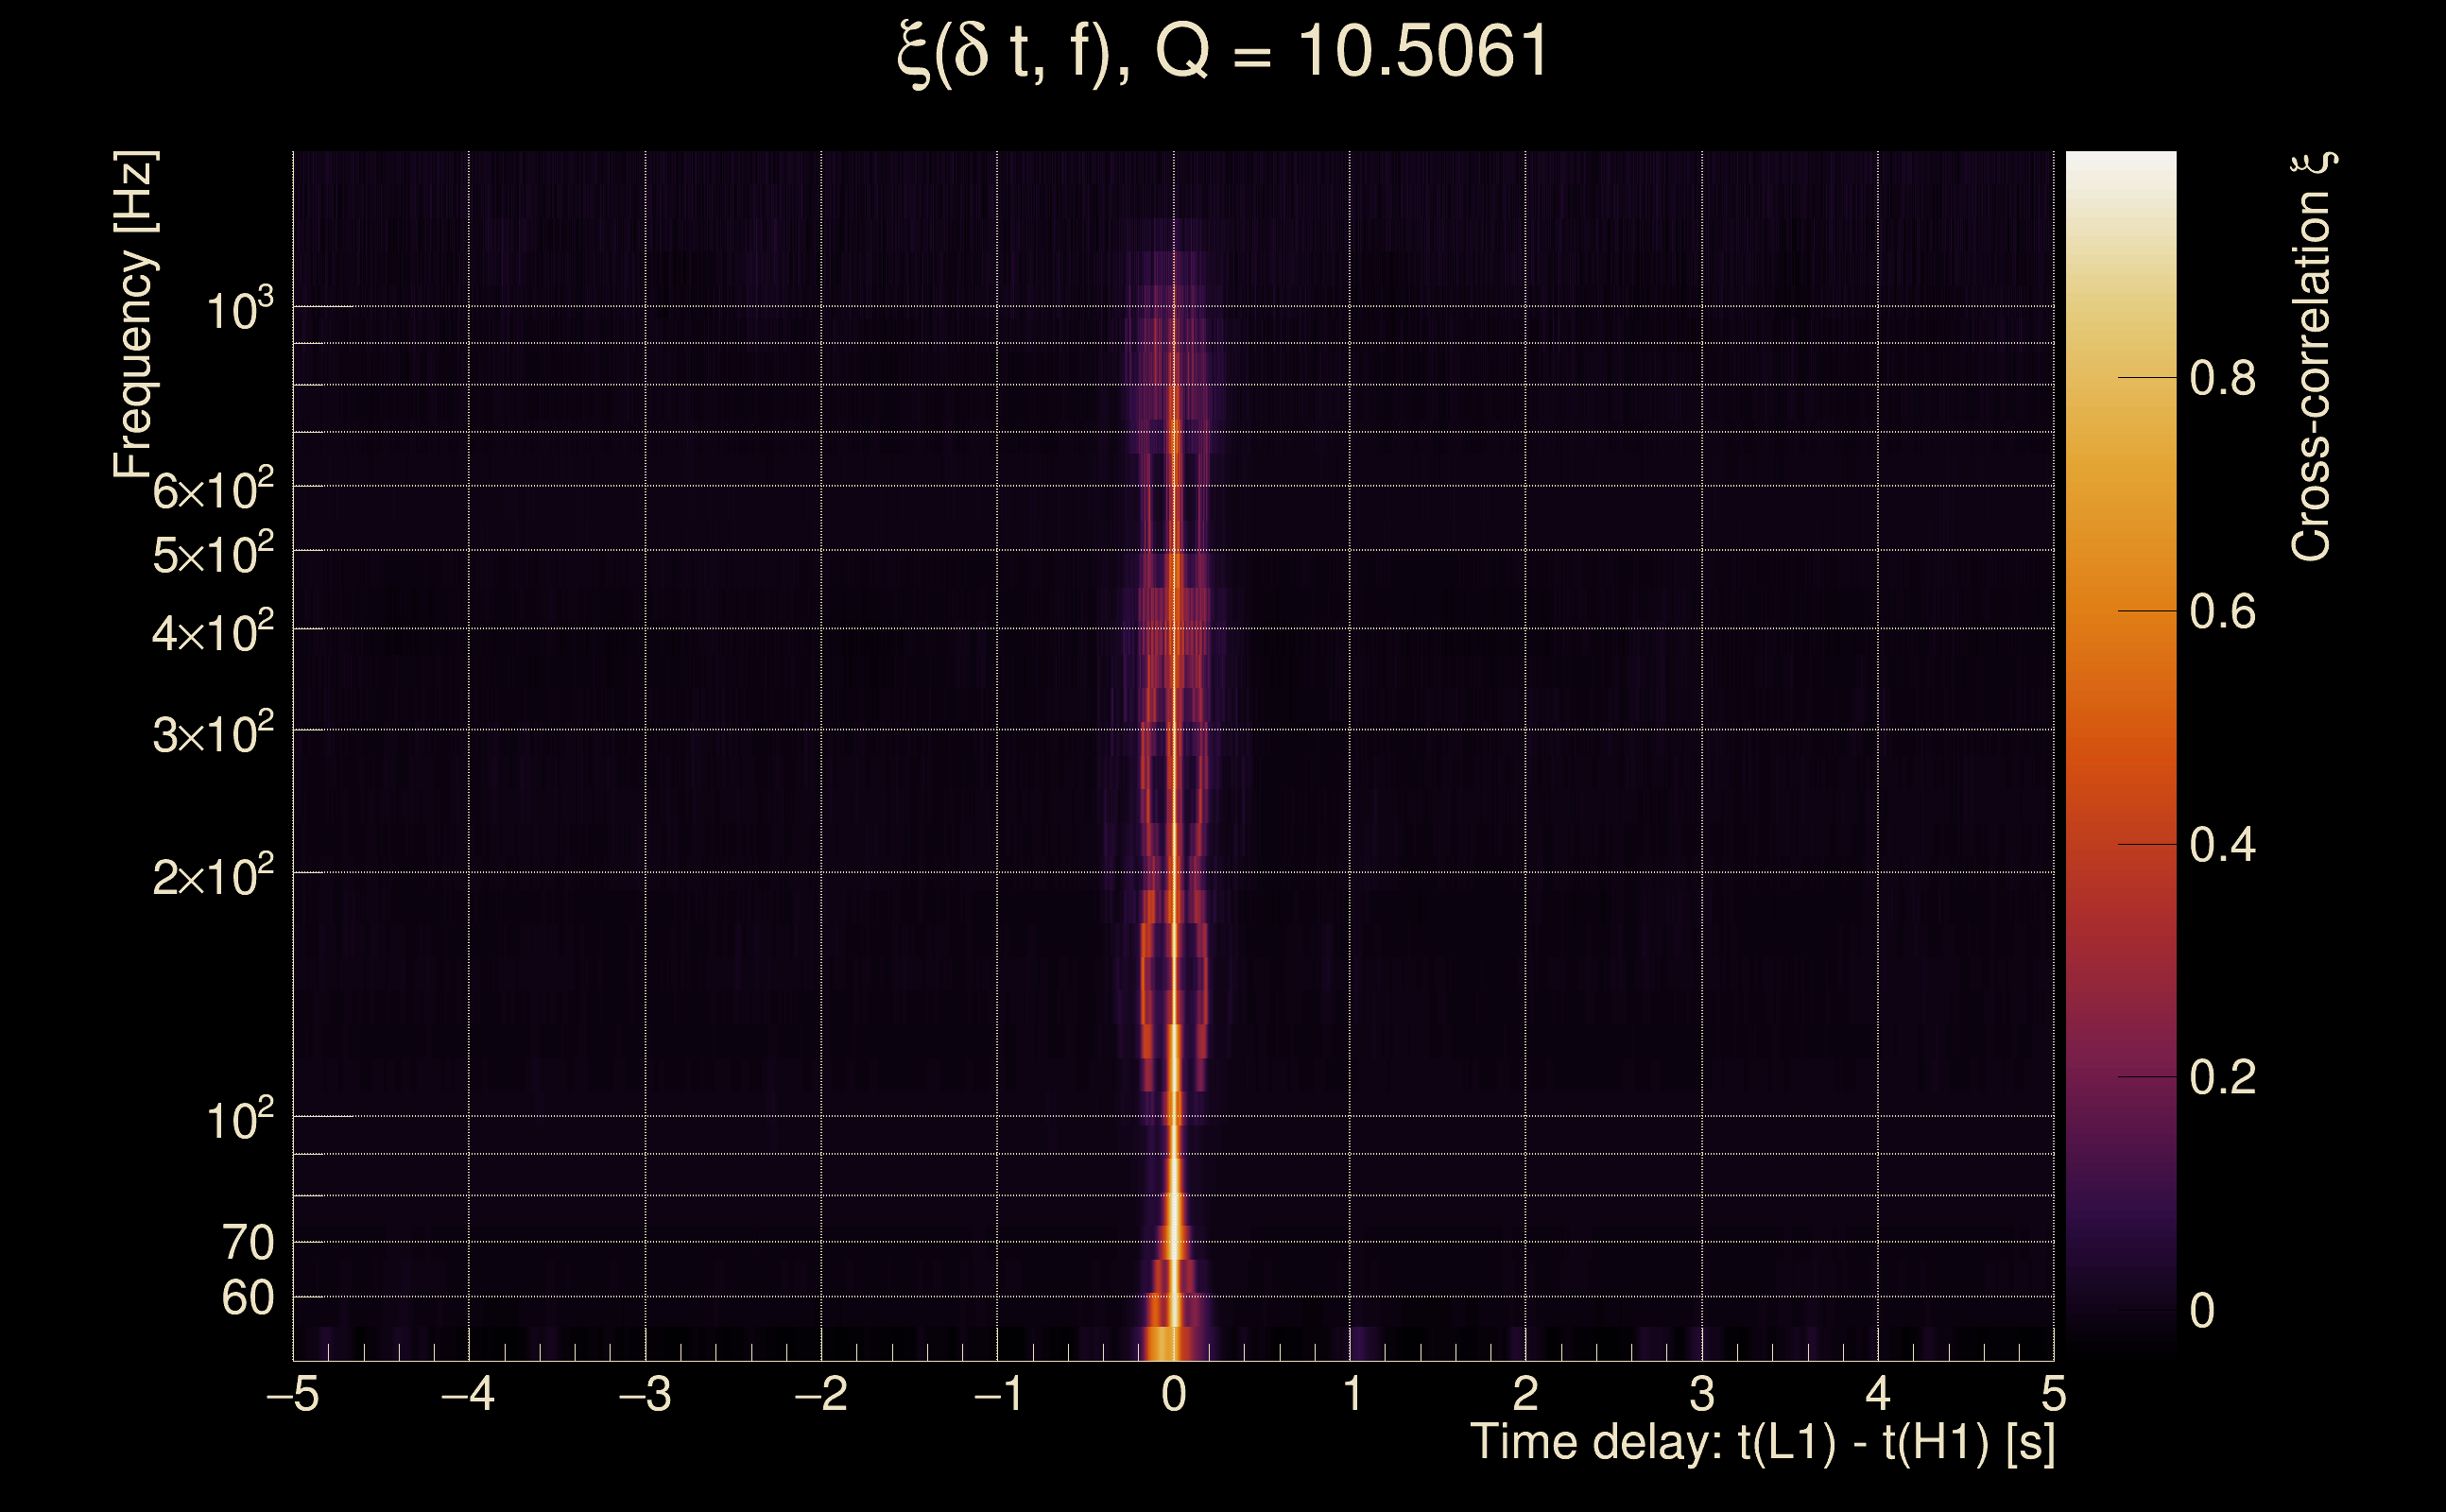
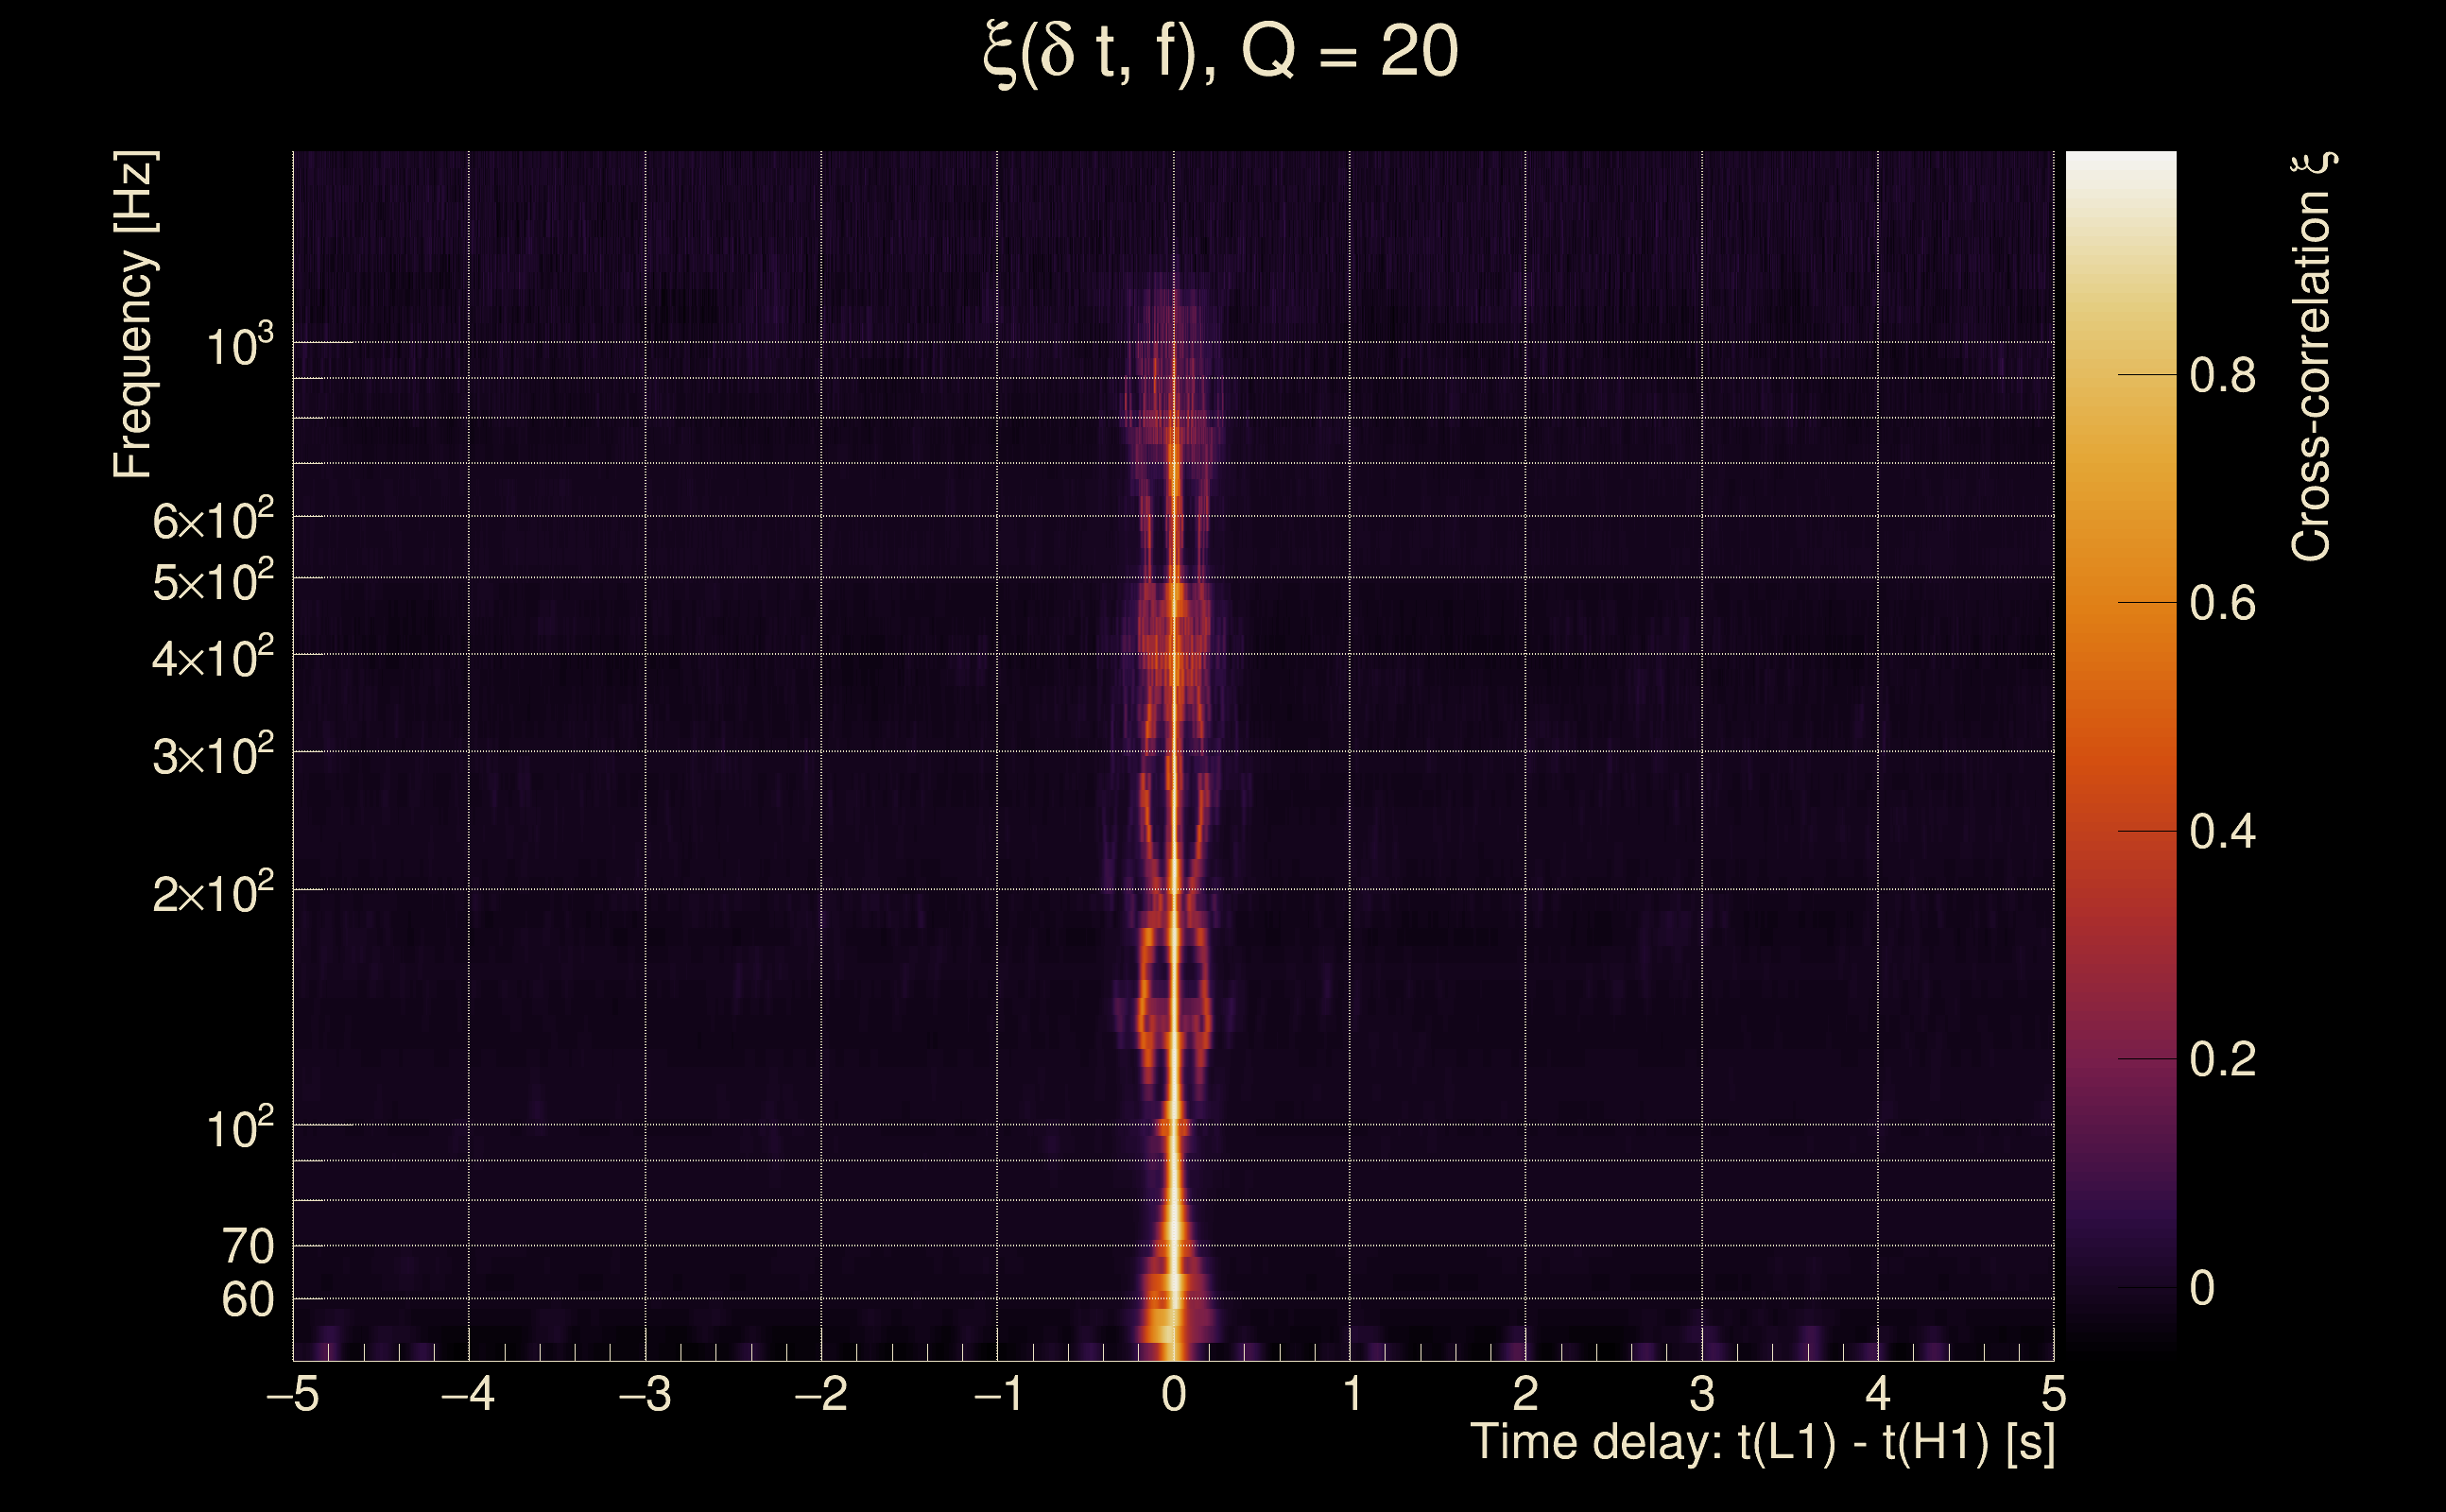
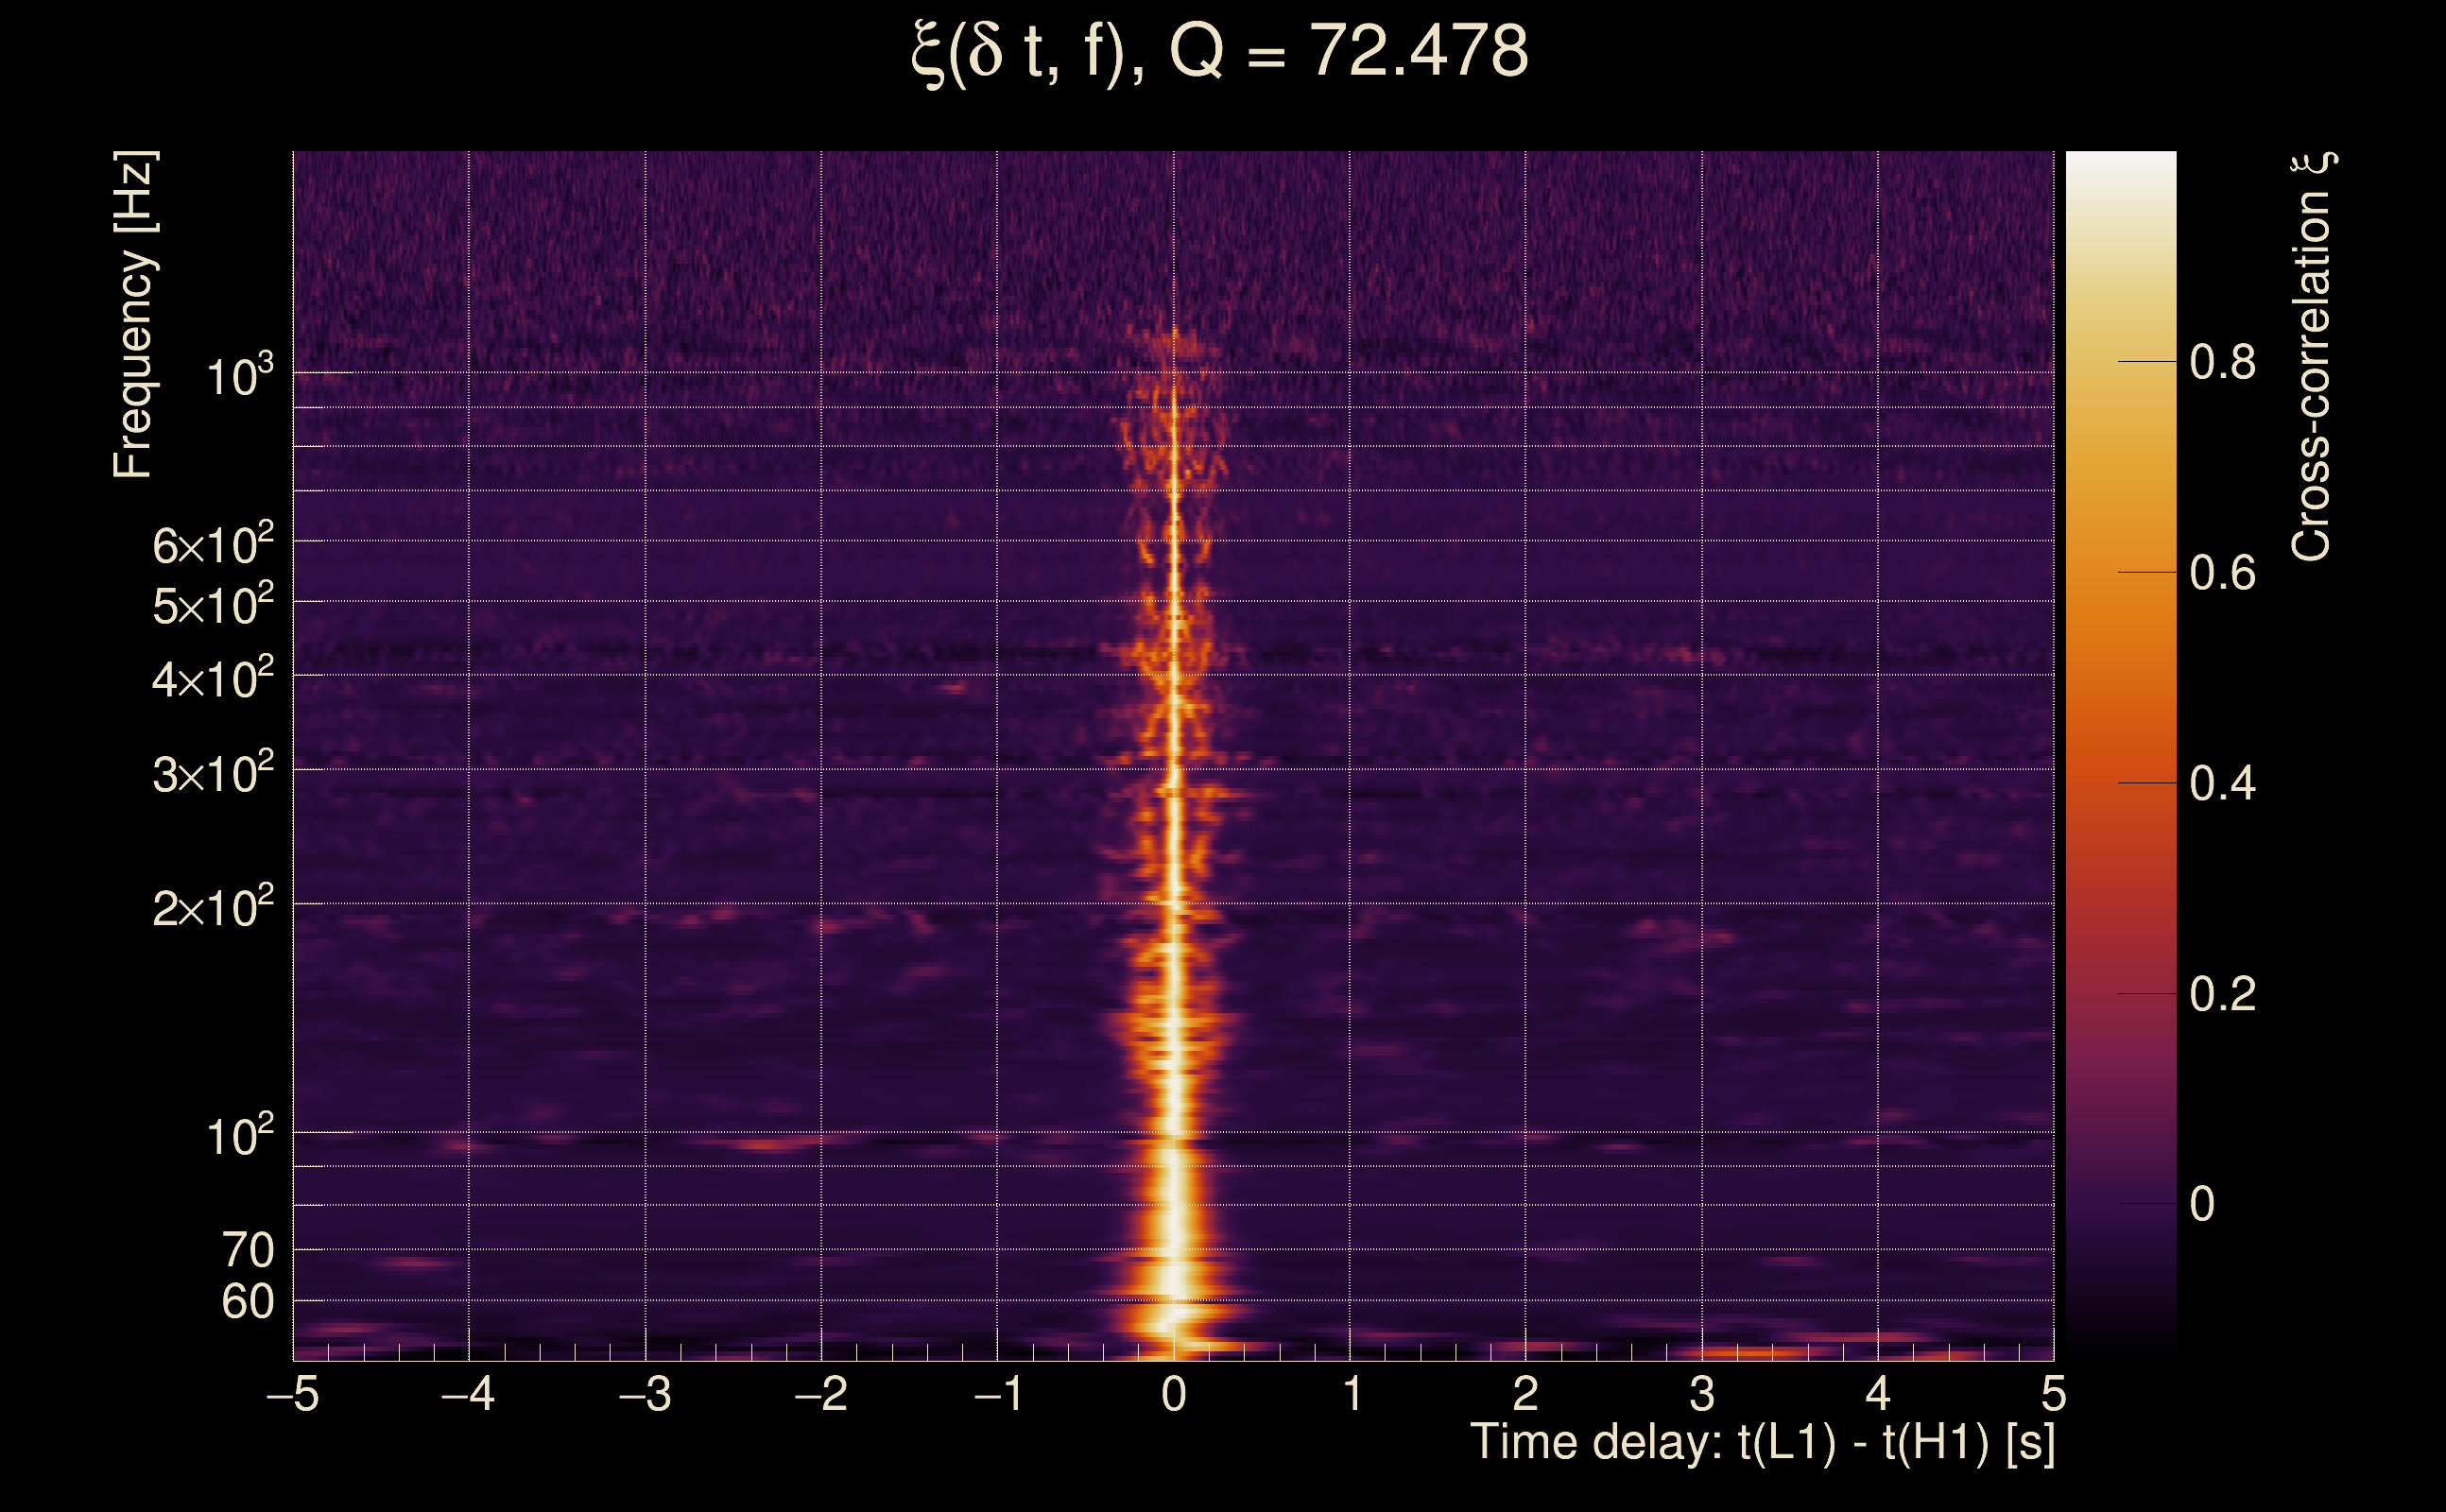
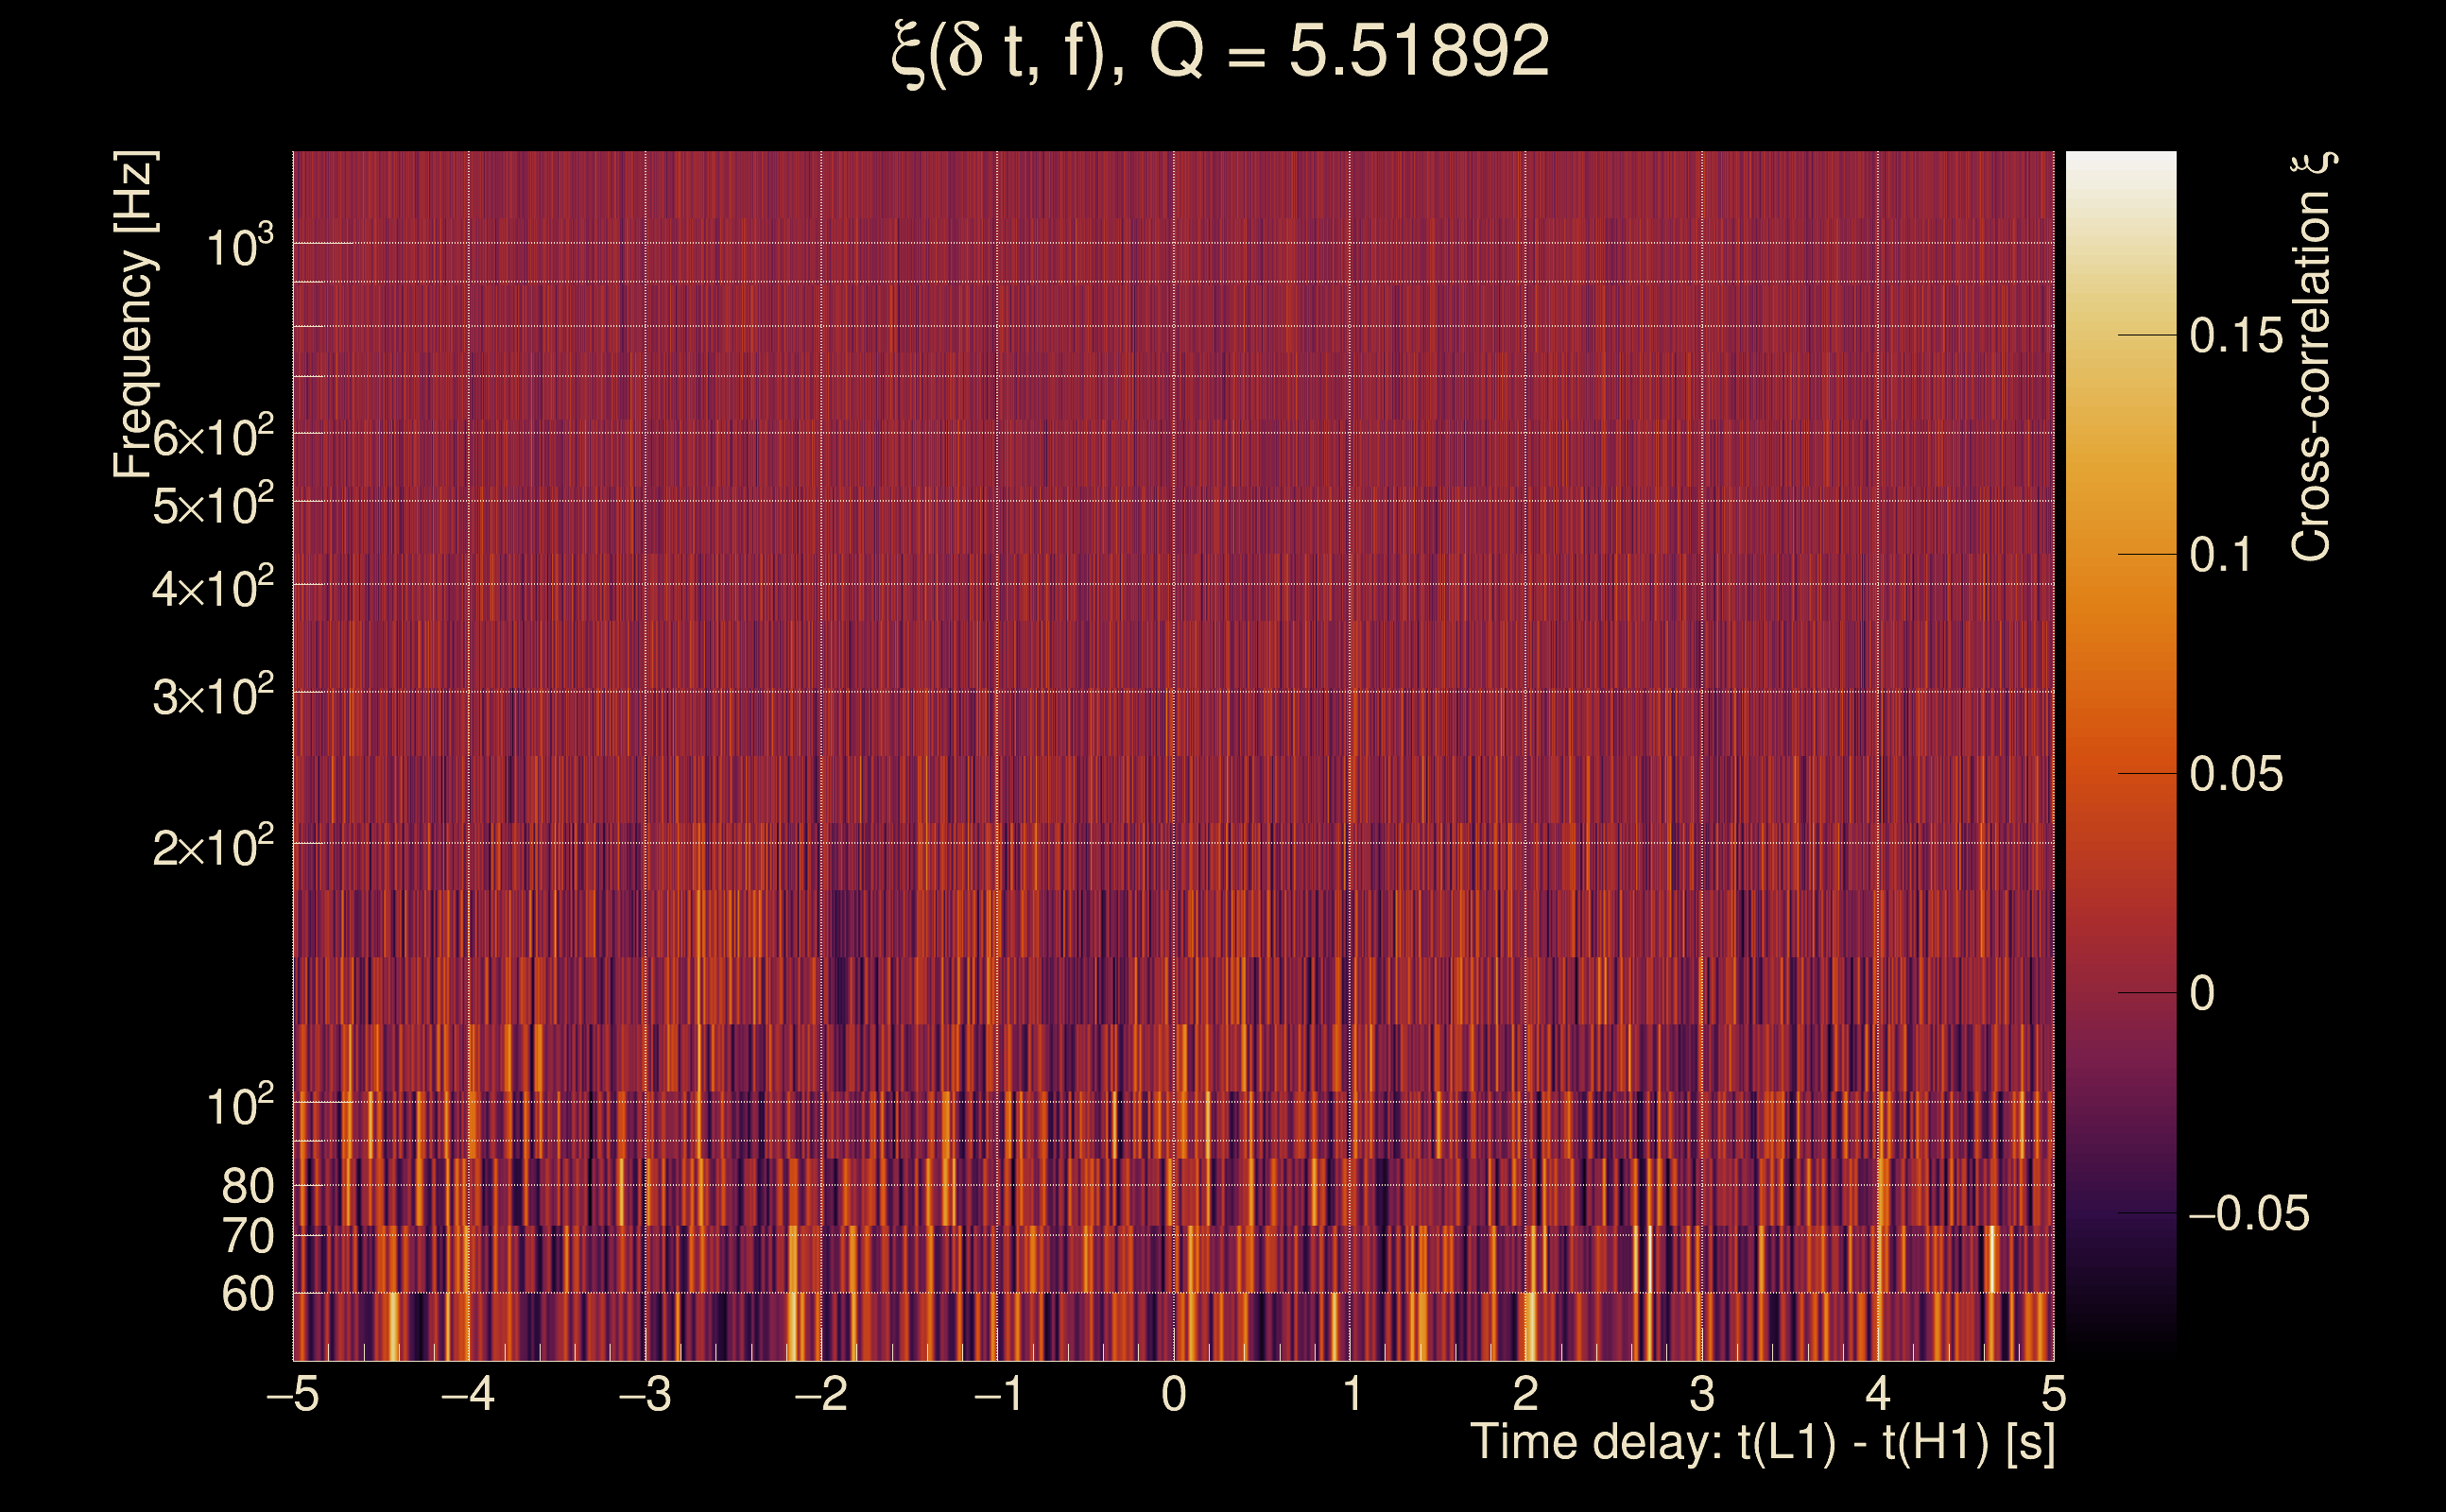
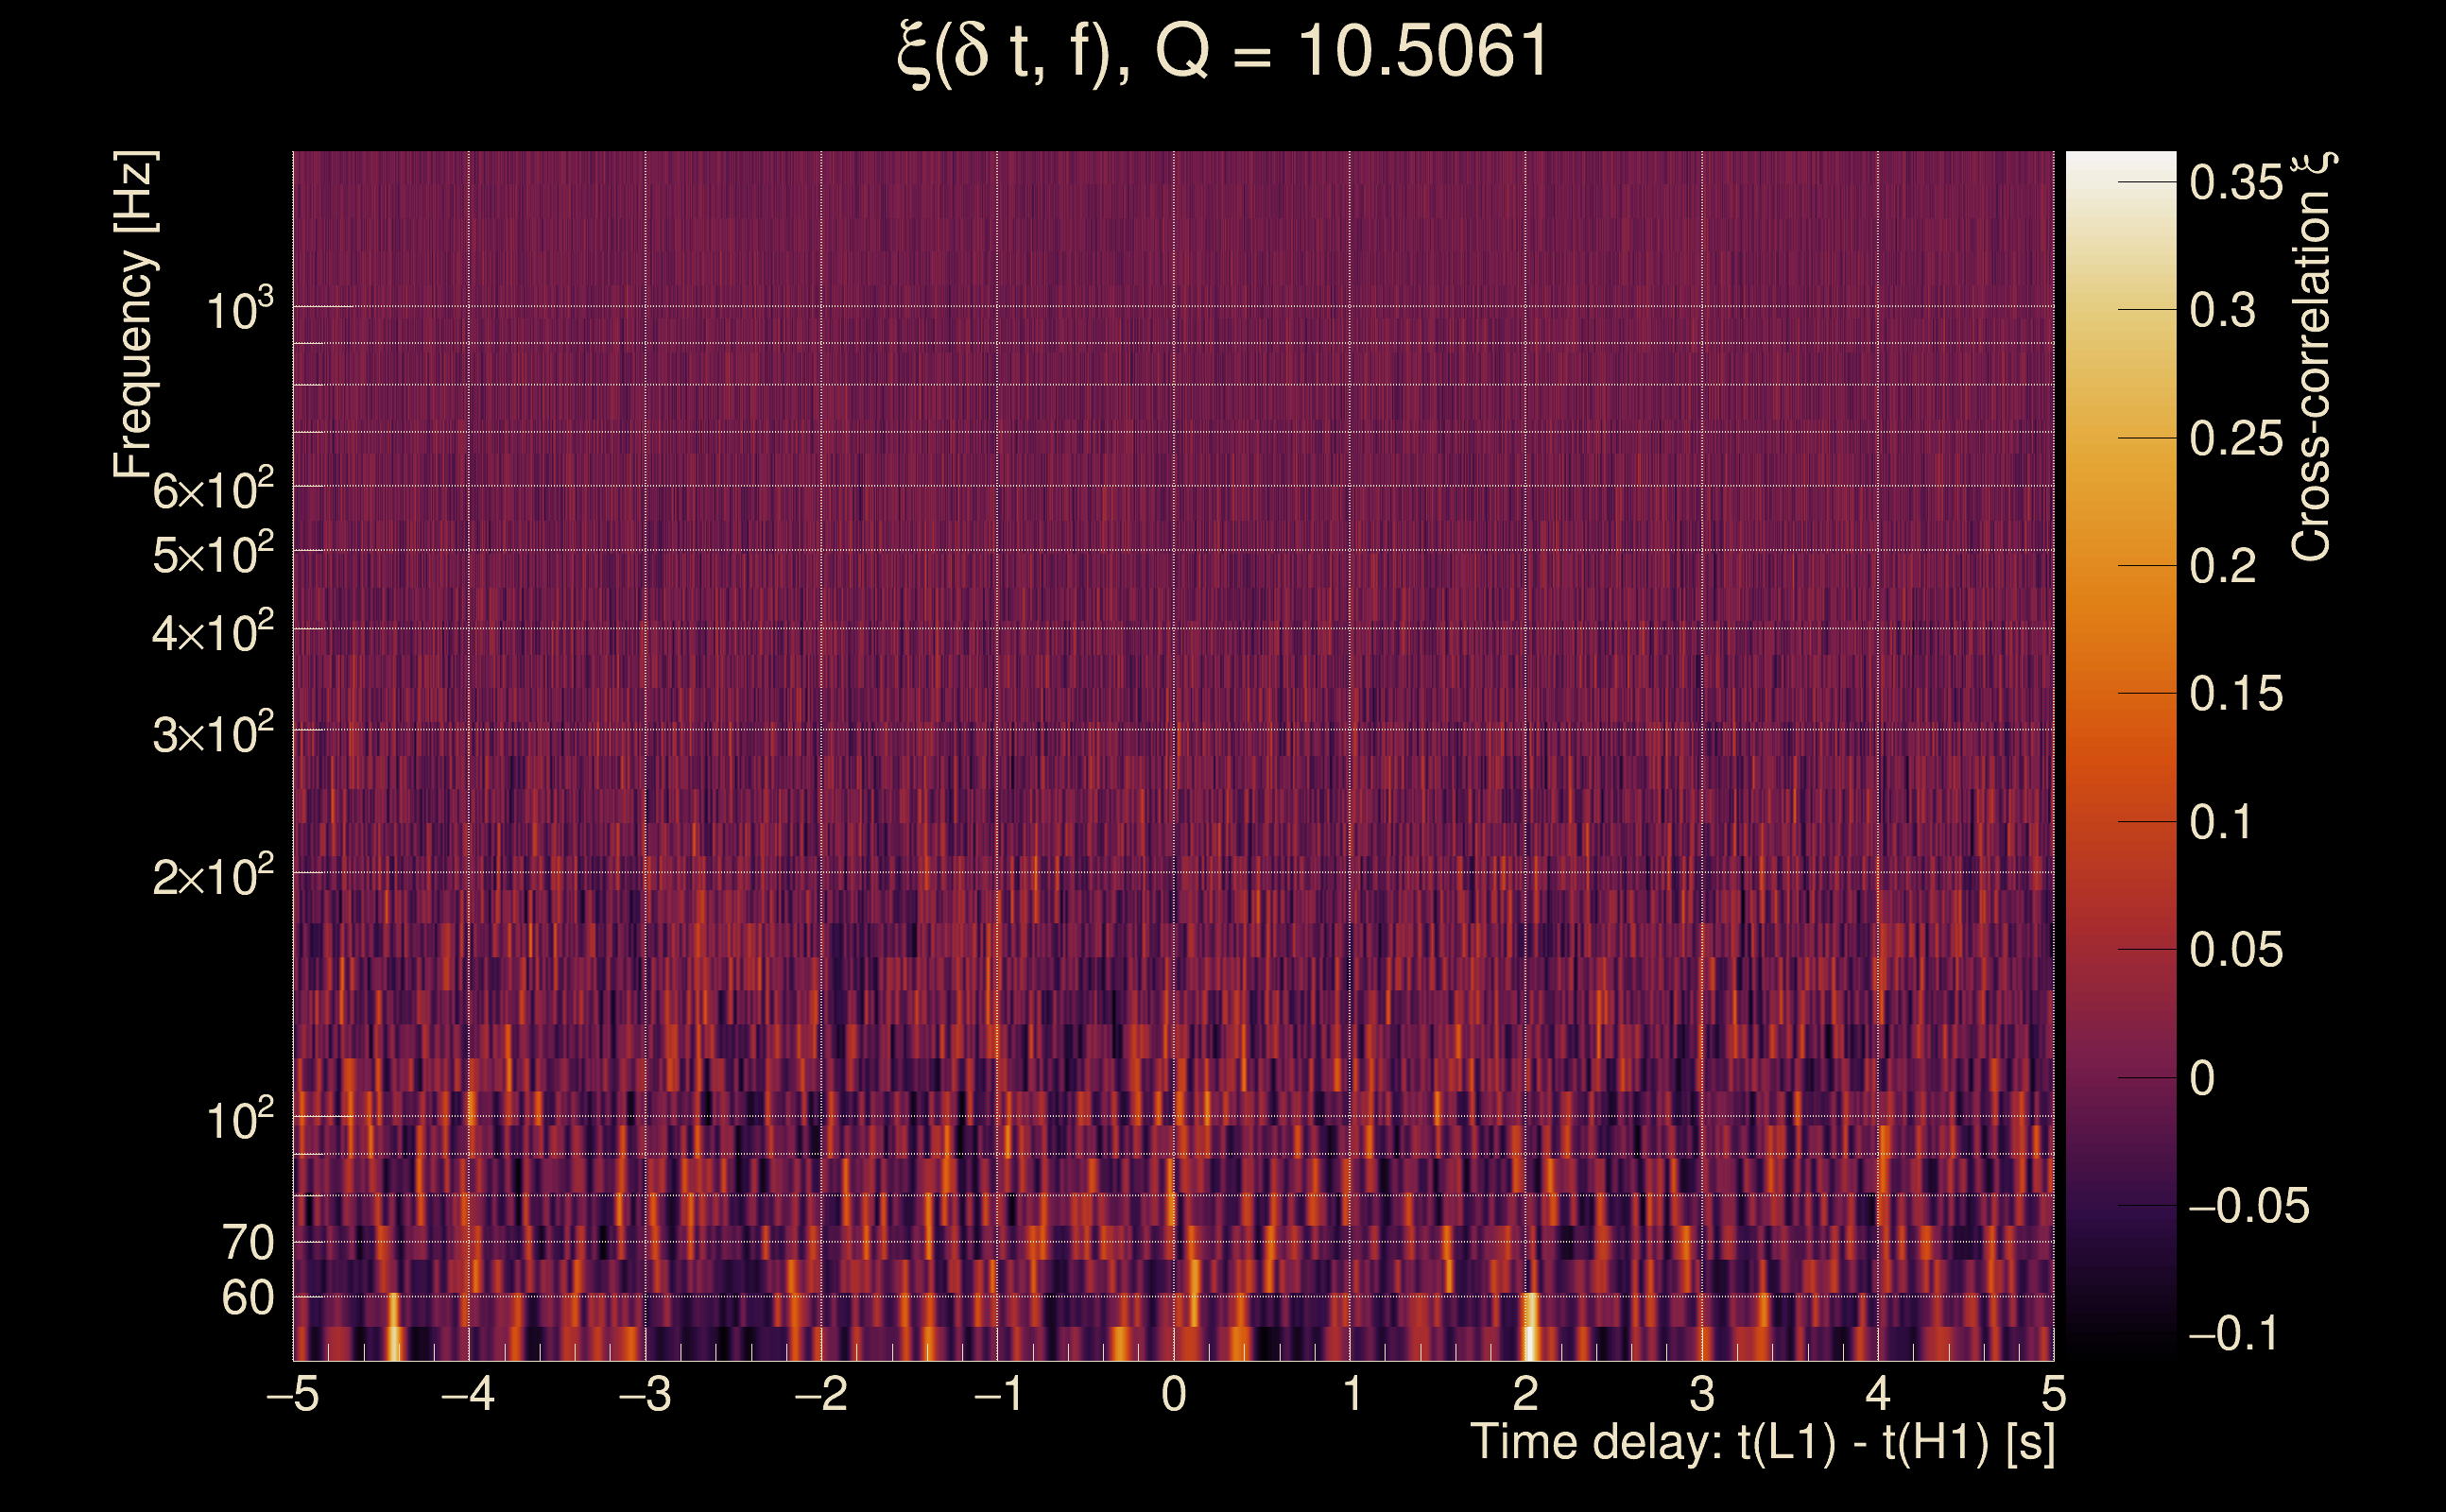
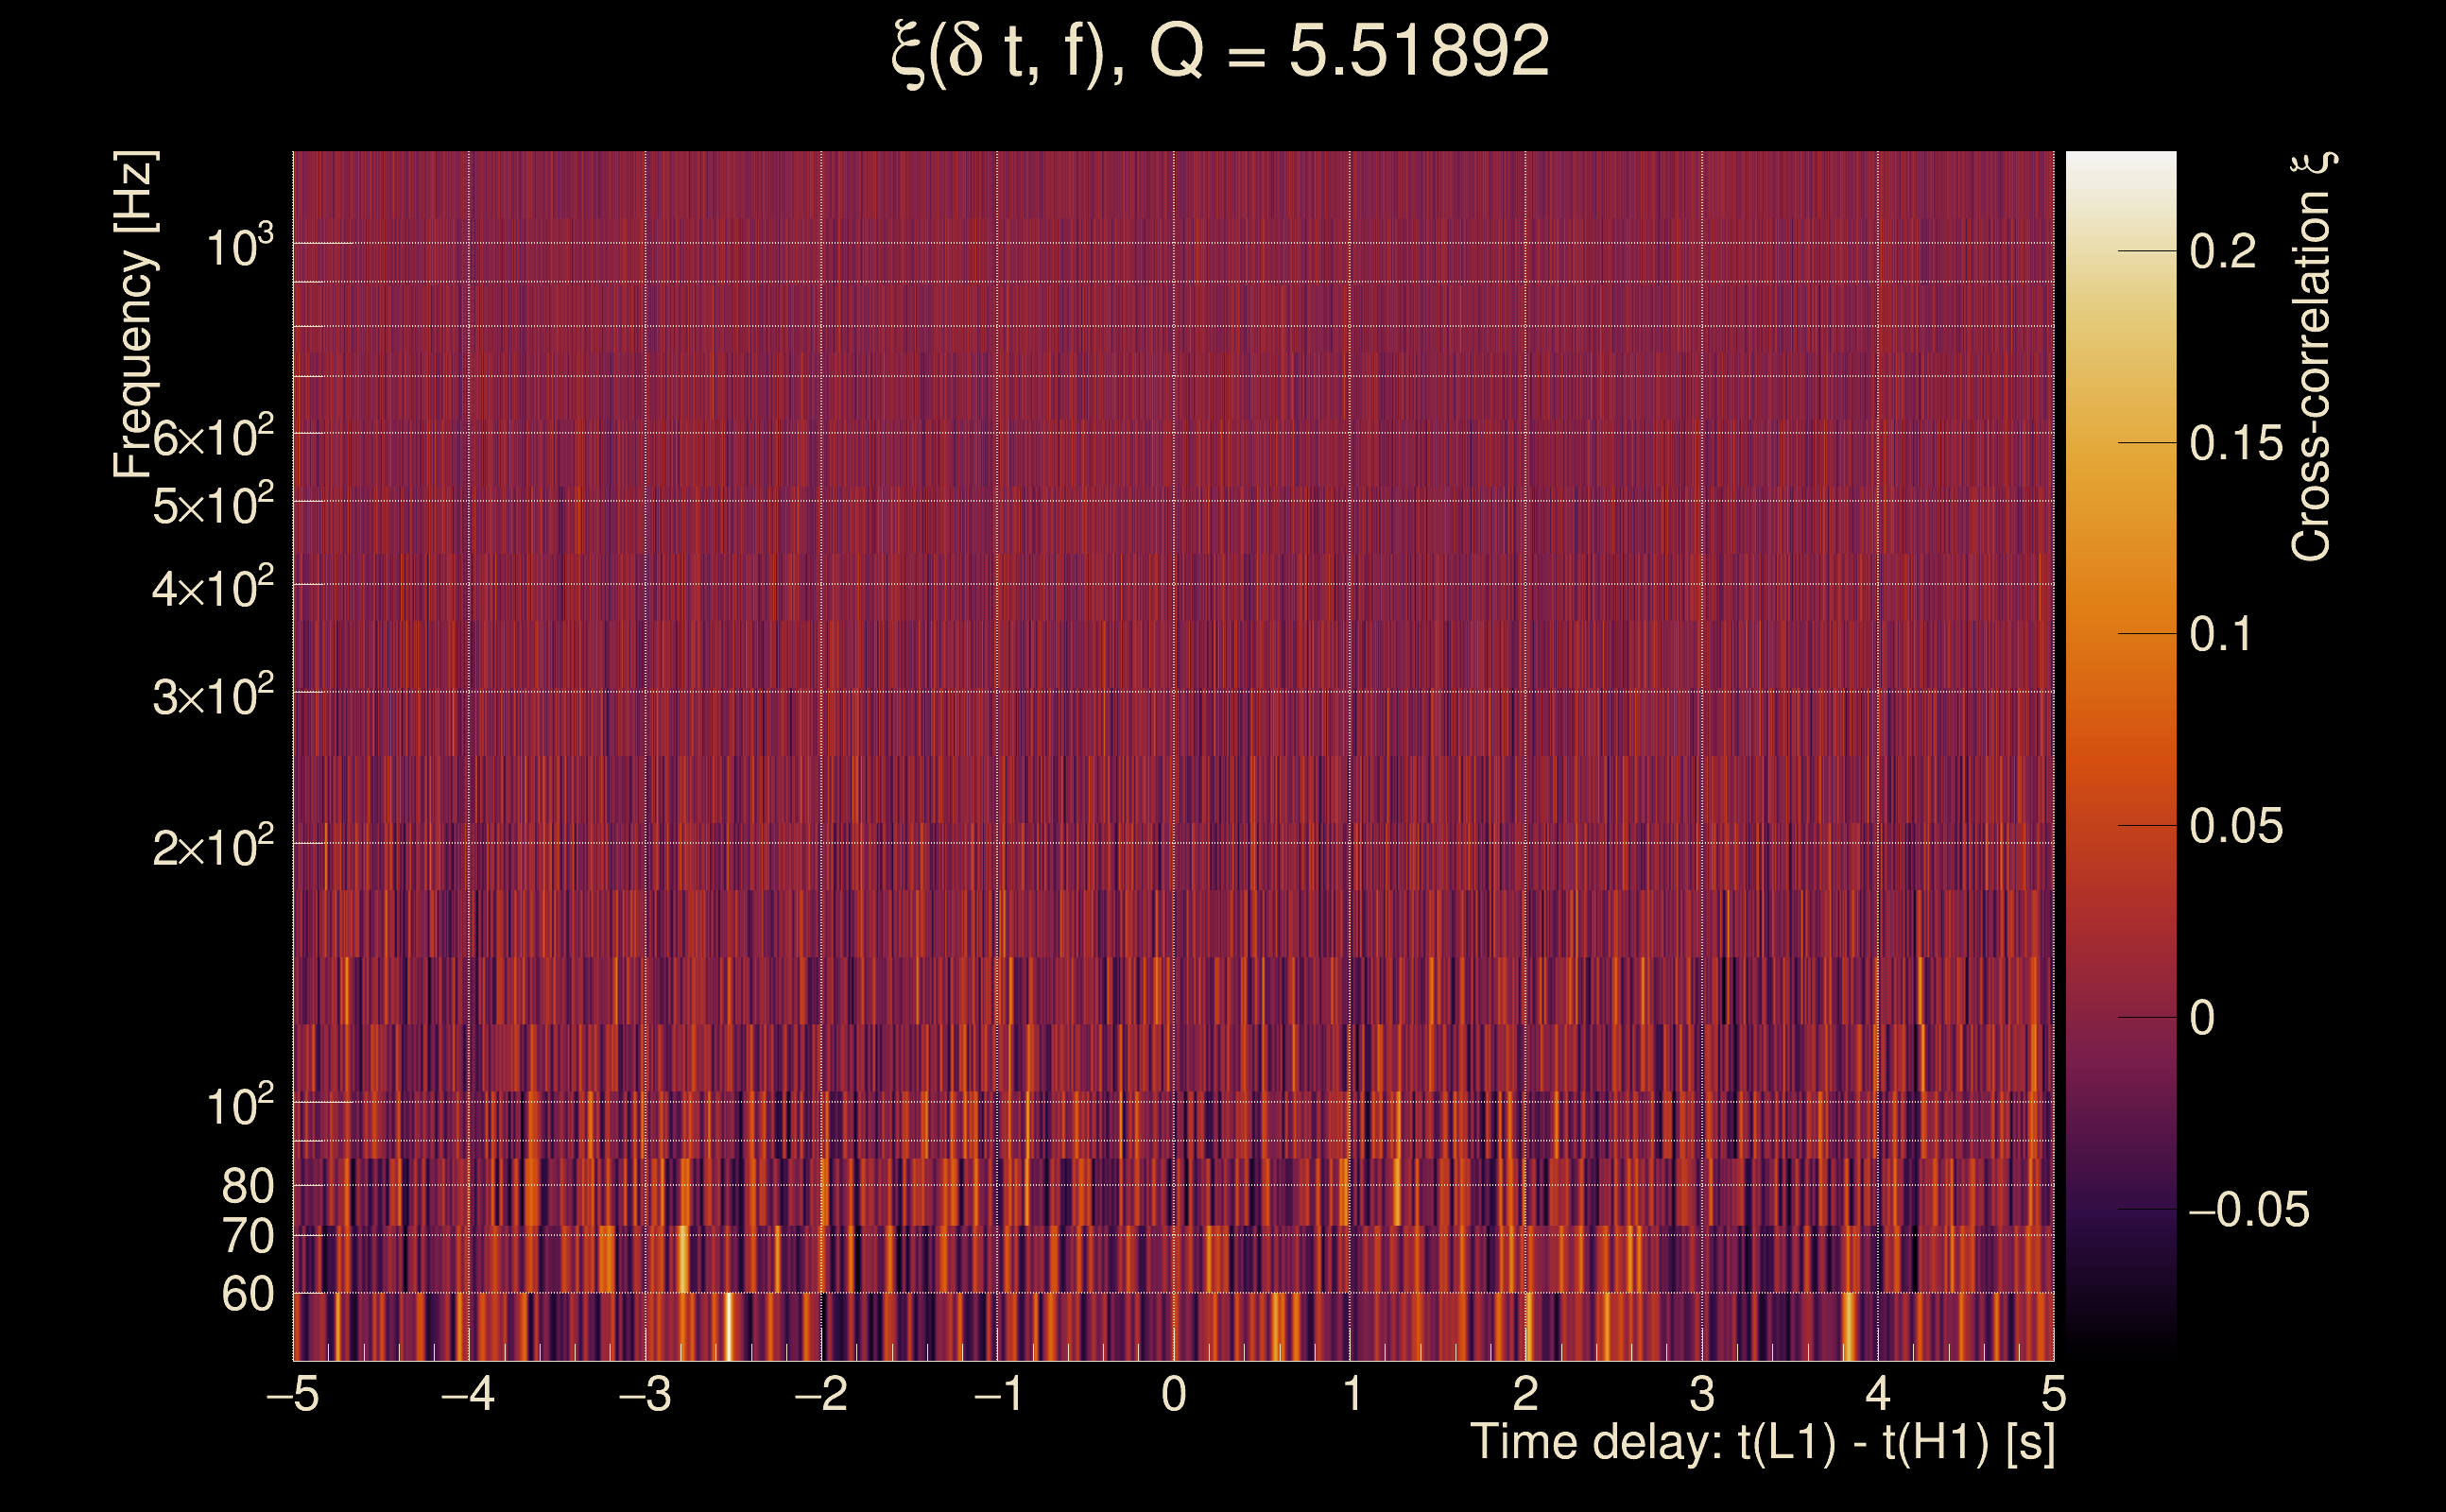
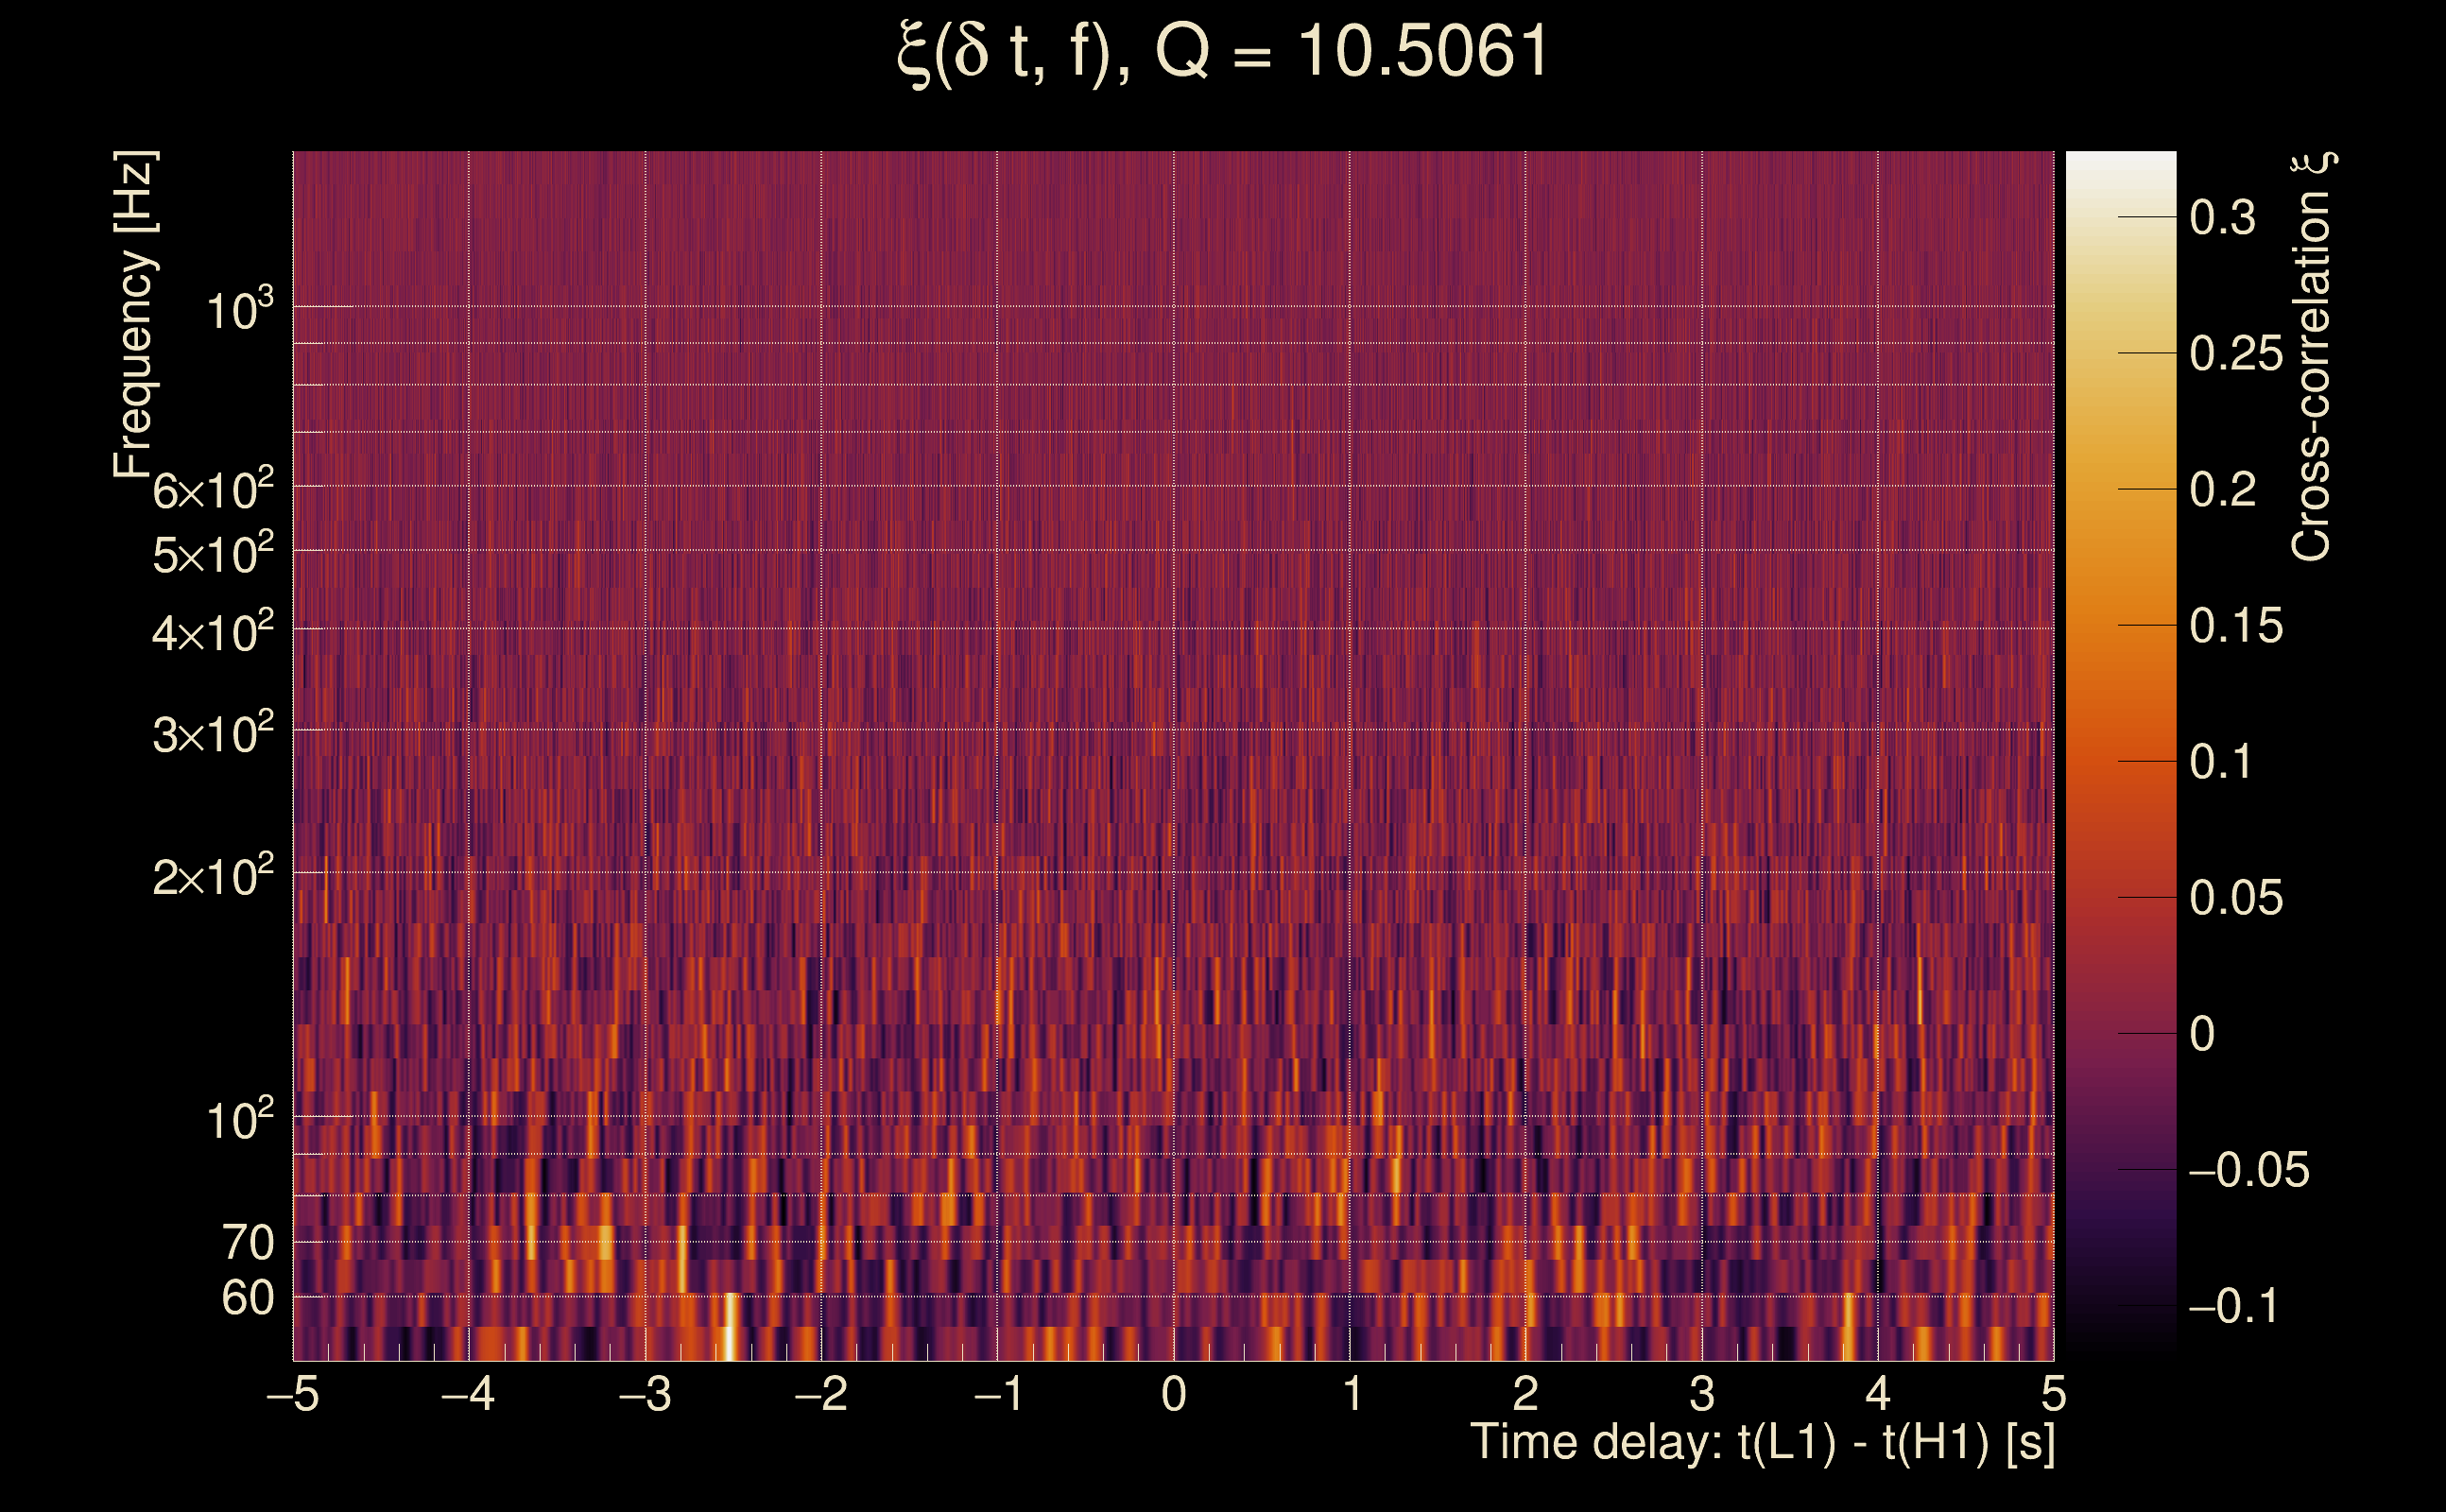
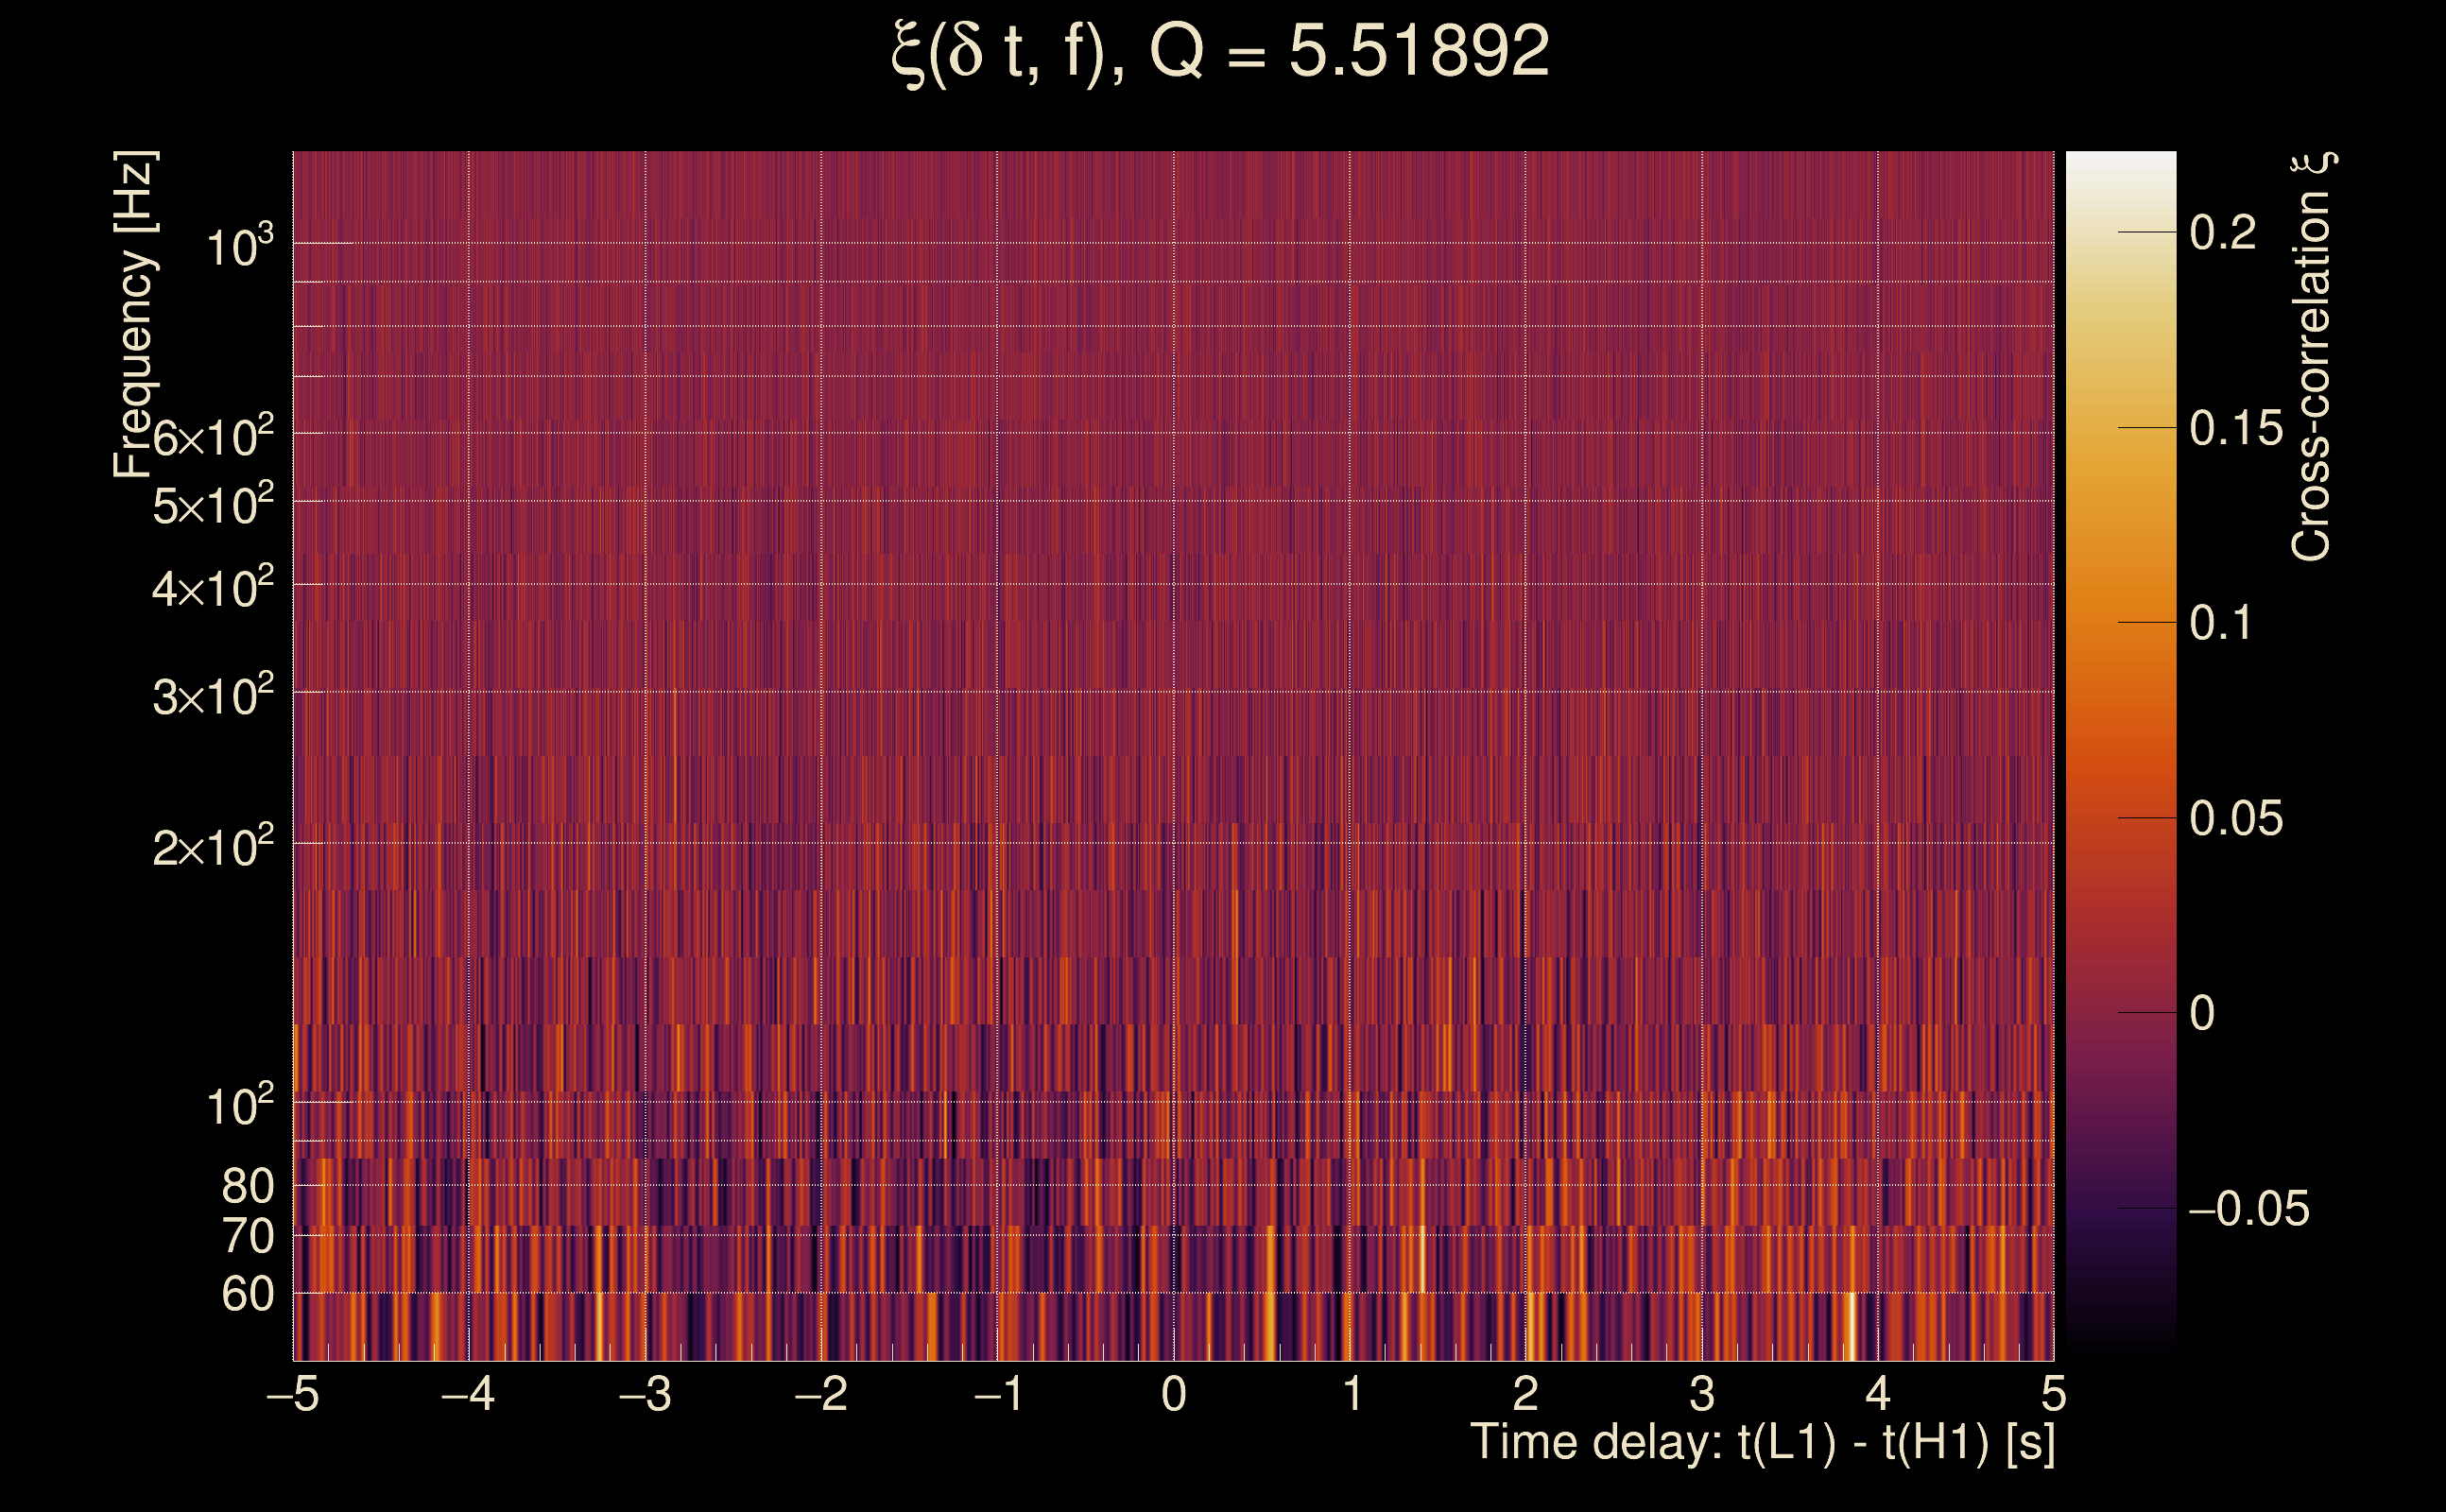
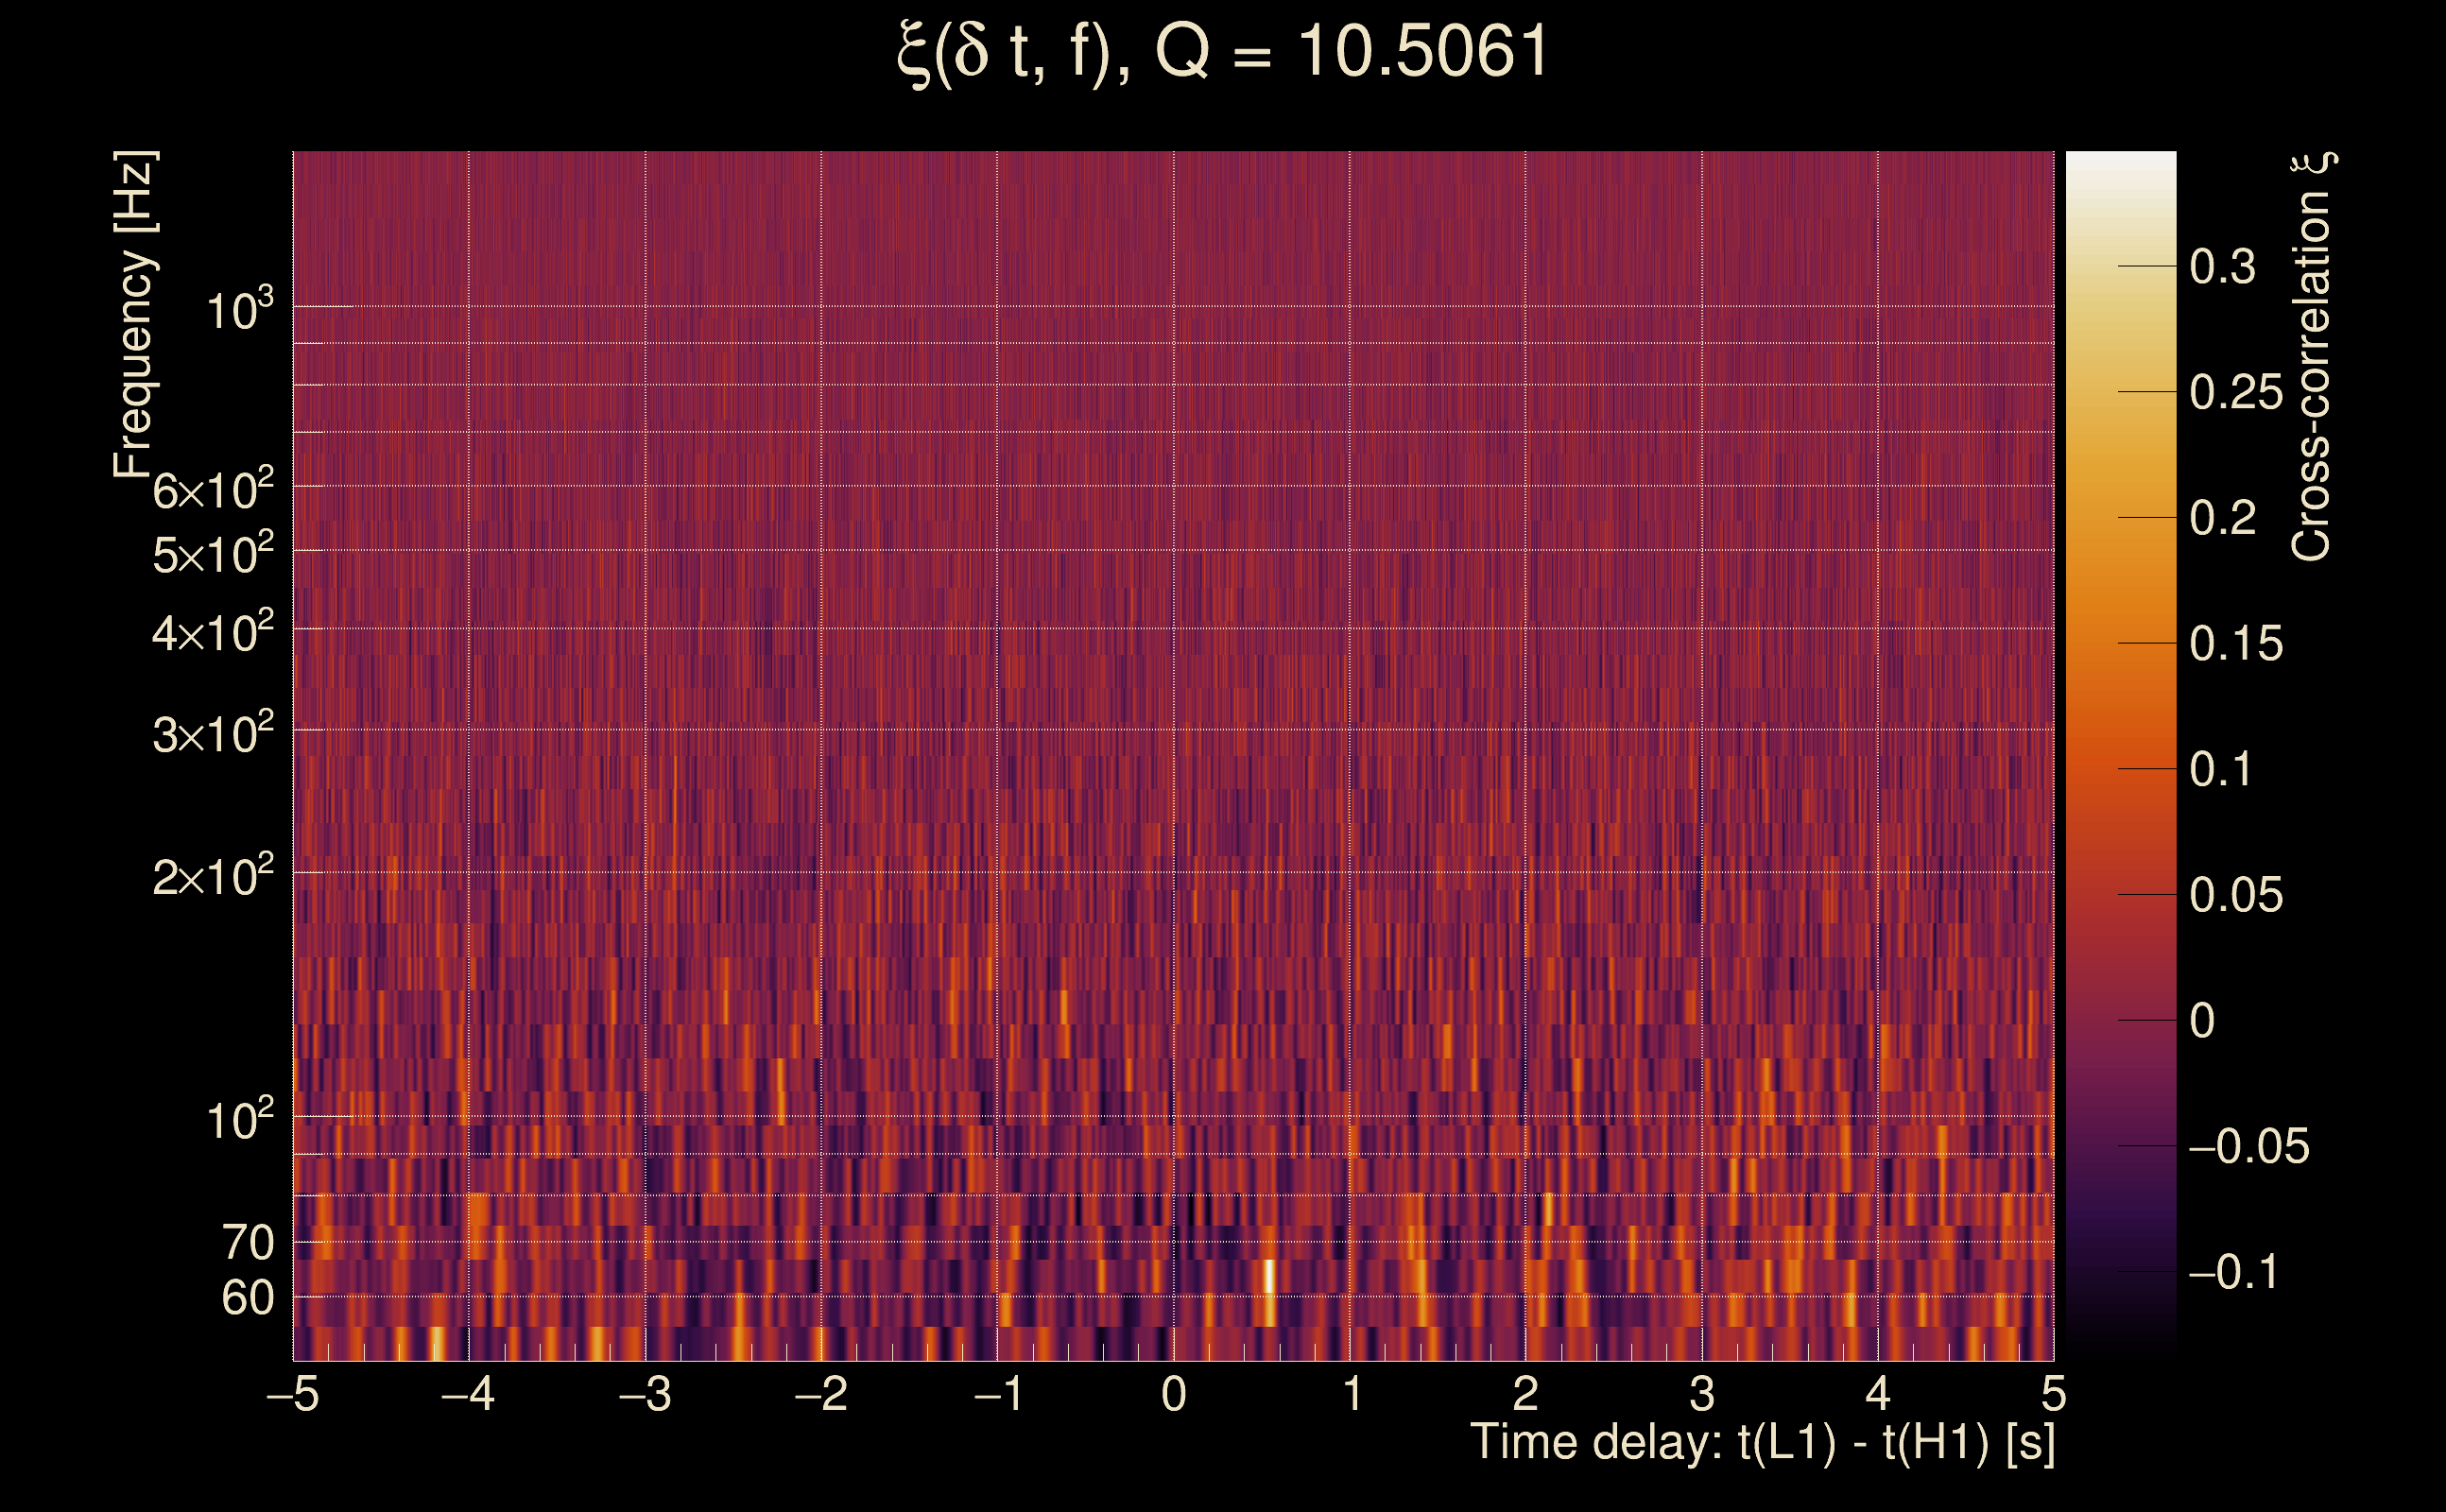
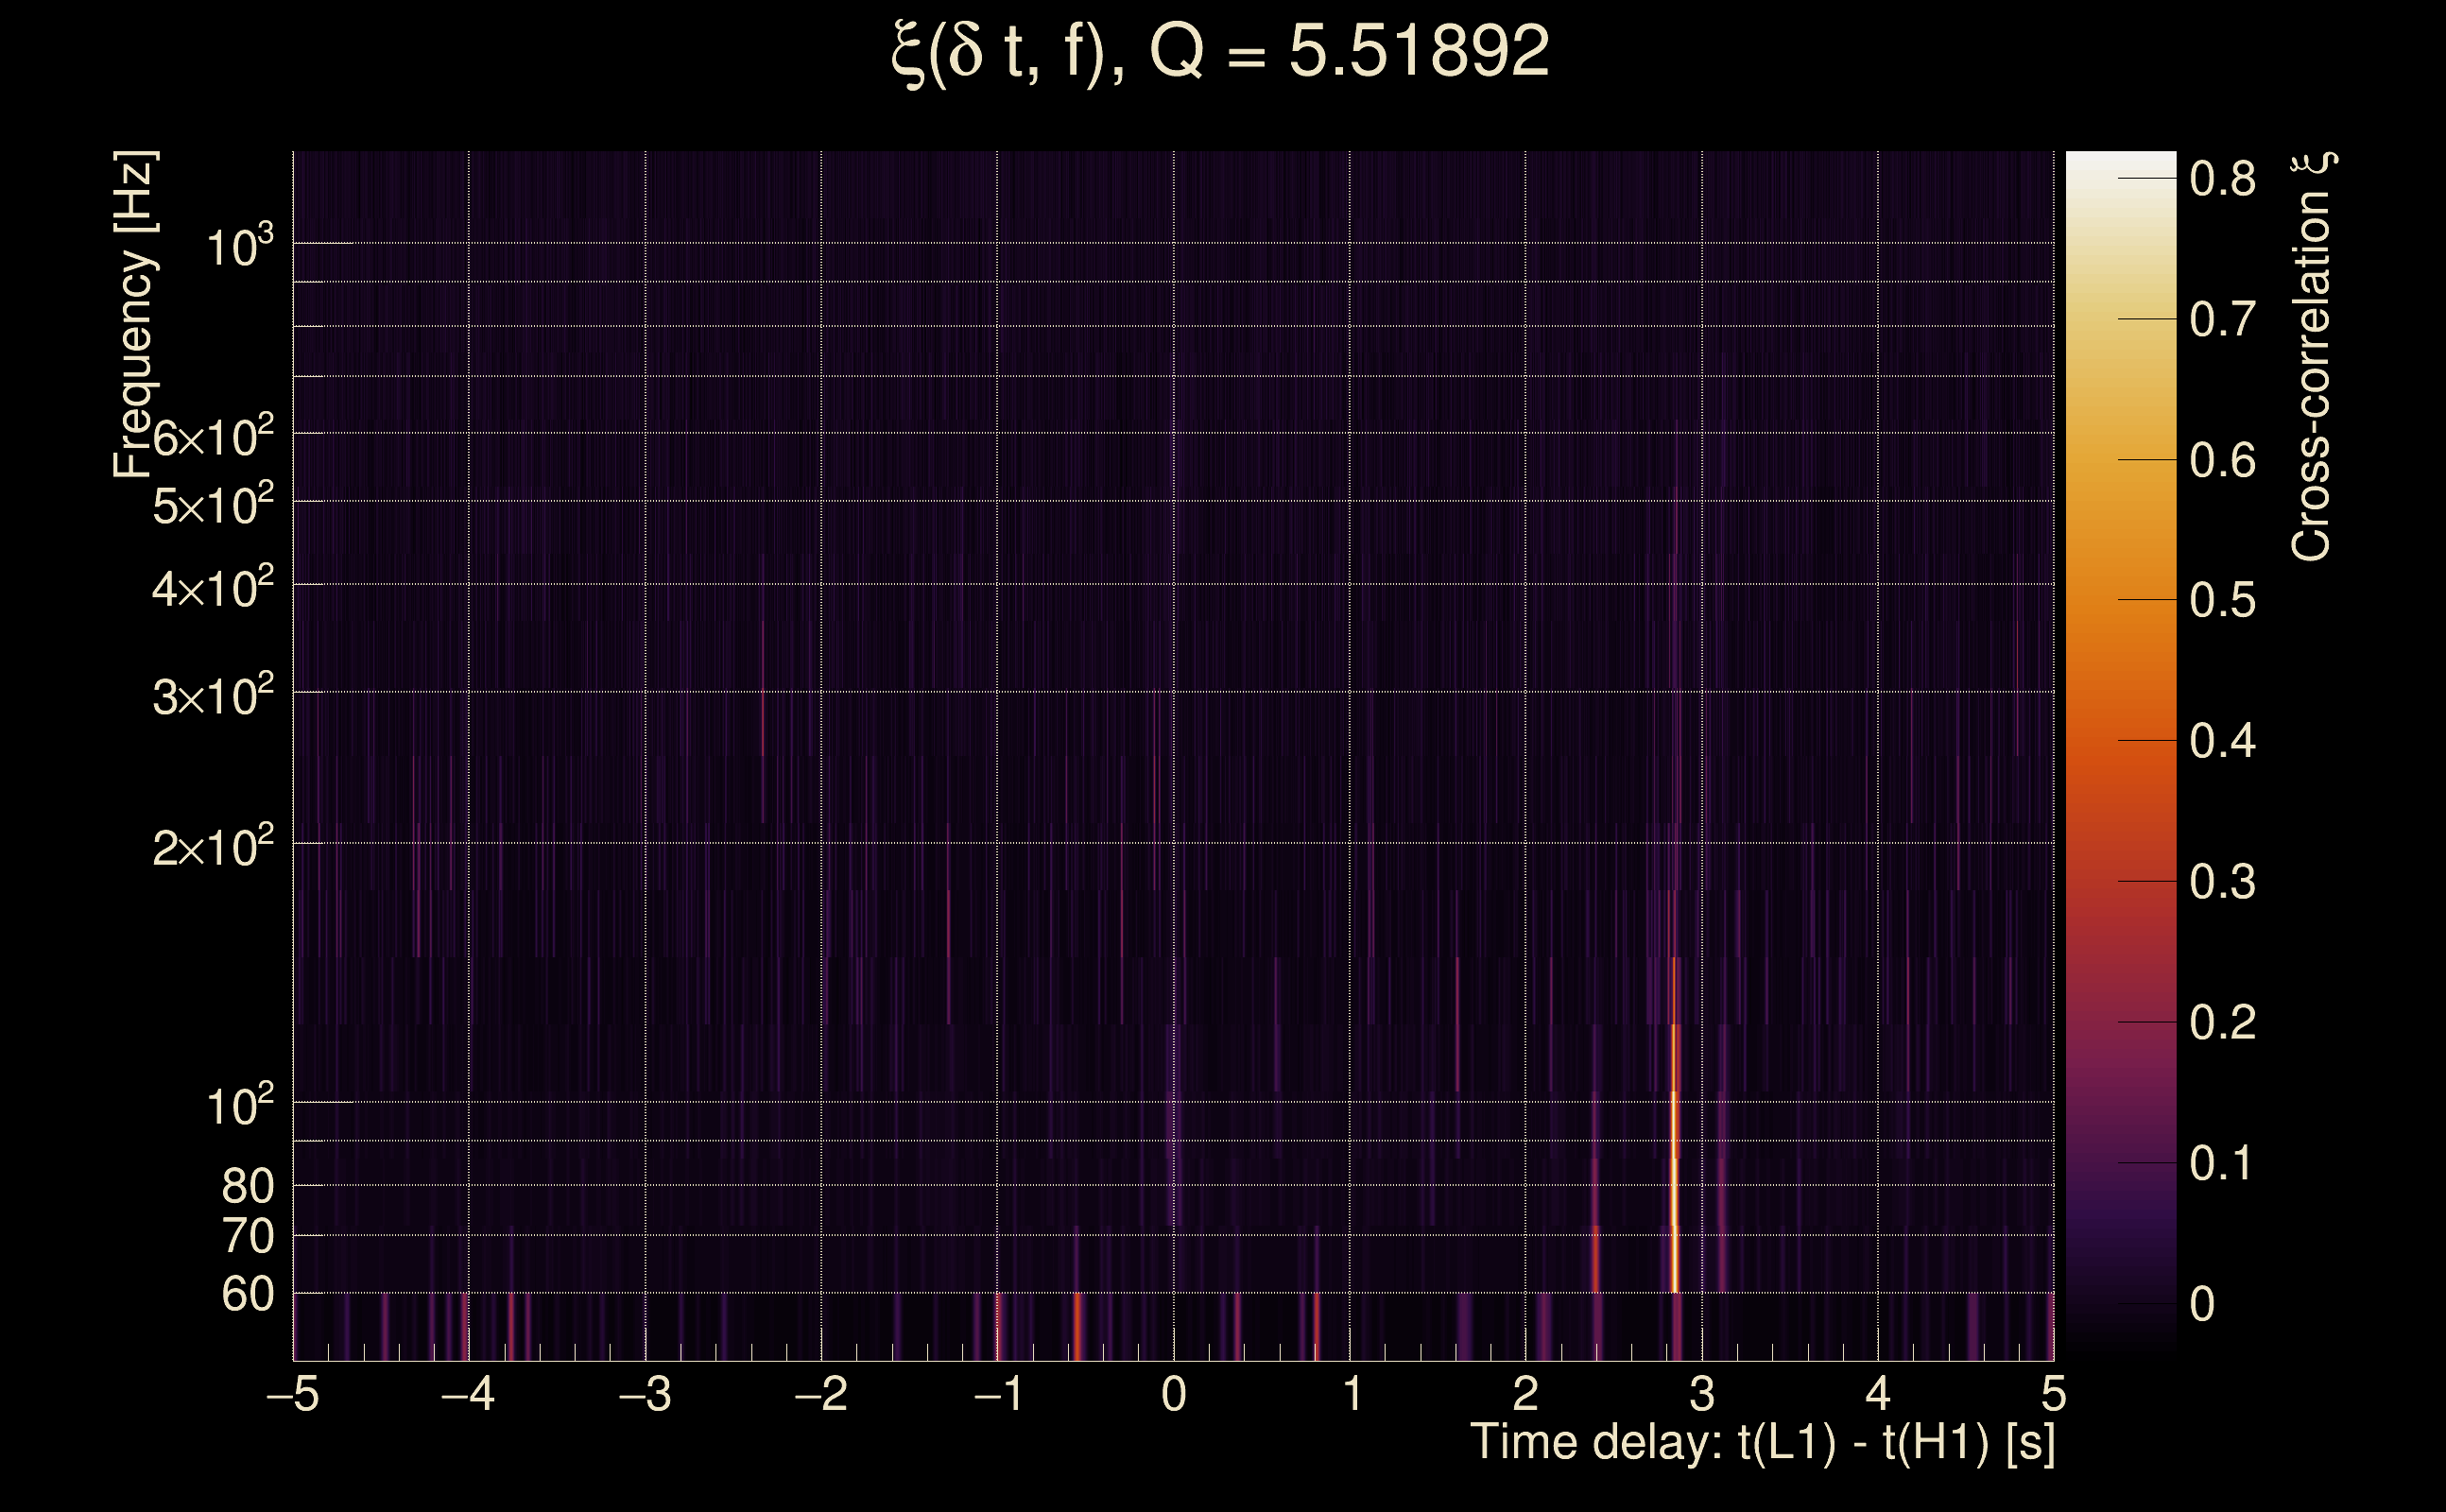
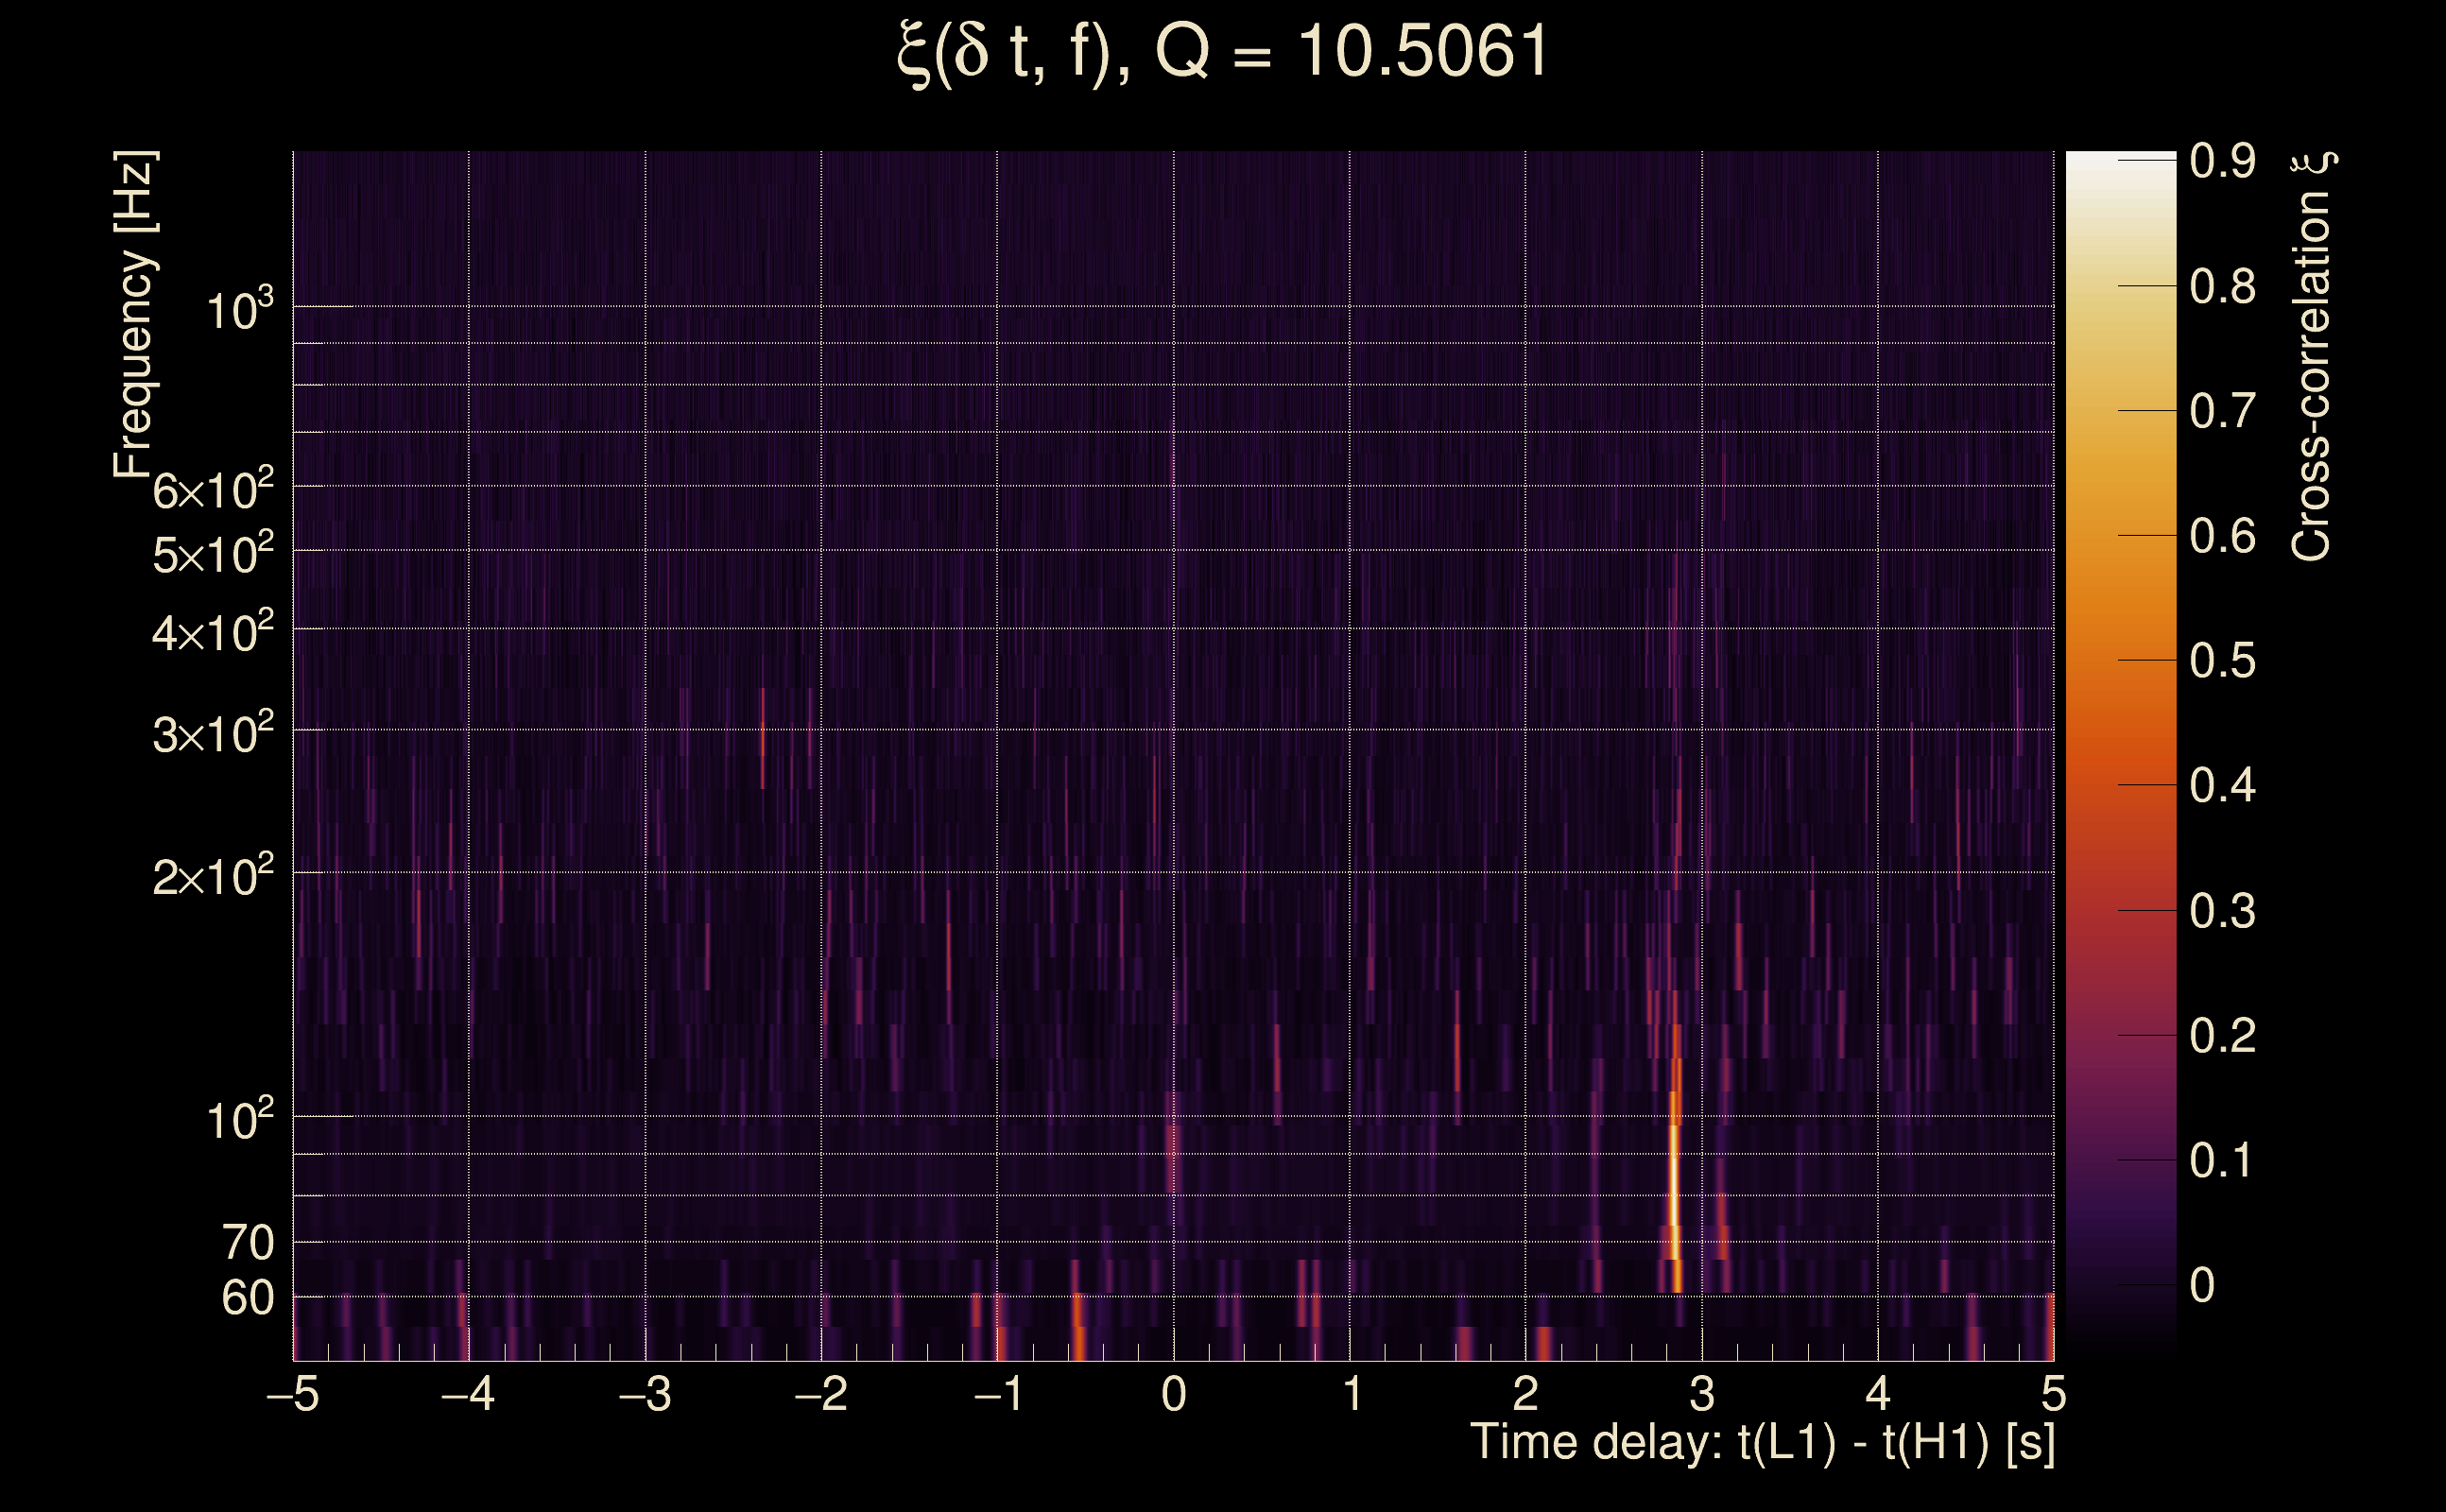
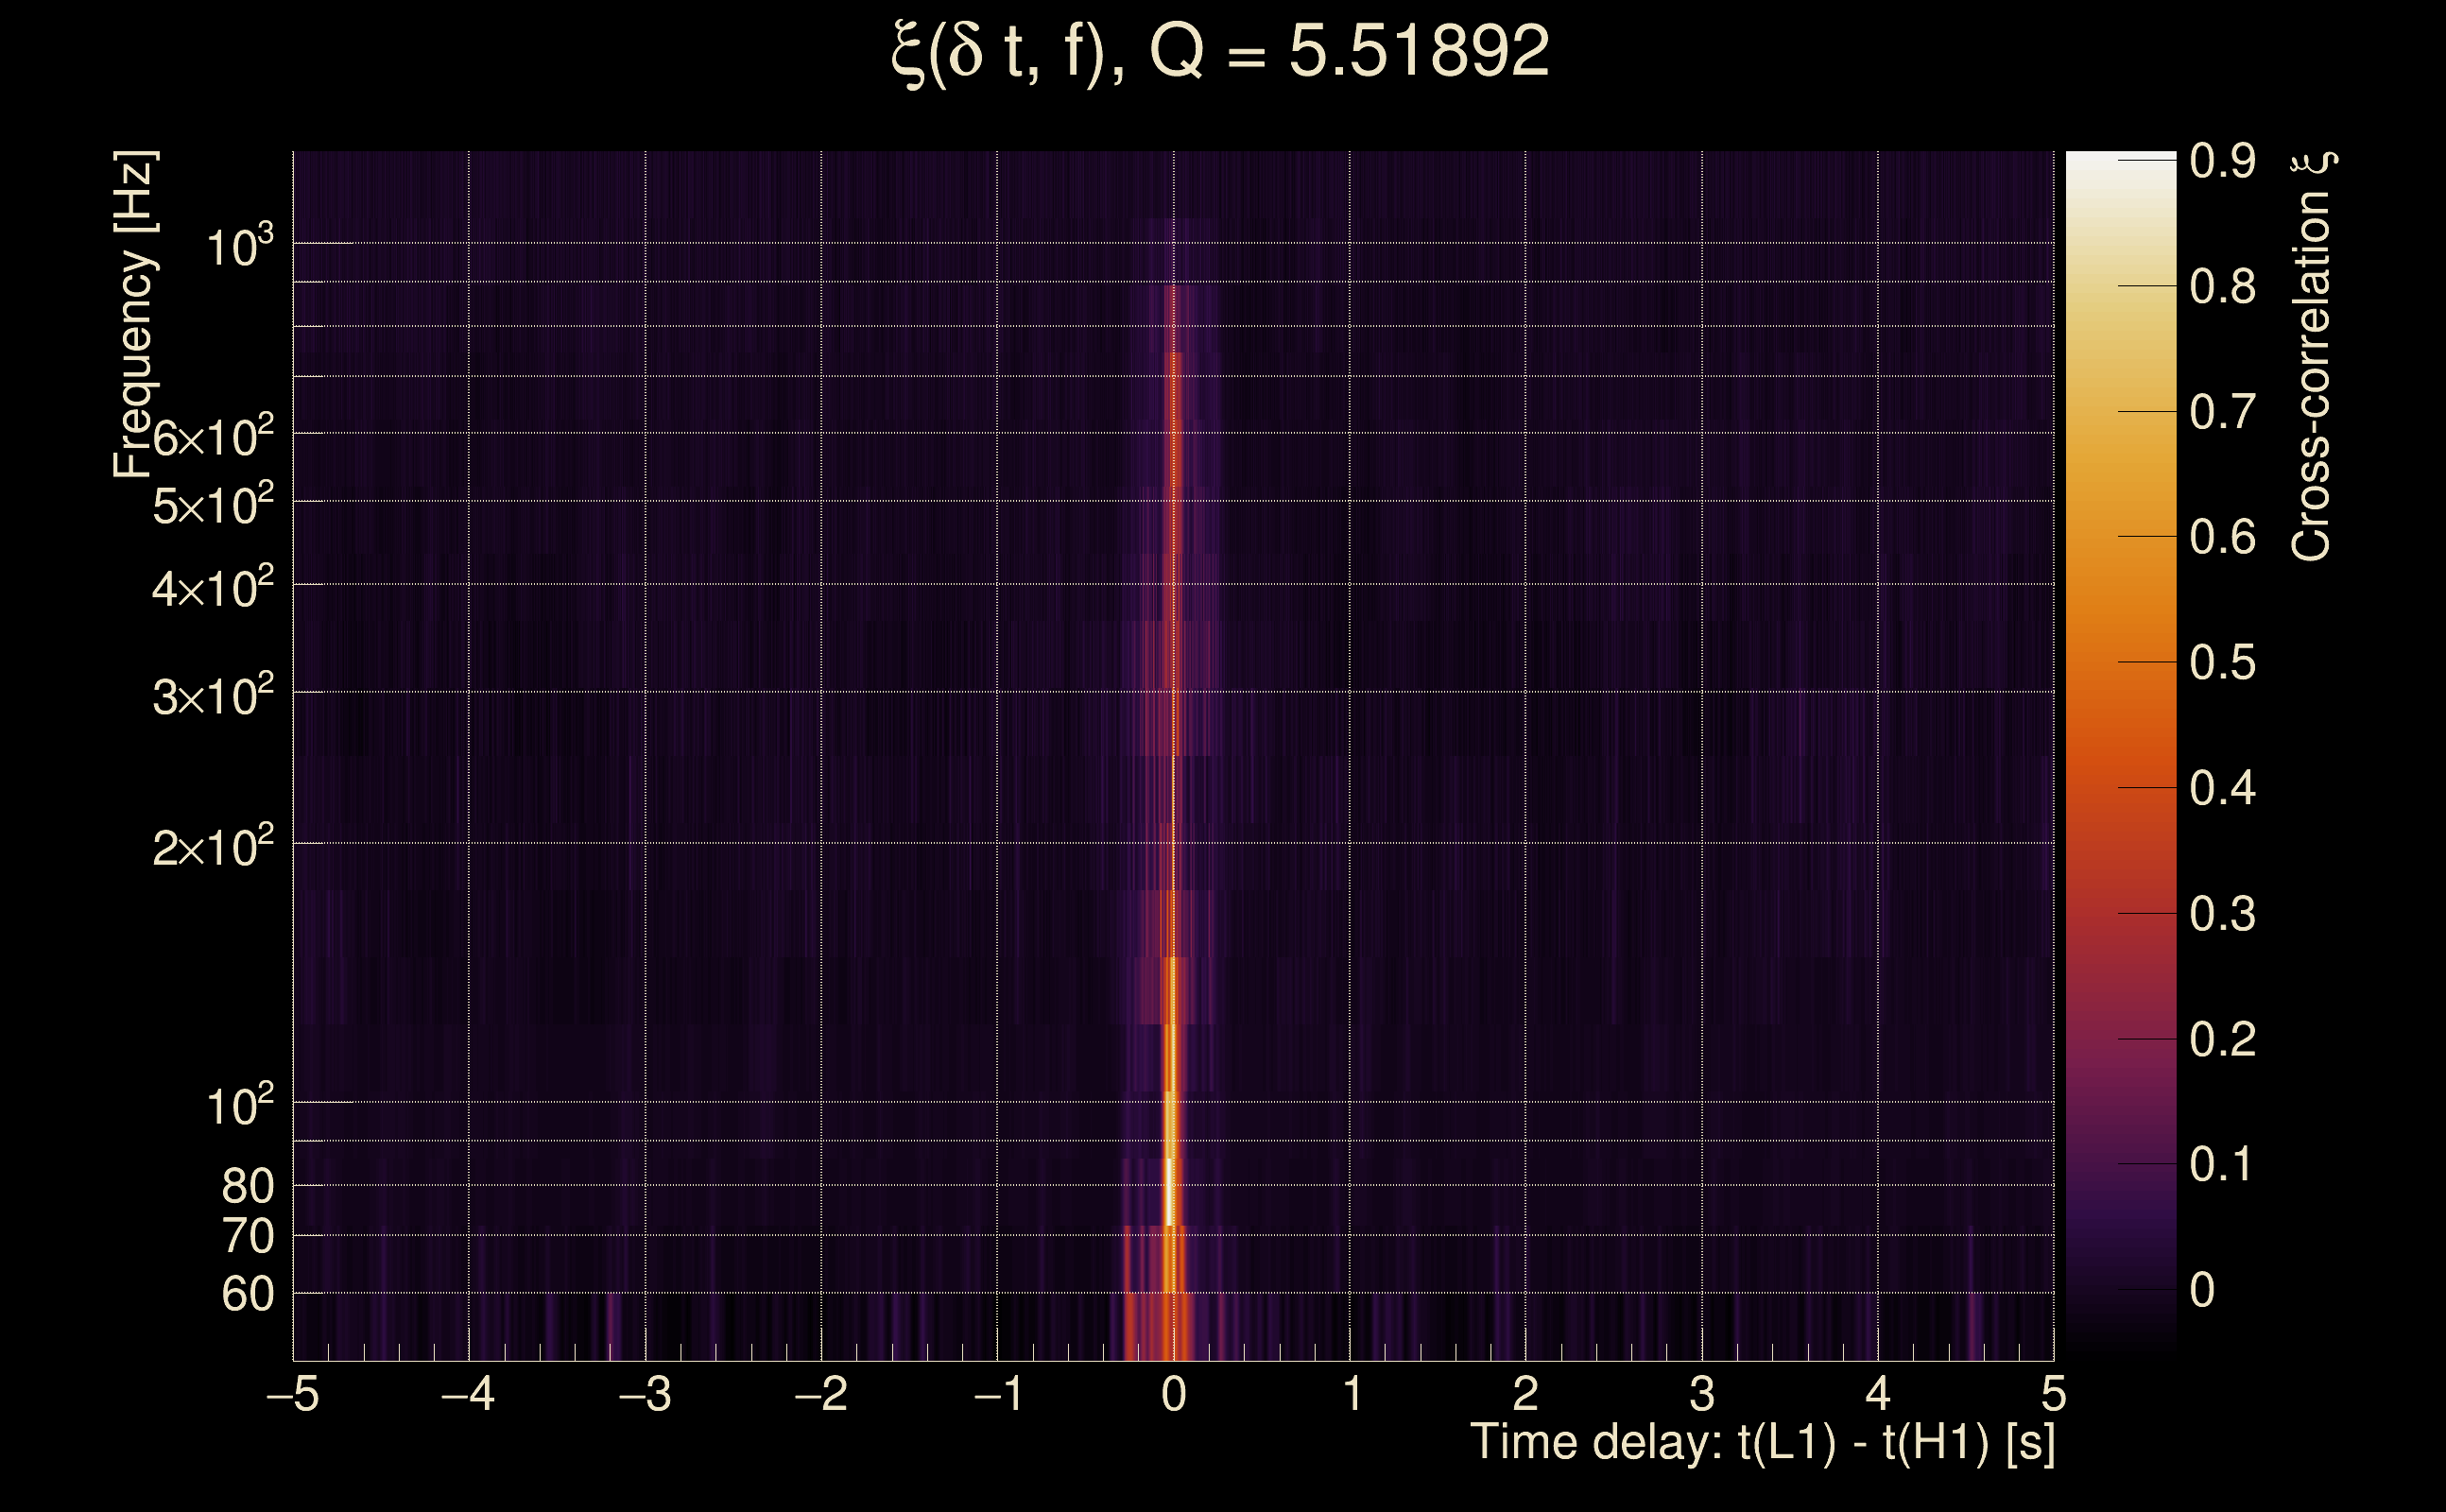
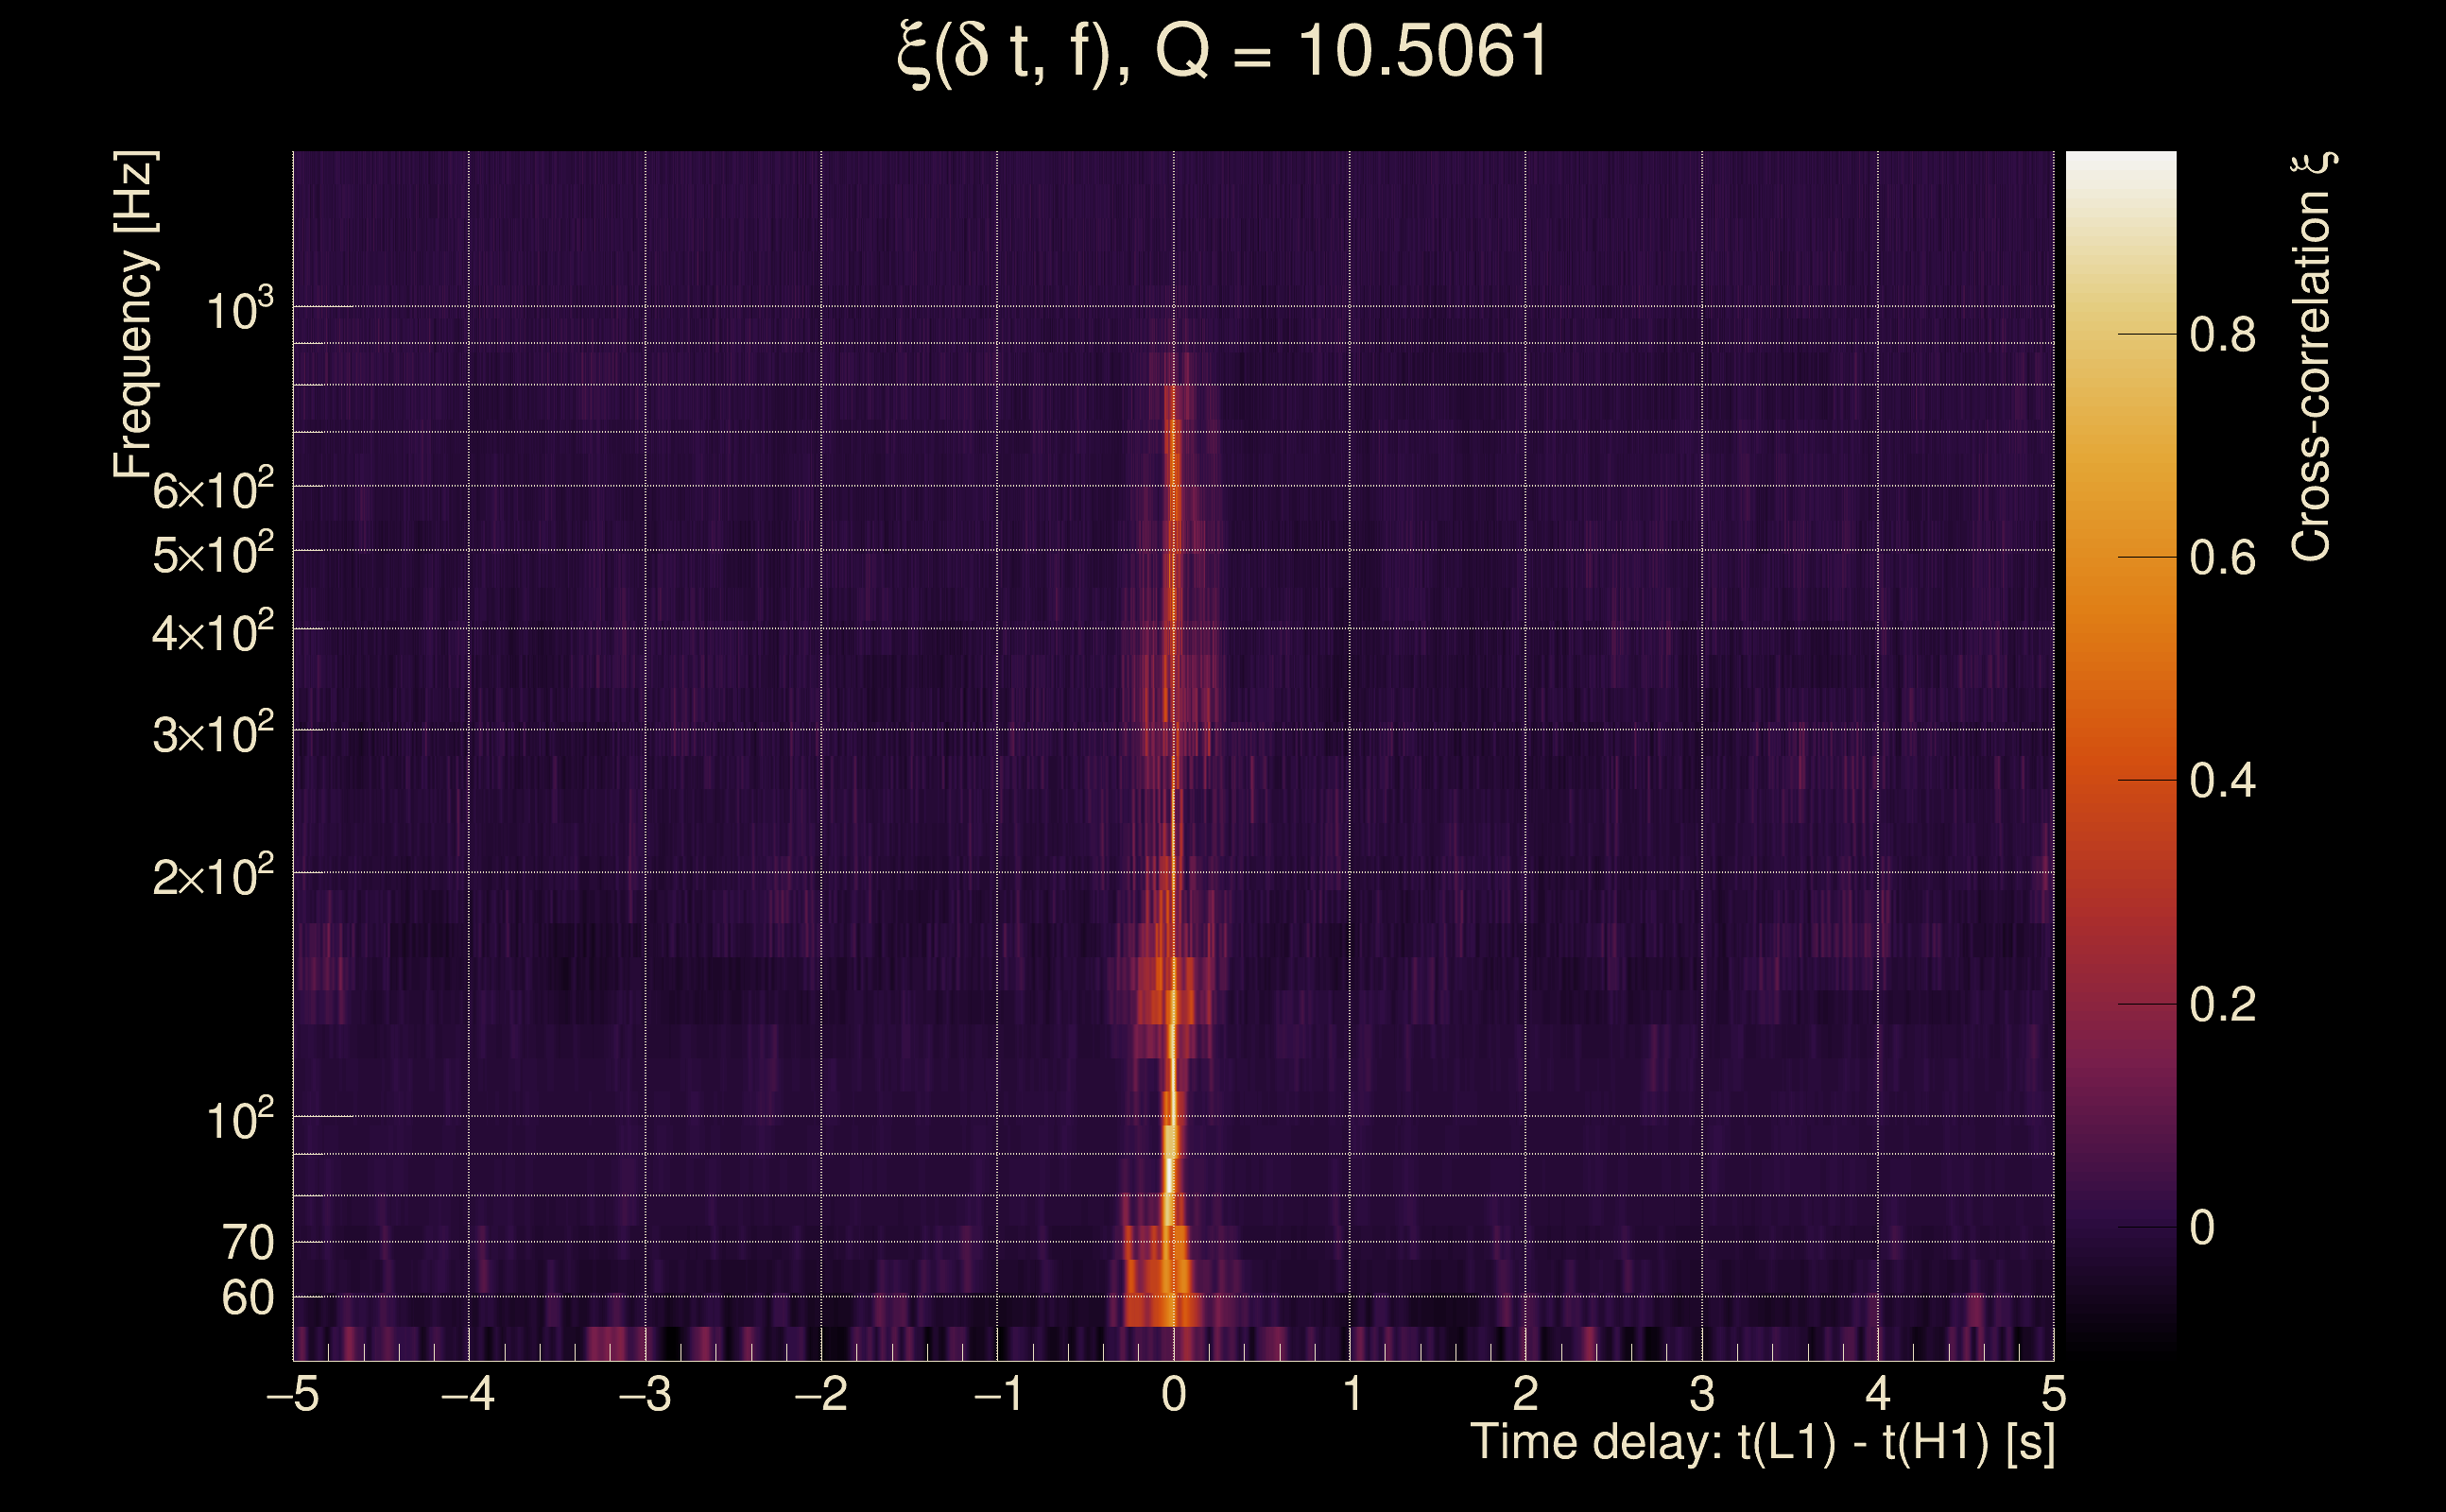
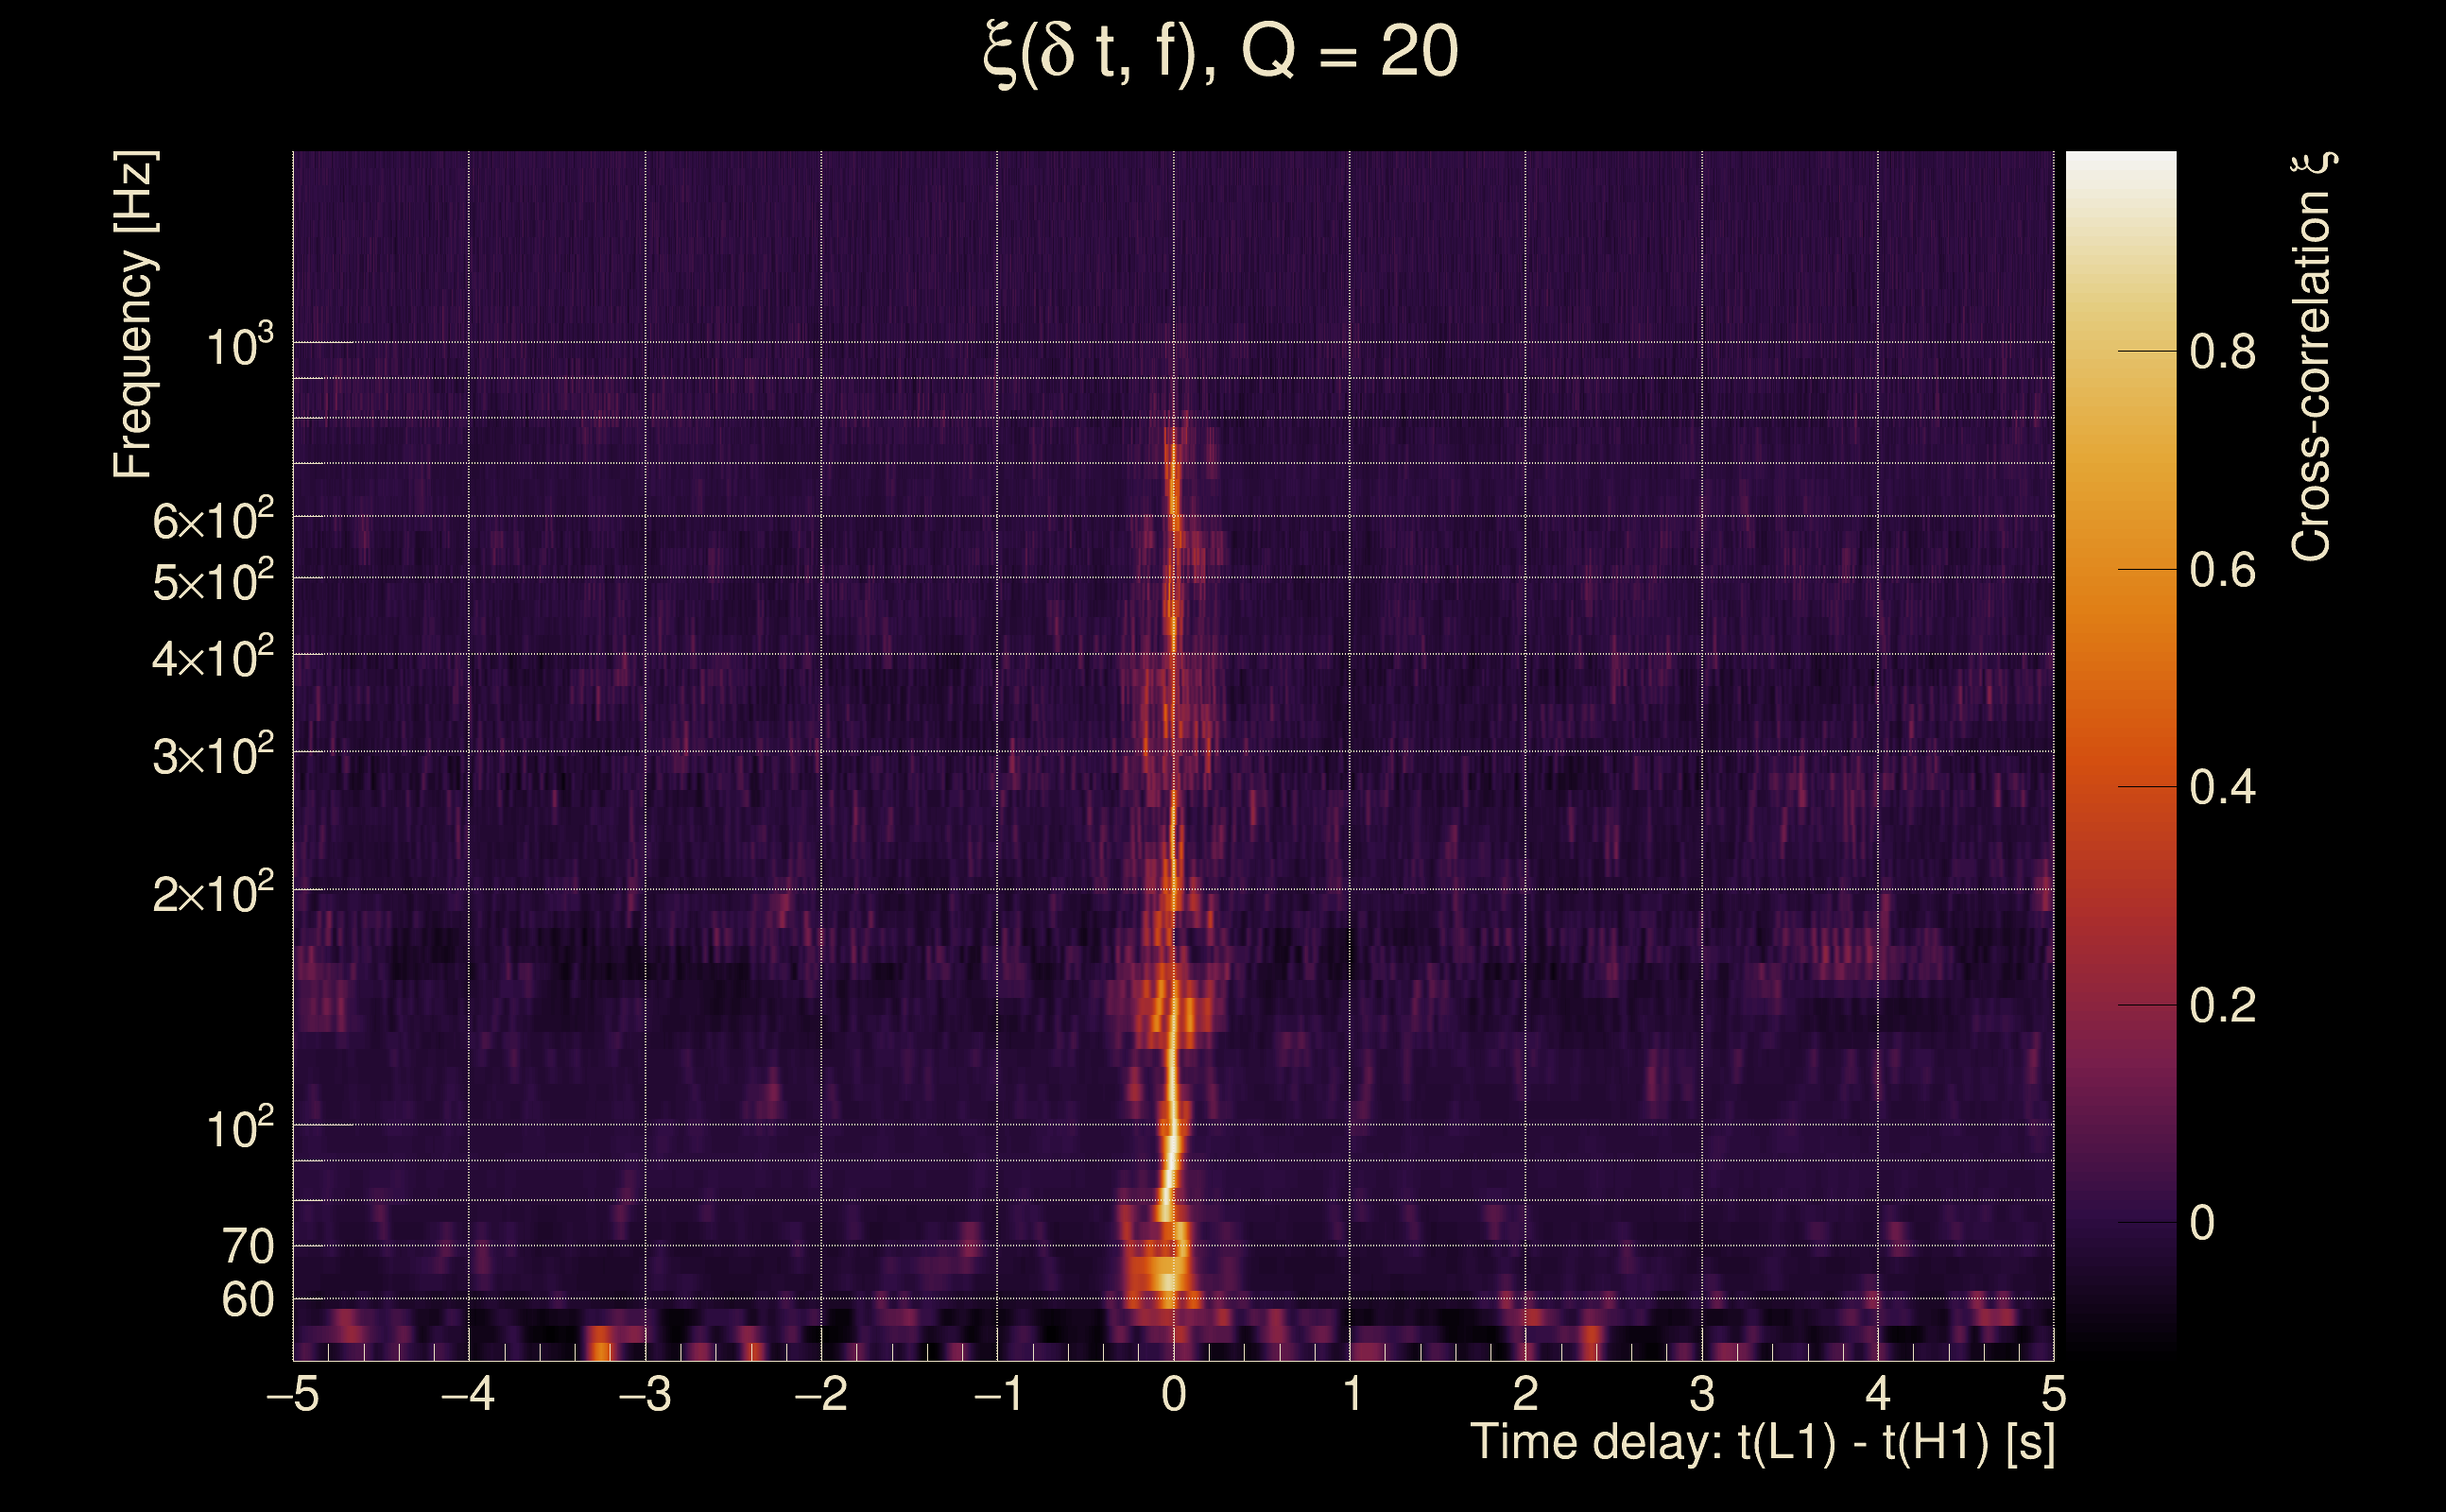
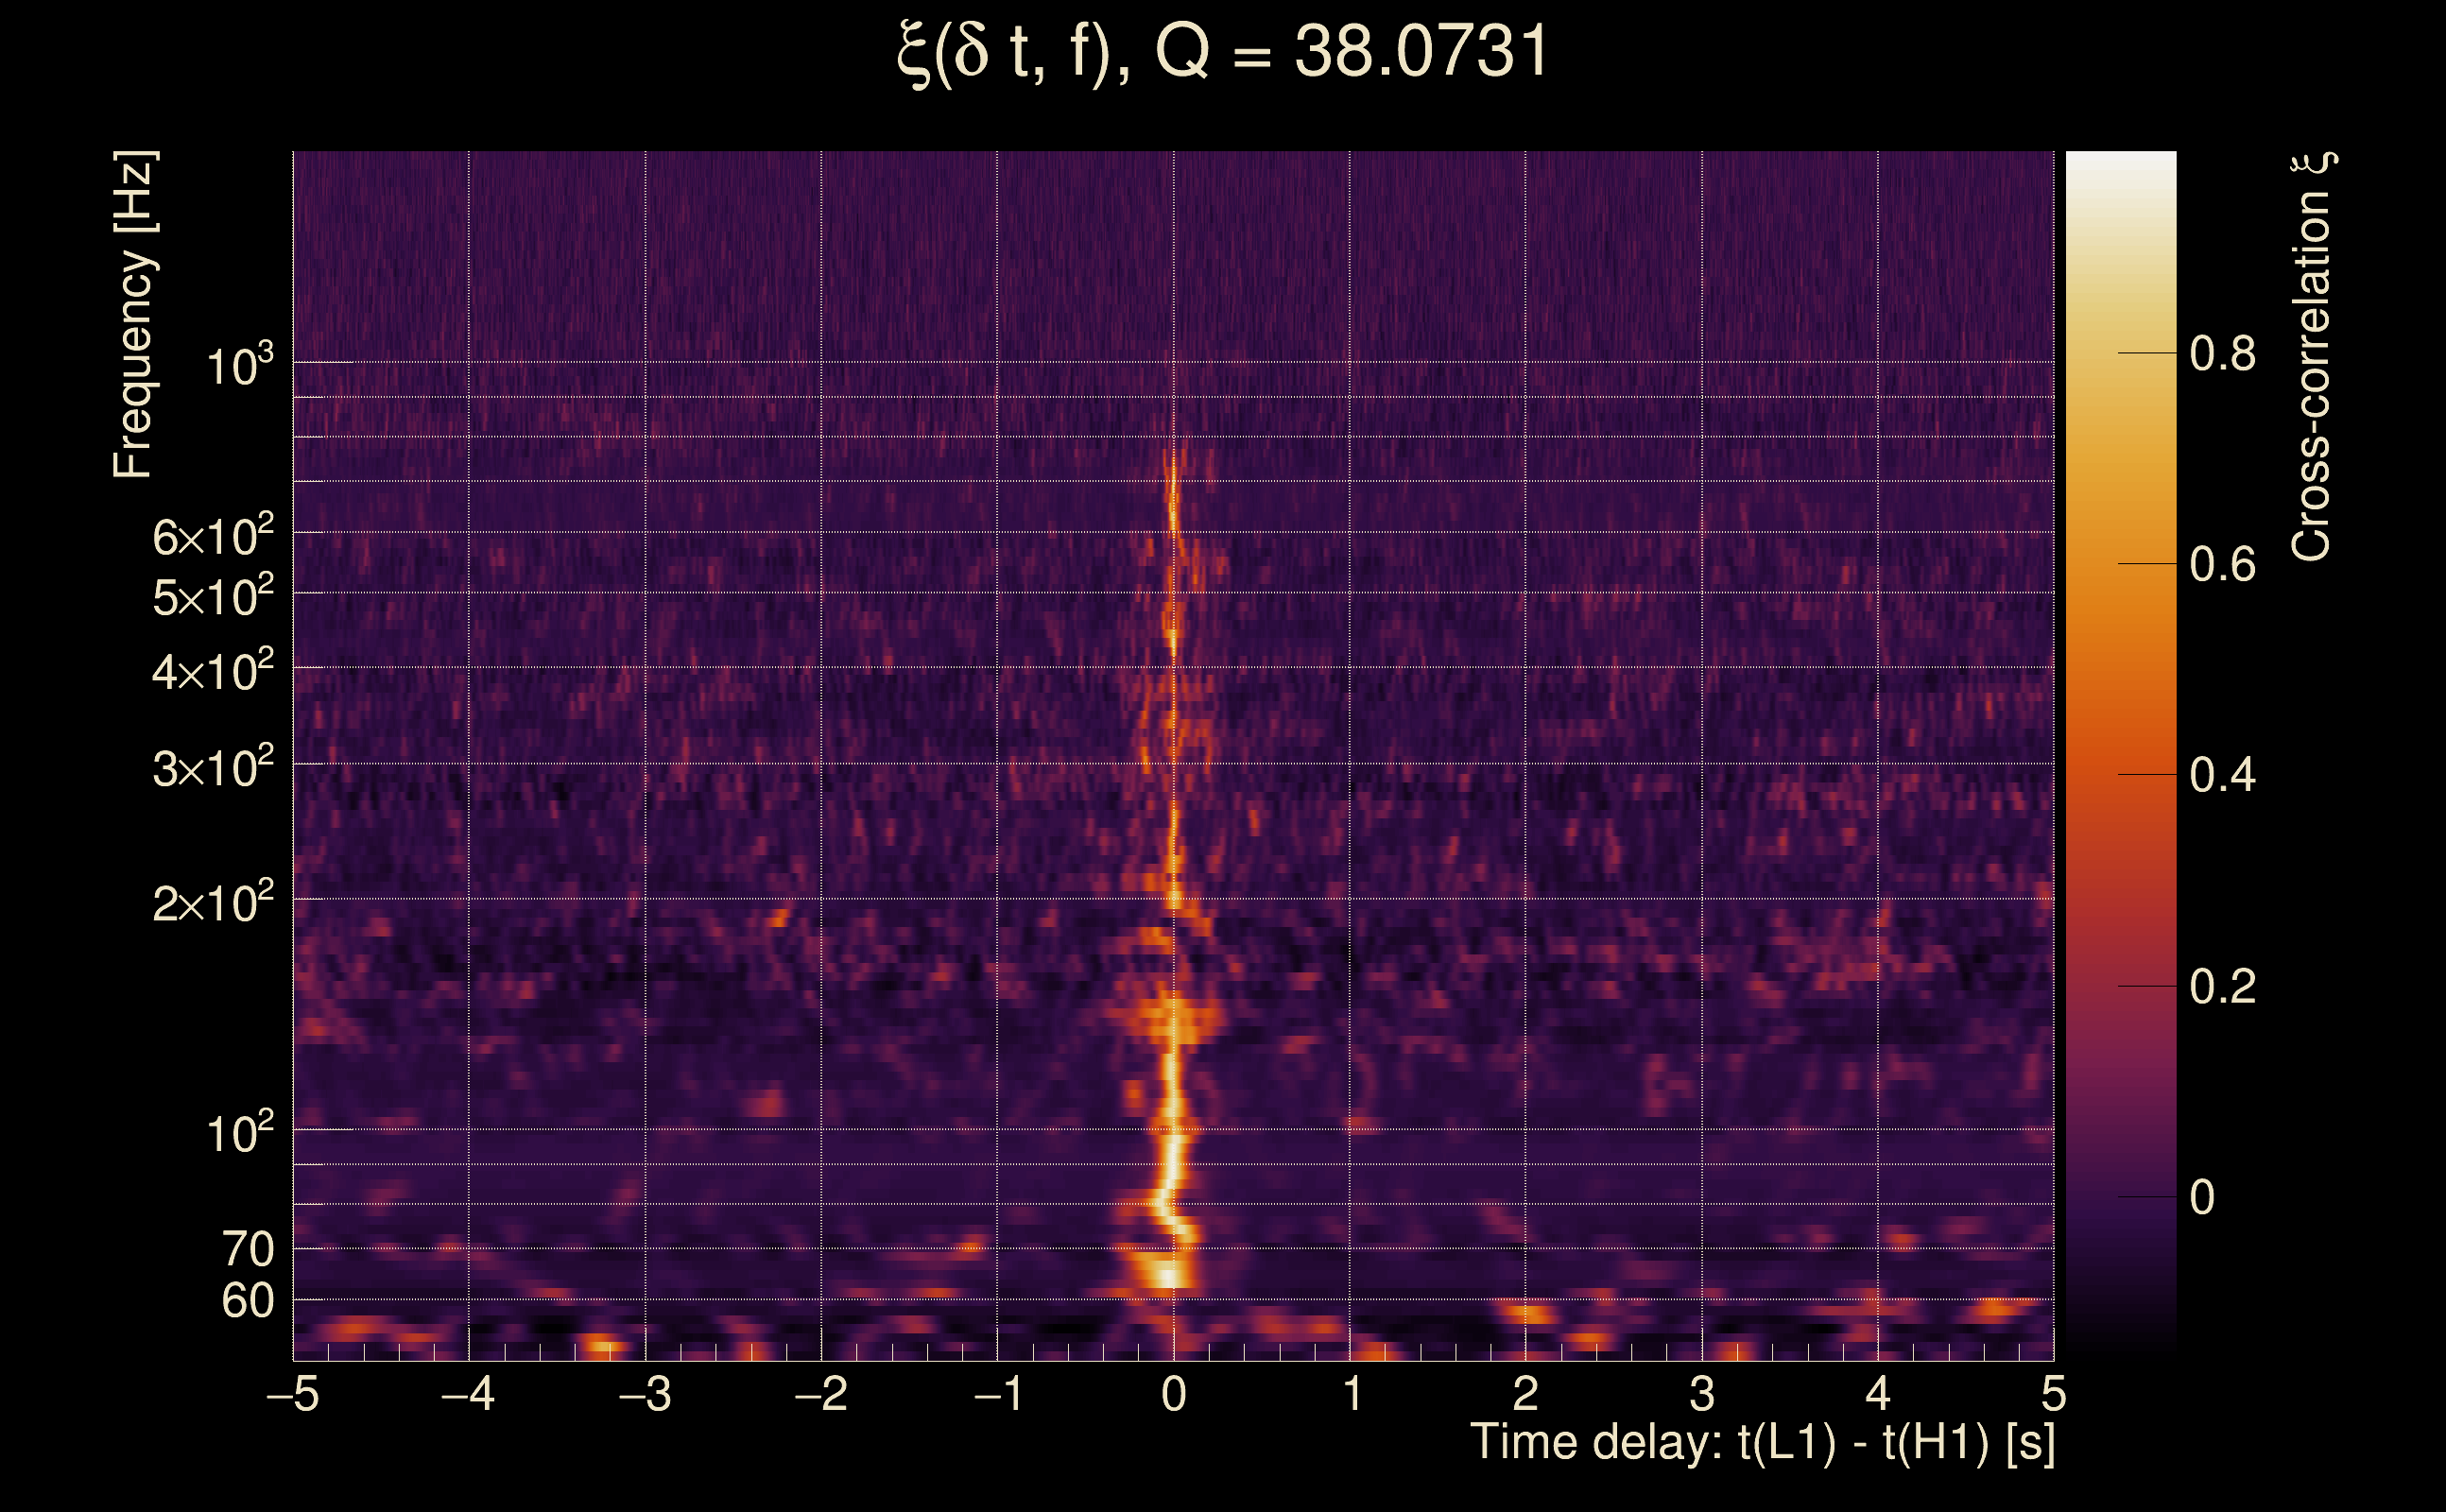
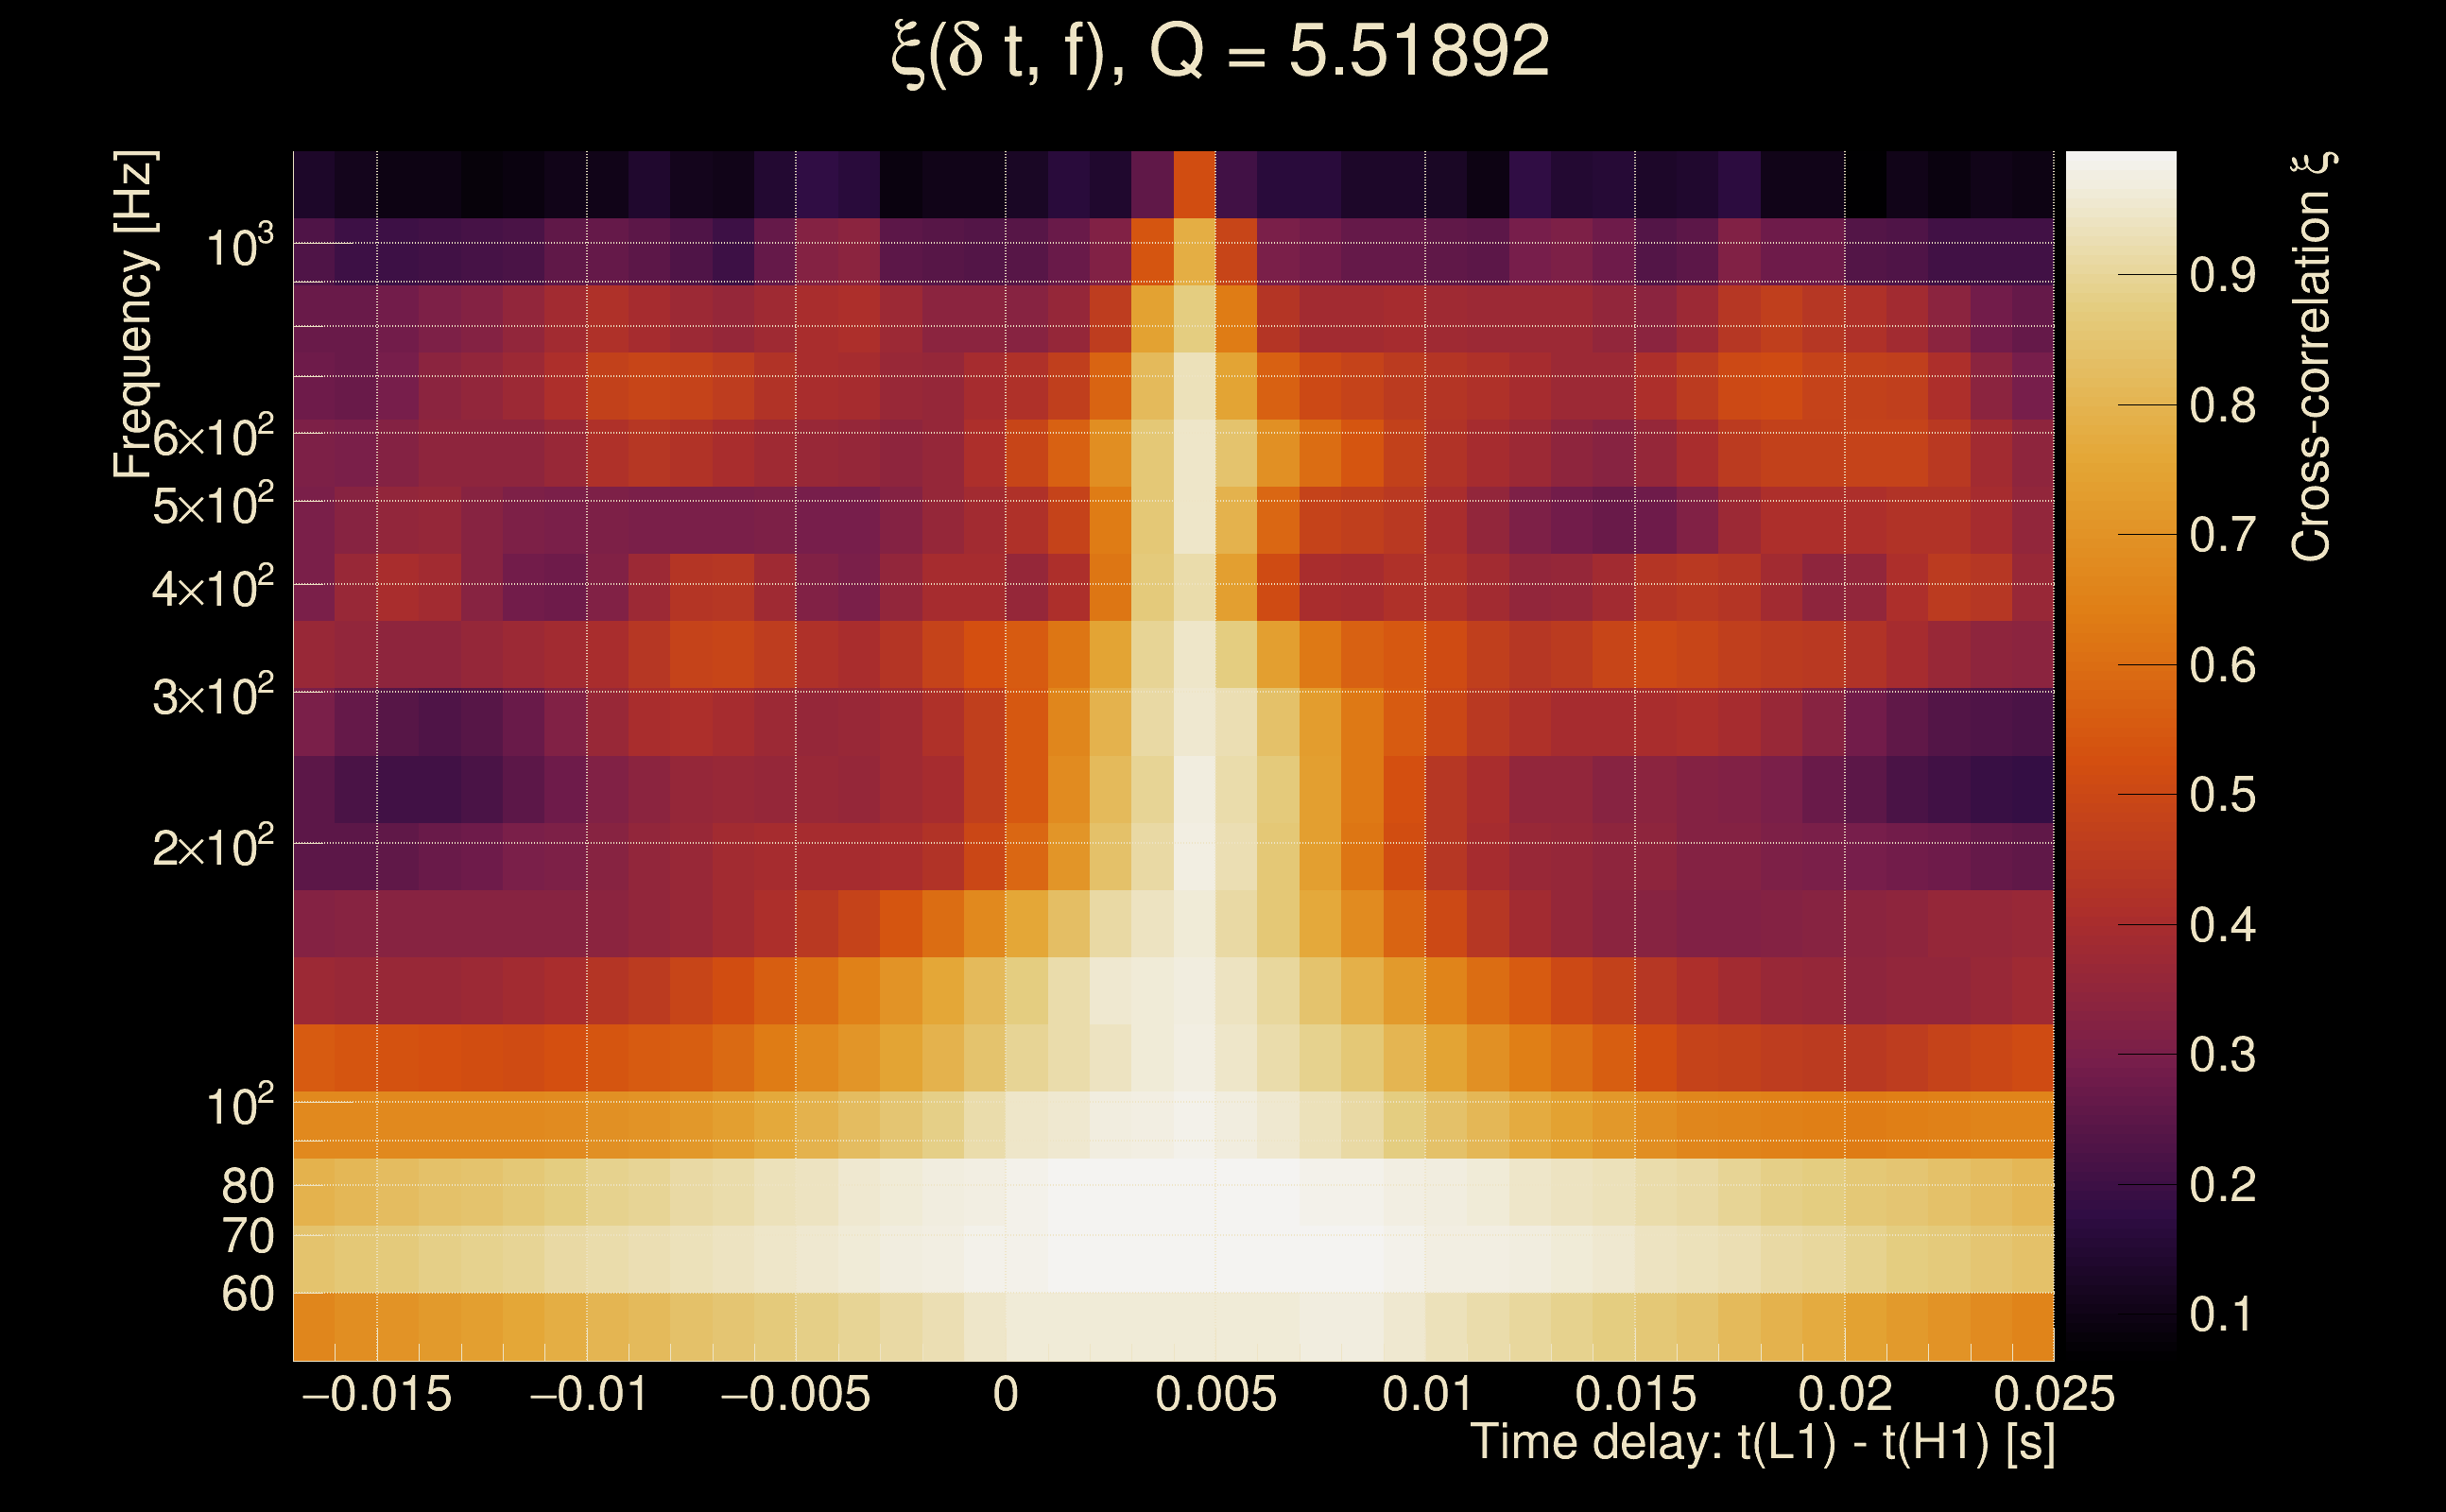
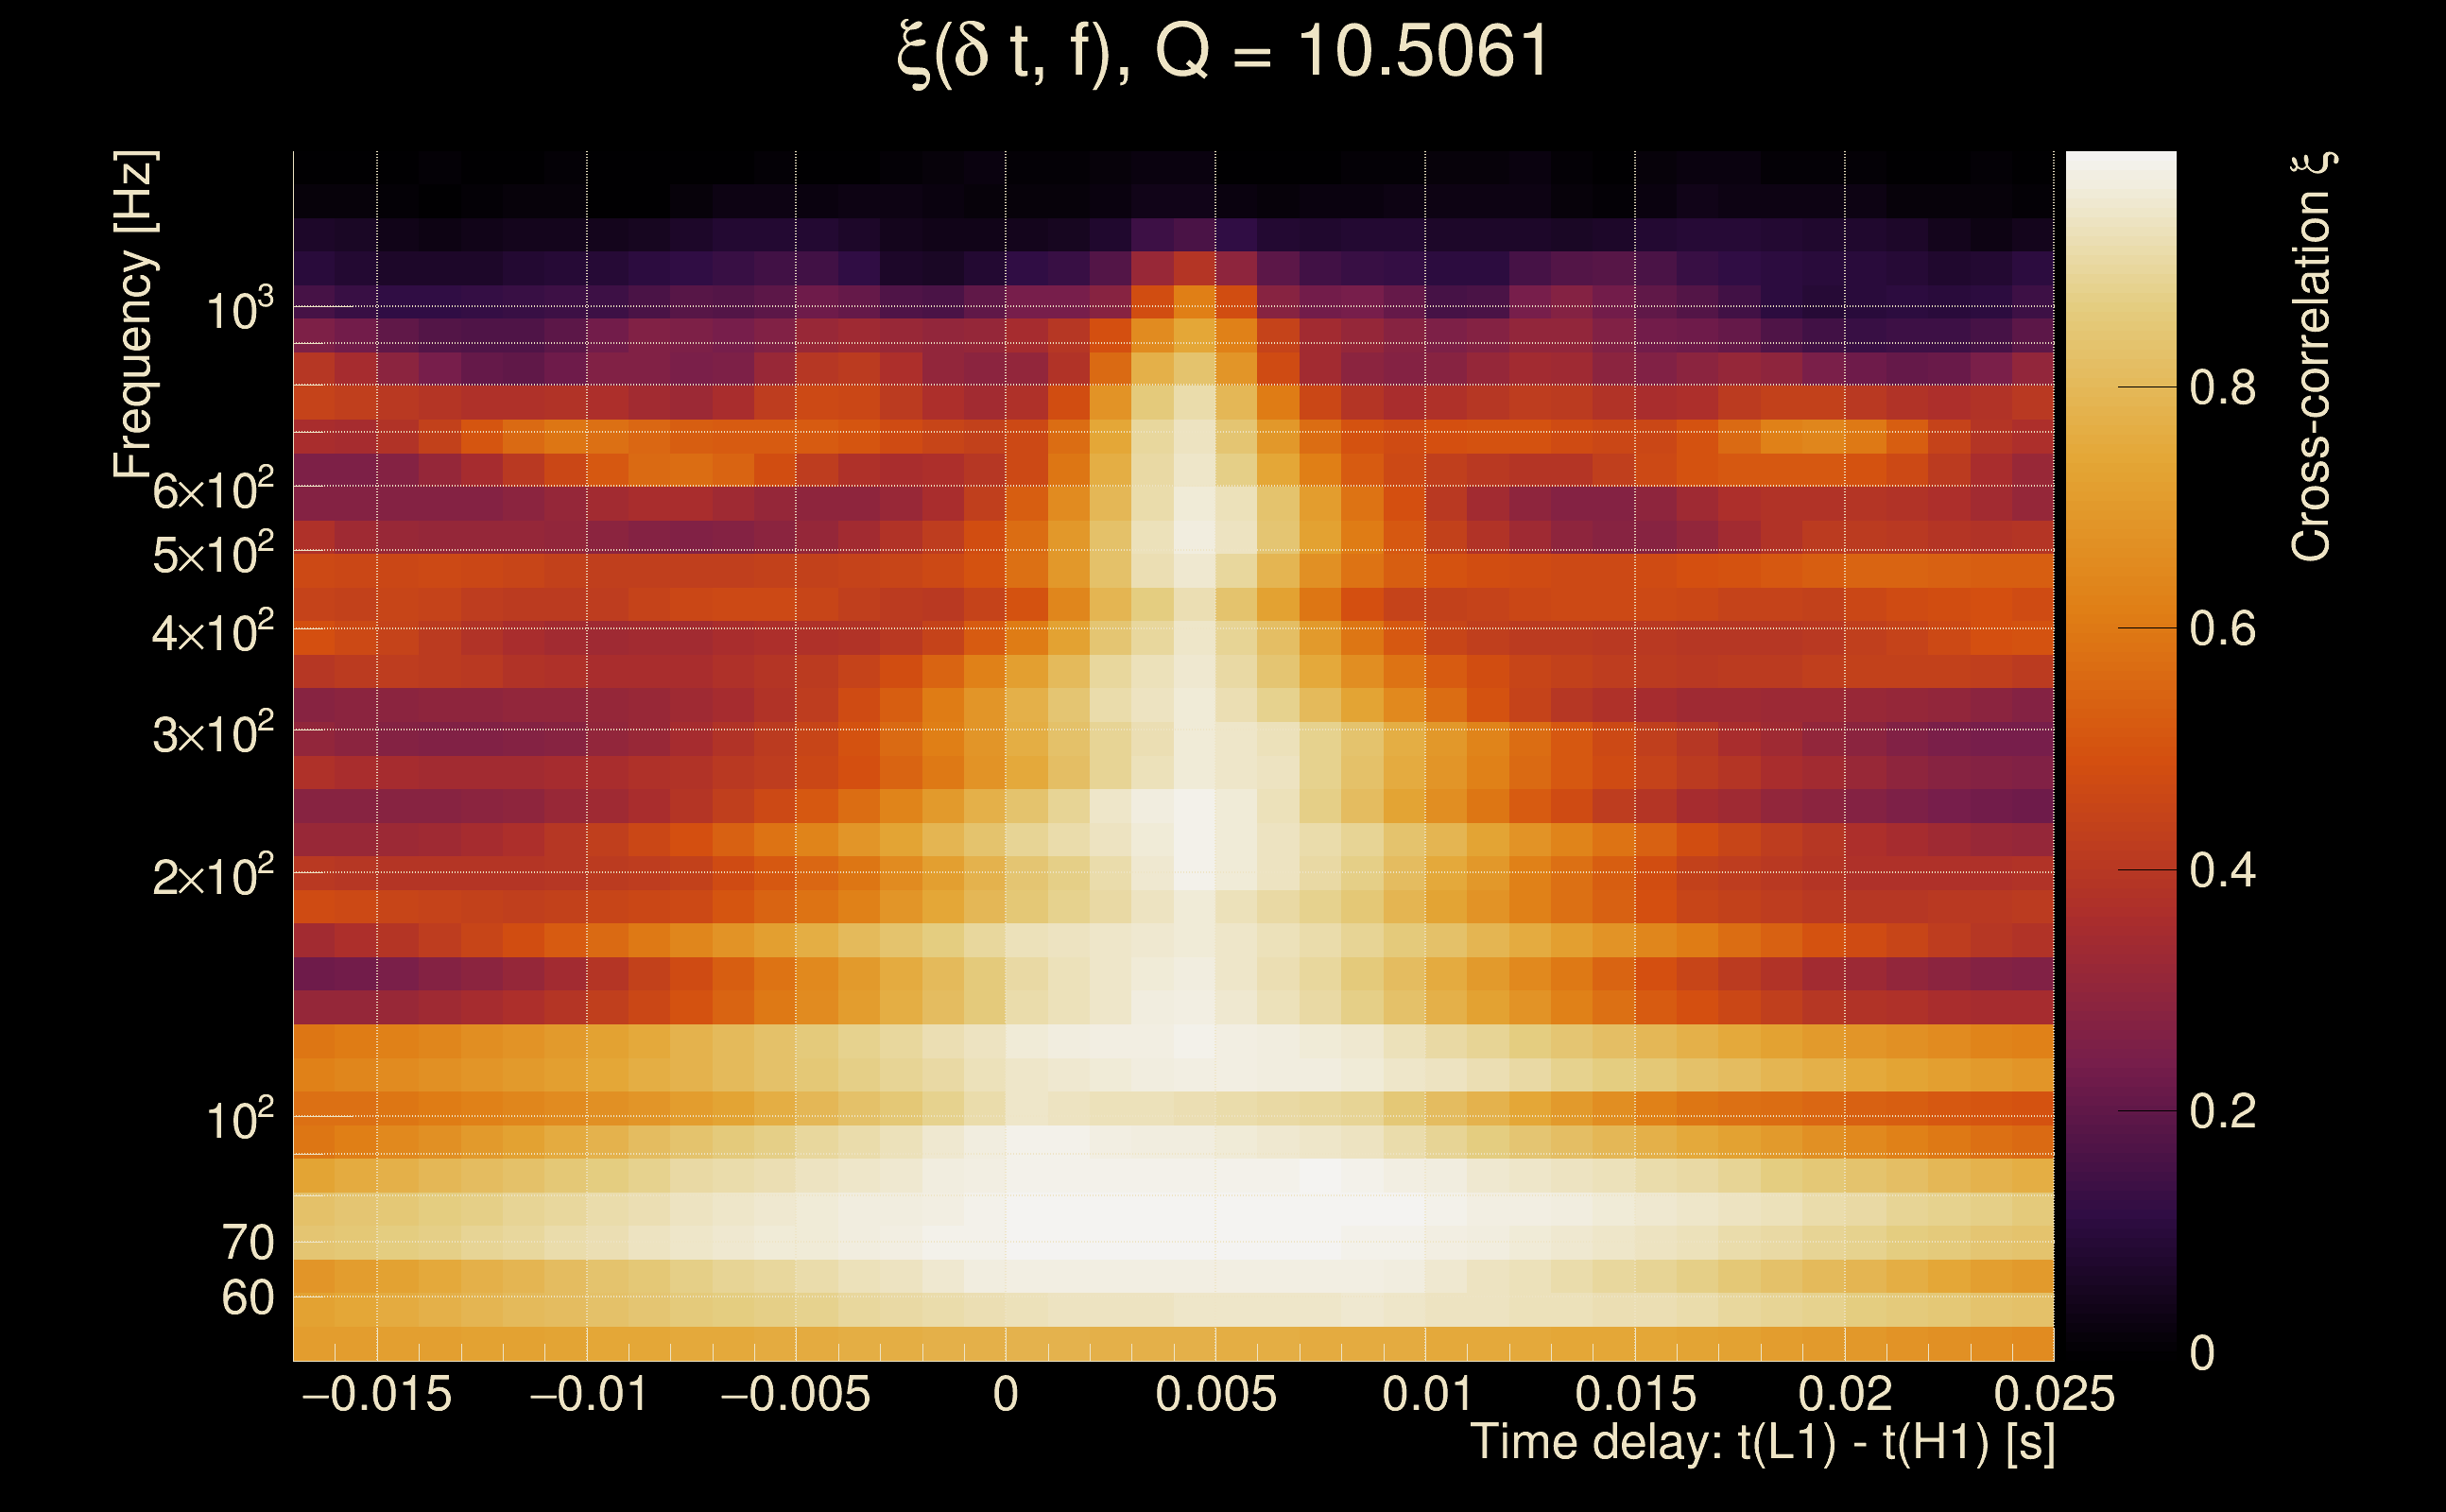
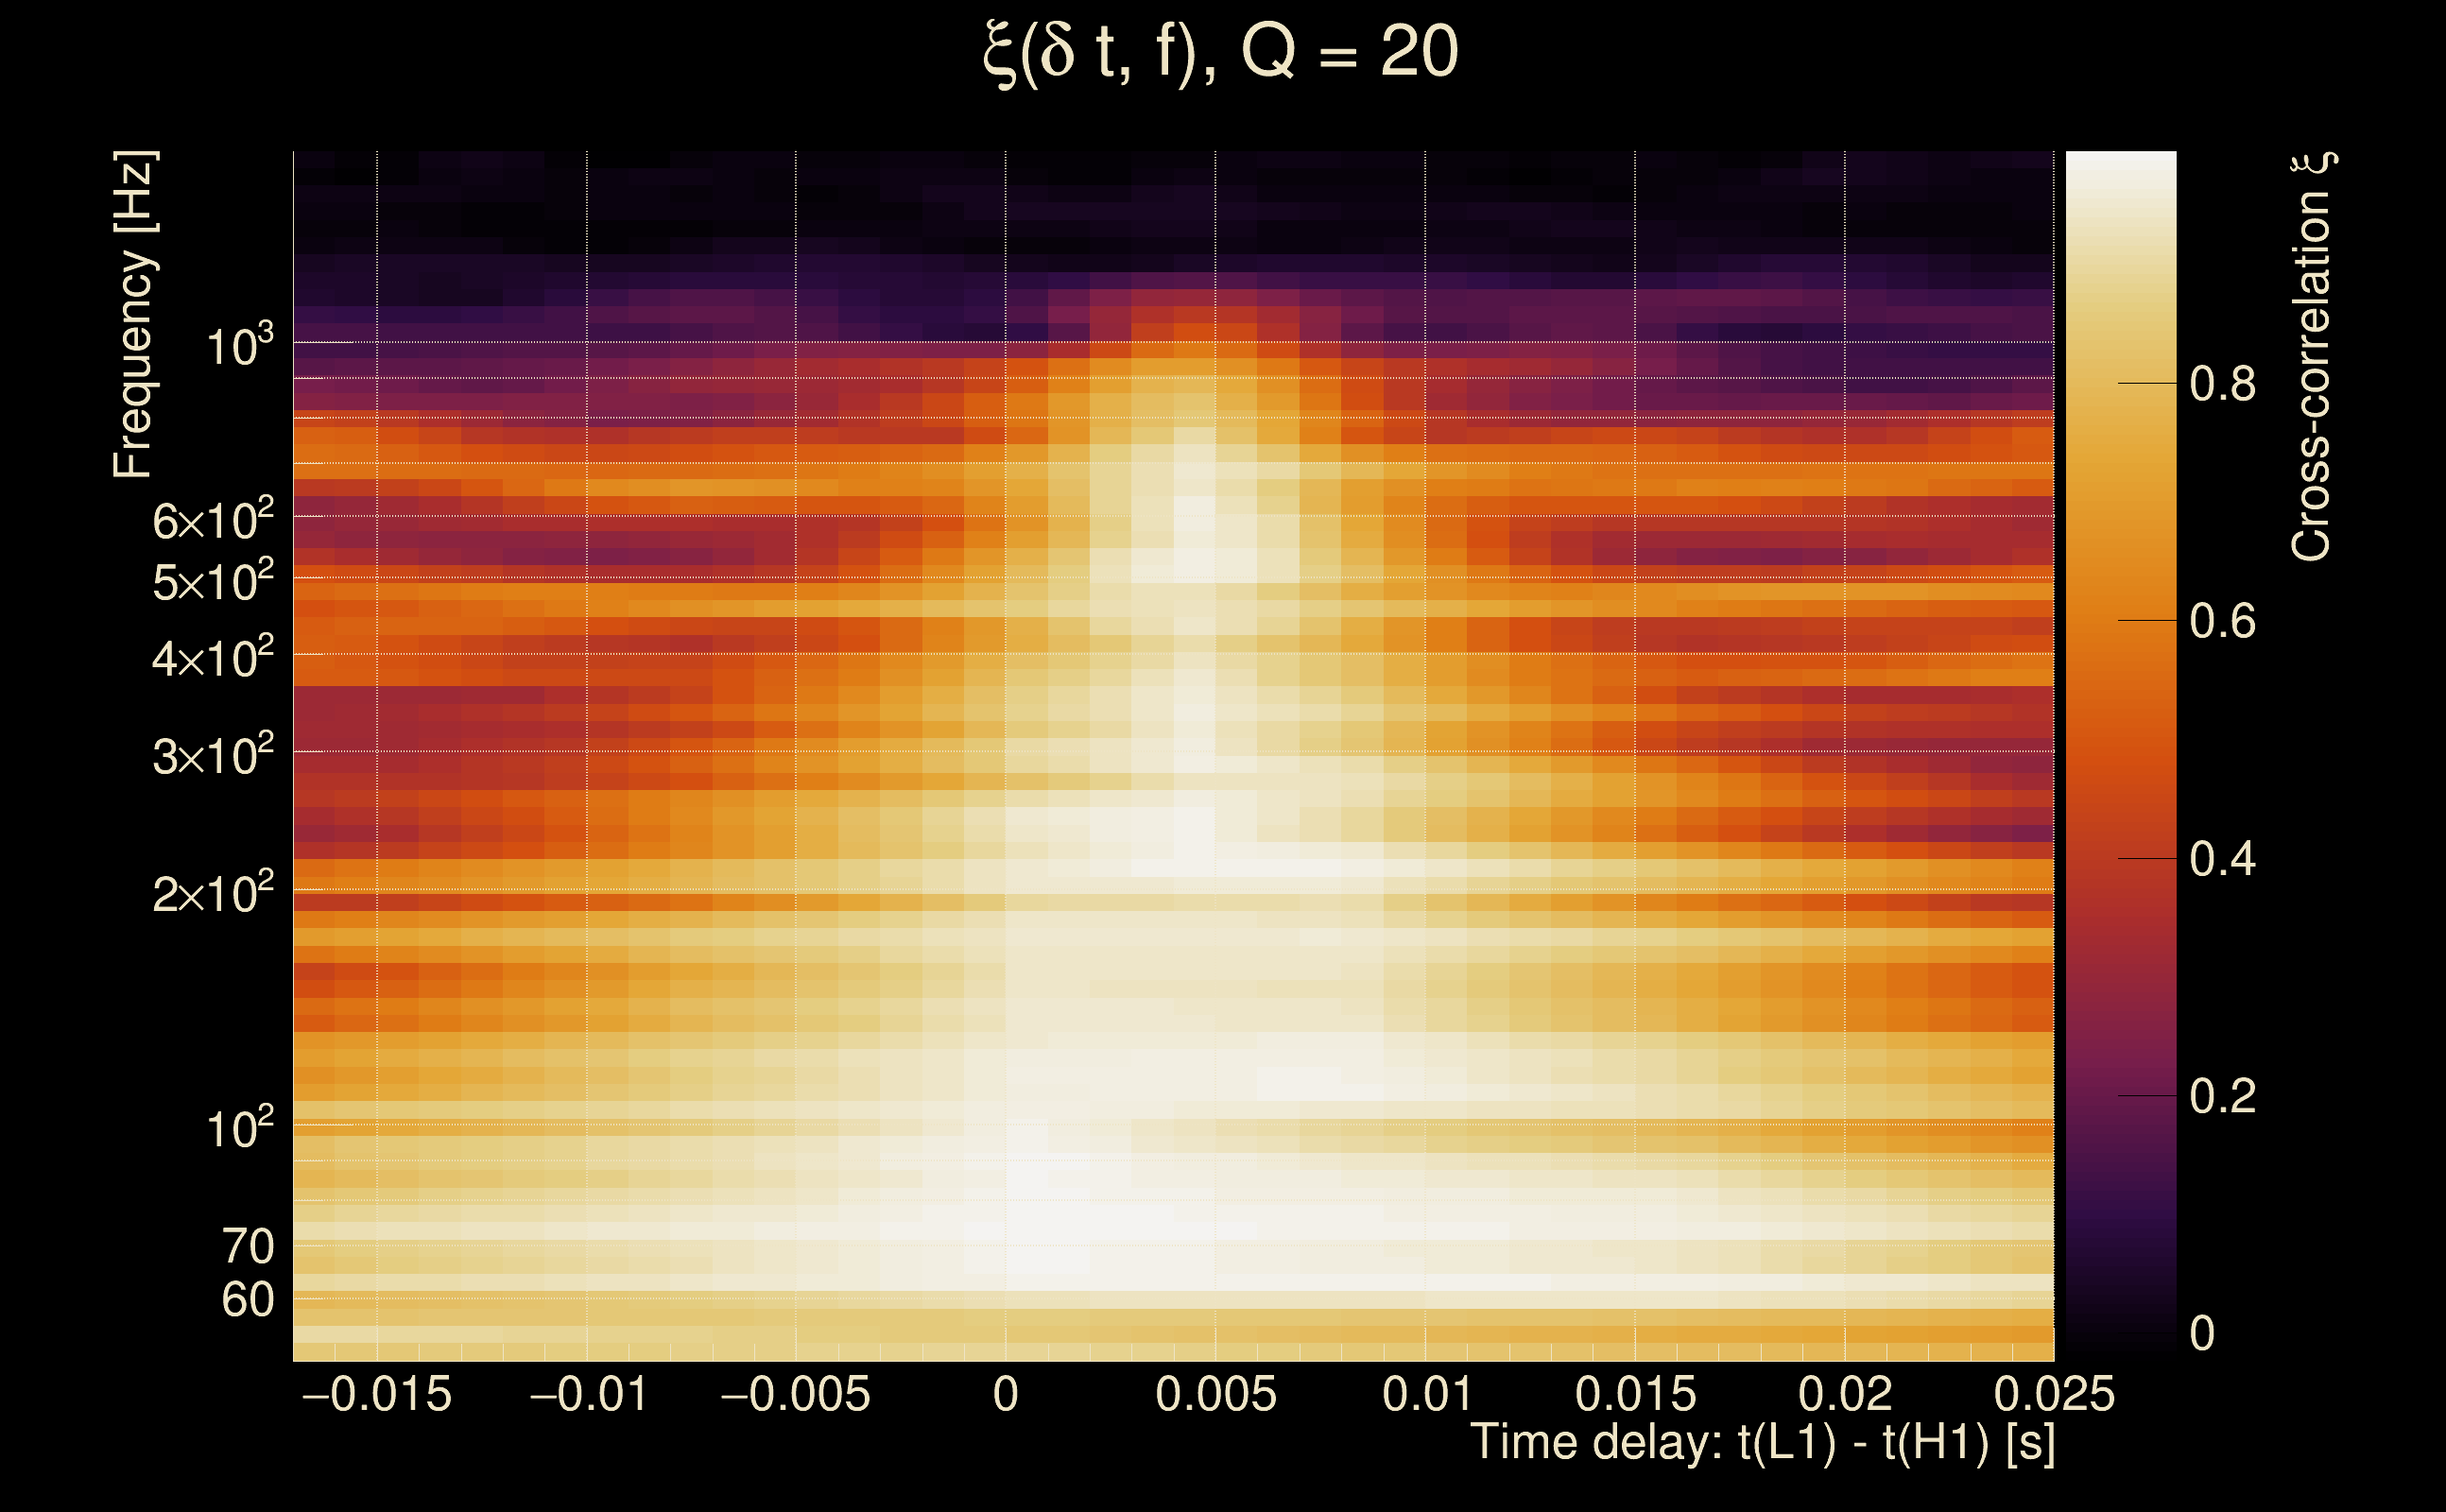
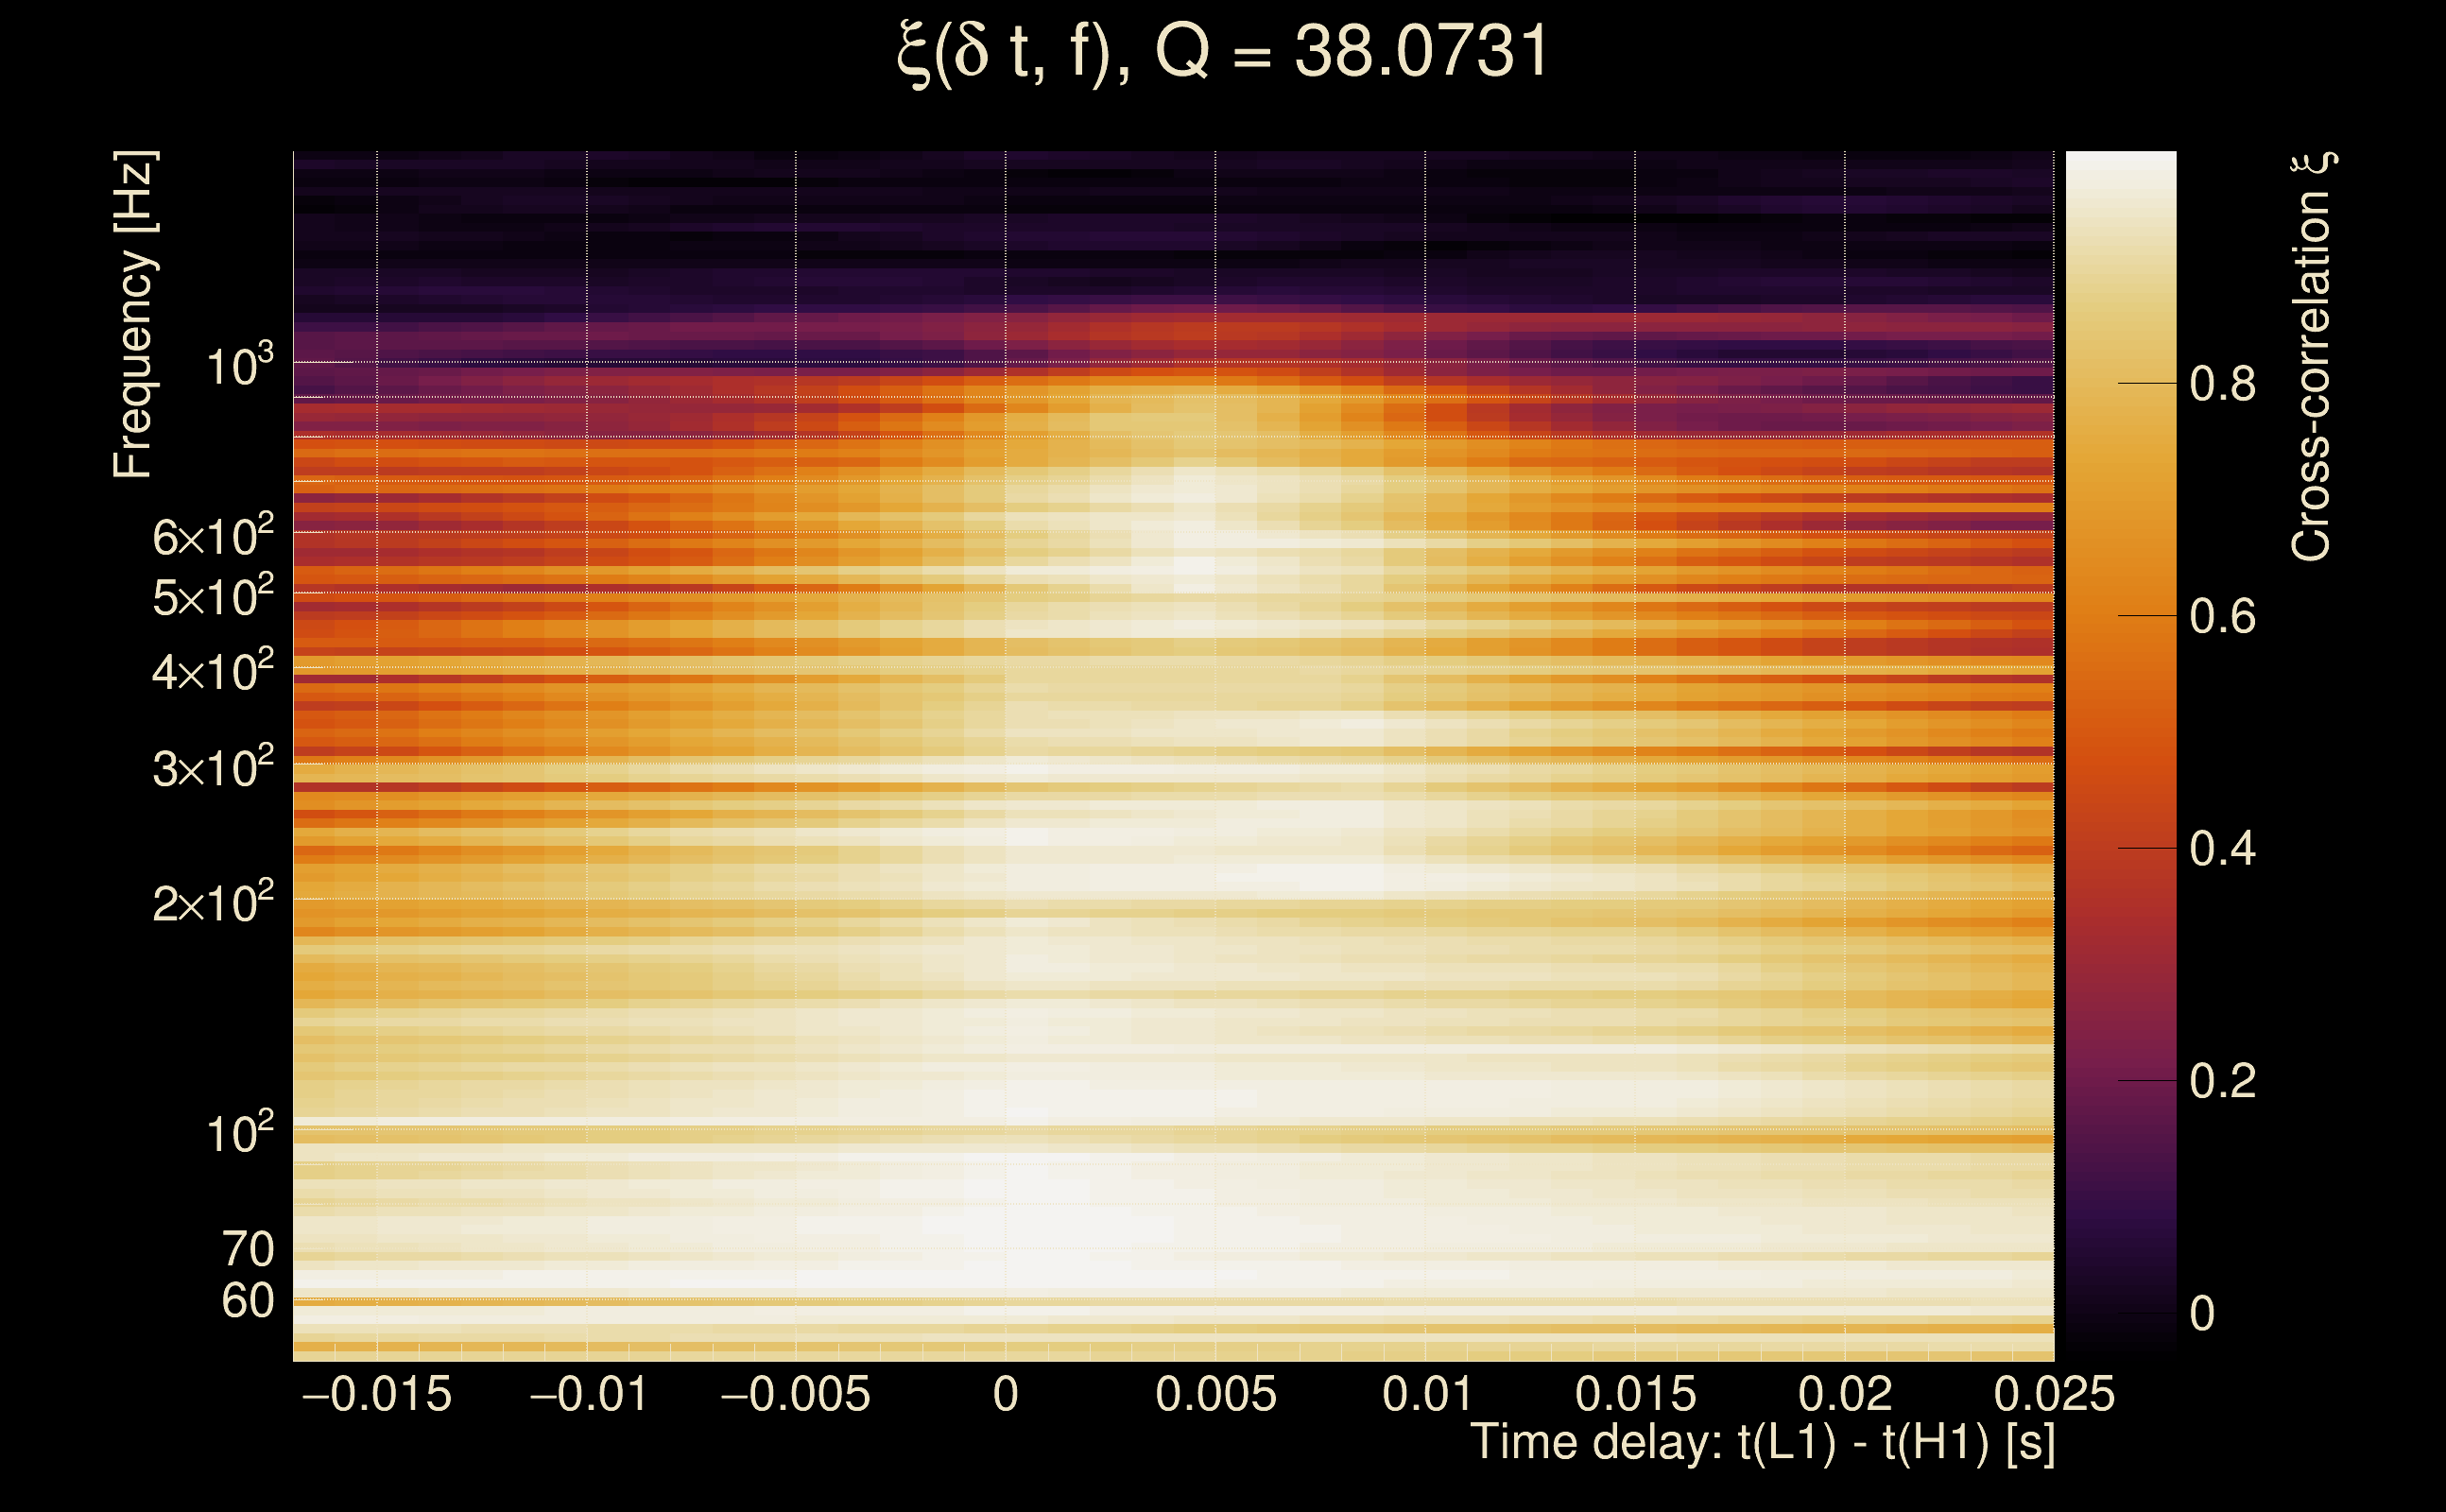
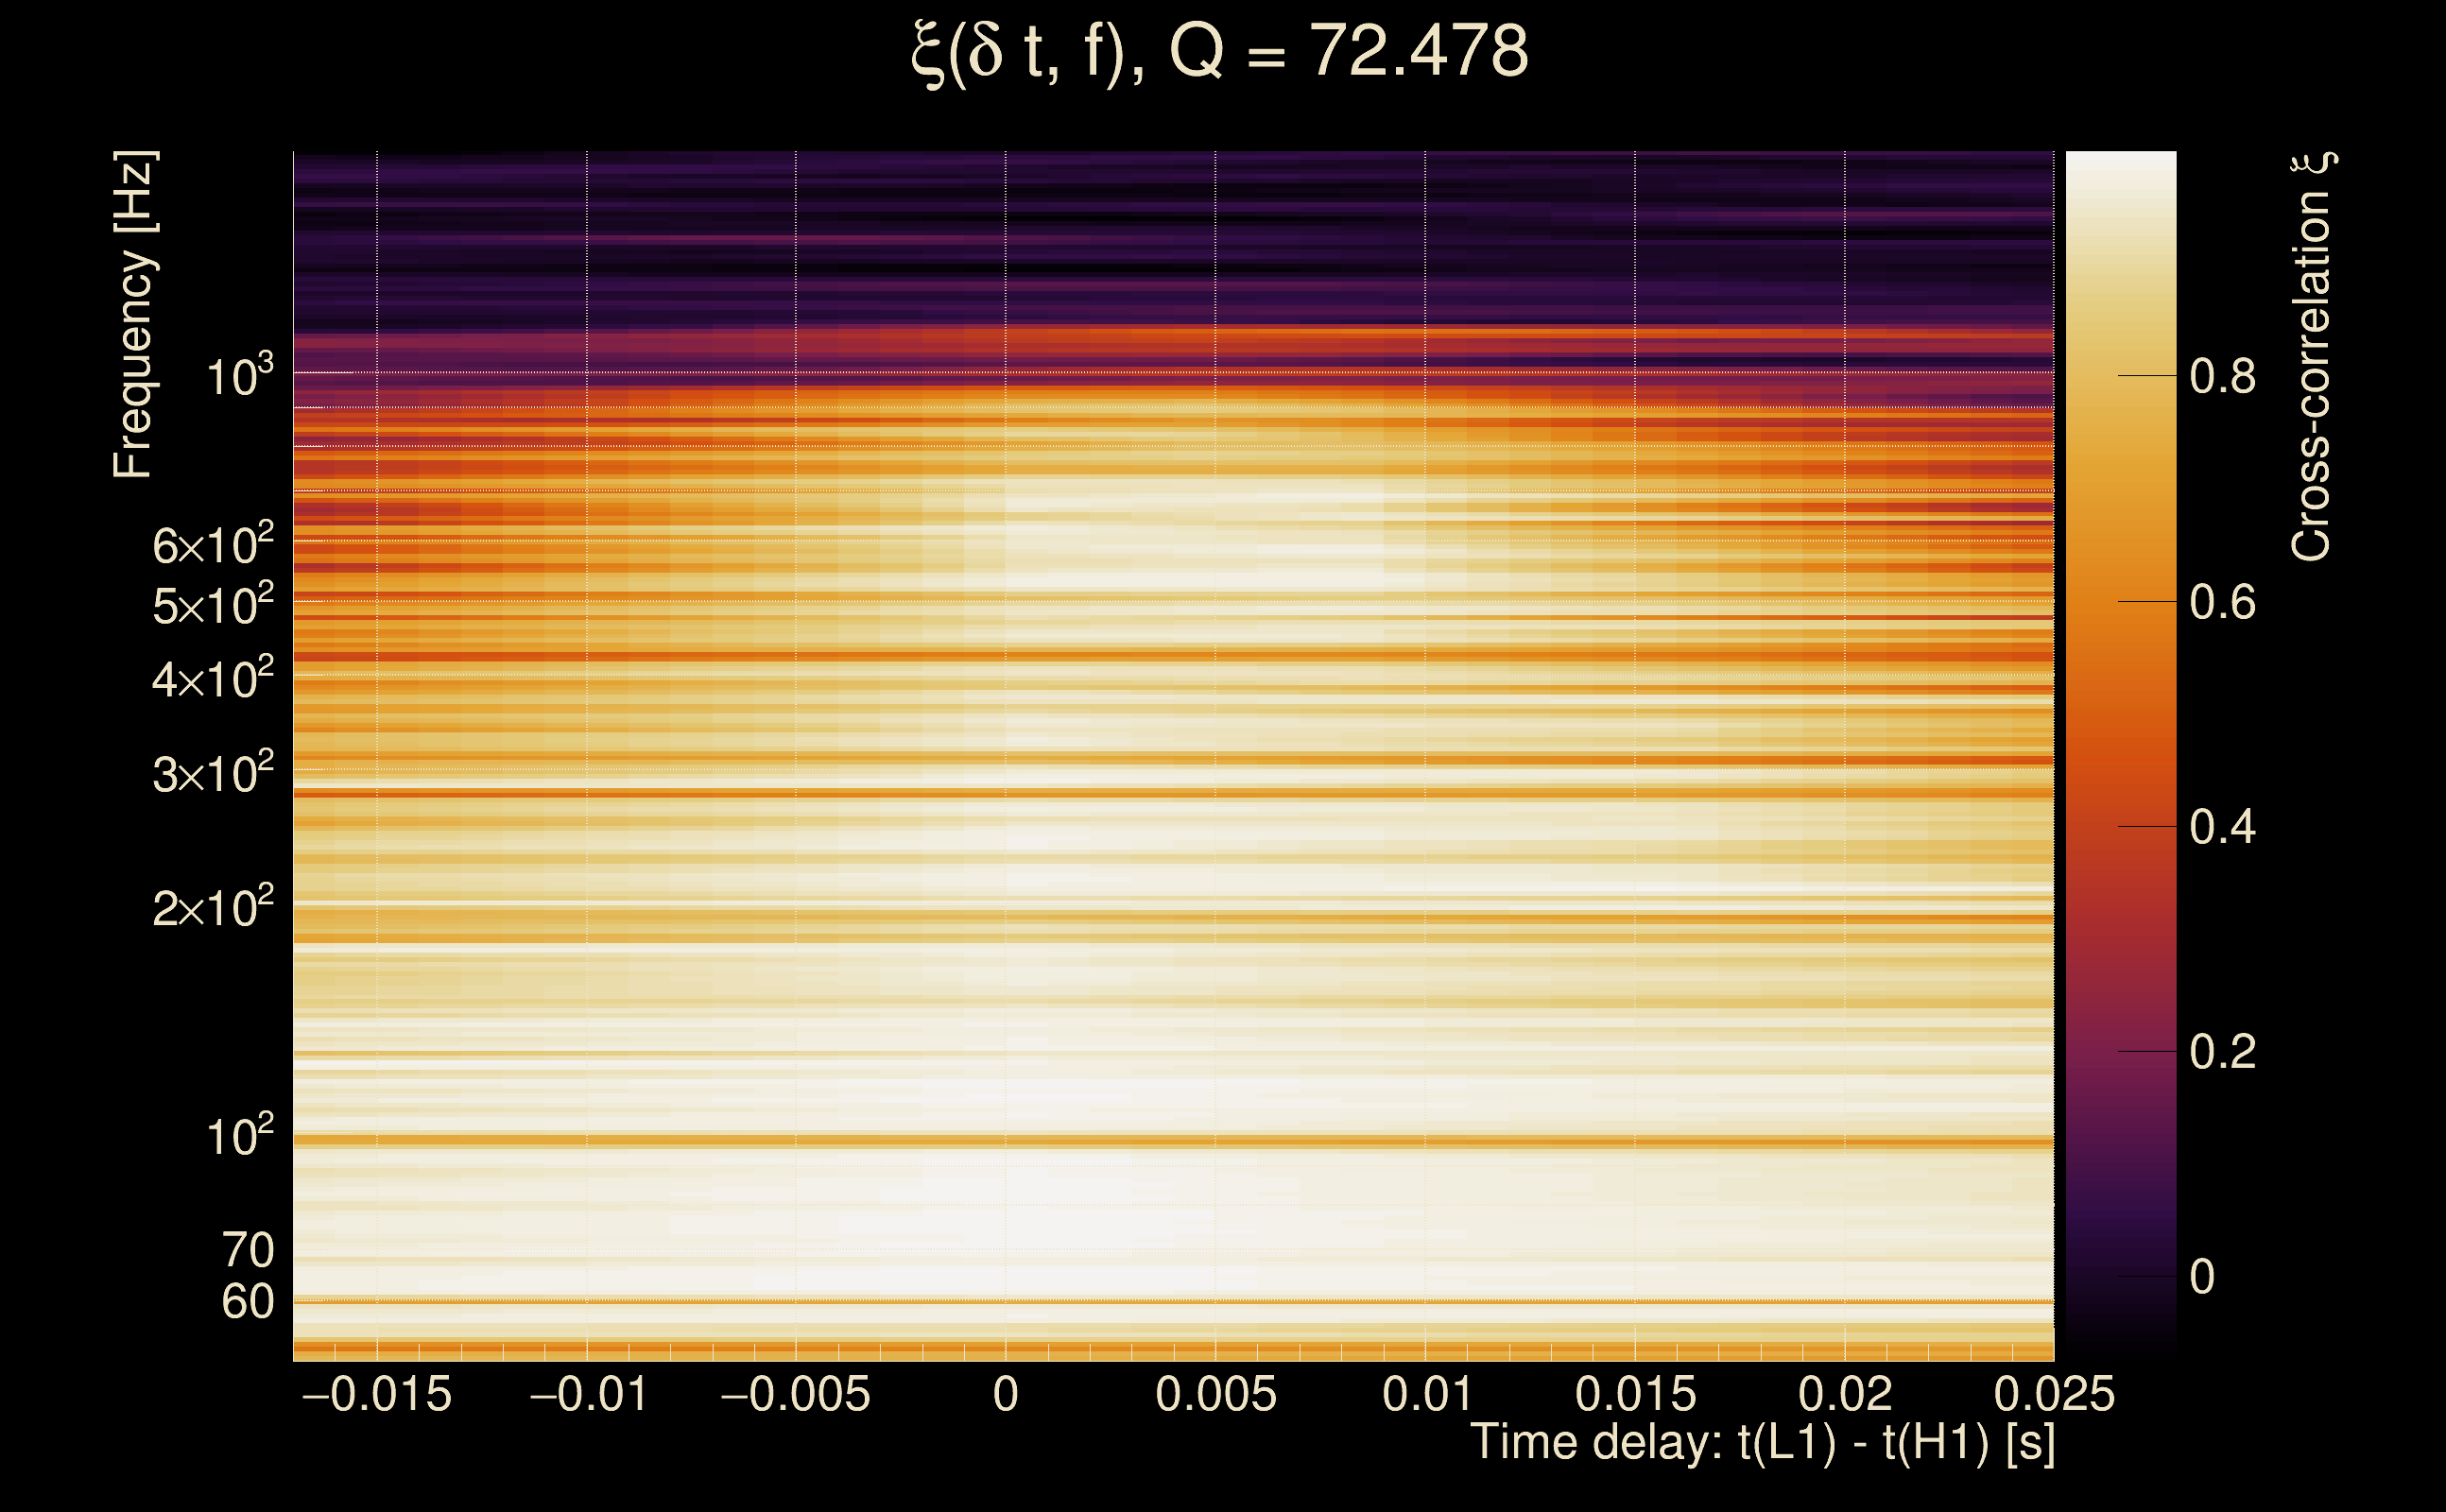
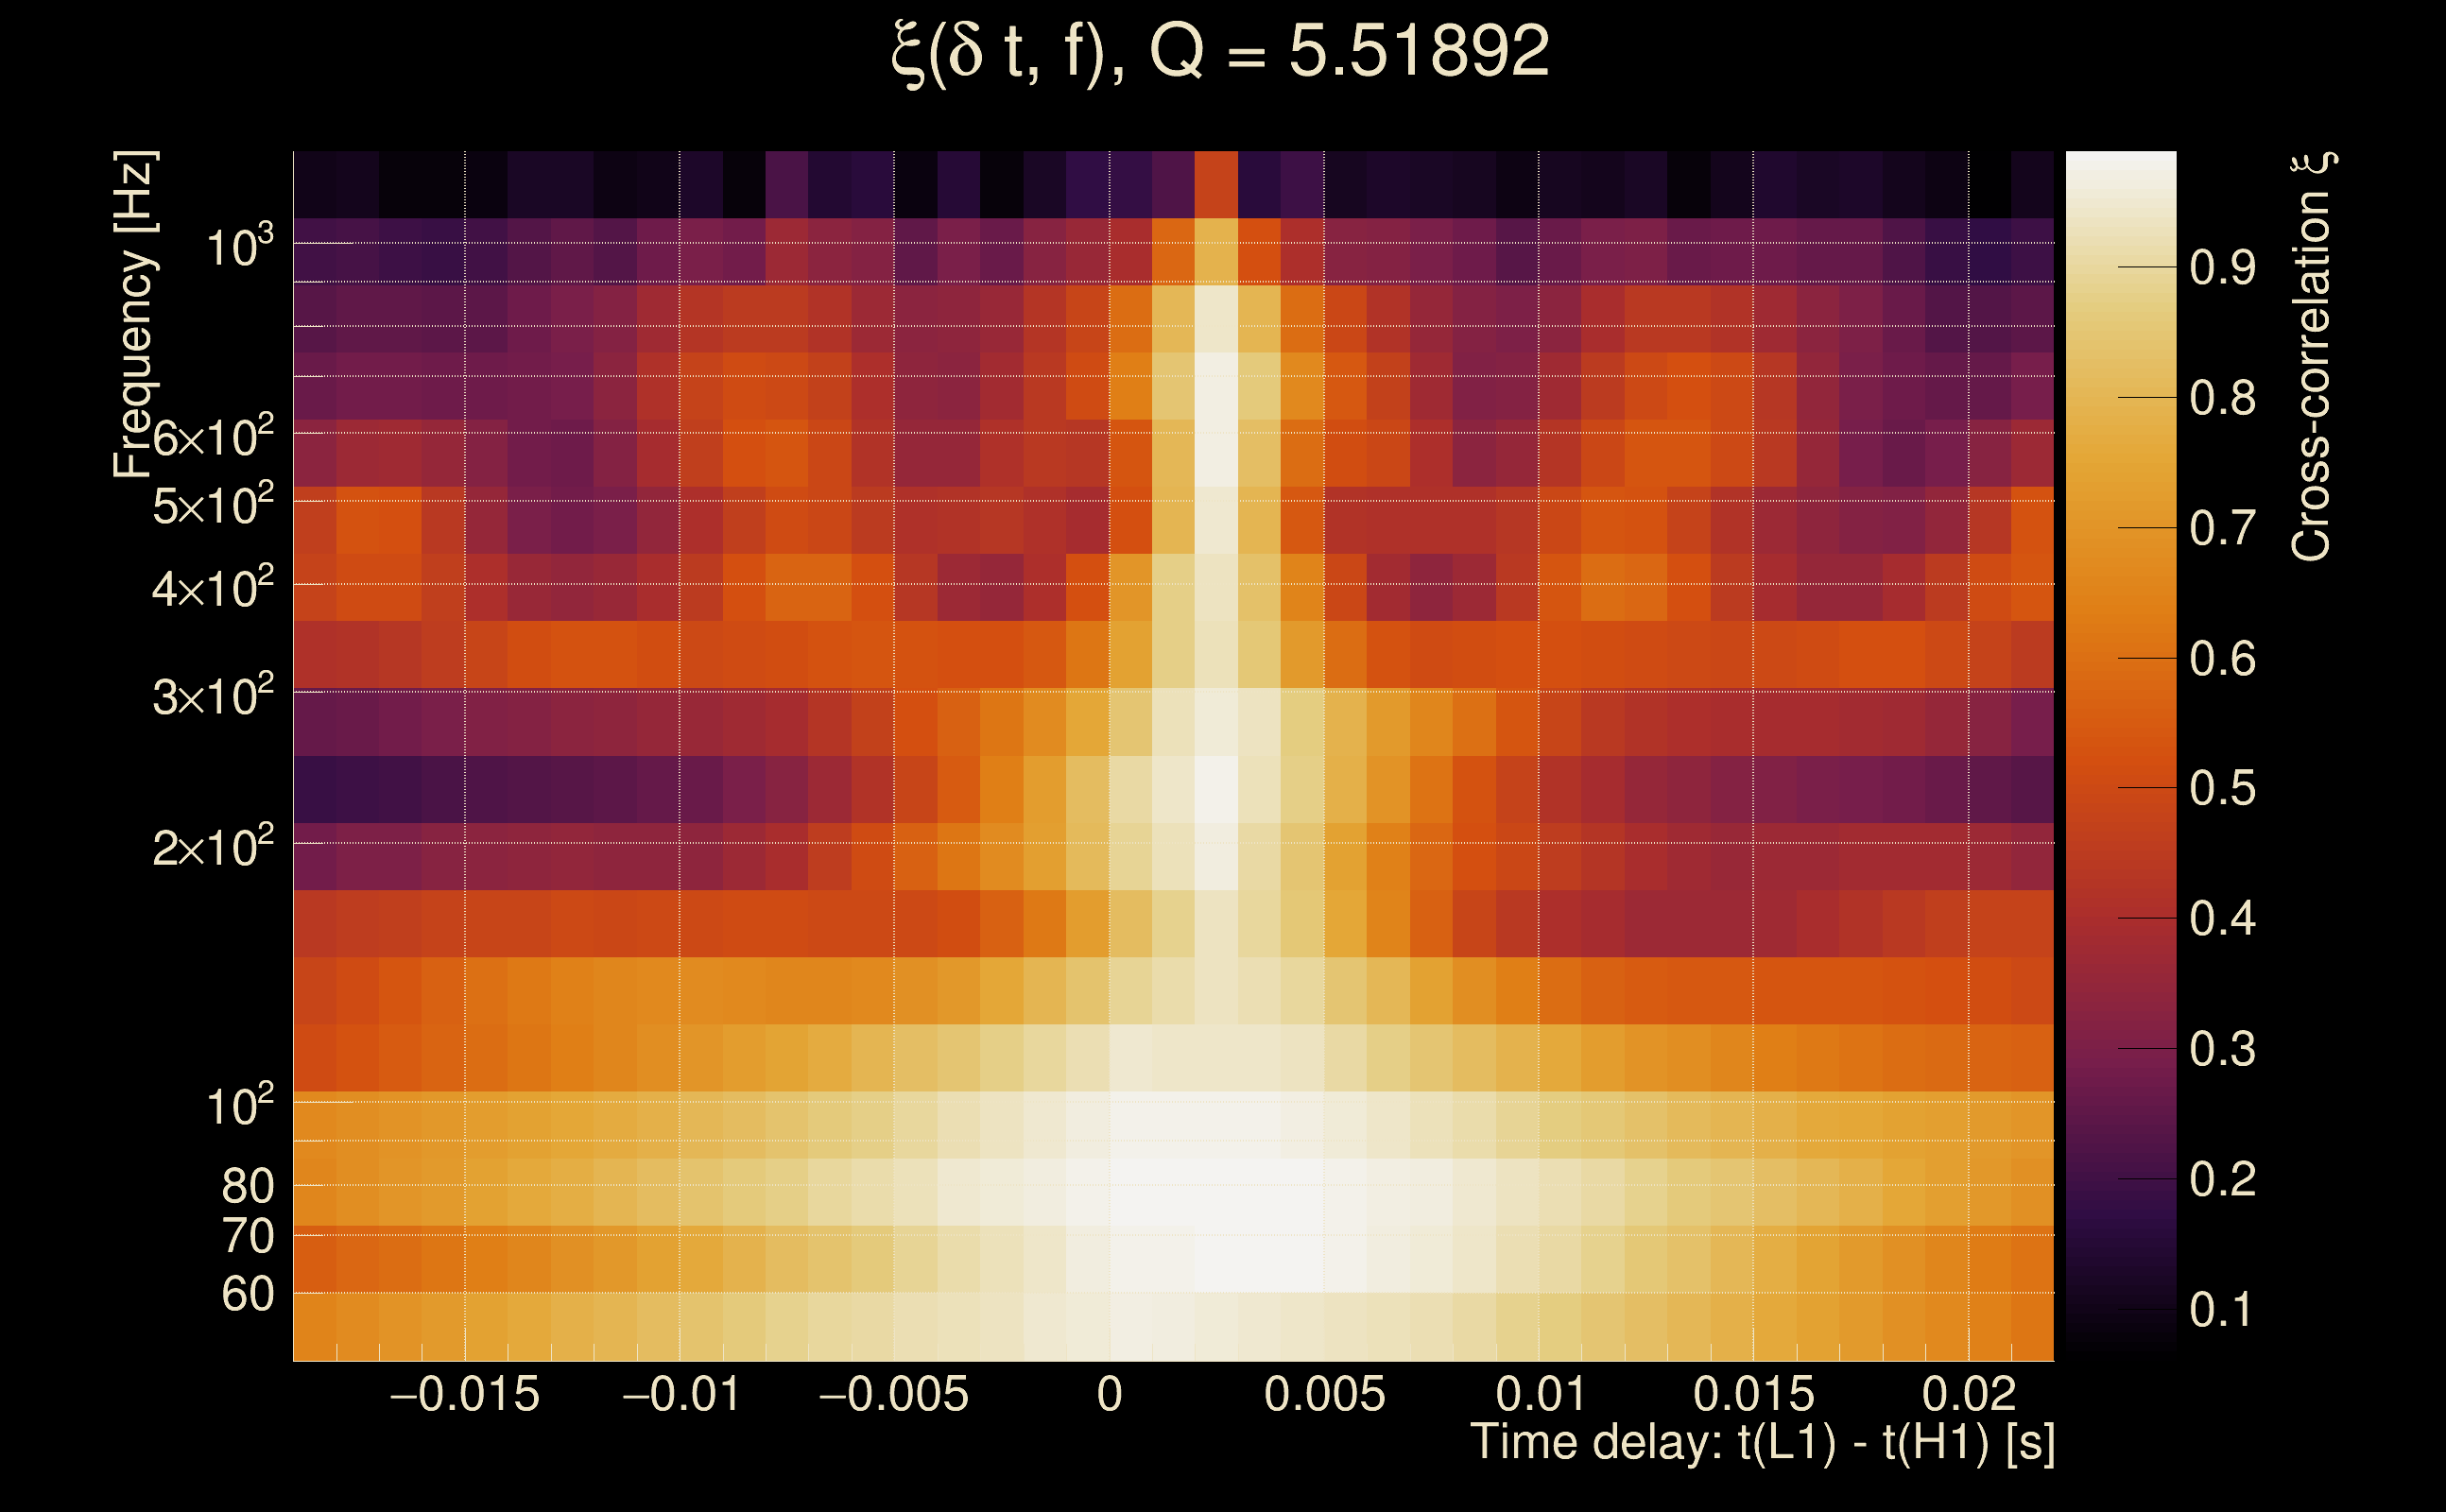
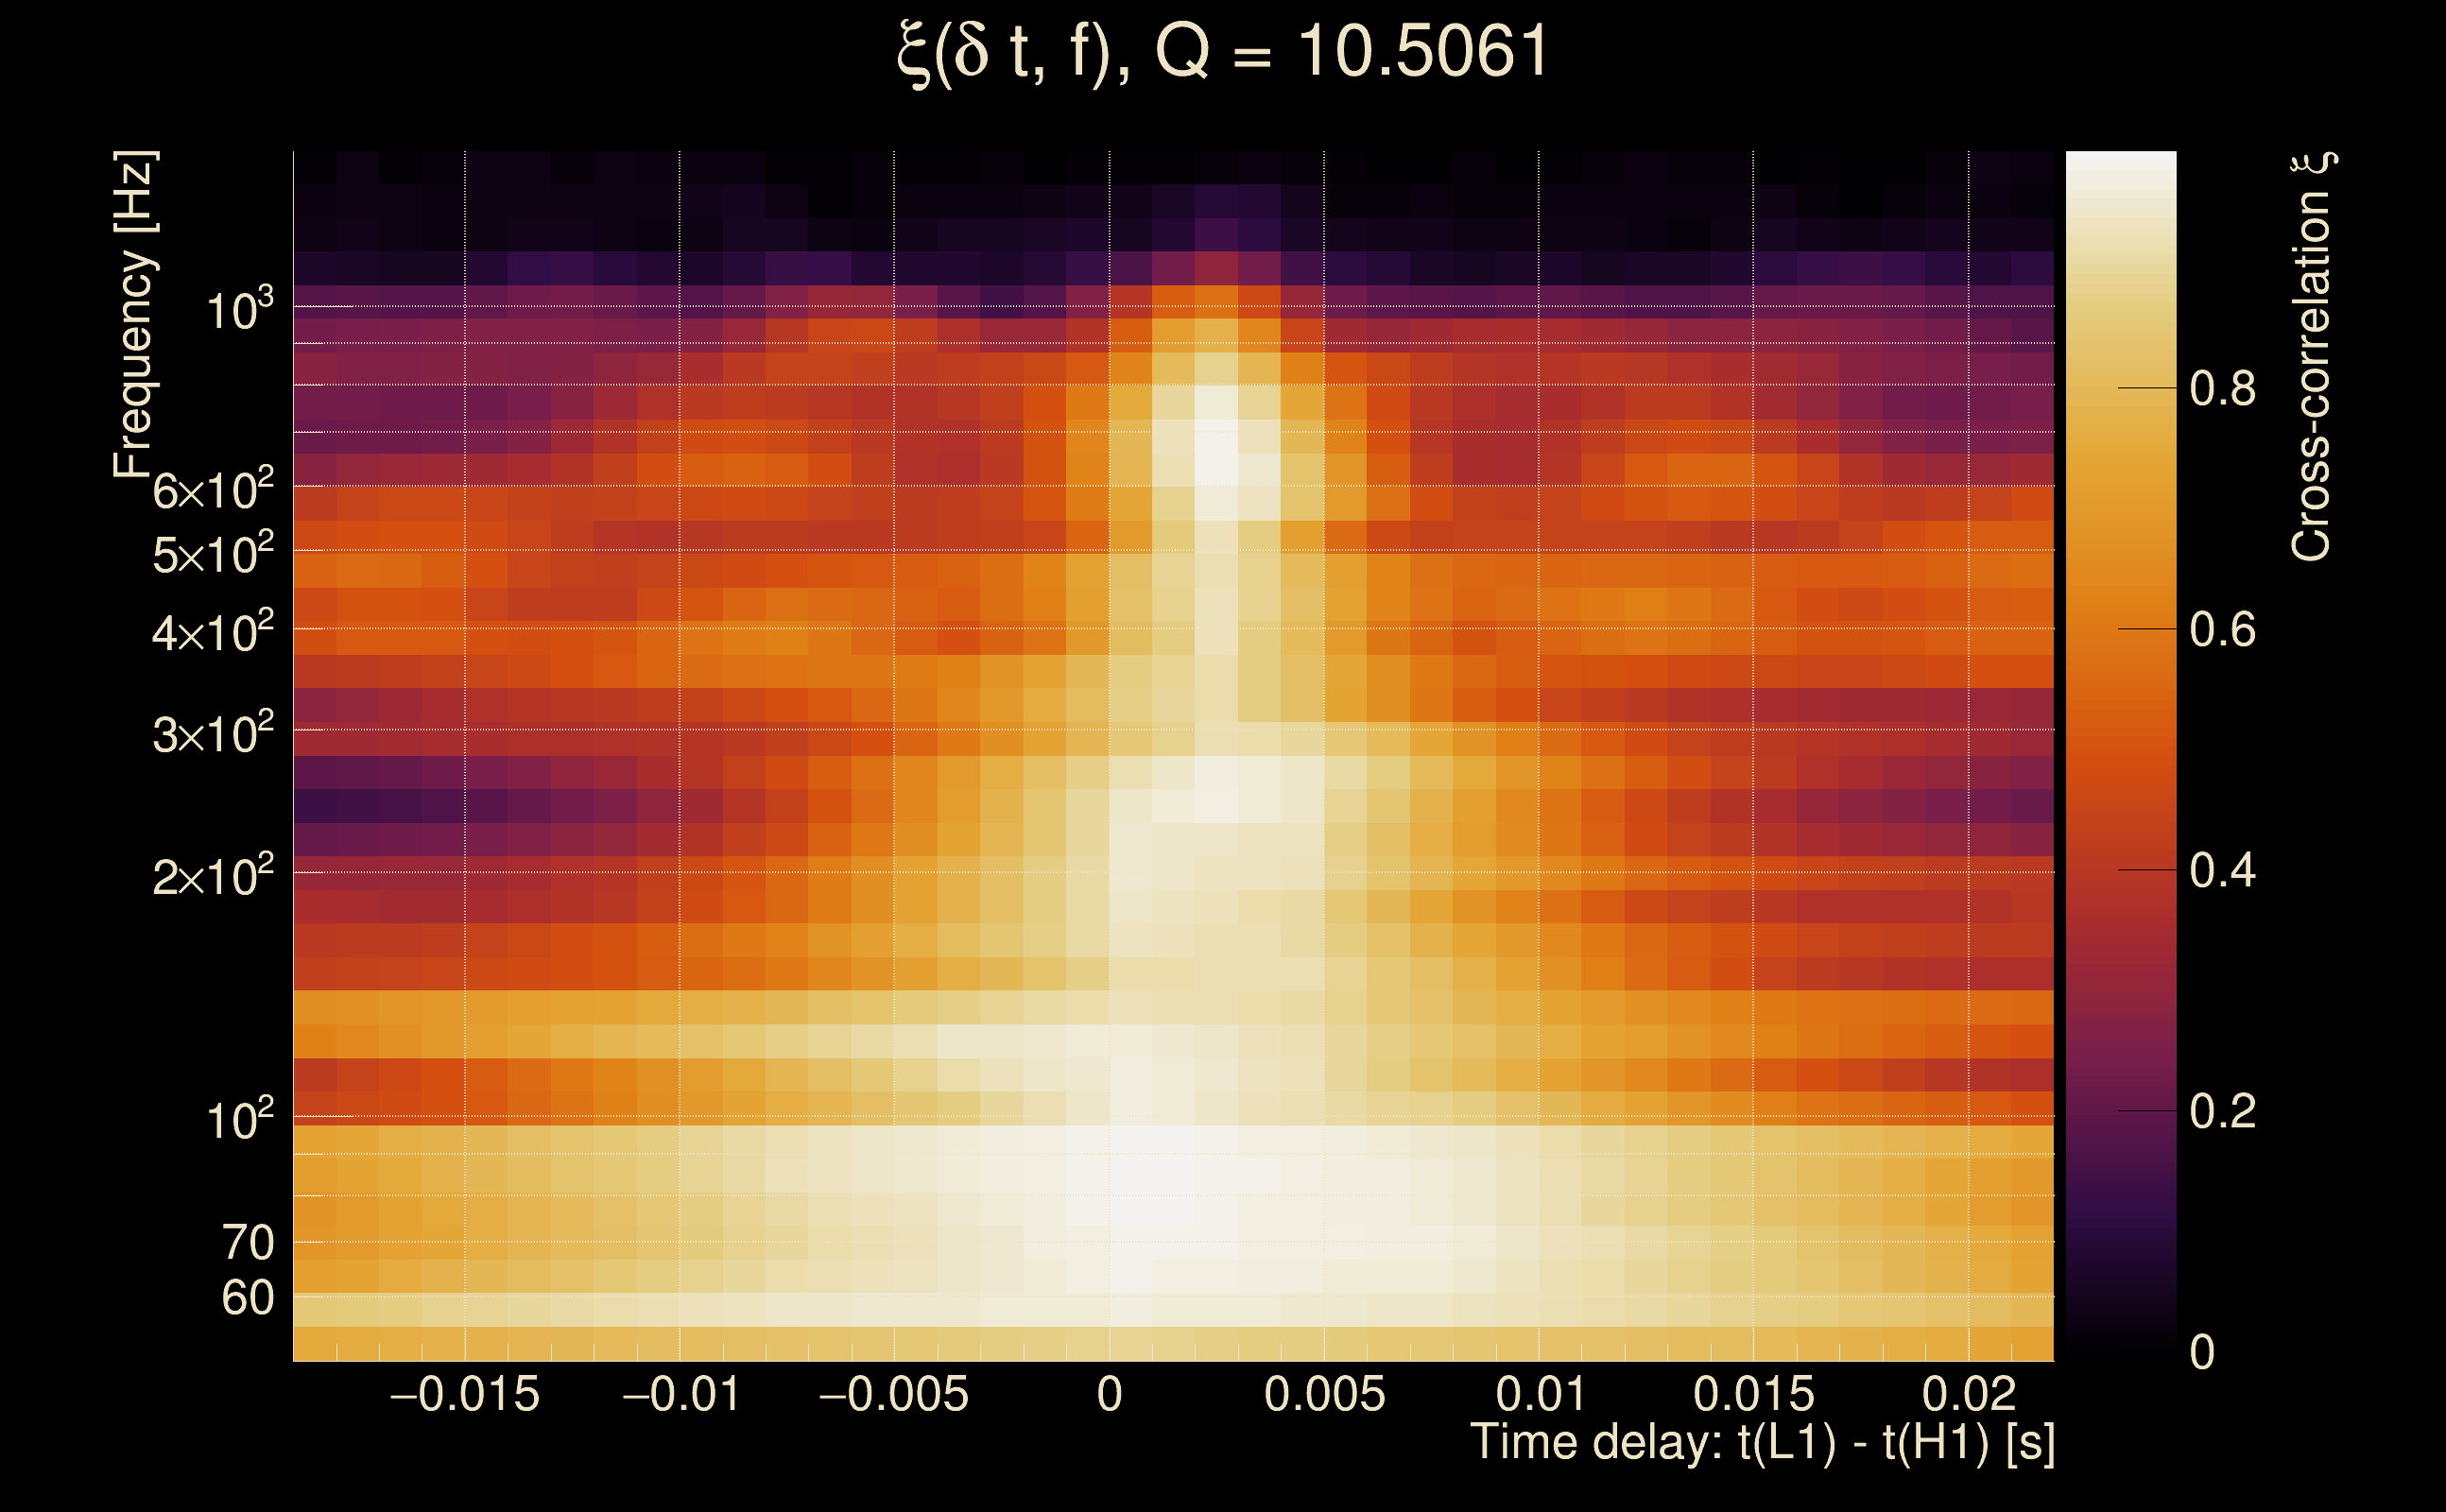
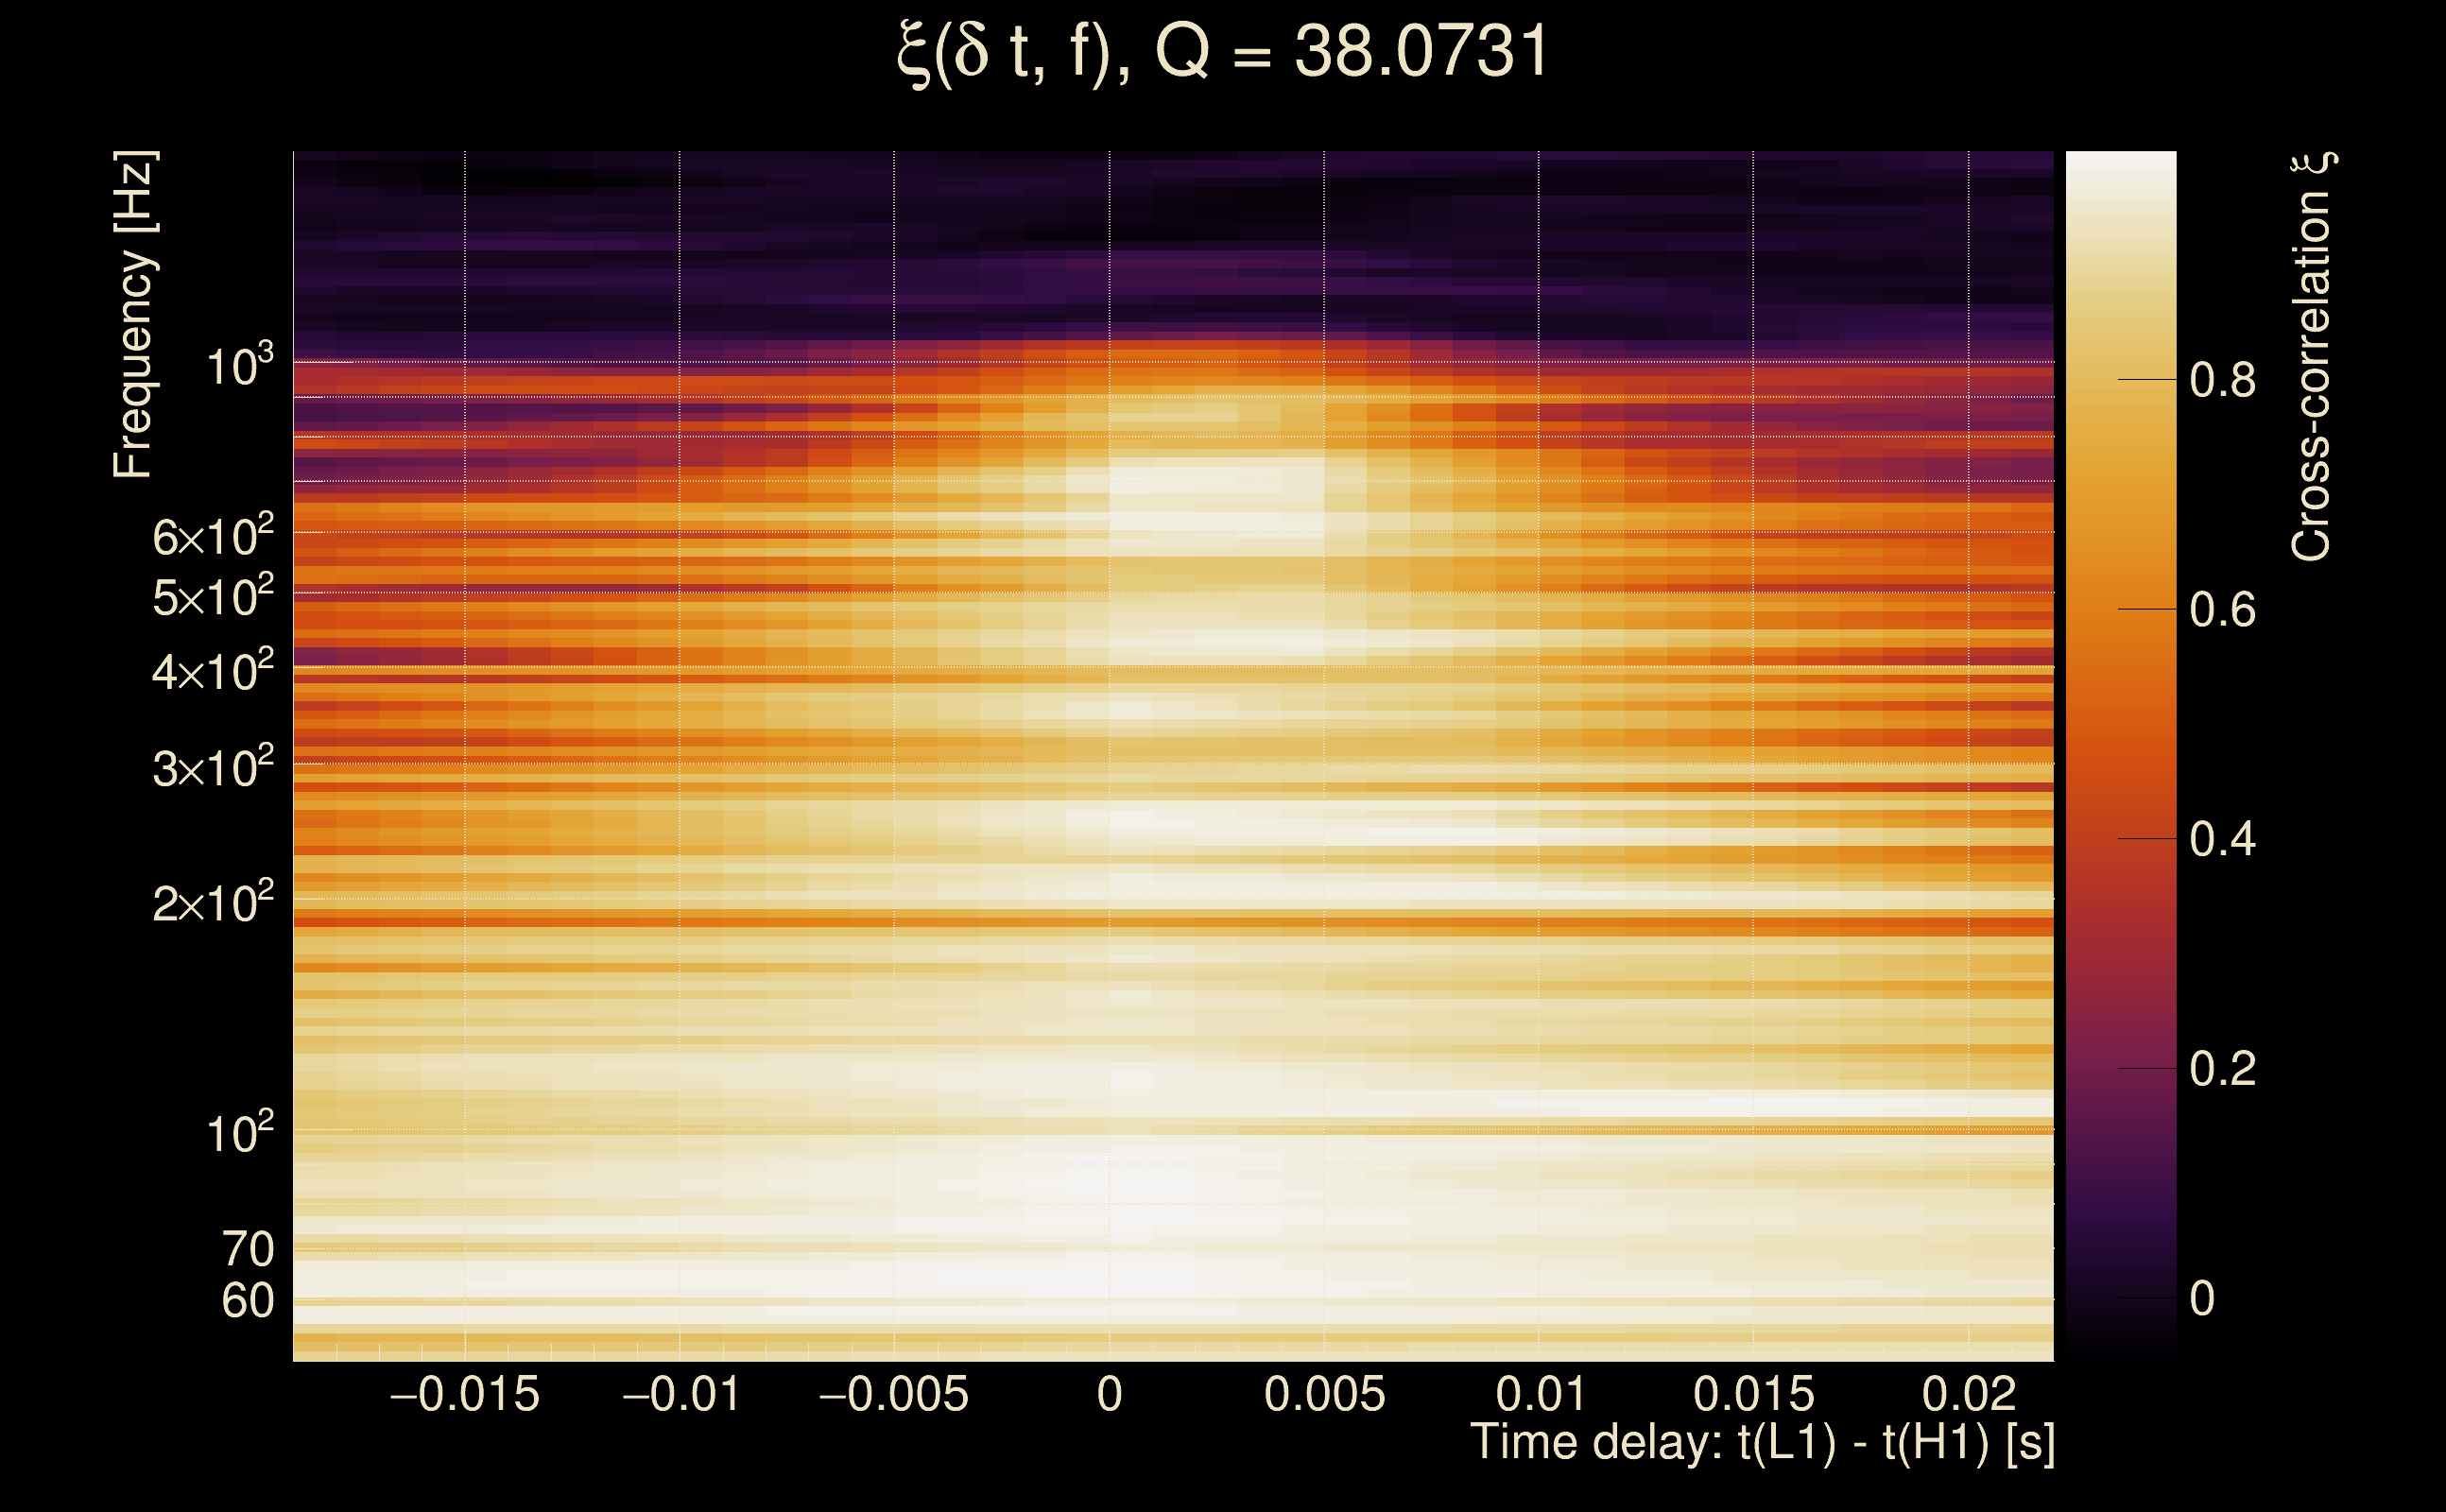
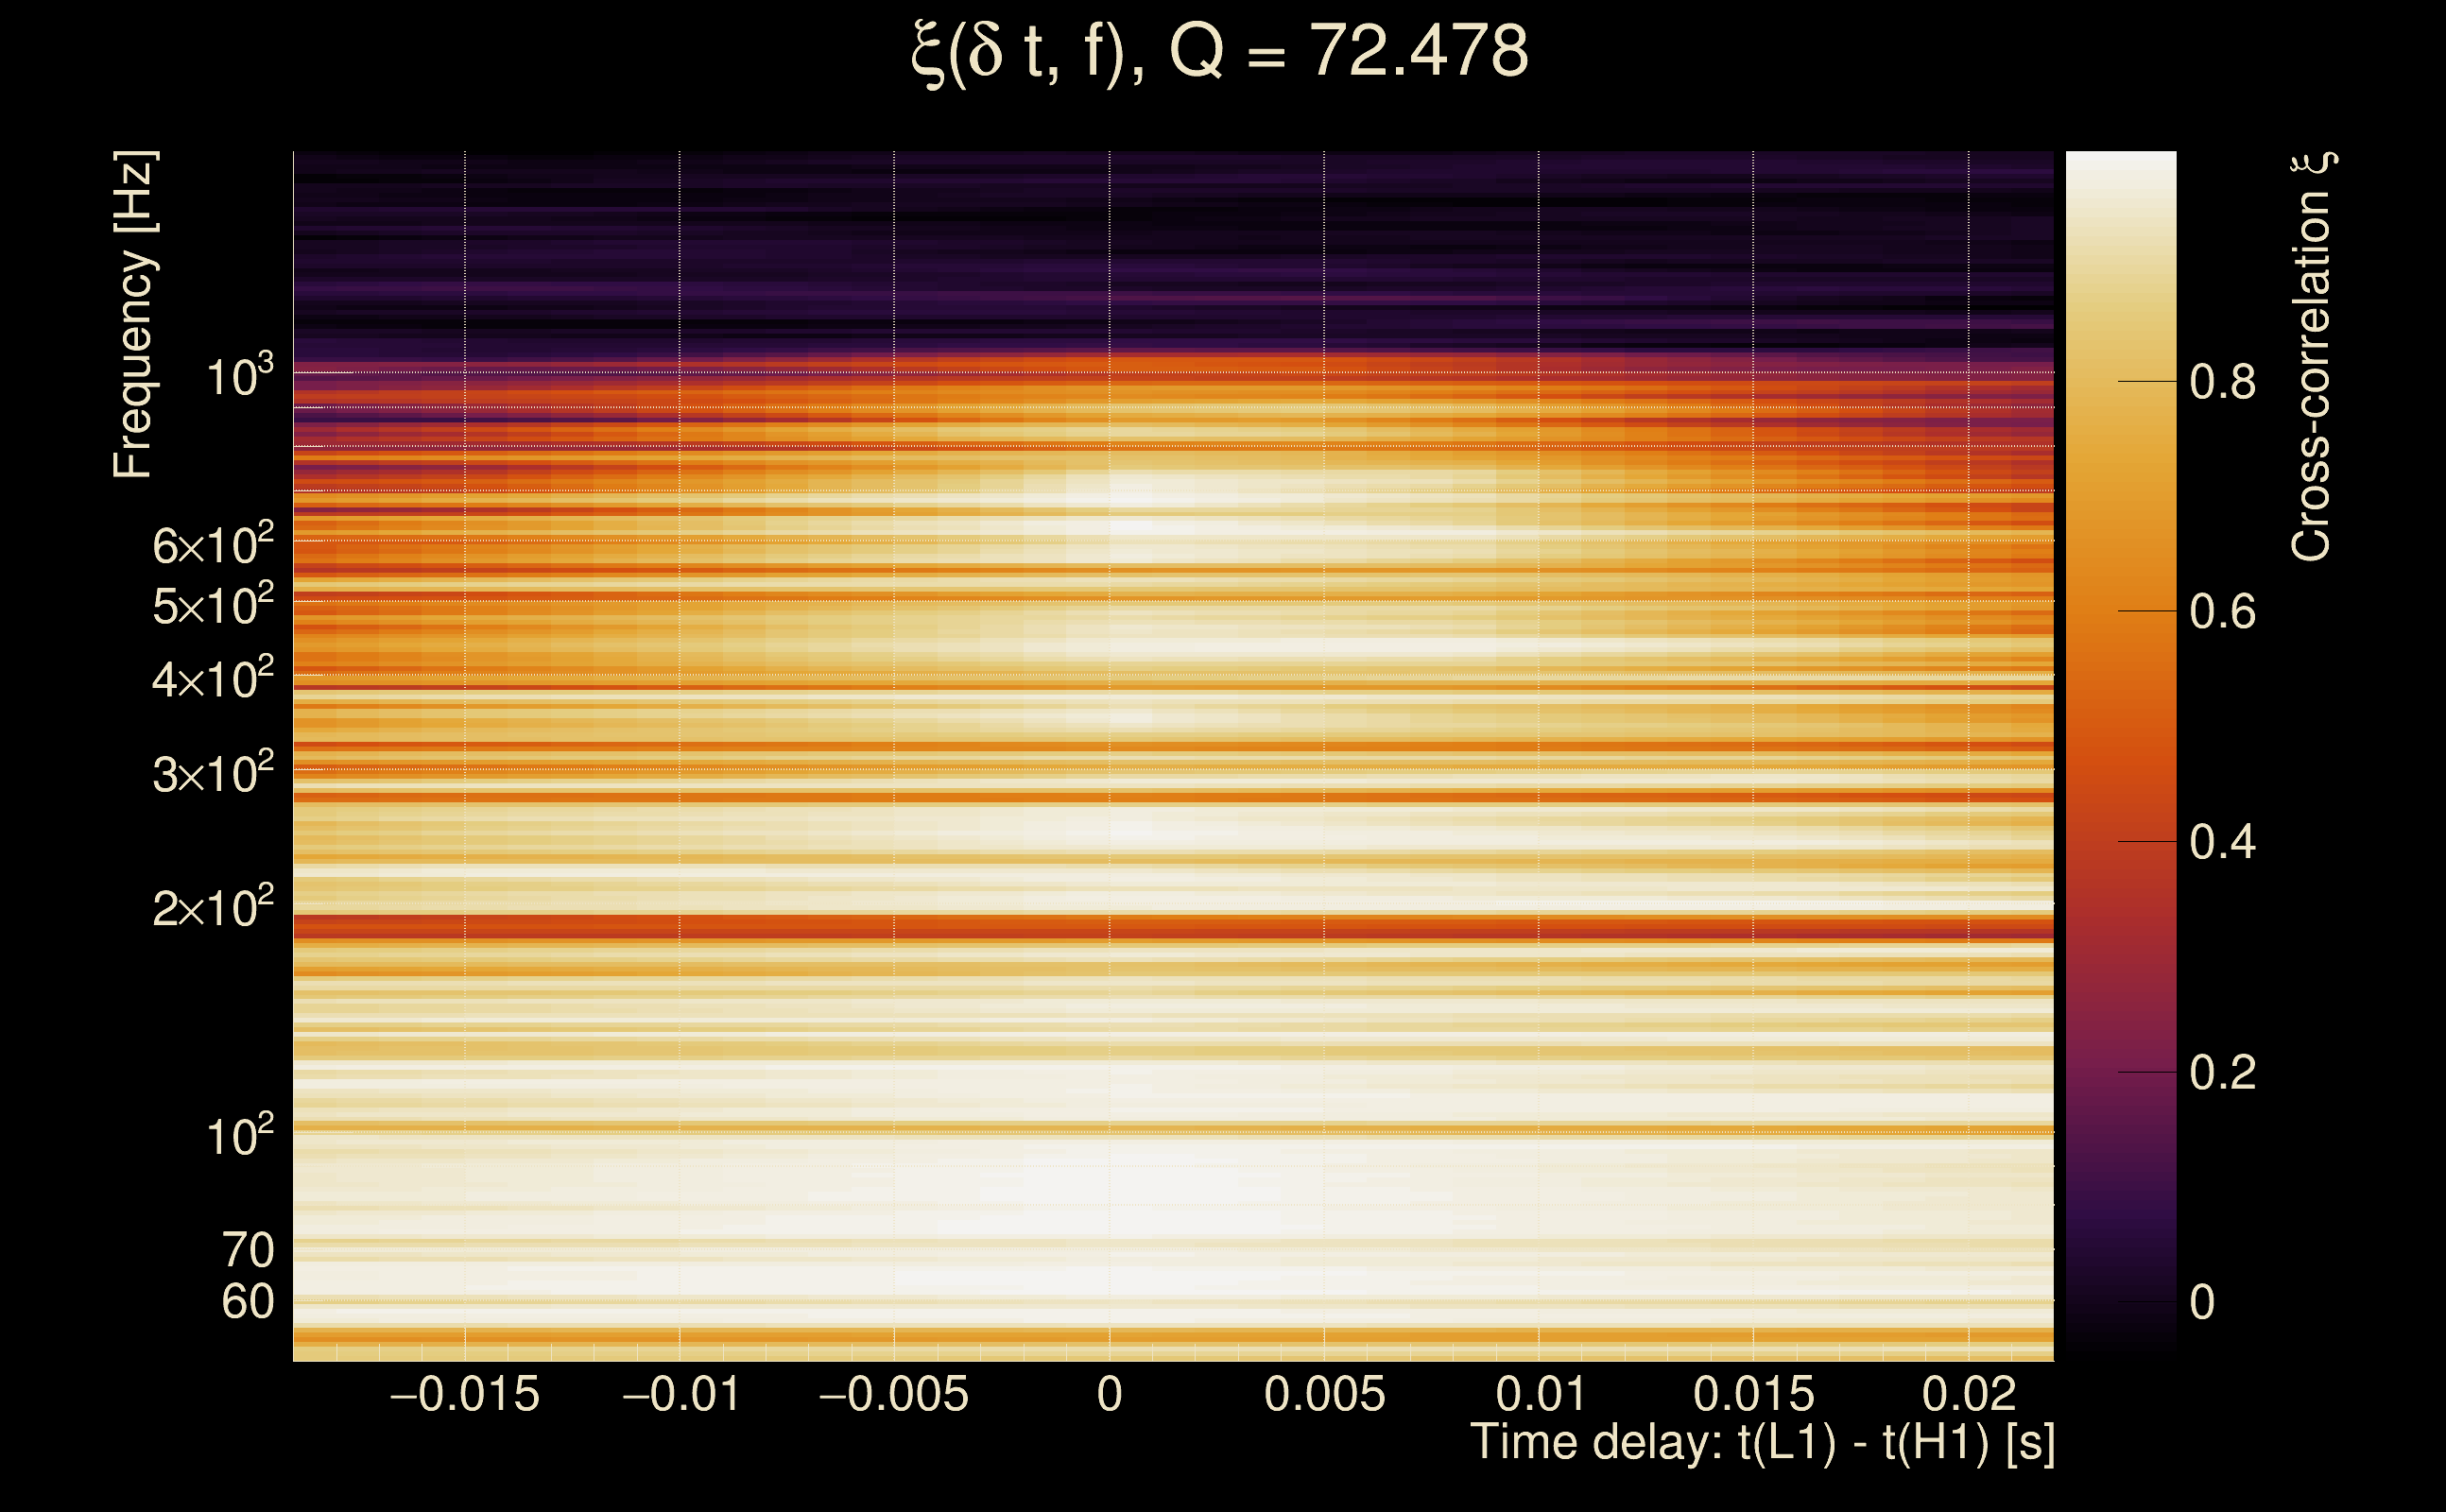
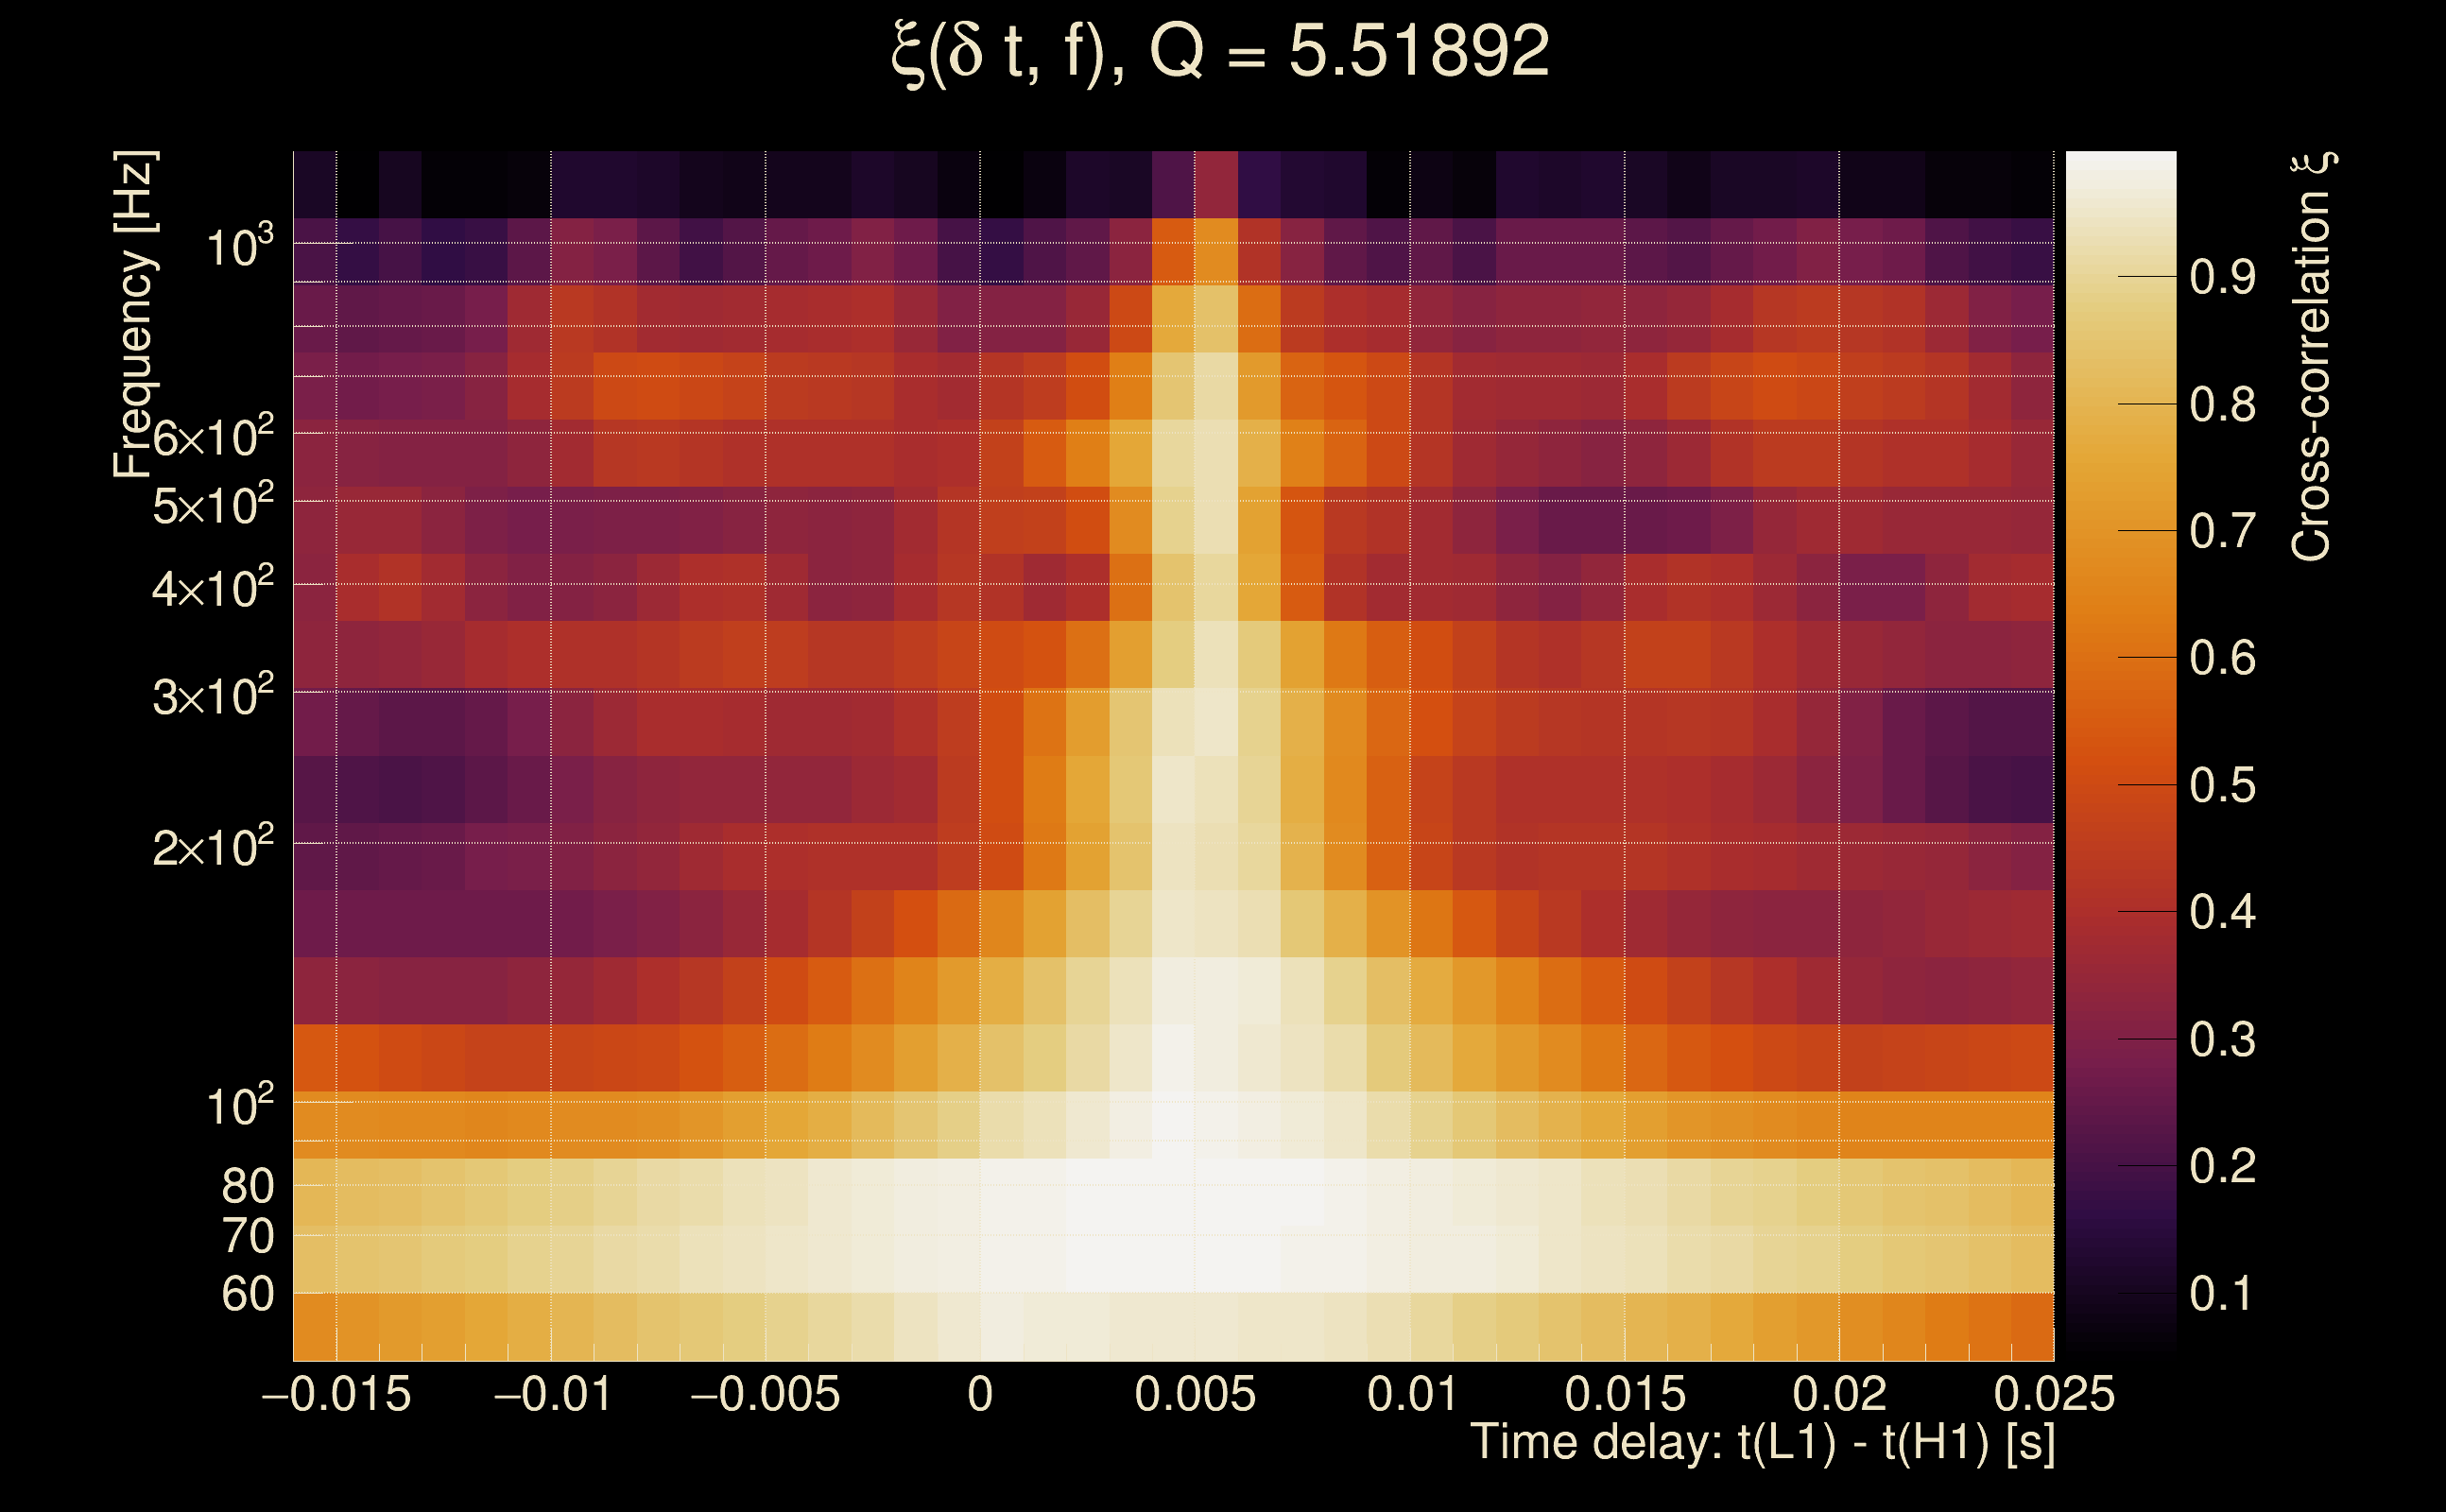
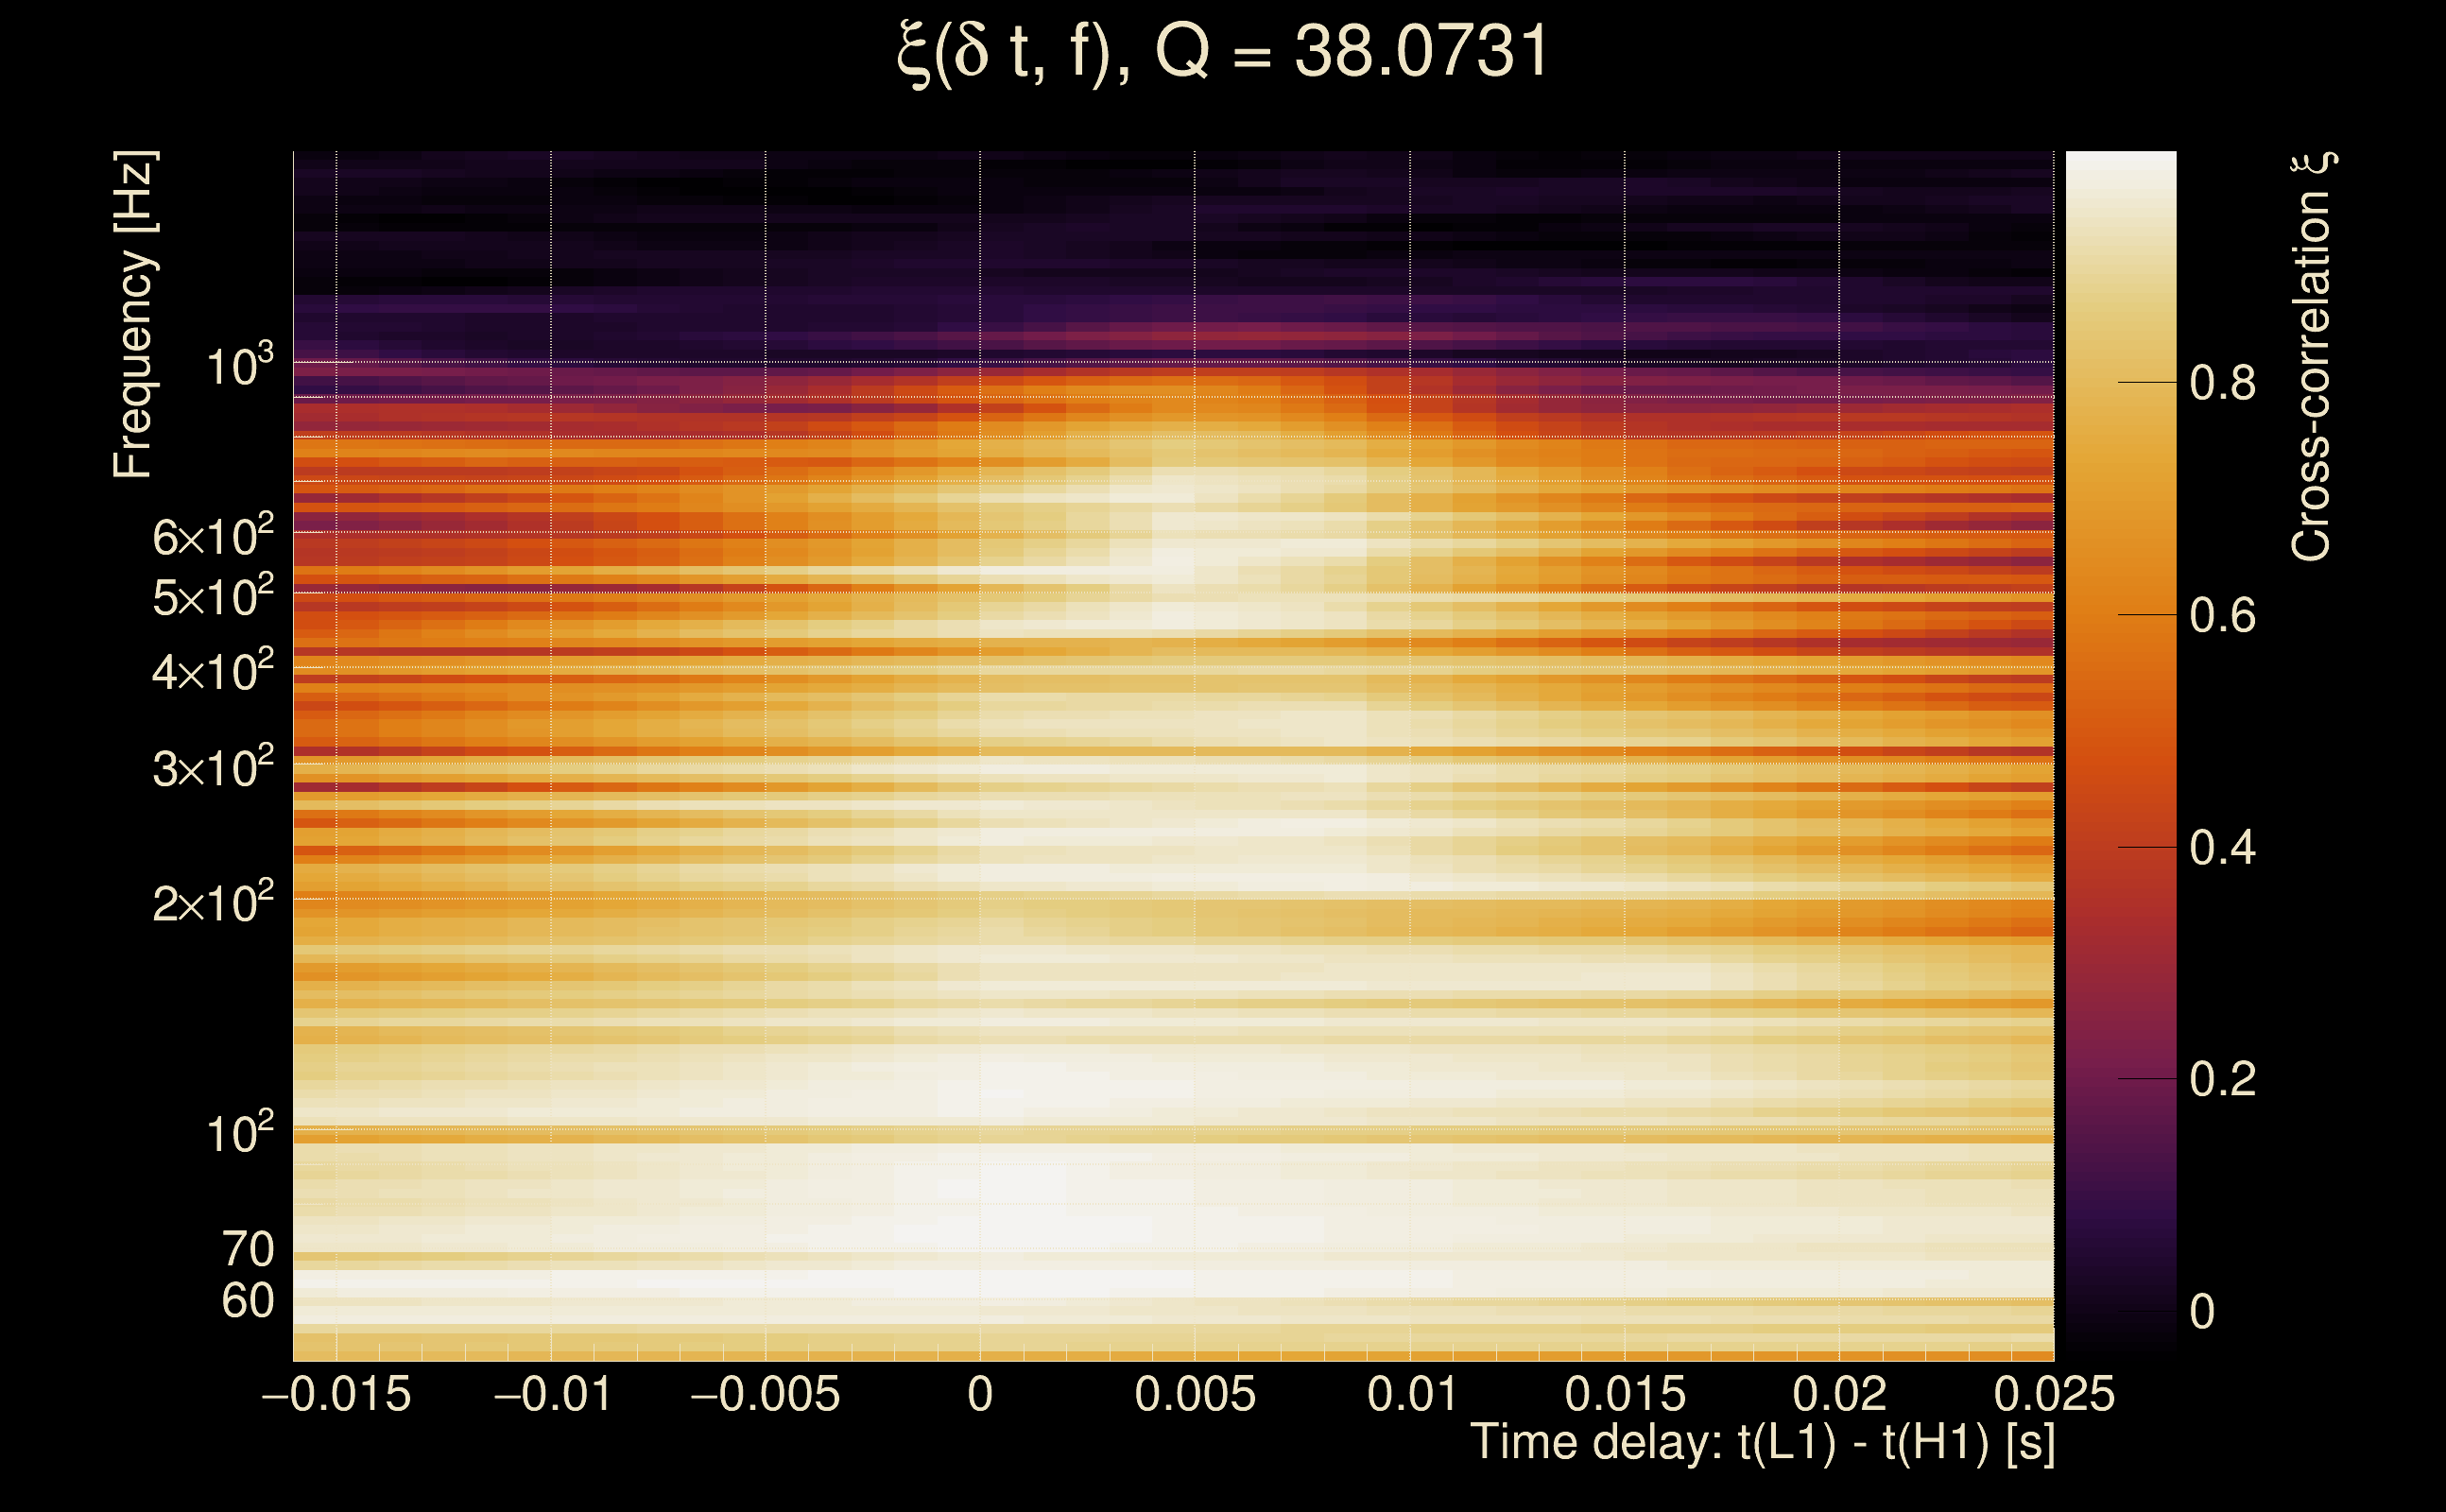
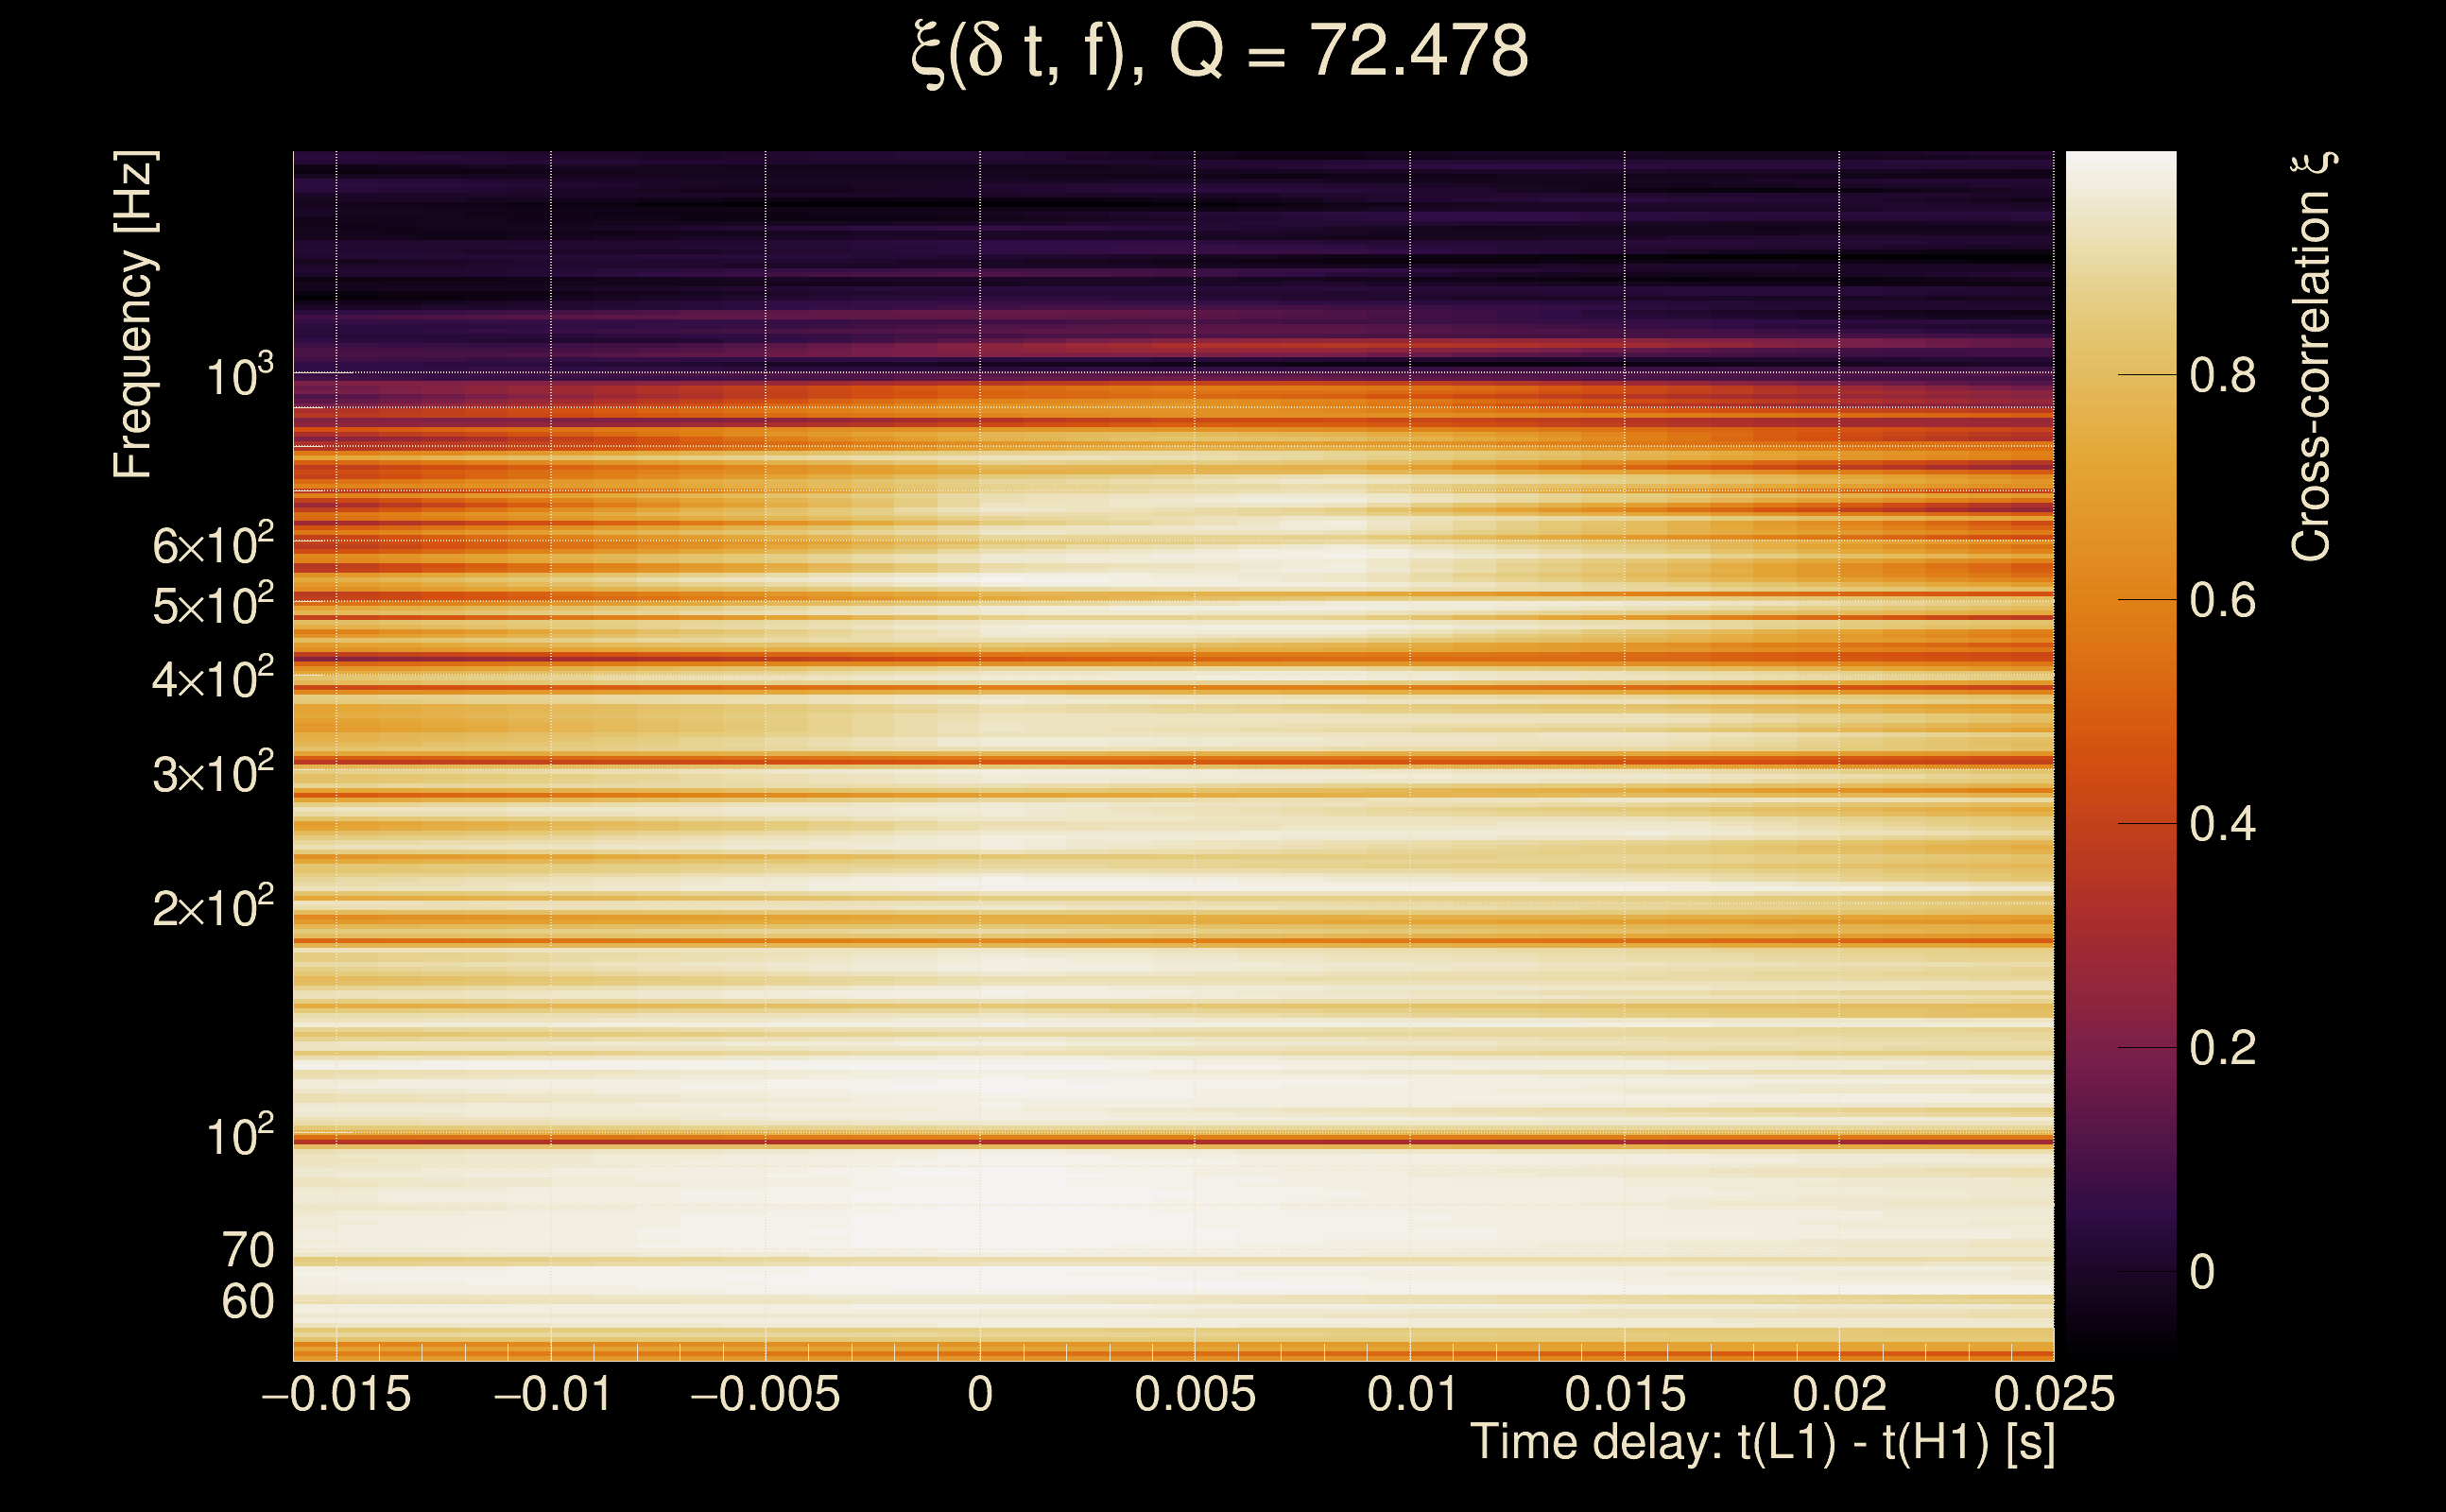
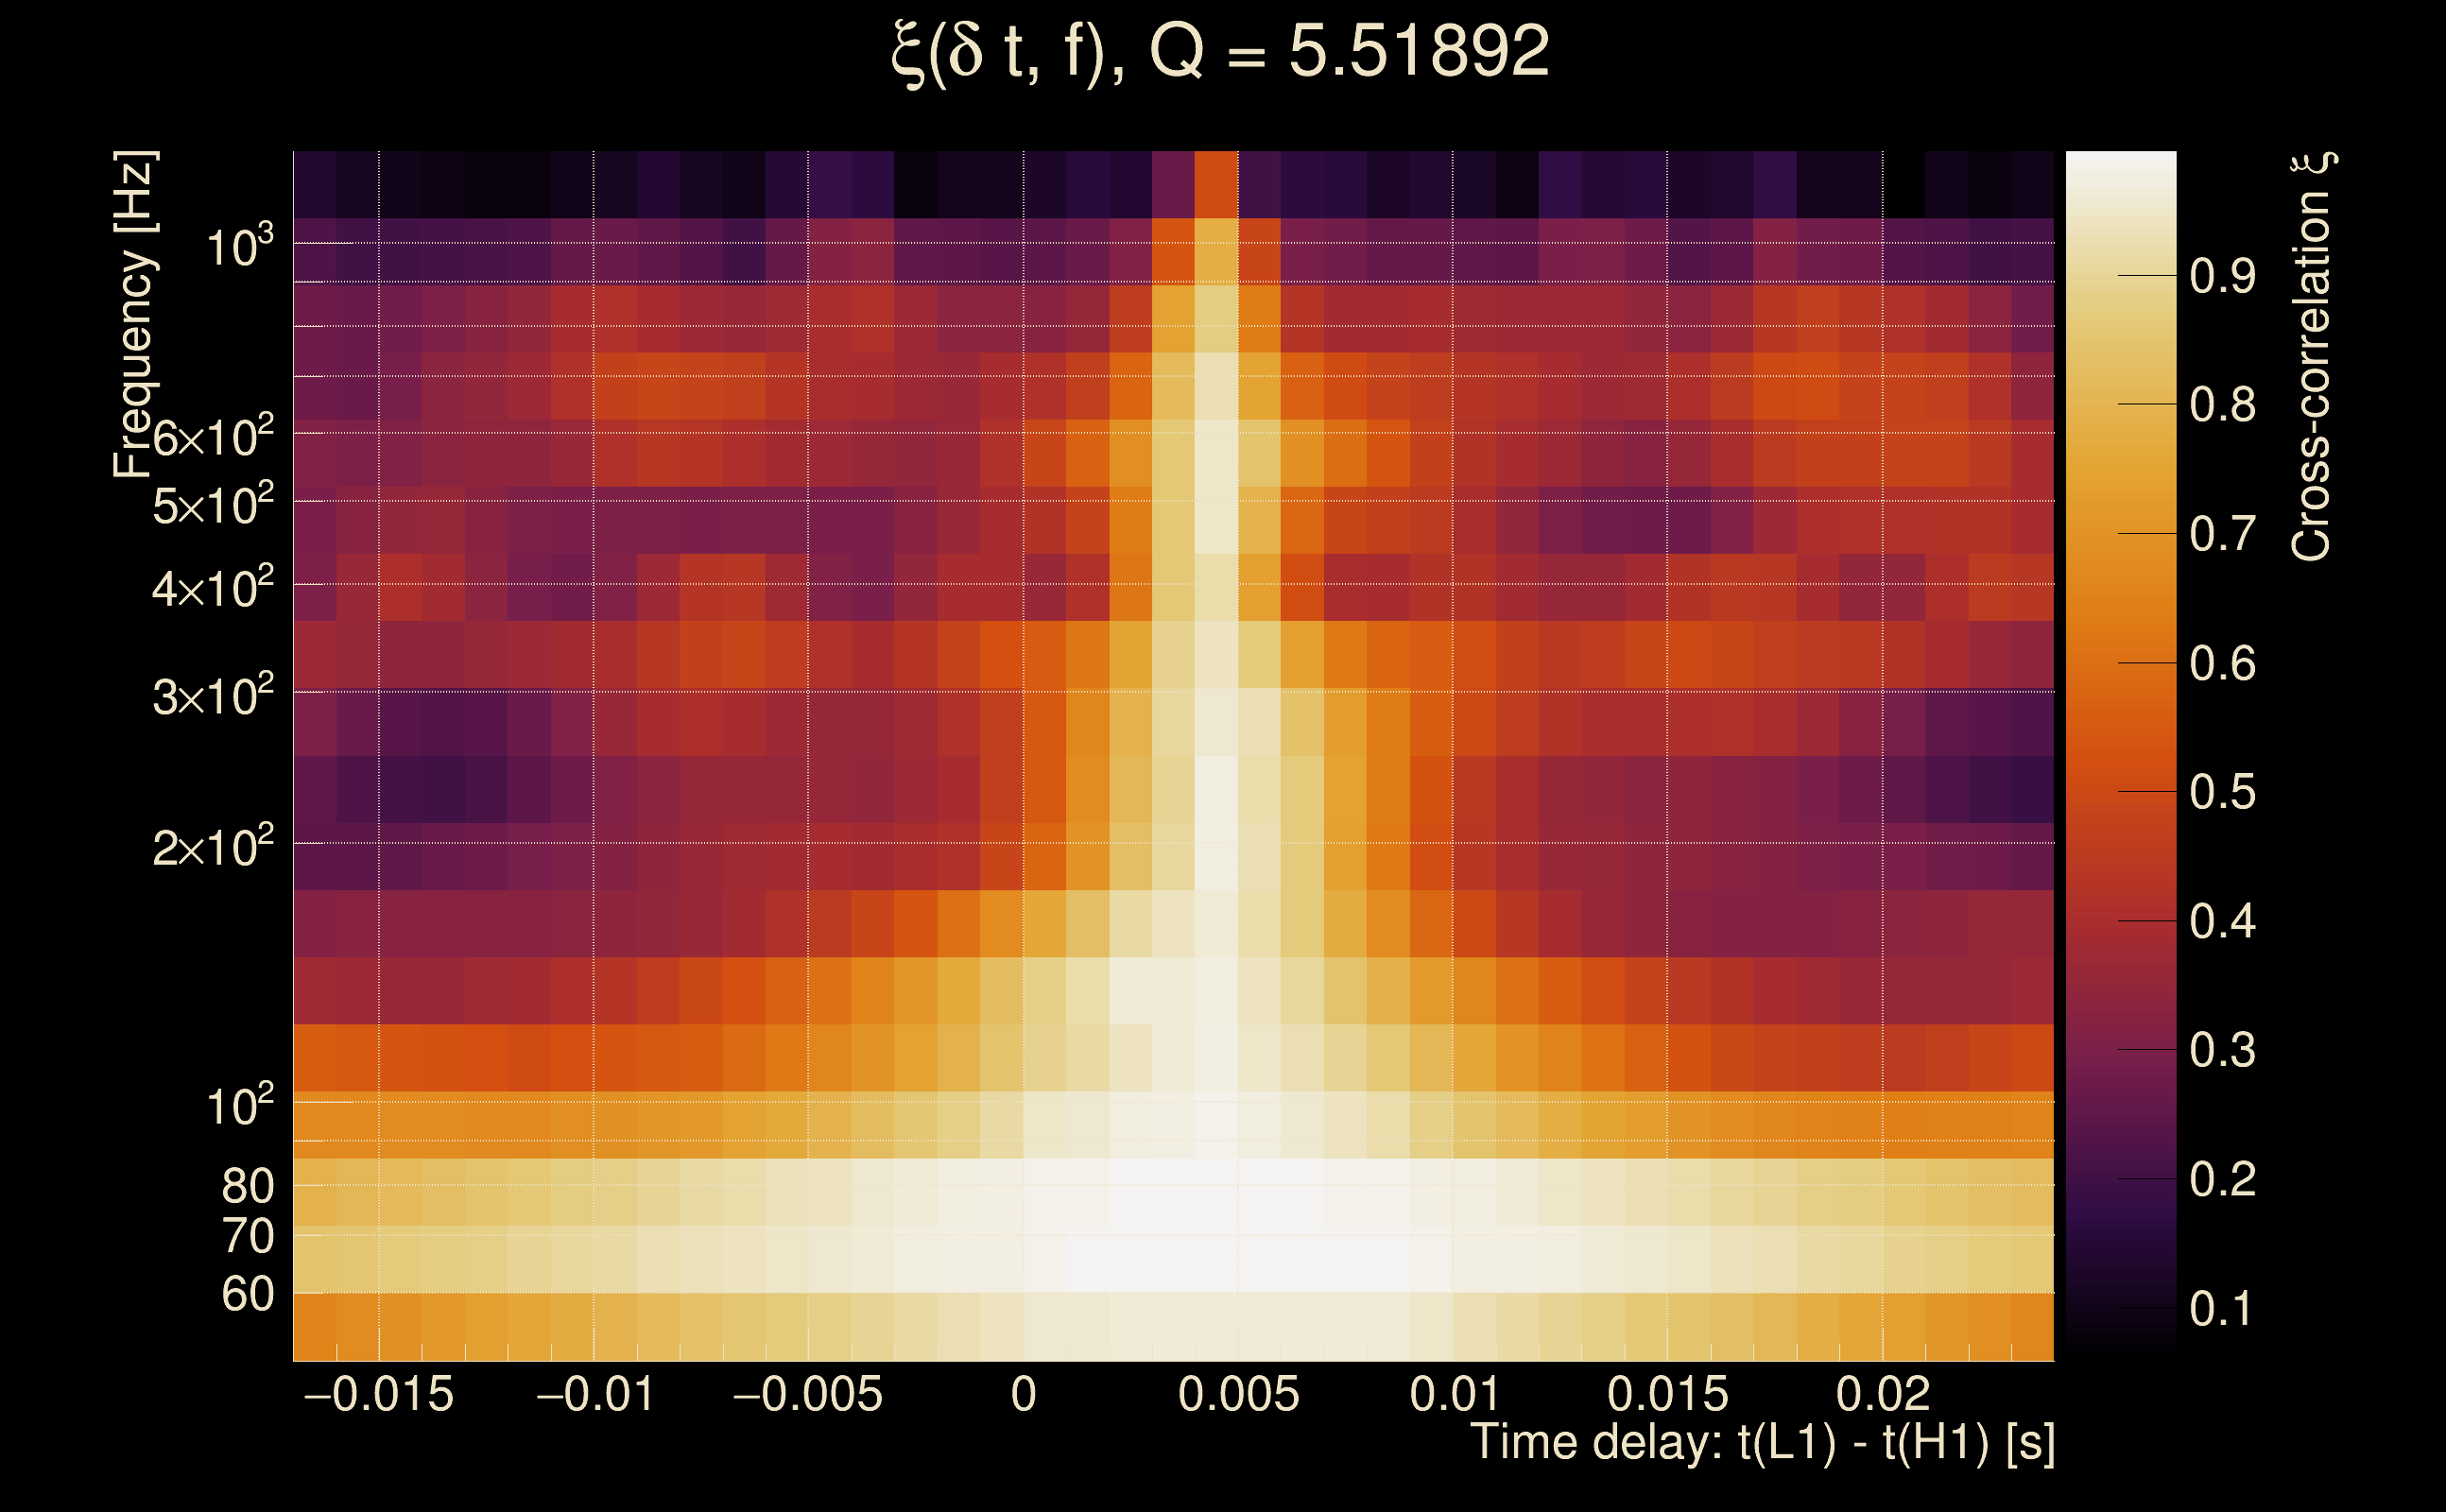
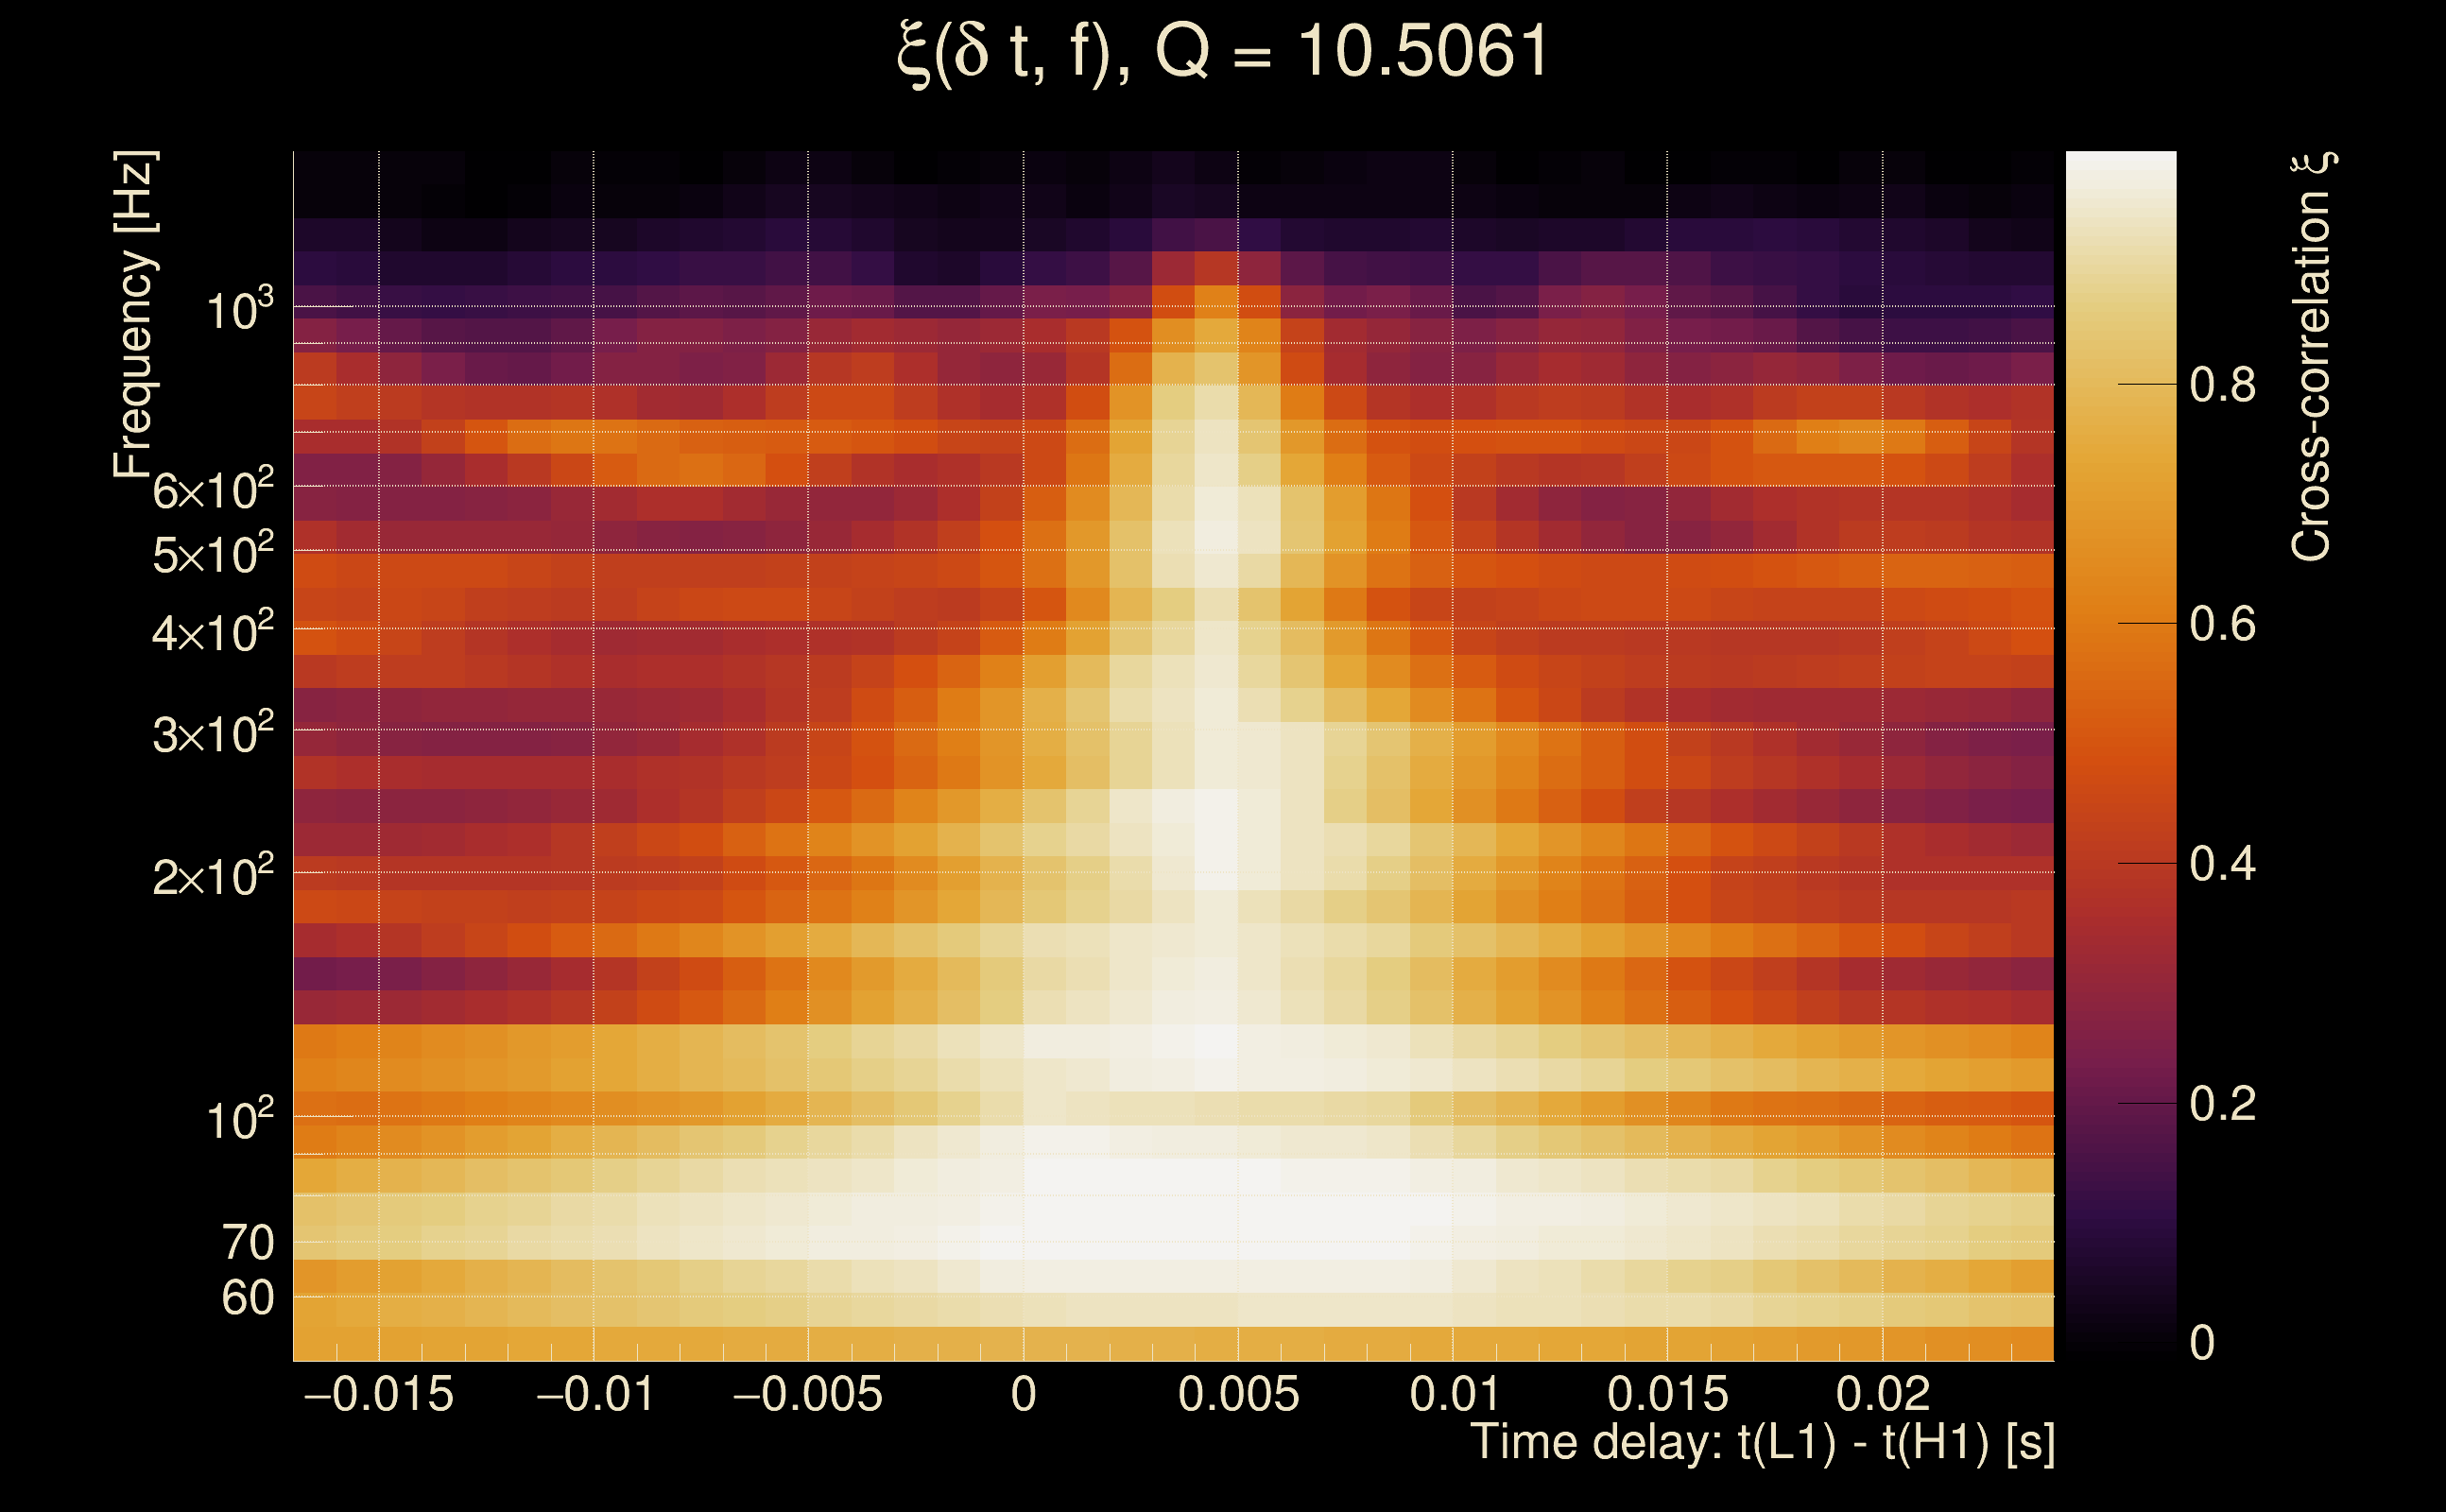
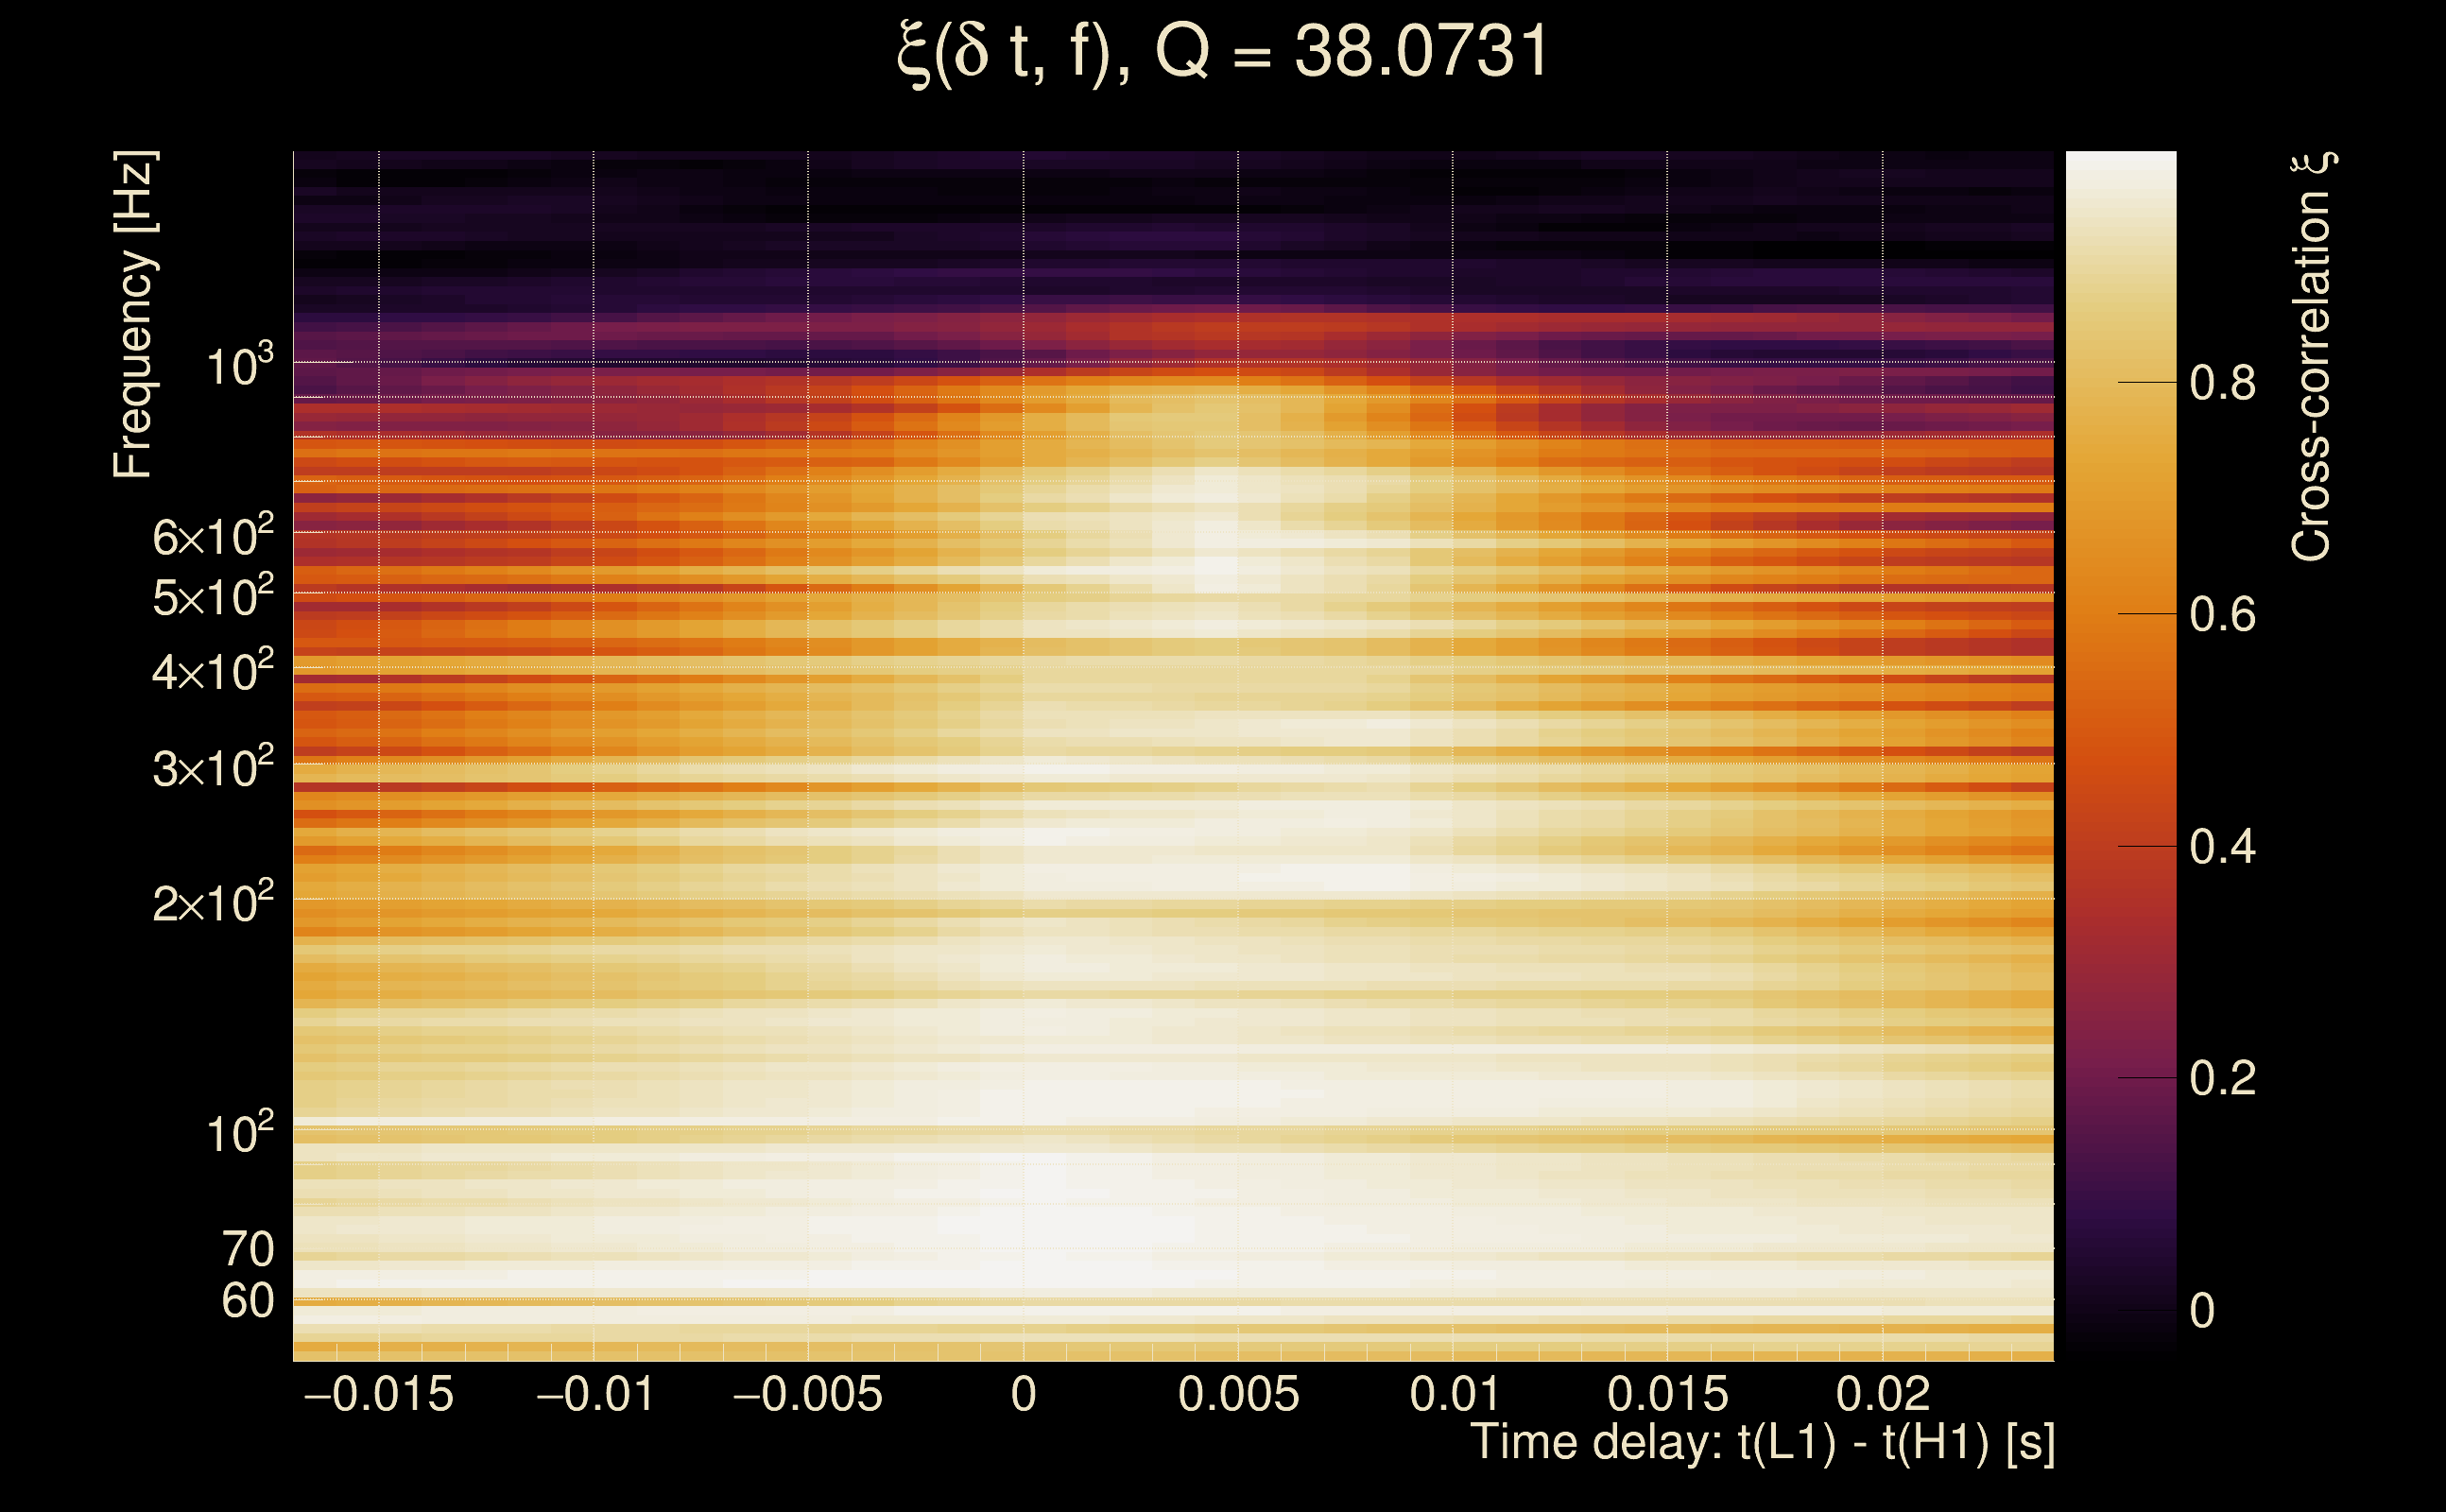
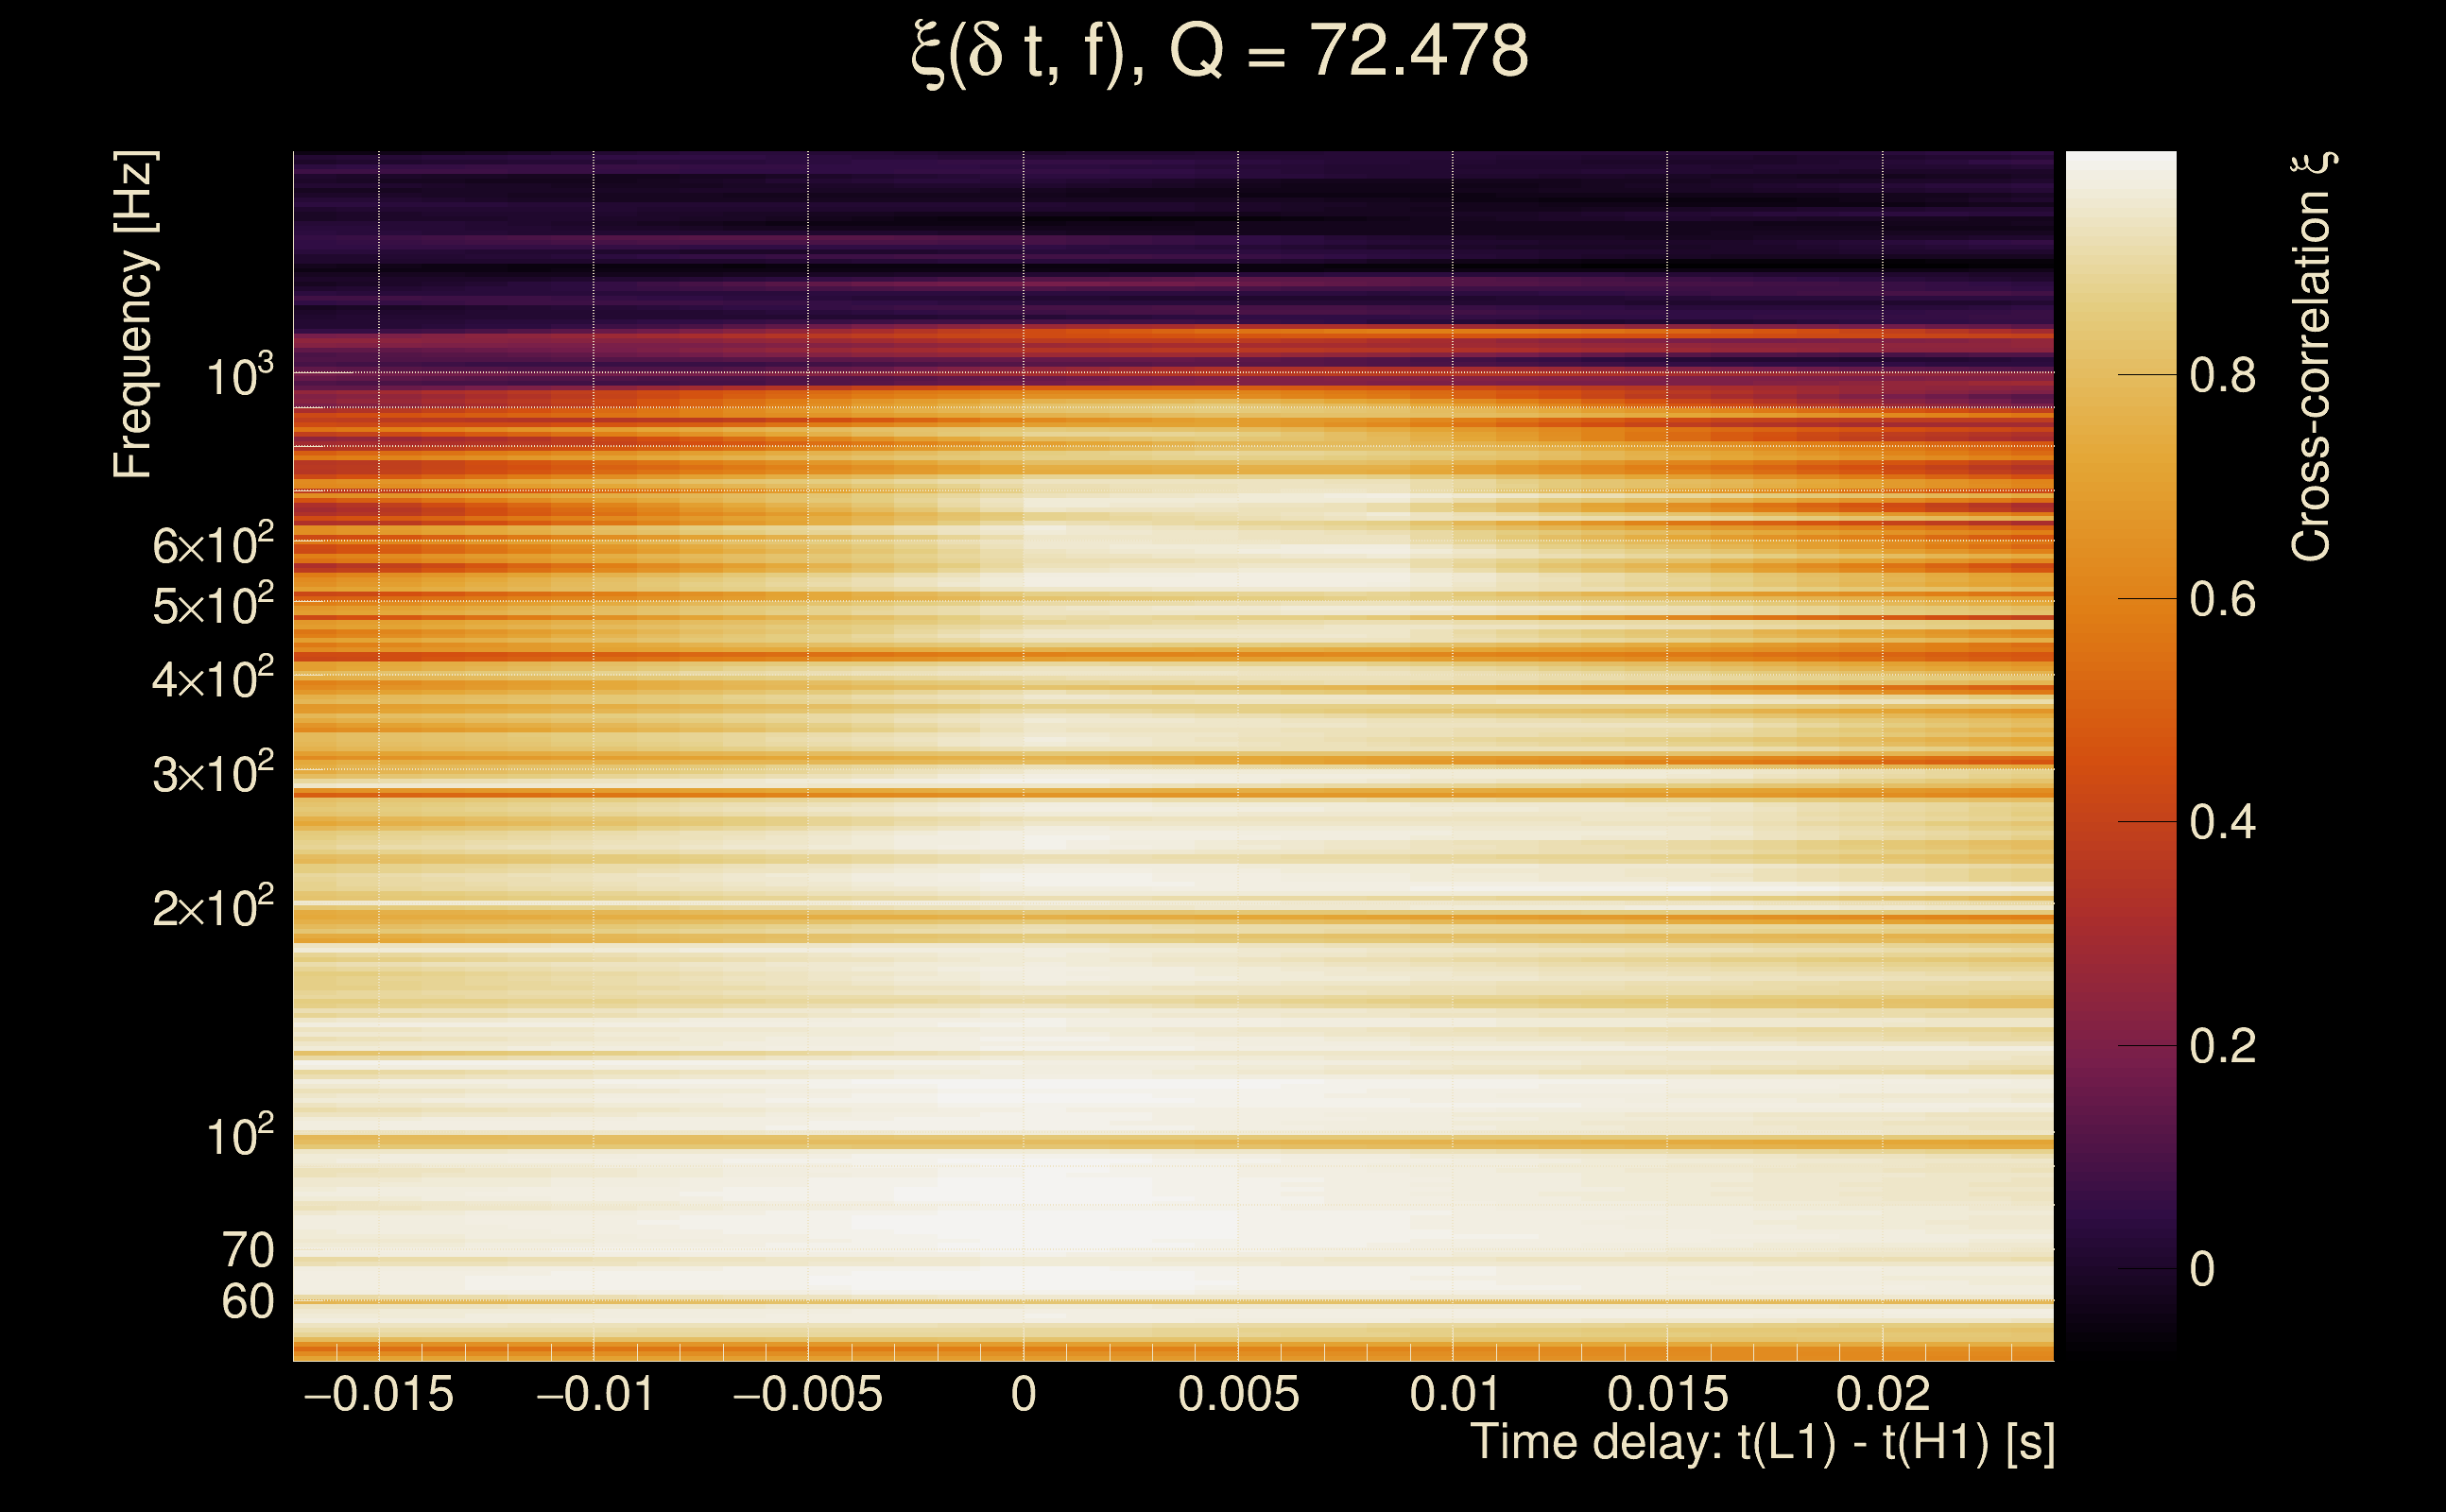
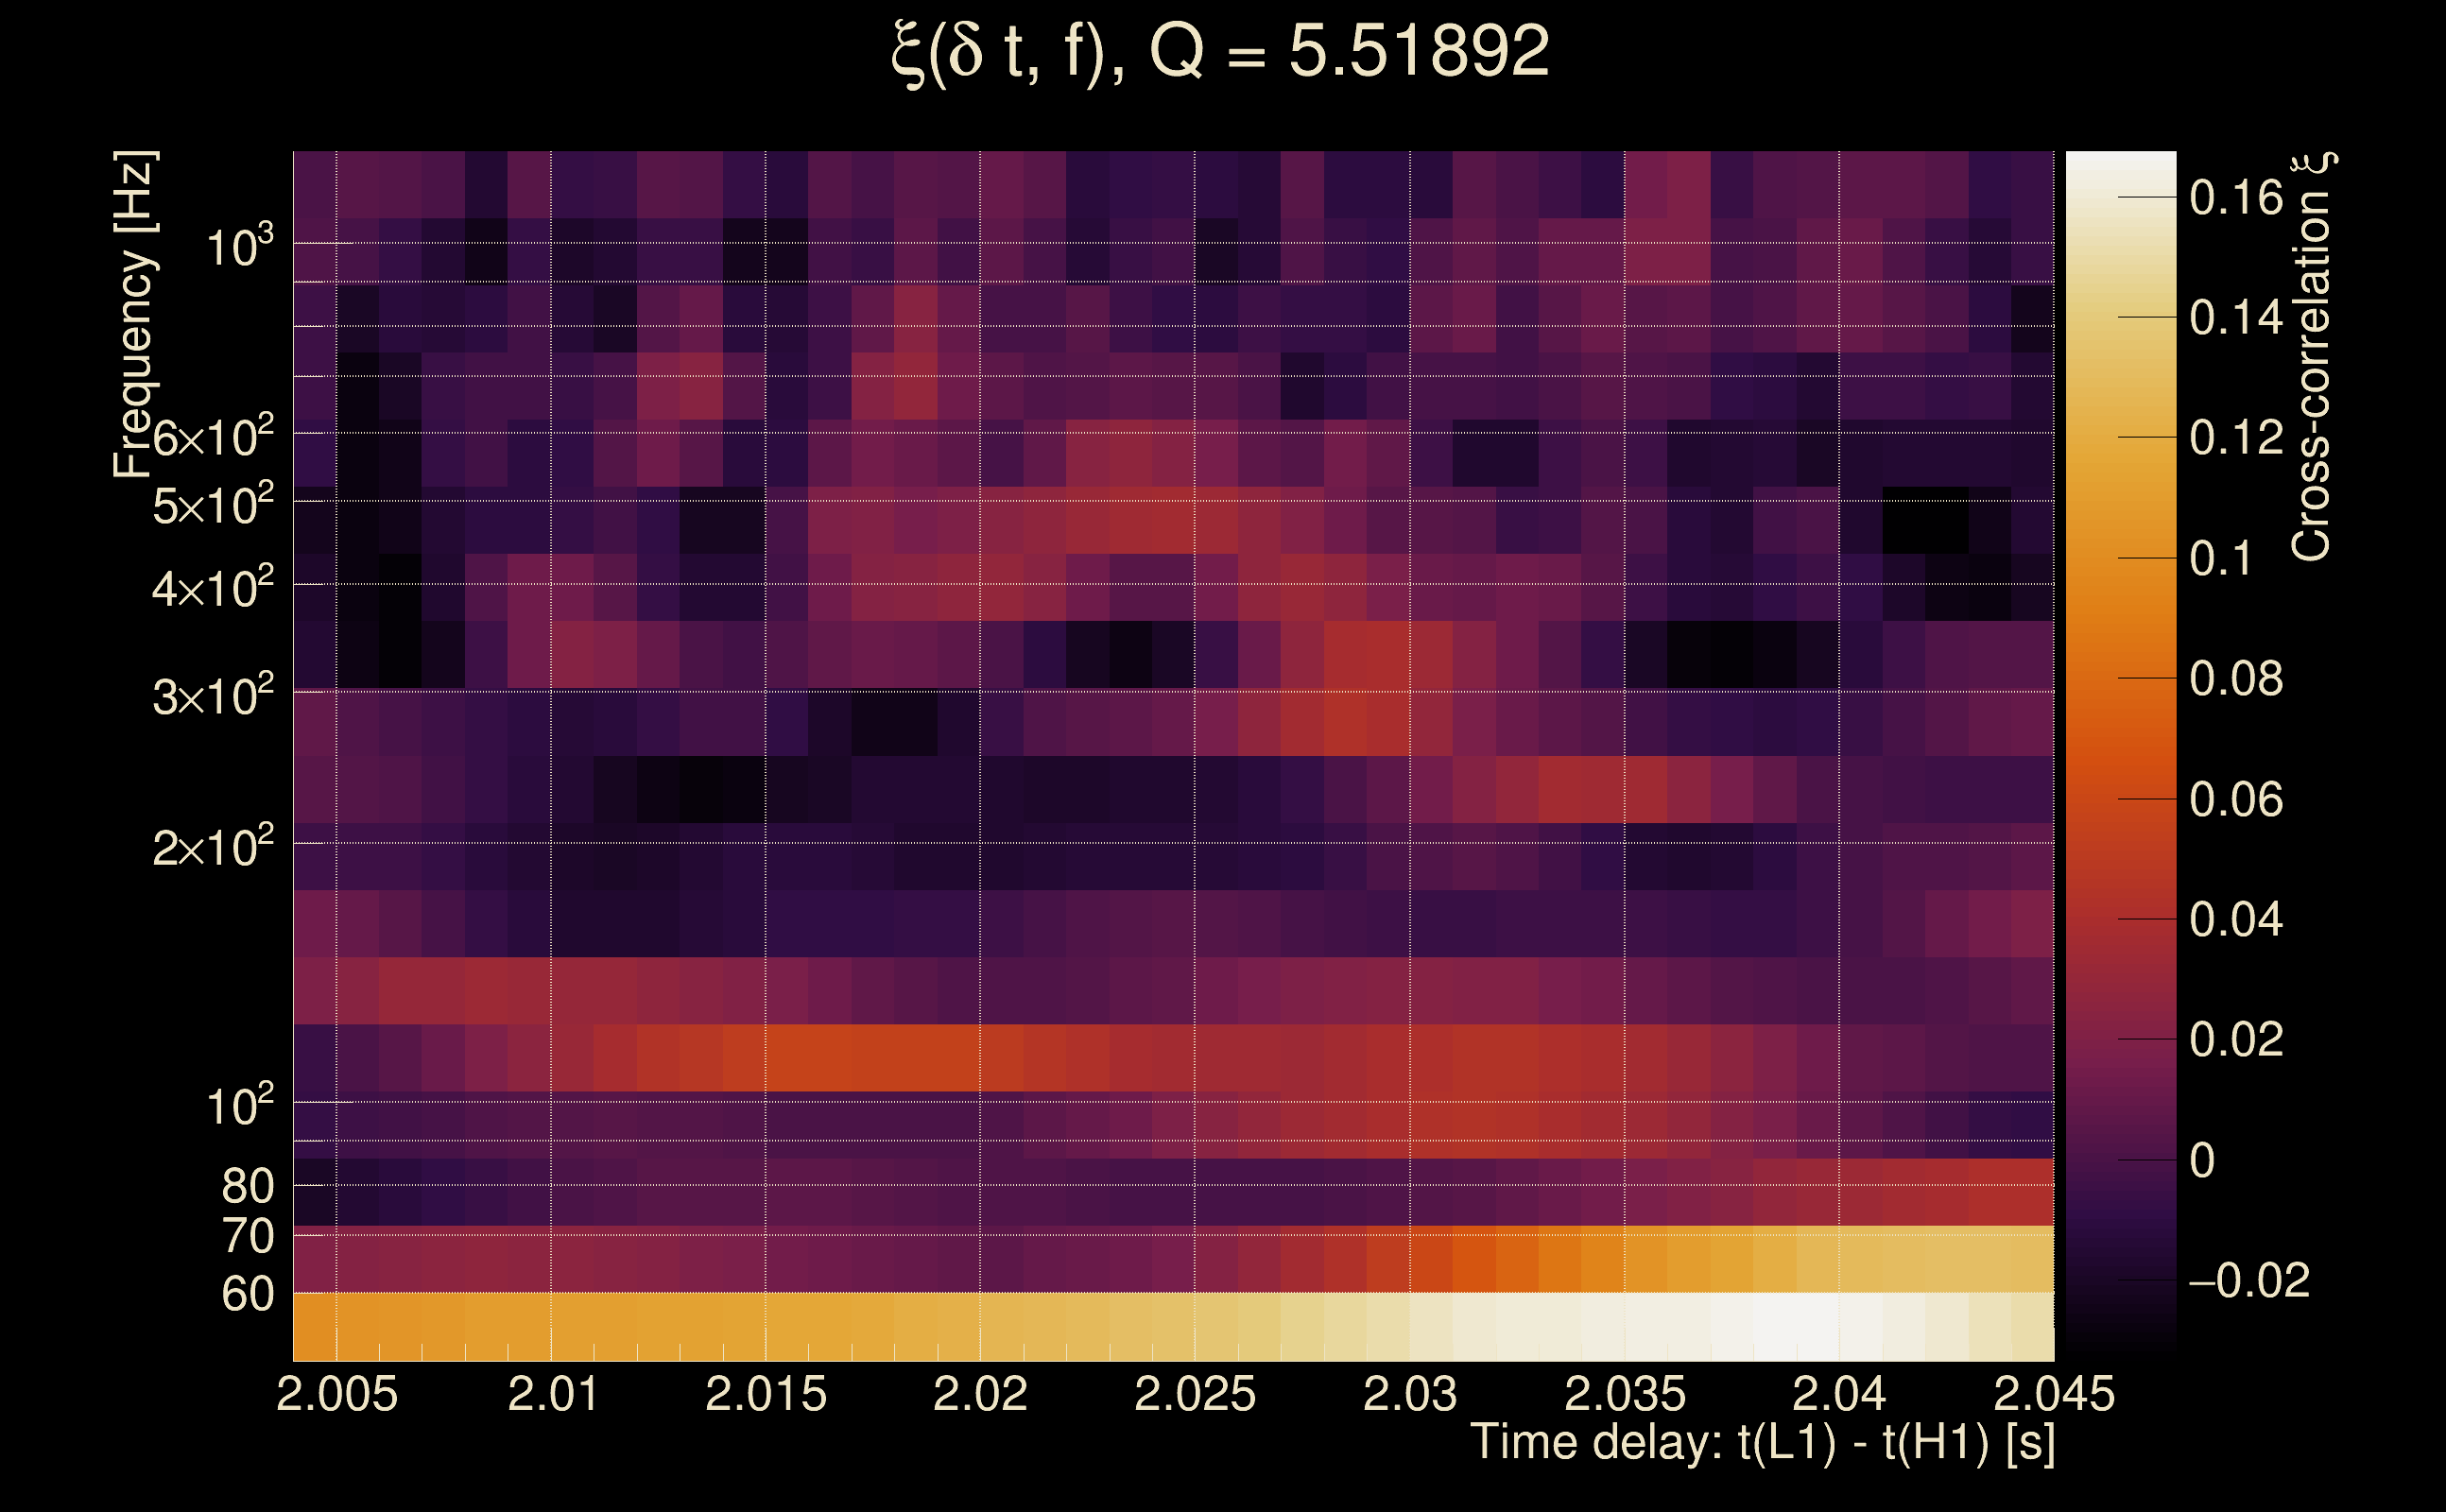
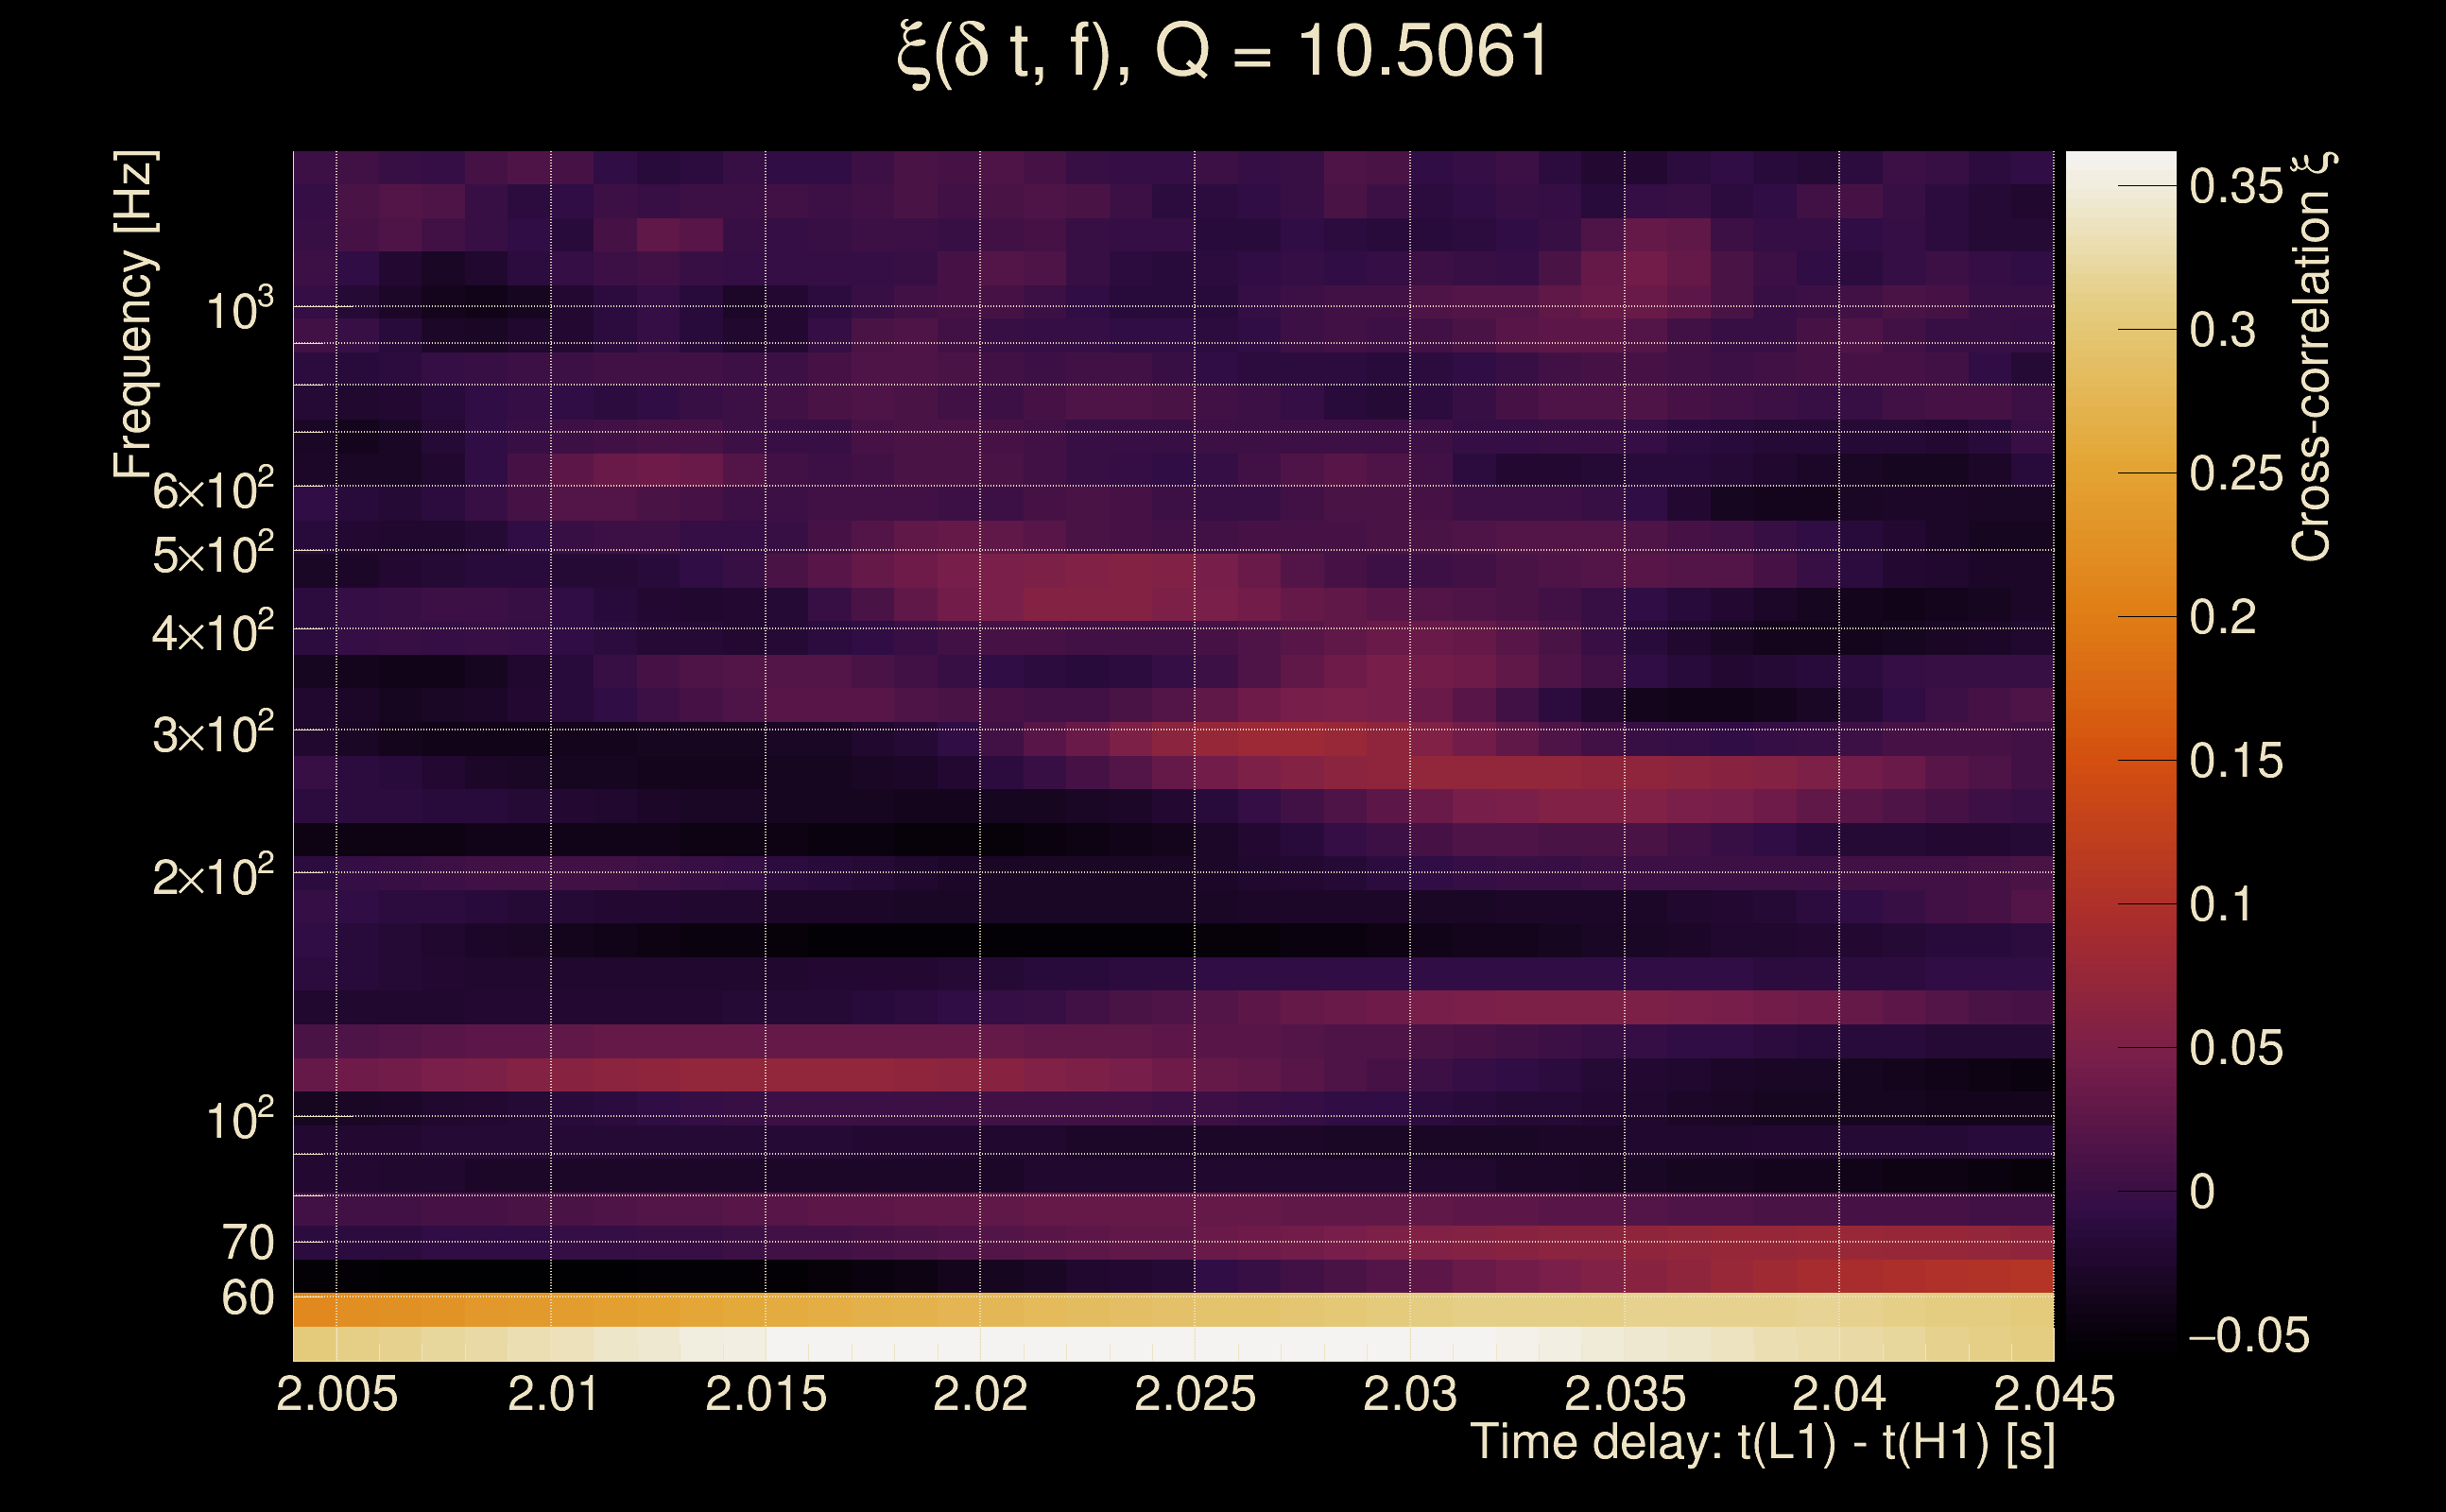
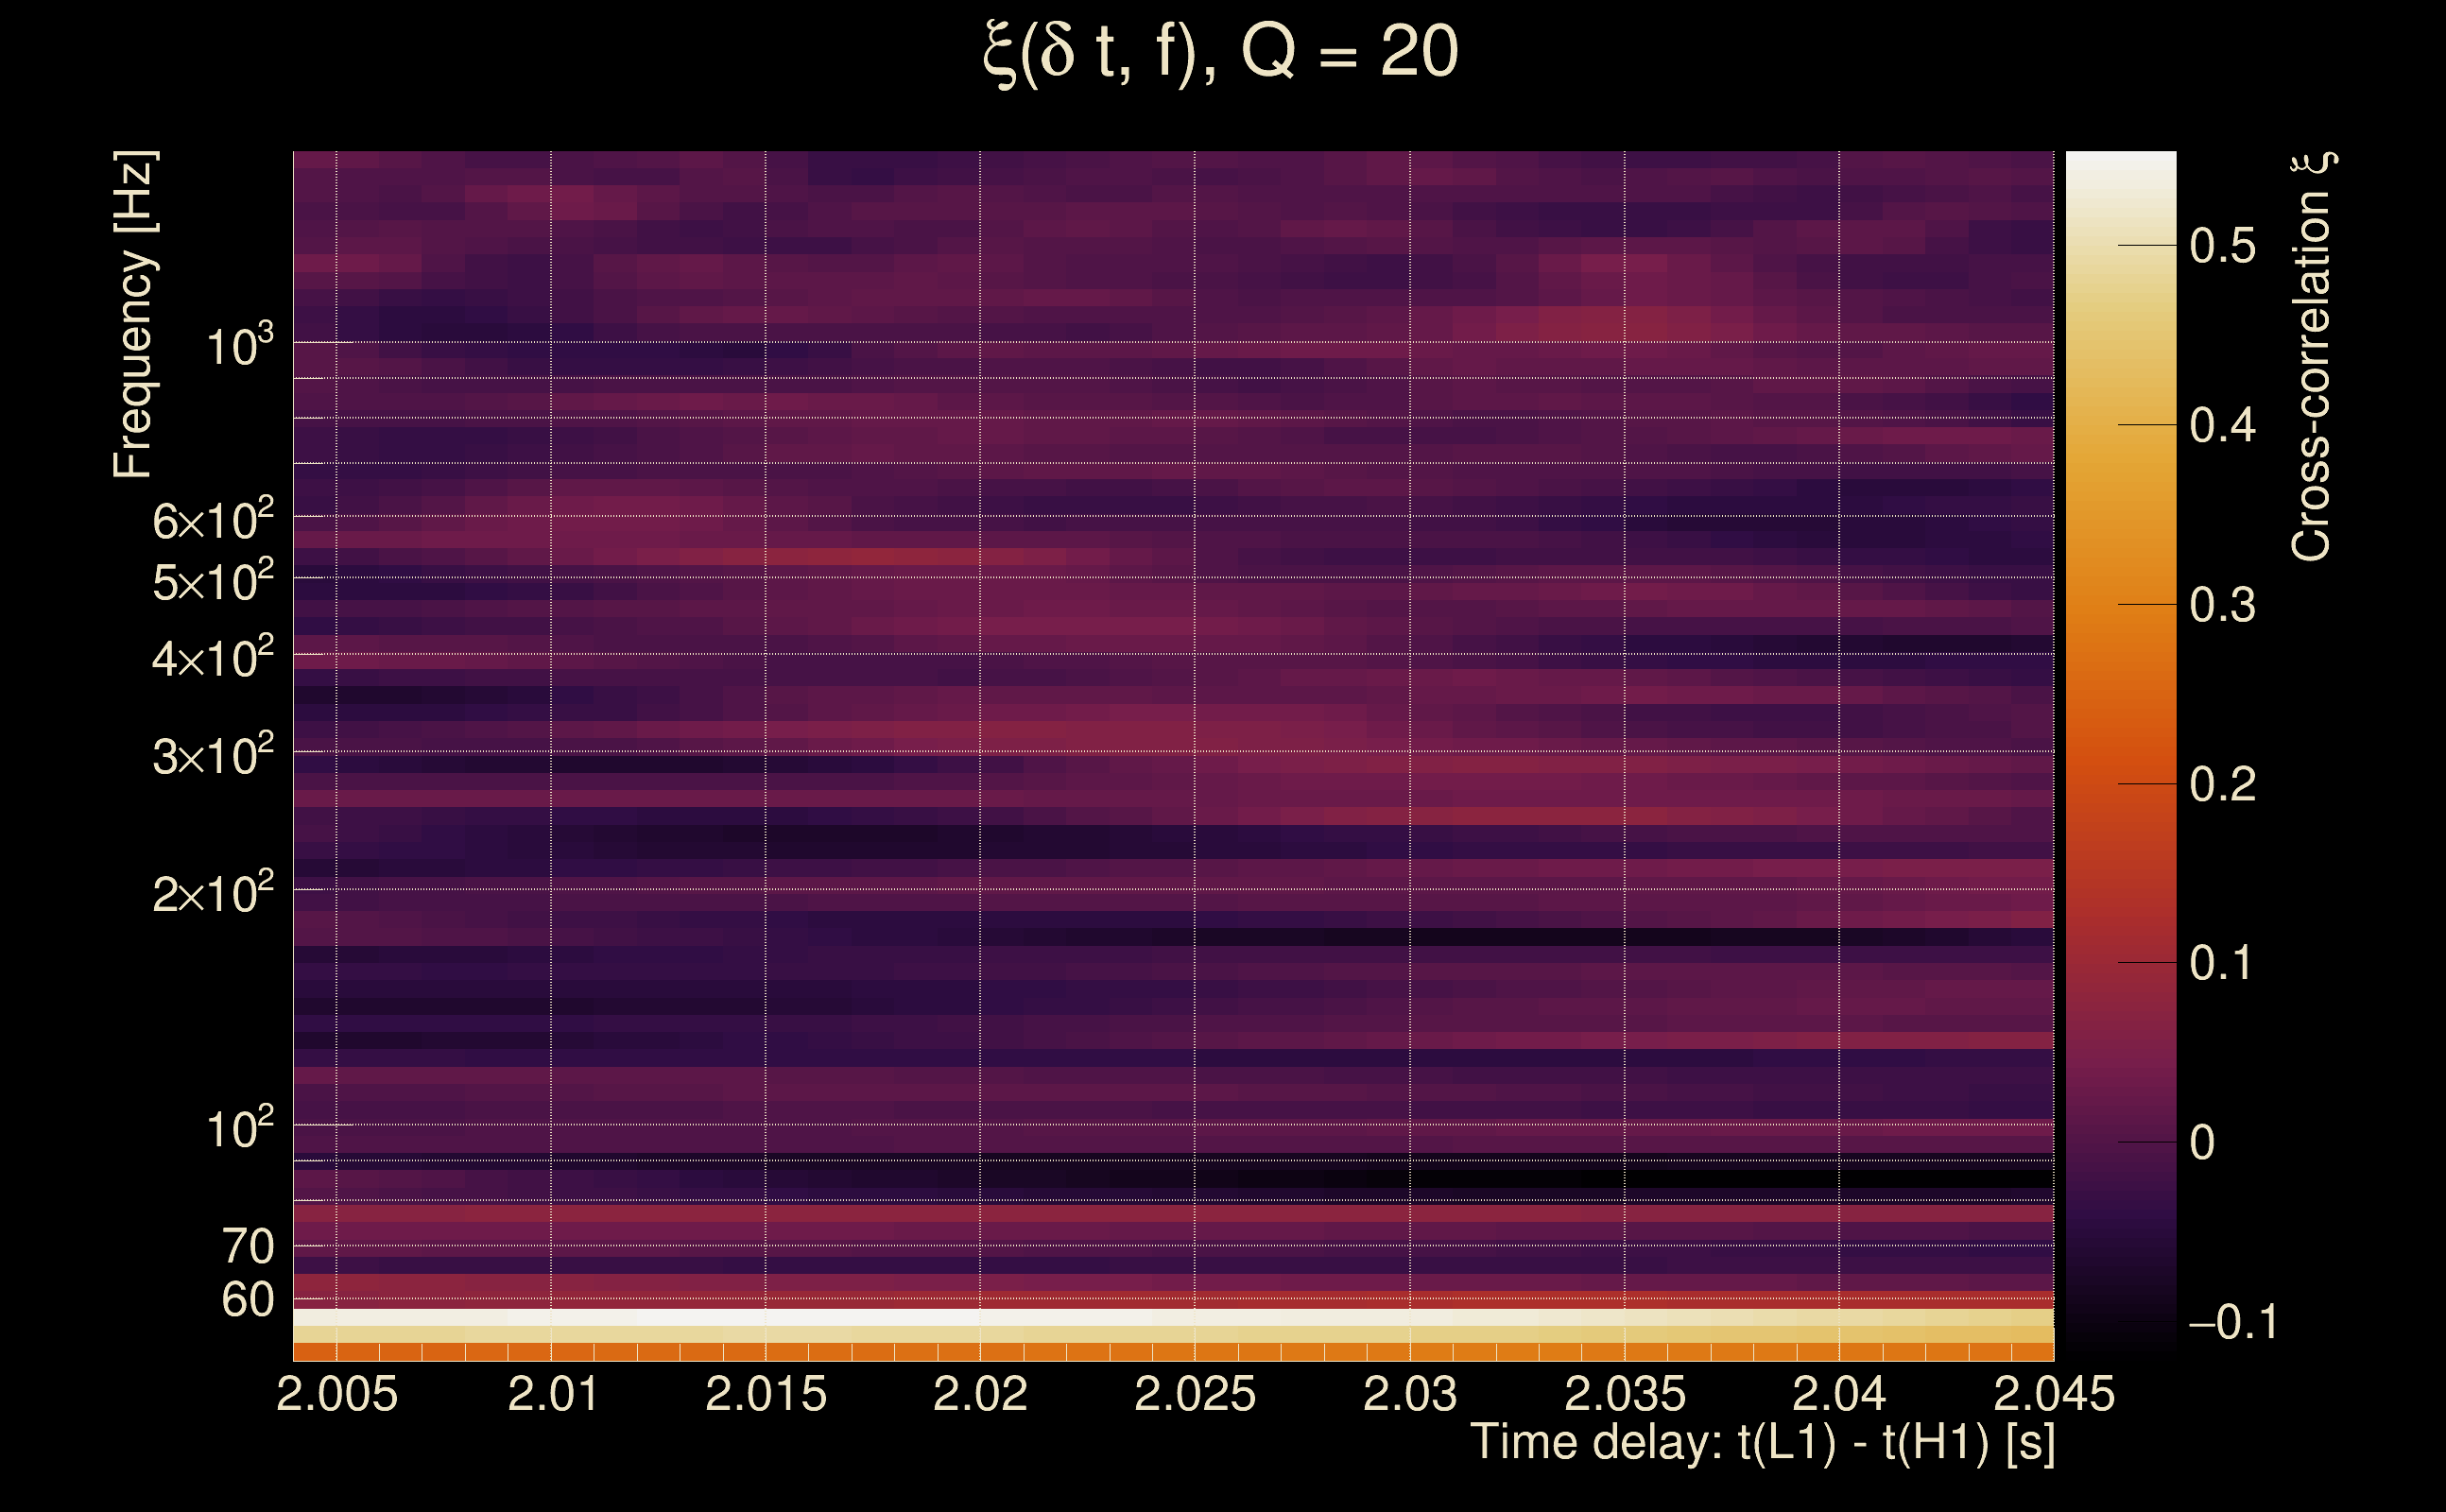
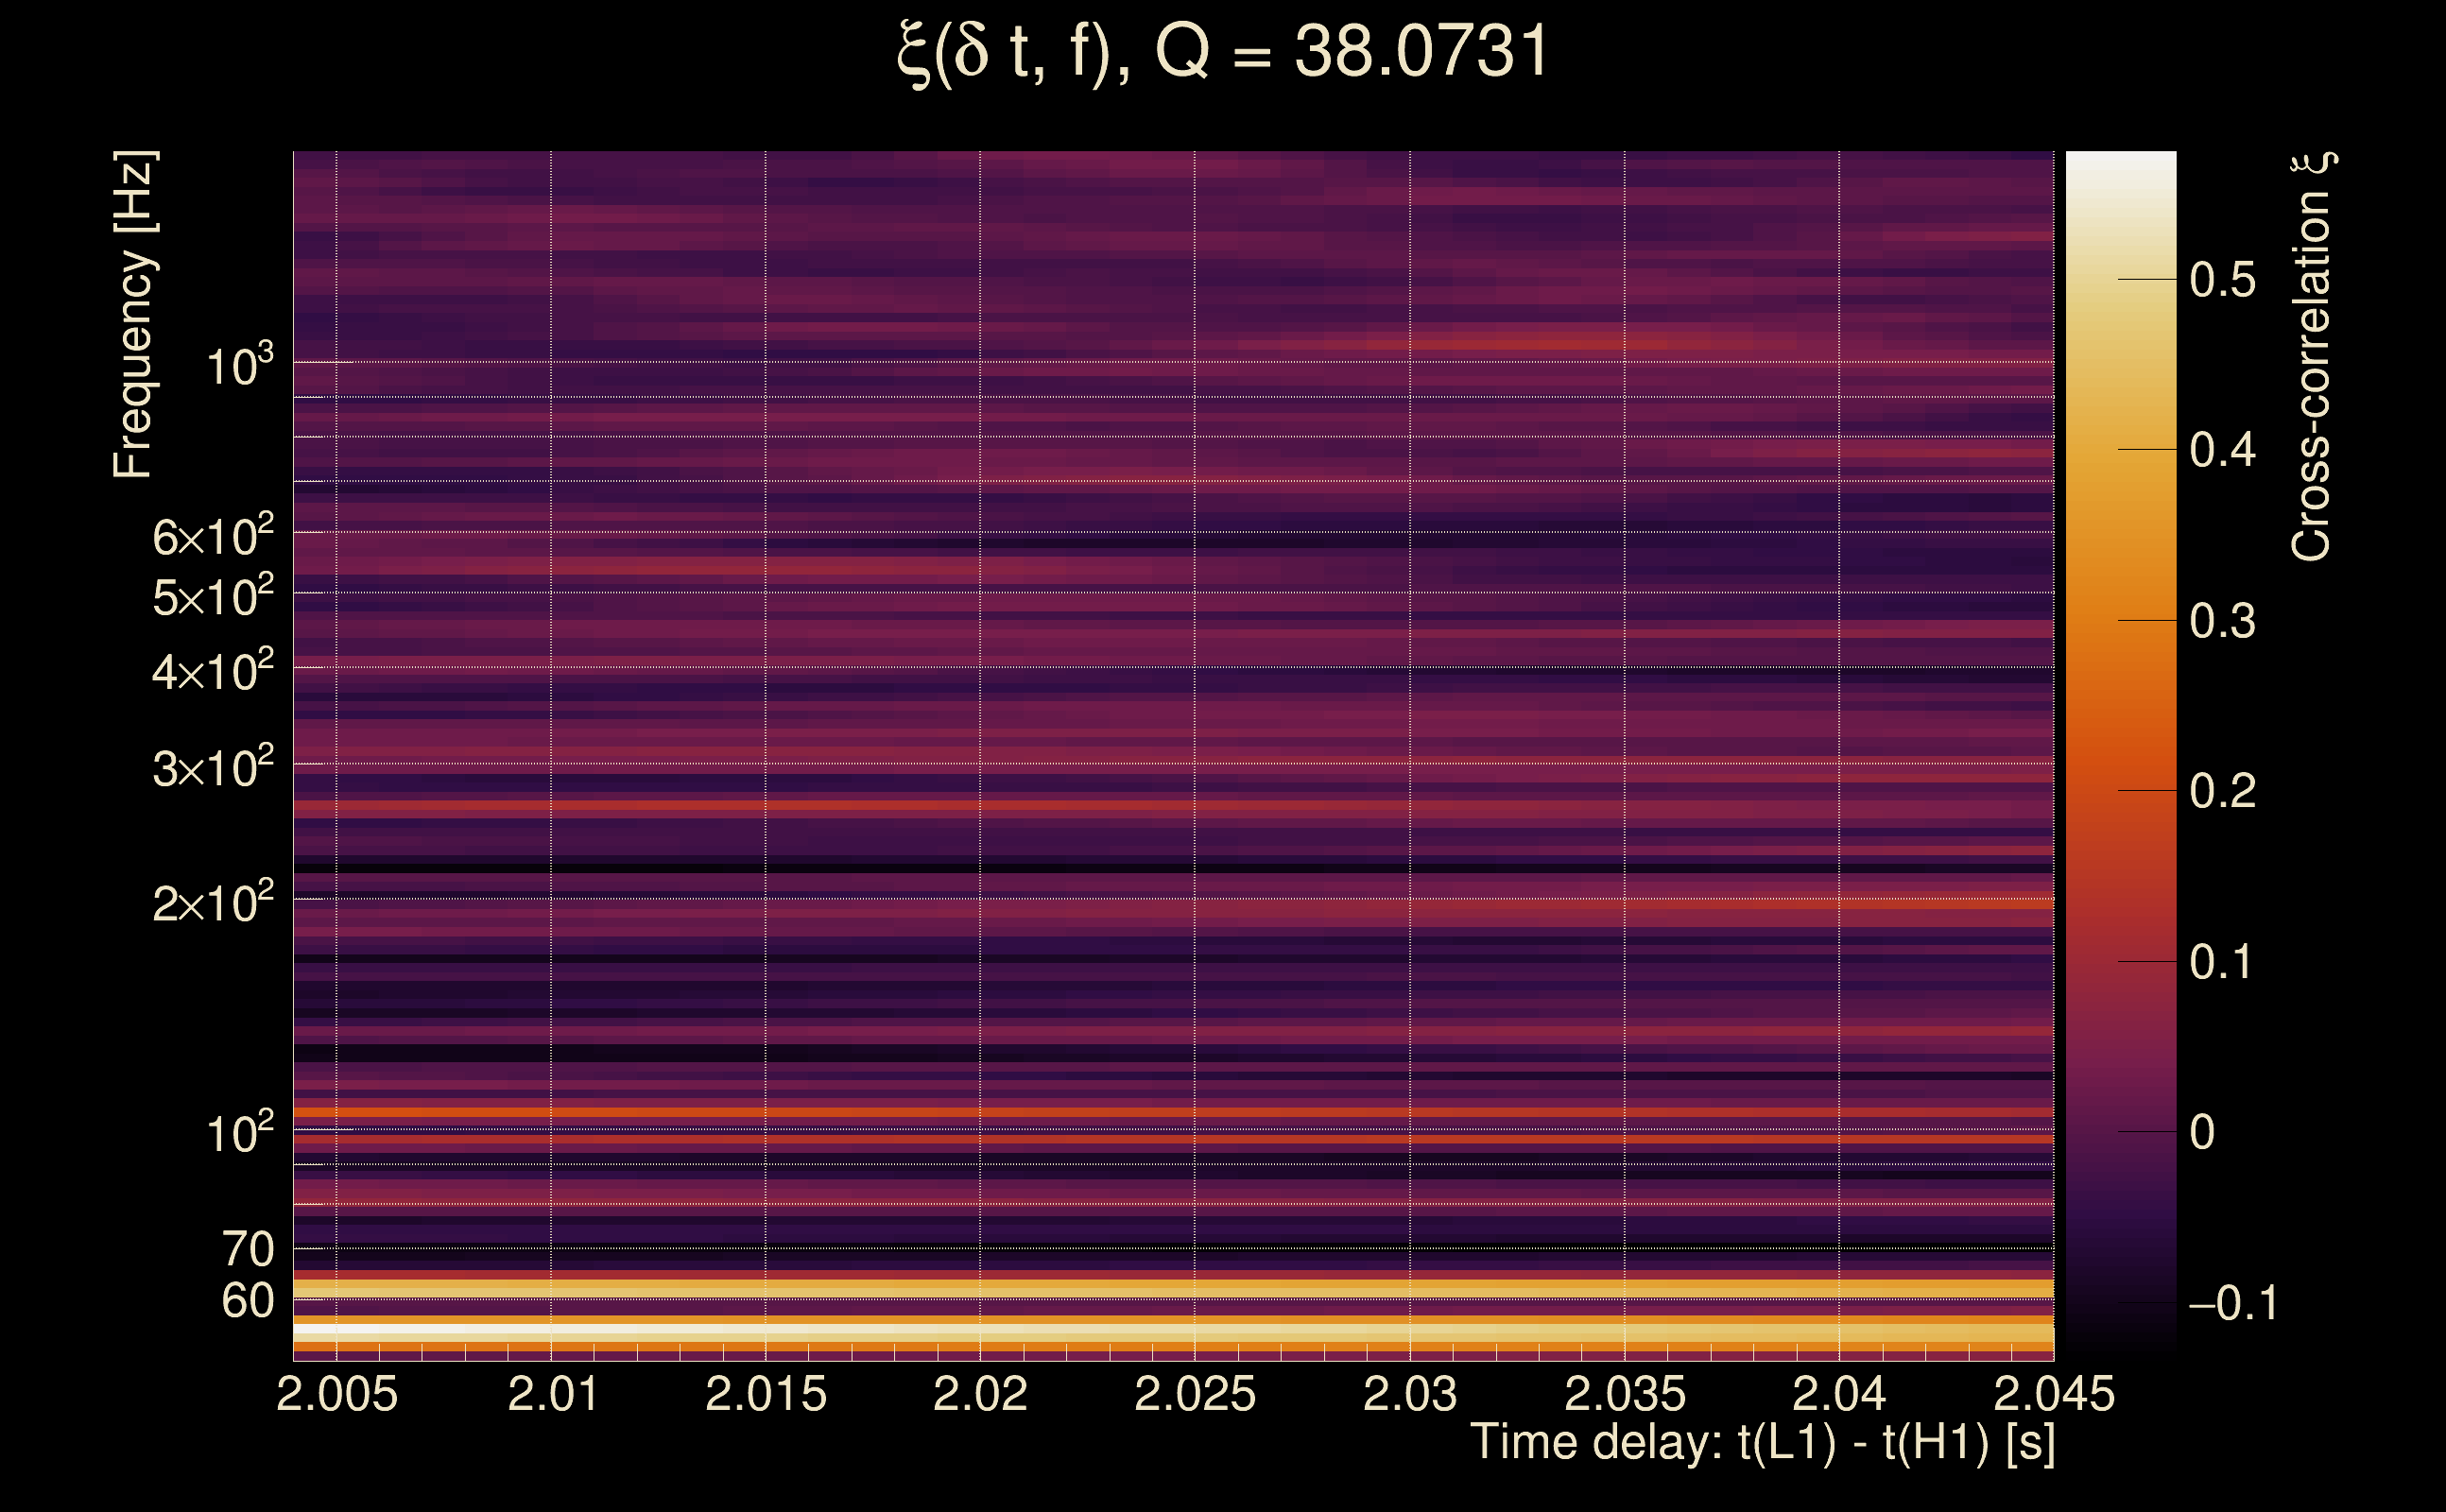
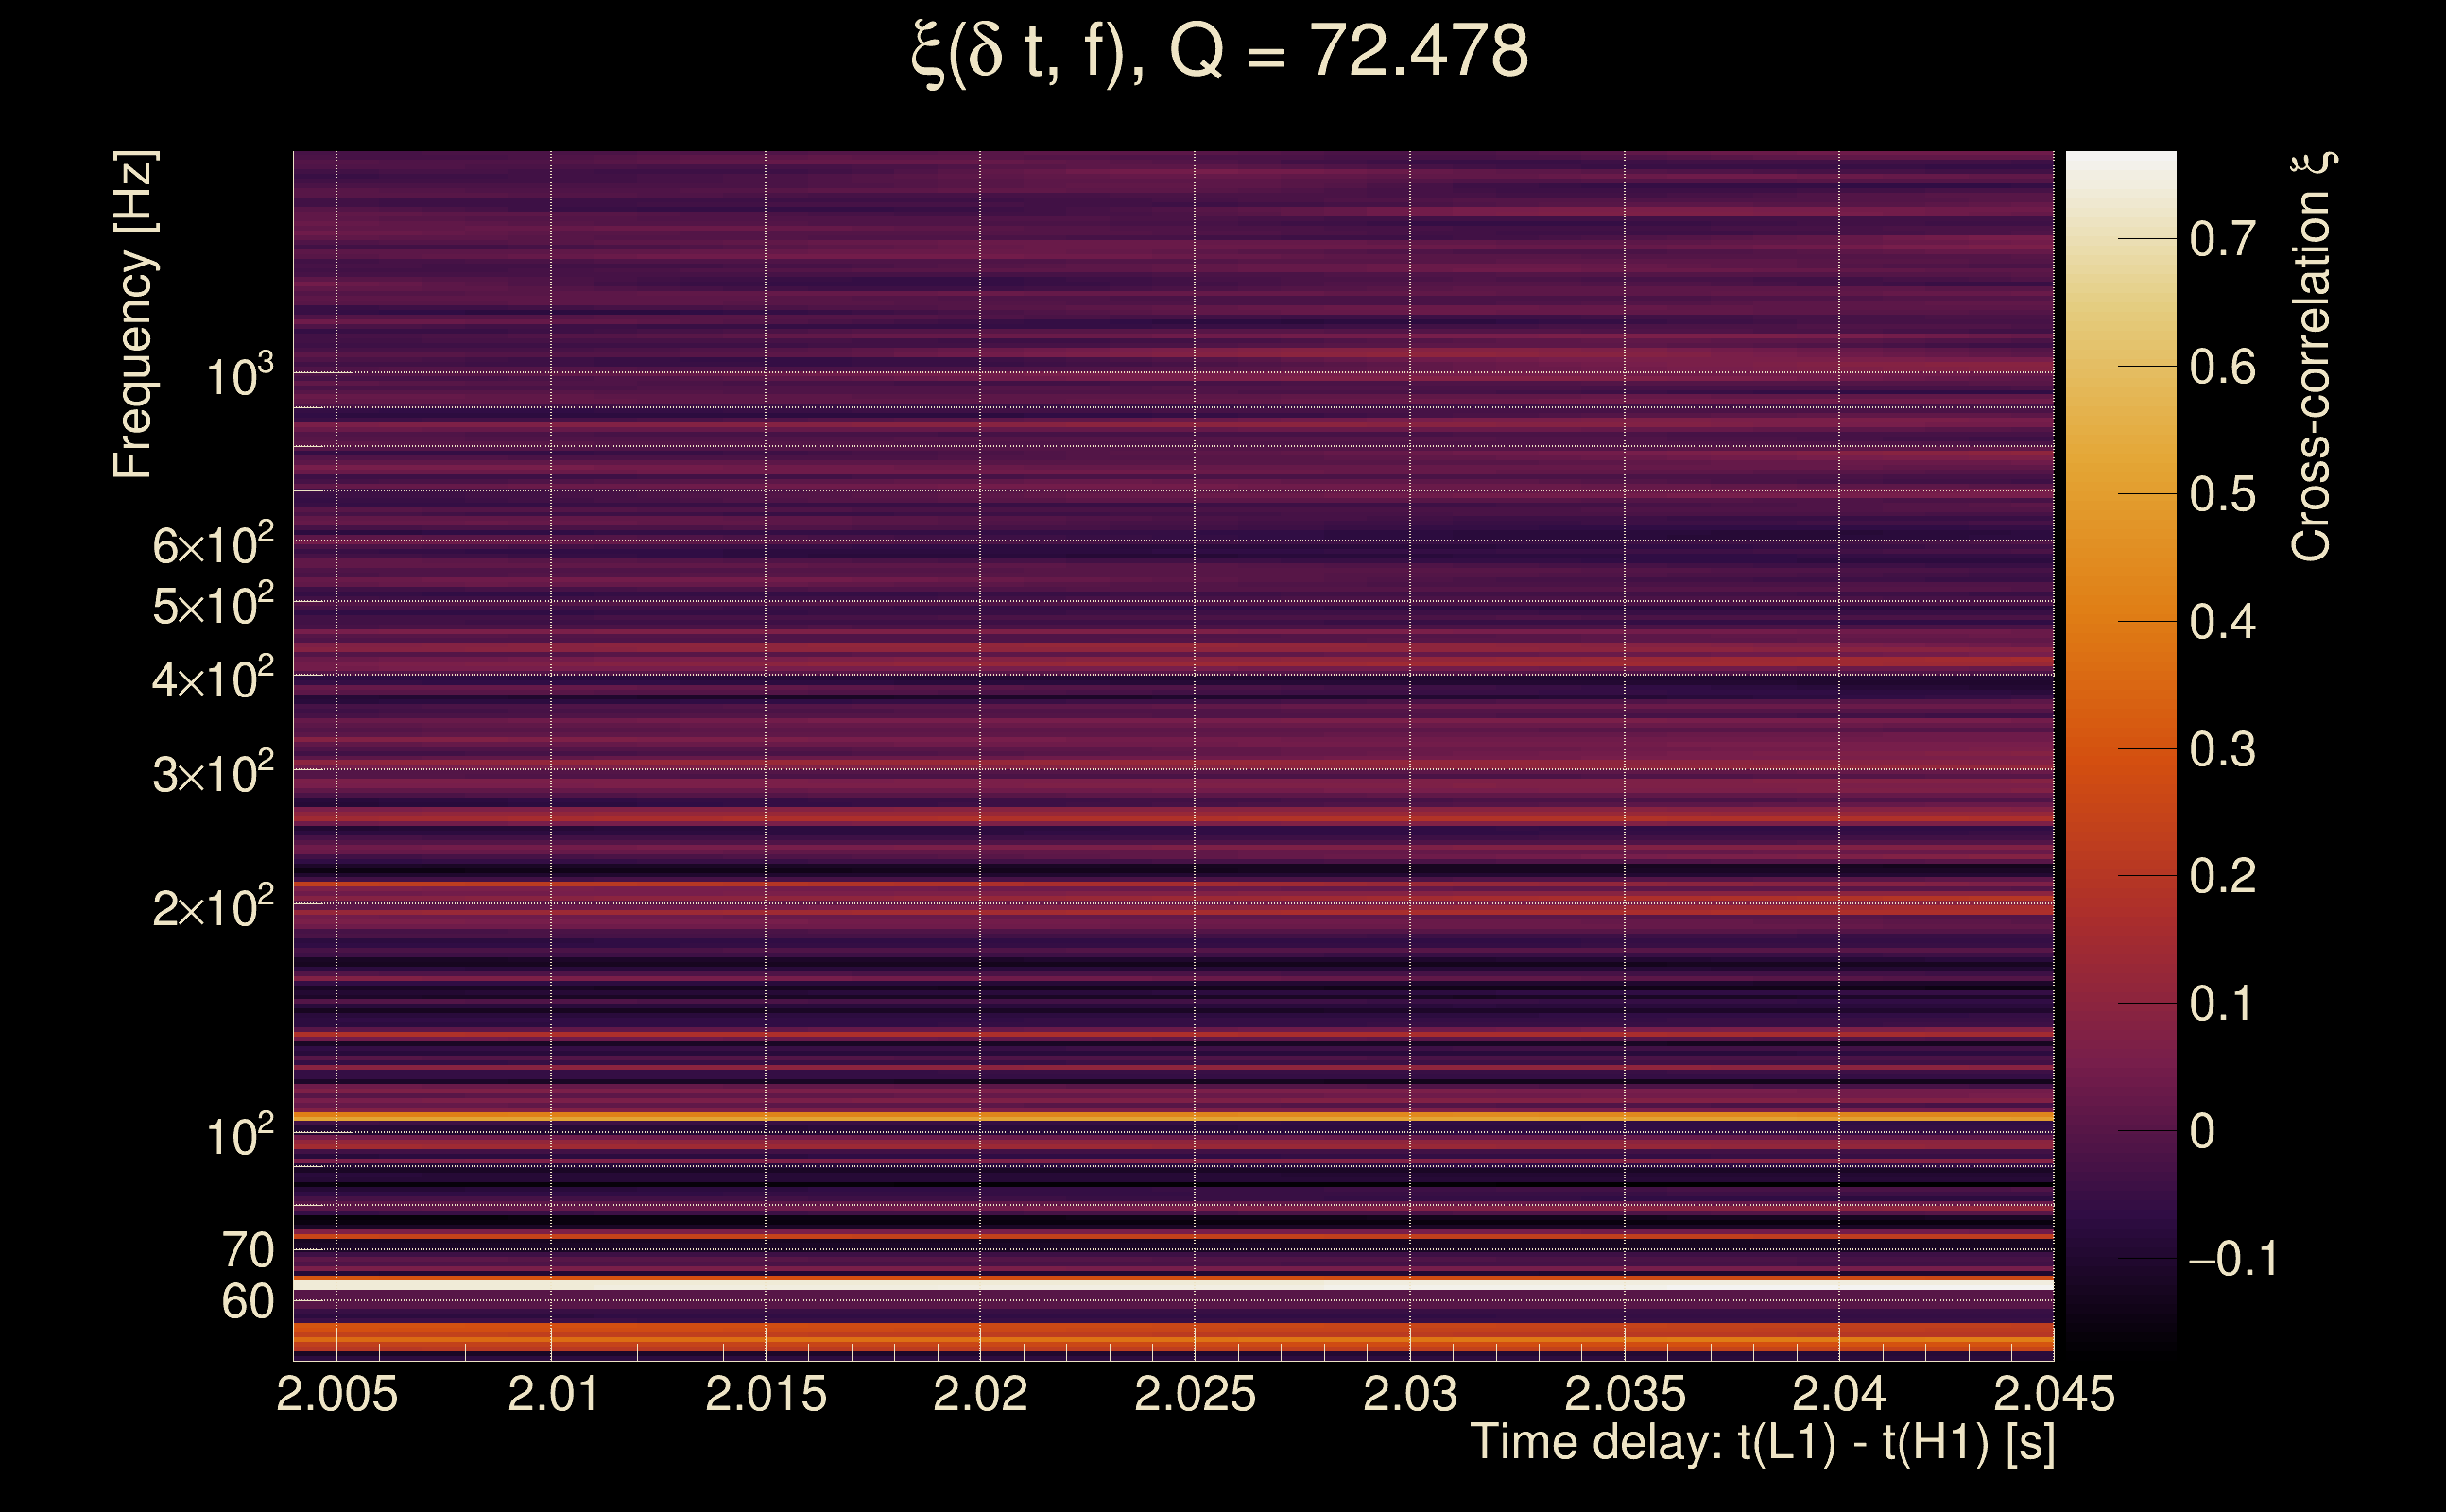
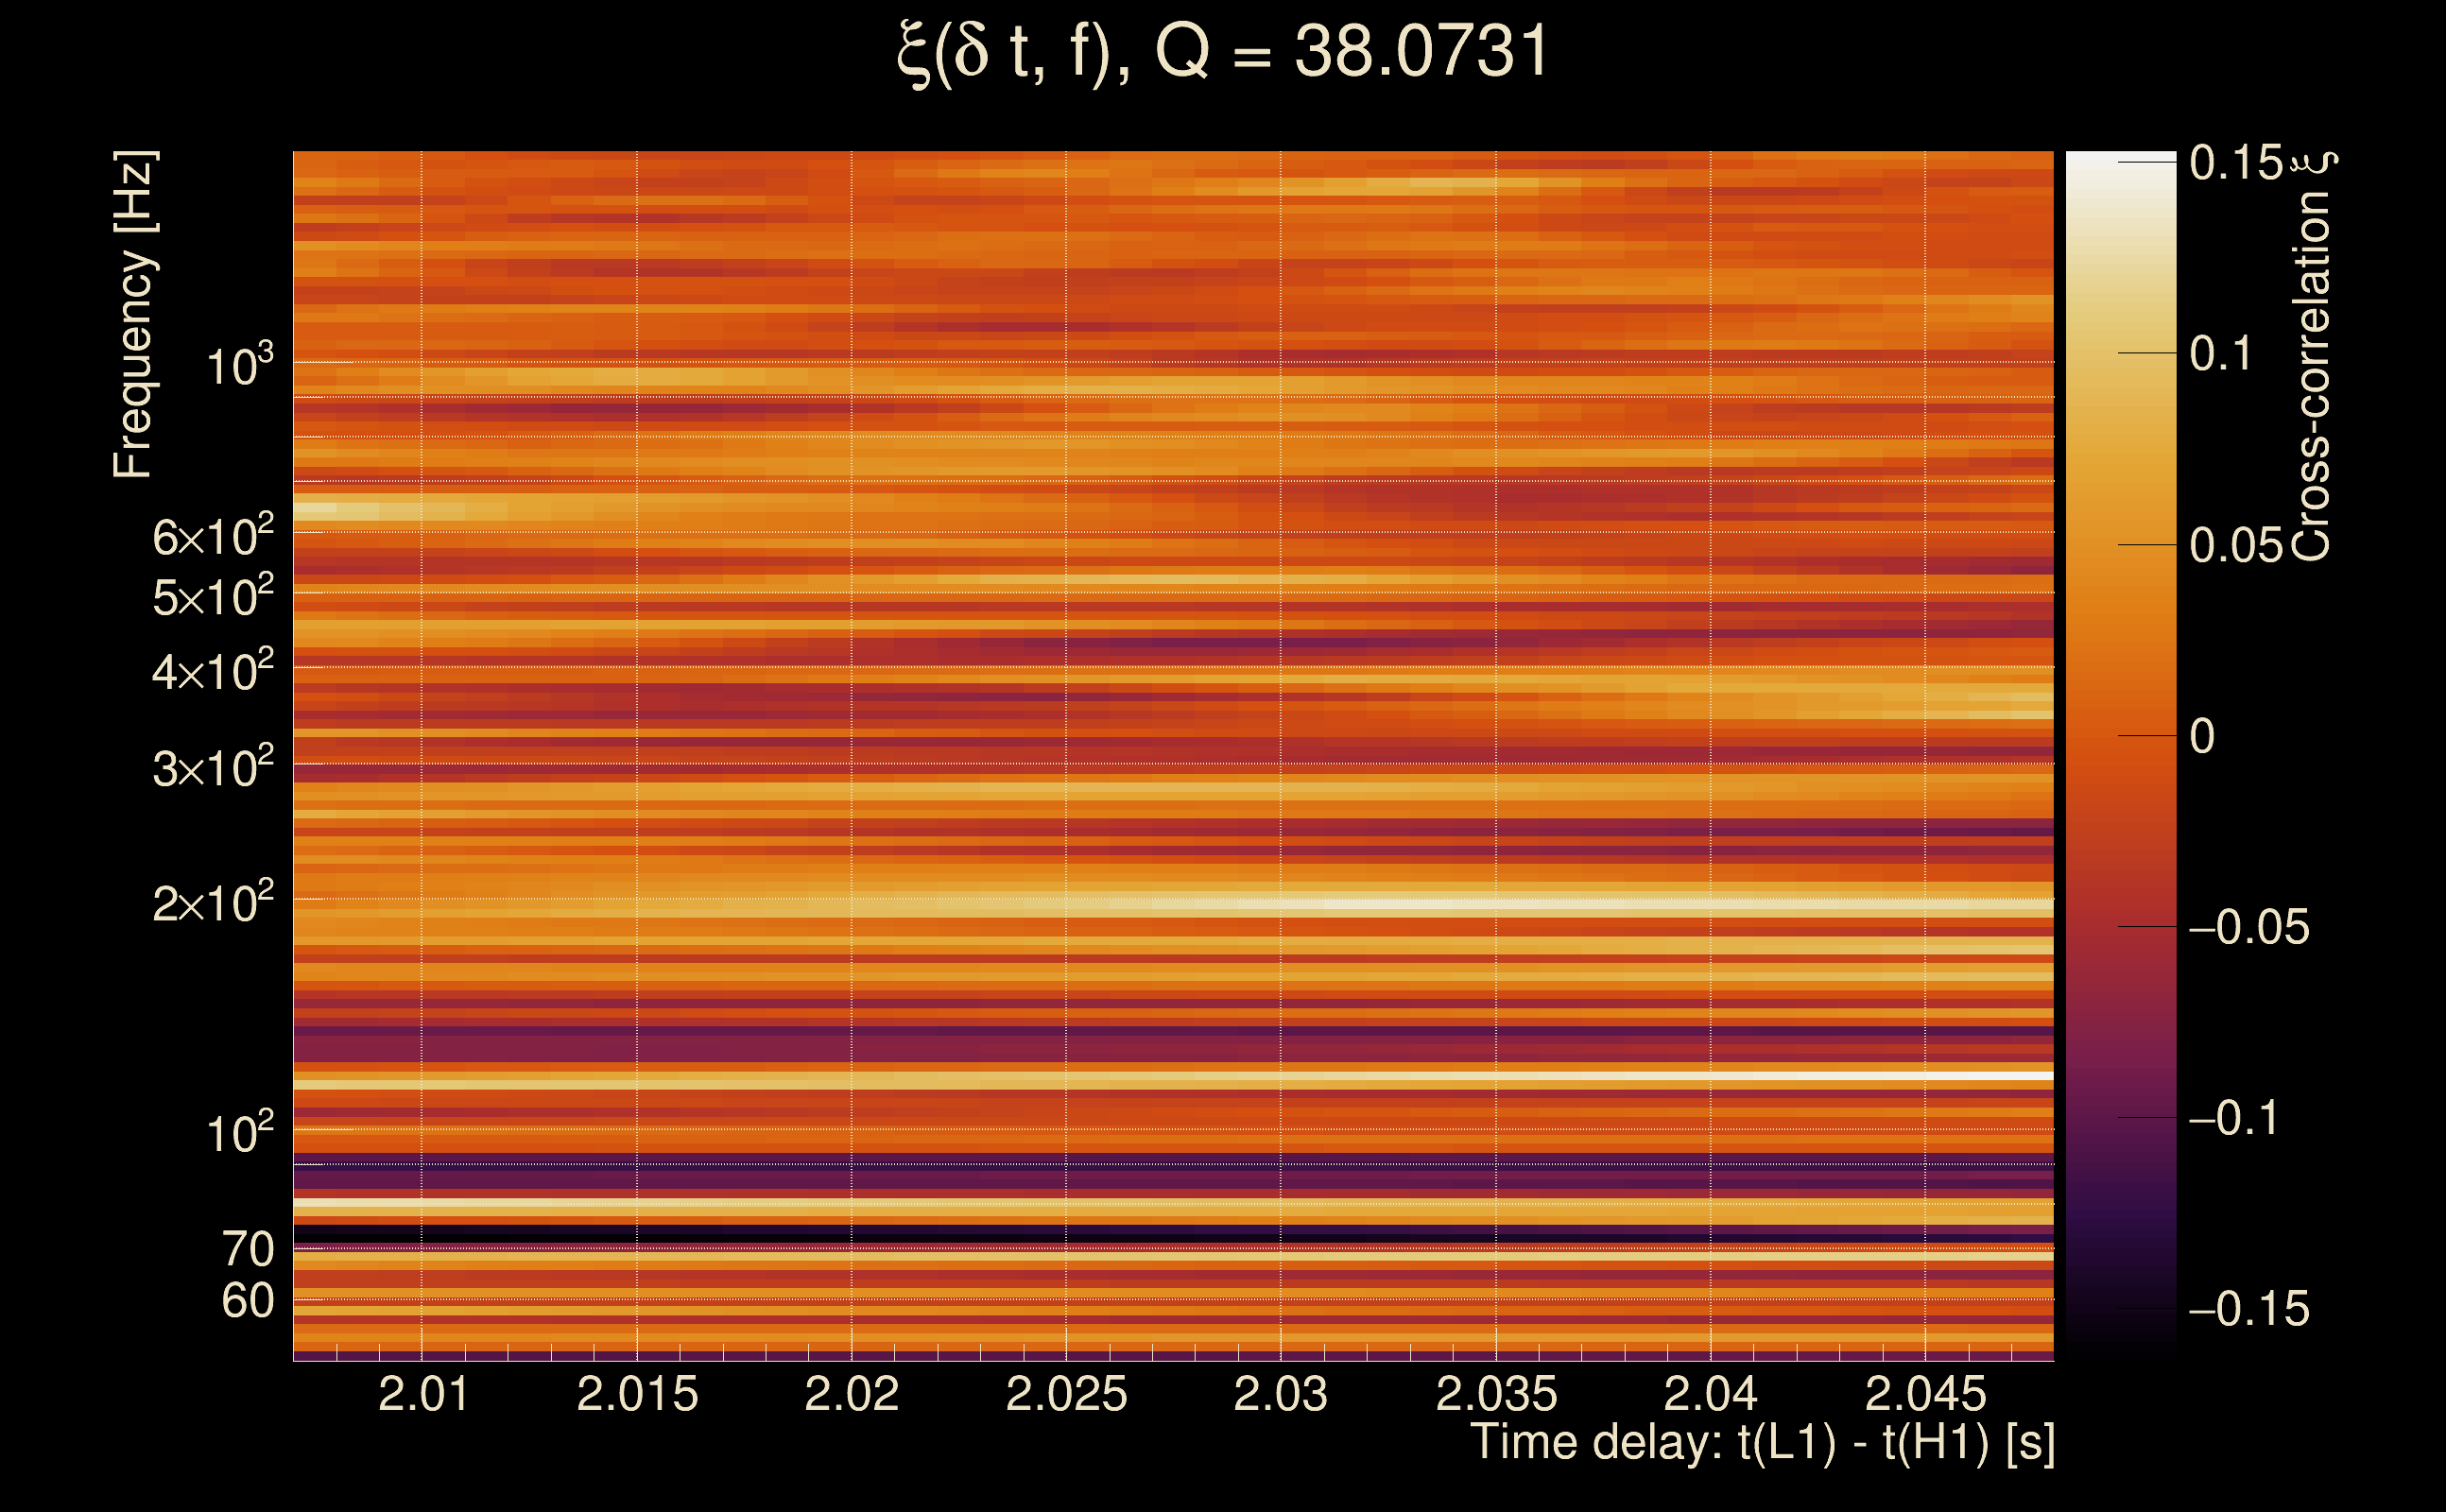
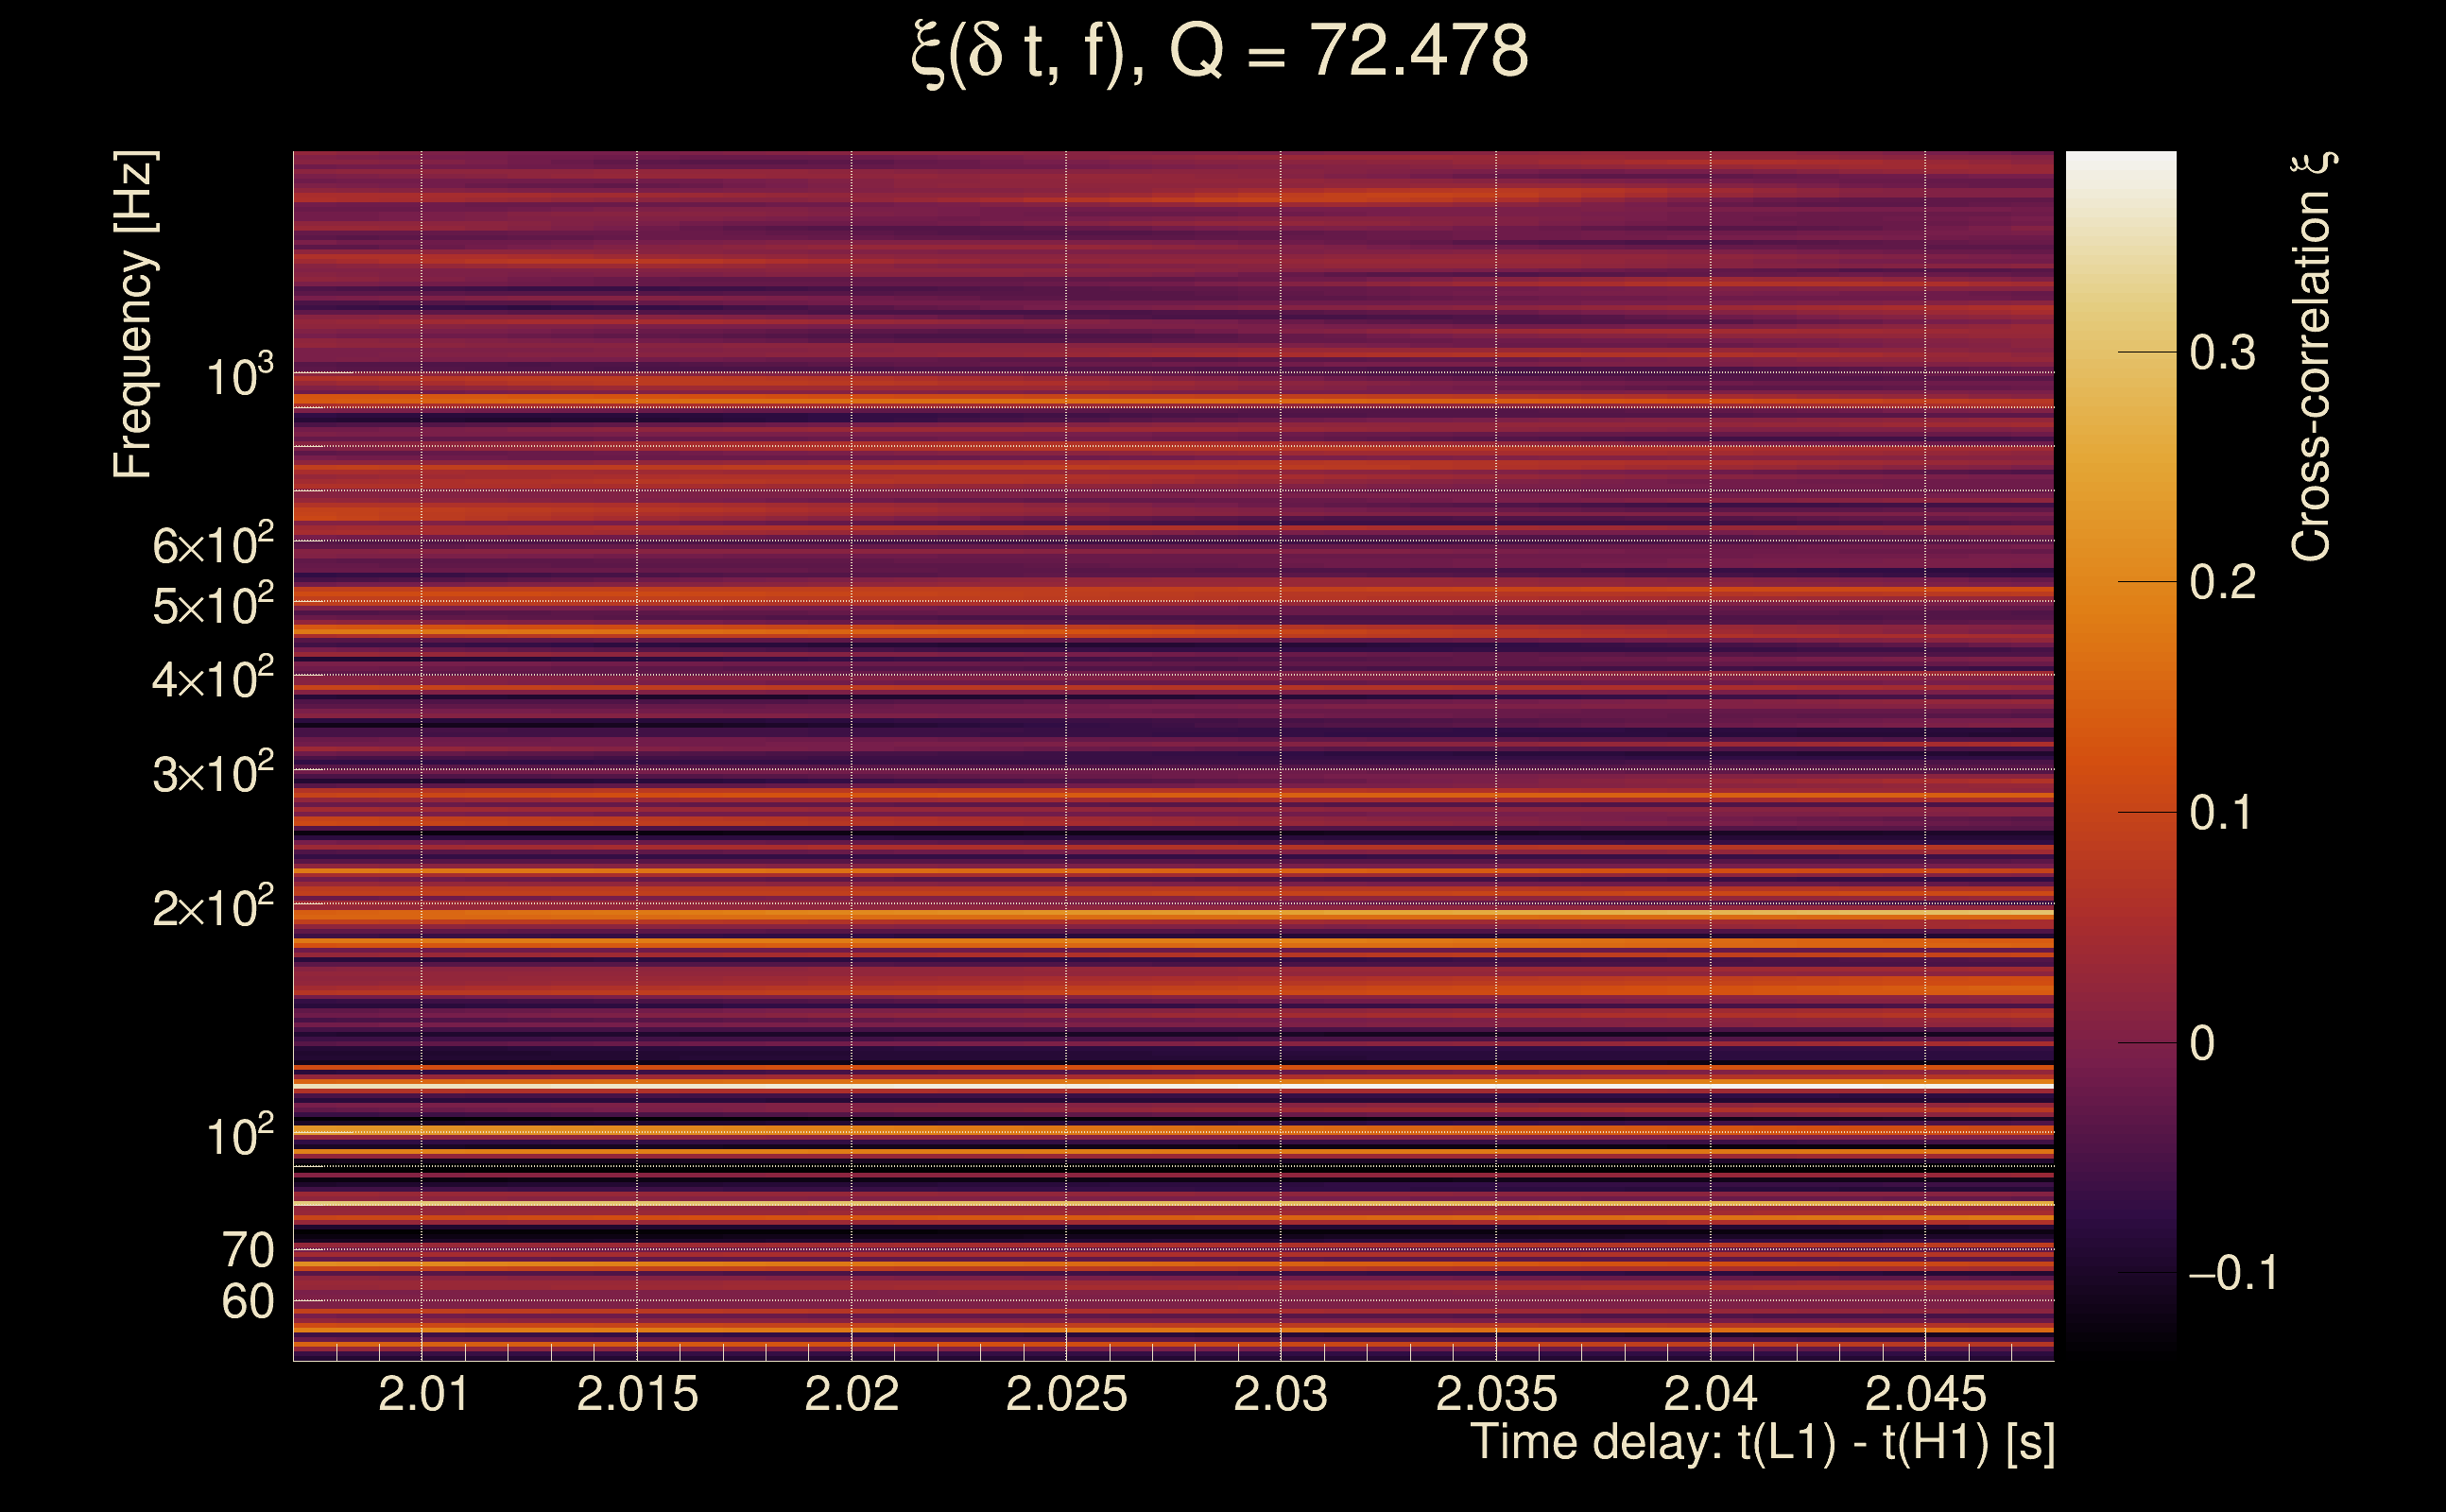
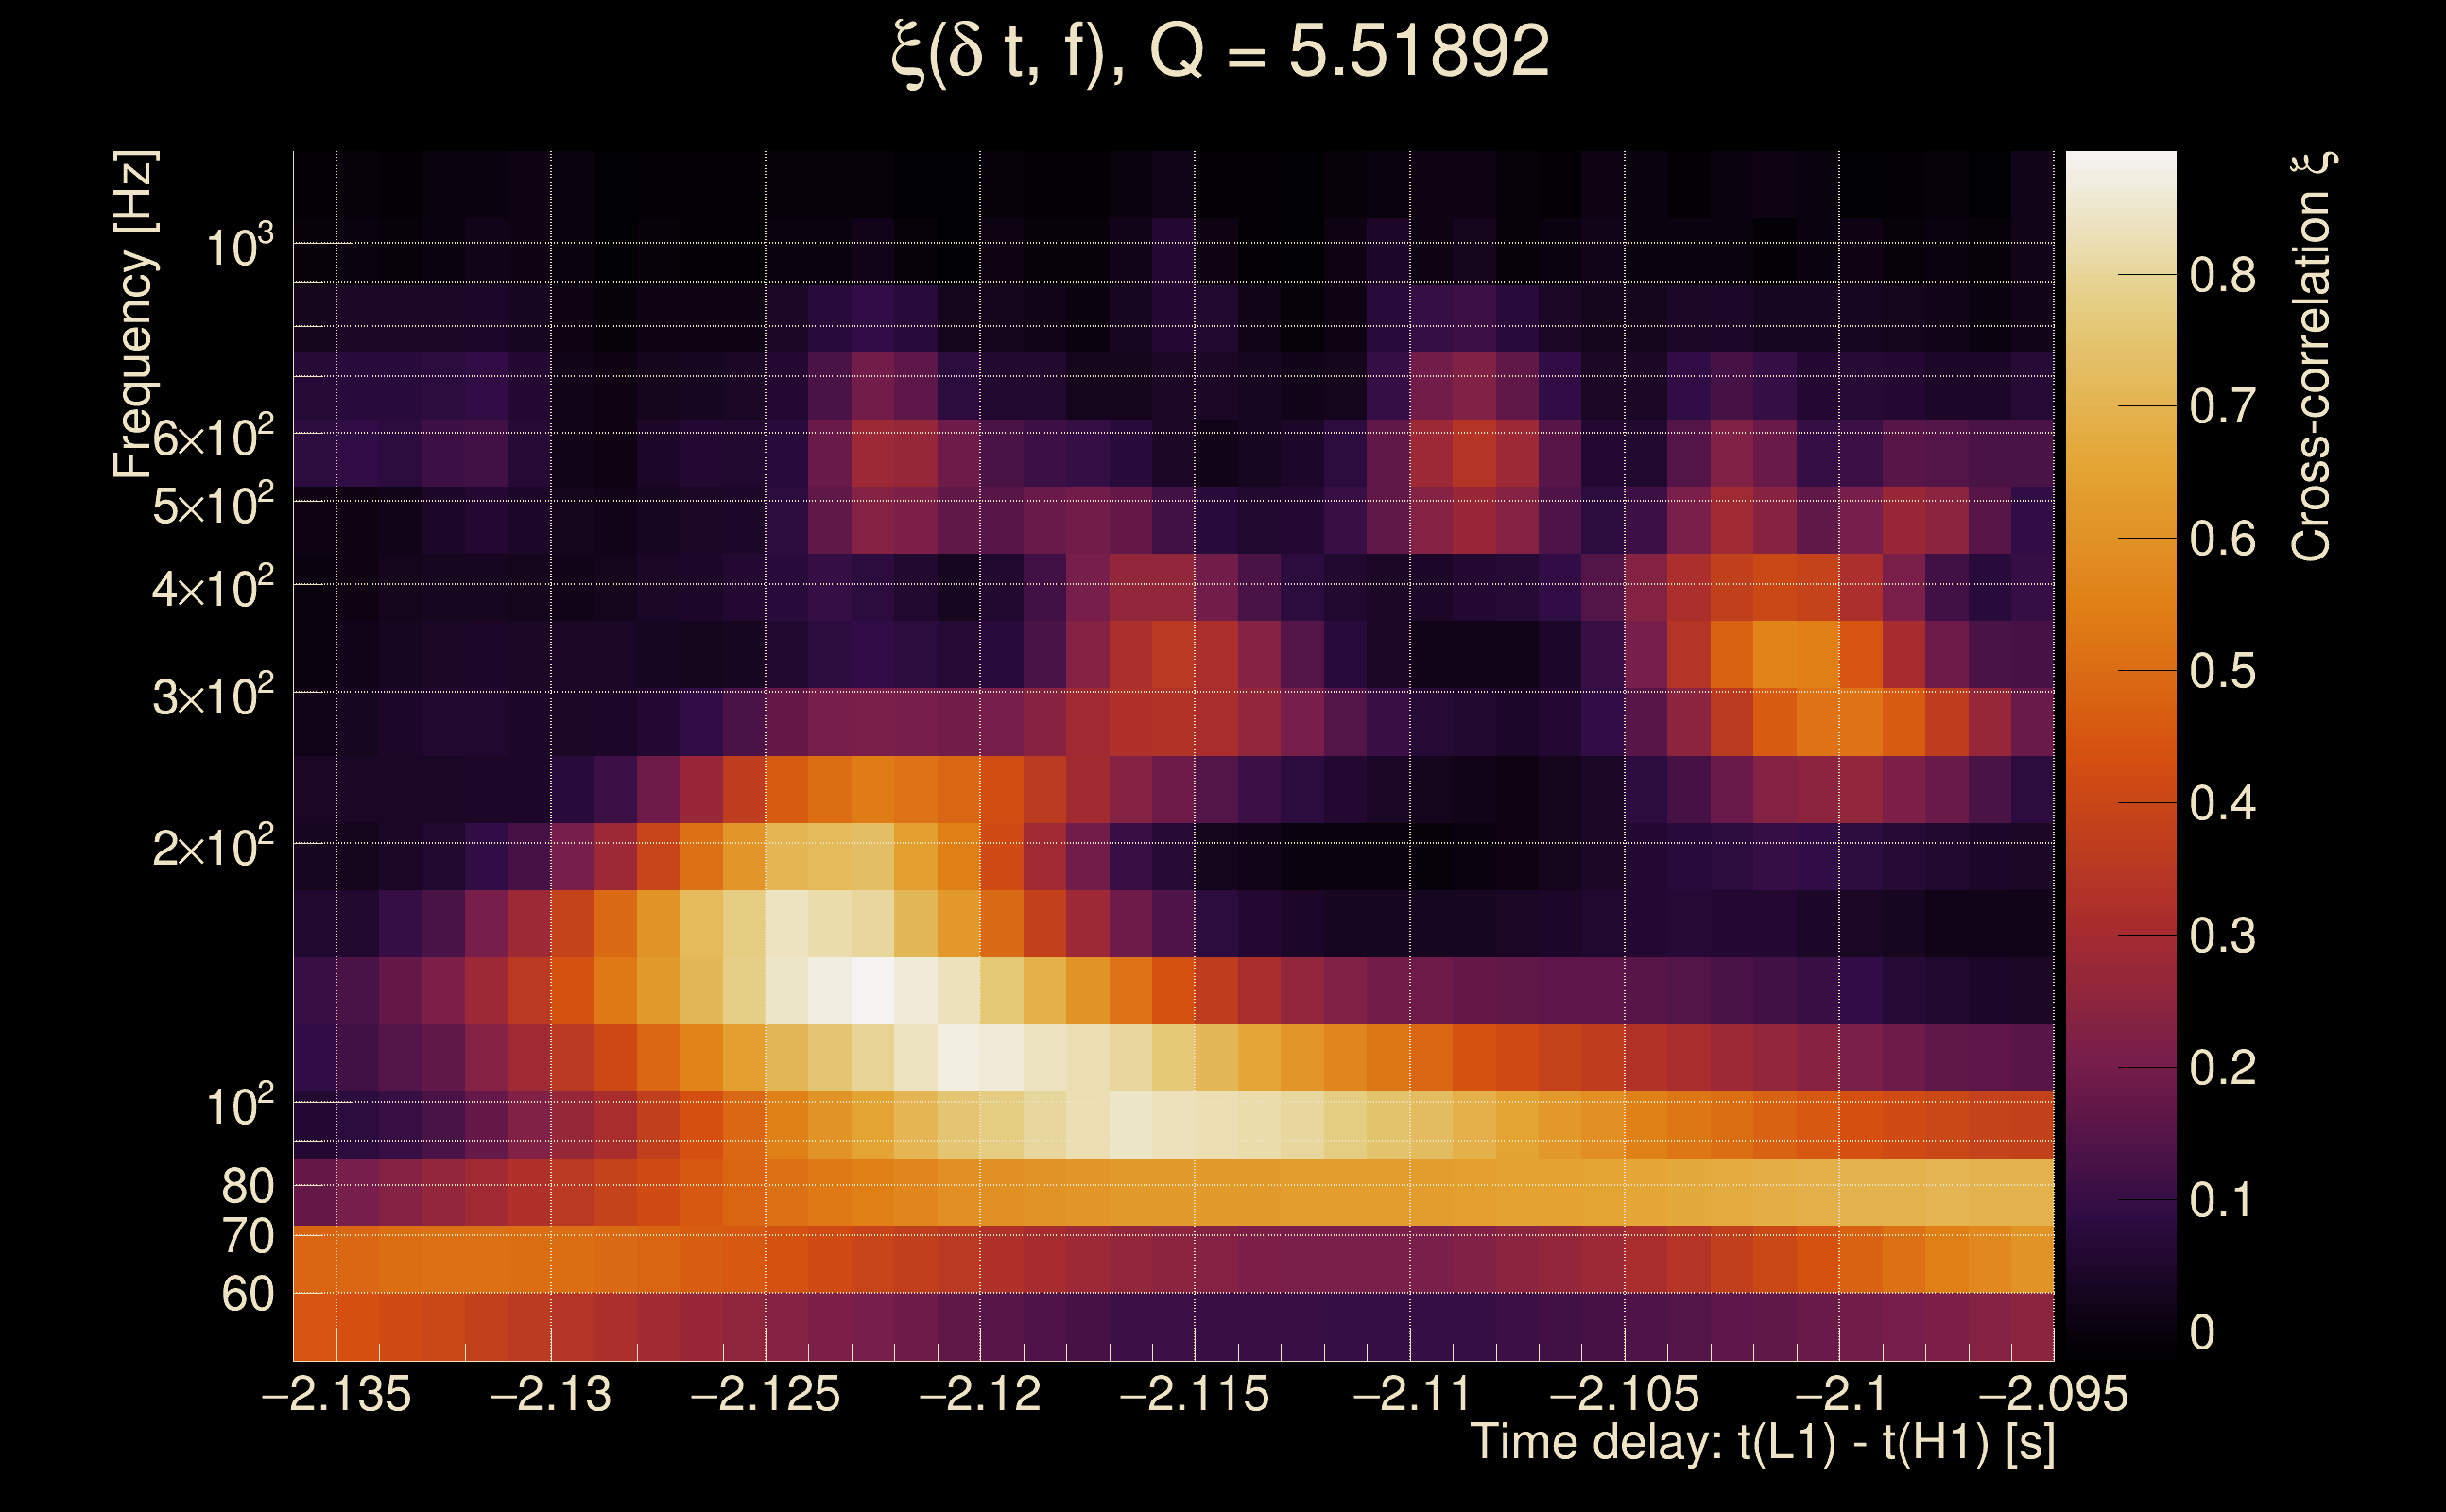
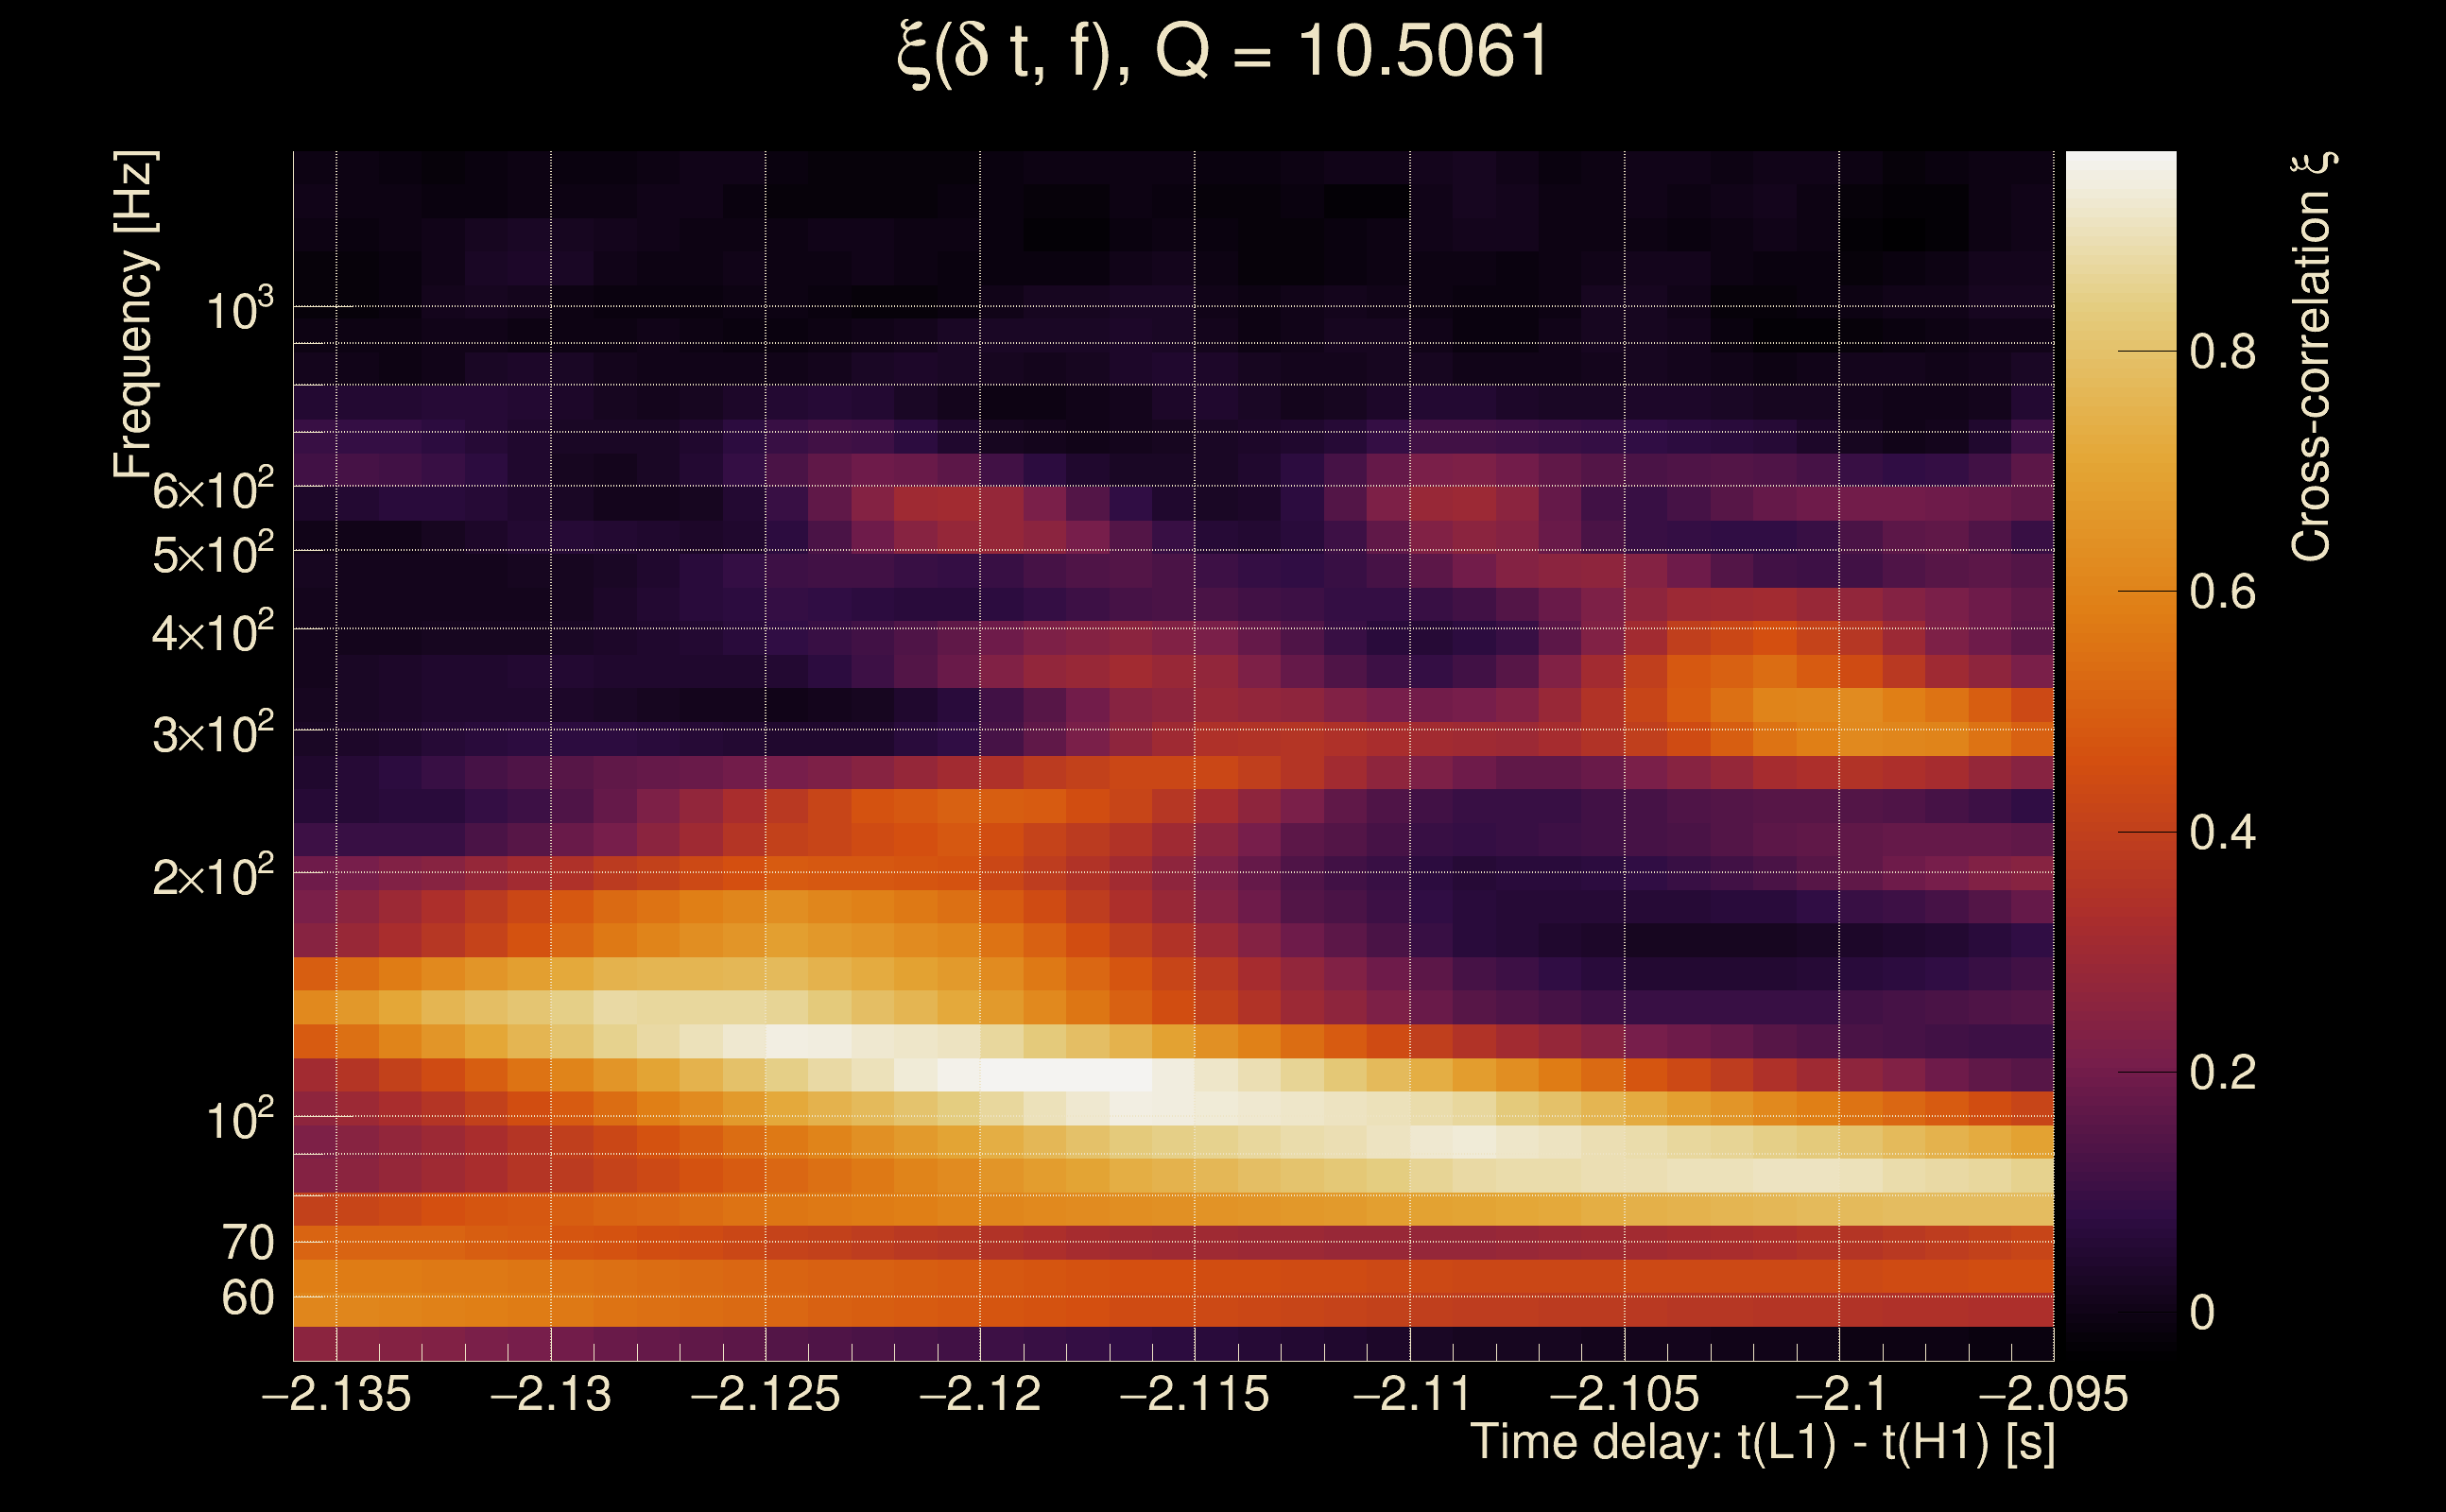
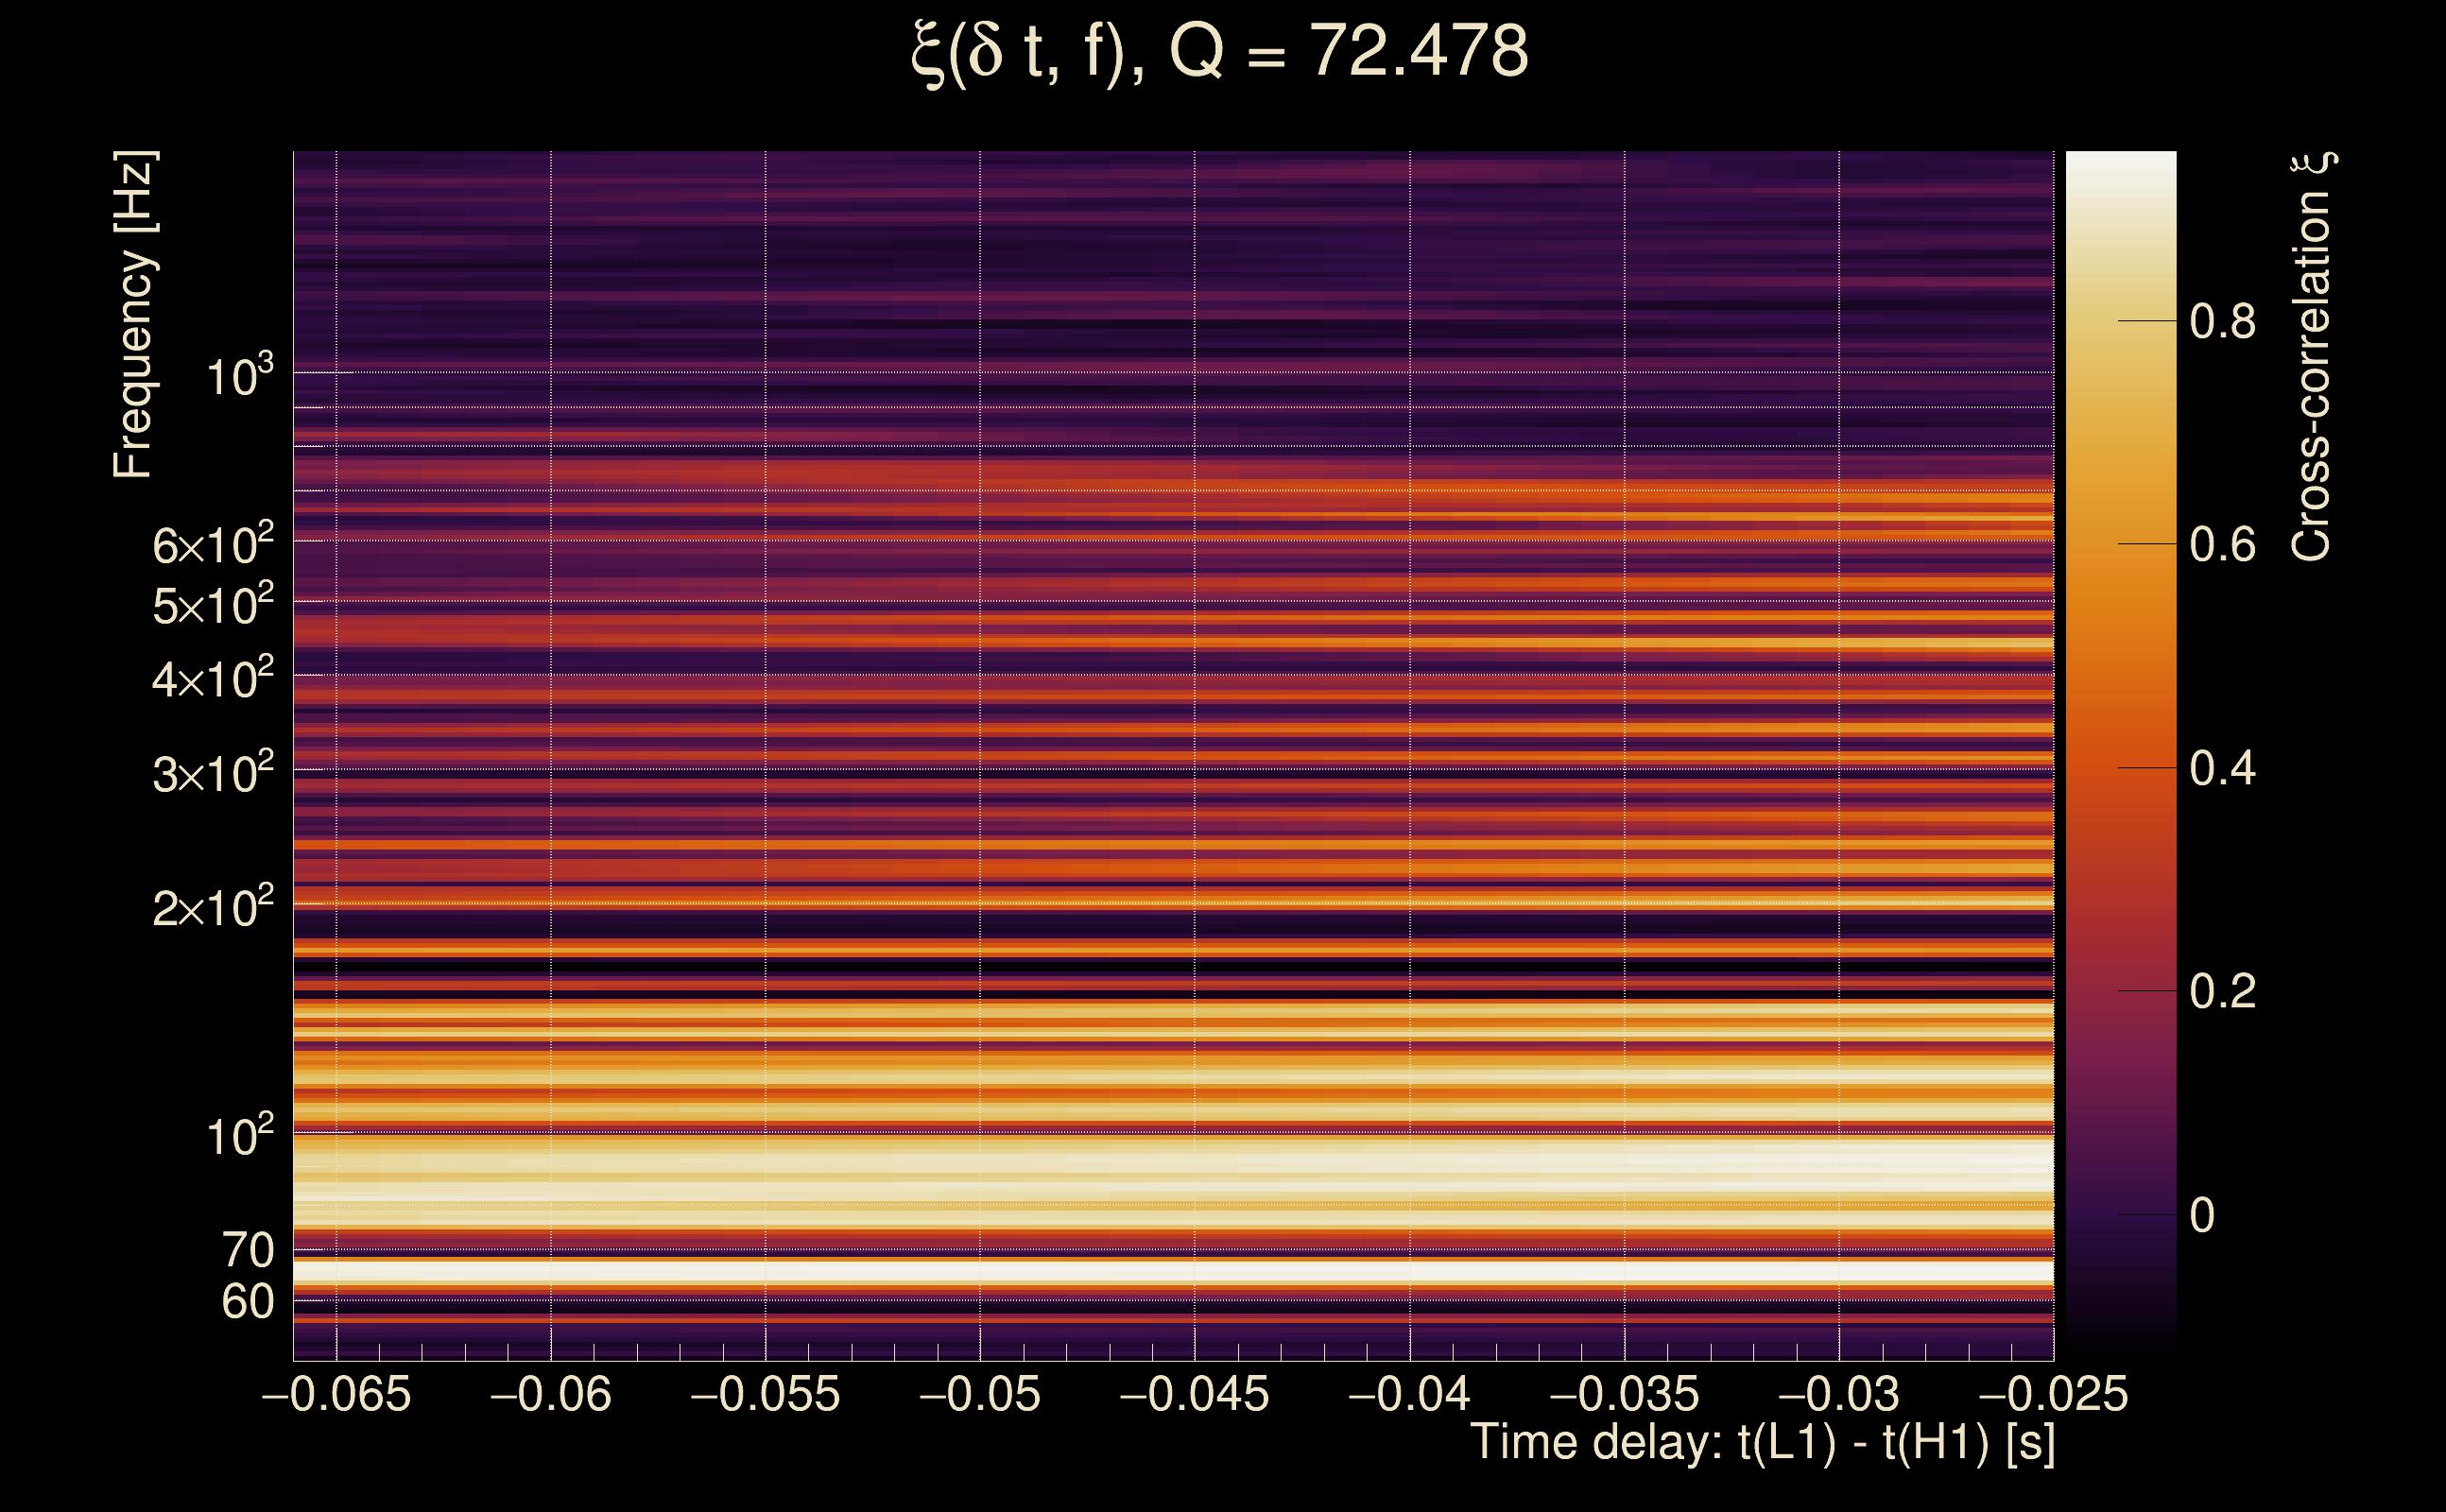
| Number of Q planes: | 5 (Q = 5.51892 → Q = 72.478) |
| Omicron frequency range: | 50 Hz → 1958.38 Hz |
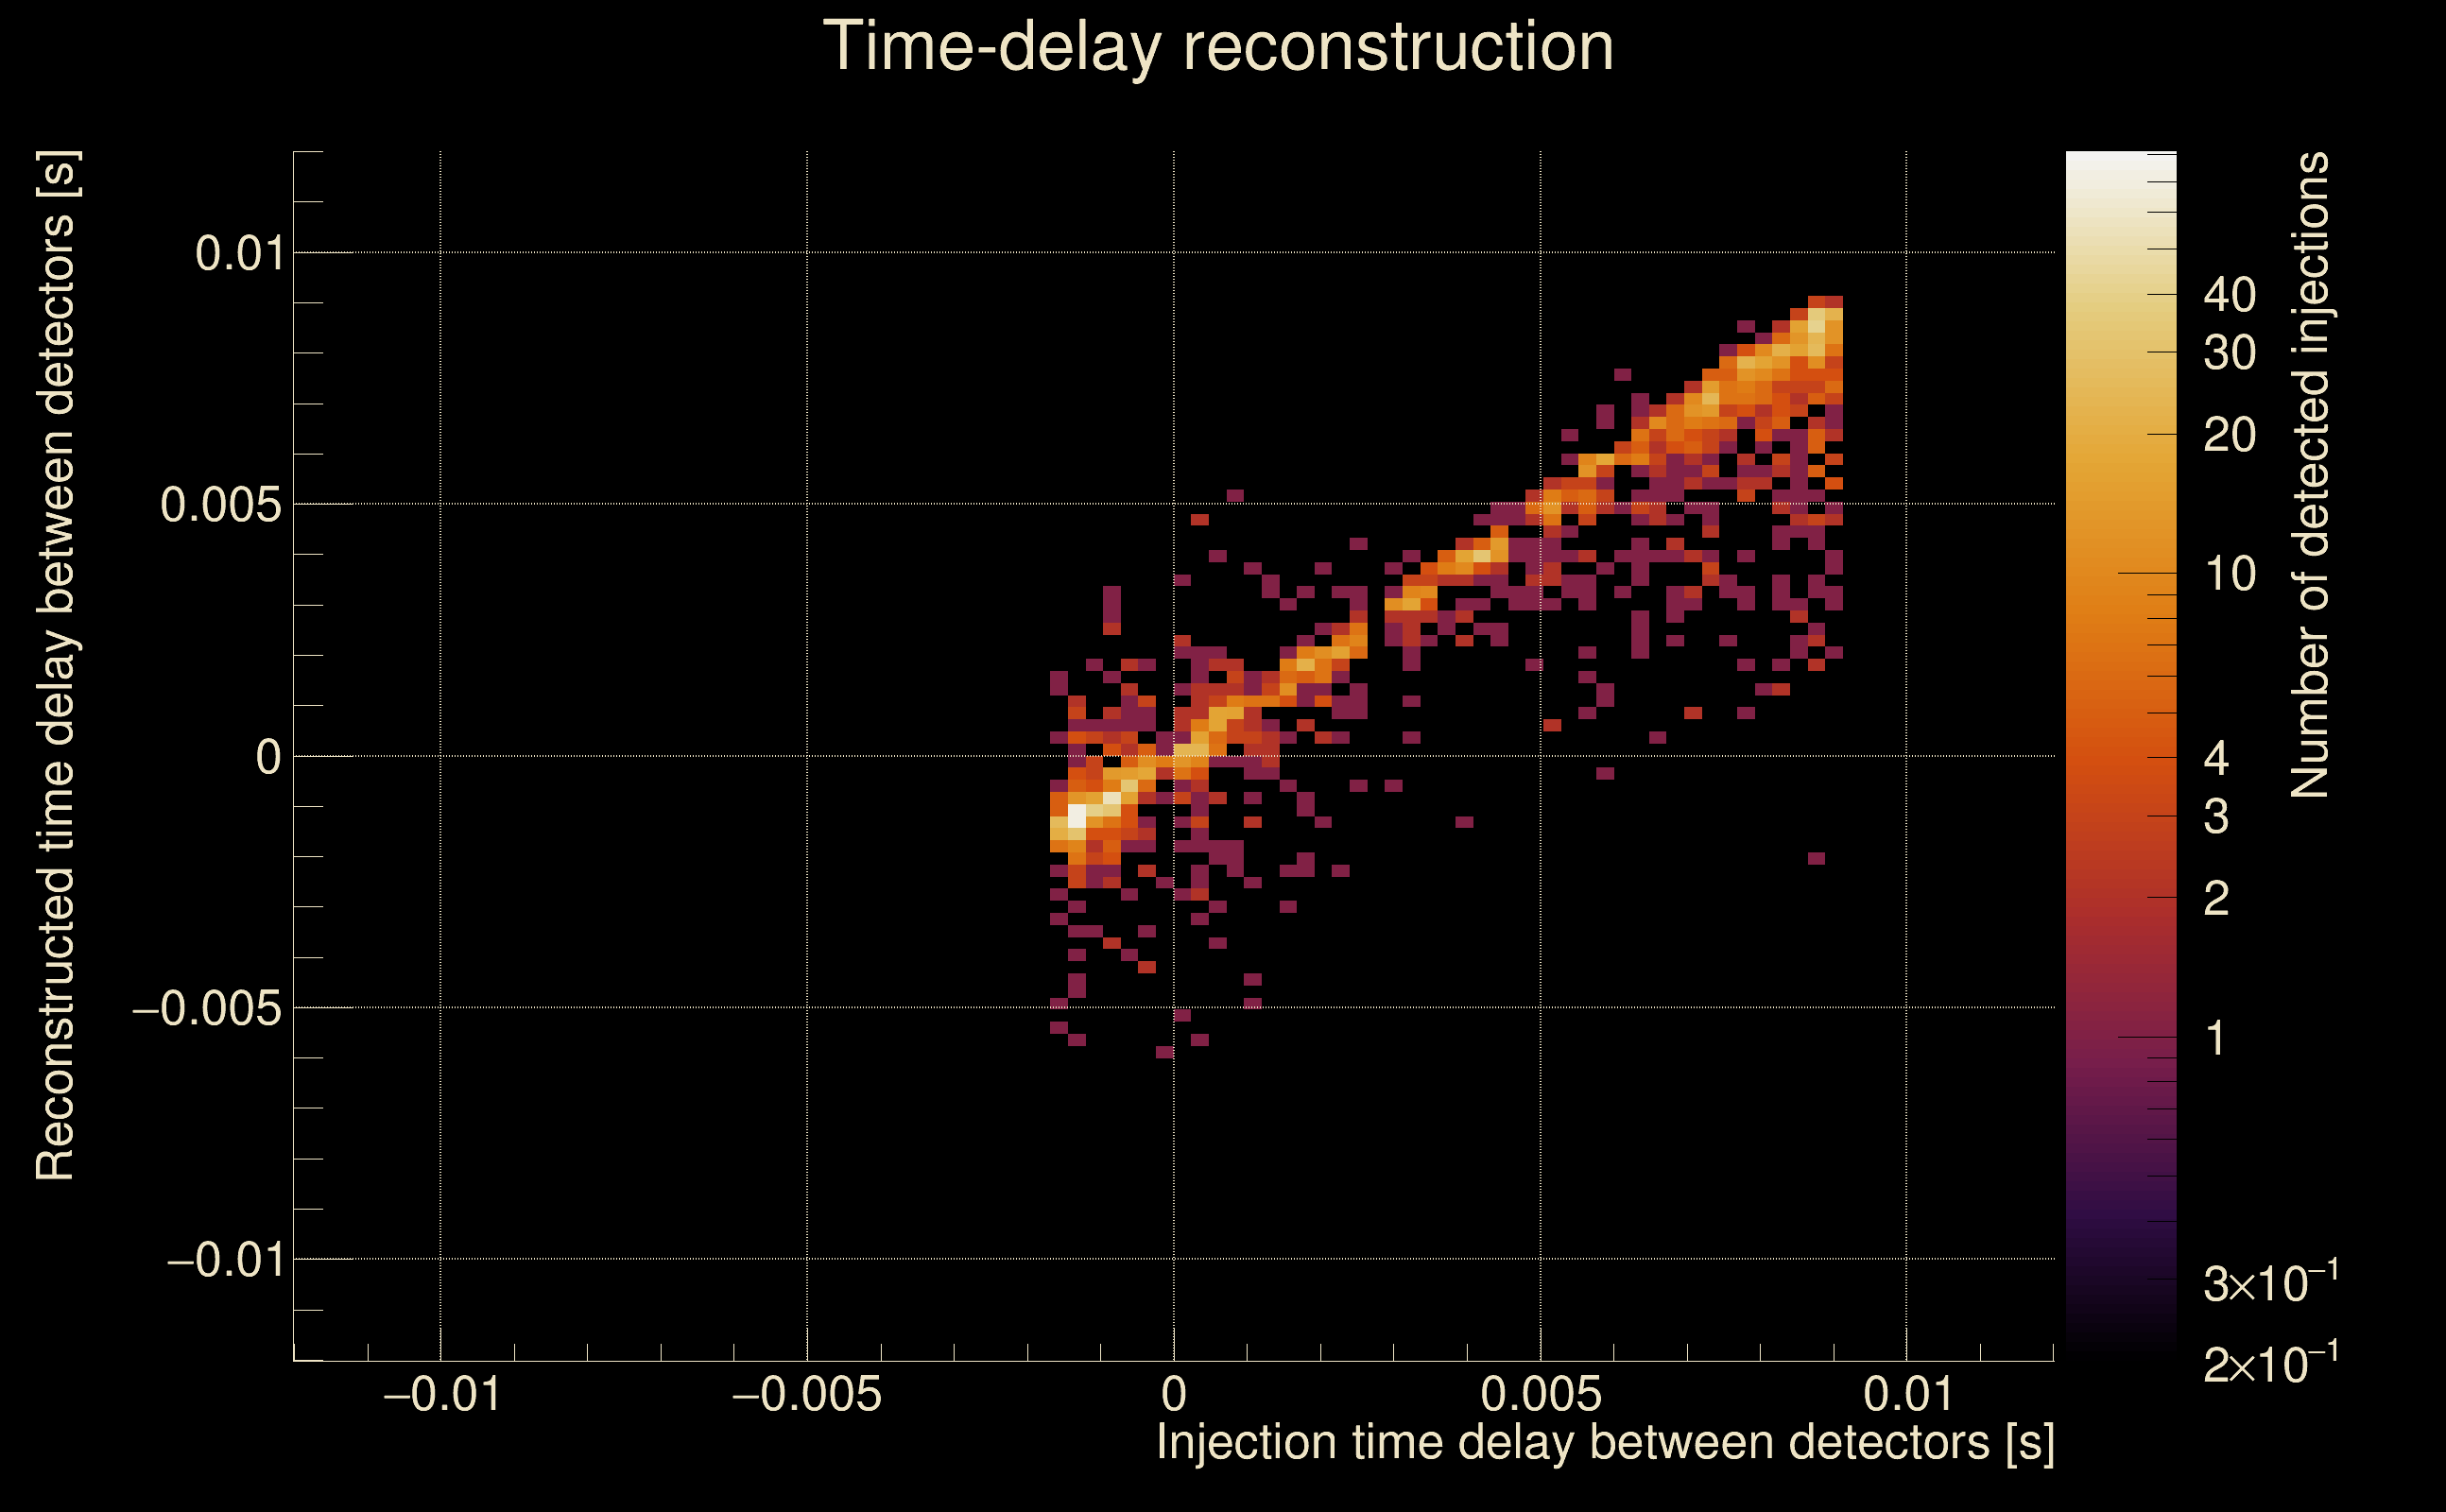
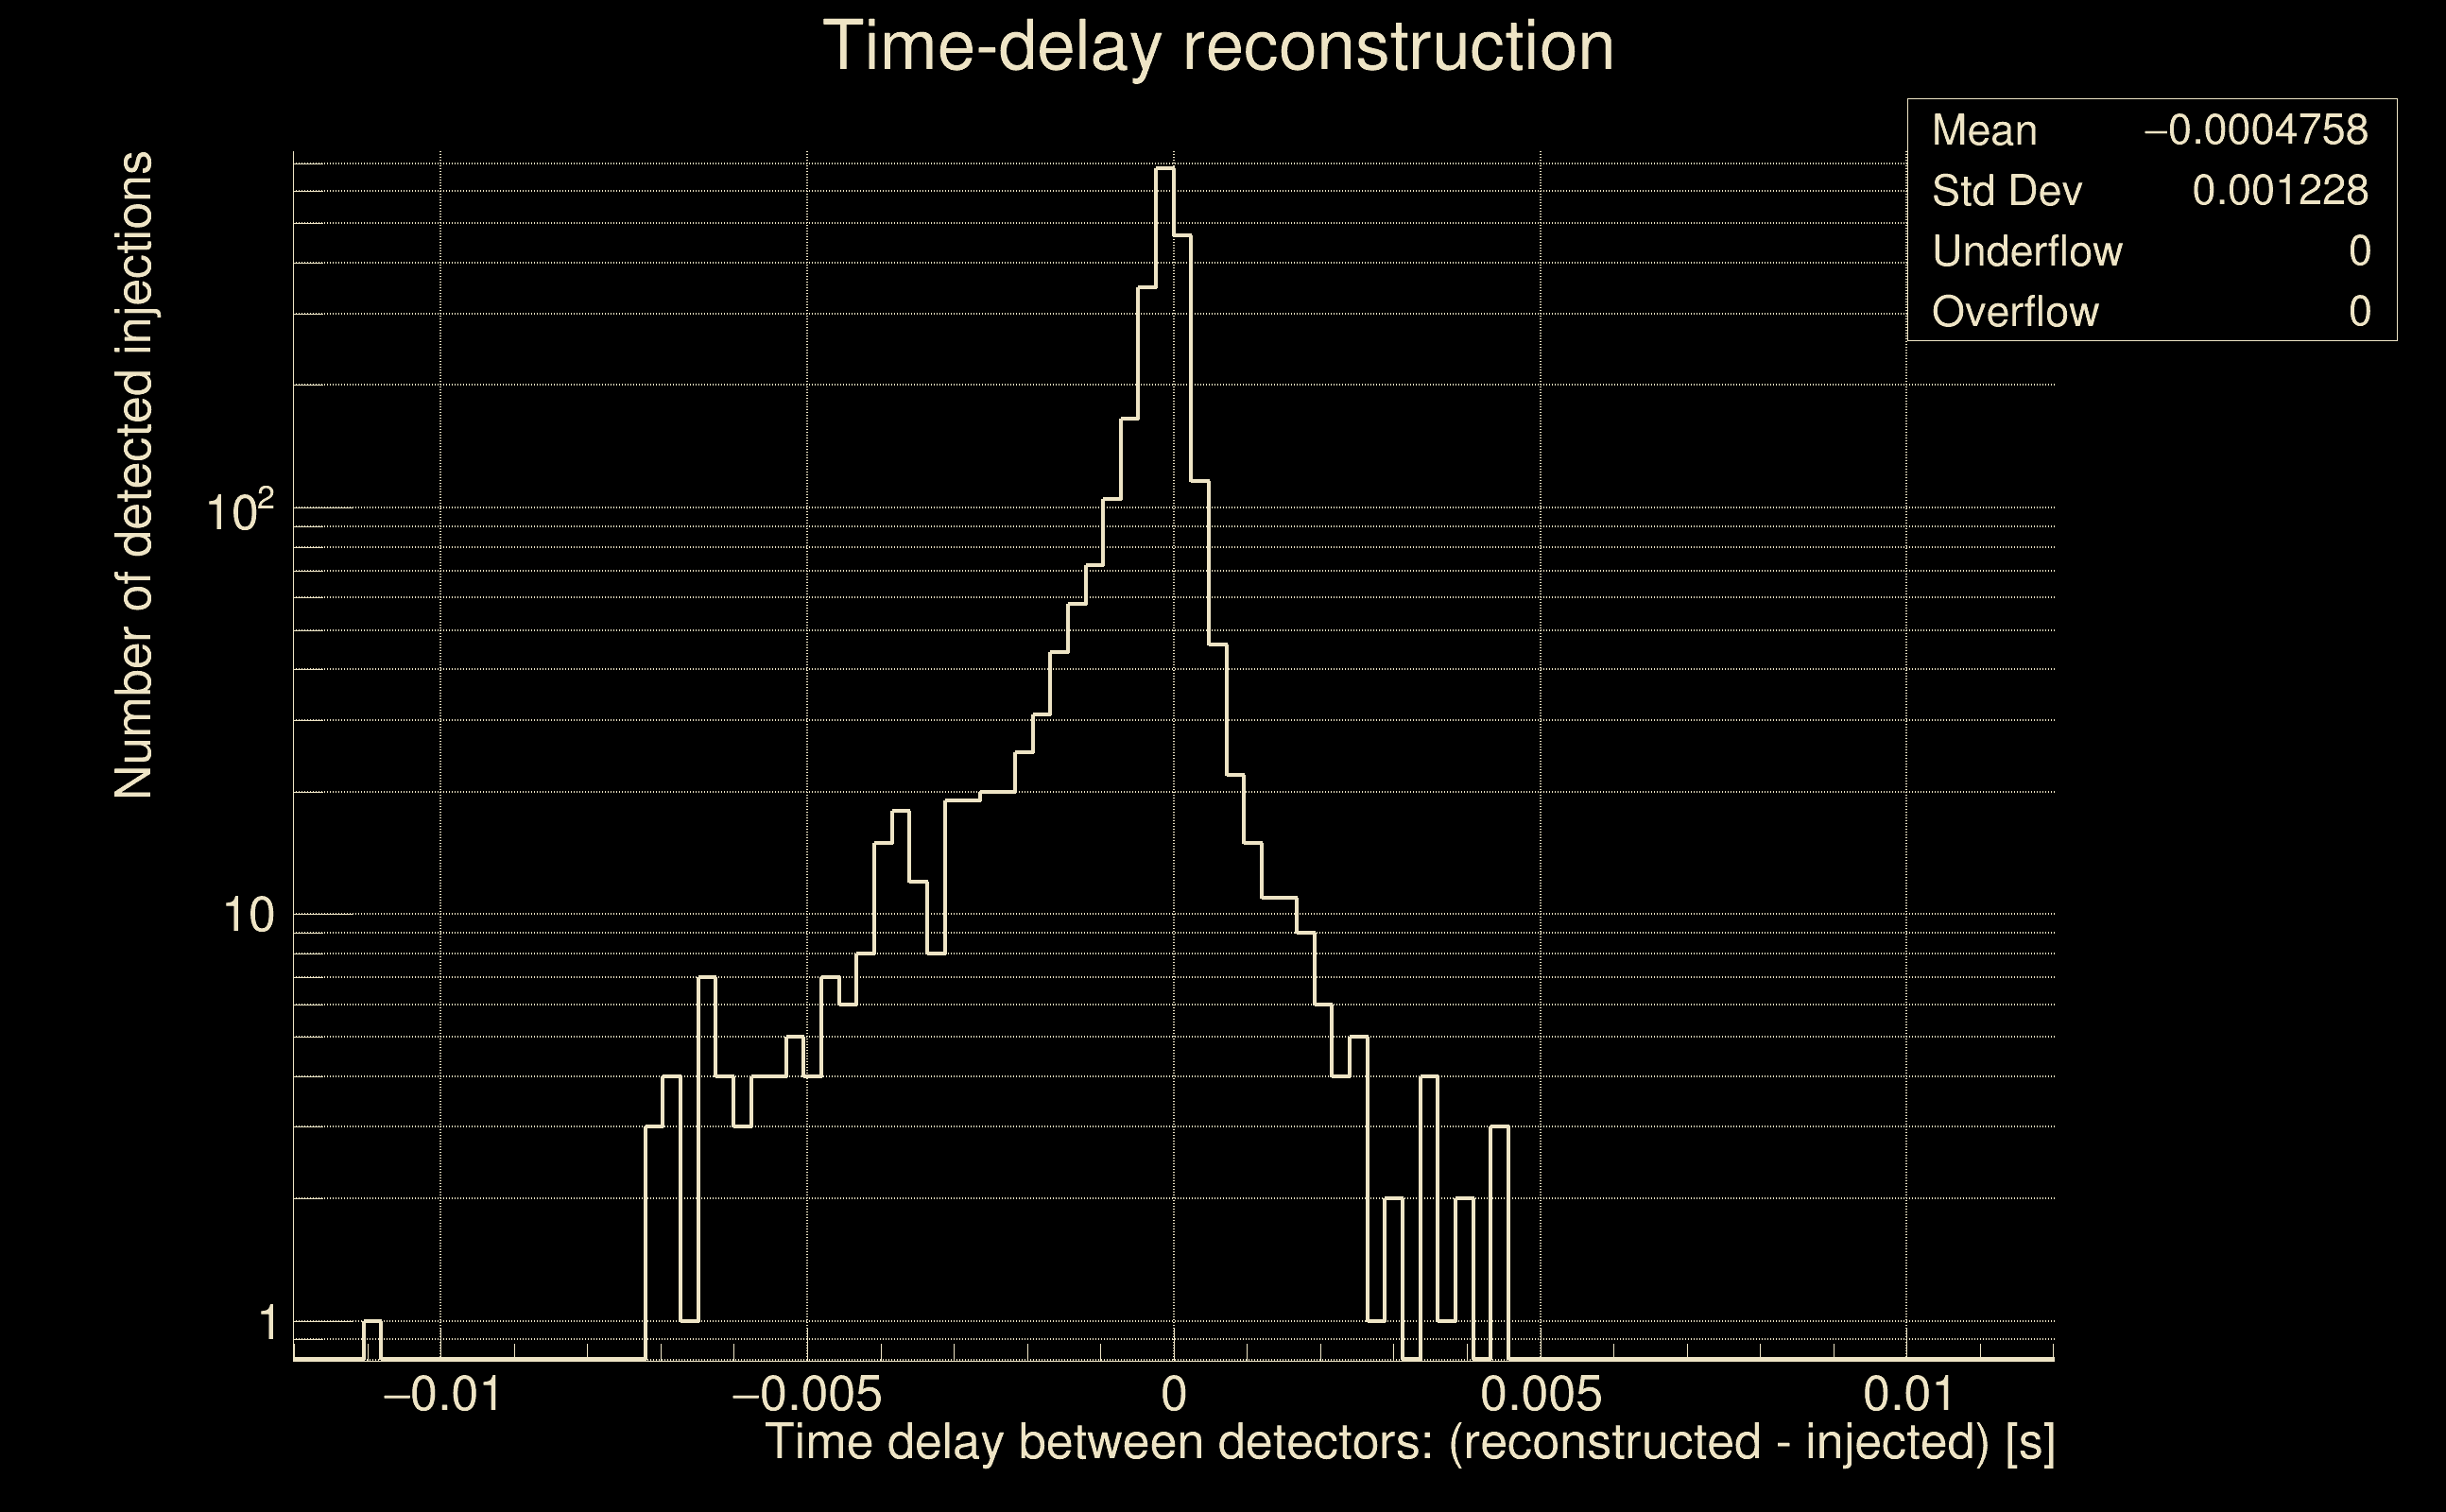
| Light travel time between detectors: | 0.0100128 s |
| Slice extra-time (calibration uncertainty + slice veto): | 0.0129872 s |
| Number of time-delay bins in a cross-correlation map: | 10000 |
| Number of slices in a cross-correlation map: | 217 |
| Number of time-delay bins in a slice: | 46 |
| SNR gating: | < 100 (detector 0), < 100 (detector 1) |
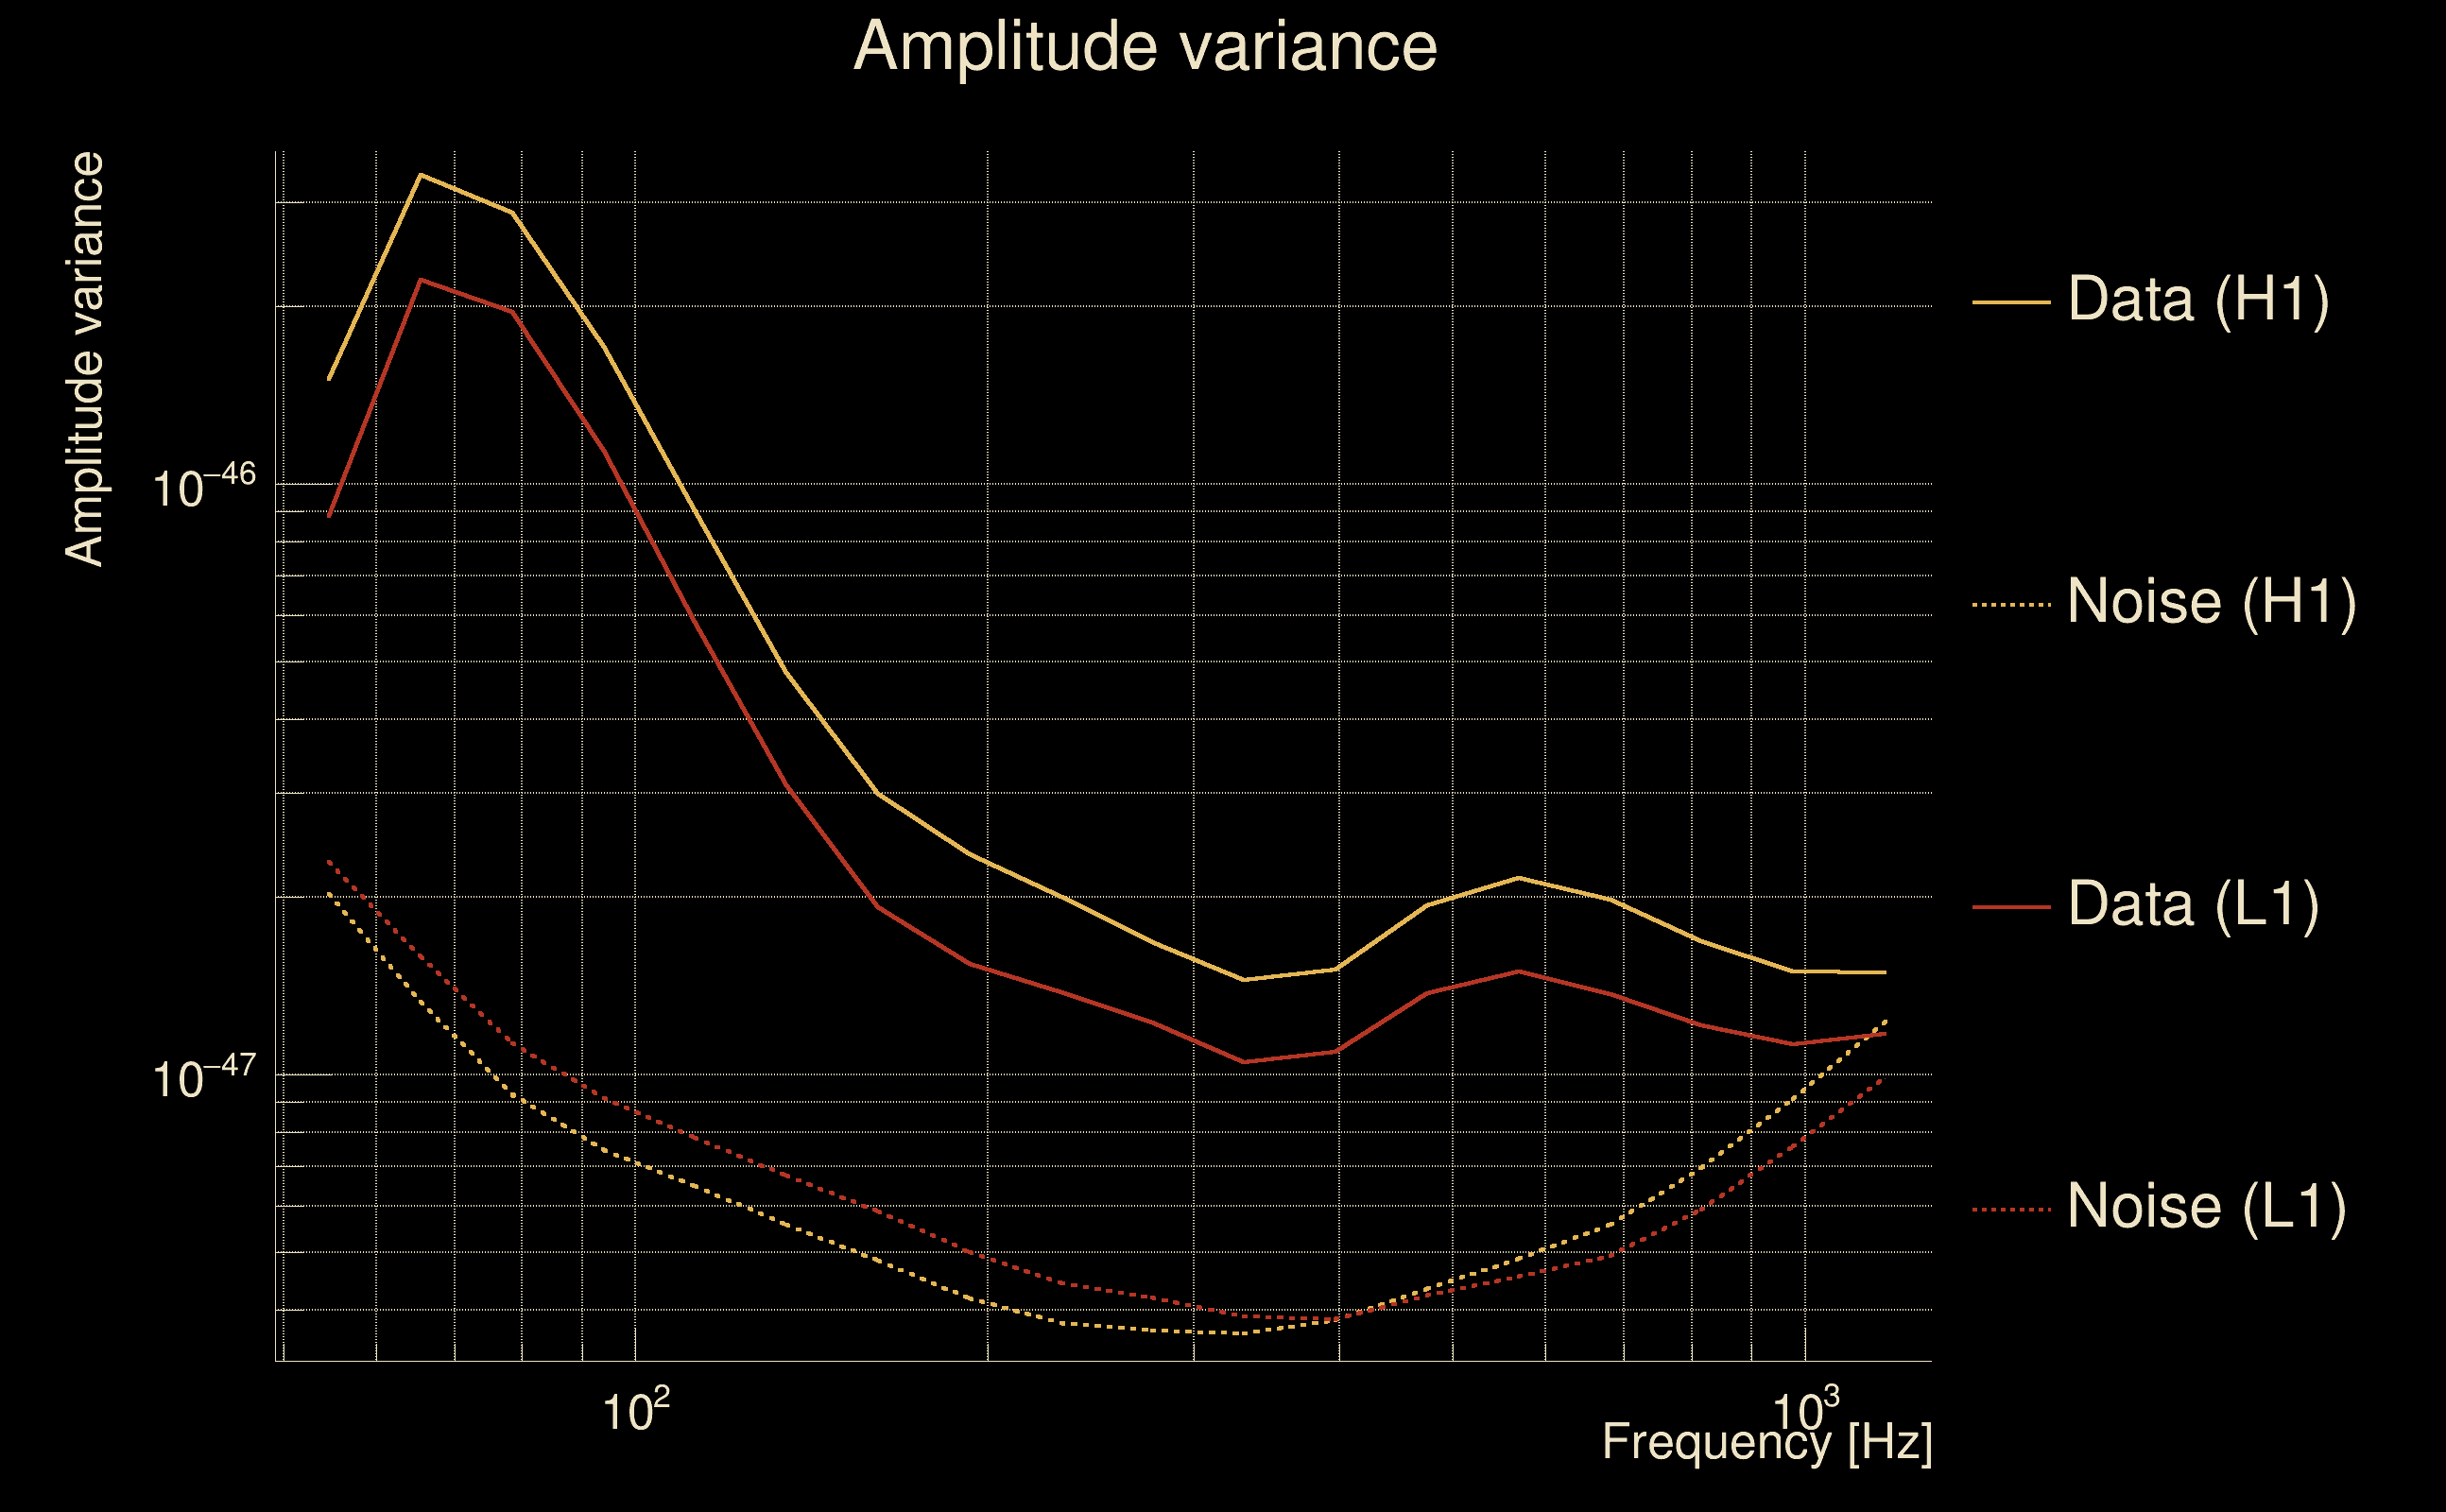
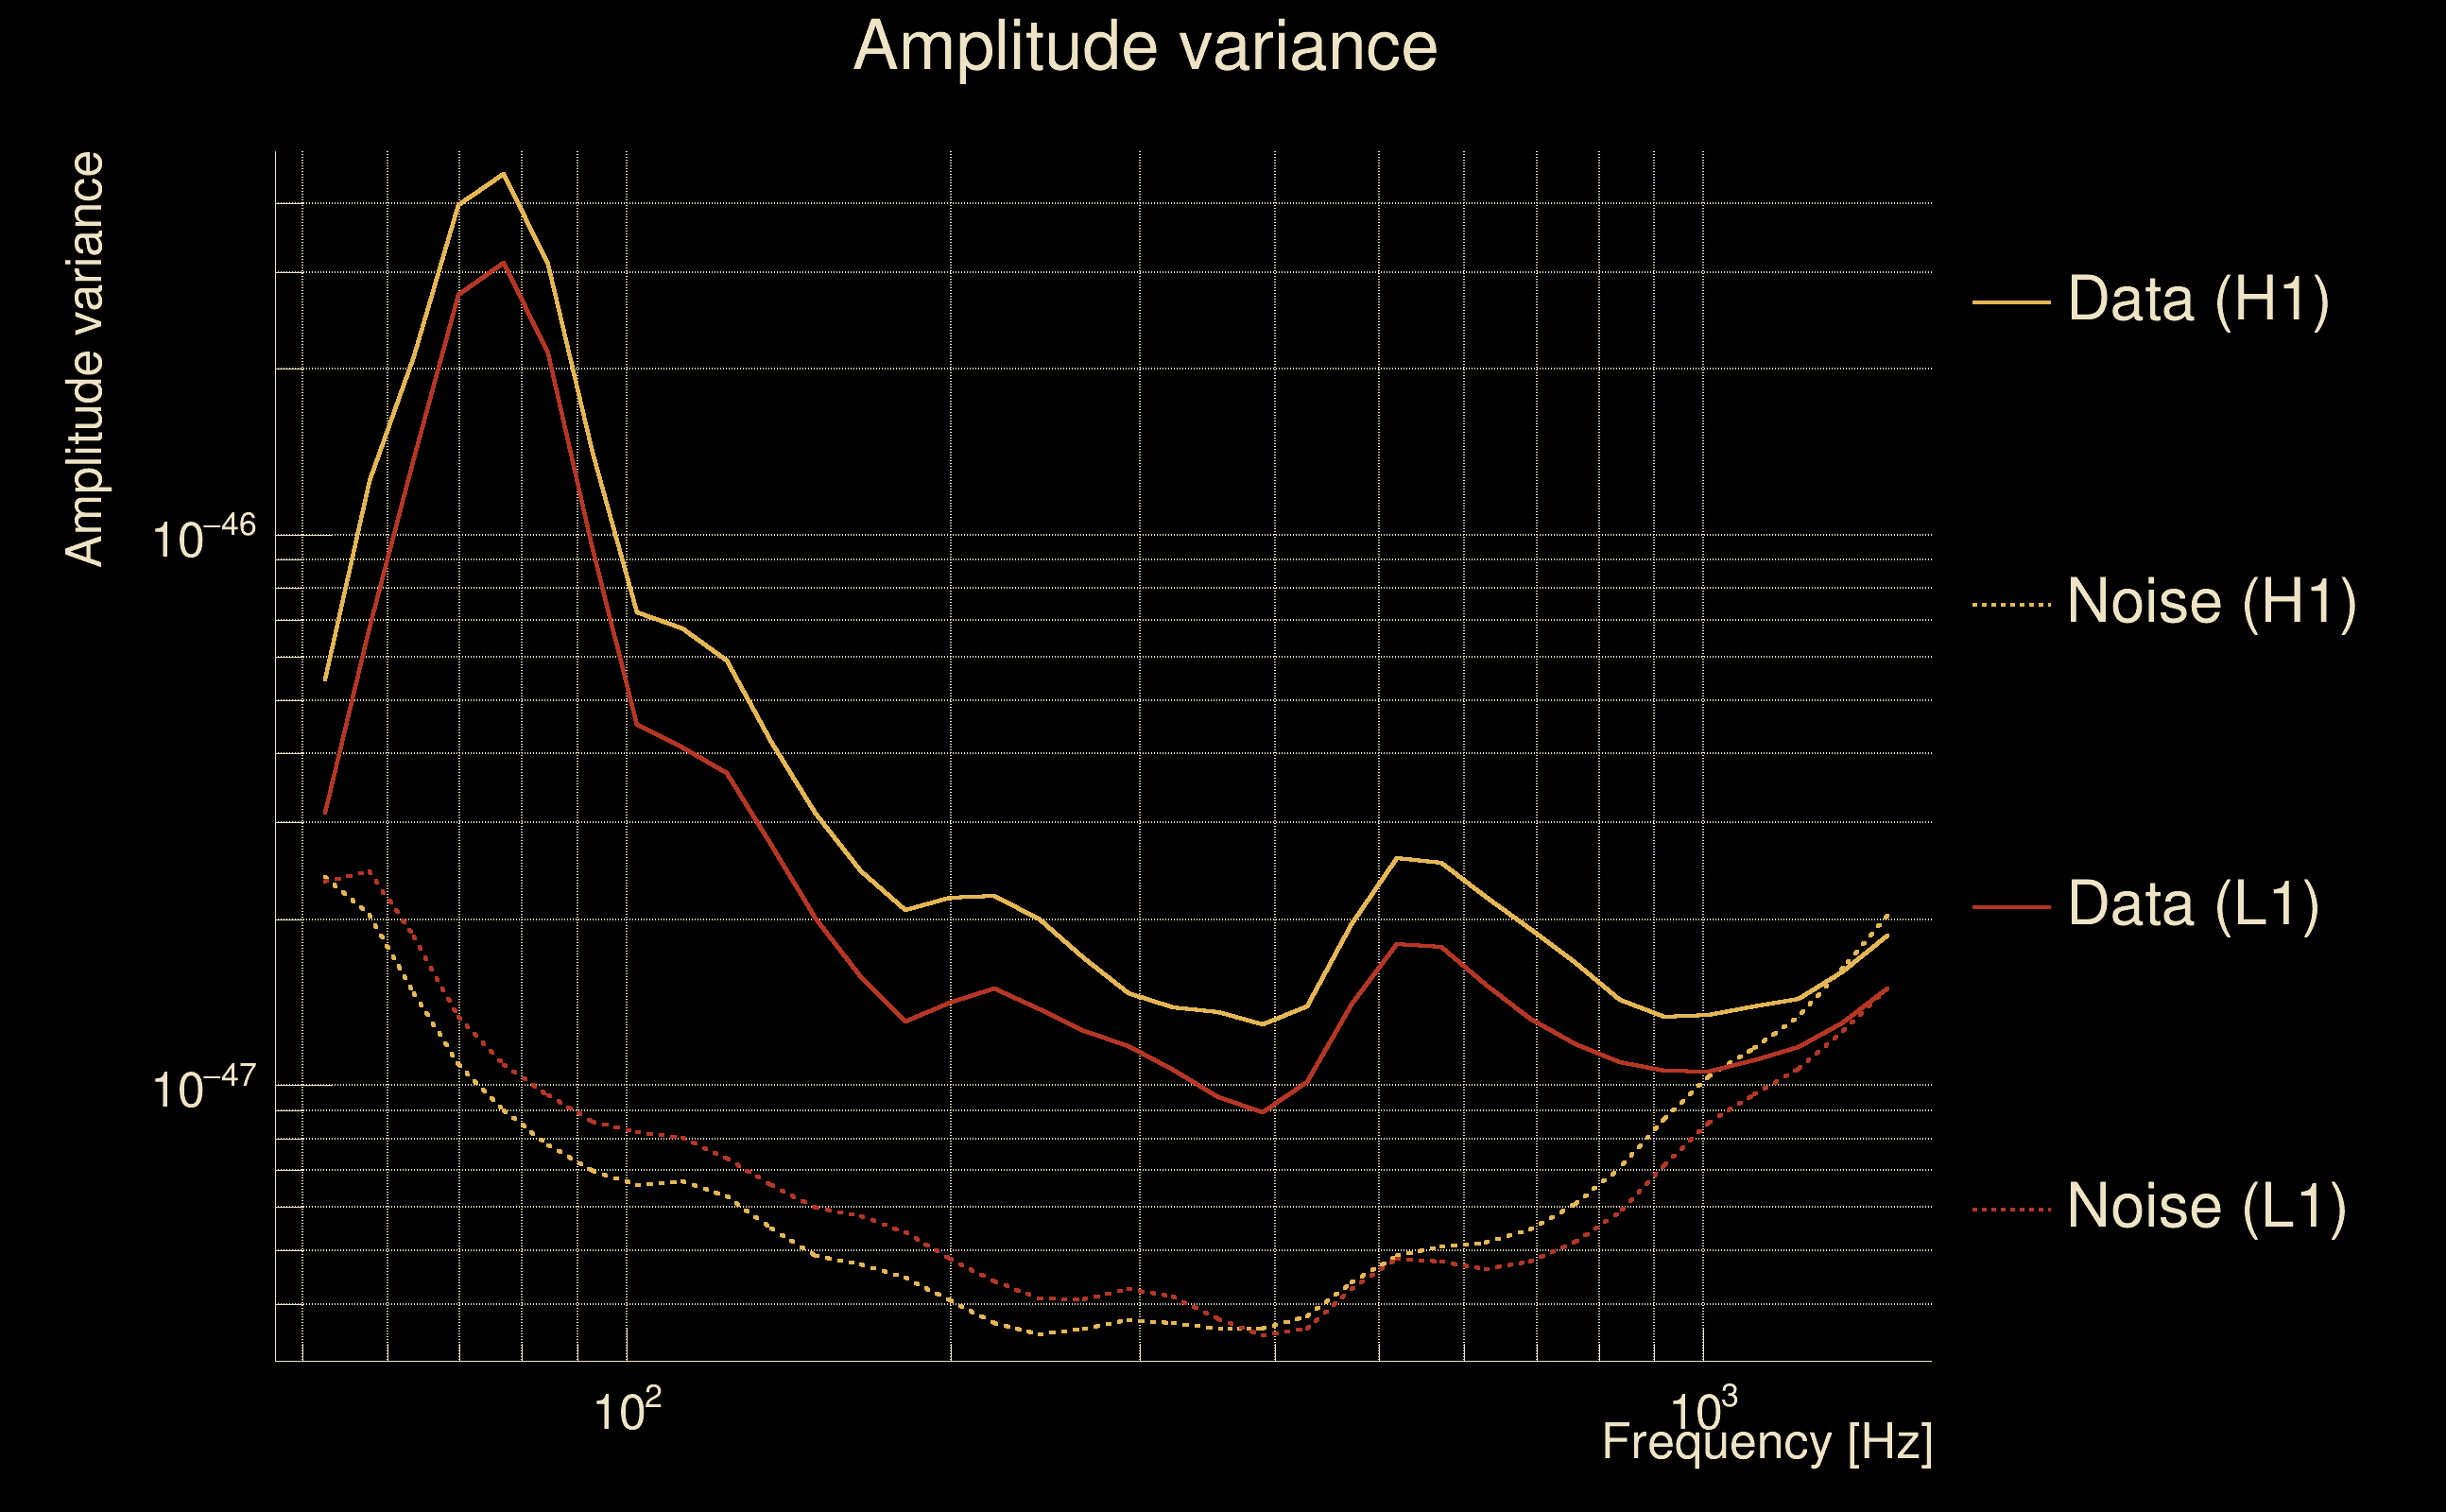
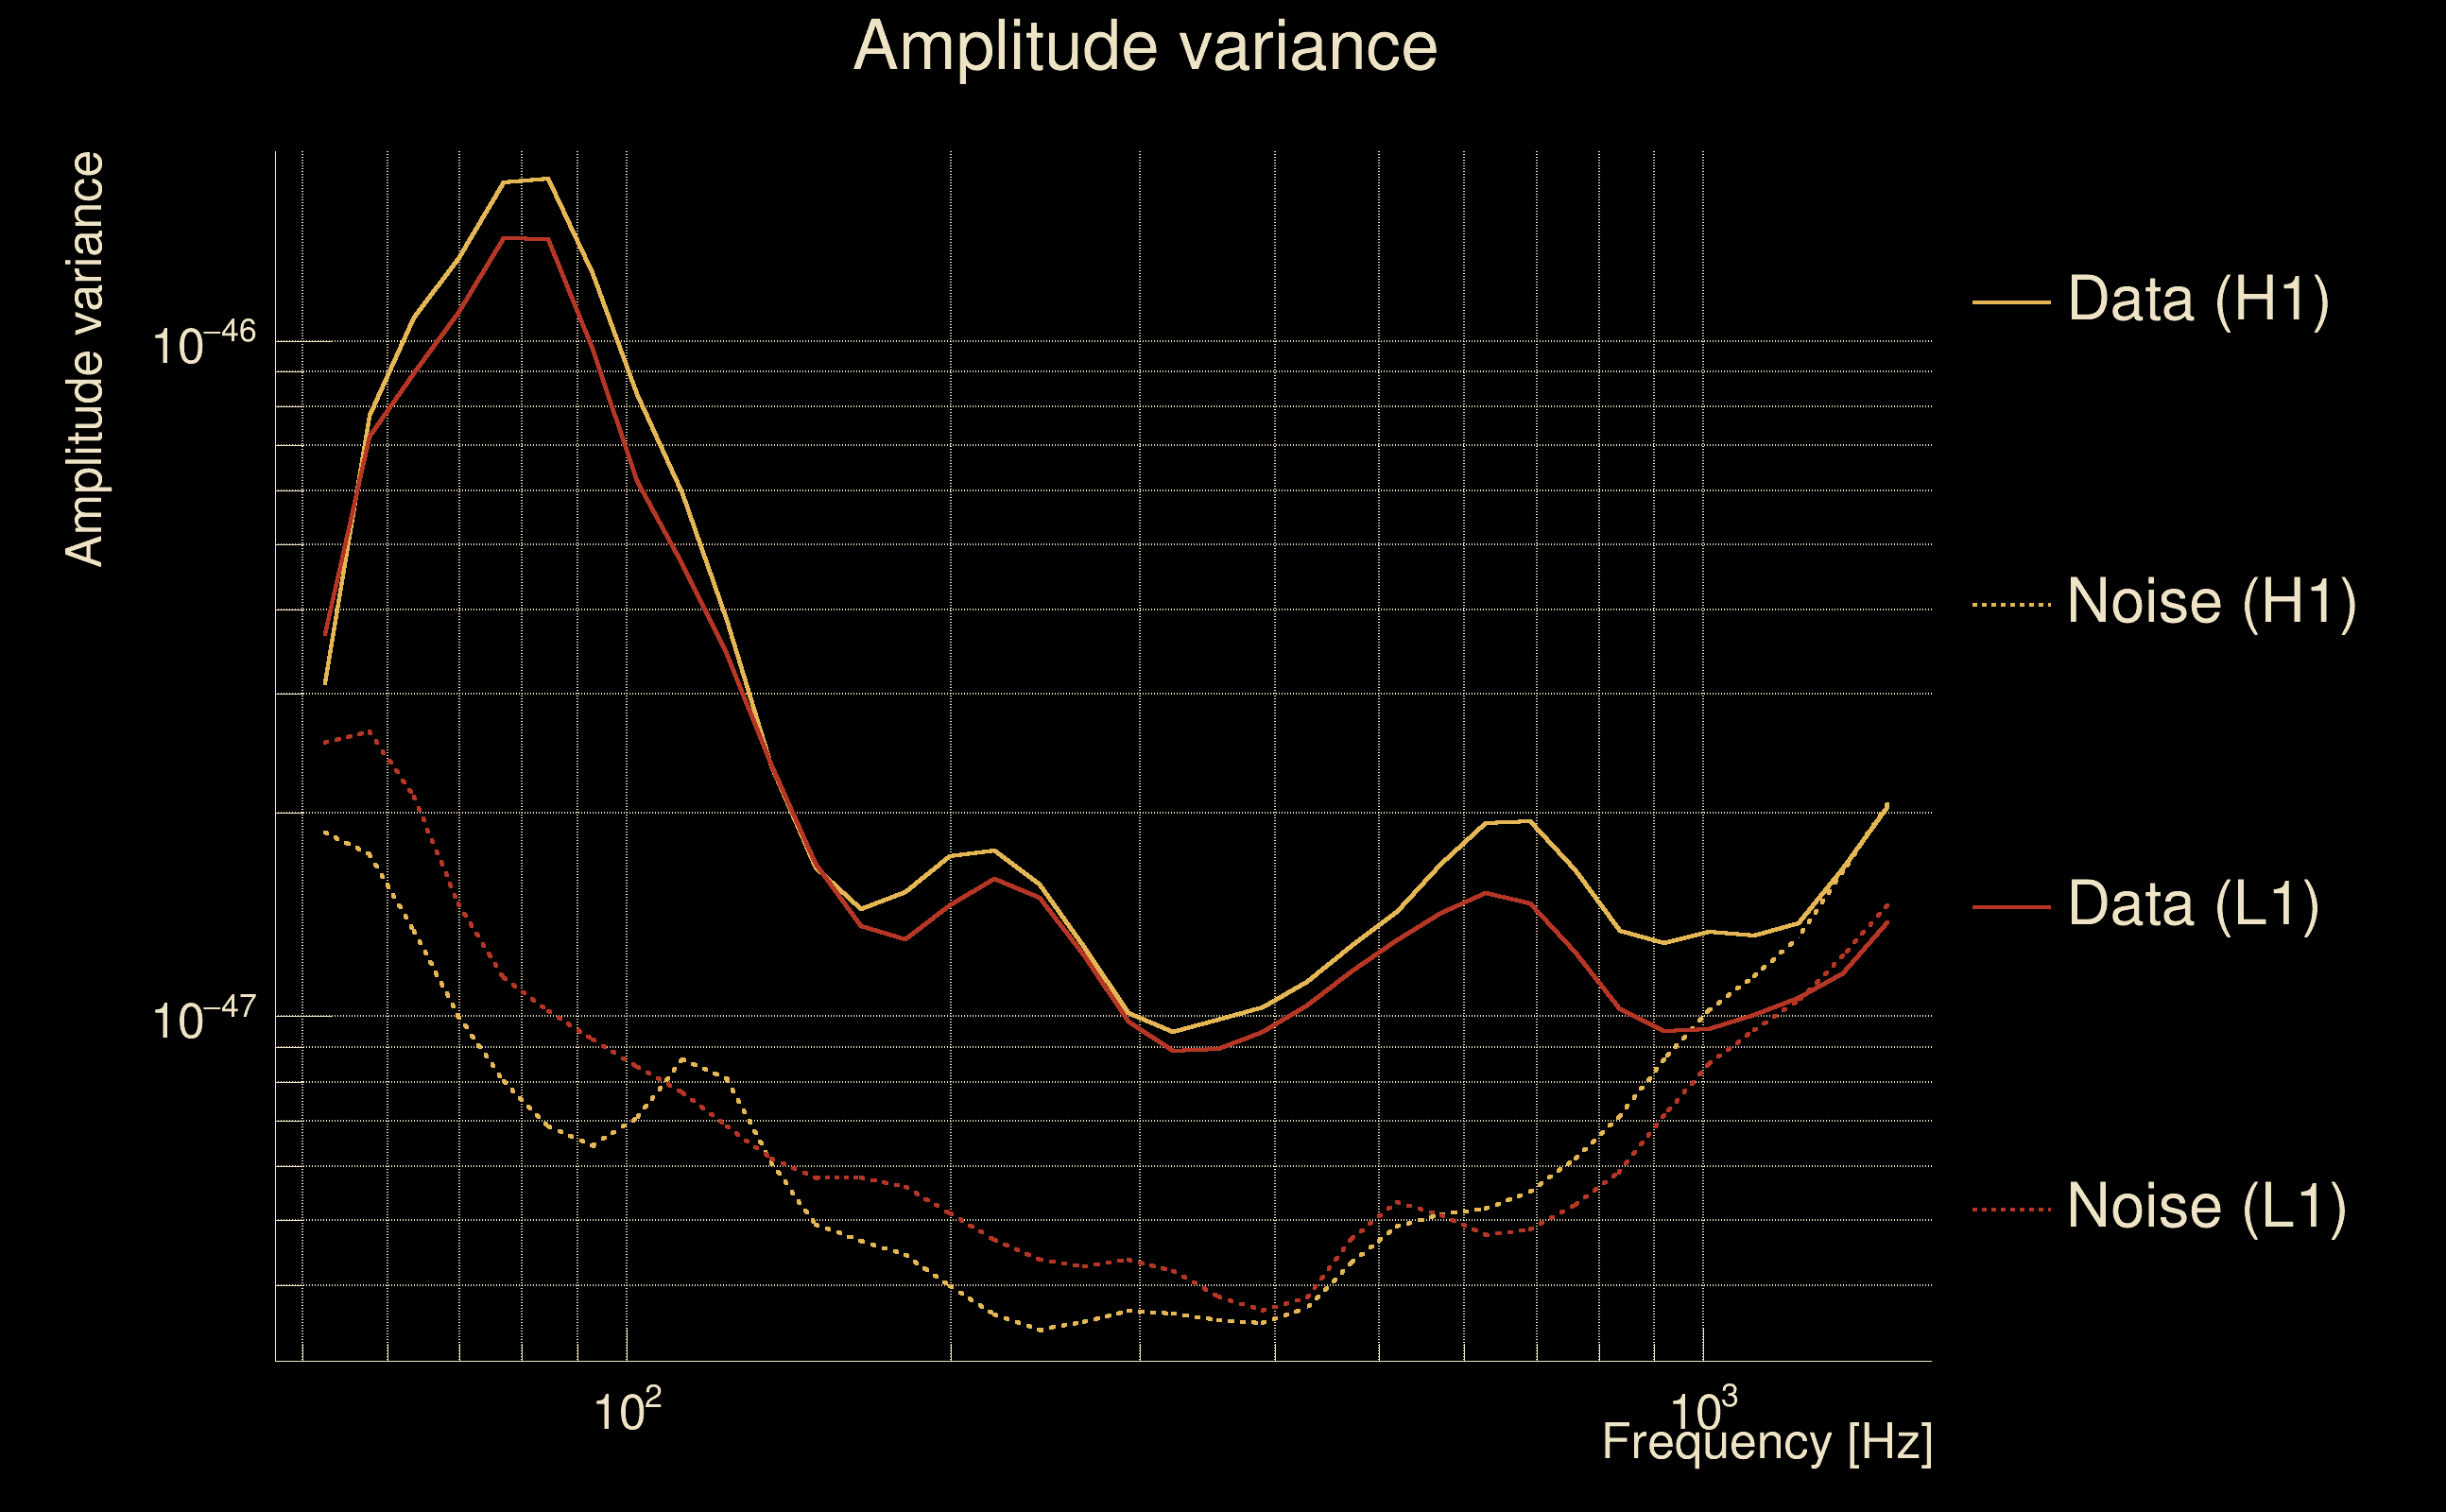
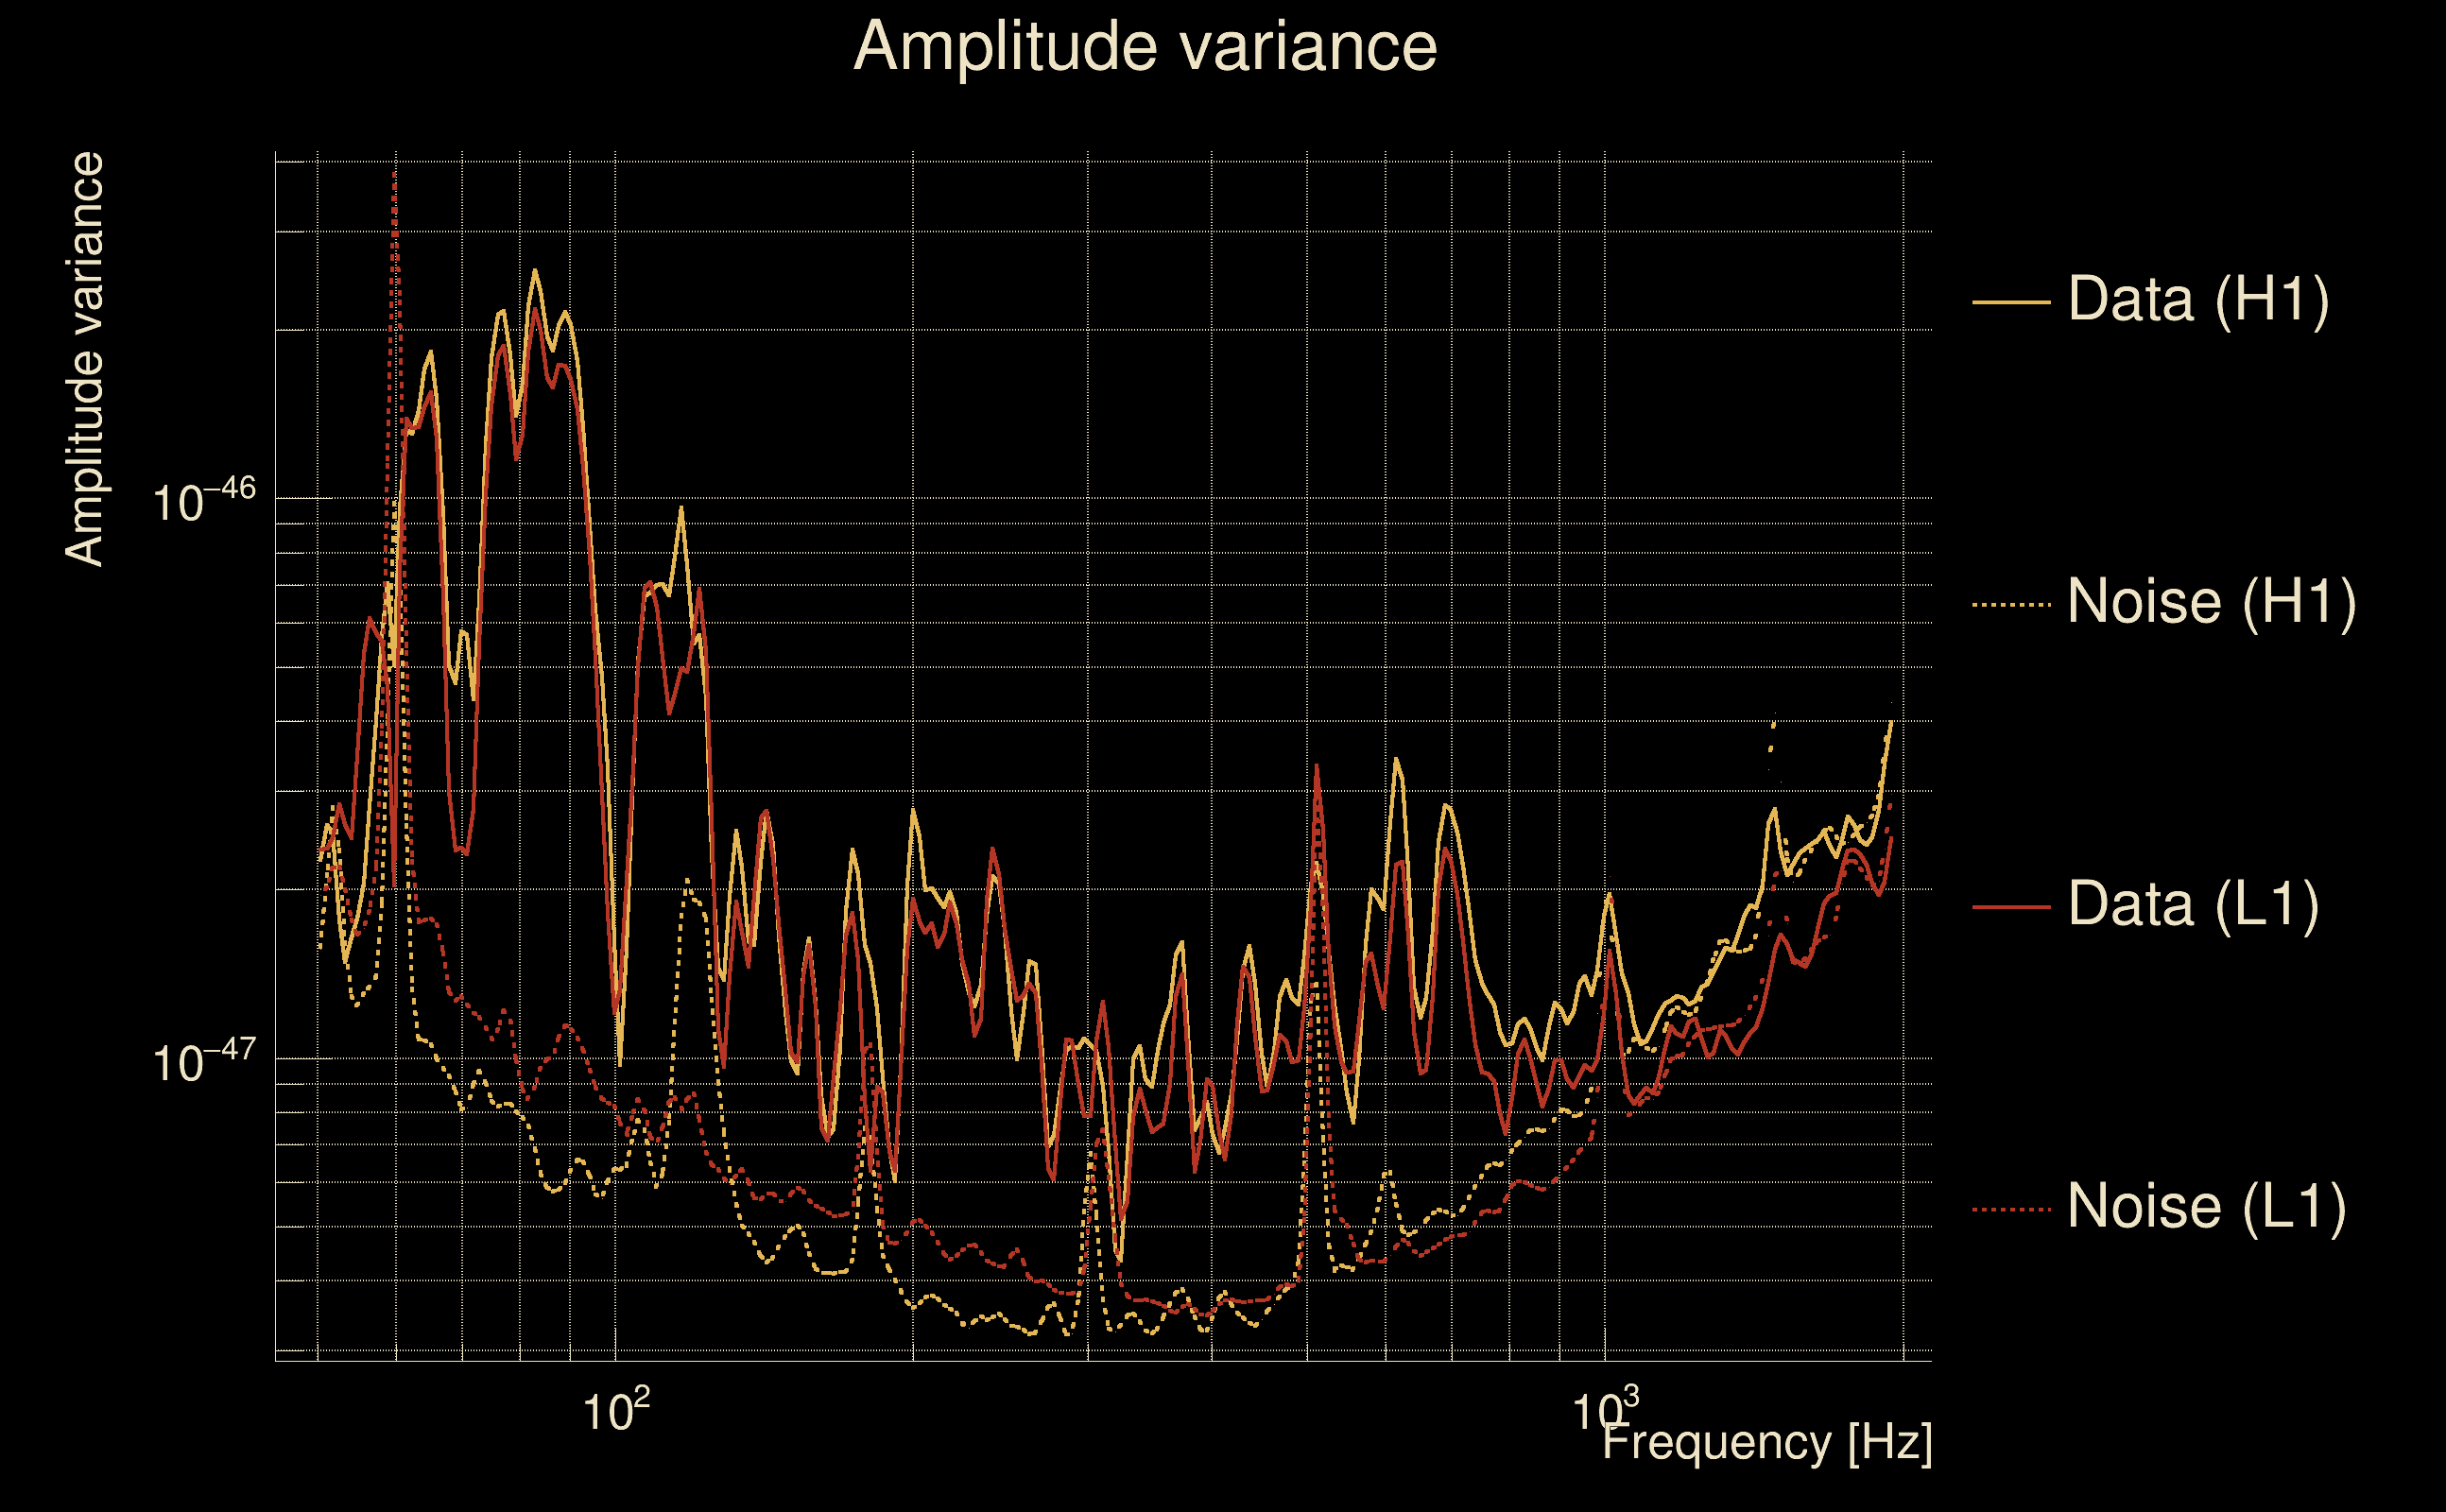
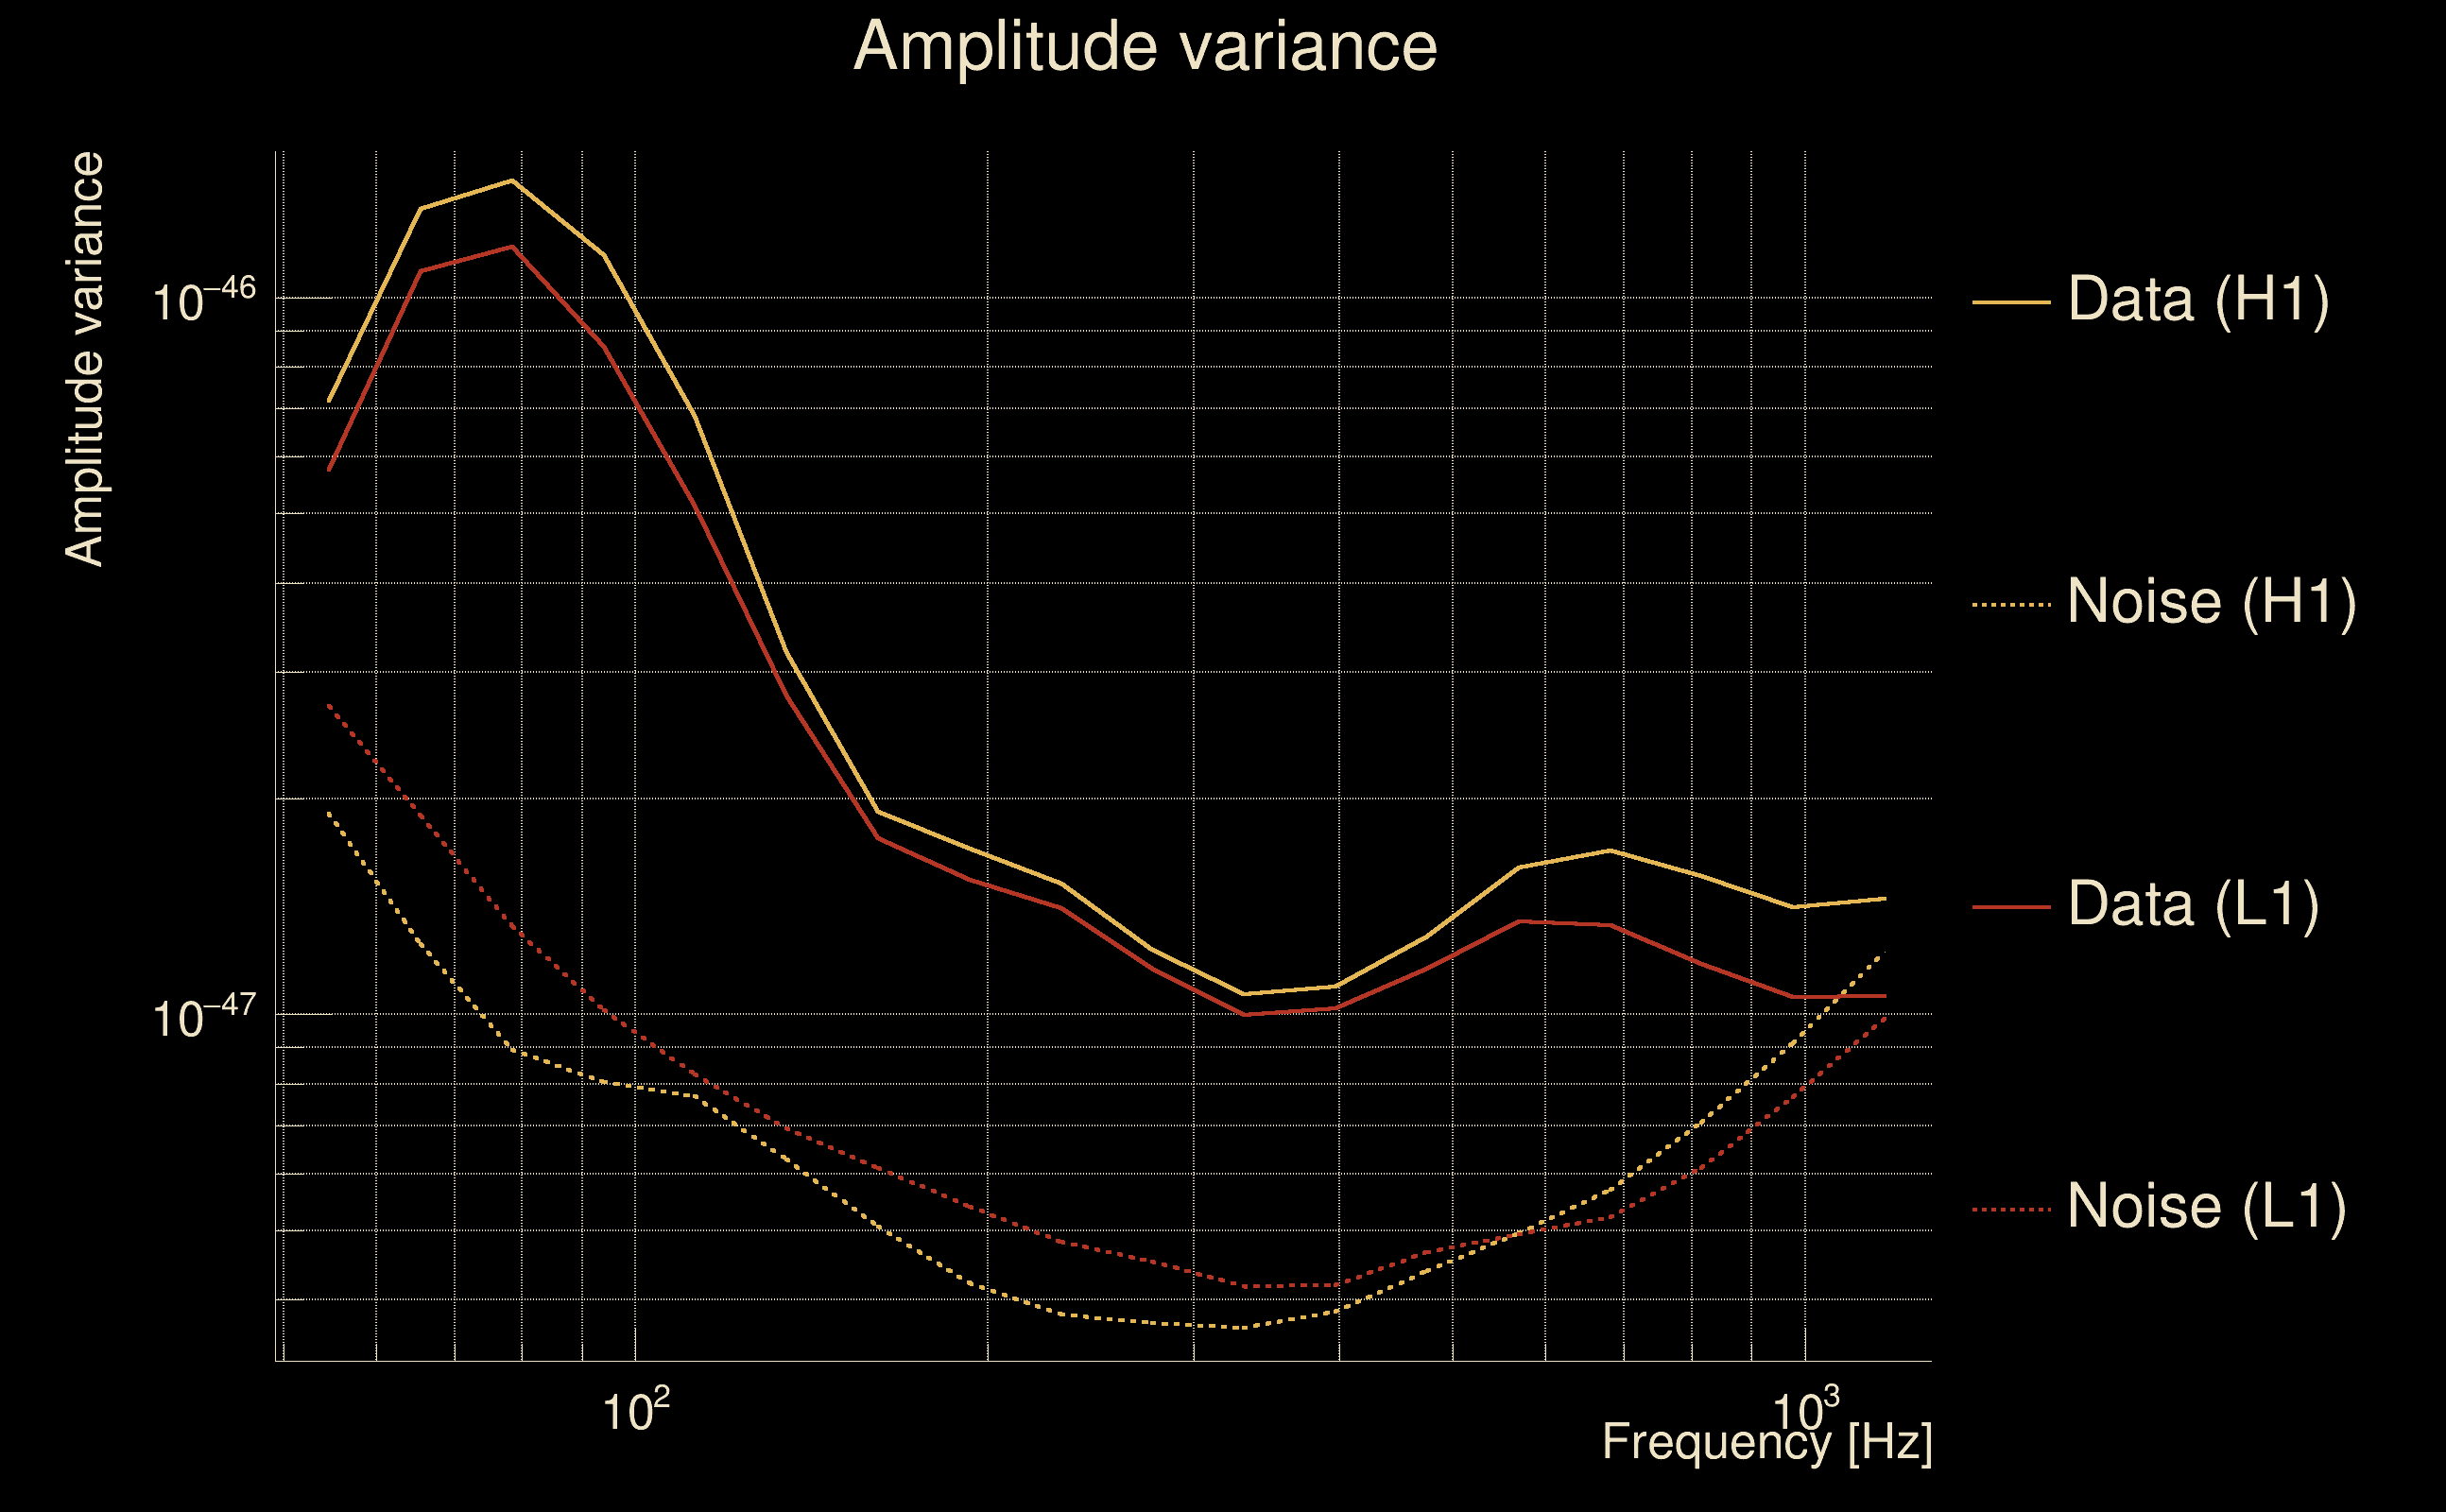
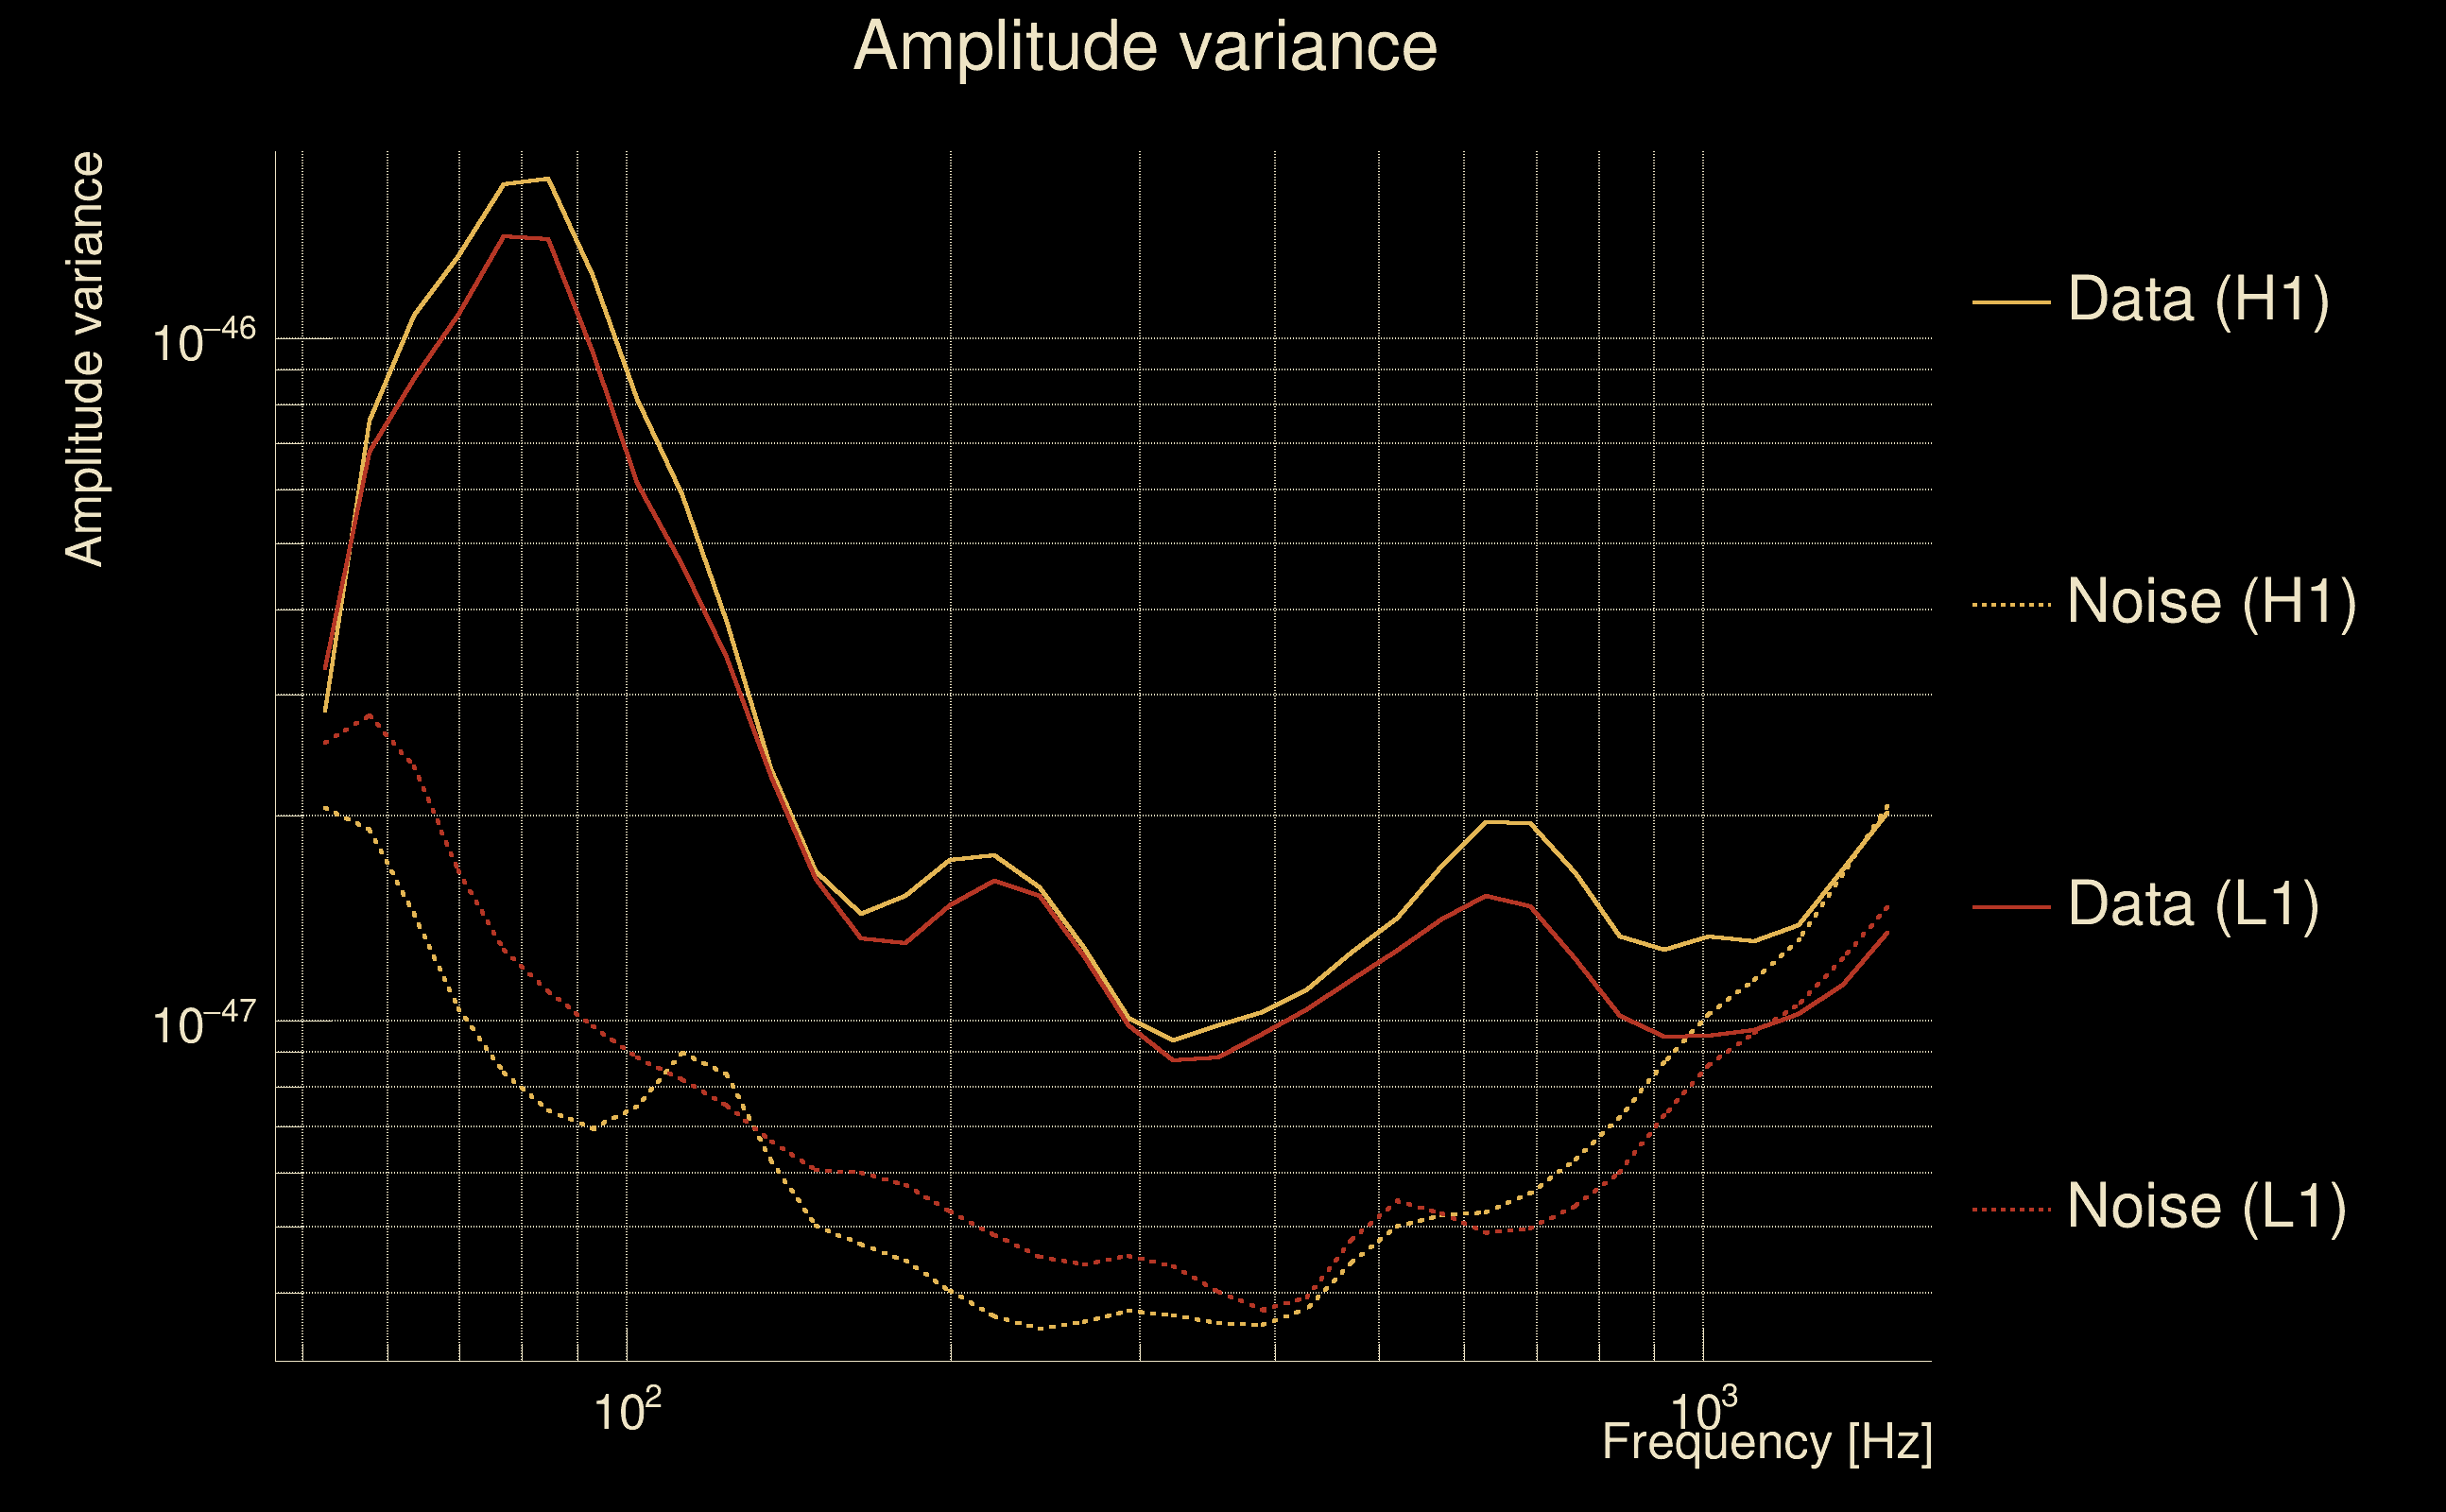
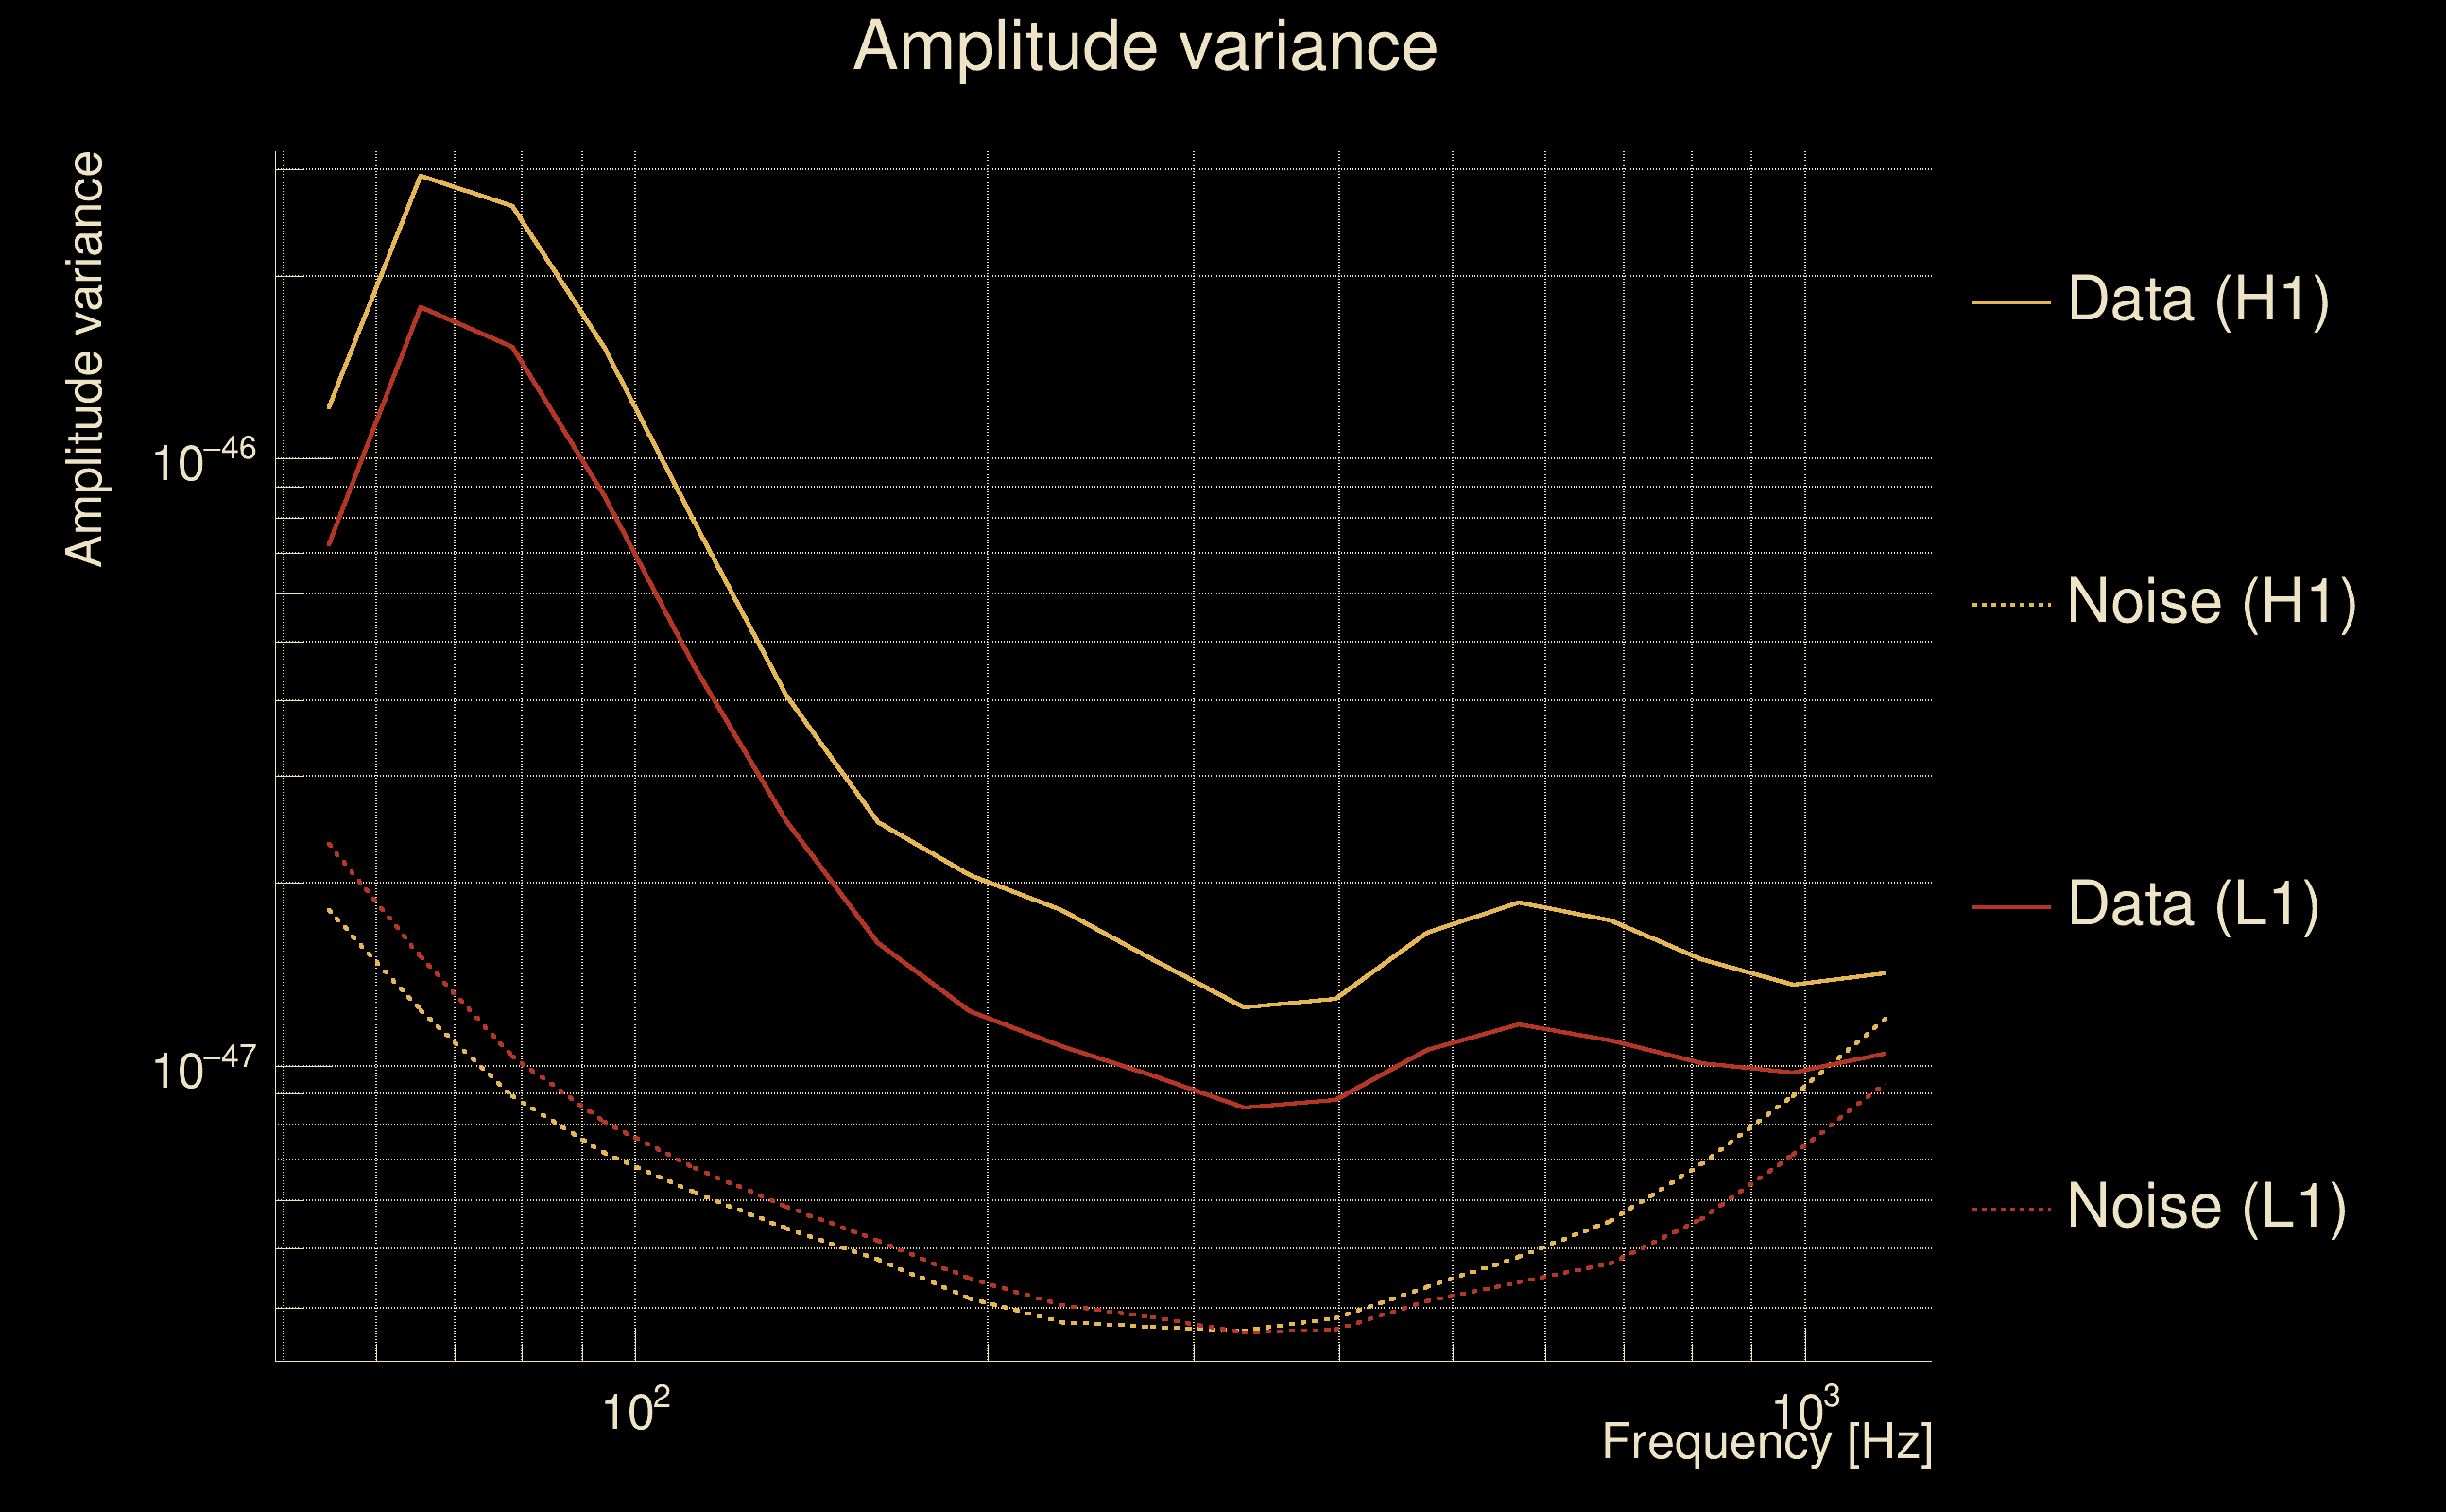
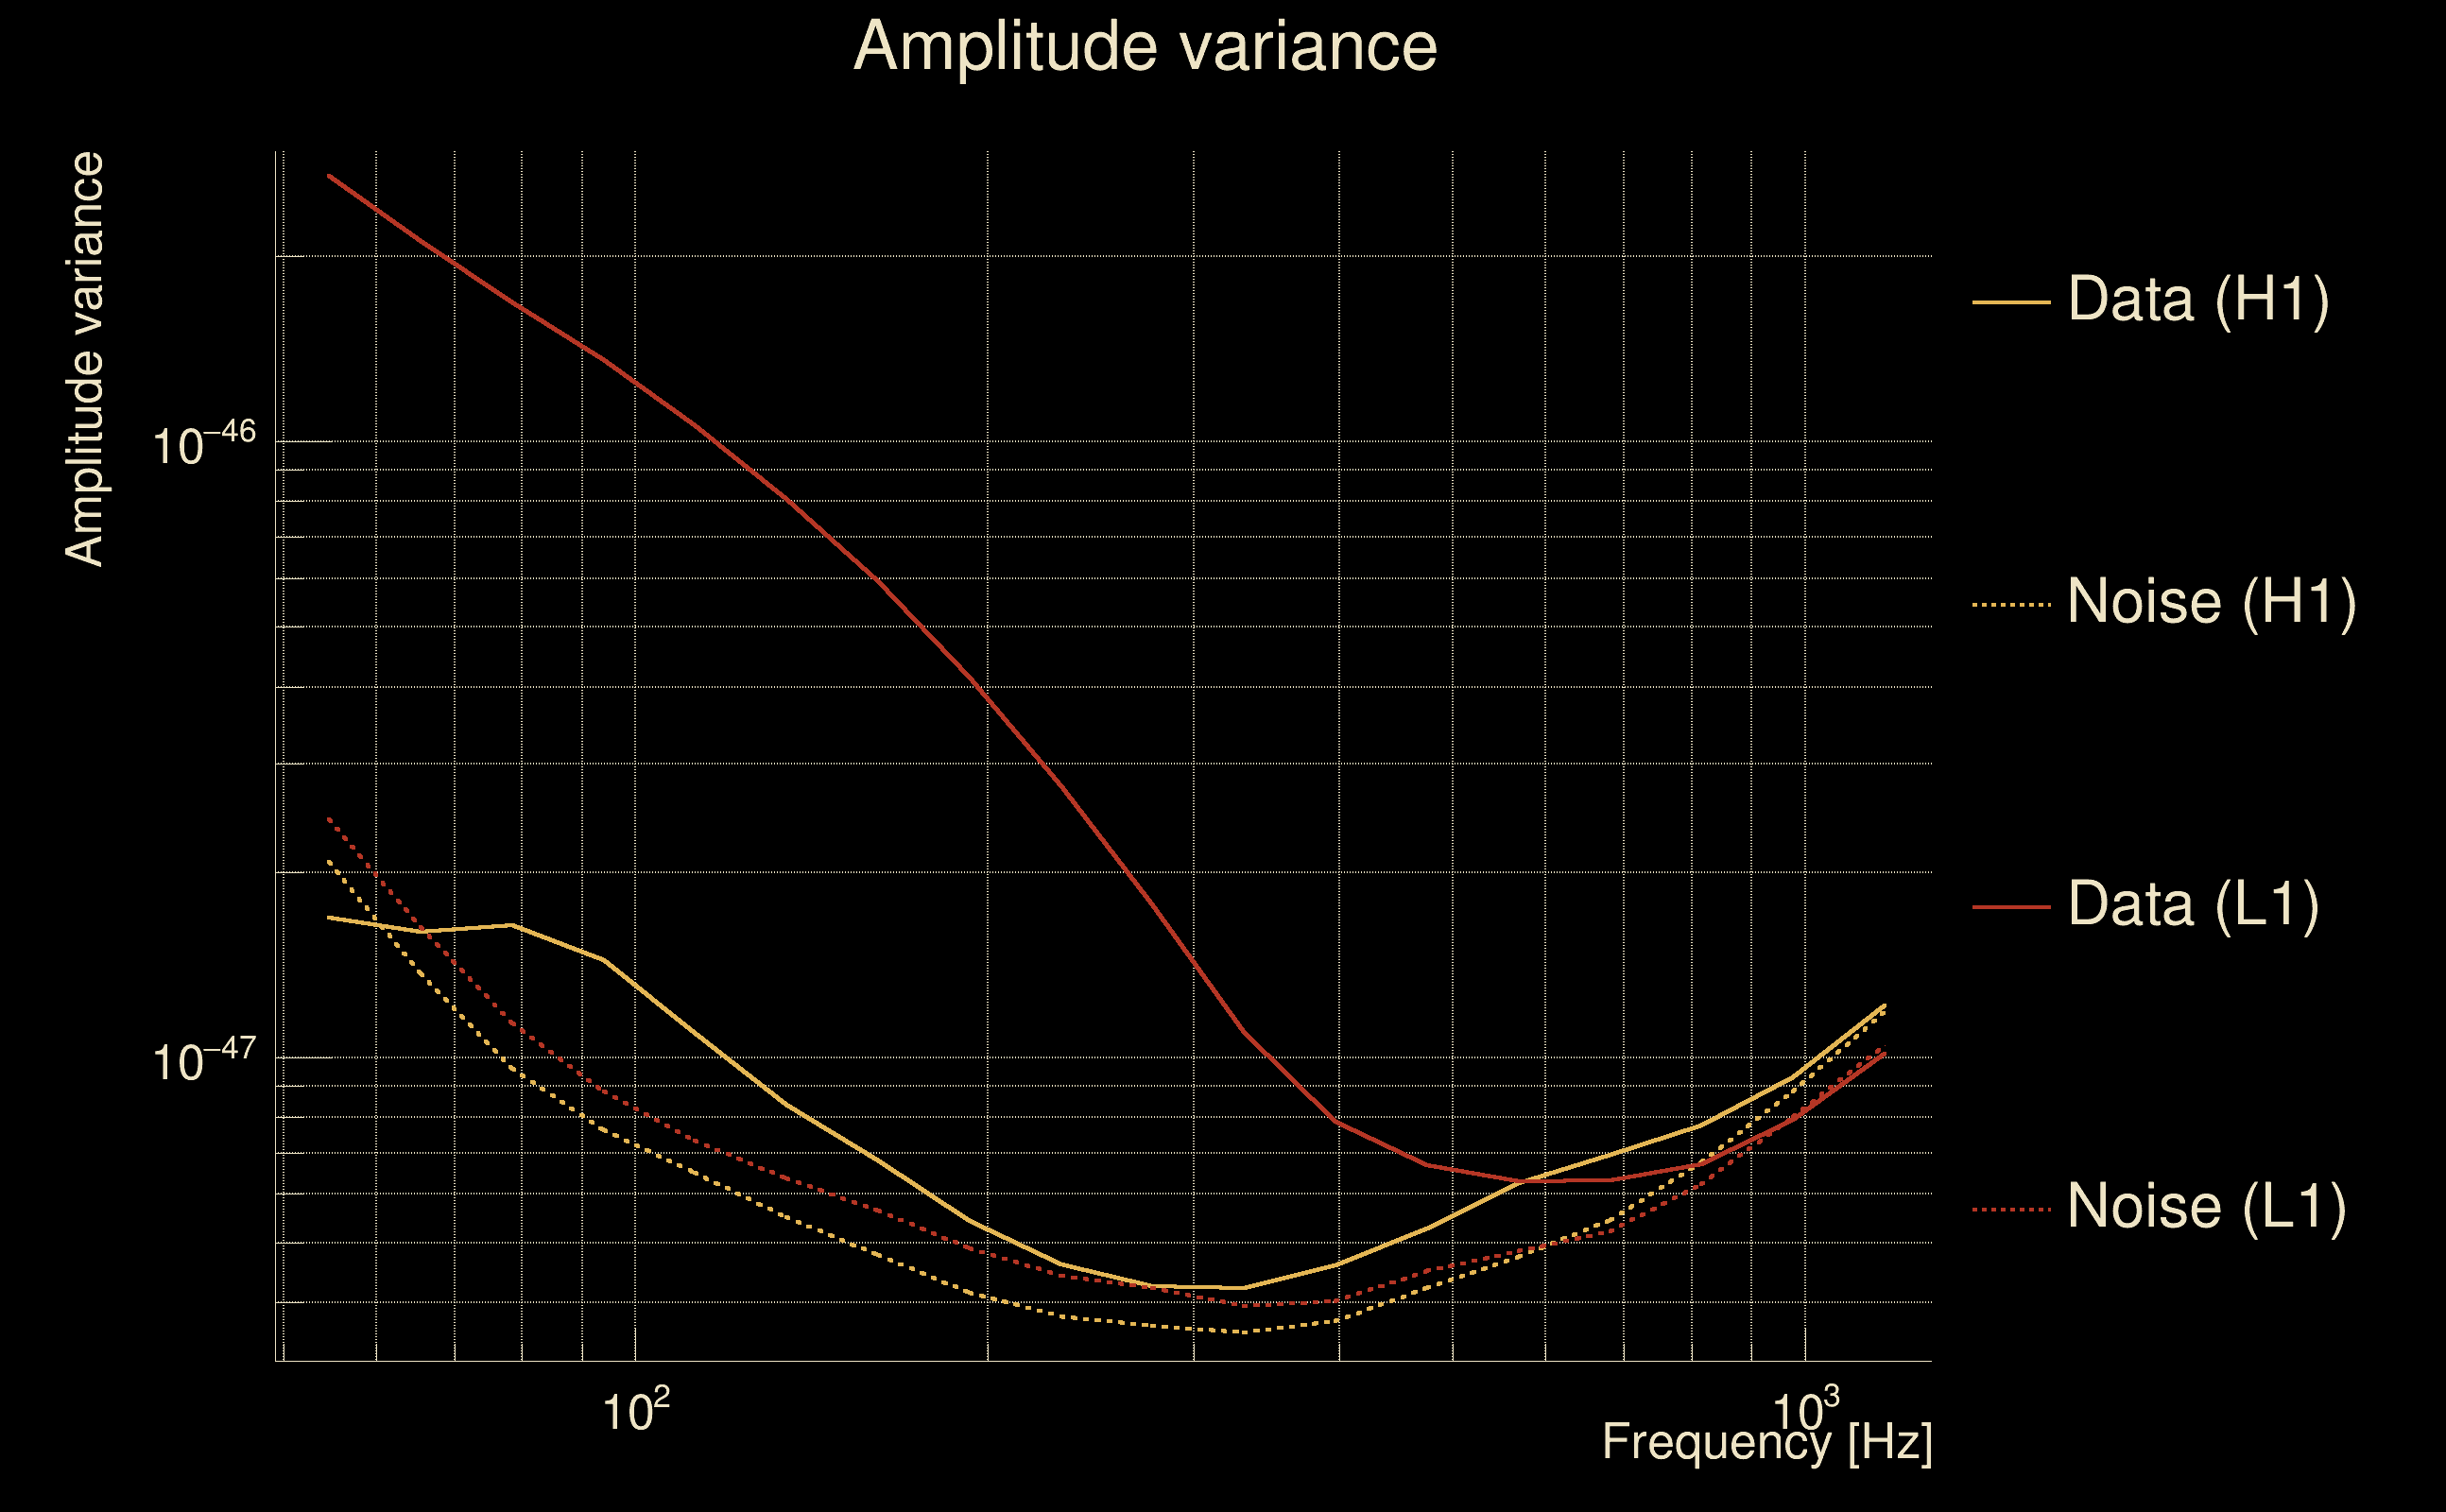
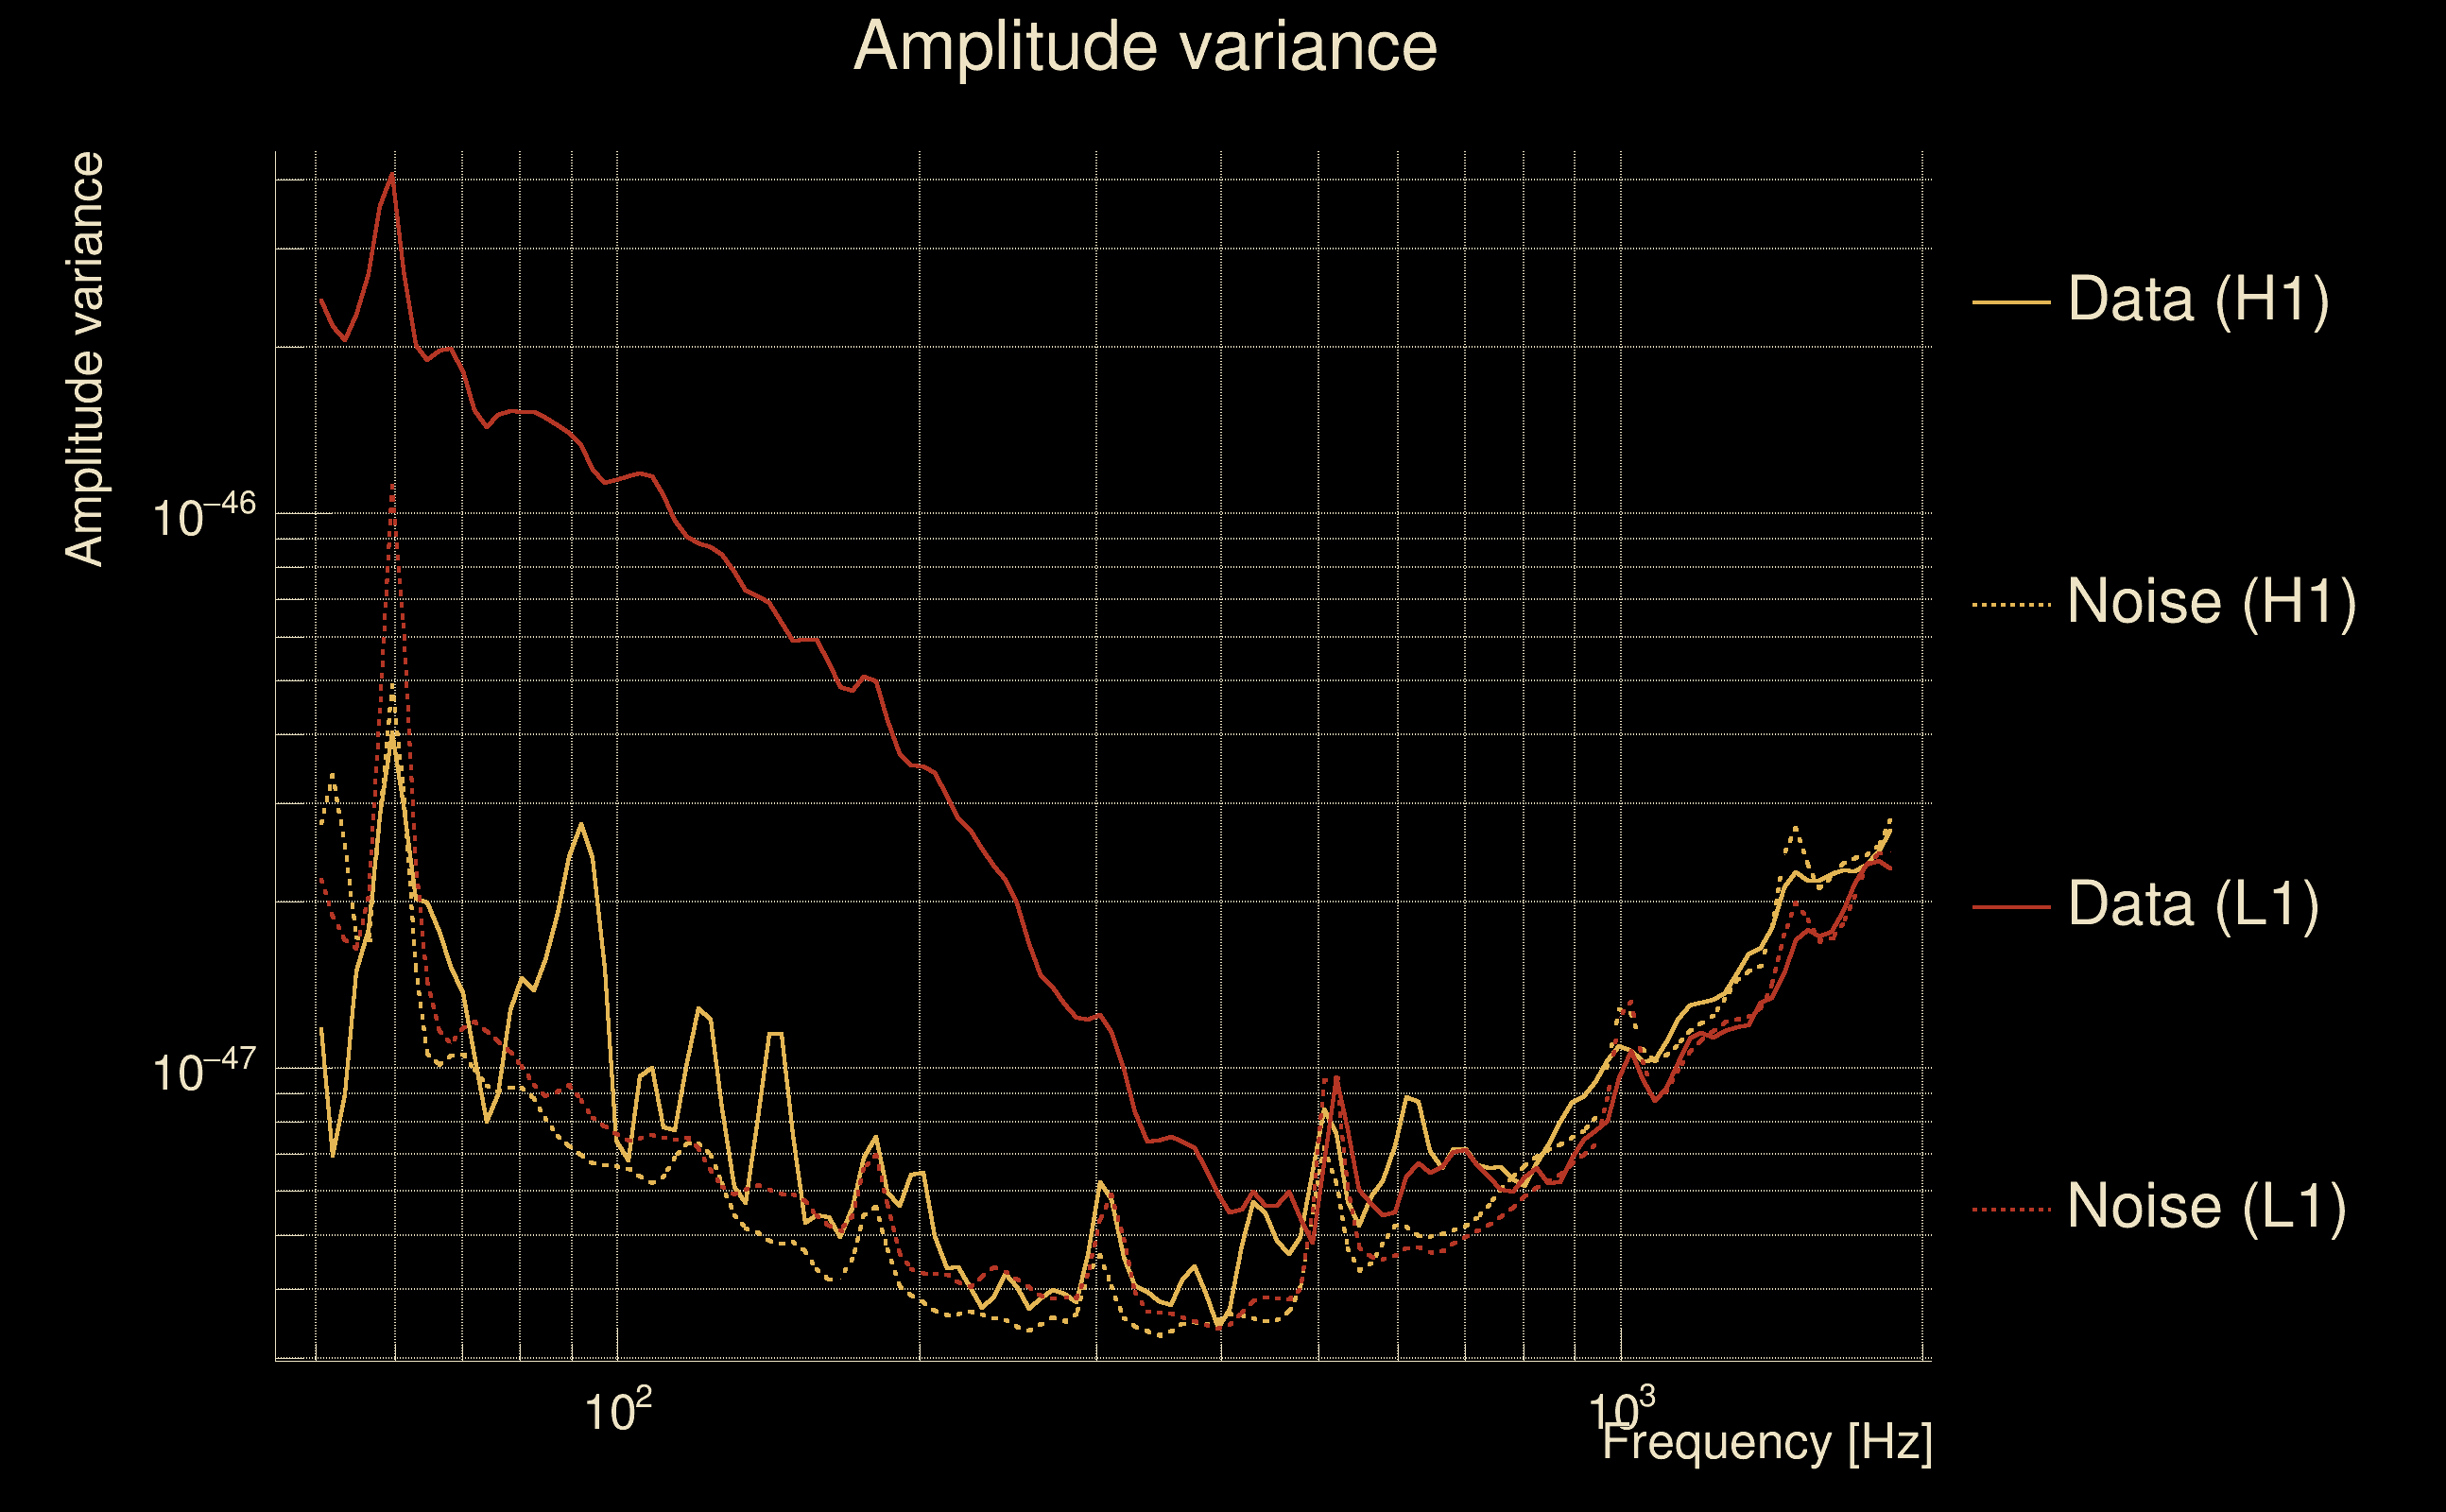
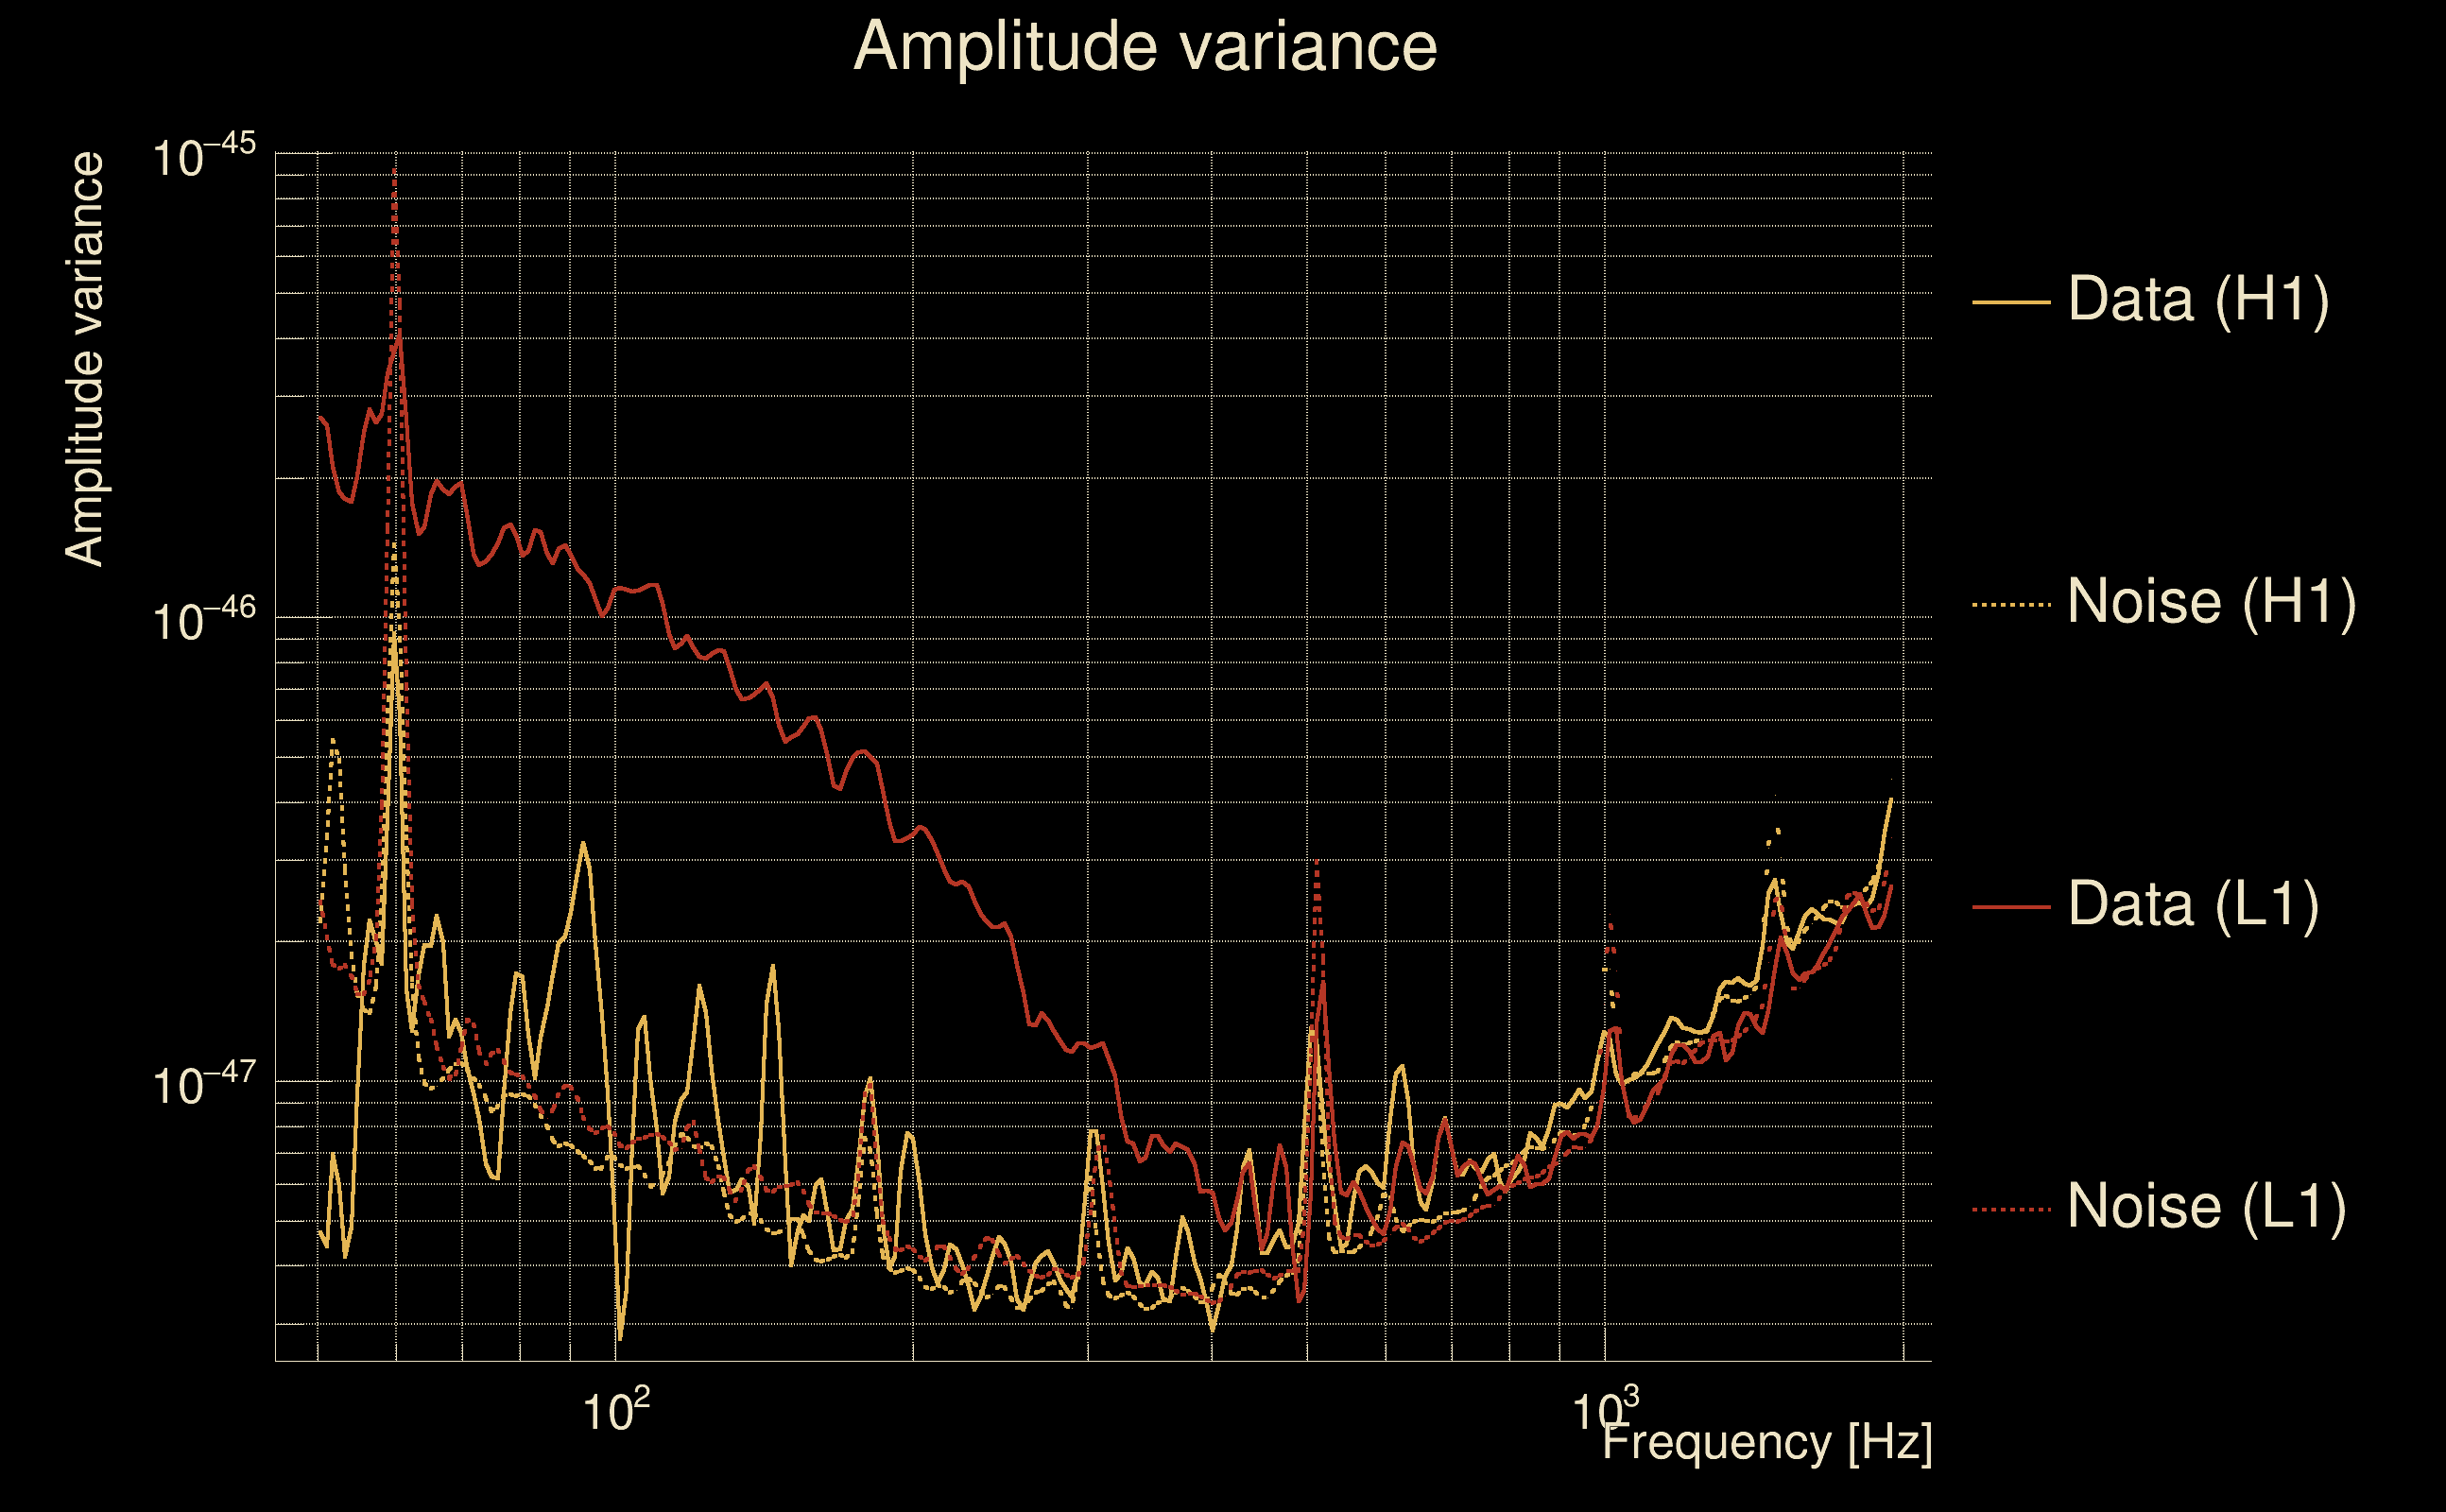
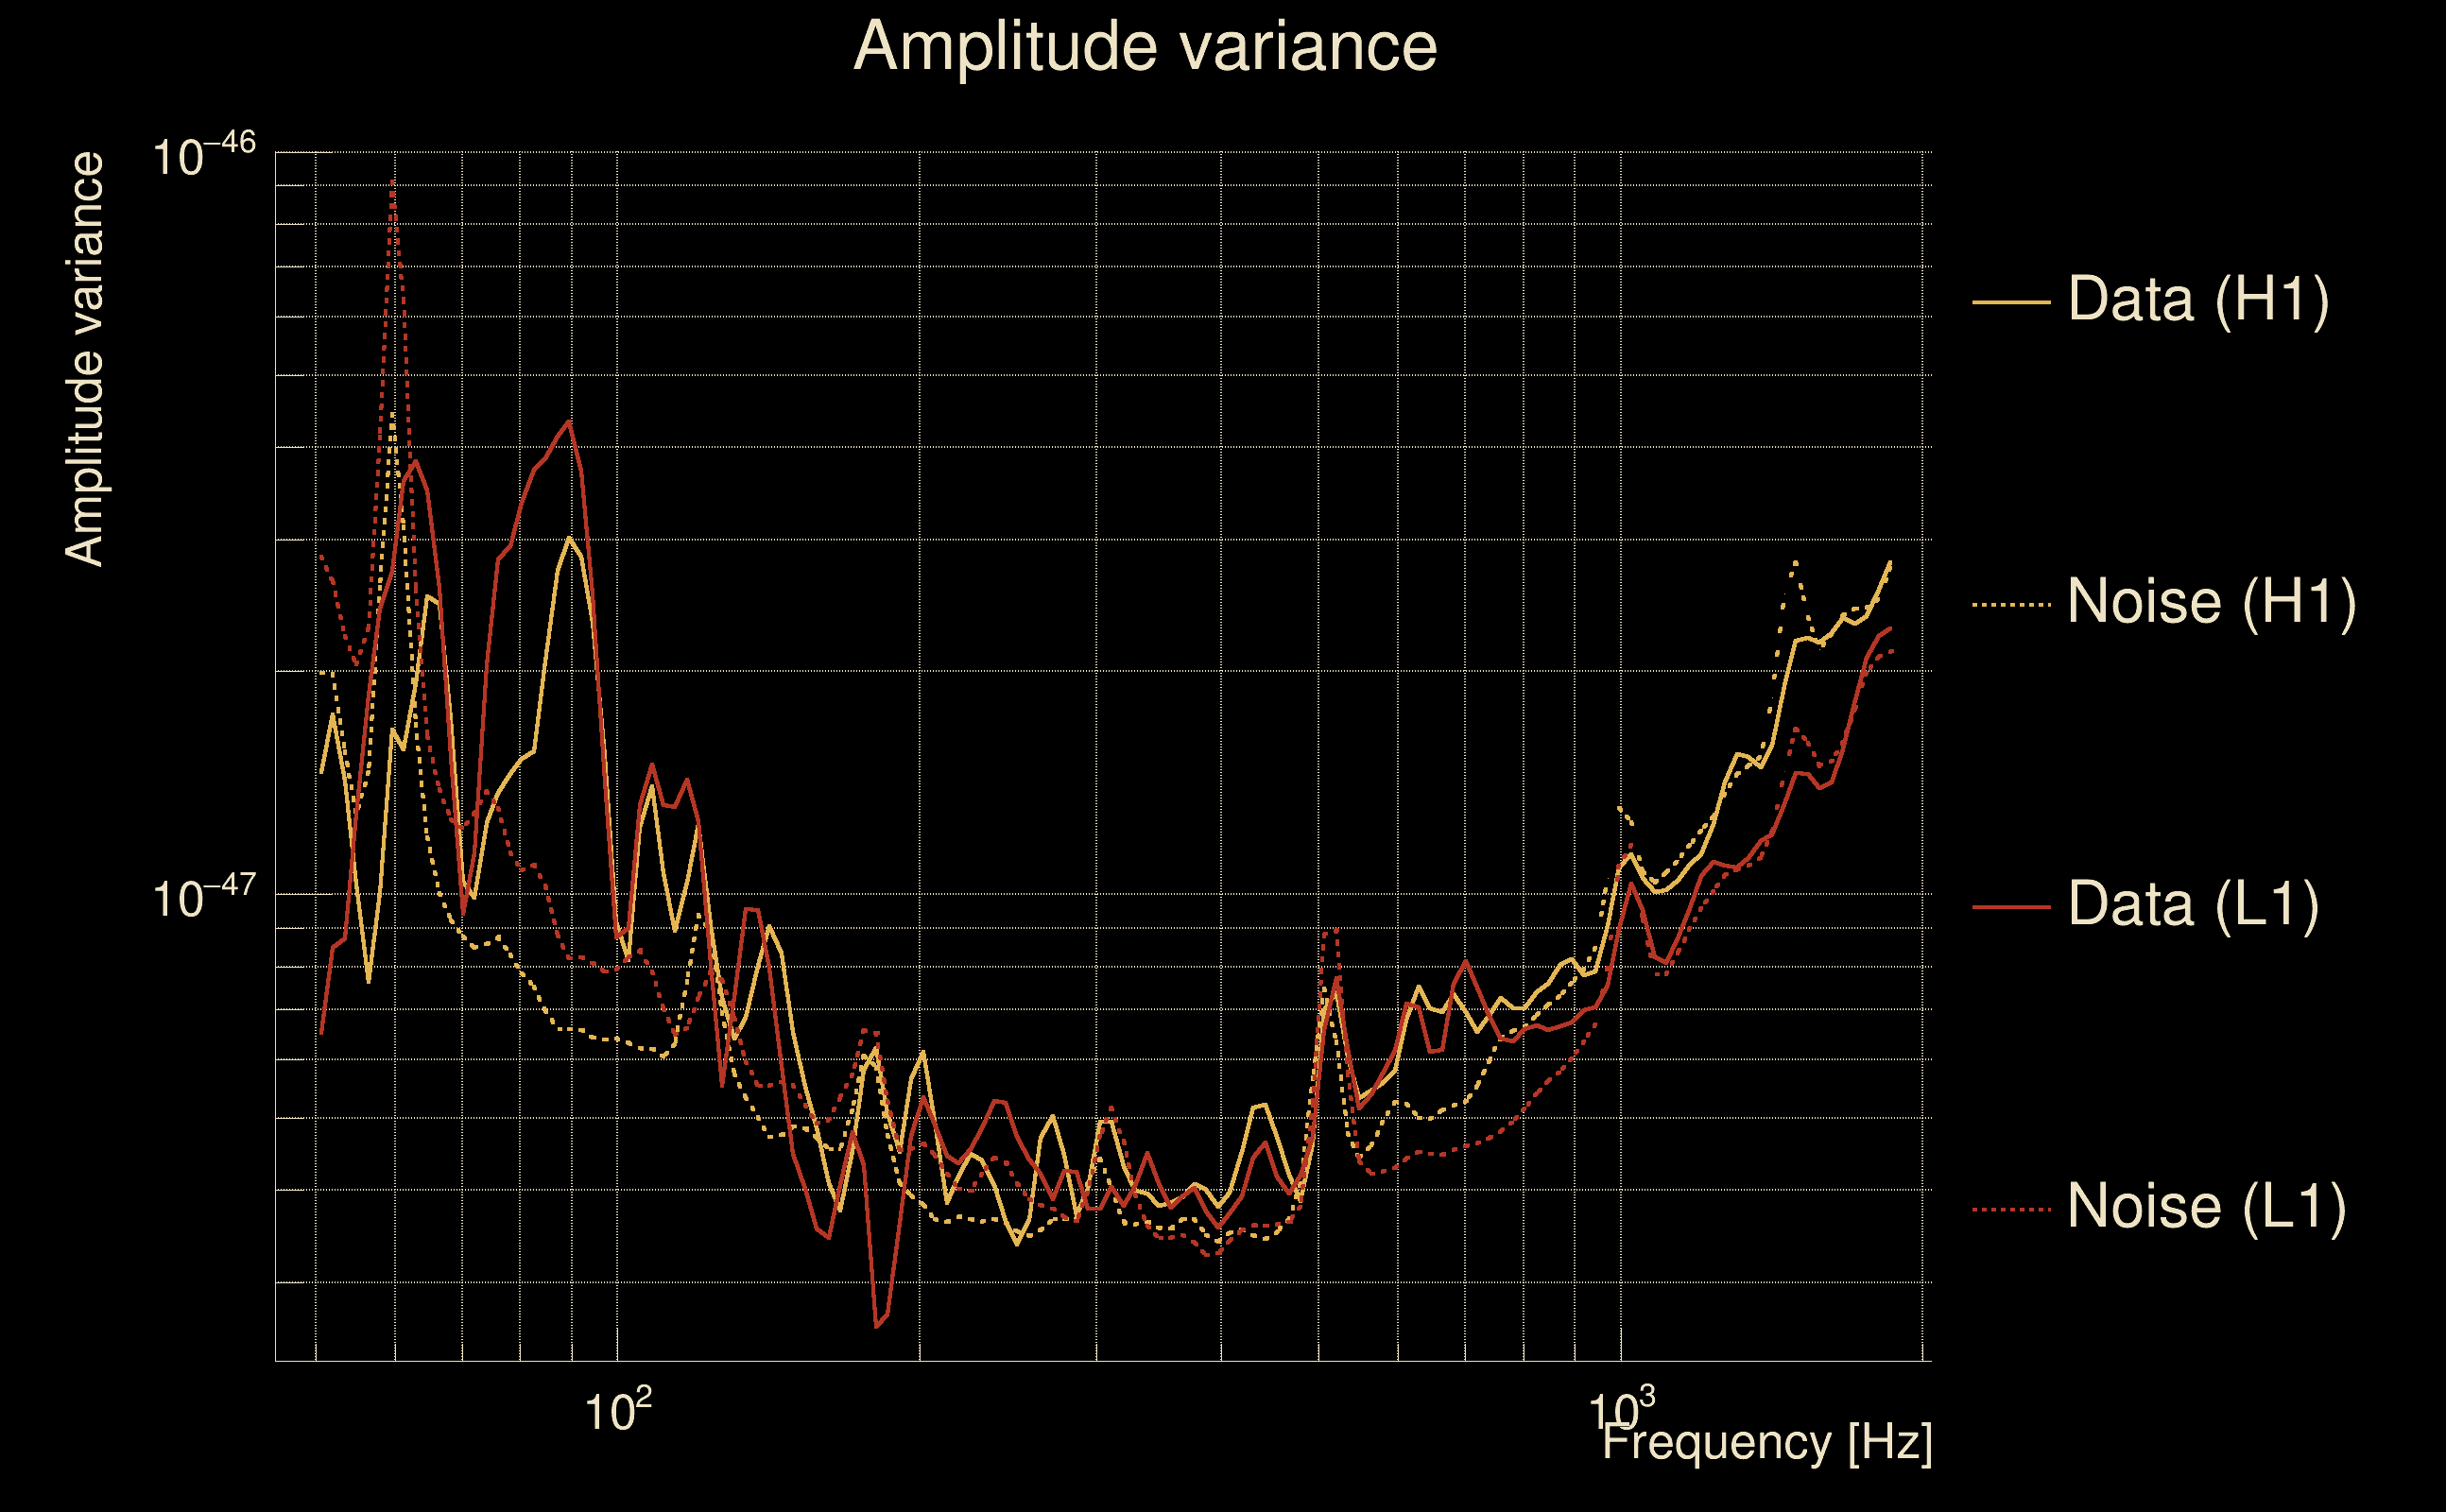
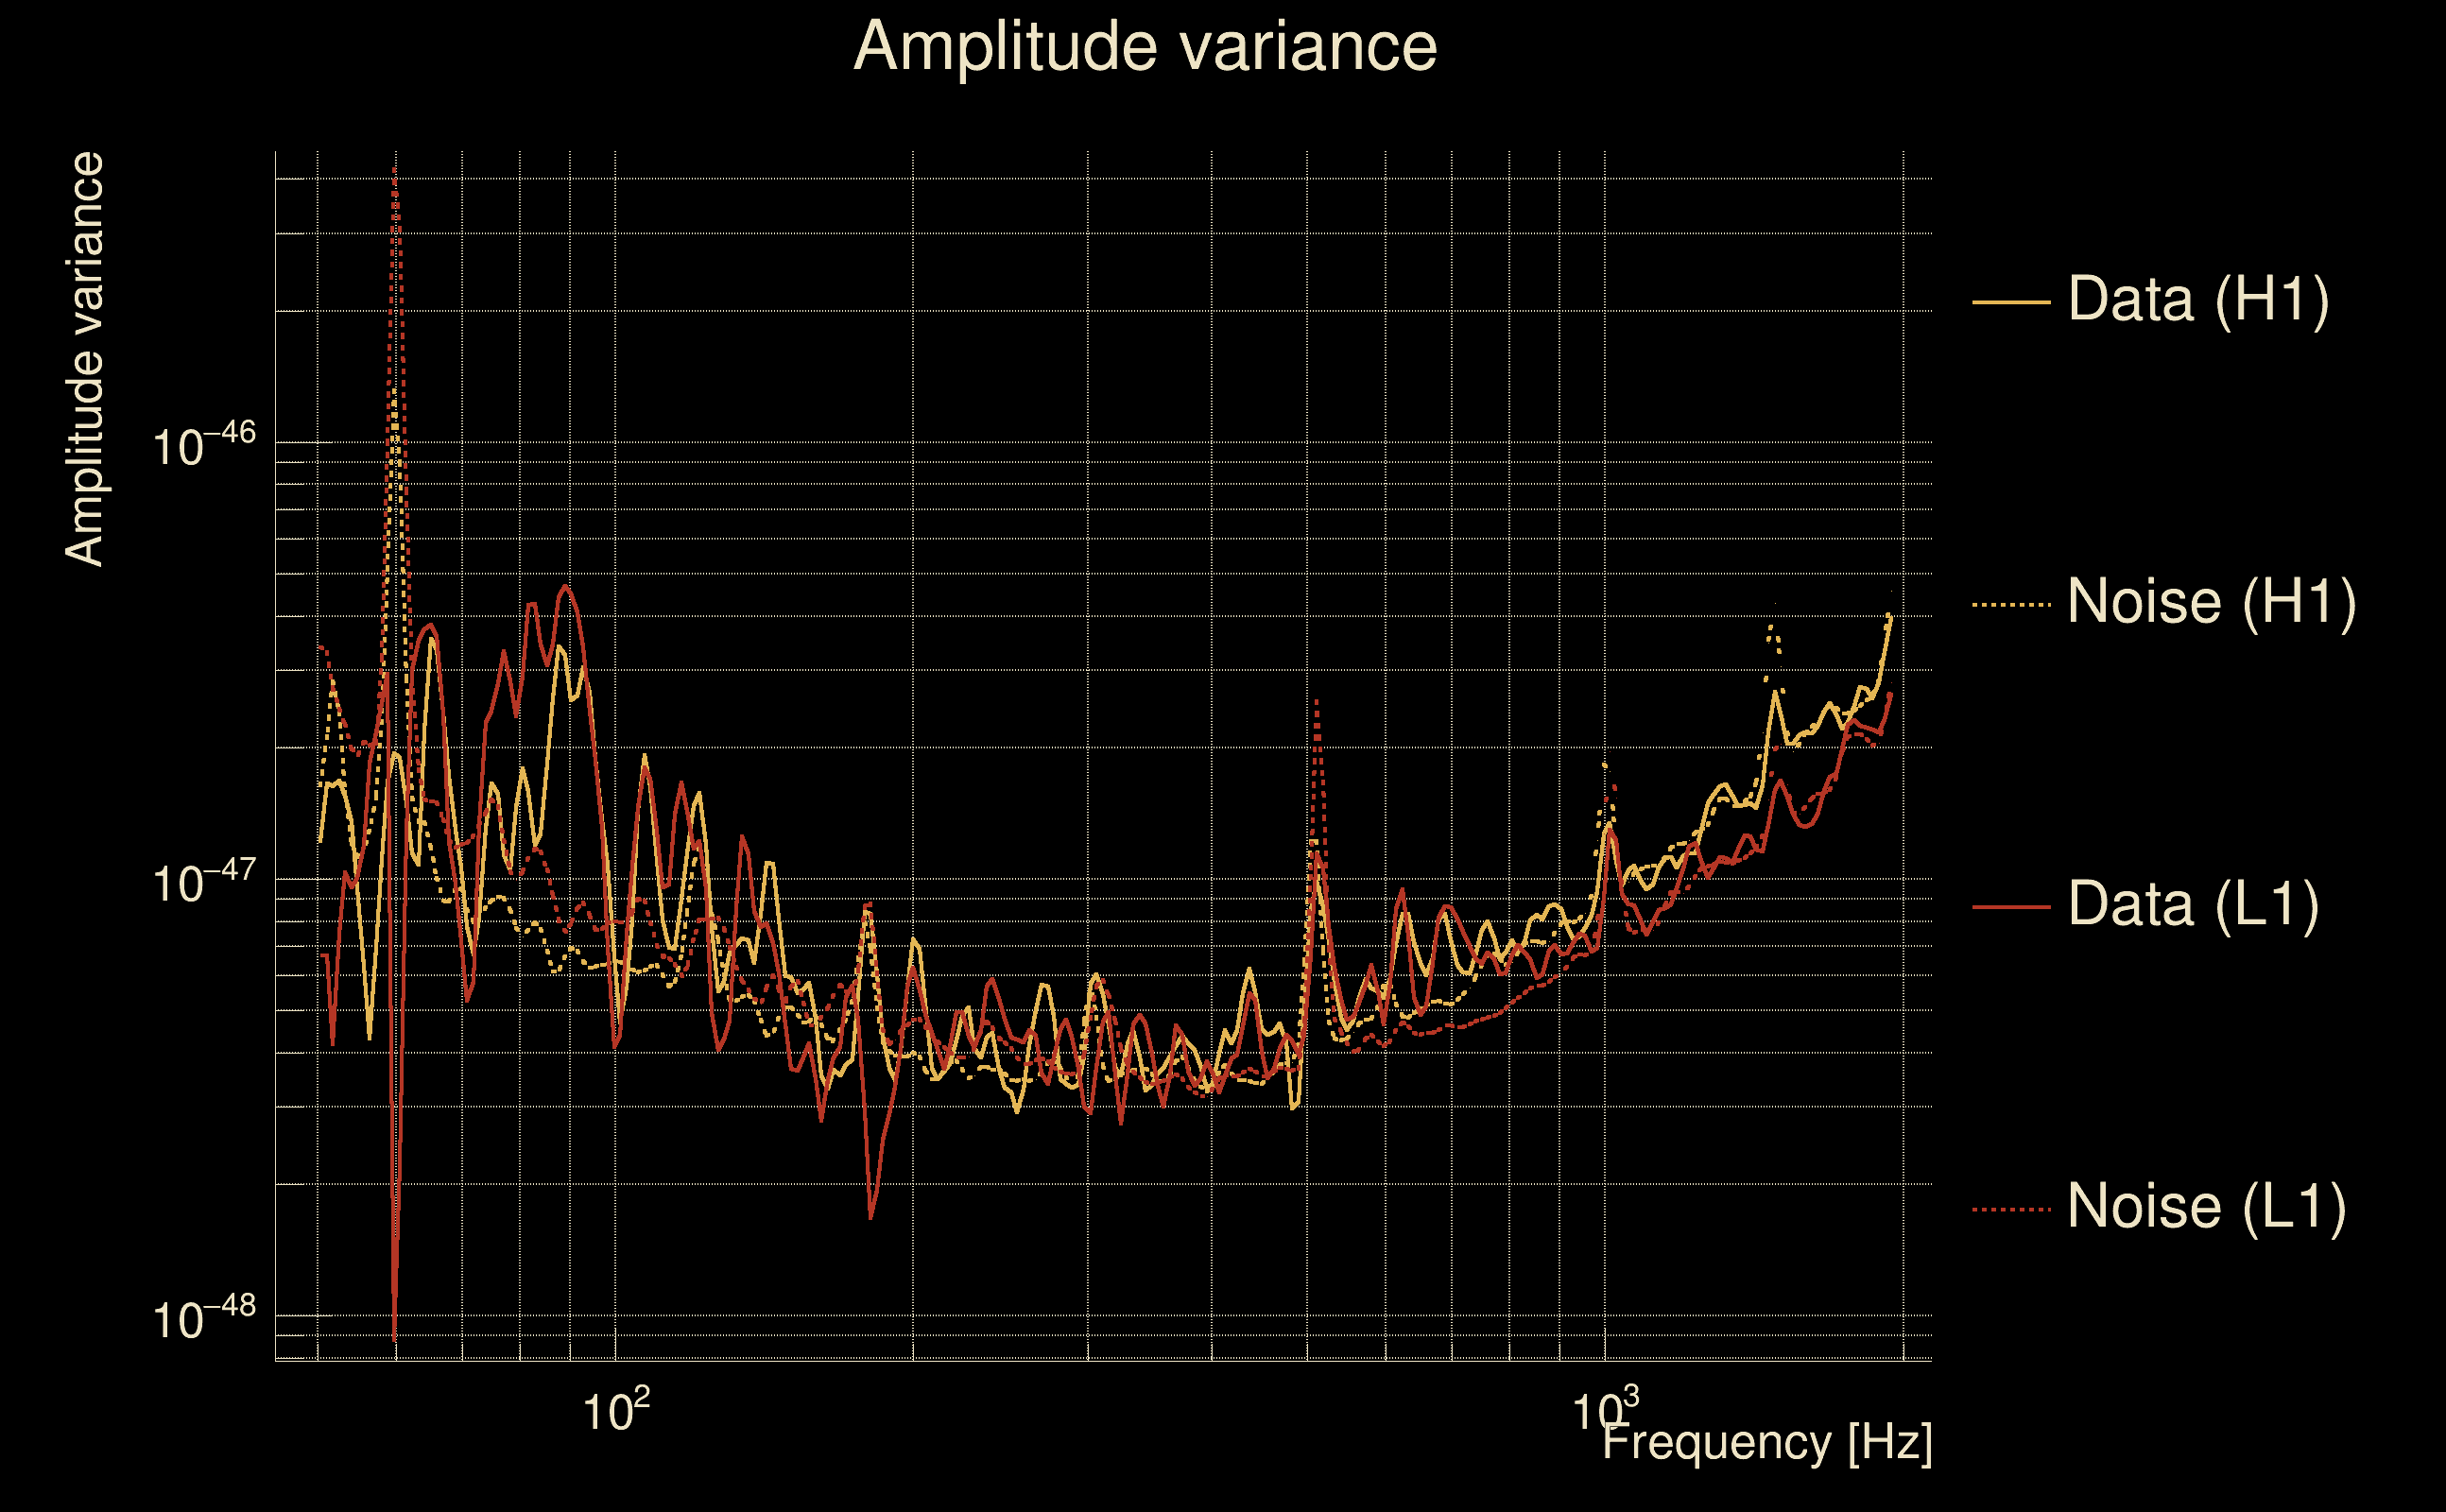
| Amplitude spectrograms: | normalization = 1e-22, power index = 2 |
| White noise SNR variance: | 0.523175 (after applying a correction factor = 1) |
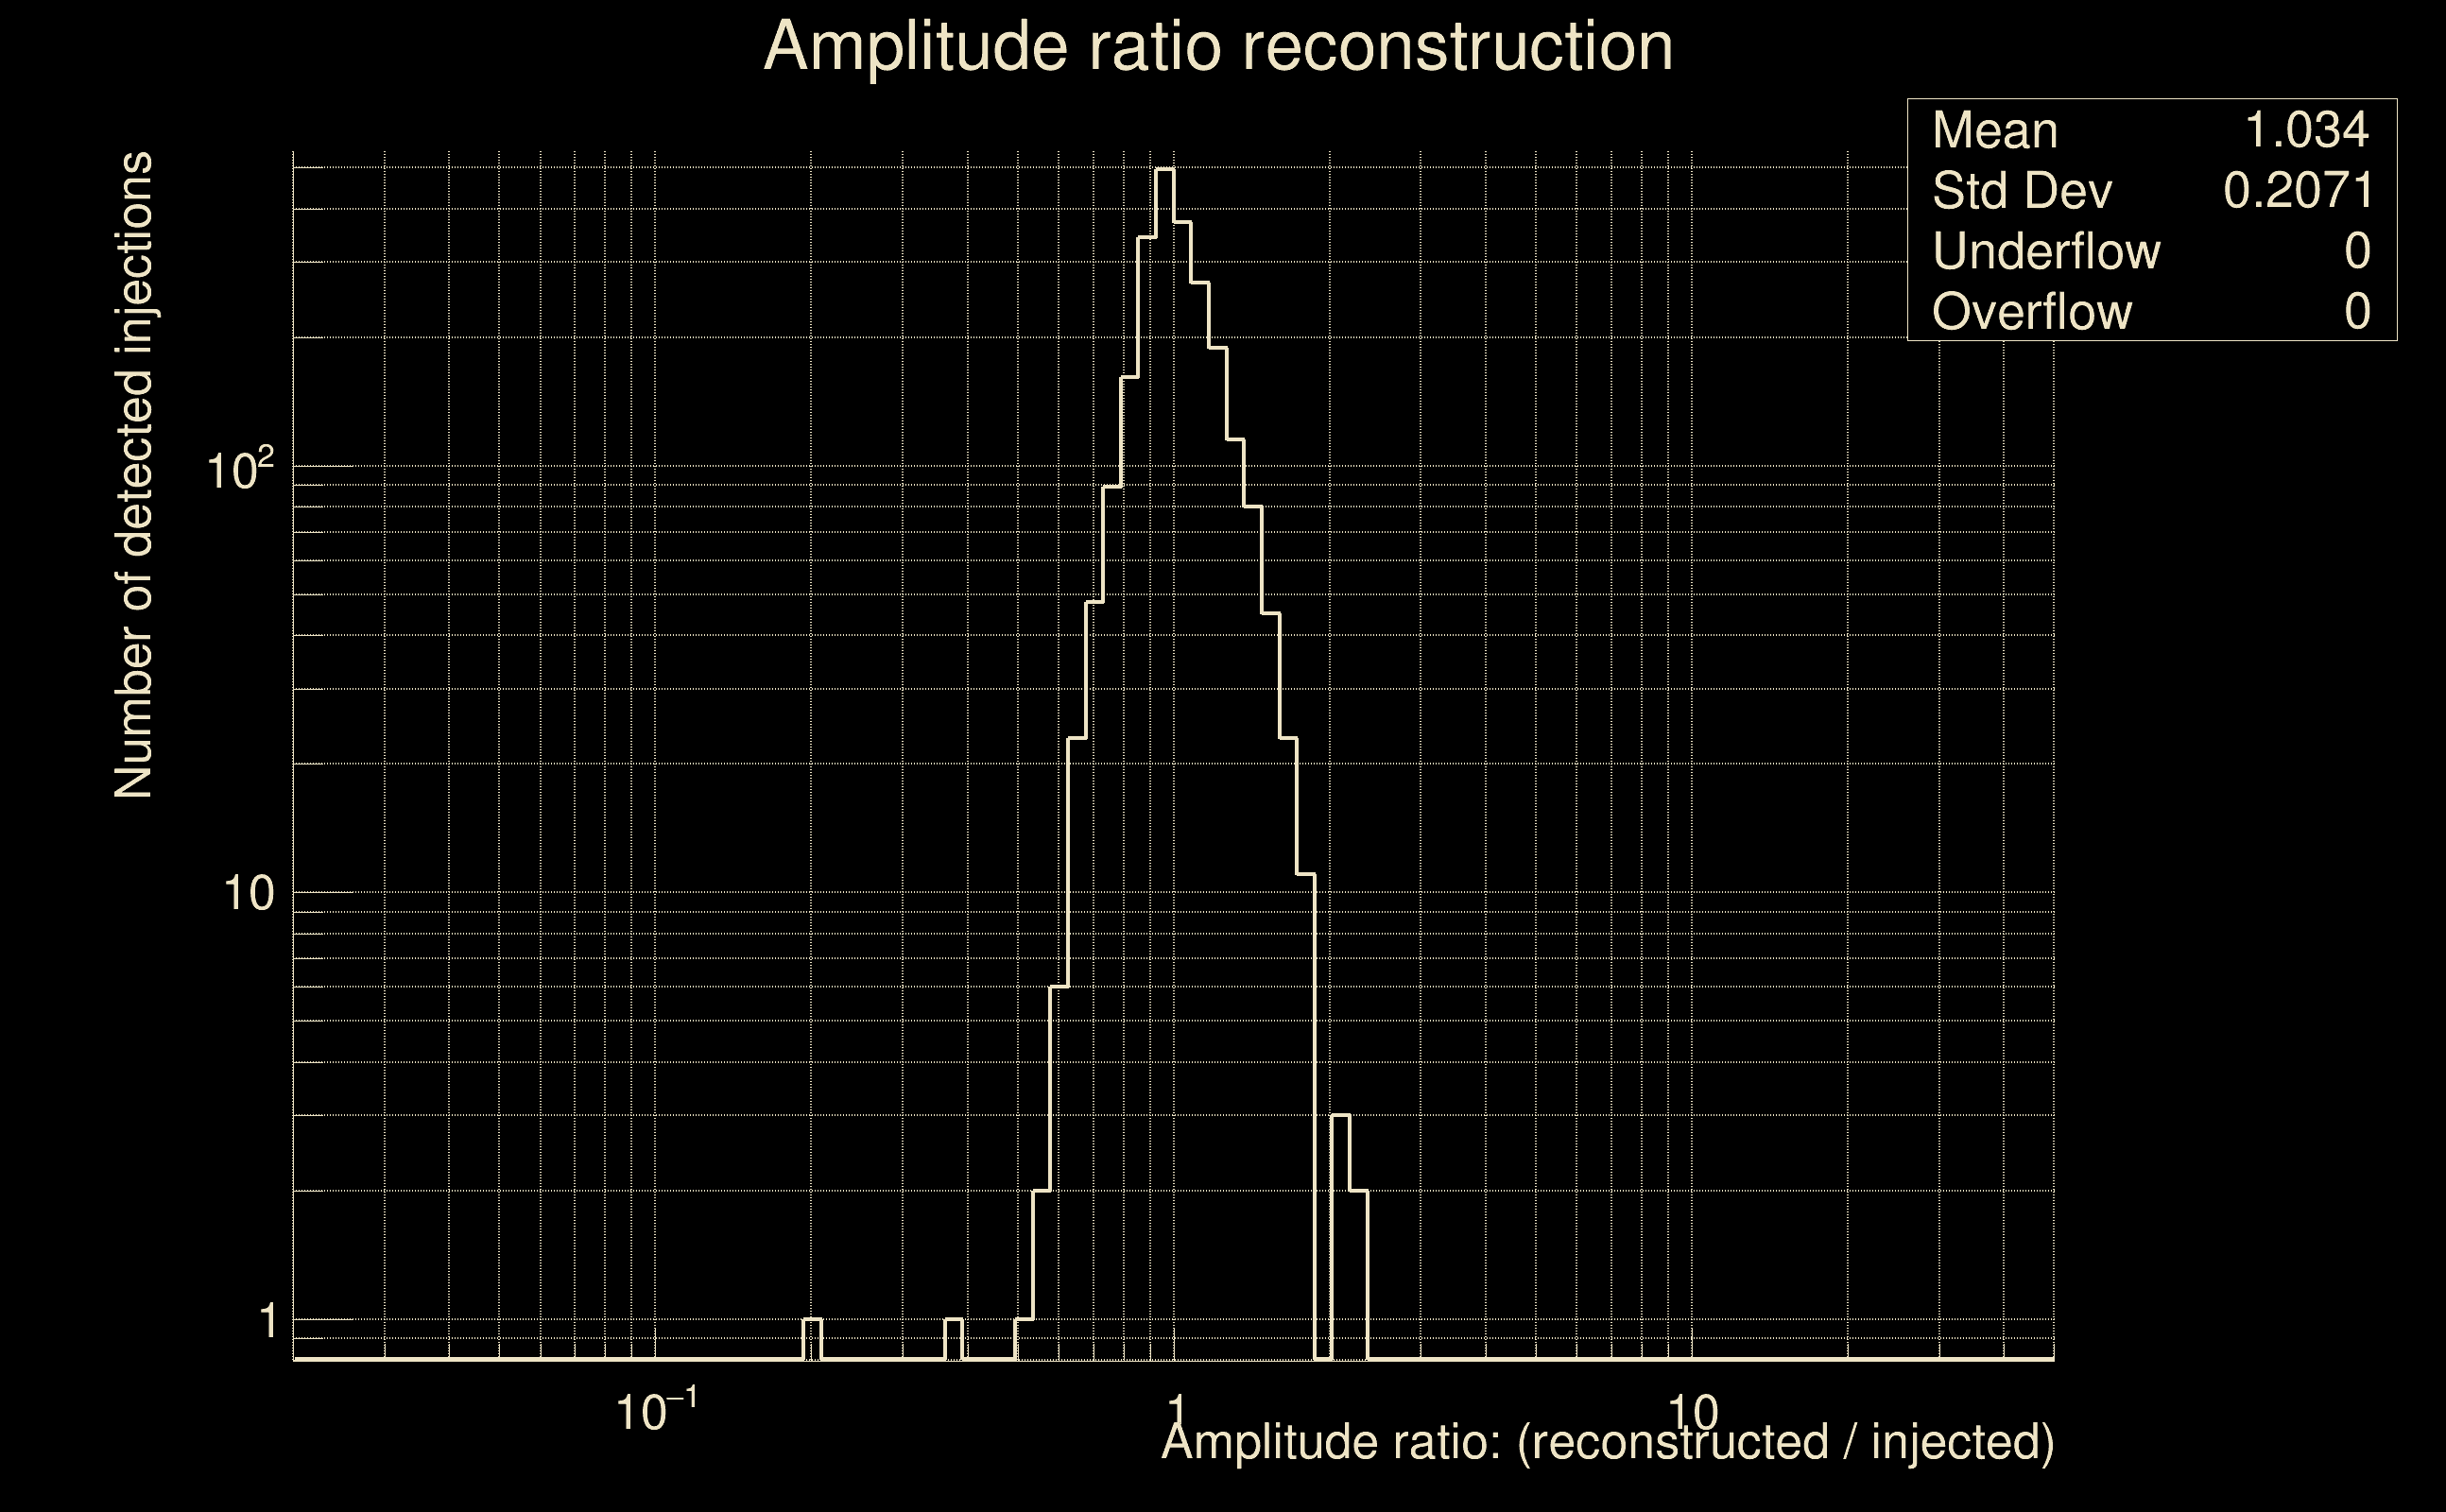
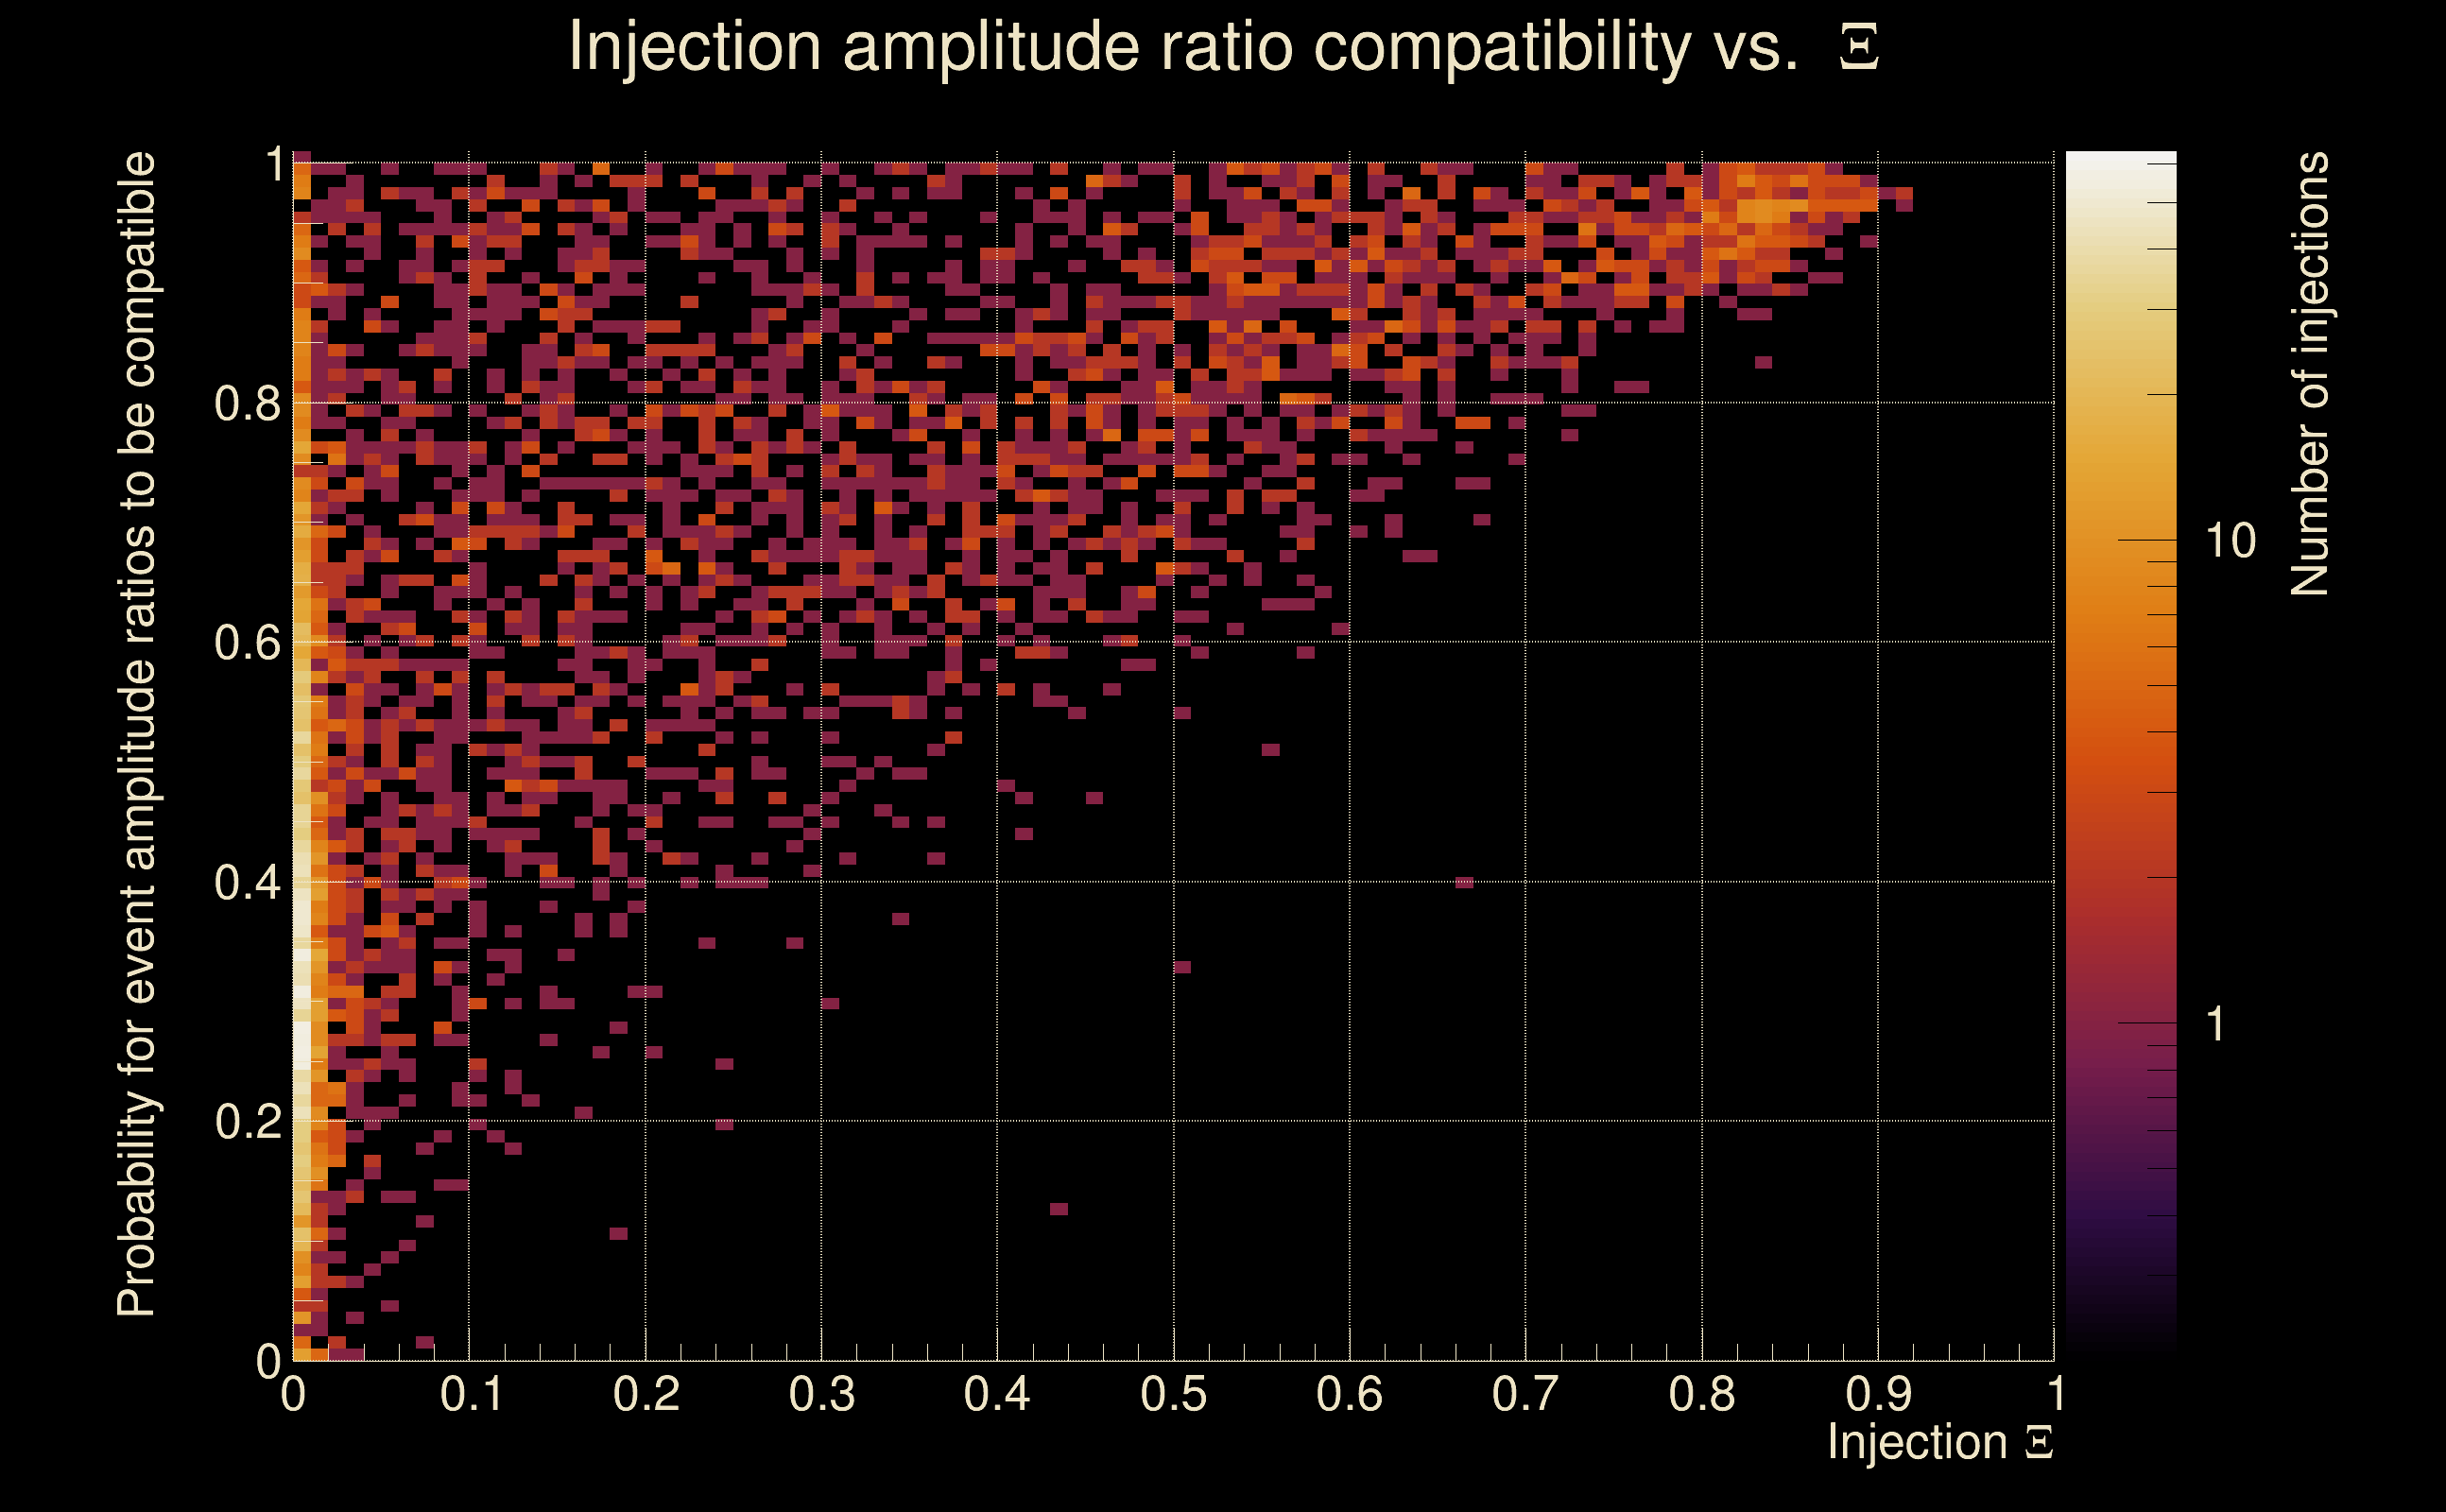
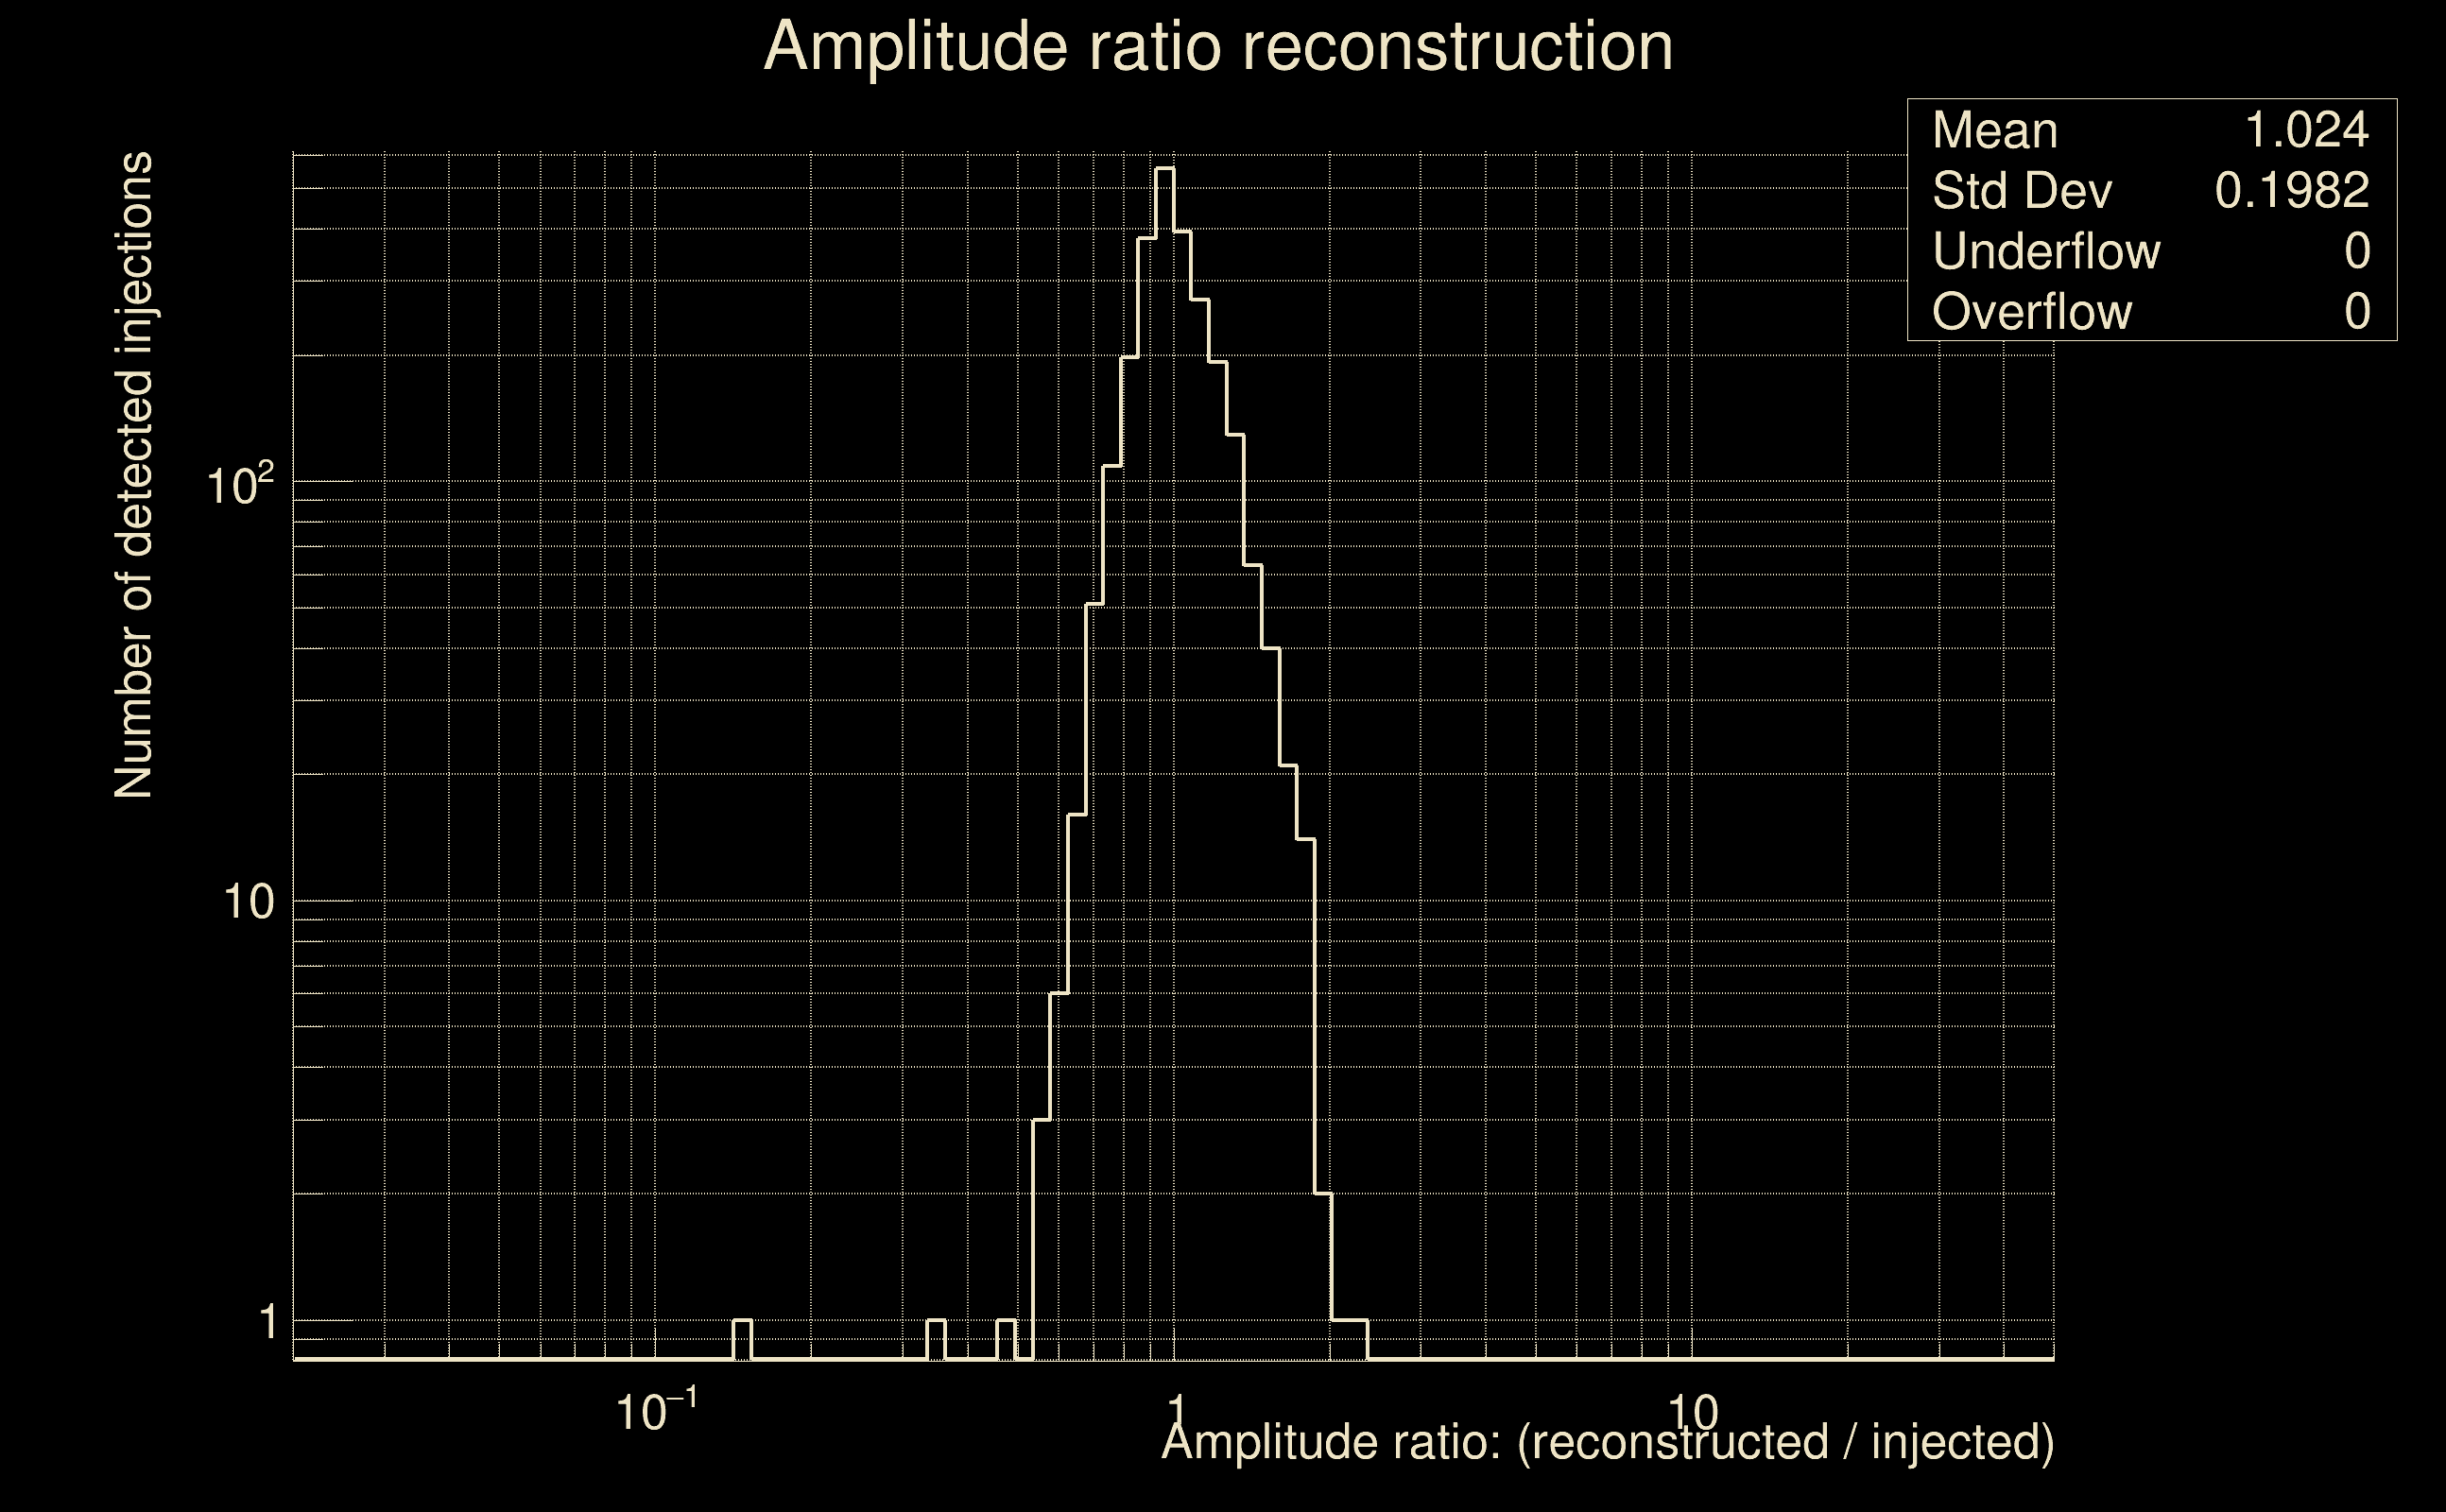
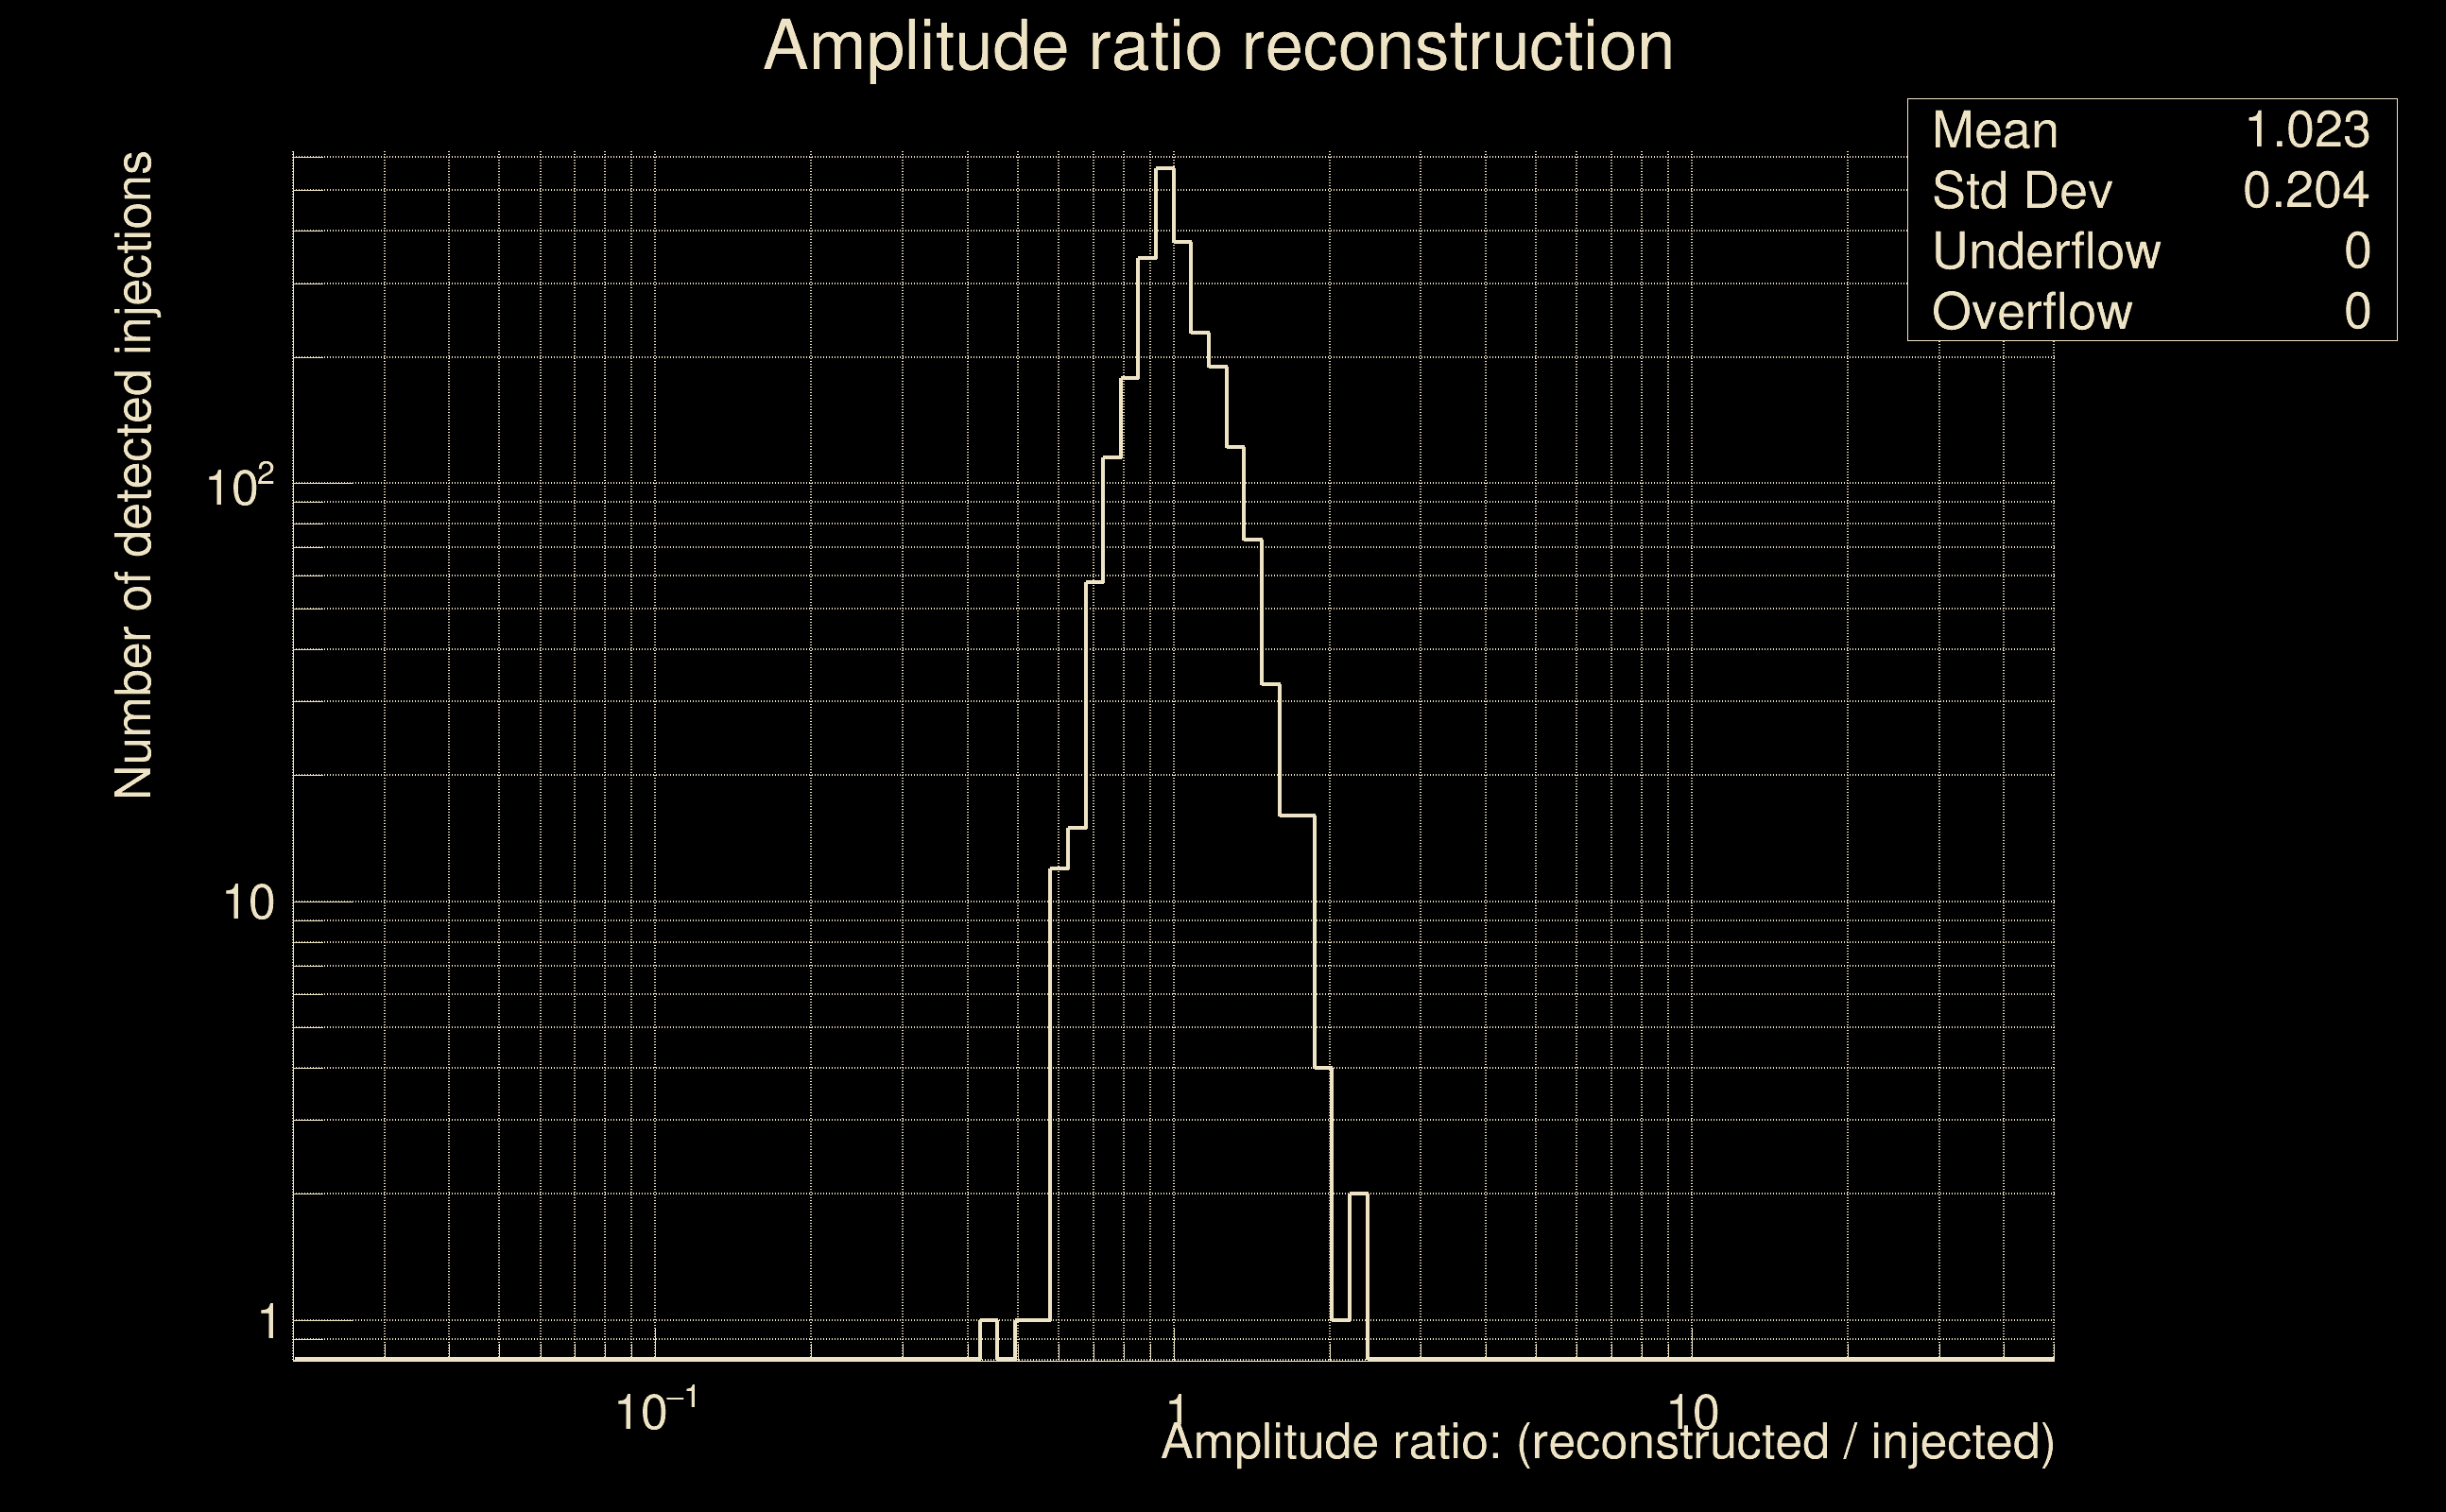
| Amplitude ratio confidence level: | 3 sigma |
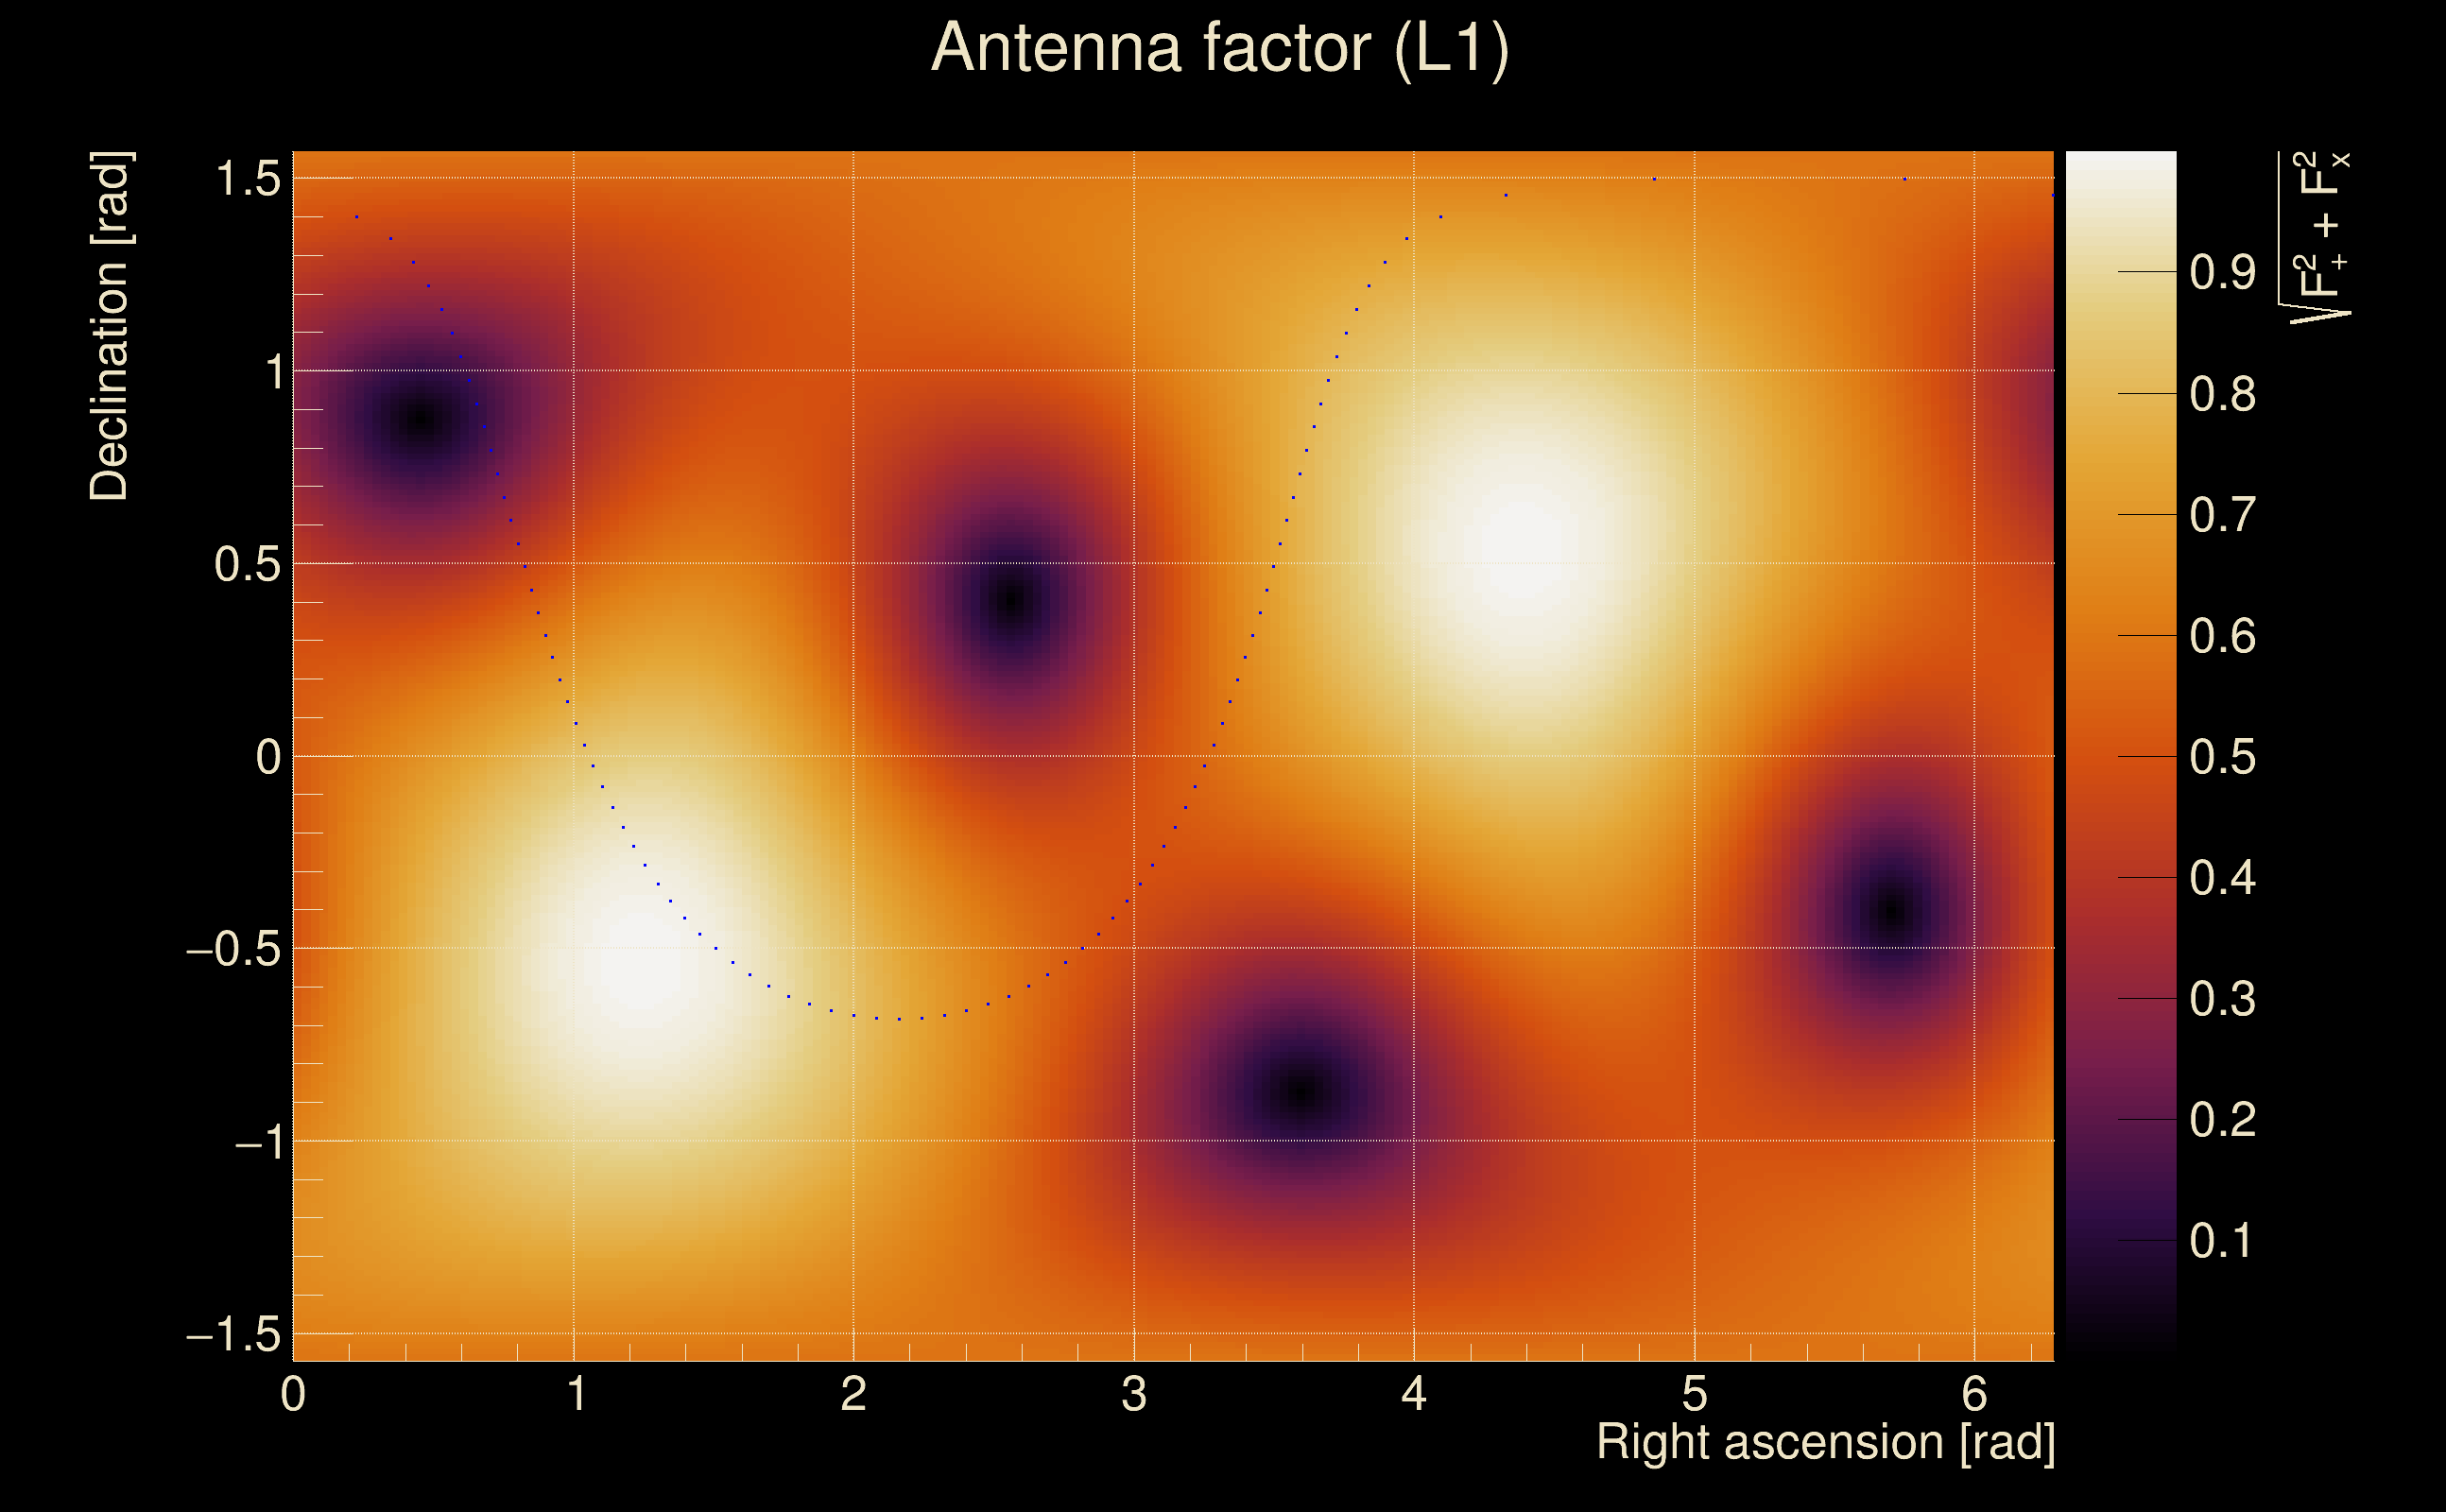
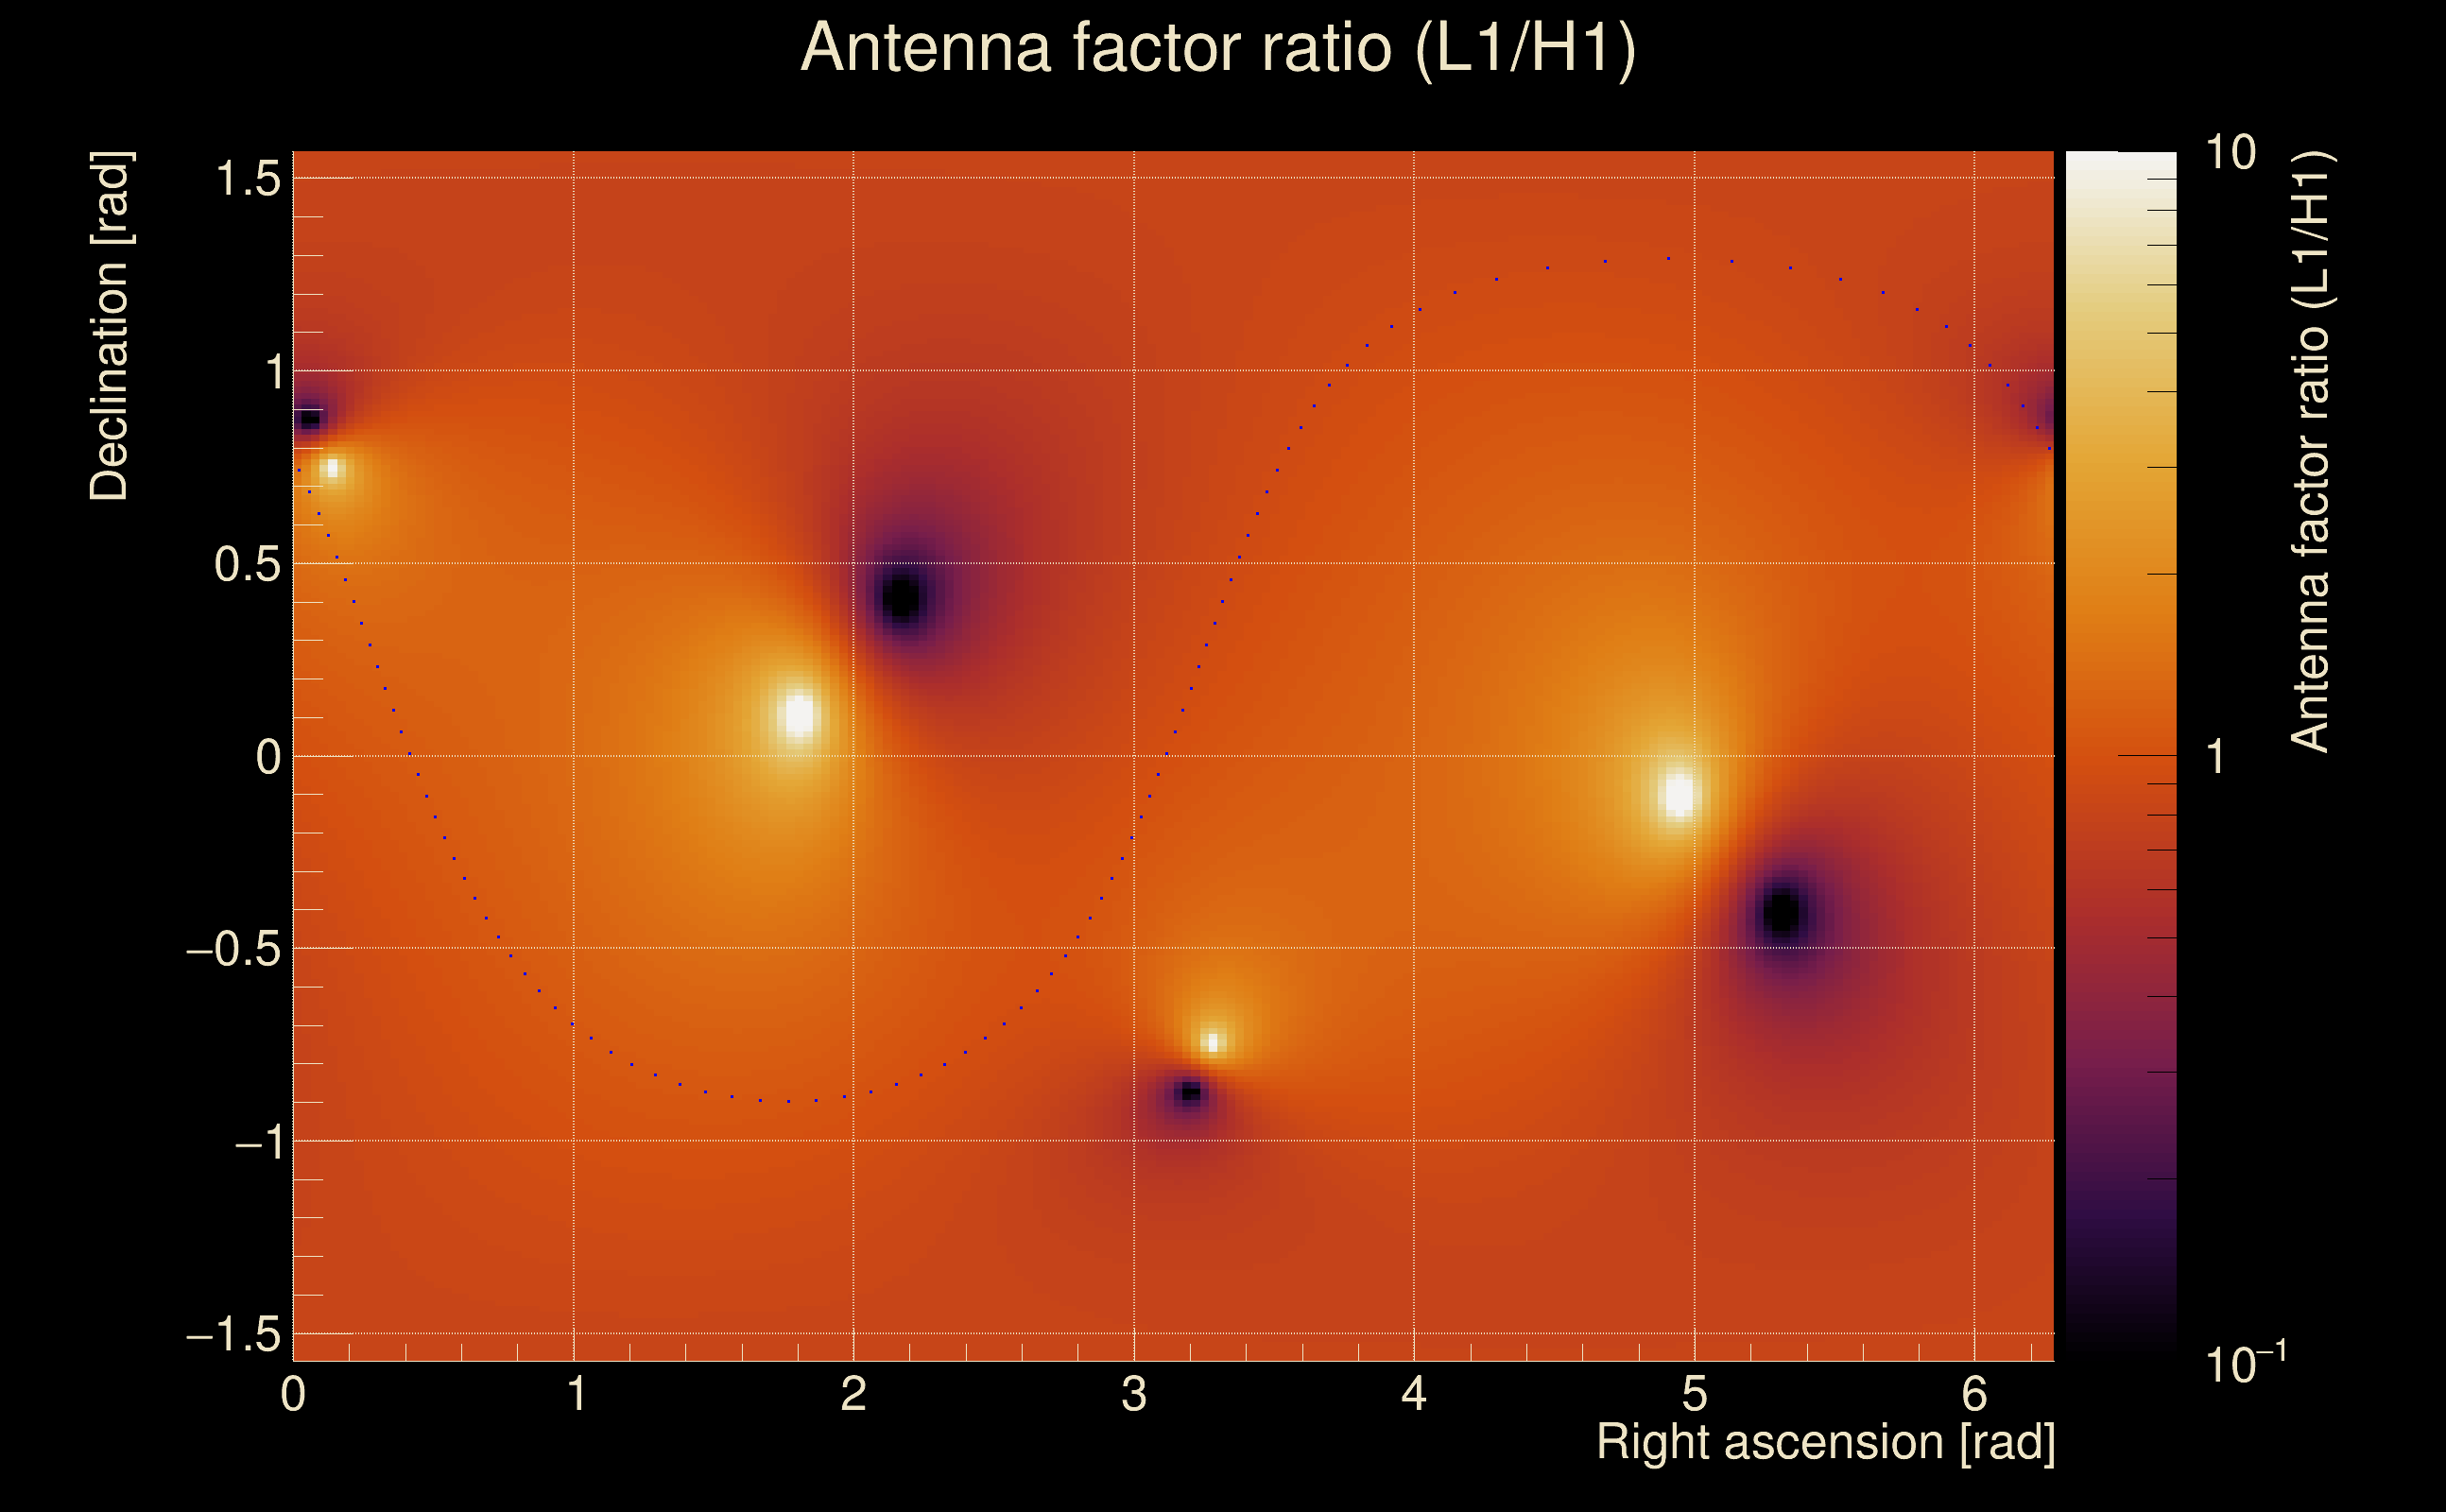
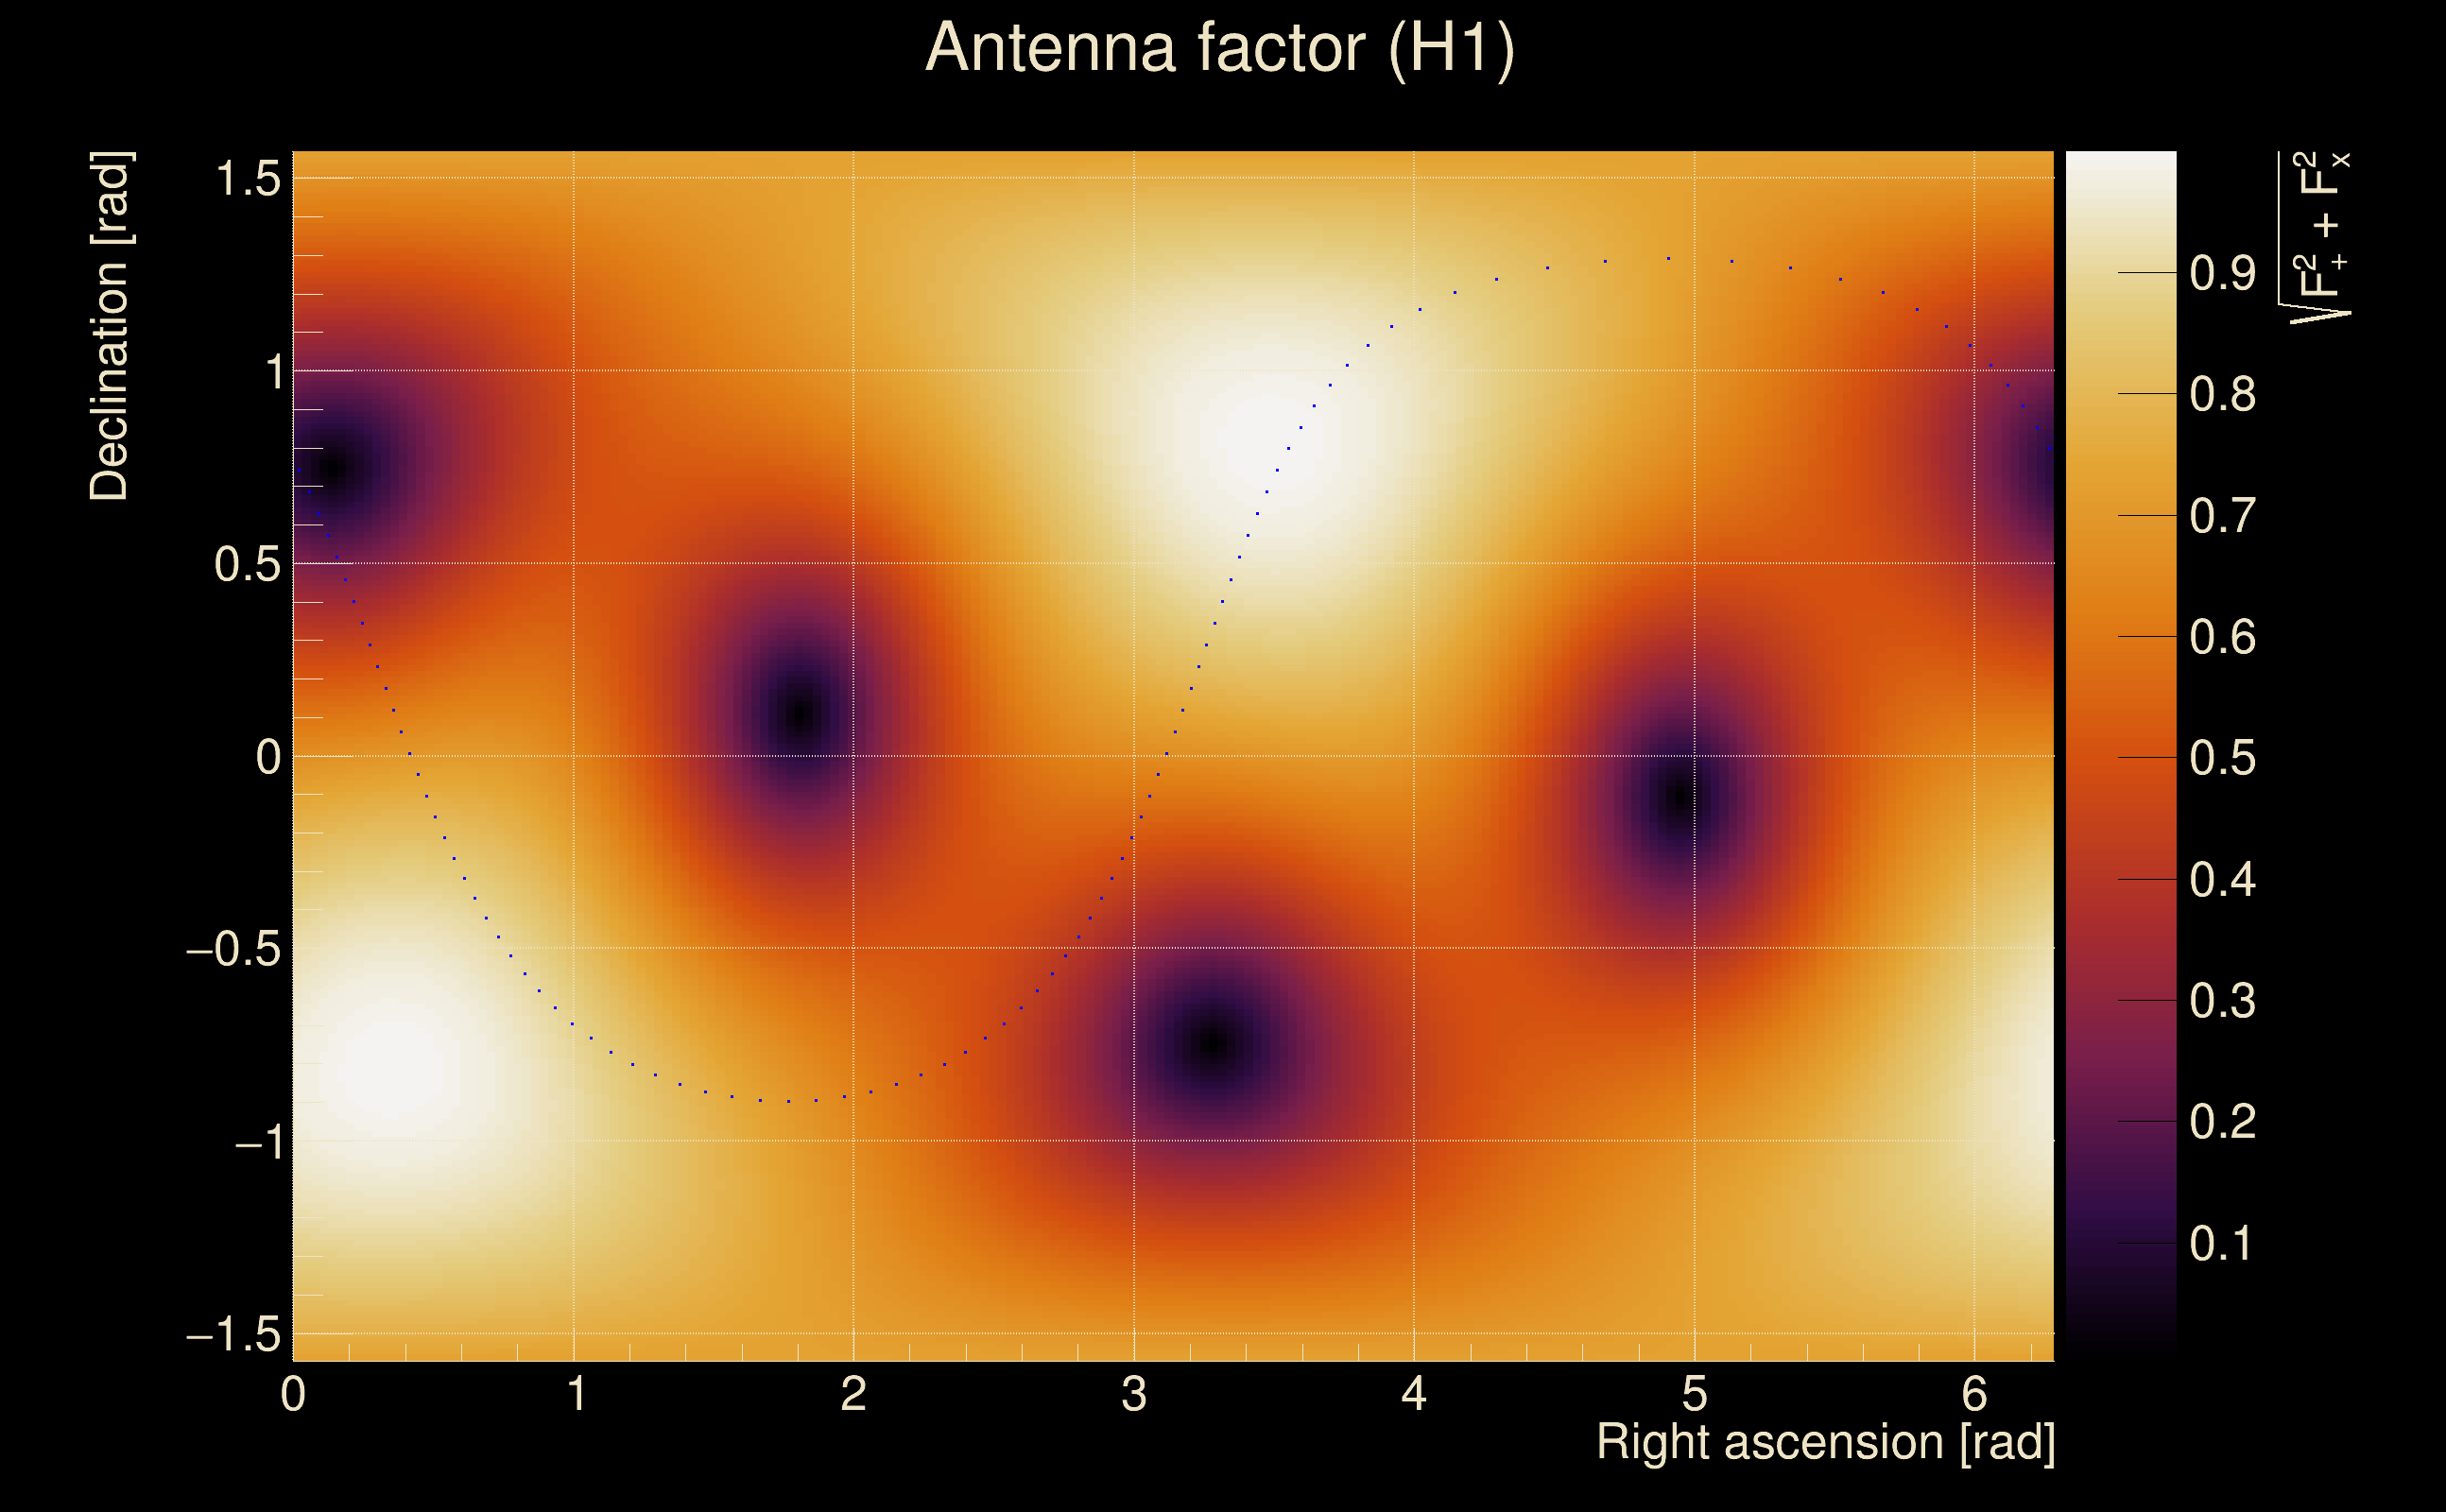
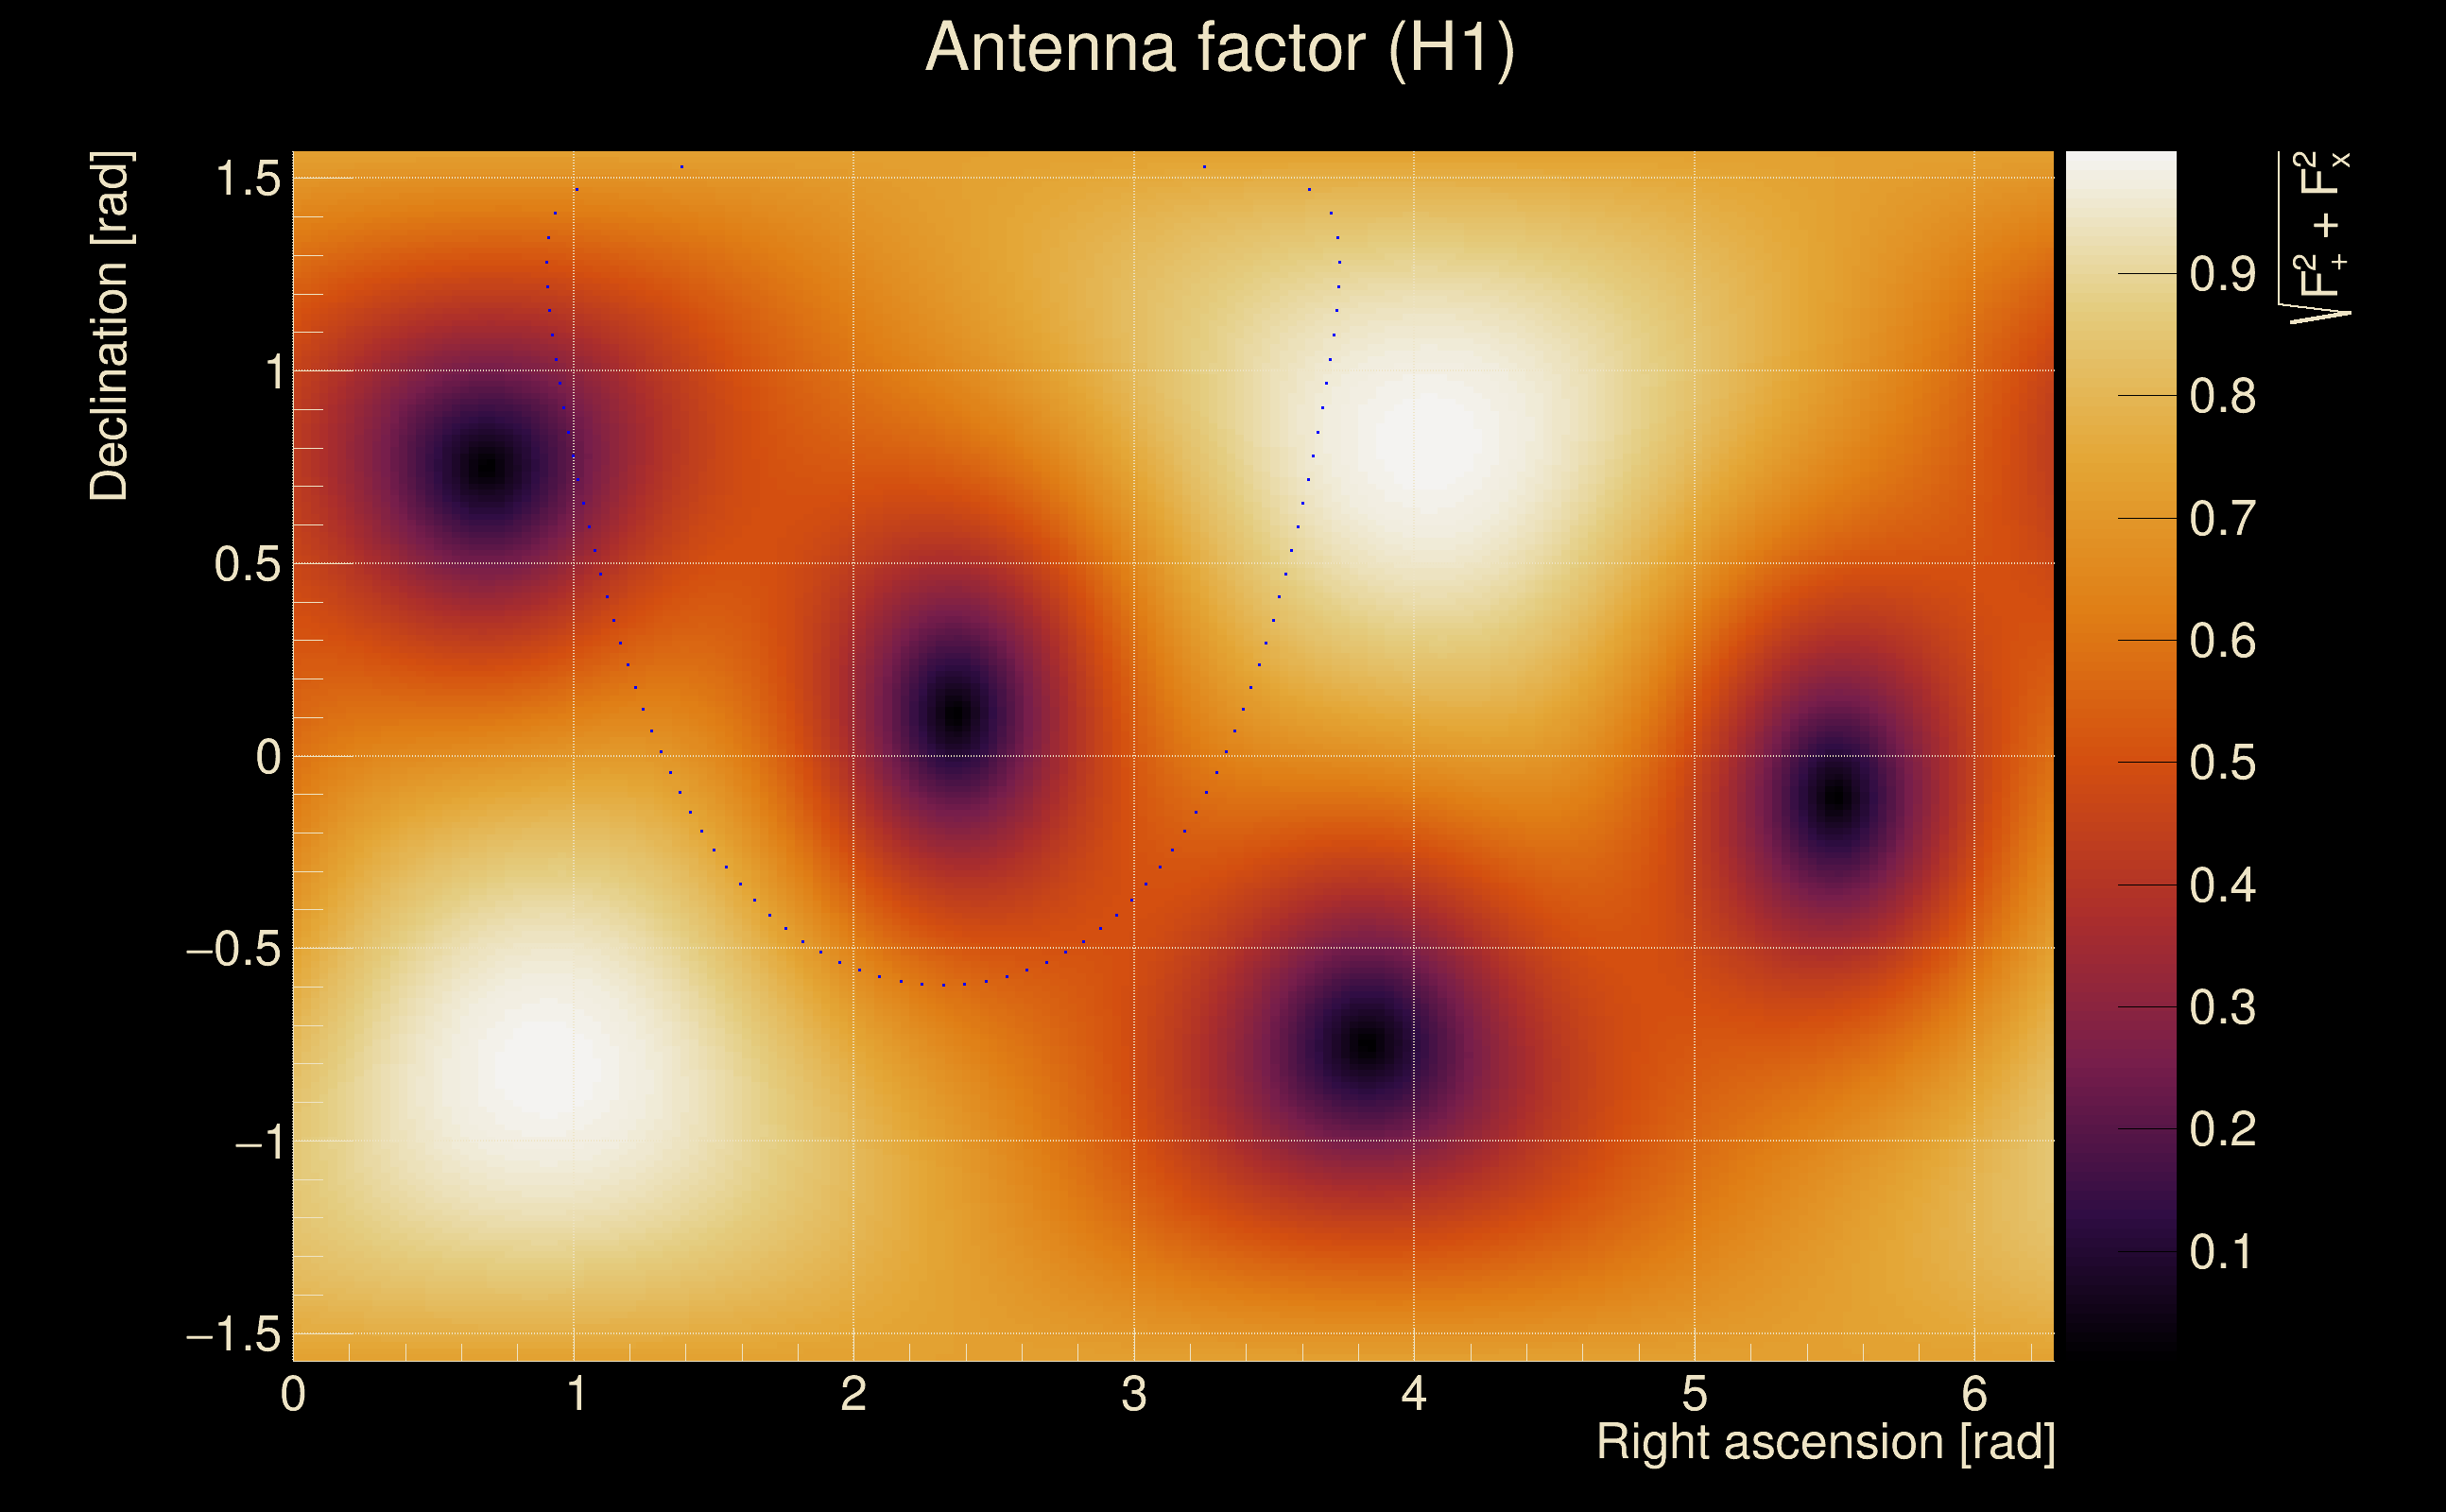
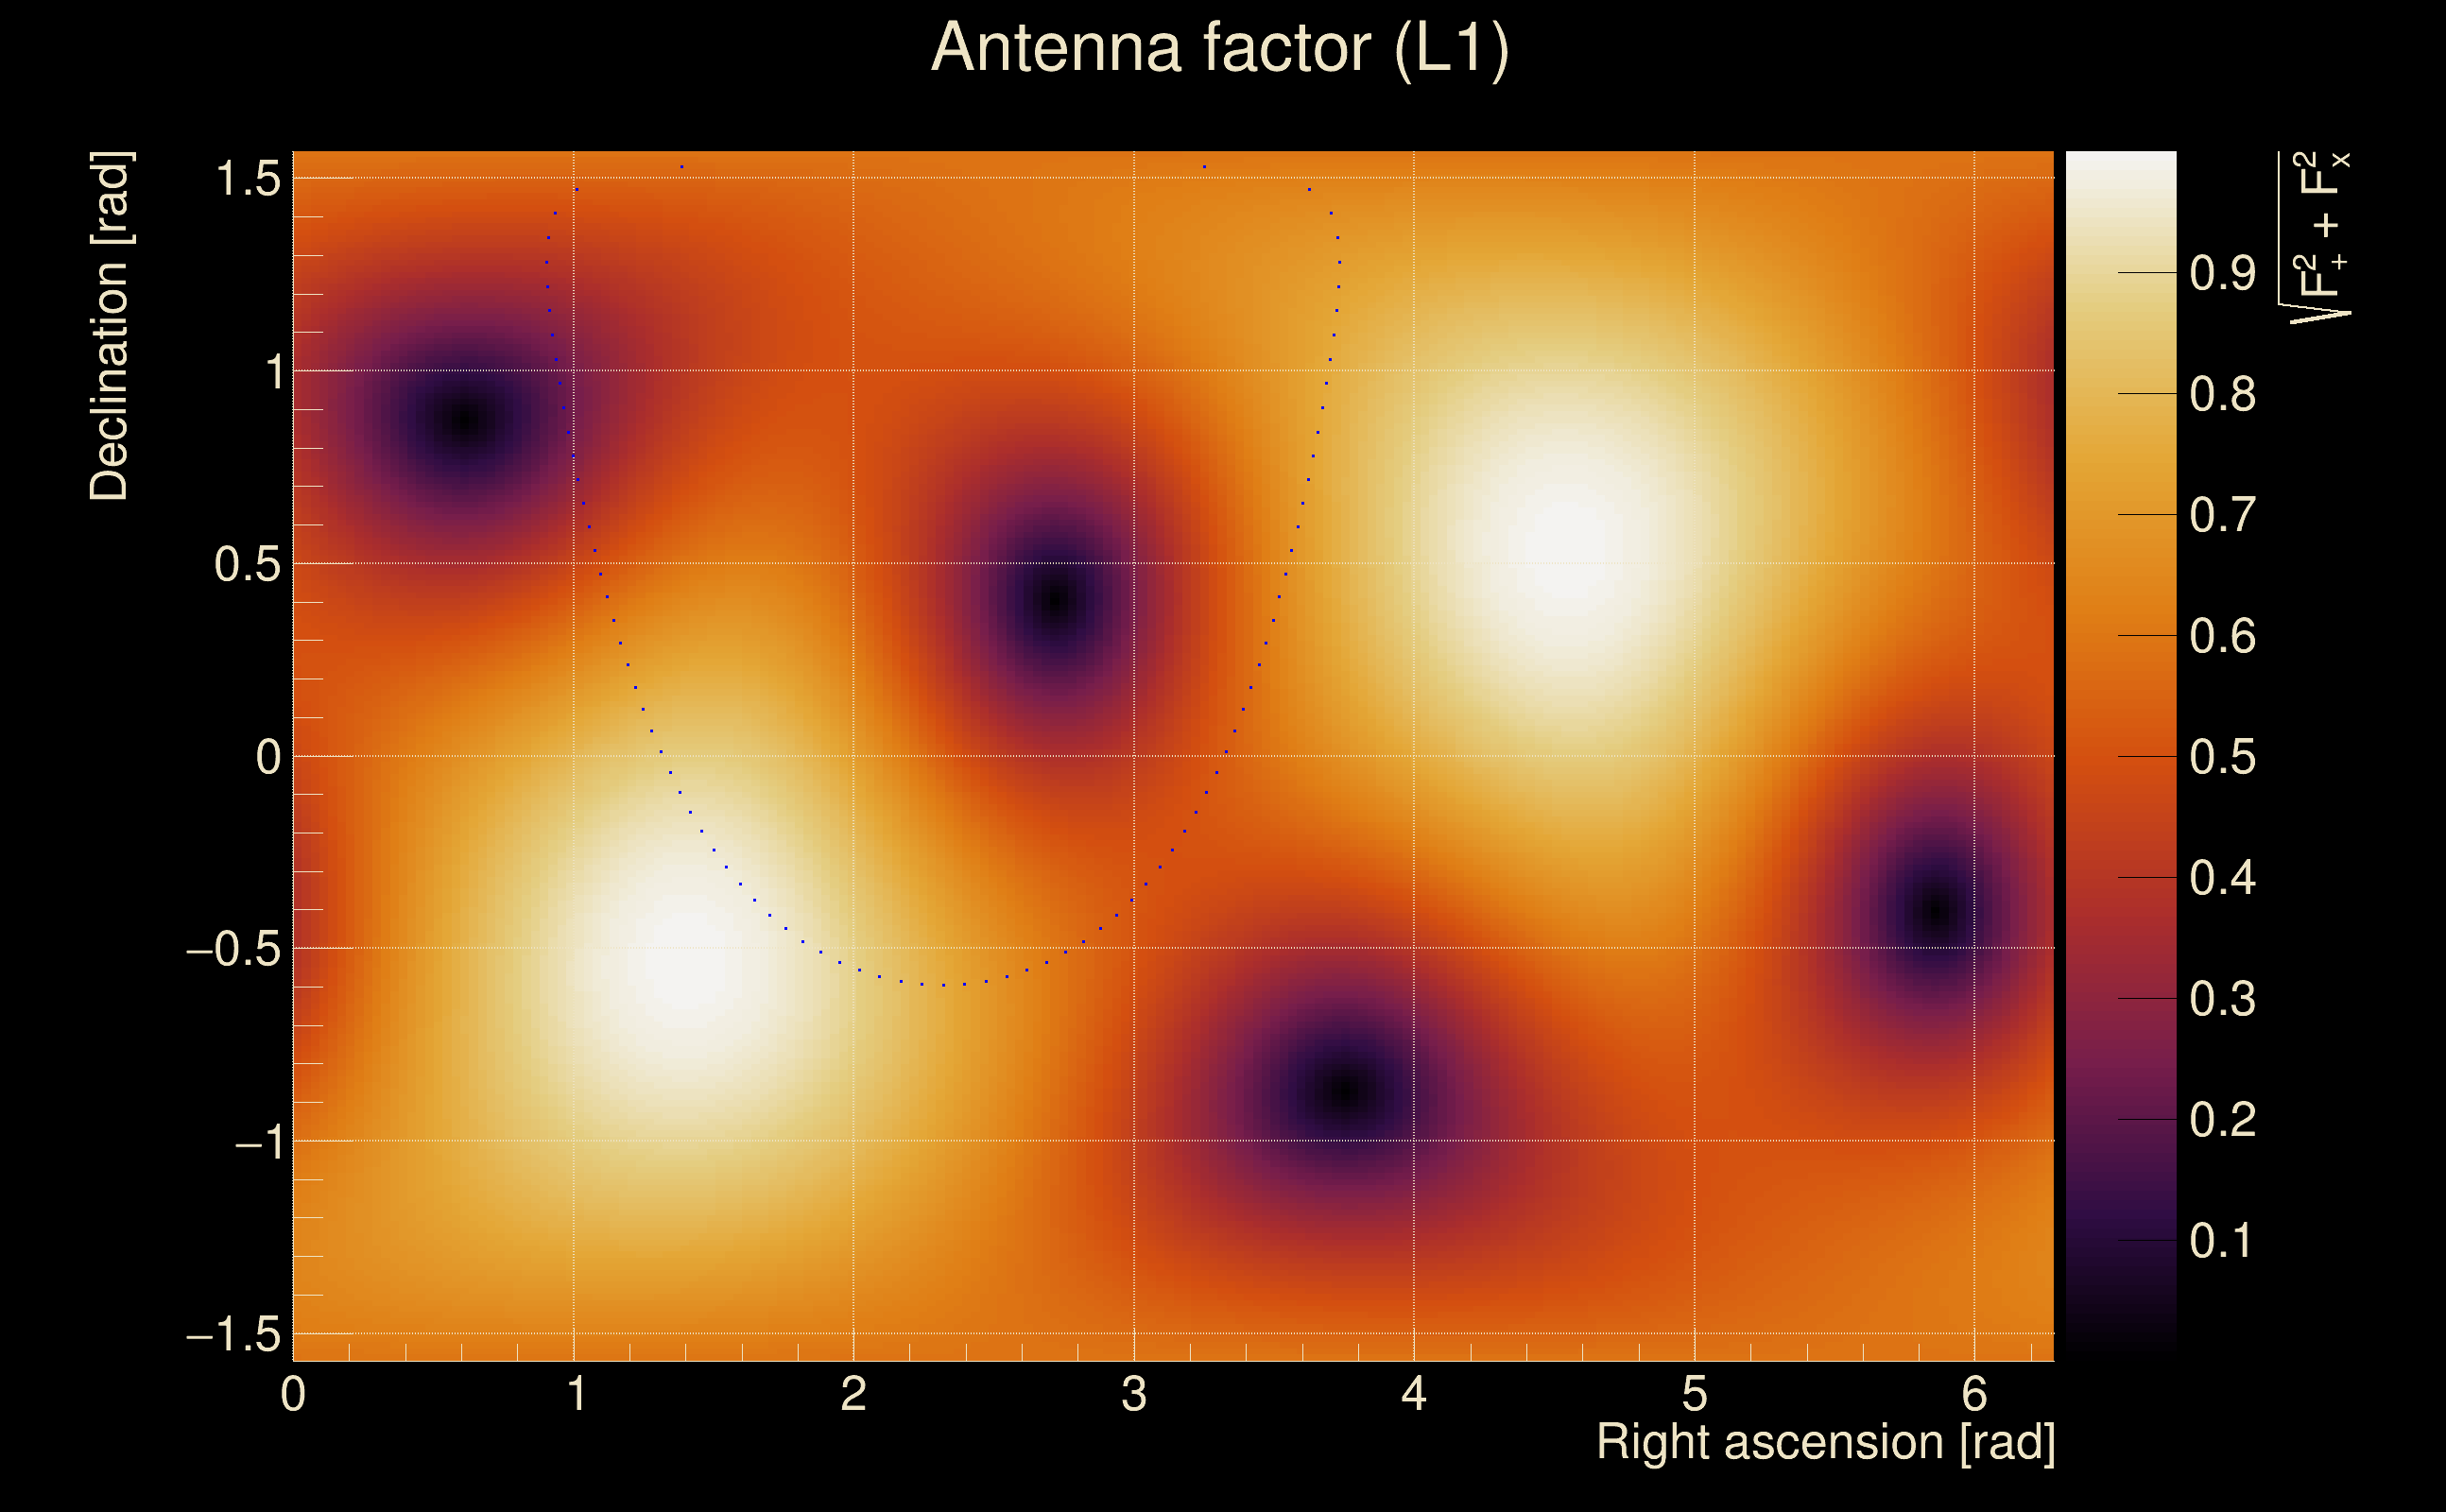
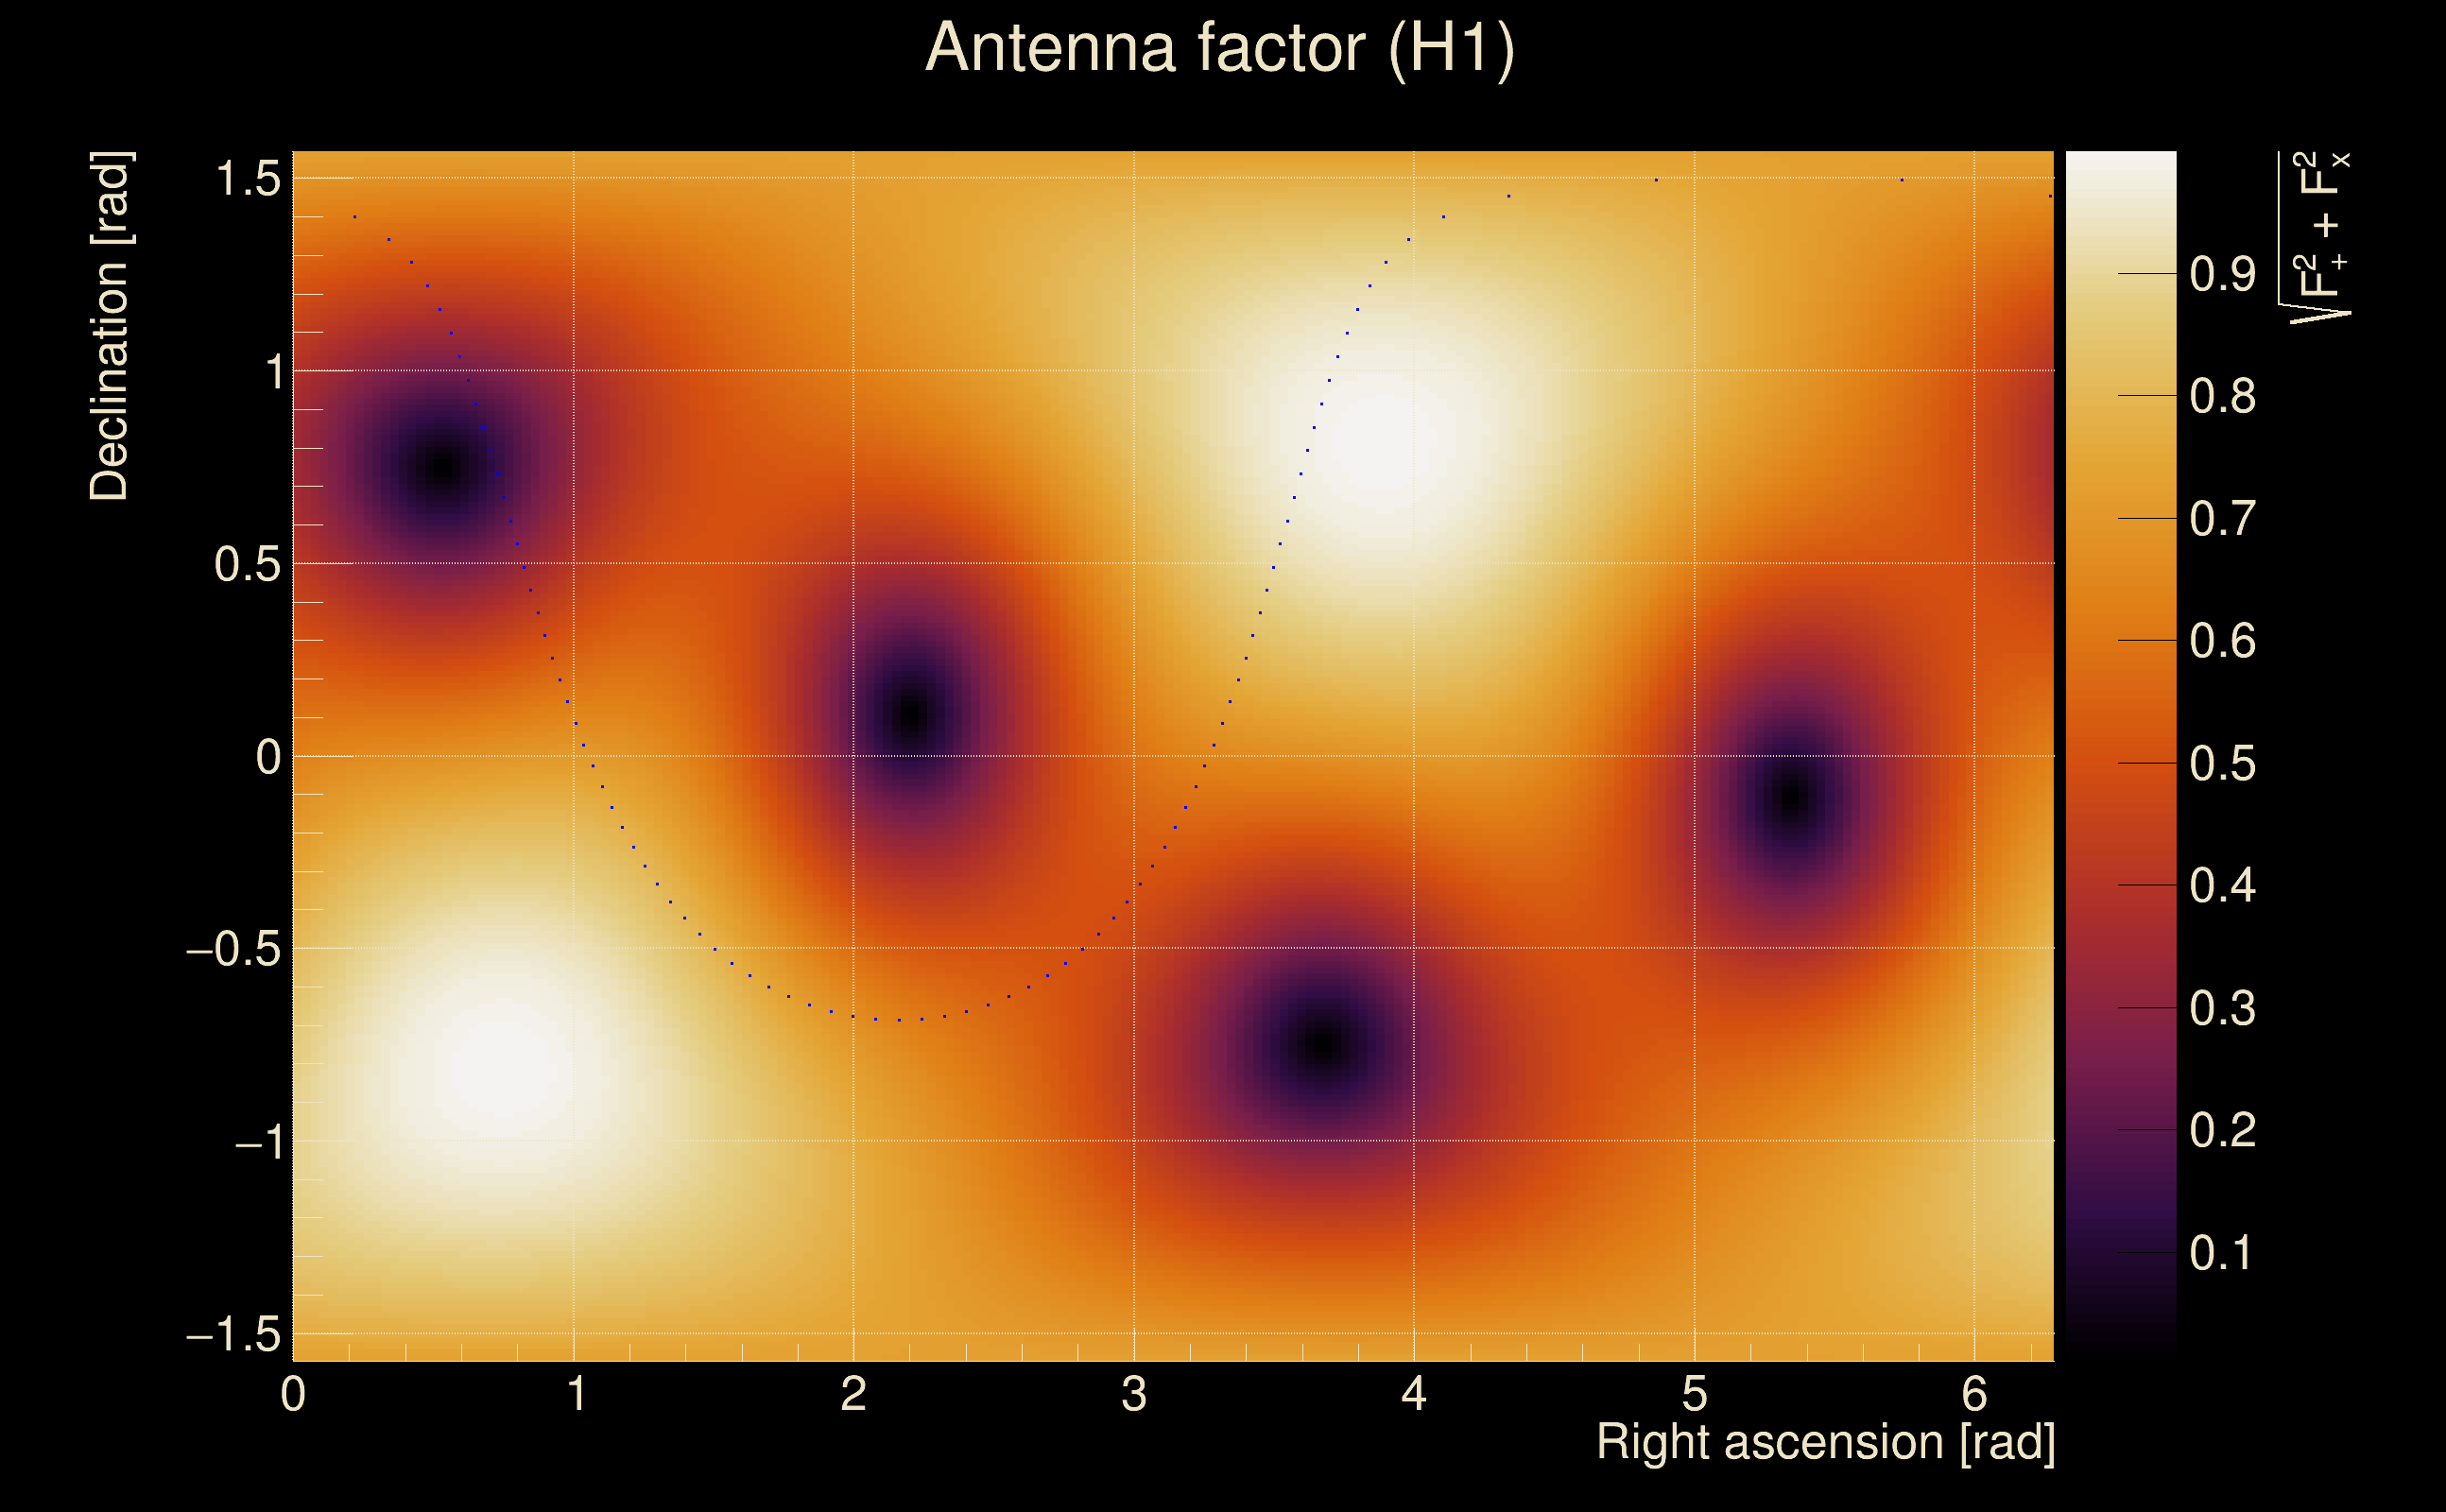
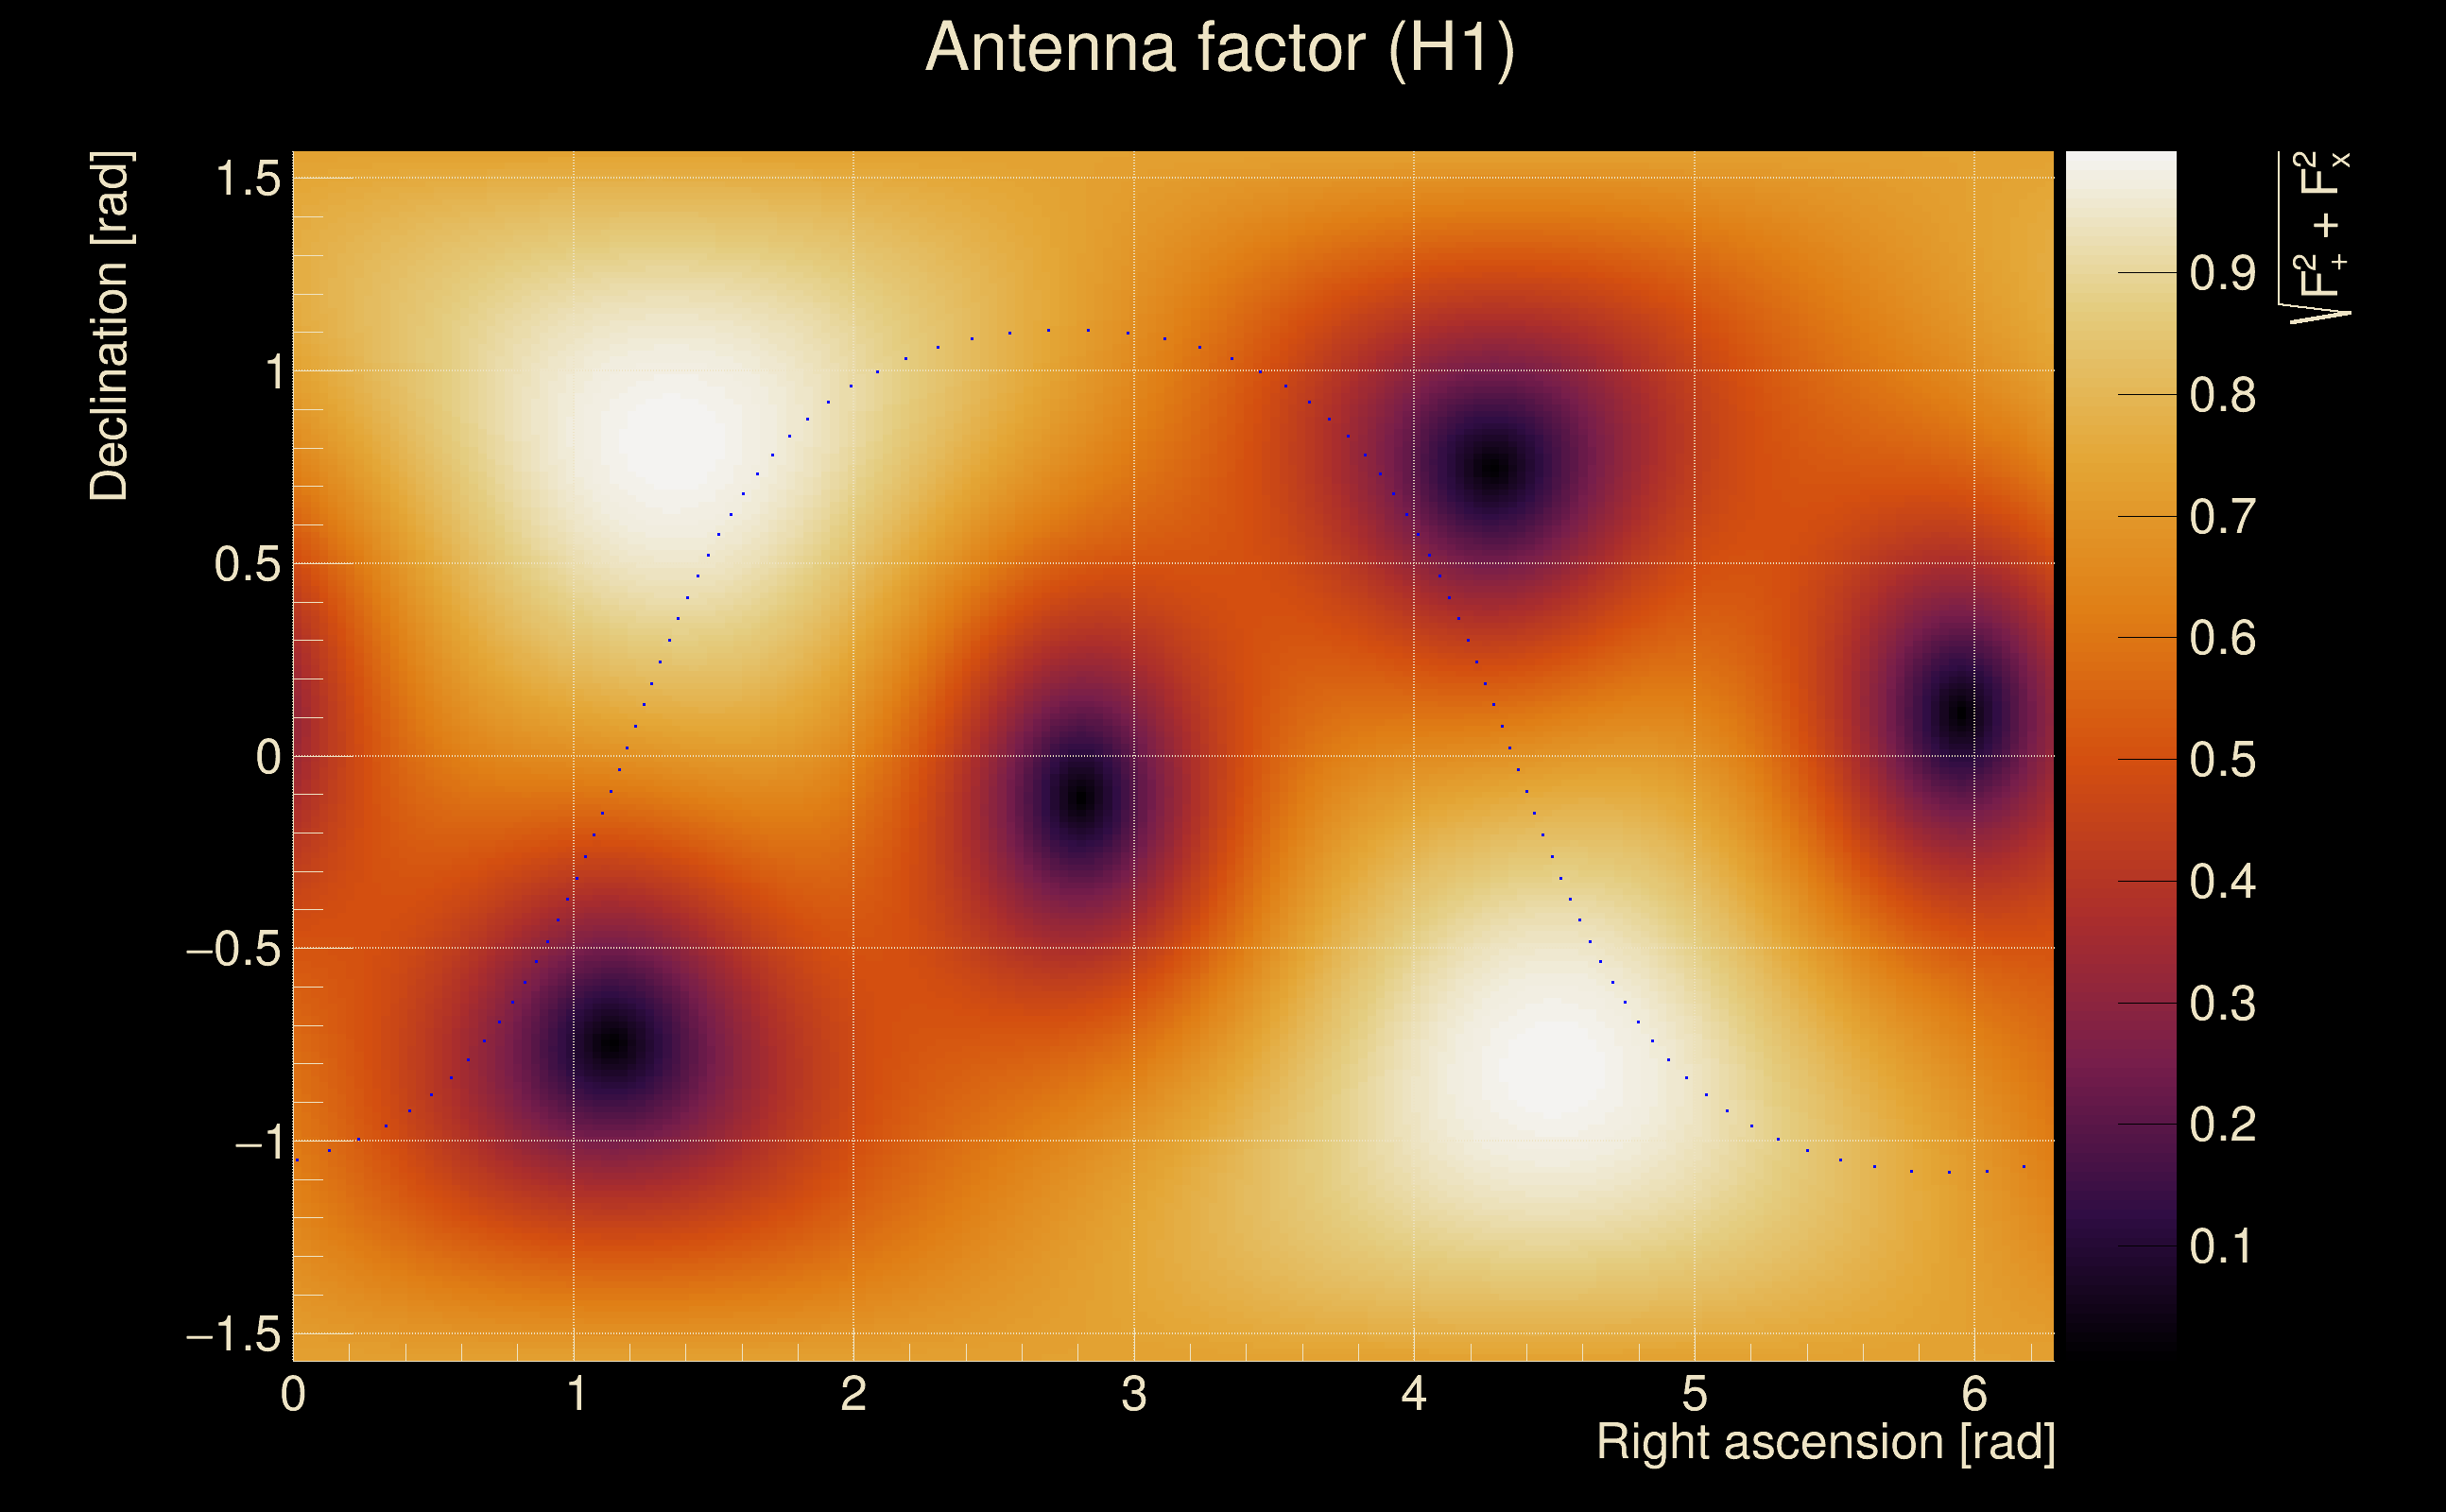
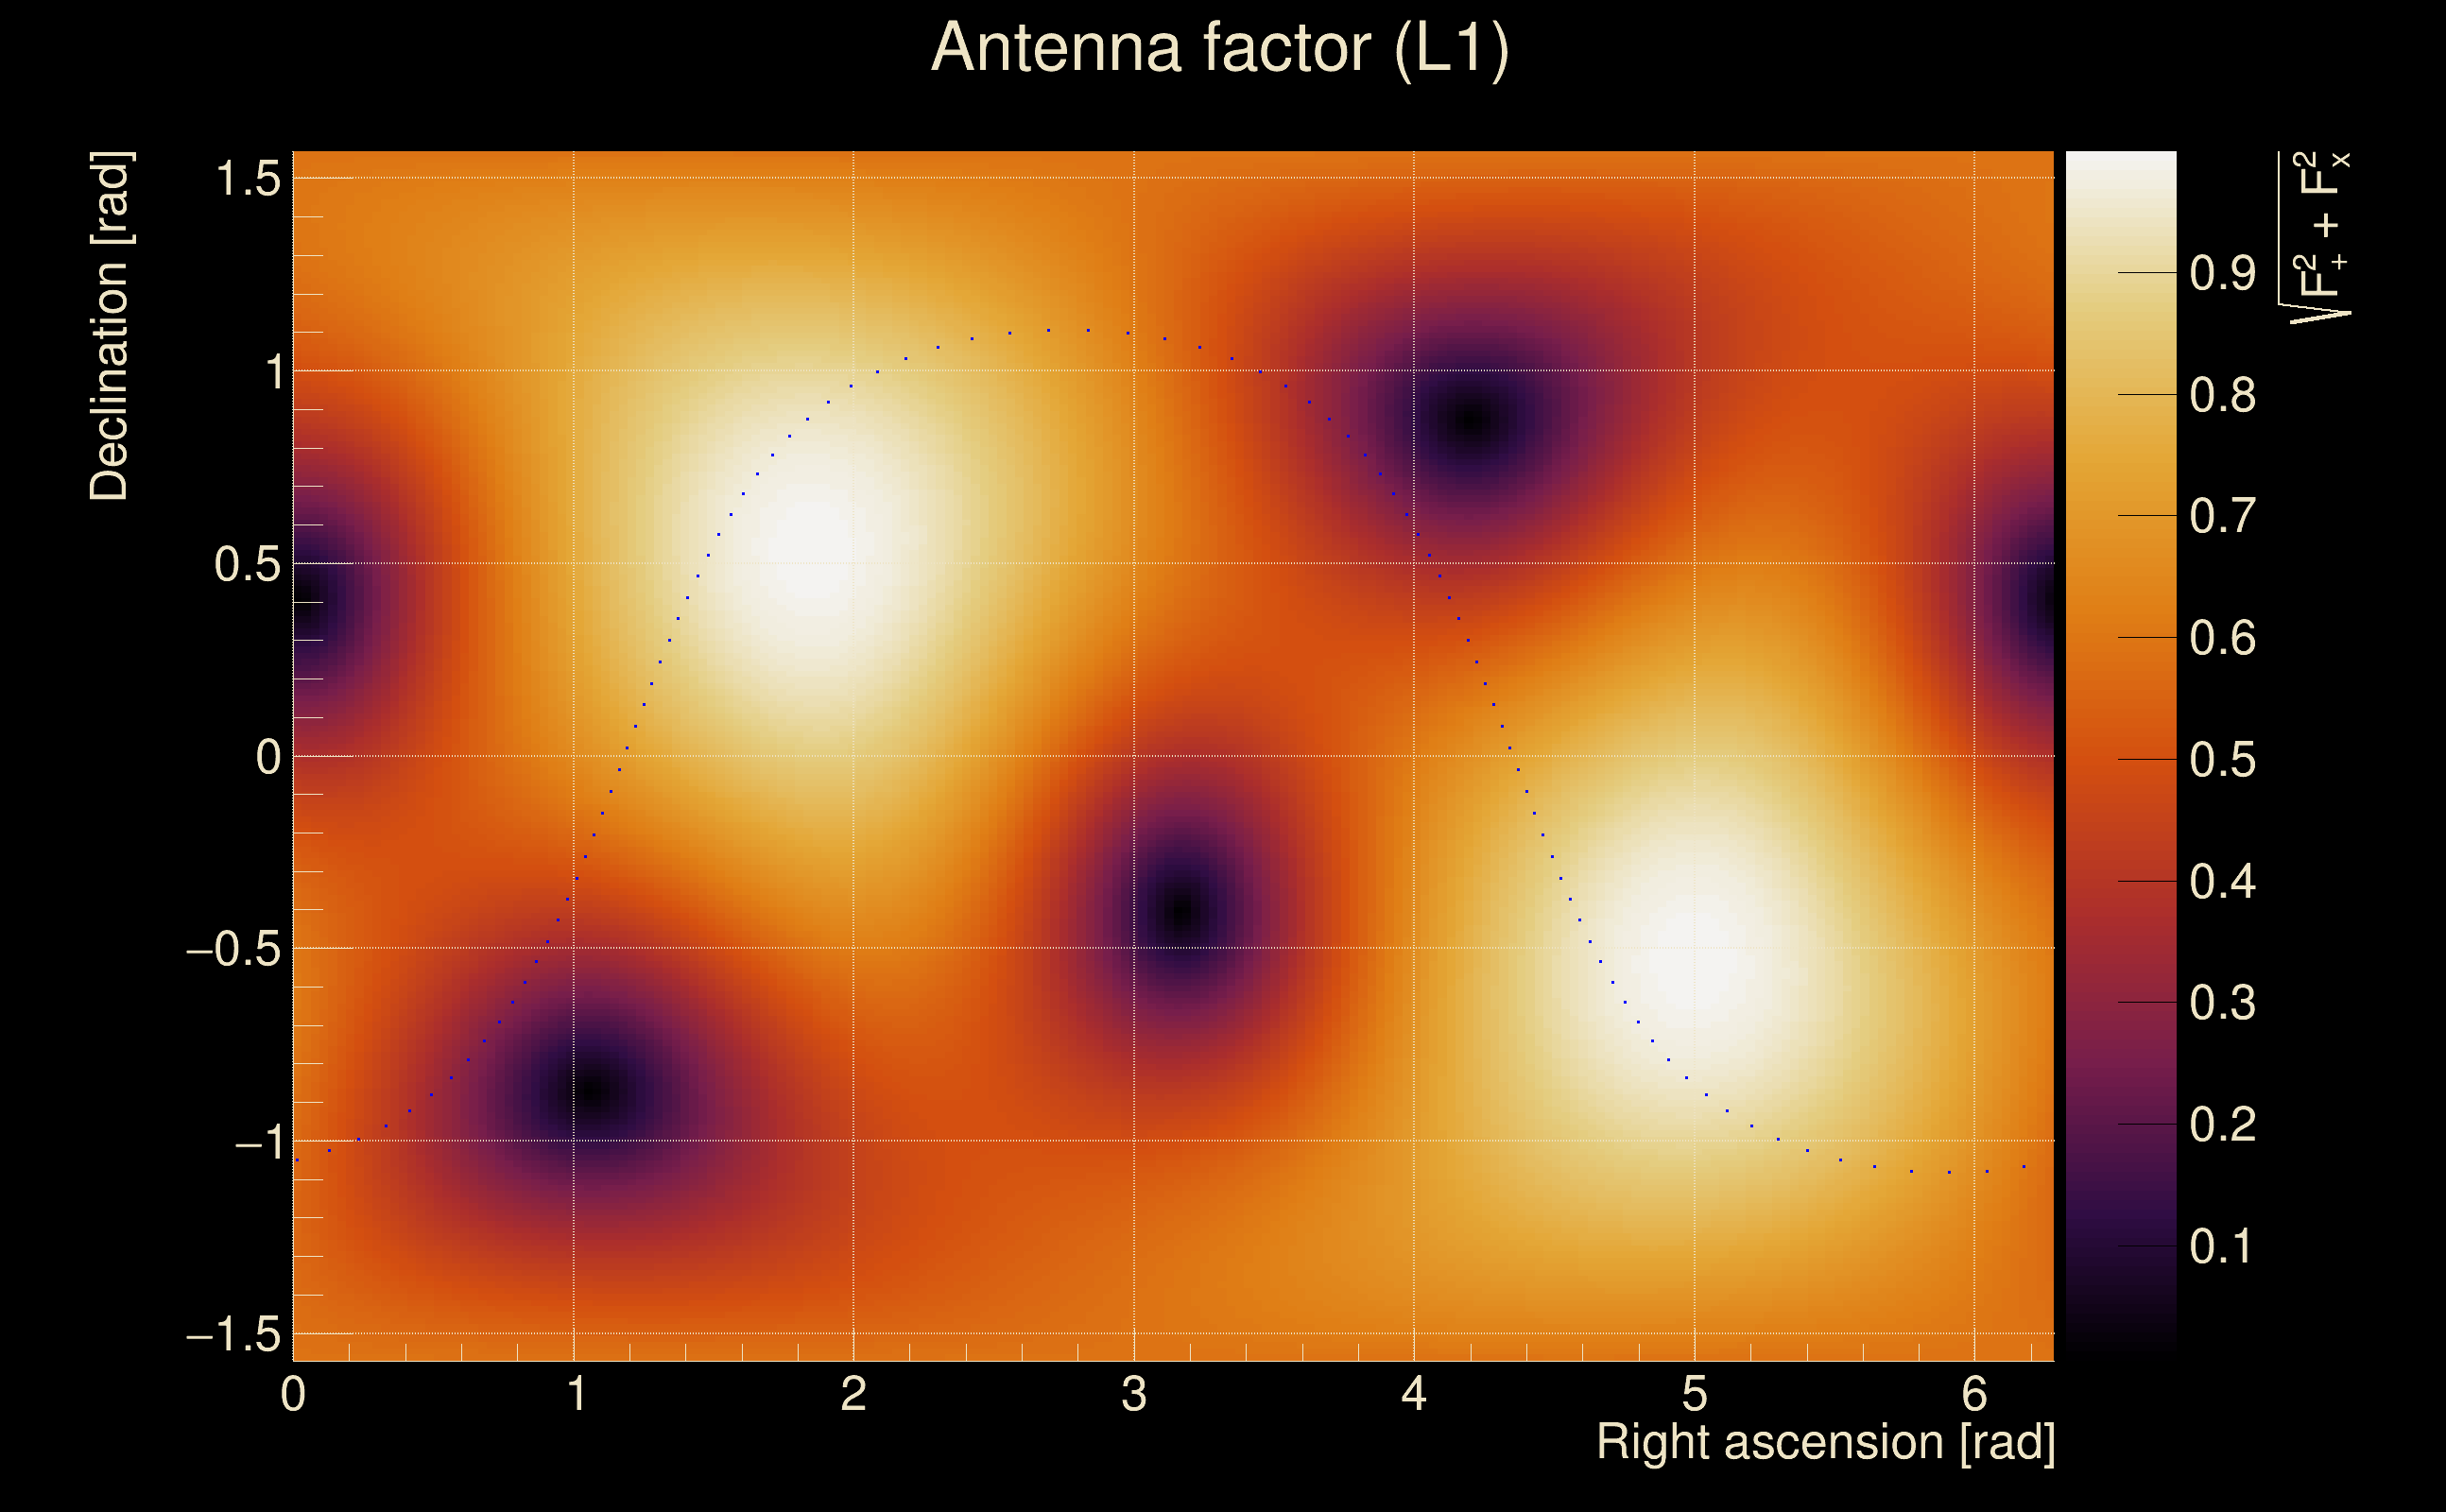
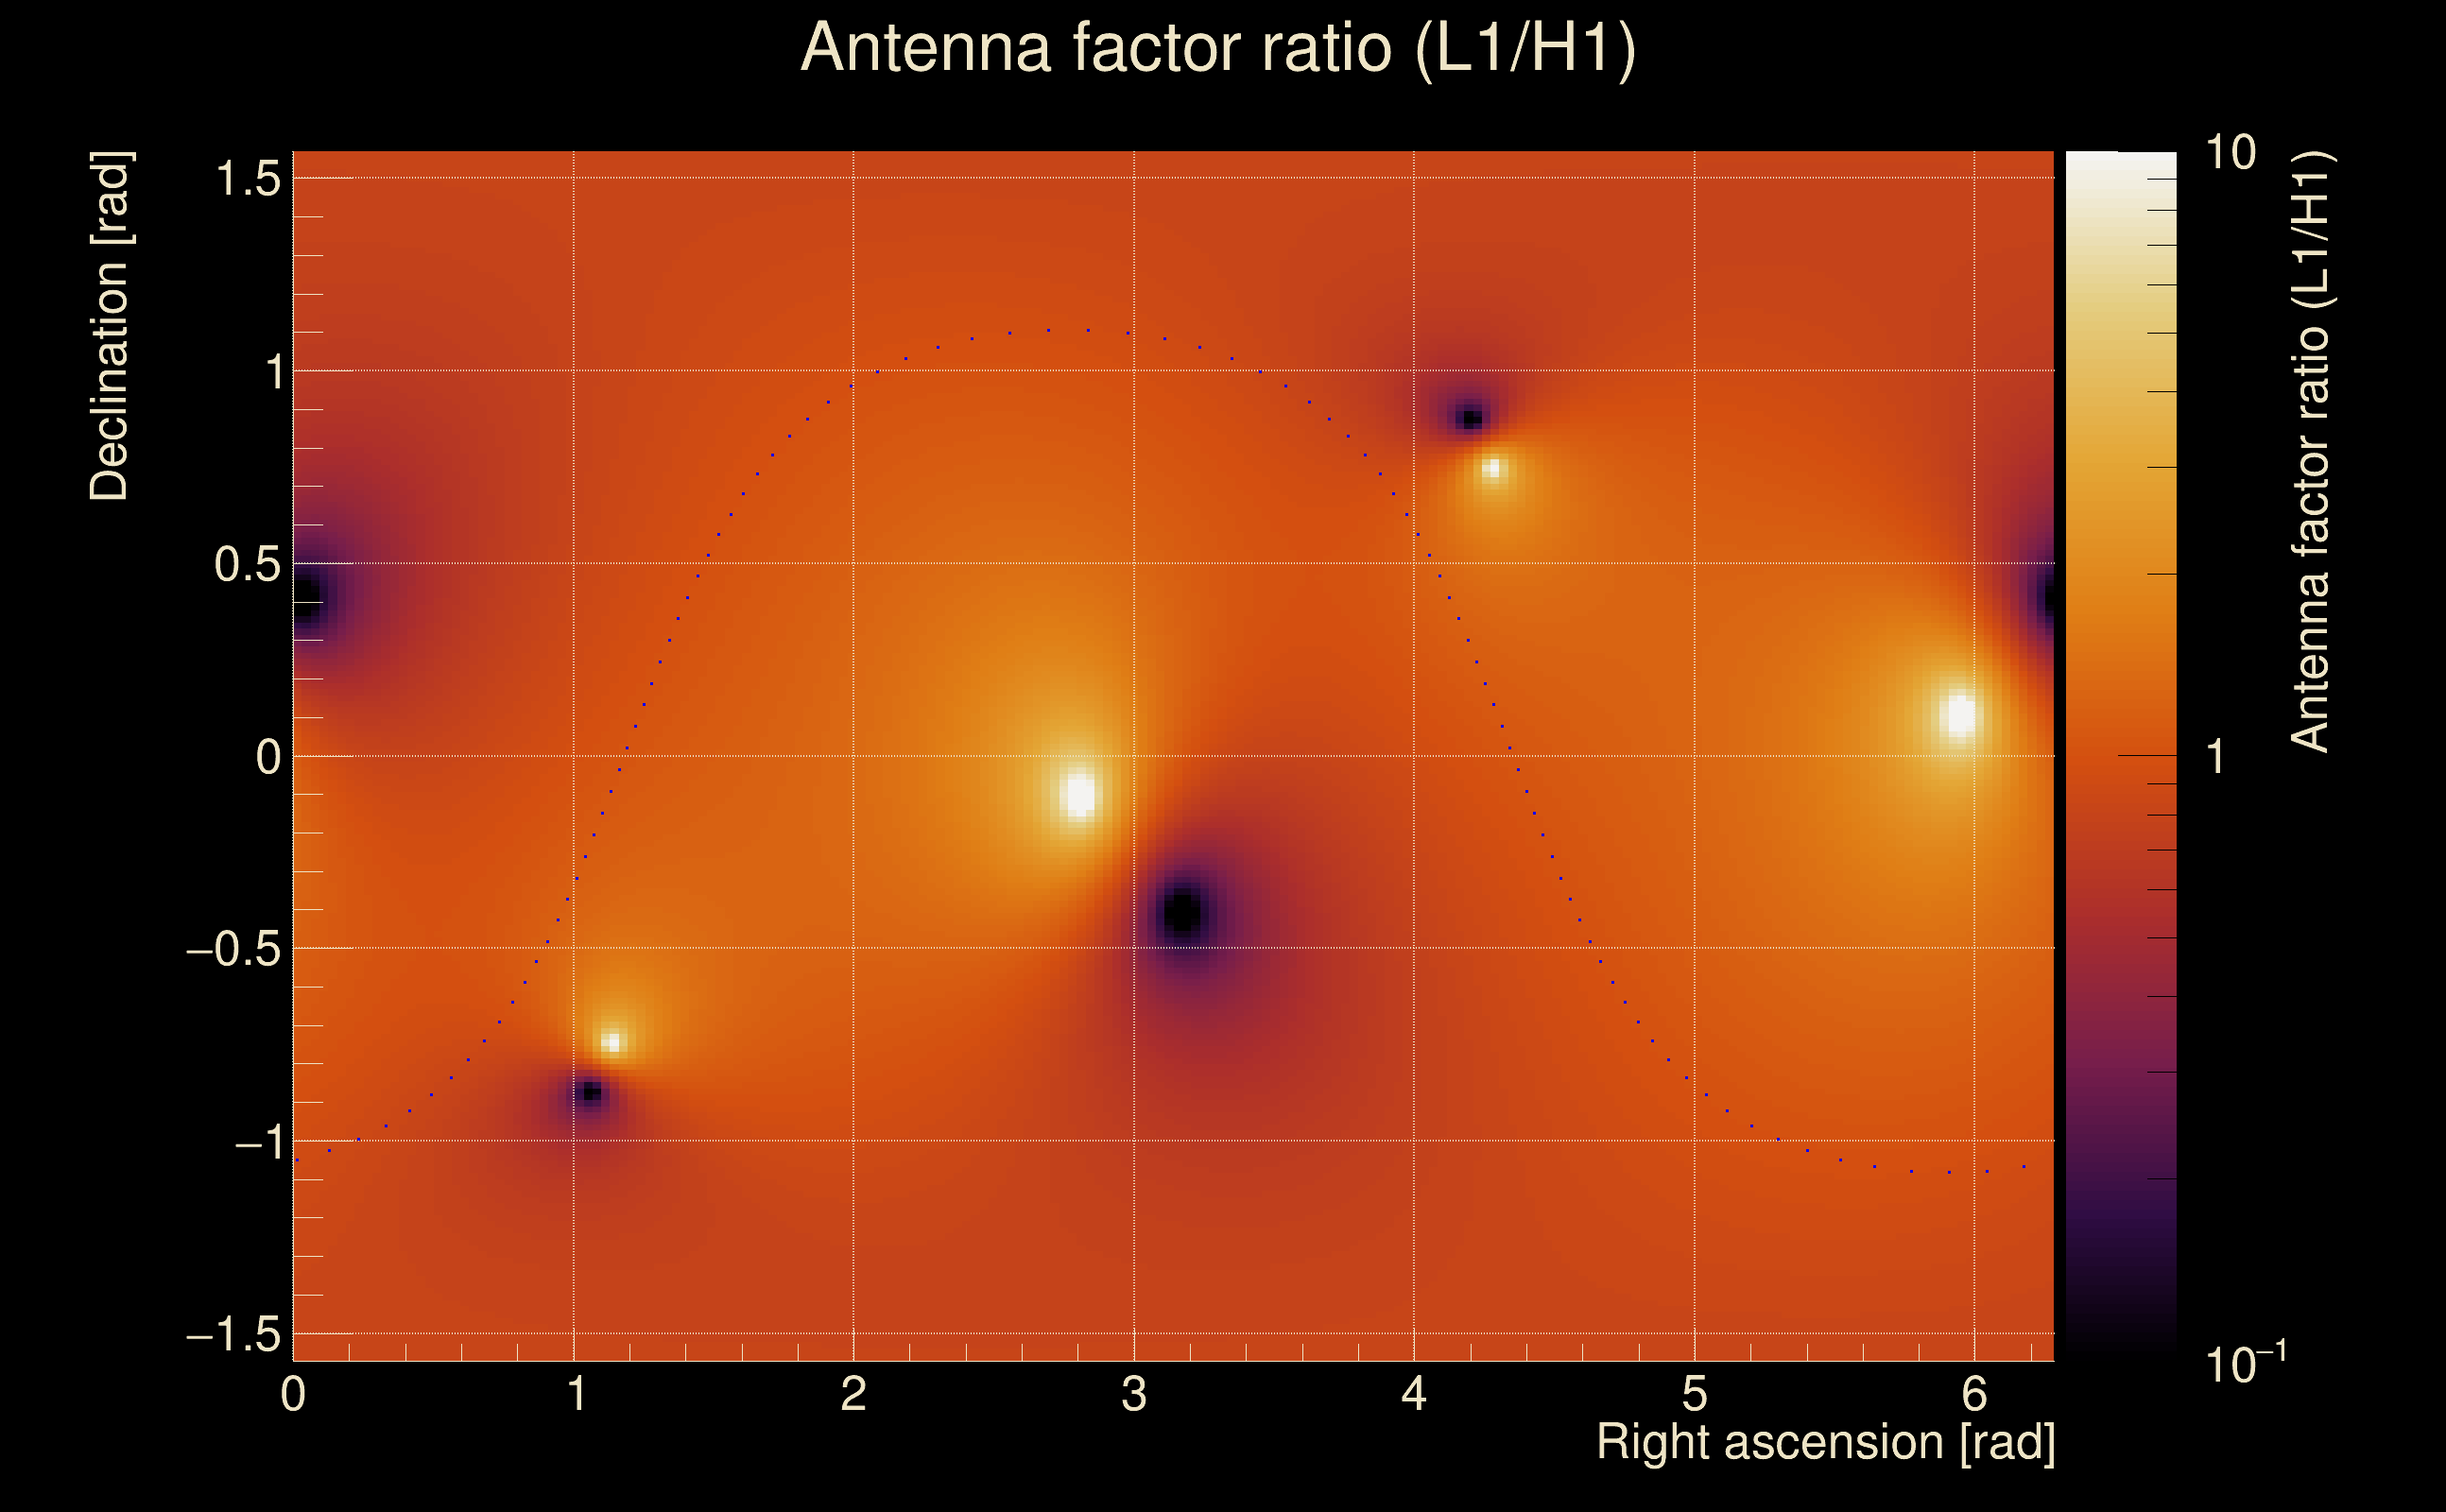
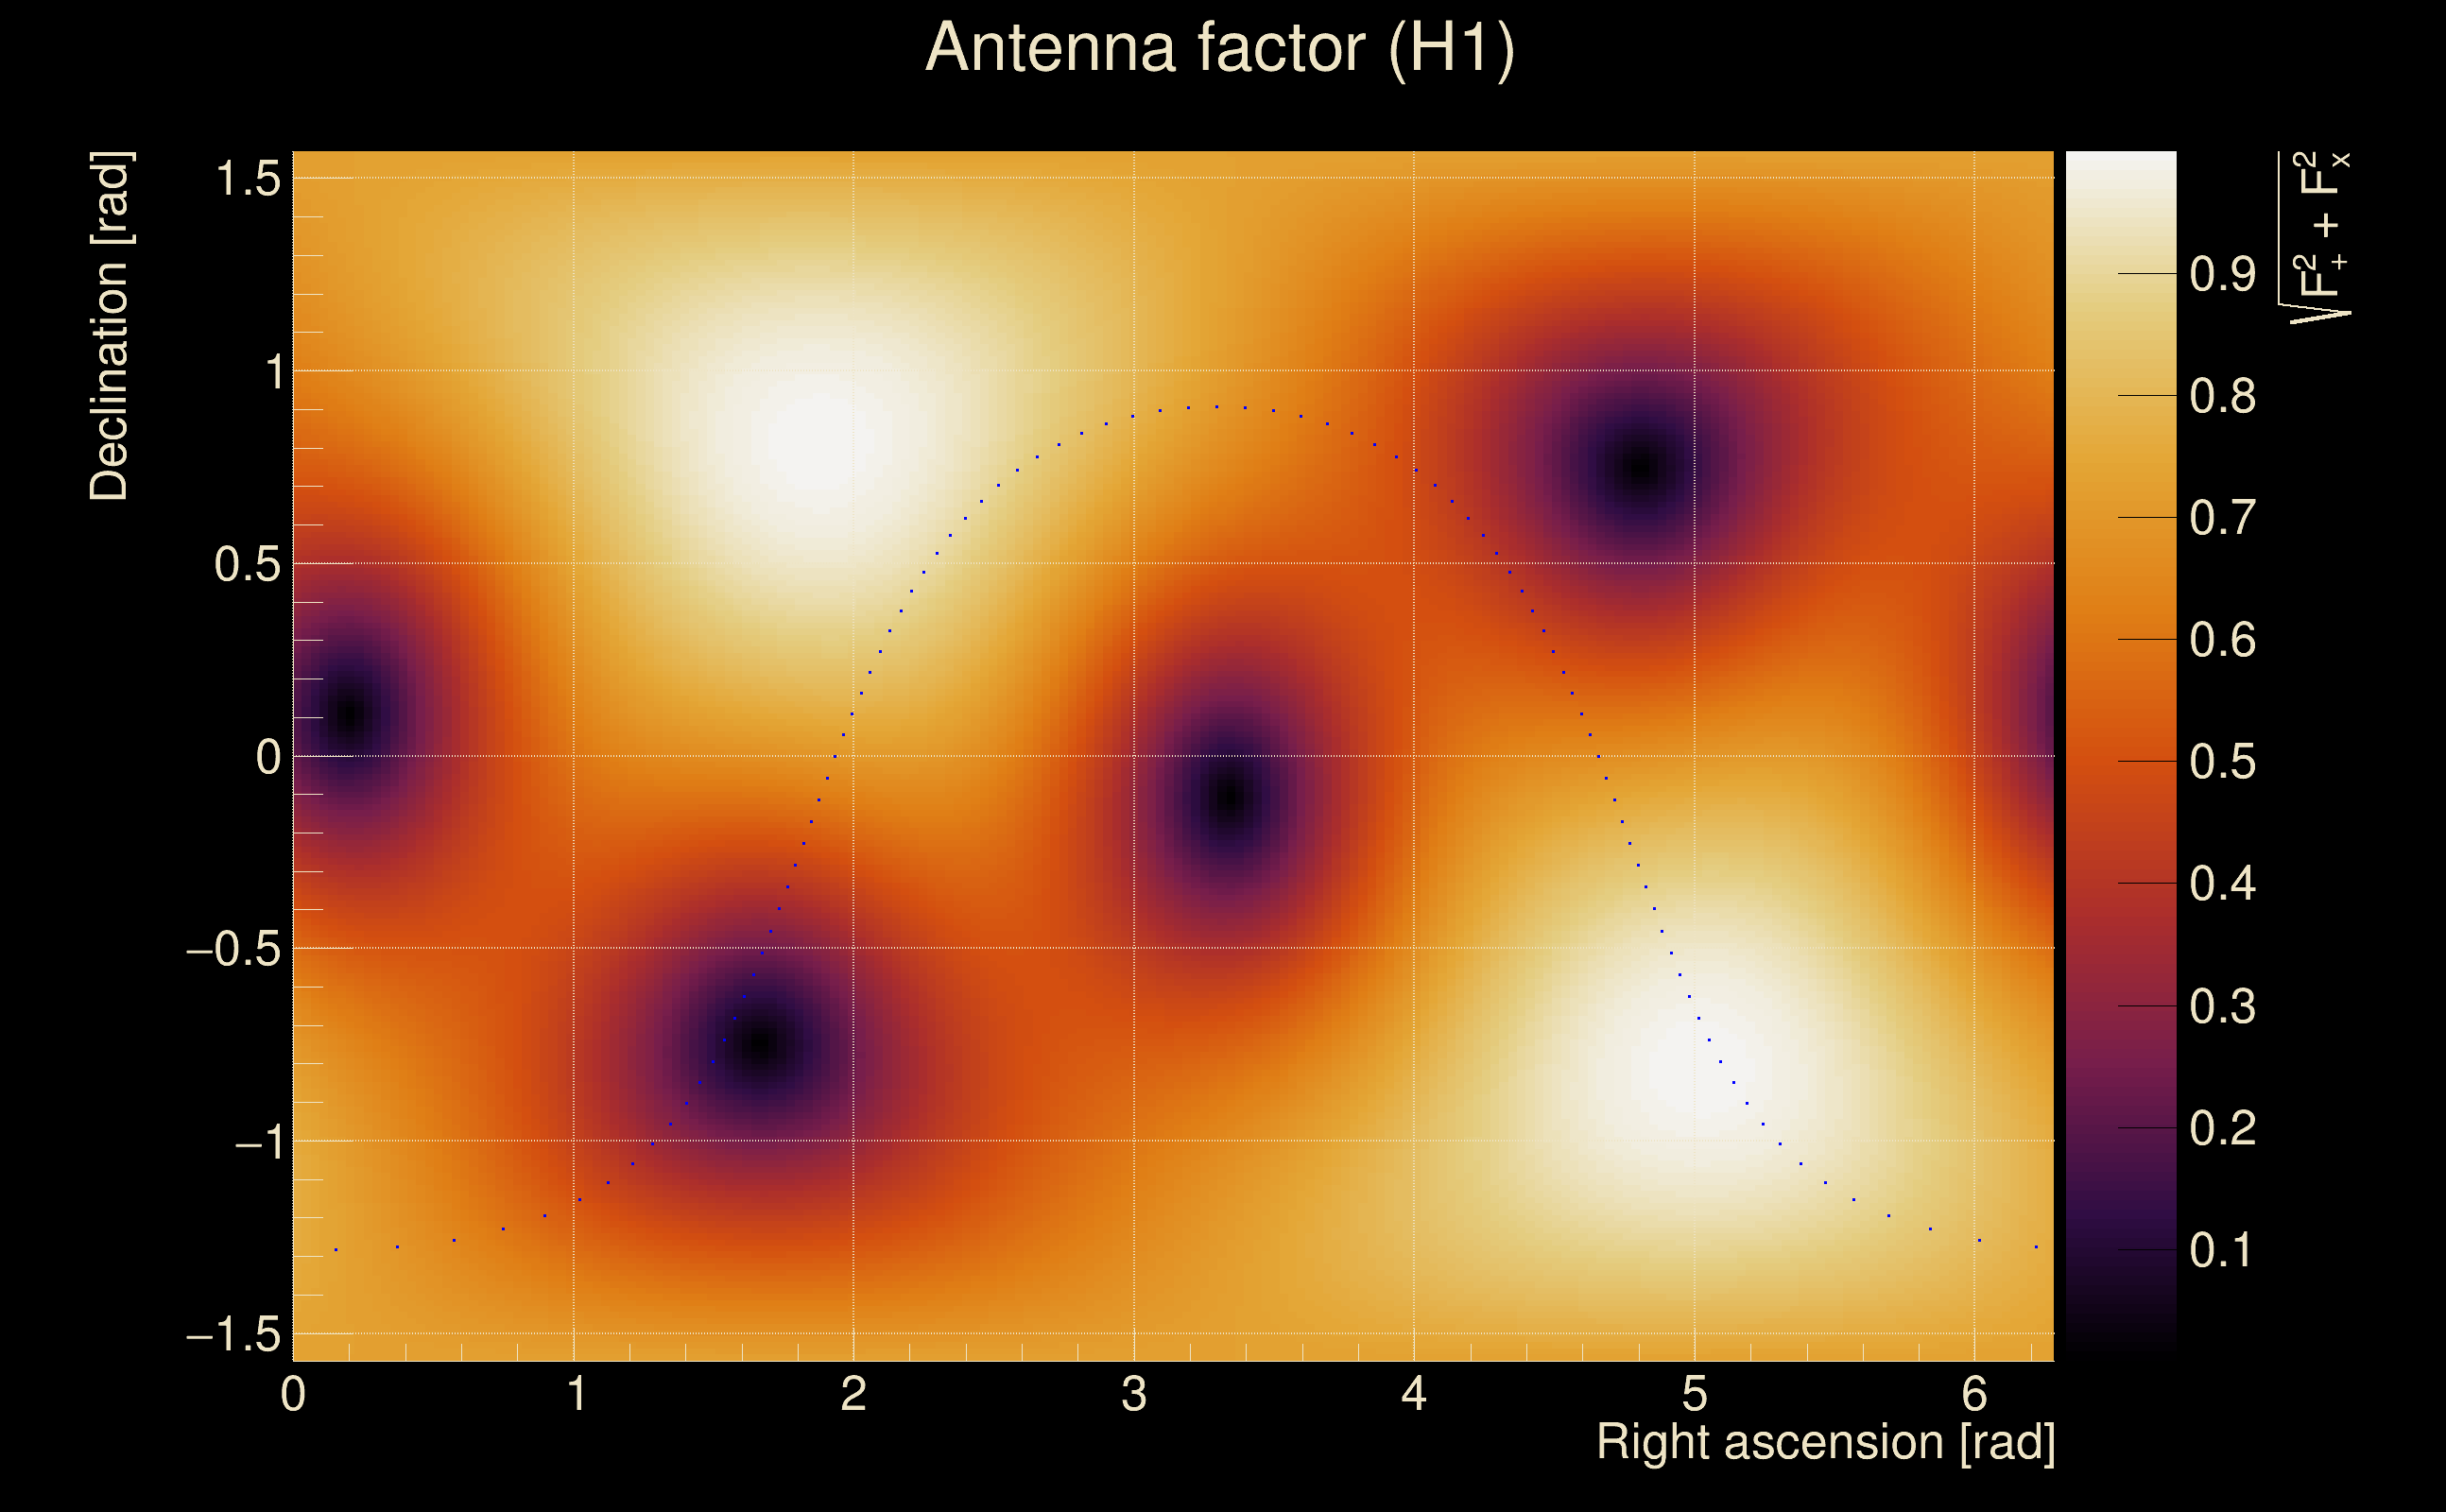
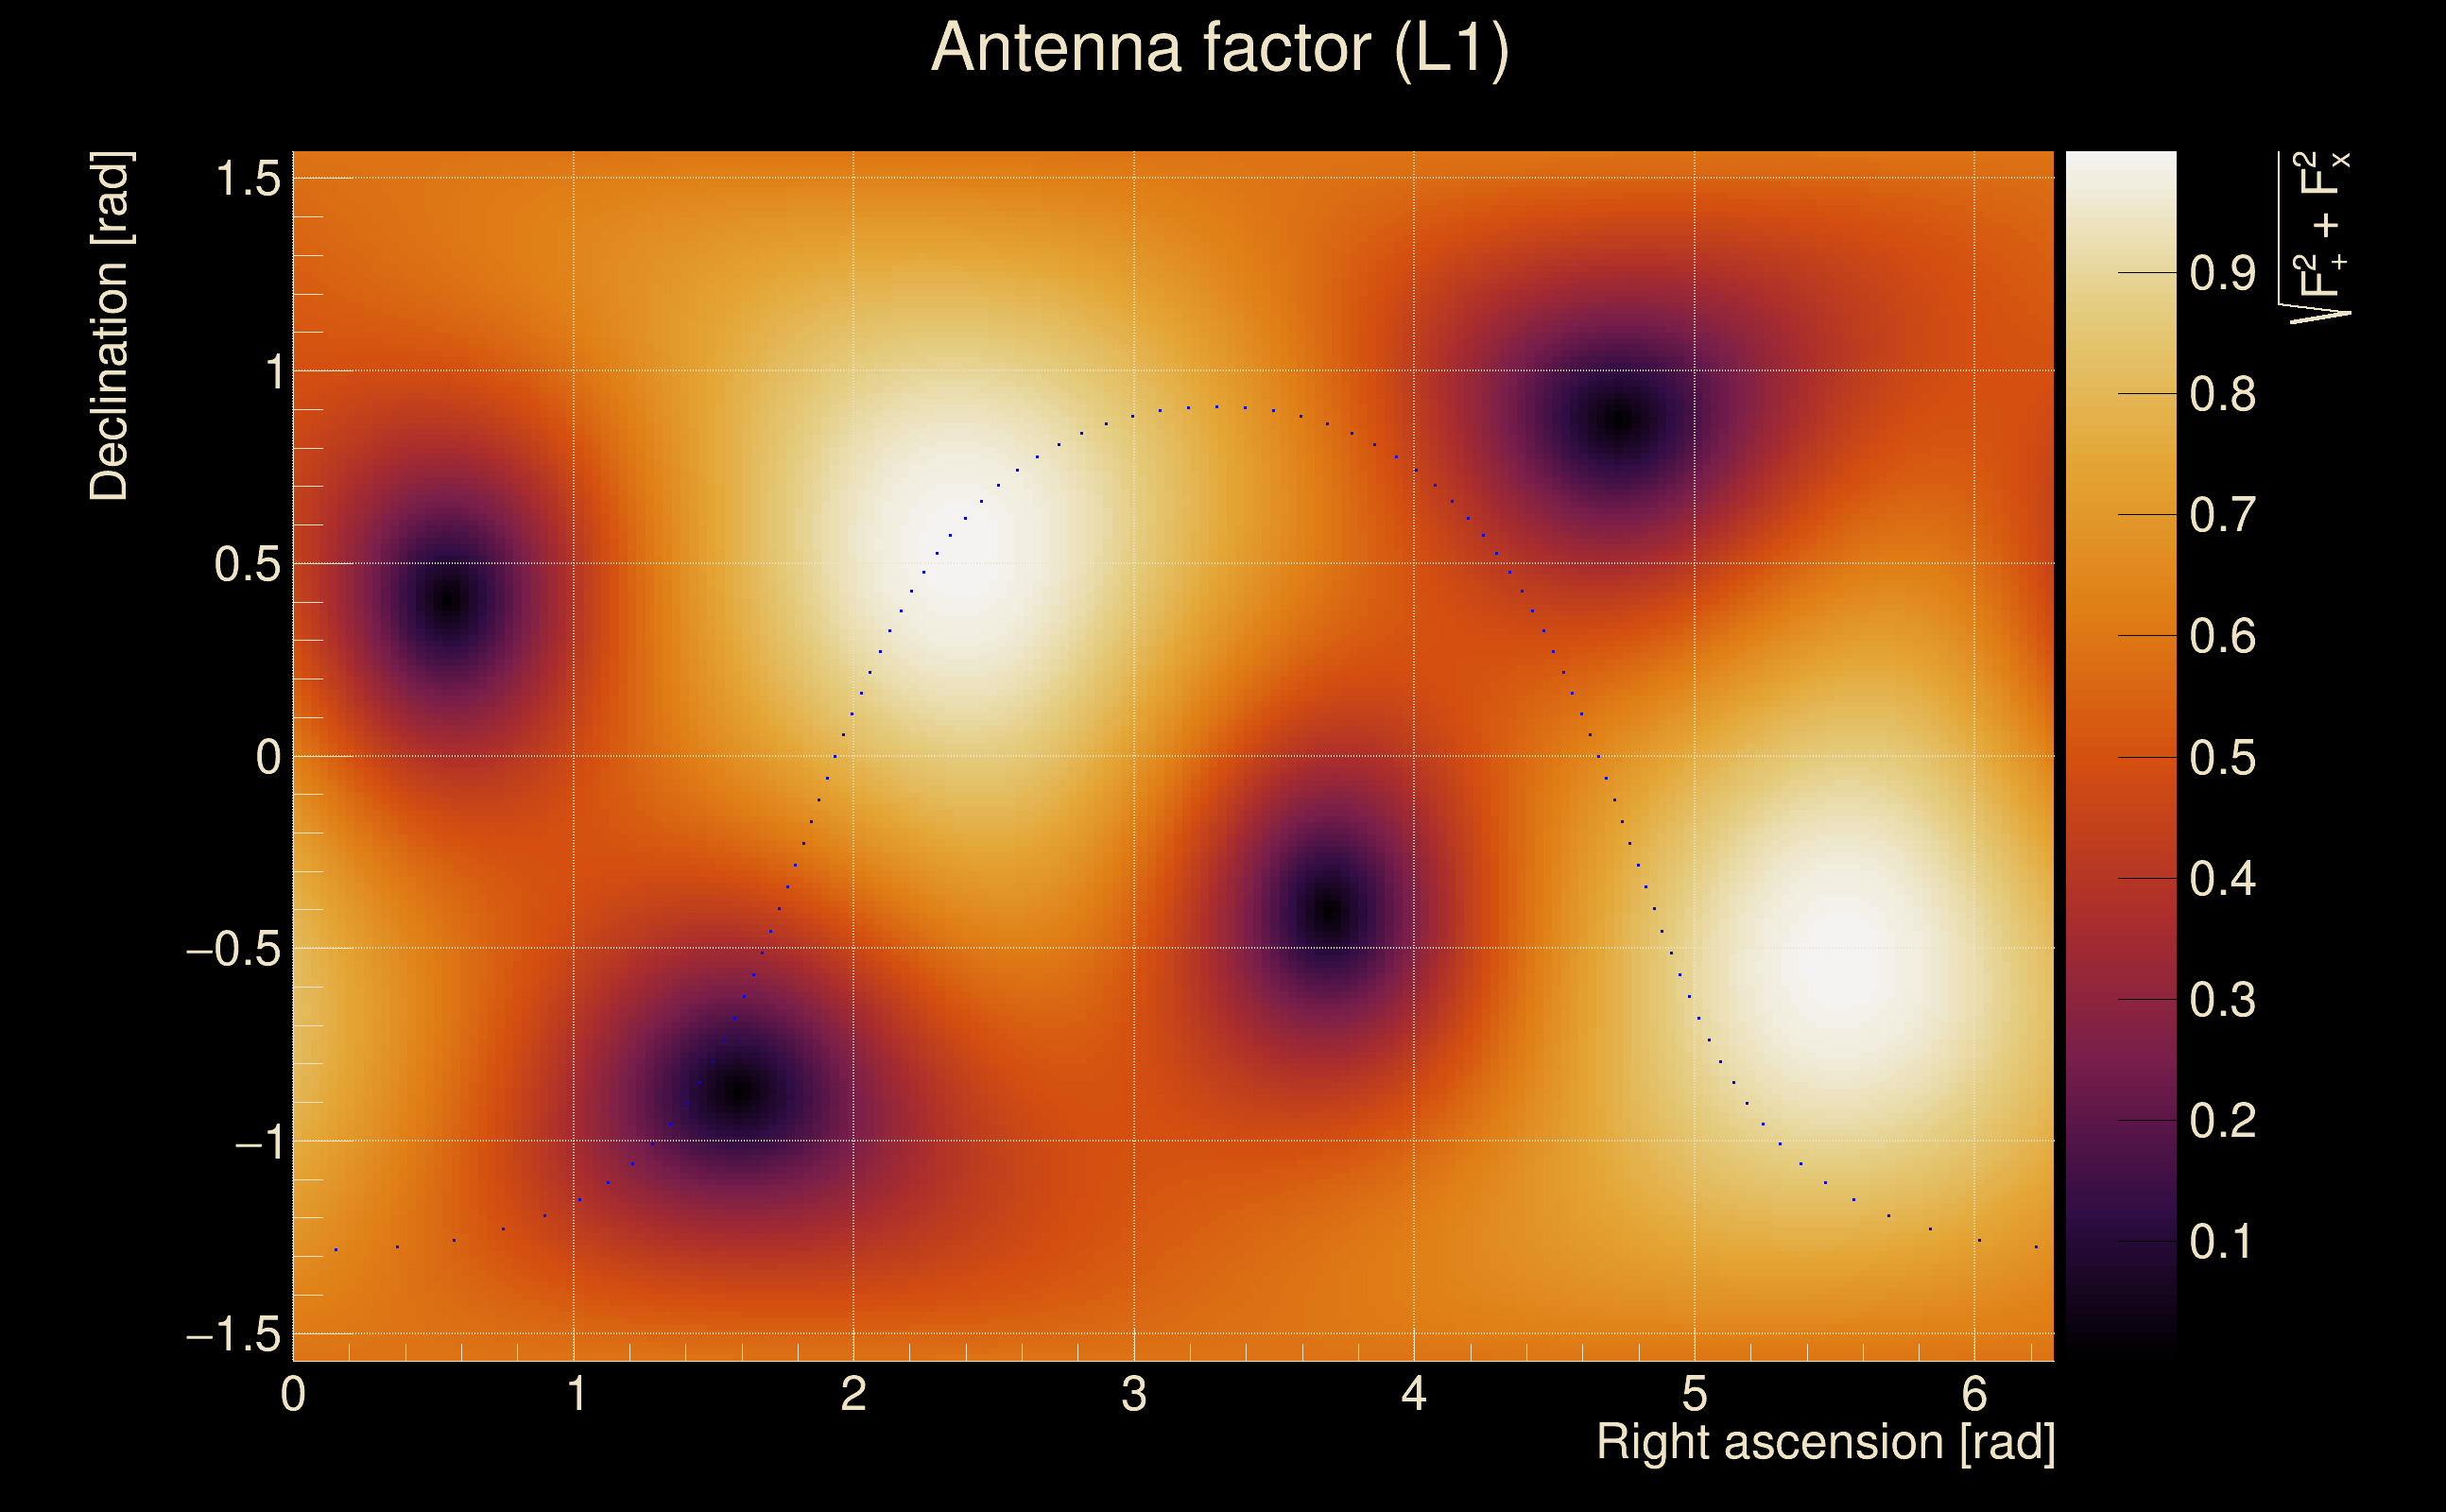
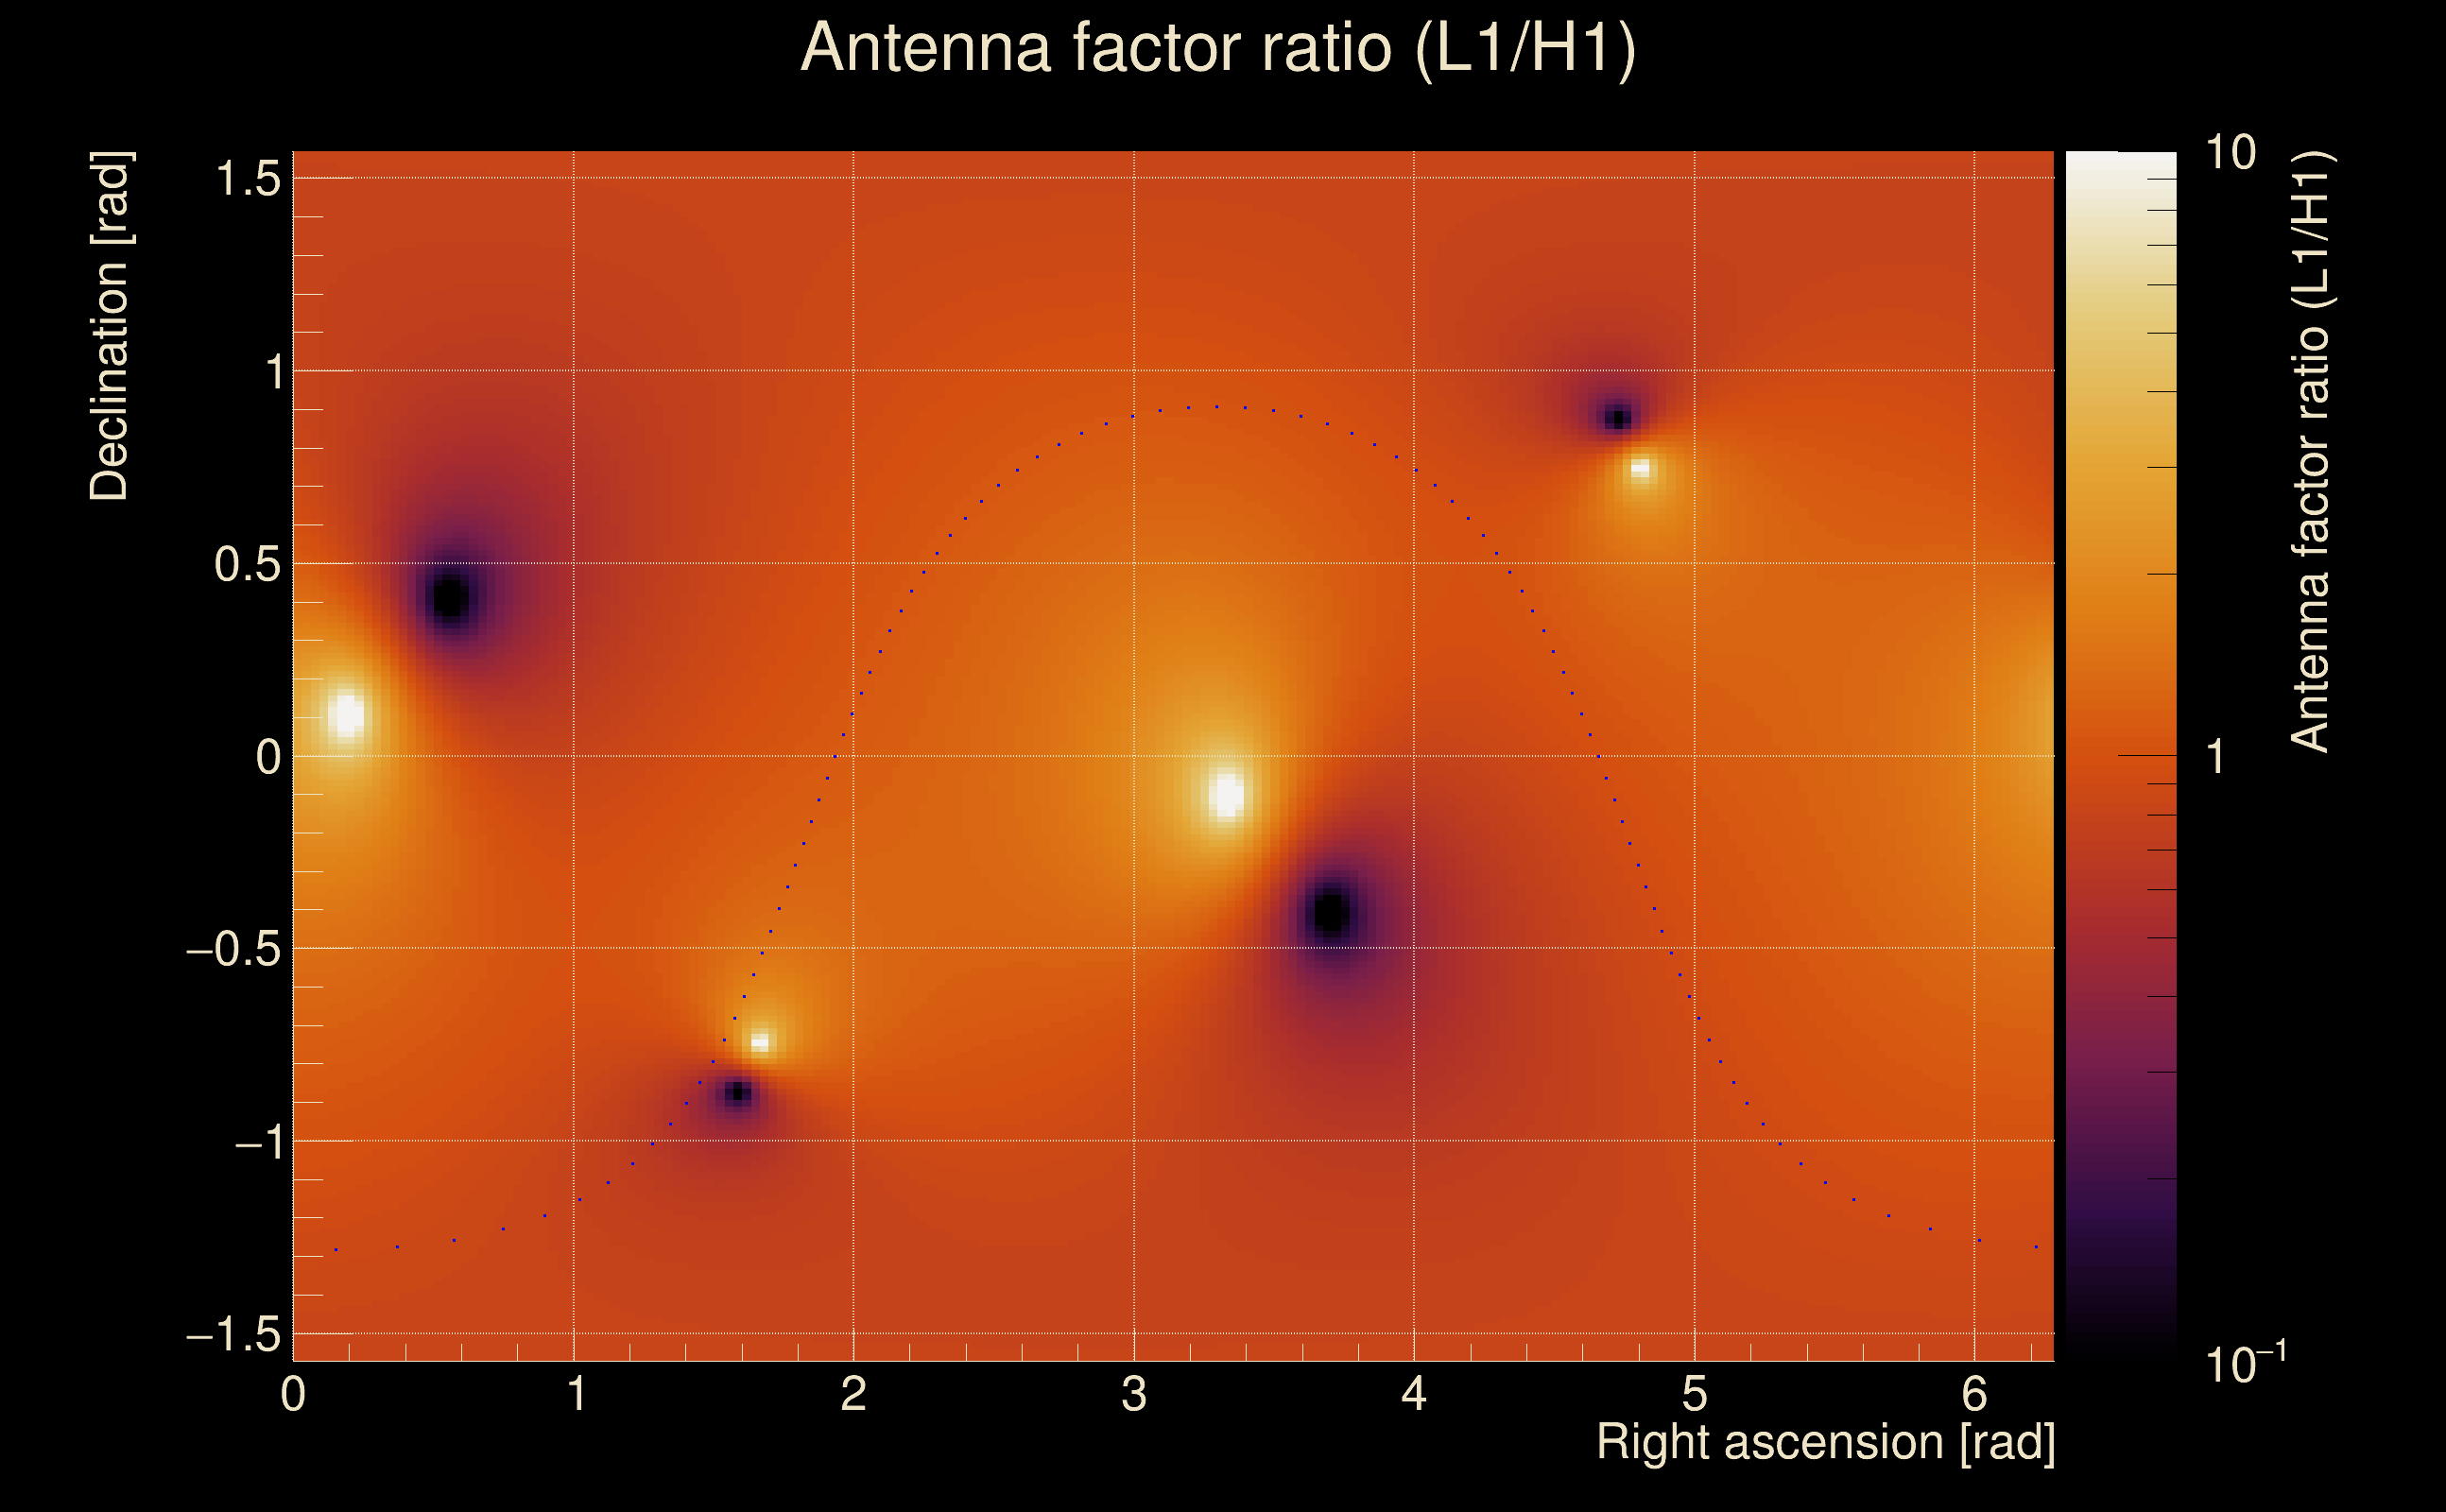
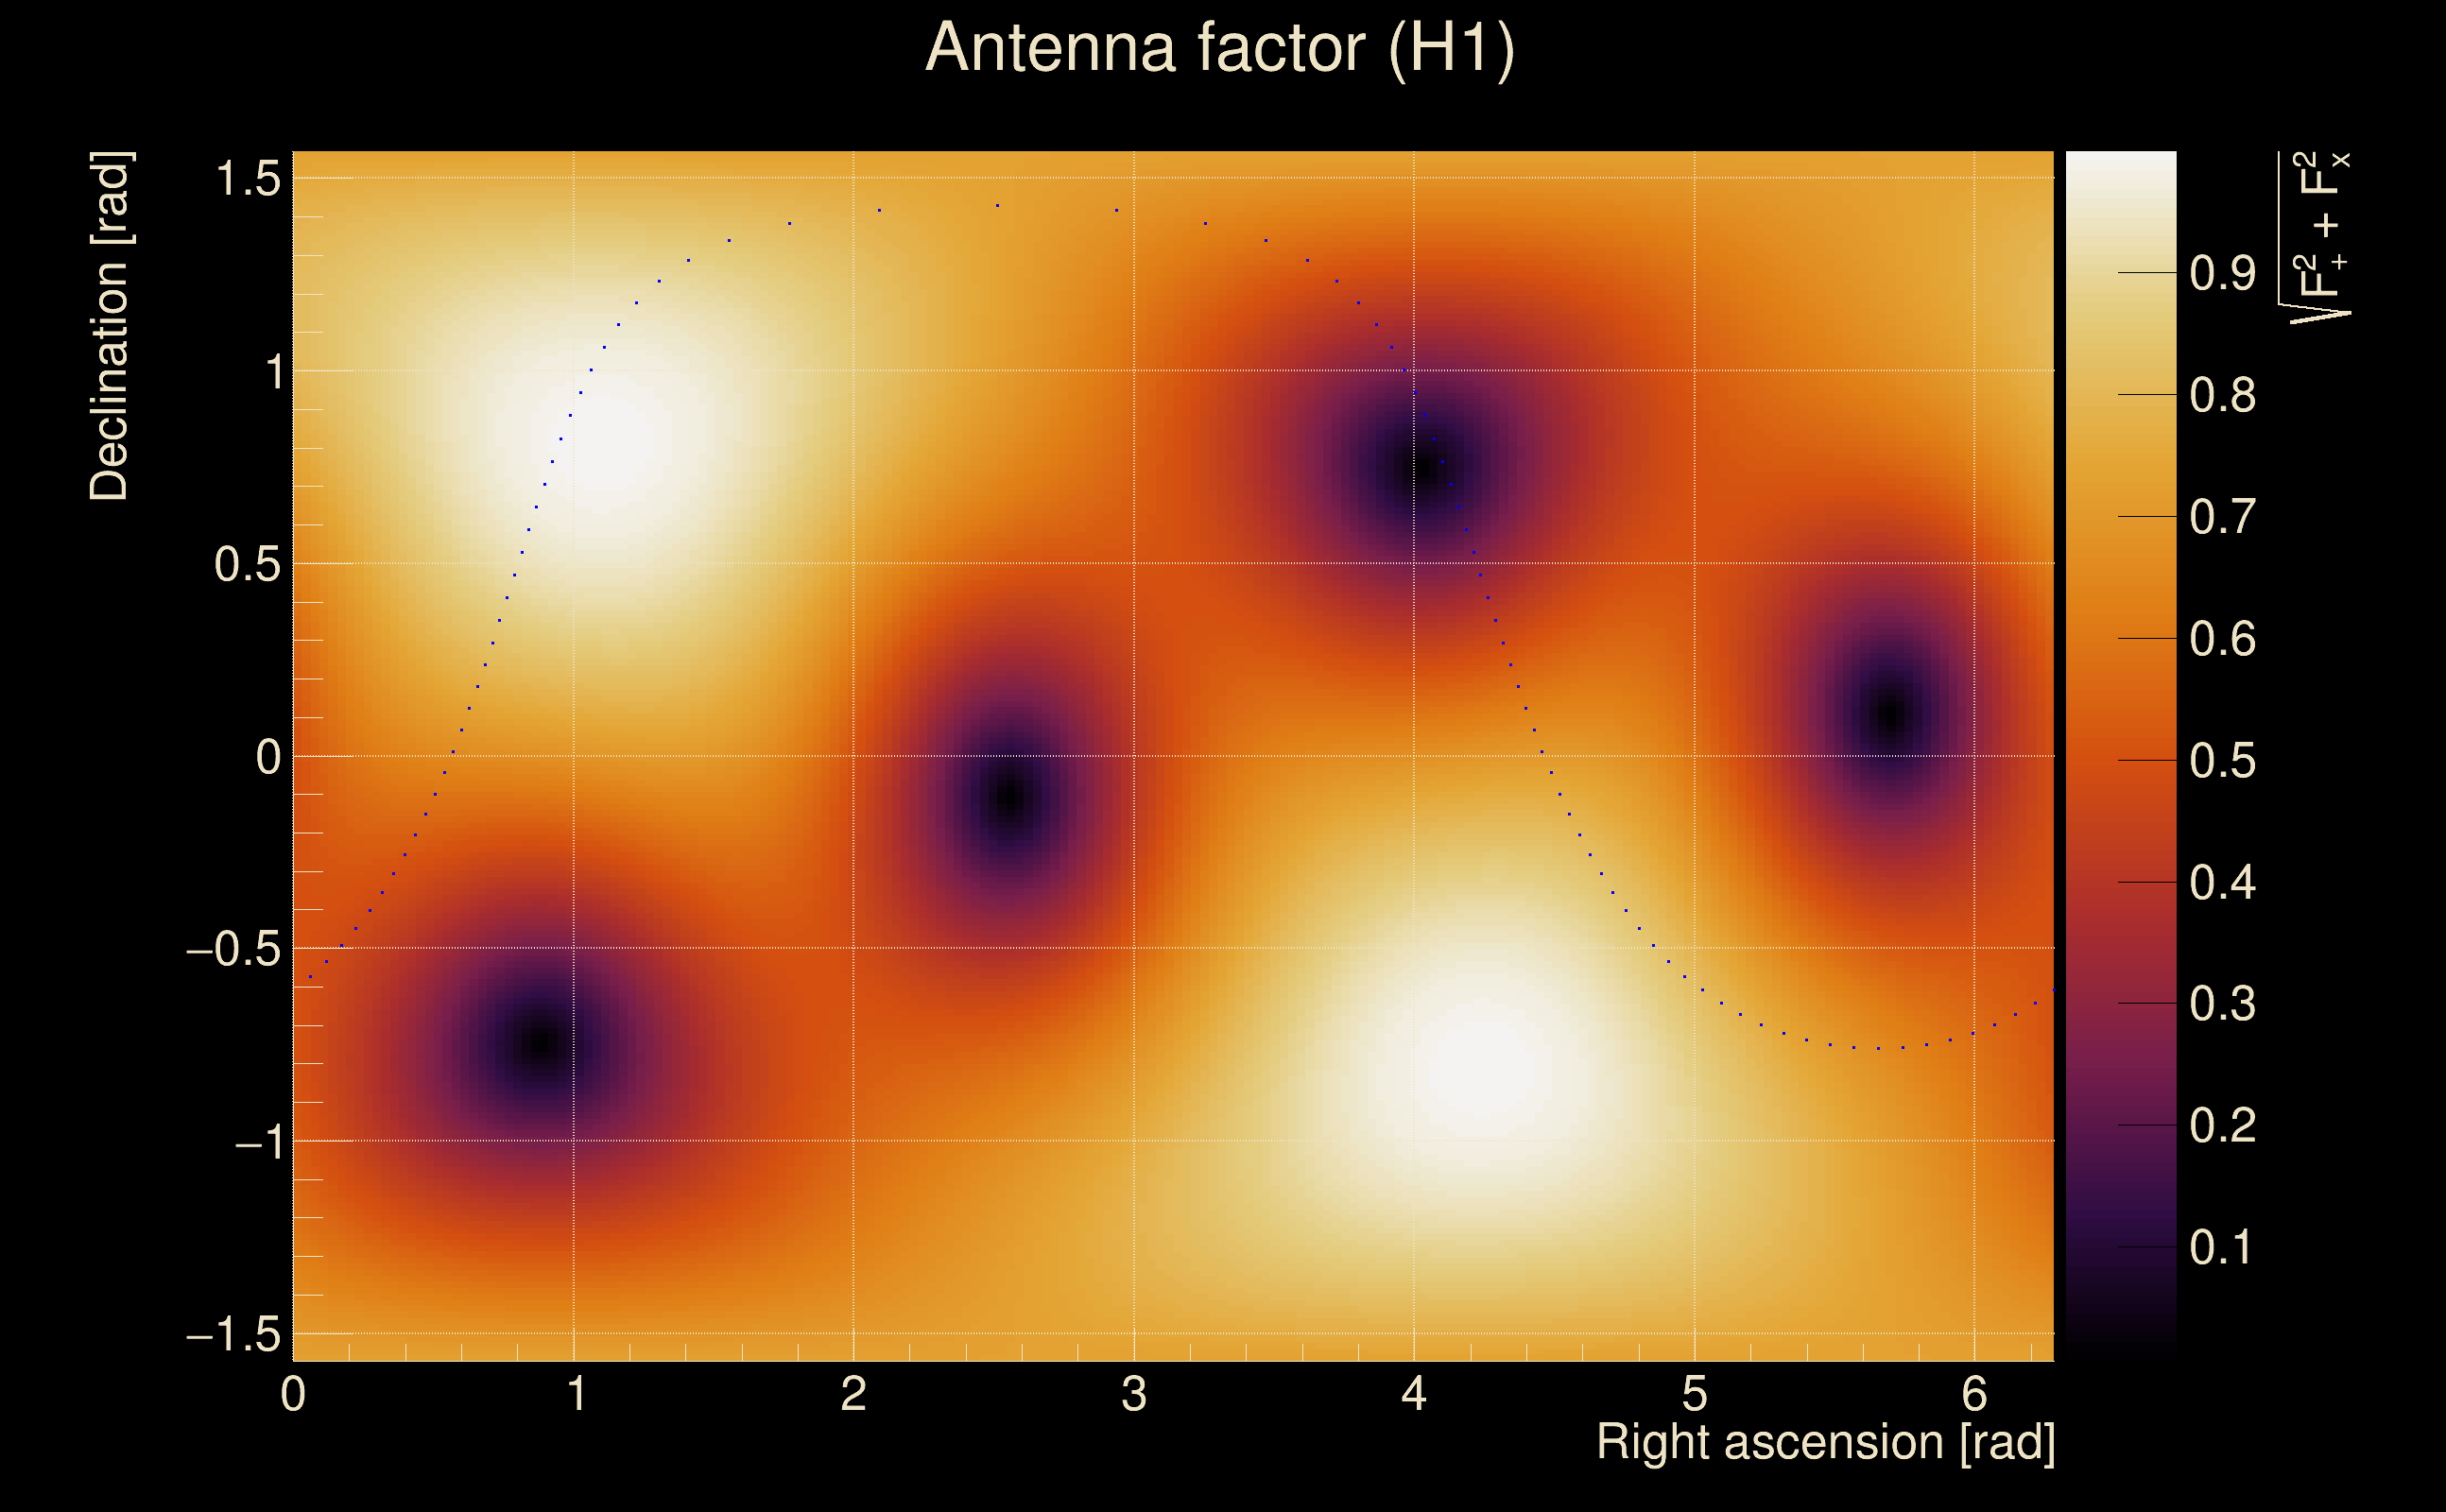
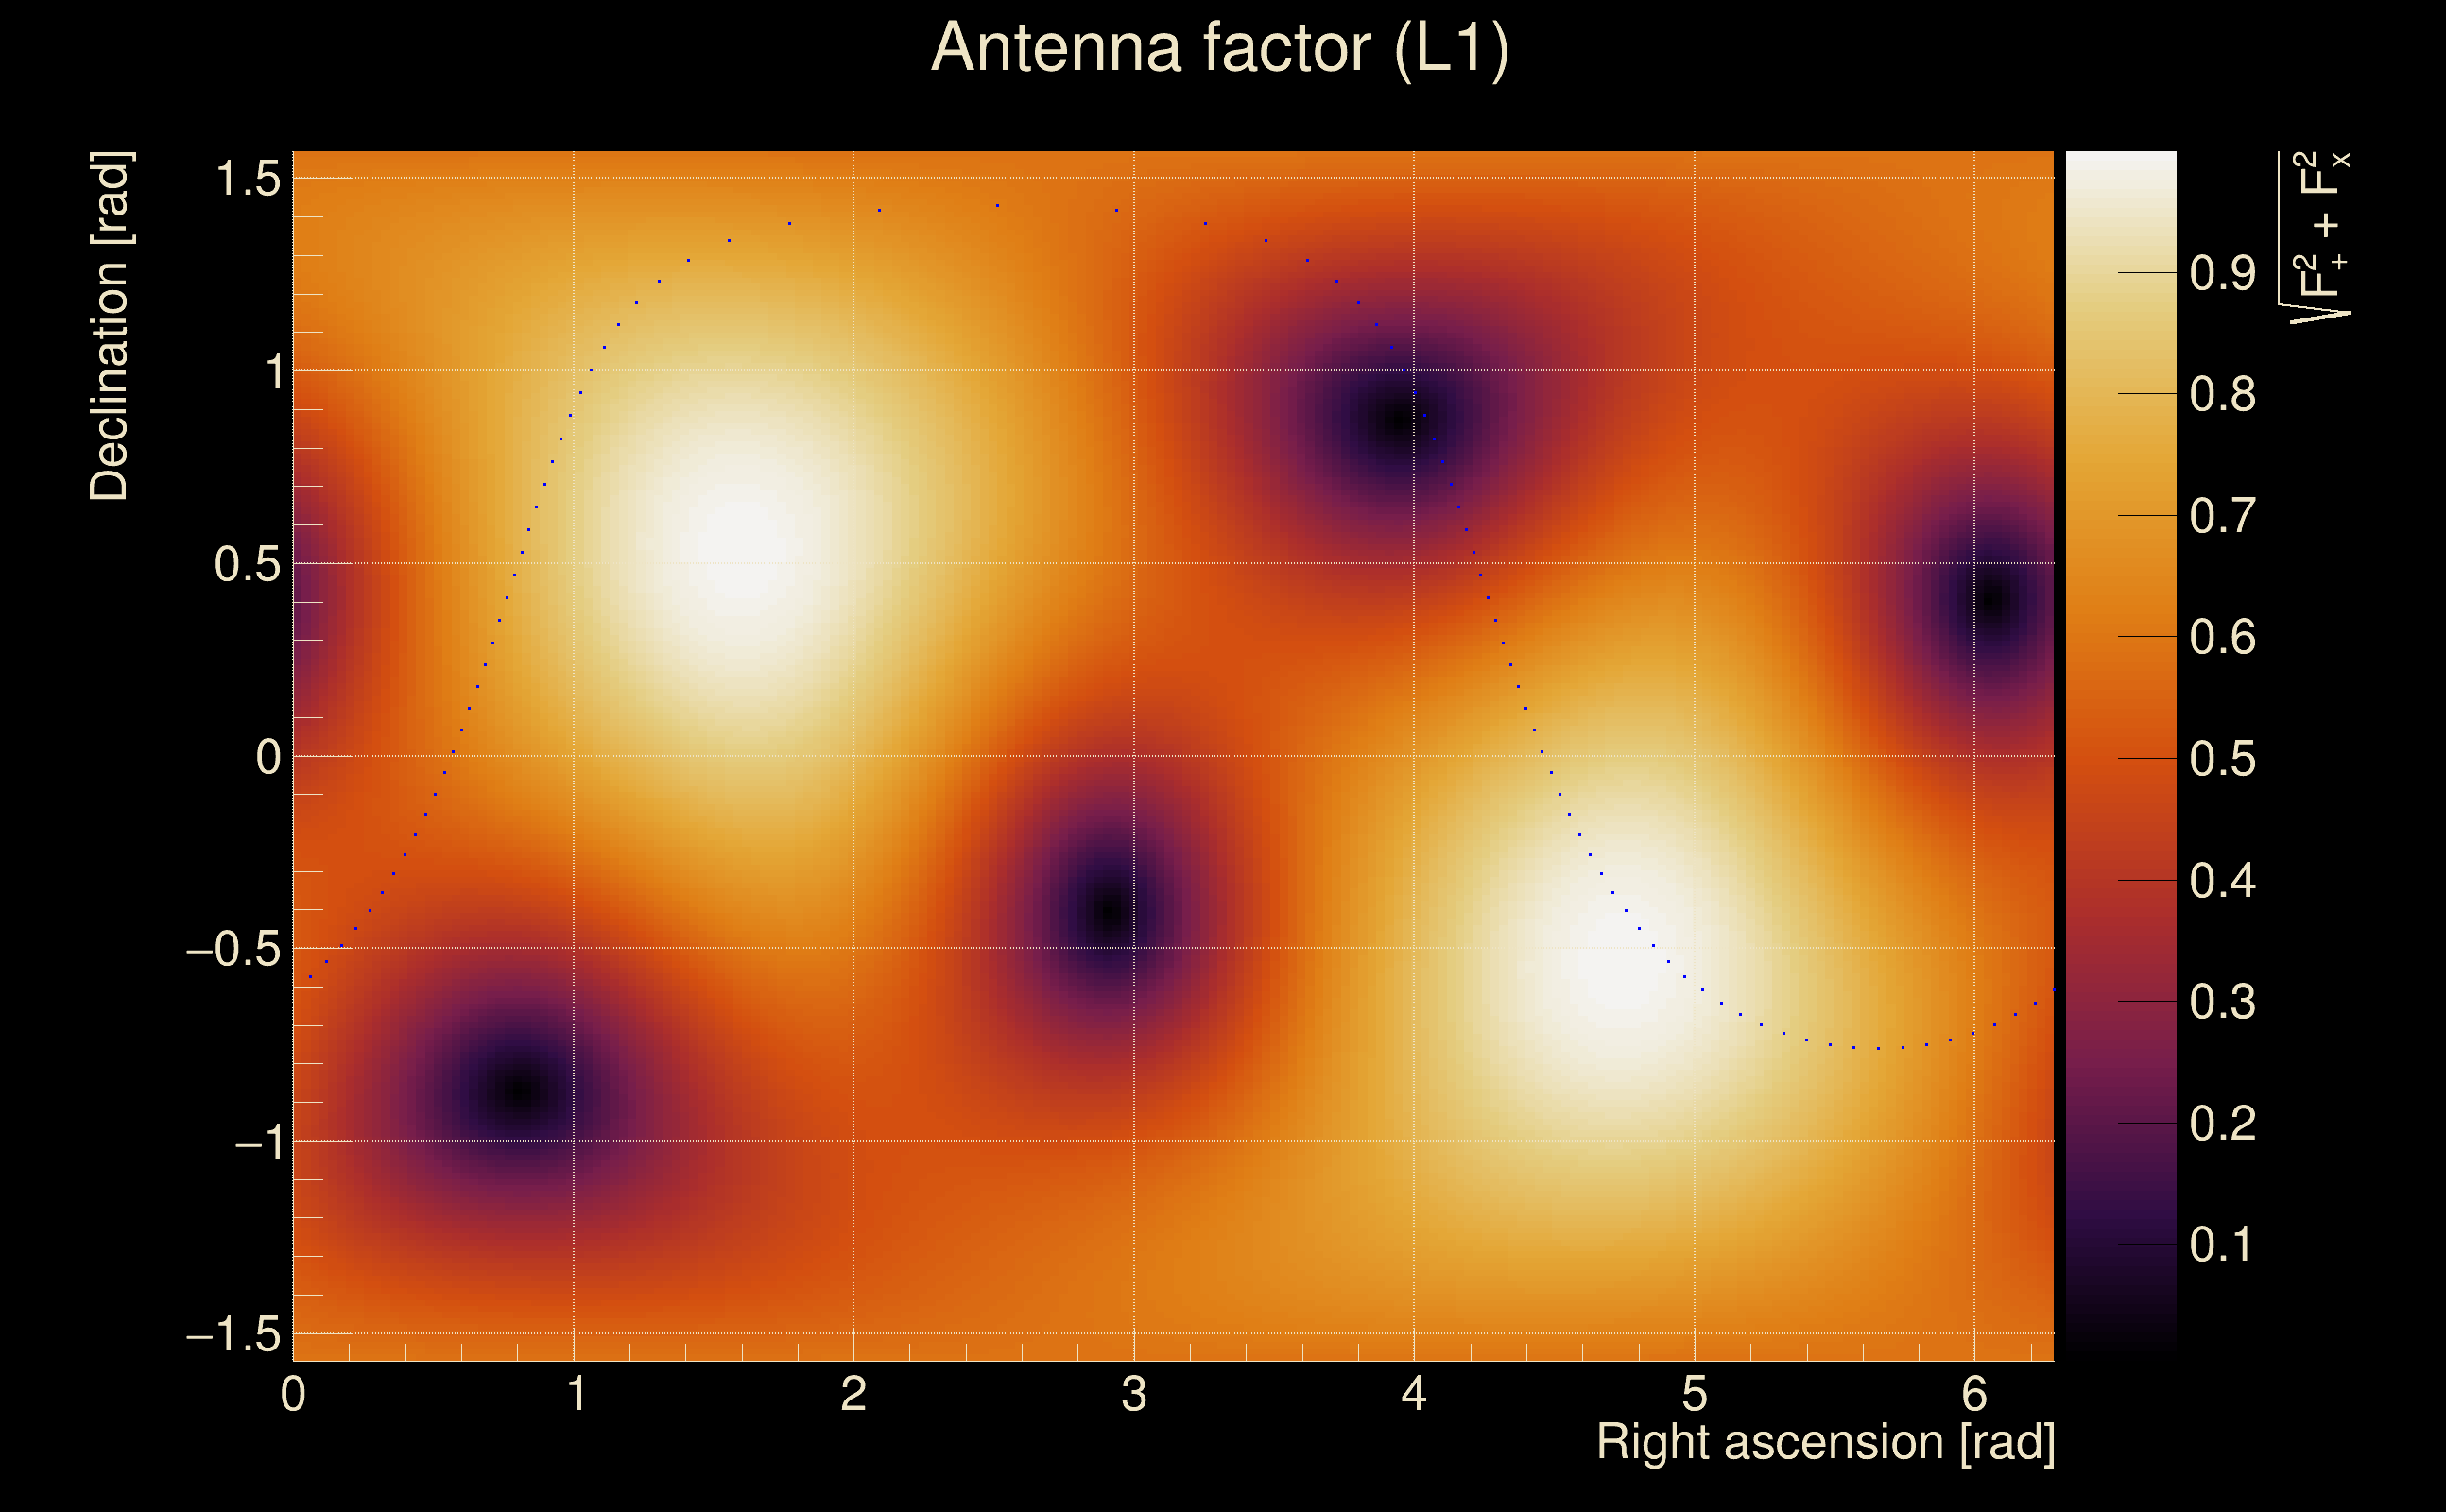
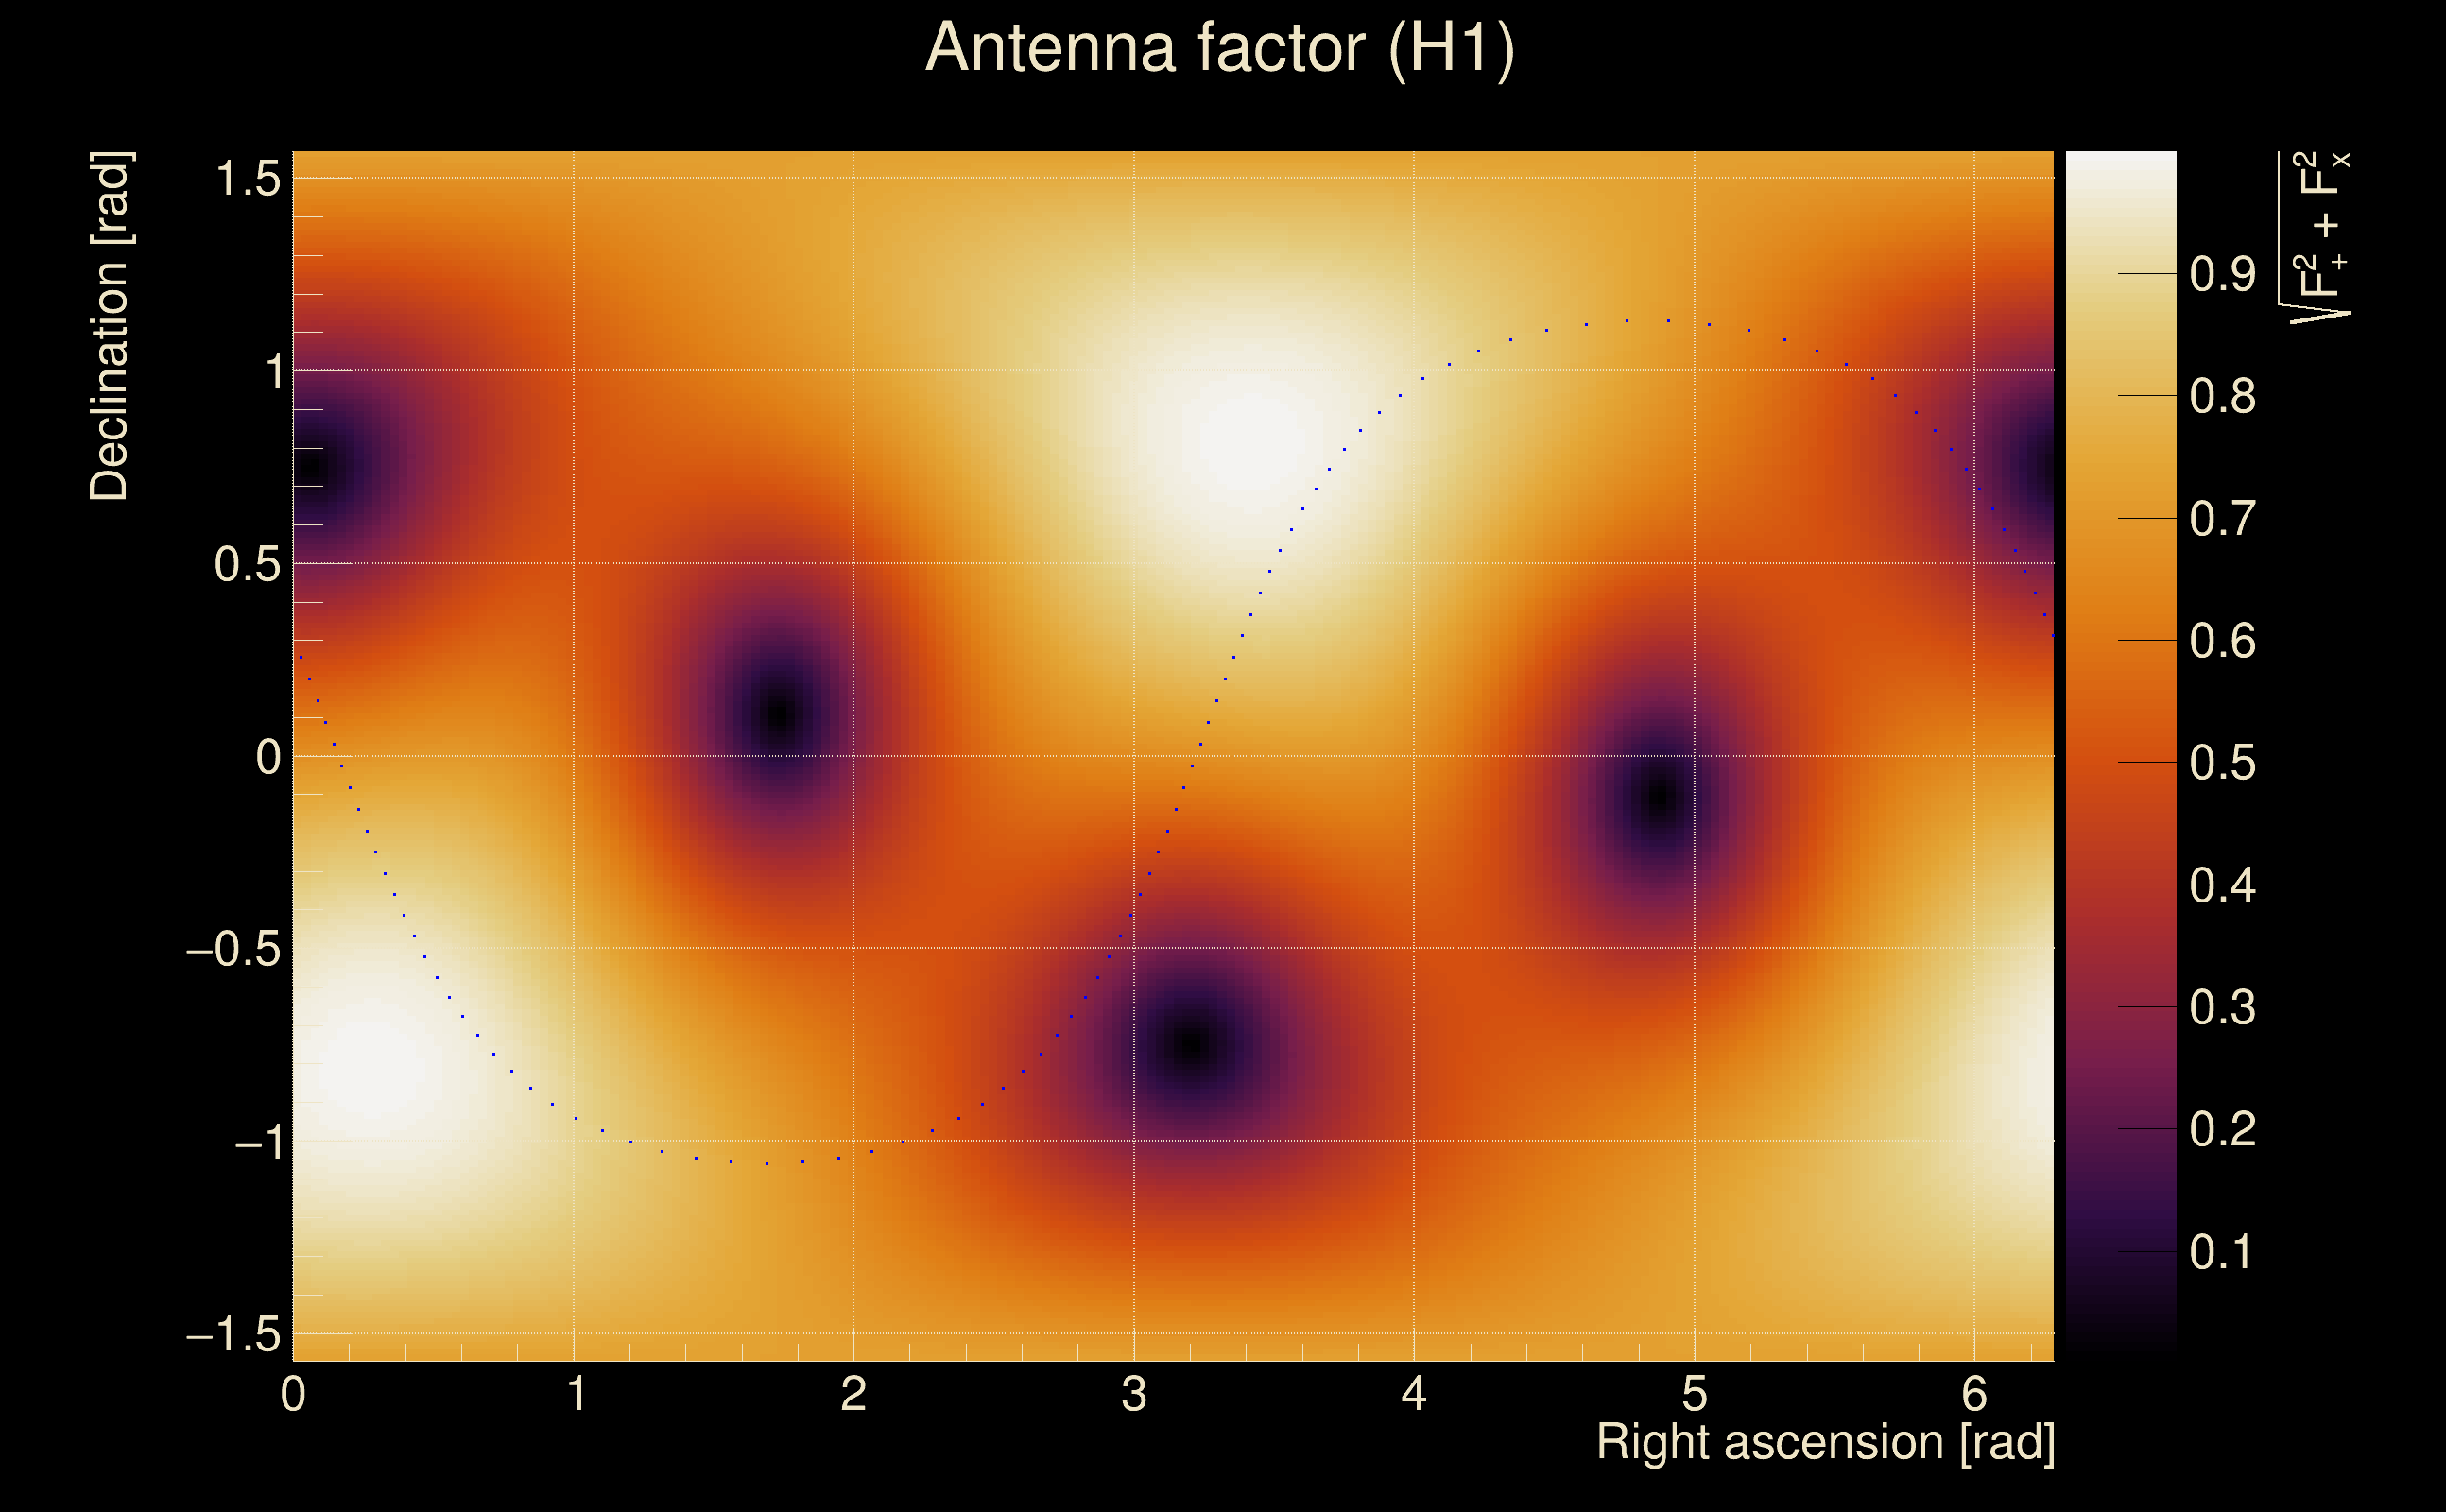
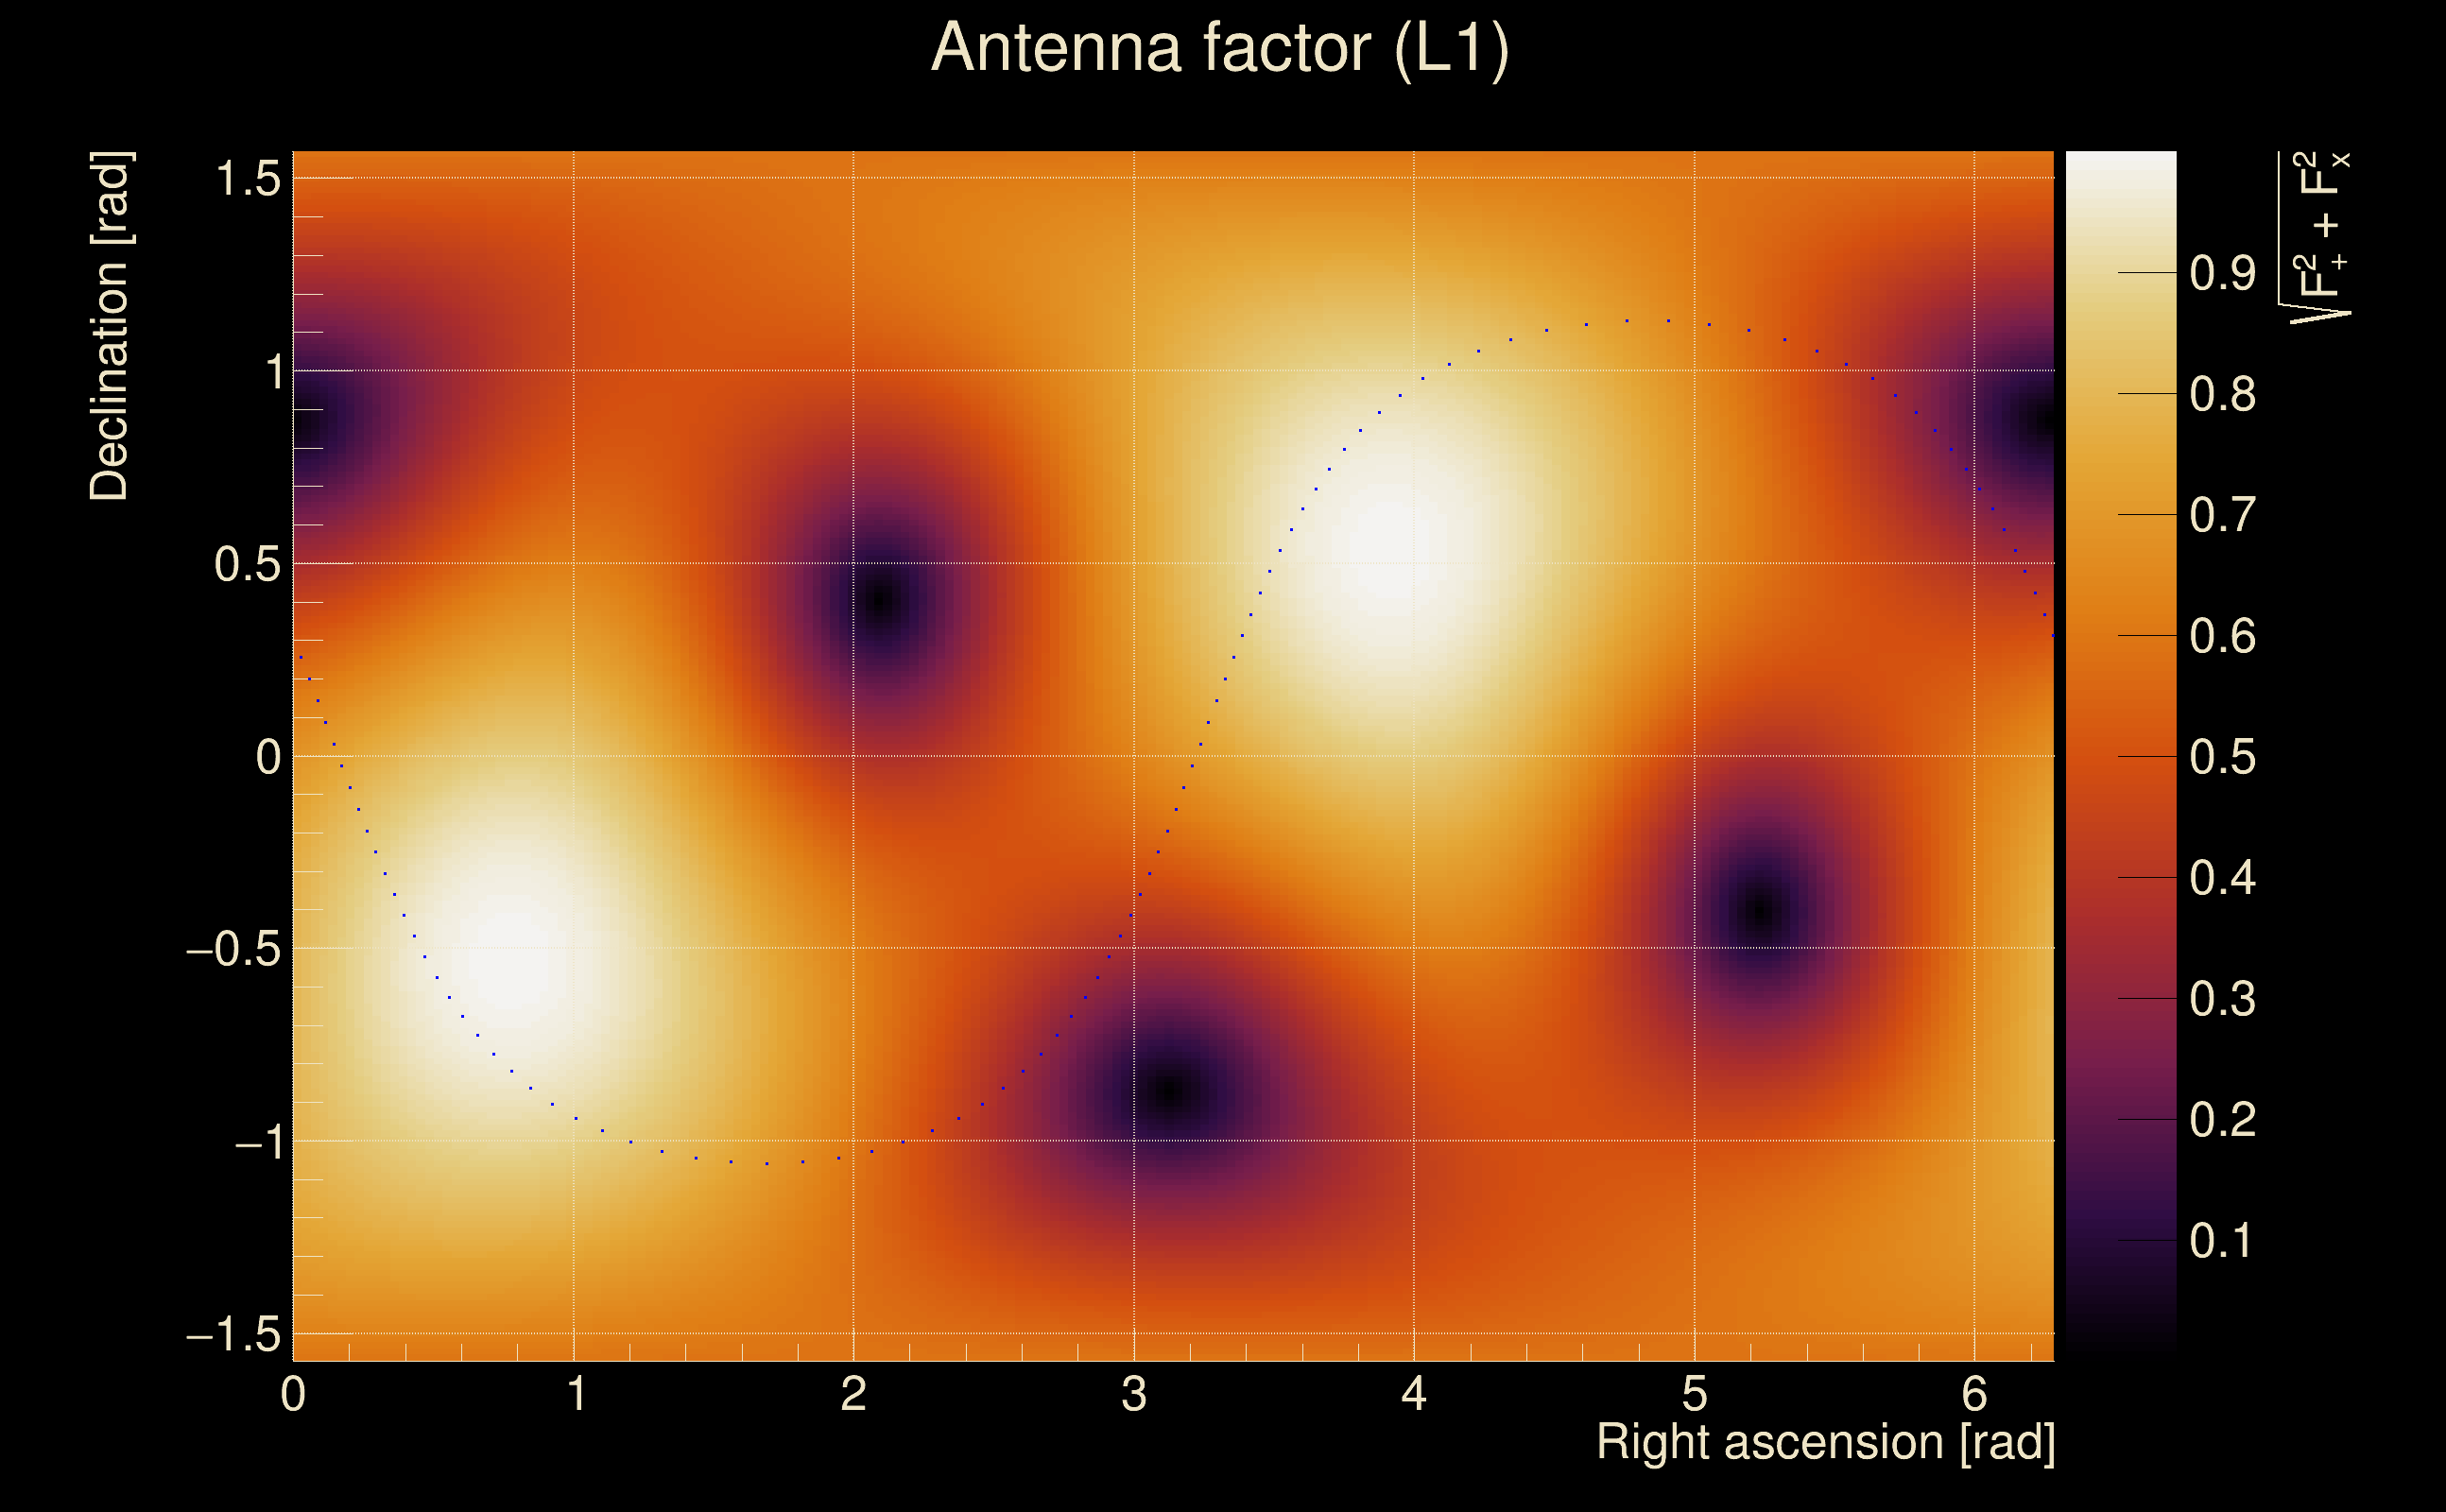
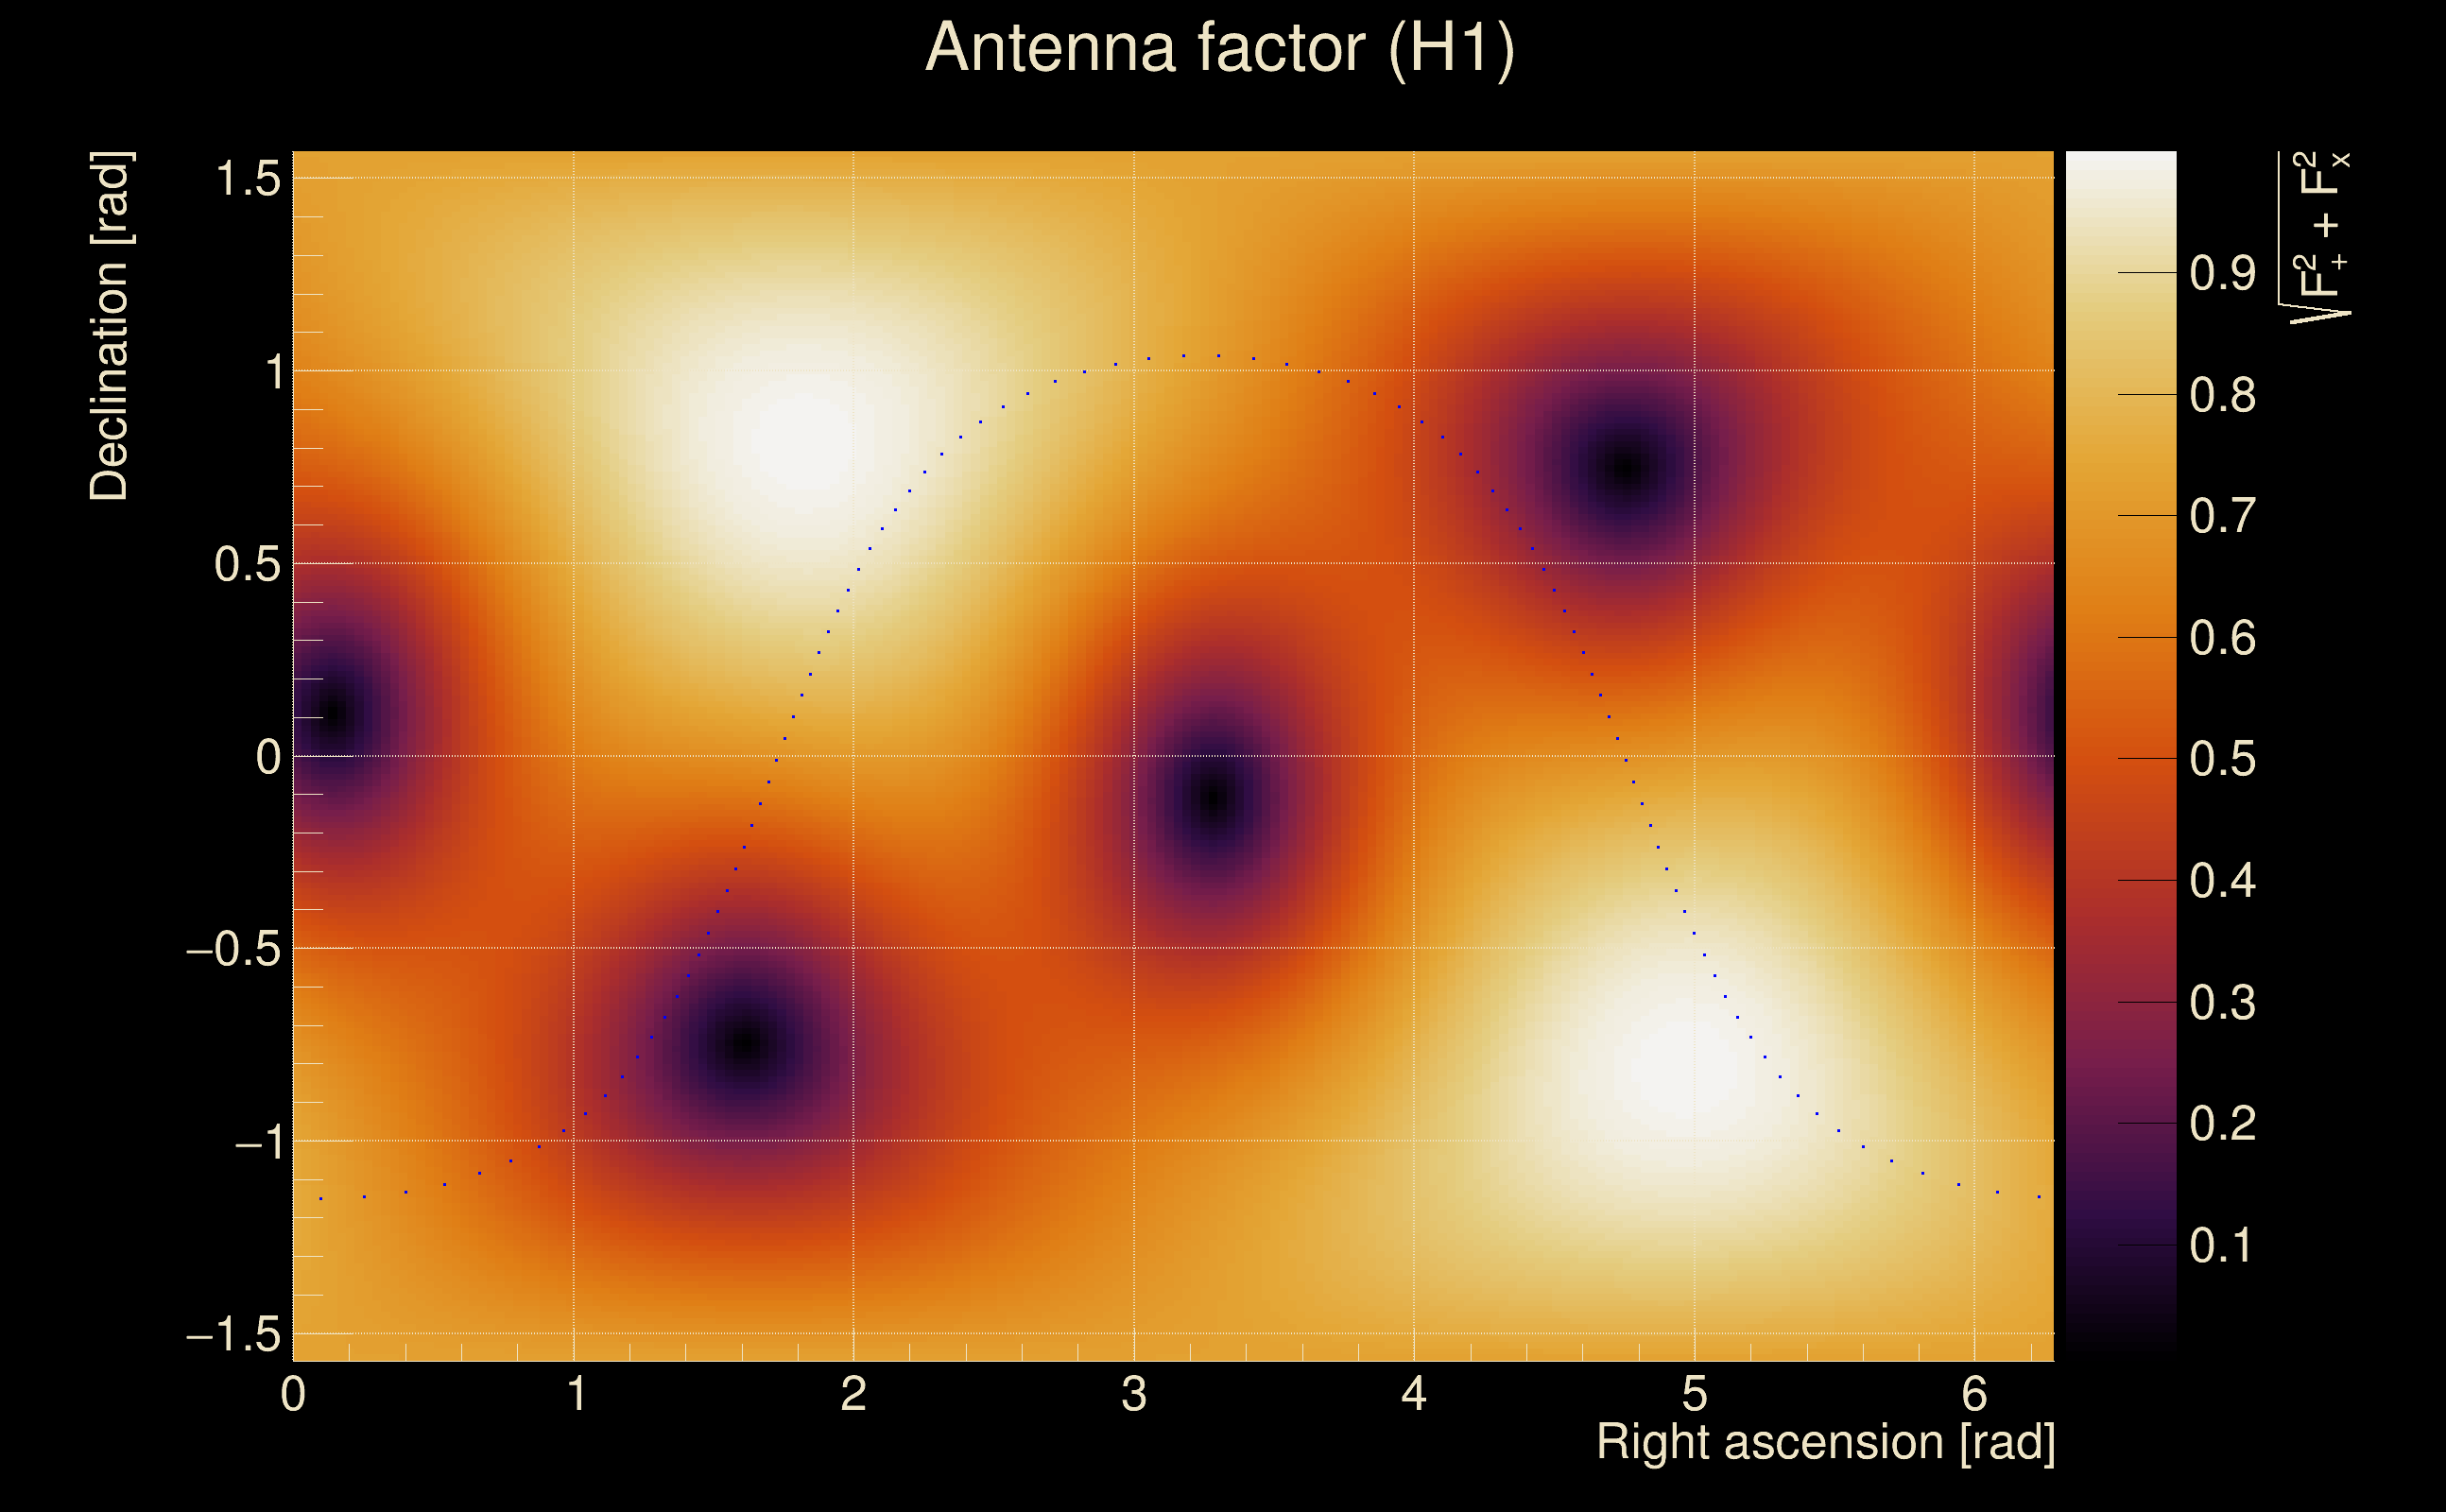
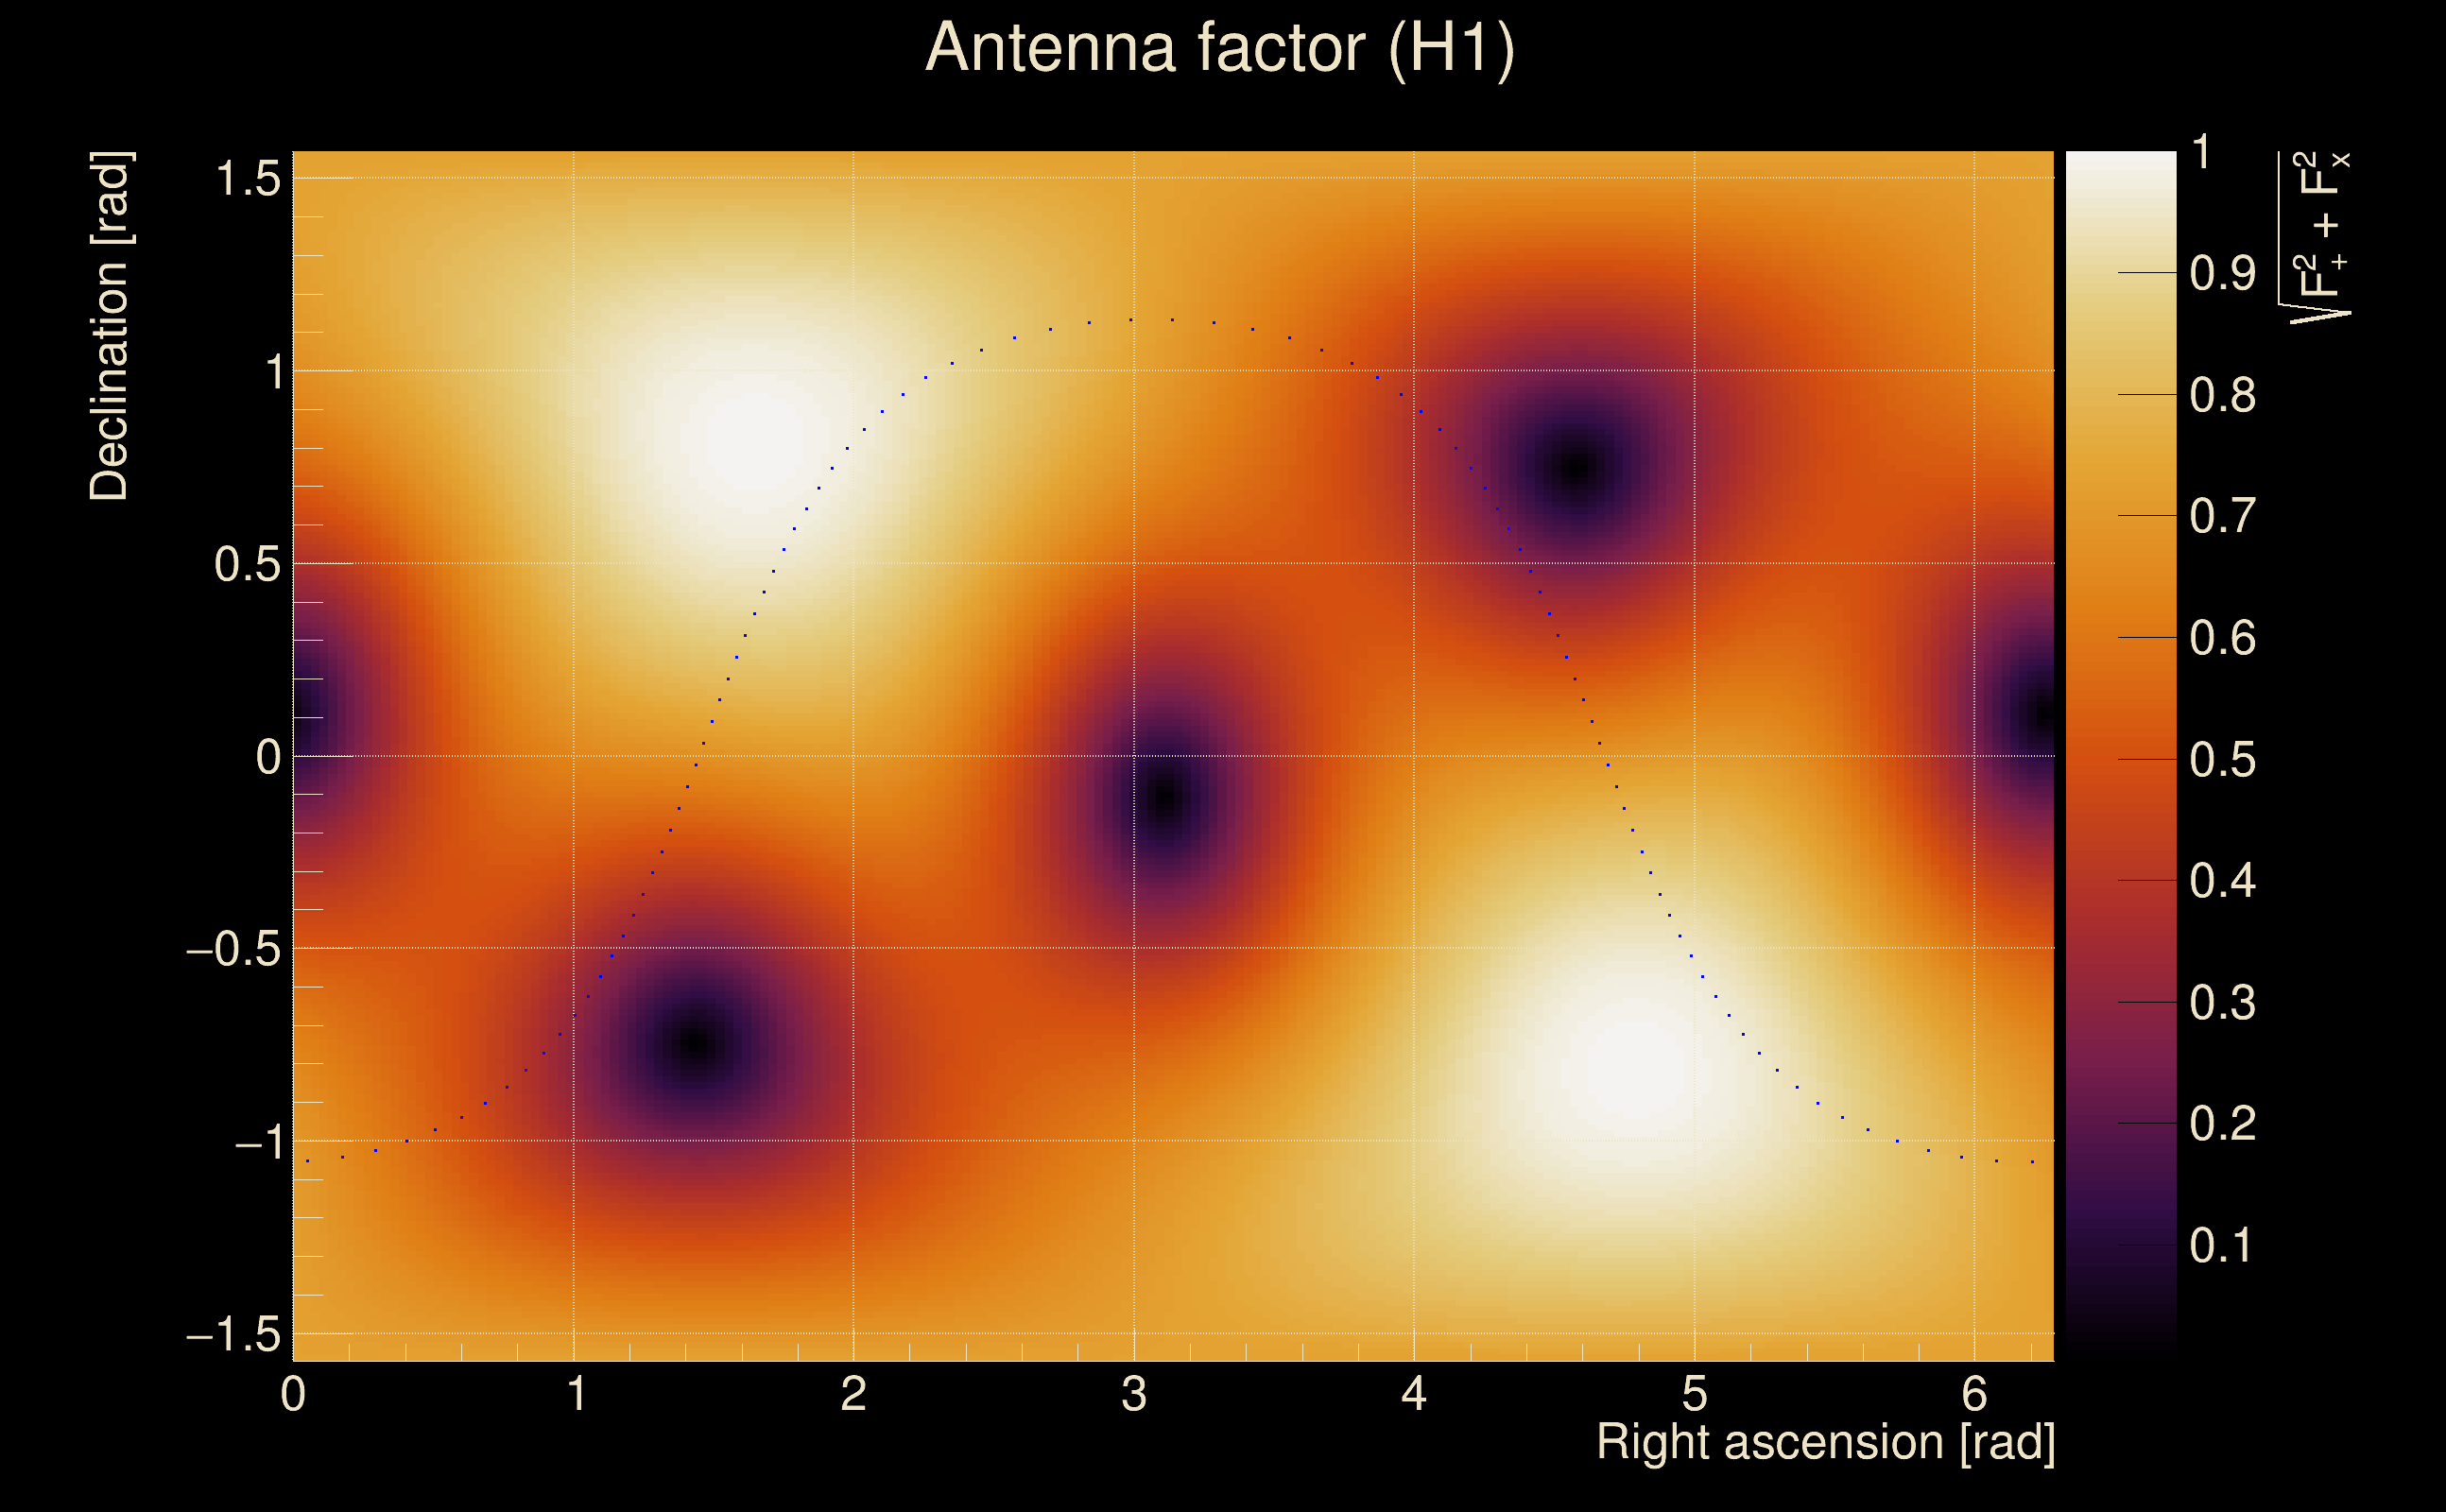
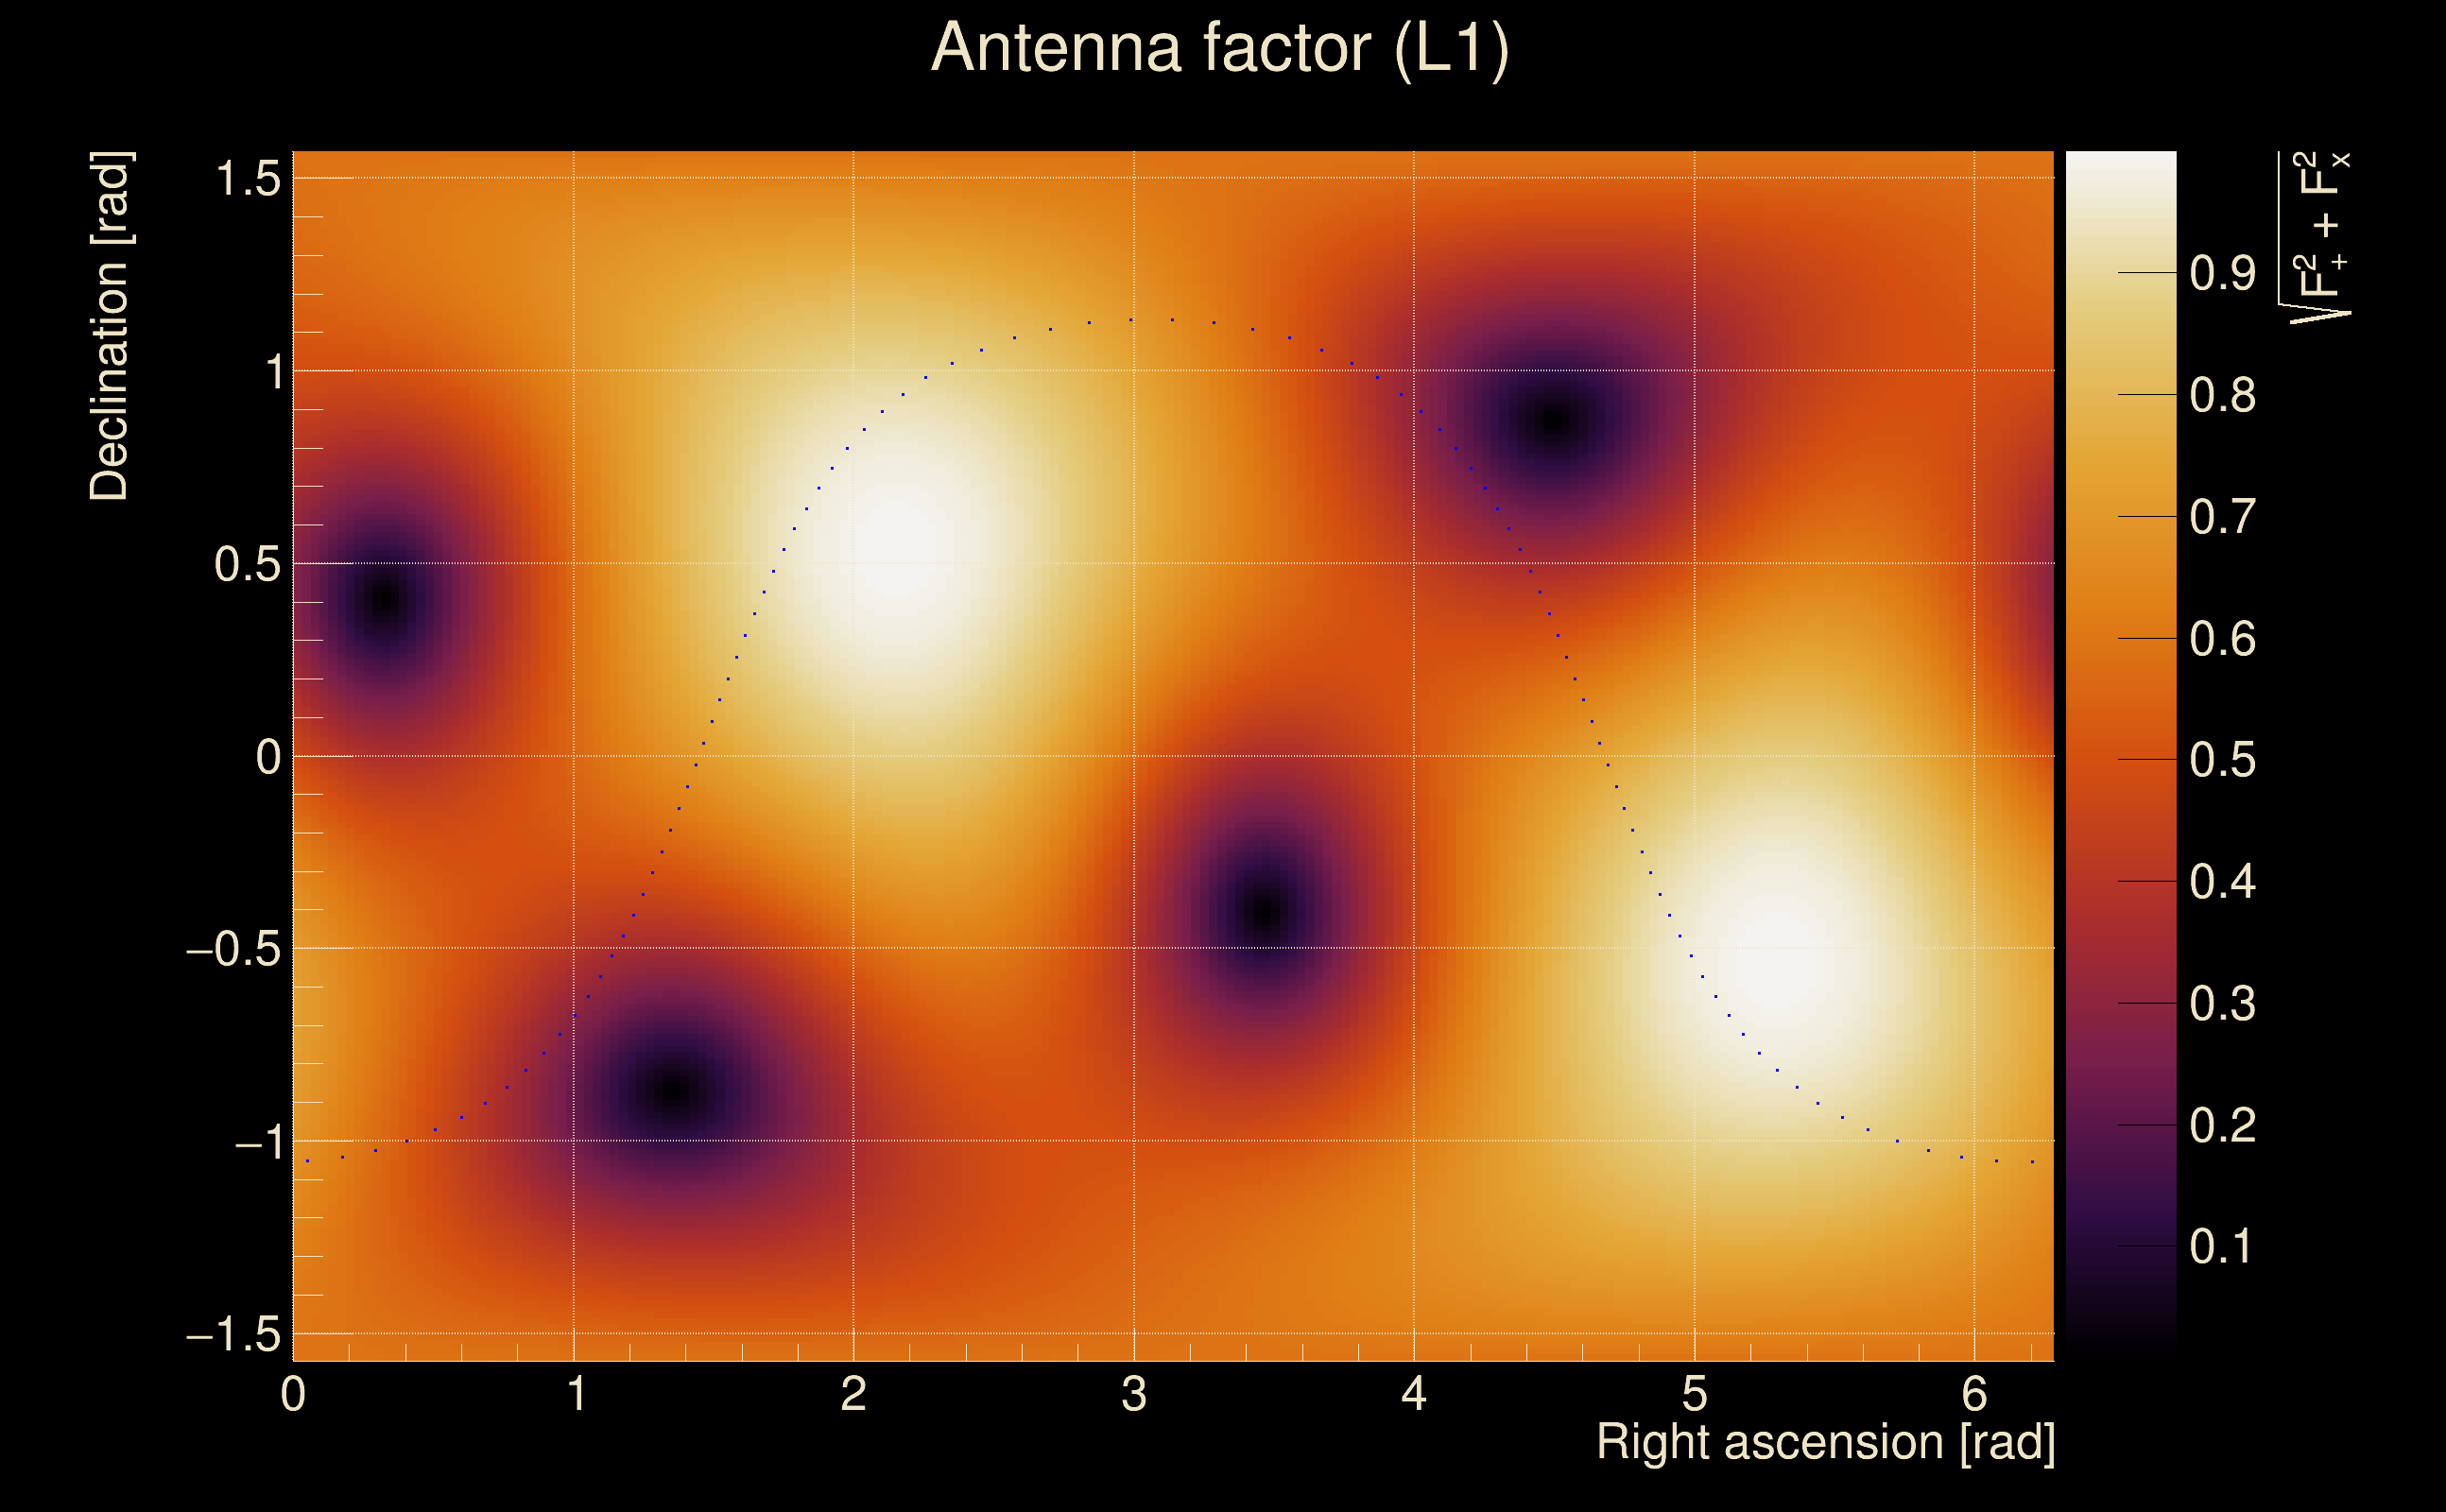
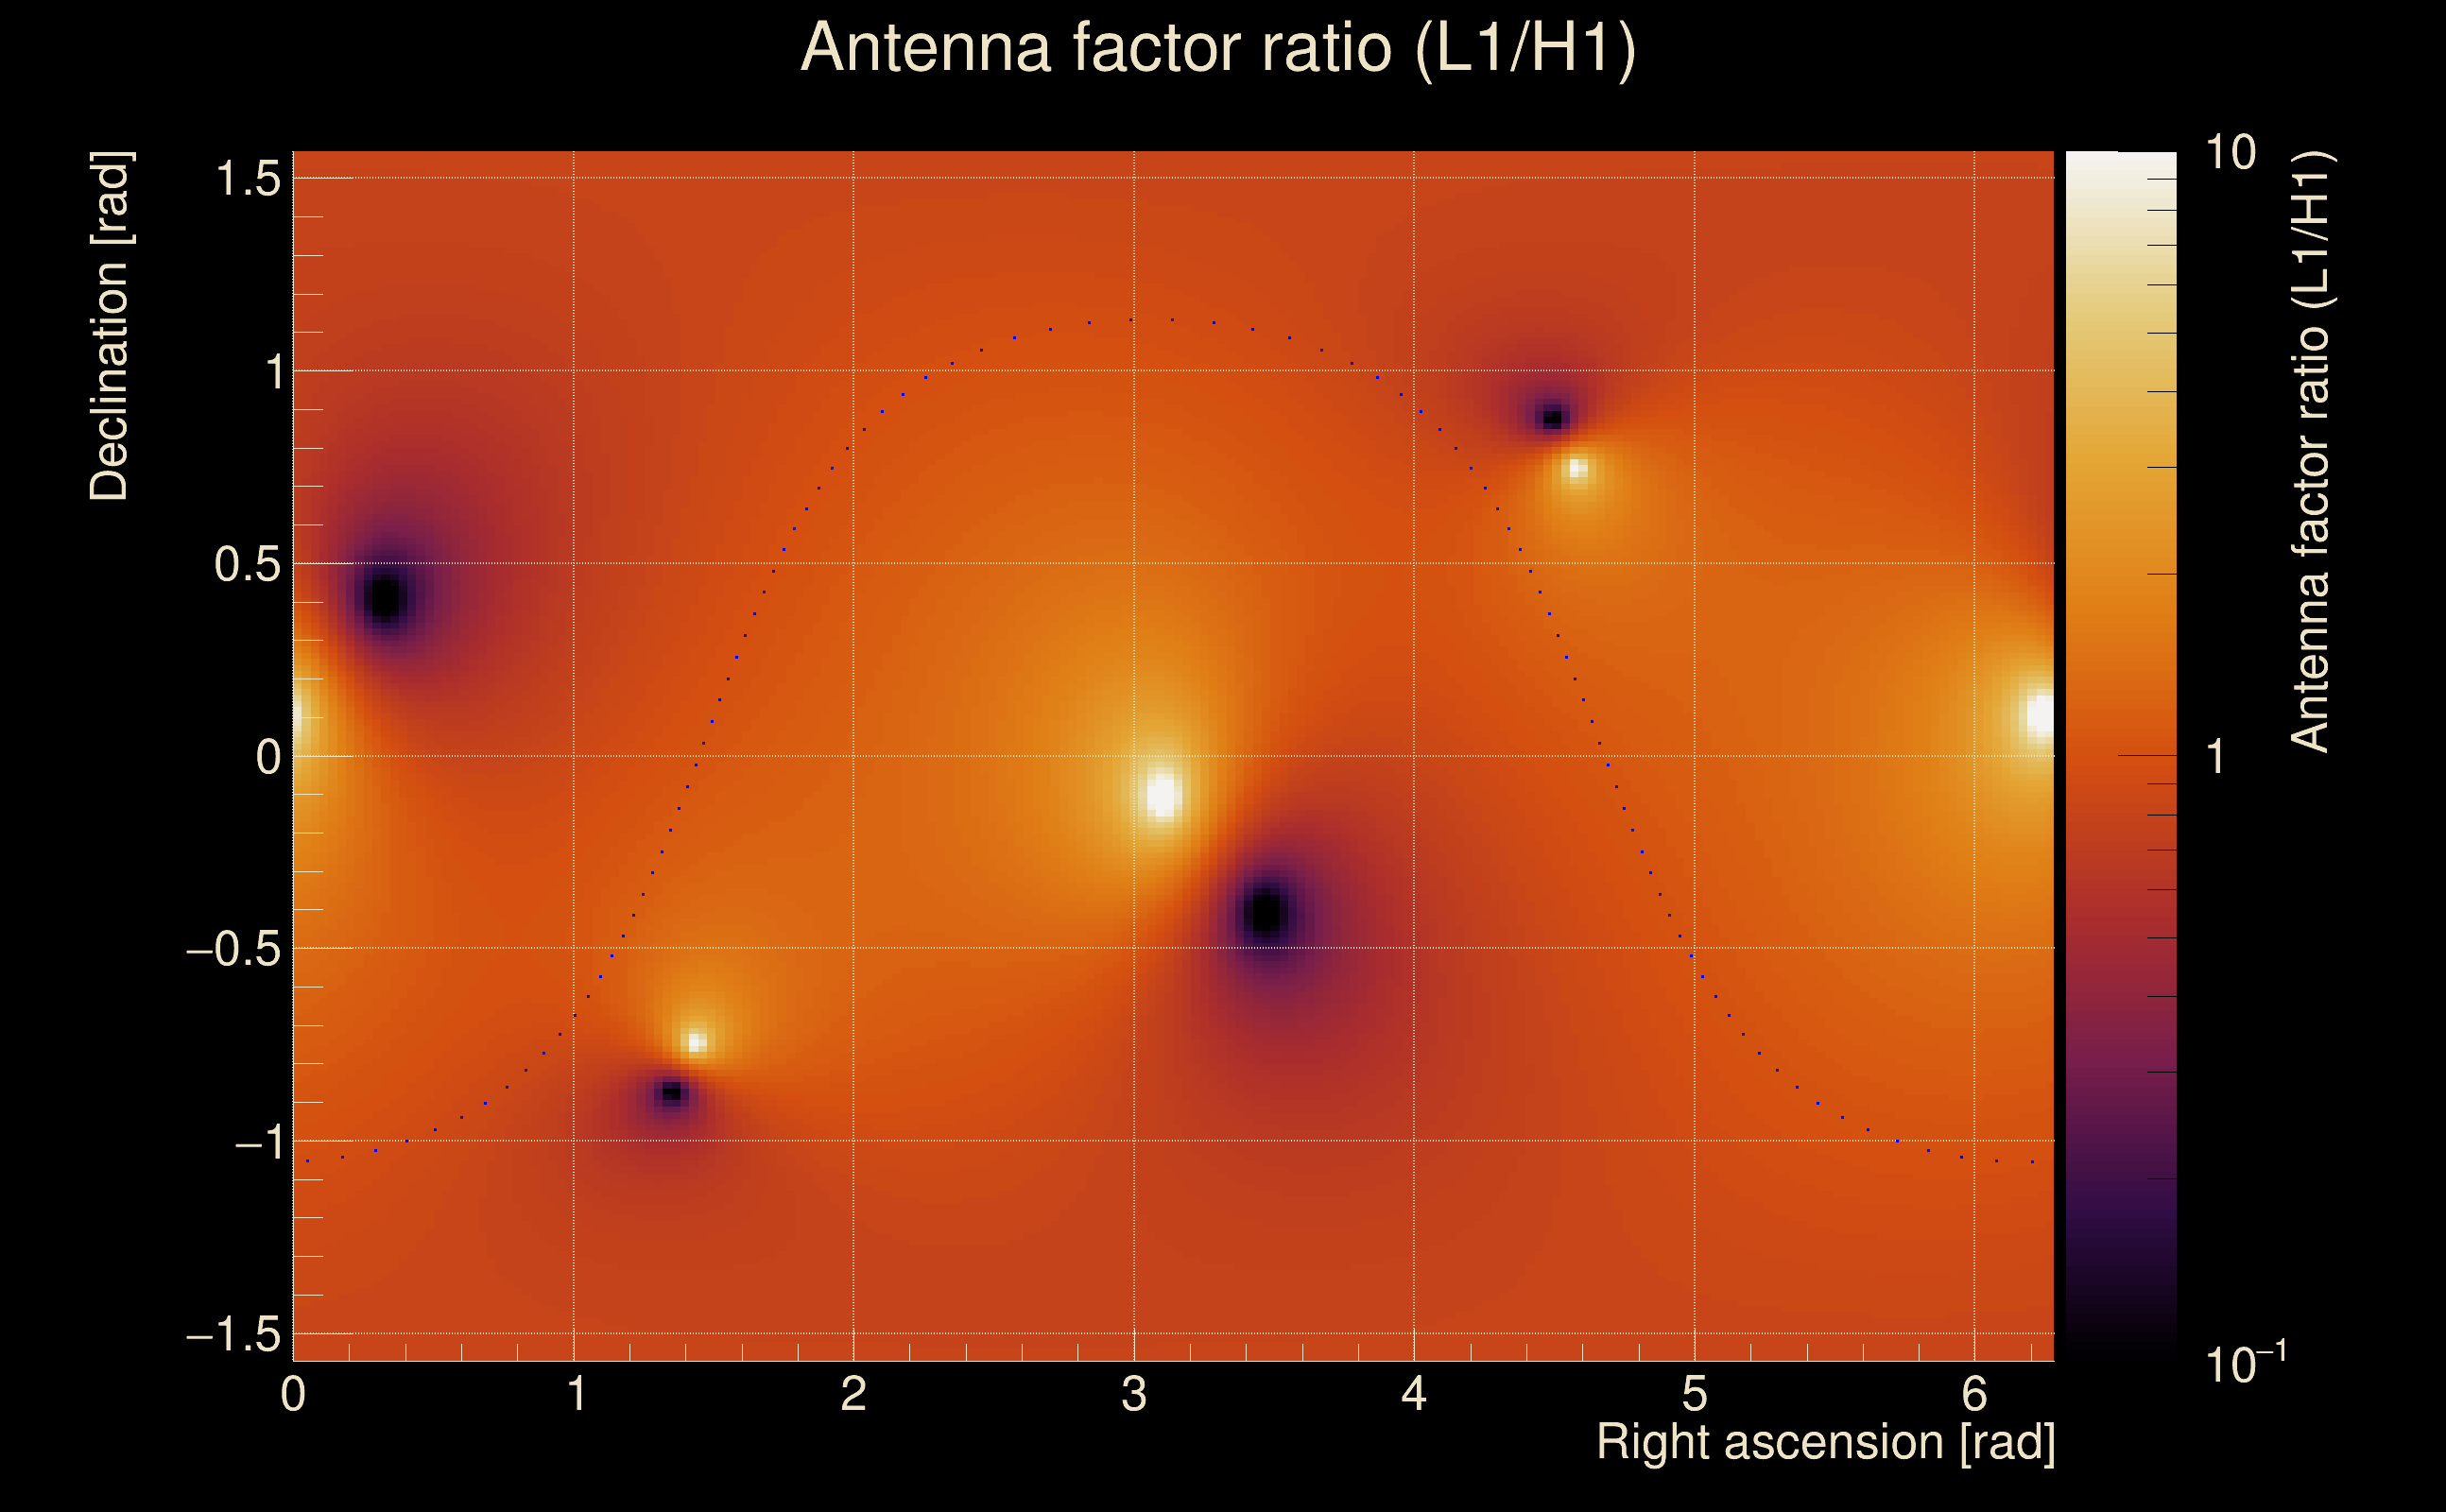
| Target sky positon: | Ra: 3.68109, Dec: 0.94792 [rad] |
| List of input Ox files: | Targ_FirstTest_O4bw_14days_file_list.txt (930 files) |
| Analysis result file: | Targ_FirstTest_O4bw_14days_results-0.root |
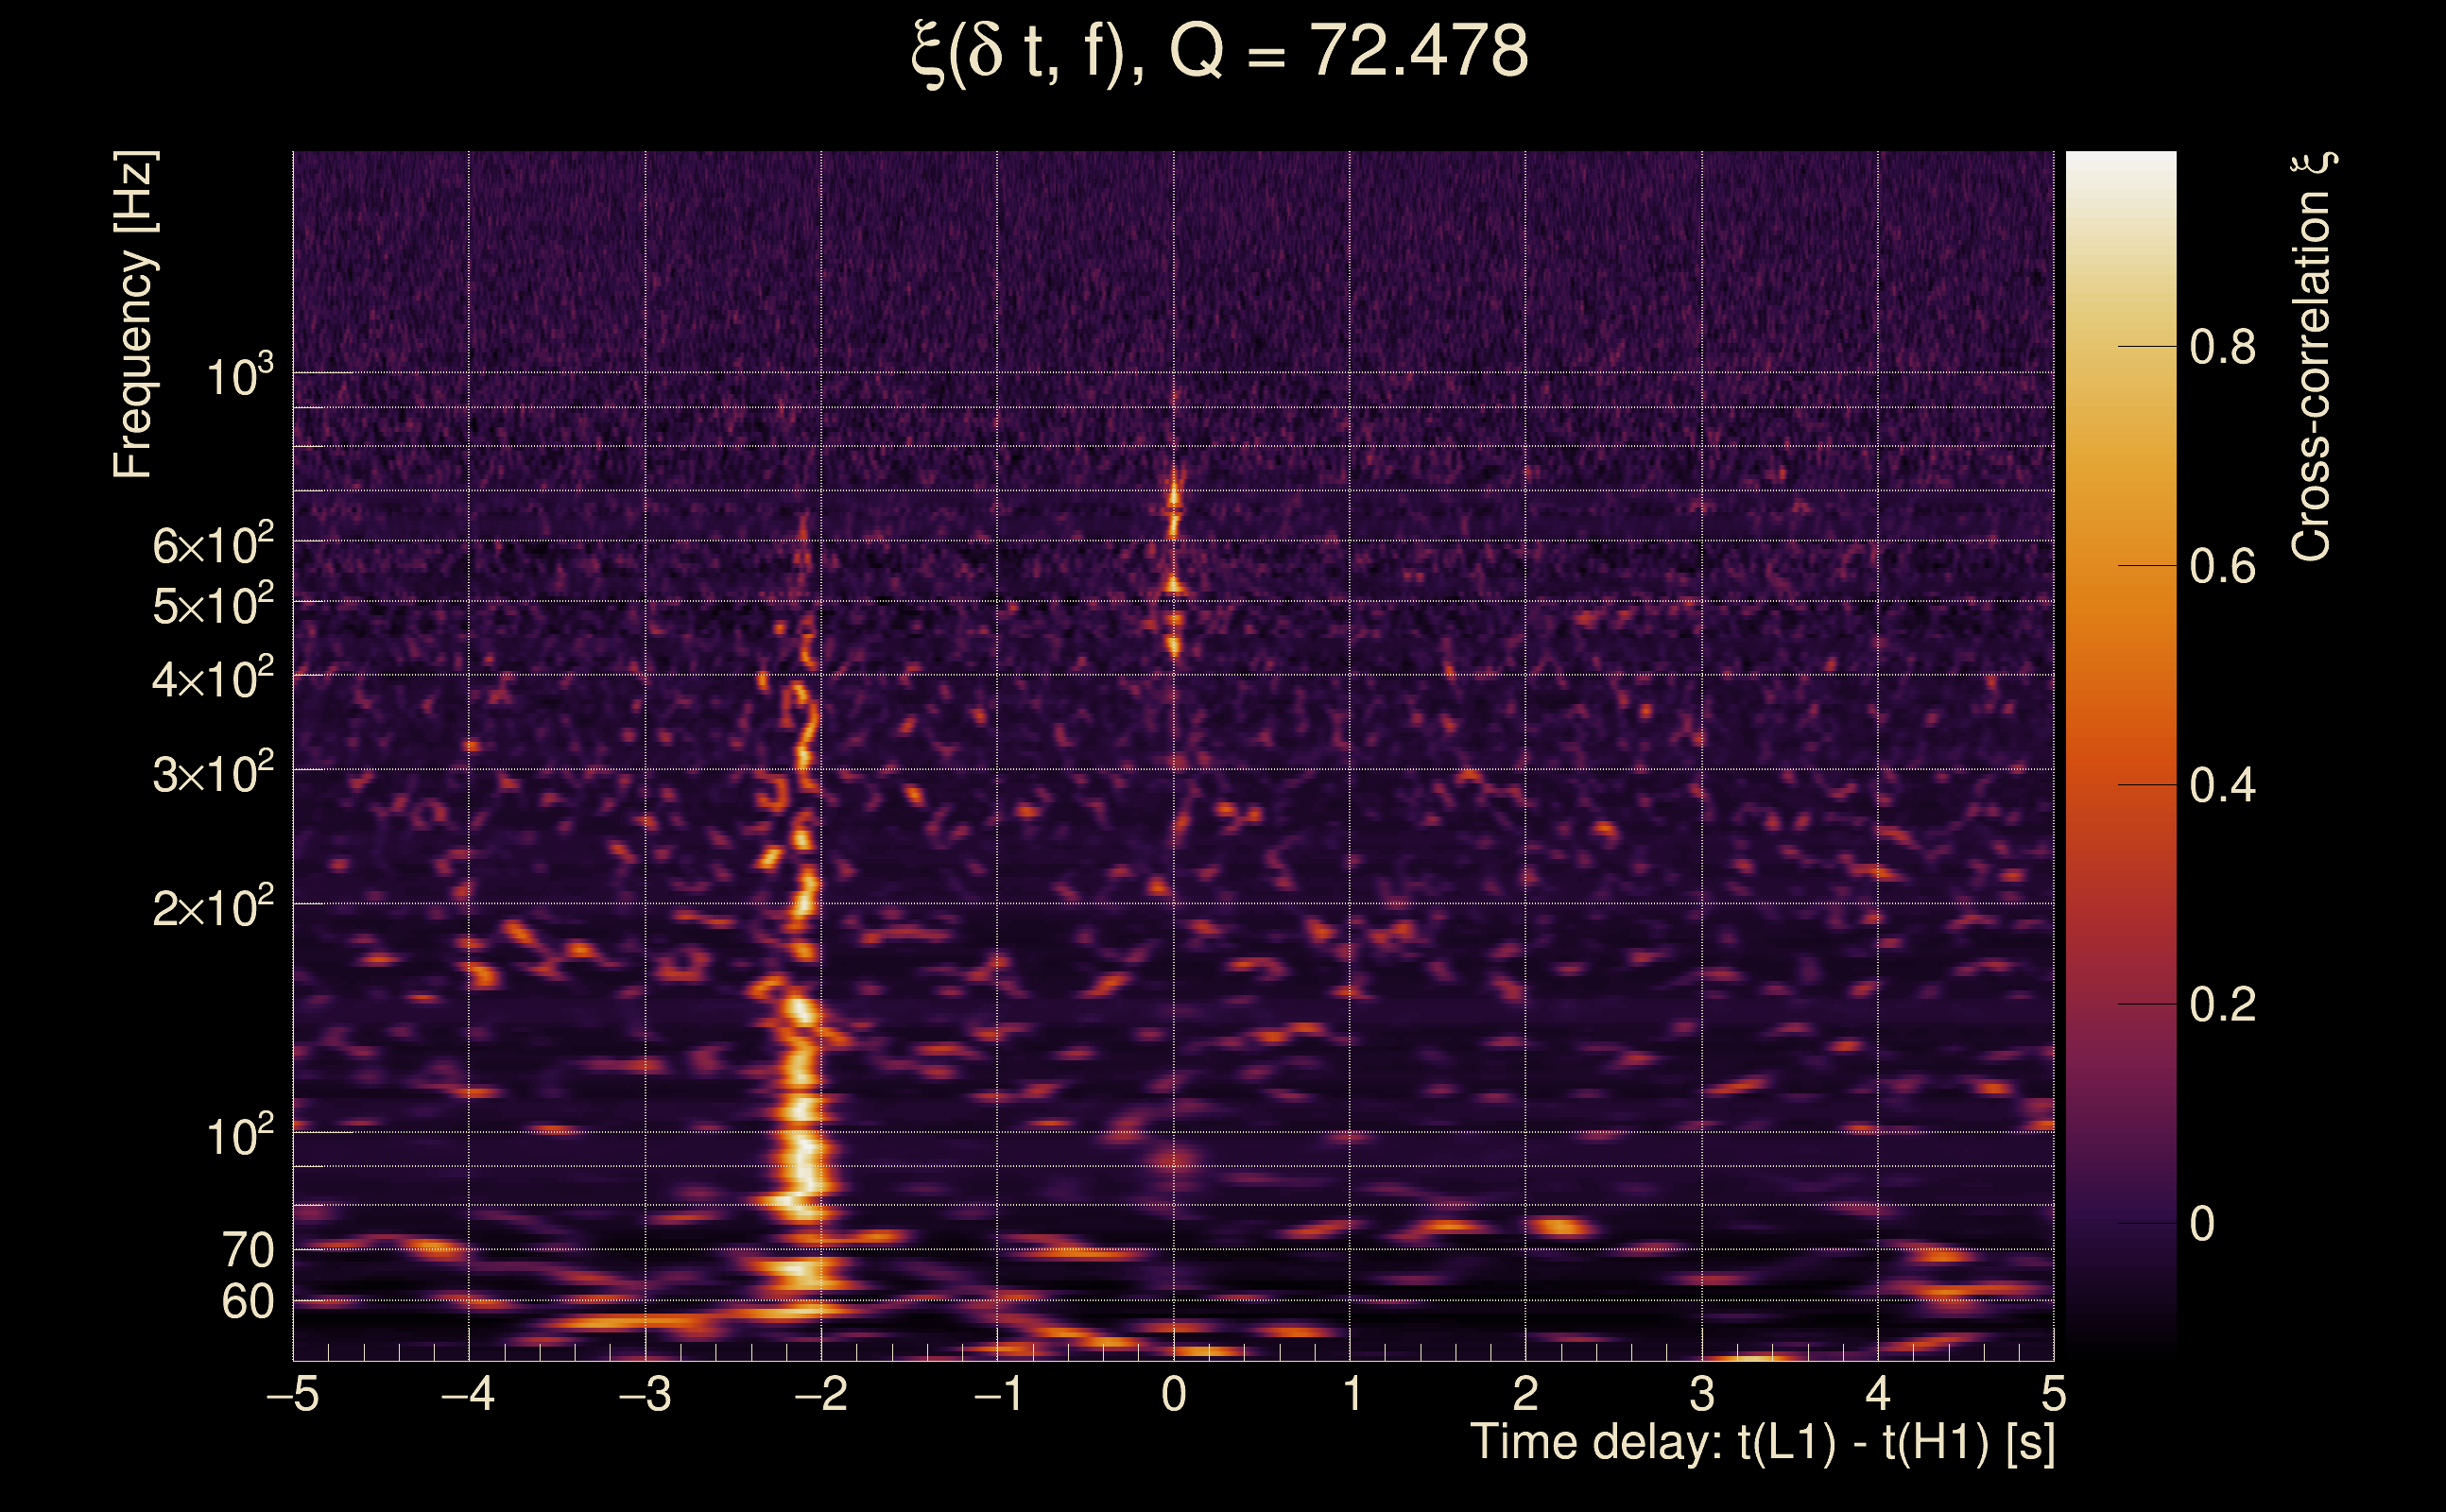
| Slice selected for the the fakeground: | slice index=64 (2.024 s), time lag = 0 s |
| Foreground | Fakeground | Background | ||
|---|---|---|---|---|
| Number of processed ox events | 175167 | 175167 | 37660905 | |
| Start Date (detector 0) | Sat Sep 2 04:54:54 2023 UTC | Sat Sep 2 04:54:54 2023 UTC | Sat Sep 2 04:54:54 2023 UTC | |
| End Date (detector 0) | Sun Sep 17 00:01:47 2023 UTC | Sun Sep 17 00:01:47 2023 UTC | Sun Sep 17 00:01:47 2023 UTC | |
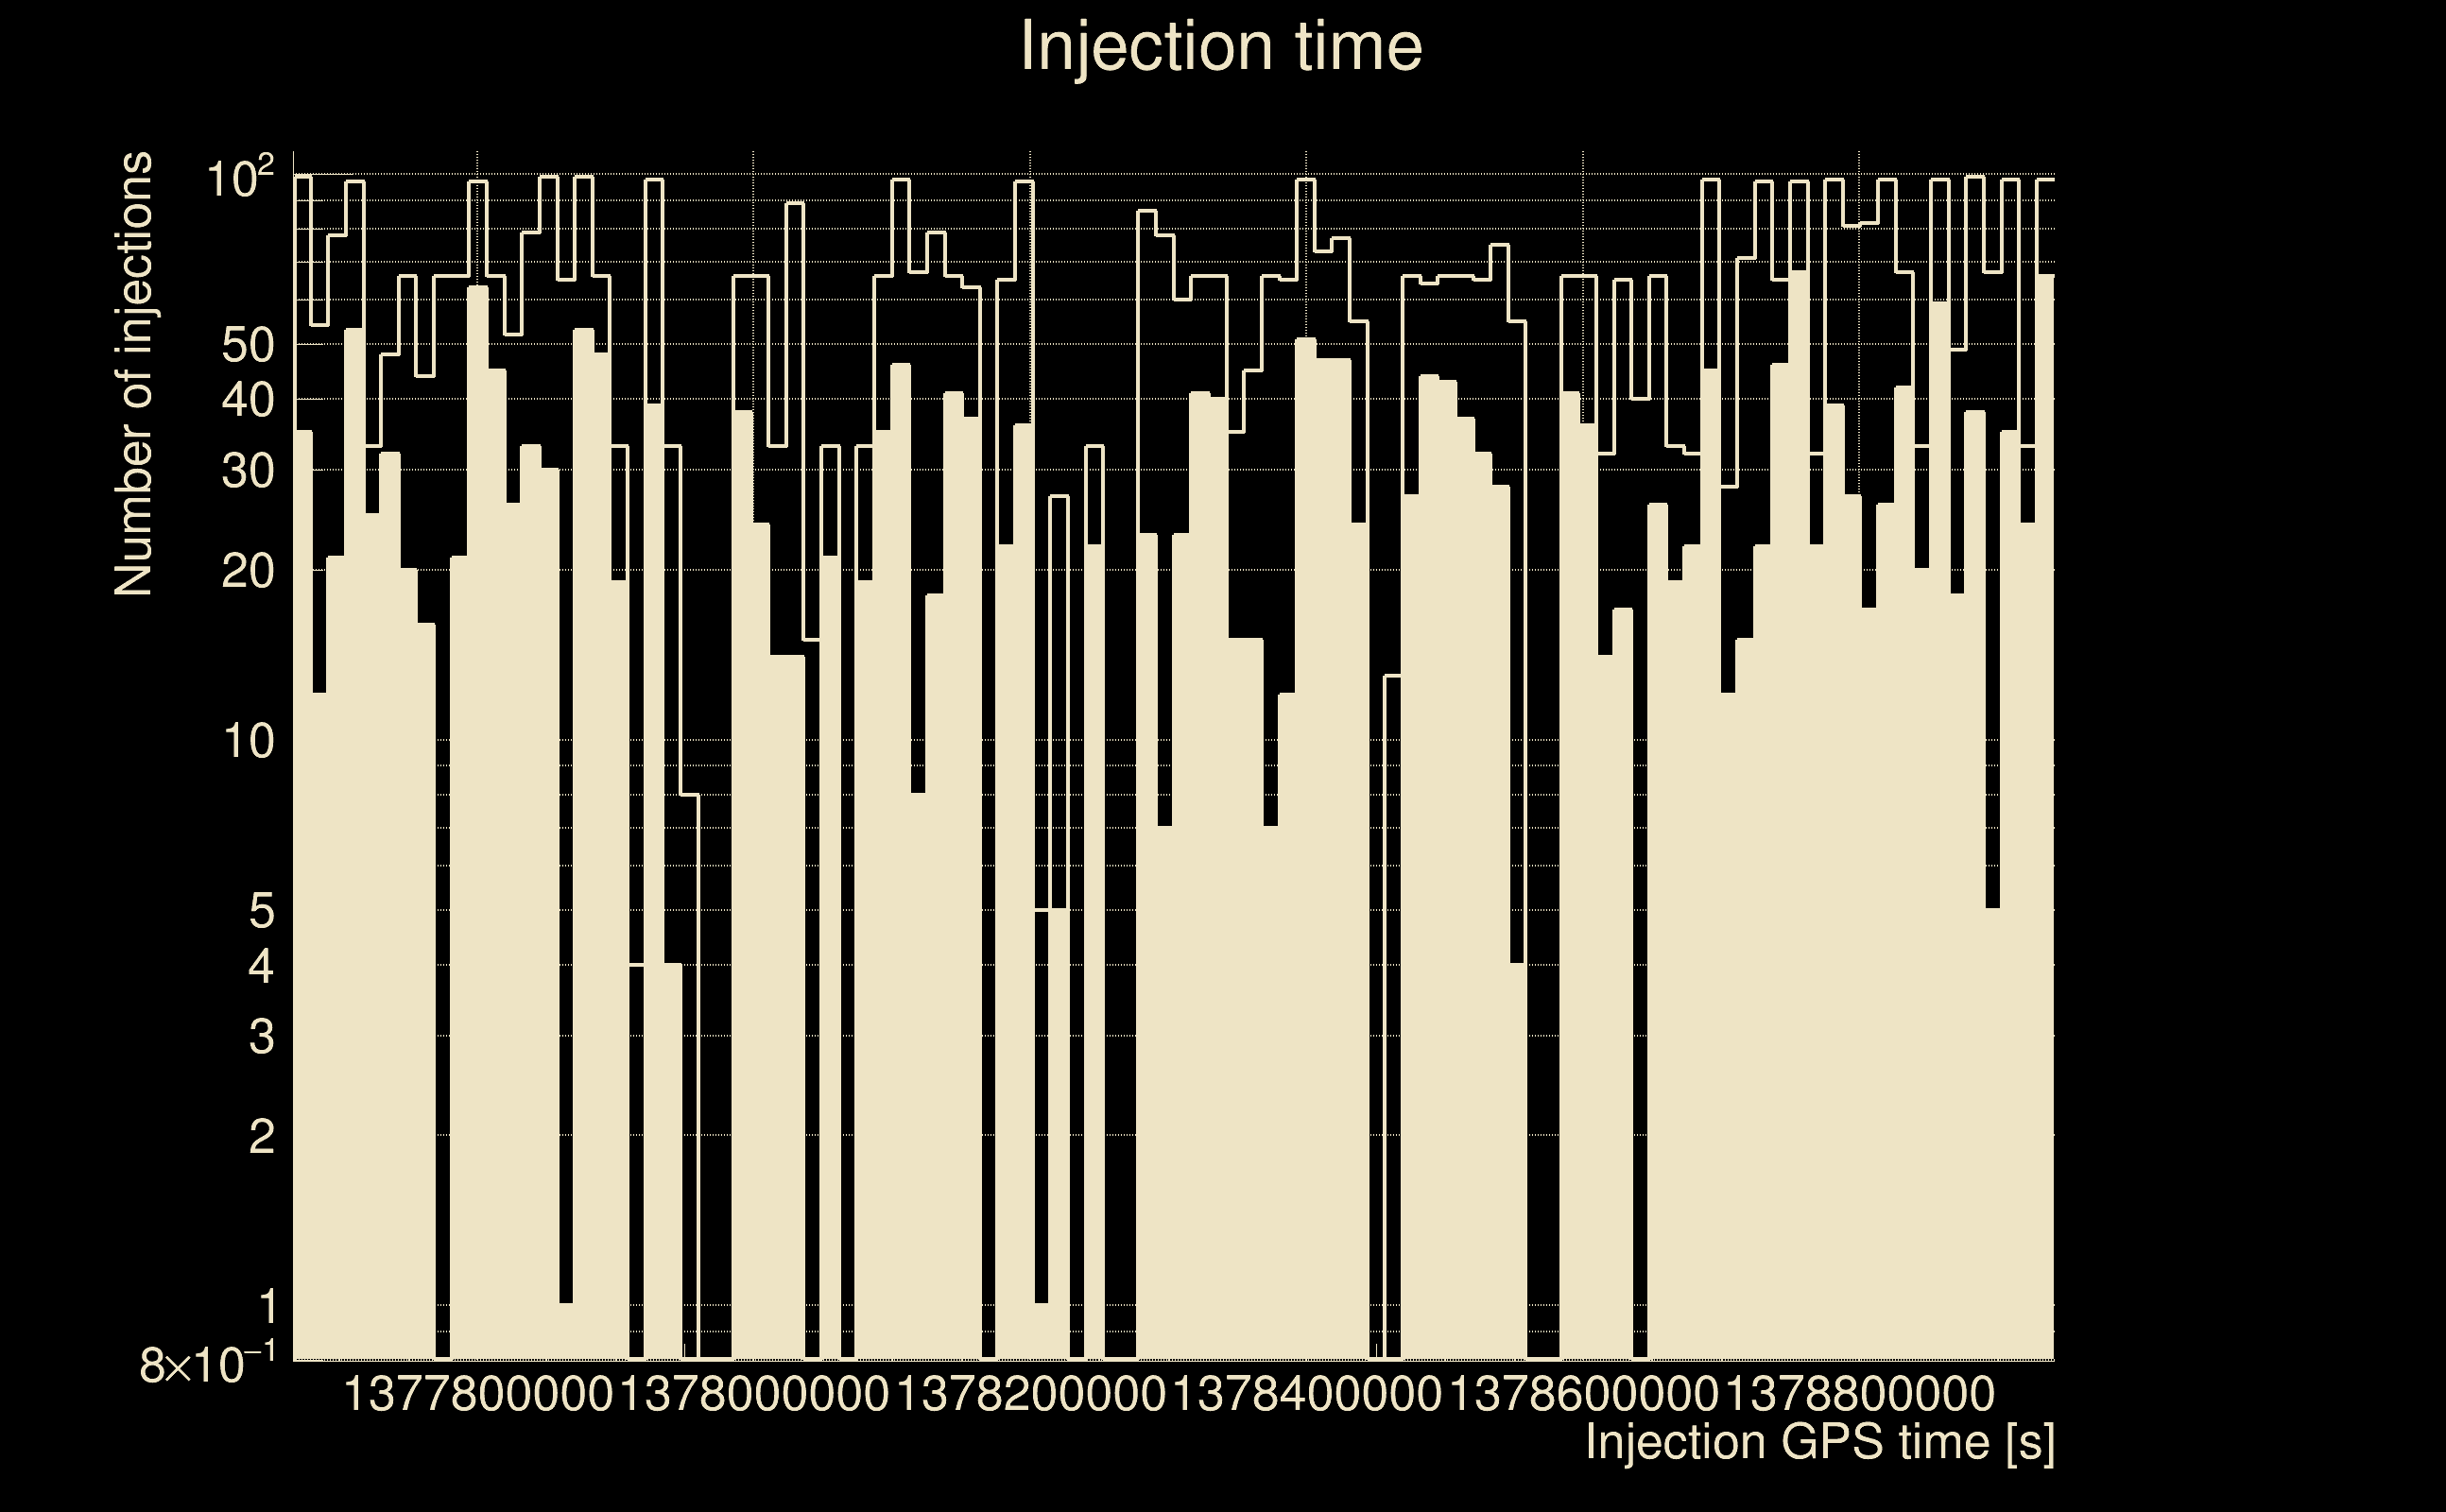
| Start GPS (detector 0) | 1377665712 | 1377665712 | 1377665712 | |
| End GPS (detector 0) | 1378944125 | 1378944125 | 1378944125 | |
| Used livetime (detector 0) | 880485 s | 880485 s | 880485 s | |
| Start Date (detector 1) | Sat Sep 2 04:54:54 2023 UTC | Sat Sep 2 04:54:54 2023 UTC | Sat Sep 2 04:54:54 2023 UTC | |
| End Date (detector 1) | Sun Sep 17 00:01:47 2023 UTC | Sun Sep 17 00:01:47 2023 UTC | Sun Sep 17 00:01:47 2023 UTC | |
| Start GPS (detector 1) | 1377665712 | 1377665712 | 1377665712 | |
| End GPS (detector 1) | 1378944125 | 1378944125 | 1378944125 | |
| Used livetime (detector 1) | 880485 s | 880485 s | 880485 s | |
| Cumulative livetime | 1751670 s | 1751670 s | 376609050 s | |
| 0 years, 20 days, 6 hours, 34 min, 30 s | 0 years, 20 days, 6 hours, 34 min, 30 s | 11 years, 341 days, 21 hours, 37 min, 30 s |
|
|
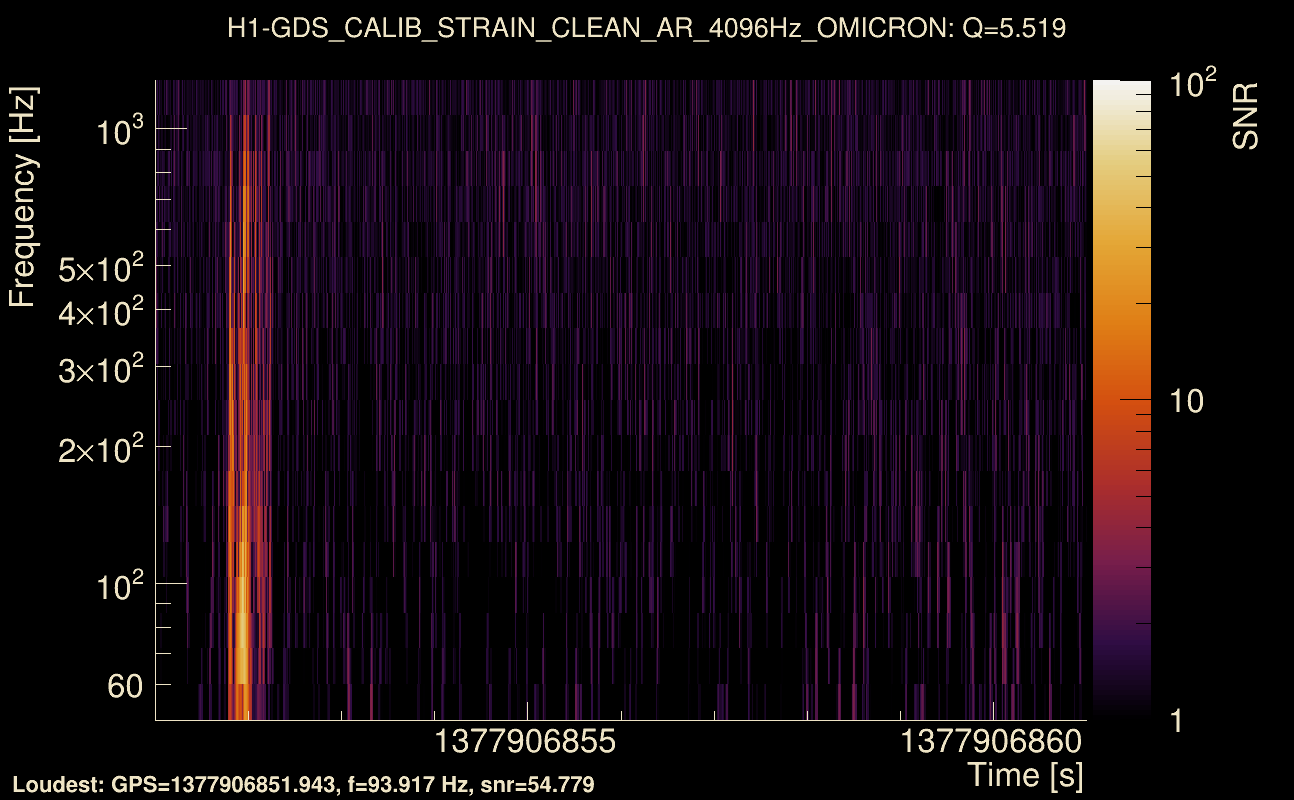
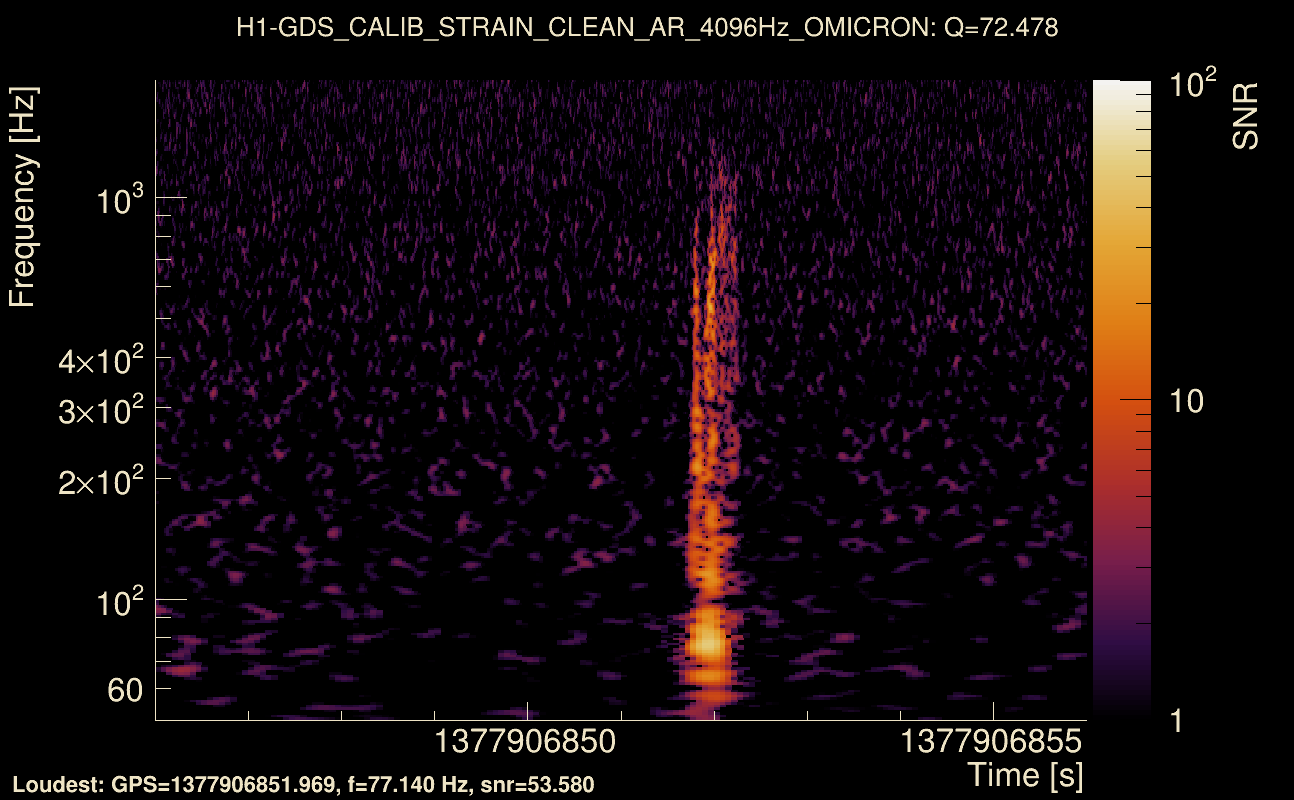
| Event time t(H1): | GPS = 1377906851 (Mon Sep 4 23:53:53 2023 ) → GPS = 1377906861 (Mon Sep 4 23:54:03 2023 ) |
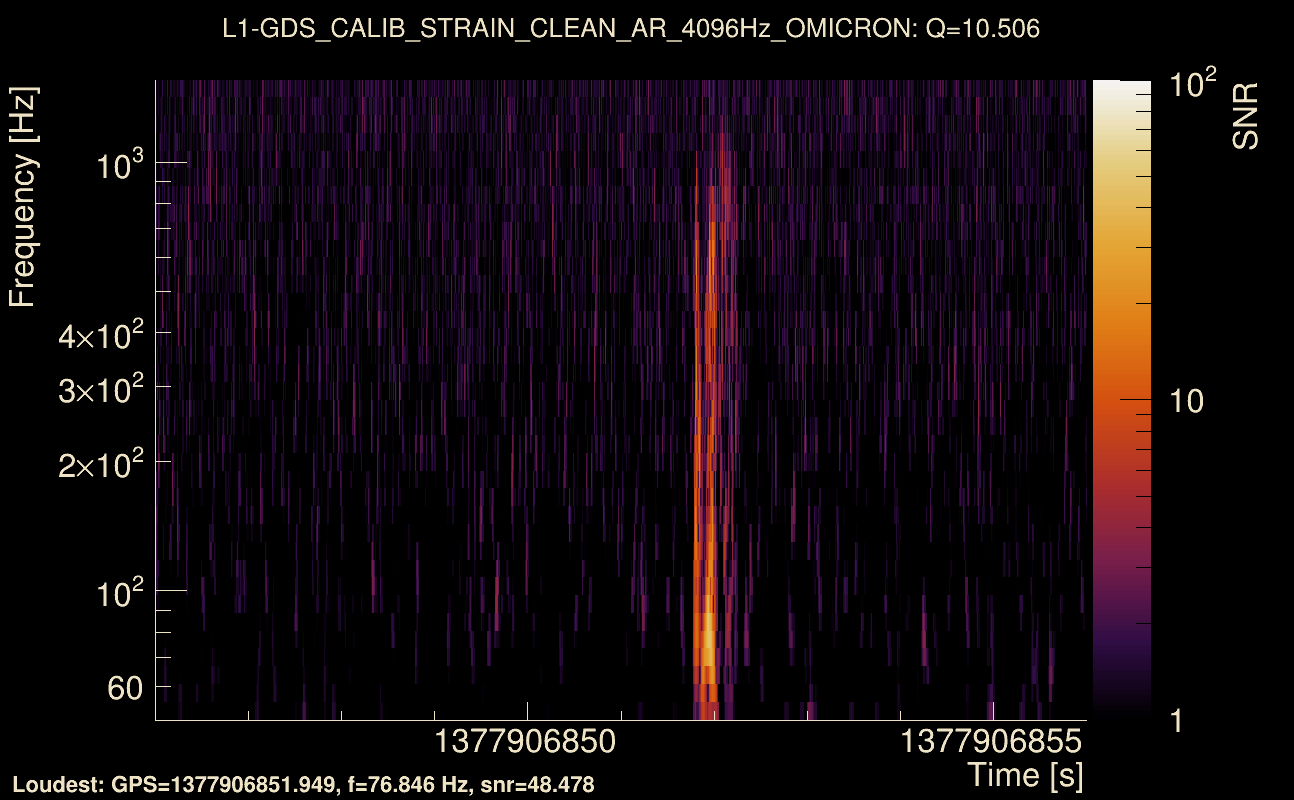
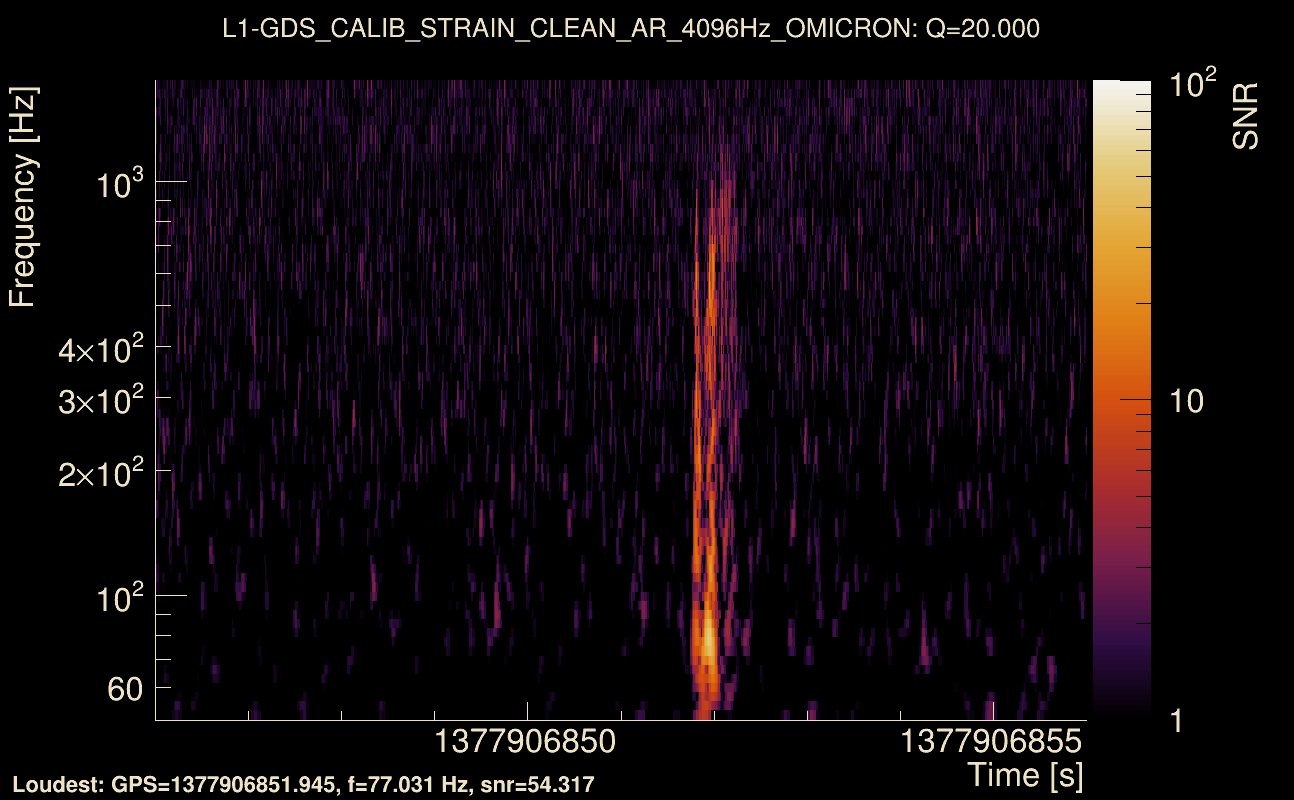
| Event time t(L1): | GPS = 1377906851 (Mon Sep 4 23:54:03 2023 ) → GPS = 1377906861 (Mon Sep 4 23:54:03 2023 ) |
| Omicron analysis time window (H1): | GPS = 1377906848 → GPS = 1377906864 |
| Omicron analysis time window (L1): | GPS = 1377906848 → GPS = 1377906864 |
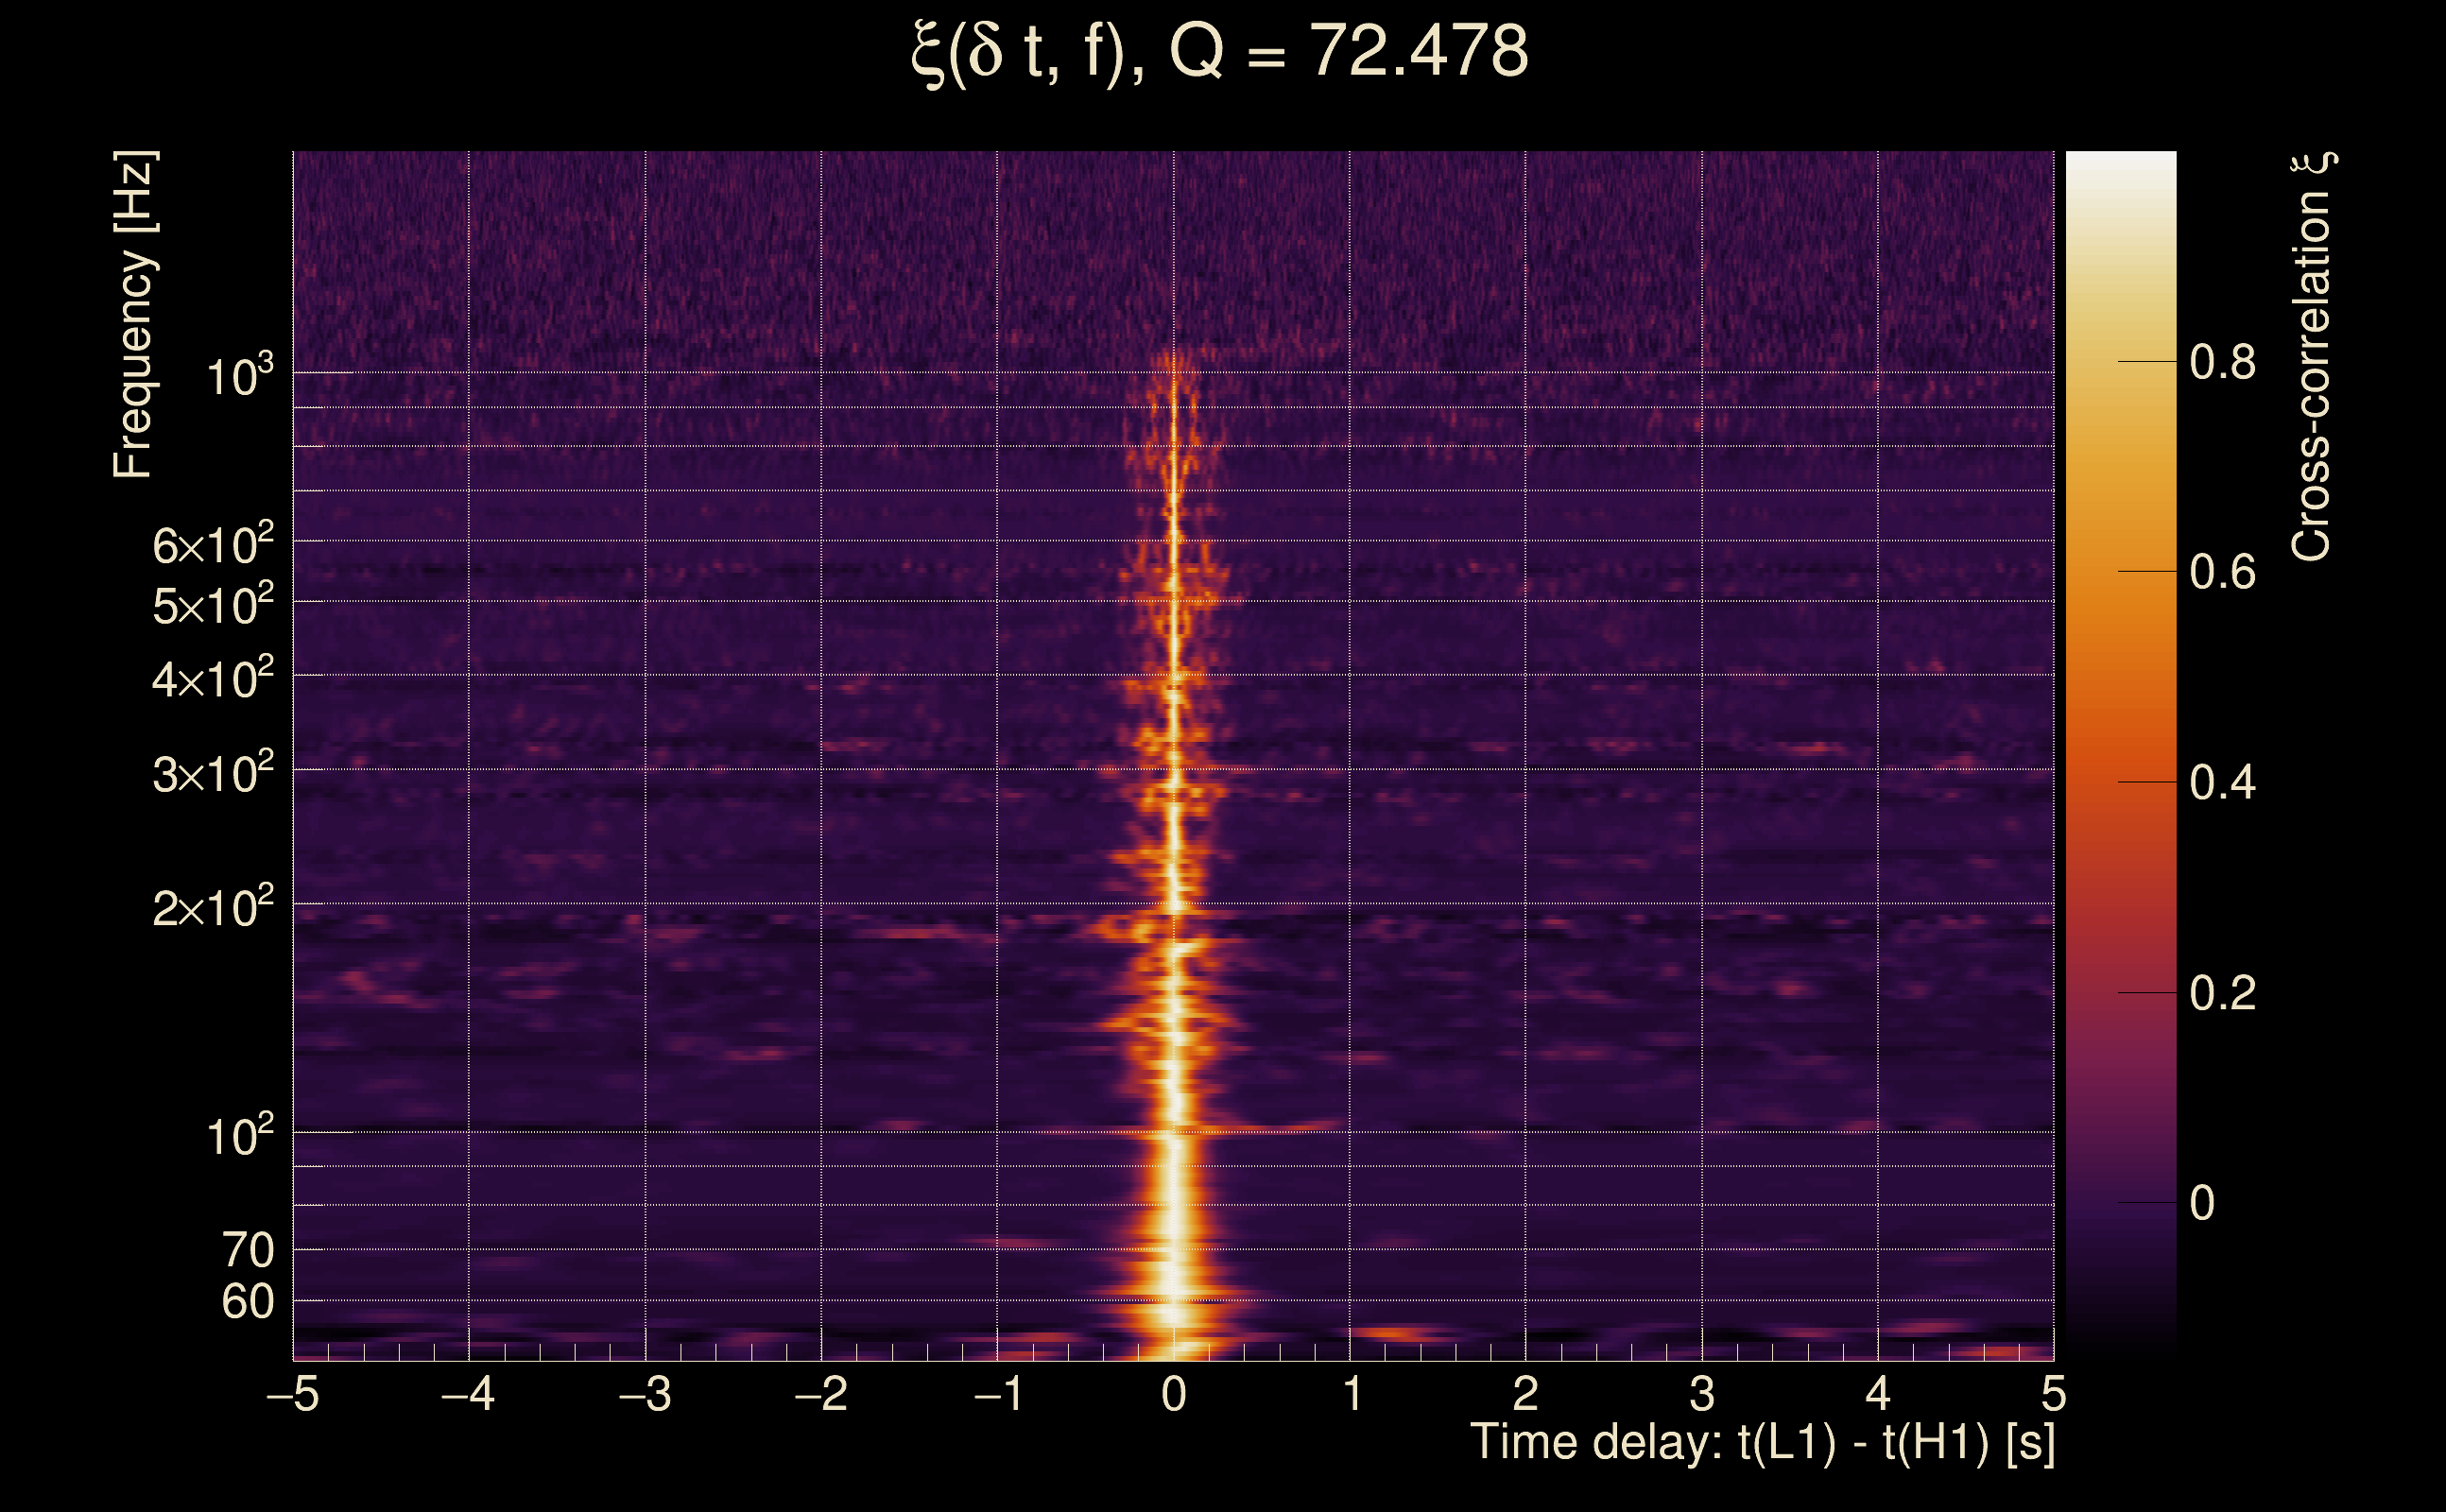
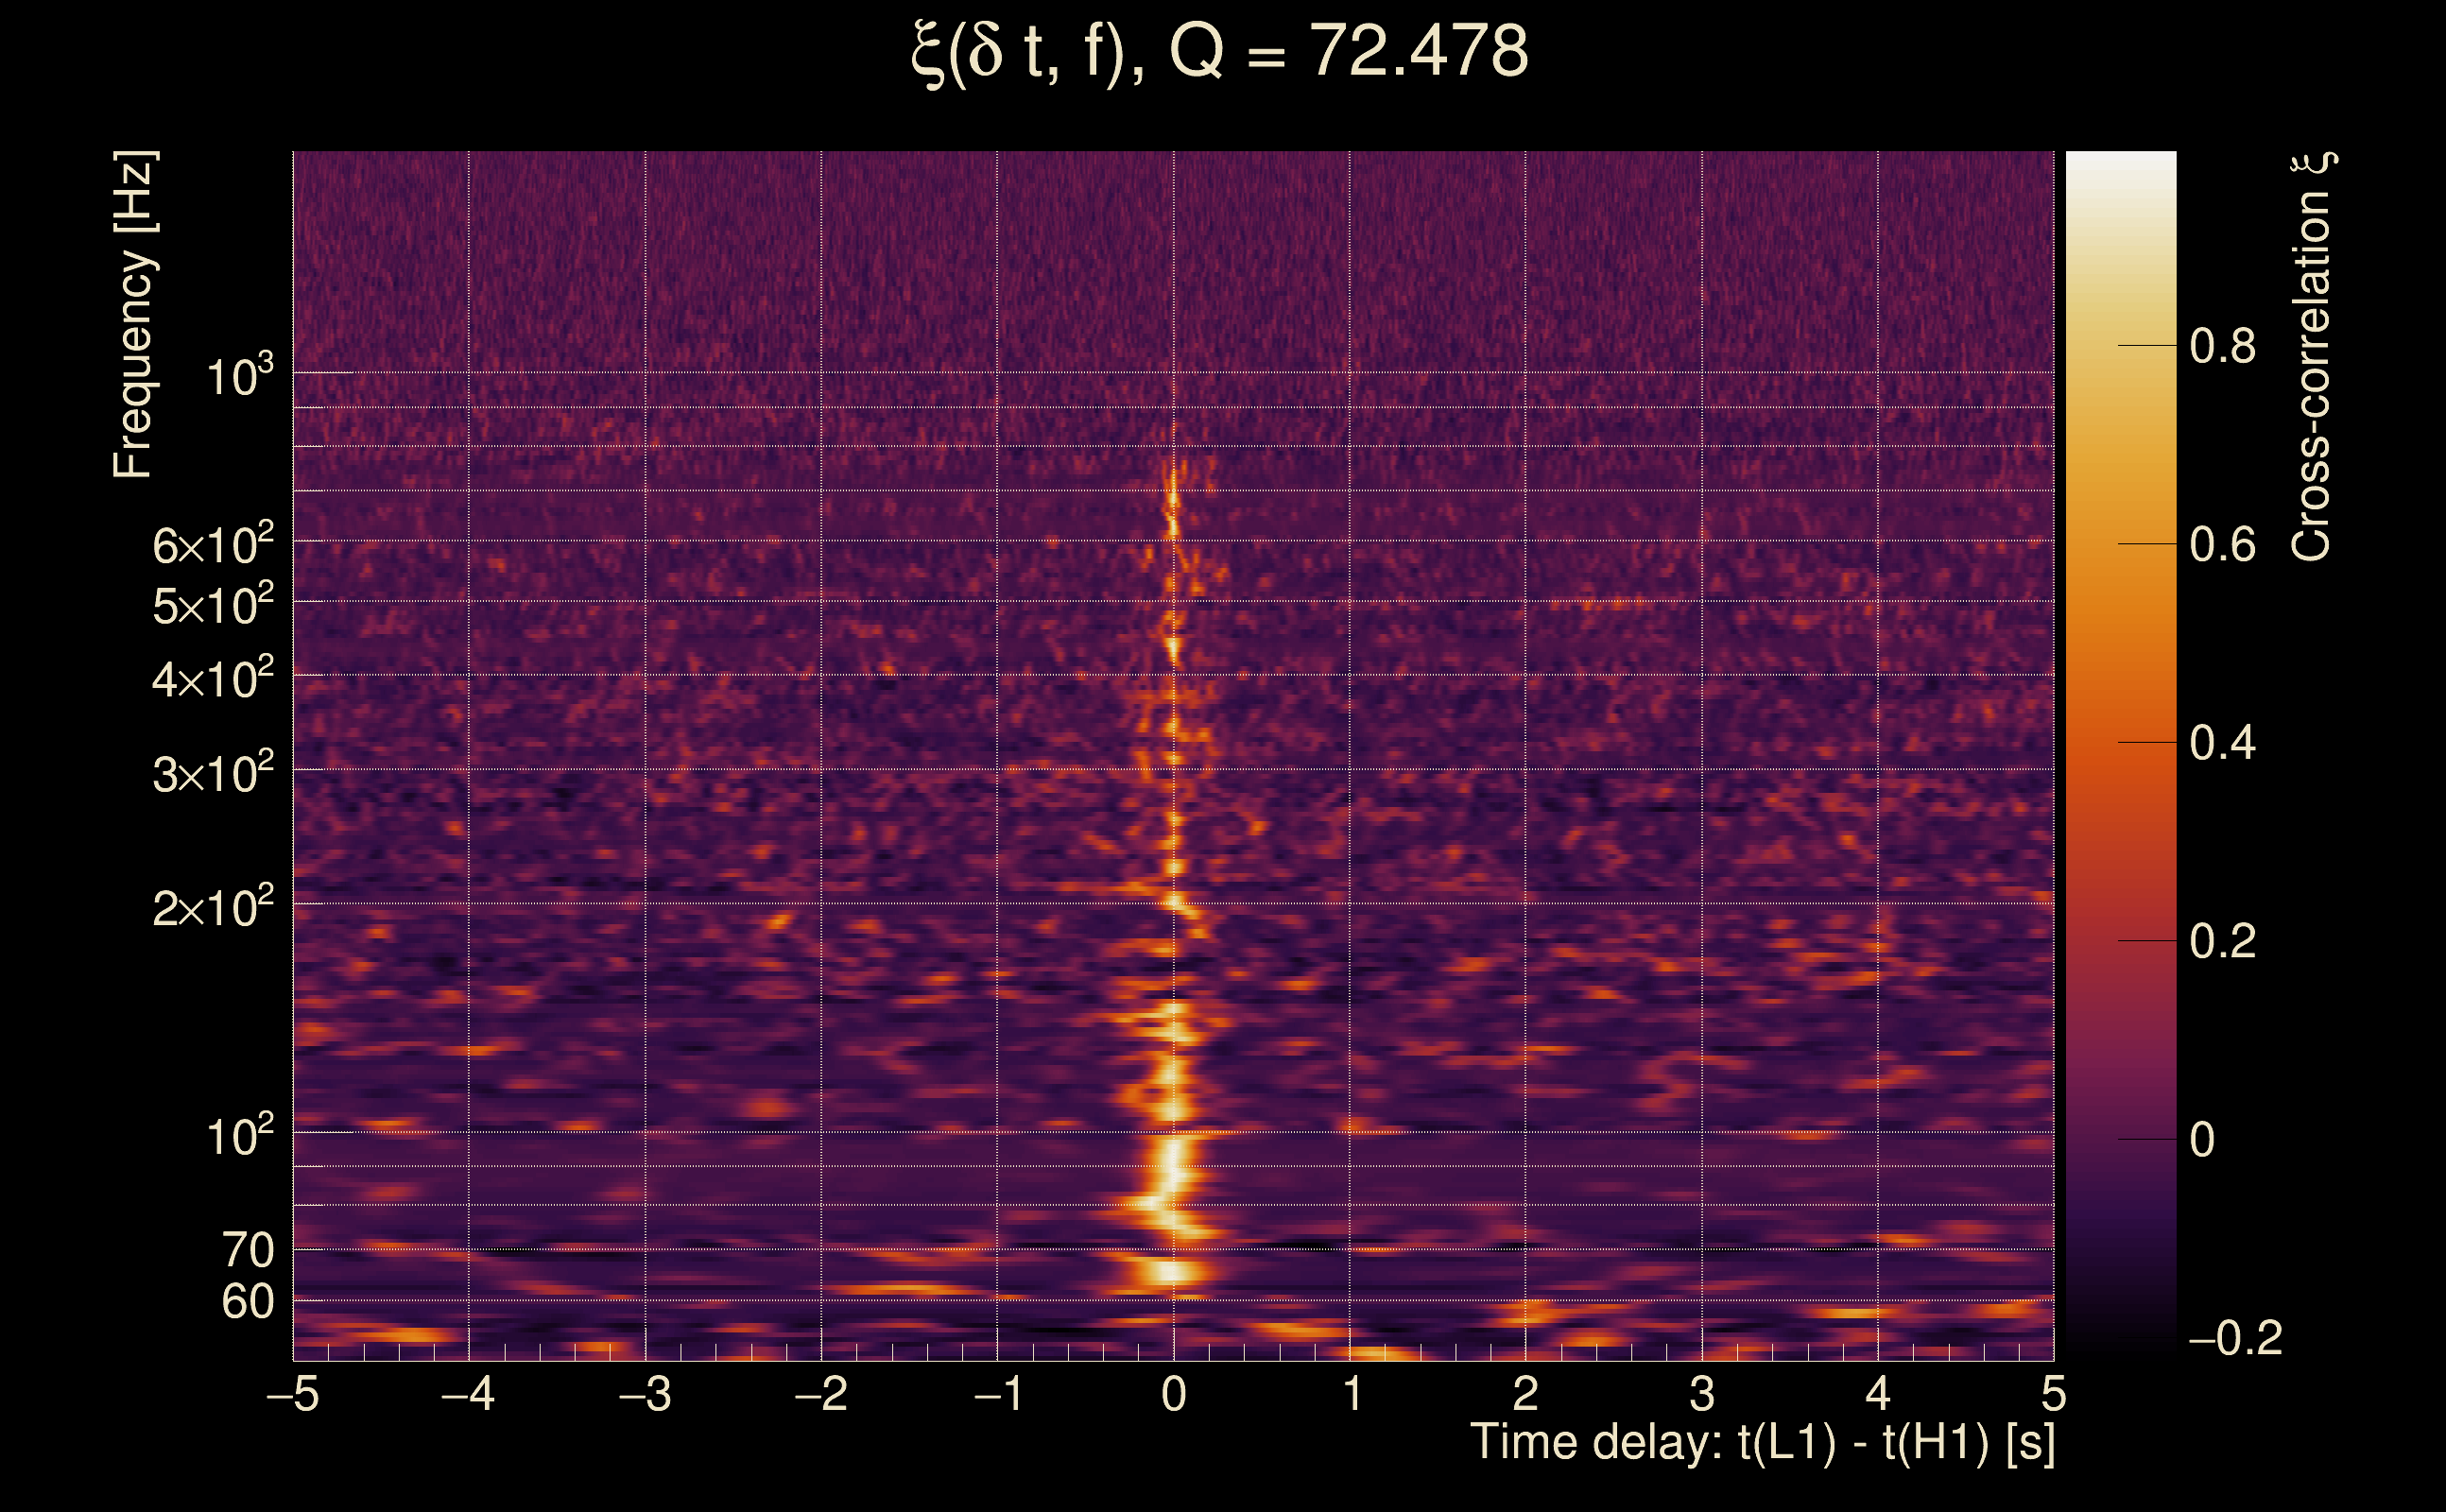
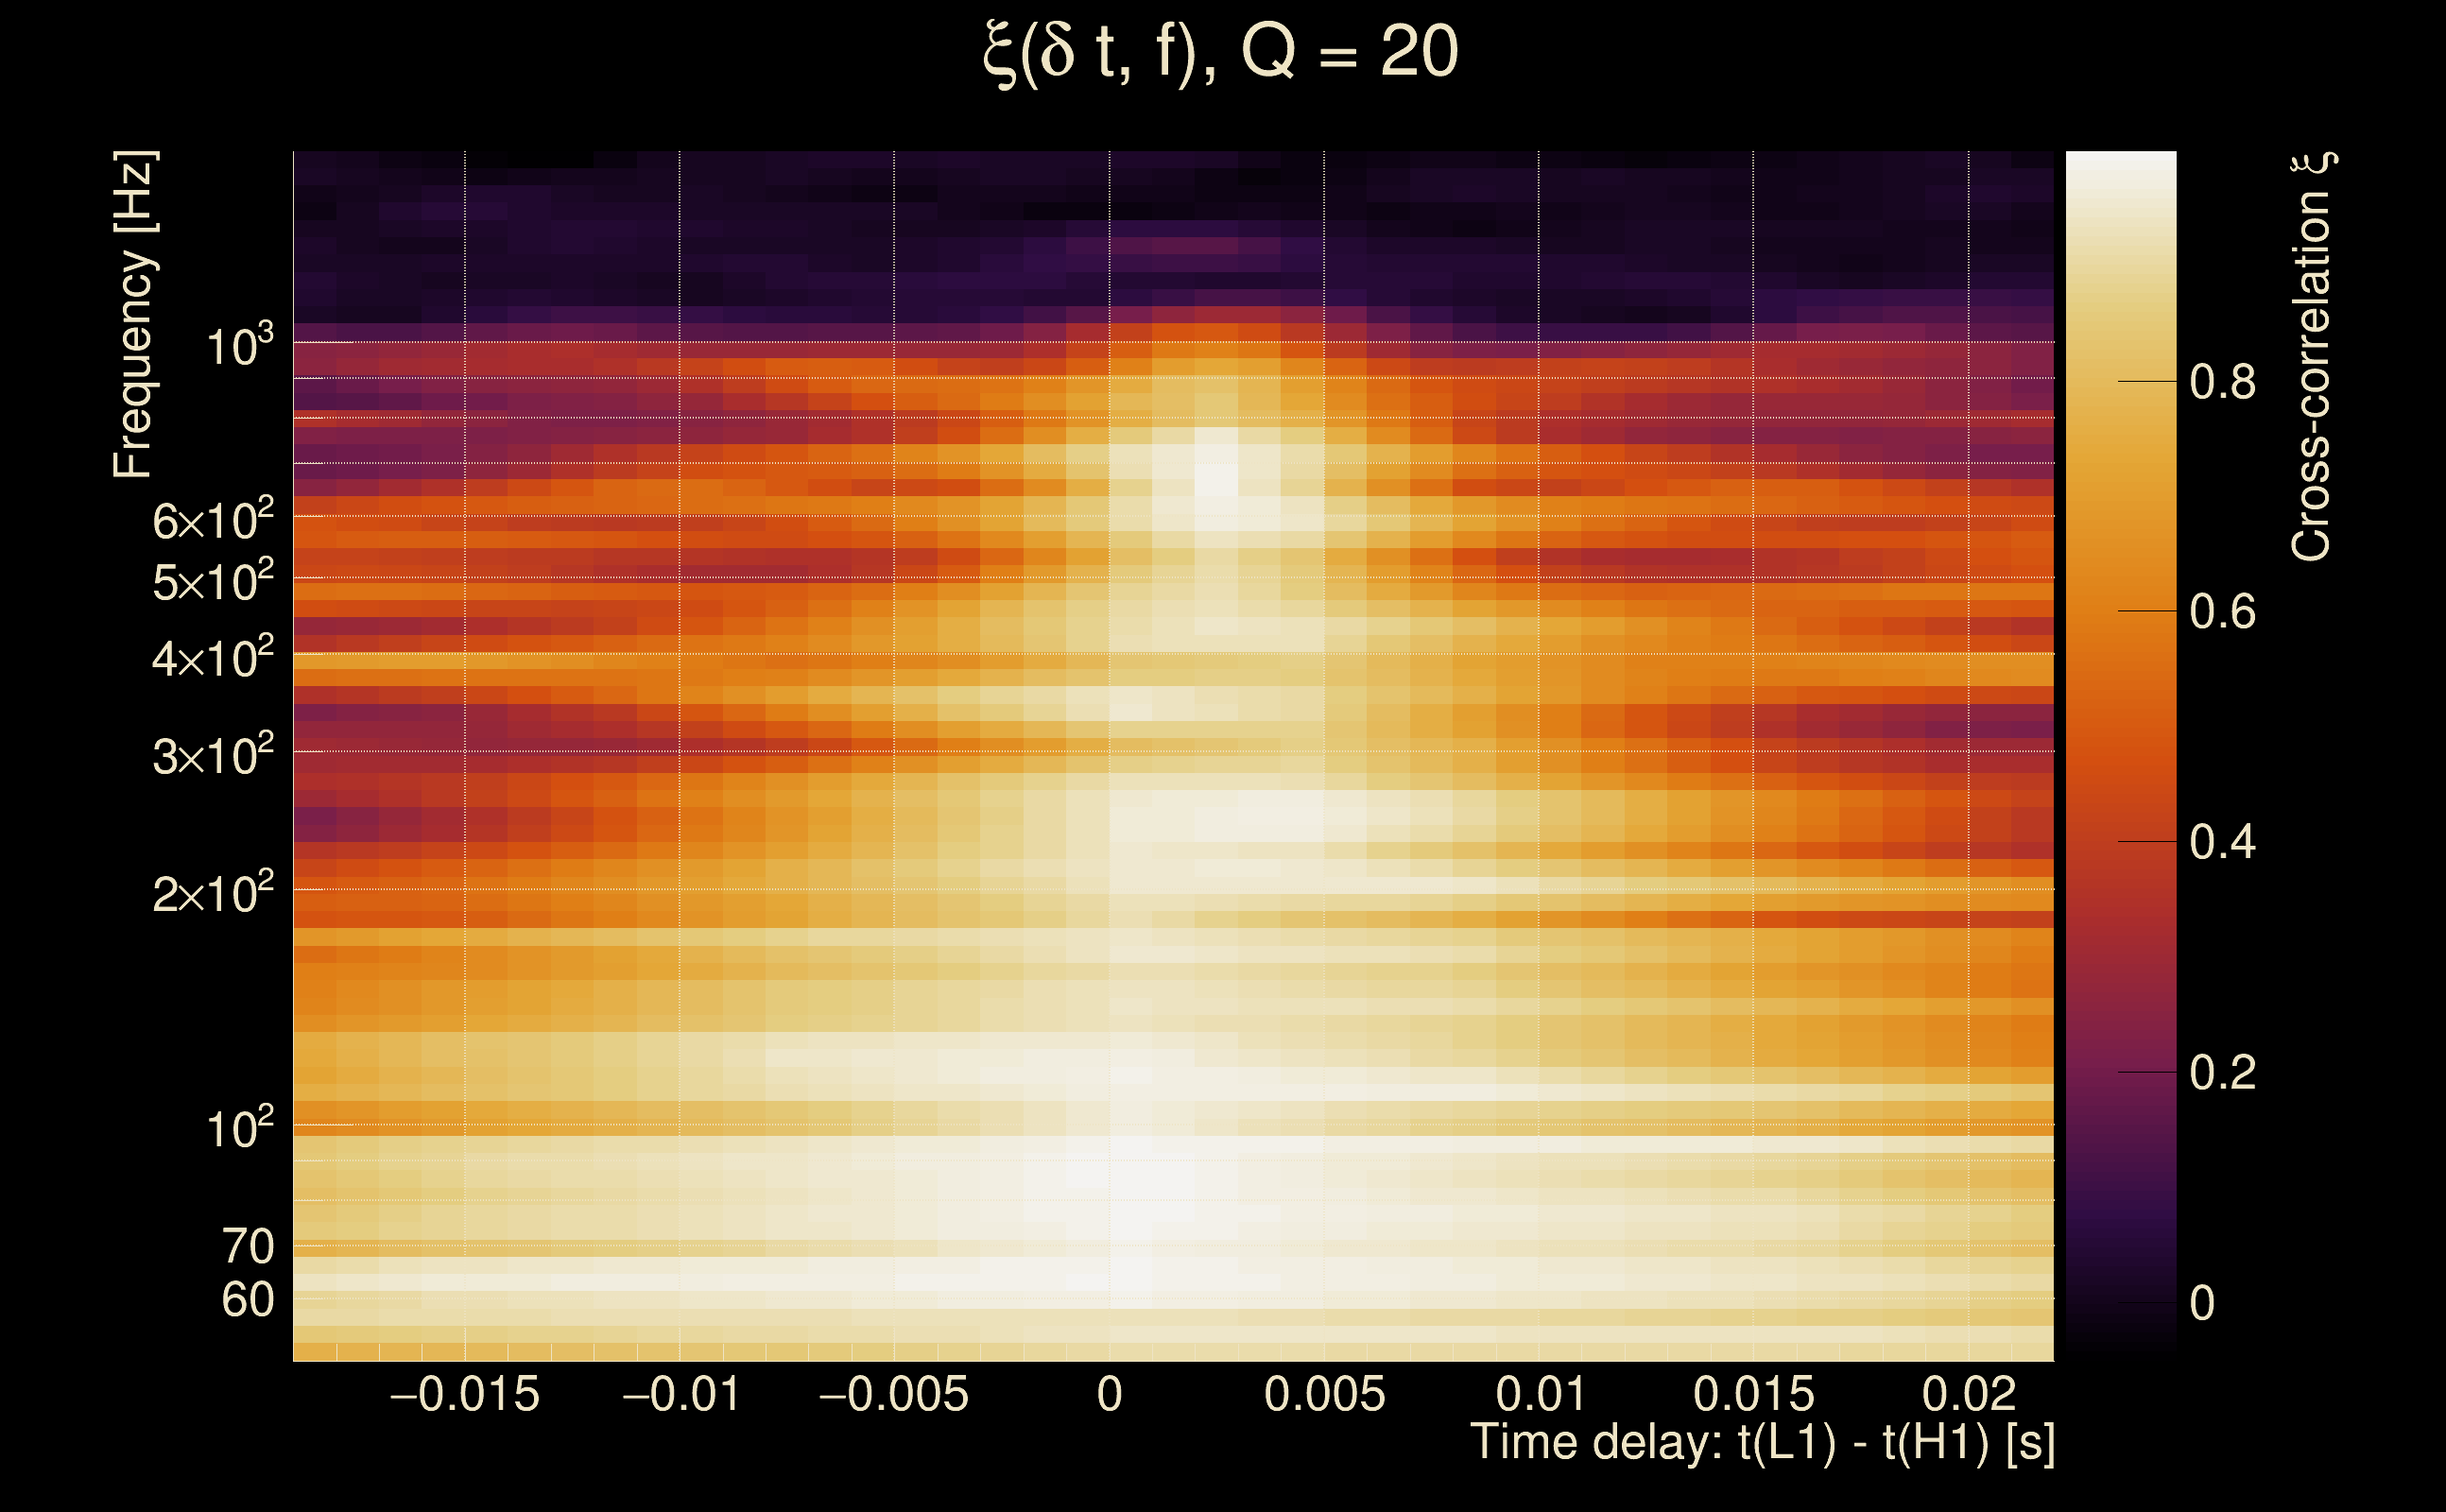
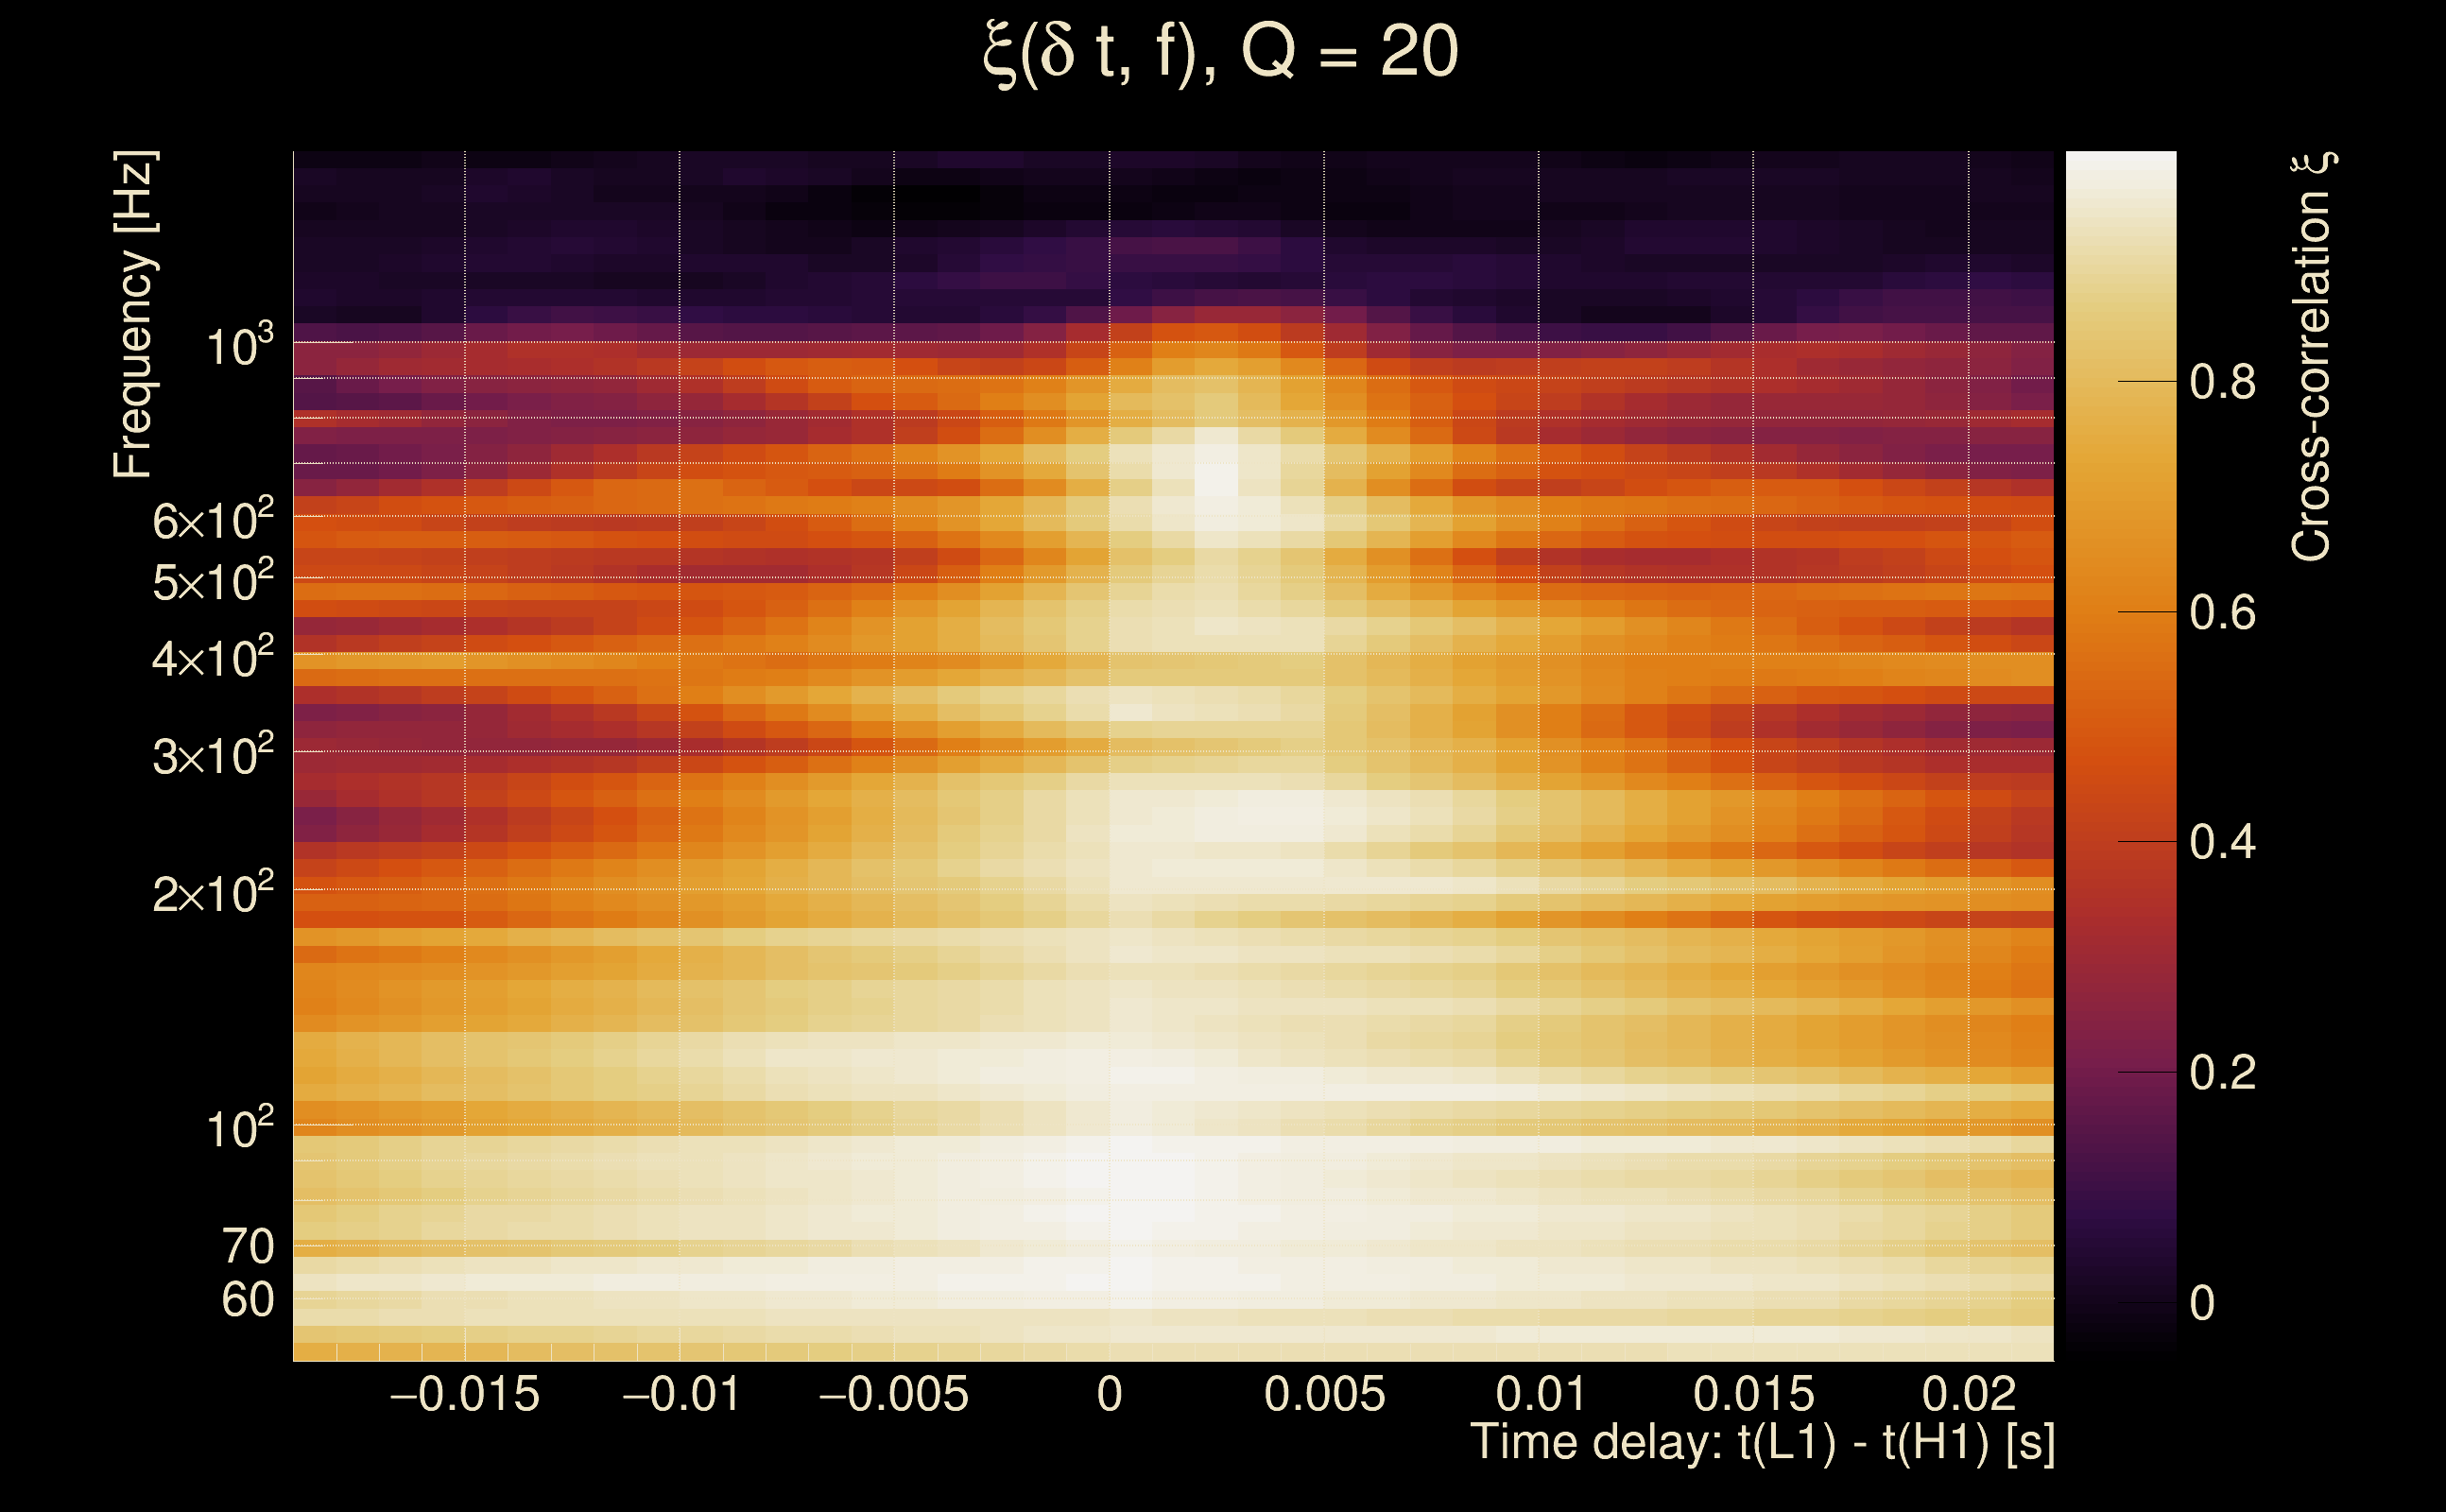
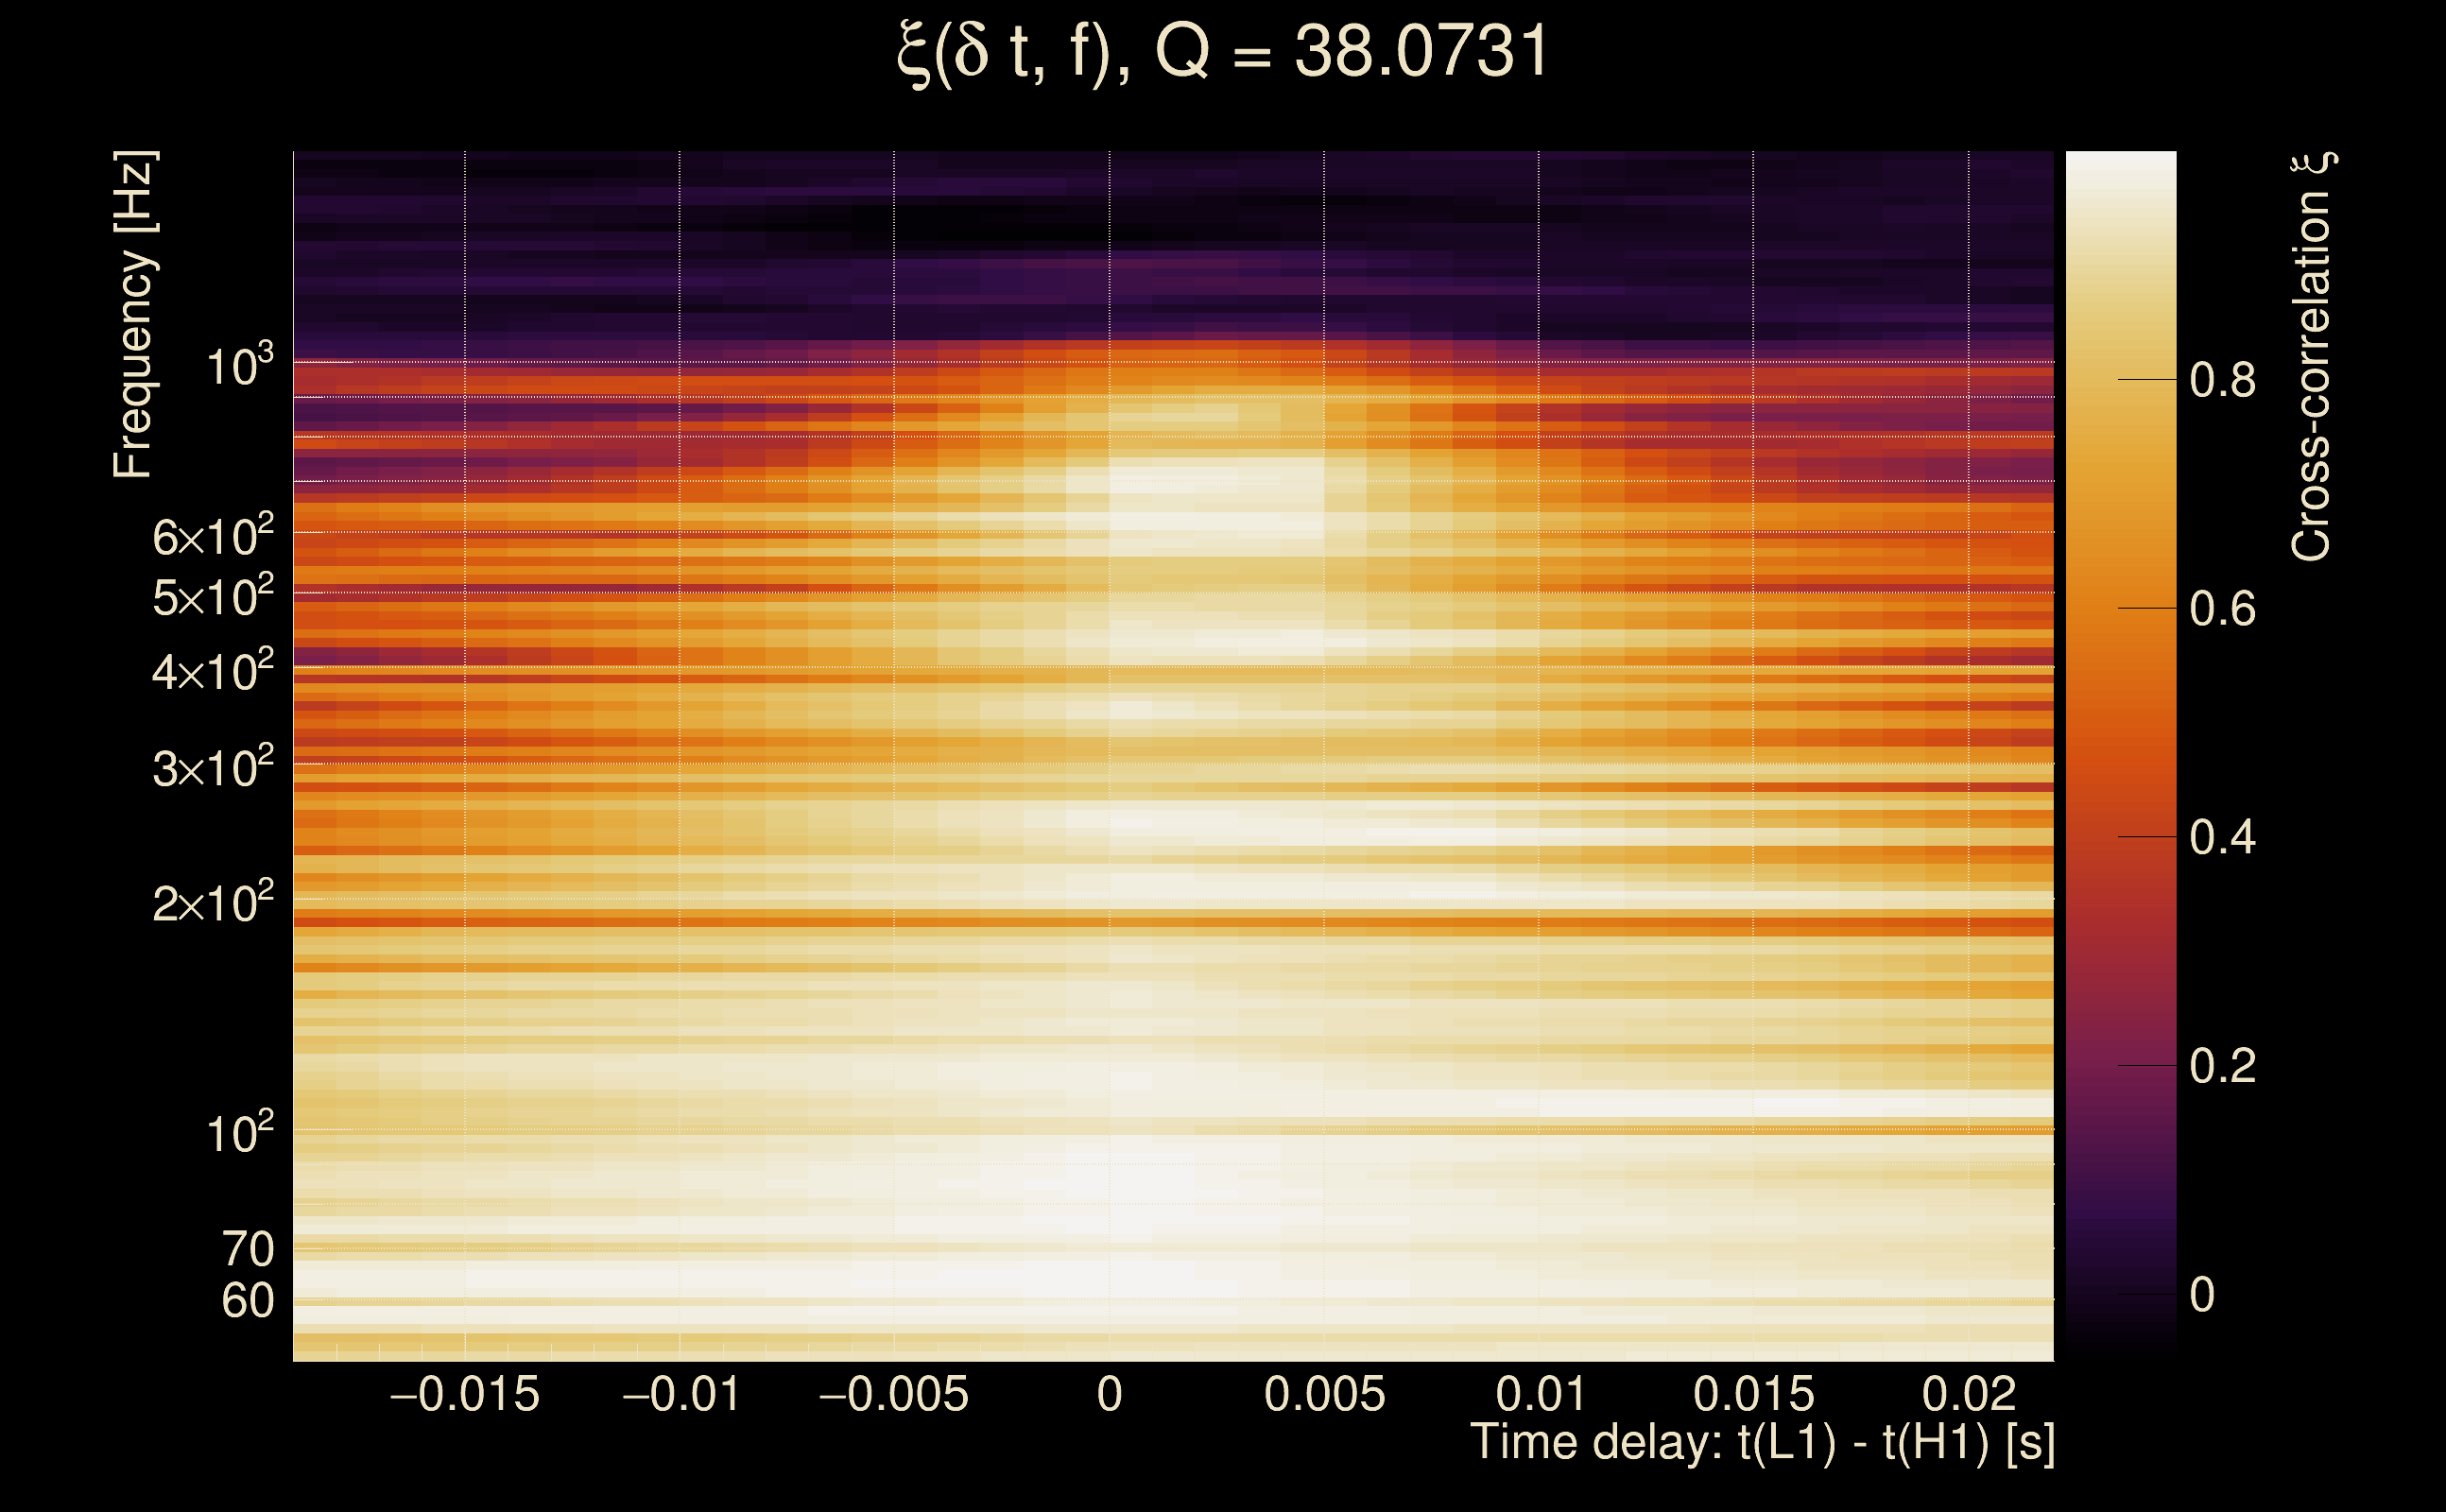
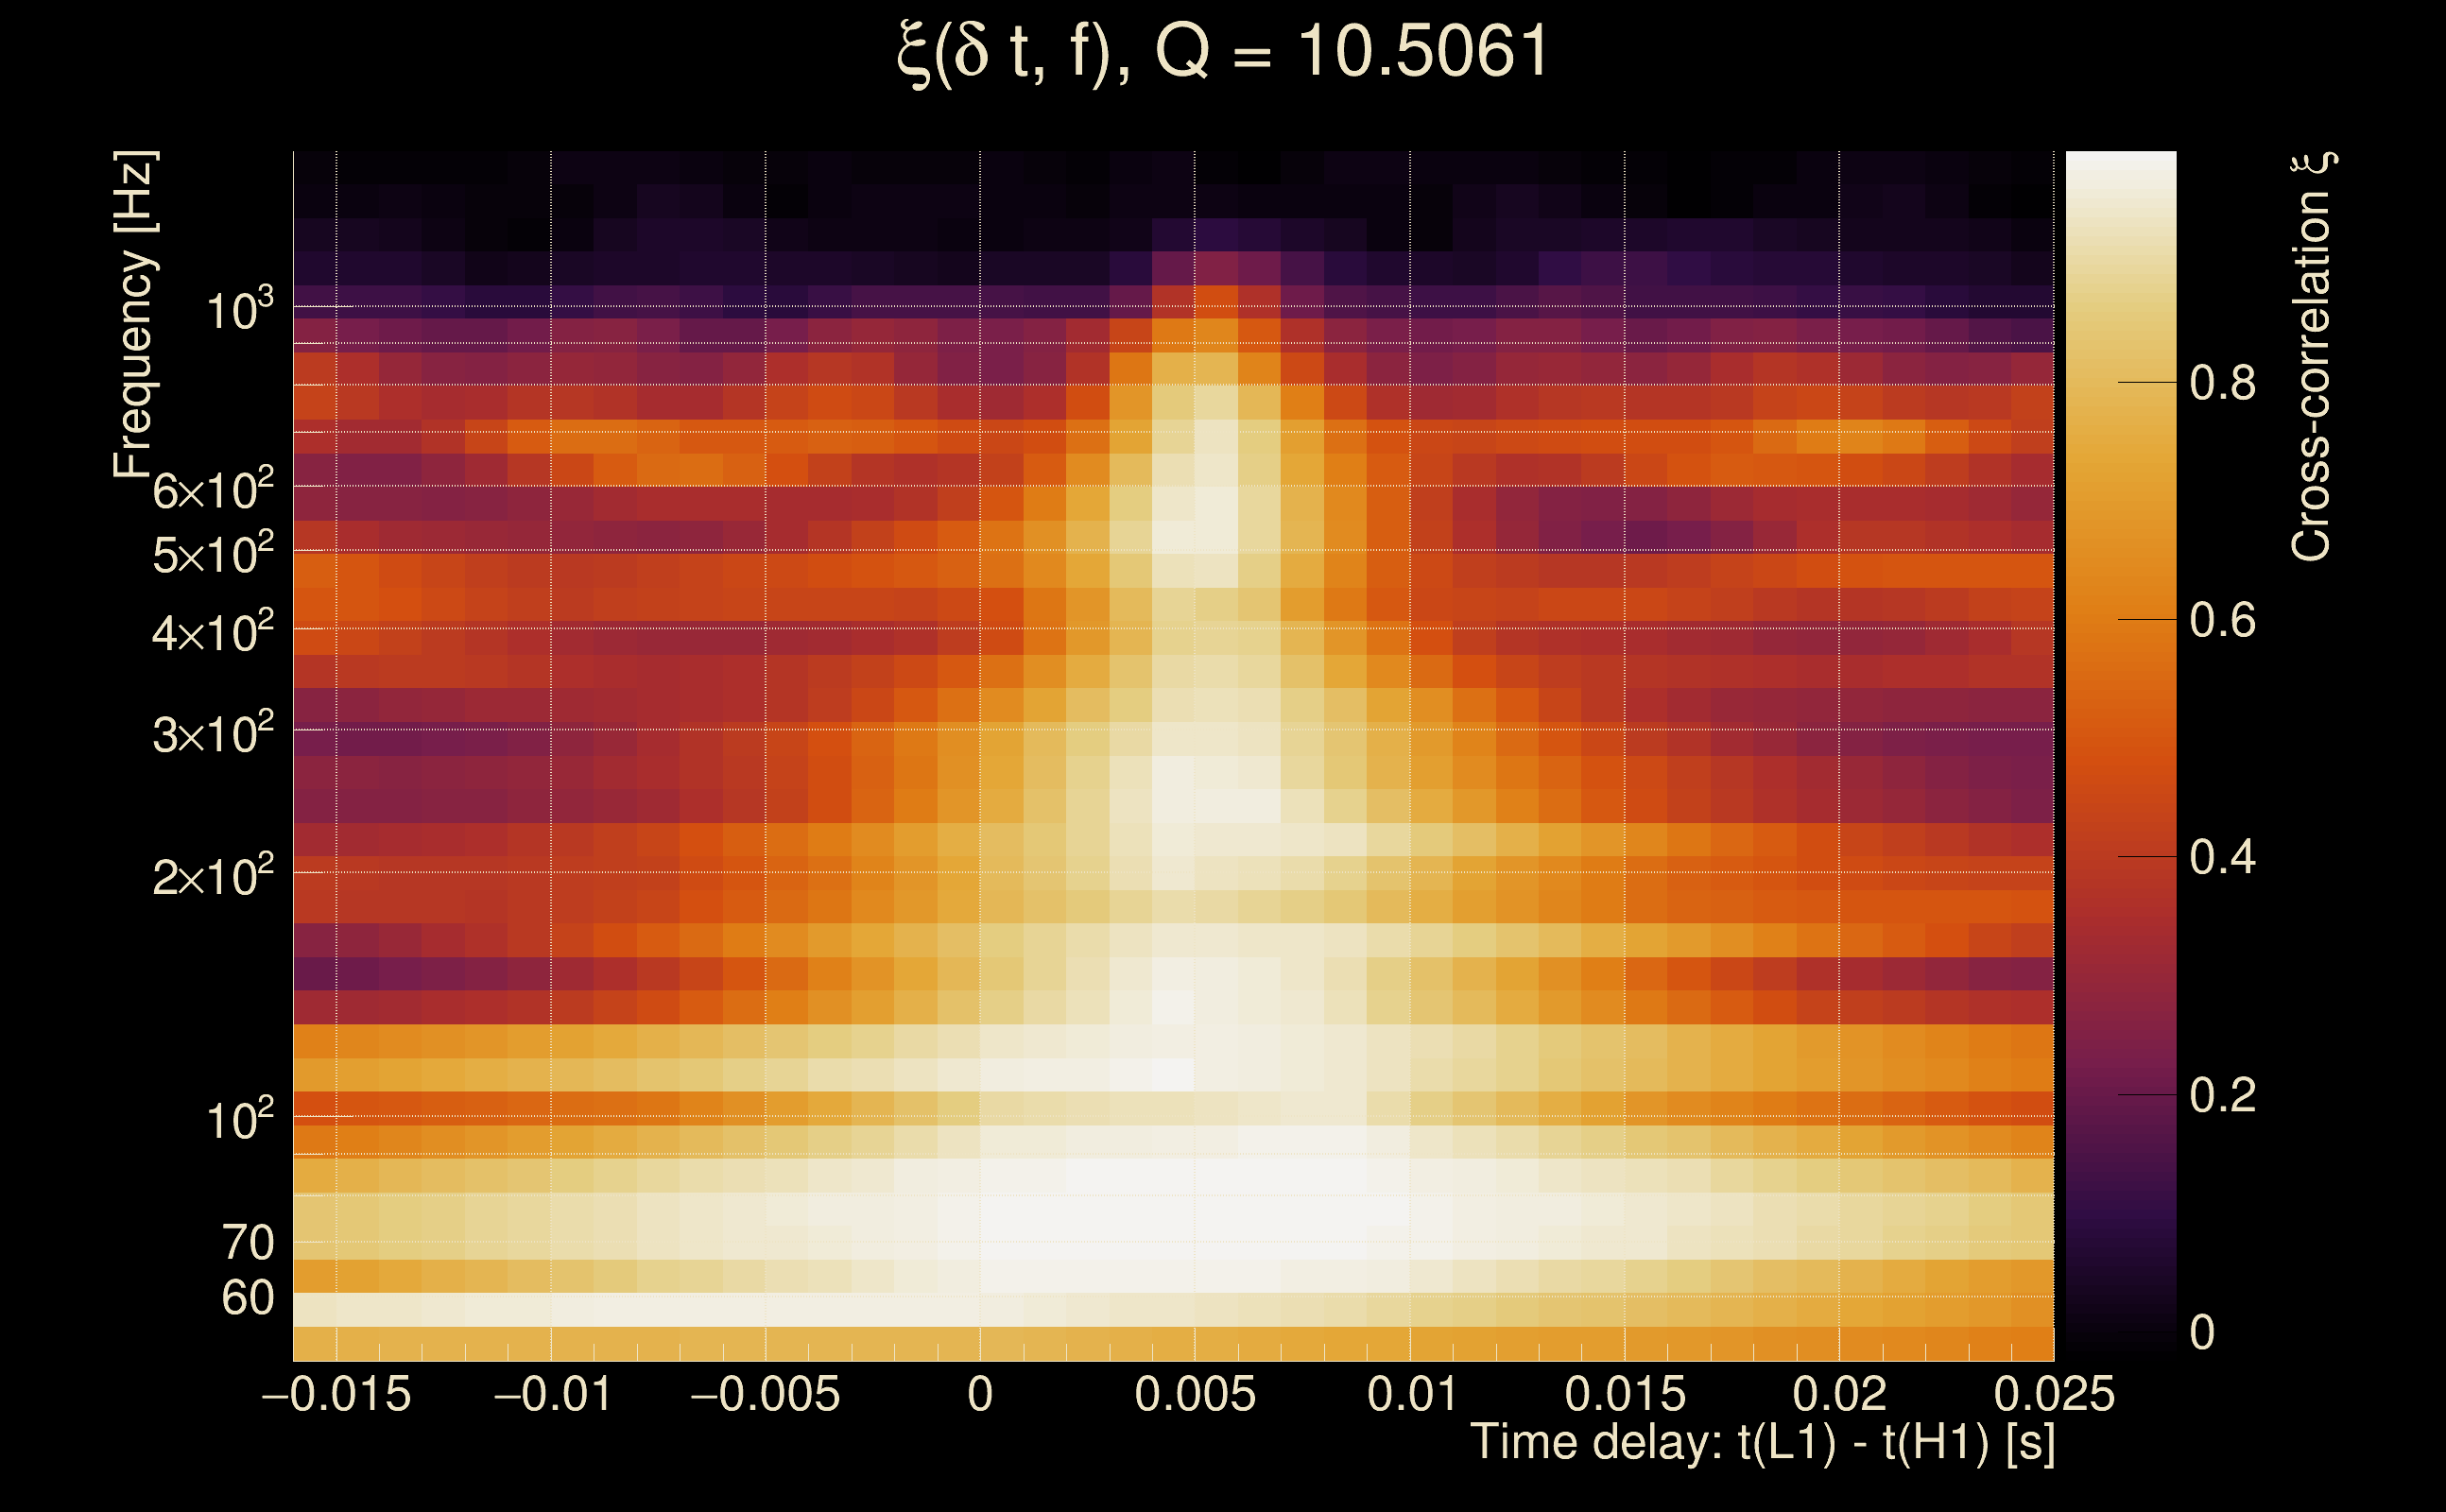
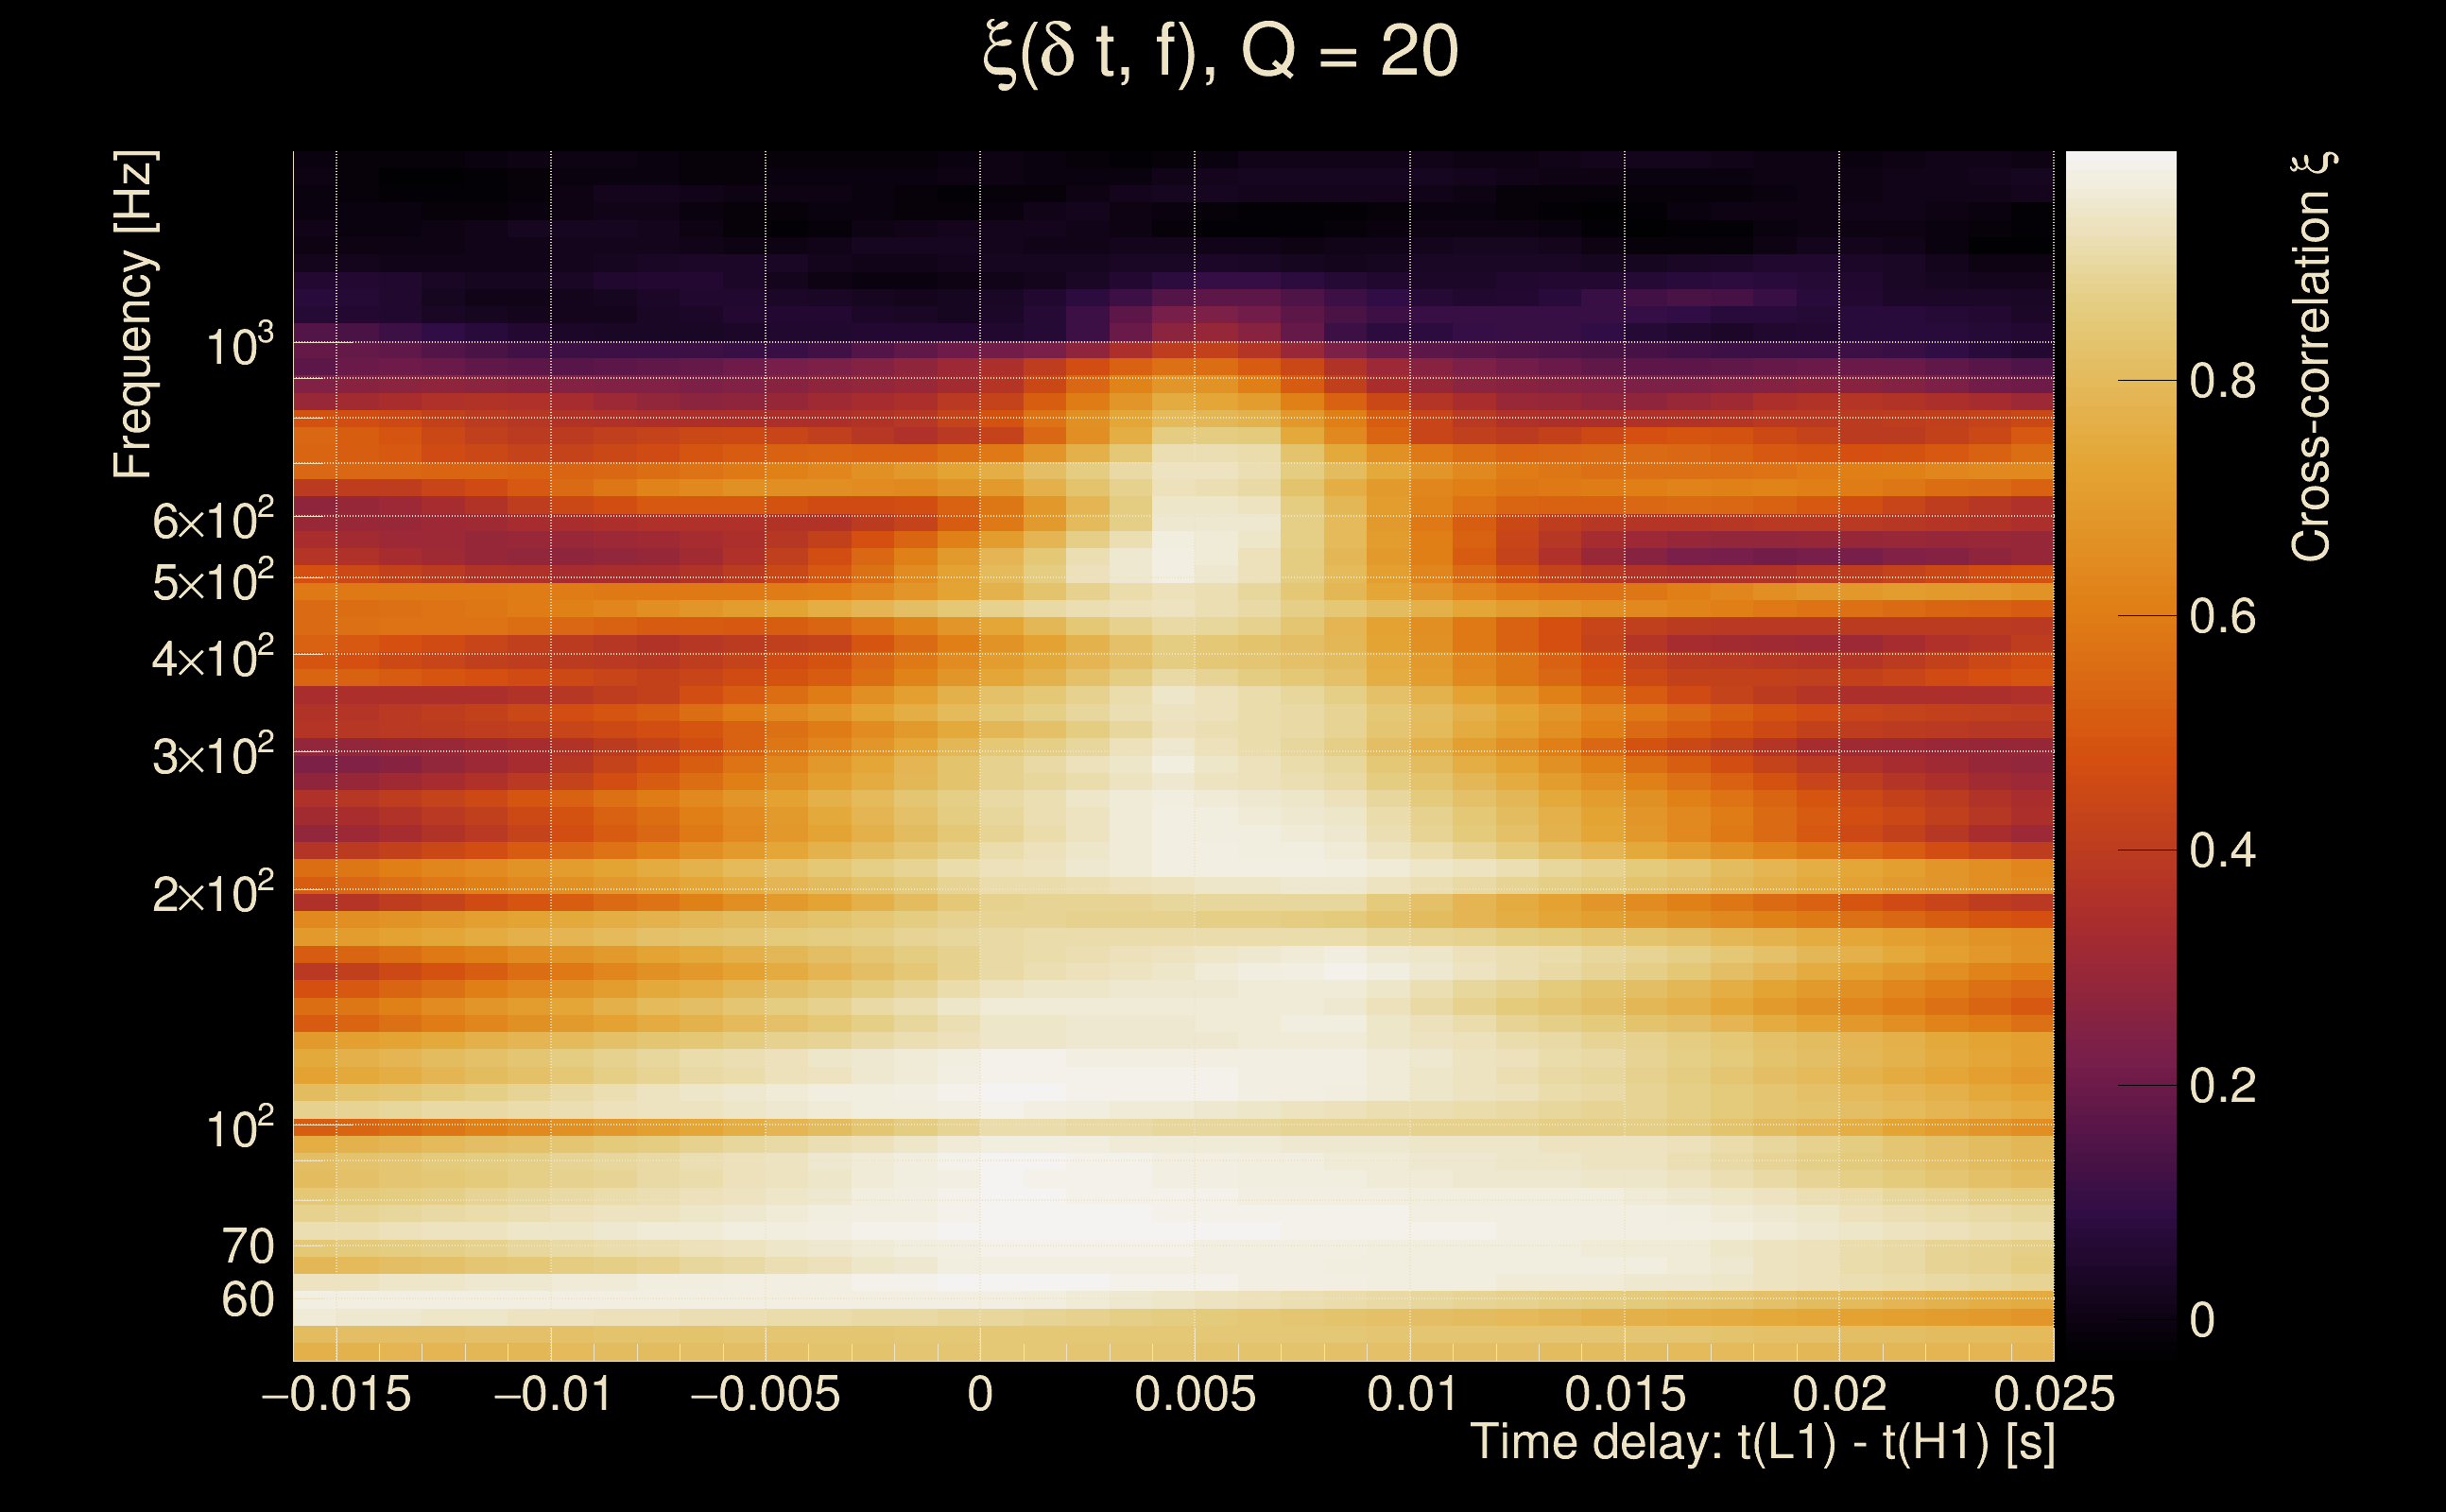
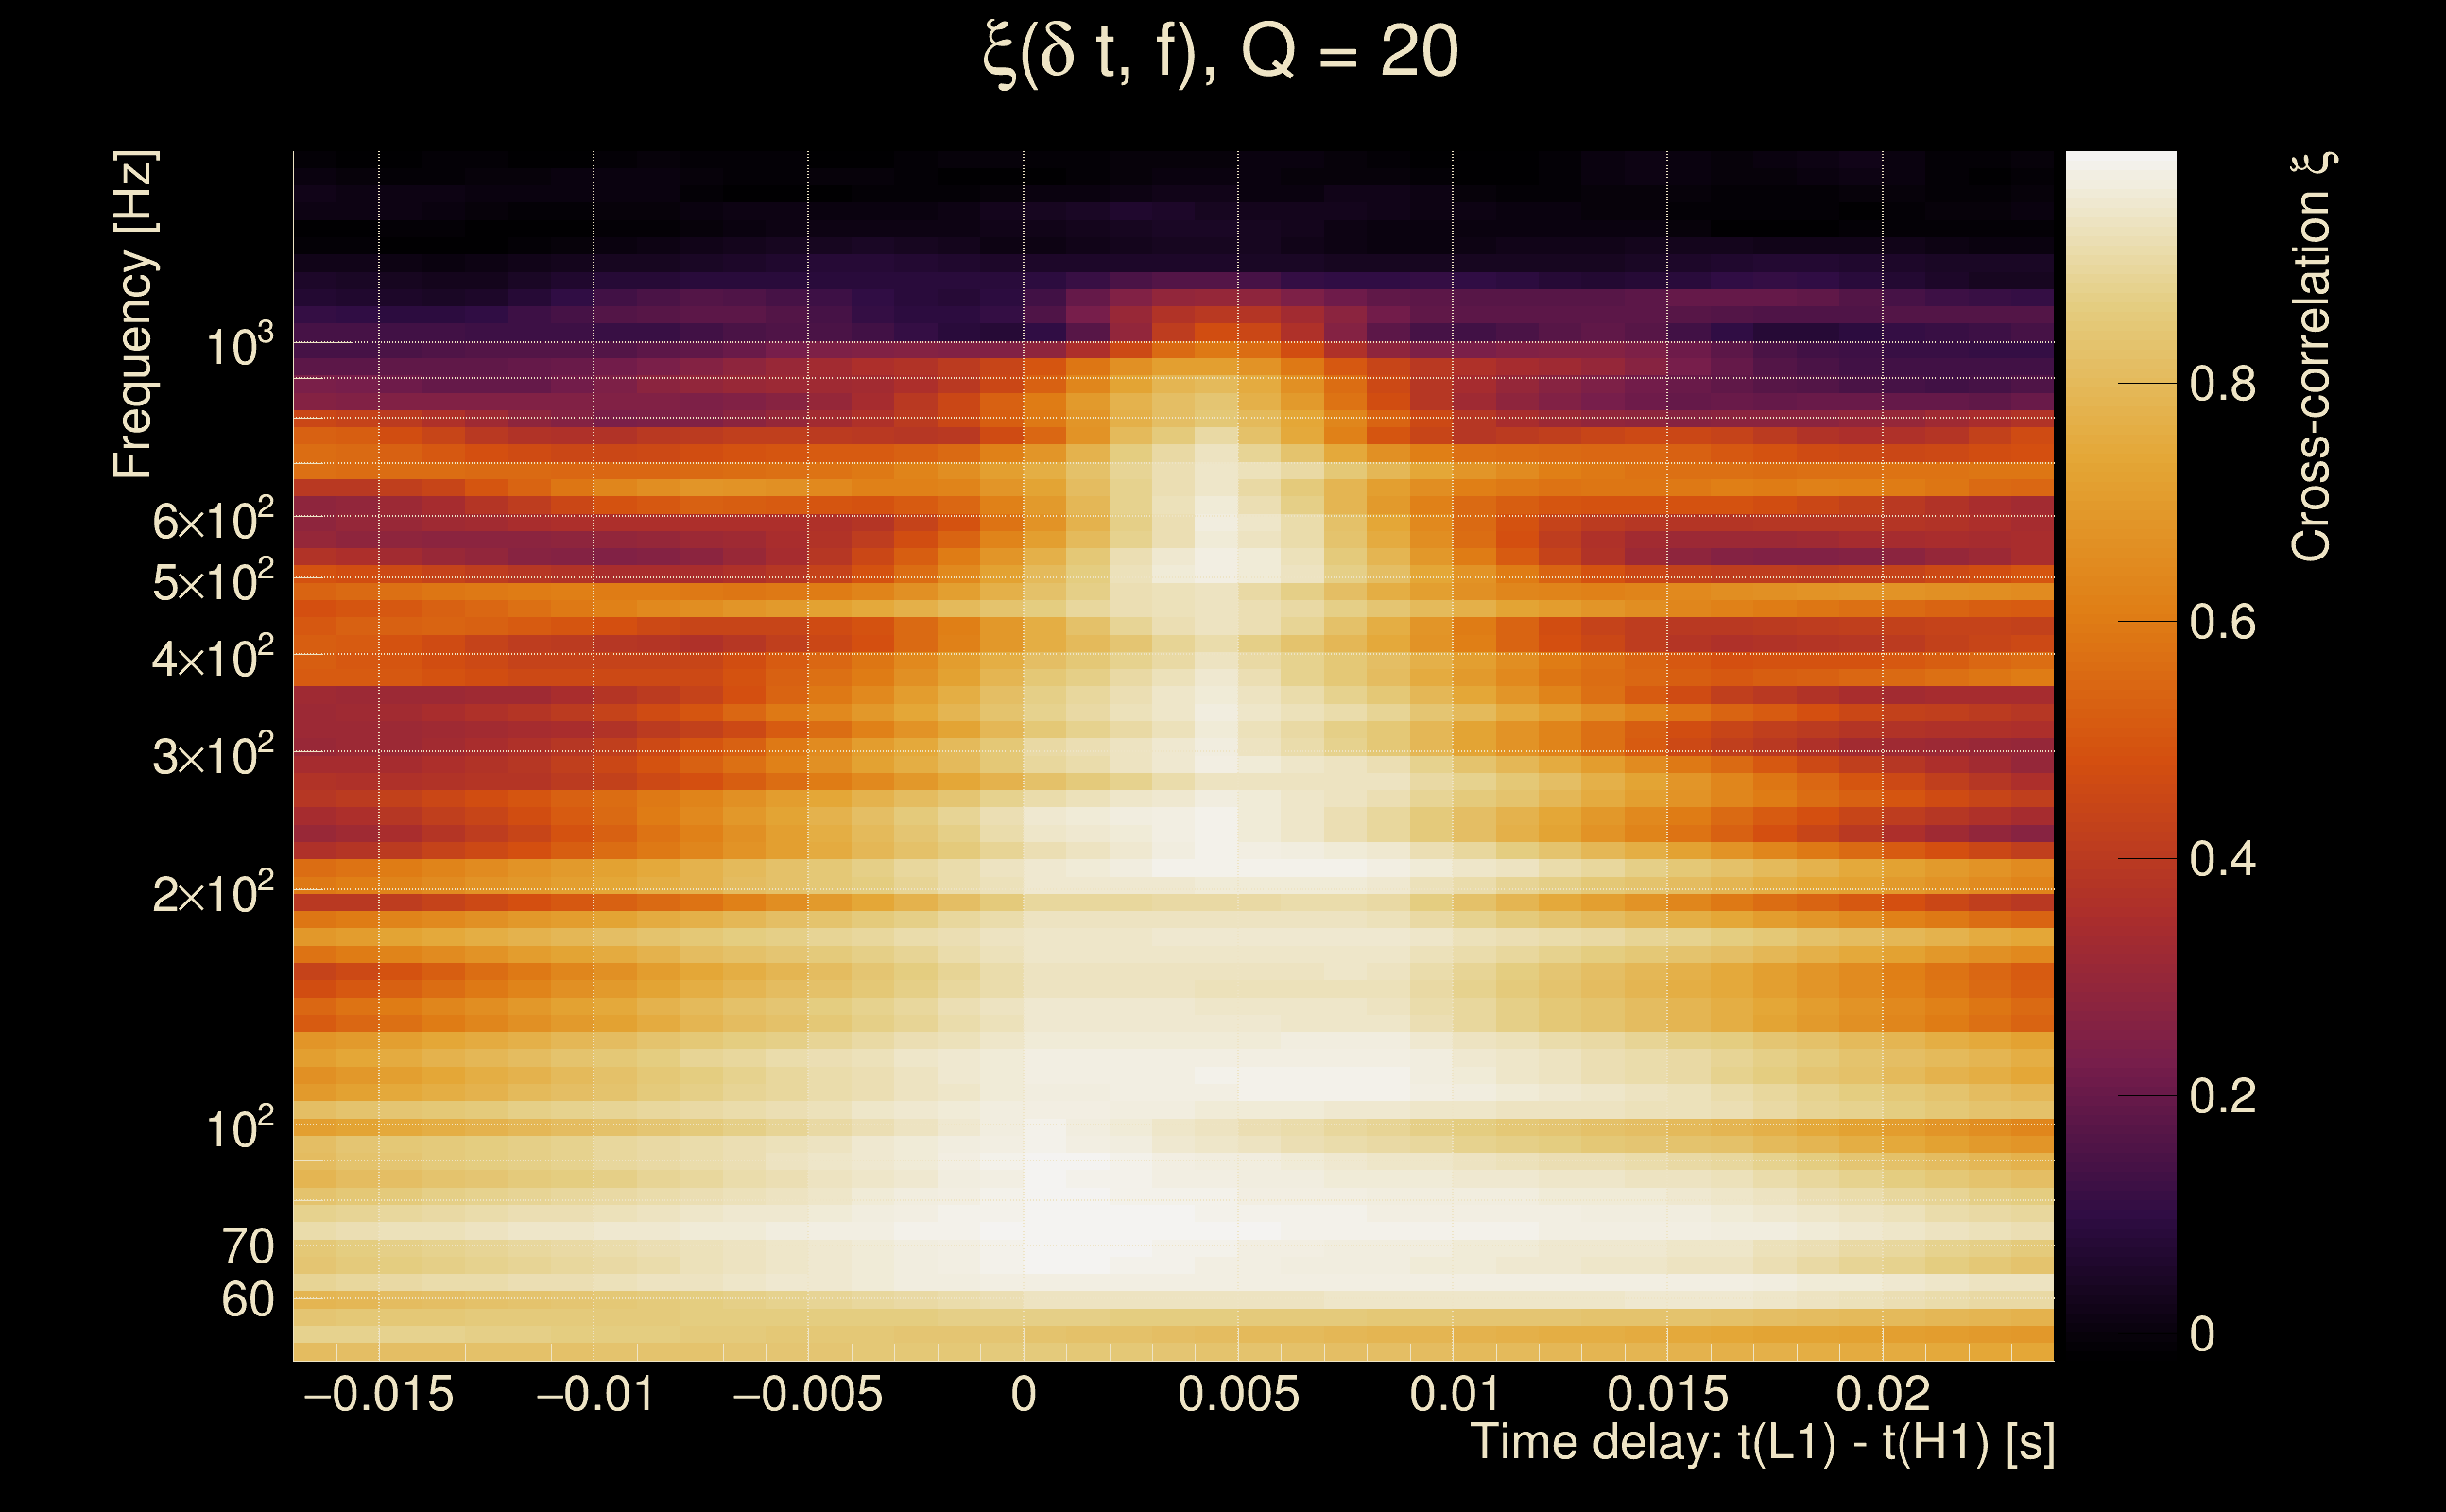
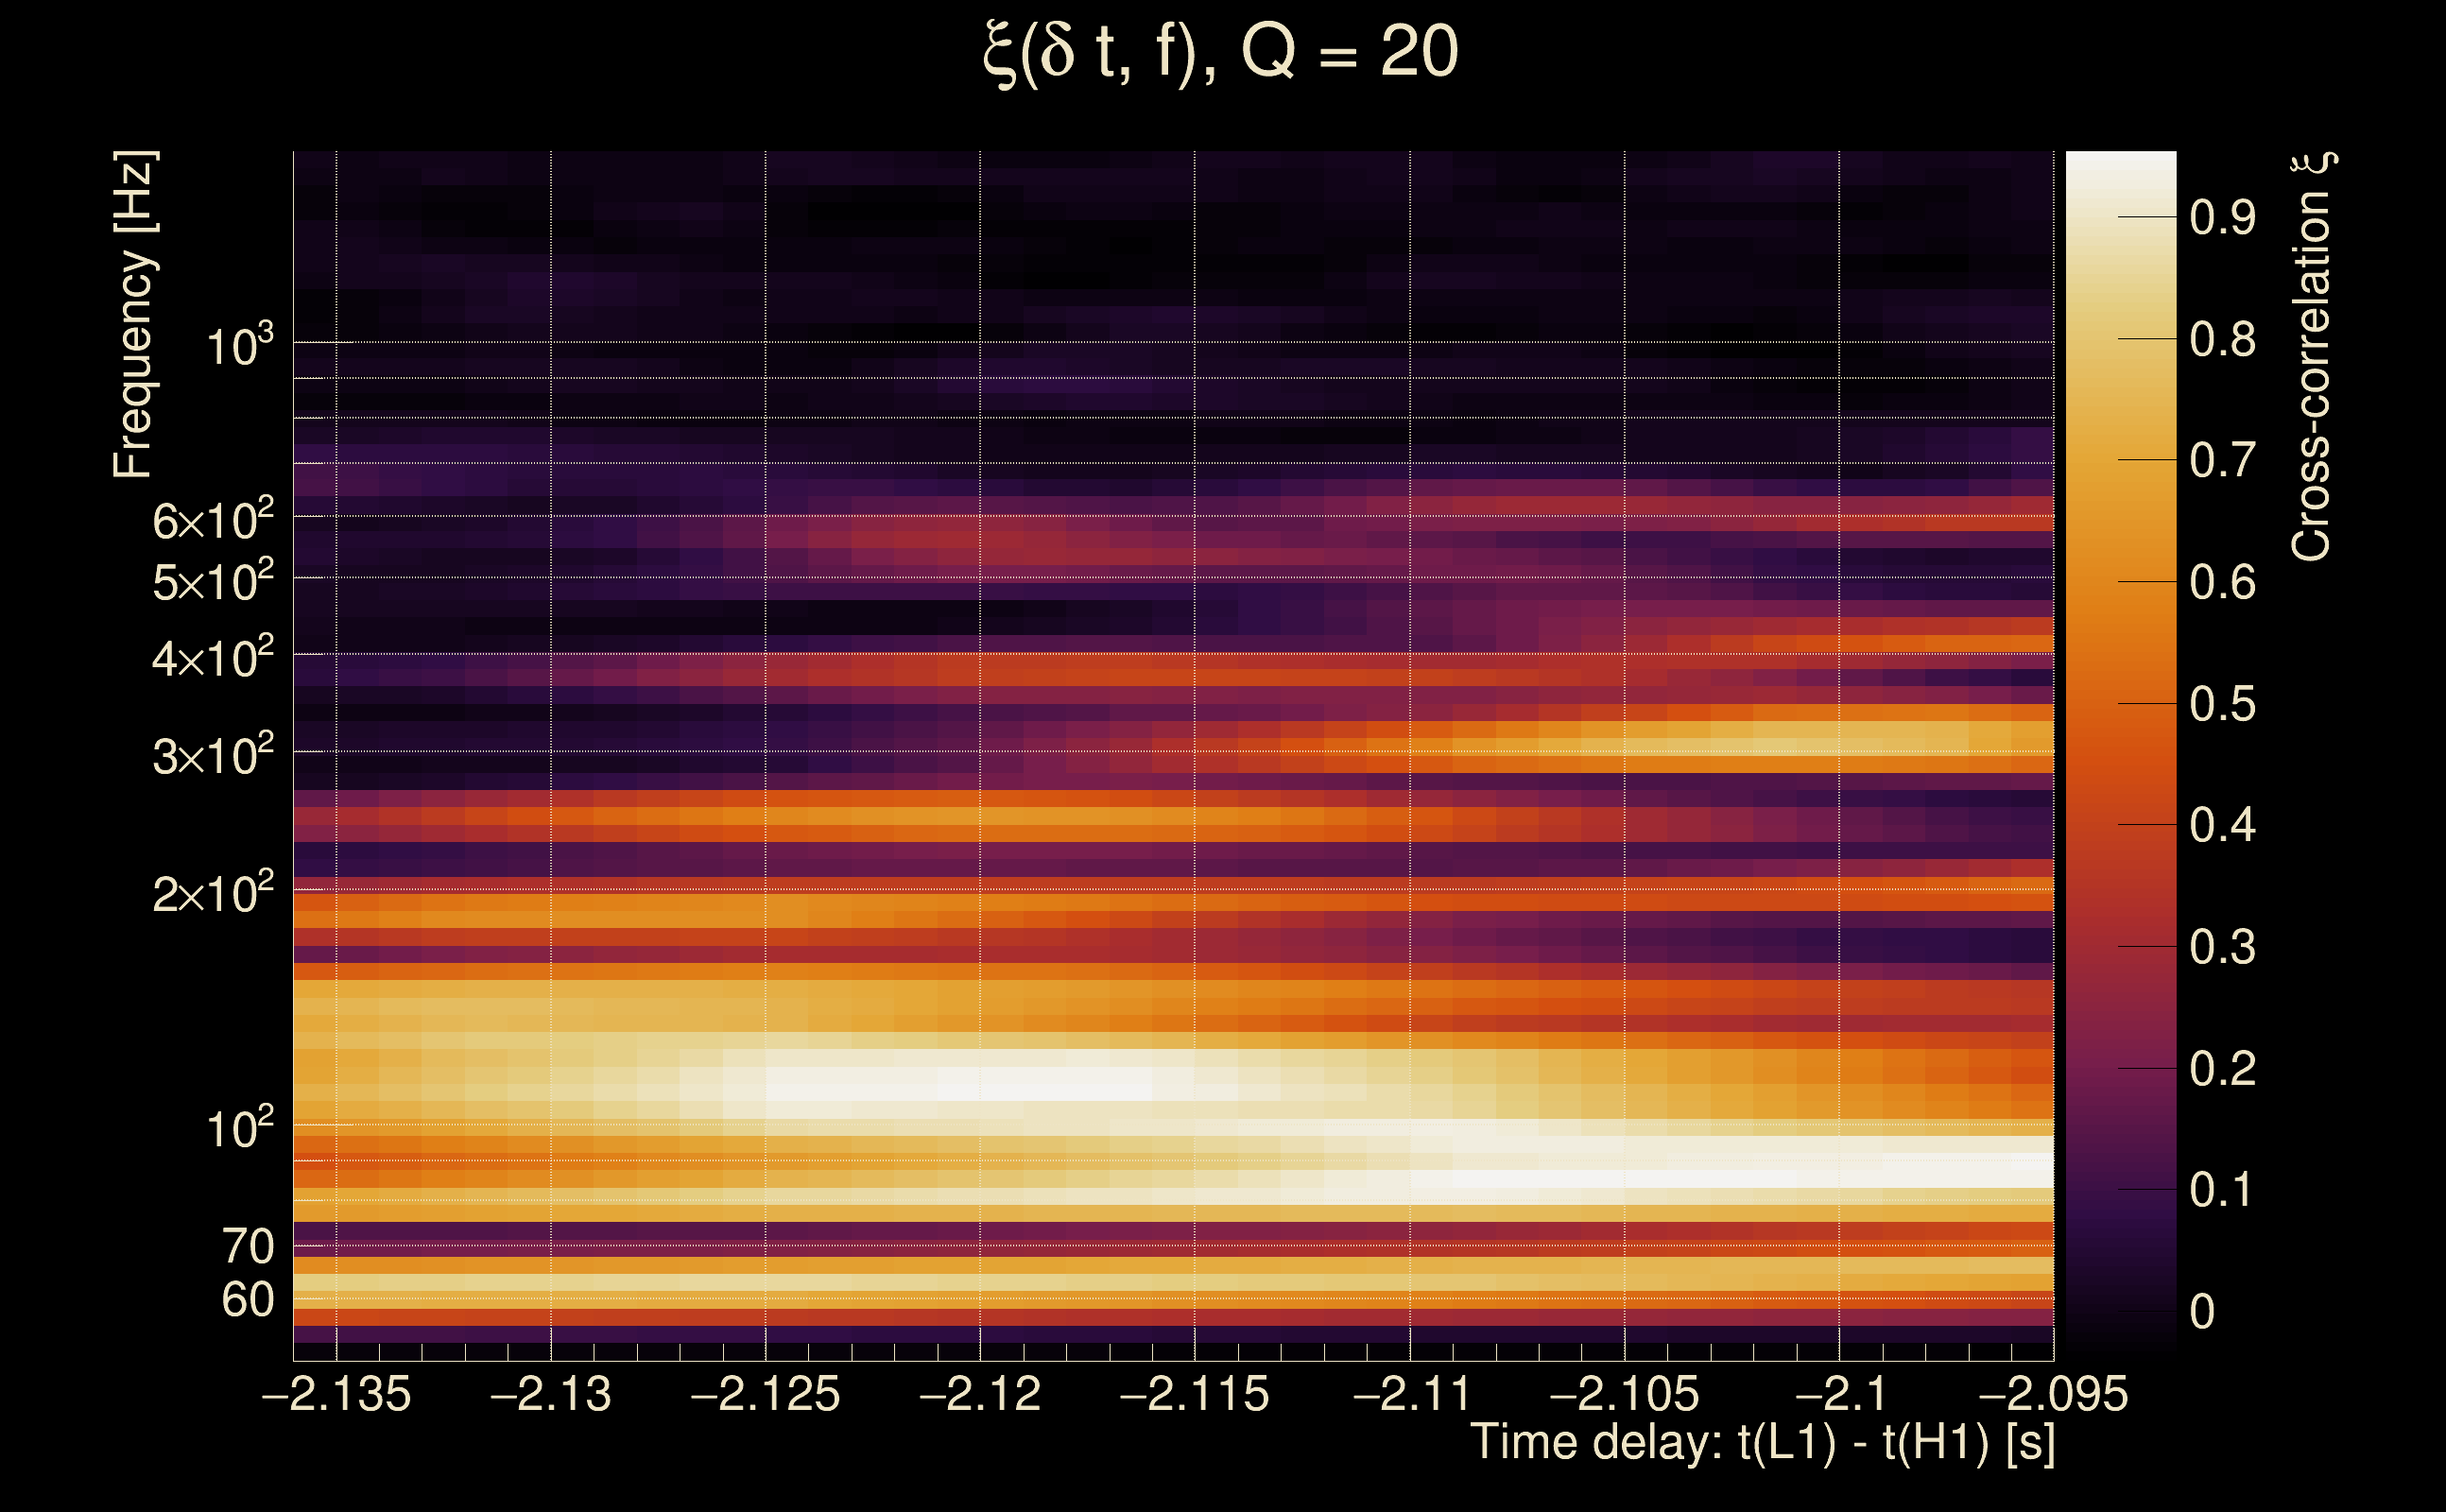
| Time delay between detectors t(L1) - t(H1): | 0.00398762 s (slice index = 108 / 217), δt_gw = 0.00398762 s |
| Time delay uncertainty: | 0.000510775 s |
| [targeted mode] Time delay probability: | 0.999742 (0.000322924 sigmas), δt_target = 1.72247e+45 s |
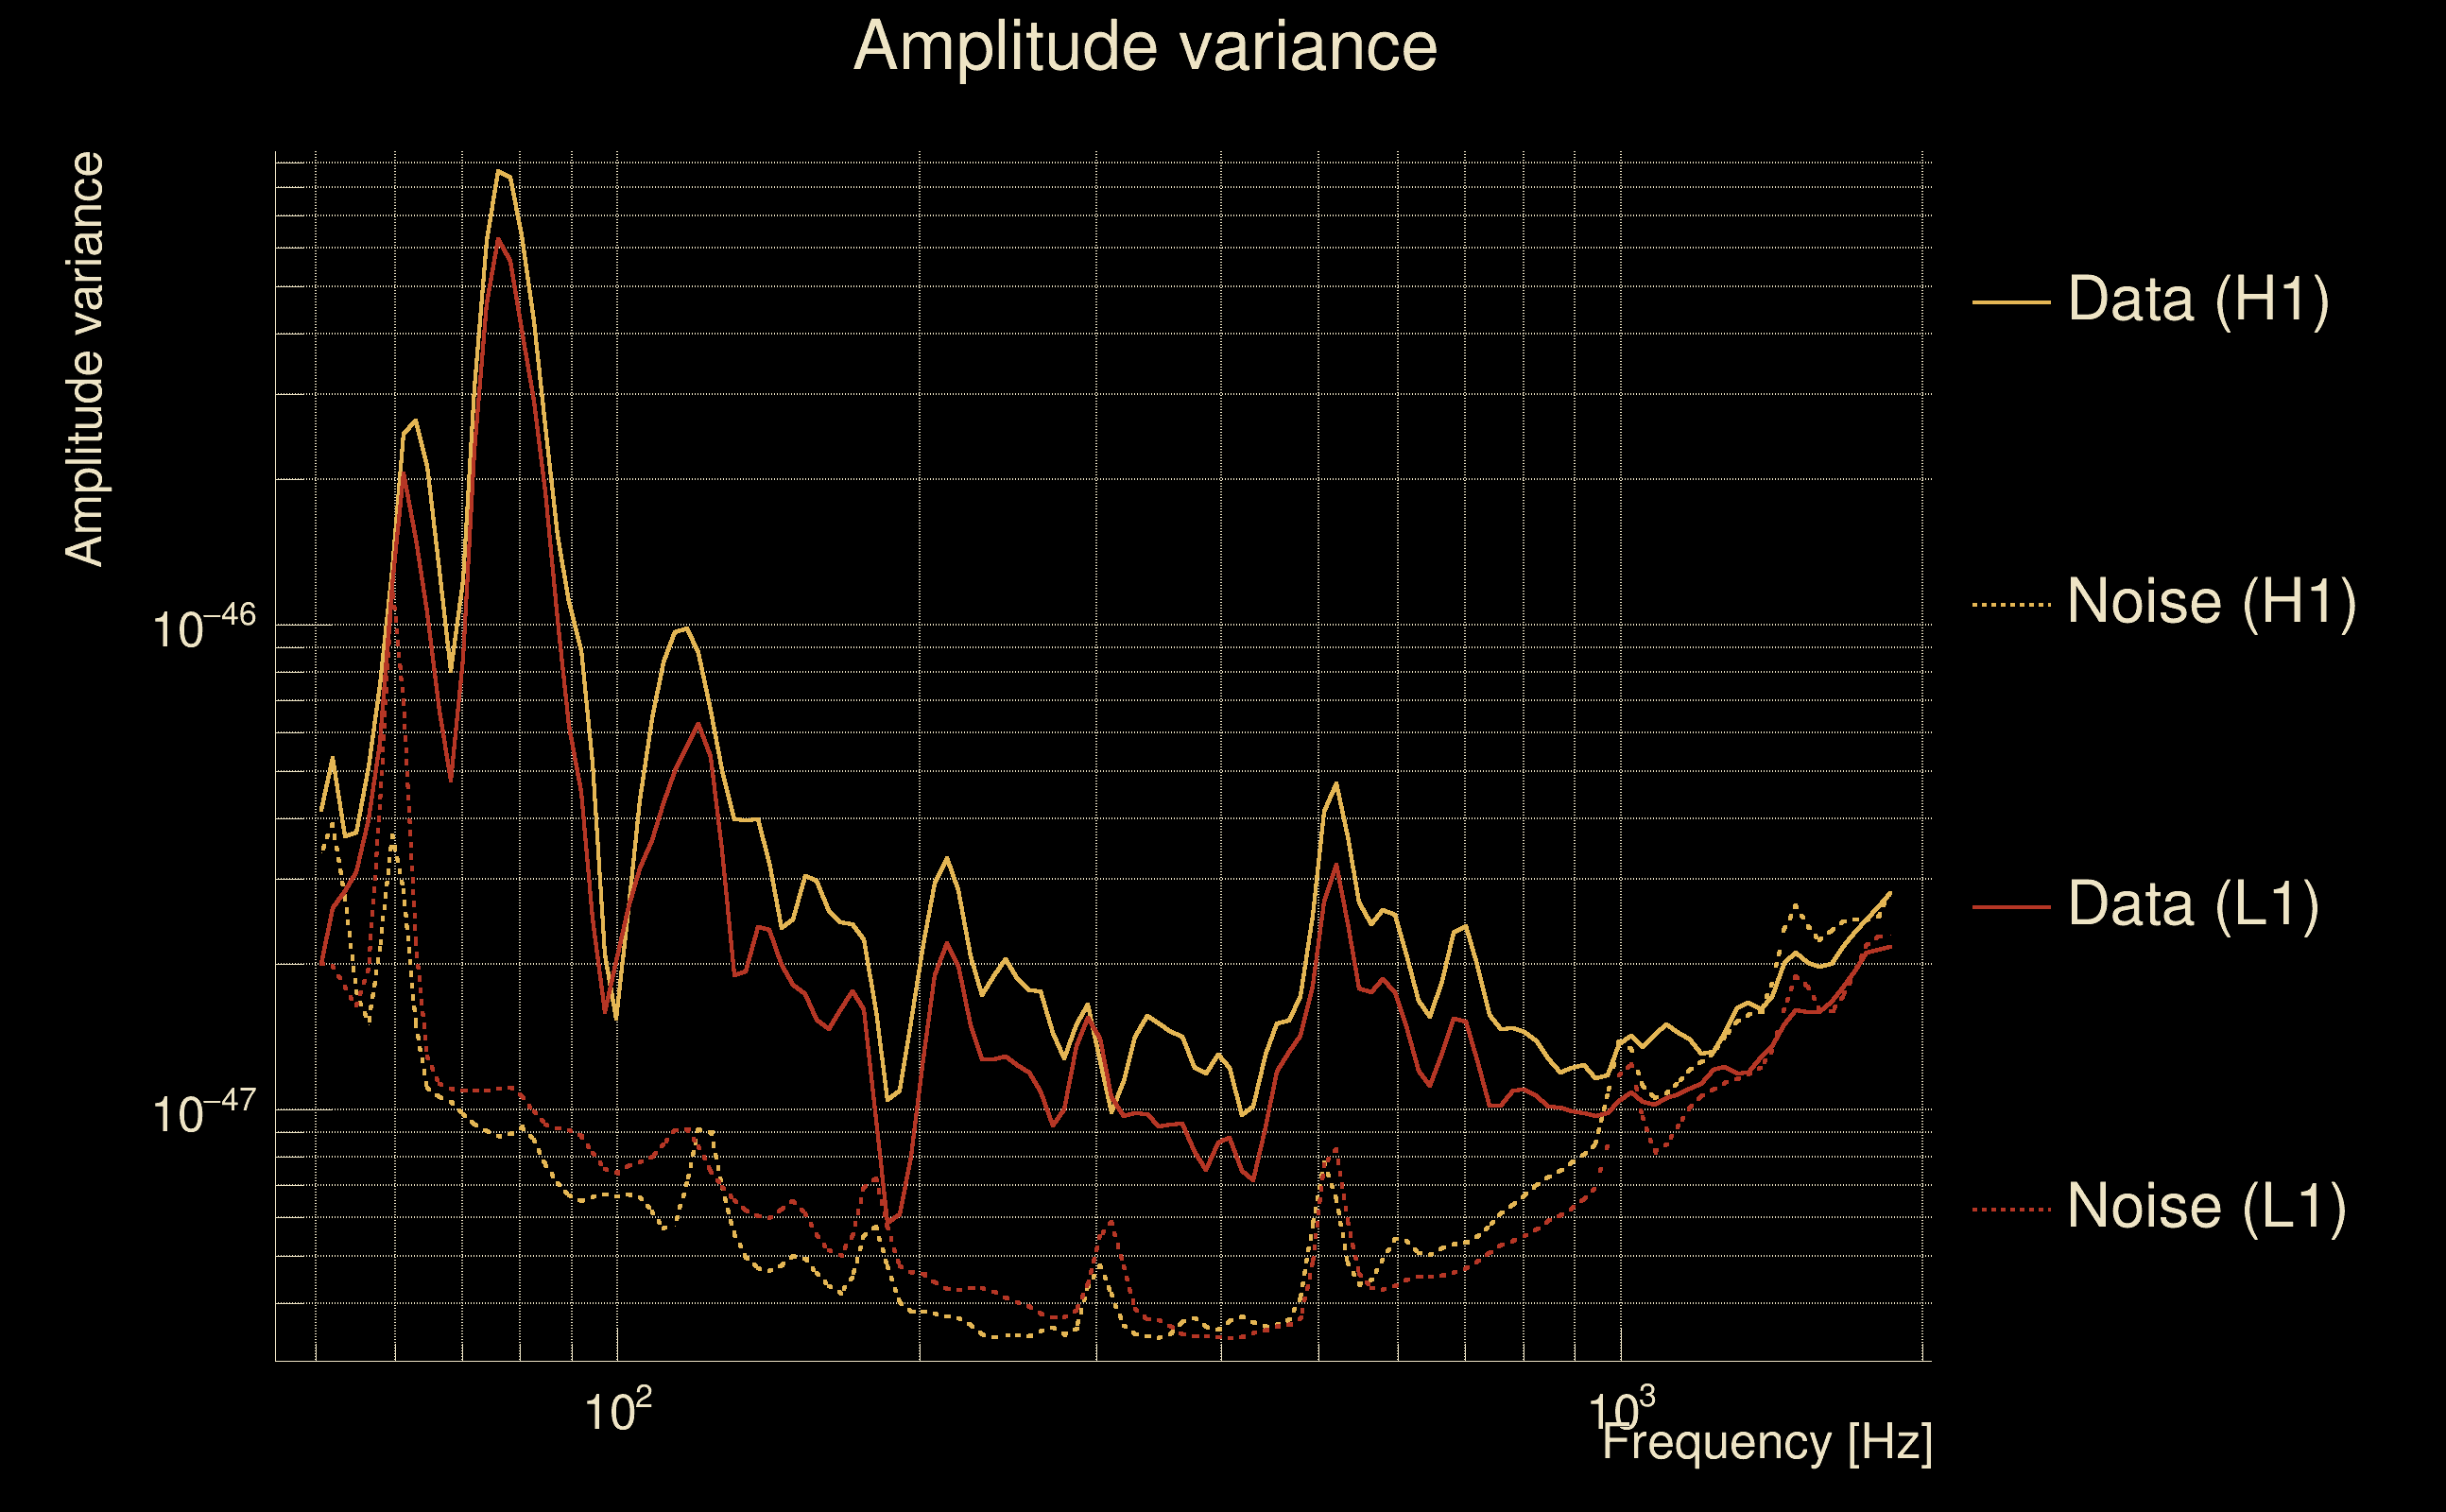
| Frequency: | 232.489 Hz |
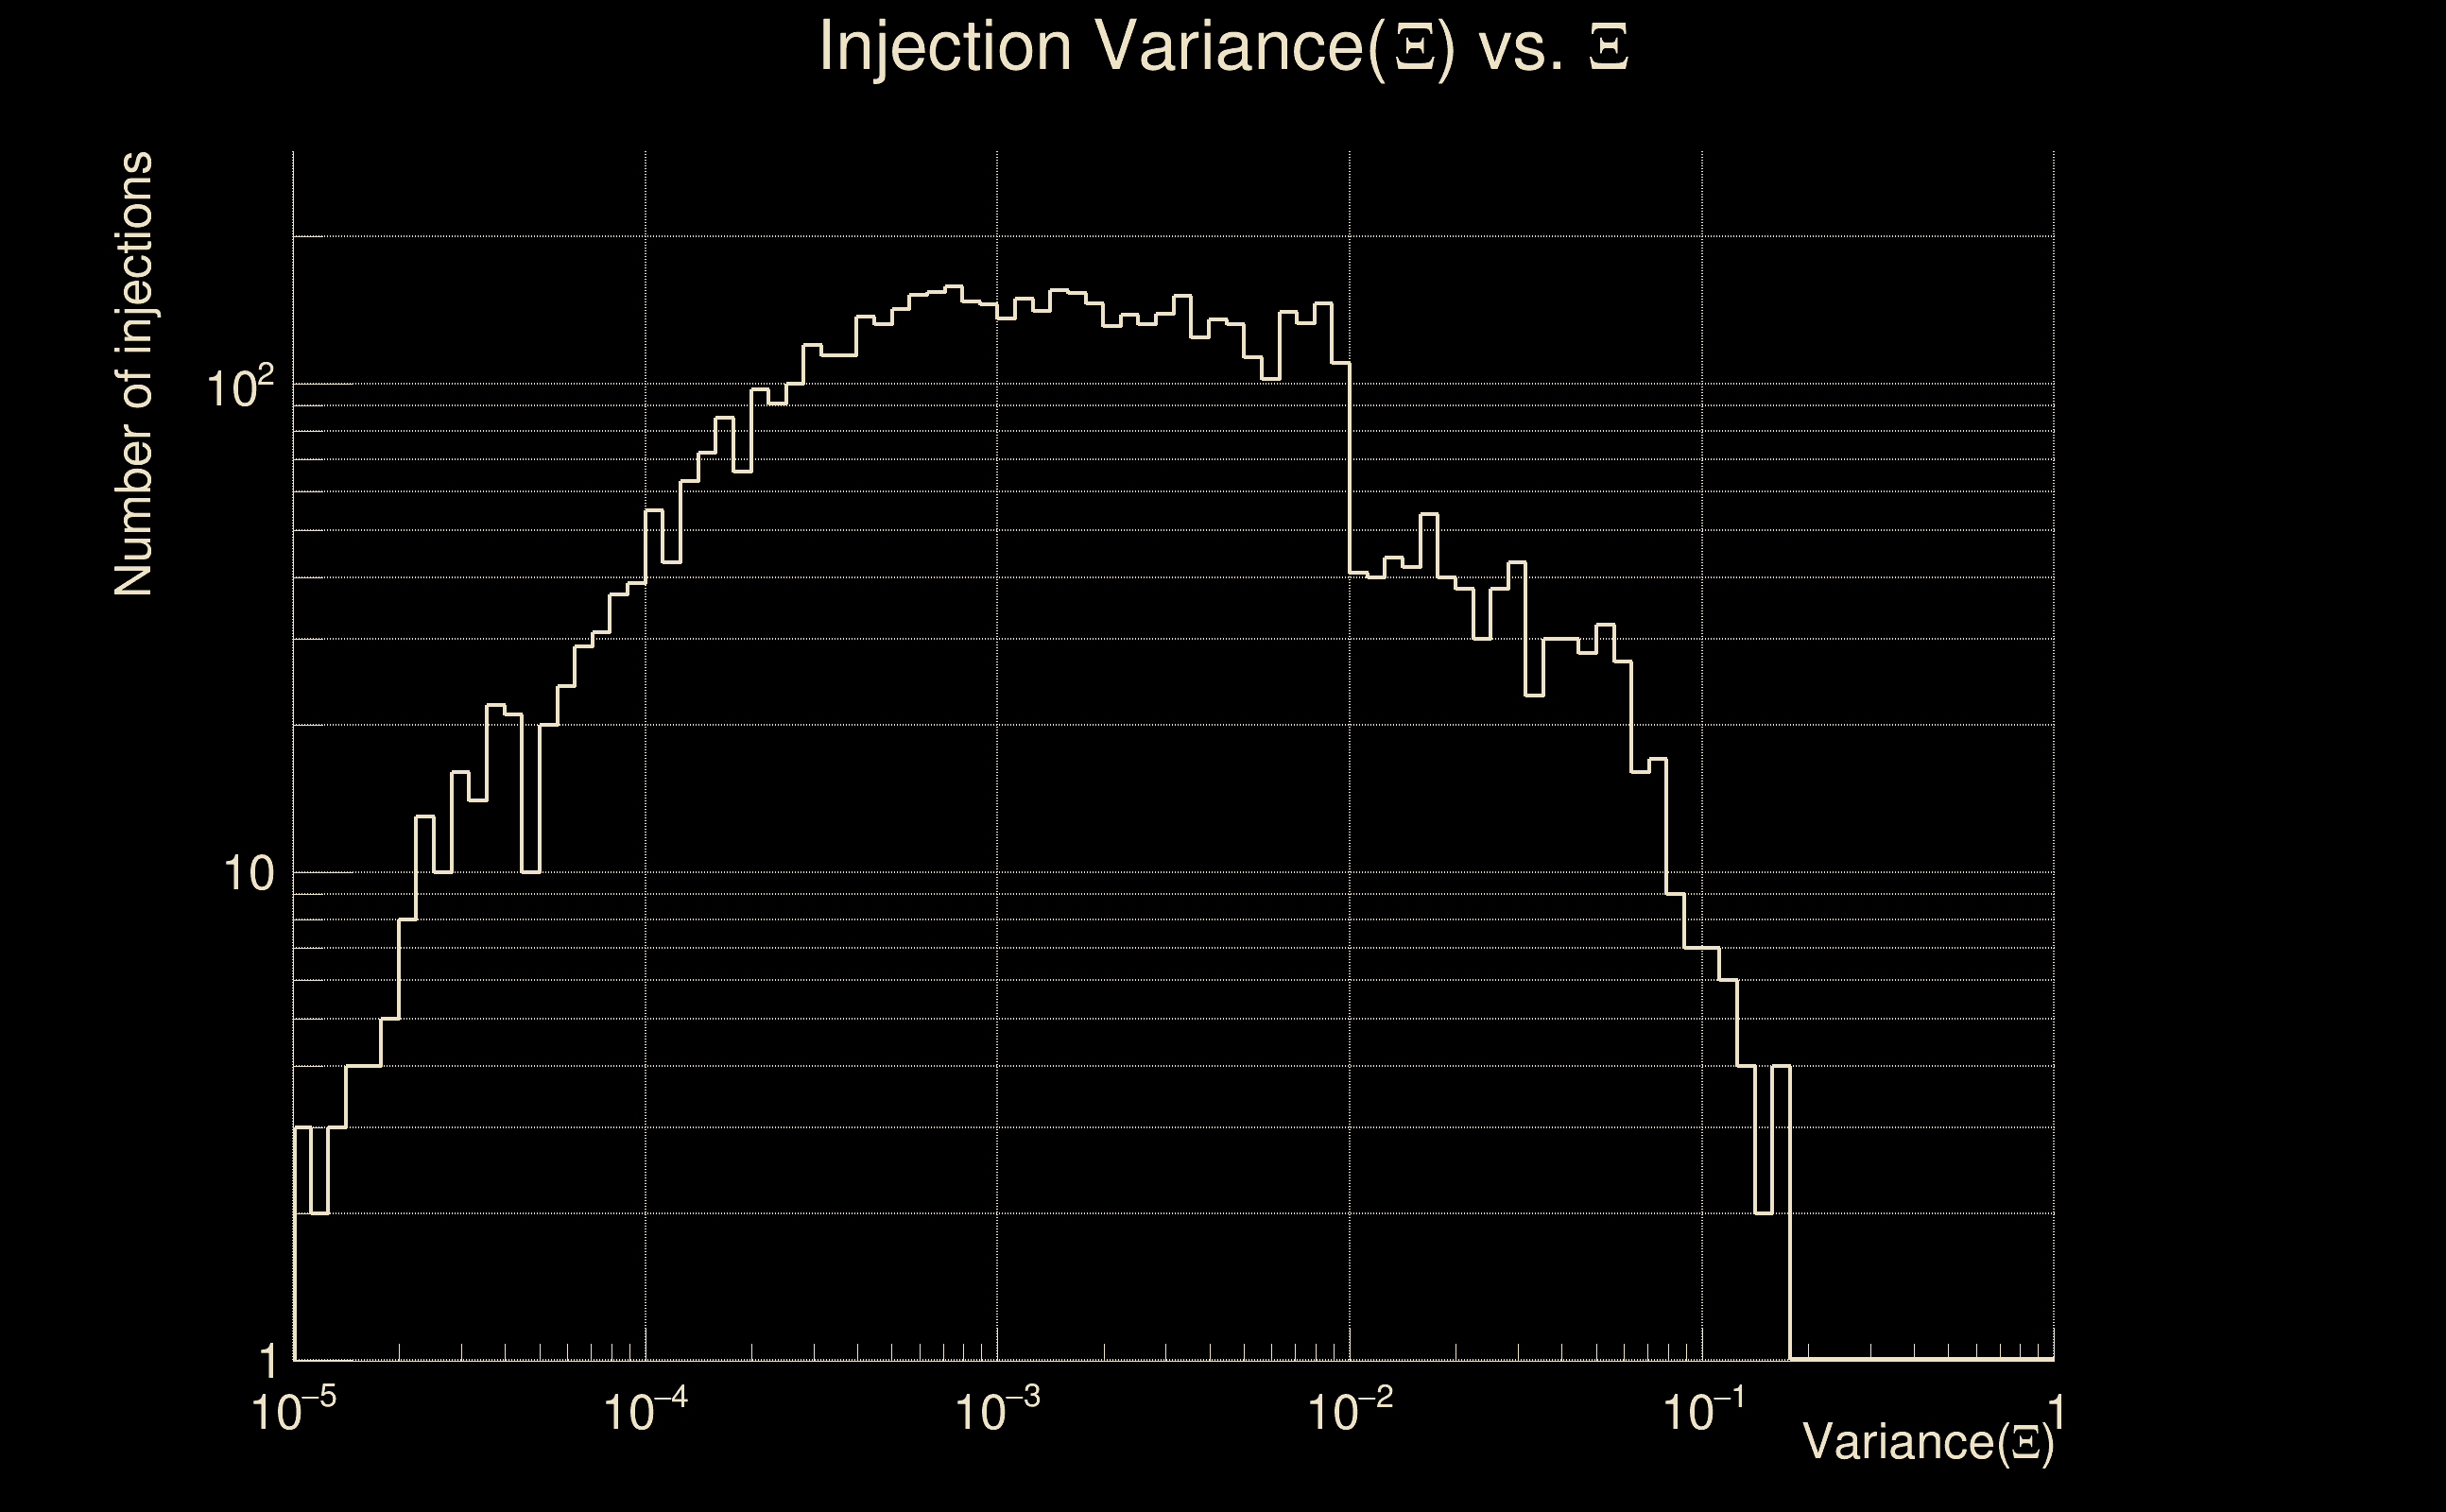
| Ξ: | 0.89164 ± 0.00323714 (variance = 1.04791e-05): Q0: 0.936108, Q1: 0.933804, Q2: 0.933947, Q3: 0.936931, Q4: 0.927693 |
| Rank: | R_A = 0.888409 |
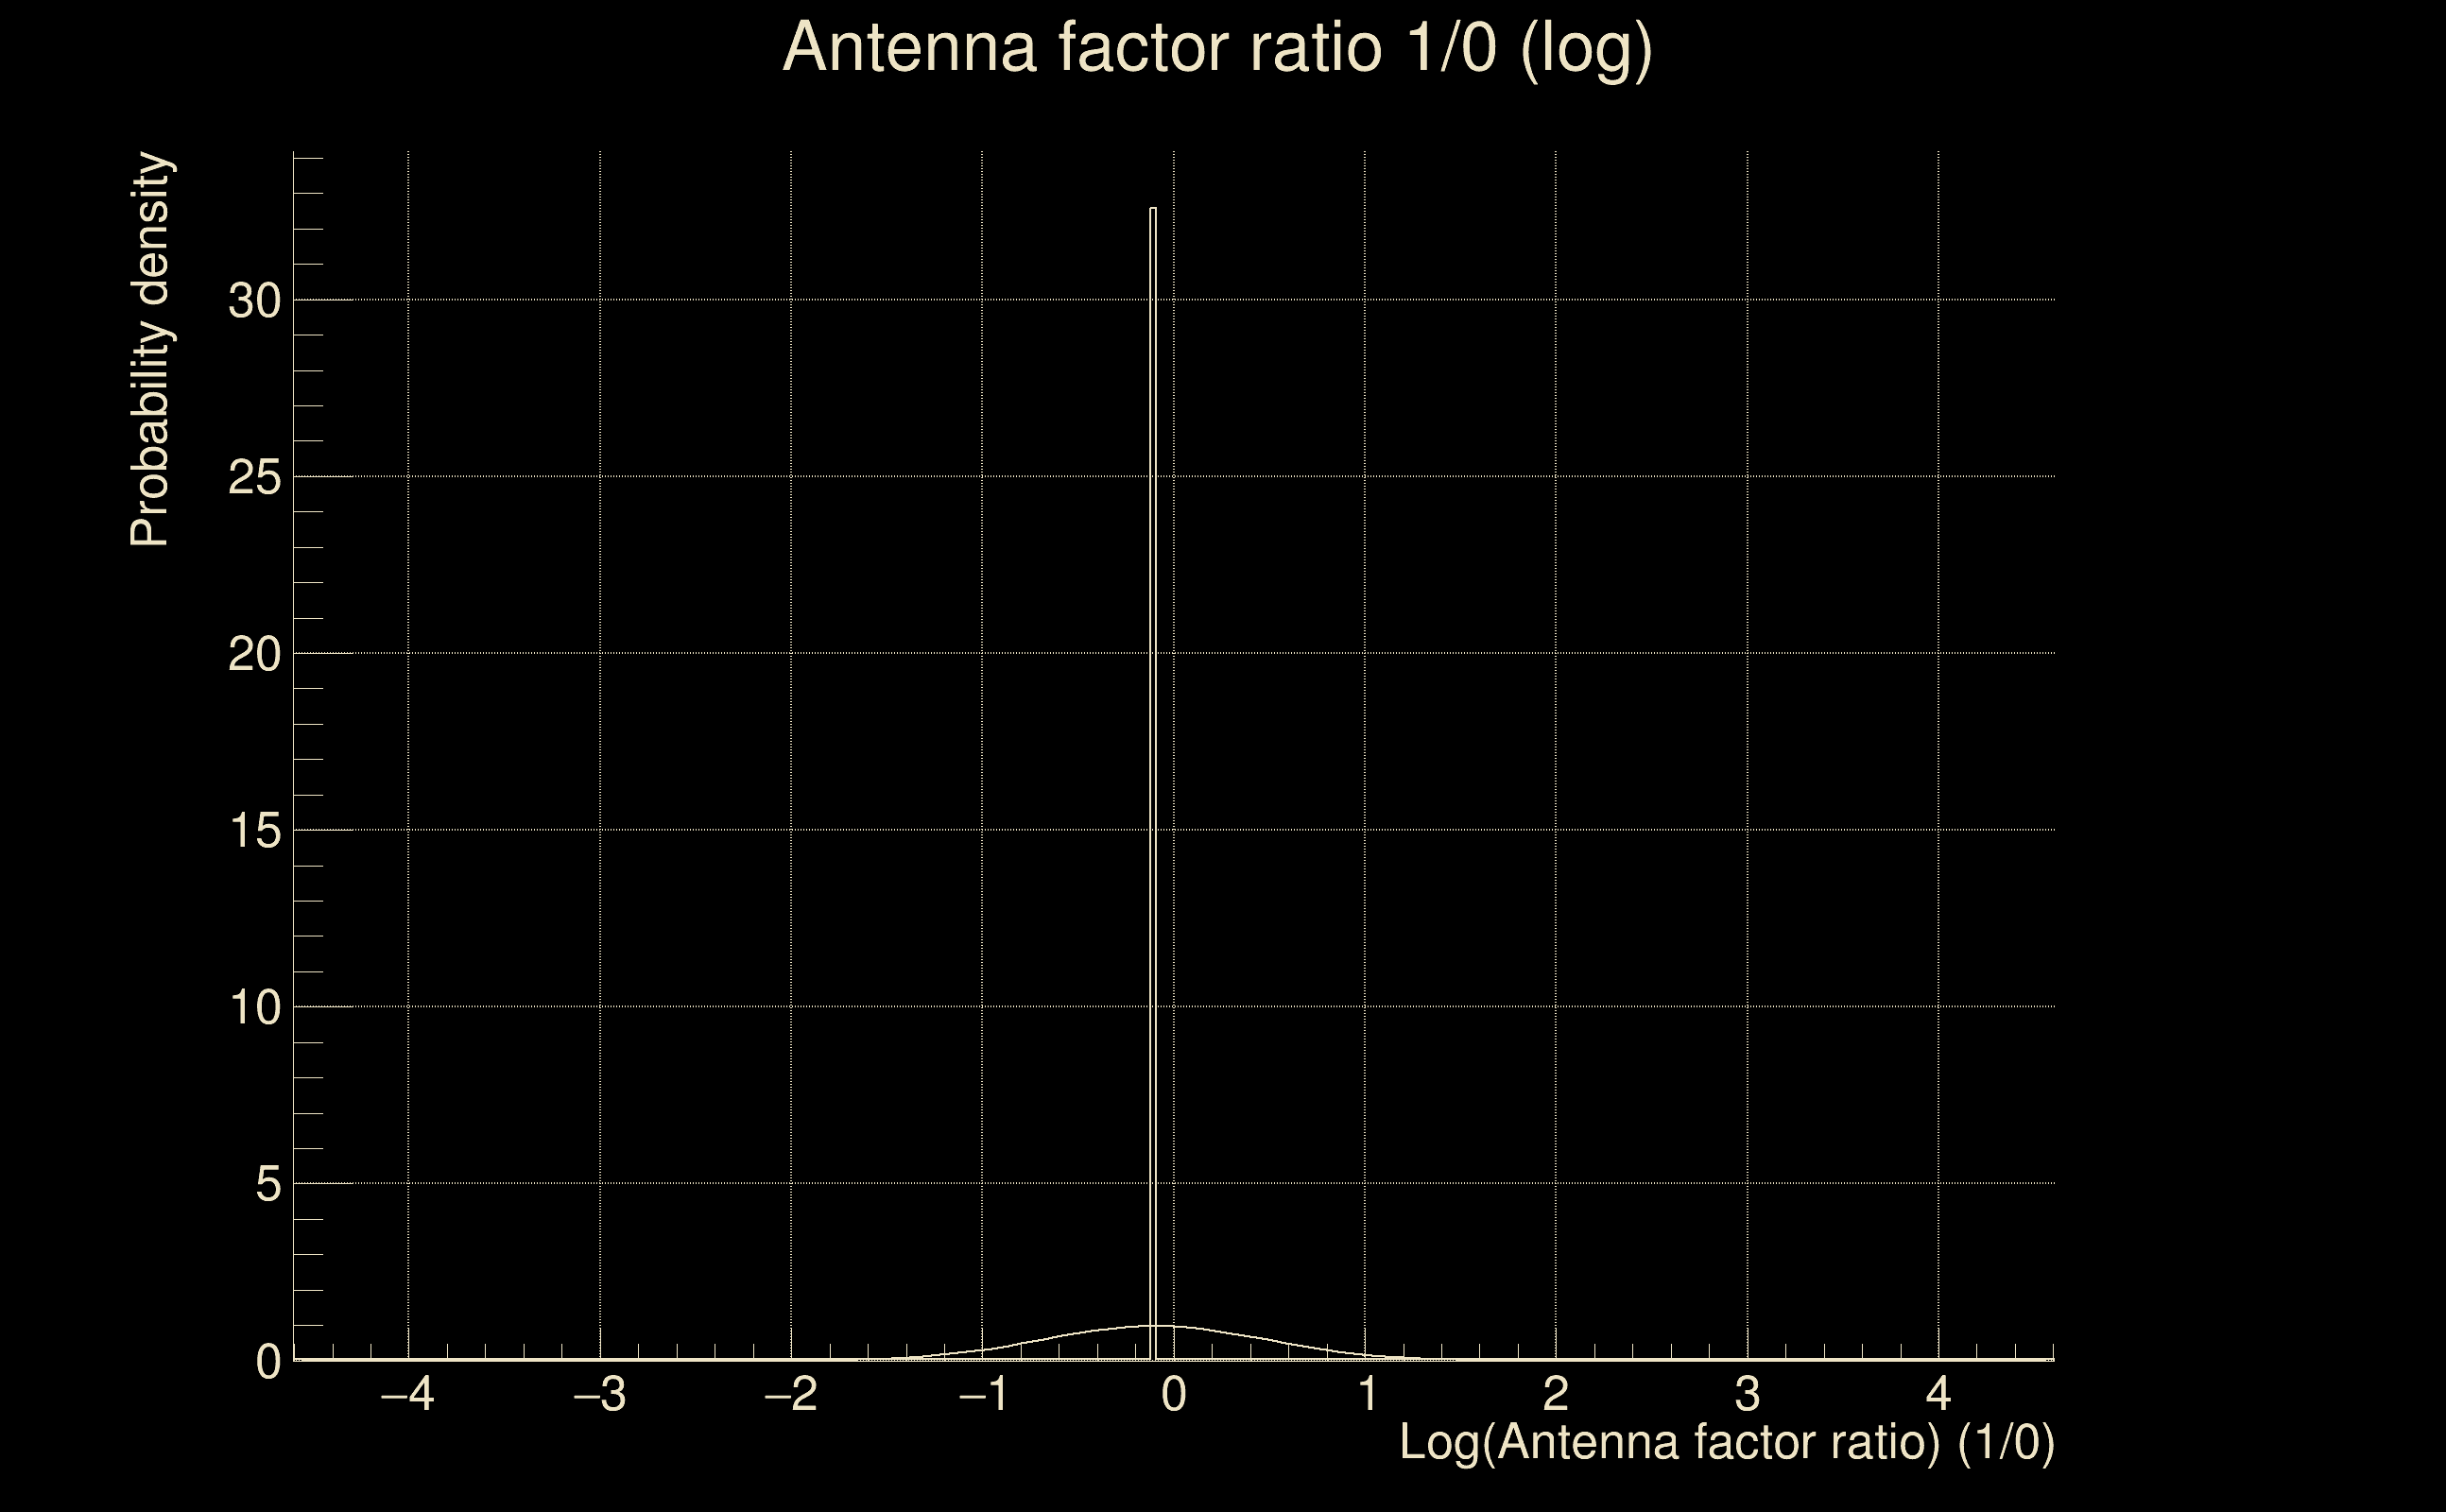
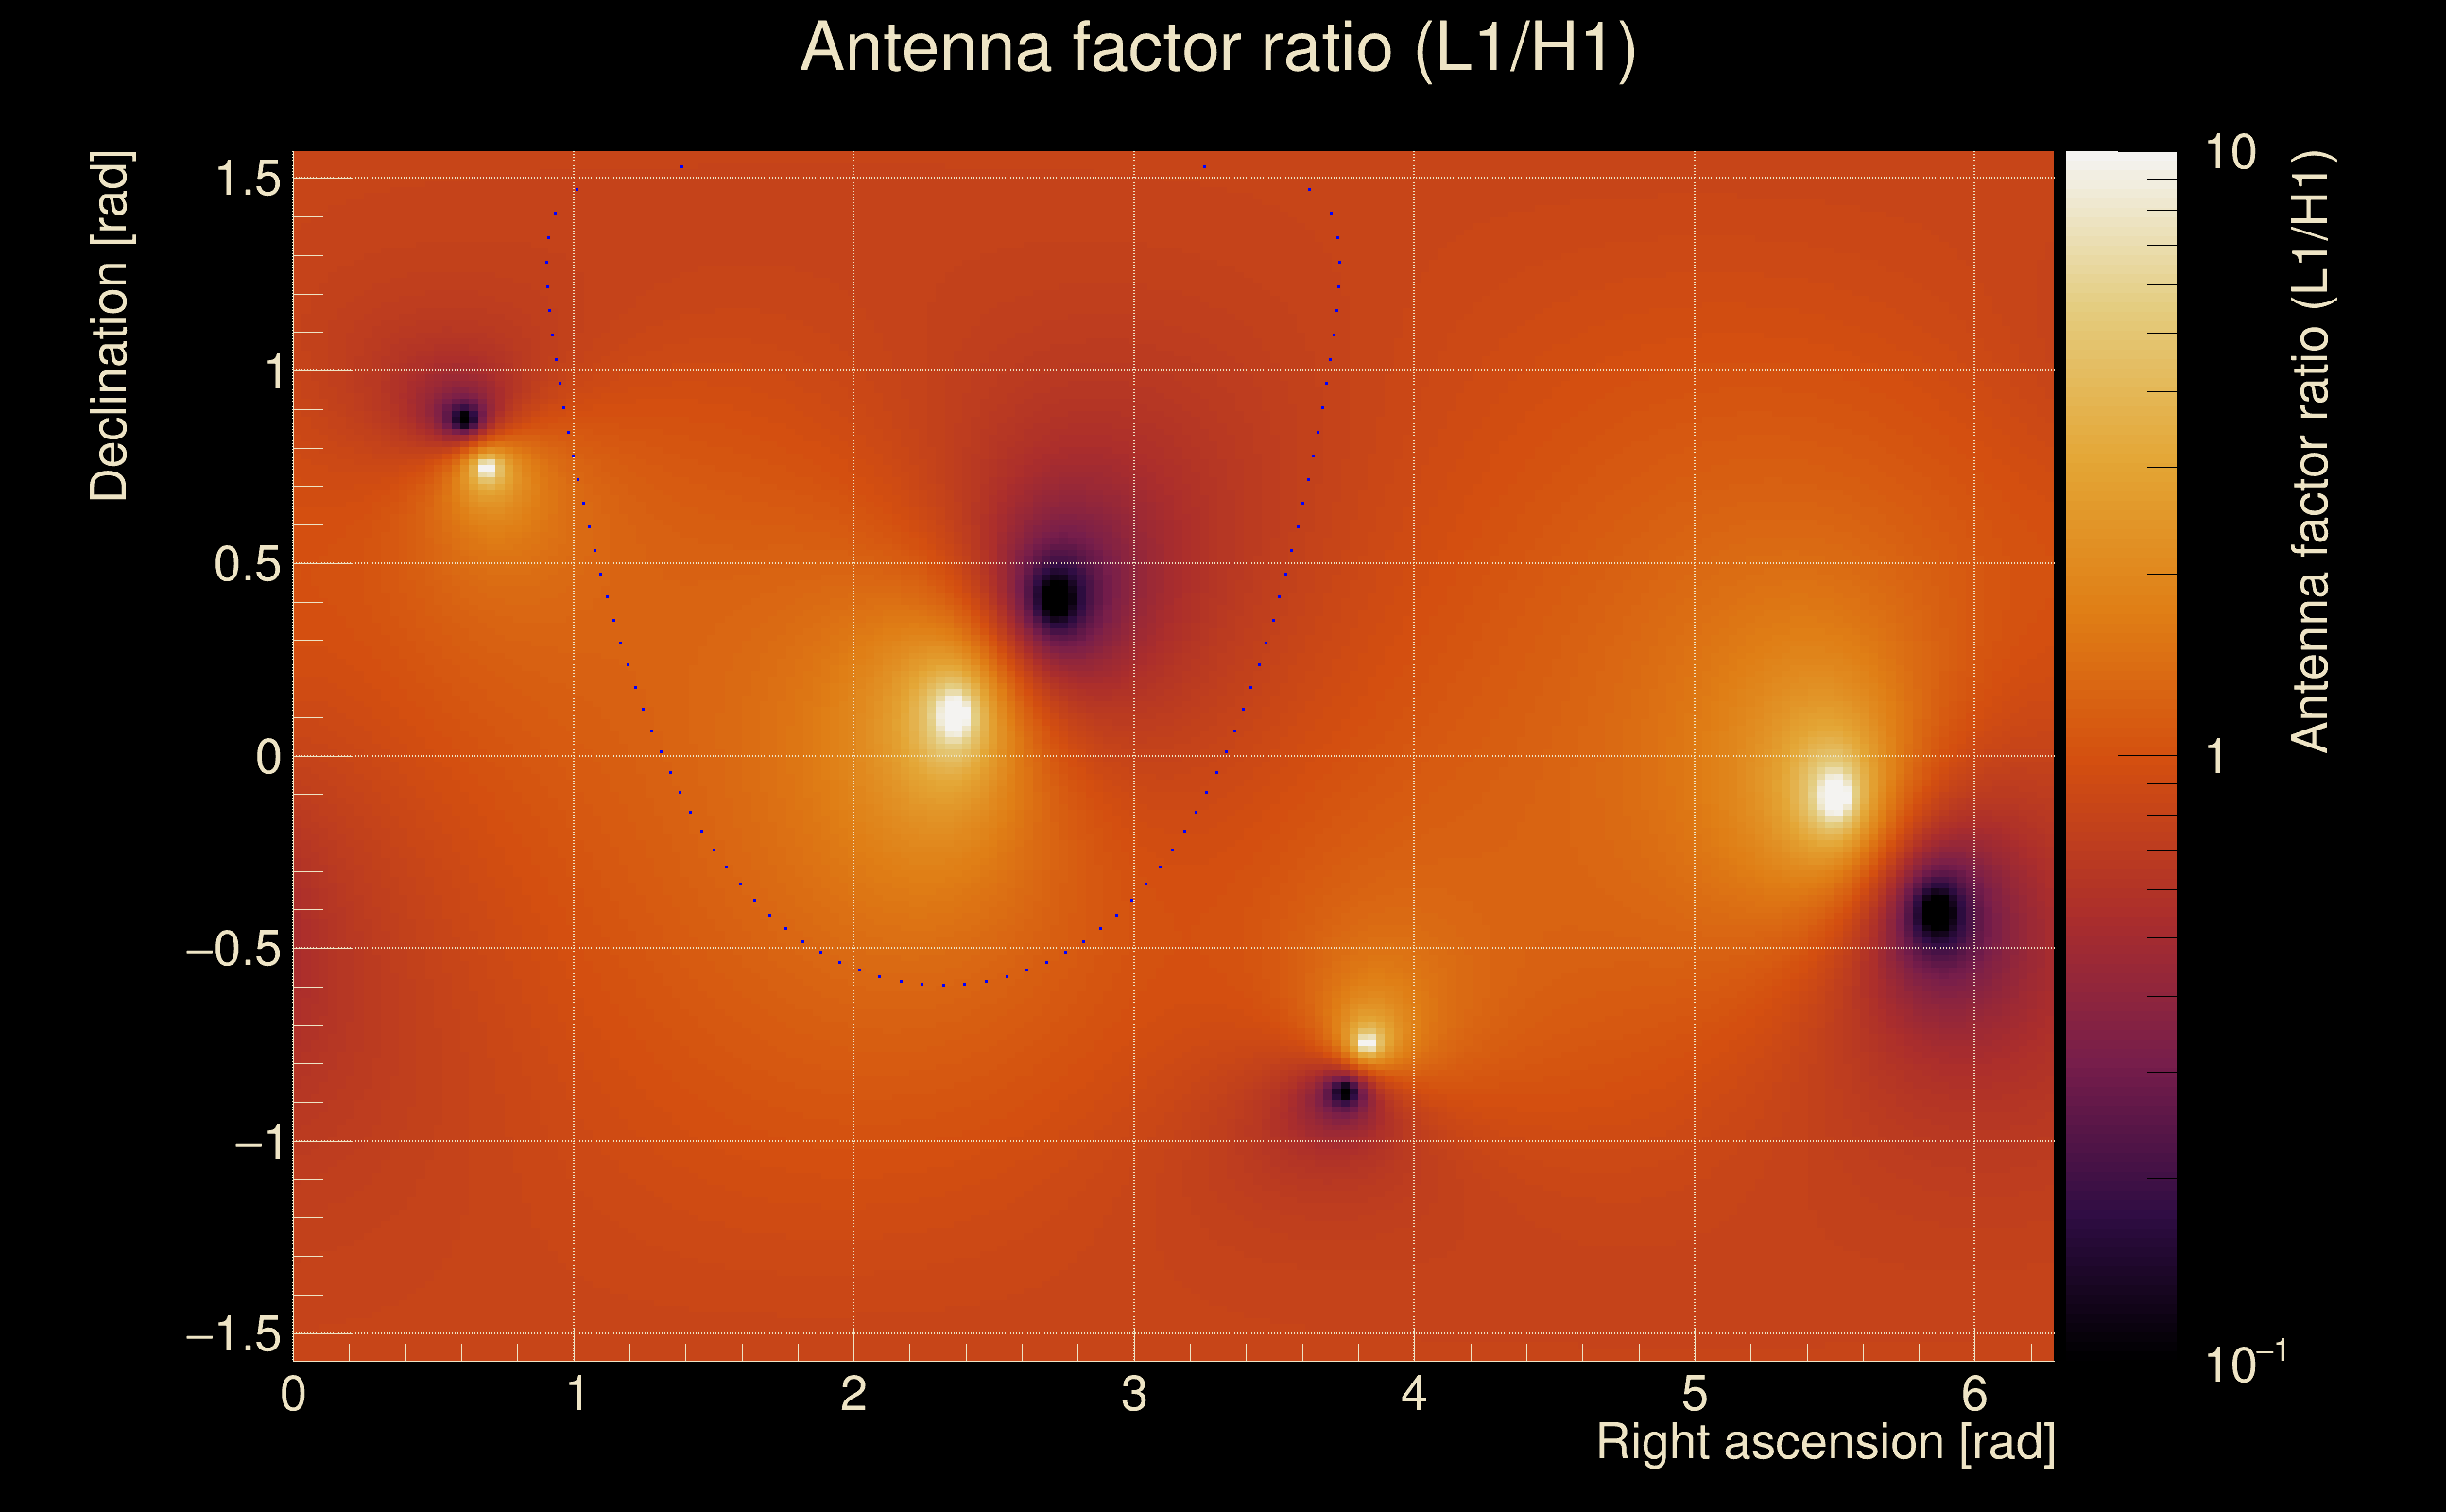
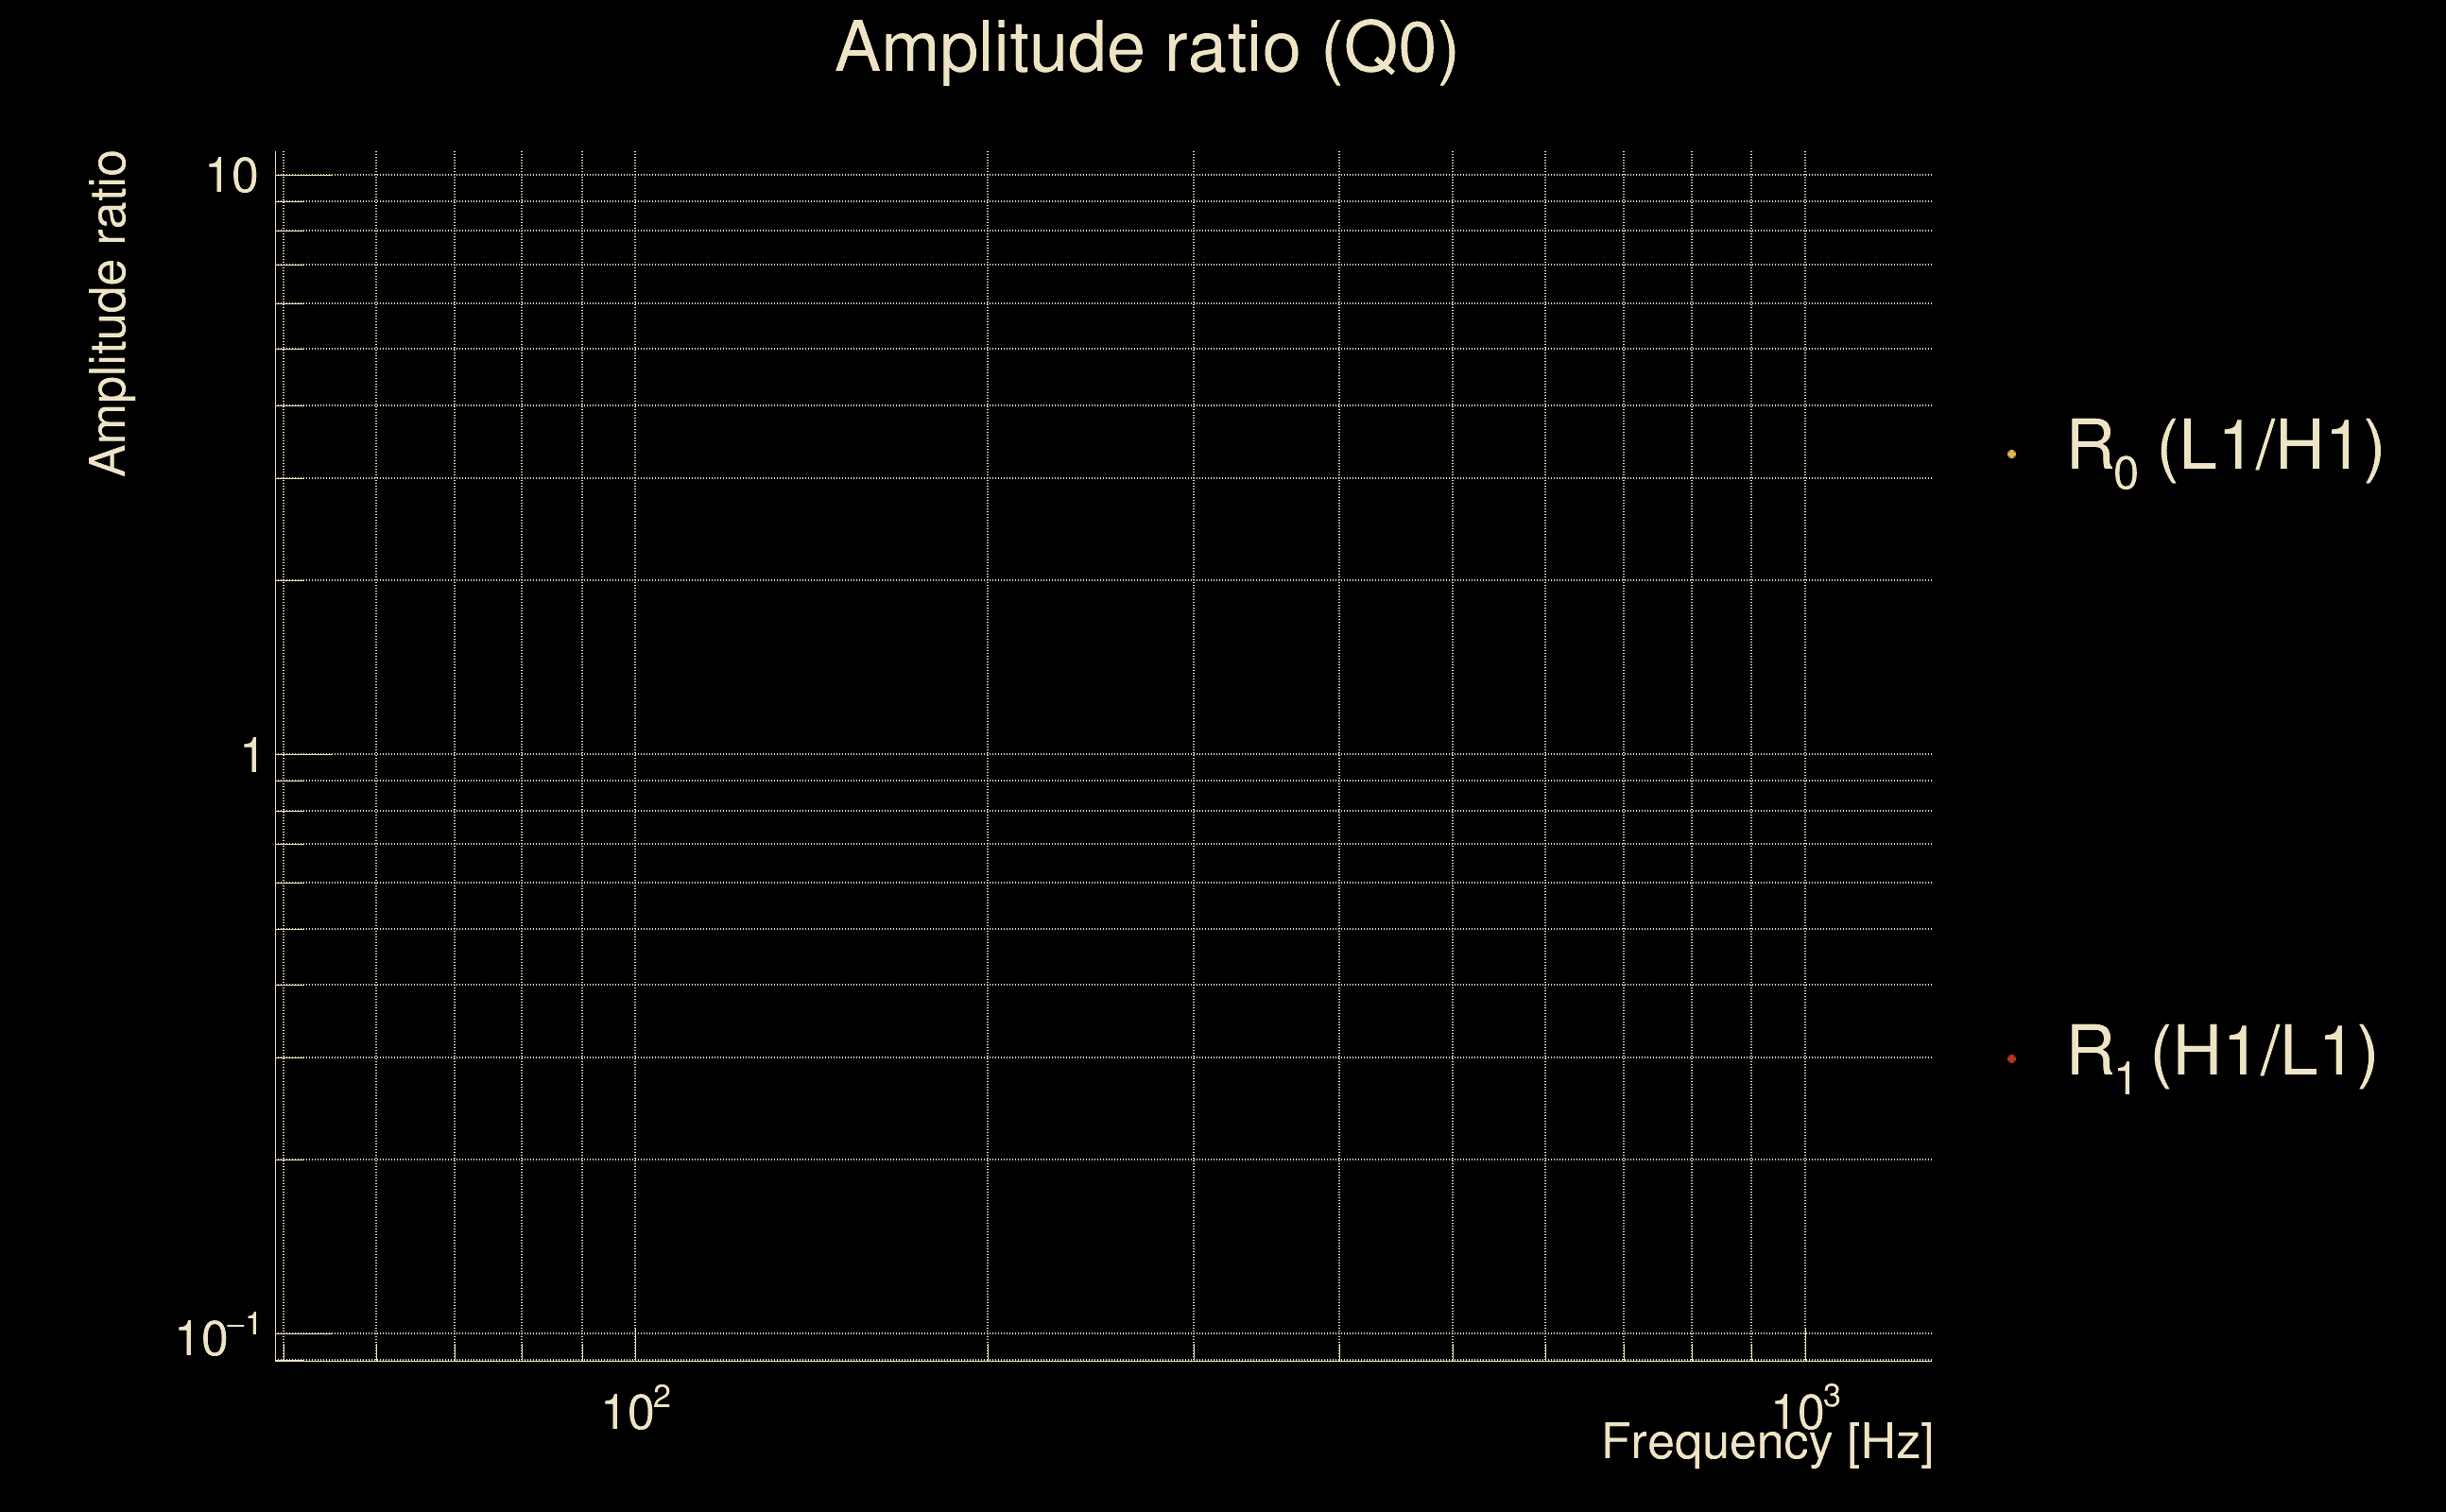
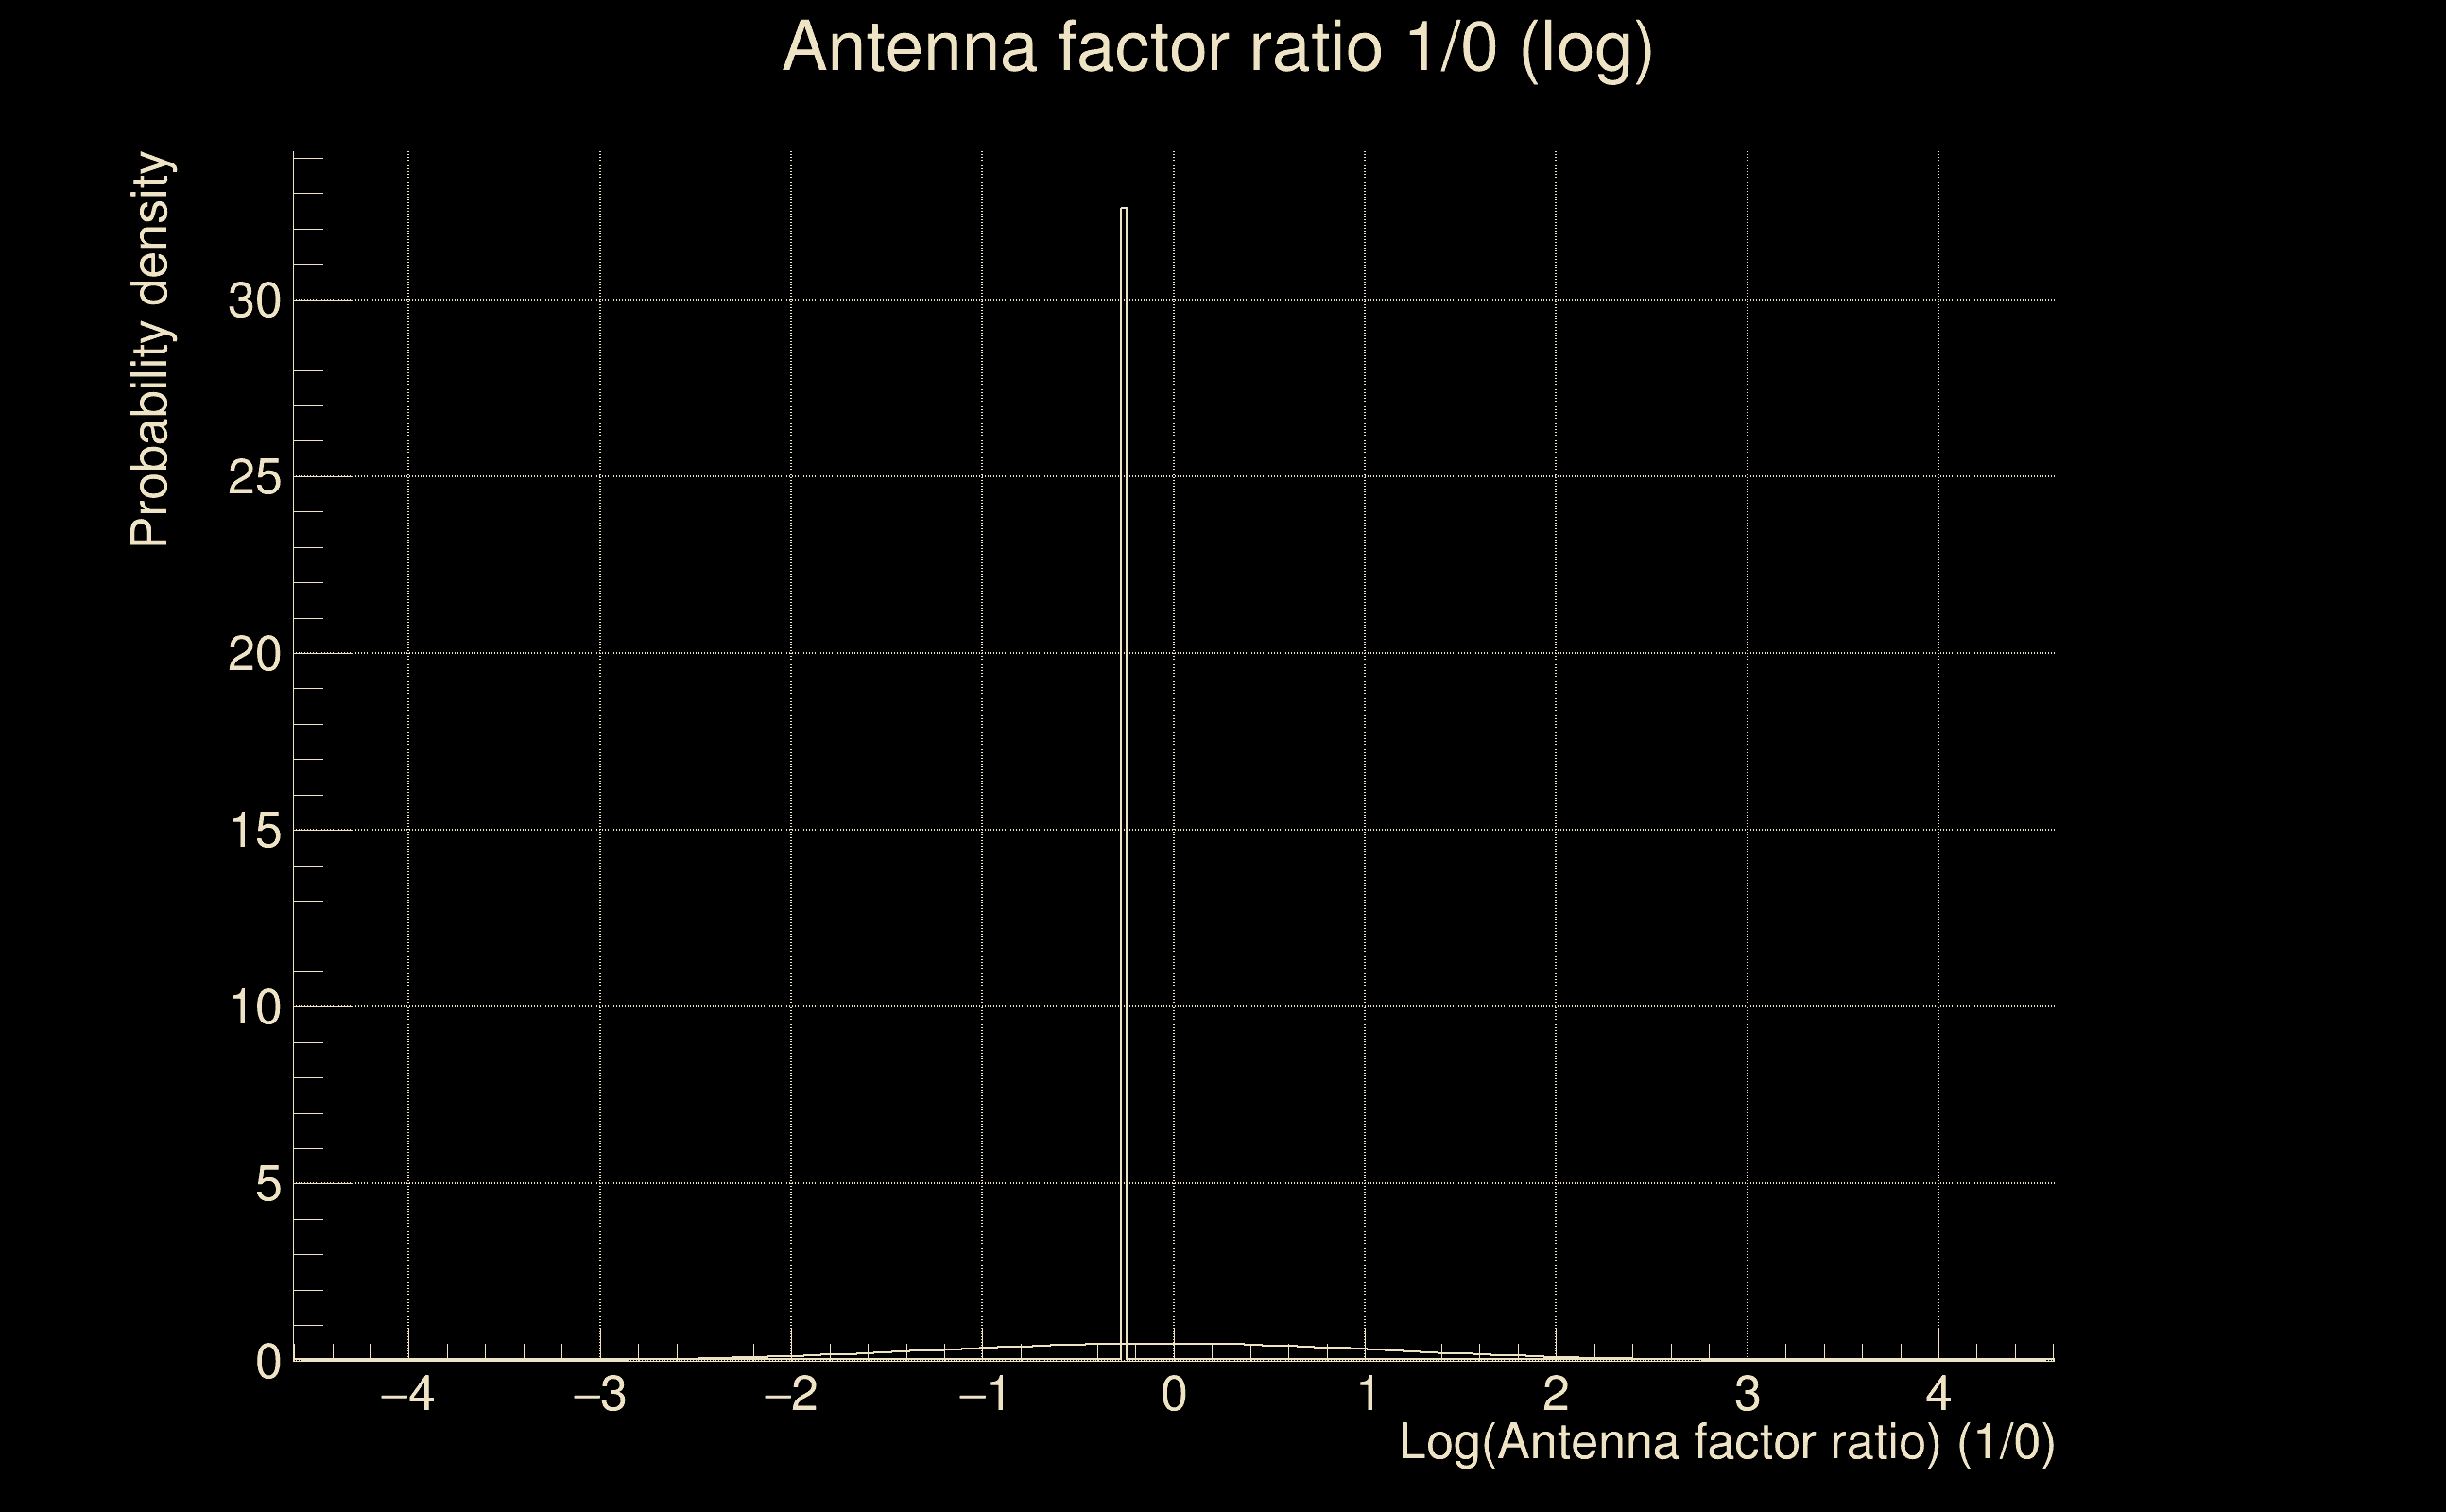
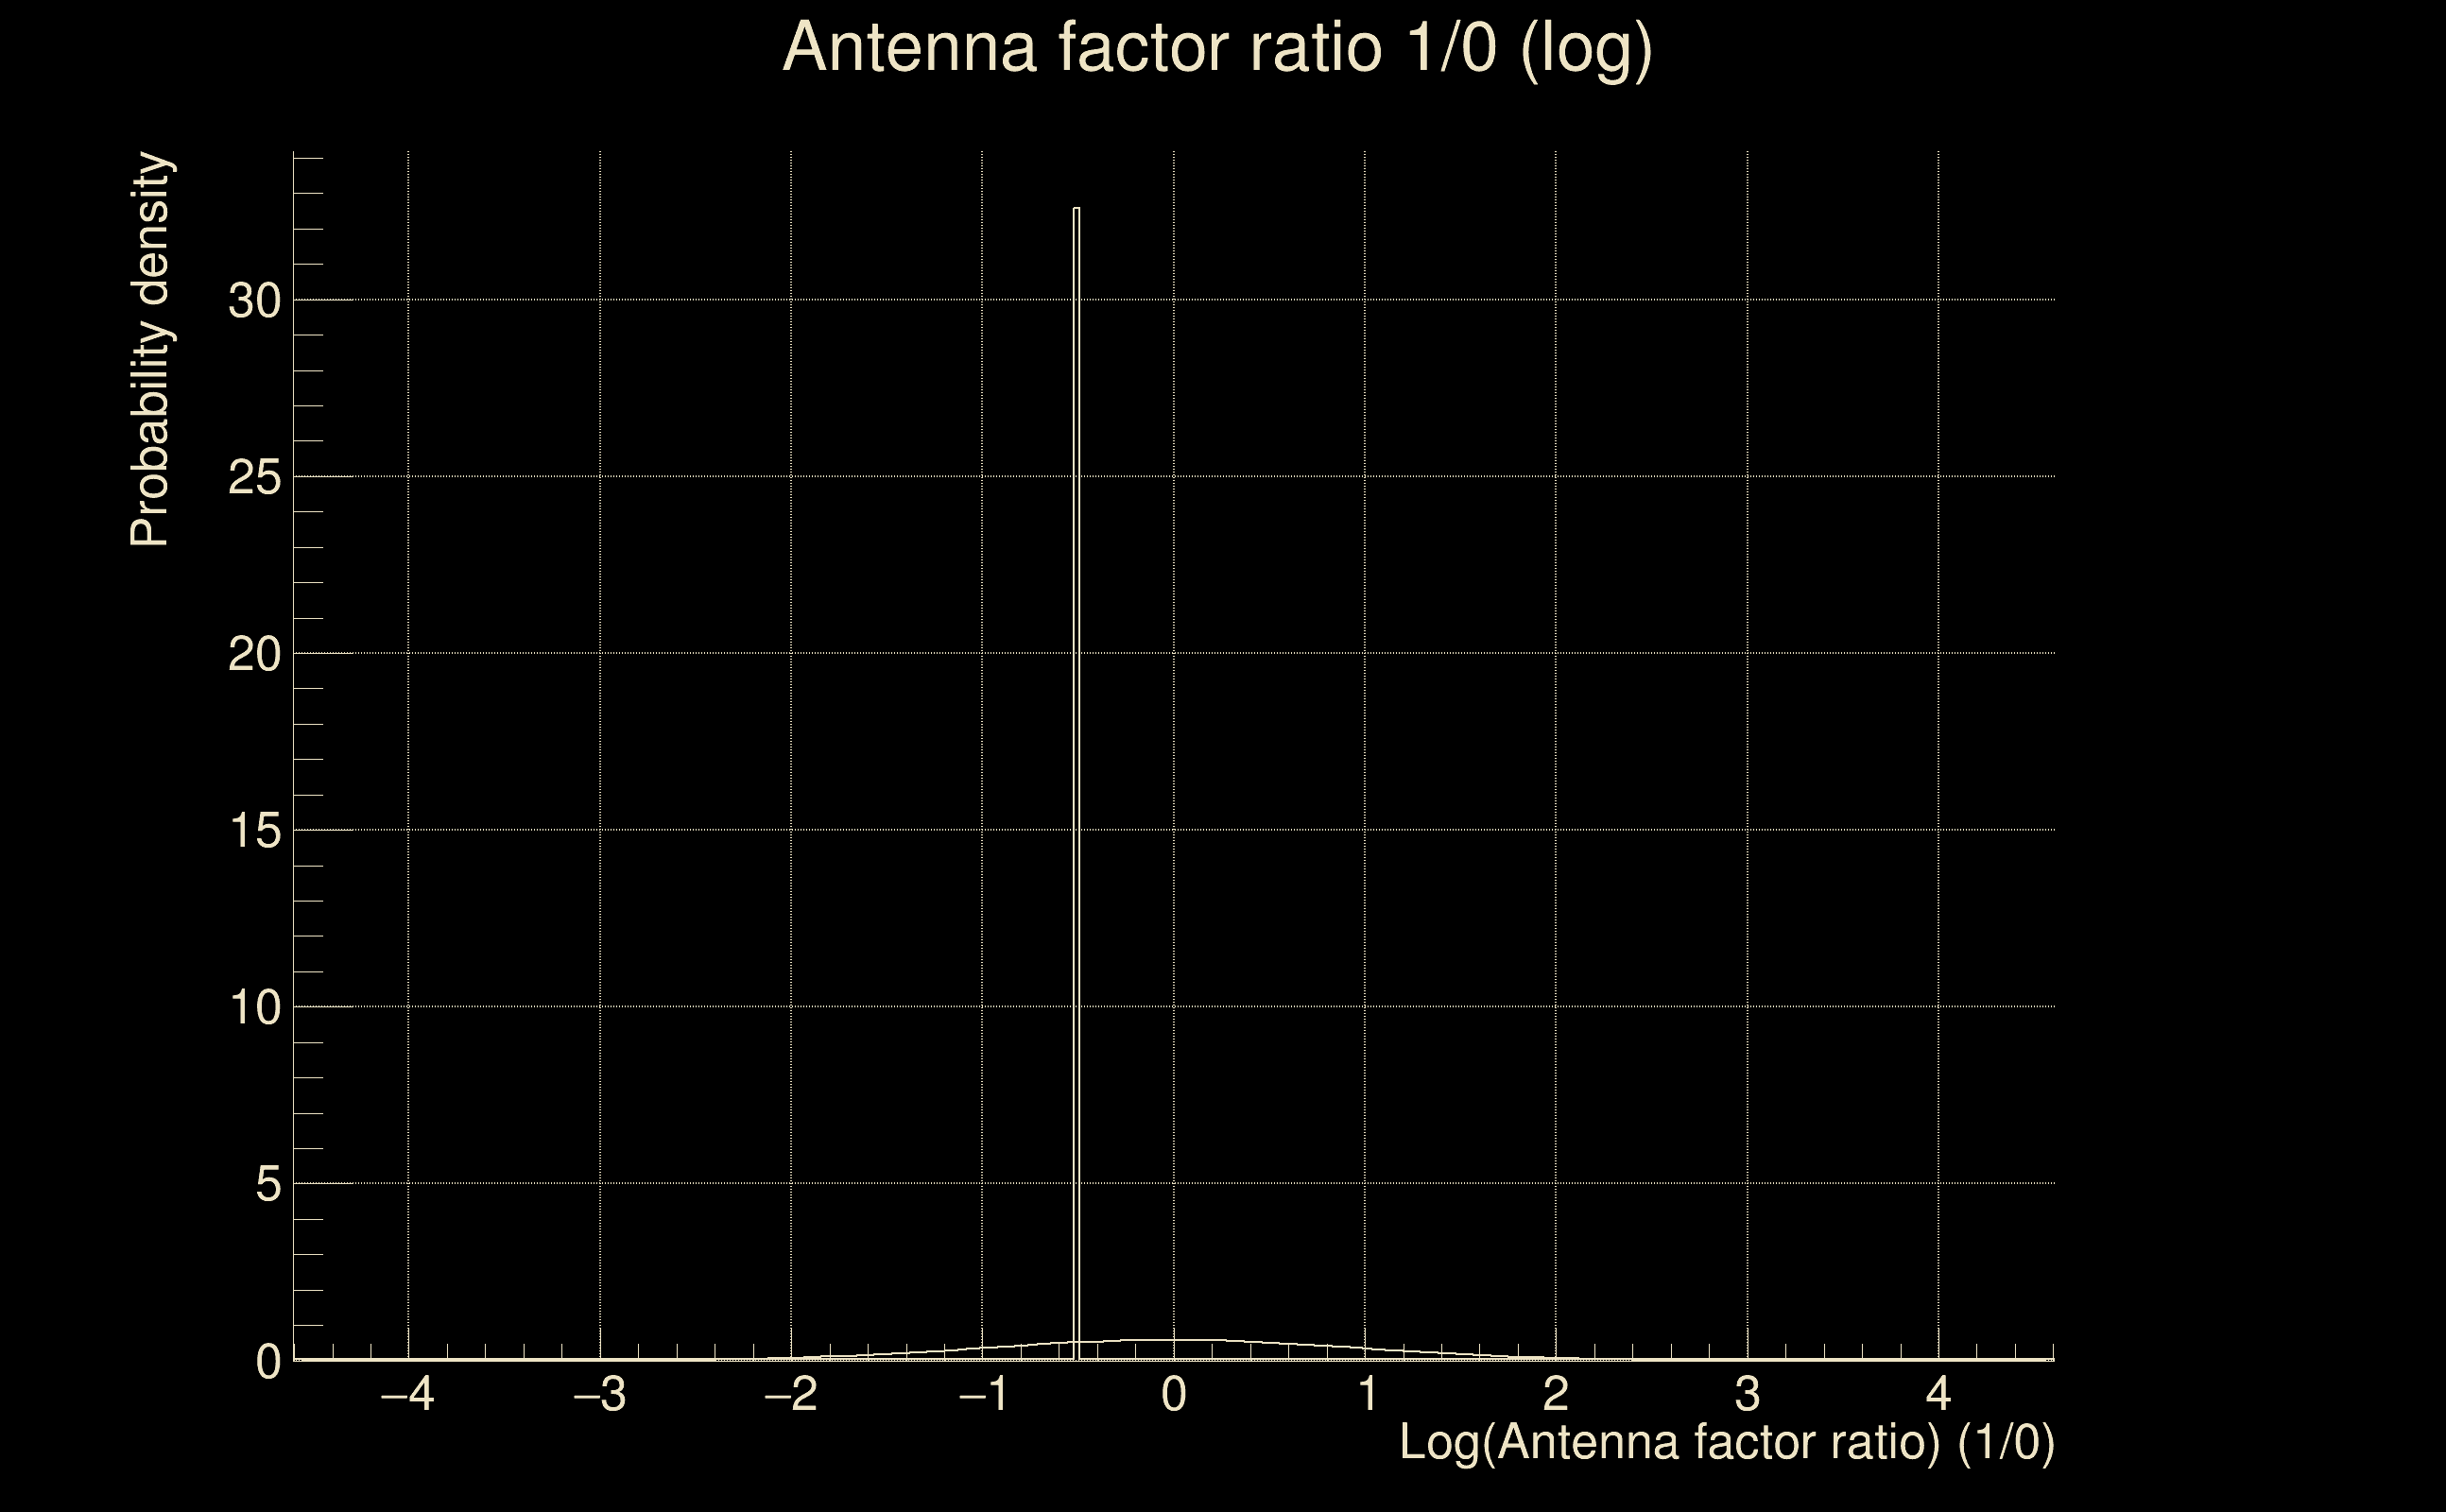
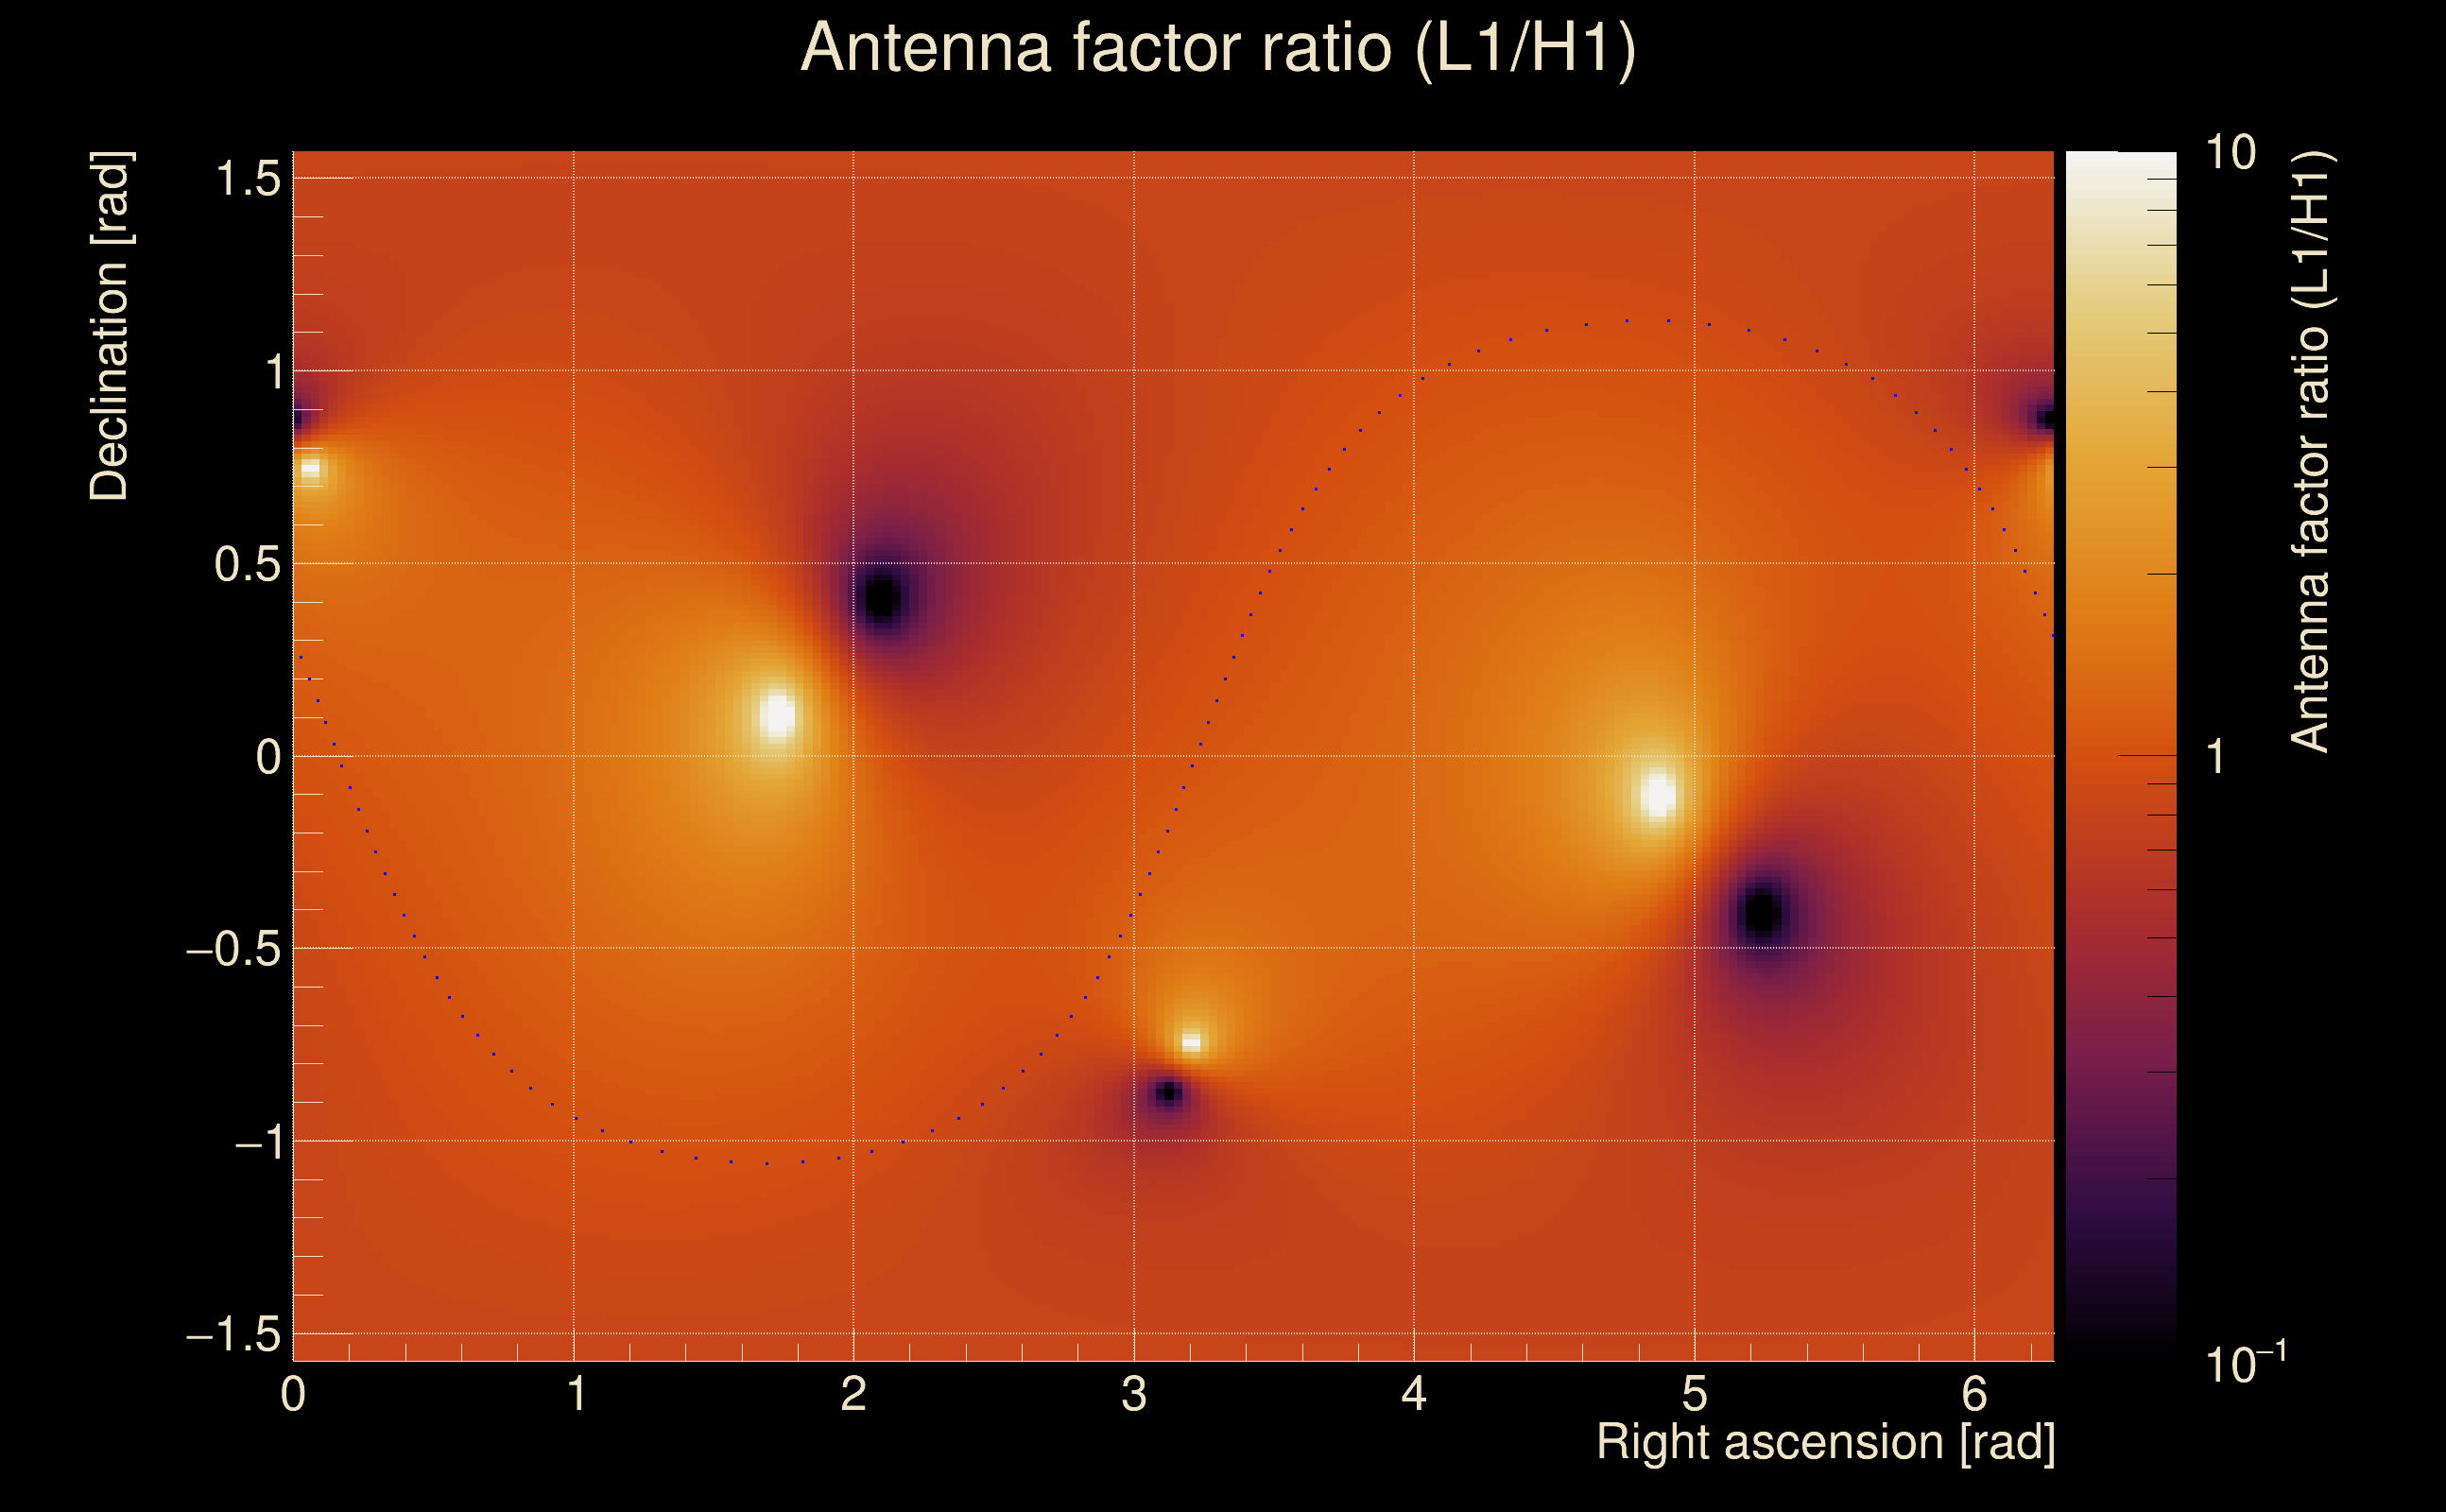
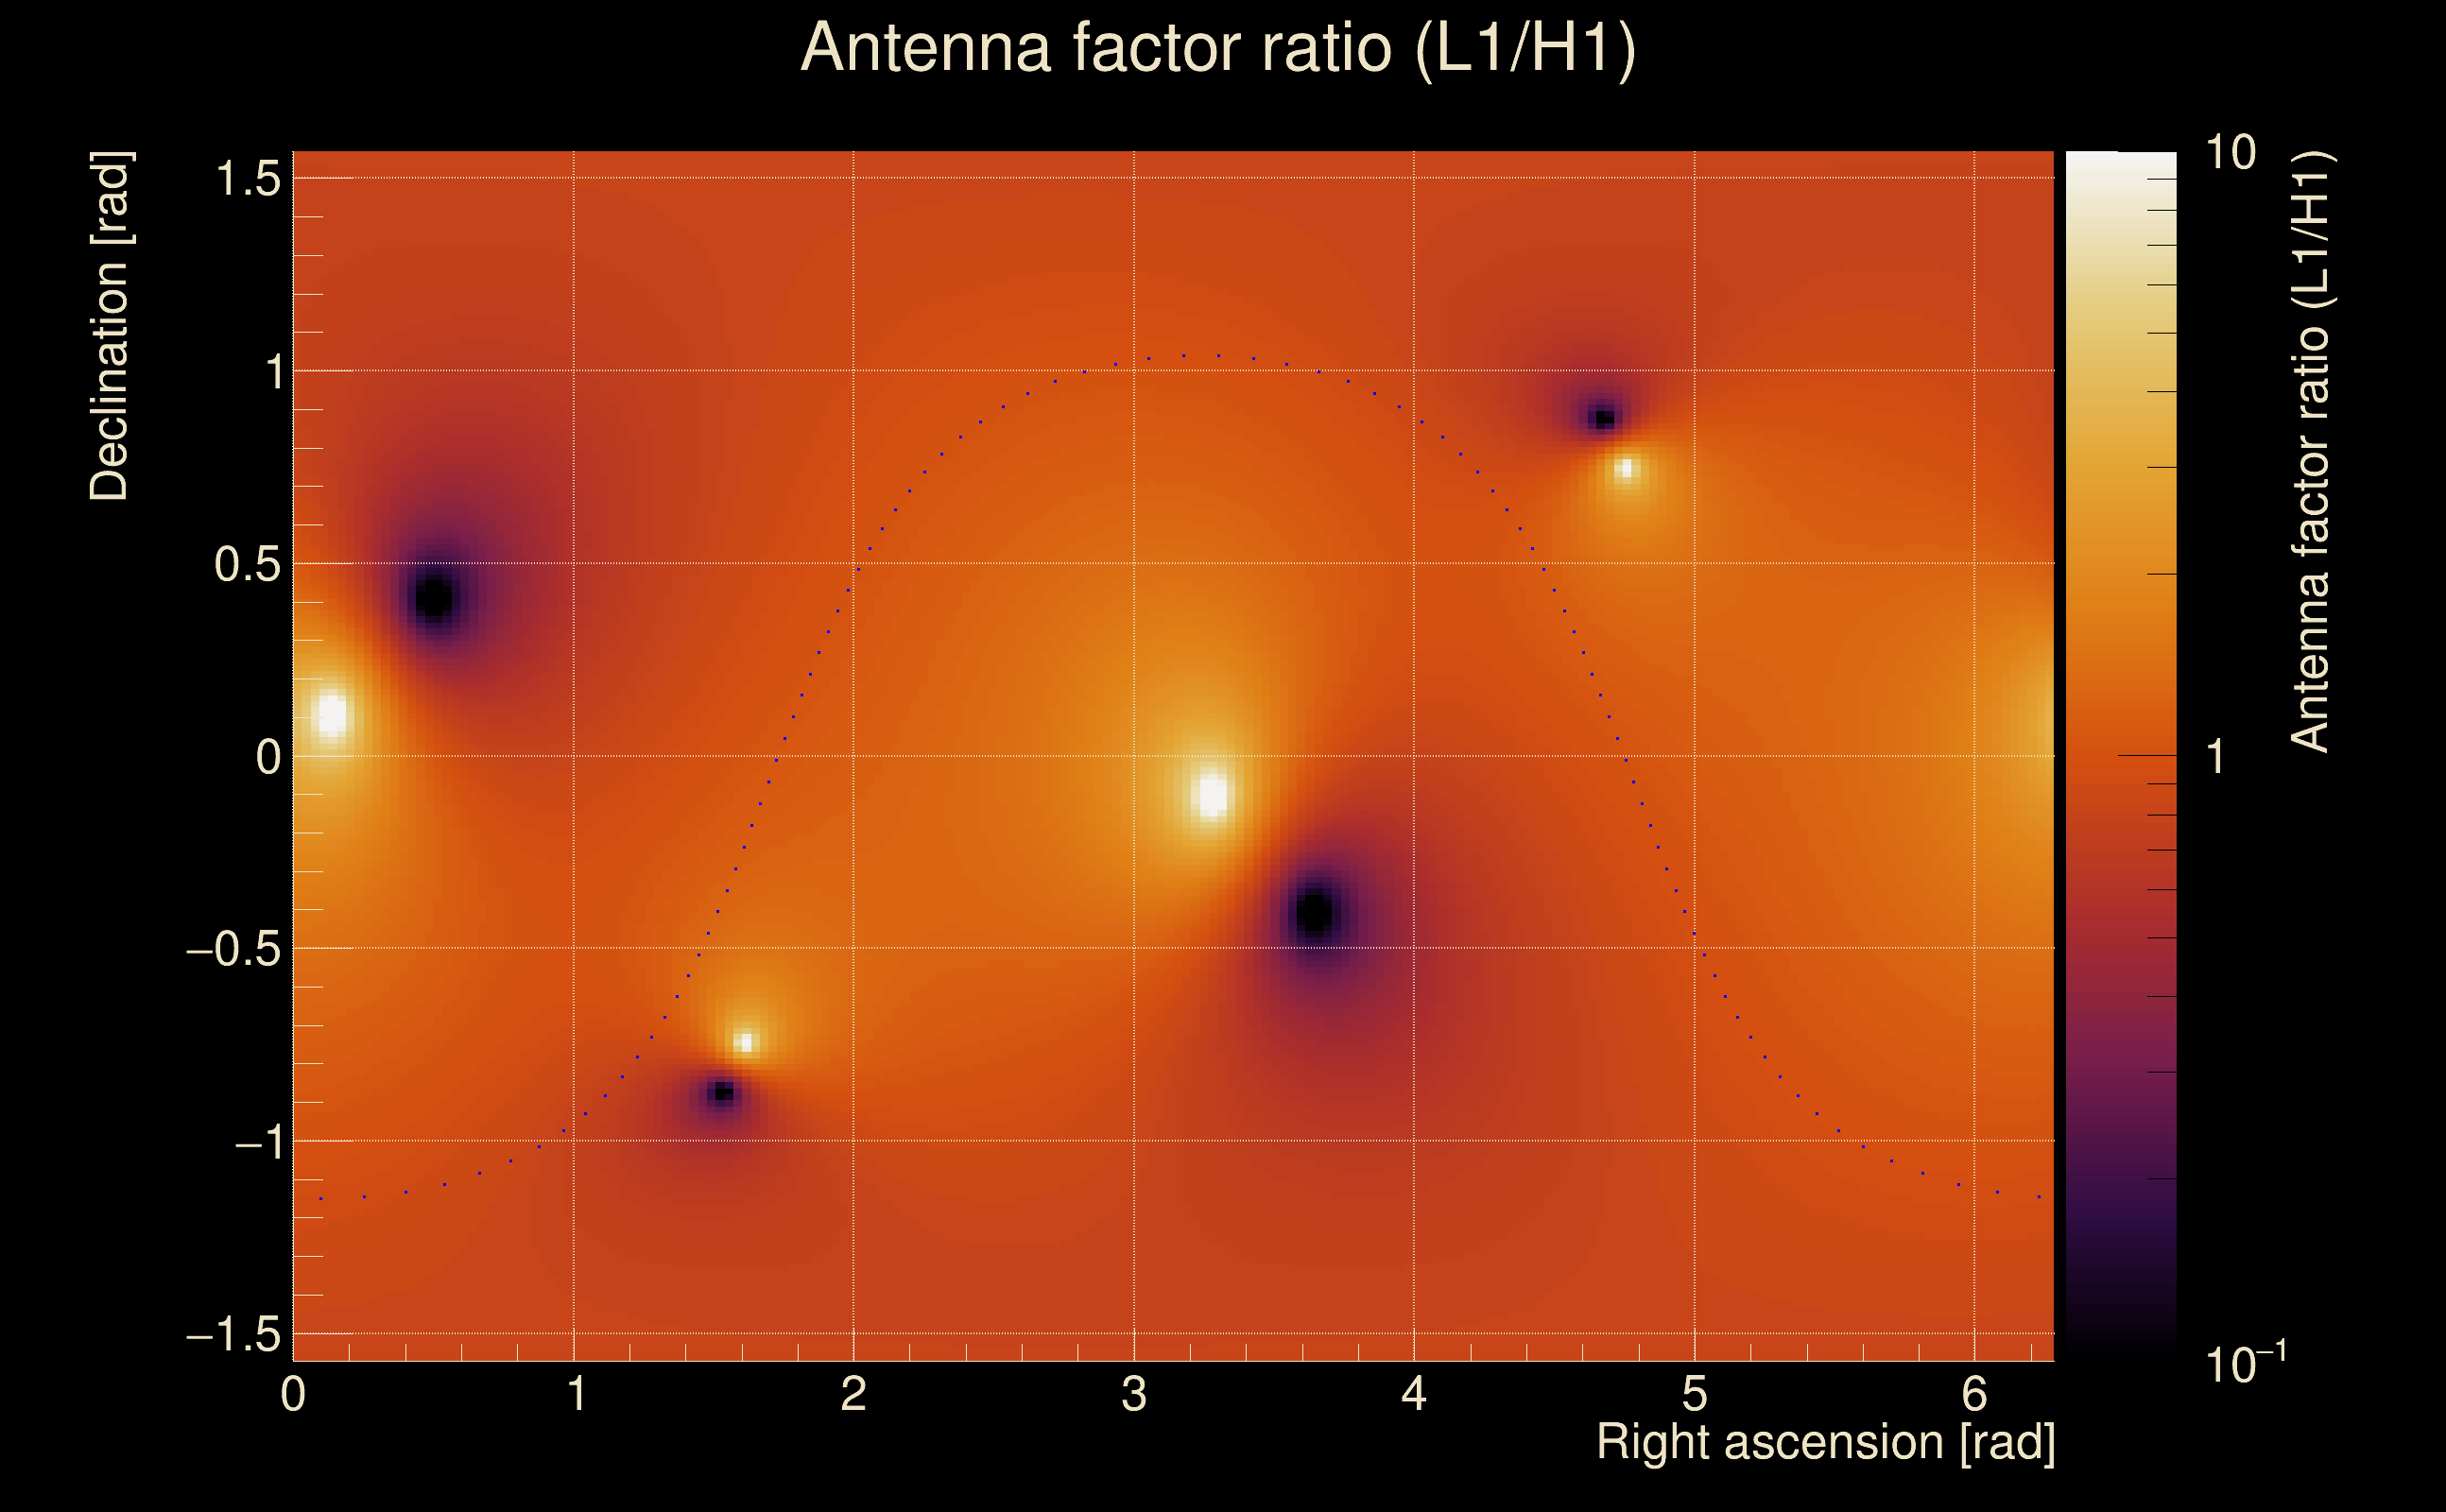
| Log of amplitude ratio (L1/H1): | -0.221549, variance = 0.158399 (L1/H1: -0.222873, variance = 0.304326, H1/L1: 0.219576, variance = 0.306481) |
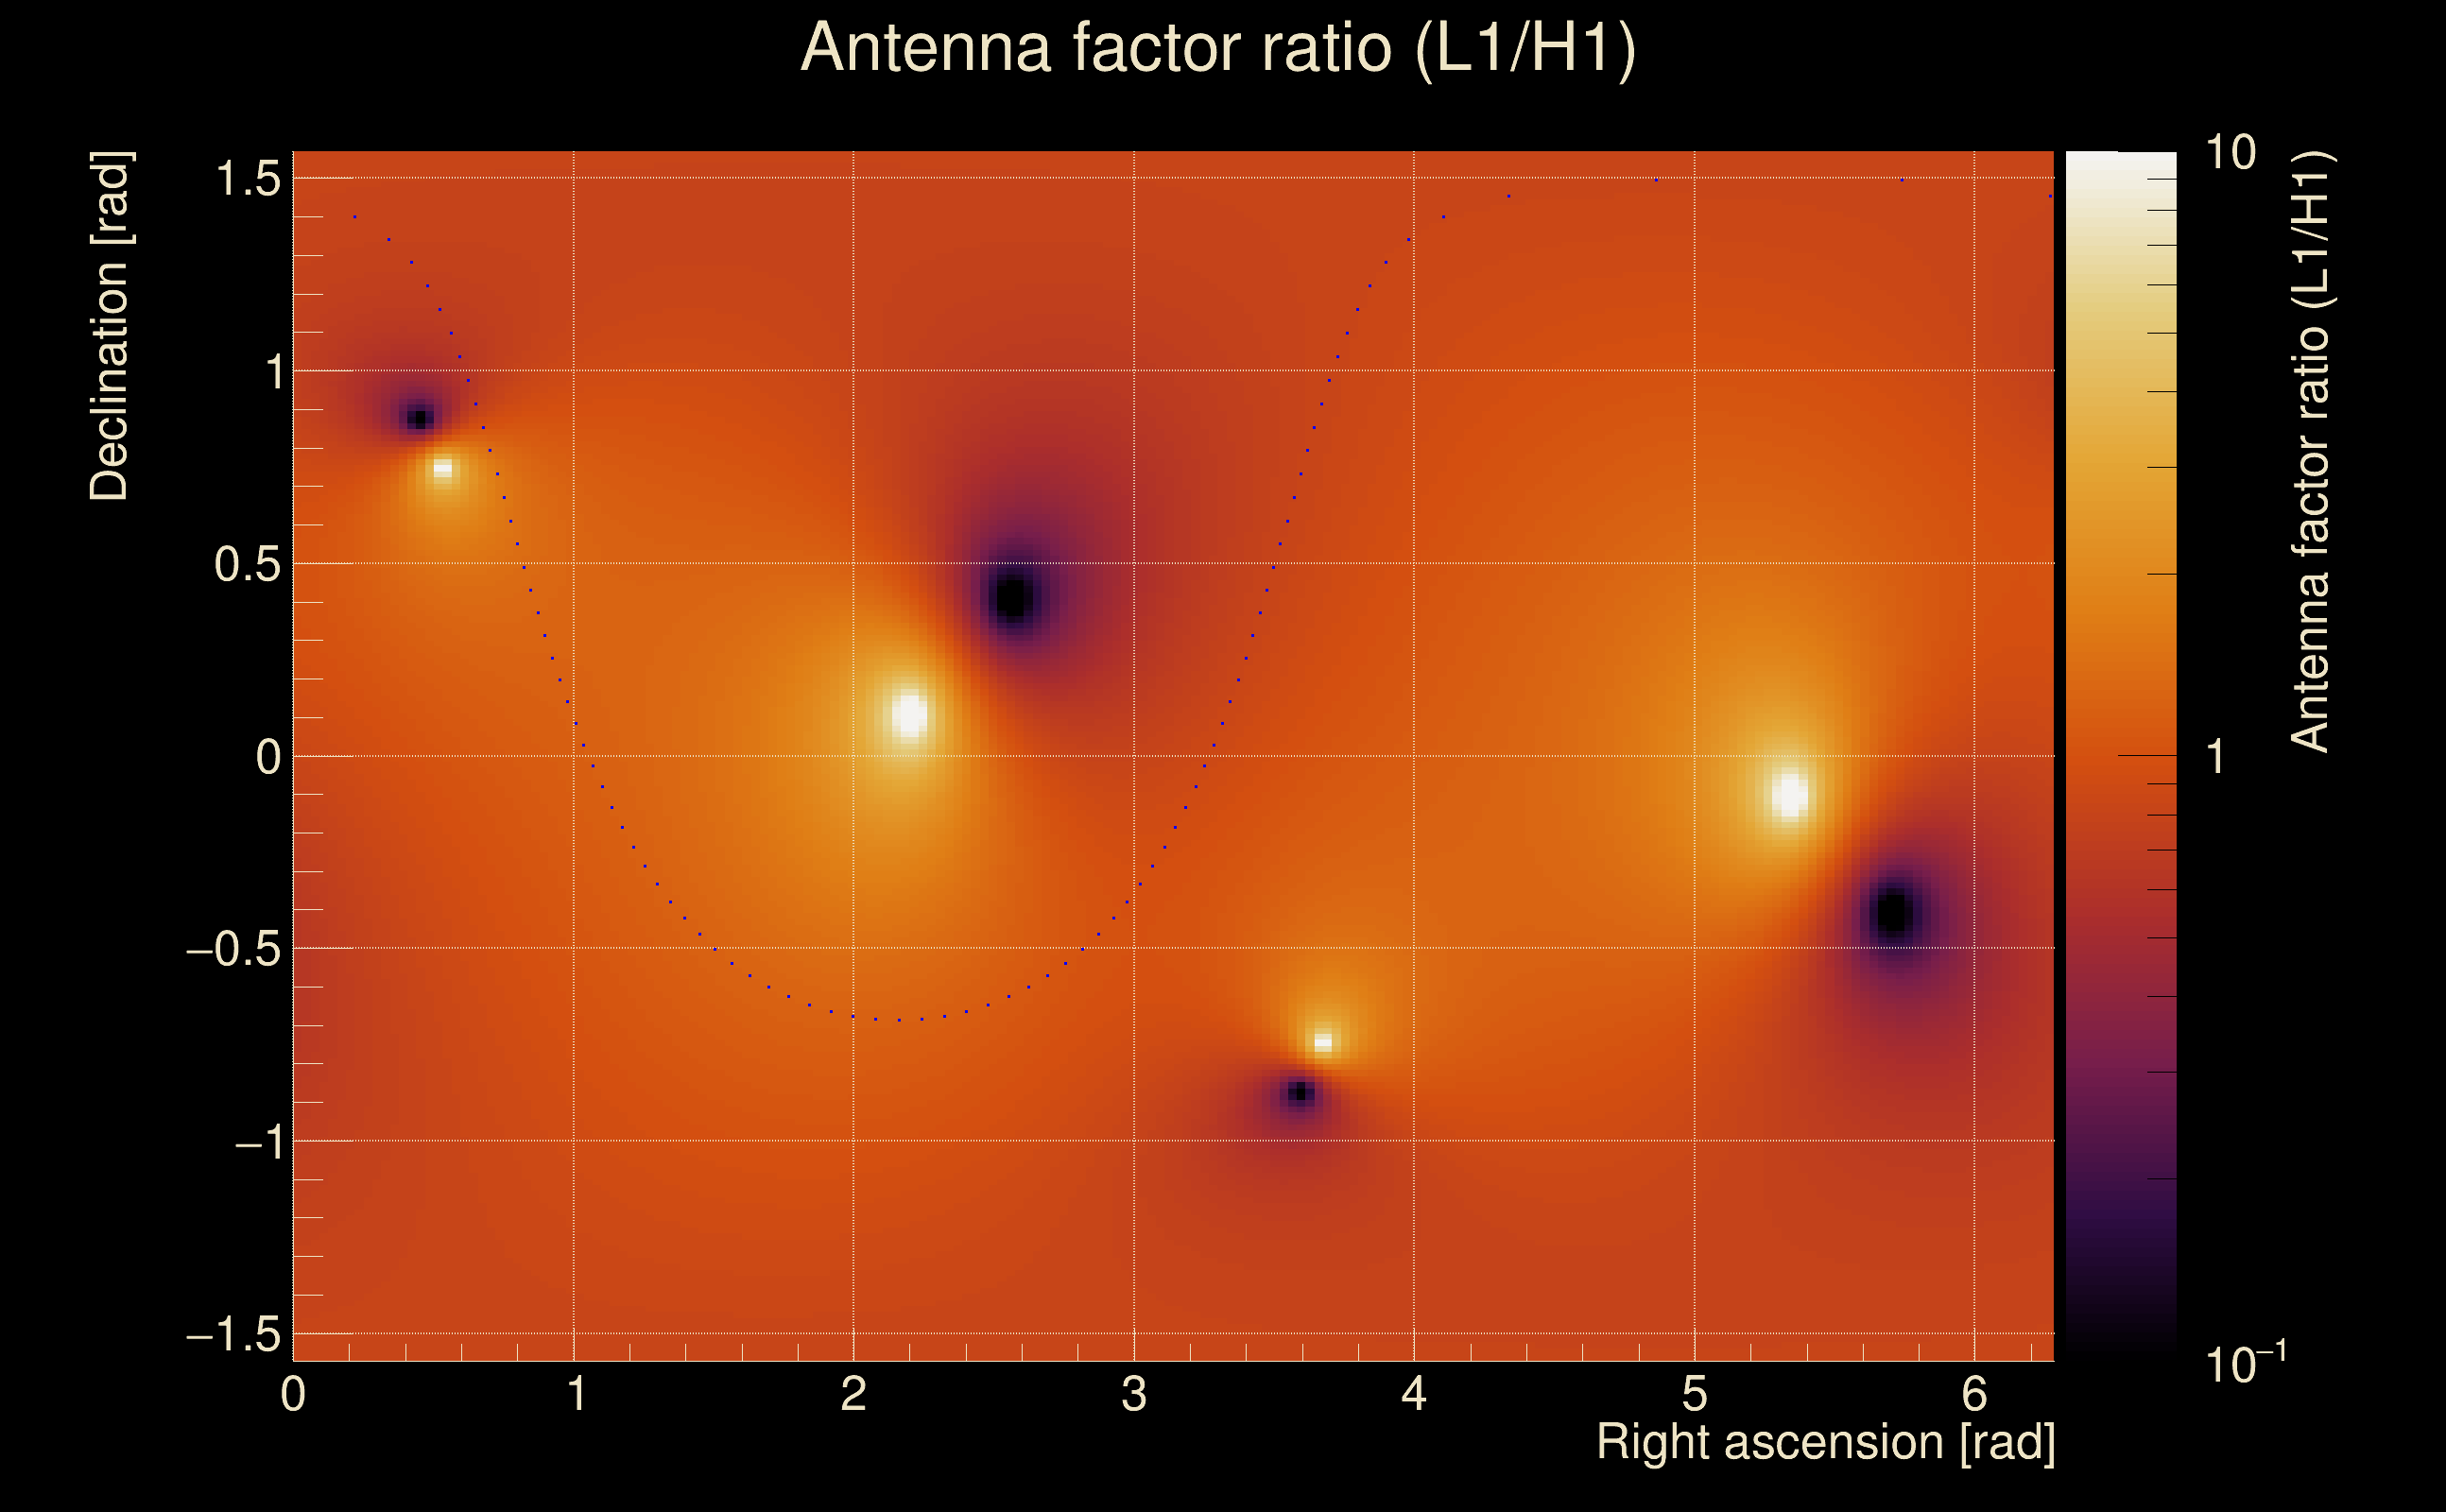
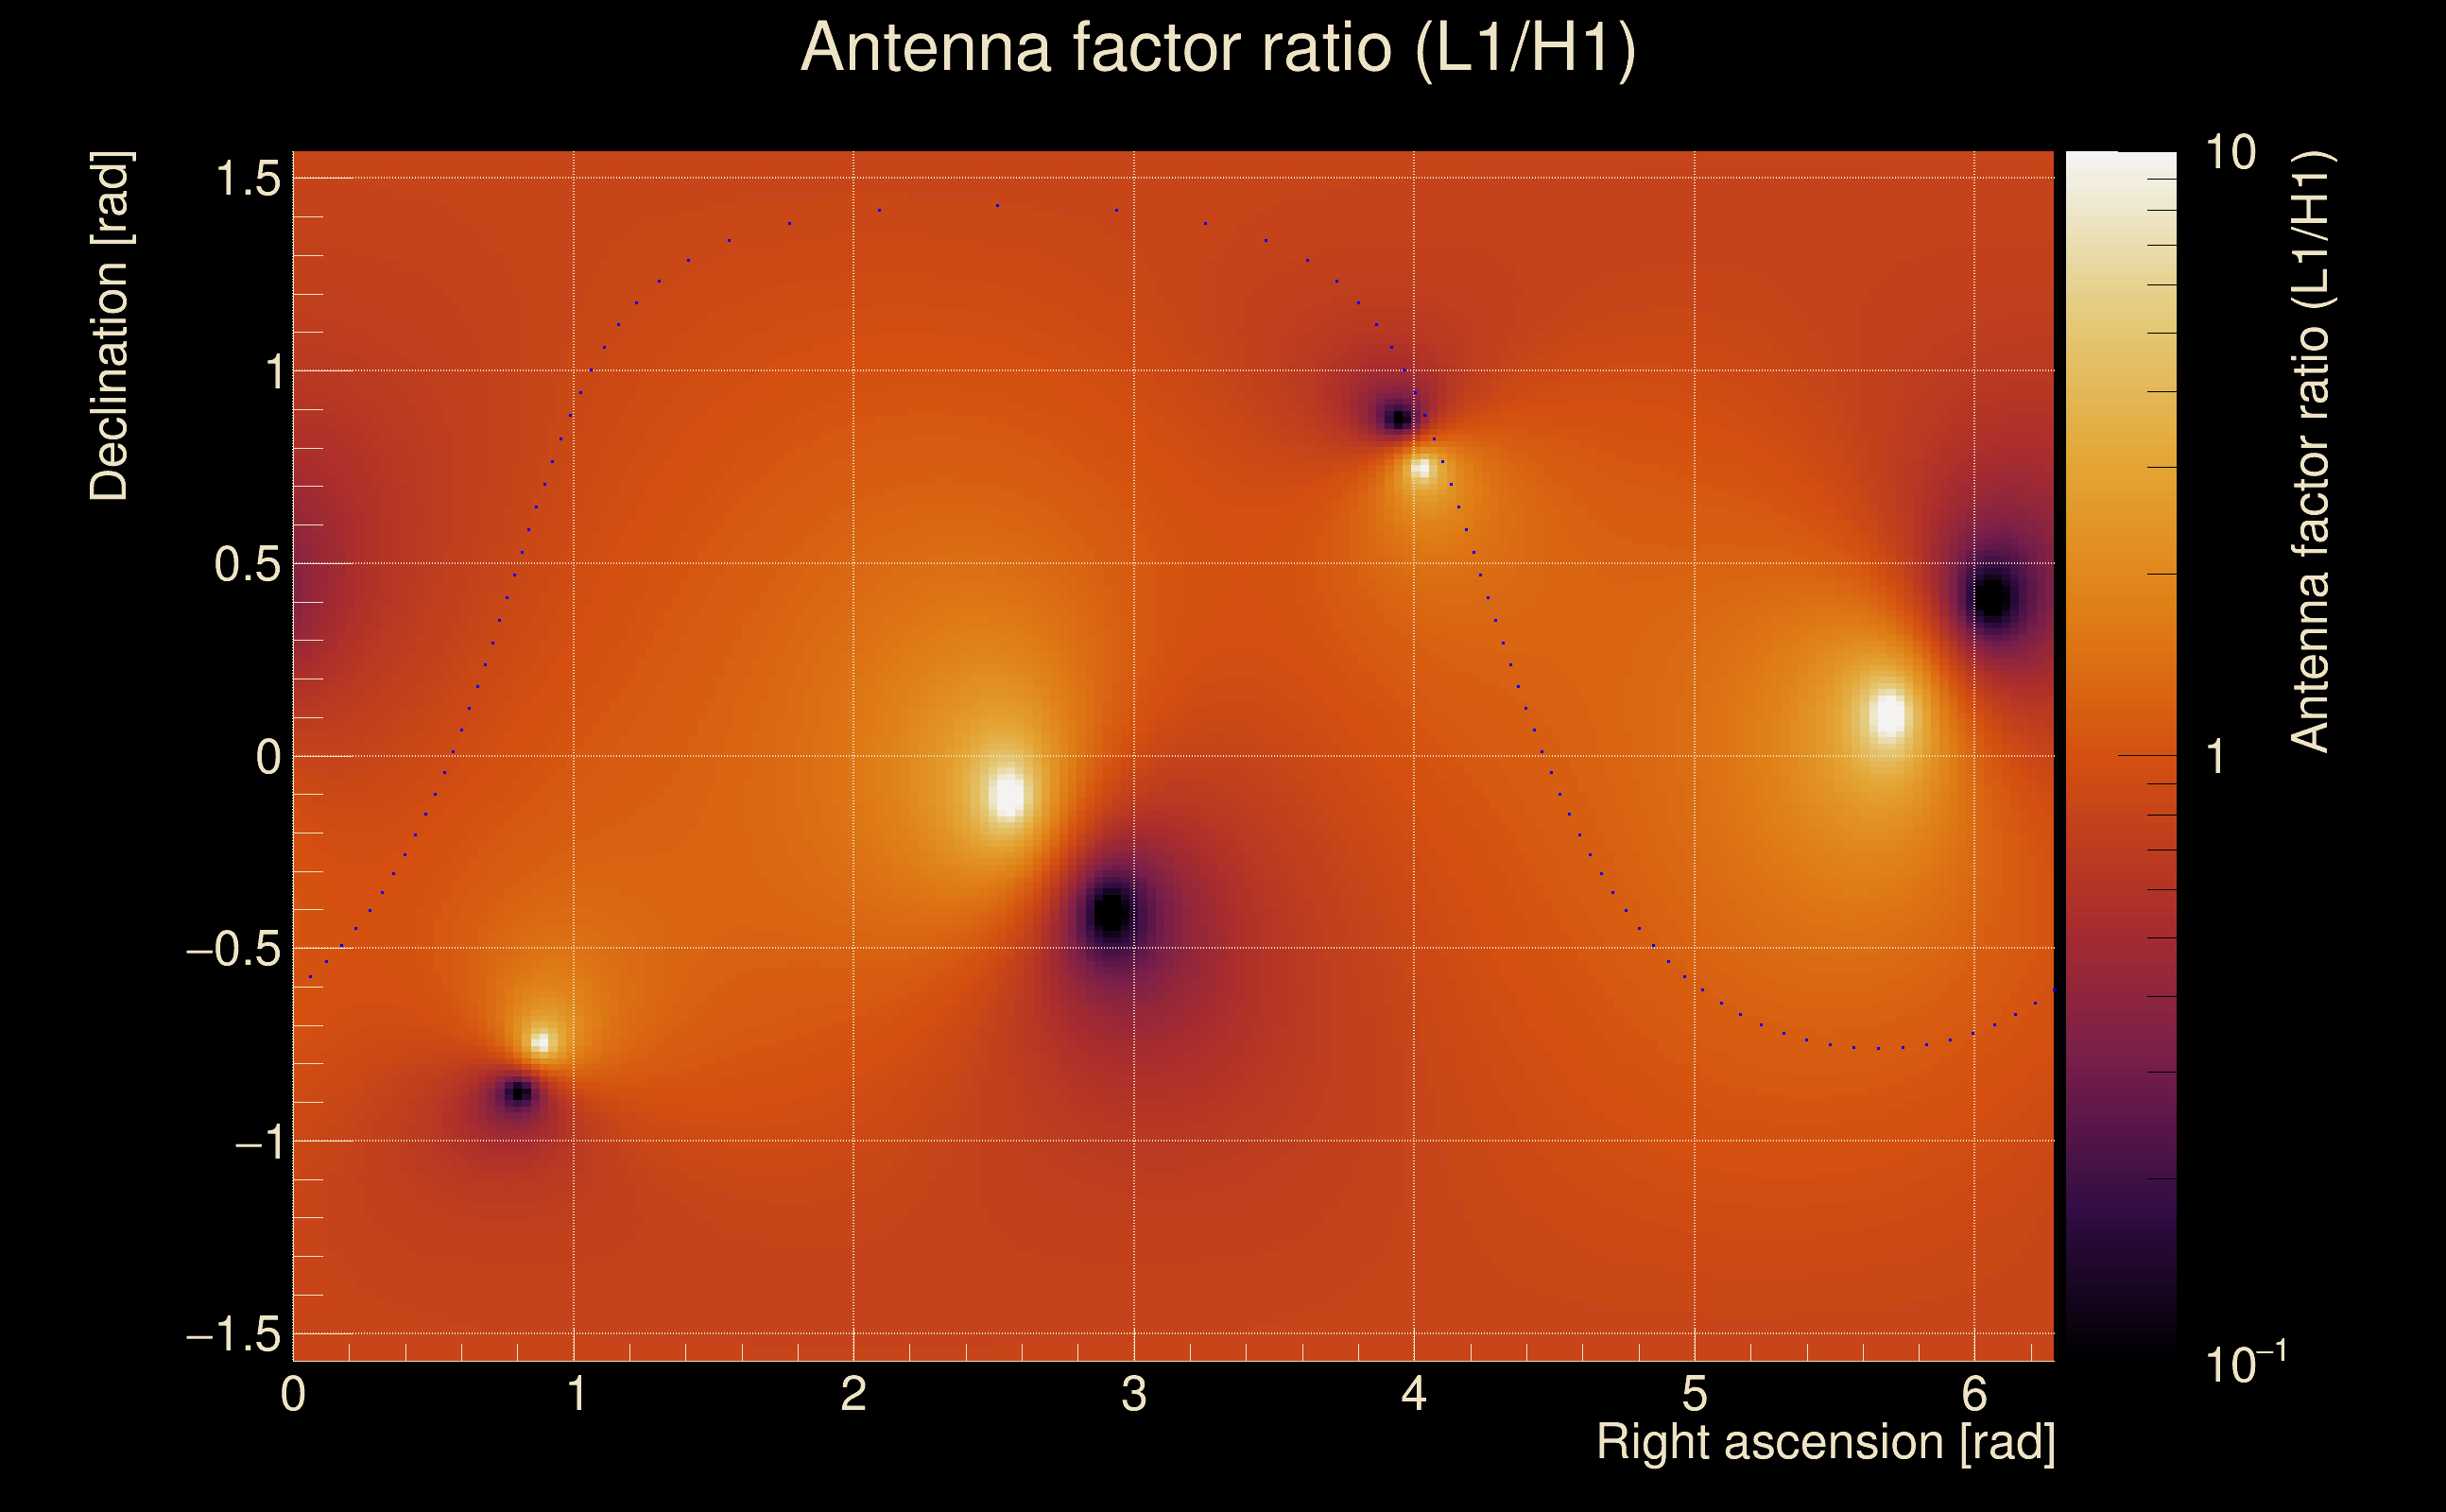
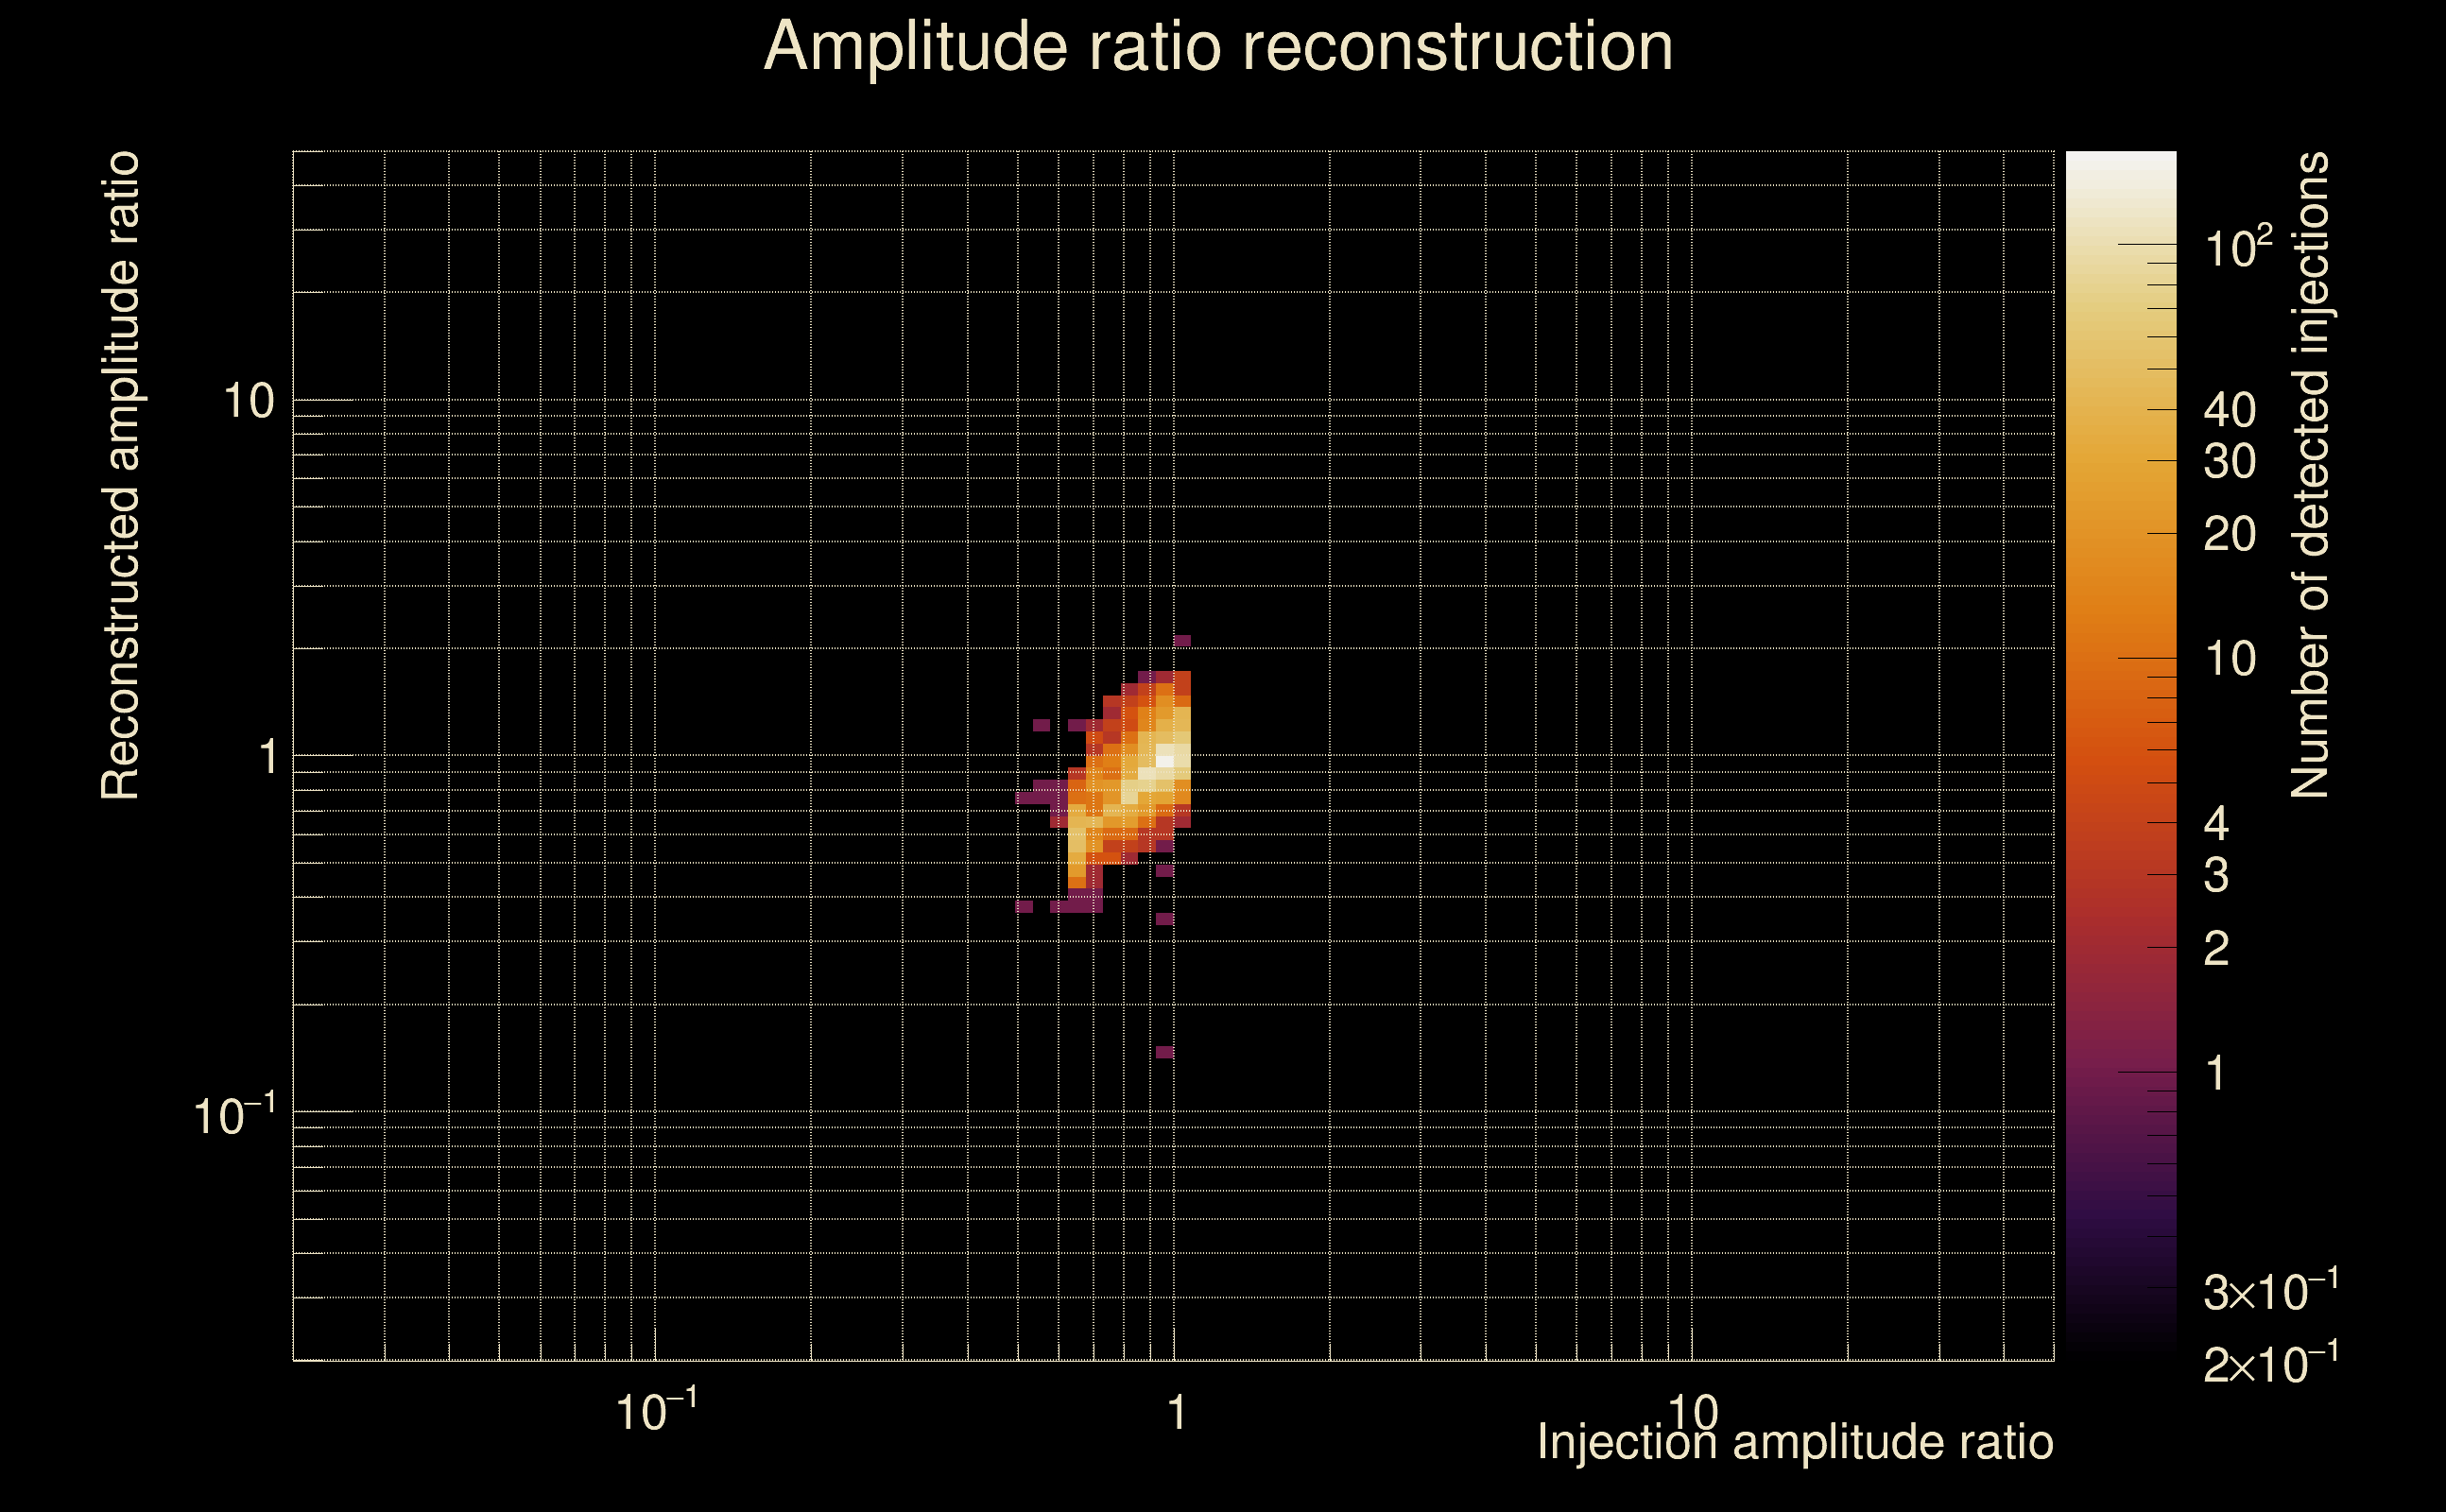
| Amplitude ratio (L1/H1): | 0.801277 ⋇ 1.48884 (L1/H1: 0.800216 ⋇ 1.73613, H1/L1: 1.24555 ⋇ 1.73952) |
| Amplitude ratio H1|L1 compatibility (probability): | 0.996634 |
| Antenna factor probability: | 1 |
| Number of rejected frequency rows: | Q0: 0 / 18, Q1: 2 / 36, Q2: 8 / 70, Q3: 19 / 134, Q4: 55 / 258 |
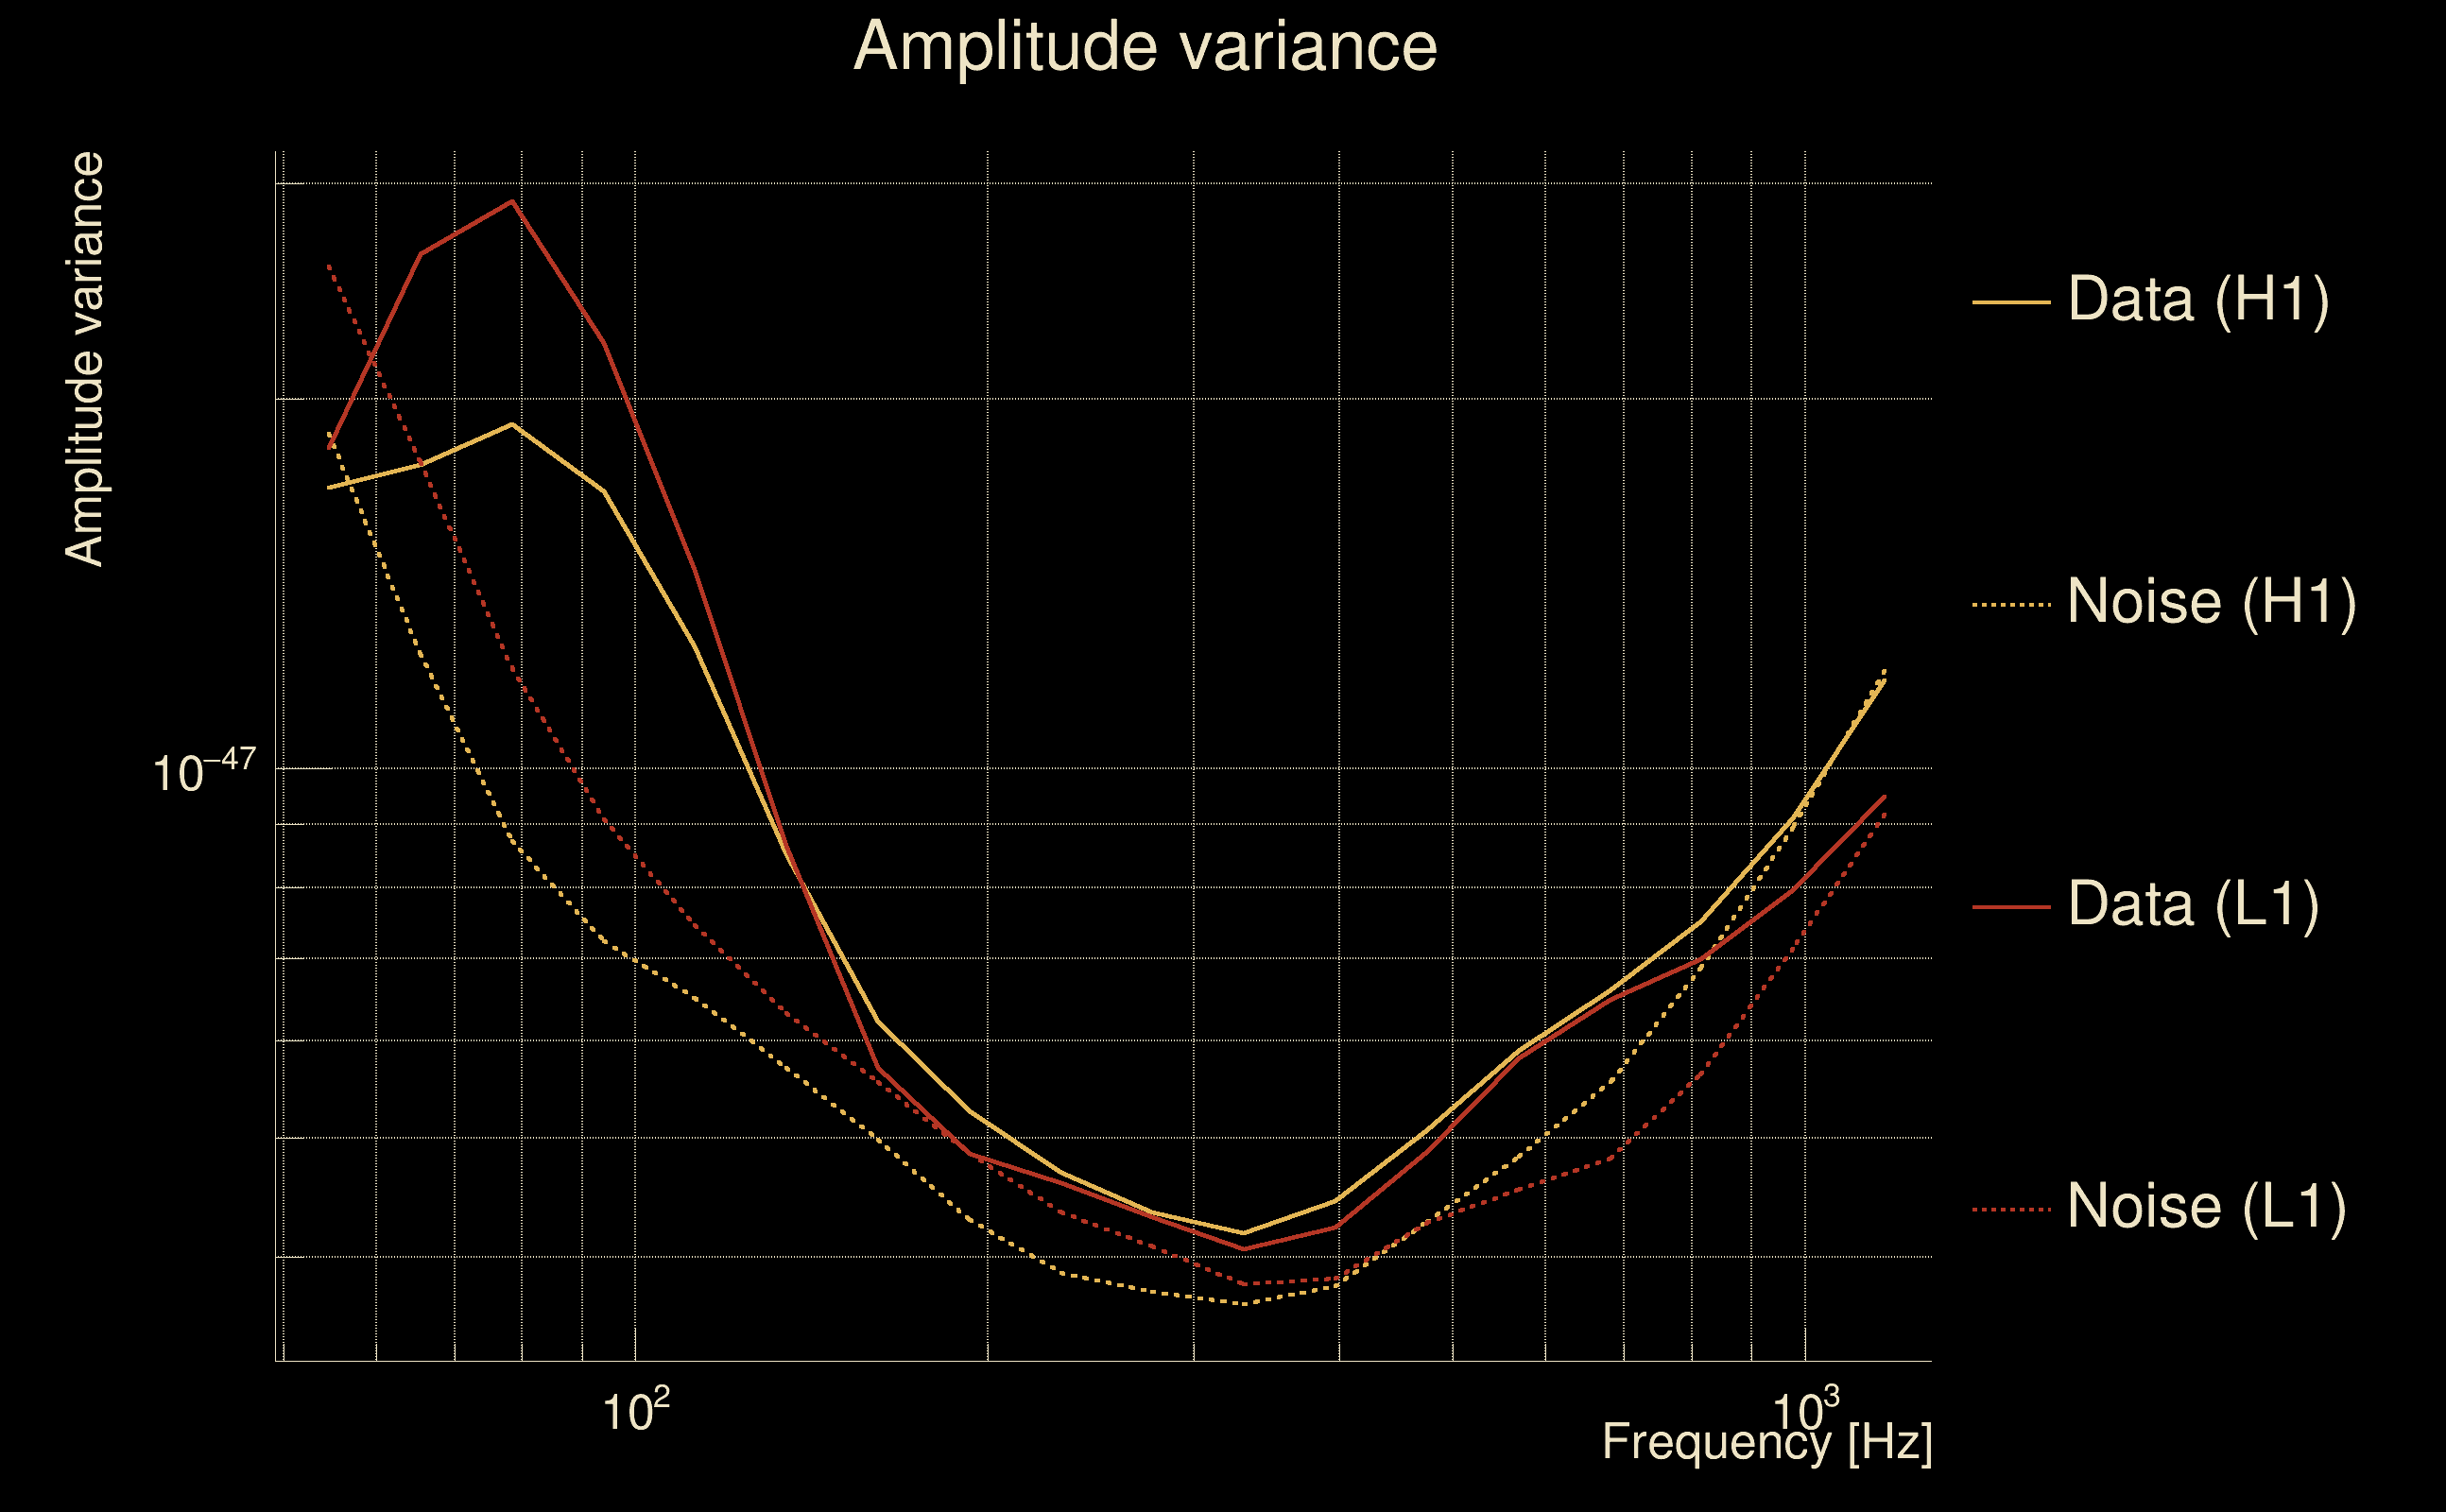
| Maximum signal-to-noise ratio: | H1: 74.9145, L1: 61.3767 |
| SNR variance: | H1: 4.31197, L1: 2.9972 |
| Click here for a zoomed plot | Click here for a zoomed plot | Click here for a zoomed plot | Click here for a zoomed plot | Click here for a zoomed plot |
 |
 |
 |
 |
 |
 |
 |
 |
 |
 |
 |
 |
 |
 |
 |
 |
 |
 |
 |
 |
 |
 |
 |
 |
 |
 |
 |
 |
 |
| Event time t(H1): | GPS = 1378590740 (Tue Sep 12 21:52:02 2023 ) → GPS = 1378590750 (Tue Sep 12 21:52:12 2023 ) |
| Event time t(L1): | GPS = 1378590740 (Tue Sep 12 21:52:12 2023 ) → GPS = 1378590750 (Tue Sep 12 21:52:12 2023 ) |
| Omicron analysis time window (H1): | GPS = 1378590737 → GPS = 1378590753 |
| Omicron analysis time window (L1): | GPS = 1378590737 → GPS = 1378590753 |
| Time delay between detectors t(L1) - t(H1): | 0.0019715 s (slice index = 108 / 217), δt_gw = 0.0019715 s |
| Time delay uncertainty: | 0.000608778 s |
| [targeted mode] Time delay probability: | 0.998103 (0.00237693 sigmas), δt_target = 0.00398779 s |
| Frequency: | 230.543 Hz |
| Ξ: | 0.895181 ± 0.0101898 (variance = 0.000103832): Q0: 0.938281, Q1: 0.932147, Q2: 0.929241, Q3: 0.921553, Q4: 0.908671 |
| Rank: | R_A = 0.882006 |
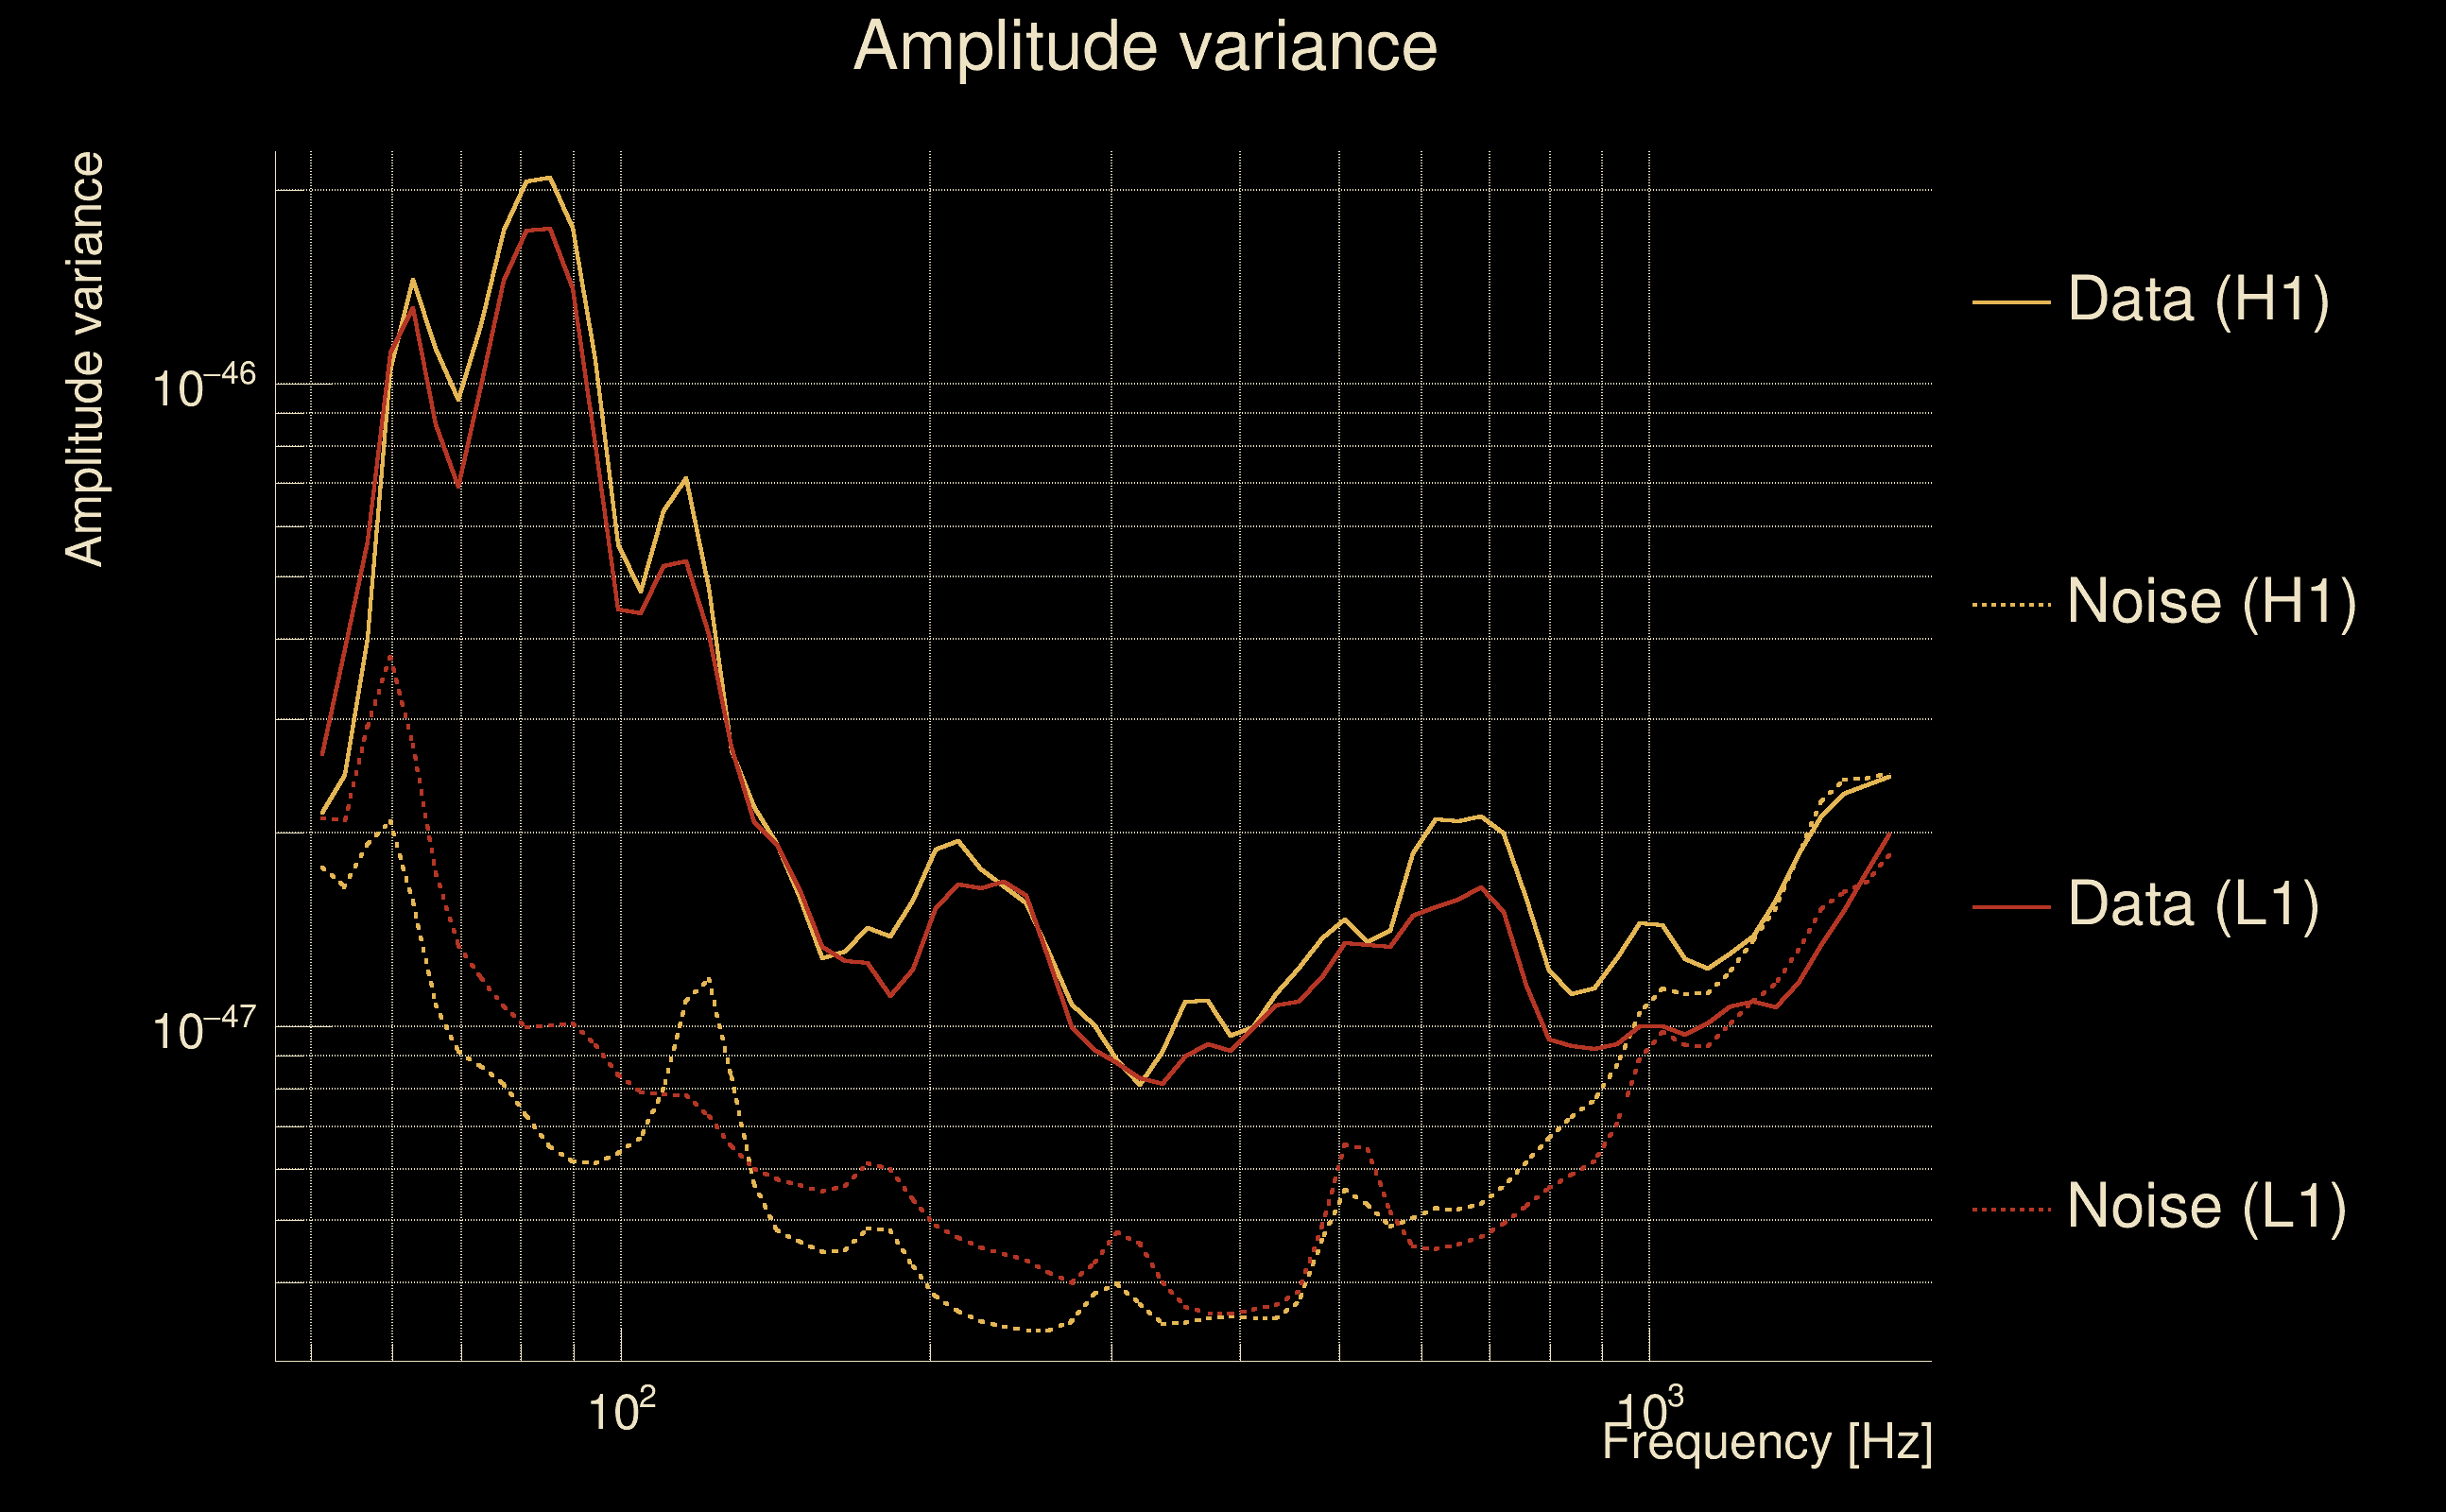
| Log of amplitude ratio (L1/H1): | -0.0976493, variance = 0.159476 (L1/H1: -0.102727, variance = 0.306962, H1/L1: 0.0901038, variance = 0.307764) |
| Amplitude ratio (L1/H1): | 0.906967 ⋇ 1.49085 (L1/H1: 0.902373 ⋇ 1.74027, H1/L1: 1.09429 ⋇ 1.74153) |
| Amplitude ratio H1|L1 compatibility (probability): | 0.987154 |
| Antenna factor probability: | 1 |
| Number of rejected frequency rows: | Q0: 0 / 18, Q1: 2 / 36, Q2: 5 / 70, Q3: 18 / 134, Q4: 62 / 258 |
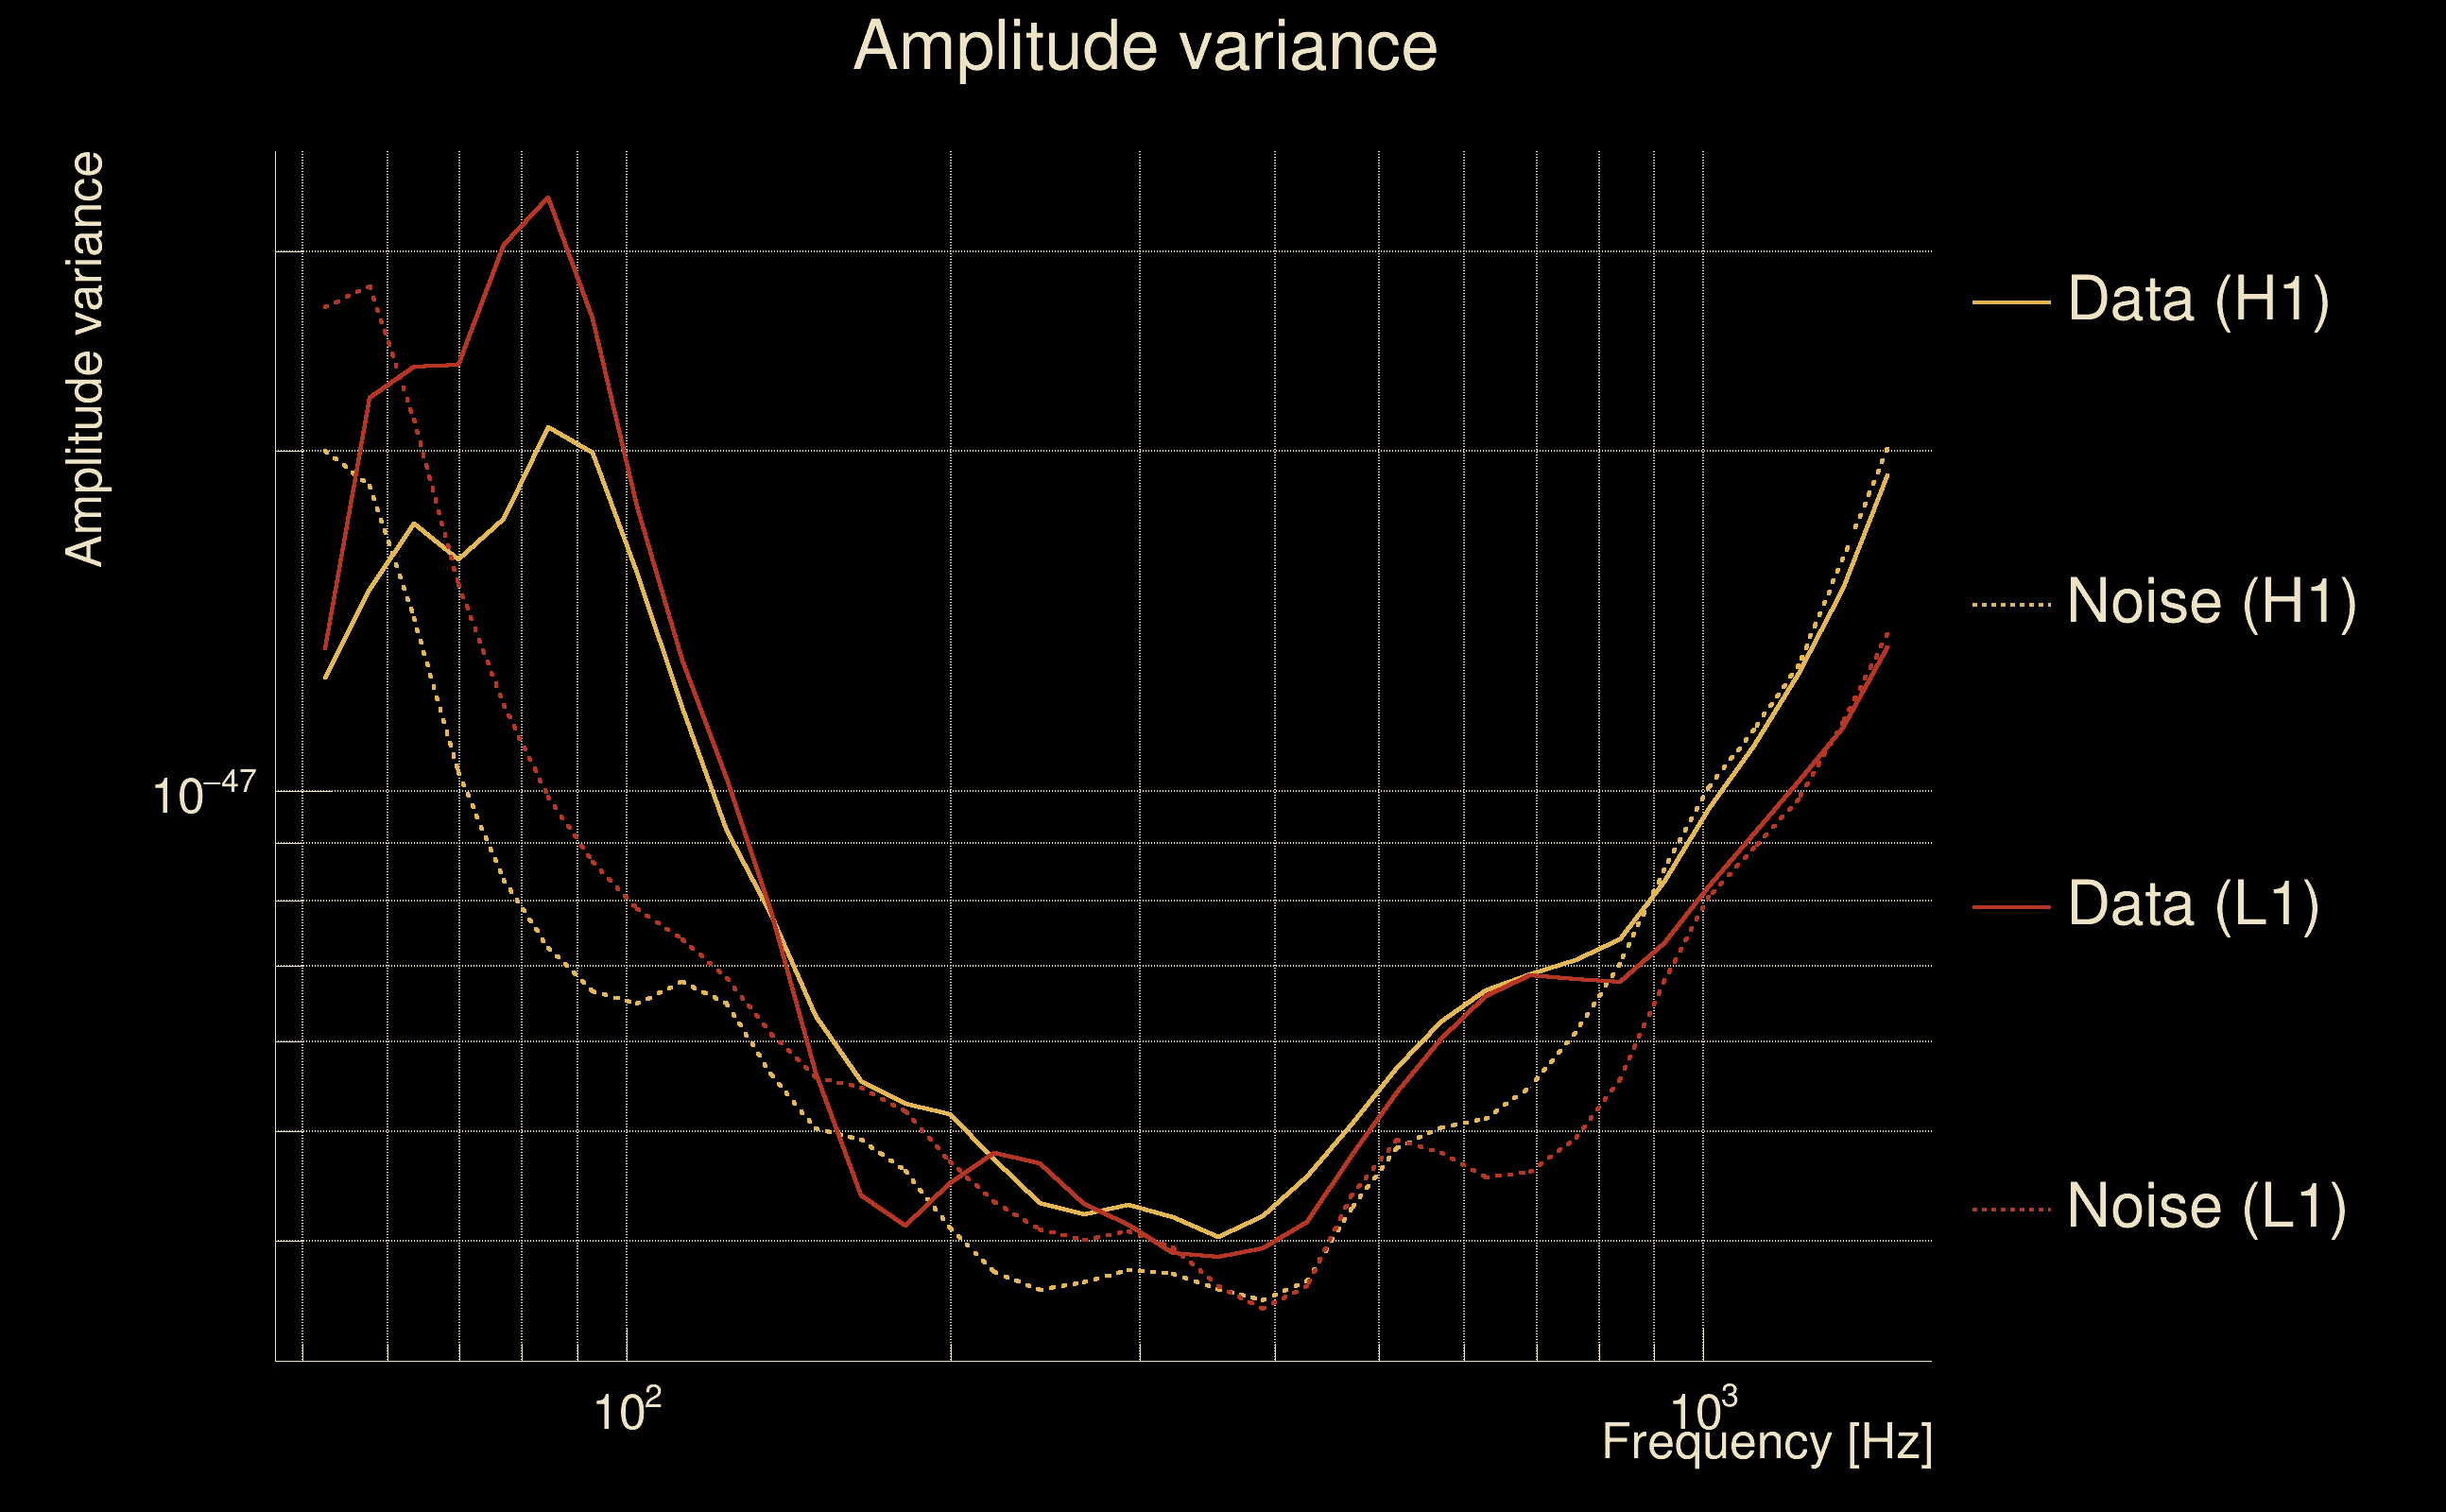
| Maximum signal-to-noise ratio: | H1: 53.4076, L1: 43.8122 |
| SNR variance: | H1: 0.500049, L1: 0.445656 |
| Click here for a zoomed plot | Click here for a zoomed plot | Click here for a zoomed plot | Click here for a zoomed plot | Click here for a zoomed plot |
 |
 |
 |
 |
 |
 |
 |
 |
 |
 |
 |
 |
 |
 |
 |
 |
 |
 |
 |
 |
 |
 |
 |
 |
 |
 |
 |
 |
 |
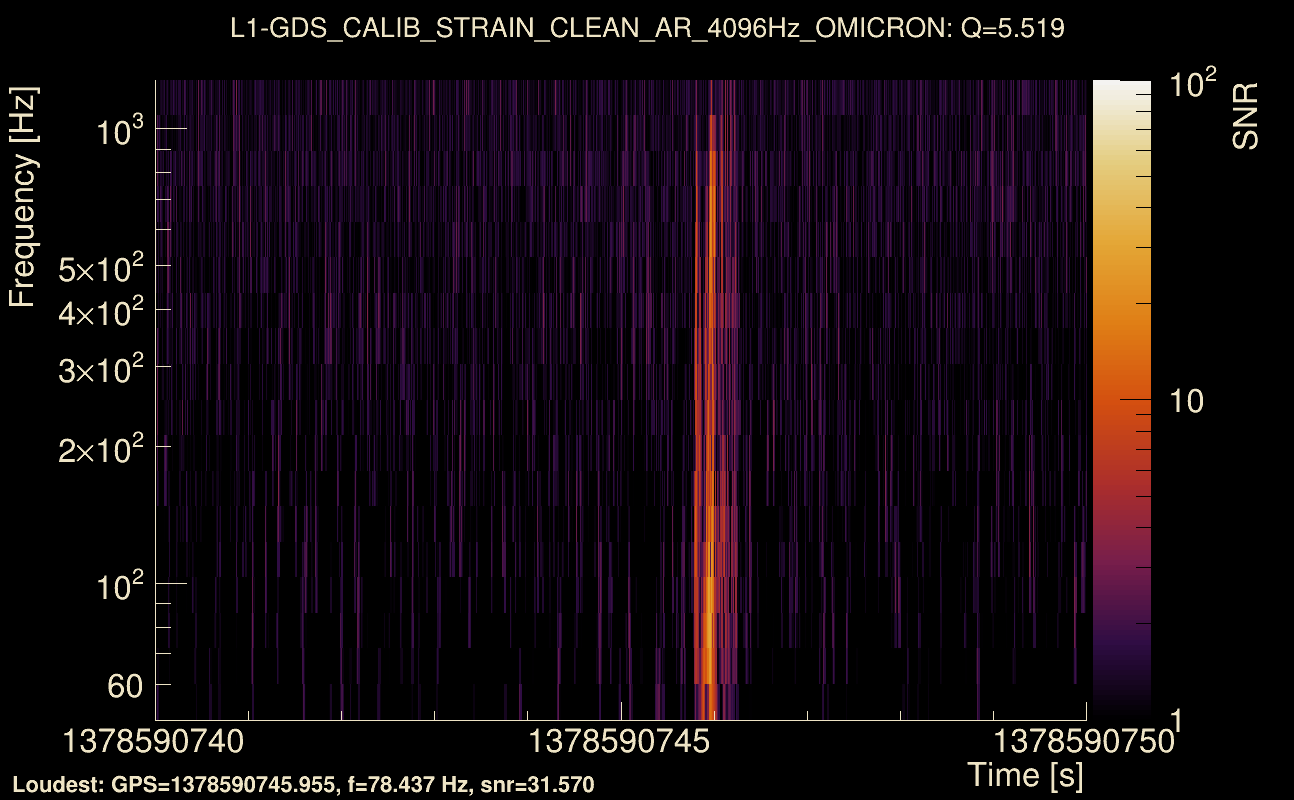
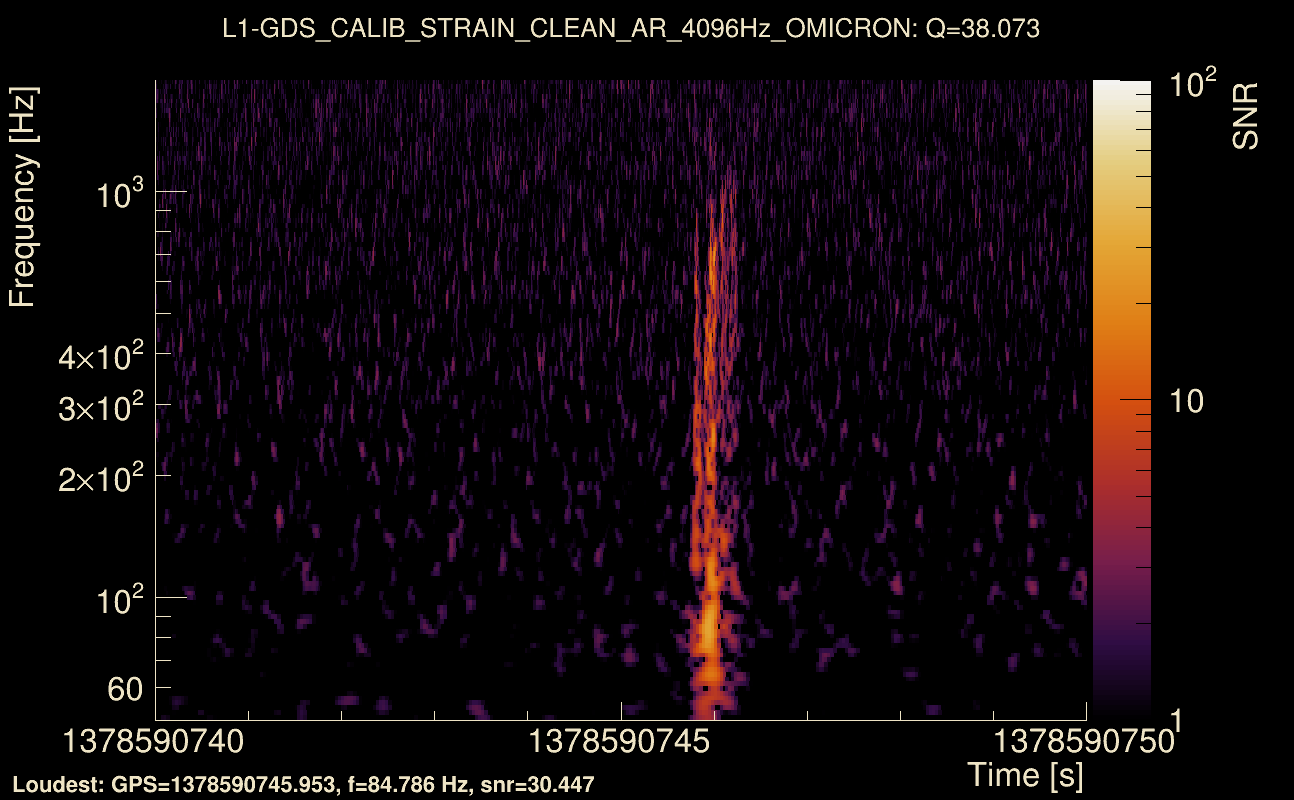
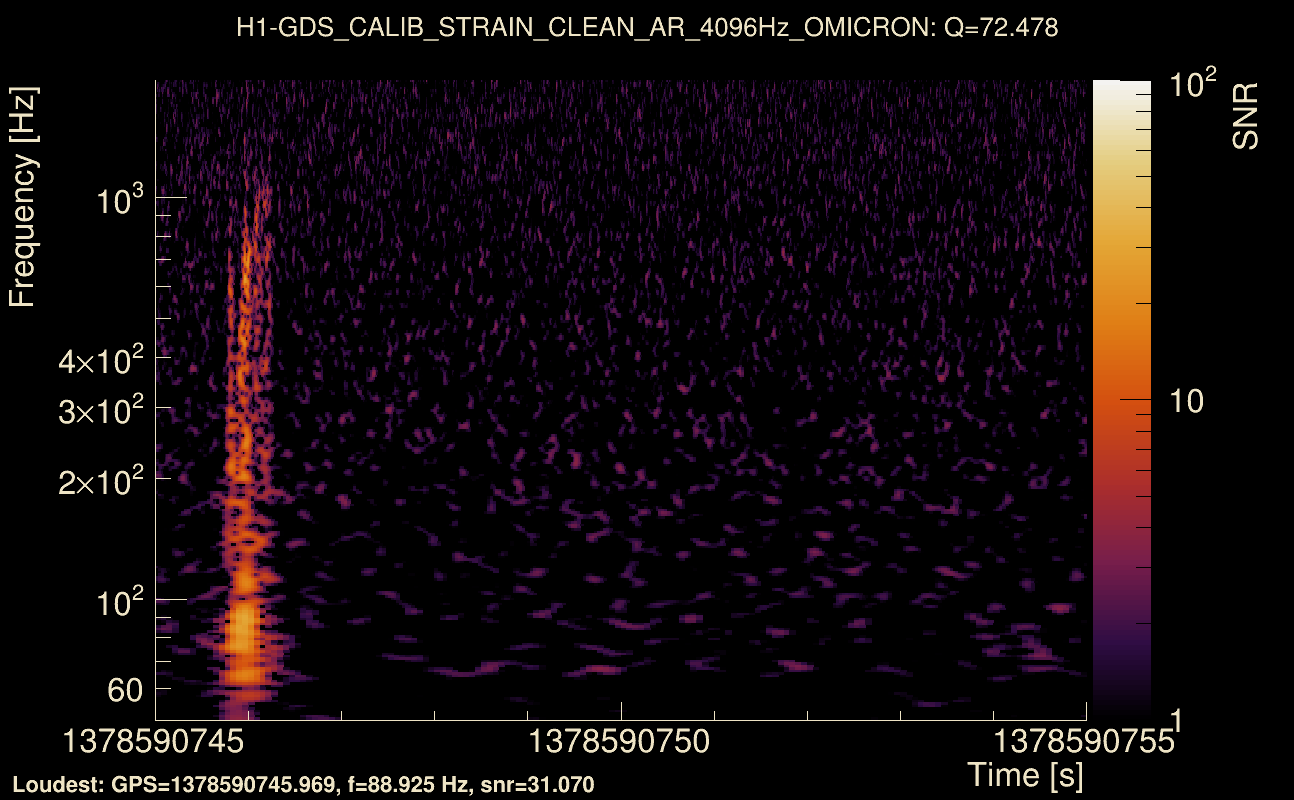
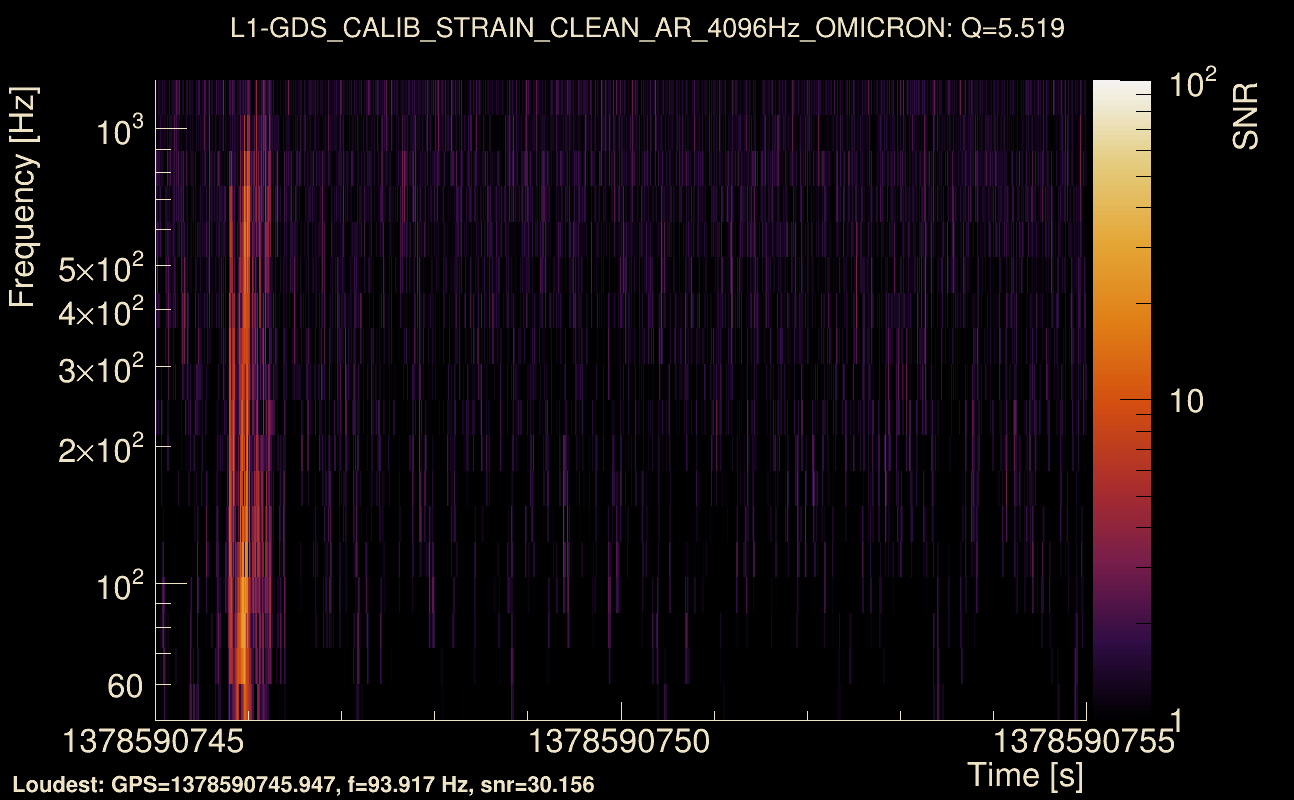
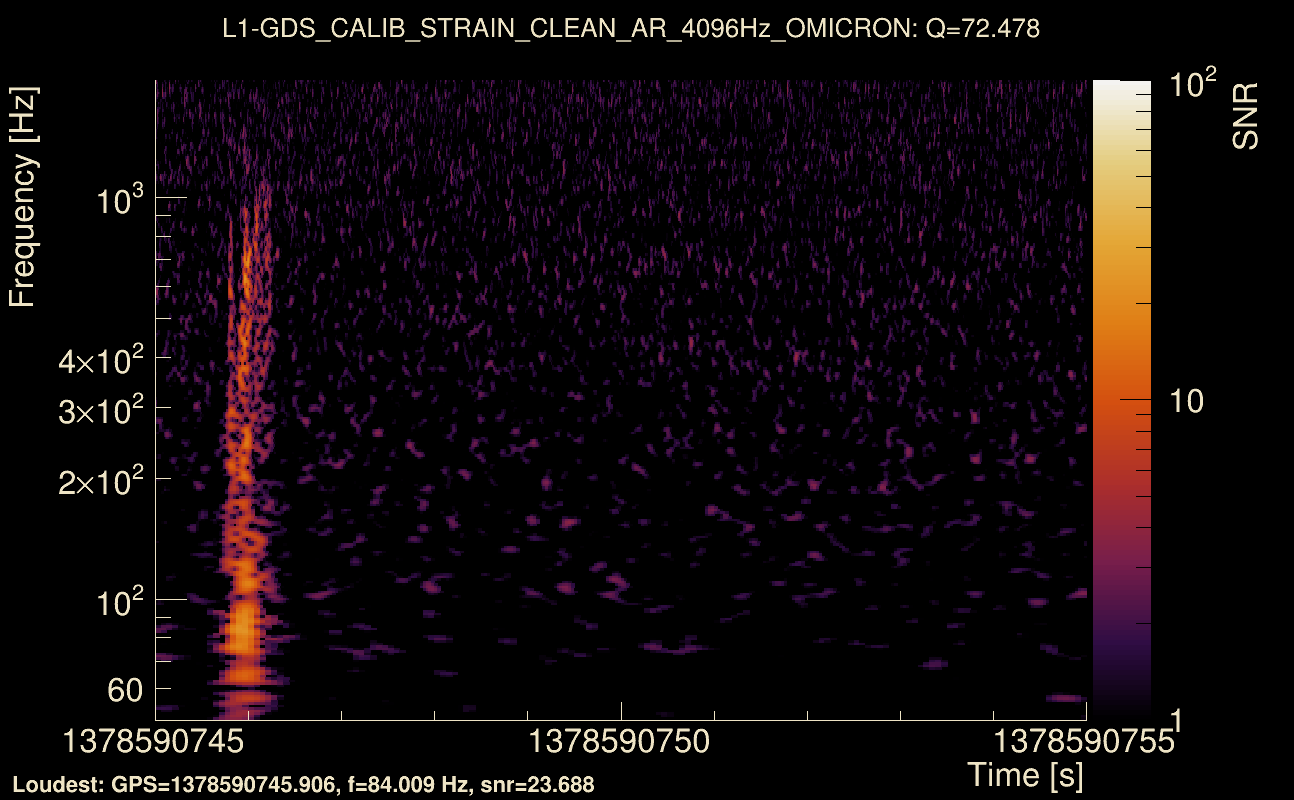
| Event time t(H1): | GPS = 1378590745 (Tue Sep 12 21:52:07 2023 ) → GPS = 1378590755 (Tue Sep 12 21:52:17 2023 ) |
| Event time t(L1): | GPS = 1378590745 (Tue Sep 12 21:52:17 2023 ) → GPS = 1378590755 (Tue Sep 12 21:52:17 2023 ) |
| Omicron analysis time window (H1): | GPS = 1378590742 → GPS = 1378590758 |
| Omicron analysis time window (L1): | GPS = 1378590742 → GPS = 1378590758 |
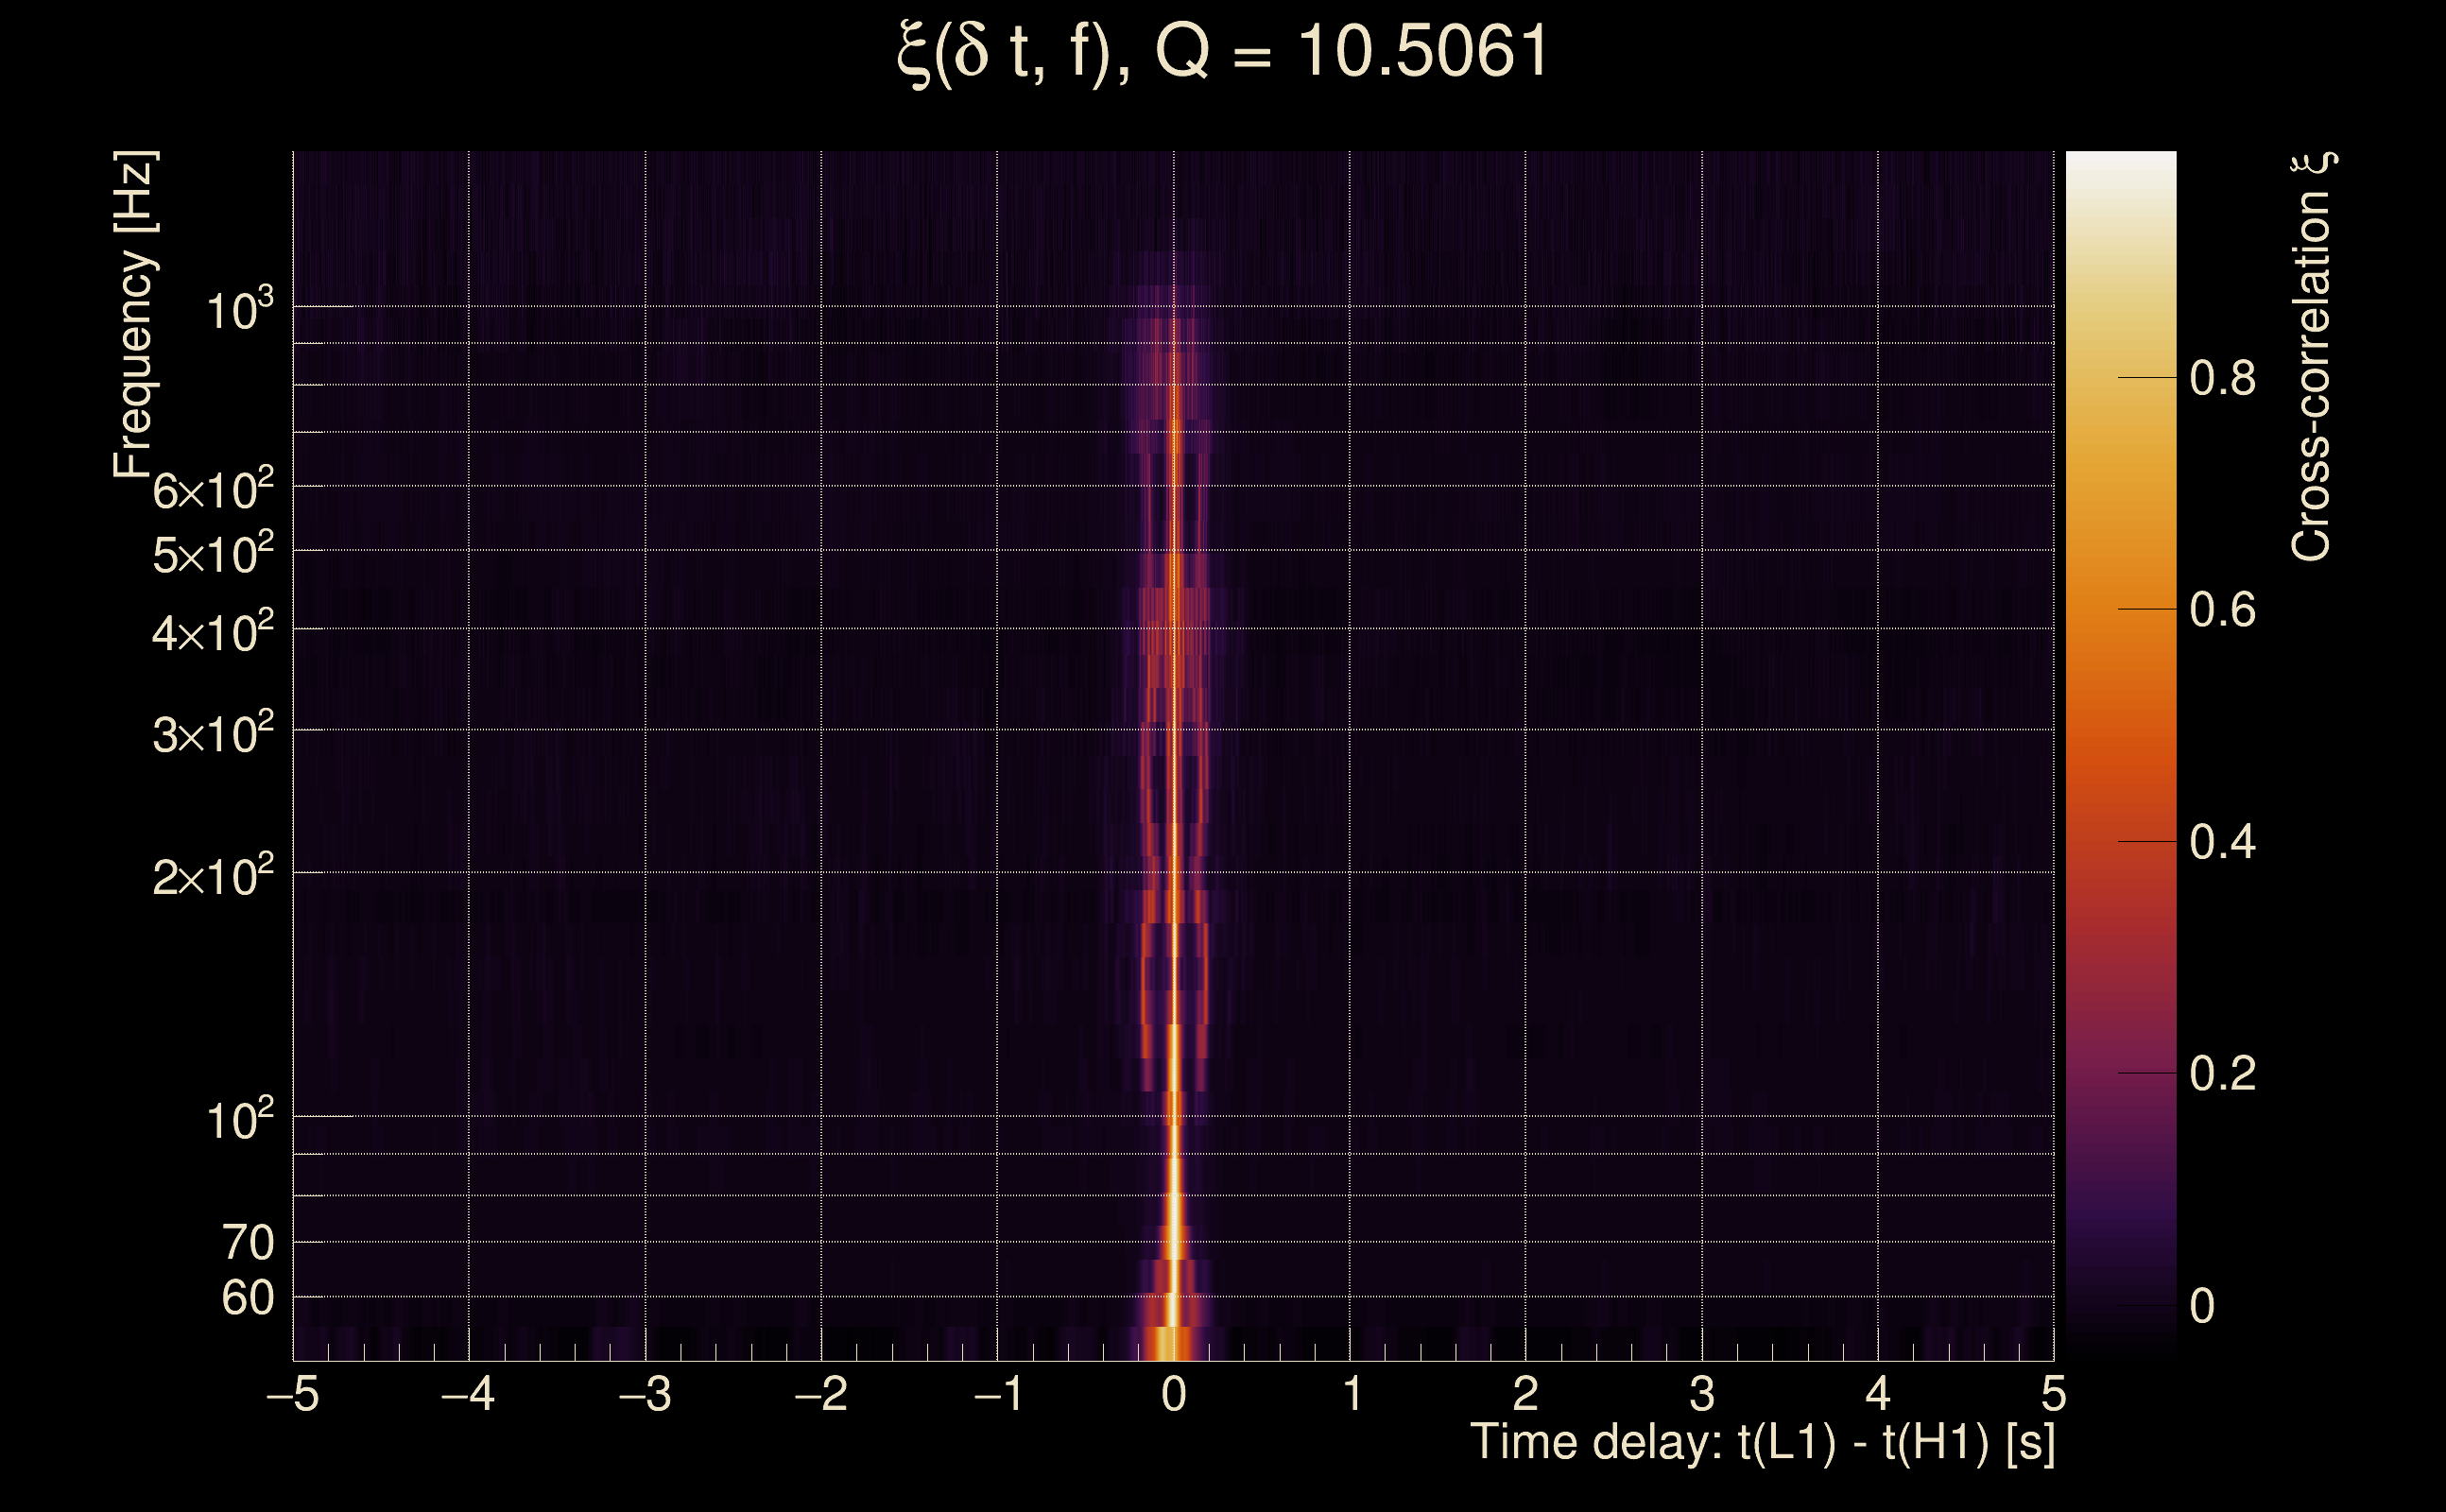
| Time delay between detectors t(L1) - t(H1): | 0.00197361 s (slice index = 108 / 217), δt_gw = 0.00197361 s |
| Time delay uncertainty: | 0.000543044 s |
| [targeted mode] Time delay probability: | 0.997573 (0.00304225 sigmas), δt_target = 0.00197005 s |
| Frequency: | 230.748 Hz |
| Ξ: | 0.887372 ± 0.00868964 (variance = 7.55098e-05): Q0: 0.937876, Q1: 0.932655, Q2: 0.931944, Q3: 0.926587, Q4: 0.912468 |
| Rank: | R_A = 0.877833 |
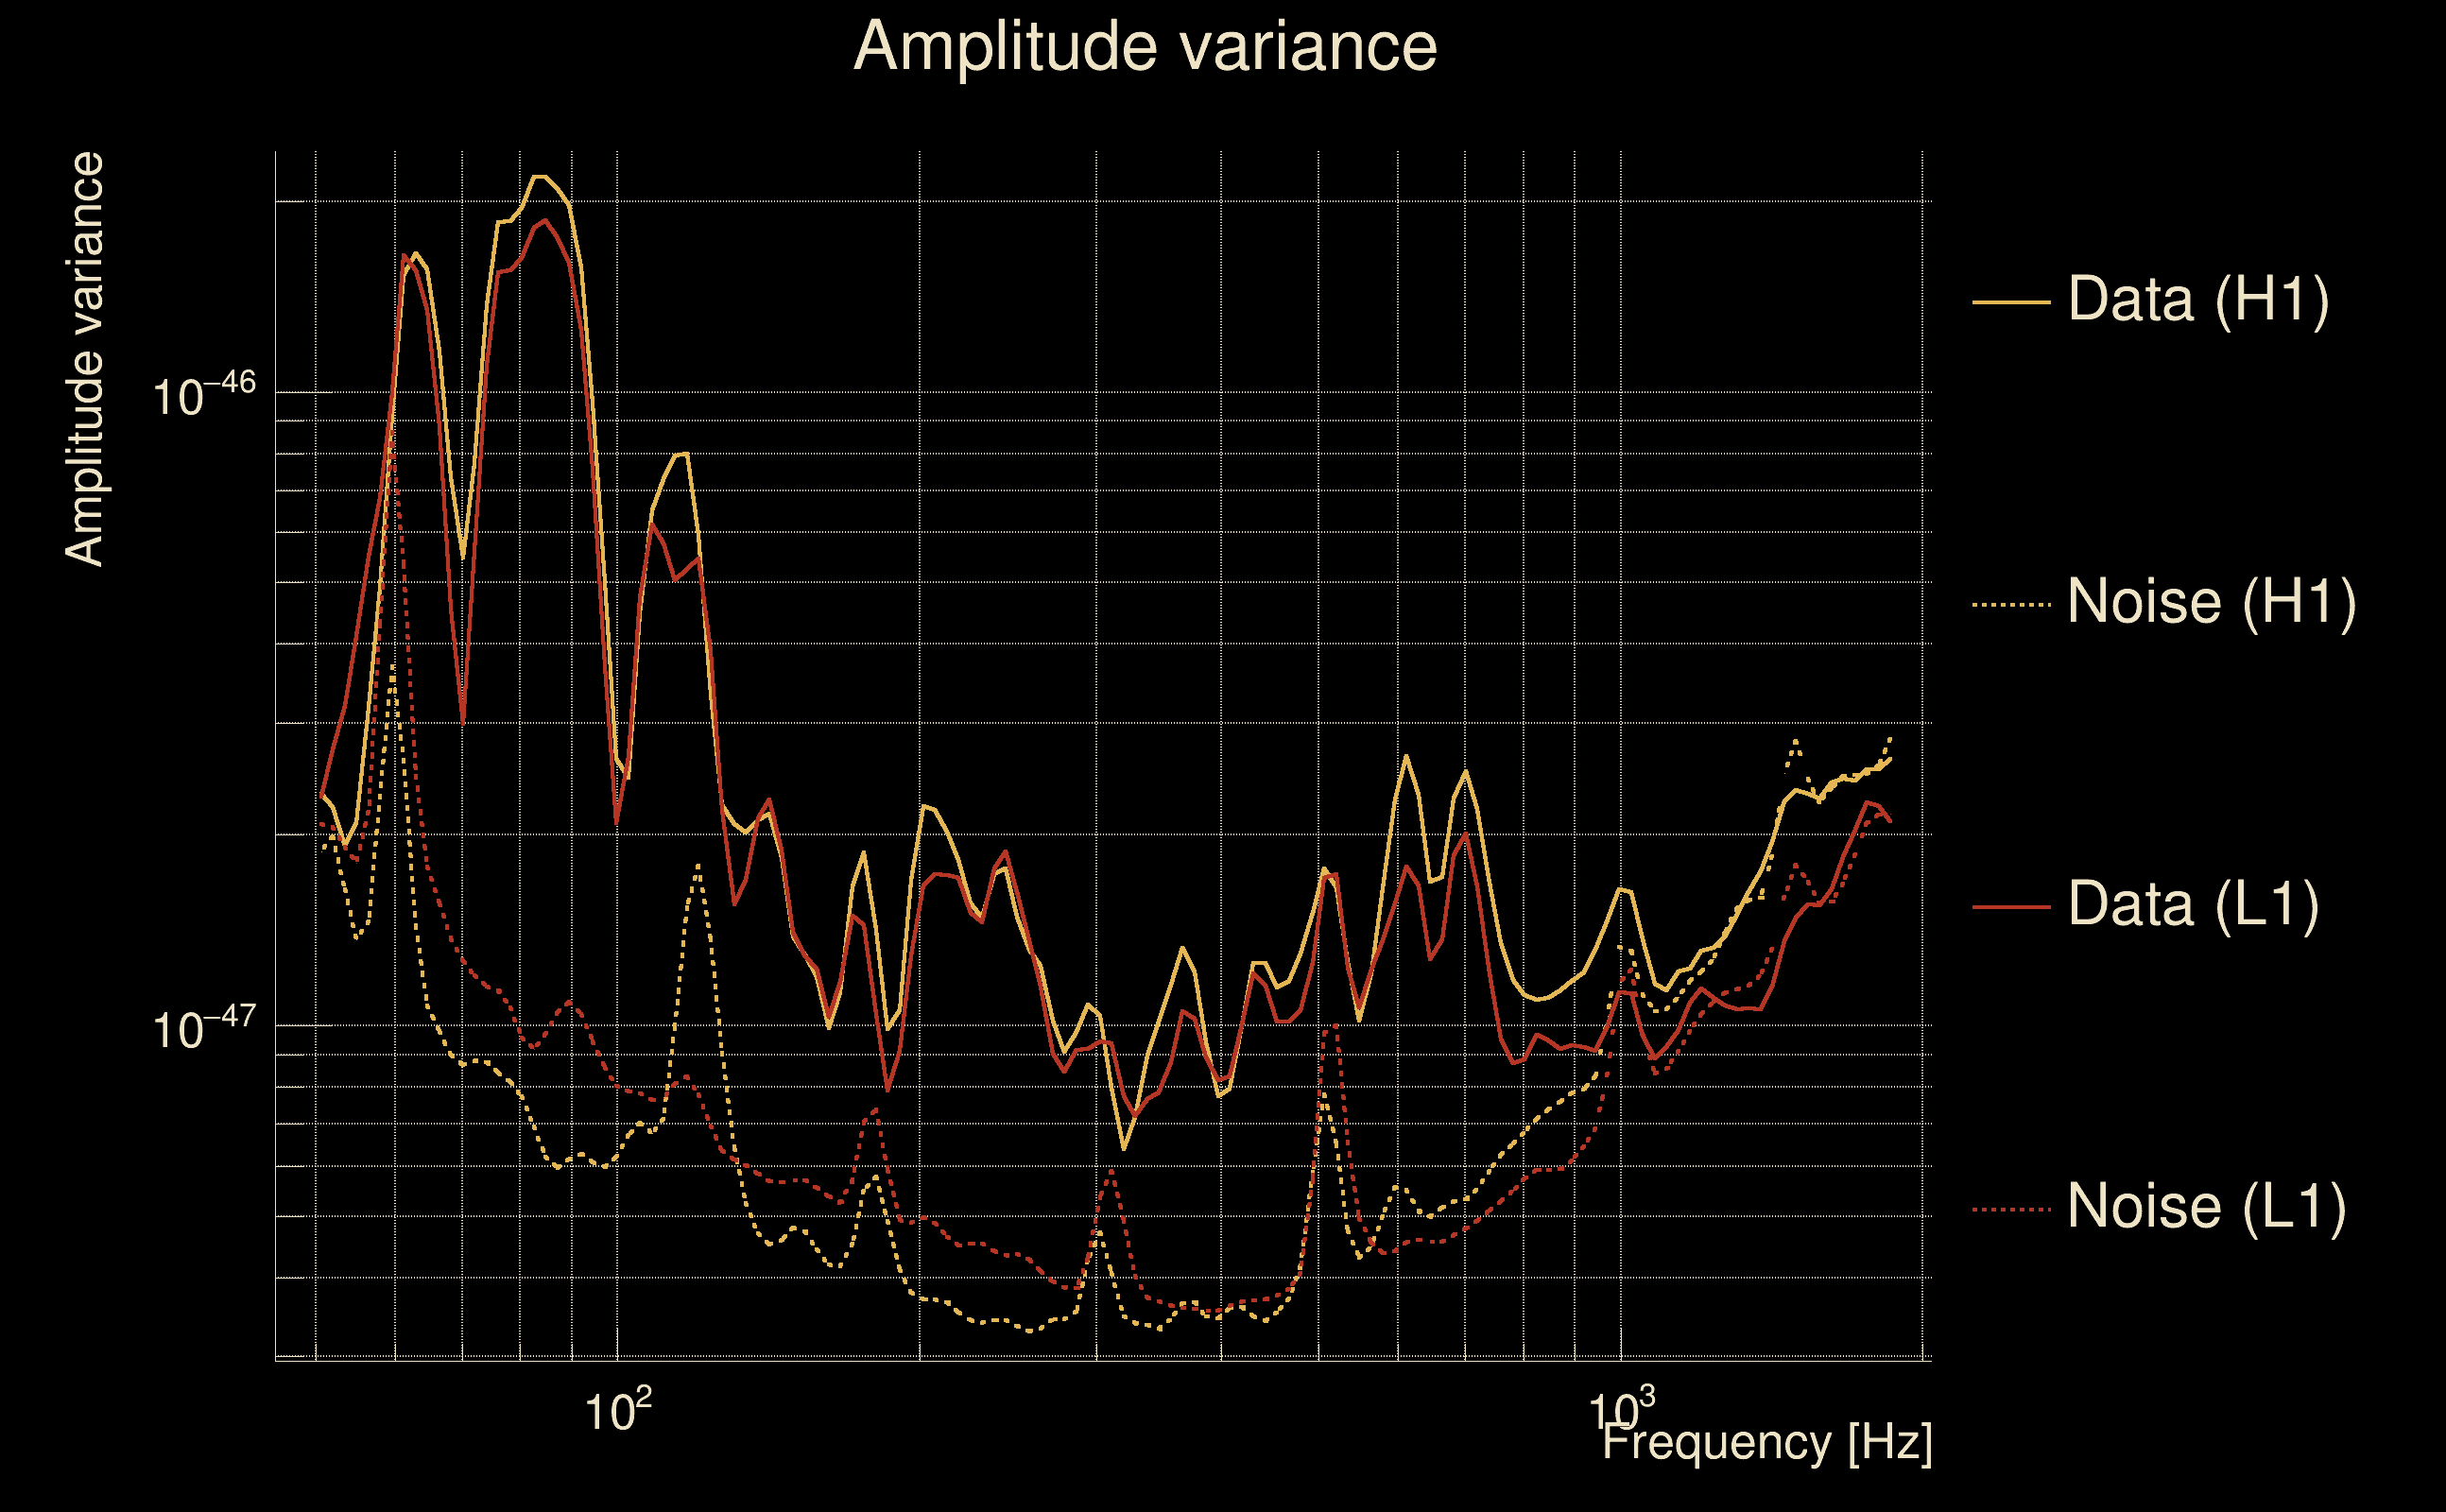
| Log of amplitude ratio (L1/H1): | -0.0951278, variance = 0.159272 (L1/H1: -0.098468, variance = 0.308379, H1/L1: 0.090266, variance = 0.307028) |
| Amplitude ratio (L1/H1): | 0.909257 ⋇ 1.49047 (L1/H1: 0.906225 ⋇ 1.7425, H1/L1: 1.09447 ⋇ 1.74038) |
| Amplitude ratio H1|L1 compatibility (probability): | 0.991658 |
| Antenna factor probability: | 1 |
| Number of rejected frequency rows: | Q0: 0 / 18, Q1: 2 / 36, Q2: 8 / 70, Q3: 24 / 134, Q4: 65 / 258 |
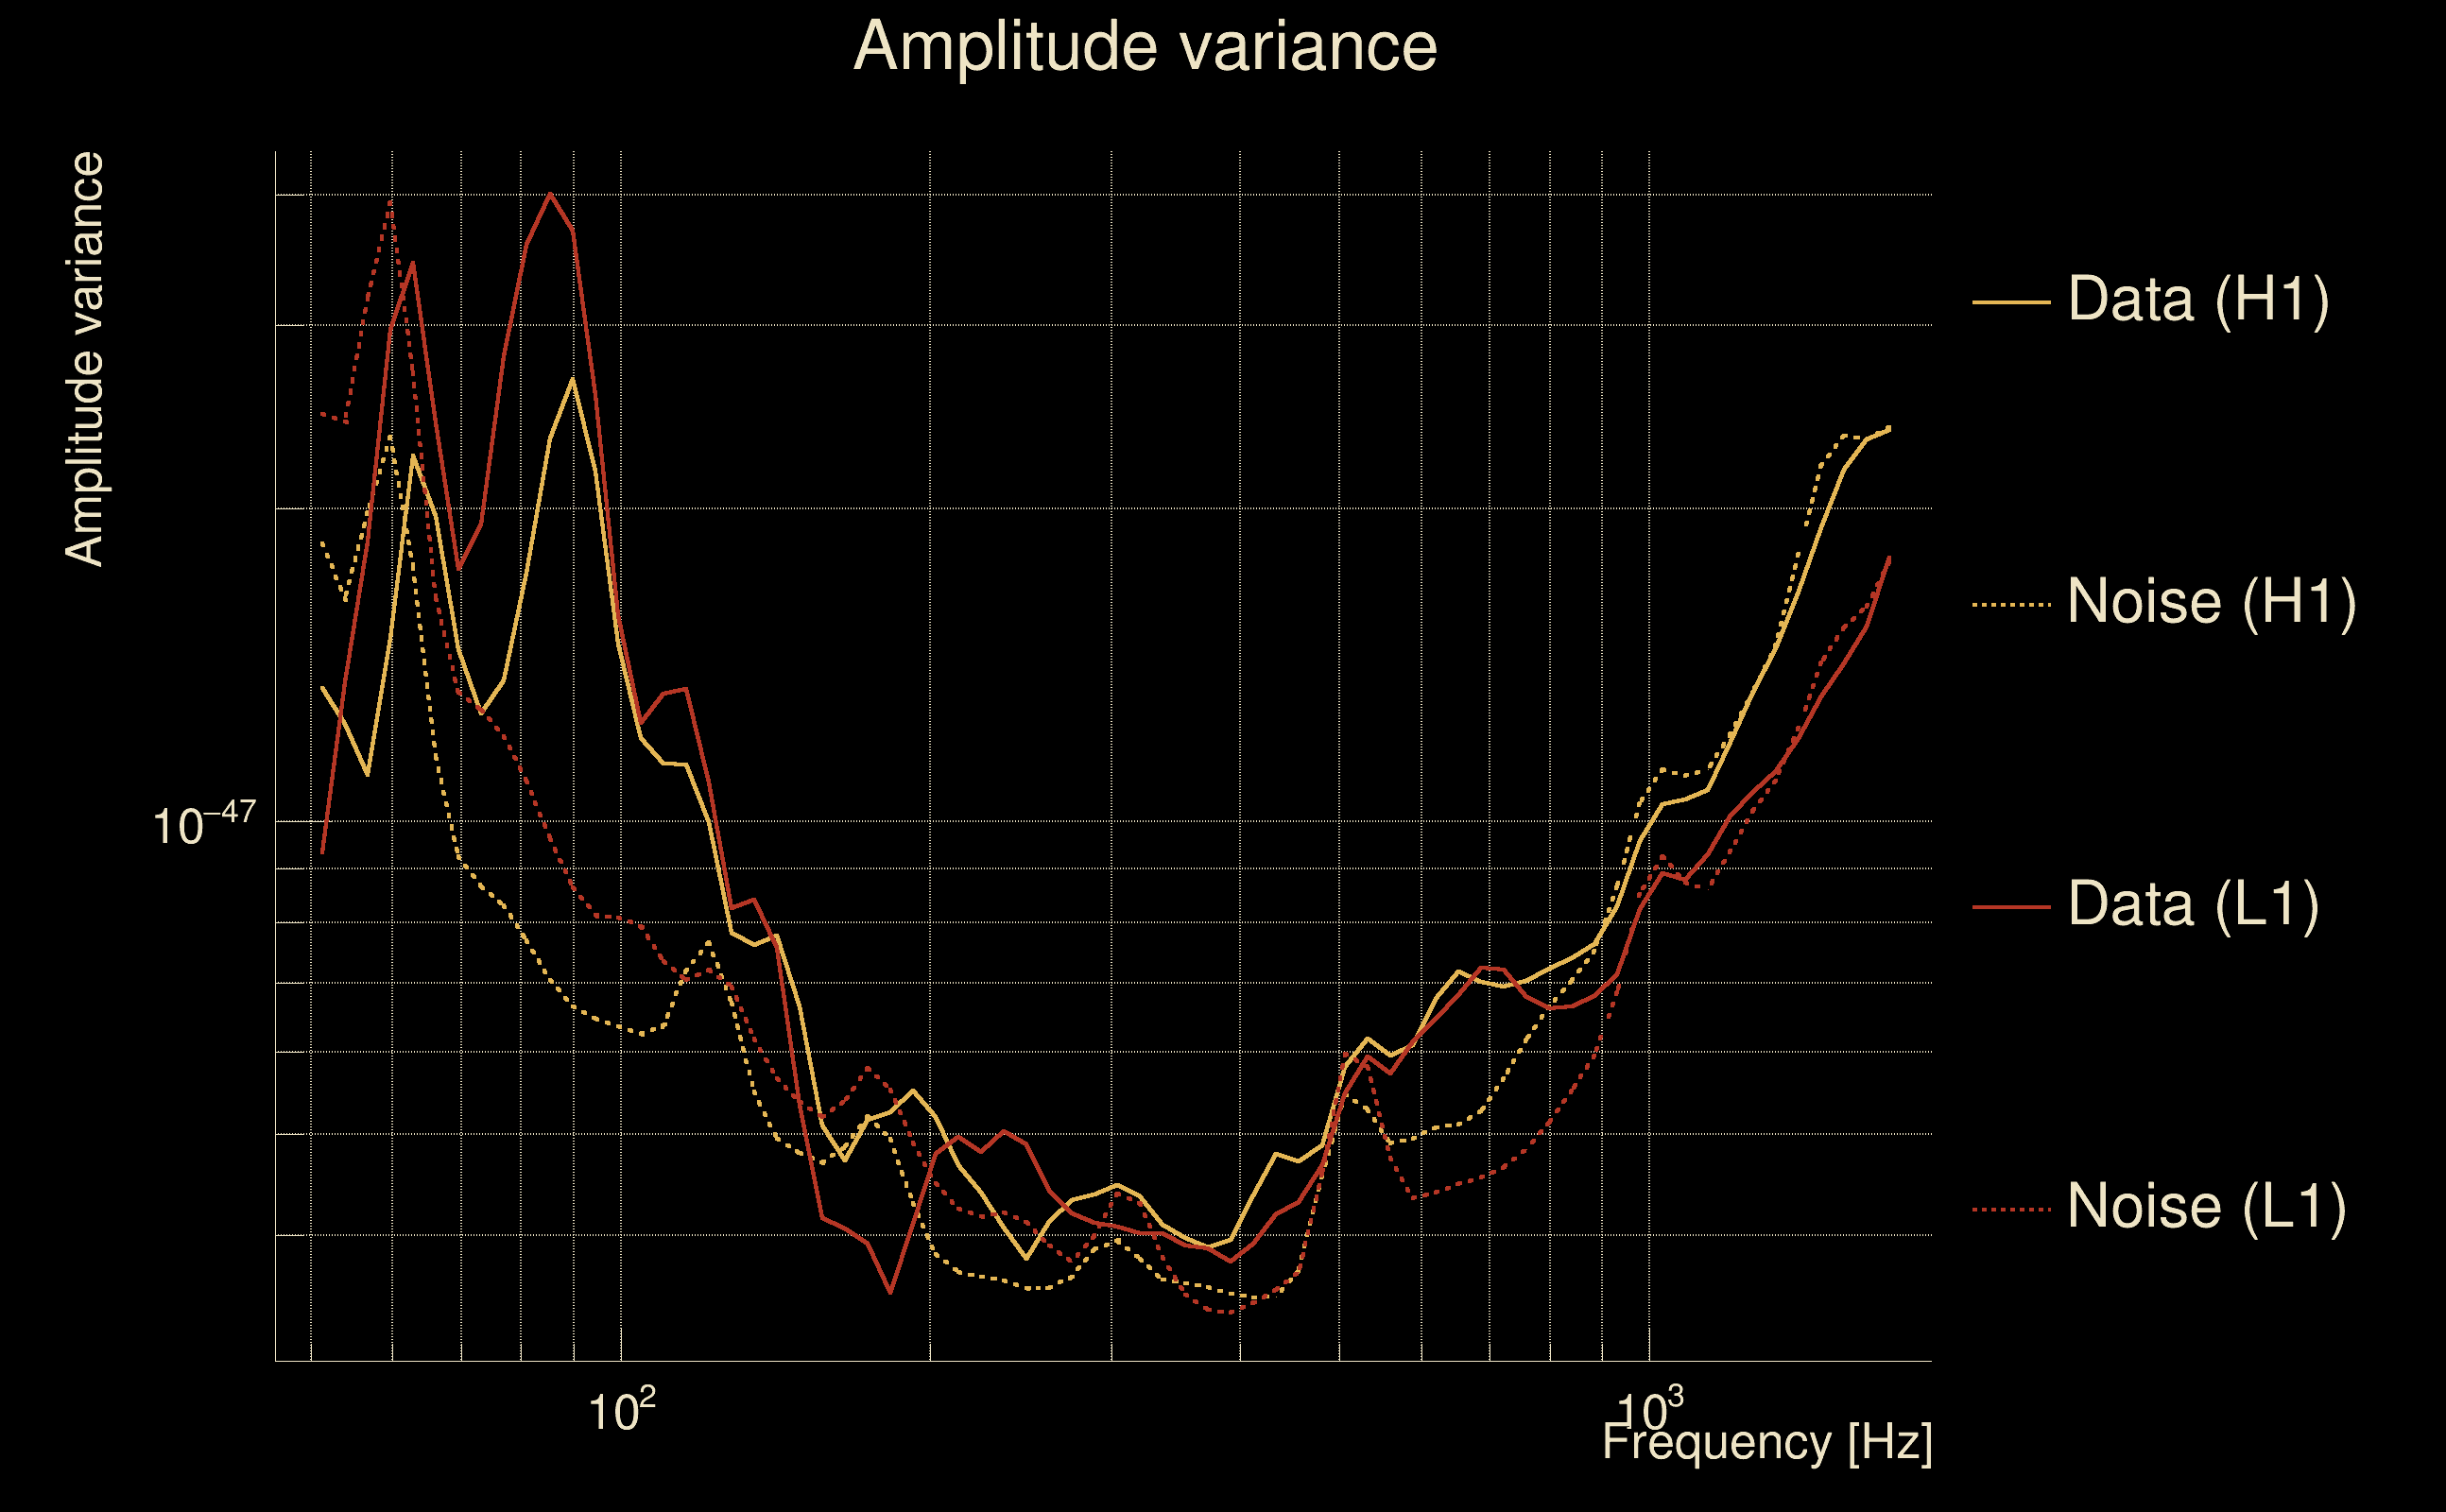
| Maximum signal-to-noise ratio: | H1: 53.2218, L1: 44.1142 |
| SNR variance: | H1: 2.73593, L1: 2.17615 |
| Click here for a zoomed plot | Click here for a zoomed plot | Click here for a zoomed plot | Click here for a zoomed plot | Click here for a zoomed plot |
 |
 |
 |
 |
 |
 |
 |
 |
 |
 |
 |
 |
 |
 |
 |
 |
 |
 |
 |
 |
 |
 |
 |
 |
 |
 |
 |
 |
 |
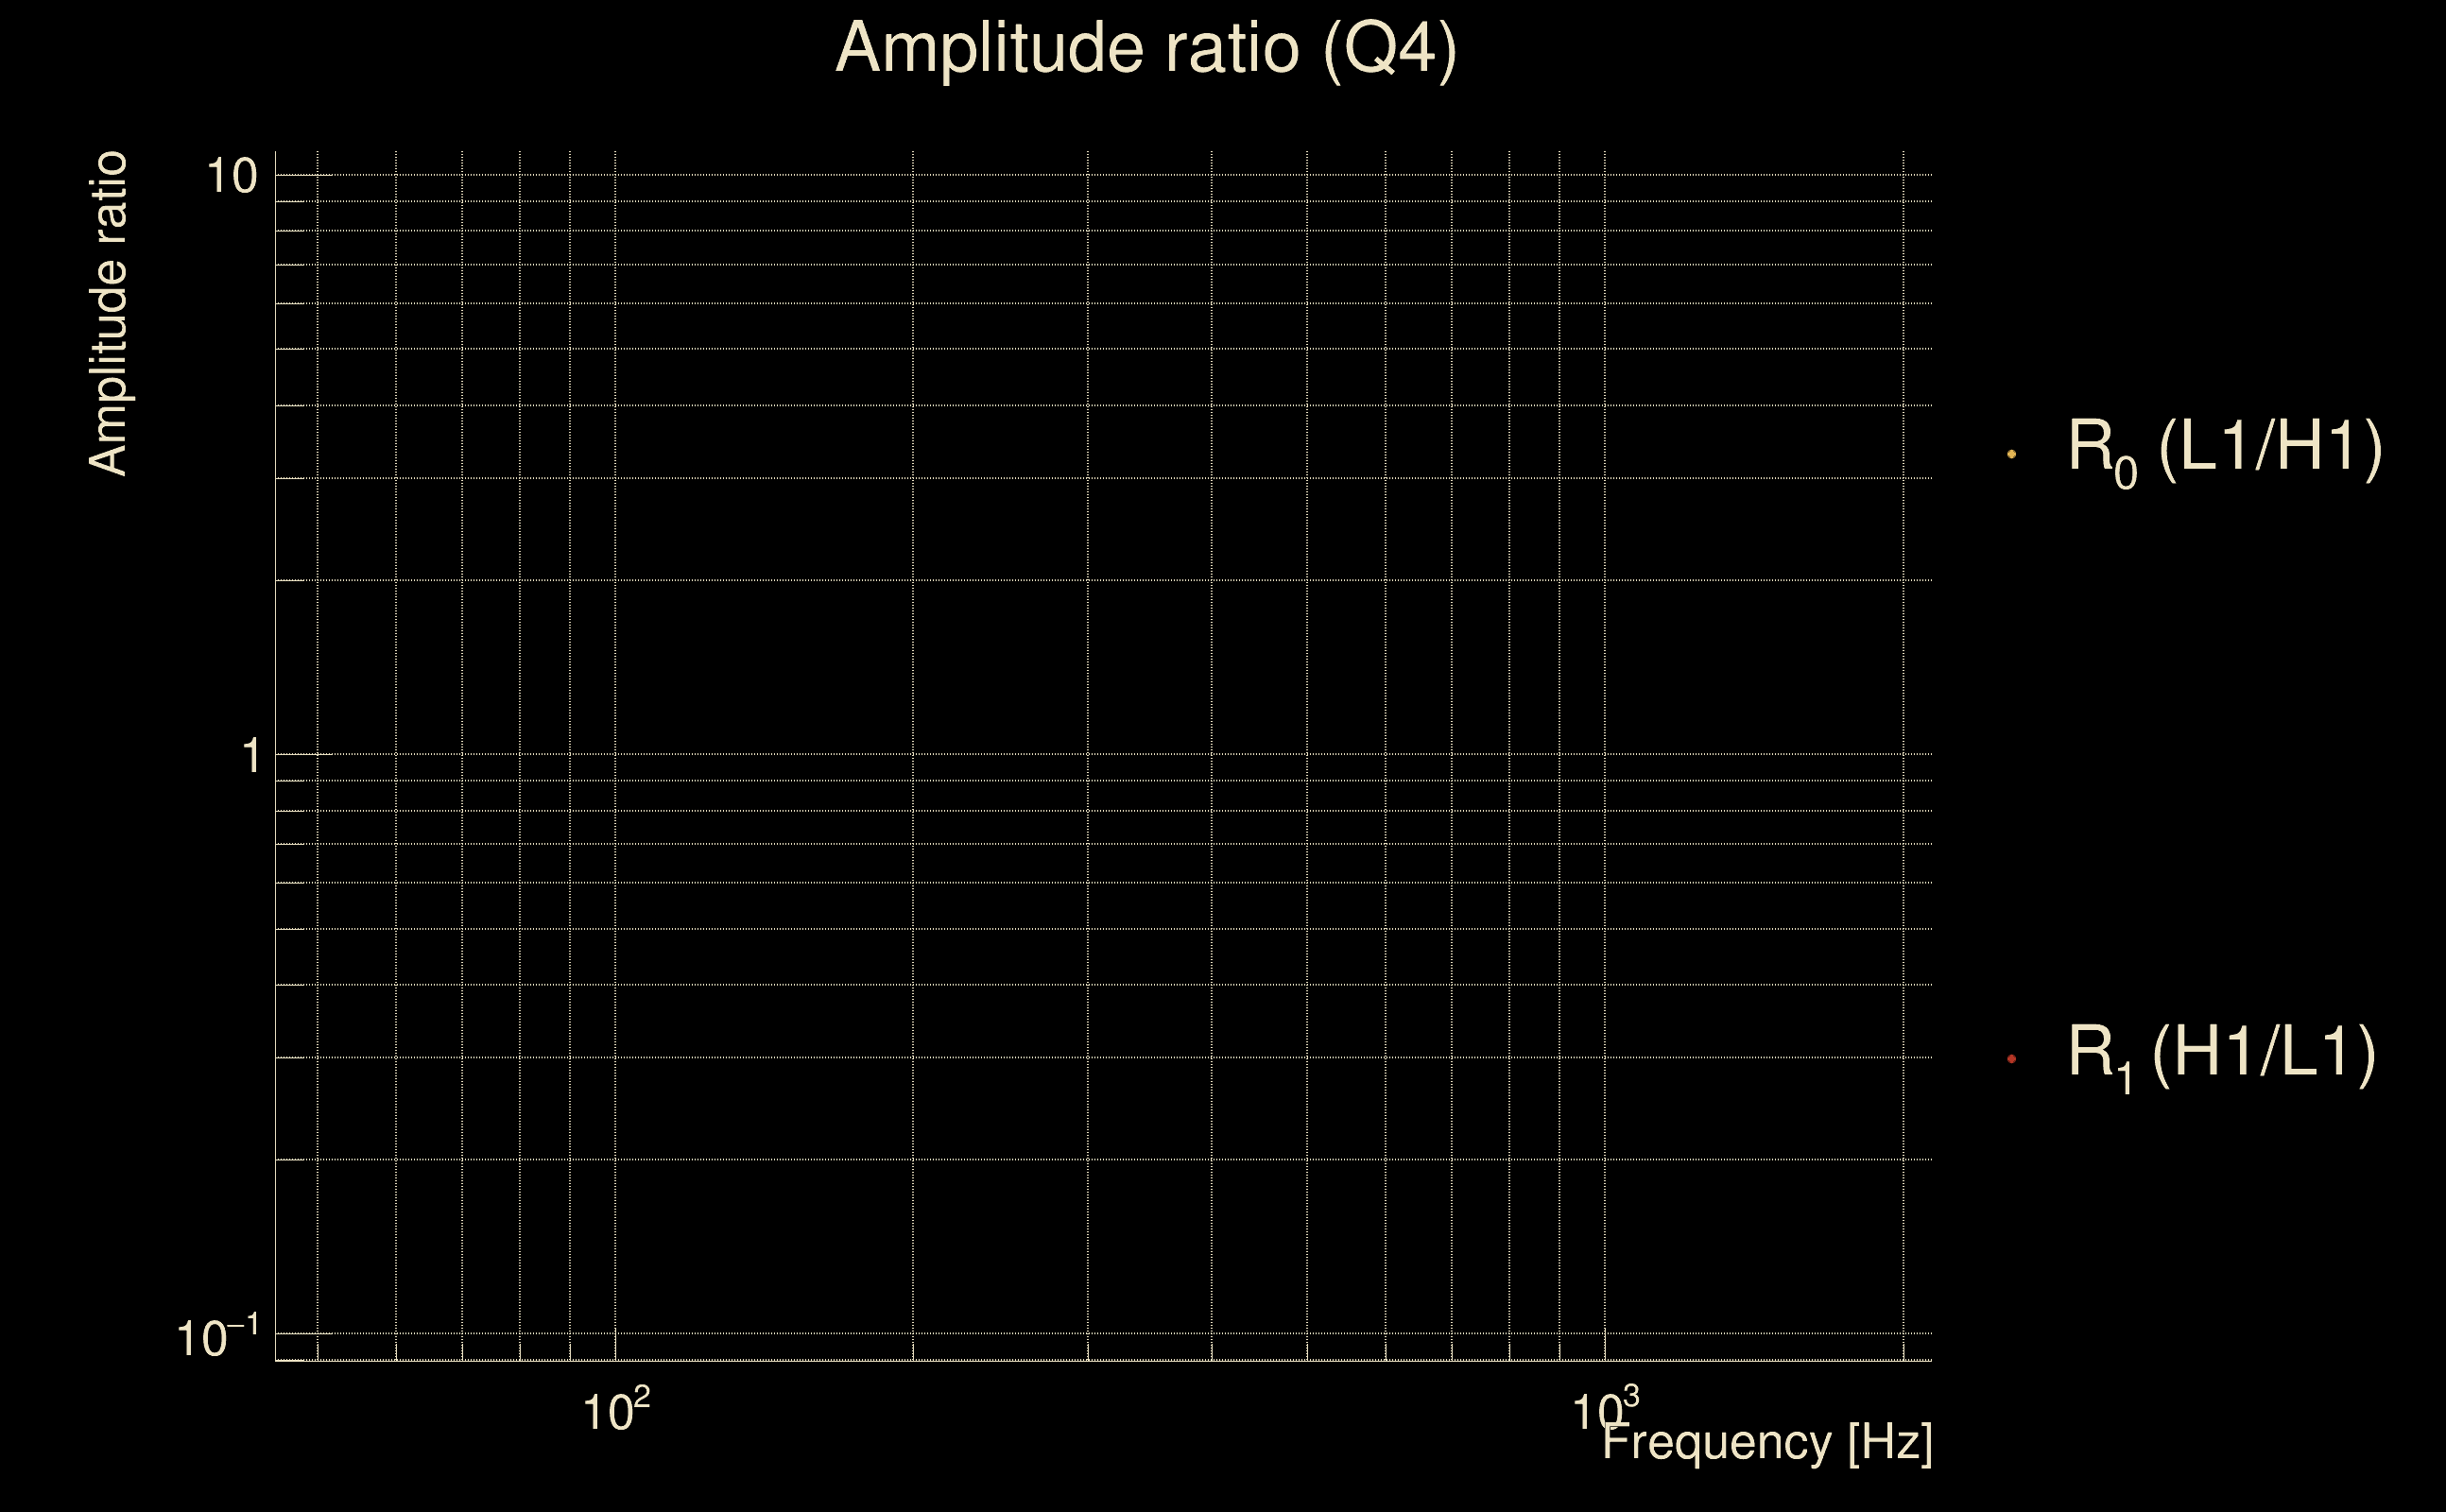
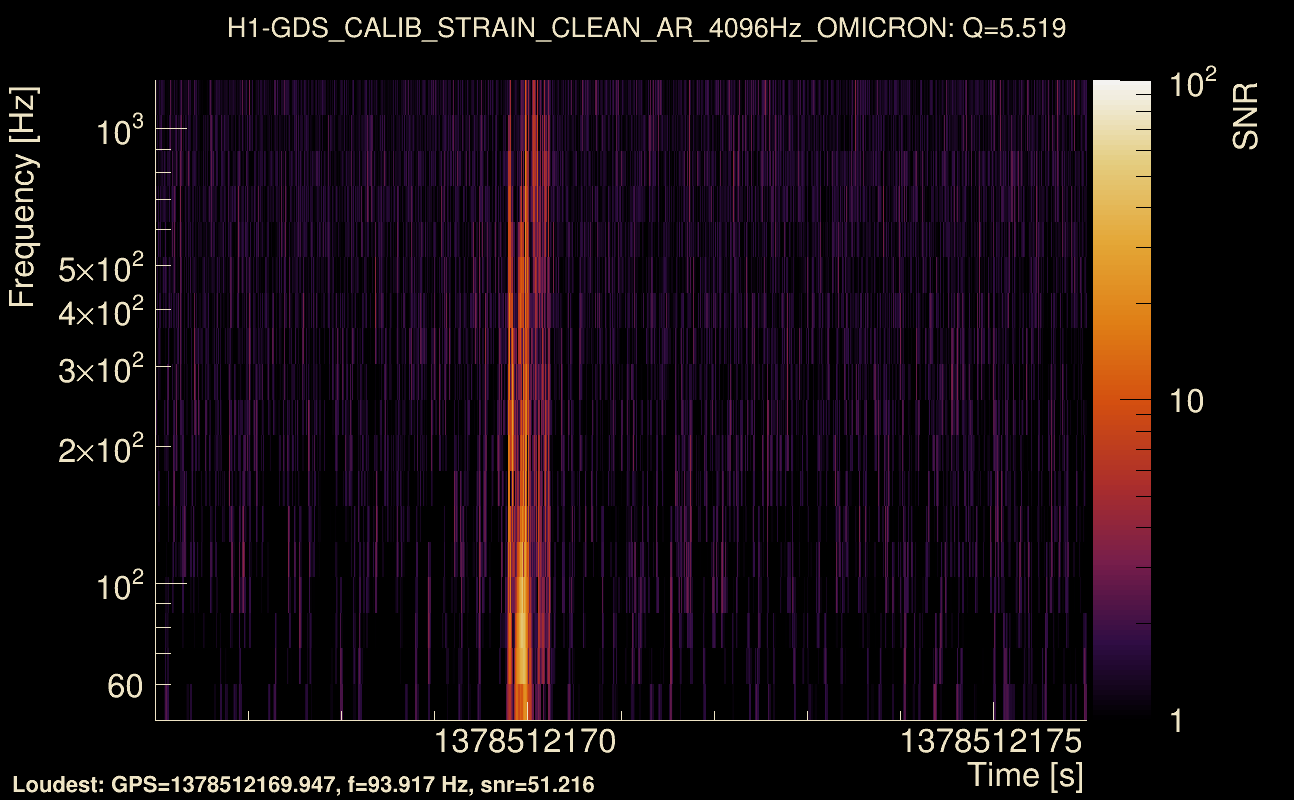
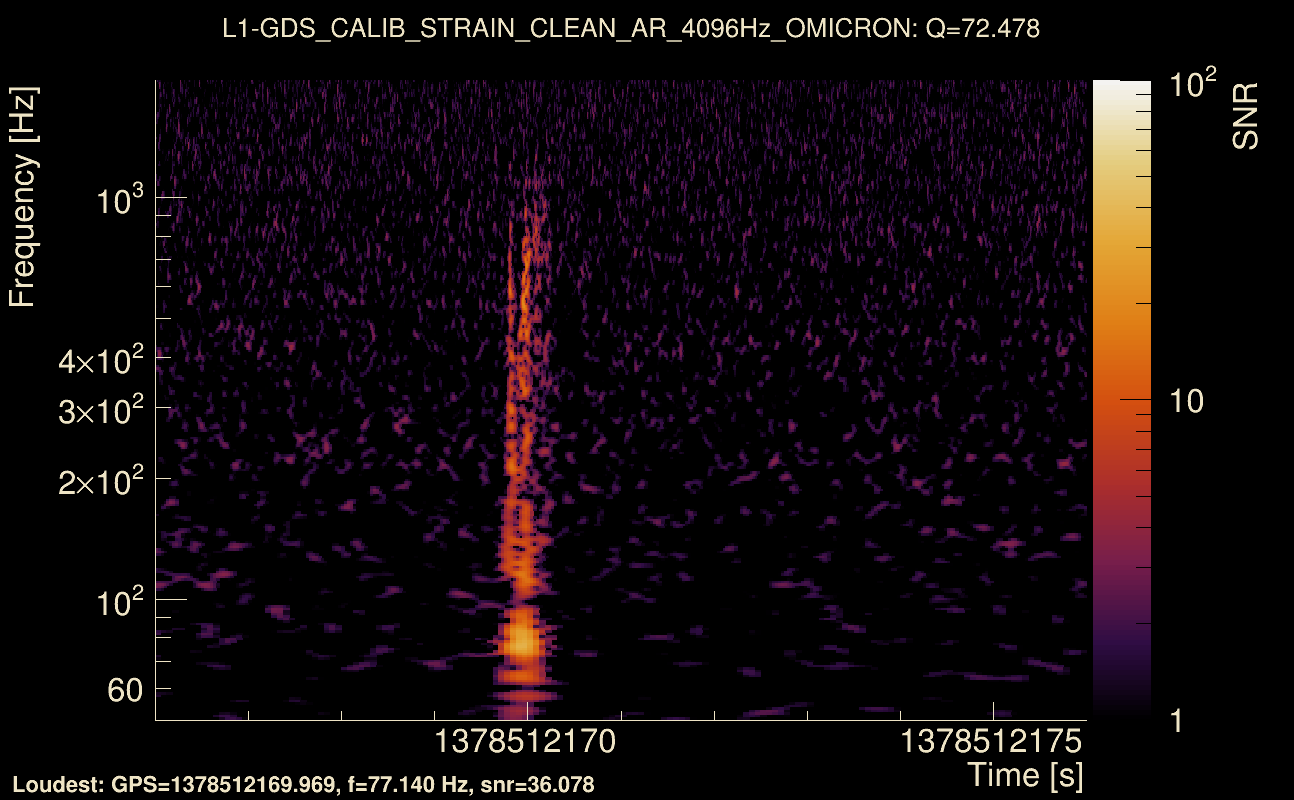
| Event time t(H1): | GPS = 1378512166 (Tue Sep 12 00:02:28 2023 ) → GPS = 1378512176 (Tue Sep 12 00:02:38 2023 ) |
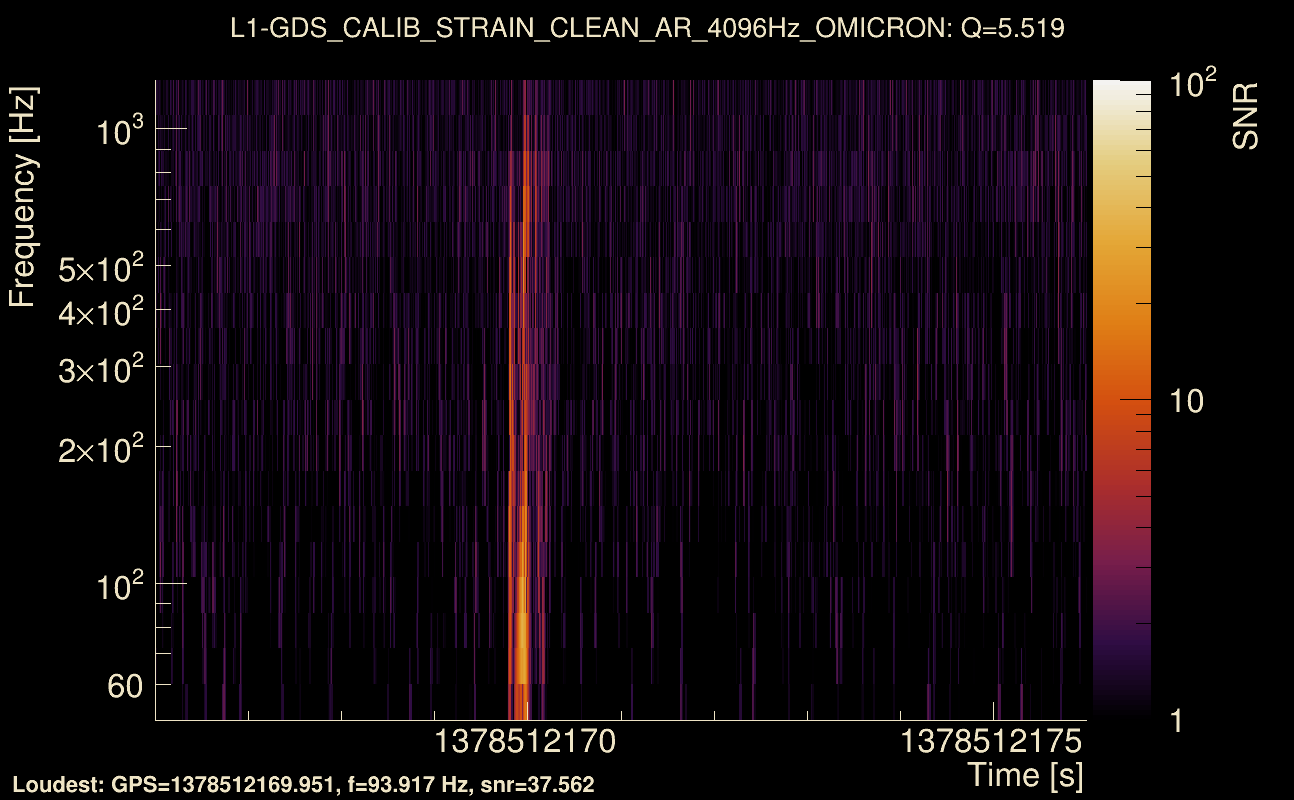
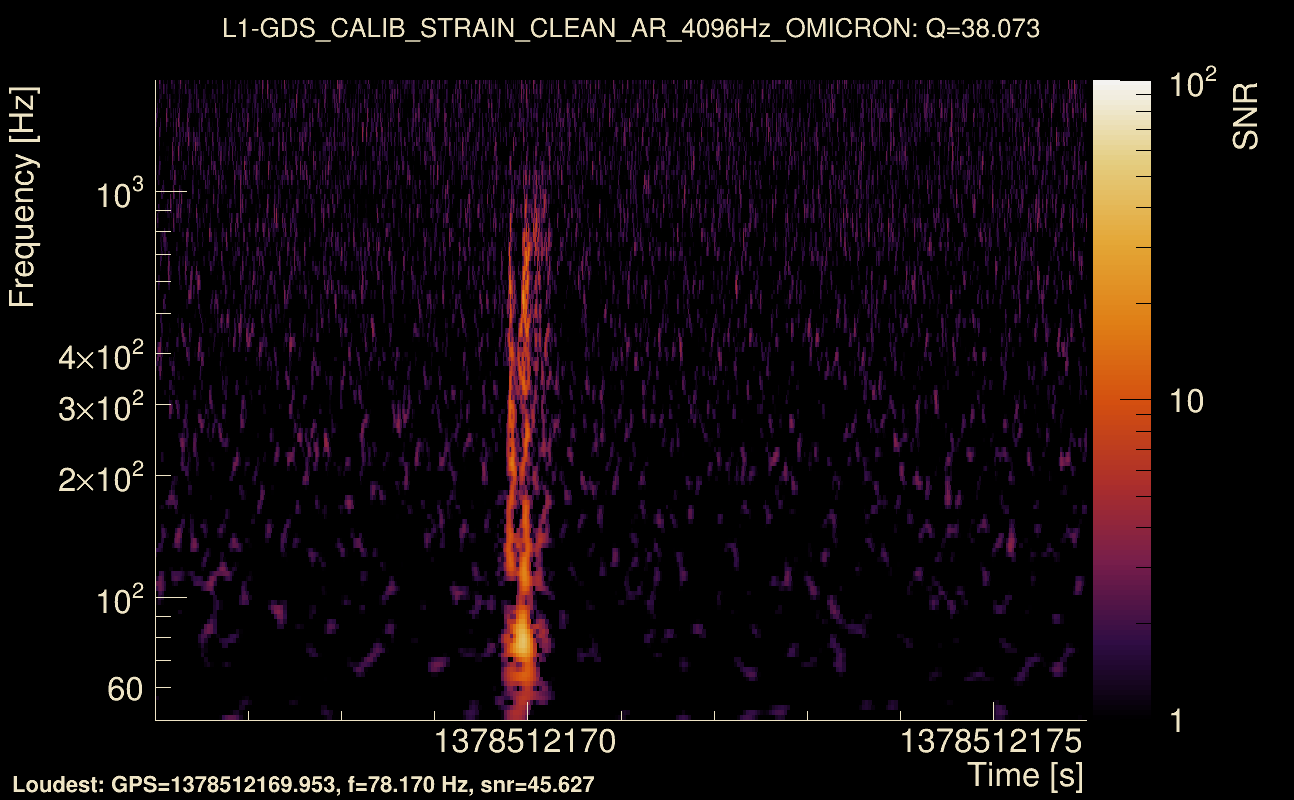
| Event time t(L1): | GPS = 1378512166 (Tue Sep 12 00:02:38 2023 ) → GPS = 1378512176 (Tue Sep 12 00:02:38 2023 ) |
| Omicron analysis time window (H1): | GPS = 1378512163 → GPS = 1378512179 |
| Omicron analysis time window (L1): | GPS = 1378512163 → GPS = 1378512179 |
| Time delay between detectors t(L1) - t(H1): | 0.00479288 s (slice index = 108 / 217), δt_gw = 0.00479288 s |
| Time delay uncertainty: | 0.000973226 s |
| [targeted mode] Time delay probability: | 0.994097 (0.00739805 sigmas), δt_target = 0.00197196 s |
| Frequency: | 227.444 Hz |
| Ξ: | 0.888412 ± 0.00501767 (variance = 2.51771e-05): Q0: 0.924398, Q1: 0.921022, Q2: 0.921364, Q3: 0.922456, Q4: 0.910116 |
| Rank: | R_A = 0.877229 |
| Log of amplitude ratio (L1/H1): | -0.297502, variance = 0.167571 (L1/H1: -0.295243, variance = 0.304419, H1/L1: 0.301833, variance = 0.307096) |
| Amplitude ratio (L1/H1): | 0.742671 ⋇ 1.50584 (L1/H1: 0.744351 ⋇ 1.73628, H1/L1: 1.35233 ⋇ 1.74048) |
| Amplitude ratio H1|L1 compatibility (probability): | 0.993276 |
| Antenna factor probability: | 1 |
| Number of rejected frequency rows: | Q0: 0 / 18, Q1: 1 / 36, Q2: 6 / 70, Q3: 20 / 134, Q4: 62 / 258 |
| Maximum signal-to-noise ratio: | H1: 71.7762, L1: 51.8378 |
| SNR variance: | H1: 3.88755, L1: 2.27958 |
| Click here for a zoomed plot | Click here for a zoomed plot | Click here for a zoomed plot | Click here for a zoomed plot | Click here for a zoomed plot |
 |
 |
 |
 |
 |
 |
 |
 |
 |
 |
 |
 |
 |
 |
 |
 |
 |
 |
 |
 |
 |
 |
 |
 |
 |
 |
 |
 |
 |
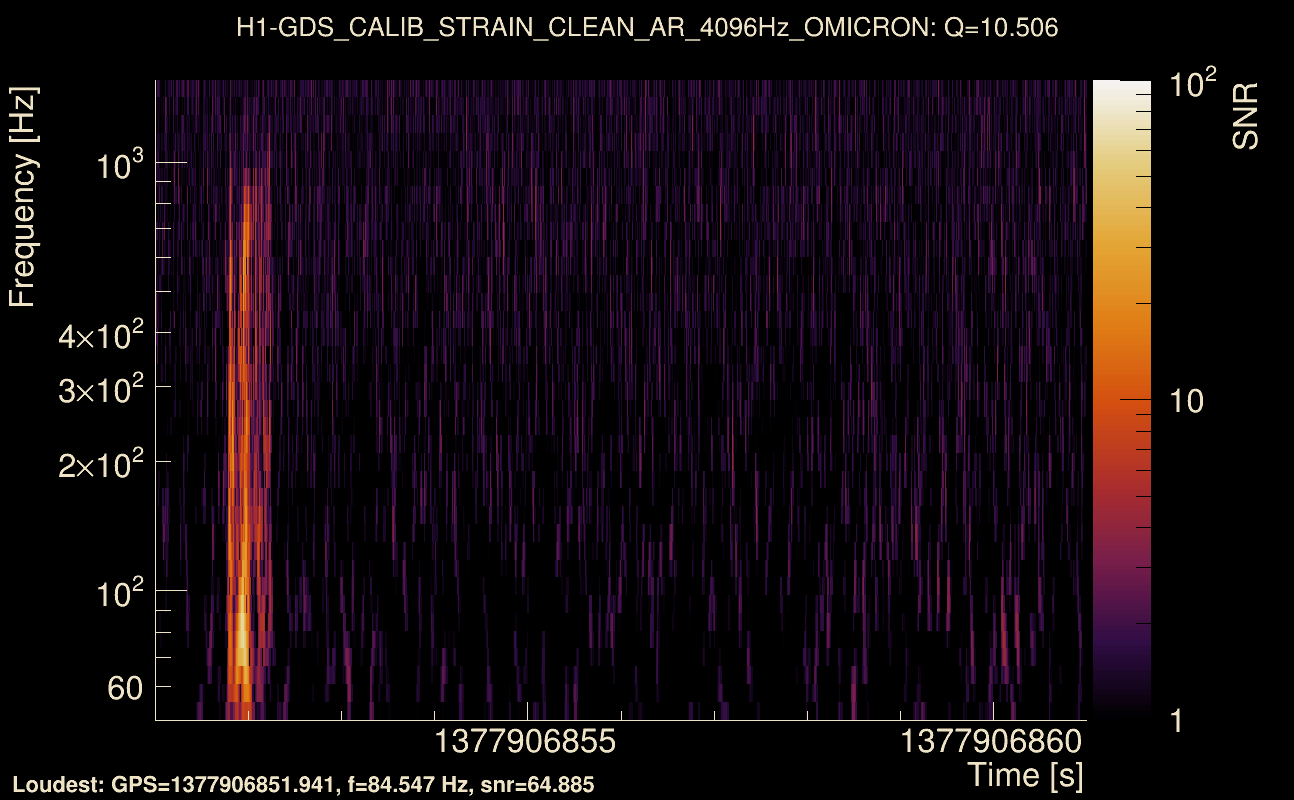
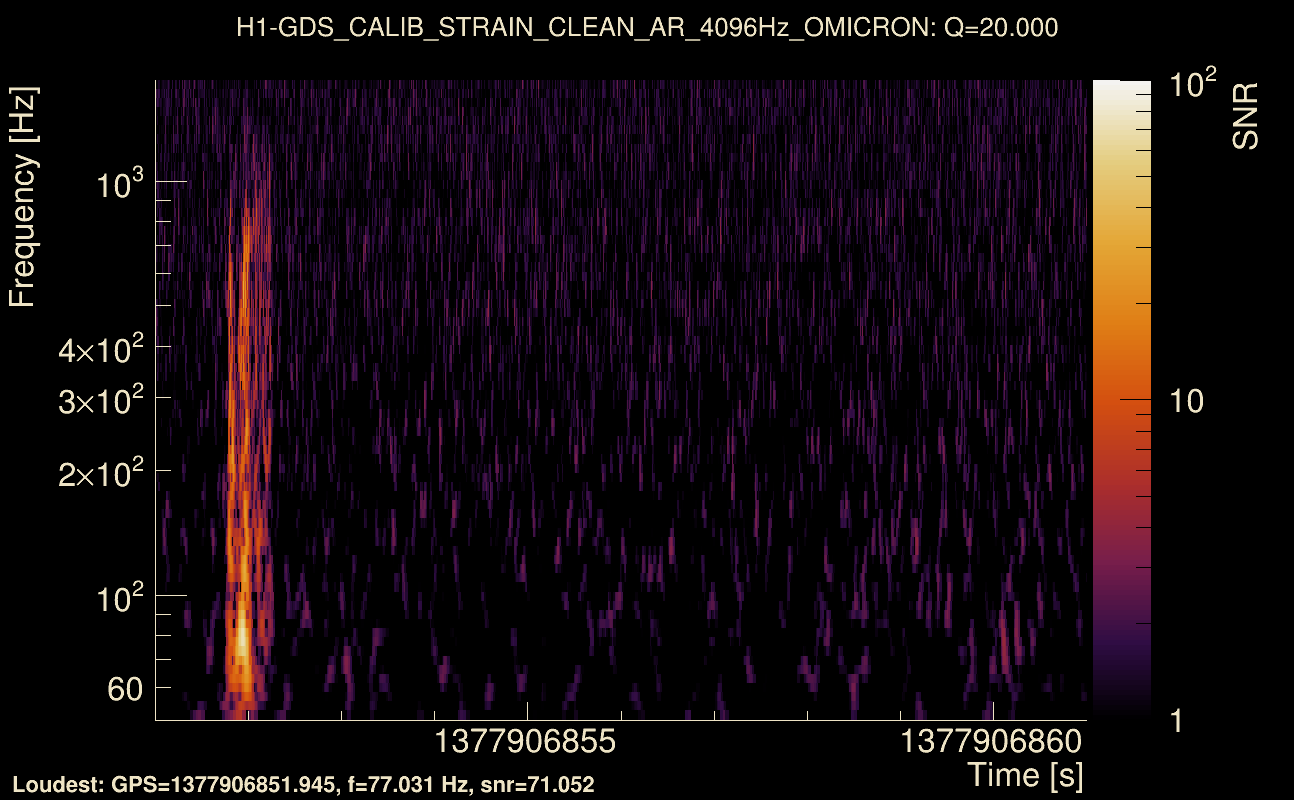
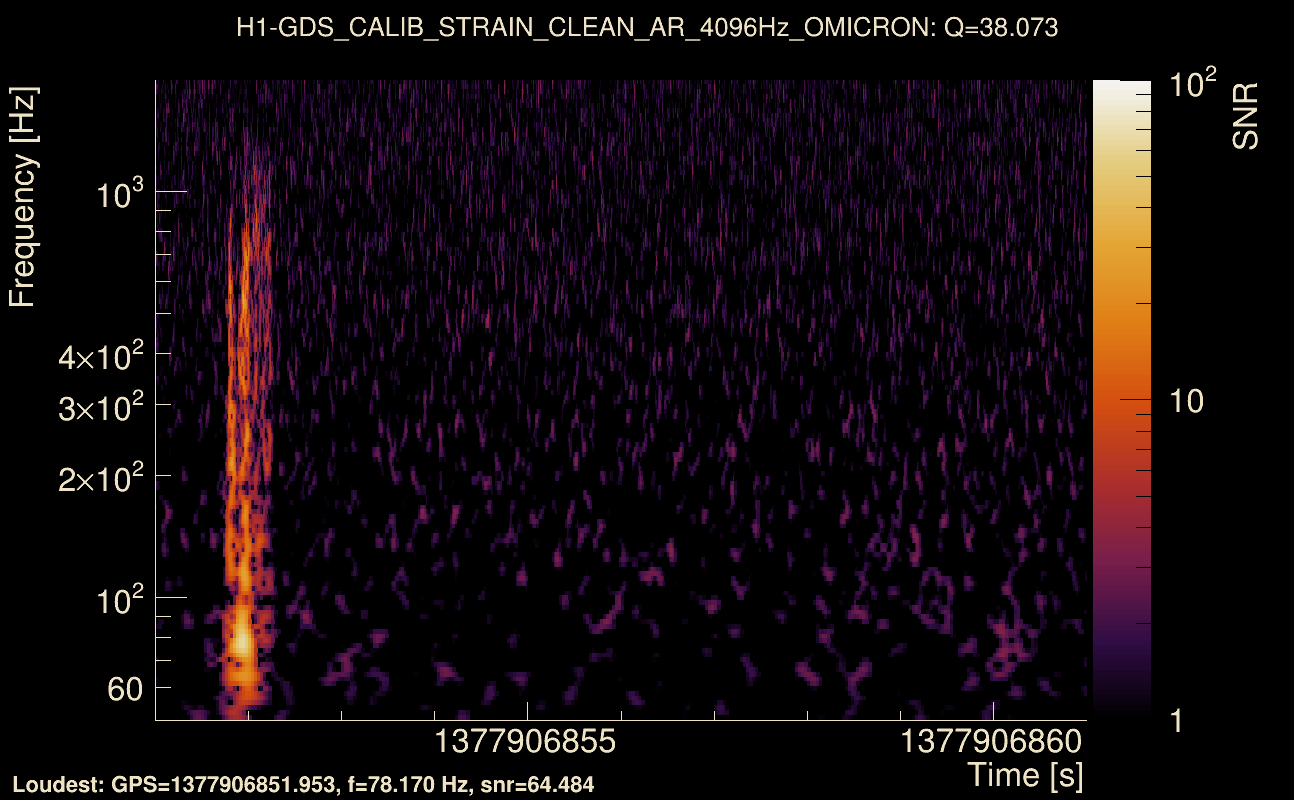
| Event time t(H1): | GPS = 1377906846 (Mon Sep 4 23:53:48 2023 ) → GPS = 1377906856 (Mon Sep 4 23:53:58 2023 ) |
| Event time t(L1): | GPS = 1377906846 (Mon Sep 4 23:53:58 2023 ) → GPS = 1377906856 (Mon Sep 4 23:53:58 2023 ) |
| Omicron analysis time window (H1): | GPS = 1377906843 → GPS = 1377906859 |
| Omicron analysis time window (L1): | GPS = 1377906843 → GPS = 1377906859 |
| Time delay between detectors t(L1) - t(H1): | 0.00396972 s (slice index = 108 / 217), δt_gw = 0.00396972 s |
| Time delay uncertainty: | 0.000586112 s |
| [targeted mode] Time delay probability: | 0.978321 (0.0271742 sigmas), δt_target = 0.00480008 s |
| Frequency: | 233.783 Hz |
| Ξ: | 0.900407 ± 0.00322769 (variance = 1.0418e-05): Q0: 0.936019, Q1: 0.932193, Q2: 0.932164, Q3: 0.934849, Q4: 0.926665 |
| Rank: | R_A = 0.876296 |
| Log of amplitude ratio (L1/H1): | -0.219681, variance = 0.158339 (L1/H1: -0.221752, variance = 0.305137, H1/L1: 0.216641, variance = 0.306804) |
| Amplitude ratio (L1/H1): | 0.802775 ⋇ 1.48872 (L1/H1: 0.801114 ⋇ 1.7374, H1/L1: 1.2419 ⋇ 1.74002) |
| Amplitude ratio H1|L1 compatibility (probability): | 0.994788 |
| Antenna factor probability: | 1 |
| Number of rejected frequency rows: | Q0: 0 / 18, Q1: 1 / 36, Q2: 7 / 70, Q3: 17 / 134, Q4: 53 / 258 |
| Maximum signal-to-noise ratio: | H1: 74.6768, L1: 61.6227 |
| SNR variance: | H1: 0.505034, L1: 0.462022 |
| Click here for a zoomed plot | Click here for a zoomed plot | Click here for a zoomed plot | Click here for a zoomed plot | Click here for a zoomed plot |
 |
 |
 |
 |
 |
 |
 |
 |
 |
 |
 |
 |
 |
 |
 |
 |
 |
 |
 |
 |
 |
 |
 |
 |
 |
 |
 |
 |
 |
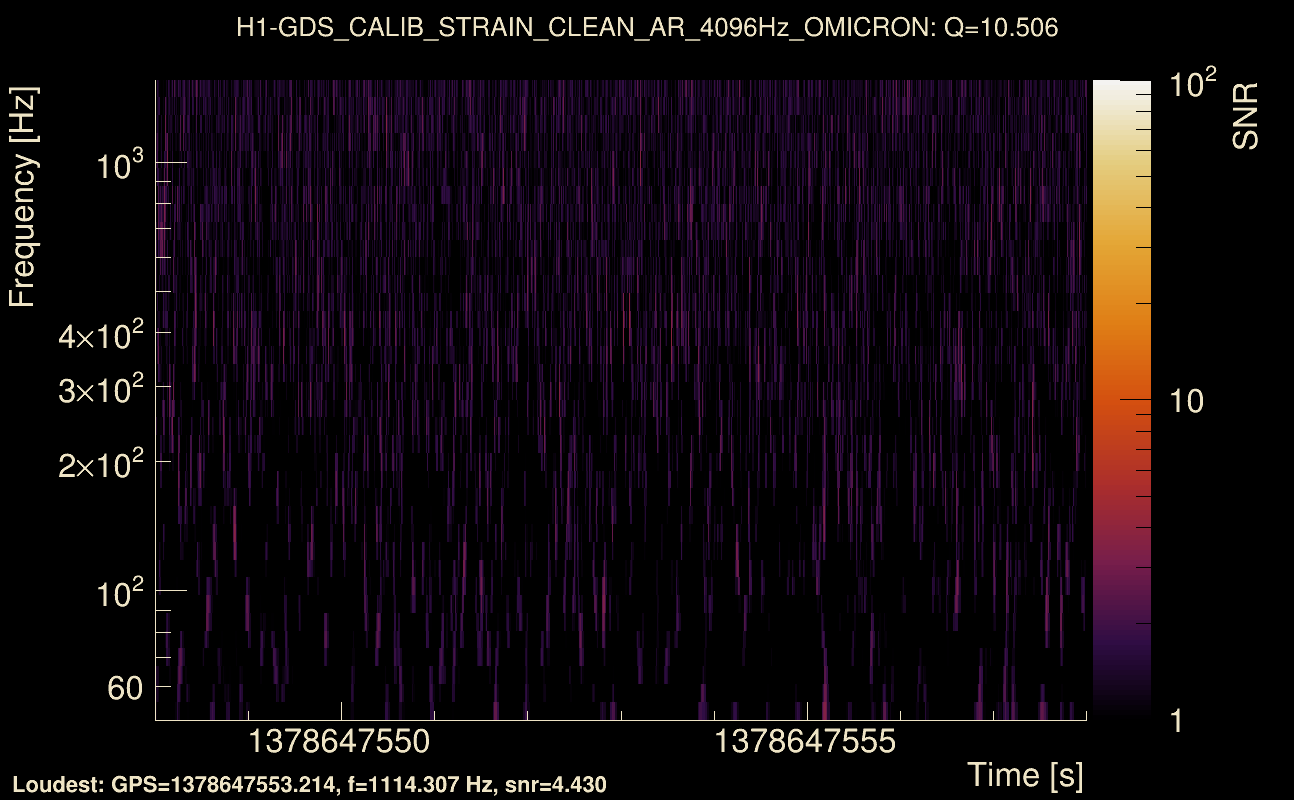
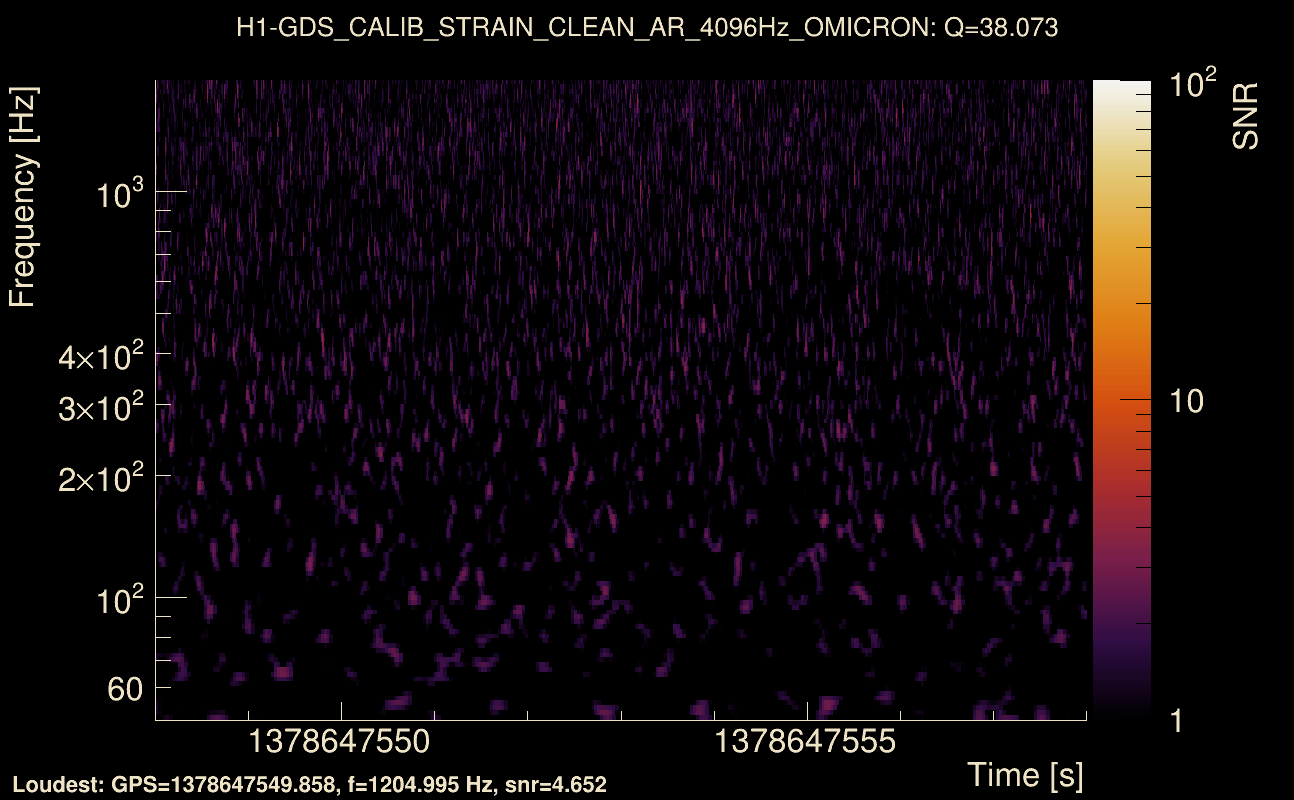
| Event time t(H1): | GPS = 1378647548 (Wed Sep 13 13:38:50 2023 ) → GPS = 1378647558 (Wed Sep 13 13:39:00 2023 ) |
| Event time t(L1): | GPS = 1378647548 (Wed Sep 13 13:39:00 2023 ) → GPS = 1378647558 (Wed Sep 13 13:39:00 2023 ) |
| Omicron analysis time window (H1): | GPS = 1378647545 → GPS = 1378647561 |
| Omicron analysis time window (L1): | GPS = 1378647545 → GPS = 1378647561 |
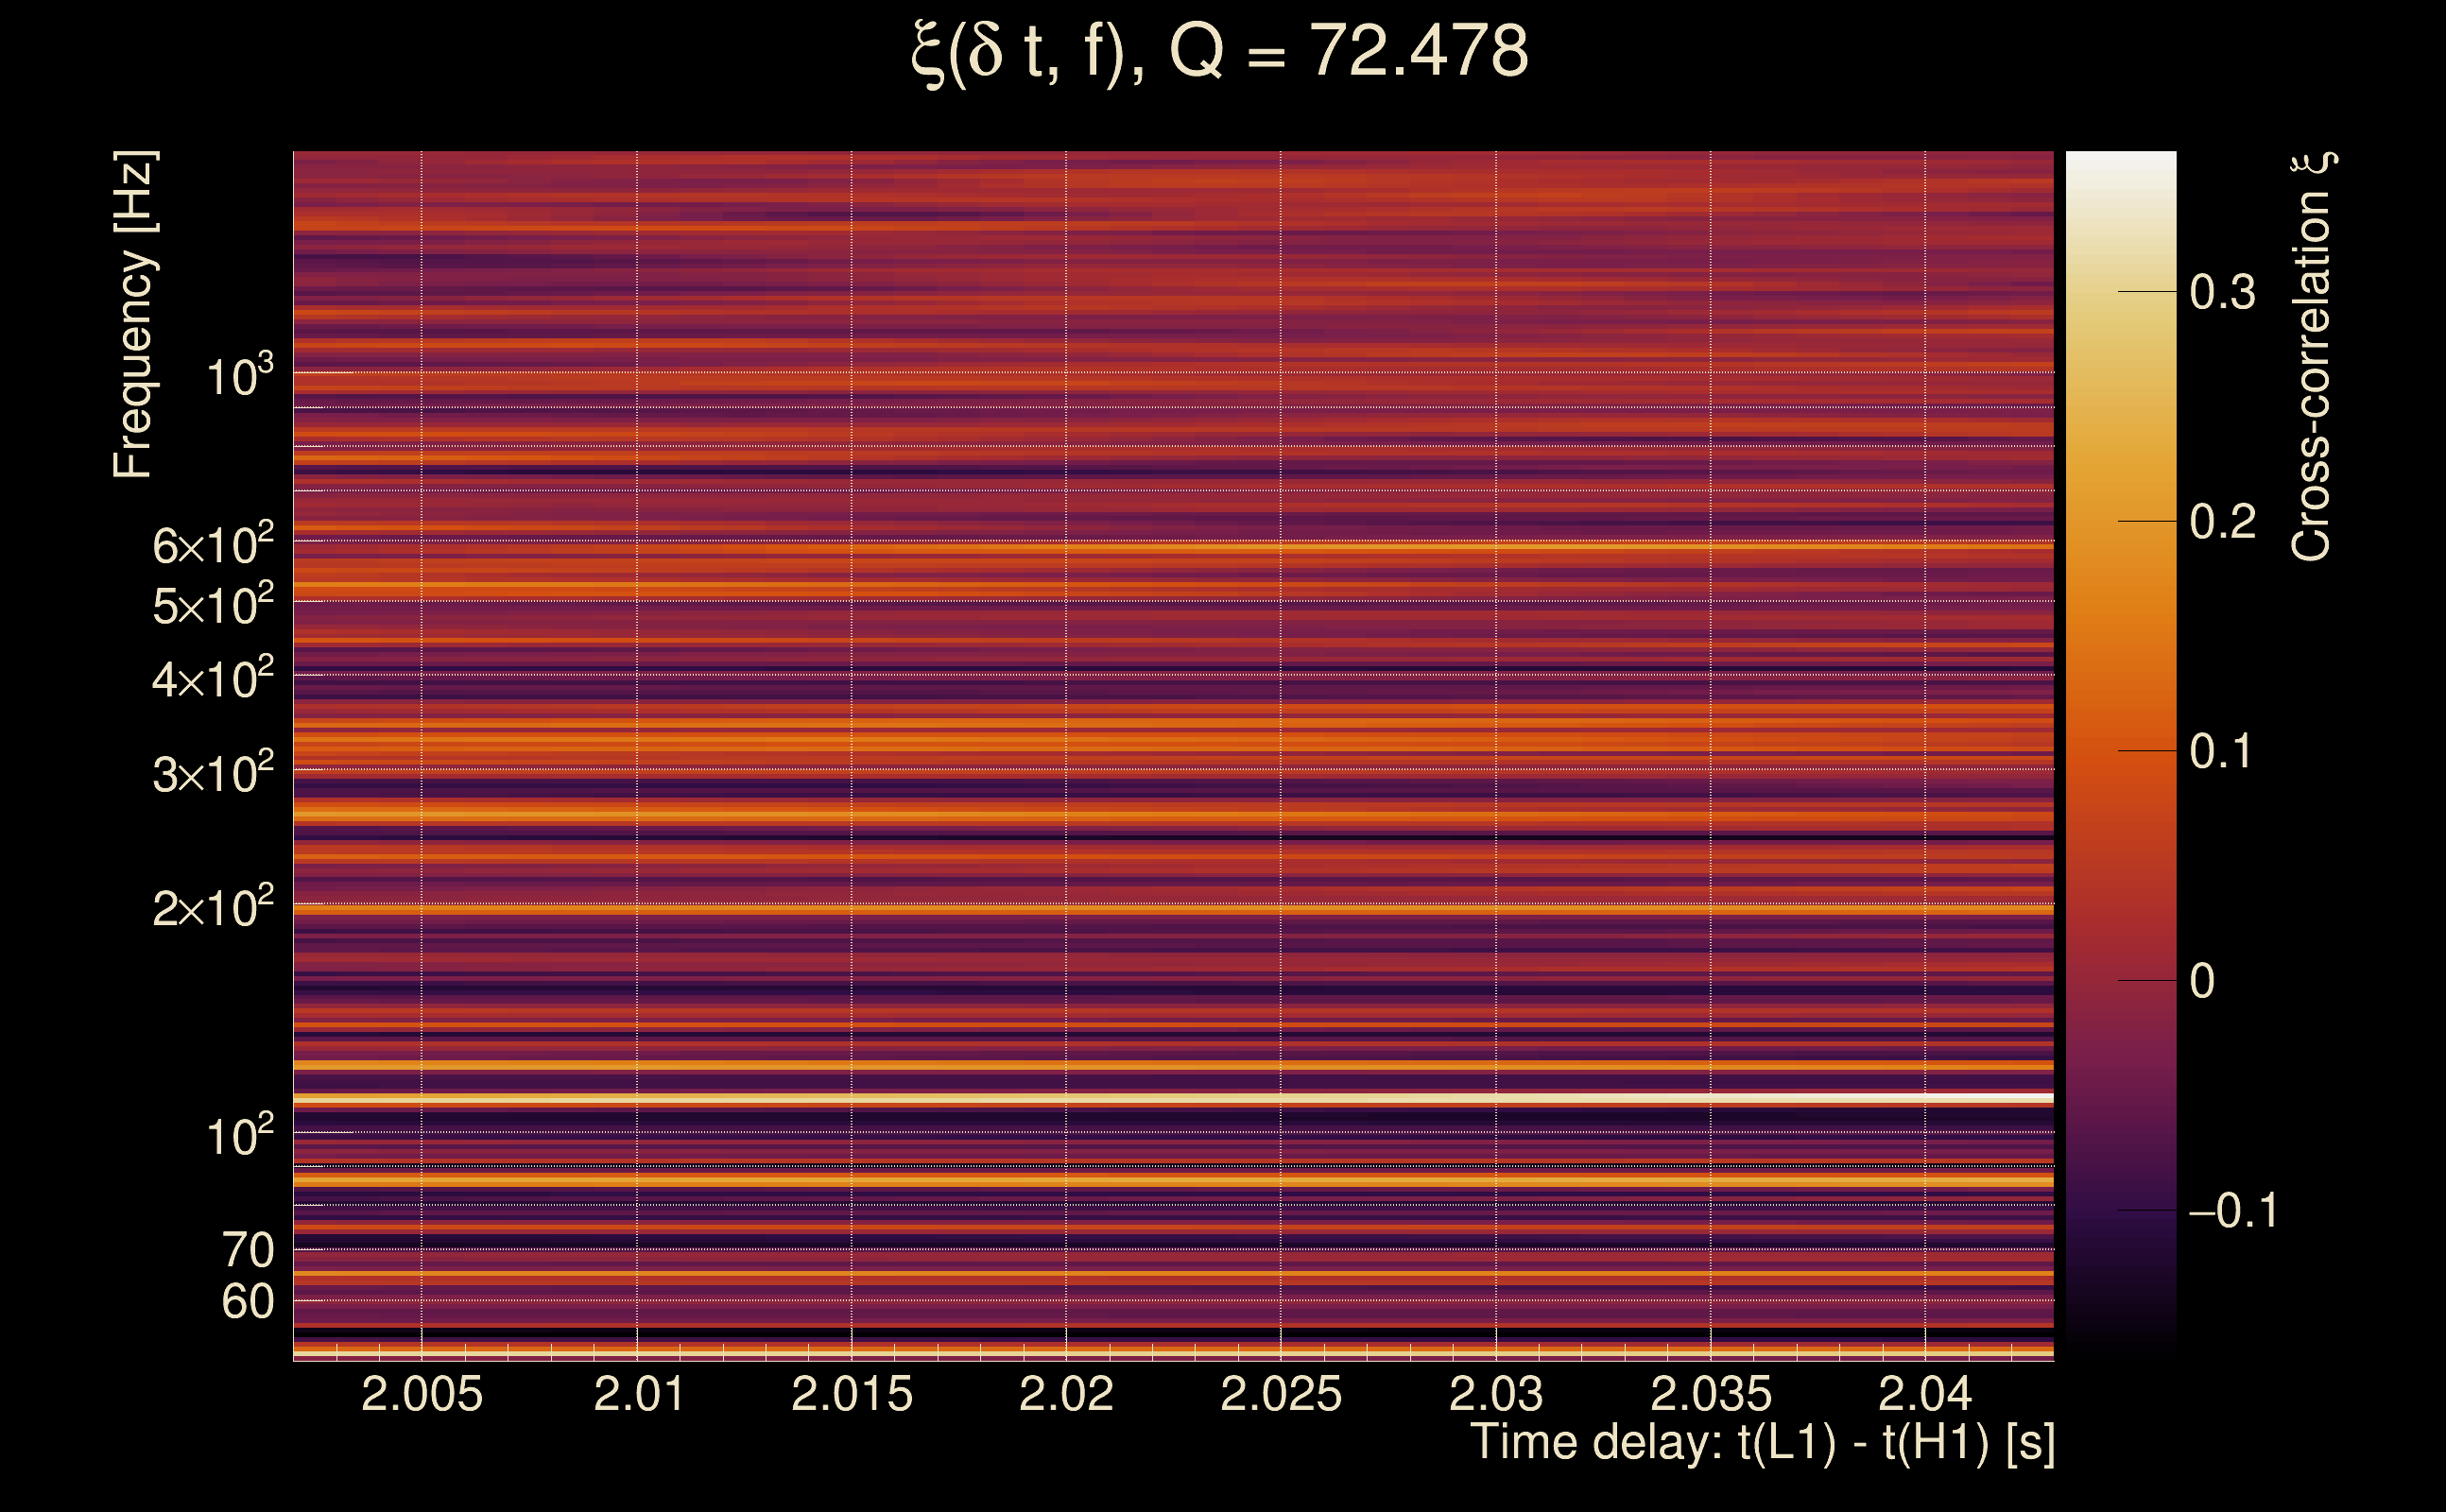
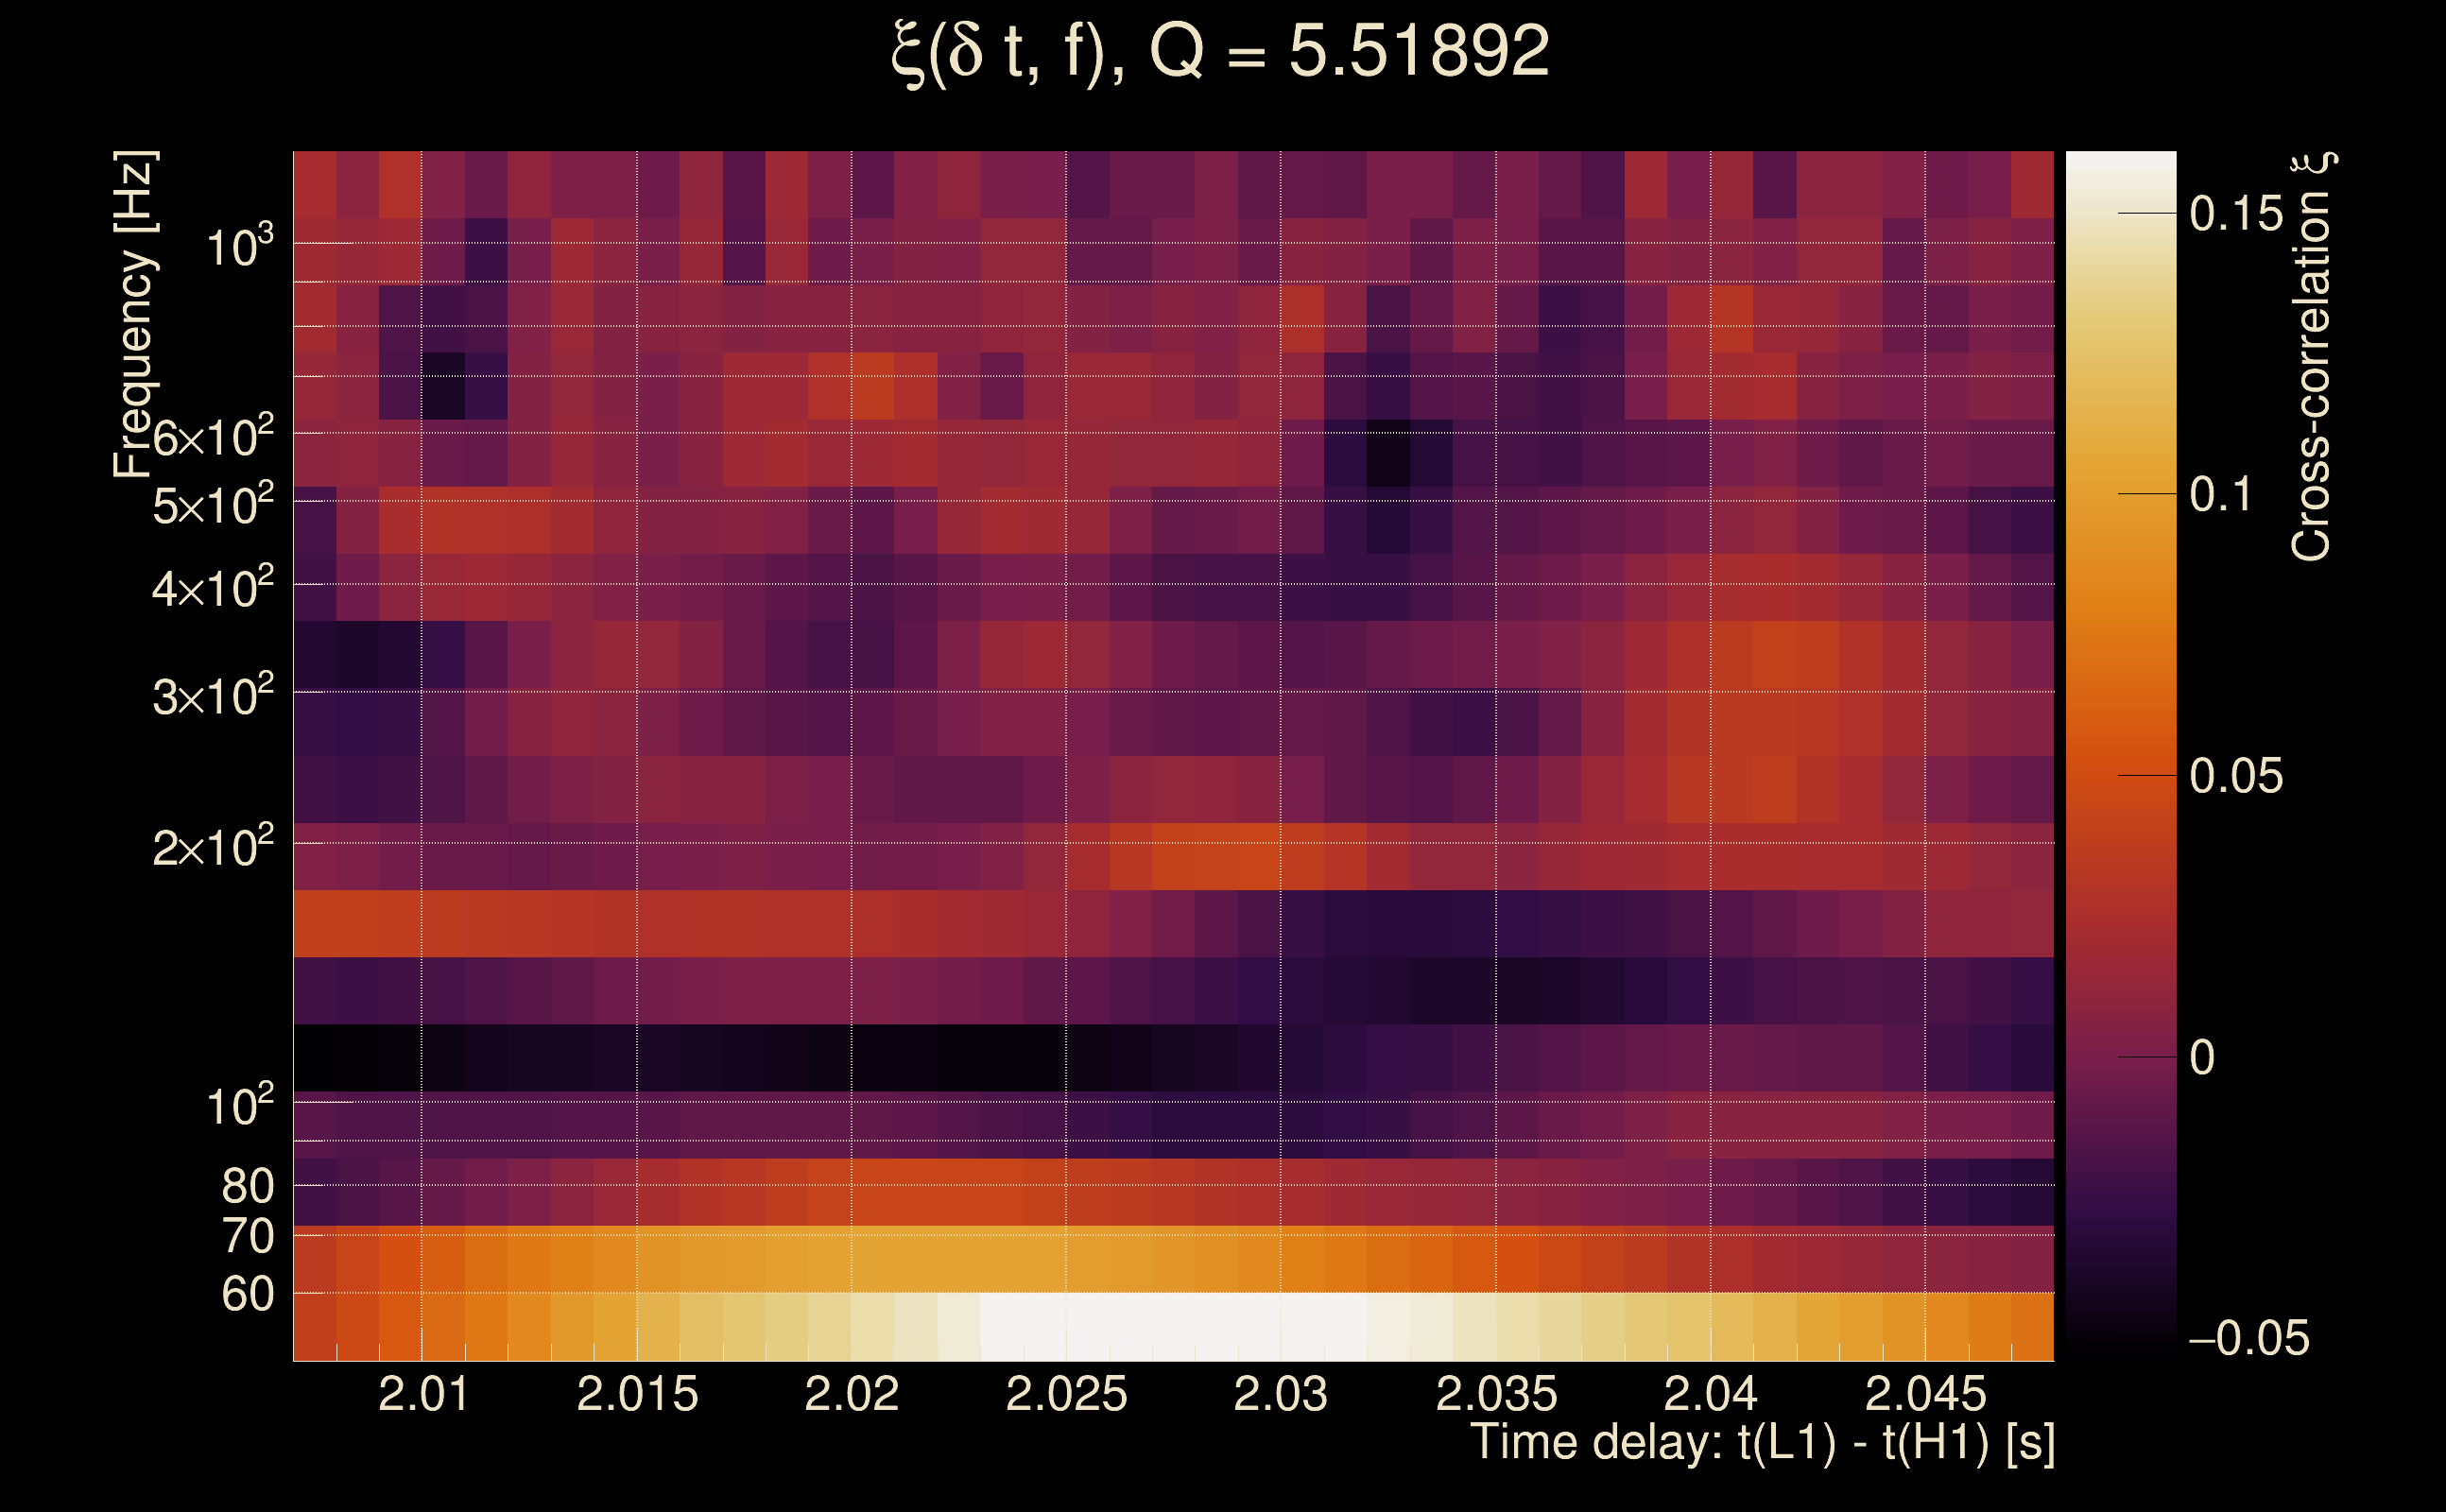
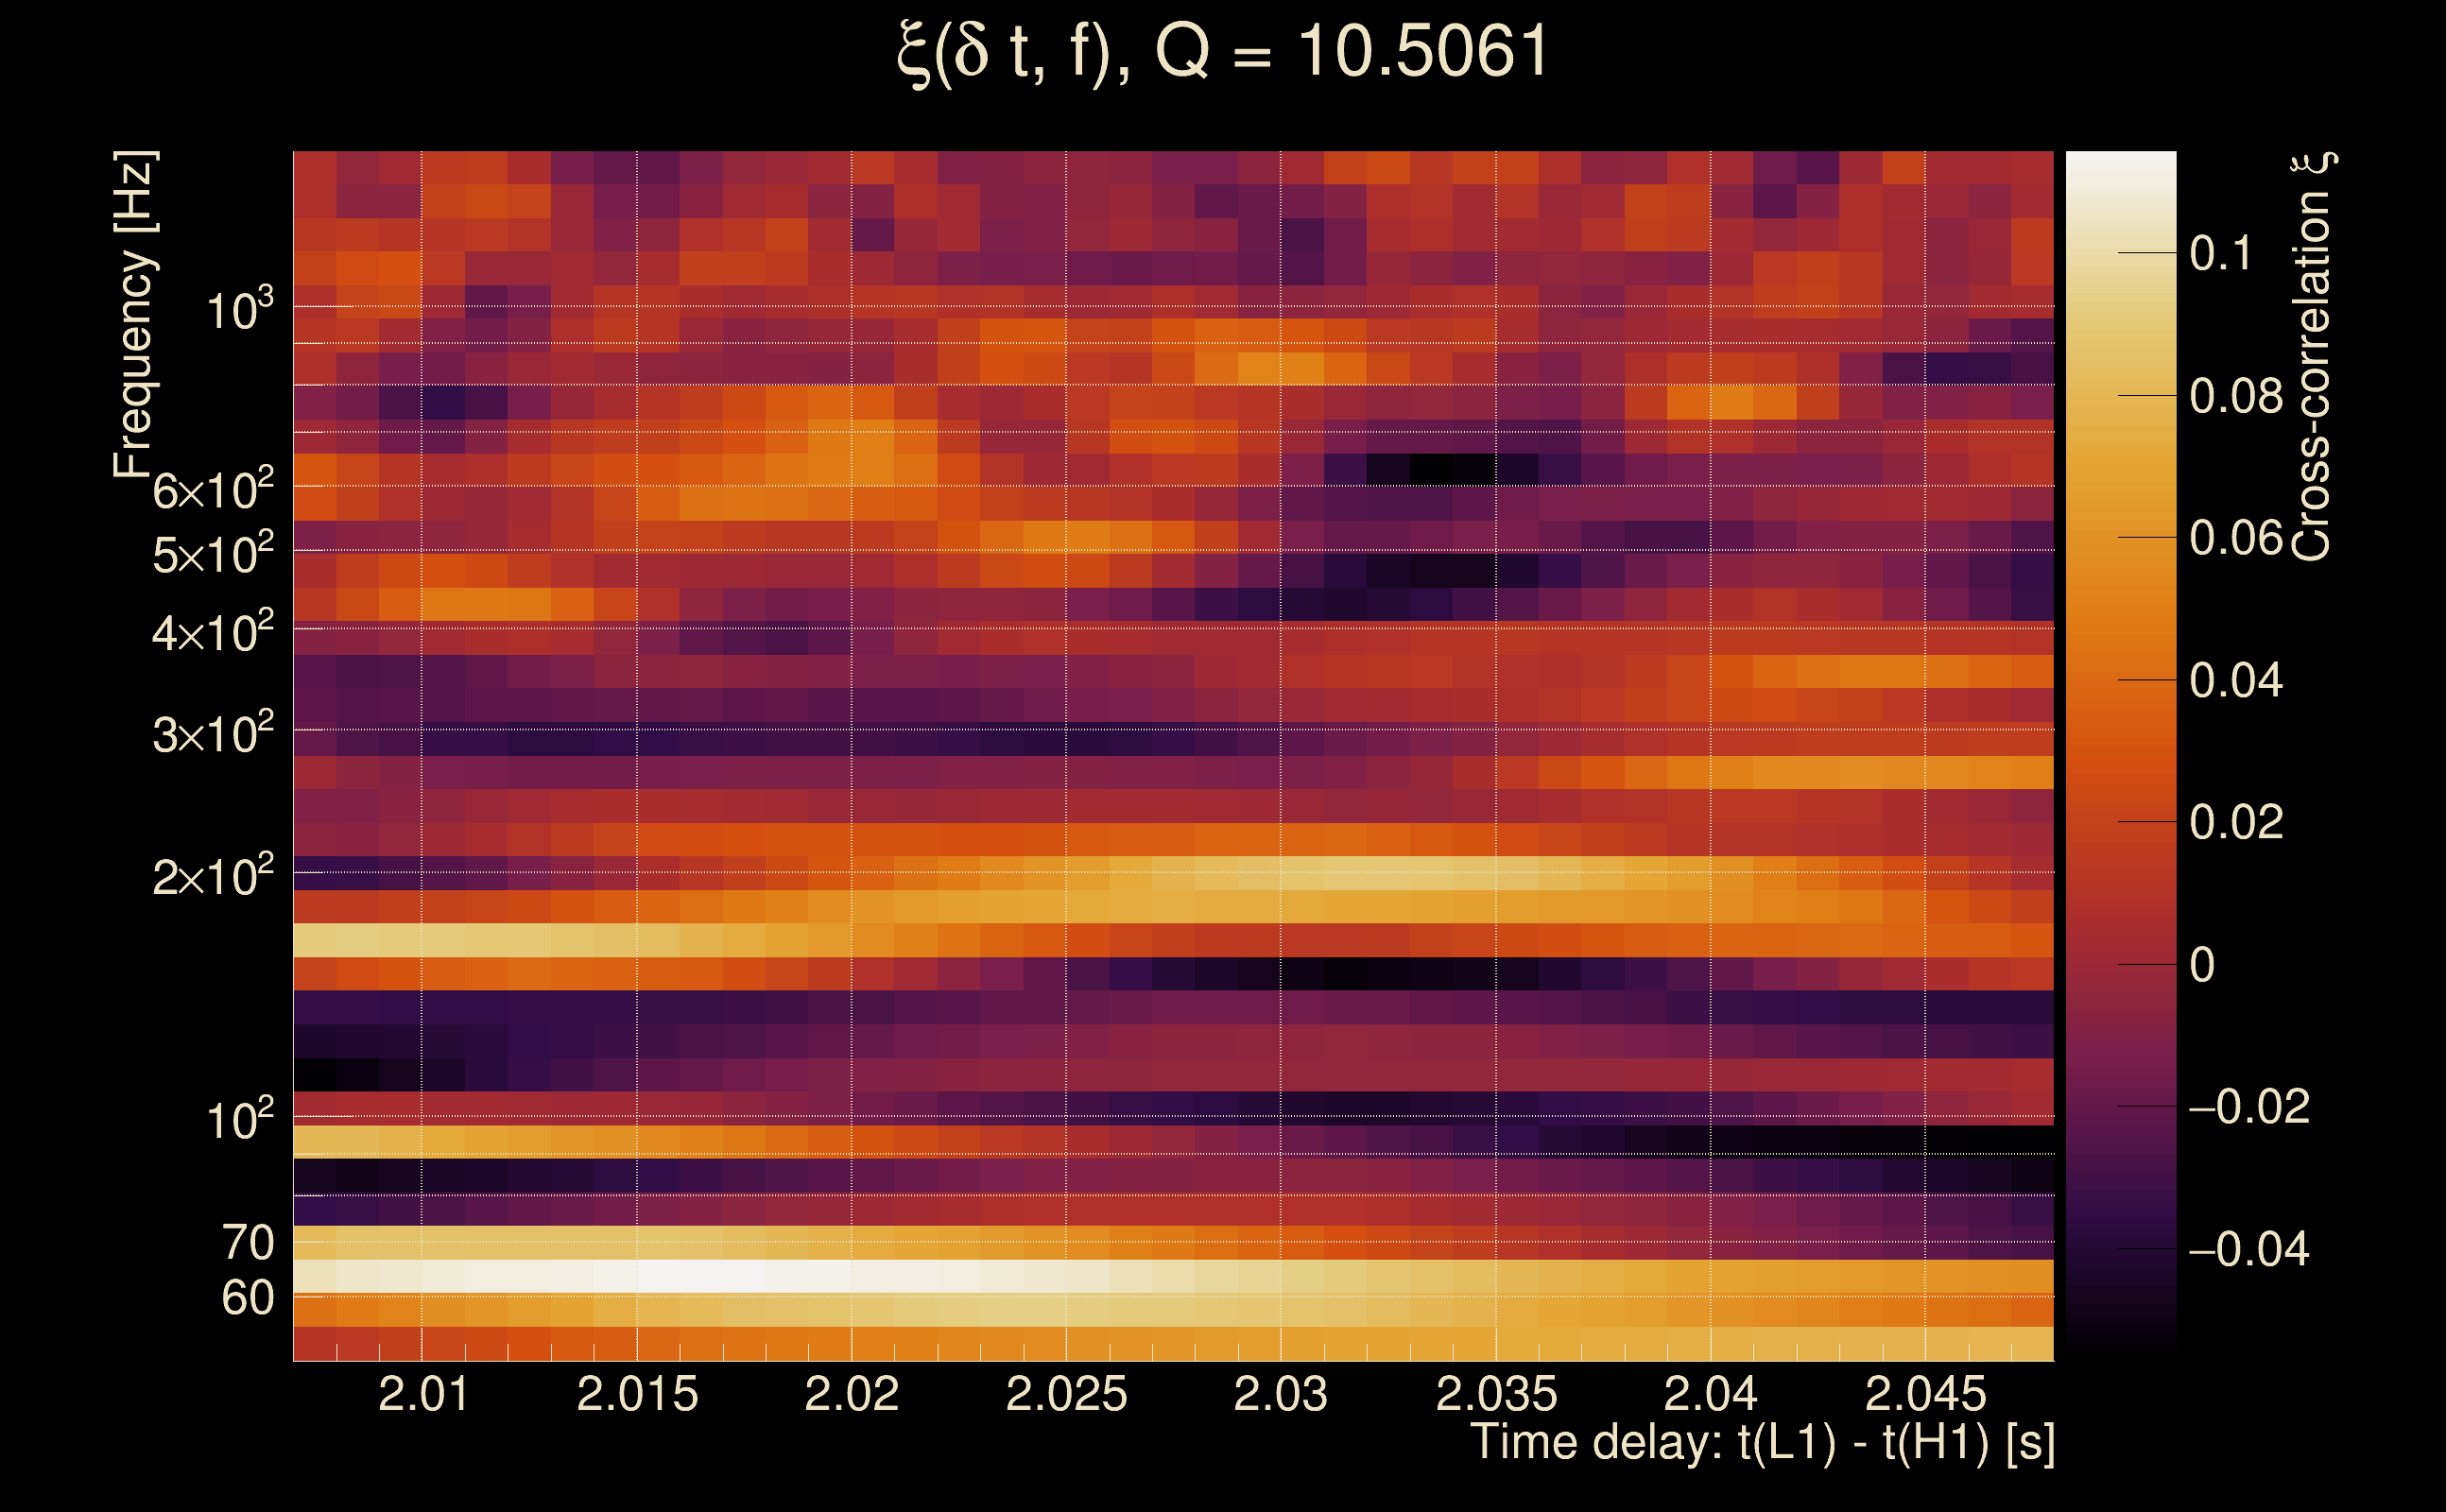
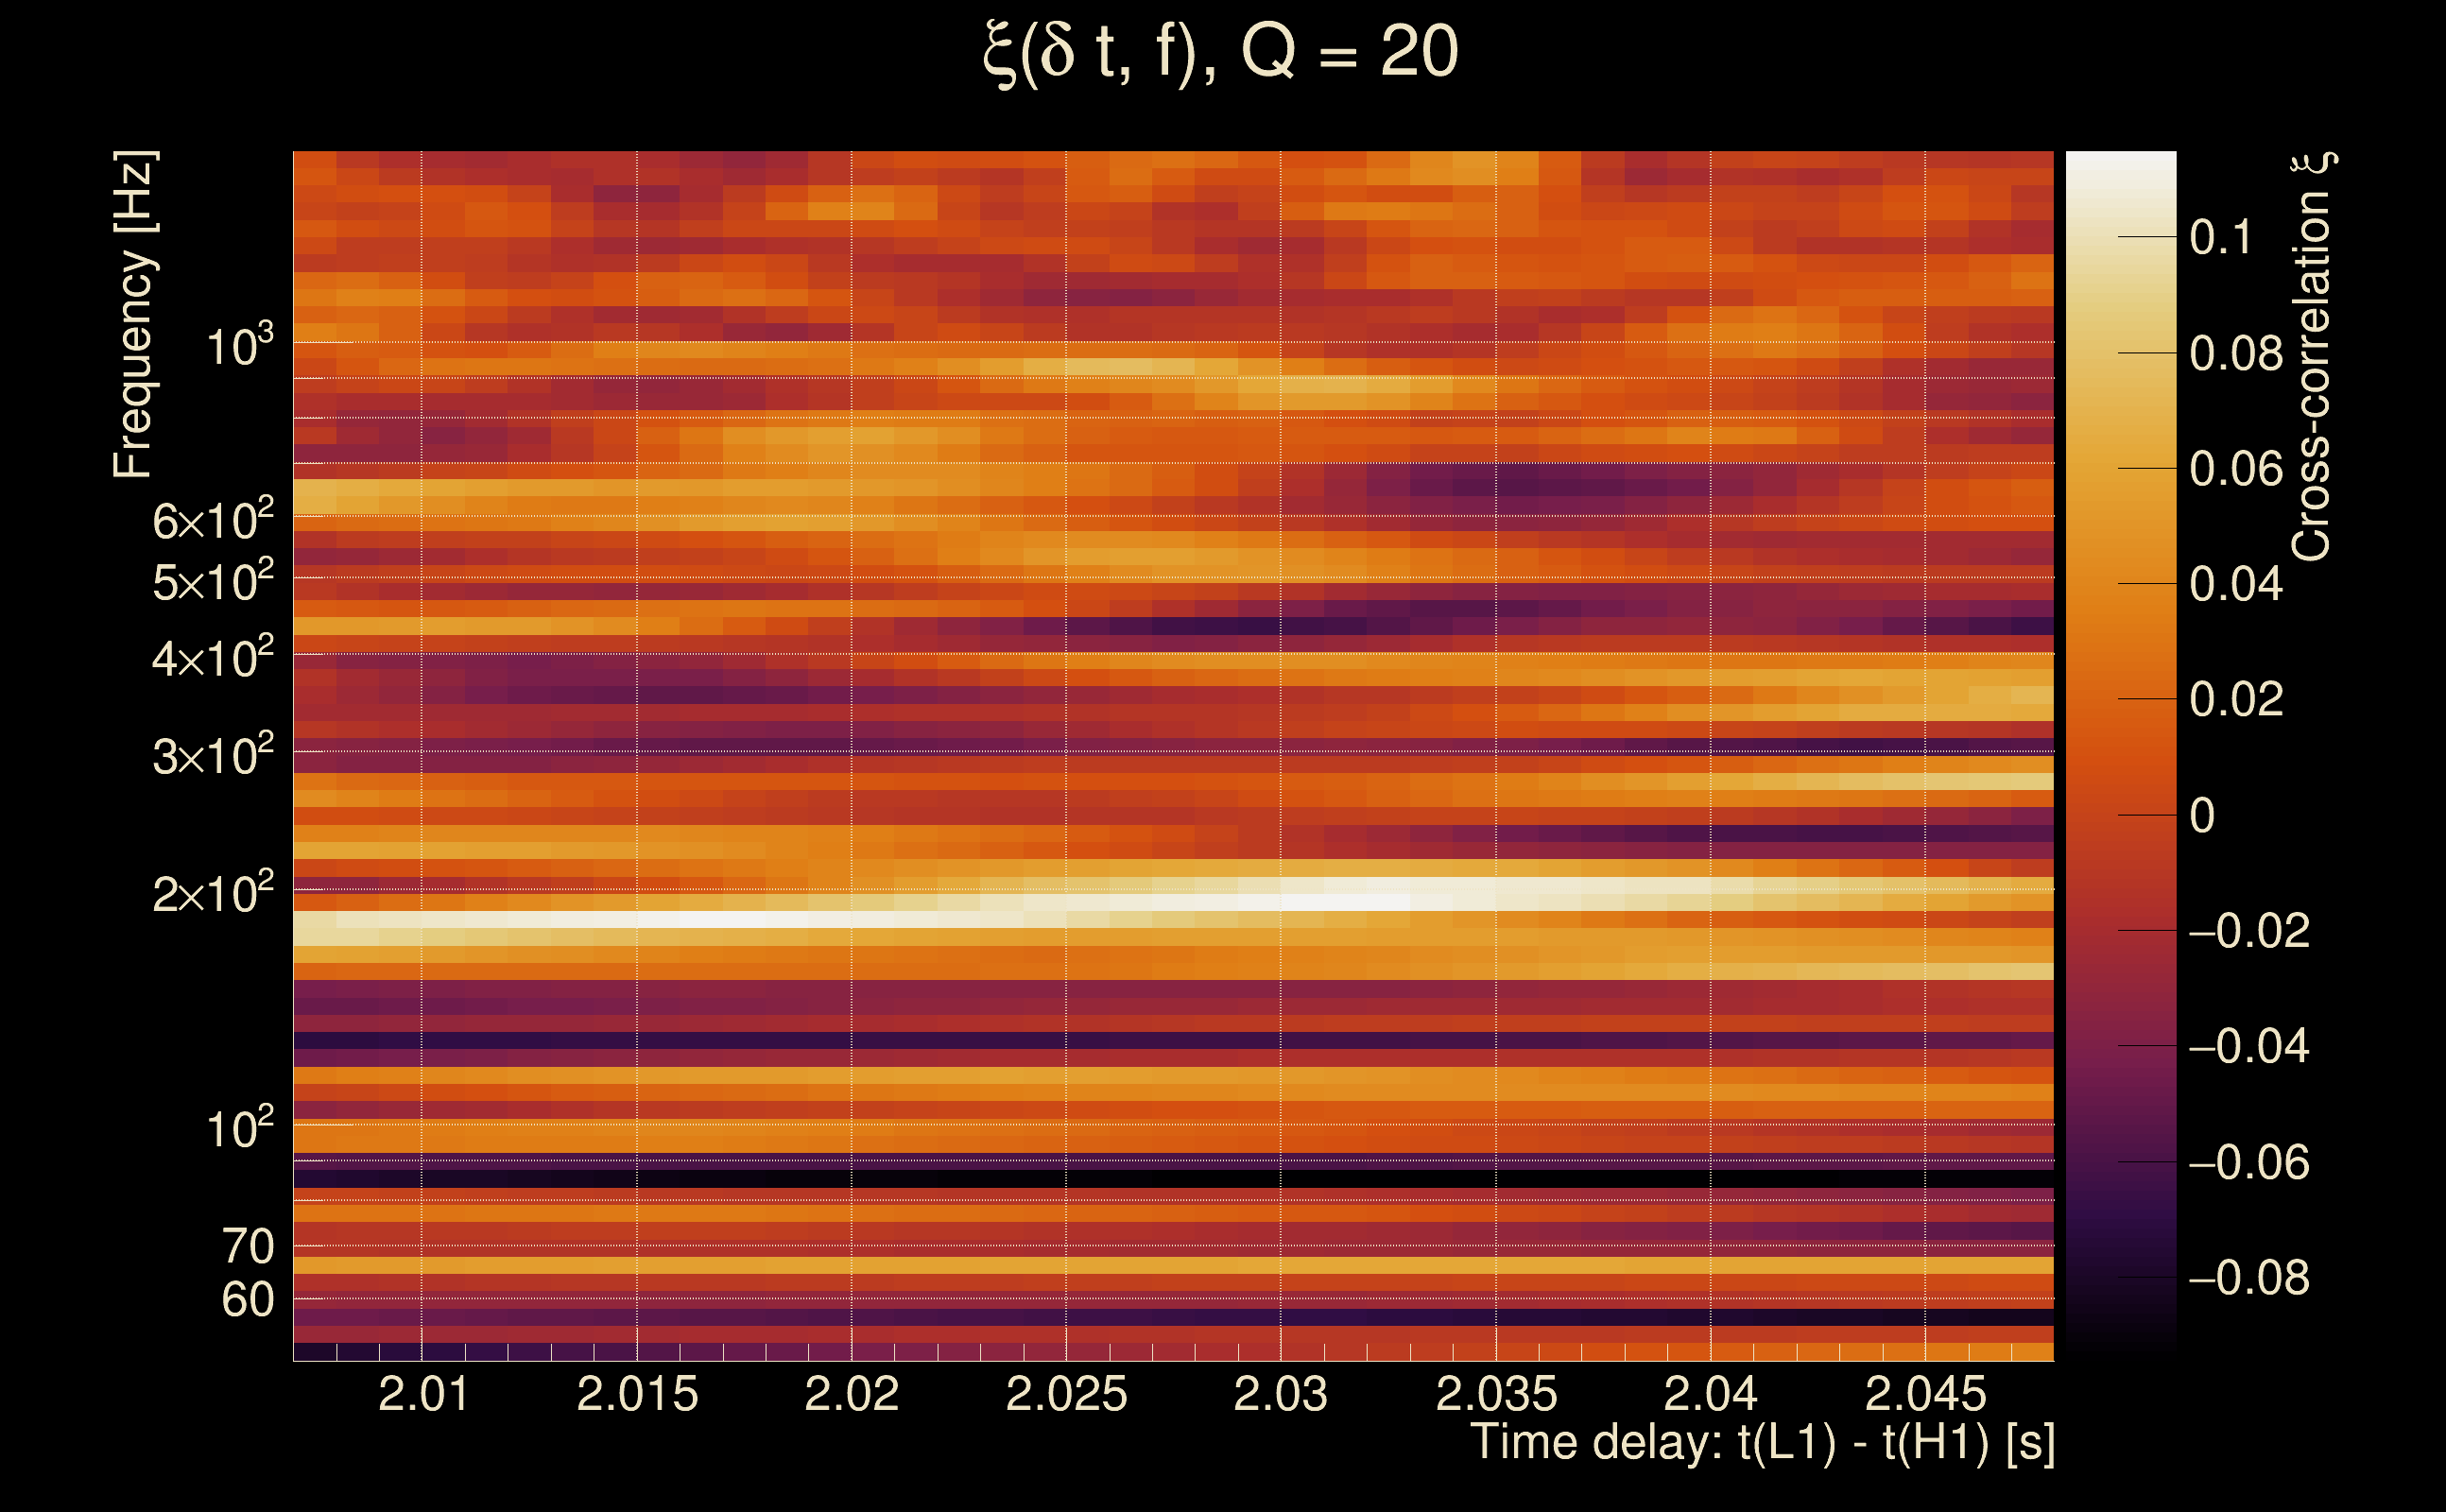
| Time delay between detectors t(L1) - t(H1): | 2.02412 s (slice index = 64 / 217), δt_gw = 0.000123823 s |
| Time delay uncertainty: | 0.00487411 s |
| [targeted mode] Time delay probability: | 0.928064 (0.0902805 sigmas), δt_target = 0.00398564 s |
| Frequency: | 162.229 Hz |
| Ξ: | 0.0190475 ± 0.0813226 (variance = 0.00661336): Q0: 0.0367887, Q1: 0.197391, Q2: 0.24064, Q3: 0.0512287, Q4: 0.0896801 |
| Rank: | R_A = 0.0145859 |
| Log of amplitude ratio (L1/H1): | -0.0687226, variance = 0.687186 (L1/H1: -0.256924, variance = 1.69691, H1/L1: -0.111183, variance = 1.0783) |
| Amplitude ratio (L1/H1): | 0.933586 ⋇ 2.29095 (L1/H1: 0.773427 ⋇ 3.67906, H1/L1: 0.894775 ⋇ 2.82473) |
| Amplitude ratio H1|L1 compatibility (probability): | 0.825119 |
| Antenna factor probability: | 1 |
| Number of rejected frequency rows: | Q0: 16 / 18, Q1: 28 / 36, Q2: 58 / 70, Q3: 125 / 134, Q4: 247 / 258 |
| Maximum signal-to-noise ratio: | H1: 4.81088, L1: 4.92055 |
| SNR variance: | H1: 0.529285, L1: 0.515461 |
| Click here for a zoomed plot | Click here for a zoomed plot | Click here for a zoomed plot | Click here for a zoomed plot | Click here for a zoomed plot |
 |
 |
 |
 |
 |
 |
 |
 |
 |
 |
 |
 |
 |
 |
 |
 |
 |
 |
 |
 |
 |
 |
 |
 |
 |
 |
 |
 |
 |
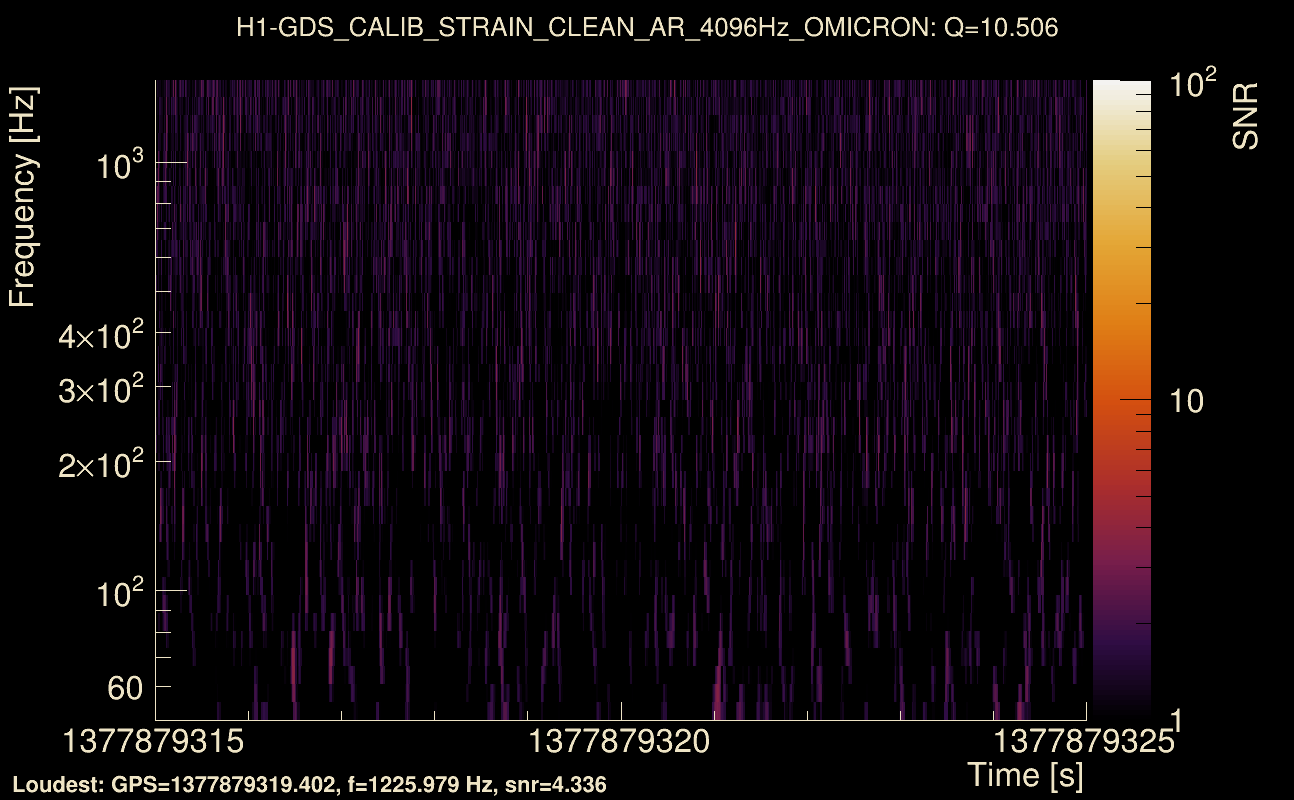
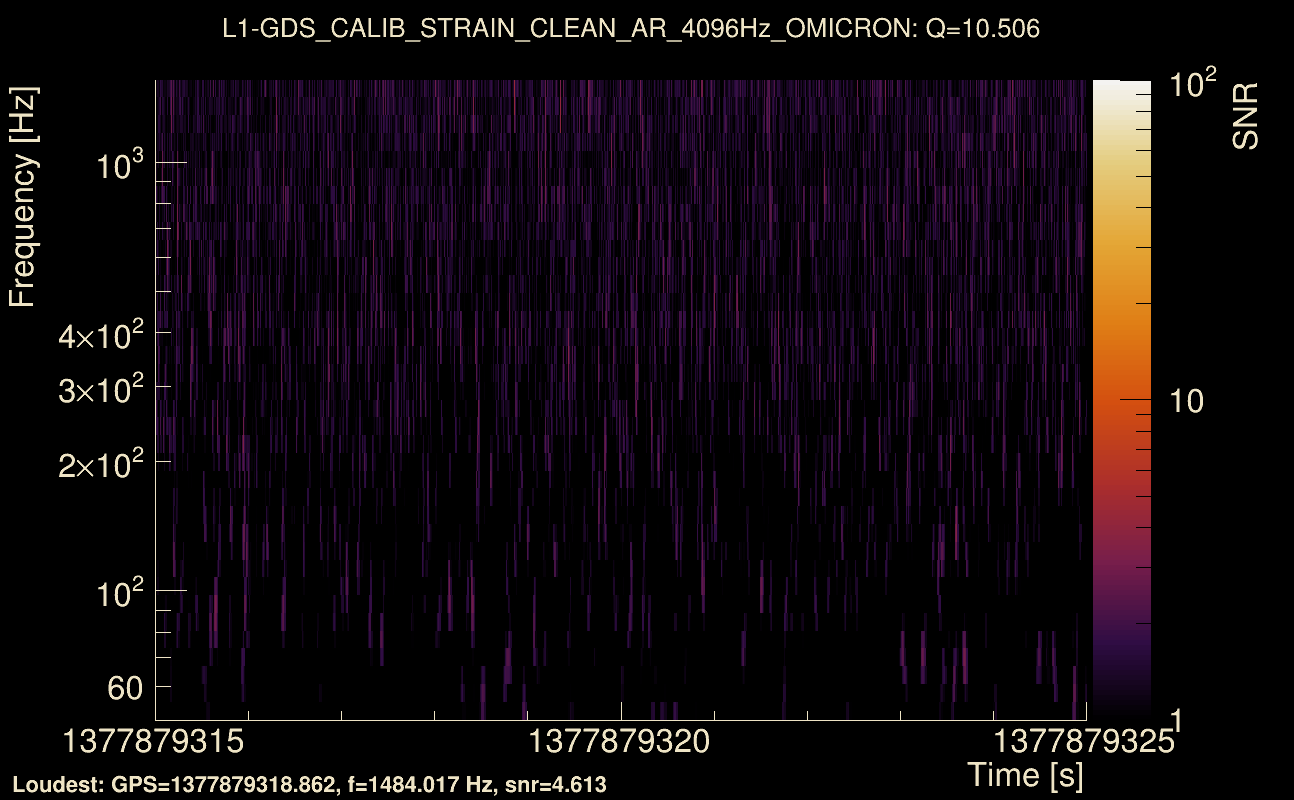
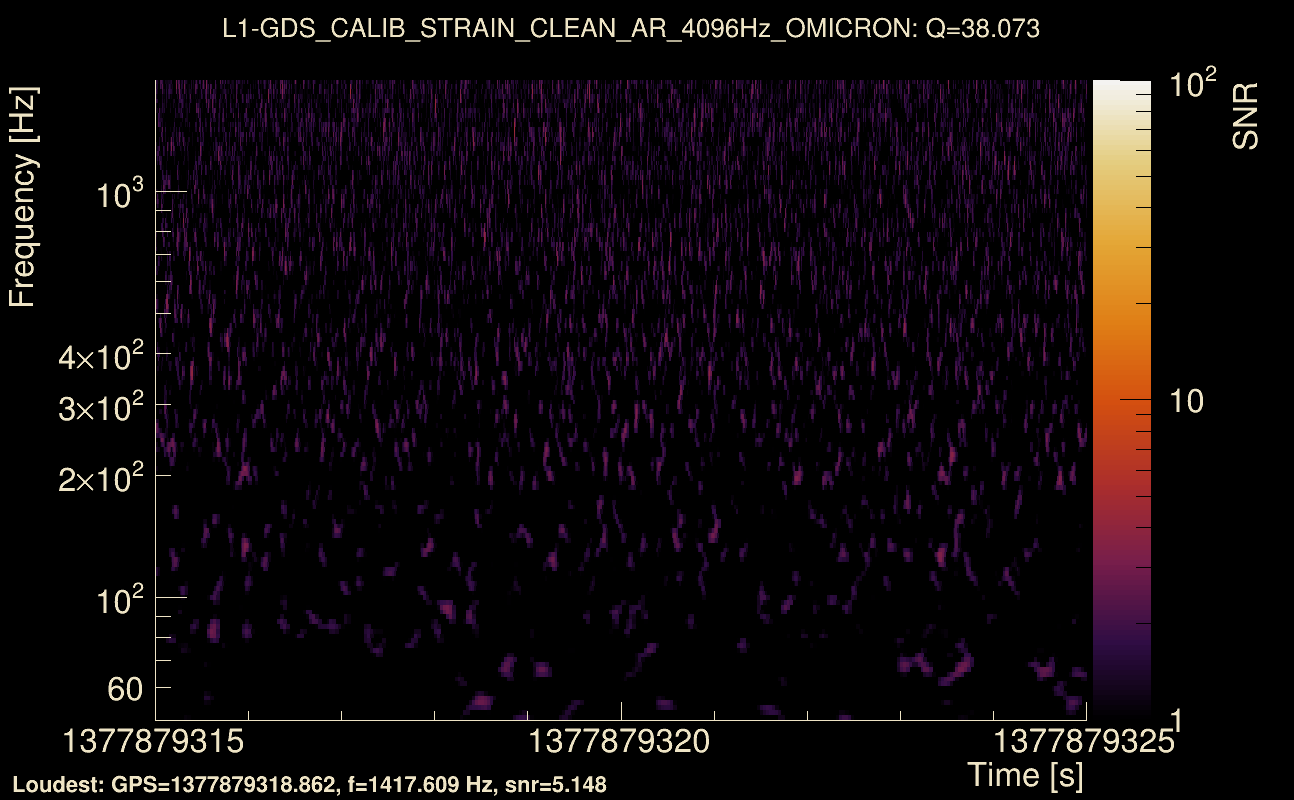
| Event time t(H1): | GPS = 1377879315 (Mon Sep 4 16:14:57 2023 ) → GPS = 1377879325 (Mon Sep 4 16:15:07 2023 ) |
| Event time t(L1): | GPS = 1377879315 (Mon Sep 4 16:15:07 2023 ) → GPS = 1377879325 (Mon Sep 4 16:15:07 2023 ) |
| Omicron analysis time window (H1): | GPS = 1377879312 → GPS = 1377879328 |
| Omicron analysis time window (L1): | GPS = 1377879312 → GPS = 1377879328 |
| Time delay between detectors t(L1) - t(H1): | 2.02213 s (slice index = 64 / 217), δt_gw = -0.00186551 s |
| Time delay uncertainty: | 0.00502345 s |
| [targeted mode] Time delay probability: | 0.875599 (0.156551 sigmas), δt_target = 0.00056386 s |
| Frequency: | 72.4449 Hz |
| Ξ: | 0.017242 ± 0.0607206 (variance = 0.00368699): Q0: 0.163878, Q1: 0.182503, Q2: 0.116291, Q3: 0.0355737, Q4: 0.0413088 |
| Rank: | R_A = 0.0136348 |
| Log of amplitude ratio (L1/H1): | 0.178064, variance = 0.476467 (L1/H1: 0.0881214, variance = 1.22063, H1/L1: -0.258275, variance = 0.734451) |
| Amplitude ratio (L1/H1): | 1.1949 ⋇ 1.99425 (L1/H1: 1.09212 ⋇ 3.01868, H1/L1: 0.772382 ⋇ 2.35608) |
| Amplitude ratio H1|L1 compatibility (probability): | 0.903143 |
| Antenna factor probability: | 1 |
| Number of rejected frequency rows: | Q0: 15 / 18, Q1: 34 / 36, Q2: 67 / 70, Q3: 131 / 134, Q4: 254 / 258 |
| Maximum signal-to-noise ratio: | H1: 4.94917, L1: 5.24078 |
| SNR variance: | H1: 0.544991, L1: 0.629174 |
| Click here for a zoomed plot | Click here for a zoomed plot | Click here for a zoomed plot | Click here for a zoomed plot | Click here for a zoomed plot |
 |
 |
 |
 |
 |
 |
 |
 |
 |
 |
 |
 |
 |
 |
 |
 |
 |
 |
 |
 |
 |
 |
 |
 |
 |
 |
 |
 |
 |
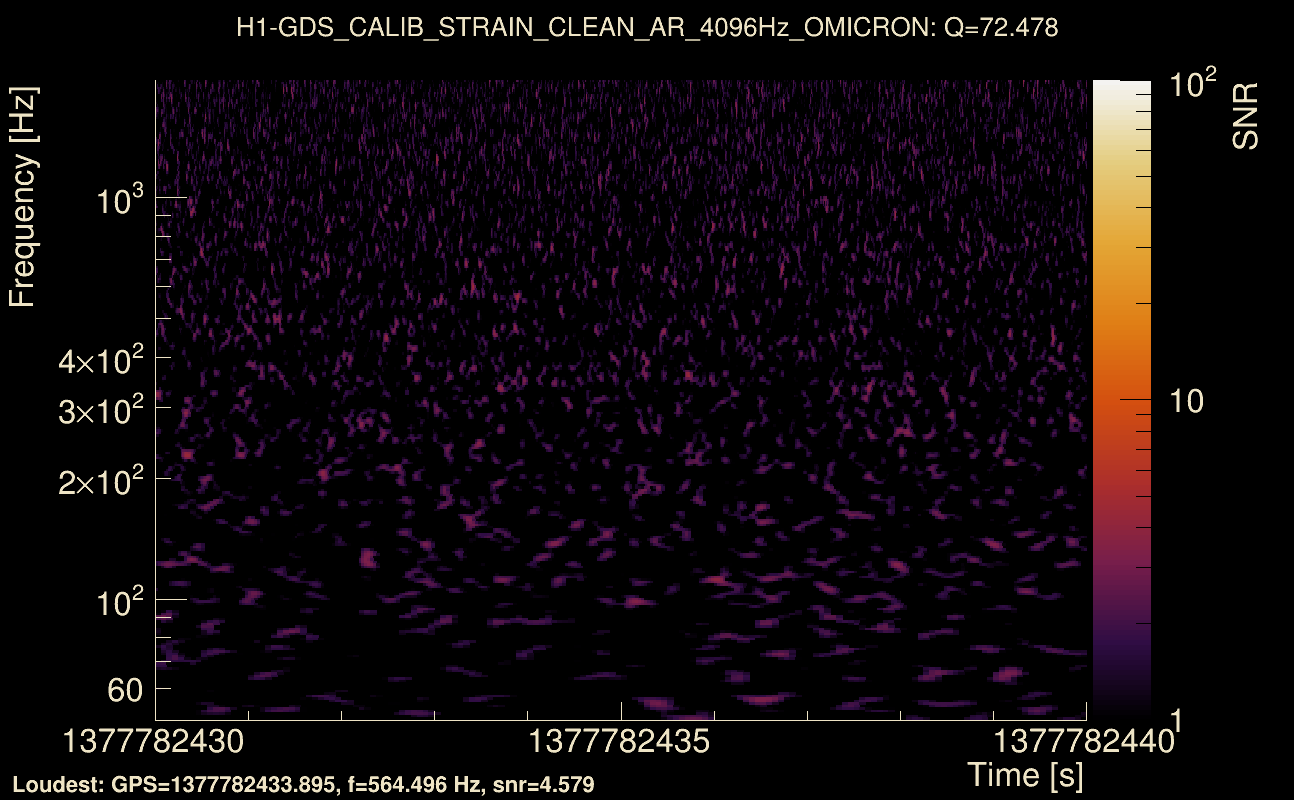
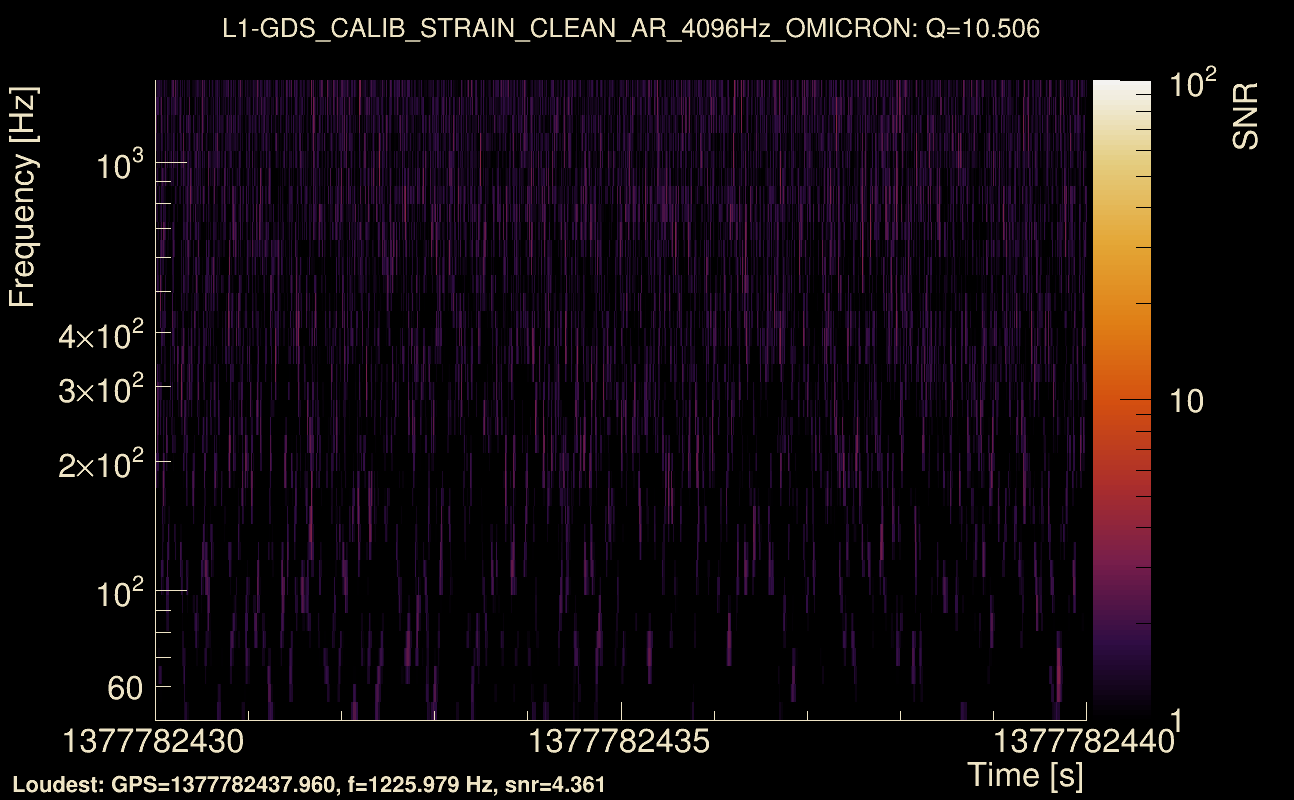
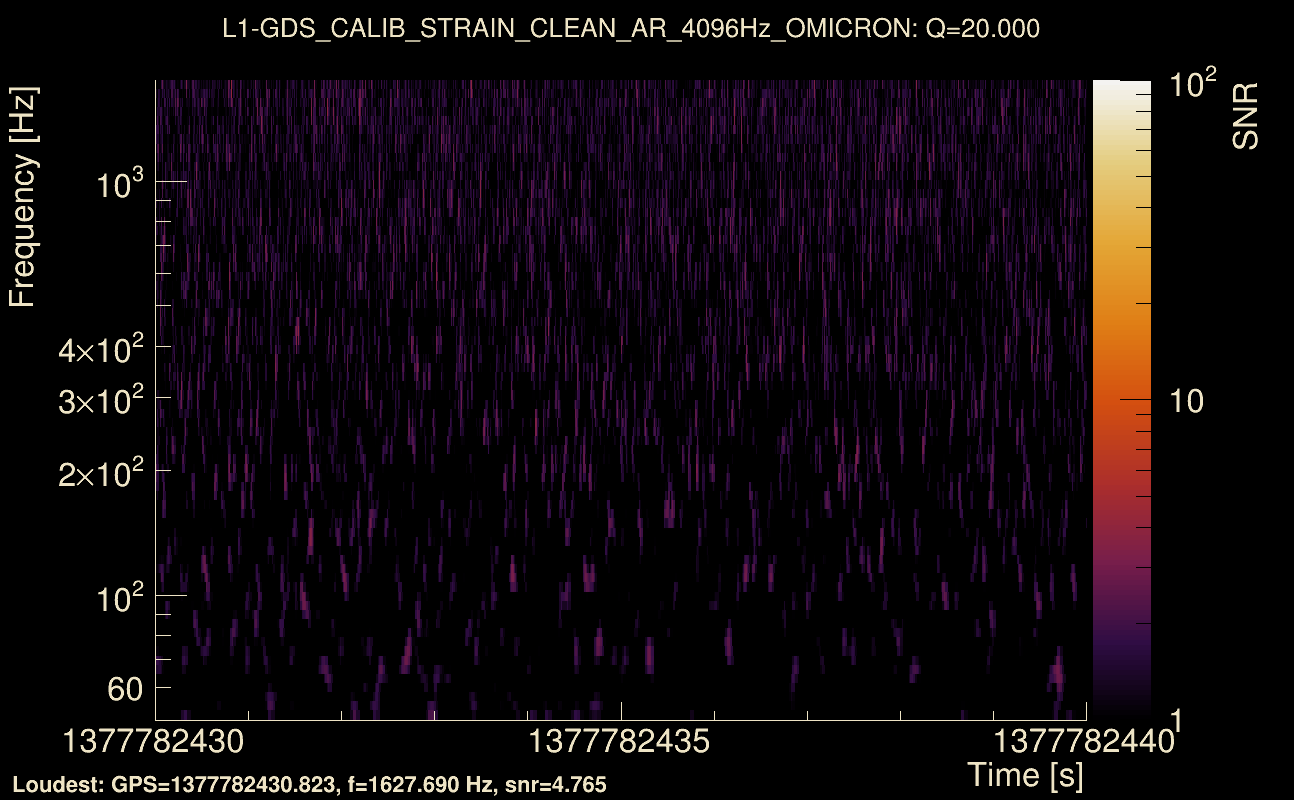
| Event time t(H1): | GPS = 1377782430 (Sun Sep 3 13:20:12 2023 ) → GPS = 1377782440 (Sun Sep 3 13:20:22 2023 ) |
| Event time t(L1): | GPS = 1377782430 (Sun Sep 3 13:20:22 2023 ) → GPS = 1377782440 (Sun Sep 3 13:20:22 2023 ) |
| Omicron analysis time window (H1): | GPS = 1377782427 → GPS = 1377782443 |
| Omicron analysis time window (L1): | GPS = 1377782427 → GPS = 1377782443 |
| Time delay between detectors t(L1) - t(H1): | 2.02729 s (slice index = 64 / 217), δt_gw = 0.00328513 s |
| Time delay uncertainty: | 0.00611875 s |
| [targeted mode] Time delay probability: | 0.795278 (0.259463 sigmas), δt_target = -0.00107908 s |
| Frequency: | 147.965 Hz |
| Ξ: | 0.0228585 ± 0.0415755 (variance = 0.00172852): Q0: 0.117571, Q1: 0.0970945, Q2: 0.0648876, Q3: 0.0798054, Q4: 0.184031 |
| Rank: | R_A = 0.0133216 |
| Log of amplitude ratio (L1/H1): | -0.0130077, variance = 0.469689 (L1/H1: -0.252454, variance = 0.884796, H1/L1: -0.214694, variance = 0.987609) |
| Amplitude ratio (L1/H1): | 0.987077 ⋇ 1.98444 (L1/H1: 0.776892 ⋇ 2.56161, H1/L1: 0.806788 ⋇ 2.70144) |
| Amplitude ratio H1|L1 compatibility (probability): | 0.732808 |
| Antenna factor probability: | 1 |
| Number of rejected frequency rows: | Q0: 13 / 18, Q1: 30 / 36, Q2: 61 / 70, Q3: 121 / 134, Q4: 240 / 258 |
| Maximum signal-to-noise ratio: | H1: 4.95298, L1: 5.0791 |
| SNR variance: | H1: 0.538251, L1: 0.544868 |
| Click here for a zoomed plot | Click here for a zoomed plot | Click here for a zoomed plot | Click here for a zoomed plot | Click here for a zoomed plot |
 |
 |
 |
 |
 |
 |
 |
 |
 |
 |
 |
 |
 |
 |
 |
 |
 |
 |
 |
 |
 |
 |
 |
 |
 |
 |
 |
 |
 |
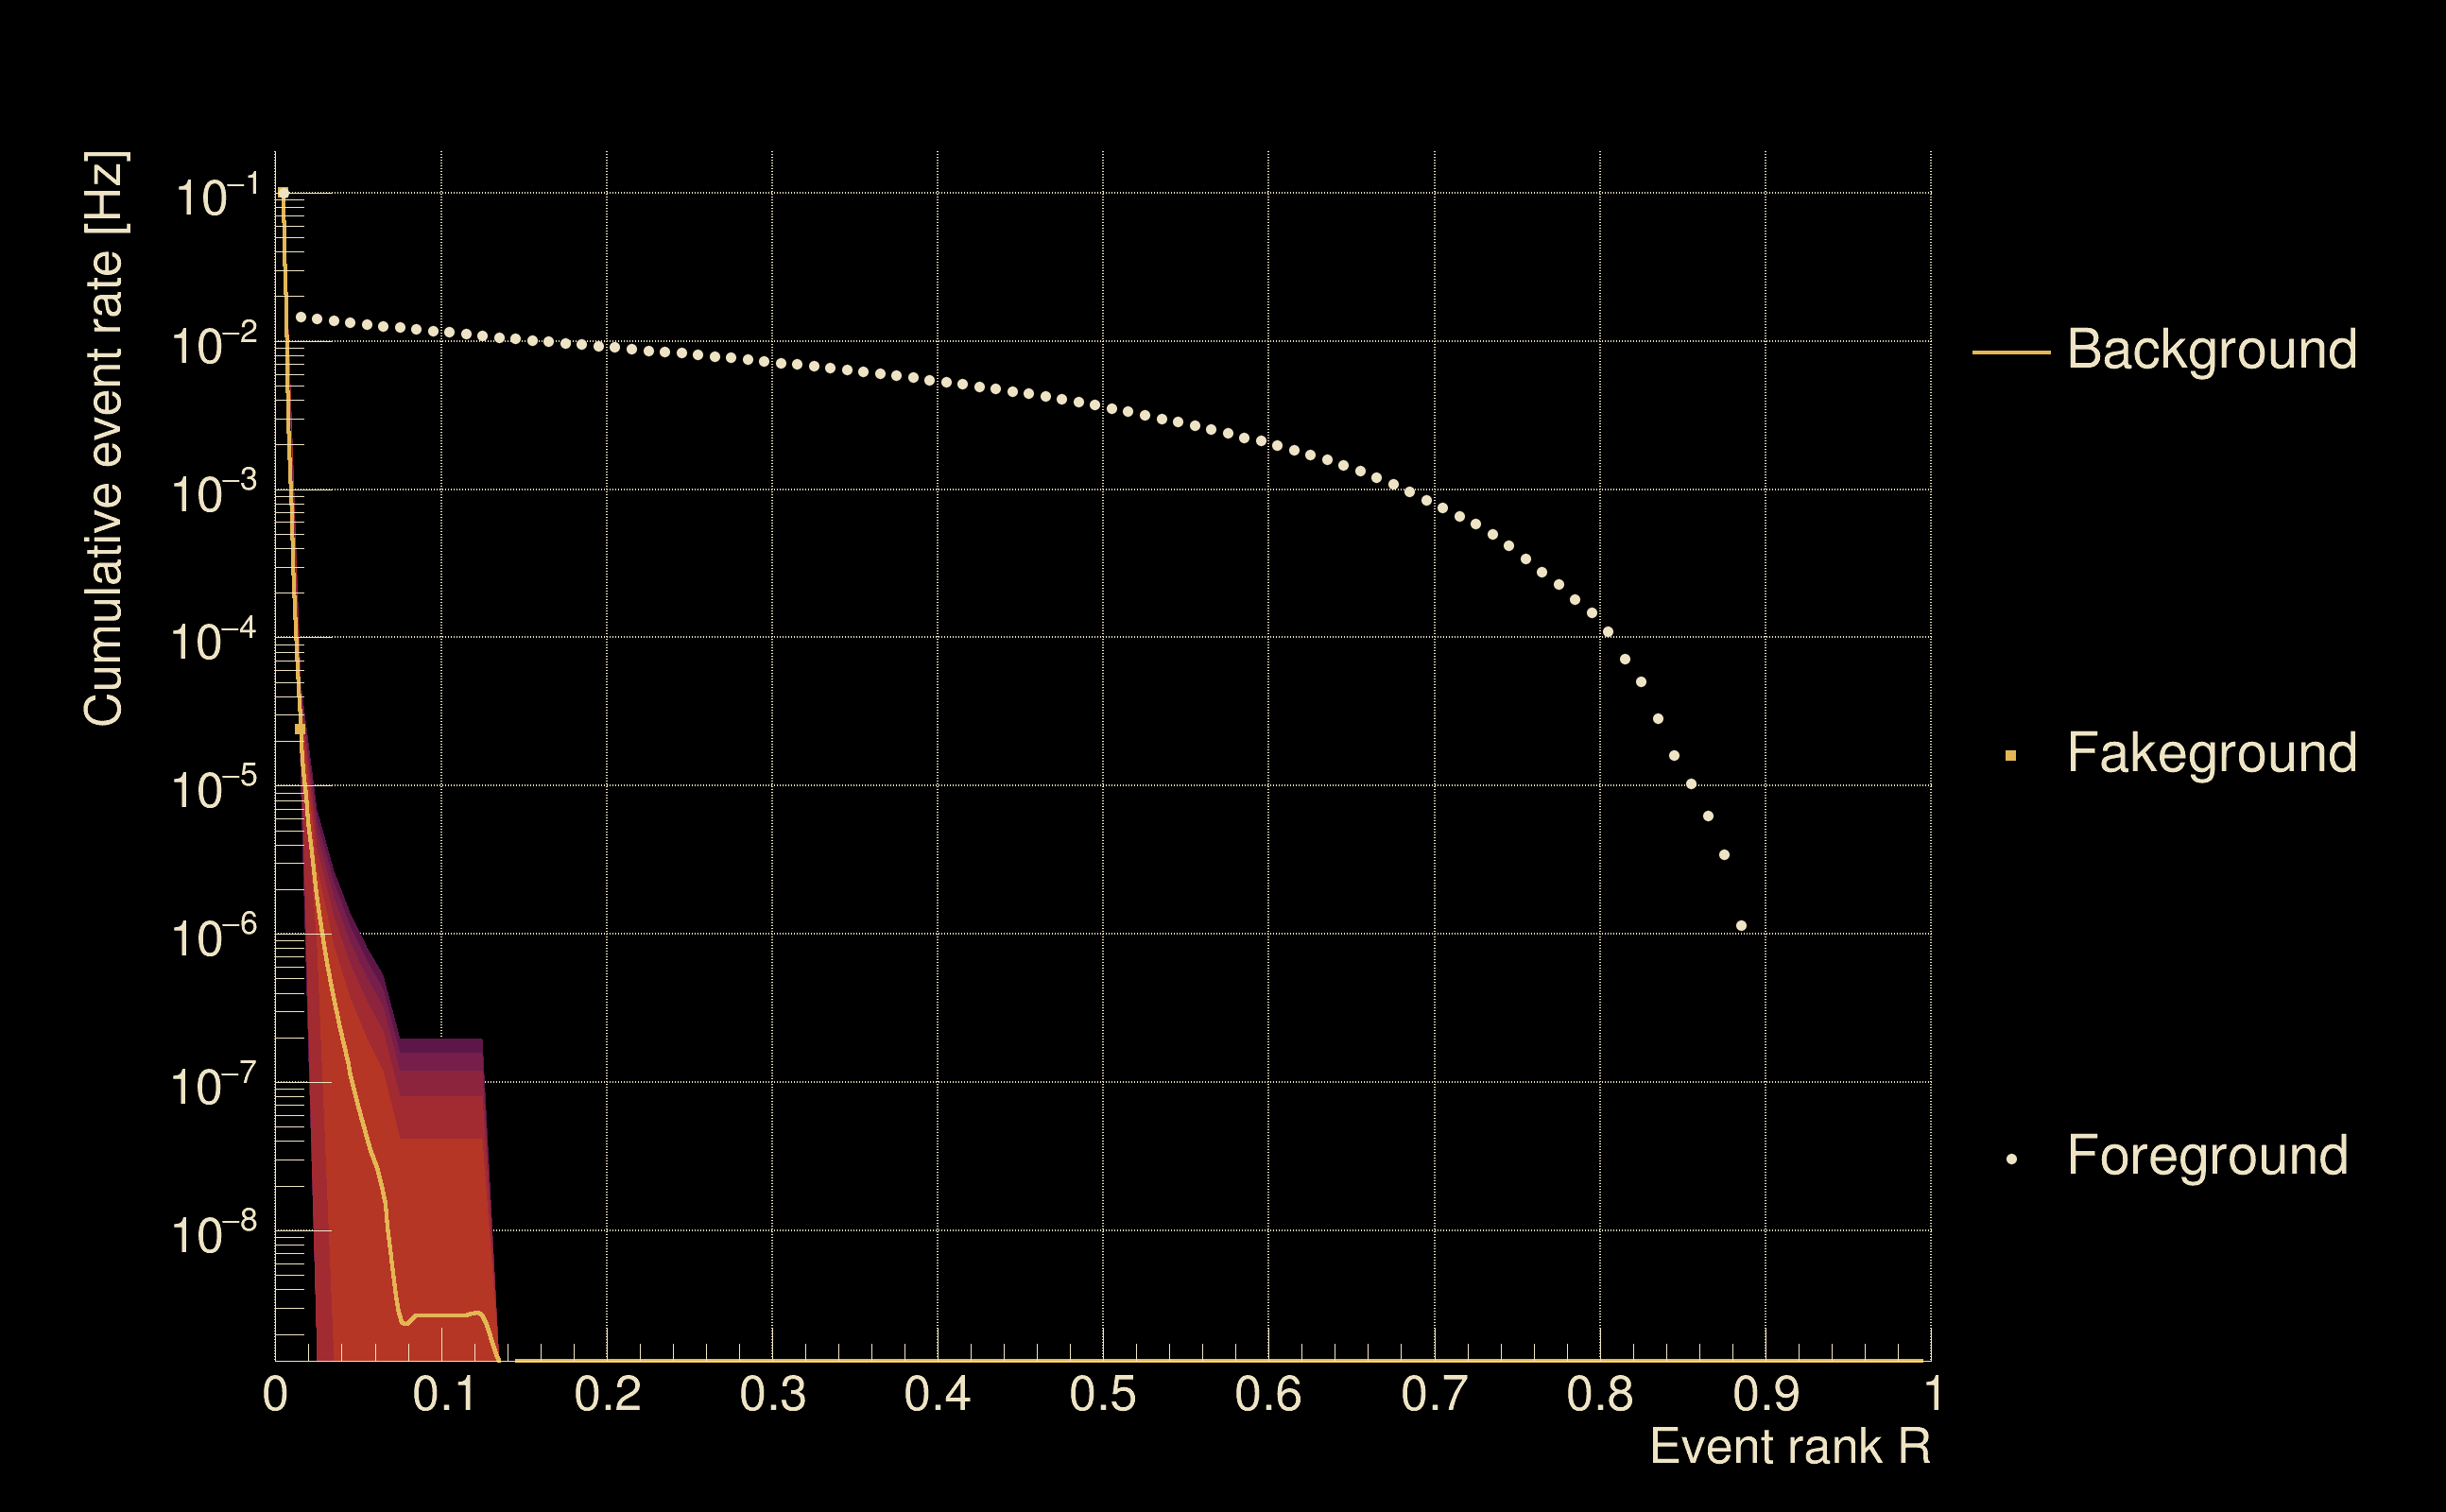
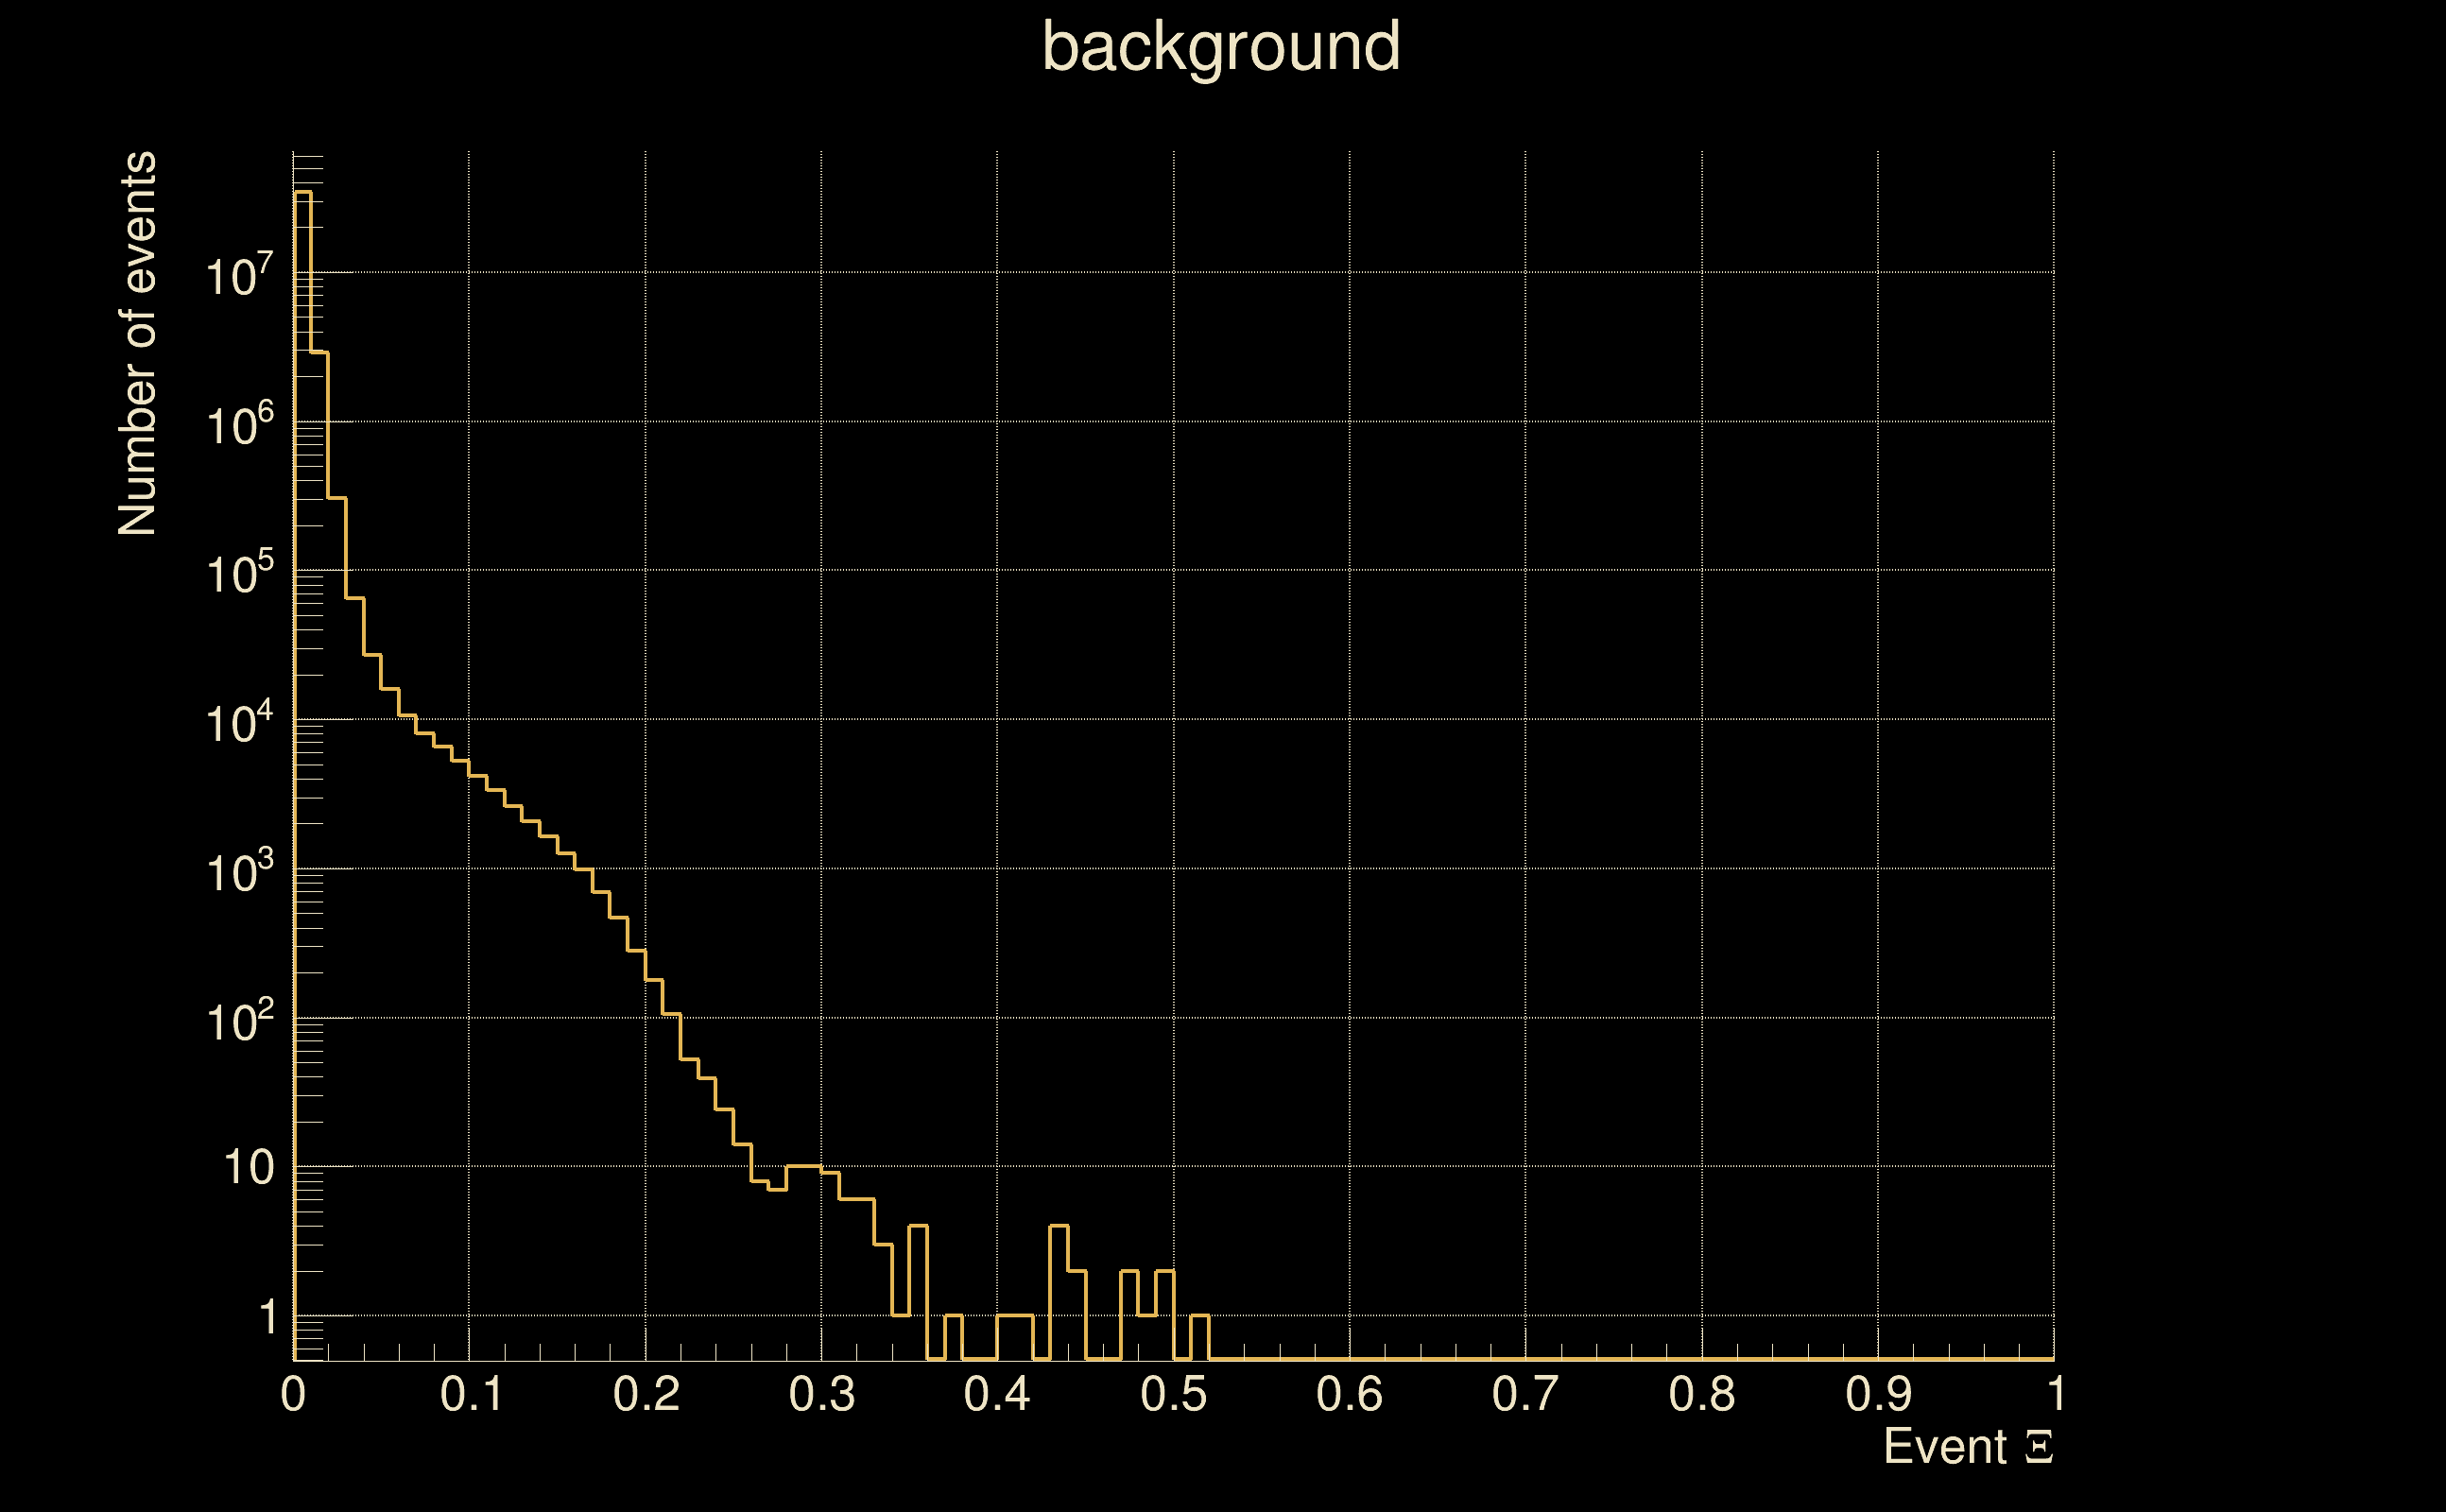
| Detection threshold: | R > 0.0398751 |
| False-alarm rate above that detection threshold: | 1.20082e-07 |
| Alternative threshold at 1/1000 yrs: | R > 0.125 |
| Alternative threshold at 1/100 yrs: | R > 0.125 |
| Alternative threshold at 1/10 yrs: | R > 0.0748735 |
| Alternative threshold at 1/1 yr: | R > 0.0563344 |
| Alternative threshold at 1/1 d: | R > 0.0159899 |
 |
|
 |
 |
 |
 |
 |
 |
 |
 |
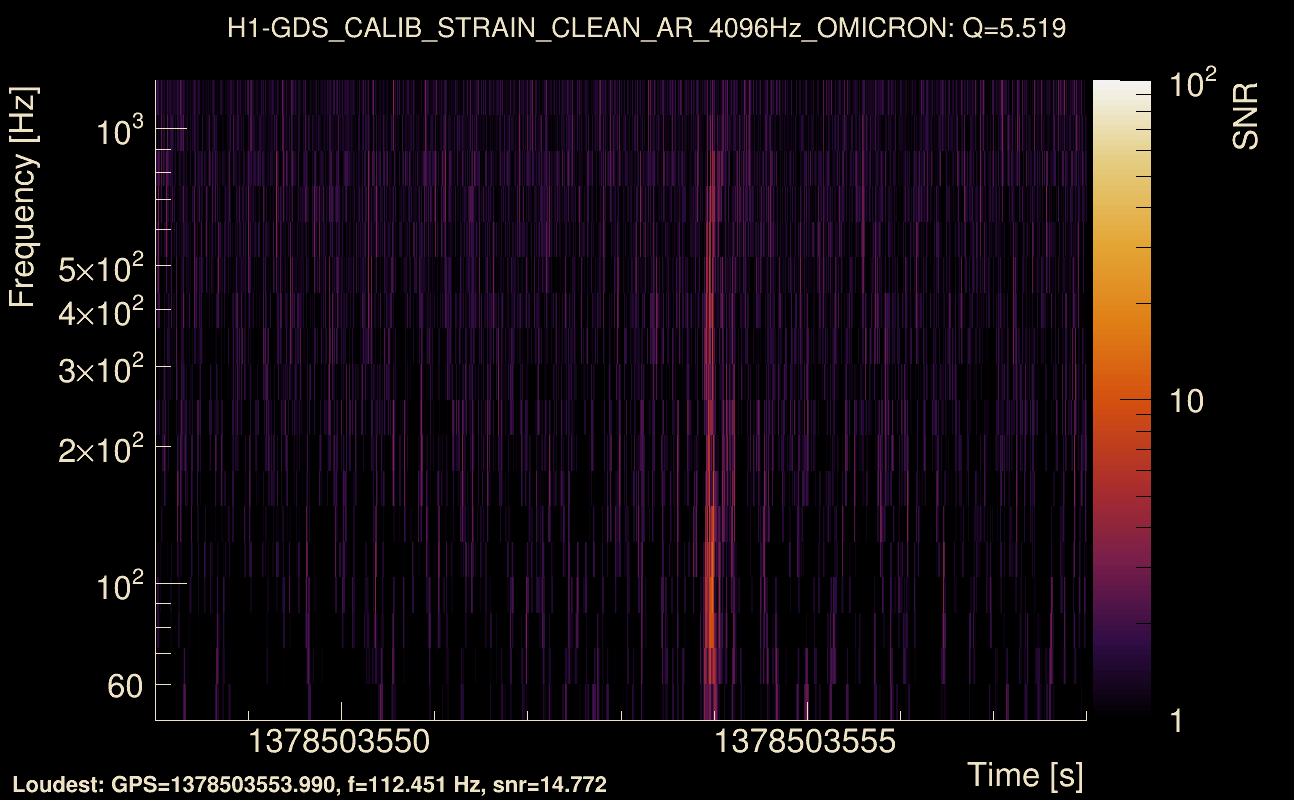
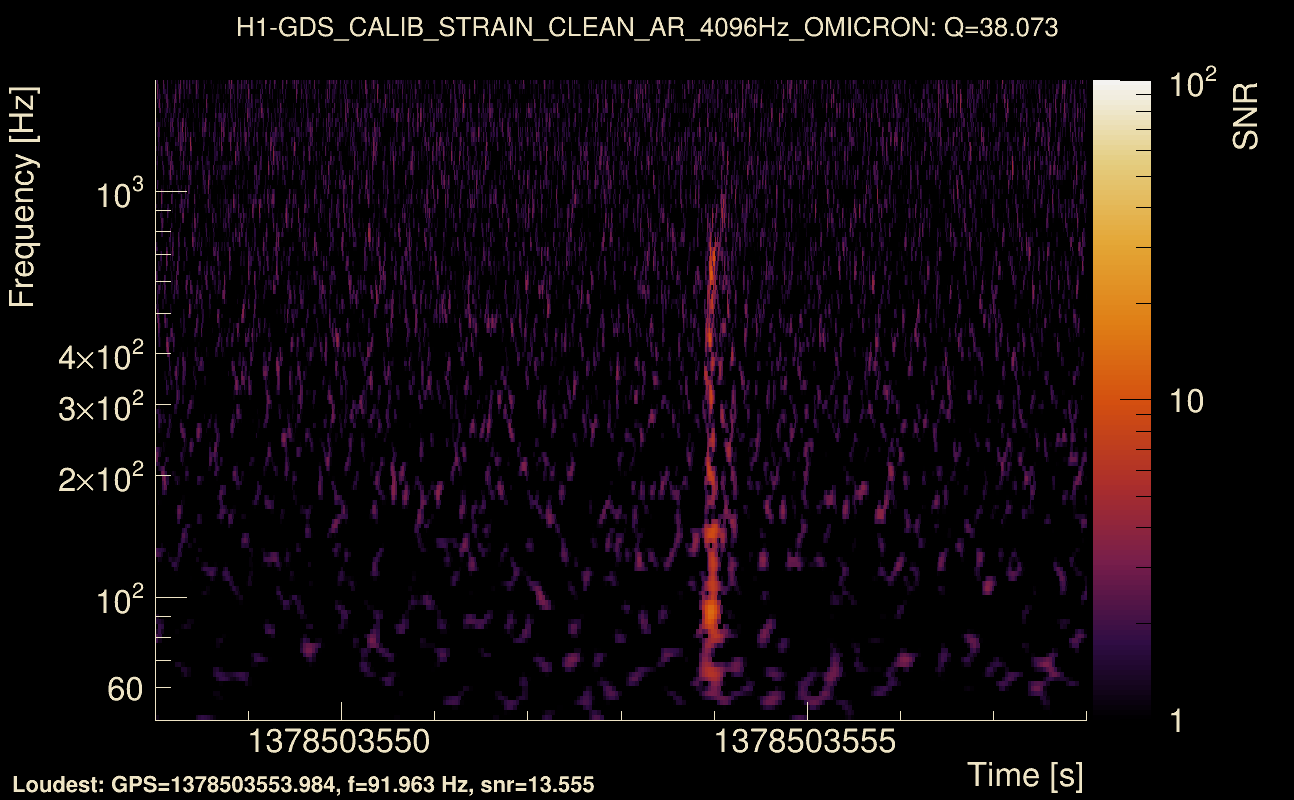
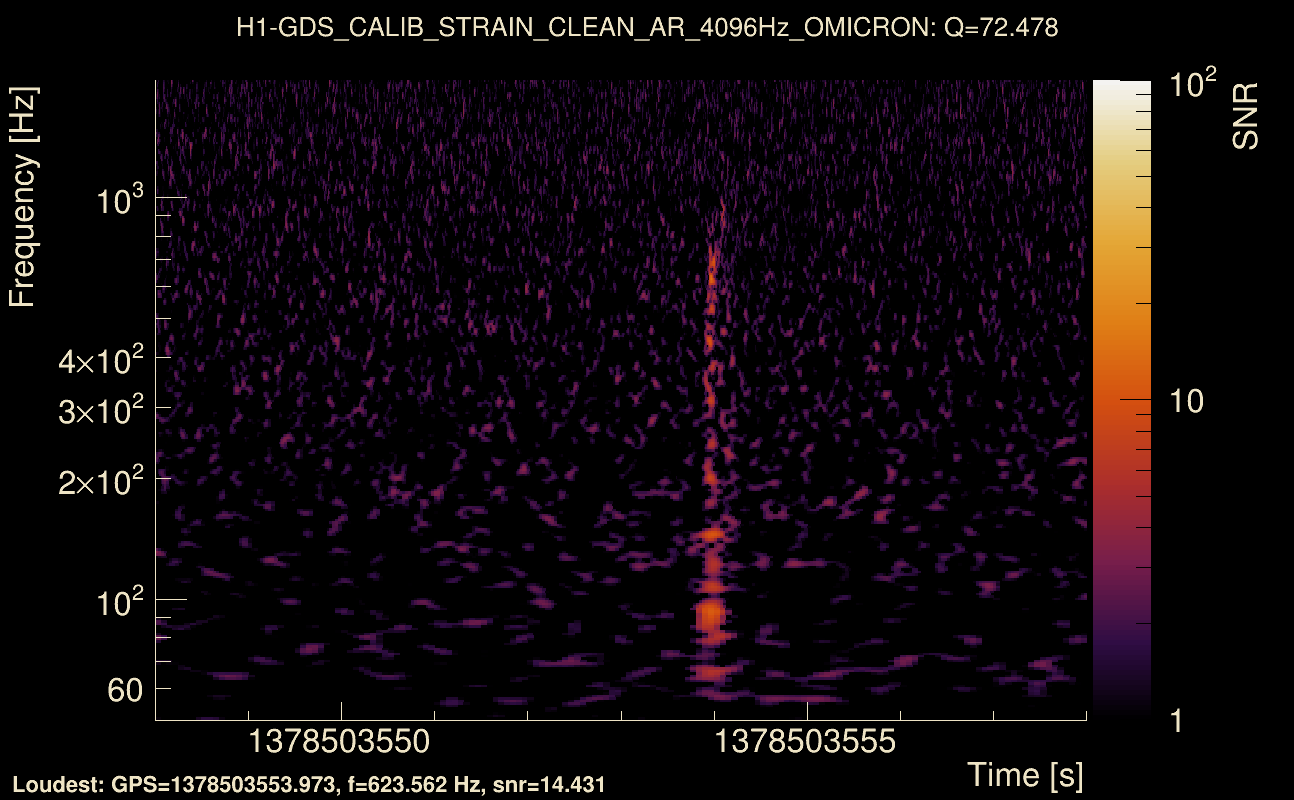
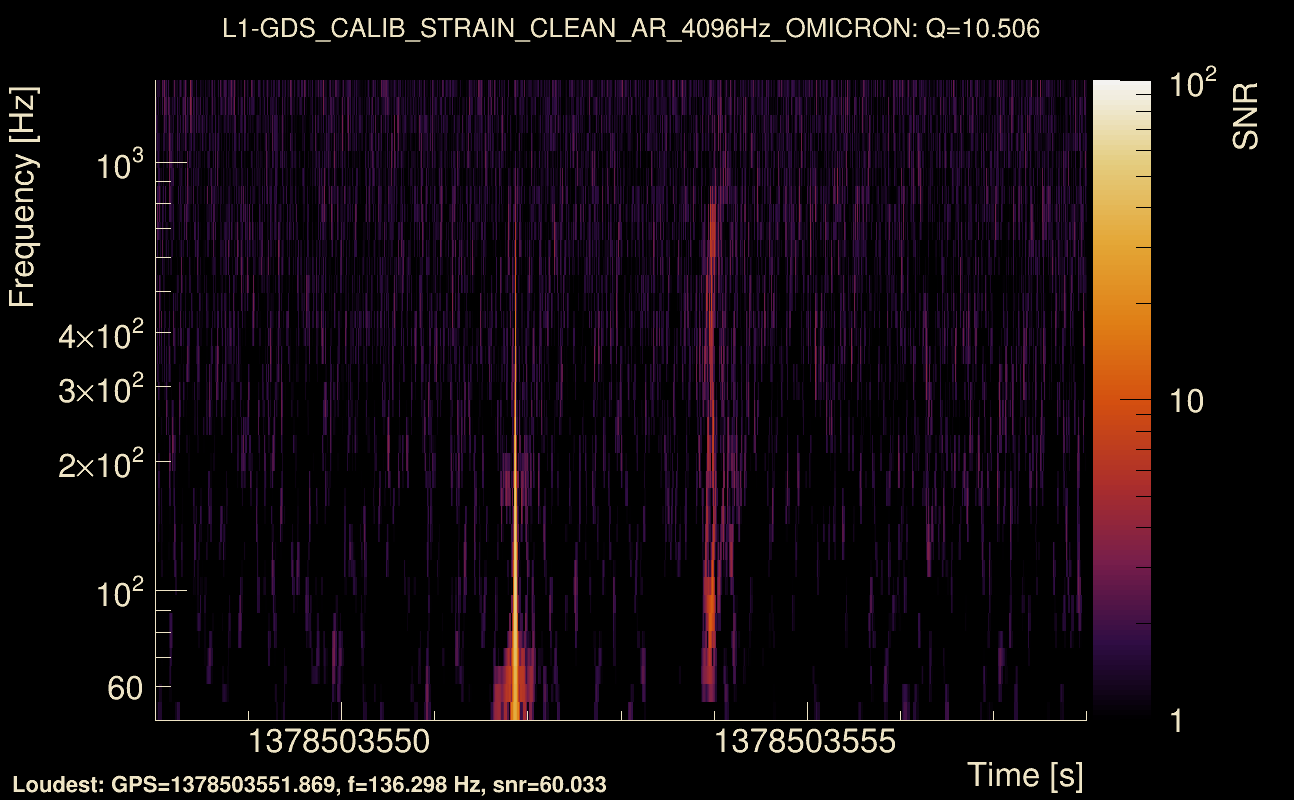
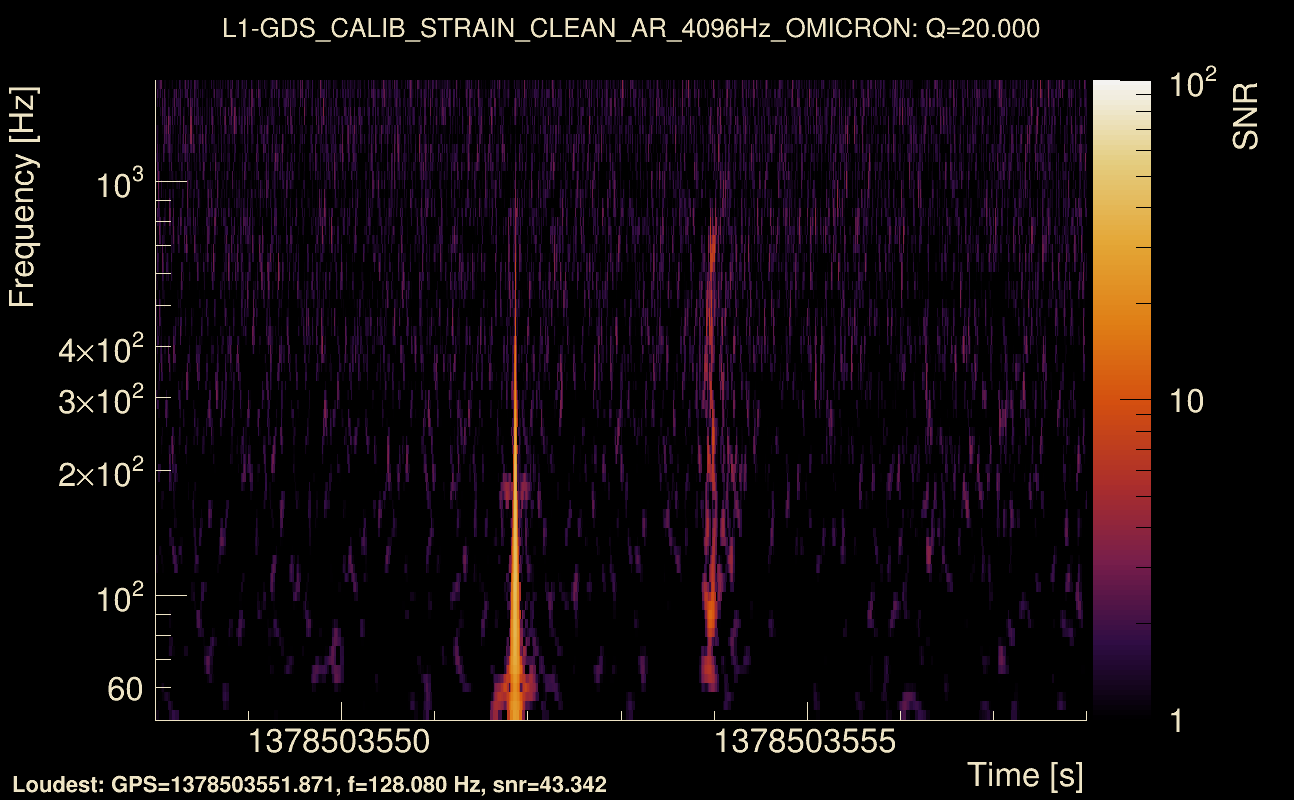
| Event time t(H1): | GPS = 1378503548 (Mon Sep 11 21:38:50 2023 ) → GPS = 1378503558 (Mon Sep 11 21:39:00 2023 ) |
| Event time t(L1): | GPS = 1378503548 (Mon Sep 11 21:39:00 2023 ) → GPS = 1378503558 (Mon Sep 11 21:39:00 2023 ) |
| Omicron analysis time window (H1): | GPS = 1378503545 → GPS = 1378503561 |
| Omicron analysis time window (L1): | GPS = 1378503545 → GPS = 1378503561 |
| Time delay between detectors t(L1) - t(H1): | -2.11563 s (slice index = 154 / 217), δt_gw = 0.000368274 s |
| Time delay uncertainty: | 0.00611706 s |
| [targeted mode] Time delay probability: | 0.839226 (0.202884 sigmas), δt_target = 0.00169754 s |
| Frequency: | 153.813 Hz |
| Ξ: | 0.306547 ± 0.0224173 (variance = 0.000502534): Q0: 0.759711, Q1: 0.715872, Q2: 0.726295, Q3: 0.733138, Q4: 0.77652 |
| Rank: | R_A = 0.122869 |
| Log of amplitude ratio (L1/H1): | 1.75903, variance = 0.445214 (L1/H1: 1.02222, variance = 0.671541, H1/L1: -1.78183, variance = 0.472544) |
| Amplitude ratio (L1/H1): | 5.80683 ⋇ 1.94886 (L1/H1: 2.77936 ⋇ 2.26931, H1/L1: 0.16833 ⋇ 1.98858) |
| Amplitude ratio H1|L1 compatibility (probability): | 0.4776 |
| Antenna factor probability: | 1 |
| Number of rejected frequency rows: | Q0: 10 / 18, Q1: 22 / 36, Q2: 42 / 70, Q3: 85 / 134, Q4: 193 / 258 |
| Maximum signal-to-noise ratio: | H1: 15.9673, L1: 90.7804 |
| SNR variance: | H1: 0.497871, L1: 3.88307 |
| Click here for a zoomed plot | Click here for a zoomed plot | Click here for a zoomed plot | Click here for a zoomed plot | Click here for a zoomed plot |
 |
 |
 |
 |
 |
 |
 |
 |
 |
 |
 |
 |
 |
 |
 |
 |
 |
 |
 |
 |
 |
 |
 |
 |
 |
 |
 |
 |
 |
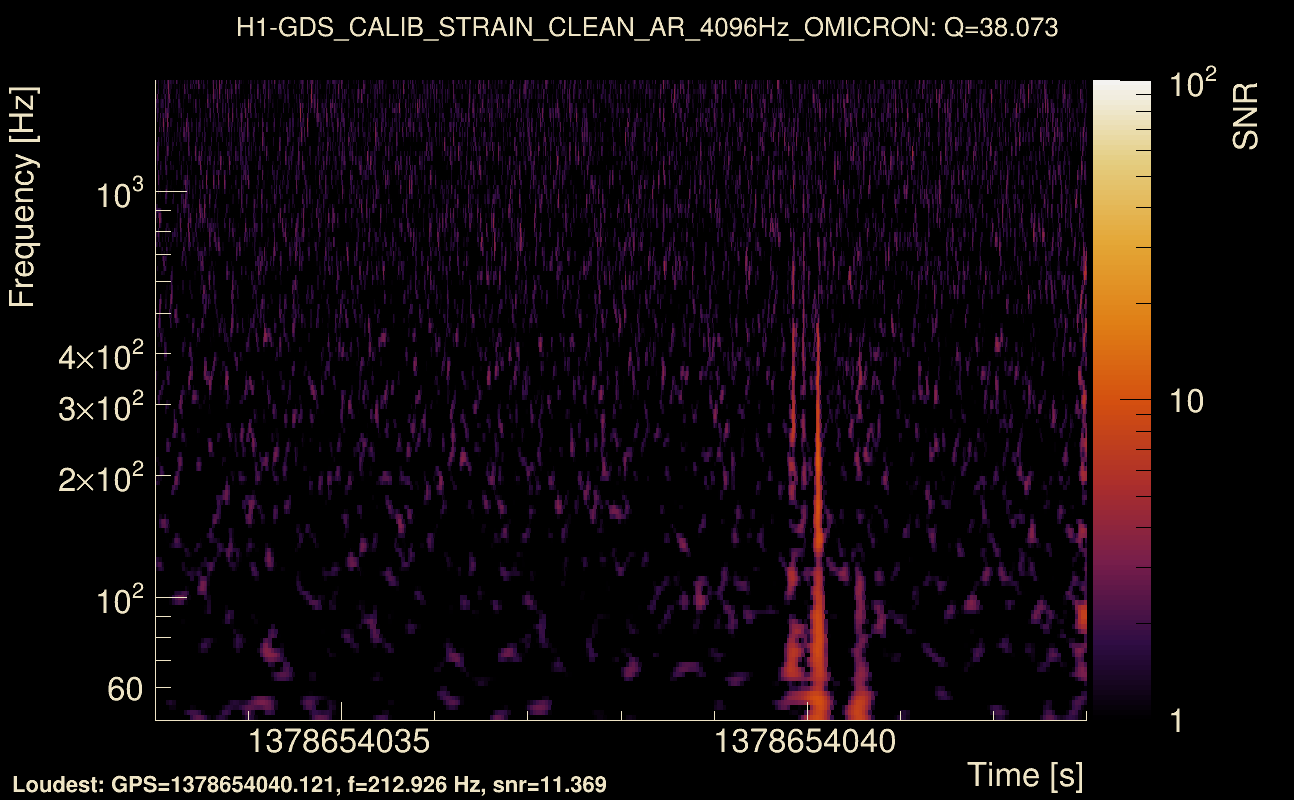
| Event time t(H1): | GPS = 1378654033 (Wed Sep 13 15:26:55 2023 ) → GPS = 1378654043 (Wed Sep 13 15:27:05 2023 ) |
| Event time t(L1): | GPS = 1378654033 (Wed Sep 13 15:27:05 2023 ) → GPS = 1378654043 (Wed Sep 13 15:27:05 2023 ) |
| Omicron analysis time window (H1): | GPS = 1378654030 → GPS = 1378654046 |
| Omicron analysis time window (L1): | GPS = 1378654030 → GPS = 1378654046 |
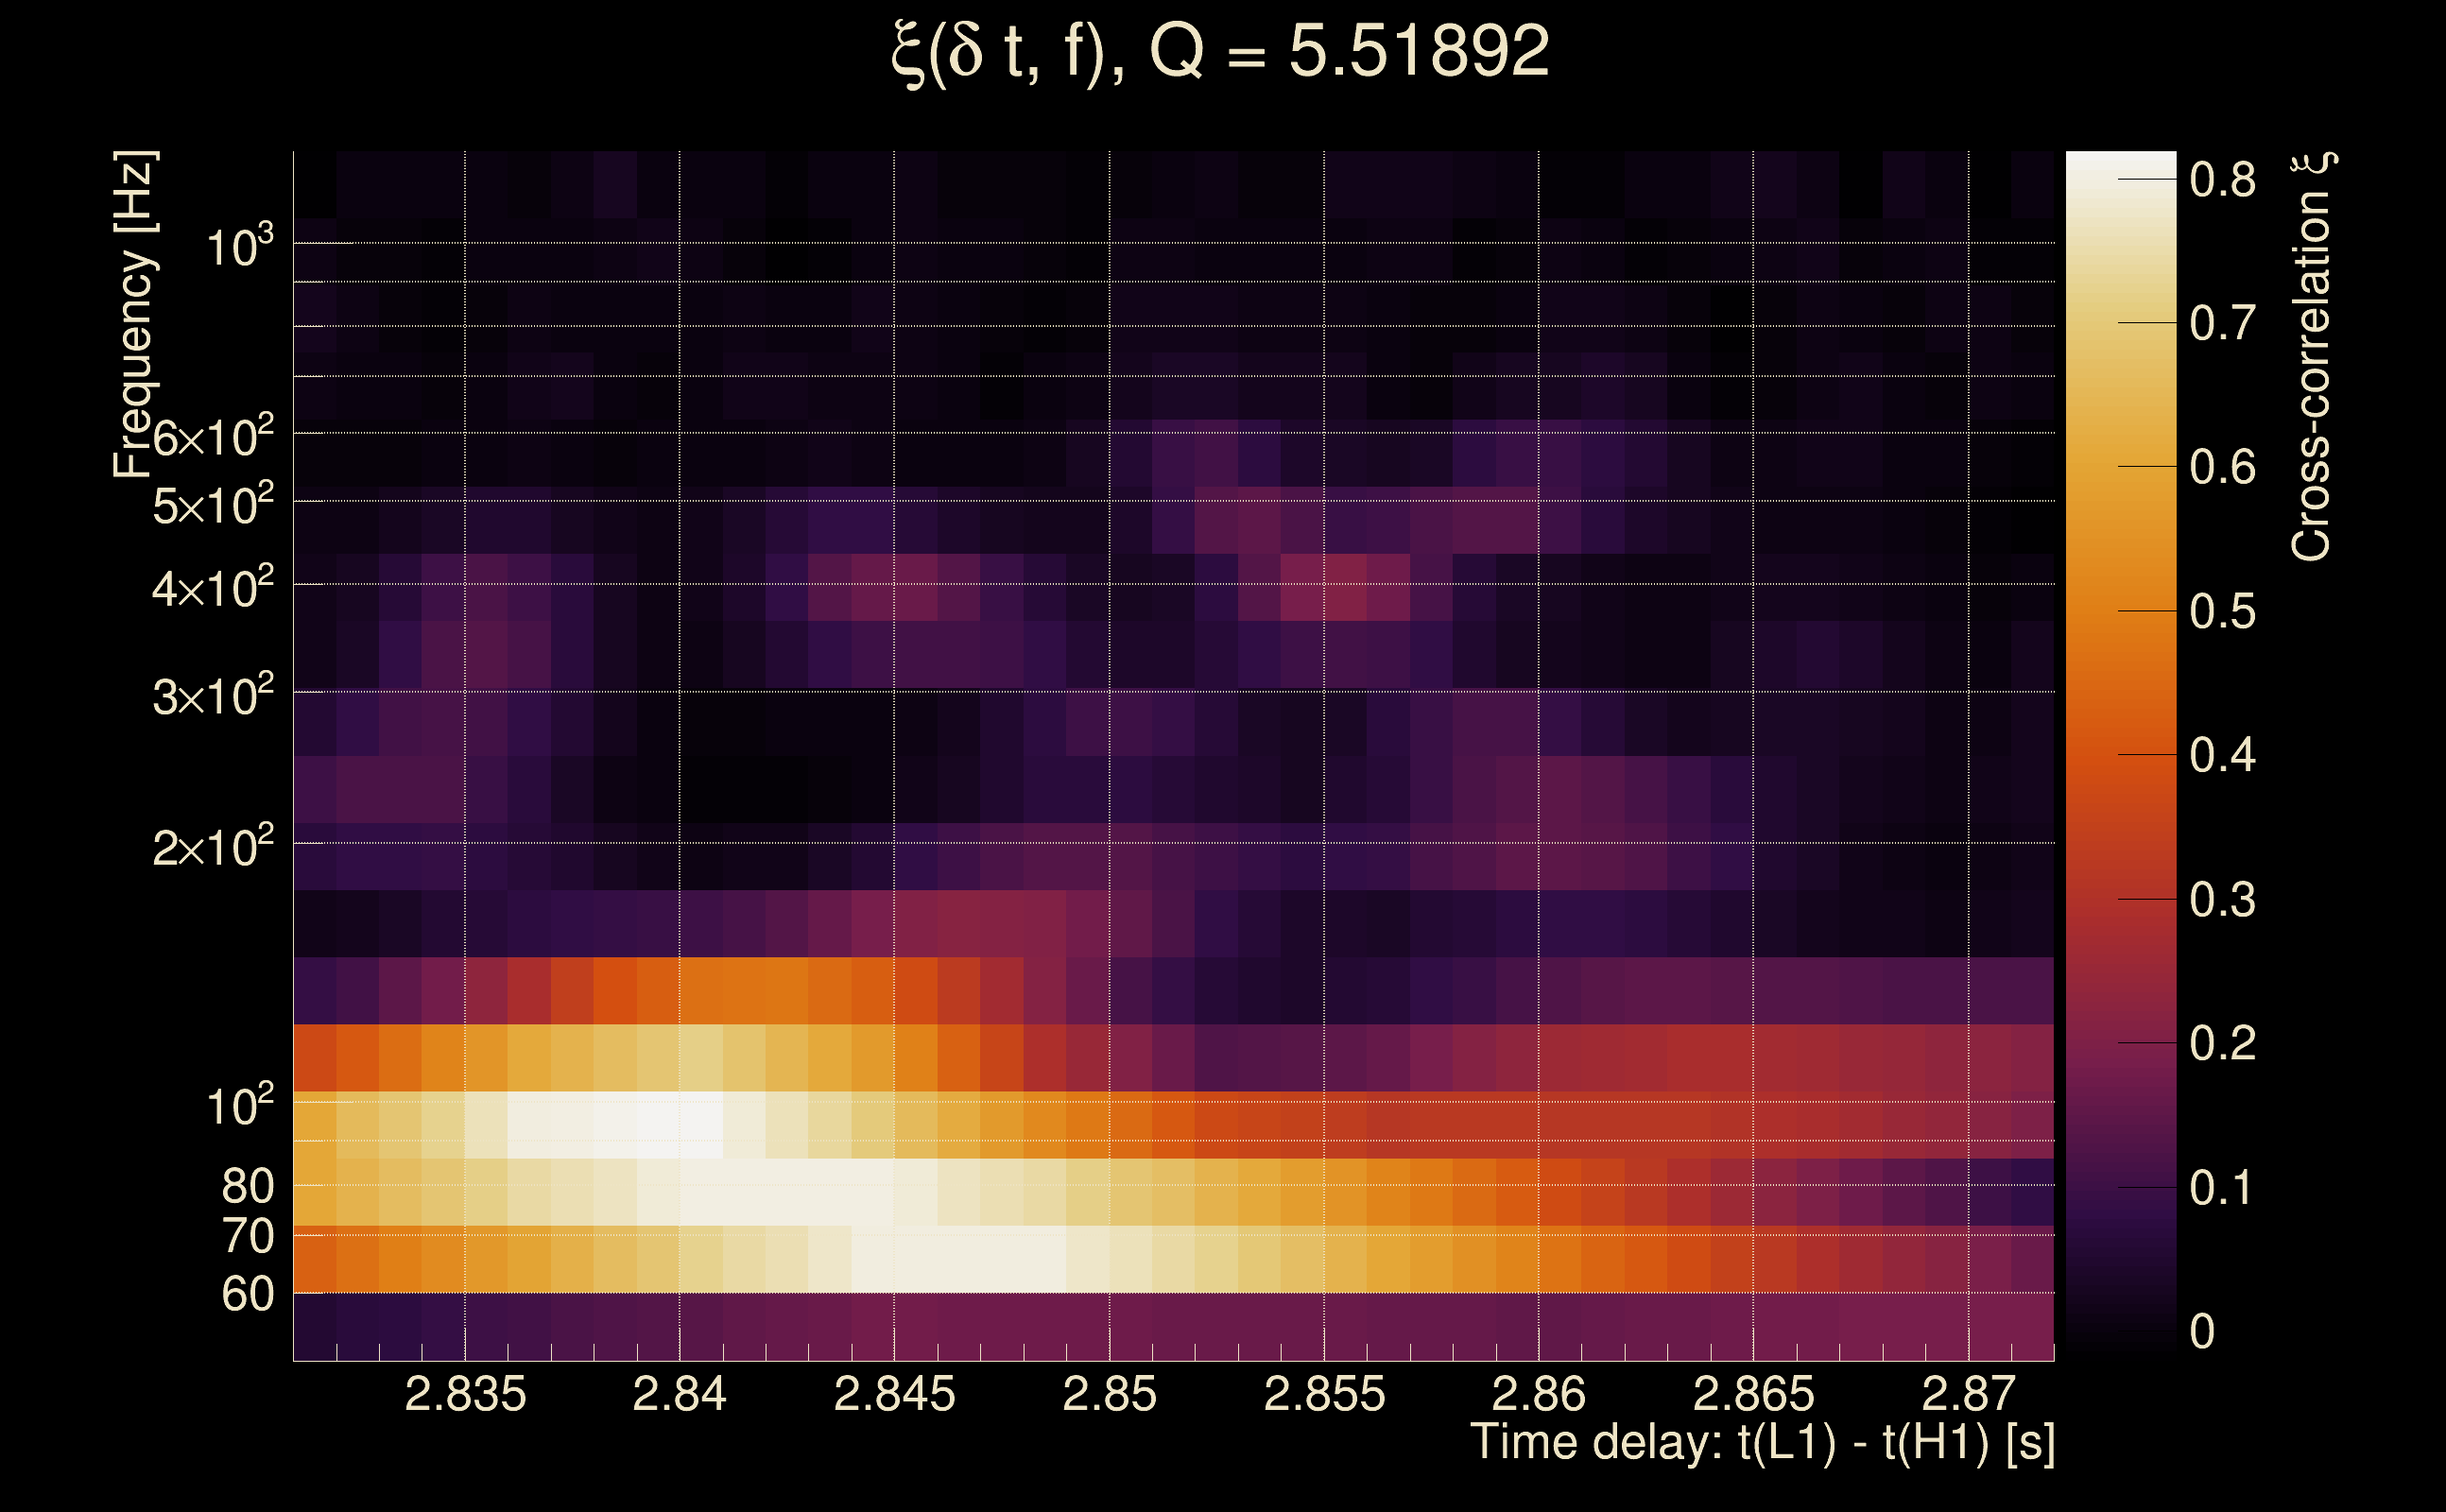
| Time delay between detectors t(L1) - t(H1): | 2.85144 s (slice index = 46 / 217), δt_gw = -0.000555658 s |
| Time delay uncertainty: | 0.0048064 s |
| [targeted mode] Time delay probability: | 0.932425 (0.0847939 sigmas), δt_target = 0.00160933 s |
| Frequency: | 127.043 Hz |
| Ξ: | 0.301879 ± 0.093819 (variance = 0.008802): Q0: 0.601121, Q1: 0.538459, Q2: 0.546062, Q3: 0.513222, Q4: 0.326401 |
| Rank: | R_A = 0.0698185 |
| Log of amplitude ratio (L1/H1): | -1.22827, variance = 0.458968 (L1/H1: -1.44655, variance = 0.634833, H1/L1: 0.136664, variance = 0.651079) |
| Amplitude ratio (L1/H1): | 0.292797 ⋇ 1.96889 (L1/H1: 0.235382 ⋇ 2.21835, H1/L1: 1.14644 ⋇ 2.24094) |
| Amplitude ratio H1|L1 compatibility (probability): | 0.248041 |
| Antenna factor probability: | 1 |
| Number of rejected frequency rows: | Q0: 7 / 18, Q1: 16 / 36, Q2: 44 / 70, Q3: 95 / 134, Q4: 225 / 258 |
| Maximum signal-to-noise ratio: | H1: 24.5919, L1: 10.9966 |
| SNR variance: | H1: 0.50812, L1: 0.51049 |
| Click here for a zoomed plot | Click here for a zoomed plot | Click here for a zoomed plot | Click here for a zoomed plot | Click here for a zoomed plot |
 |
 |
 |
 |
 |
 |
 |
 |
 |
 |
 |
 |
 |
 |
 |
 |
 |
 |
 |
 |
 |
 |
 |
 |
 |
 |
 |
 |
 |
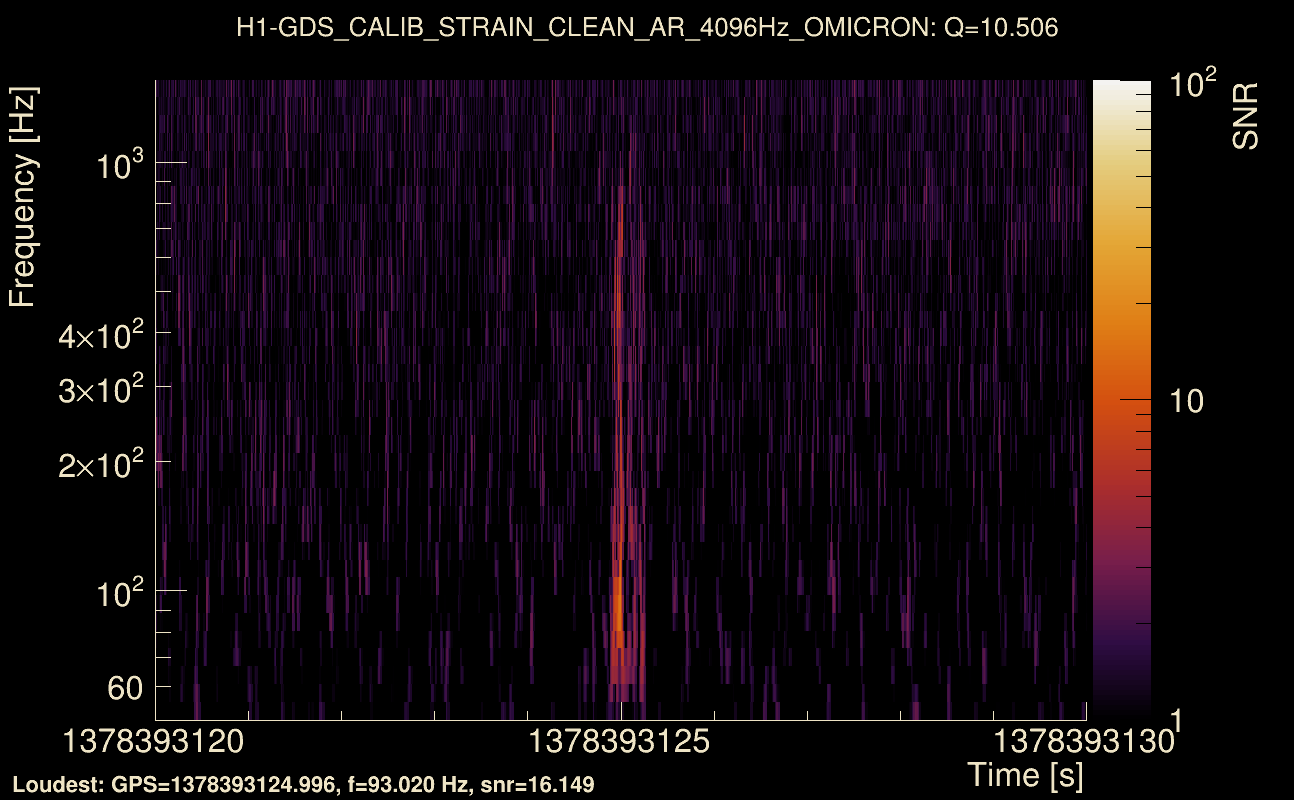
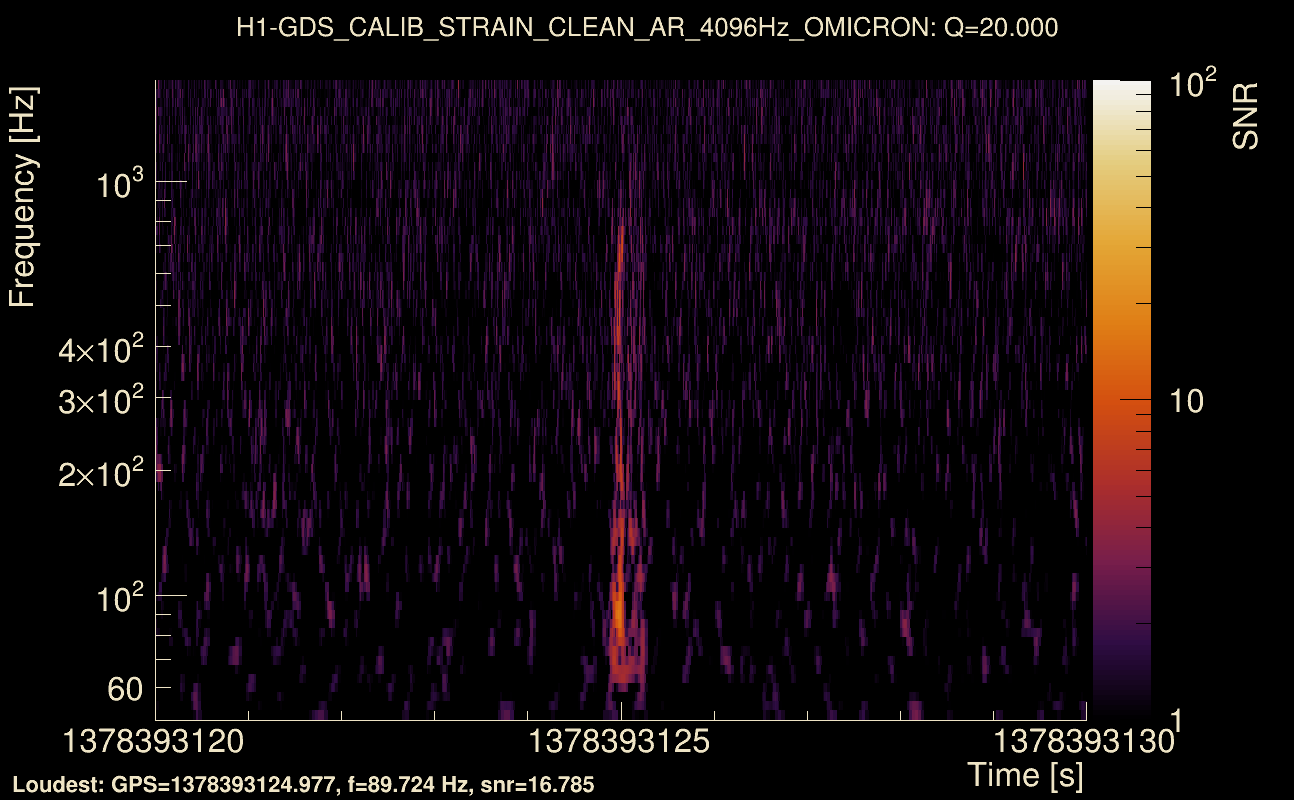
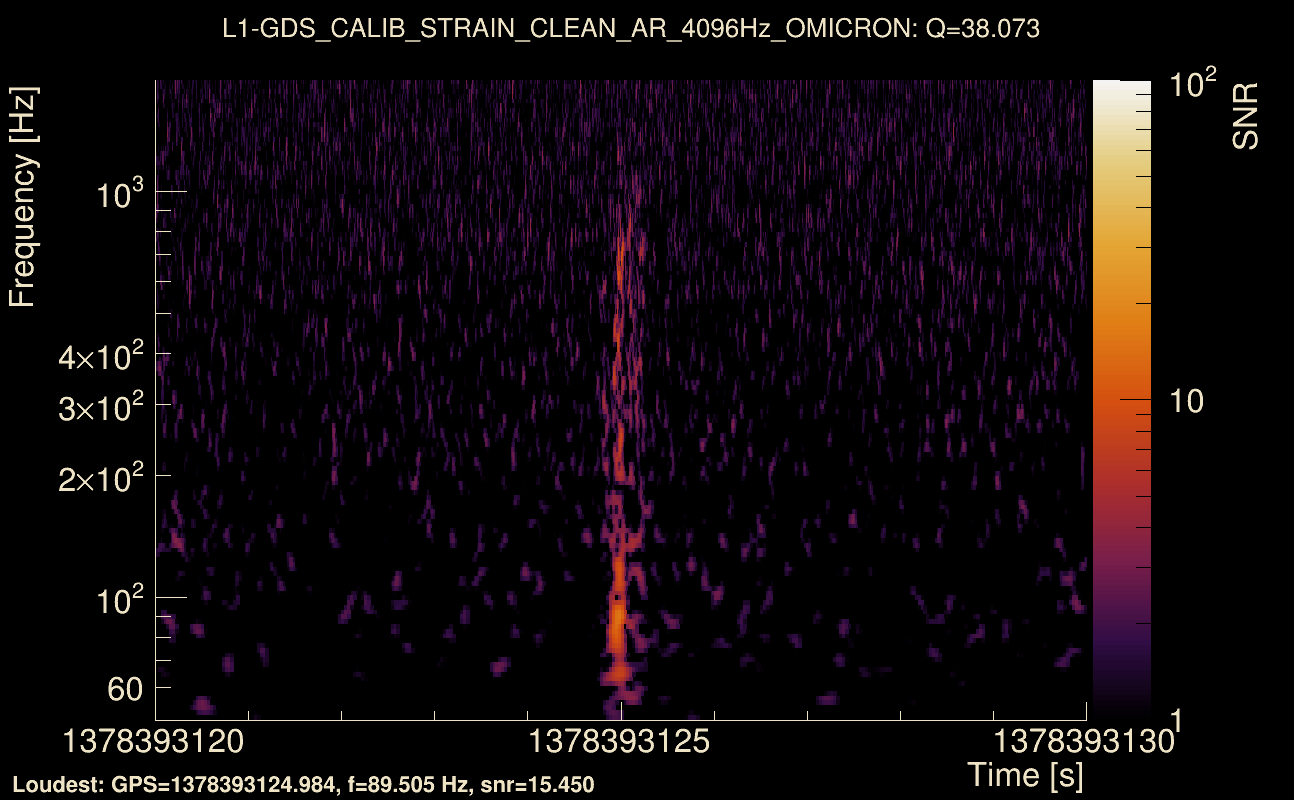
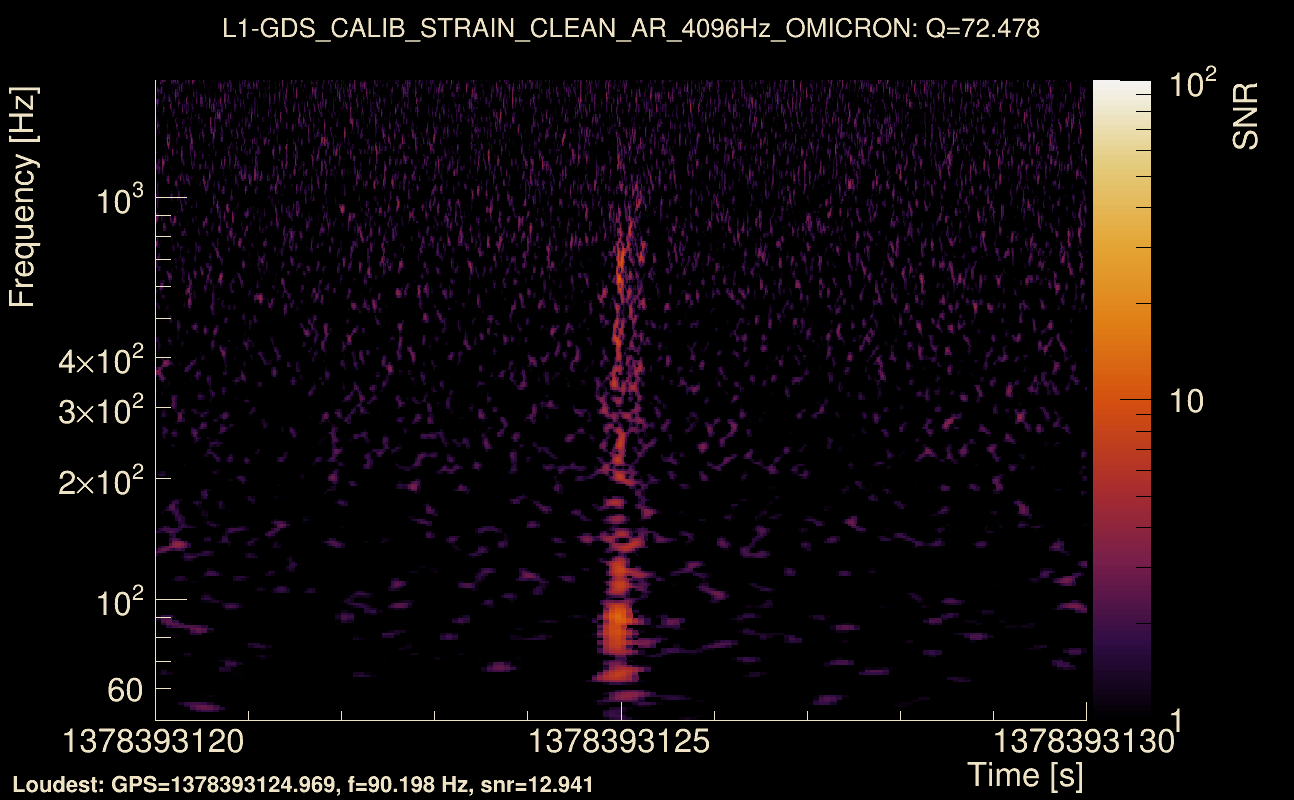
| Event time t(H1): | GPS = 1378393120 (Sun Sep 10 14:58:22 2023 ) → GPS = 1378393130 (Sun Sep 10 14:58:32 2023 ) |
| Event time t(L1): | GPS = 1378393120 (Sun Sep 10 14:58:32 2023 ) → GPS = 1378393130 (Sun Sep 10 14:58:32 2023 ) |
| Omicron analysis time window (H1): | GPS = 1378393117 → GPS = 1378393133 |
| Omicron analysis time window (L1): | GPS = 1378393117 → GPS = 1378393133 |
| Time delay between detectors t(L1) - t(H1): | -0.0456052 s (slice index = 109 / 217), δt_gw = 0.000394828 s |
| Time delay uncertainty: | 0.00495841 s |
| [targeted mode] Time delay probability: | 0.856792 (0.18046 sigmas), δt_target = -0.000963211 s |
| Frequency: | 183.292 Hz |
| Ξ: | 0.246366 ± 0.0908289 (variance = 0.0082499): Q0: 0.496677, Q1: 0.457704, Q2: 0.487507, Q3: 0.316427, Q4: 0.280687 |
| Rank: | R_A = 0.0655336 |
| Log of amplitude ratio (L1/H1): | 0.350808, variance = 0.205077 (L1/H1: -0.226187, variance = 0.422707, H1/L1: -0.67504, variance = 0.366834) |
| Amplitude ratio (L1/H1): | 1.42021 ⋇ 1.57279 (L1/H1: 0.797569 ⋇ 1.91585, H1/L1: 0.509136 ⋇ 1.83248) |
| Amplitude ratio H1|L1 compatibility (probability): | 0.310461 |
| Antenna factor probability: | 1 |
| Number of rejected frequency rows: | Q0: 6 / 18, Q1: 19 / 36, Q2: 50 / 70, Q3: 113 / 134, Q4: 238 / 258 |
| Maximum signal-to-noise ratio: | H1: 16.5061, L1: 22.0193 |
| SNR variance: | H1: 0.638667, L1: 0.744699 |
| Click here for a zoomed plot | Click here for a zoomed plot | Click here for a zoomed plot | Click here for a zoomed plot | Click here for a zoomed plot |
 |
 |
 |
 |
 |
 |
 |
 |
 |
 |
 |
 |
 |
 |
 |
 |
 |
 |
 |
 |
 |
 |
 |
 |
 |
 |
 |
 |
 |
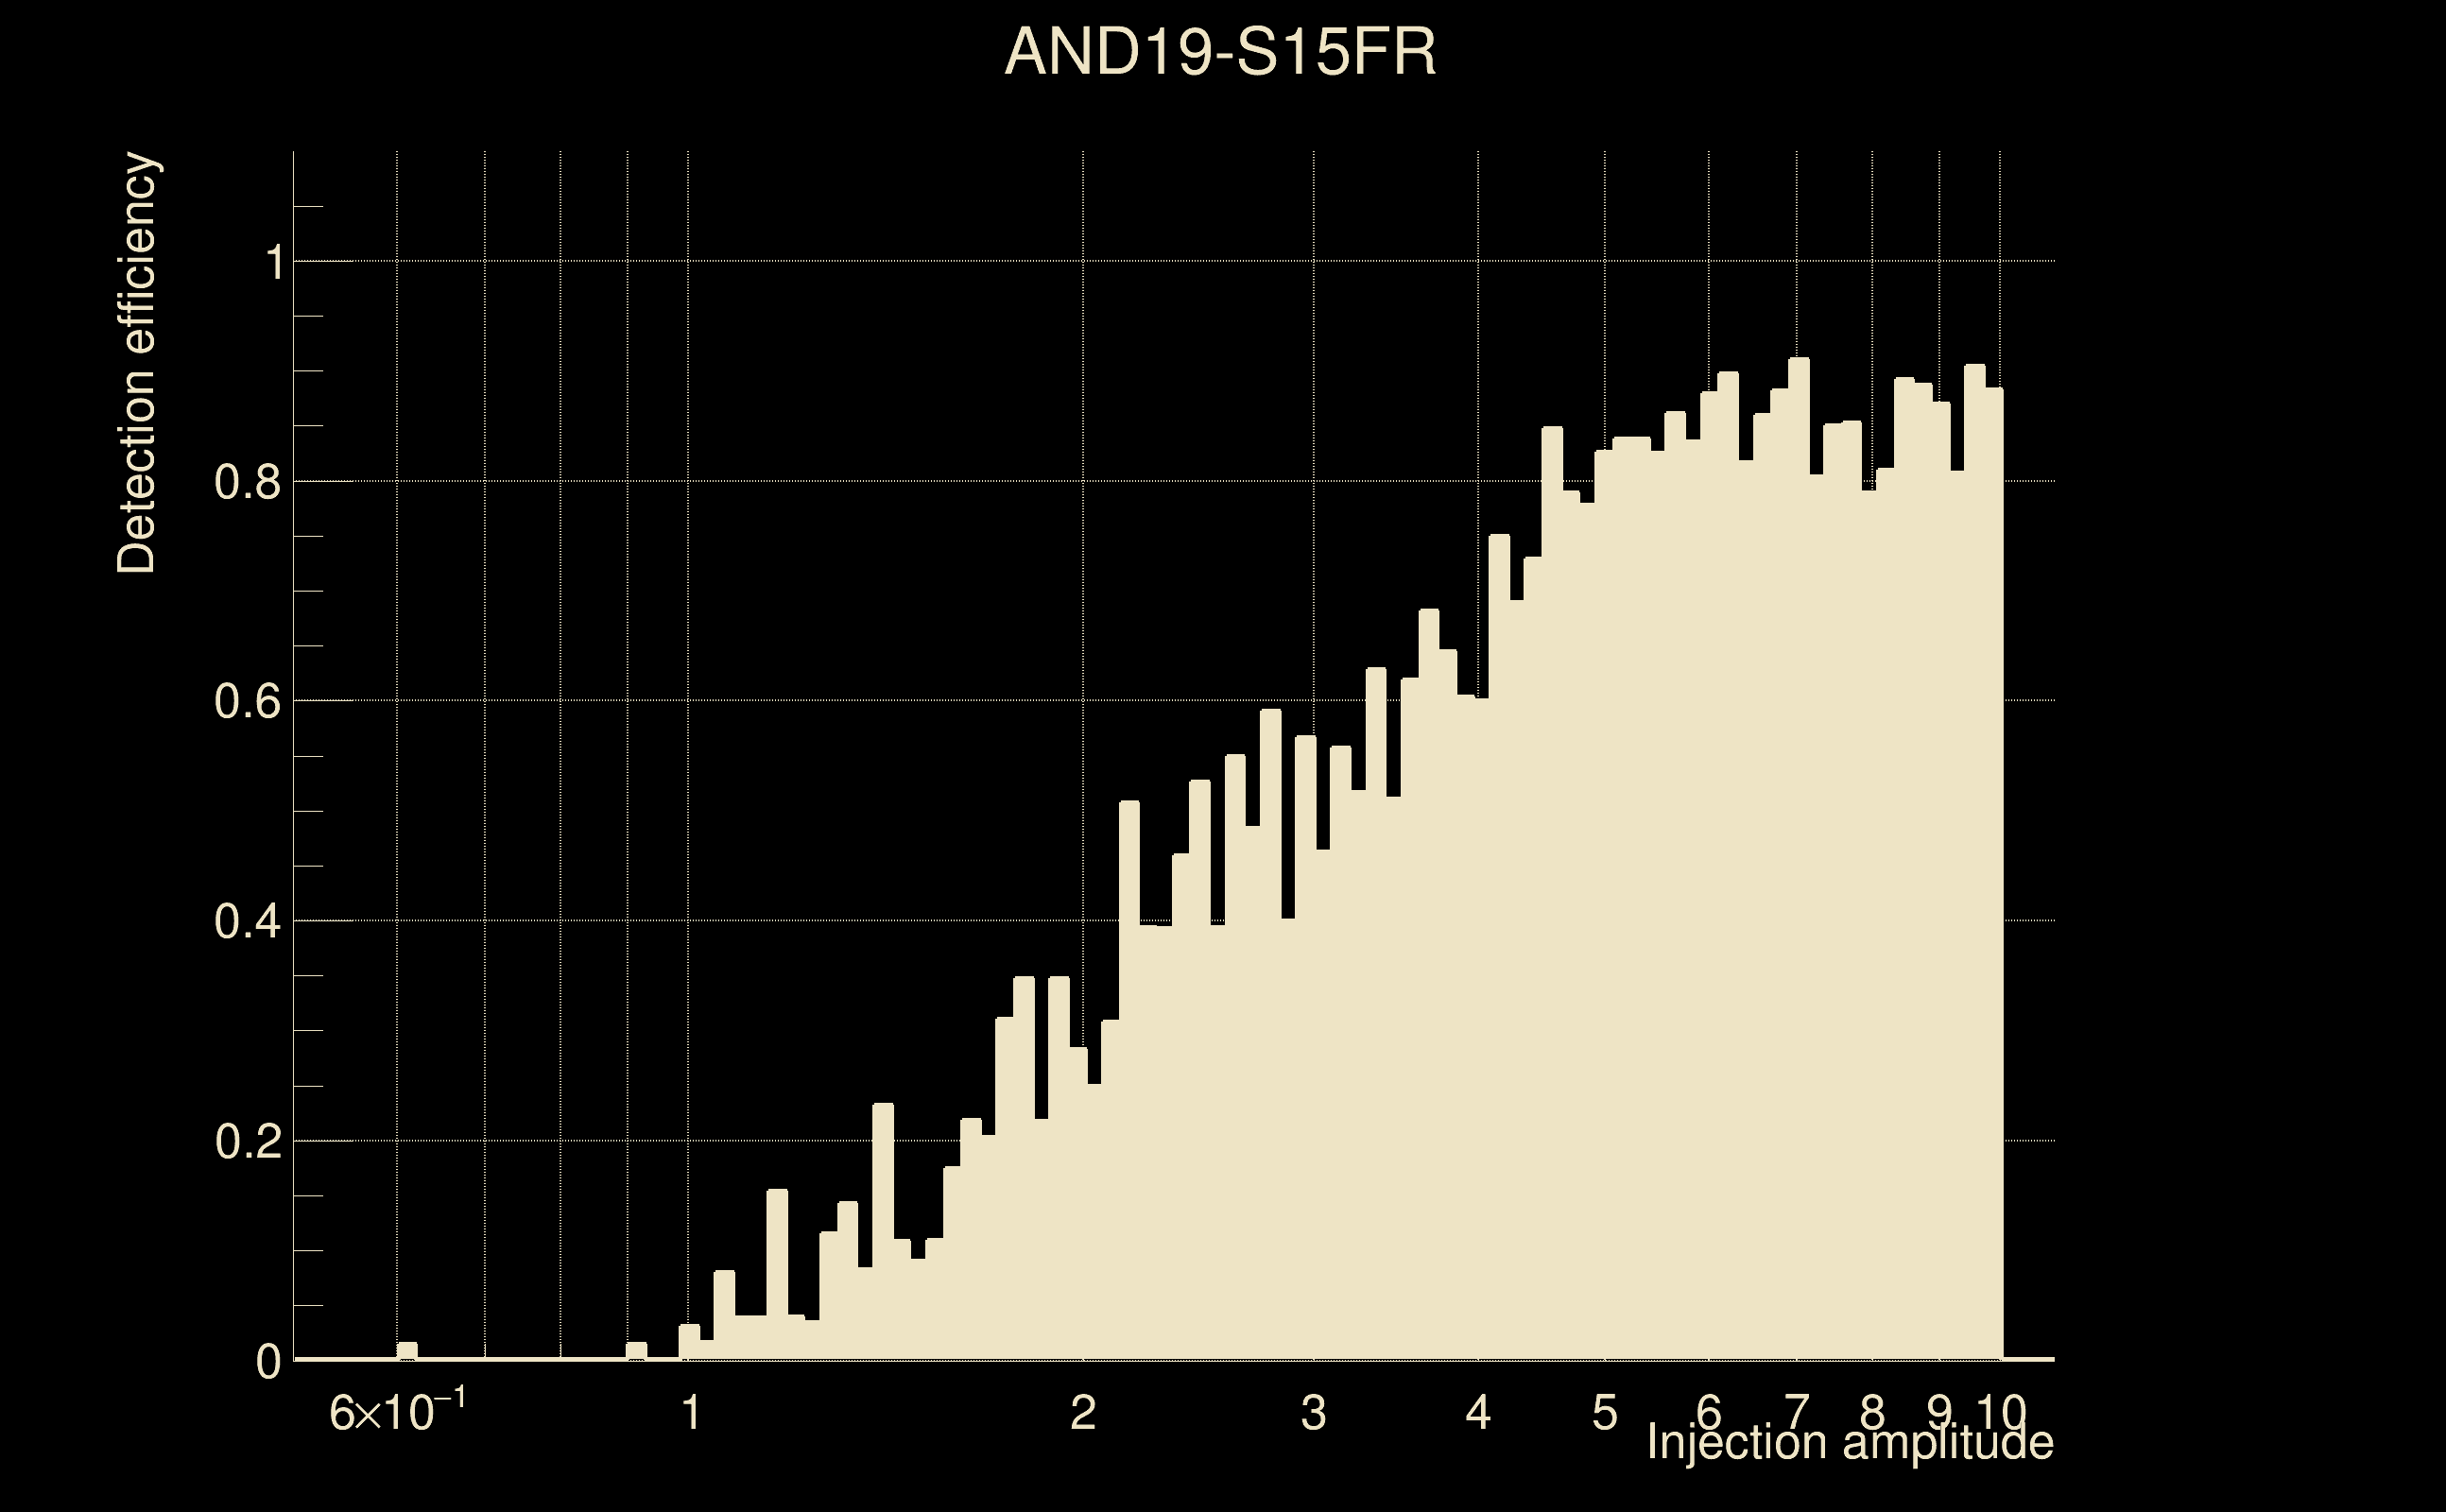
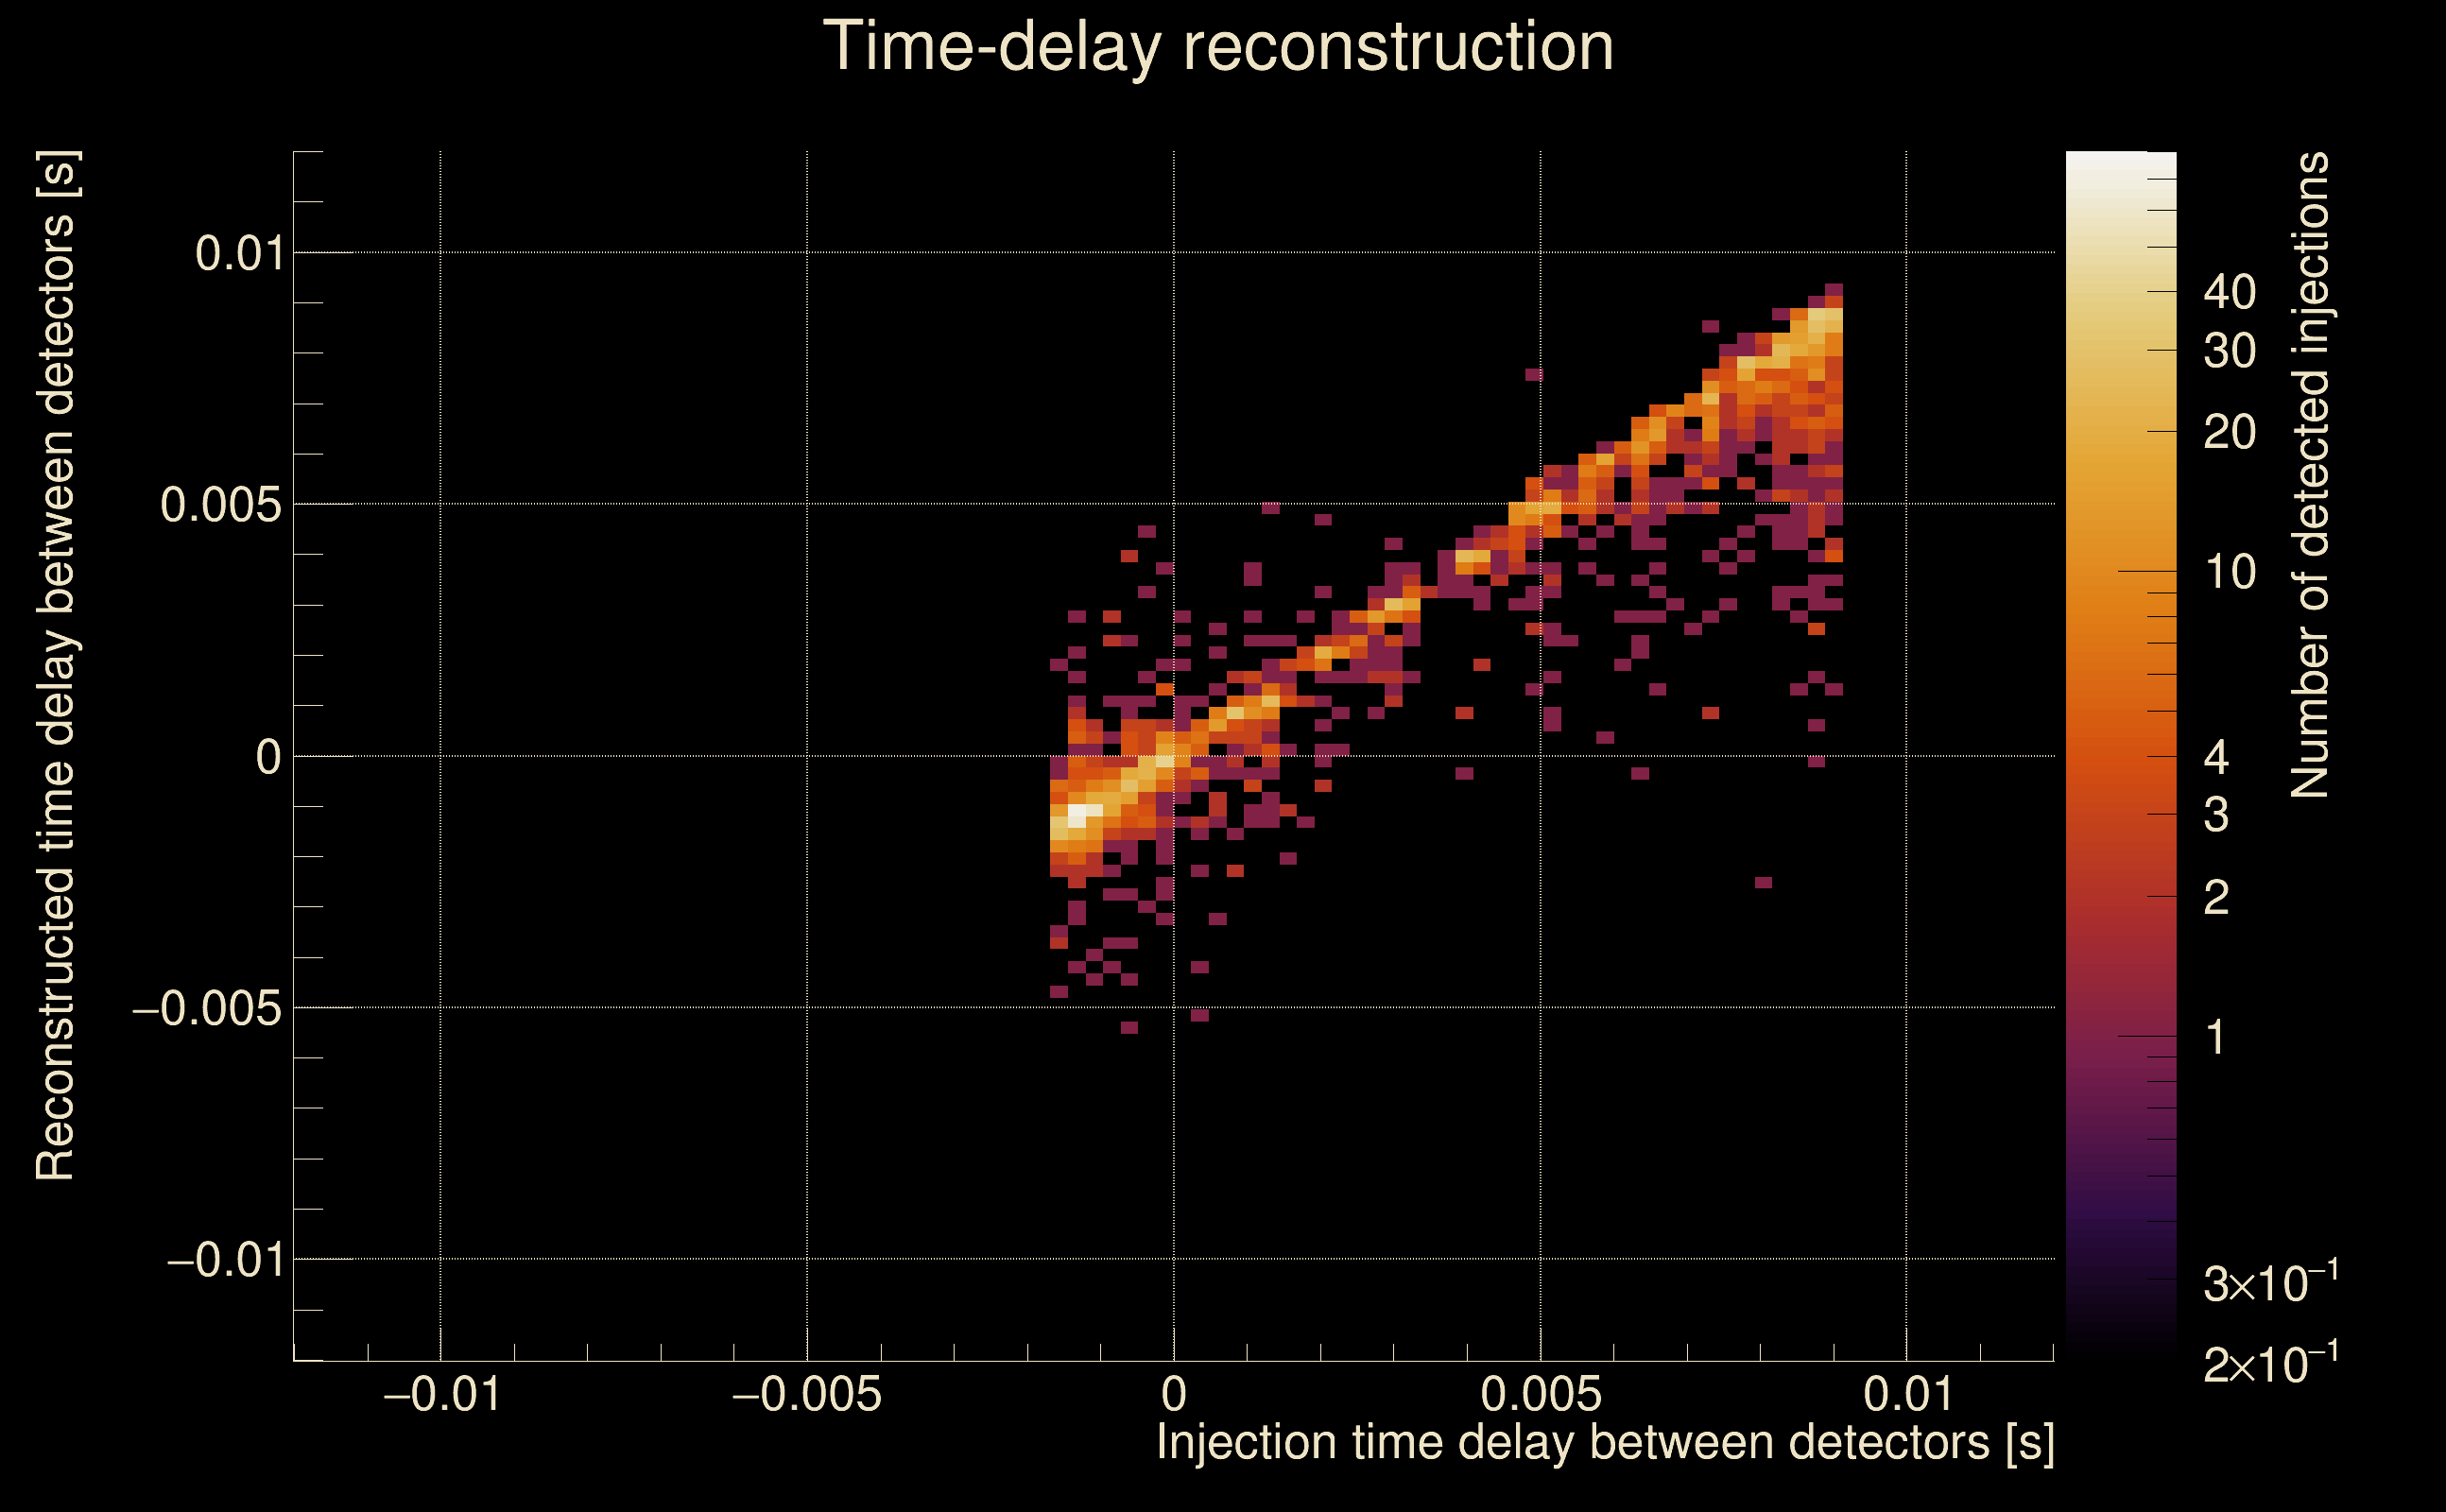
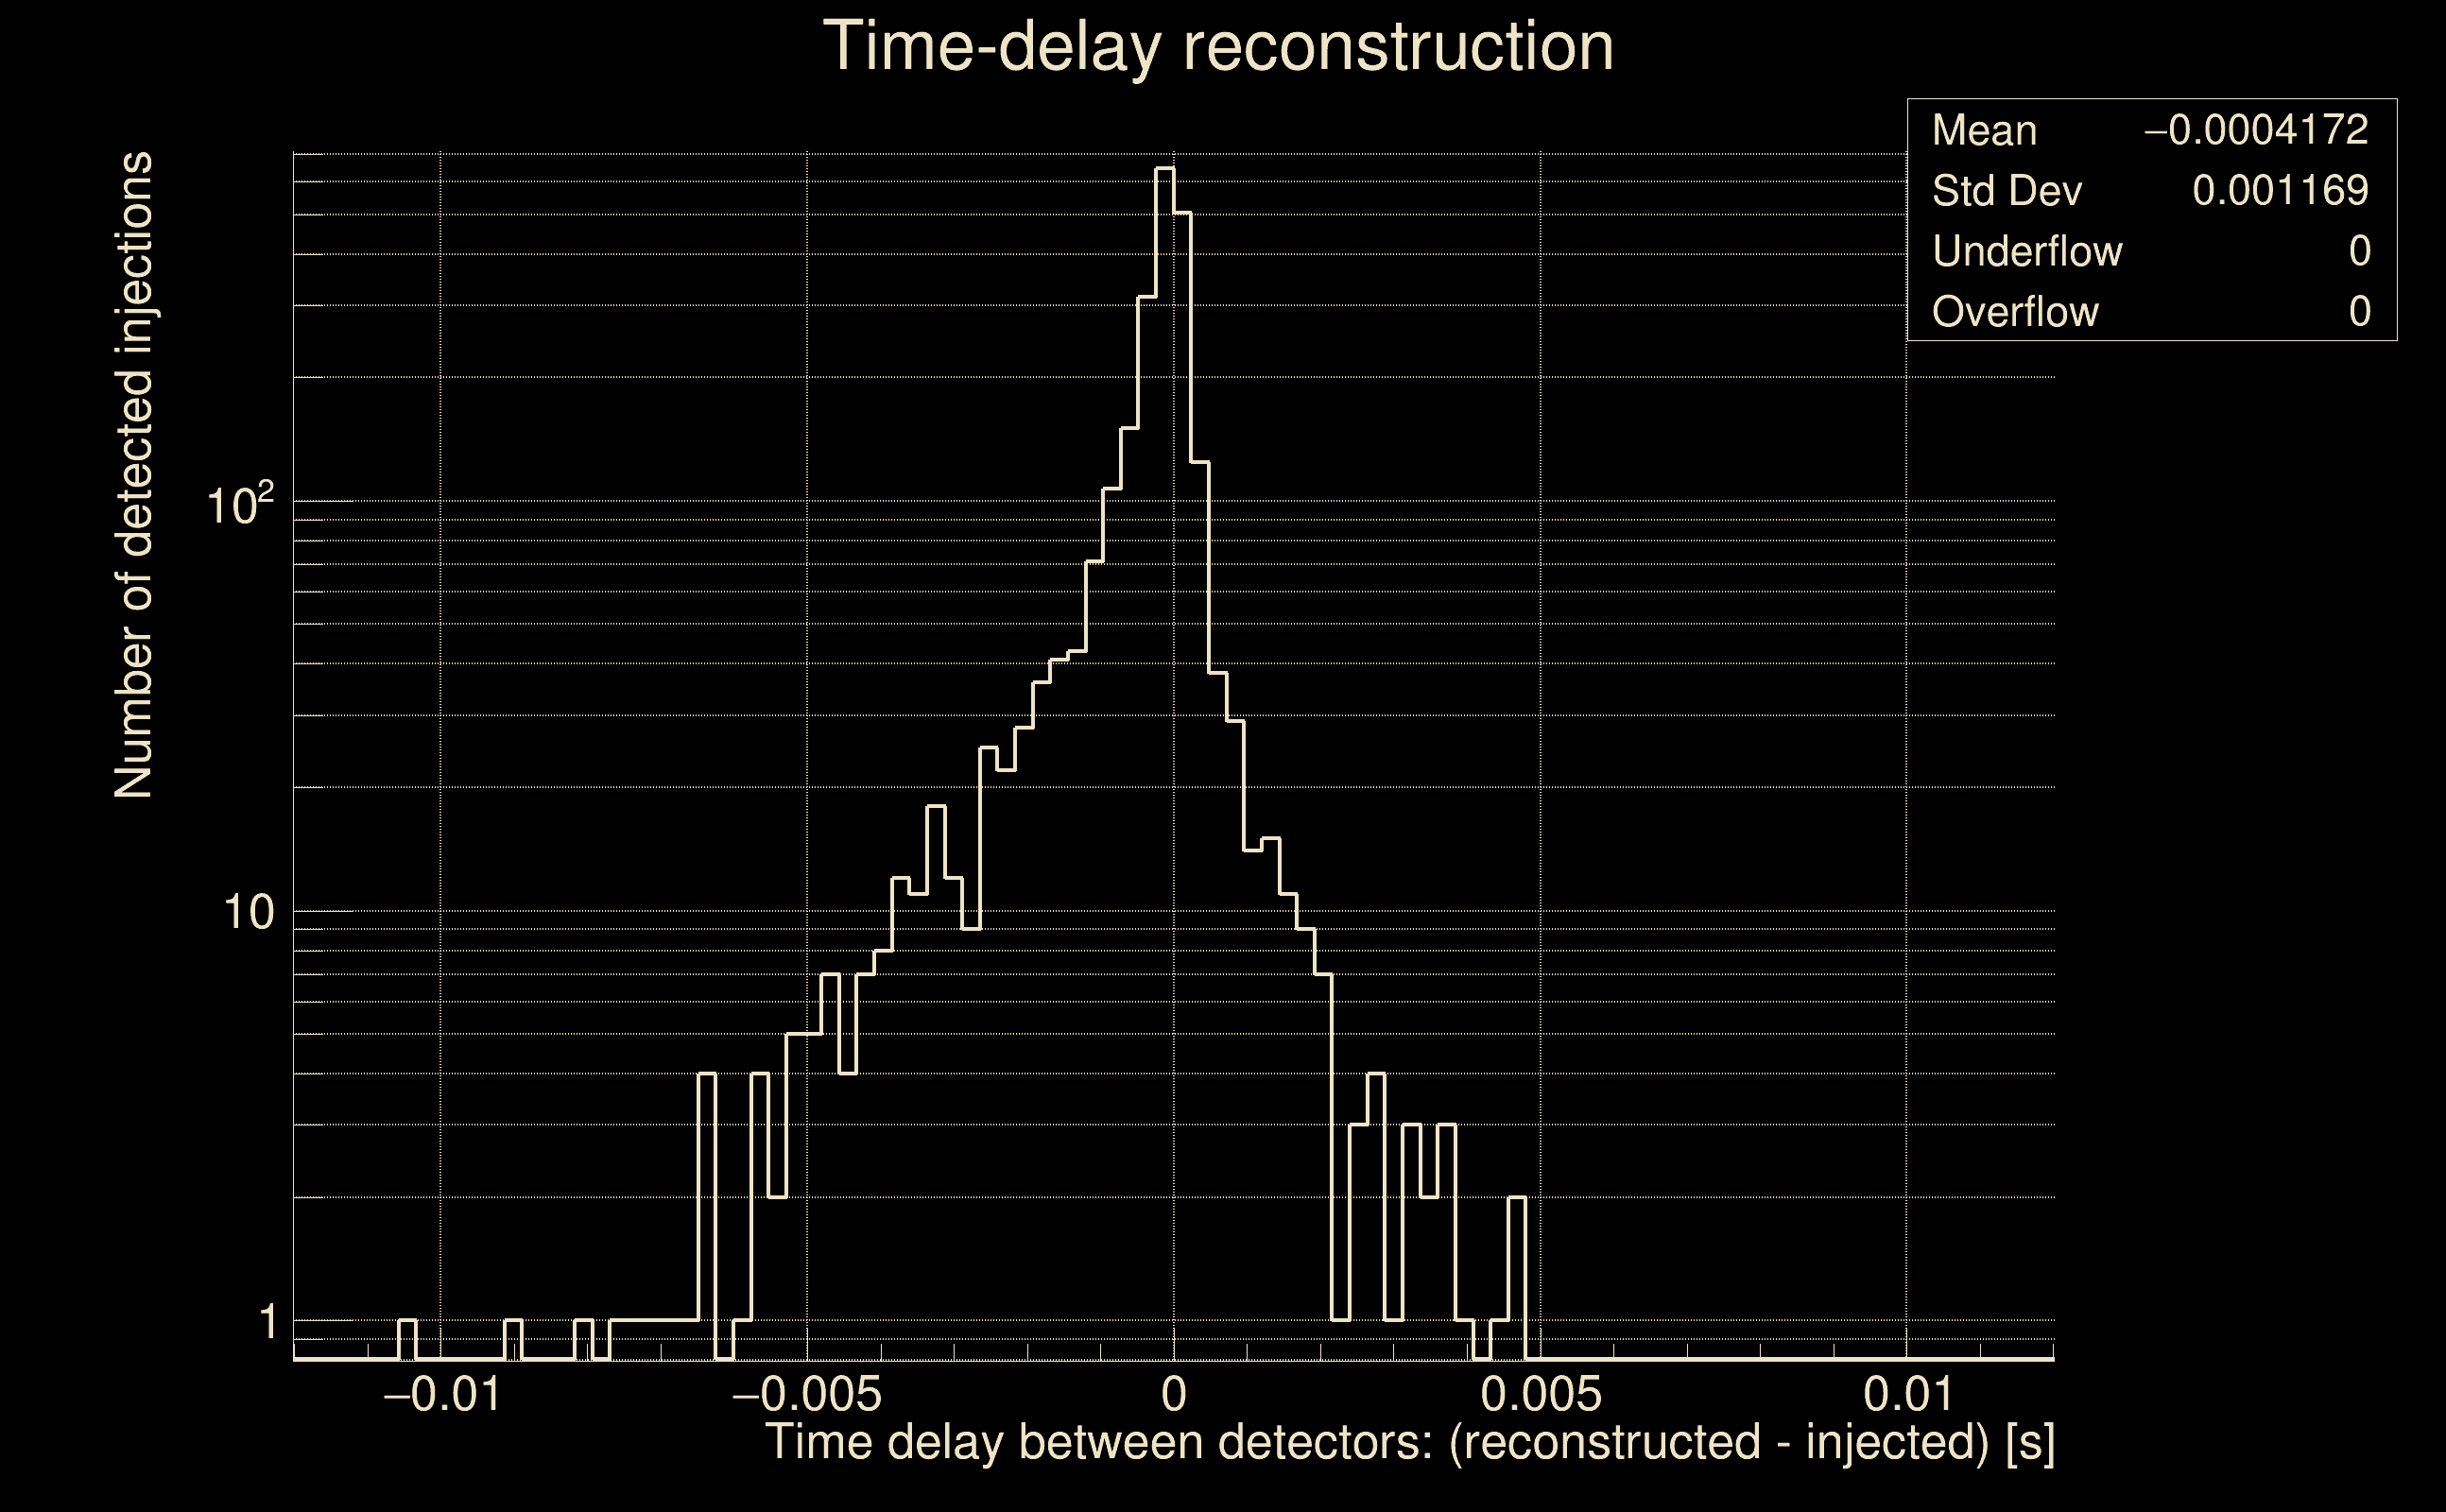
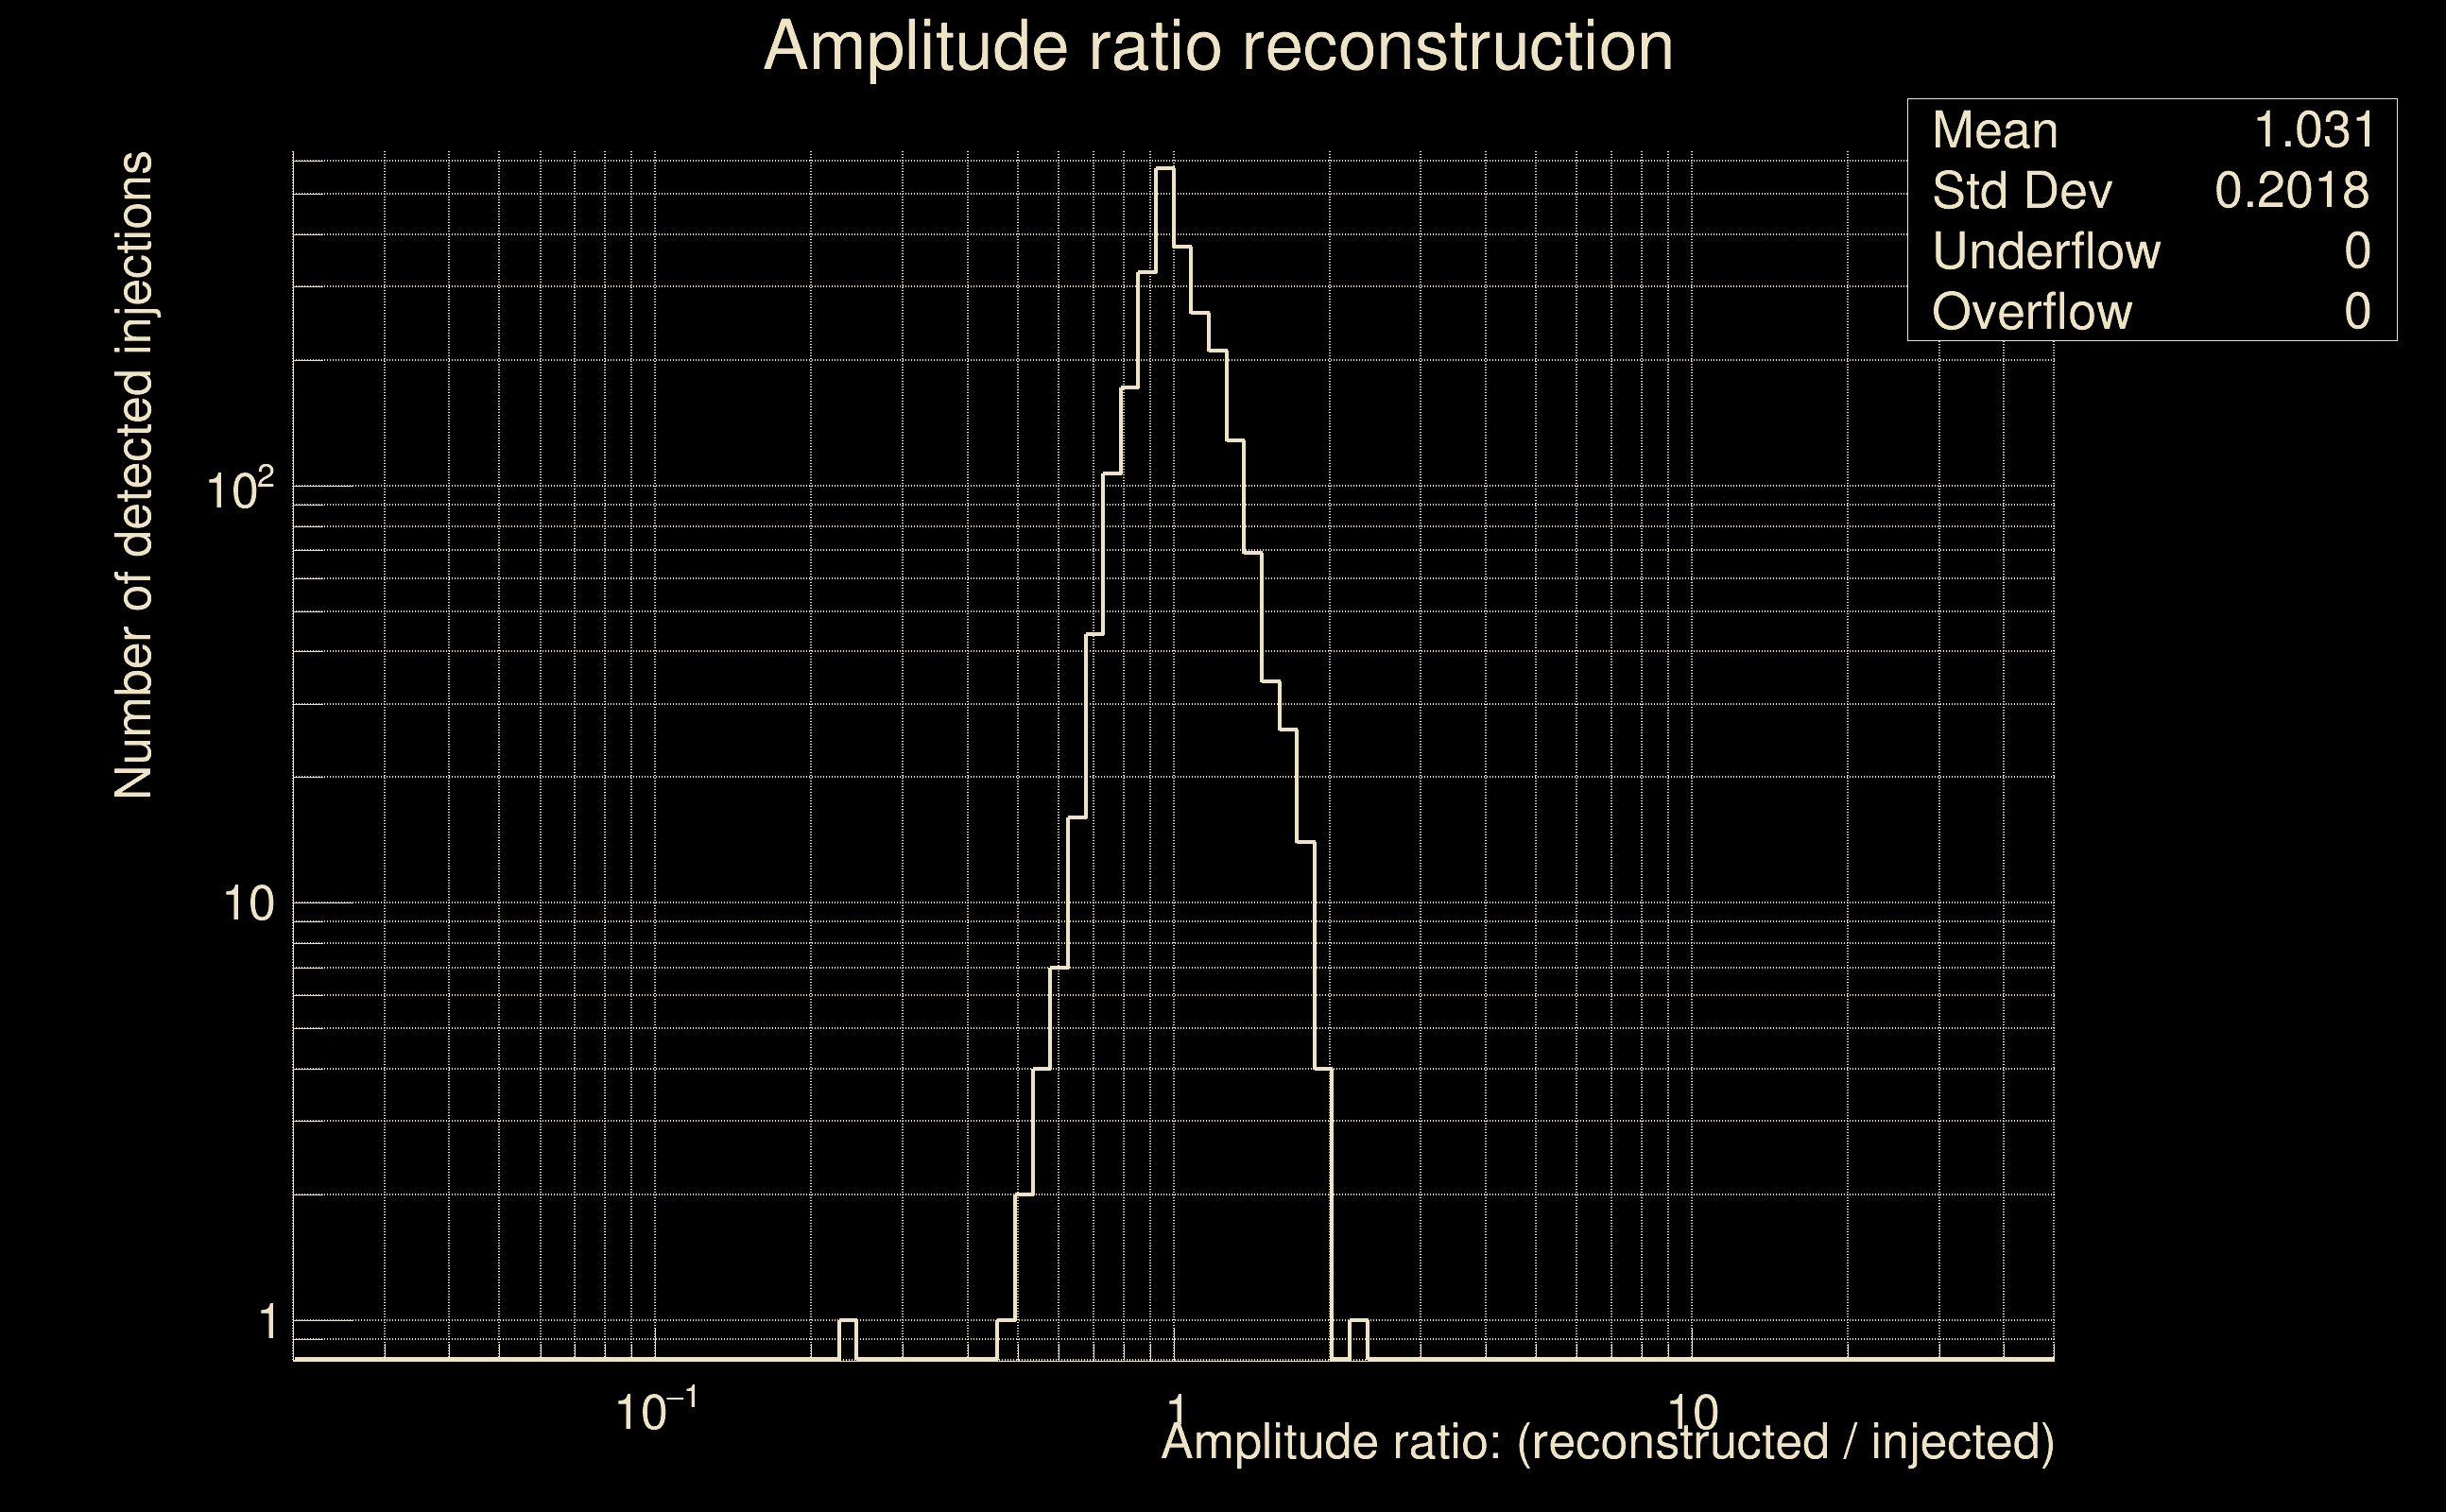
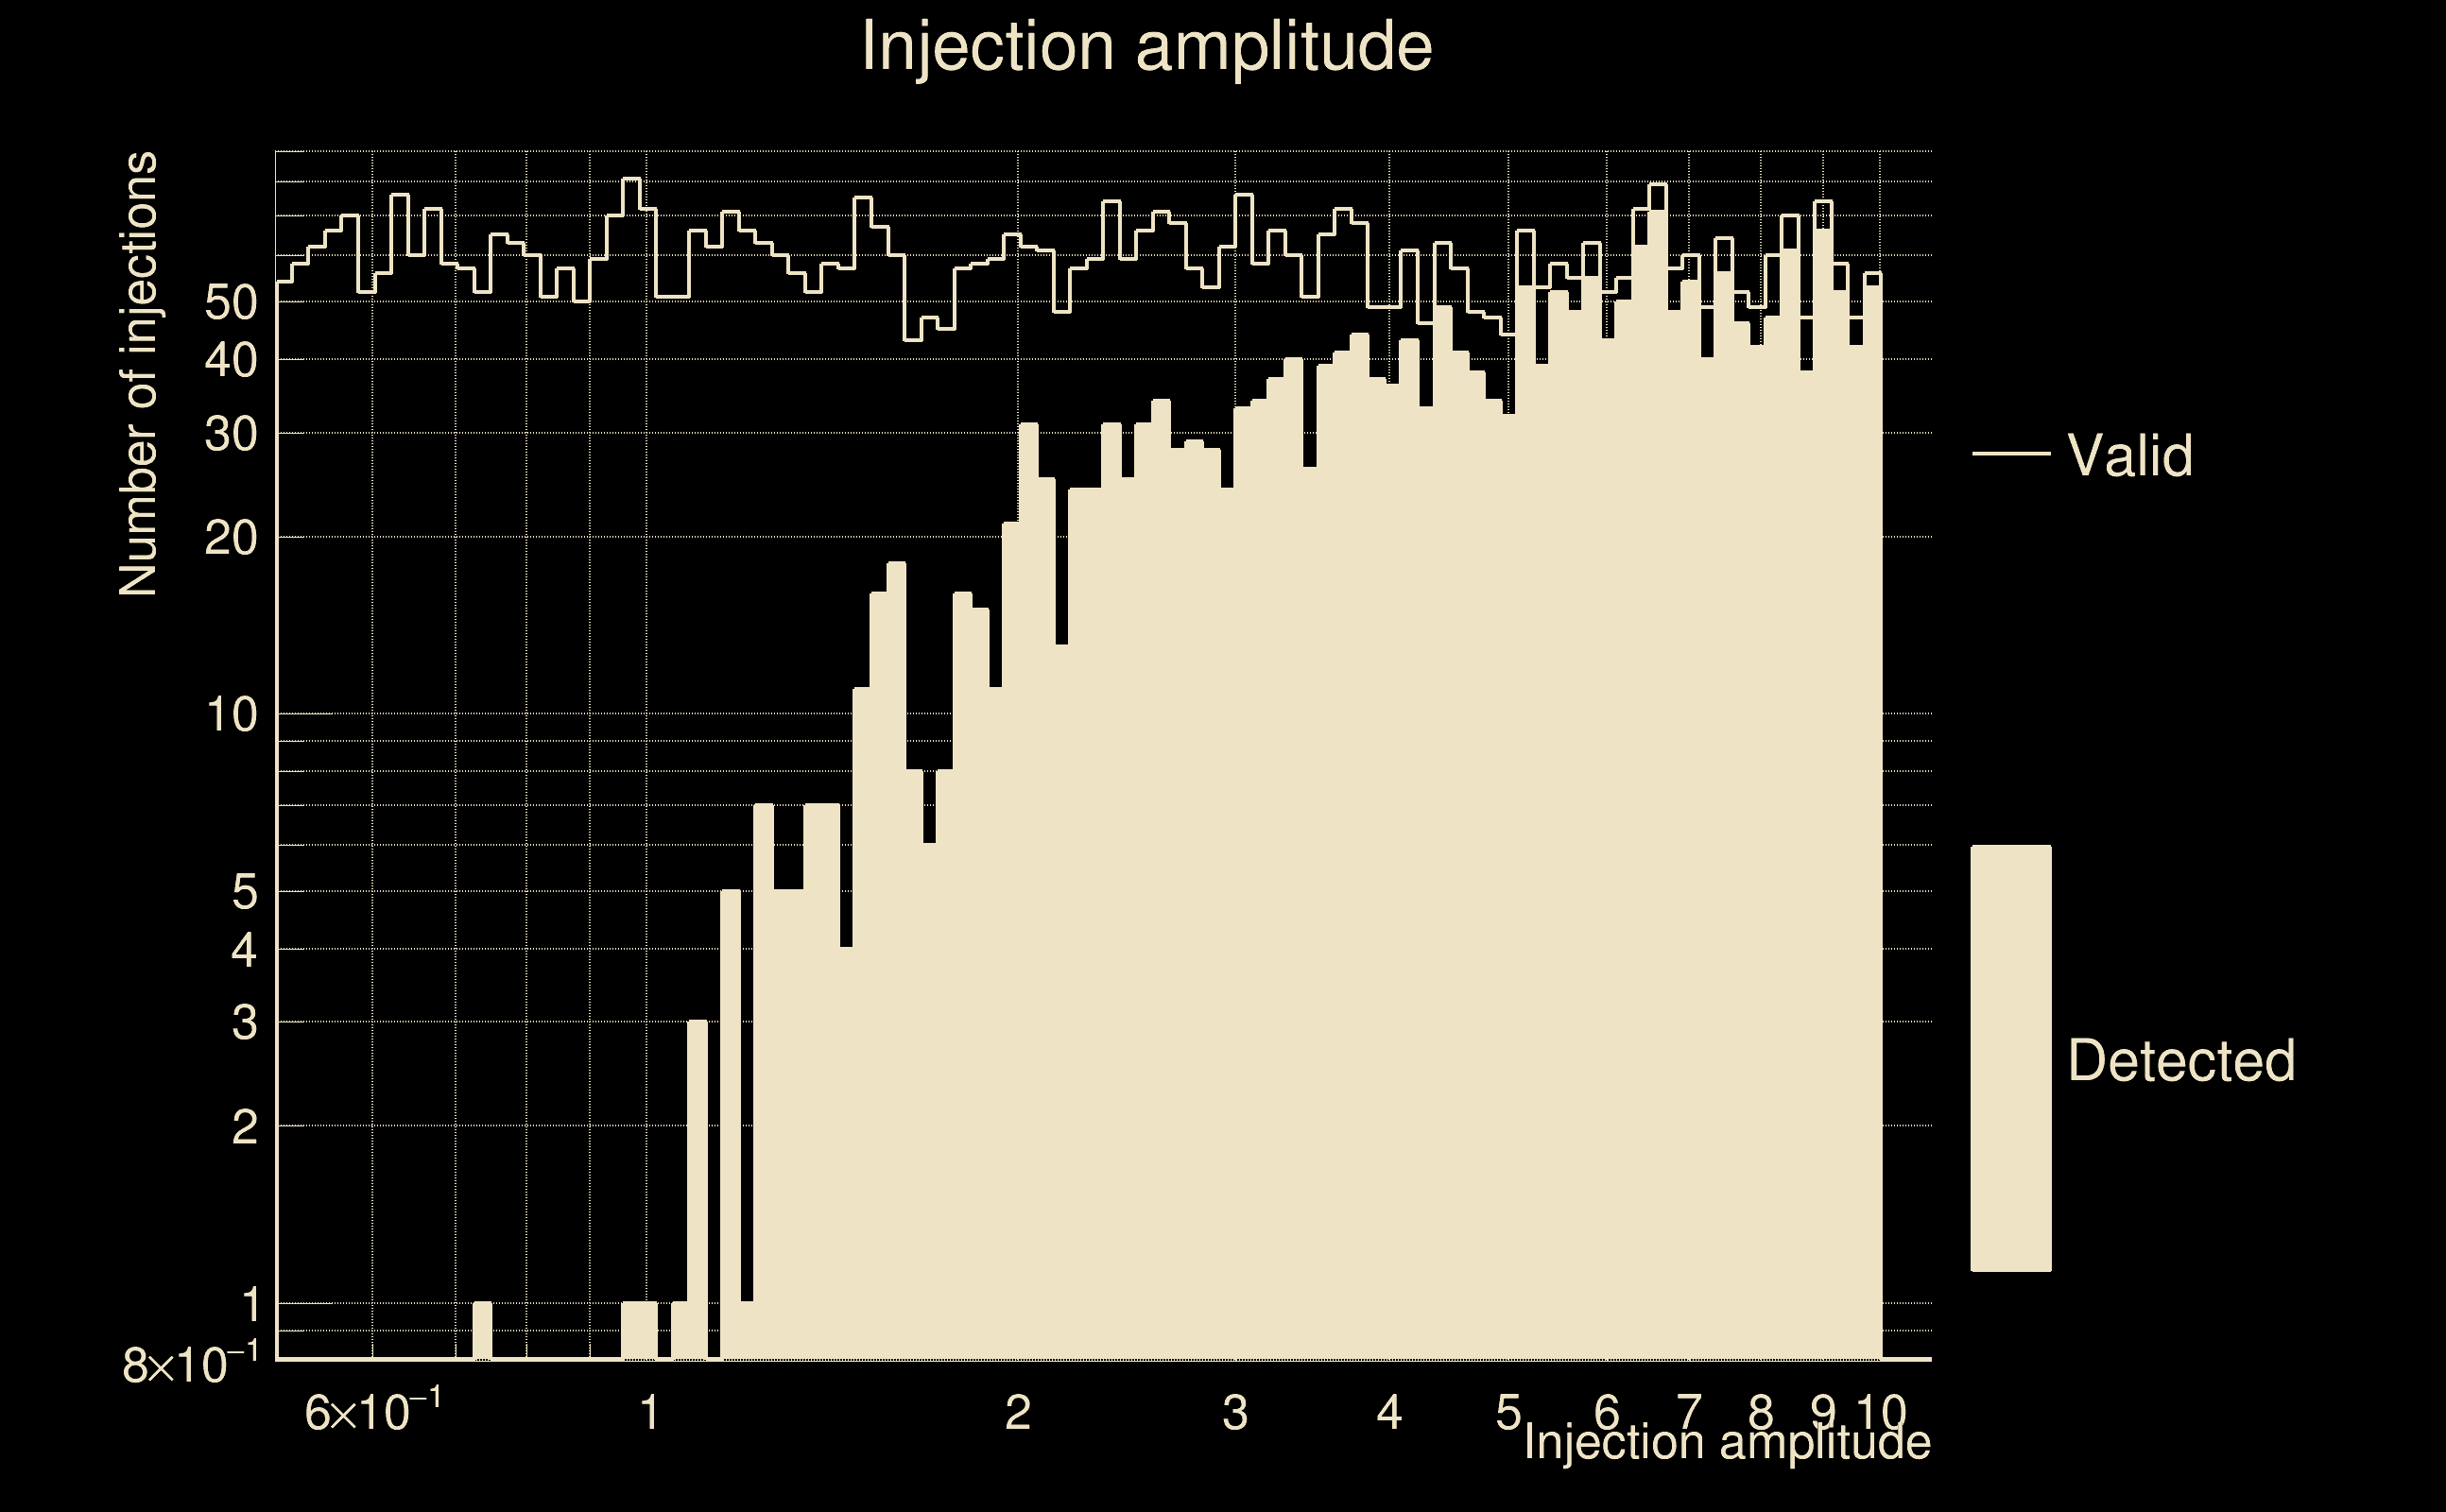
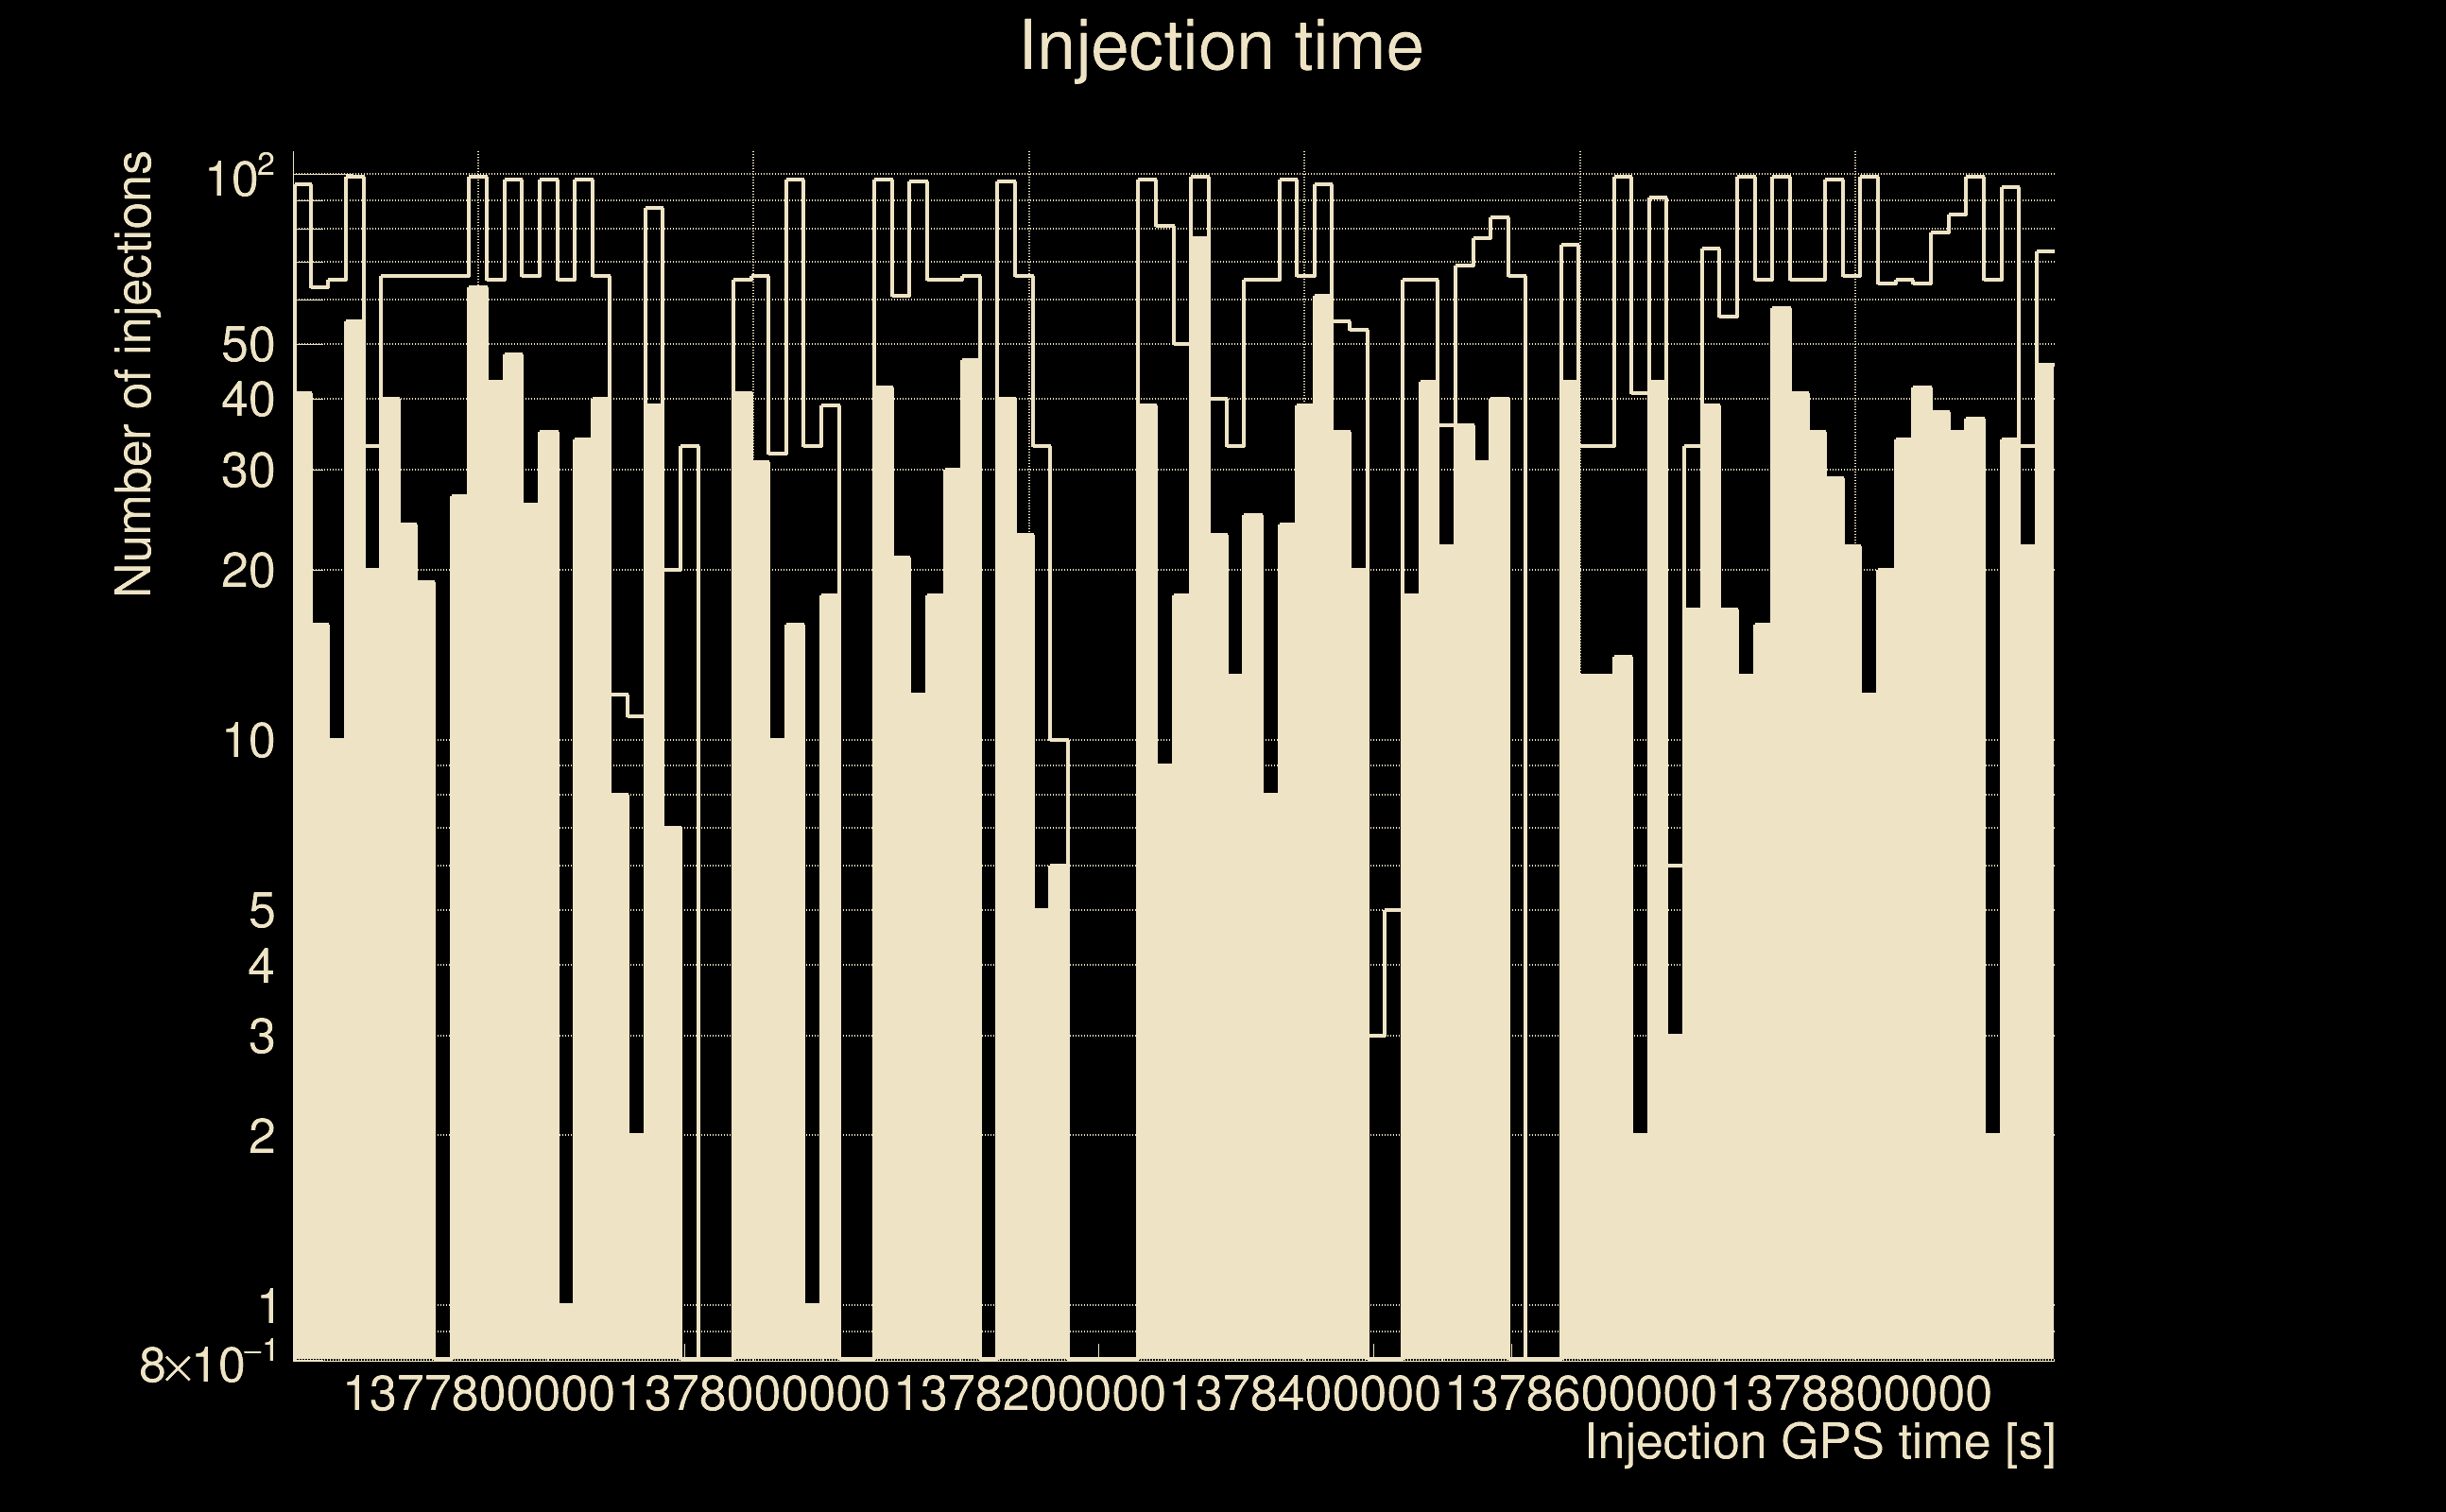
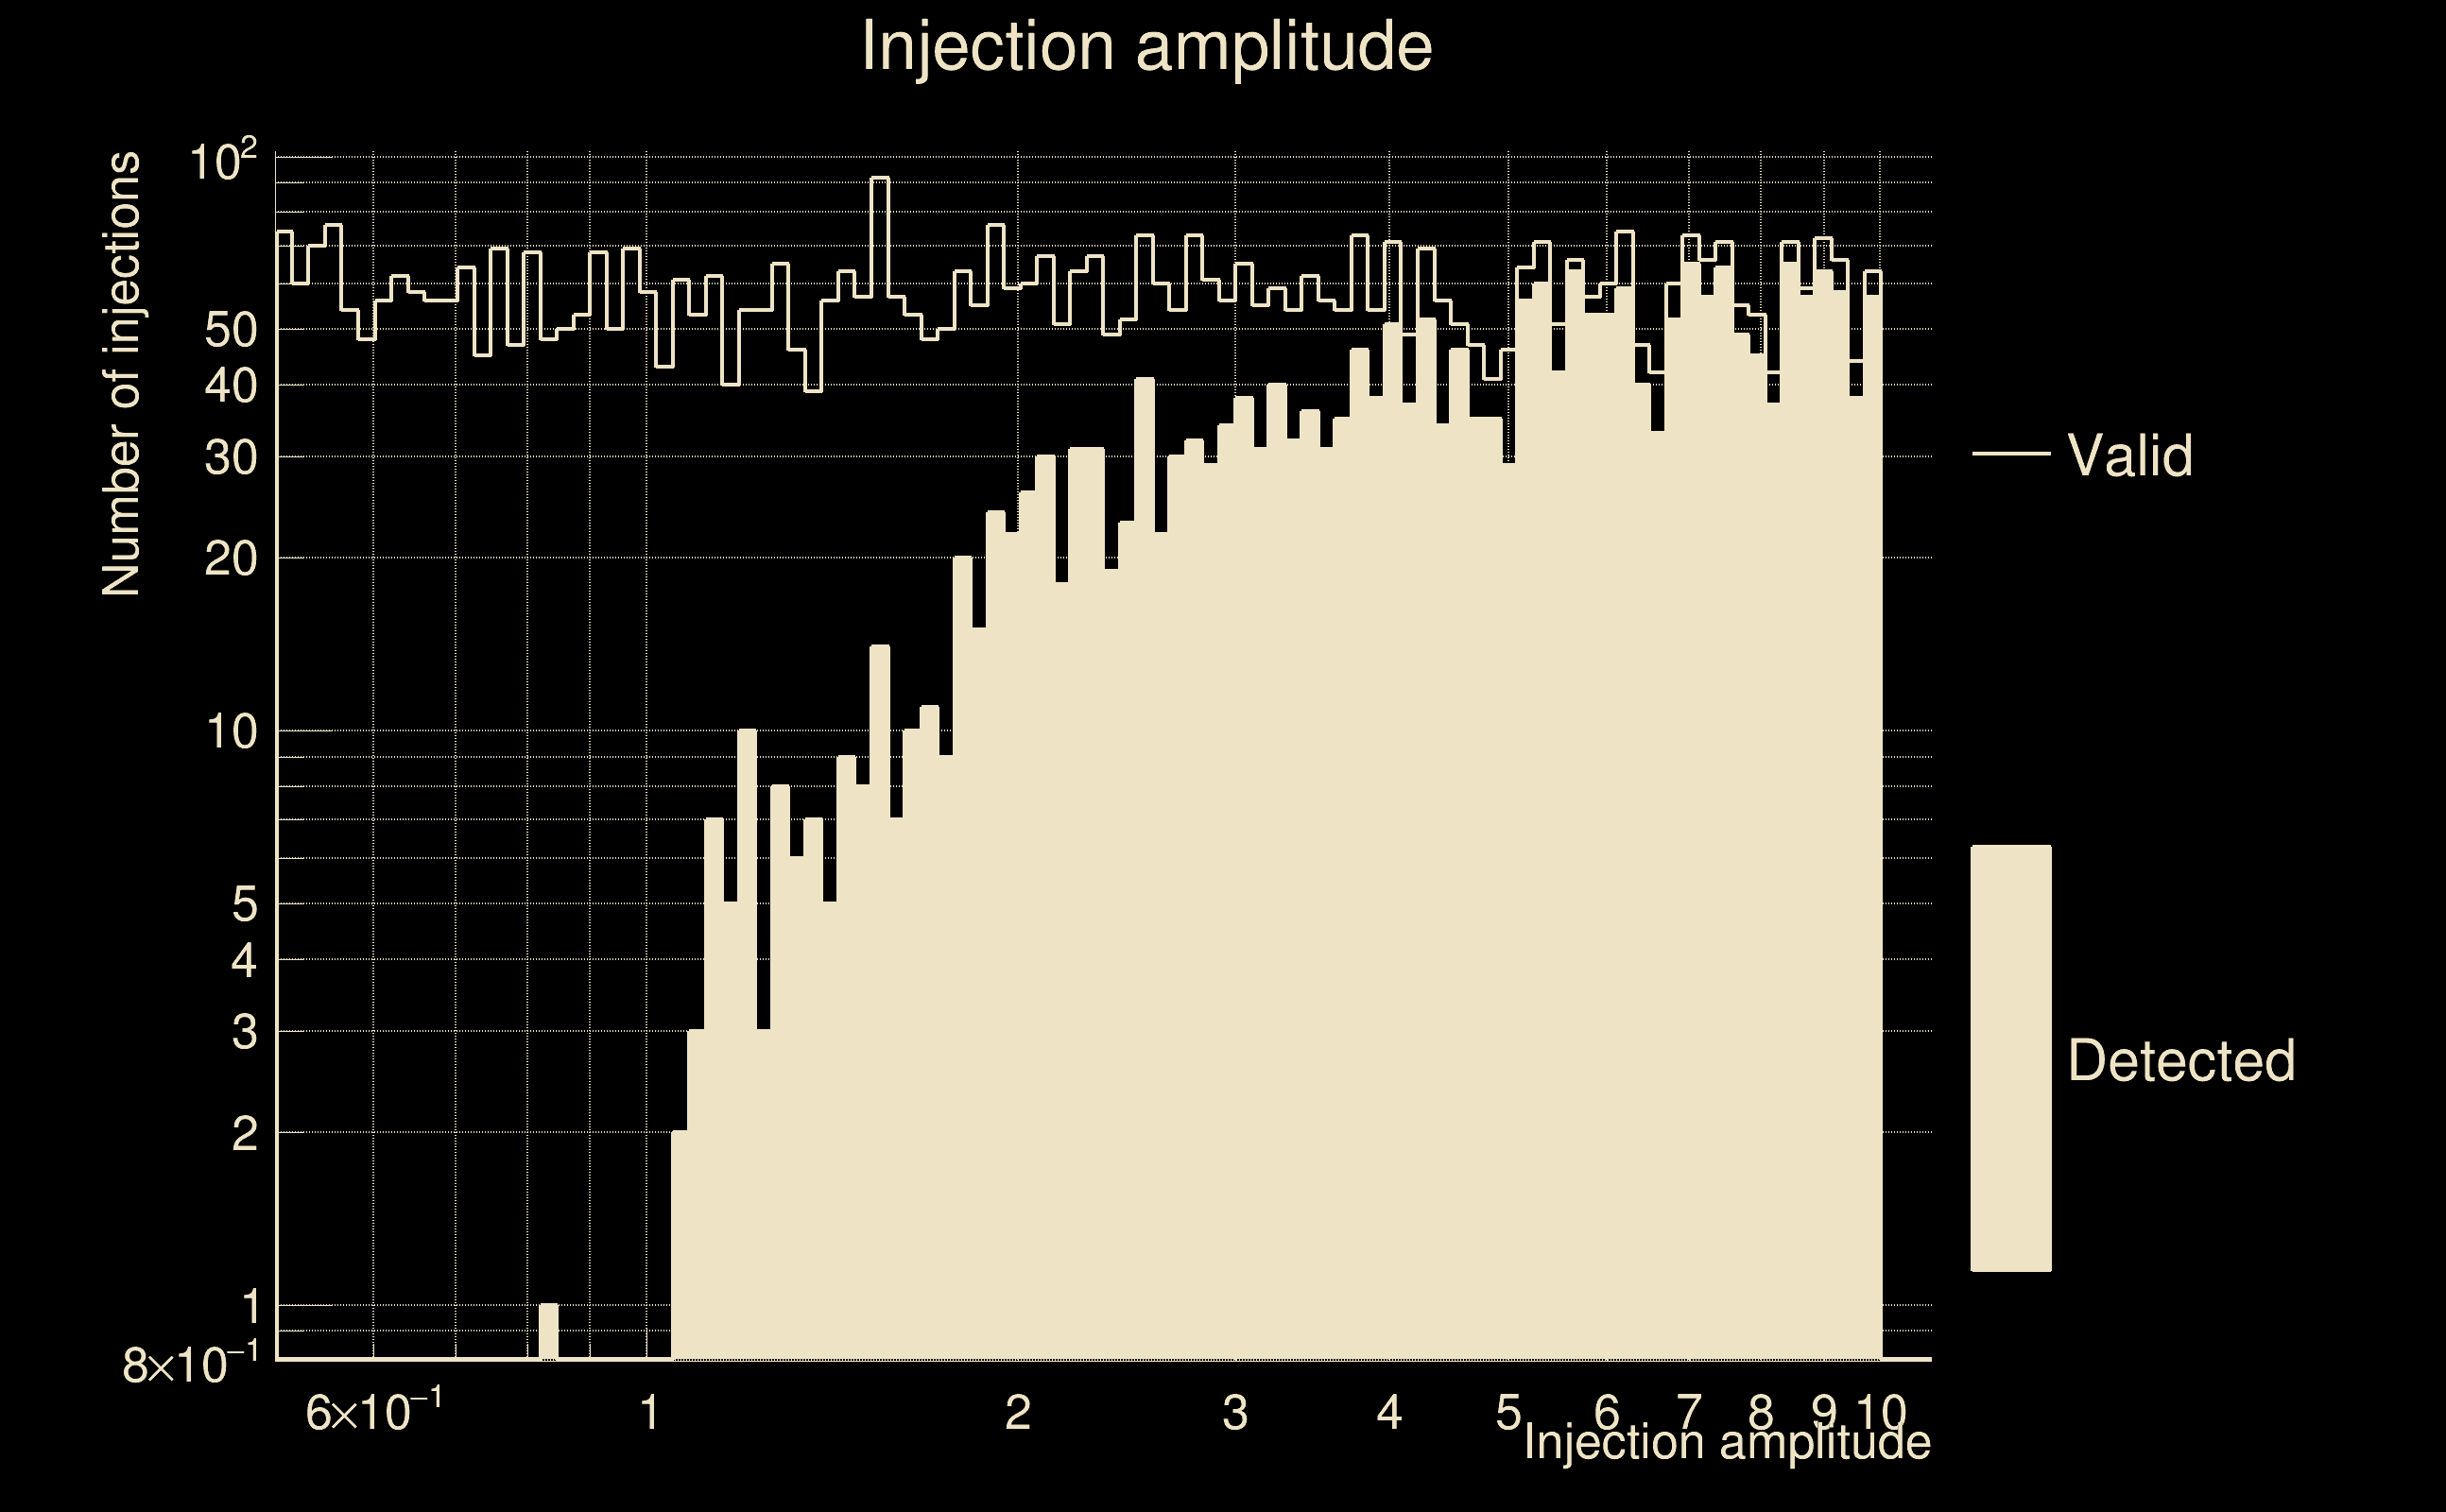
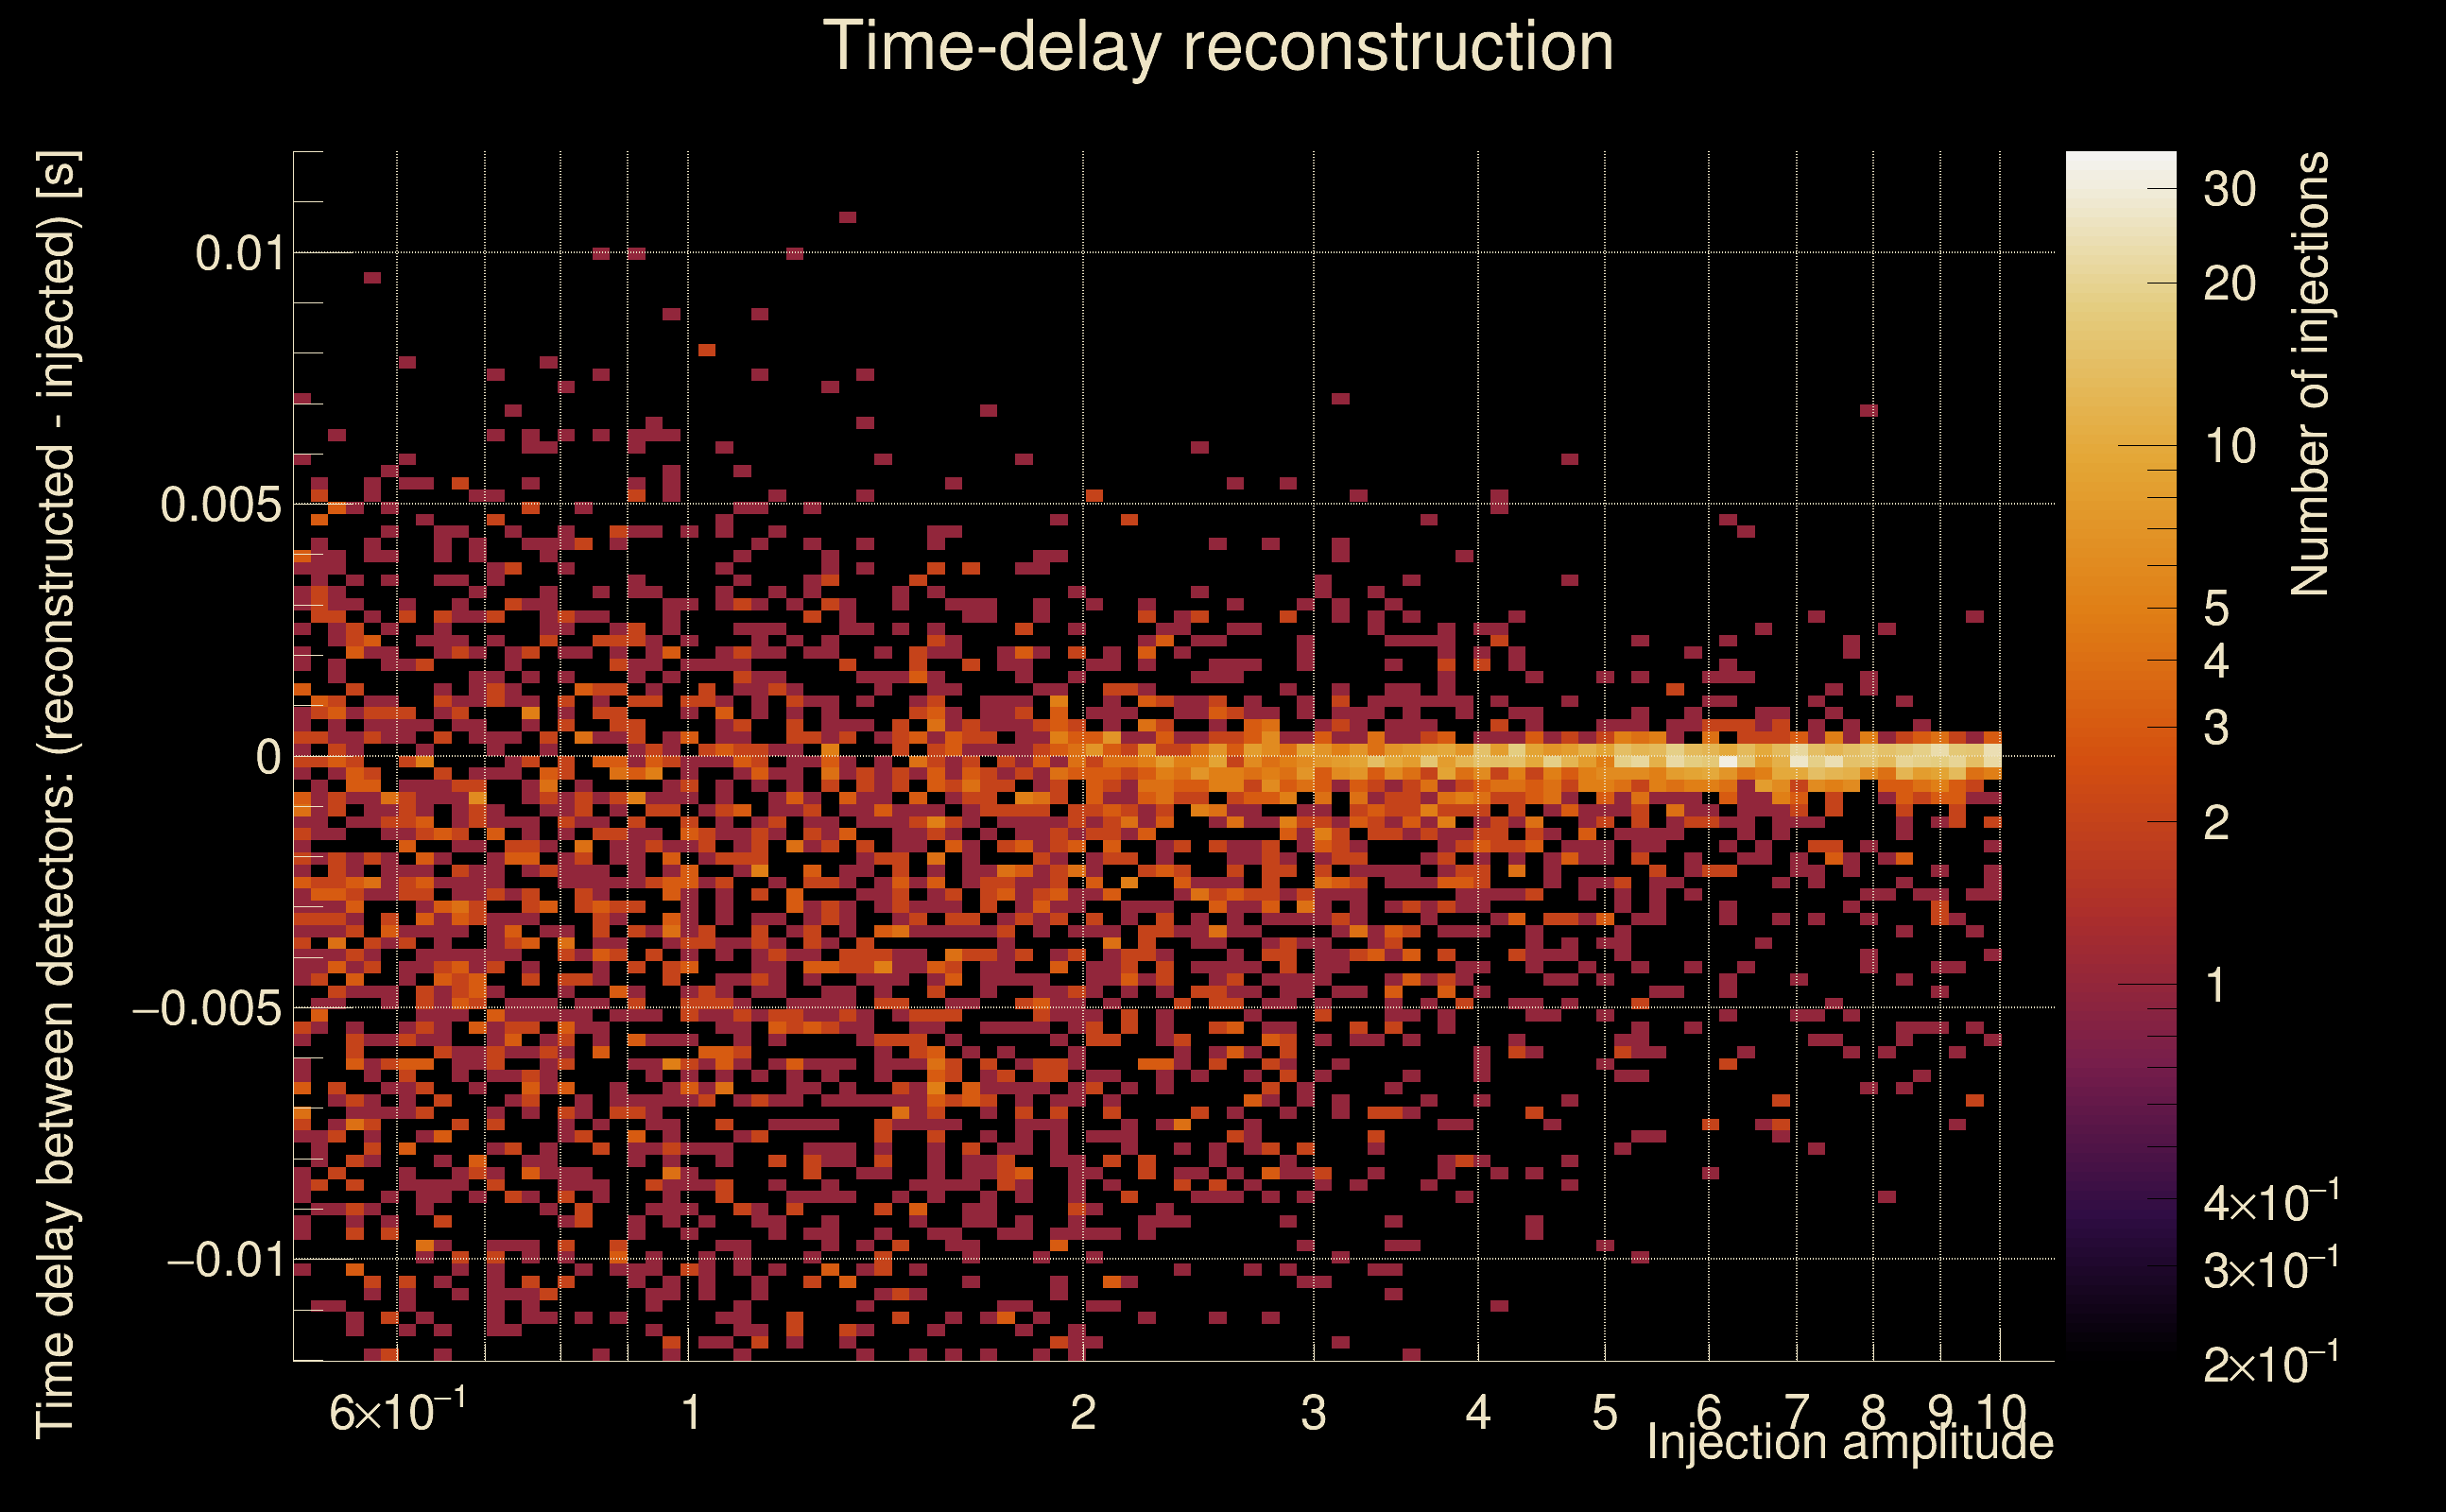
| Number of injections (total/valid/detected): | 5923 / 5871 / 2374 |
| List of missed injections: | ./AND19-S15FR_missed.txt |
| Injection amplitude at 90% detection efficiency: | 6.94573 |
| Injection amplitude at 50% detection efficiency: | 3.0878 |
| Injection amplitude at 10% detection efficiency: | 1.5211 |
 |
 |
 |
 |
 |
 |
|
 |
 |
|
 |
 |
 |
 |
 |
 |
 |
 |
| Number of injections (total/valid/detected): | 5836 / 5783 / 2280 |
| List of missed injections: | ./MEZ23-D15_missed.txt |
| Injection amplitude at 90% detection efficiency: | 9.60498 |
| Injection amplitude at 50% detection efficiency: | 3.09214 |
| Injection amplitude at 10% detection efficiency: | 1.47116 |
 |
 |
 |
 |
 |
 |
|
 |
 |
|
 |
 |
 |
 |
 |
 |
 |
 |
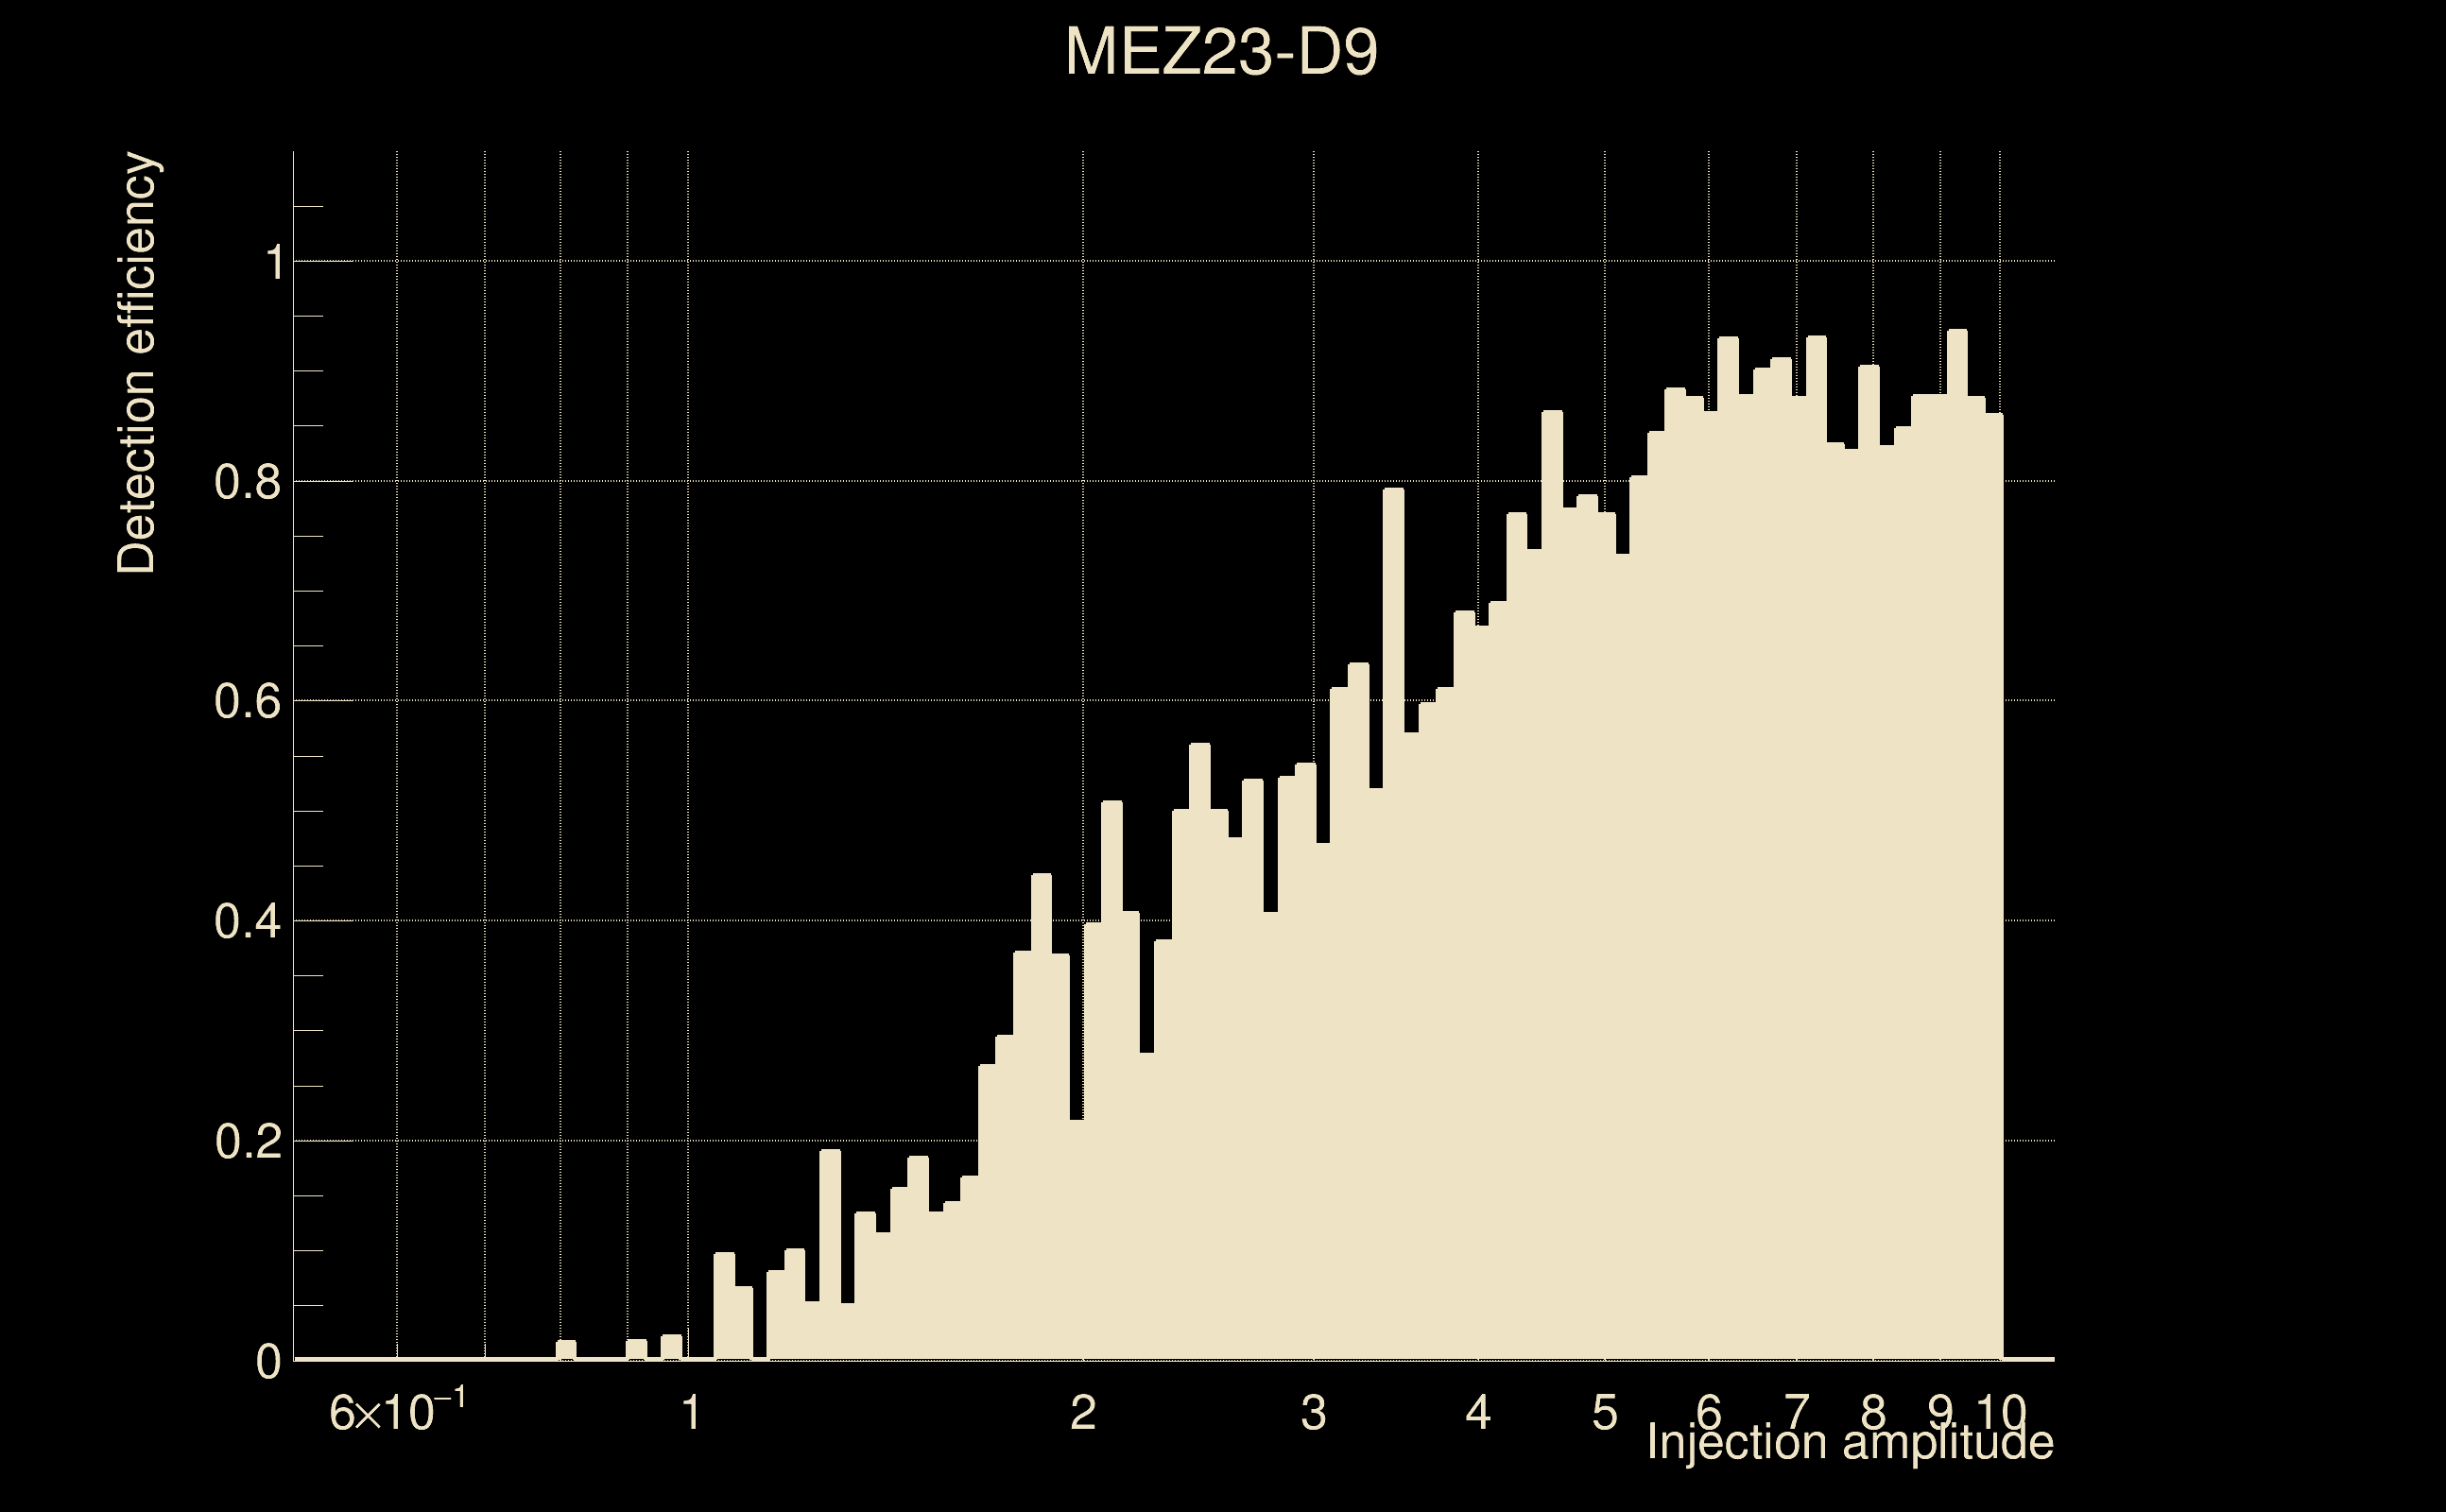
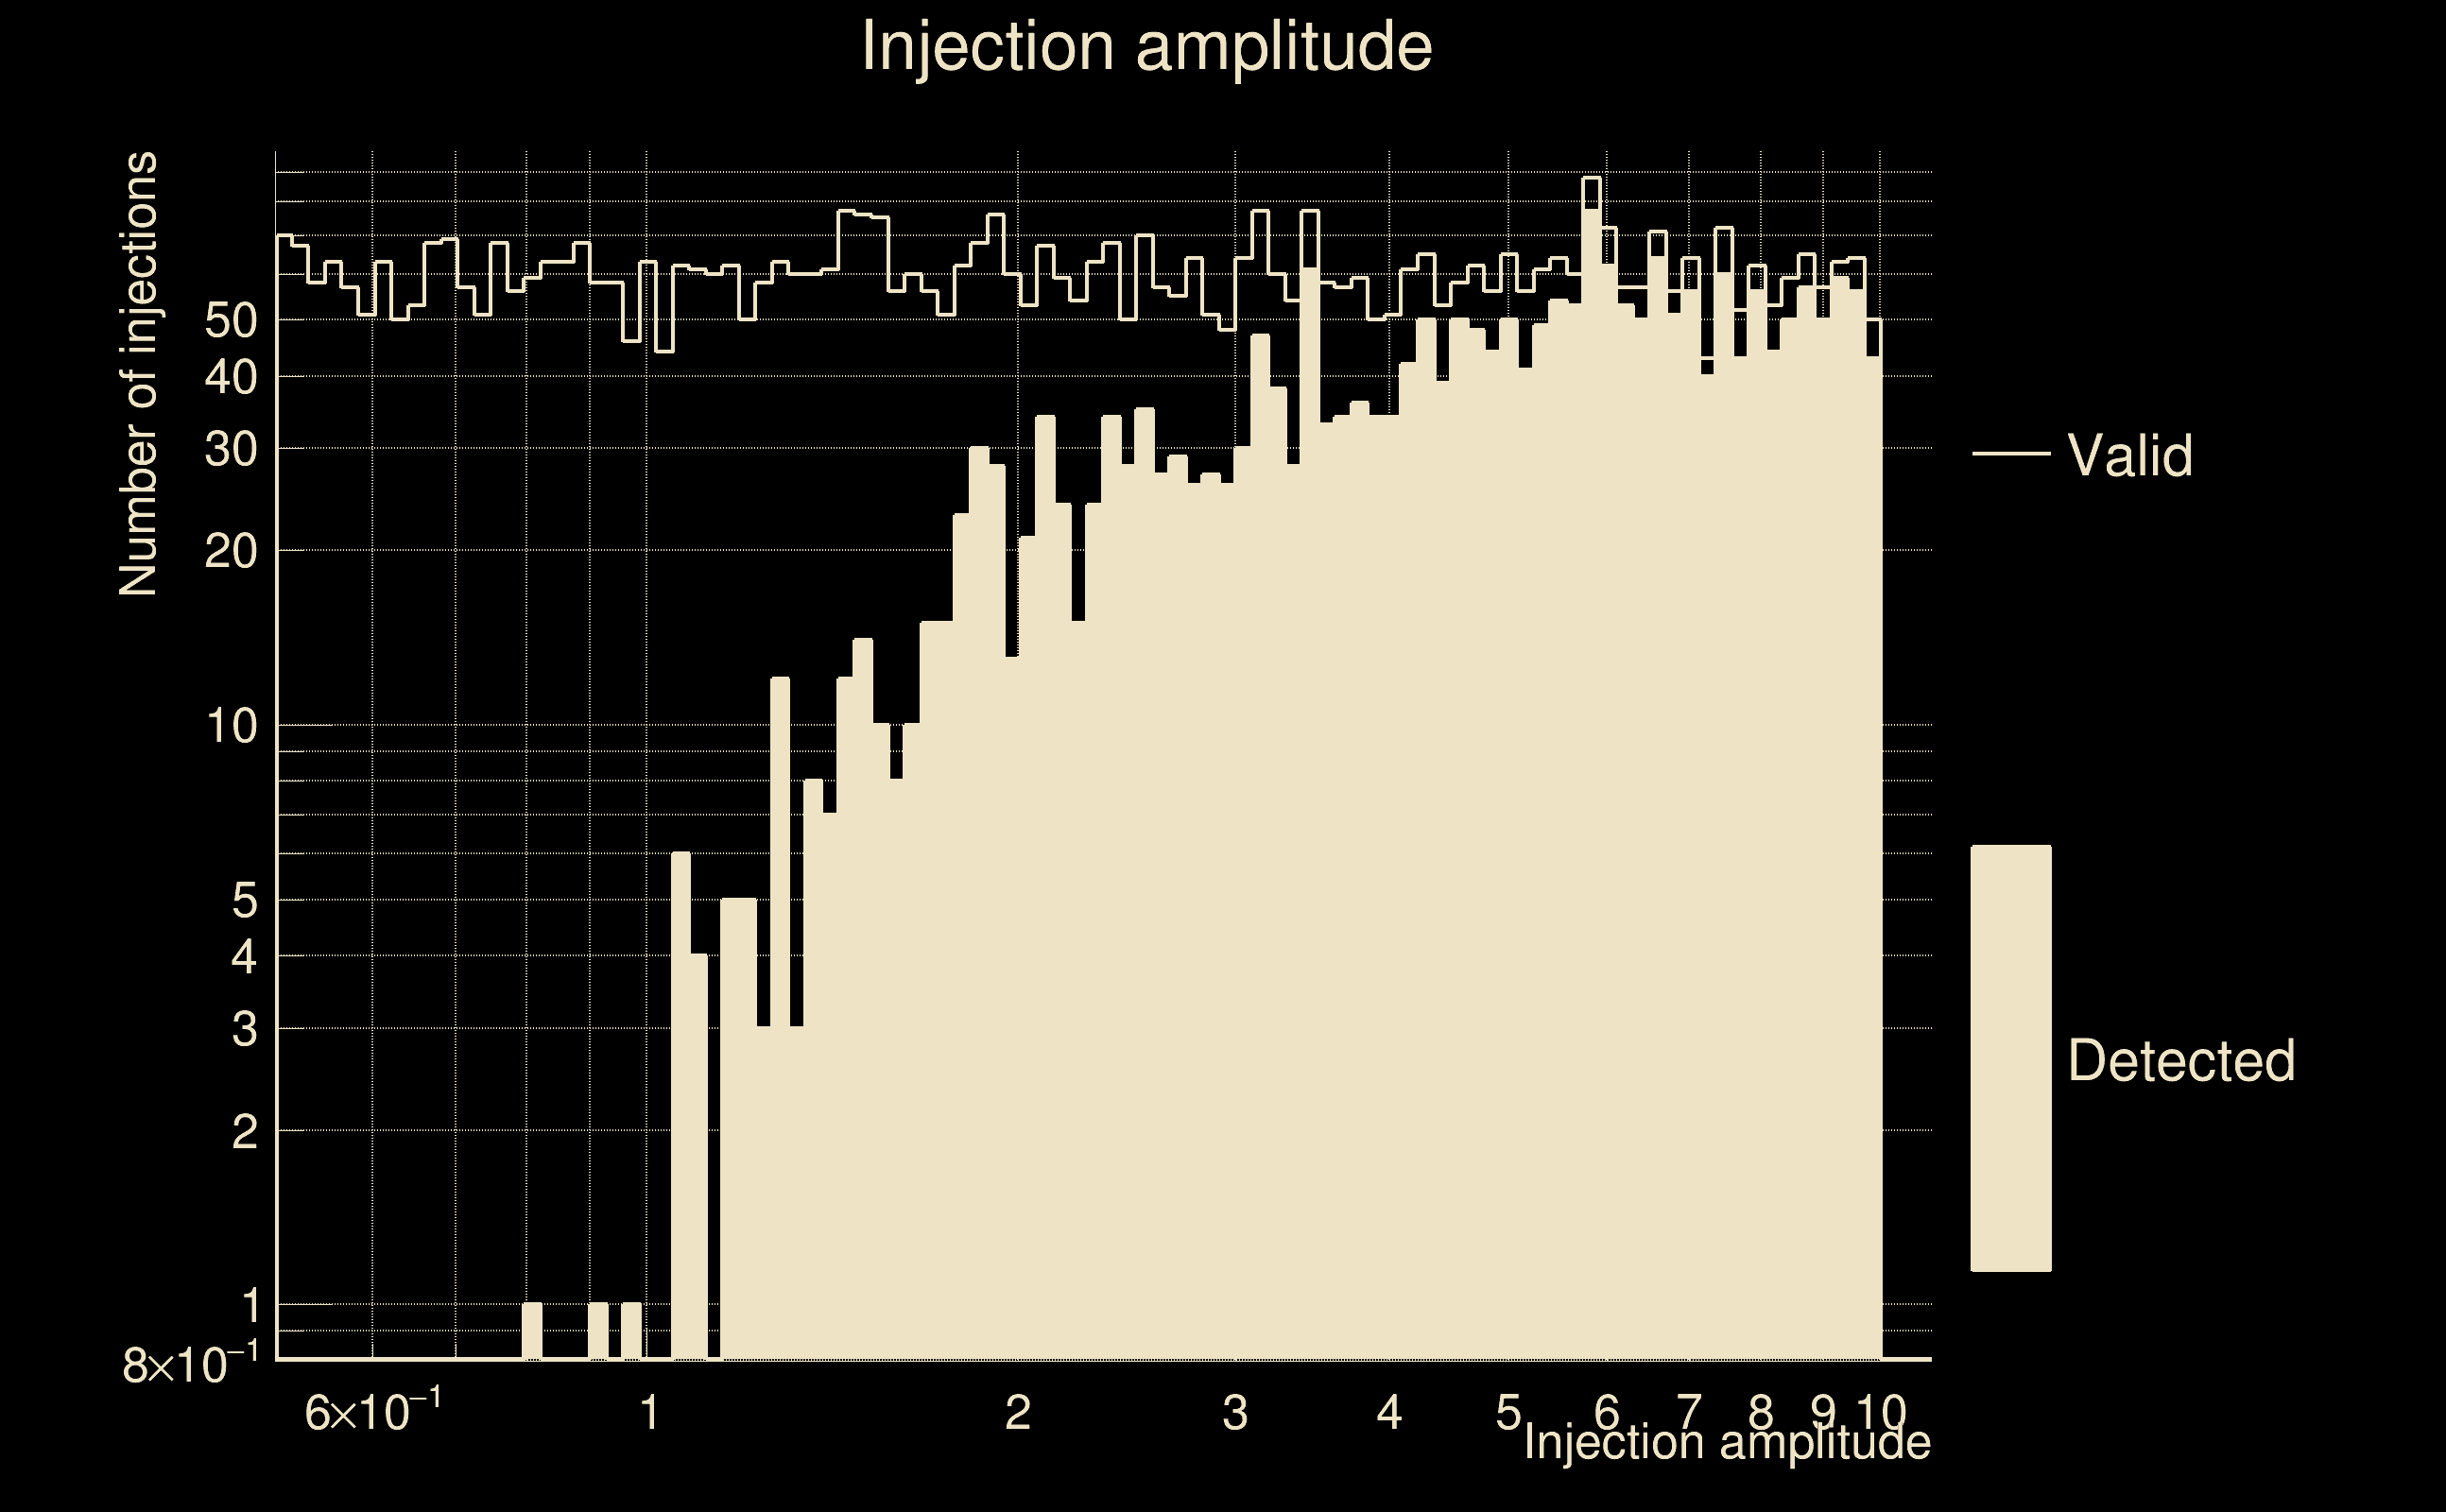
| Number of injections (total/valid/detected): | 5911 / 5869 / 2450 |
| List of missed injections: | ./MEZ23-D9_missed.txt |
| Injection amplitude at 90% detection efficiency: | 9.10295 |
| Injection amplitude at 50% detection efficiency: | 3.07121 |
| Injection amplitude at 10% detection efficiency: | 1.34929 |
 |
 |
 |
 |
 |
 |
|
 |
 |
|
 |
 |
 |
 |
 |
 |
 |
 |
| Number of injections (total/valid/detected): | 5730 / 5680 / 2384 |
| List of missed injections: | ./OCO18-MESA20PERTLR_missed.txt |
| Injection amplitude at 90% detection efficiency: | 8.33937 |
| Injection amplitude at 50% detection efficiency: | 2.88331 |
| Injection amplitude at 10% detection efficiency: | 1.41703 |
 |
 |
 |
 |
 |
 |
|
 |
 |
|
 |
 |
 |
 |
 |
 |
 |
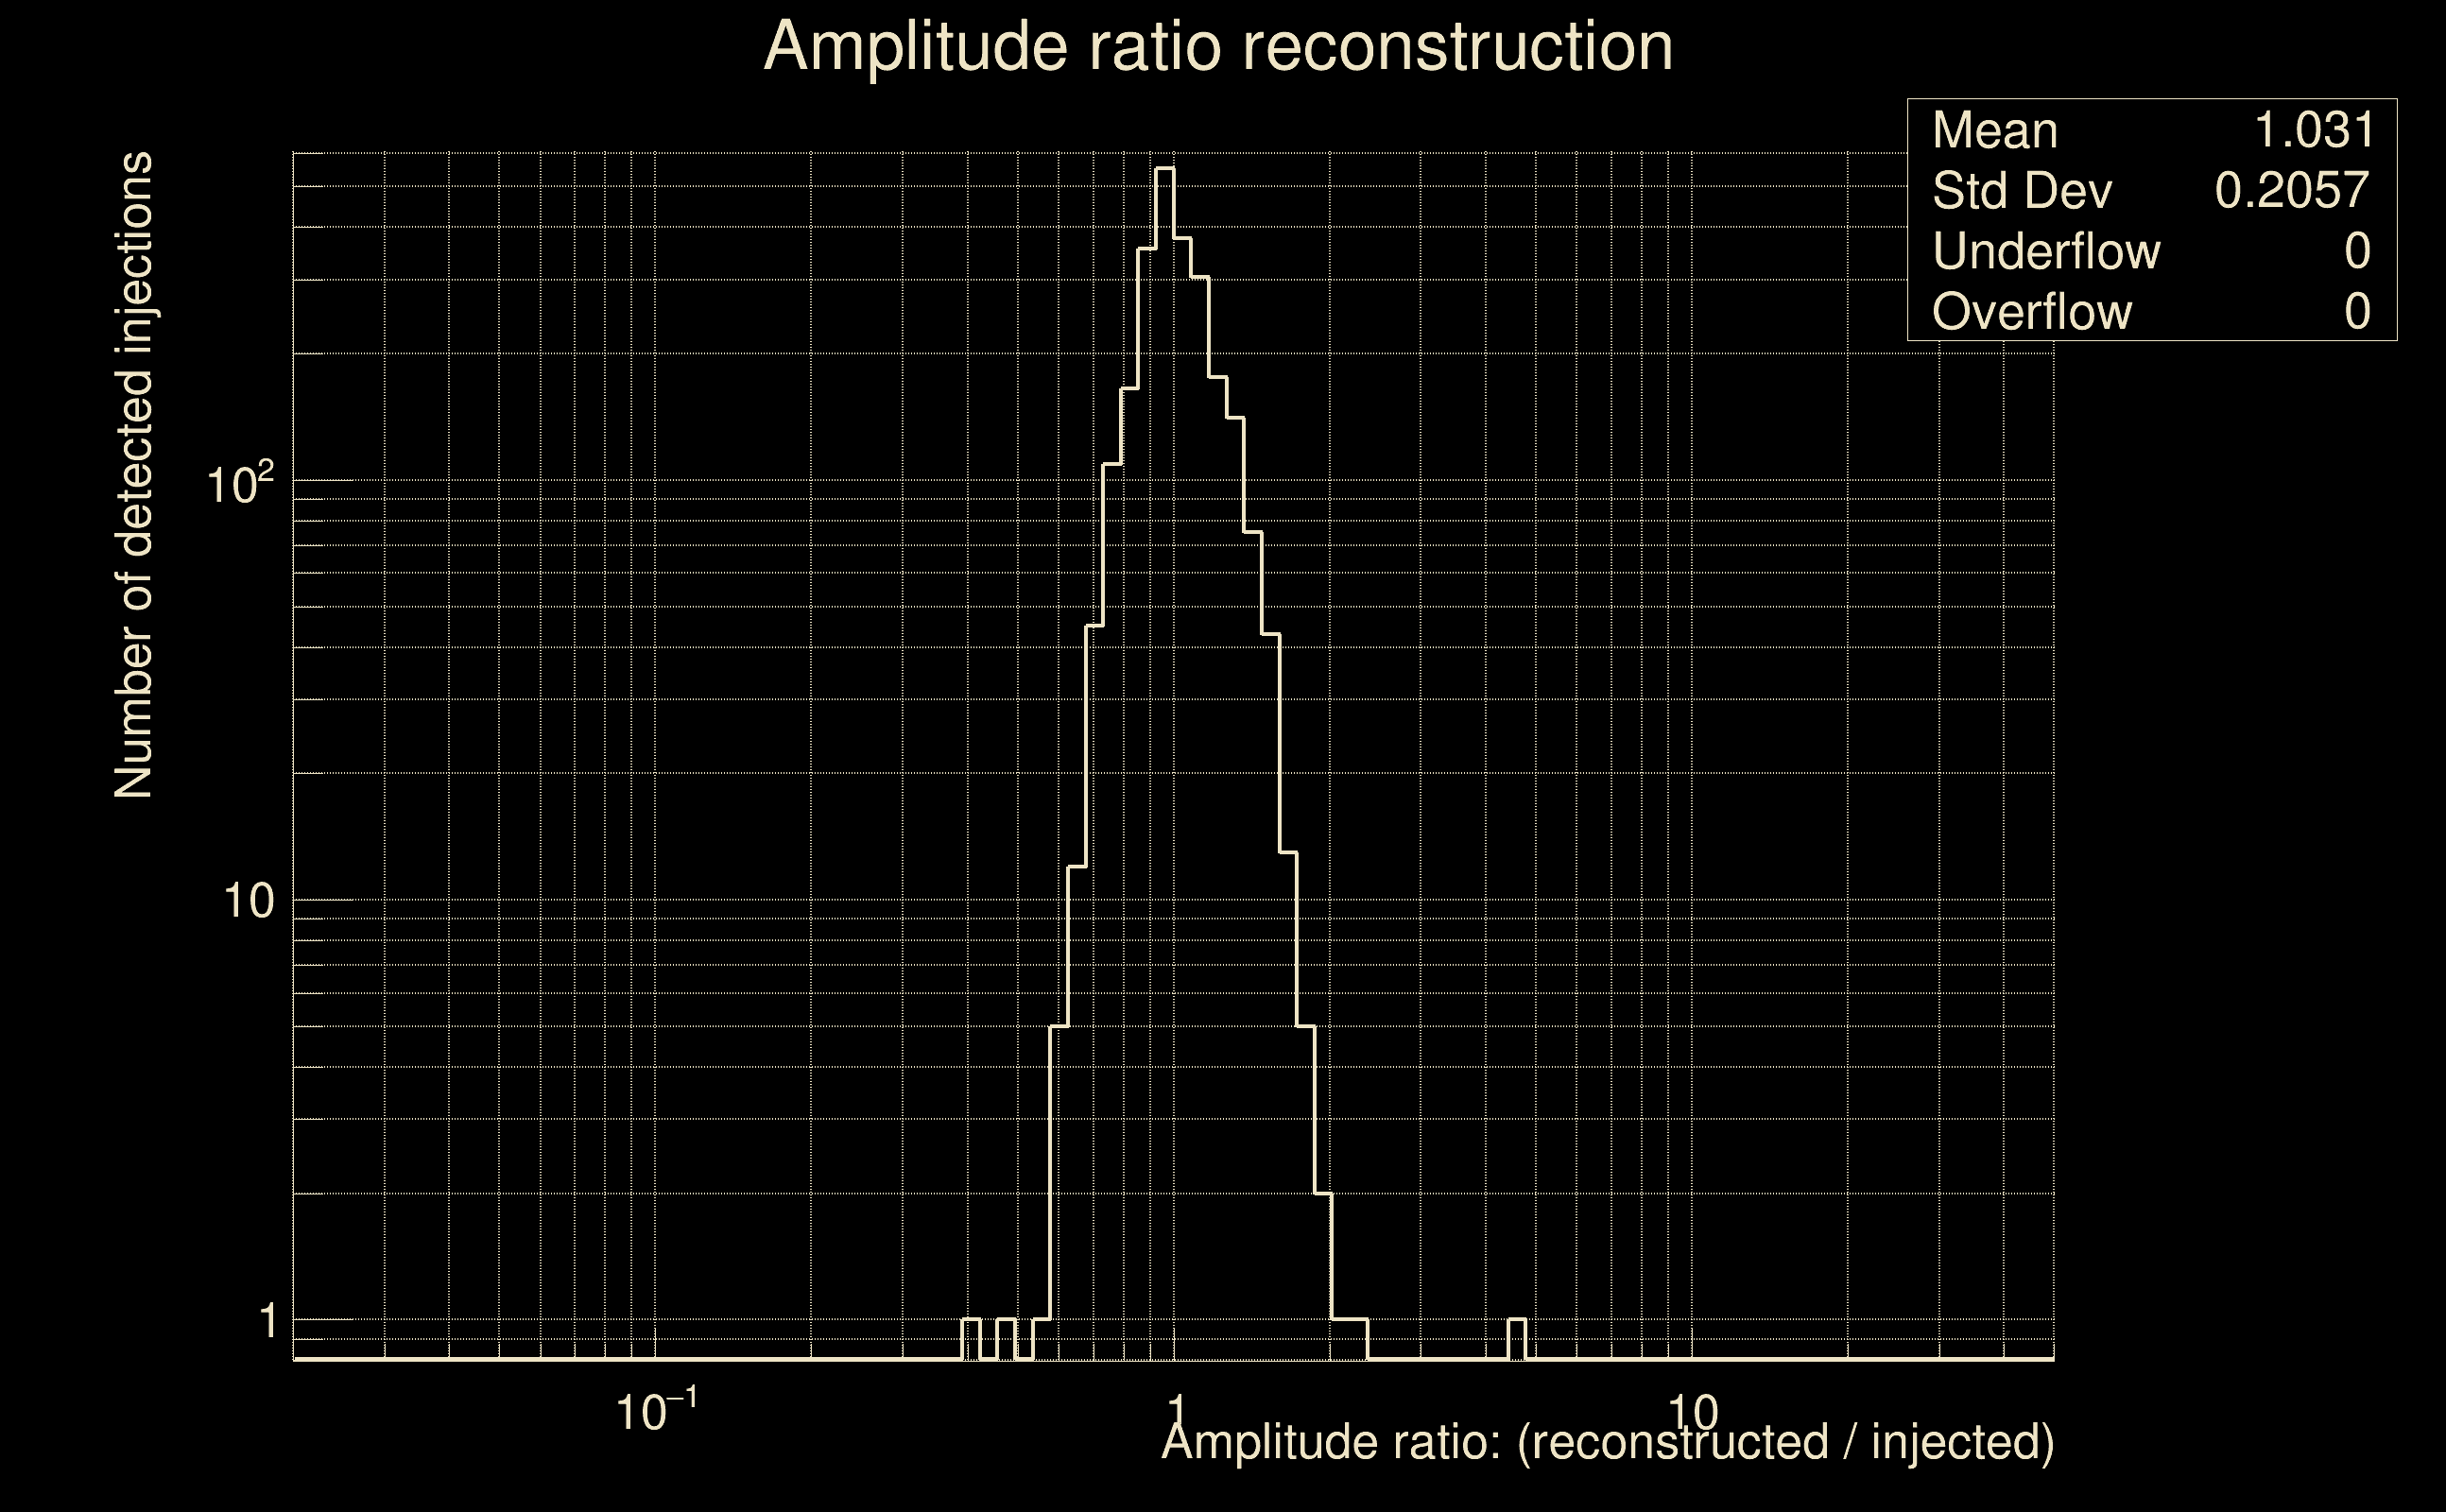 |
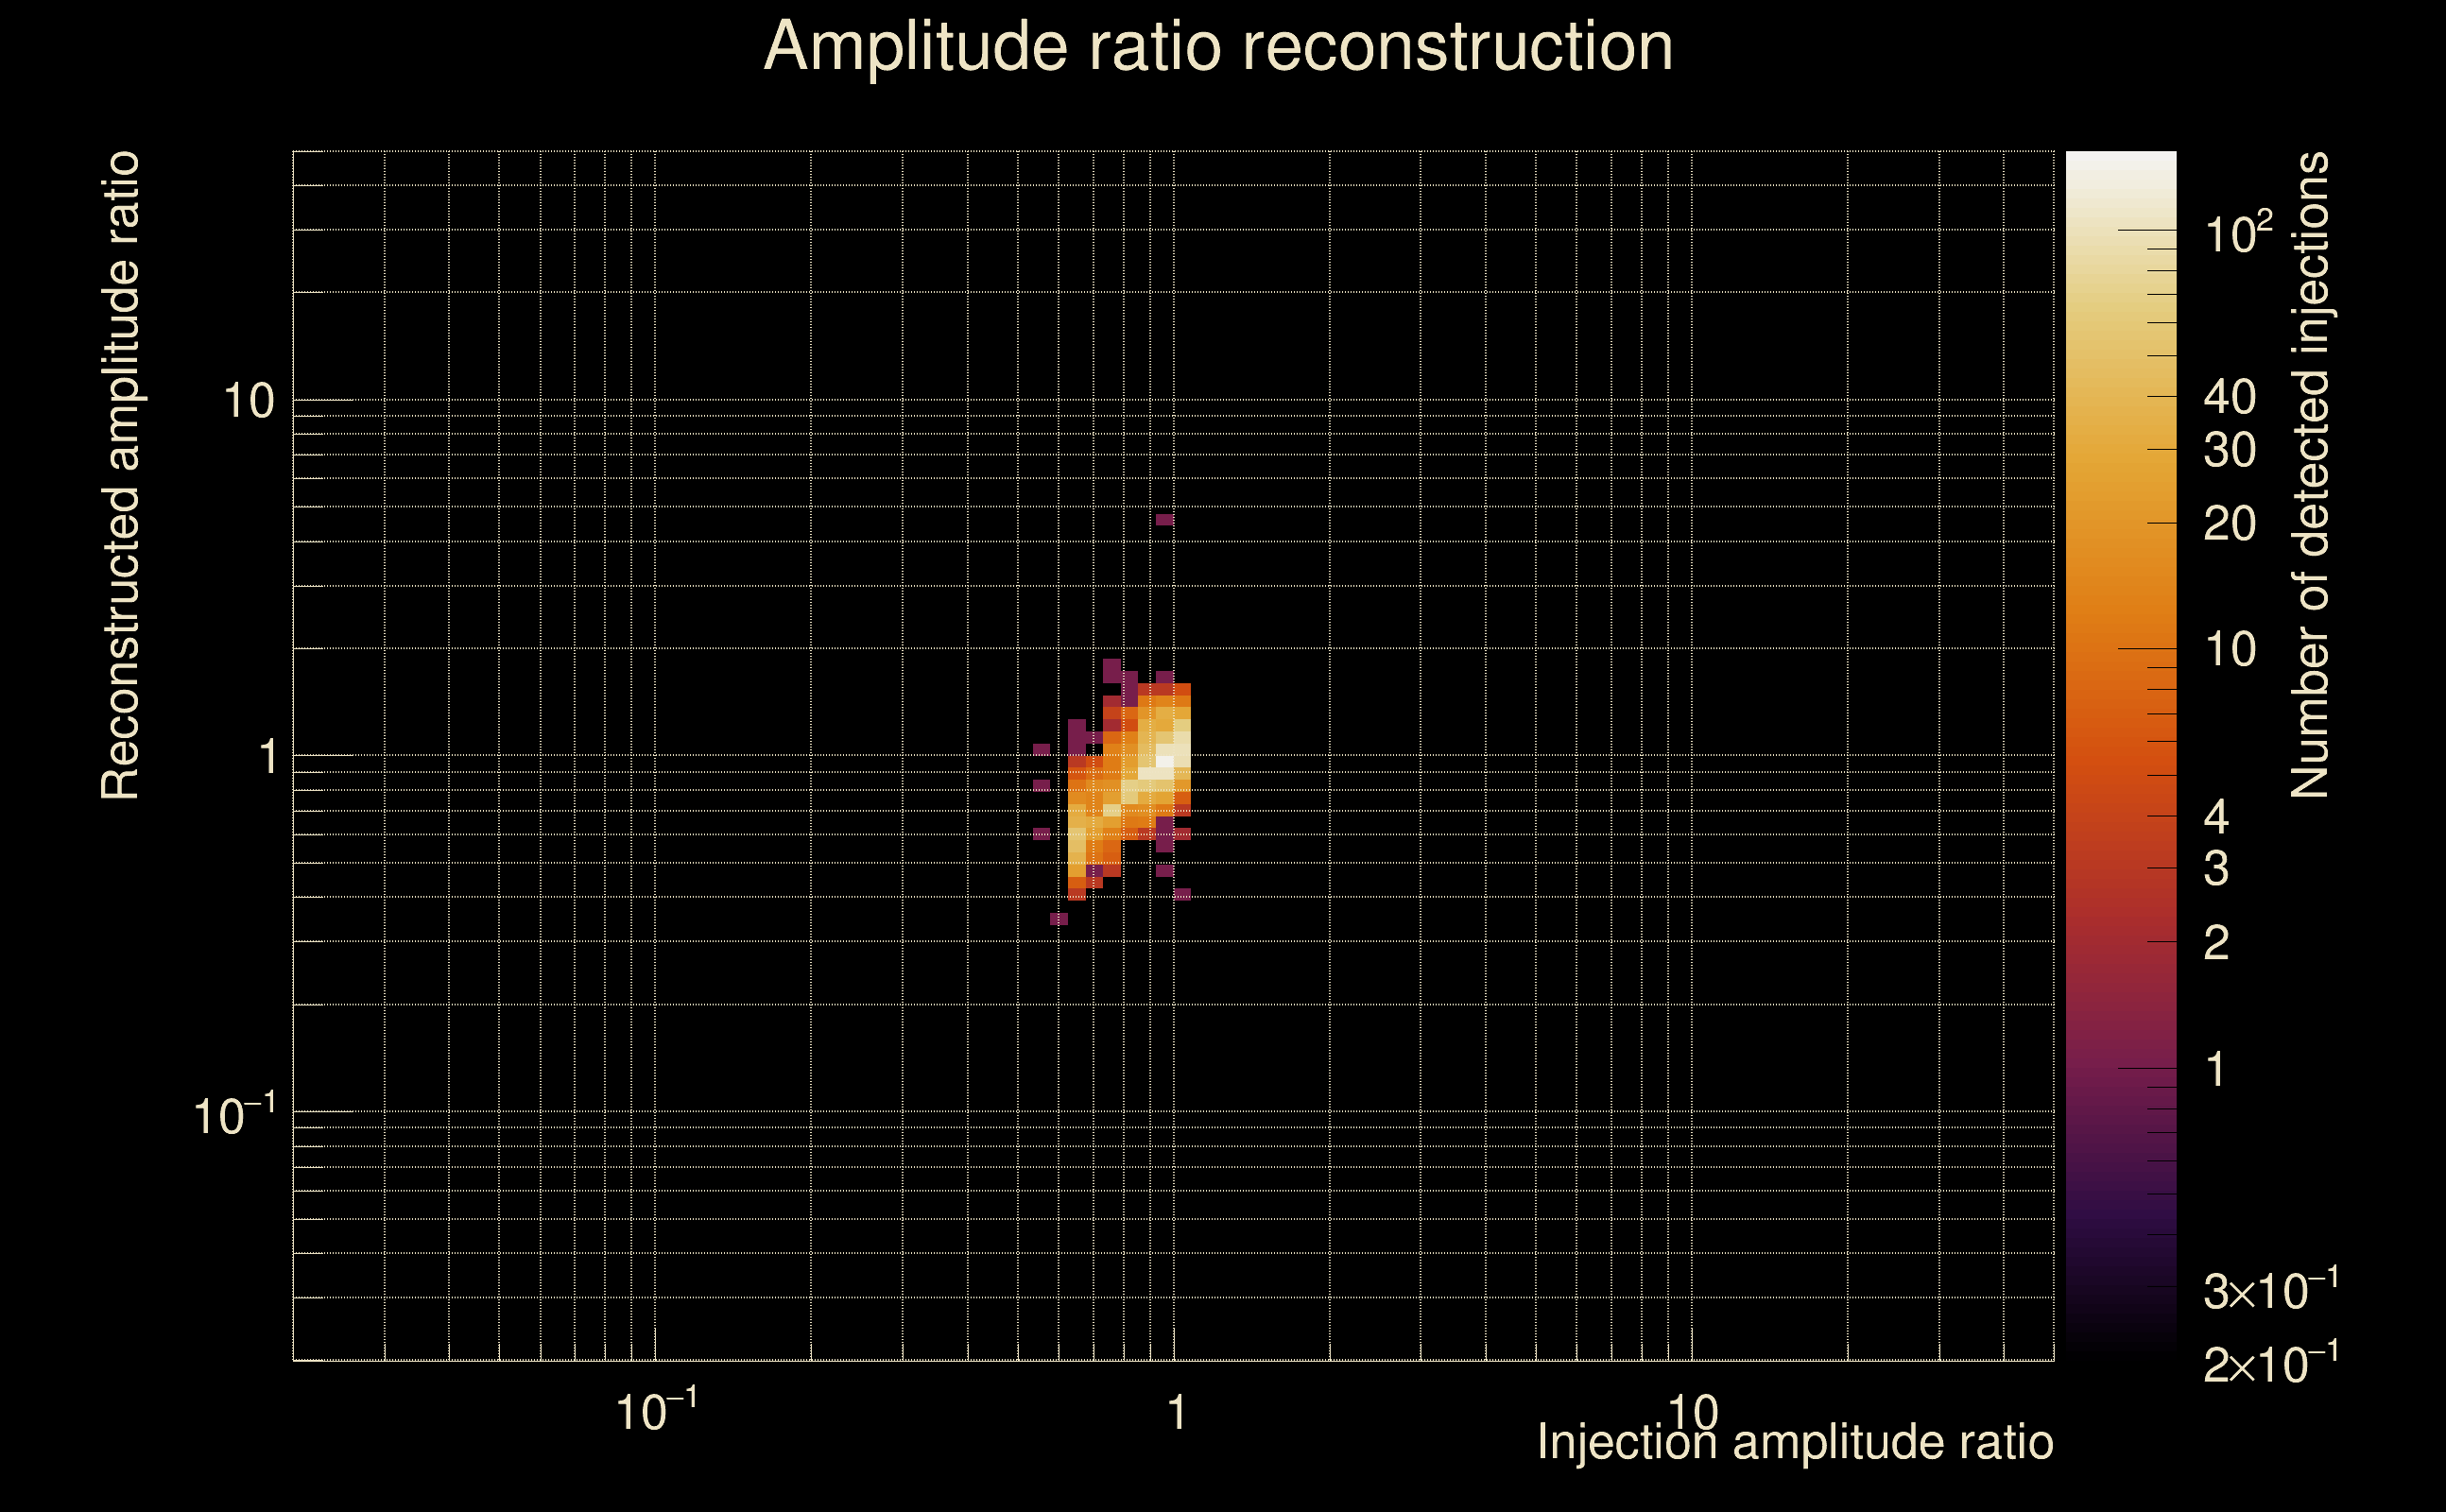
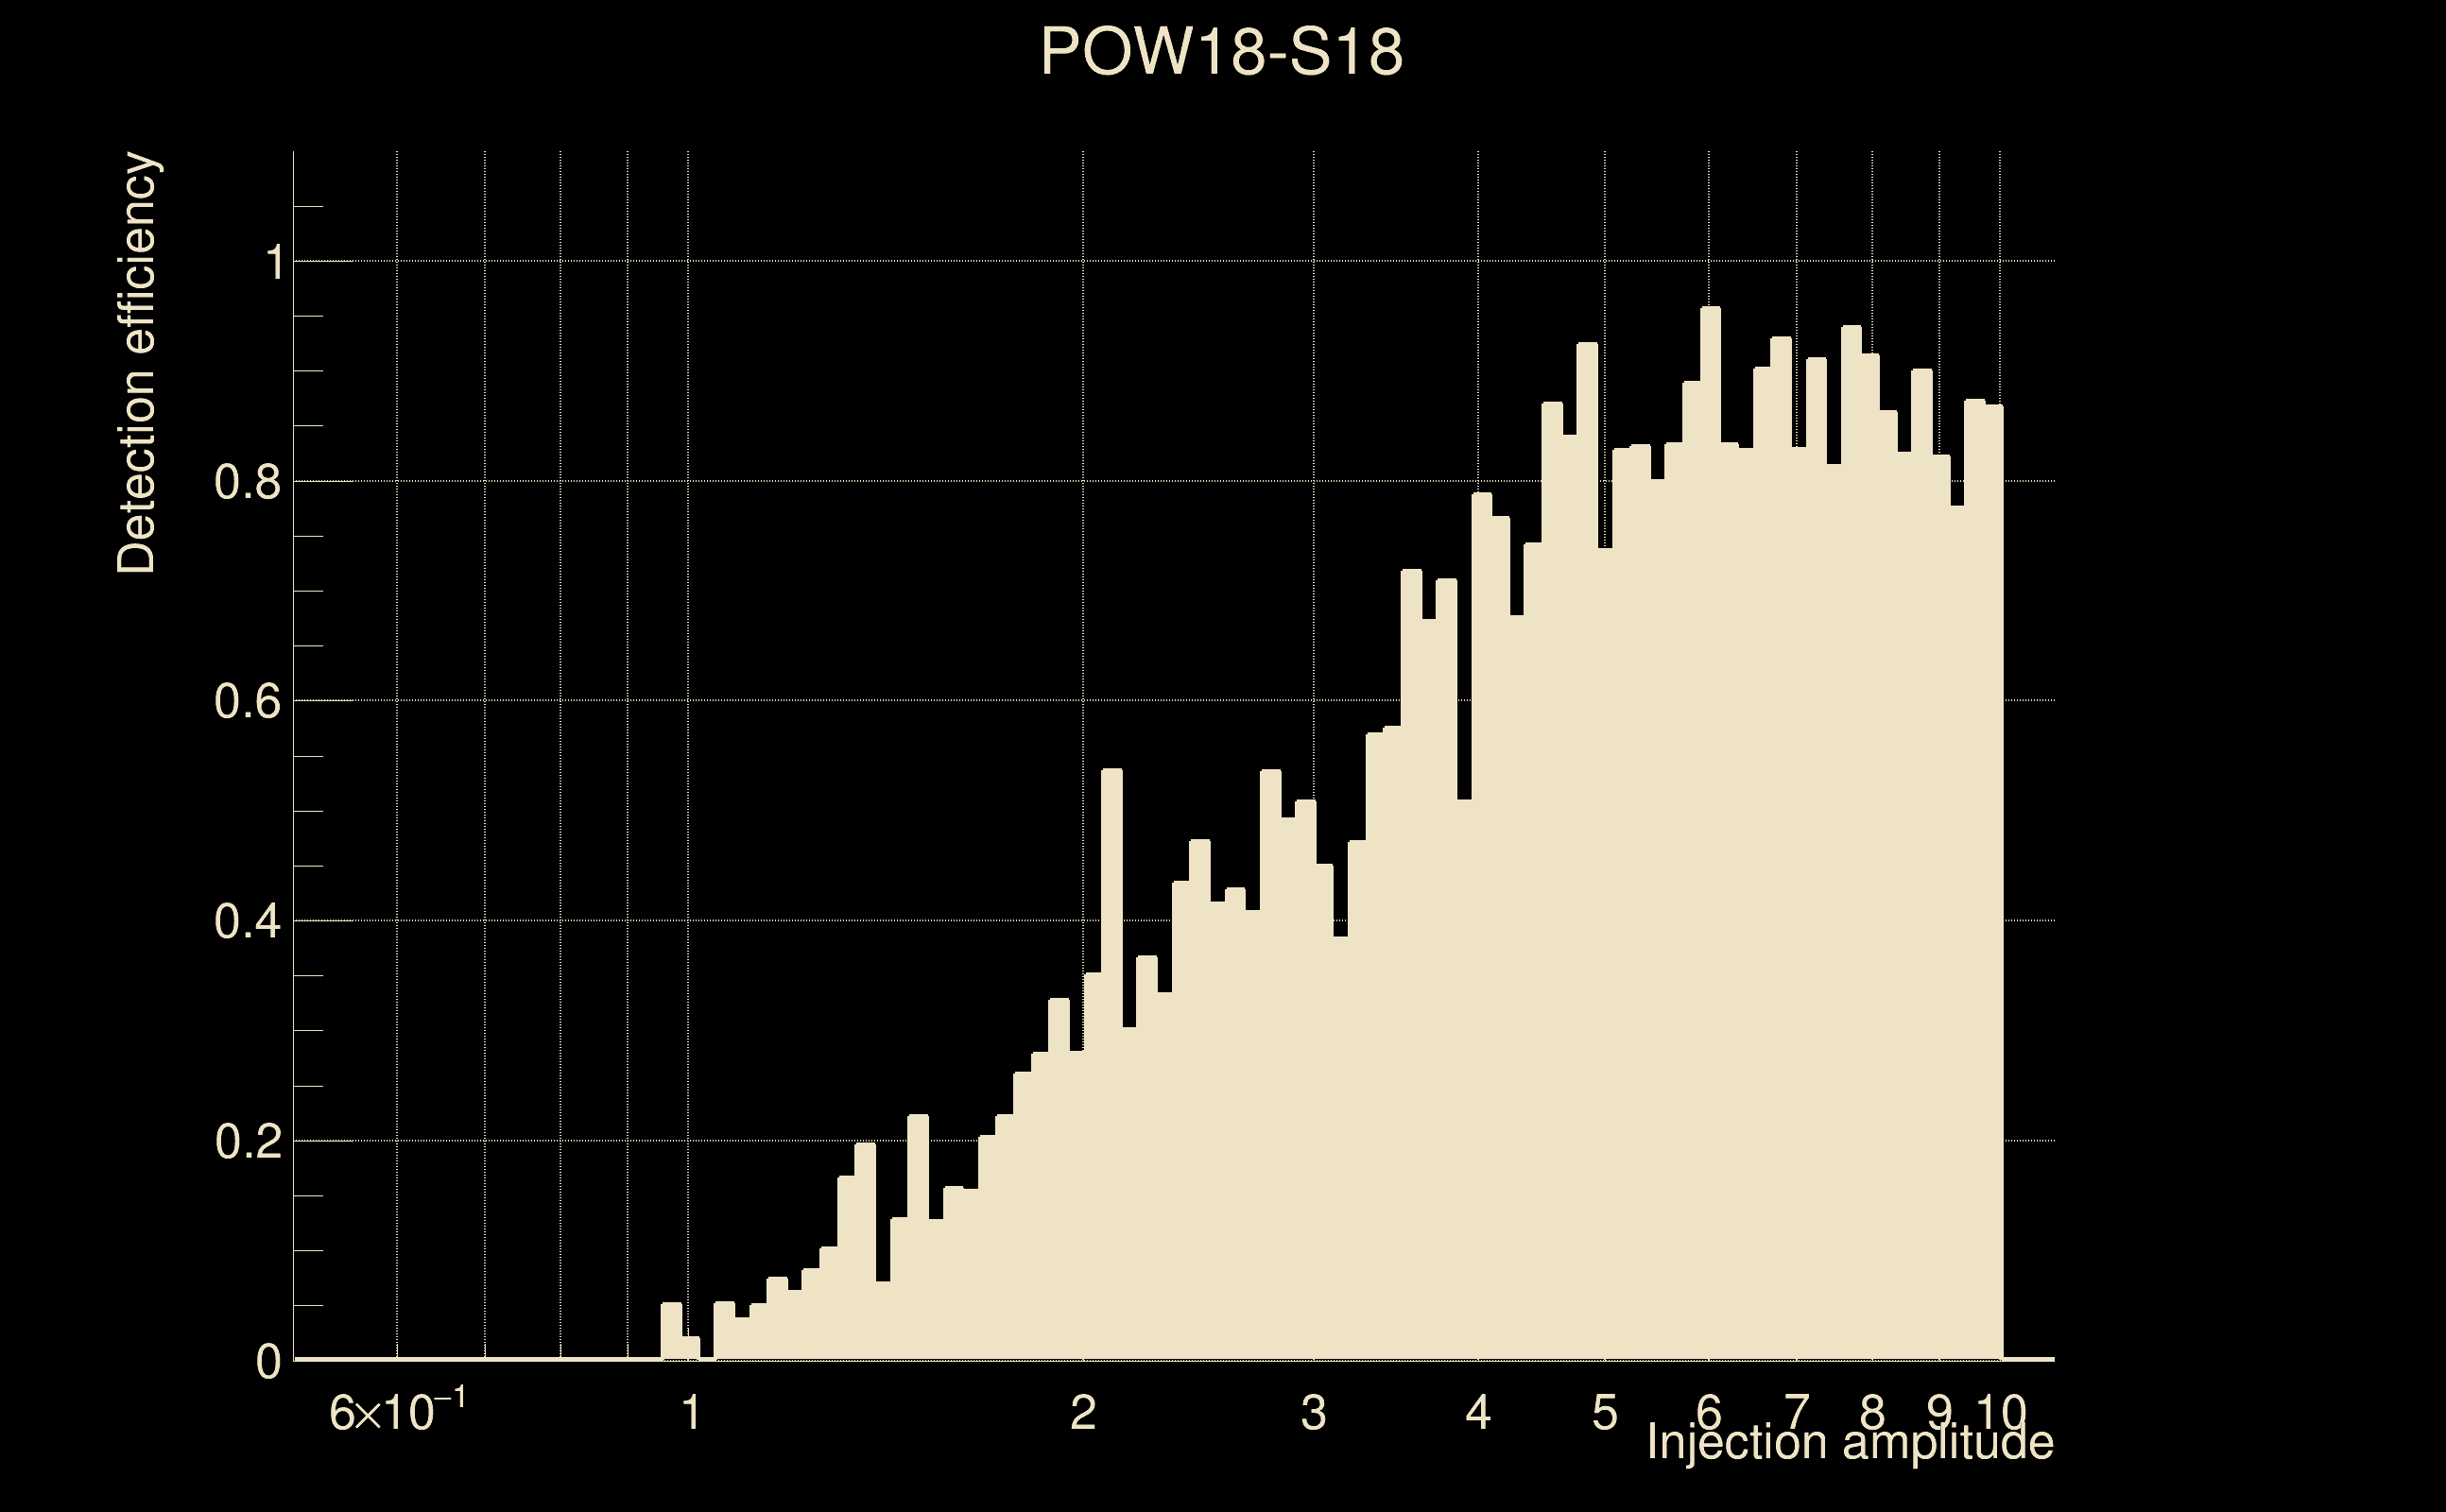
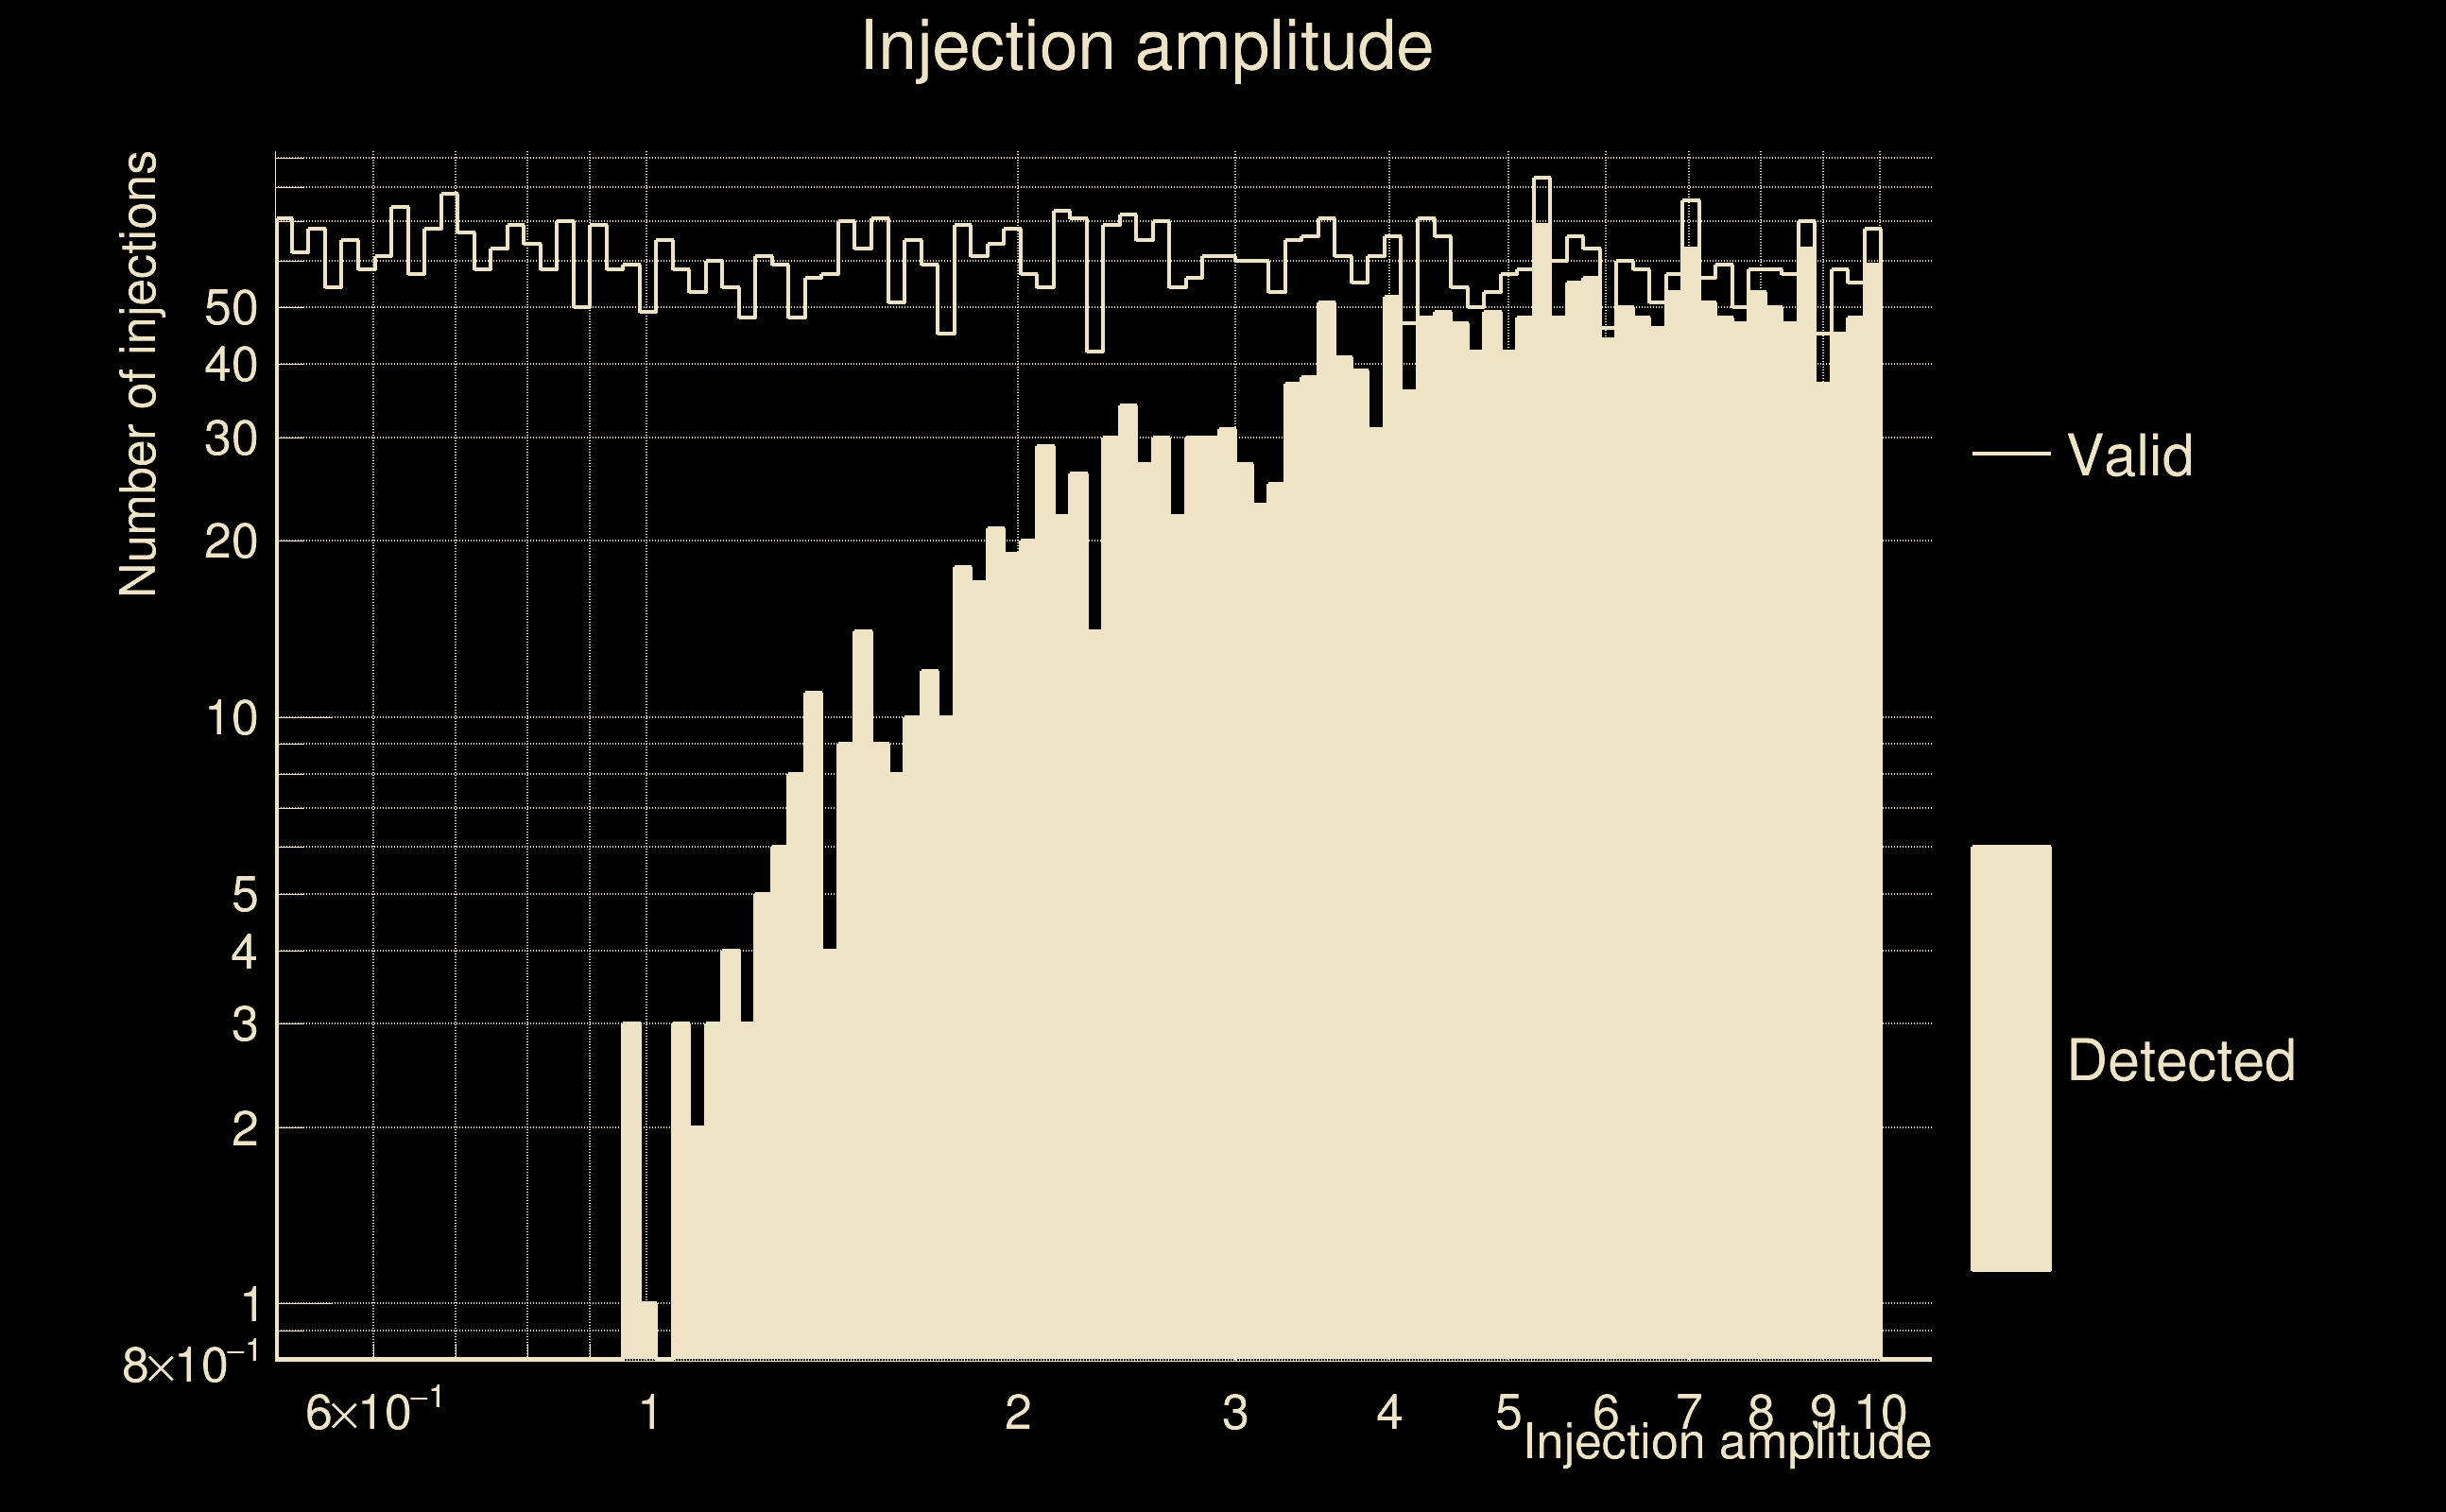
| Number of injections (total/valid/detected): | 5932 / 5888 / 2350 |
| List of missed injections: | ./POW18-S18_missed.txt |
| Injection amplitude at 90% detection efficiency: | 5.8675 |
| Injection amplitude at 50% detection efficiency: | 3.2744 |
| Injection amplitude at 10% detection efficiency: | 1.43119 |
 |
 |
 |
 |
 |
 |
|
 |
 |
|
 |
 |
 |
 |
 |
 |
 |
 |
| florent.robinet@ijclab.in2p3.fr |