| Omicron version: | 4.2.0: documentation gitlab repository |
| Omicron run by: | unknown |
| Report produced on: | Mon Nov 3 13:35:07 2025 UTC |
| Ox option file: | Targ_FirstTest_O4bw_14days_options.txt |
| Omicron option files: | detector 0, detector 1 |
| Detector channel names: | H1:GDS-CALIB_STRAIN_CLEAN_AR_4096Hz, L1:GDS-CALIB_STRAIN_CLEAN_AR_4096Hz |
| Omicron analysis time window and overlap: | 16 s, 6 s |
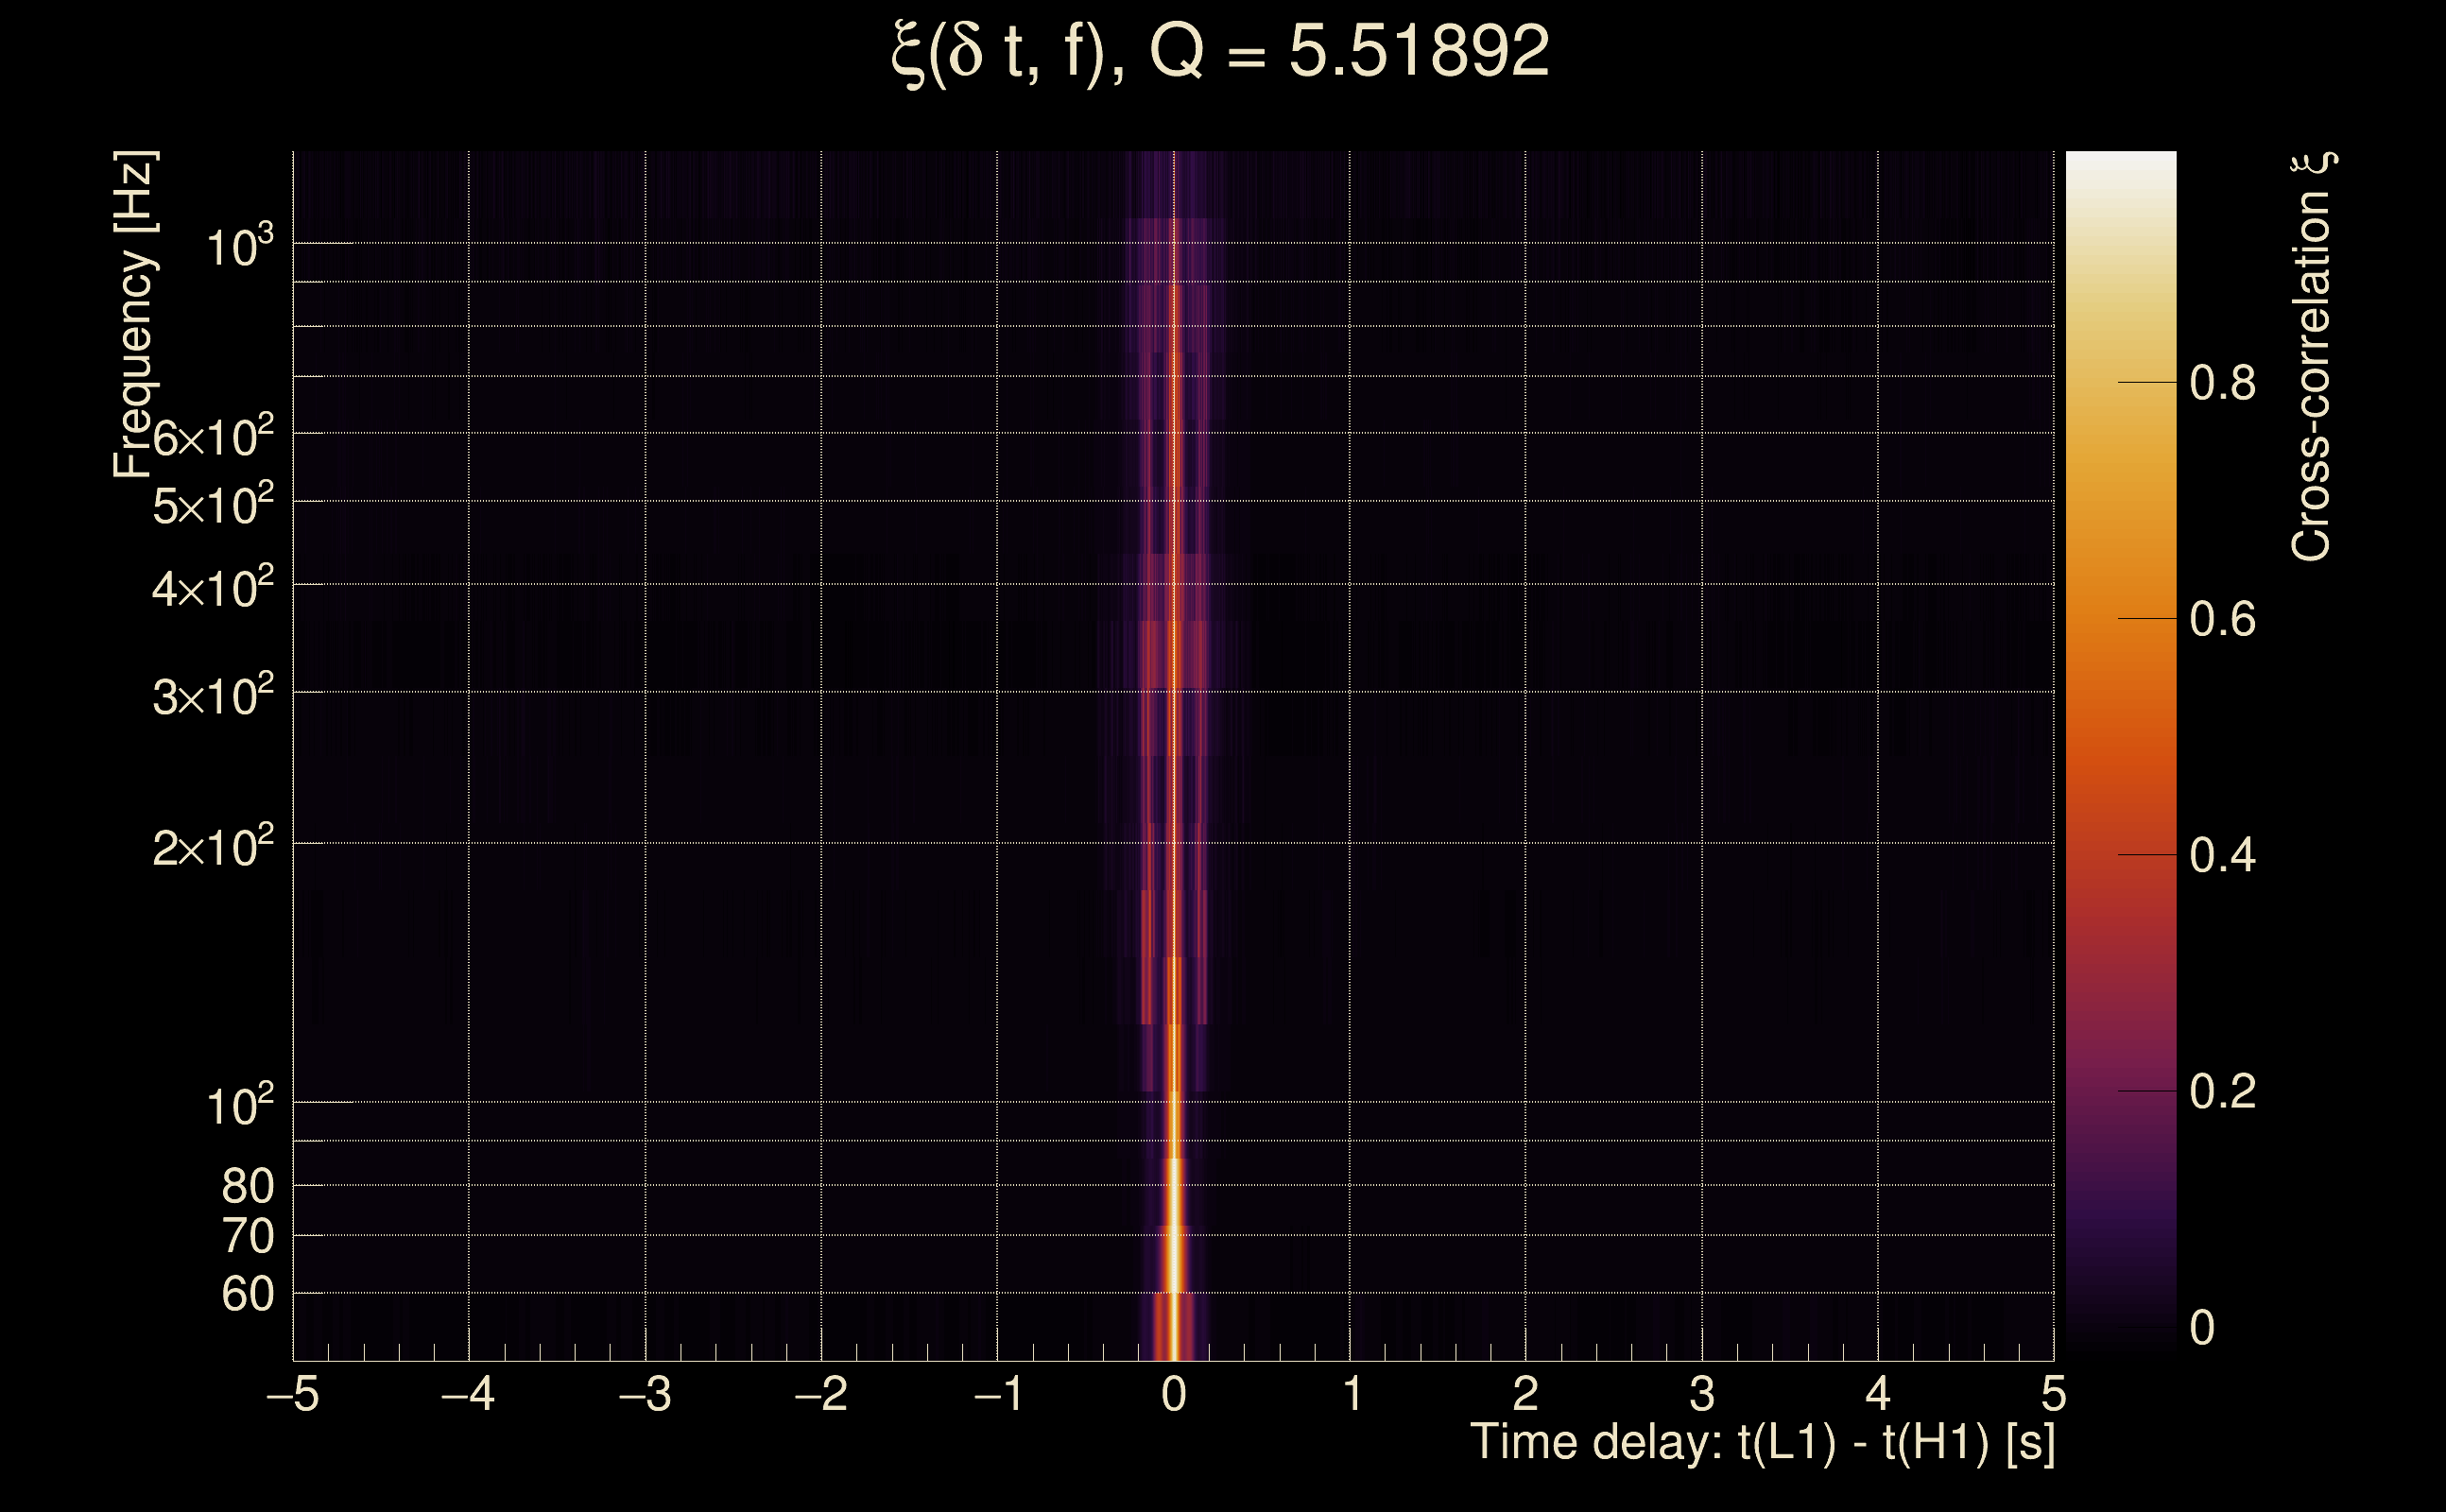
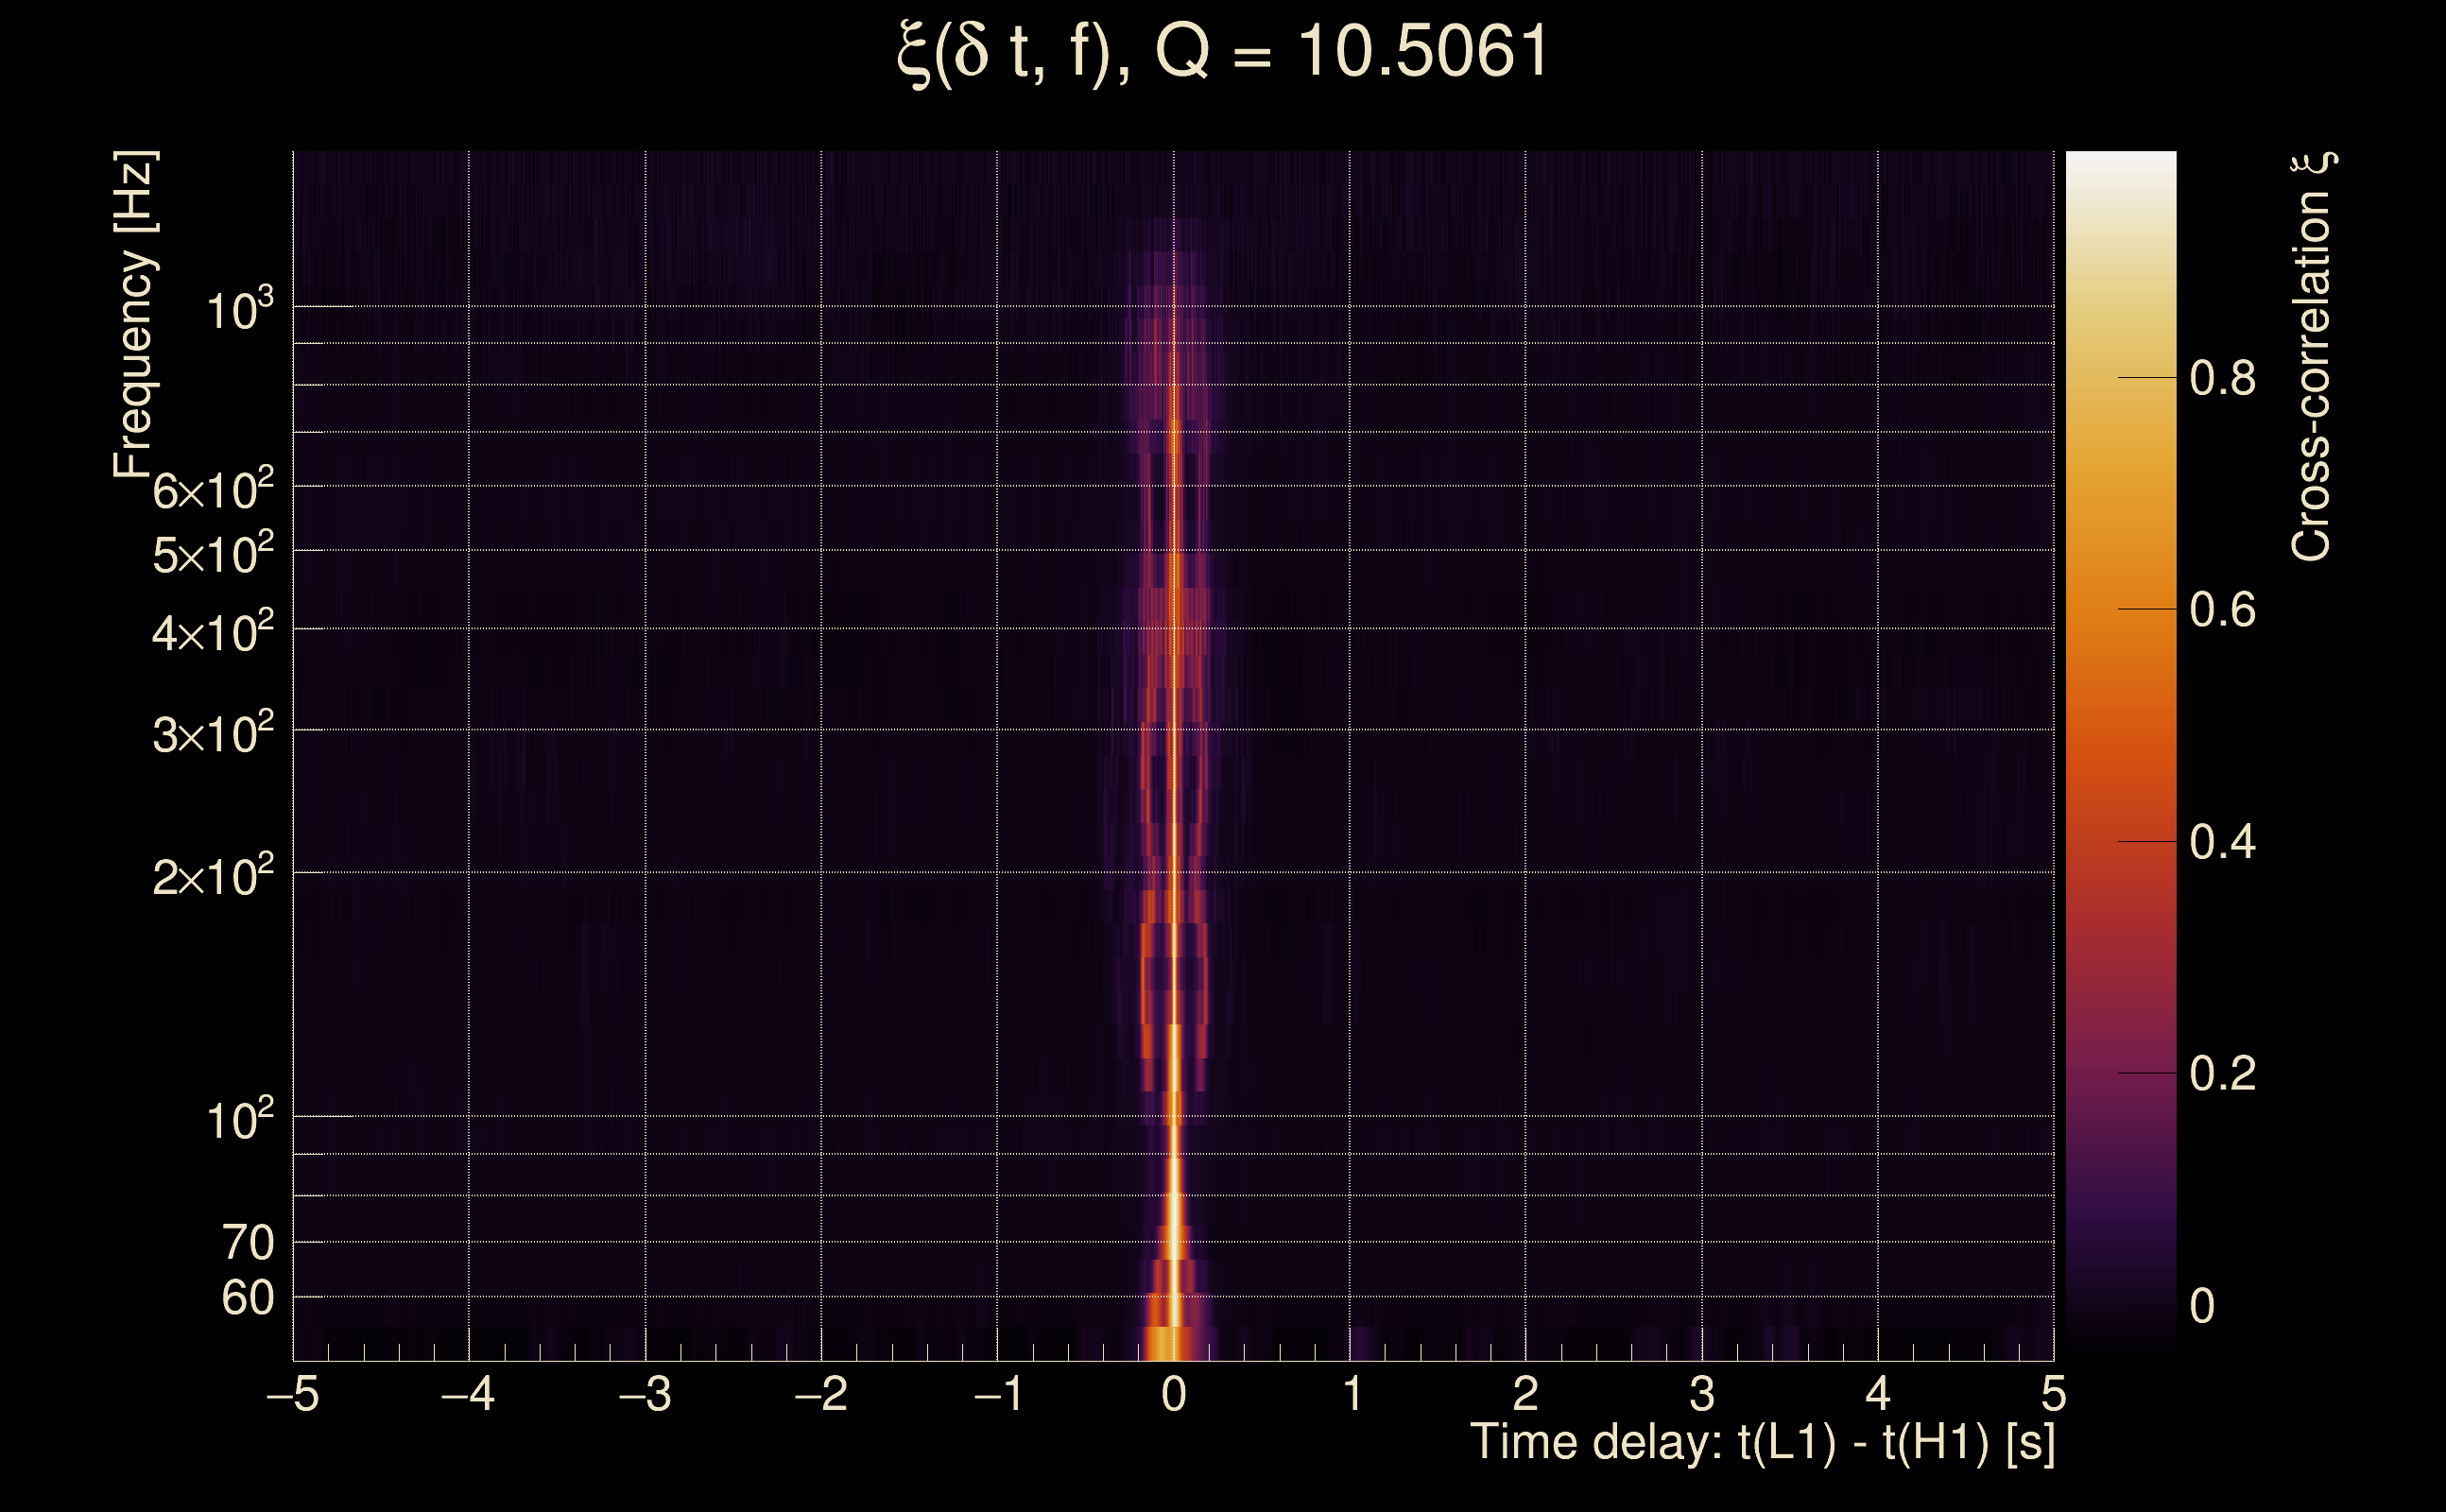
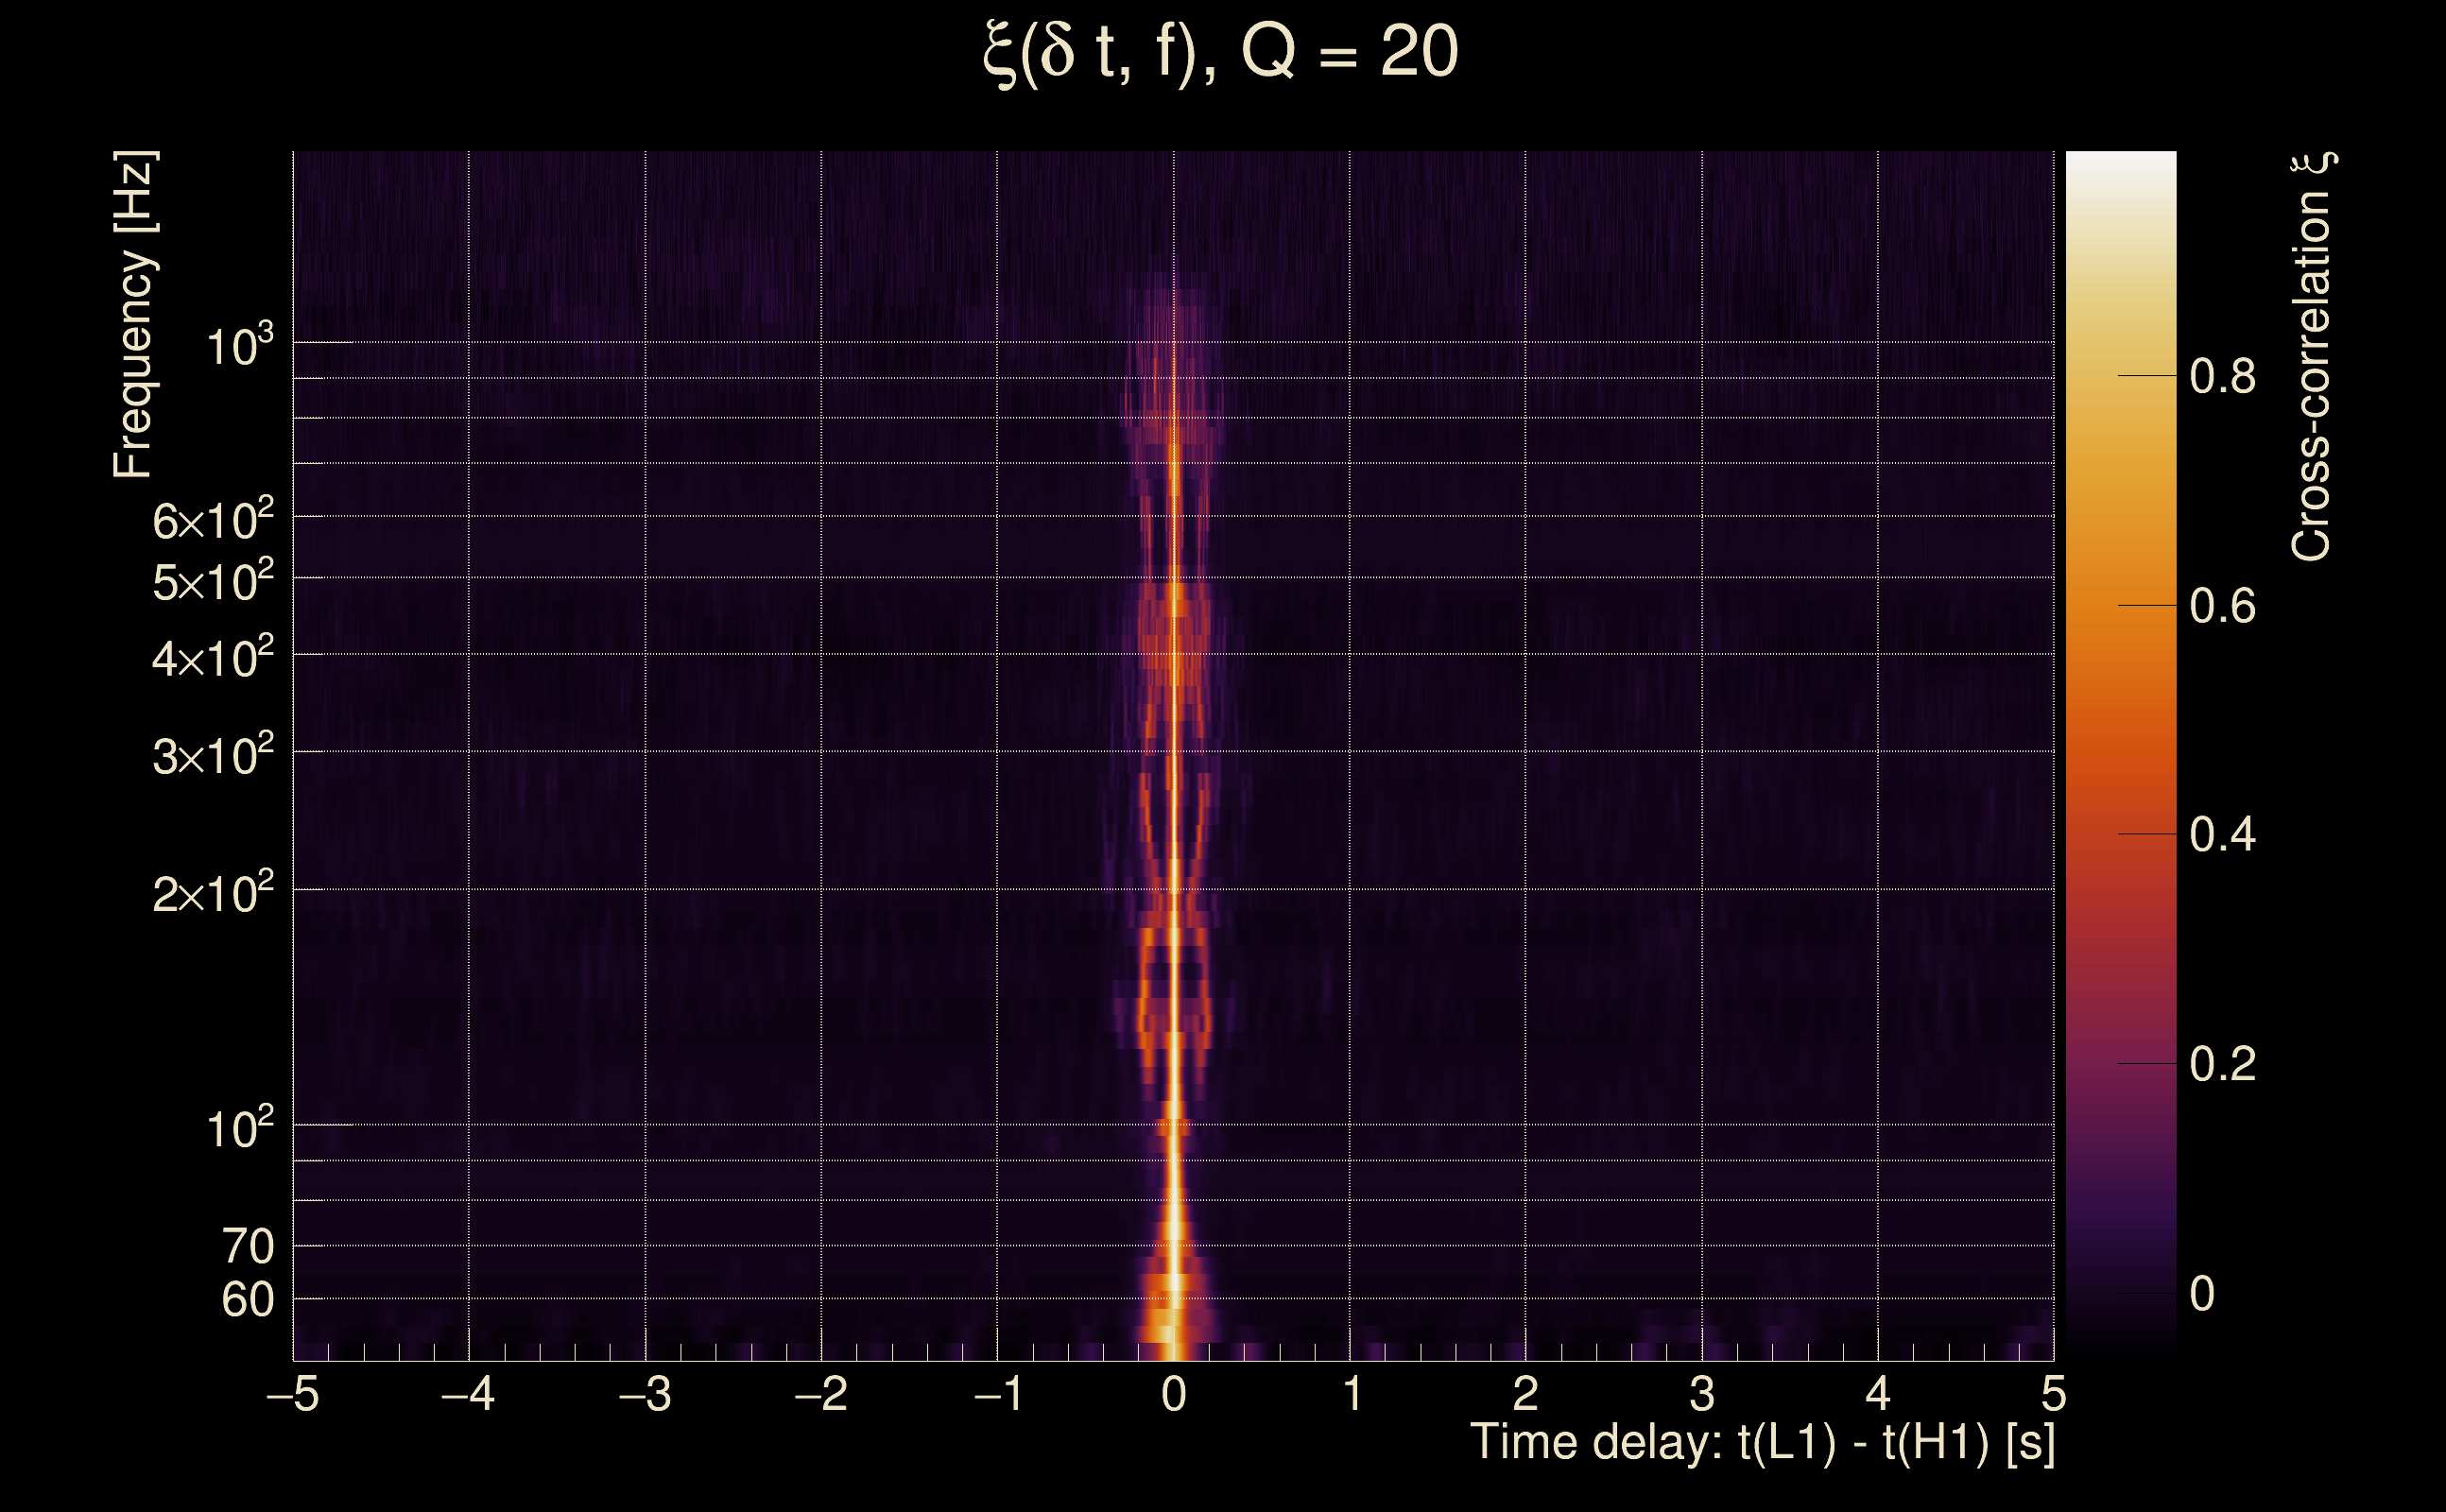
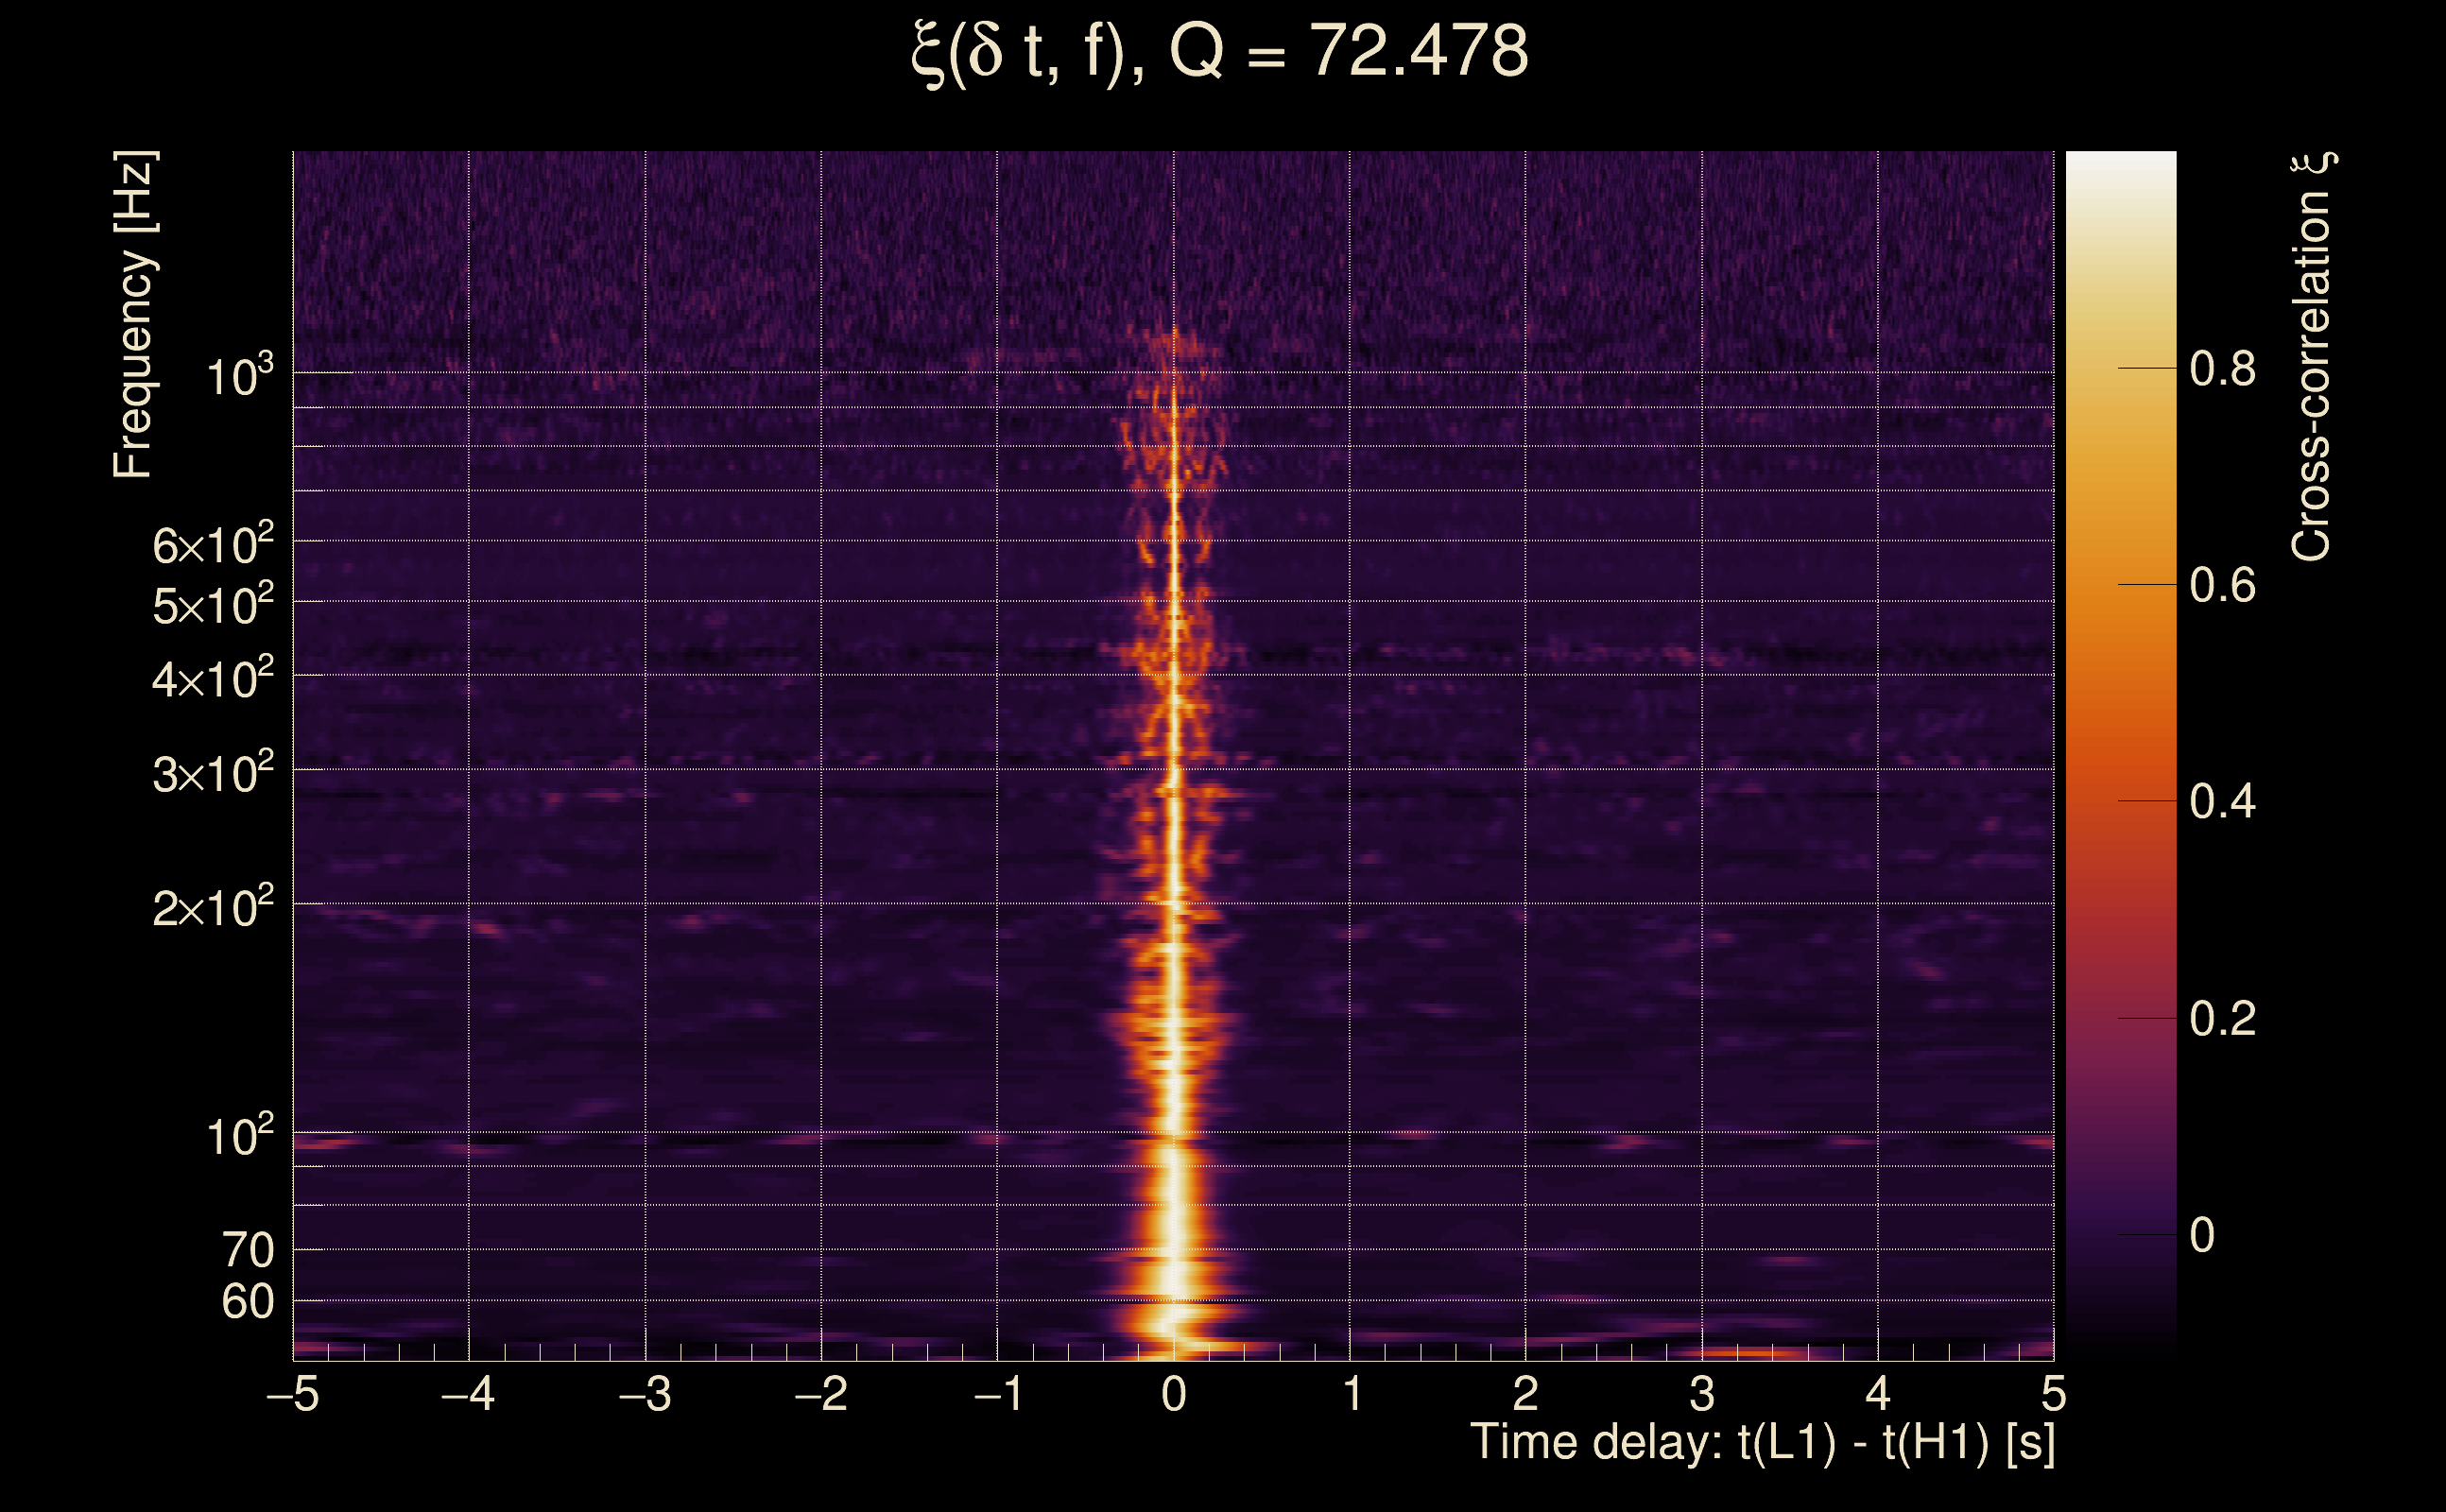
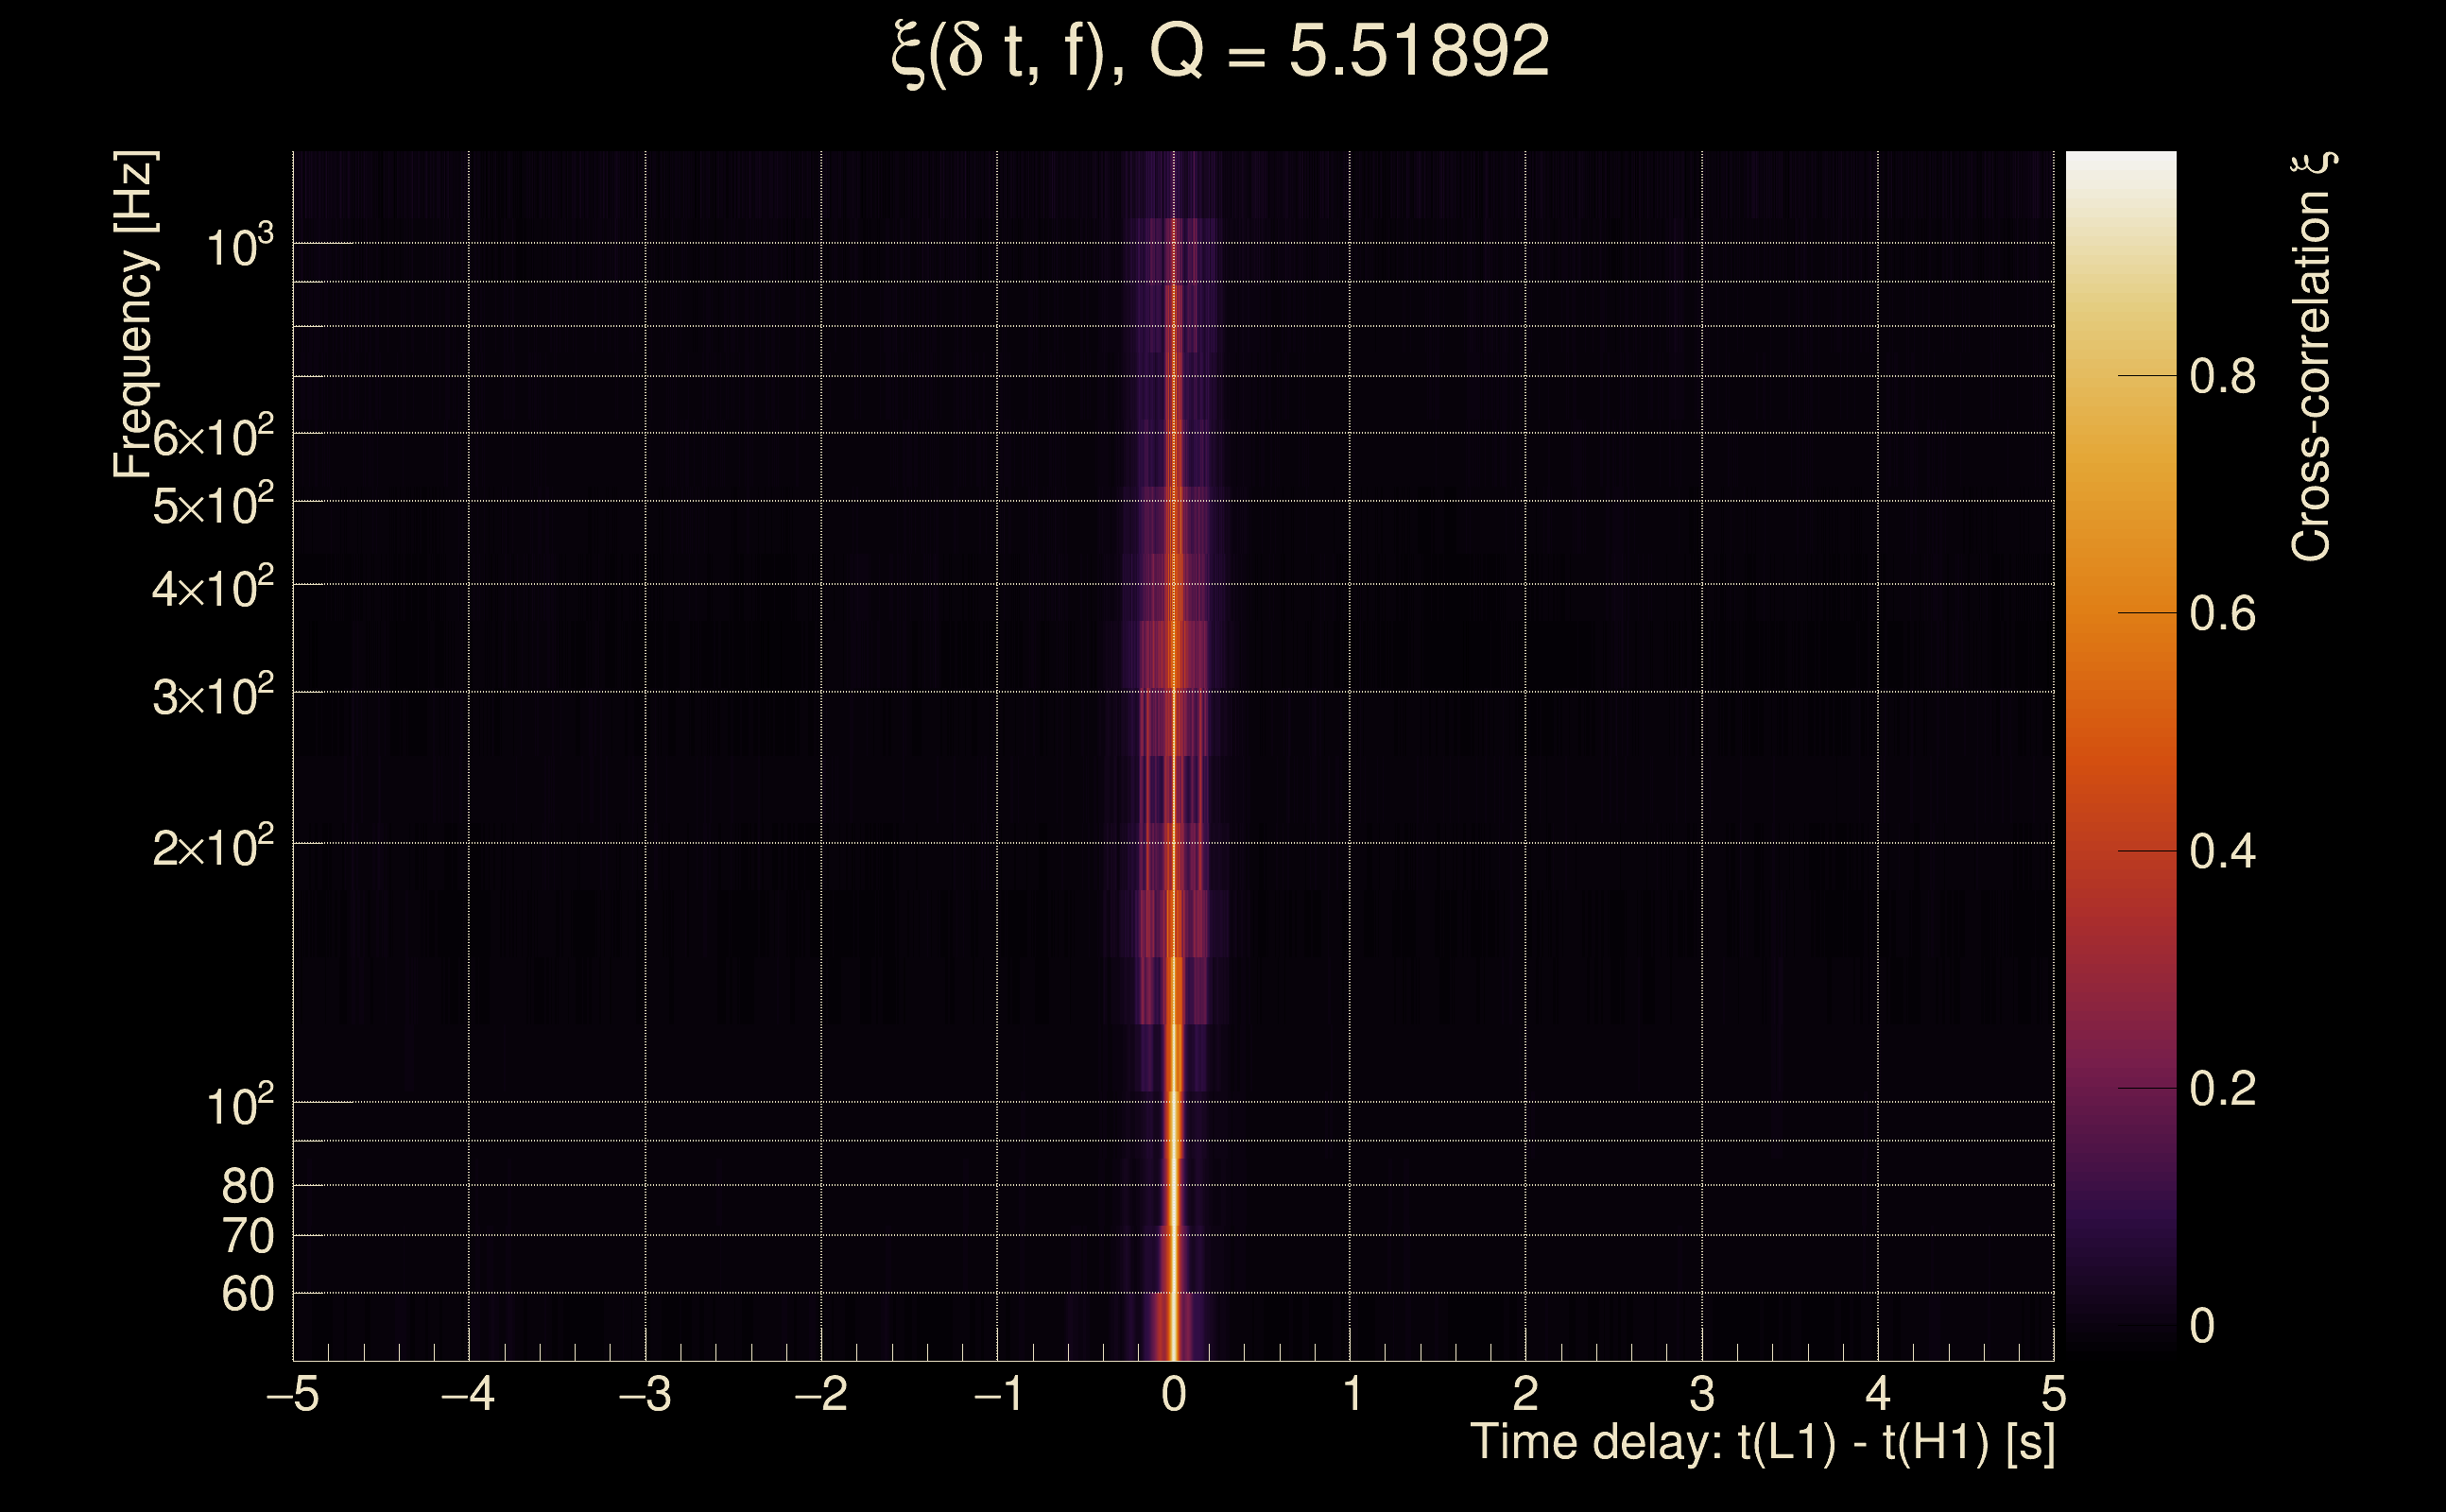
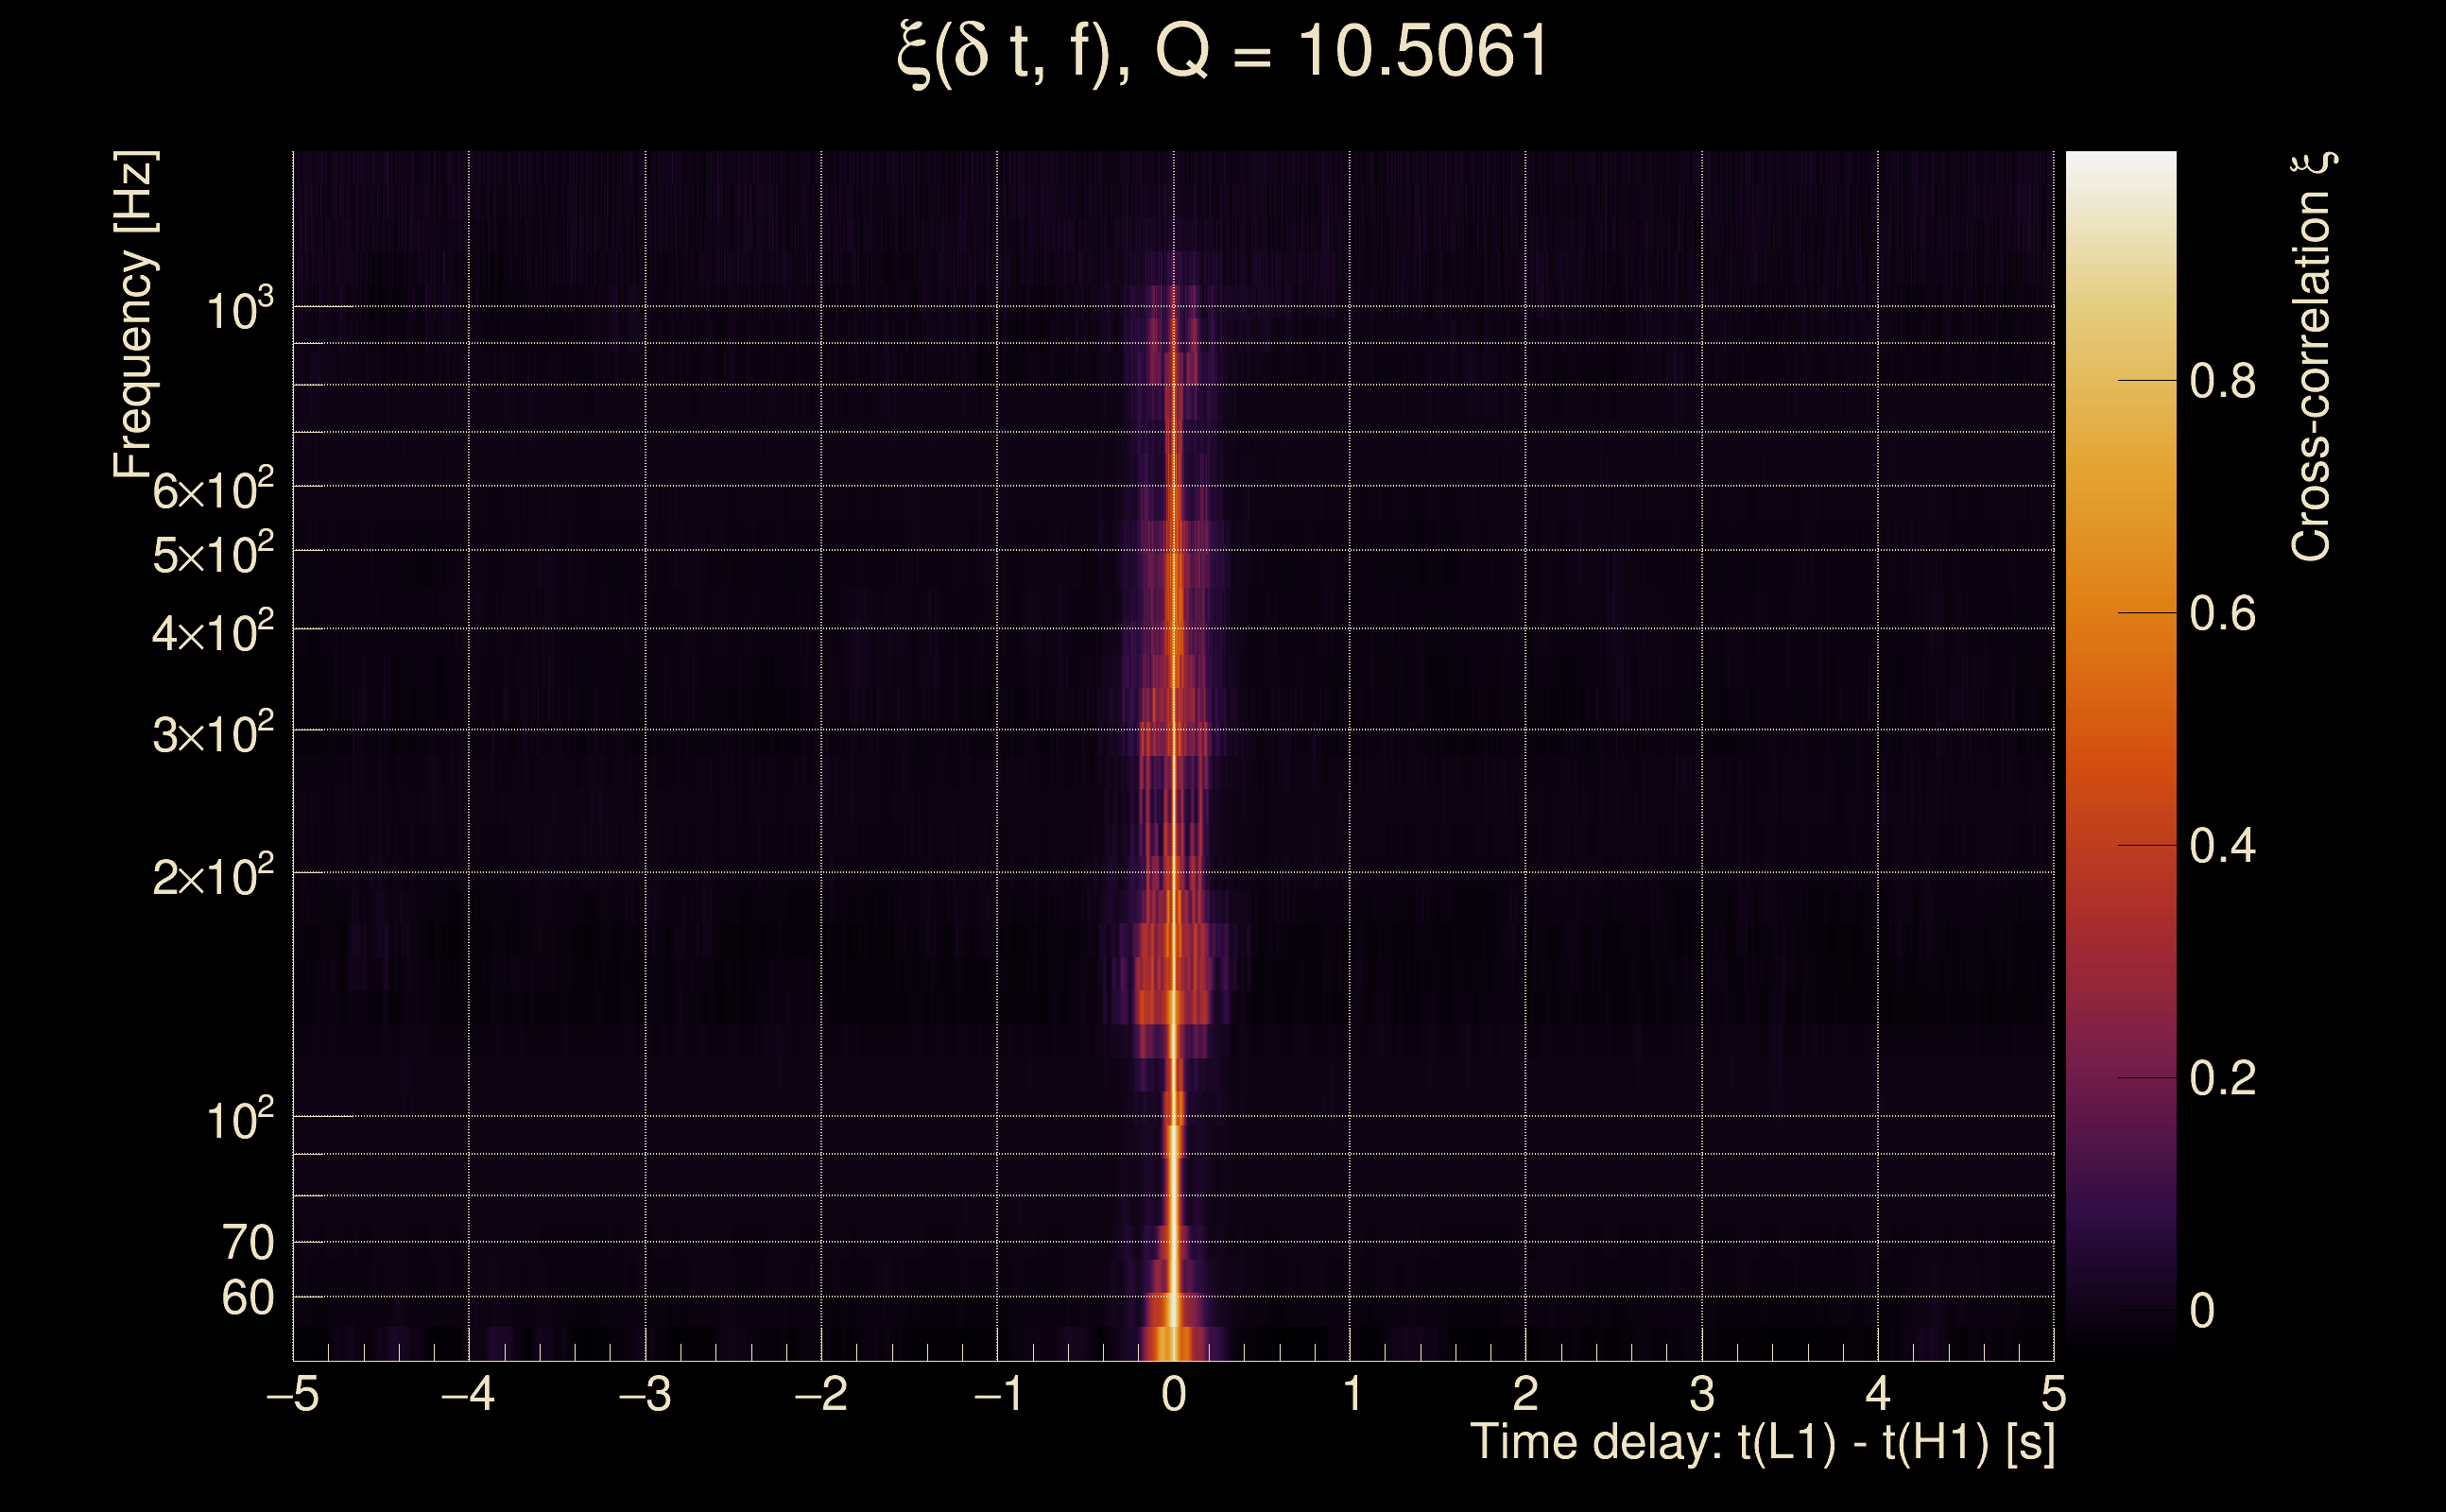
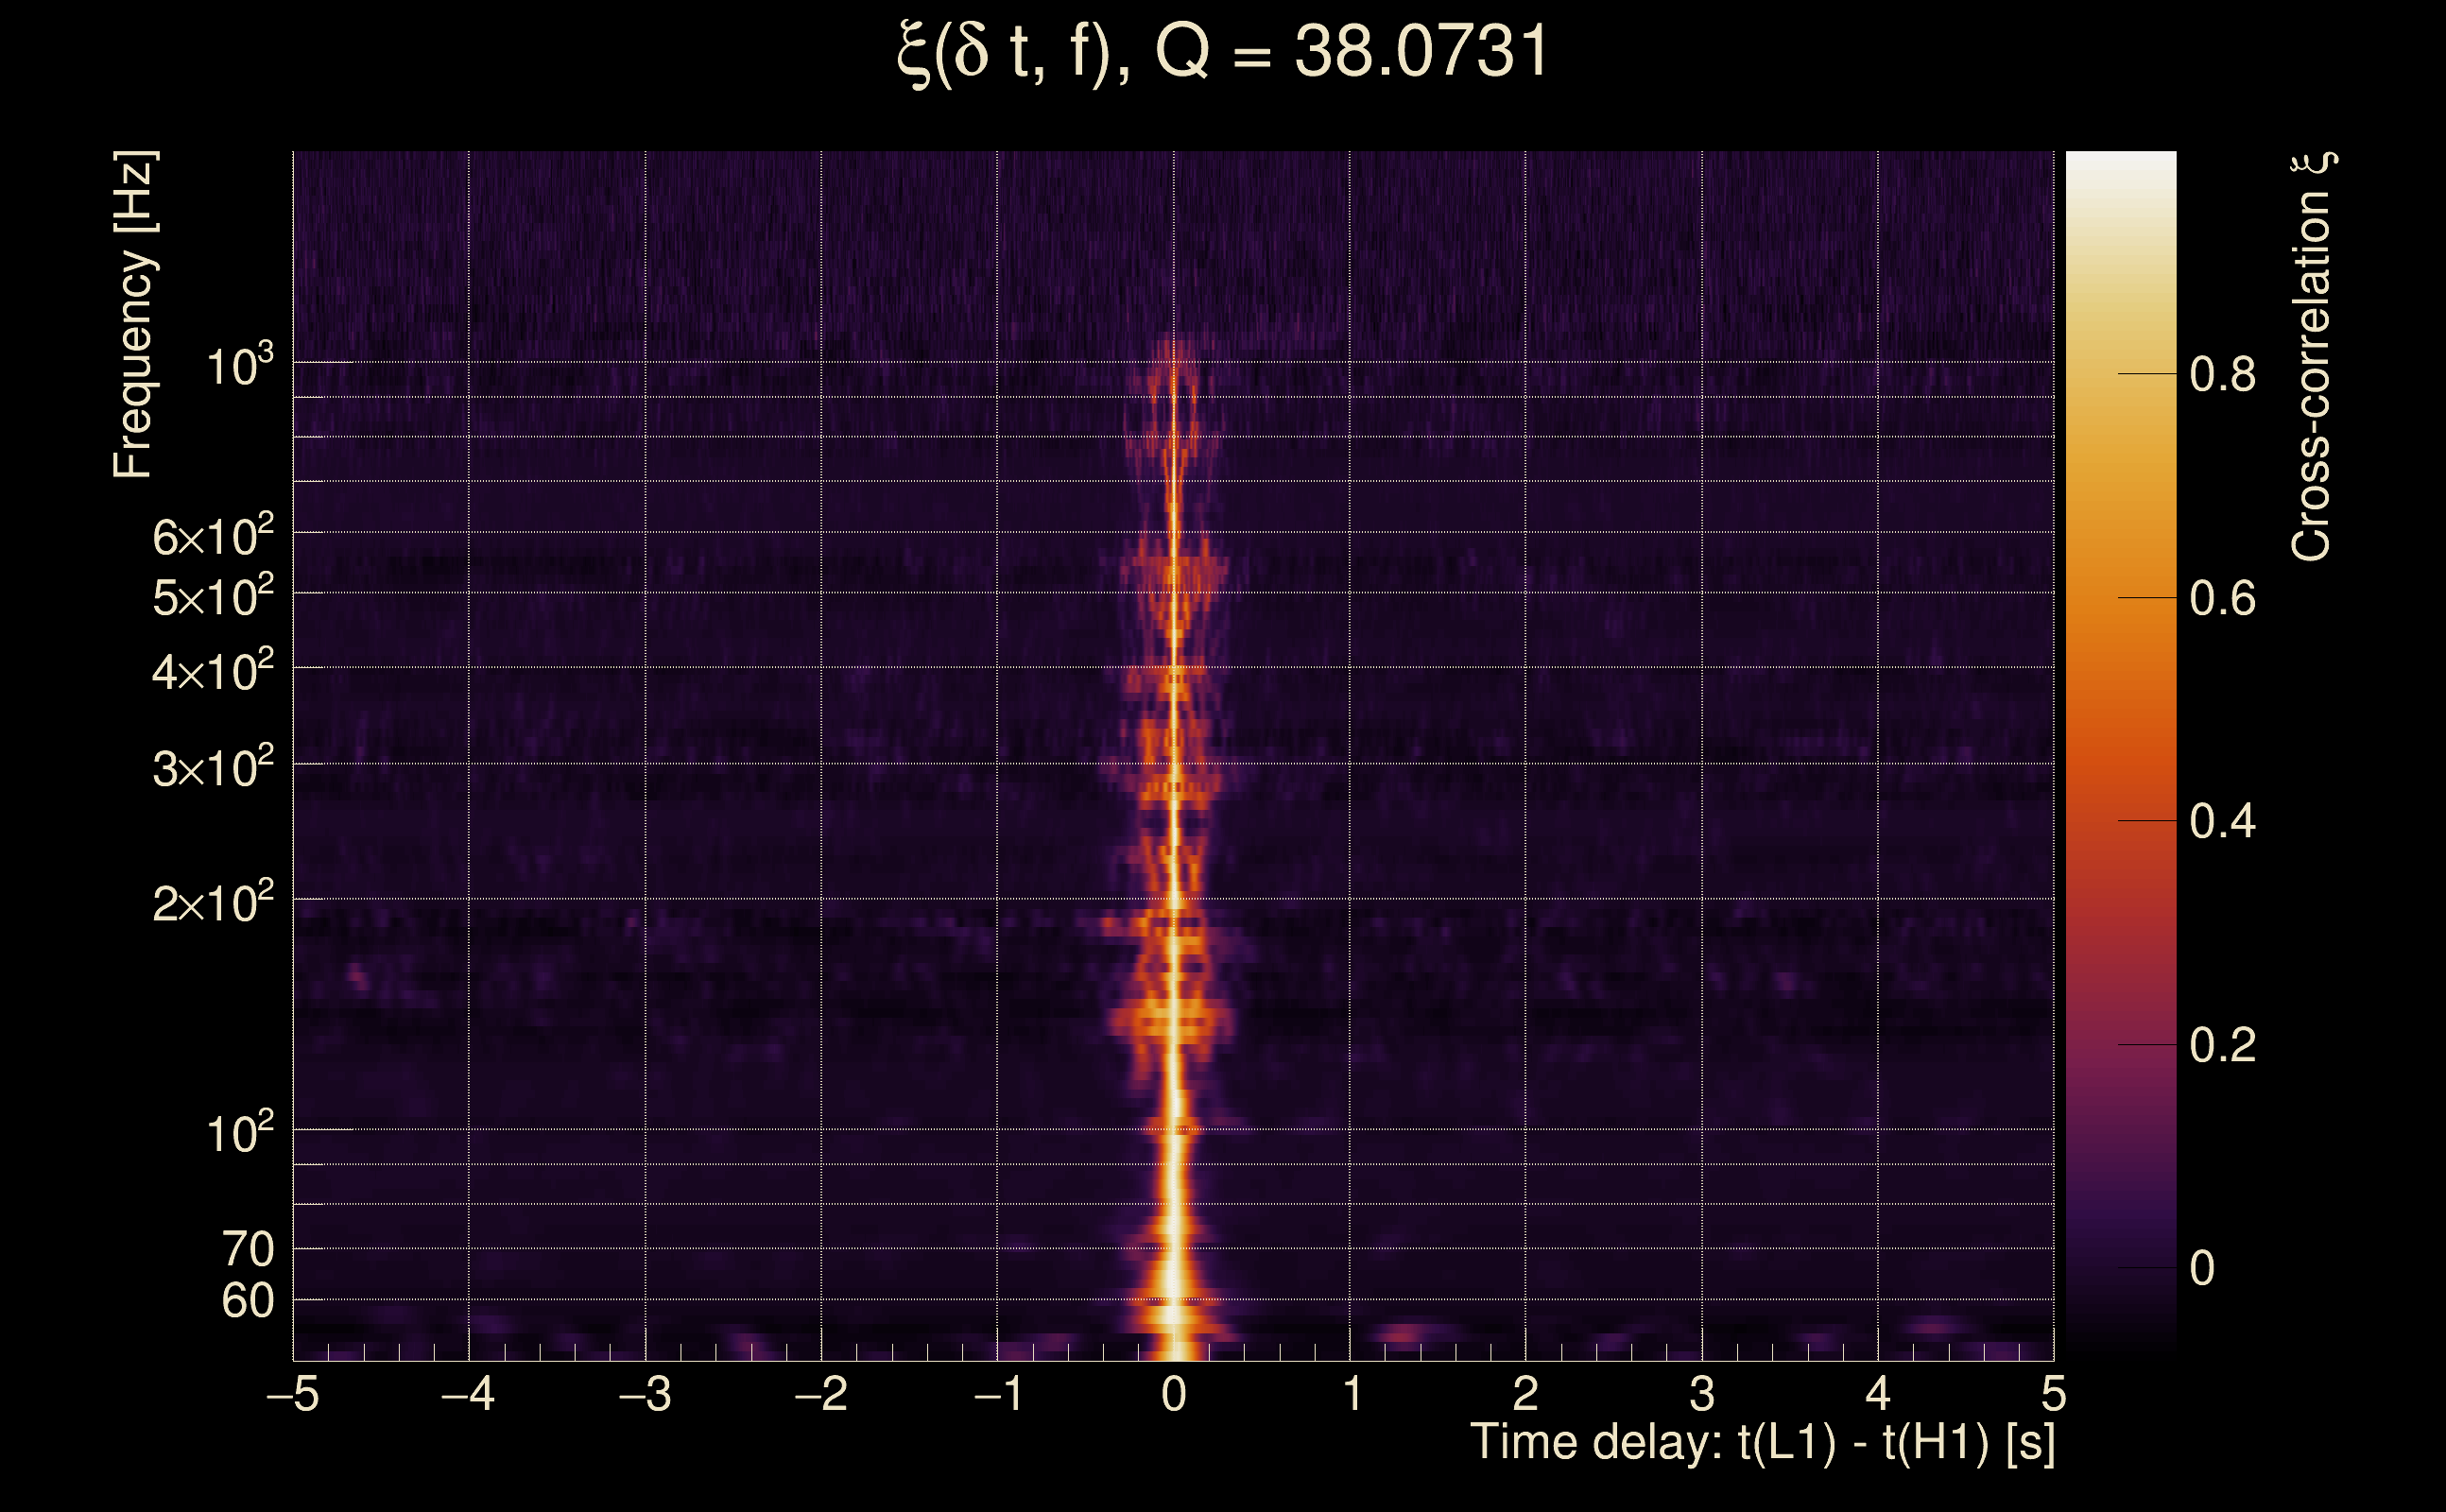
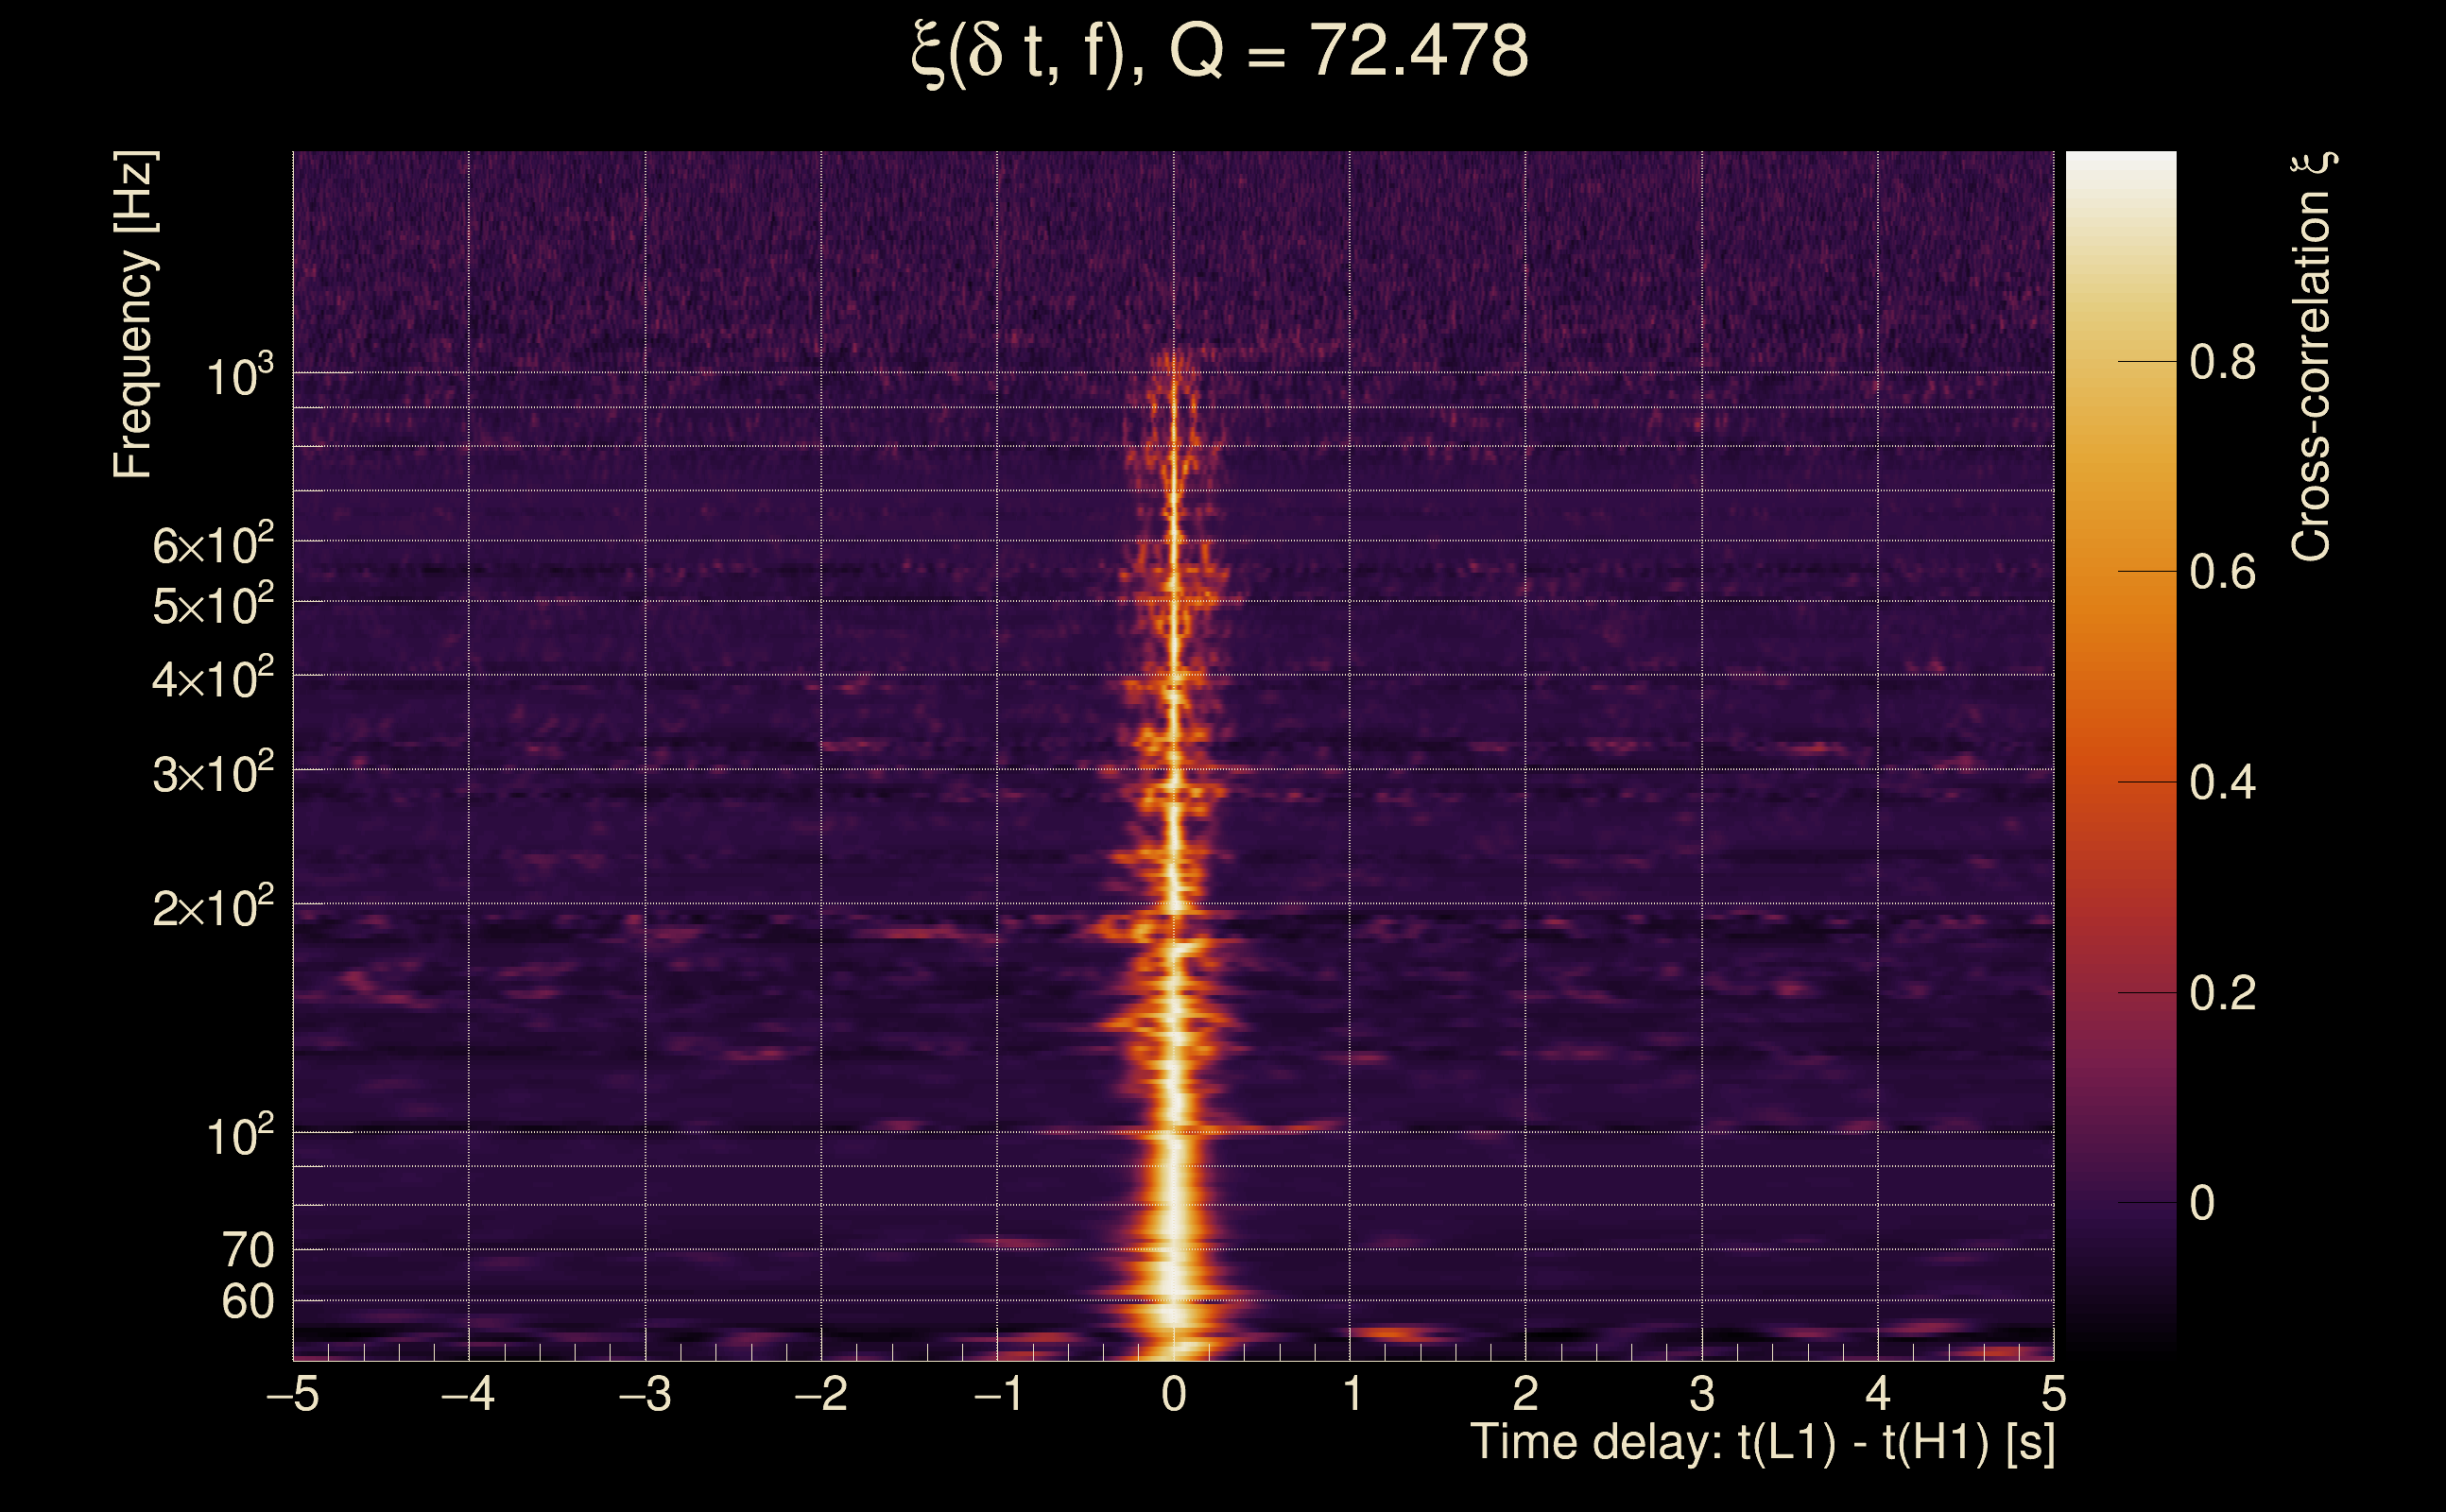
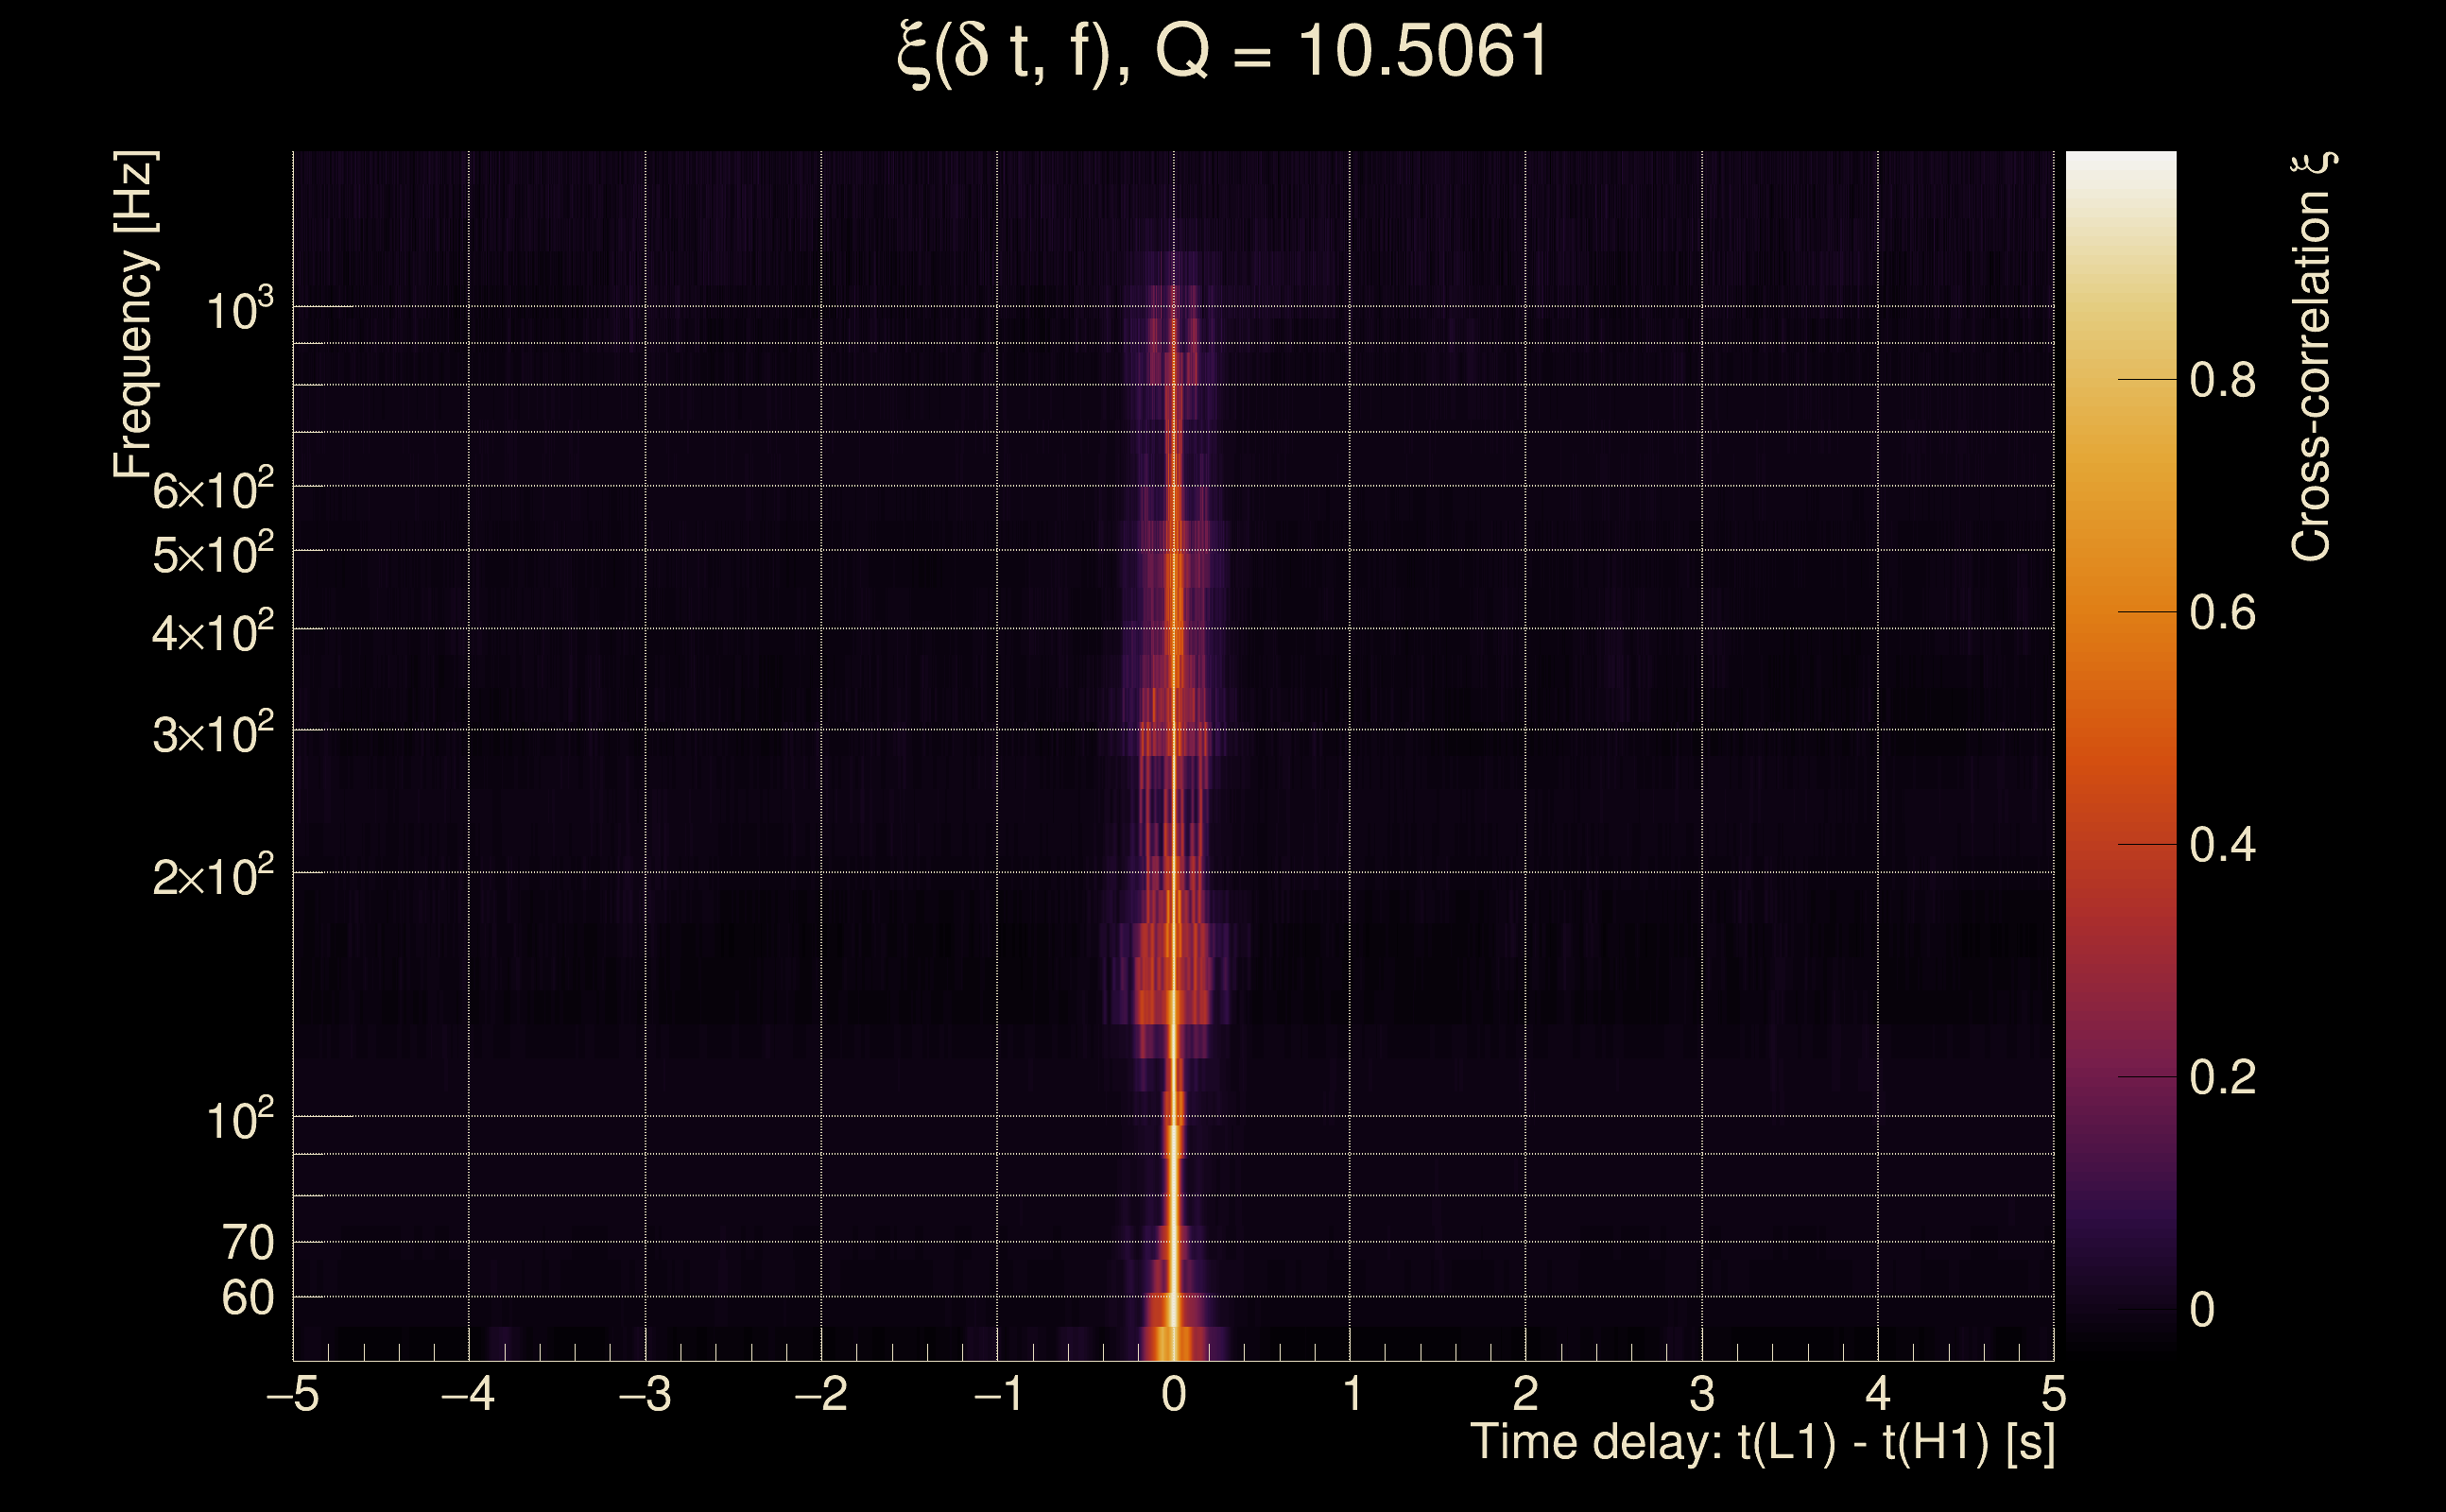
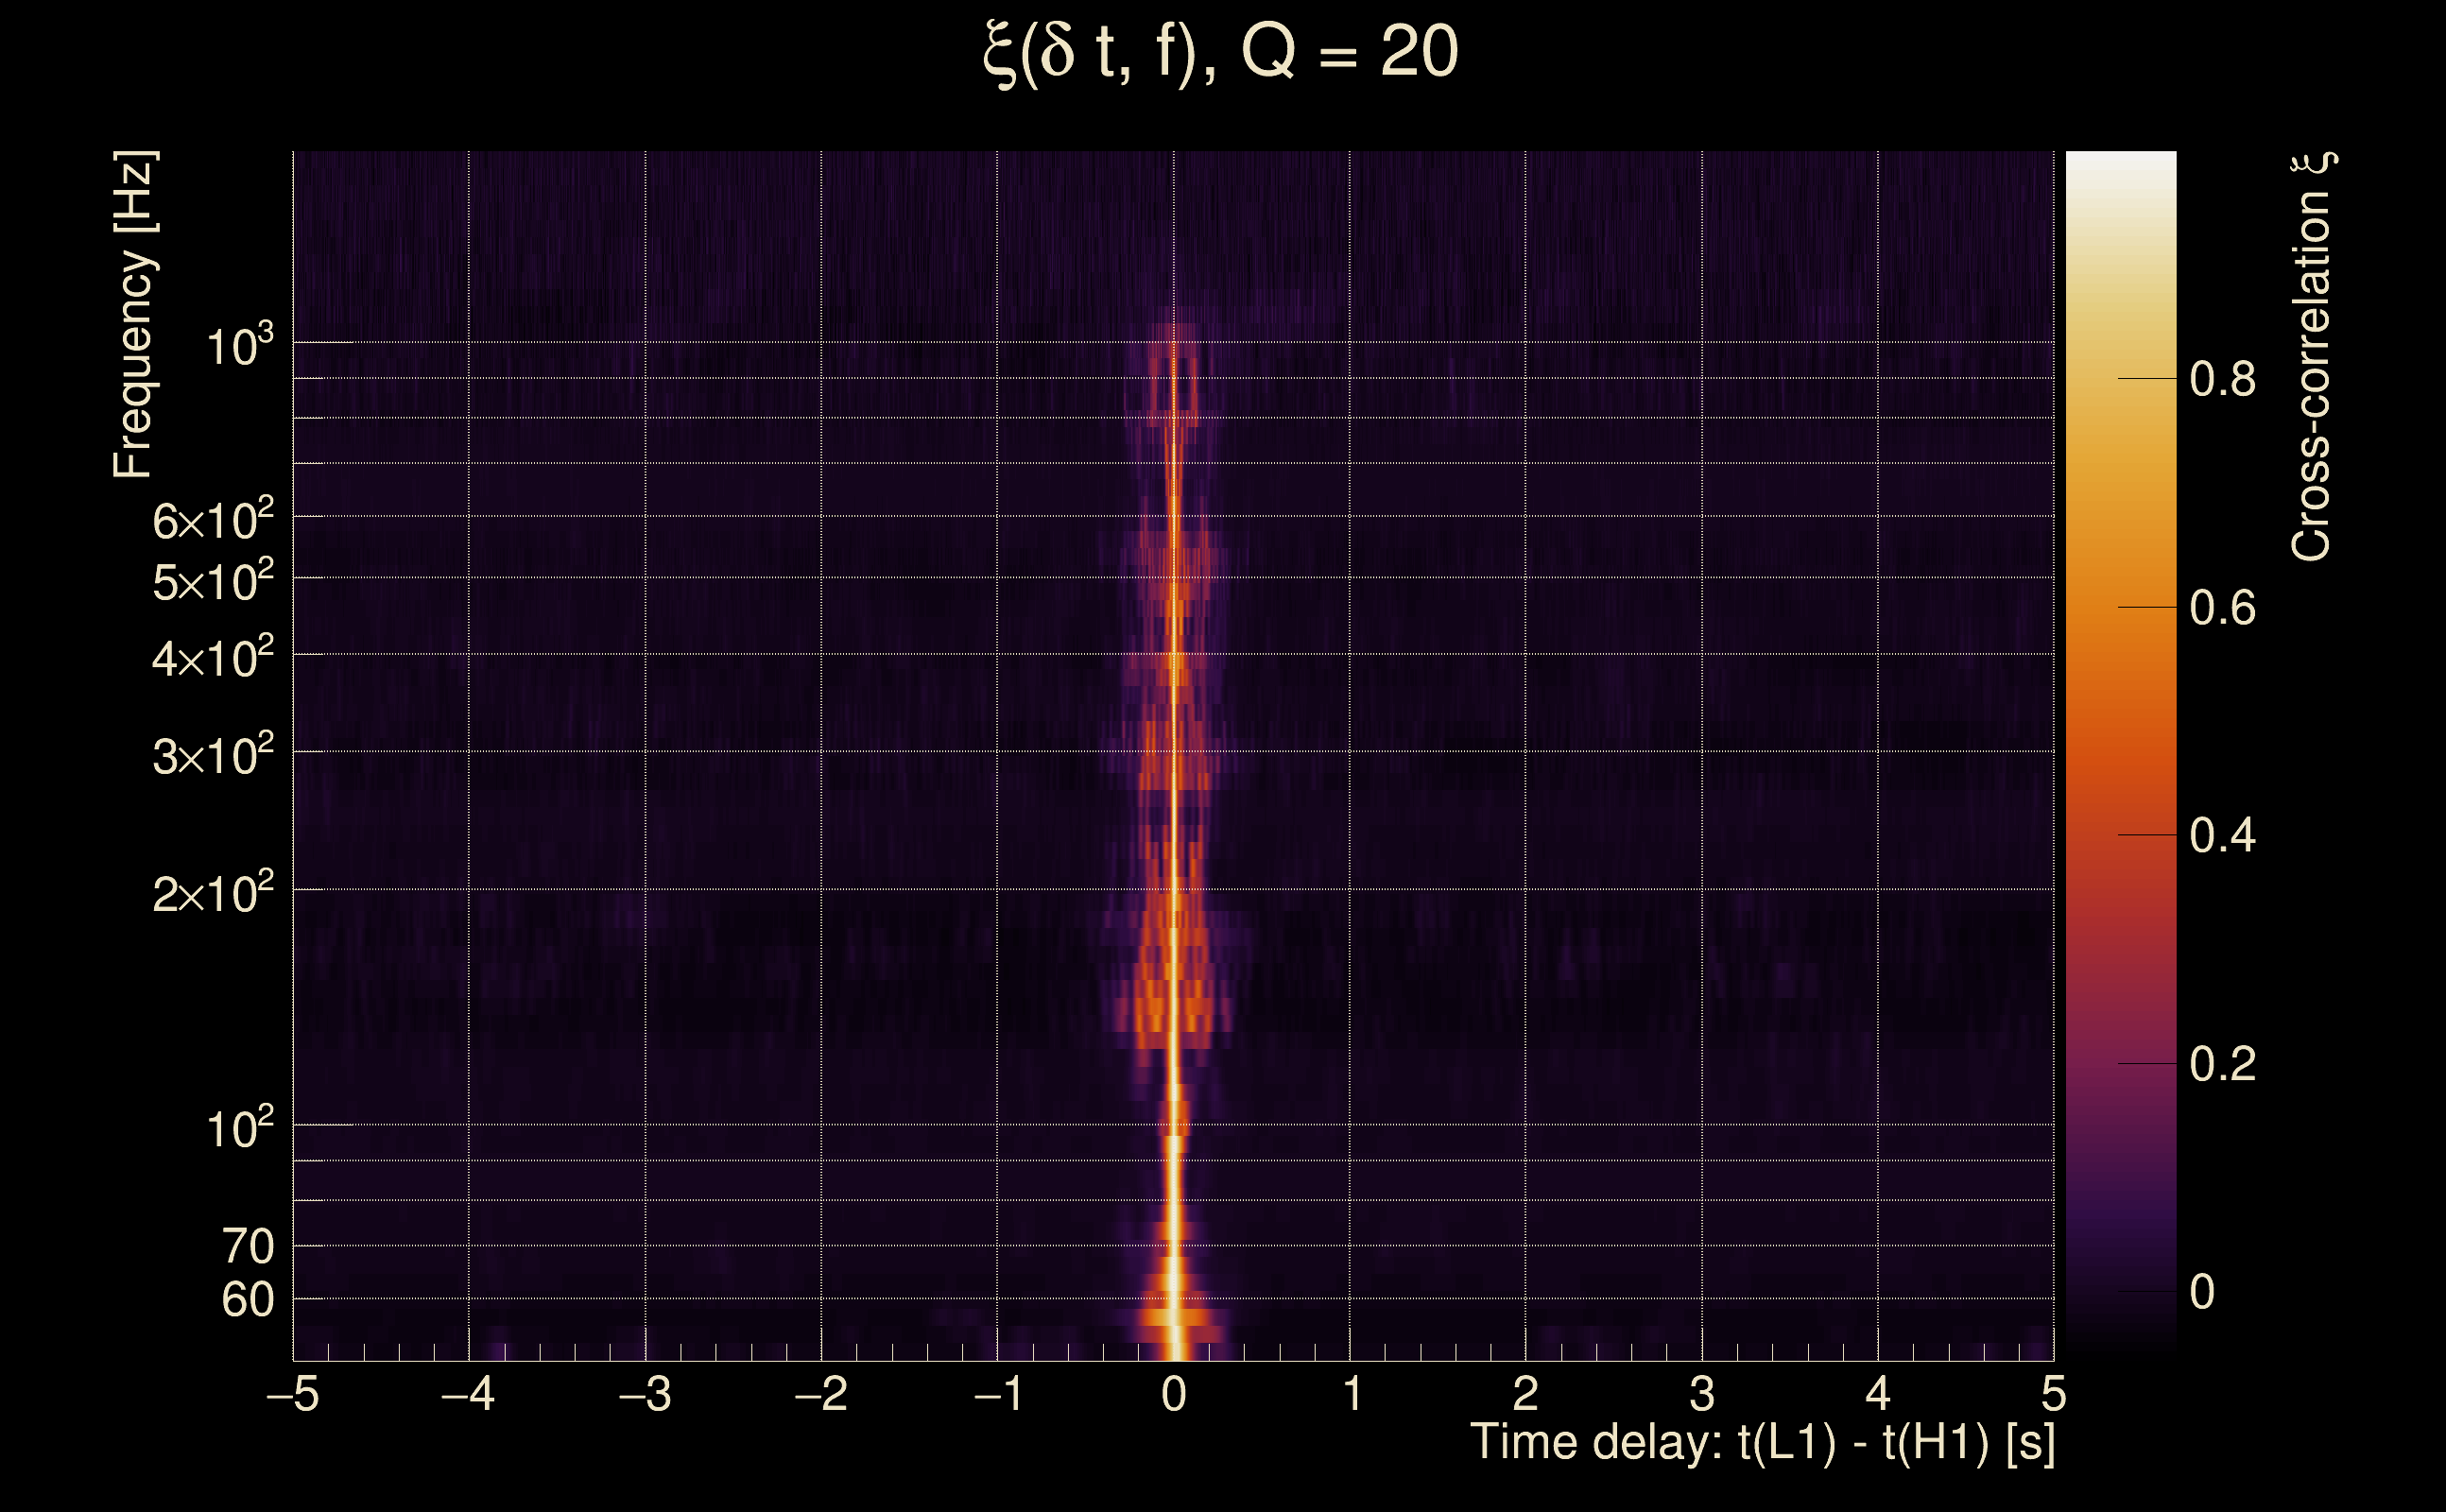
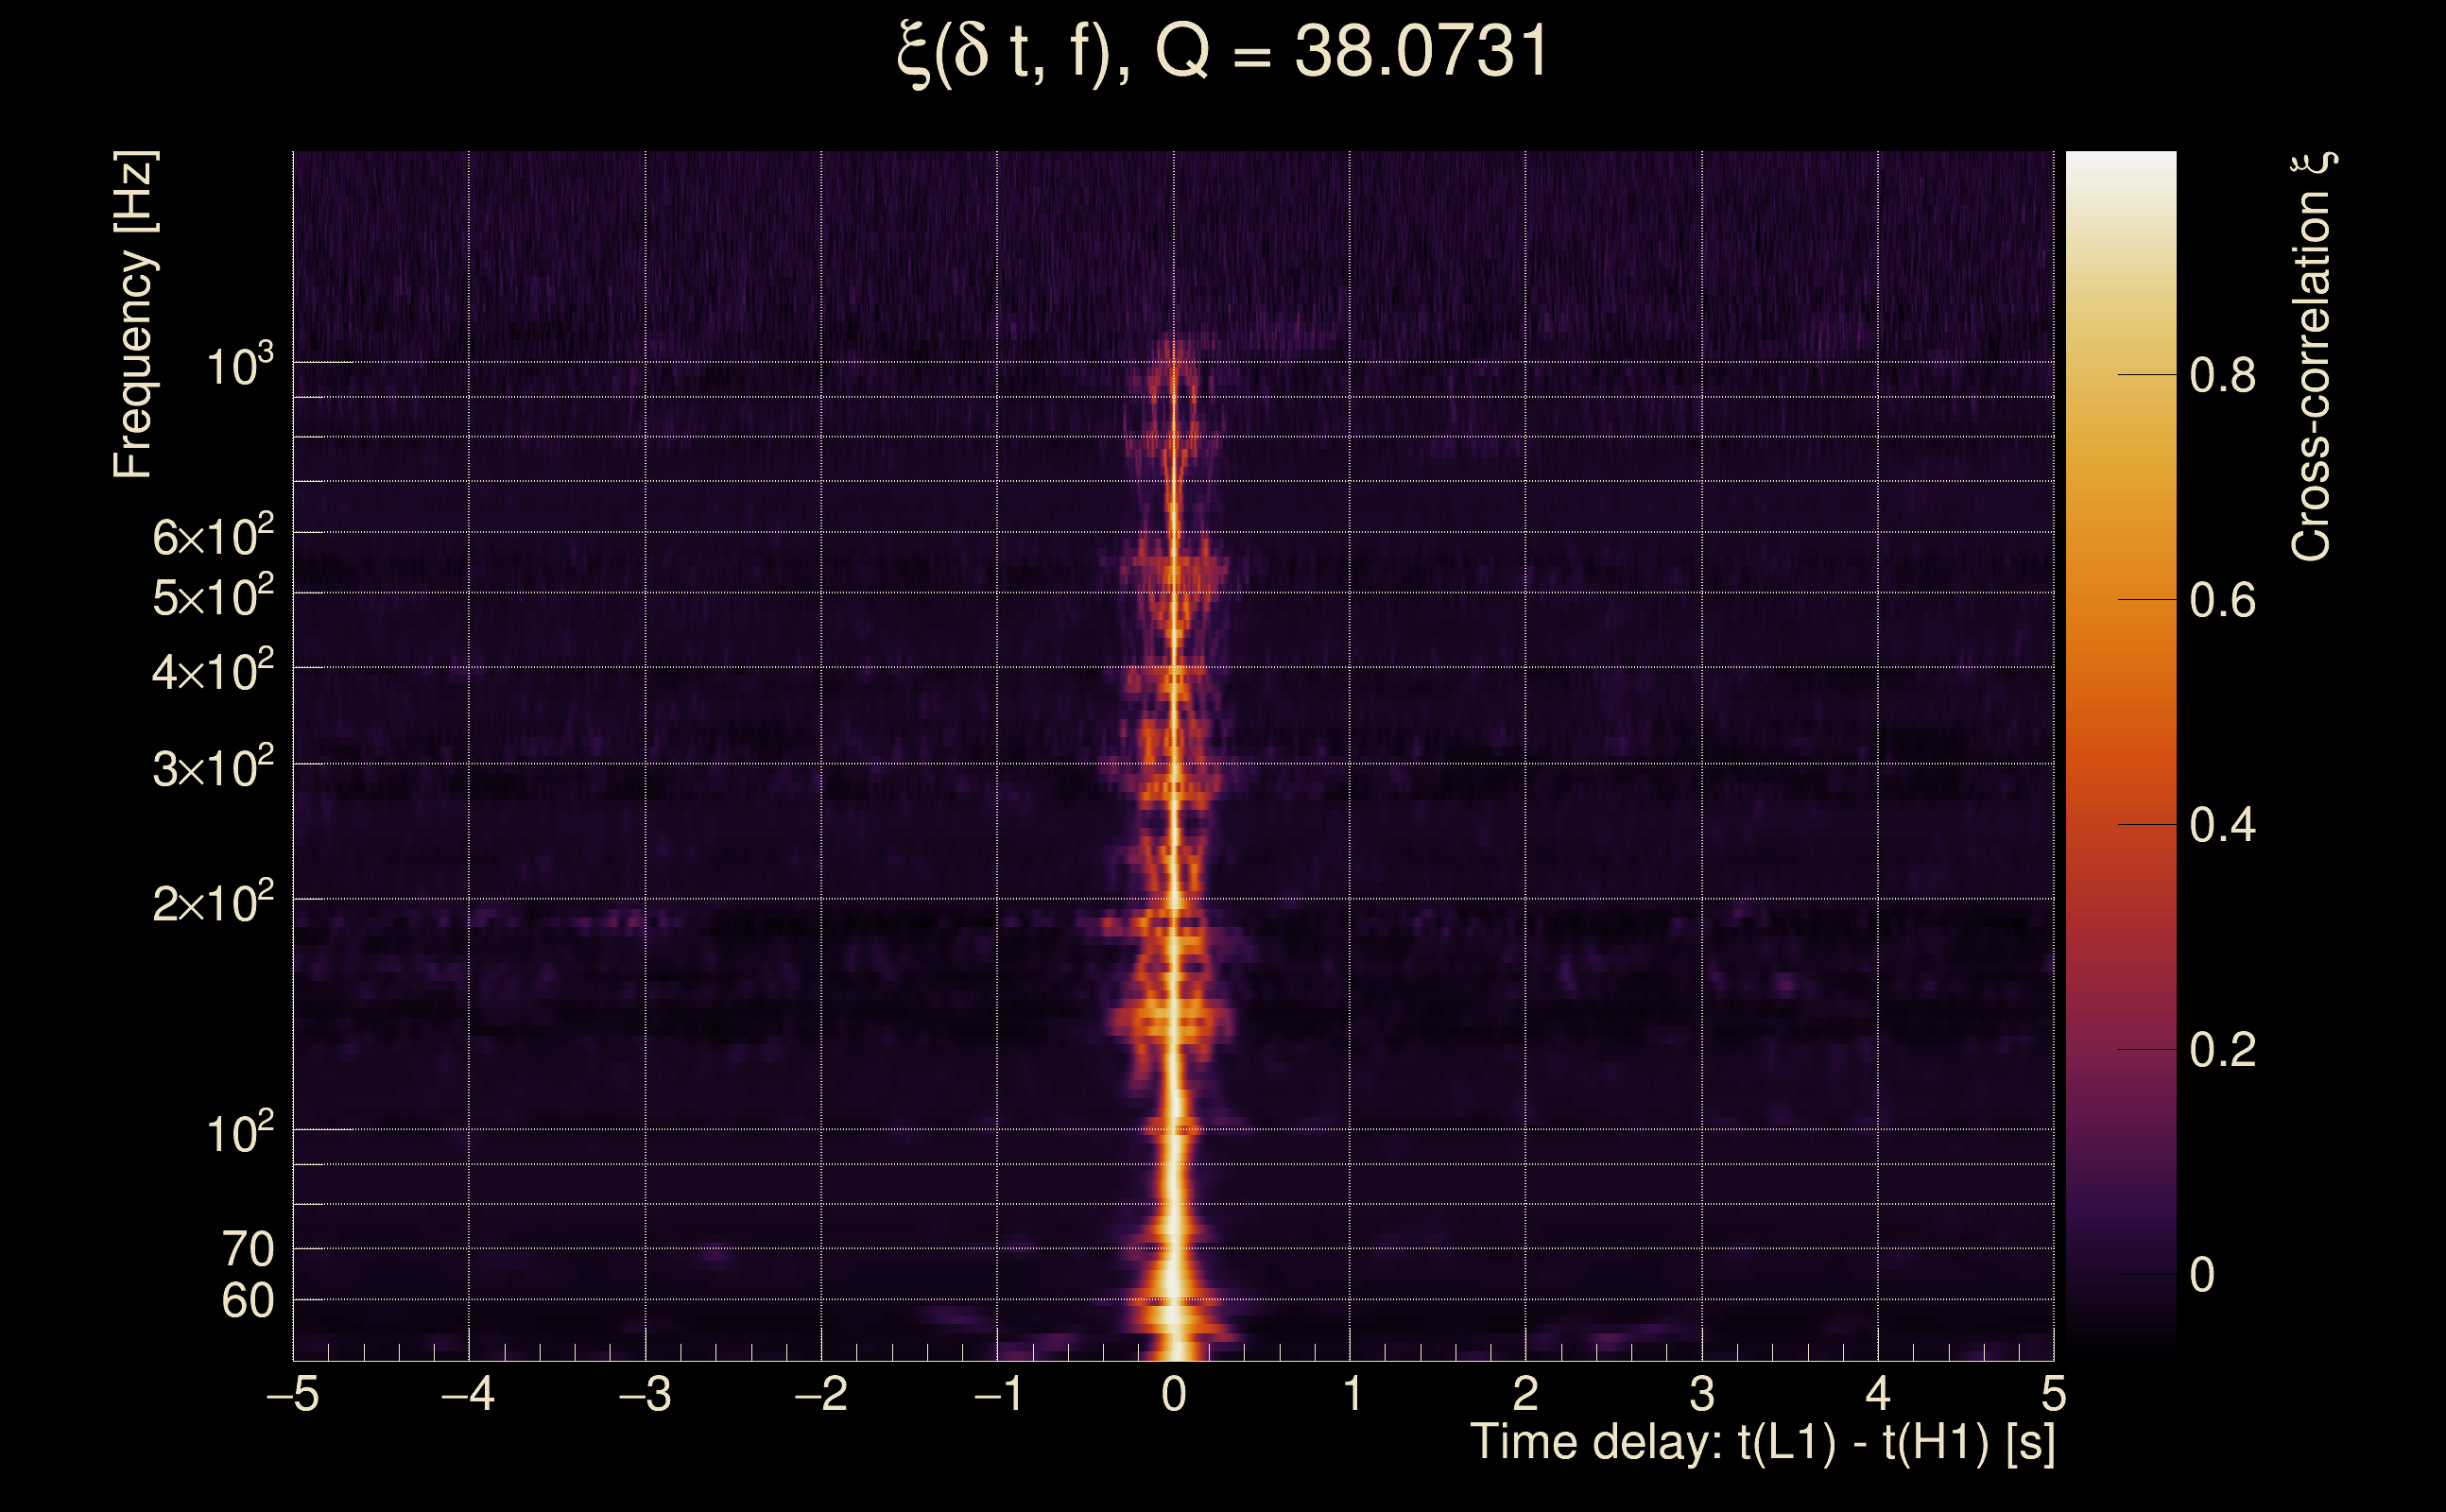
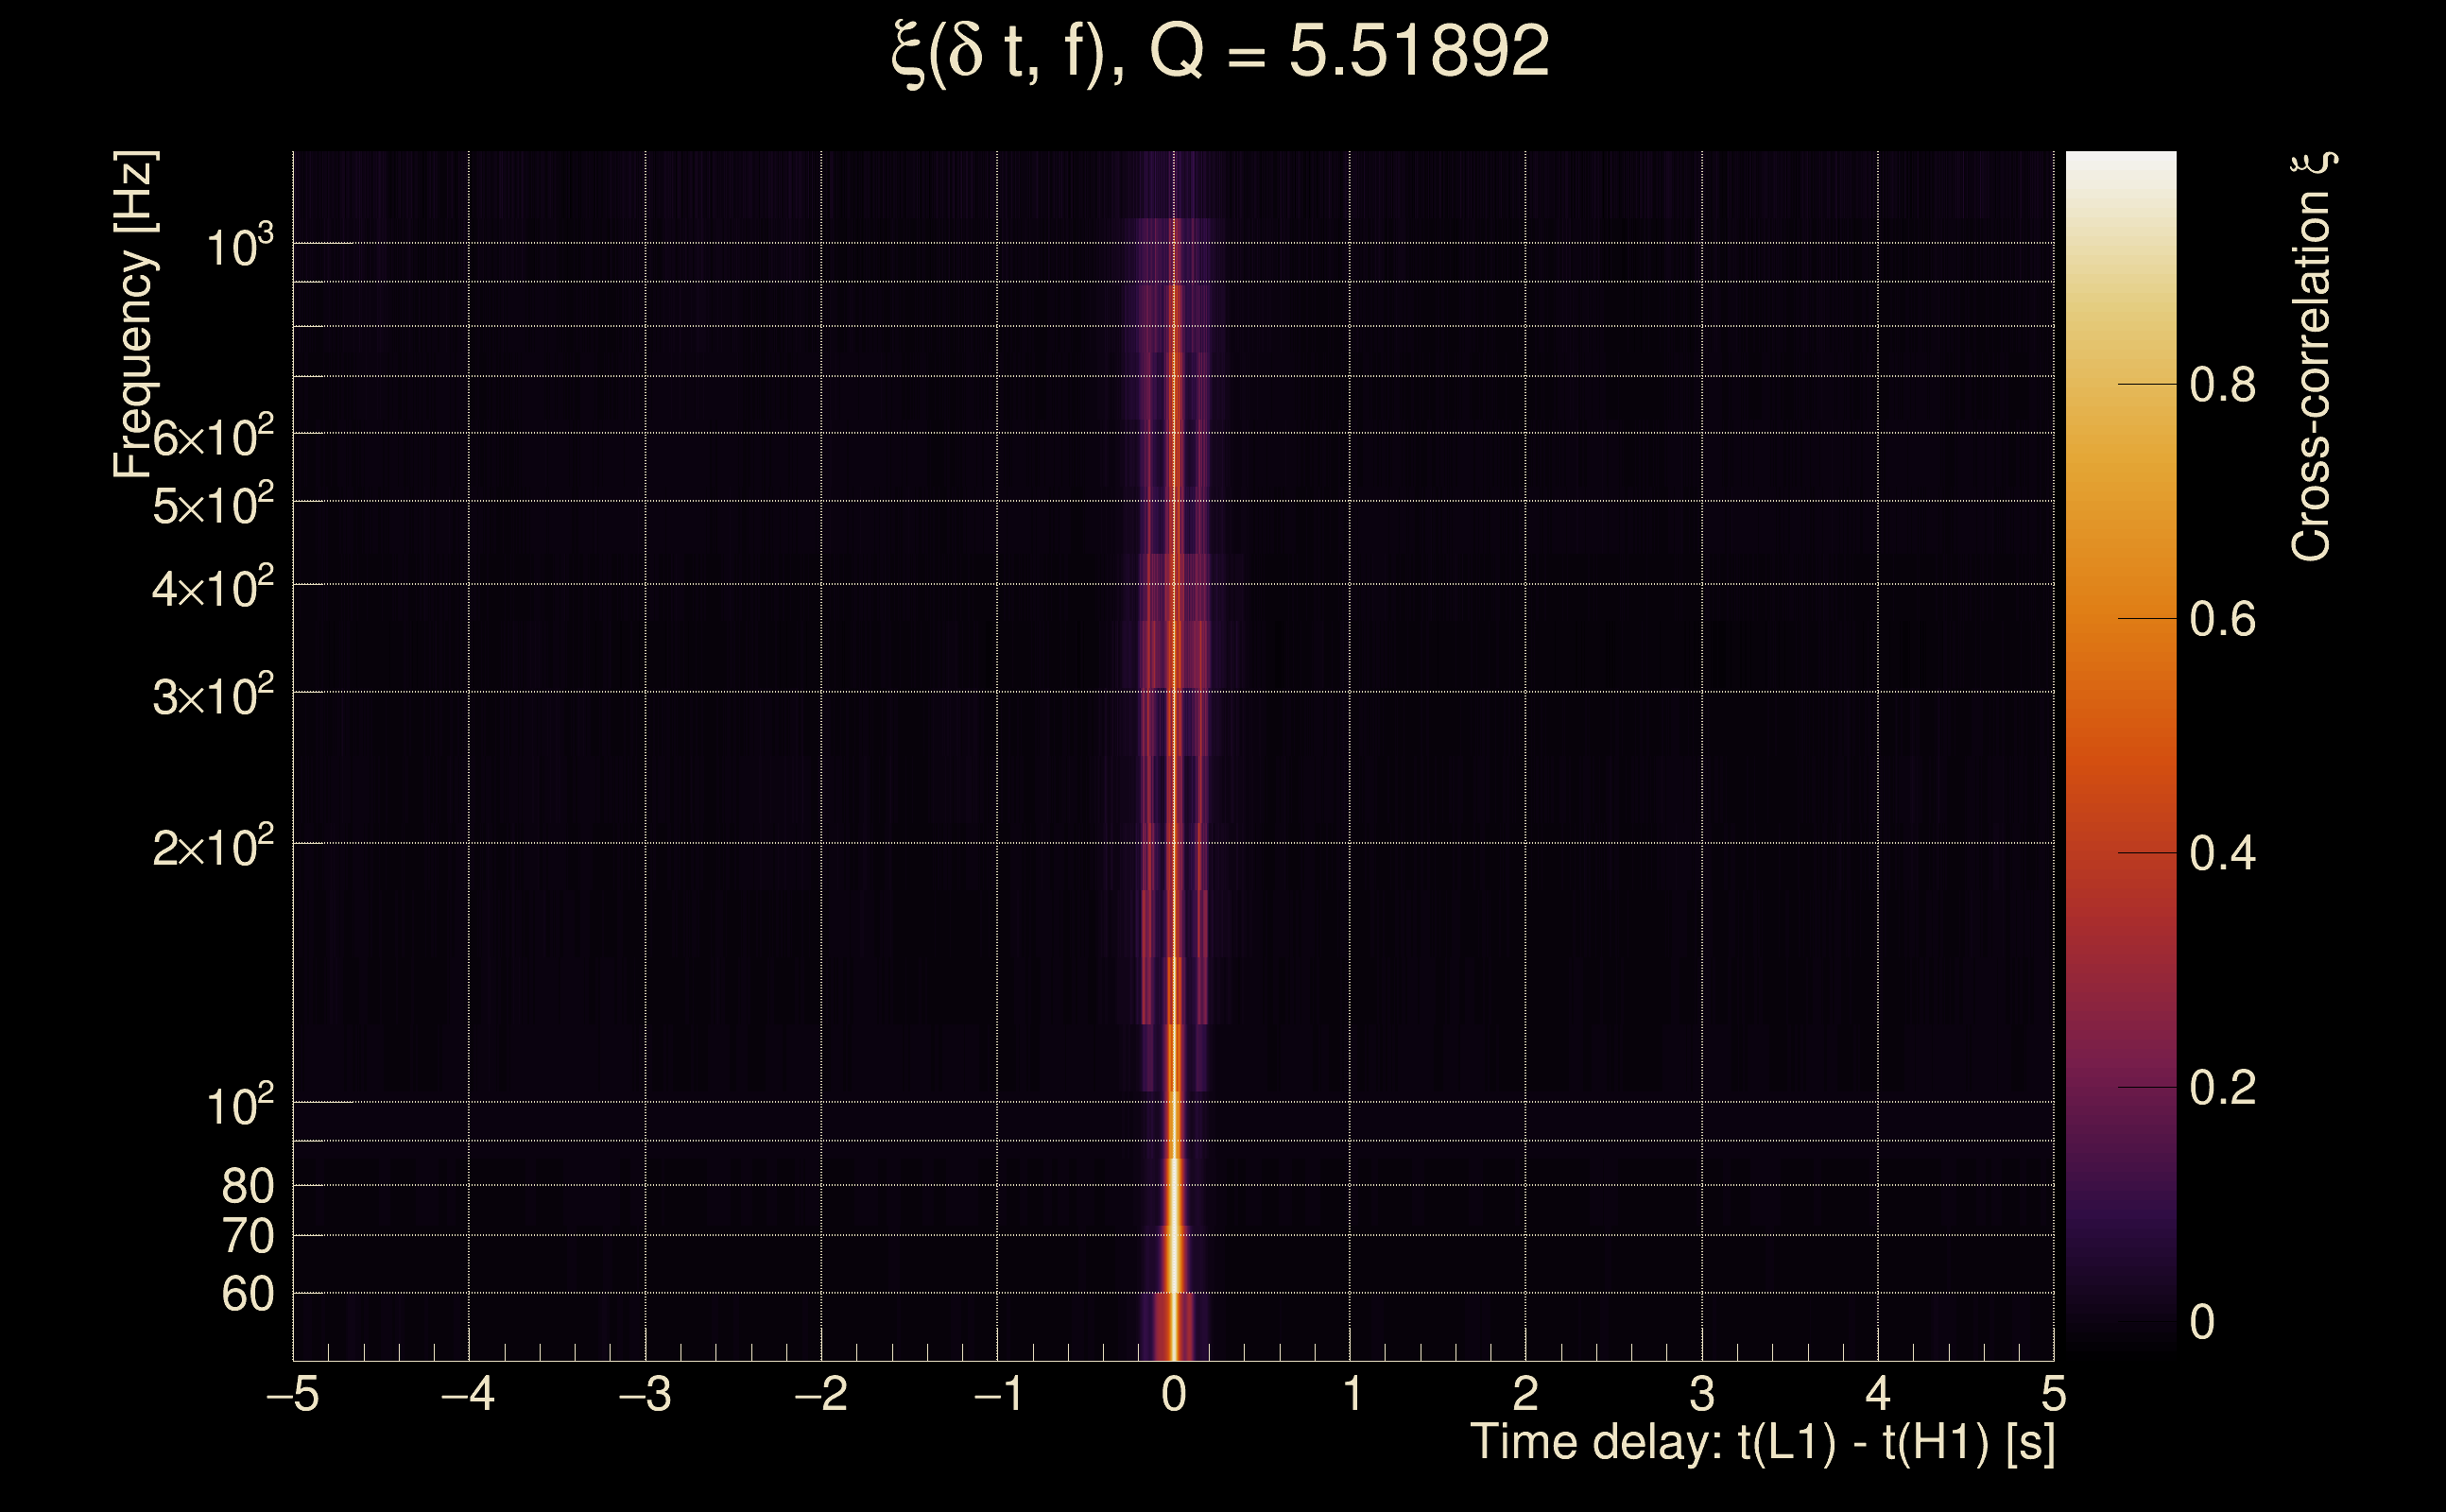
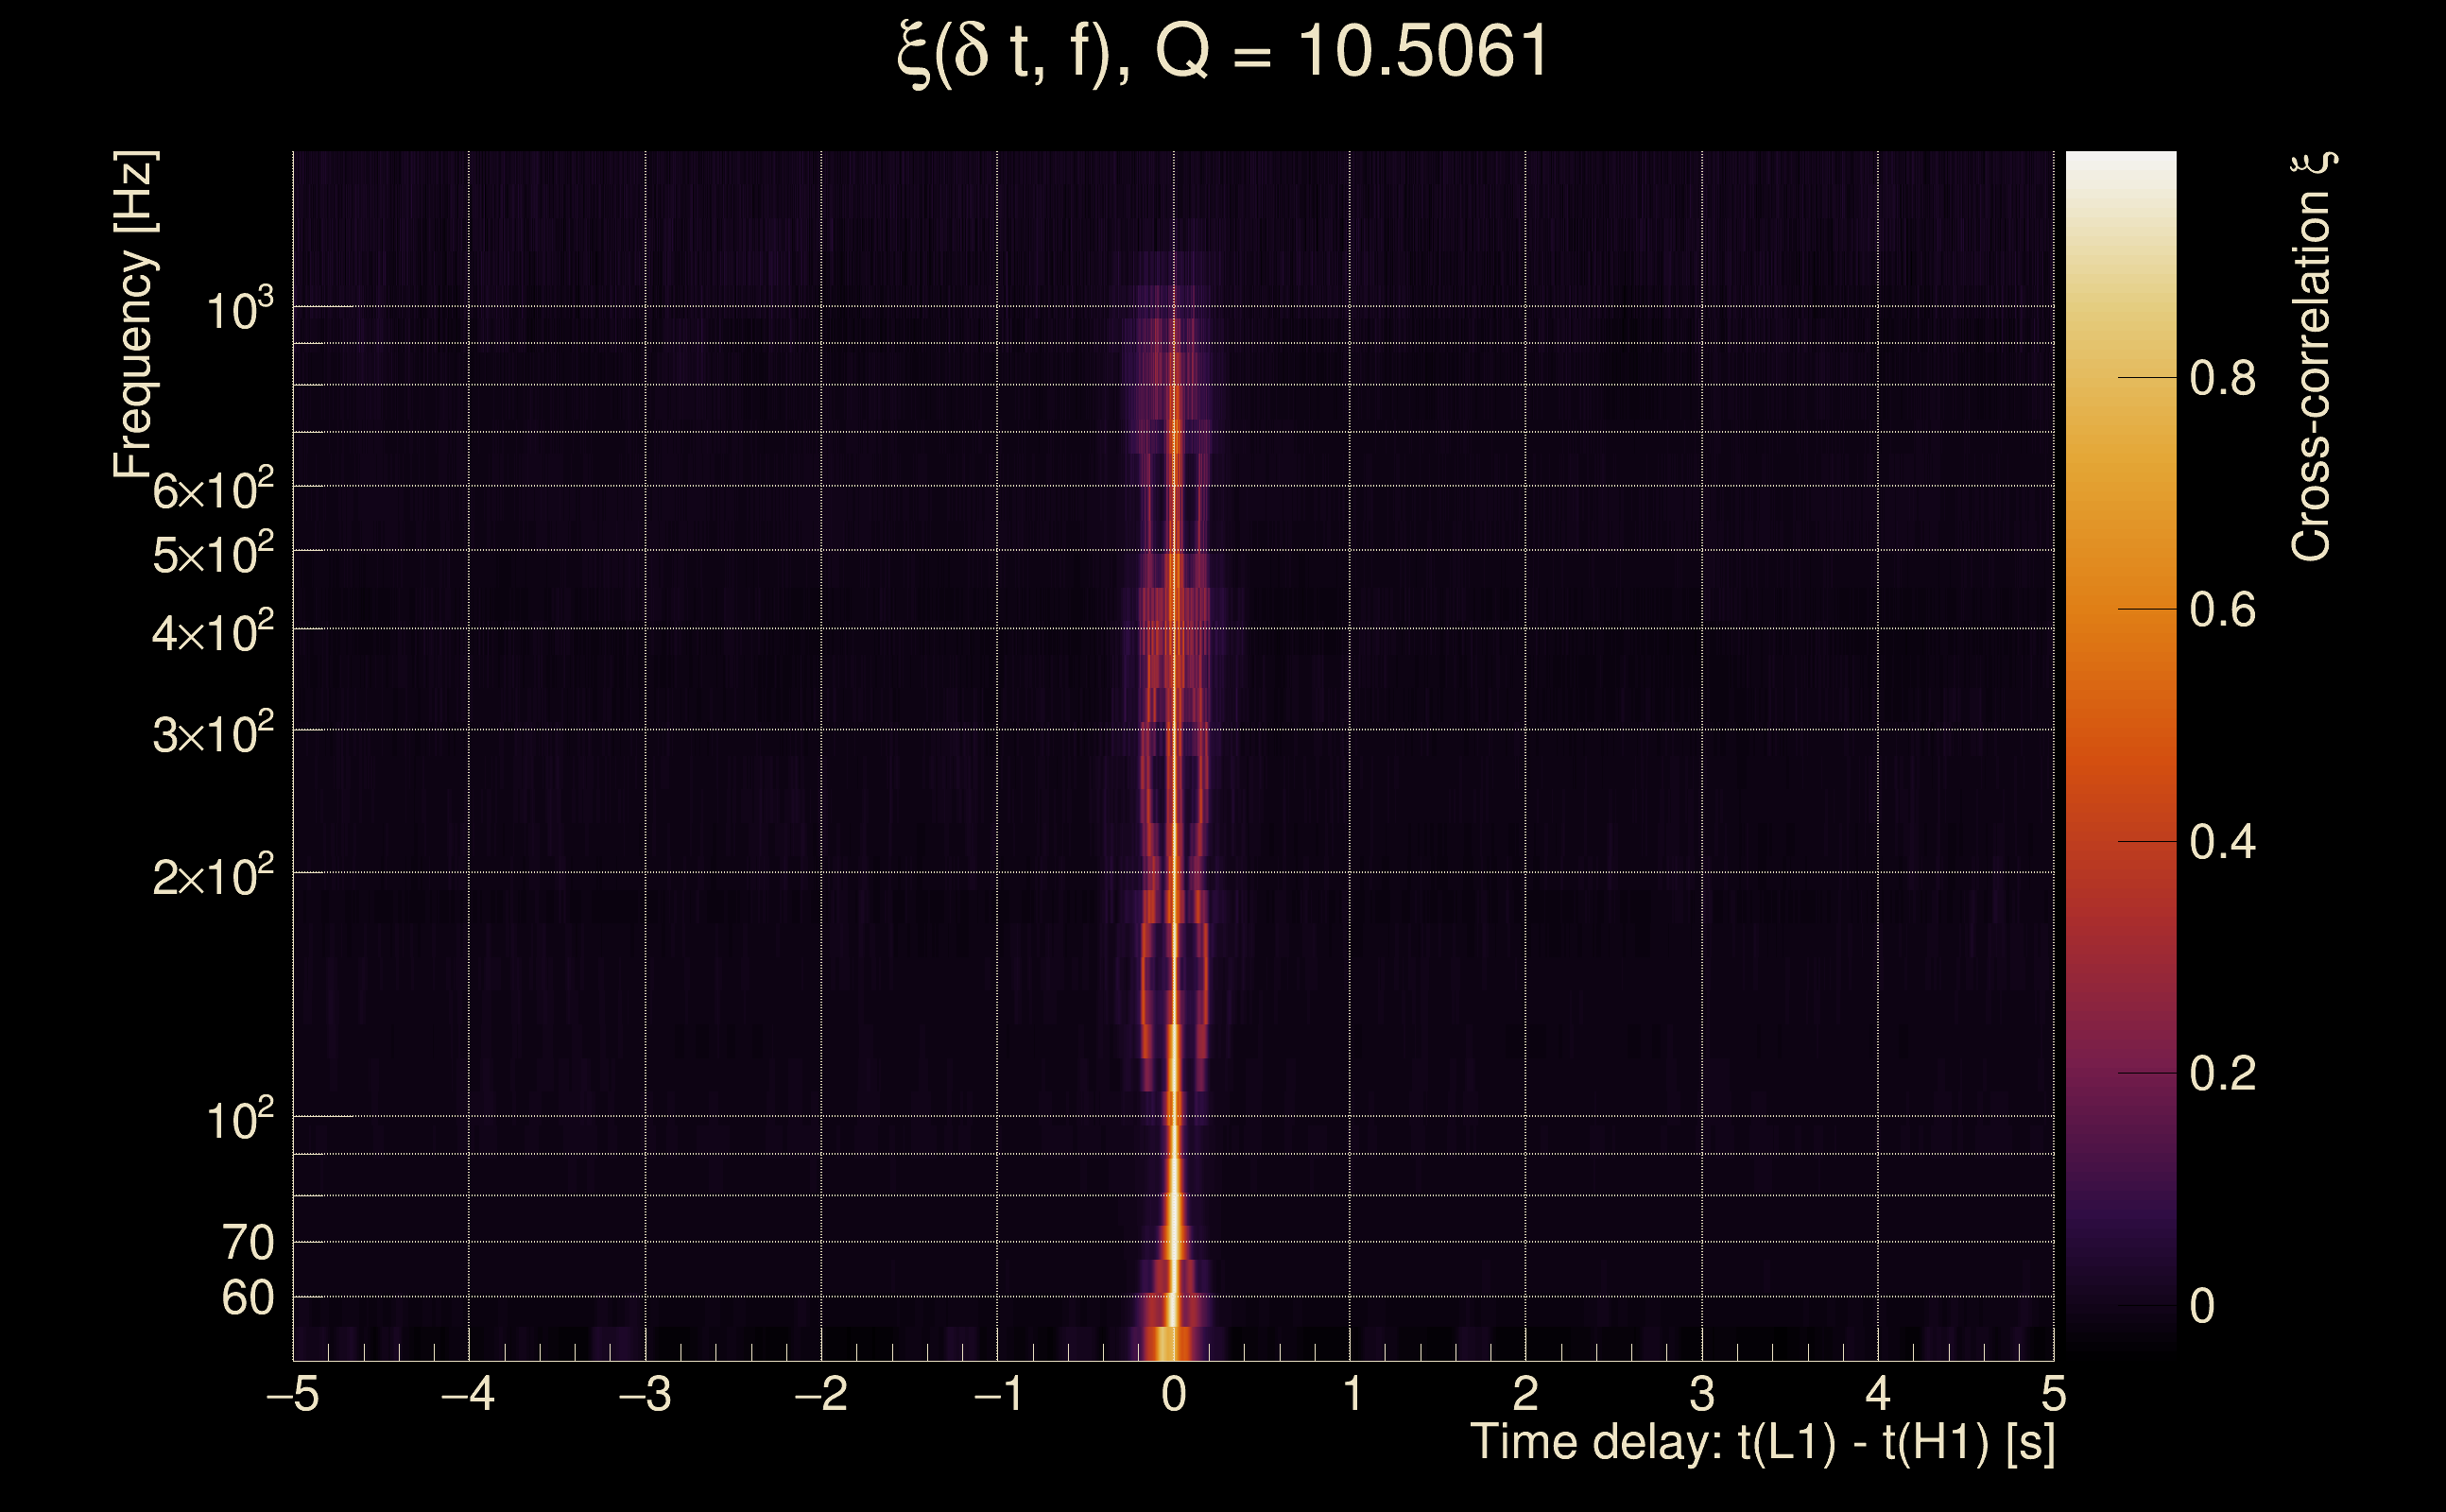
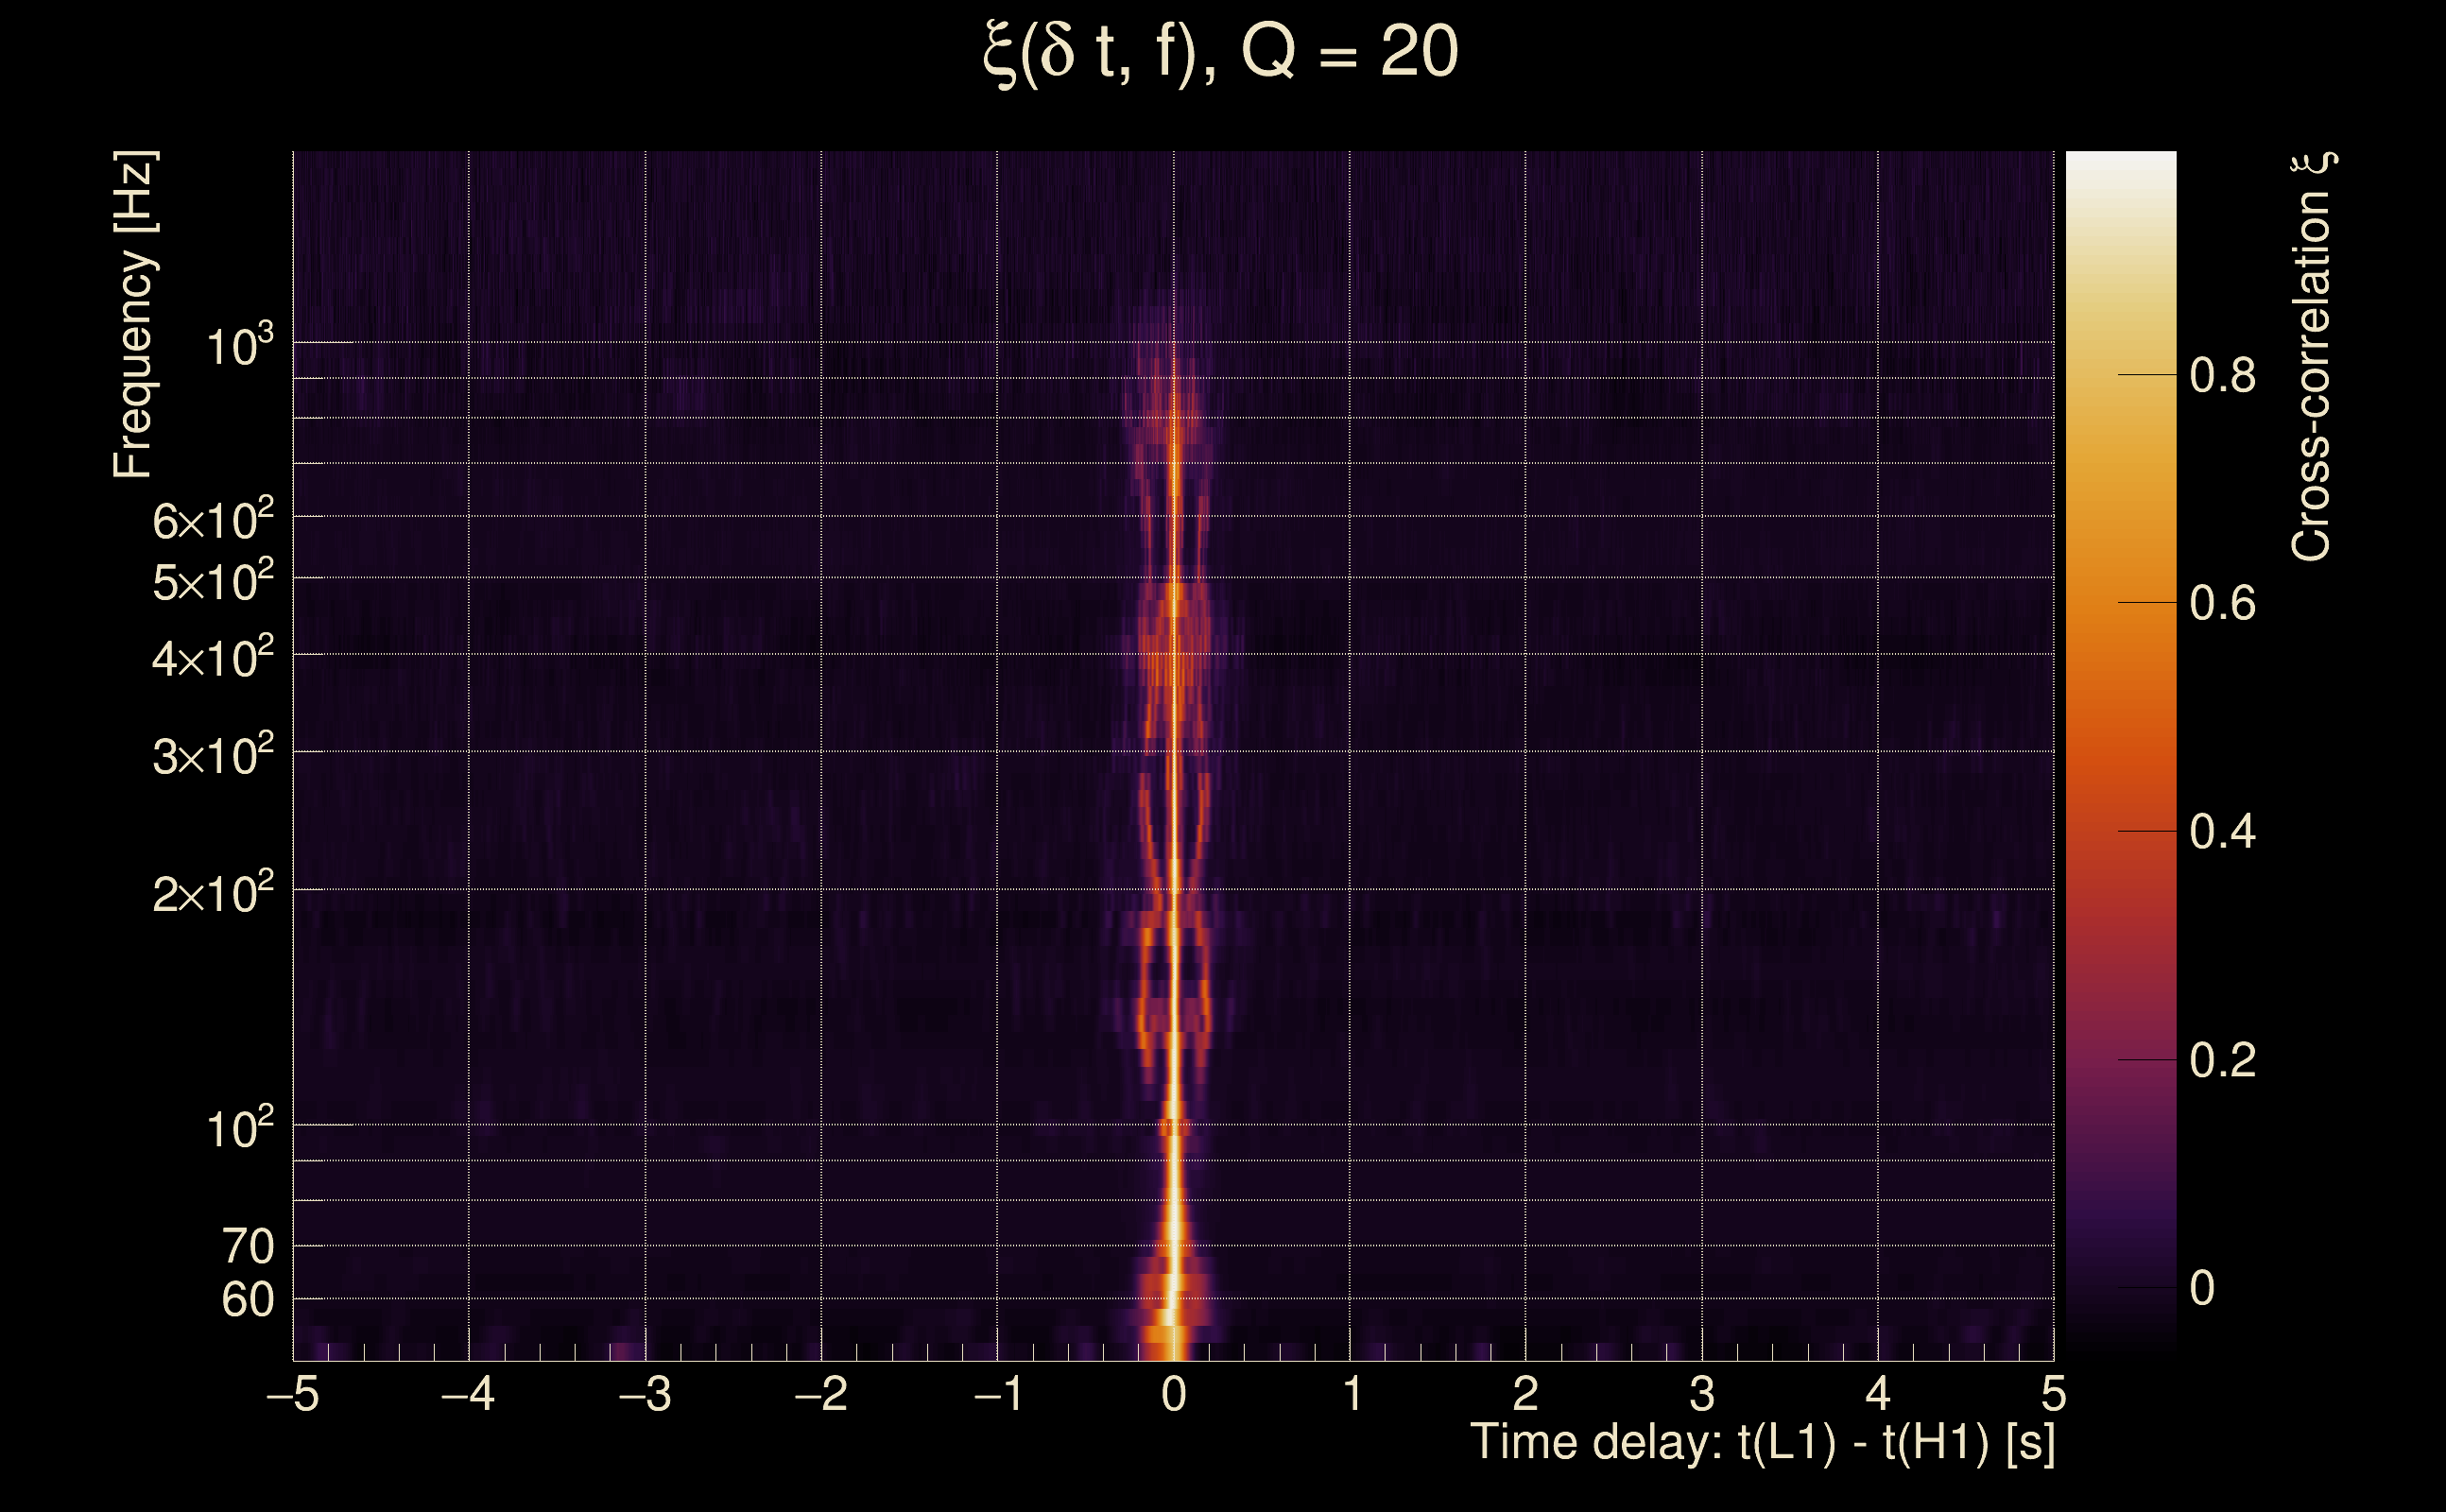
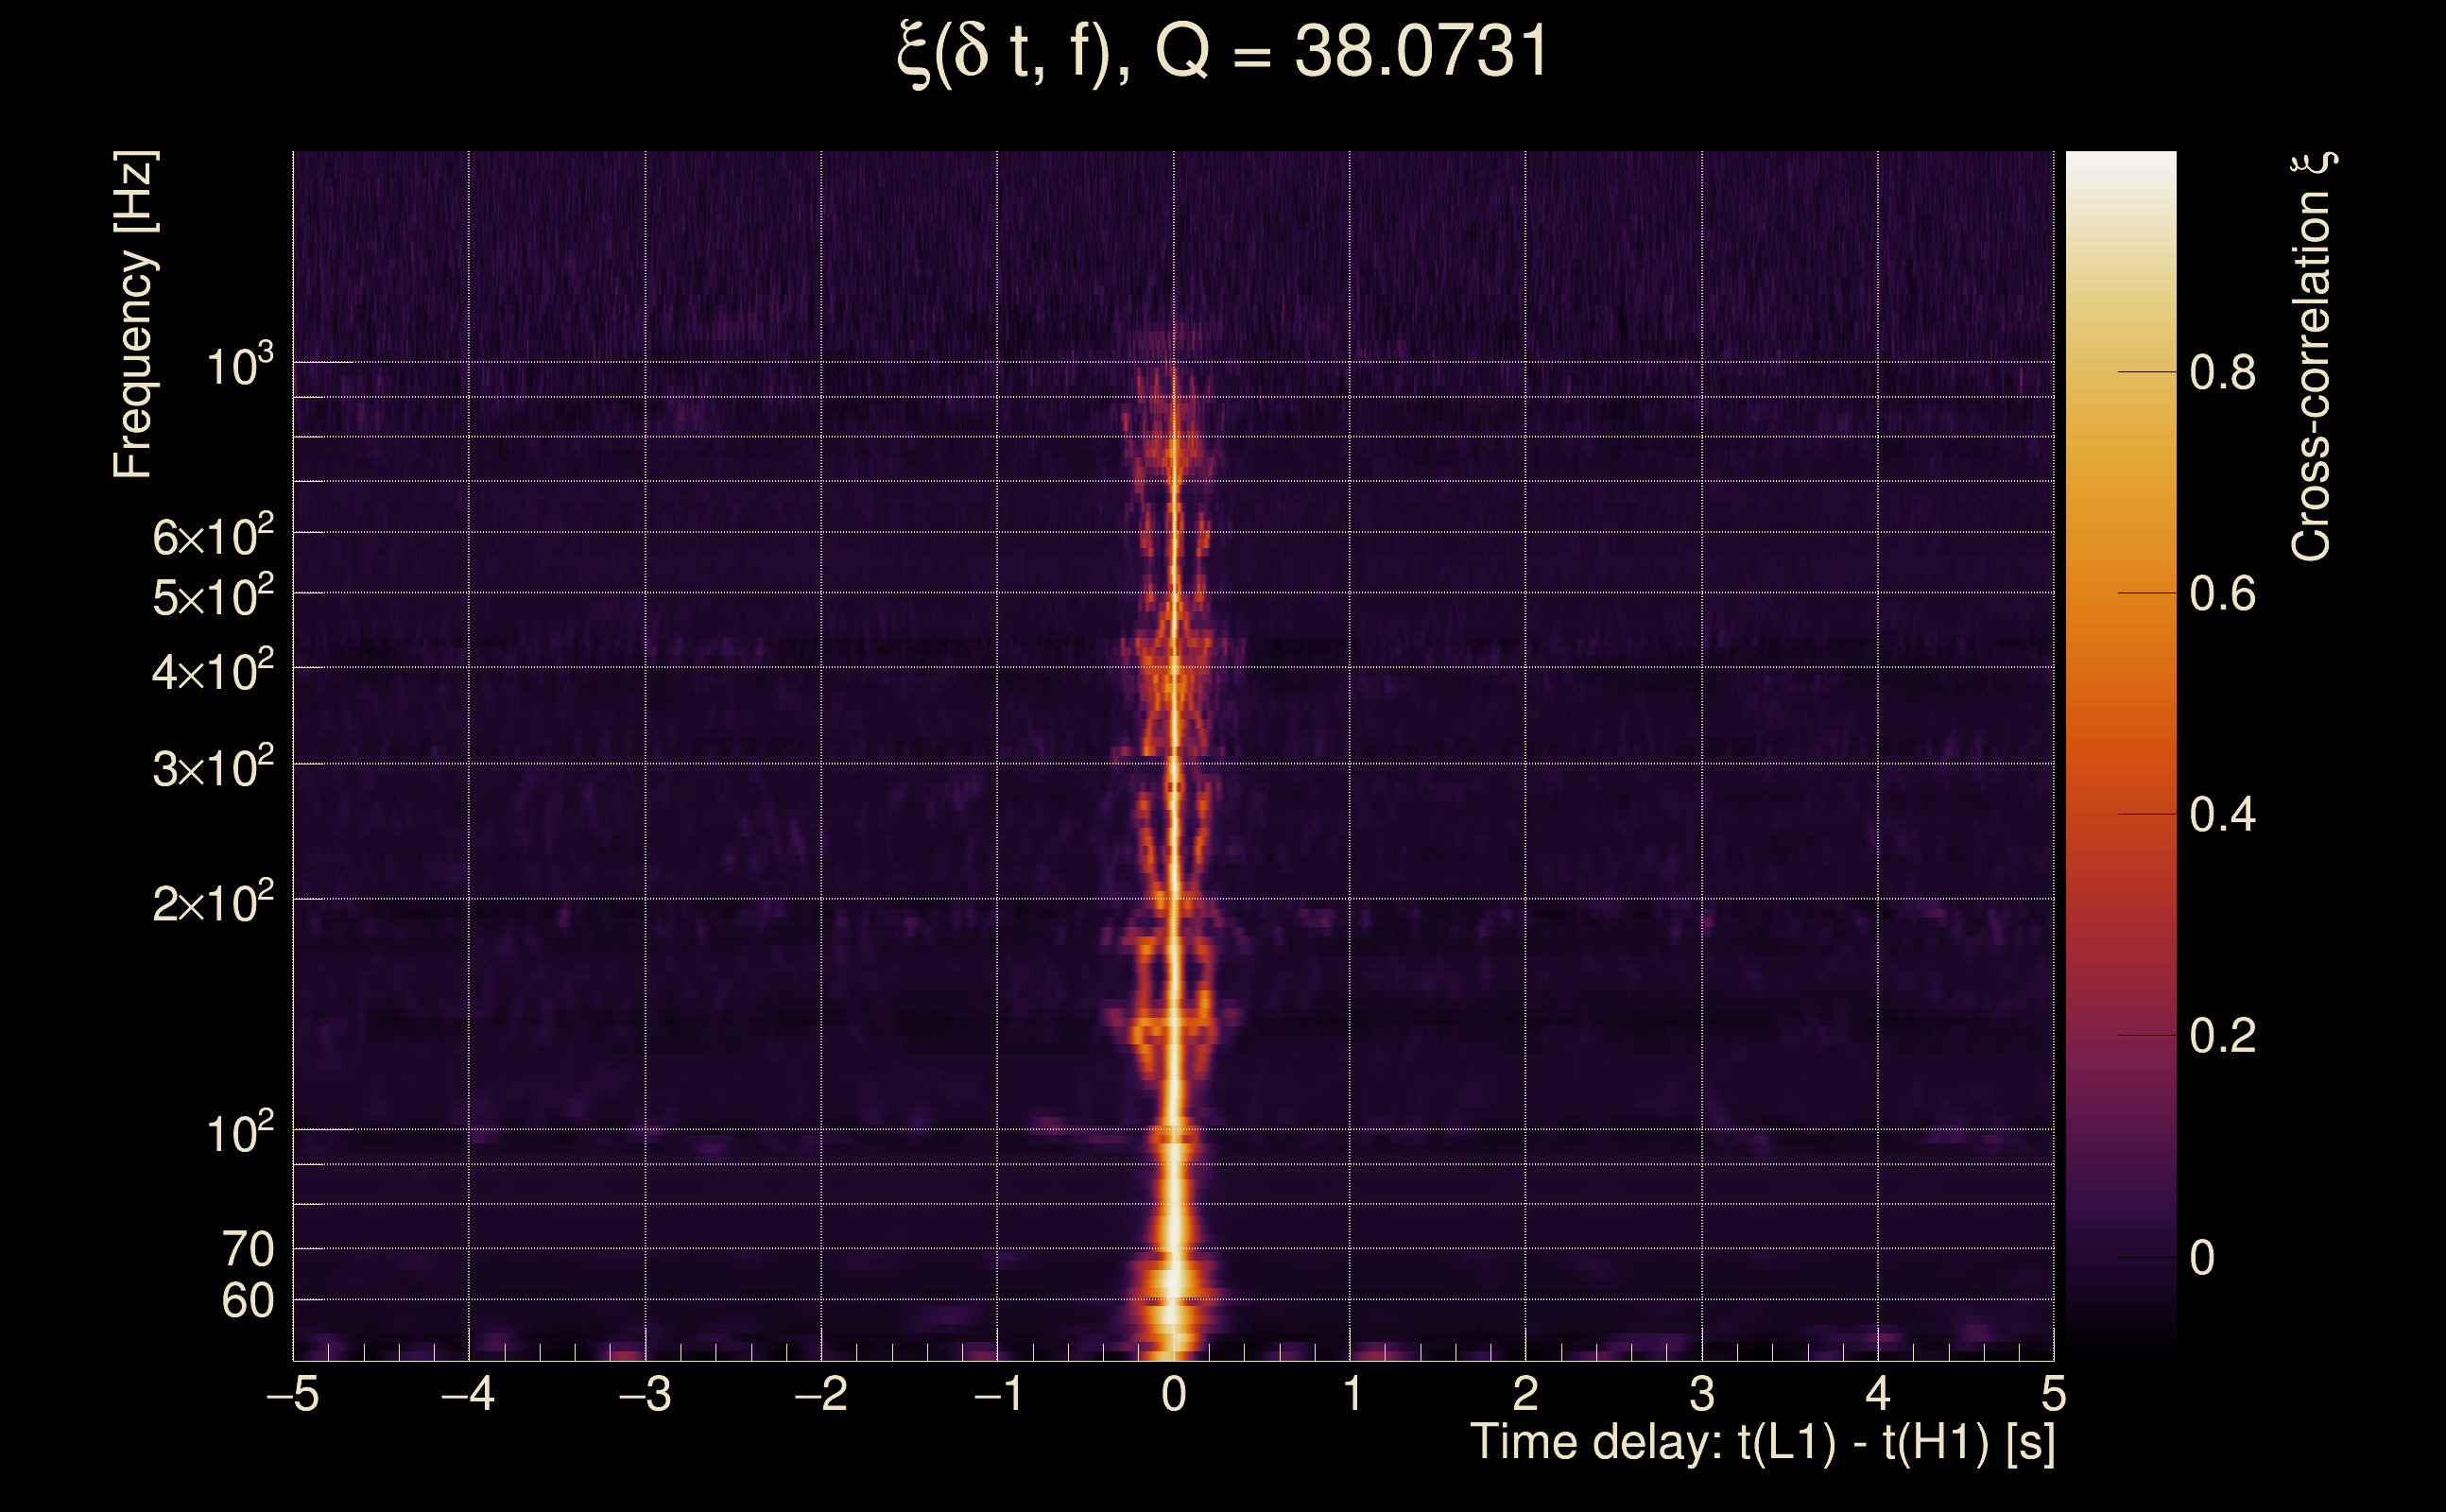
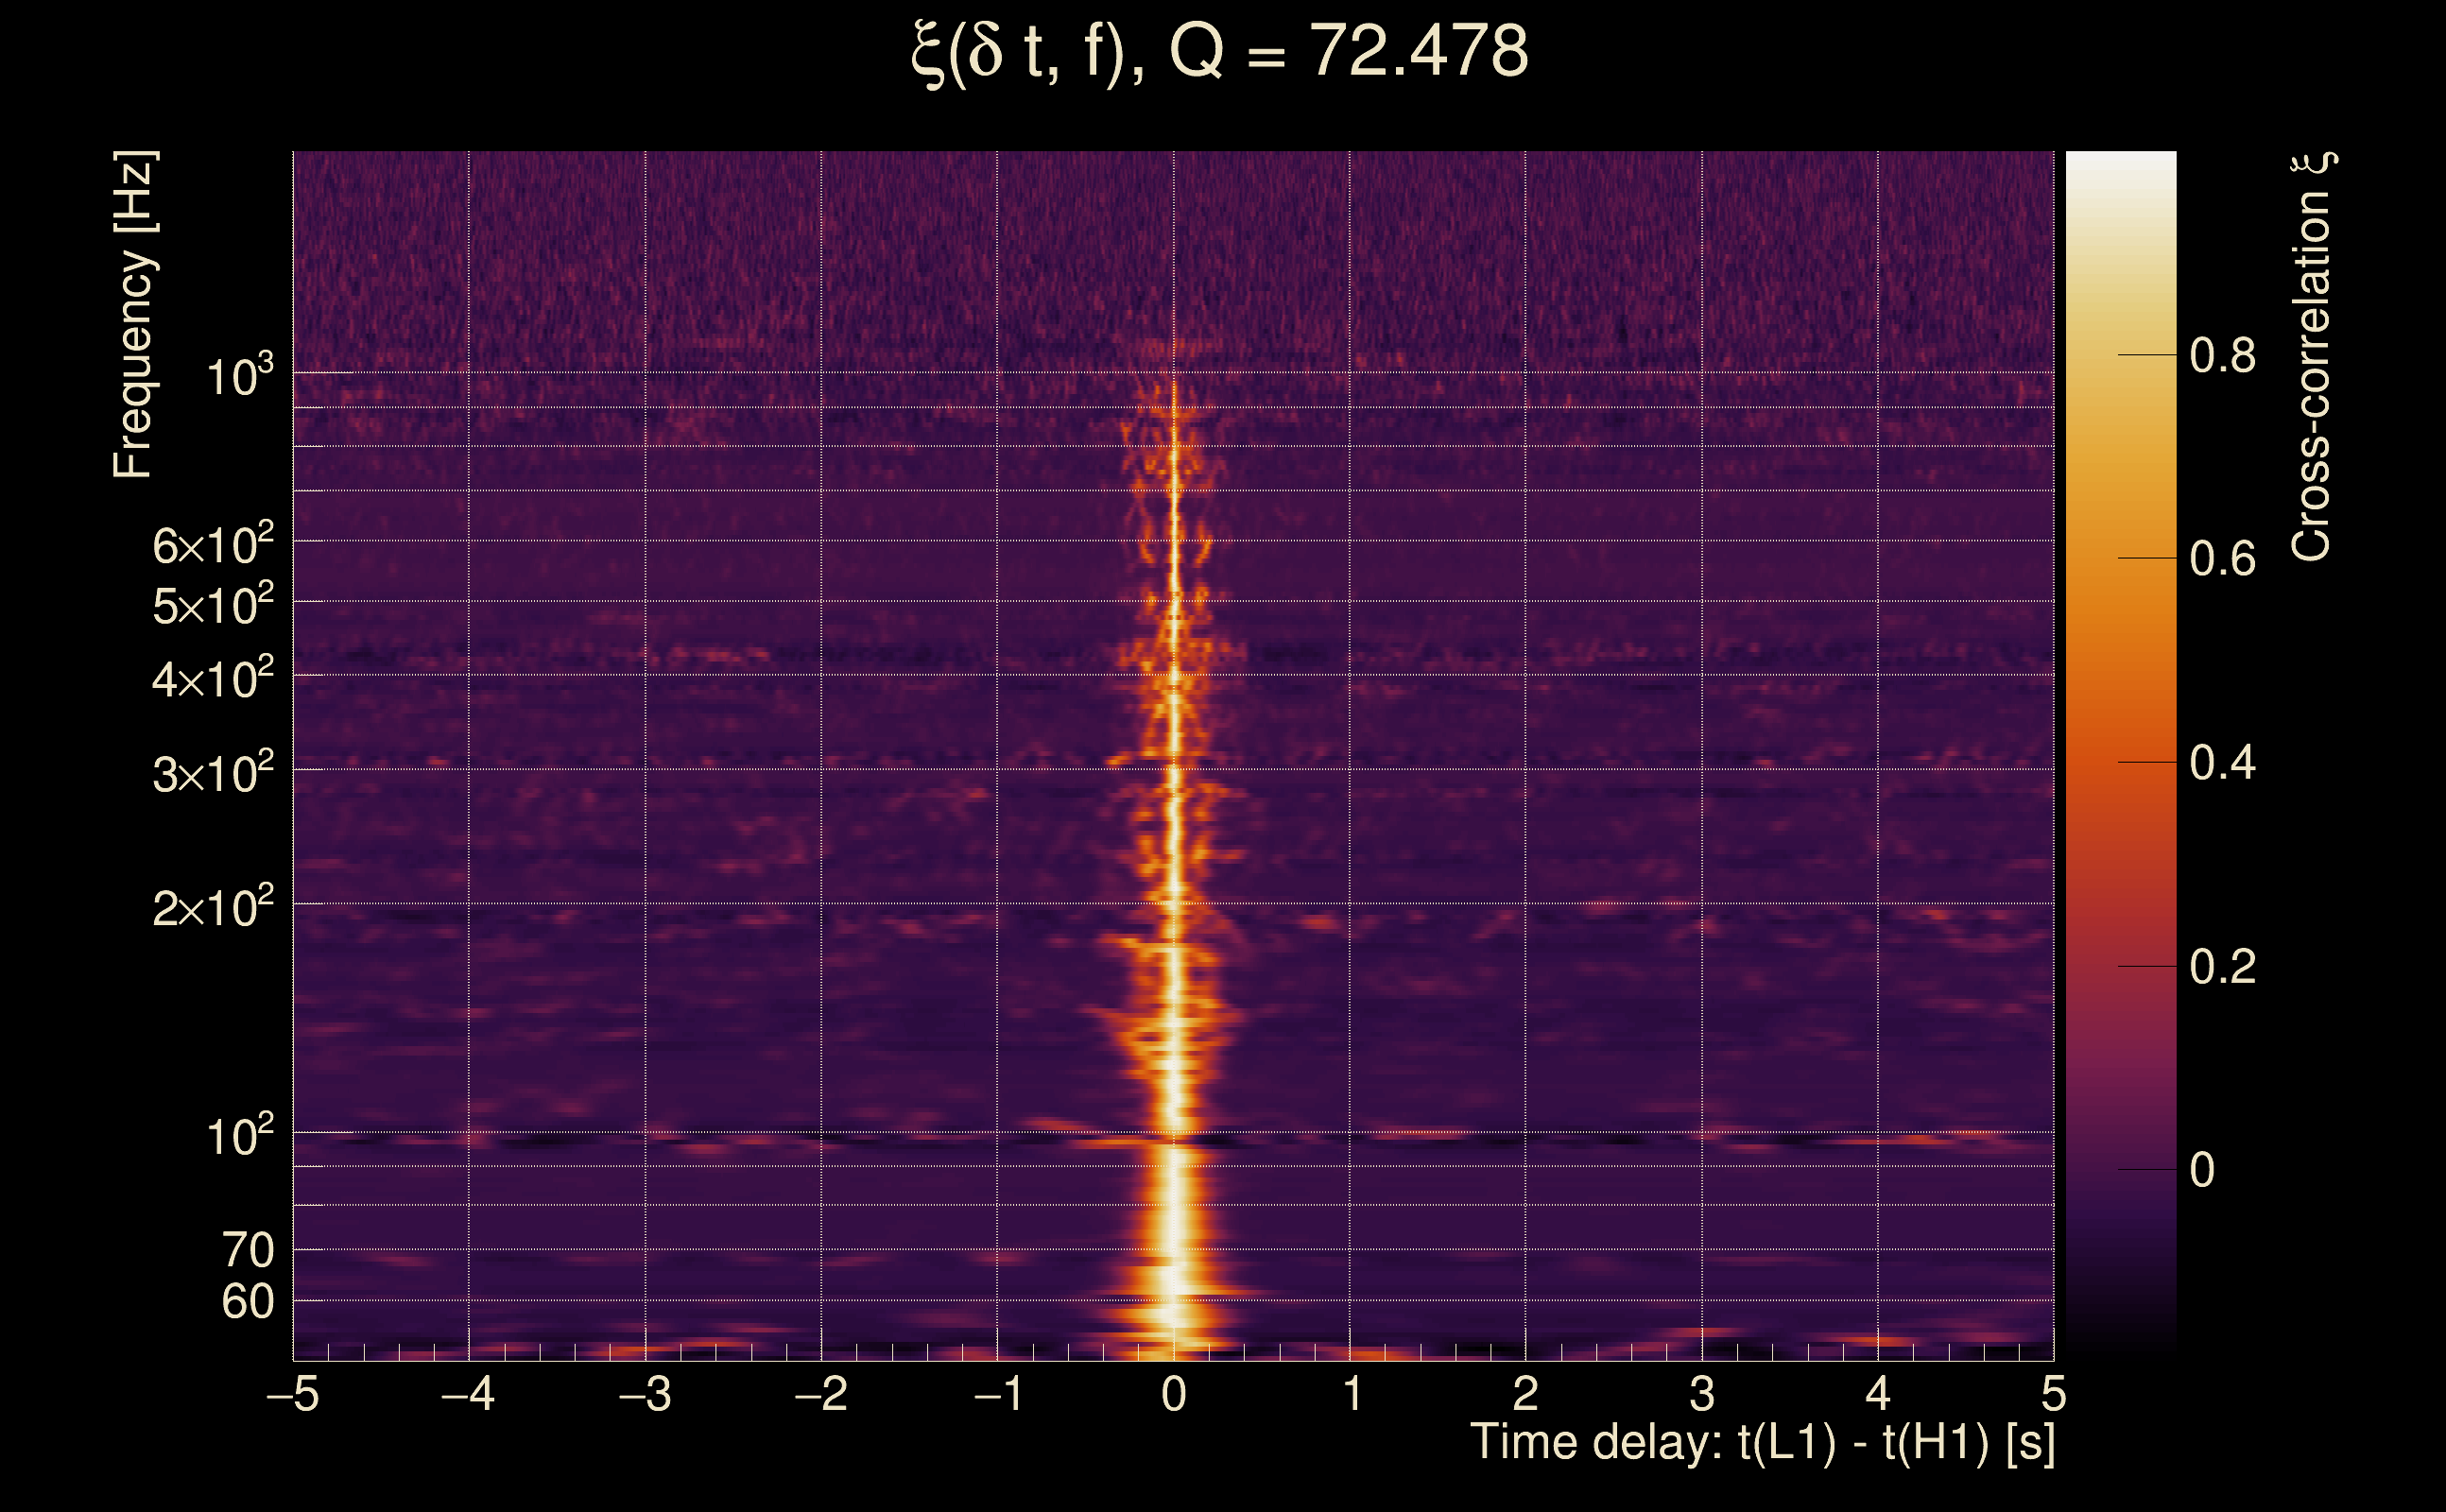
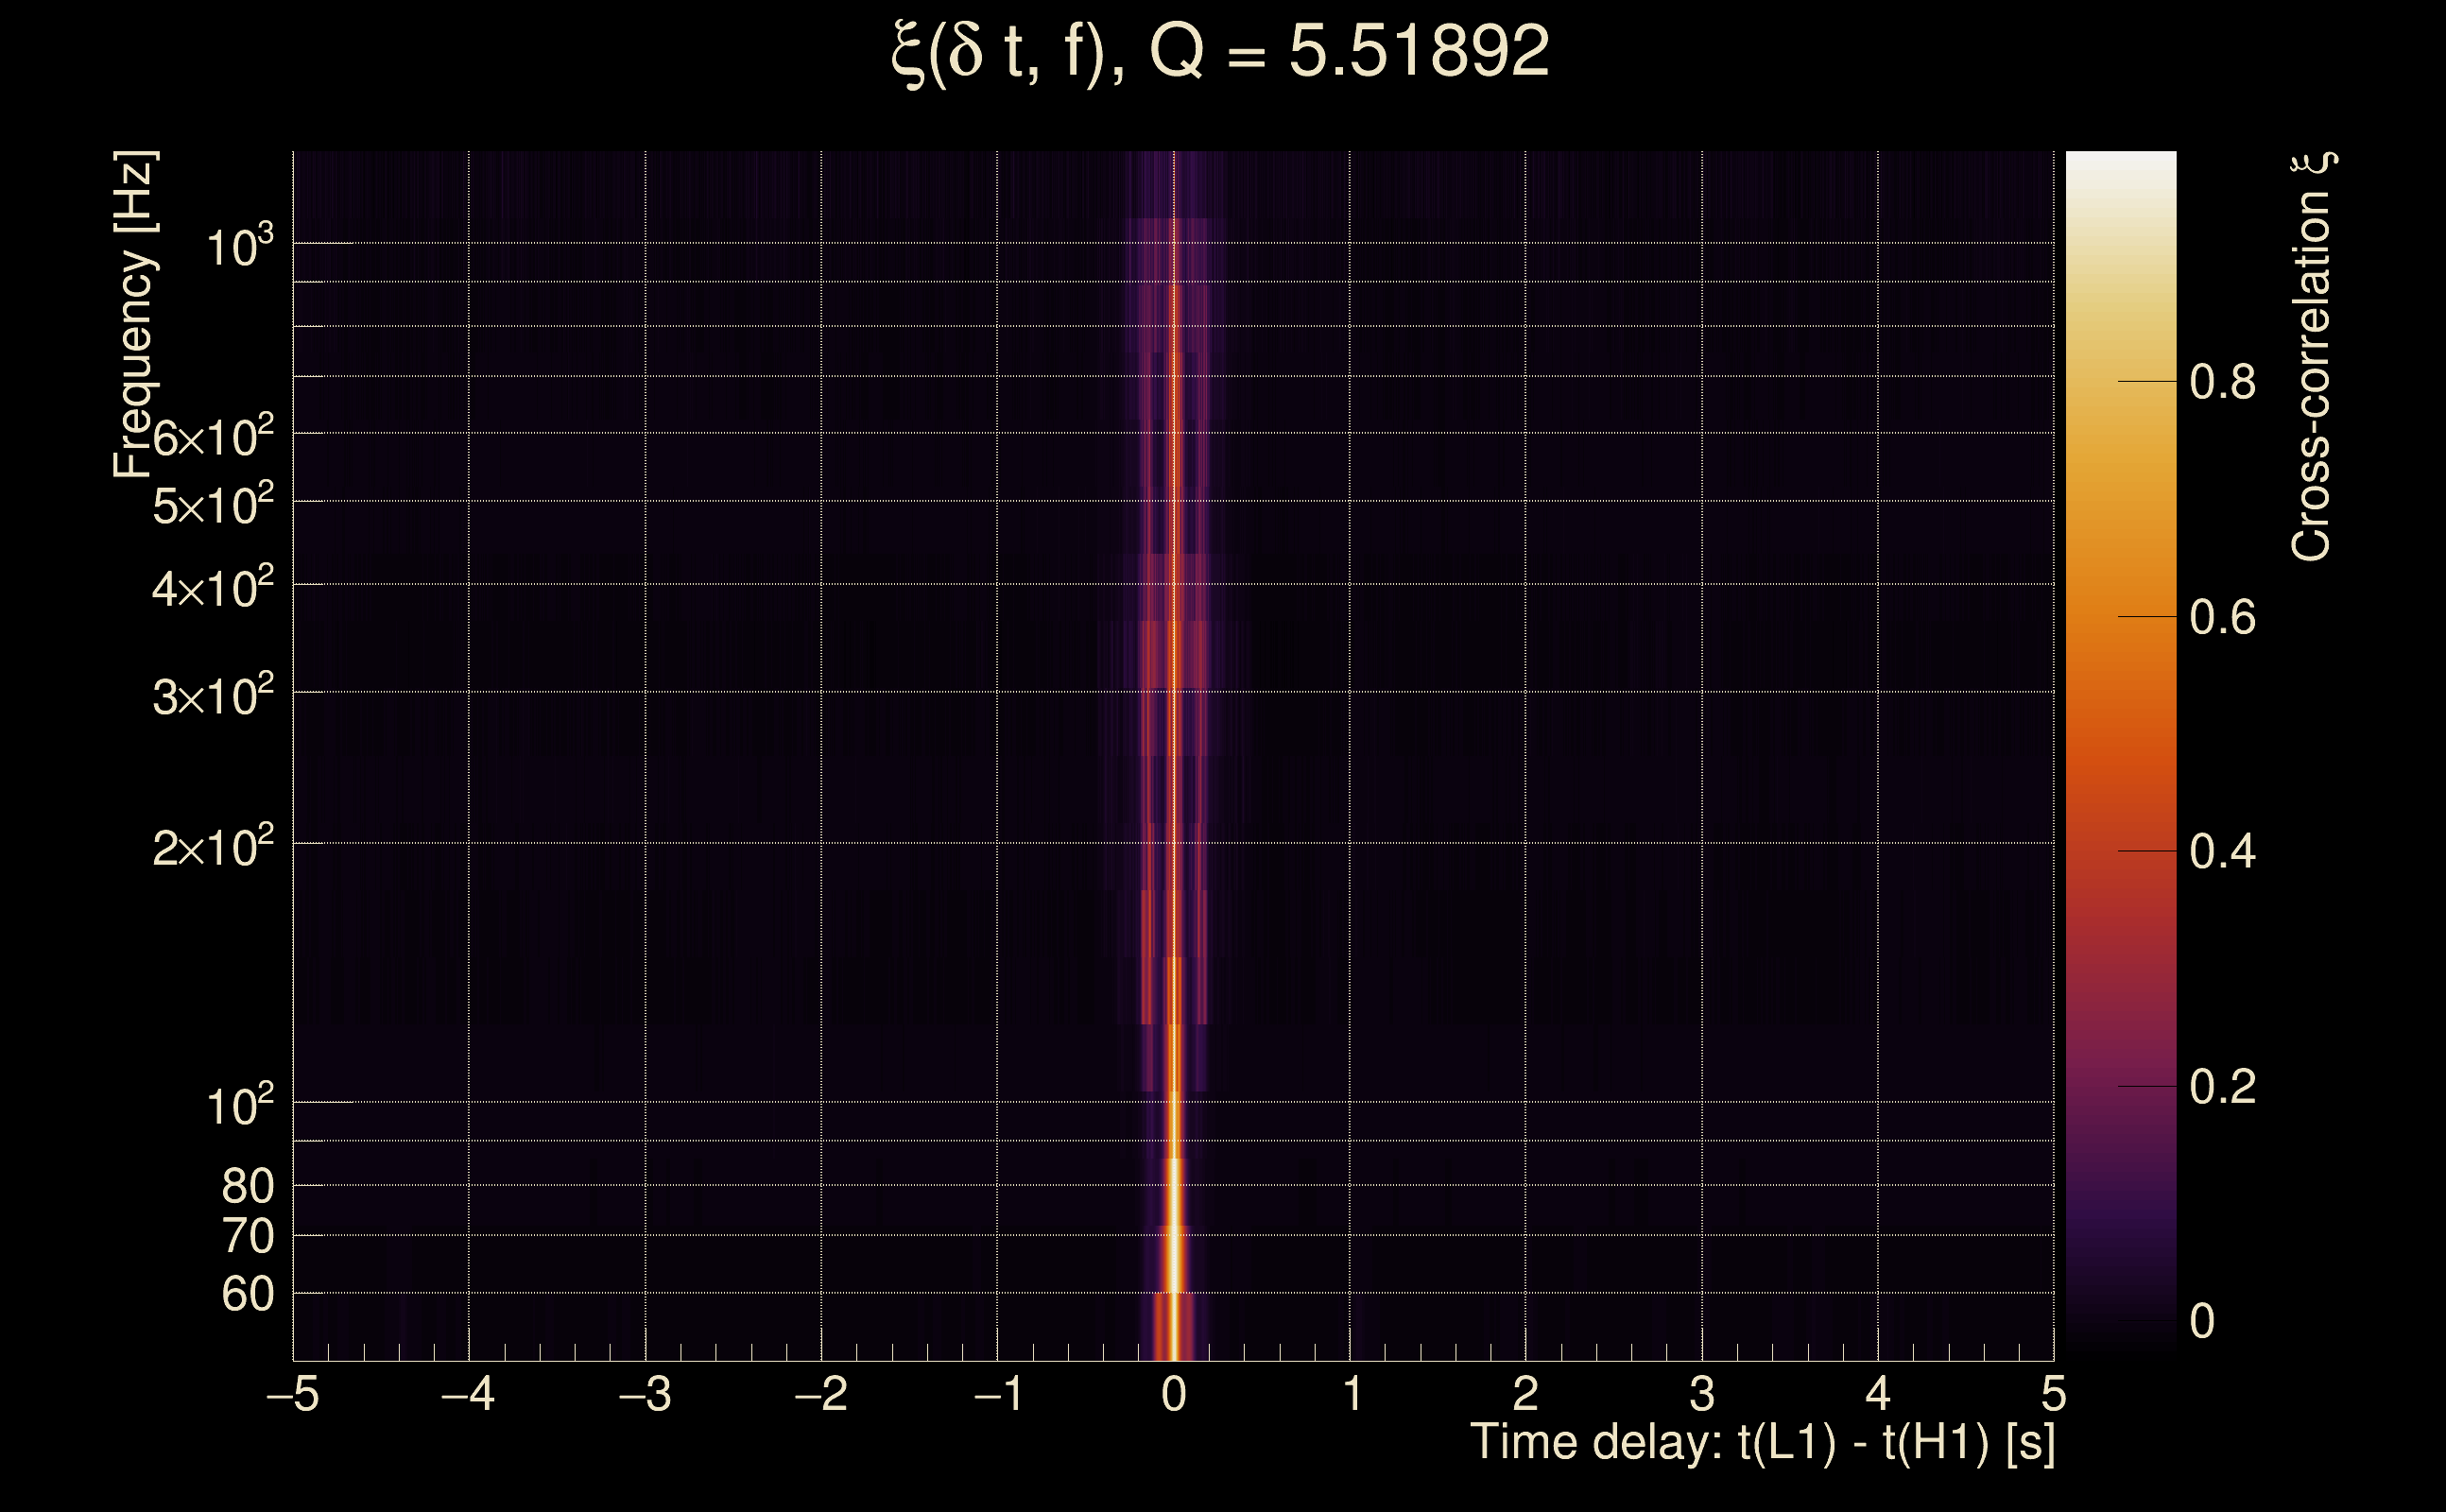
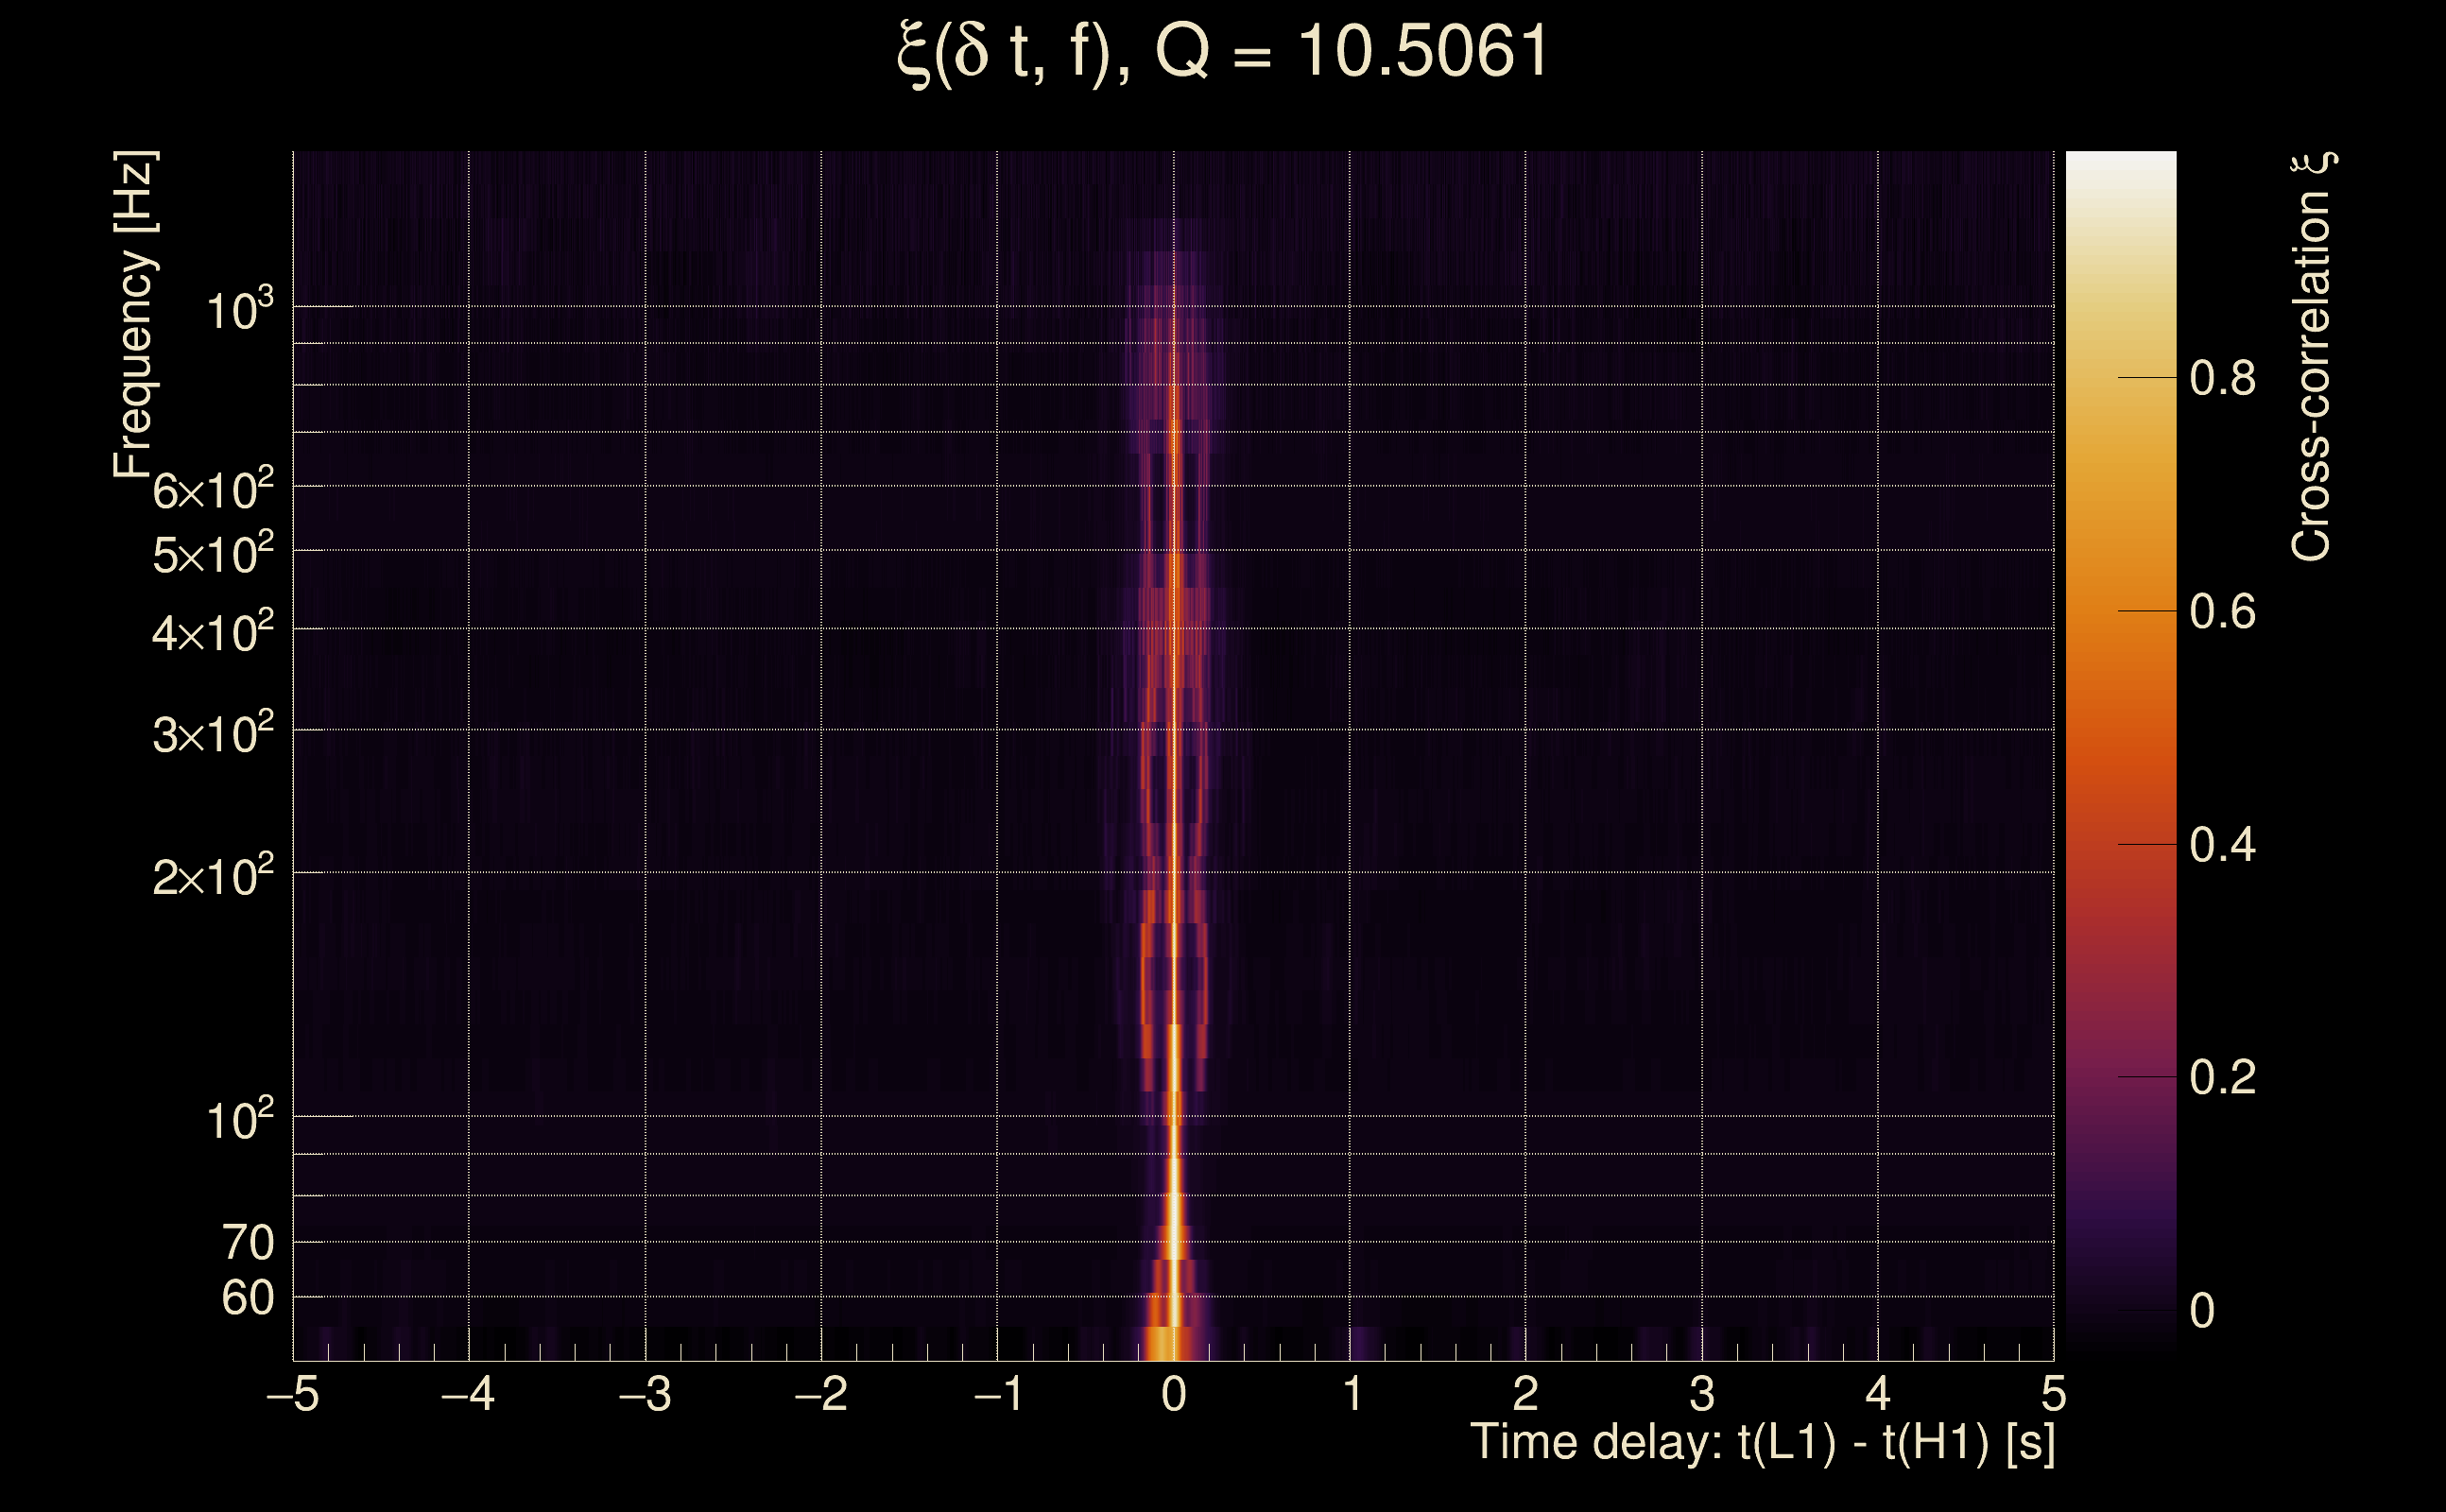
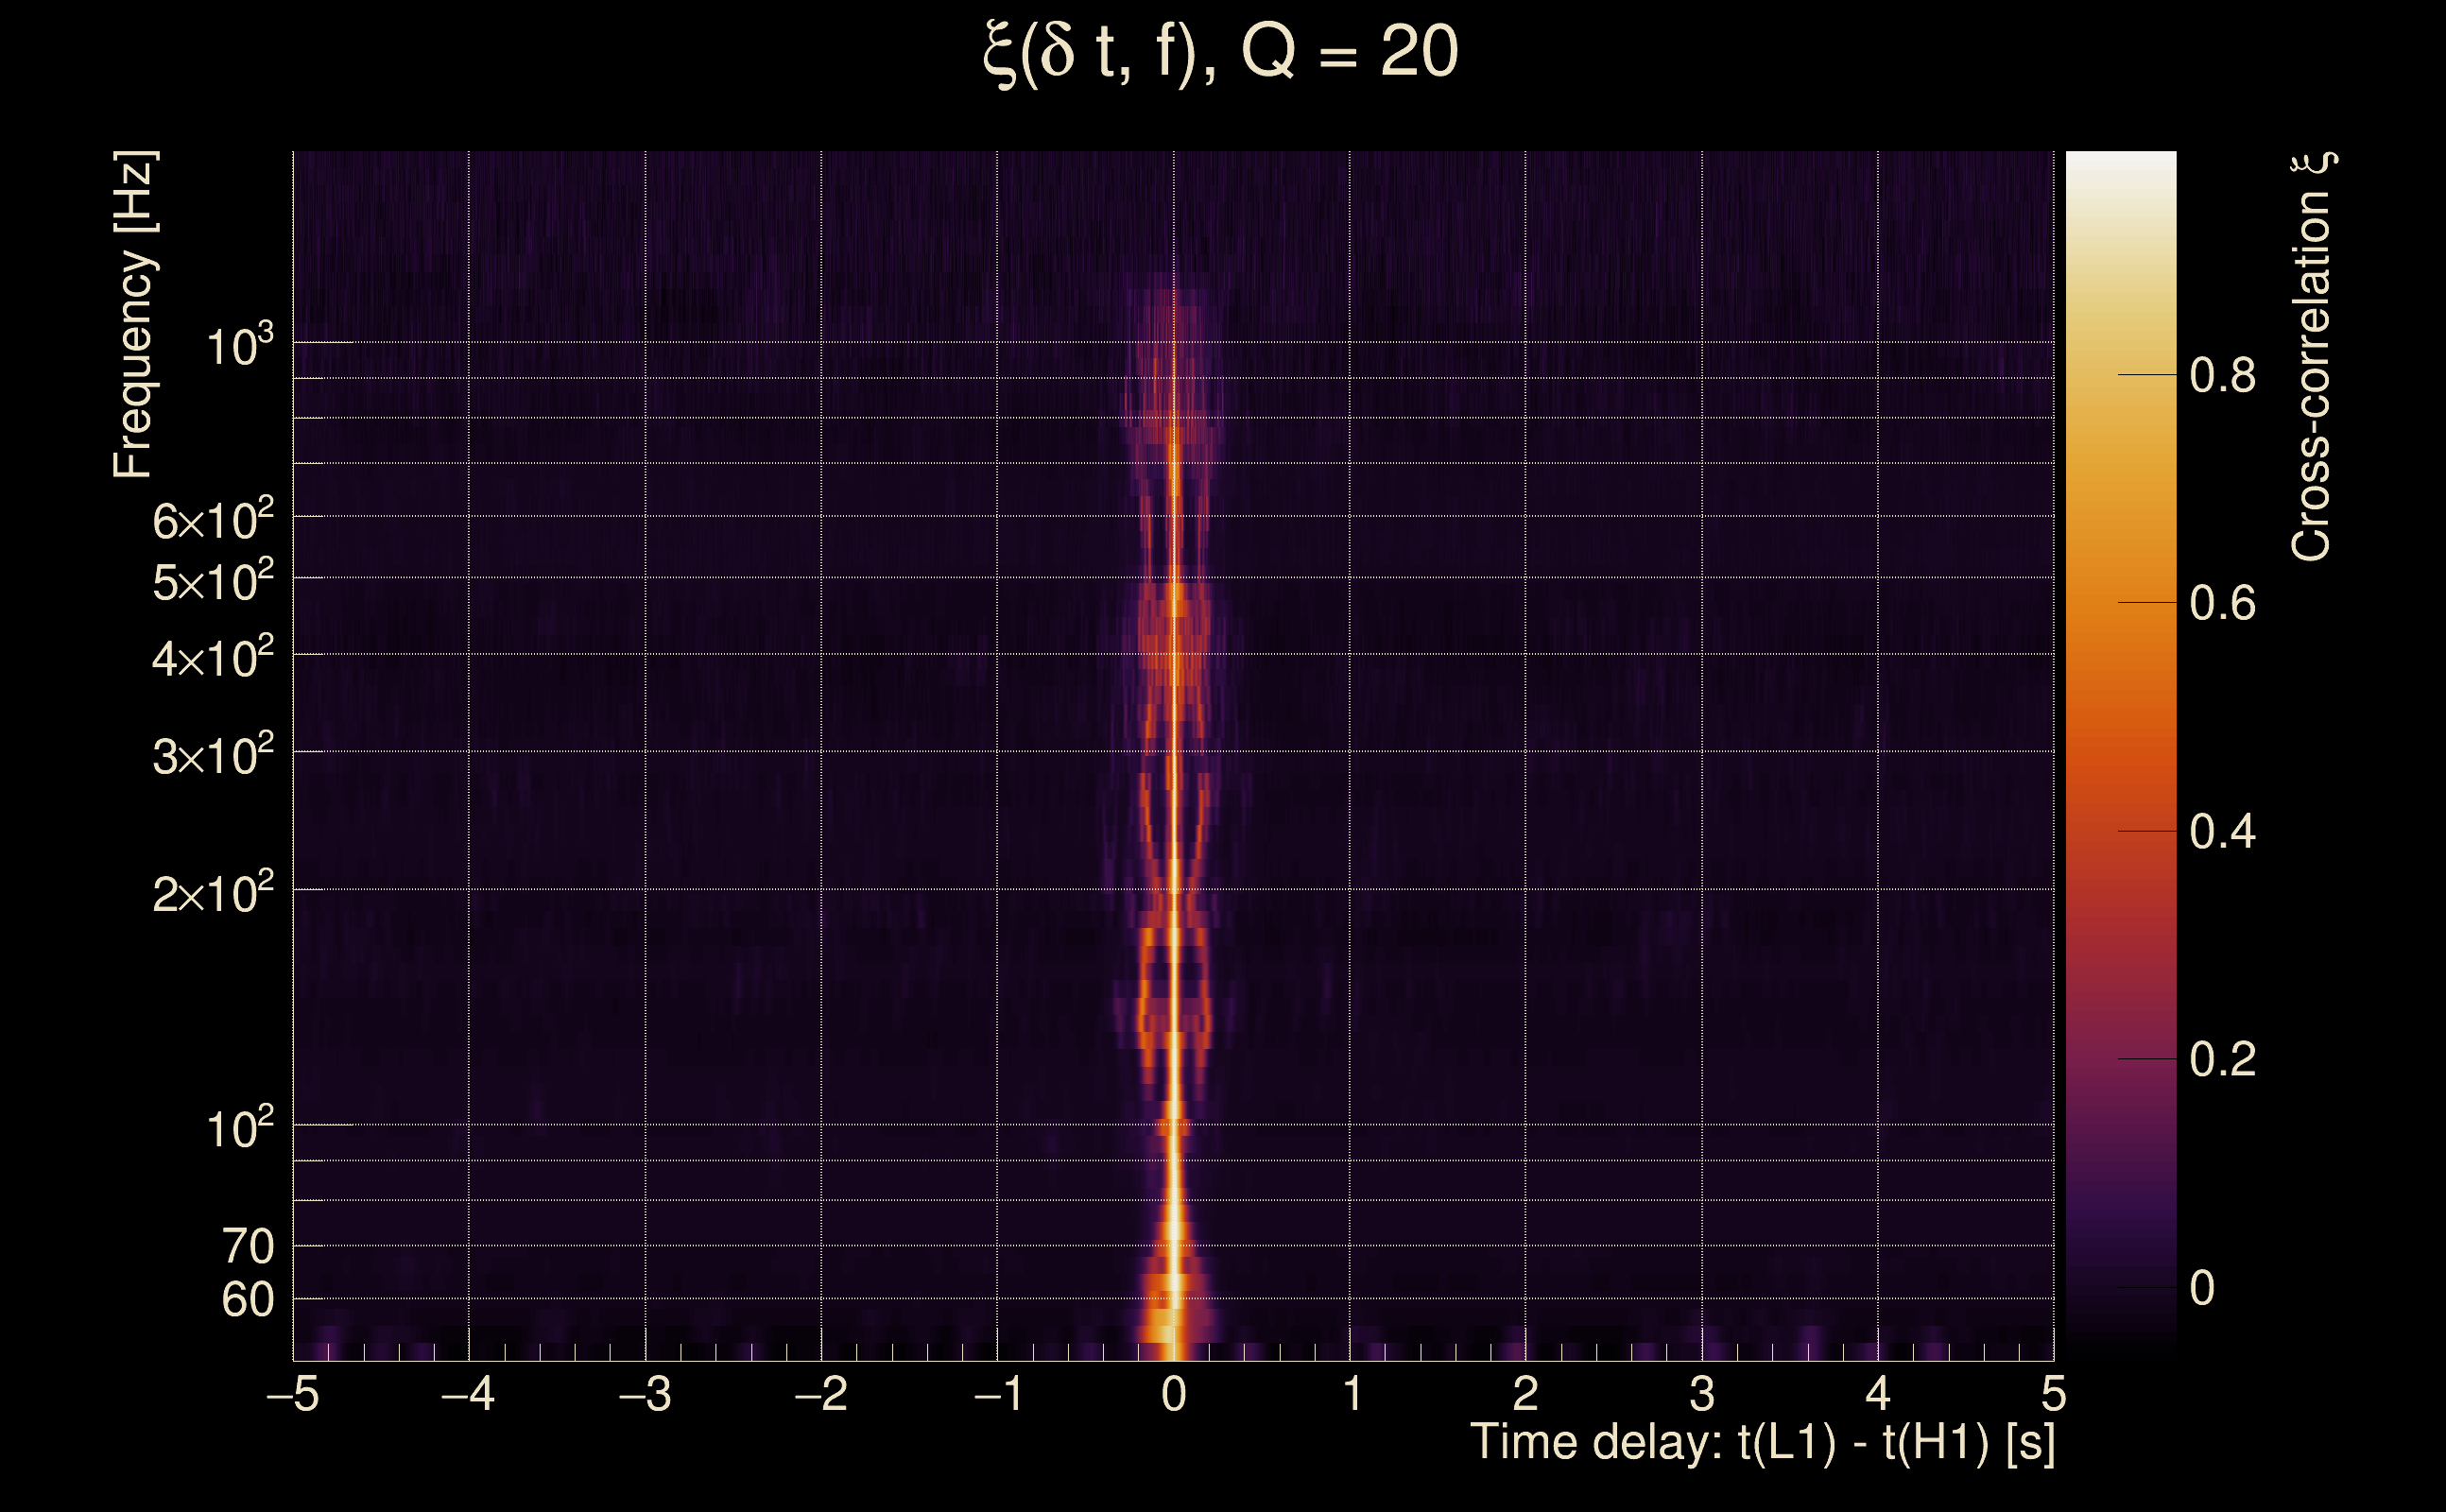
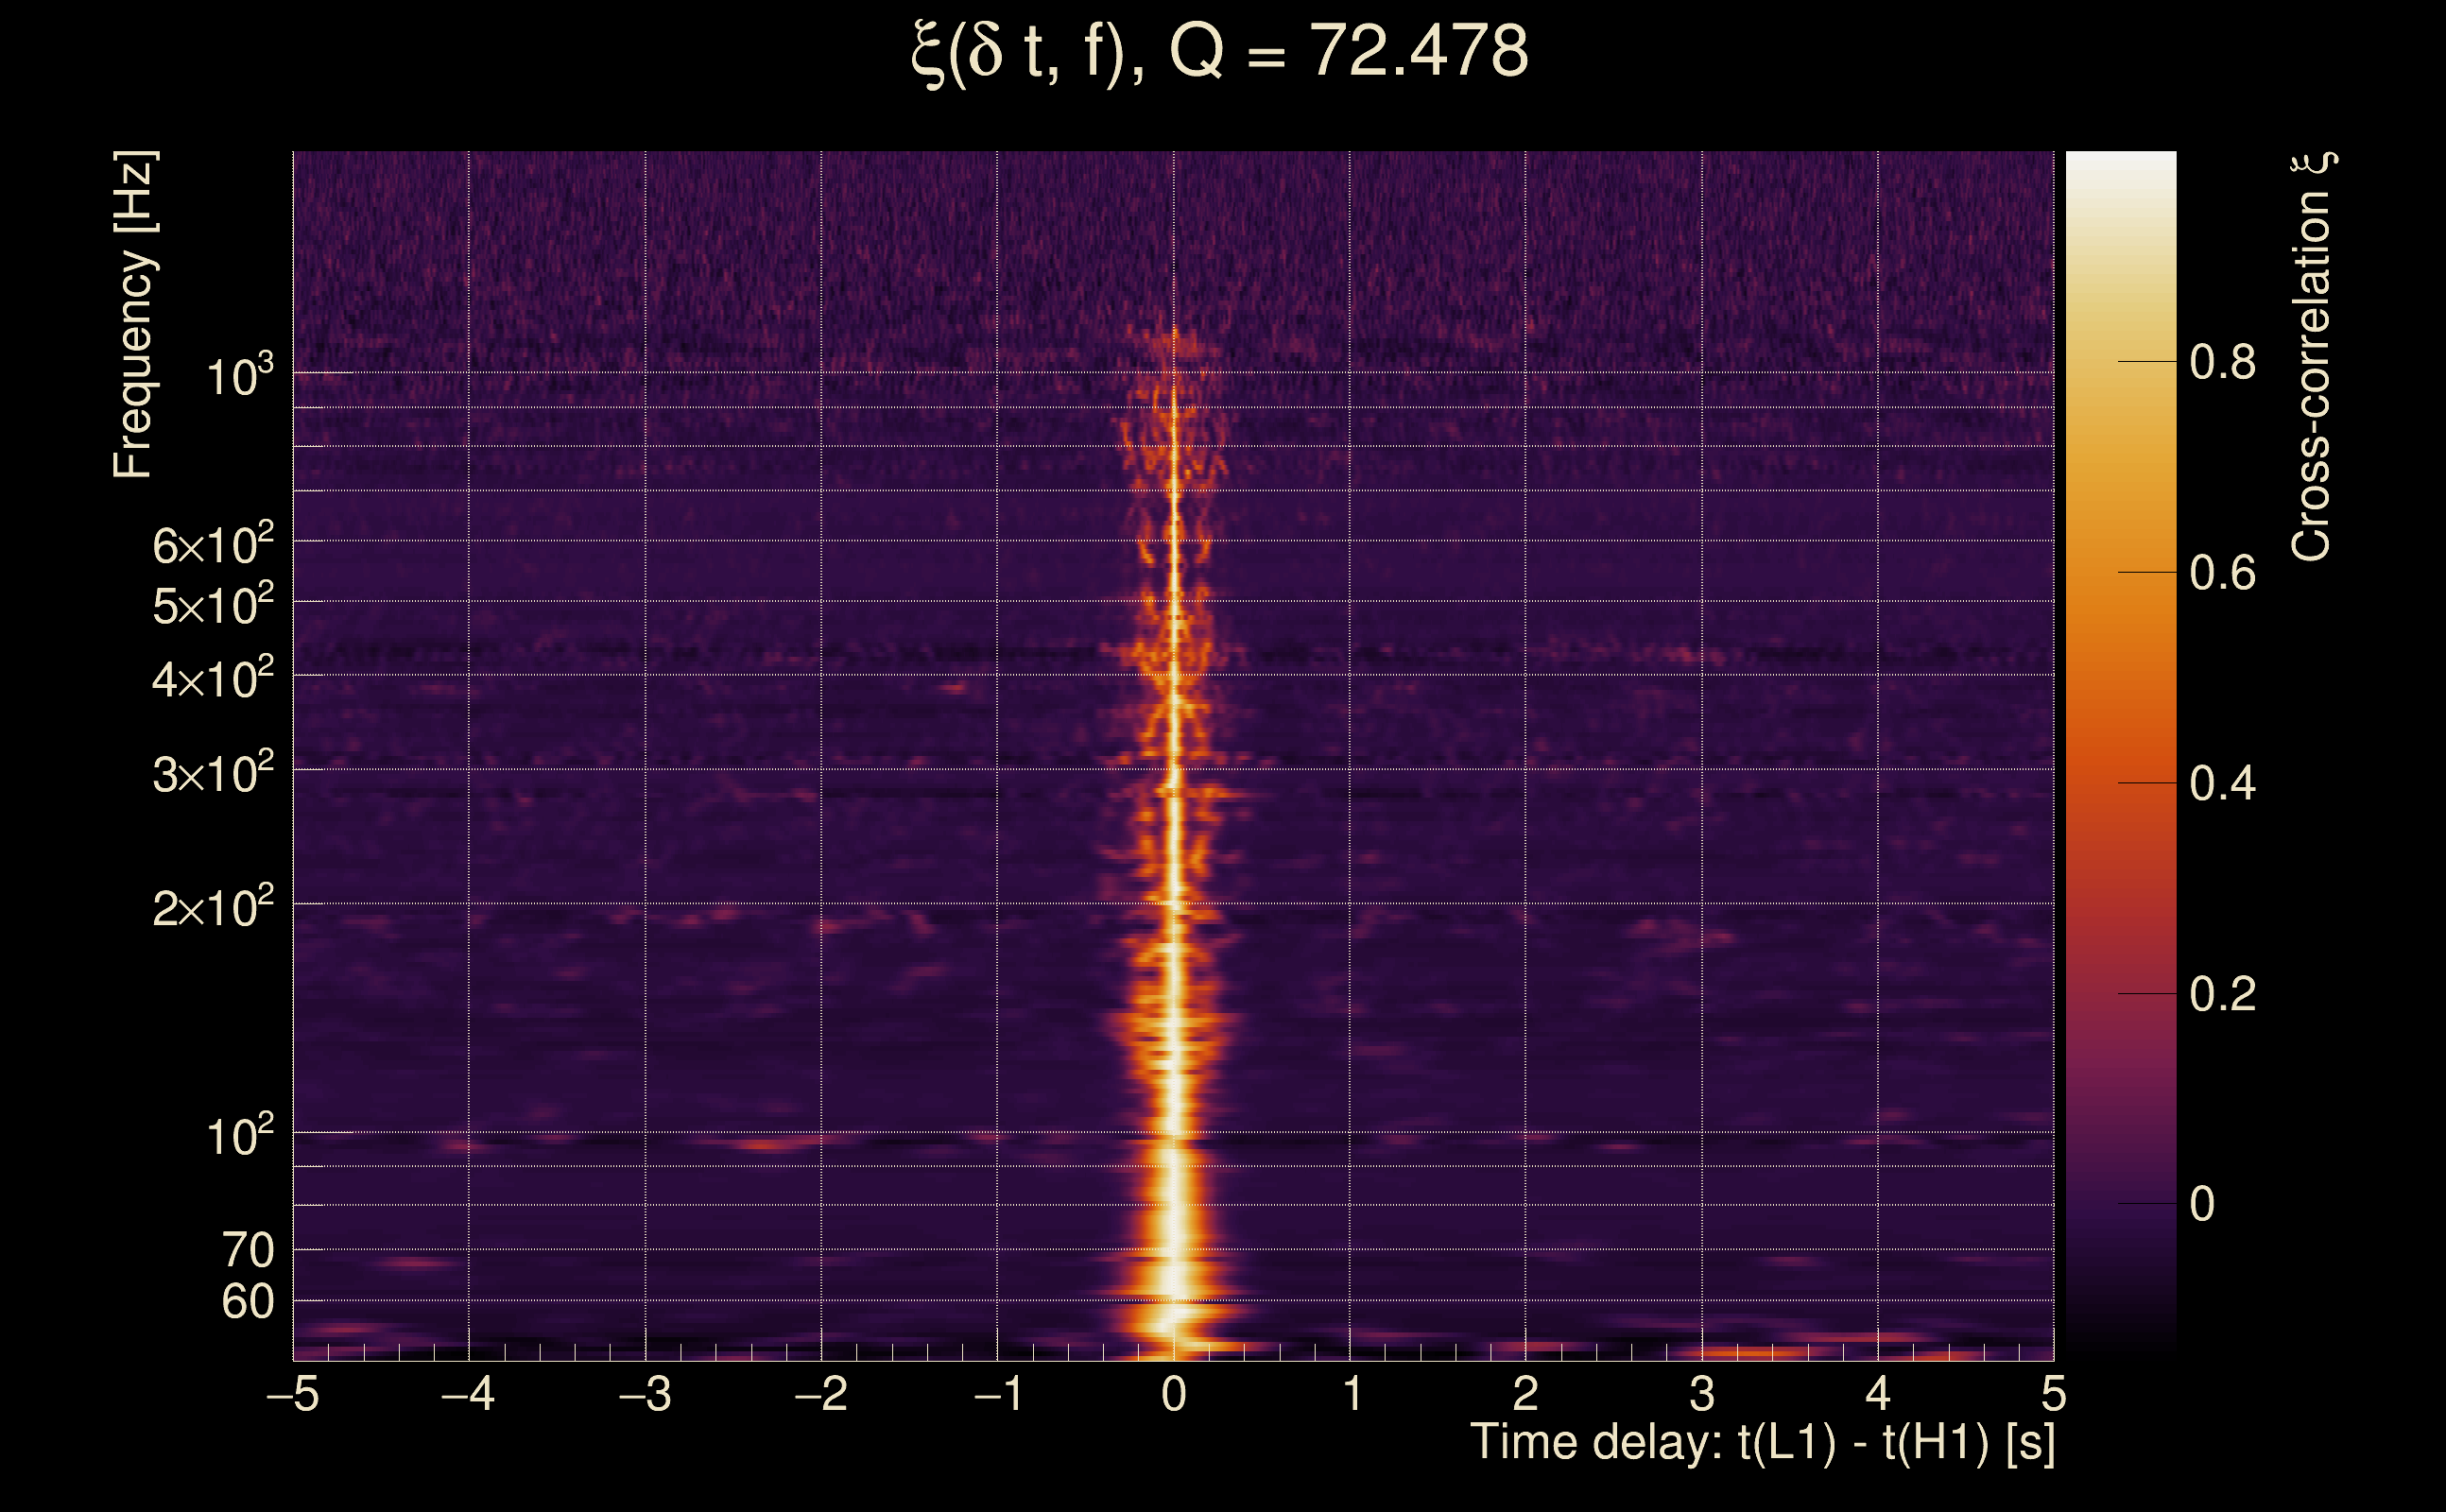
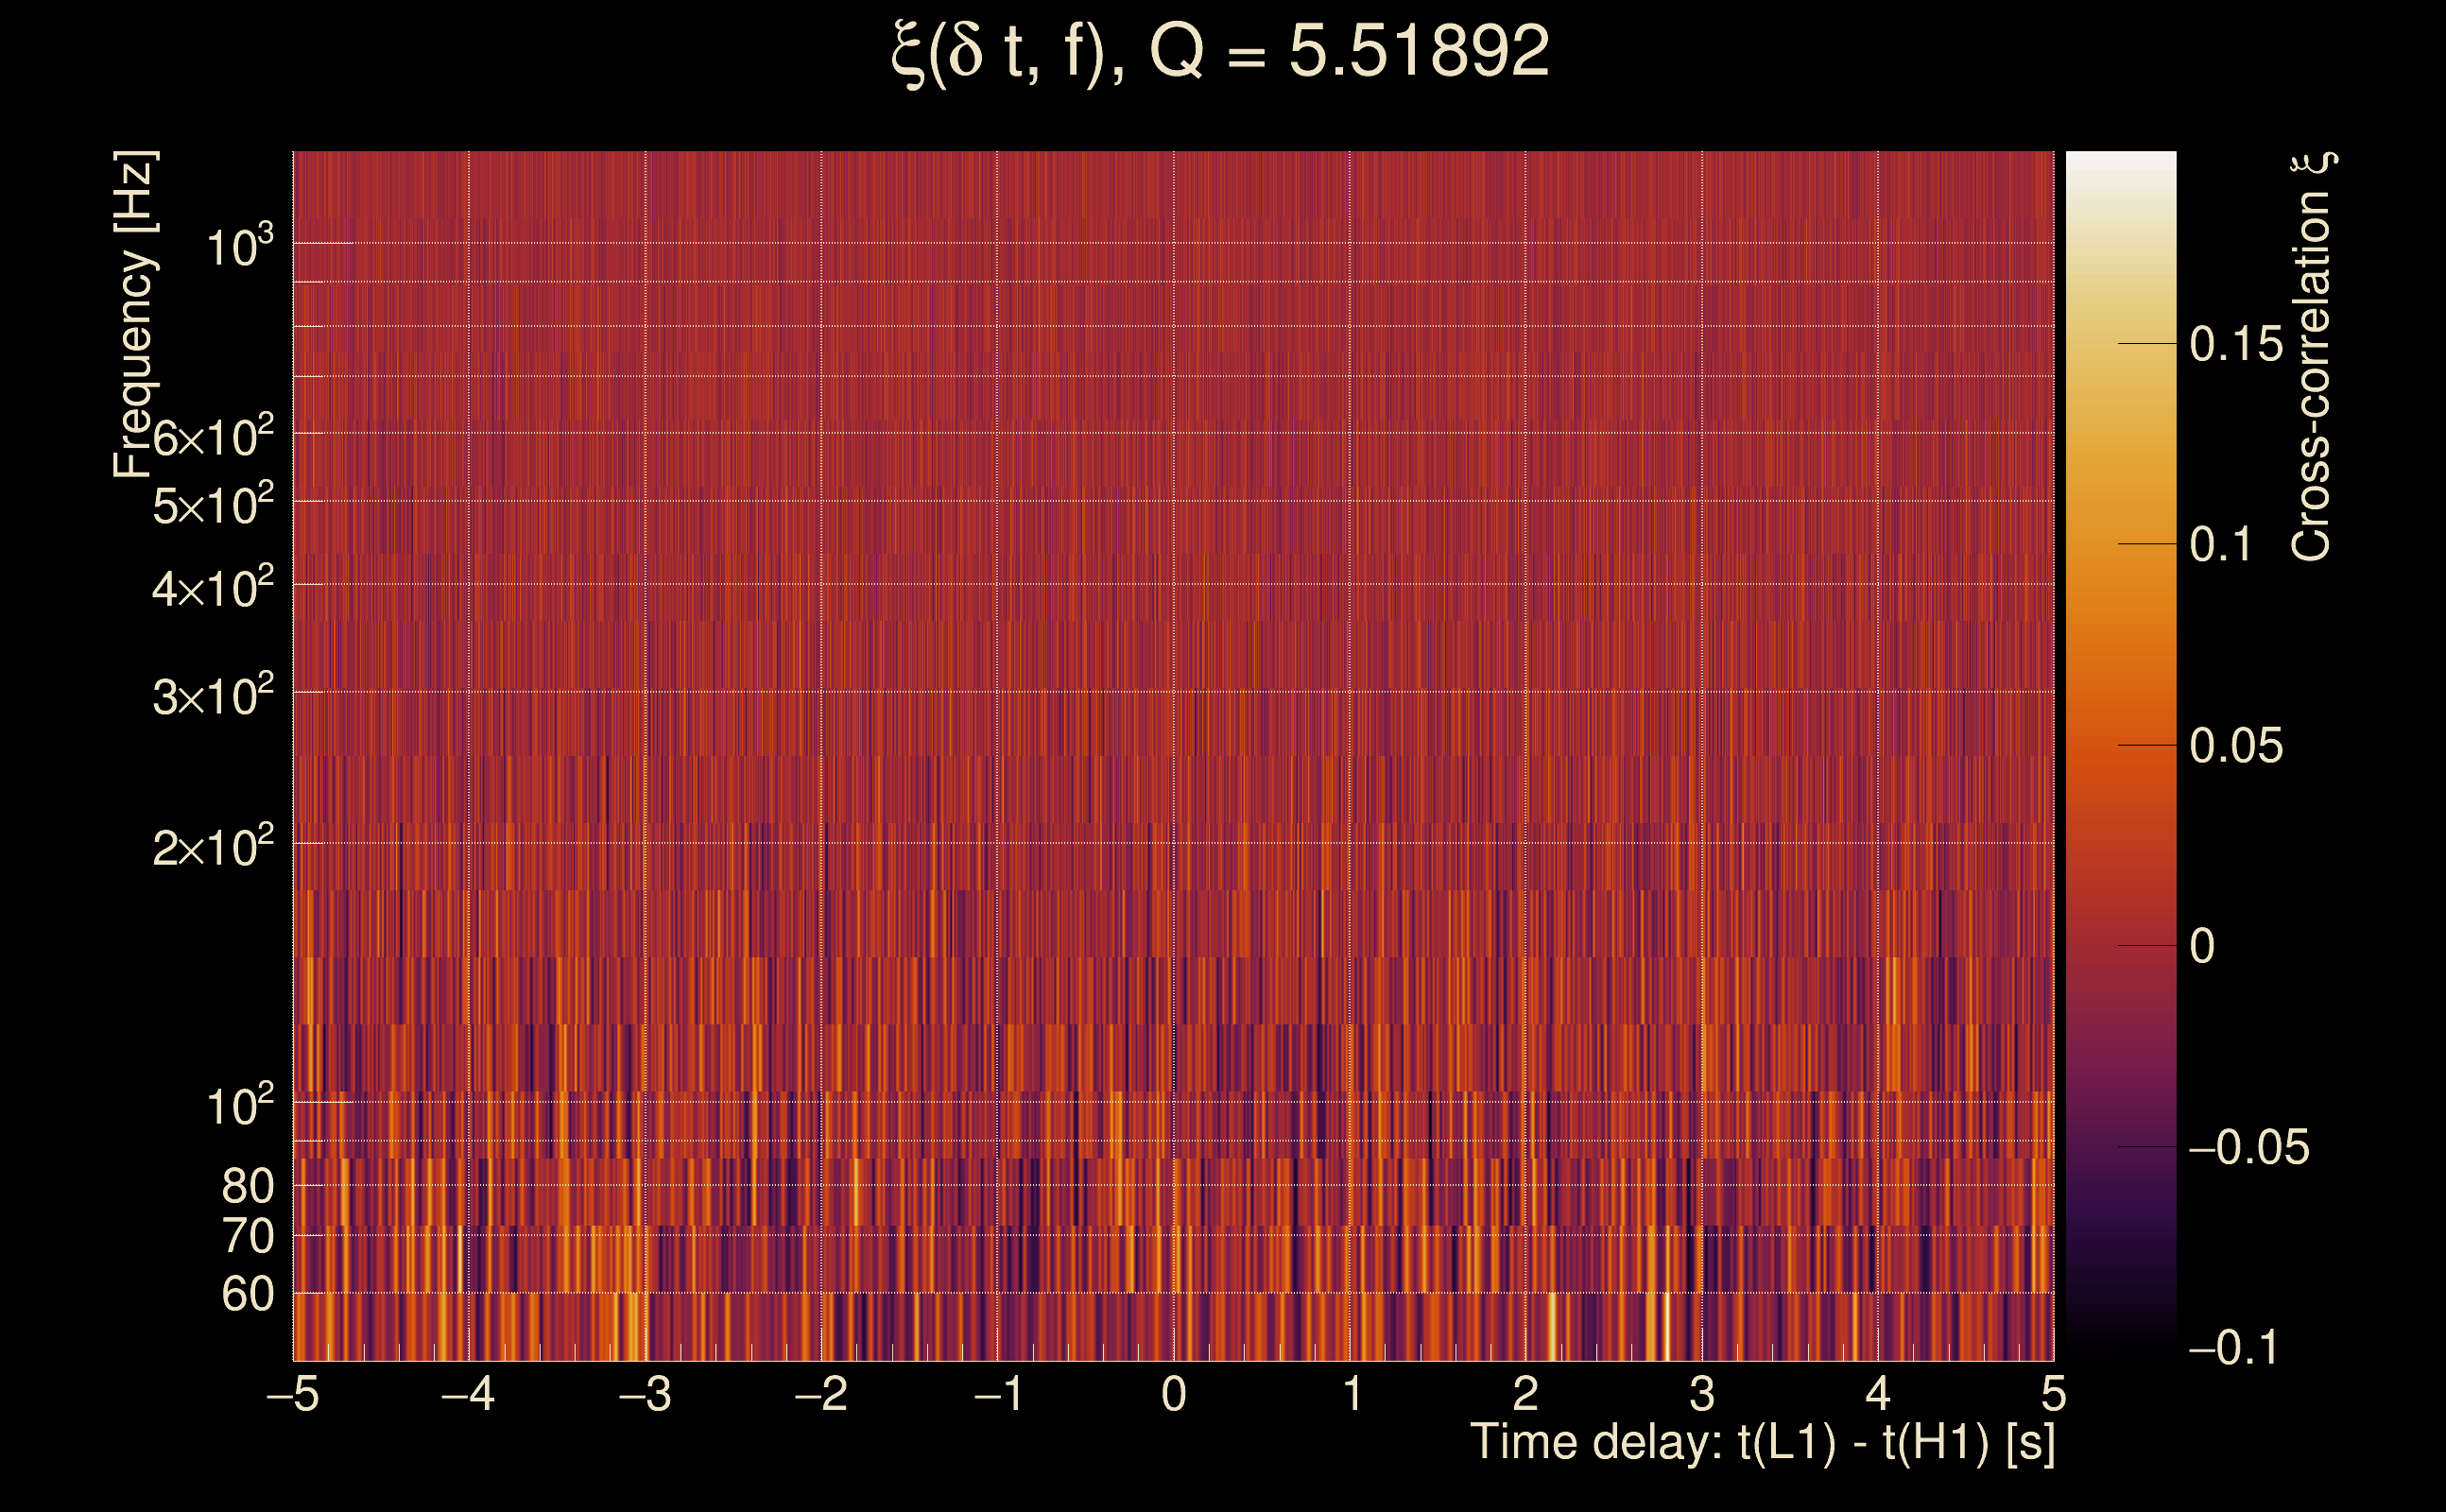
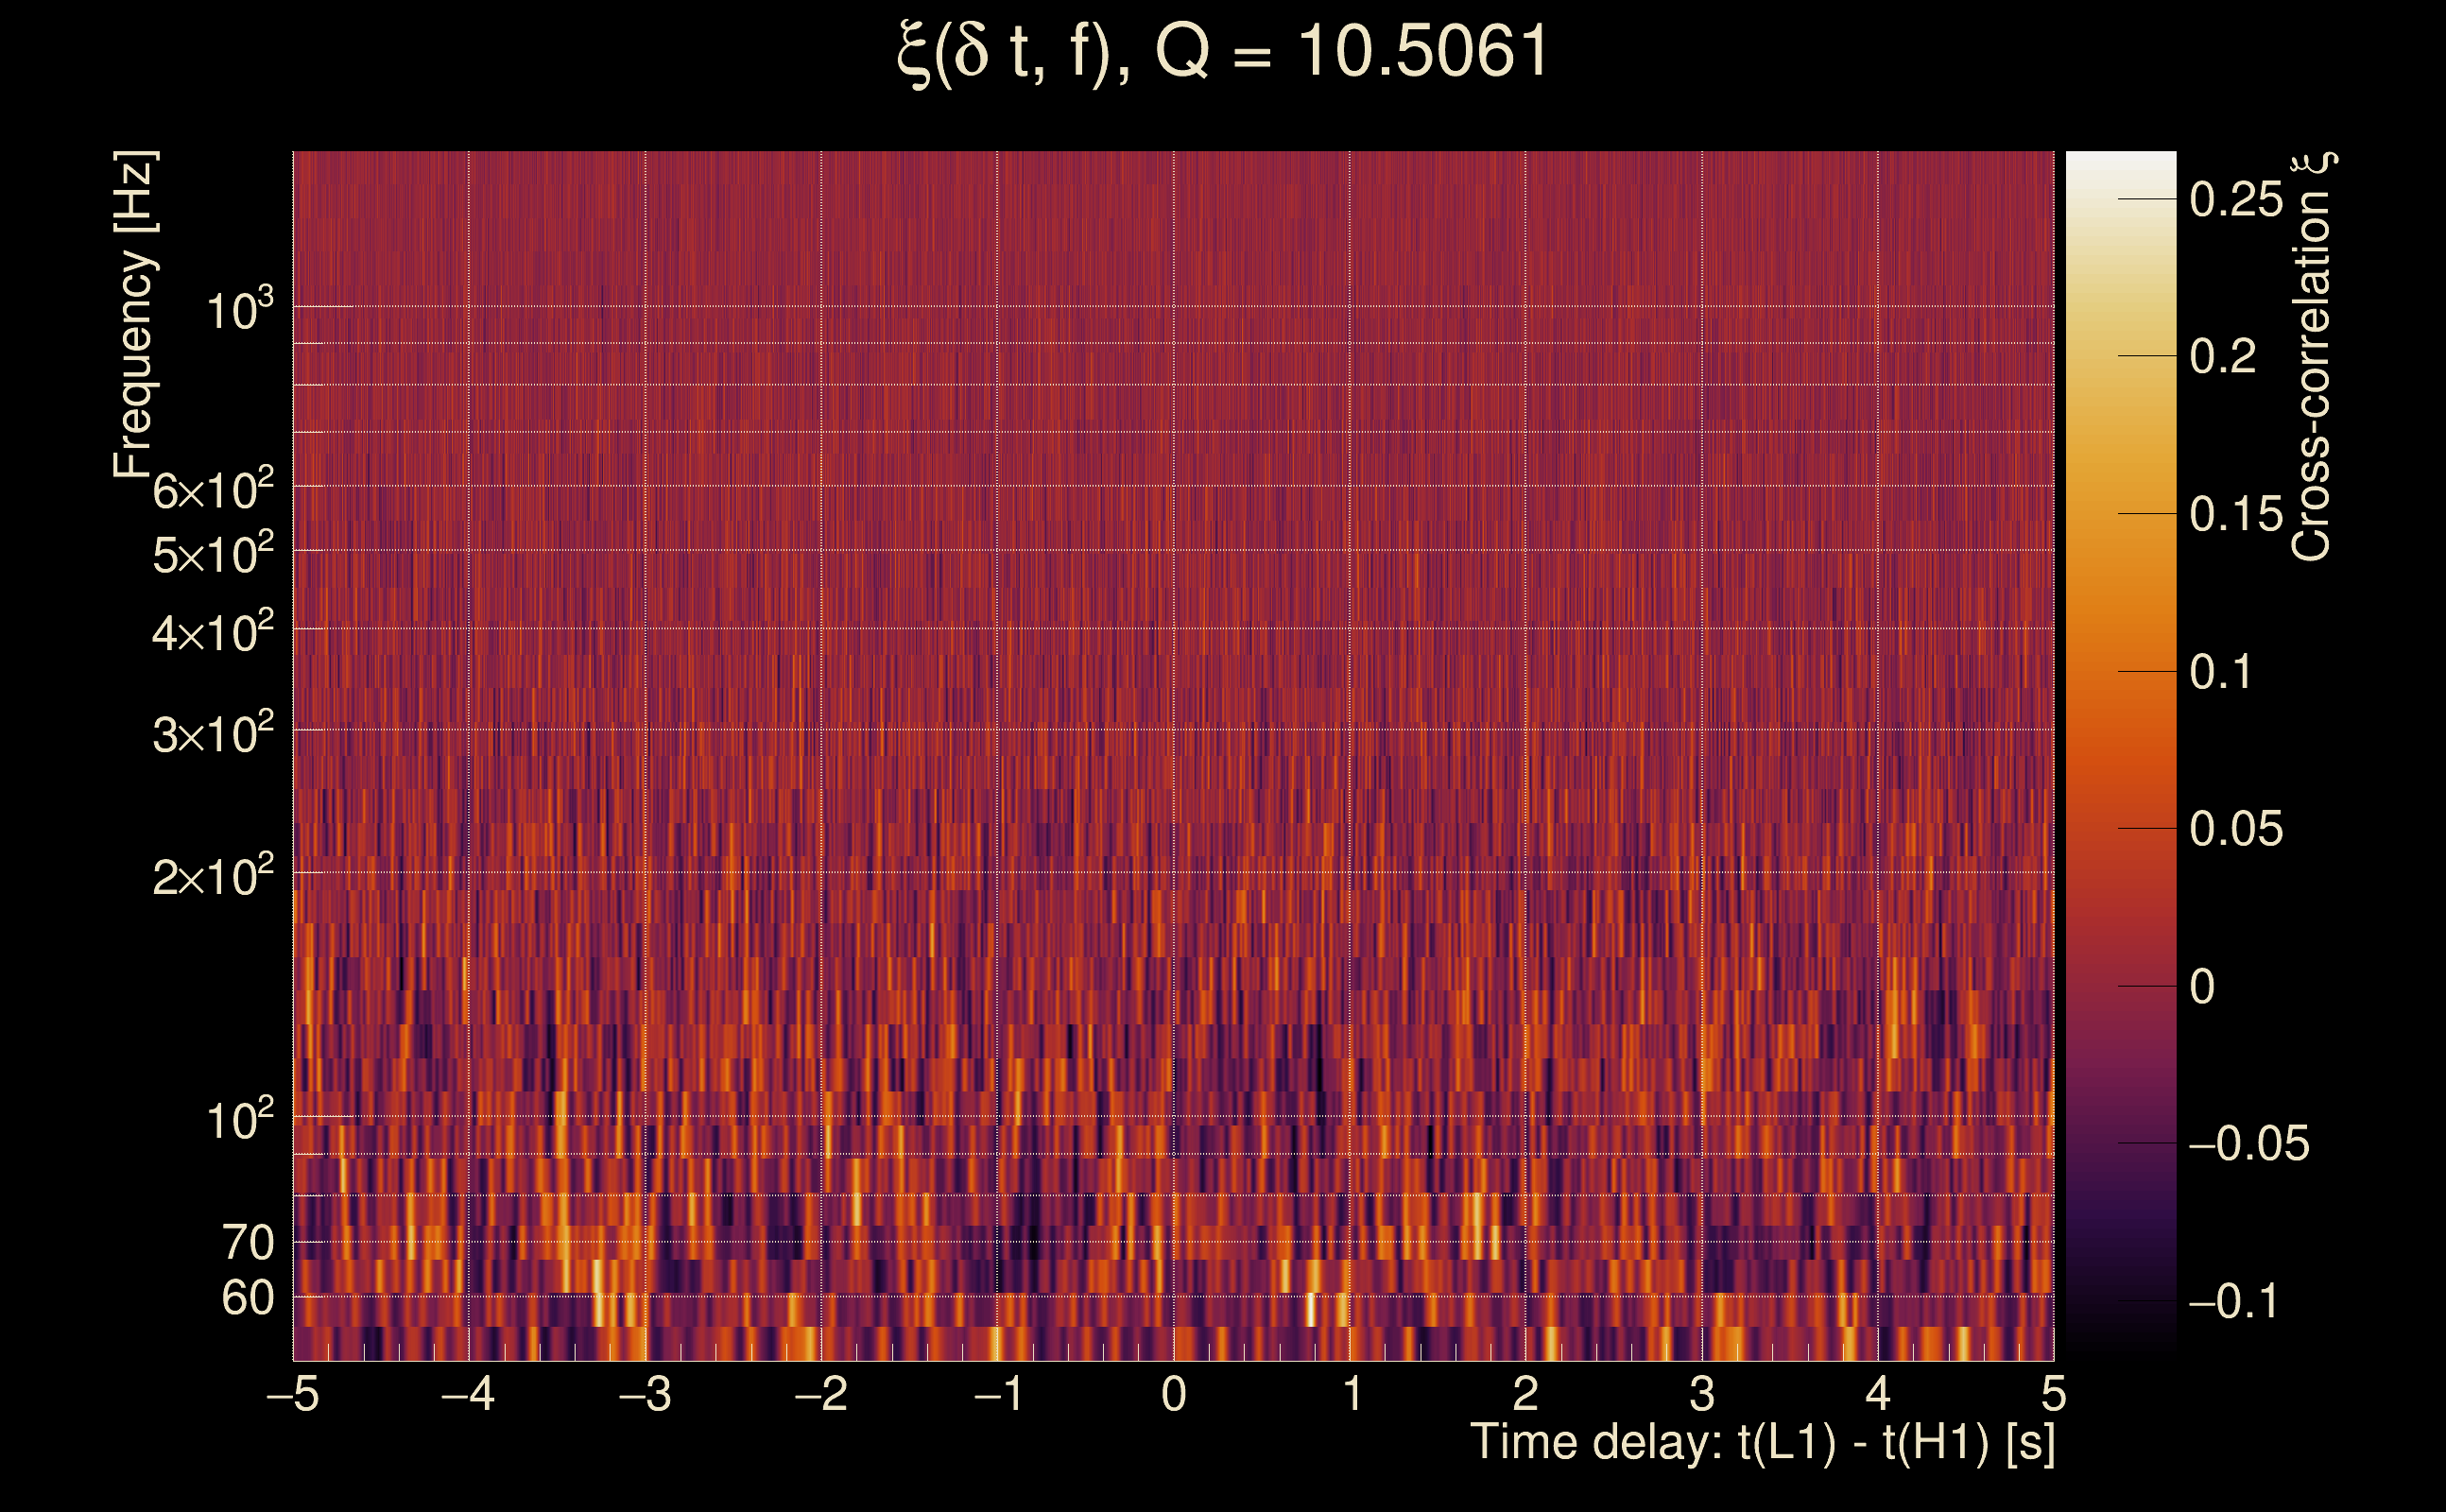
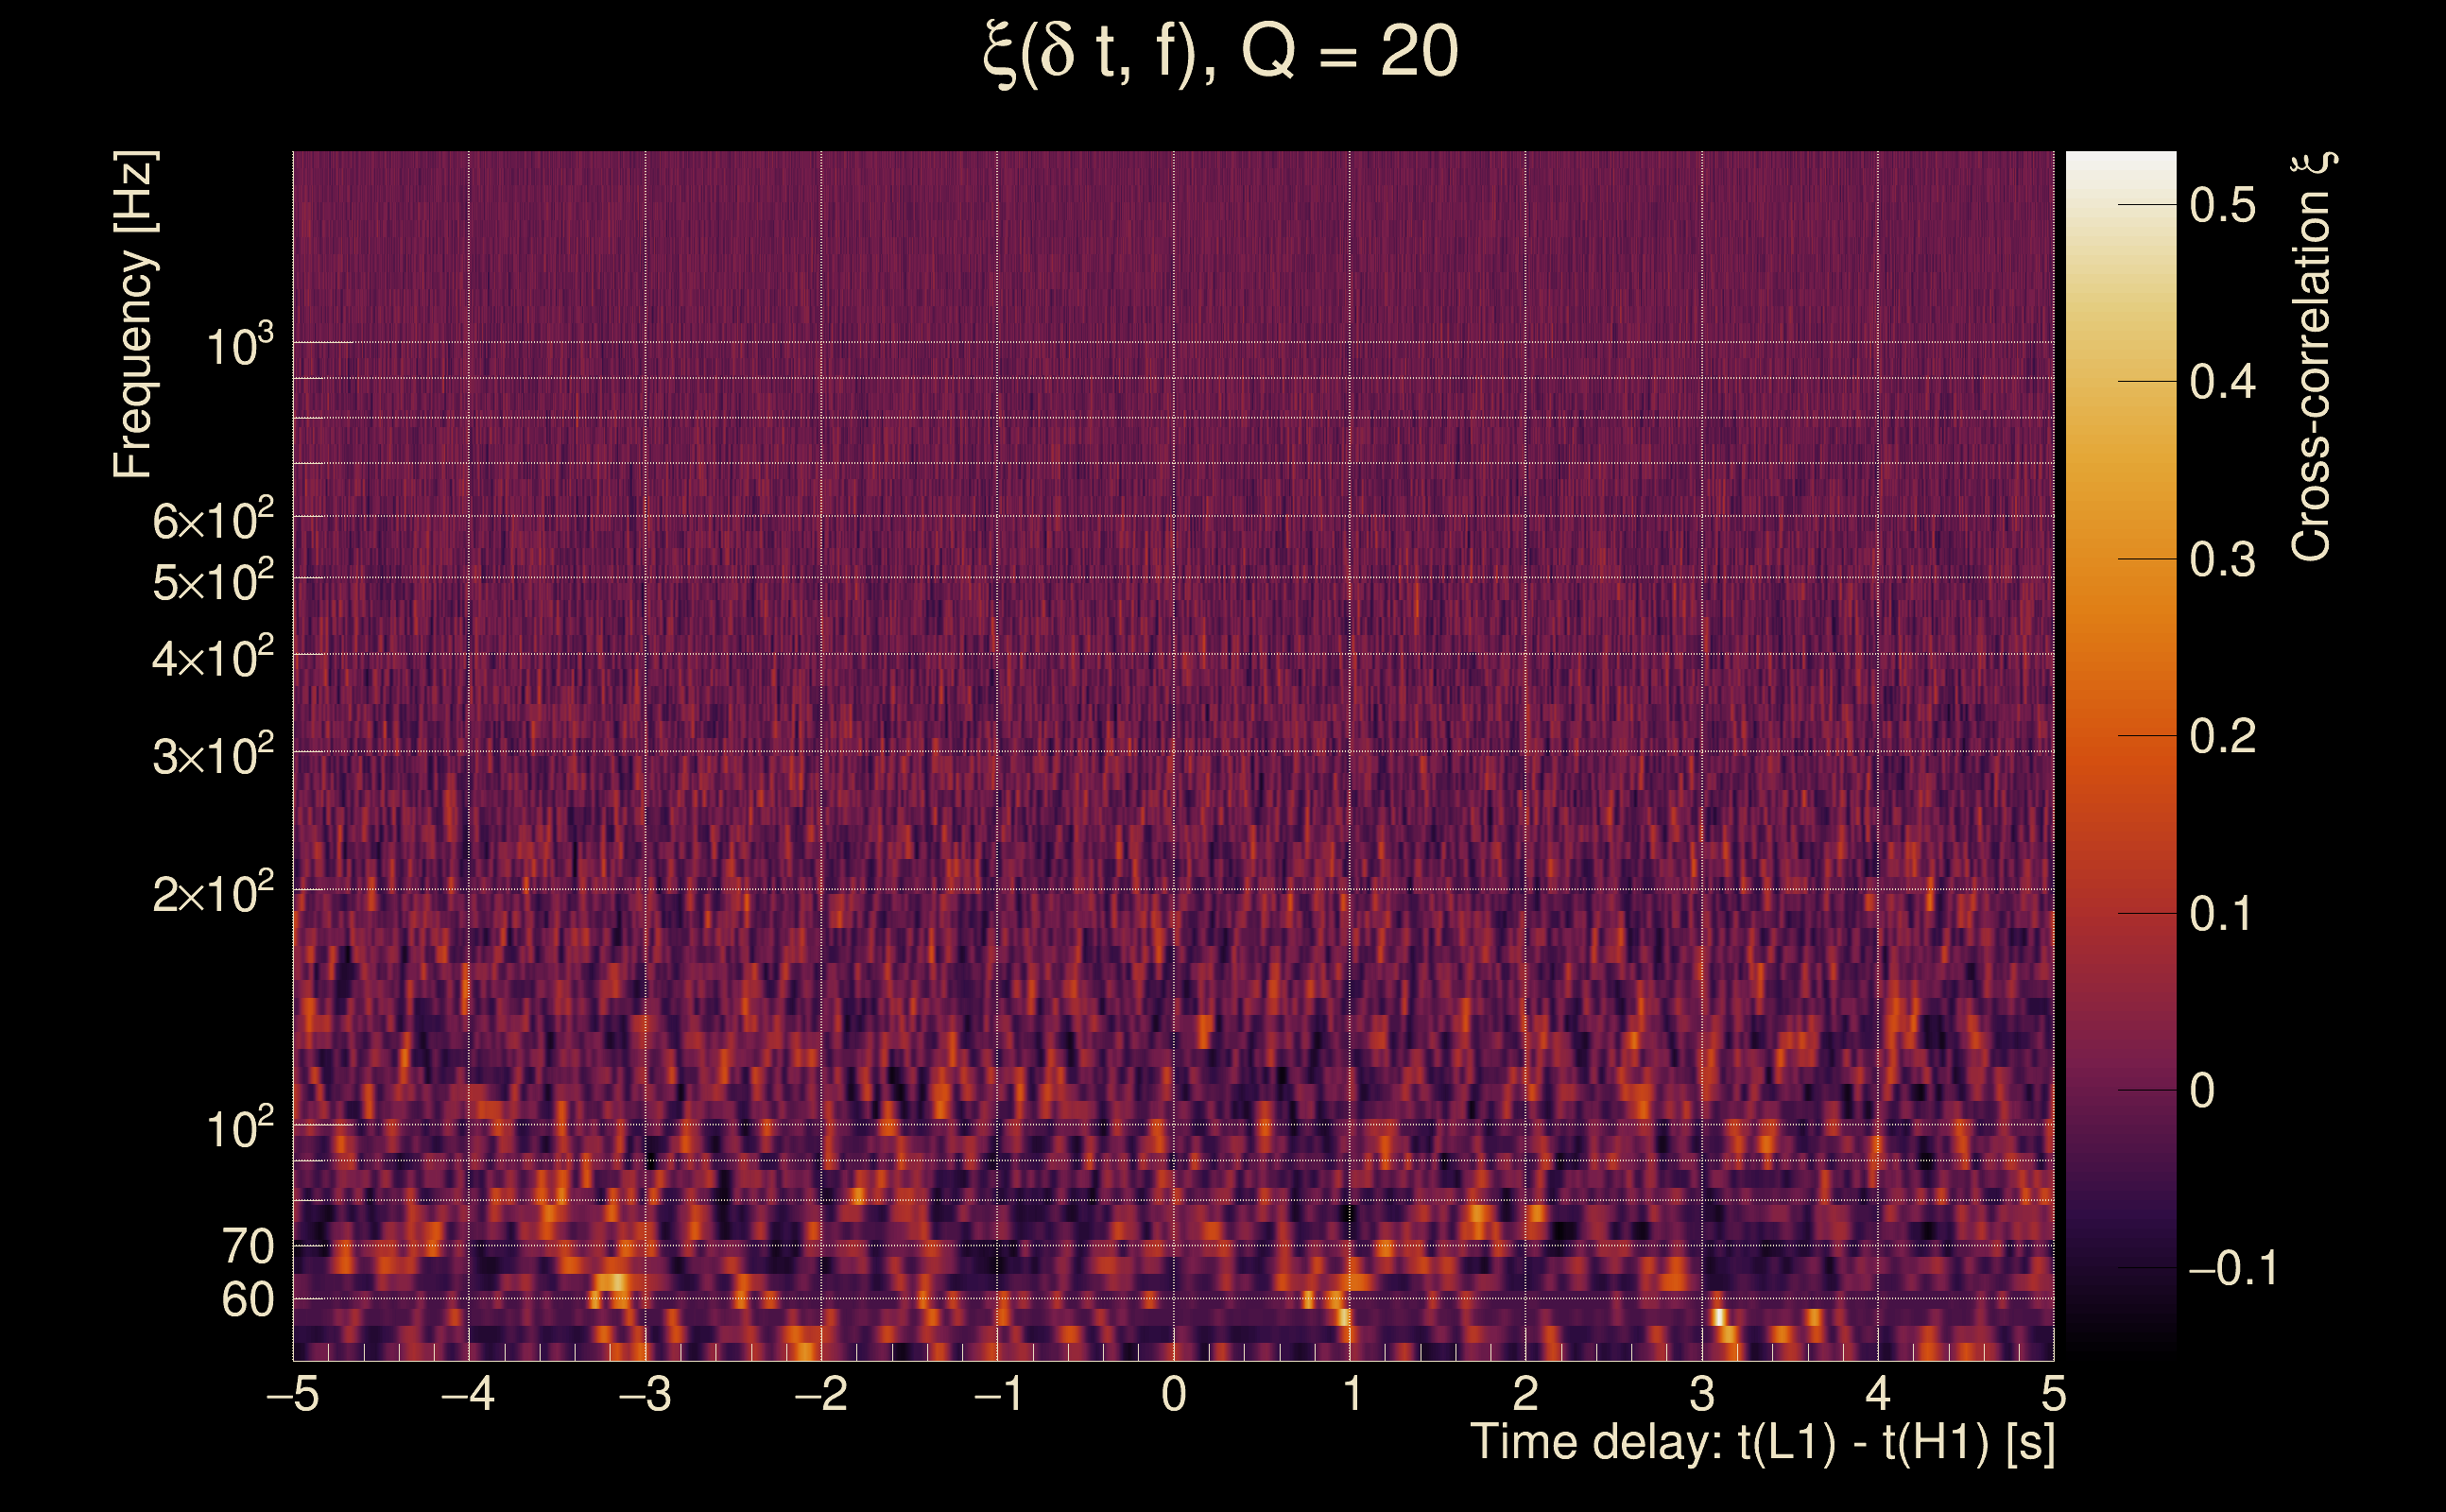
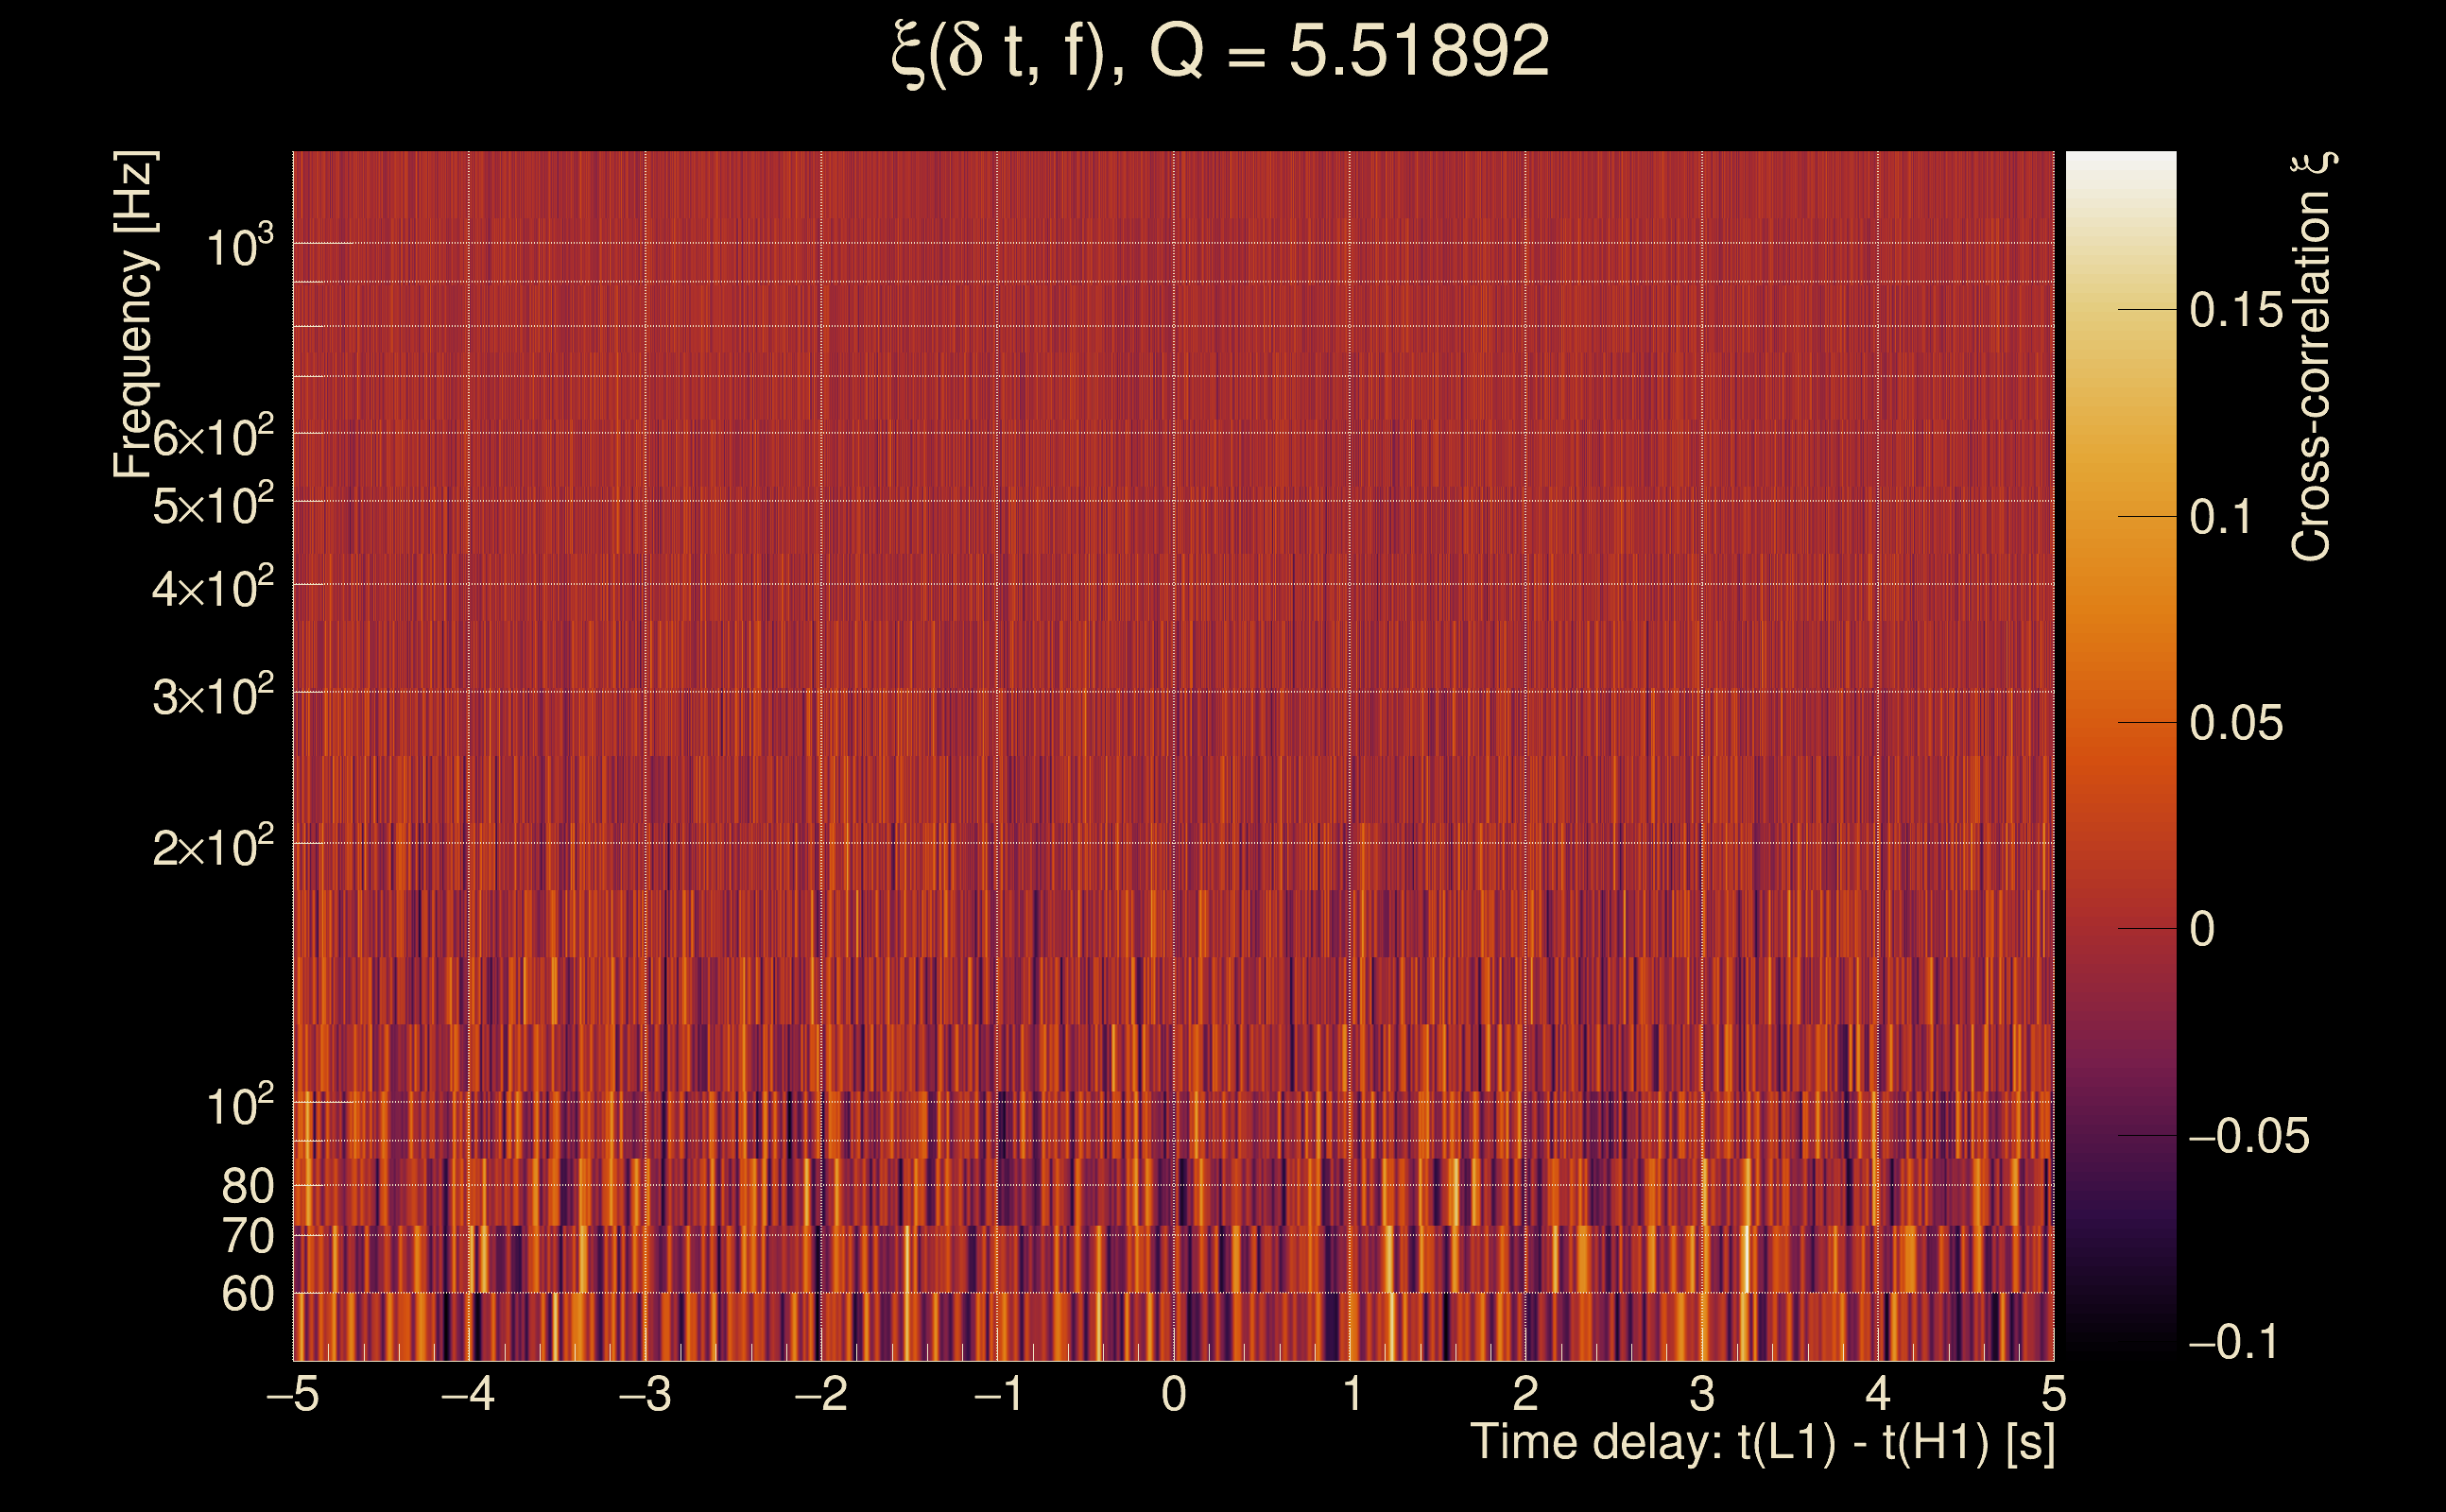
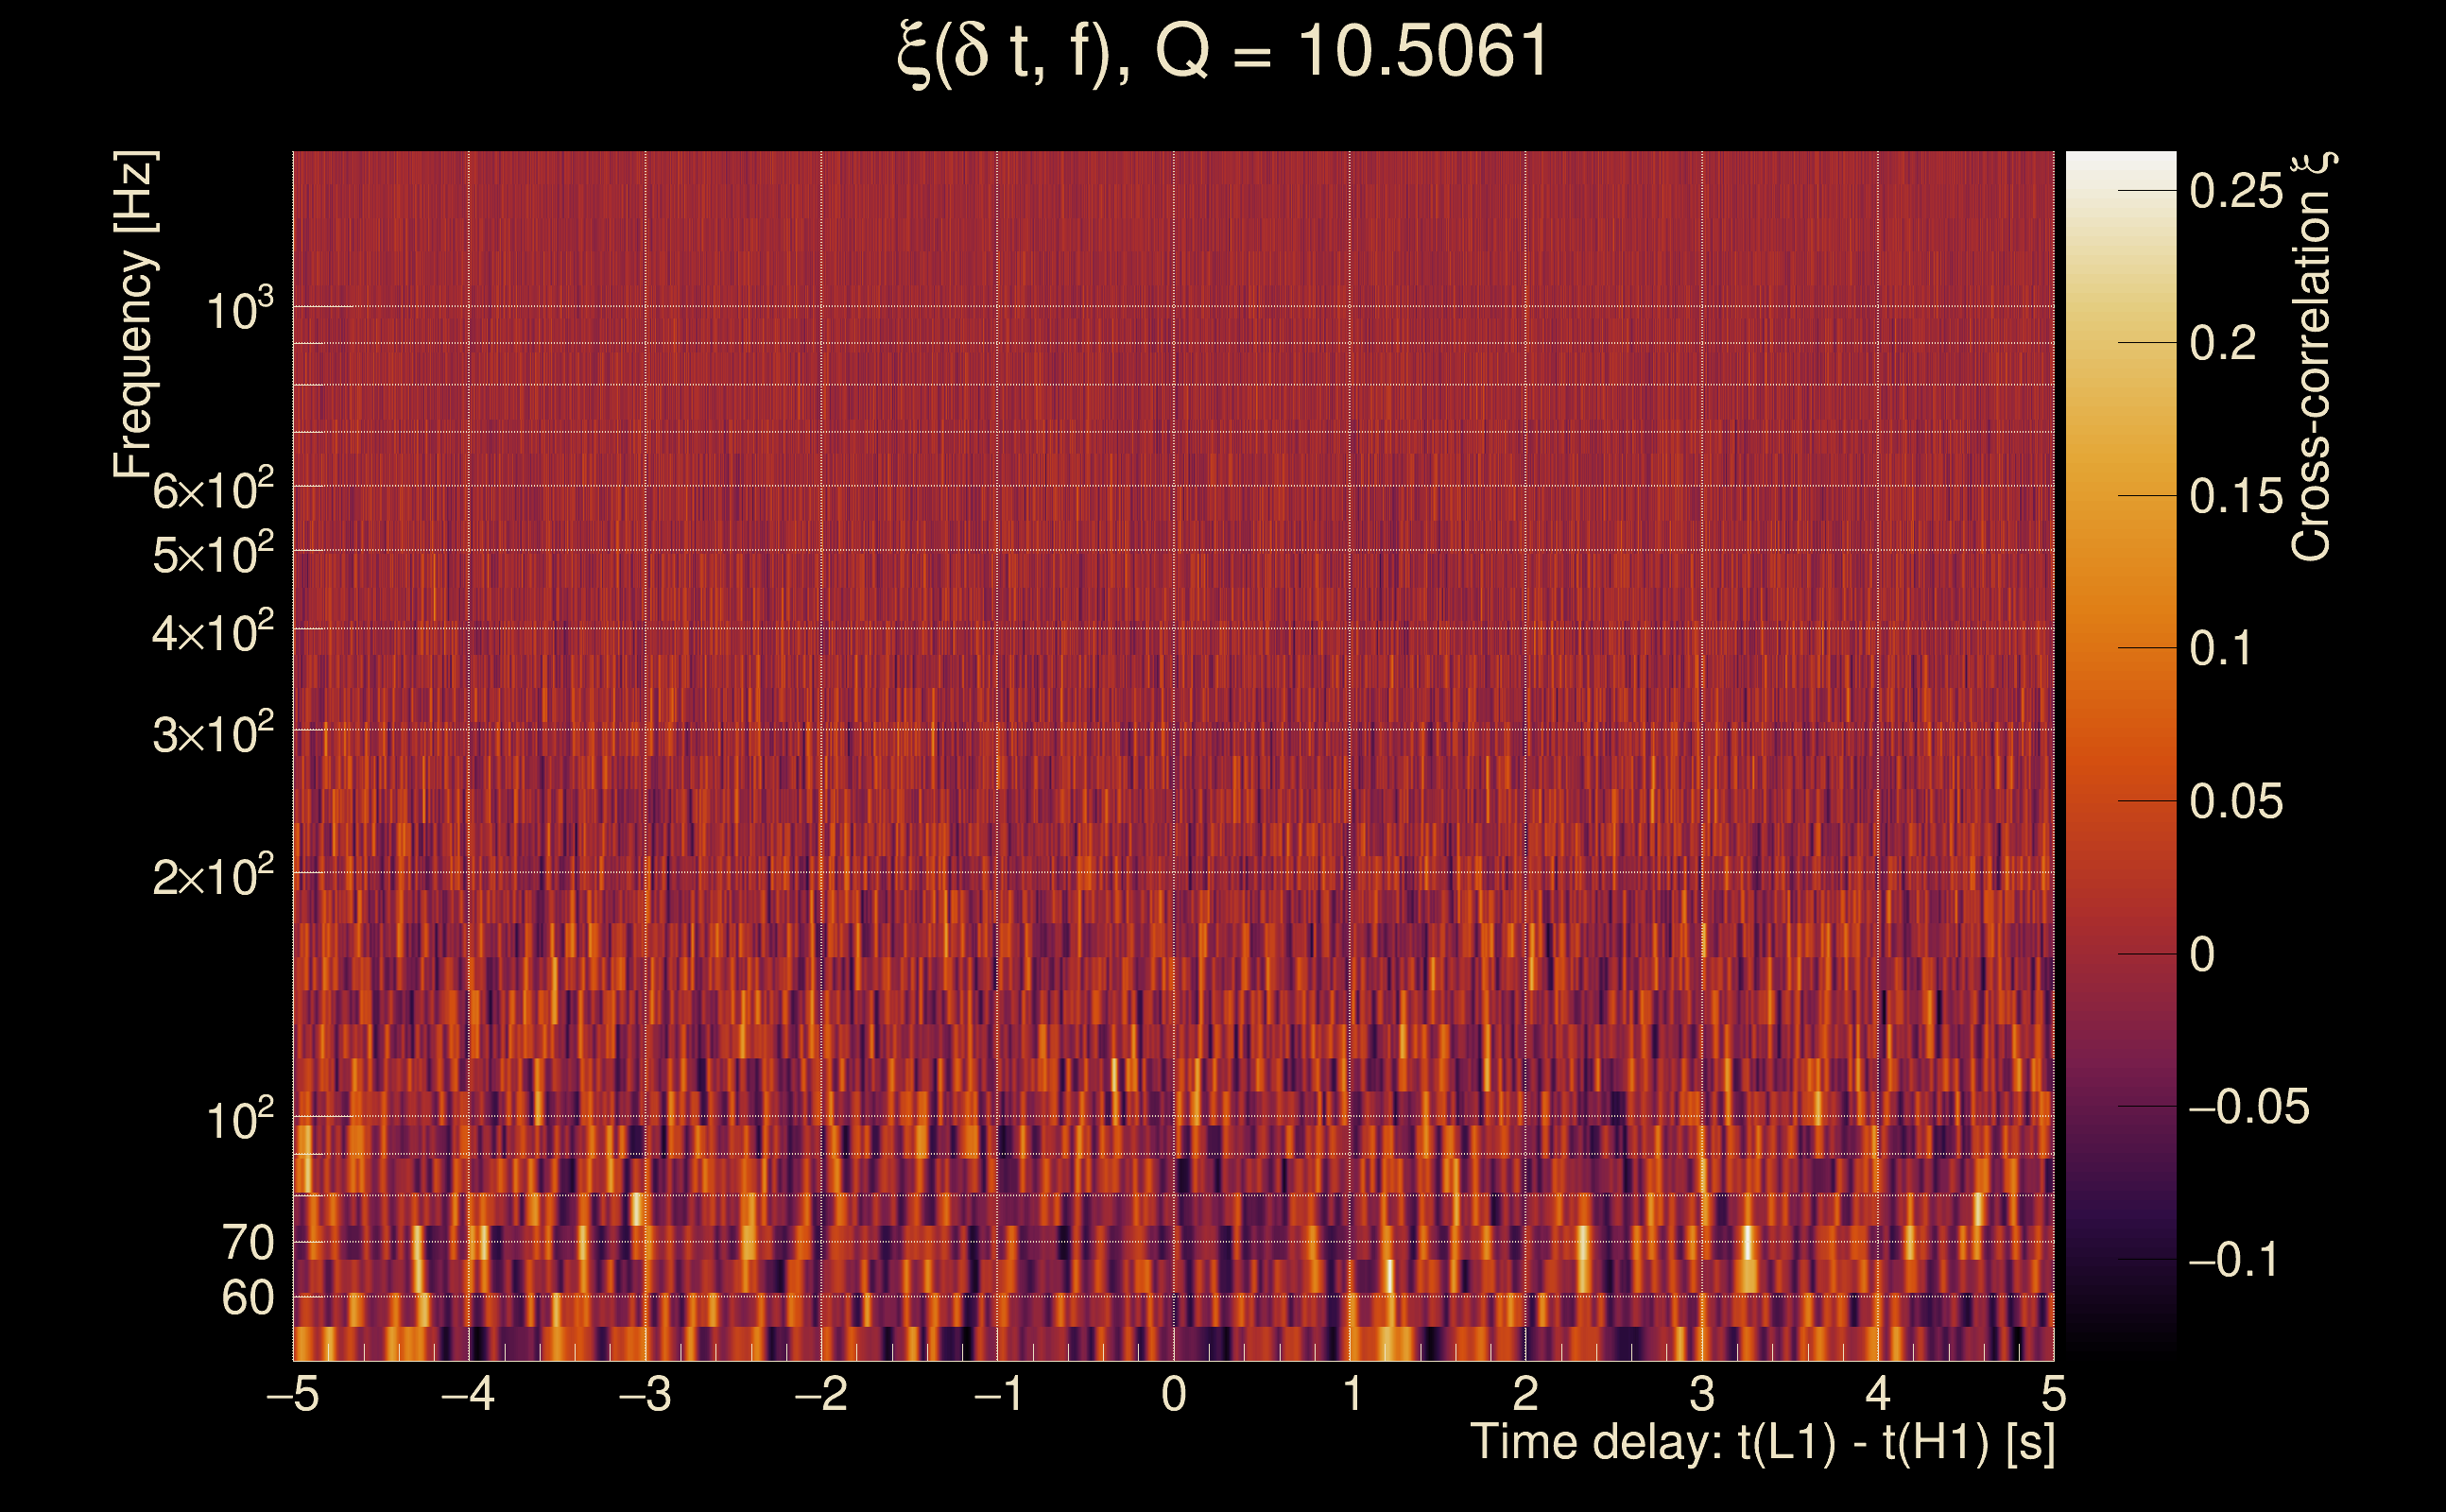
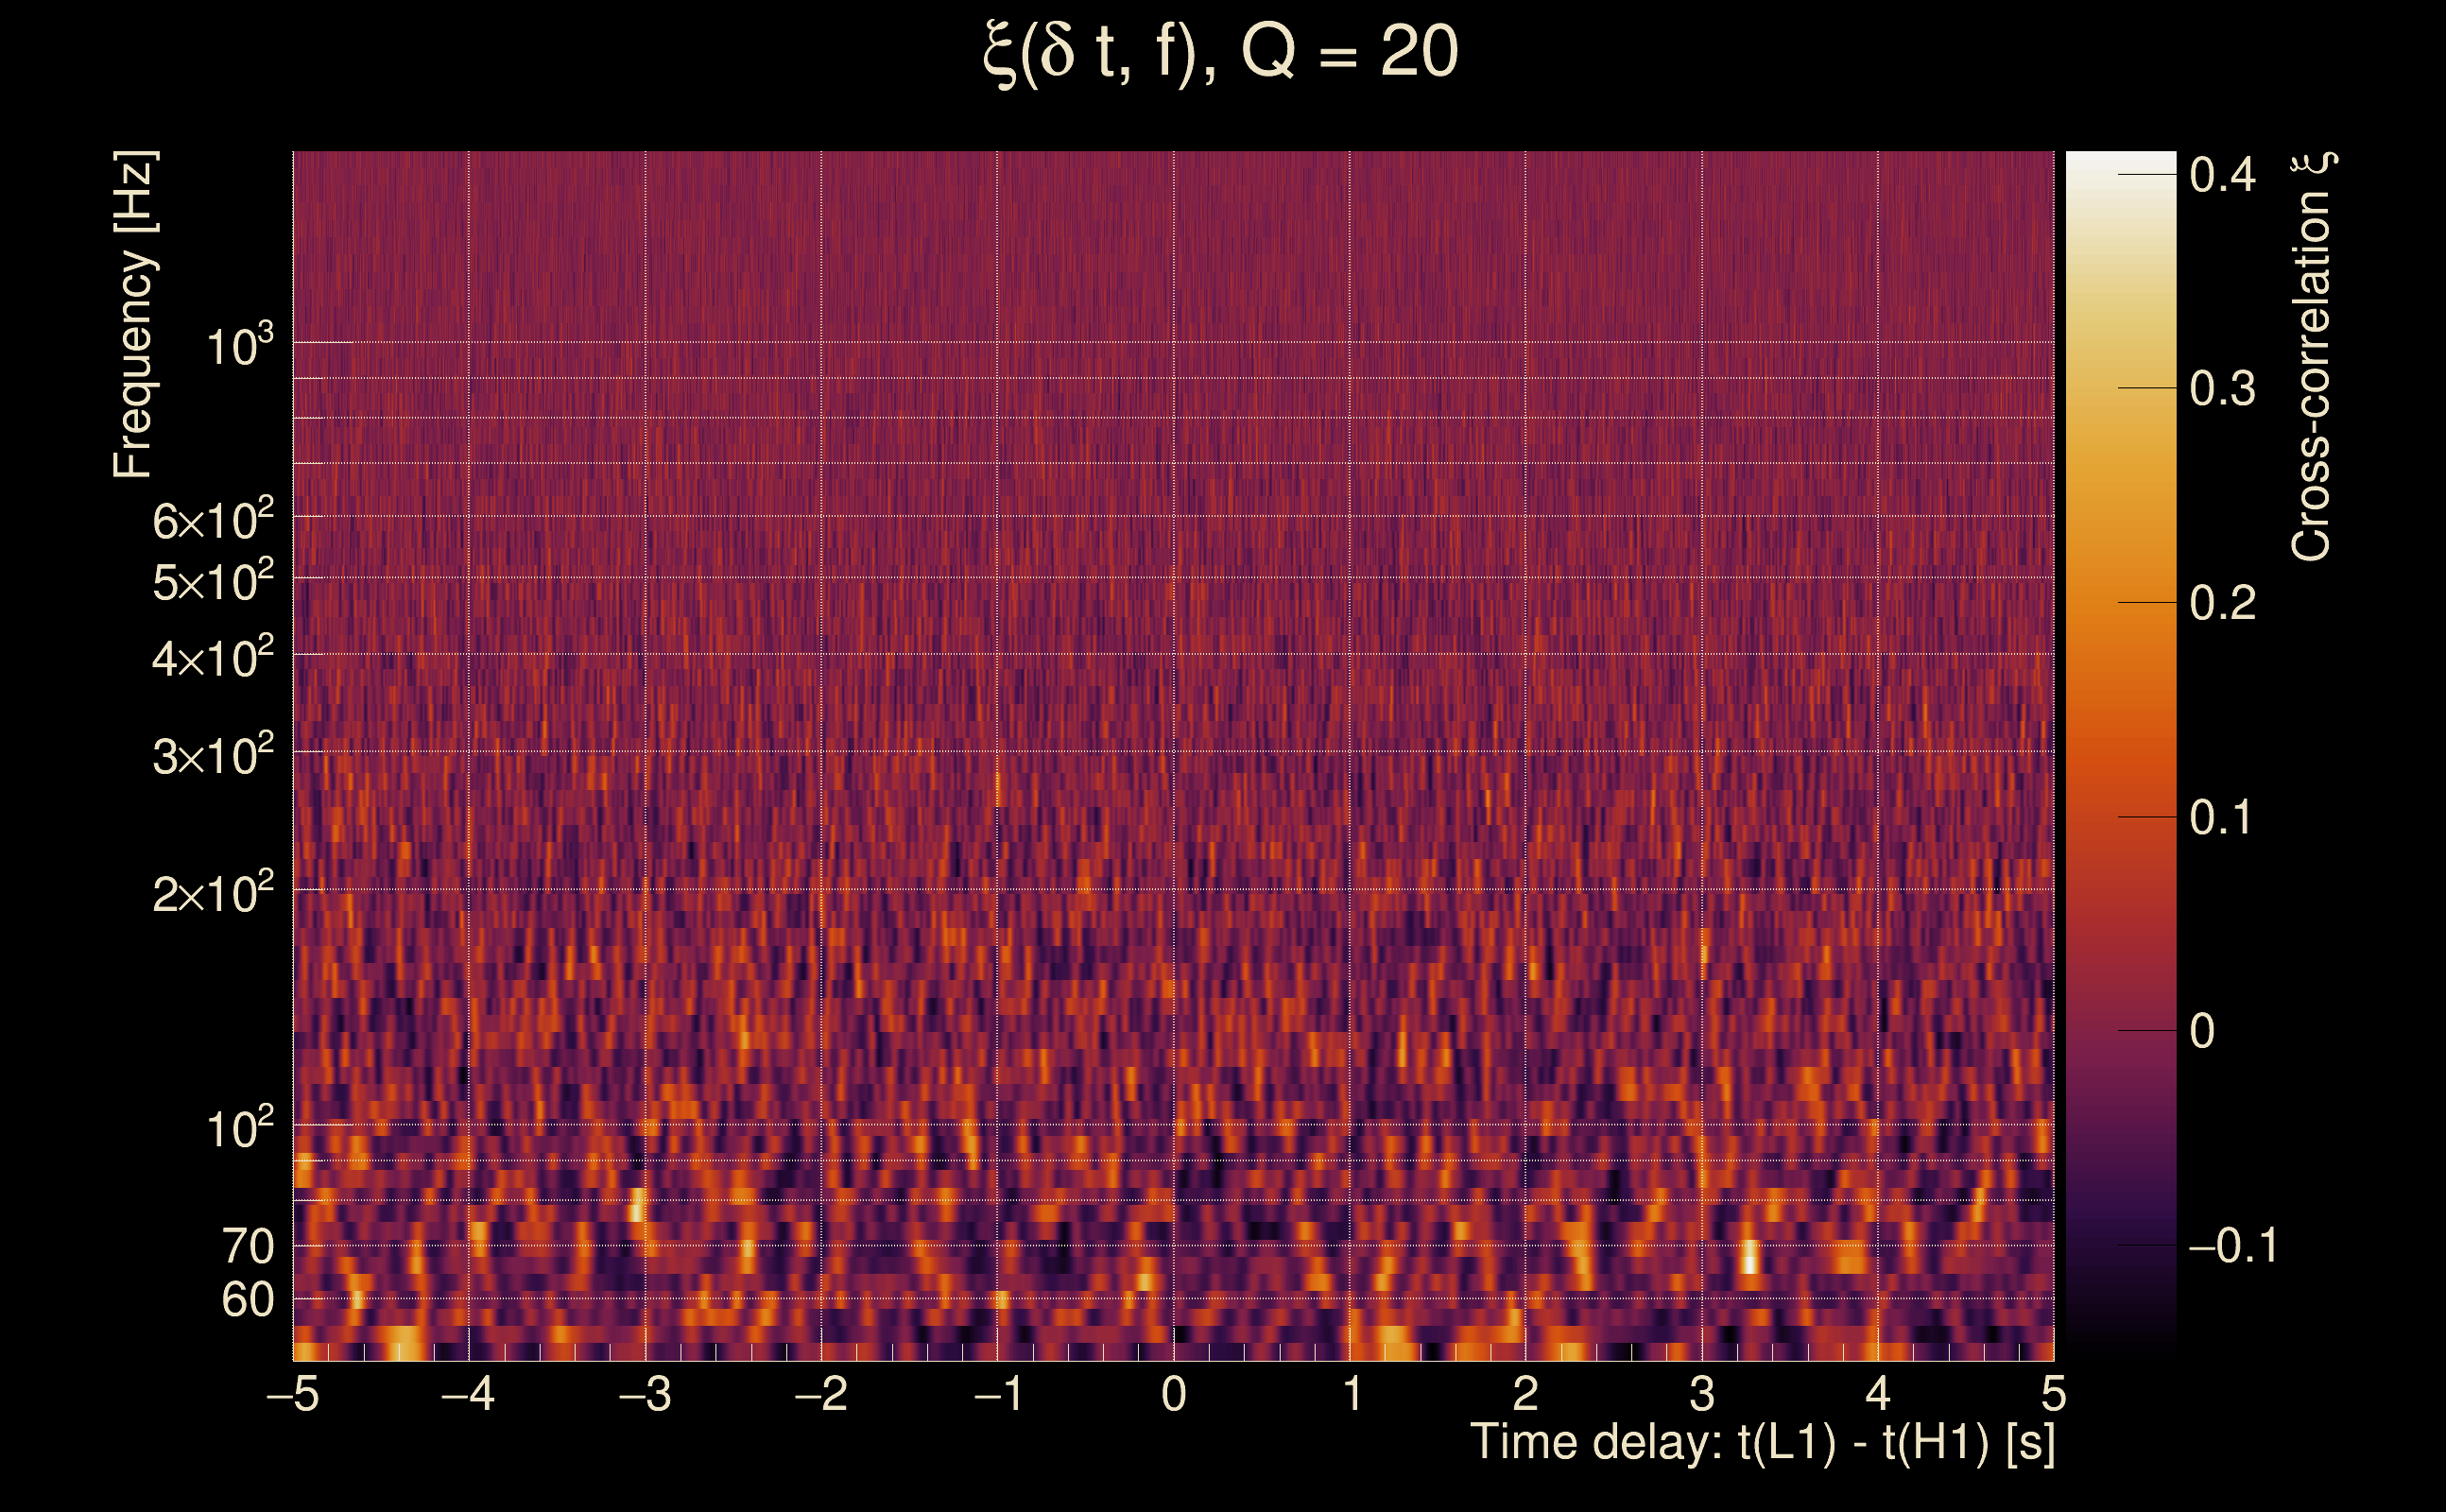
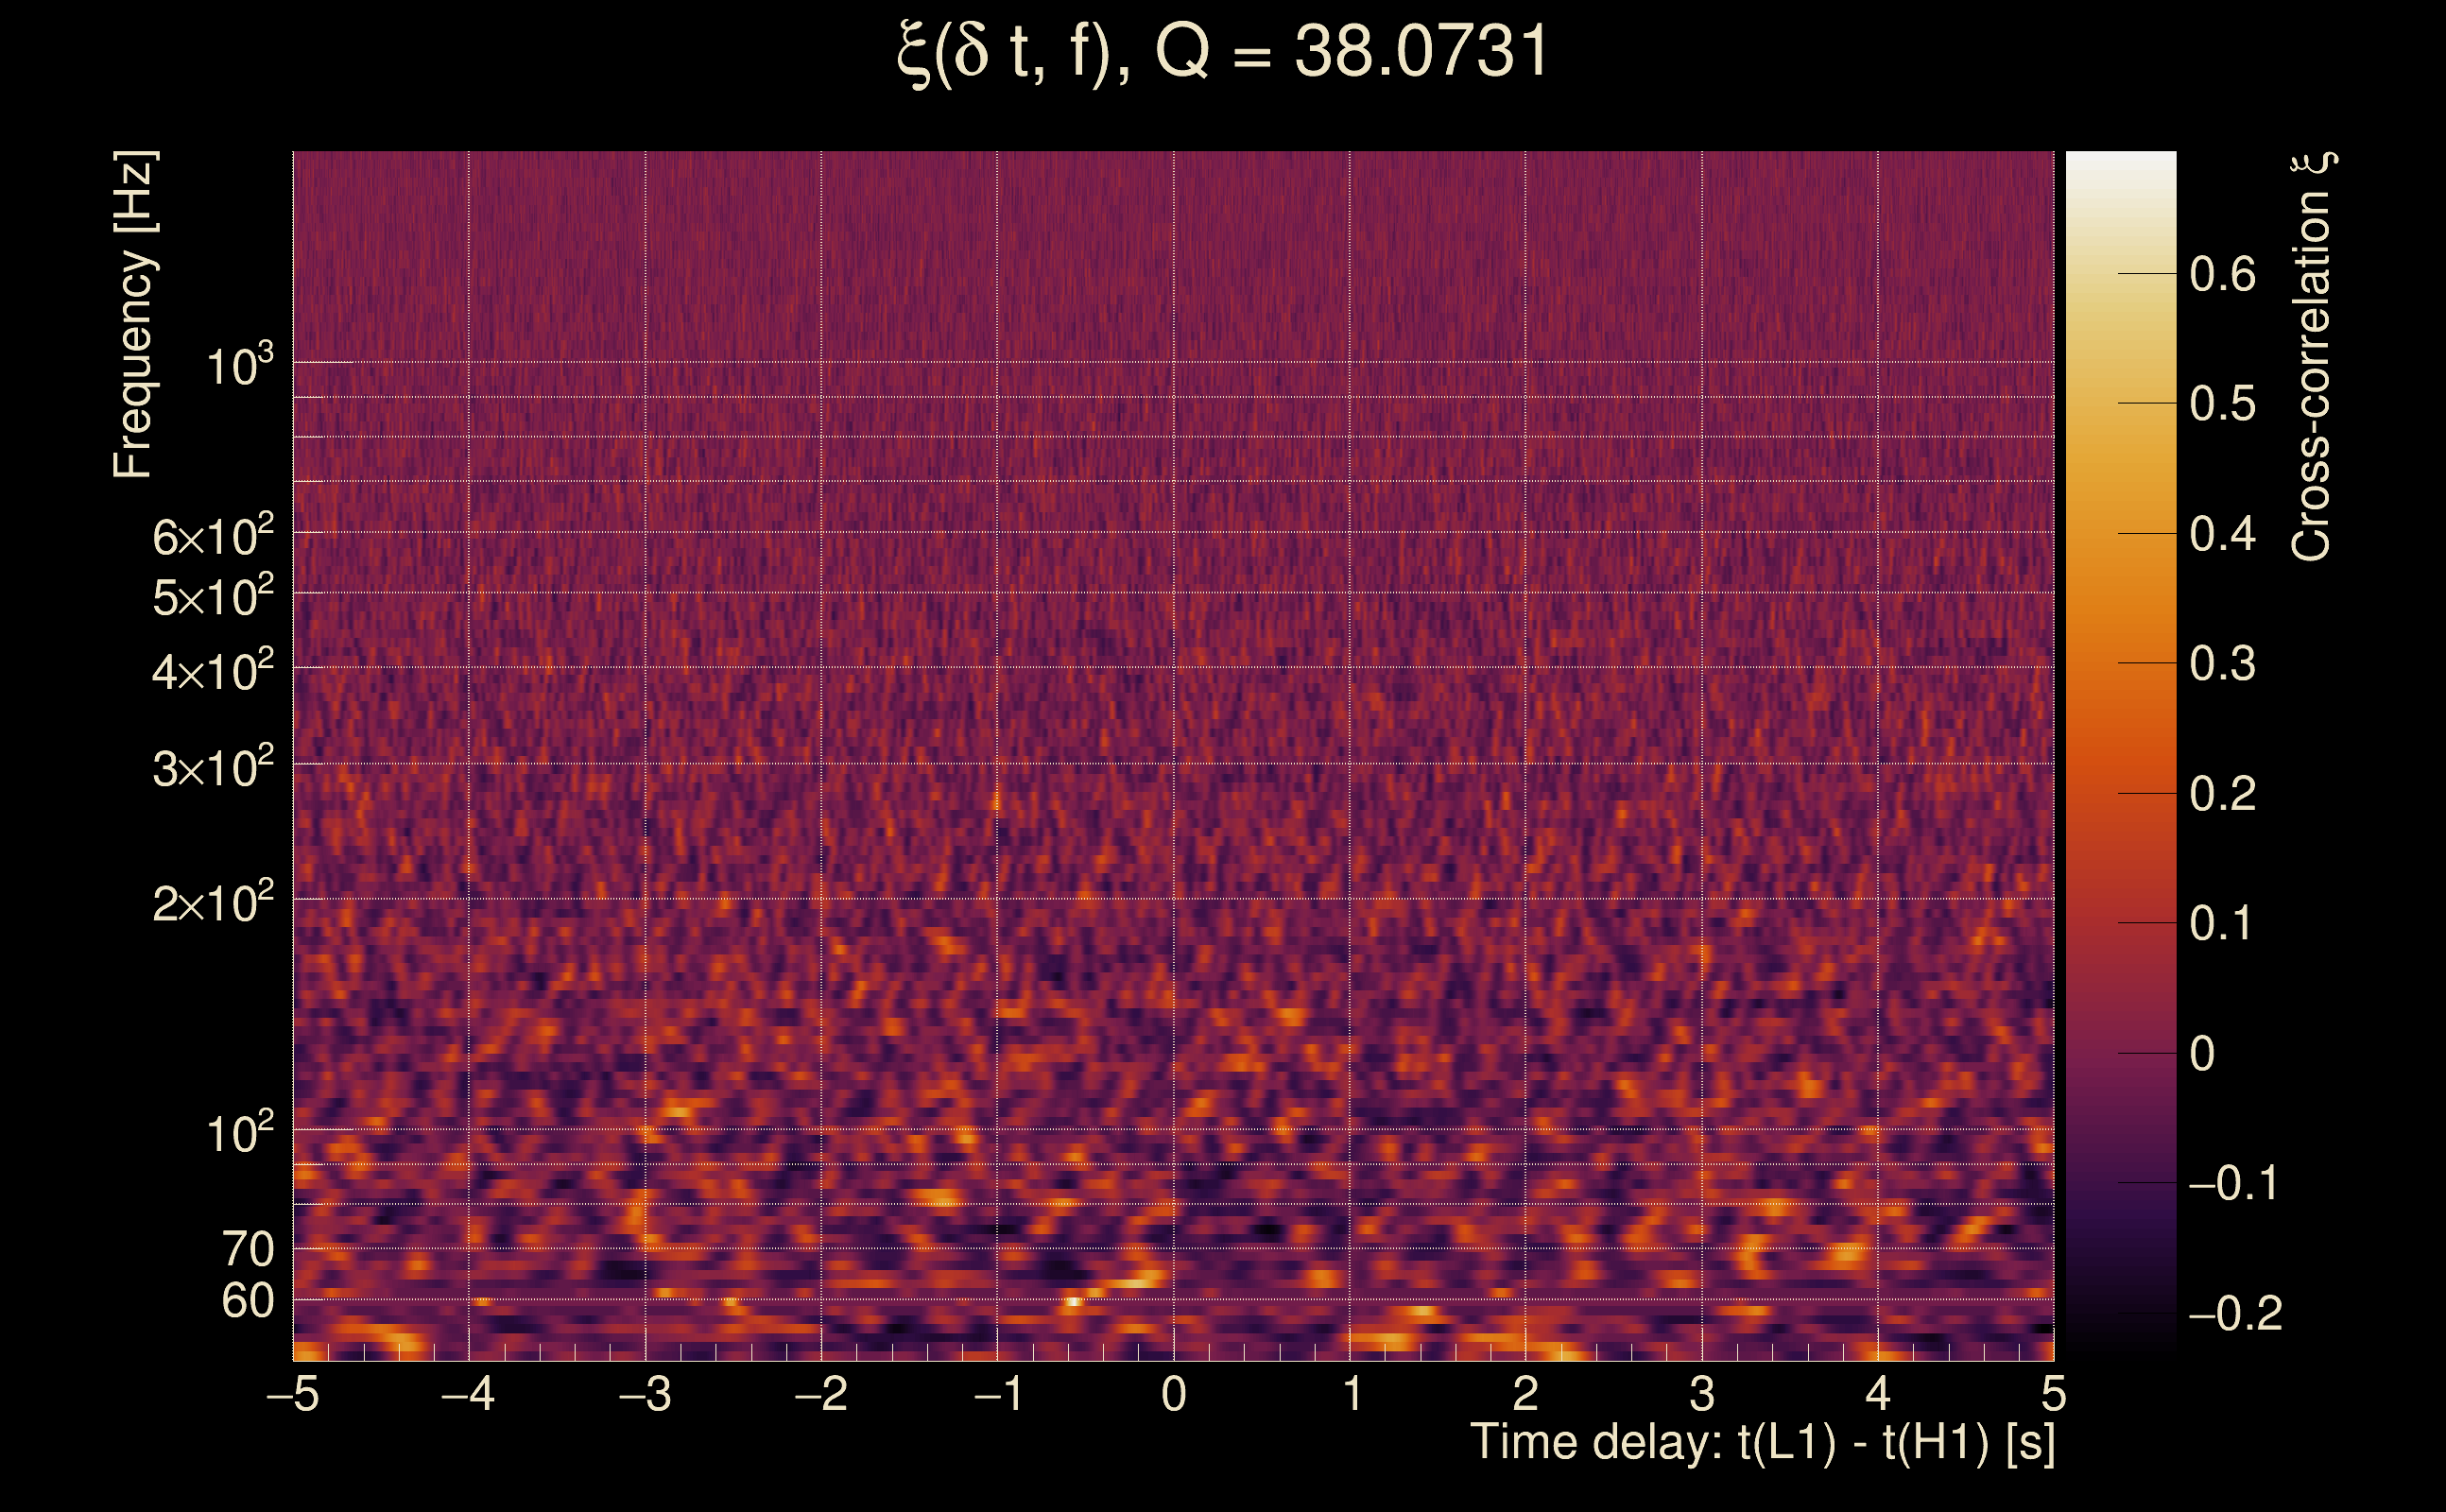
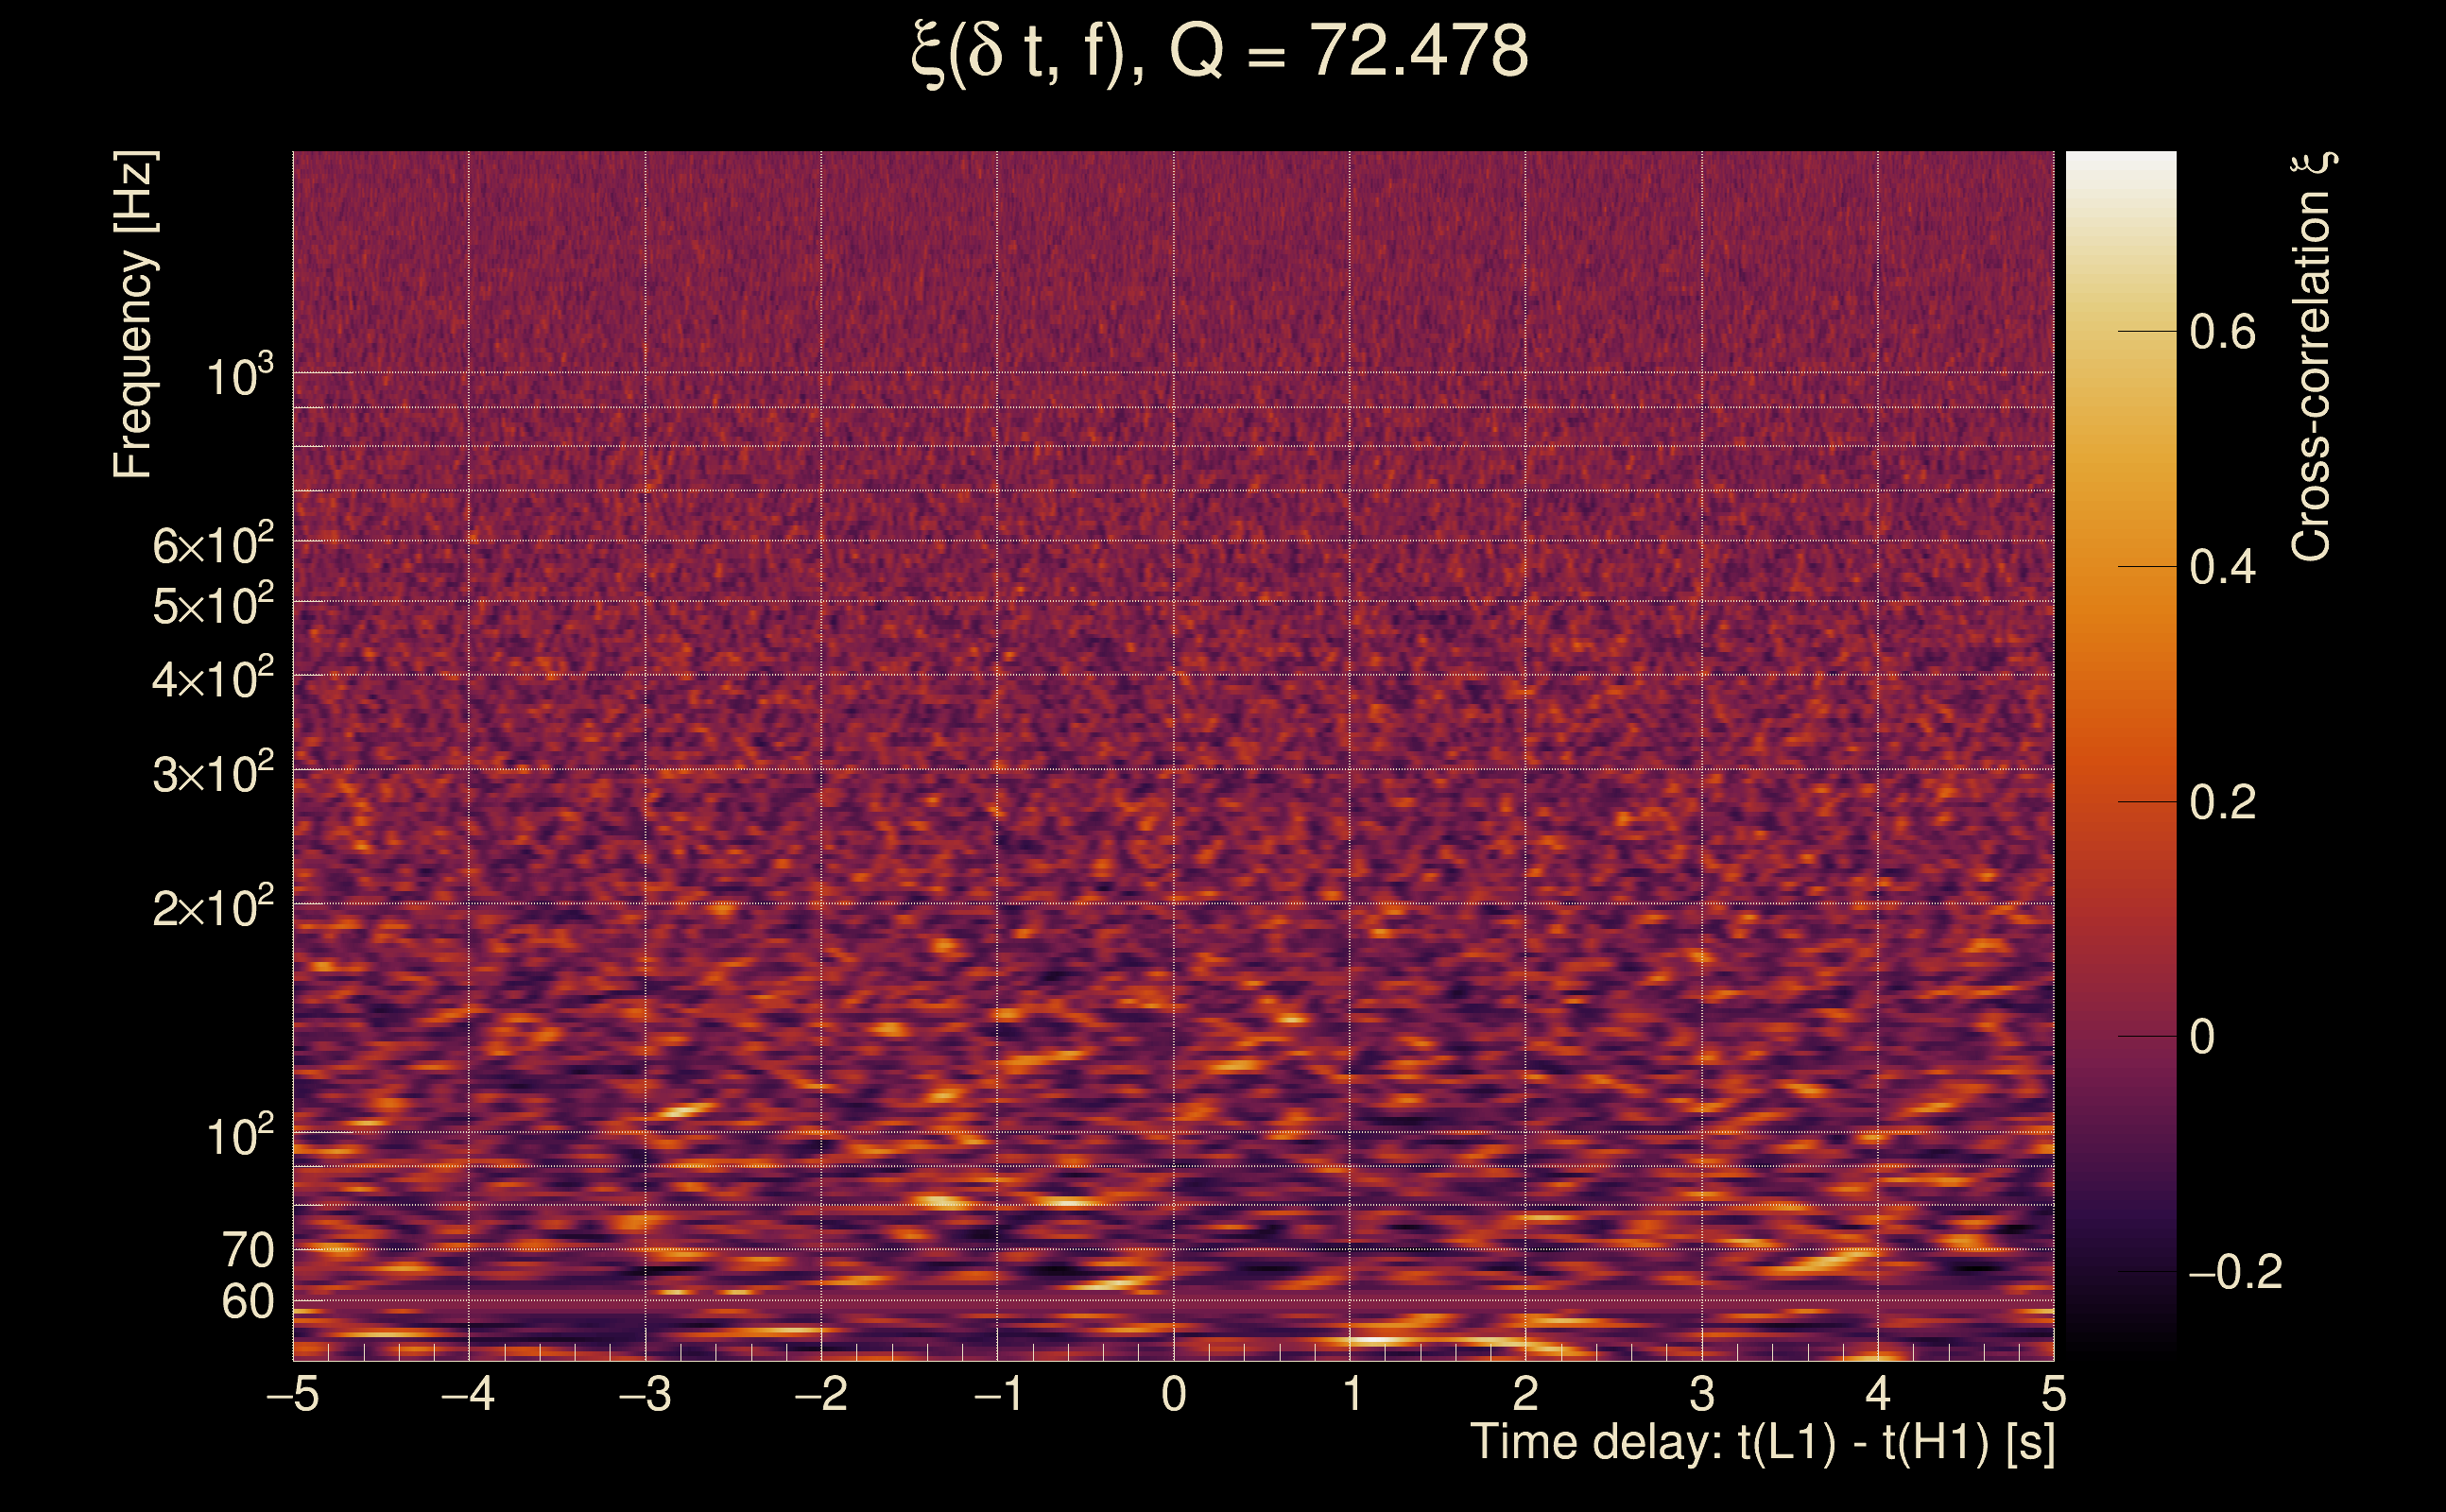
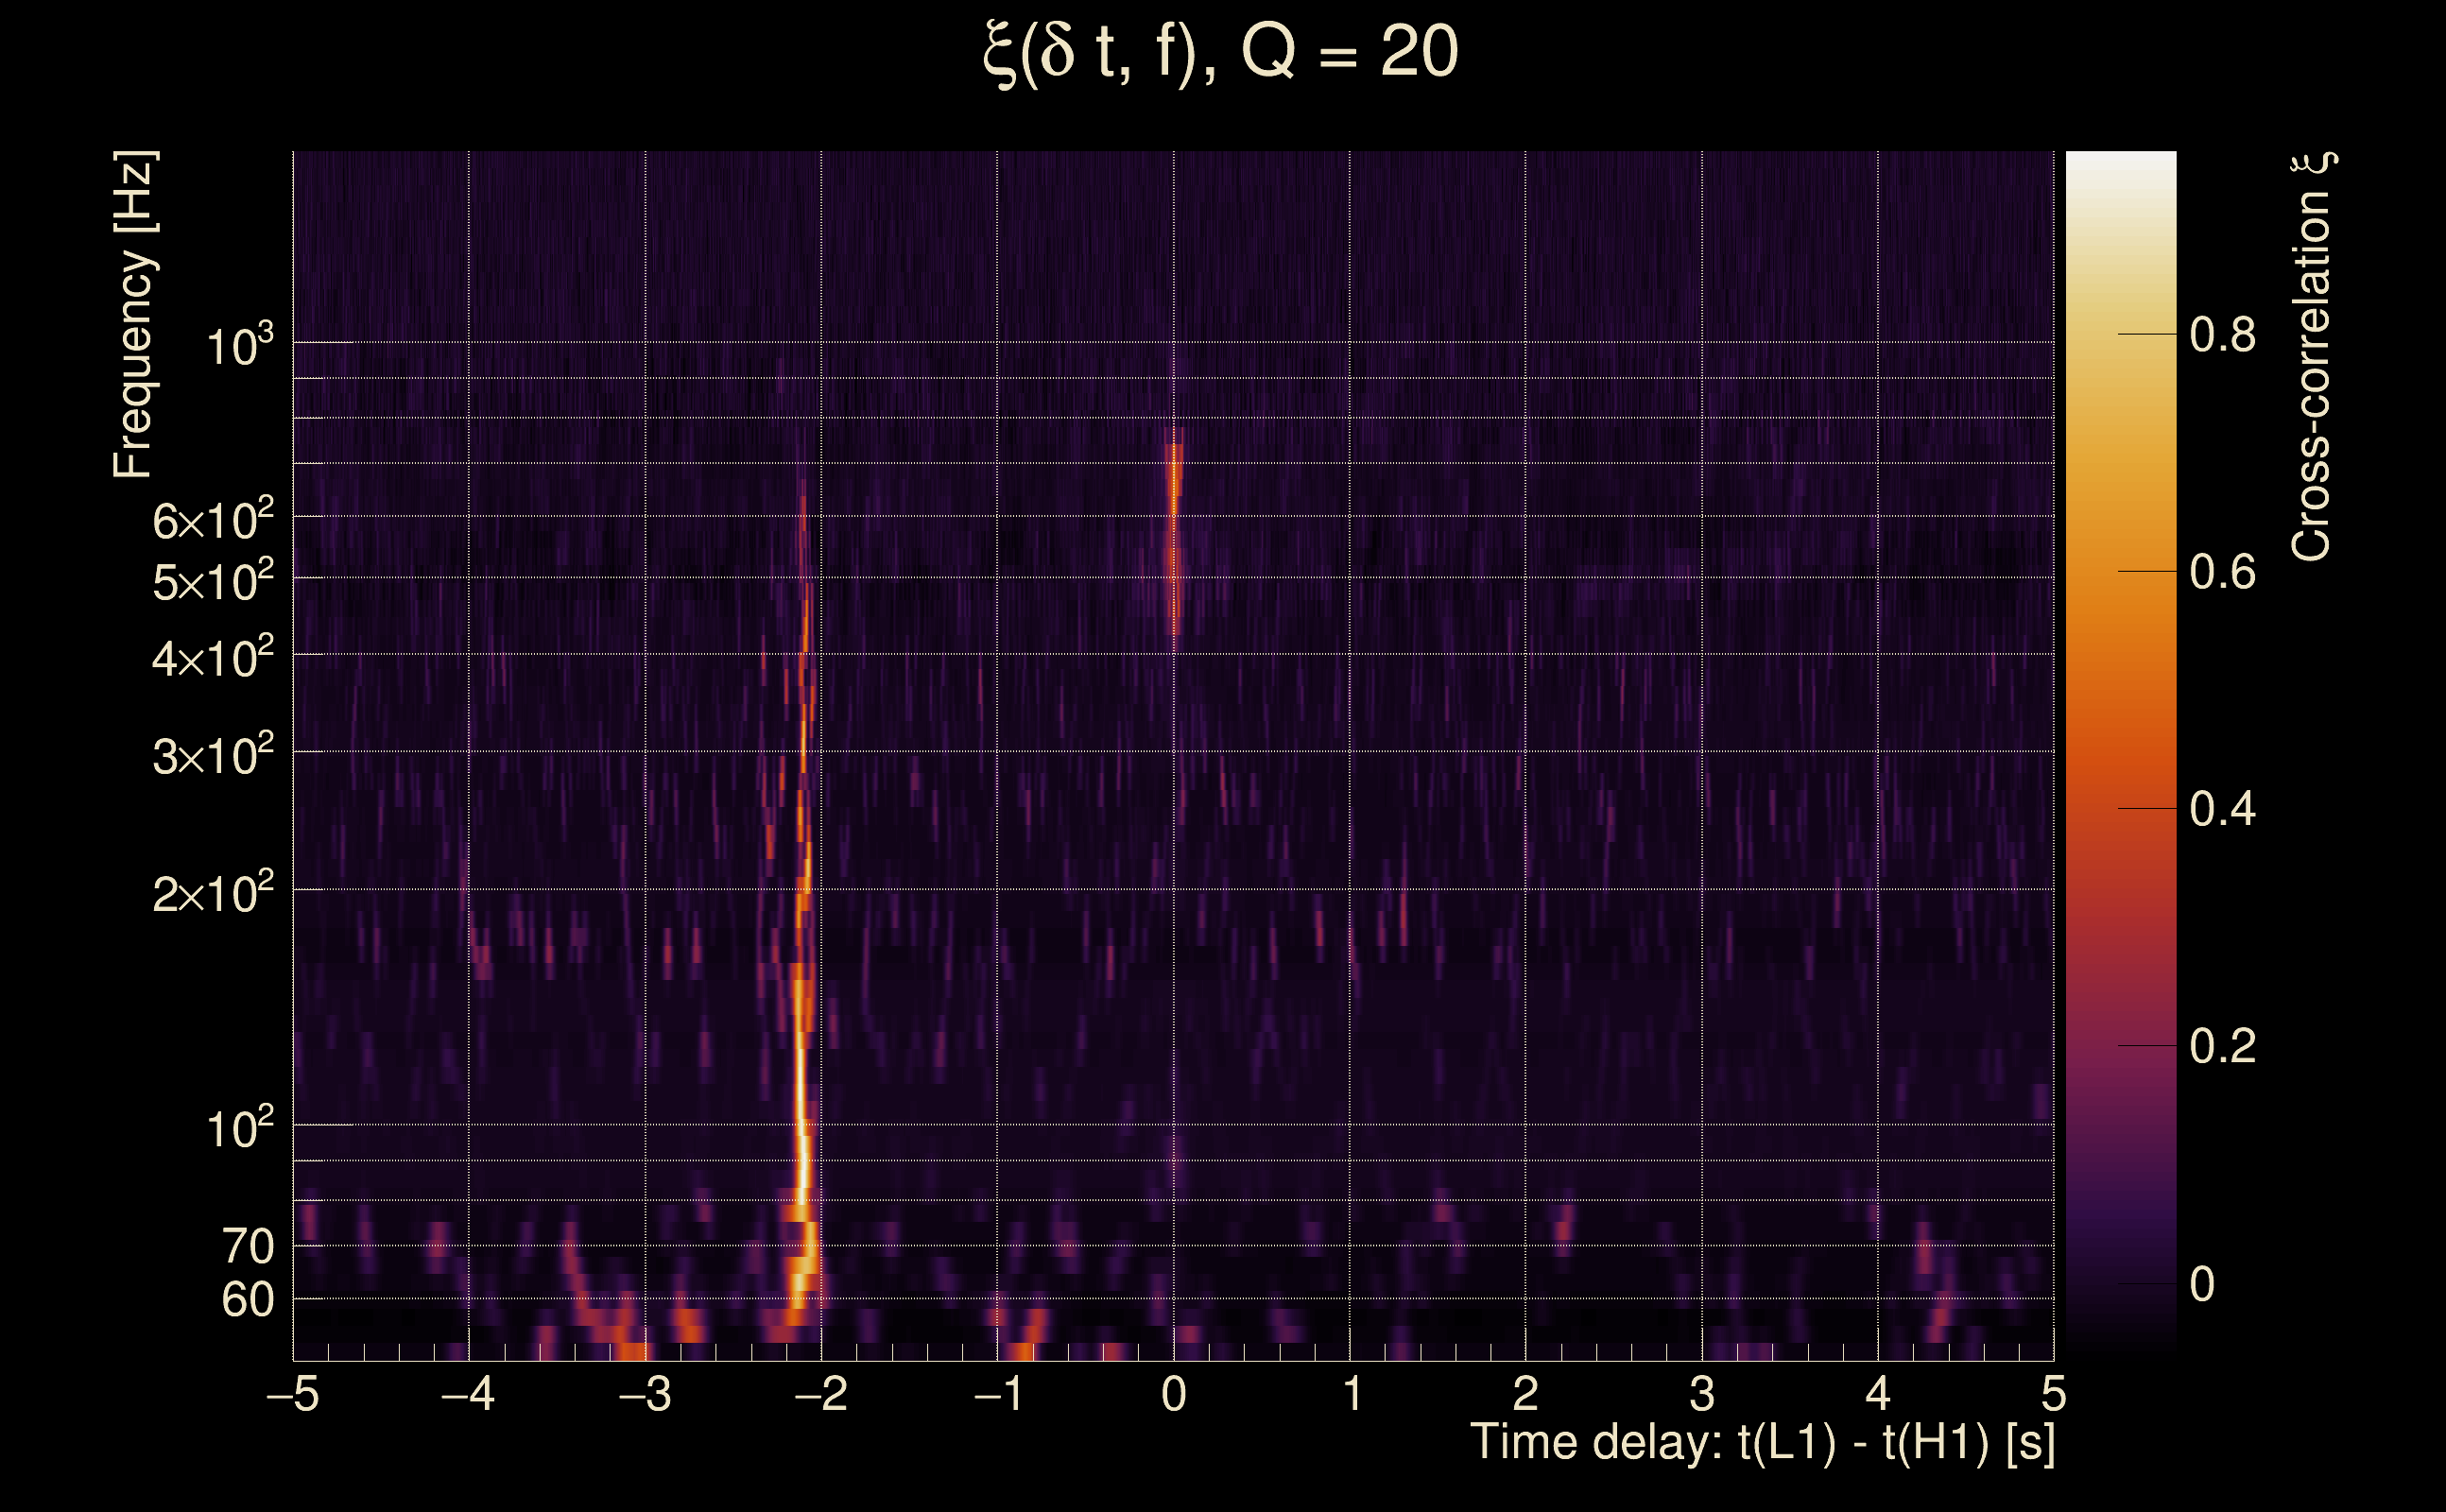
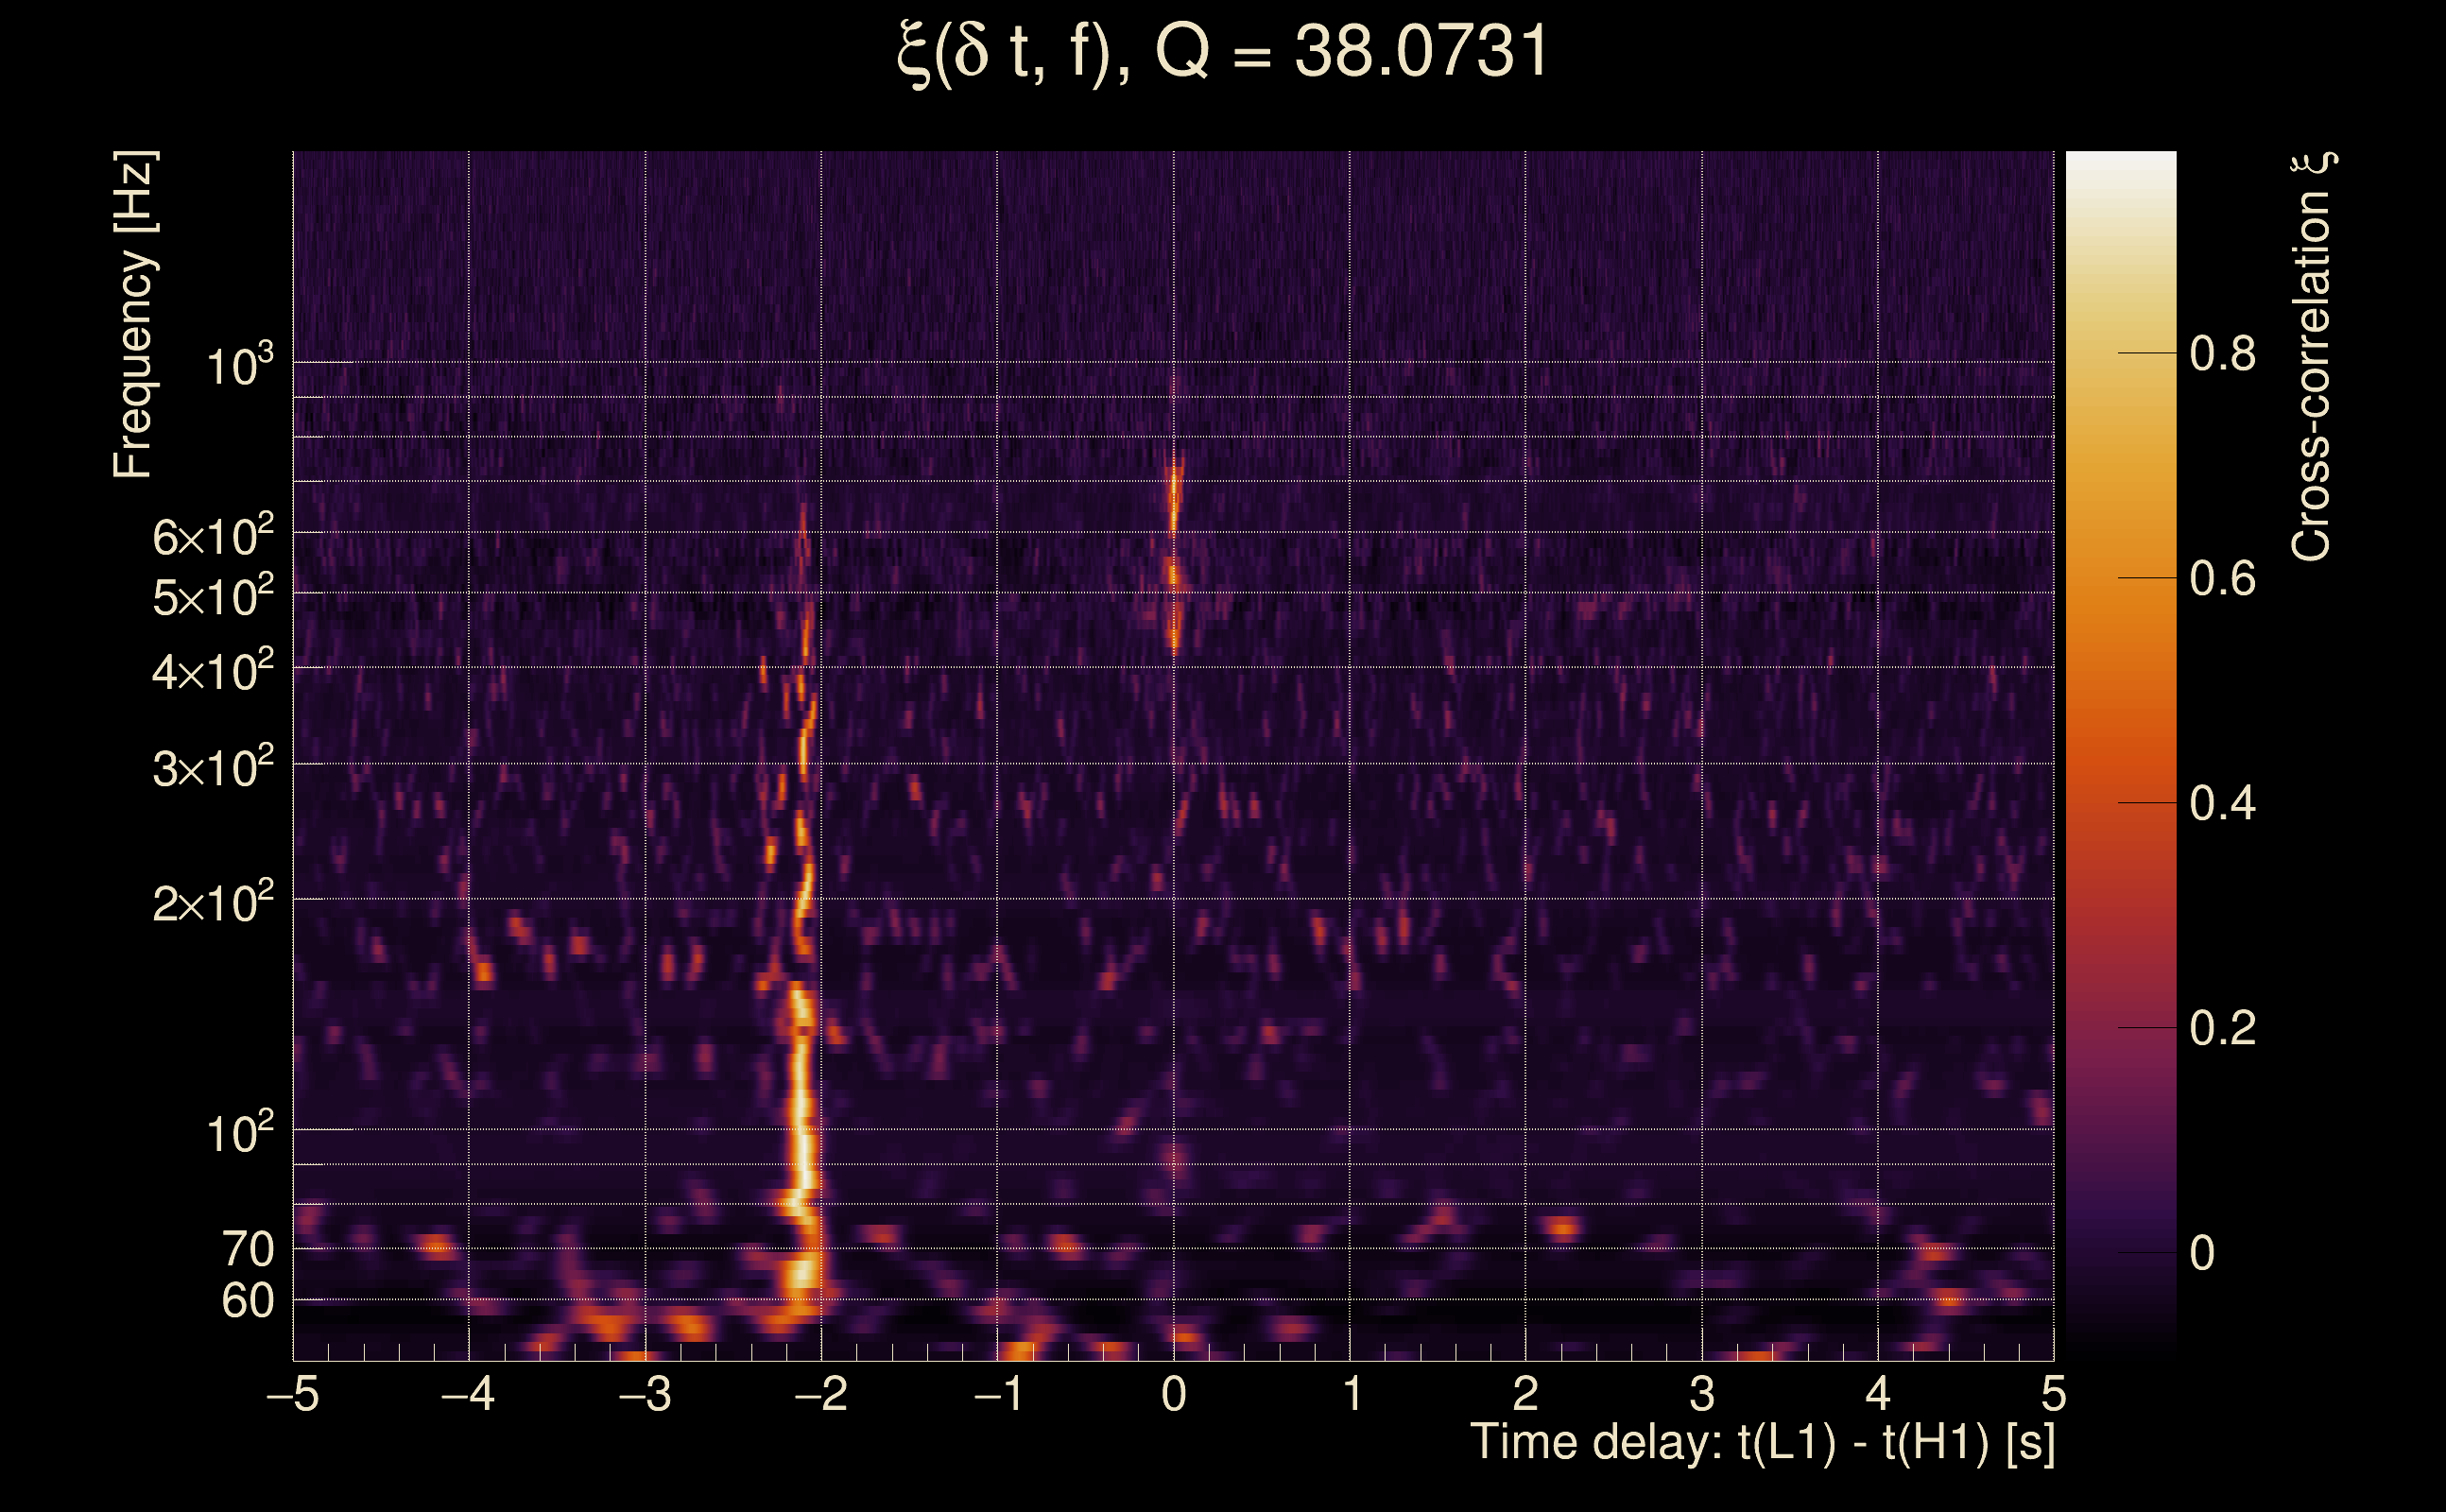
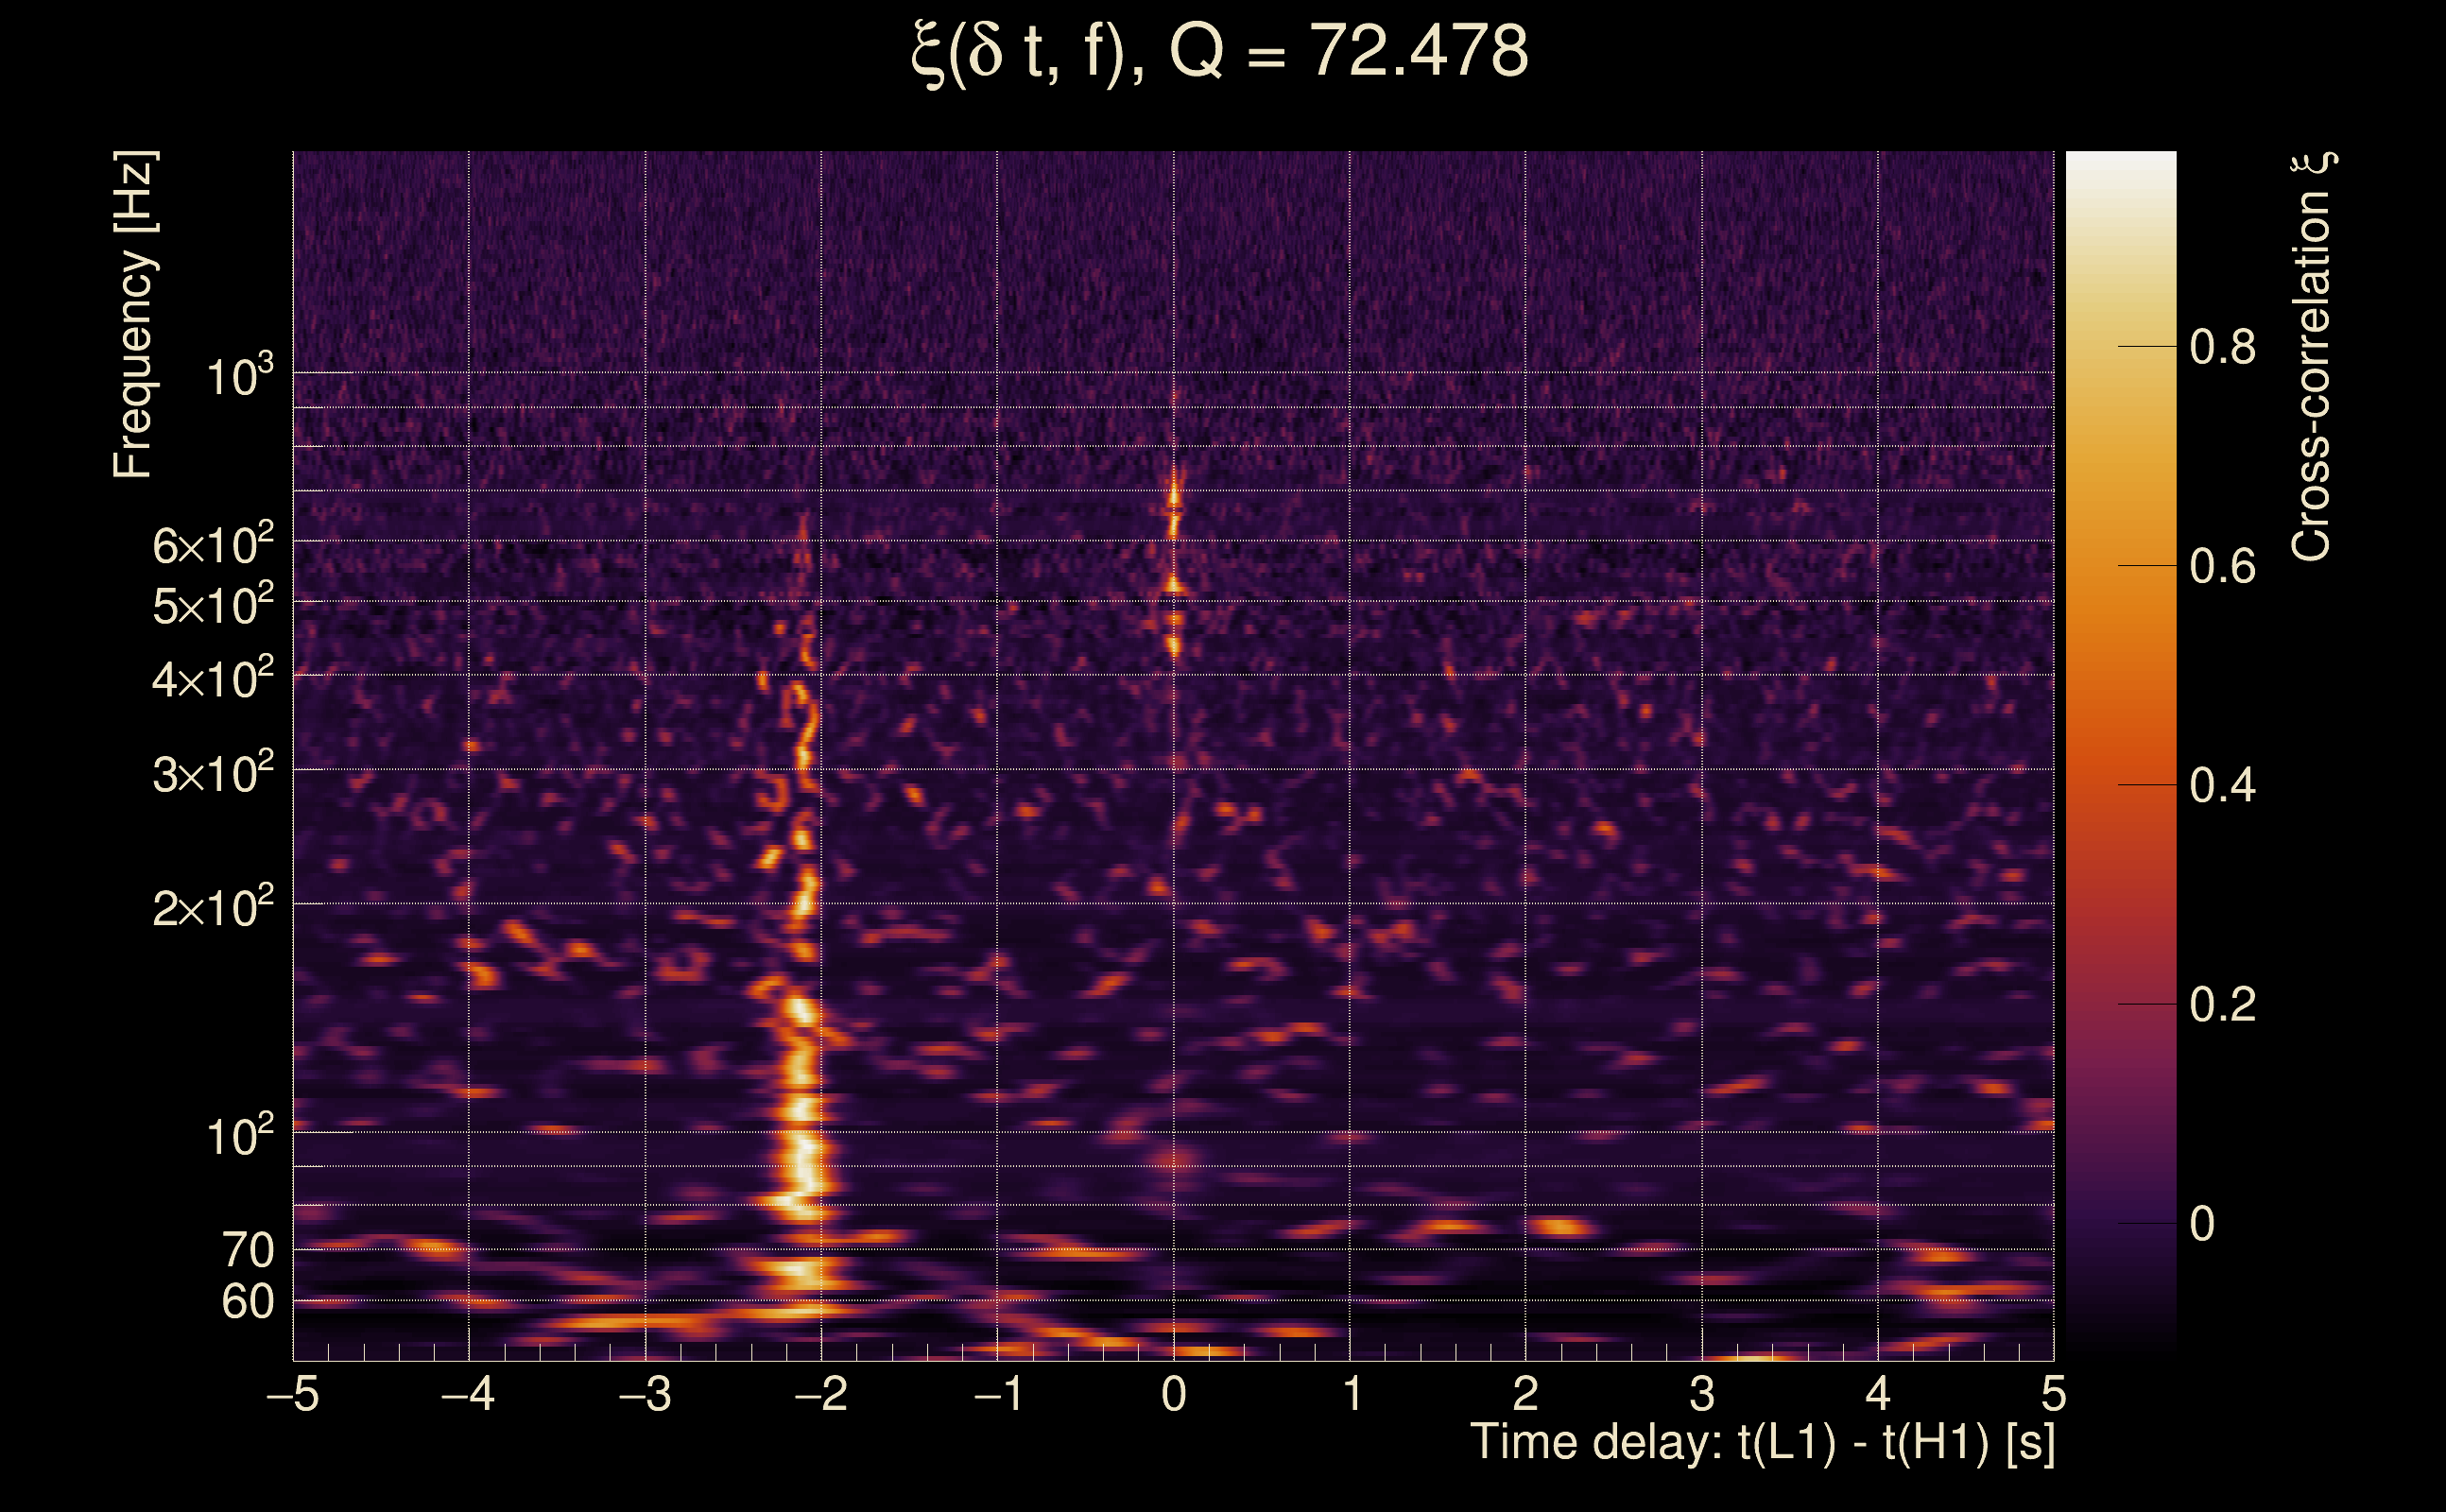
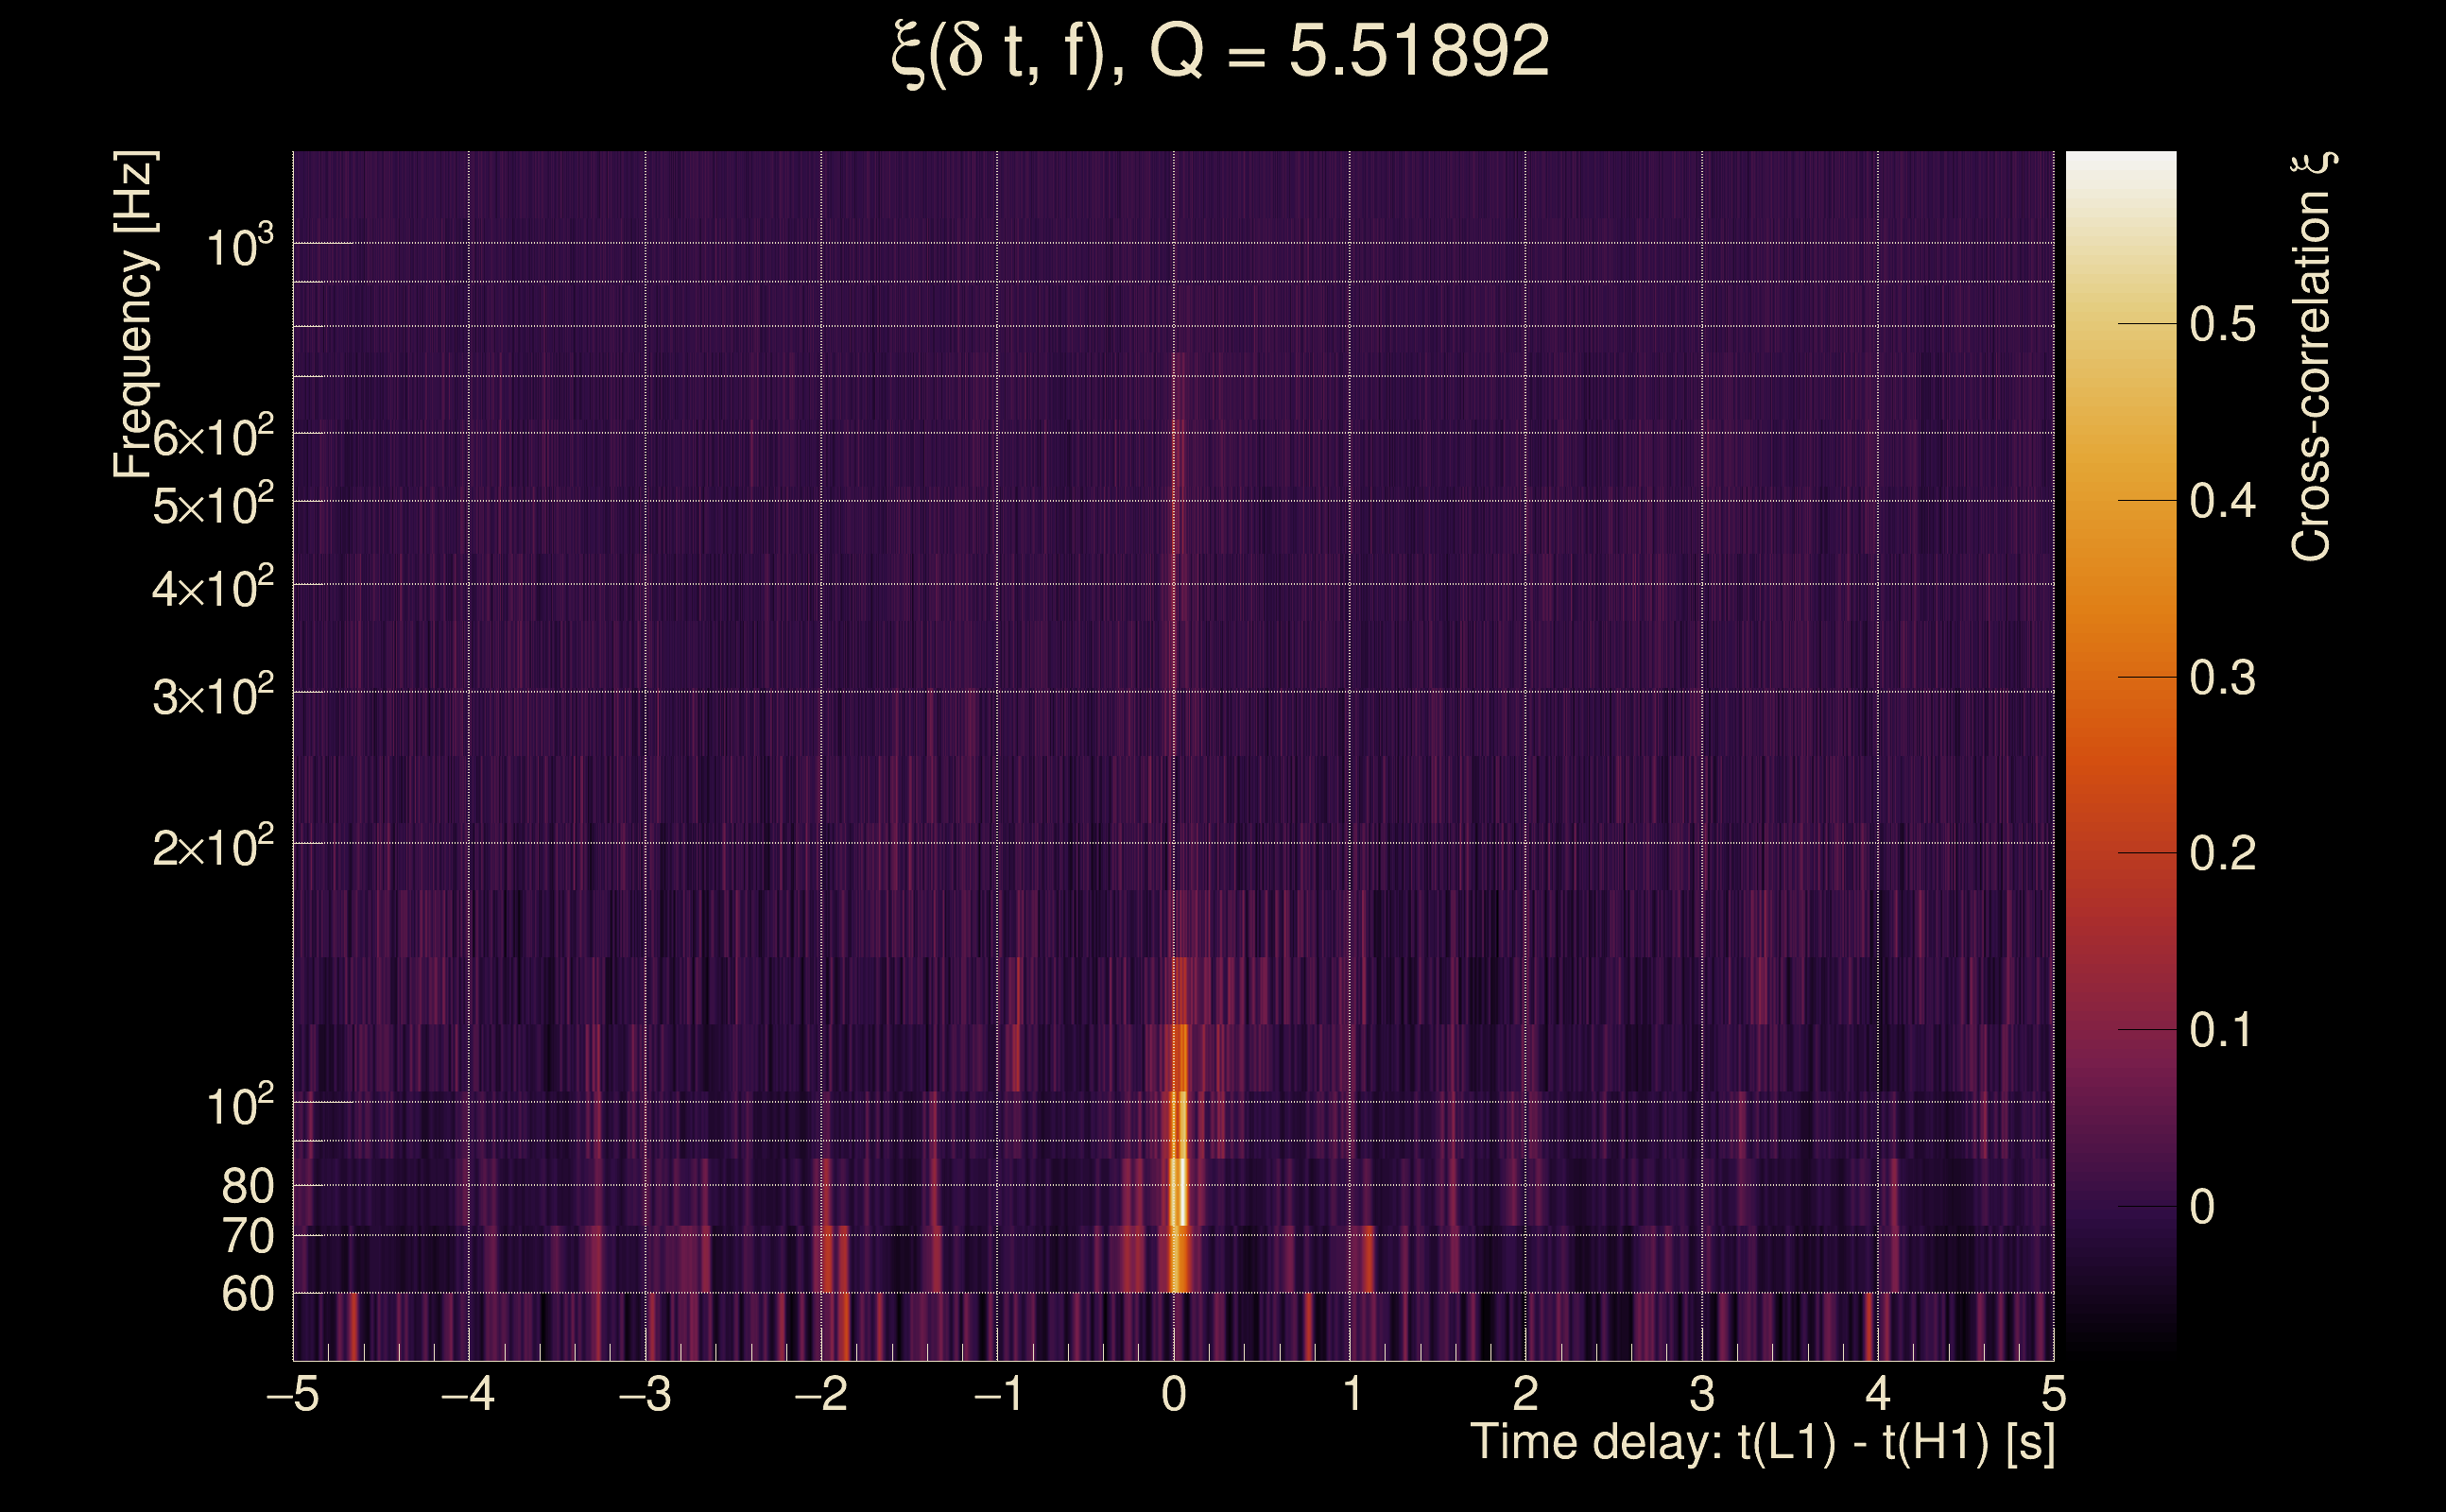
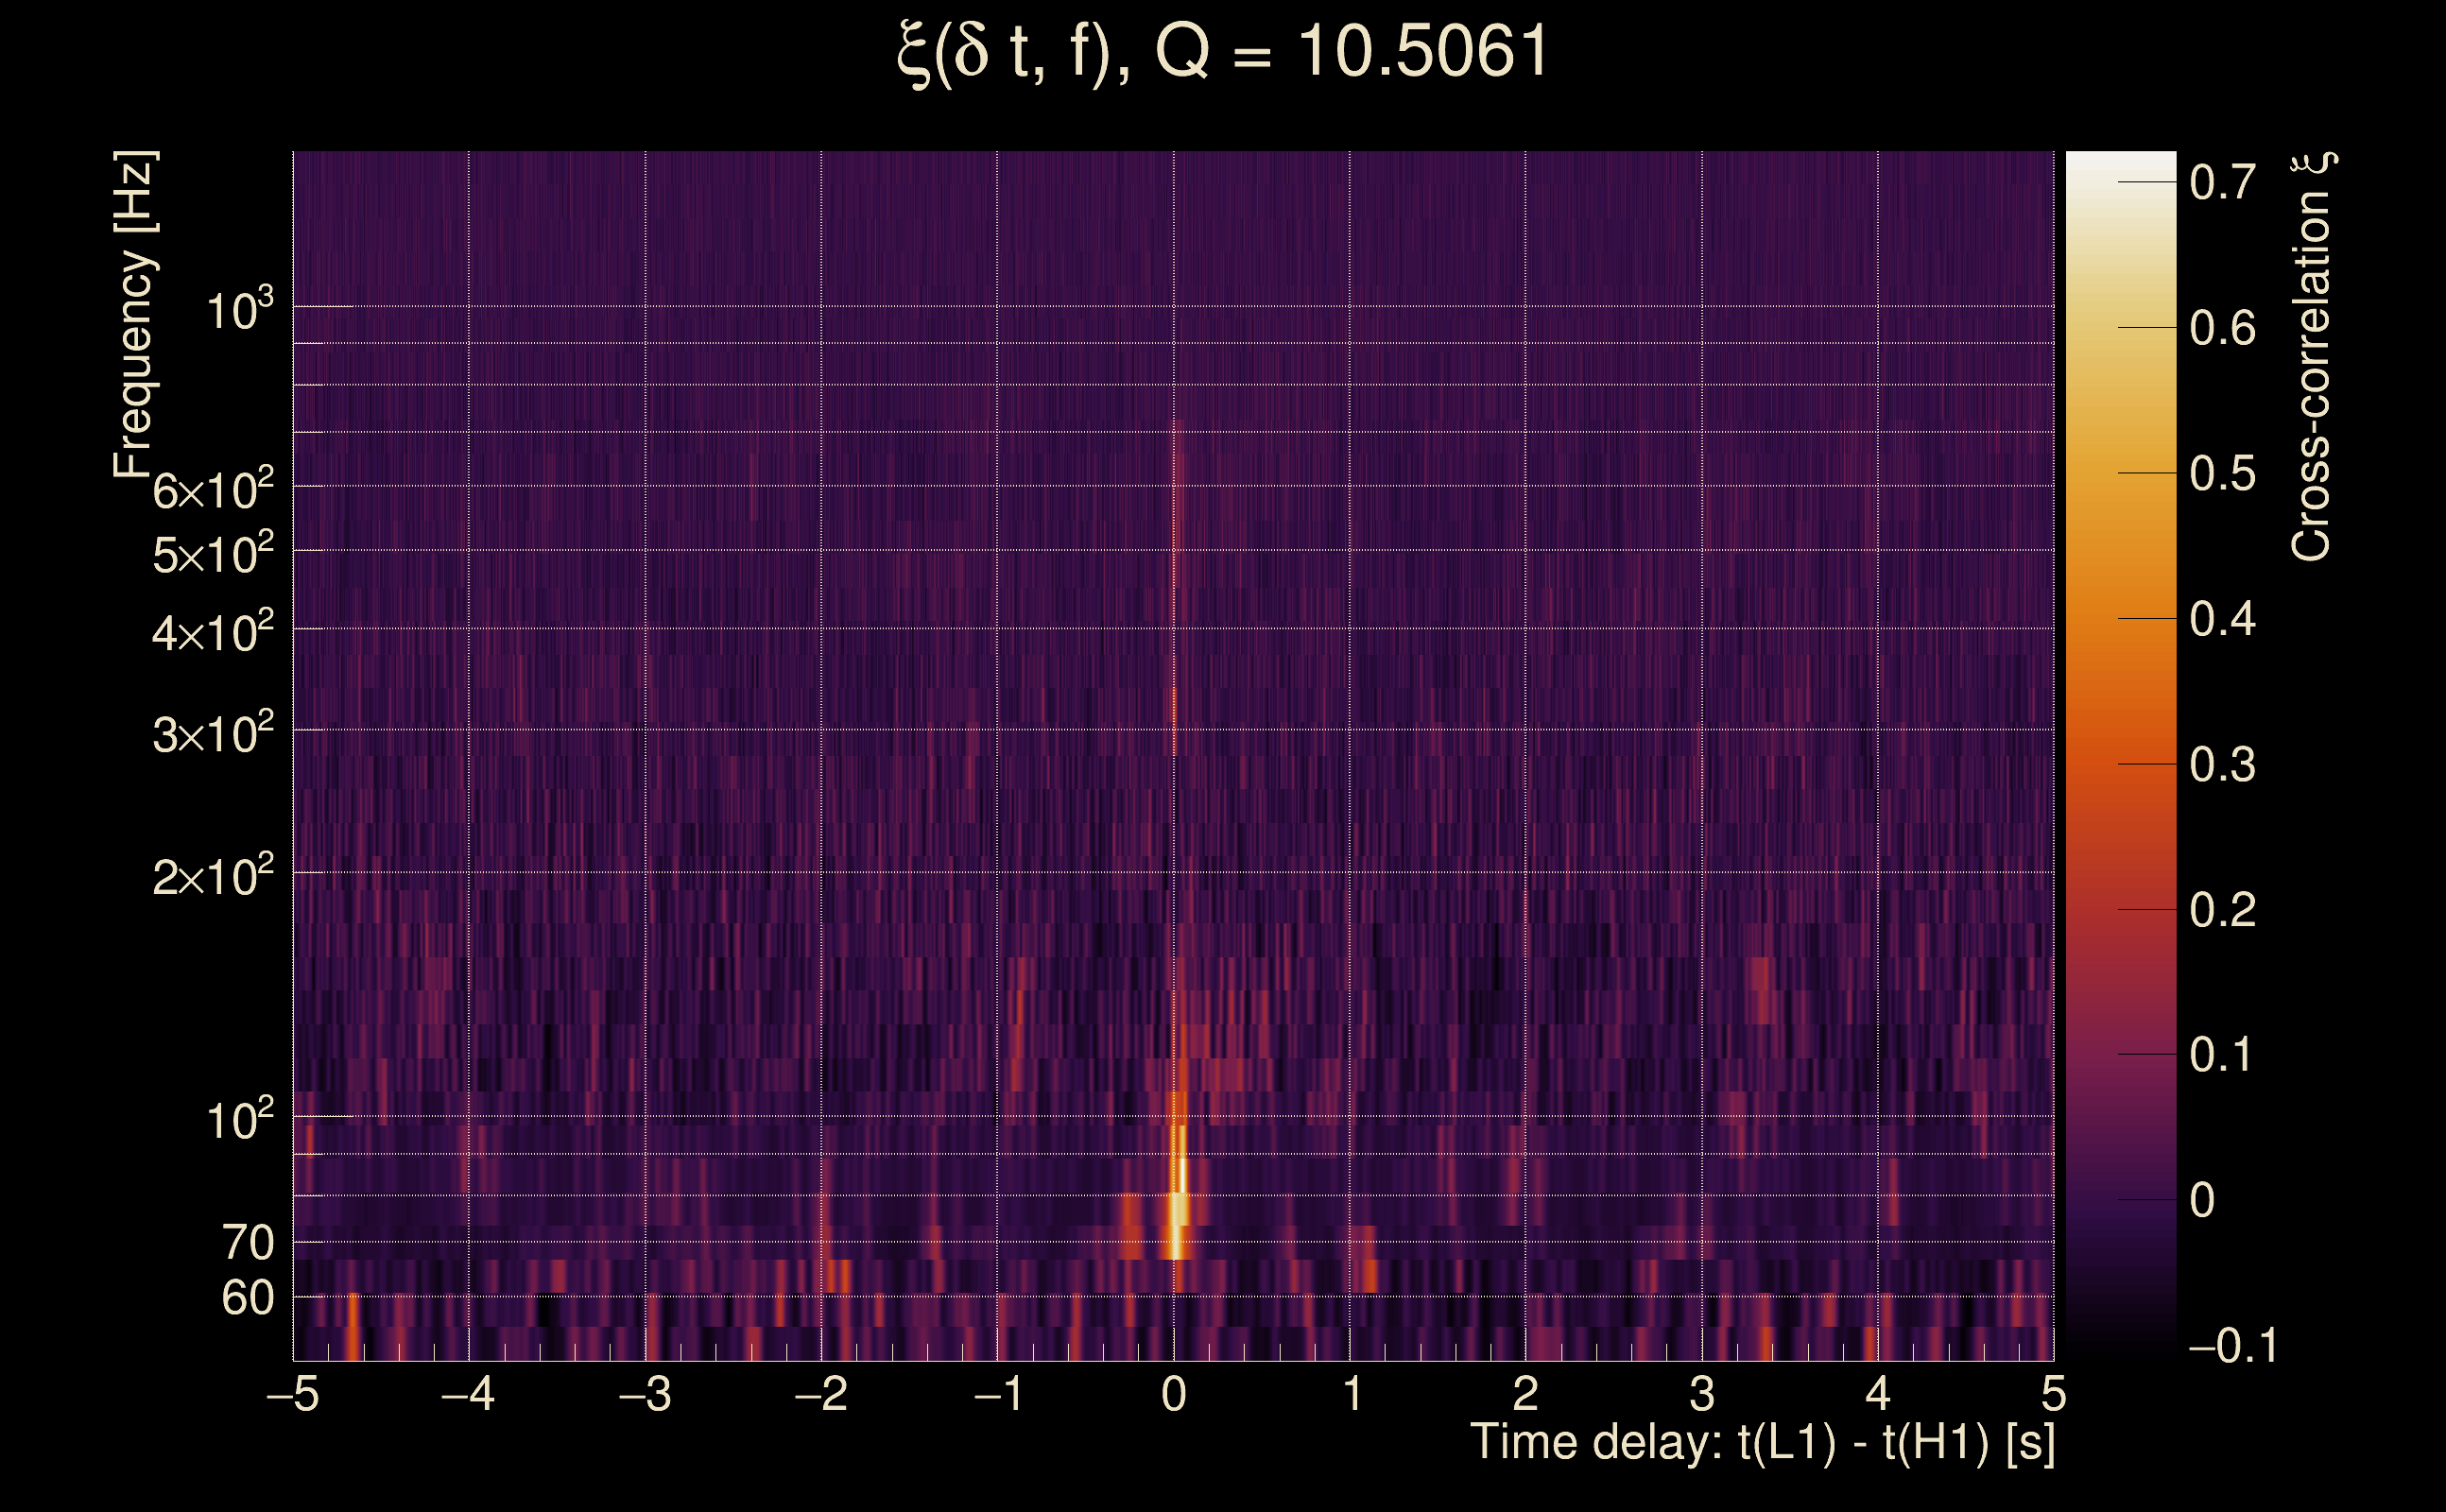
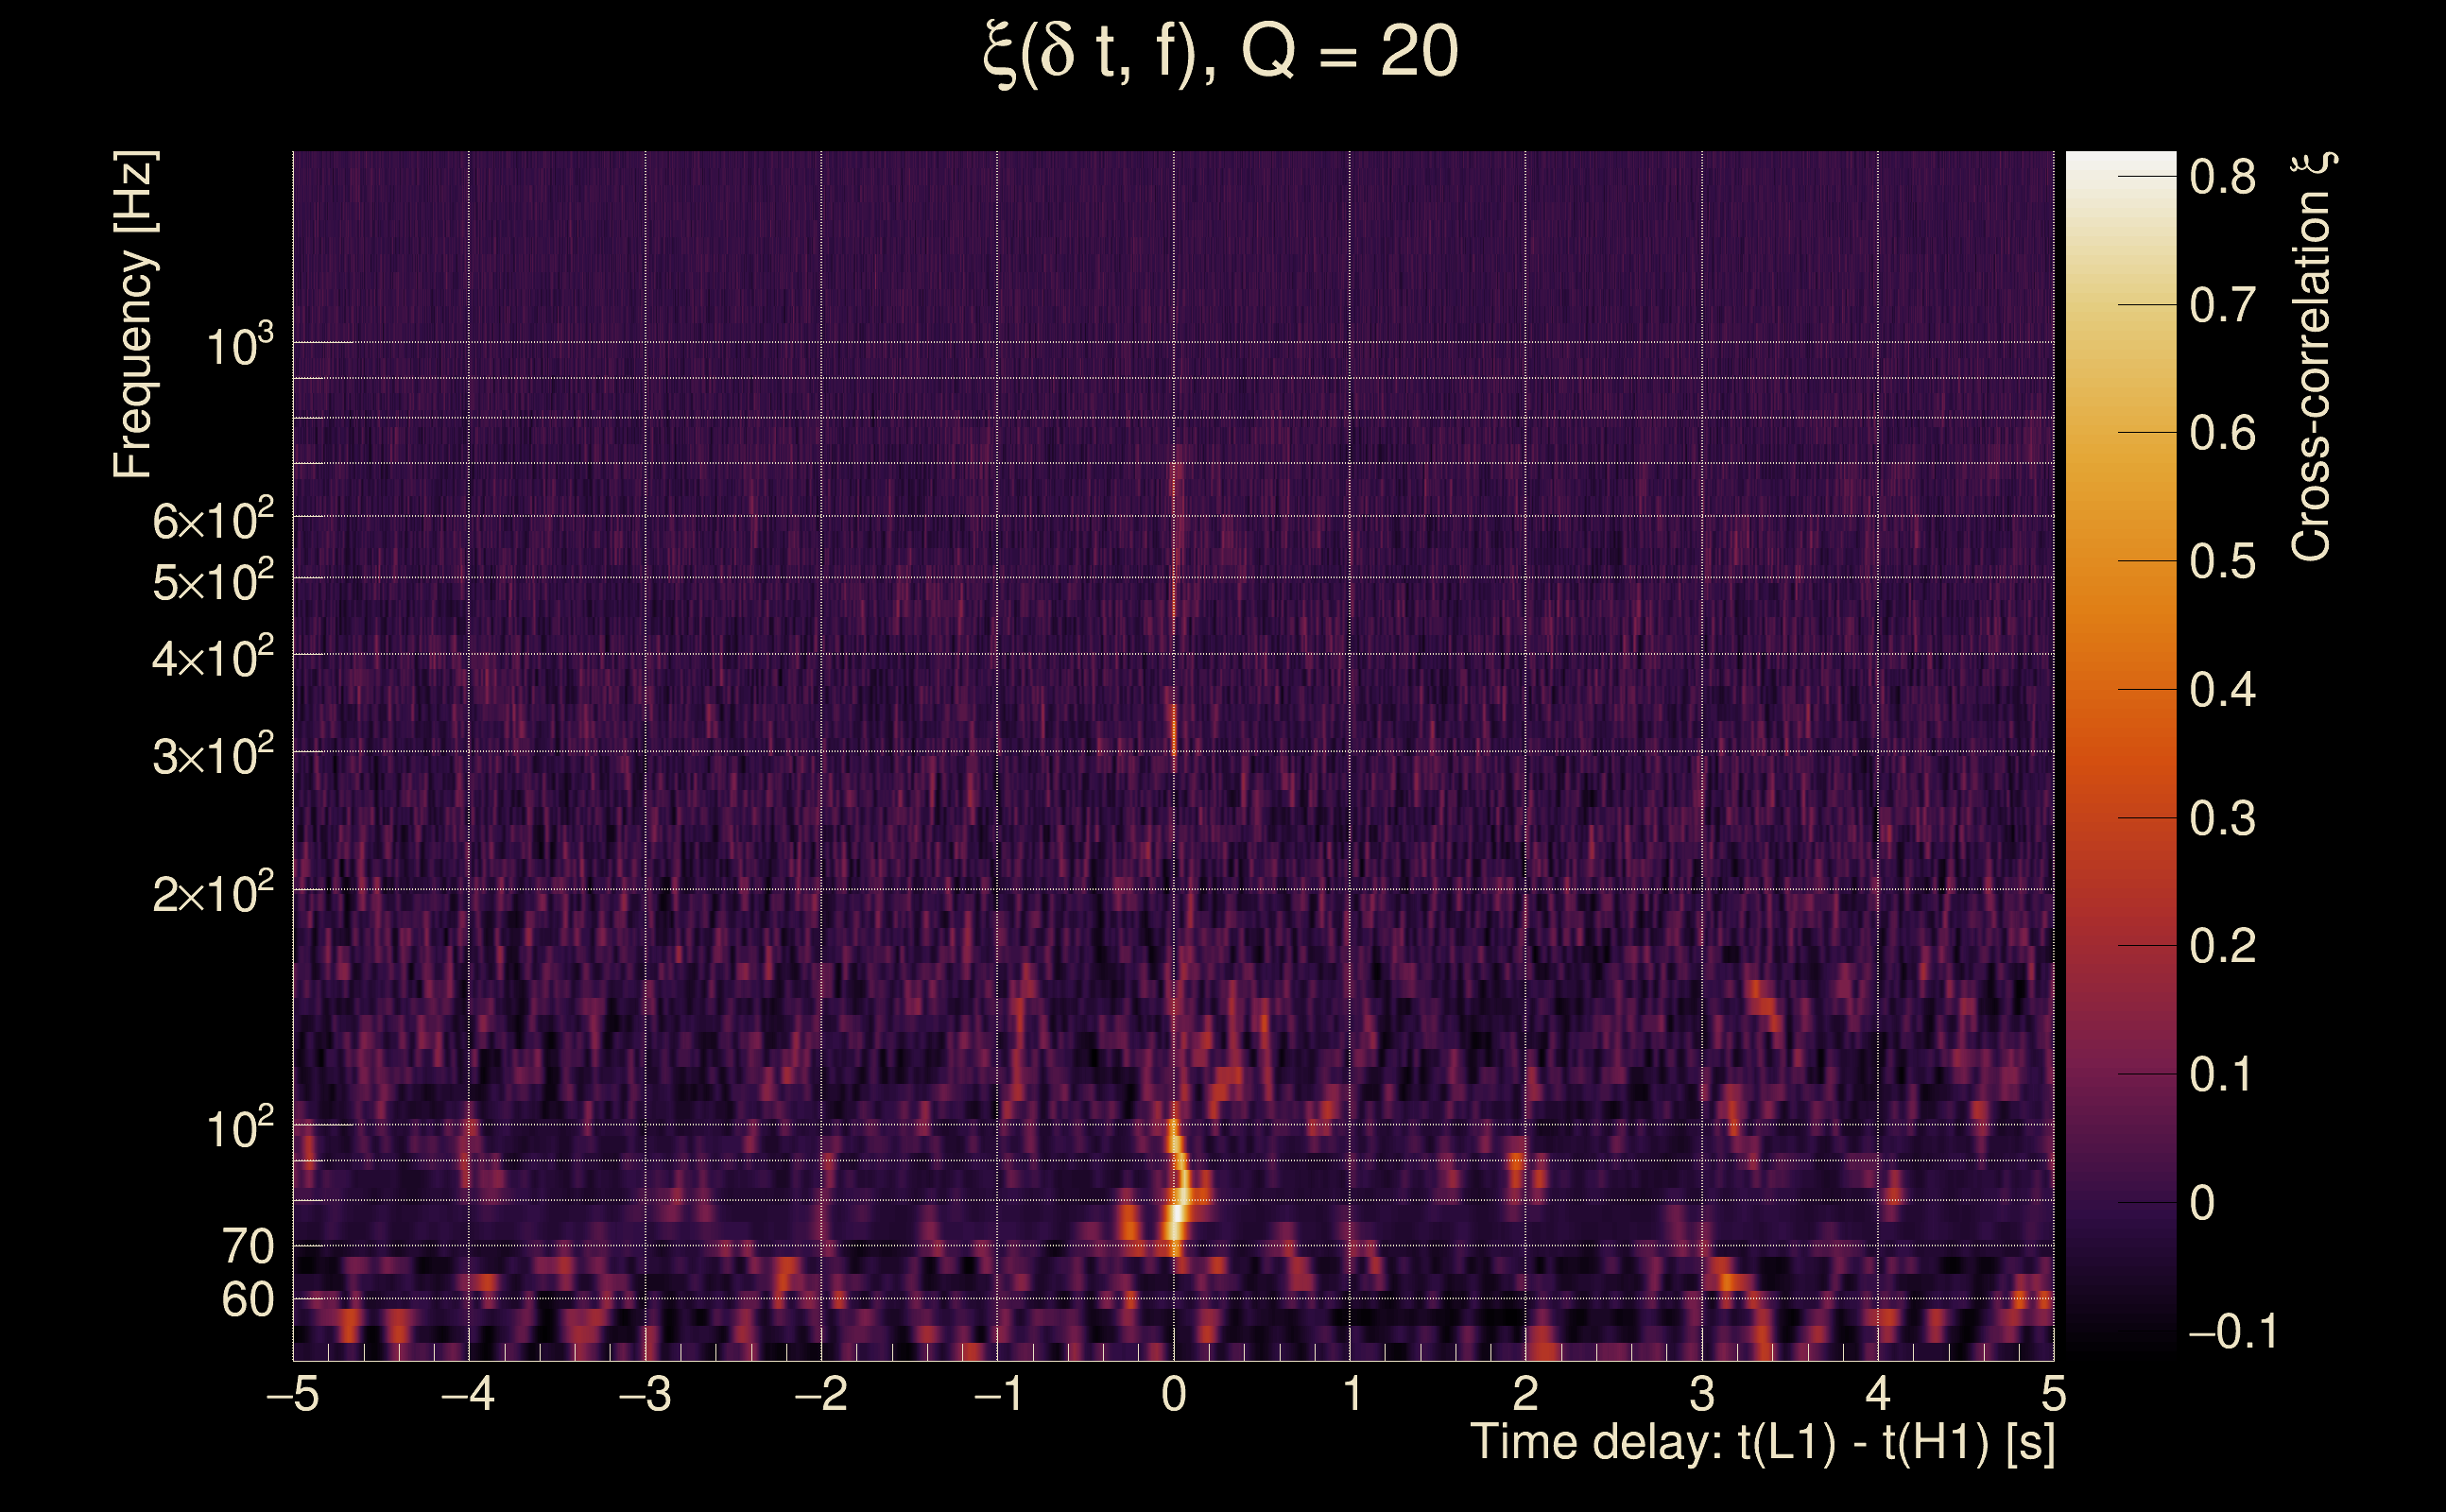
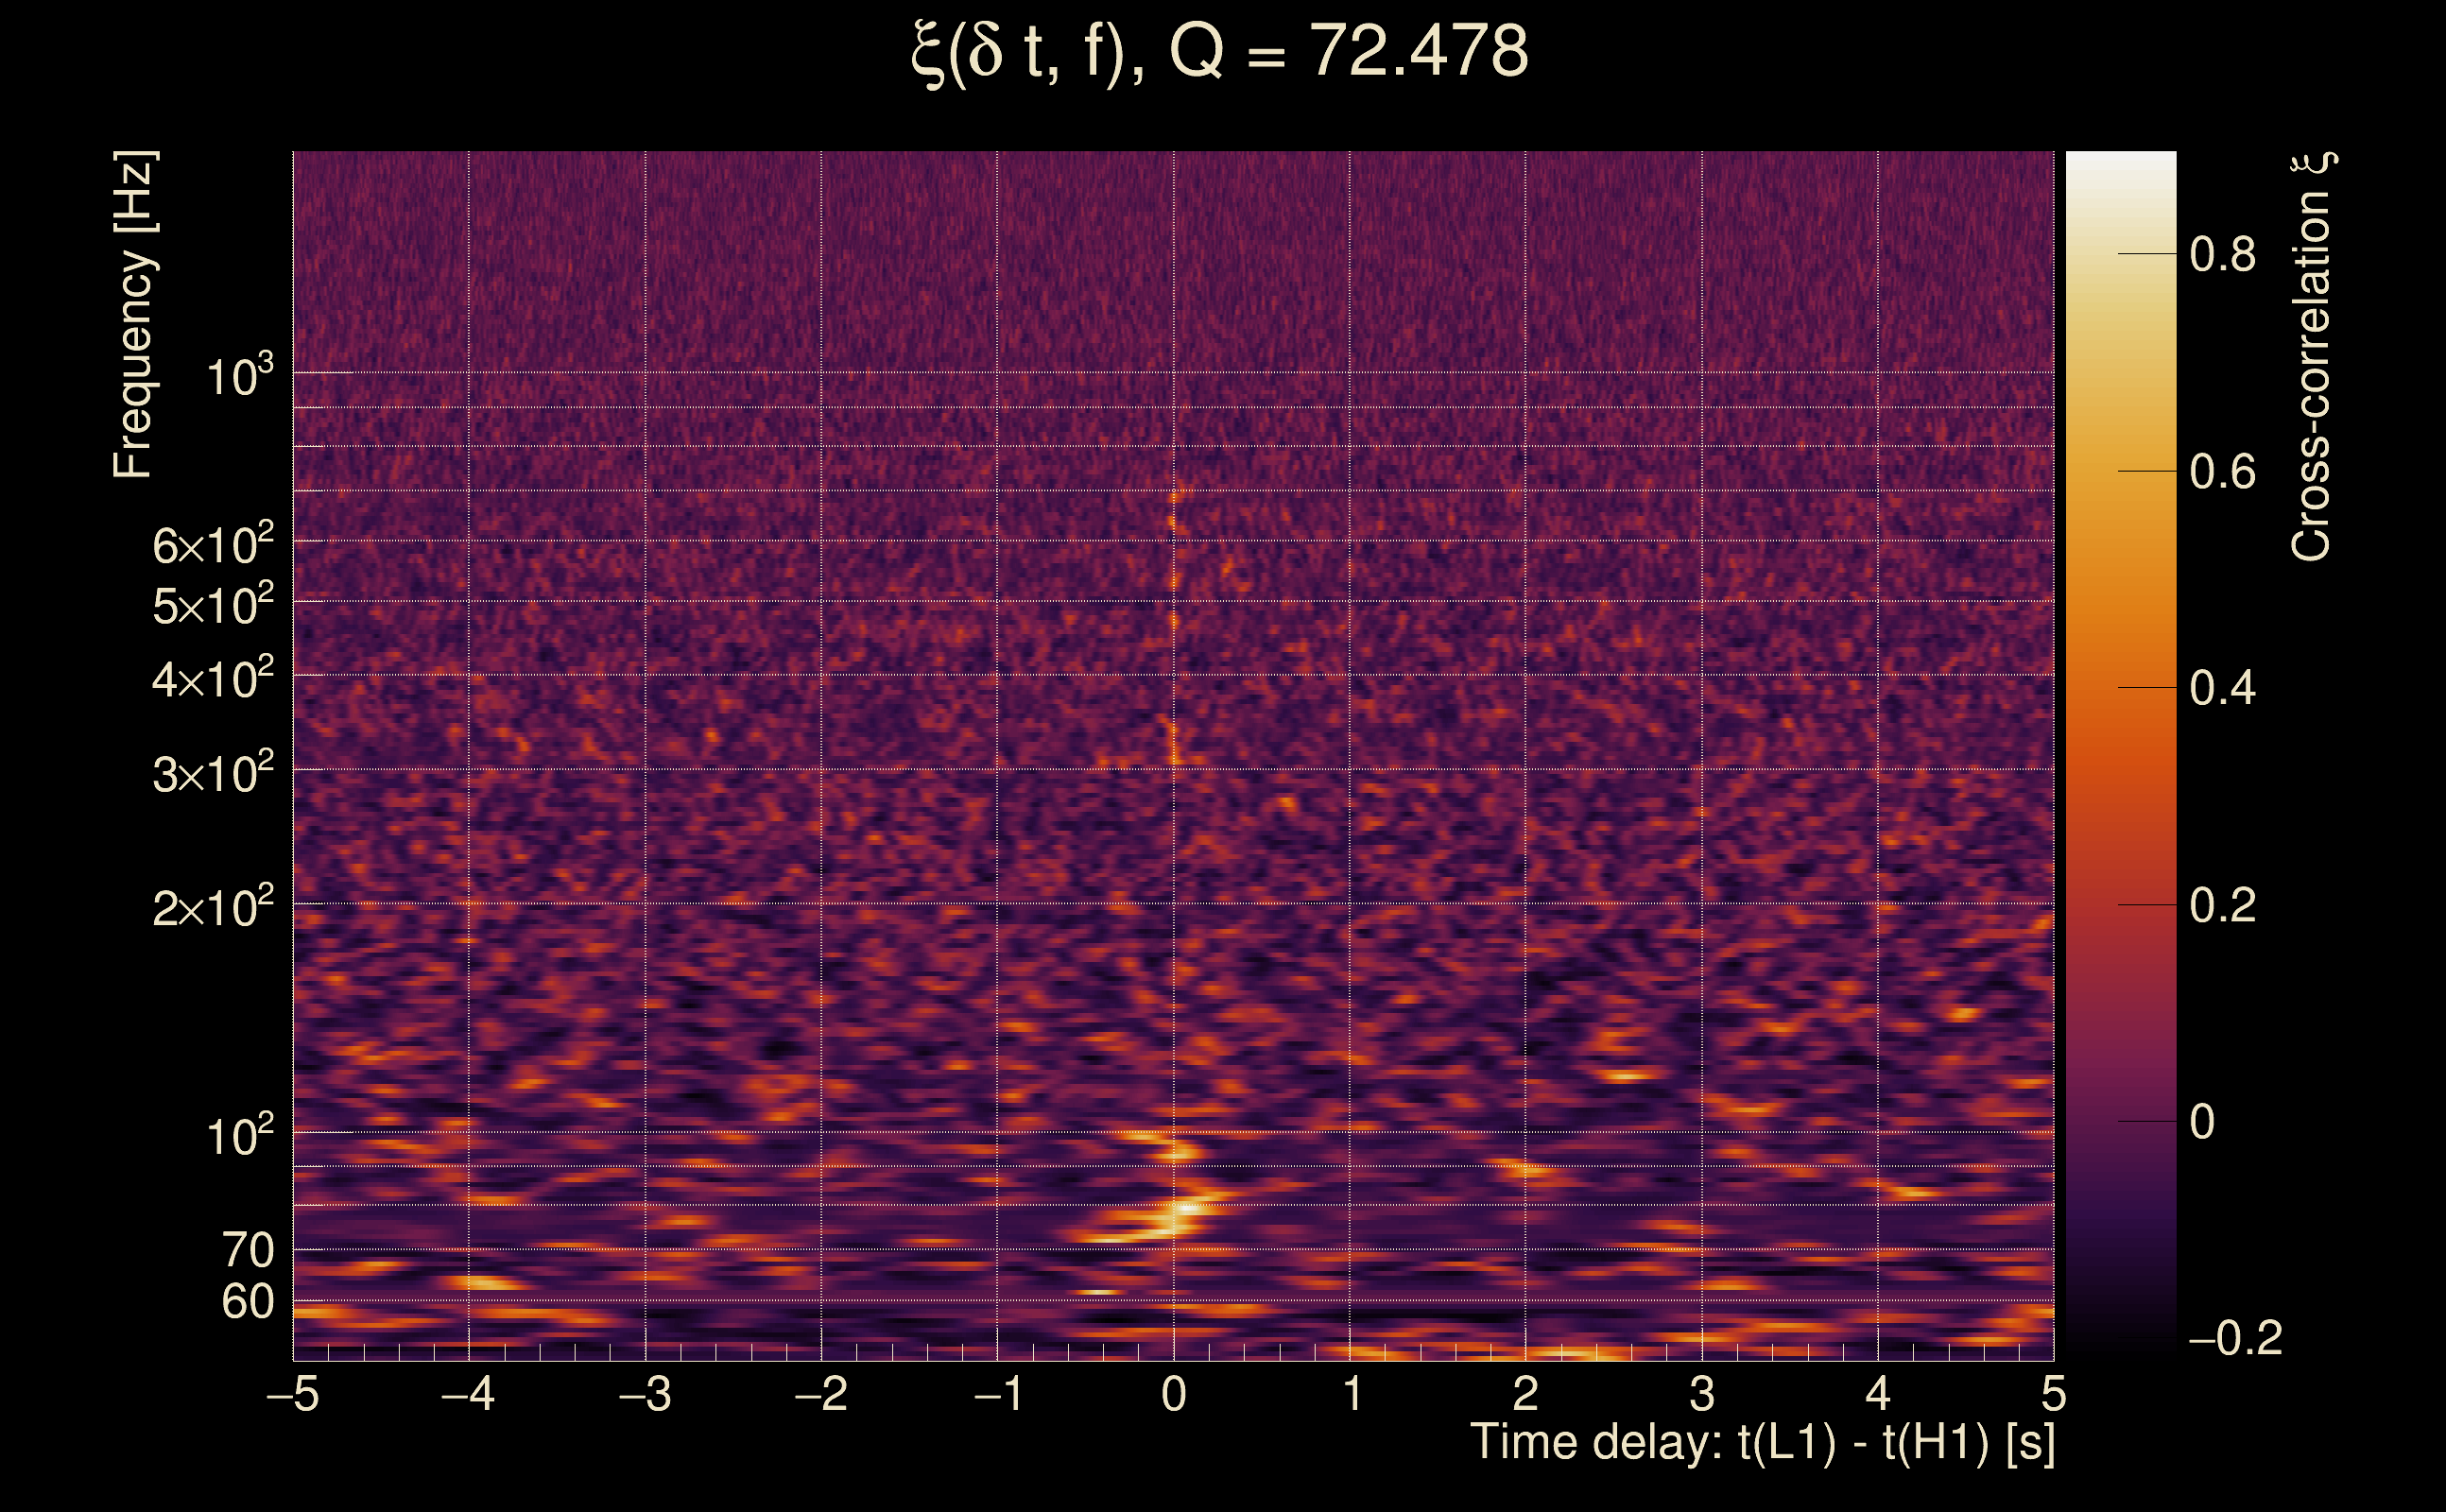
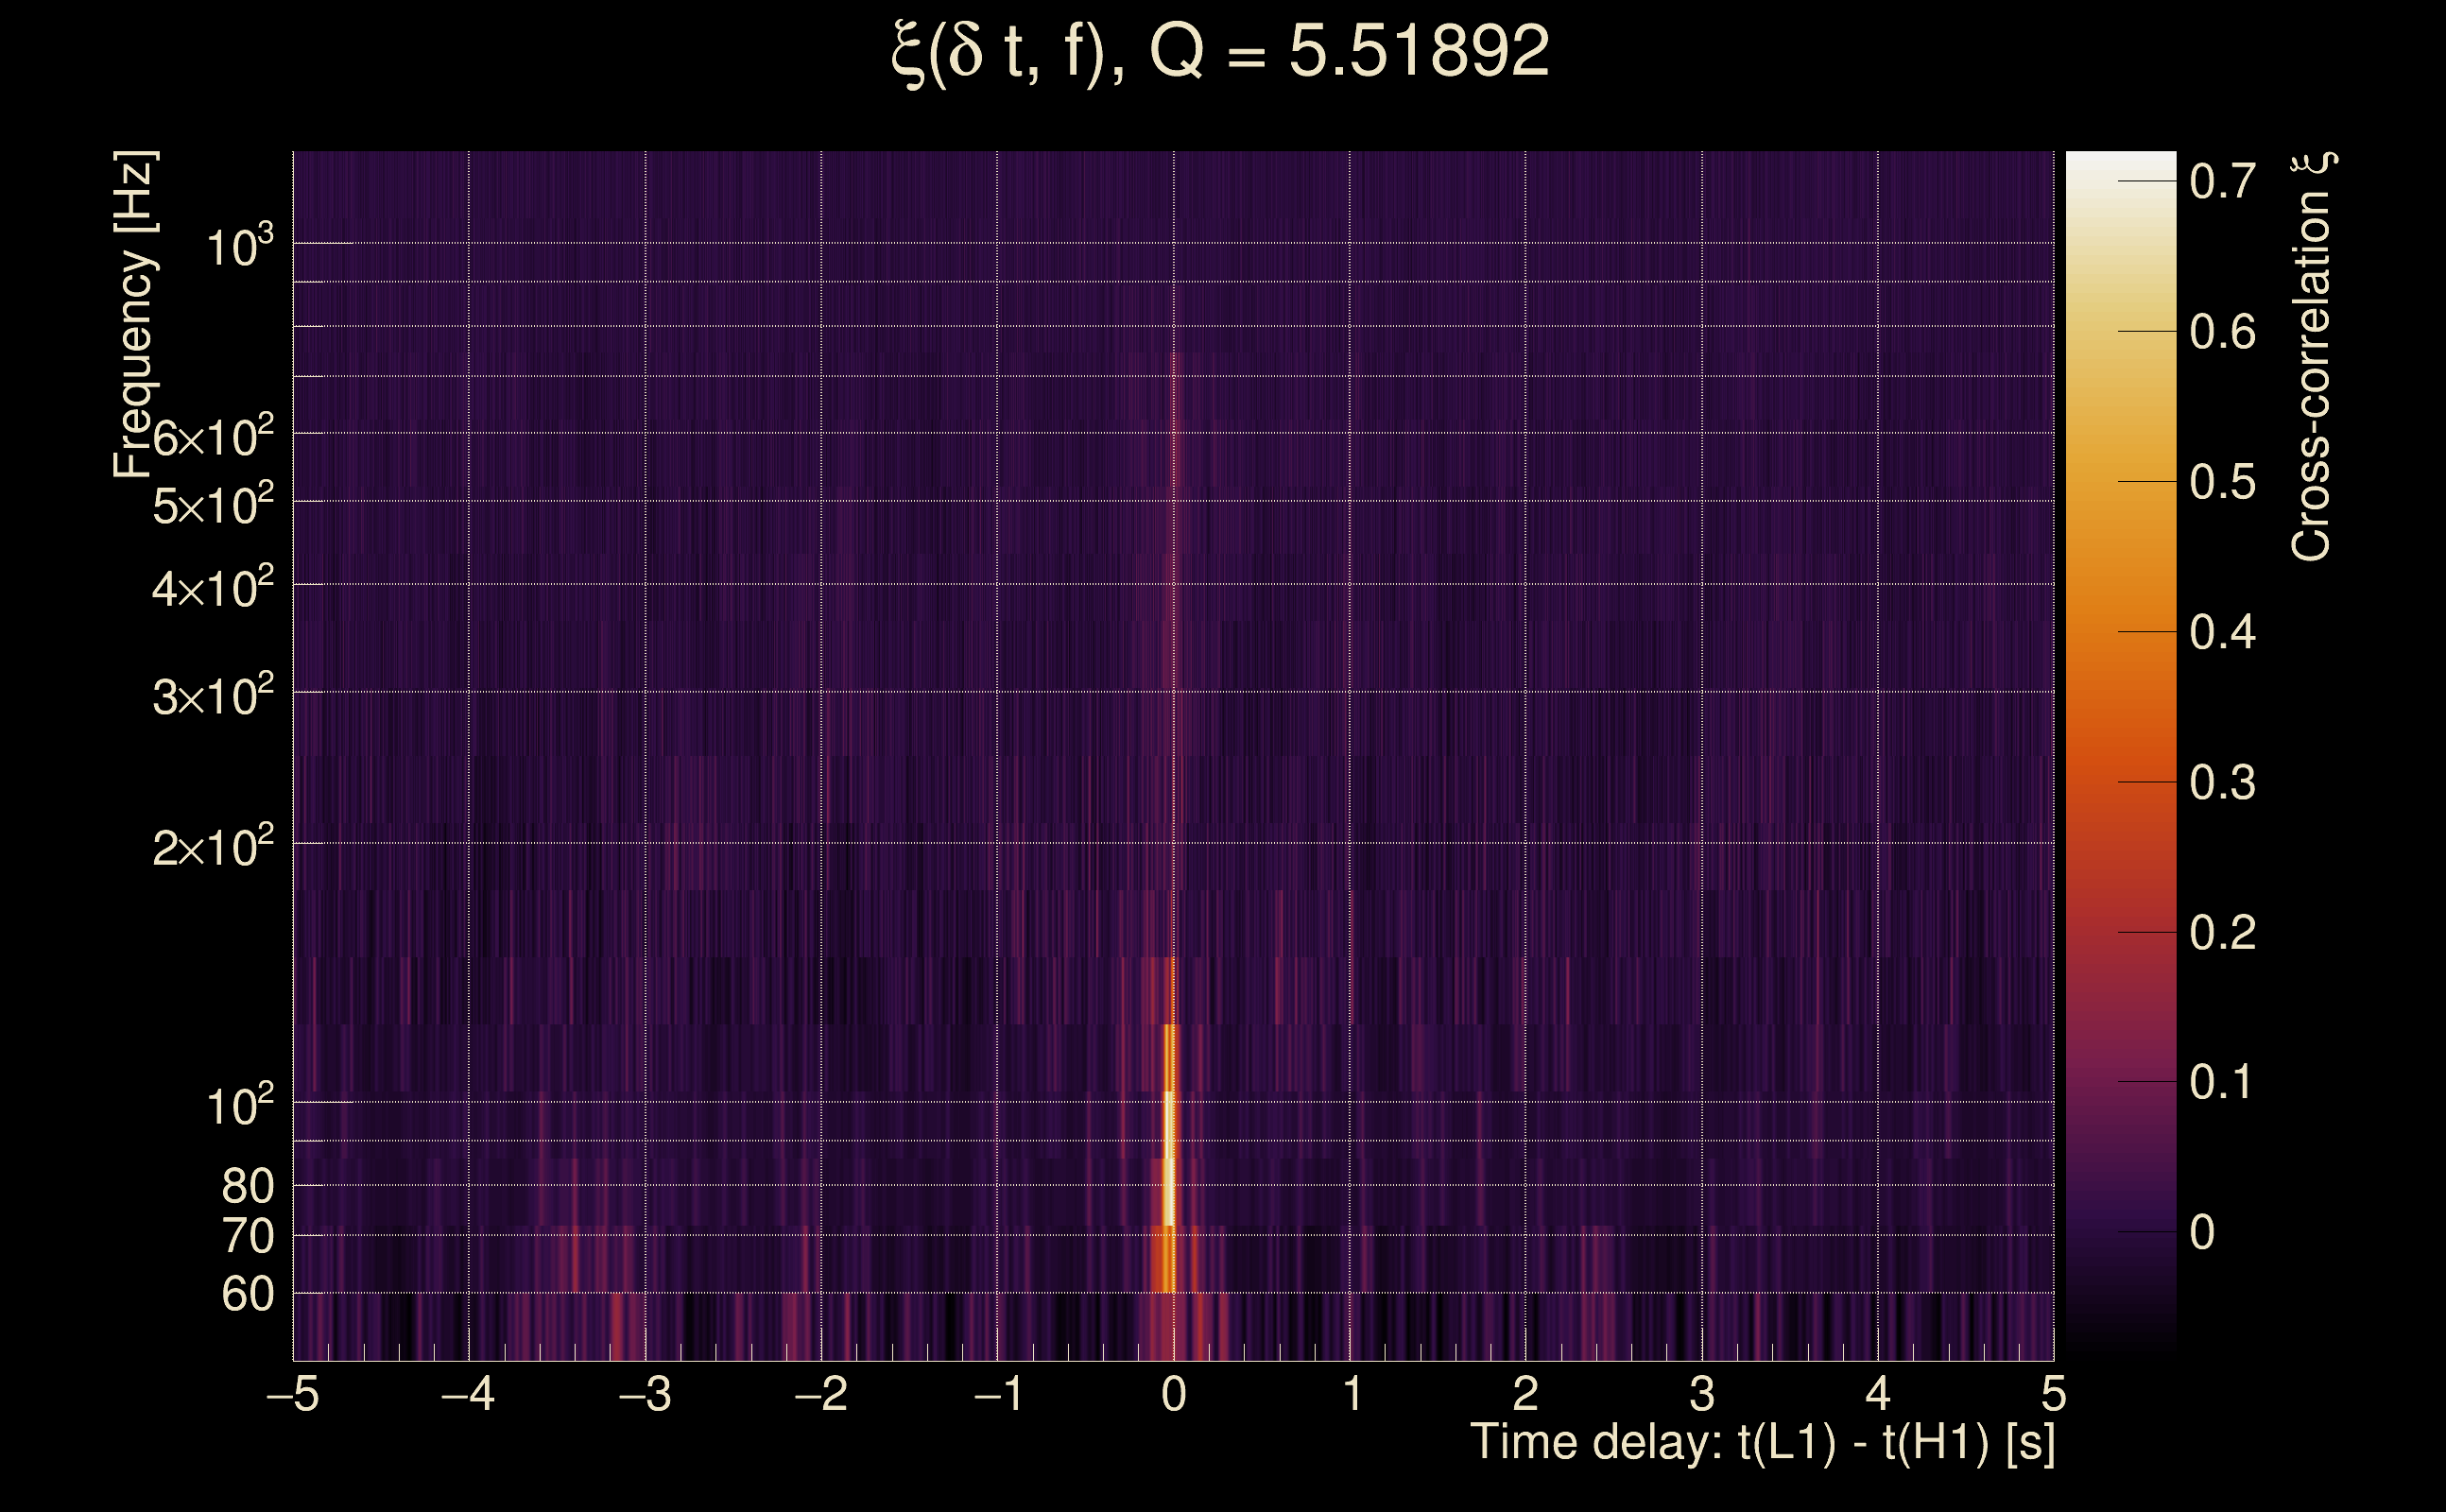
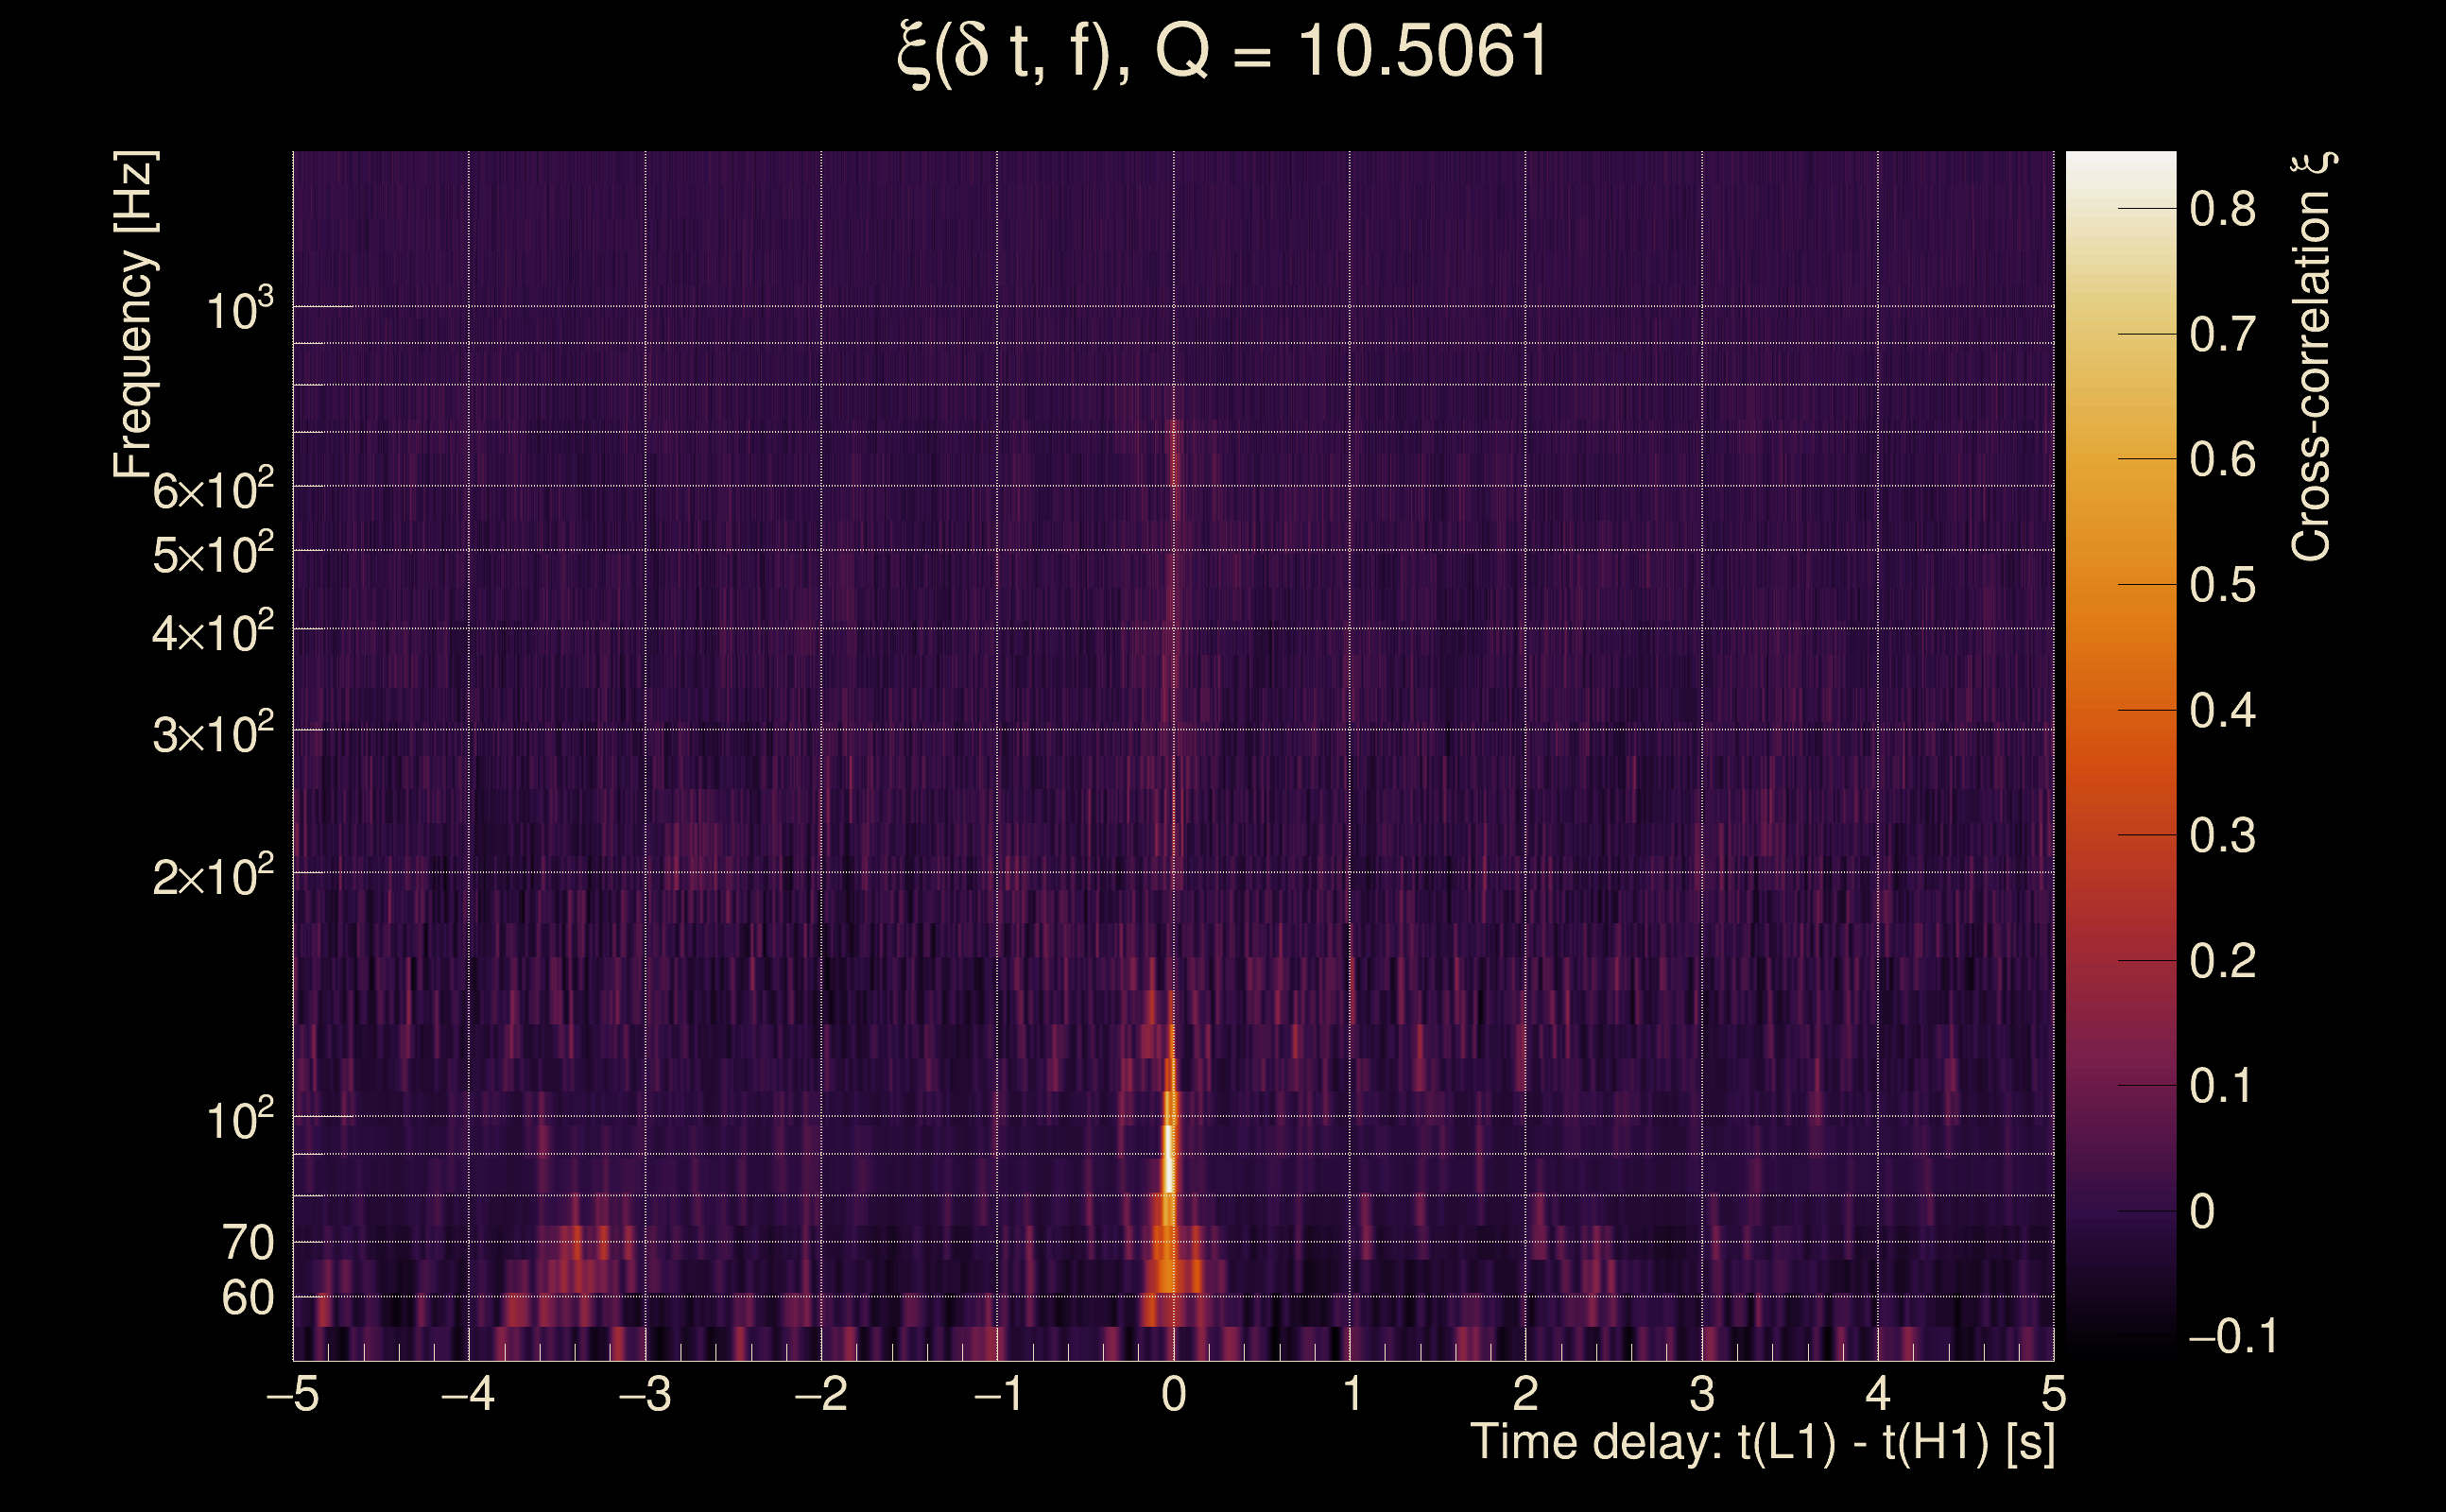
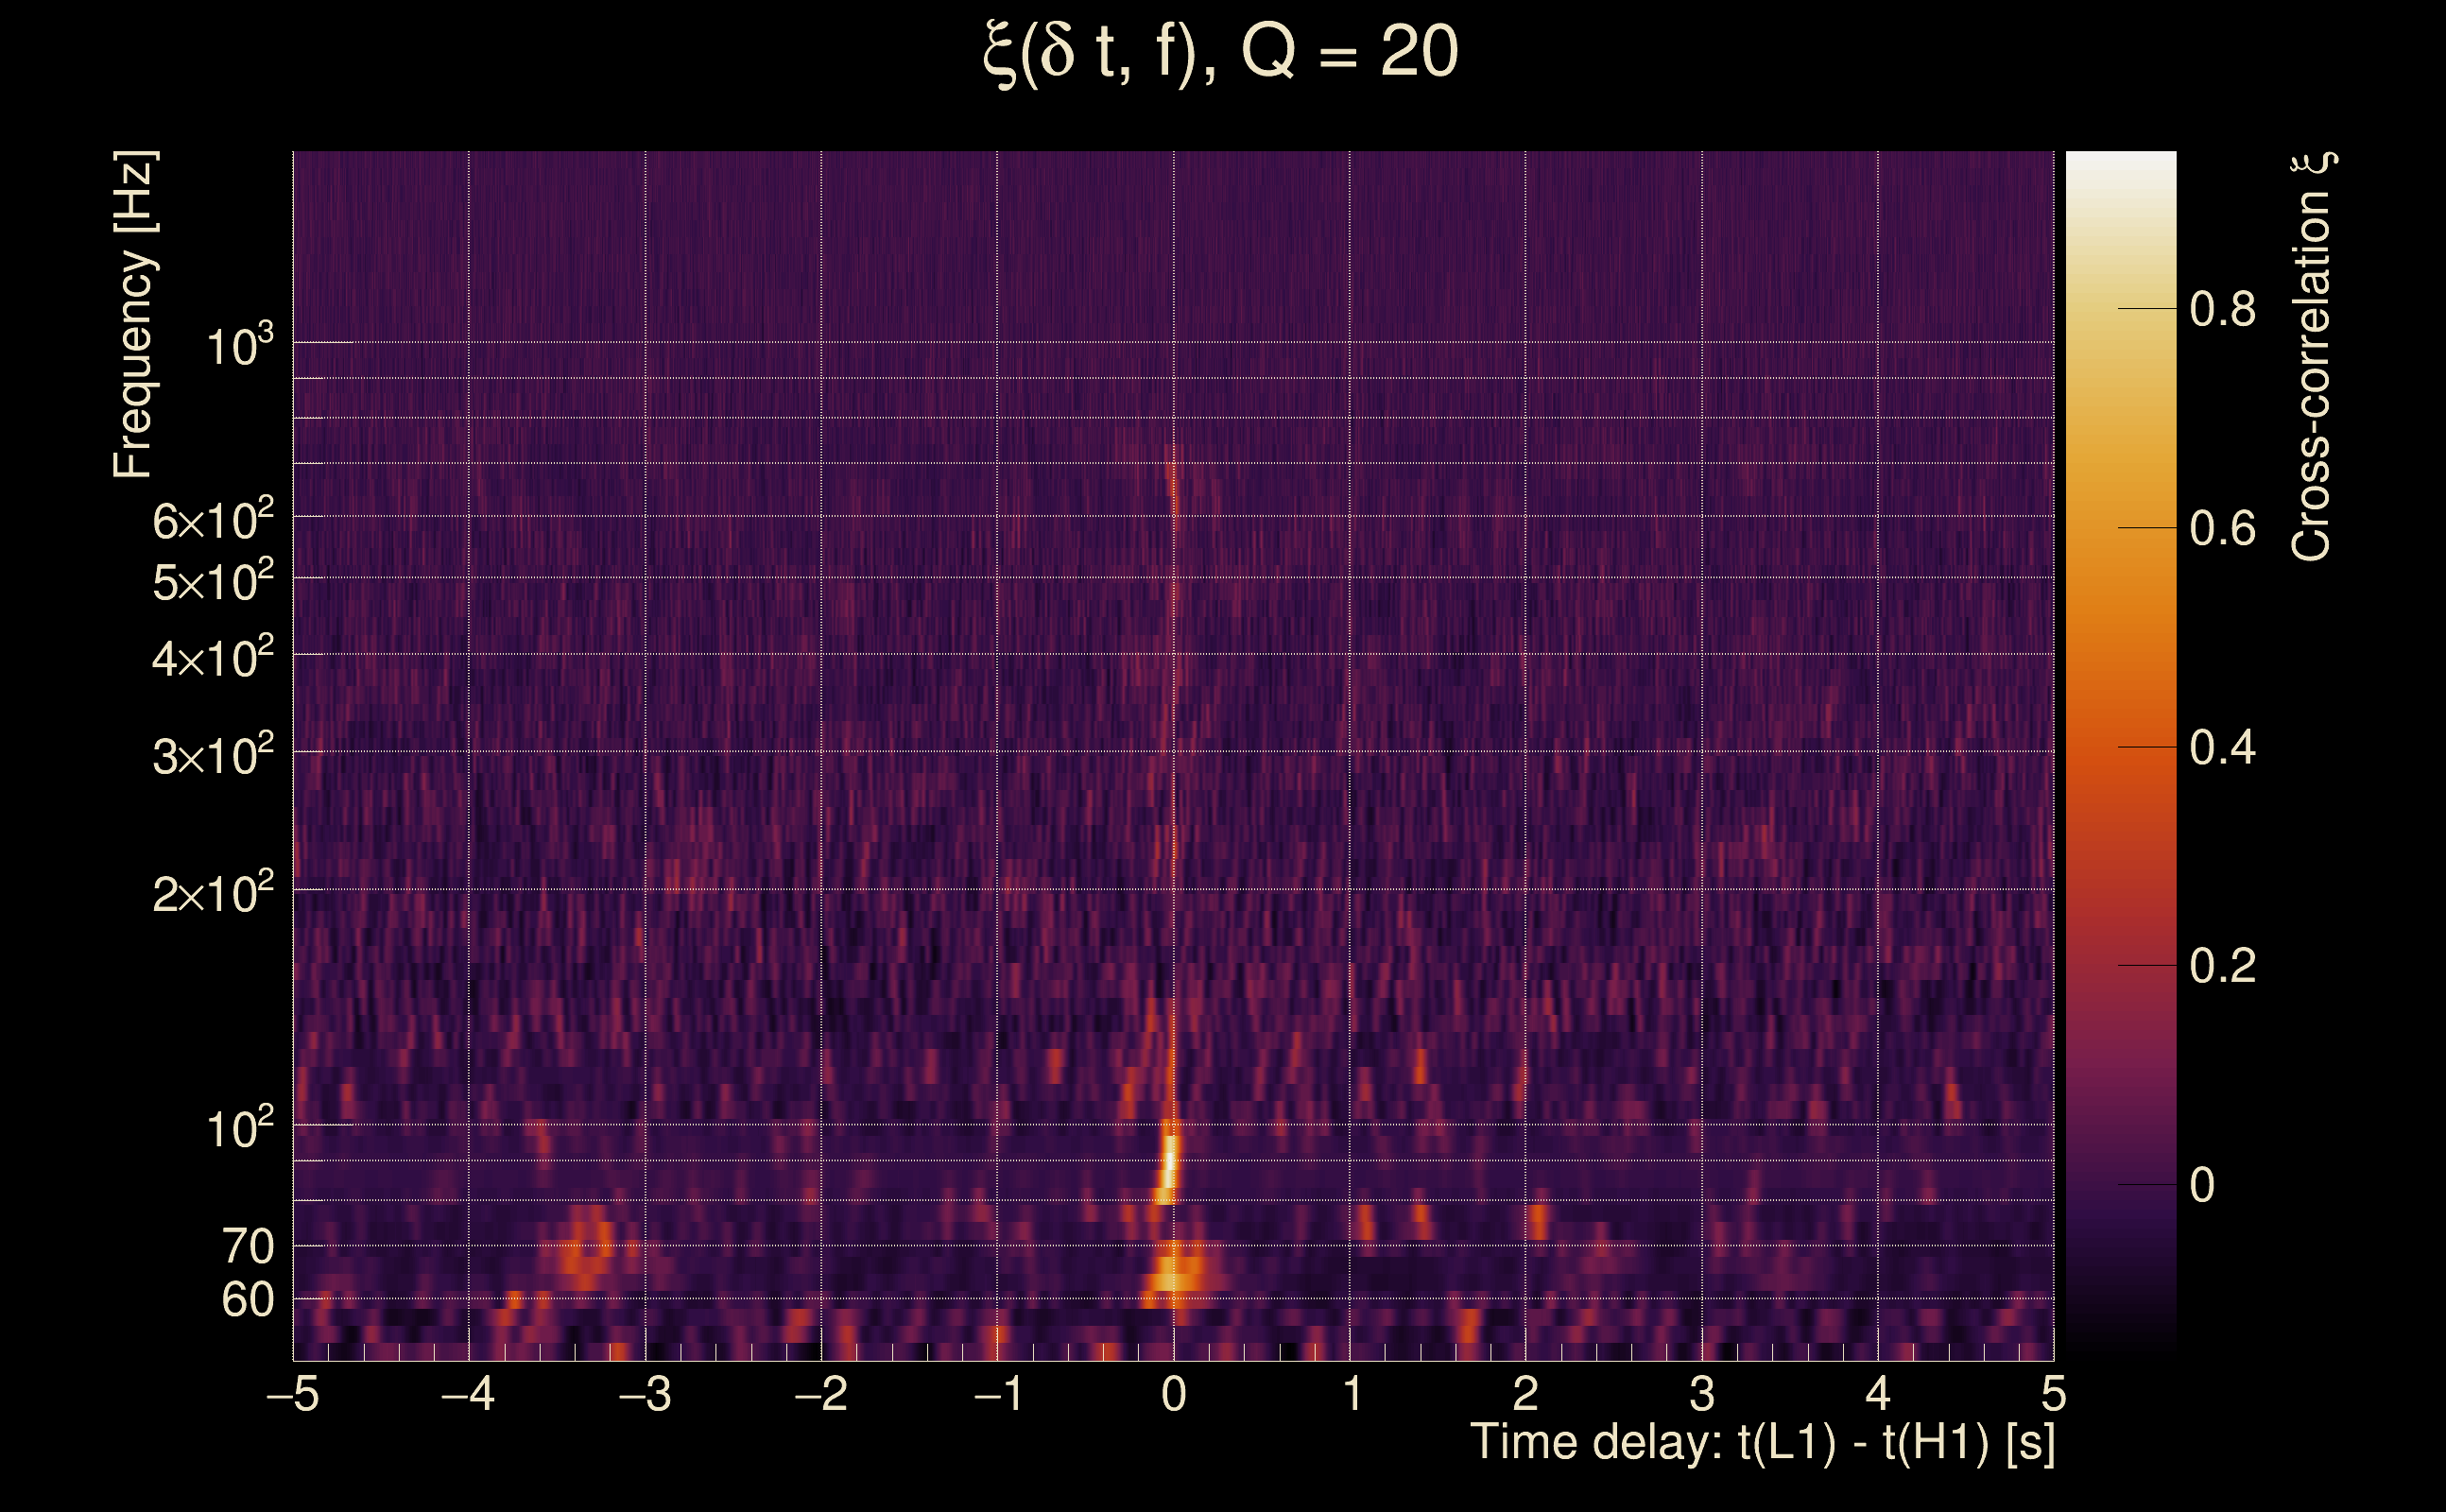
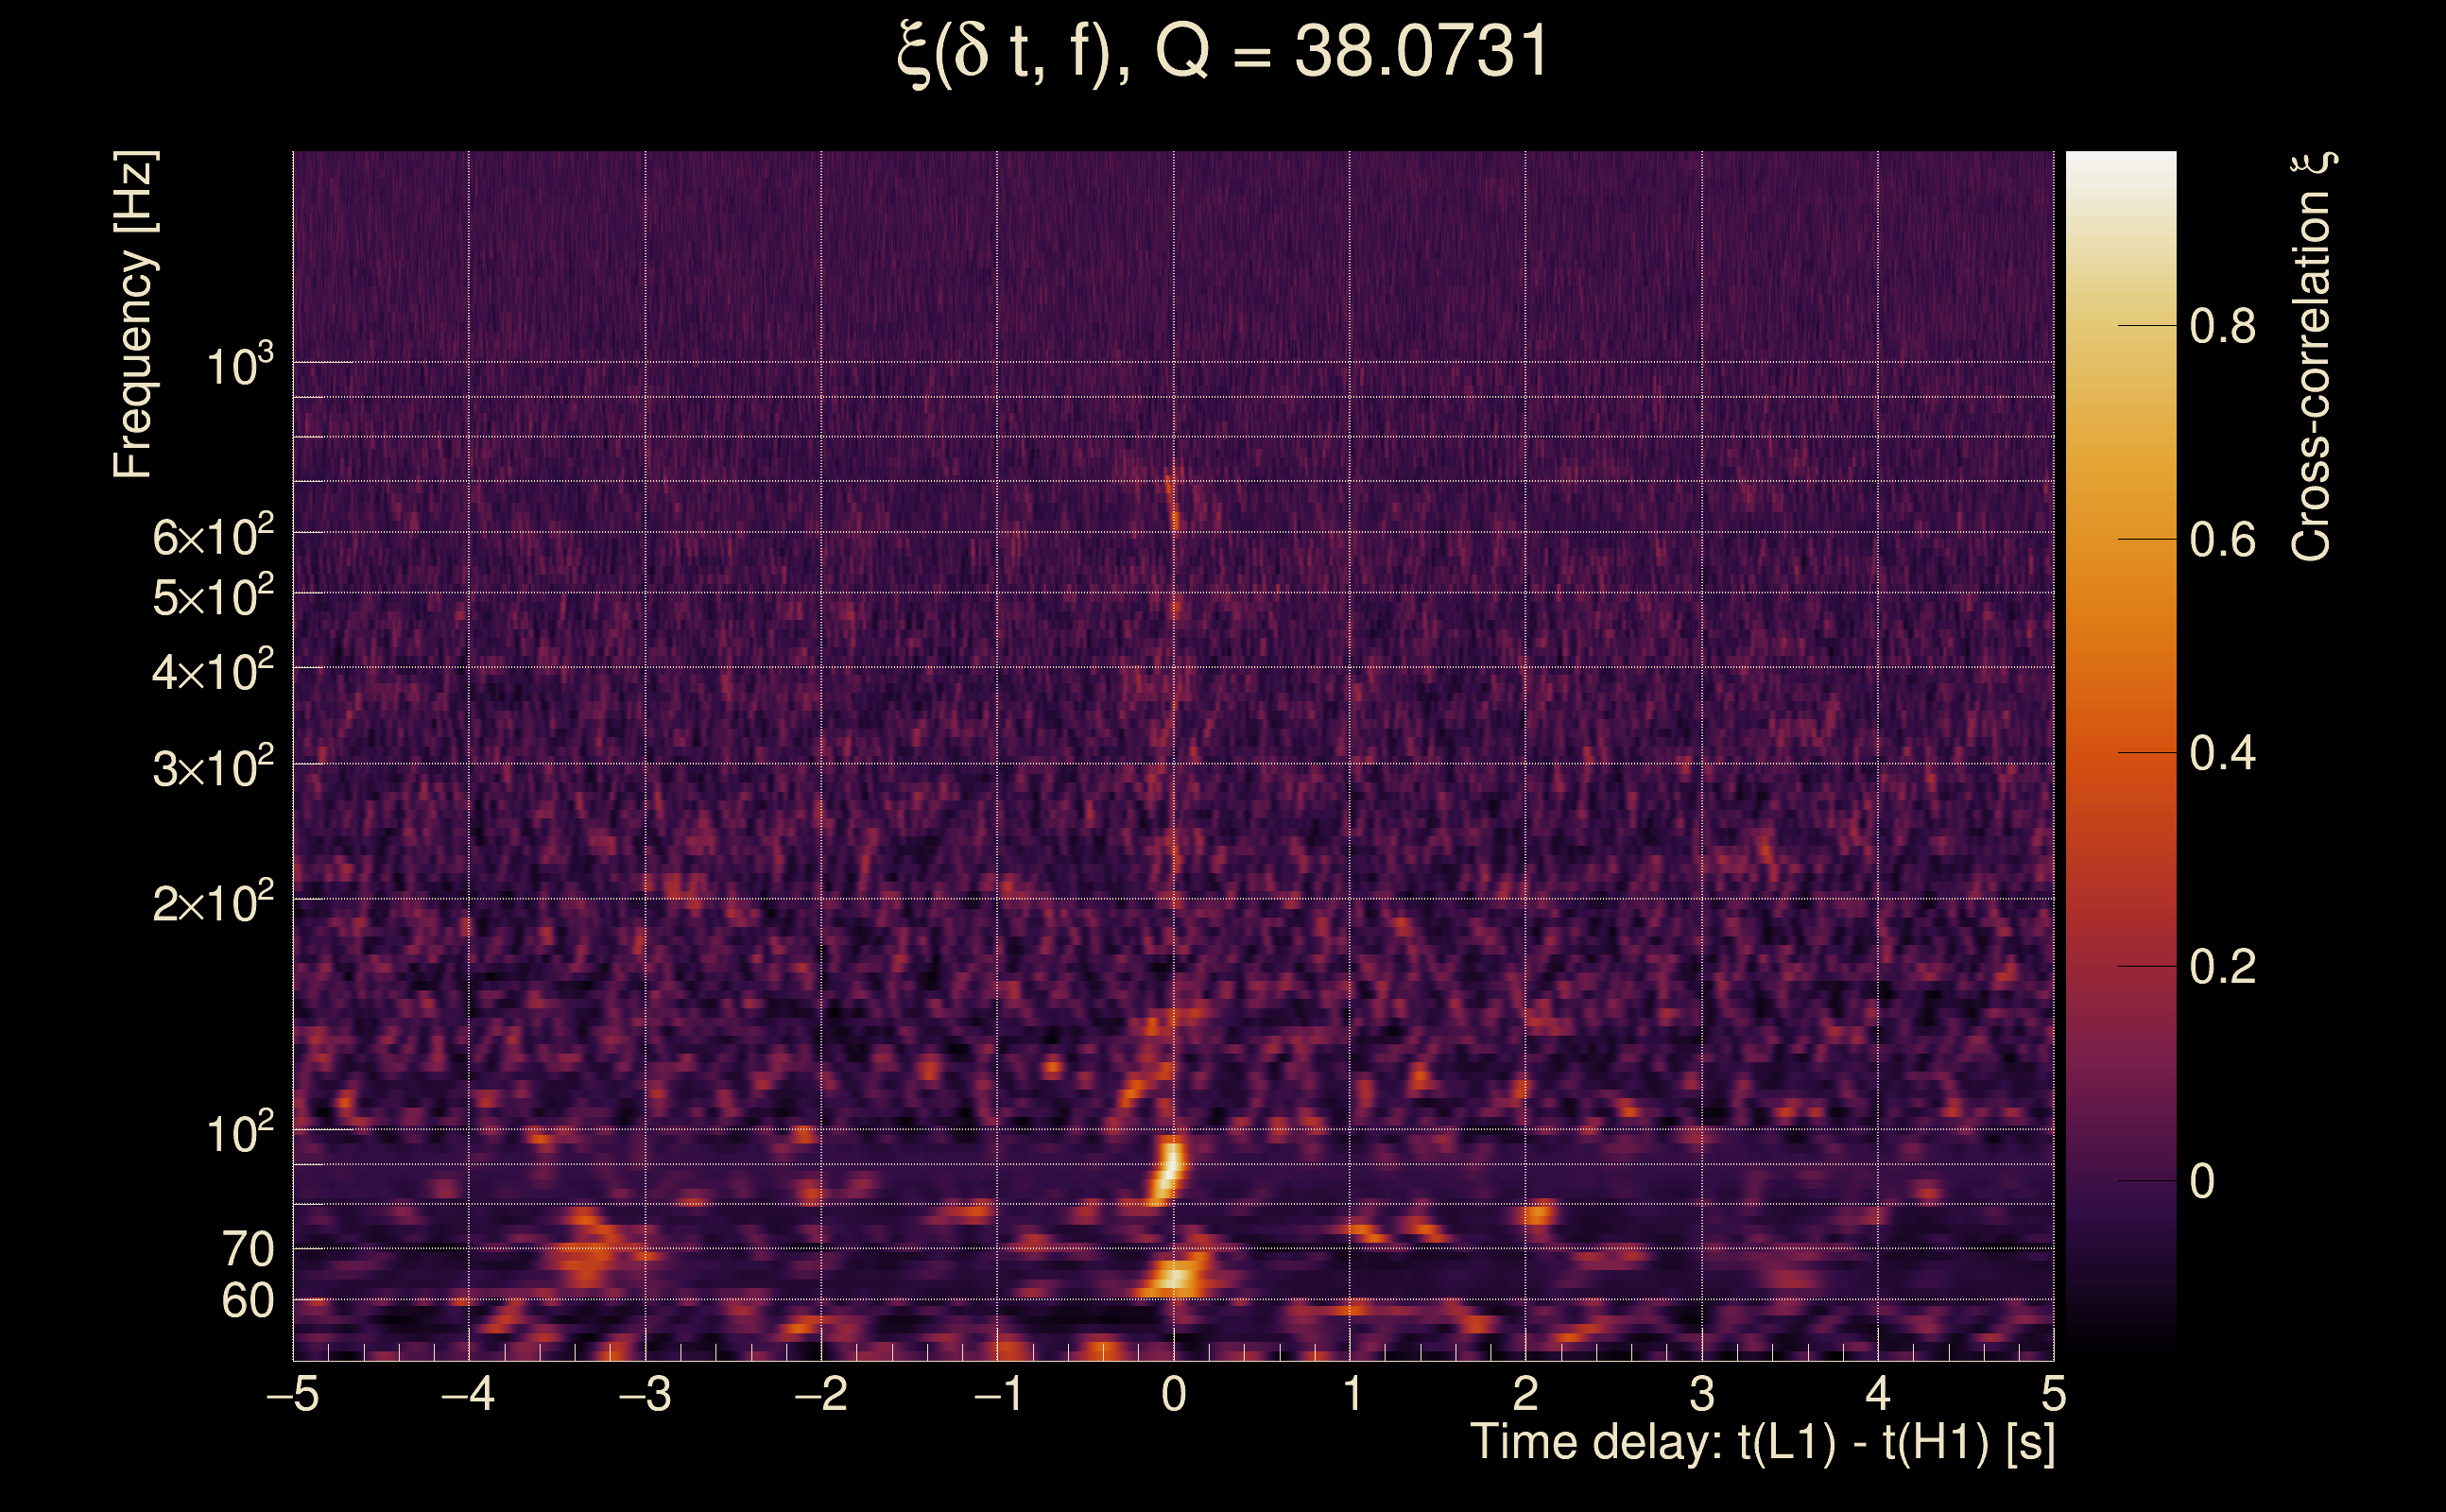
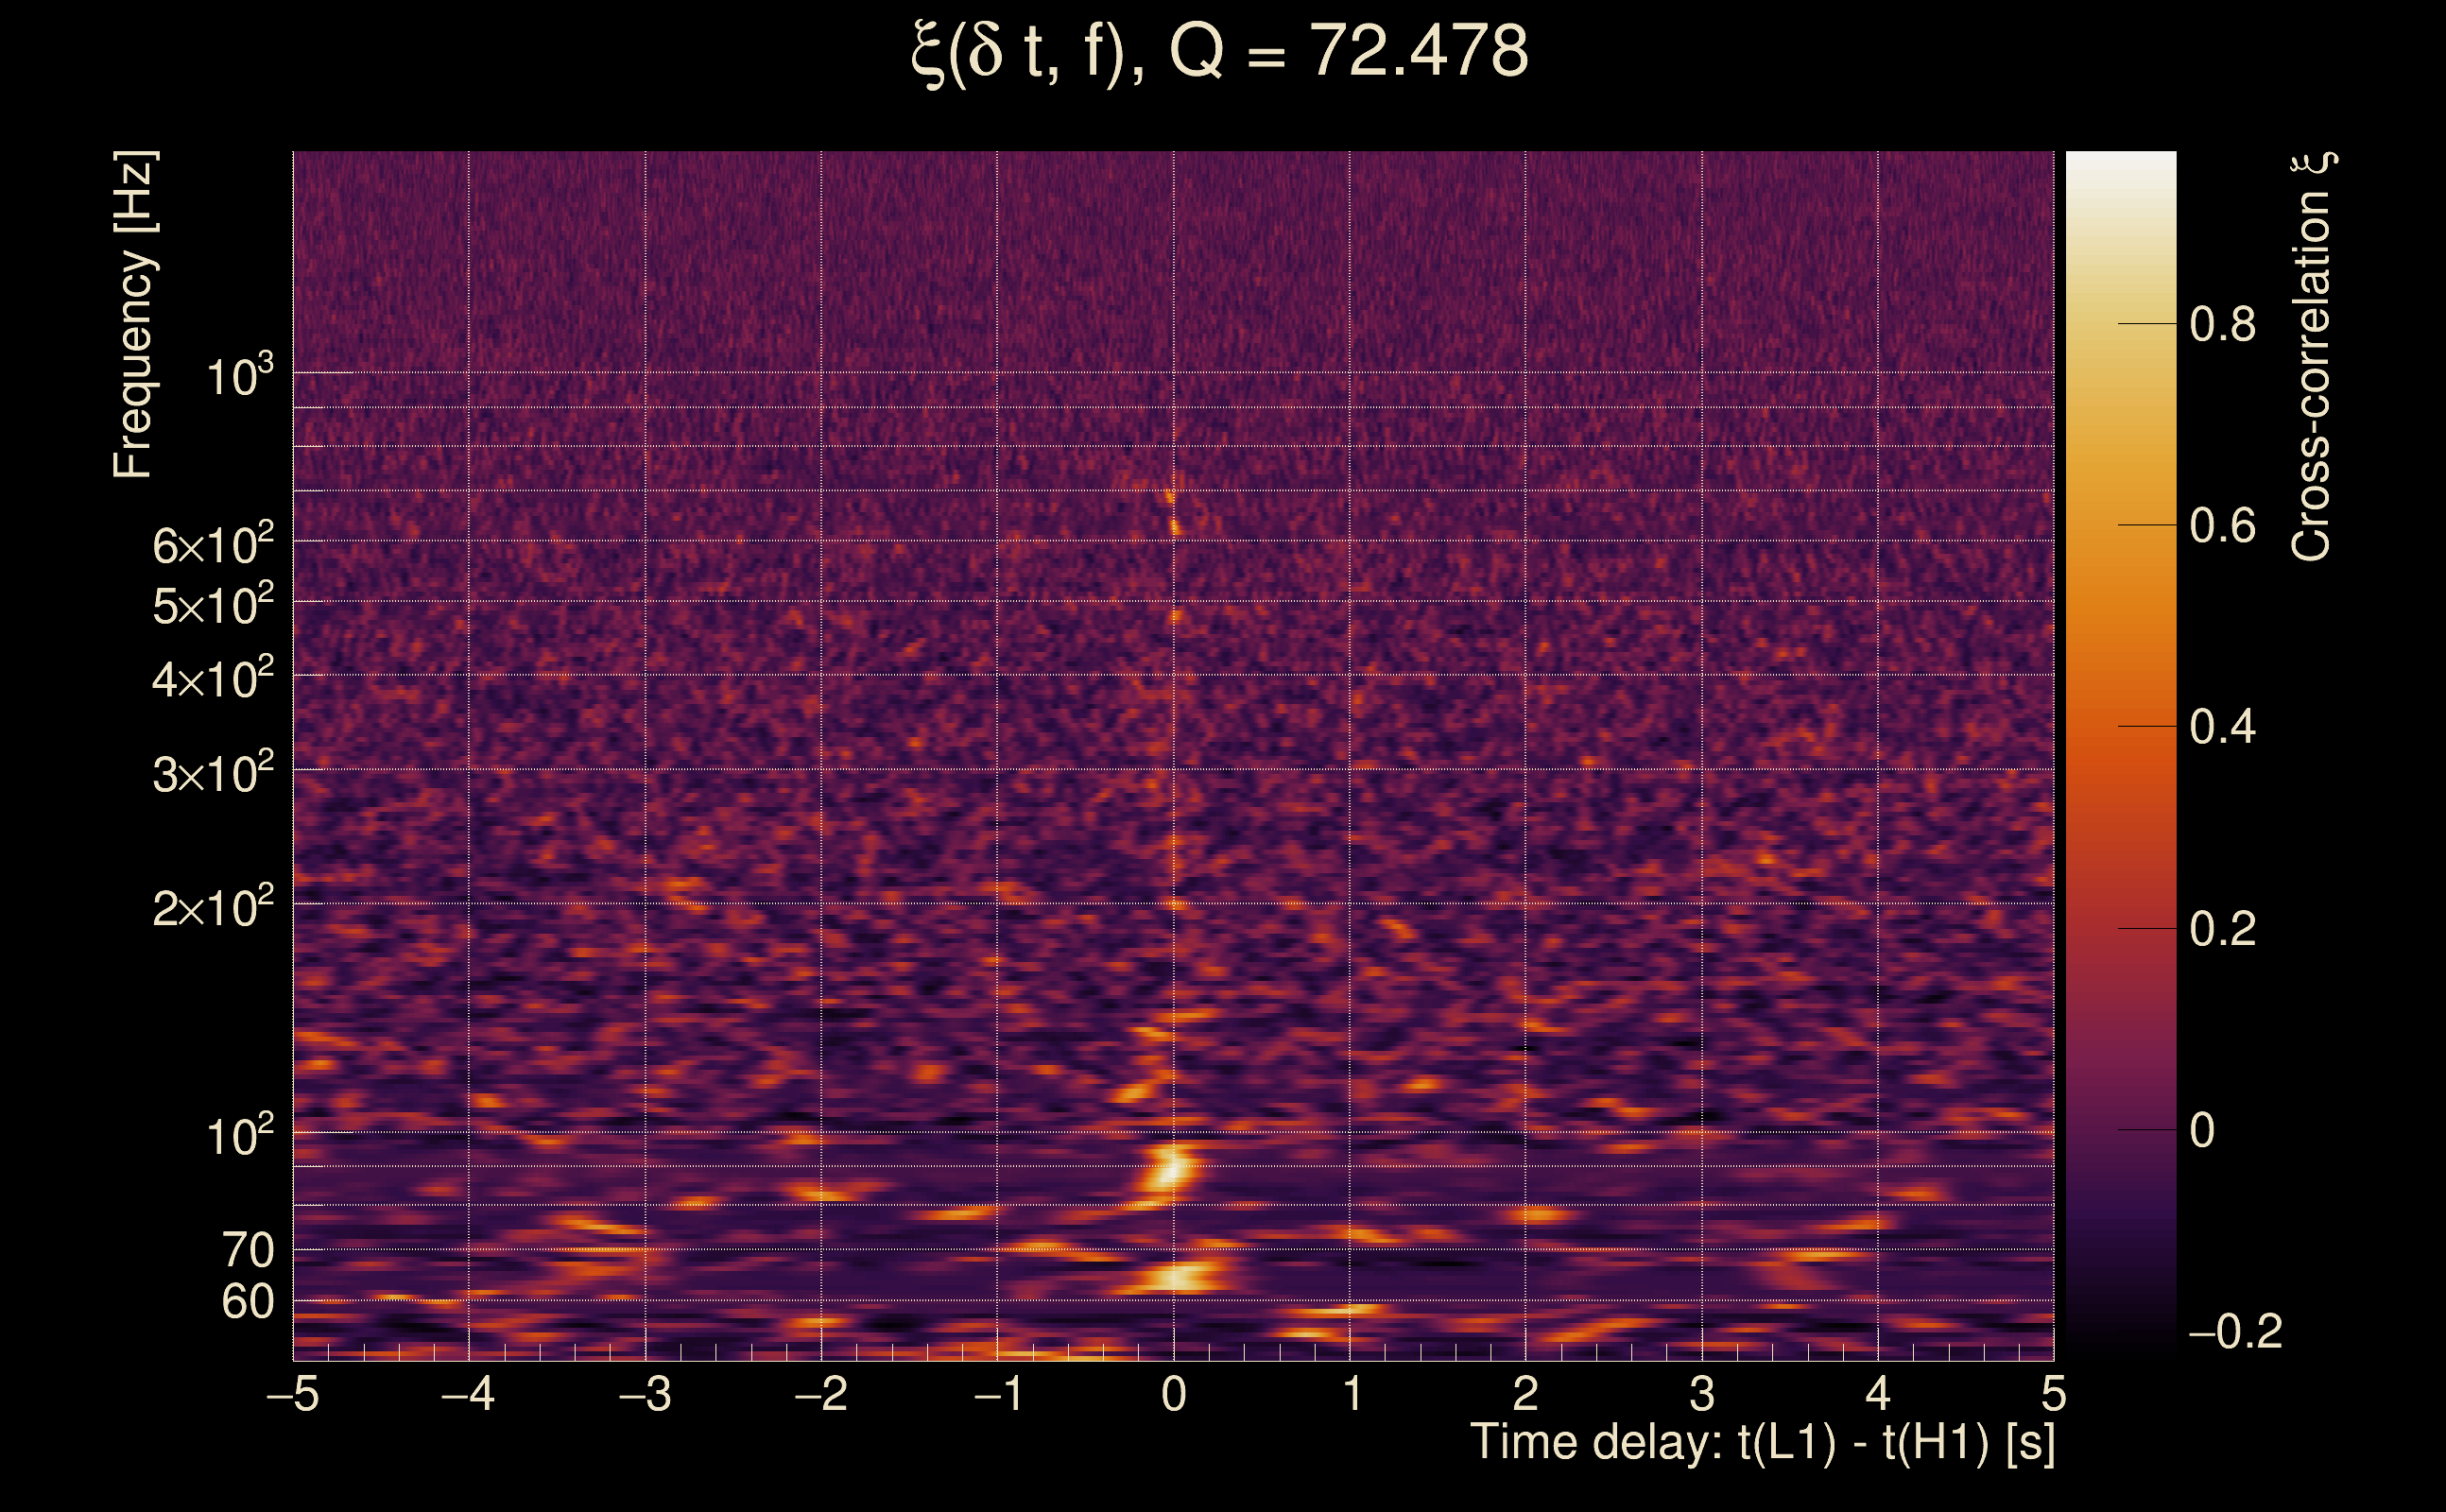
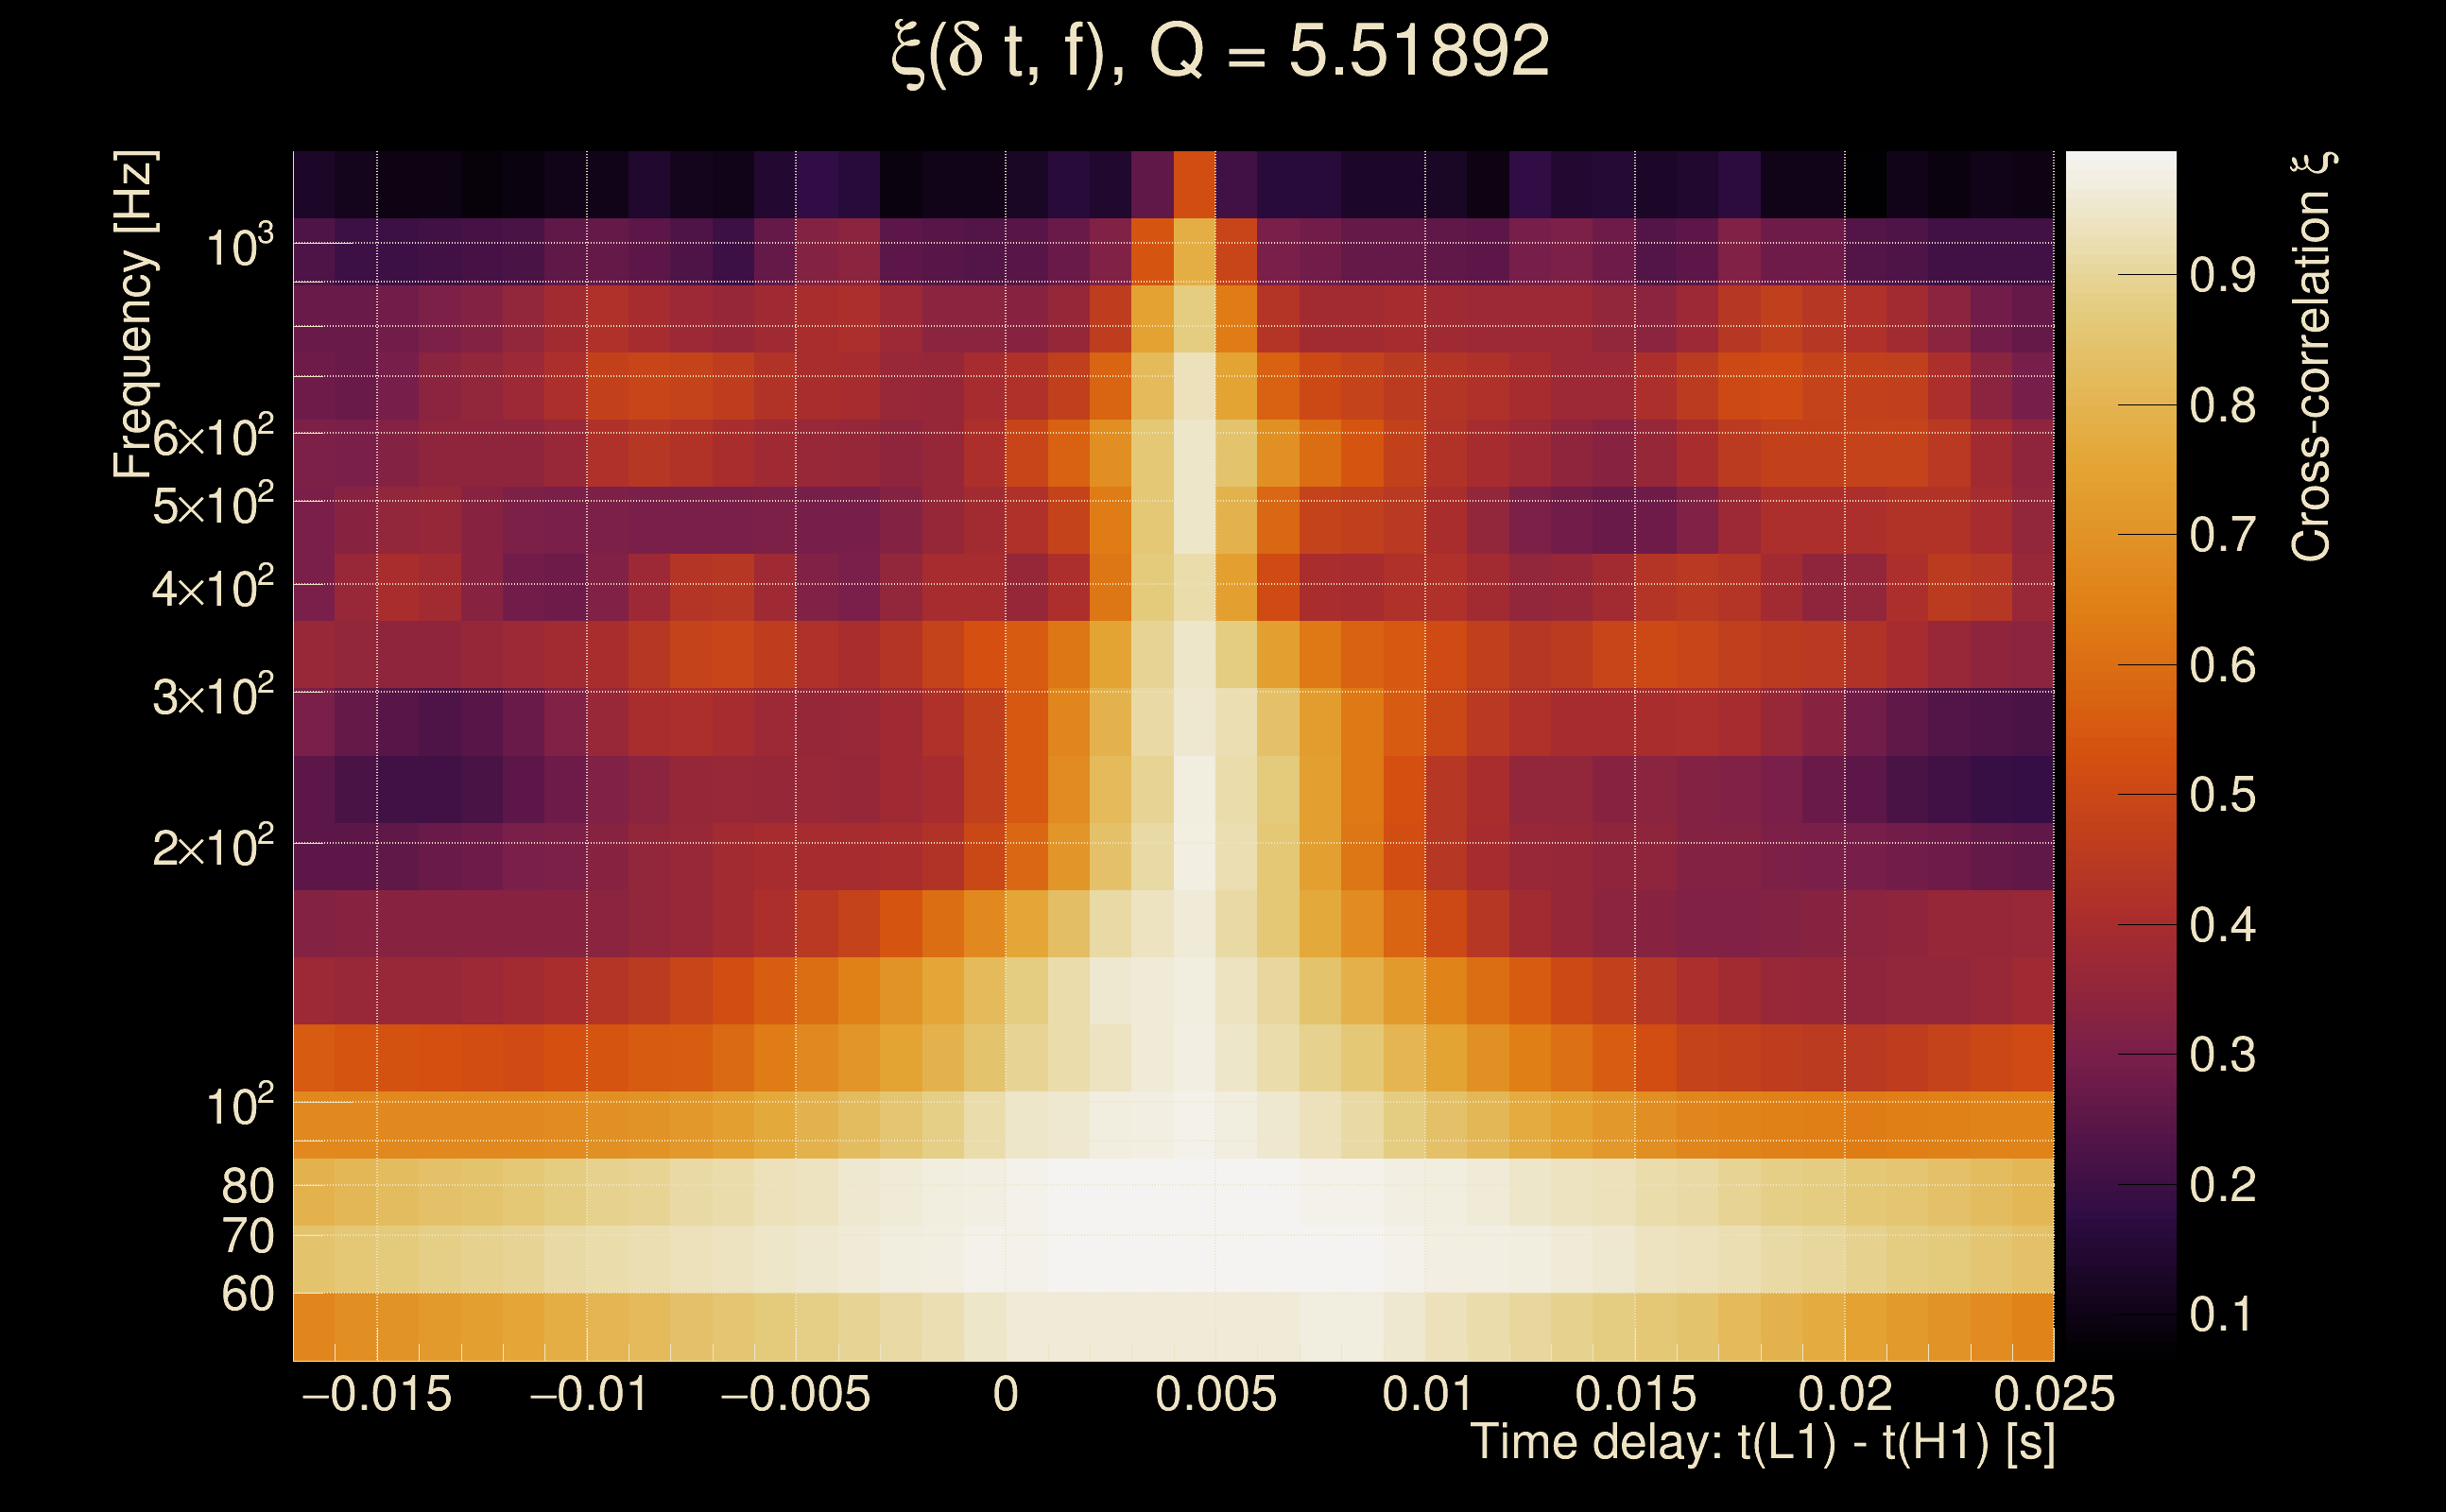
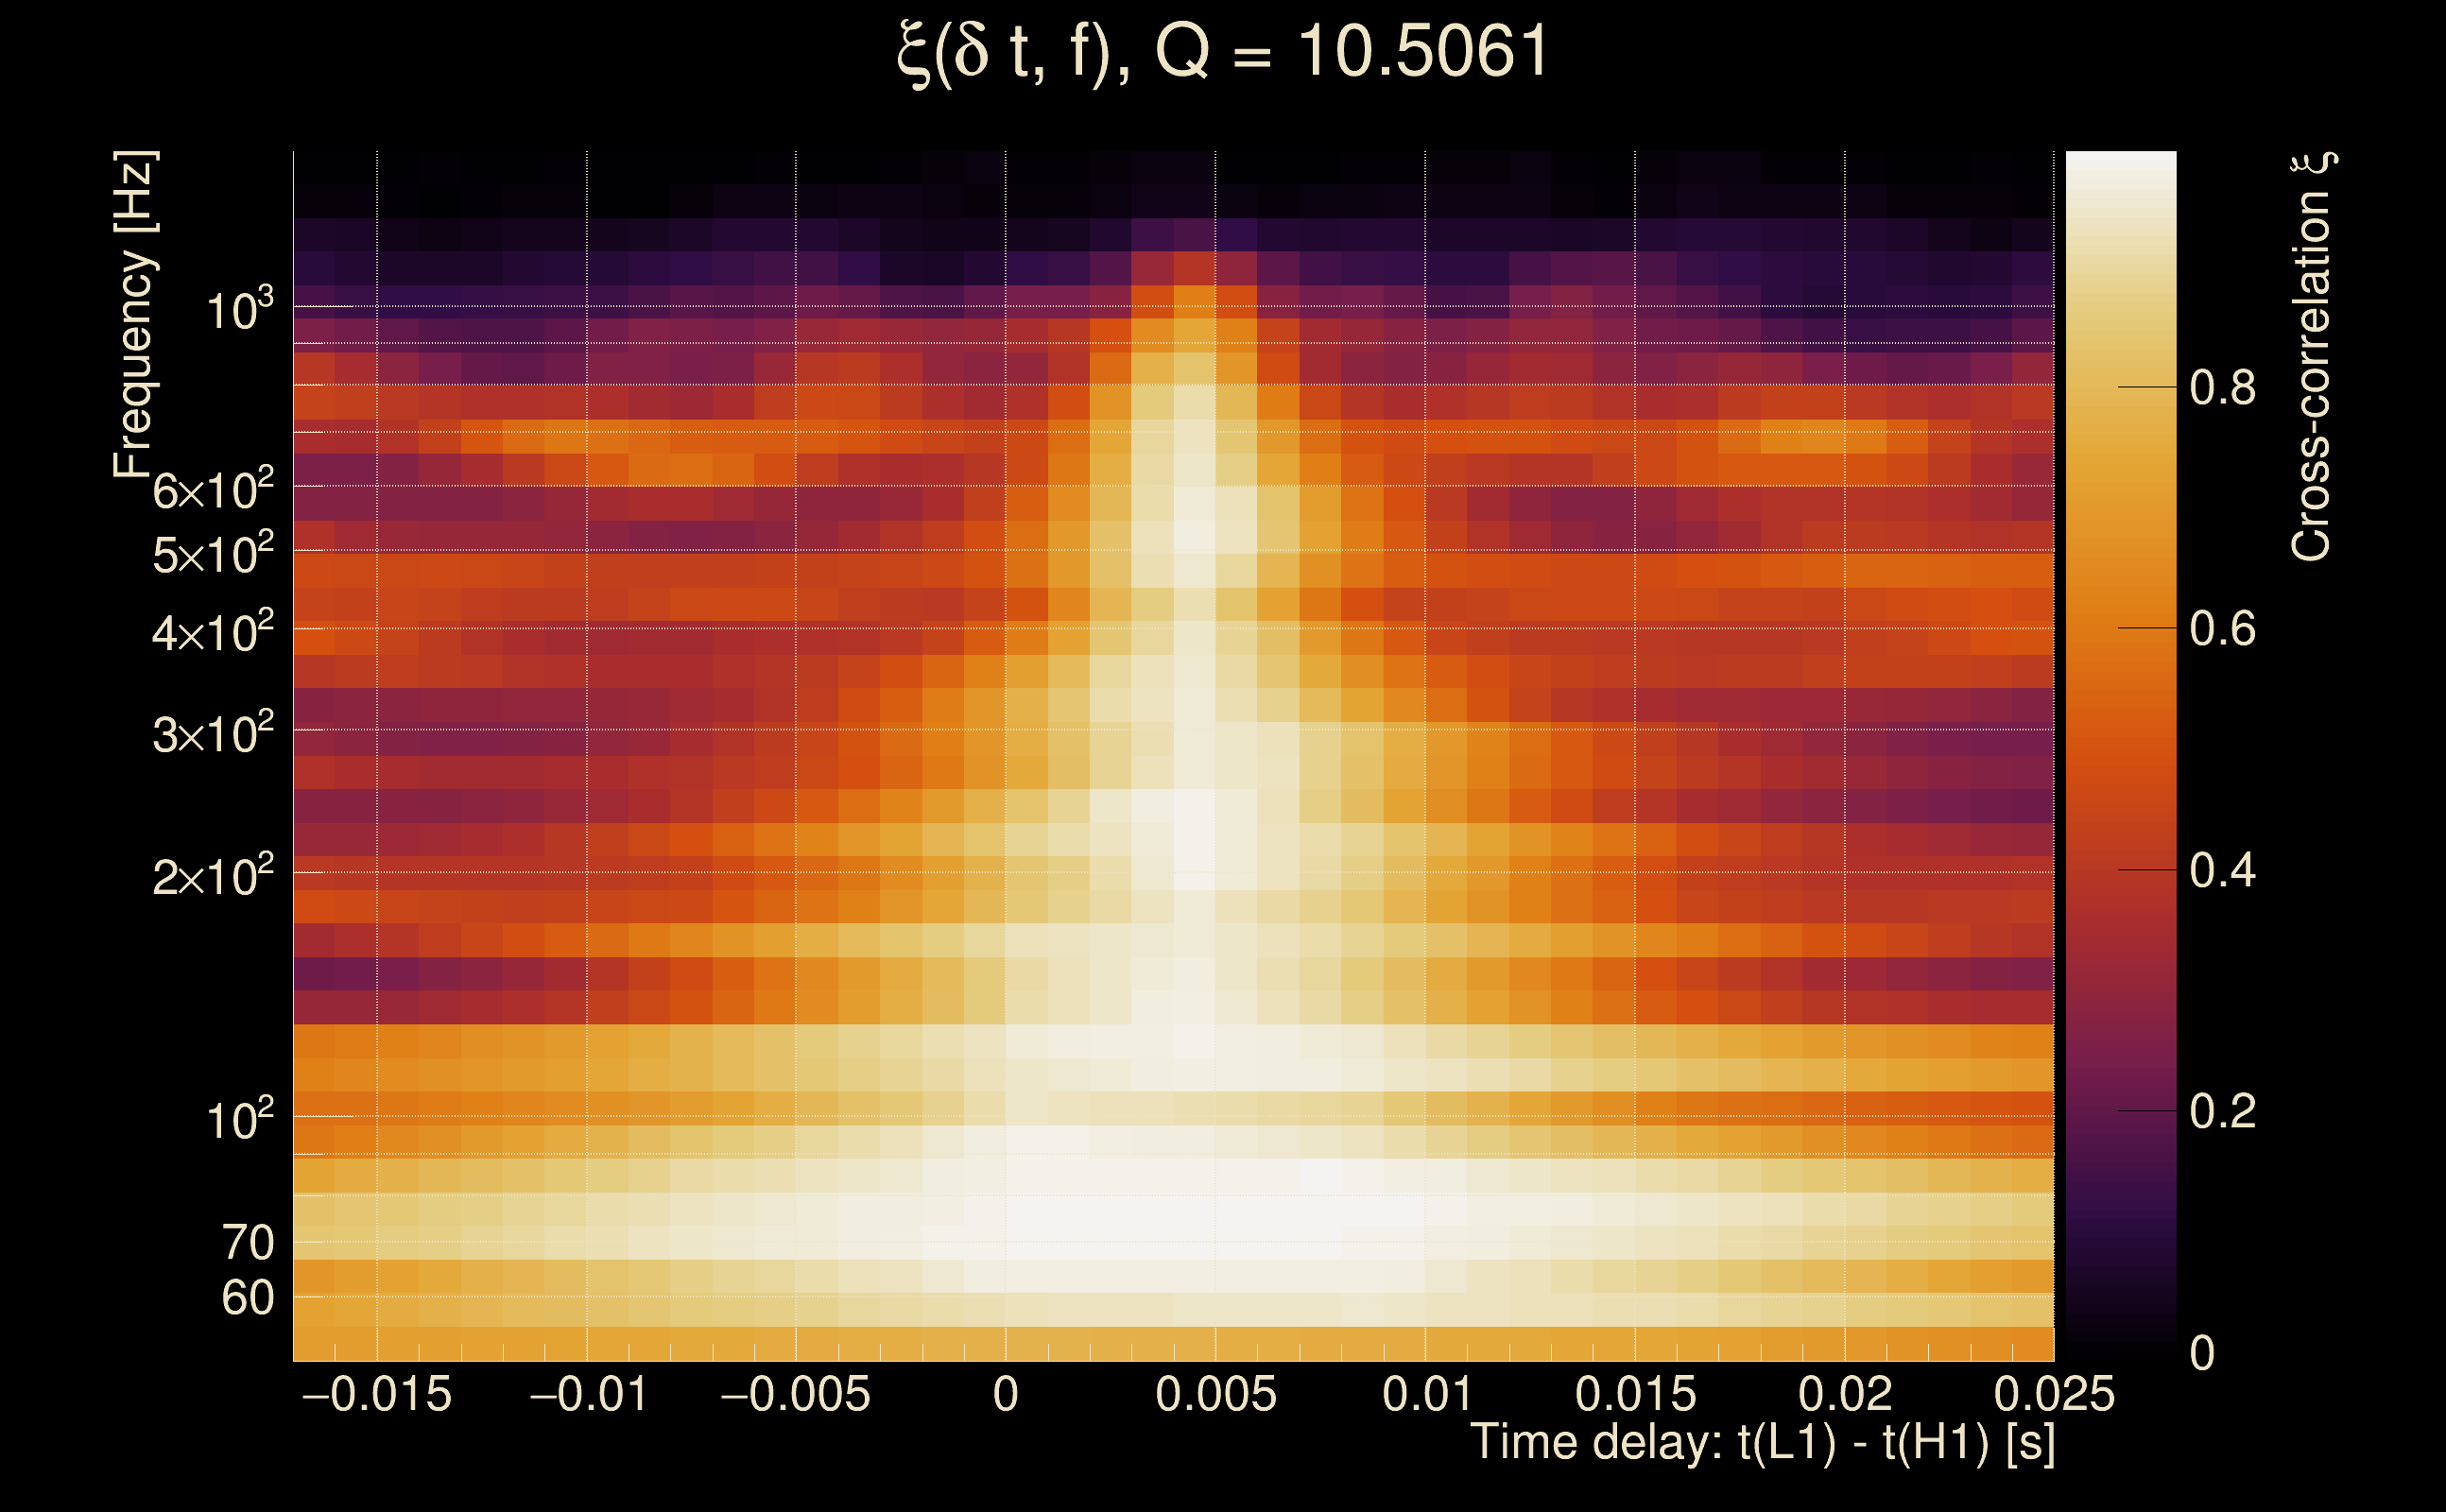
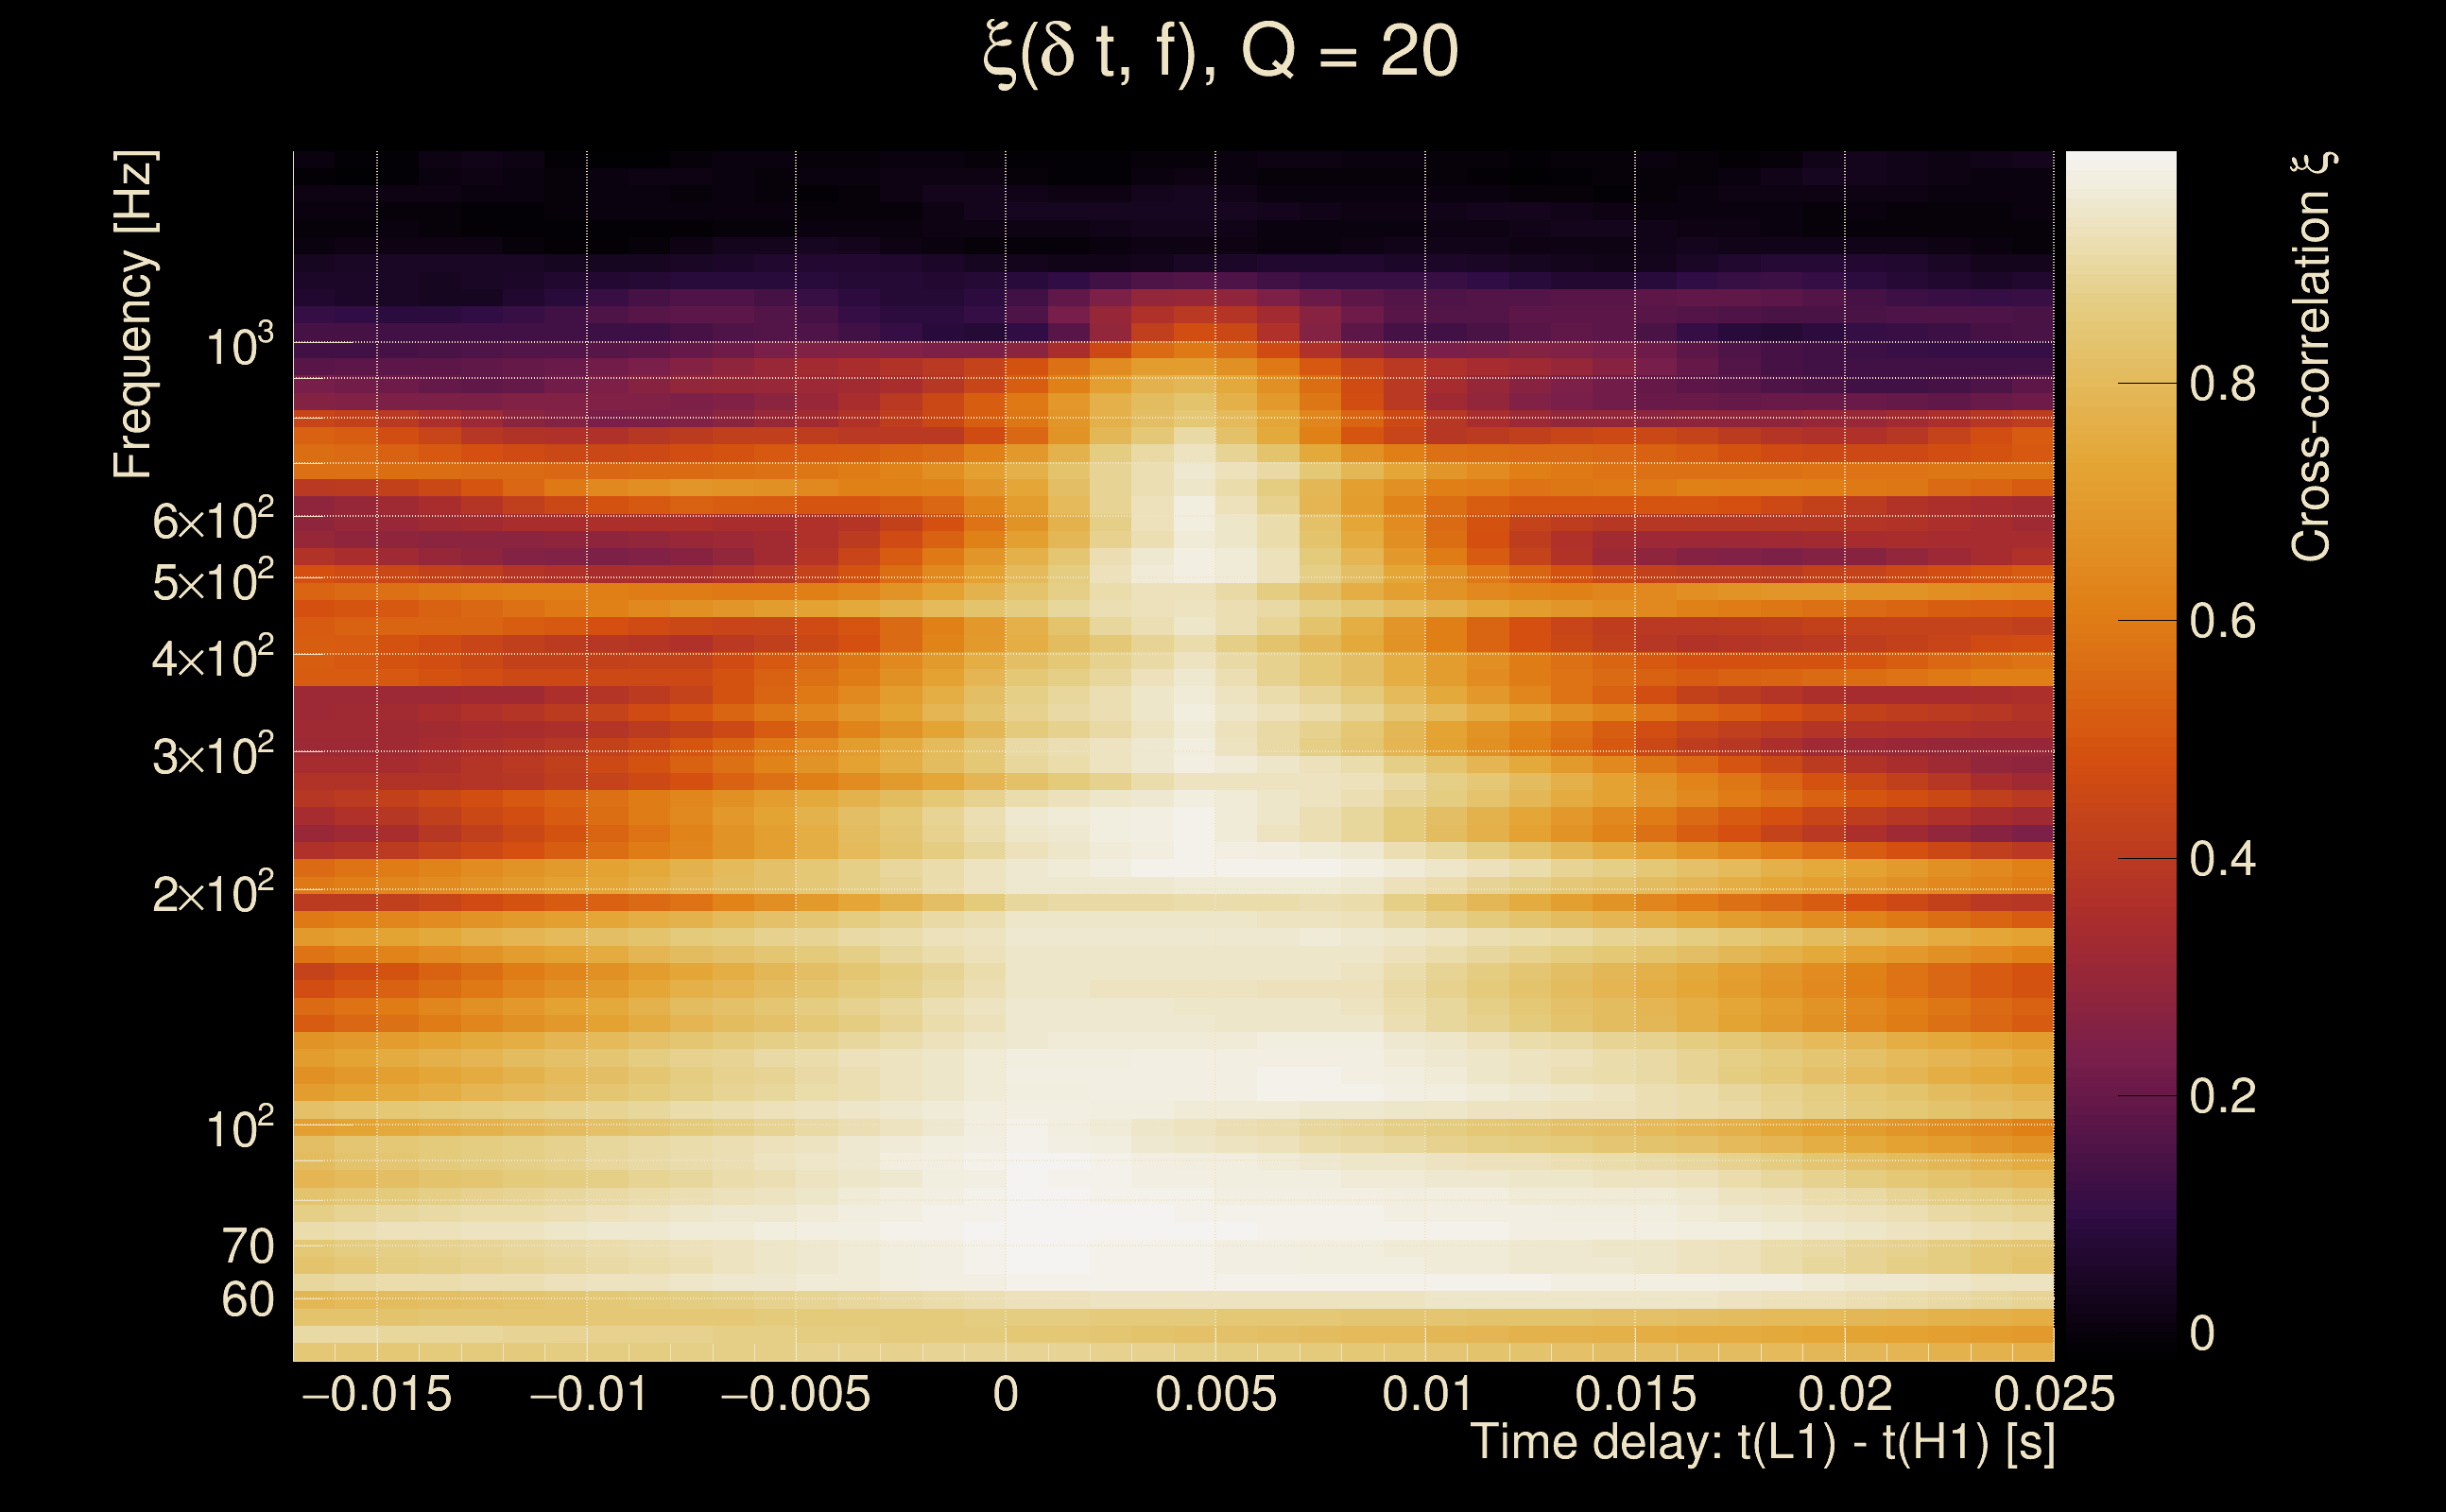
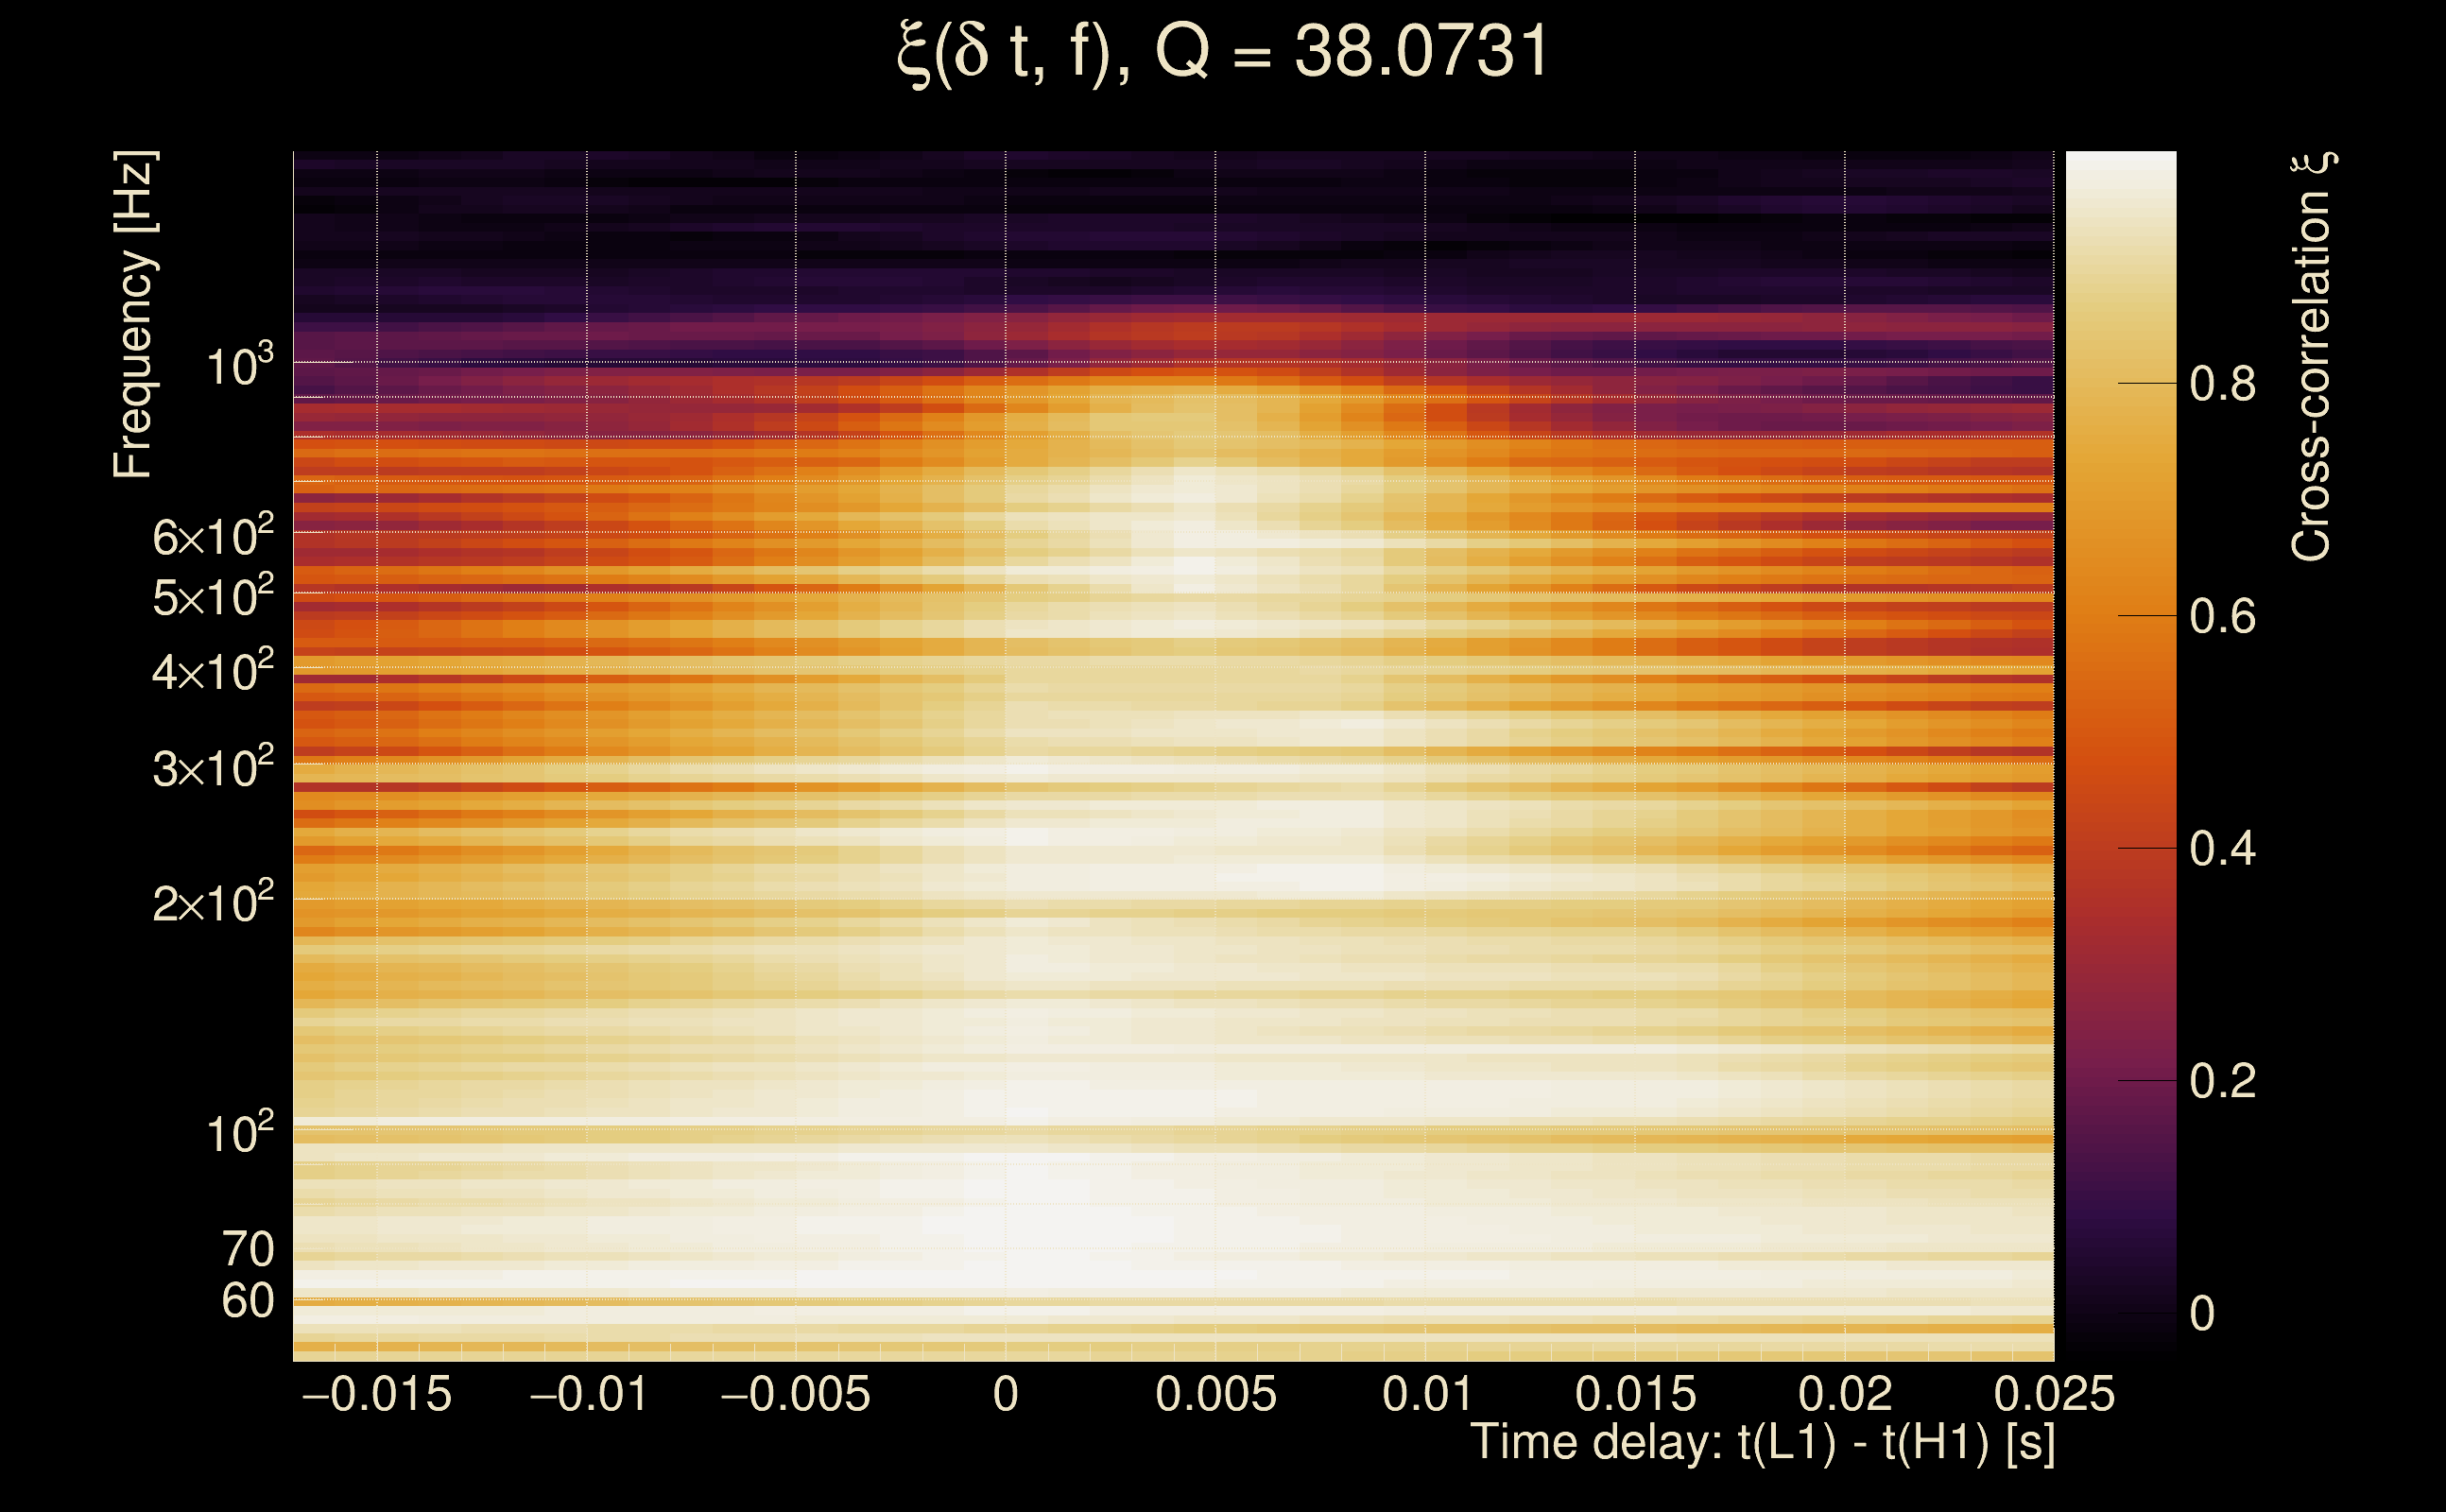
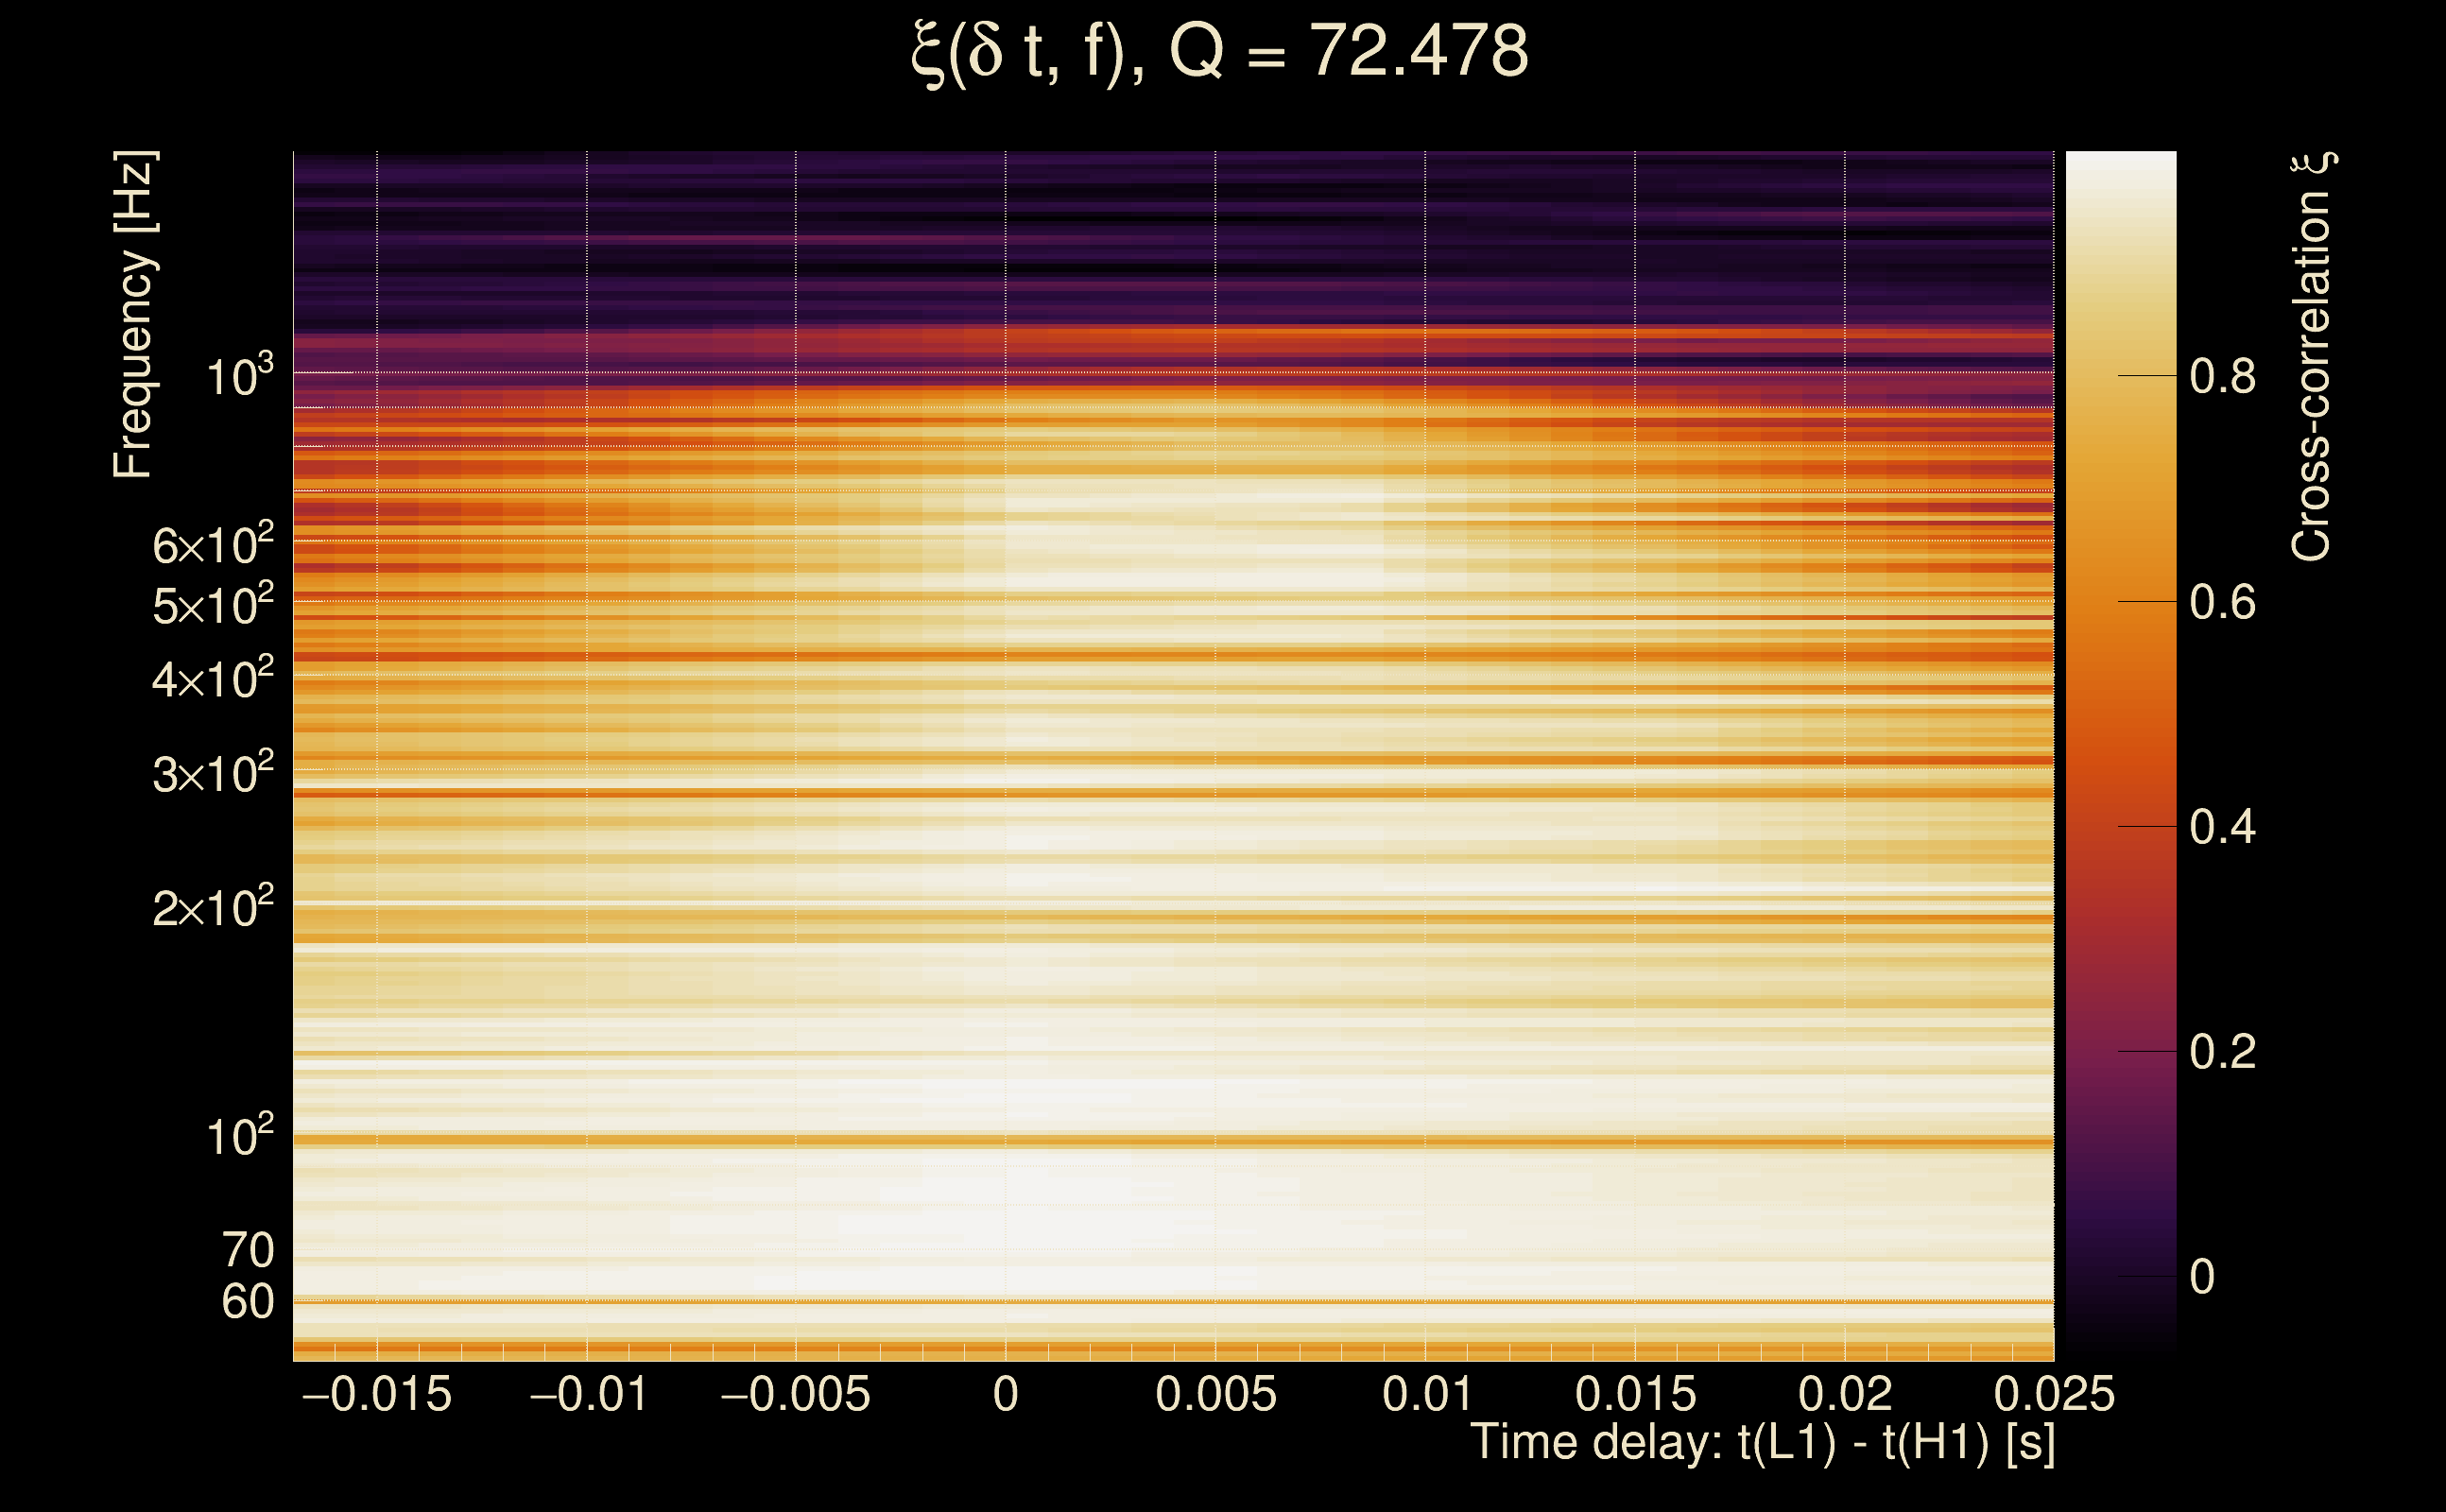
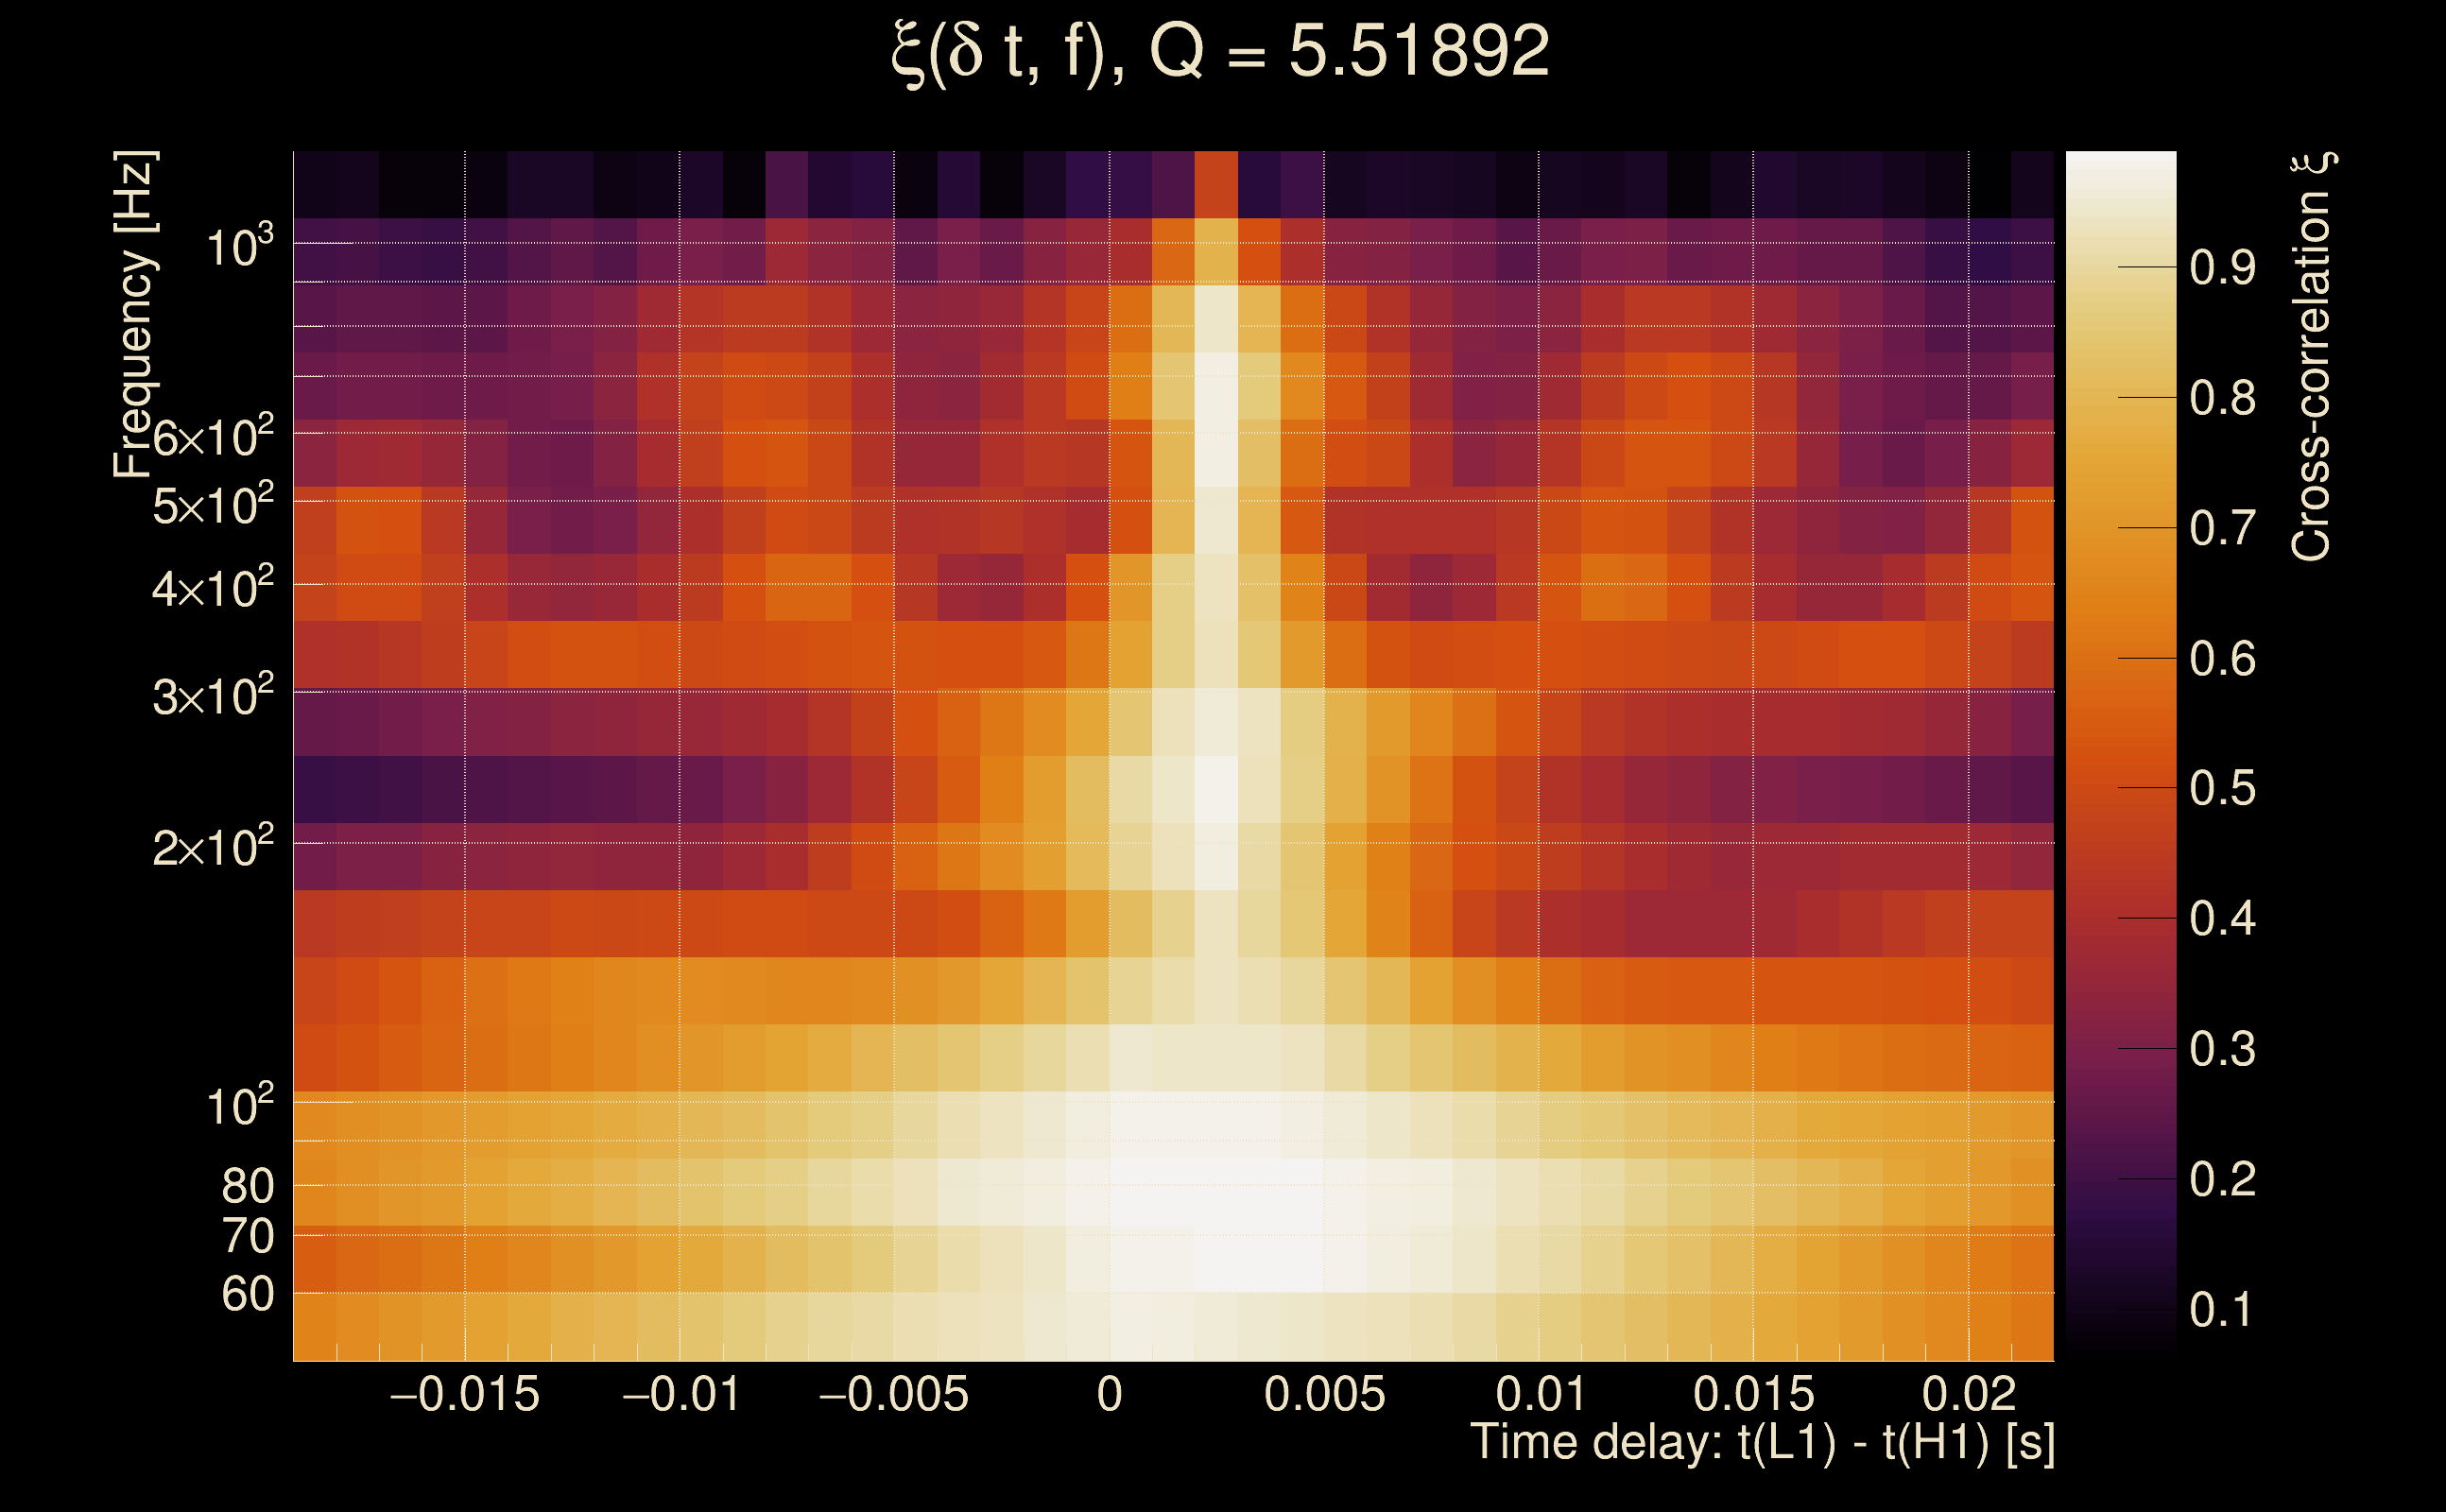
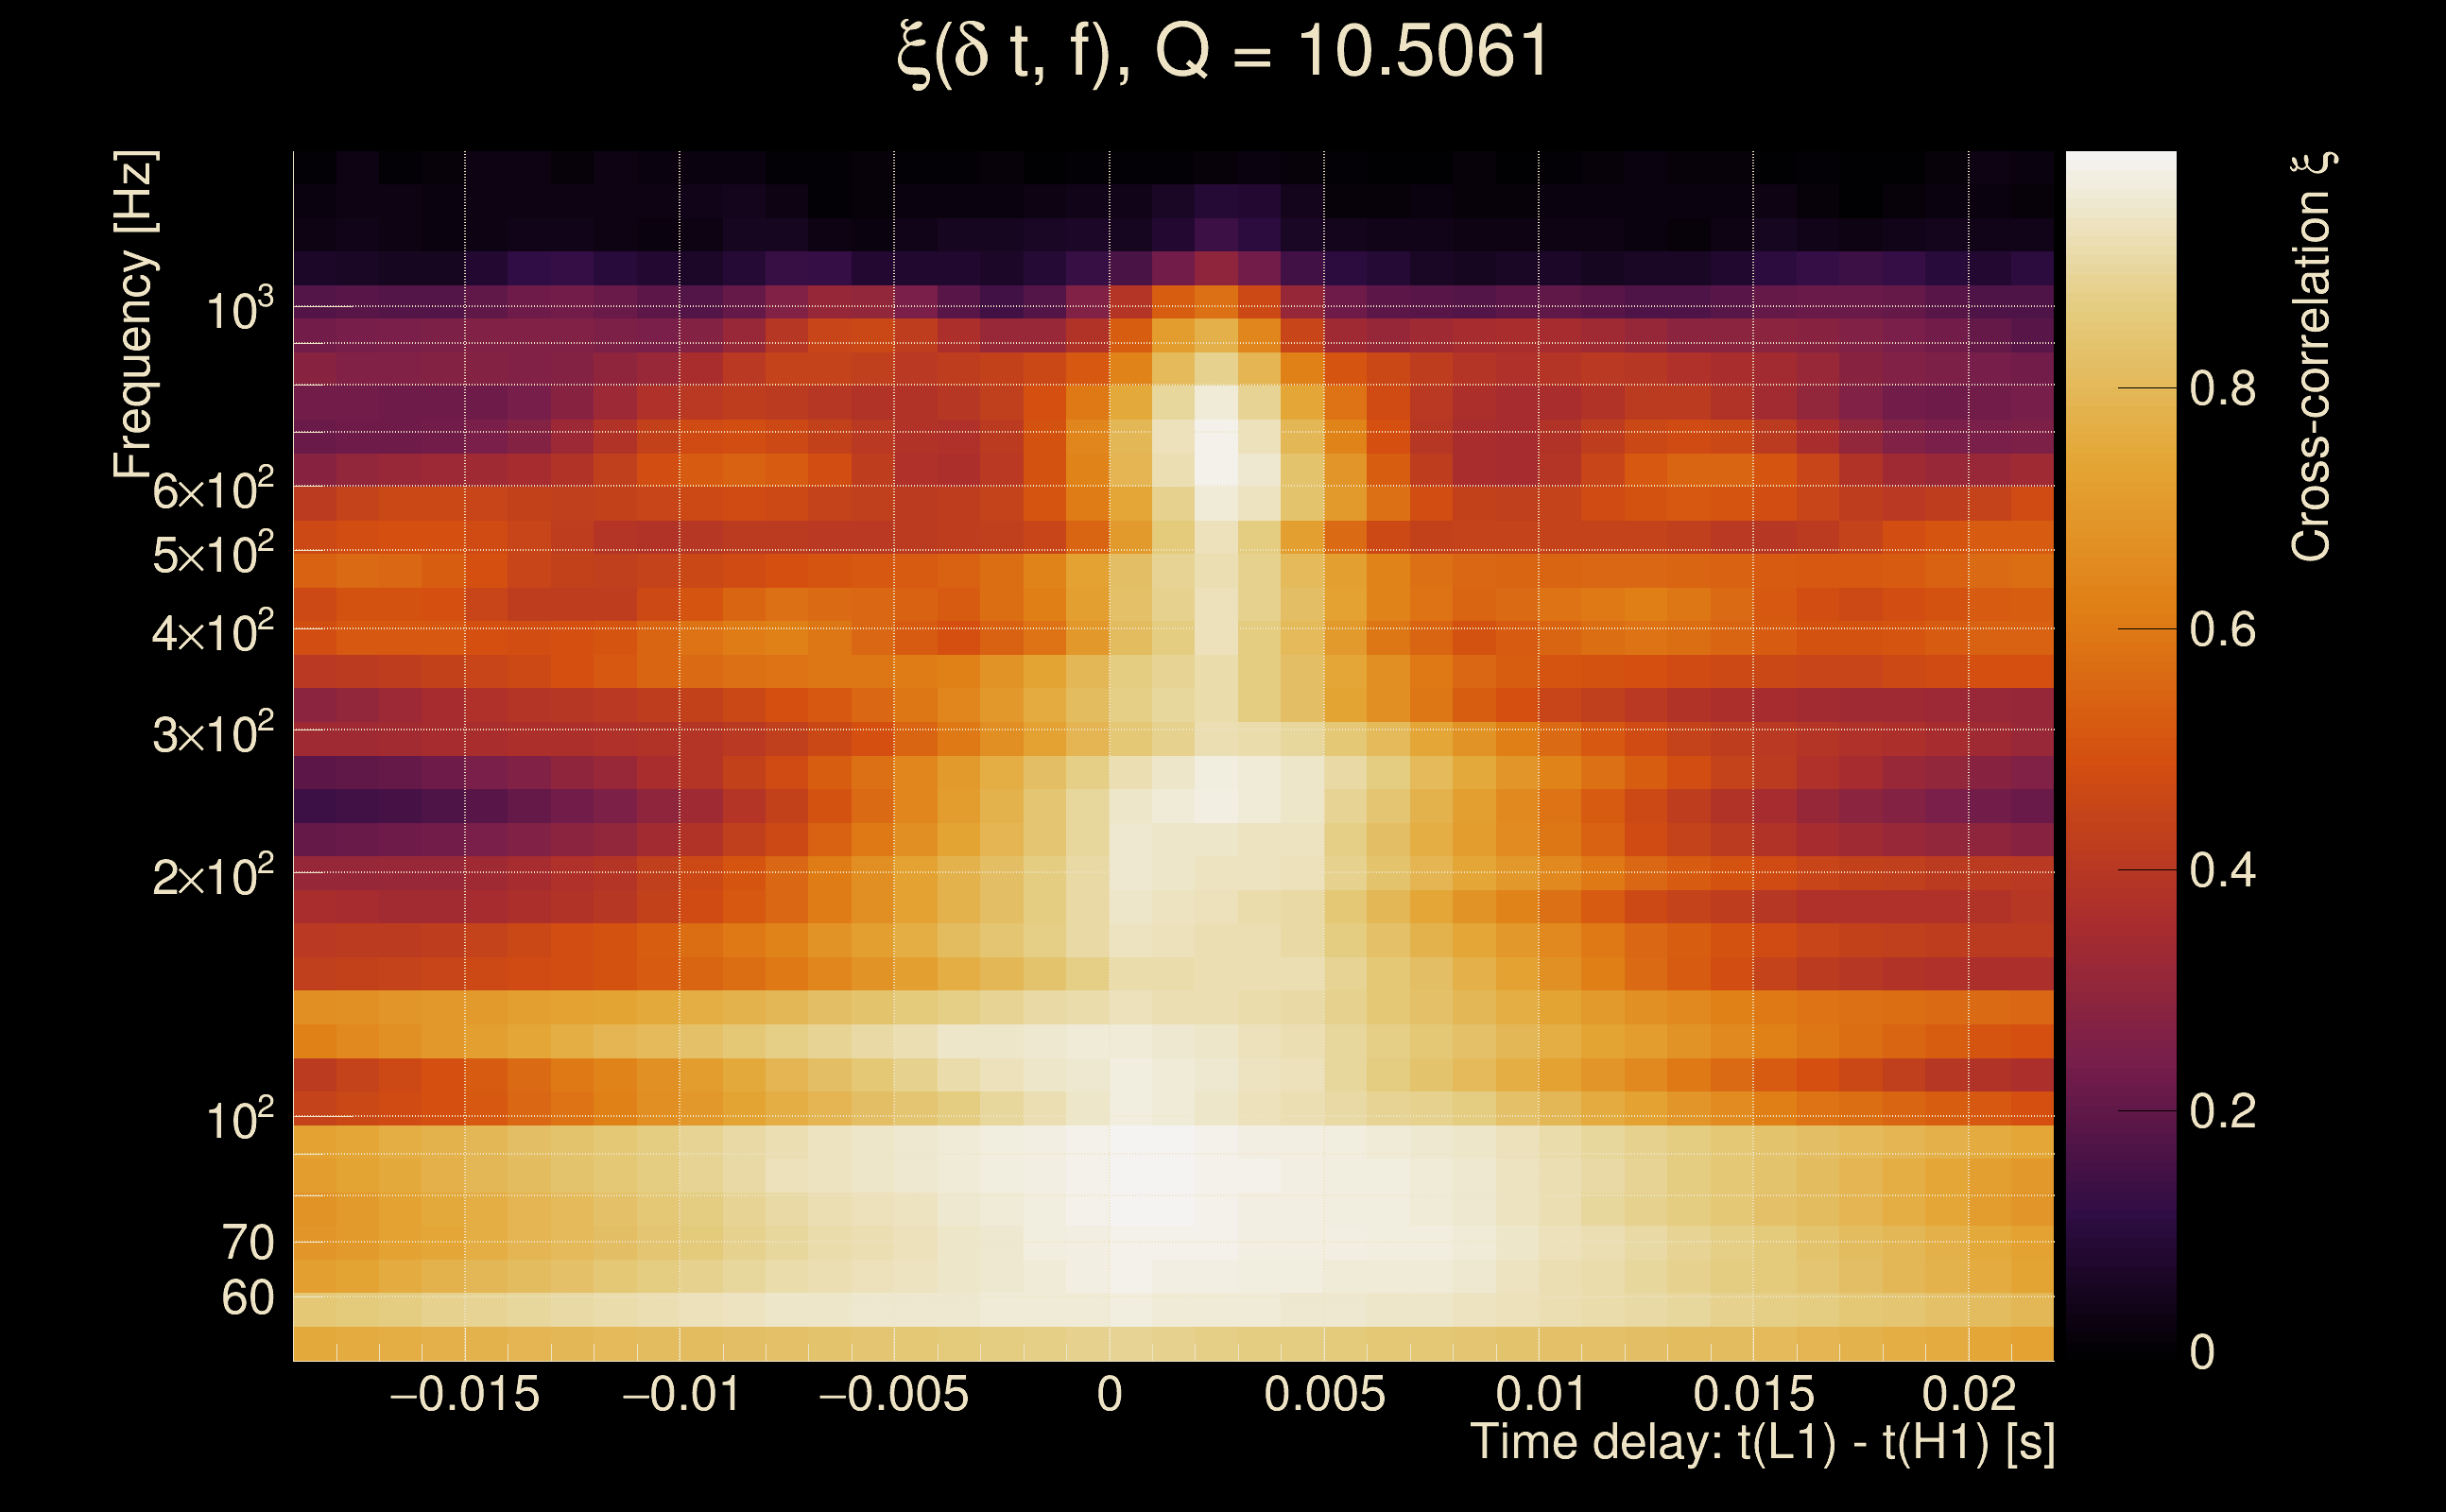
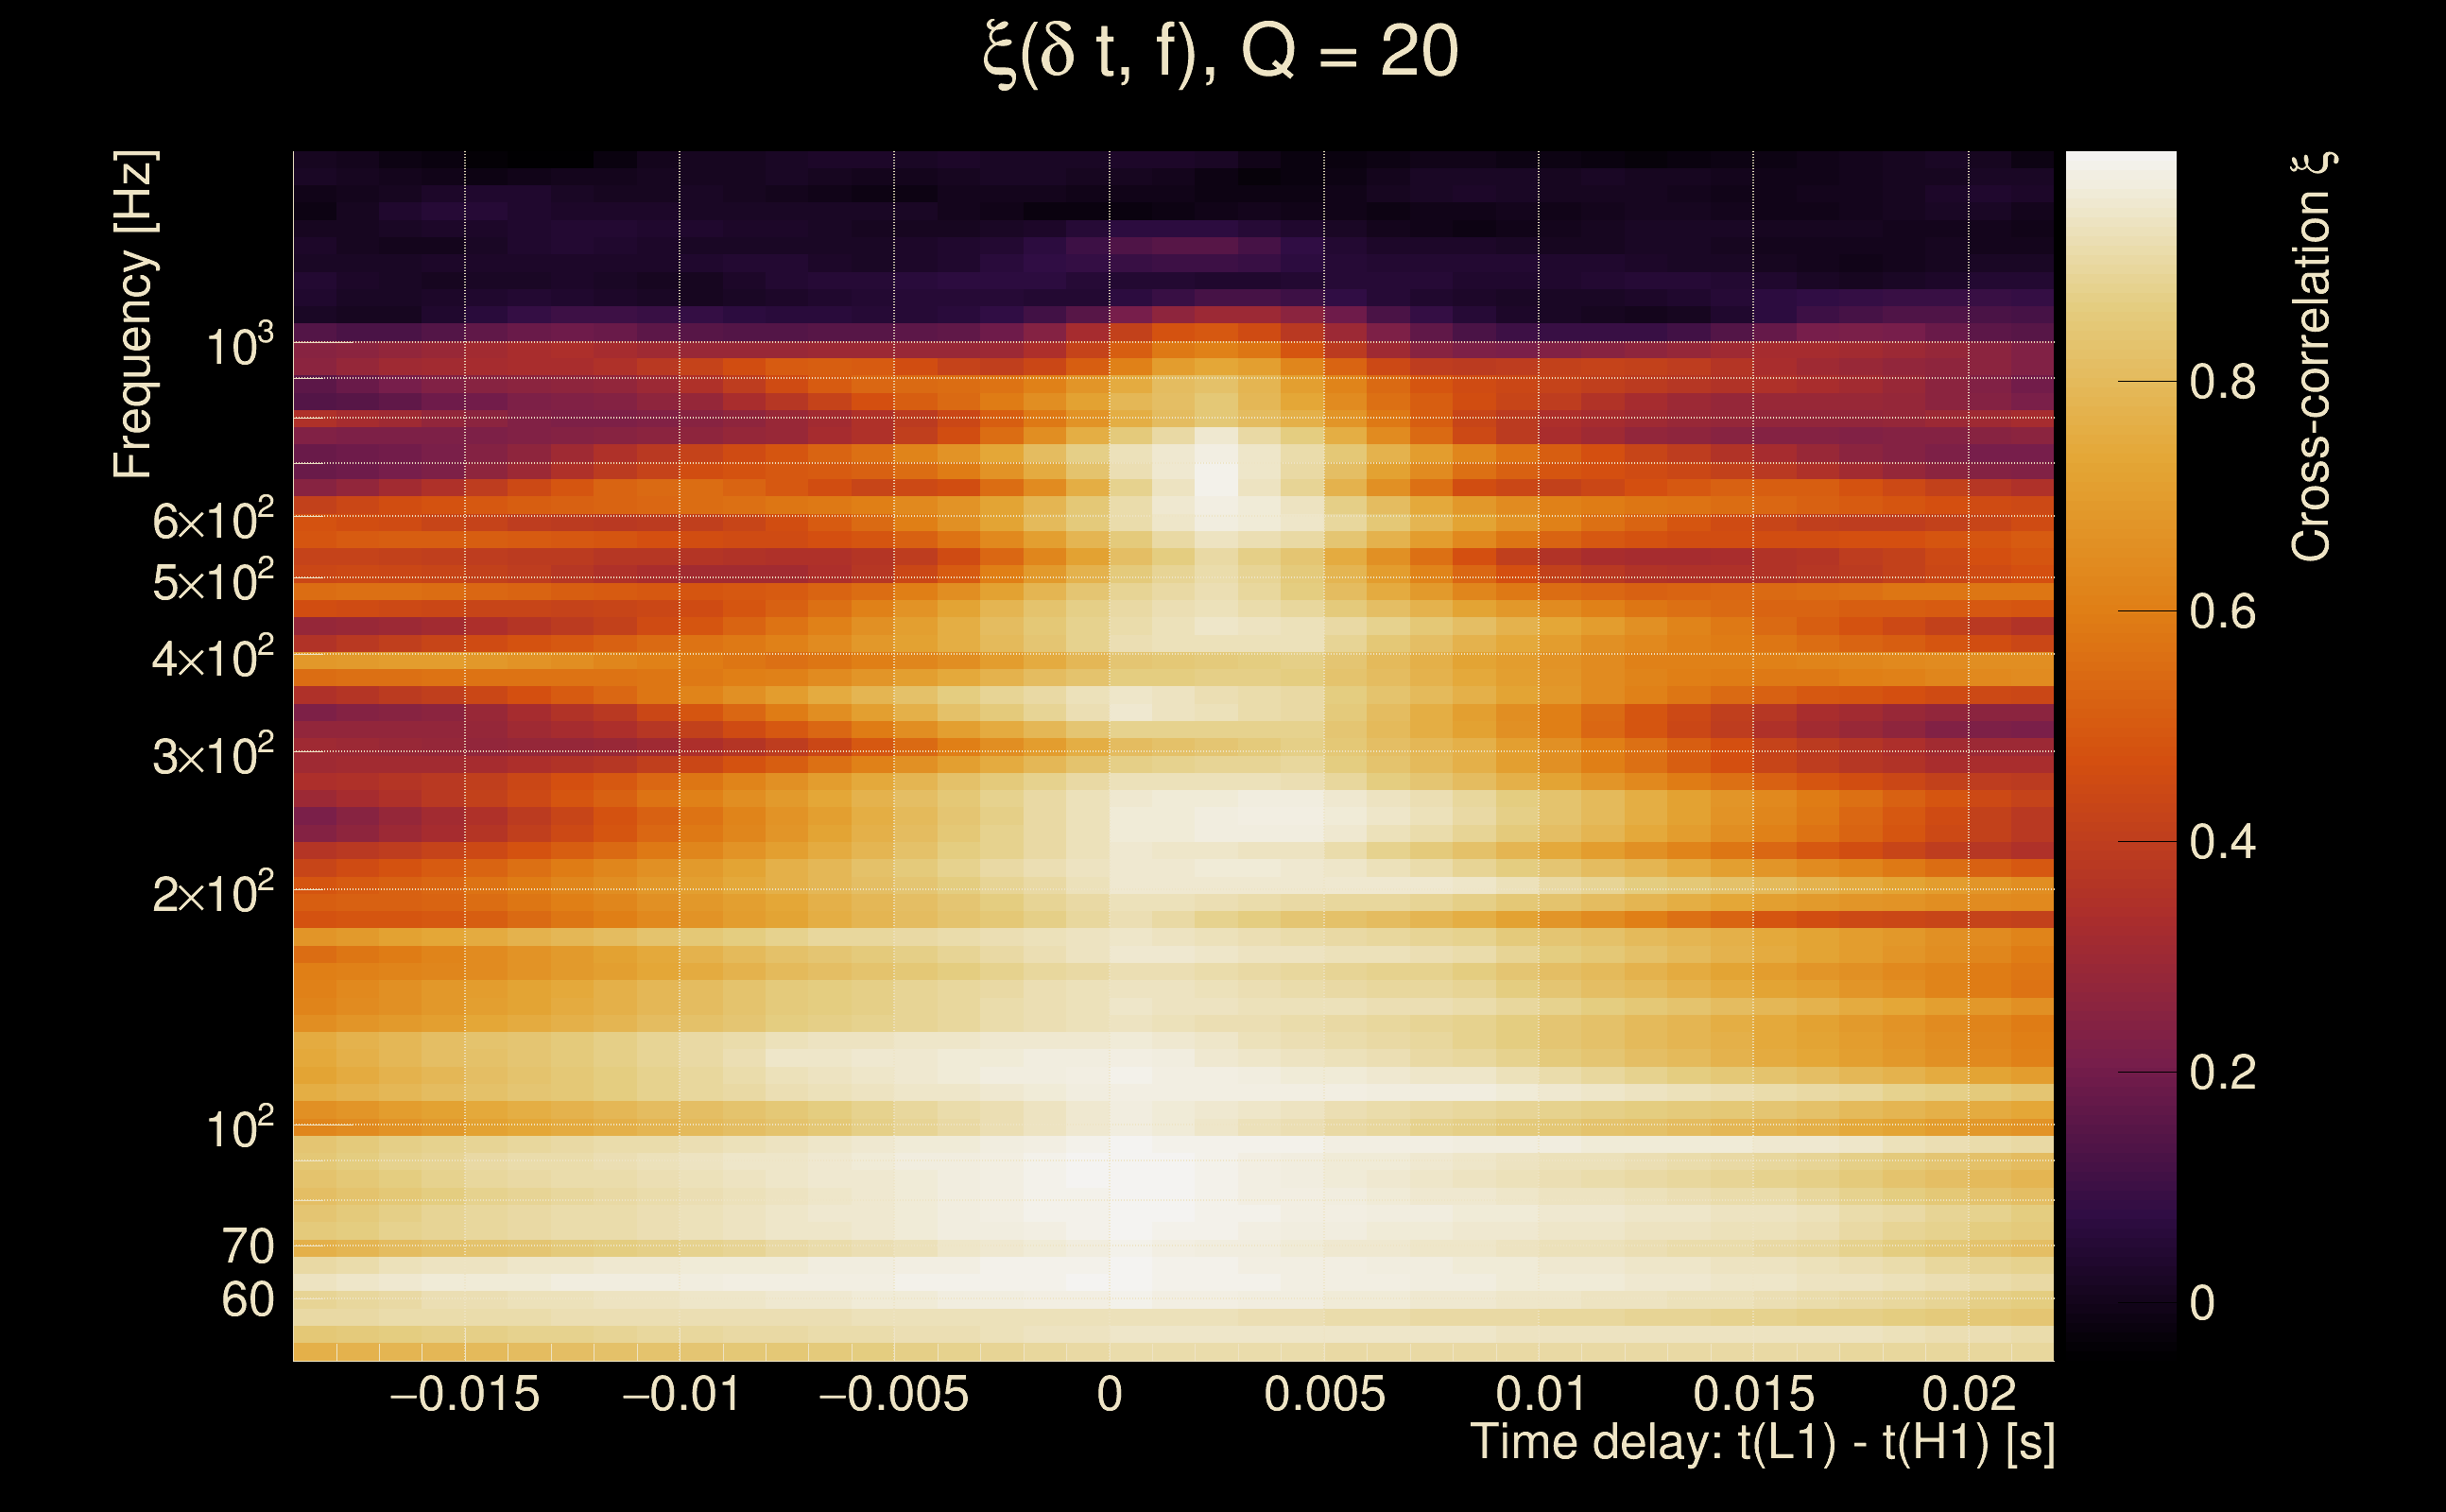
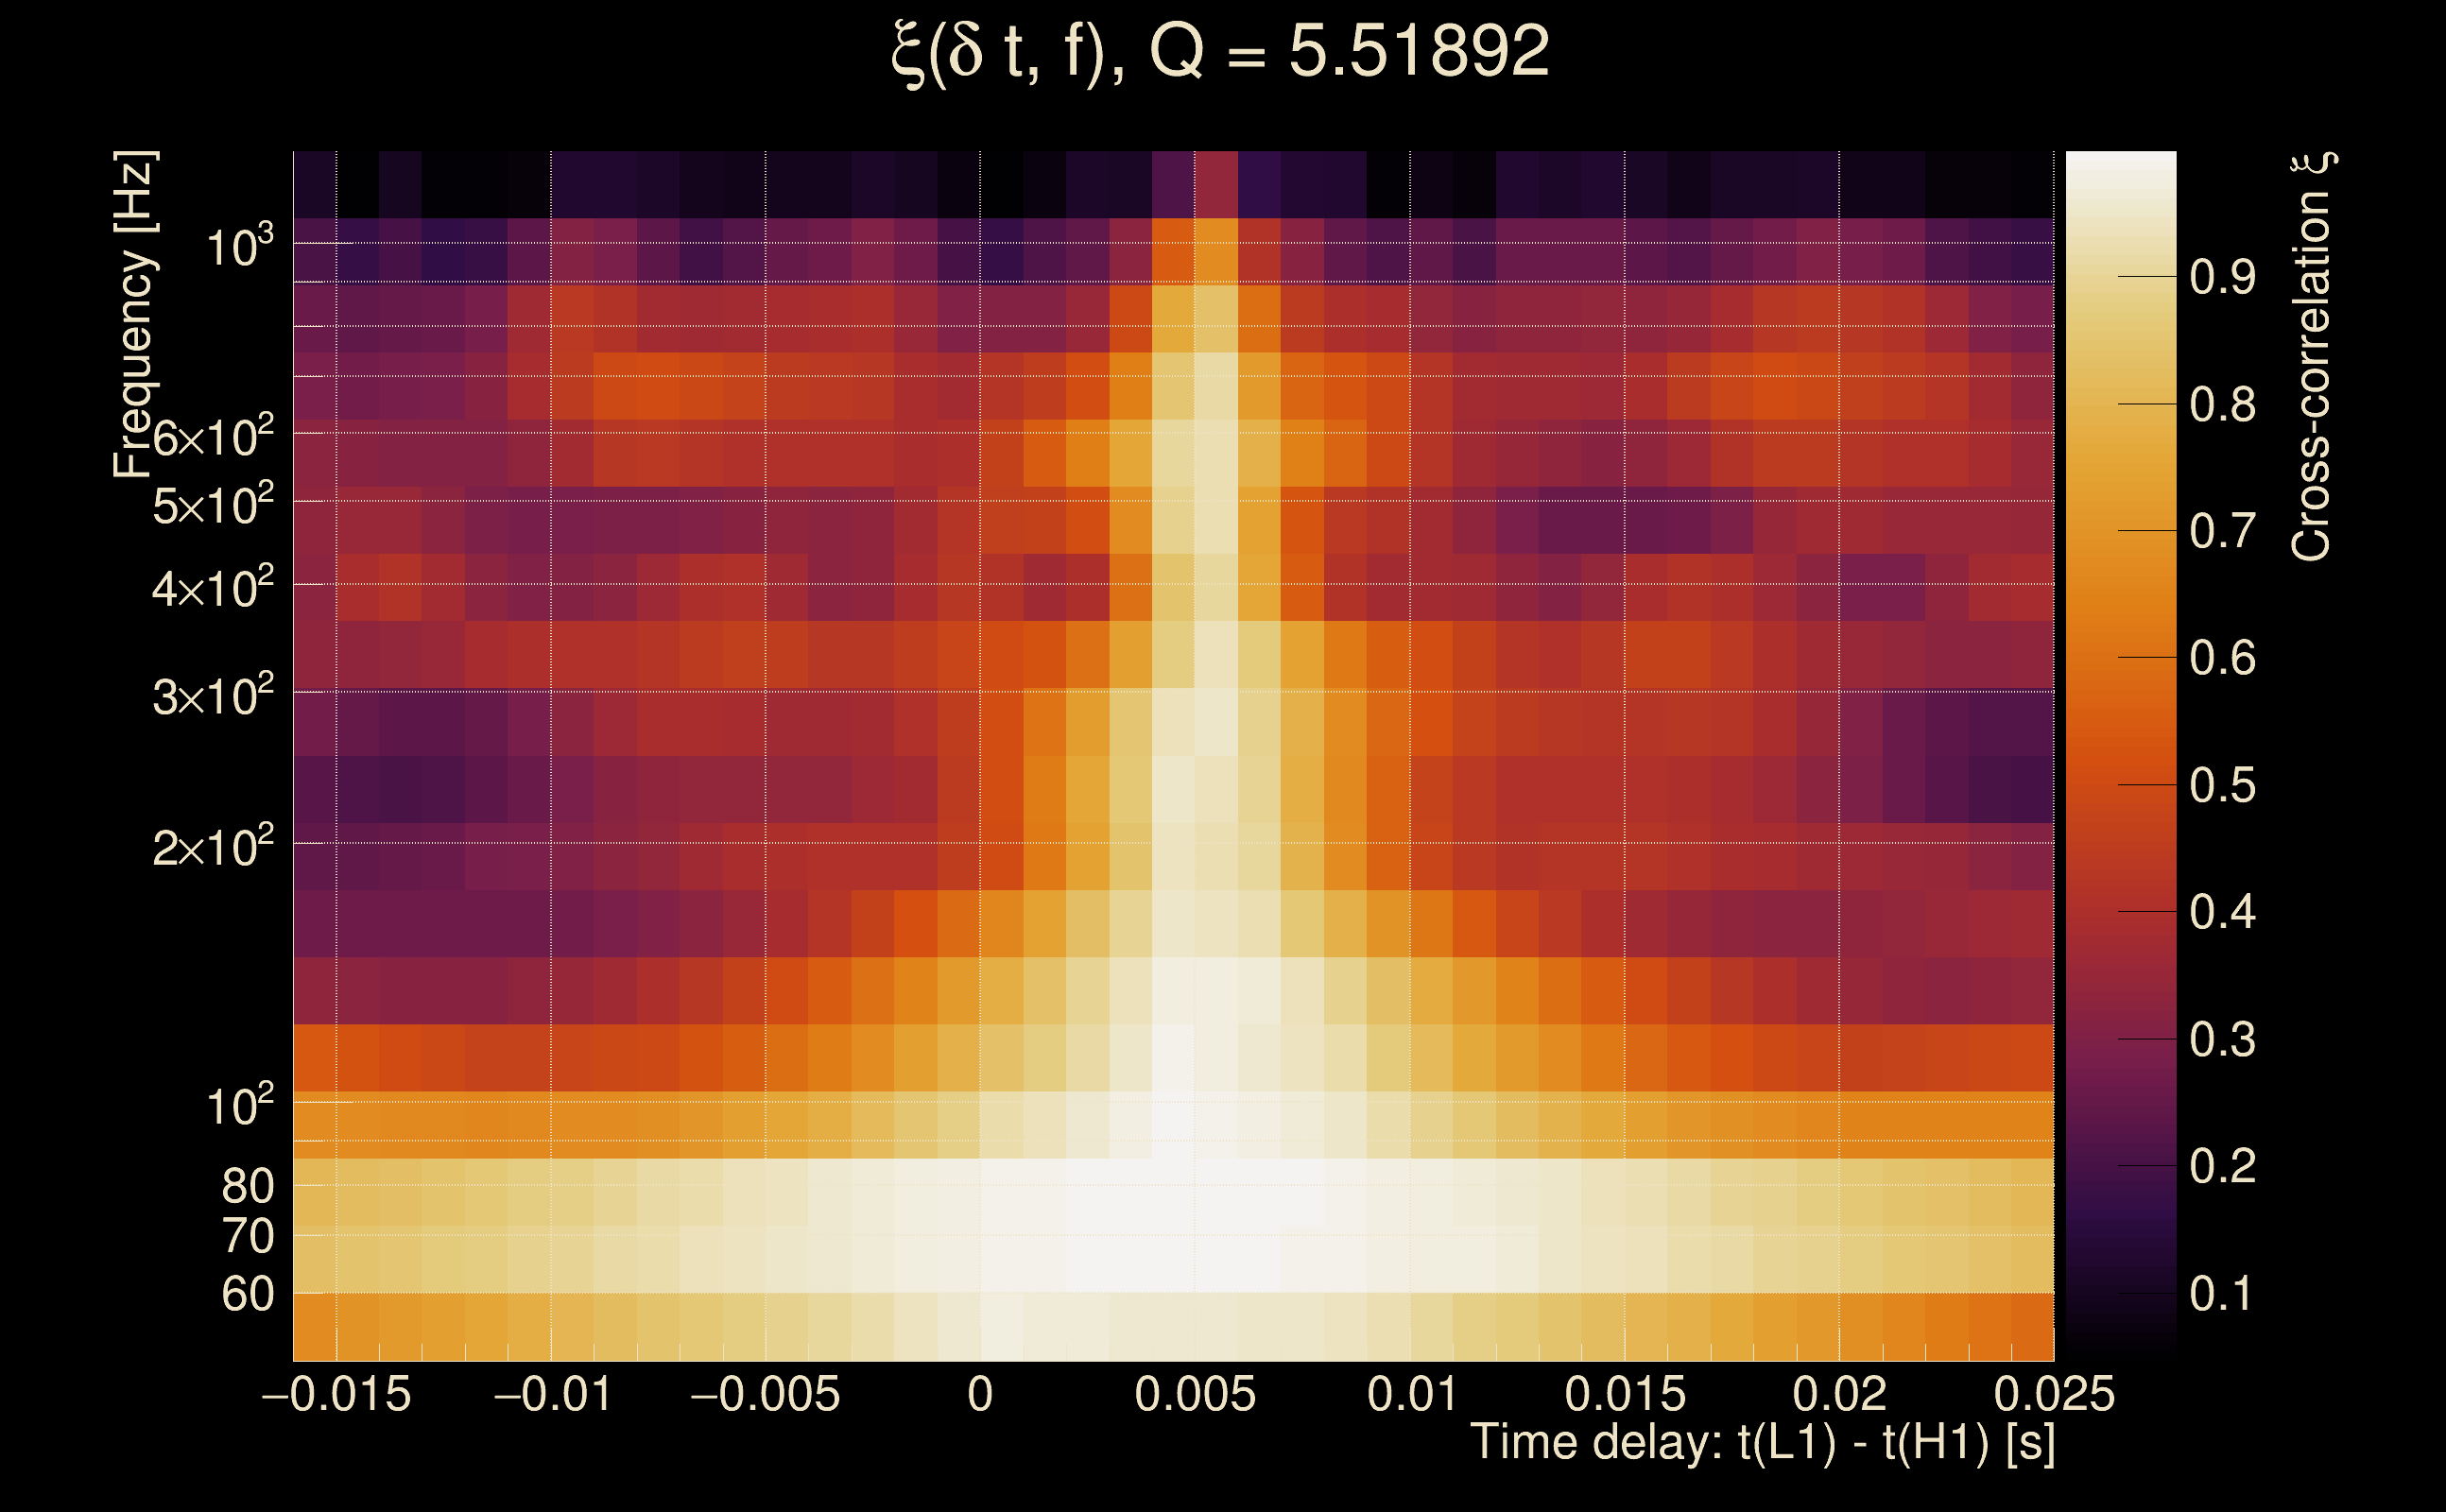
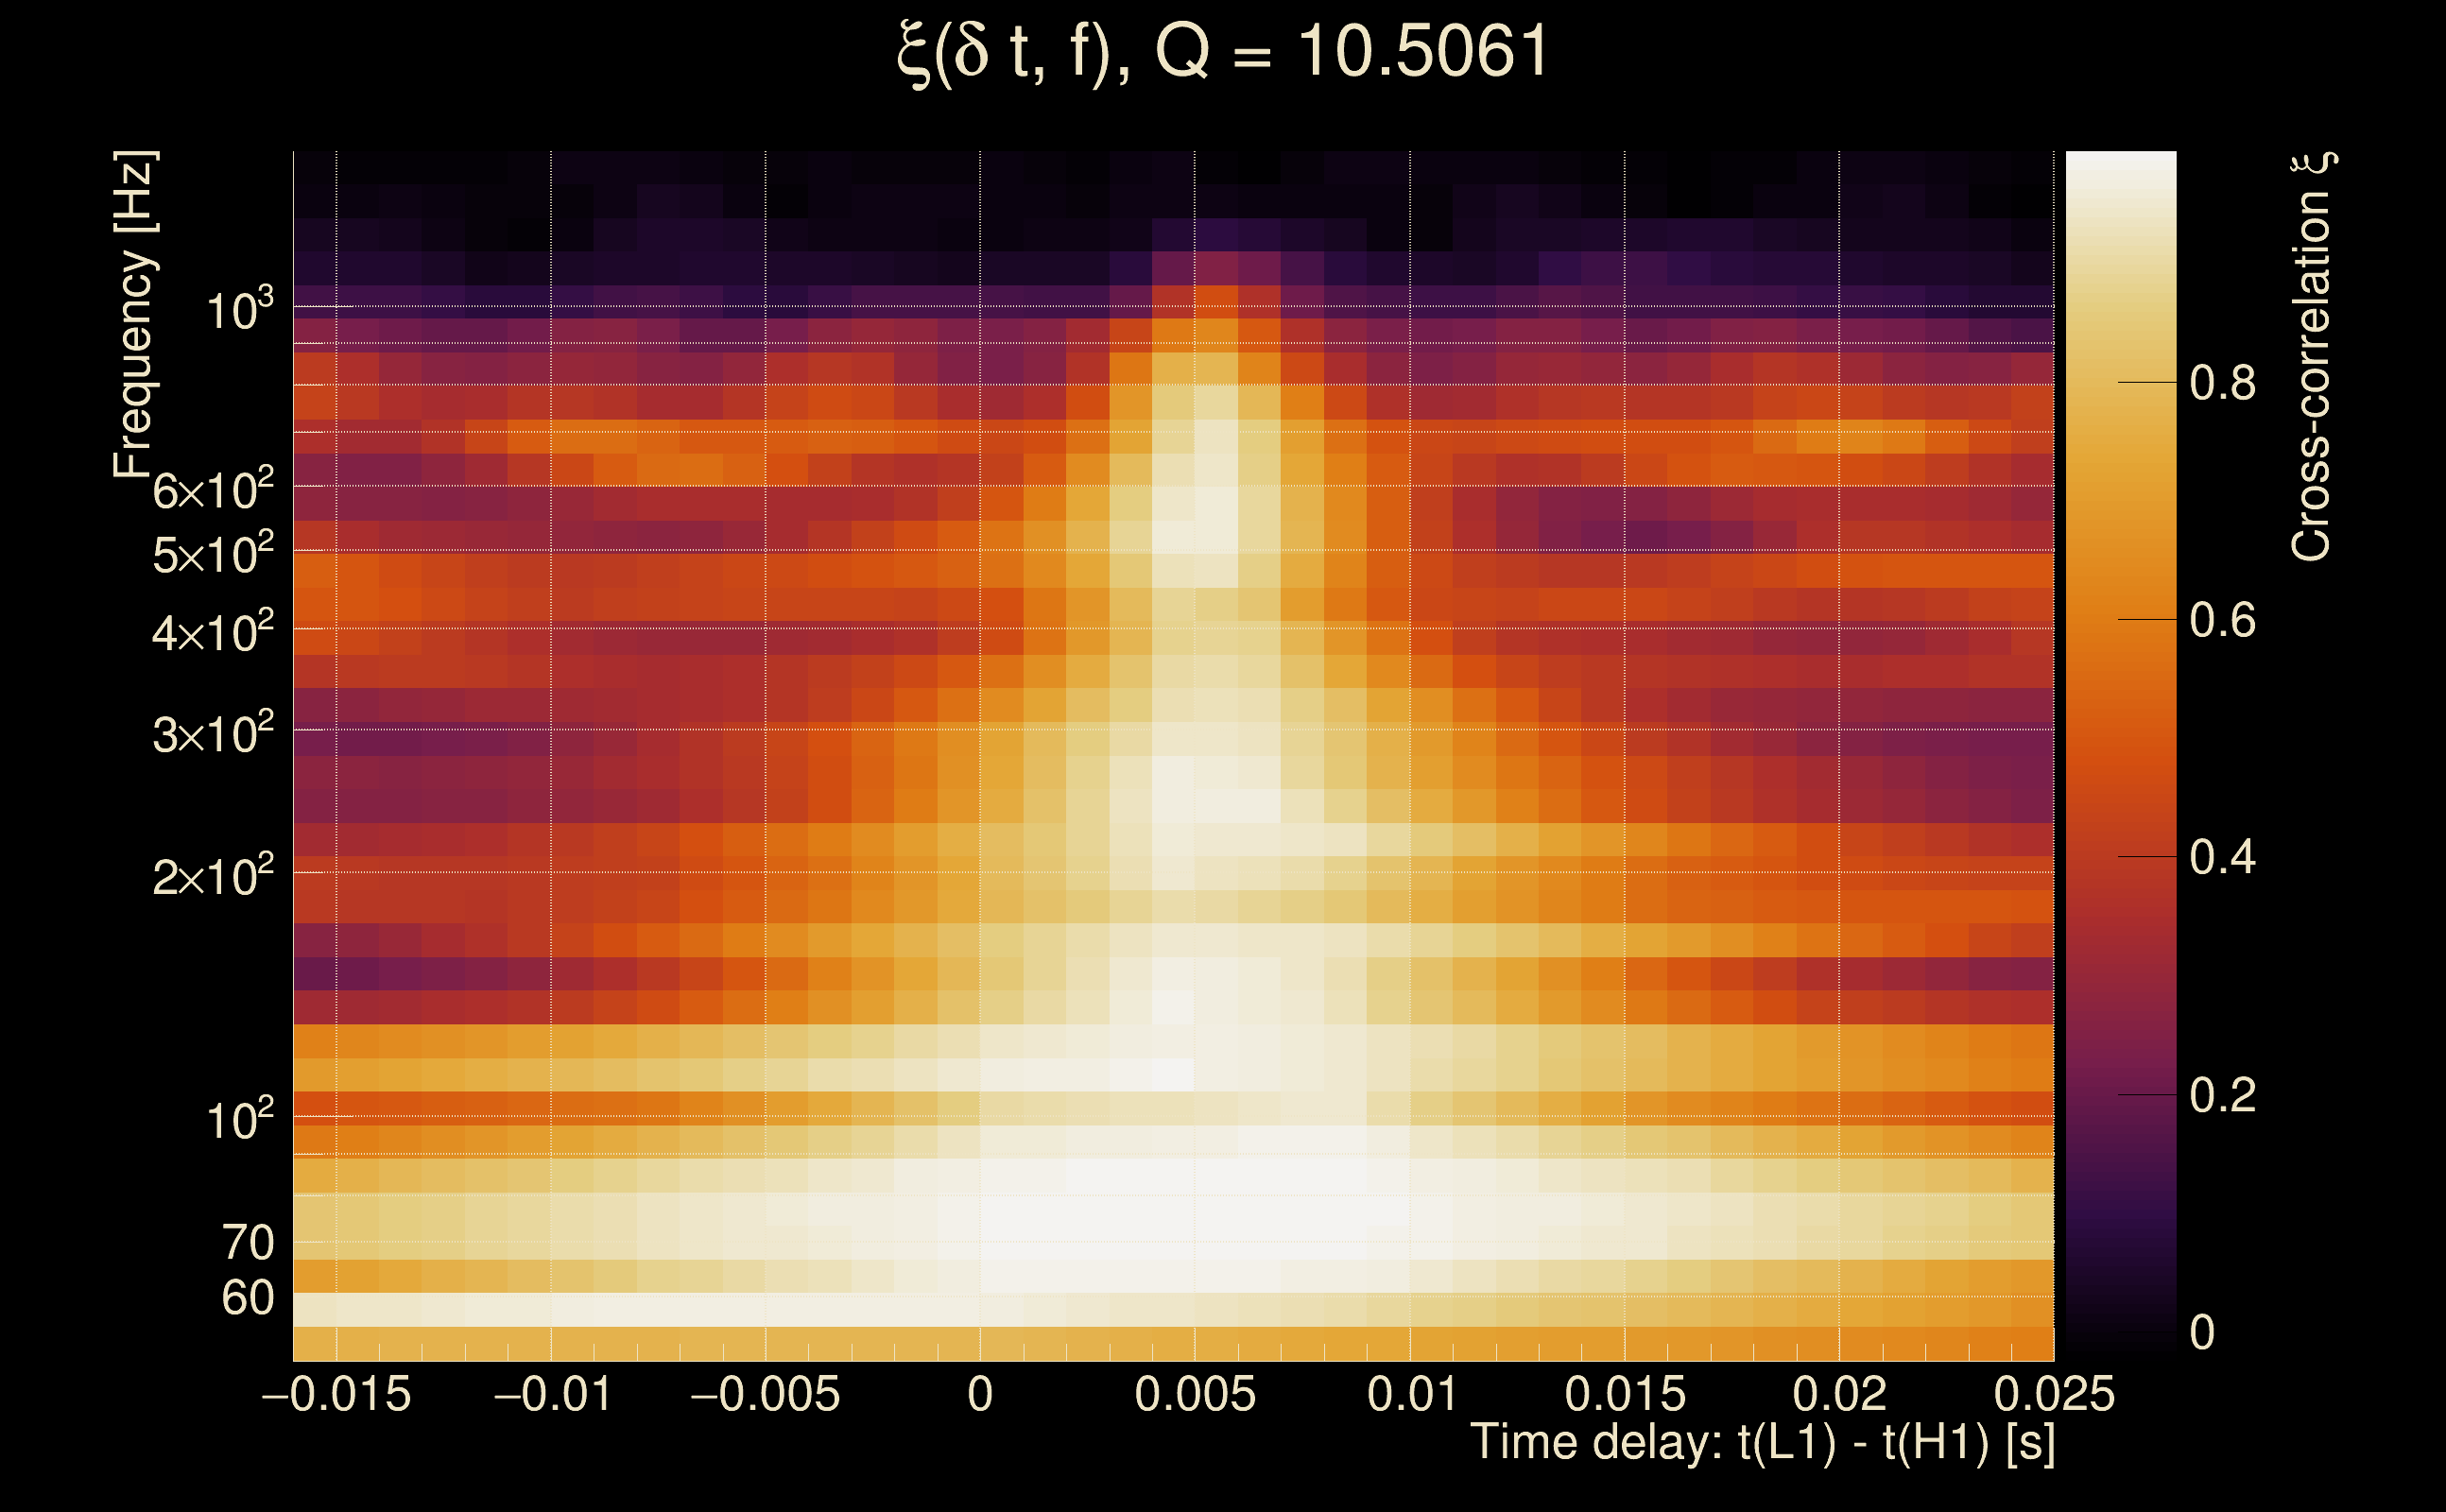
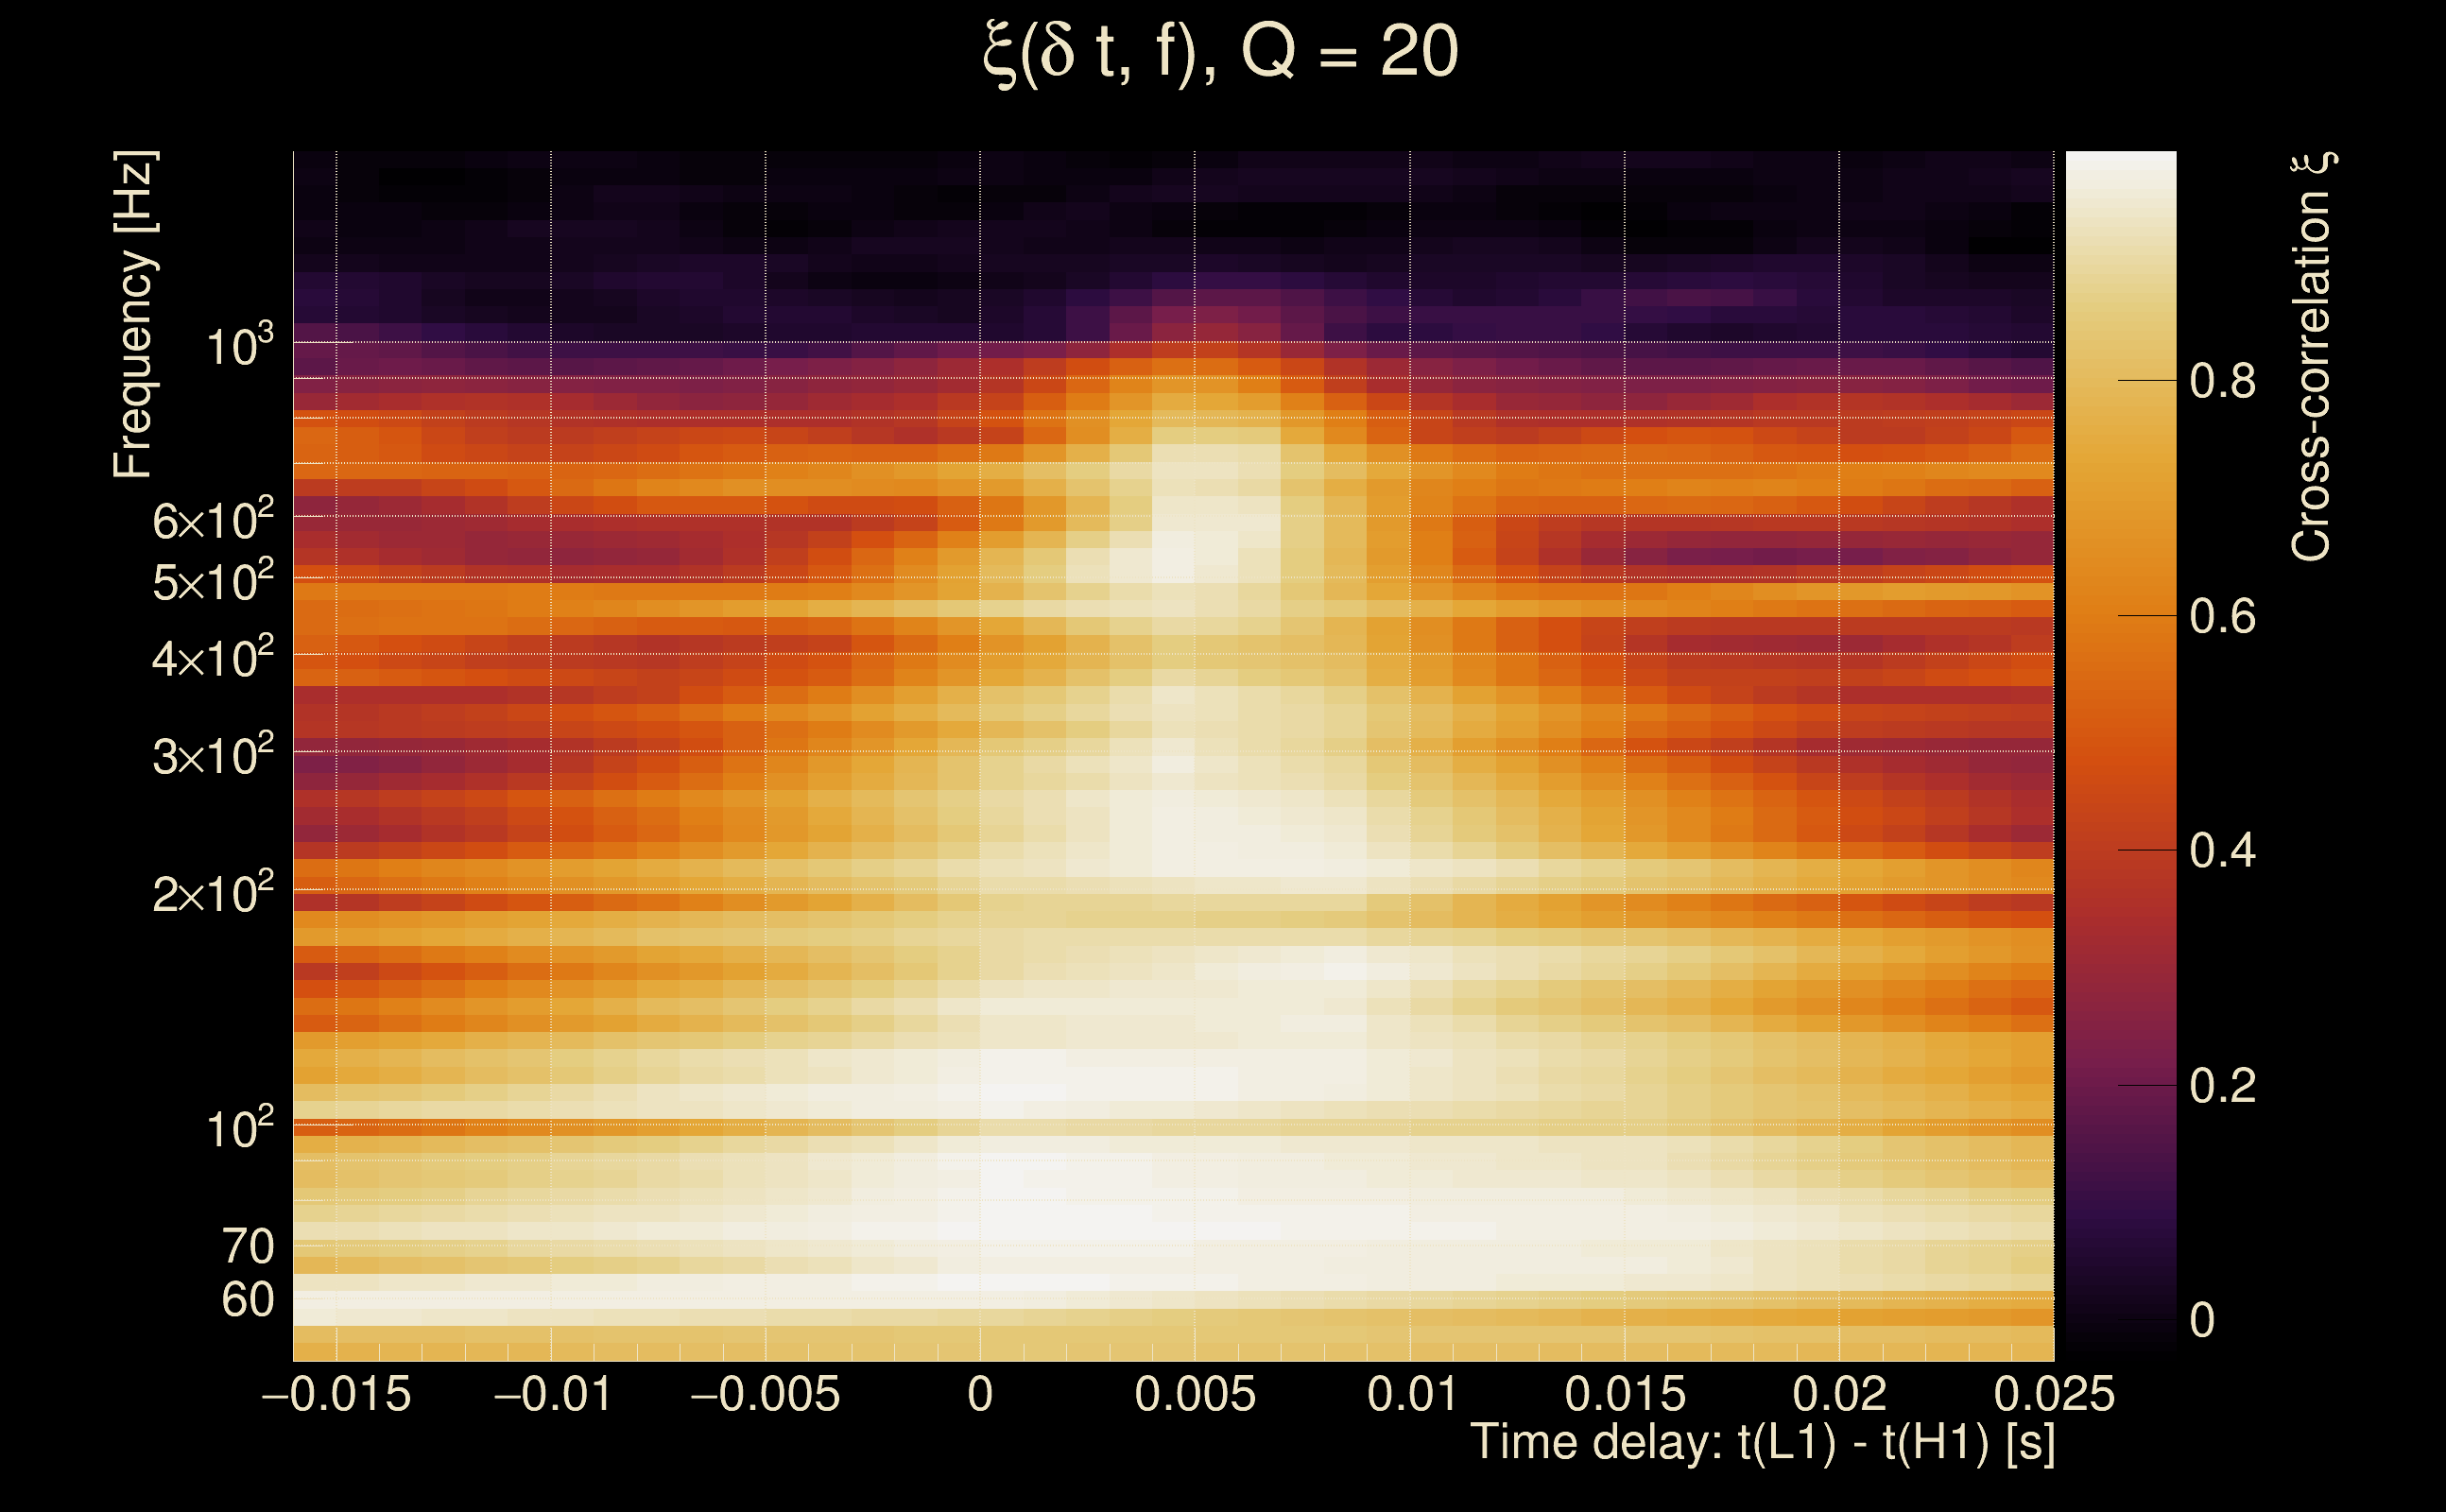
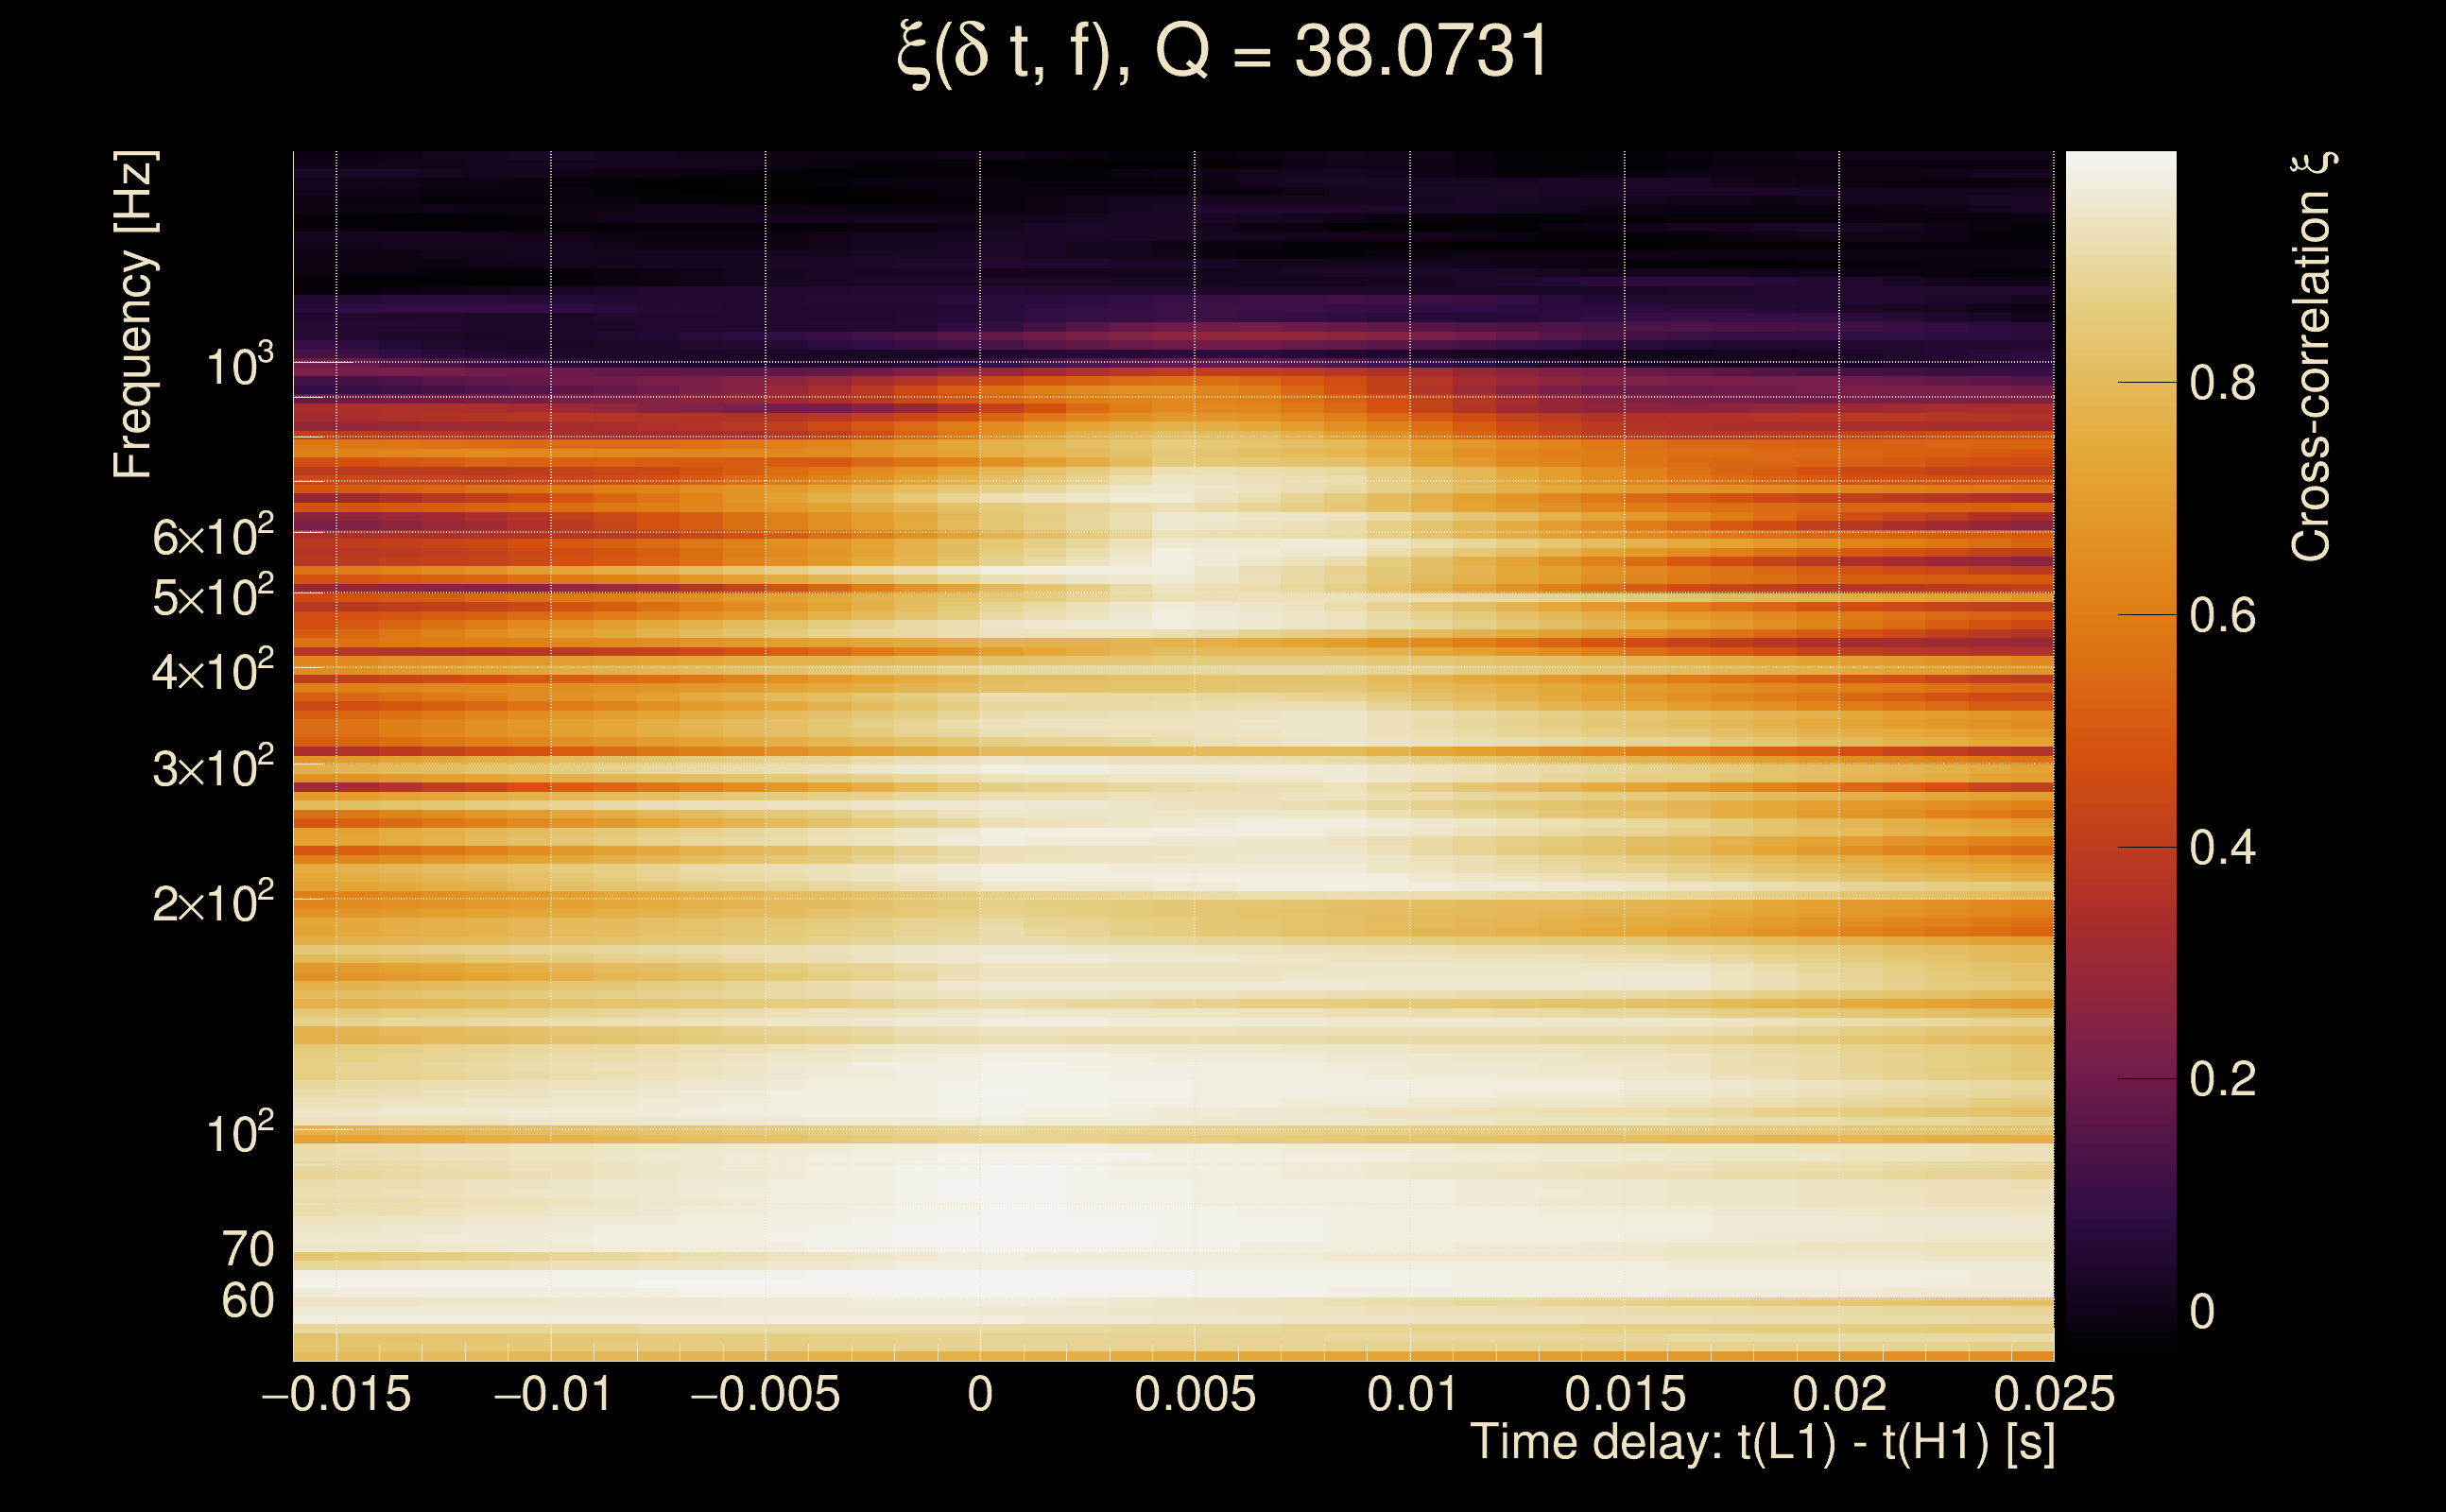
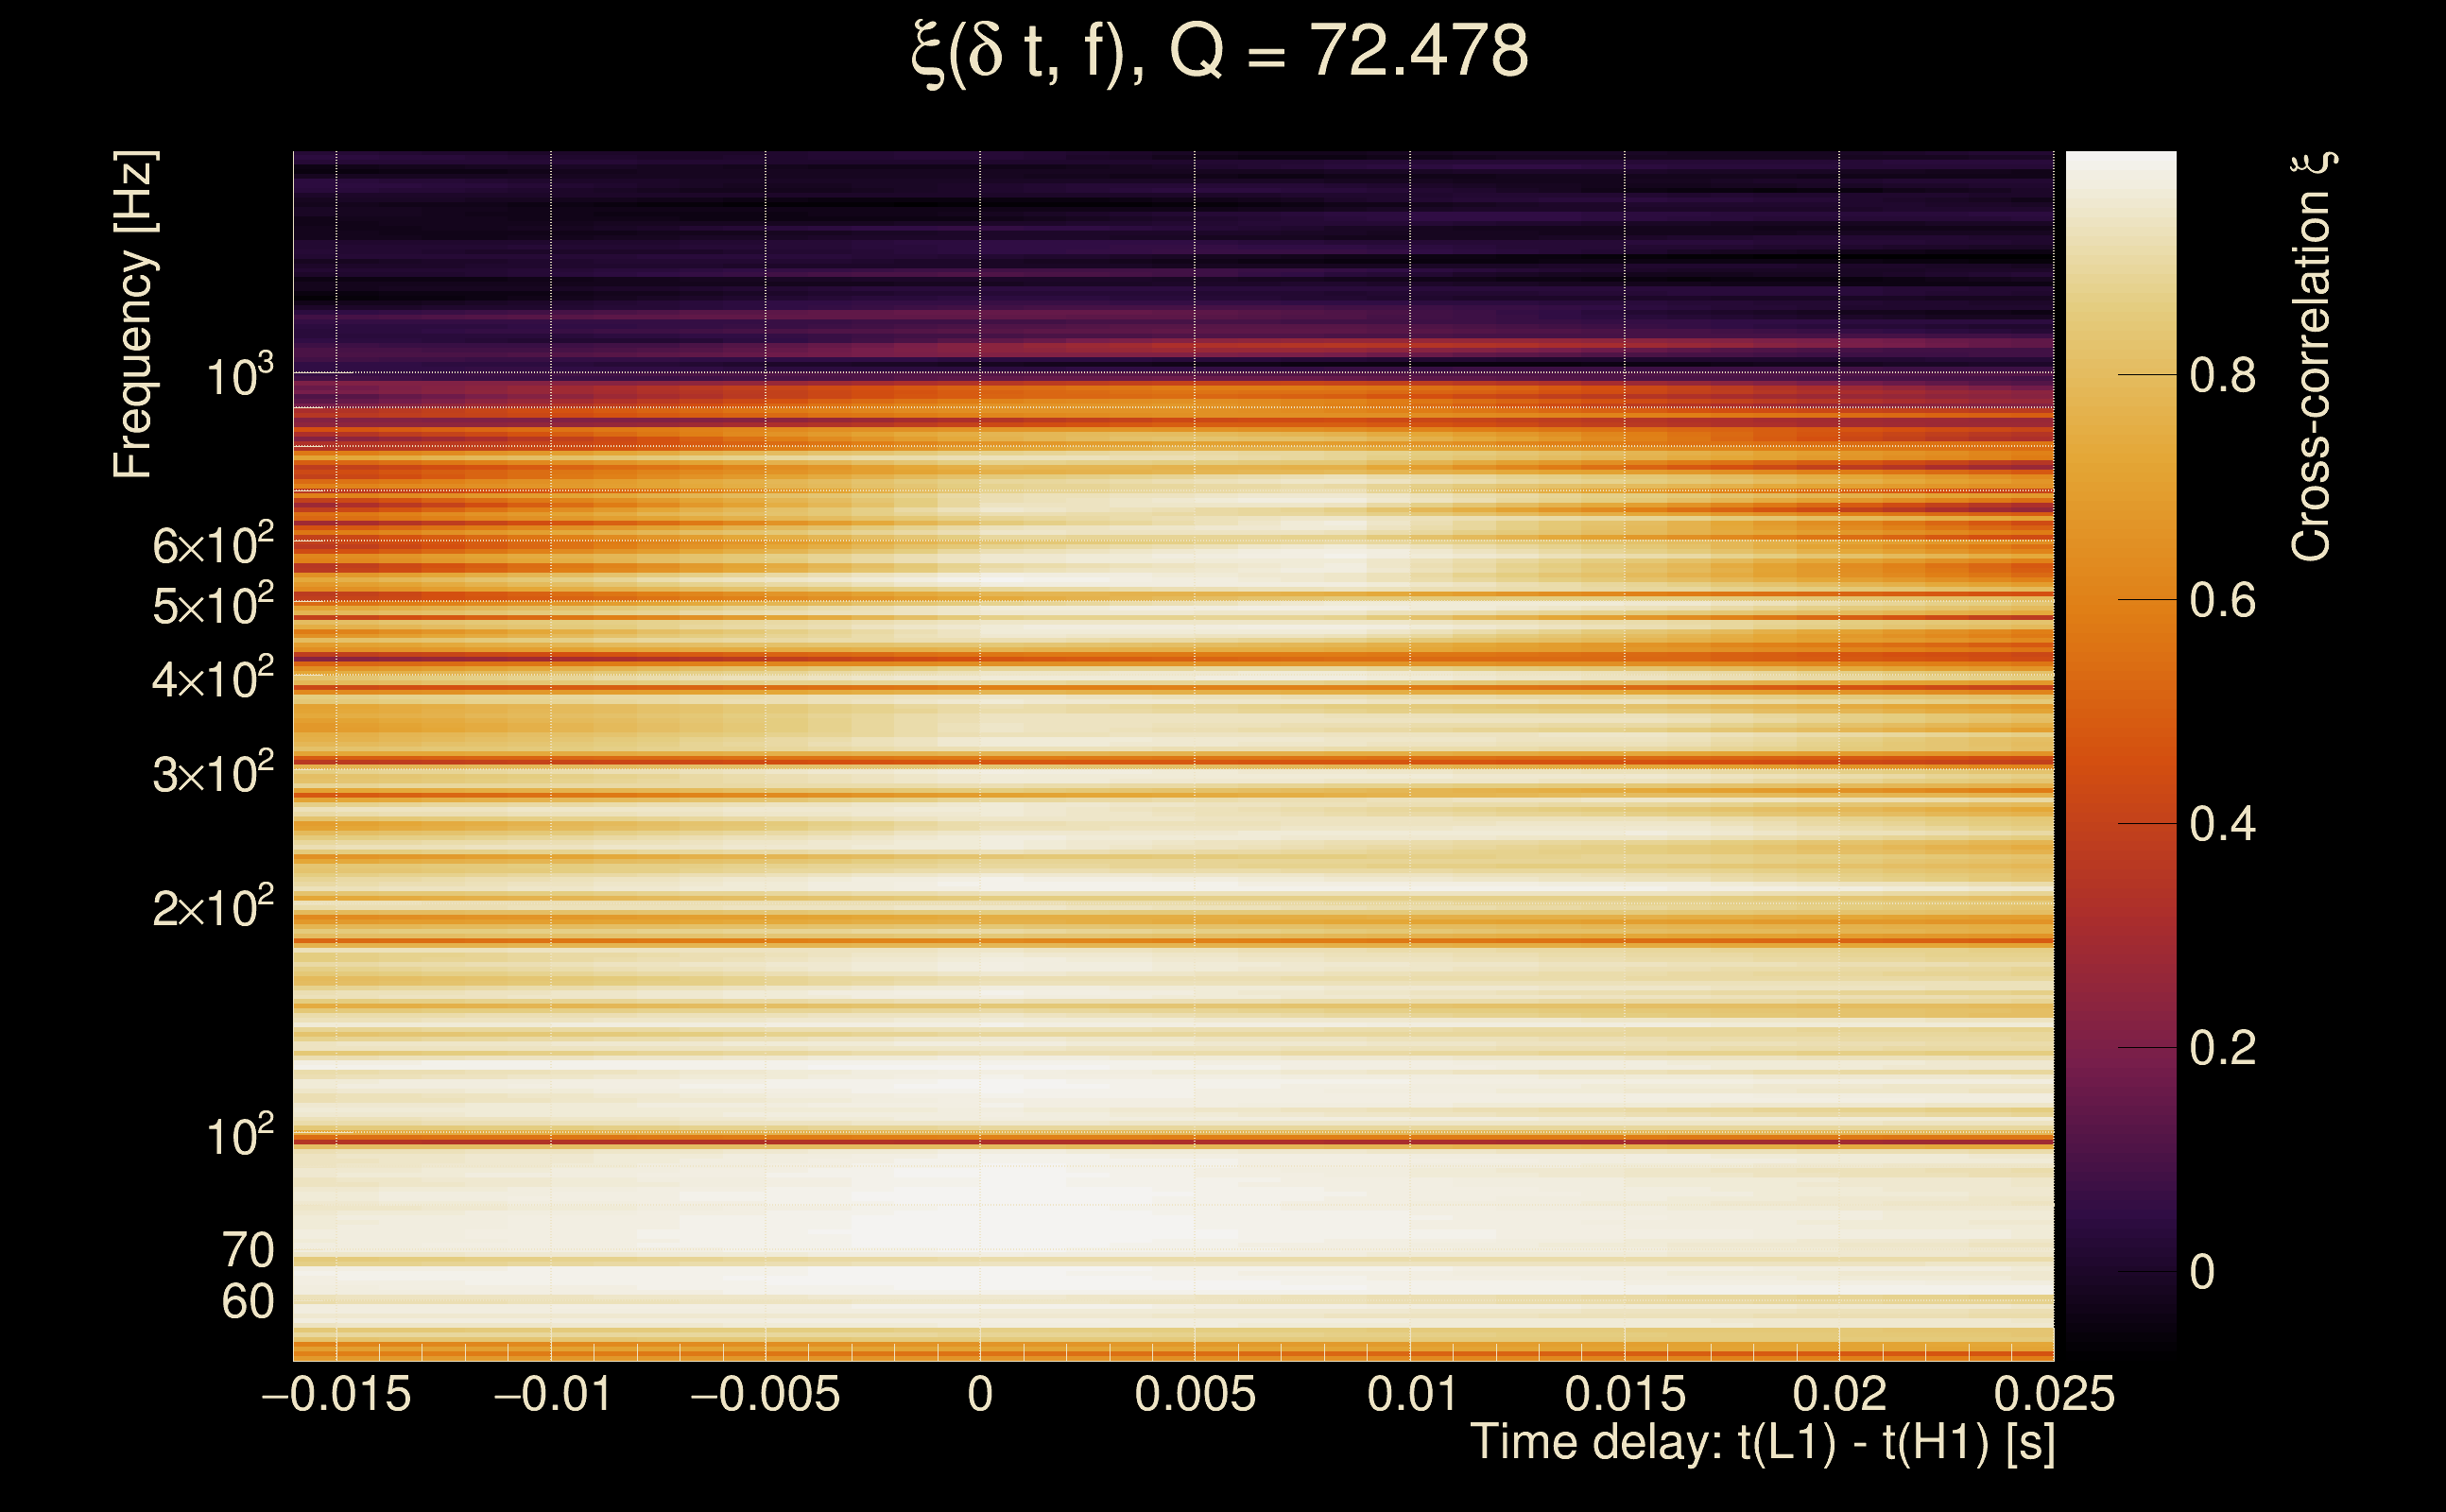
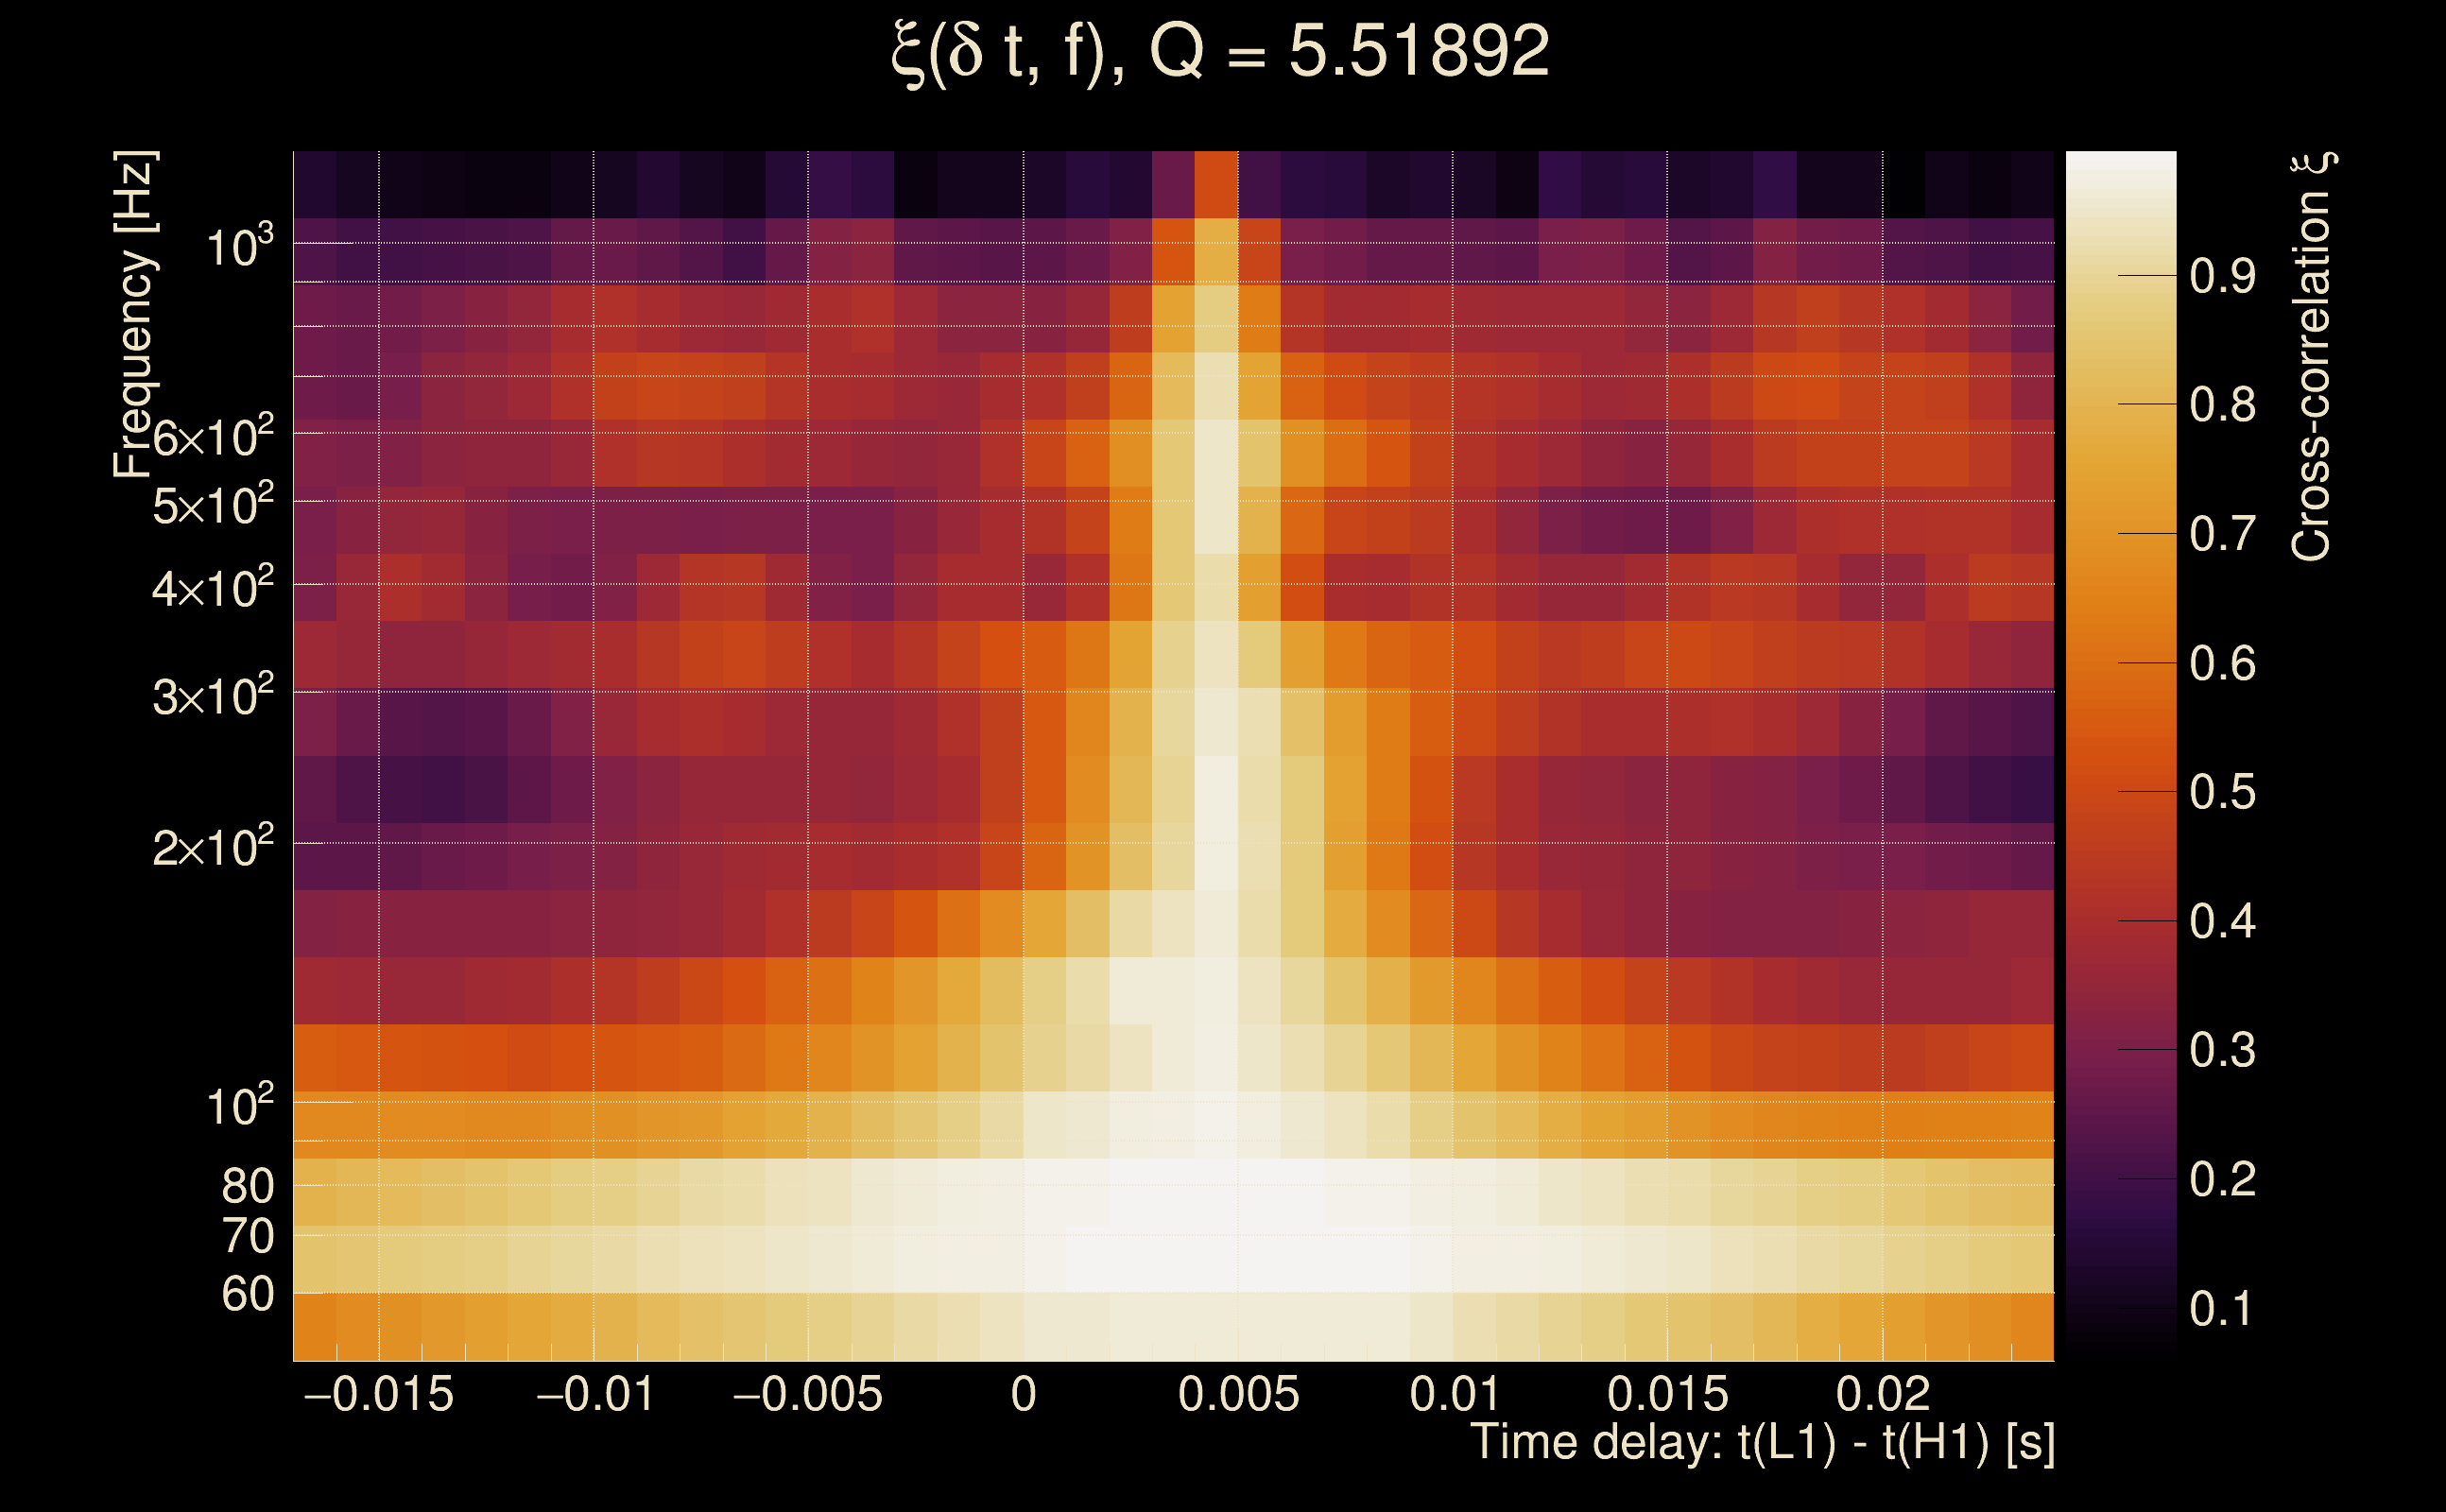
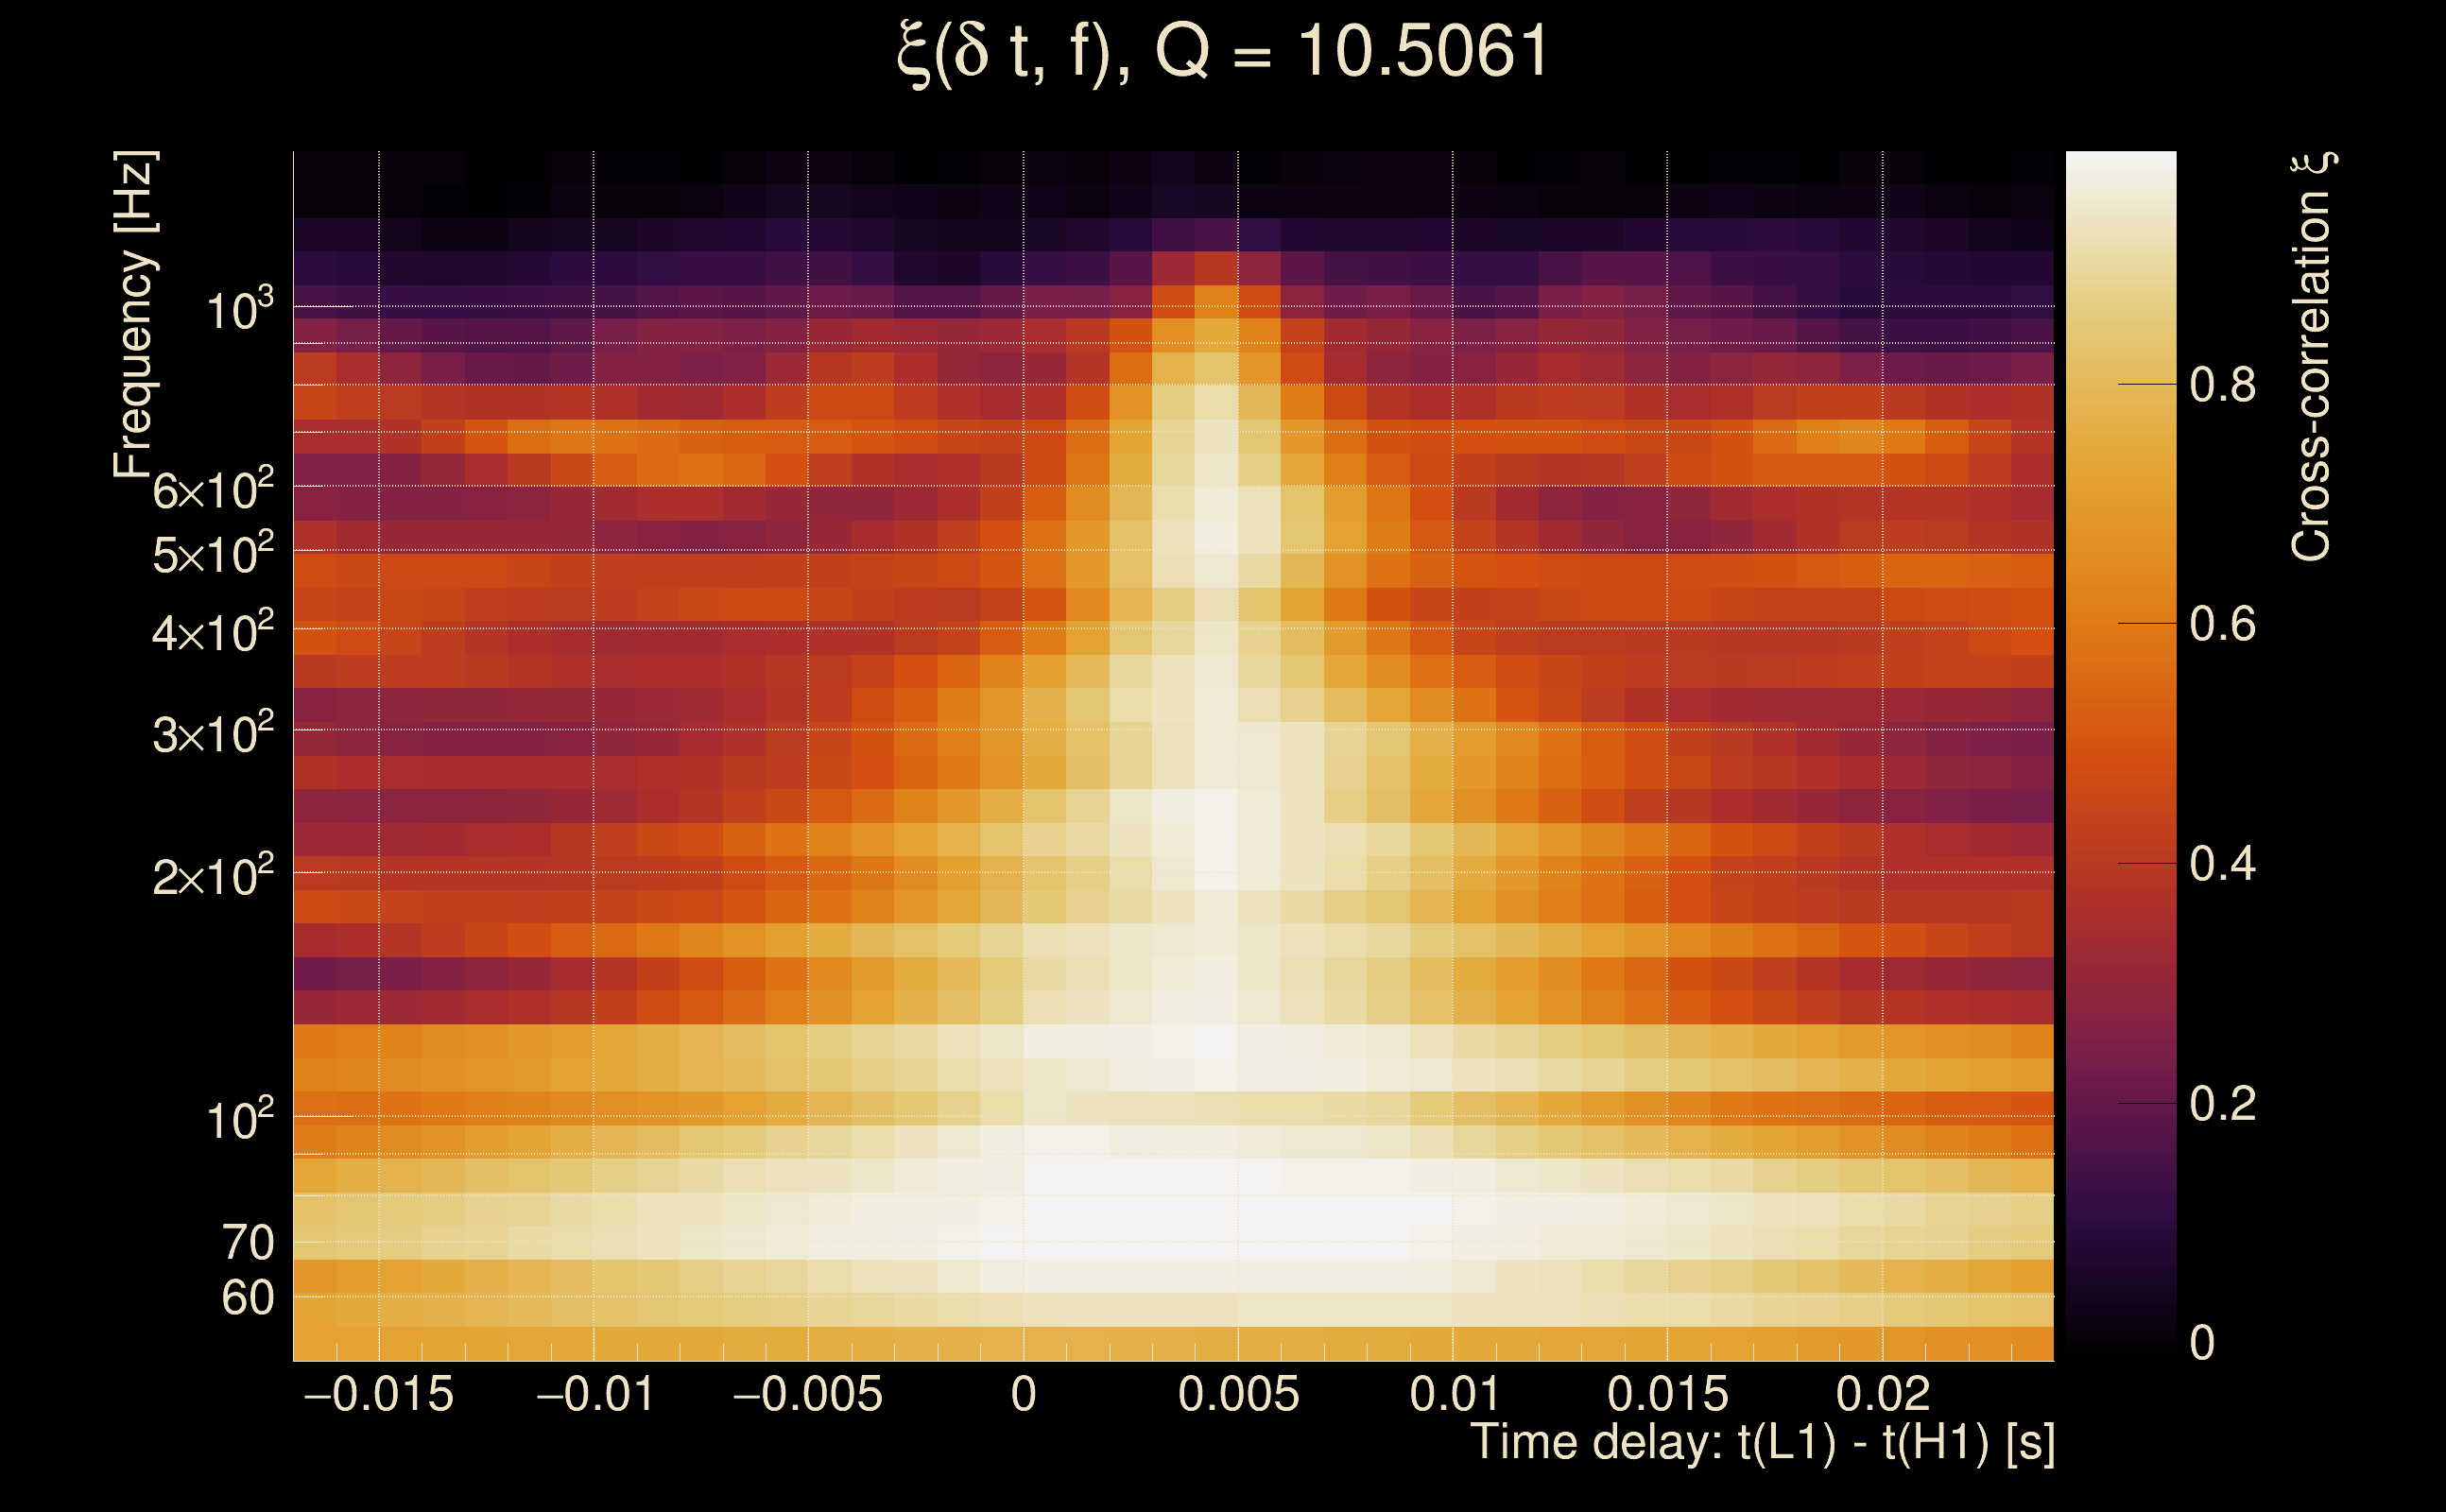
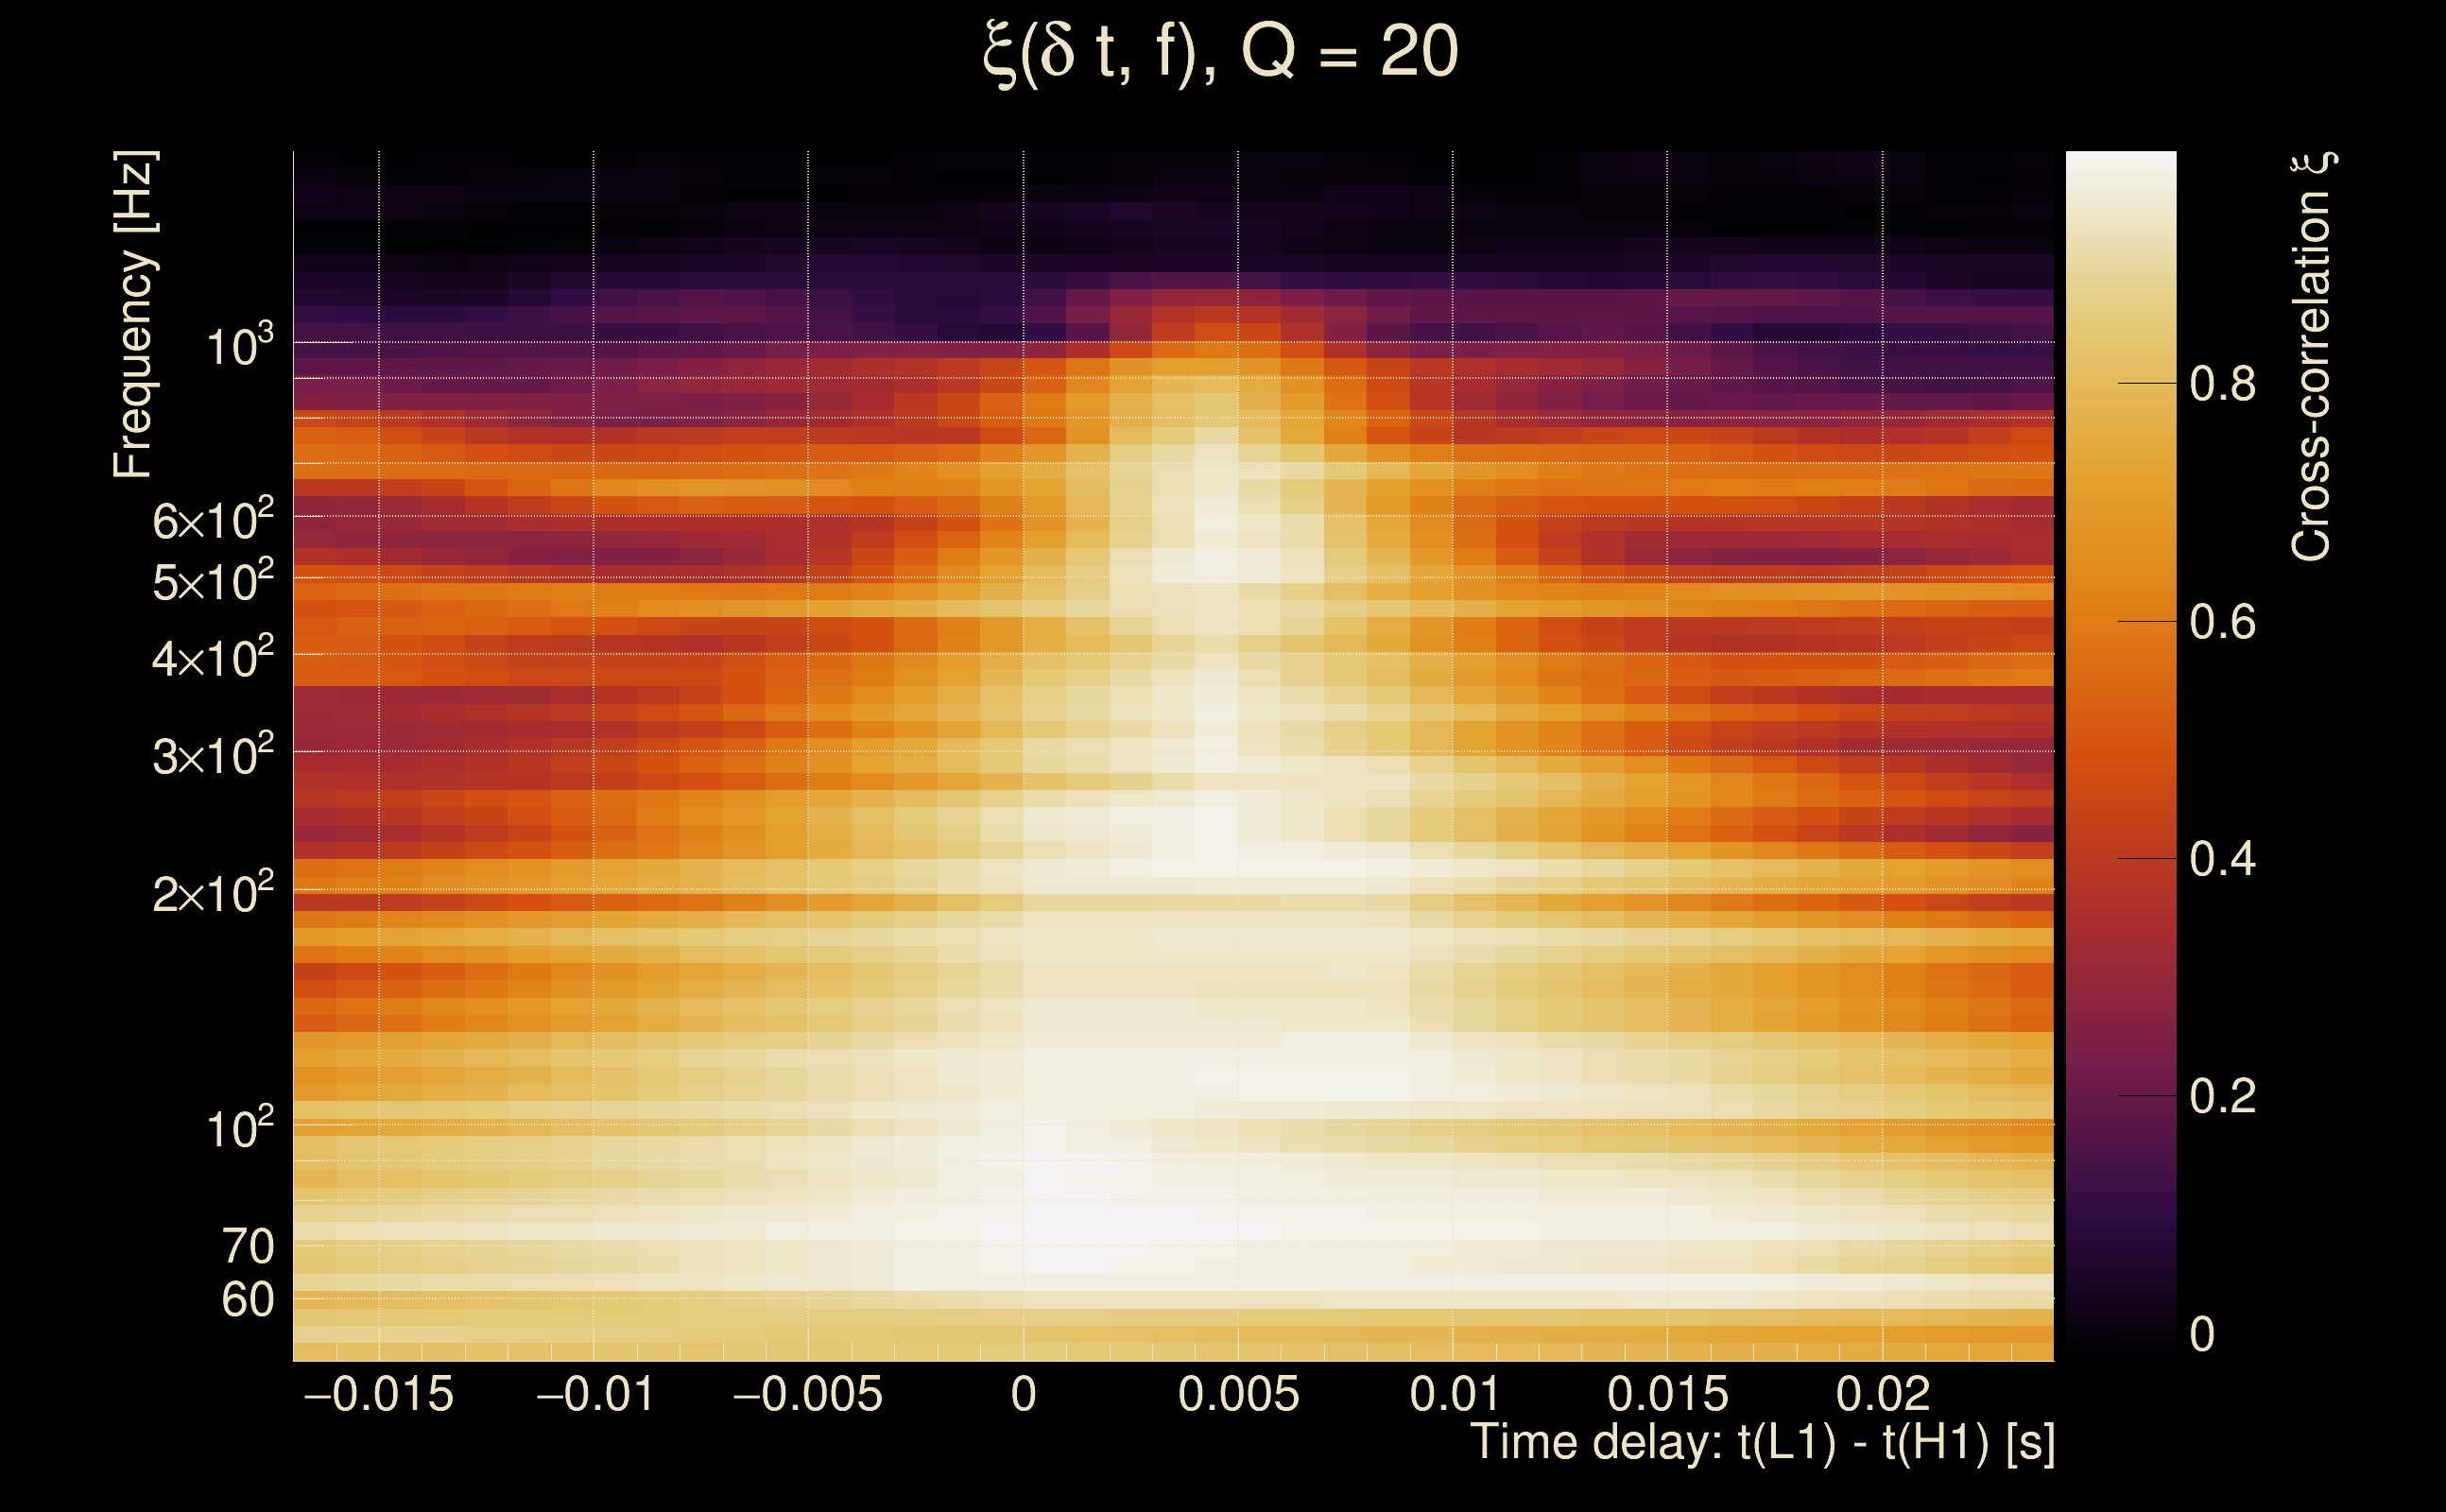
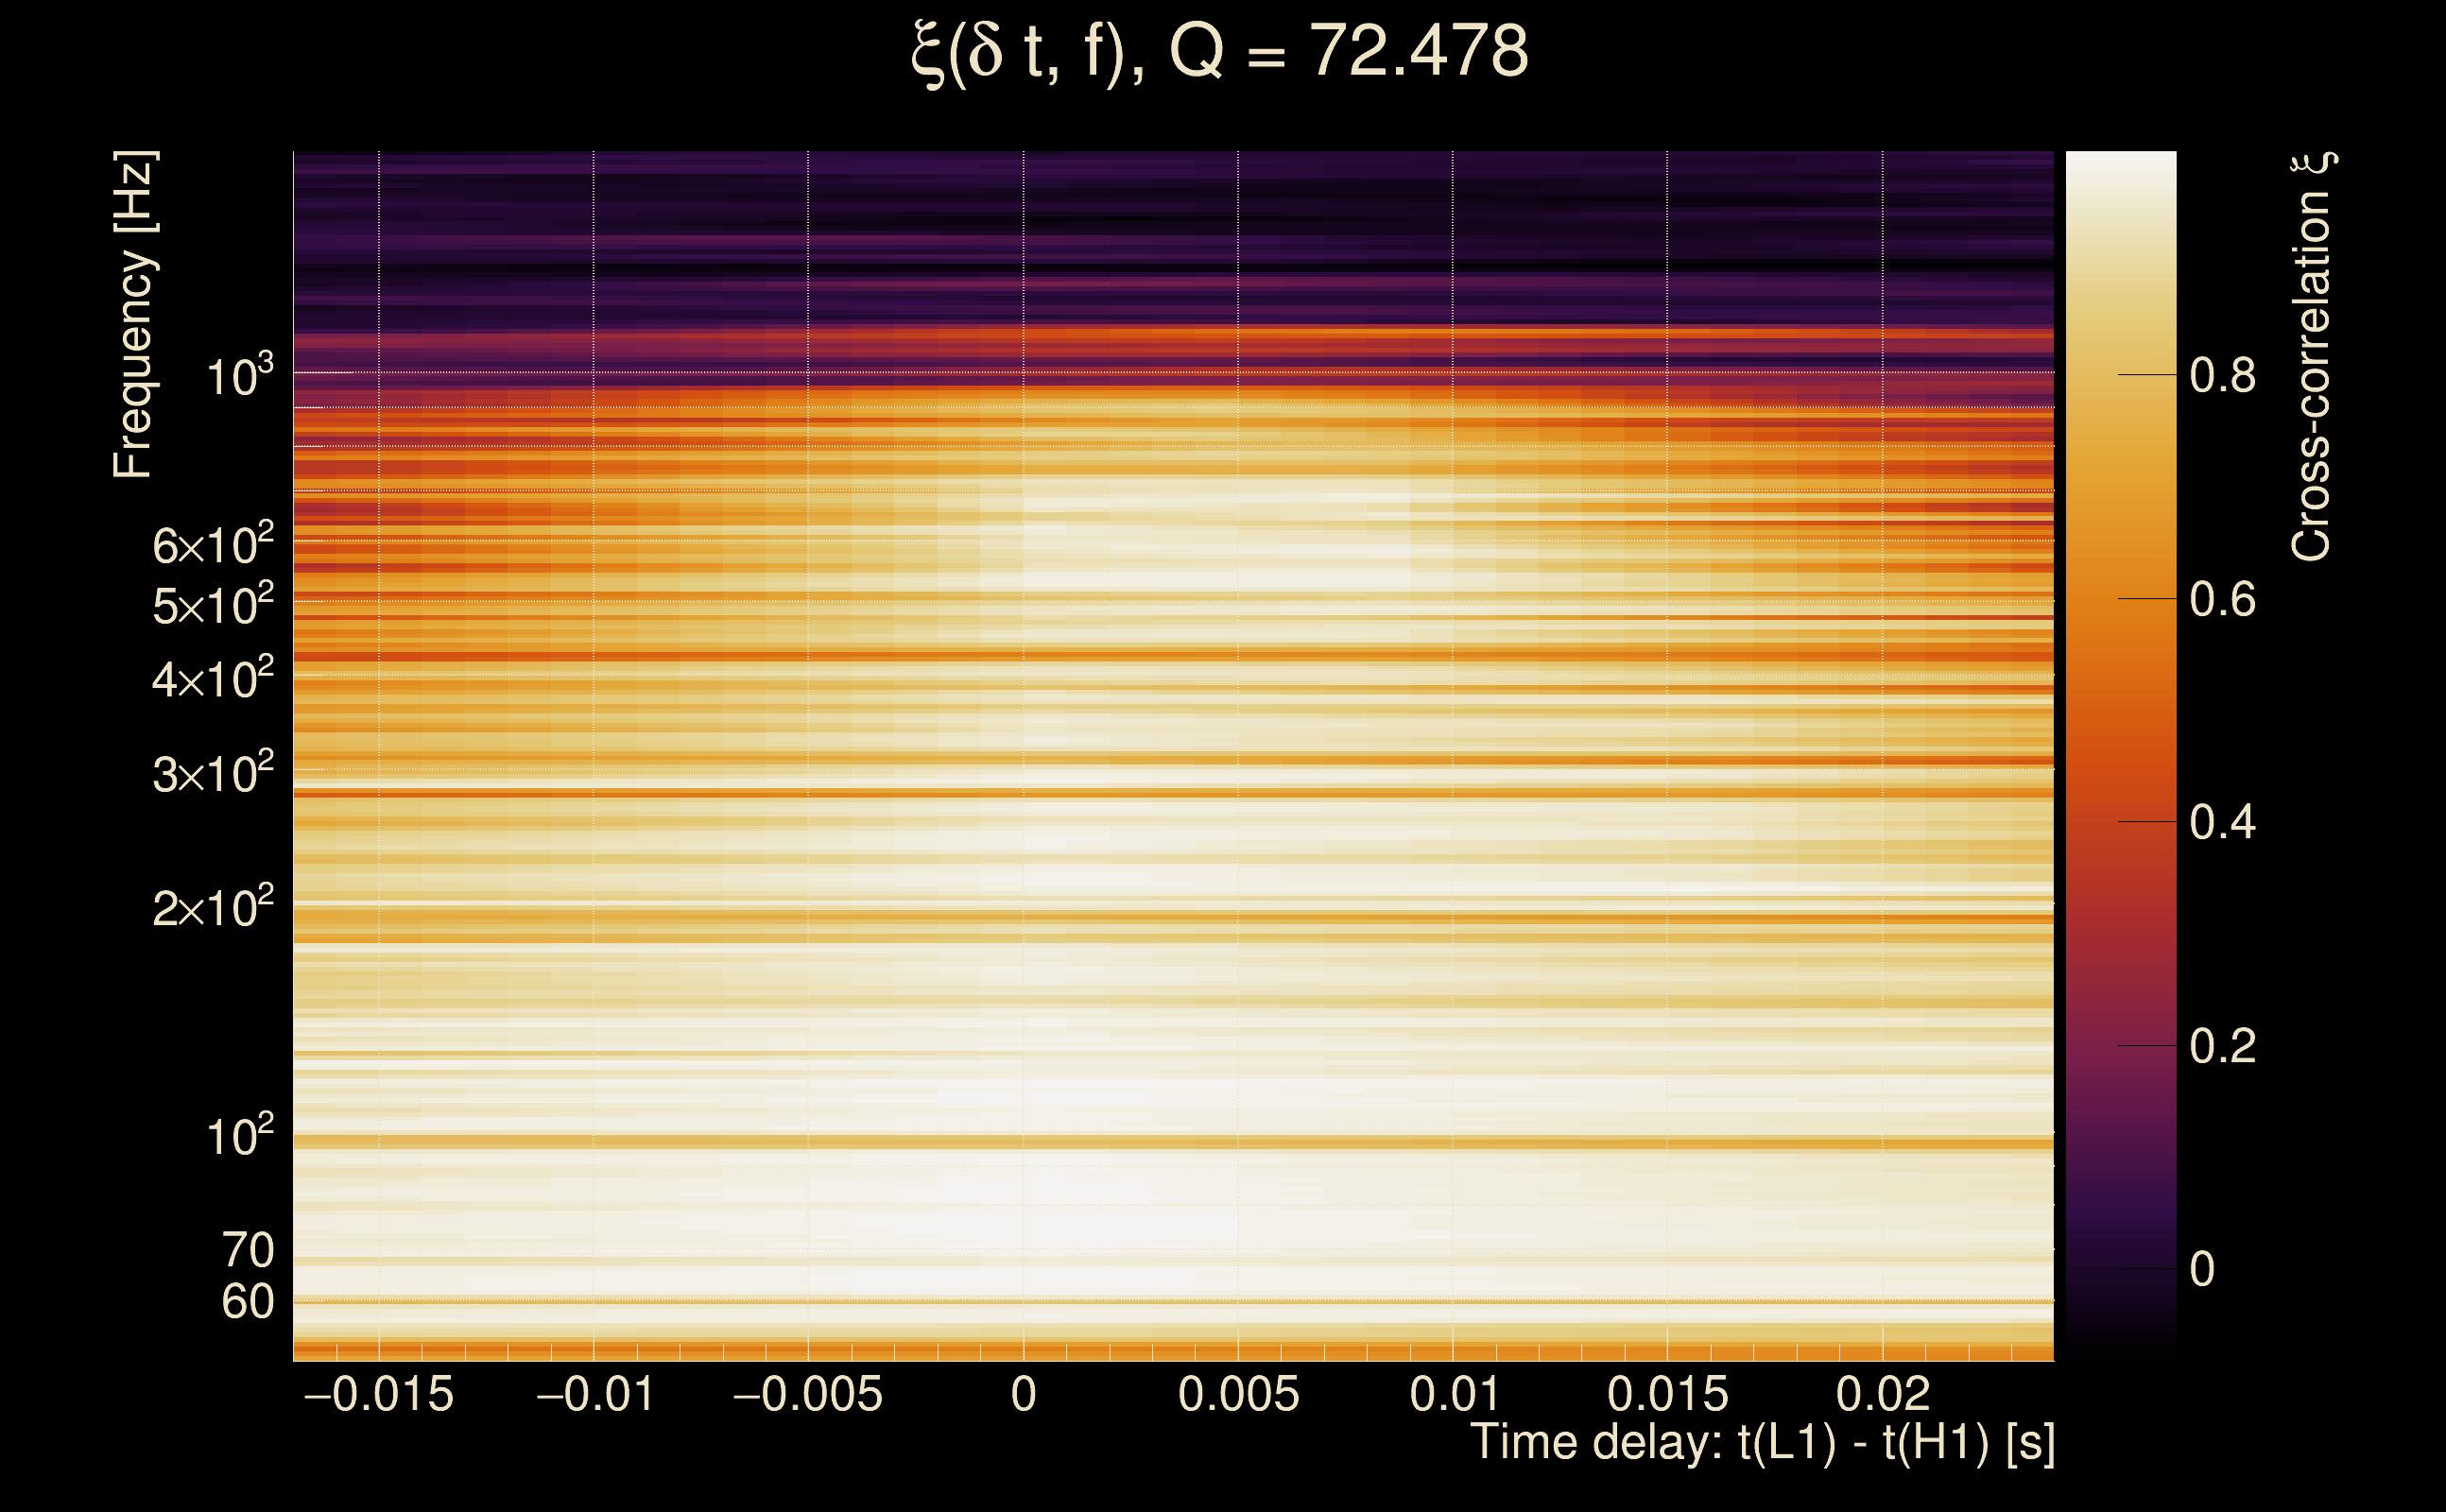
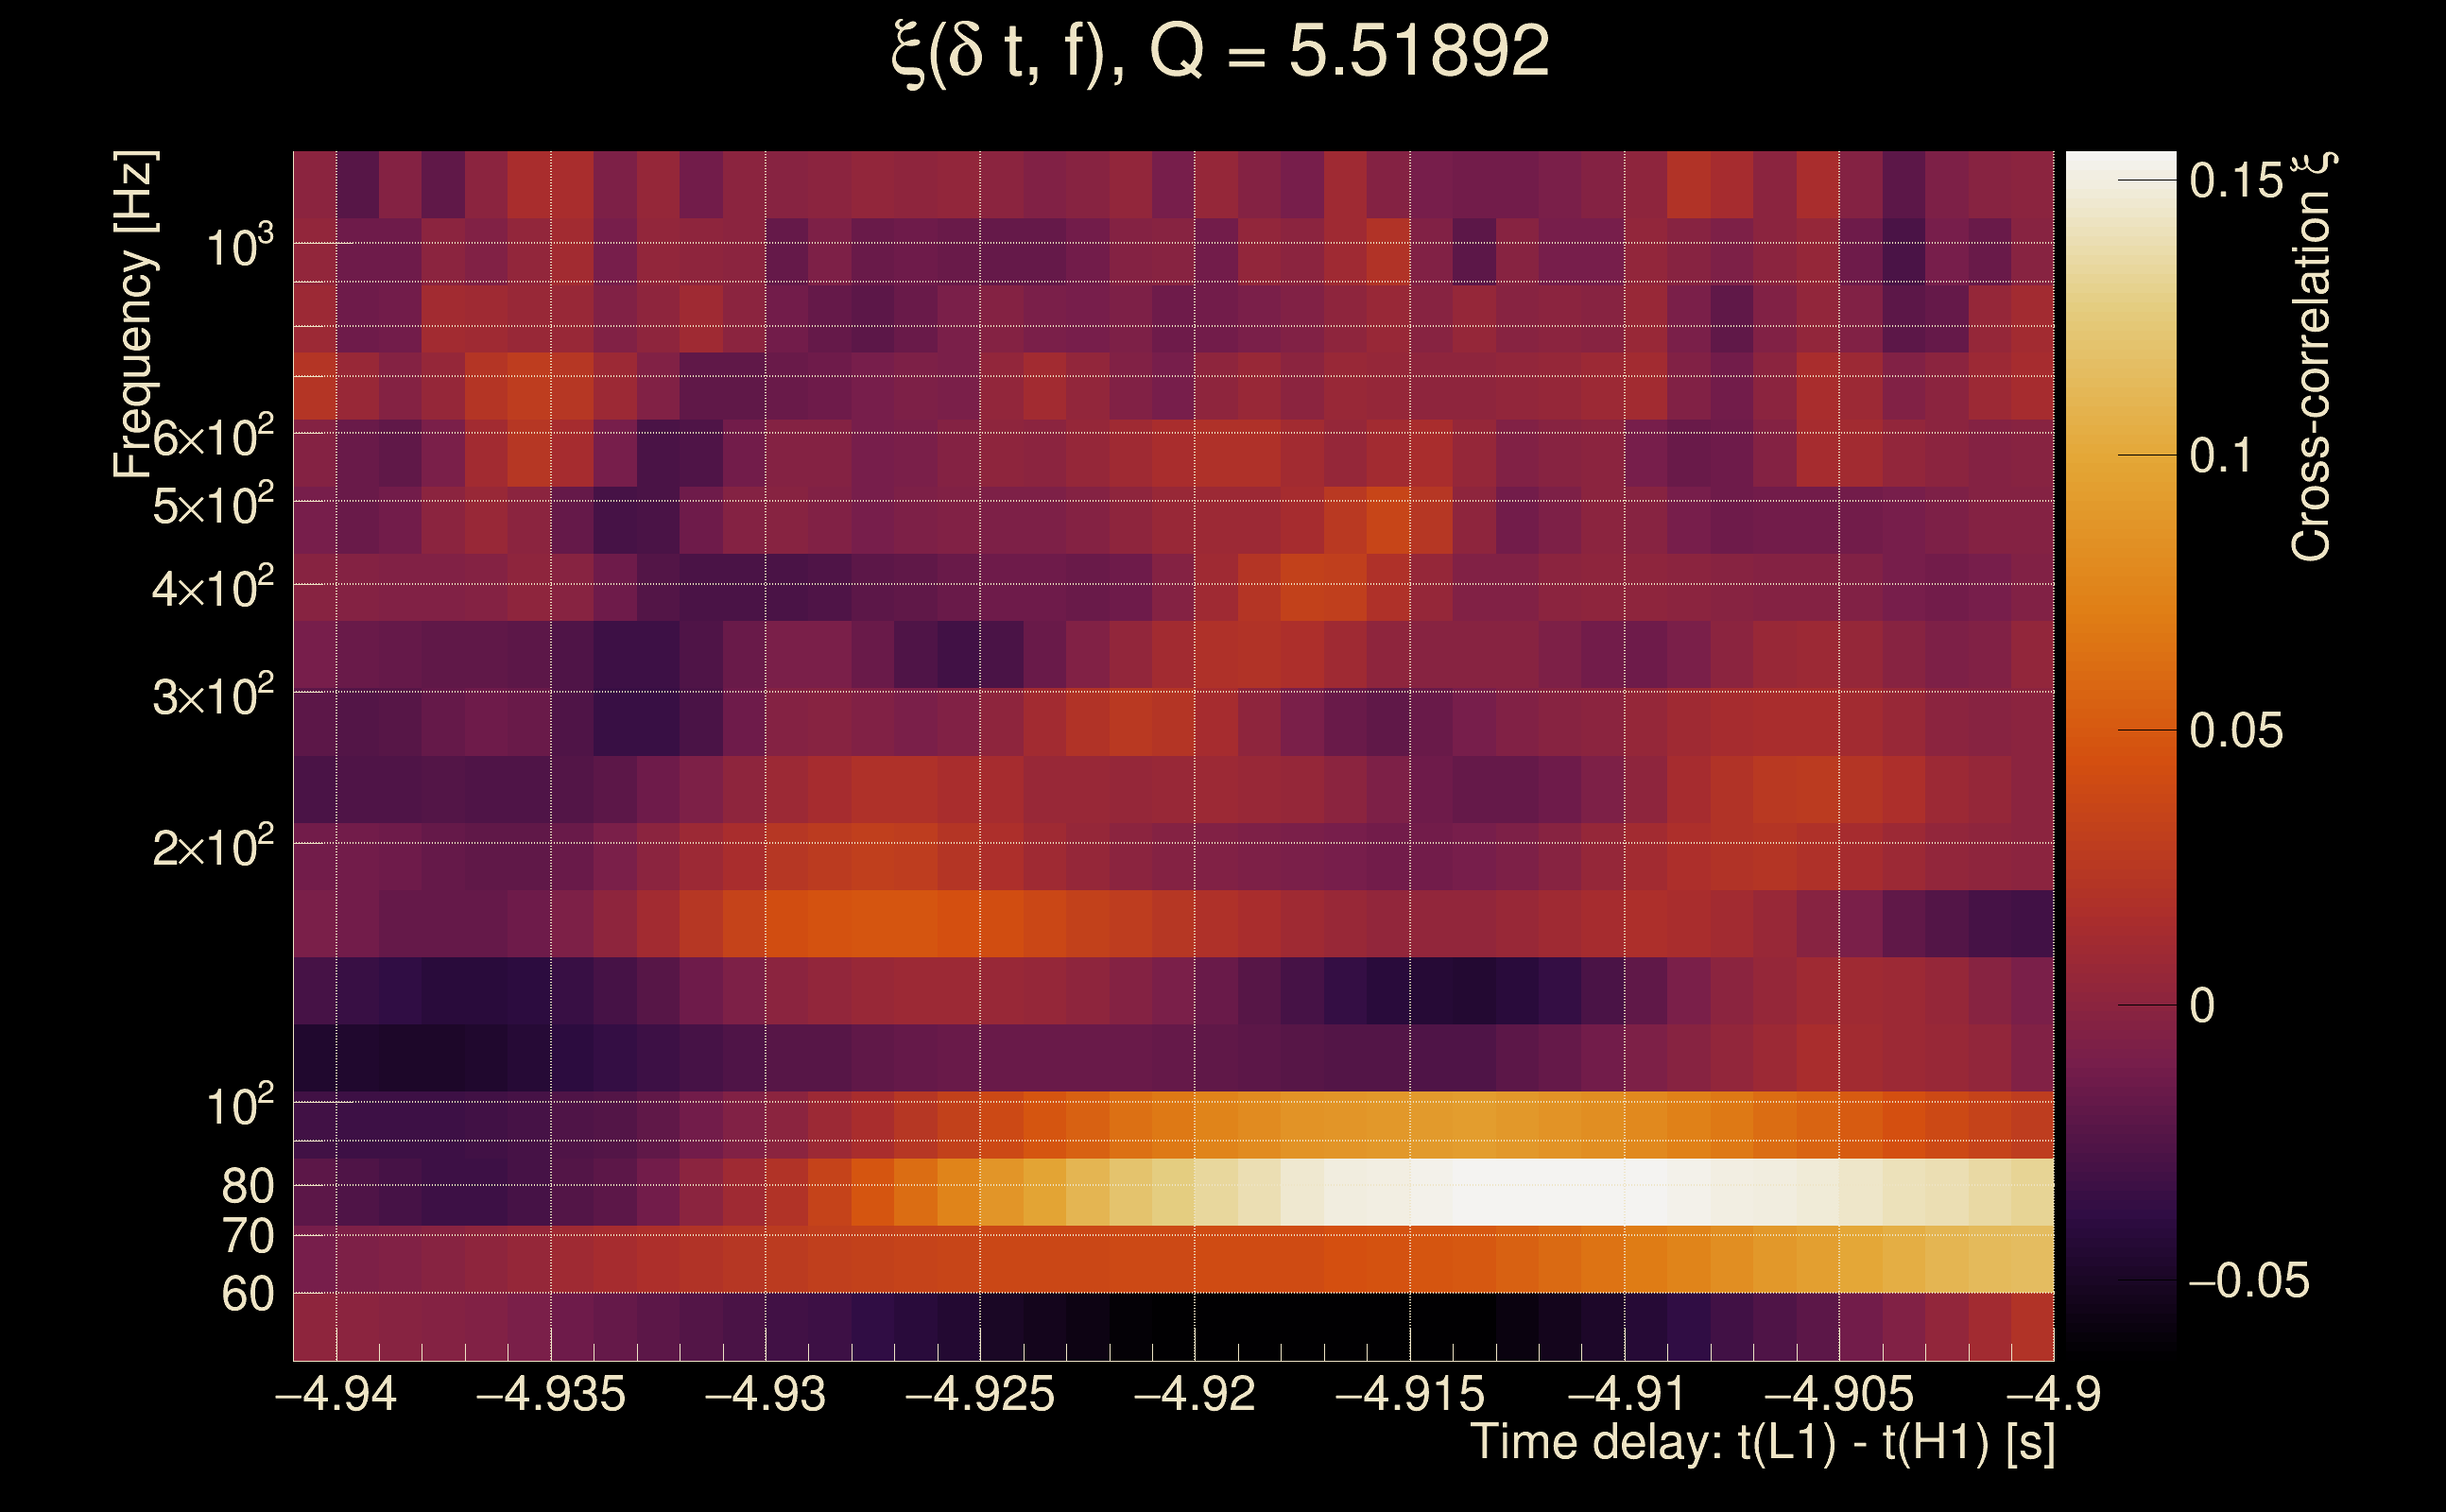
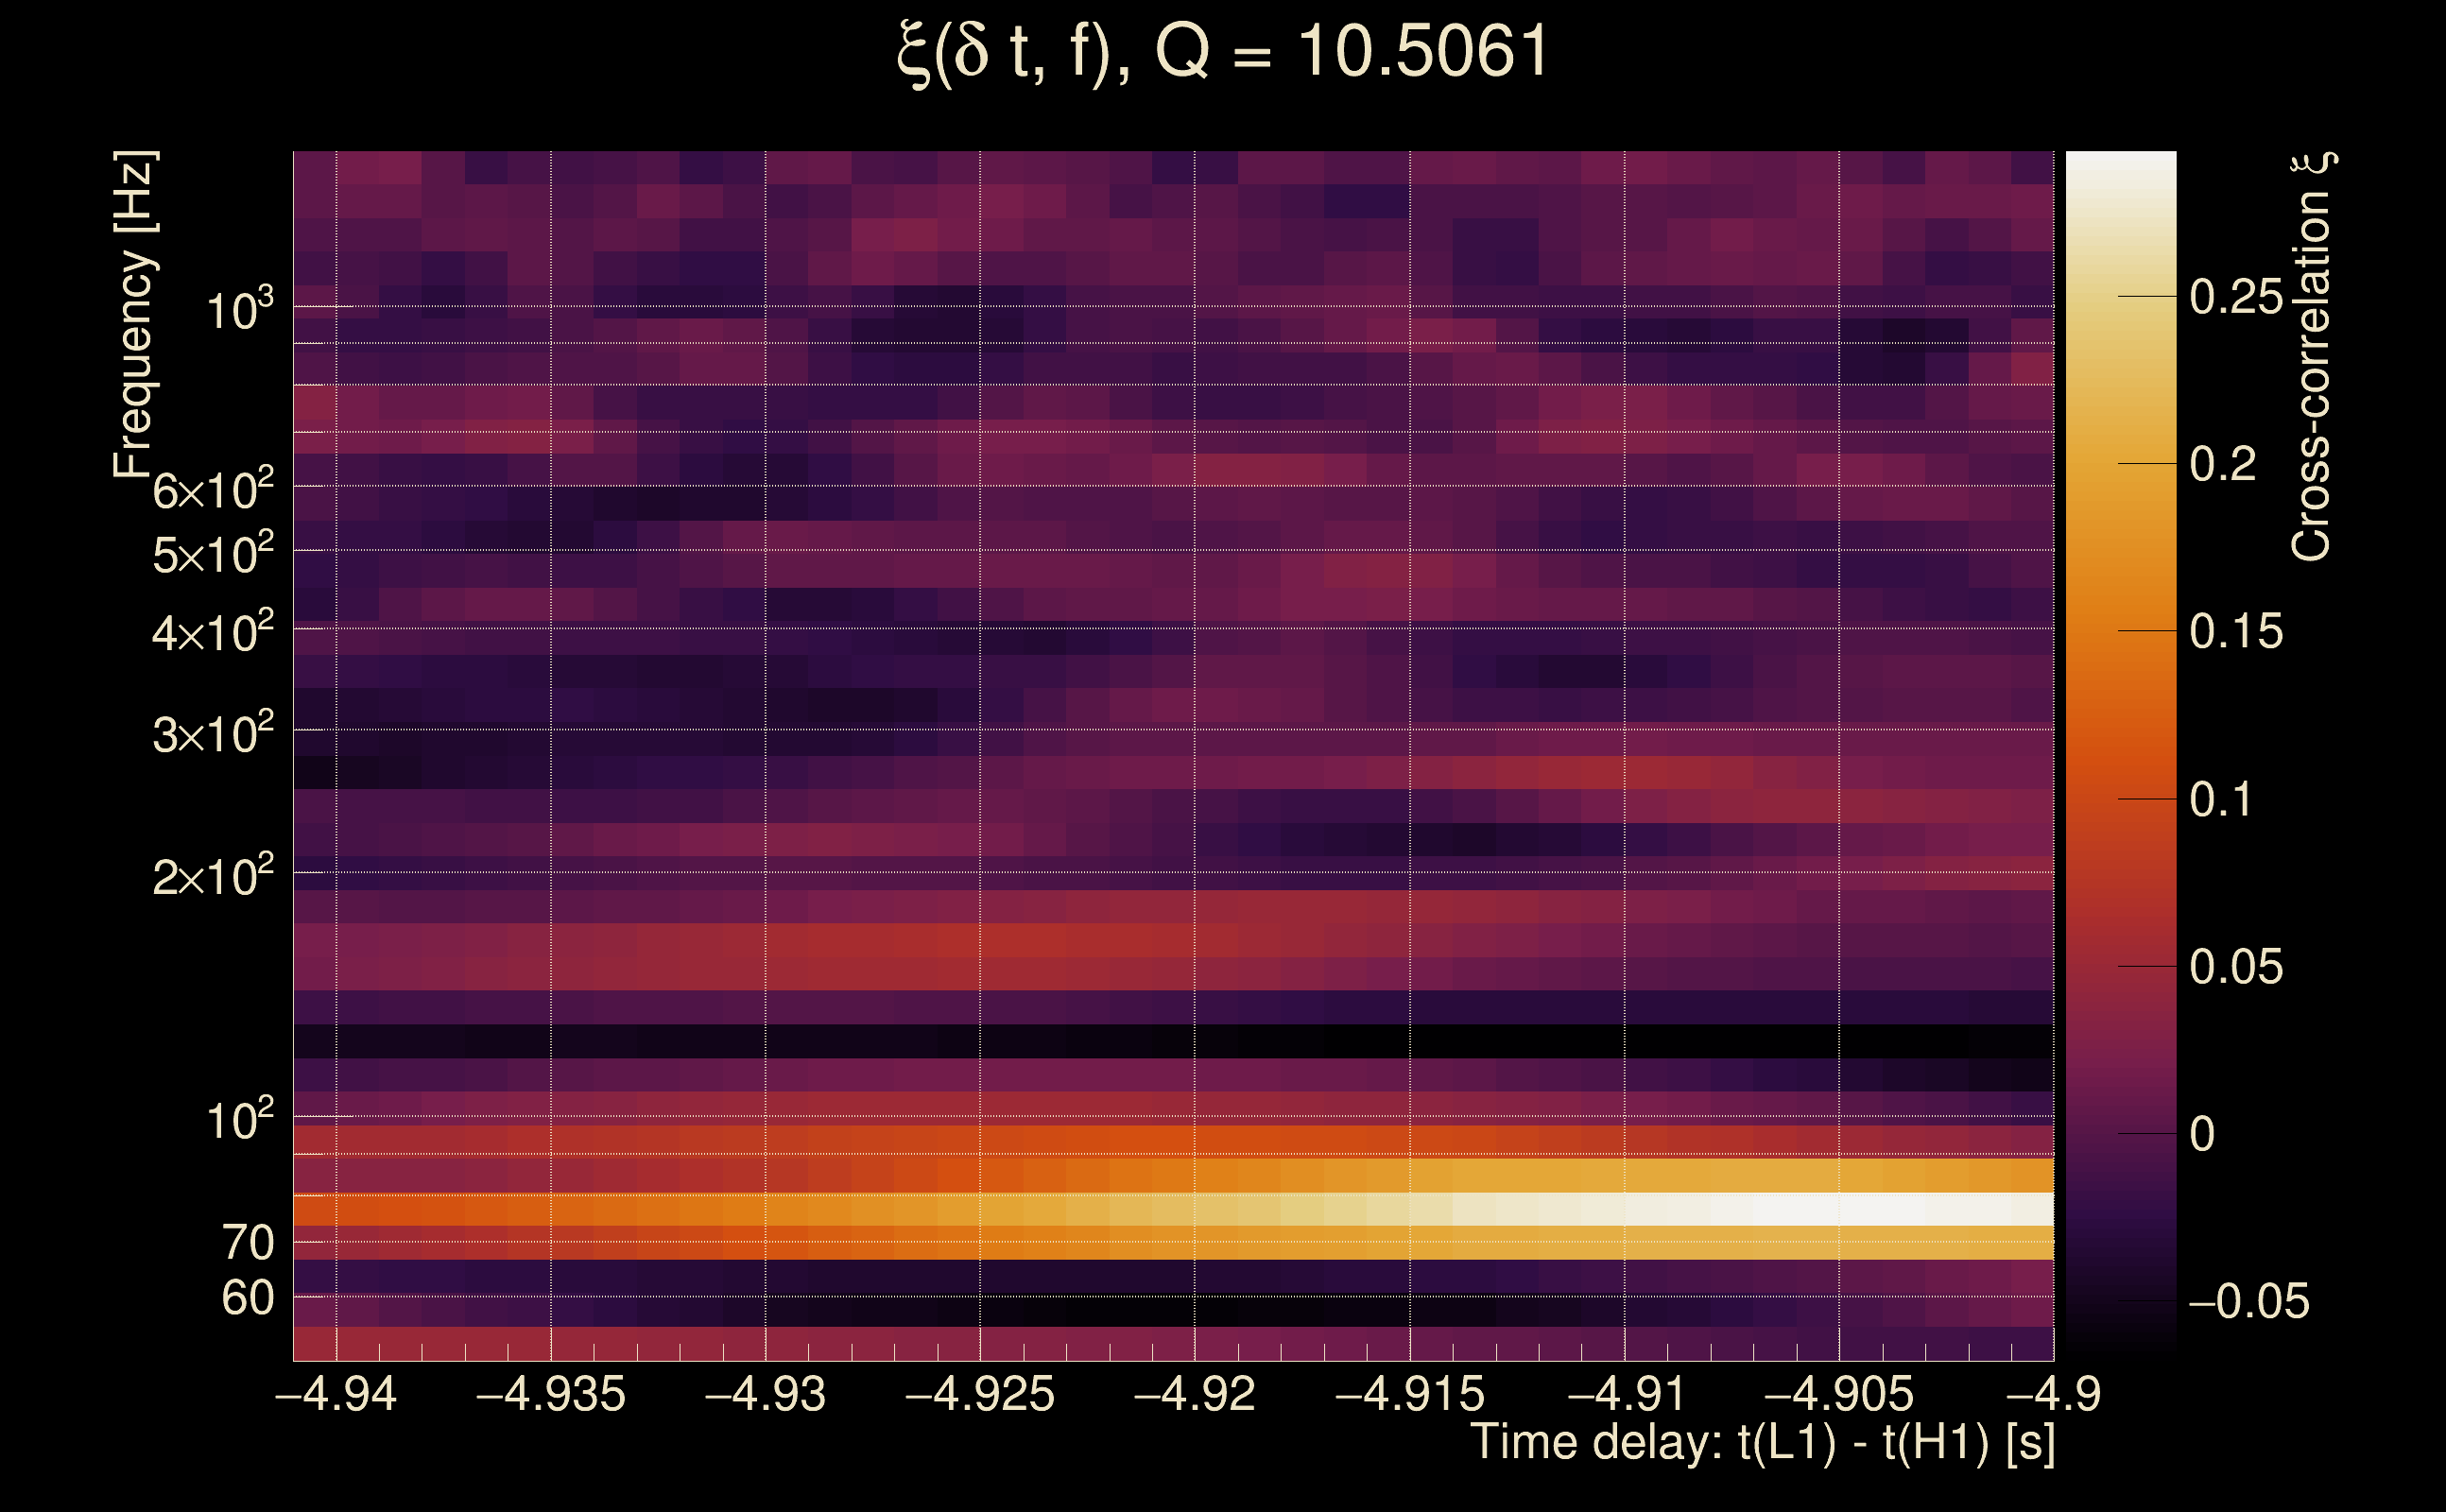
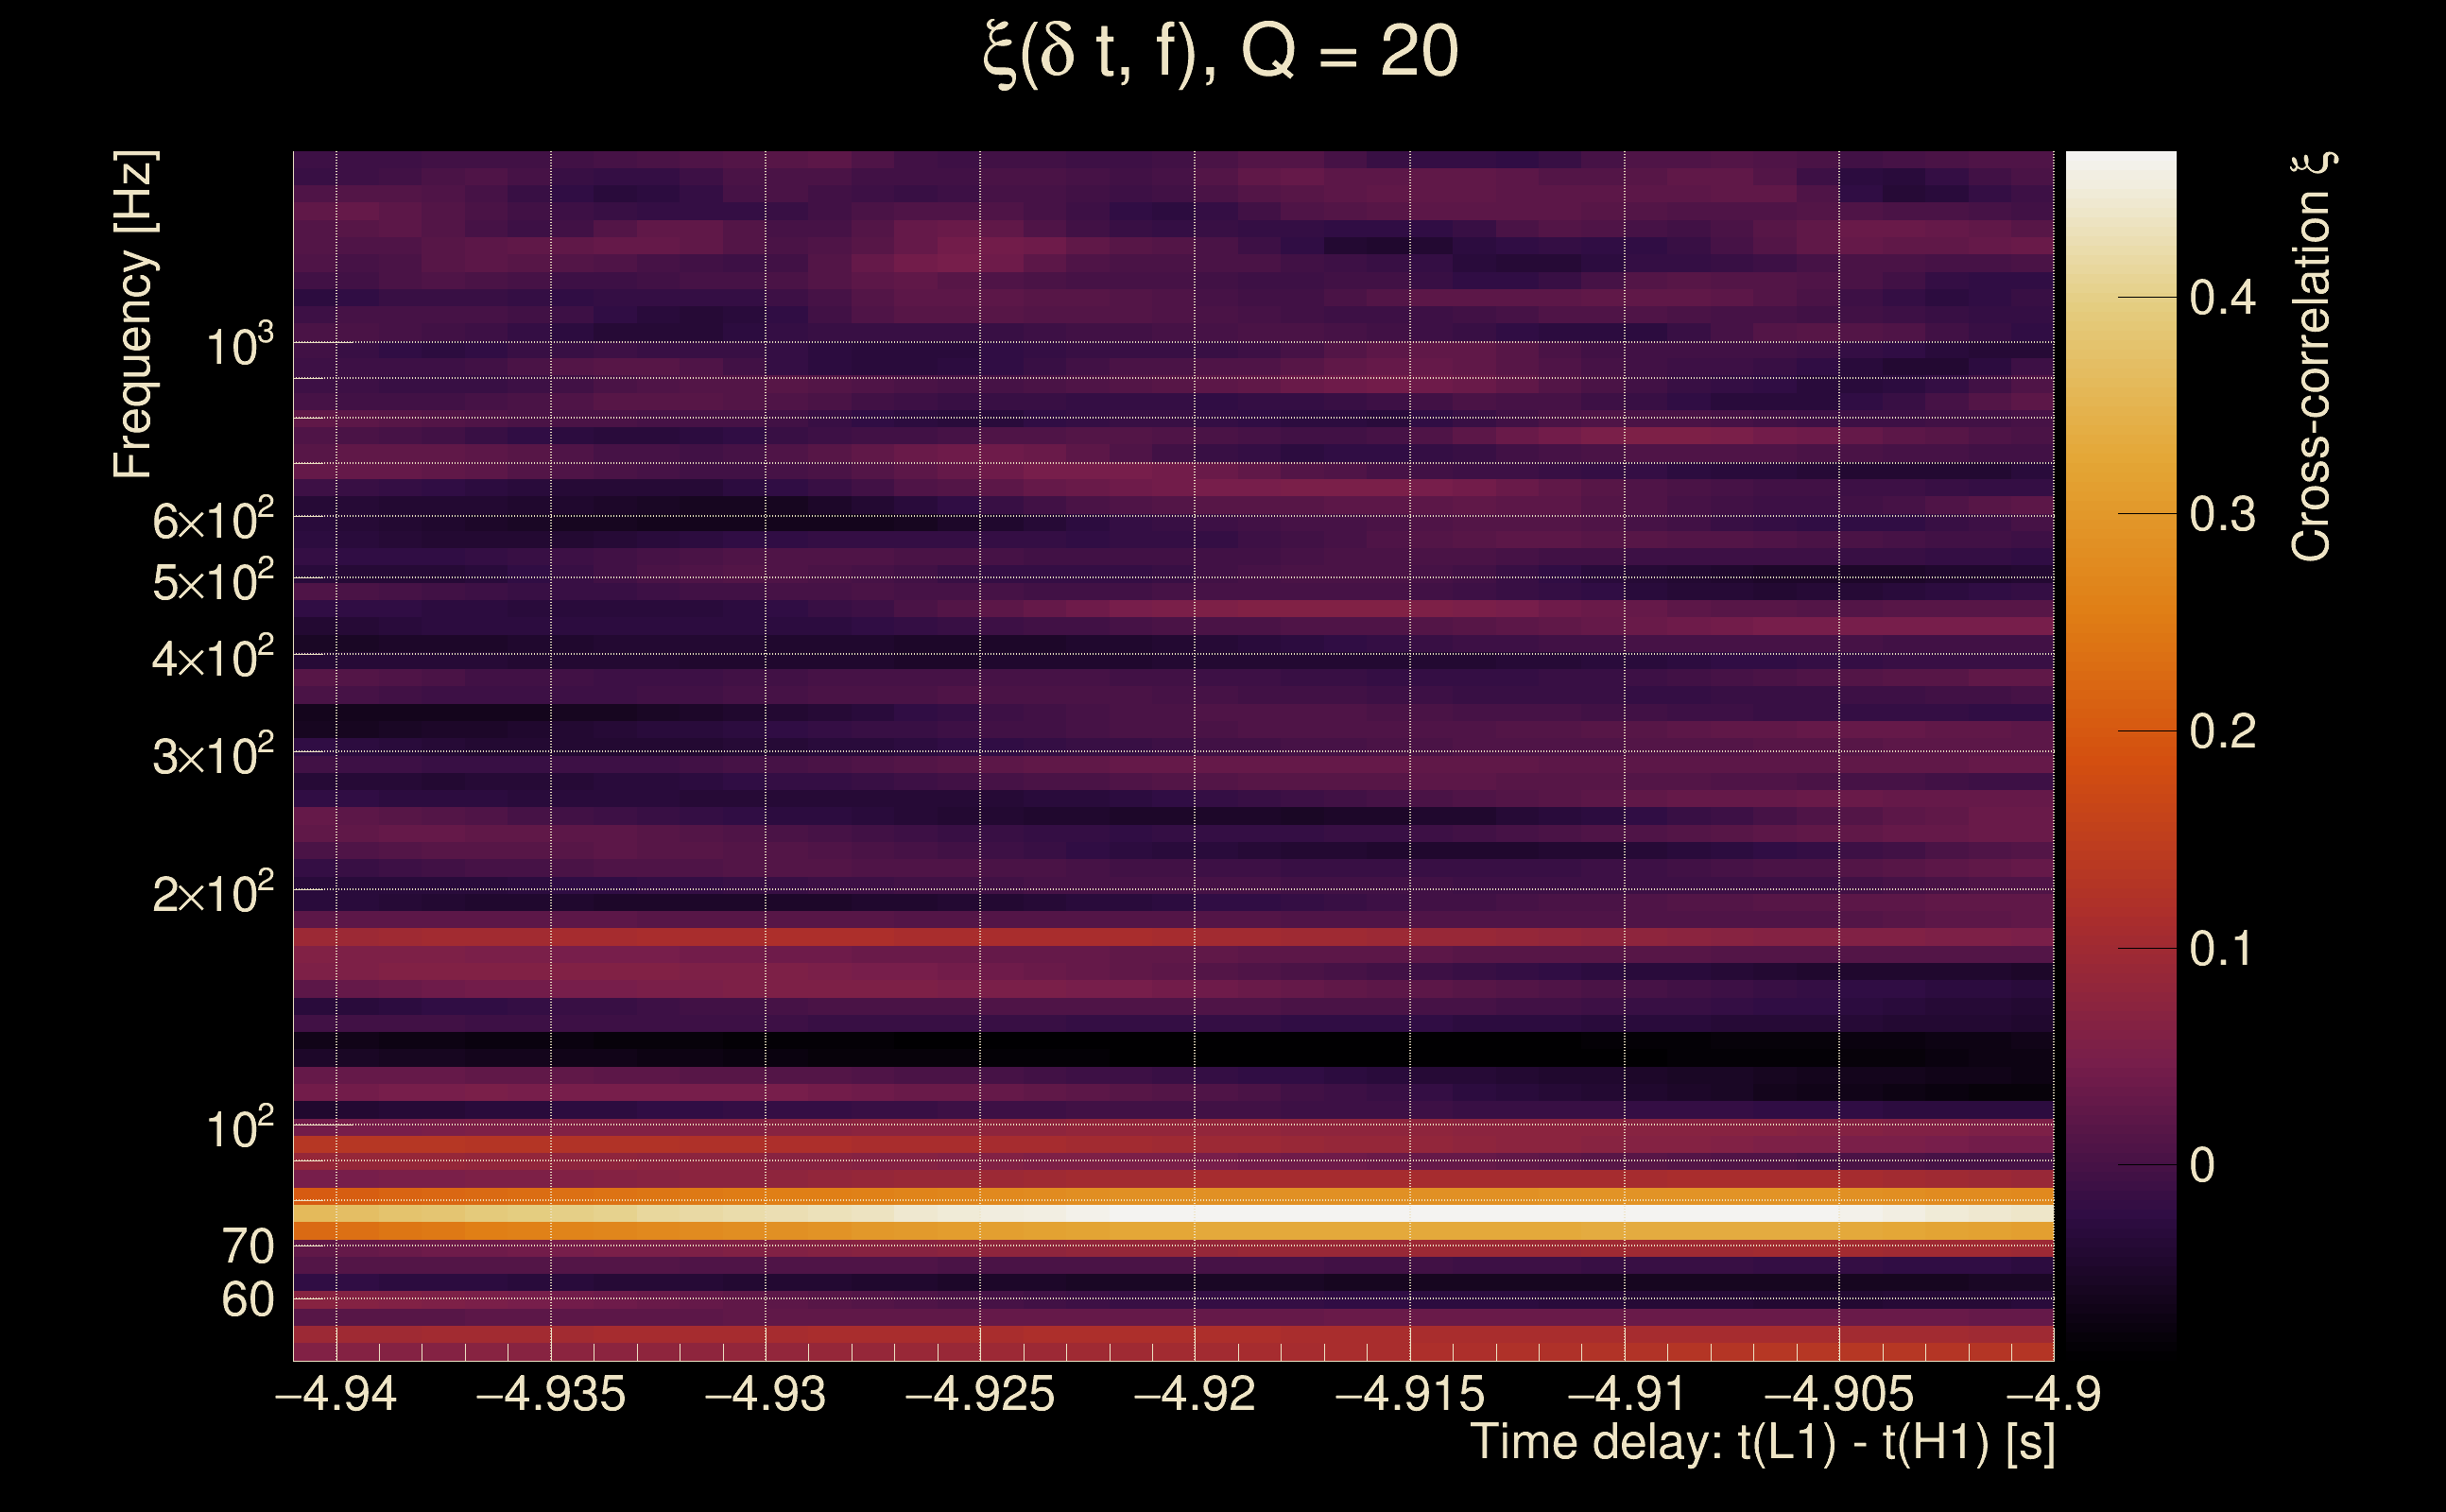
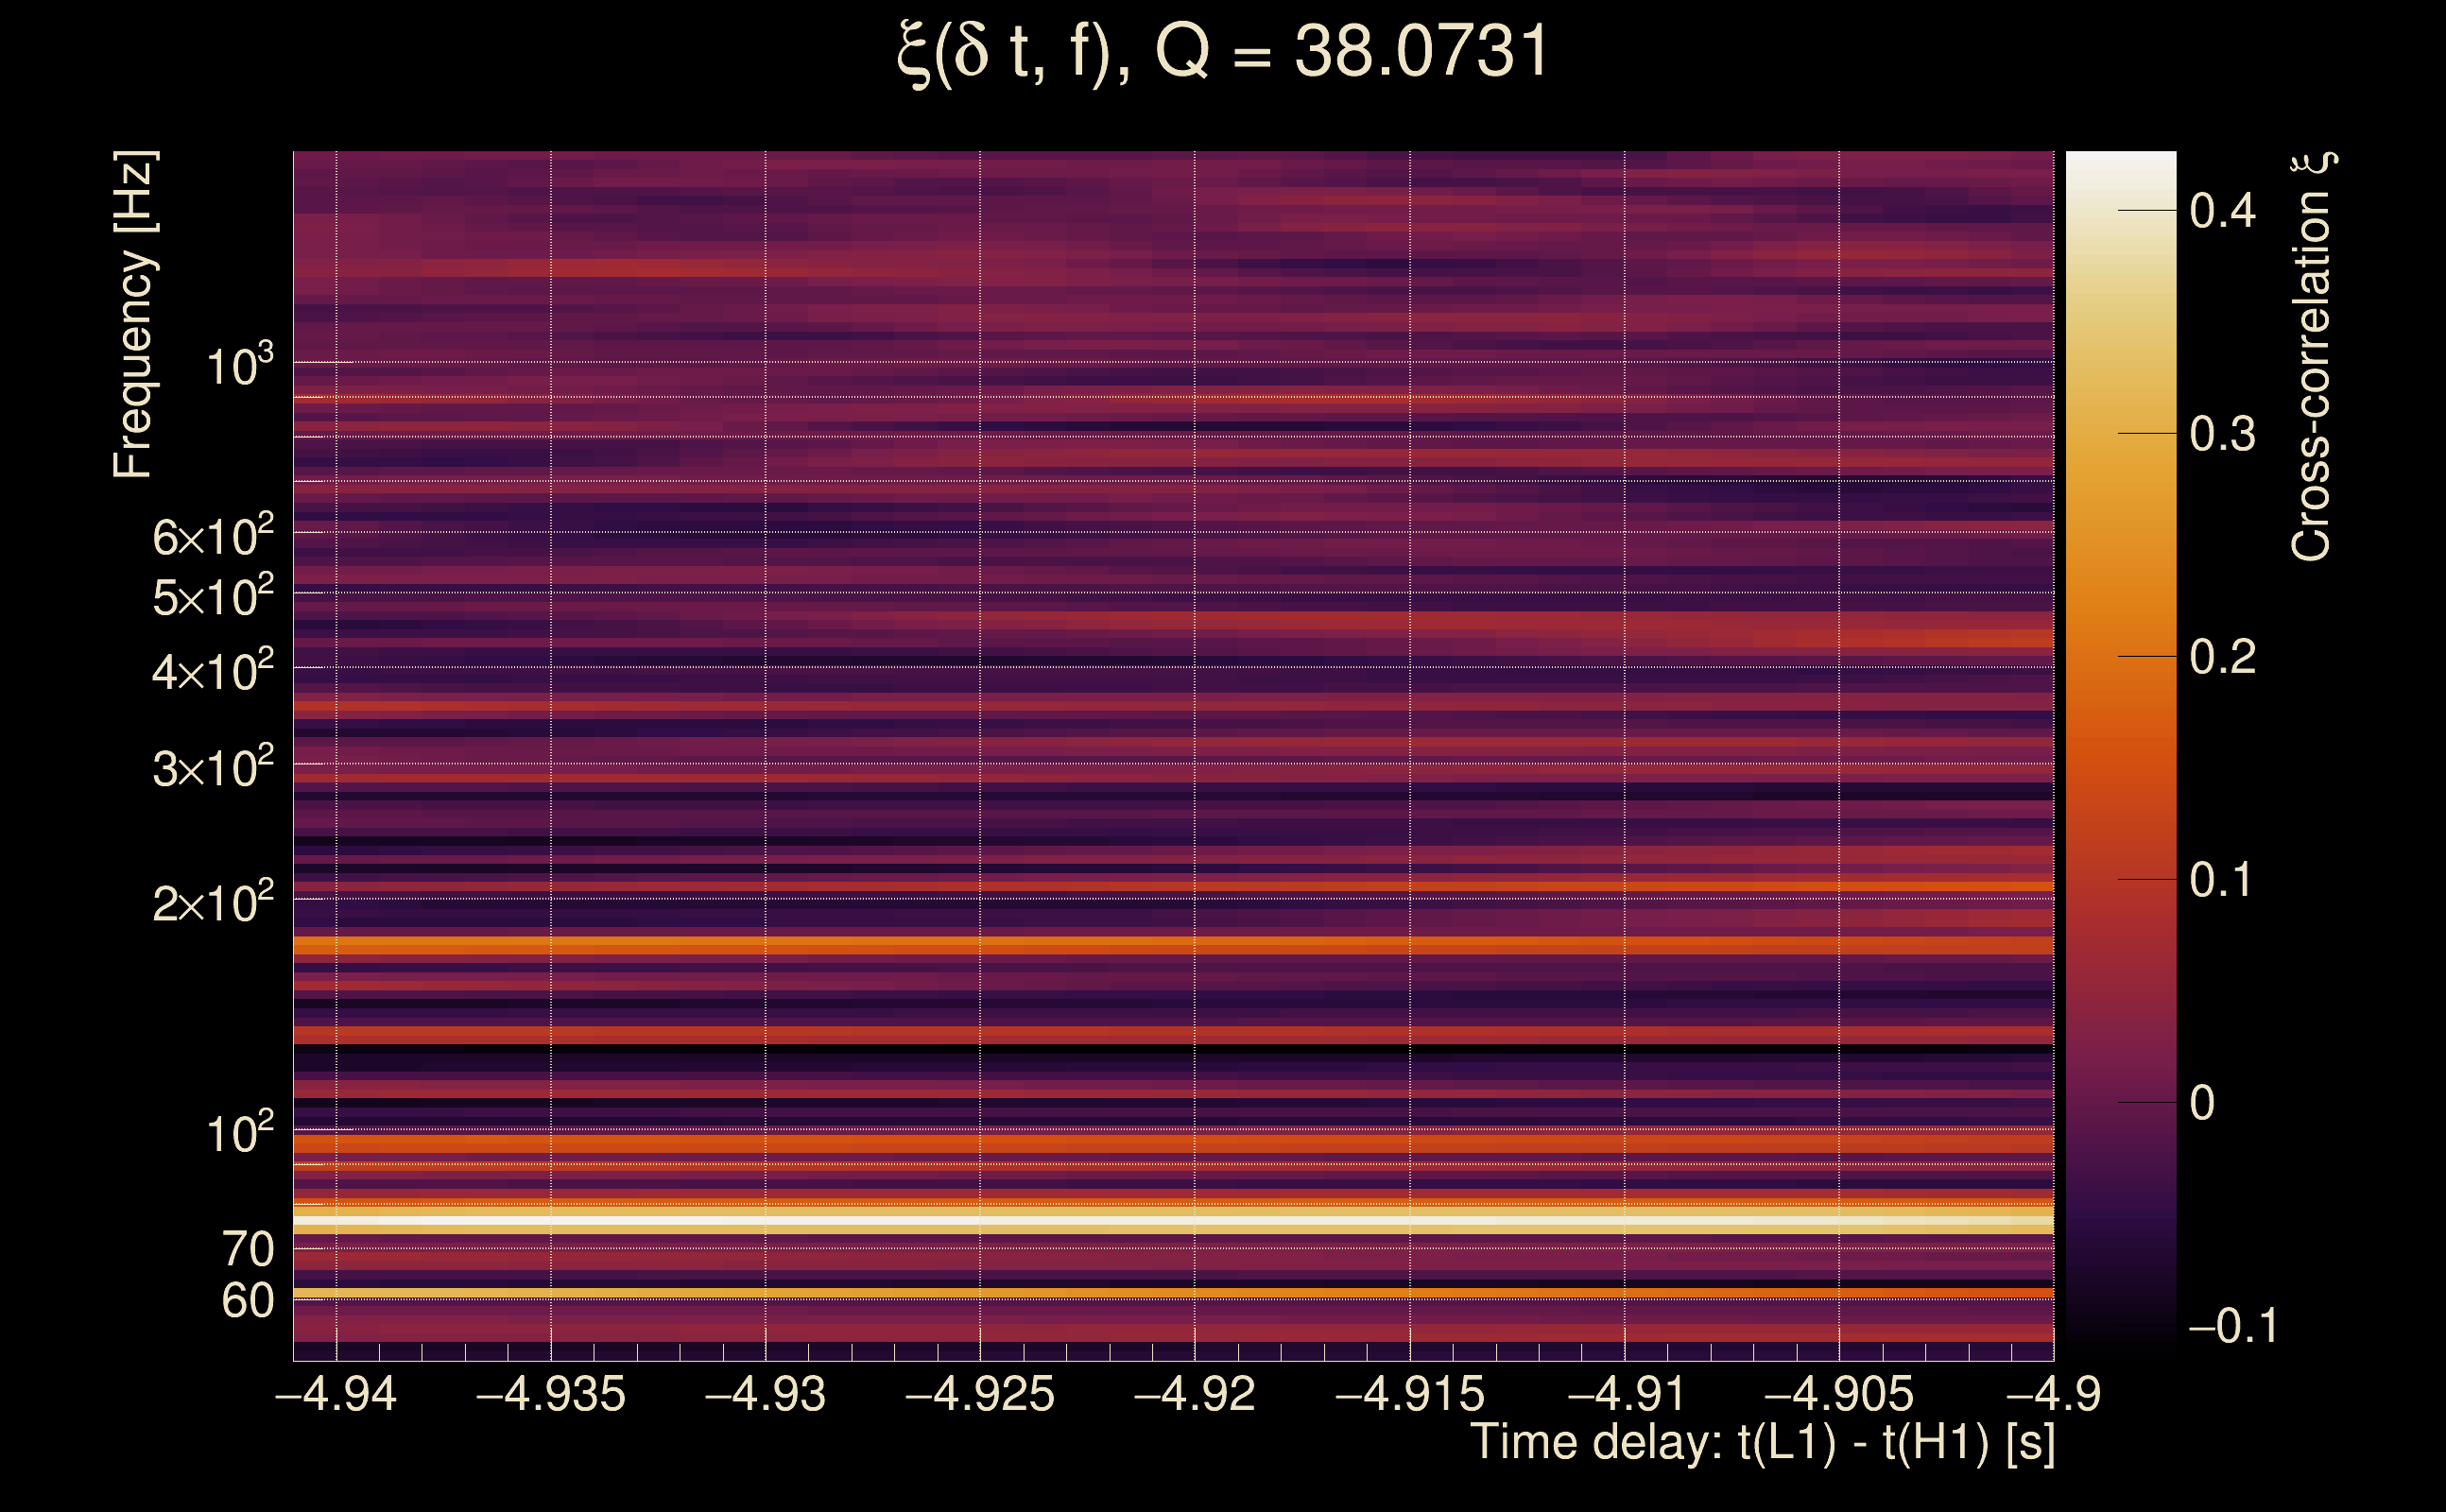
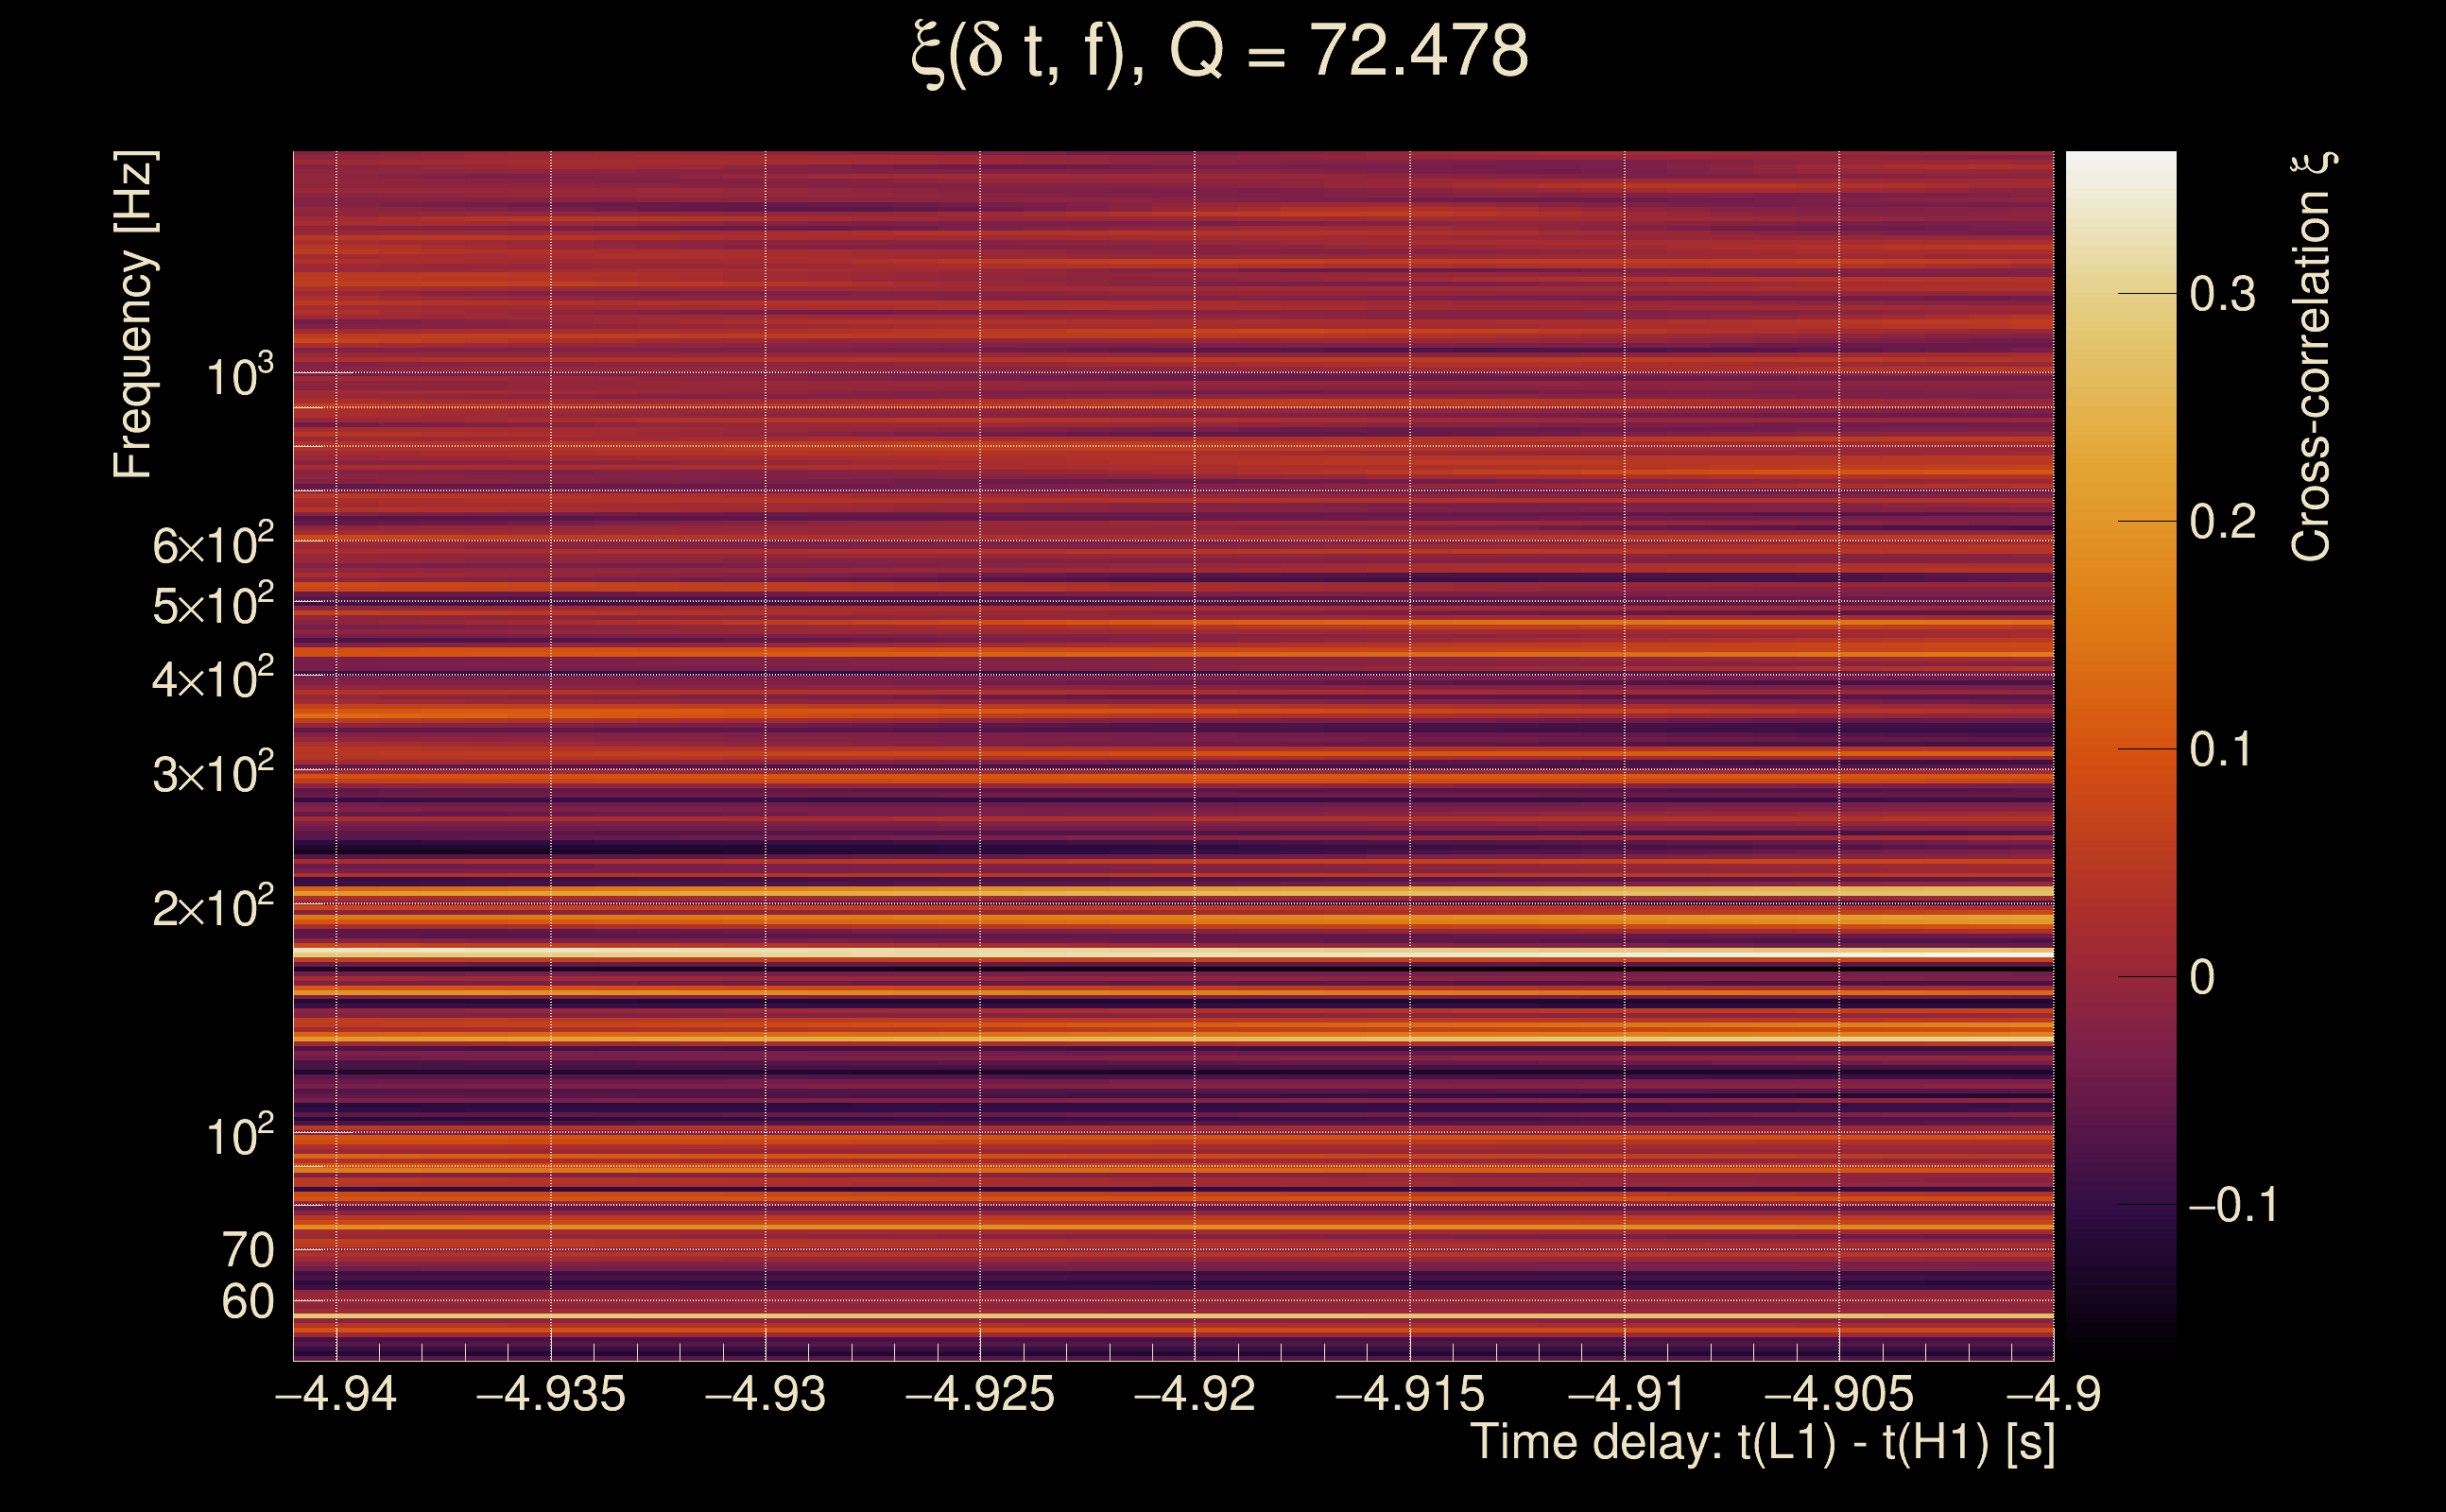
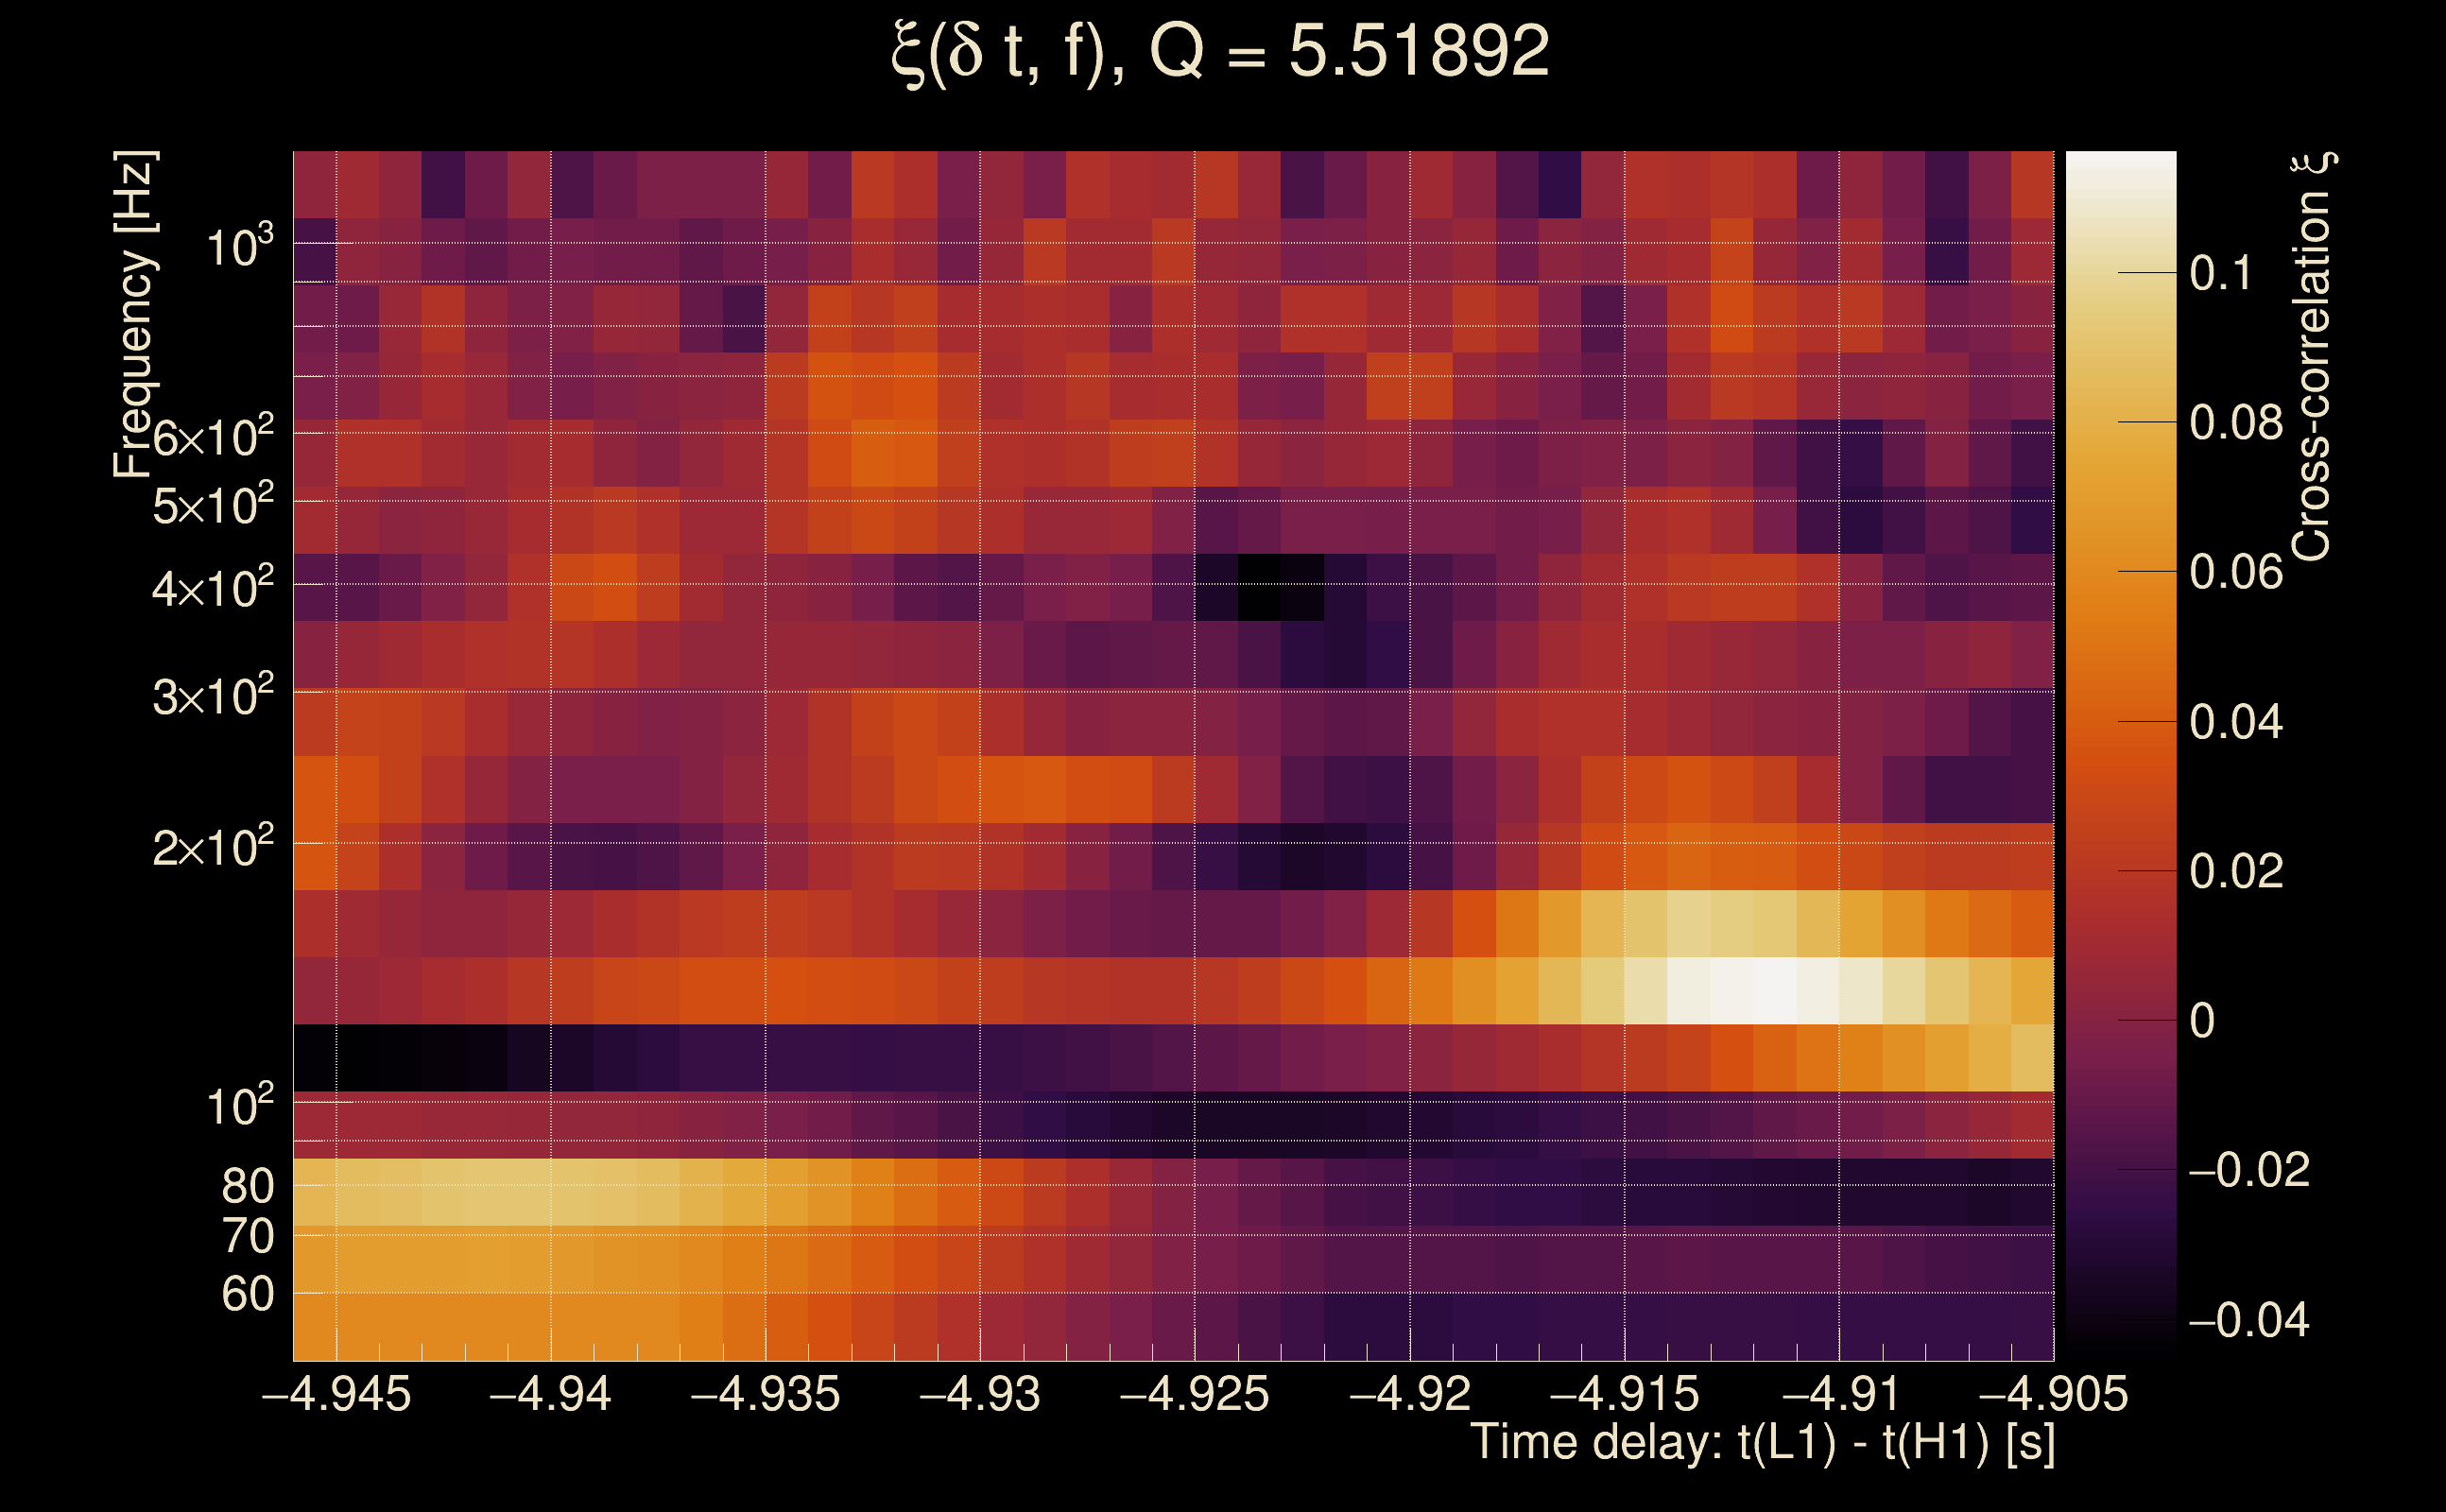
| Number of Q planes: | 5 (Q = 5.51892 → Q = 72.478) |
| Omicron frequency range: | 50 Hz → 1958.38 Hz |
| Light travel time between detectors: | 0.0100128 s |
| Slice extra-time (calibration uncertainty + slice veto): | 0.0129872 s |
| Number of time-delay bins in a cross-correlation map: | 10000 |
| Number of slices in a cross-correlation map: | 217 |
| Number of time-delay bins in a slice: | 46 |
| SNR gating: | < 100 (detector 0), < 100 (detector 1) |
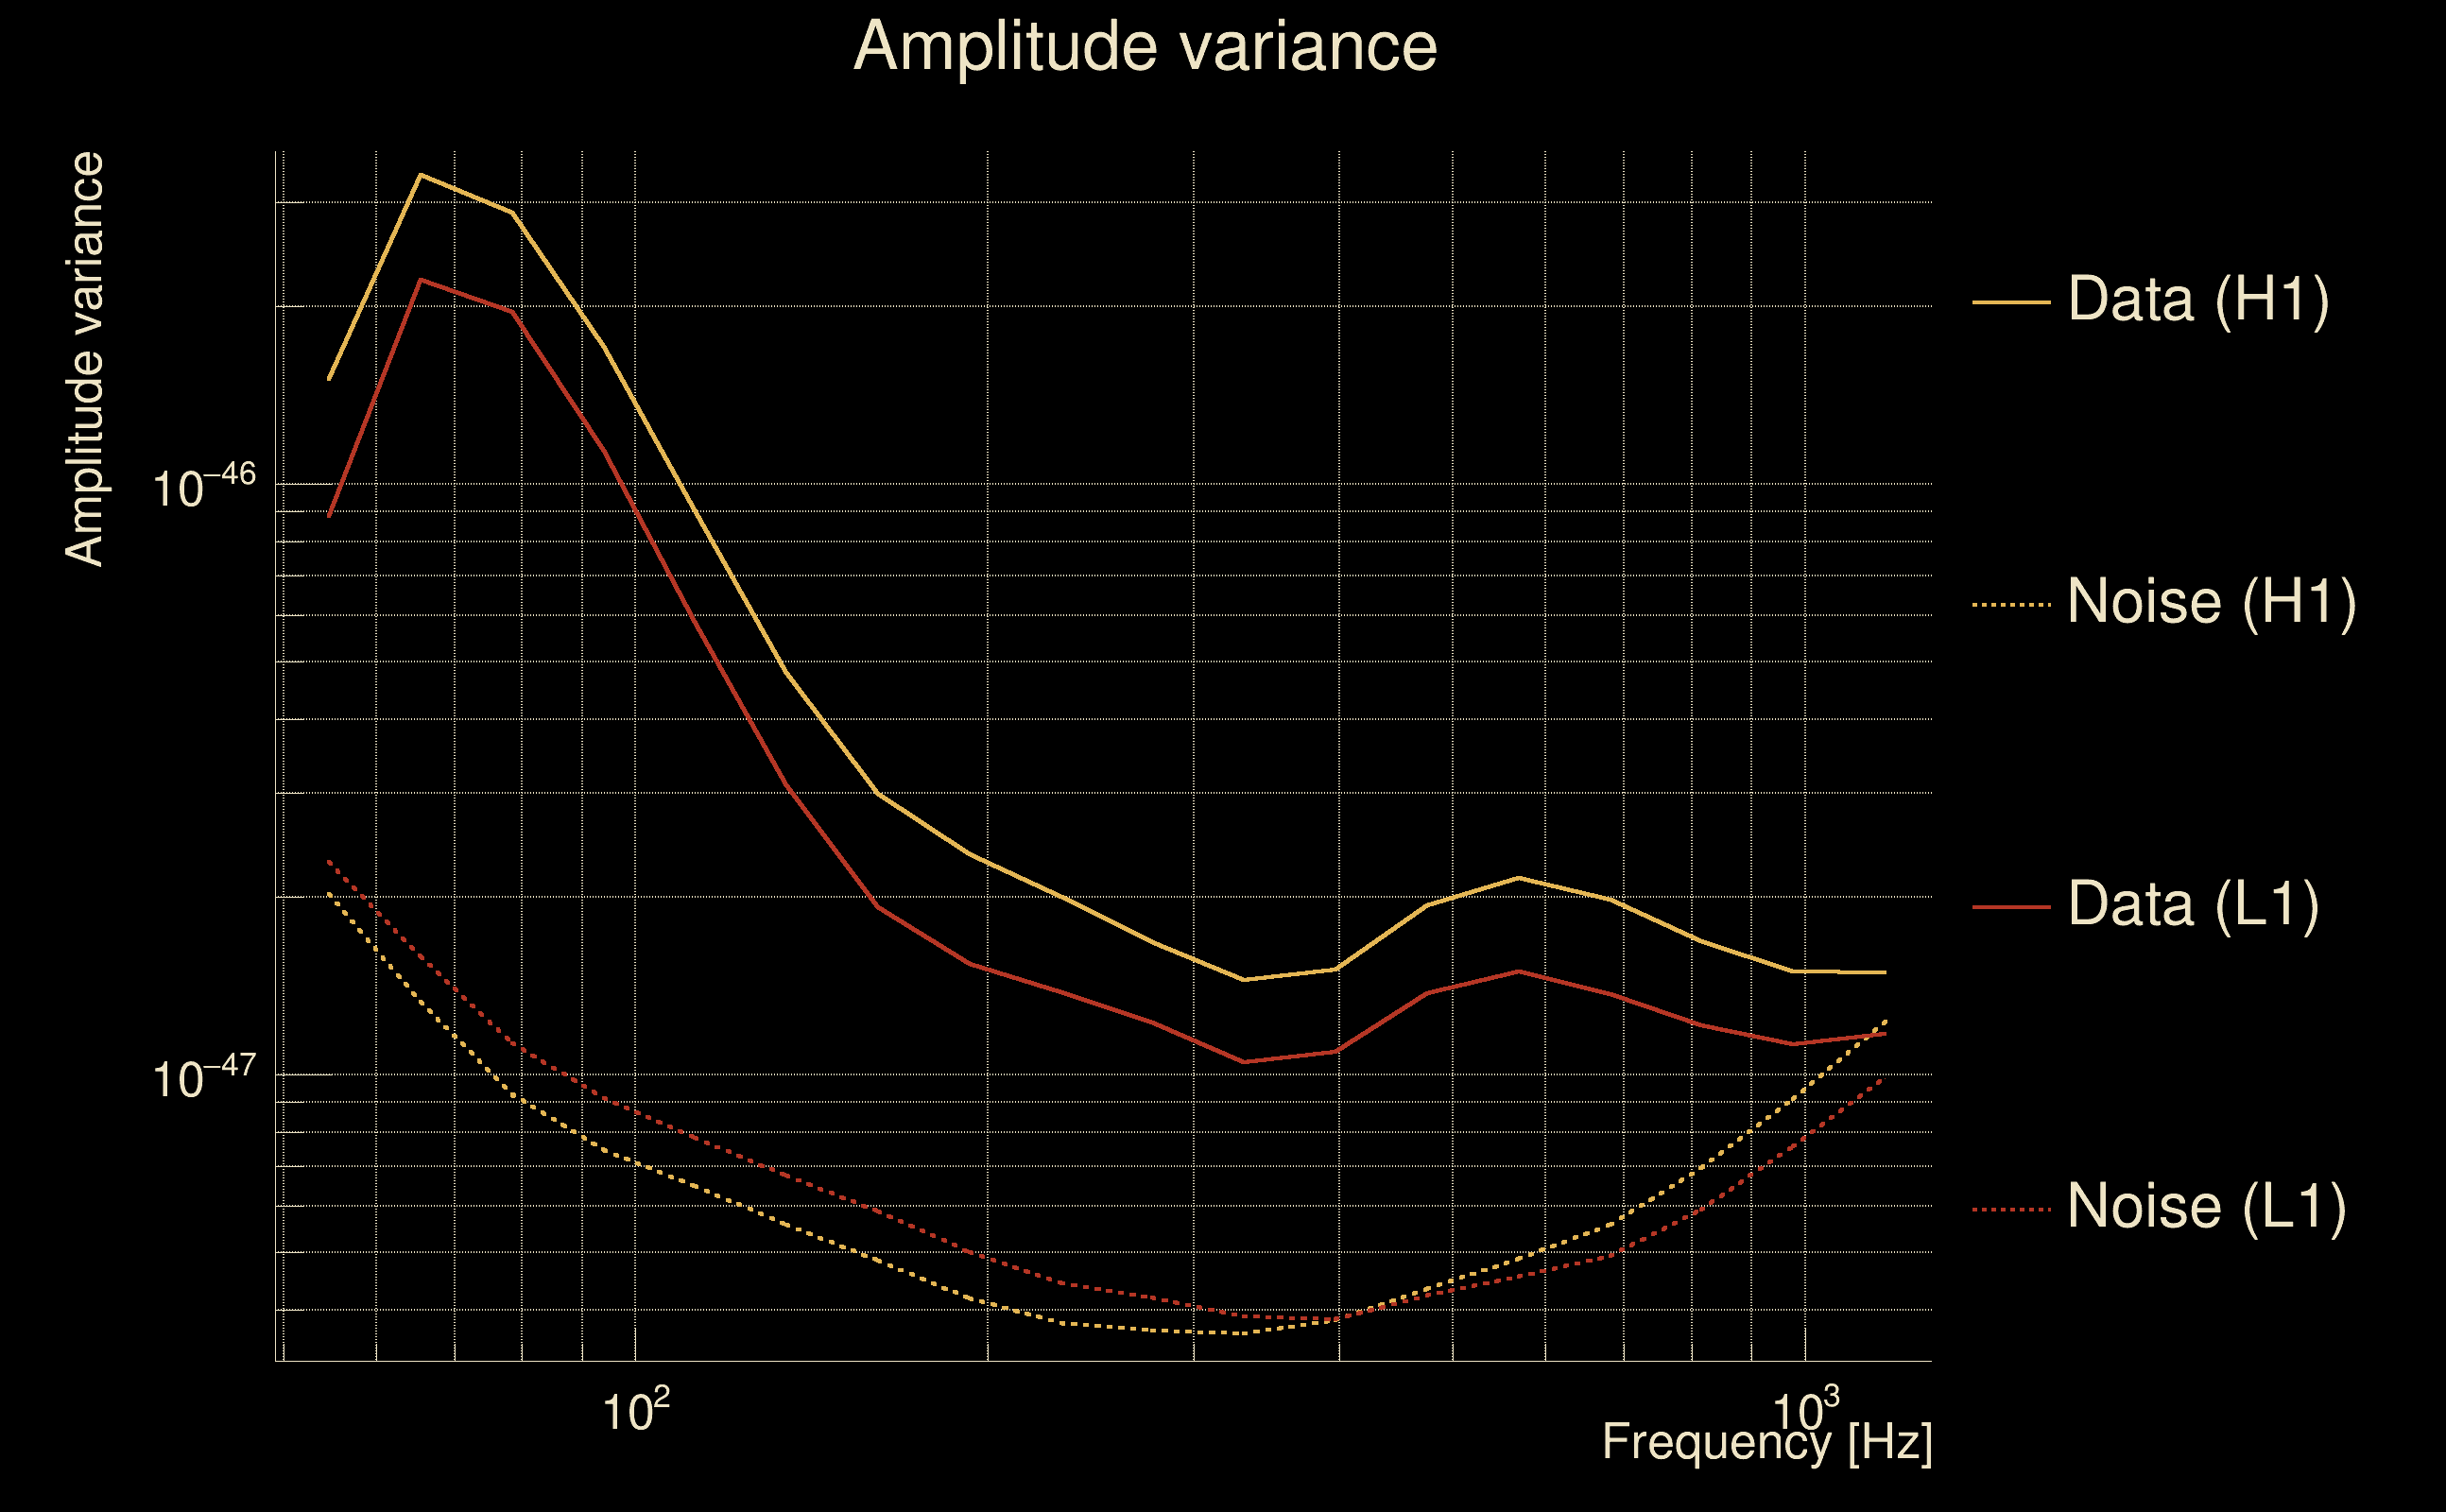
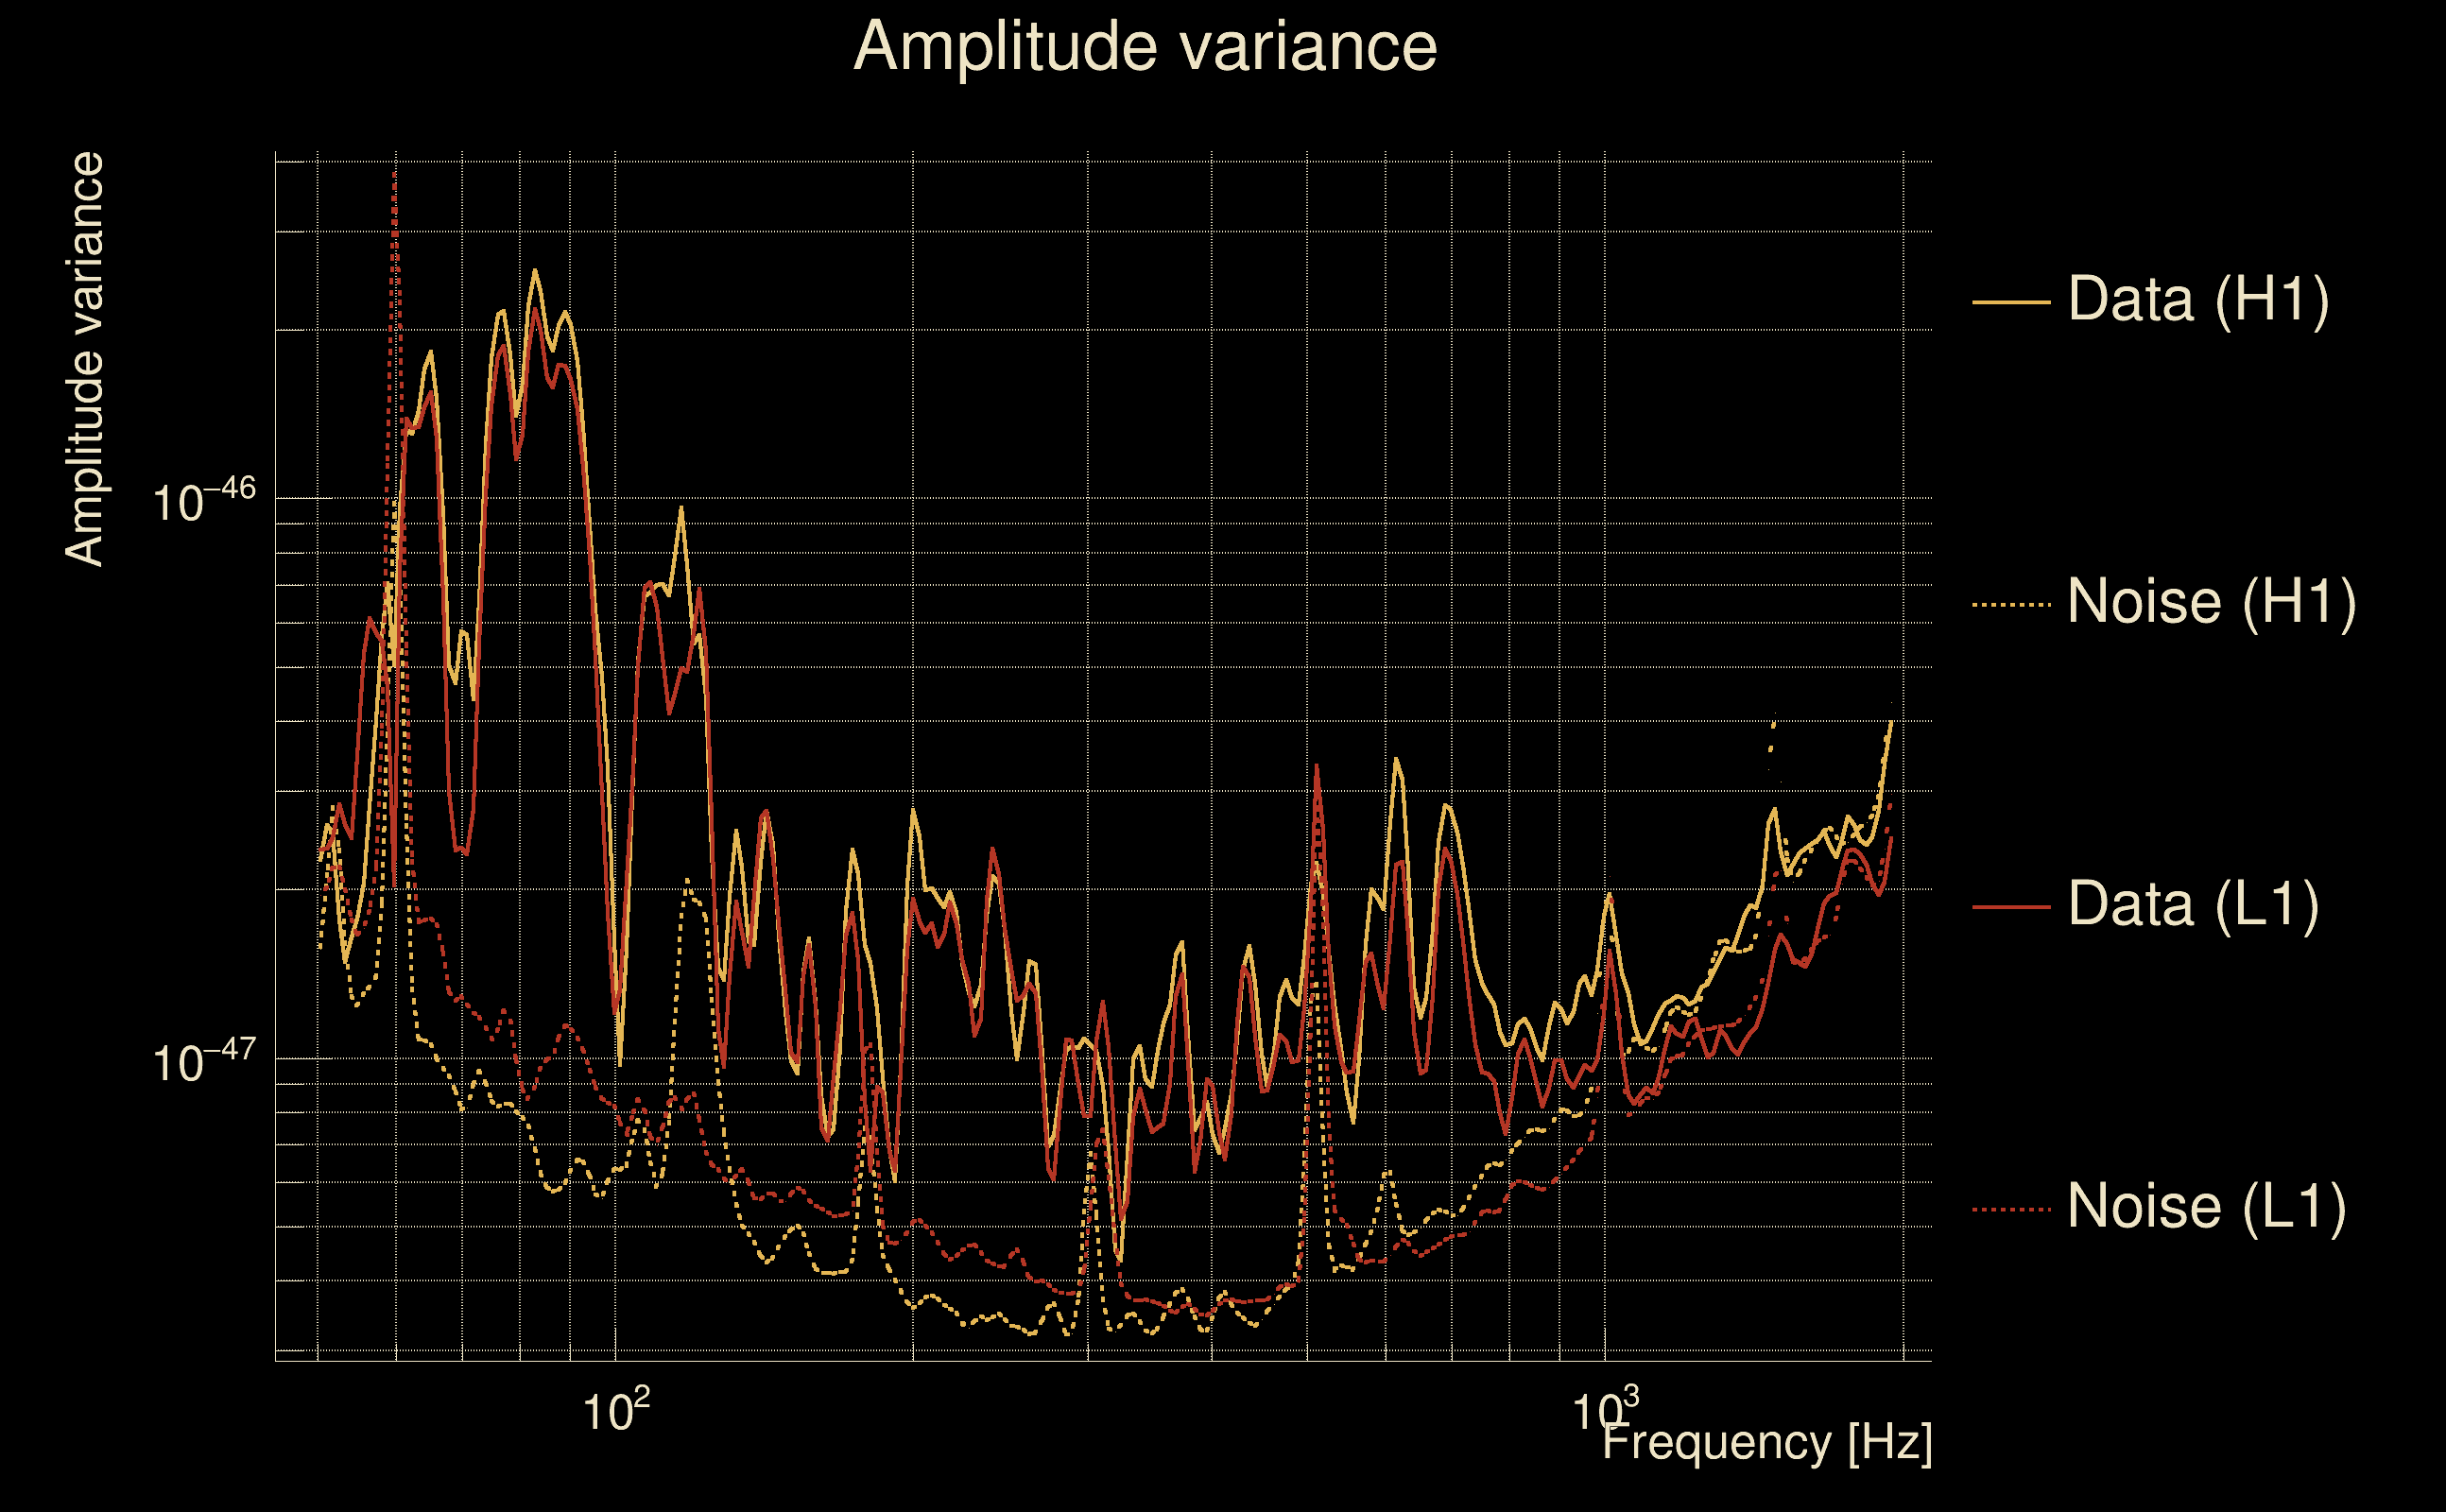
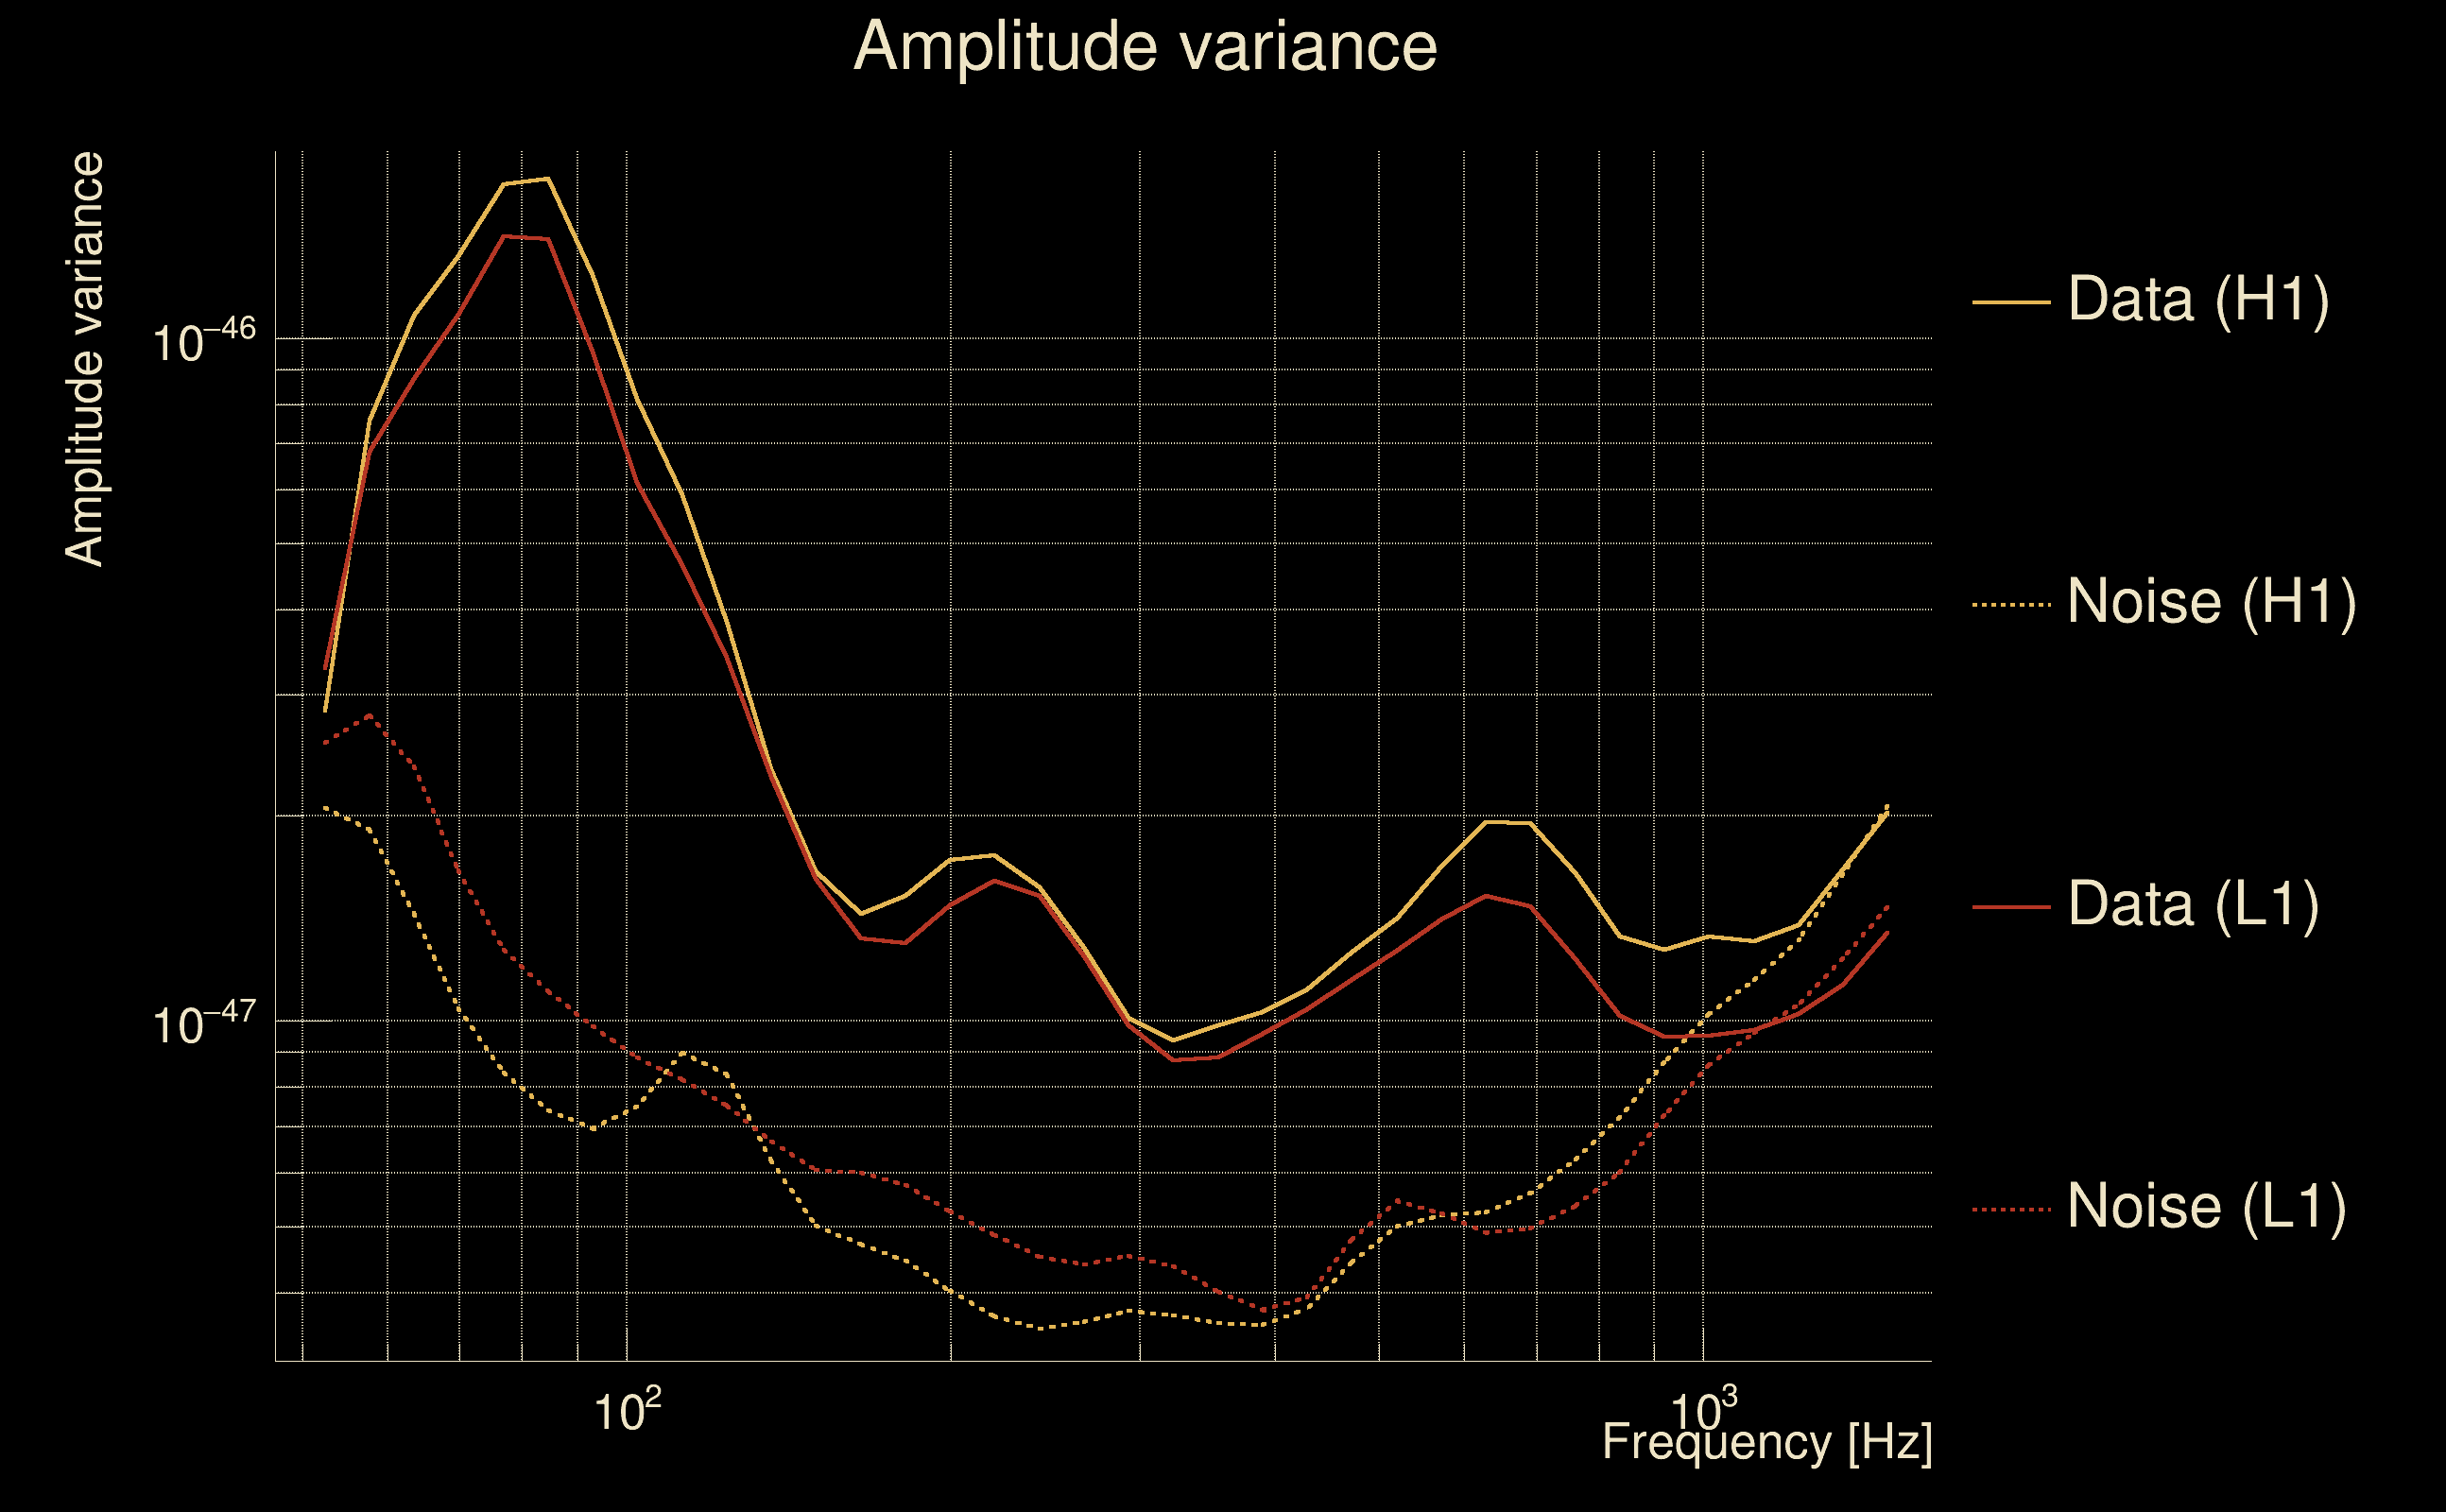
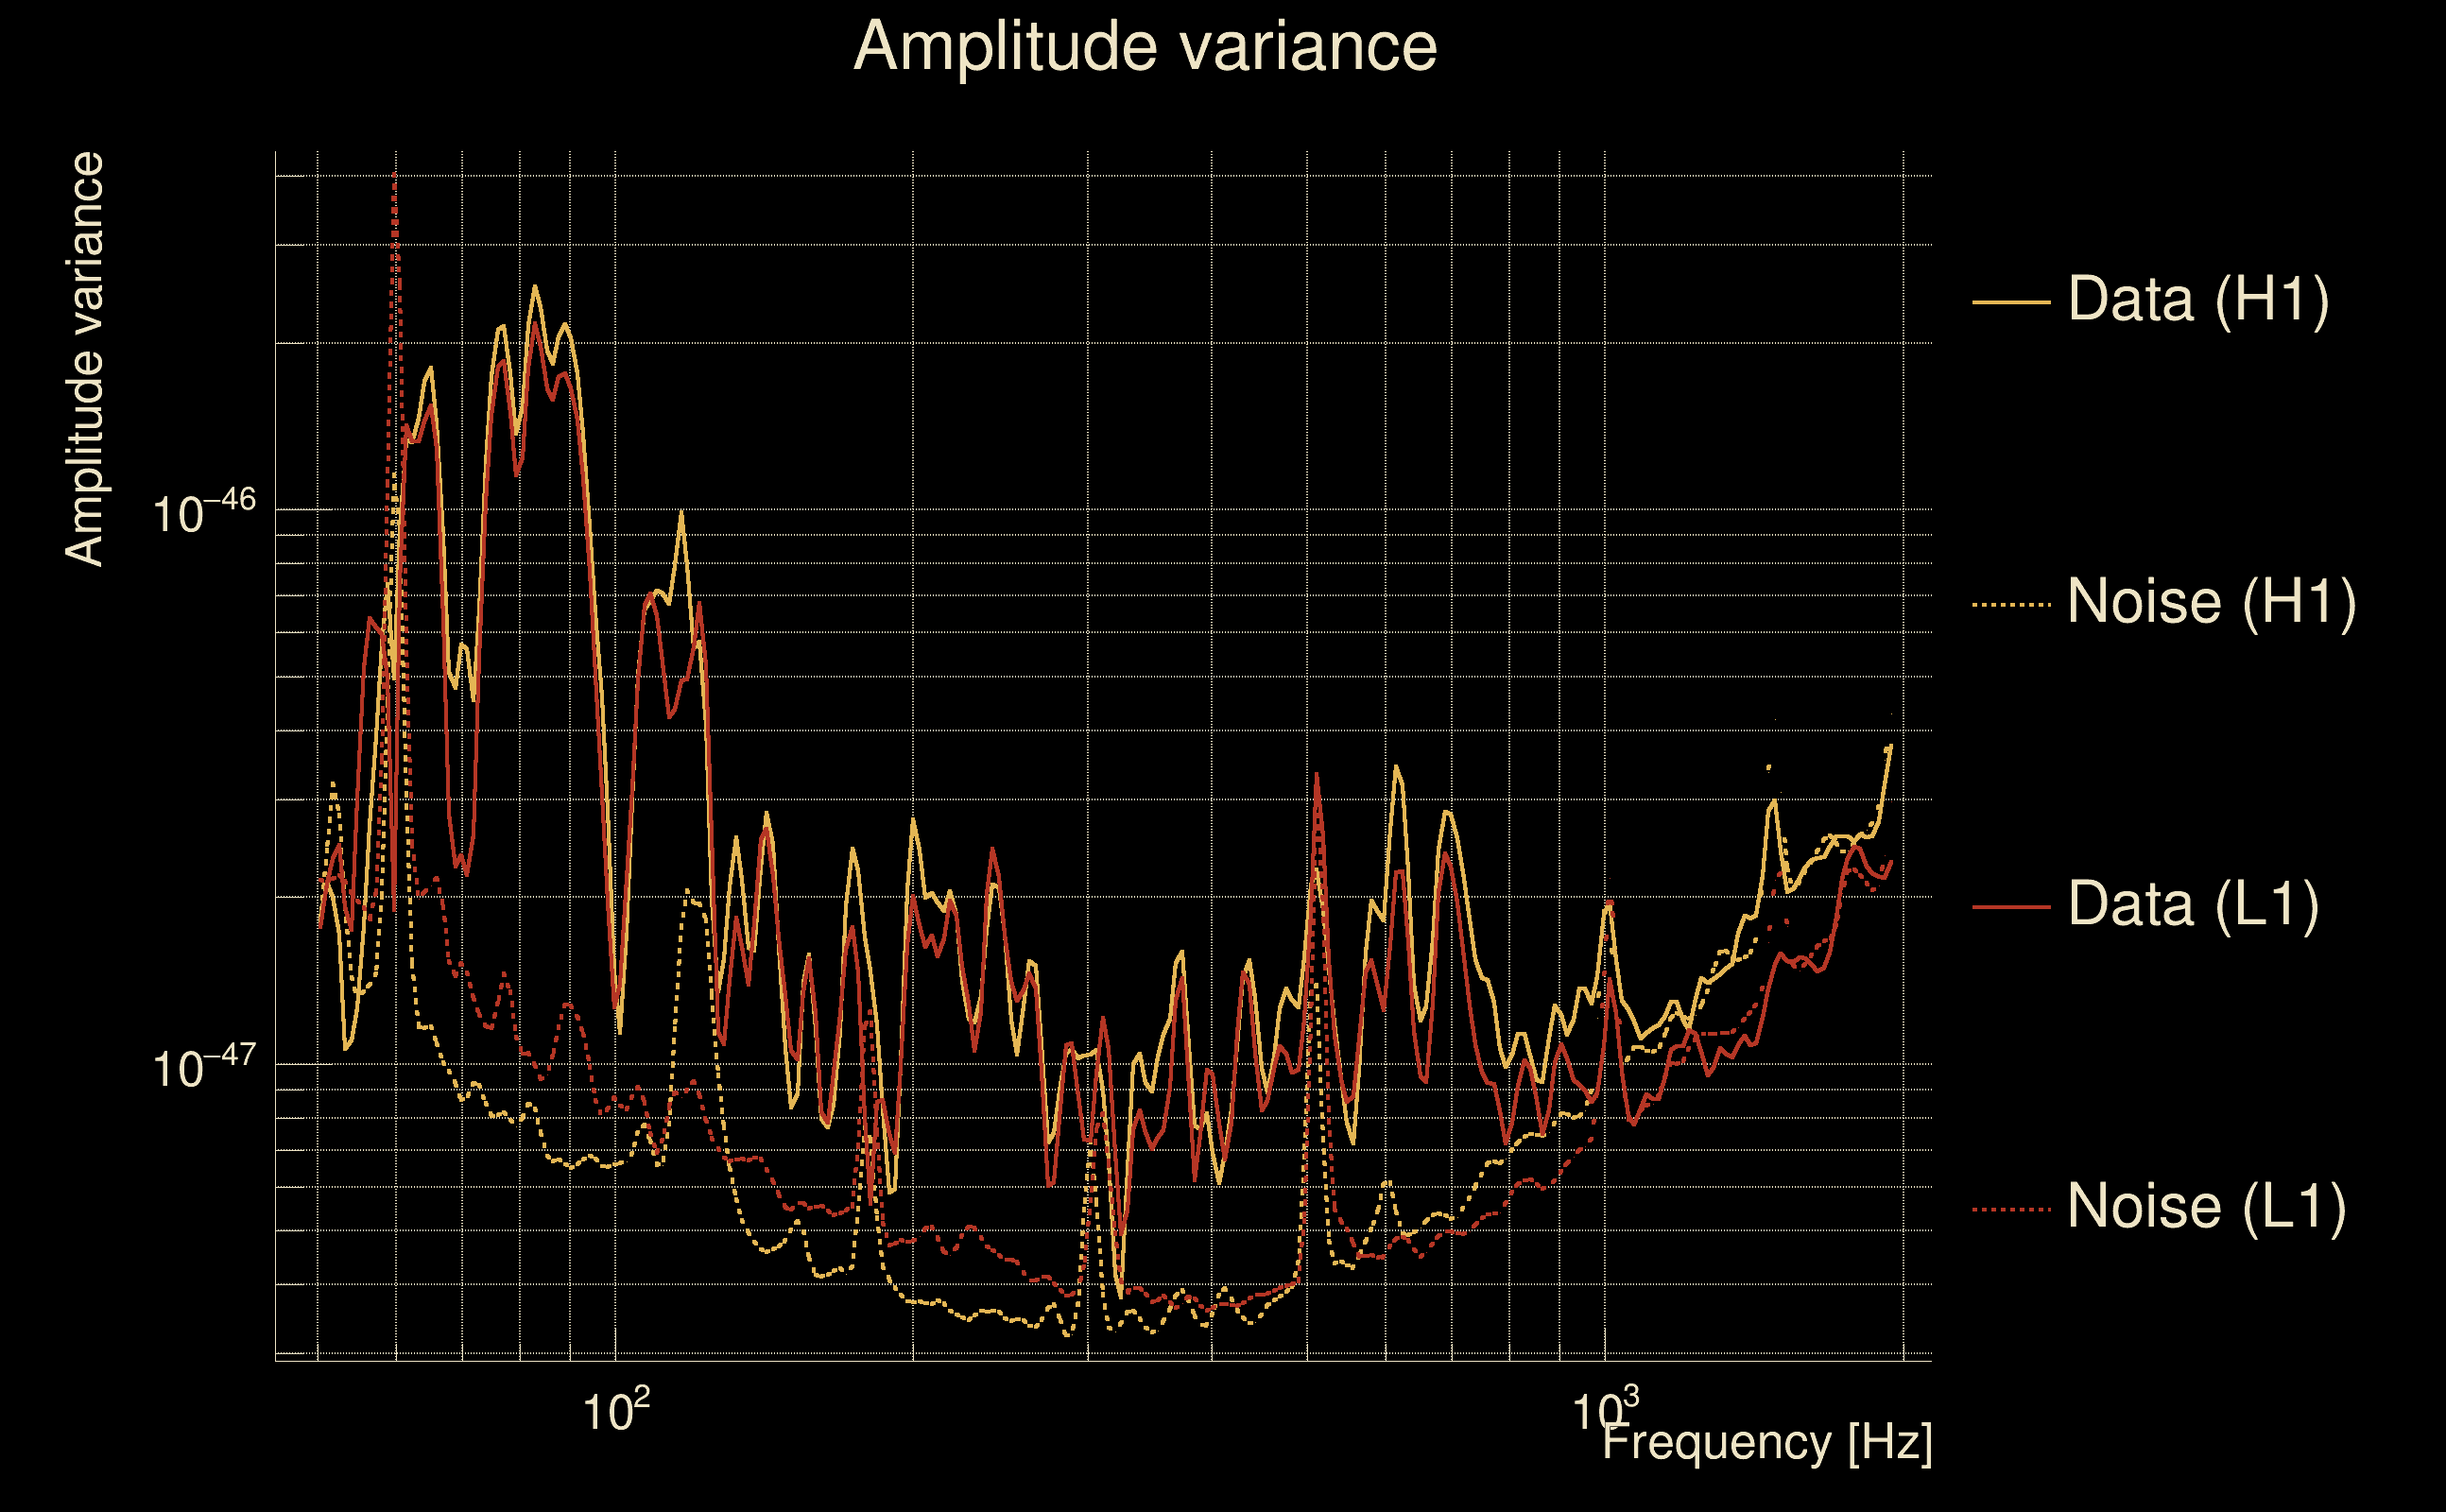
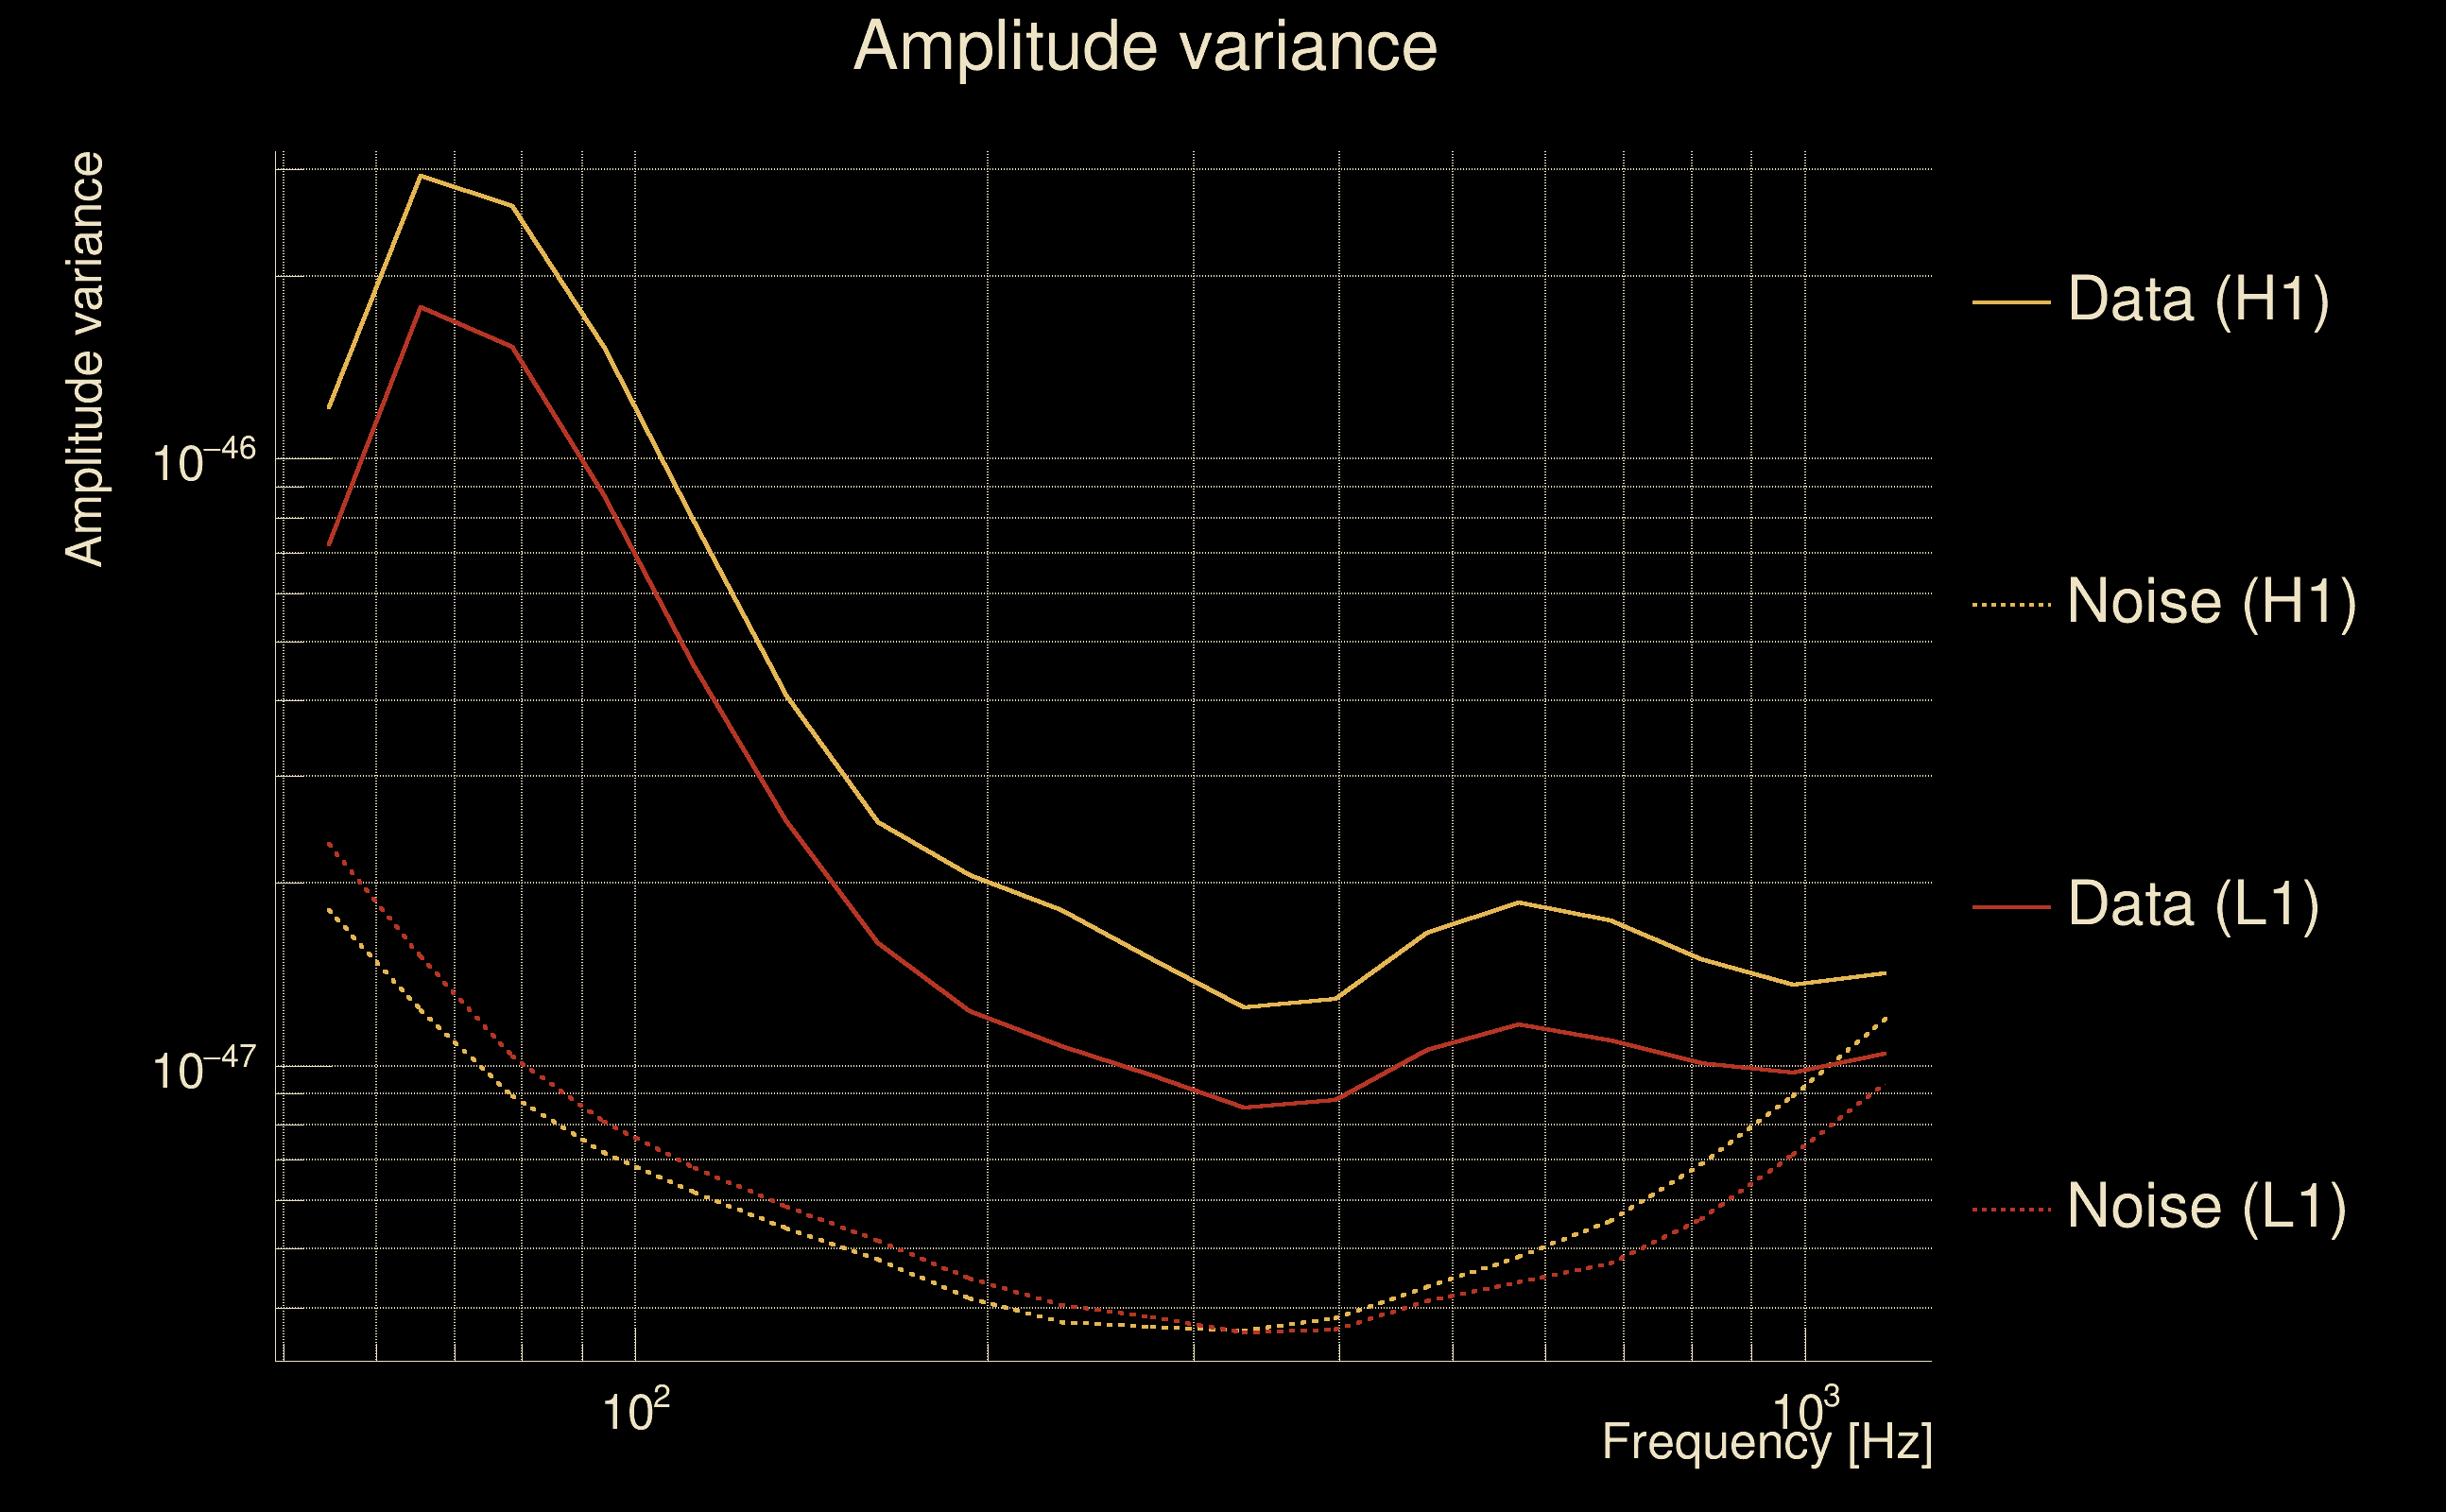
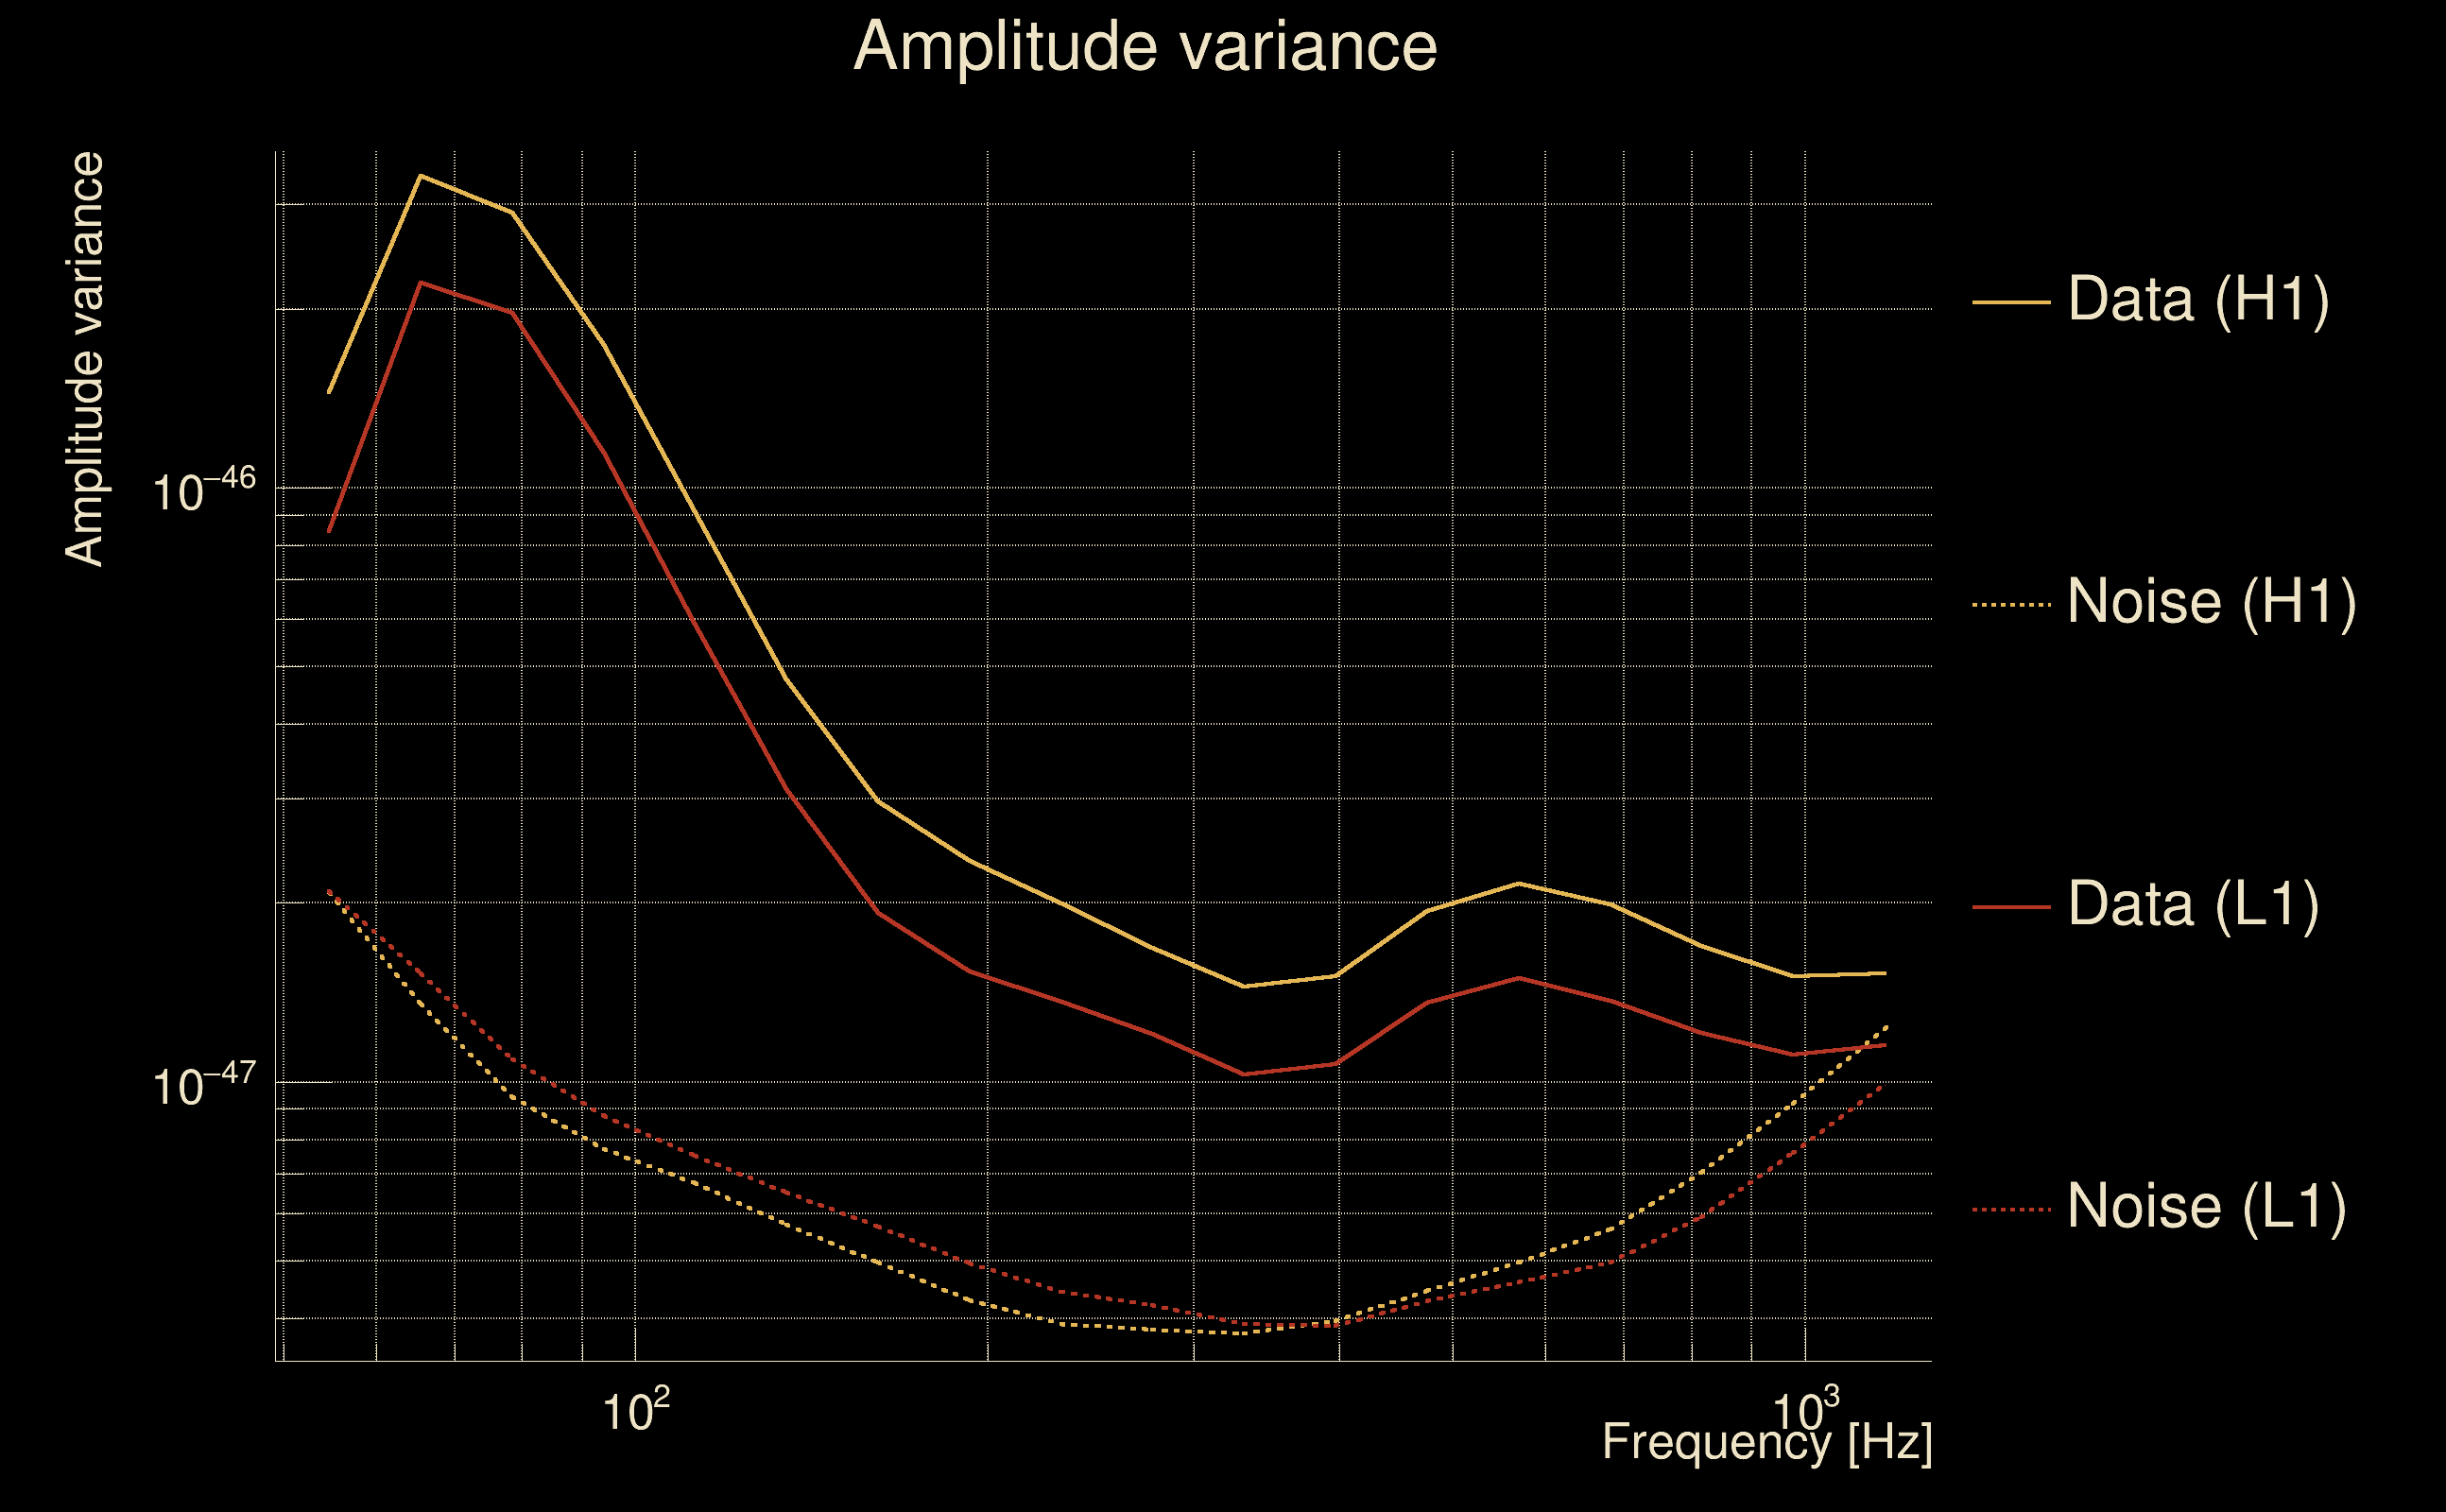
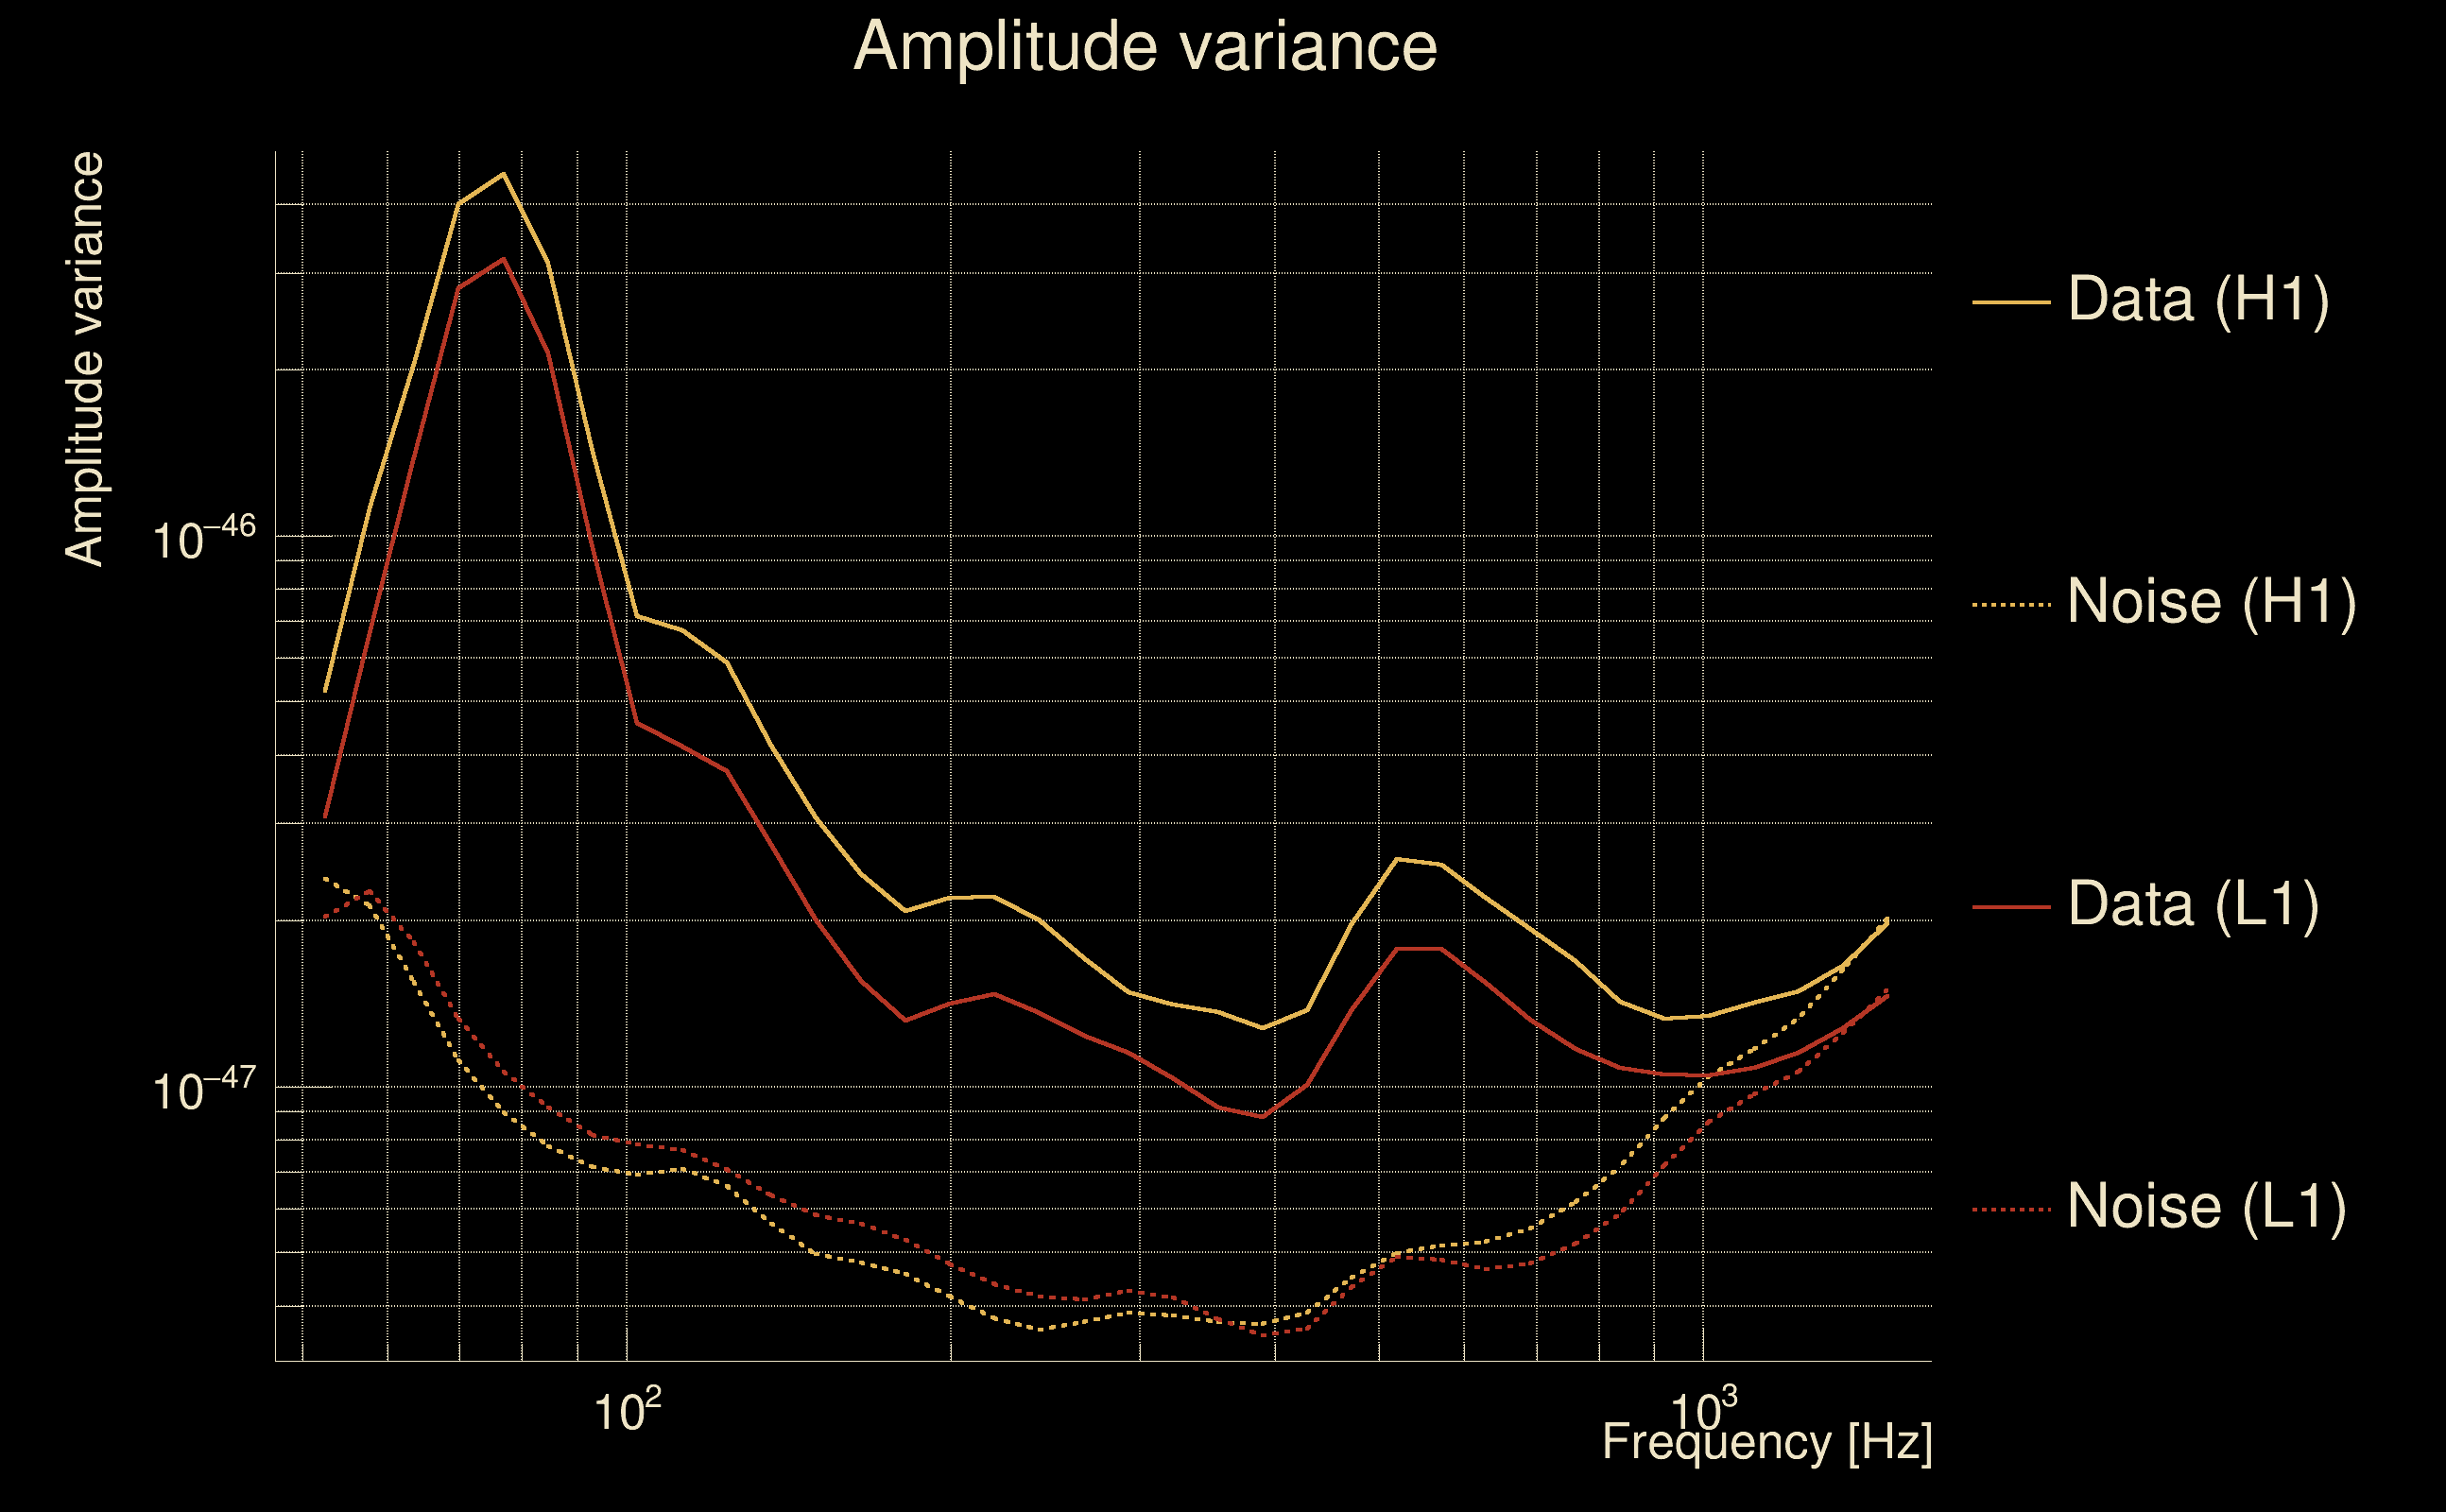
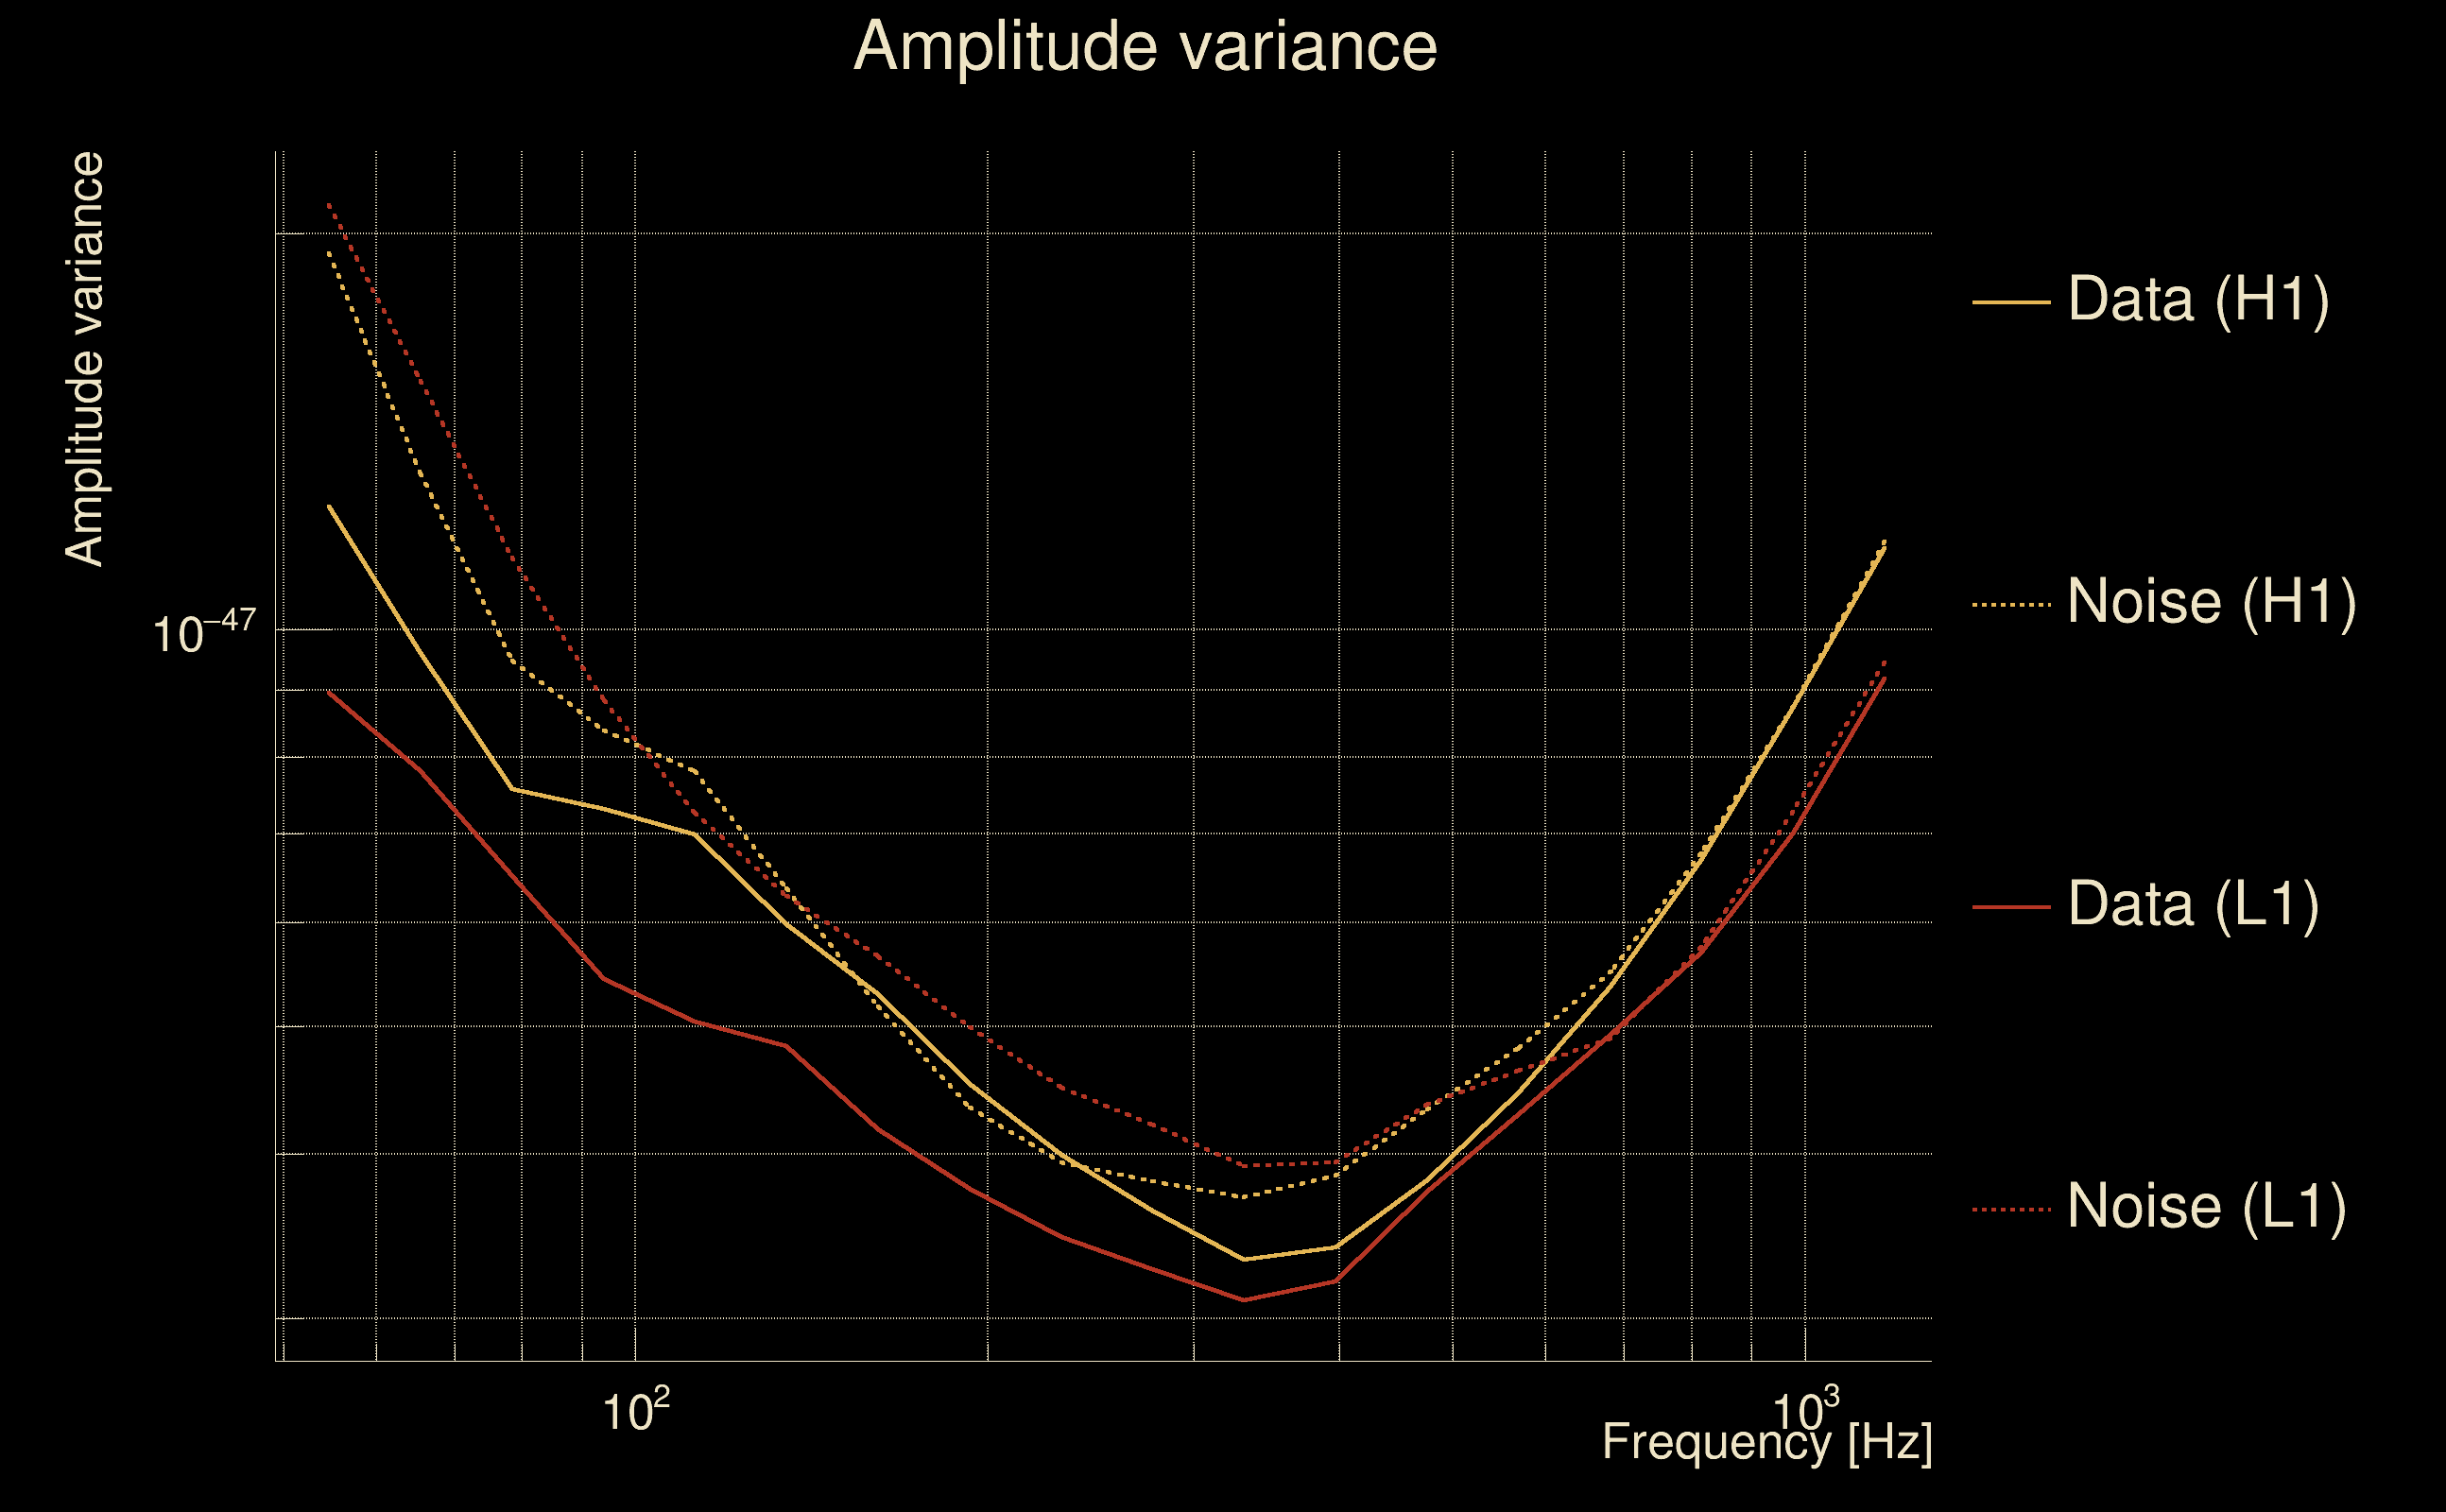
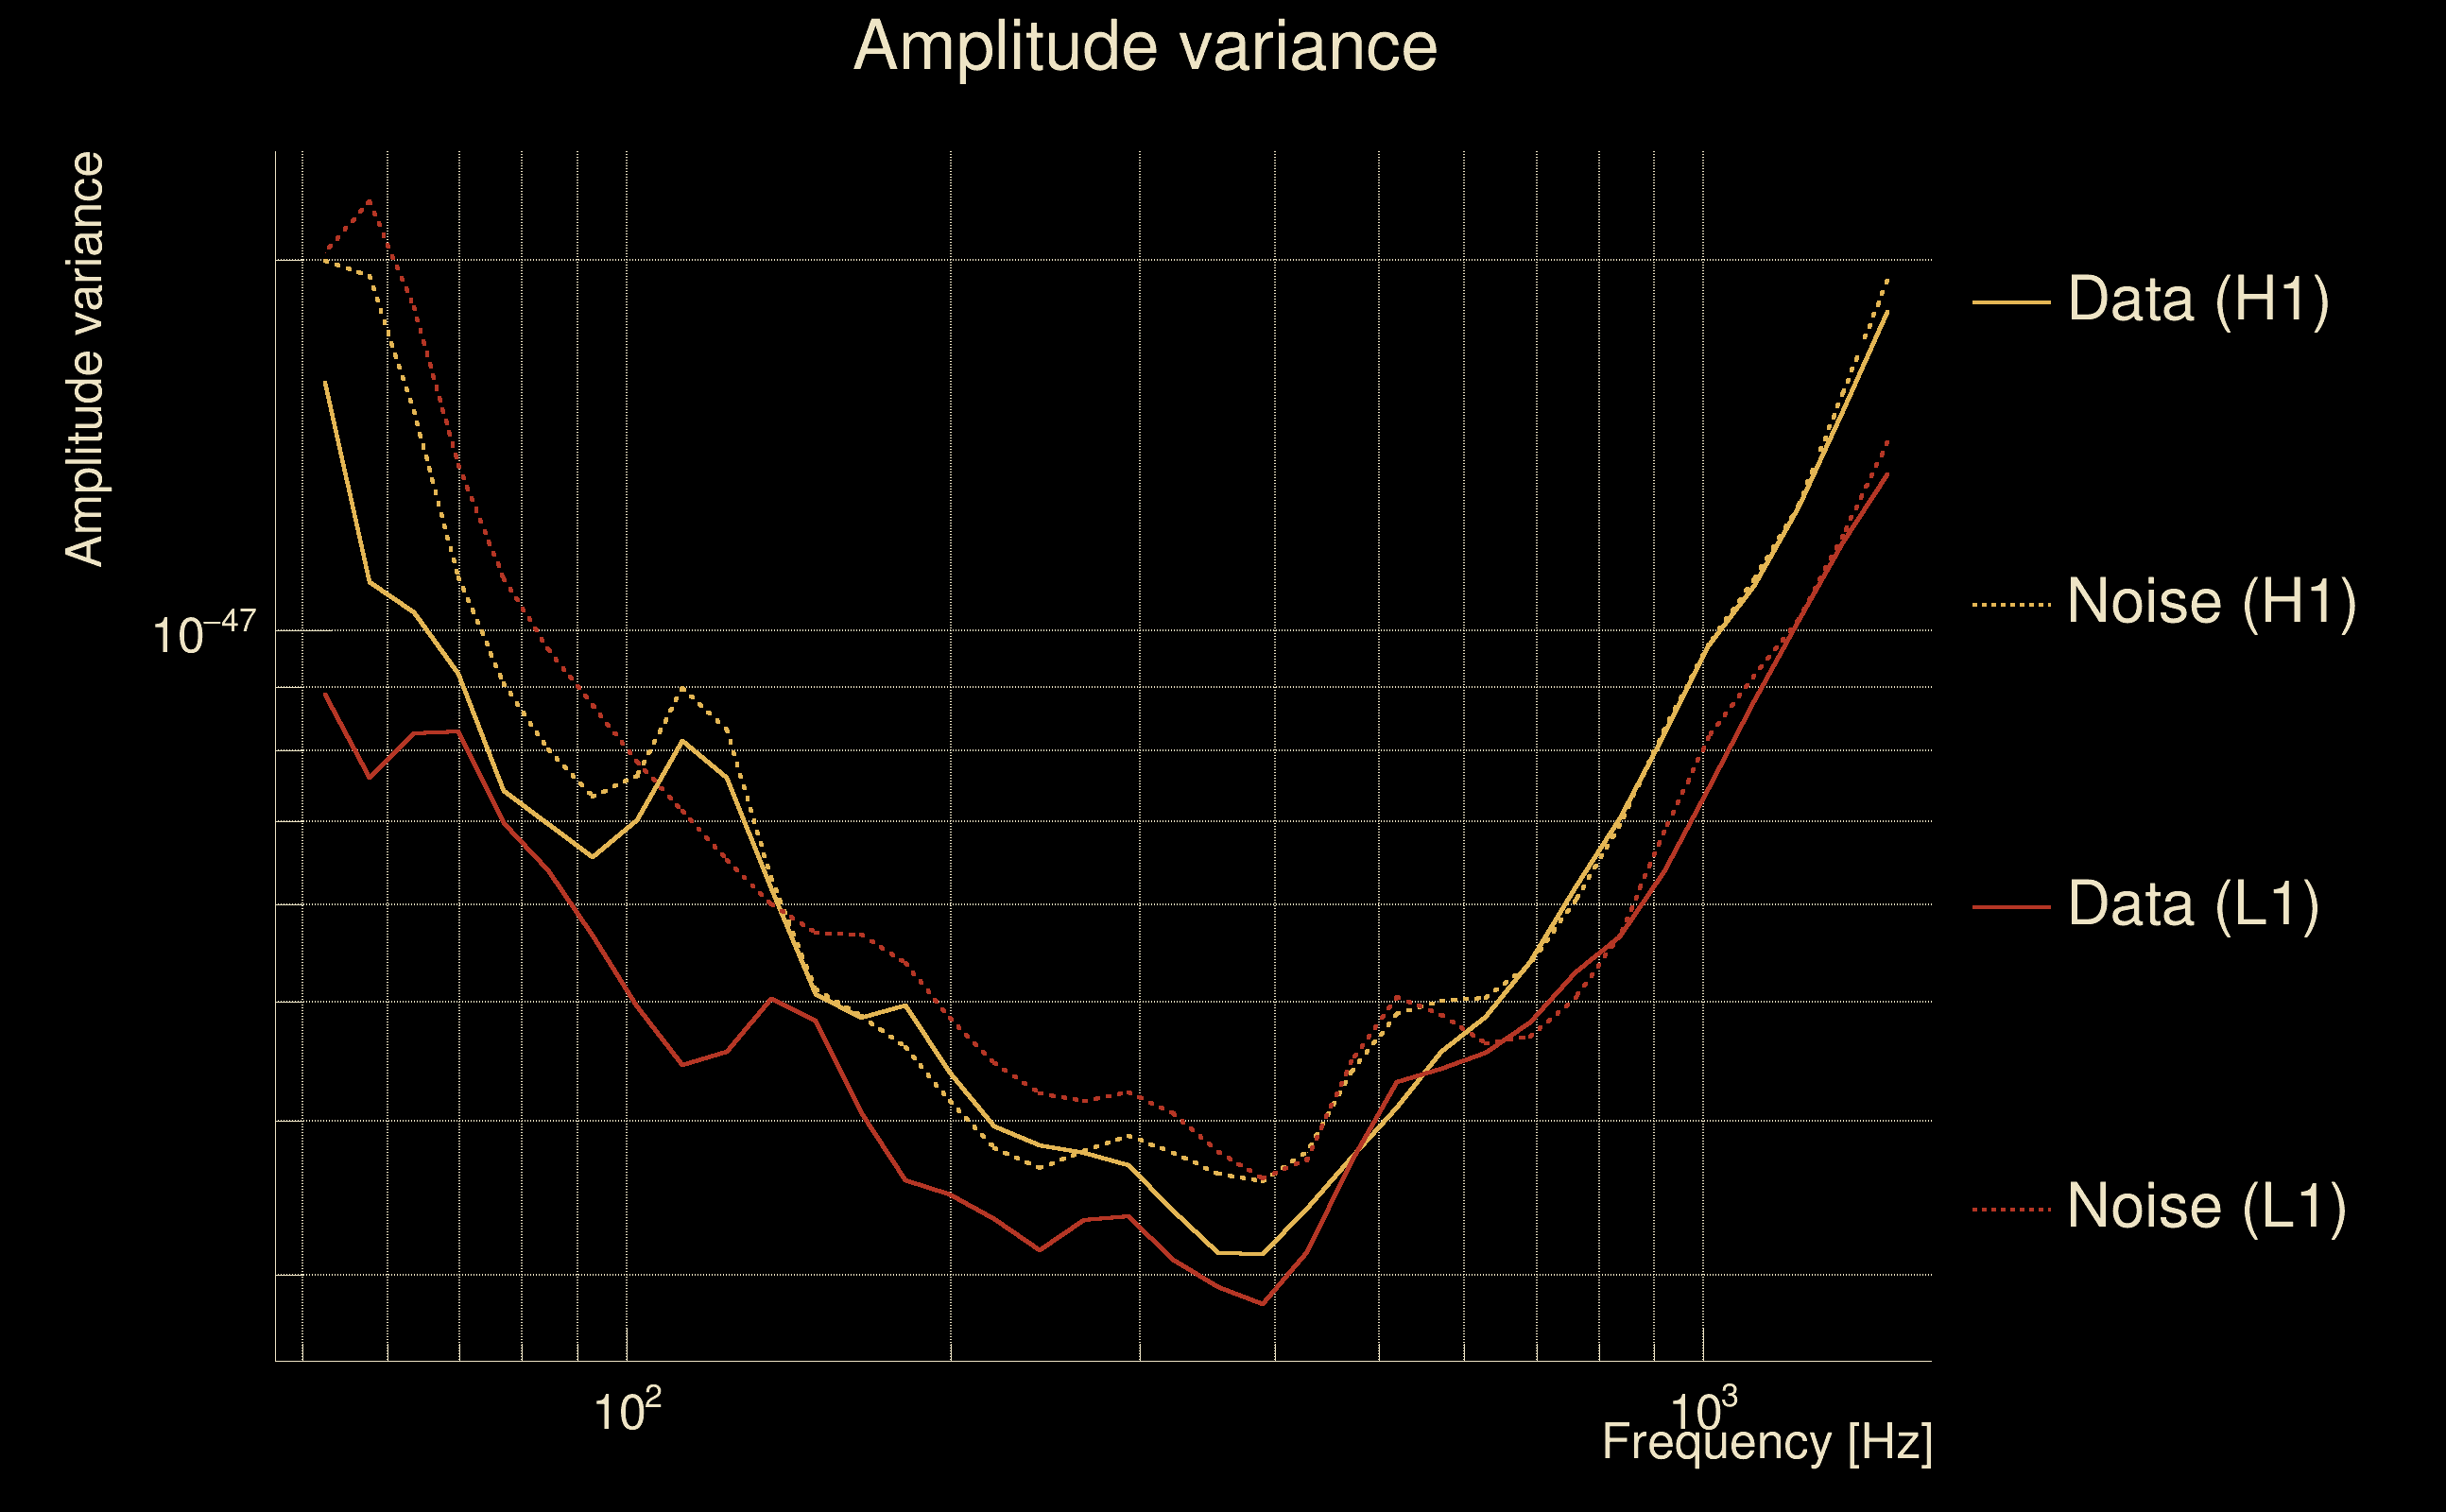
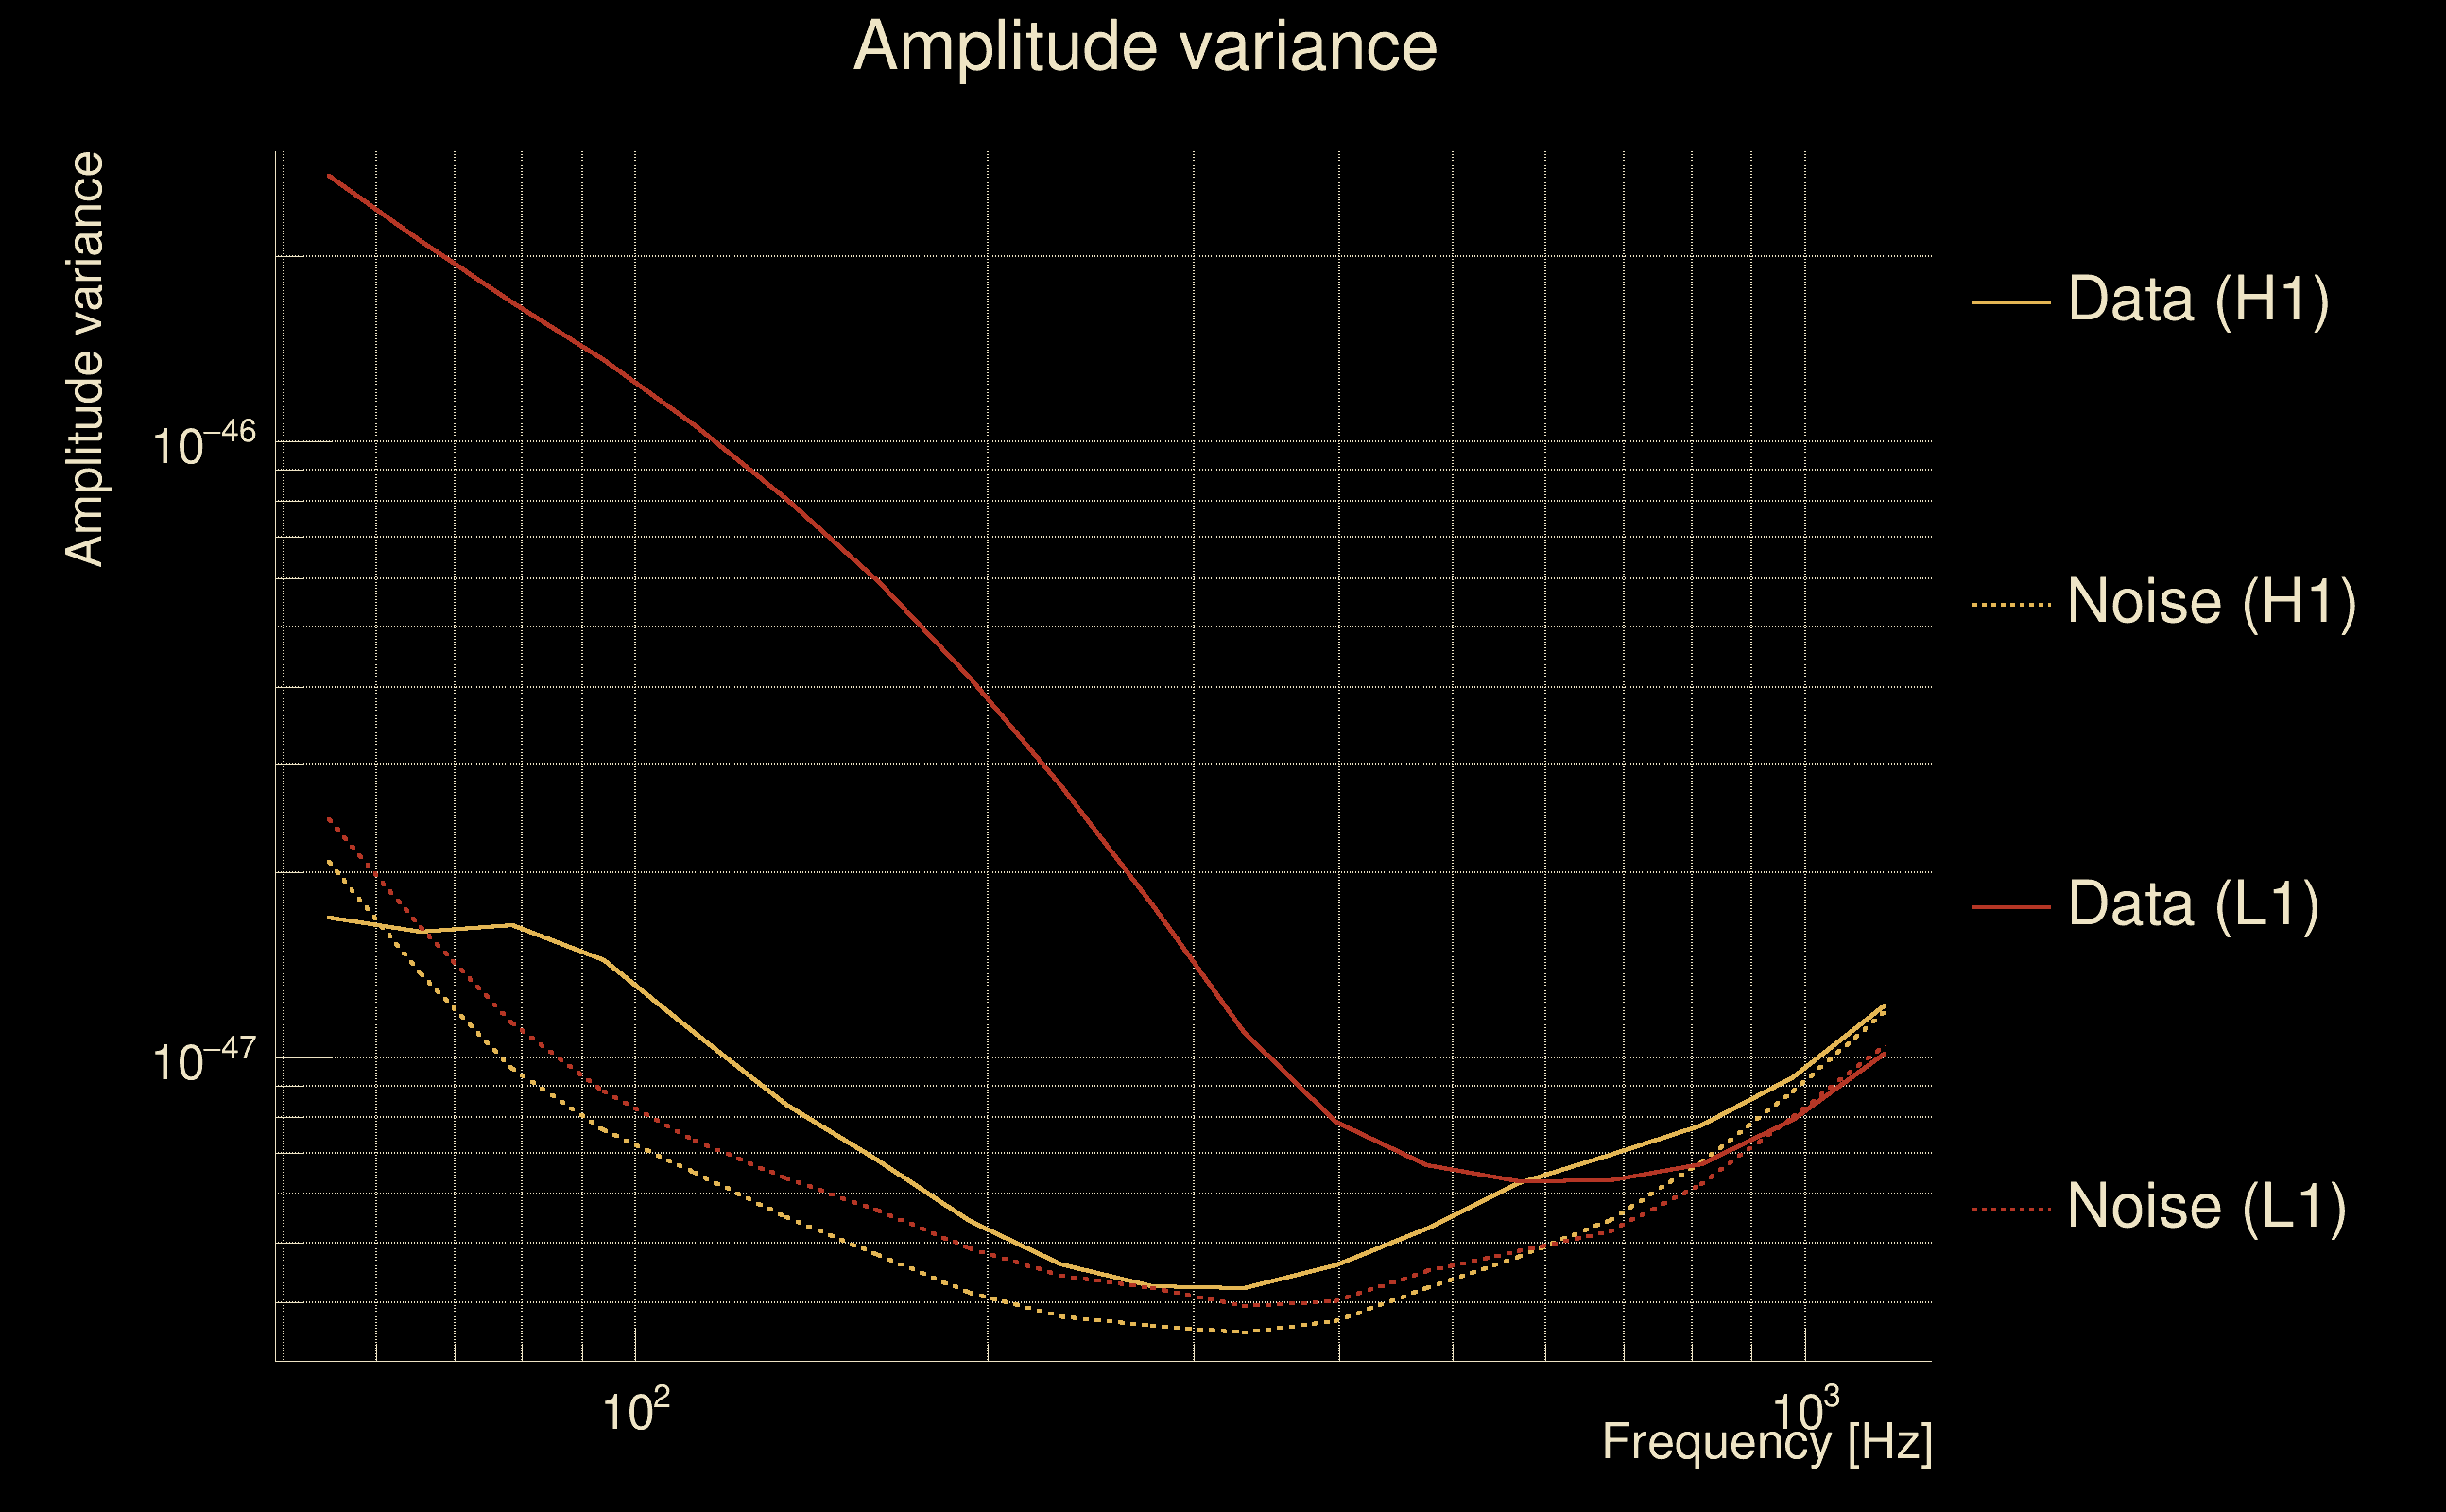
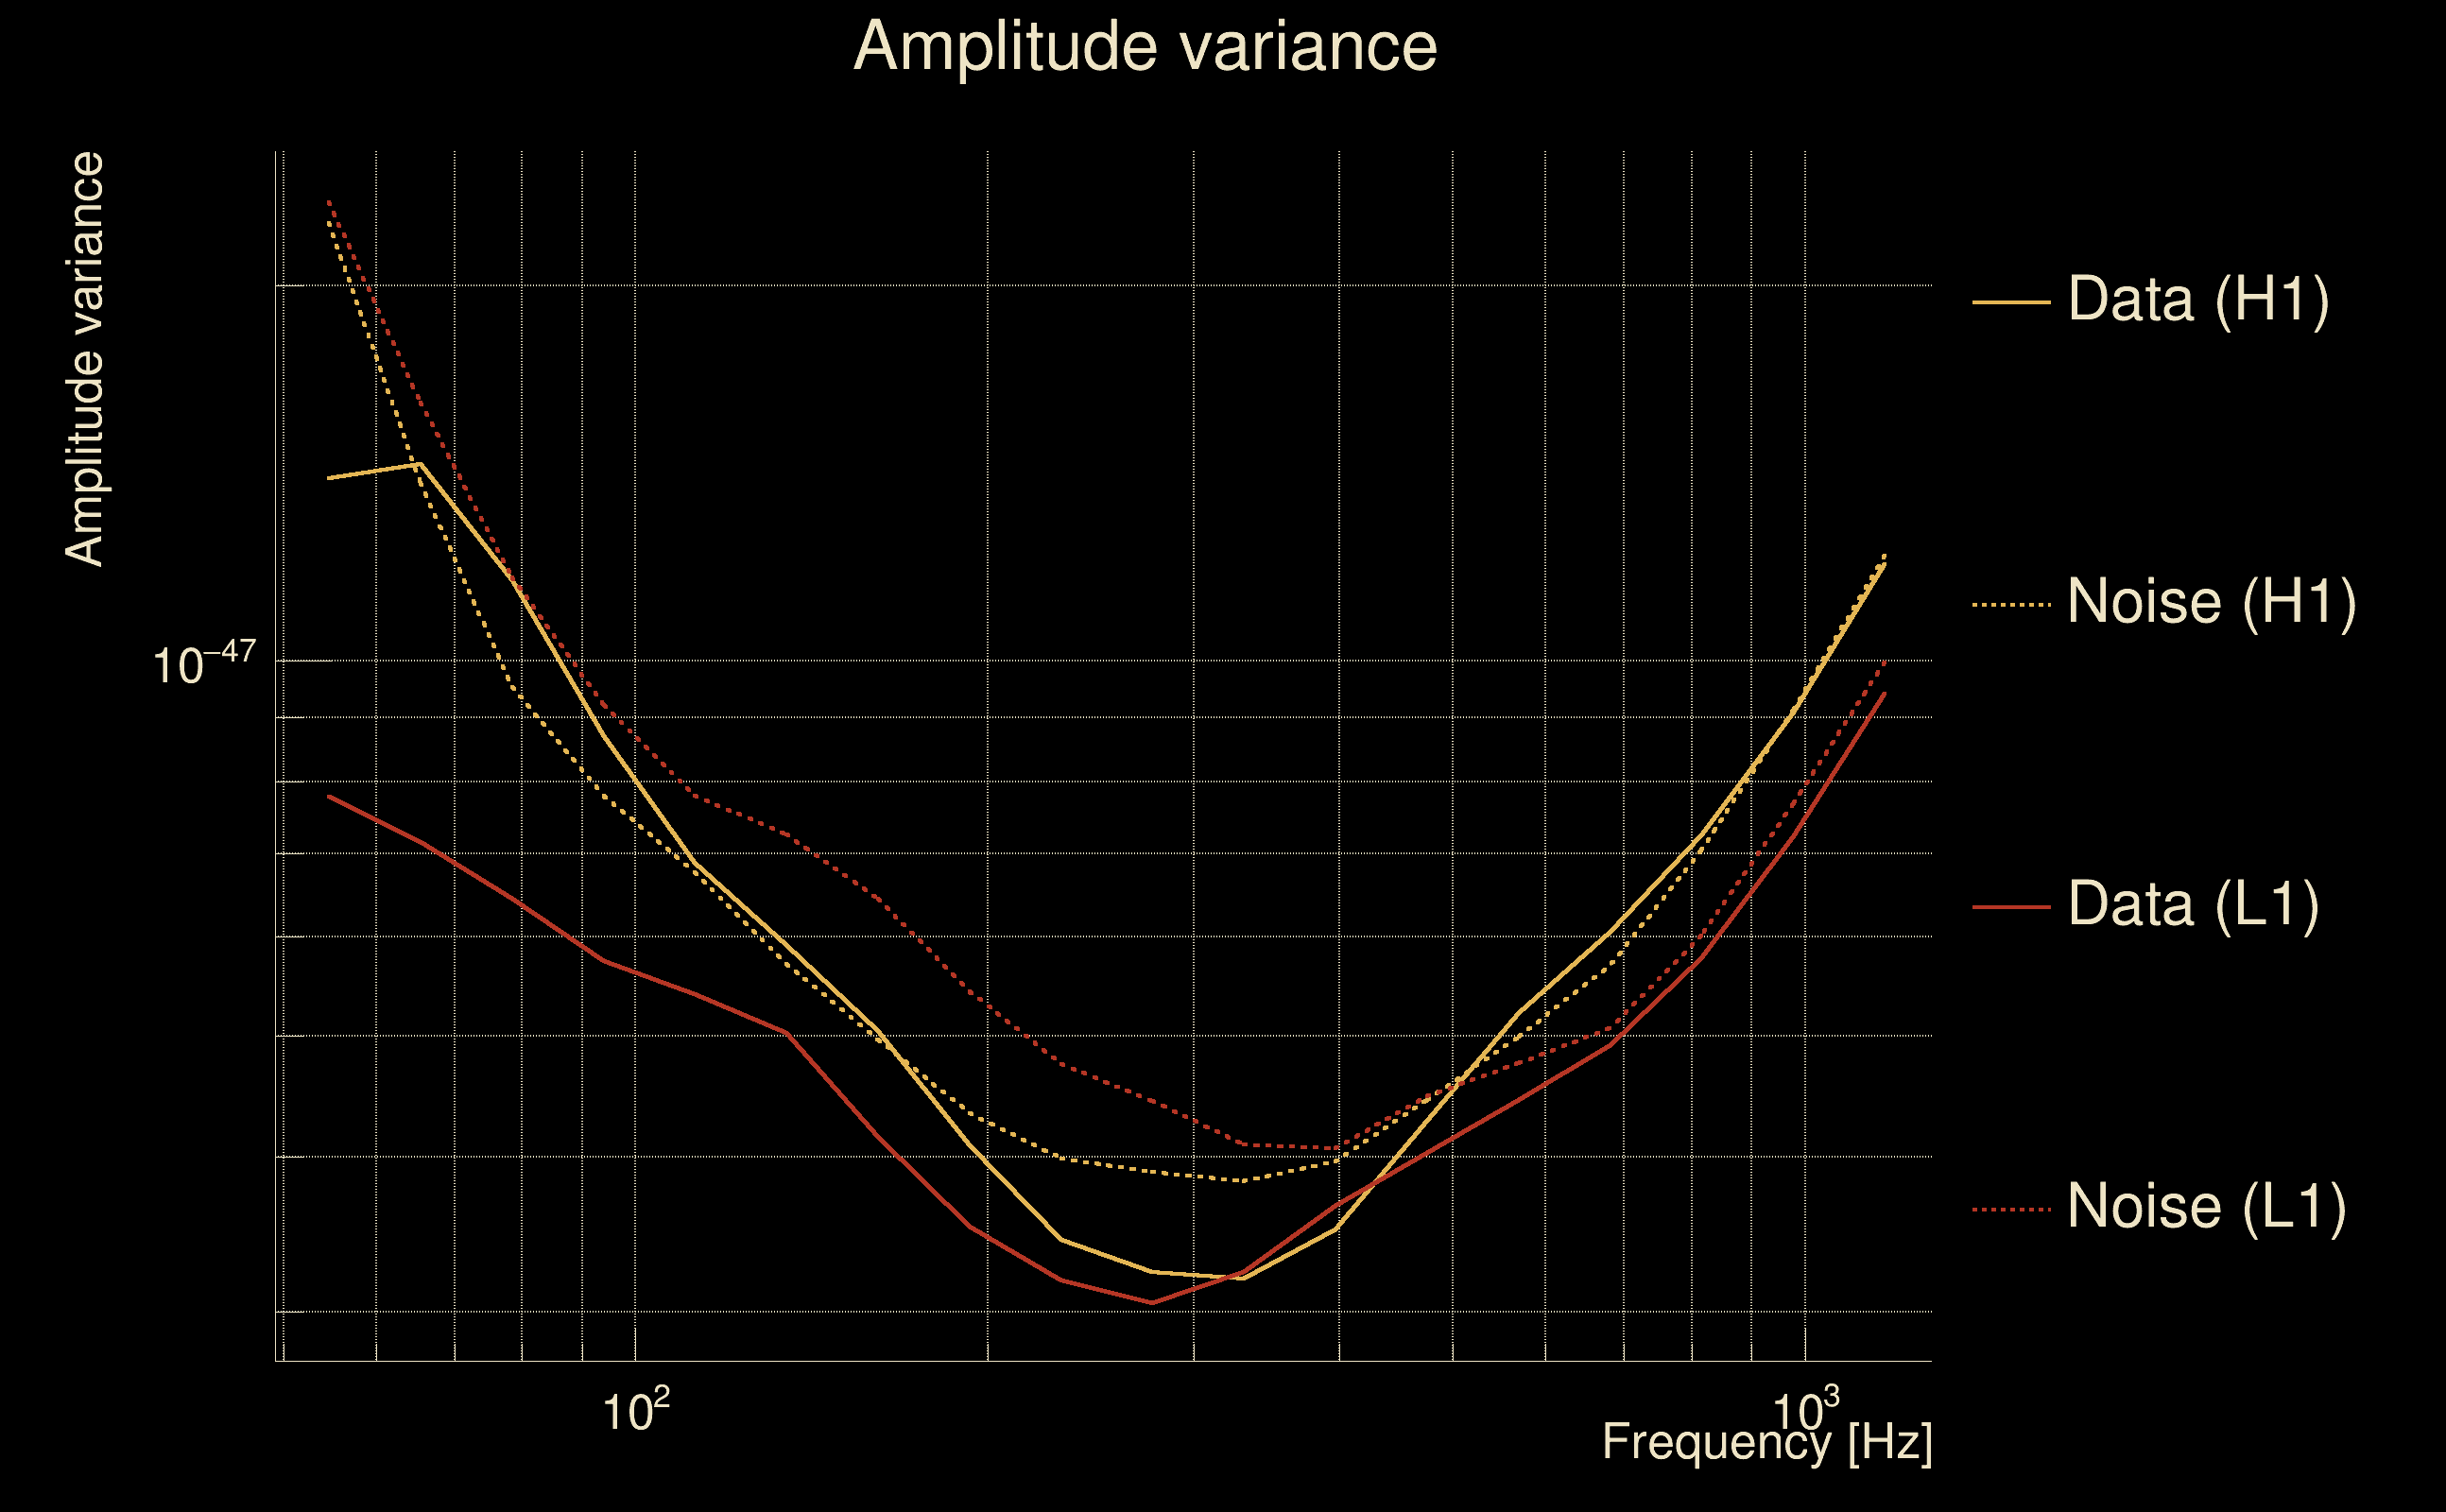
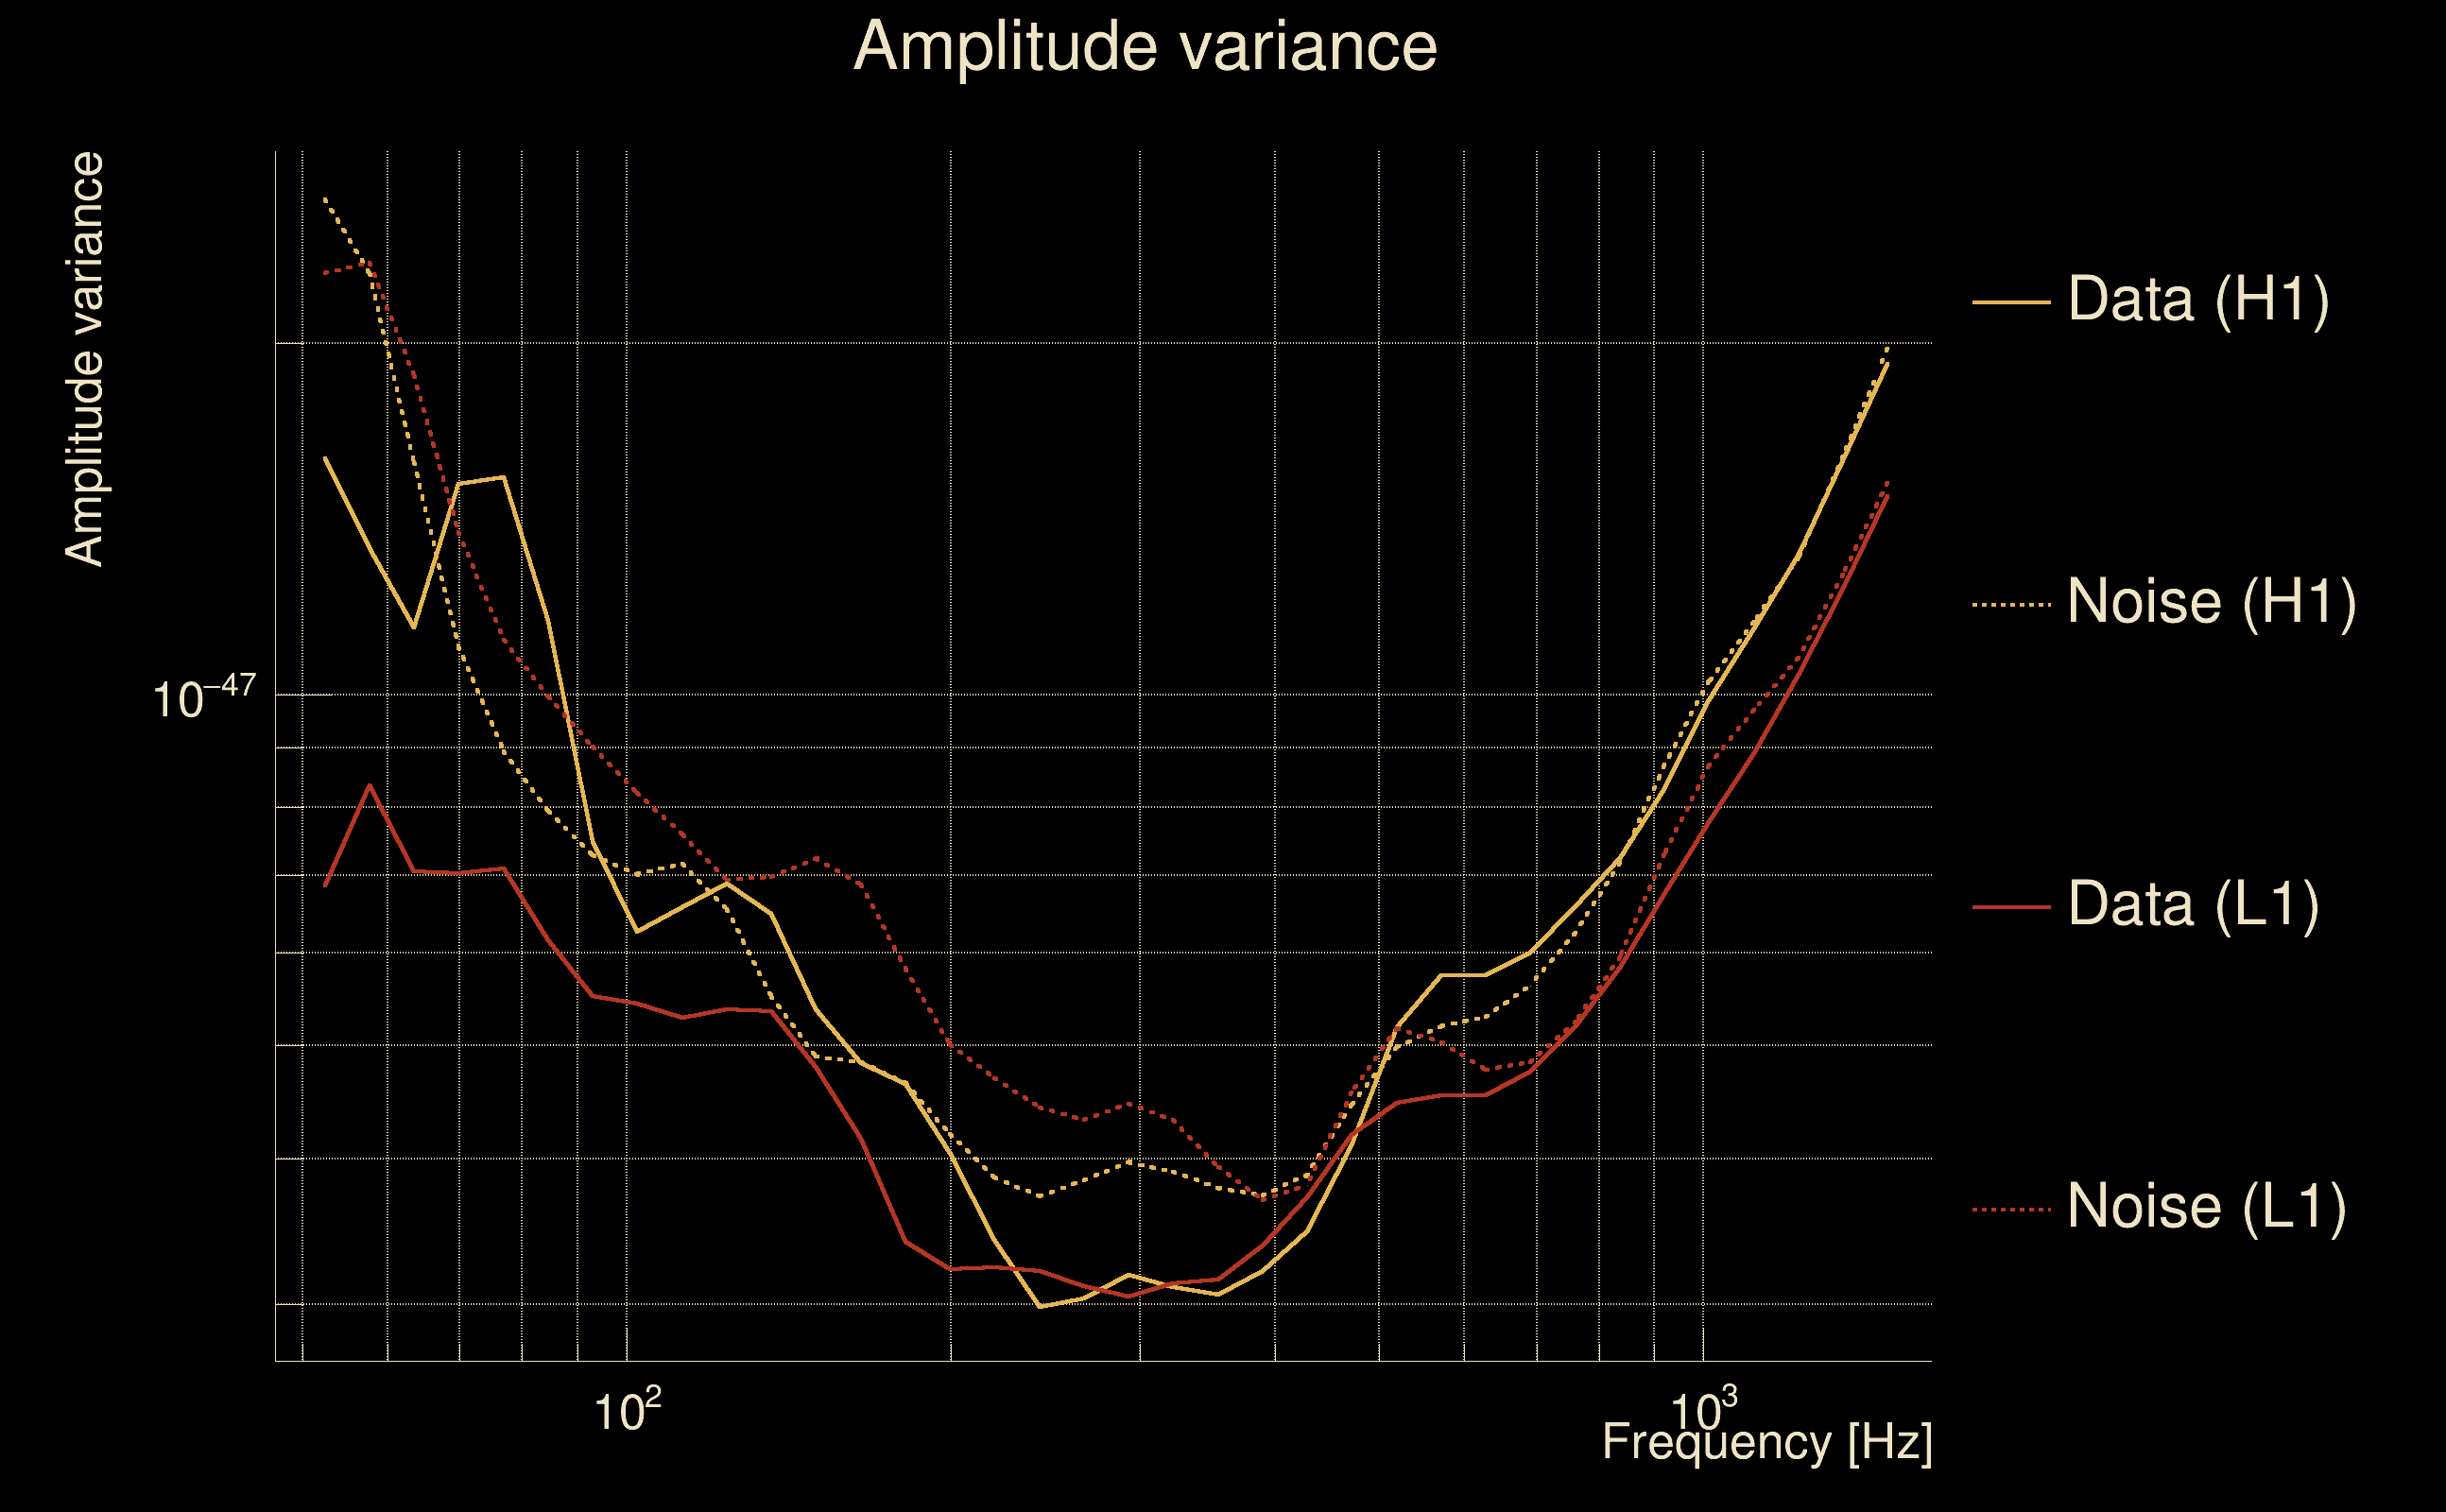
| Amplitude spectrograms: | normalization = 1e-22, power index = 2 |
| White noise SNR variance: | 0.523175 (after applying a correction factor = 1) |
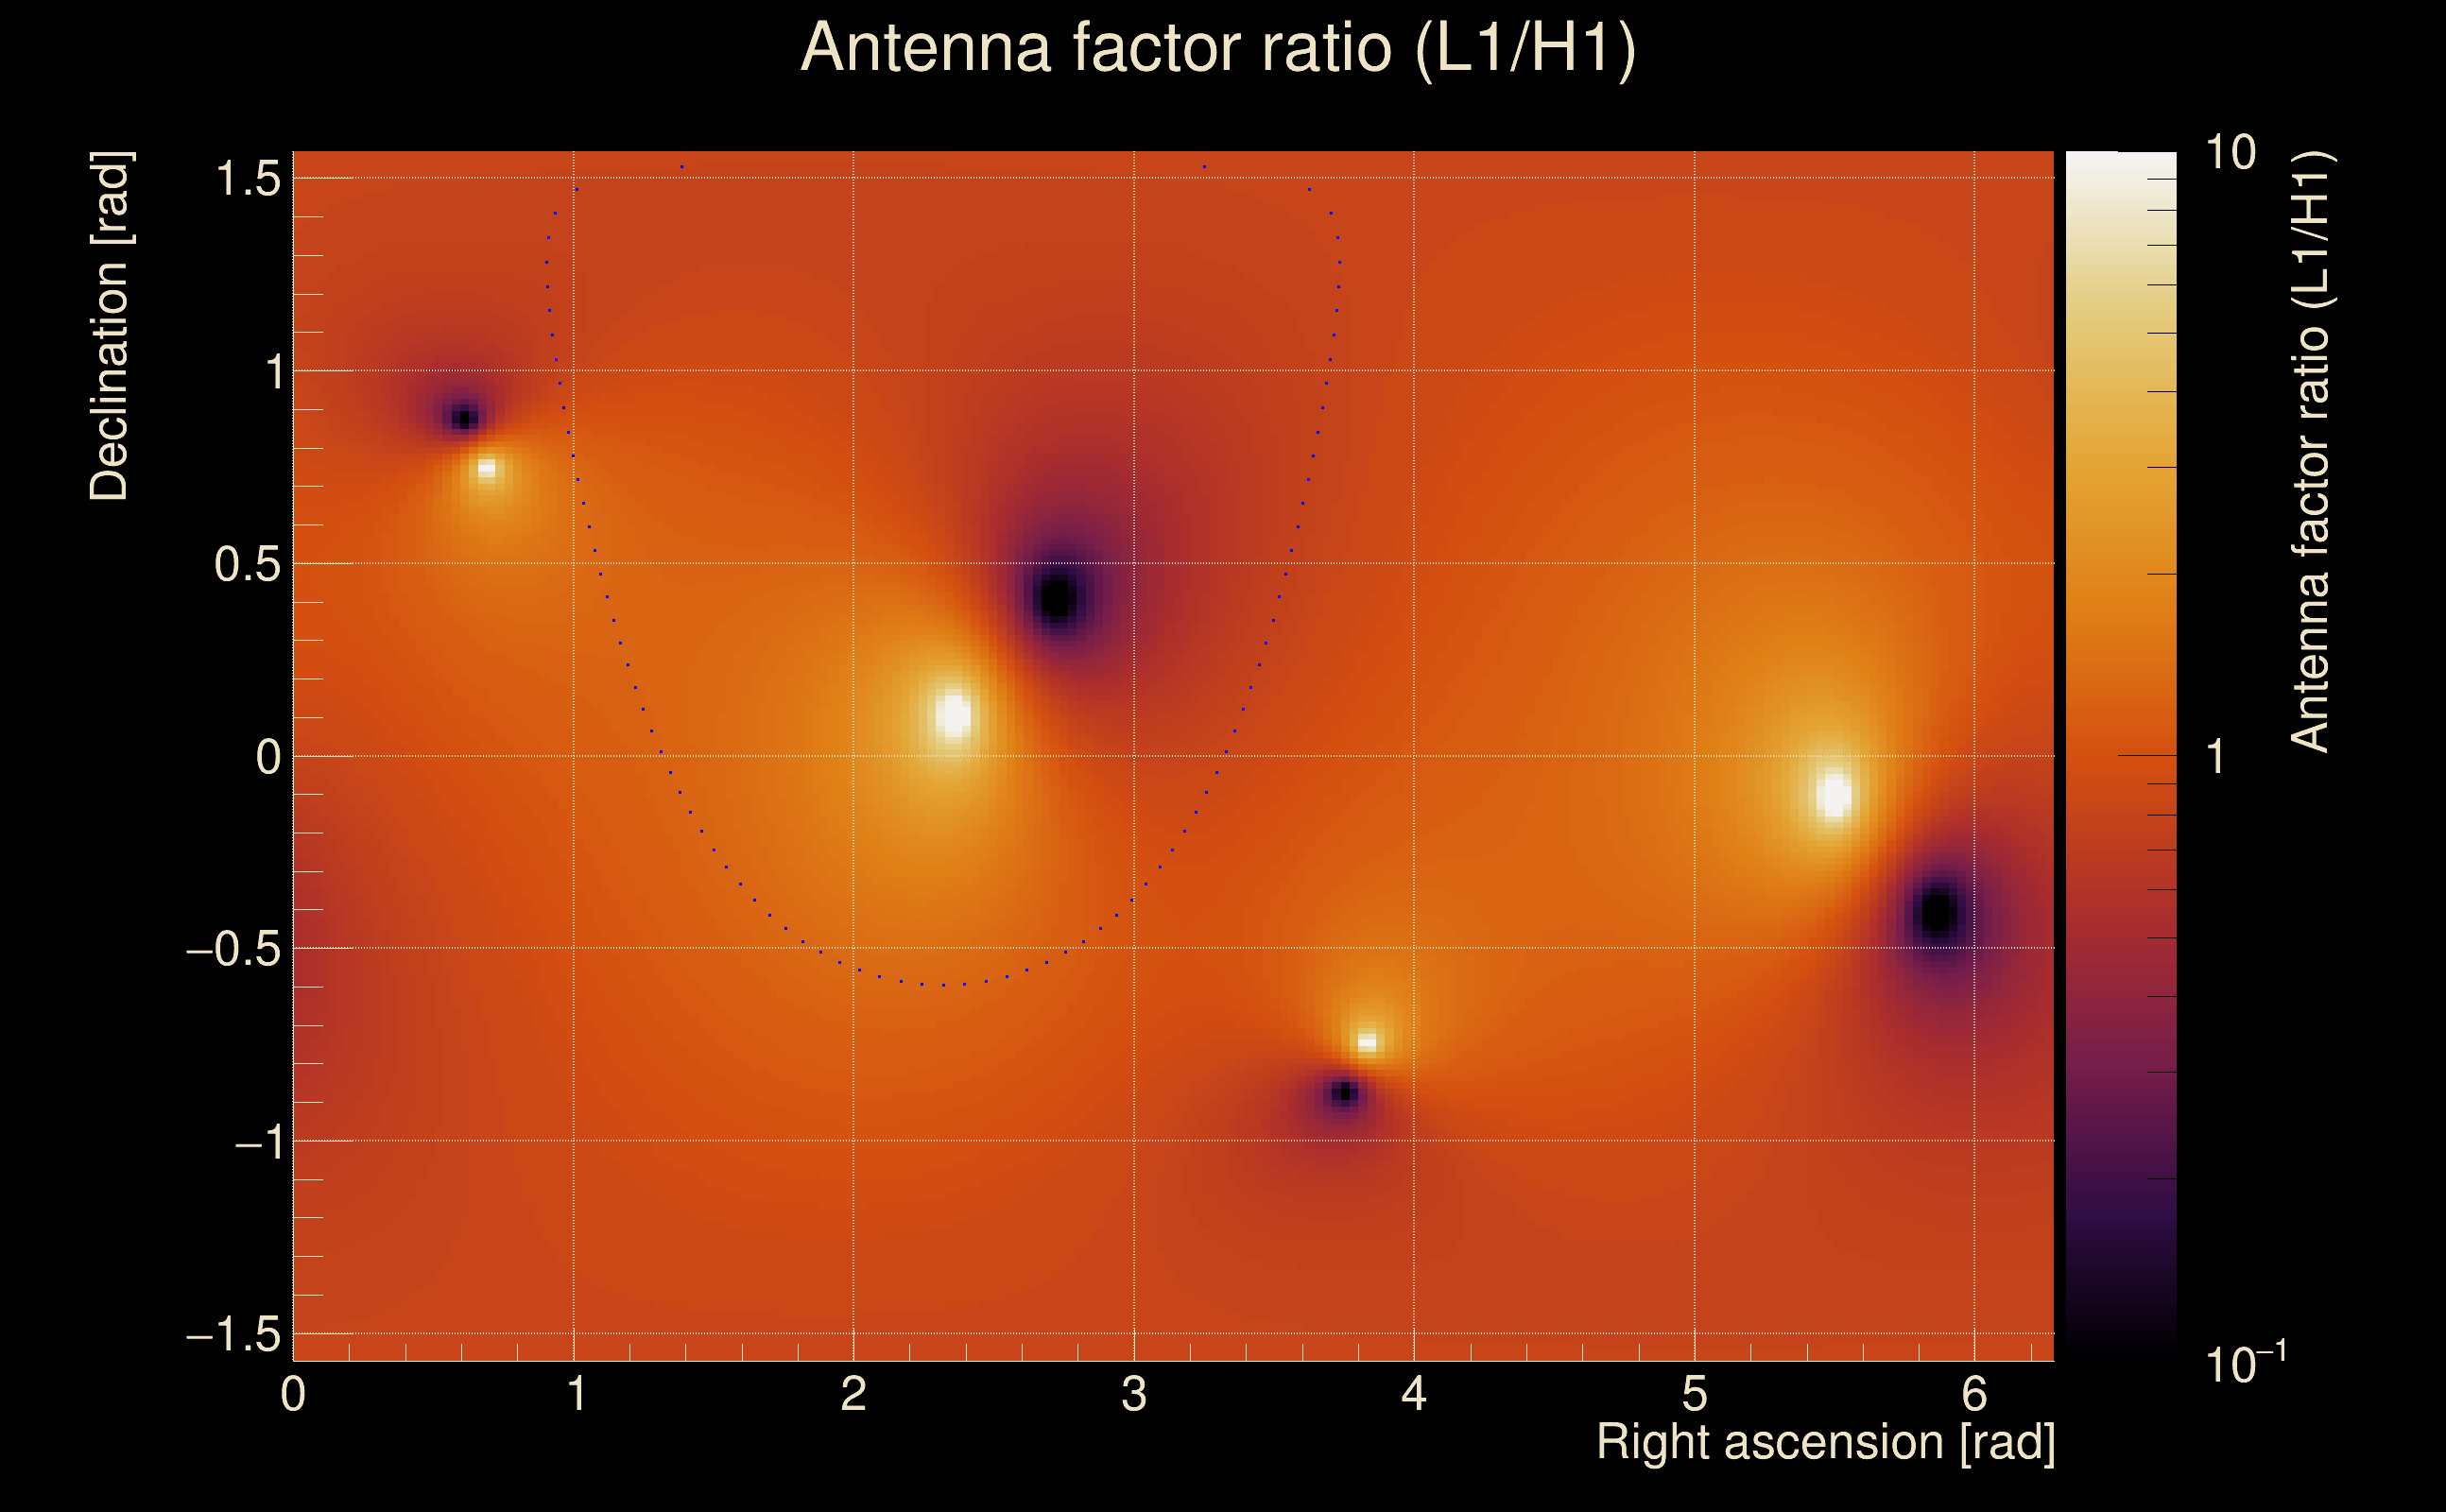
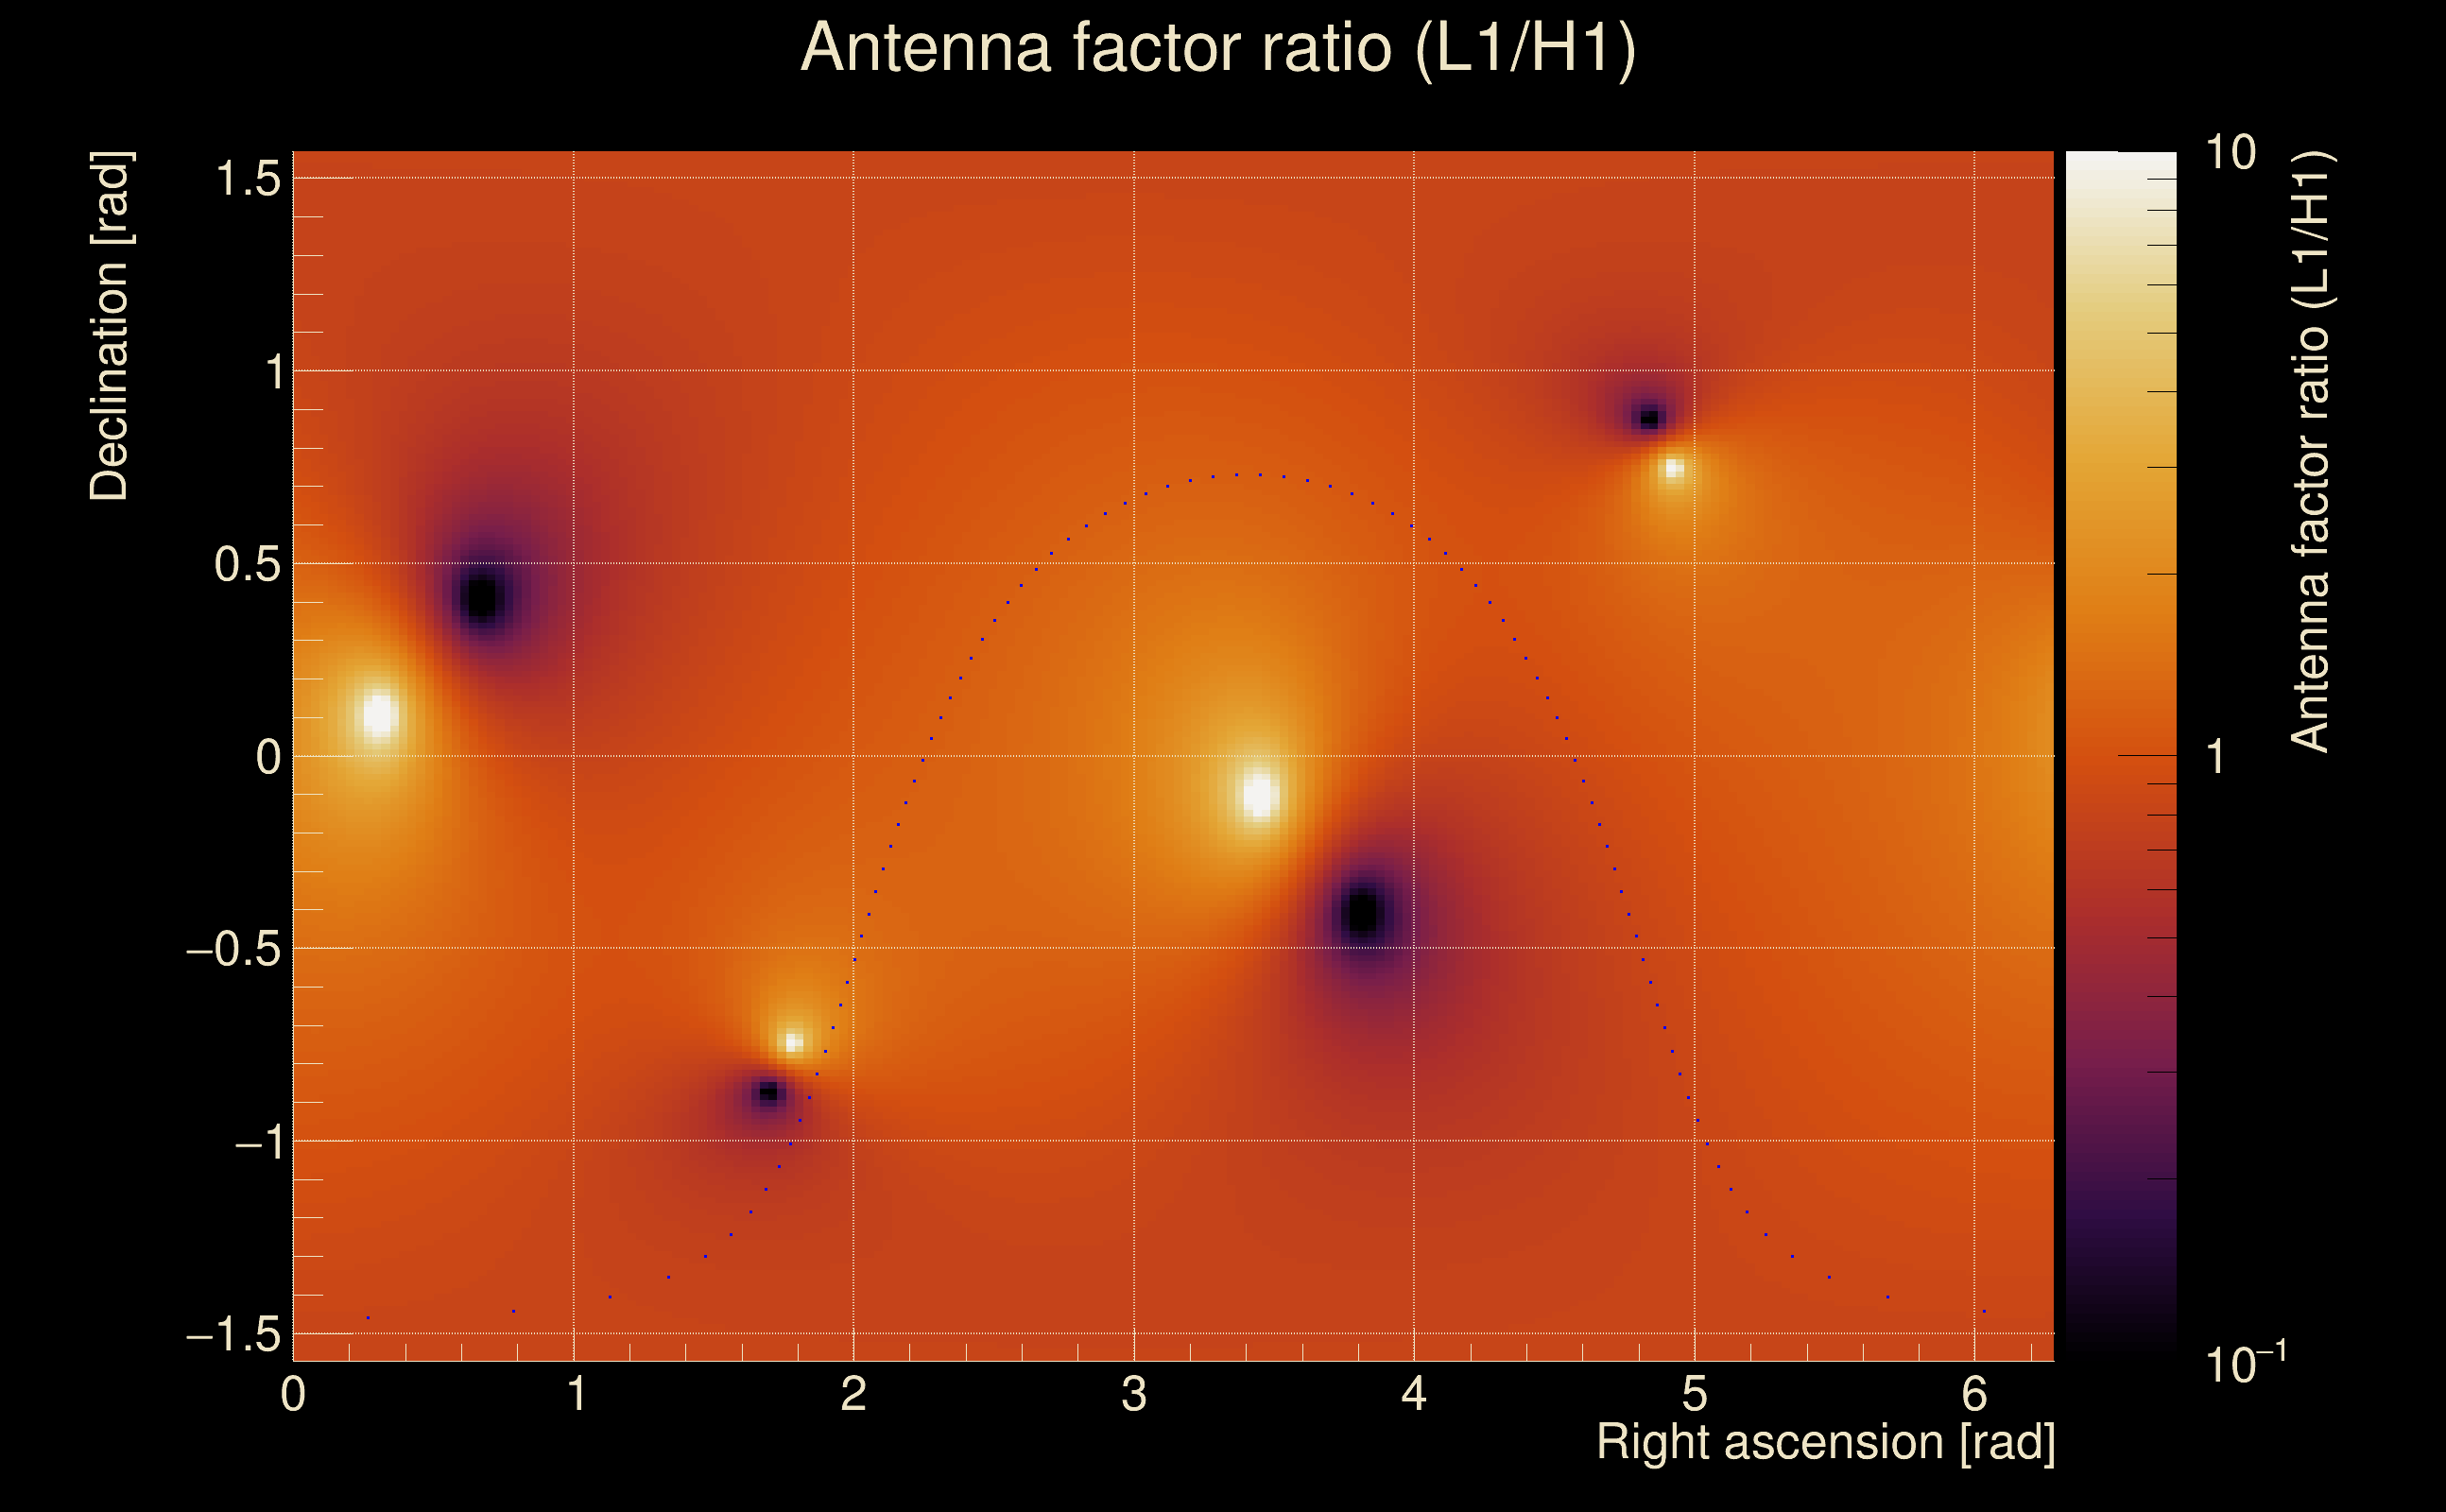
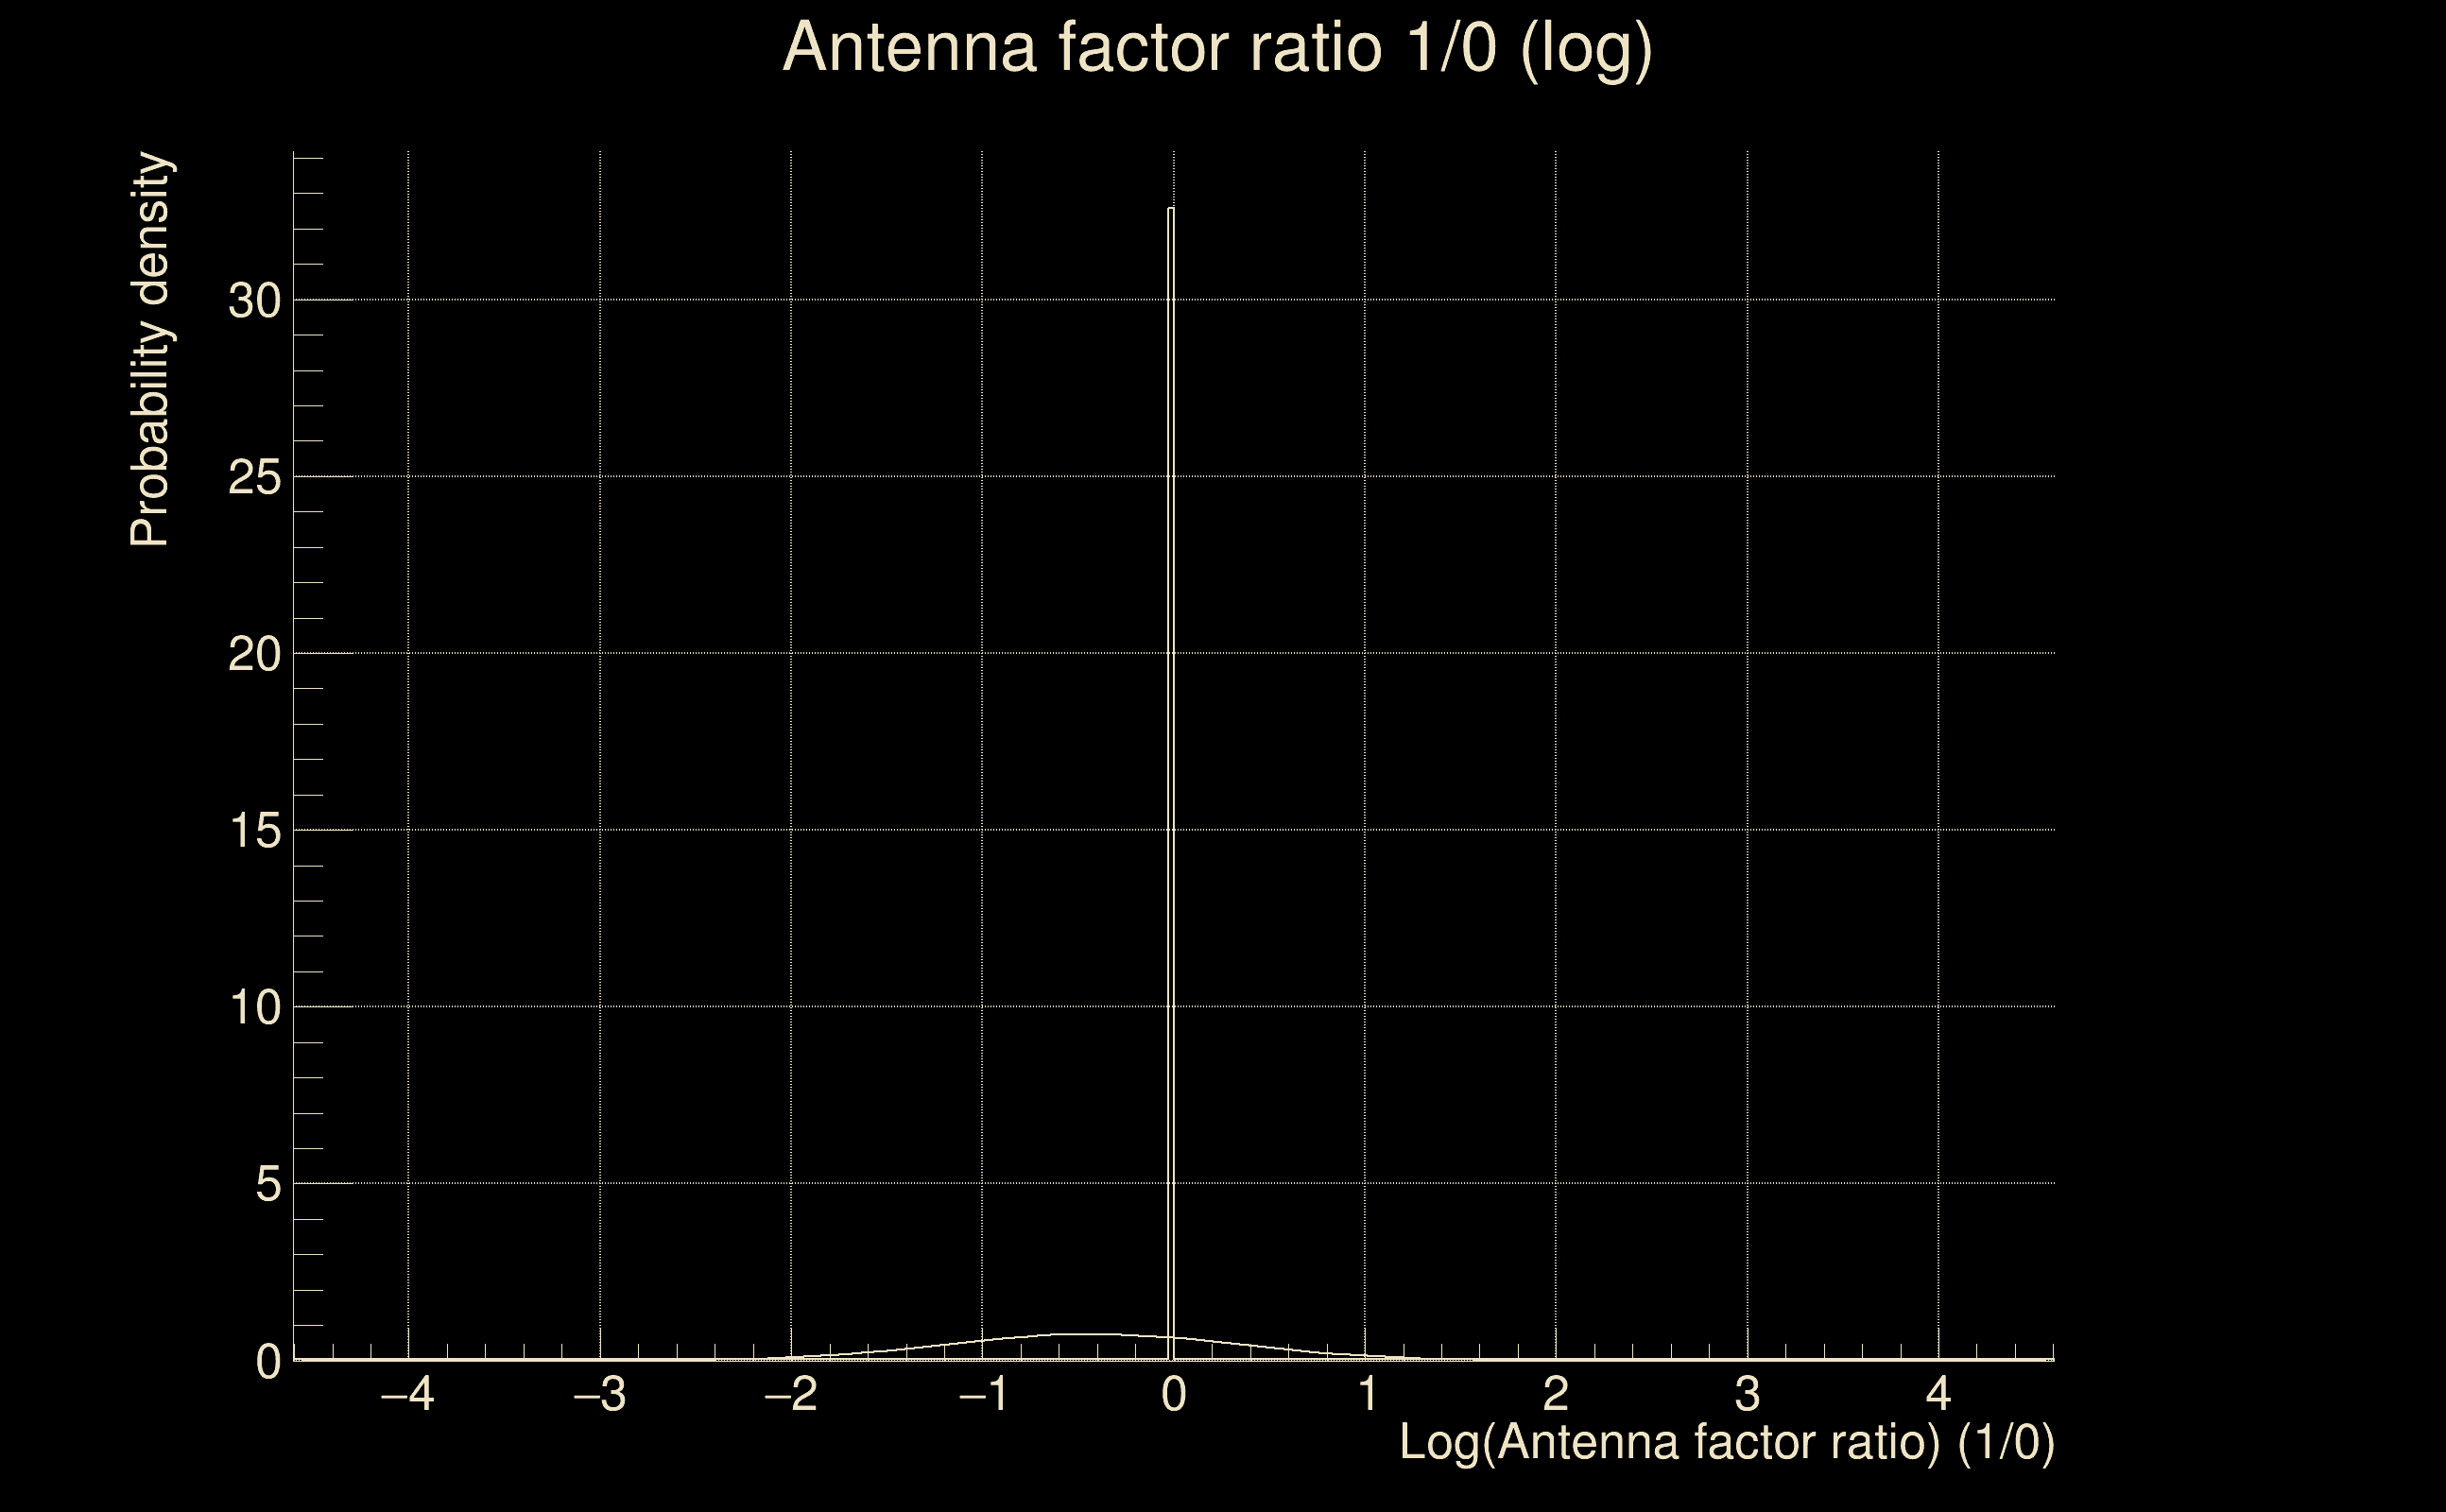
| Amplitude ratio confidence level: | 3 sigma |
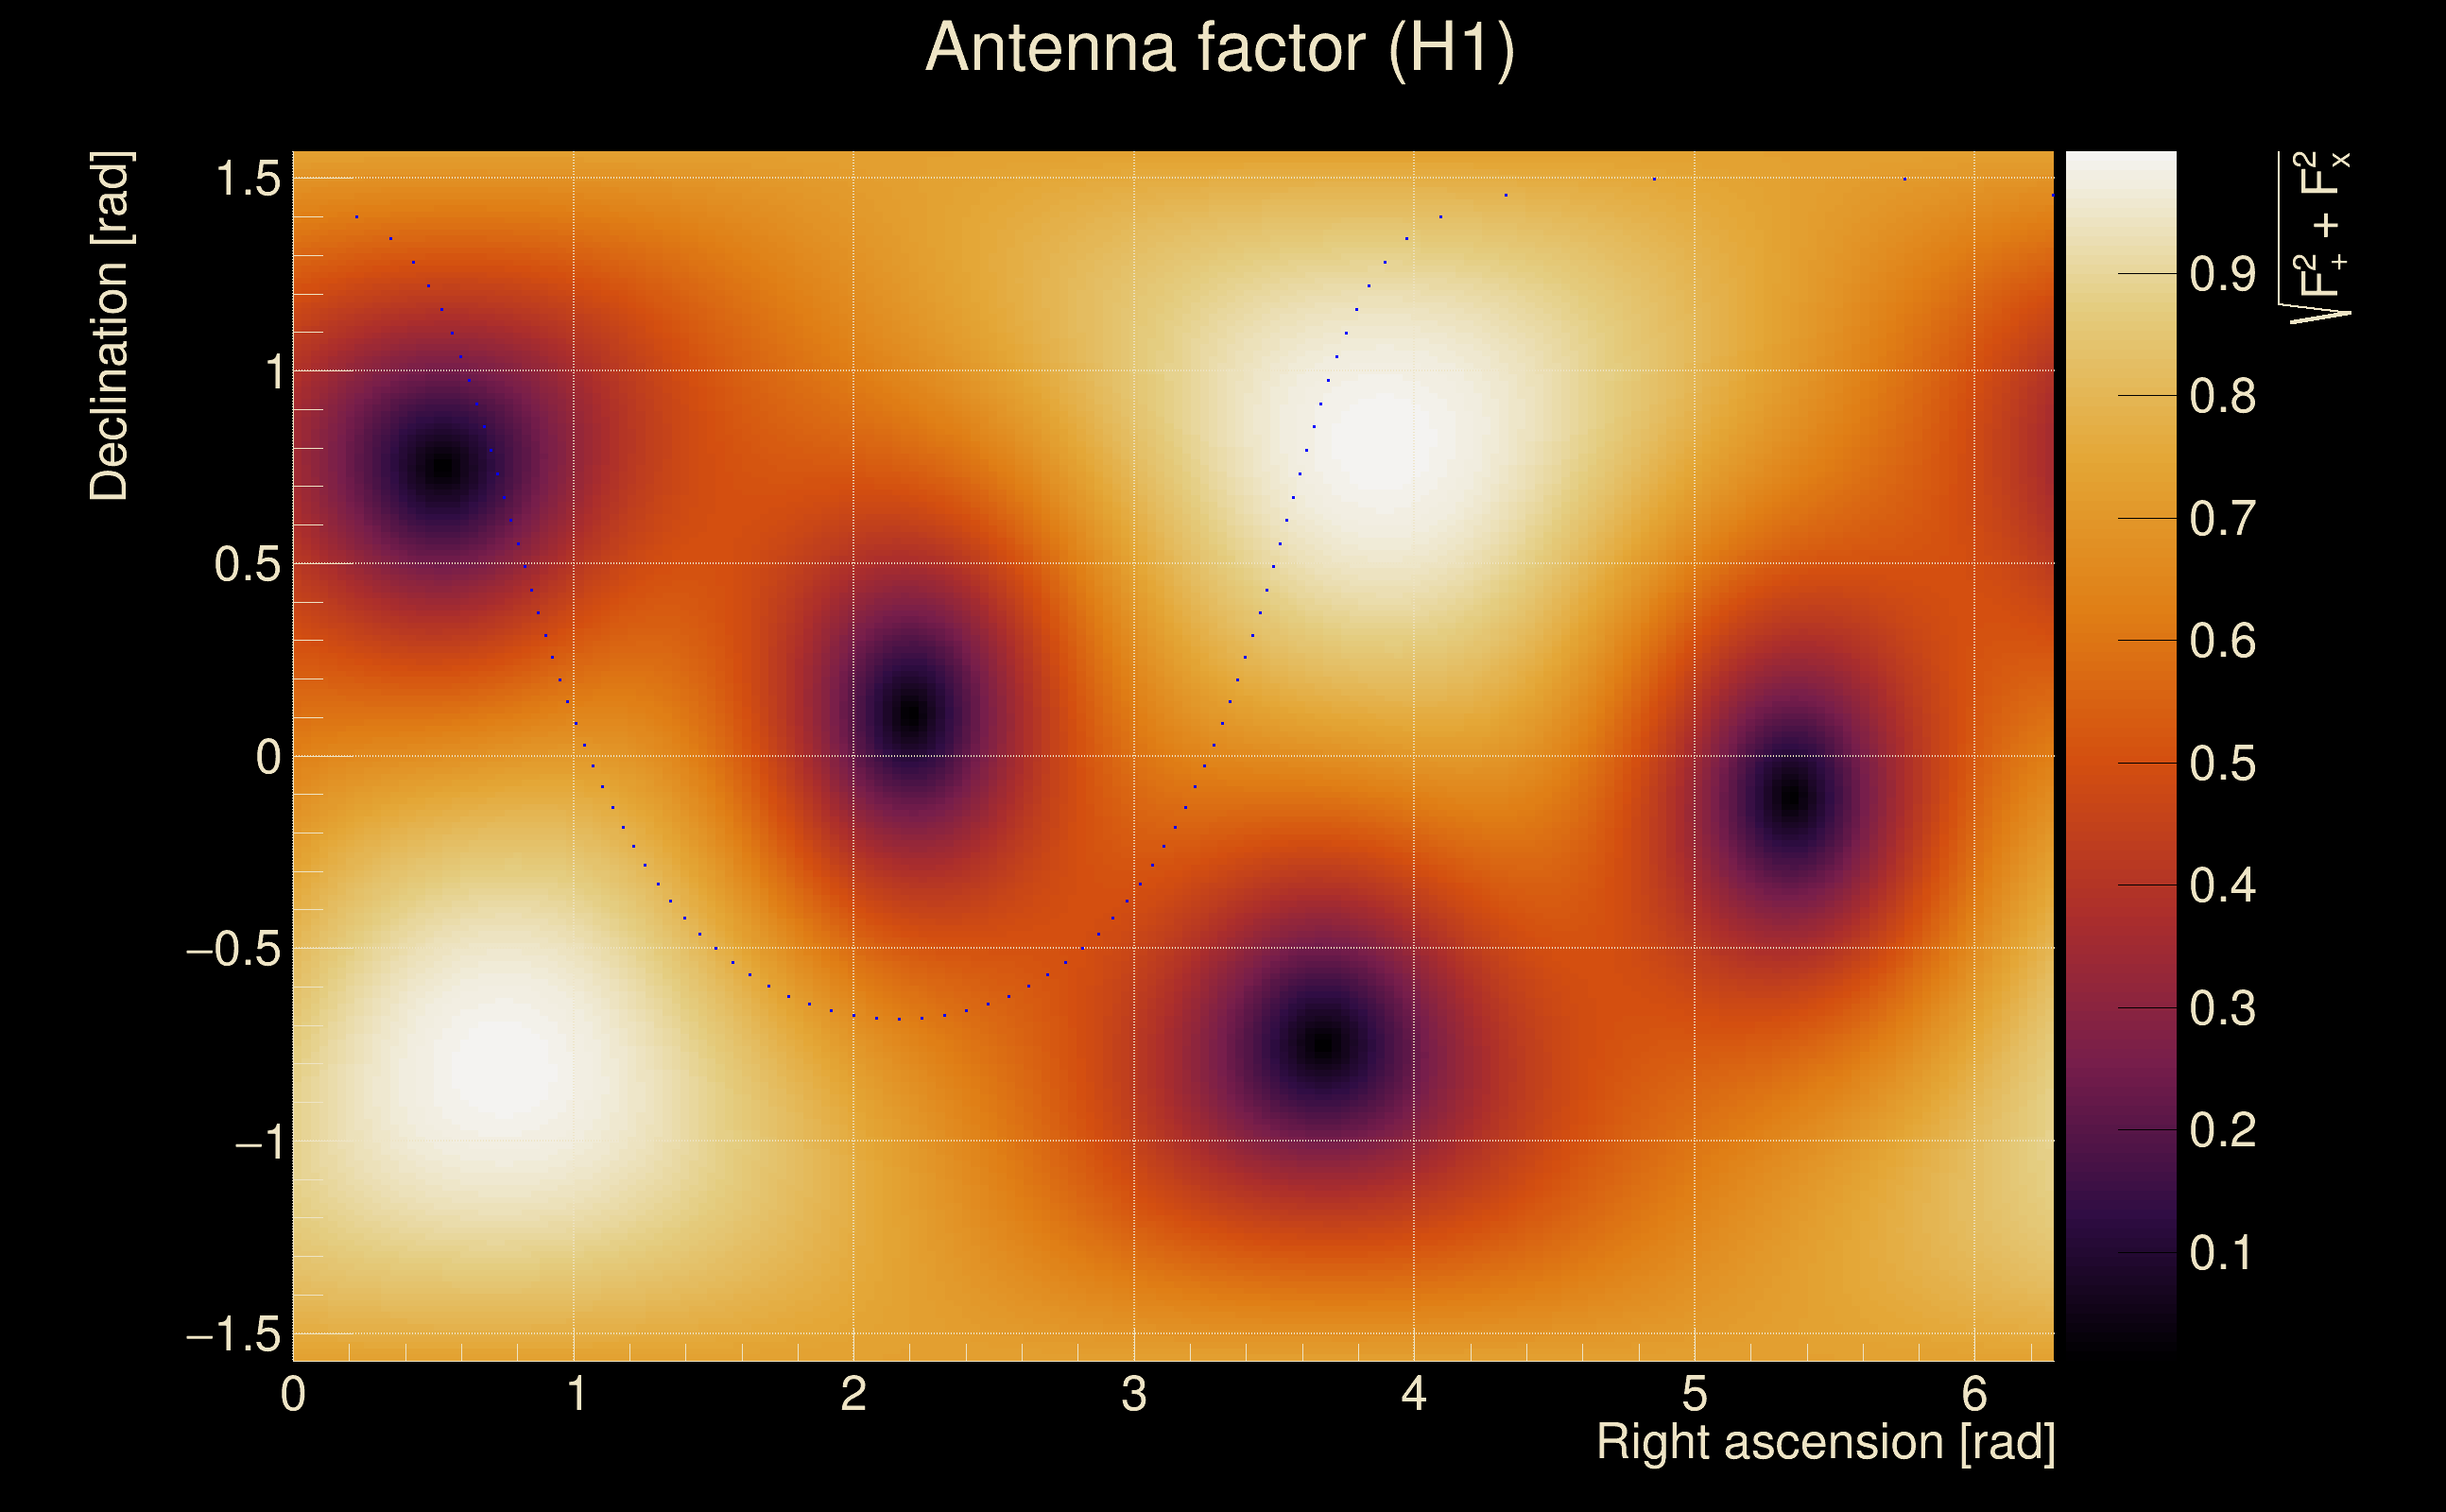
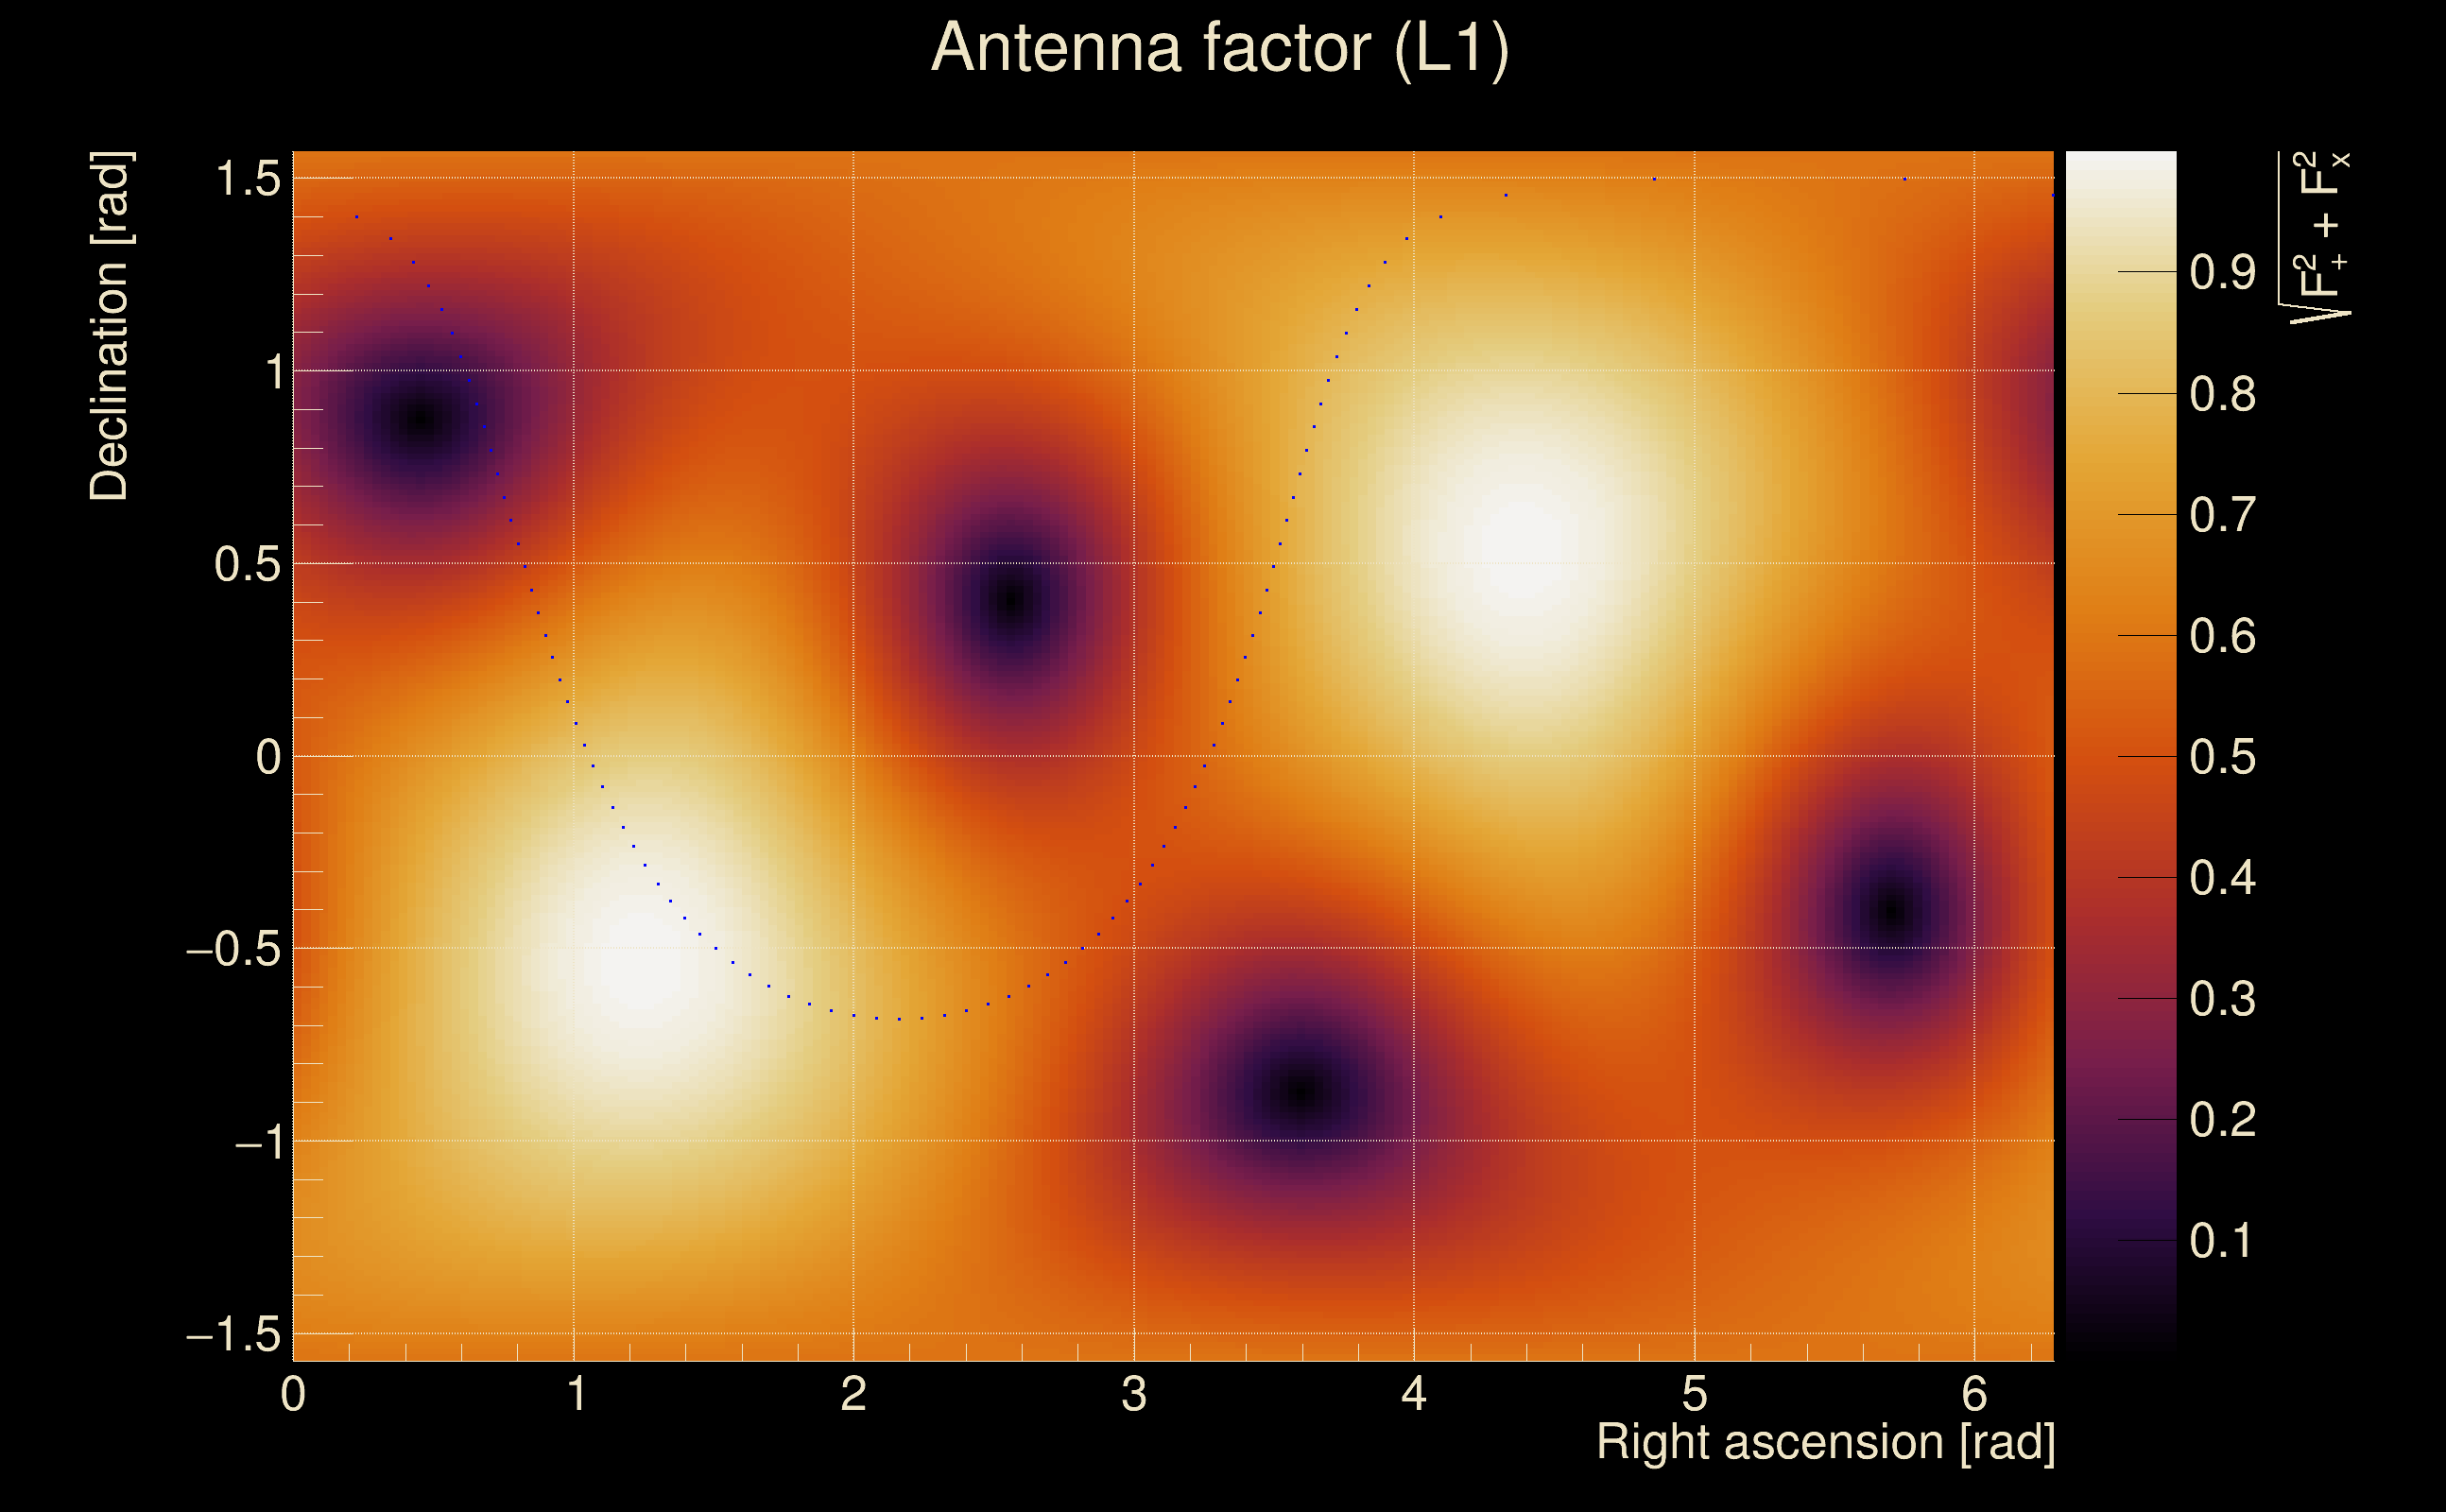
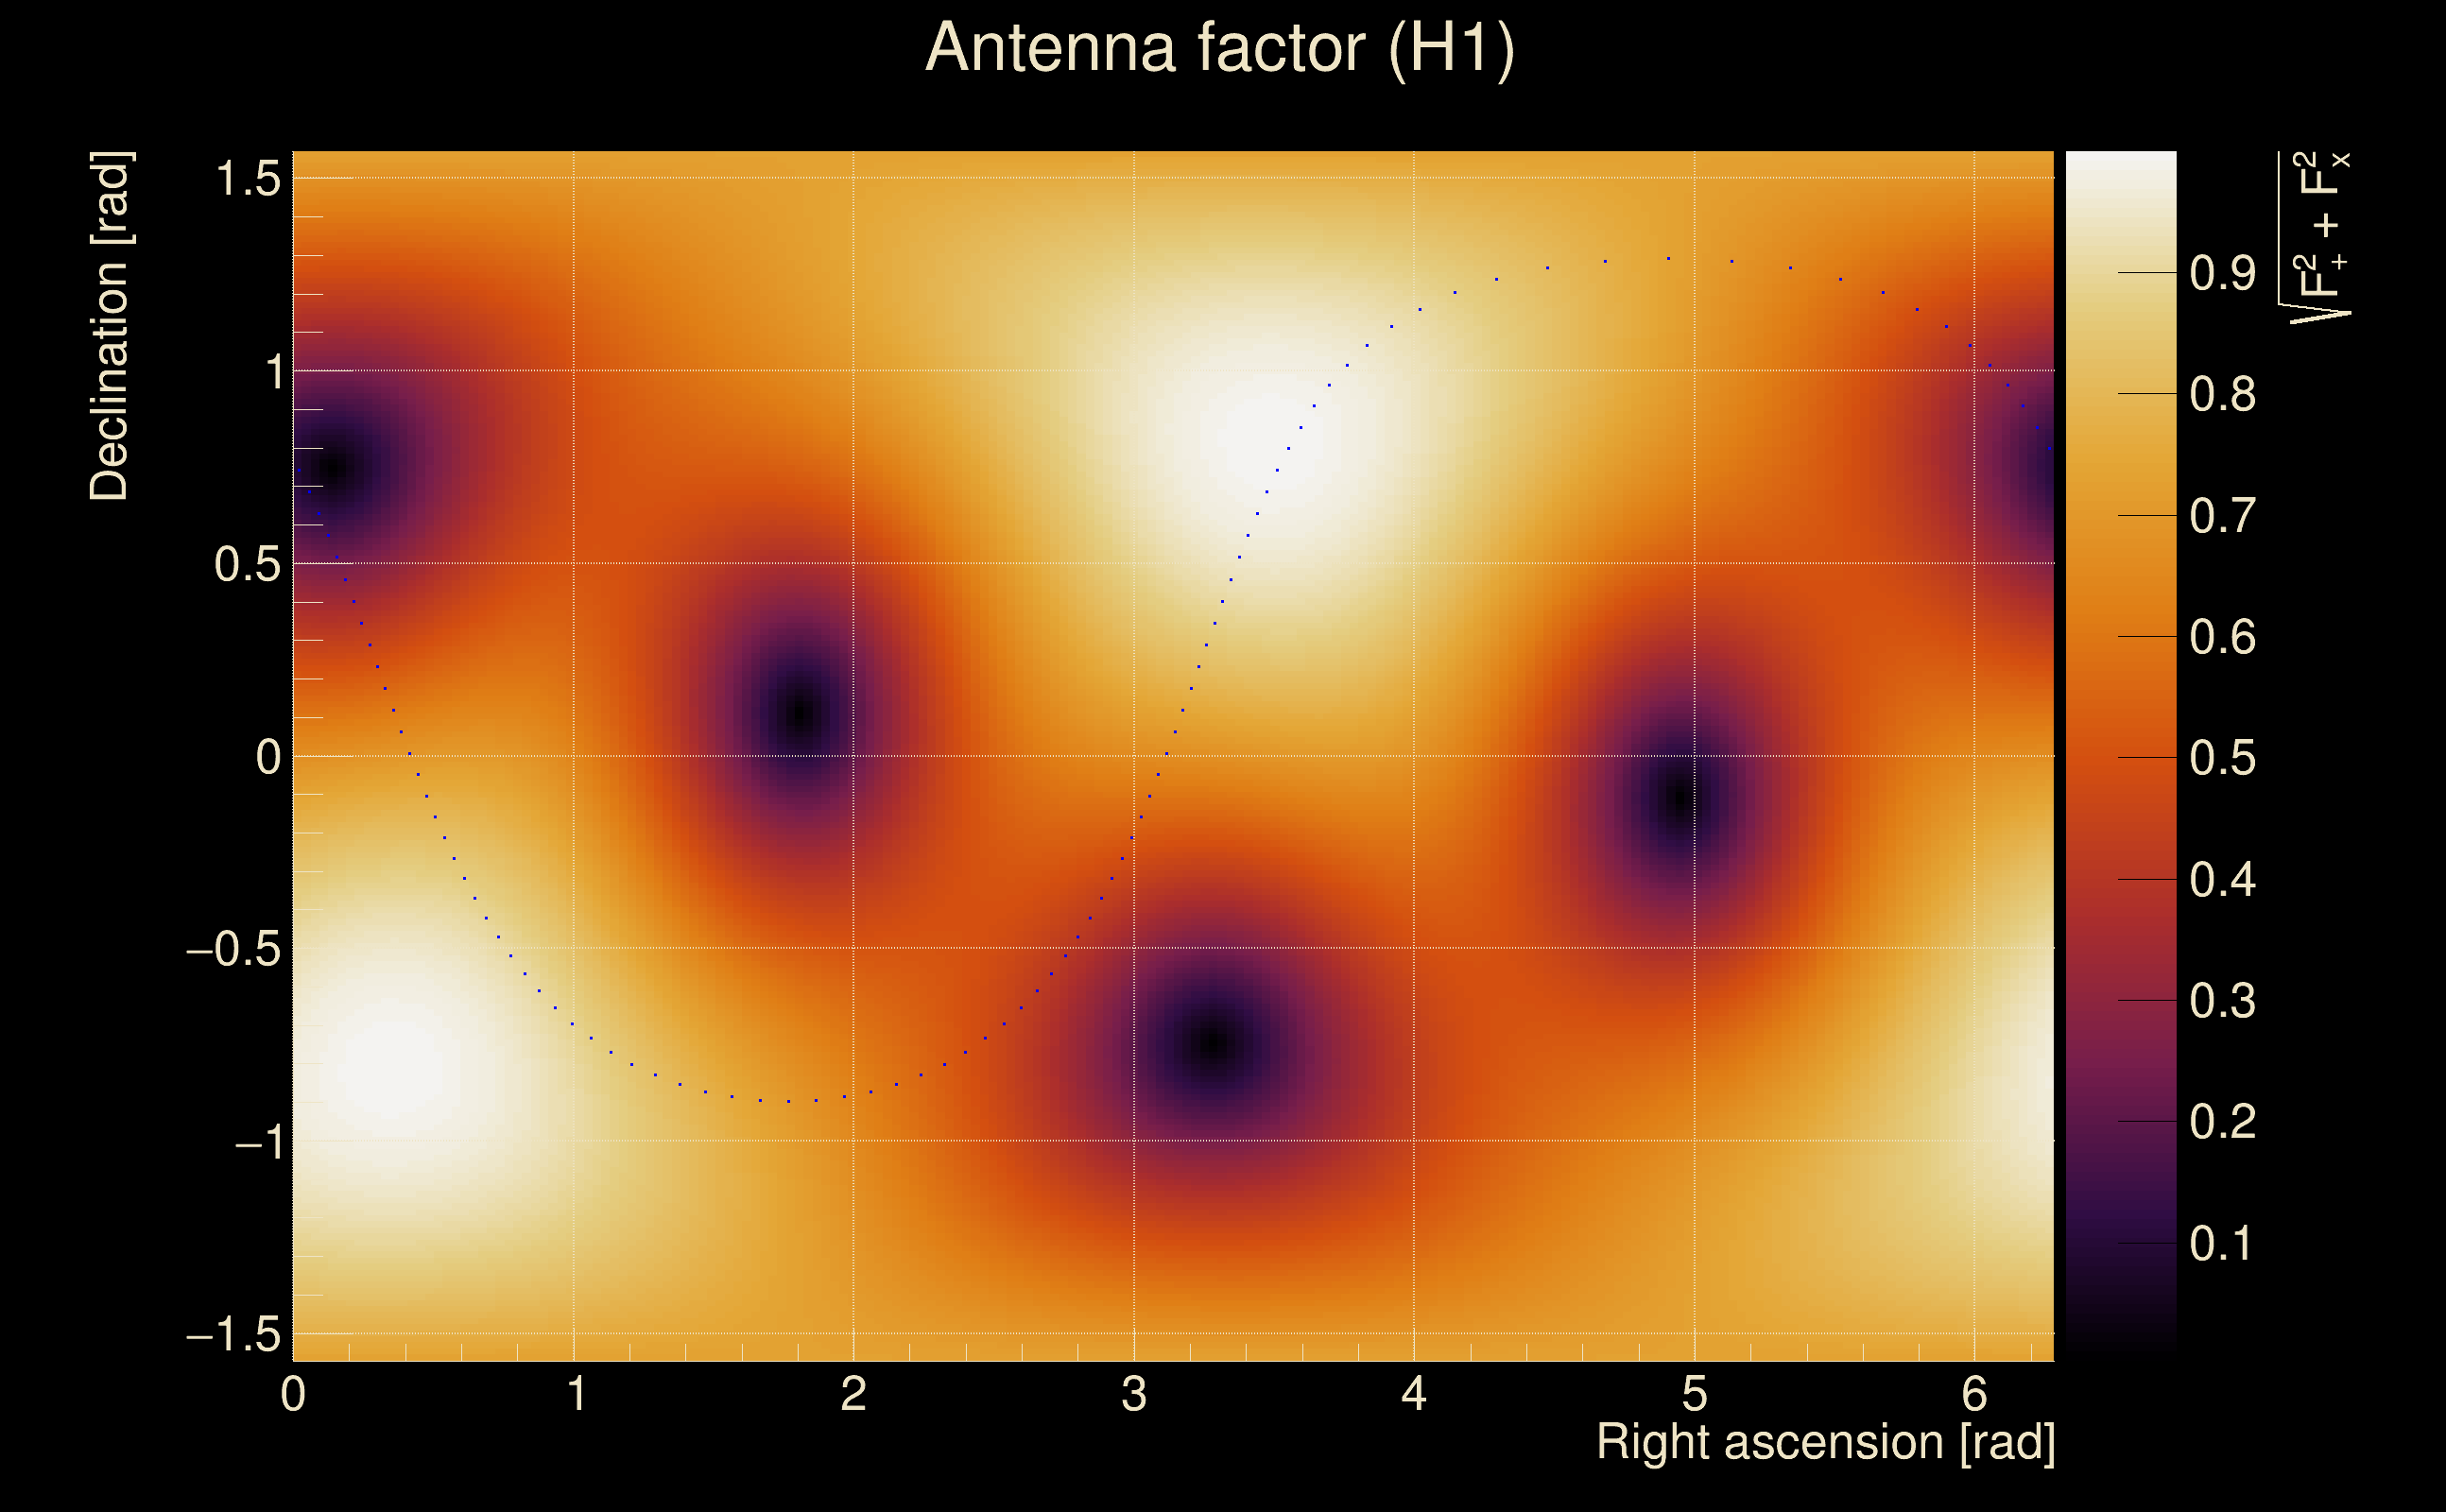
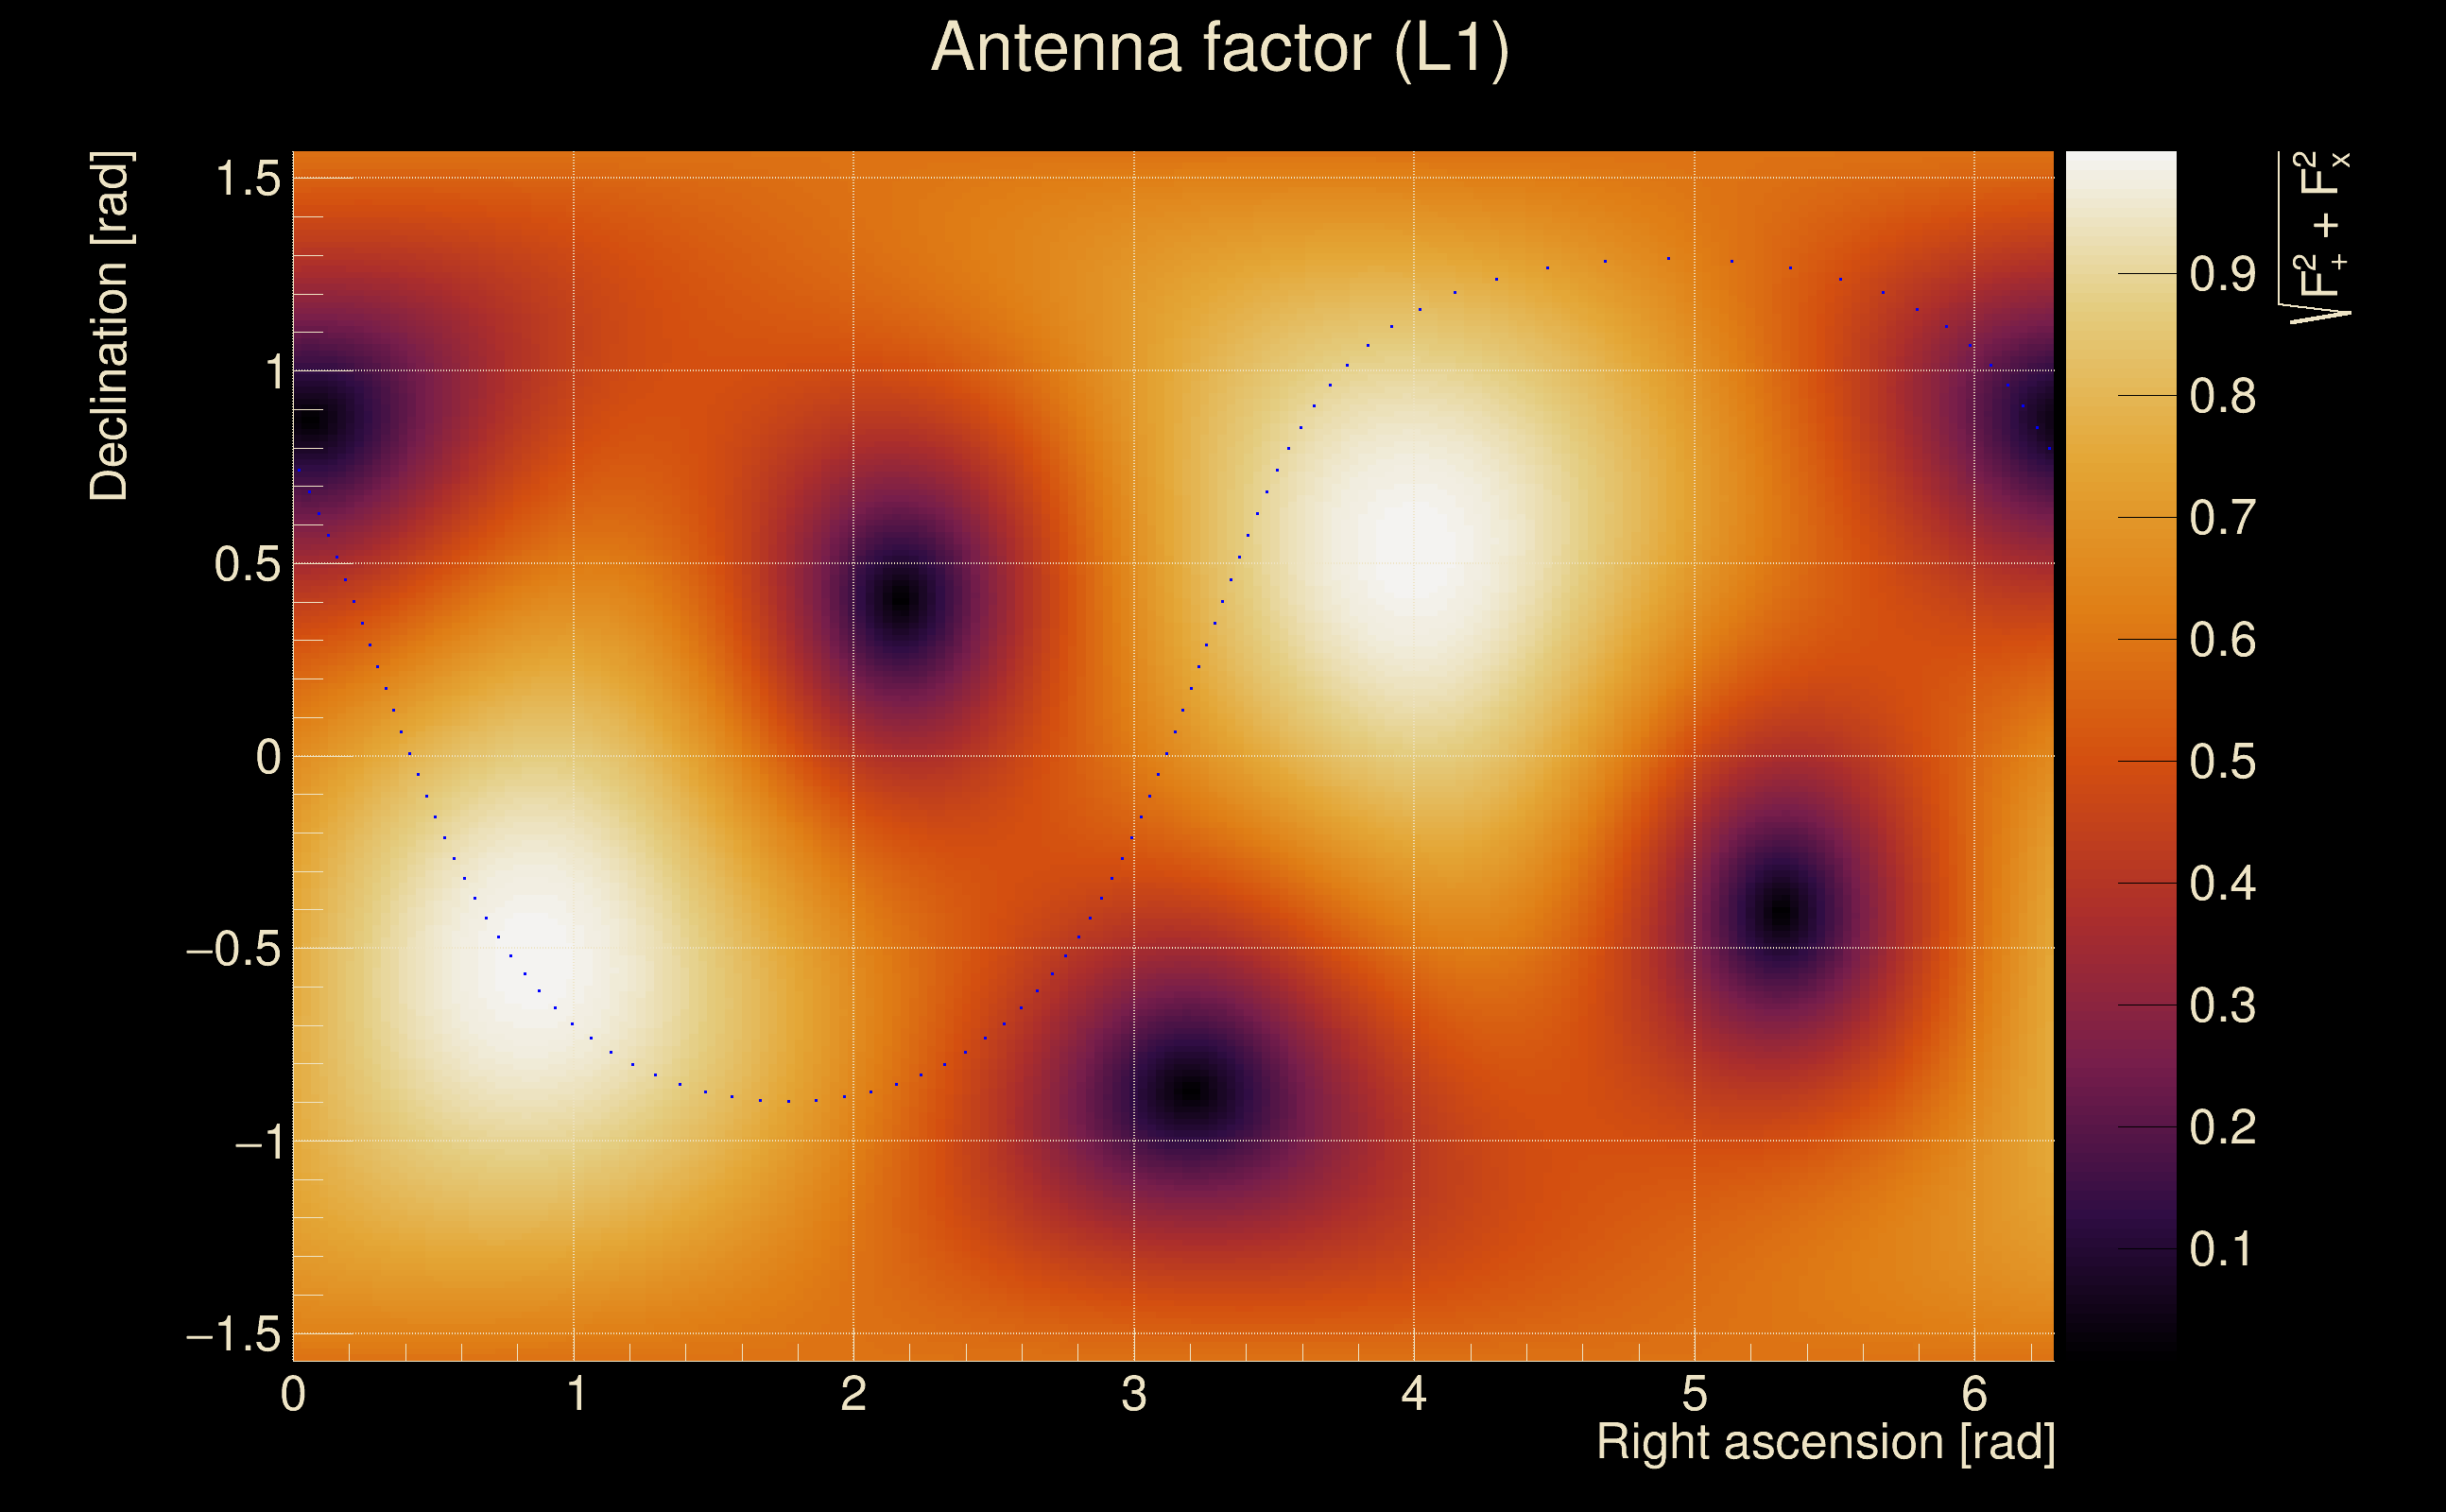
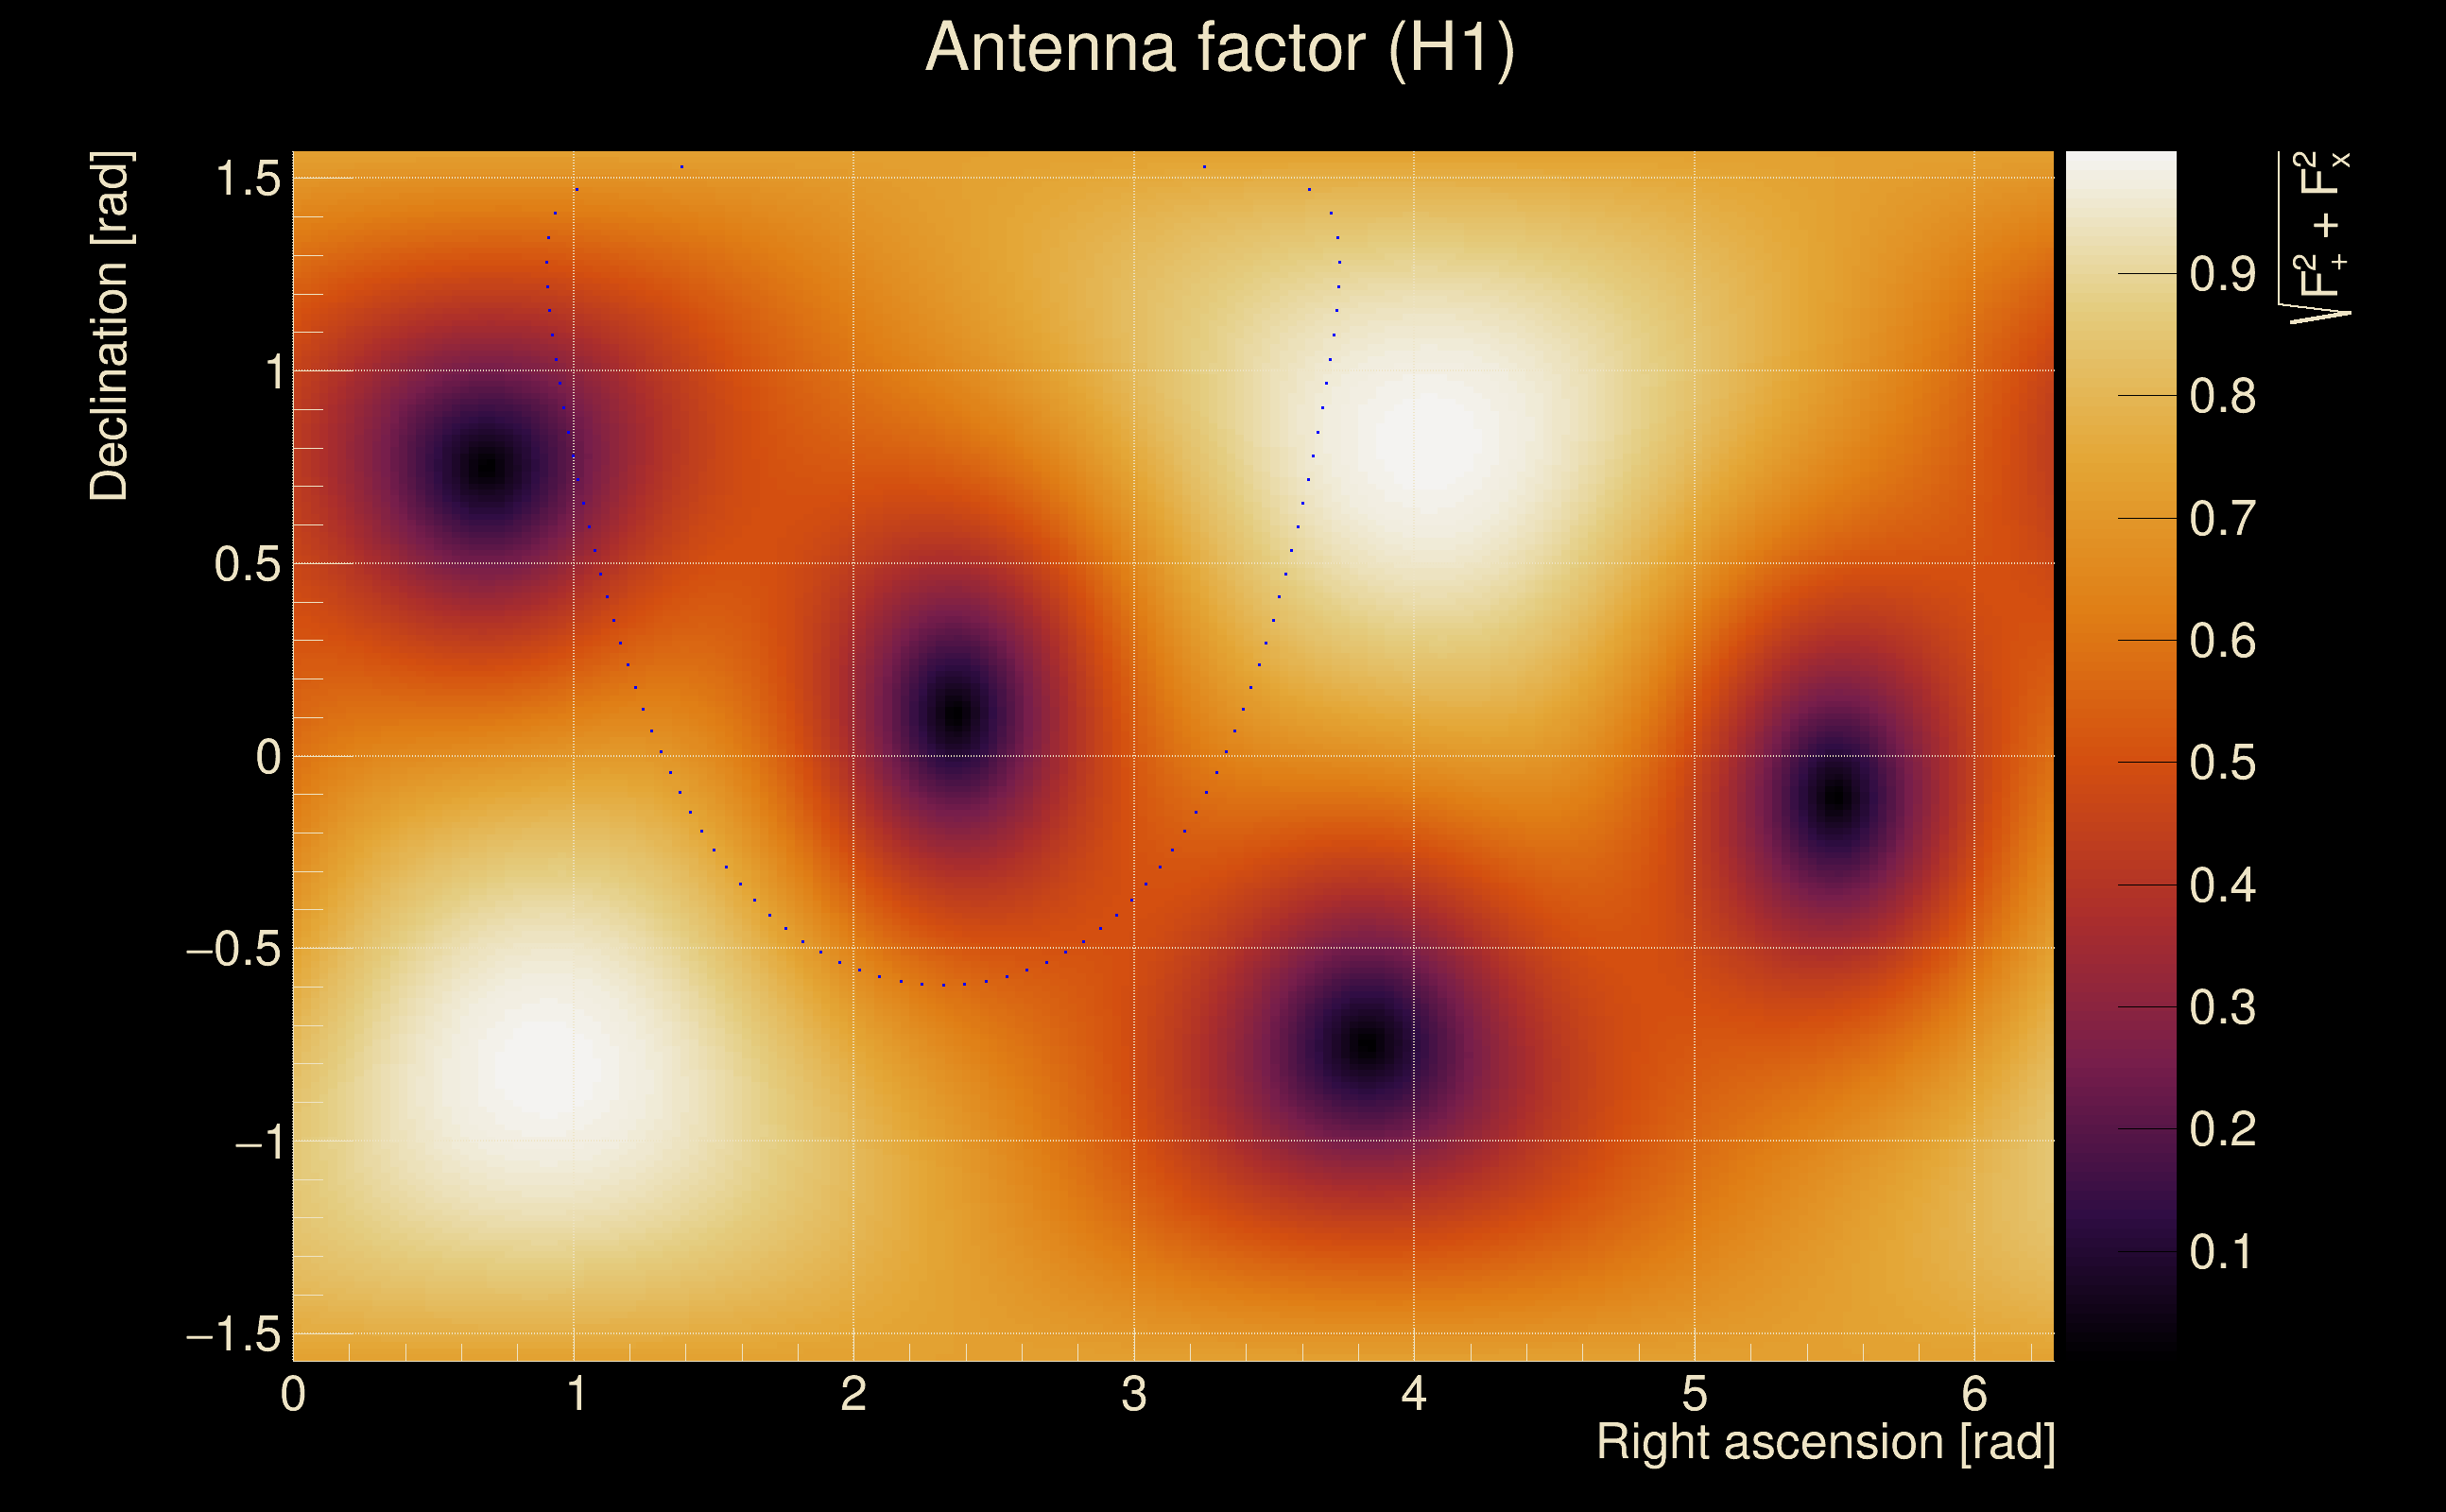
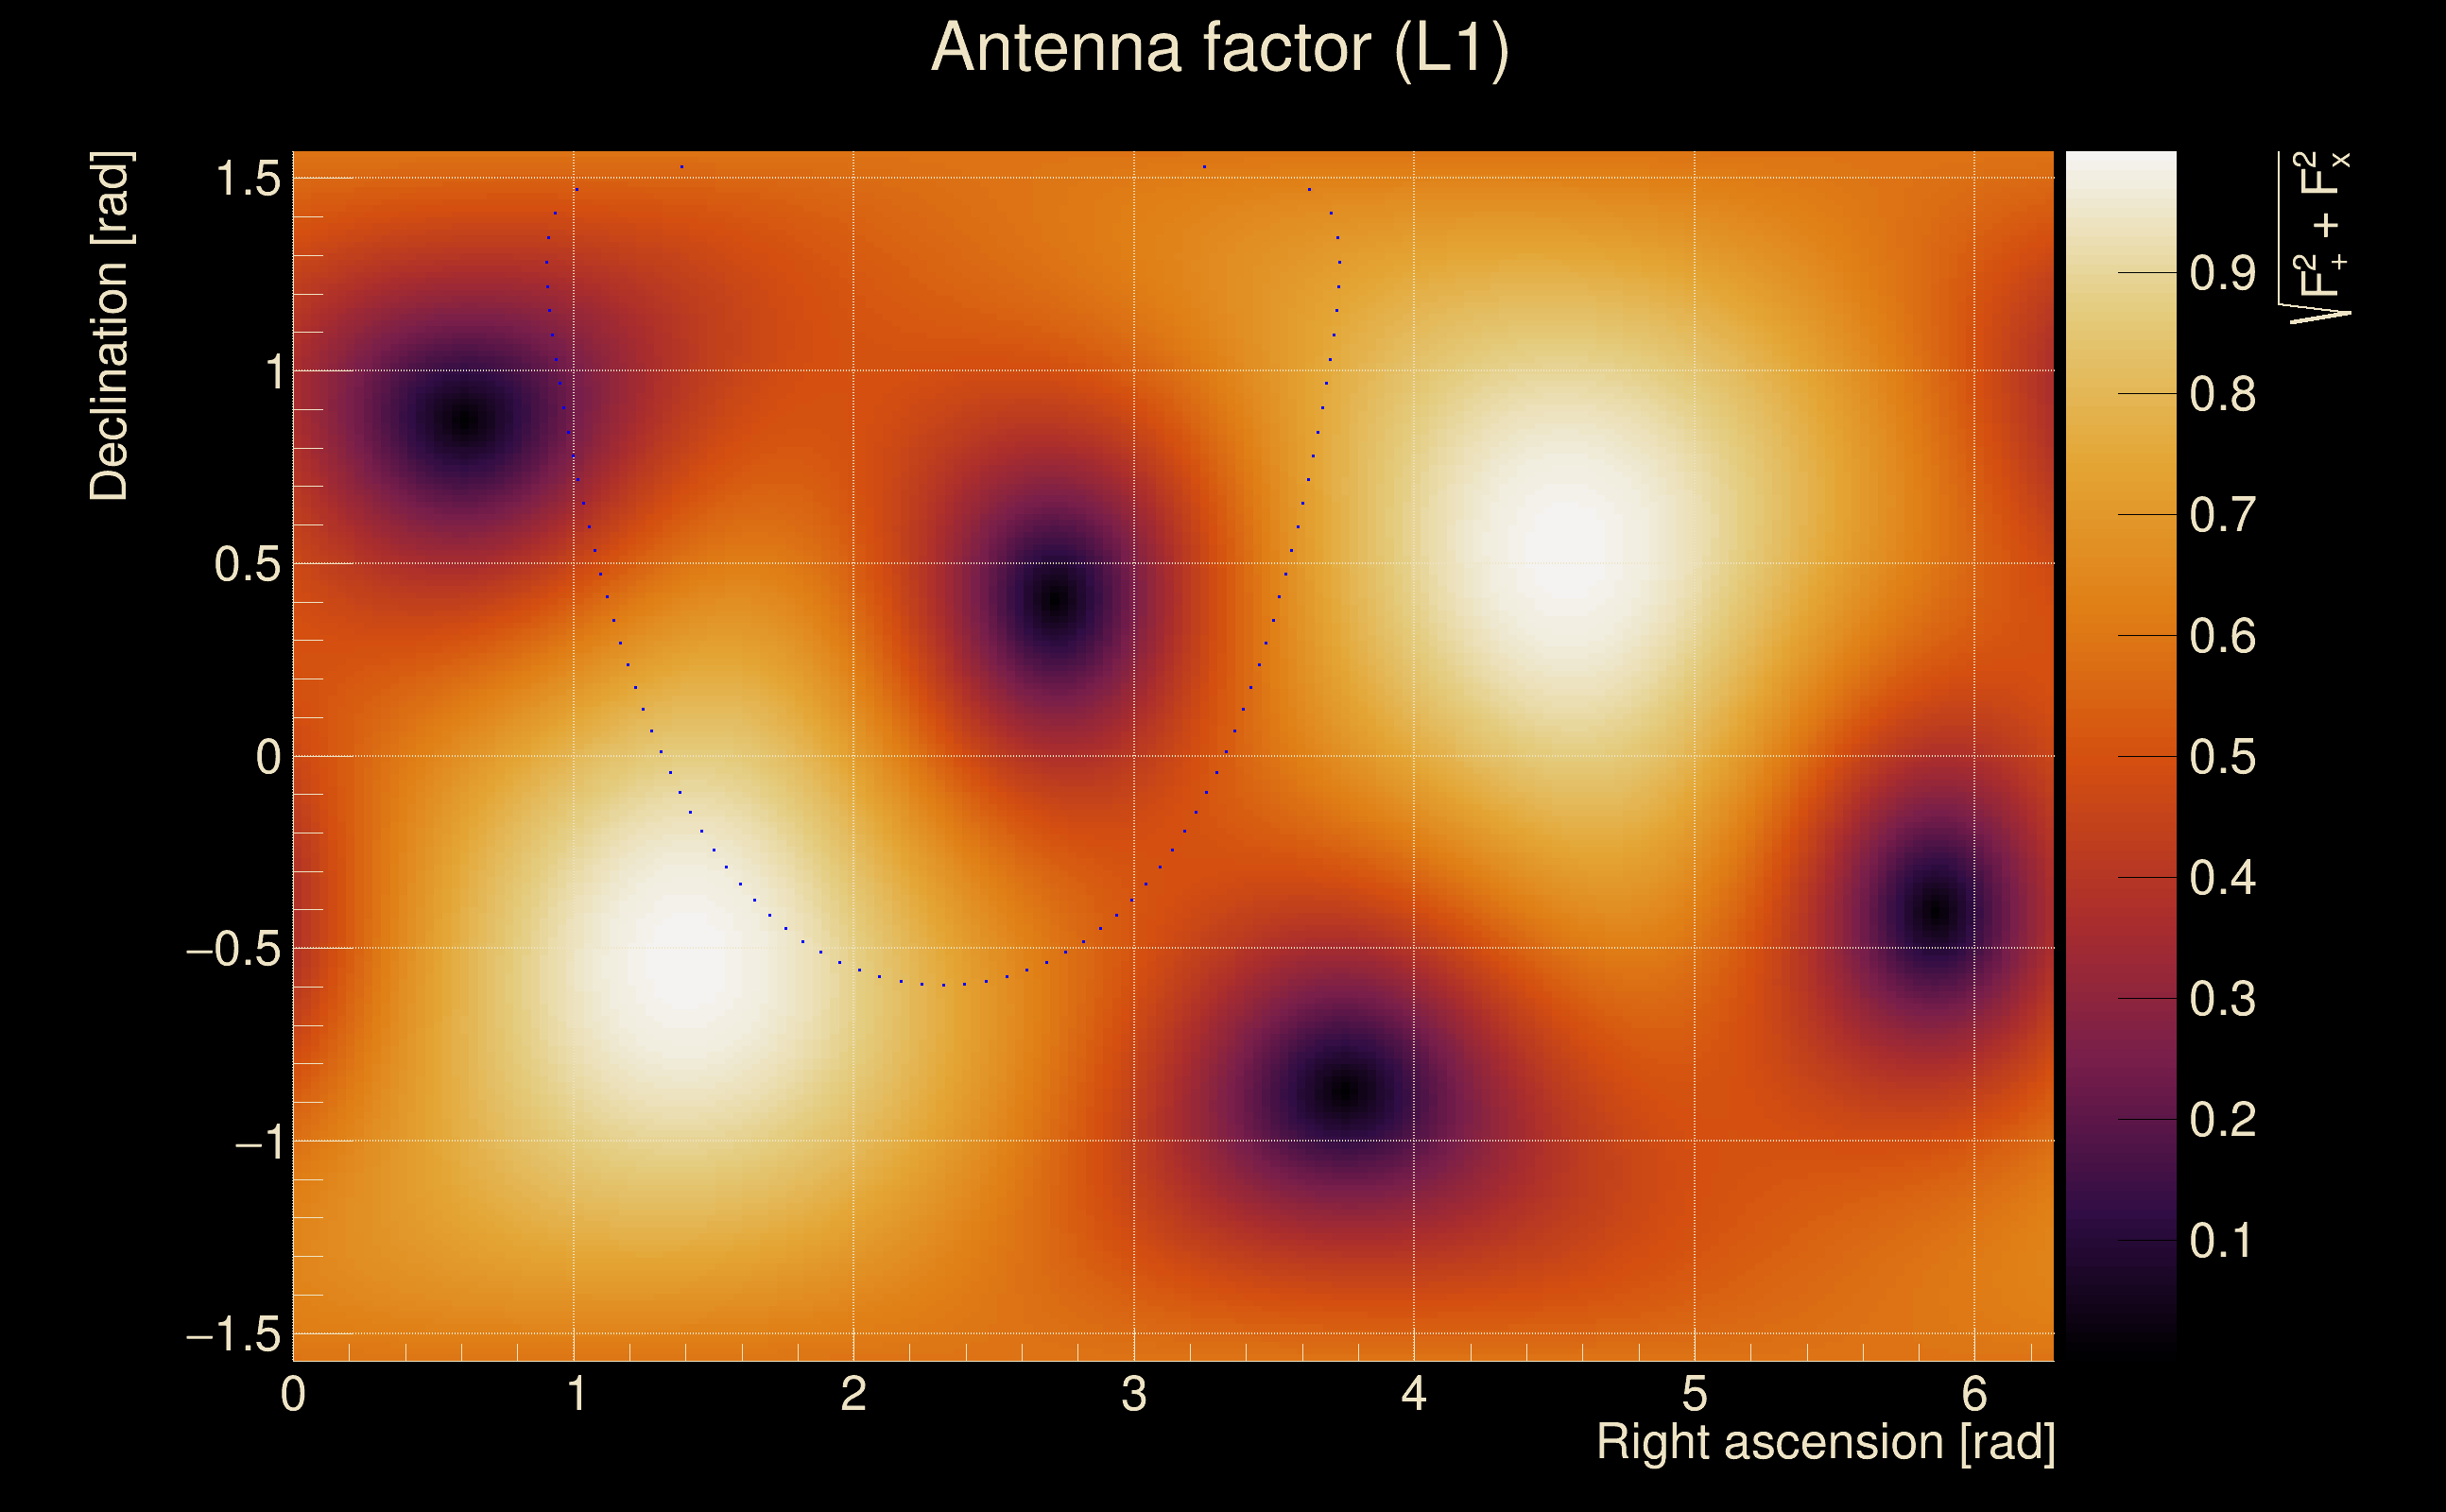
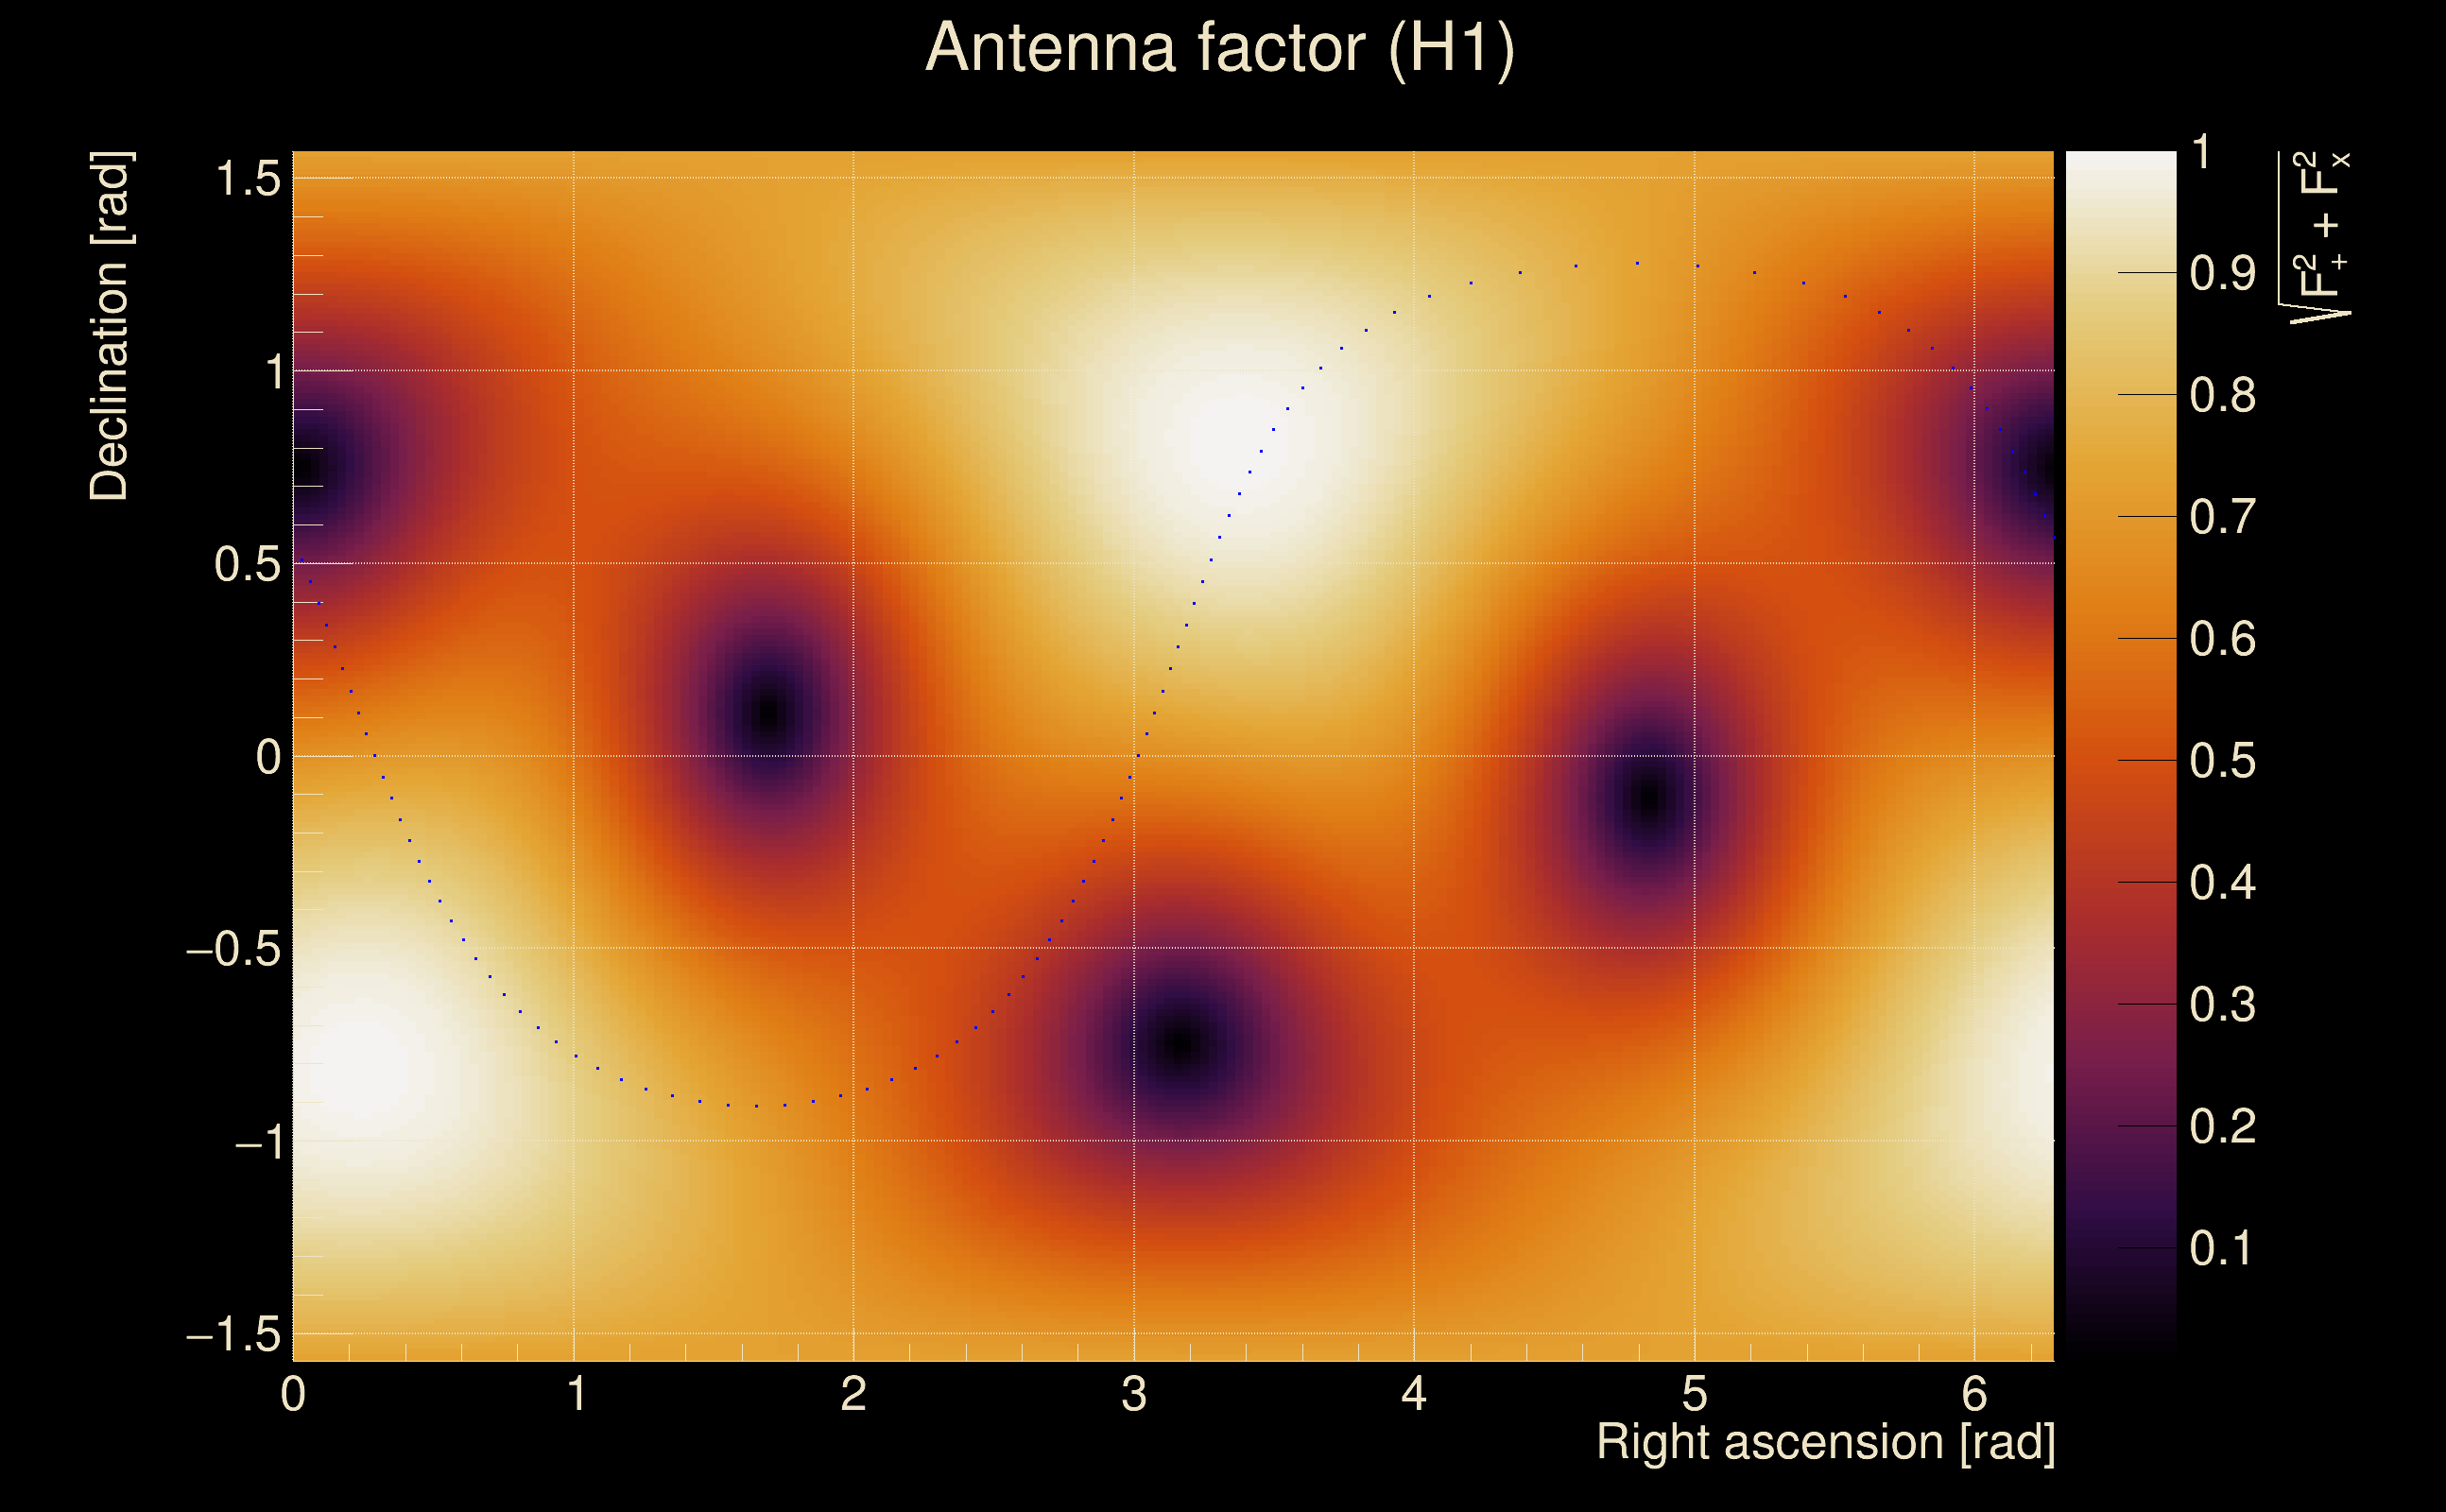
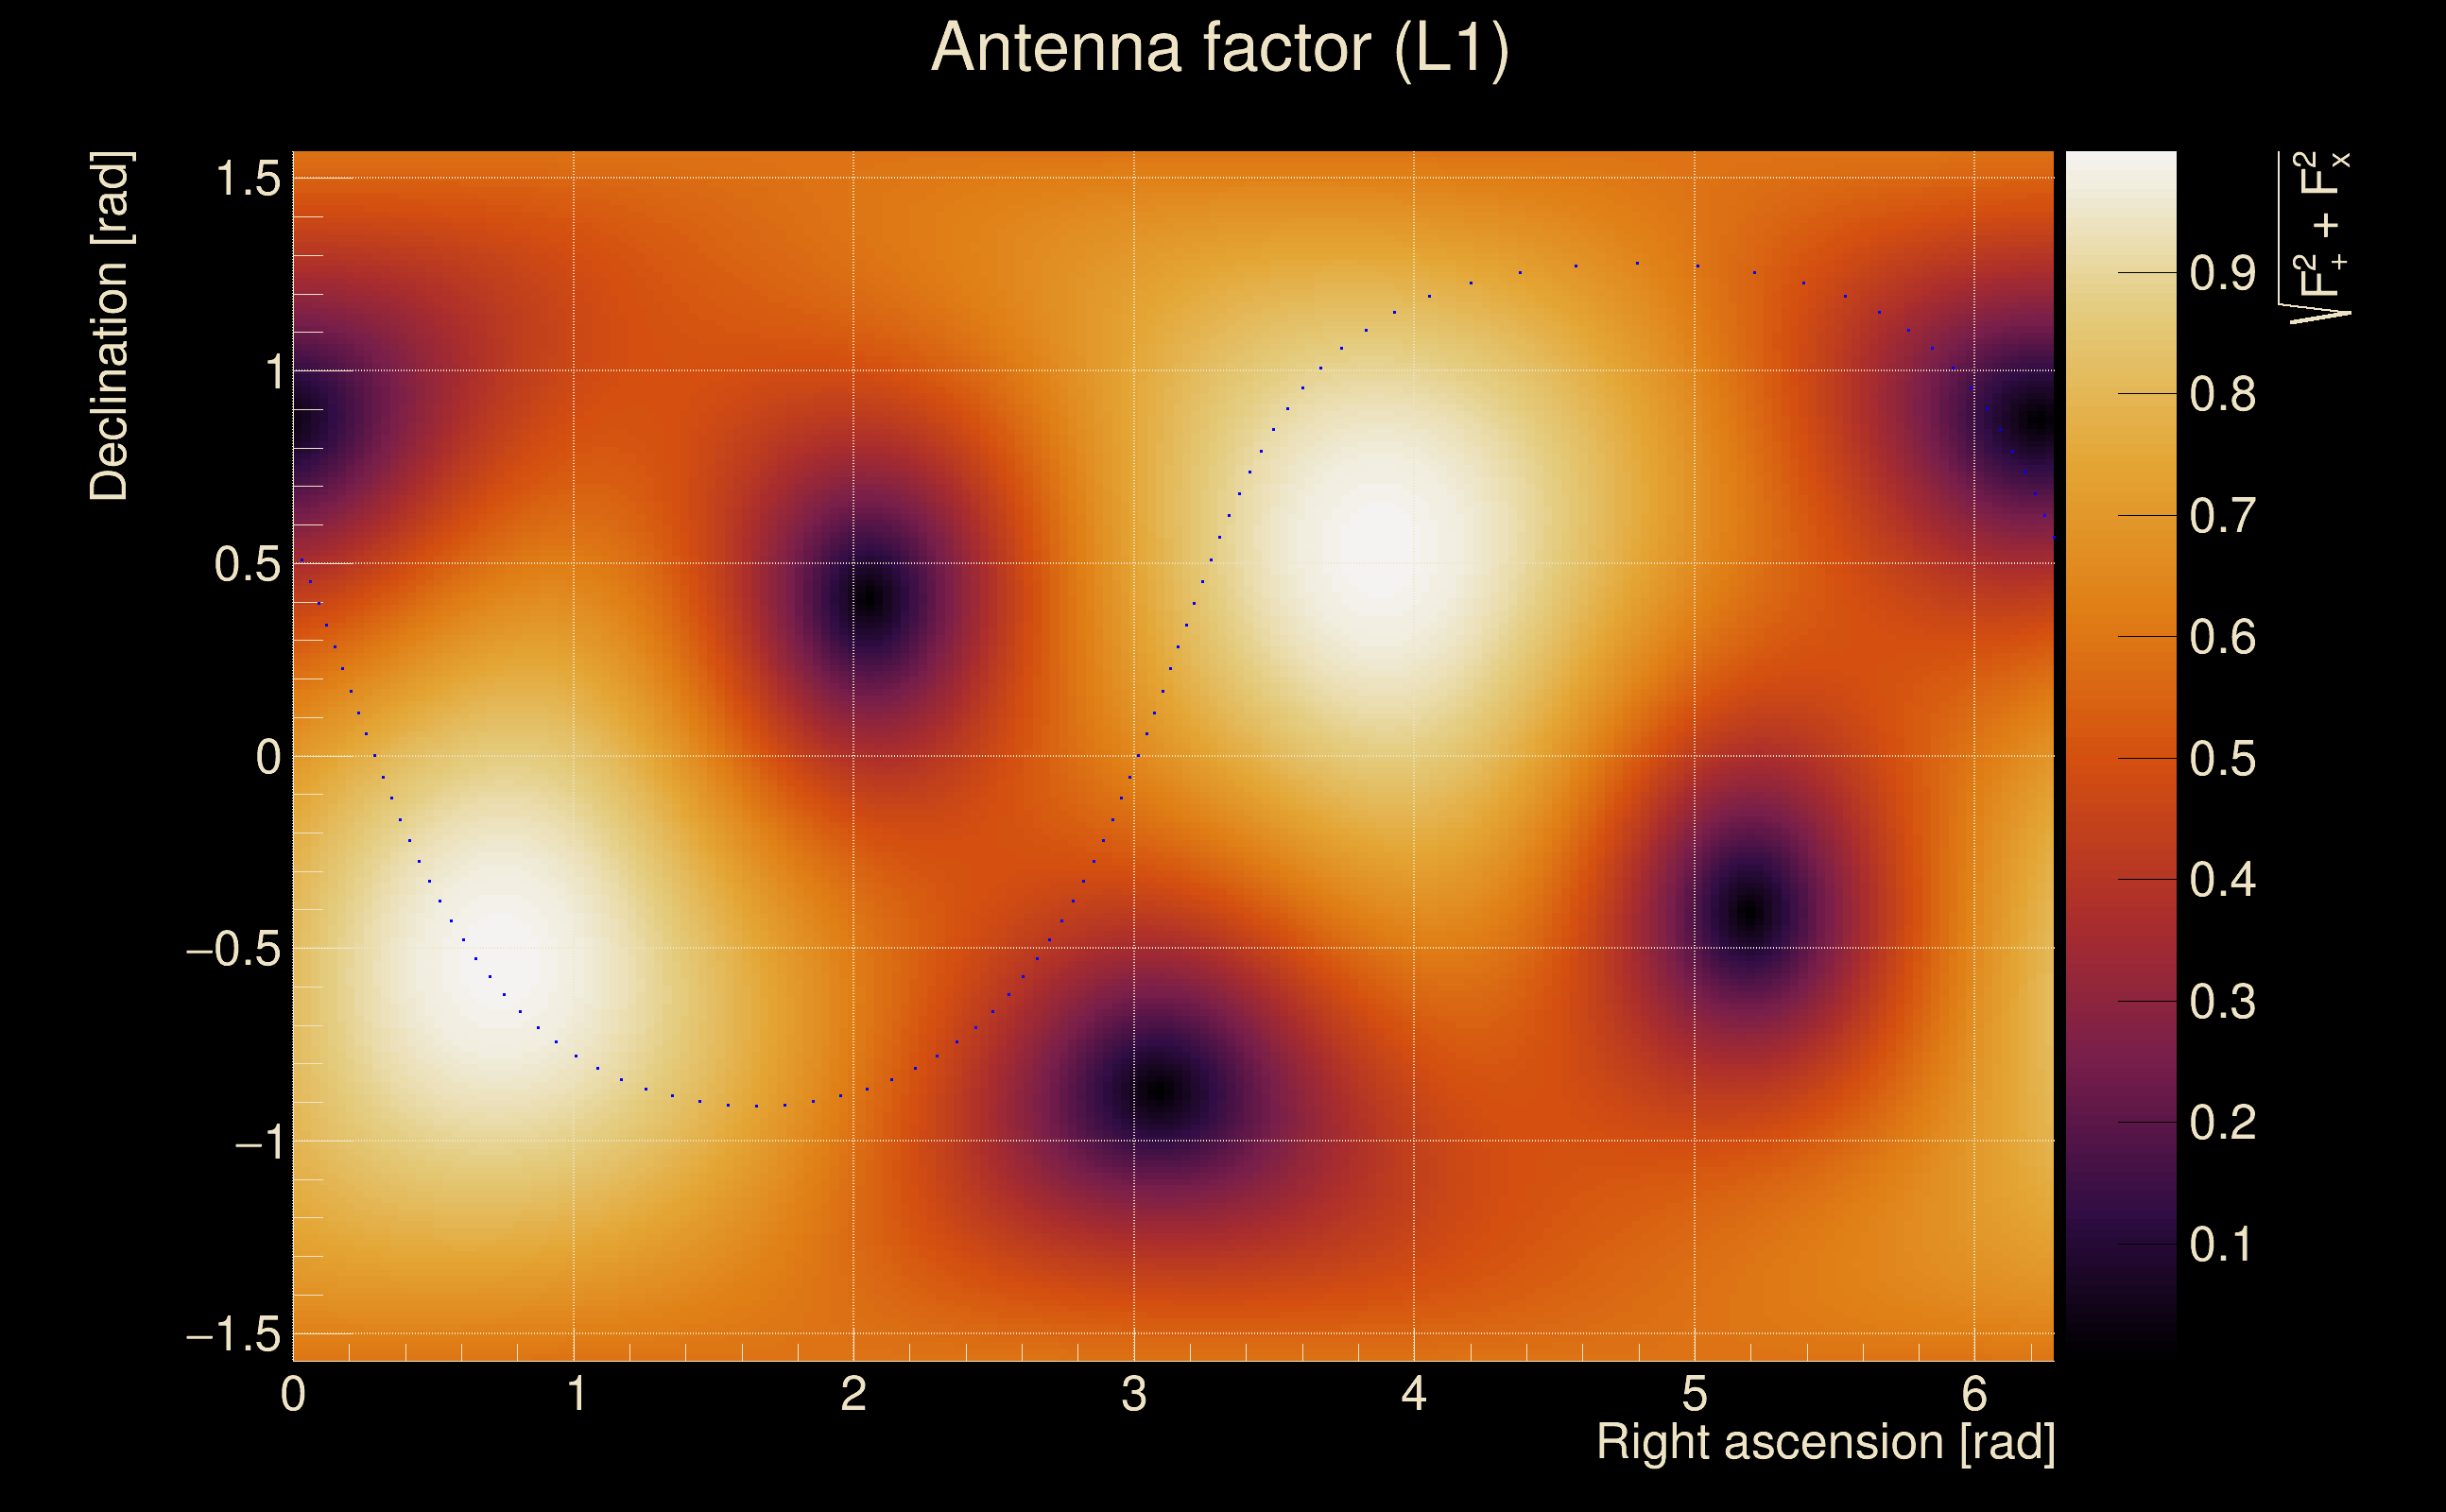
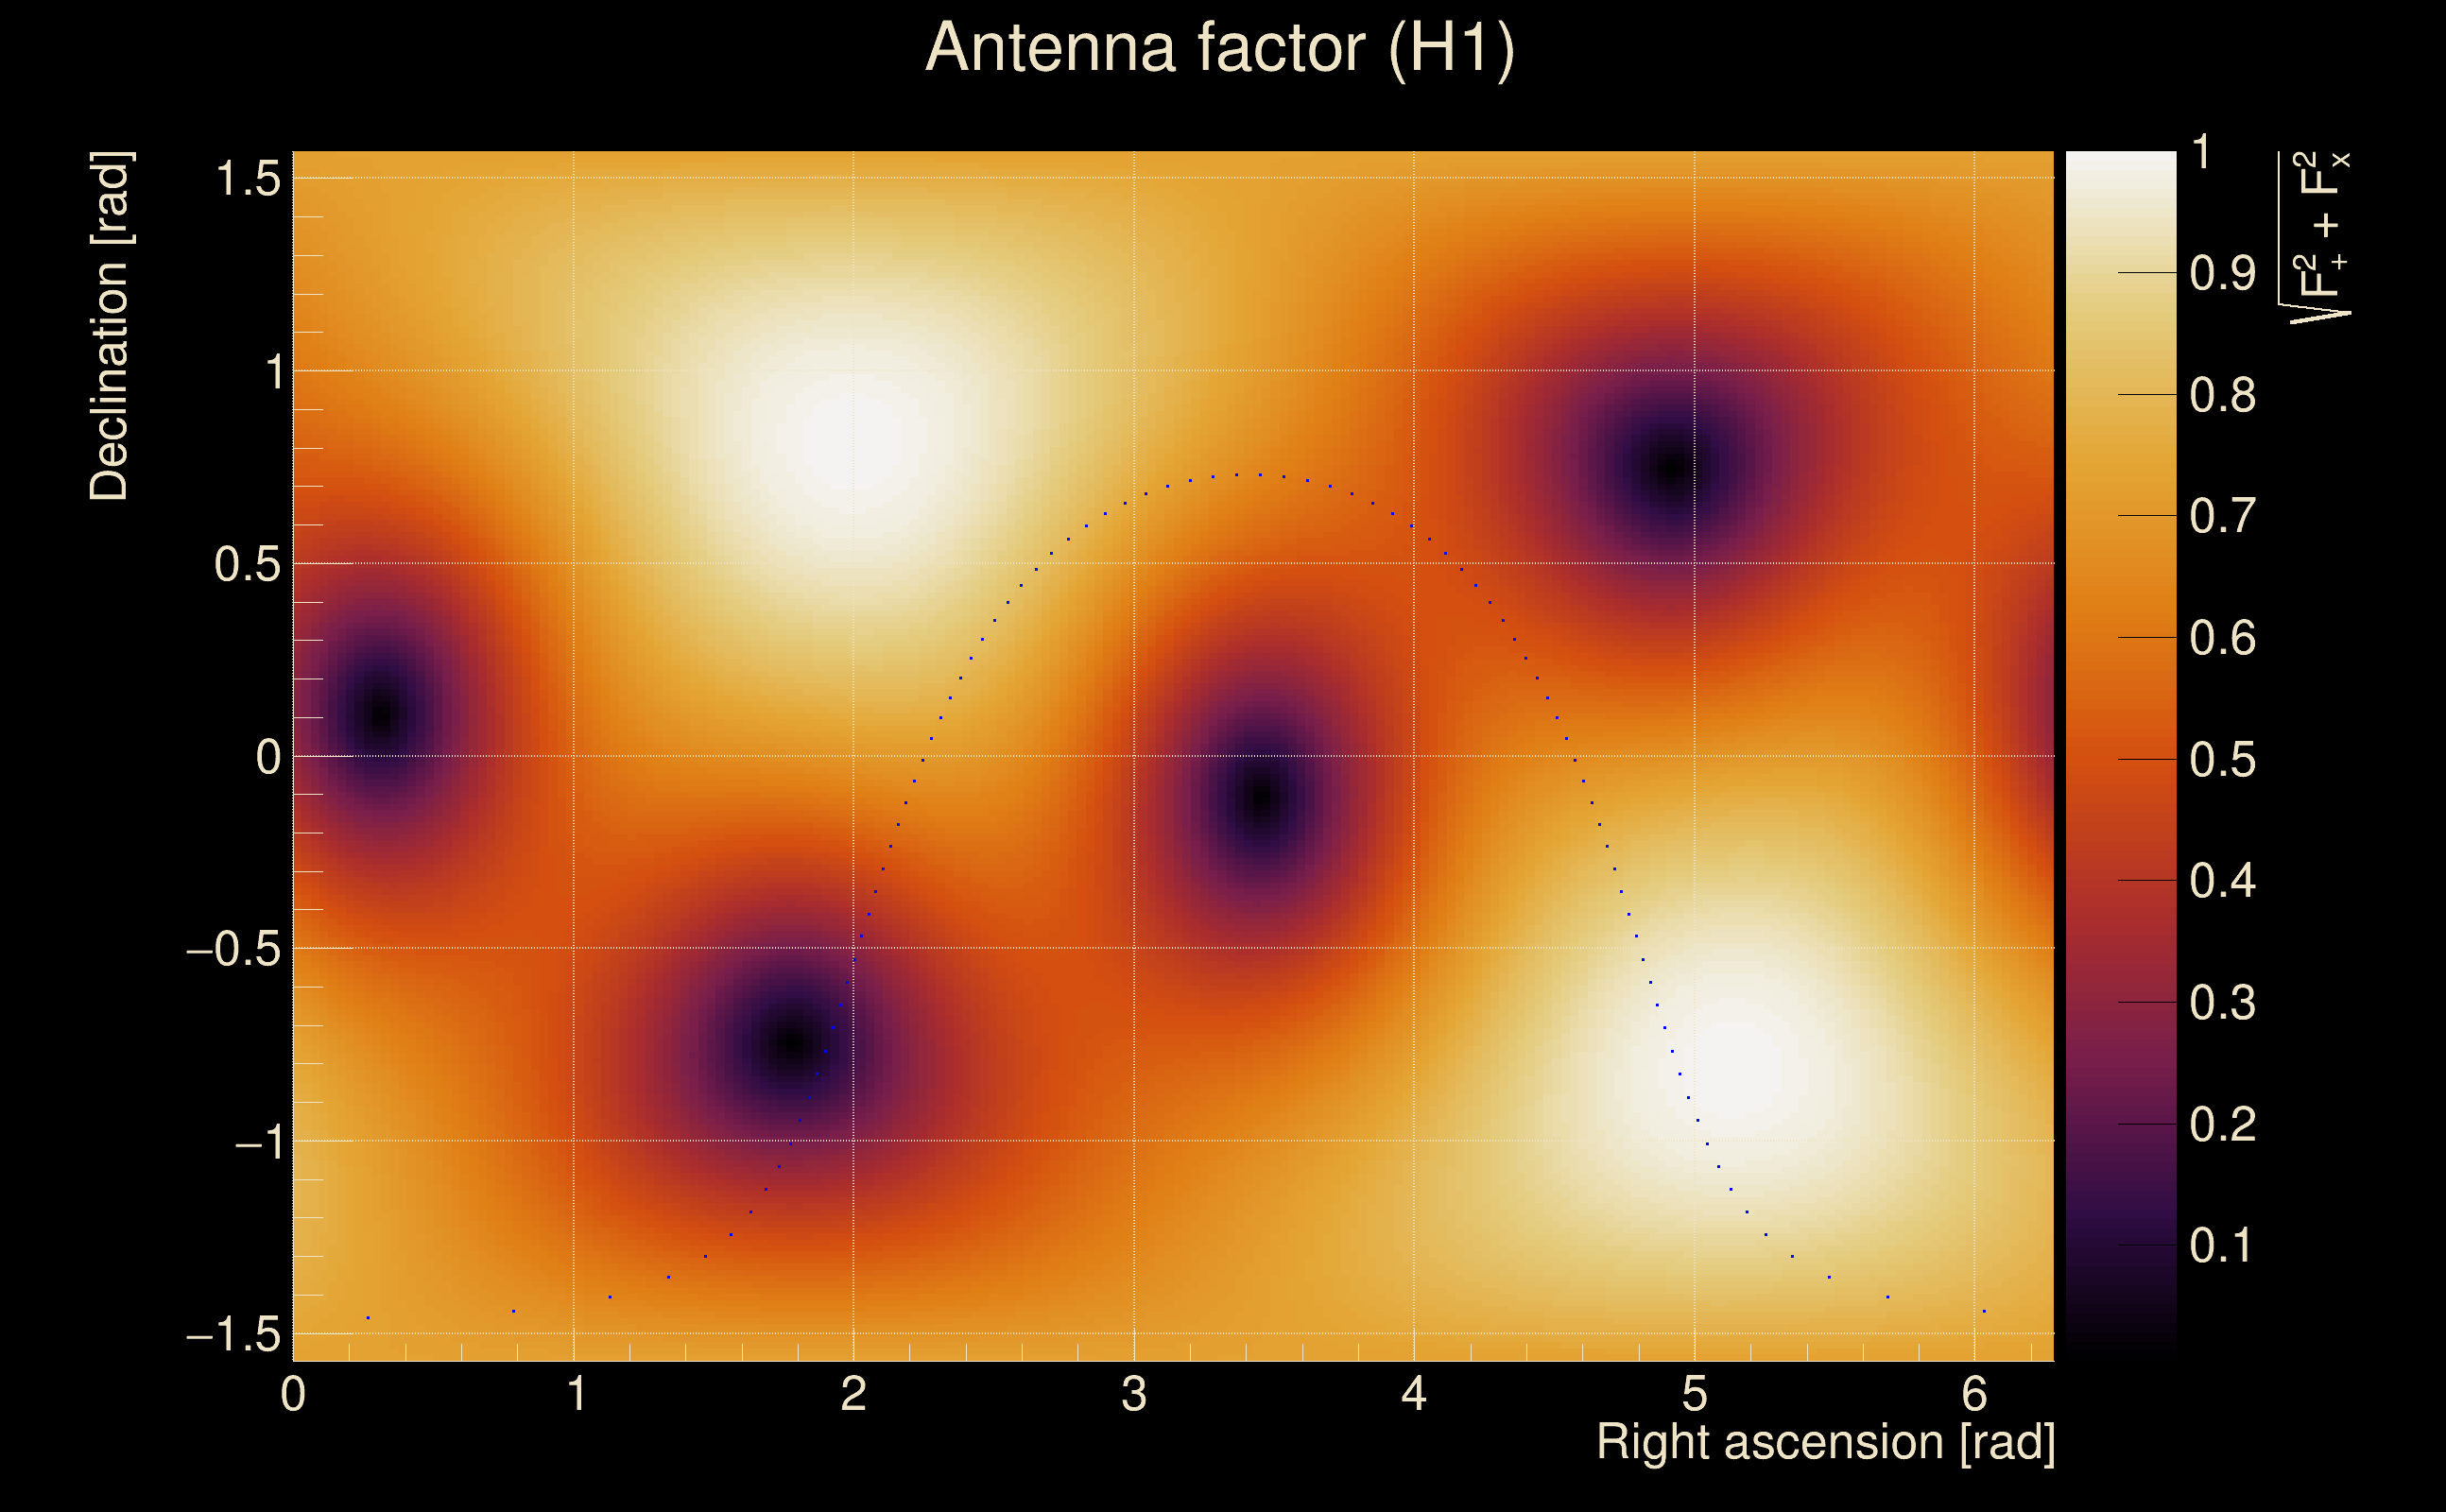
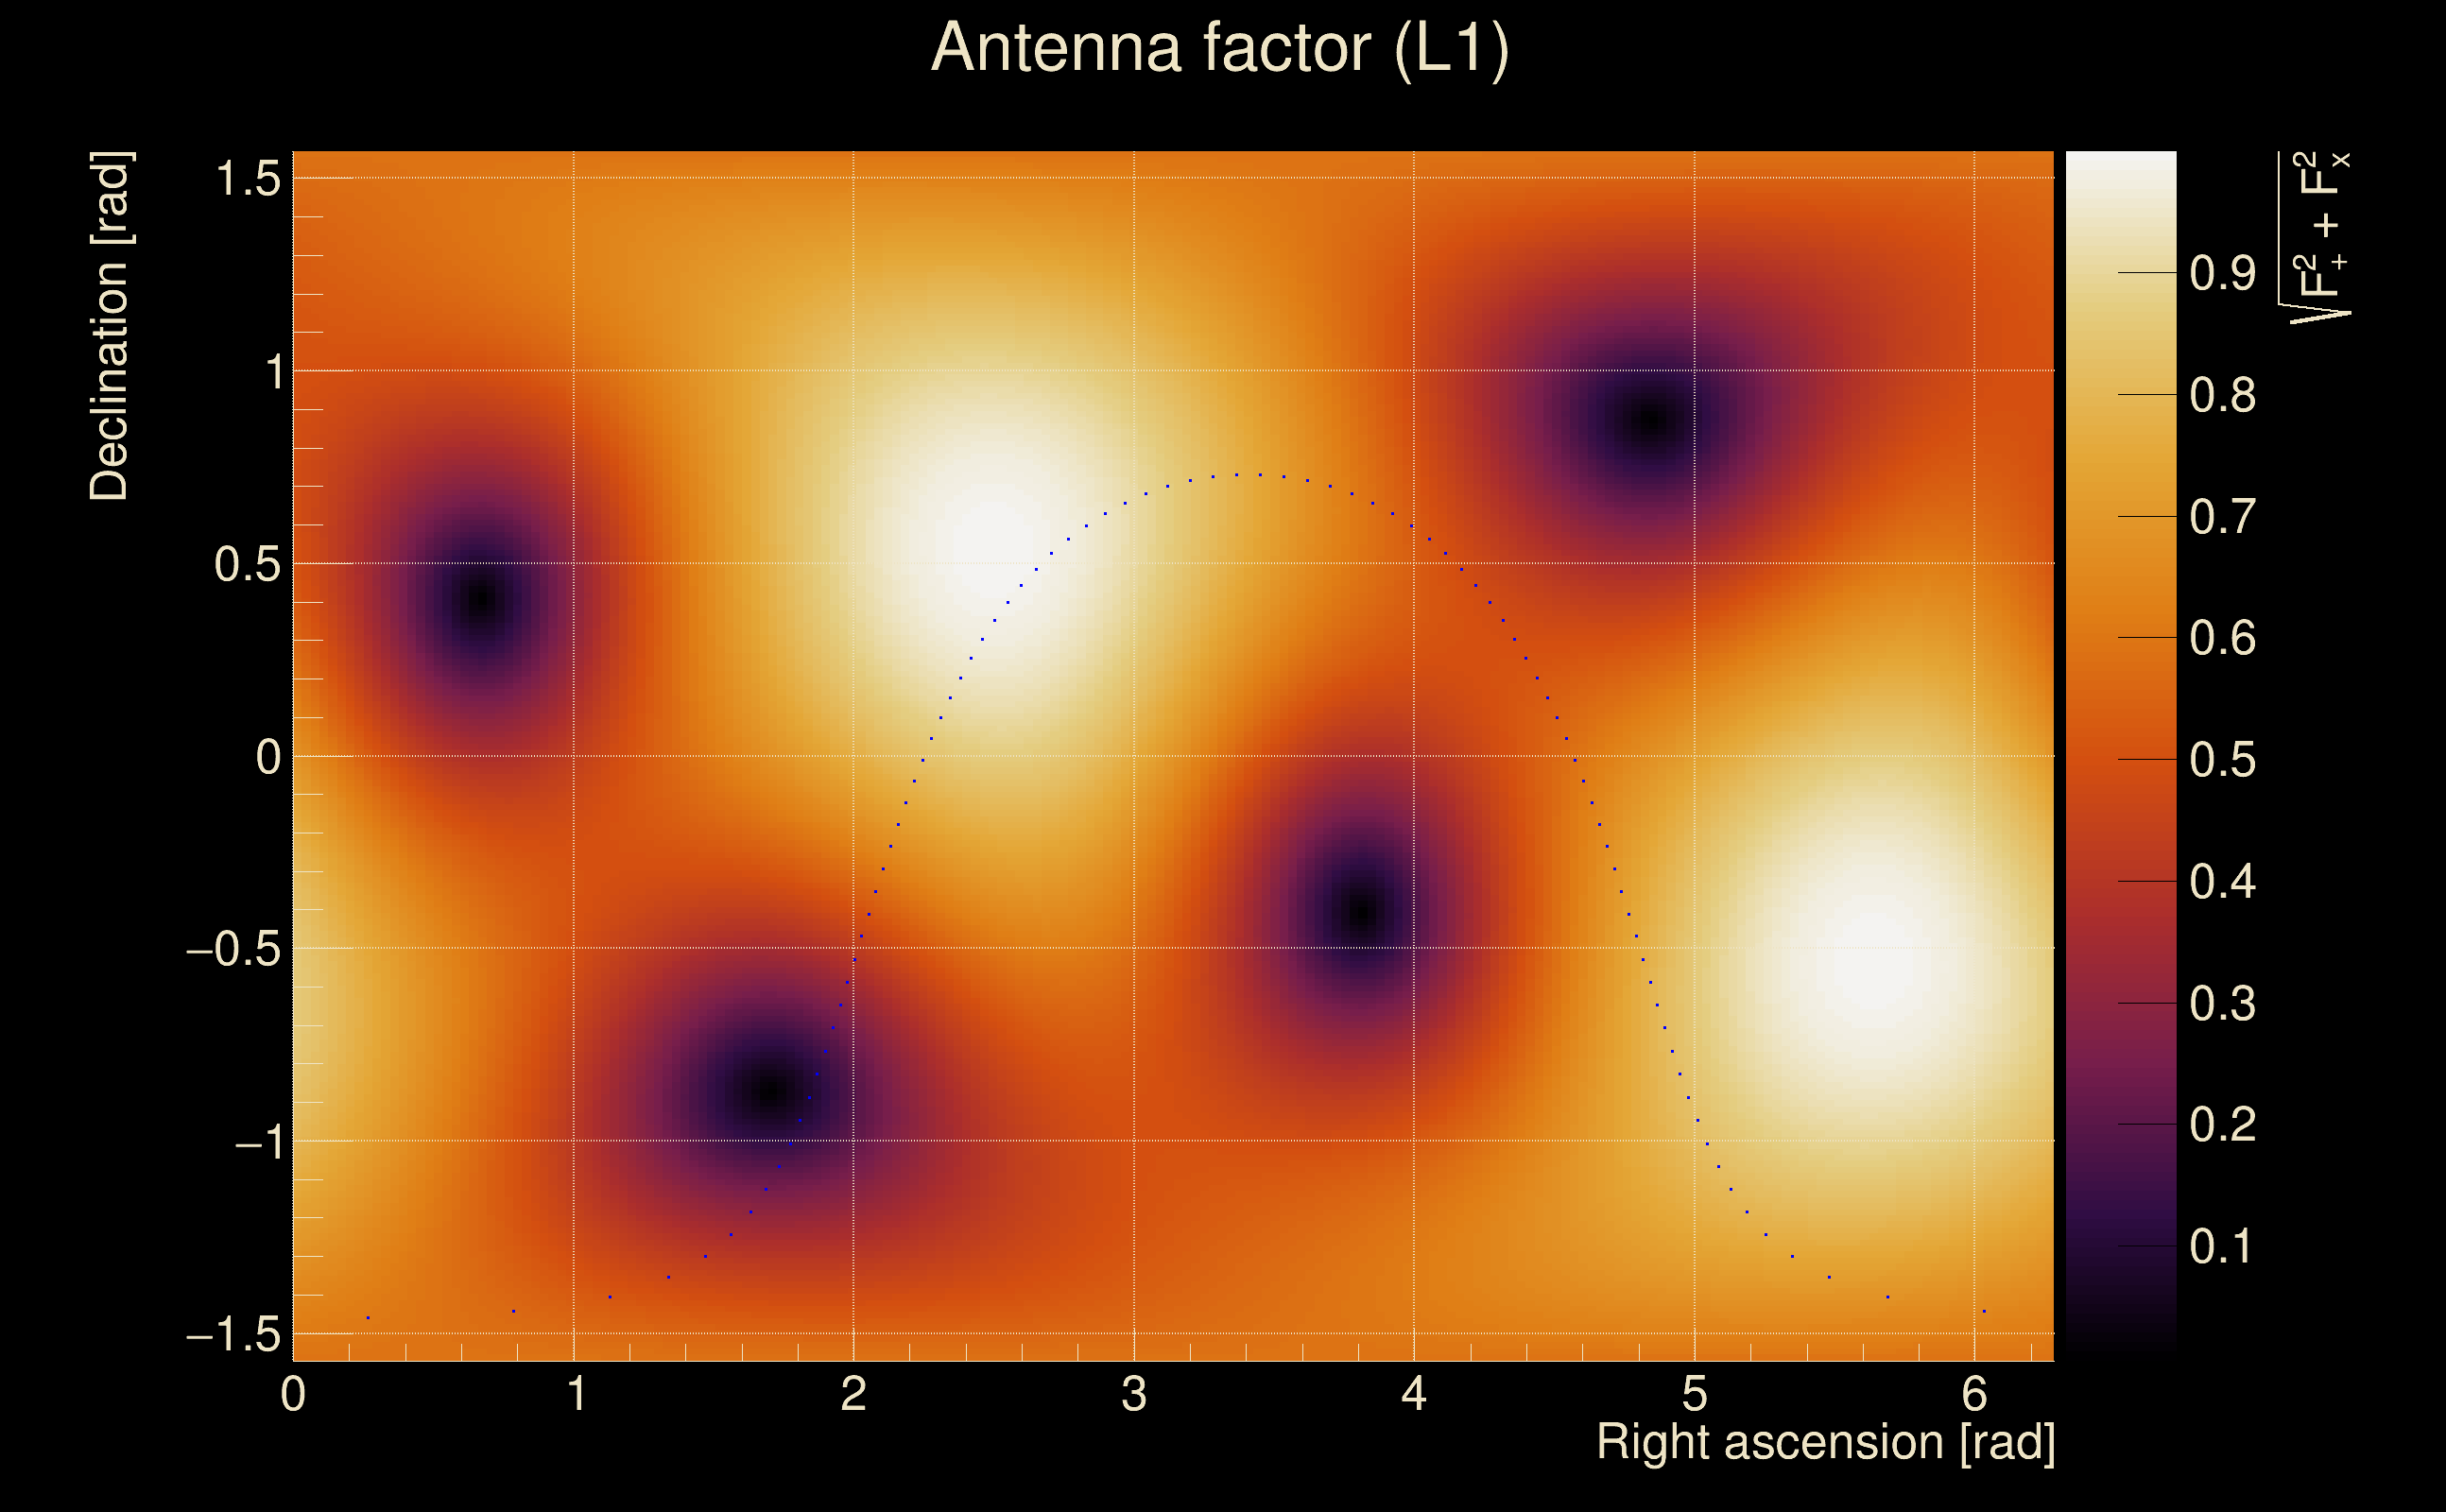
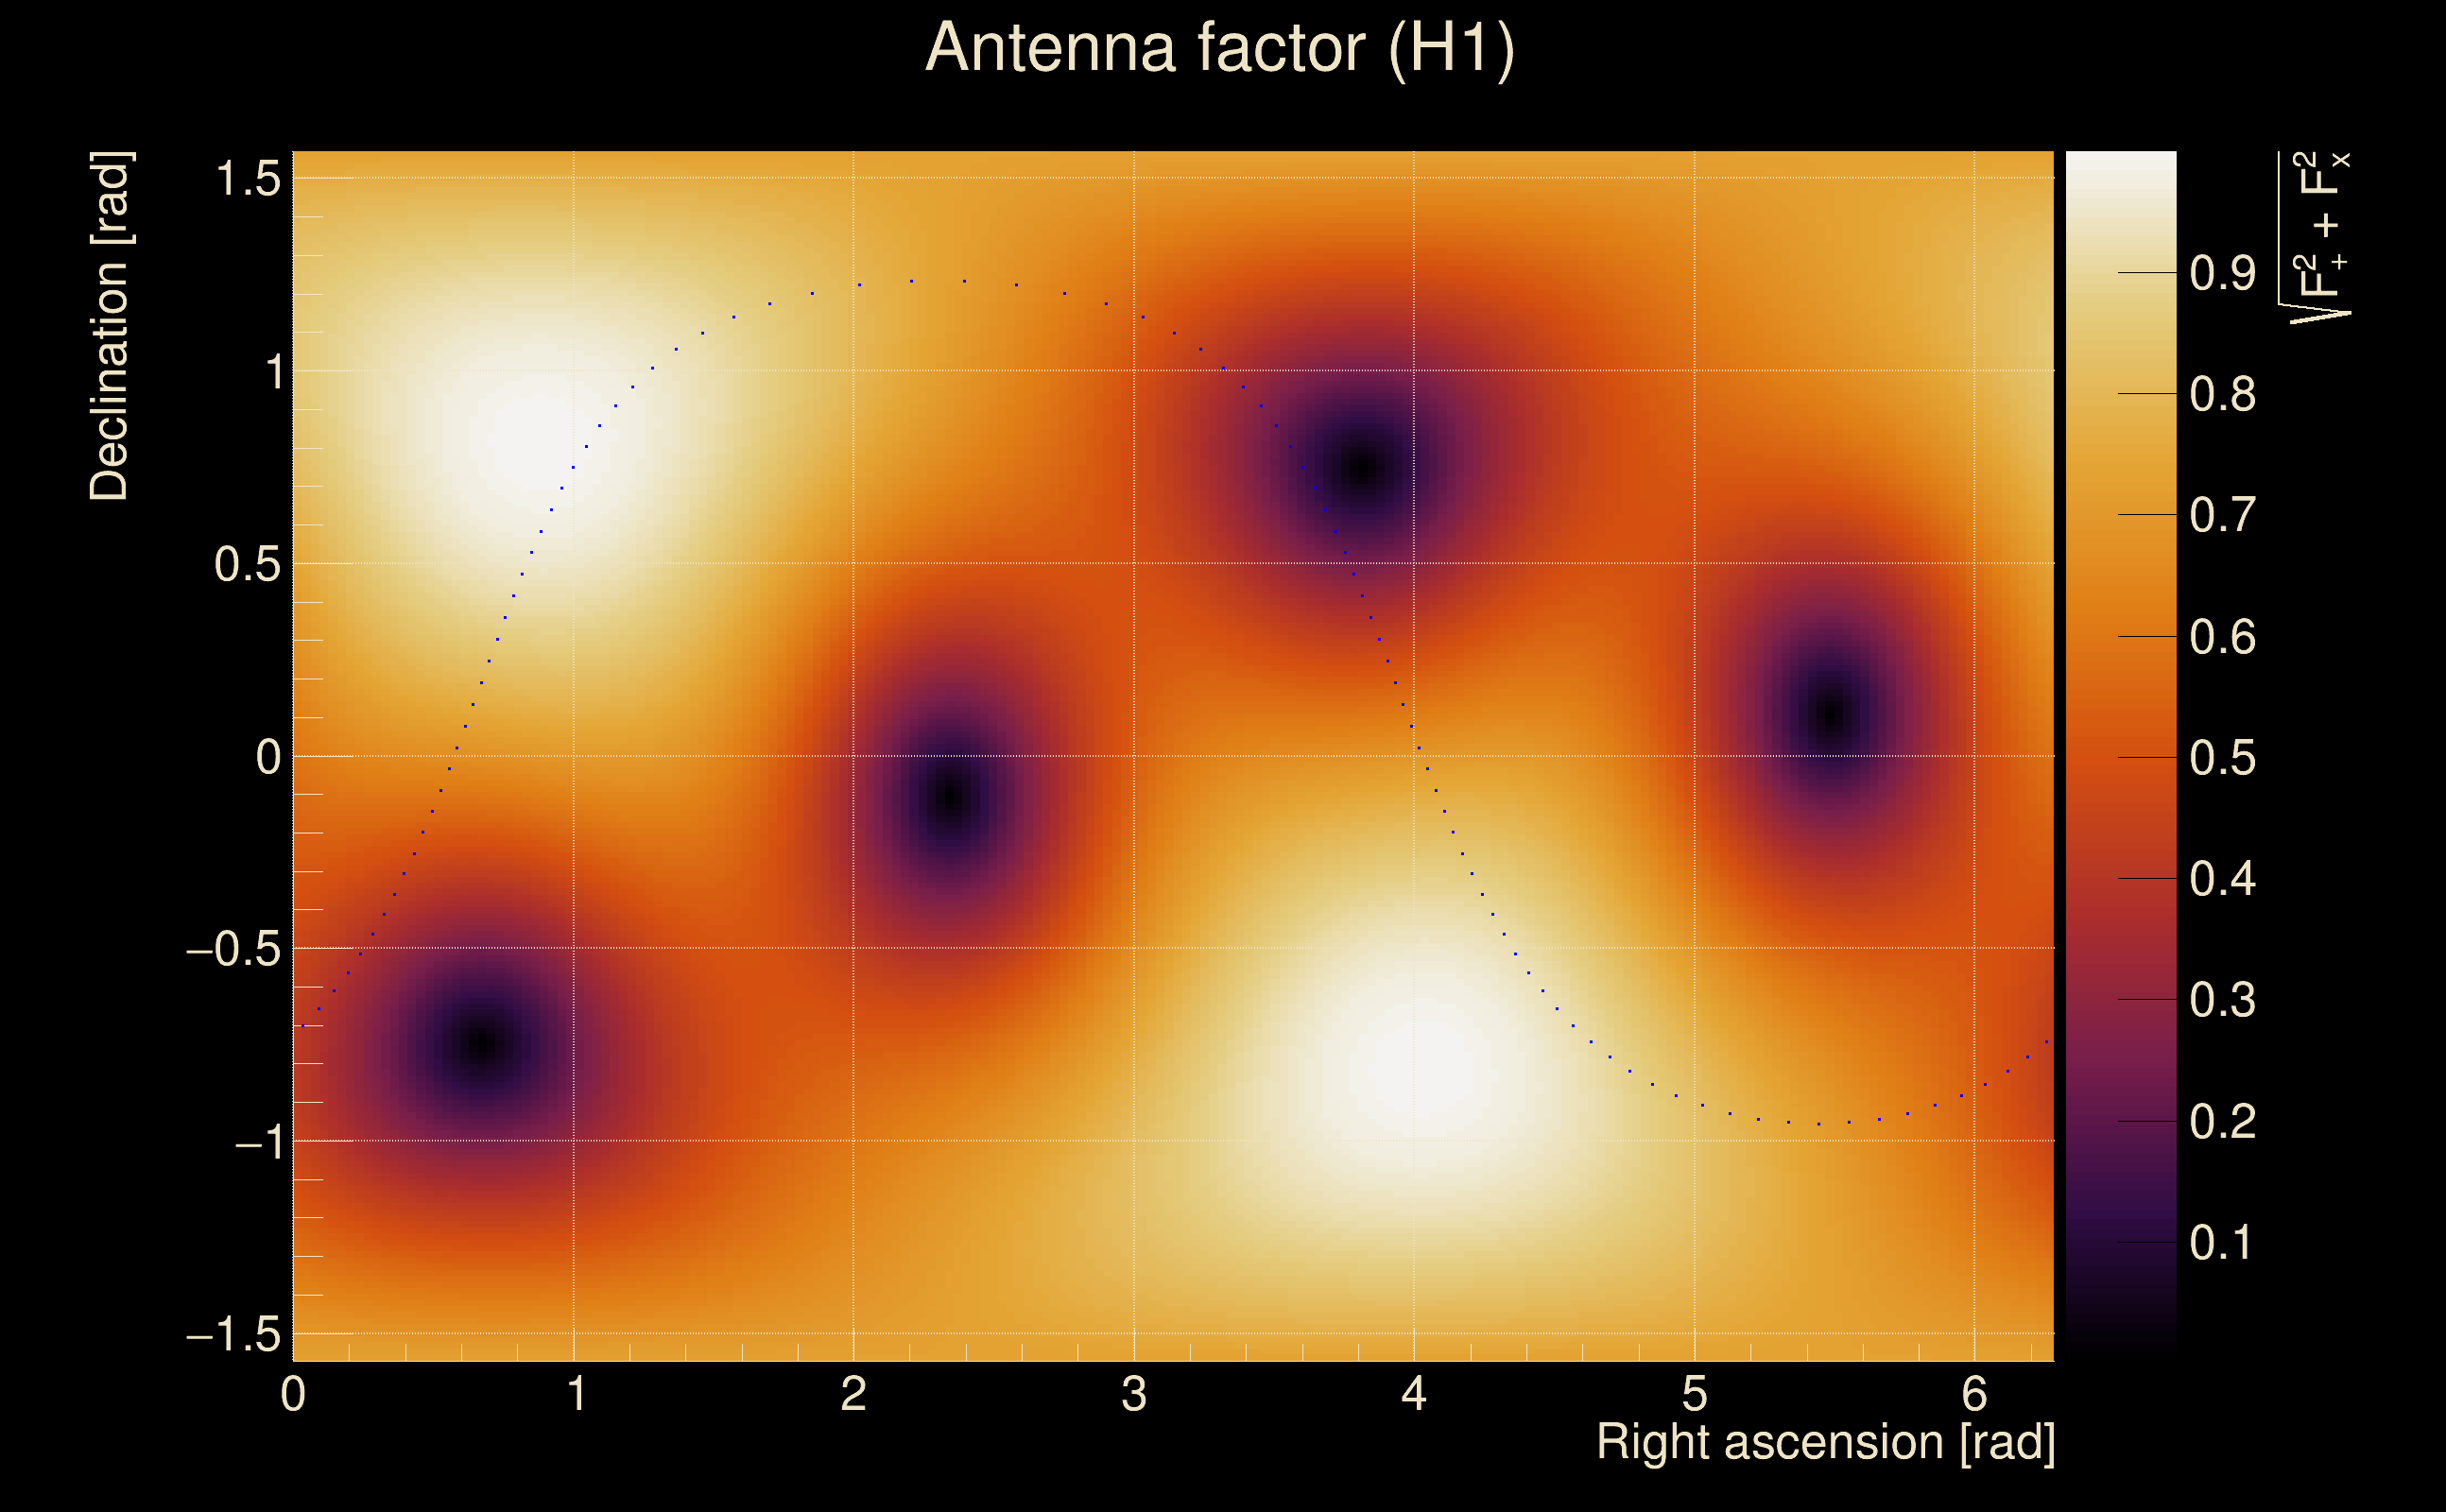
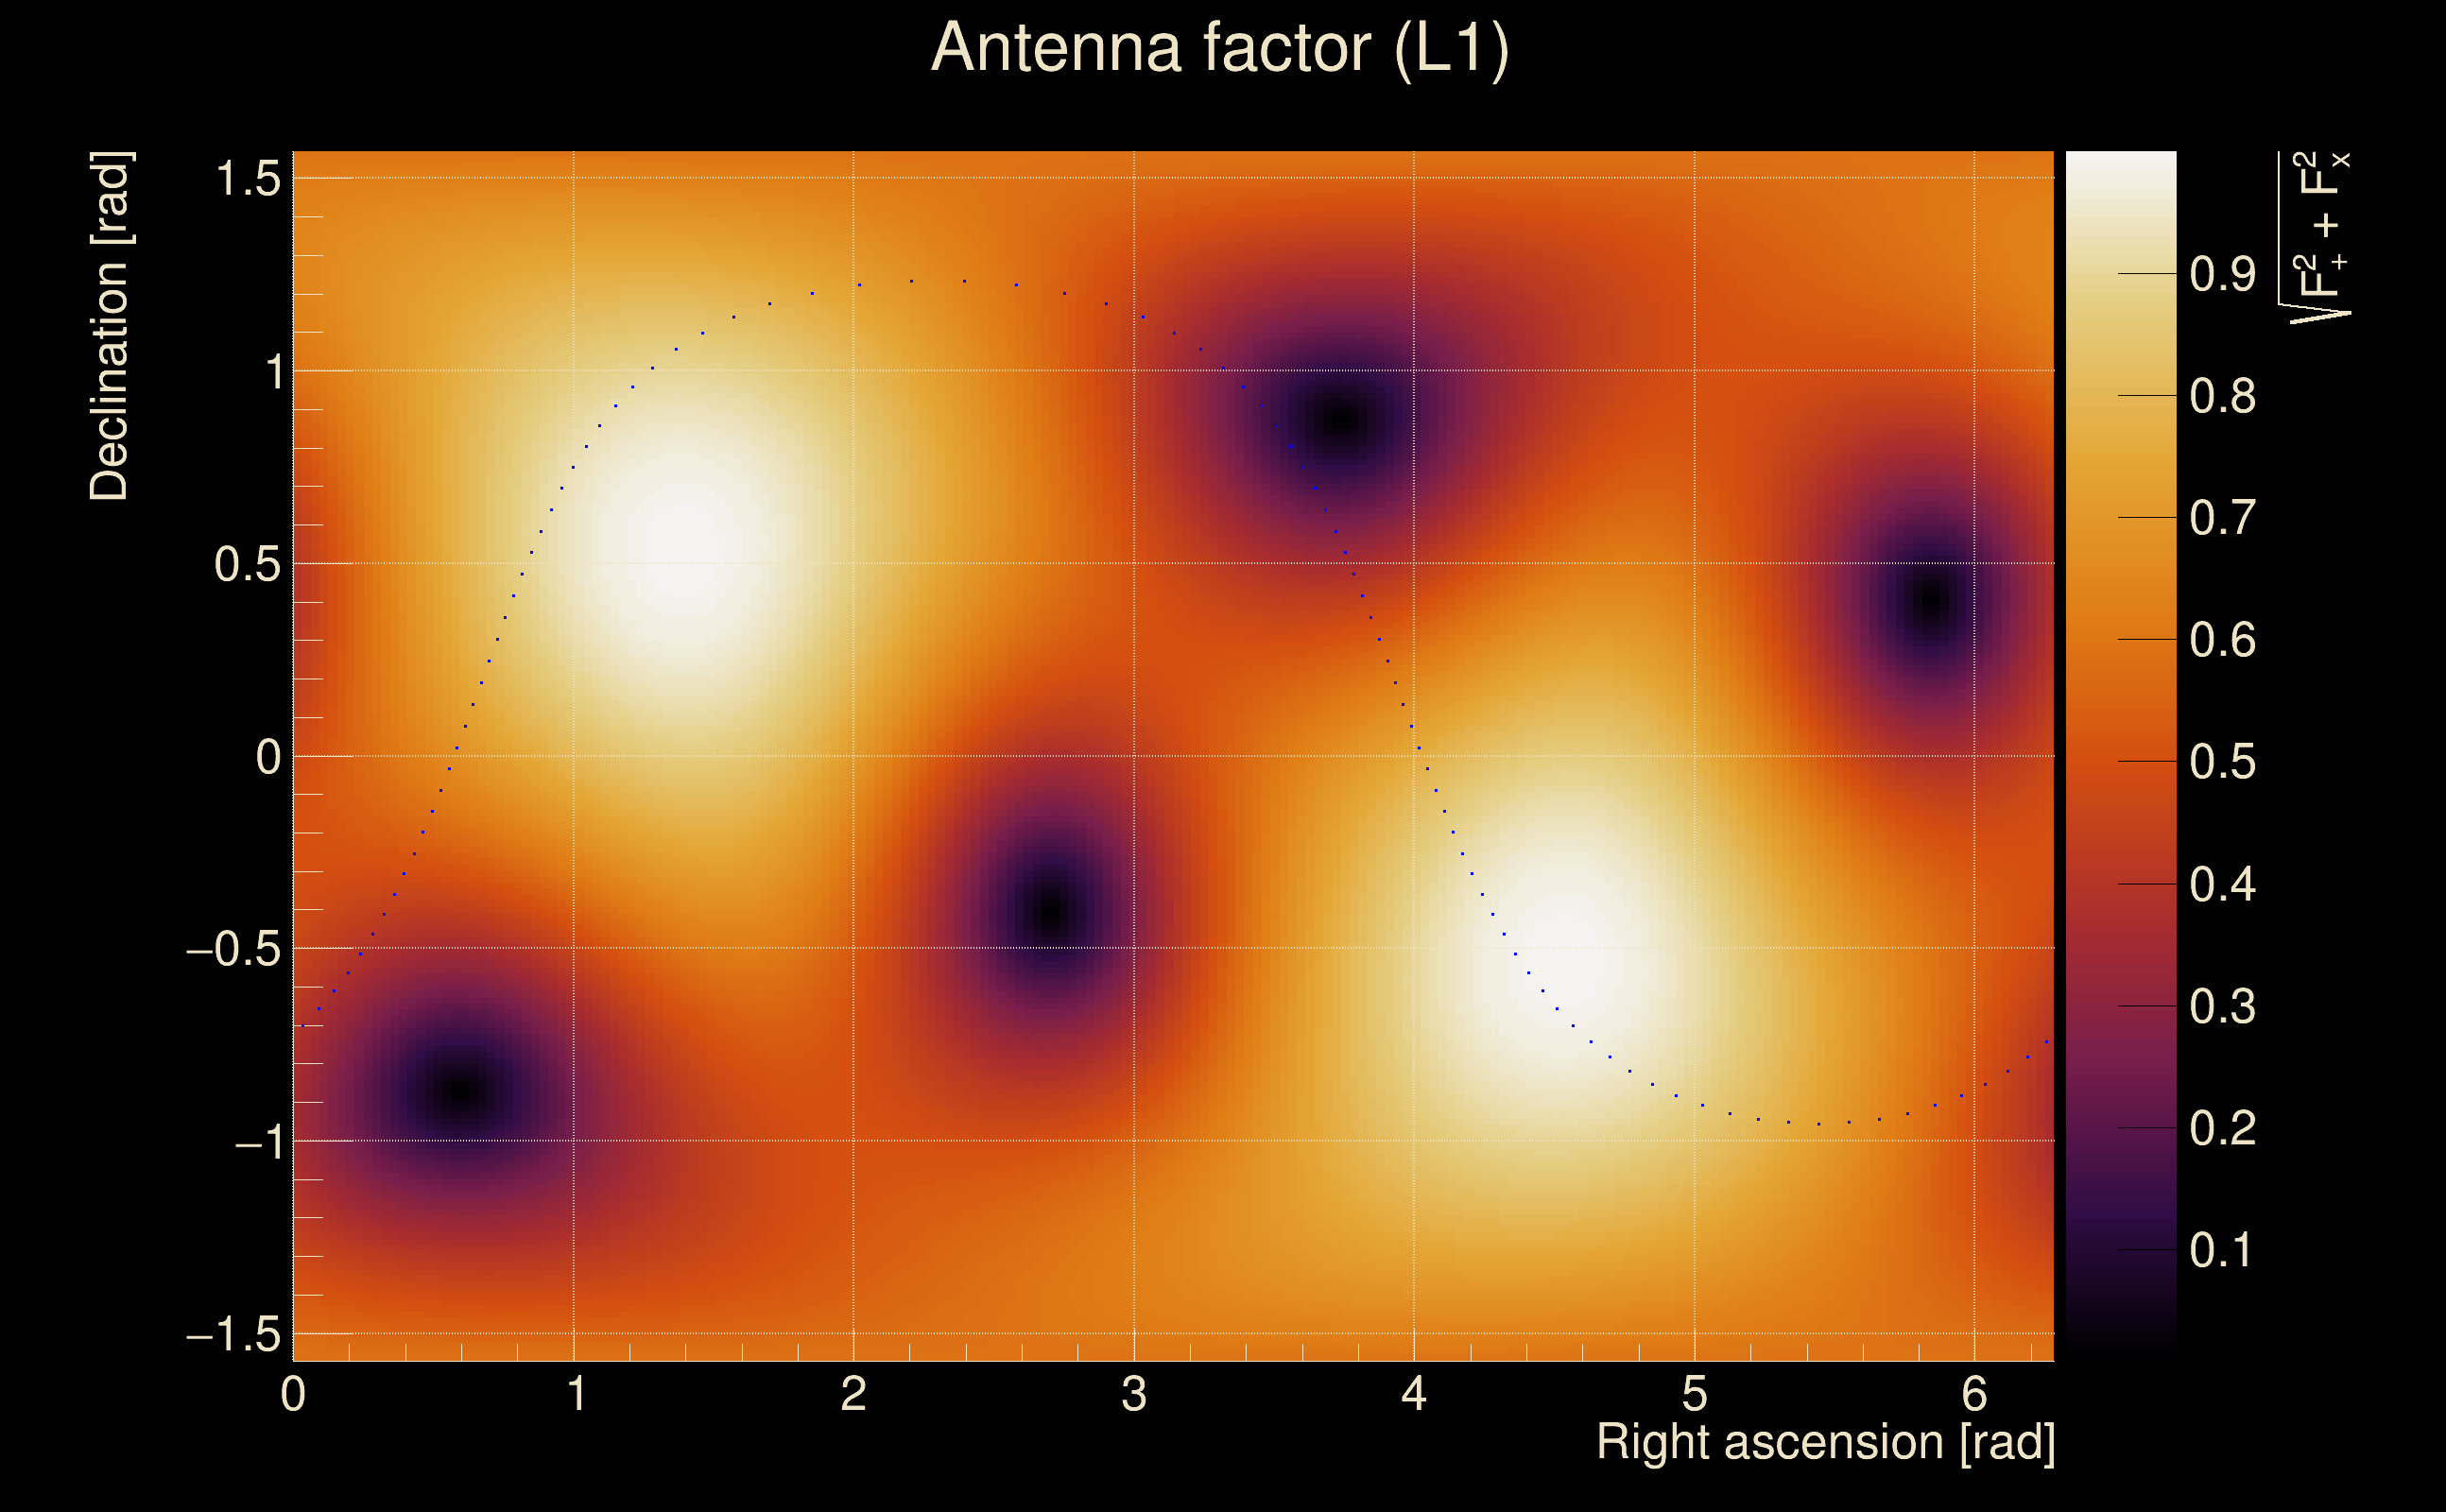
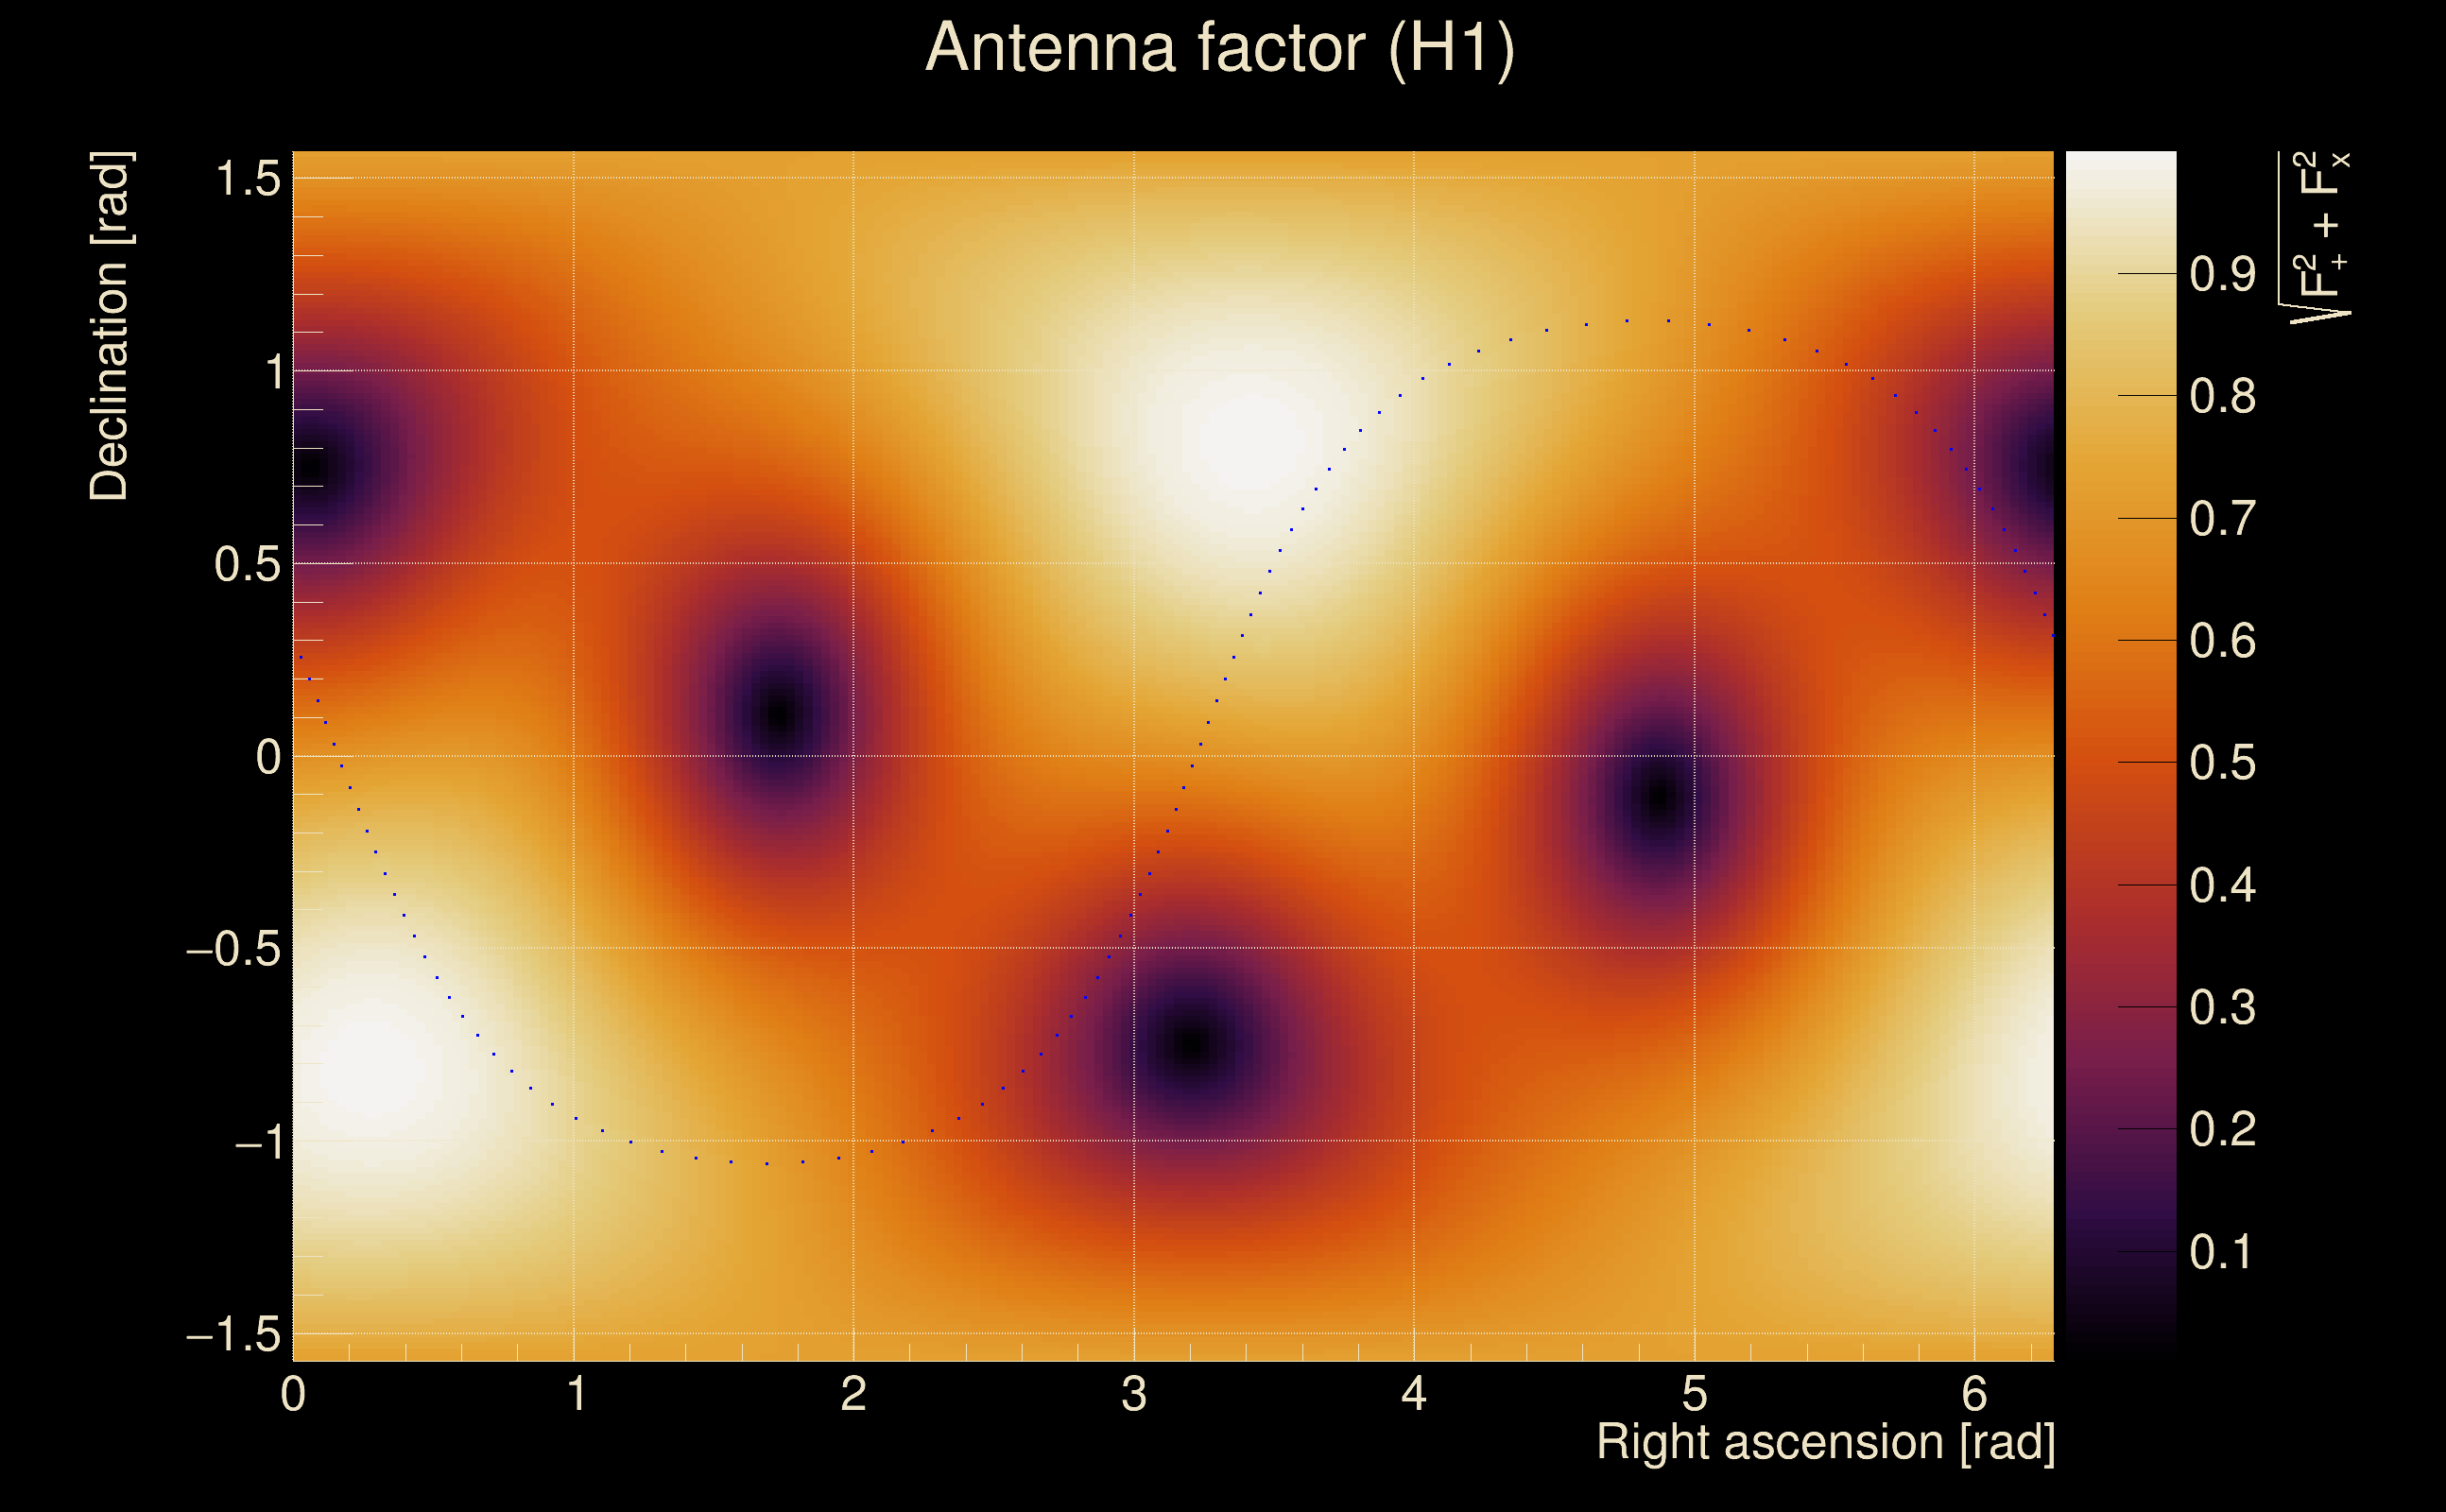
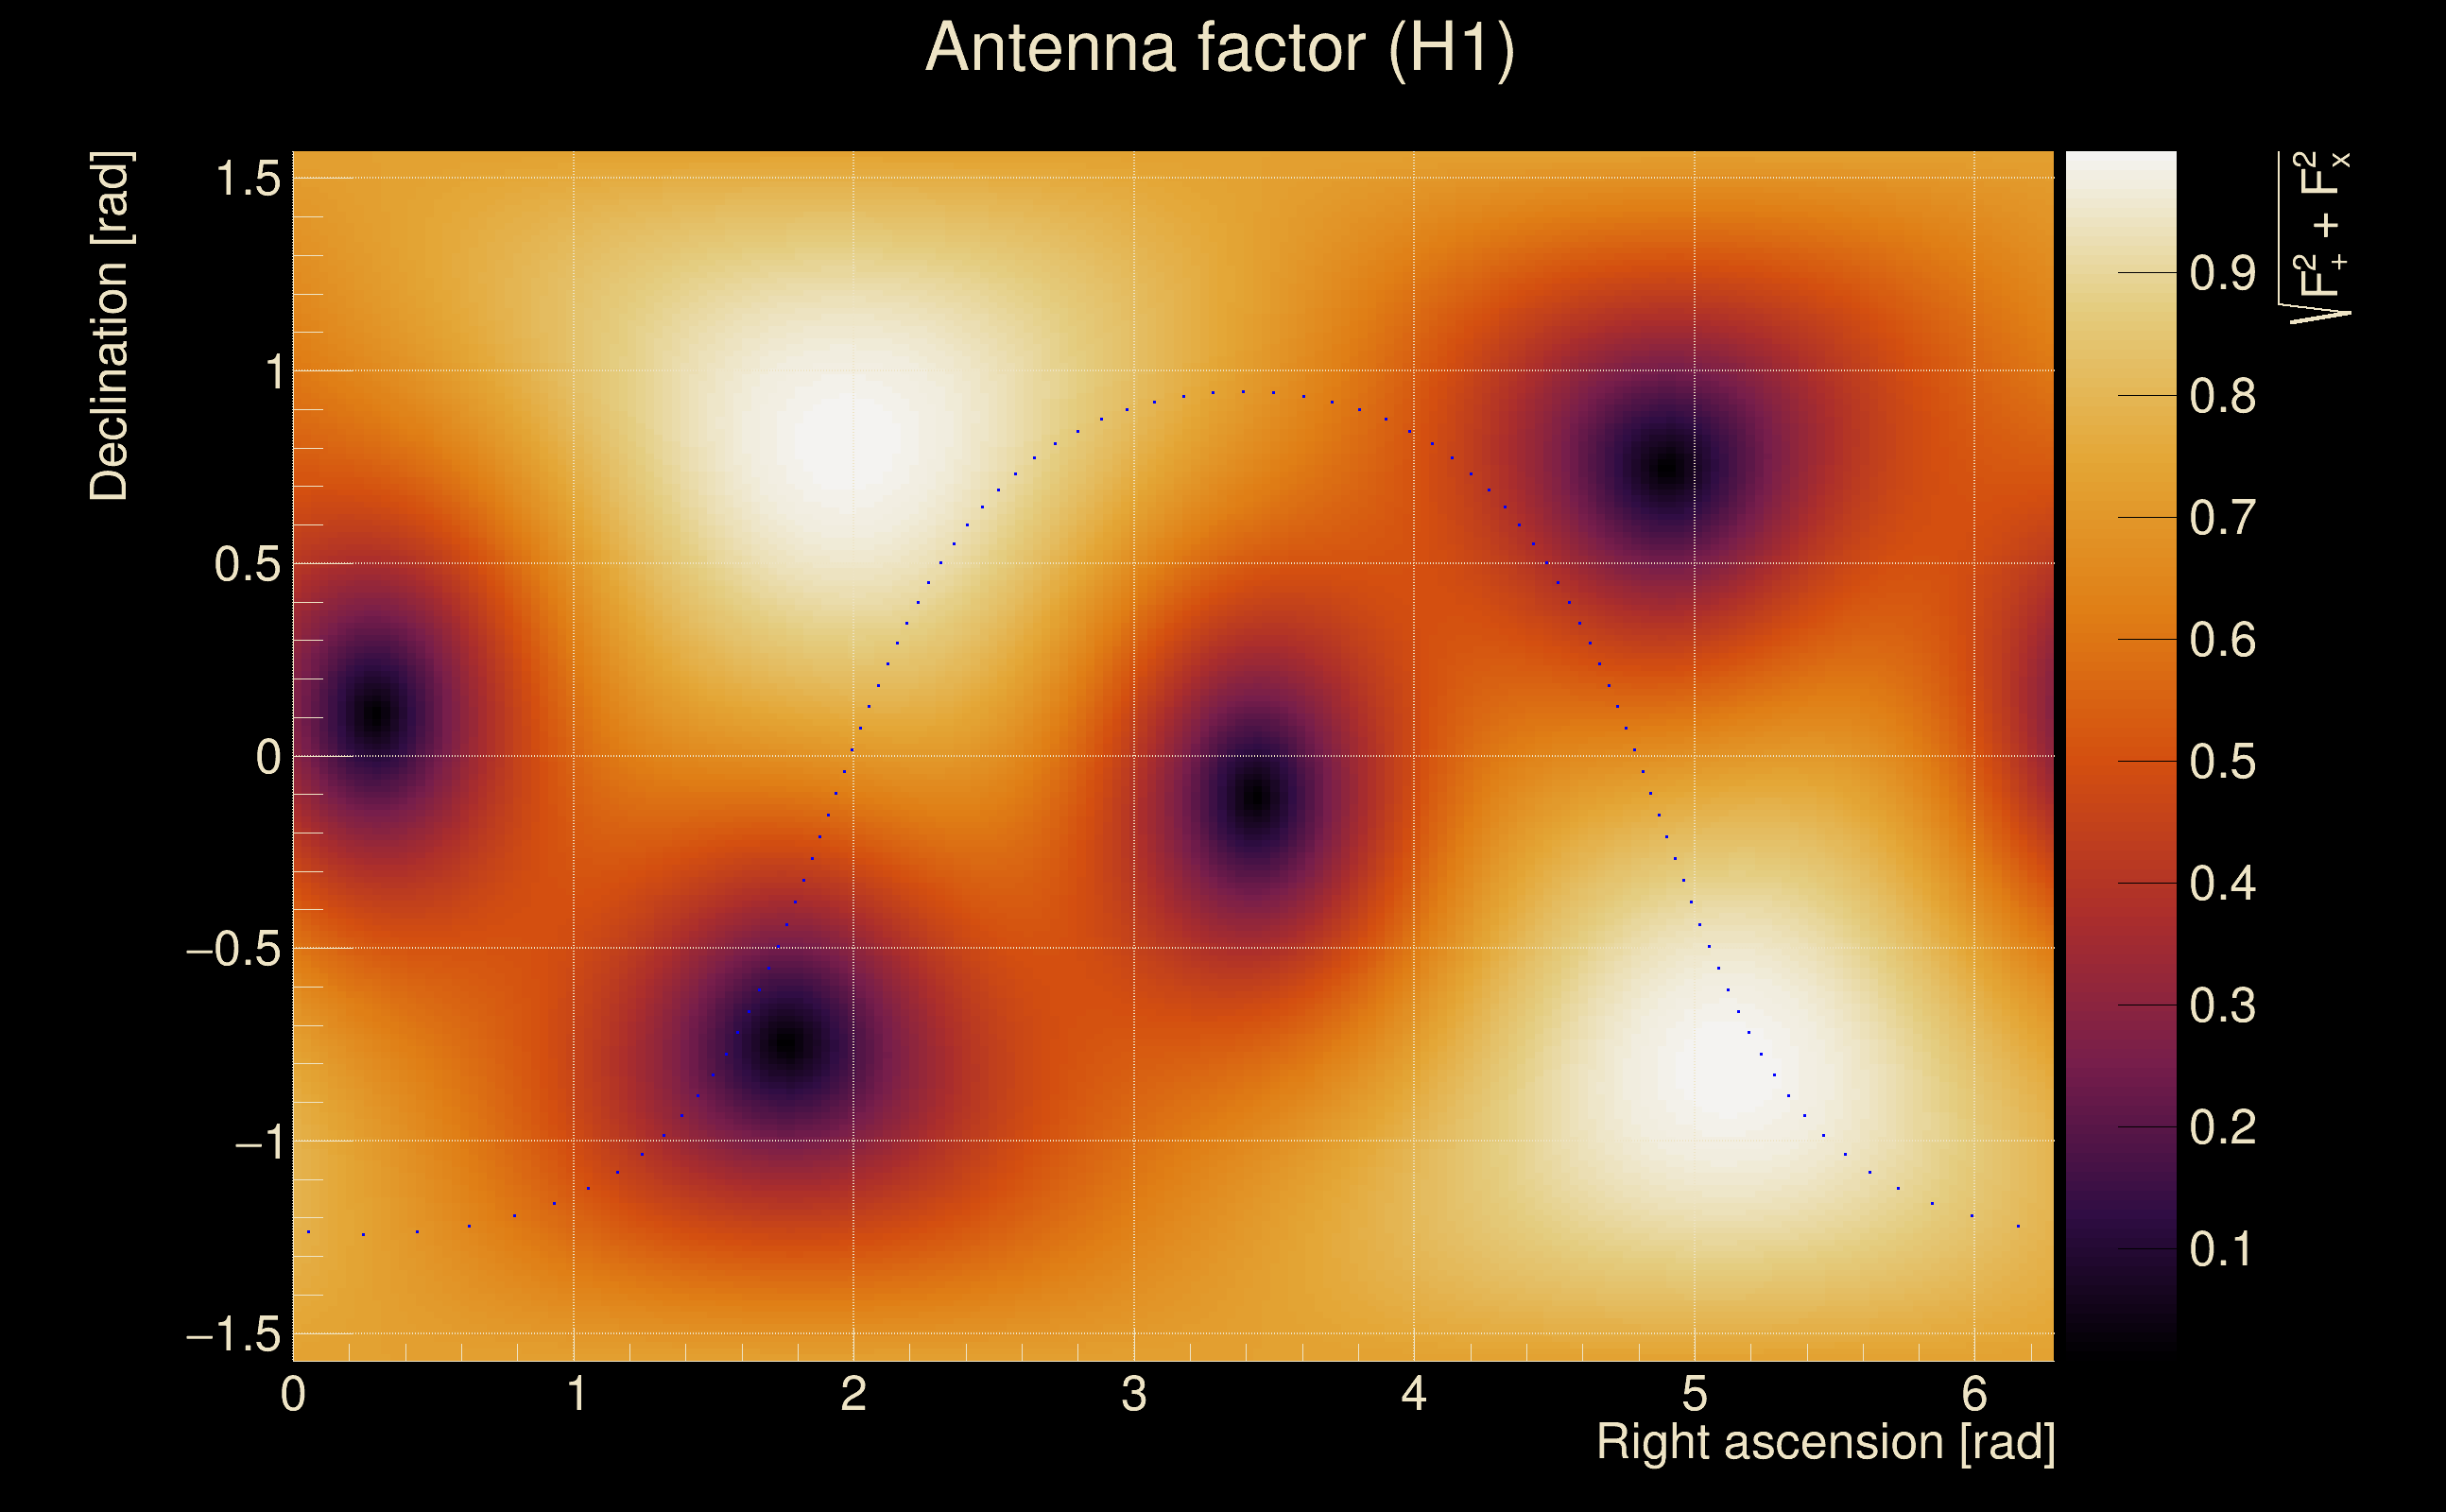
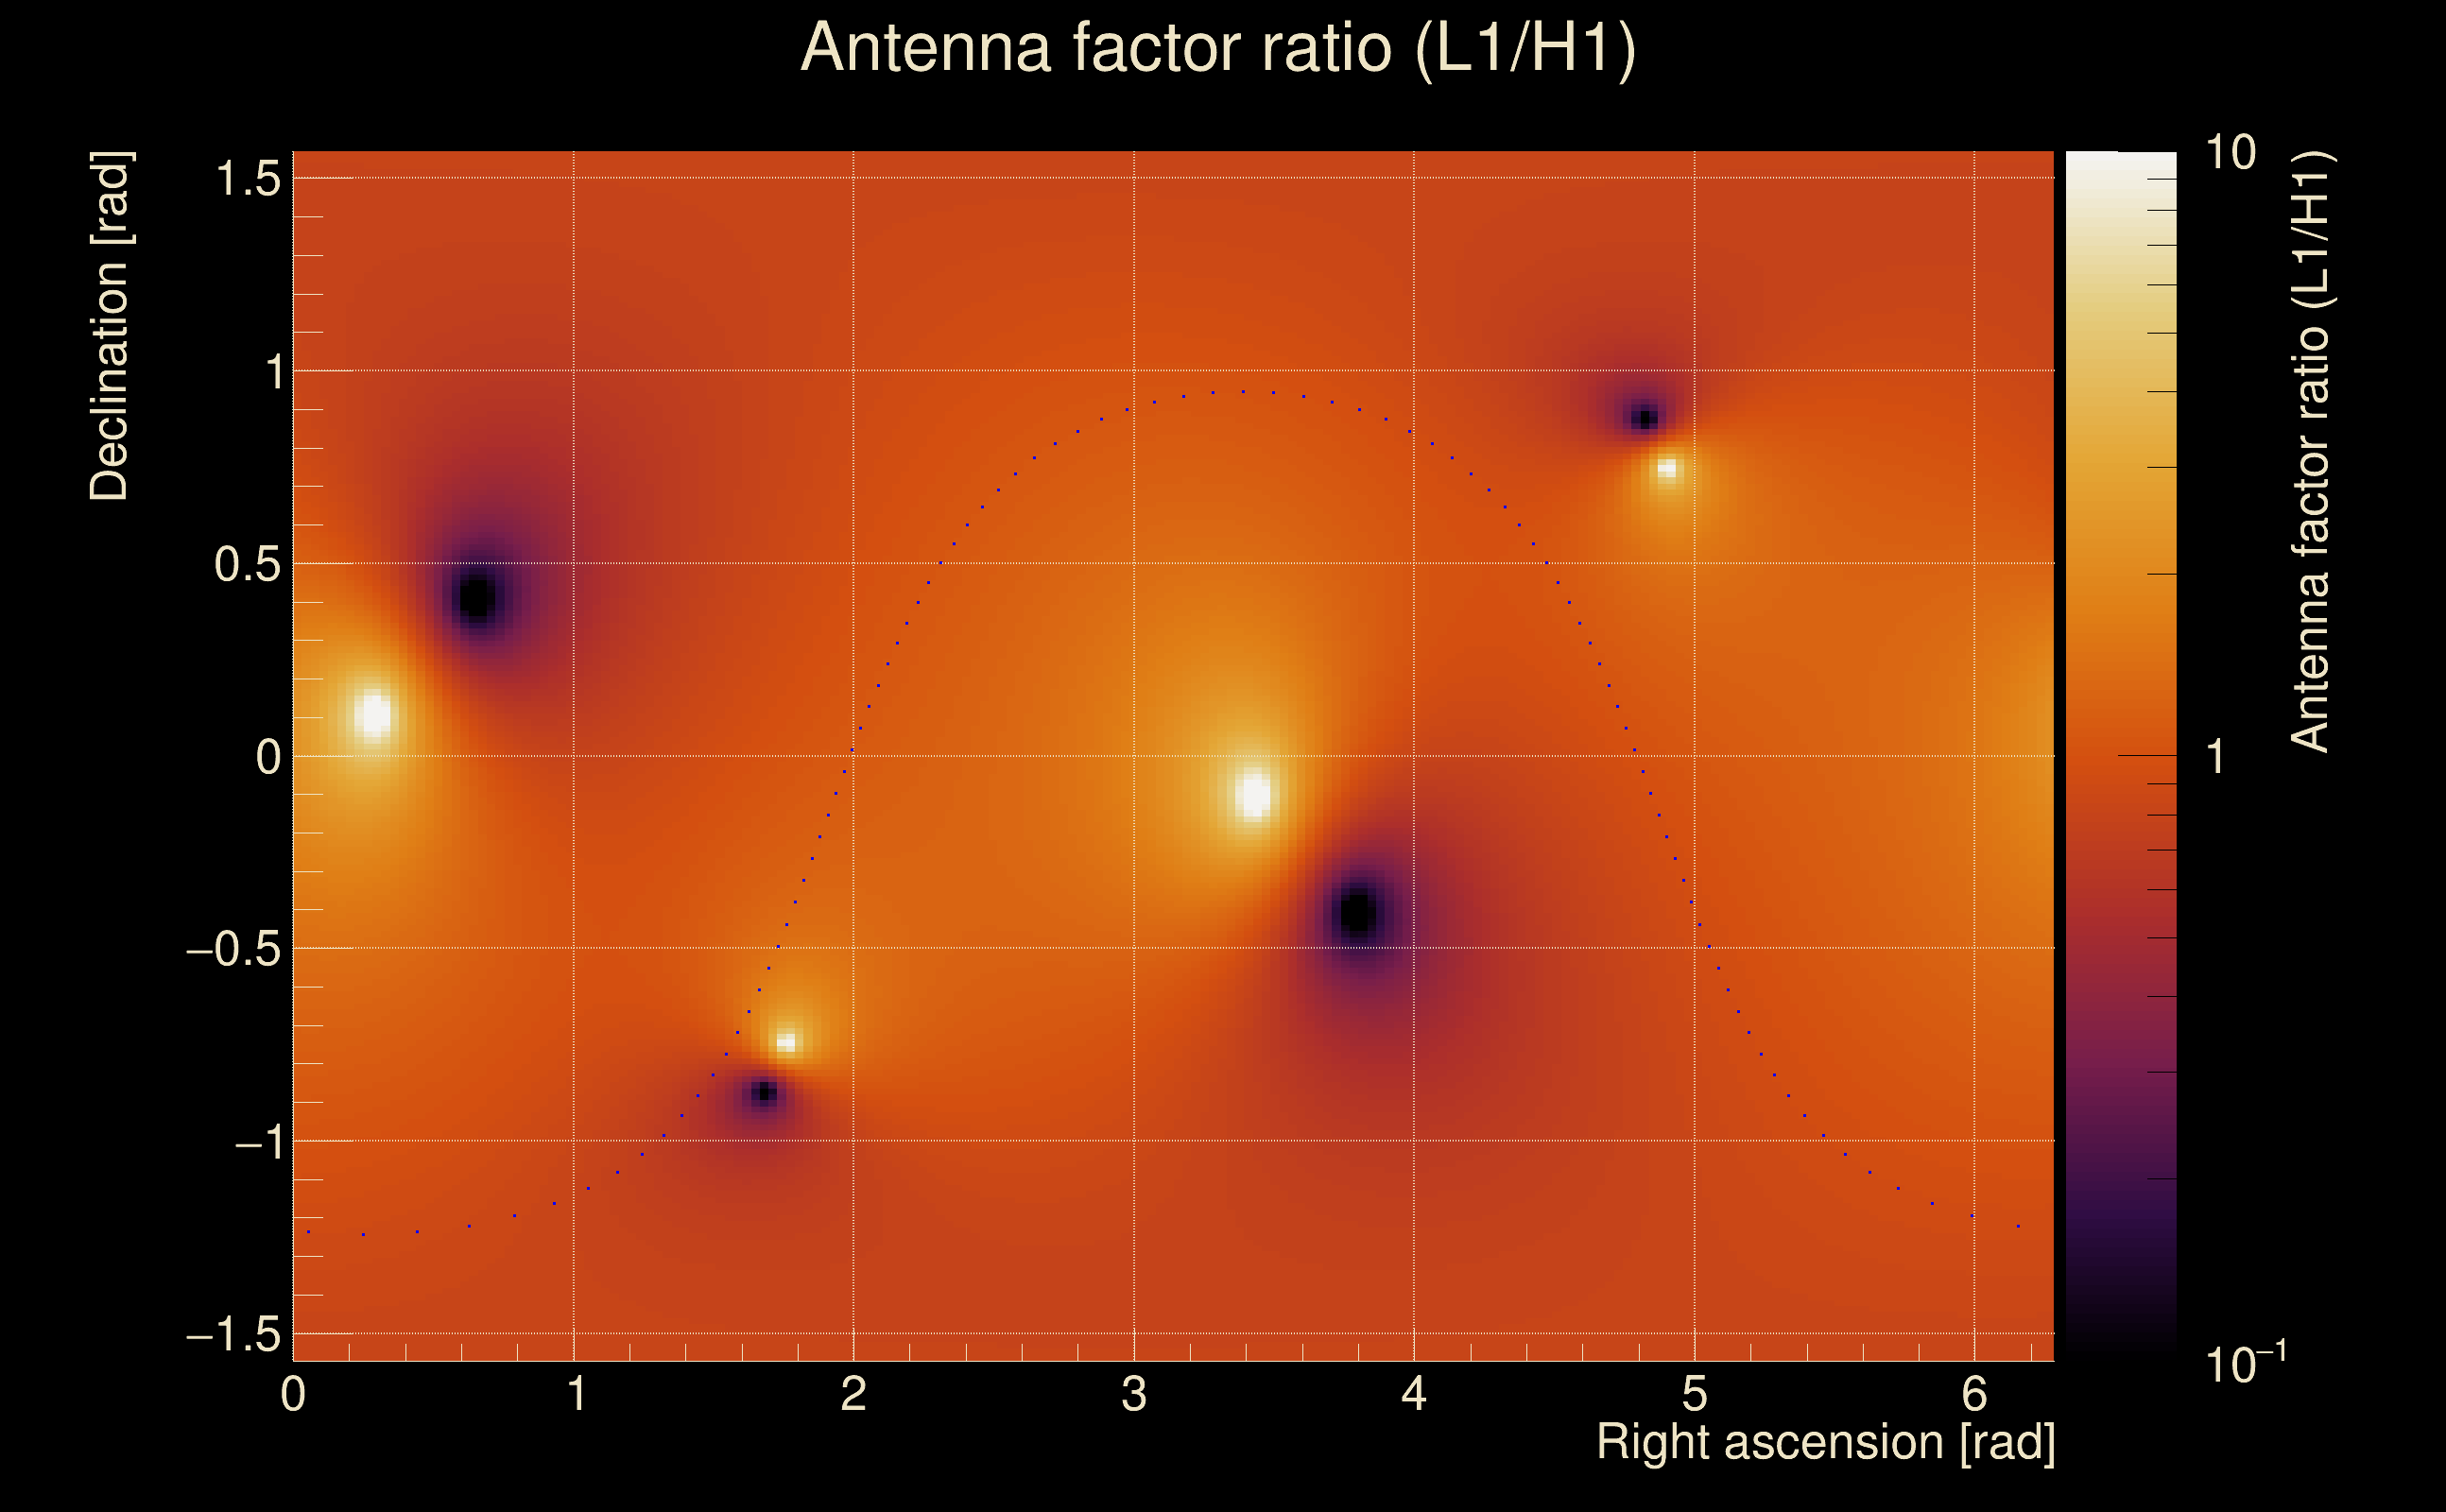
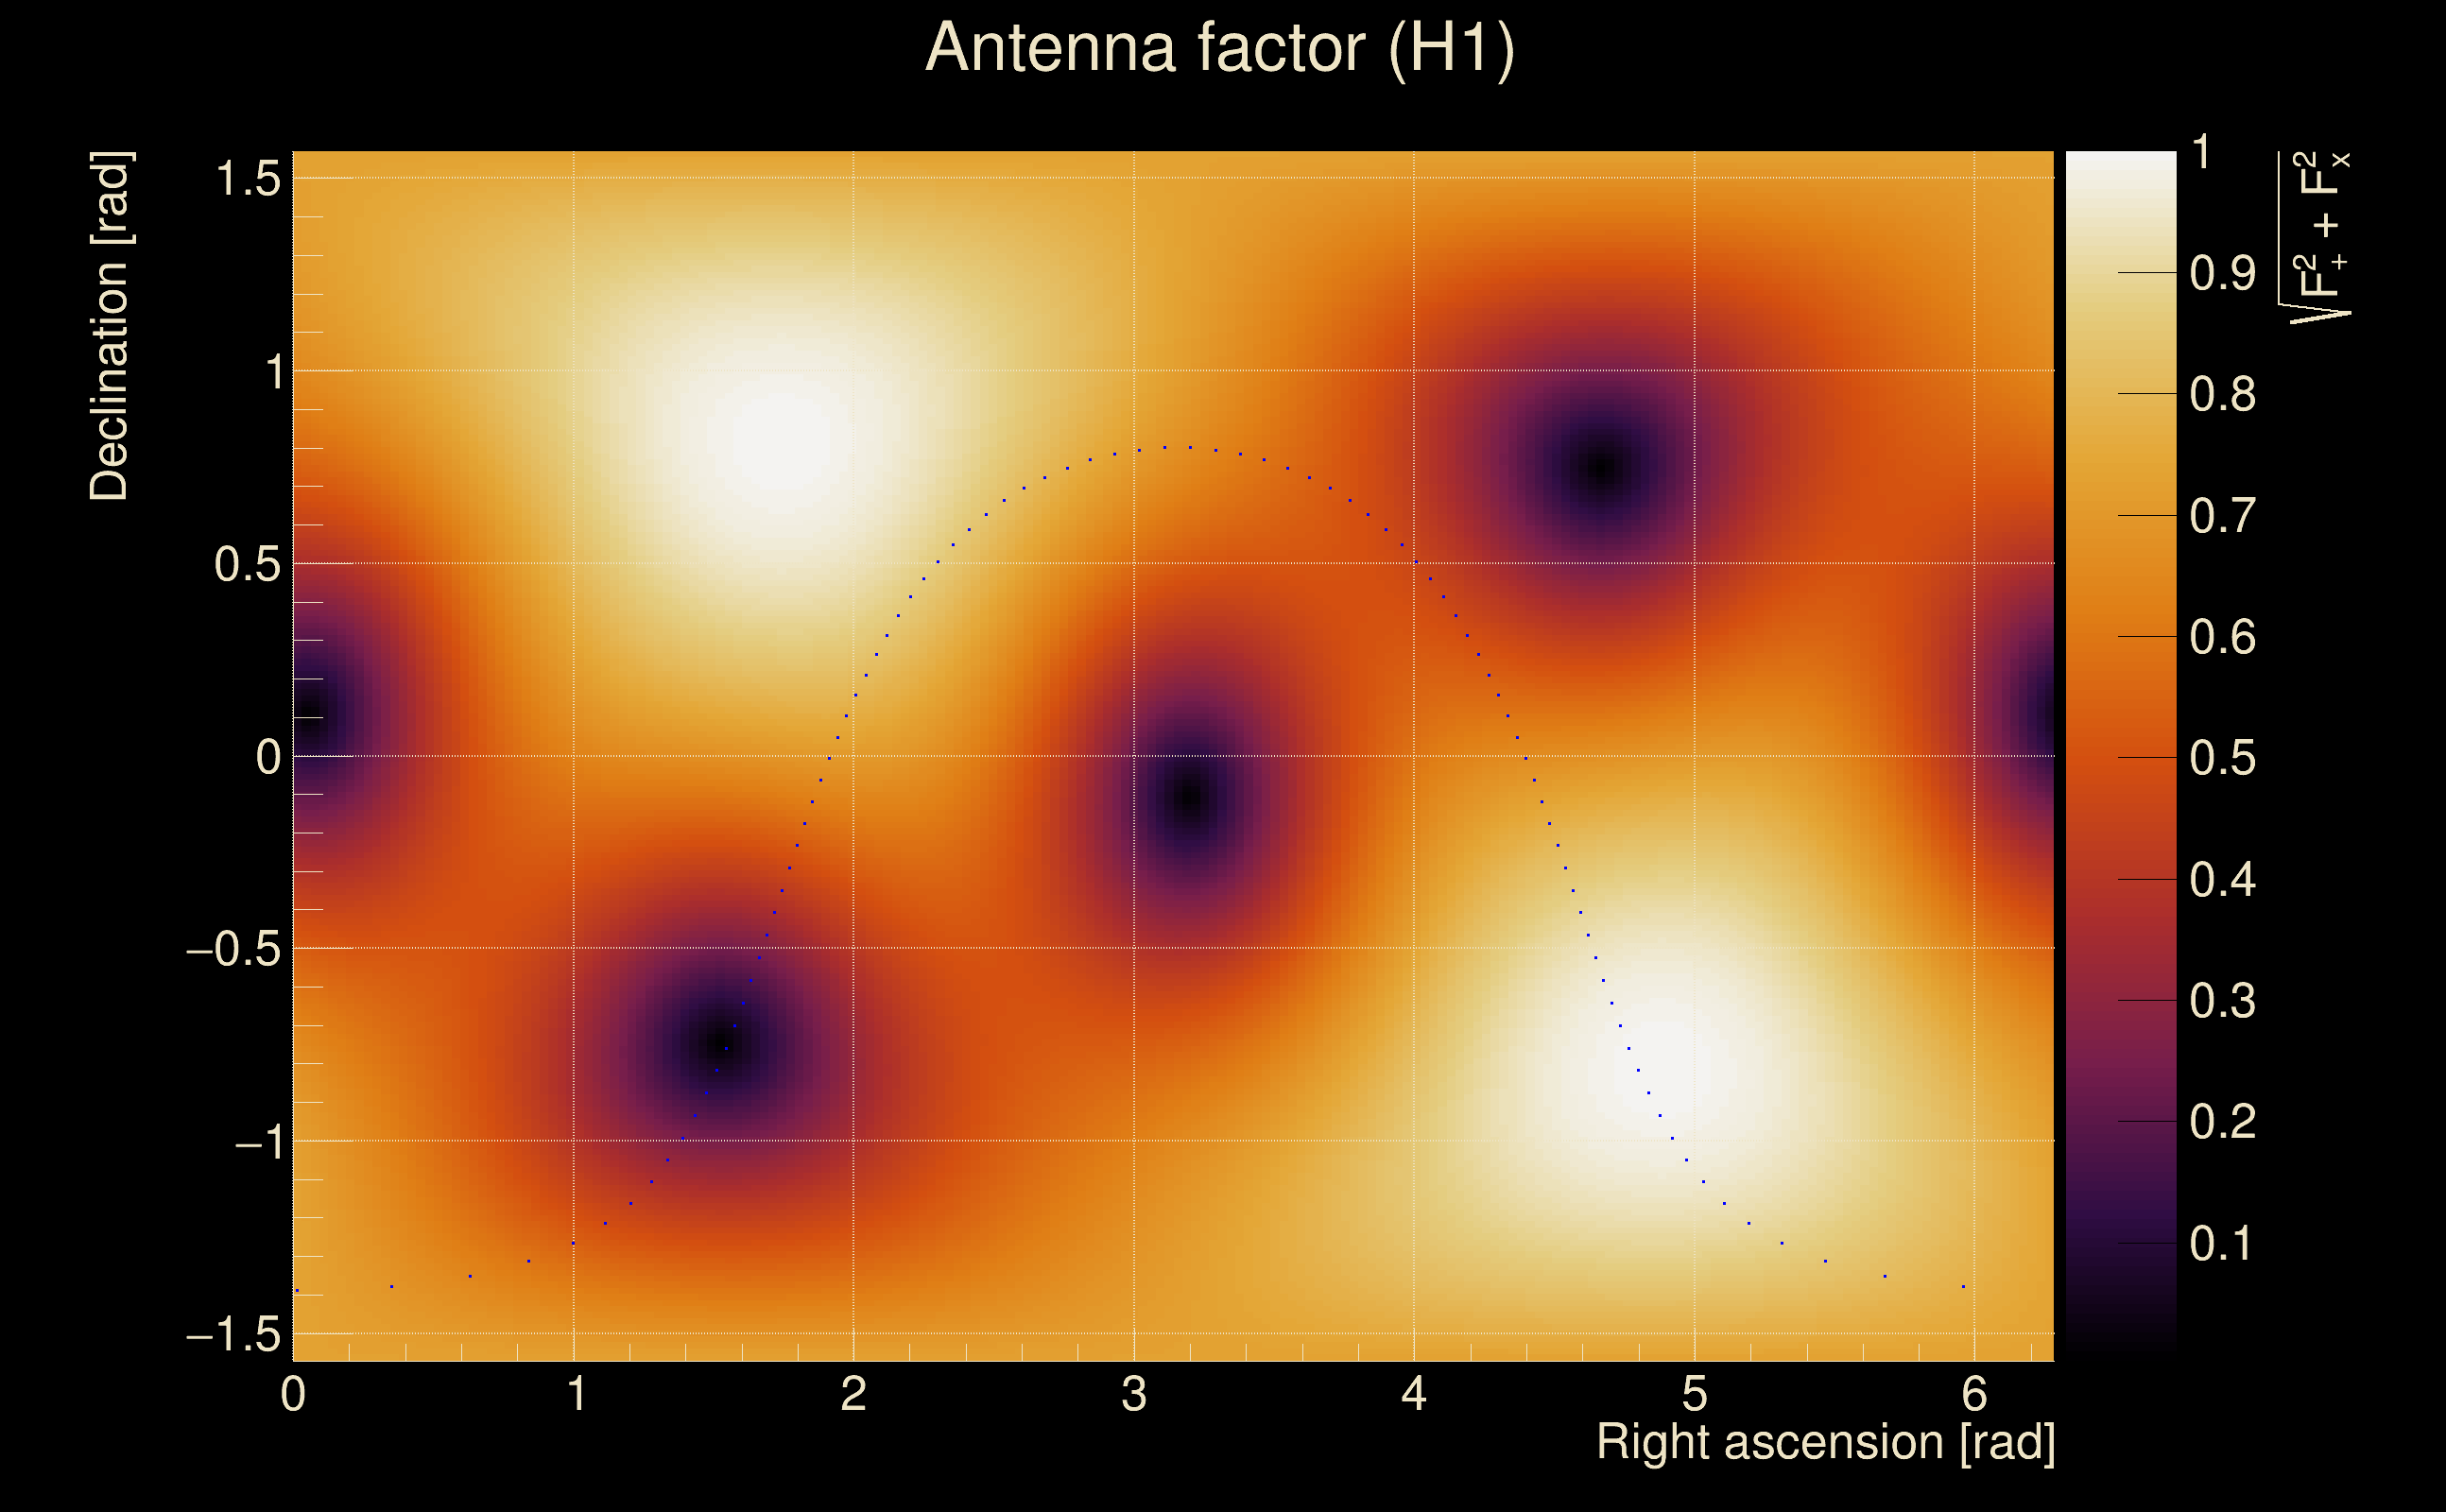
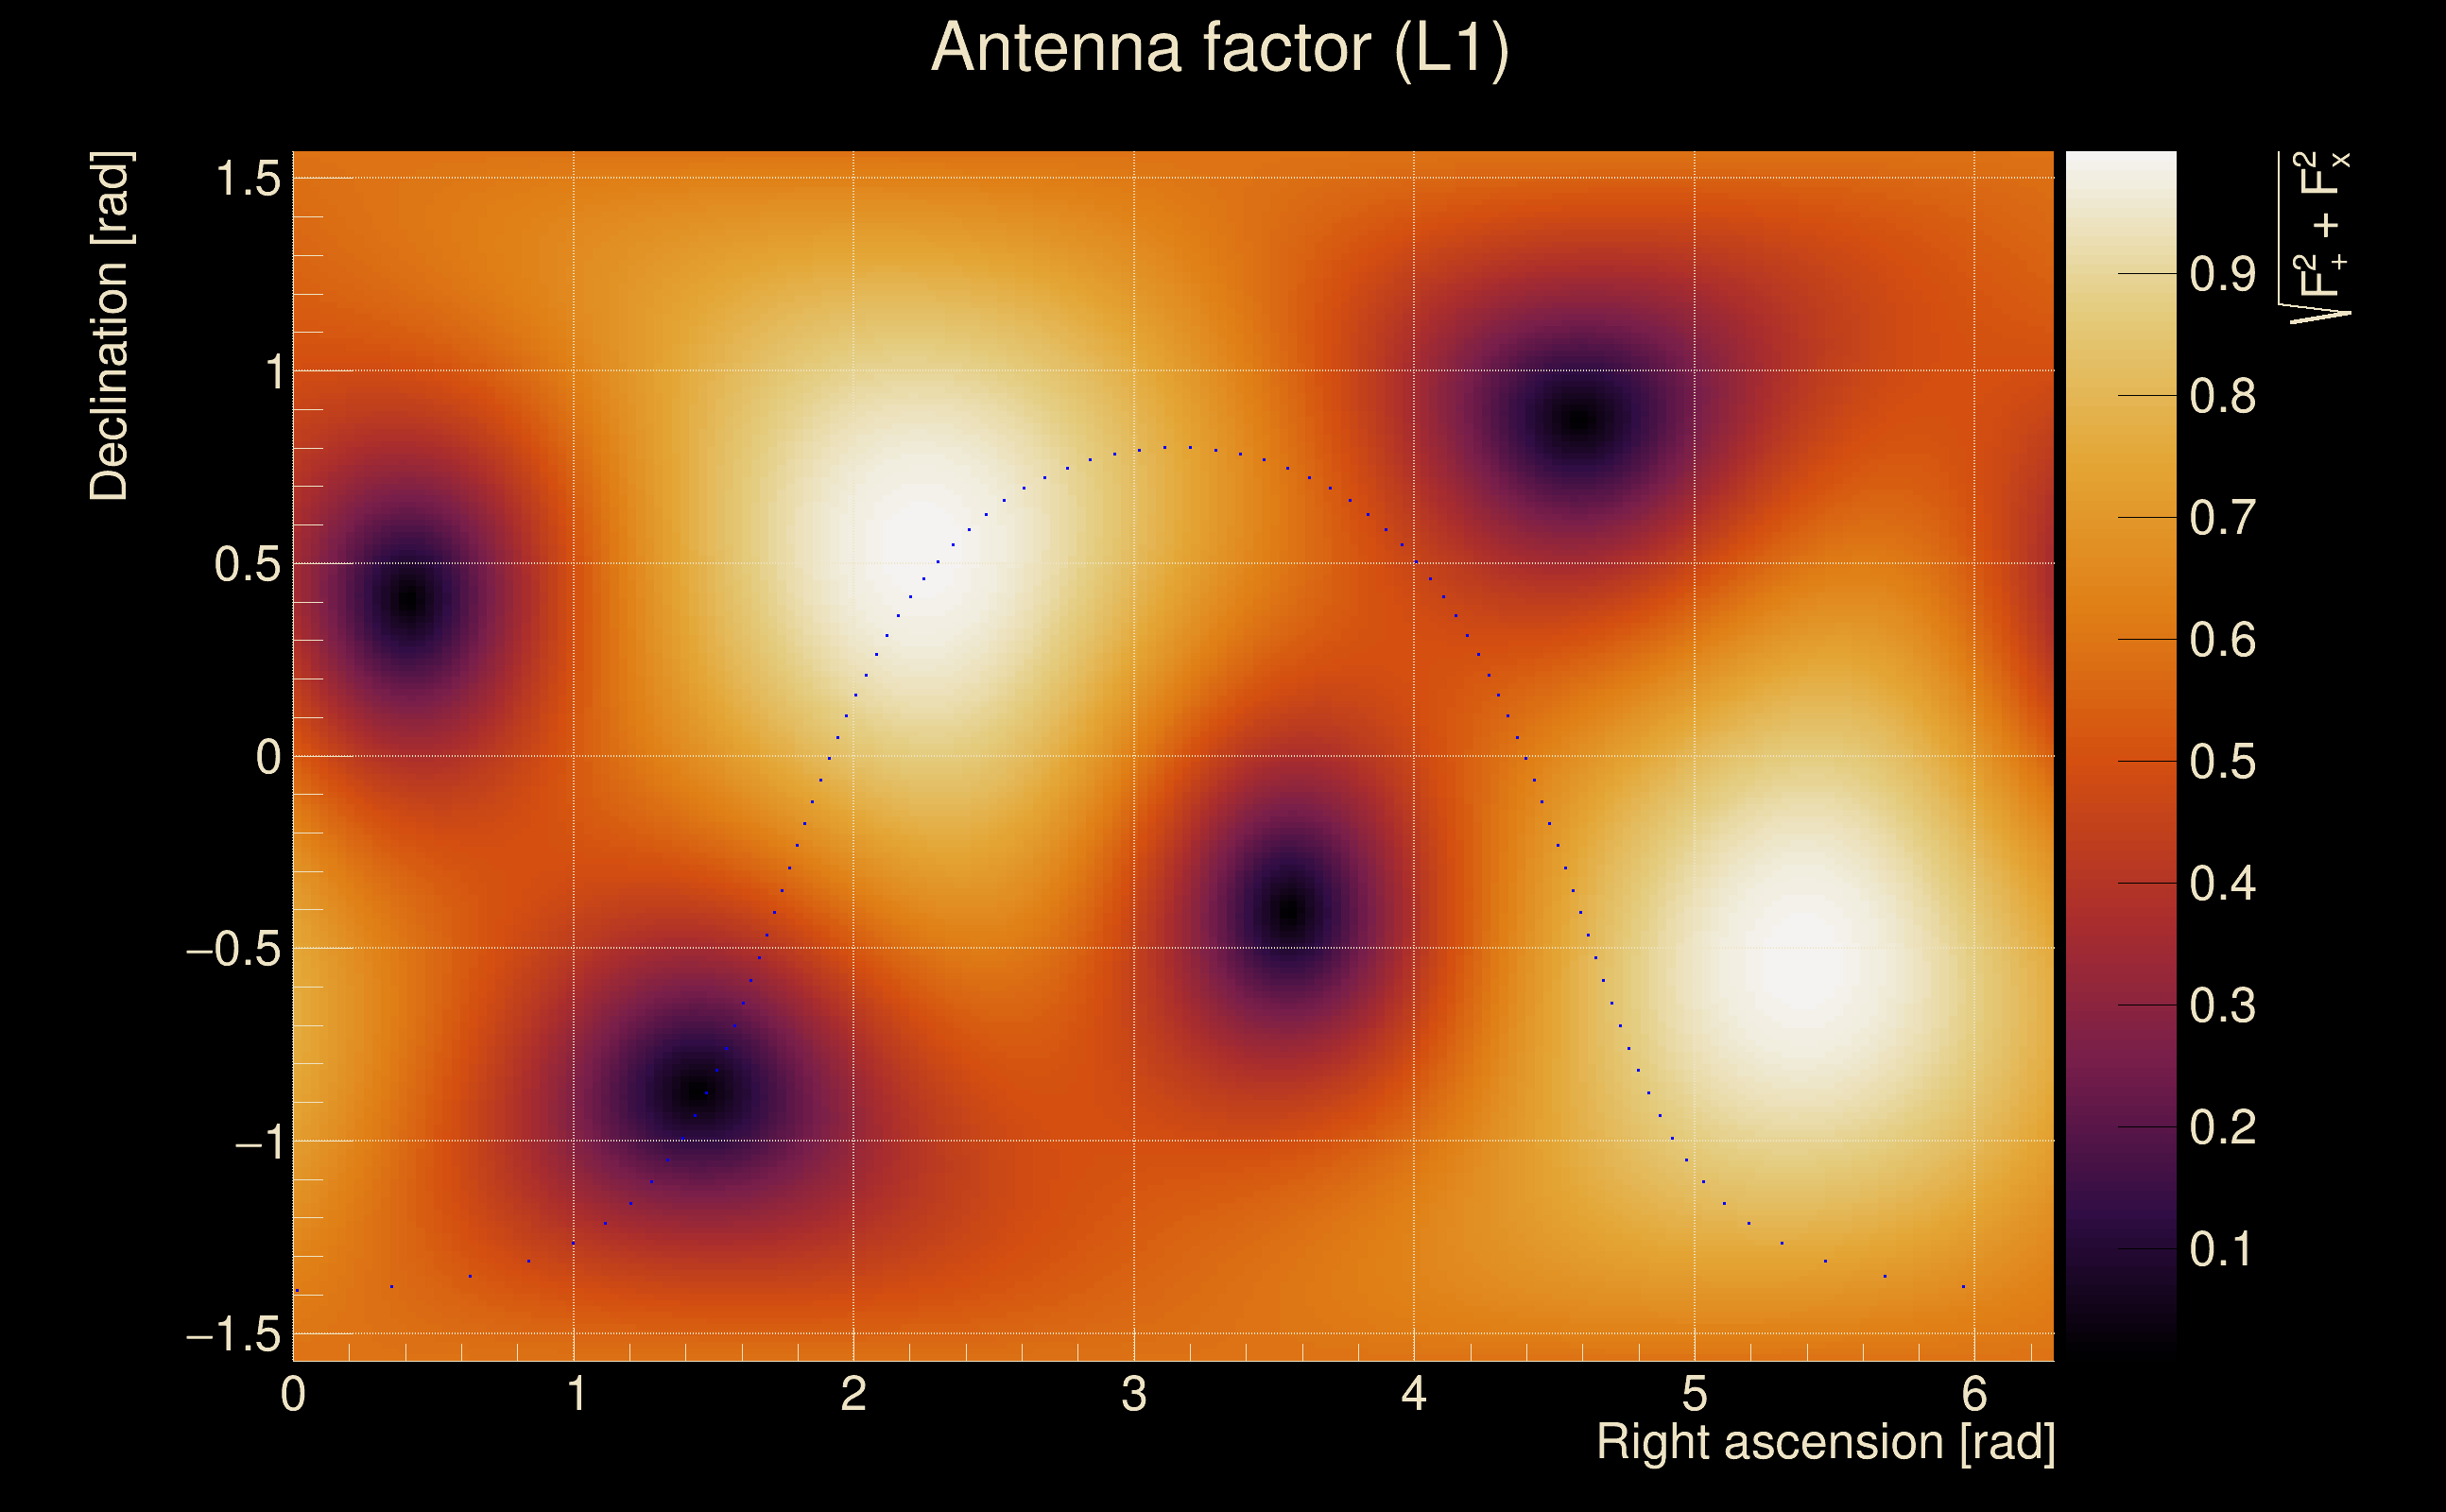
| Target sky positon: | Ra: 3.68109, Dec: 0.94792 [rad] |
| List of input Ox files: | Targ_FirstTest_O4bw_14days_file_list.txt (930 files) |
| Analysis result file: | Targ_FirstTest_O4bw_14days_results-0.root |
| Slice selected for the the fakeground: | slice index=215 (-4.922 s), time lag = 0 s |
| Foreground | Fakeground | Background | ||
|---|---|---|---|---|
| Number of processed ox events | 175167 | 175167 | 37660905 | |
| Start Date (detector 0) | Sat Sep 2 04:54:54 2023 UTC | Sat Sep 2 04:54:54 2023 UTC | Sat Sep 2 04:54:54 2023 UTC | |
| End Date (detector 0) | Sun Sep 17 00:01:47 2023 UTC | Sun Sep 17 00:01:47 2023 UTC | Sun Sep 17 00:01:47 2023 UTC | |
| Start GPS (detector 0) | 1377665712 | 1377665712 | 1377665712 | |
| End GPS (detector 0) | 1378944125 | 1378944125 | 1378944125 | |
| Used livetime (detector 0) | 880485 s | 880485 s | 880485 s | |
| Start Date (detector 1) | Sat Sep 2 04:54:54 2023 UTC | Sat Sep 2 04:54:54 2023 UTC | Sat Sep 2 04:54:54 2023 UTC | |
| End Date (detector 1) | Sun Sep 17 00:01:47 2023 UTC | Sun Sep 17 00:01:47 2023 UTC | Sun Sep 17 00:01:47 2023 UTC | |
| Start GPS (detector 1) | 1377665712 | 1377665712 | 1377665712 | |
| End GPS (detector 1) | 1378944125 | 1378944125 | 1378944125 | |
| Used livetime (detector 1) | 880485 s | 880485 s | 880485 s | |
| Cumulative livetime | 1751670 s | 1751670 s | 376609050 s | |
| 0 years, 20 days, 6 hours, 34 min, 30 s | 0 years, 20 days, 6 hours, 34 min, 30 s | 11 years, 341 days, 21 hours, 37 min, 30 s |
|
|
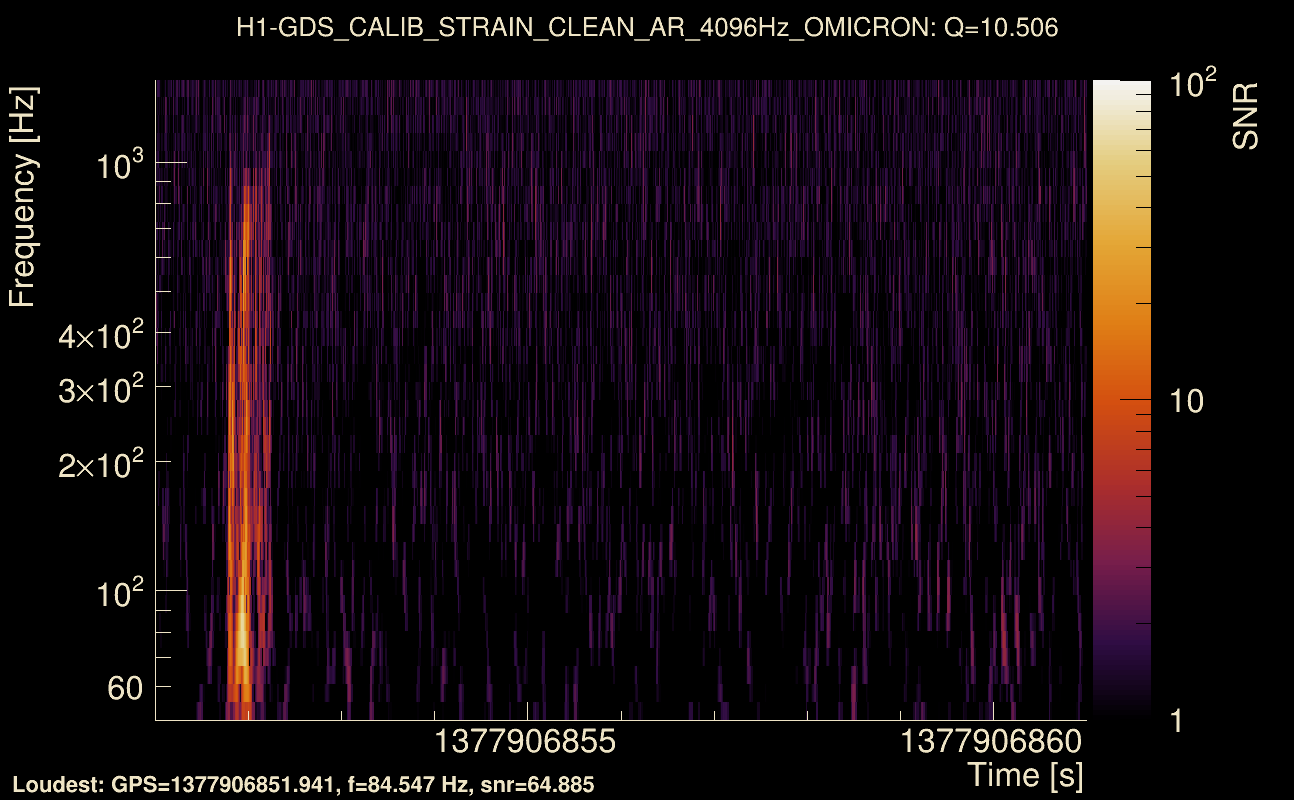
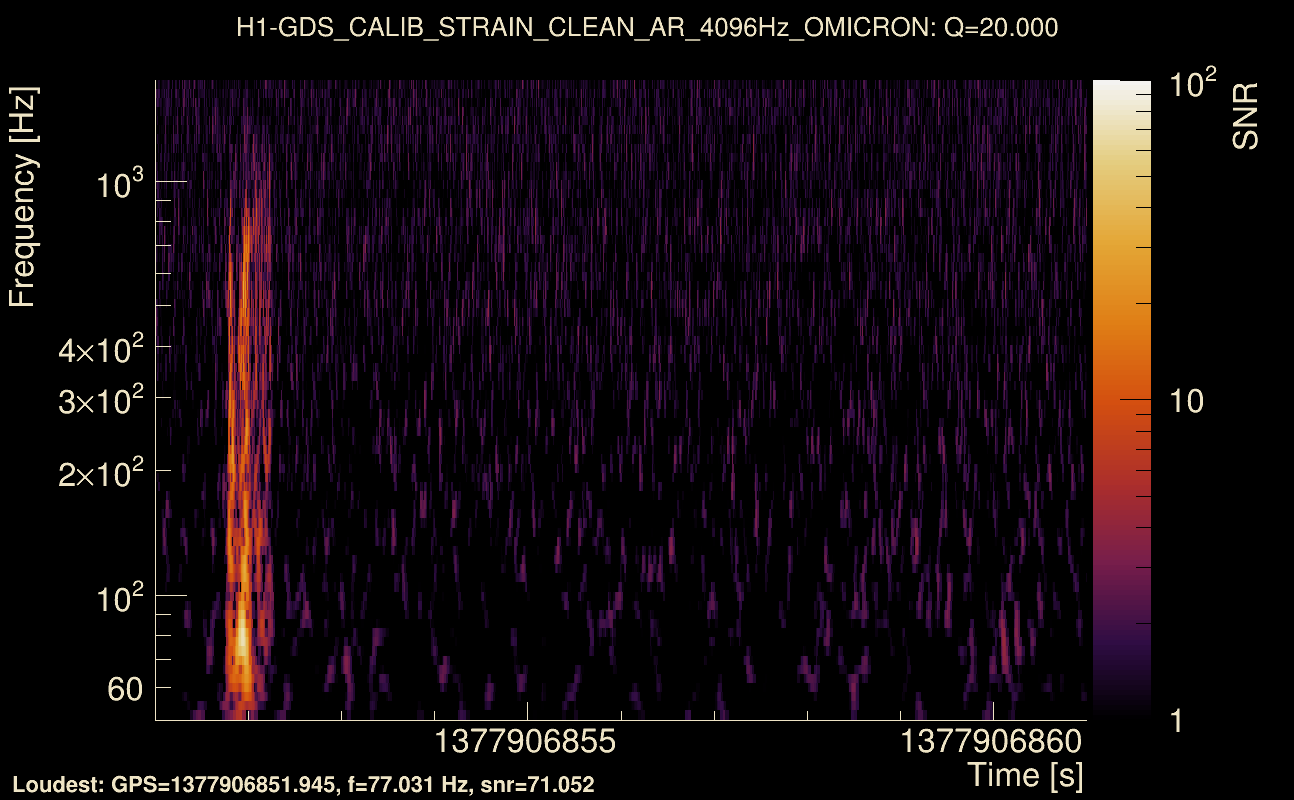
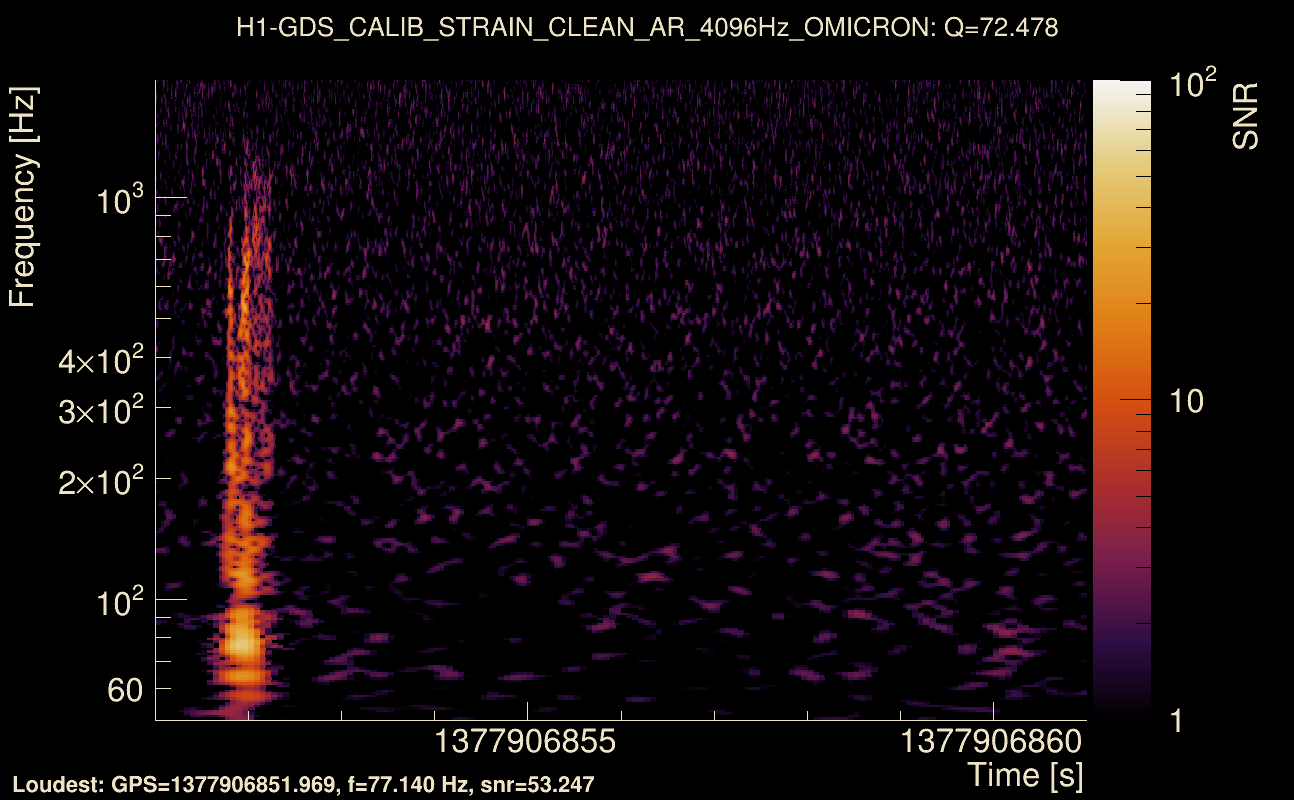
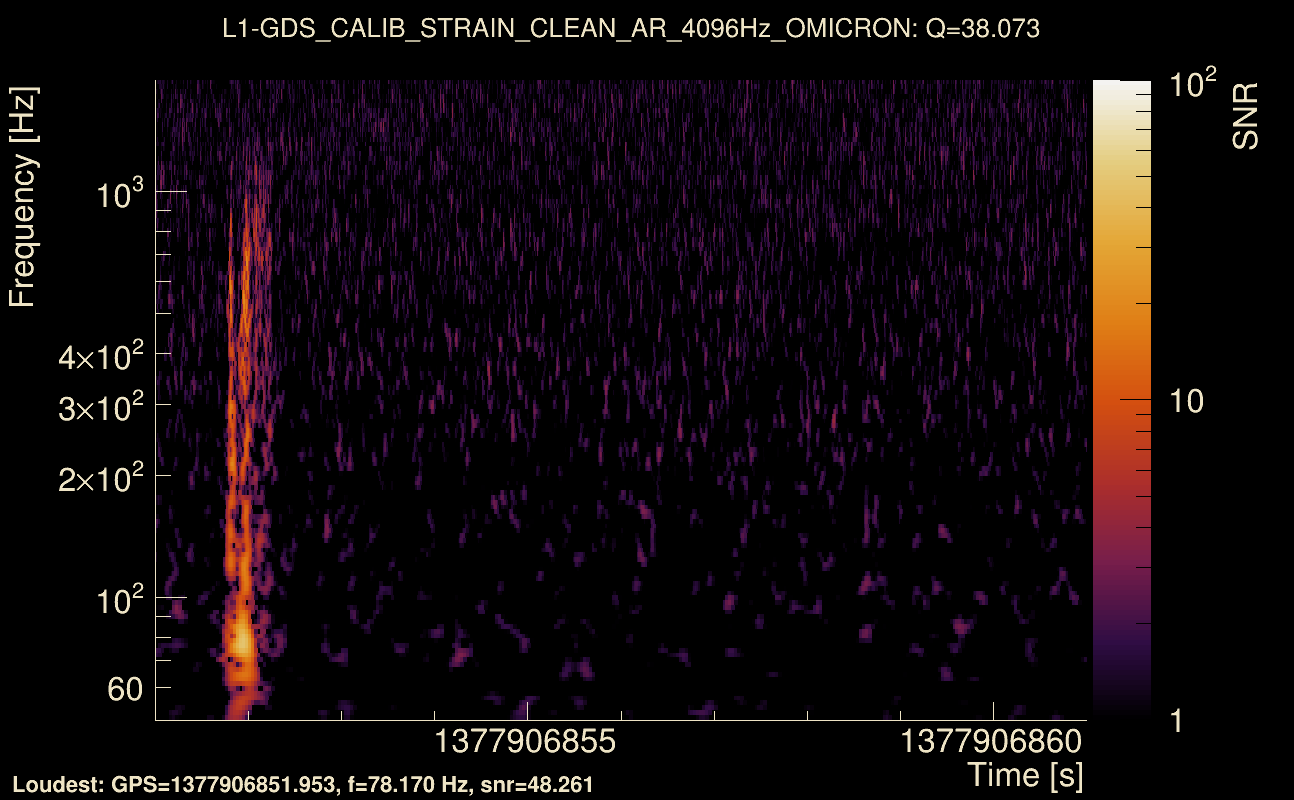
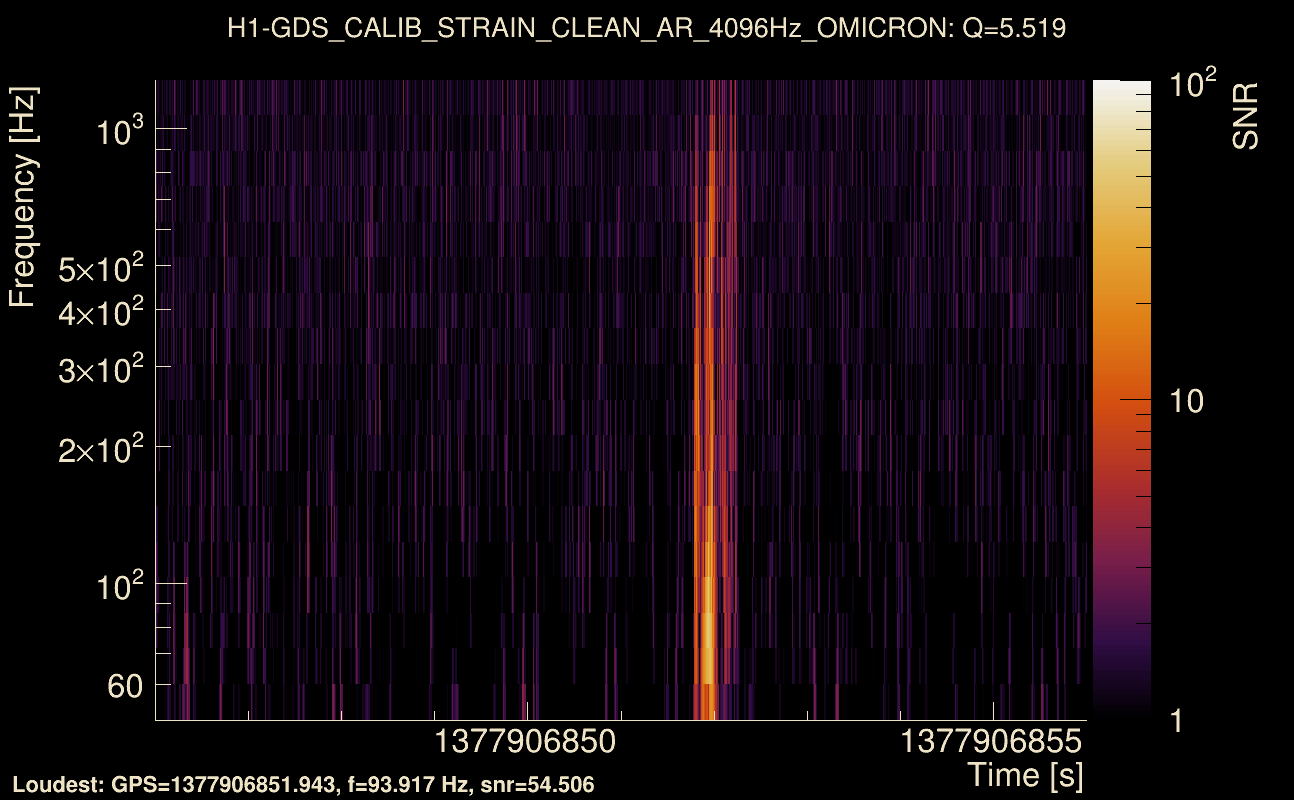
| Event time t(H1): | GPS = 1377906851 (Mon Sep 4 23:53:53 2023 ) → GPS = 1377906861 (Mon Sep 4 23:54:03 2023 ) |
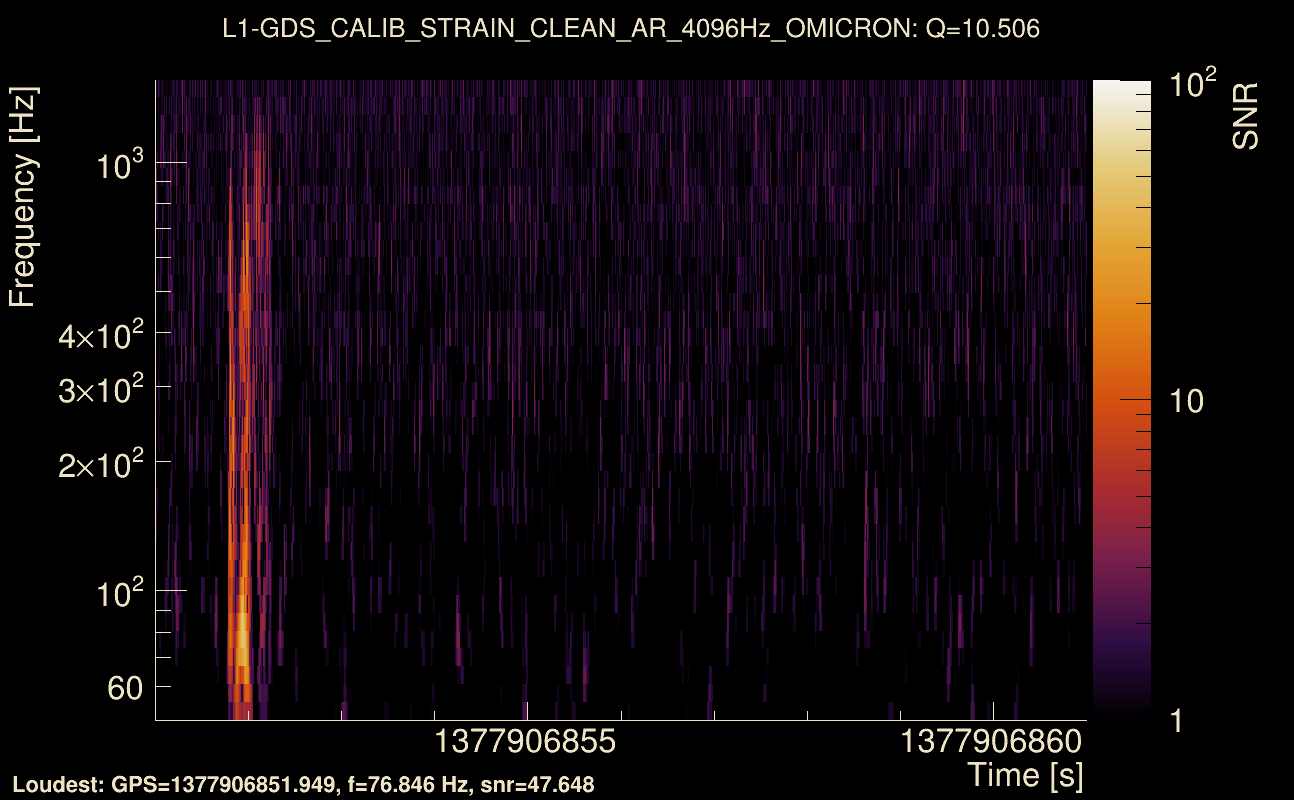
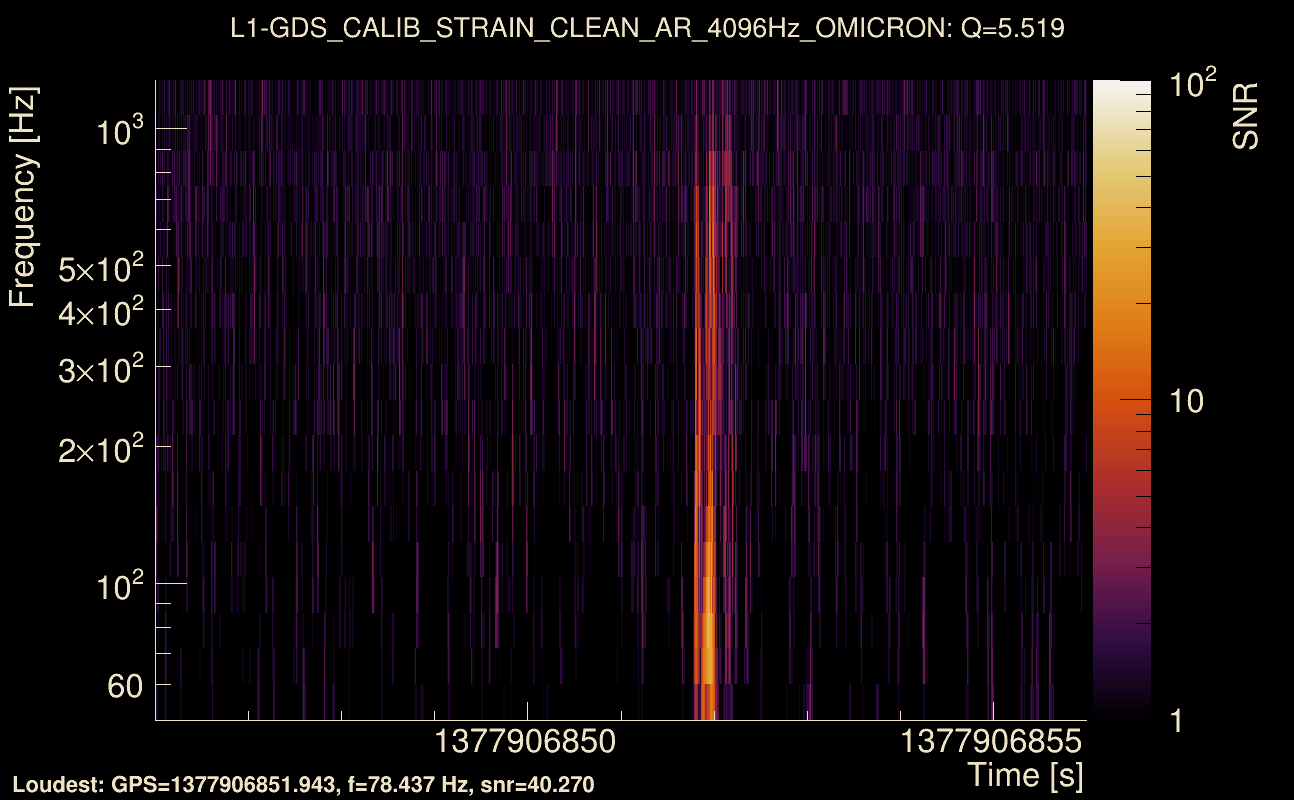
| Event time t(L1): | GPS = 1377906851 (Mon Sep 4 23:54:03 2023 ) → GPS = 1377906861 (Mon Sep 4 23:54:03 2023 ) |
| Omicron analysis time window (H1): | GPS = 1377906848 → GPS = 1377906864 |
| Omicron analysis time window (L1): | GPS = 1377906848 → GPS = 1377906864 |
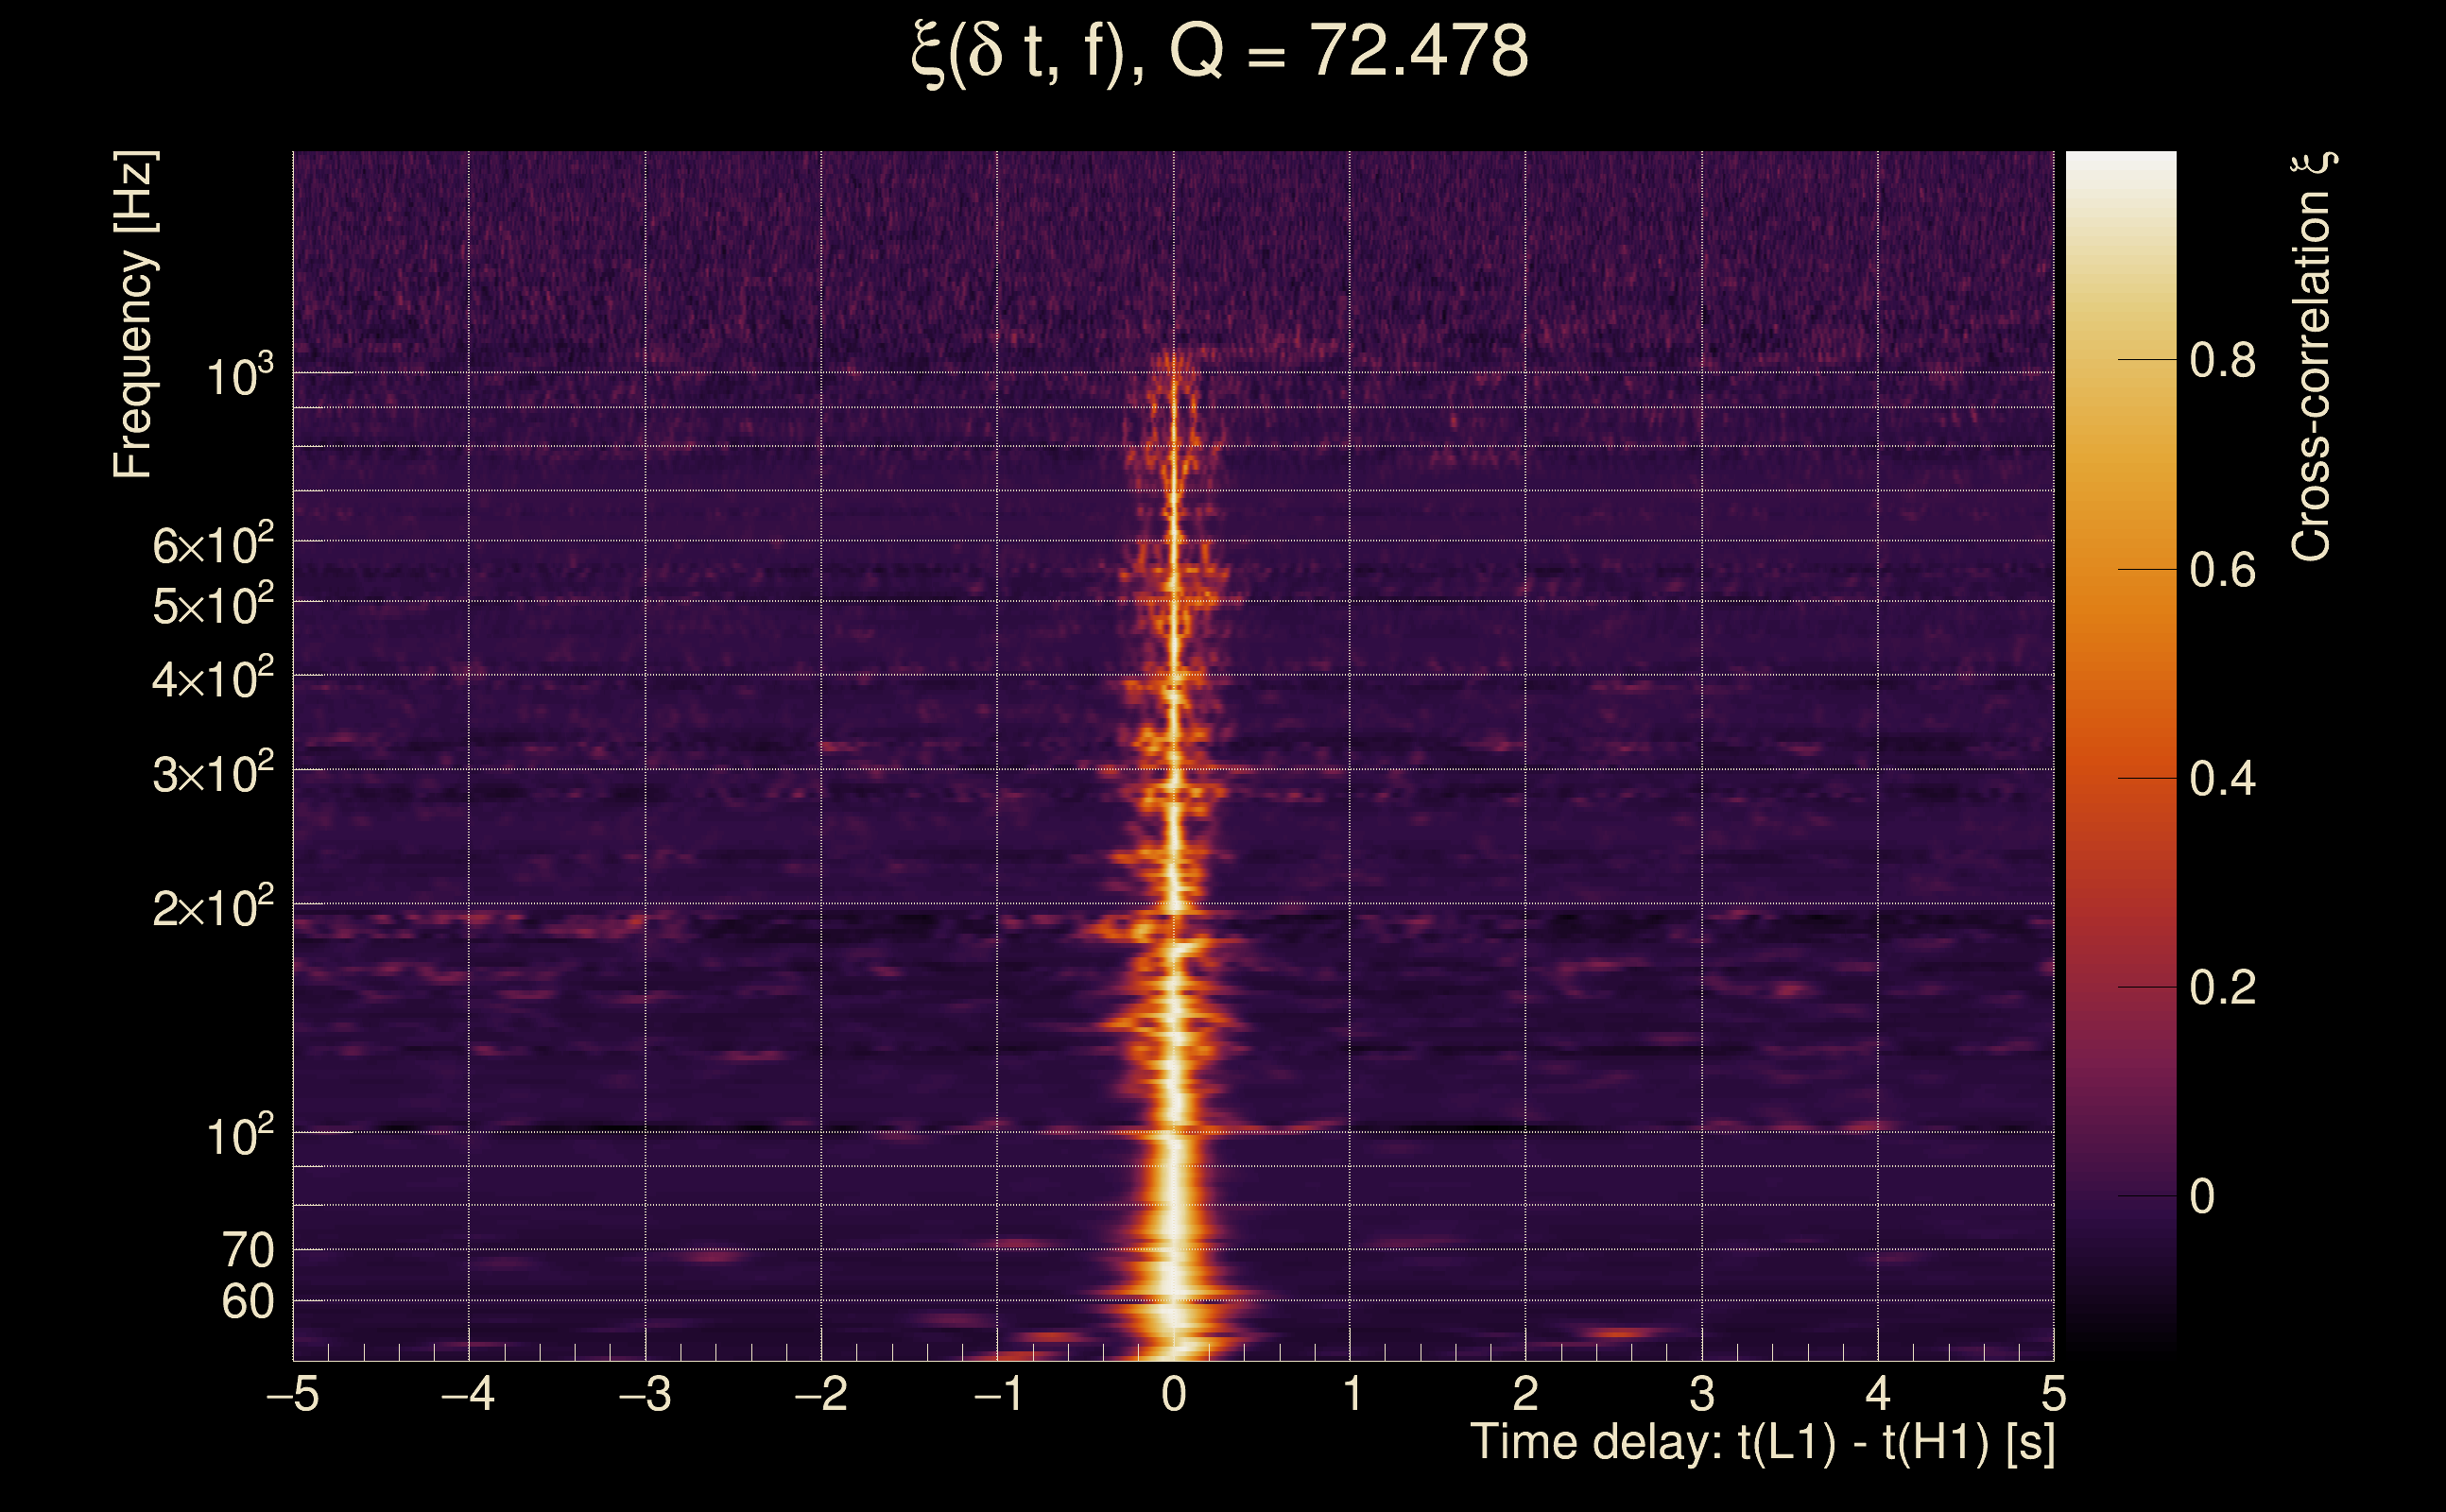
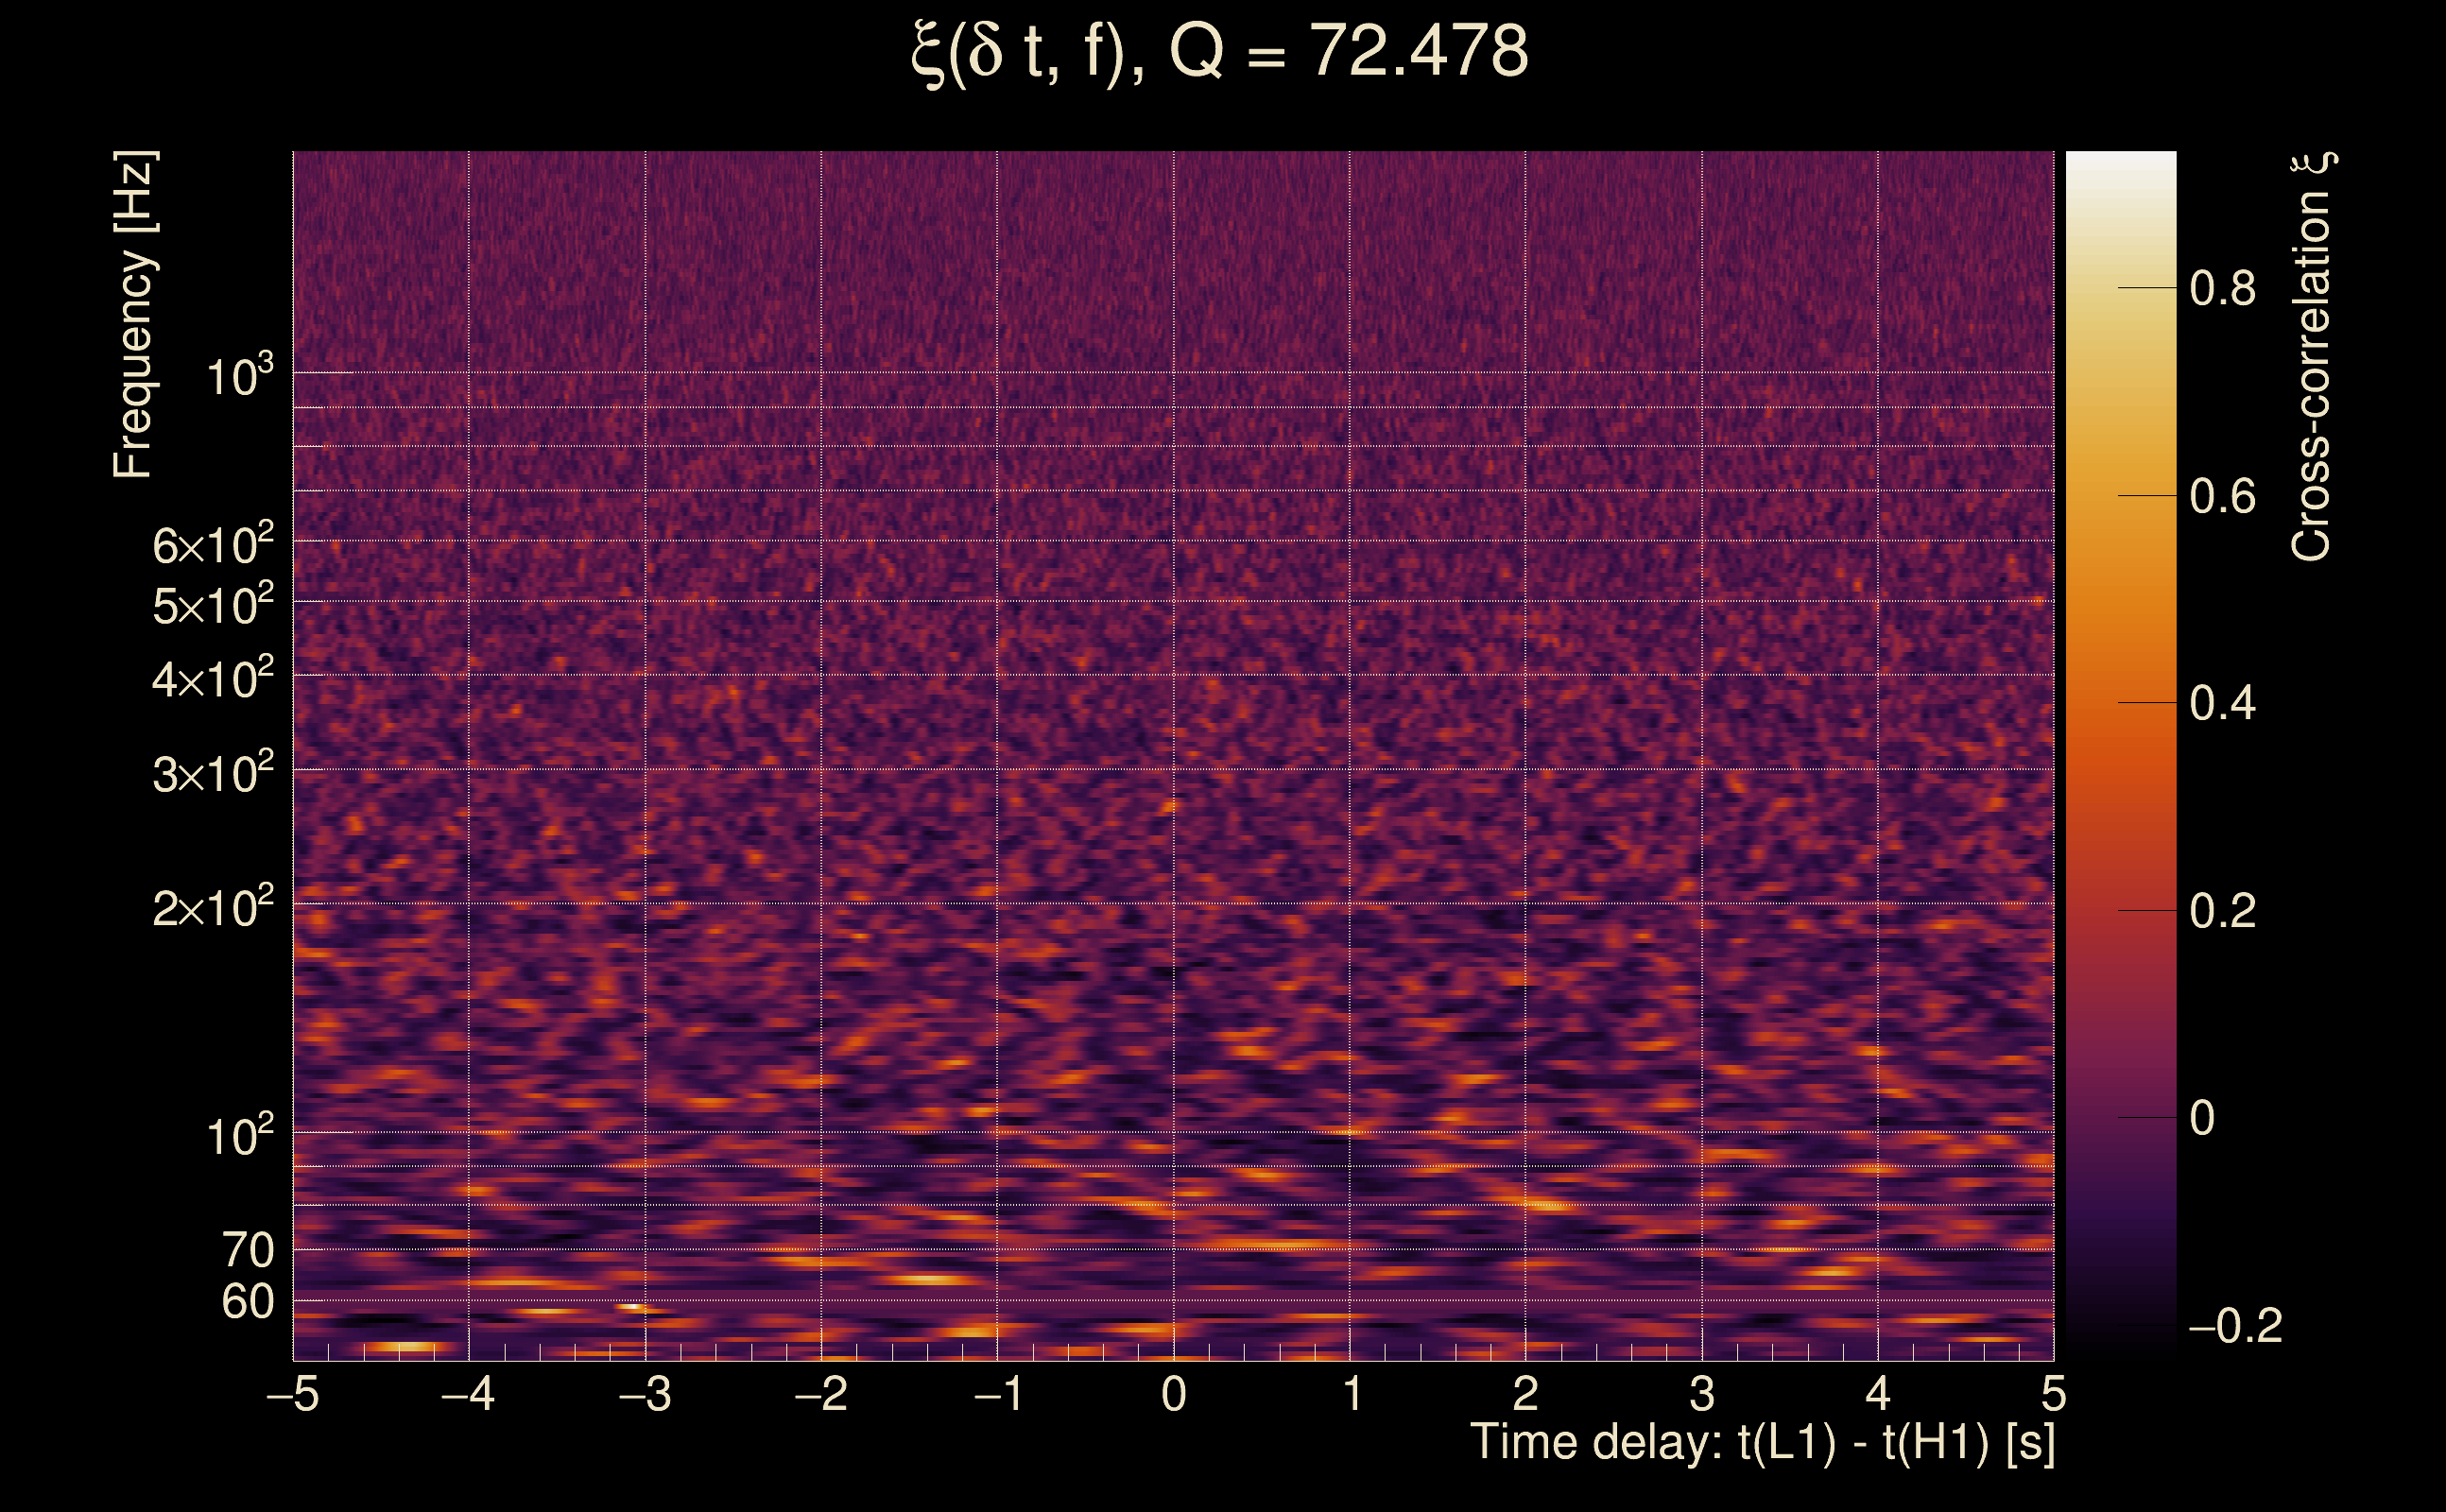
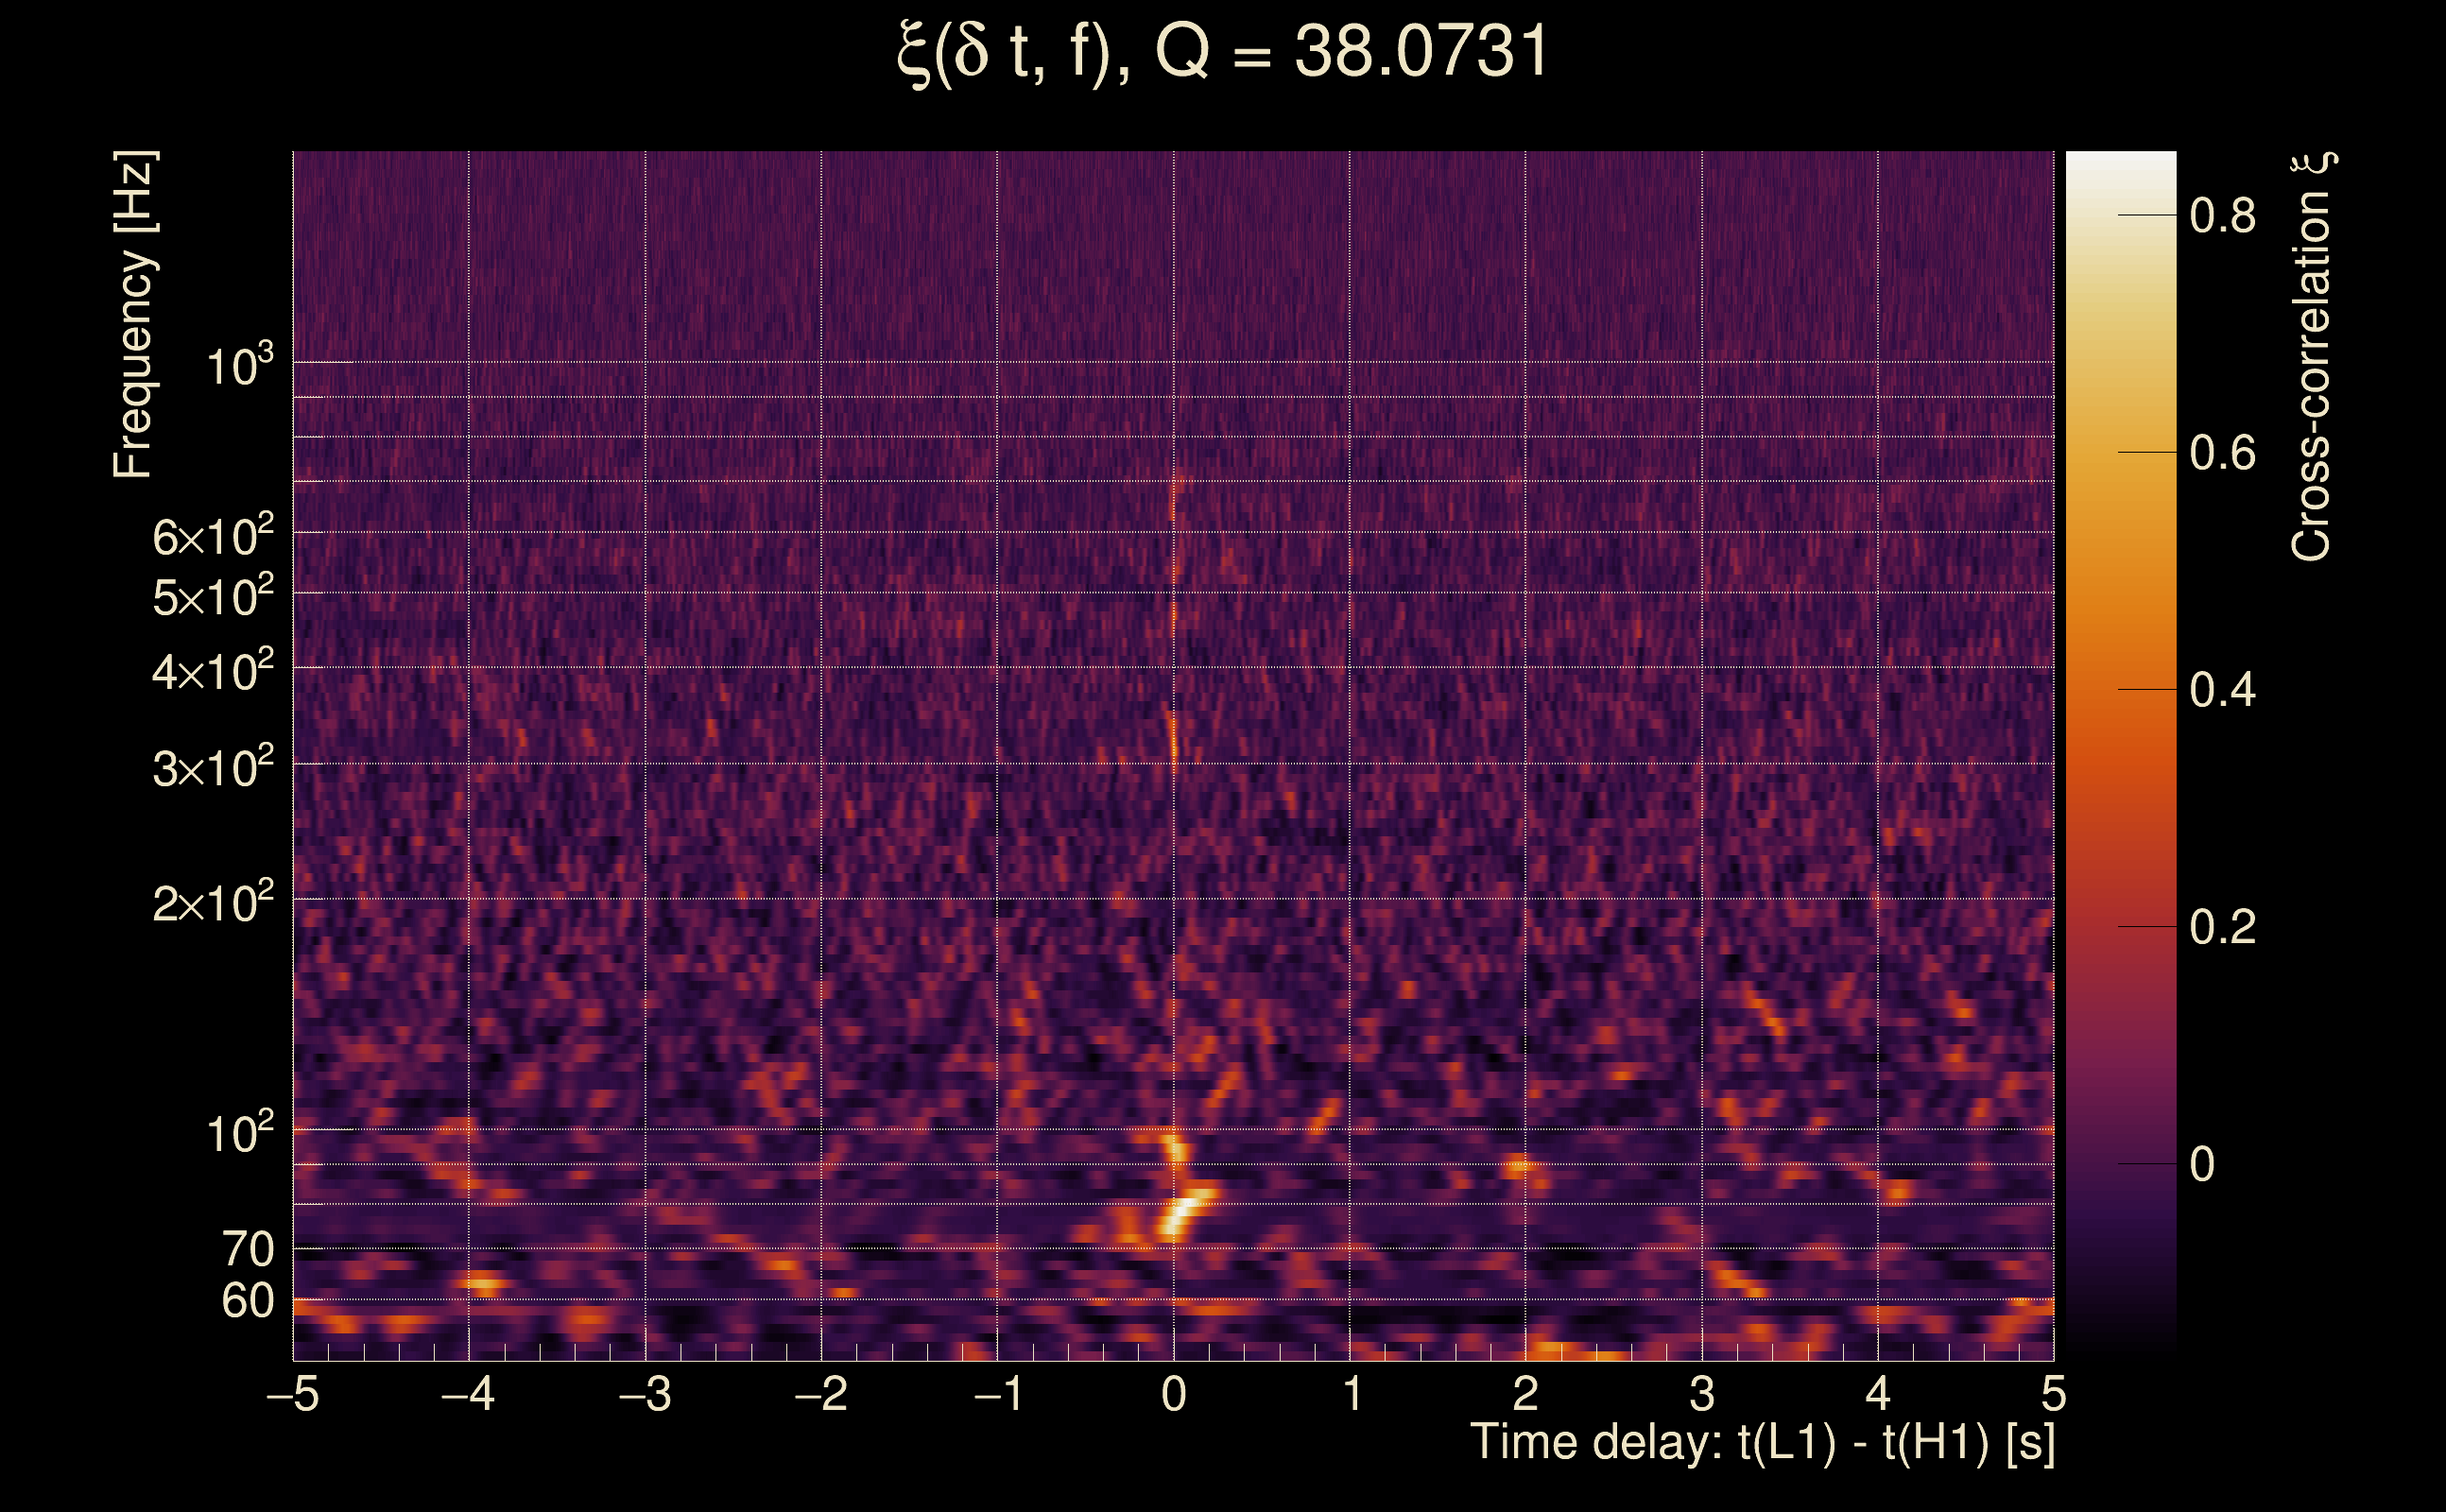
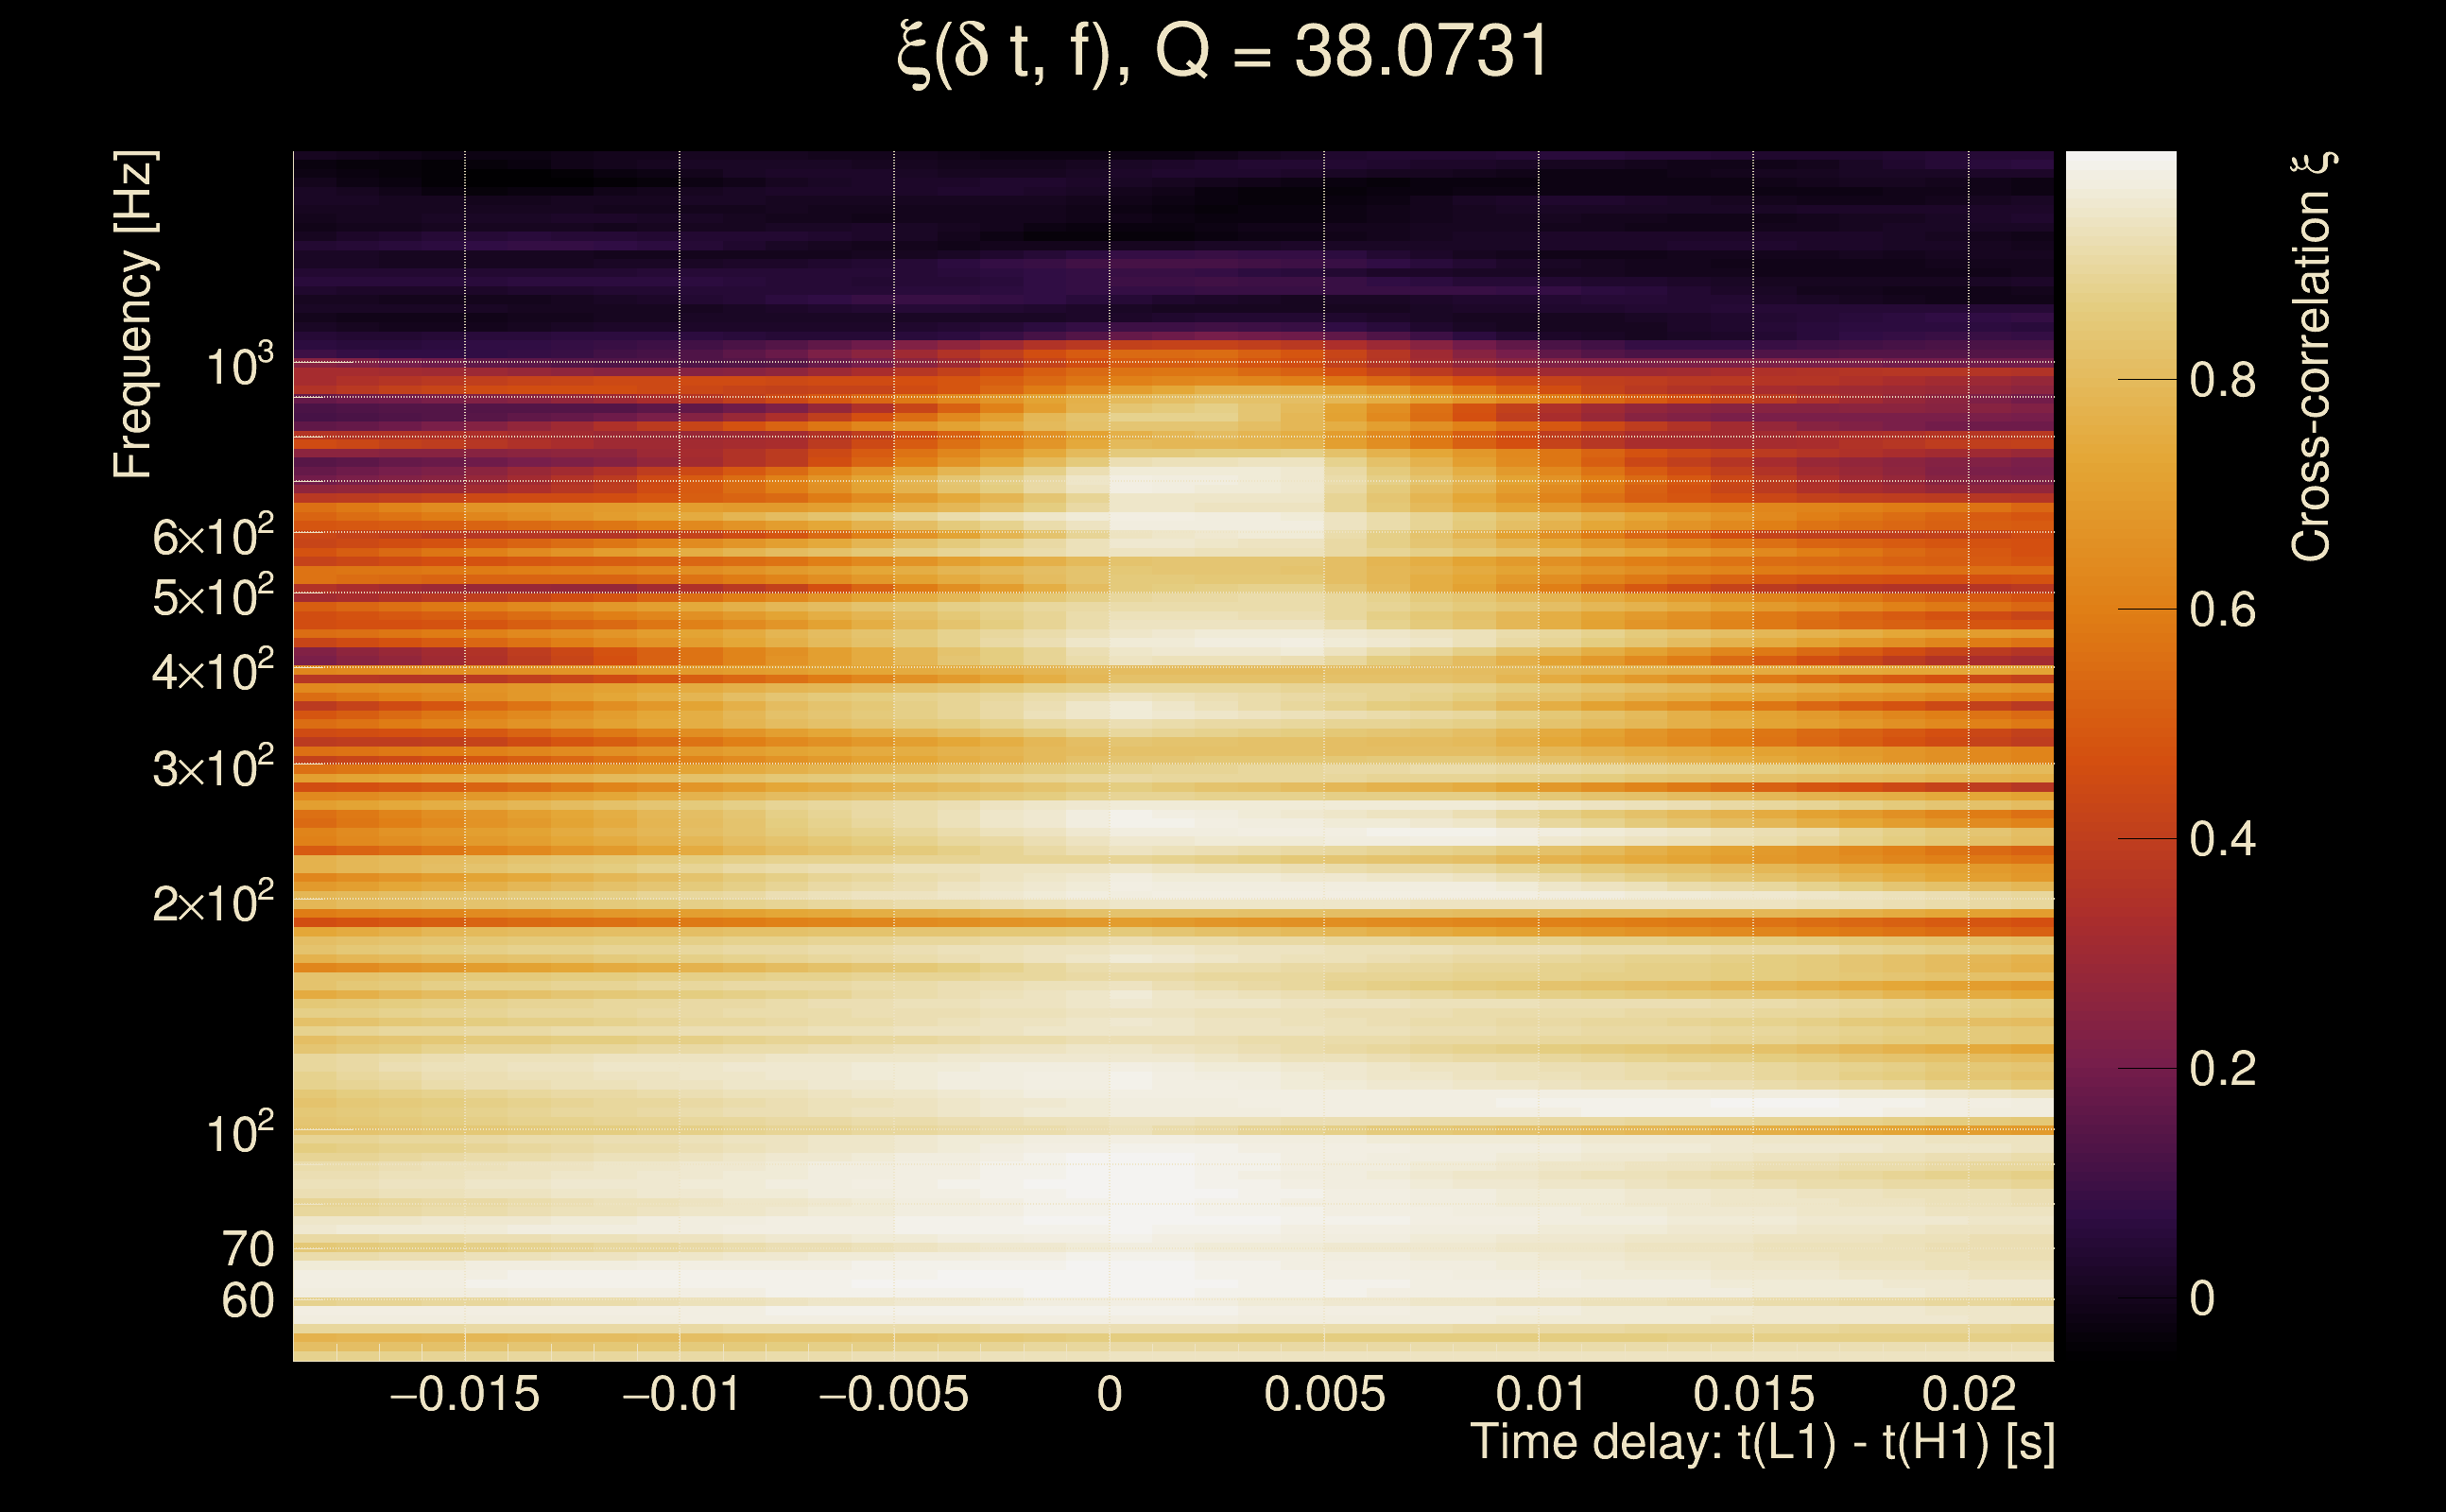
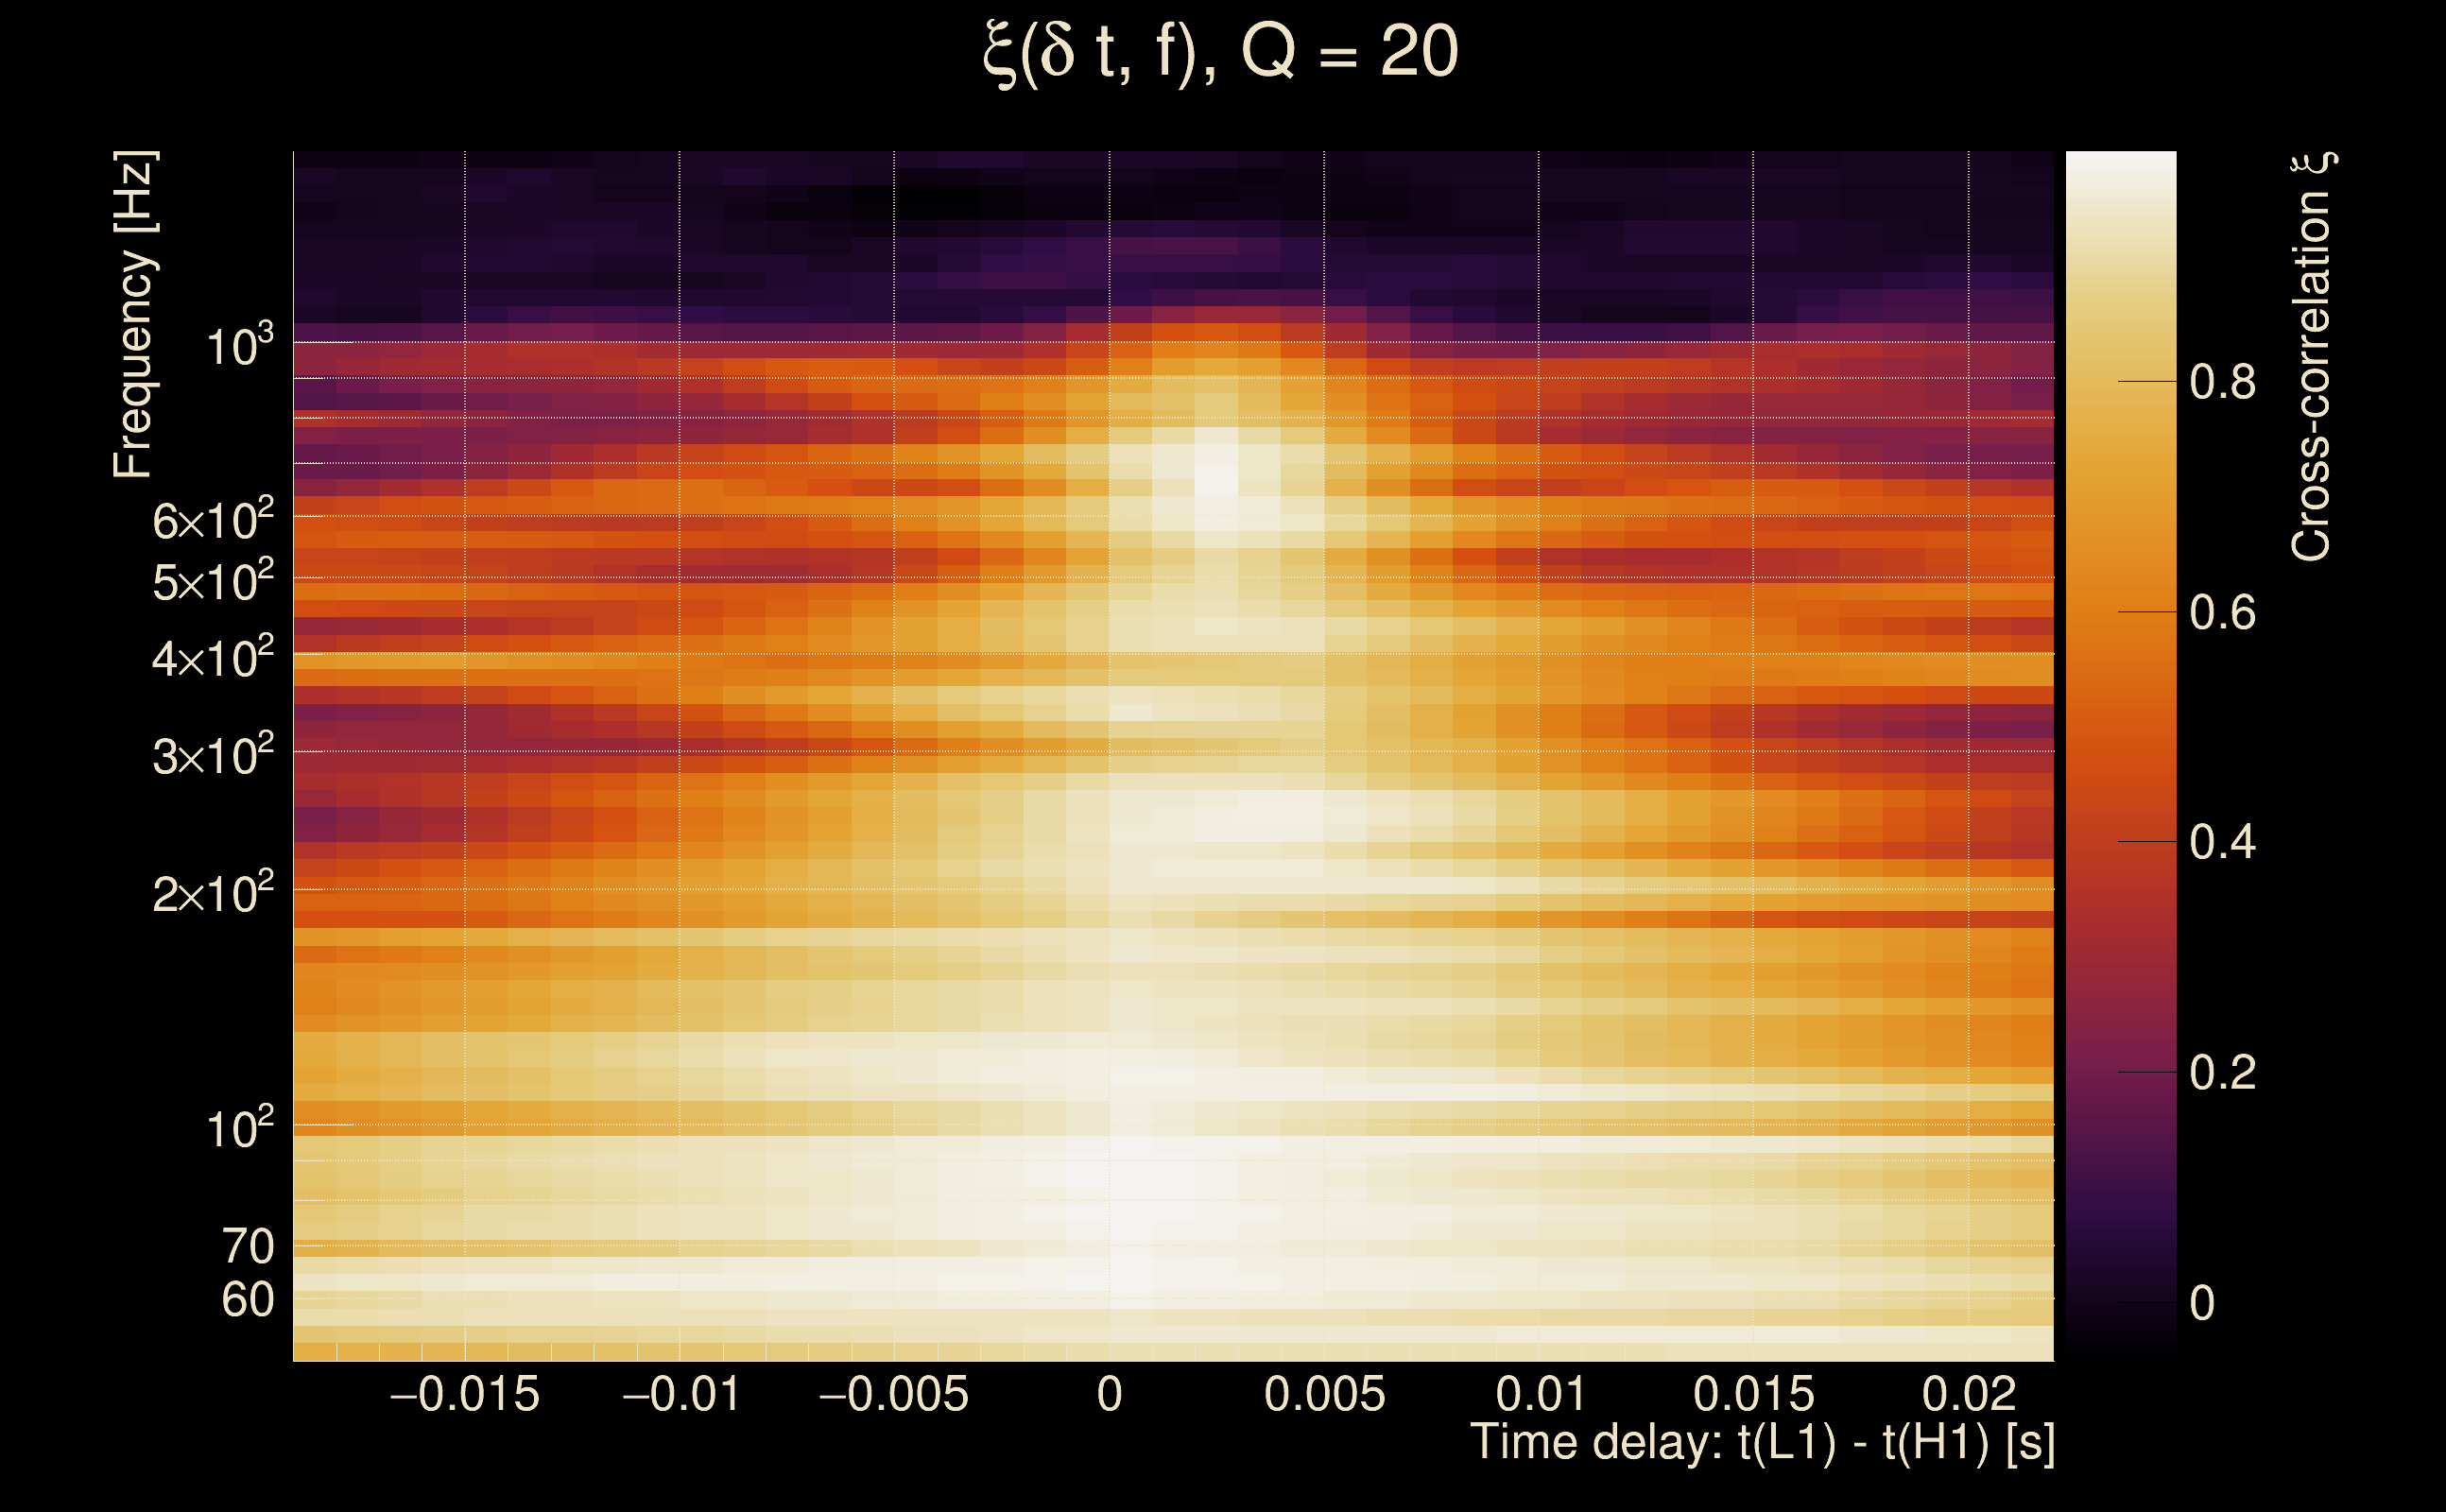
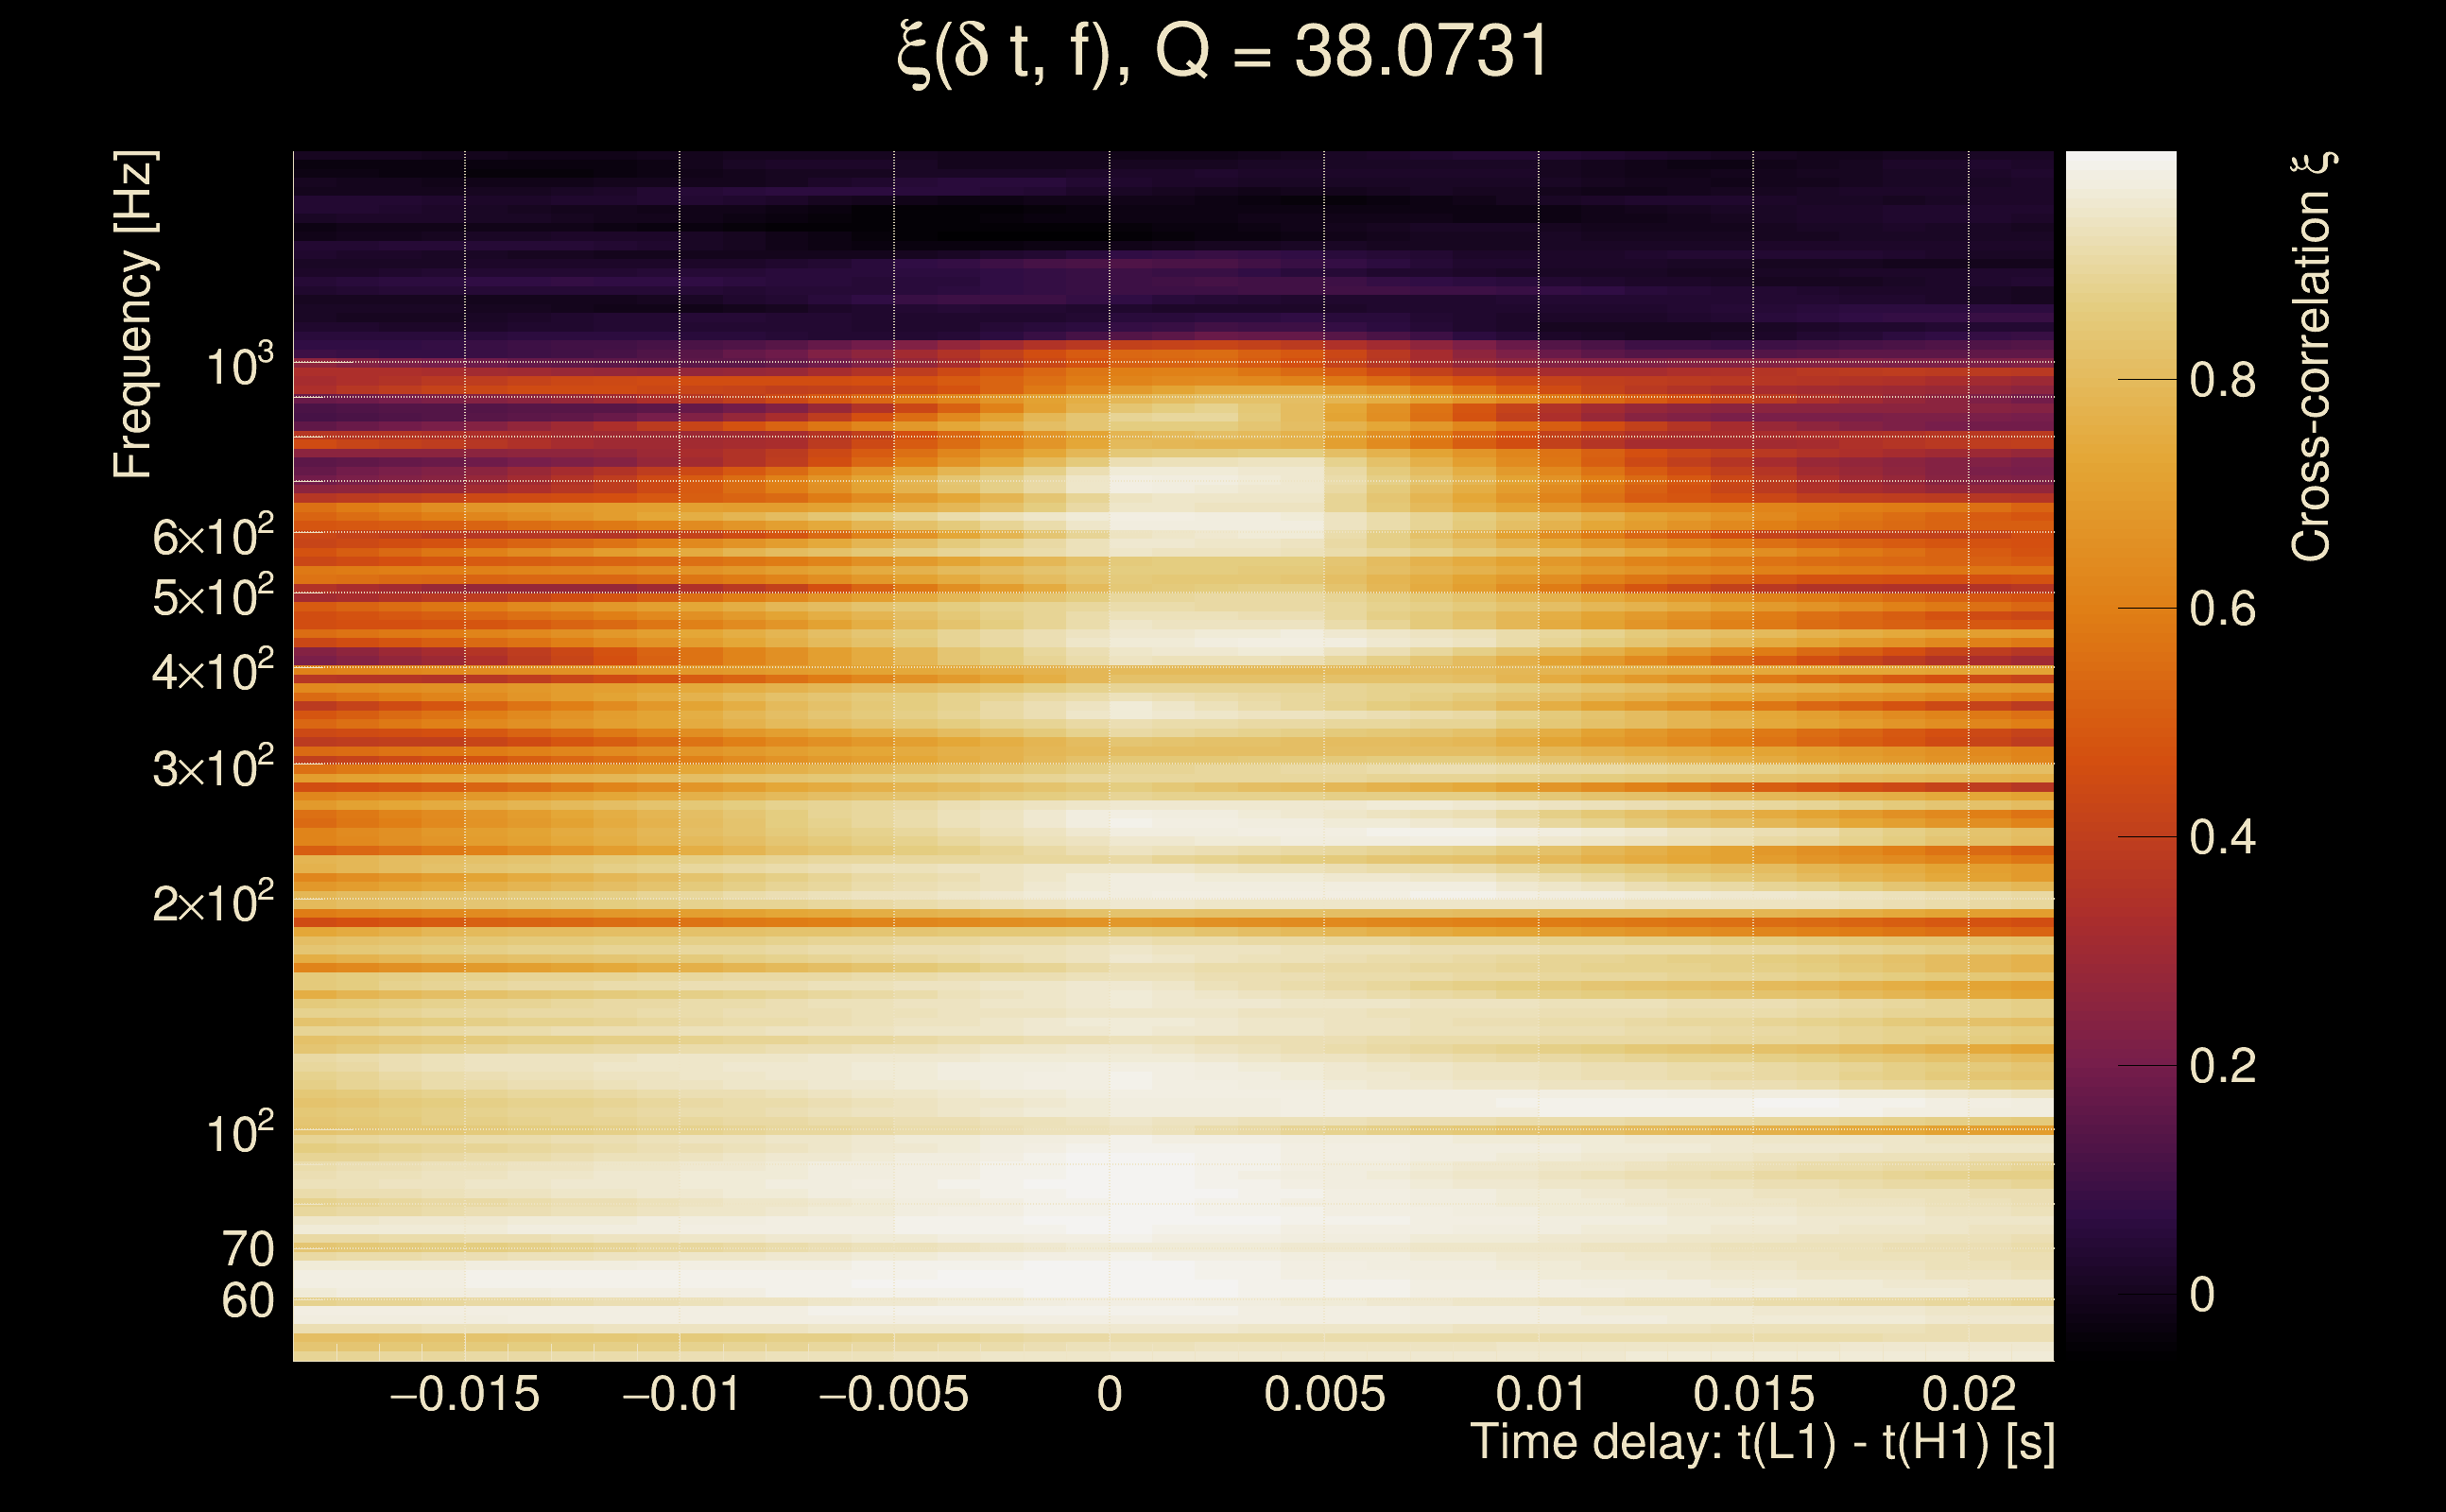
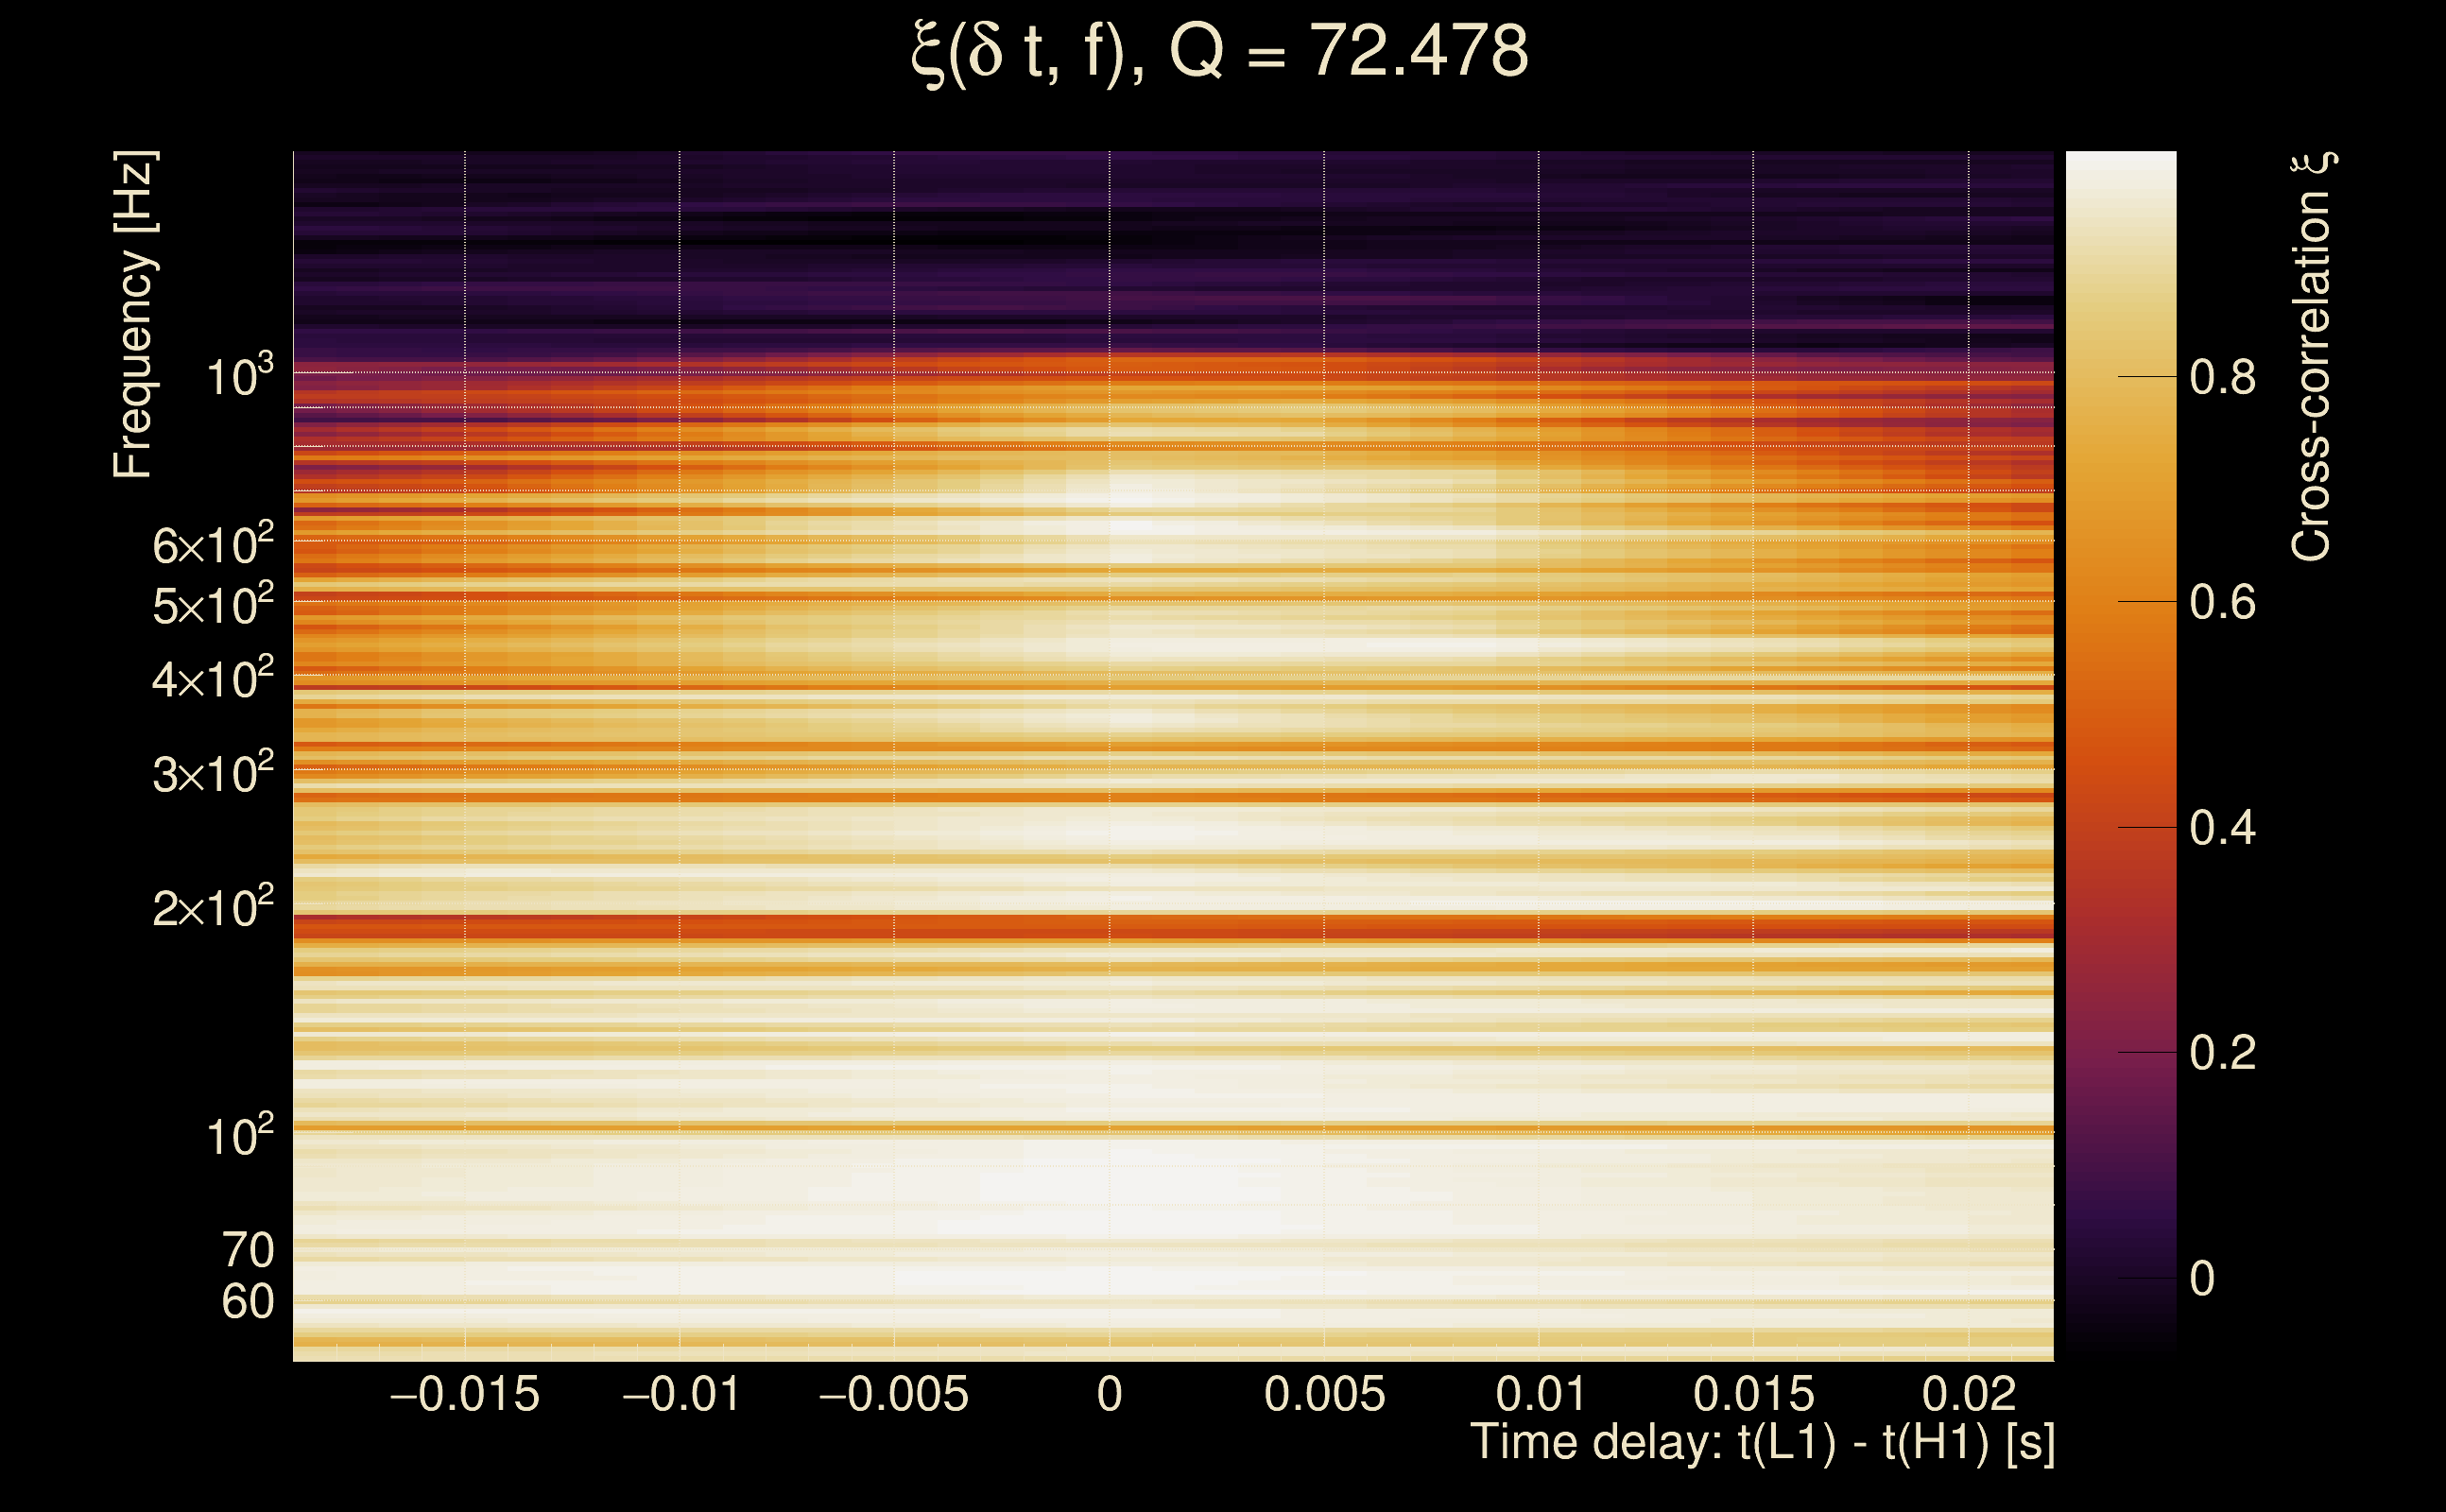
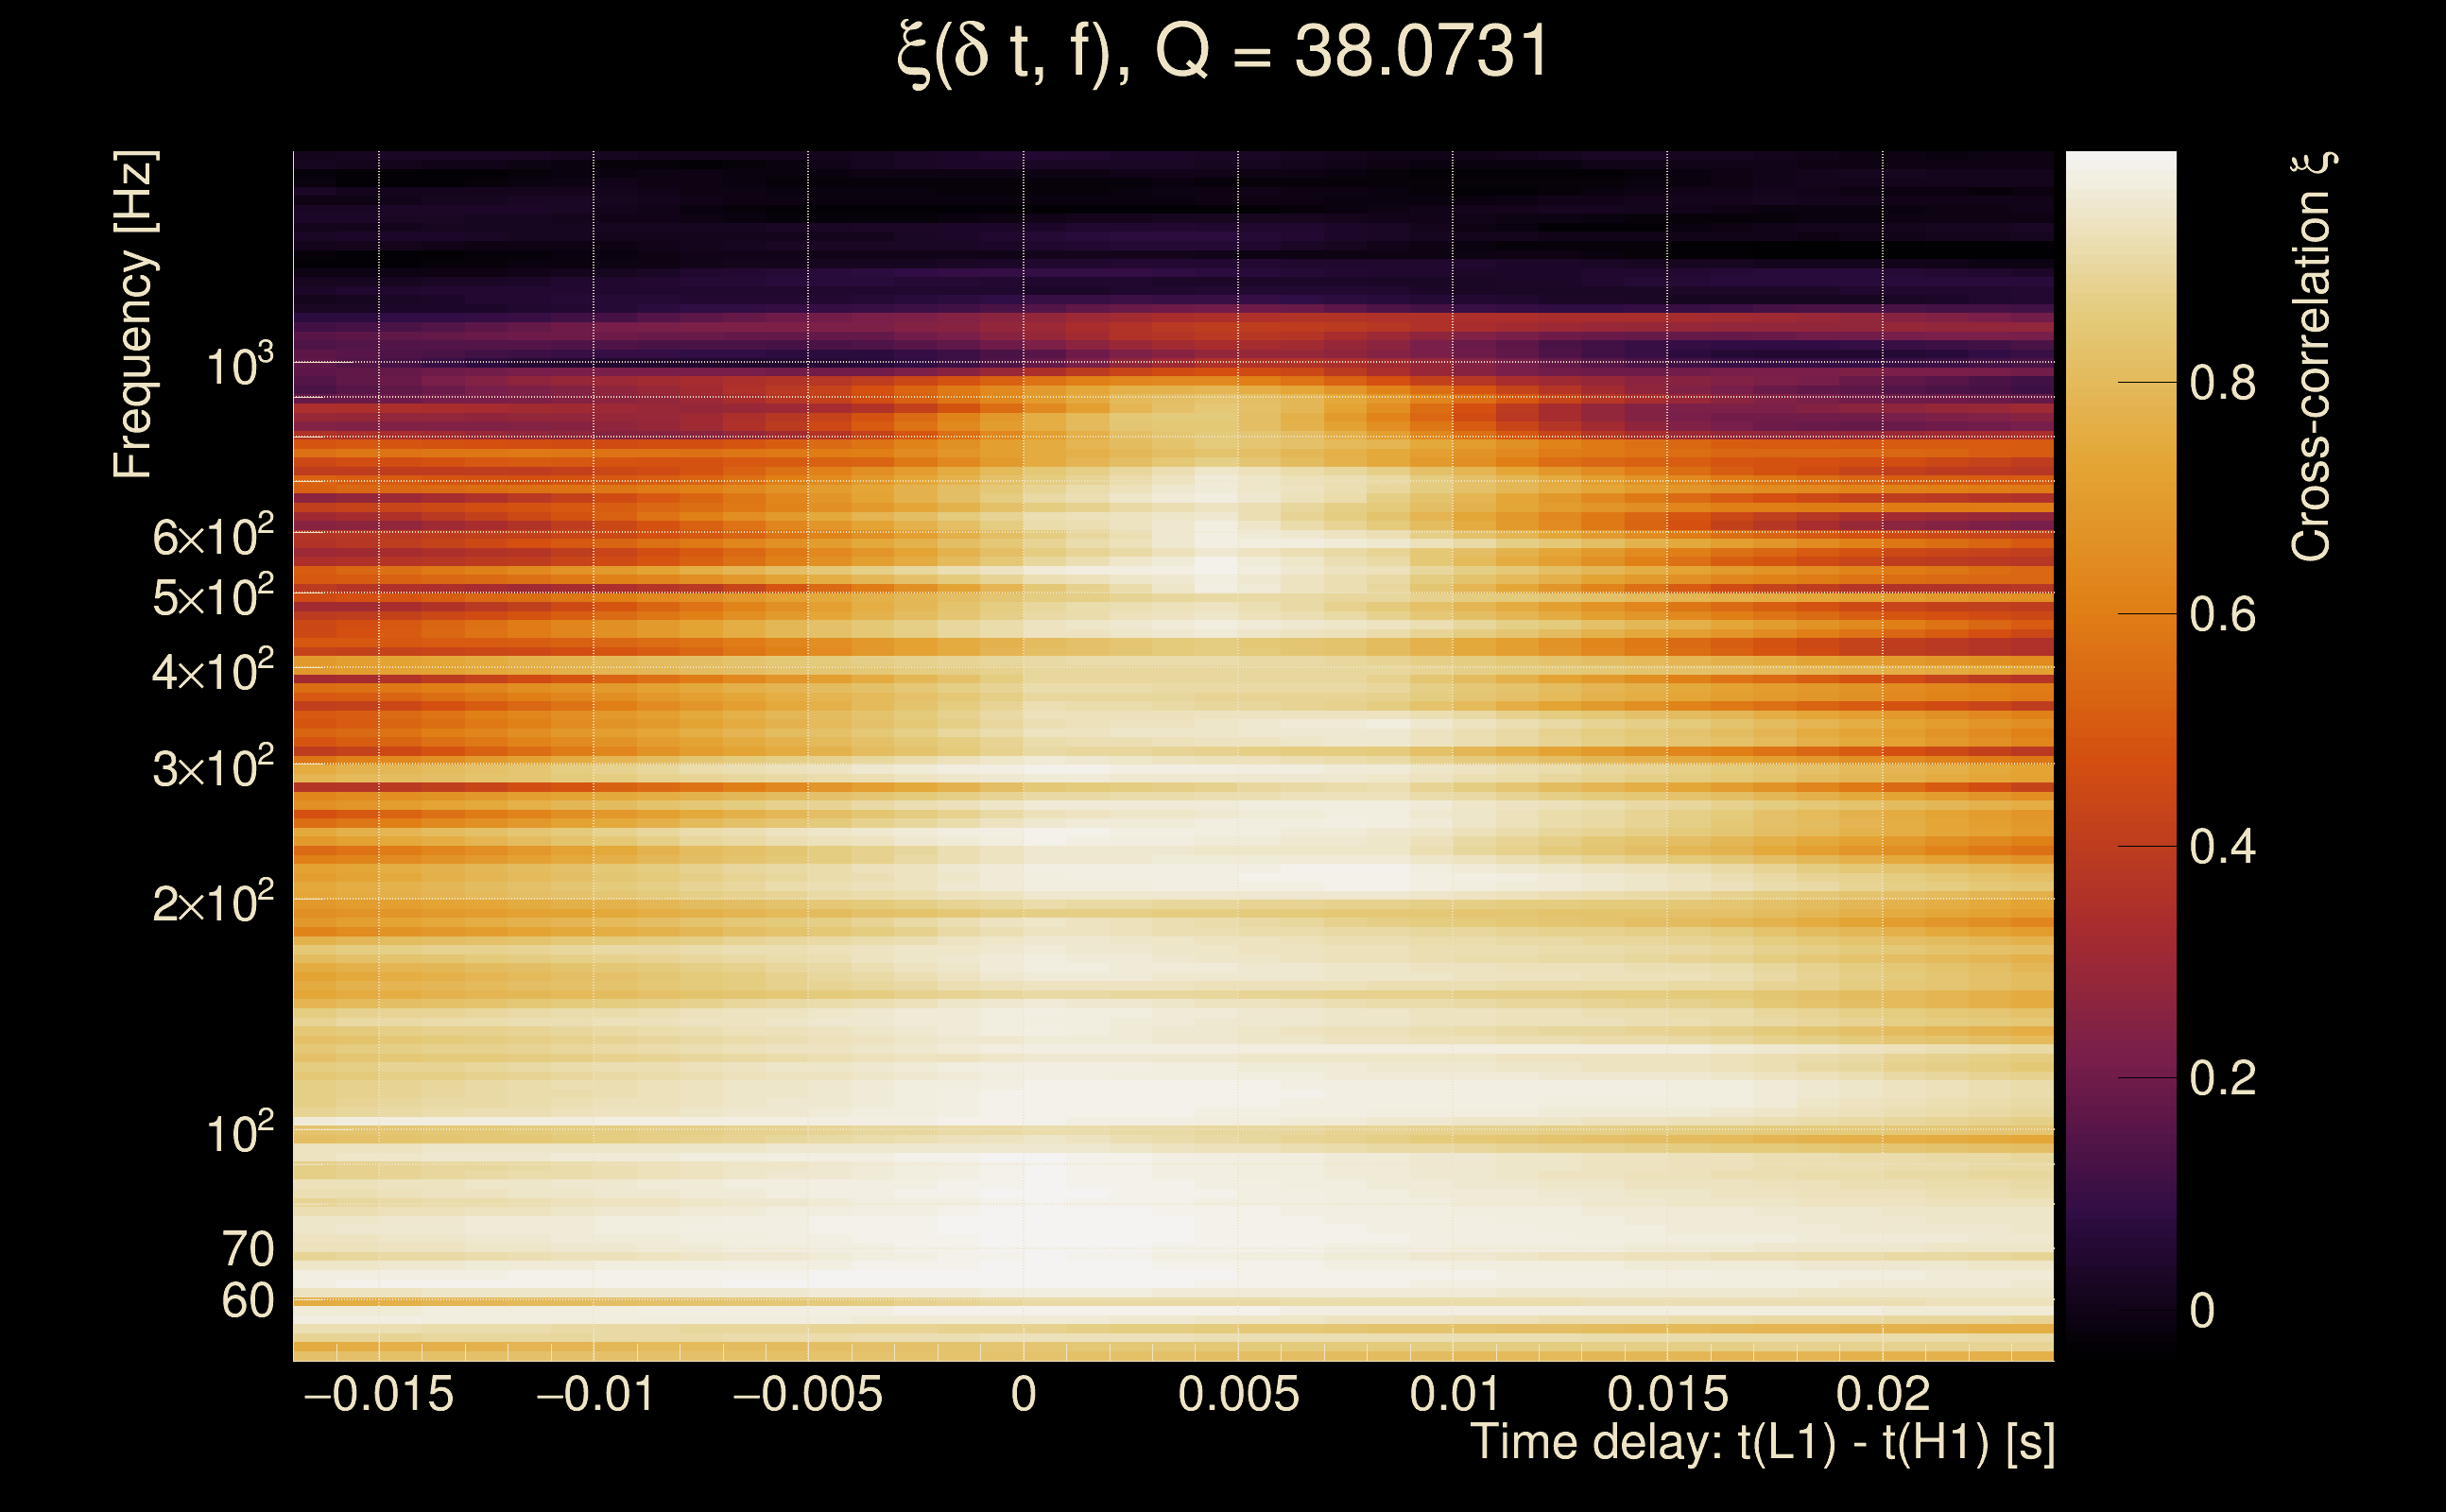
| Time delay between detectors t(L1) - t(H1): | 0.00398762 s (slice index = 108 / 217), δt_gw = 0.00398762 s |
| Time delay uncertainty: | 0.000510775 s |
| [targeted mode] Time delay probability: | 0.999742 (0.000322924 sigmas), δt_target = 1.72247e+45 s |
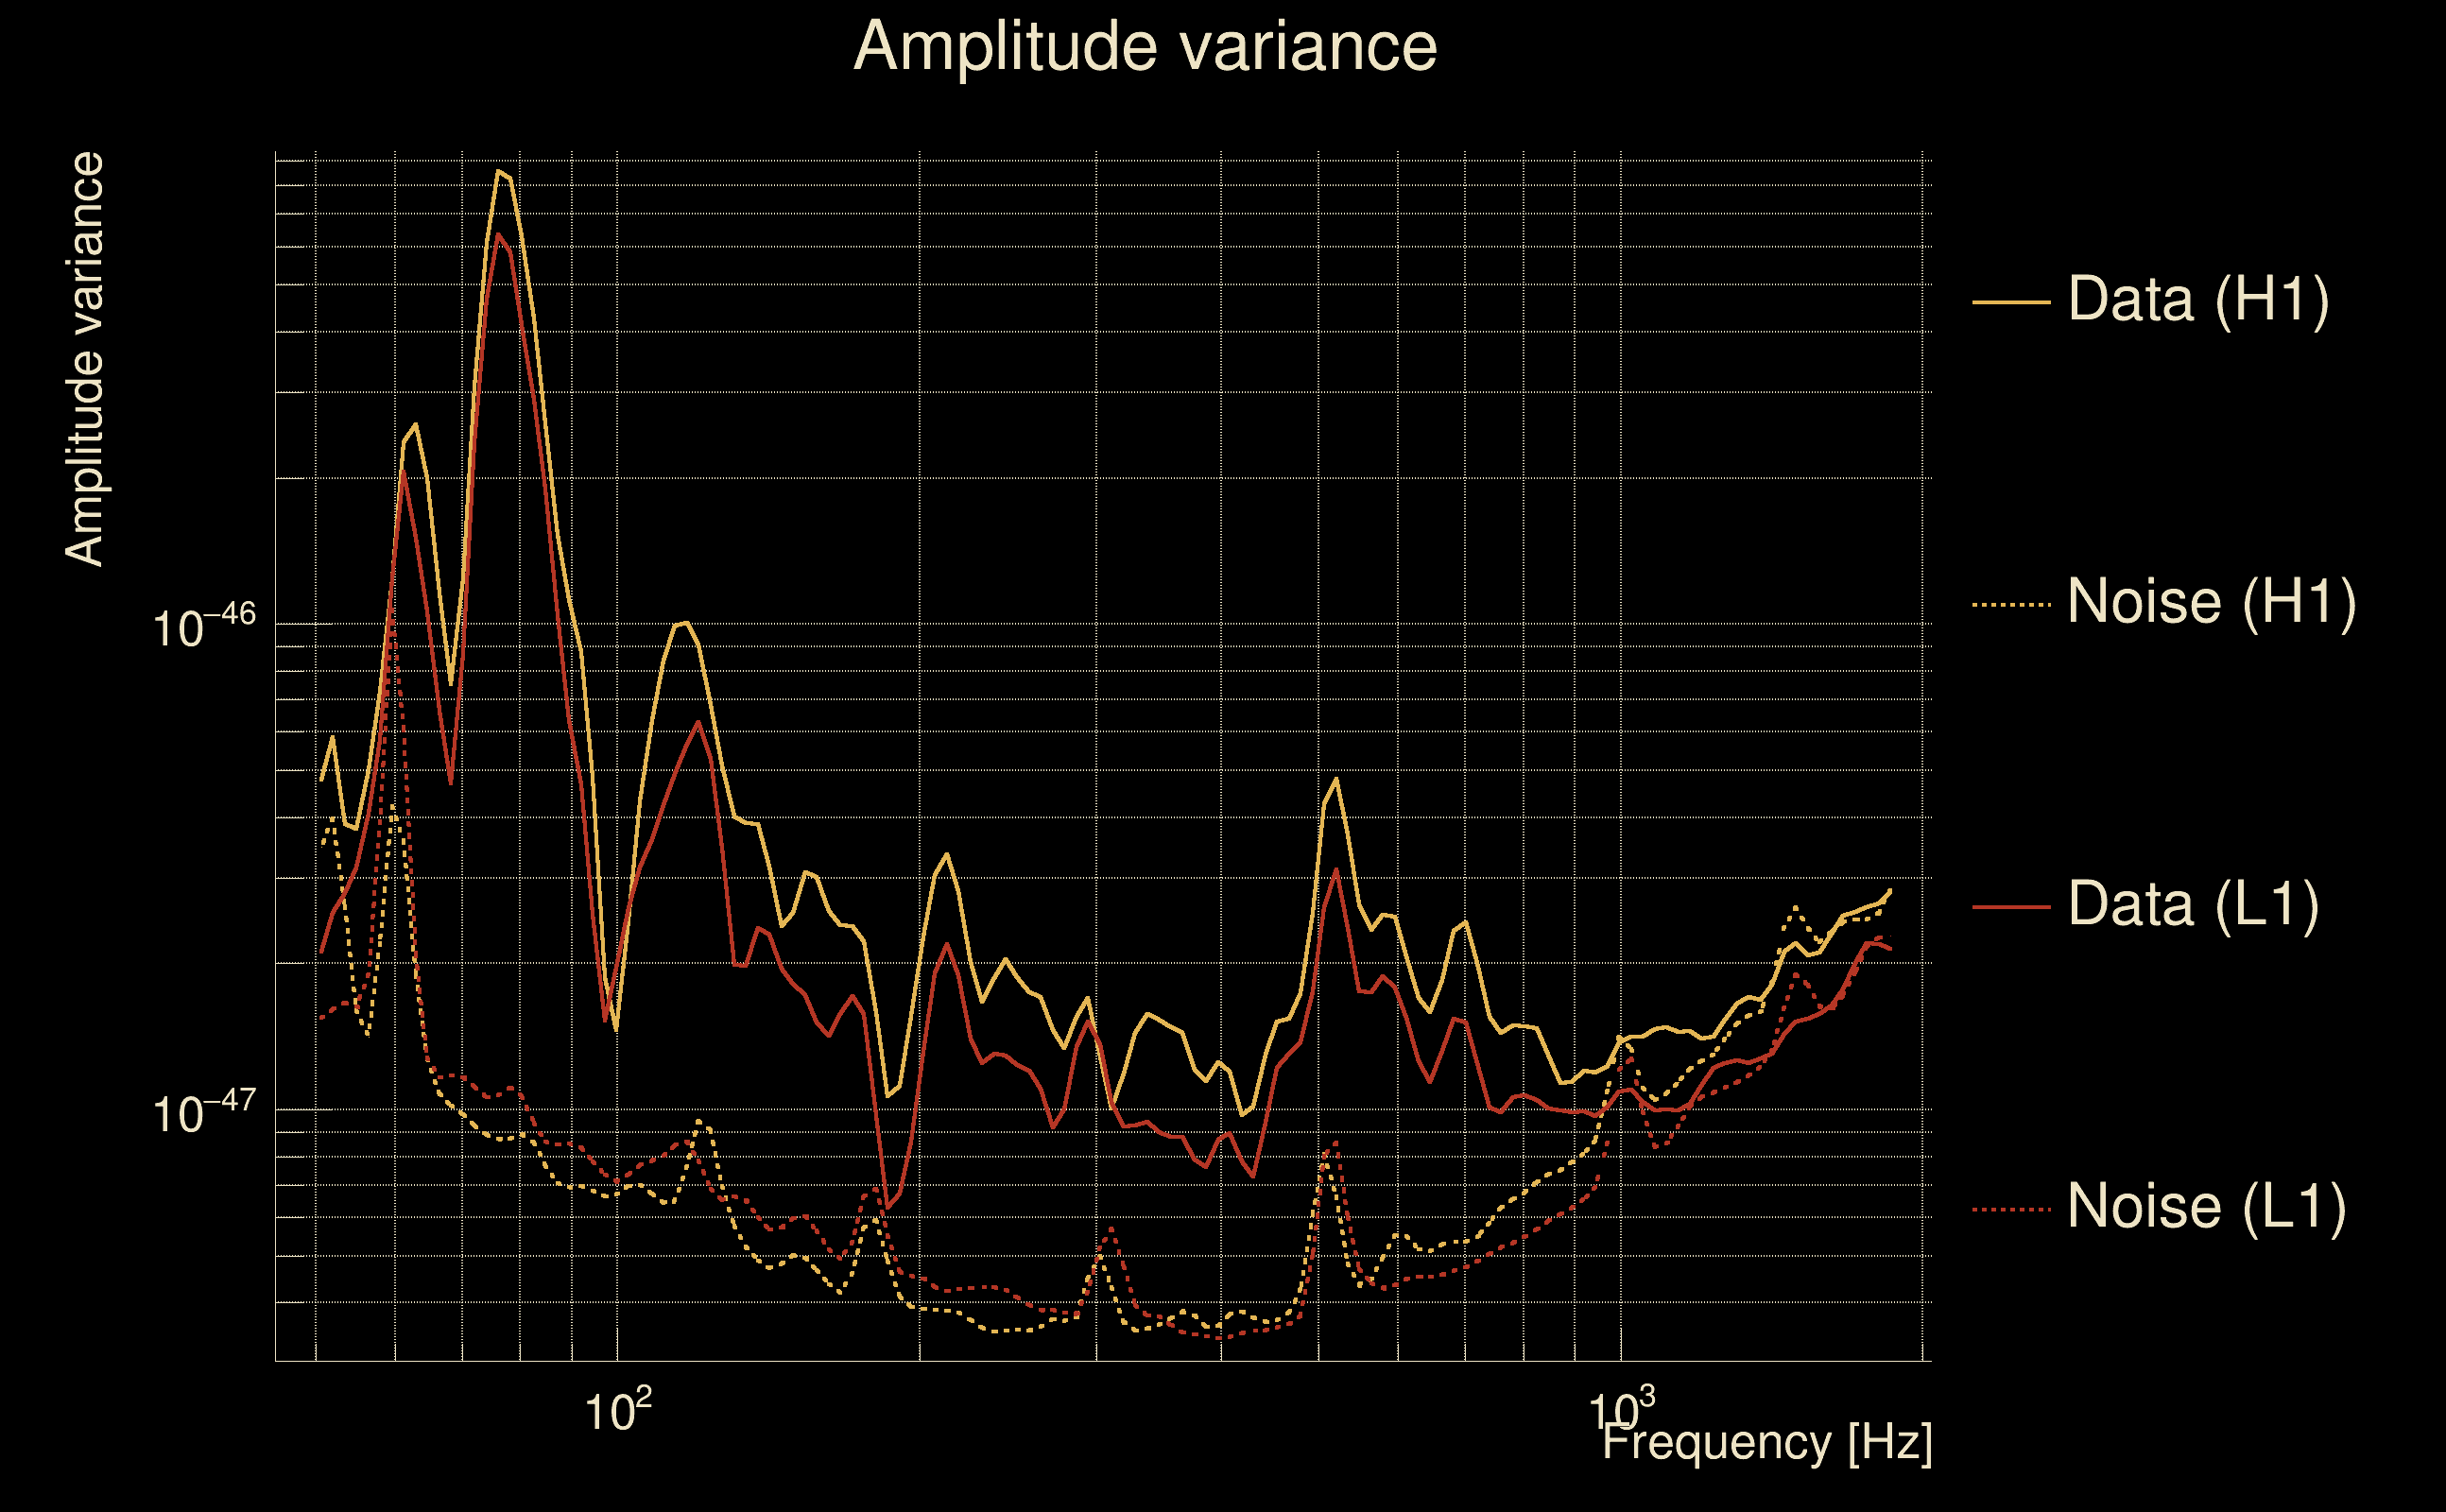
| Frequency: | 232.489 Hz |
| Ξ: | 0.89164 ± 0.00323714 (variance = 1.04791e-05): Q0: 0.936108, Q1: 0.933804, Q2: 0.933947, Q3: 0.936931, Q4: 0.927693 |
| Rank: | R_A = 0.888409 |
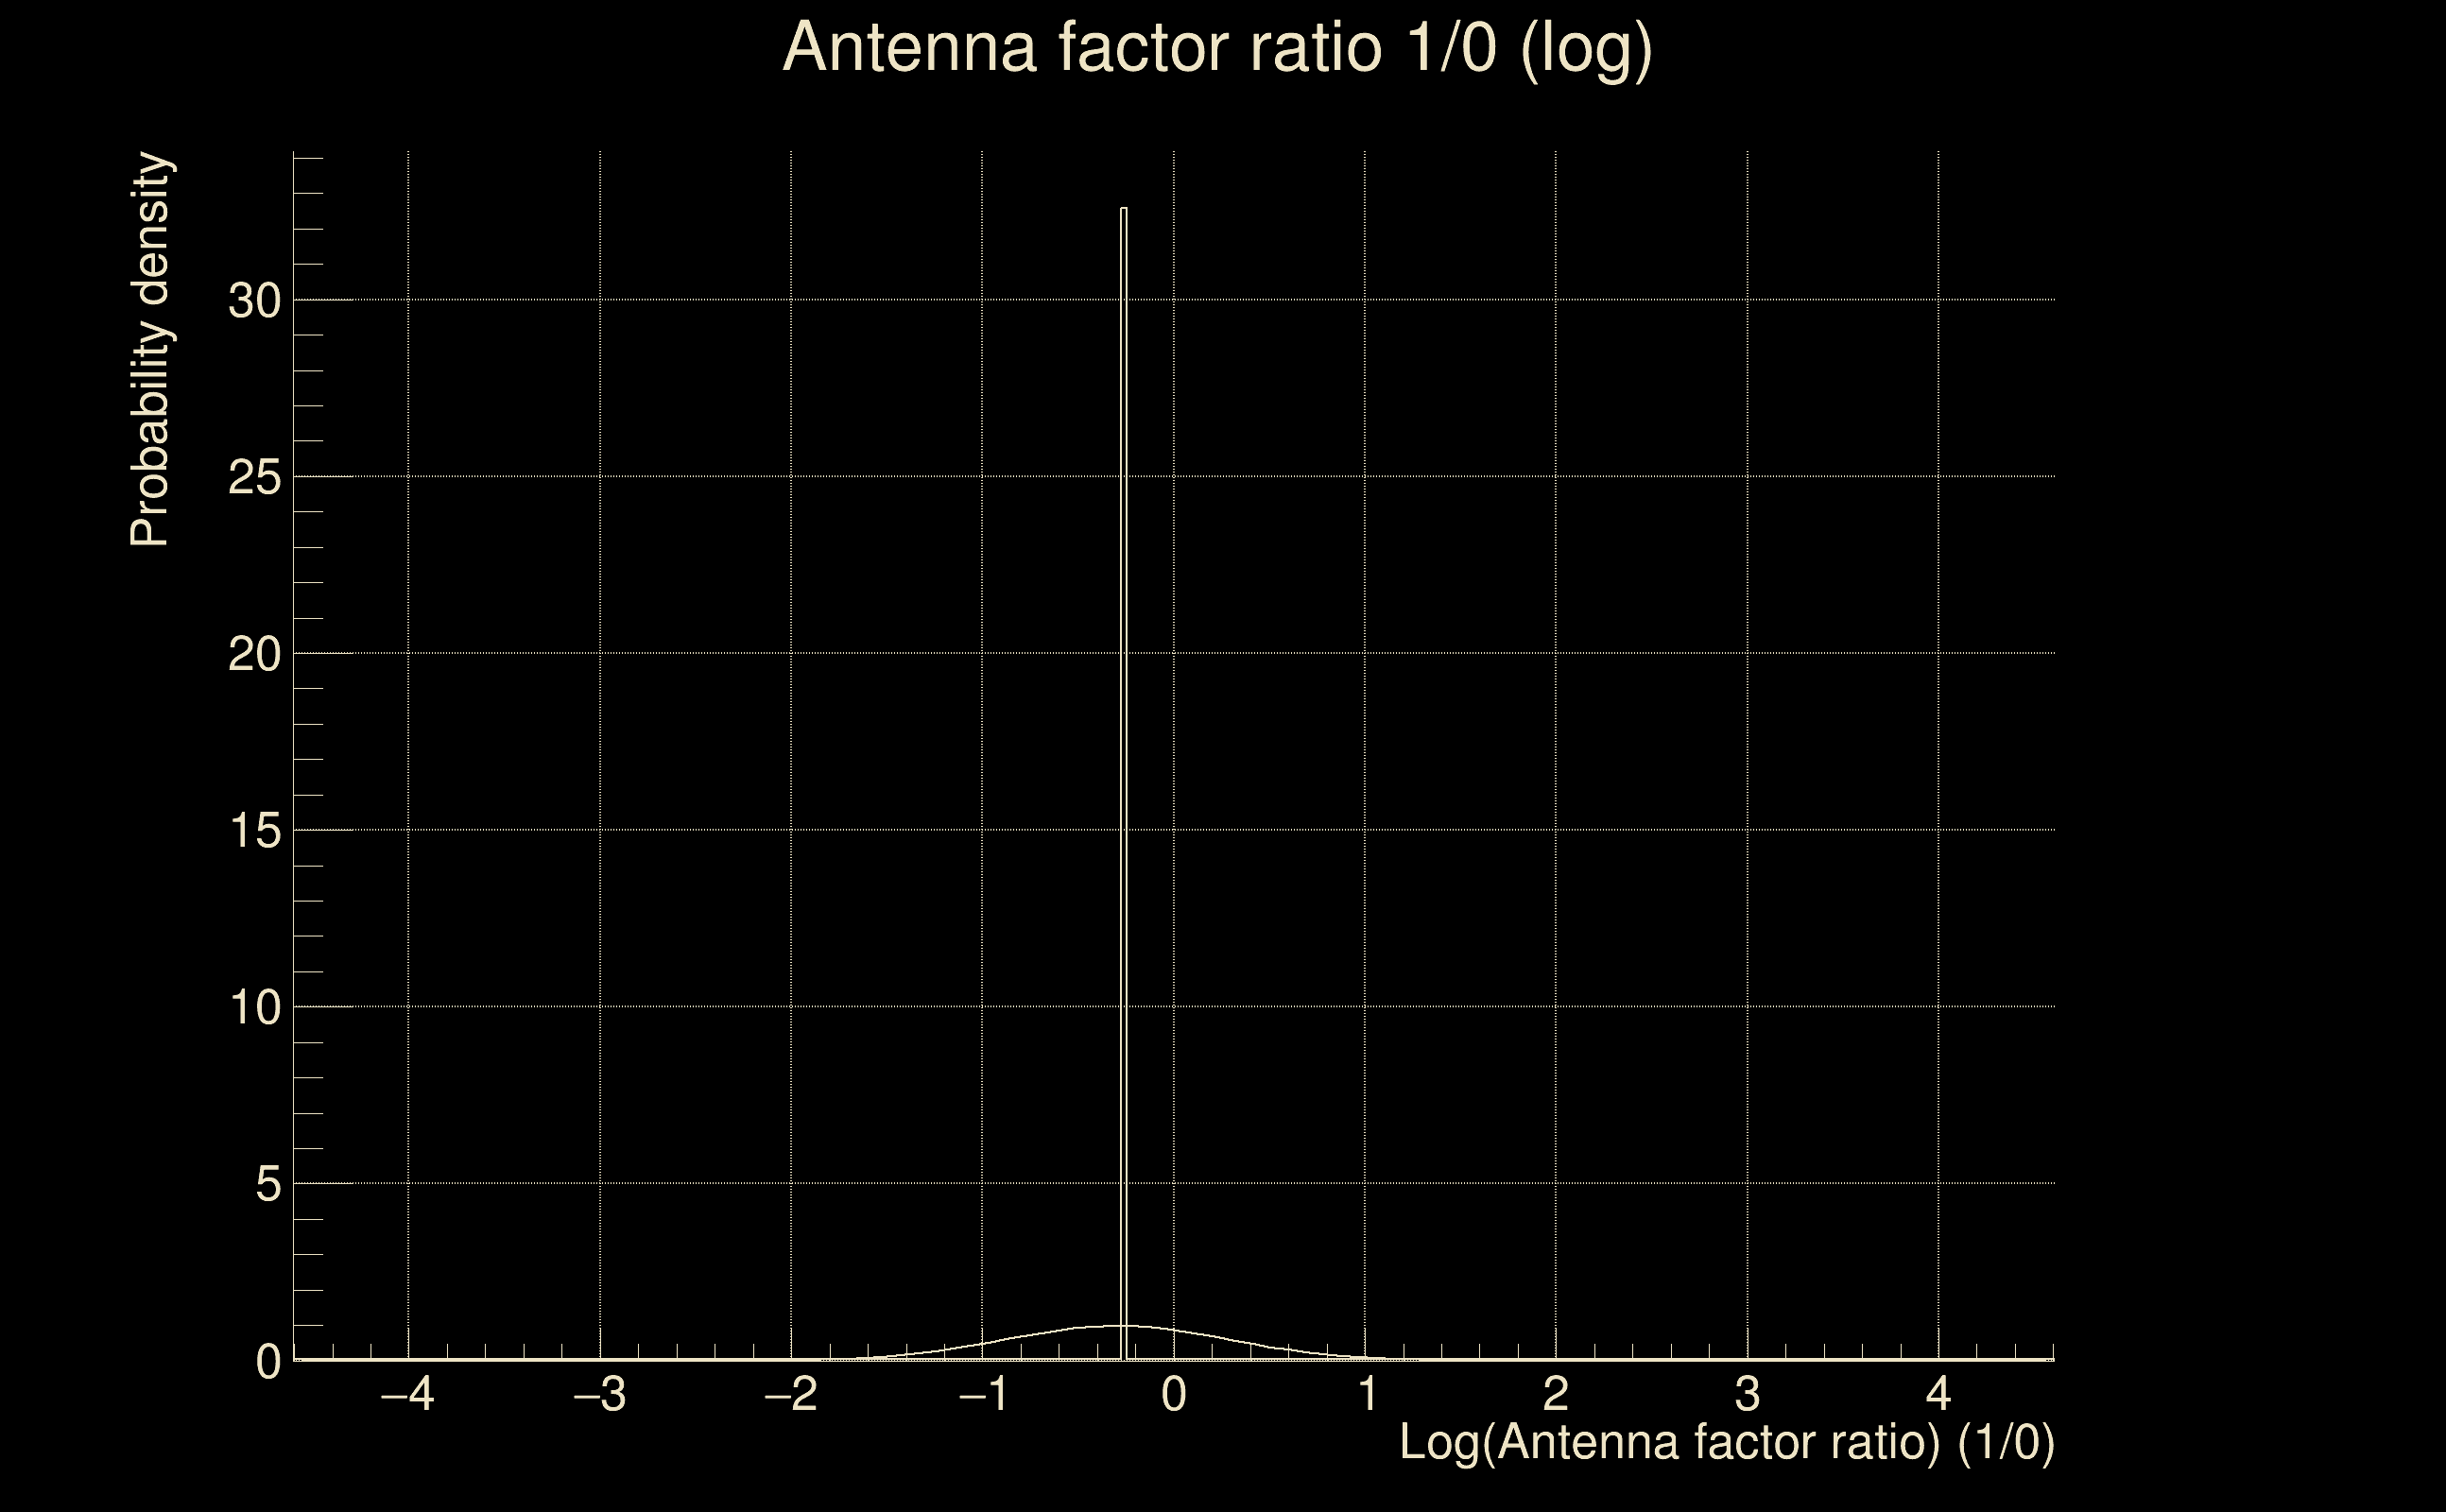
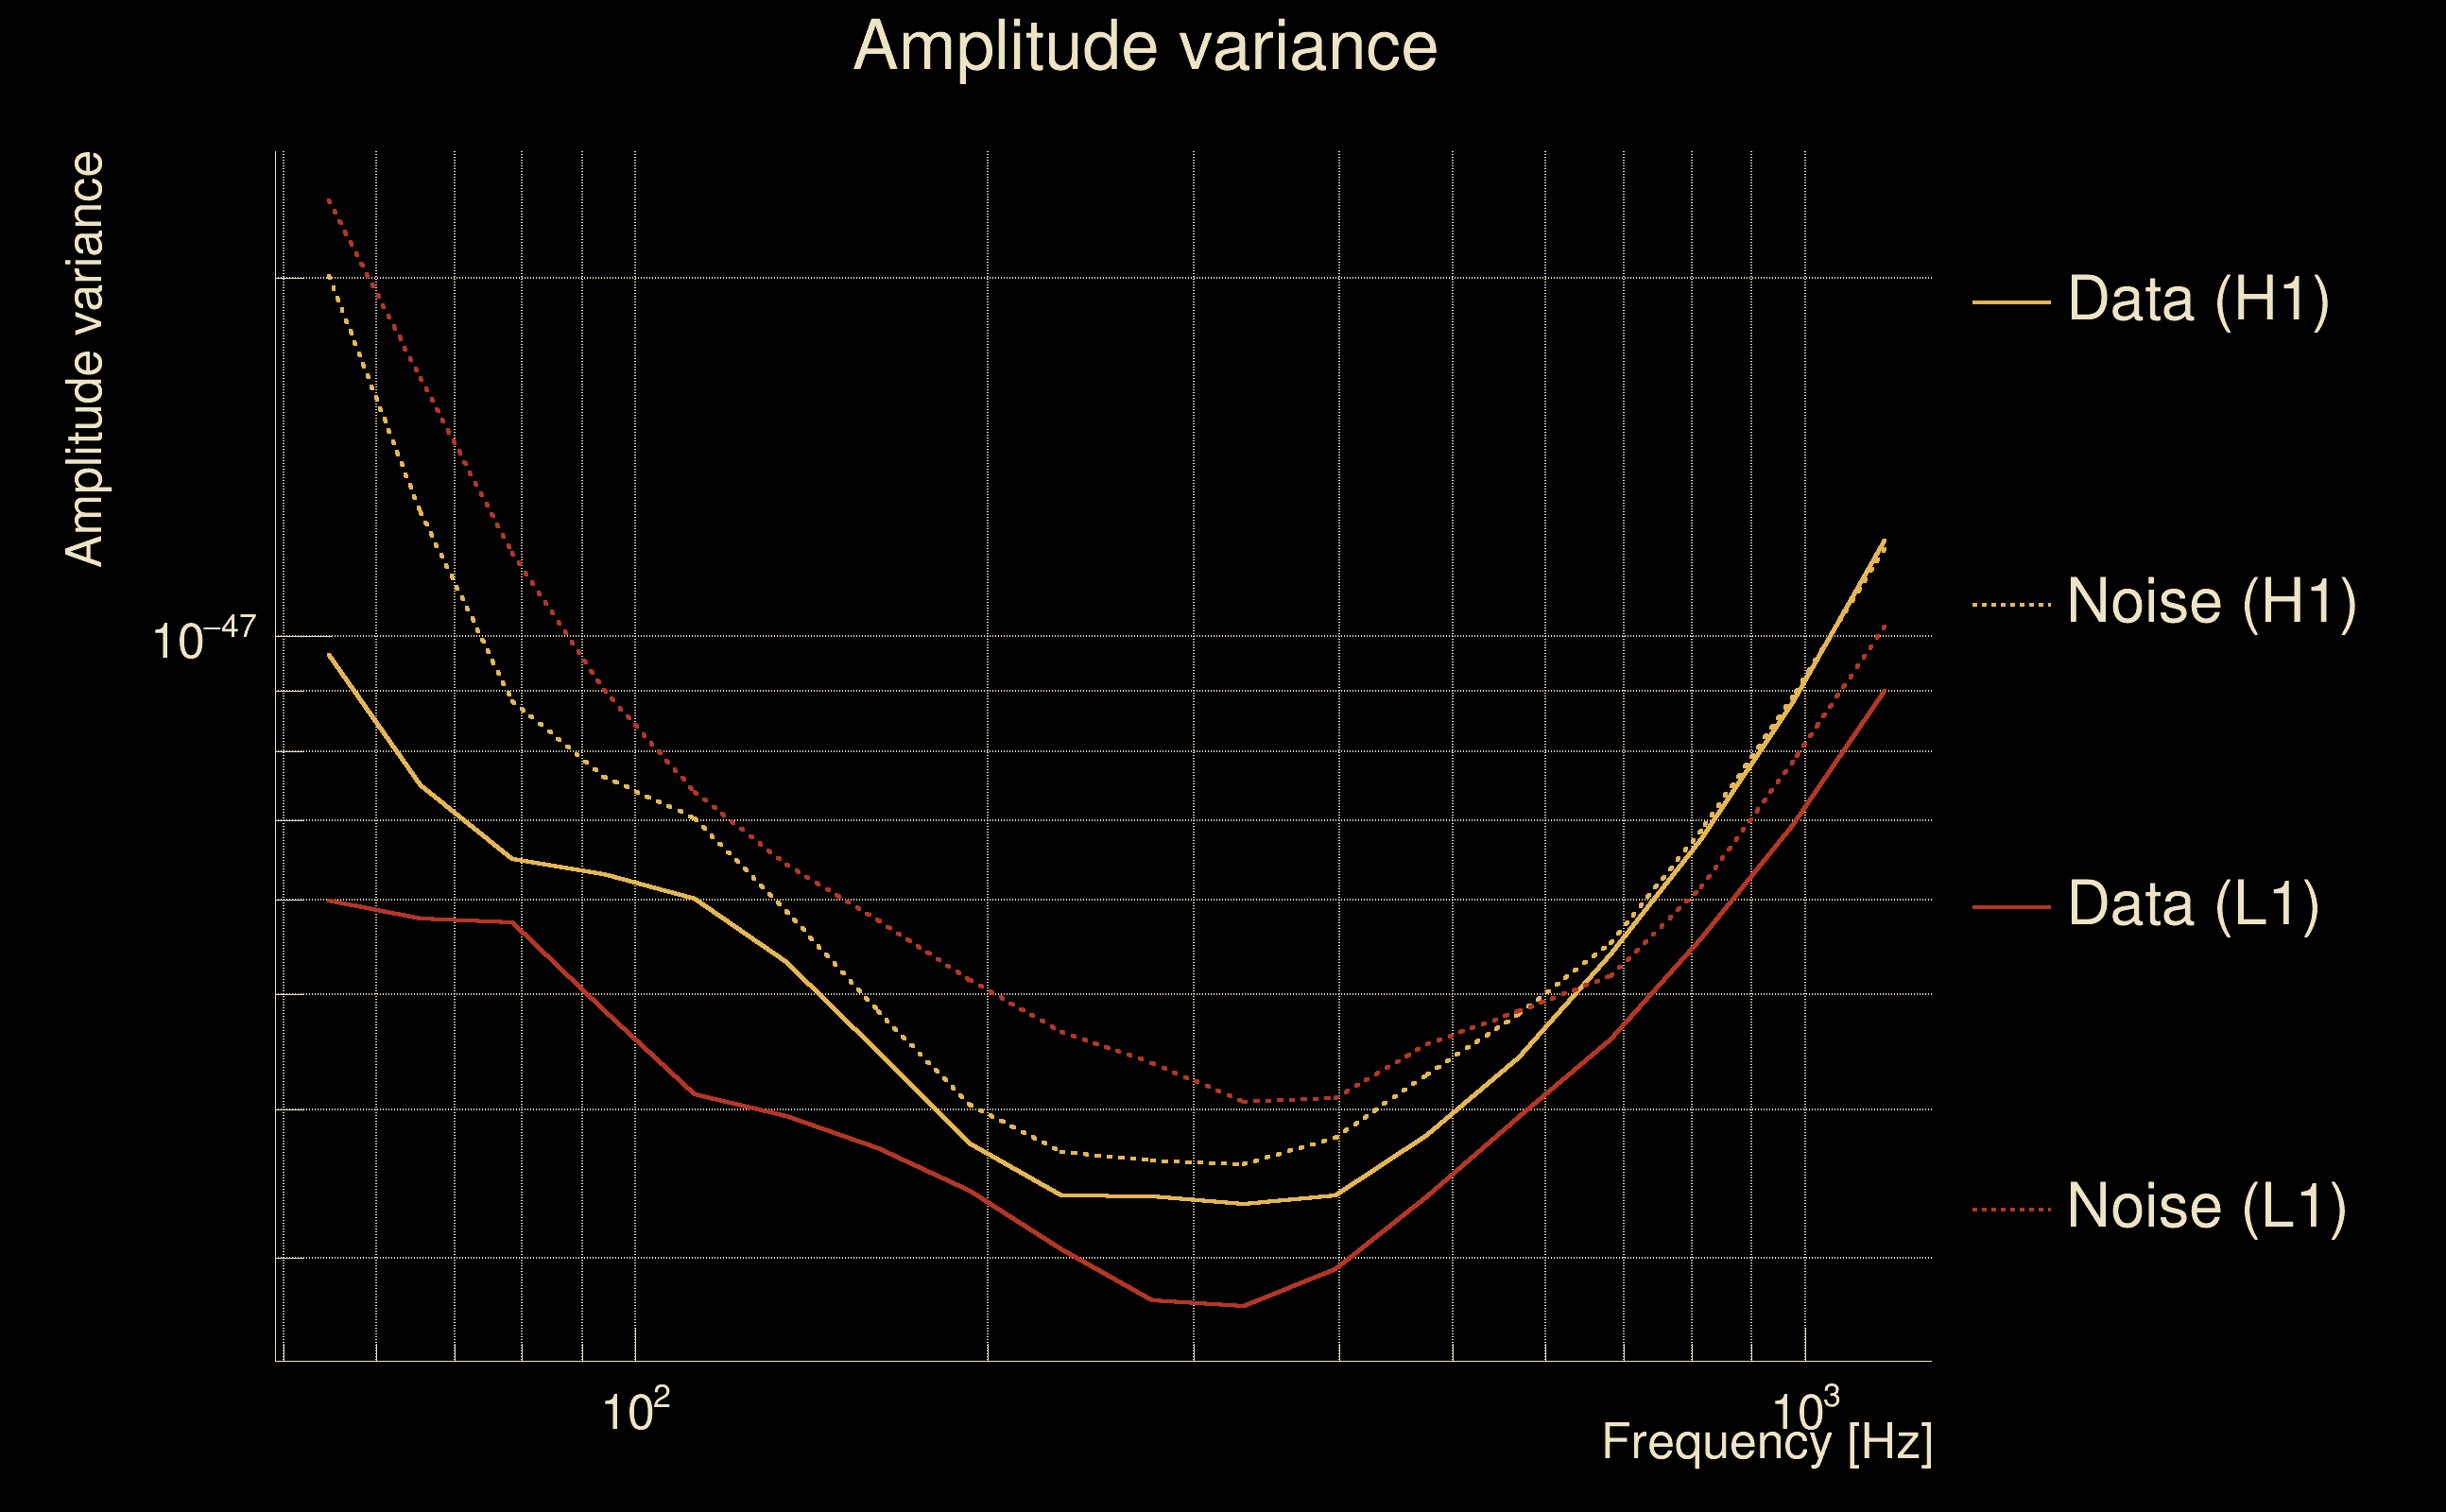
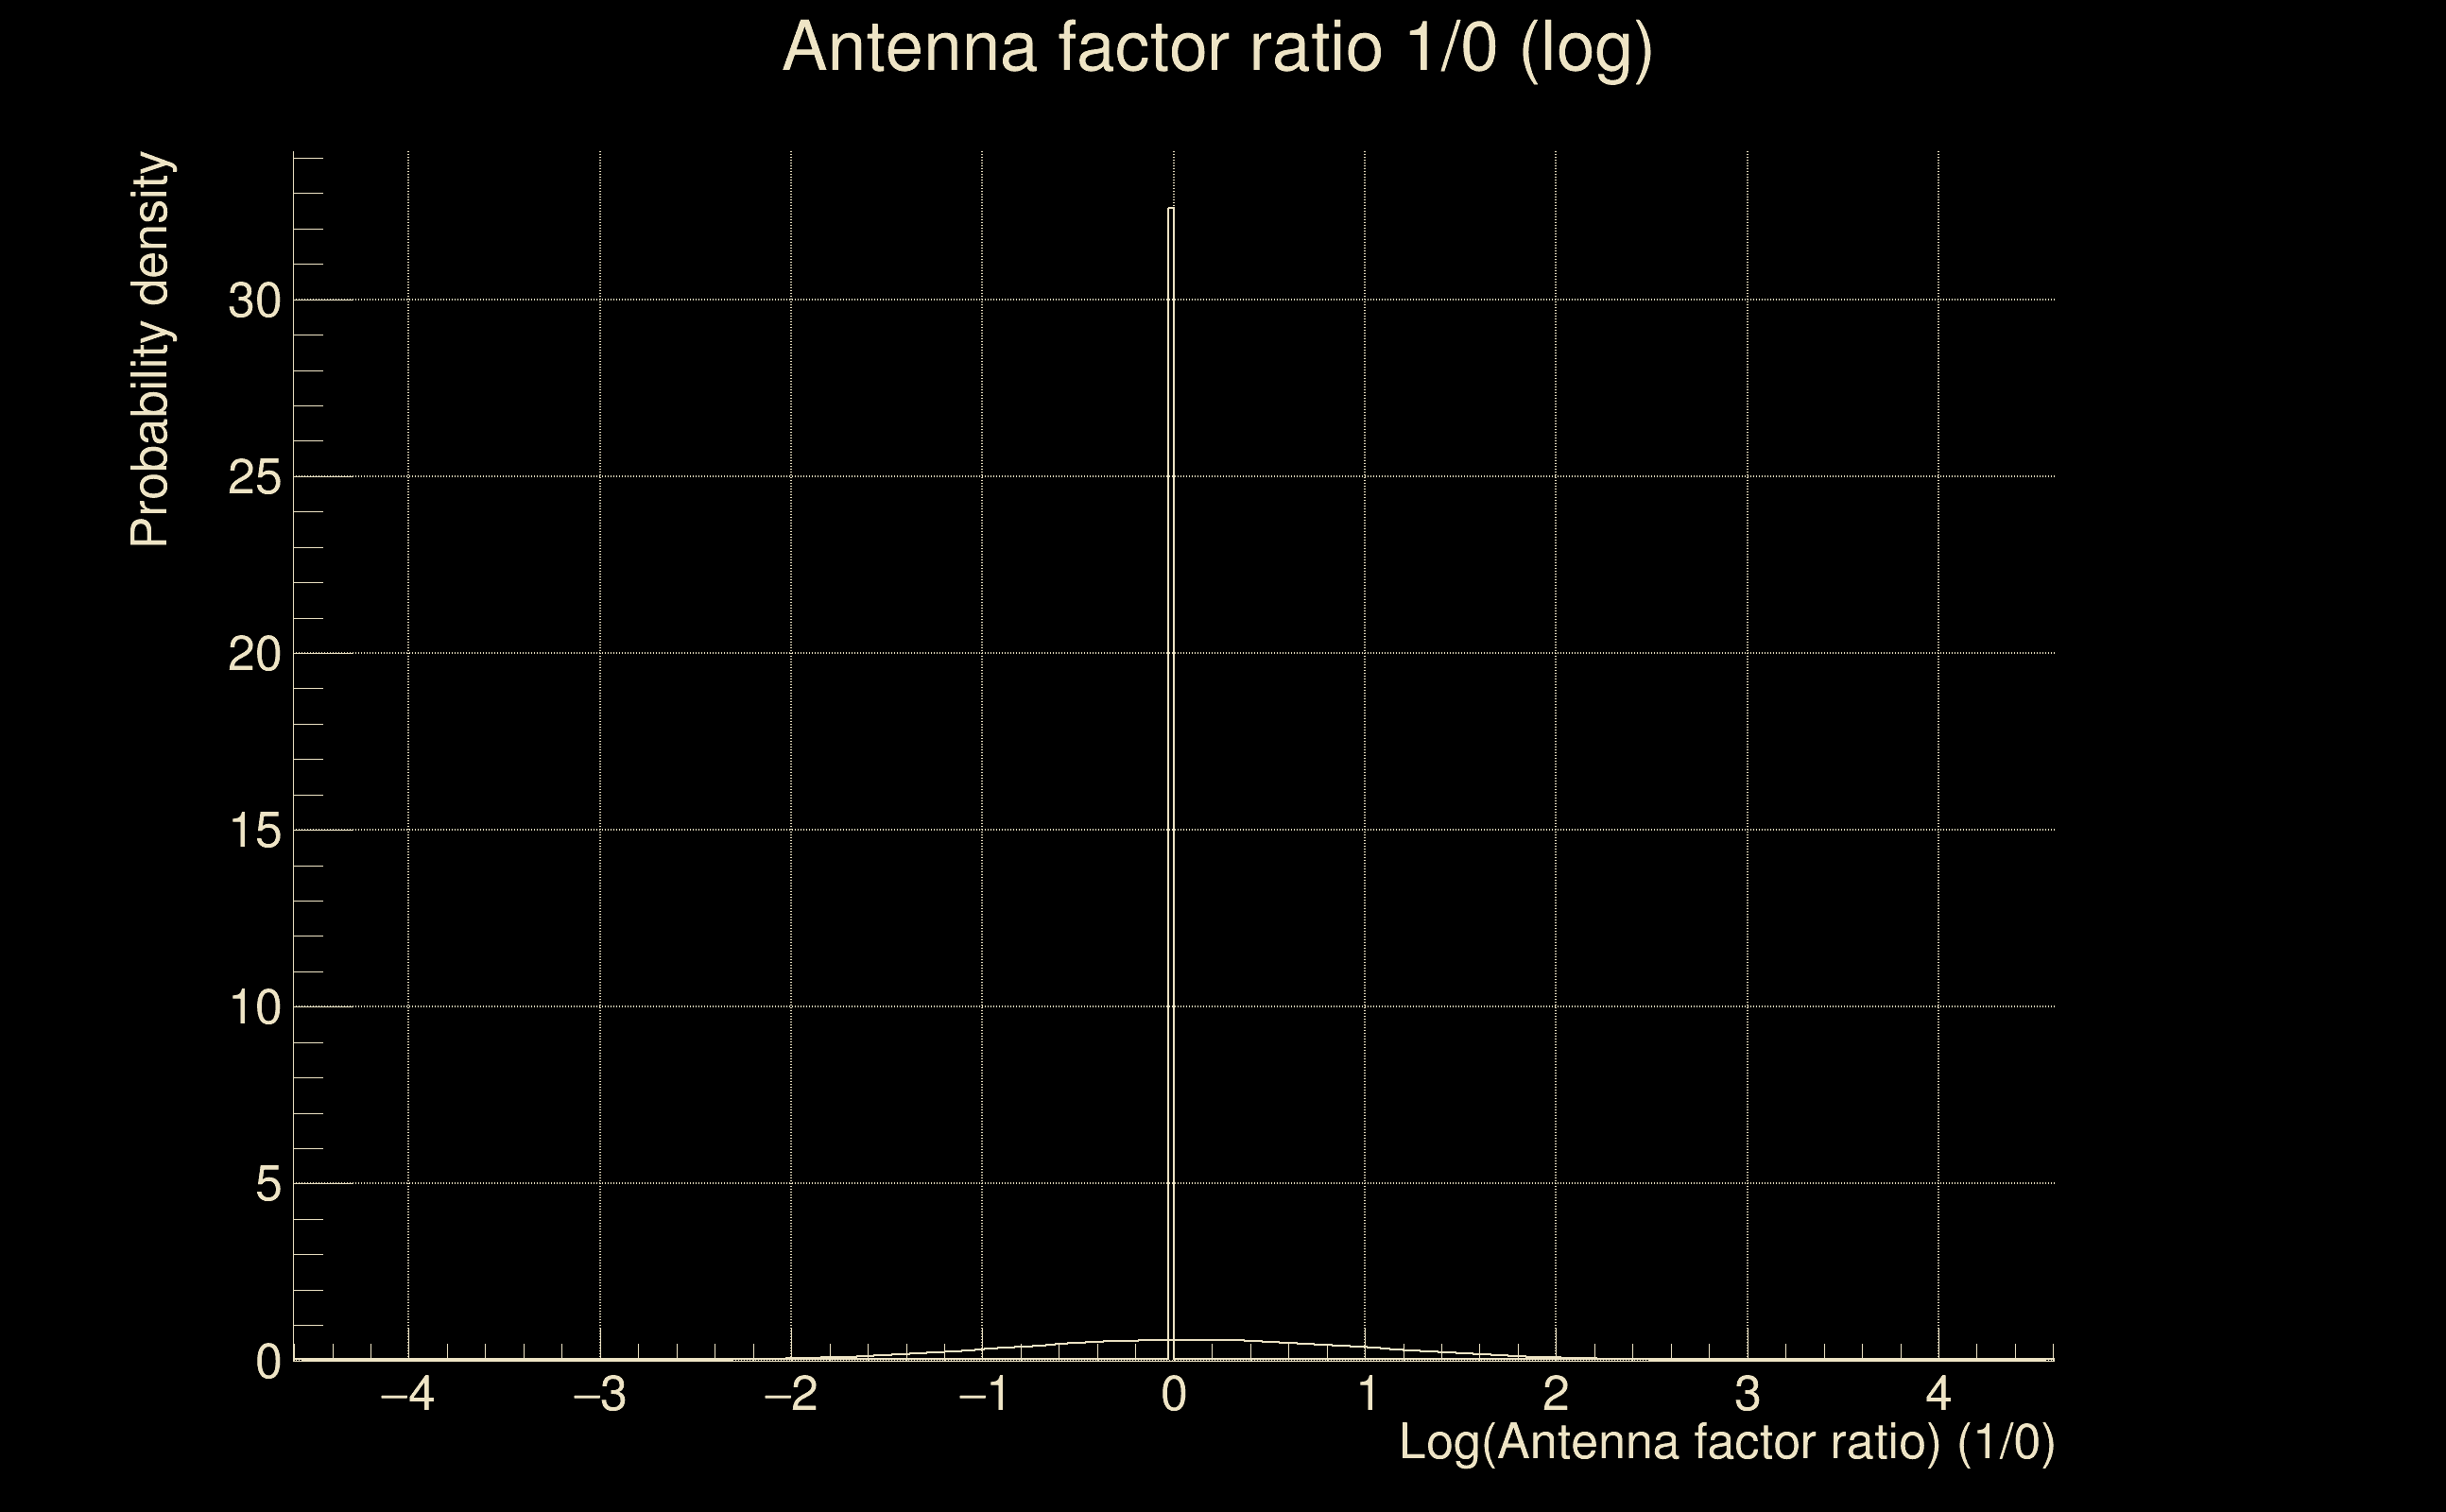
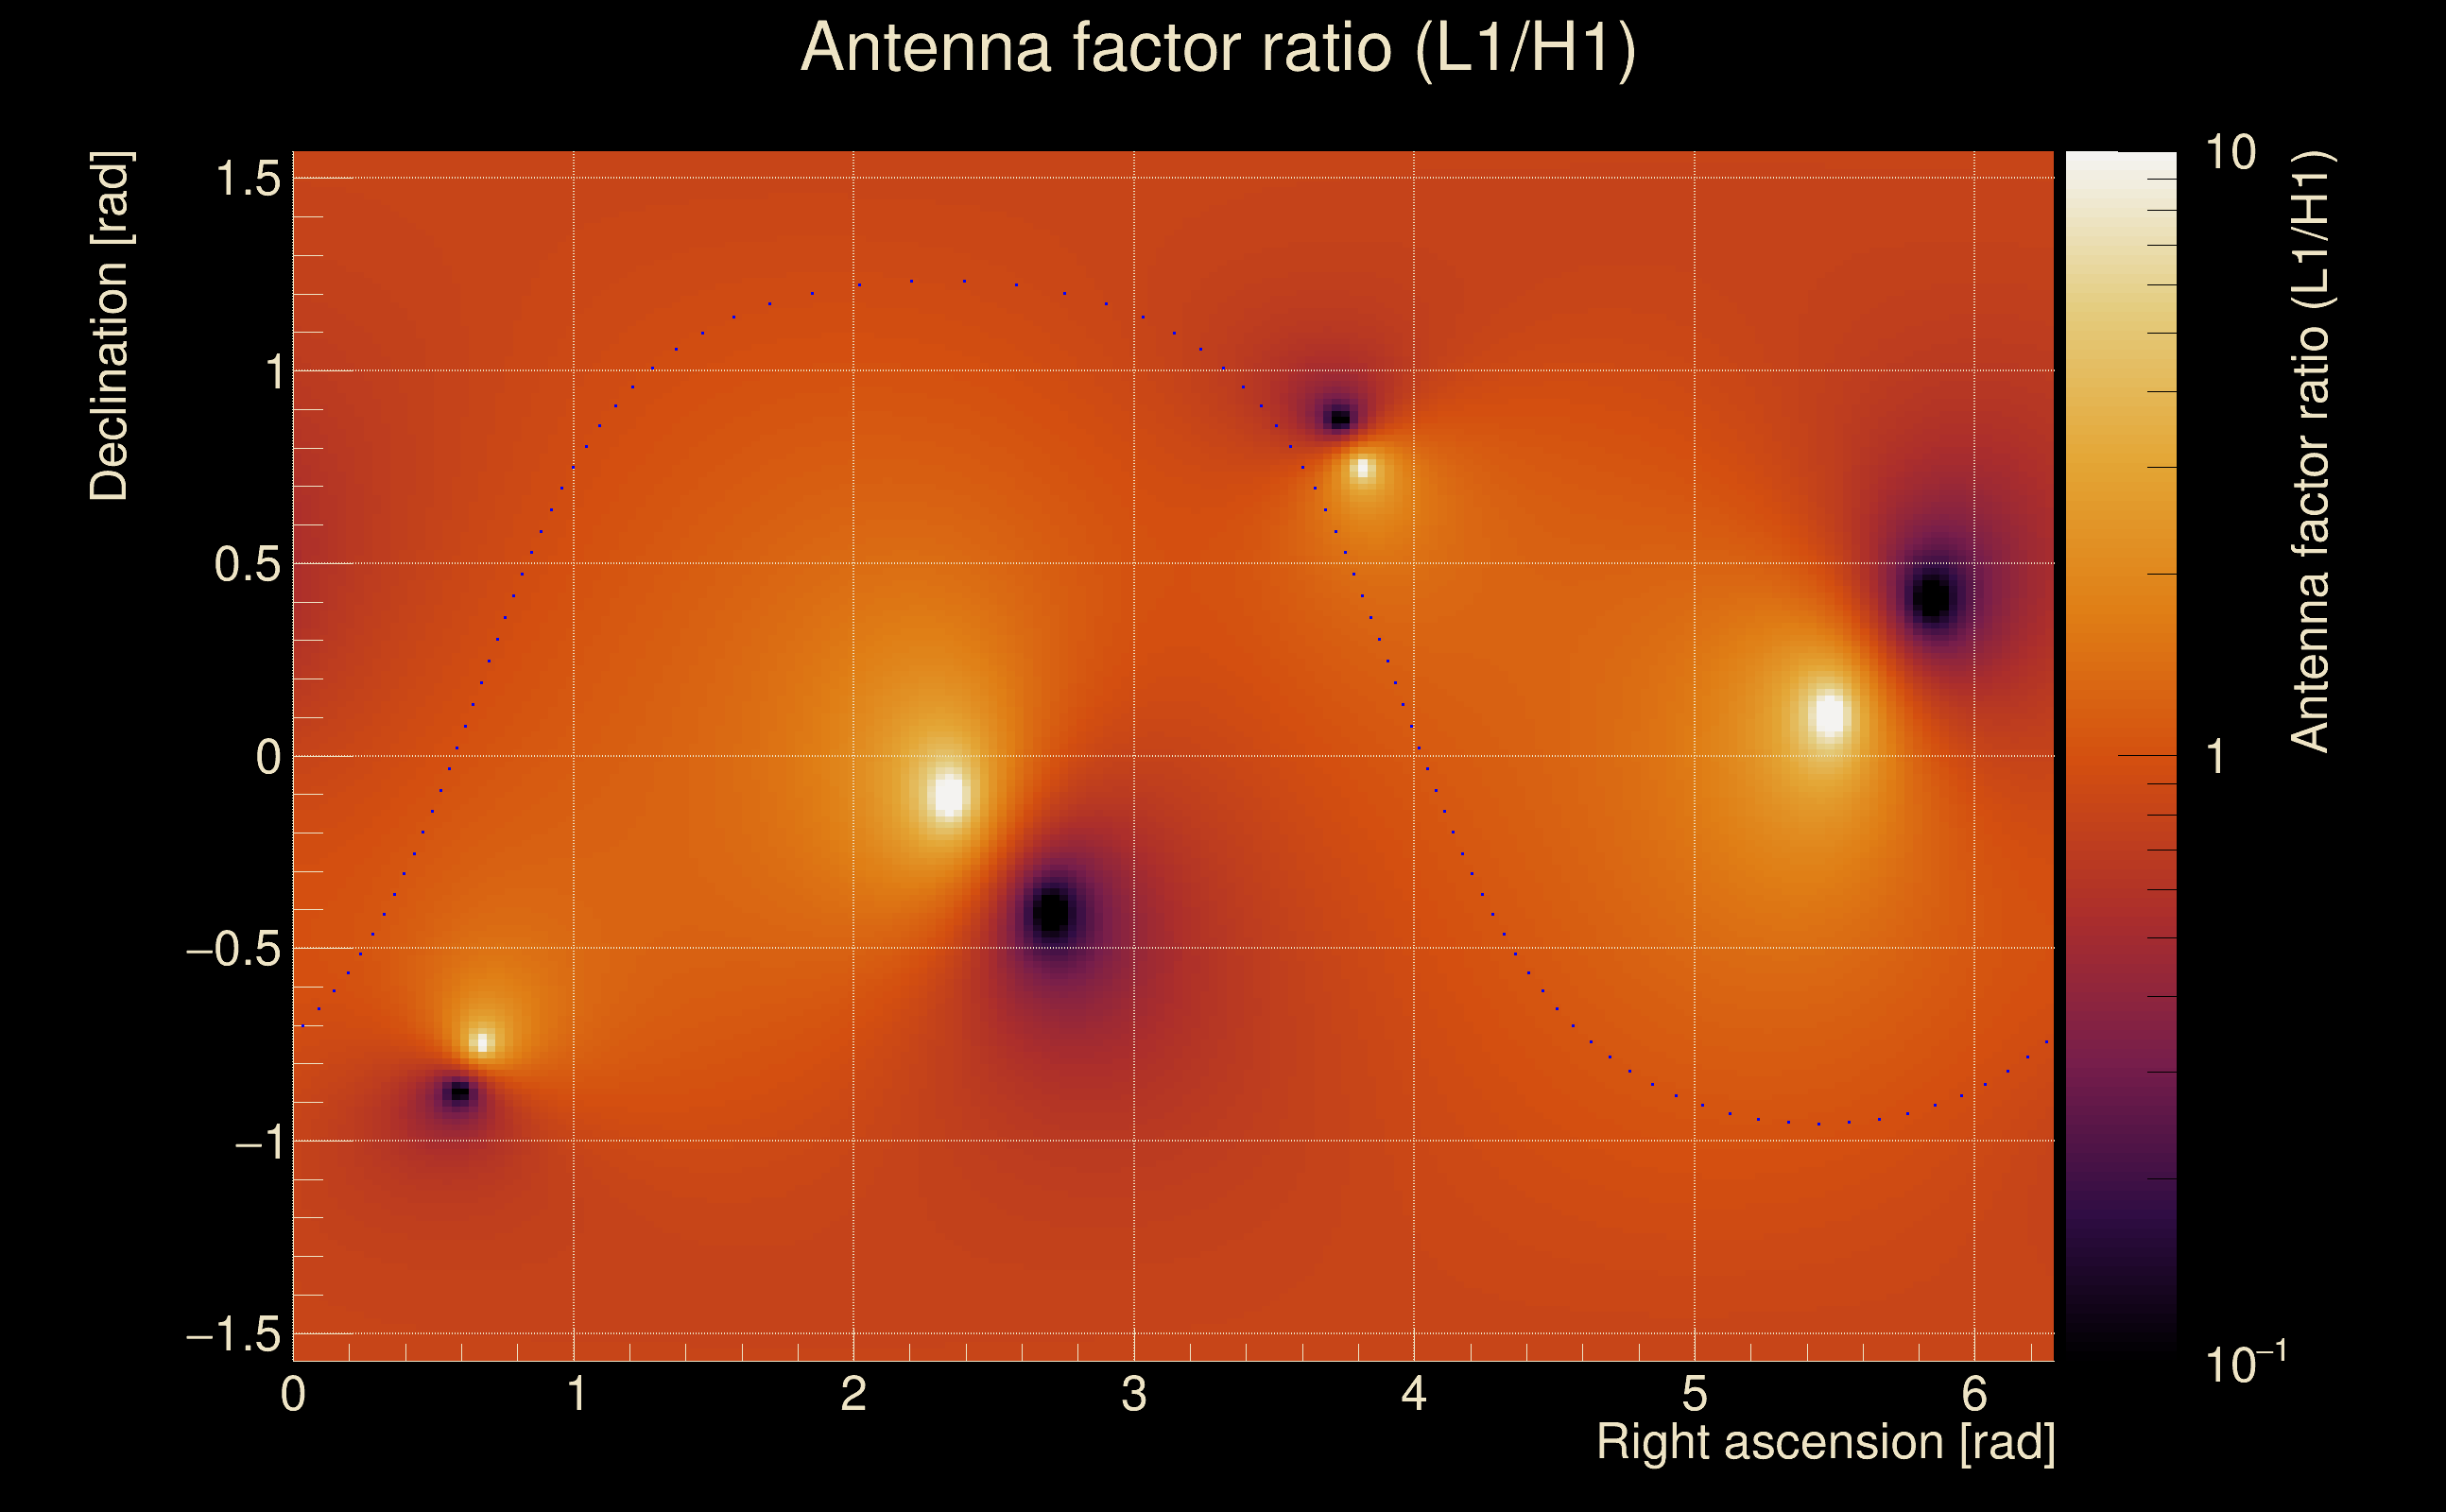
| Log of amplitude ratio (L1/H1): | -0.221549, variance = 0.158399 (L1/H1: -0.222873, variance = 0.304326, H1/L1: 0.219576, variance = 0.306481) |
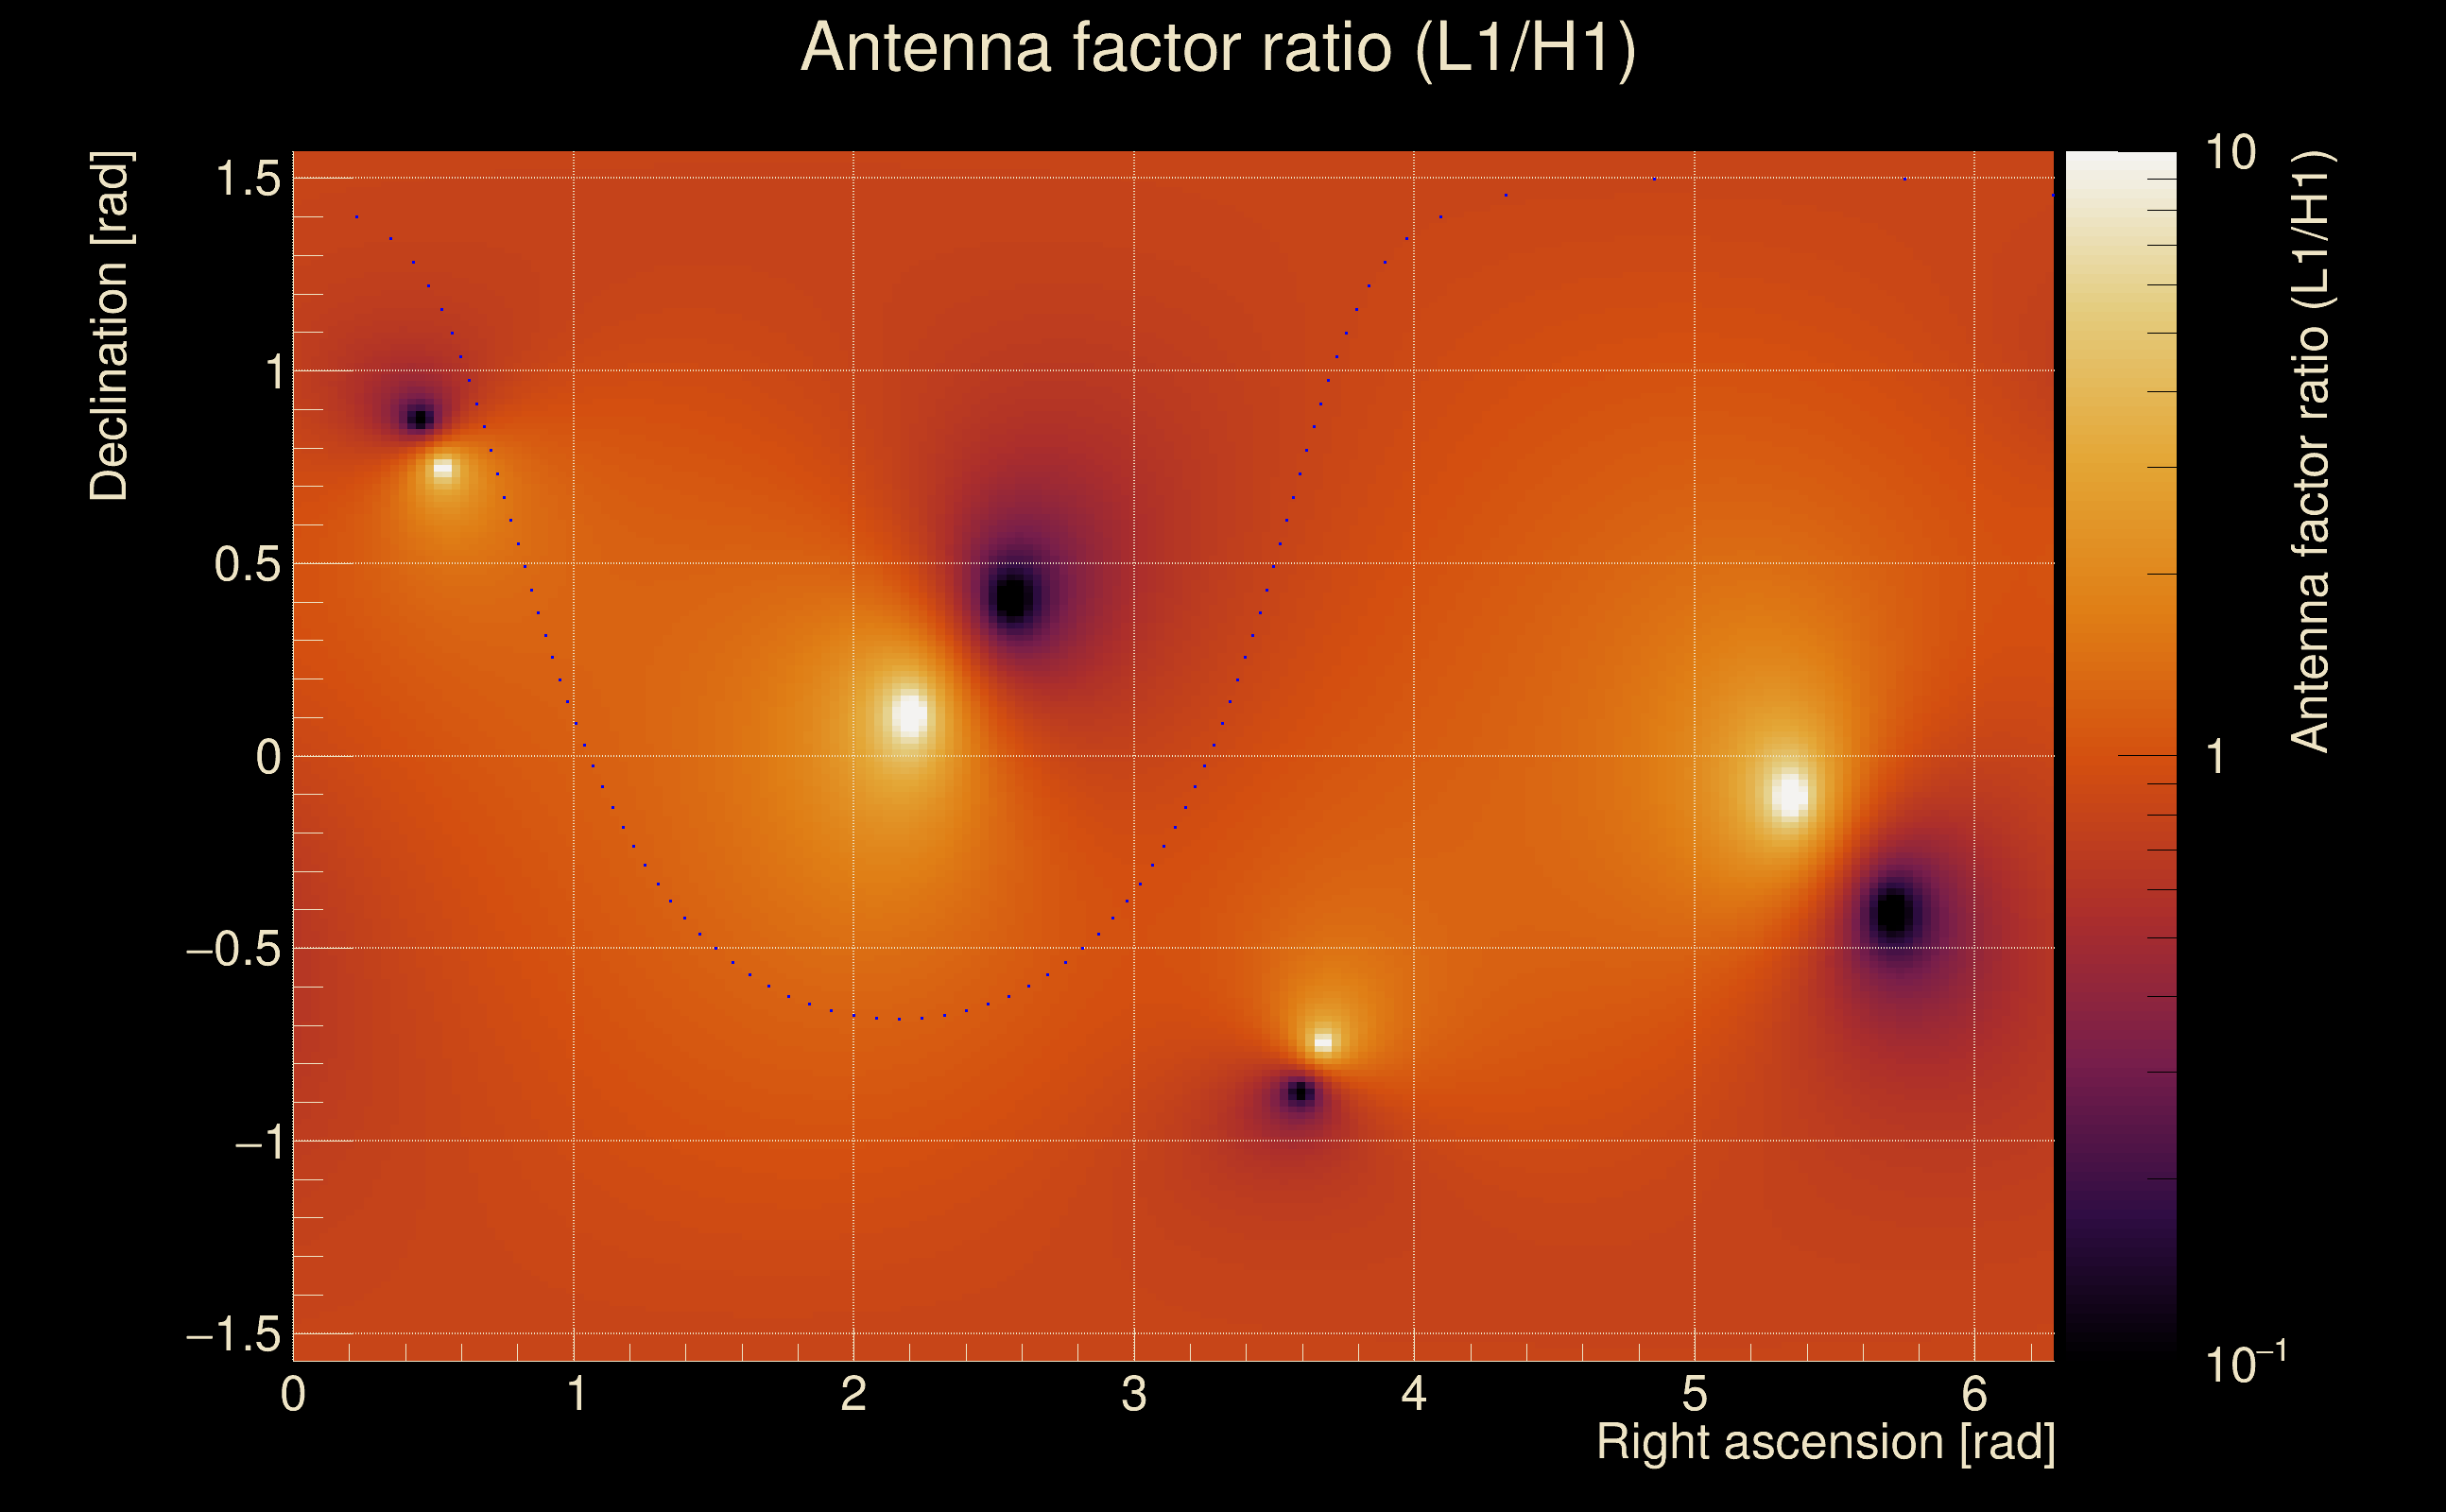
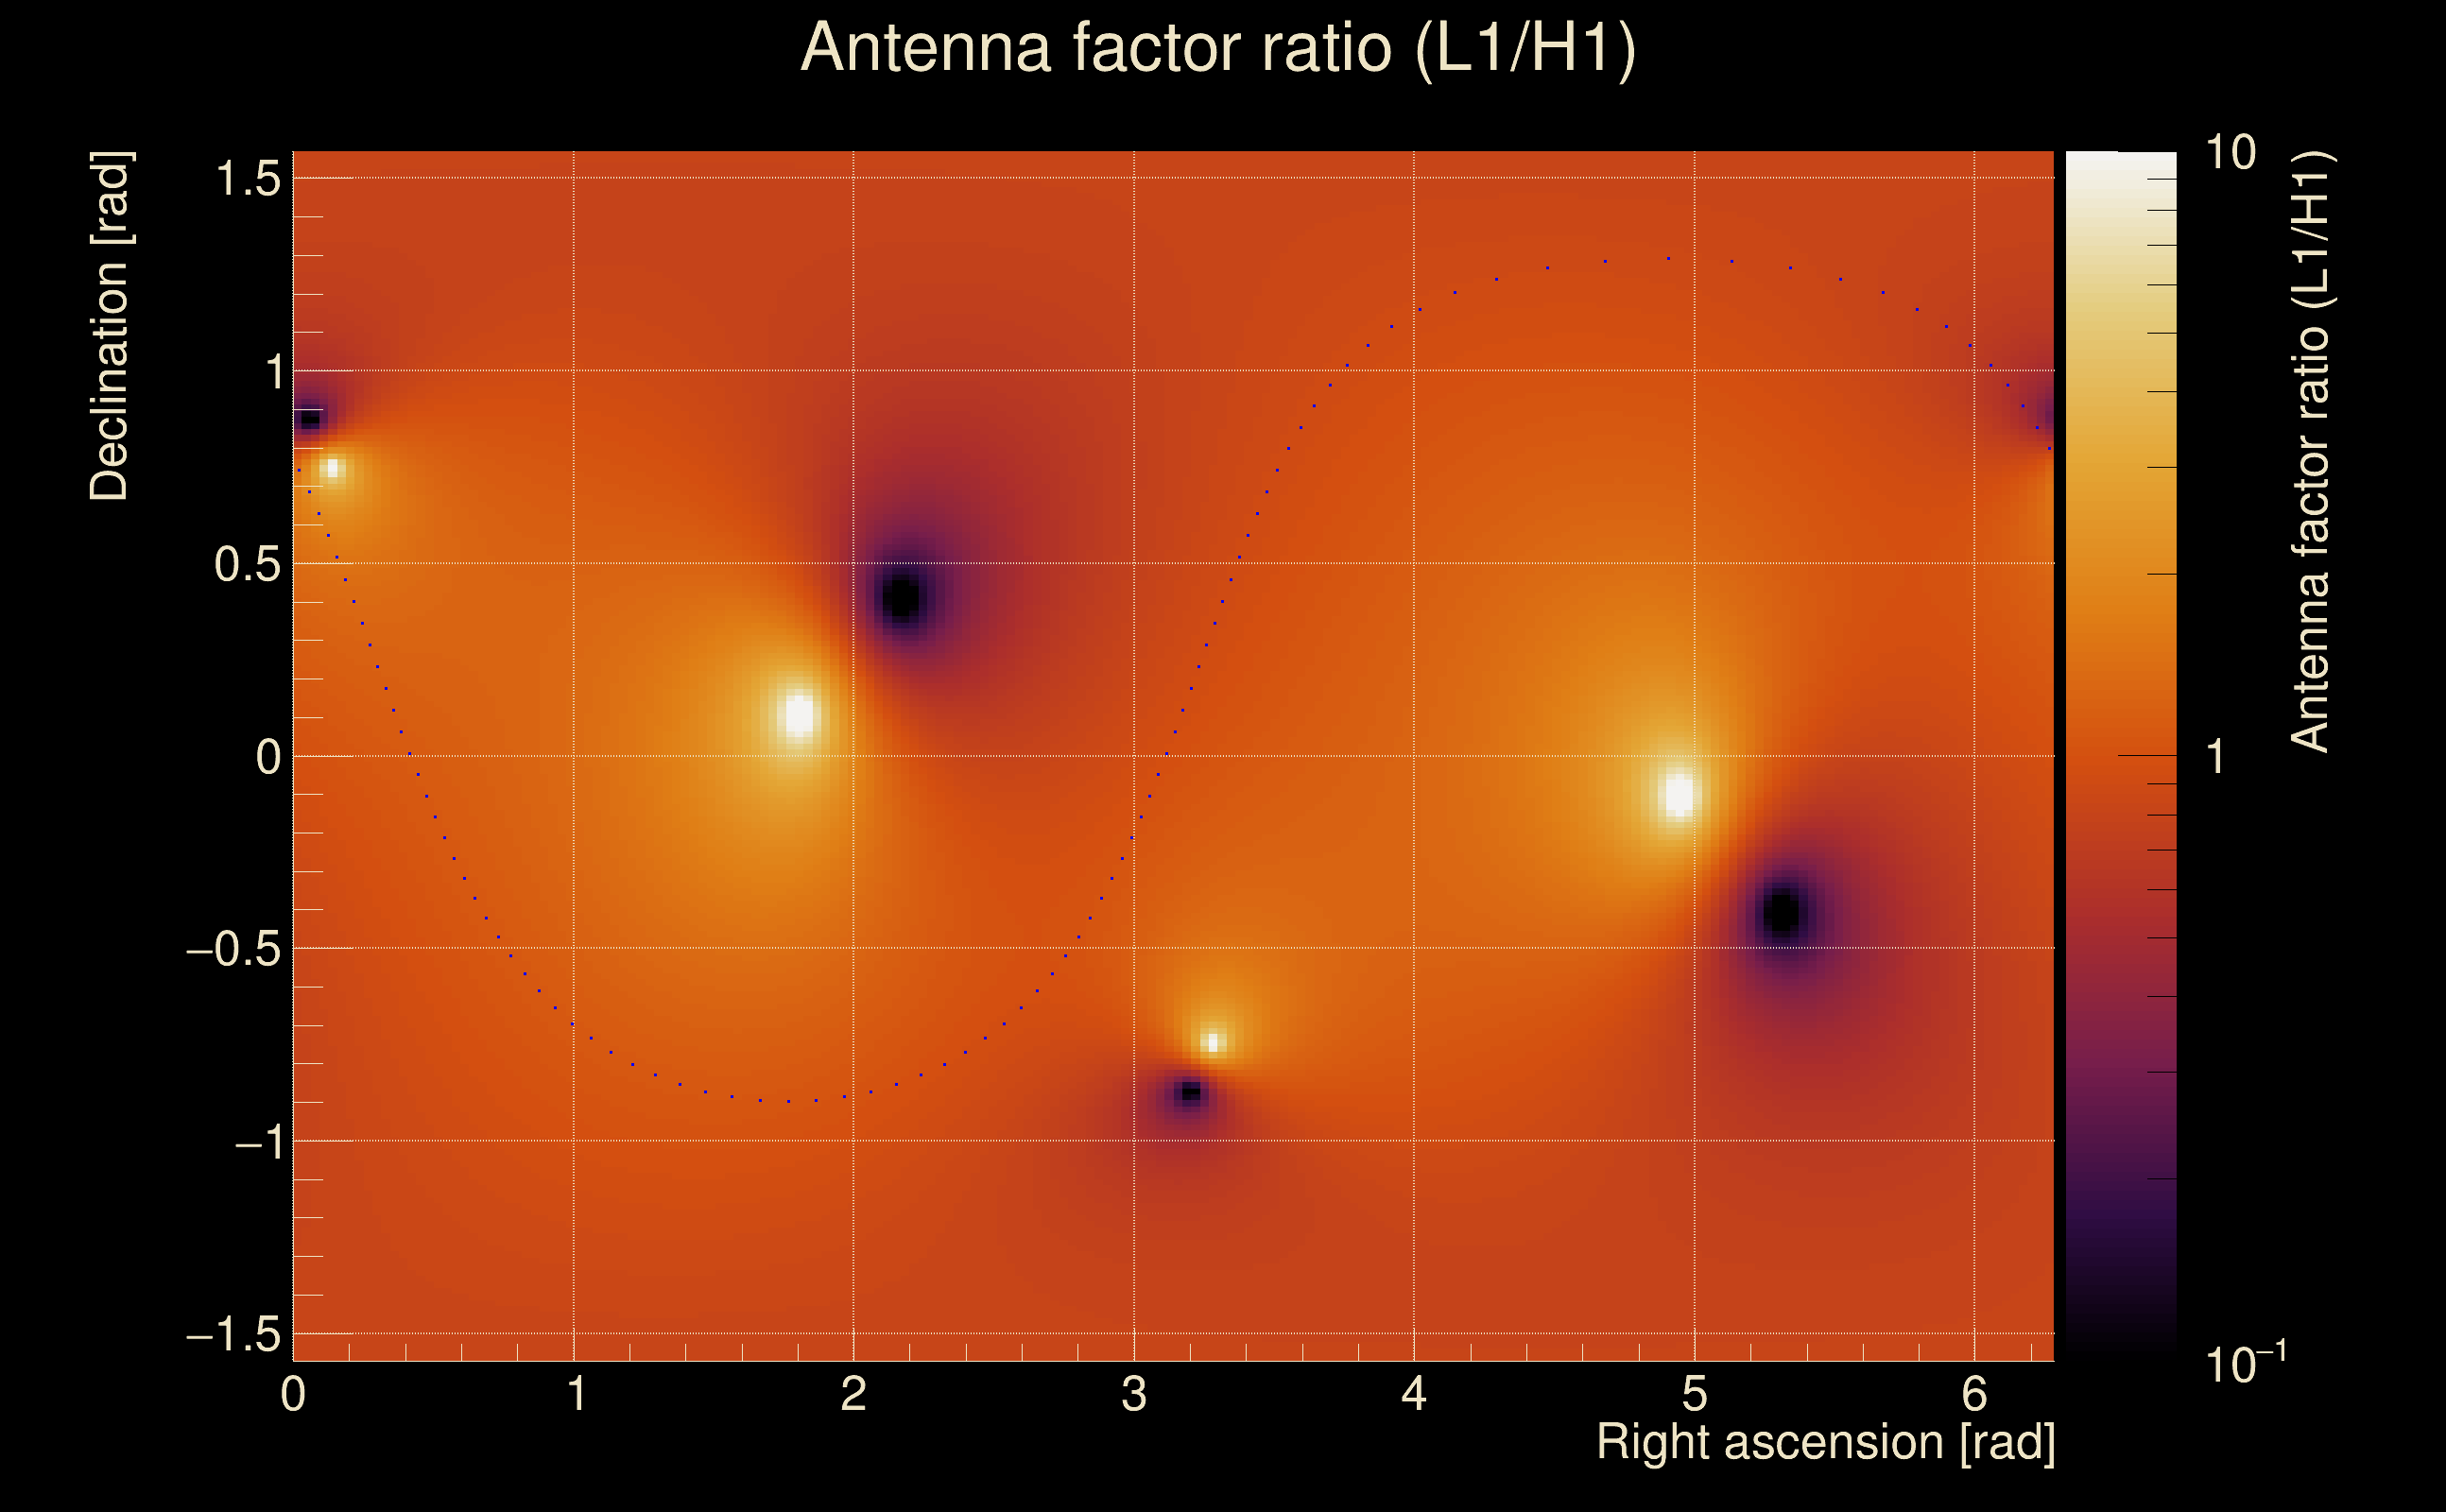
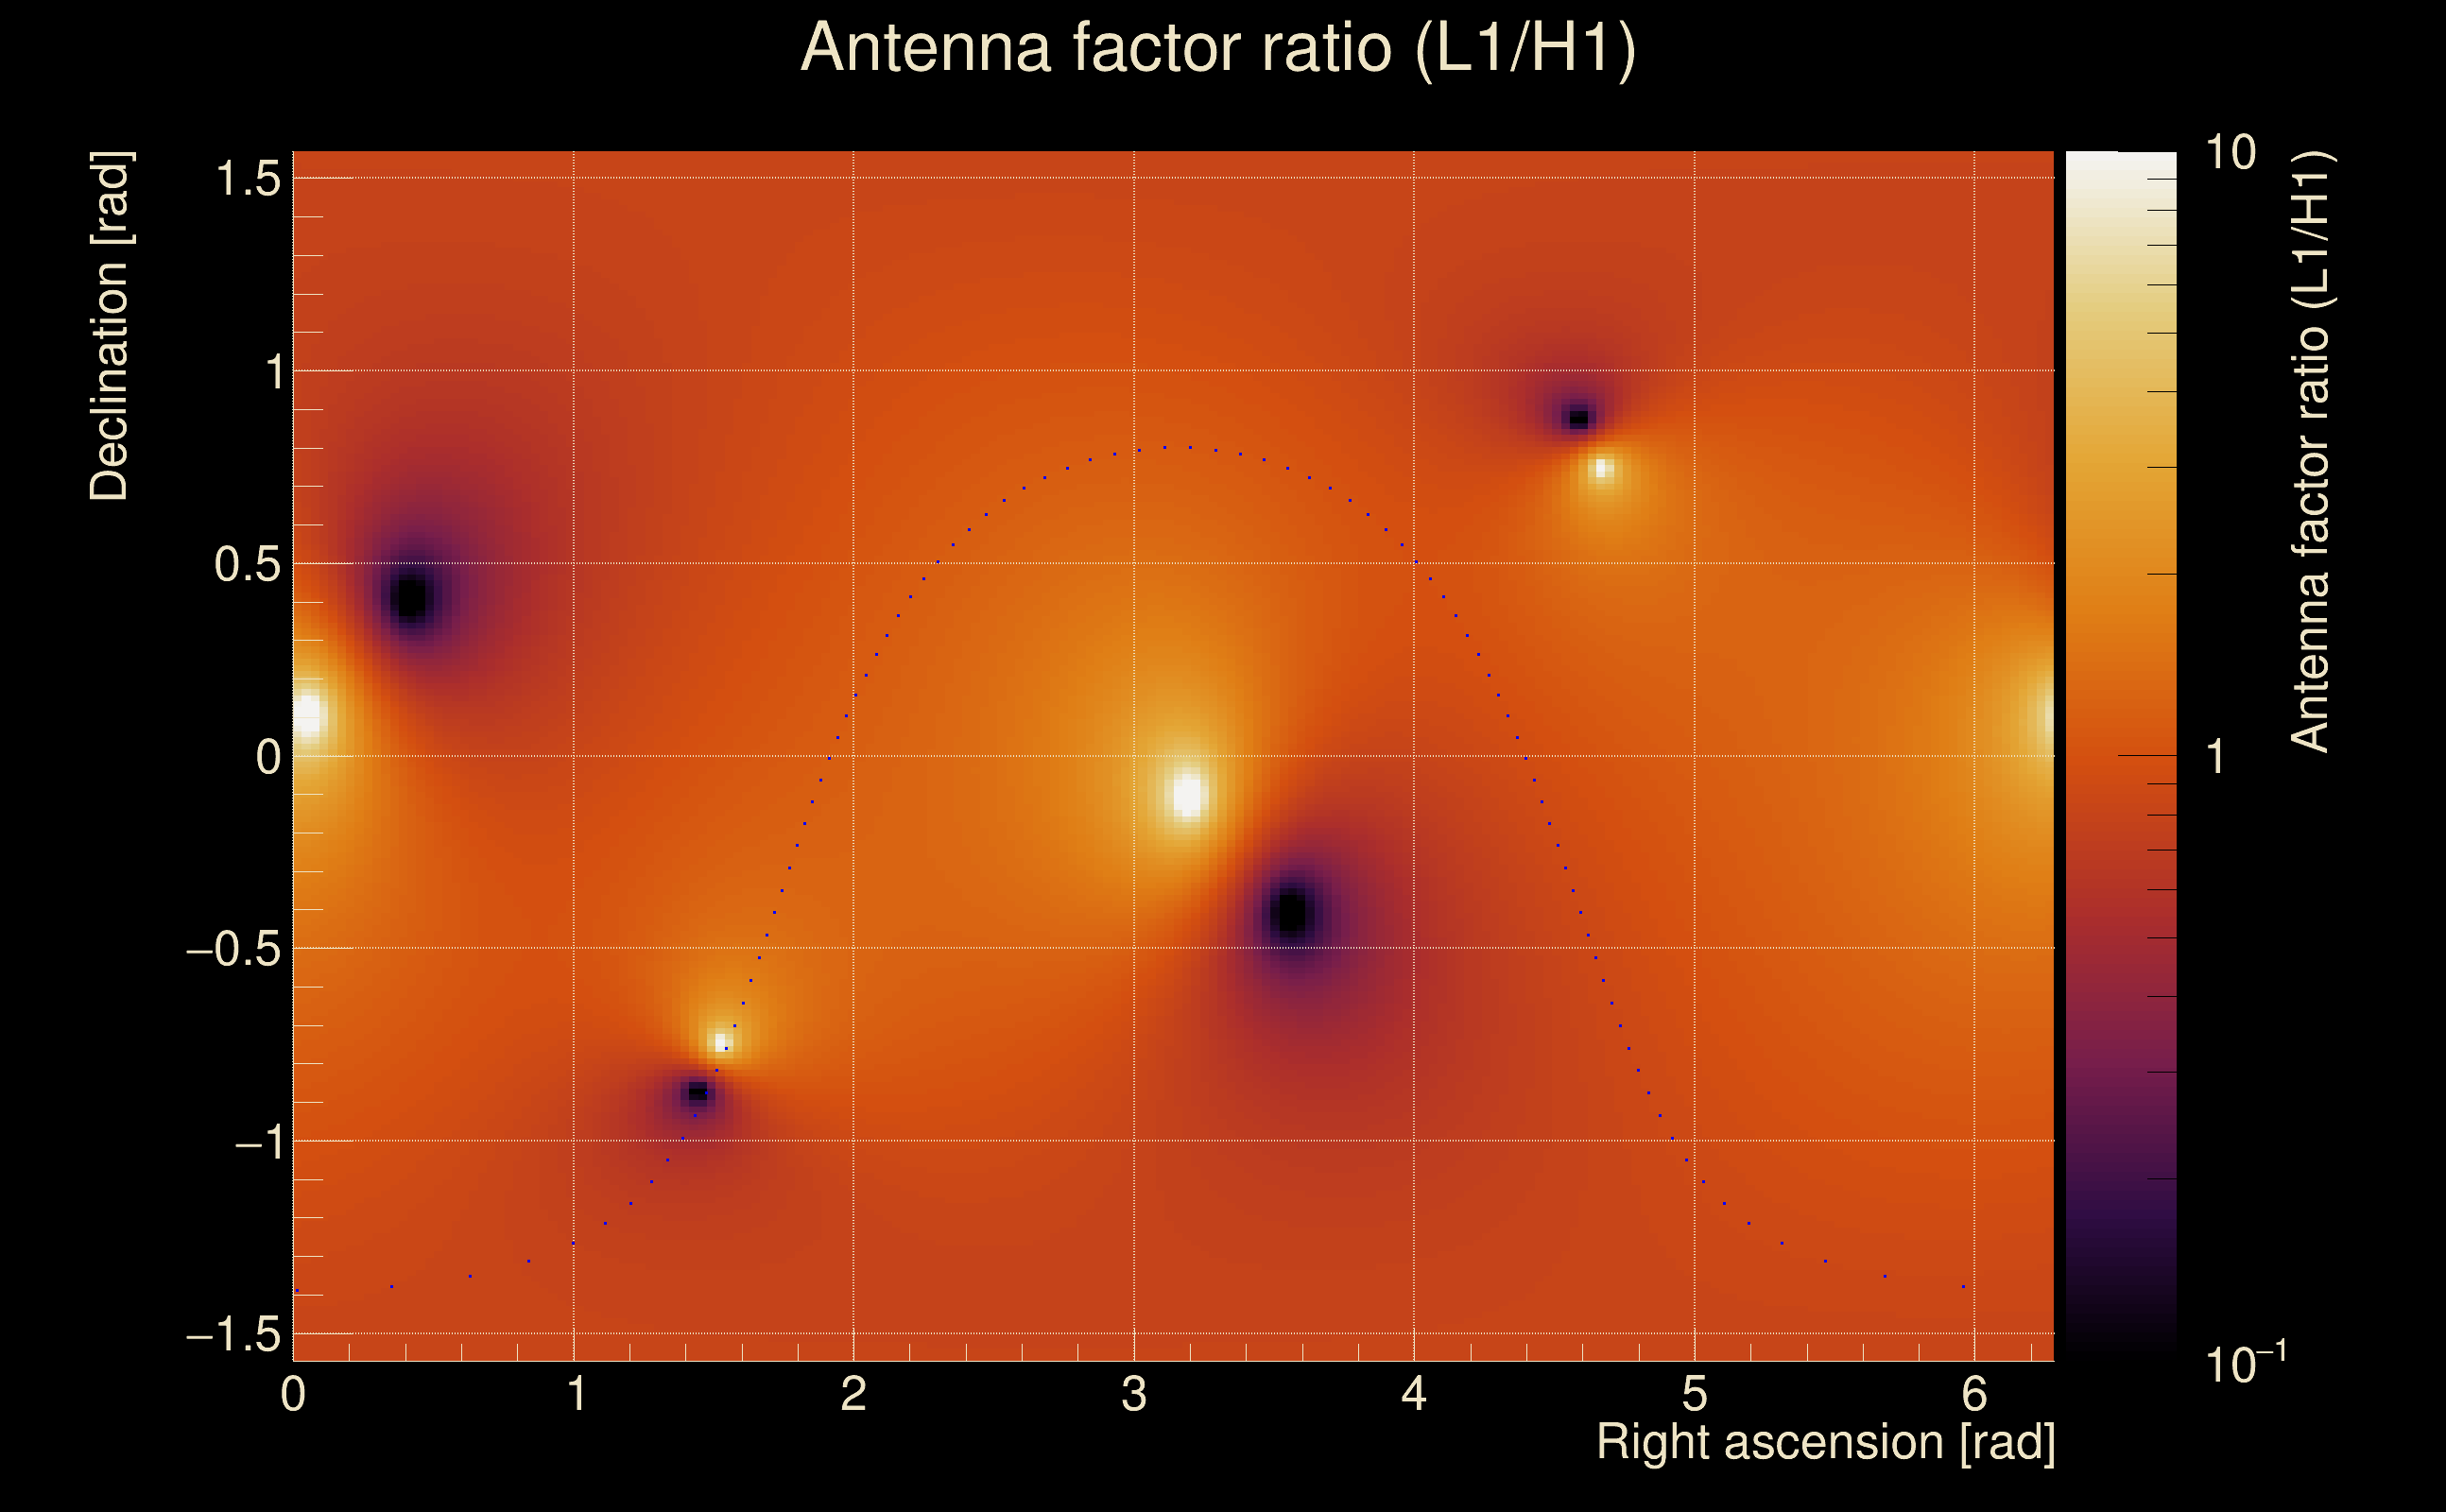
| Amplitude ratio (L1/H1): | 0.801277 ⋇ 1.48884 (L1/H1: 0.800216 ⋇ 1.73613, H1/L1: 1.24555 ⋇ 1.73952) |
| Amplitude ratio H1|L1 compatibility (probability): | 0.996634 |
| Antenna factor probability: | 1 |
| Number of rejected frequency rows: | Q0: 0 / 18, Q1: 2 / 36, Q2: 8 / 70, Q3: 19 / 134, Q4: 55 / 258 |
| Maximum signal-to-noise ratio: | H1: 74.9145, L1: 61.3767 |
| SNR variance: | H1: 4.31197, L1: 2.9972 |
| Click here for a zoomed plot | Click here for a zoomed plot | Click here for a zoomed plot | Click here for a zoomed plot | Click here for a zoomed plot |
 |
 |
 |
 |
 |
 |
 |
 |
 |
 |
 |
 |
 |
 |
 |
 |
 |
 |
 |
 |
 |
 |
 |
 |
 |
 |
 |
 |
 |
| Event time t(H1): | GPS = 1378590740 (Tue Sep 12 21:52:02 2023 ) → GPS = 1378590750 (Tue Sep 12 21:52:12 2023 ) |
| Event time t(L1): | GPS = 1378590740 (Tue Sep 12 21:52:12 2023 ) → GPS = 1378590750 (Tue Sep 12 21:52:12 2023 ) |
| Omicron analysis time window (H1): | GPS = 1378590737 → GPS = 1378590753 |
| Omicron analysis time window (L1): | GPS = 1378590737 → GPS = 1378590753 |
| Time delay between detectors t(L1) - t(H1): | 0.0019715 s (slice index = 108 / 217), δt_gw = 0.0019715 s |
| Time delay uncertainty: | 0.000608778 s |
| [targeted mode] Time delay probability: | 0.998103 (0.00237693 sigmas), δt_target = 0.00398779 s |
| Frequency: | 230.543 Hz |
| Ξ: | 0.895181 ± 0.0101898 (variance = 0.000103832): Q0: 0.938281, Q1: 0.932147, Q2: 0.929241, Q3: 0.921553, Q4: 0.908671 |
| Rank: | R_A = 0.882006 |
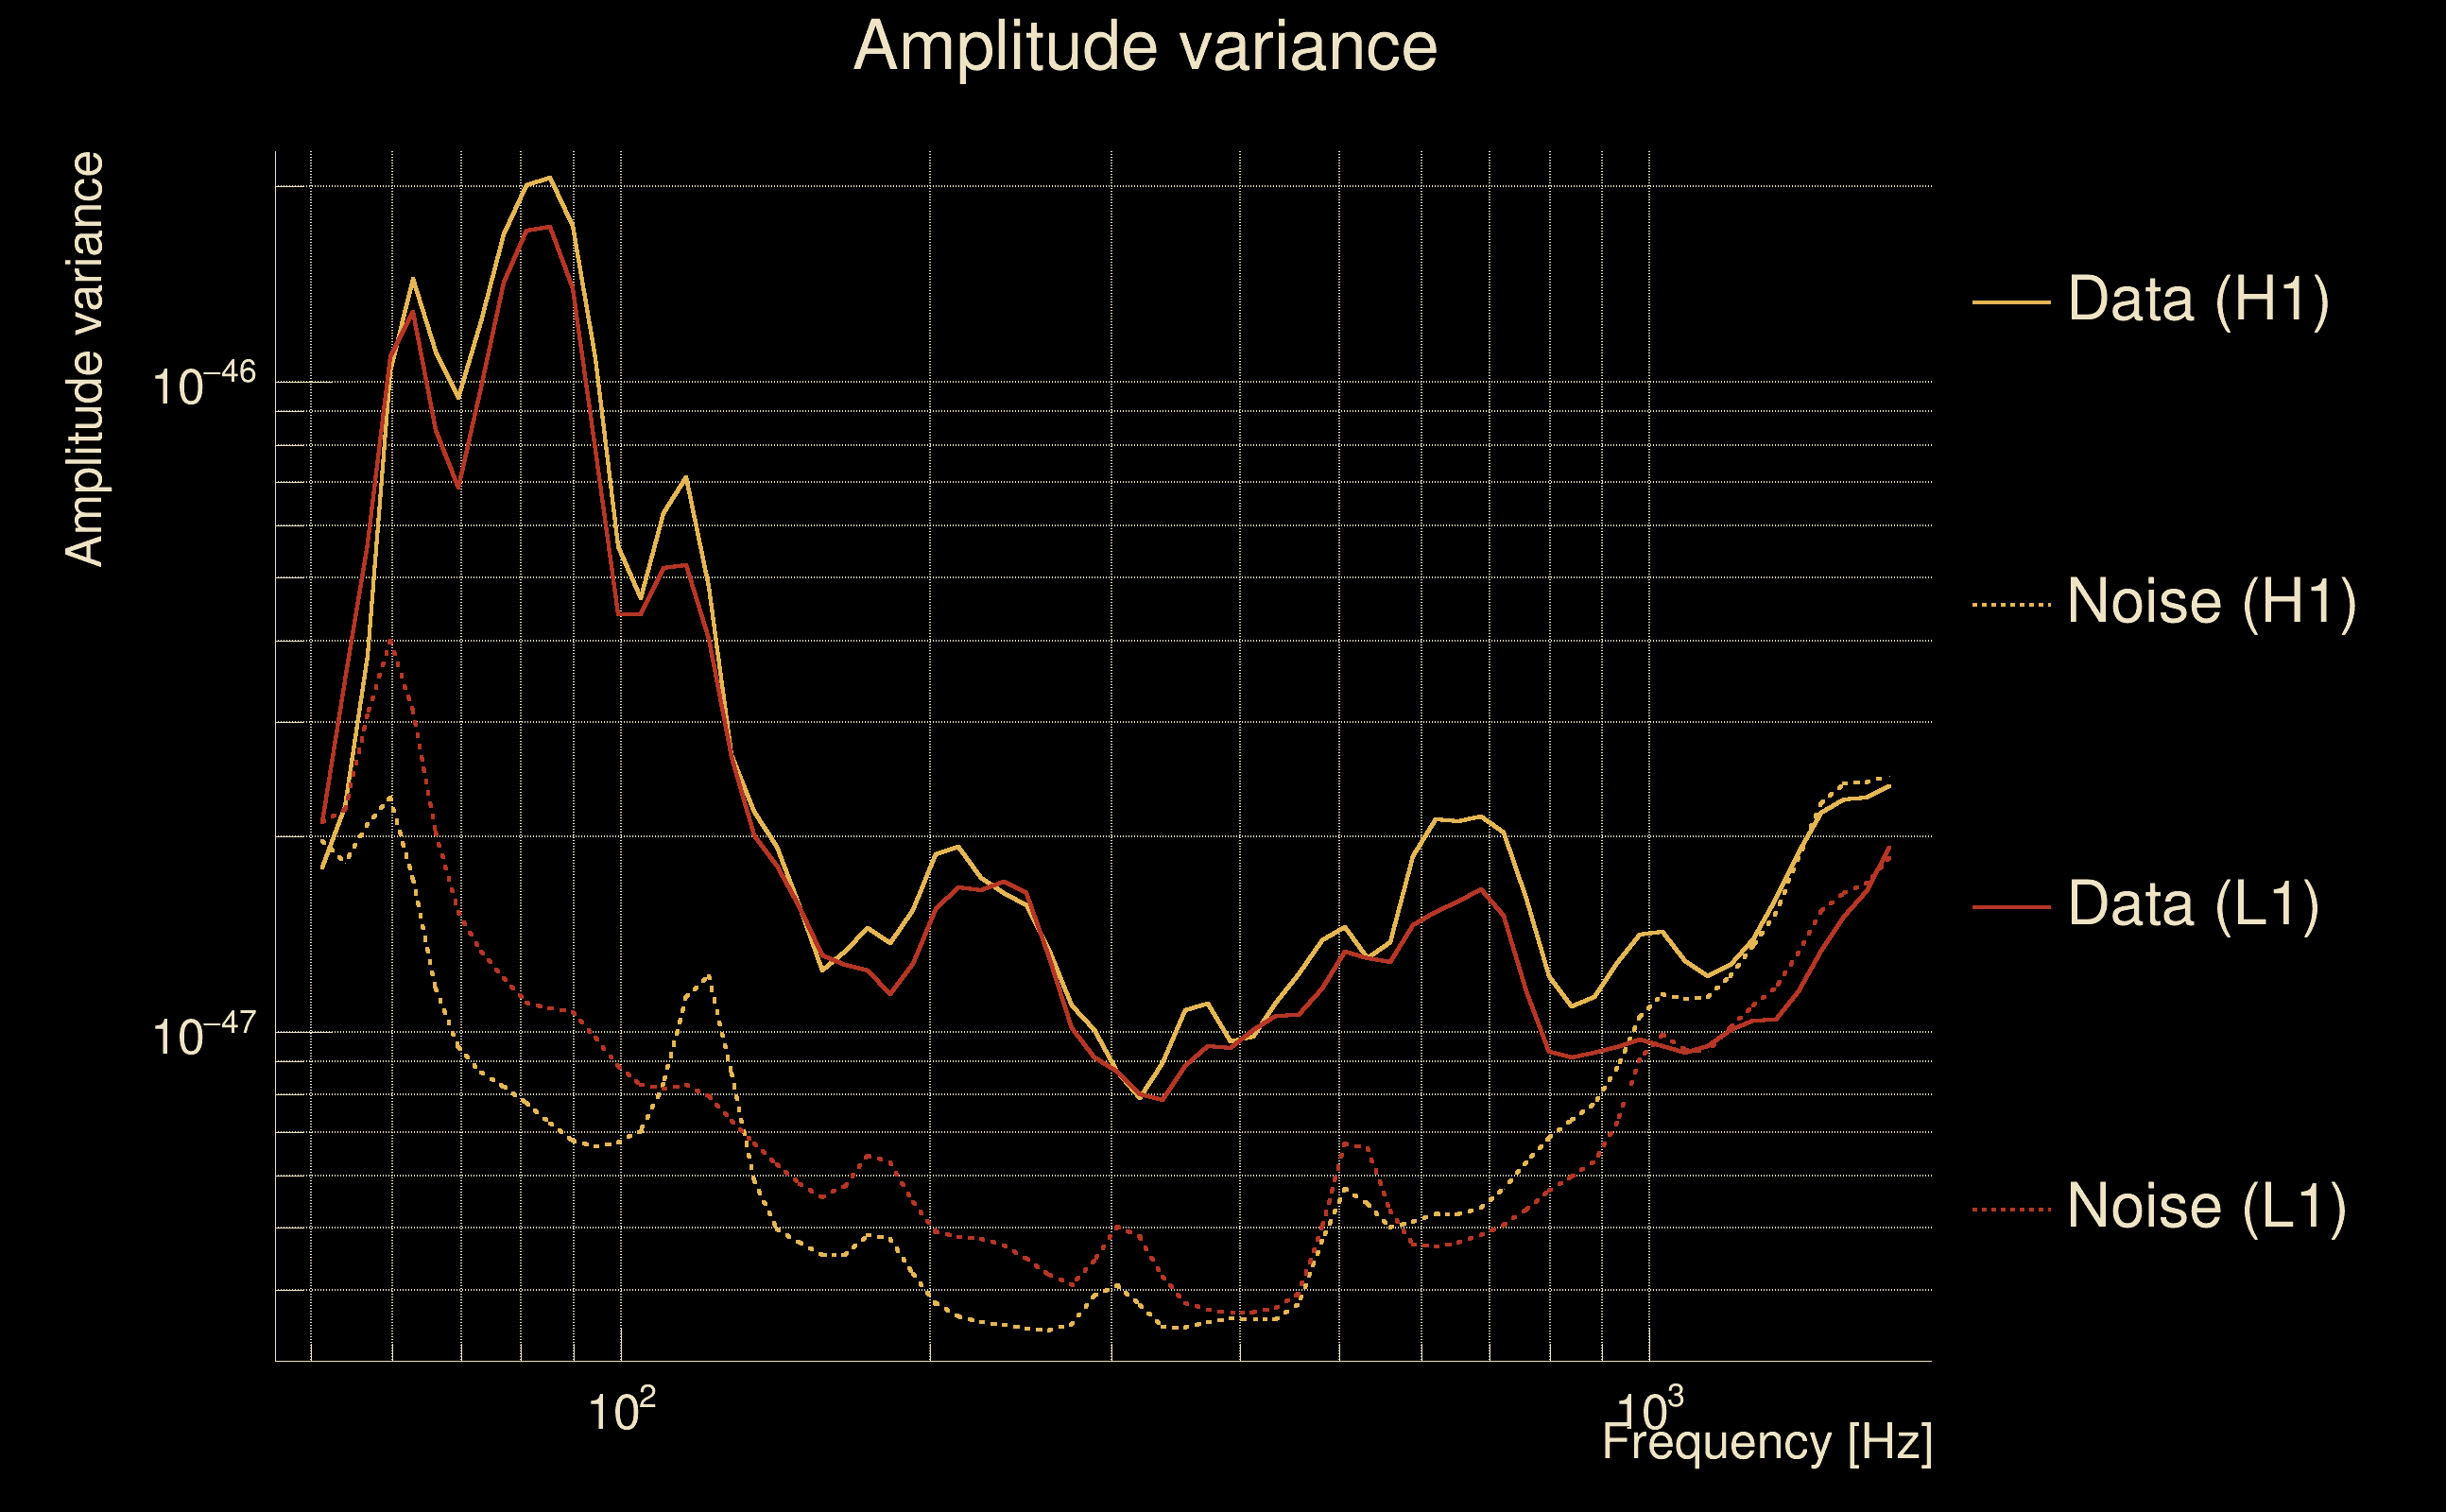
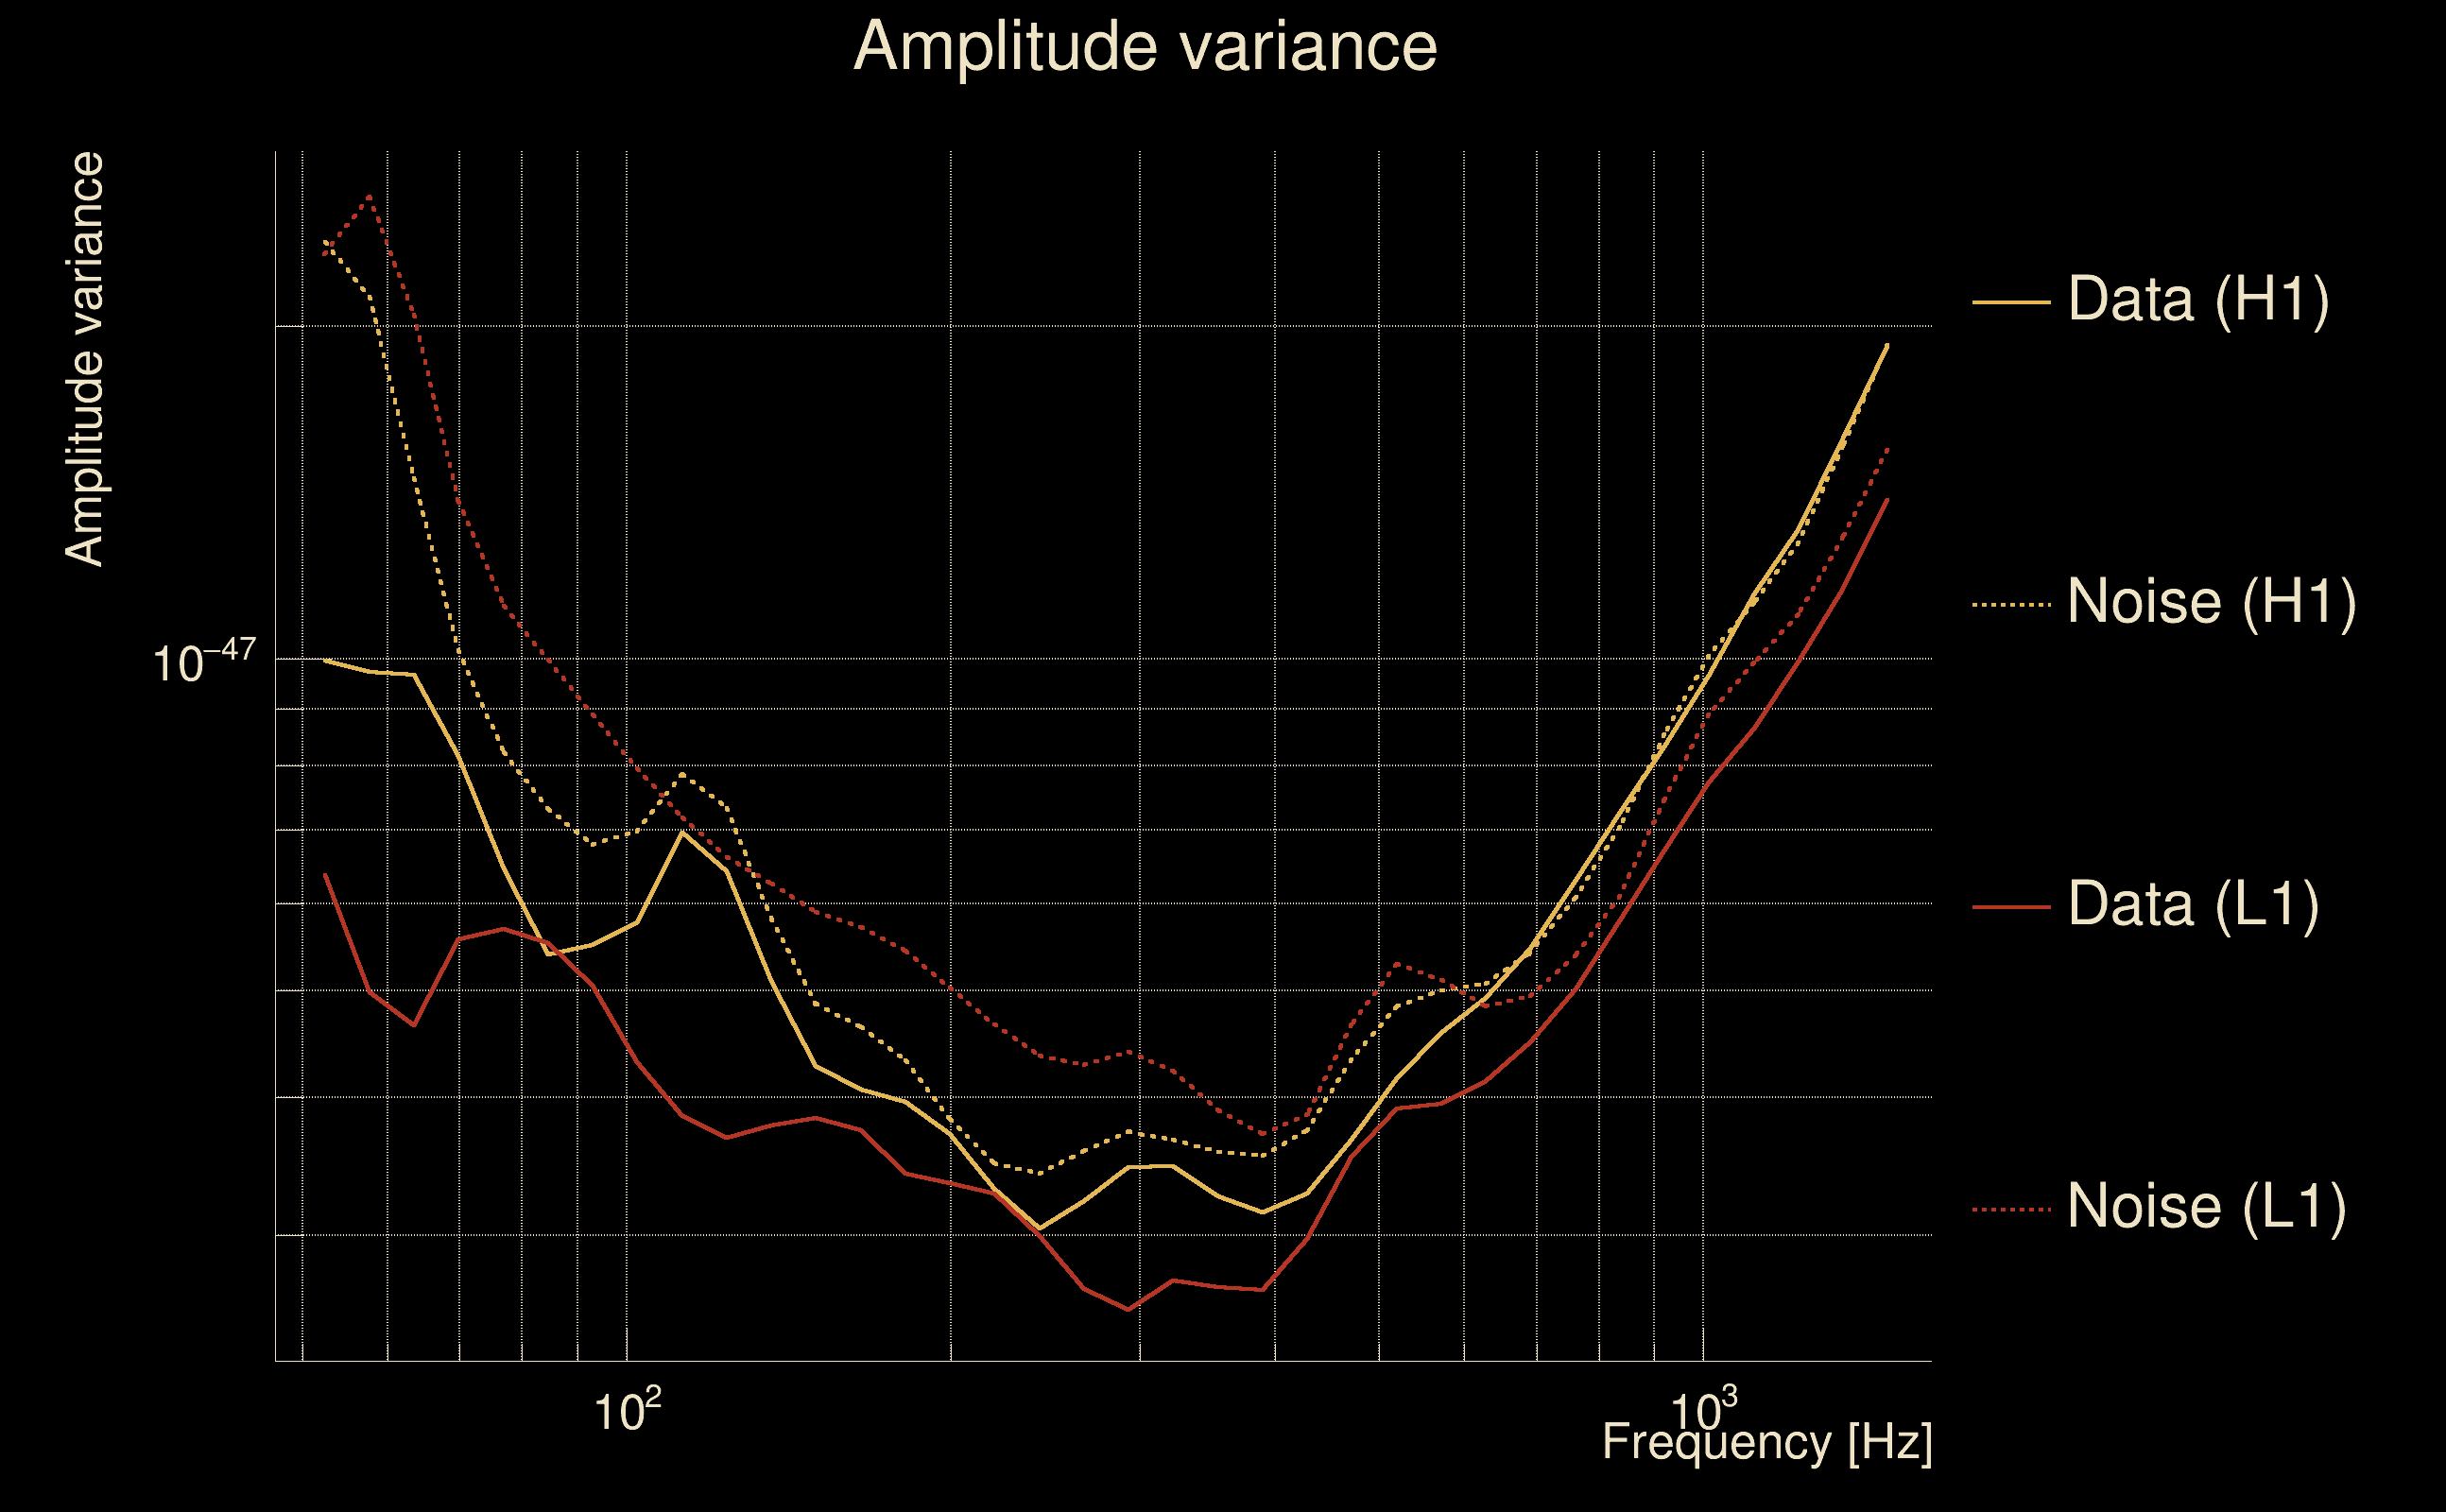
| Log of amplitude ratio (L1/H1): | -0.0976493, variance = 0.159476 (L1/H1: -0.102727, variance = 0.306962, H1/L1: 0.0901038, variance = 0.307764) |
| Amplitude ratio (L1/H1): | 0.906967 ⋇ 1.49085 (L1/H1: 0.902373 ⋇ 1.74027, H1/L1: 1.09429 ⋇ 1.74153) |
| Amplitude ratio H1|L1 compatibility (probability): | 0.987154 |
| Antenna factor probability: | 1 |
| Number of rejected frequency rows: | Q0: 0 / 18, Q1: 2 / 36, Q2: 5 / 70, Q3: 18 / 134, Q4: 62 / 258 |
| Maximum signal-to-noise ratio: | H1: 53.4076, L1: 43.8122 |
| SNR variance: | H1: 0.500049, L1: 0.445656 |
| Click here for a zoomed plot | Click here for a zoomed plot | Click here for a zoomed plot | Click here for a zoomed plot | Click here for a zoomed plot |
 |
 |
 |
 |
 |
 |
 |
 |
 |
 |
 |
 |
 |
 |
 |
 |
 |
 |
 |
 |
 |
 |
 |
 |
 |
 |
 |
 |
 |
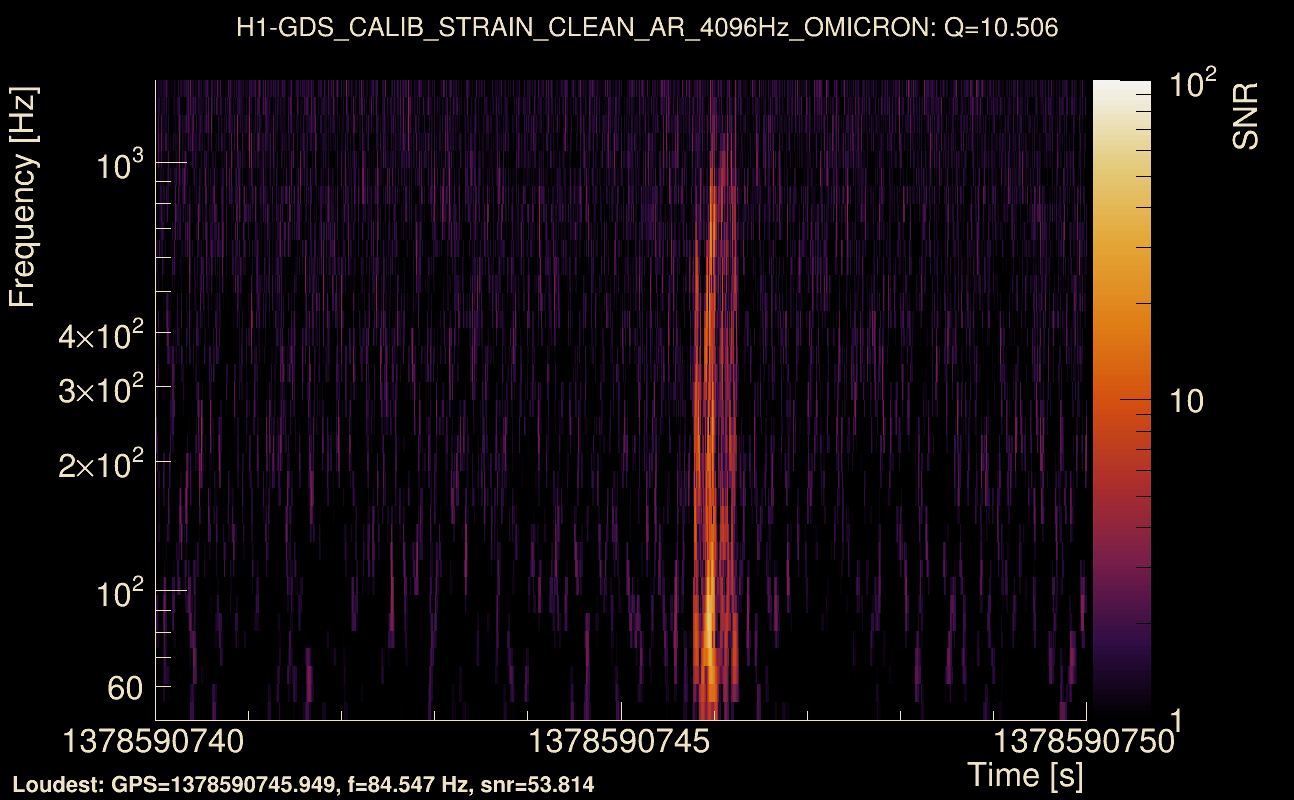
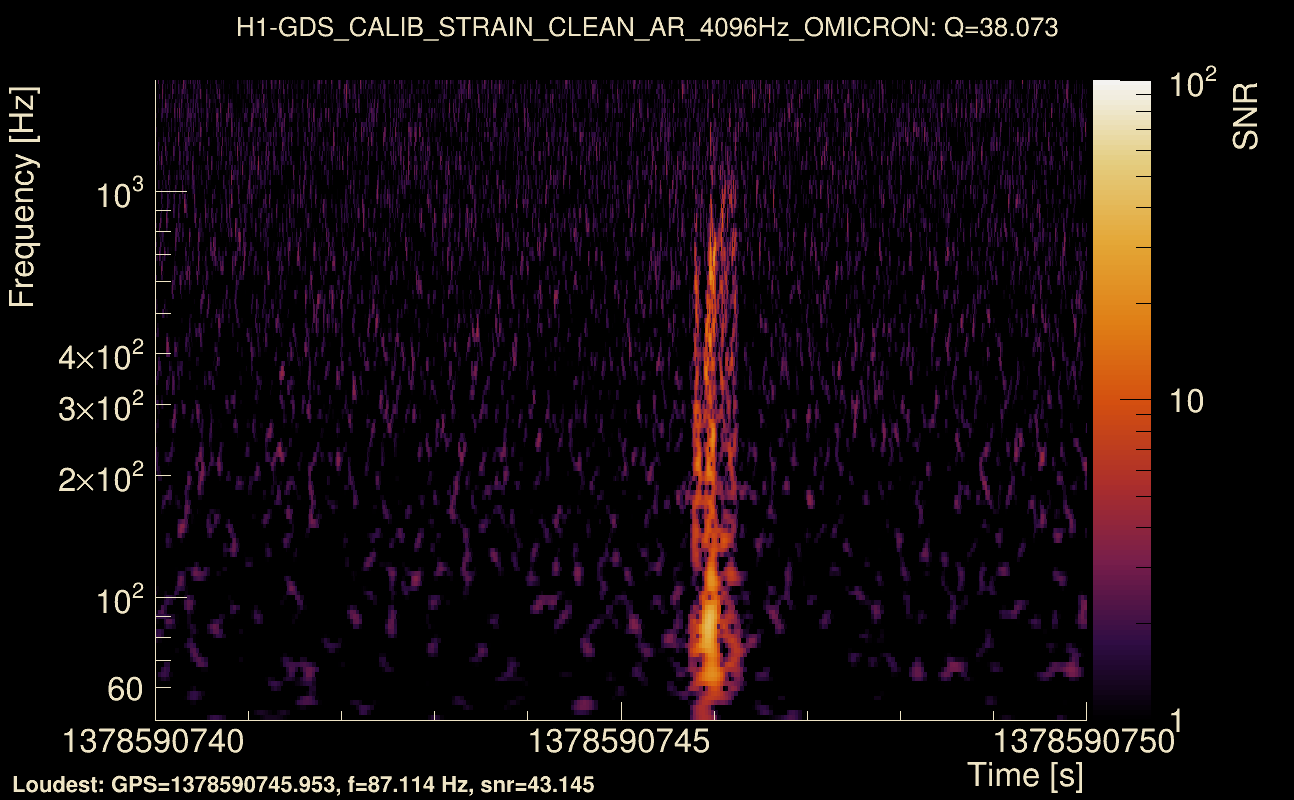
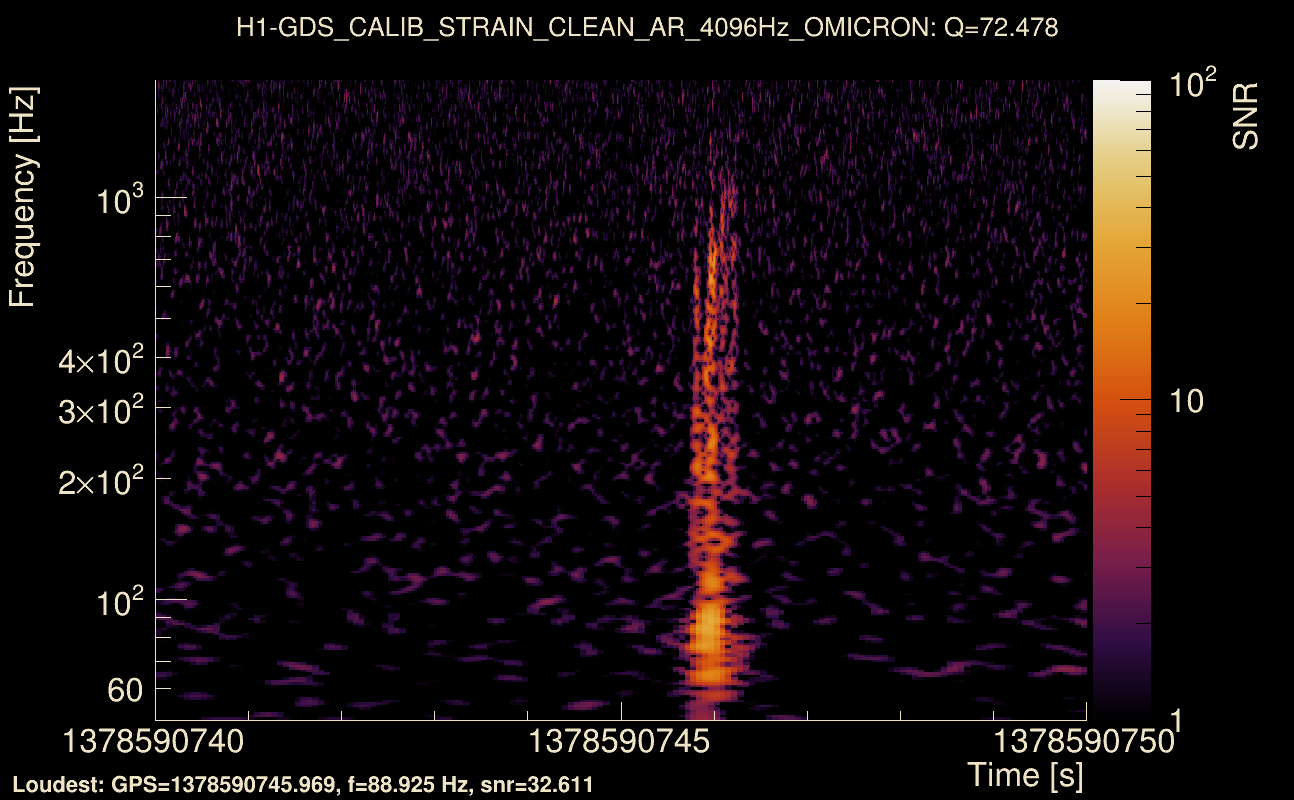
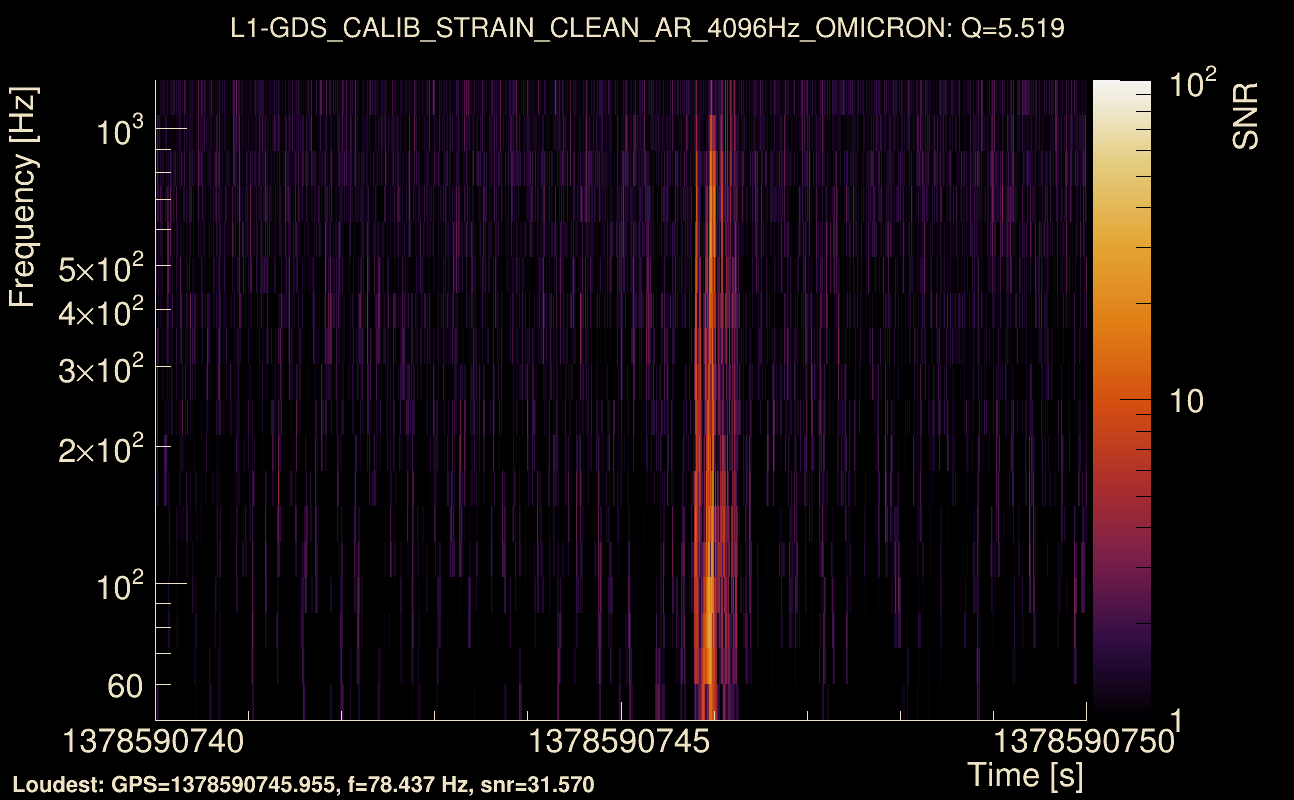
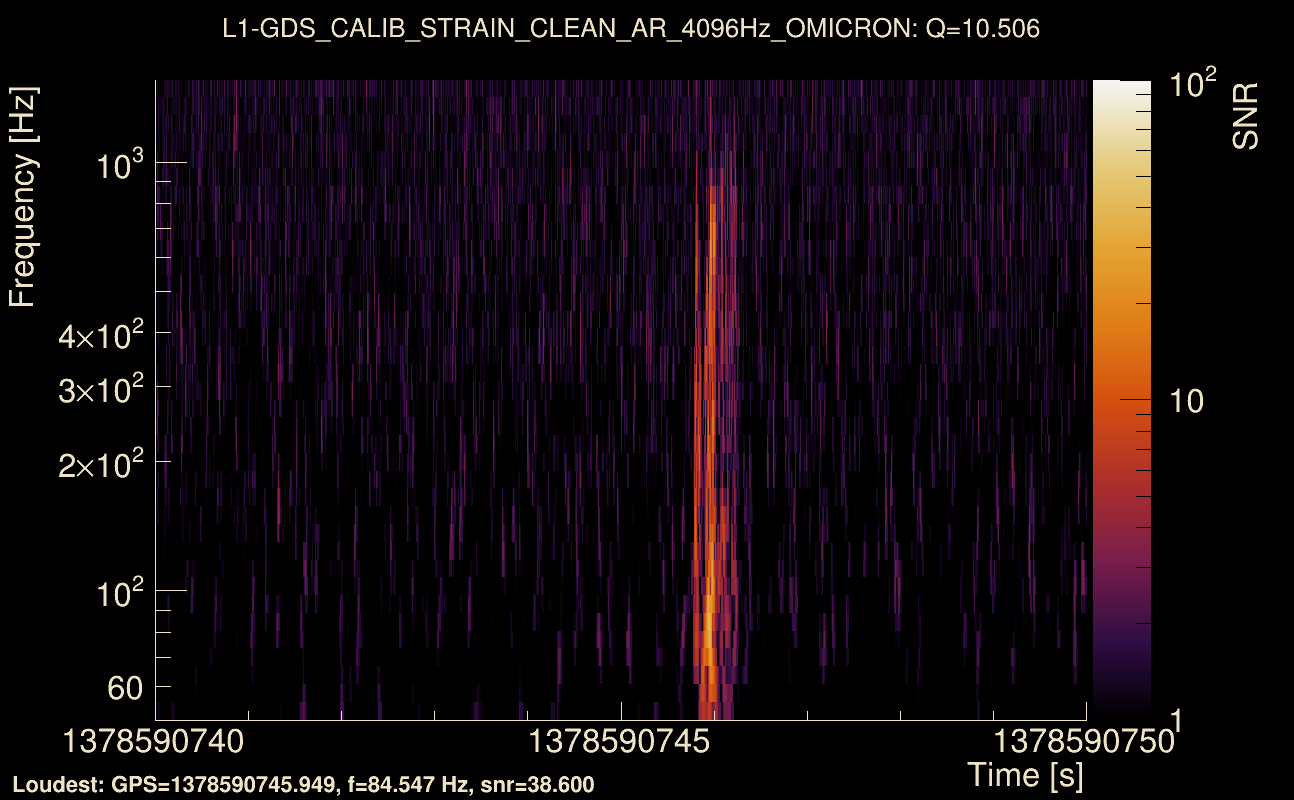
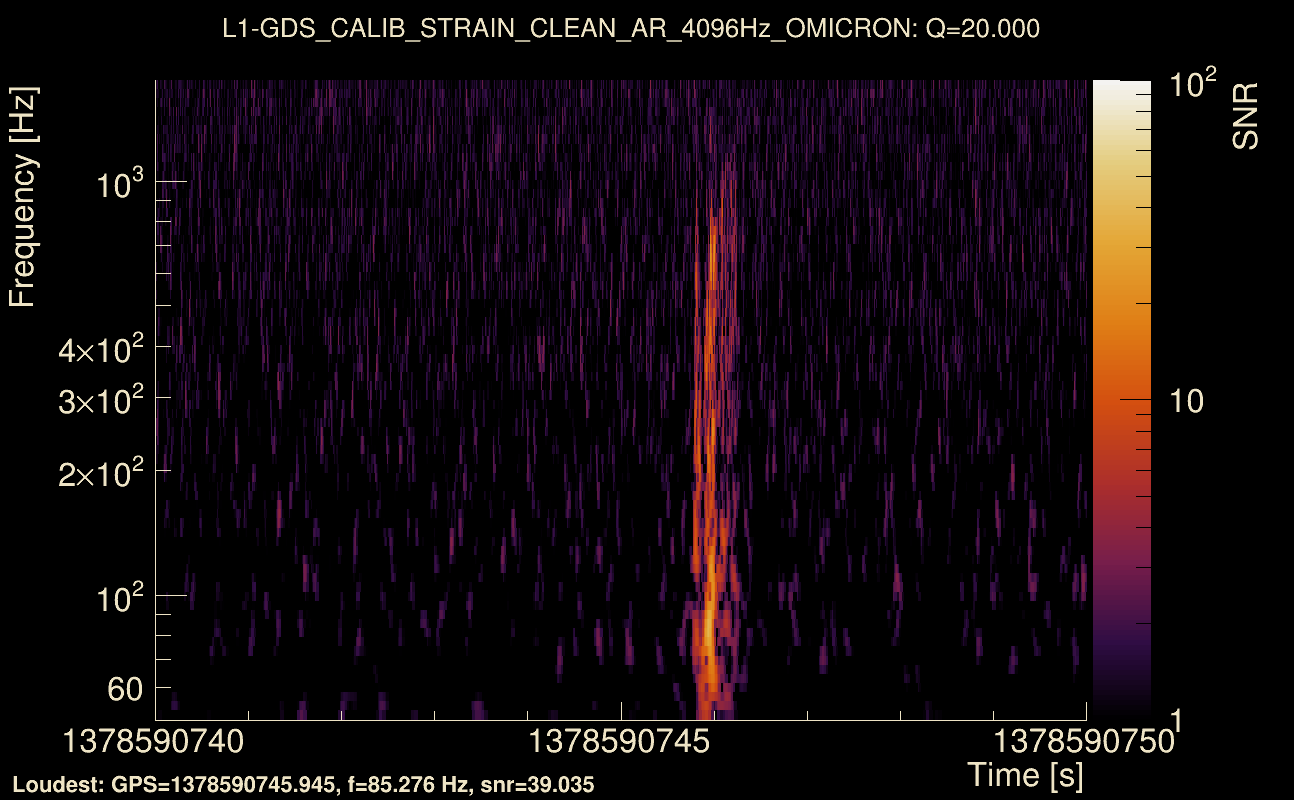
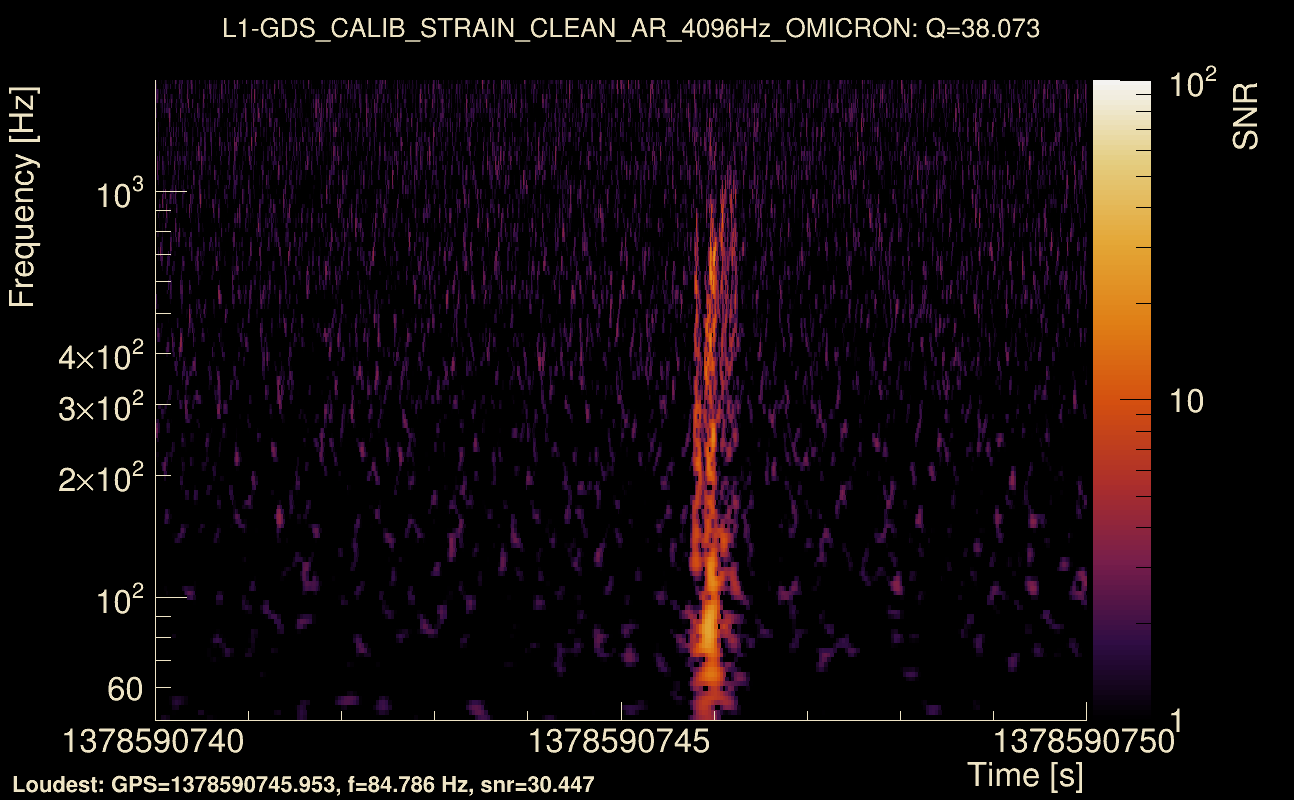
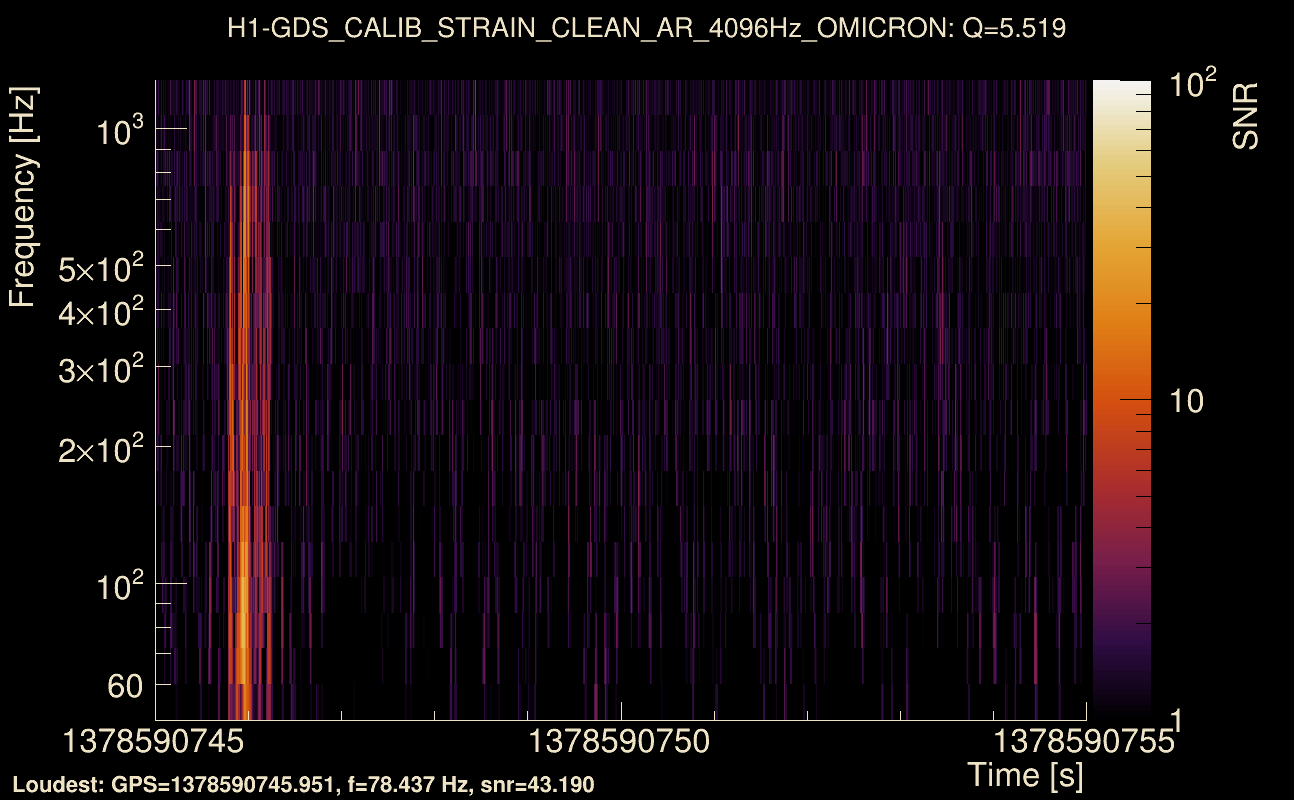
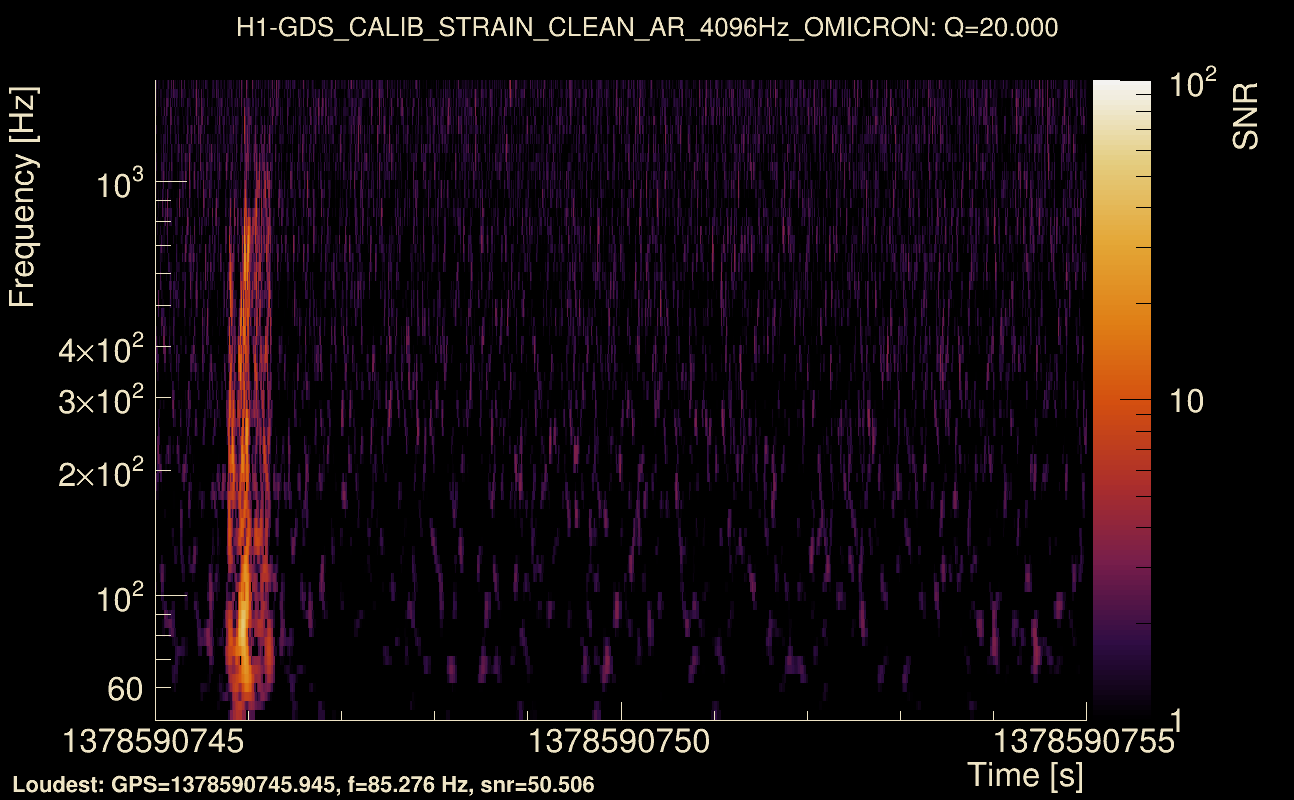
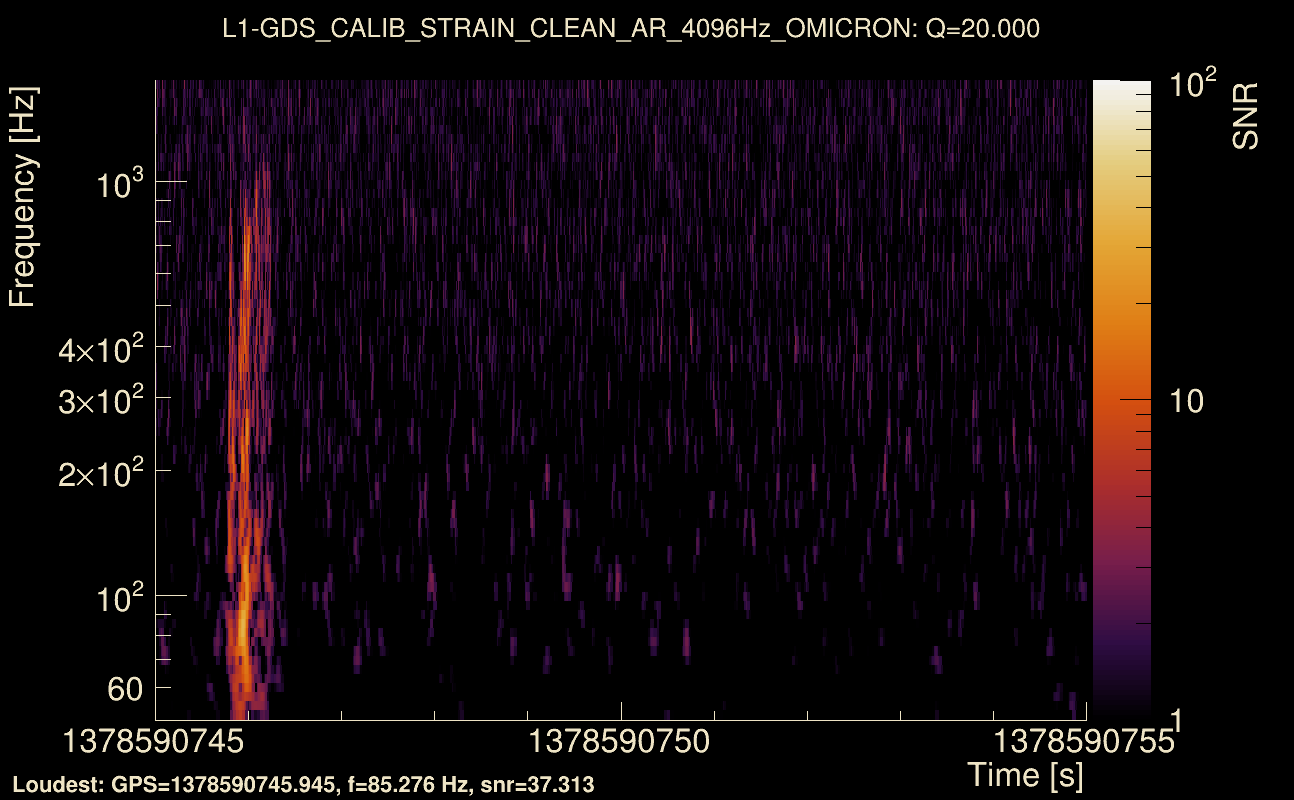
| Event time t(H1): | GPS = 1378590745 (Tue Sep 12 21:52:07 2023 ) → GPS = 1378590755 (Tue Sep 12 21:52:17 2023 ) |
| Event time t(L1): | GPS = 1378590745 (Tue Sep 12 21:52:17 2023 ) → GPS = 1378590755 (Tue Sep 12 21:52:17 2023 ) |
| Omicron analysis time window (H1): | GPS = 1378590742 → GPS = 1378590758 |
| Omicron analysis time window (L1): | GPS = 1378590742 → GPS = 1378590758 |
| Time delay between detectors t(L1) - t(H1): | 0.00197361 s (slice index = 108 / 217), δt_gw = 0.00197361 s |
| Time delay uncertainty: | 0.000543044 s |
| [targeted mode] Time delay probability: | 0.997573 (0.00304225 sigmas), δt_target = 0.00197005 s |
| Frequency: | 230.748 Hz |
| Ξ: | 0.887372 ± 0.00868964 (variance = 7.55098e-05): Q0: 0.937876, Q1: 0.932655, Q2: 0.931944, Q3: 0.926587, Q4: 0.912468 |
| Rank: | R_A = 0.877833 |
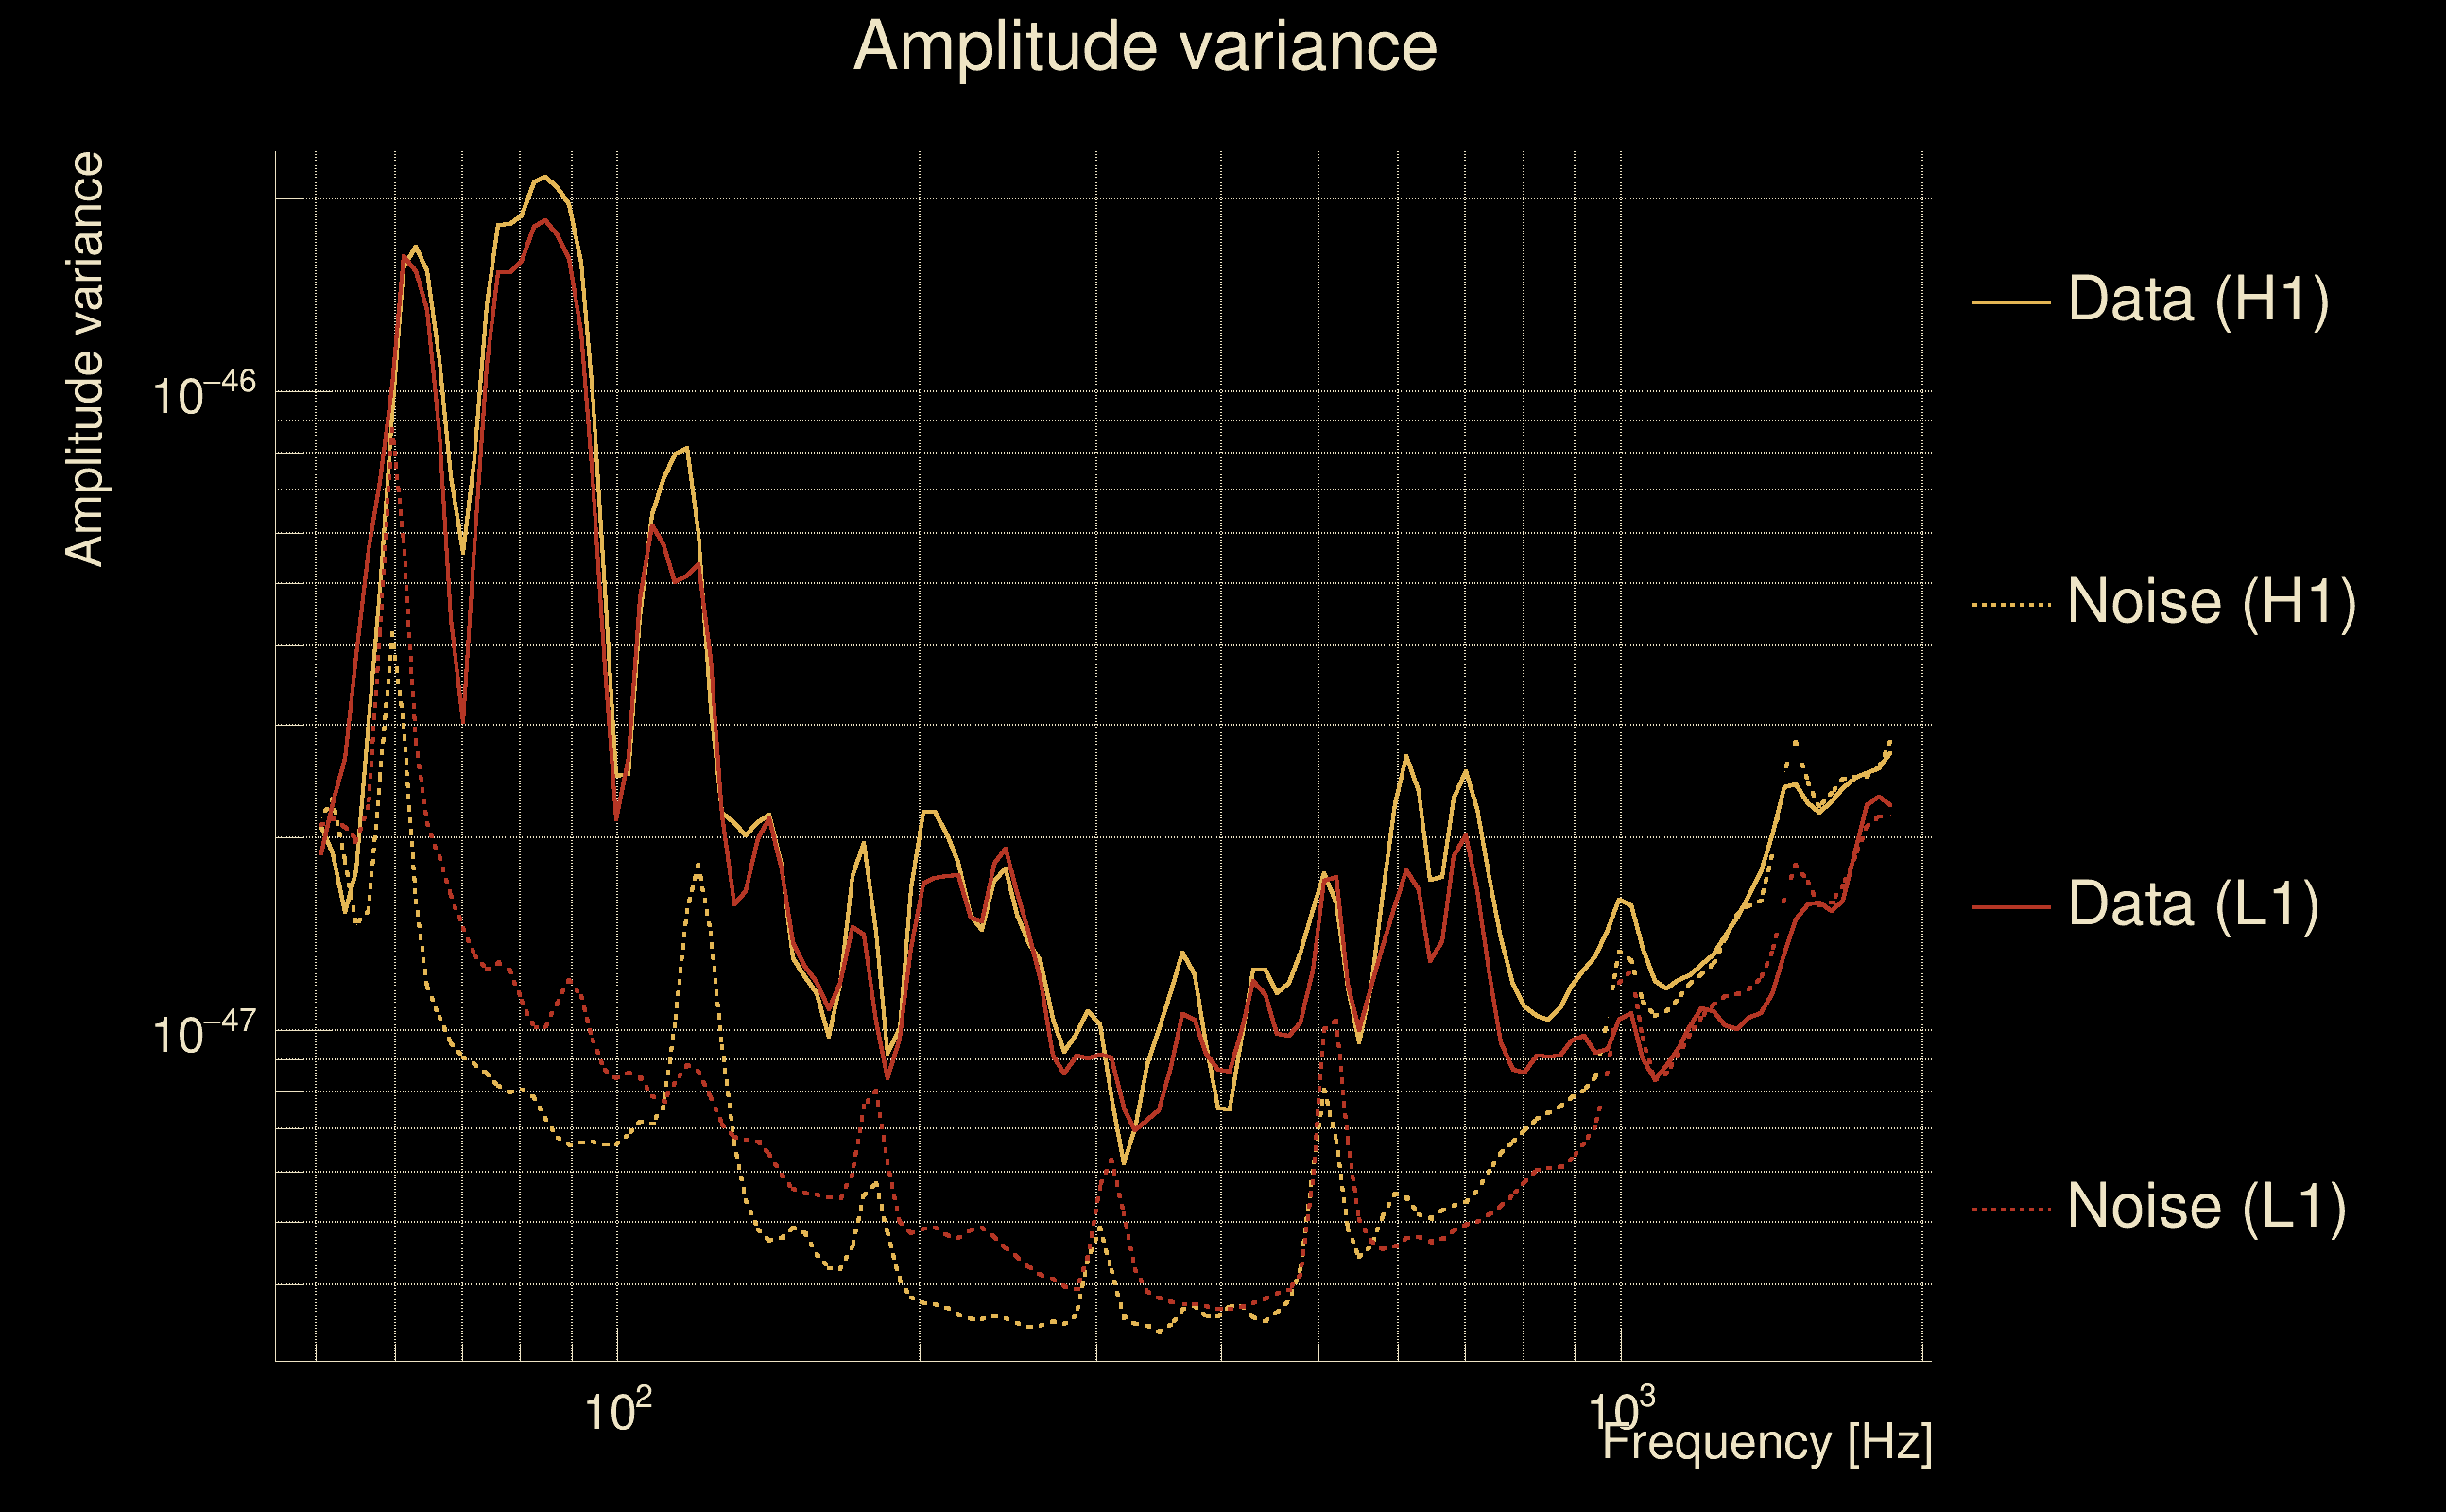
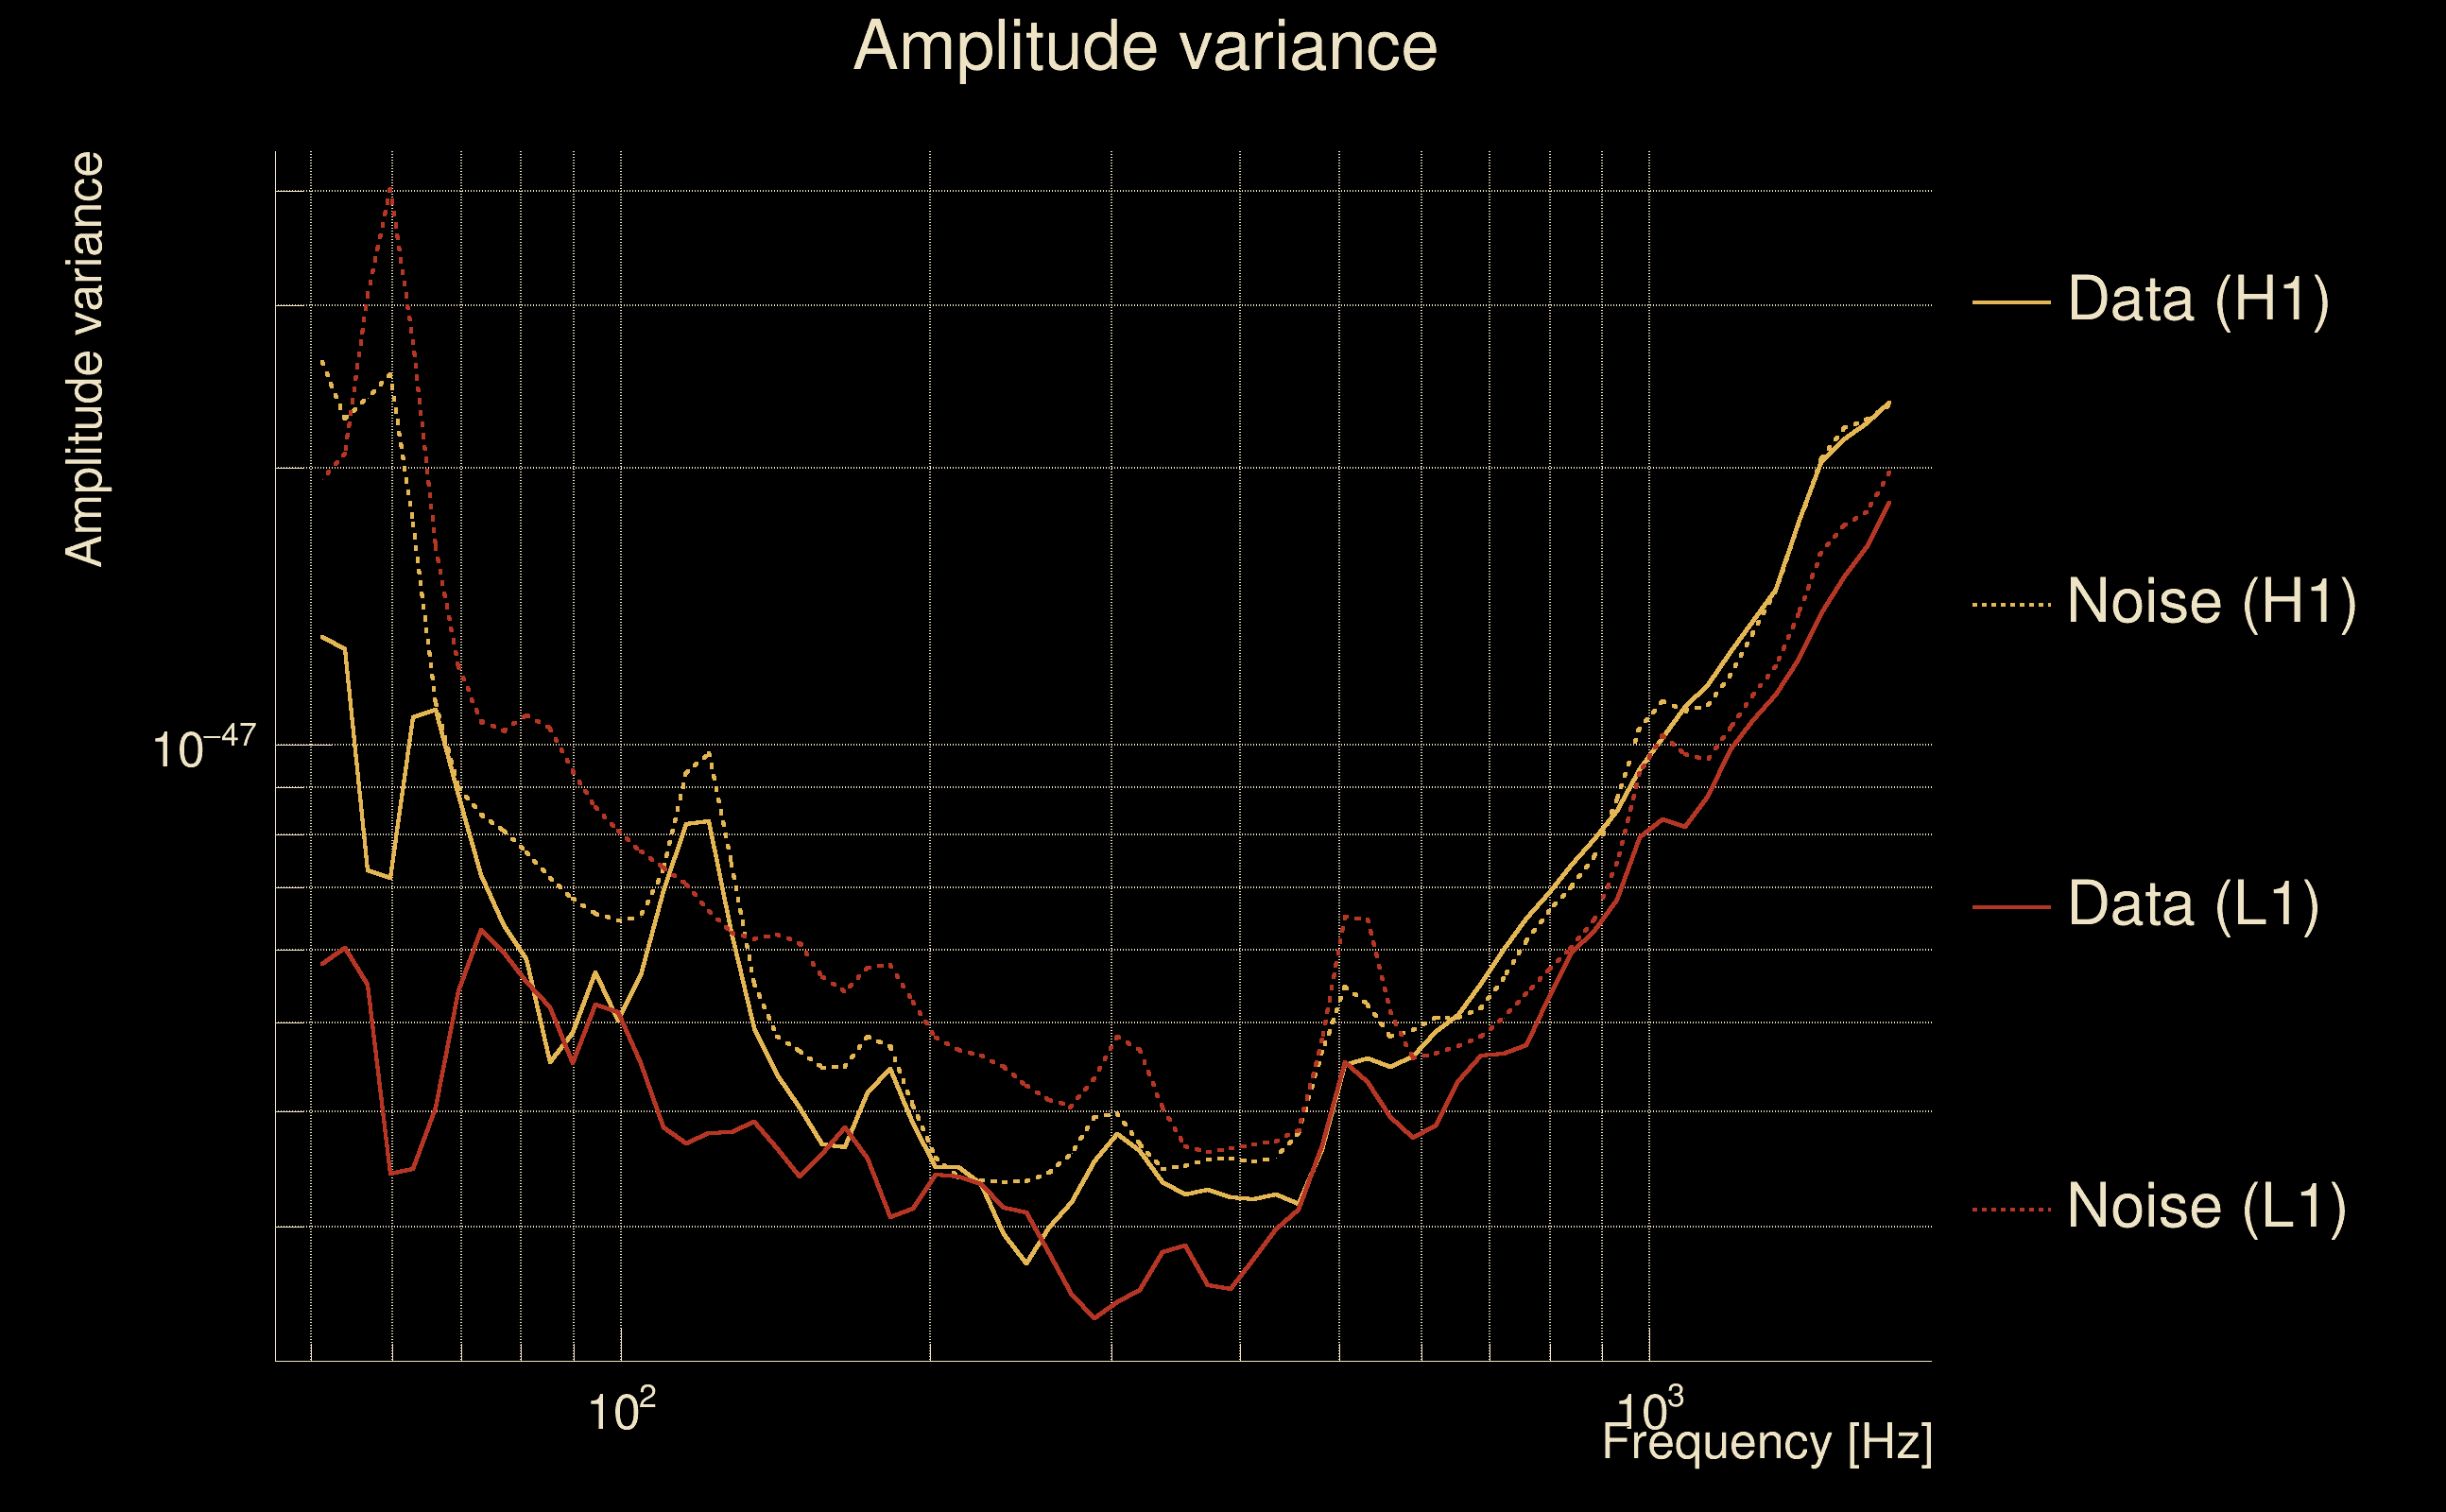
| Log of amplitude ratio (L1/H1): | -0.0951278, variance = 0.159272 (L1/H1: -0.098468, variance = 0.308379, H1/L1: 0.090266, variance = 0.307028) |
| Amplitude ratio (L1/H1): | 0.909257 ⋇ 1.49047 (L1/H1: 0.906225 ⋇ 1.7425, H1/L1: 1.09447 ⋇ 1.74038) |
| Amplitude ratio H1|L1 compatibility (probability): | 0.991658 |
| Antenna factor probability: | 1 |
| Number of rejected frequency rows: | Q0: 0 / 18, Q1: 2 / 36, Q2: 8 / 70, Q3: 24 / 134, Q4: 65 / 258 |
| Maximum signal-to-noise ratio: | H1: 53.2218, L1: 44.1142 |
| SNR variance: | H1: 2.73593, L1: 2.17615 |
| Click here for a zoomed plot | Click here for a zoomed plot | Click here for a zoomed plot | Click here for a zoomed plot | Click here for a zoomed plot |
 |
 |
 |
 |
 |
 |
 |
 |
 |
 |
 |
 |
 |
 |
 |
 |
 |
 |
 |
 |
 |
 |
 |
 |
 |
 |
 |
 |
 |
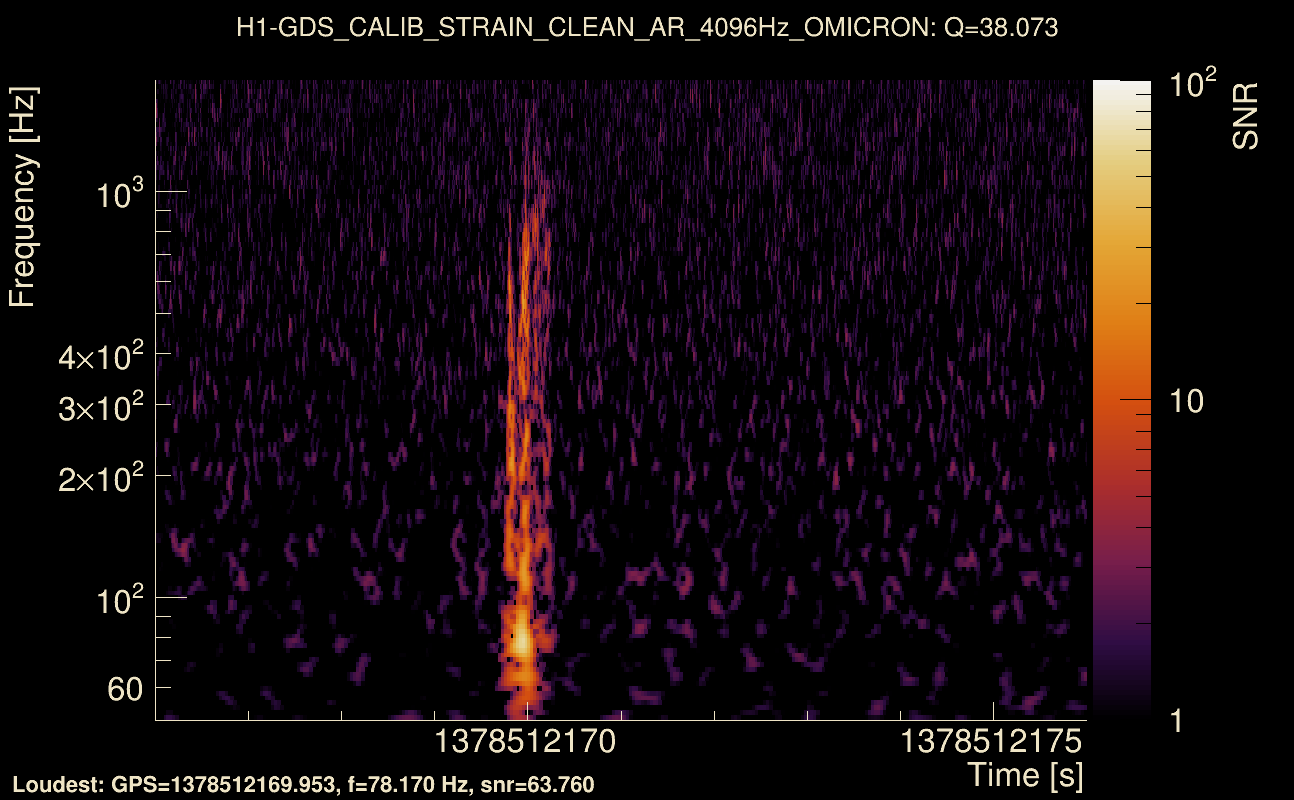
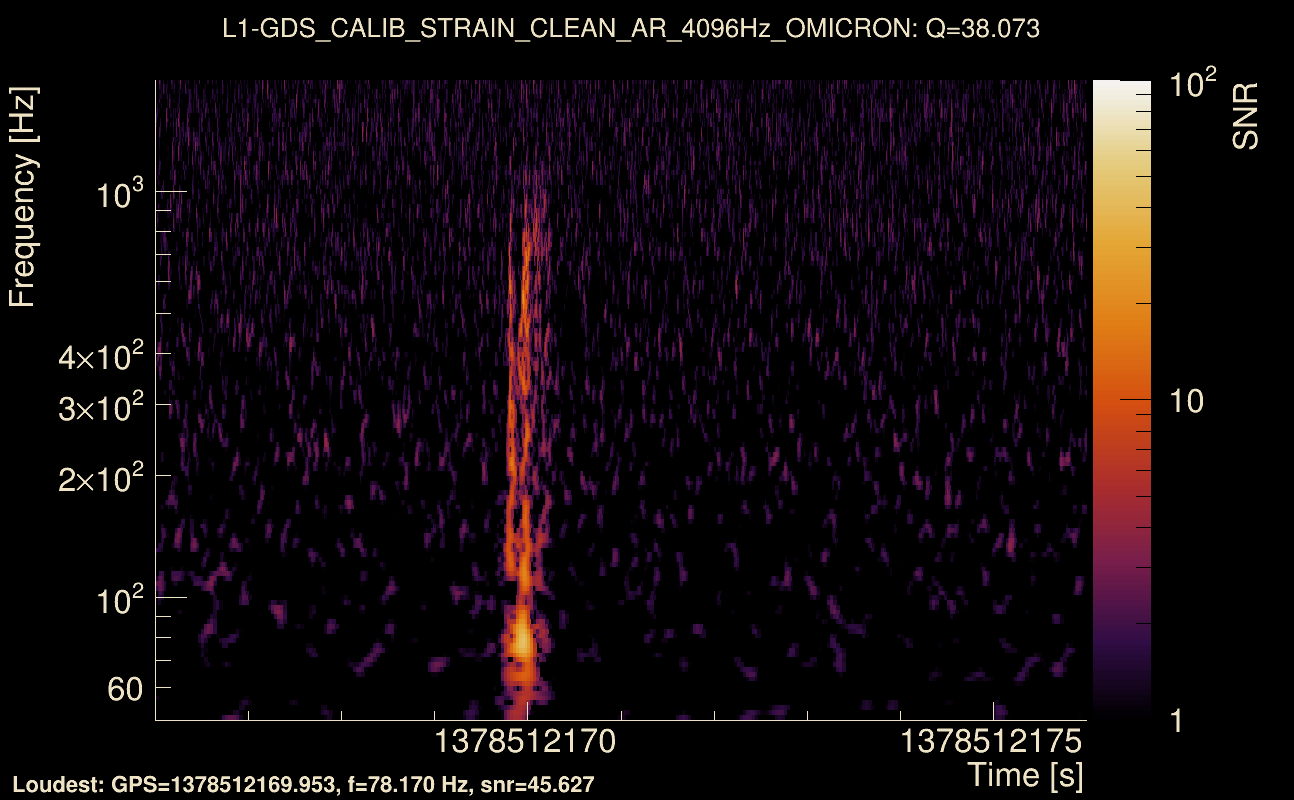
| Event time t(H1): | GPS = 1378512166 (Tue Sep 12 00:02:28 2023 ) → GPS = 1378512176 (Tue Sep 12 00:02:38 2023 ) |
| Event time t(L1): | GPS = 1378512166 (Tue Sep 12 00:02:38 2023 ) → GPS = 1378512176 (Tue Sep 12 00:02:38 2023 ) |
| Omicron analysis time window (H1): | GPS = 1378512163 → GPS = 1378512179 |
| Omicron analysis time window (L1): | GPS = 1378512163 → GPS = 1378512179 |
| Time delay between detectors t(L1) - t(H1): | 0.00479288 s (slice index = 108 / 217), δt_gw = 0.00479288 s |
| Time delay uncertainty: | 0.000973226 s |
| [targeted mode] Time delay probability: | 0.994097 (0.00739805 sigmas), δt_target = 0.00197196 s |
| Frequency: | 227.444 Hz |
| Ξ: | 0.888412 ± 0.00501767 (variance = 2.51771e-05): Q0: 0.924398, Q1: 0.921022, Q2: 0.921364, Q3: 0.922456, Q4: 0.910116 |
| Rank: | R_A = 0.877229 |
| Log of amplitude ratio (L1/H1): | -0.297502, variance = 0.167571 (L1/H1: -0.295243, variance = 0.304419, H1/L1: 0.301833, variance = 0.307096) |
| Amplitude ratio (L1/H1): | 0.742671 ⋇ 1.50584 (L1/H1: 0.744351 ⋇ 1.73628, H1/L1: 1.35233 ⋇ 1.74048) |
| Amplitude ratio H1|L1 compatibility (probability): | 0.993276 |
| Antenna factor probability: | 1 |
| Number of rejected frequency rows: | Q0: 0 / 18, Q1: 1 / 36, Q2: 6 / 70, Q3: 20 / 134, Q4: 62 / 258 |
| Maximum signal-to-noise ratio: | H1: 71.7762, L1: 51.8378 |
| SNR variance: | H1: 3.88755, L1: 2.27958 |
| Click here for a zoomed plot | Click here for a zoomed plot | Click here for a zoomed plot | Click here for a zoomed plot | Click here for a zoomed plot |
 |
 |
 |
 |
 |
 |
 |
 |
 |
 |
 |
 |
 |
 |
 |
 |
 |
 |
 |
 |
 |
 |
 |
 |
 |
 |
 |
 |
 |
| Event time t(H1): | GPS = 1377906846 (Mon Sep 4 23:53:48 2023 ) → GPS = 1377906856 (Mon Sep 4 23:53:58 2023 ) |
| Event time t(L1): | GPS = 1377906846 (Mon Sep 4 23:53:58 2023 ) → GPS = 1377906856 (Mon Sep 4 23:53:58 2023 ) |
| Omicron analysis time window (H1): | GPS = 1377906843 → GPS = 1377906859 |
| Omicron analysis time window (L1): | GPS = 1377906843 → GPS = 1377906859 |
| Time delay between detectors t(L1) - t(H1): | 0.00396972 s (slice index = 108 / 217), δt_gw = 0.00396972 s |
| Time delay uncertainty: | 0.000586112 s |
| [targeted mode] Time delay probability: | 0.978321 (0.0271742 sigmas), δt_target = 0.00480008 s |
| Frequency: | 233.783 Hz |
| Ξ: | 0.900407 ± 0.00322769 (variance = 1.0418e-05): Q0: 0.936019, Q1: 0.932193, Q2: 0.932164, Q3: 0.934849, Q4: 0.926665 |
| Rank: | R_A = 0.876296 |
| Log of amplitude ratio (L1/H1): | -0.219681, variance = 0.158339 (L1/H1: -0.221752, variance = 0.305137, H1/L1: 0.216641, variance = 0.306804) |
| Amplitude ratio (L1/H1): | 0.802775 ⋇ 1.48872 (L1/H1: 0.801114 ⋇ 1.7374, H1/L1: 1.2419 ⋇ 1.74002) |
| Amplitude ratio H1|L1 compatibility (probability): | 0.994788 |
| Antenna factor probability: | 1 |
| Number of rejected frequency rows: | Q0: 0 / 18, Q1: 1 / 36, Q2: 7 / 70, Q3: 17 / 134, Q4: 53 / 258 |
| Maximum signal-to-noise ratio: | H1: 74.6768, L1: 61.6227 |
| SNR variance: | H1: 0.505034, L1: 0.462022 |
| Click here for a zoomed plot | Click here for a zoomed plot | Click here for a zoomed plot | Click here for a zoomed plot | Click here for a zoomed plot |
 |
 |
 |
 |
 |
 |
 |
 |
 |
 |
 |
 |
 |
 |
 |
 |
 |
 |
 |
 |
 |
 |
 |
 |
 |
 |
 |
 |
 |
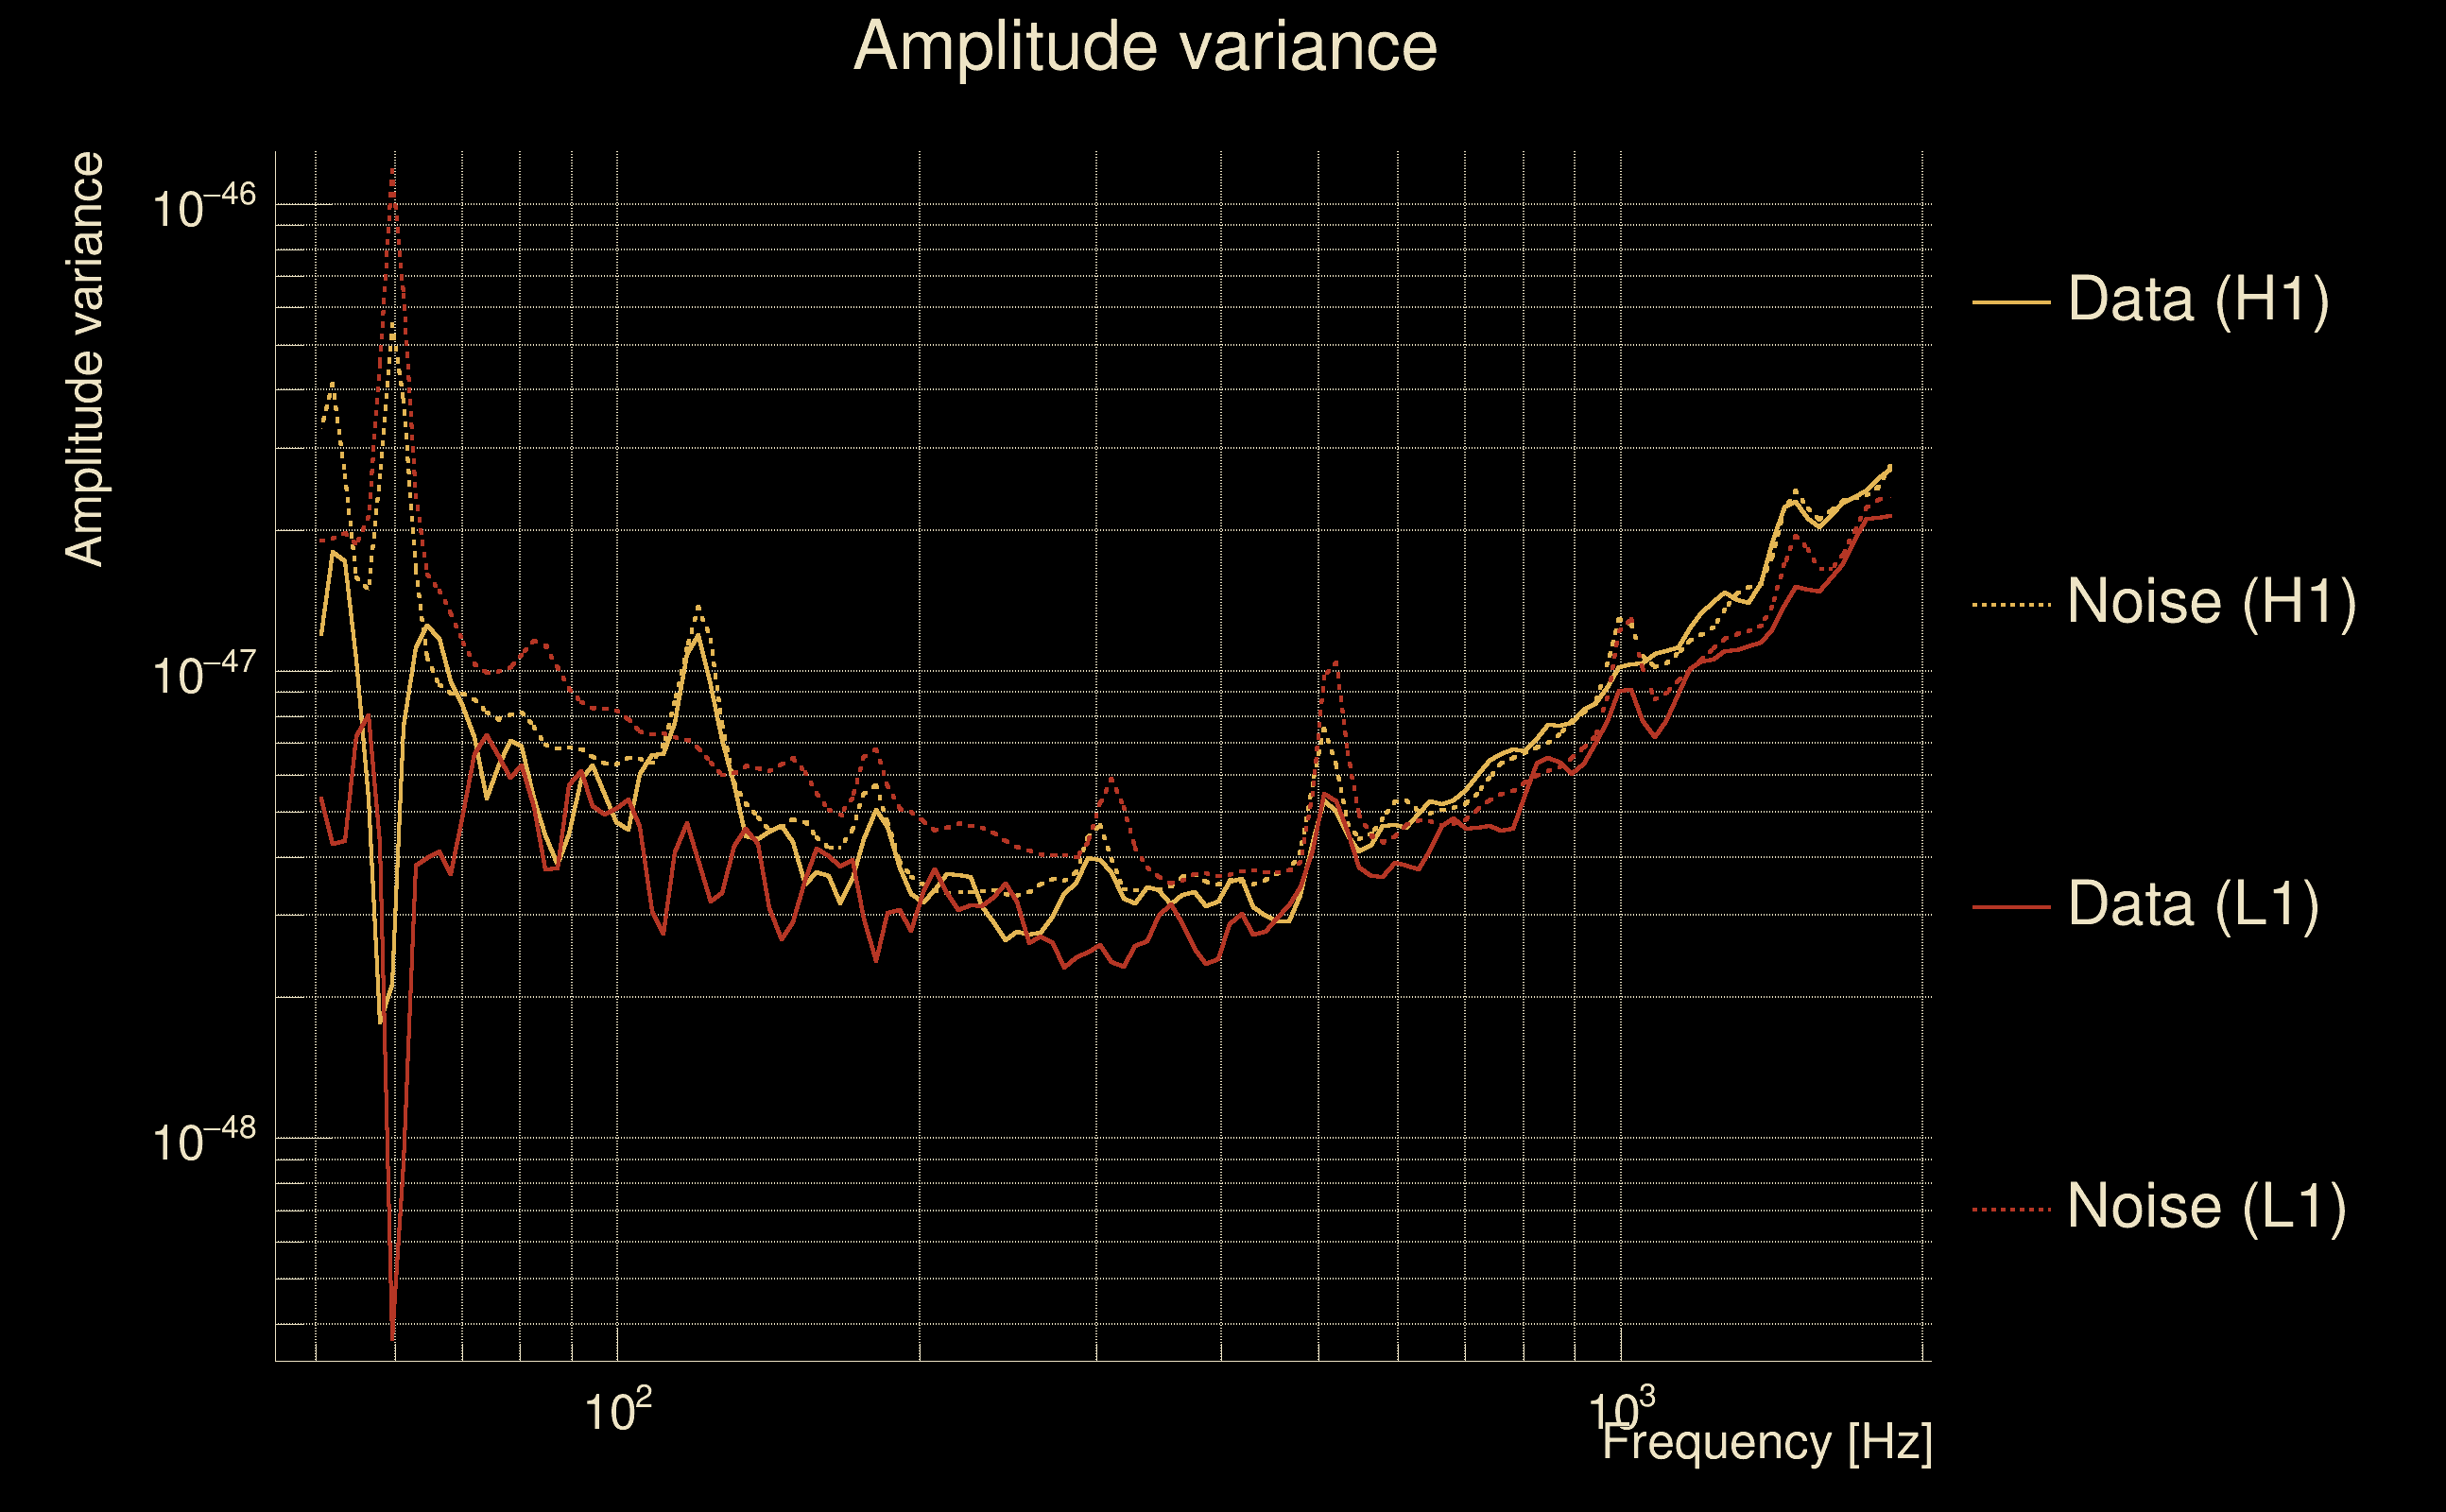
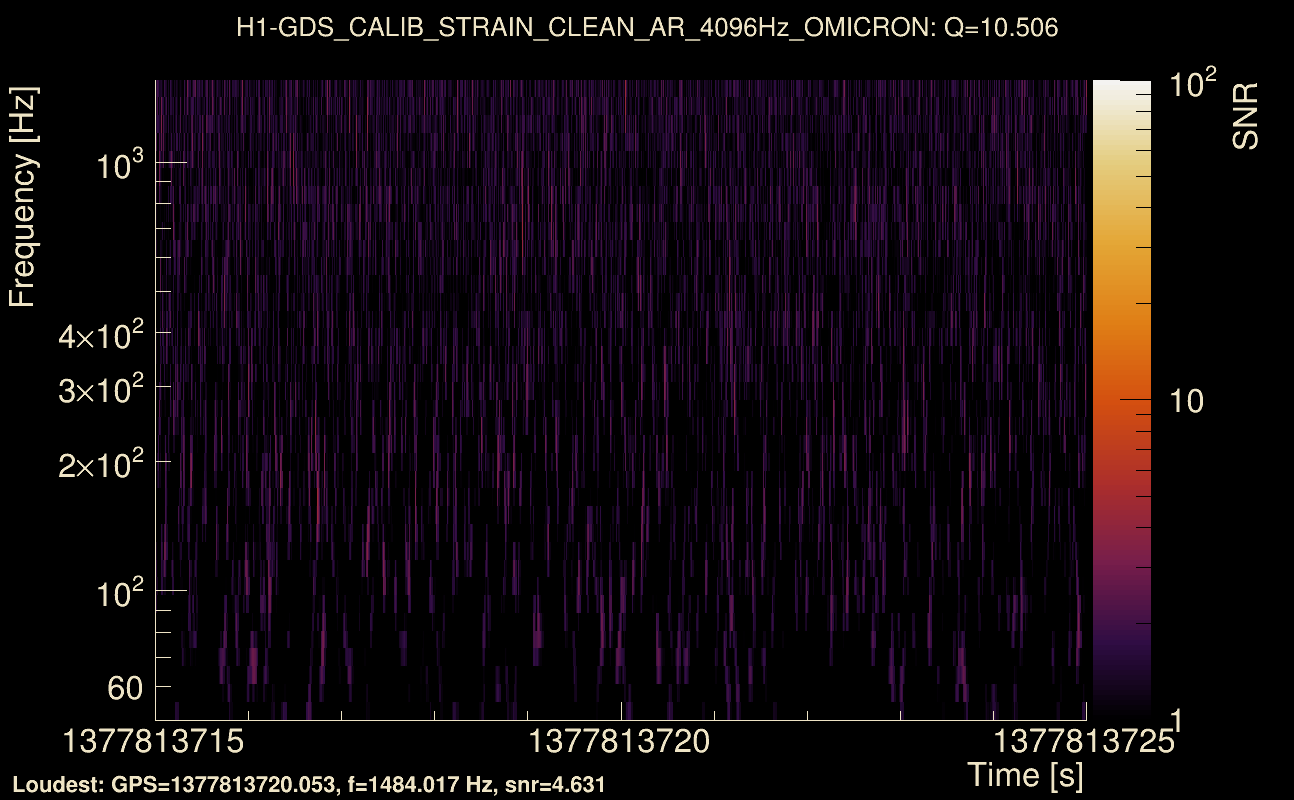
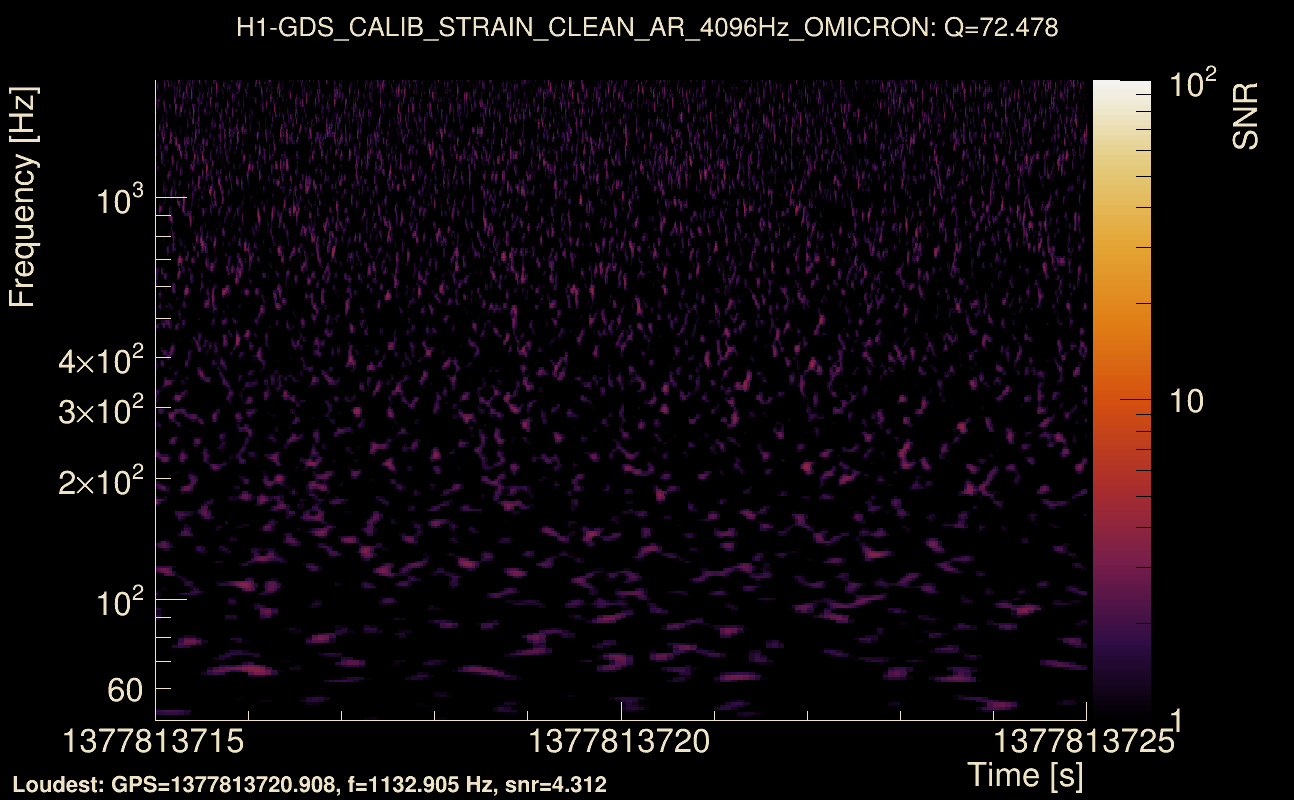
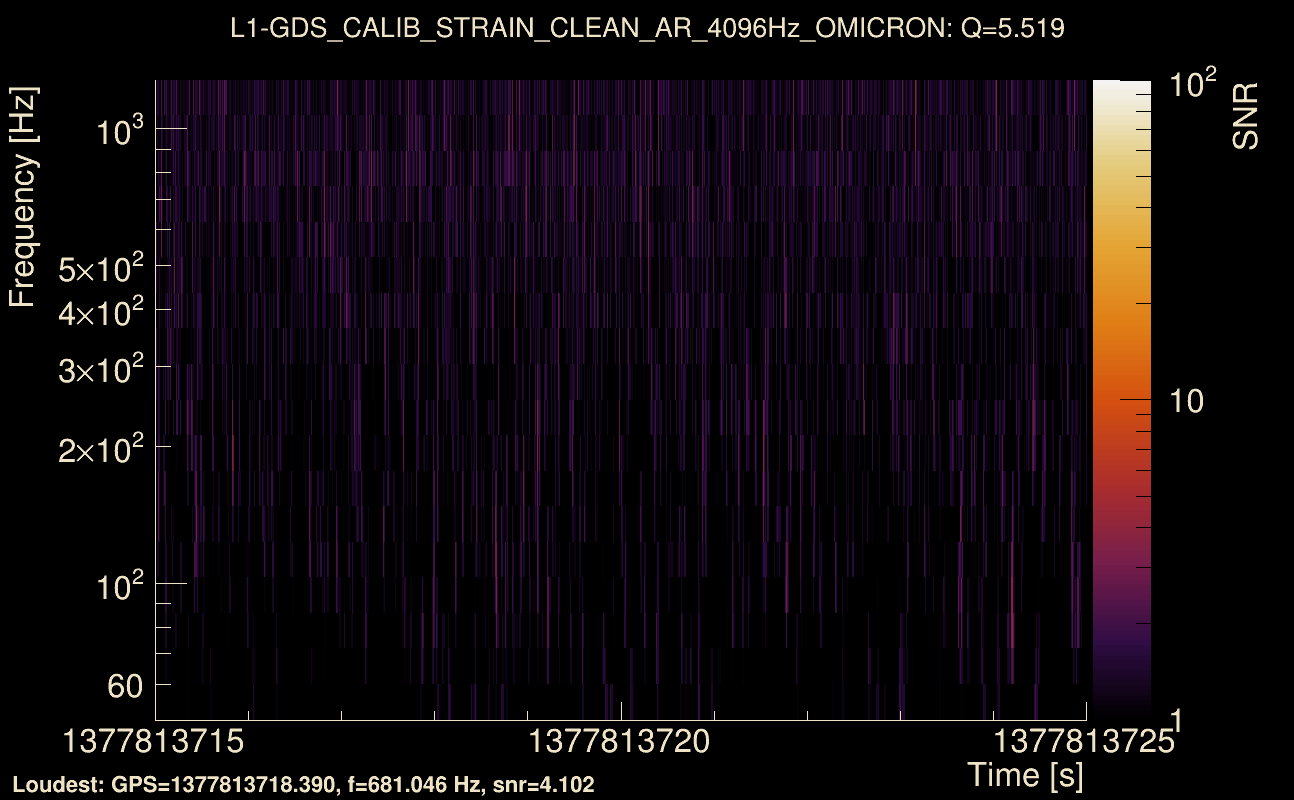
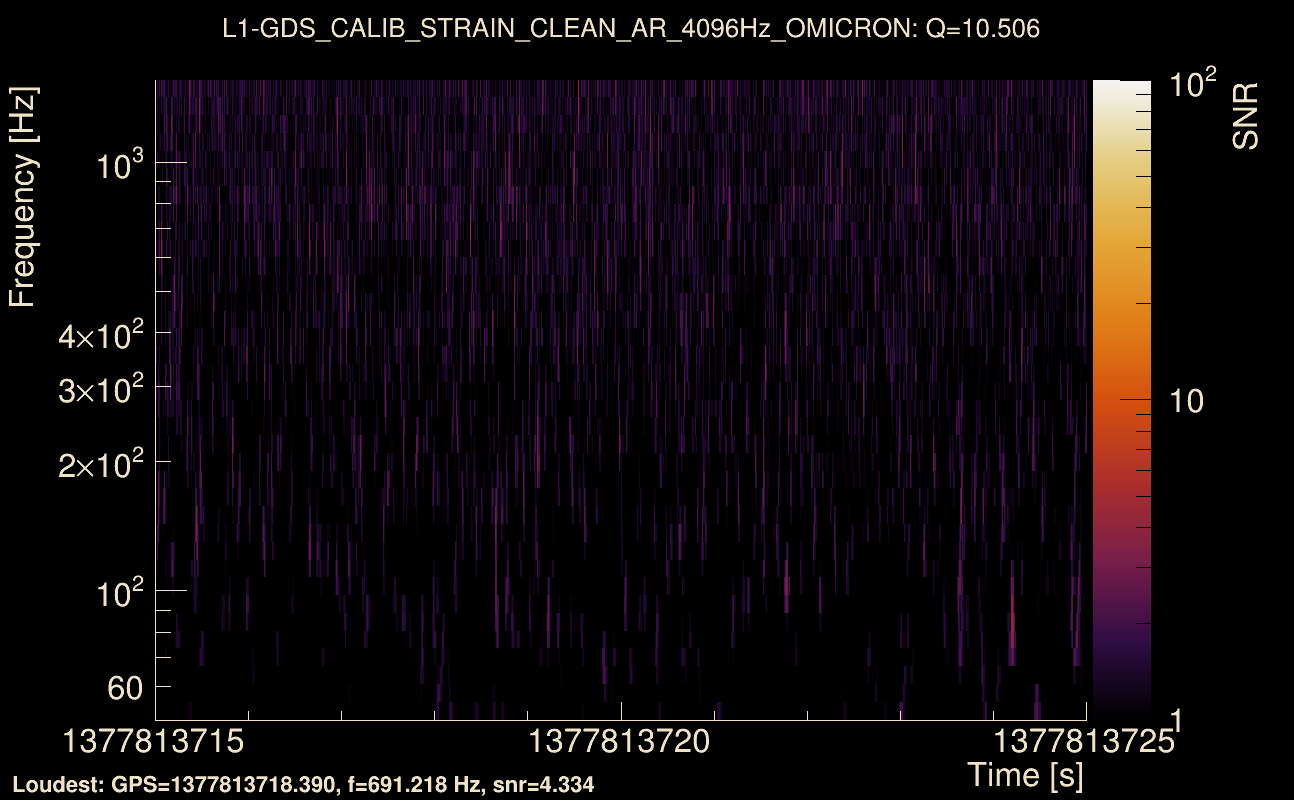
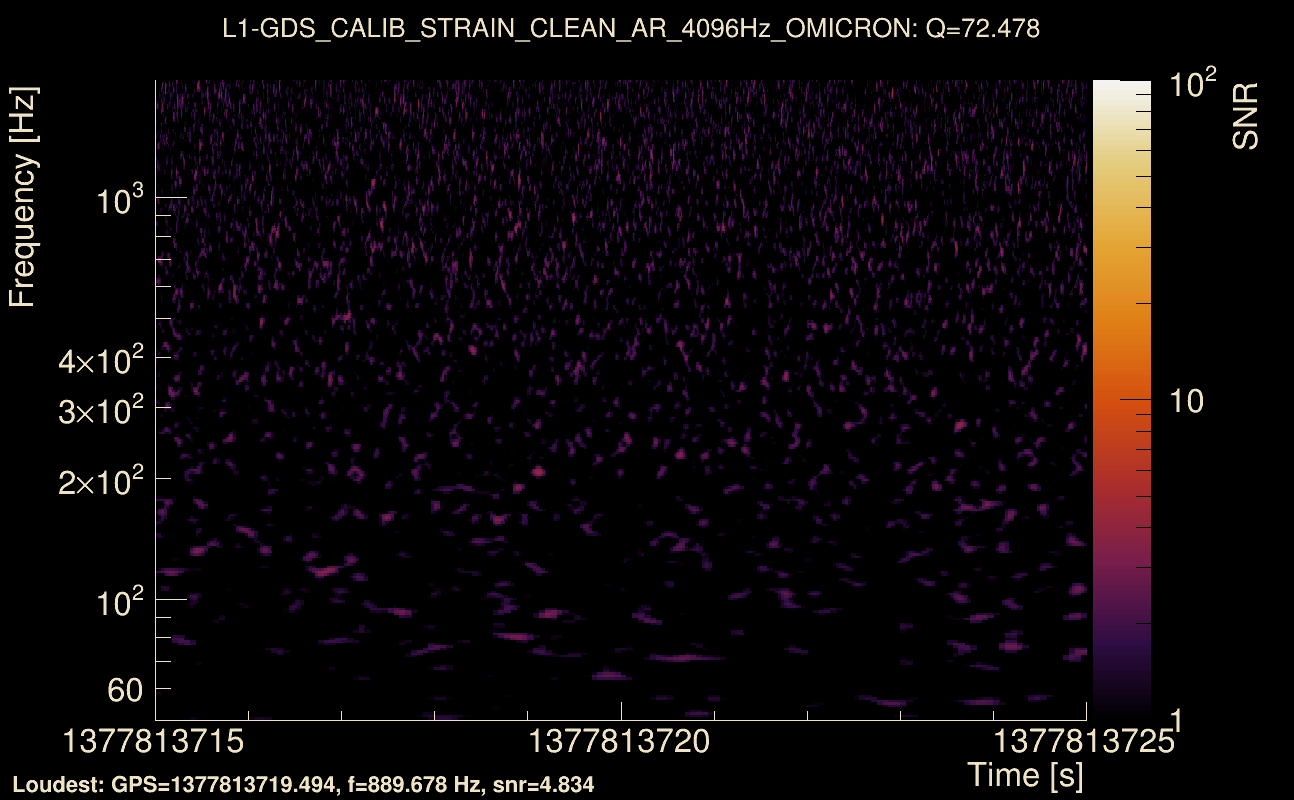
| Event time t(H1): | GPS = 1377813715 (Sun Sep 3 22:01:37 2023 ) → GPS = 1377813725 (Sun Sep 3 22:01:47 2023 ) |
| Event time t(L1): | GPS = 1377813715 (Sun Sep 3 22:01:47 2023 ) → GPS = 1377813725 (Sun Sep 3 22:01:47 2023 ) |
| Omicron analysis time window (H1): | GPS = 1377813712 → GPS = 1377813728 |
| Omicron analysis time window (L1): | GPS = 1377813712 → GPS = 1377813728 |
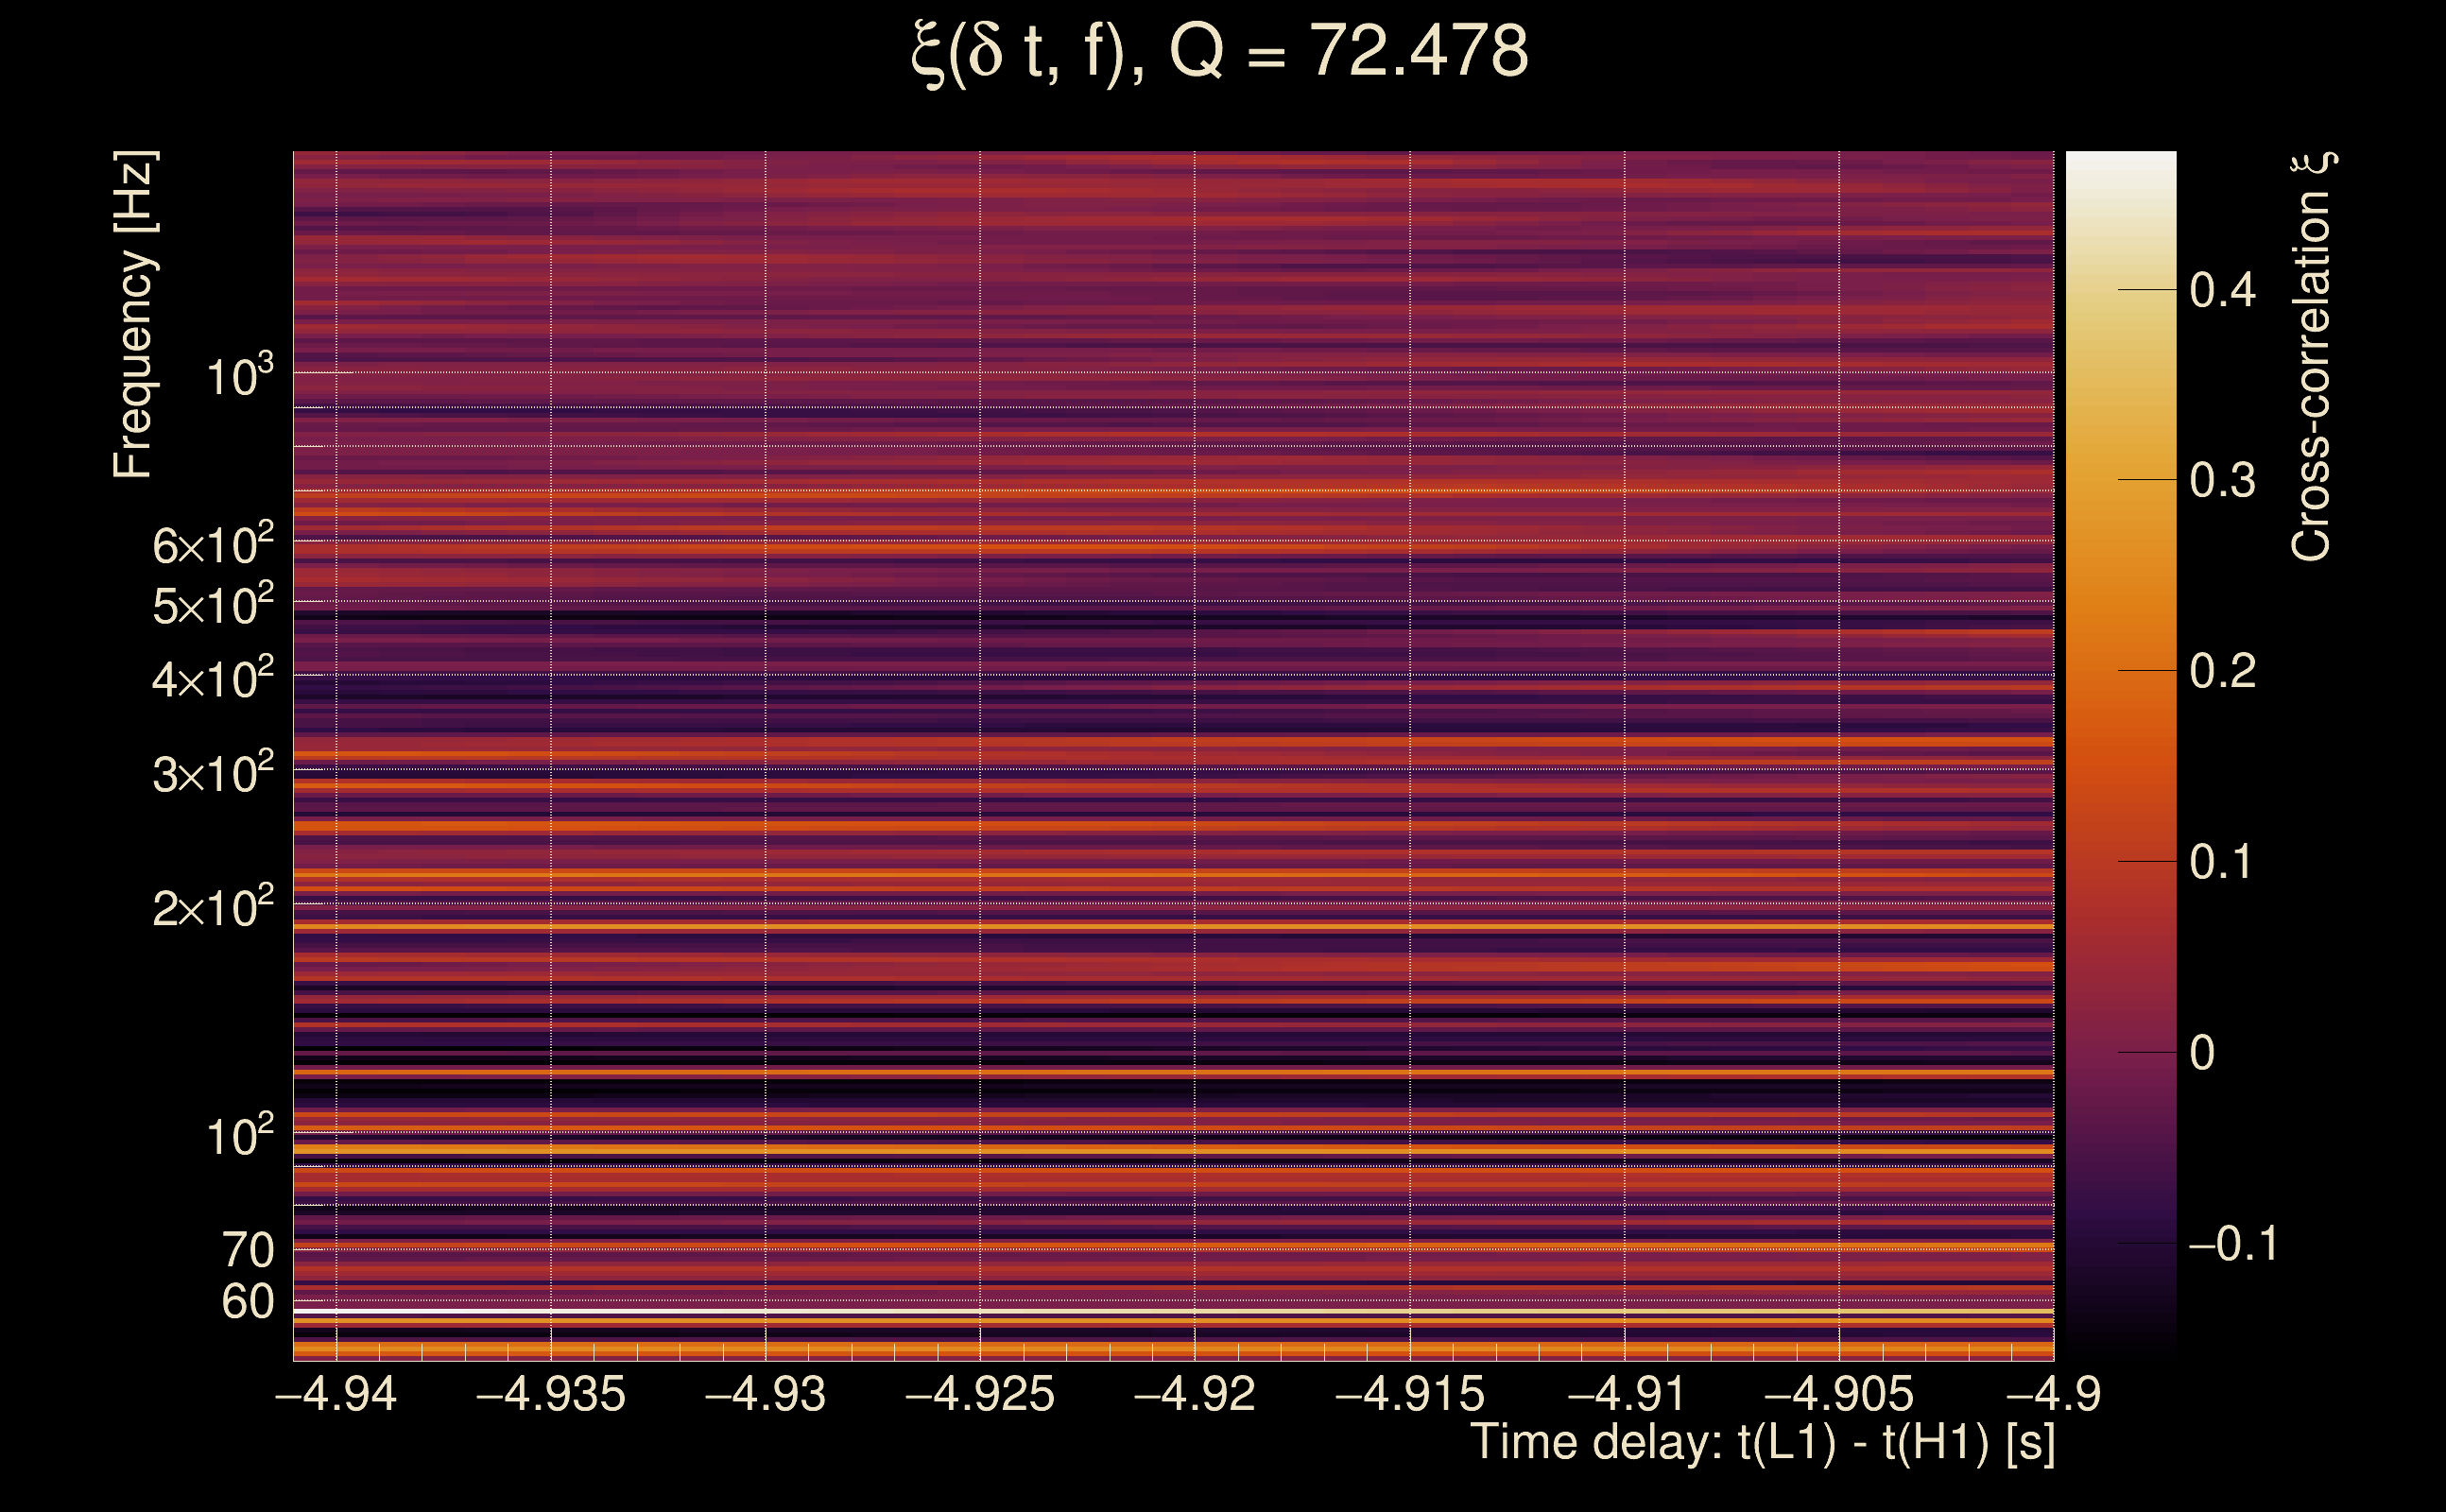
| Time delay between detectors t(L1) - t(H1): | -4.92015 s (slice index = 215 / 217), δt_gw = 0.00185163 s |
| Time delay uncertainty: | 0.00469072 s |
| [targeted mode] Time delay probability: | 0.928546 (0.0896747 sigmas), δt_target = 0.00398564 s |
| Frequency: | 112.508 Hz |
| Ξ: | 0.0220483 ± 0.0914166 (variance = 0.00835699): Q0: 0.105252, Q1: 0.127517, Q2: 0.292763, Q3: 0.0560879, Q4: 0.0327054 |
| Rank: | R_A = 0.0186583 |
| Log of amplitude ratio (L1/H1): | -0.166197, variance = 0.590895 (L1/H1: -0.253988, variance = 1.27084, H1/L1: 0.0826101, variance = 1.0997) |
| Amplitude ratio (L1/H1): | 0.846879 ⋇ 2.15695 (L1/H1: 0.775701 ⋇ 3.08736, H1/L1: 1.08612 ⋇ 2.85385) |
| Amplitude ratio H1|L1 compatibility (probability): | 0.911371 |
| Antenna factor probability: | 1 |
| Number of rejected frequency rows: | Q0: 14 / 18, Q1: 31 / 36, Q2: 60 / 70, Q3: 130 / 134, Q4: 256 / 258 |
| Maximum signal-to-noise ratio: | H1: 4.94211, L1: 5.06488 |
| SNR variance: | H1: 0.532991, L1: 0.483535 |
| Click here for a zoomed plot | Click here for a zoomed plot | Click here for a zoomed plot | Click here for a zoomed plot | Click here for a zoomed plot |
 |
 |
 |
 |
 |
 |
 |
 |
 |
 |
 |
 |
 |
 |
 |
 |
 |
 |
 |
 |
 |
 |
 |
 |
 |
 |
 |
 |
 |
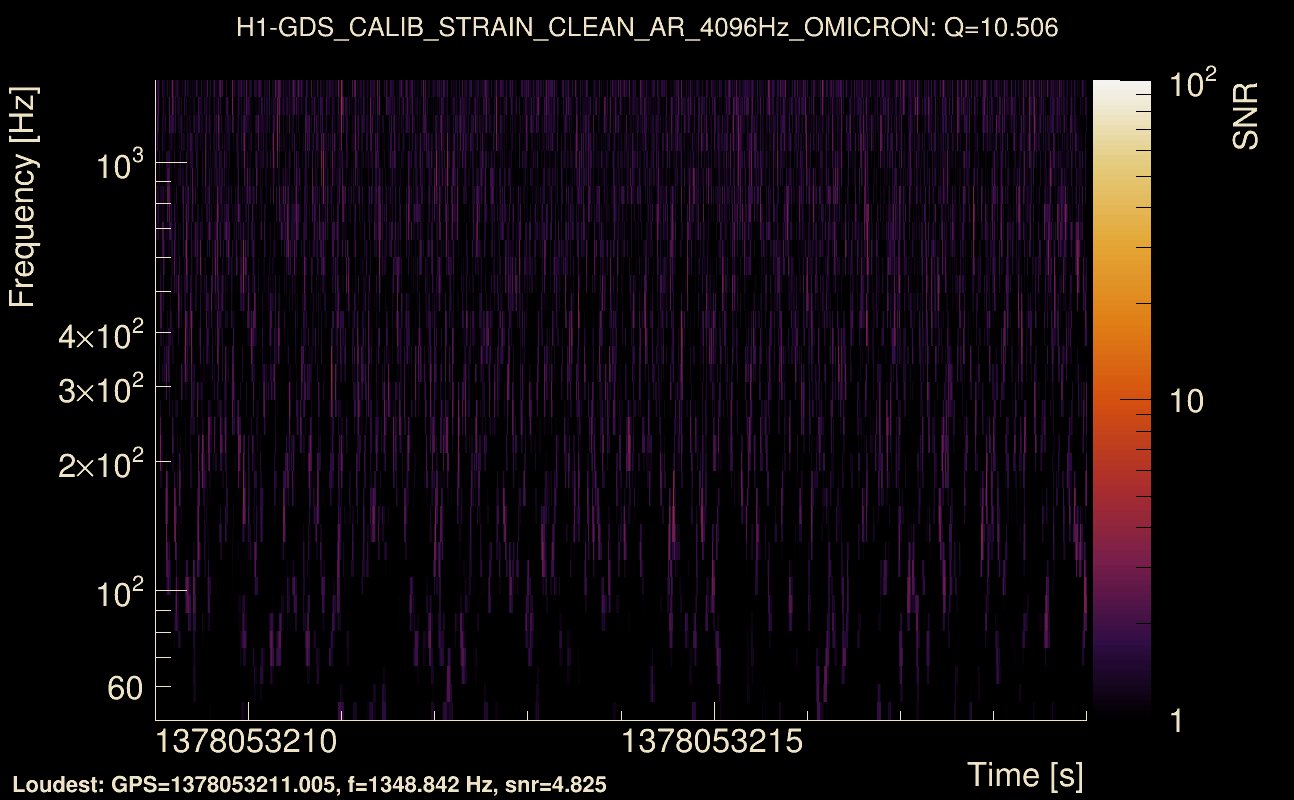
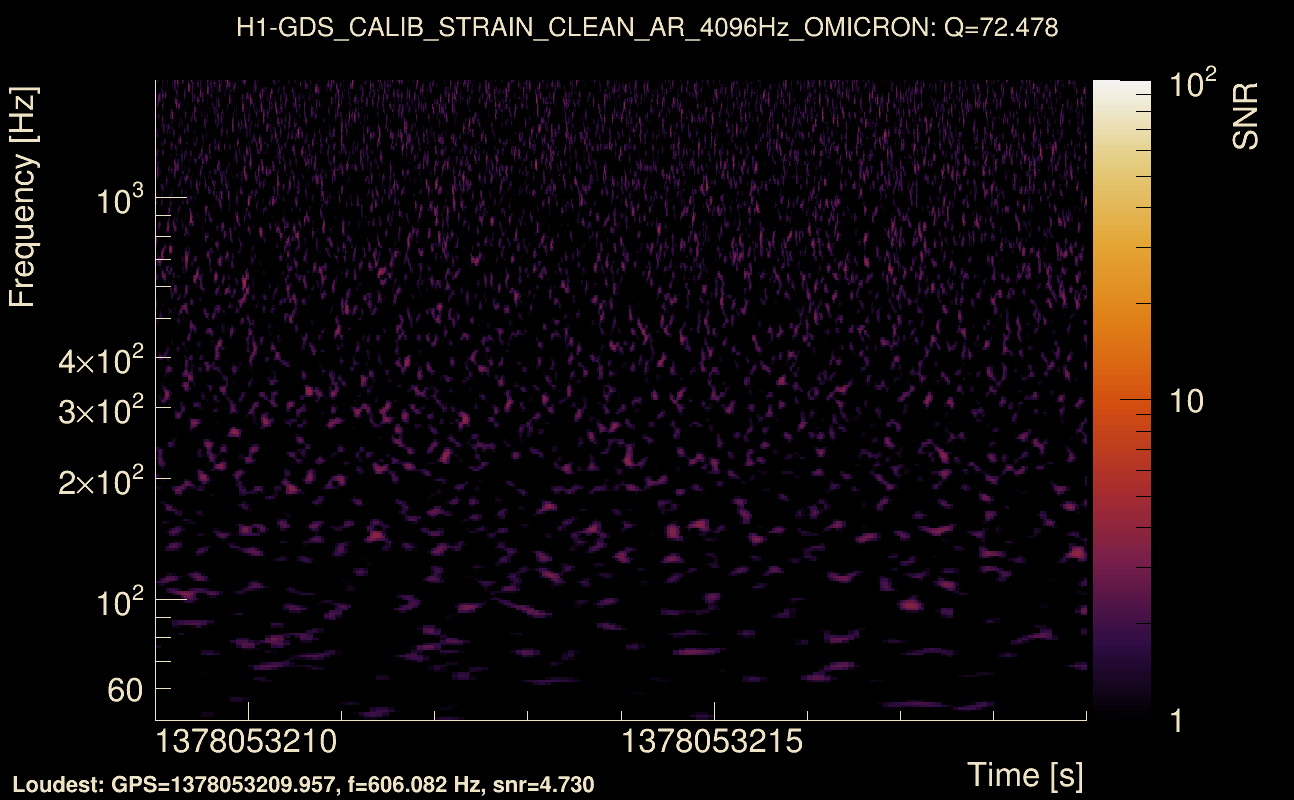
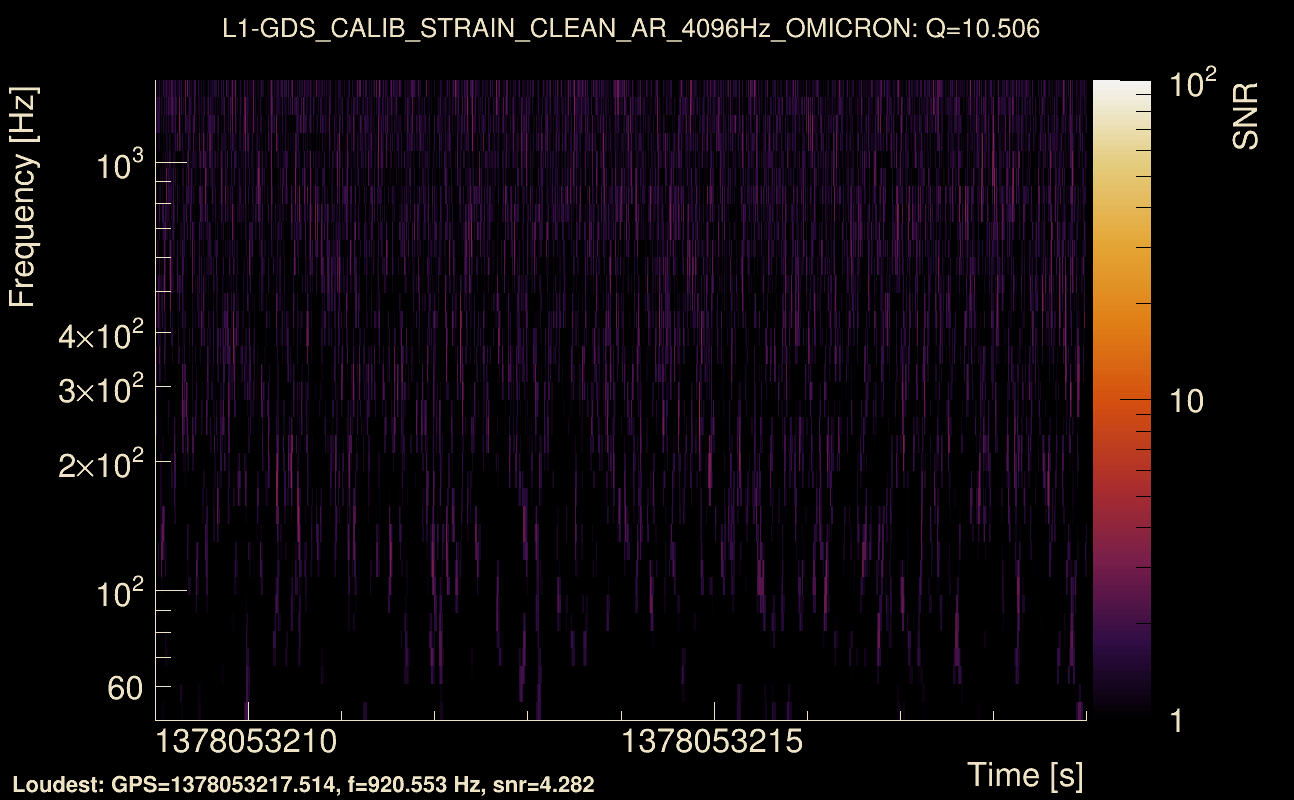
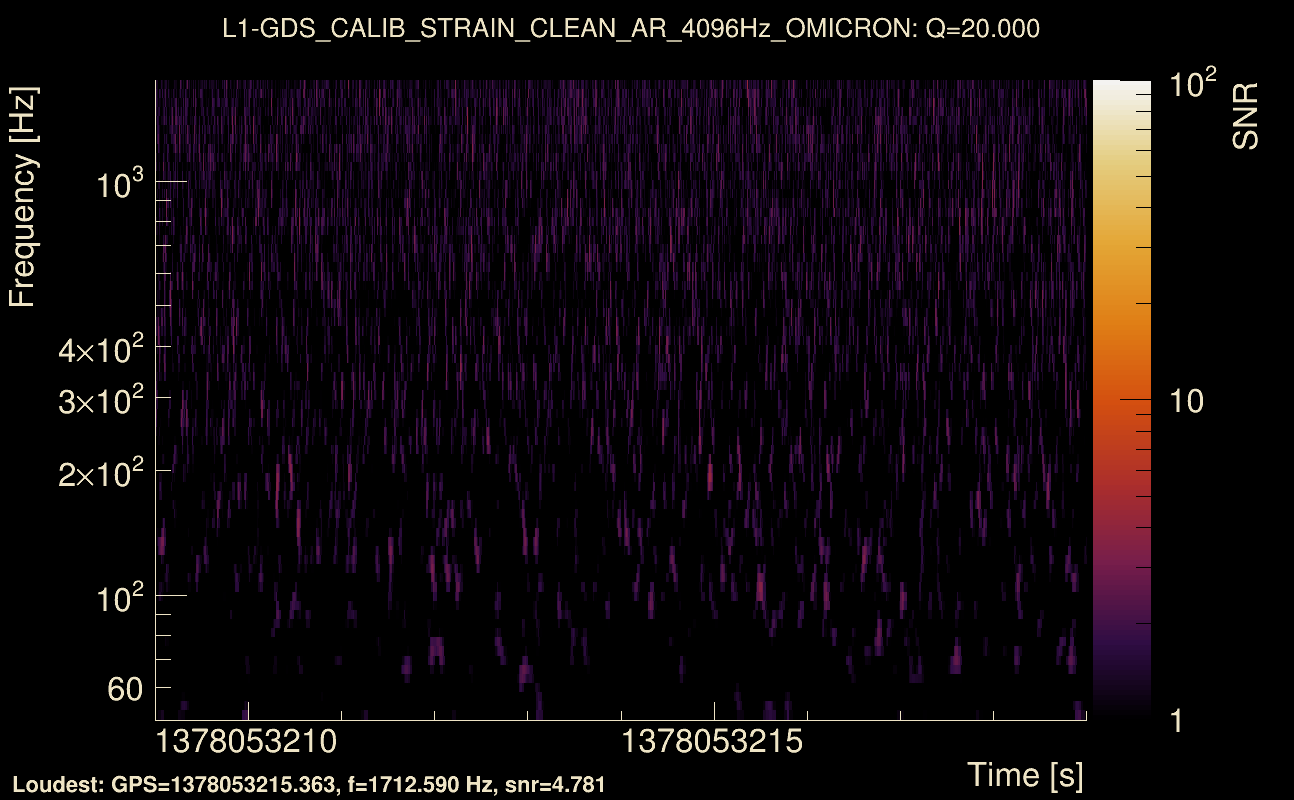
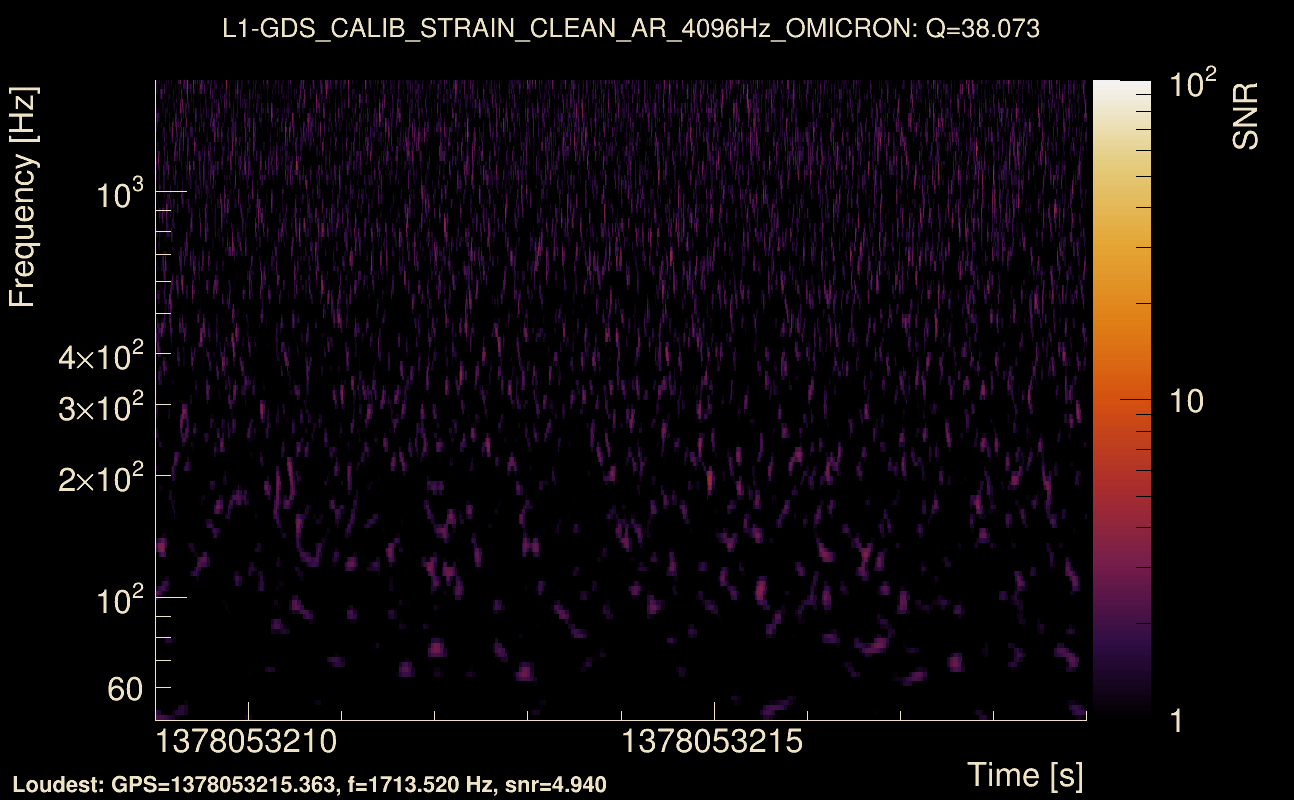
| Event time t(H1): | GPS = 1378053209 (Wed Sep 6 16:33:11 2023 ) → GPS = 1378053219 (Wed Sep 6 16:33:21 2023 ) |
| Event time t(L1): | GPS = 1378053209 (Wed Sep 6 16:33:21 2023 ) → GPS = 1378053219 (Wed Sep 6 16:33:21 2023 ) |
| Omicron analysis time window (H1): | GPS = 1378053206 → GPS = 1378053222 |
| Omicron analysis time window (L1): | GPS = 1378053206 → GPS = 1378053222 |
| Time delay between detectors t(L1) - t(H1): | -4.92556 s (slice index = 215 / 217), δt_gw = -0.00356298 s |
| Time delay uncertainty: | 0.00880426 s |
| [targeted mode] Time delay probability: | 0.794613 (0.260325 sigmas), δt_target = 0.00143099 s |
| Frequency: | 323.53 Hz |
| Ξ: | 0.0267839 ± 0.0209408 (variance = 0.000438516): Q0: 0.0891052, Q1: 0.110412, Q2: 0.0602031, Q3: 0.108914, Q4: 0.118335 |
| Rank: | R_A = 0.0182263 |
| Log of amplitude ratio (L1/H1): | 0.0780003, variance = 0.463403 (L1/H1: -0.0561457, variance = 0.802922, H1/L1: -0.186183, variance = 0.990017) |
| Amplitude ratio (L1/H1): | 1.08112 ⋇ 1.97533 (L1/H1: 0.945401 ⋇ 2.44993, H1/L1: 0.830122 ⋇ 2.70471) |
| Amplitude ratio H1|L1 compatibility (probability): | 0.856386 |
| Antenna factor probability: | 1 |
| Number of rejected frequency rows: | Q0: 11 / 18, Q1: 27 / 36, Q2: 61 / 70, Q3: 119 / 134, Q4: 244 / 258 |
| Maximum signal-to-noise ratio: | H1: 4.80584, L1: 5.35155 |
| SNR variance: | H1: 0.500466, L1: 0.51323 |
| Click here for a zoomed plot | Click here for a zoomed plot | Click here for a zoomed plot | Click here for a zoomed plot | Click here for a zoomed plot |
 |
 |
 |
 |
 |
 |
 |
 |
 |
 |
 |
 |
 |
 |
 |
 |
 |
 |
 |
 |
 |
 |
 |
 |
 |
 |
 |
 |
 |
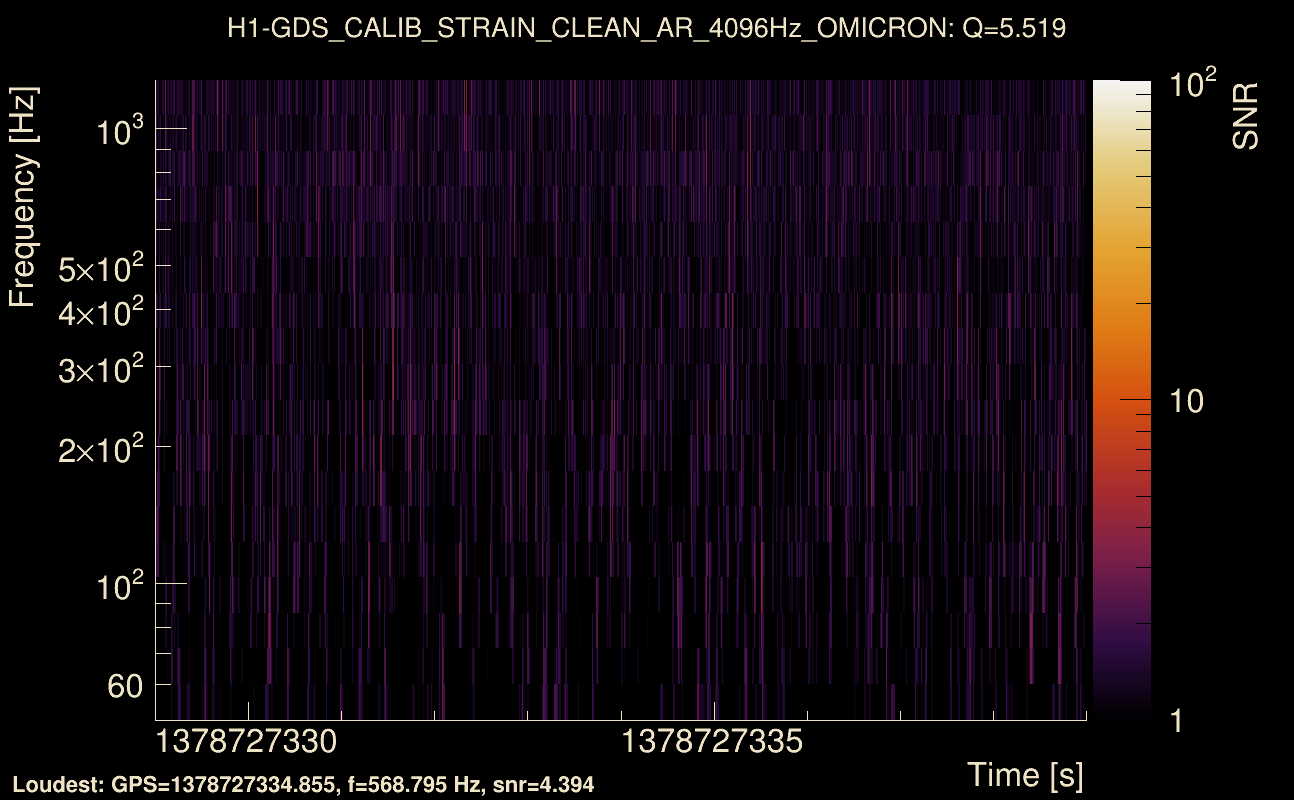
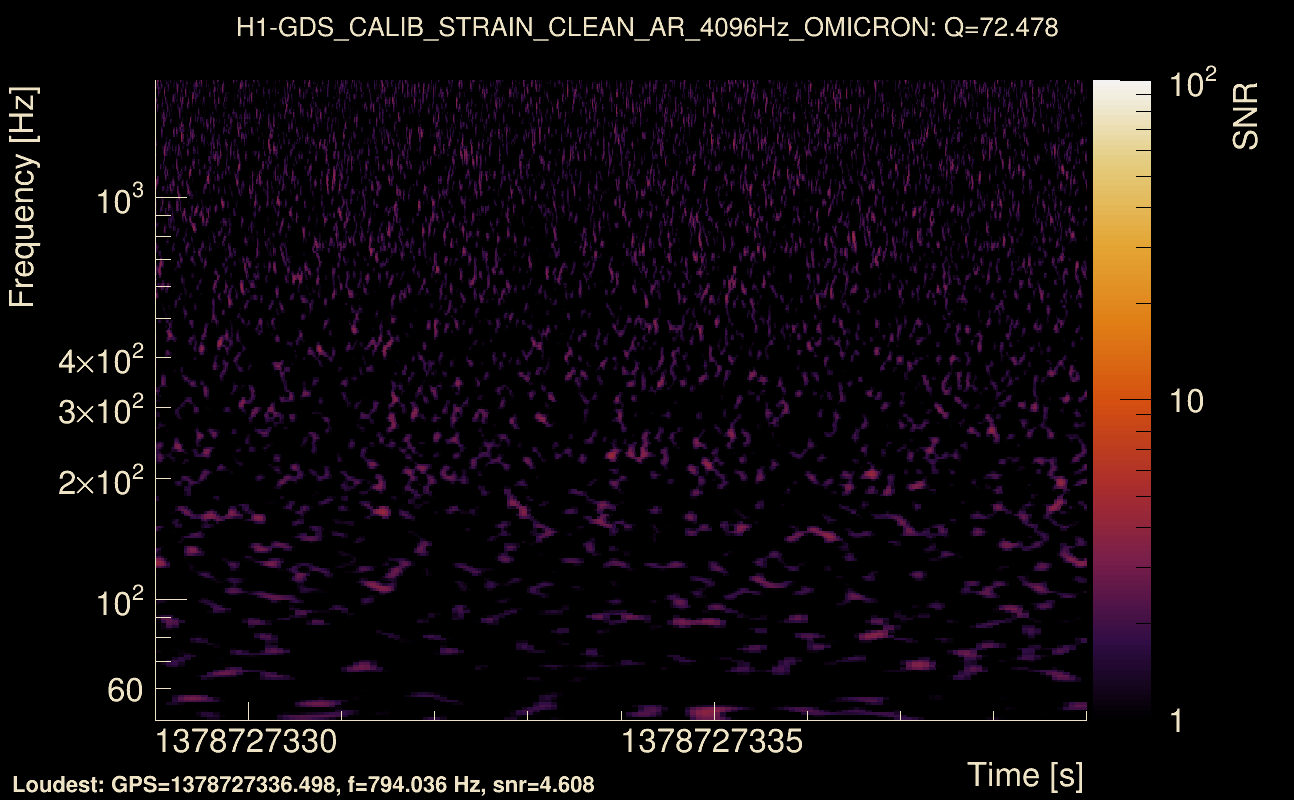
| Event time t(H1): | GPS = 1378727329 (Thu Sep 14 11:48:31 2023 ) → GPS = 1378727339 (Thu Sep 14 11:48:41 2023 ) |
| Event time t(L1): | GPS = 1378727329 (Thu Sep 14 11:48:41 2023 ) → GPS = 1378727339 (Thu Sep 14 11:48:41 2023 ) |
| Omicron analysis time window (H1): | GPS = 1378727326 → GPS = 1378727342 |
| Omicron analysis time window (L1): | GPS = 1378727326 → GPS = 1378727342 |
| Time delay between detectors t(L1) - t(H1): | -4.9206 s (slice index = 215 / 217), δt_gw = 0.00139629 s |
| Time delay uncertainty: | 0.00619532 s |
| [targeted mode] Time delay probability: | 0.827285 (0.218184 sigmas), δt_target = -0.00127101 s |
| Frequency: | 163.73 Hz |
| Ξ: | 0.040818 ± 0.0260786 (variance = 0.000680091): Q0: 0.0966591, Q1: 0.148754, Q2: 0.131767, Q3: 0.0792944, Q4: 0.0925591 |
| Rank: | R_A = 0.0160109 |
| Log of amplitude ratio (L1/H1): | 0.0402392, variance = 0.588635 (L1/H1: -0.543241, variance = 0.90705, H1/L1: -0.533608, variance = 1.35643) |
| Amplitude ratio (L1/H1): | 1.04106 ⋇ 2.15378 (L1/H1: 0.580863 ⋇ 2.5919, H1/L1: 0.586485 ⋇ 3.20483) |
| Amplitude ratio H1|L1 compatibility (probability): | 0.474141 |
| Antenna factor probability: | 1 |
| Number of rejected frequency rows: | Q0: 8 / 18, Q1: 27 / 36, Q2: 57 / 70, Q3: 119 / 134, Q4: 247 / 258 |
| Maximum signal-to-noise ratio: | H1: 4.81649, L1: 5.23791 |
| SNR variance: | H1: 0.537896, L1: 0.52221 |
| Click here for a zoomed plot | Click here for a zoomed plot | Click here for a zoomed plot | Click here for a zoomed plot | Click here for a zoomed plot |
 |
 |
 |
 |
 |
 |
 |
 |
 |
 |
 |
 |
 |
 |
 |
 |
 |
 |
 |
 |
 |
 |
 |
 |
 |
 |
 |
 |
 |
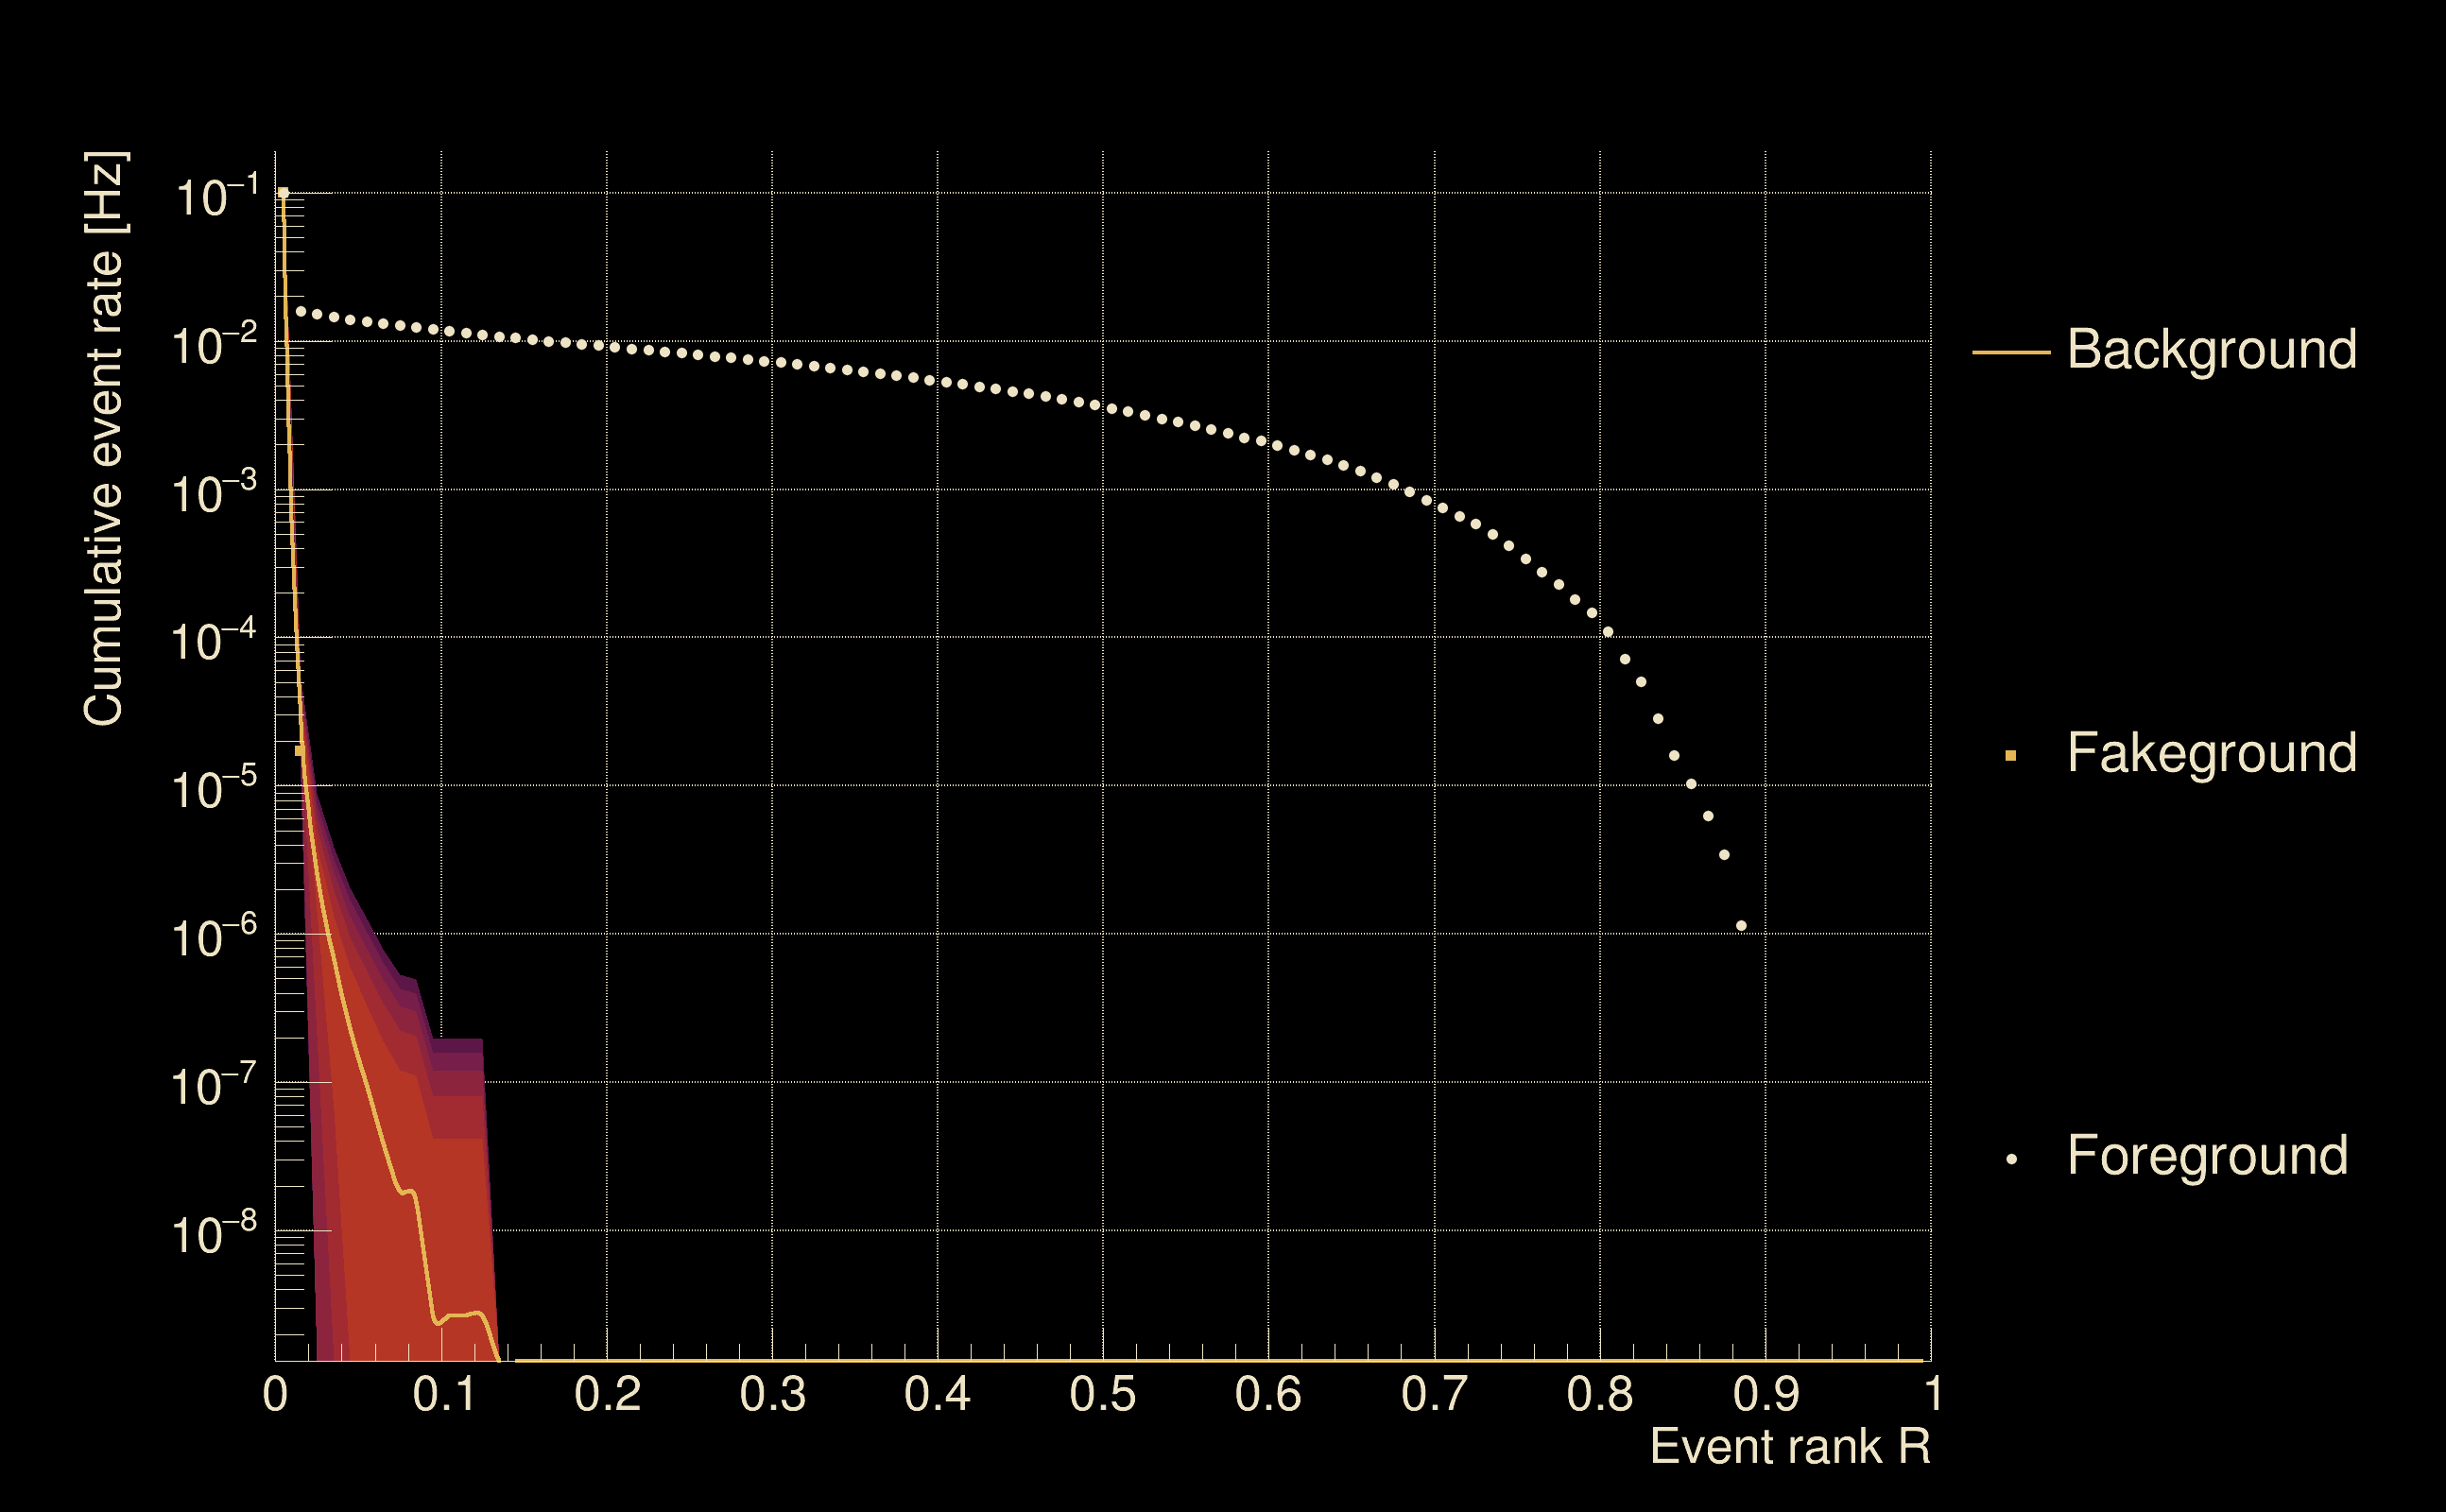
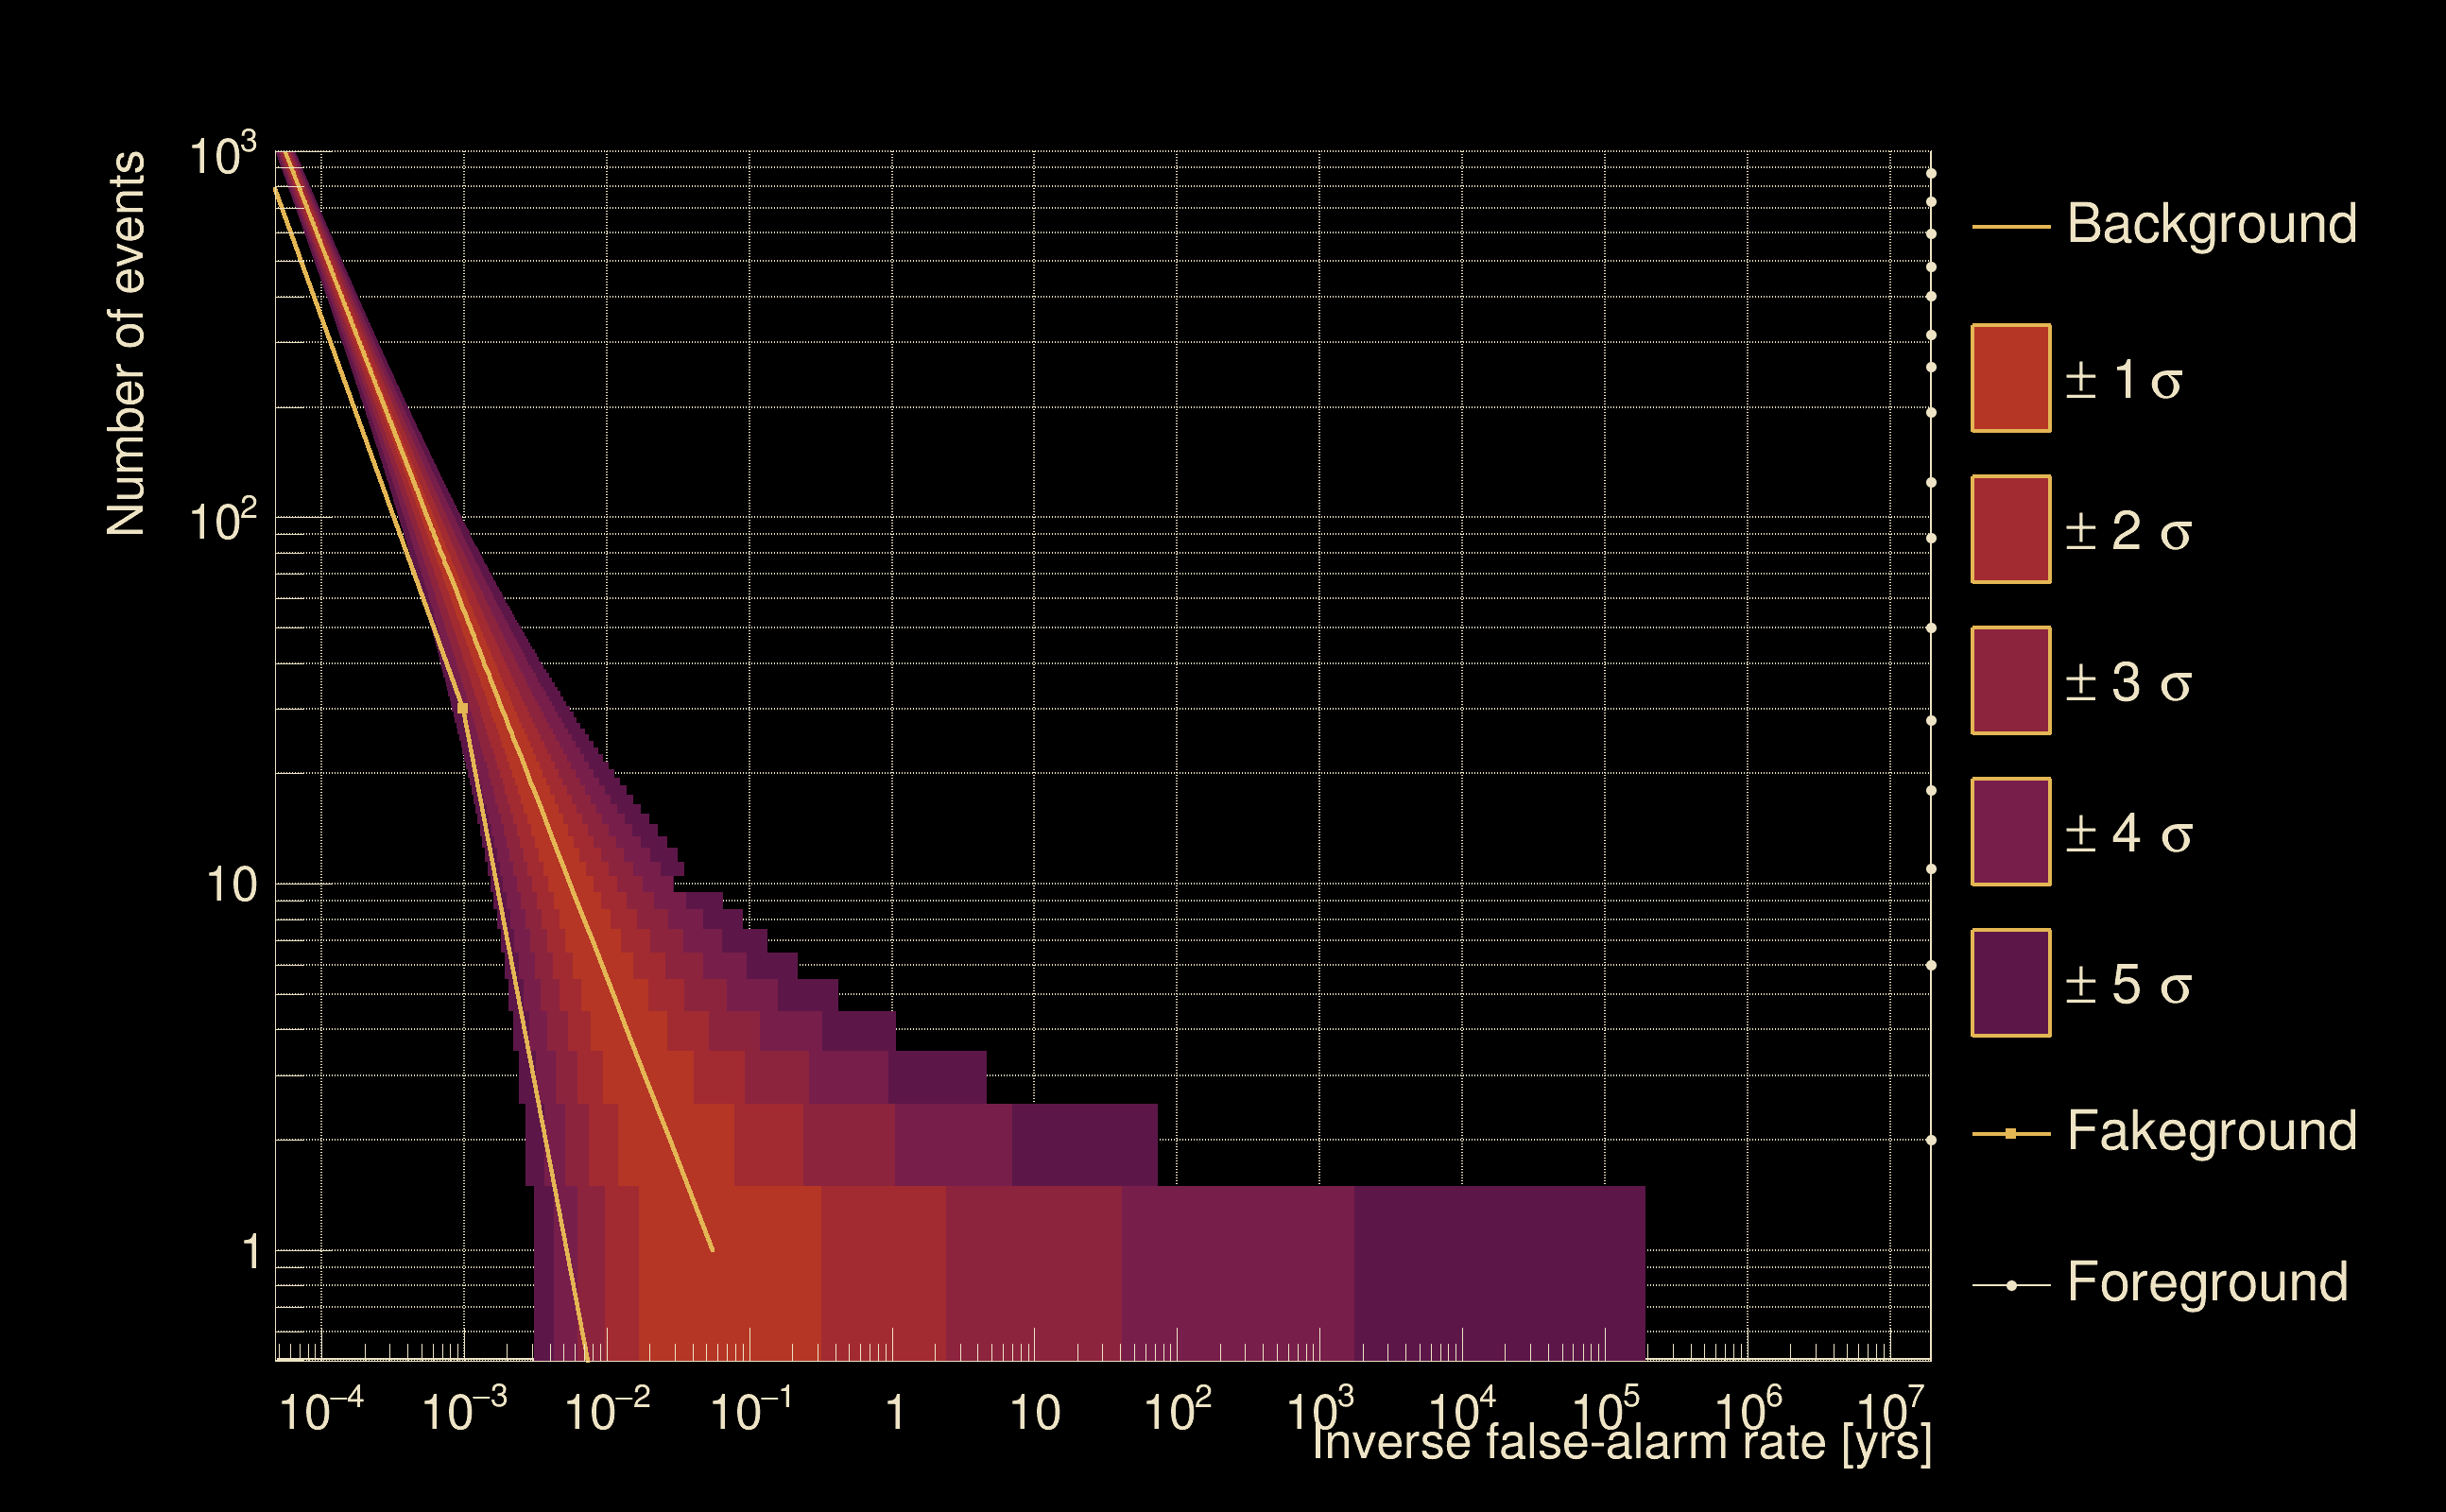
| Detection threshold: | R > 0.0668116 |
| False-alarm rate above that detection threshold: | 2.53598e-08 |
| Alternative threshold at 1/1000 yrs: | R > 0.125 |
| Alternative threshold at 1/100 yrs: | R > 0.125 |
| Alternative threshold at 1/10 yrs: | R > 0.0950343 |
| Alternative threshold at 1/1 yr: | R > 0.0660996 |
| Alternative threshold at 1/1 d: | R > 0.016096 |
 |
|
 |
 |
 |
 |
 |
 |
 |
 |
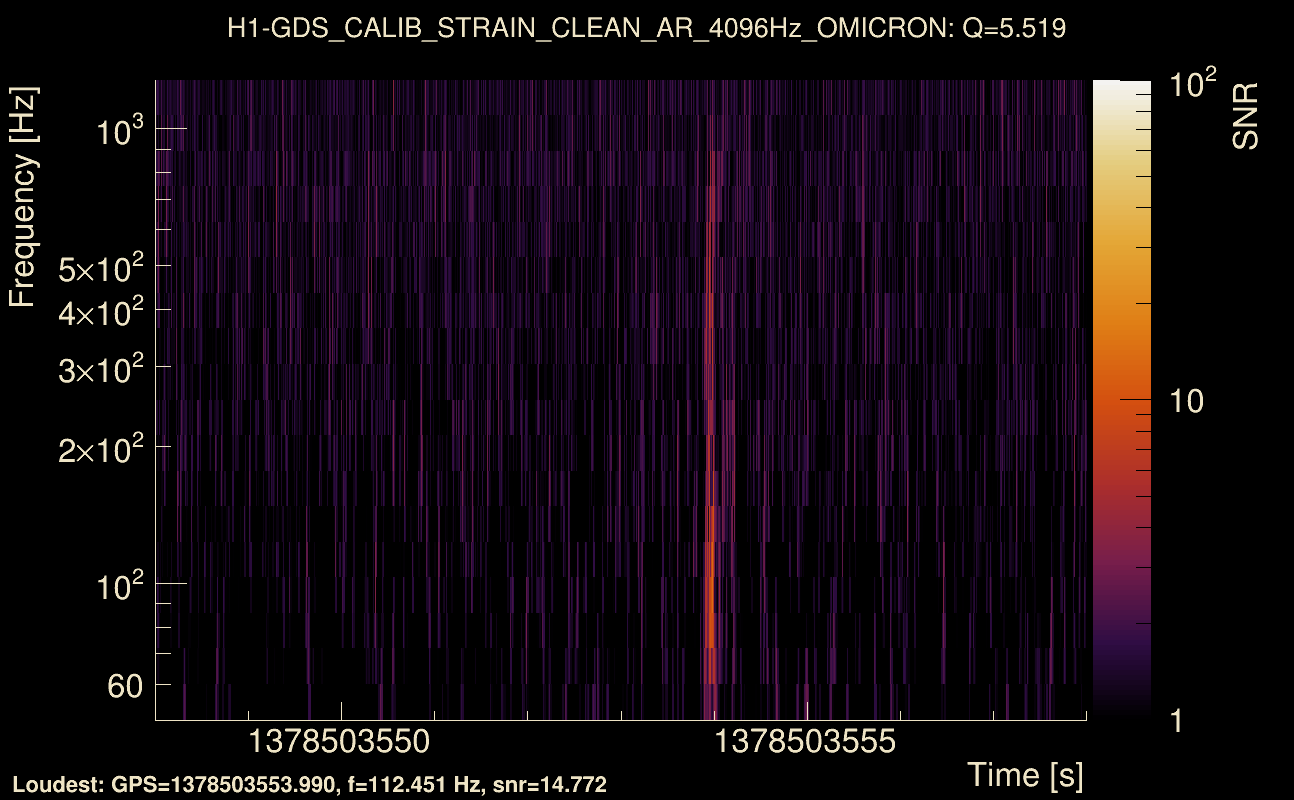
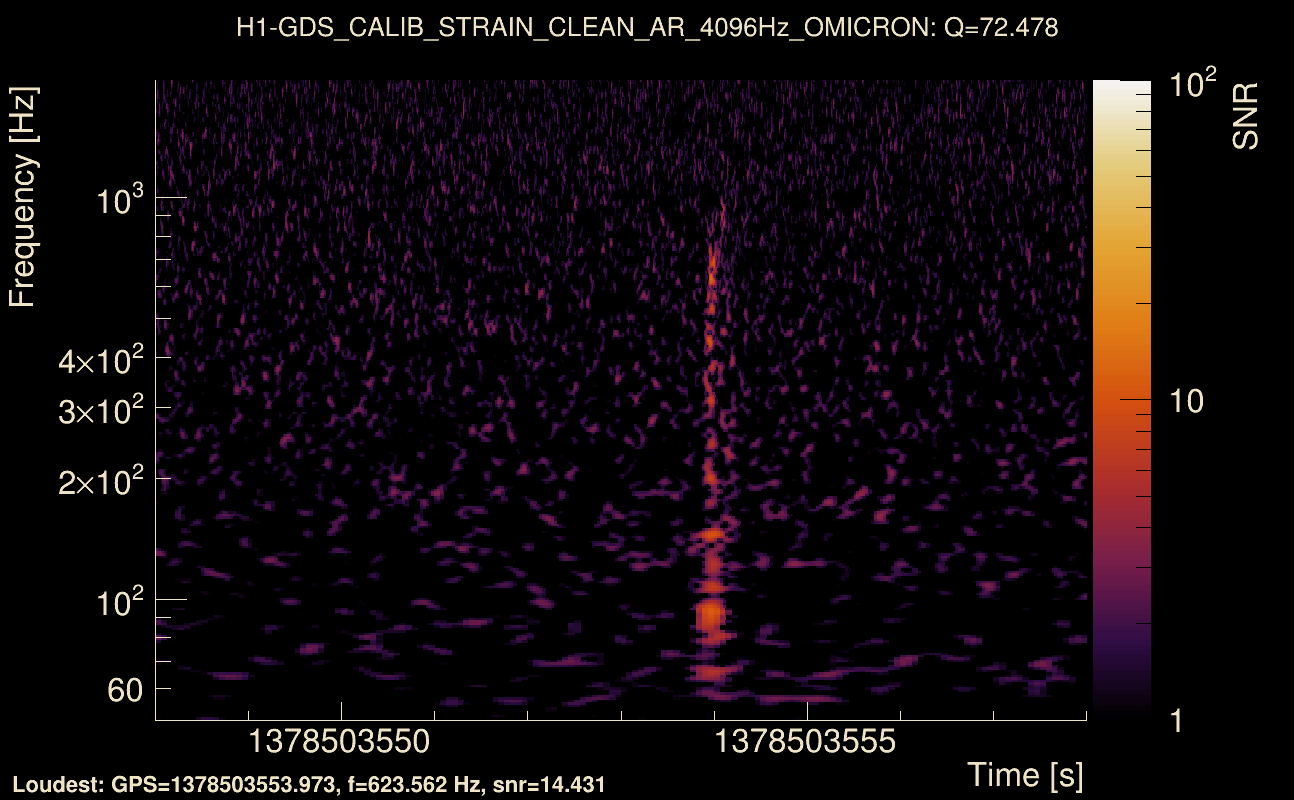
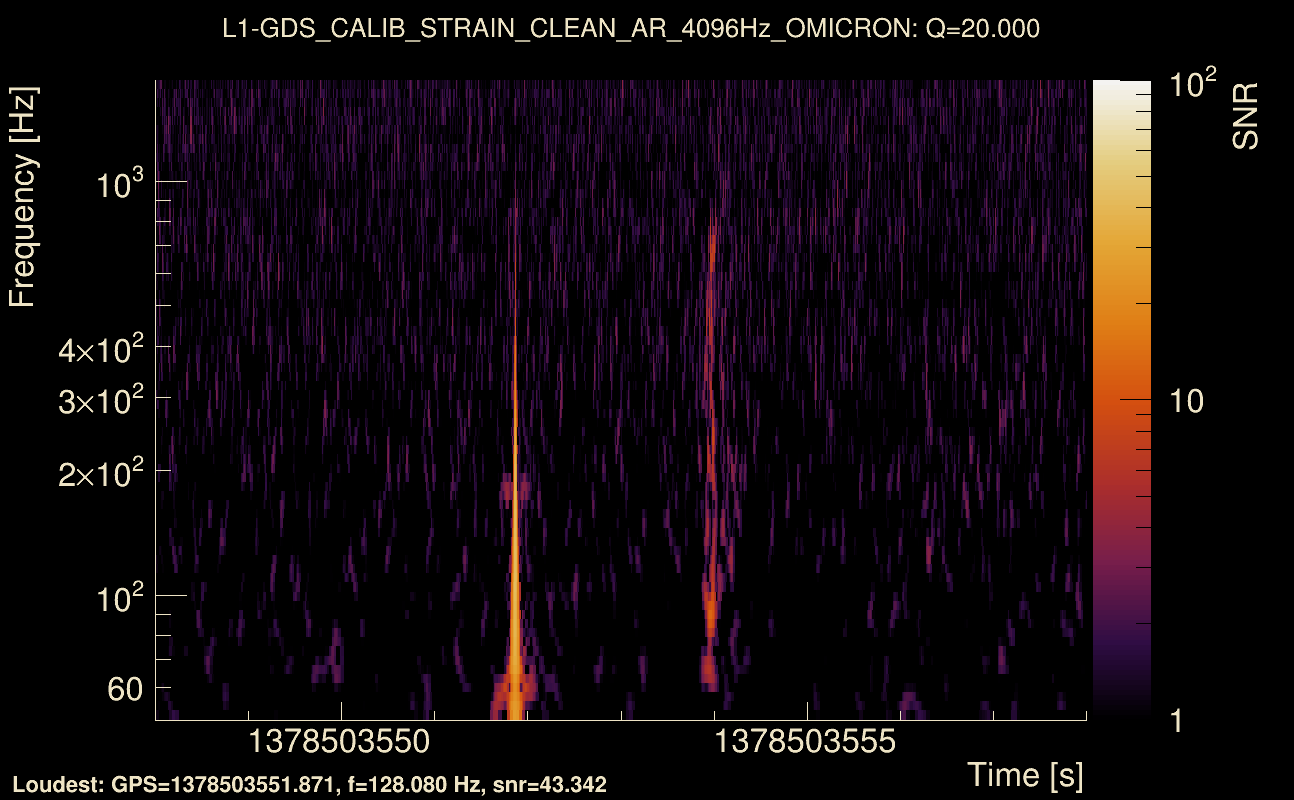
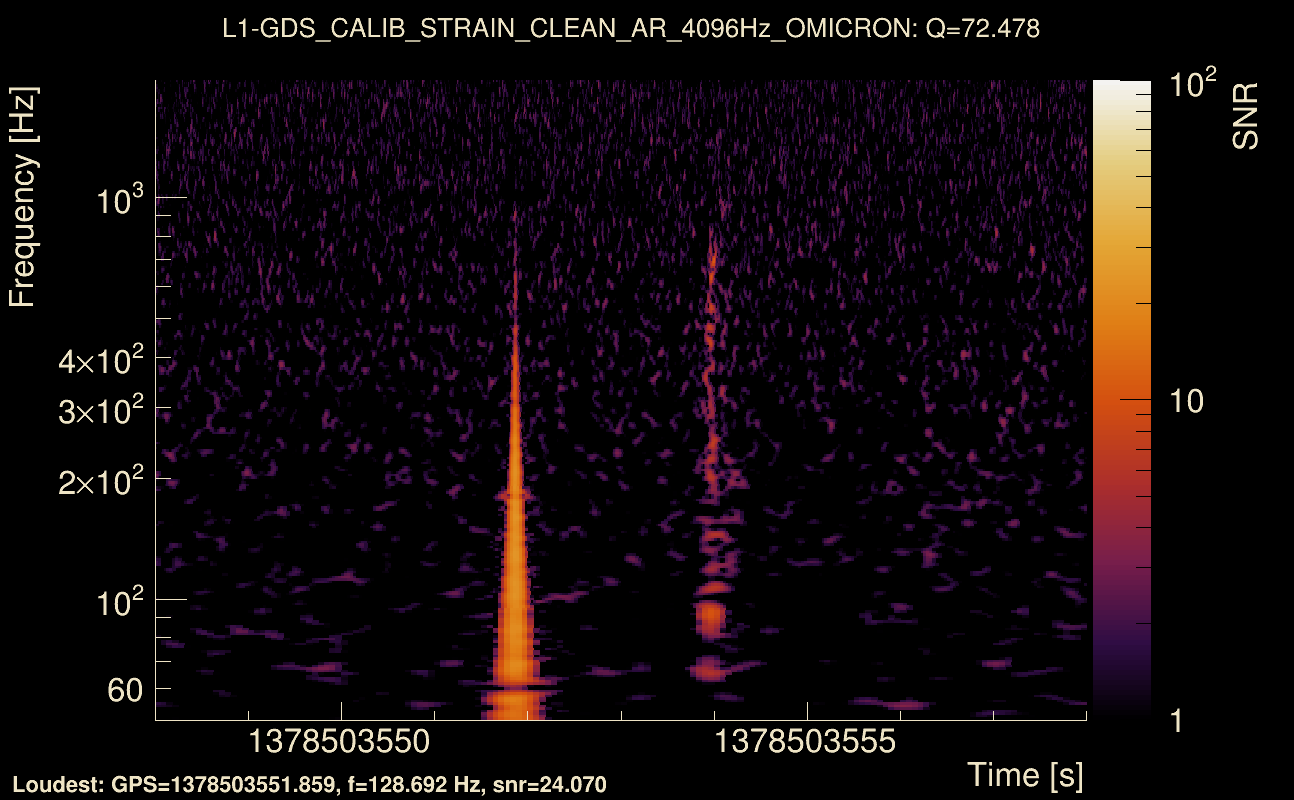
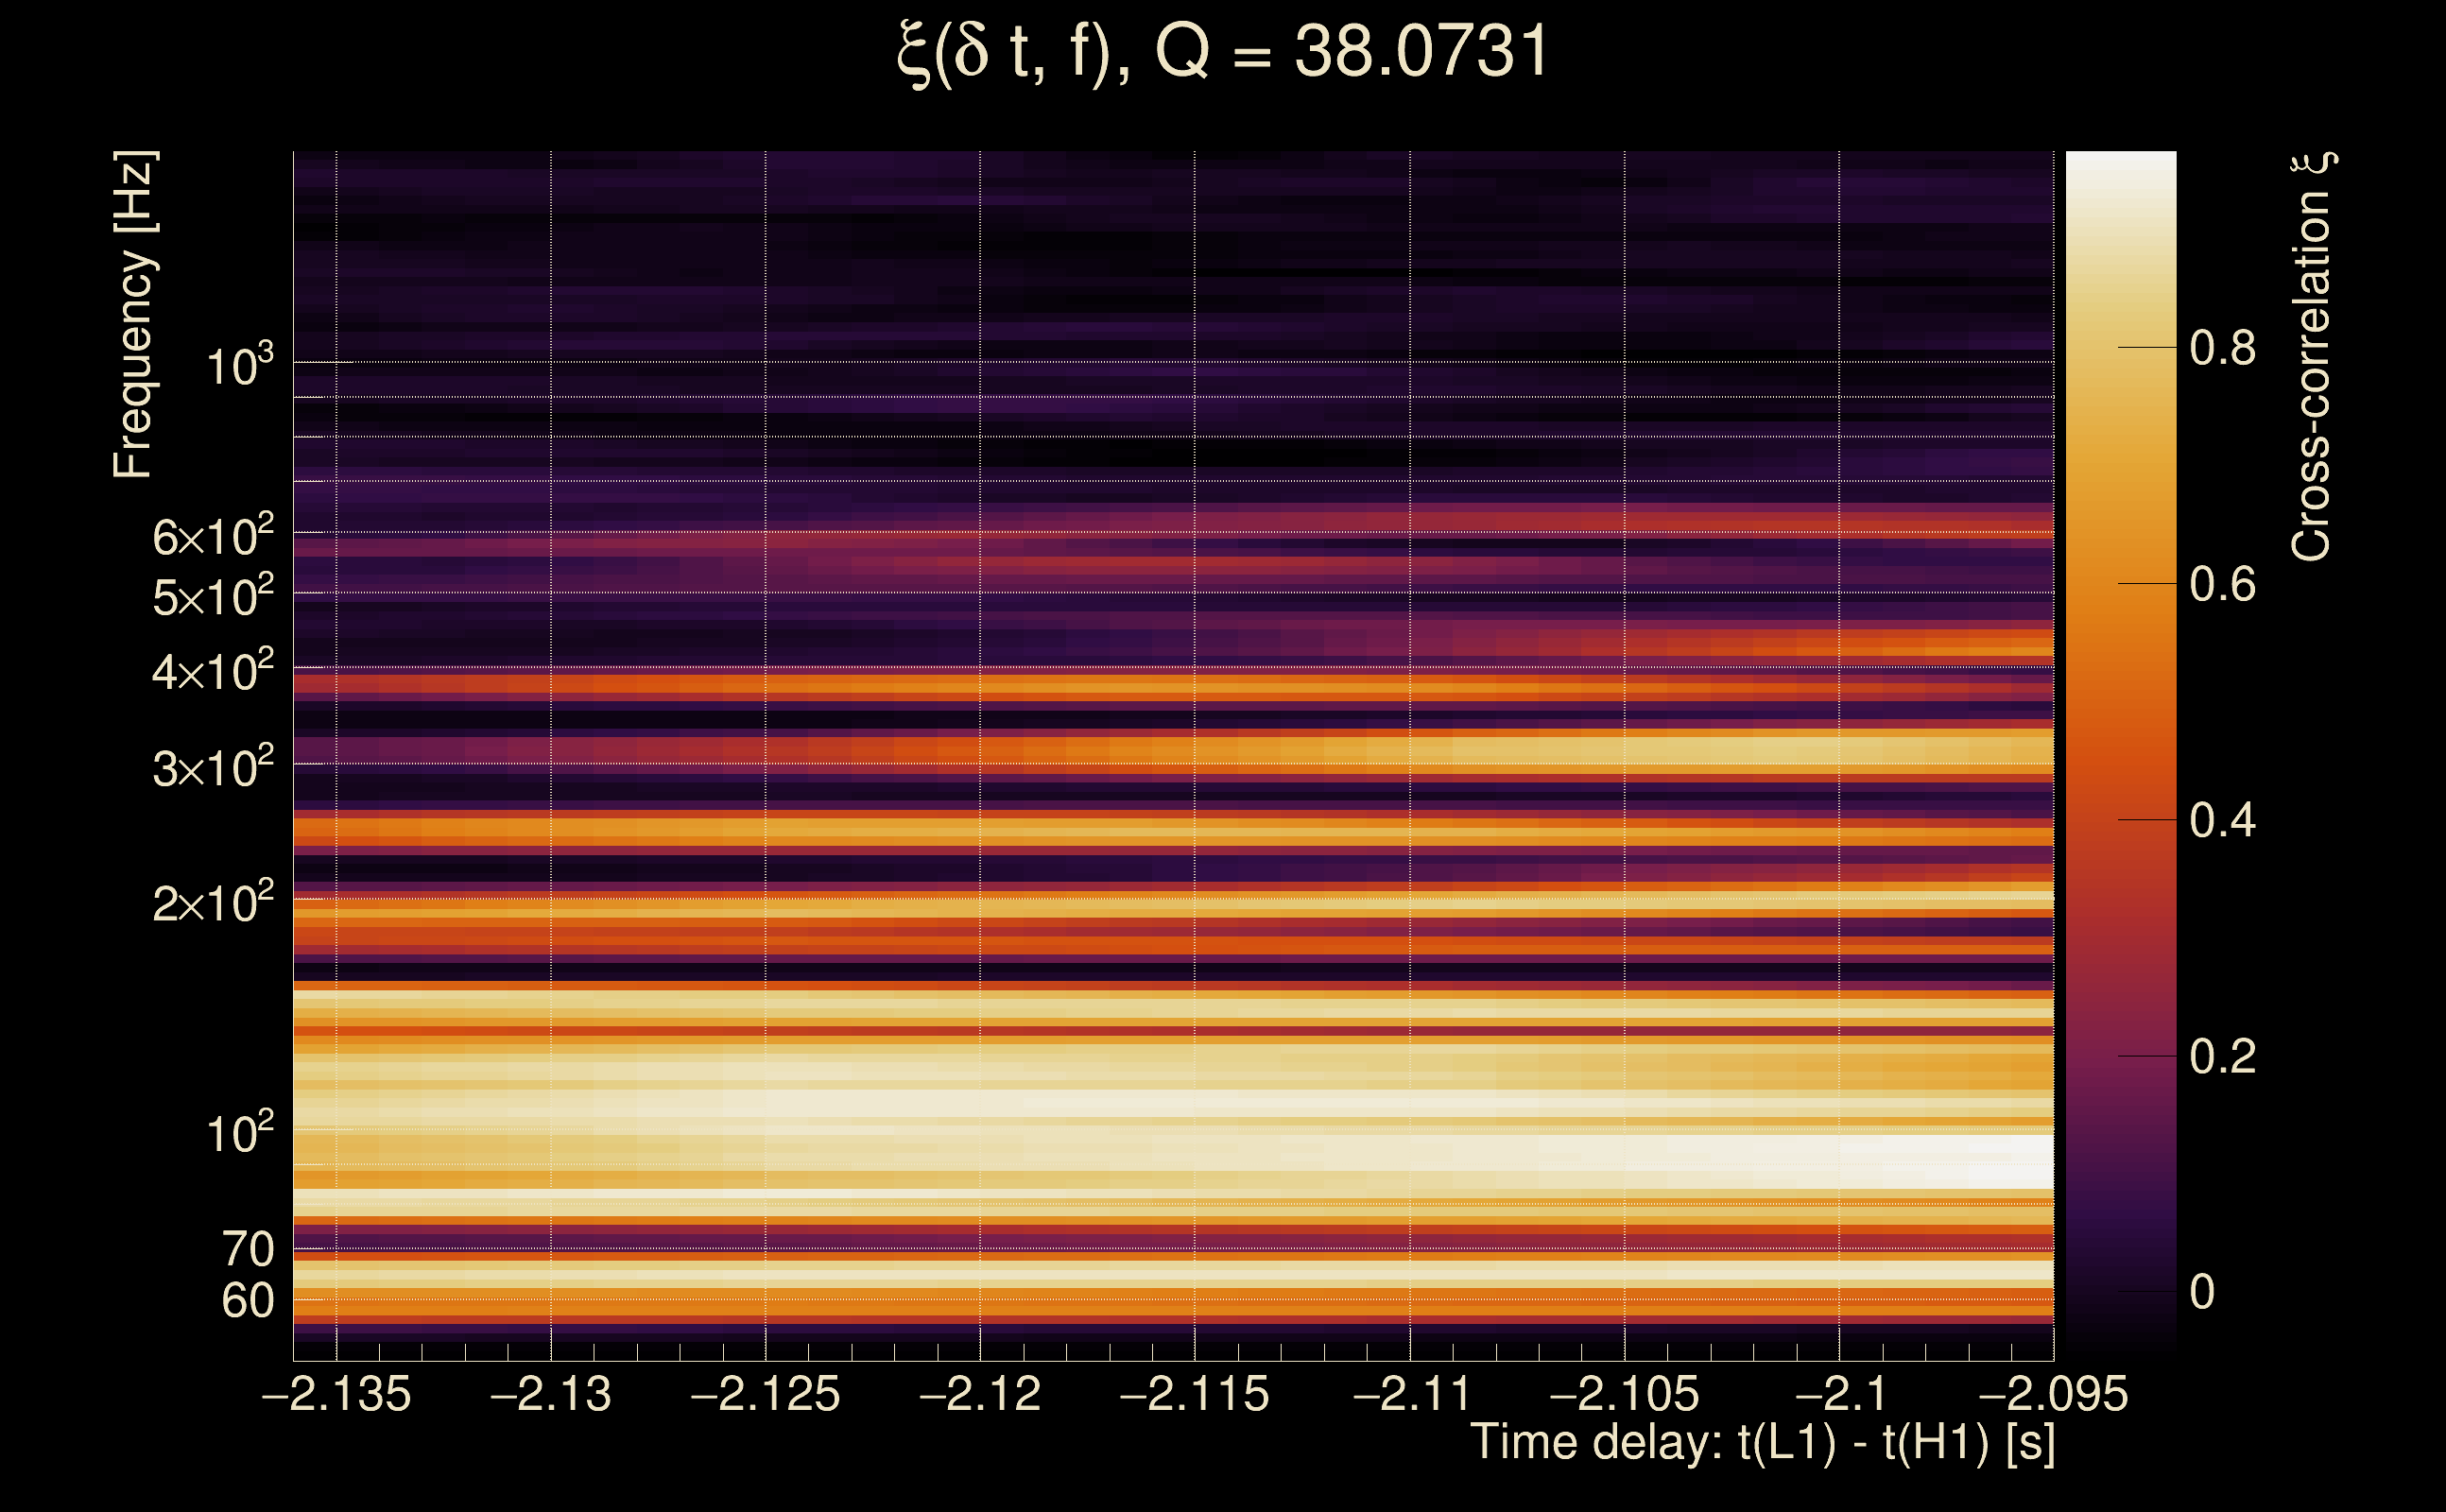
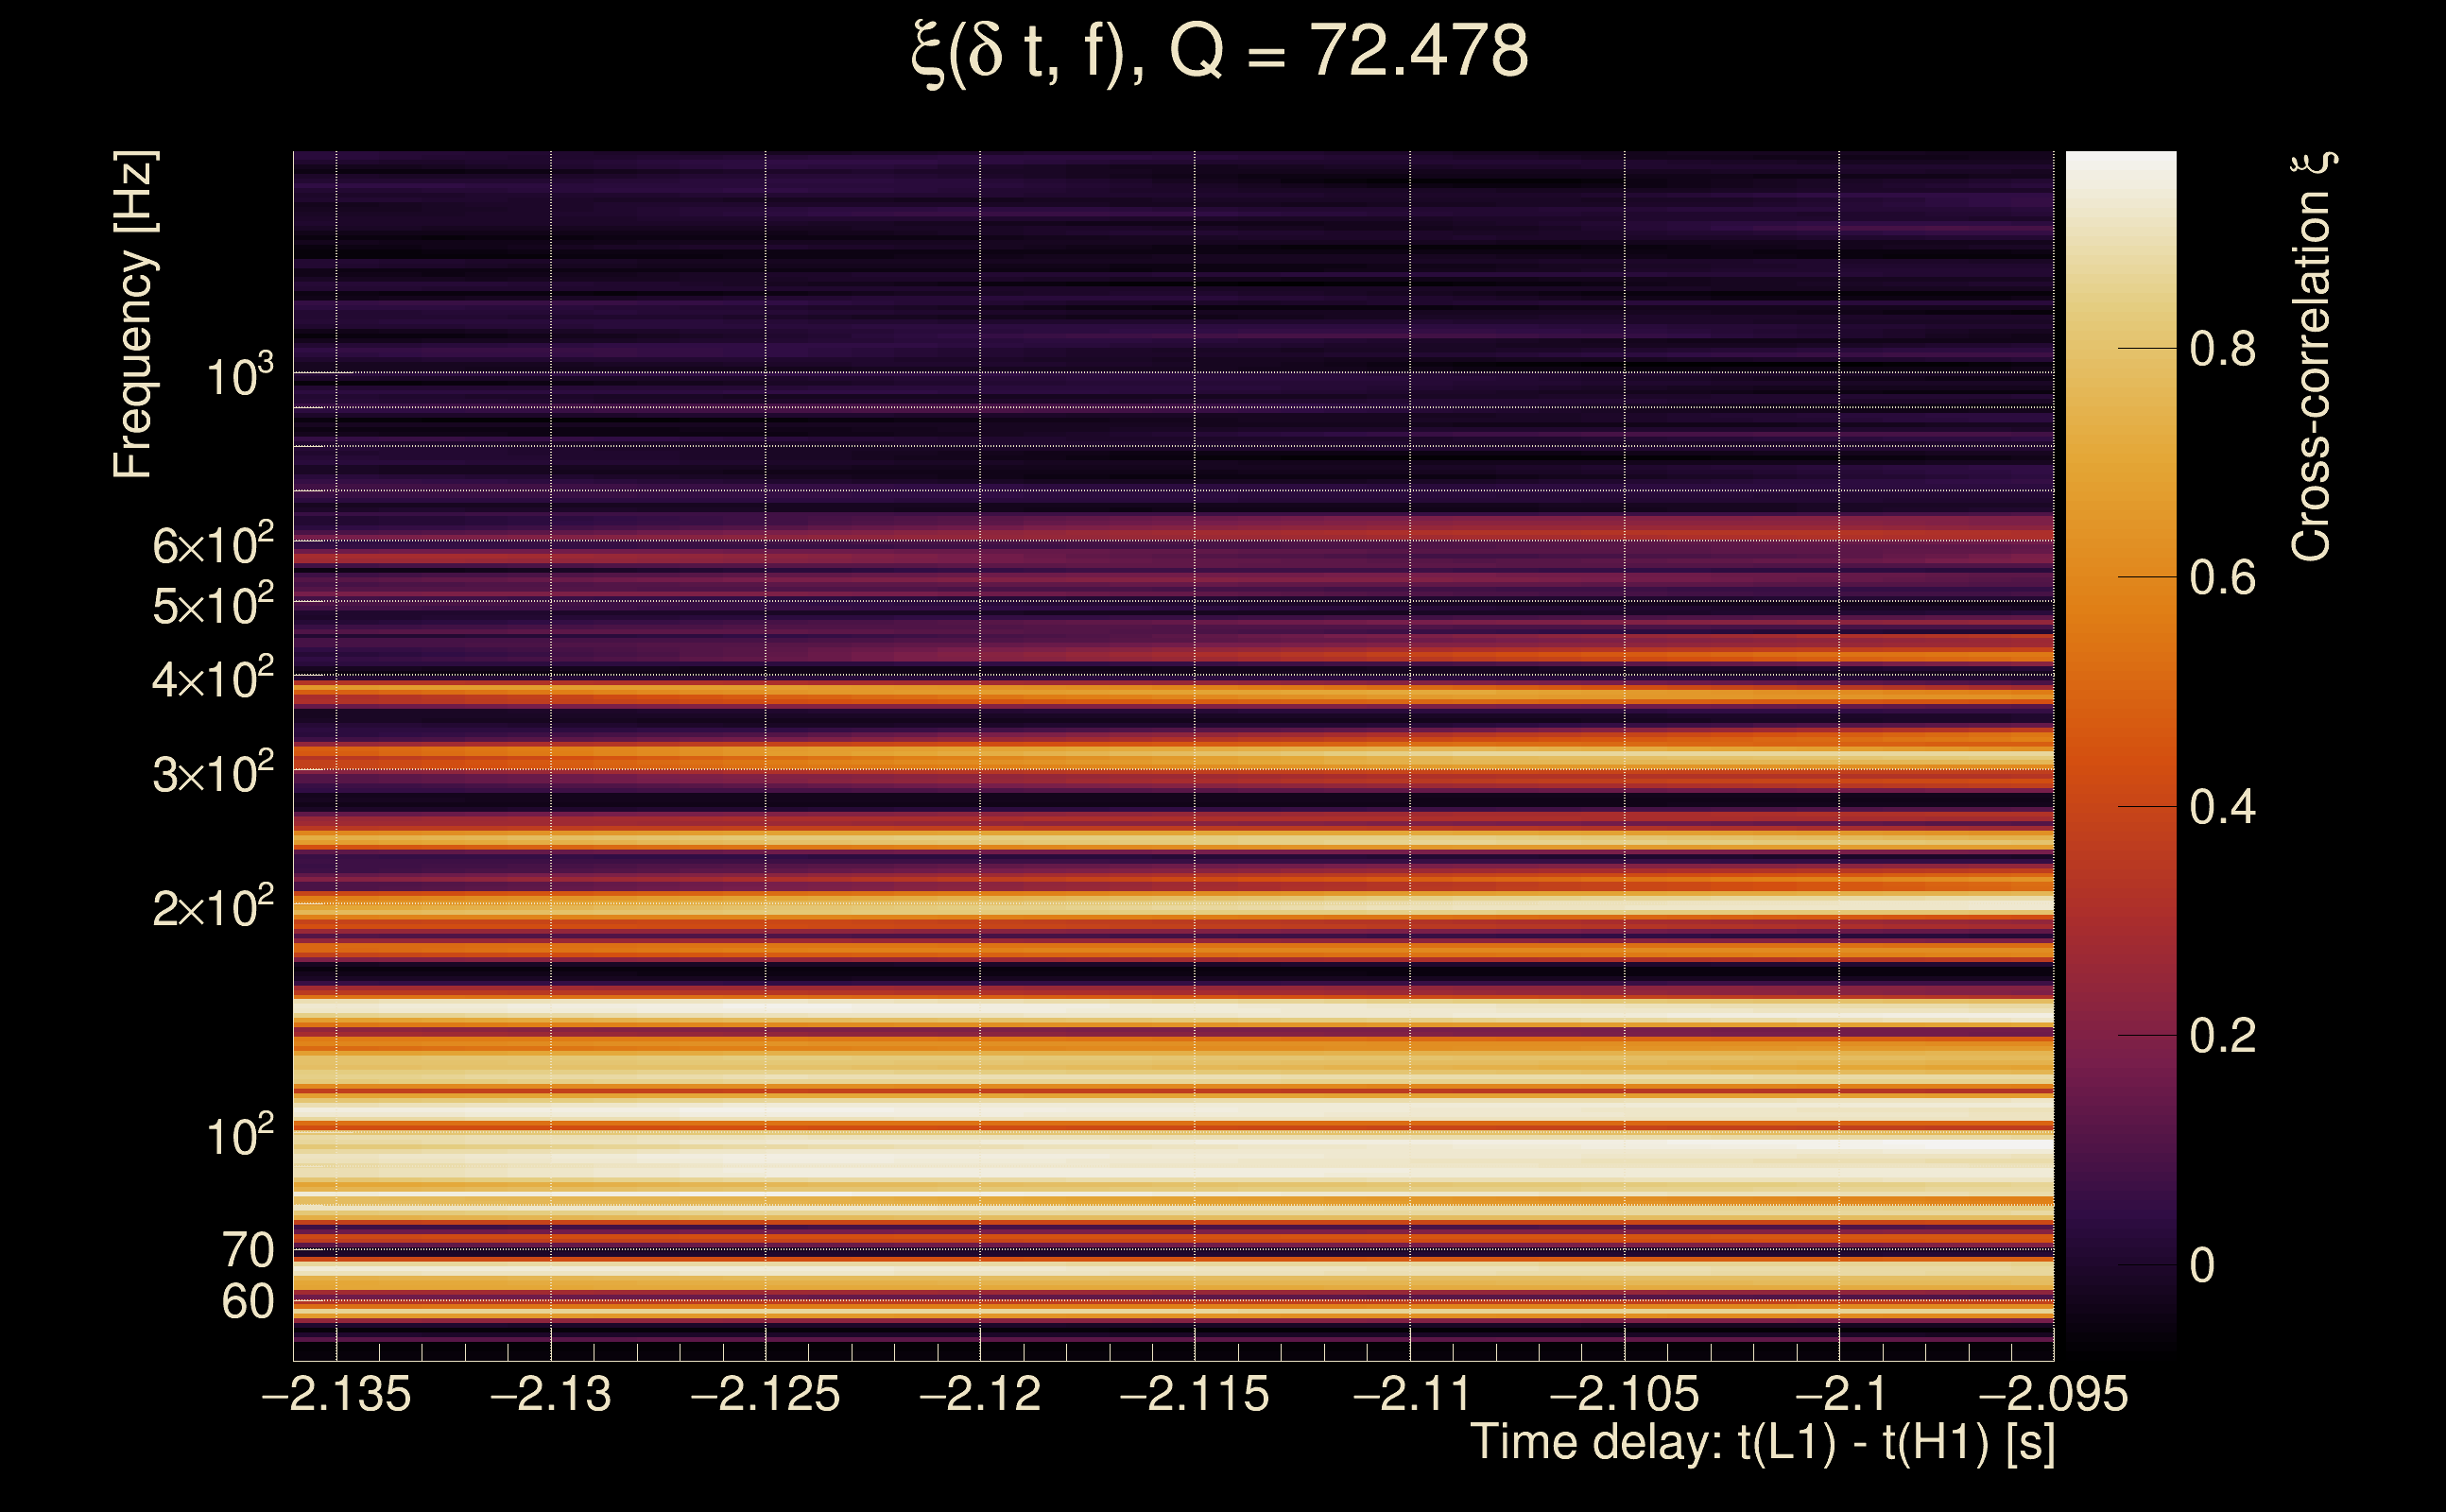
| Event time t(H1): | GPS = 1378503548 (Mon Sep 11 21:38:50 2023 ) → GPS = 1378503558 (Mon Sep 11 21:39:00 2023 ) |
| Event time t(L1): | GPS = 1378503548 (Mon Sep 11 21:39:00 2023 ) → GPS = 1378503558 (Mon Sep 11 21:39:00 2023 ) |
| Omicron analysis time window (H1): | GPS = 1378503545 → GPS = 1378503561 |
| Omicron analysis time window (L1): | GPS = 1378503545 → GPS = 1378503561 |
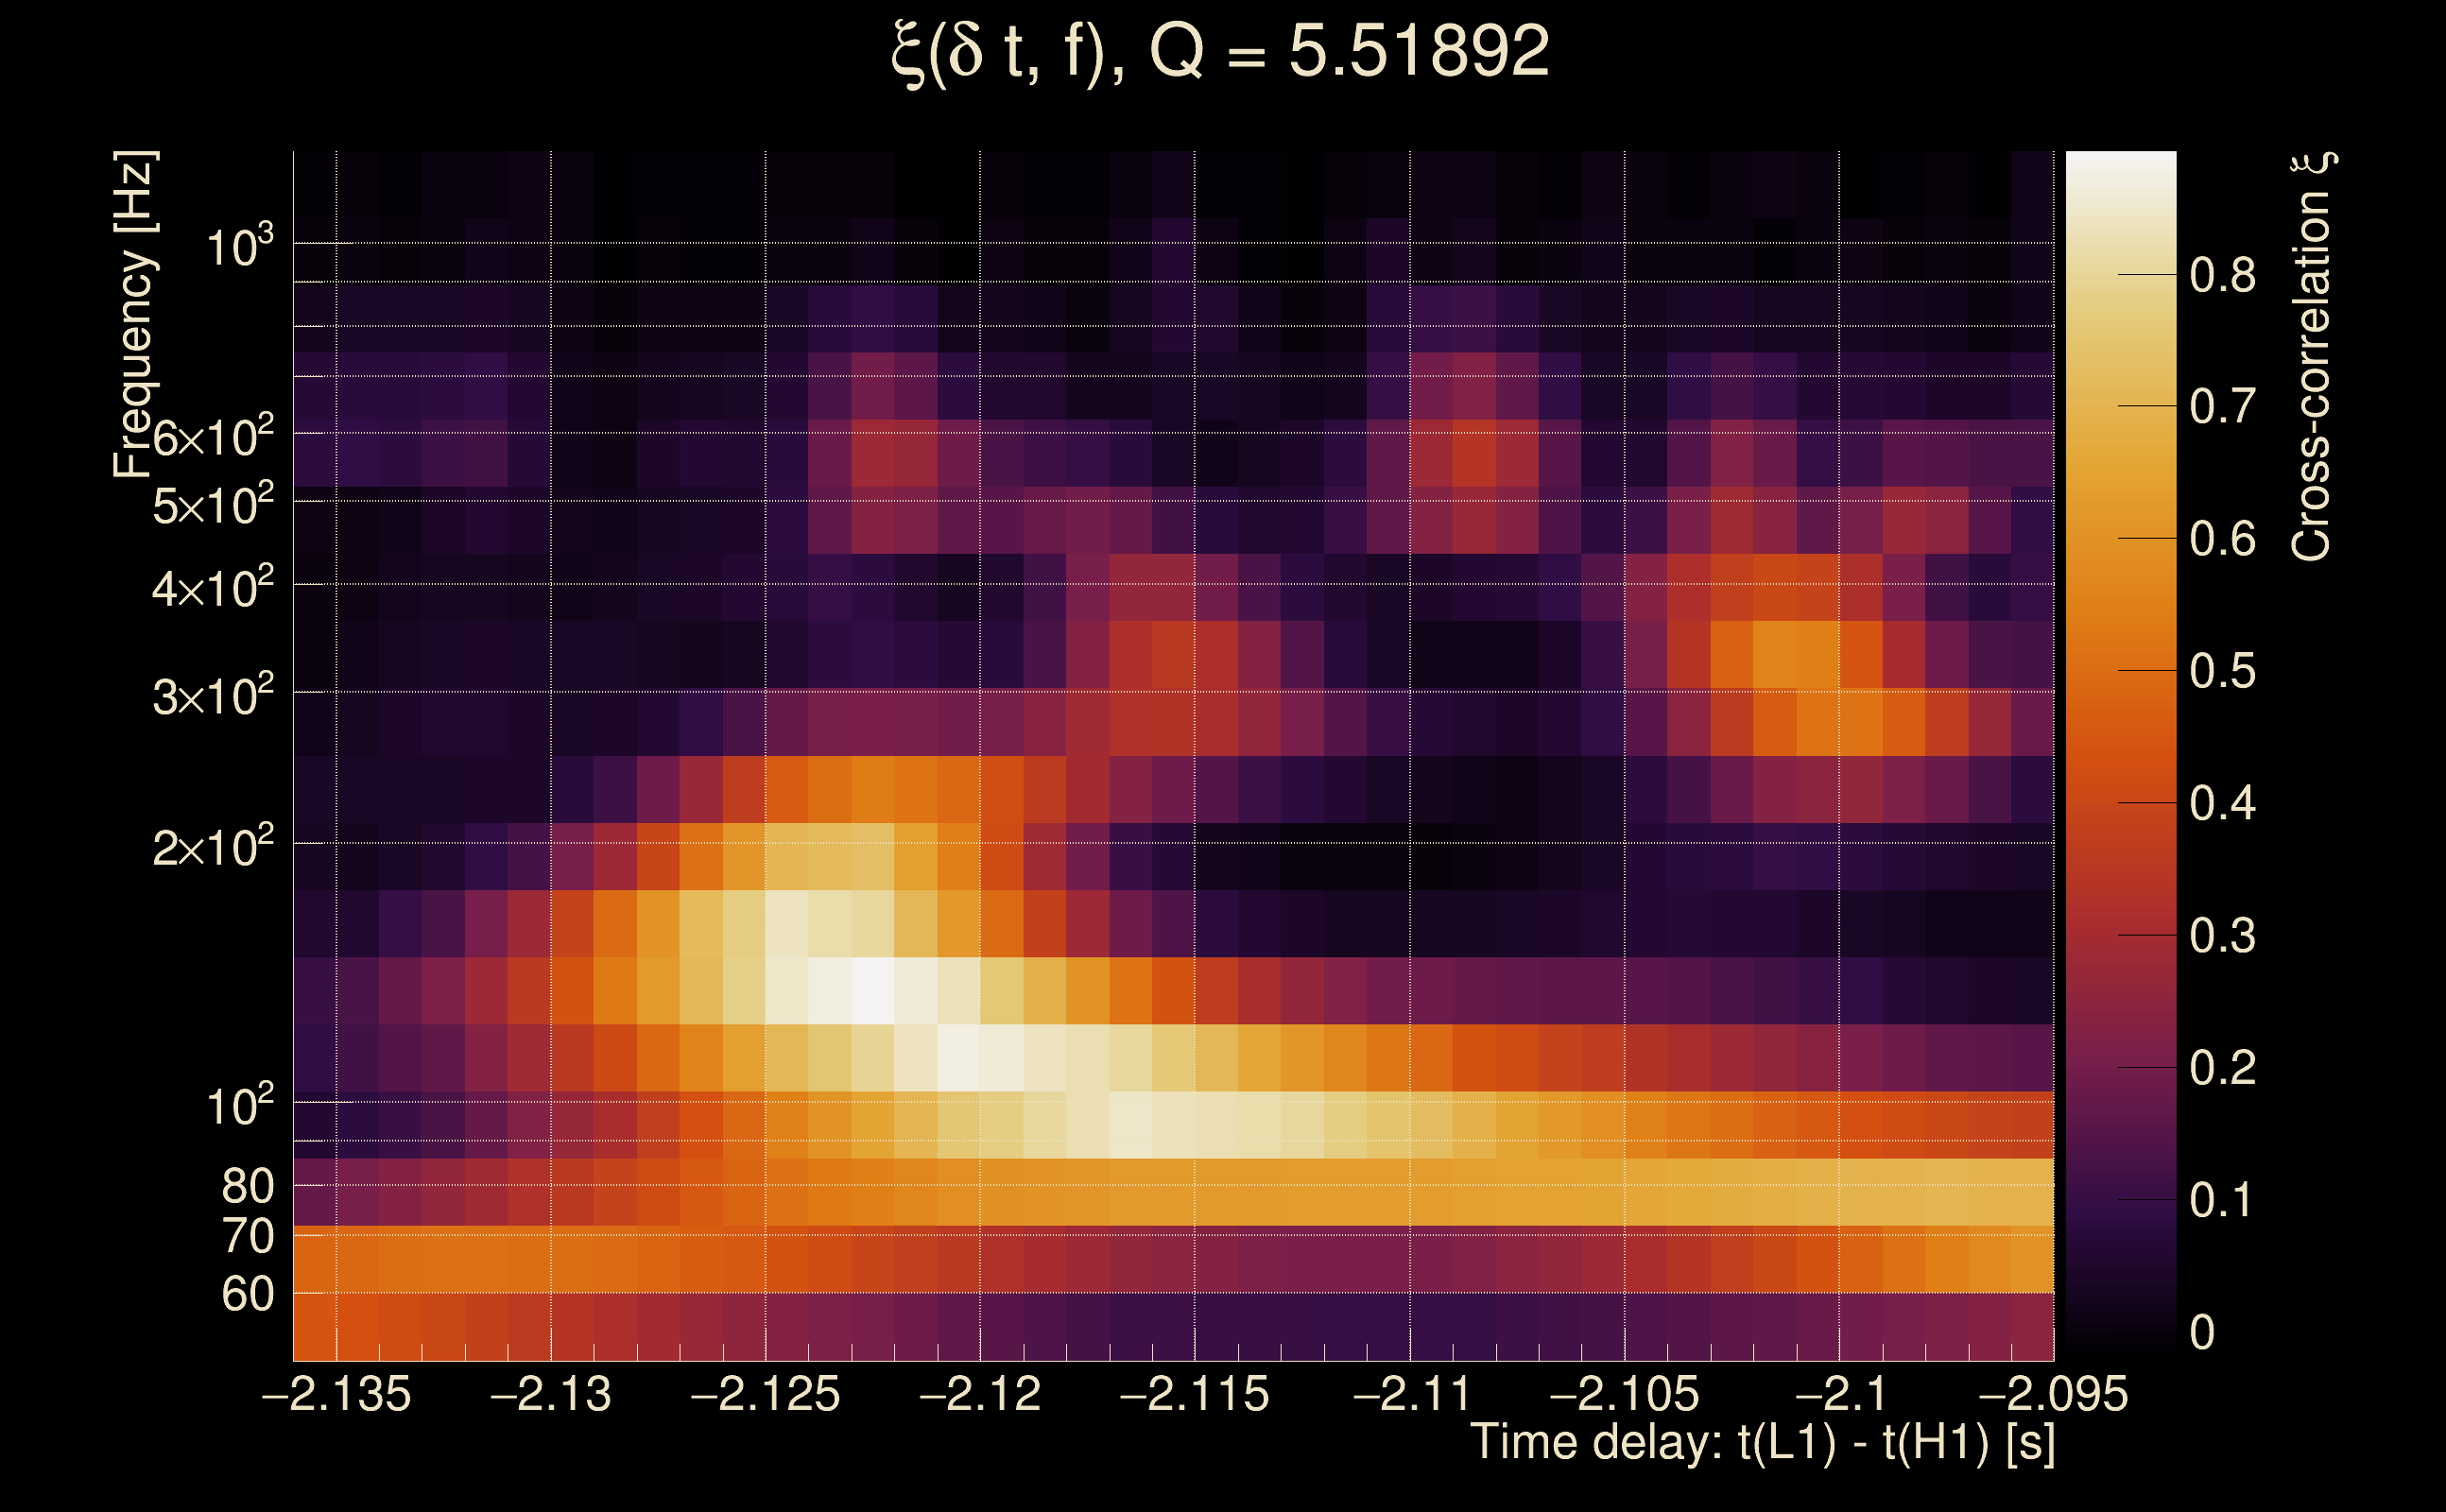
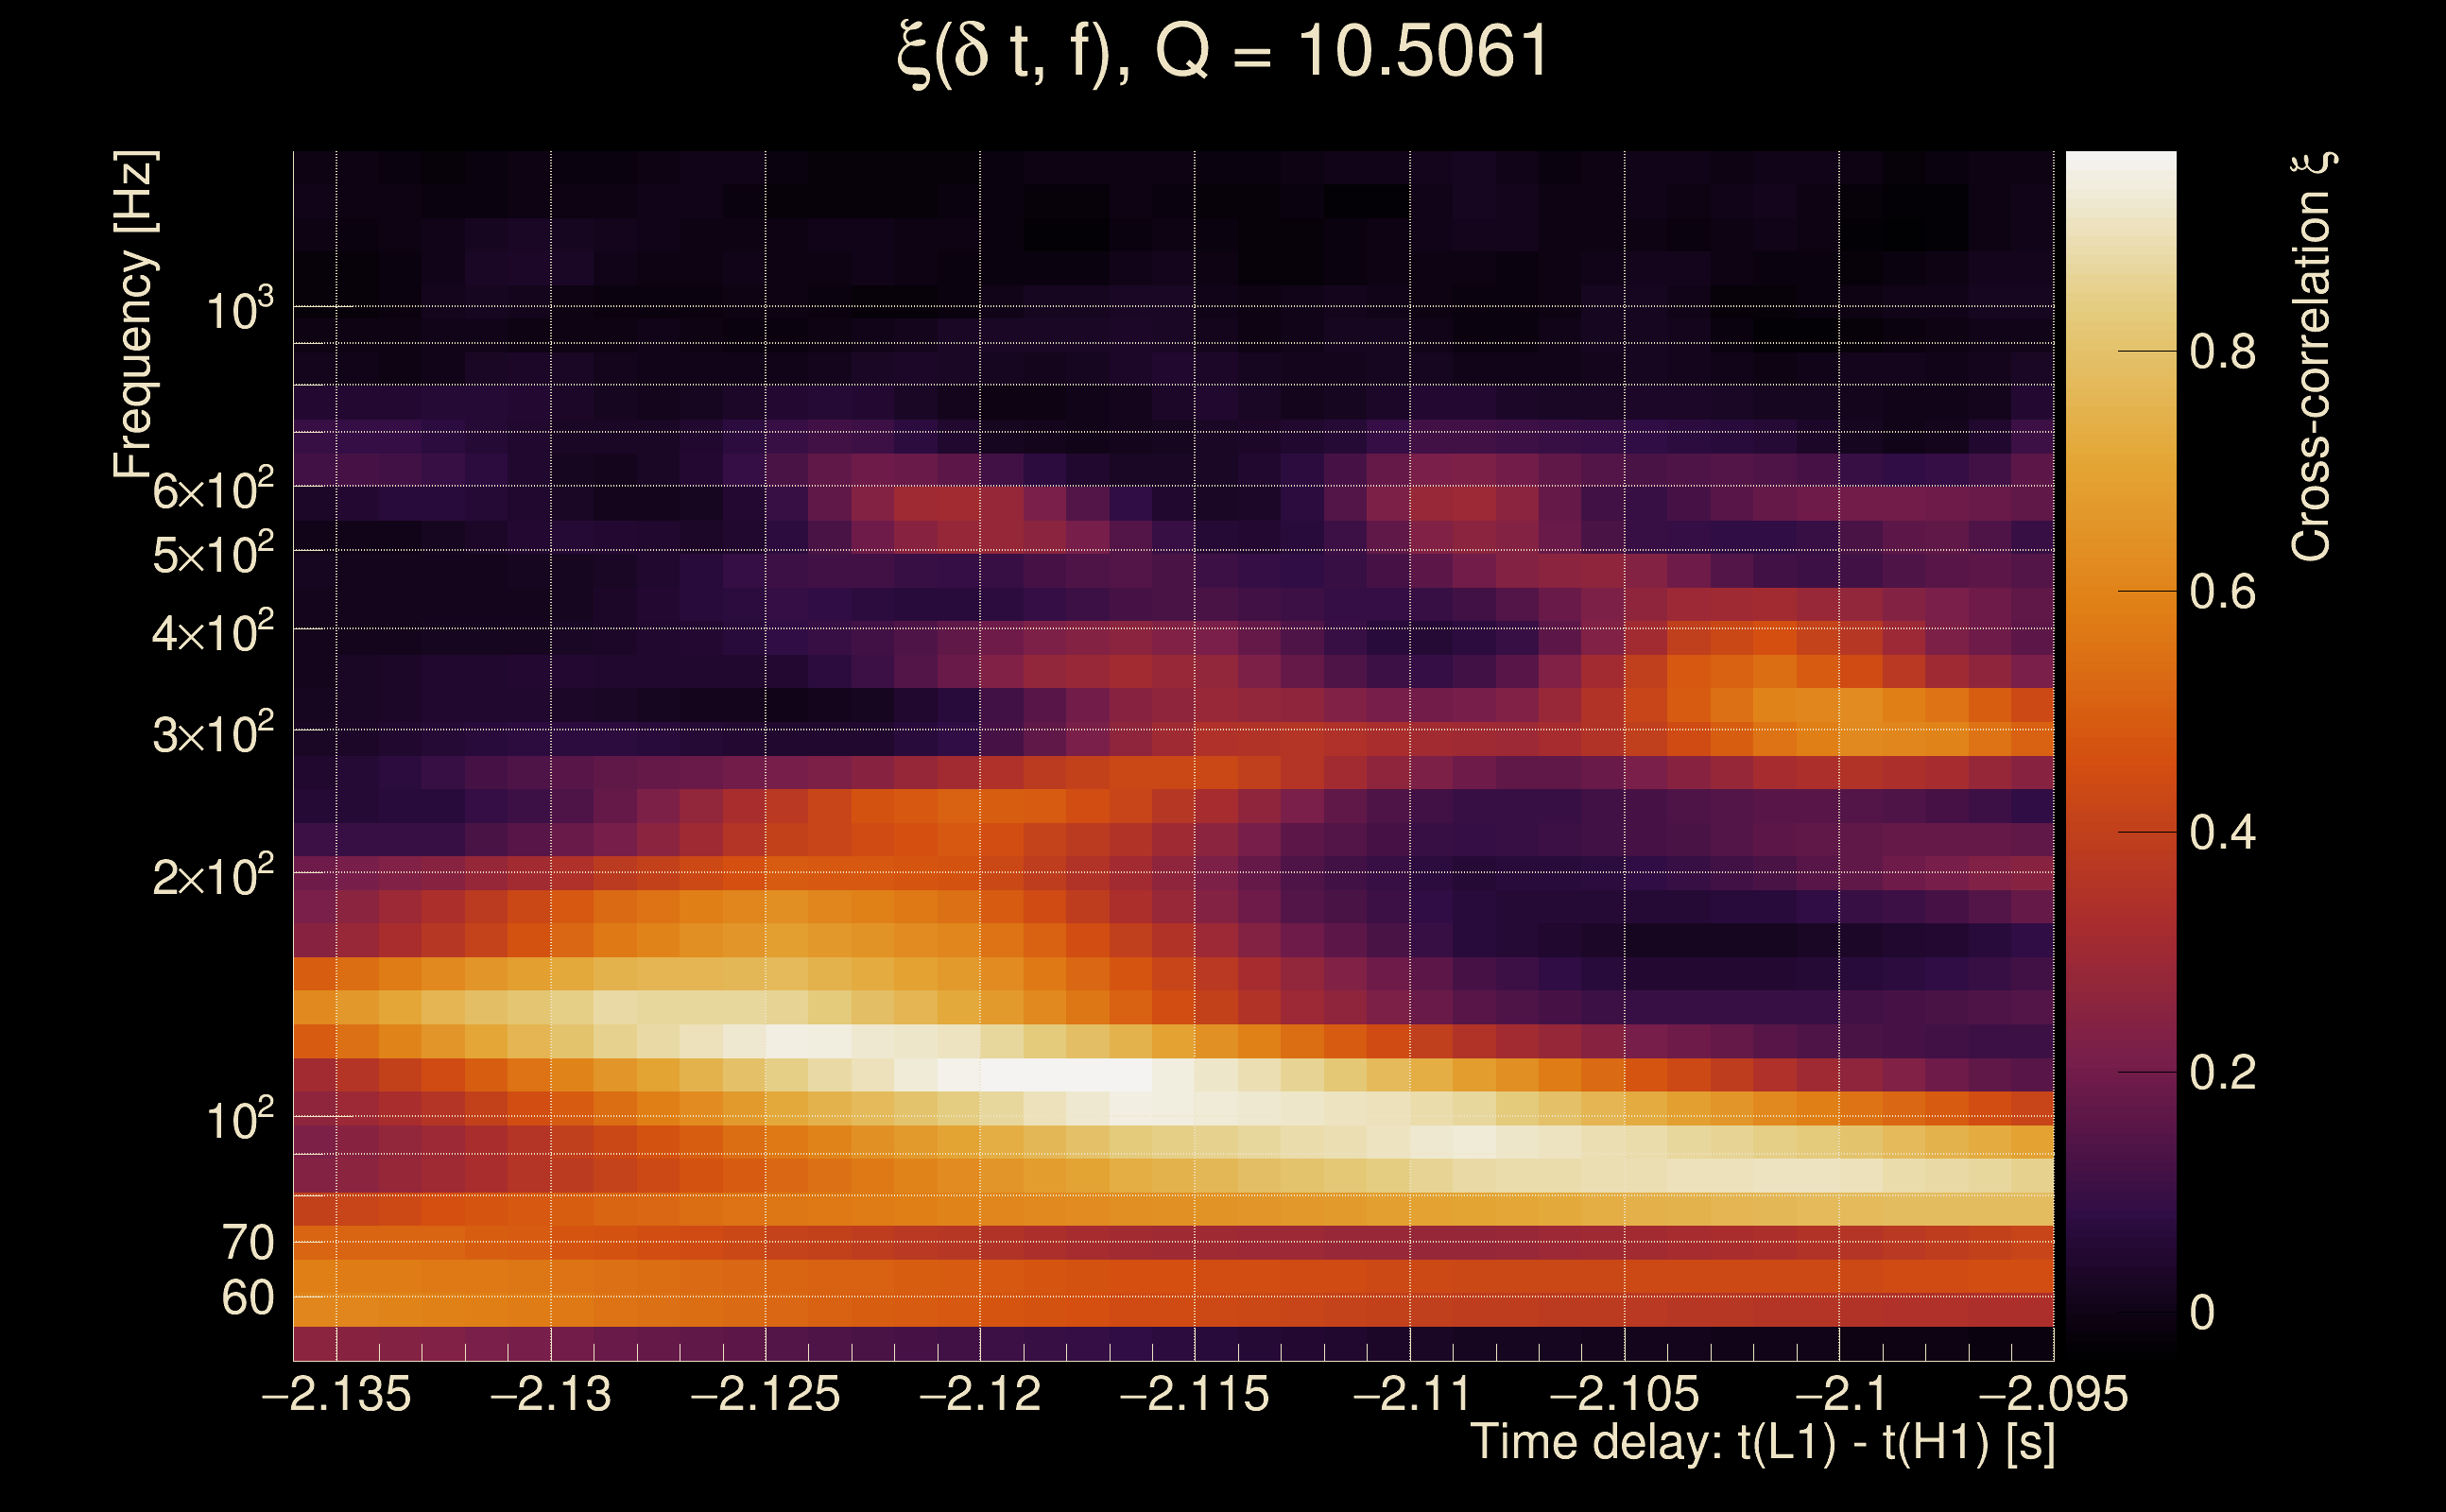
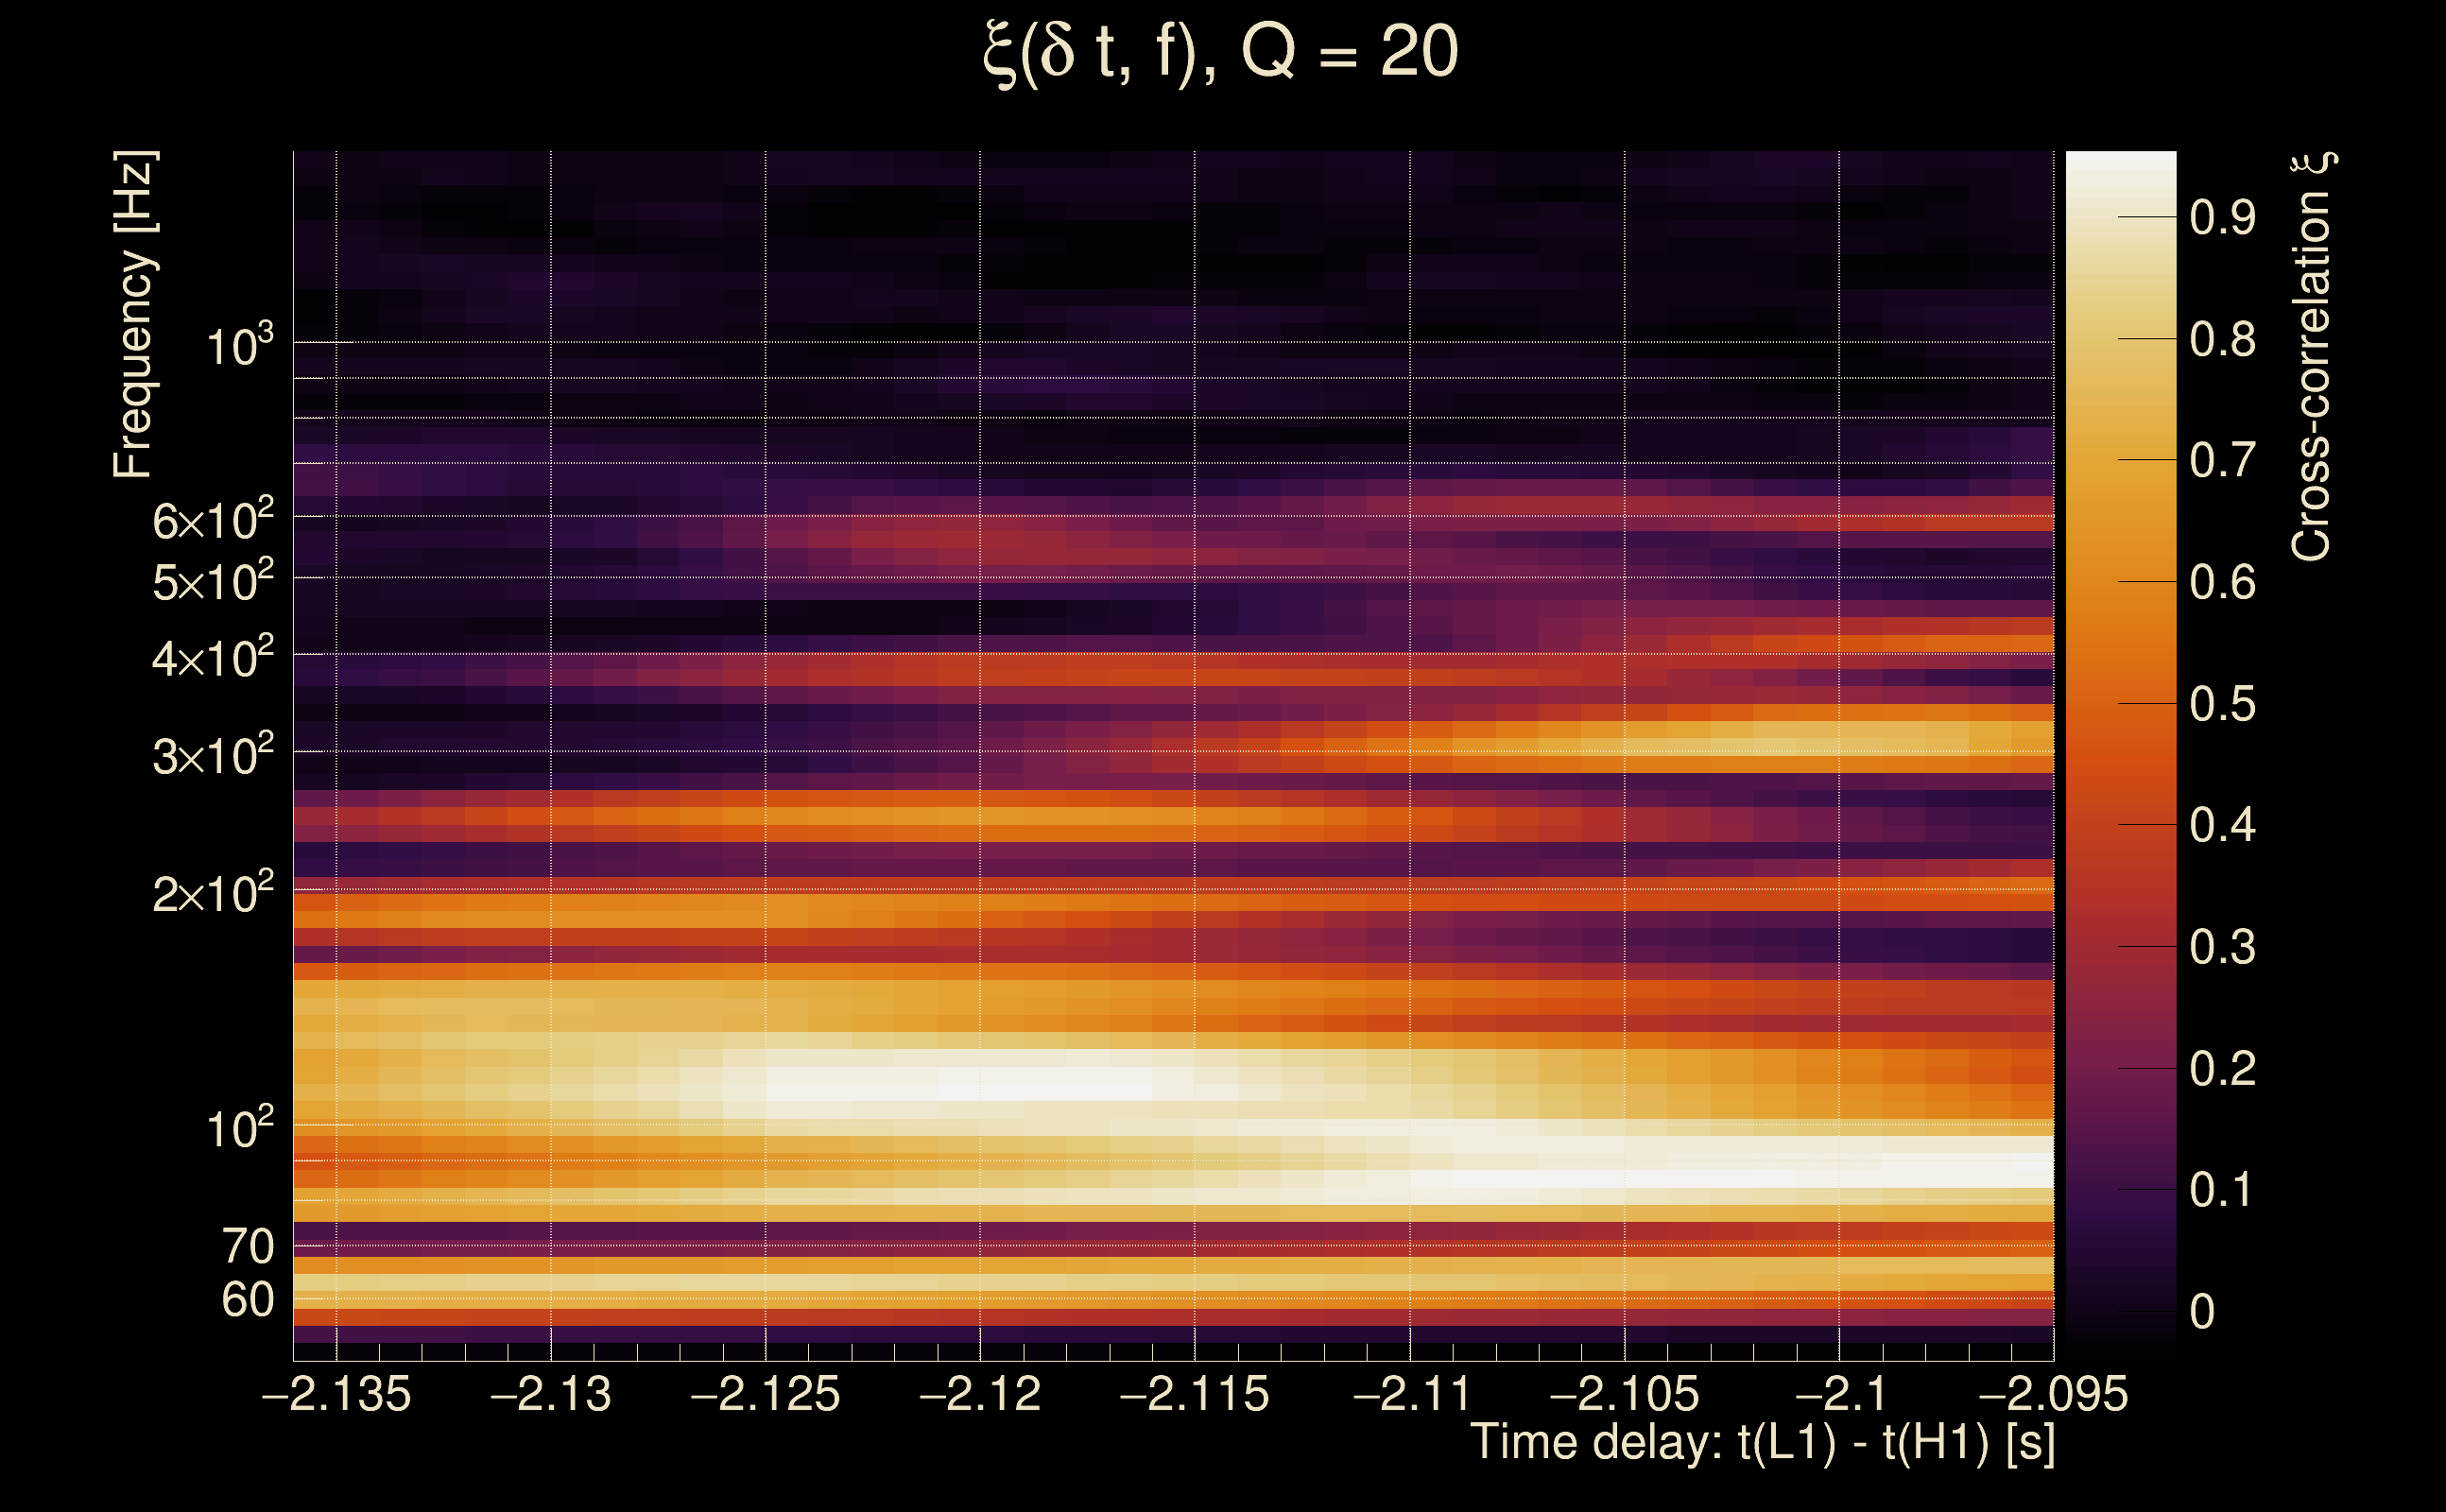
| Time delay between detectors t(L1) - t(H1): | -2.11563 s (slice index = 154 / 217), δt_gw = 0.000368274 s |
| Time delay uncertainty: | 0.00611706 s |
| [targeted mode] Time delay probability: | 0.839226 (0.202884 sigmas), δt_target = 0.00274801 s |
| Frequency: | 153.813 Hz |
| Ξ: | 0.306547 ± 0.0224173 (variance = 0.000502534): Q0: 0.759711, Q1: 0.715872, Q2: 0.726295, Q3: 0.733138, Q4: 0.77652 |
| Rank: | R_A = 0.122869 |
| Log of amplitude ratio (L1/H1): | 1.75903, variance = 0.445214 (L1/H1: 1.02222, variance = 0.671541, H1/L1: -1.78183, variance = 0.472544) |
| Amplitude ratio (L1/H1): | 5.80683 ⋇ 1.94886 (L1/H1: 2.77936 ⋇ 2.26931, H1/L1: 0.16833 ⋇ 1.98858) |
| Amplitude ratio H1|L1 compatibility (probability): | 0.4776 |
| Antenna factor probability: | 1 |
| Number of rejected frequency rows: | Q0: 10 / 18, Q1: 22 / 36, Q2: 42 / 70, Q3: 85 / 134, Q4: 193 / 258 |
| Maximum signal-to-noise ratio: | H1: 15.9673, L1: 90.7804 |
| SNR variance: | H1: 0.497871, L1: 3.88307 |
| Click here for a zoomed plot | Click here for a zoomed plot | Click here for a zoomed plot | Click here for a zoomed plot | Click here for a zoomed plot |
 |
 |
 |
 |
 |
 |
 |
 |
 |
 |
 |
 |
 |
 |
 |
 |
 |
 |
 |
 |
 |
 |
 |
 |
 |
 |
 |
 |
 |
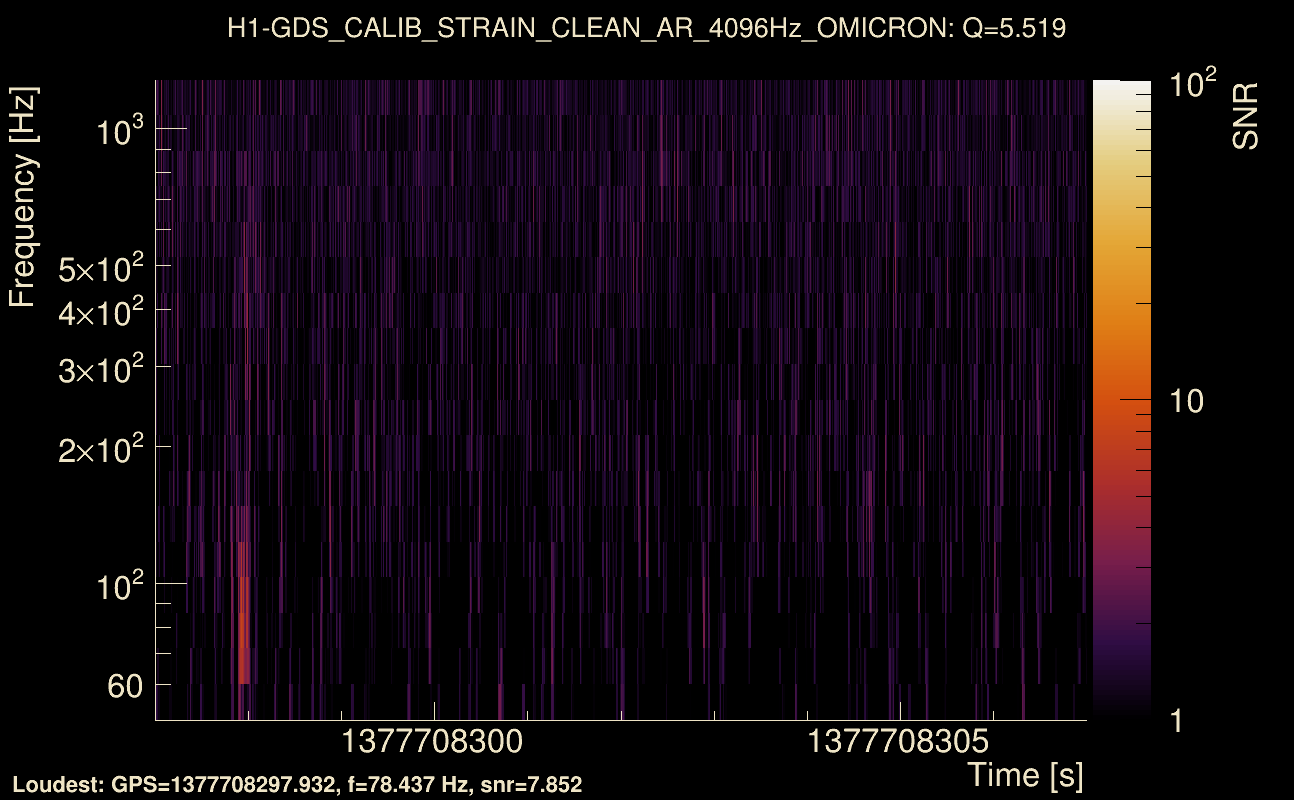
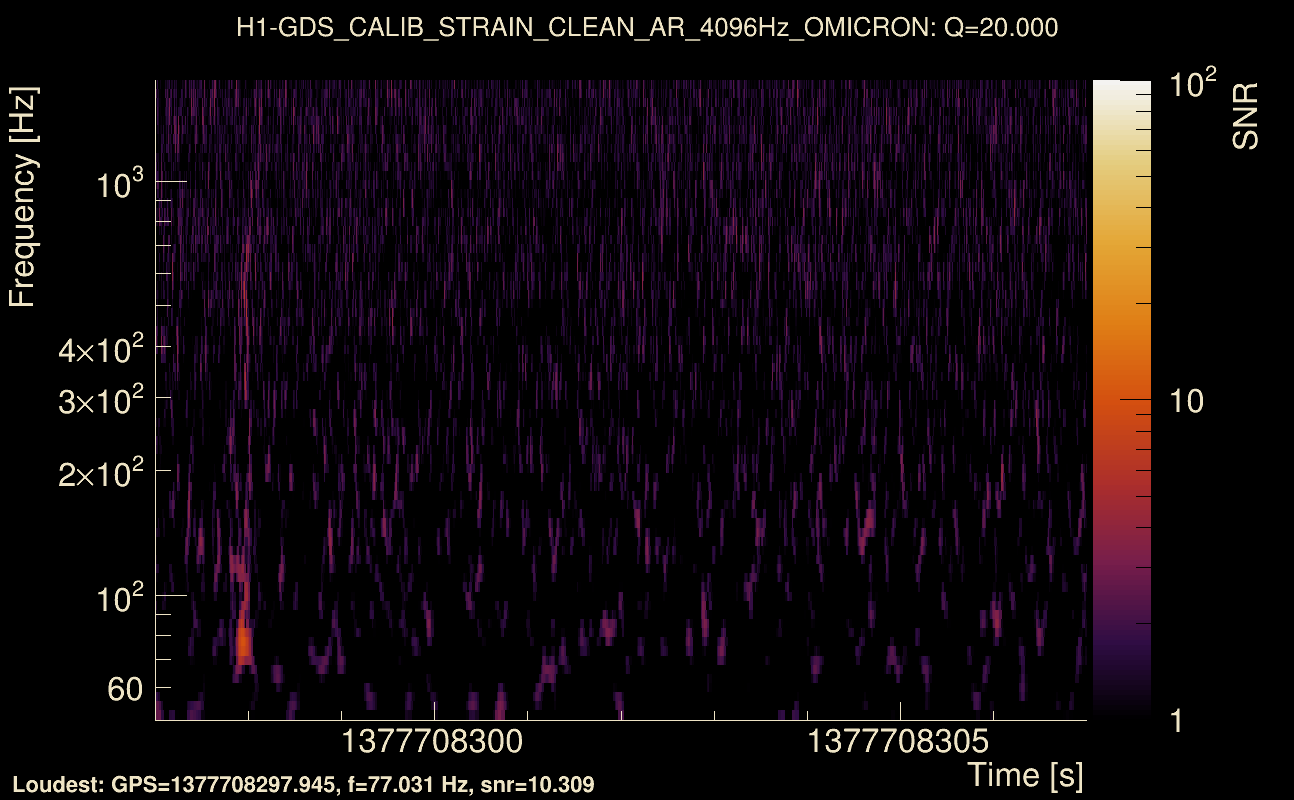
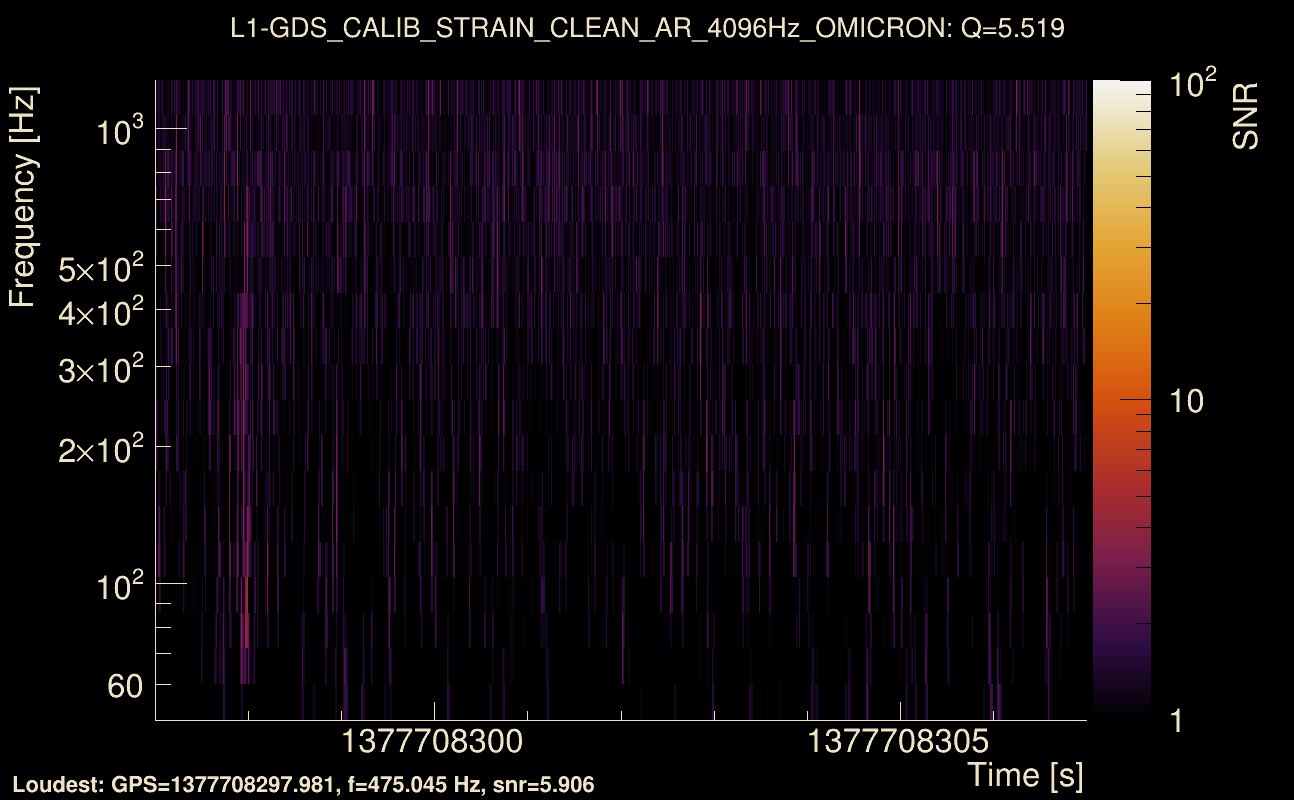
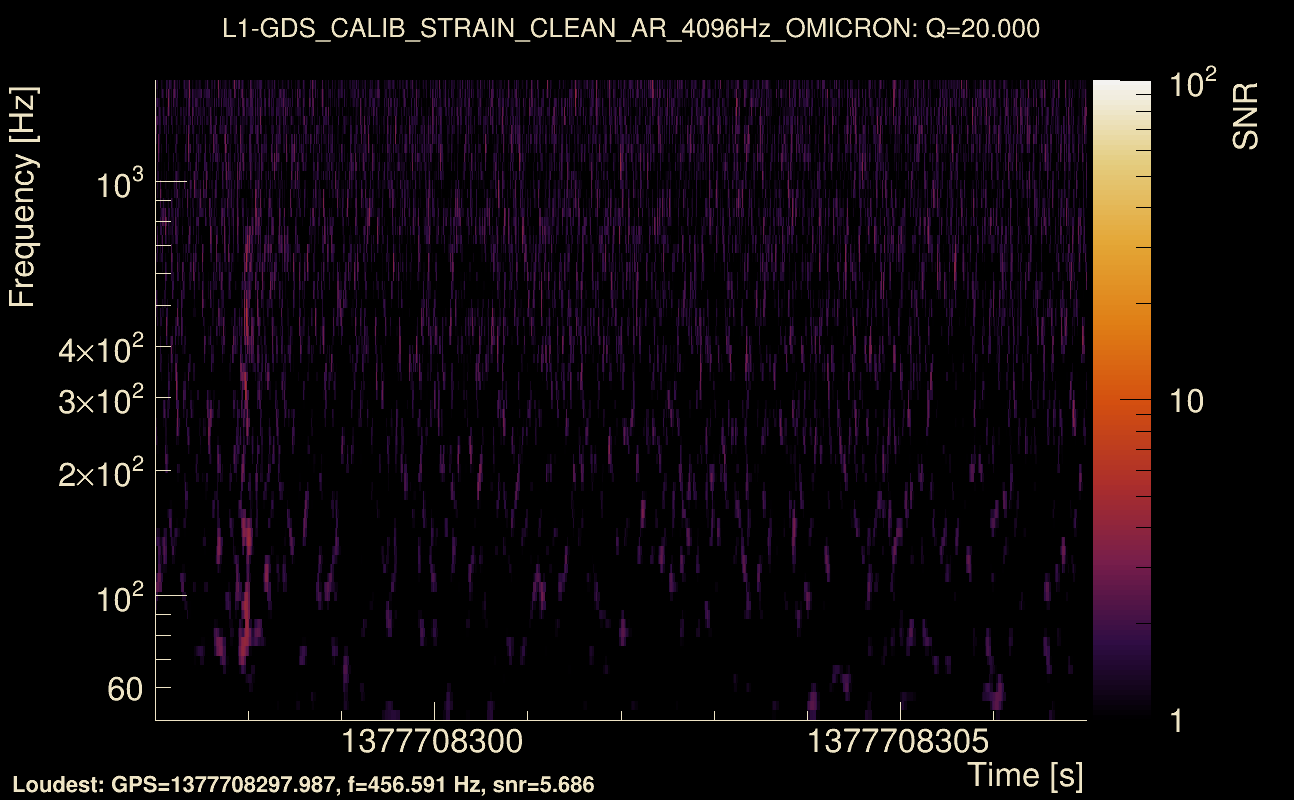
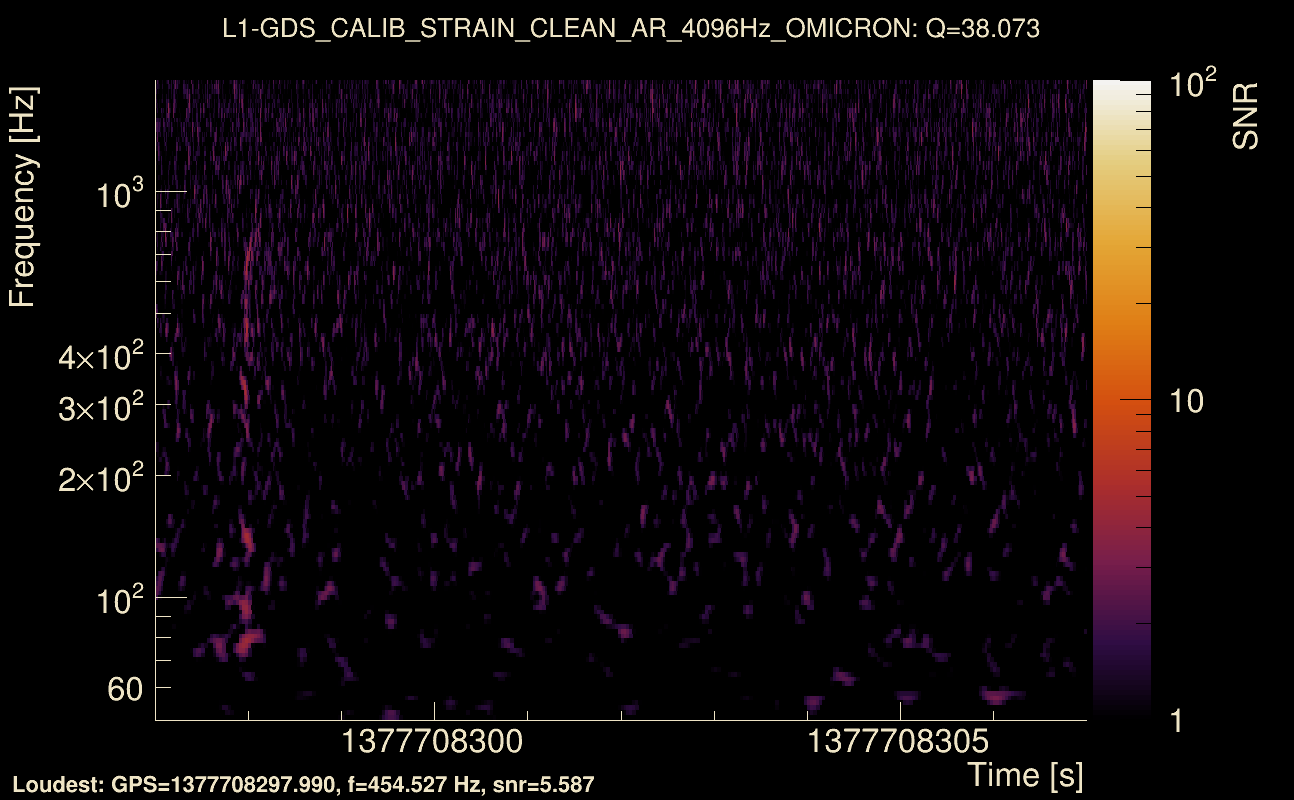
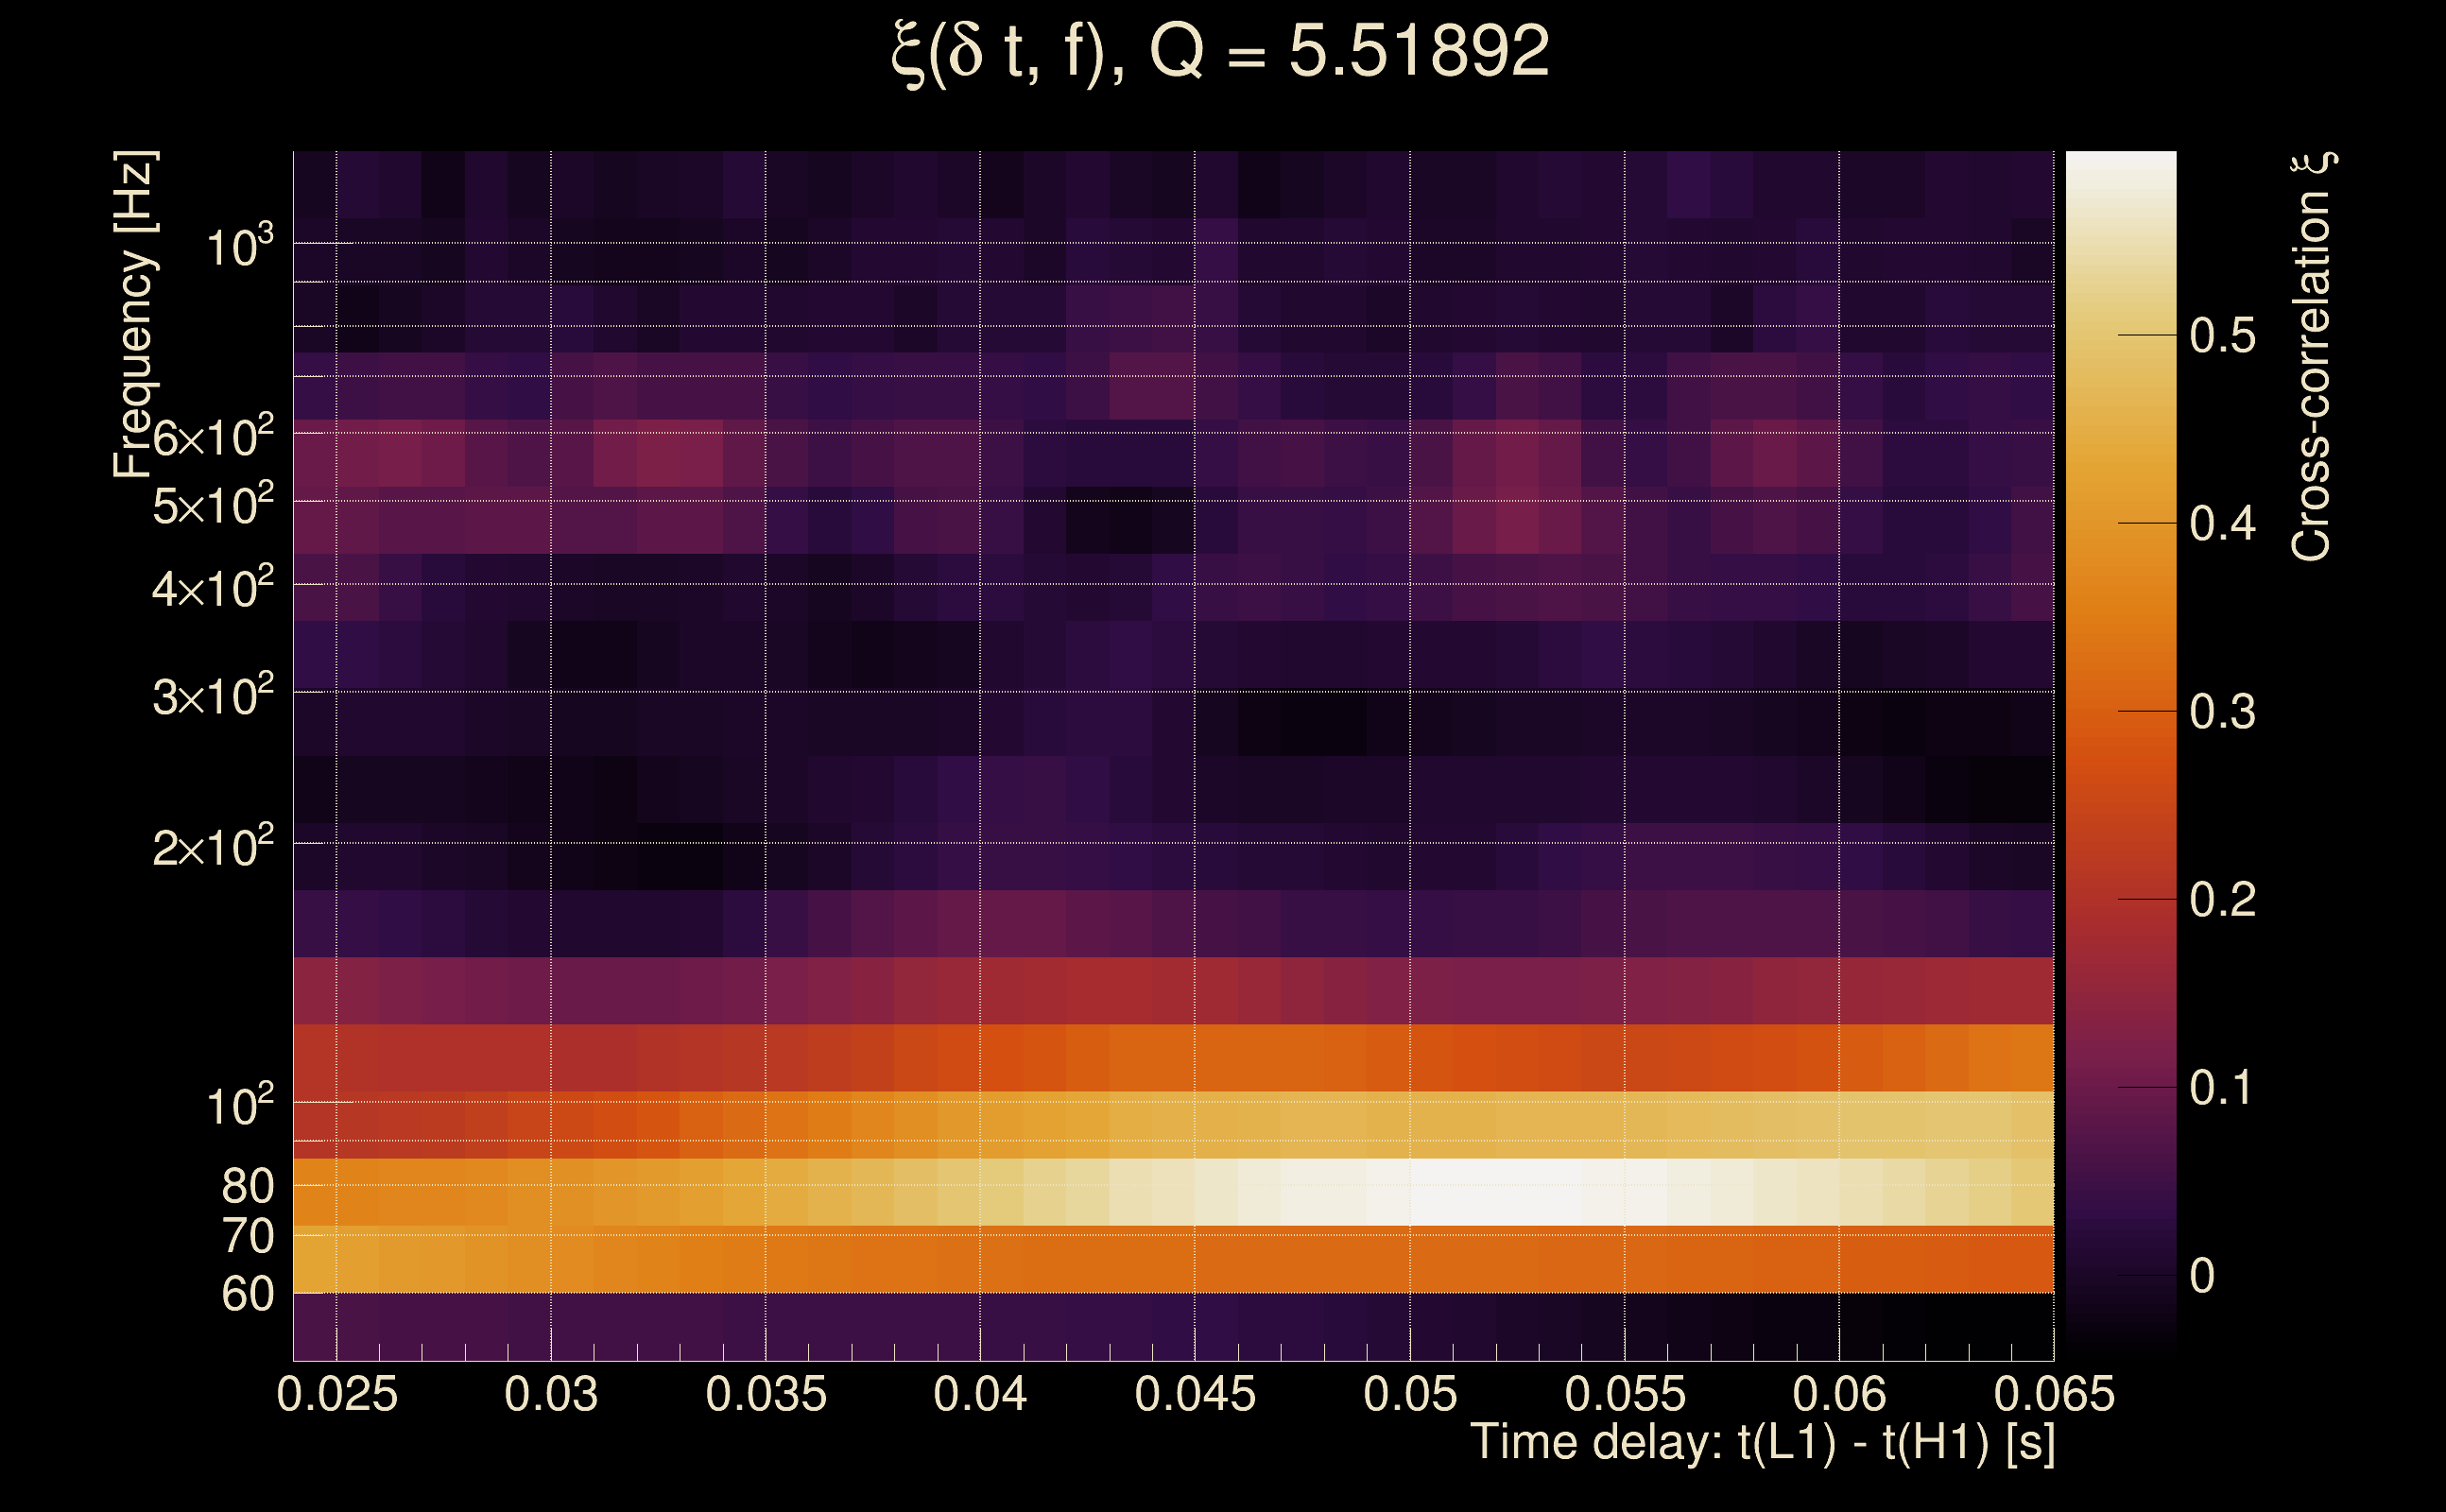
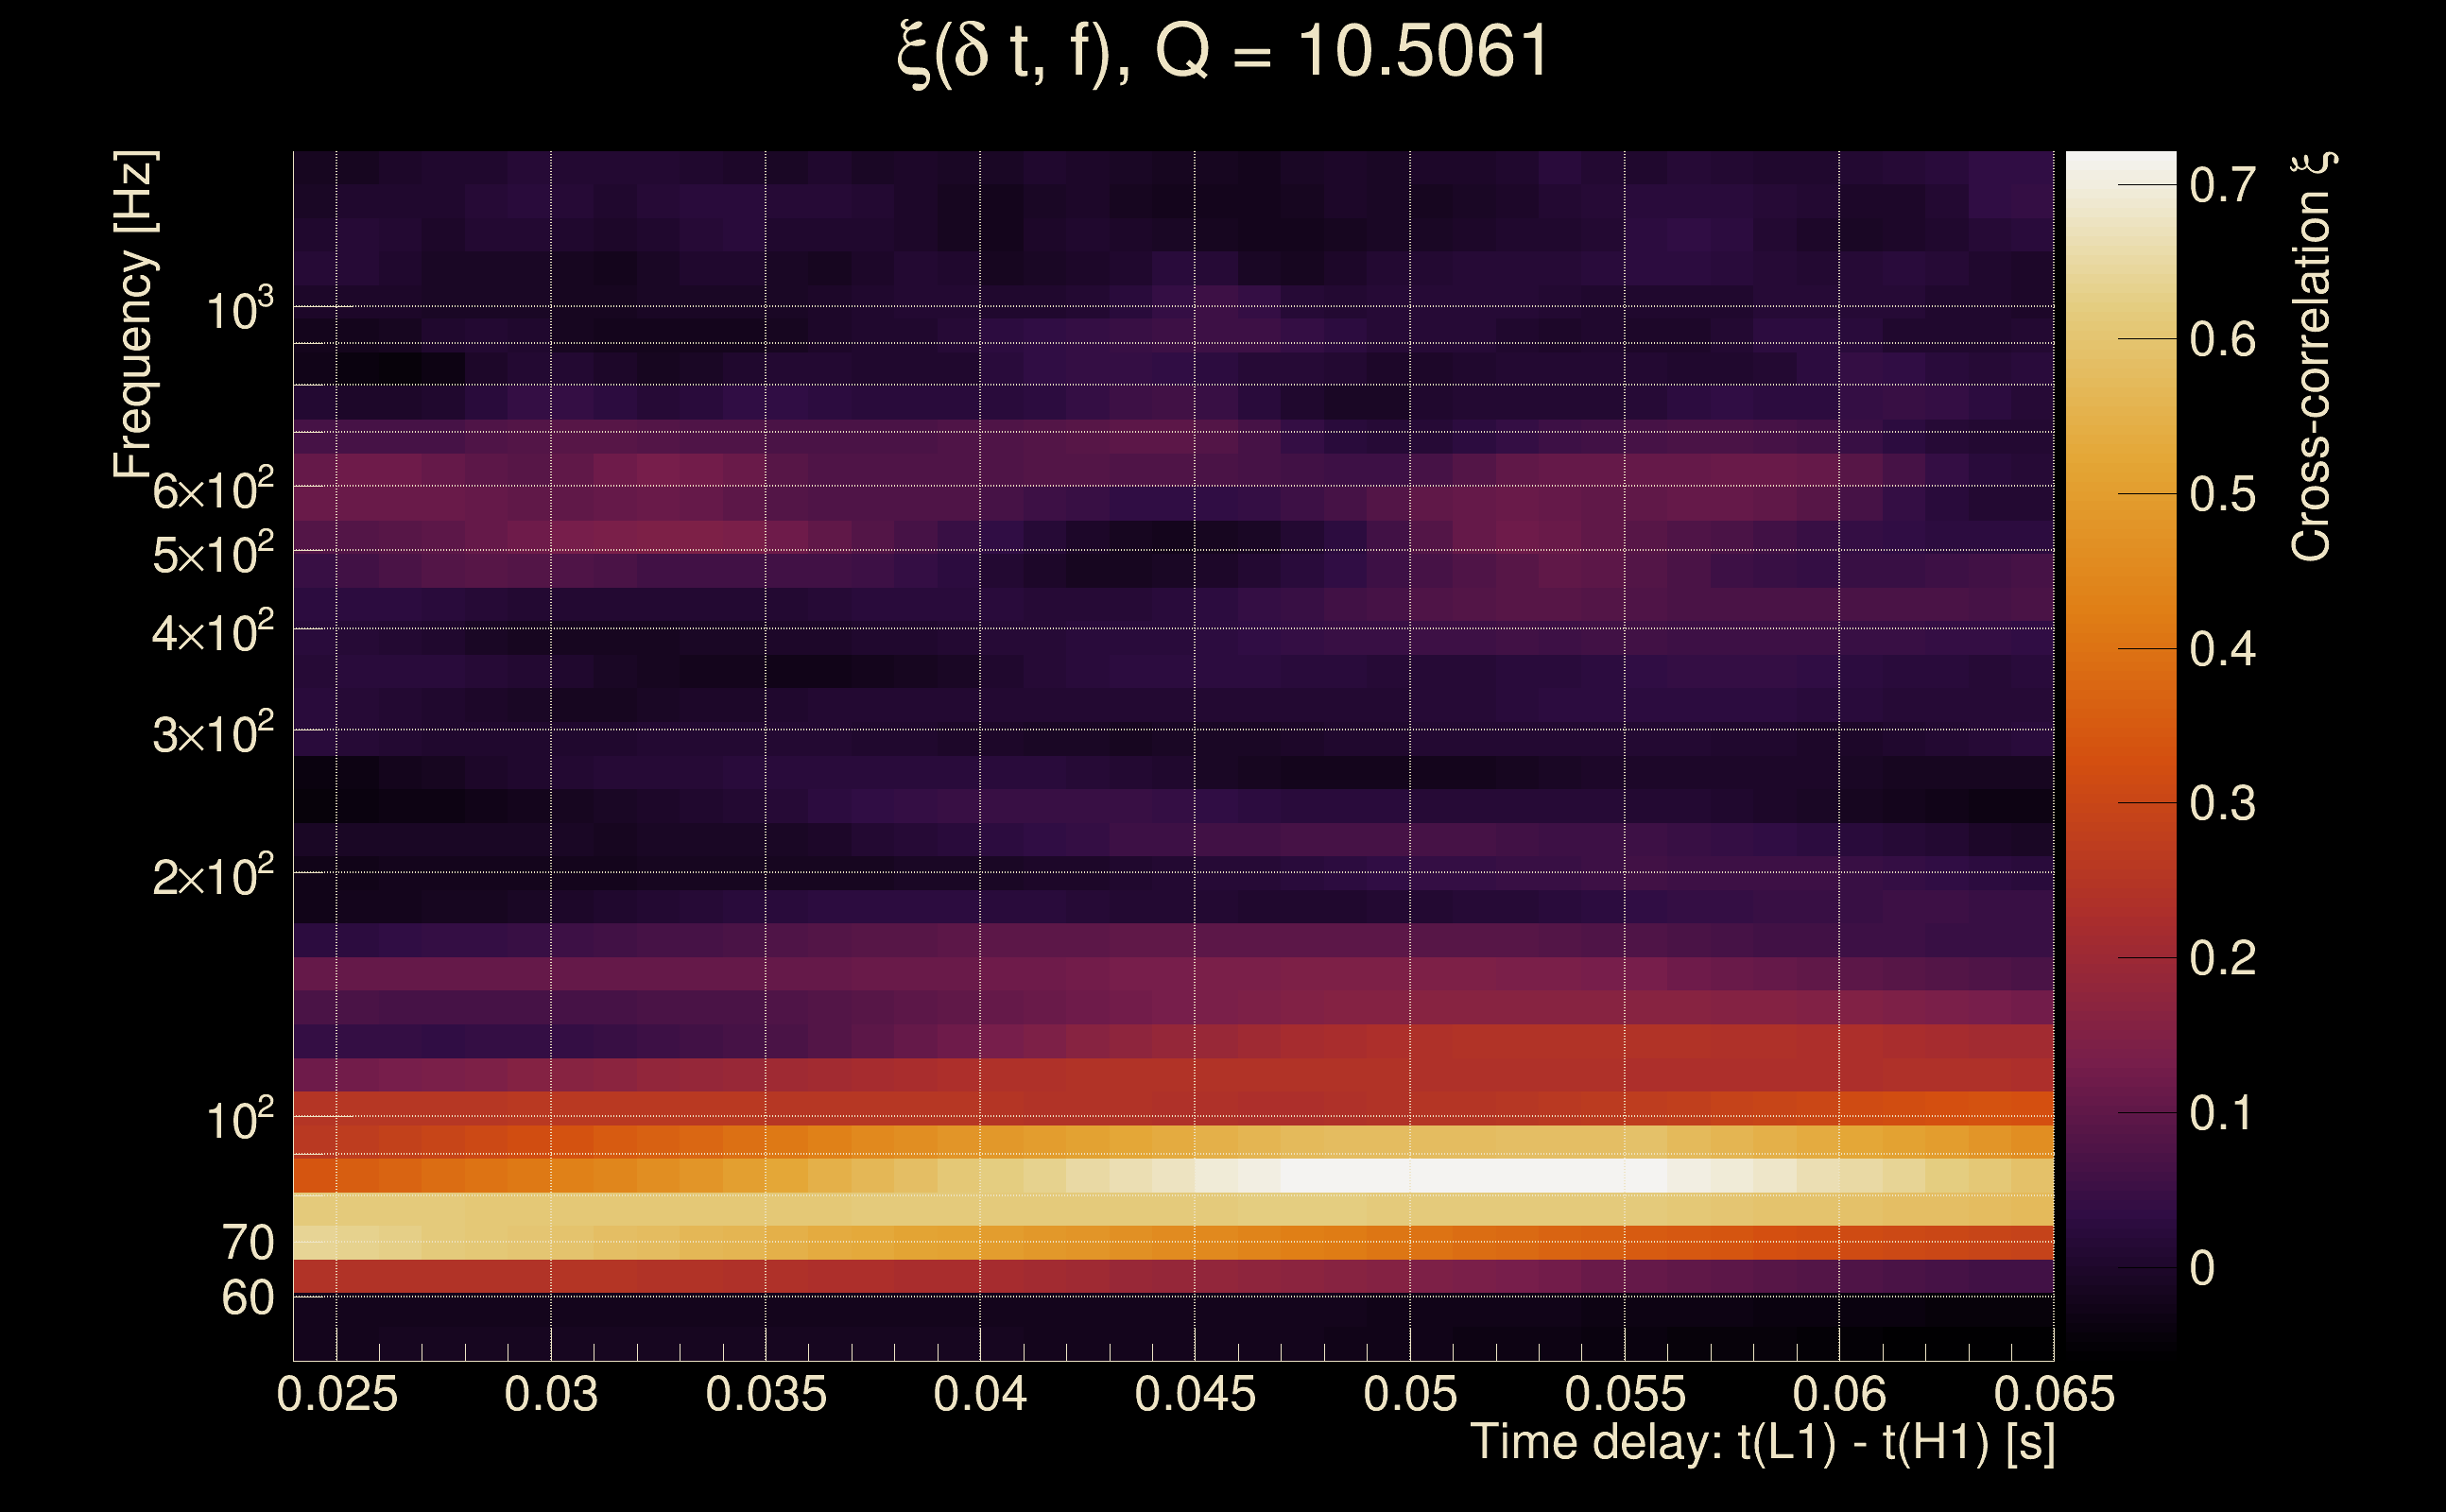
| Event time t(H1): | GPS = 1377708297 (Sat Sep 2 16:44:39 2023 ) → GPS = 1377708307 (Sat Sep 2 16:44:49 2023 ) |
| Event time t(L1): | GPS = 1377708297 (Sat Sep 2 16:44:49 2023 ) → GPS = 1377708307 (Sat Sep 2 16:44:49 2023 ) |
| Omicron analysis time window (H1): | GPS = 1377708294 → GPS = 1377708310 |
| Omicron analysis time window (L1): | GPS = 1377708294 → GPS = 1377708310 |
| Time delay between detectors t(L1) - t(H1): | 0.0445246 s (slice index = 107 / 217), δt_gw = -0.00147541 s |
| Time delay uncertainty: | 0.00382108 s |
| [targeted mode] Time delay probability: | 0.951674 (0.0606047 sigmas), δt_target = 0.00160933 s |
| Frequency: | 138.324 Hz |
| Ξ: | 0.0997521 ± 0.112027 (variance = 0.0125501): Q0: 0.395558, Q1: 0.422053, Q2: 0.301194, Q3: 0.138594, Q4: 0.184481 |
| Rank: | R_A = 0.0841955 |
| Log of amplitude ratio (L1/H1): | -0.417922, variance = 0.283037 (L1/H1: -0.452765, variance = 0.449344, H1/L1: 0.314414, variance = 0.497005) |
| Amplitude ratio (L1/H1): | 0.658414 ⋇ 1.70235 (L1/H1: 0.635868 ⋇ 1.95488, H1/L1: 1.36946 ⋇ 2.02382) |
| Amplitude ratio H1|L1 compatibility (probability): | 0.886908 |
| Antenna factor probability: | 1 |
| Number of rejected frequency rows: | Q0: 12 / 18, Q1: 27 / 36, Q2: 62 / 70, Q3: 123 / 134, Q4: 245 / 258 |
| Maximum signal-to-noise ratio: | H1: 11.3392, L1: 6.57889 |
| SNR variance: | H1: 0.571361, L1: 0.561952 |
| Click here for a zoomed plot | Click here for a zoomed plot | Click here for a zoomed plot | Click here for a zoomed plot | Click here for a zoomed plot |
 |
 |
 |
 |
 |
 |
 |
 |
 |
 |
 |
 |
 |
 |
 |
 |
 |
 |
 |
 |
 |
 |
 |
 |
 |
 |
 |
 |
 |
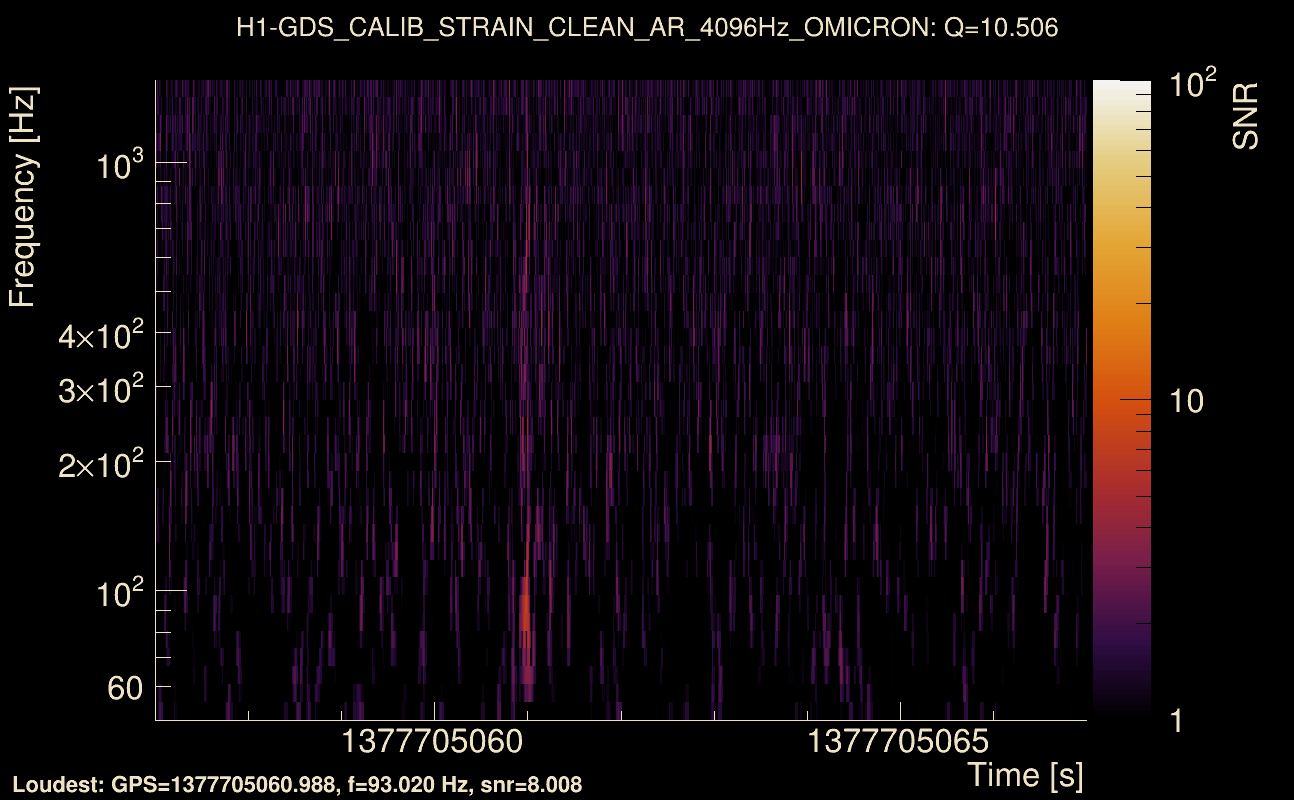
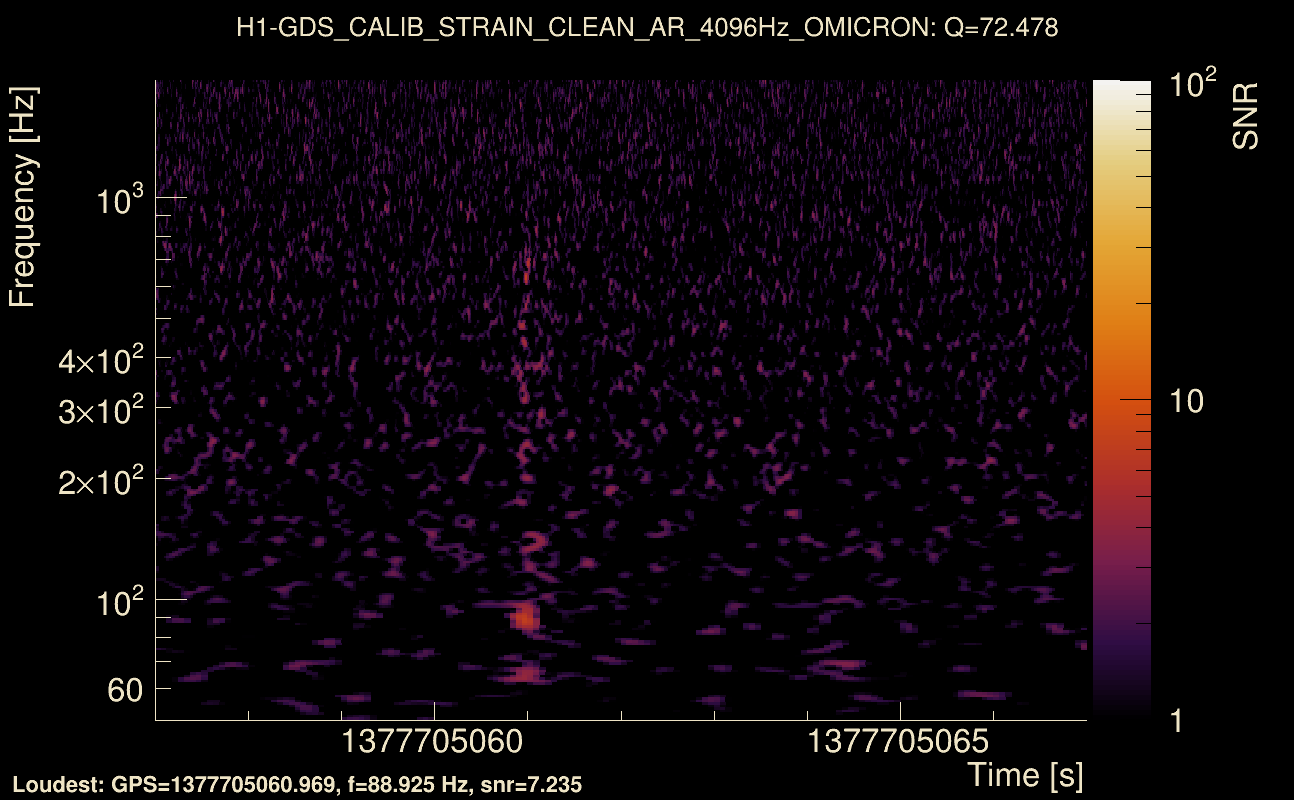
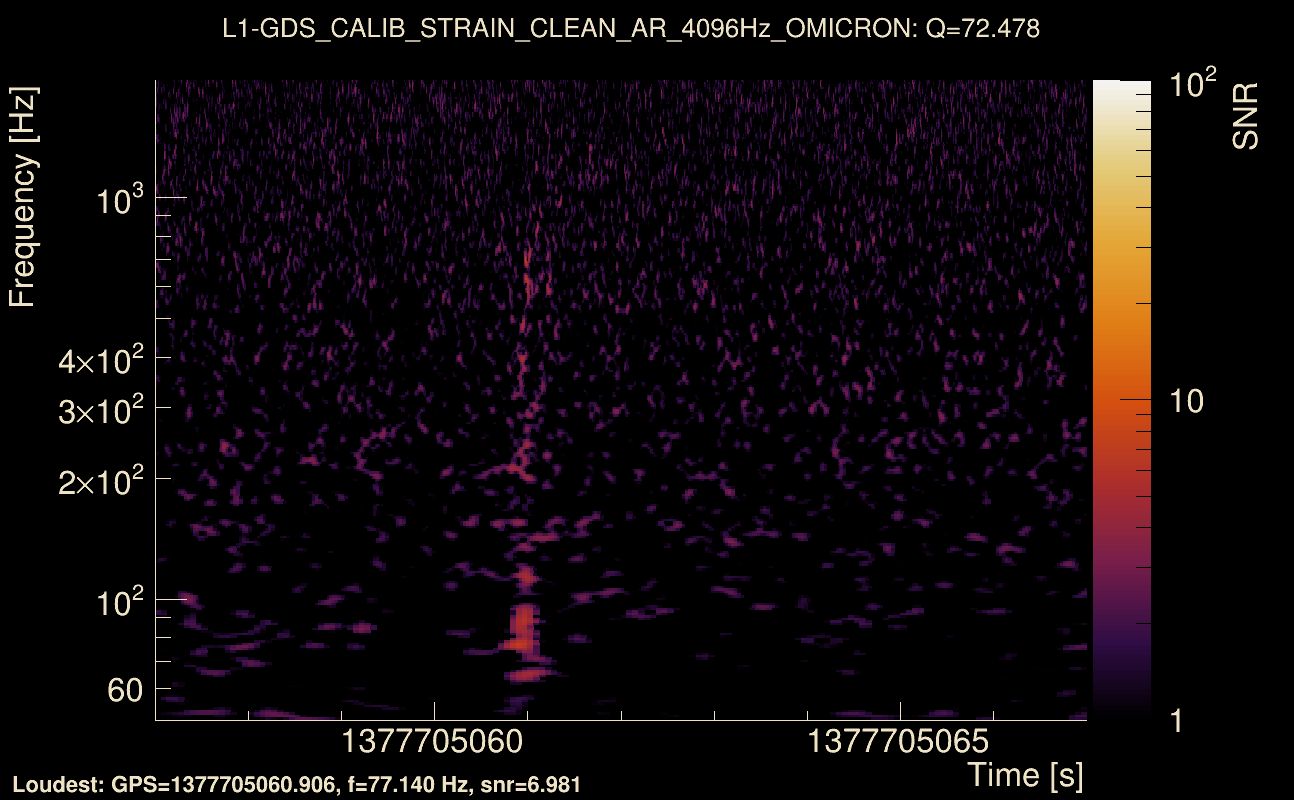
| Event time t(H1): | GPS = 1377705057 (Sat Sep 2 15:50:39 2023 ) → GPS = 1377705067 (Sat Sep 2 15:50:49 2023 ) |
| Event time t(L1): | GPS = 1377705057 (Sat Sep 2 15:50:49 2023 ) → GPS = 1377705067 (Sat Sep 2 15:50:49 2023 ) |
| Omicron analysis time window (H1): | GPS = 1377705054 → GPS = 1377705070 |
| Omicron analysis time window (L1): | GPS = 1377705054 → GPS = 1377705070 |
| Time delay between detectors t(L1) - t(H1): | -0.0488919 s (slice index = 109 / 217), δt_gw = -0.0028919 s |
| Time delay uncertainty: | 0.00717776 s |
| [targeted mode] Time delay probability: | 0.766084 (0.297501 sigmas), δt_target = -0.00124383 s |
| Frequency: | 131.503 Hz |
| Ξ: | 0.23897 ± 0.118386 (variance = 0.0140153): Q0: 0.471233, Q1: 0.410759, Q2: 0.235766, Q3: 0.212053, Q4: 0.171051 |
| Rank: | R_A = 0.0829097 |
| Log of amplitude ratio (L1/H1): | 0.439713, variance = 0.378889 (L1/H1: -0.155013, variance = 0.858772, H1/L1: -0.767183, variance = 0.650645) |
| Amplitude ratio (L1/H1): | 1.55226 ⋇ 1.85065 (L1/H1: 0.856404 ⋇ 2.52616, H1/L1: 0.464319 ⋇ 2.24034) |
| Amplitude ratio H1|L1 compatibility (probability): | 0.452883 |
| Antenna factor probability: | 1 |
| Number of rejected frequency rows: | Q0: 4 / 18, Q1: 21 / 36, Q2: 55 / 70, Q3: 121 / 134, Q4: 240 / 258 |
| Maximum signal-to-noise ratio: | H1: 9.20276, L1: 12.402 |
| SNR variance: | H1: 0.583452, L1: 0.629078 |
| Click here for a zoomed plot | Click here for a zoomed plot | Click here for a zoomed plot | Click here for a zoomed plot | Click here for a zoomed plot |
 |
 |
 |
 |
 |
 |
 |
 |
 |
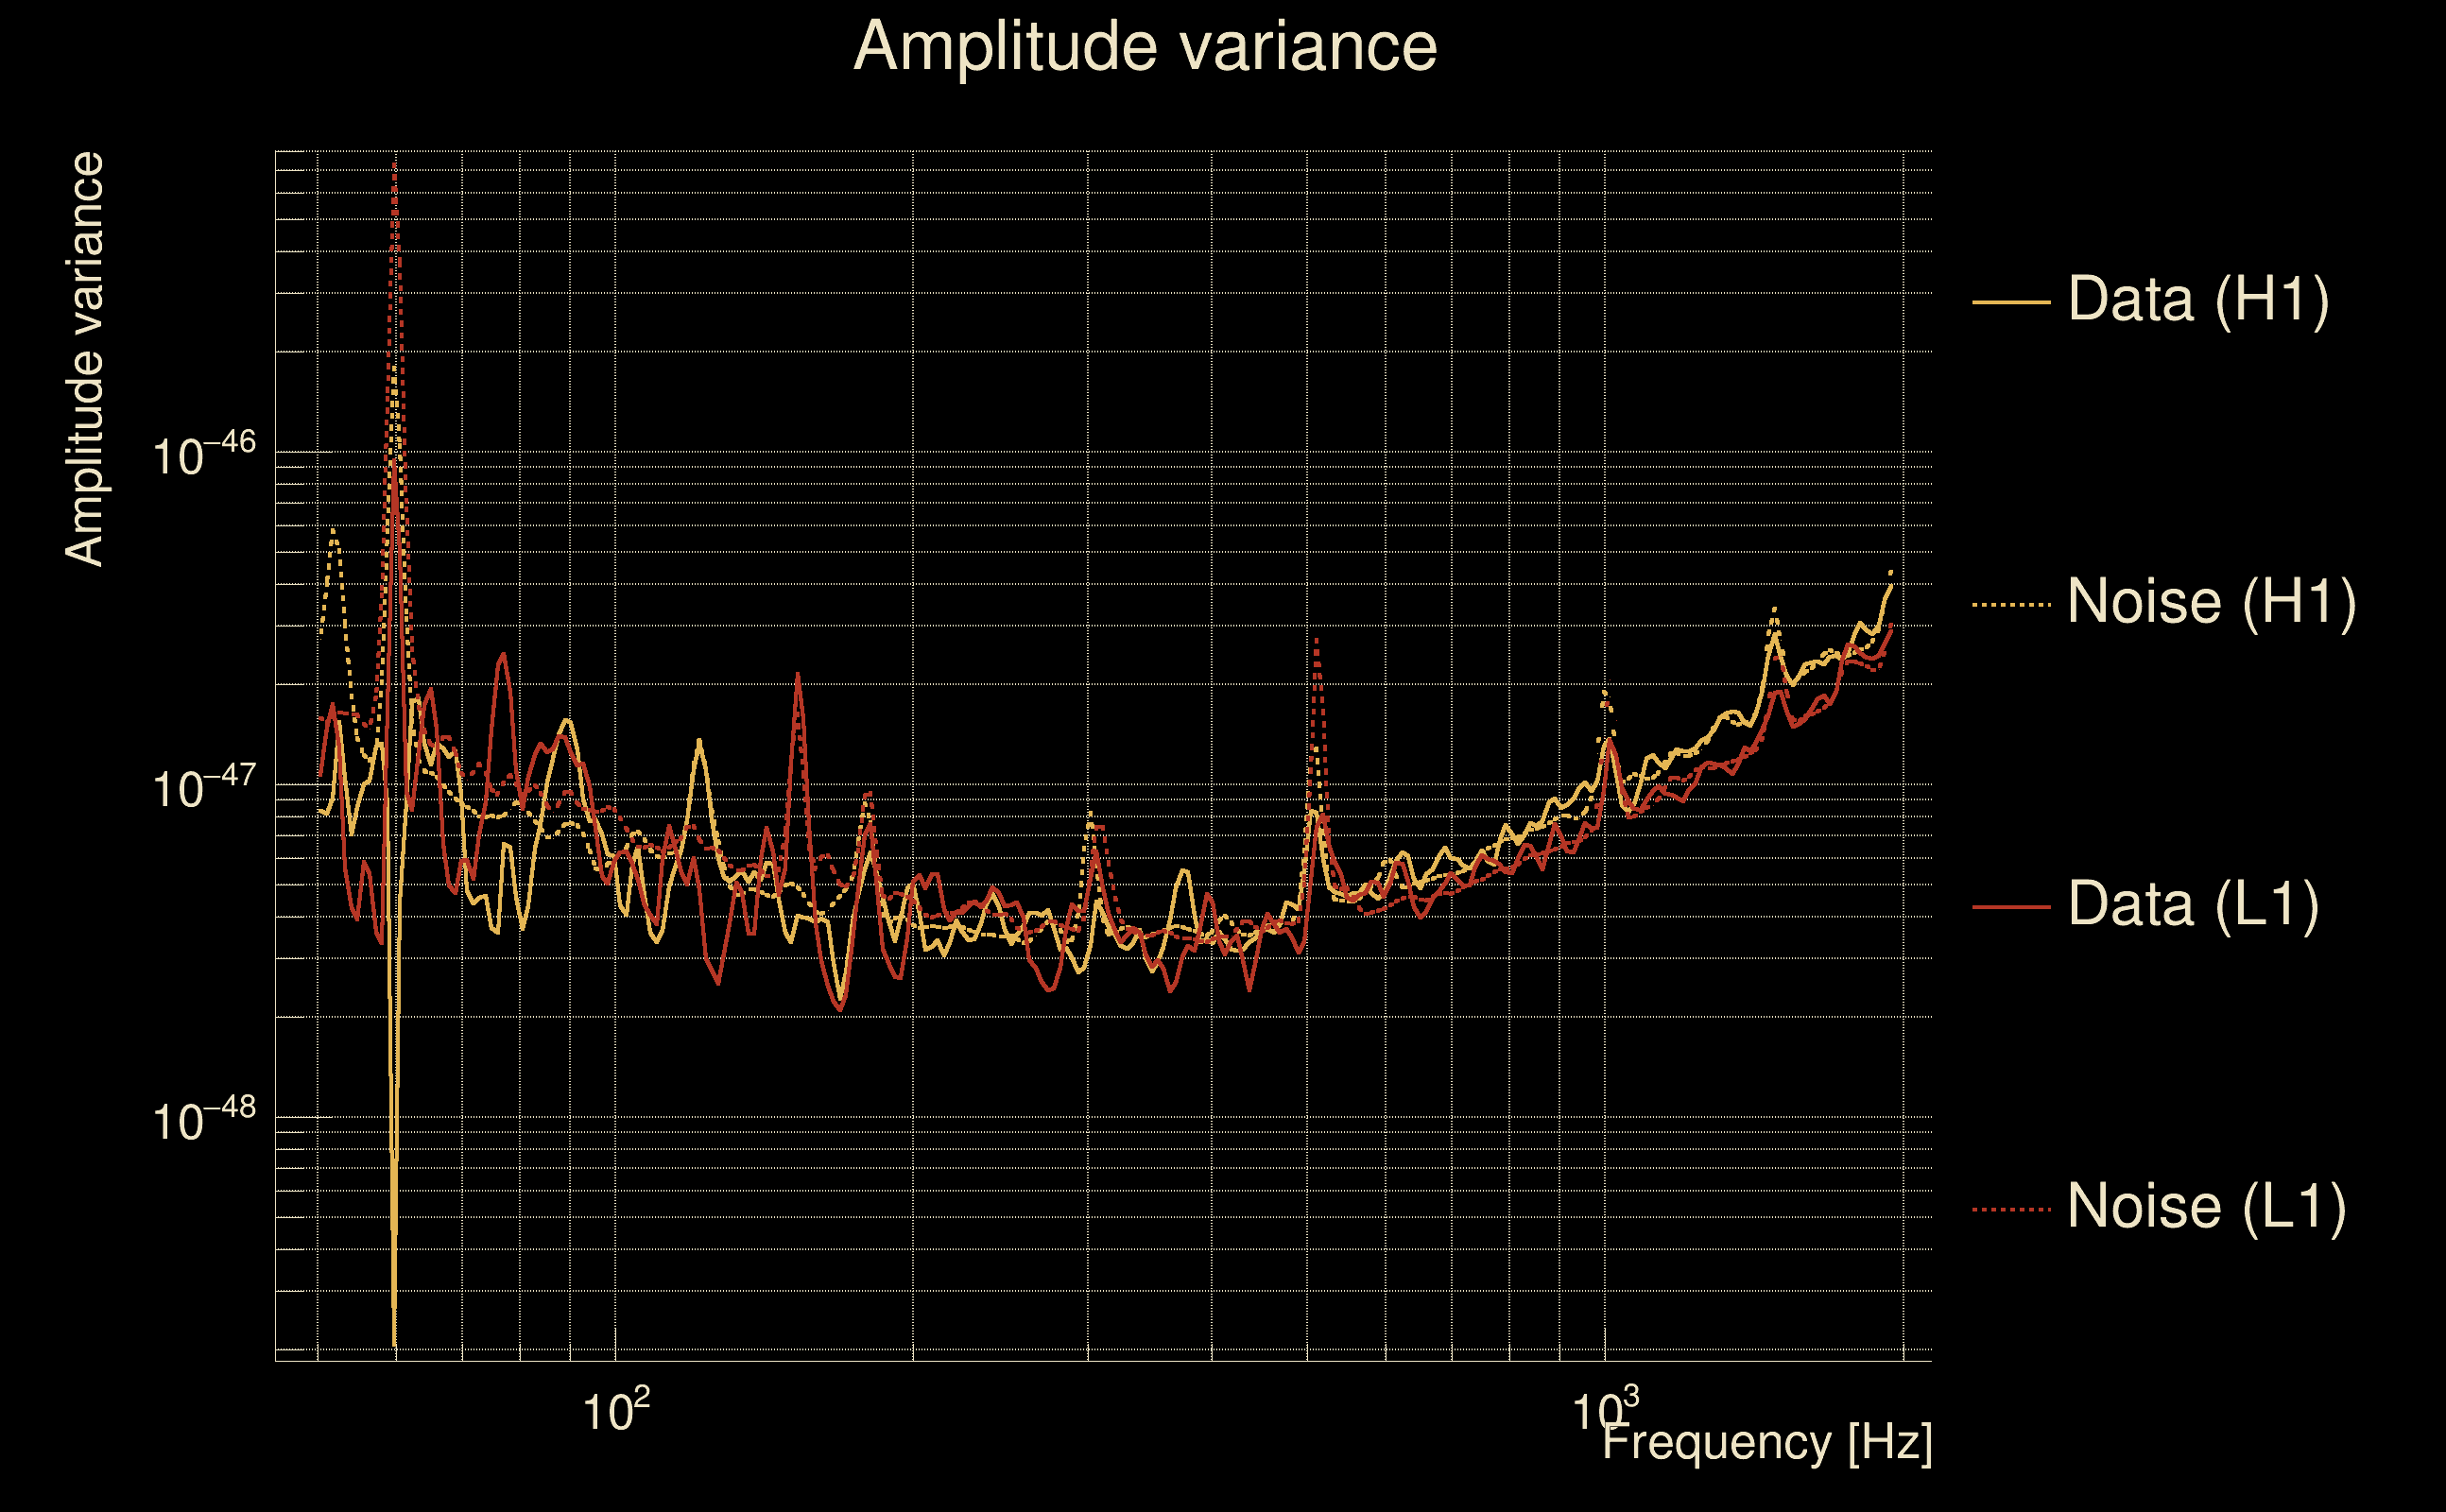 |
 |
 |
 |
 |
 |
 |
 |
 |
 |
 |
 |
 |
 |
 |
 |
 |
 |
 |
 |
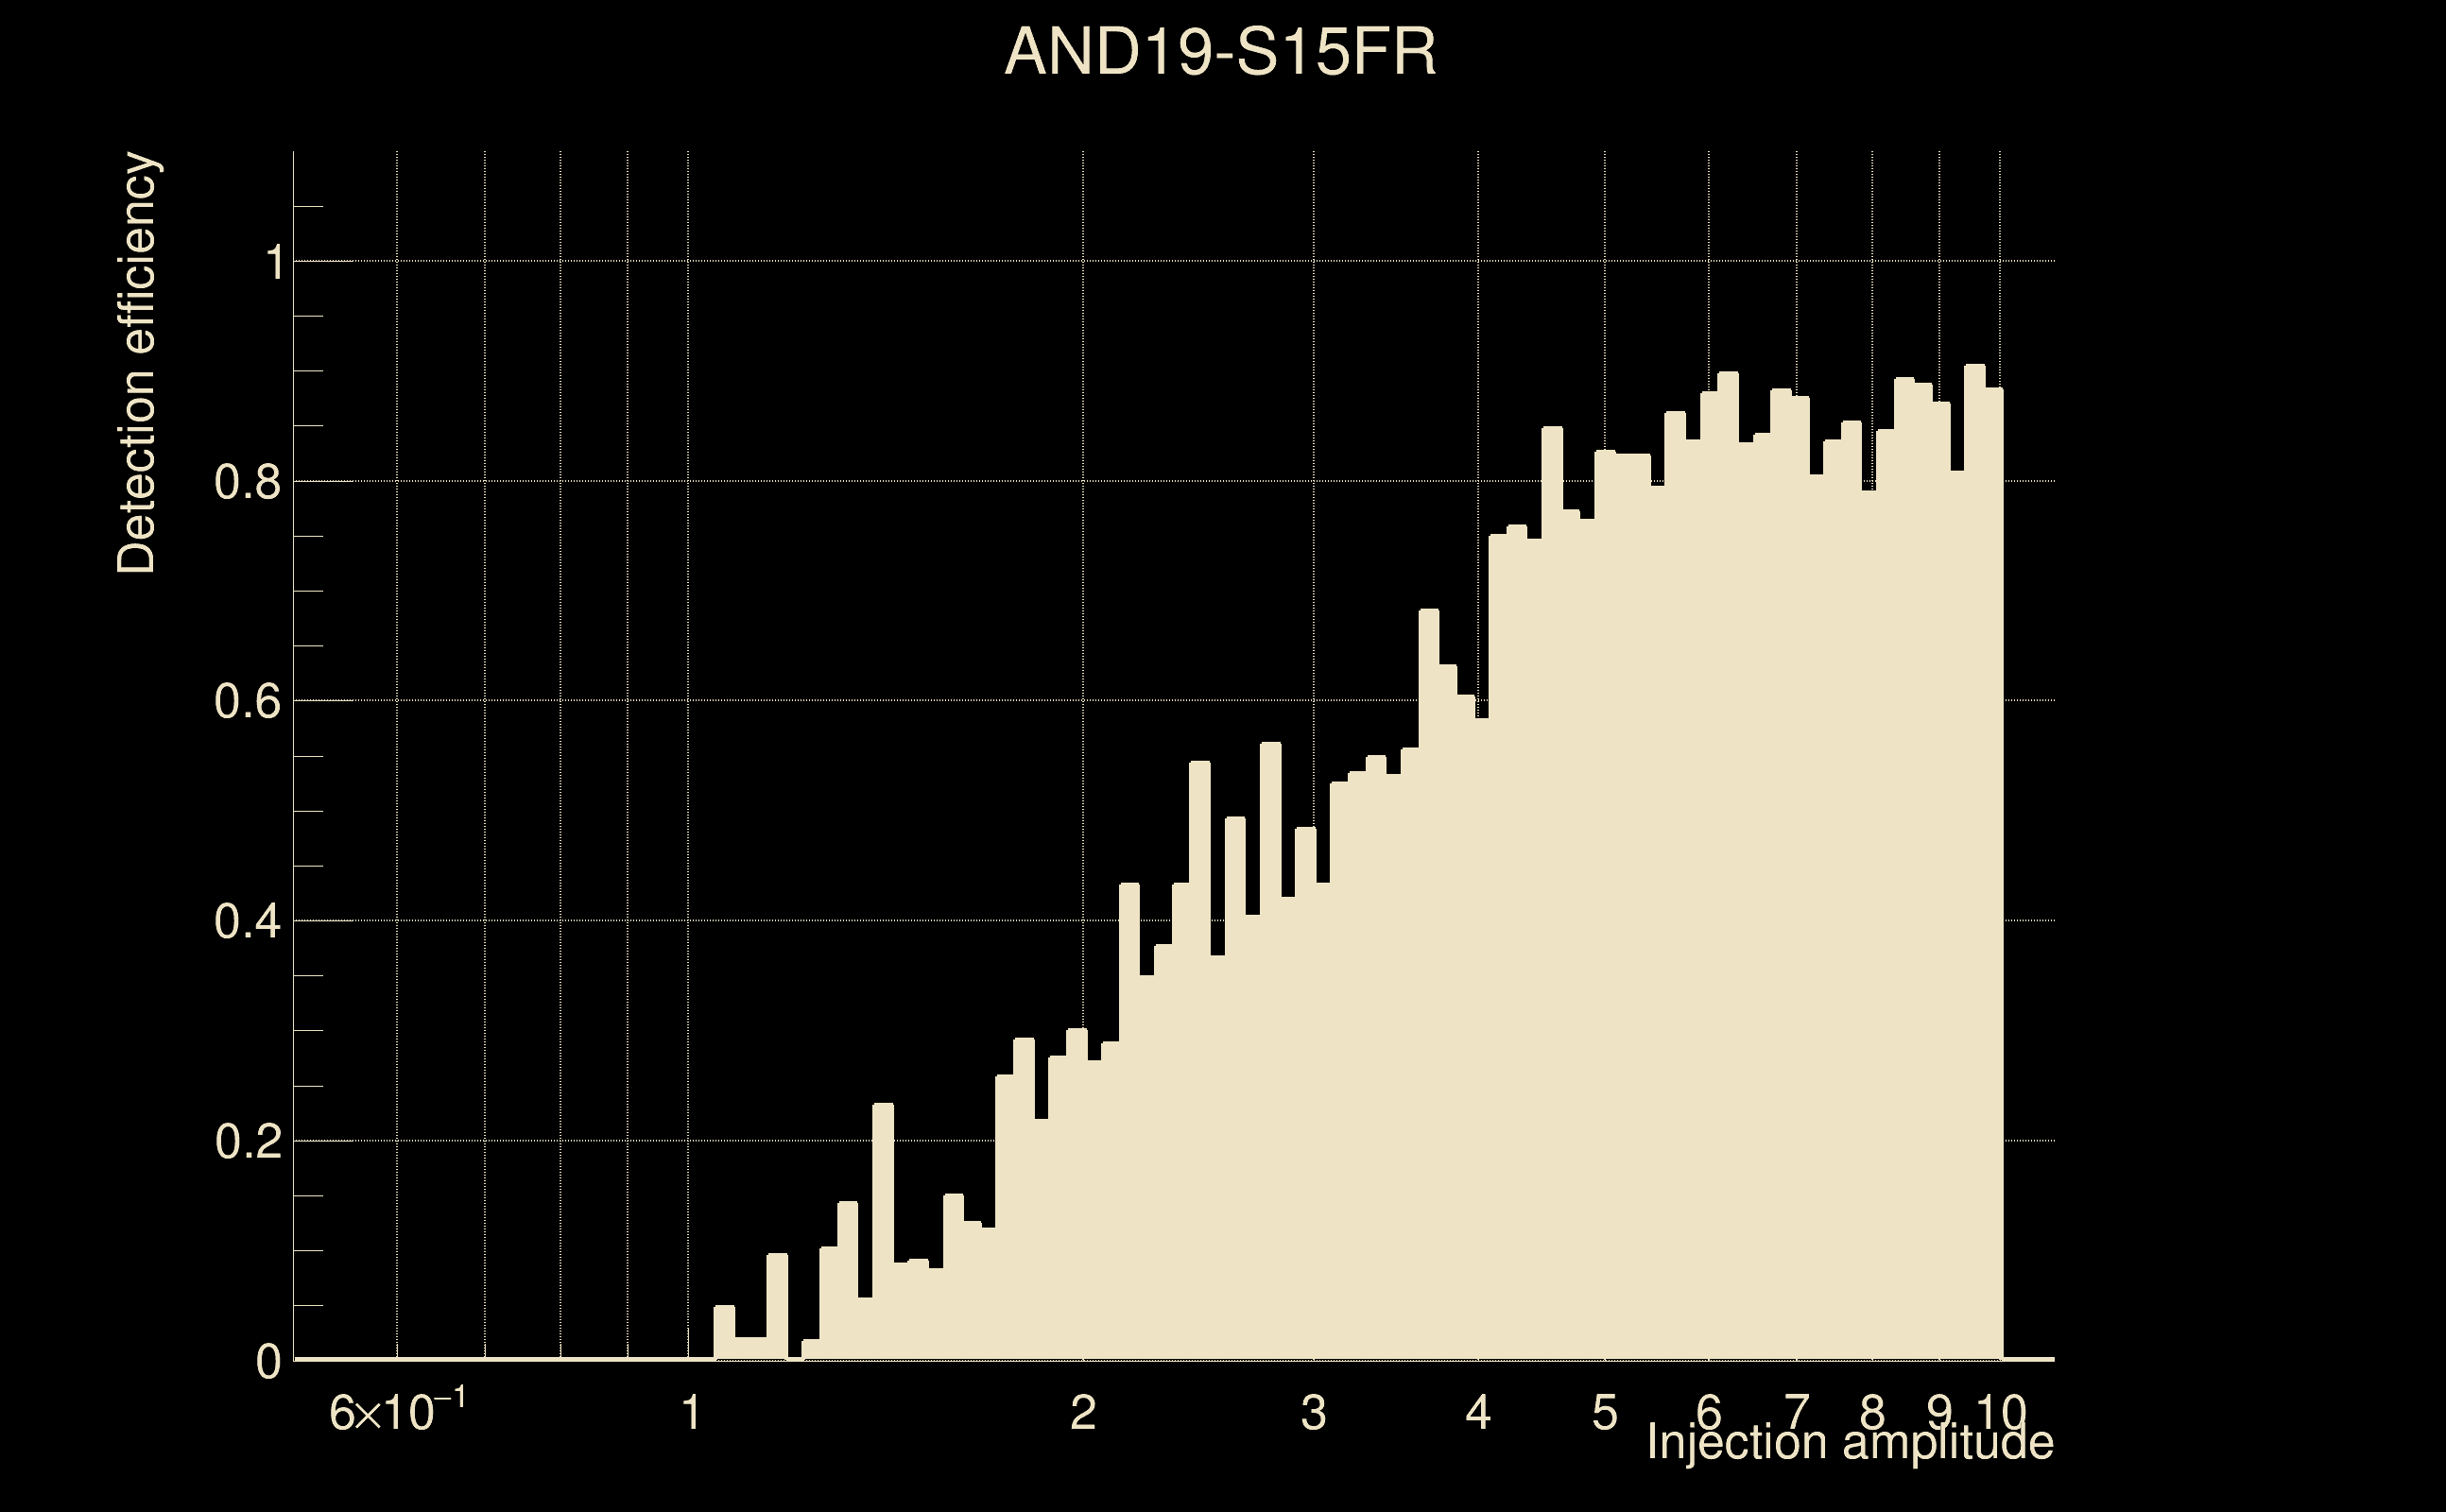
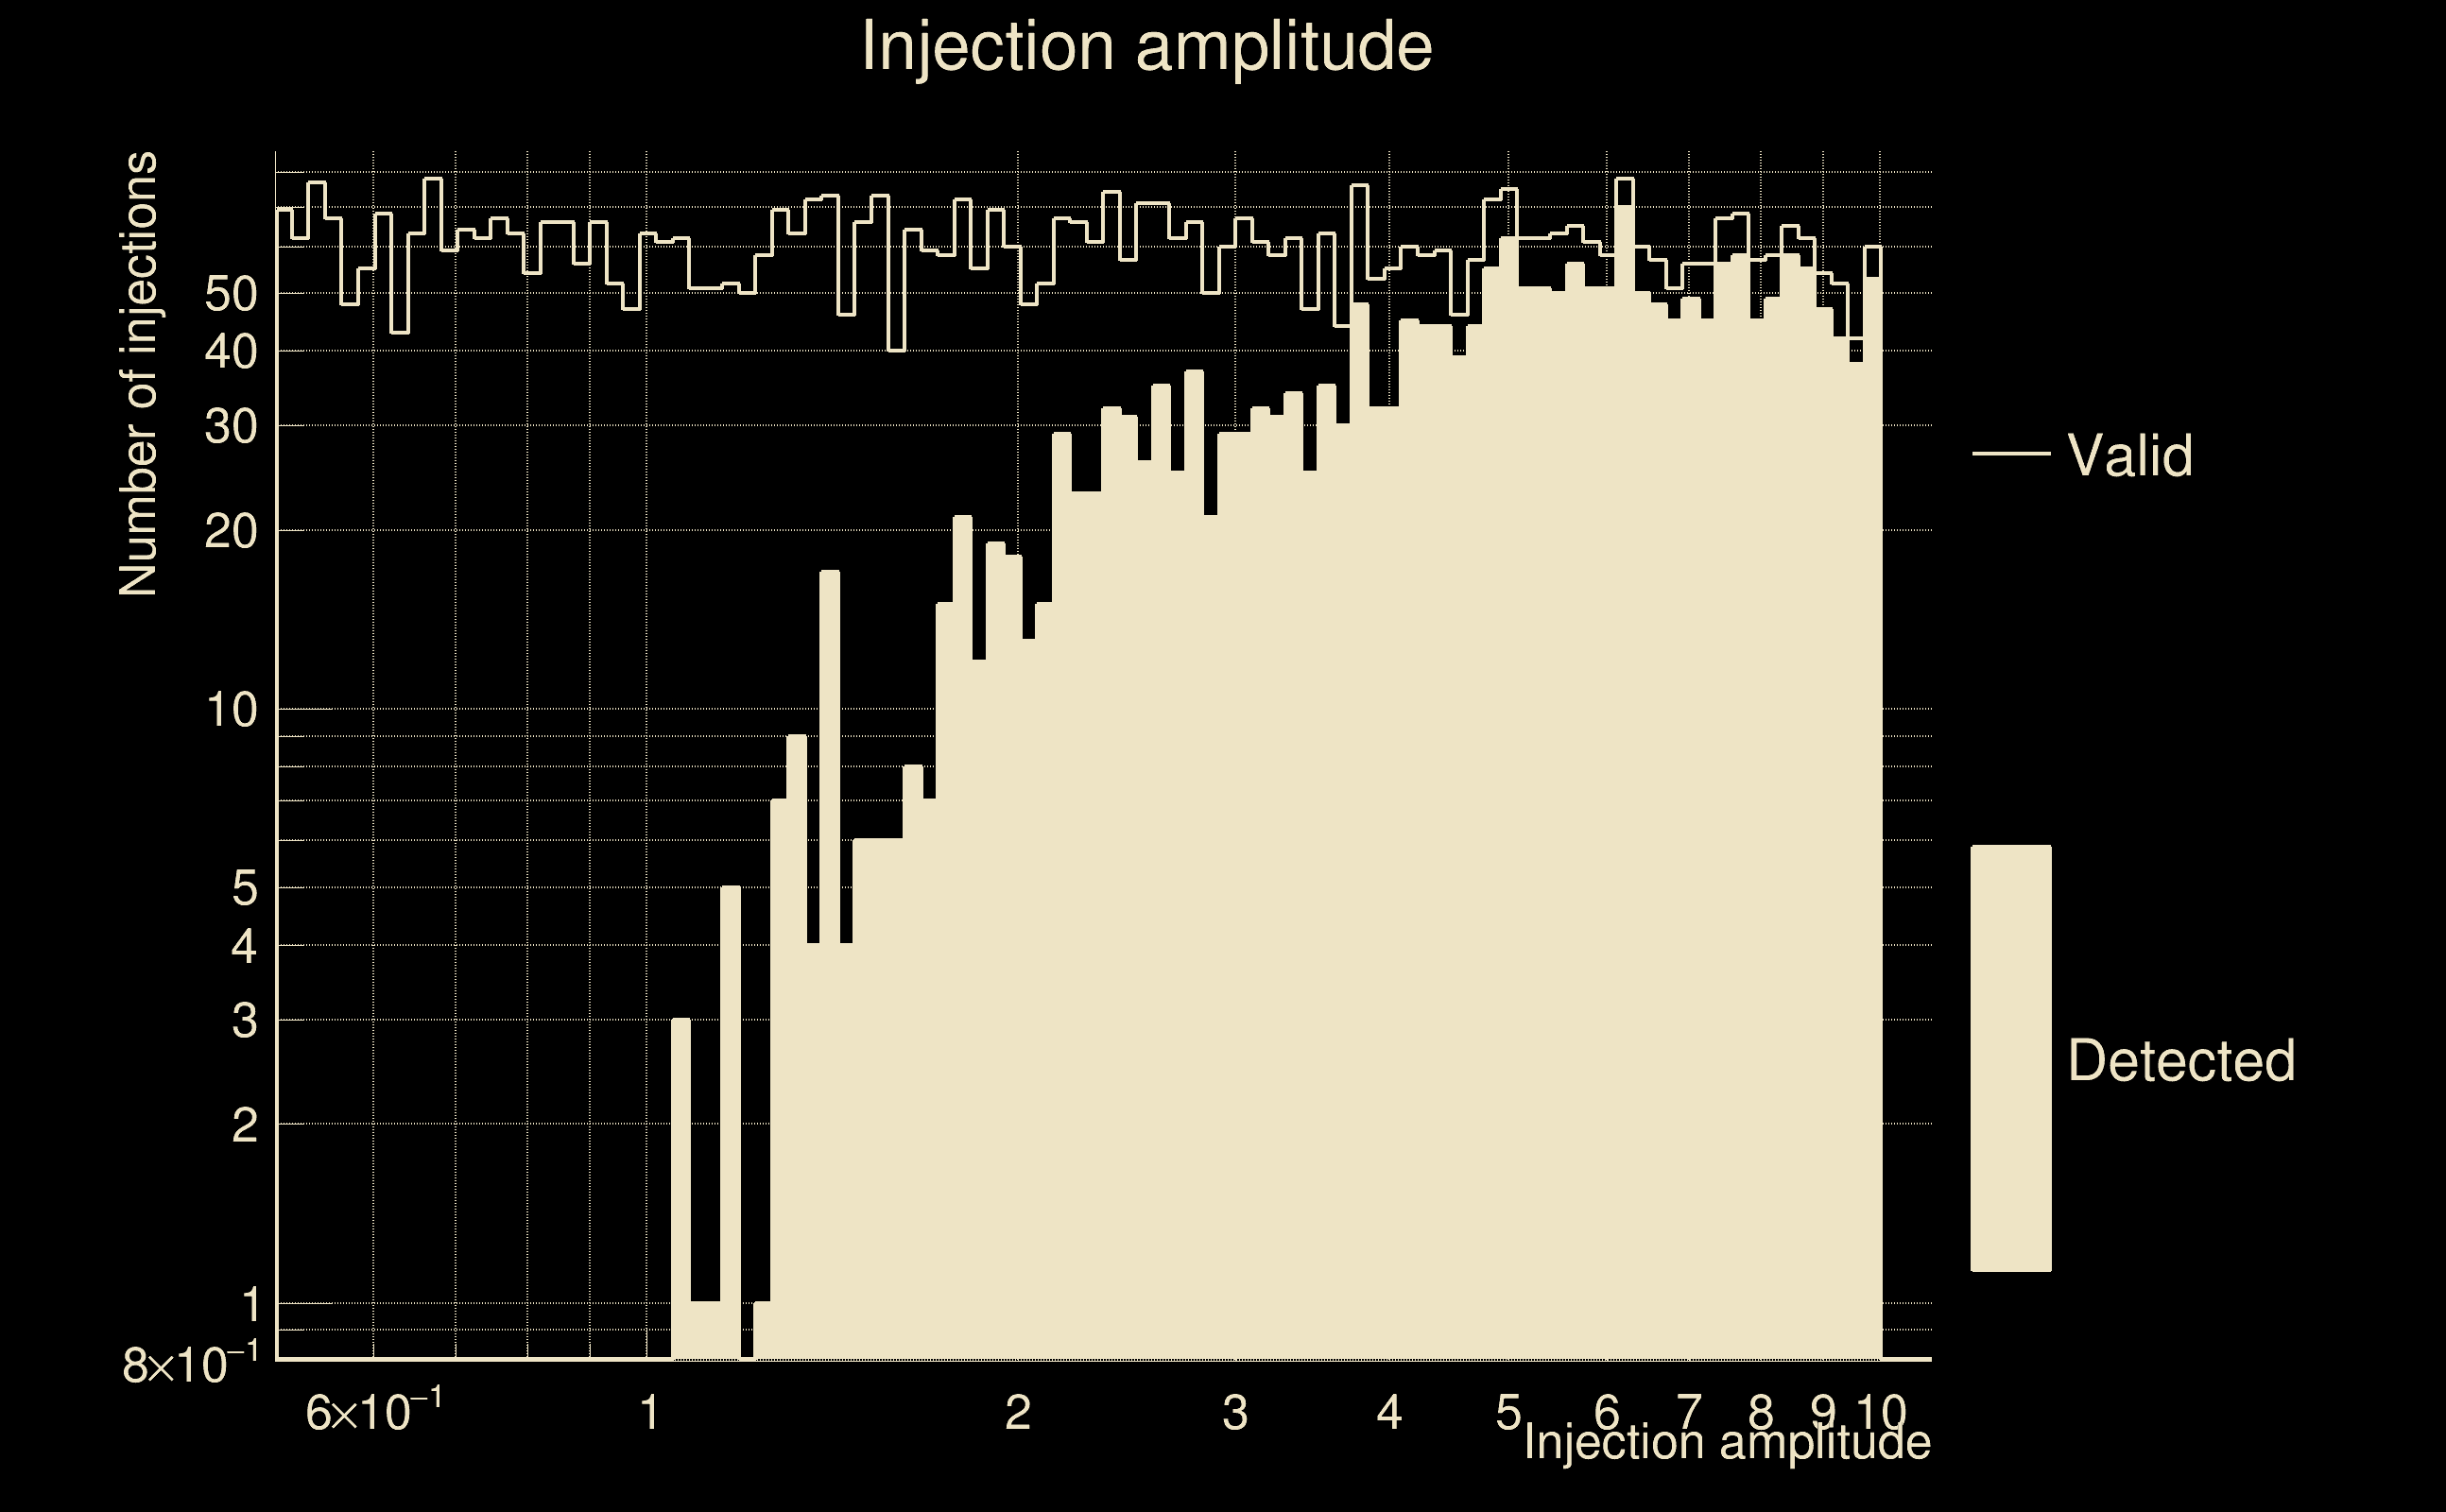
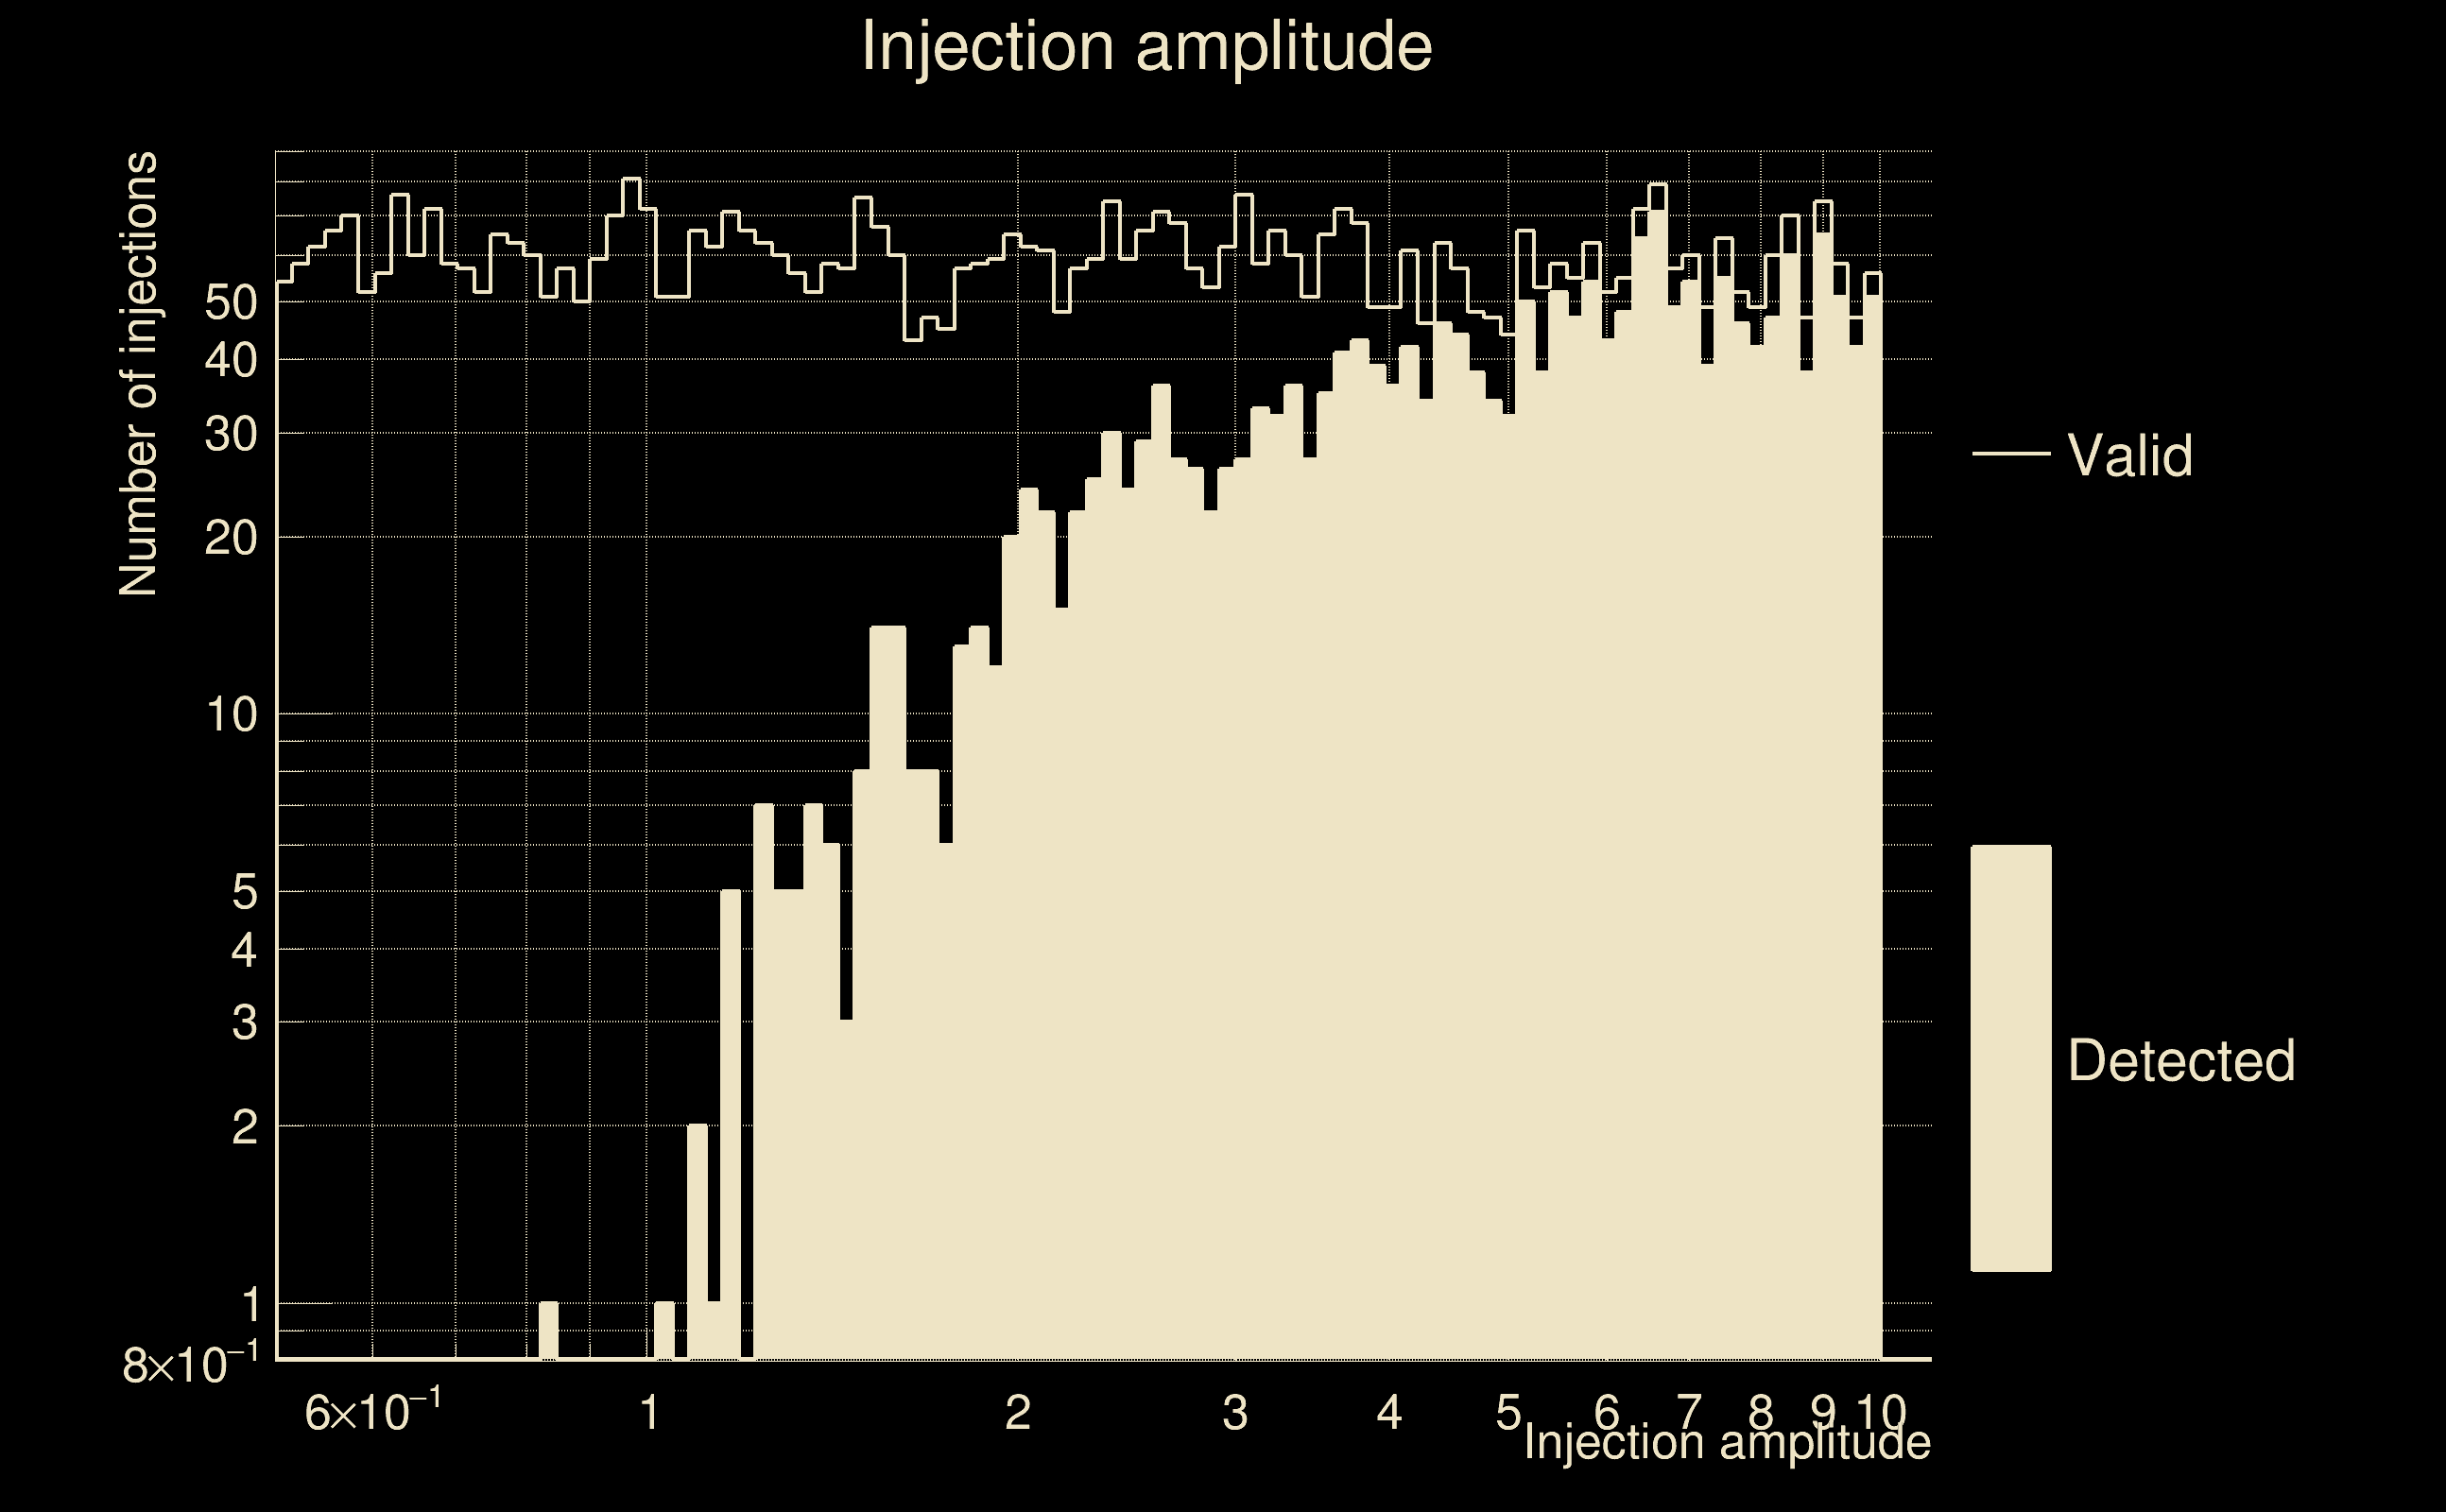
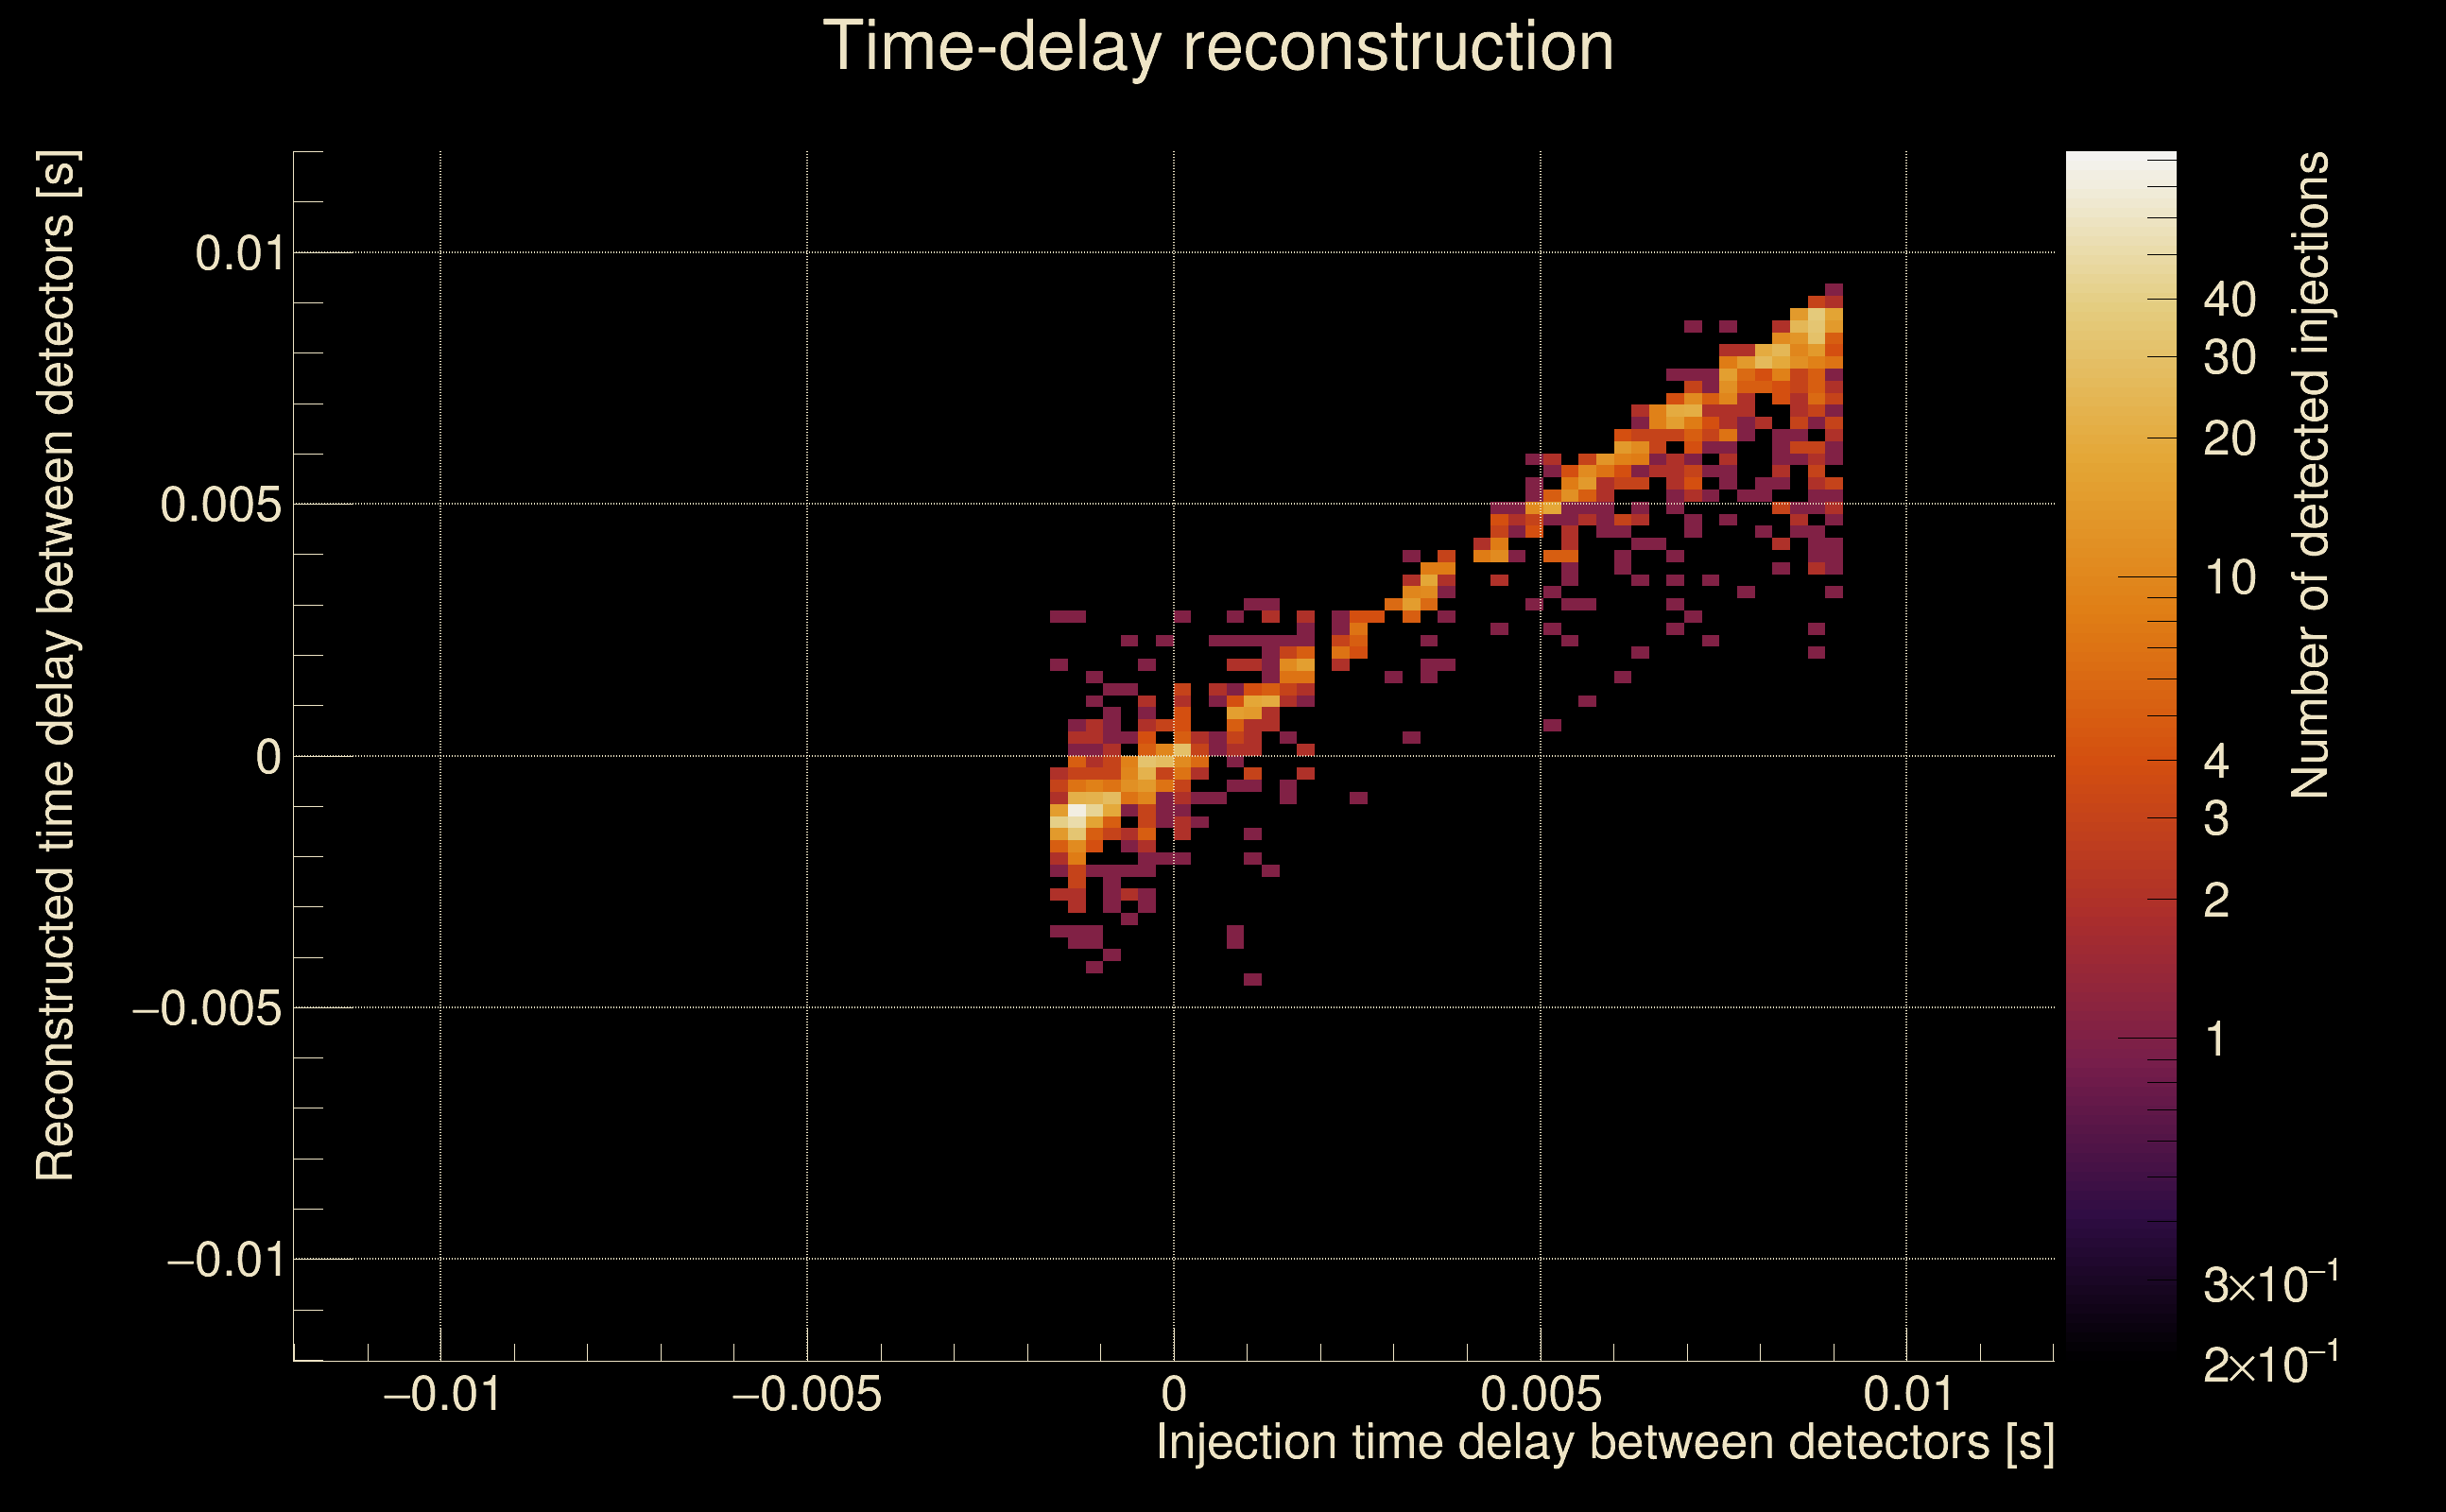
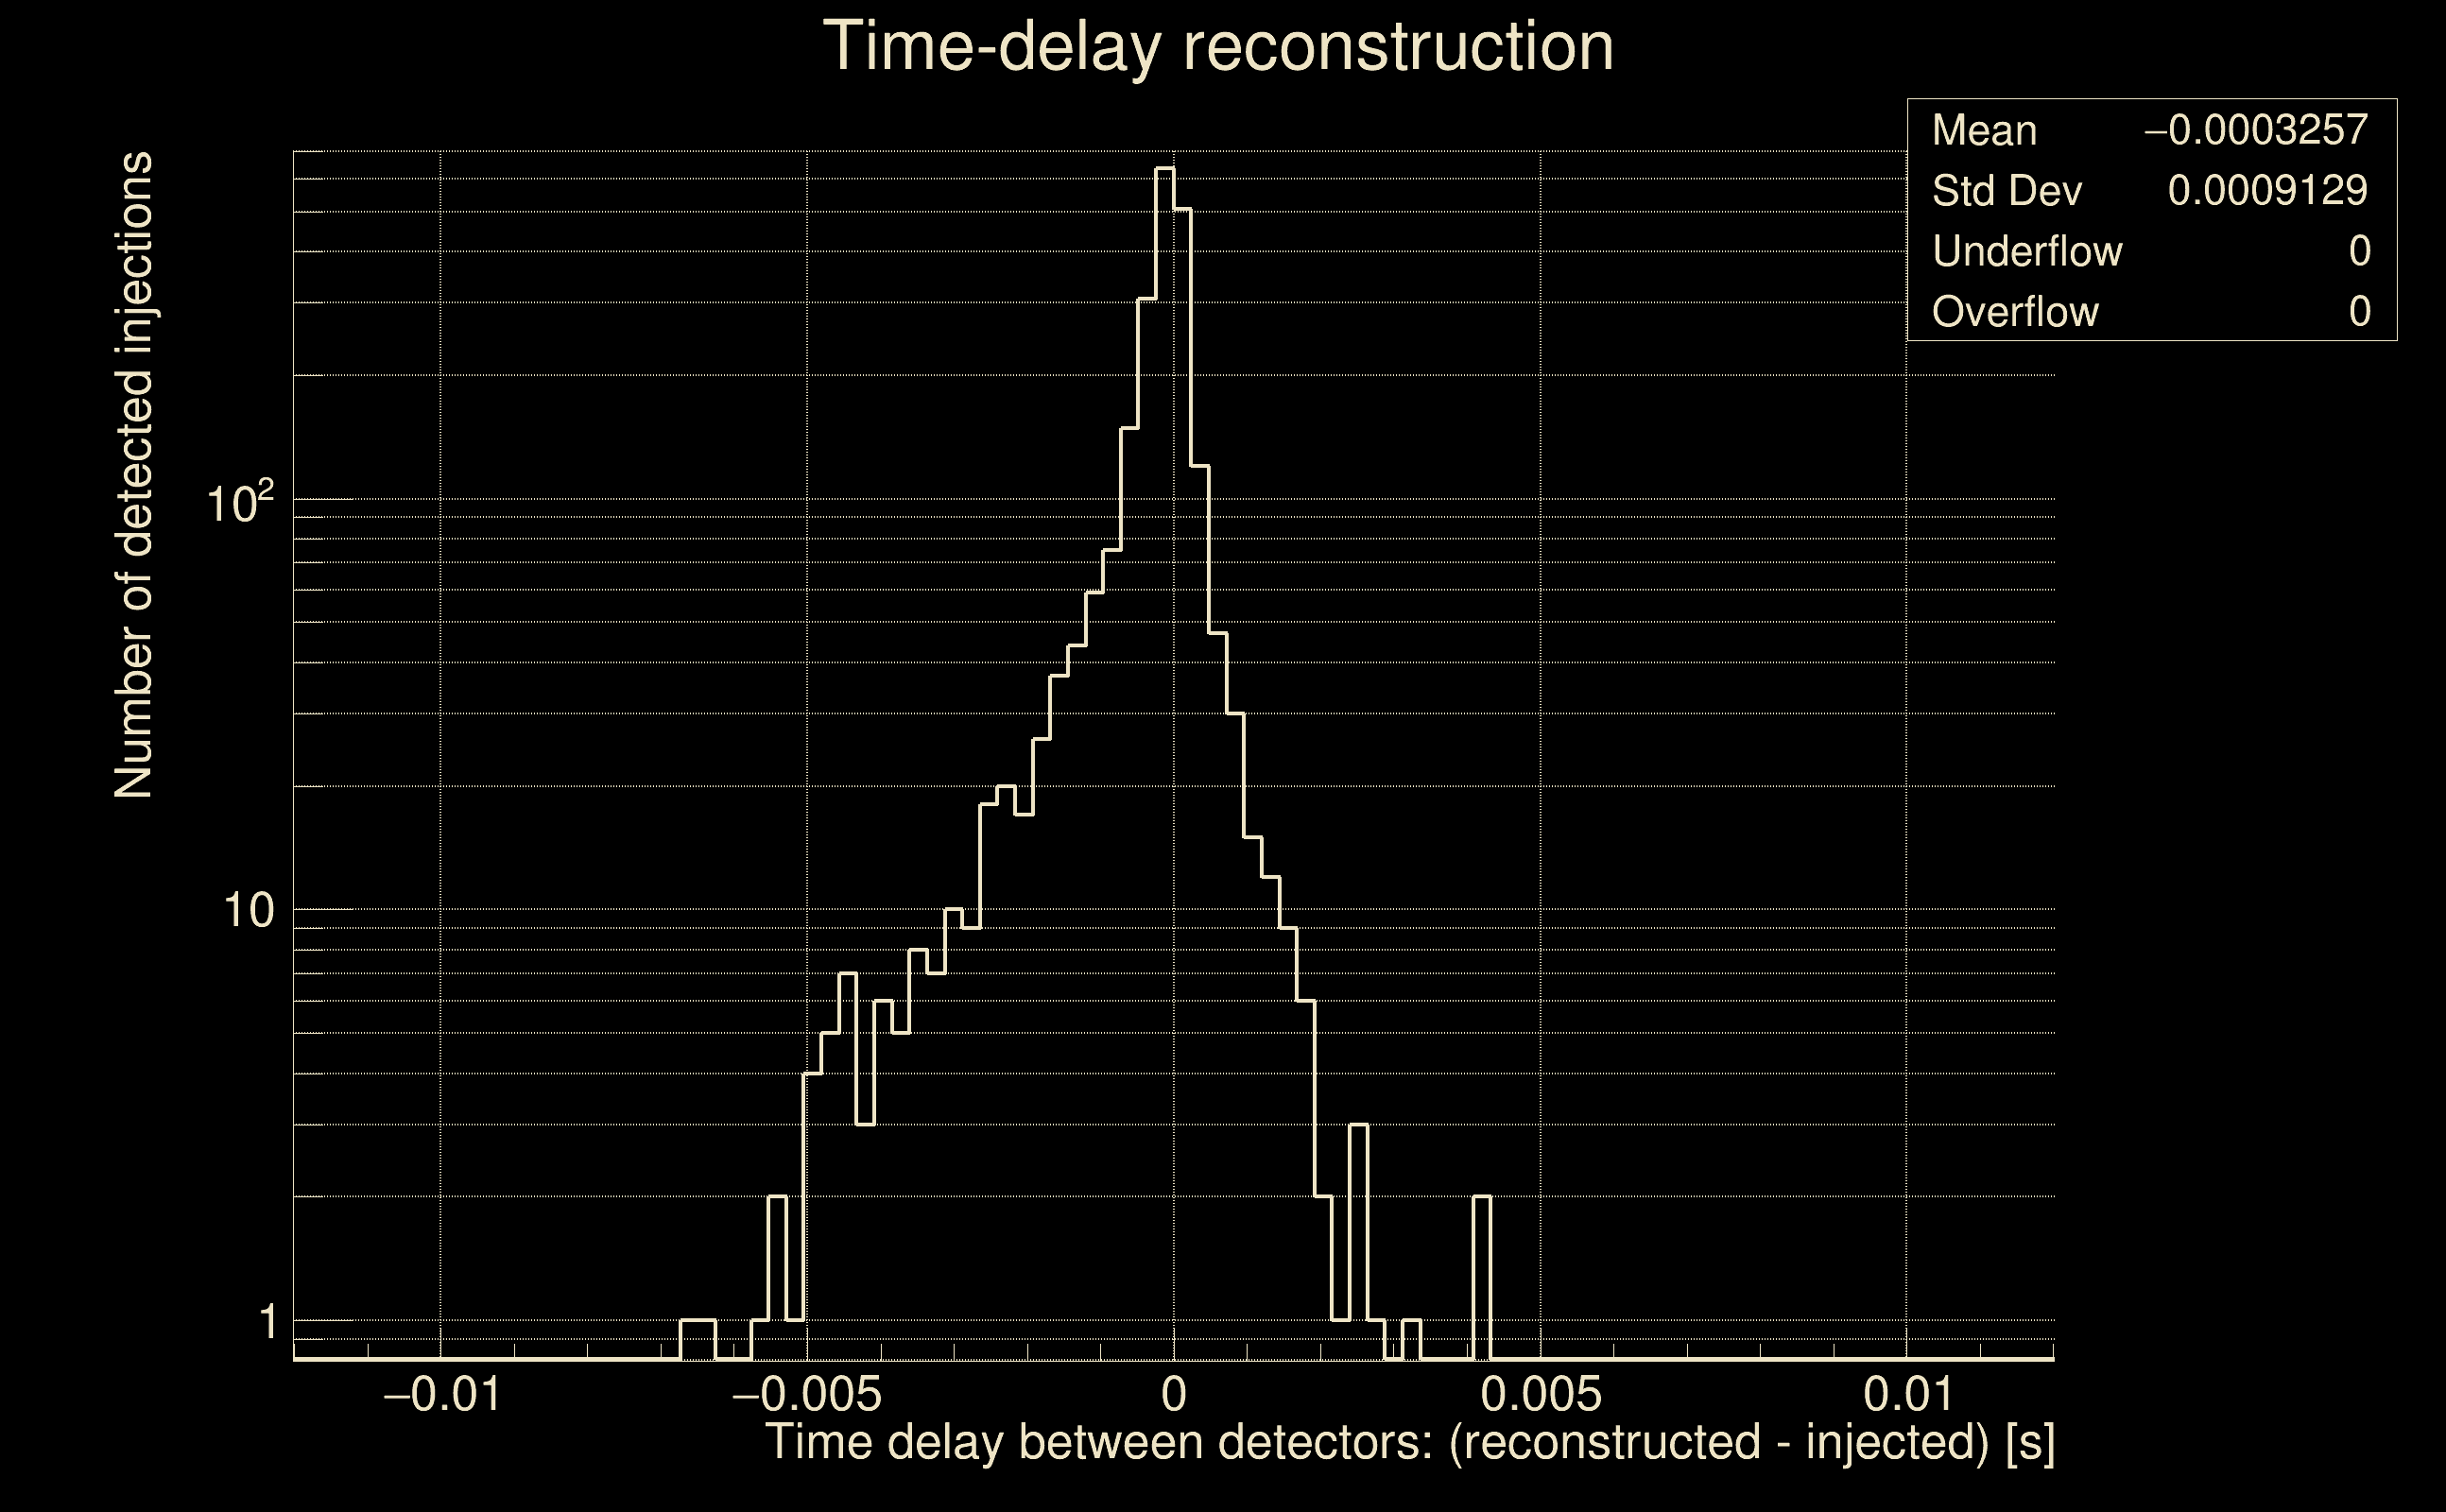
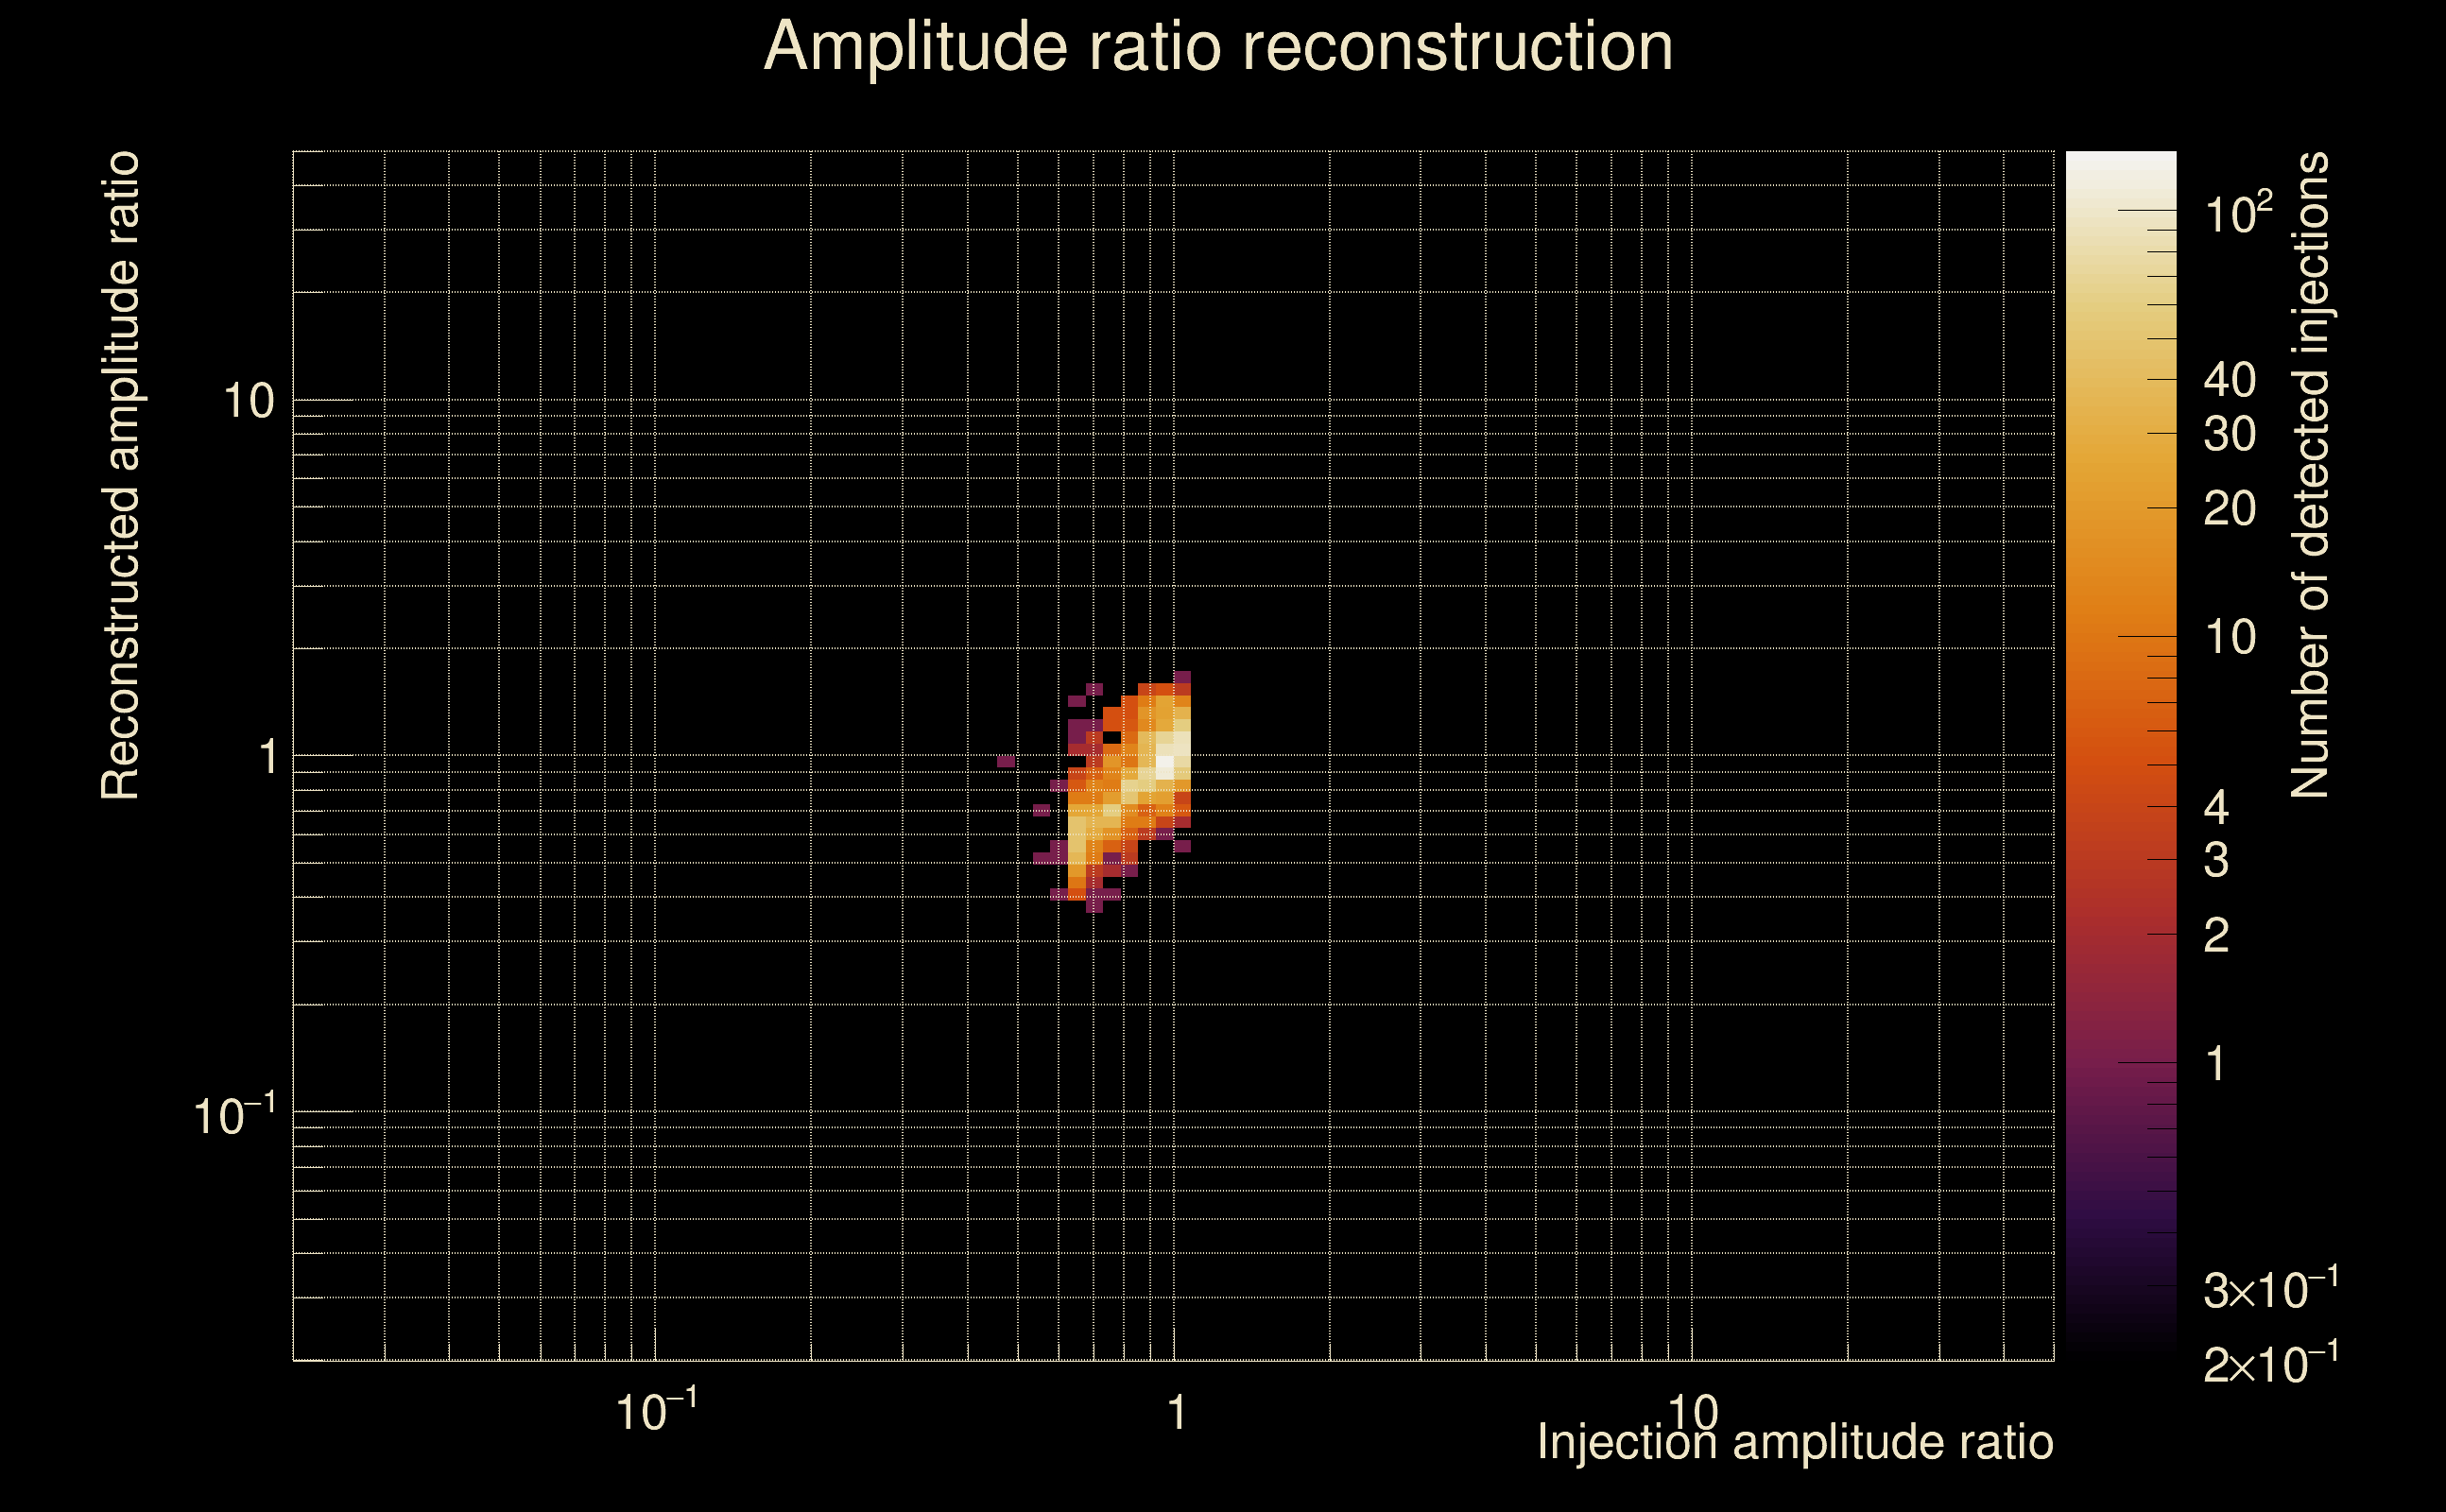
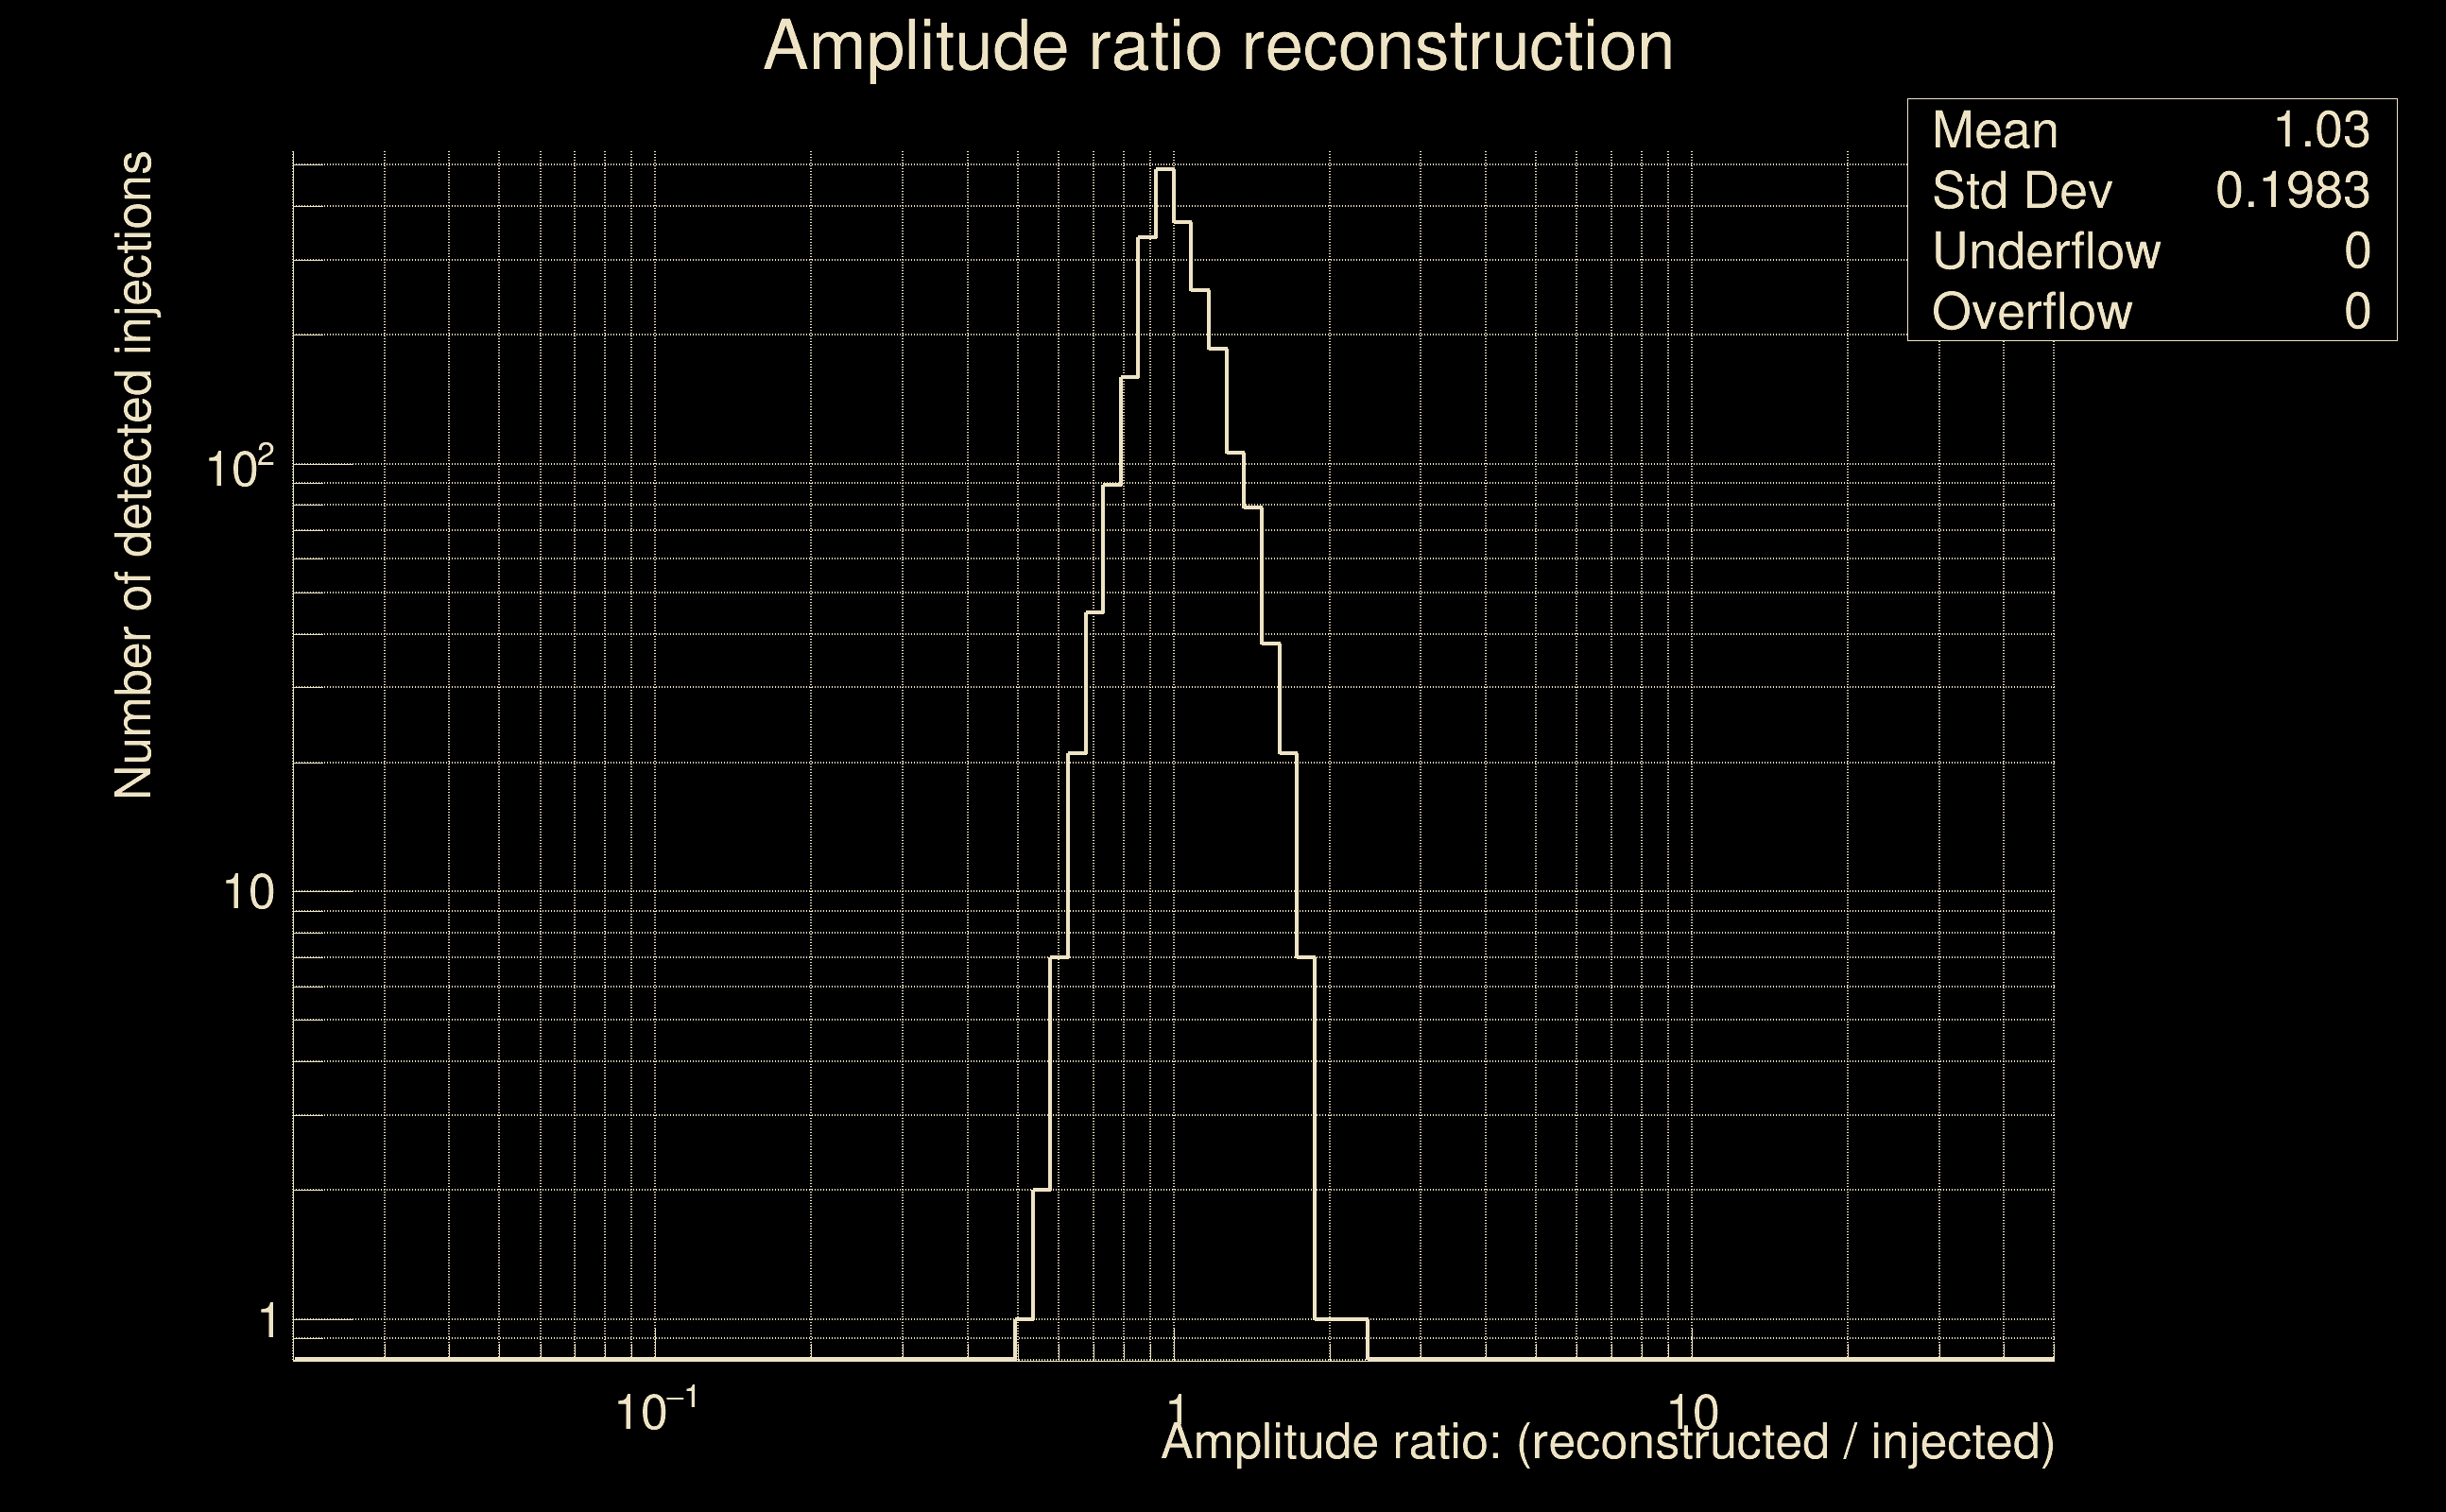
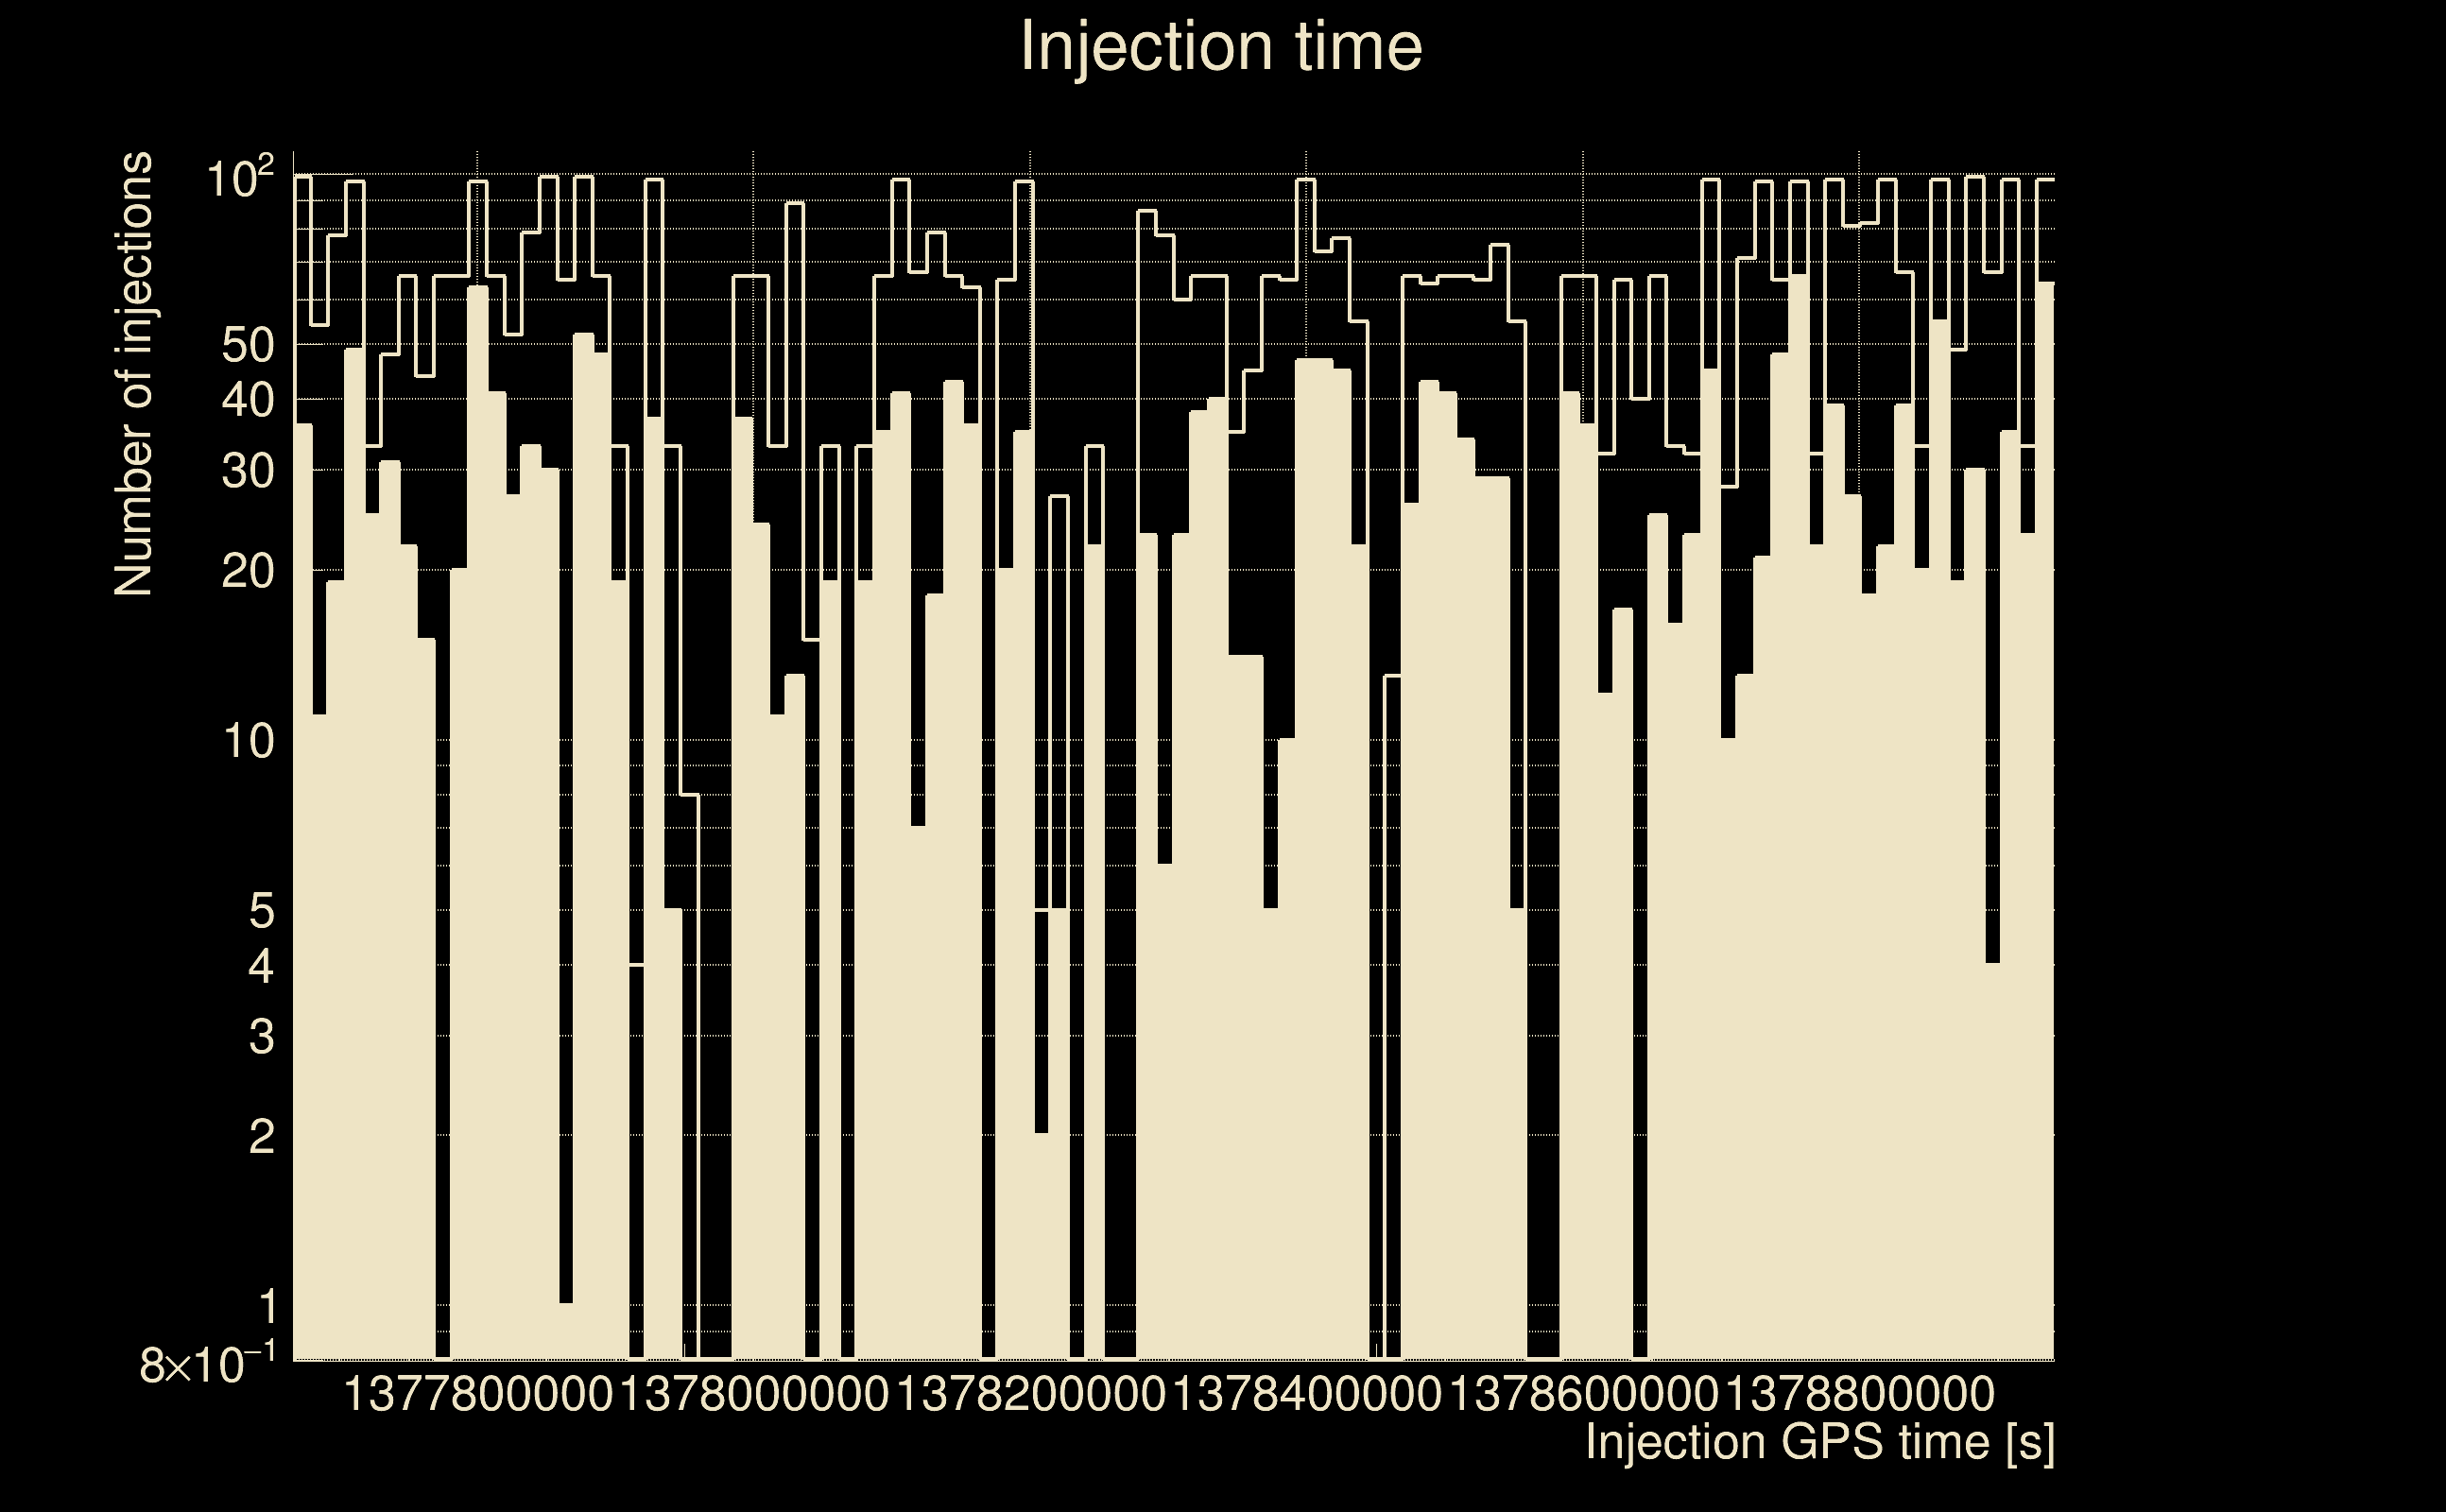
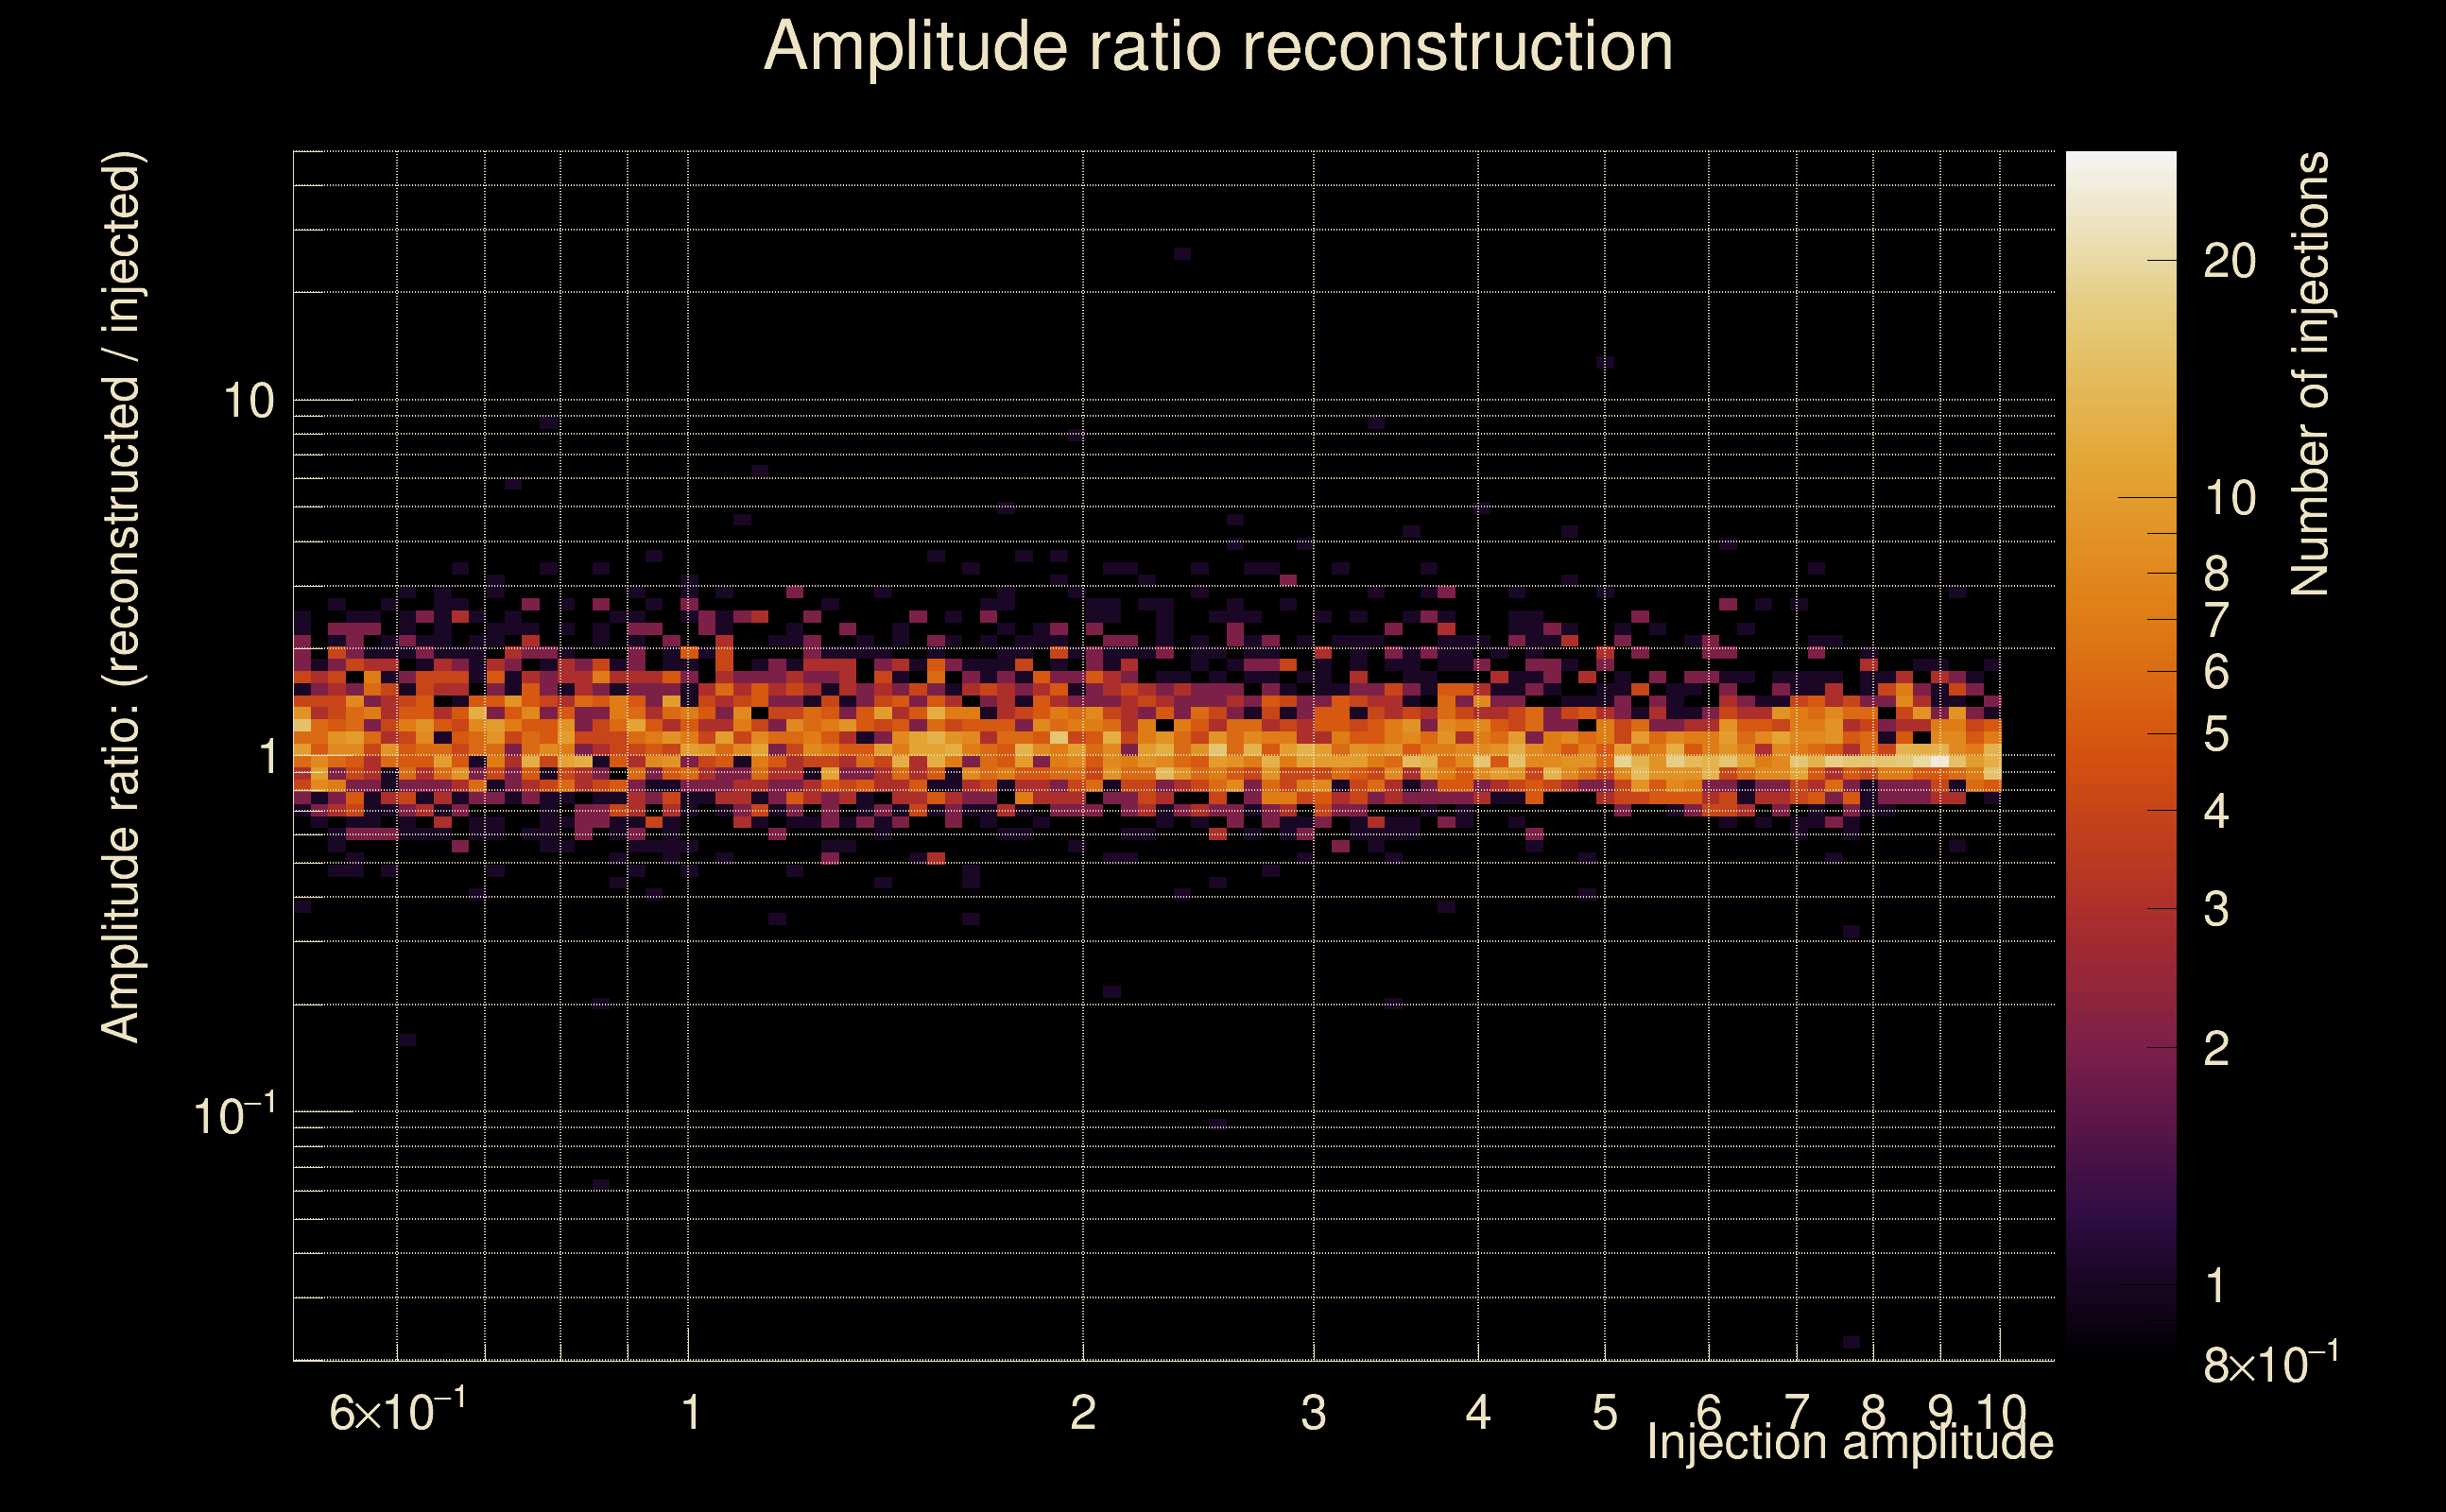
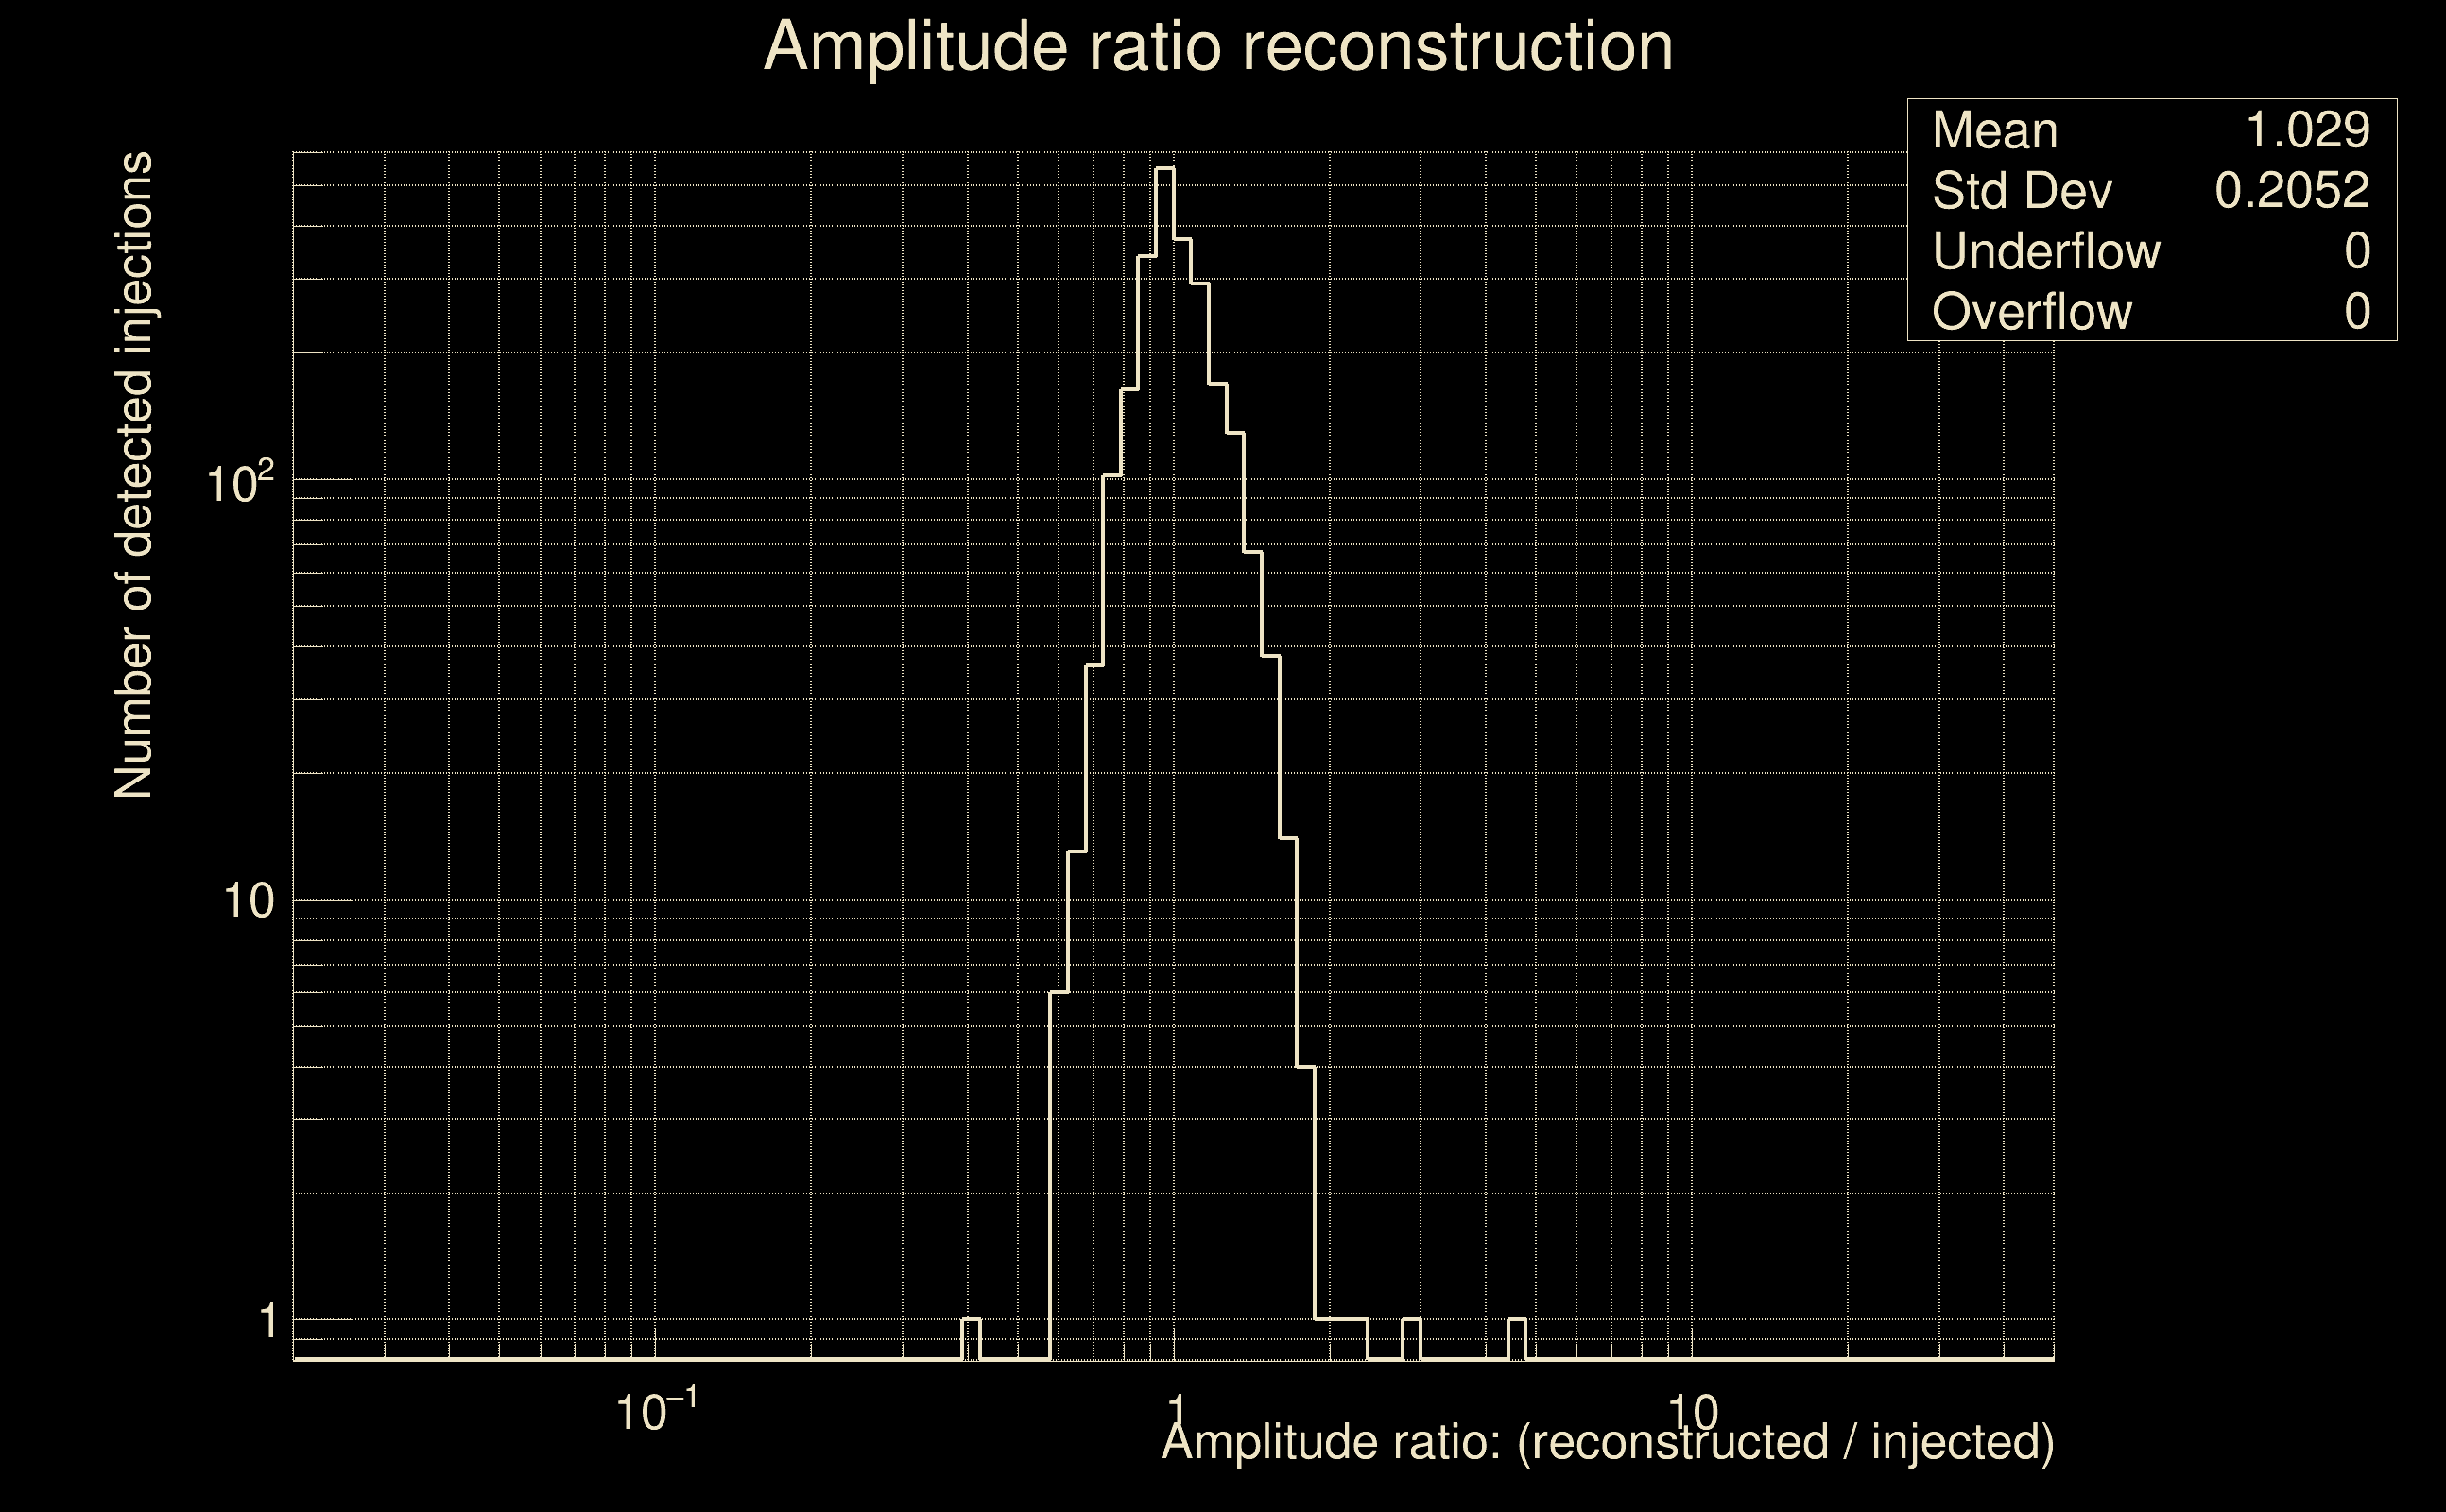
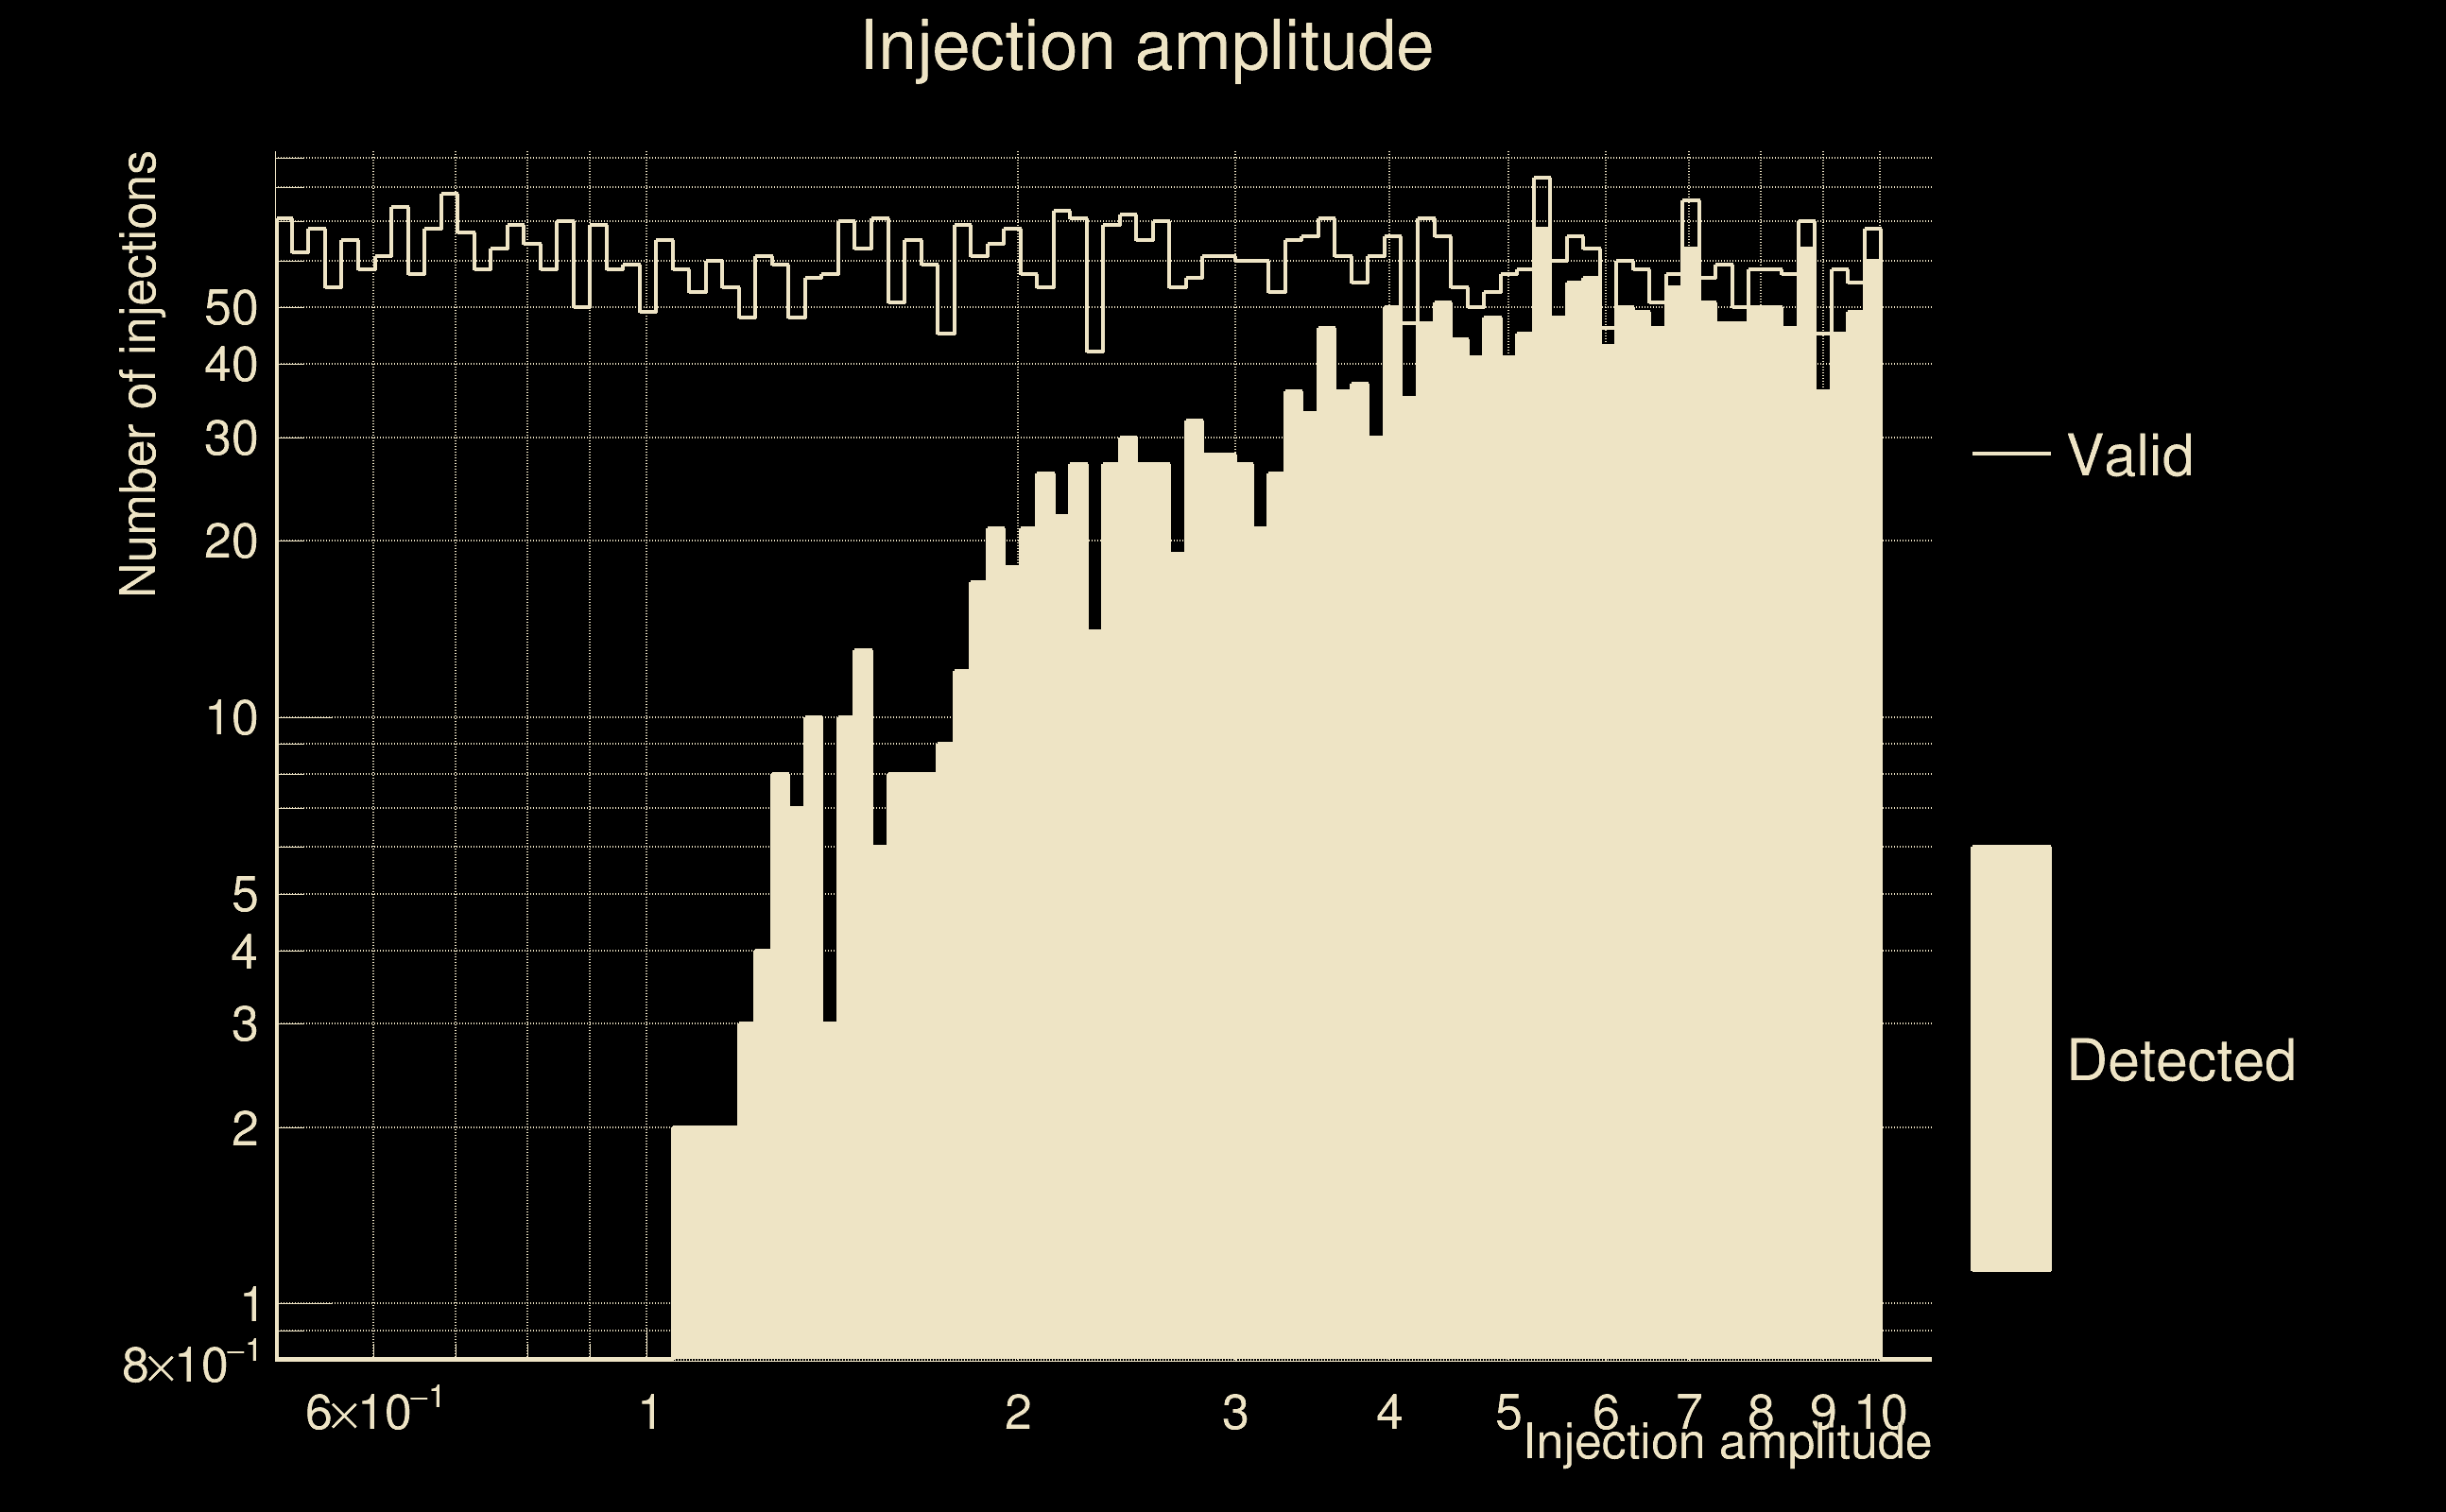
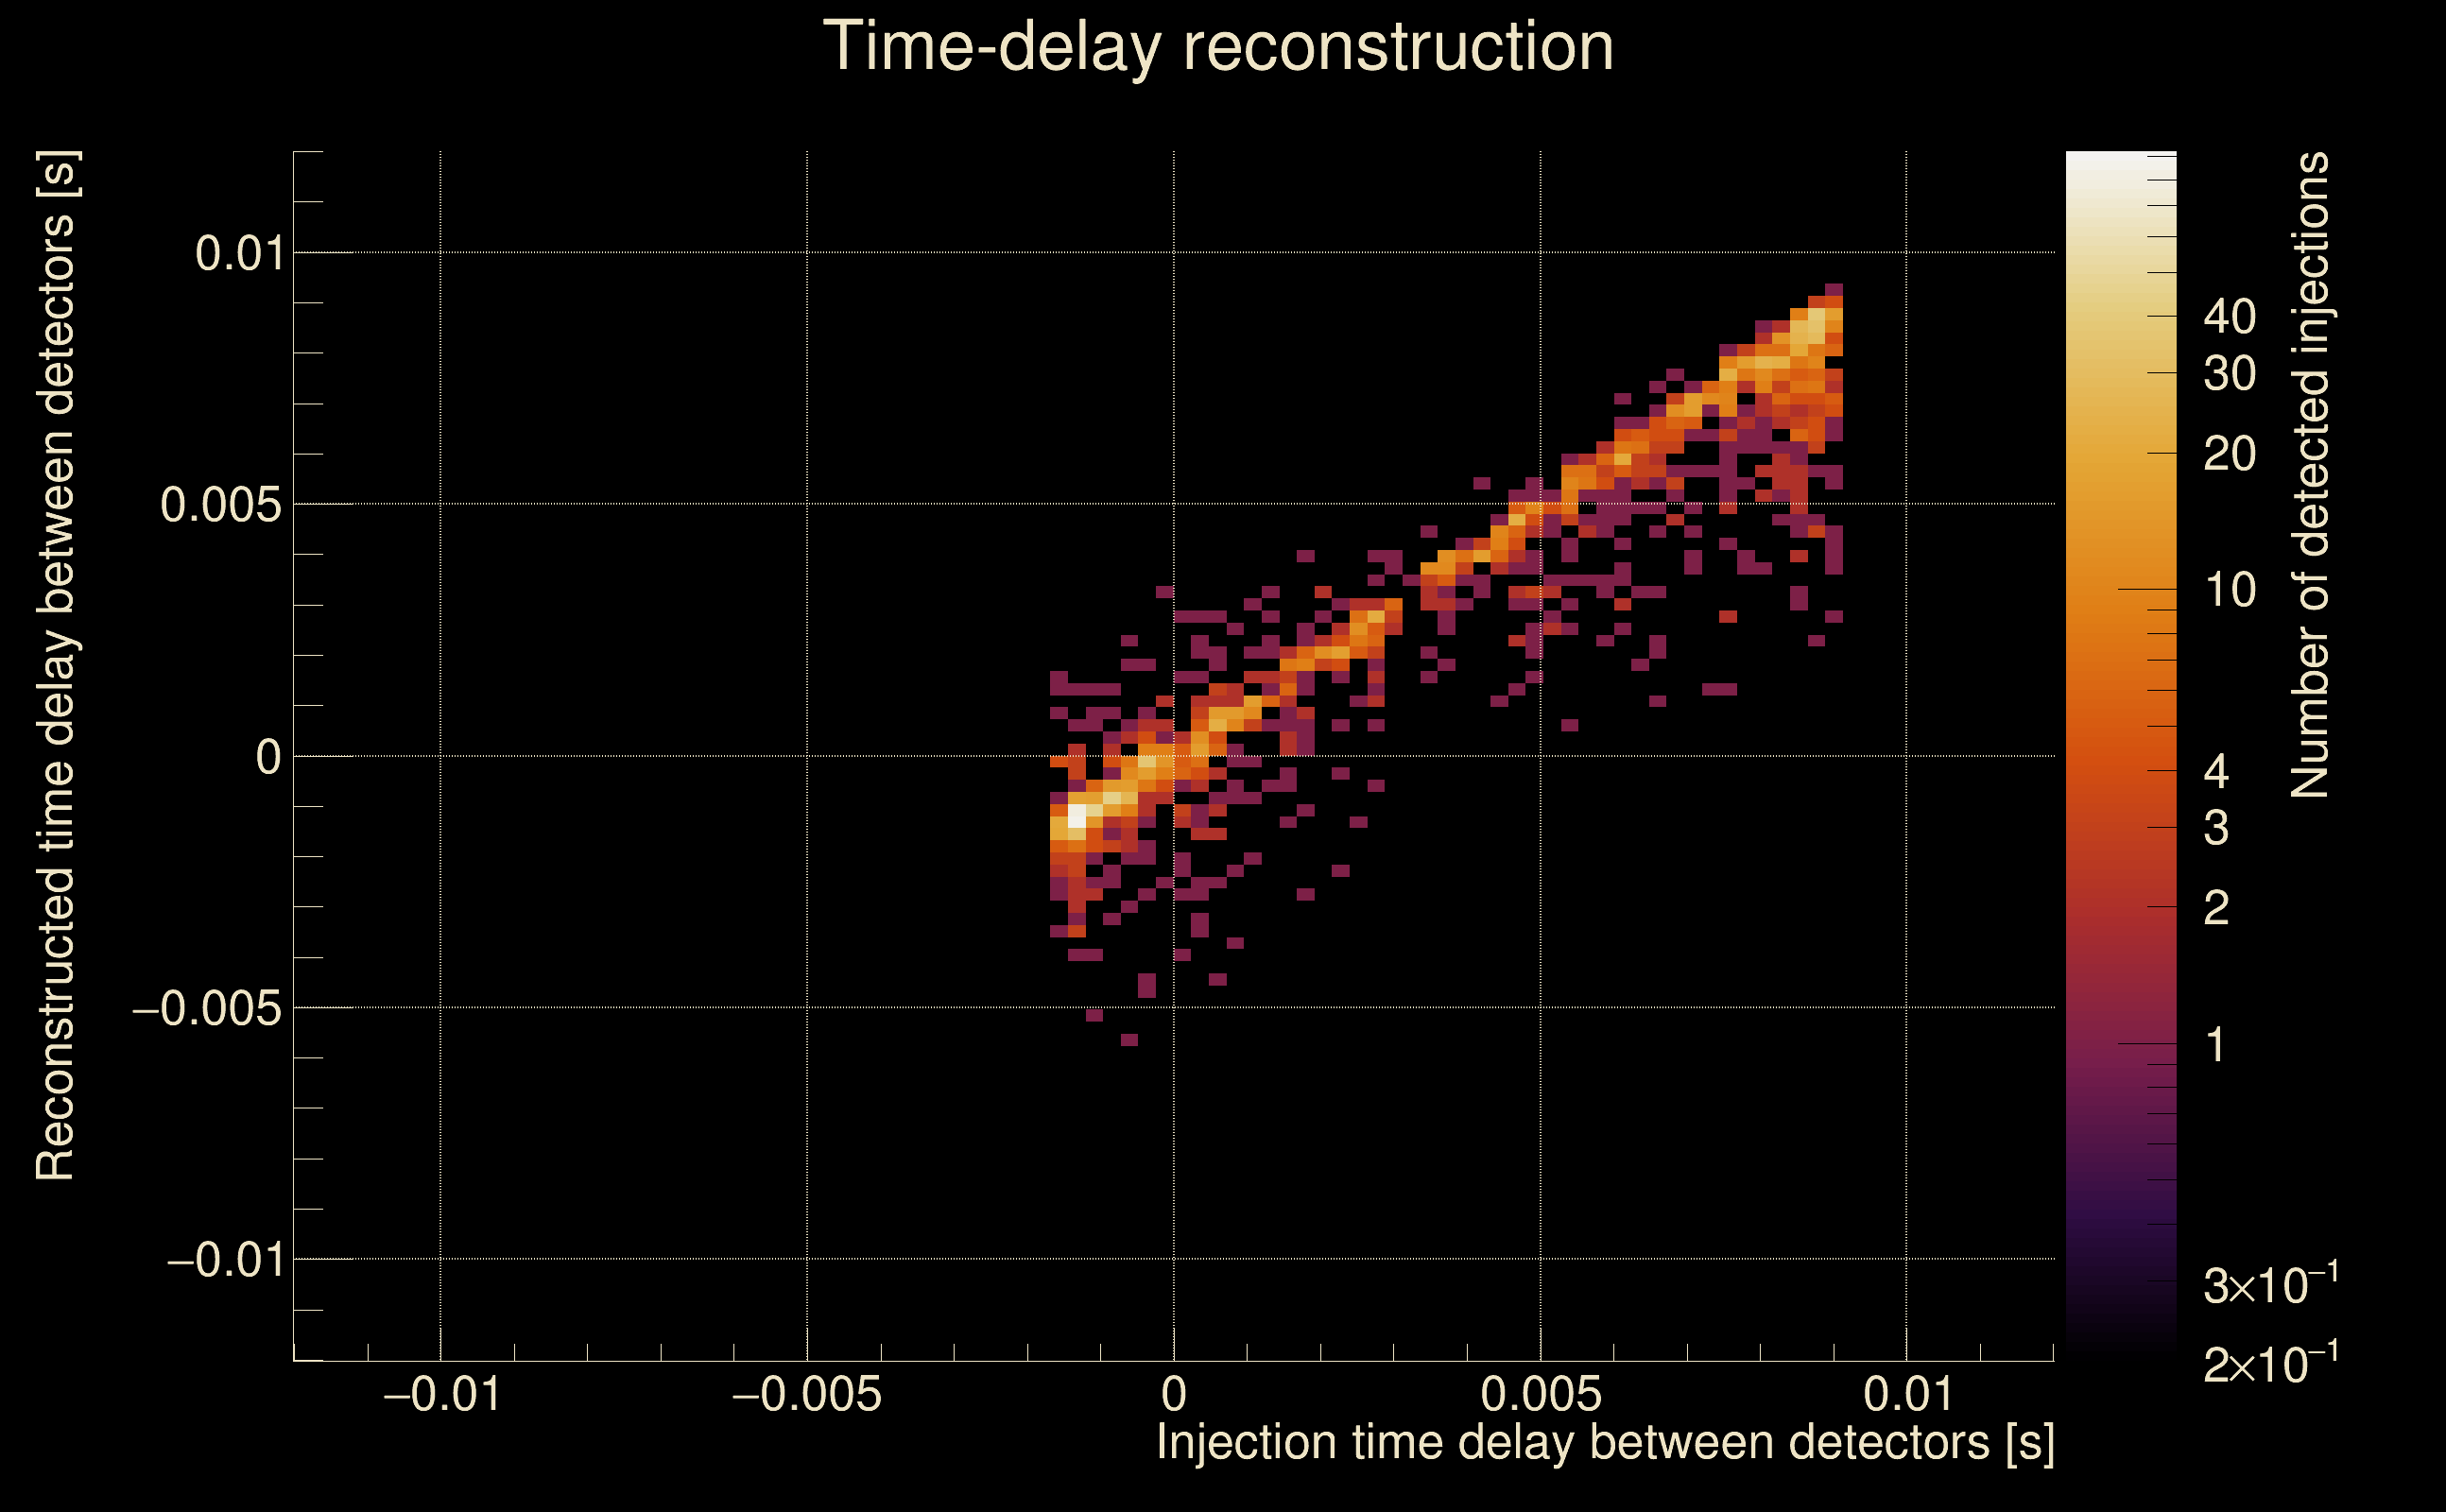
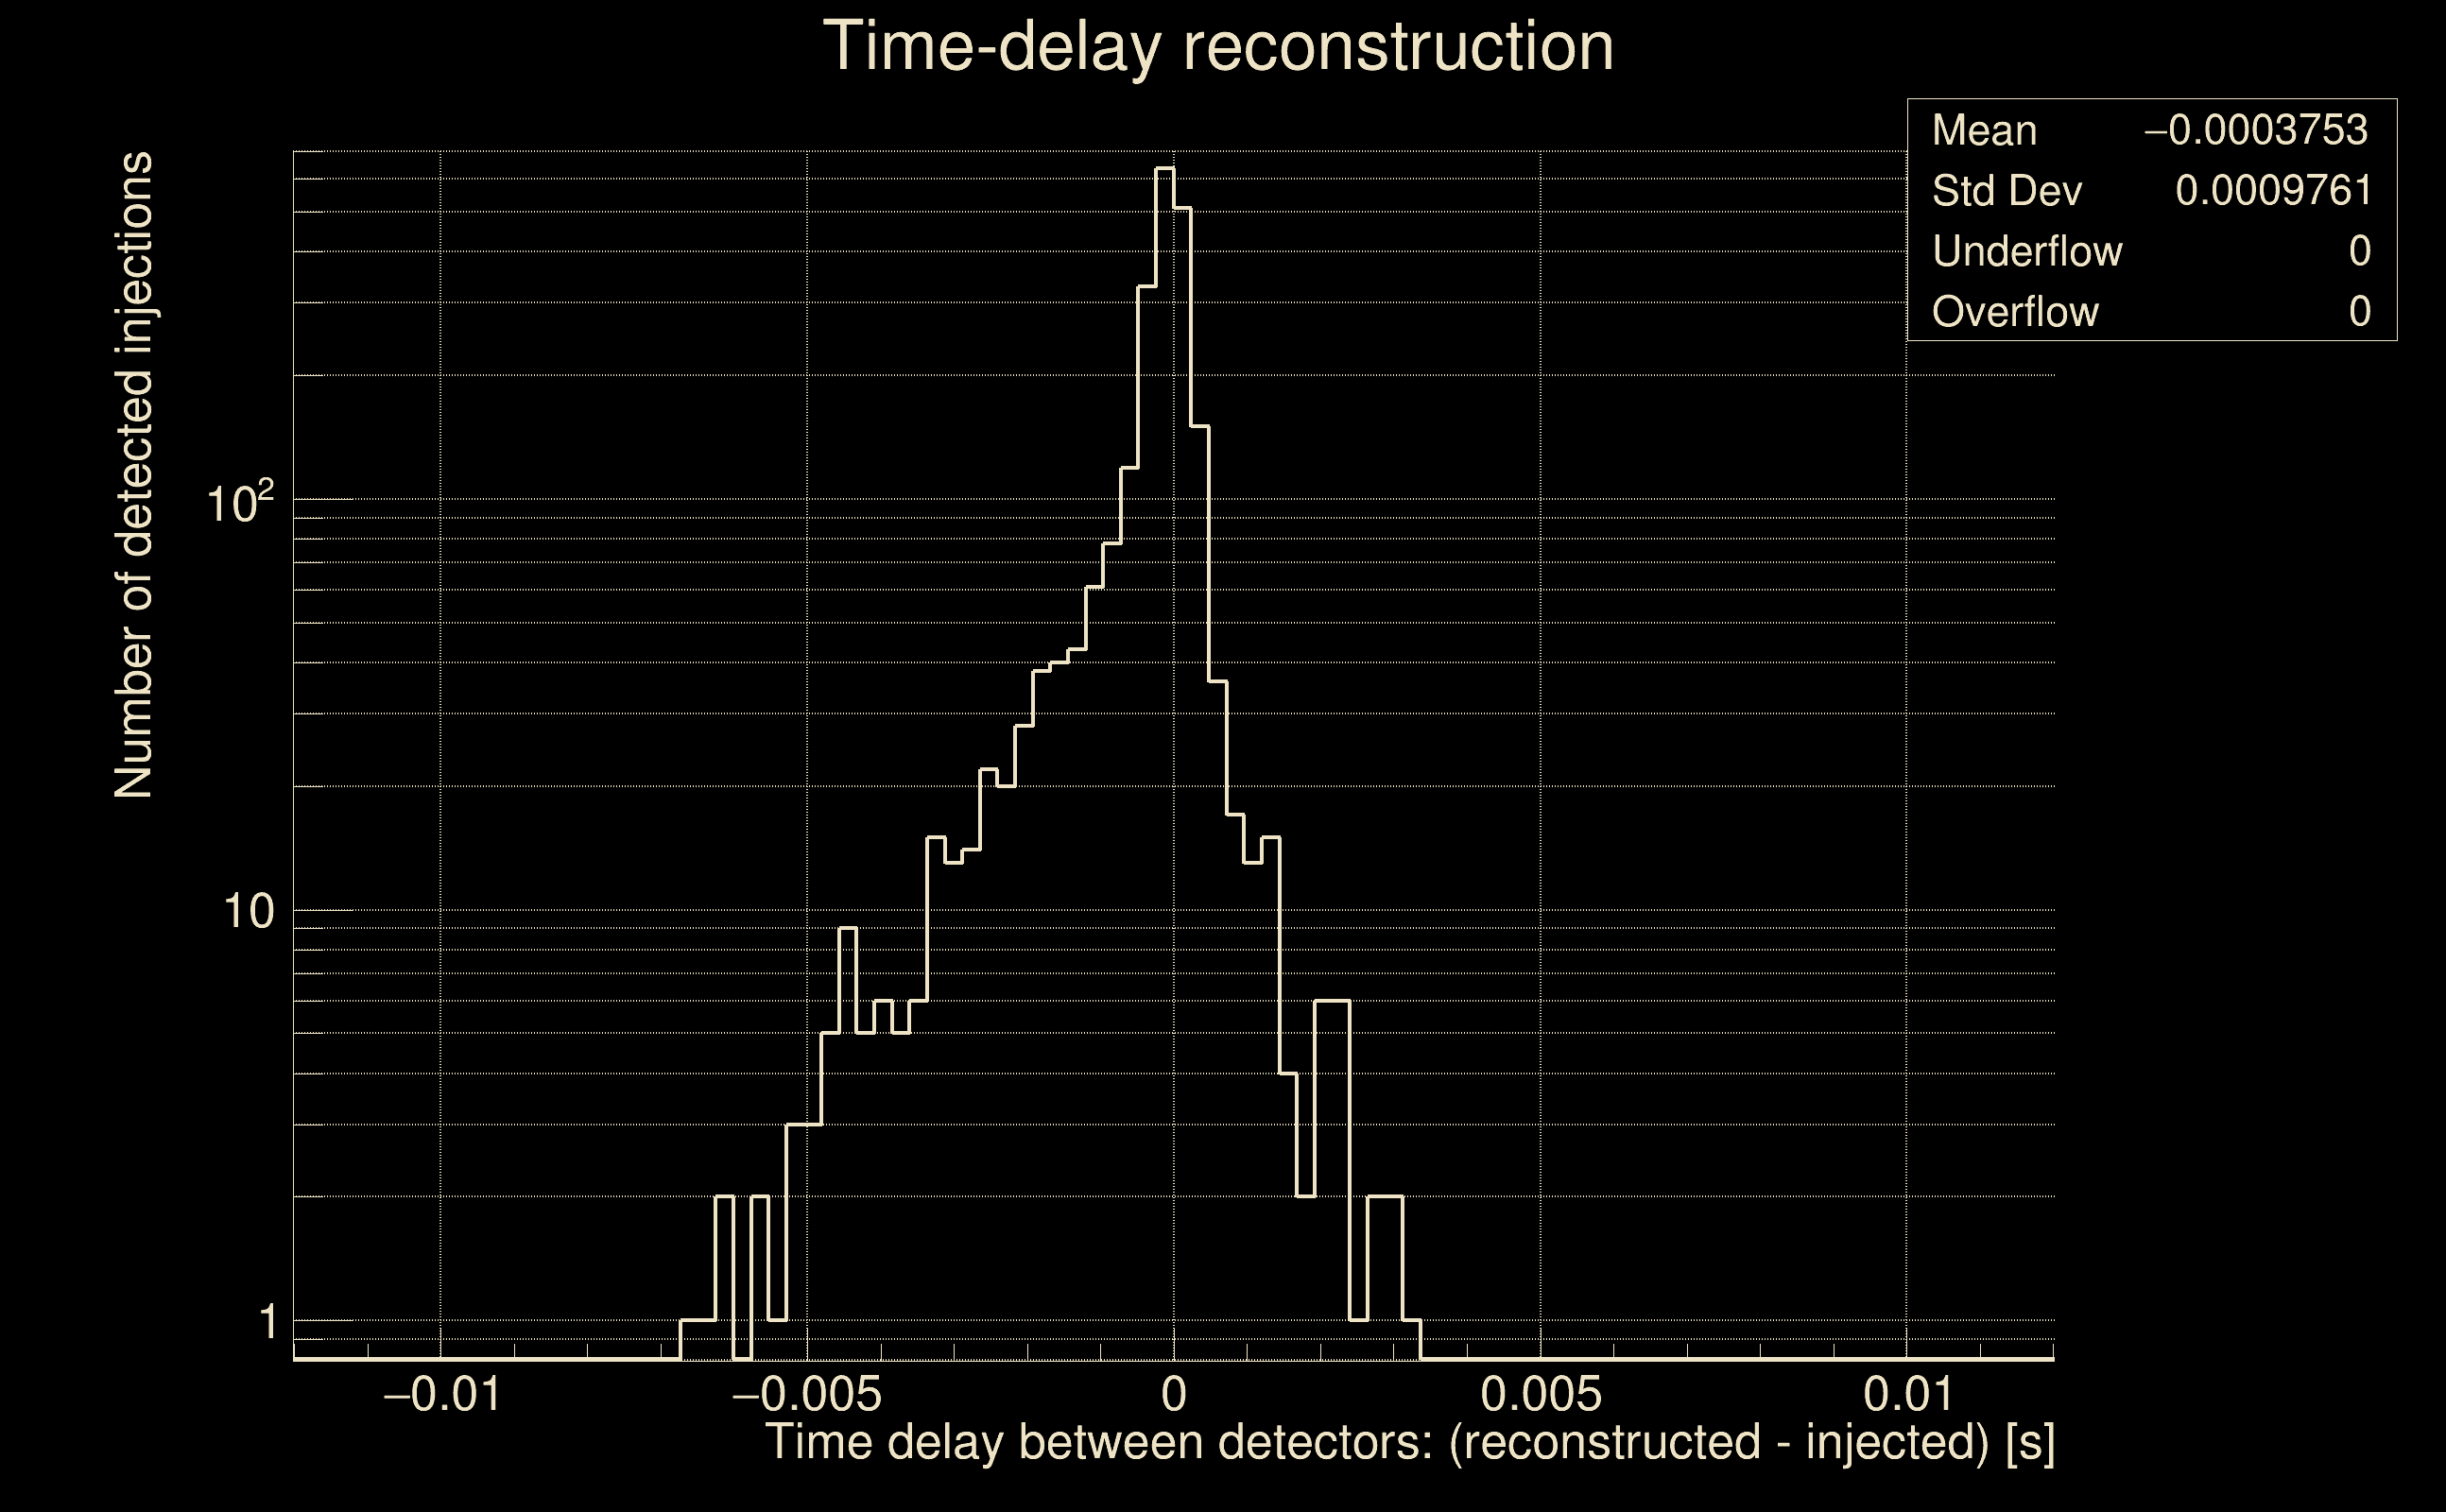
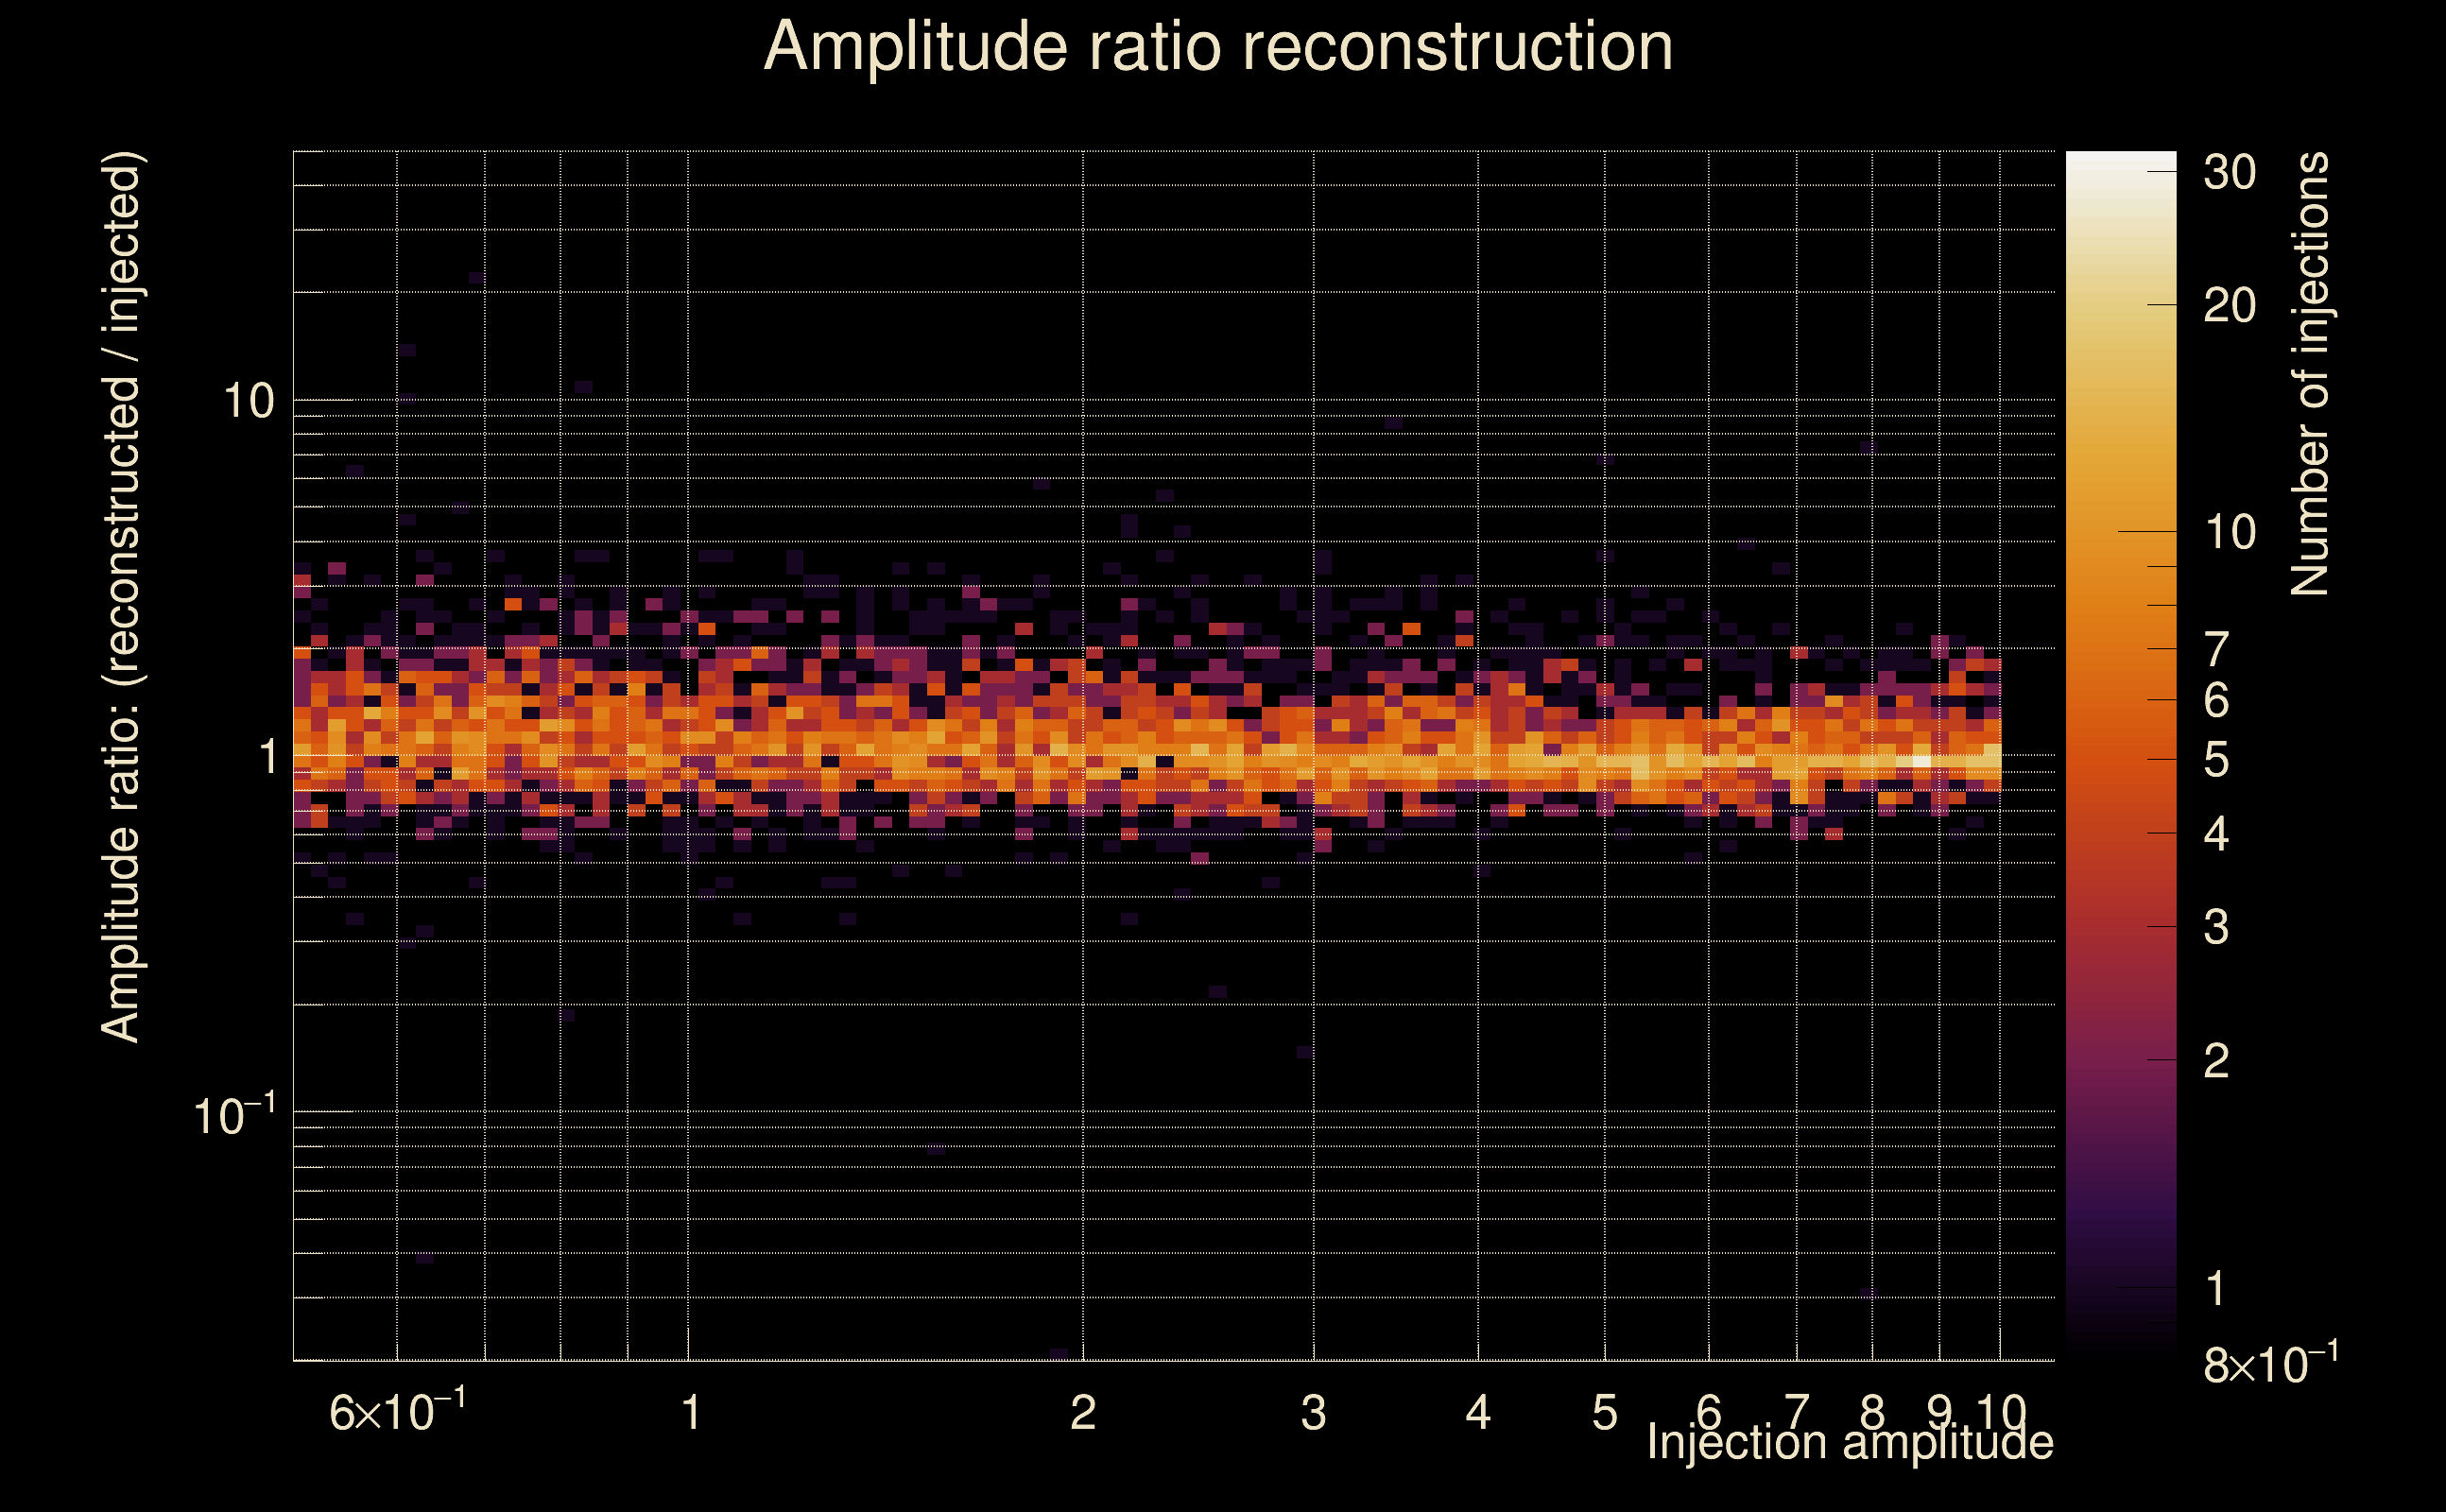
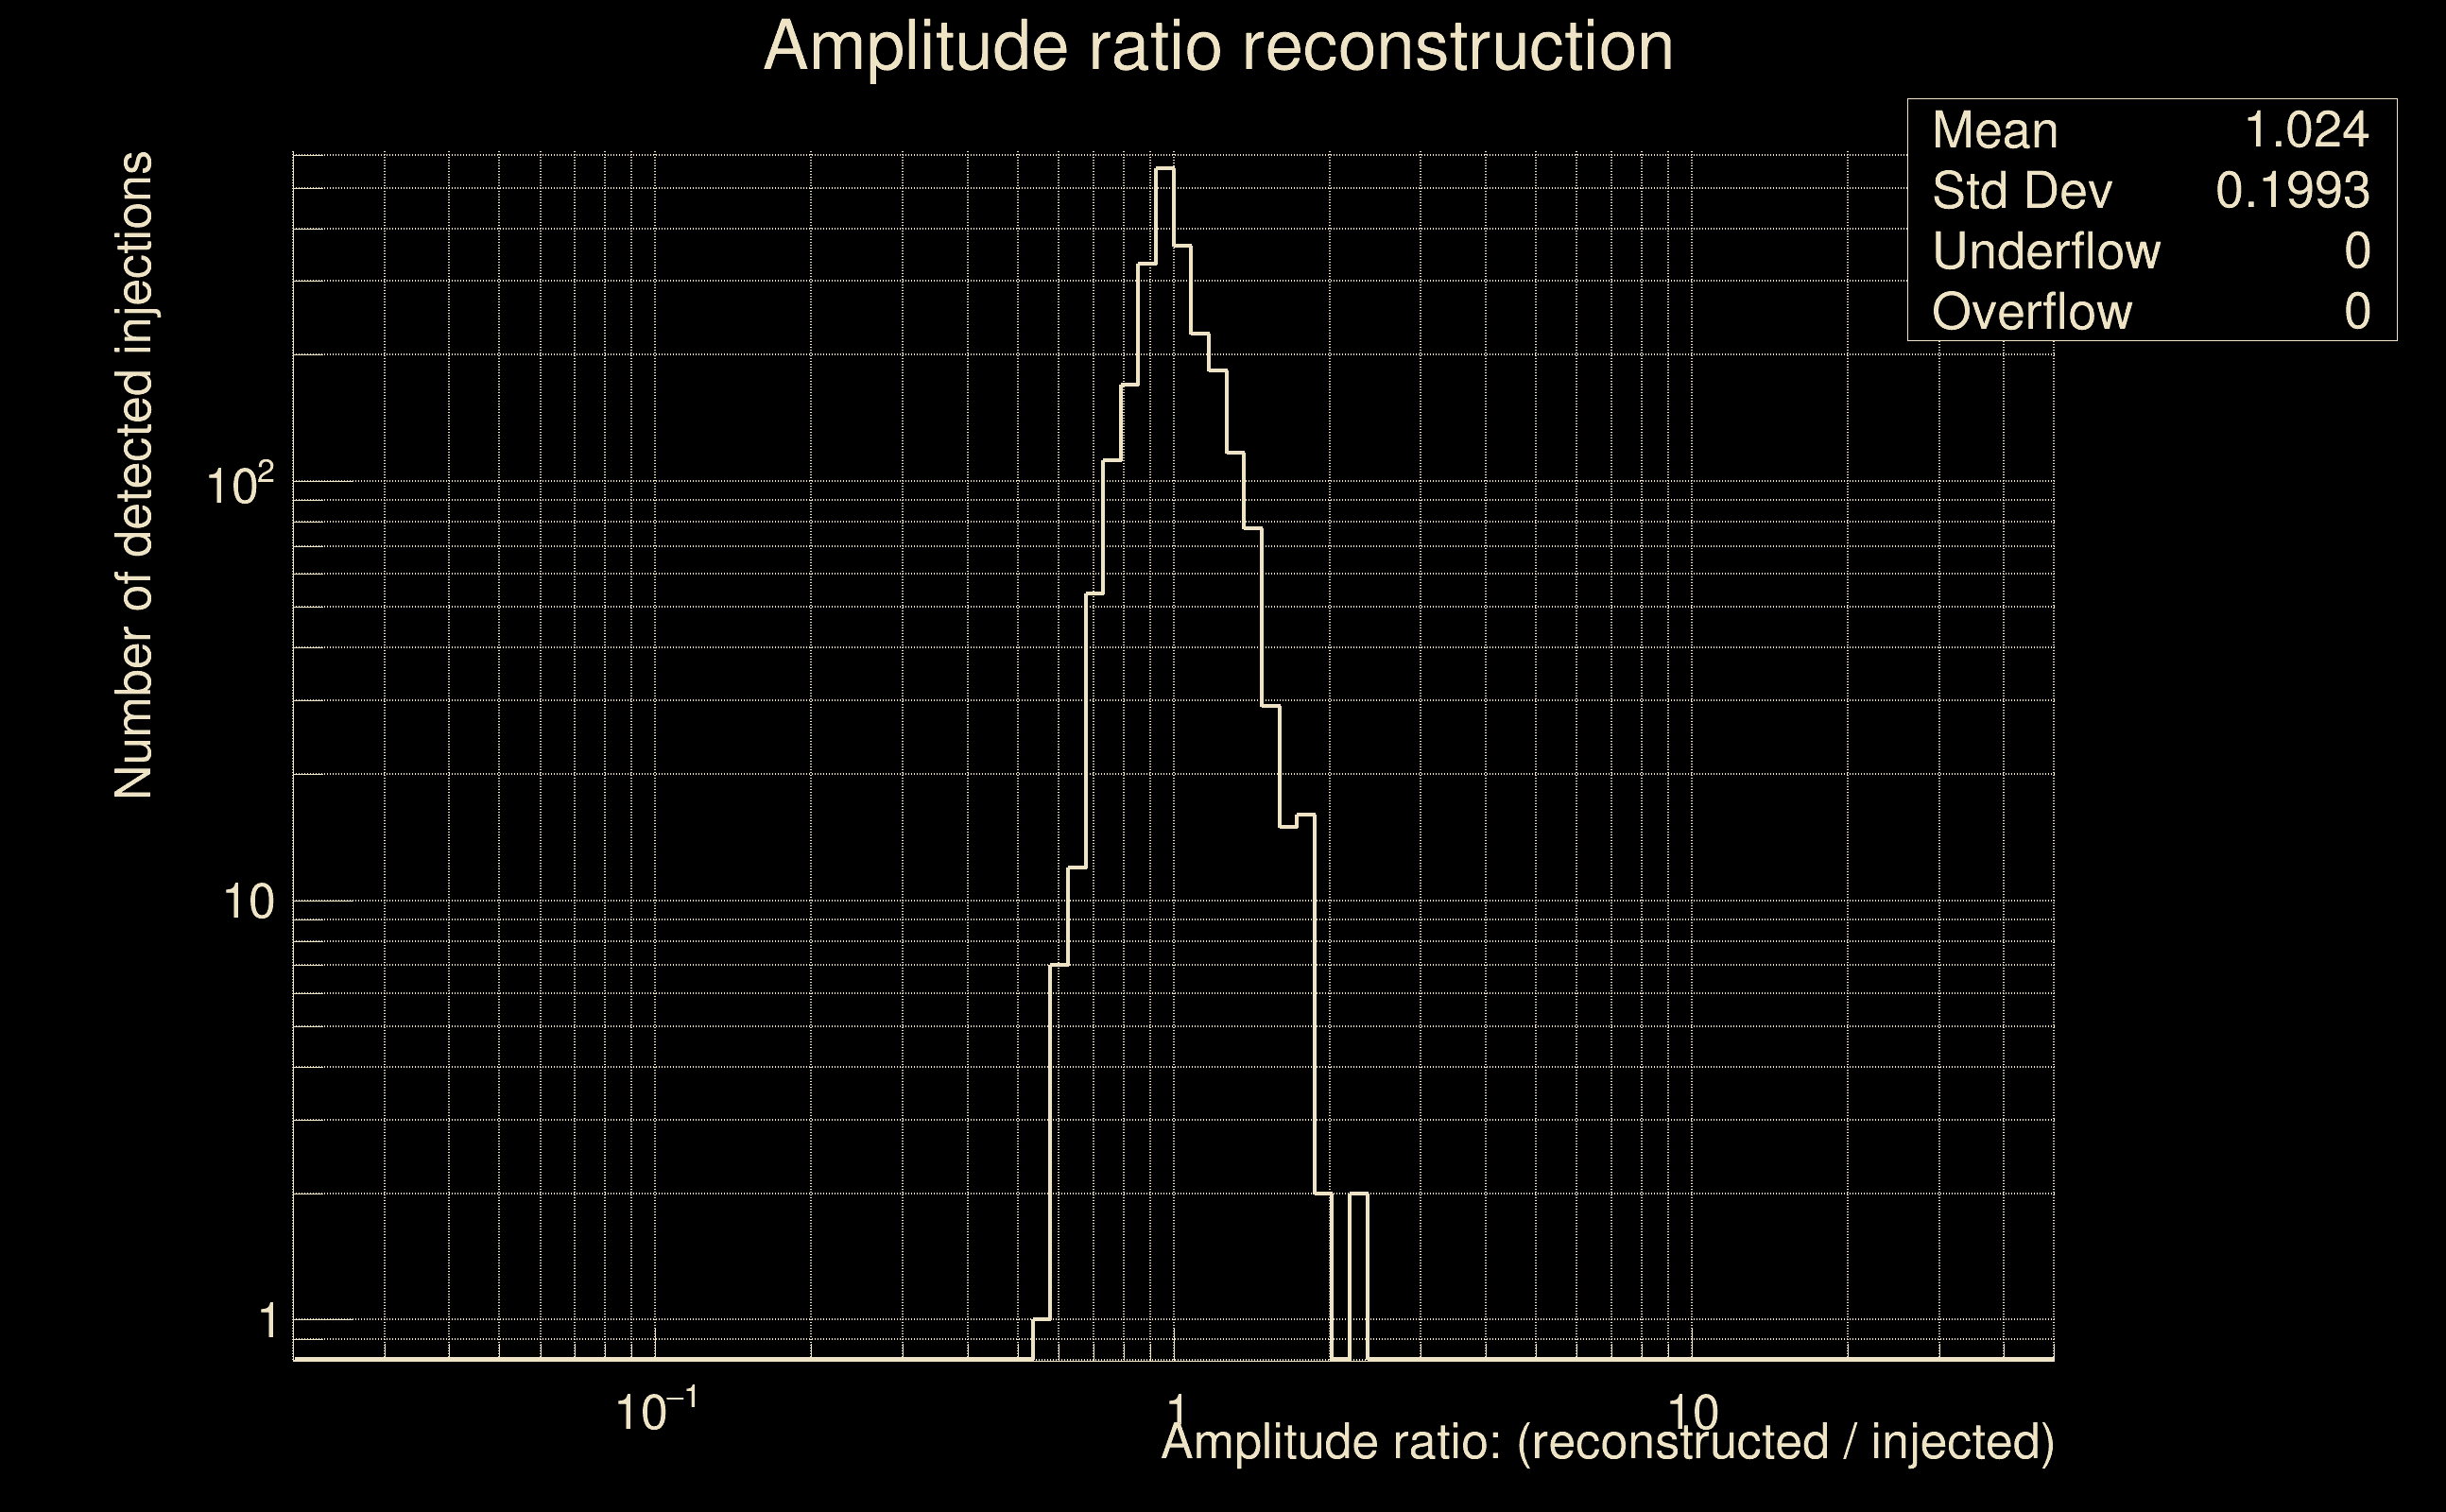
| Number of injections (total/valid/detected): | 5923 / 5871 / 2288 |
| List of missed injections: | ./AND19-S15FR_missed.txt |
| Injection amplitude at 90% detection efficiency: | 9.55707 |
| Injection amplitude at 50% detection efficiency: | 3.12016 |
| Injection amplitude at 10% detection efficiency: | 1.55798 |
 |
 |
 |
 |
 |
 |
|
 |
 |
|
 |
 |
 |
 |
 |
 |
 |
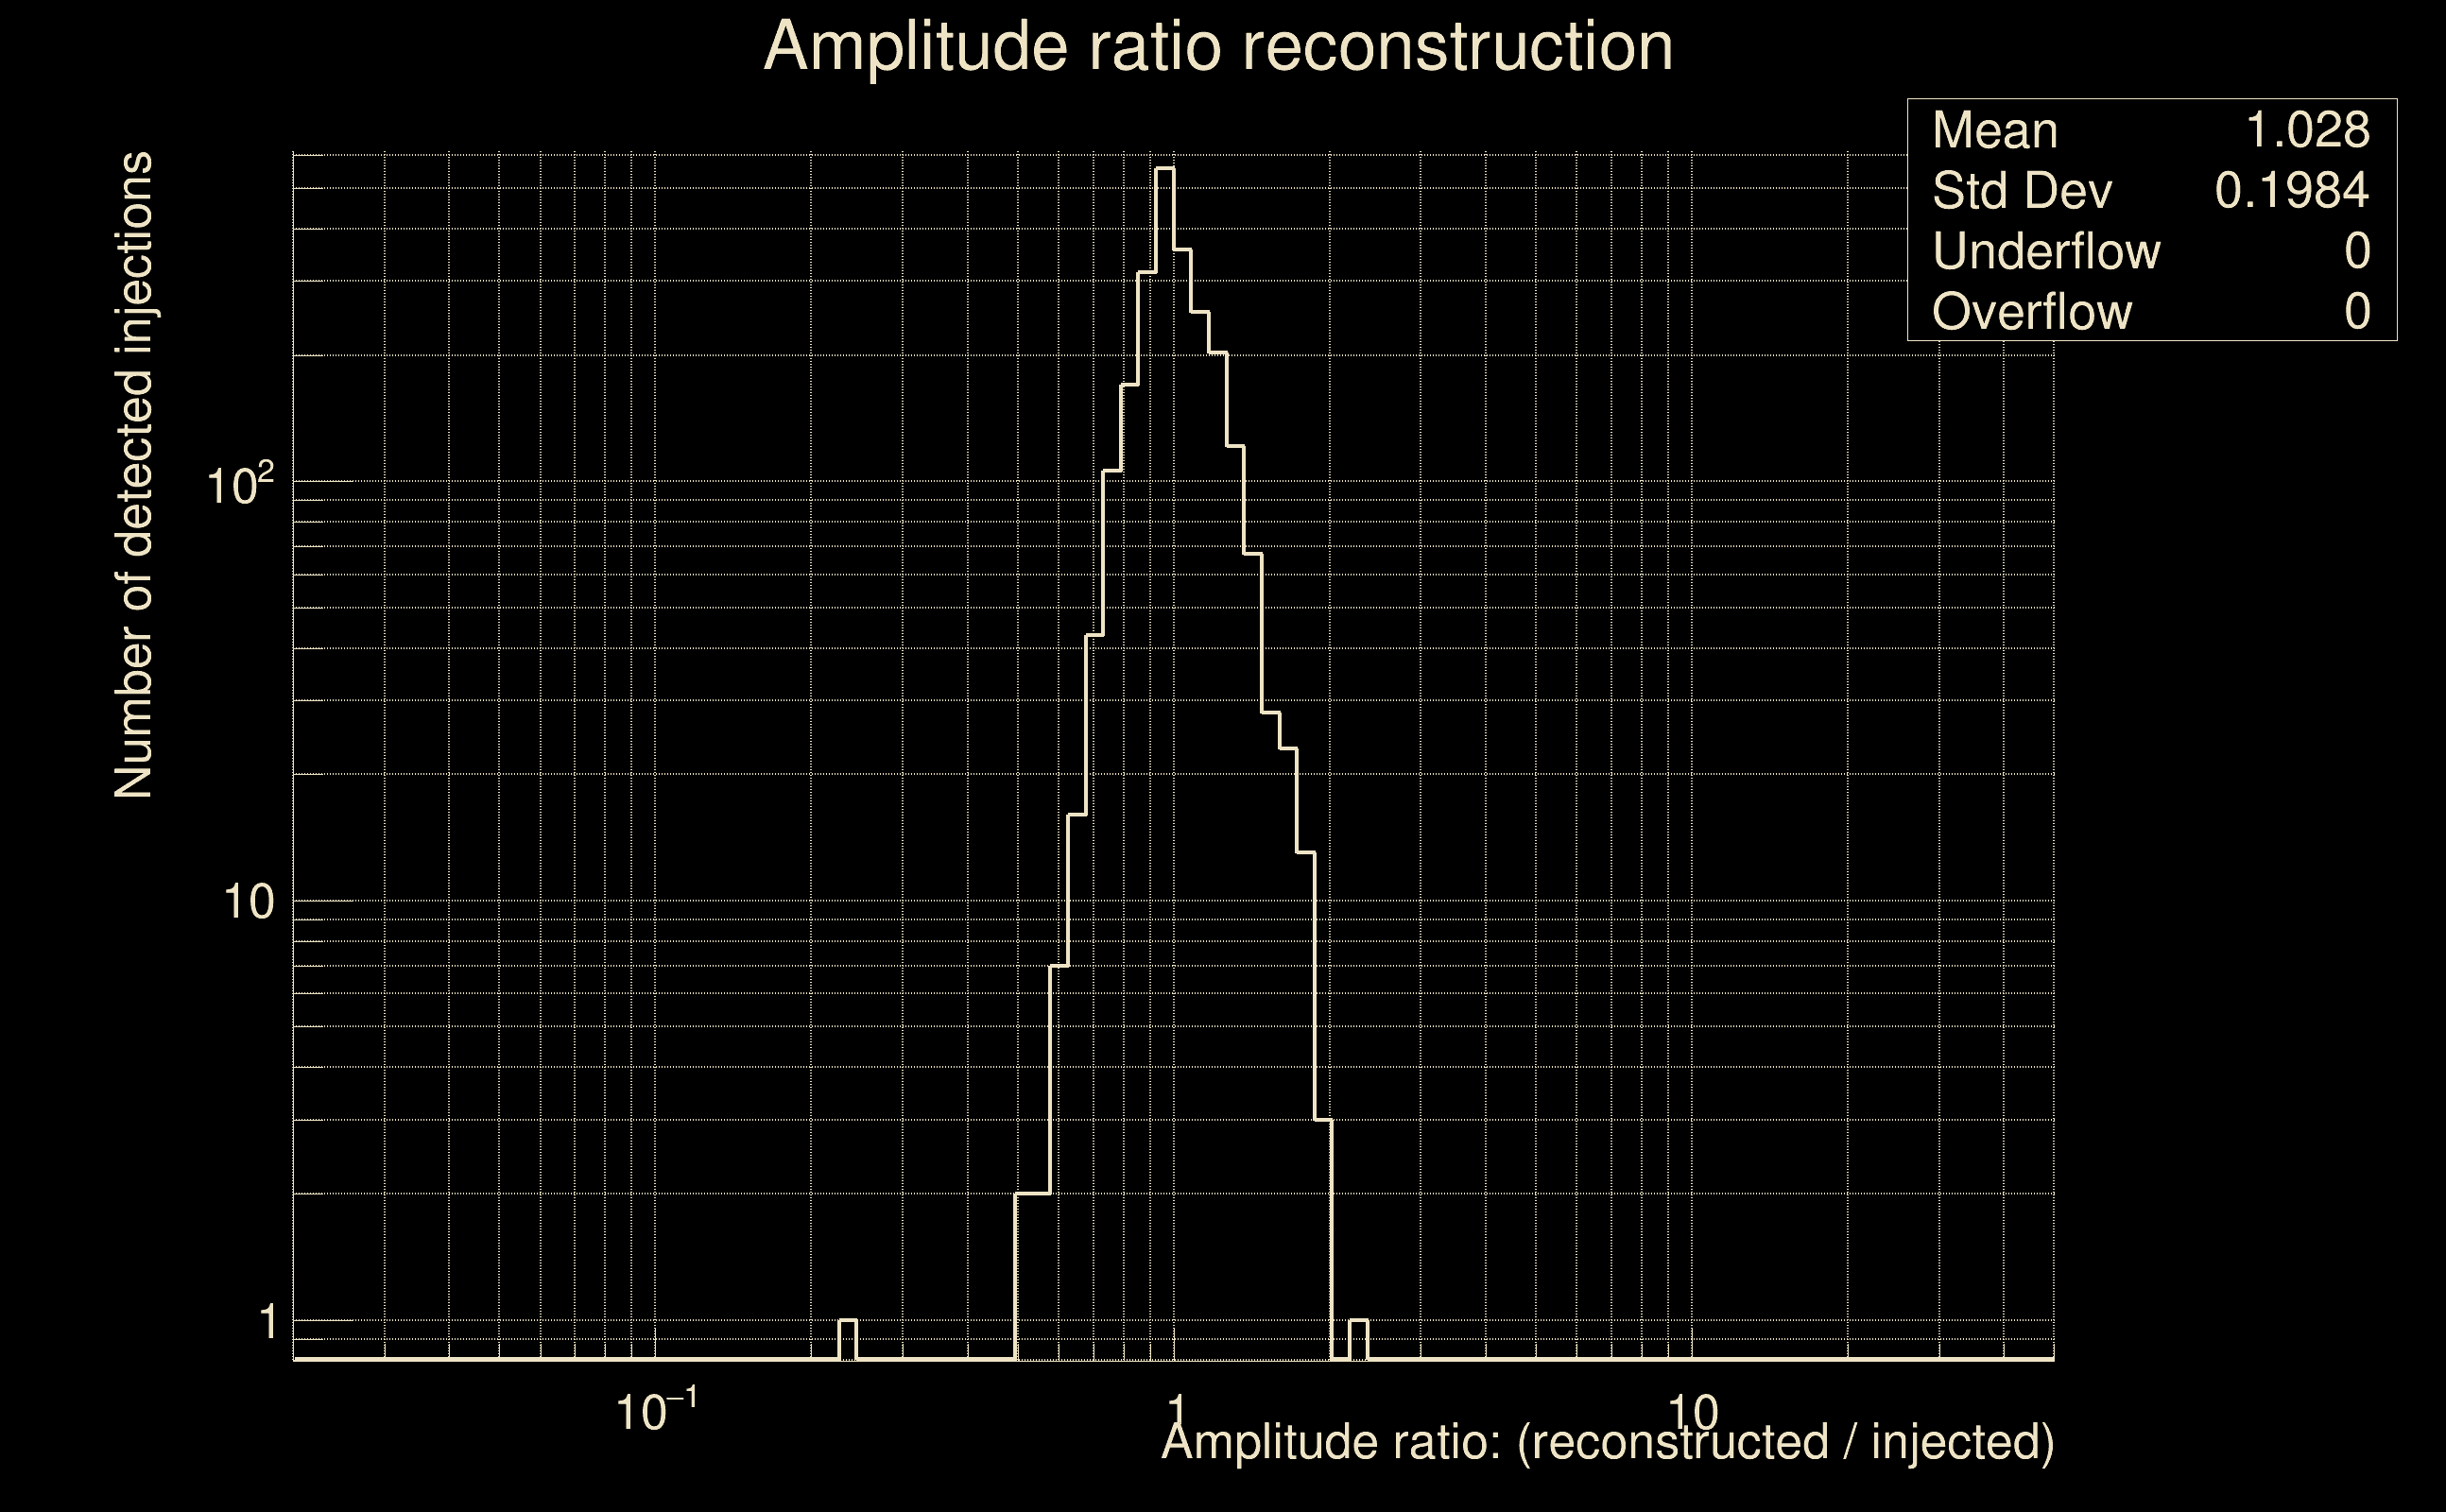 |
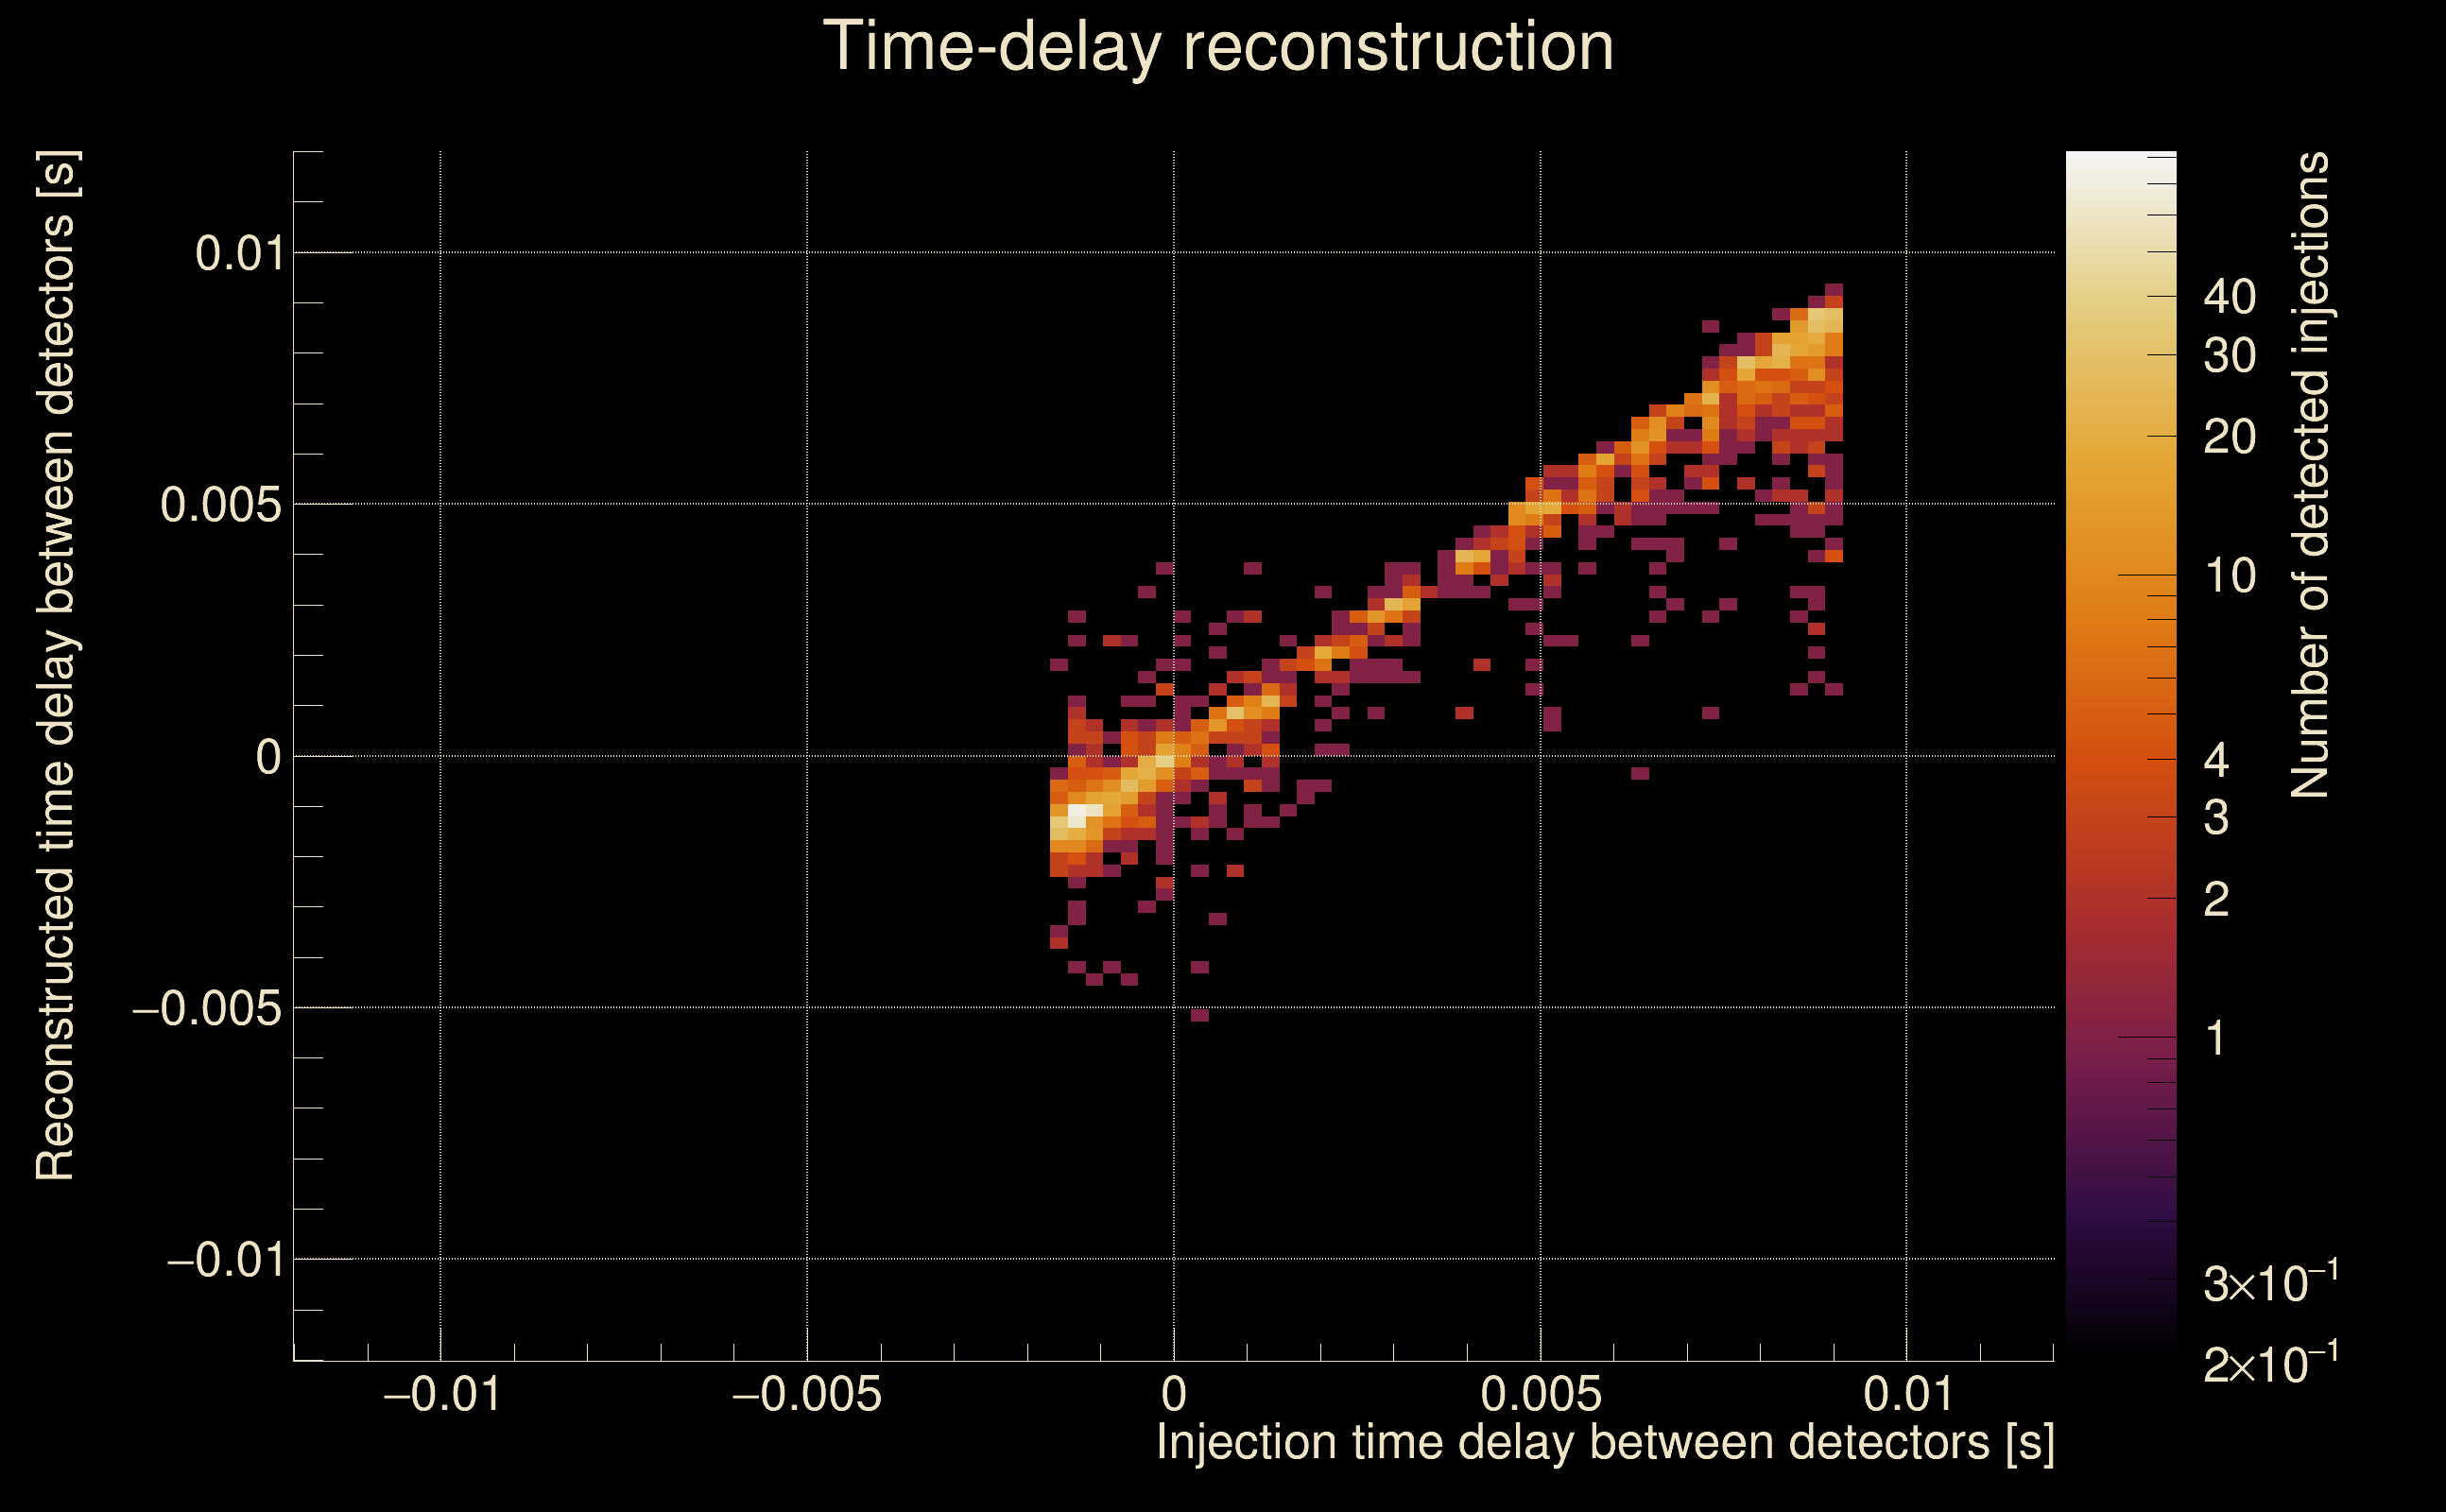
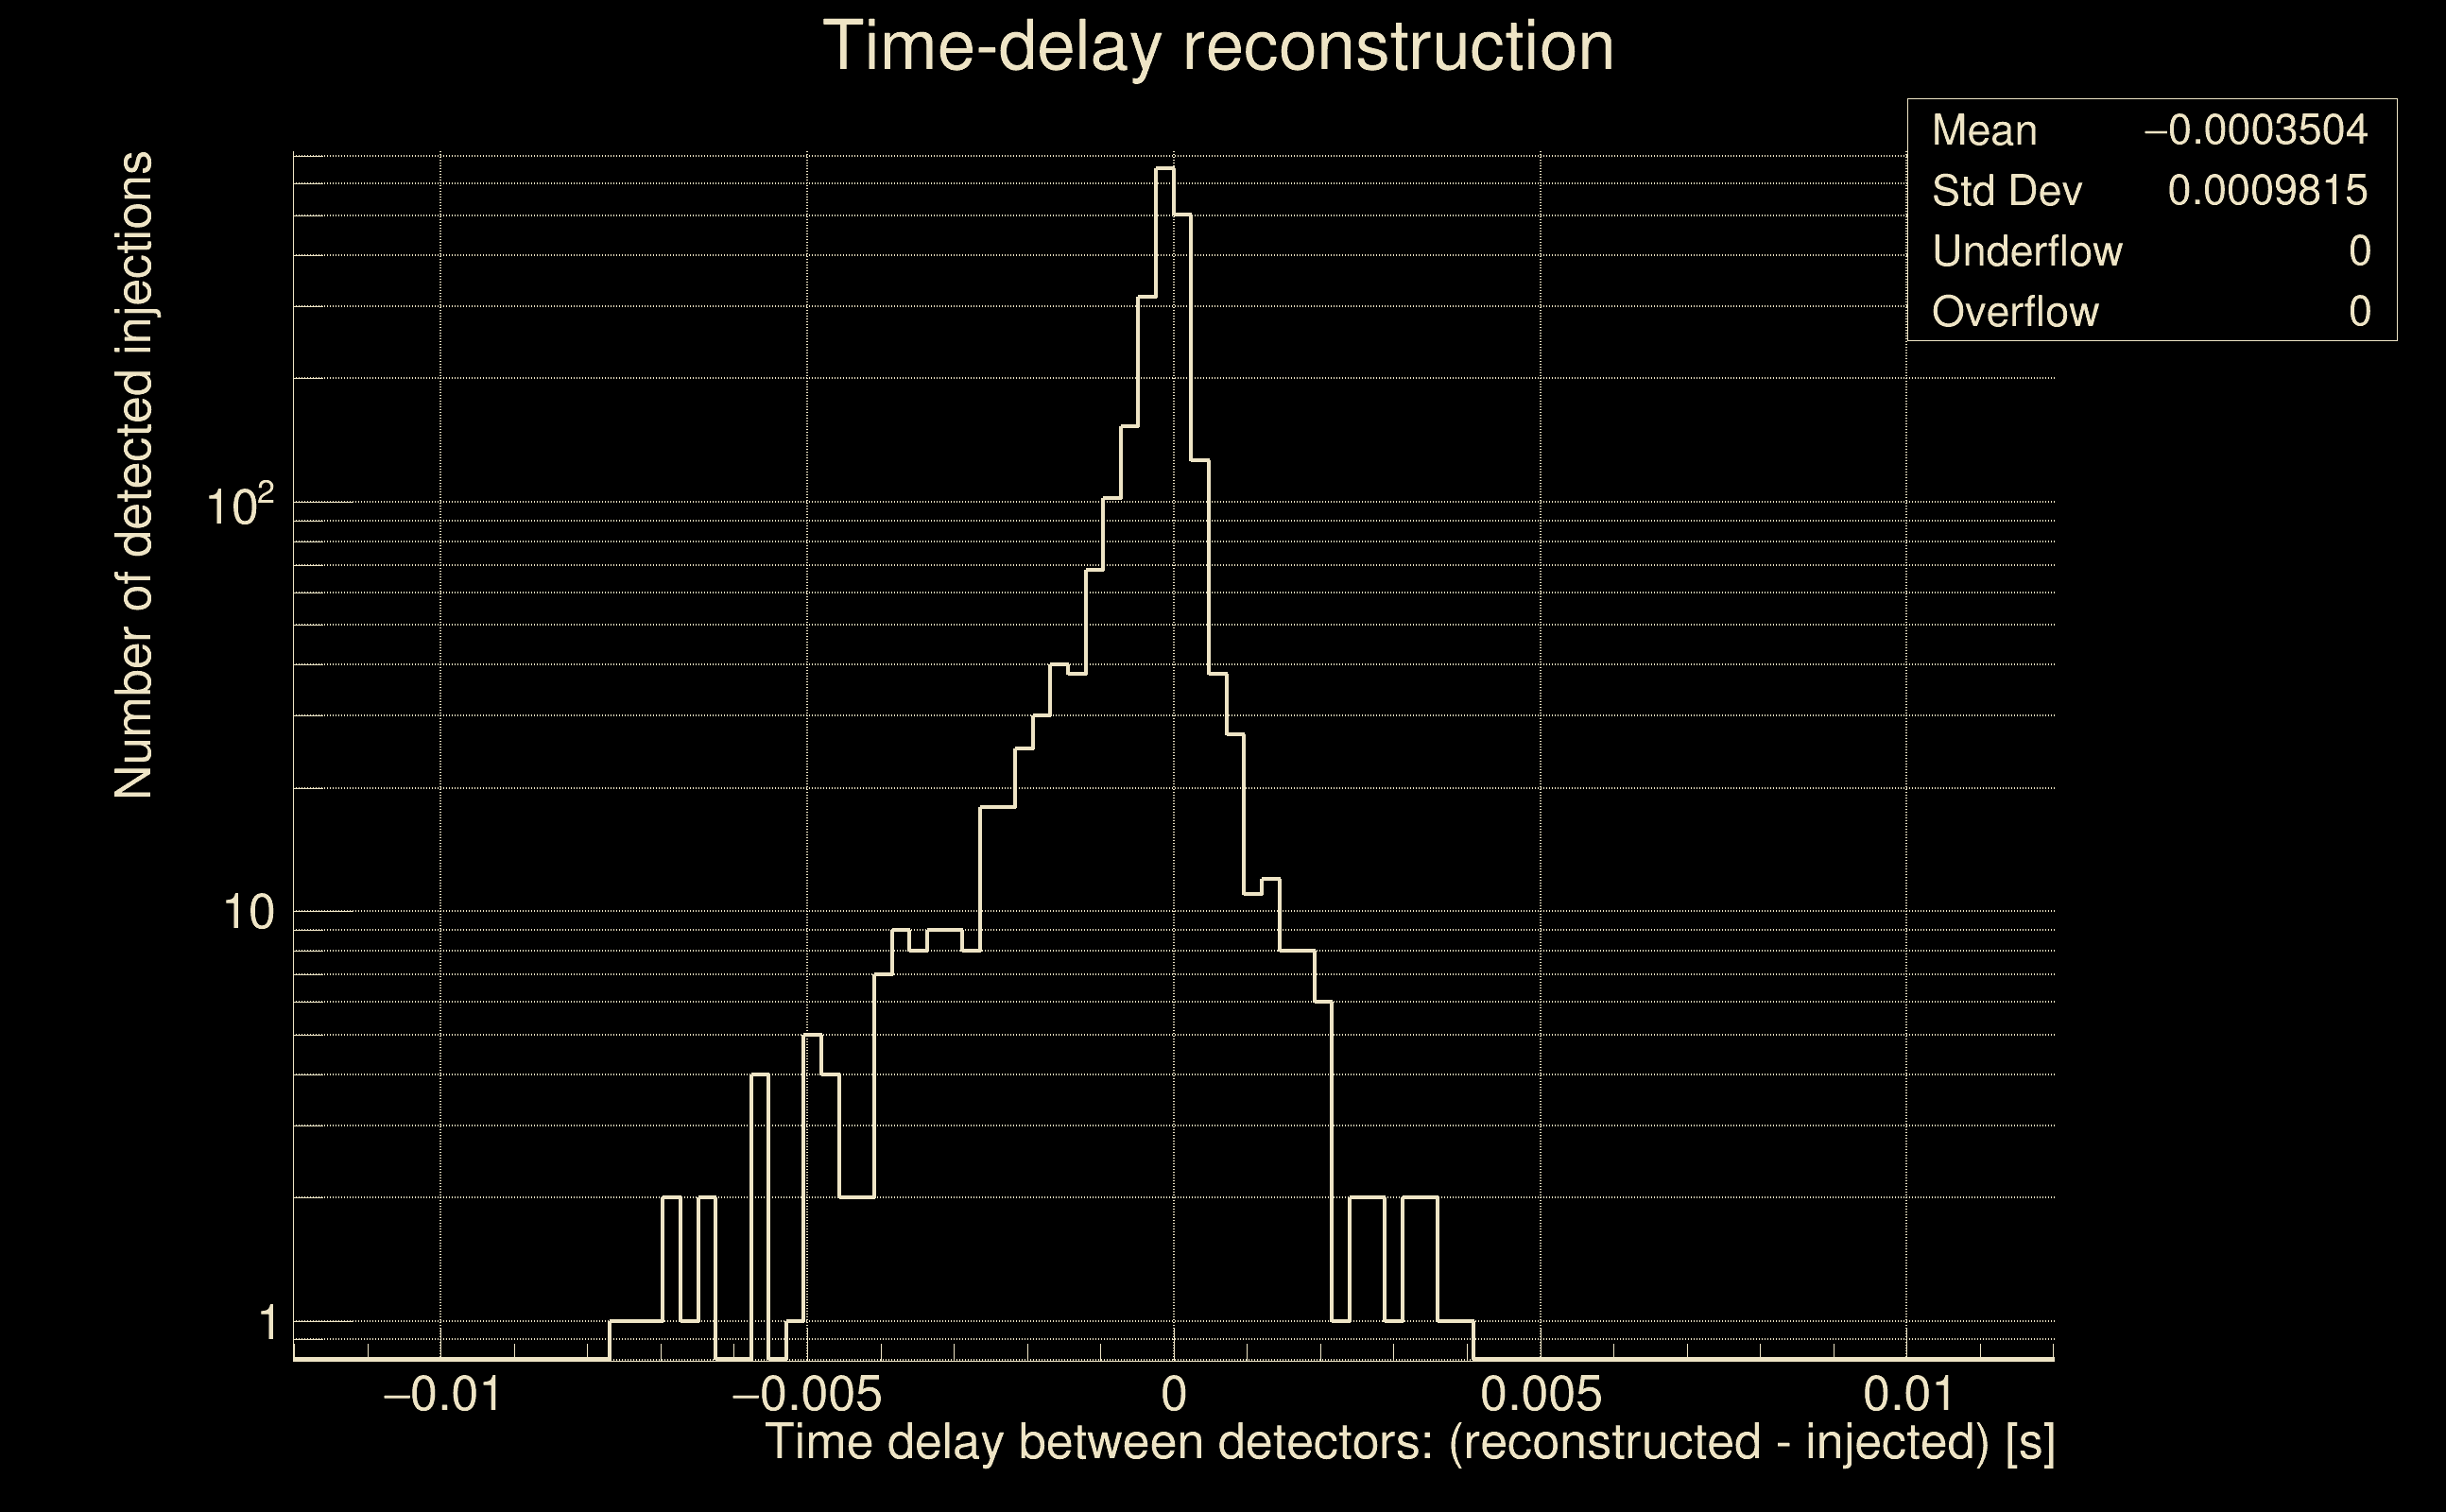
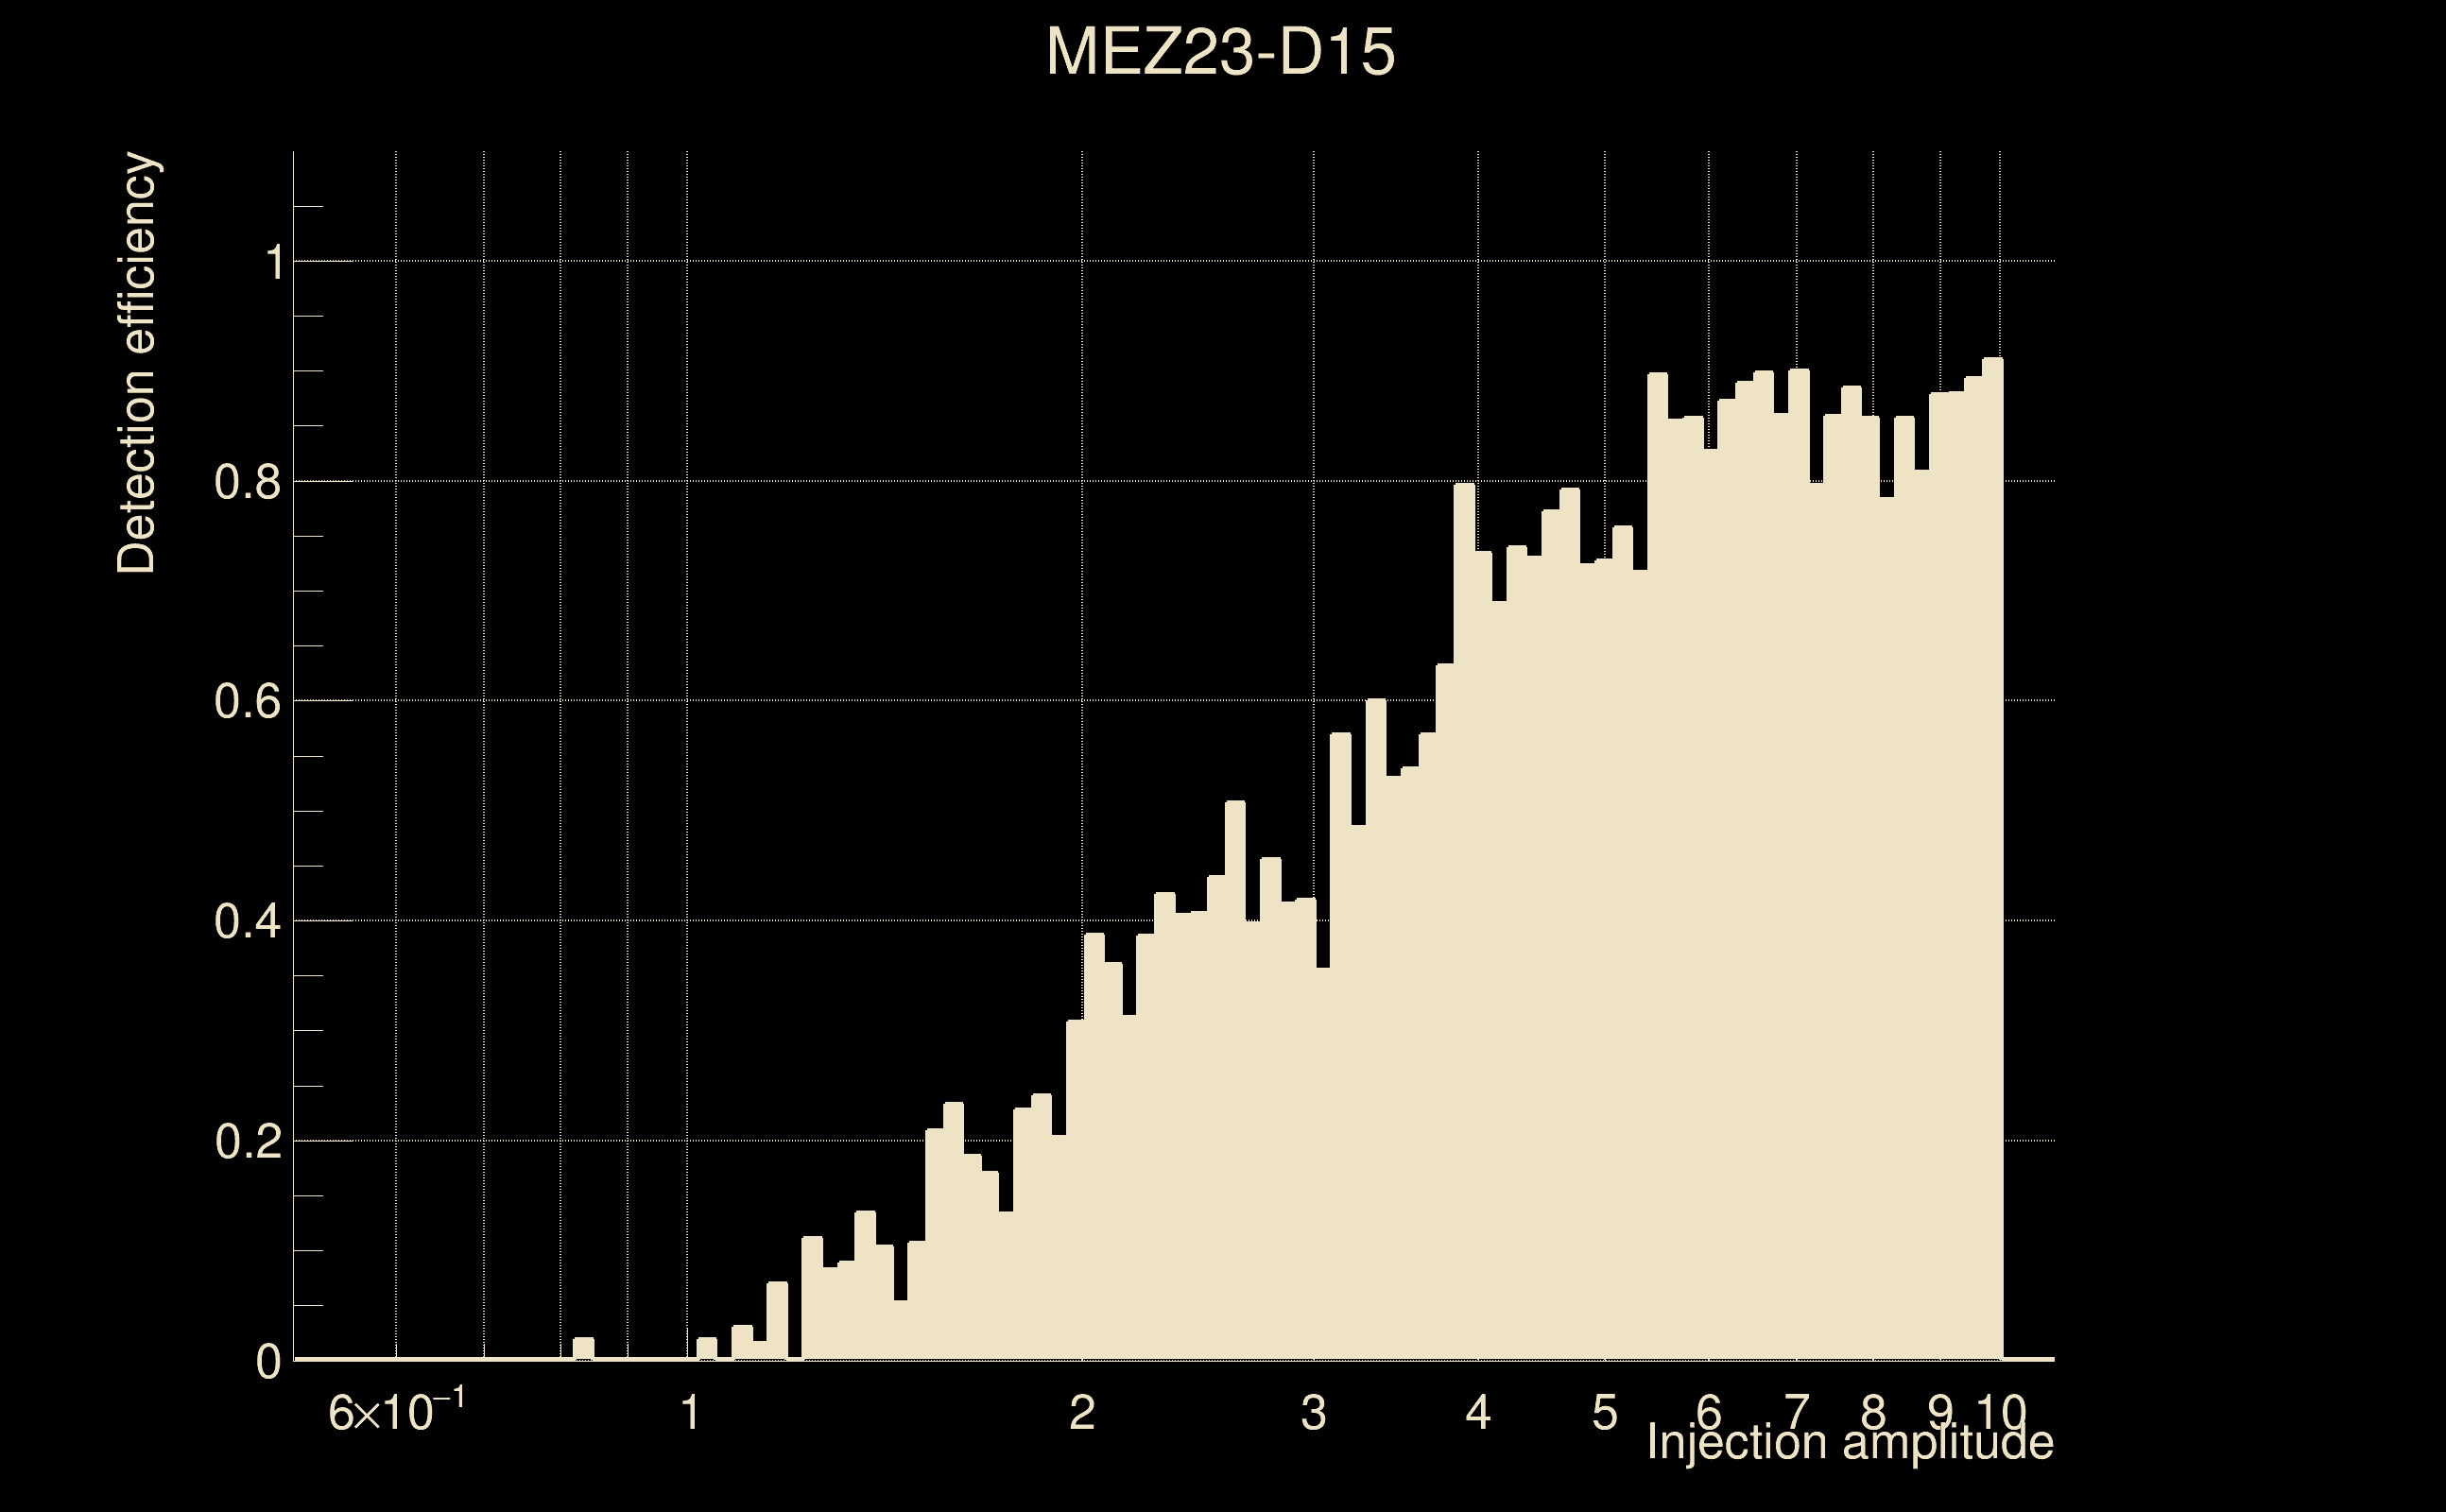
| Number of injections (total/valid/detected): | 5836 / 5783 / 2213 |
| List of missed injections: | ./MEZ23-D15_missed.txt |
| Injection amplitude at 90% detection efficiency: | 9.68078 |
| Injection amplitude at 50% detection efficiency: | 3.25855 |
| Injection amplitude at 10% detection efficiency: | 1.49335 |
 |
 |
 |
 |
 |
 |
|
 |
 |
|
 |
 |
 |
 |
 |
 |
 |
 |
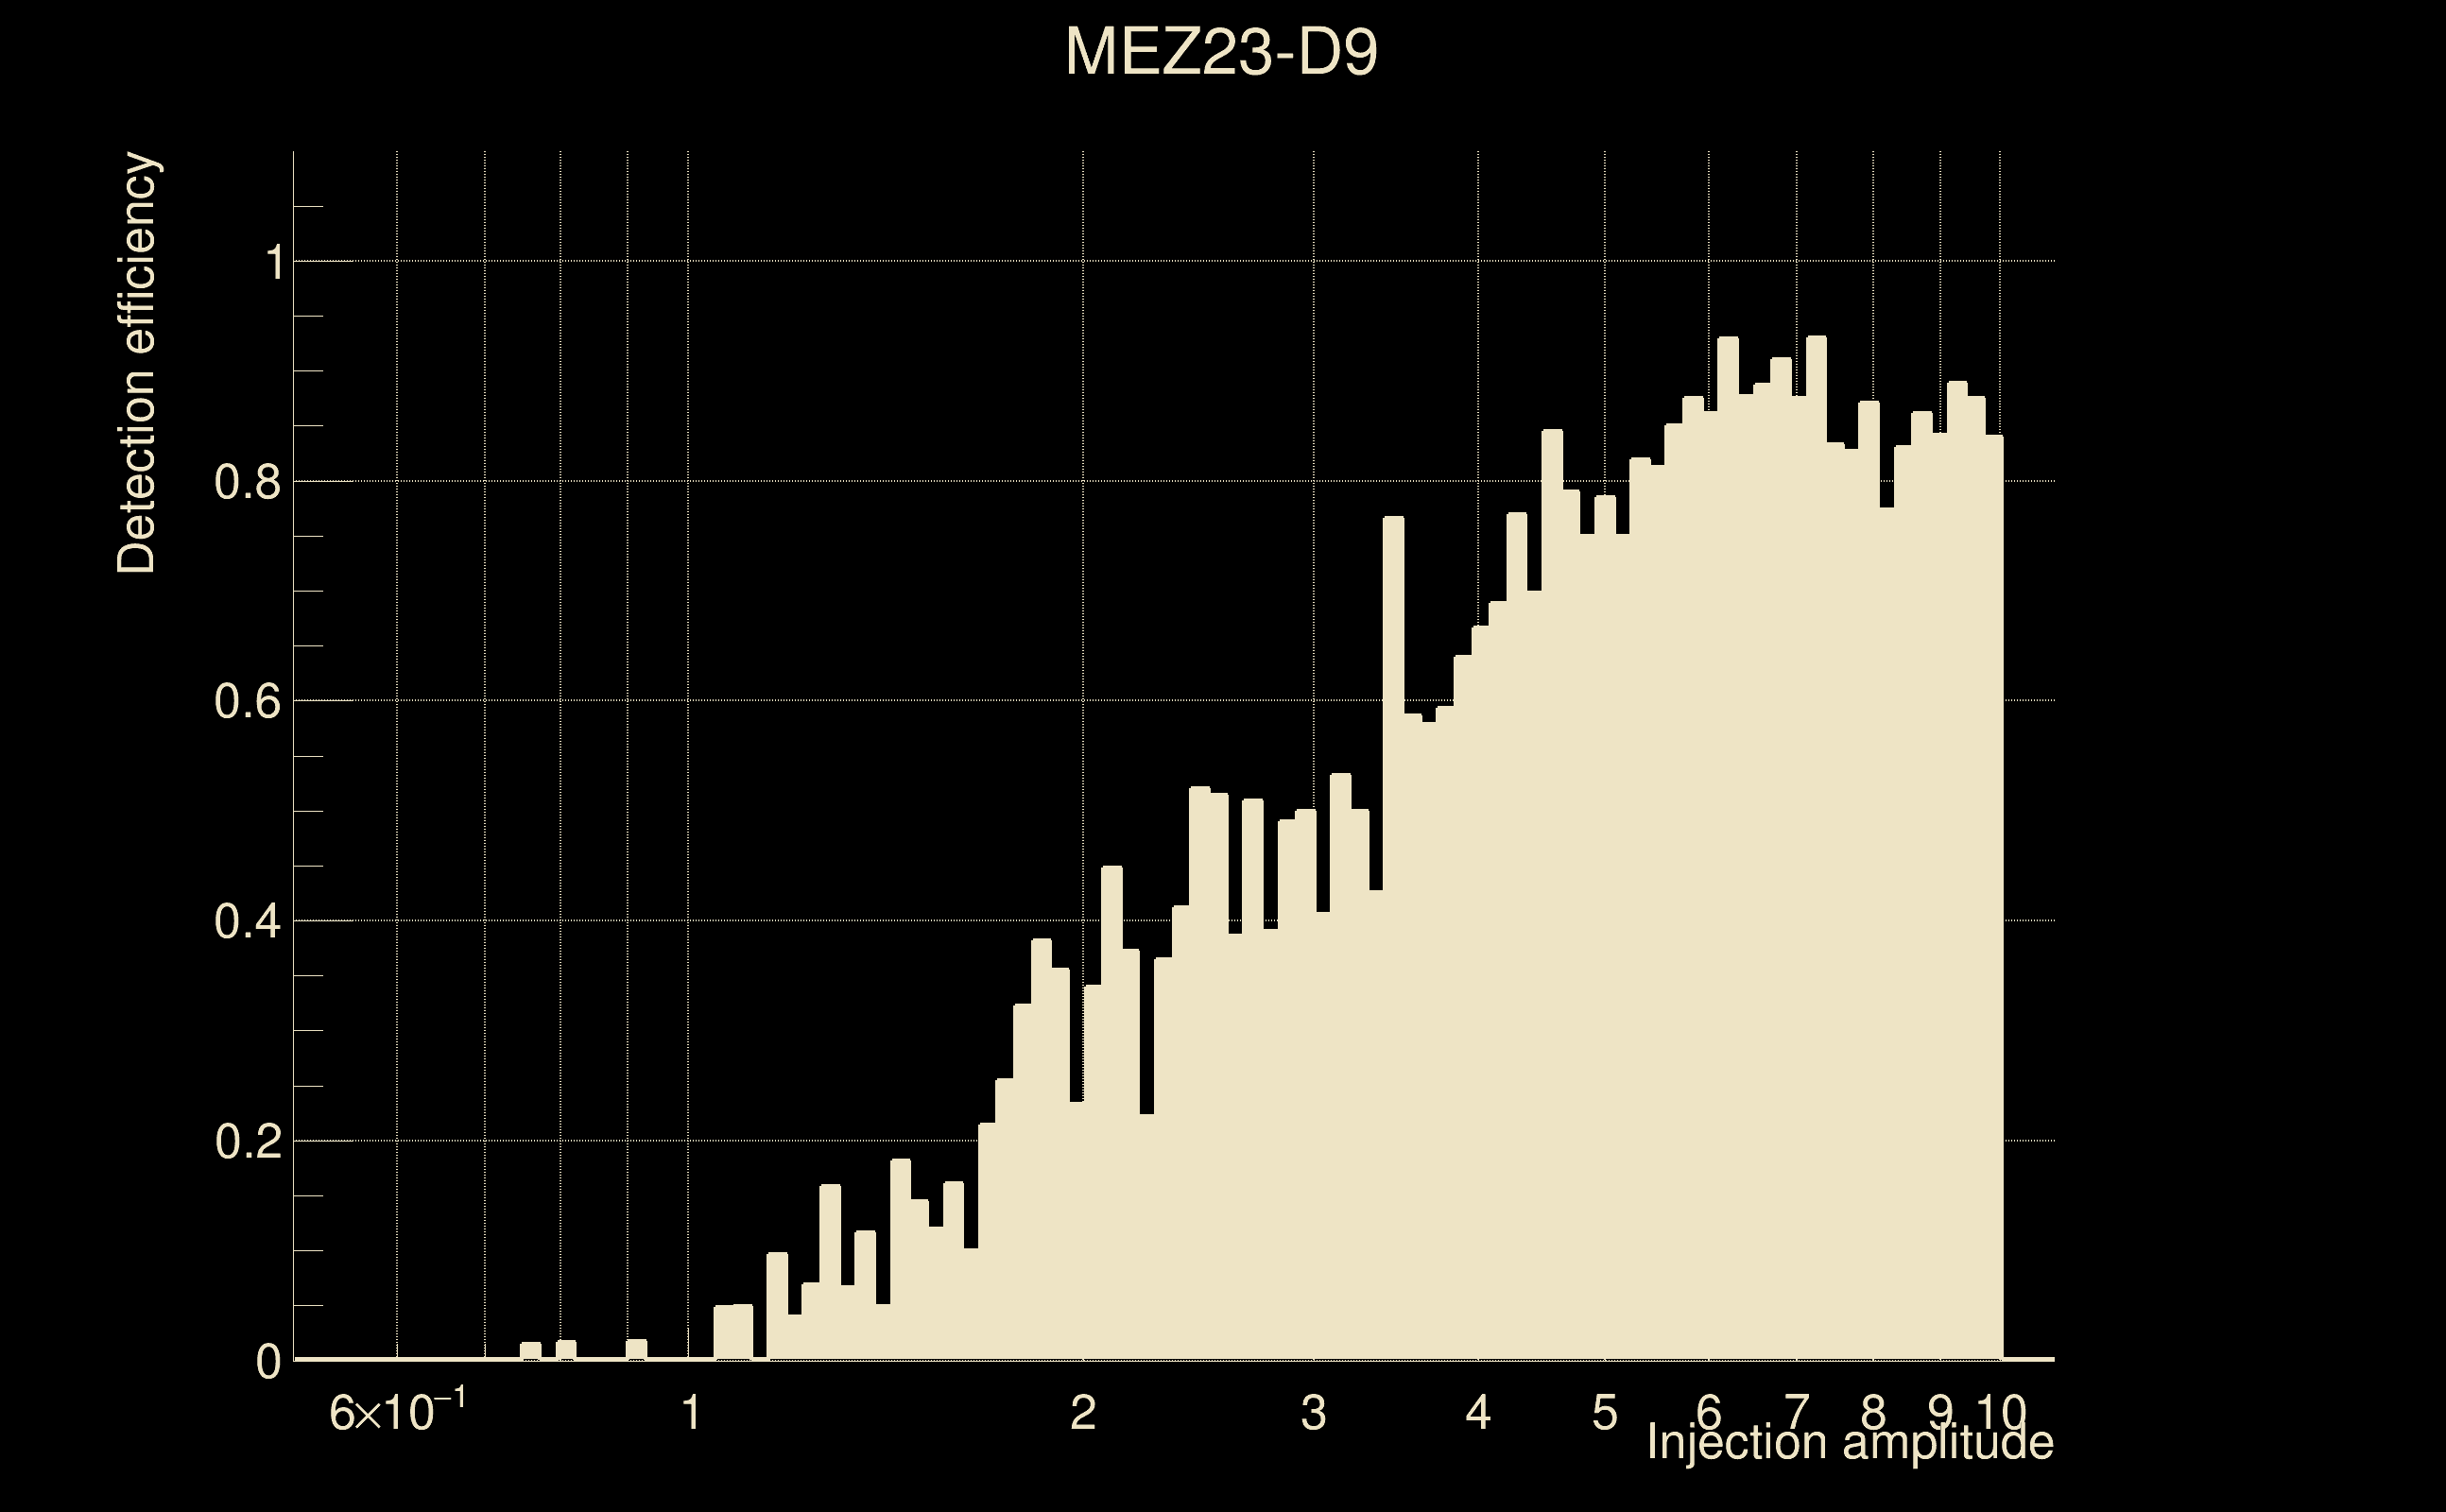
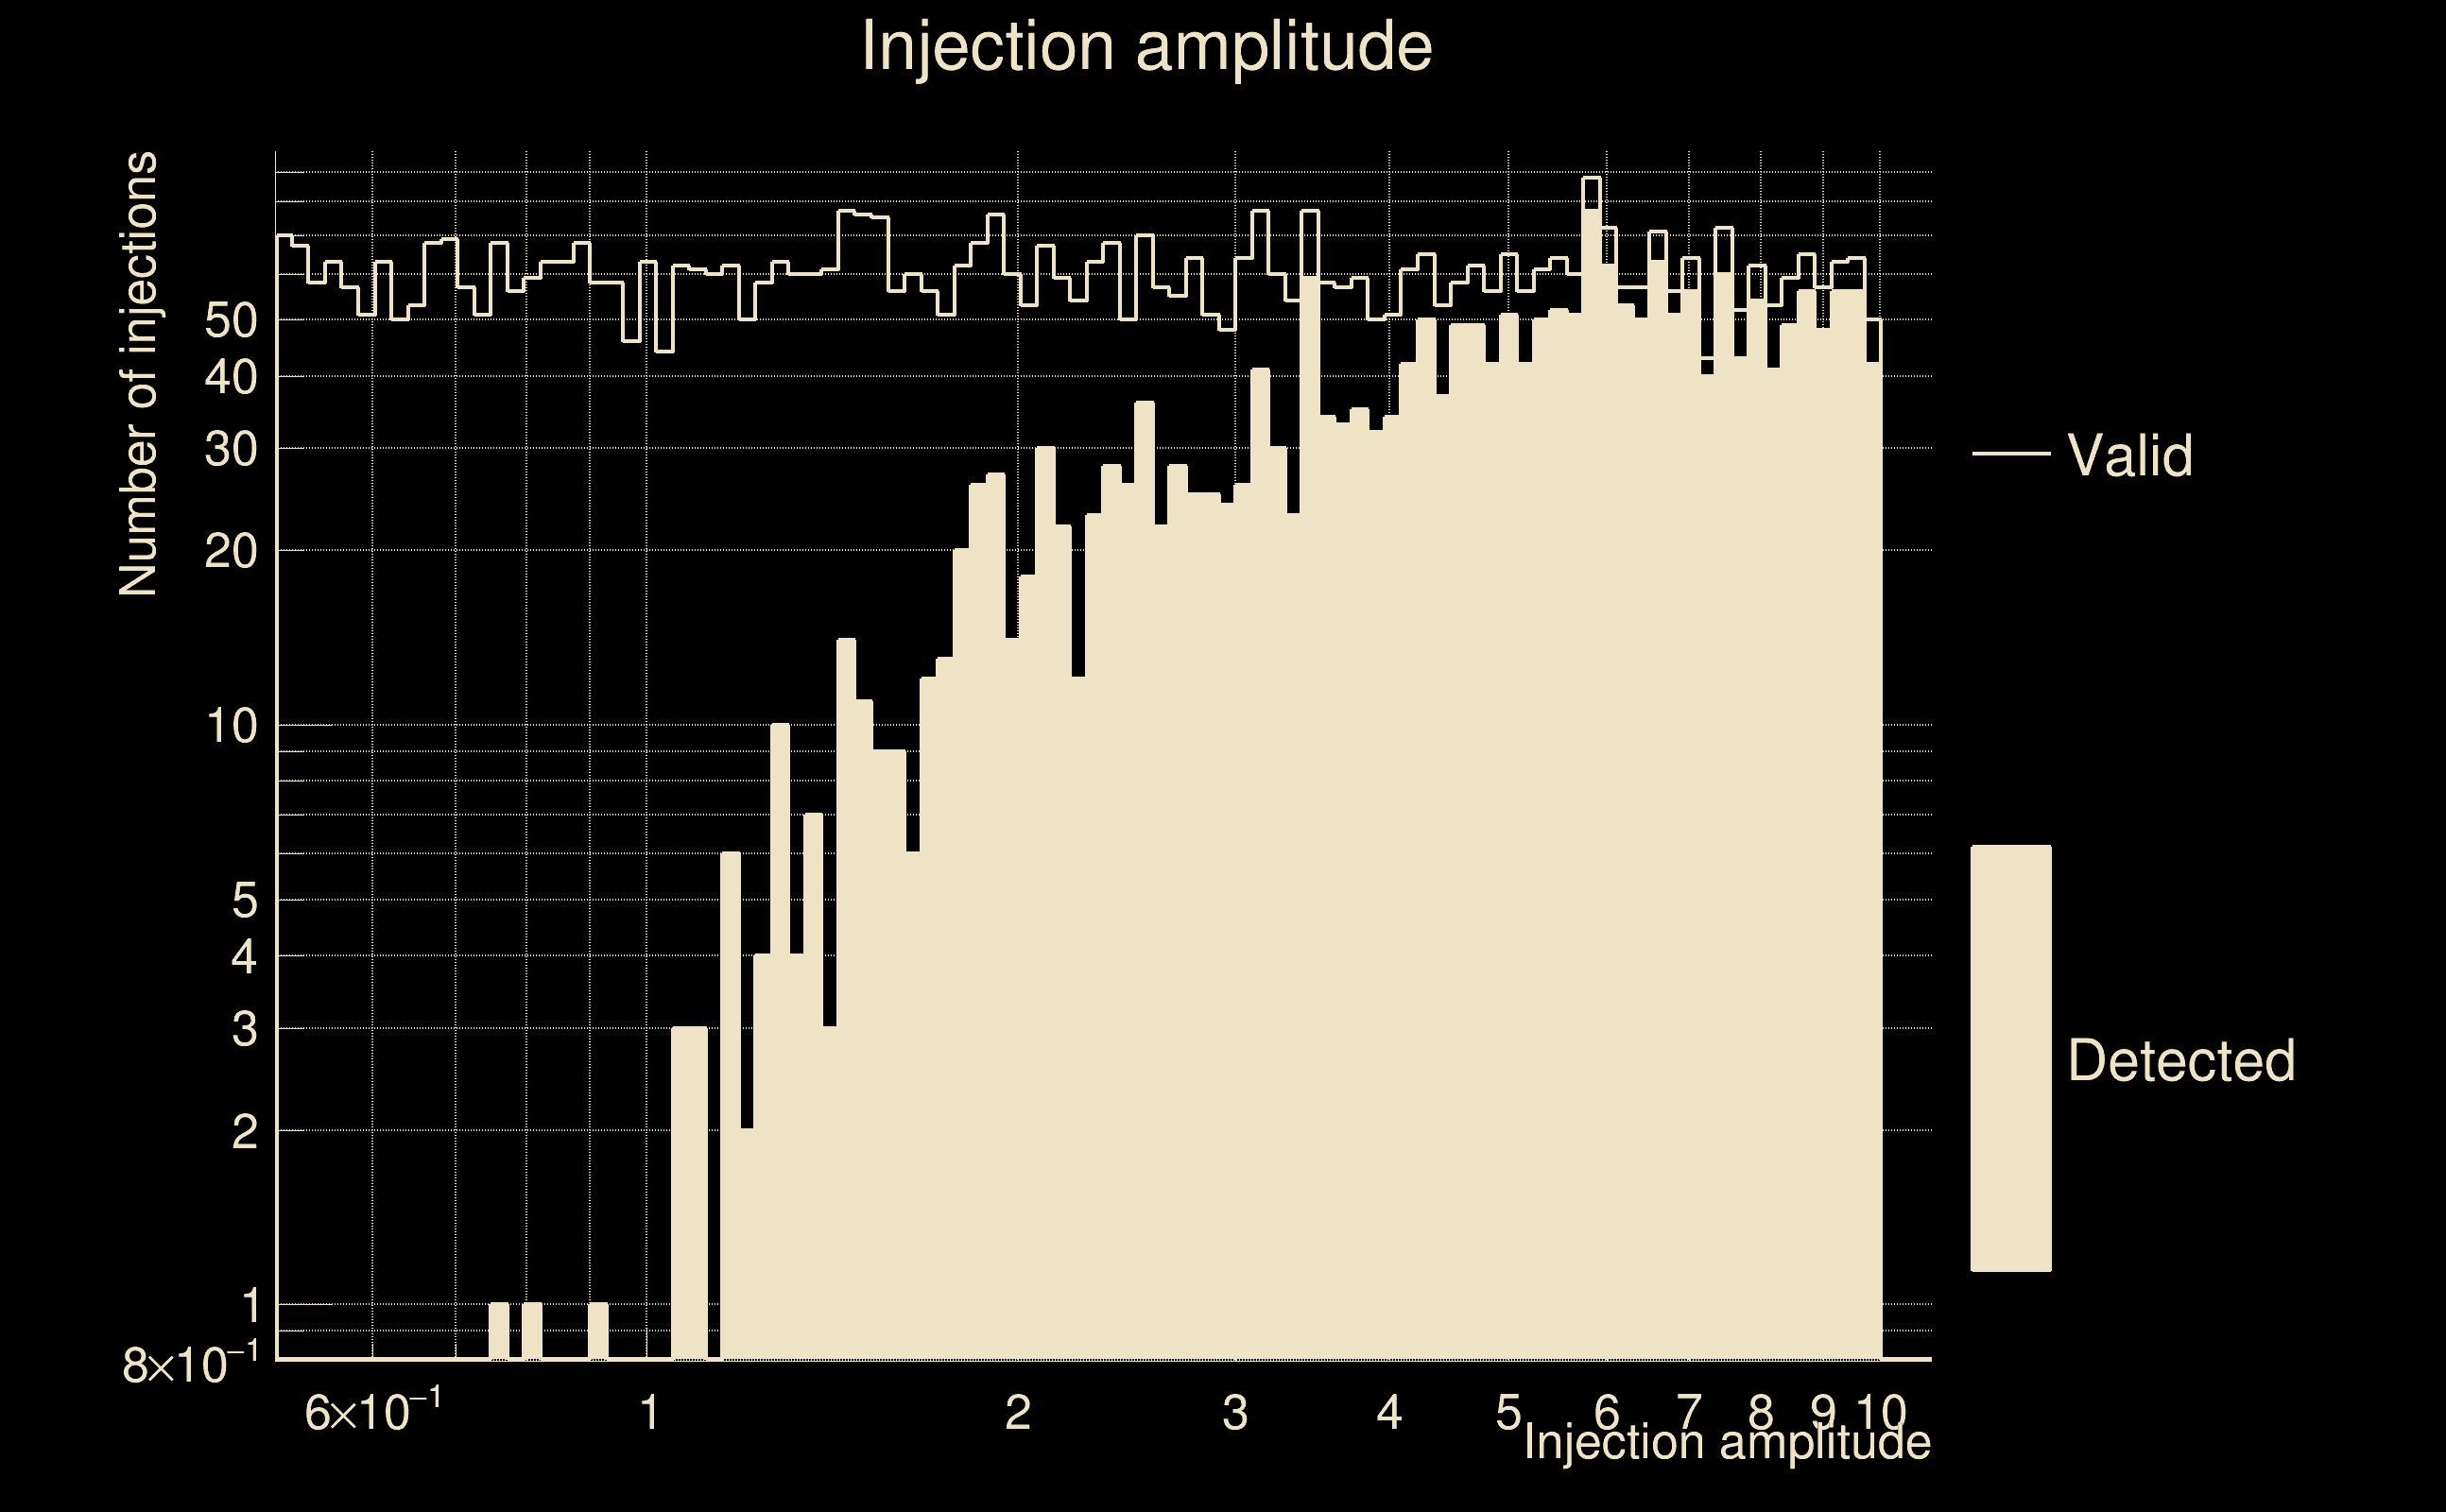
| Number of injections (total/valid/detected): | 5911 / 5869 / 2344 |
| List of missed injections: | ./MEZ23-D9_missed.txt |
| Injection amplitude at 90% detection efficiency: | 7.12439 |
| Injection amplitude at 50% detection efficiency: | 3.3692 |
| Injection amplitude at 10% detection efficiency: | 1.42571 |
 |
 |
 |
 |
 |
 |
|
 |
 |
|
 |
 |
 |
 |
 |
 |
 |
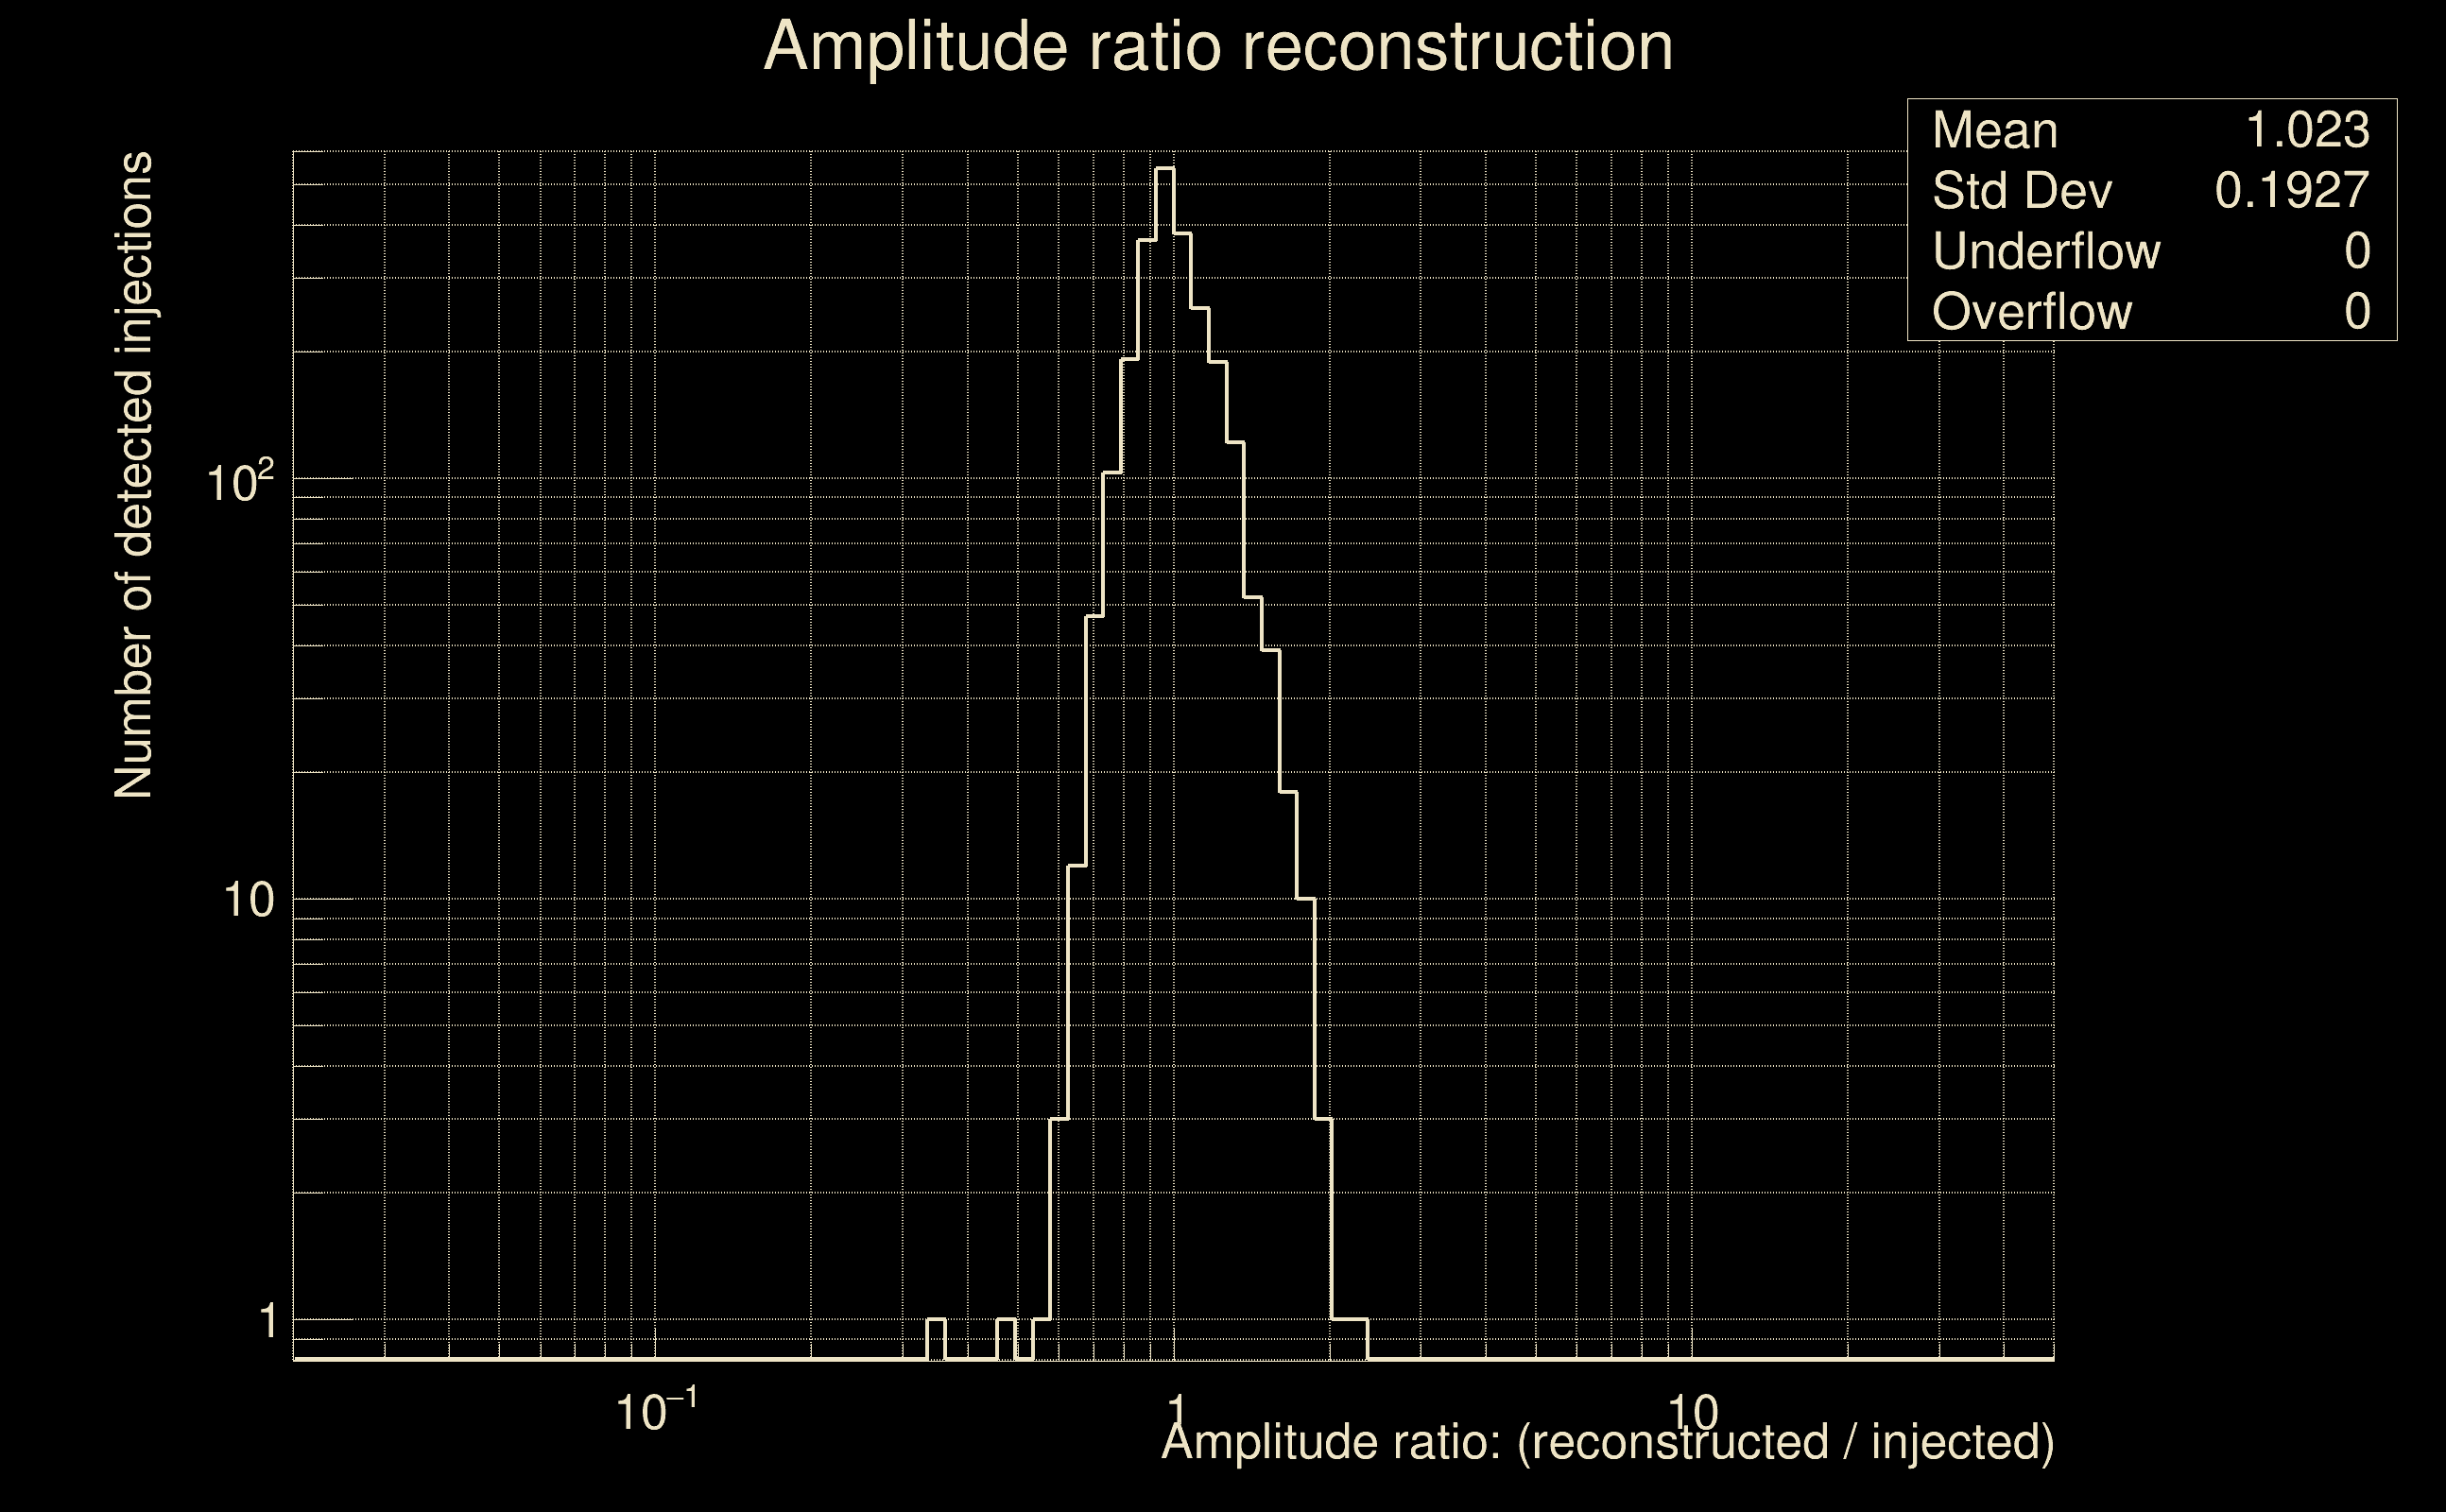 |
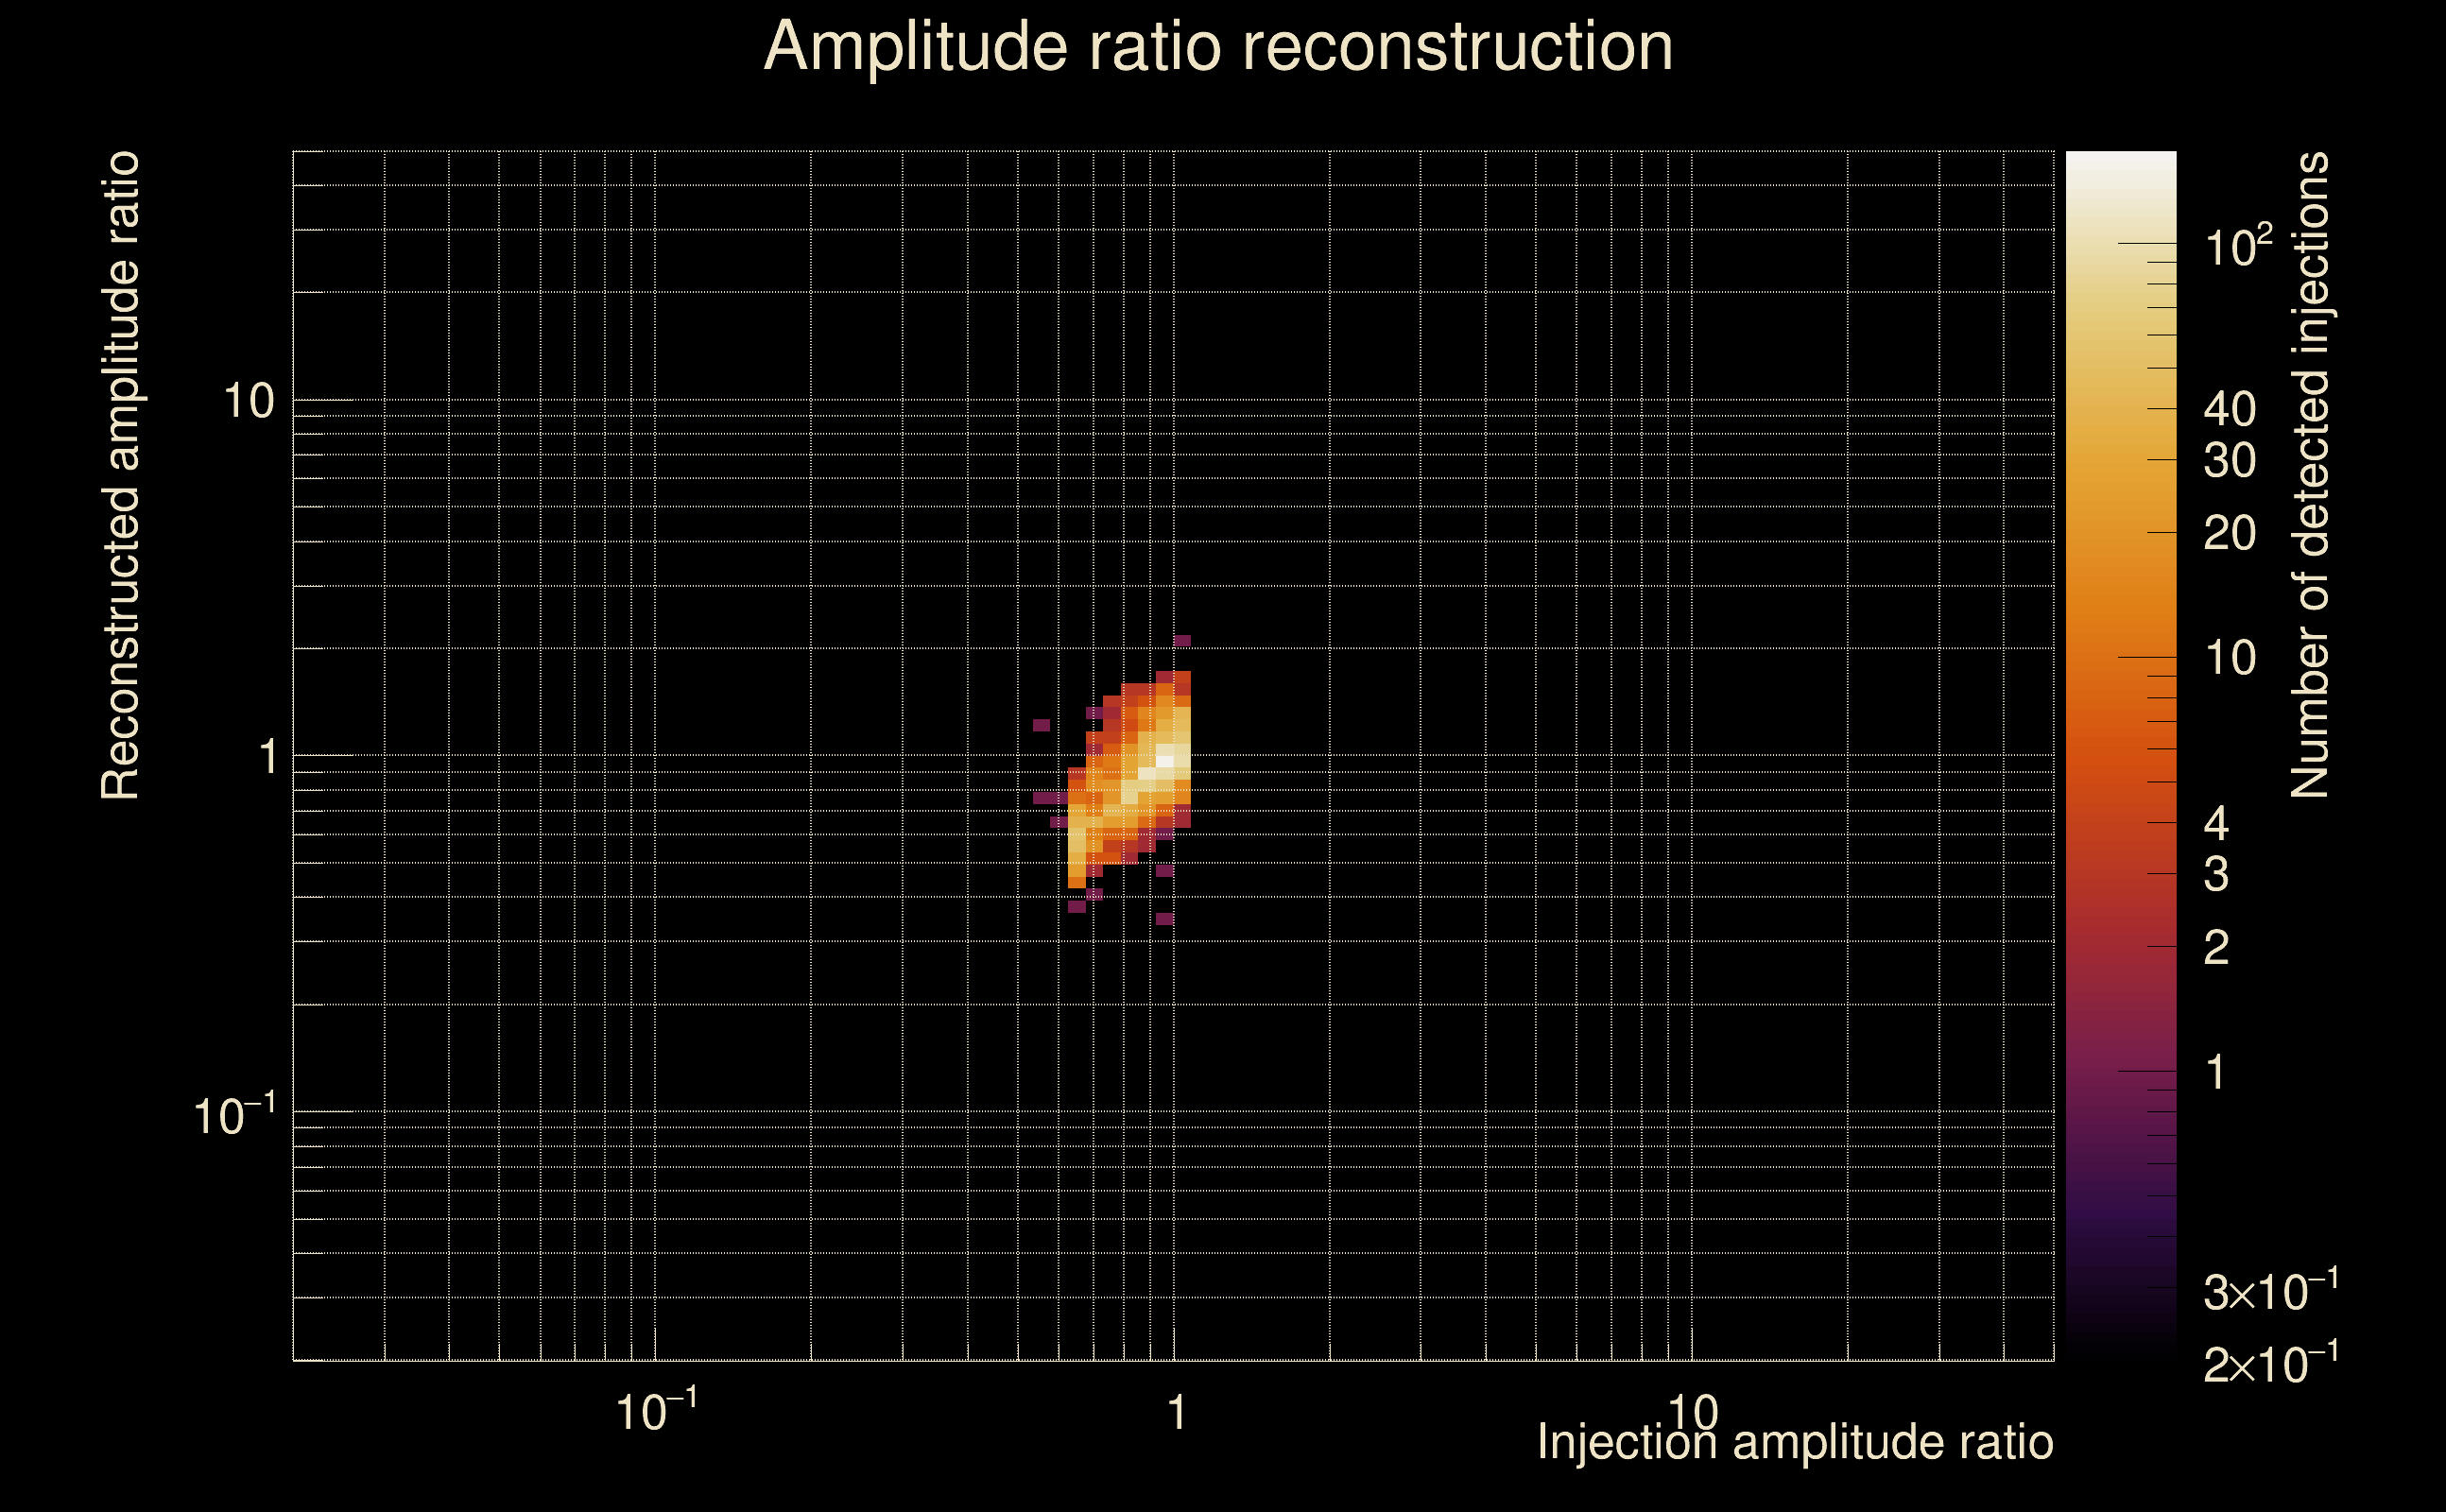
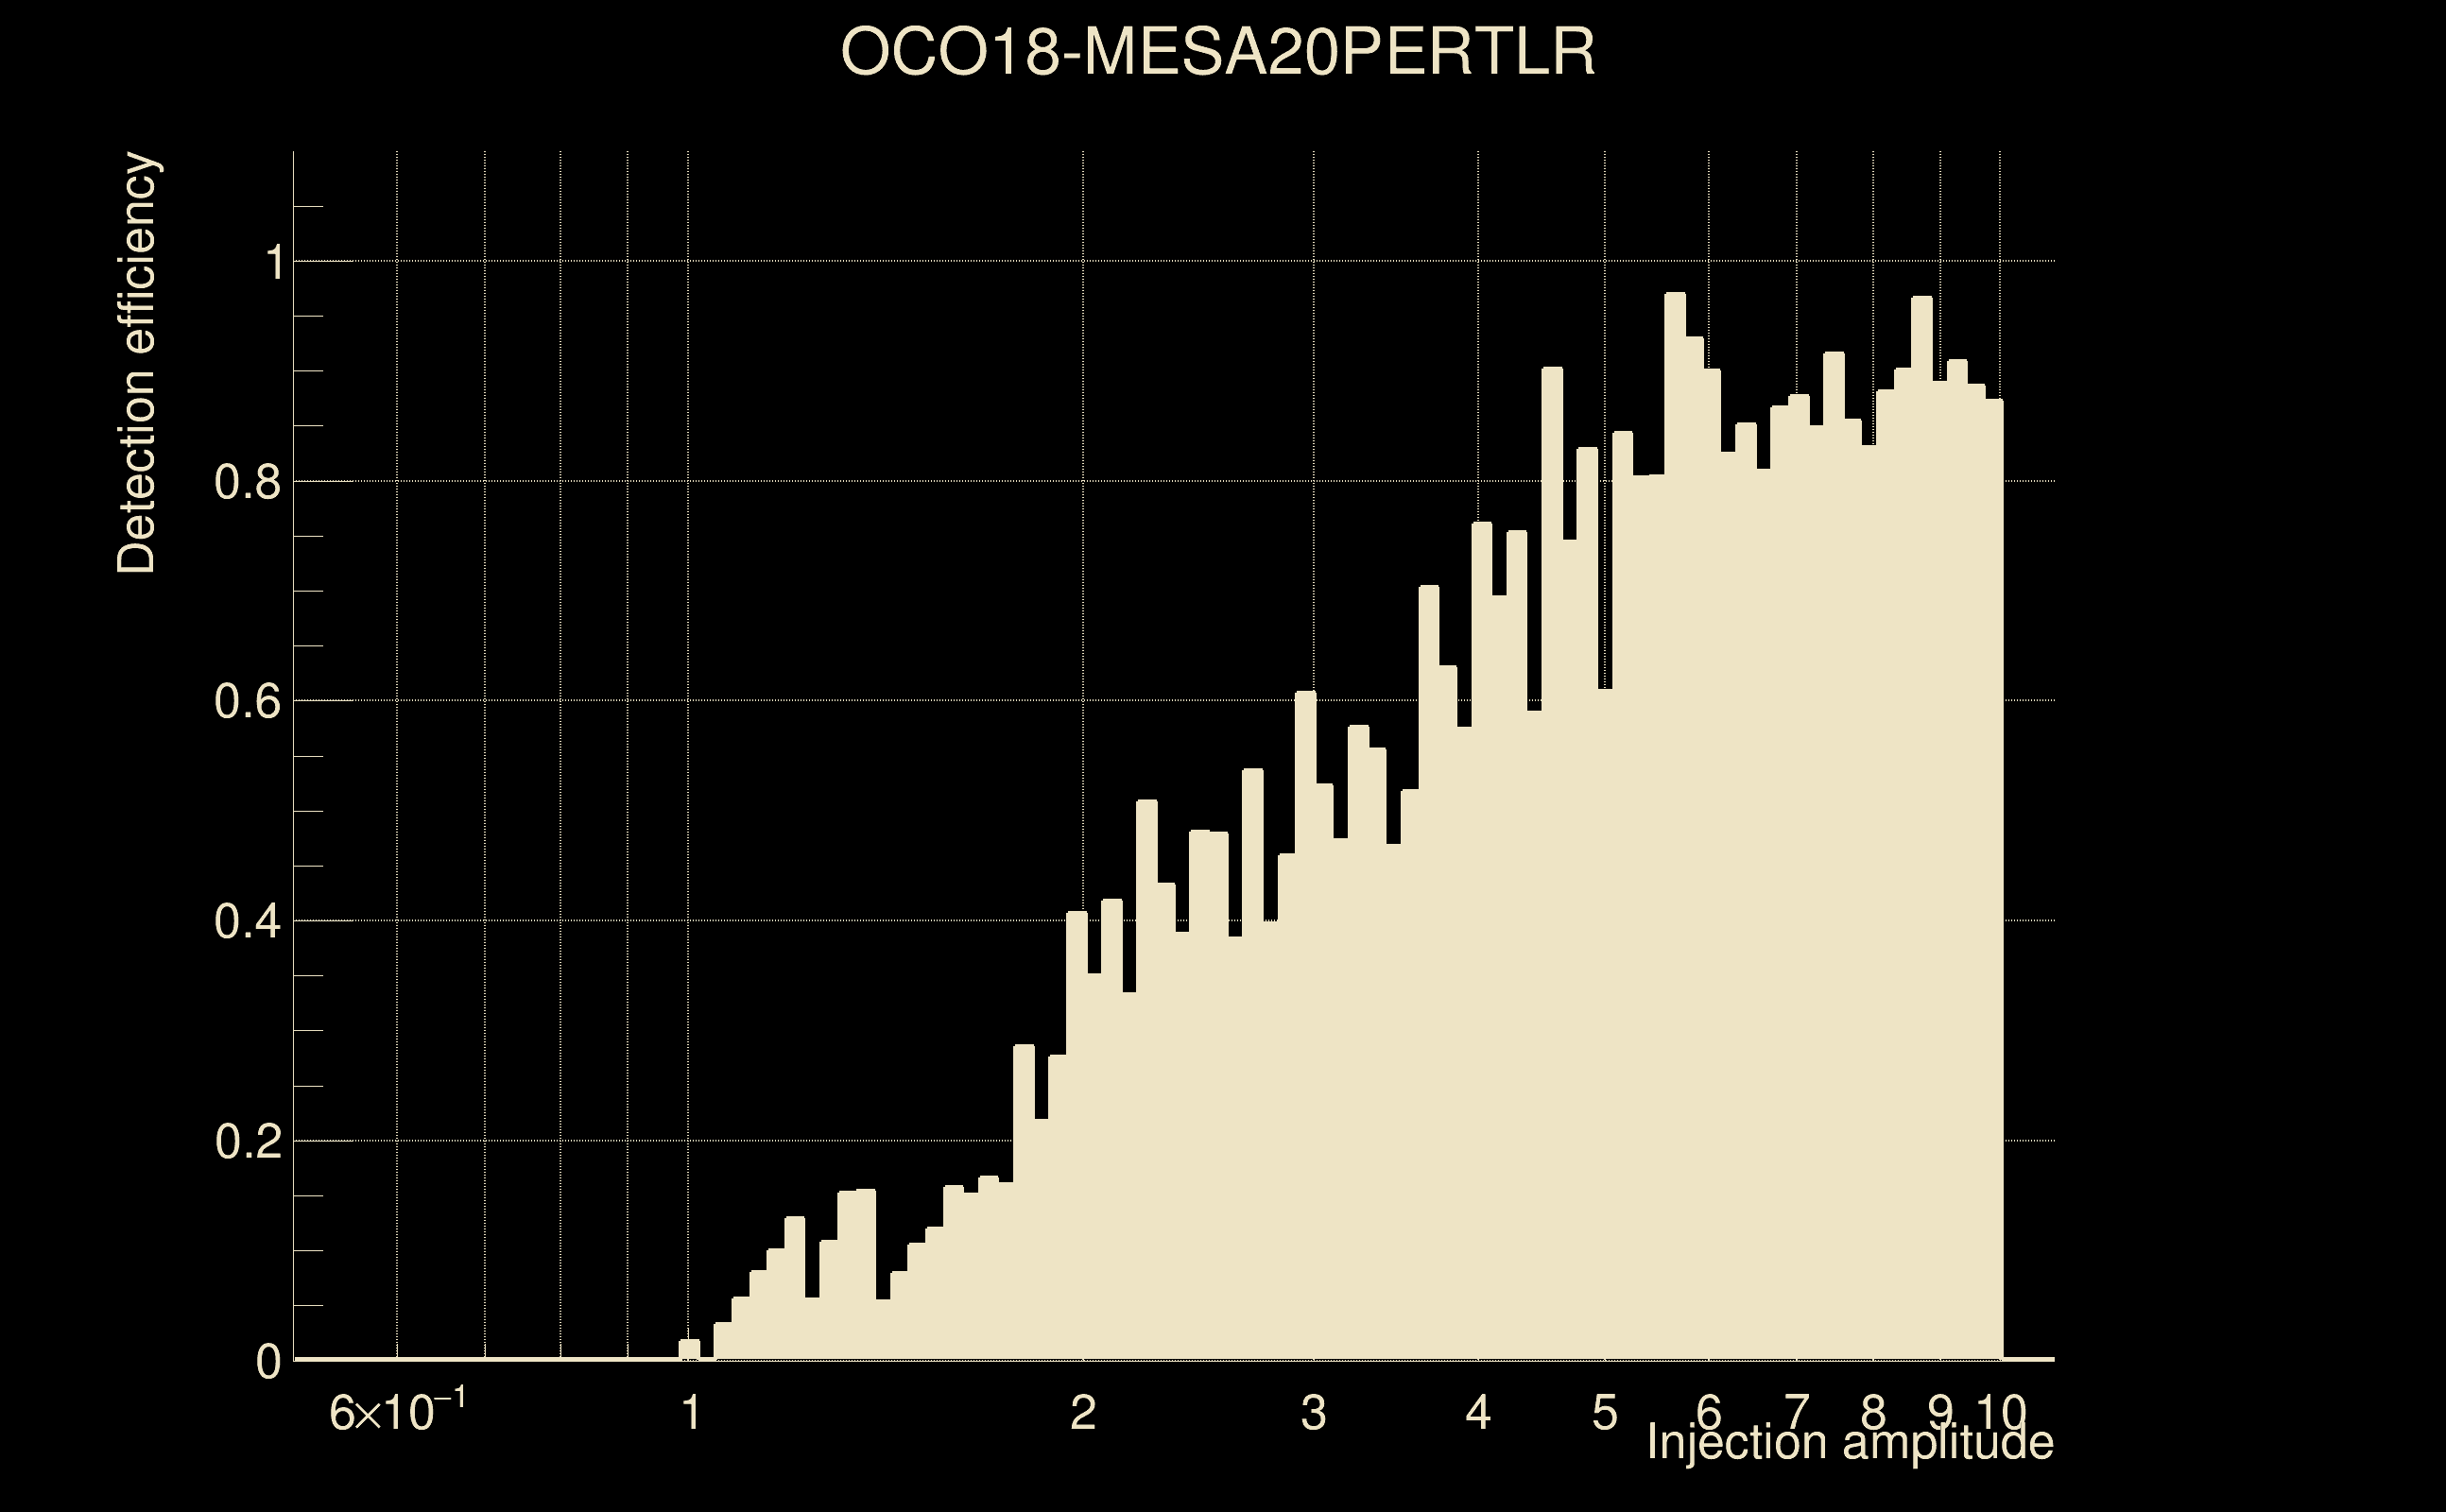
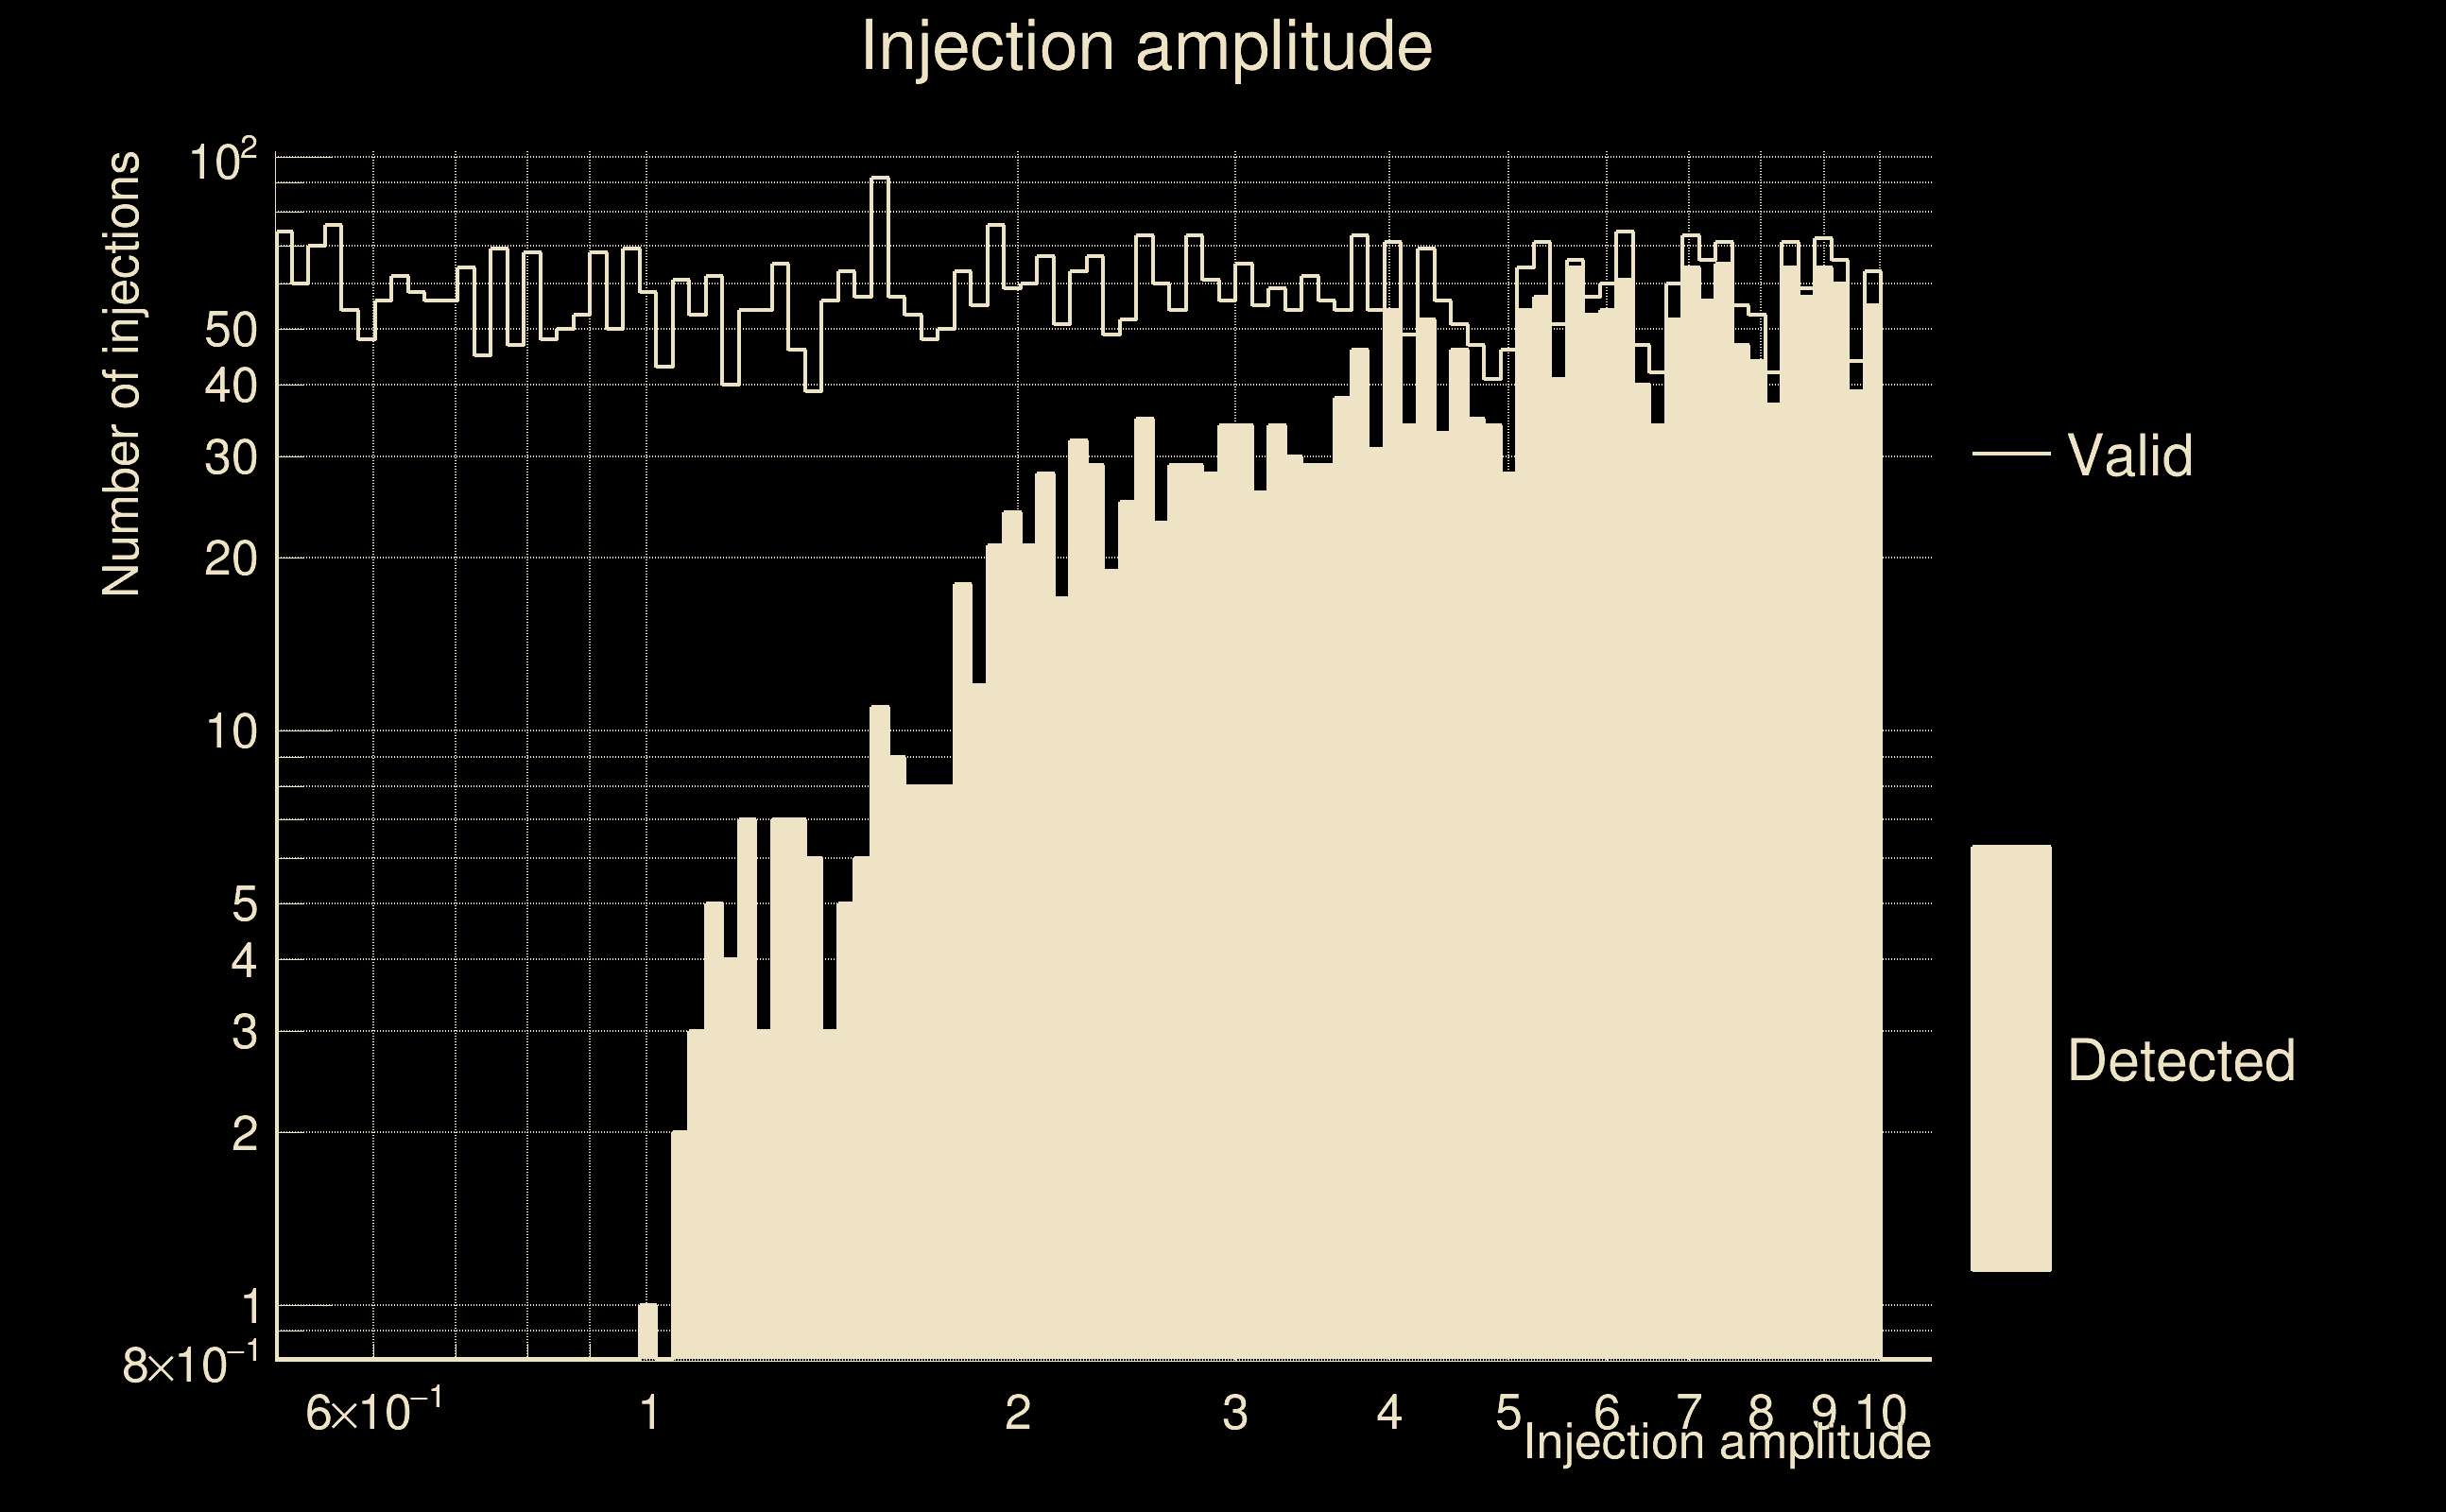
| Number of injections (total/valid/detected): | 5730 / 5680 / 2302 |
| List of missed injections: | ./OCO18-MESA20PERTLR_missed.txt |
| Injection amplitude at 90% detection efficiency: | 5.58511 |
| Injection amplitude at 50% detection efficiency: | 3.52021 |
| Injection amplitude at 10% detection efficiency: | 1.48871 |
 |
 |
 |
 |
 |
 |
|
 |
 |
|
 |
 |
 |
 |
 |
 |
 |
 |
| Number of injections (total/valid/detected): | 5932 / 5888 / 2271 |
| List of missed injections: | ./POW18-S18_missed.txt |
| Injection amplitude at 90% detection efficiency: | 6.59865 |
| Injection amplitude at 50% detection efficiency: | 3.90975 |
| Injection amplitude at 10% detection efficiency: | 1.55584 |
 |
 |
 |
 |
 |
 |
|
 |
 |
|
 |
 |
 |
 |
 |
 |
 |
 |
| florent.robinet@ijclab.in2p3.fr |