| Omicron version: | 4.2.0: documentation gitlab repository |
| Omicron run by: | unknown |
| Report produced on: | Fri Oct 31 09:12:04 2025 UTC |
| Ox option file: | Targ_FirstTest_O4bw_14days_options.txt |
| Omicron option files: | detector 0, detector 1 |
| Detector channel names: | H1:GDS-CALIB_STRAIN_CLEAN_AR_4096Hz, L1:GDS-CALIB_STRAIN_CLEAN_AR_4096Hz |
| Omicron analysis time window and overlap: | 16 s, 6 s |
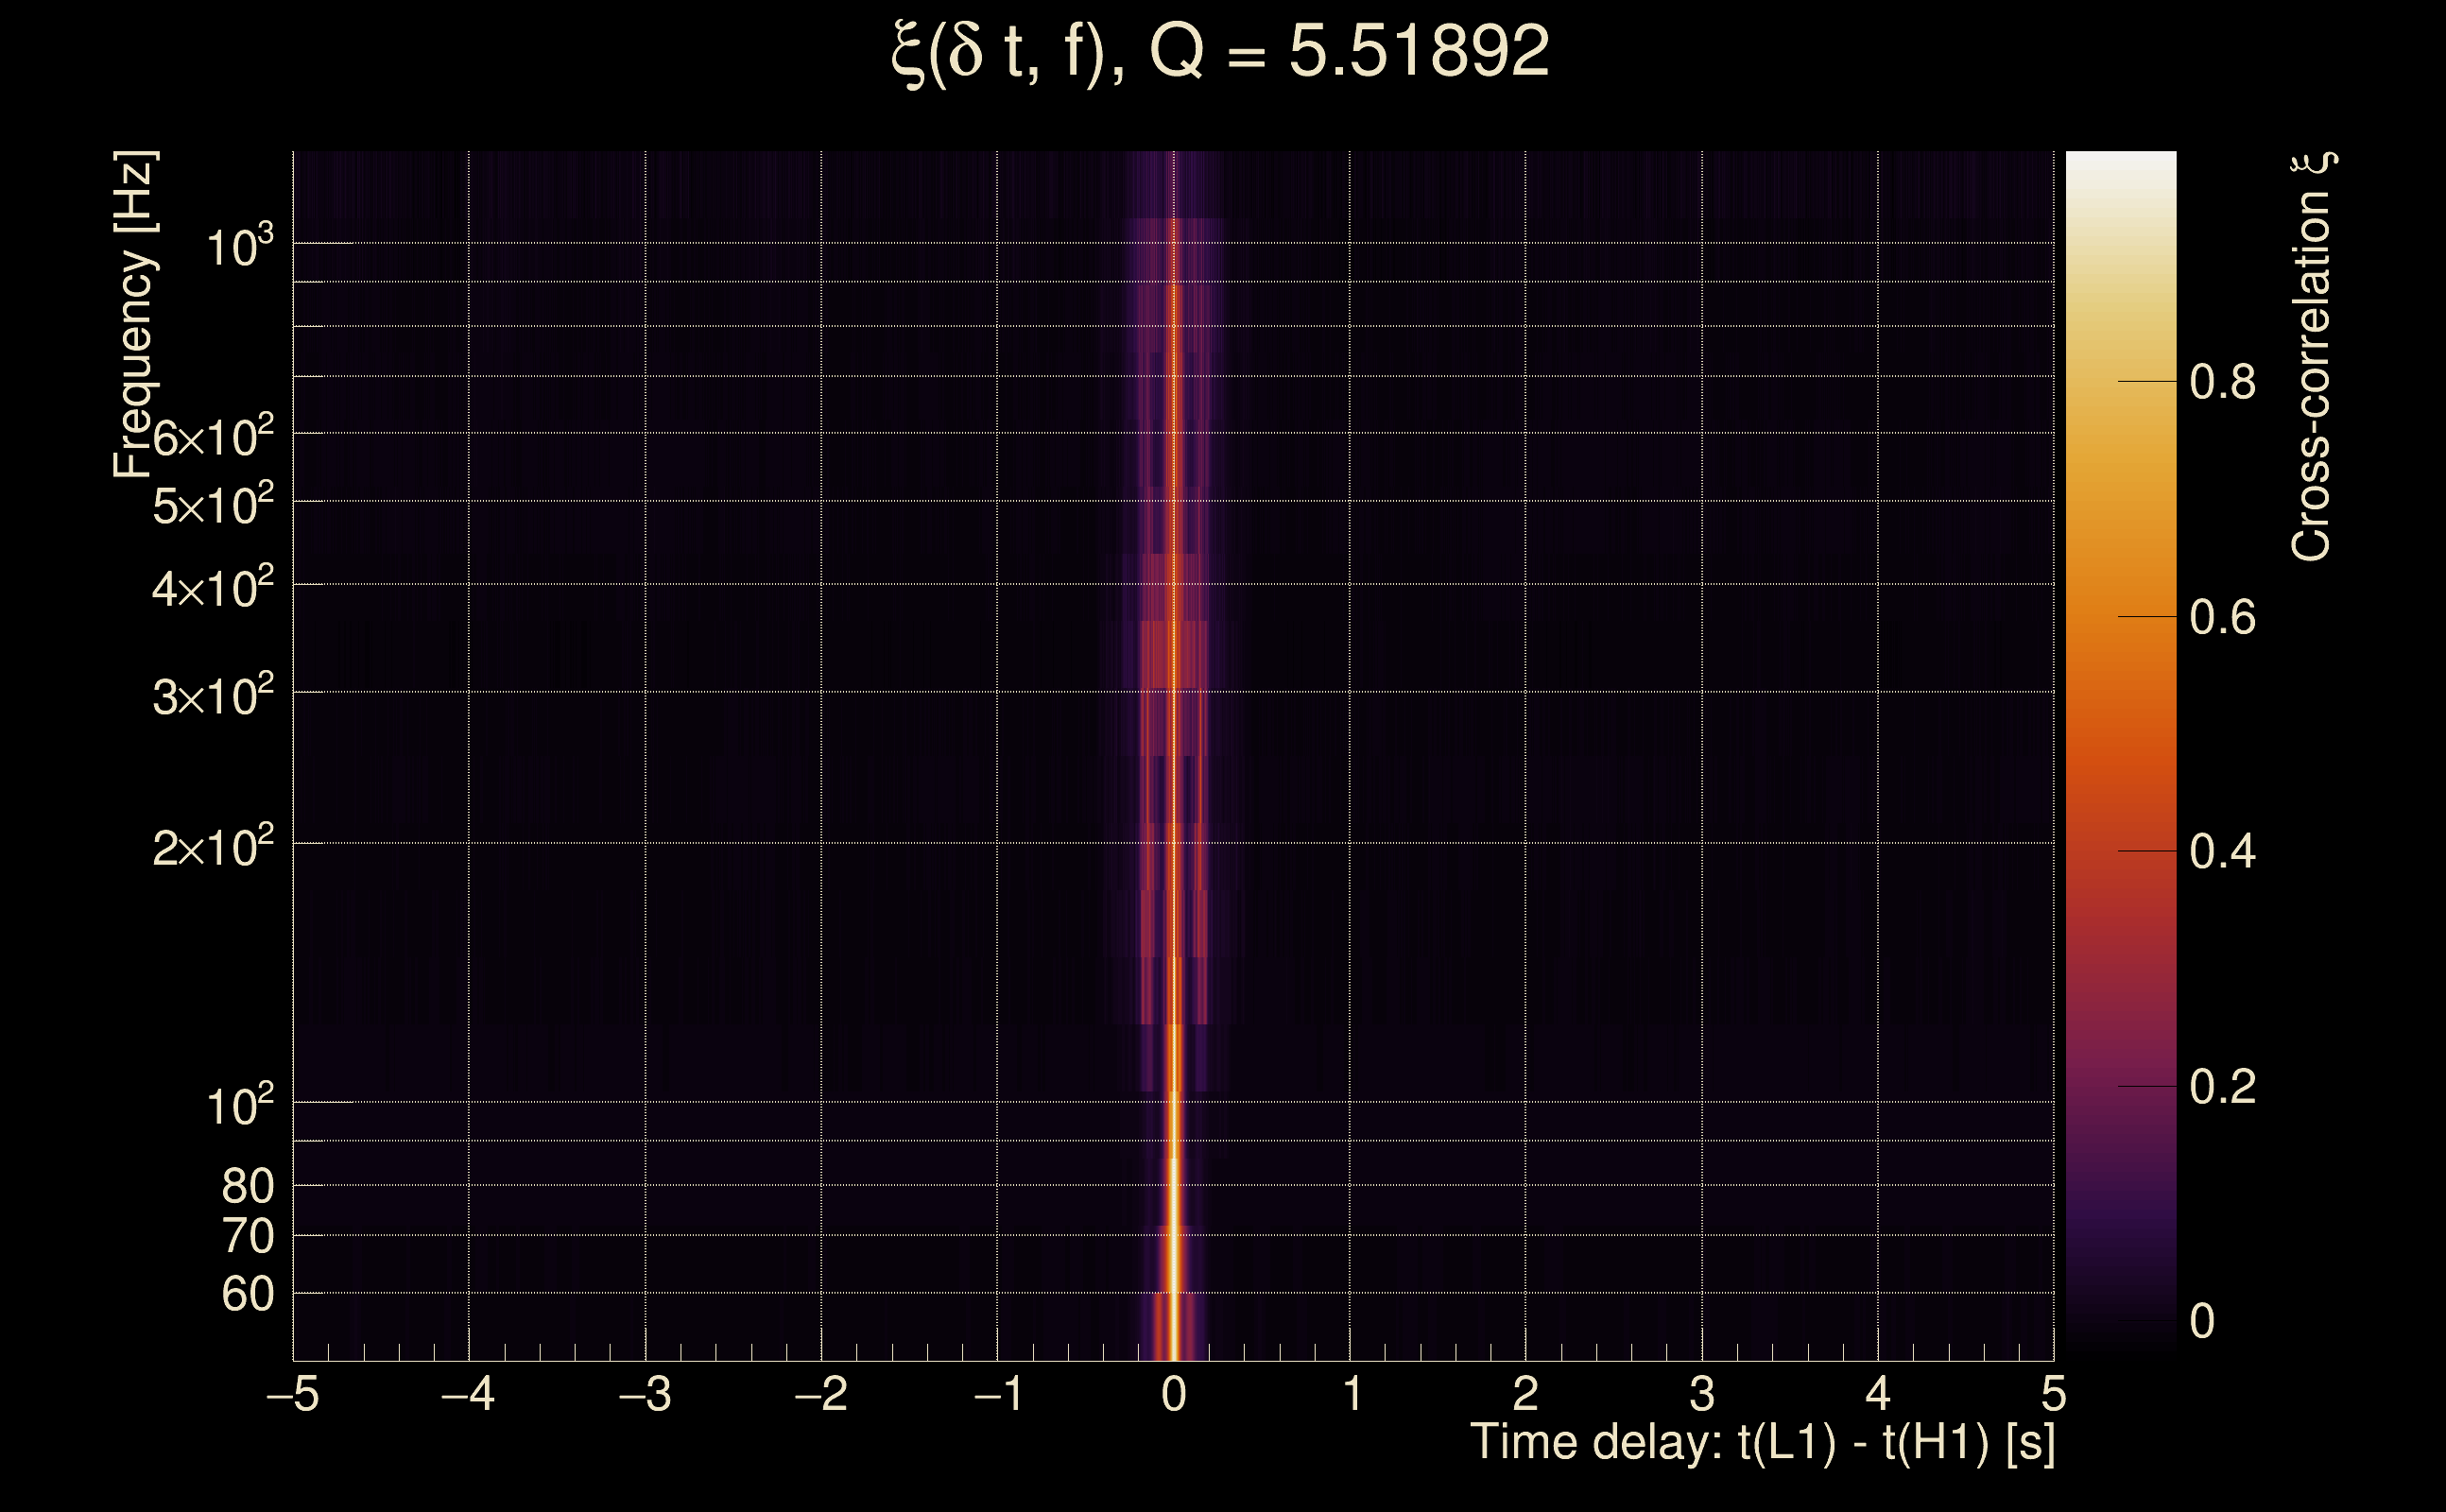
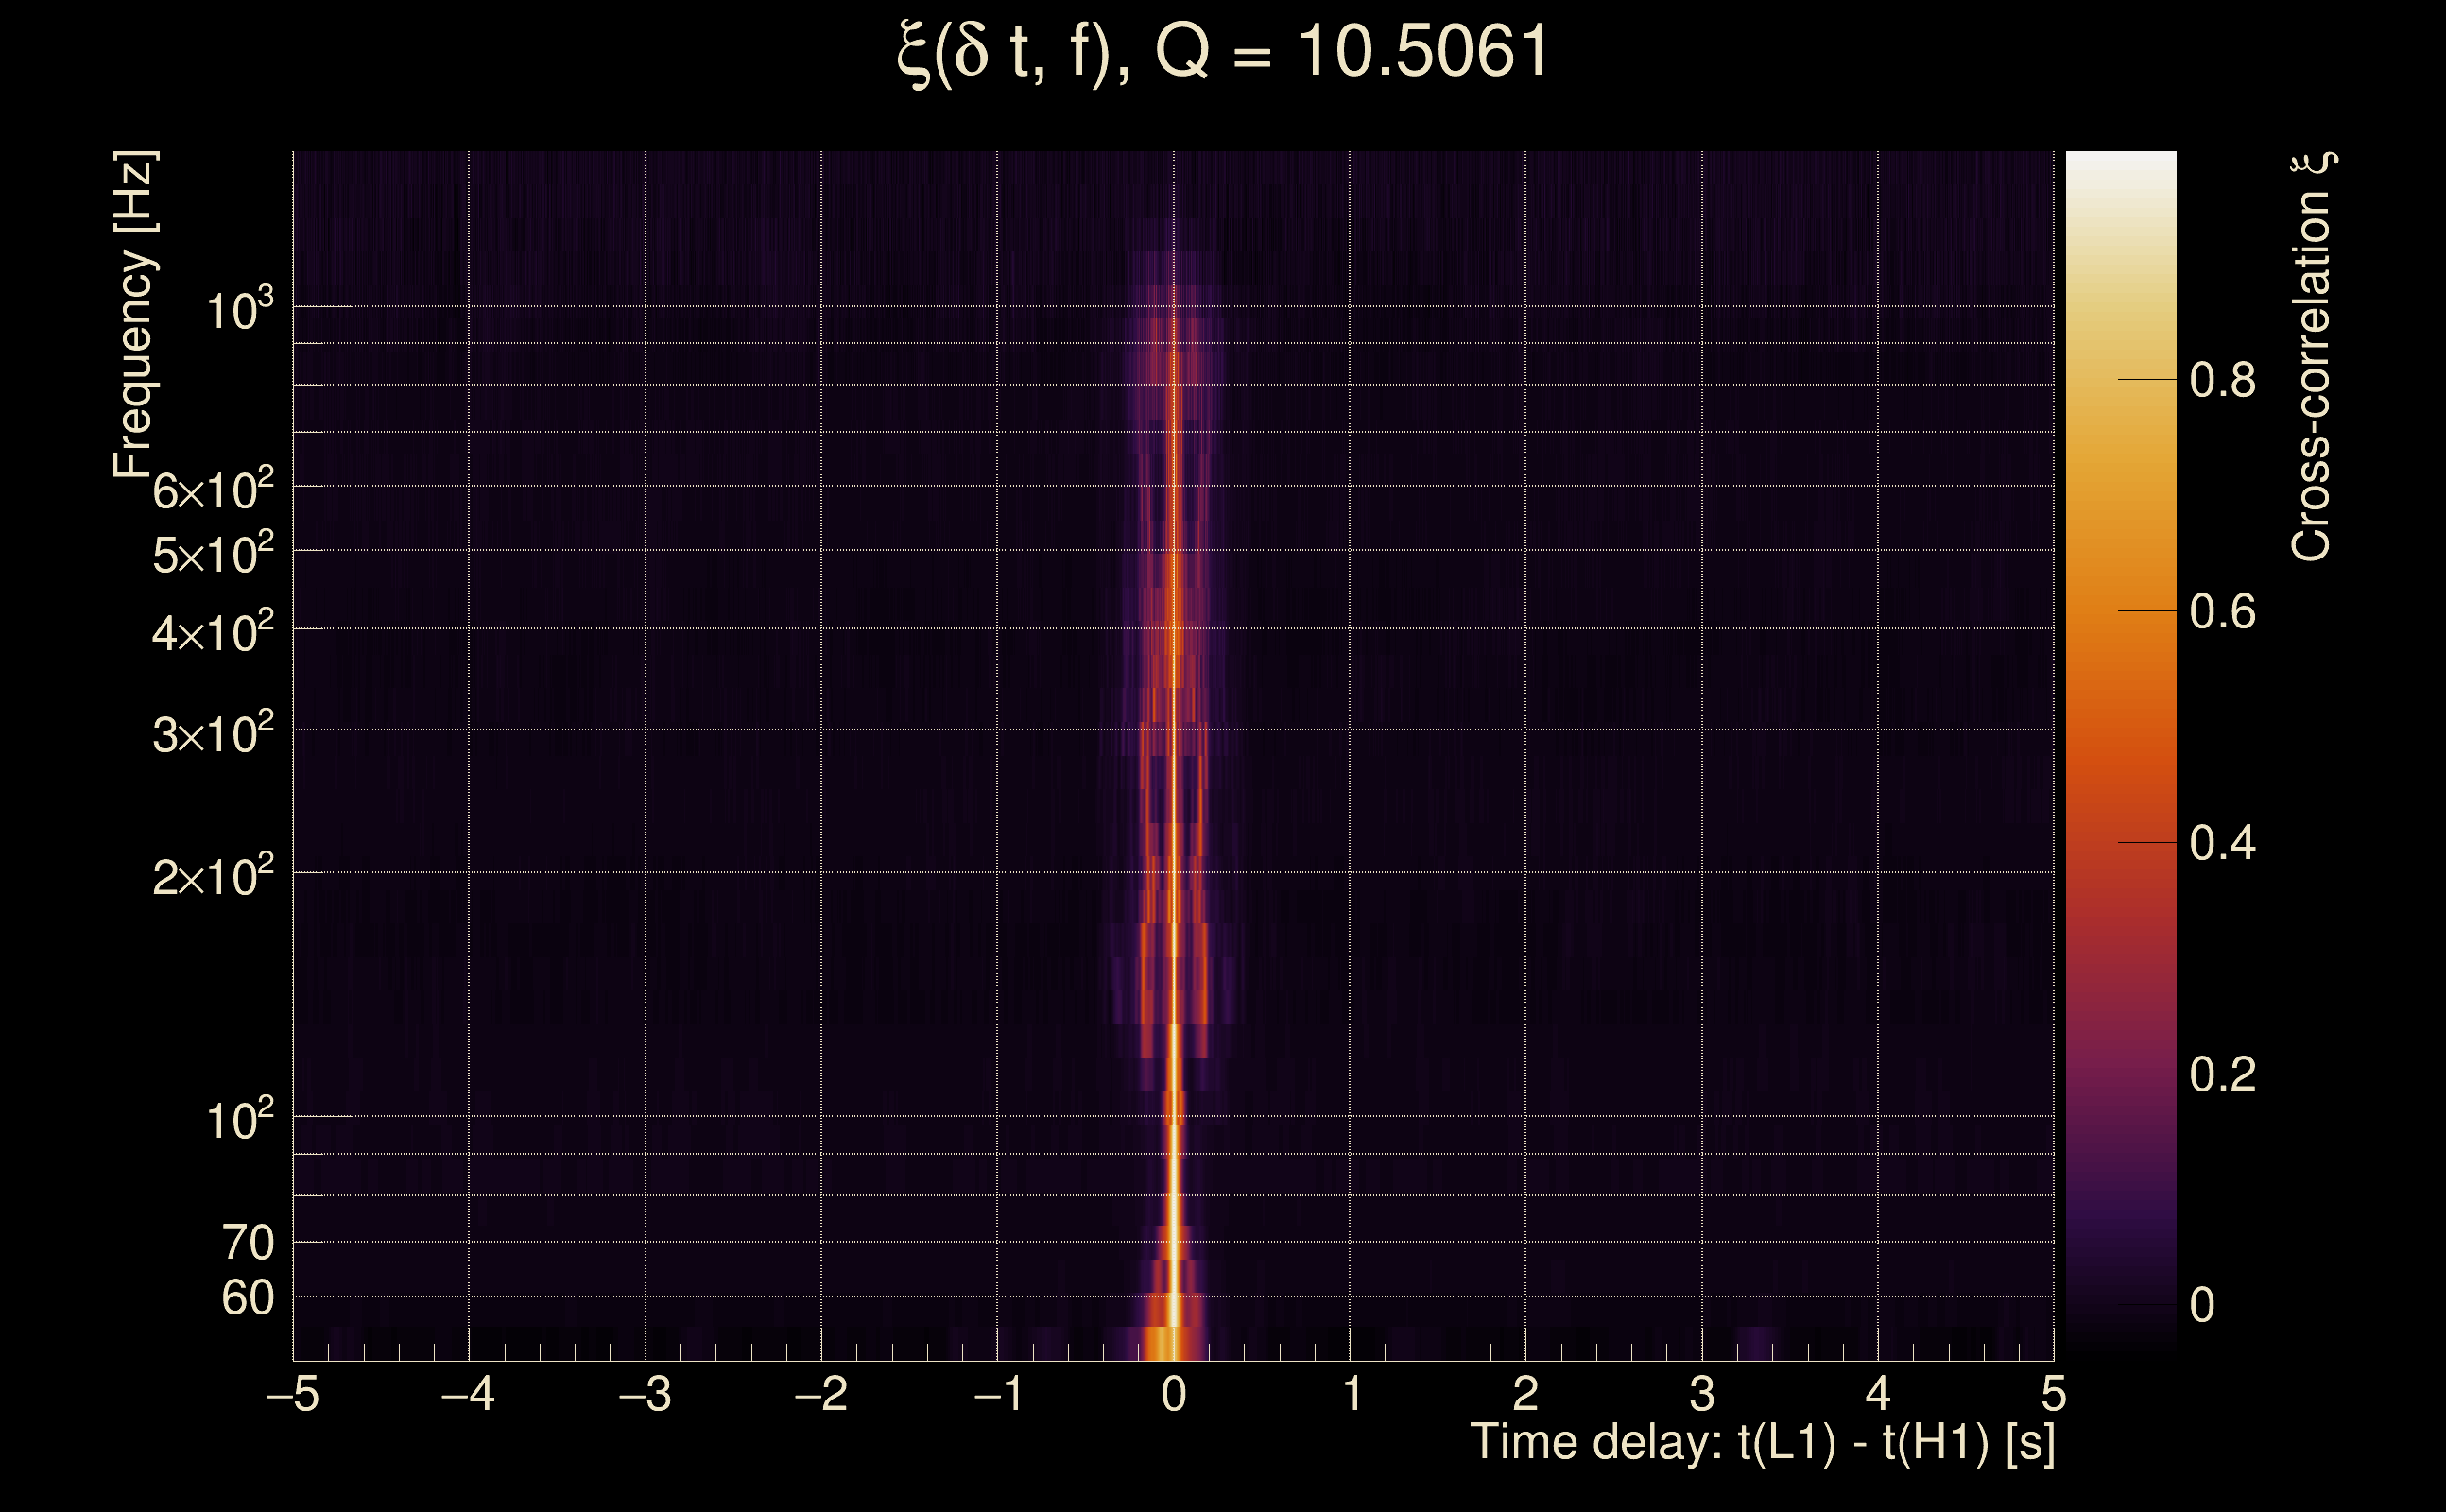
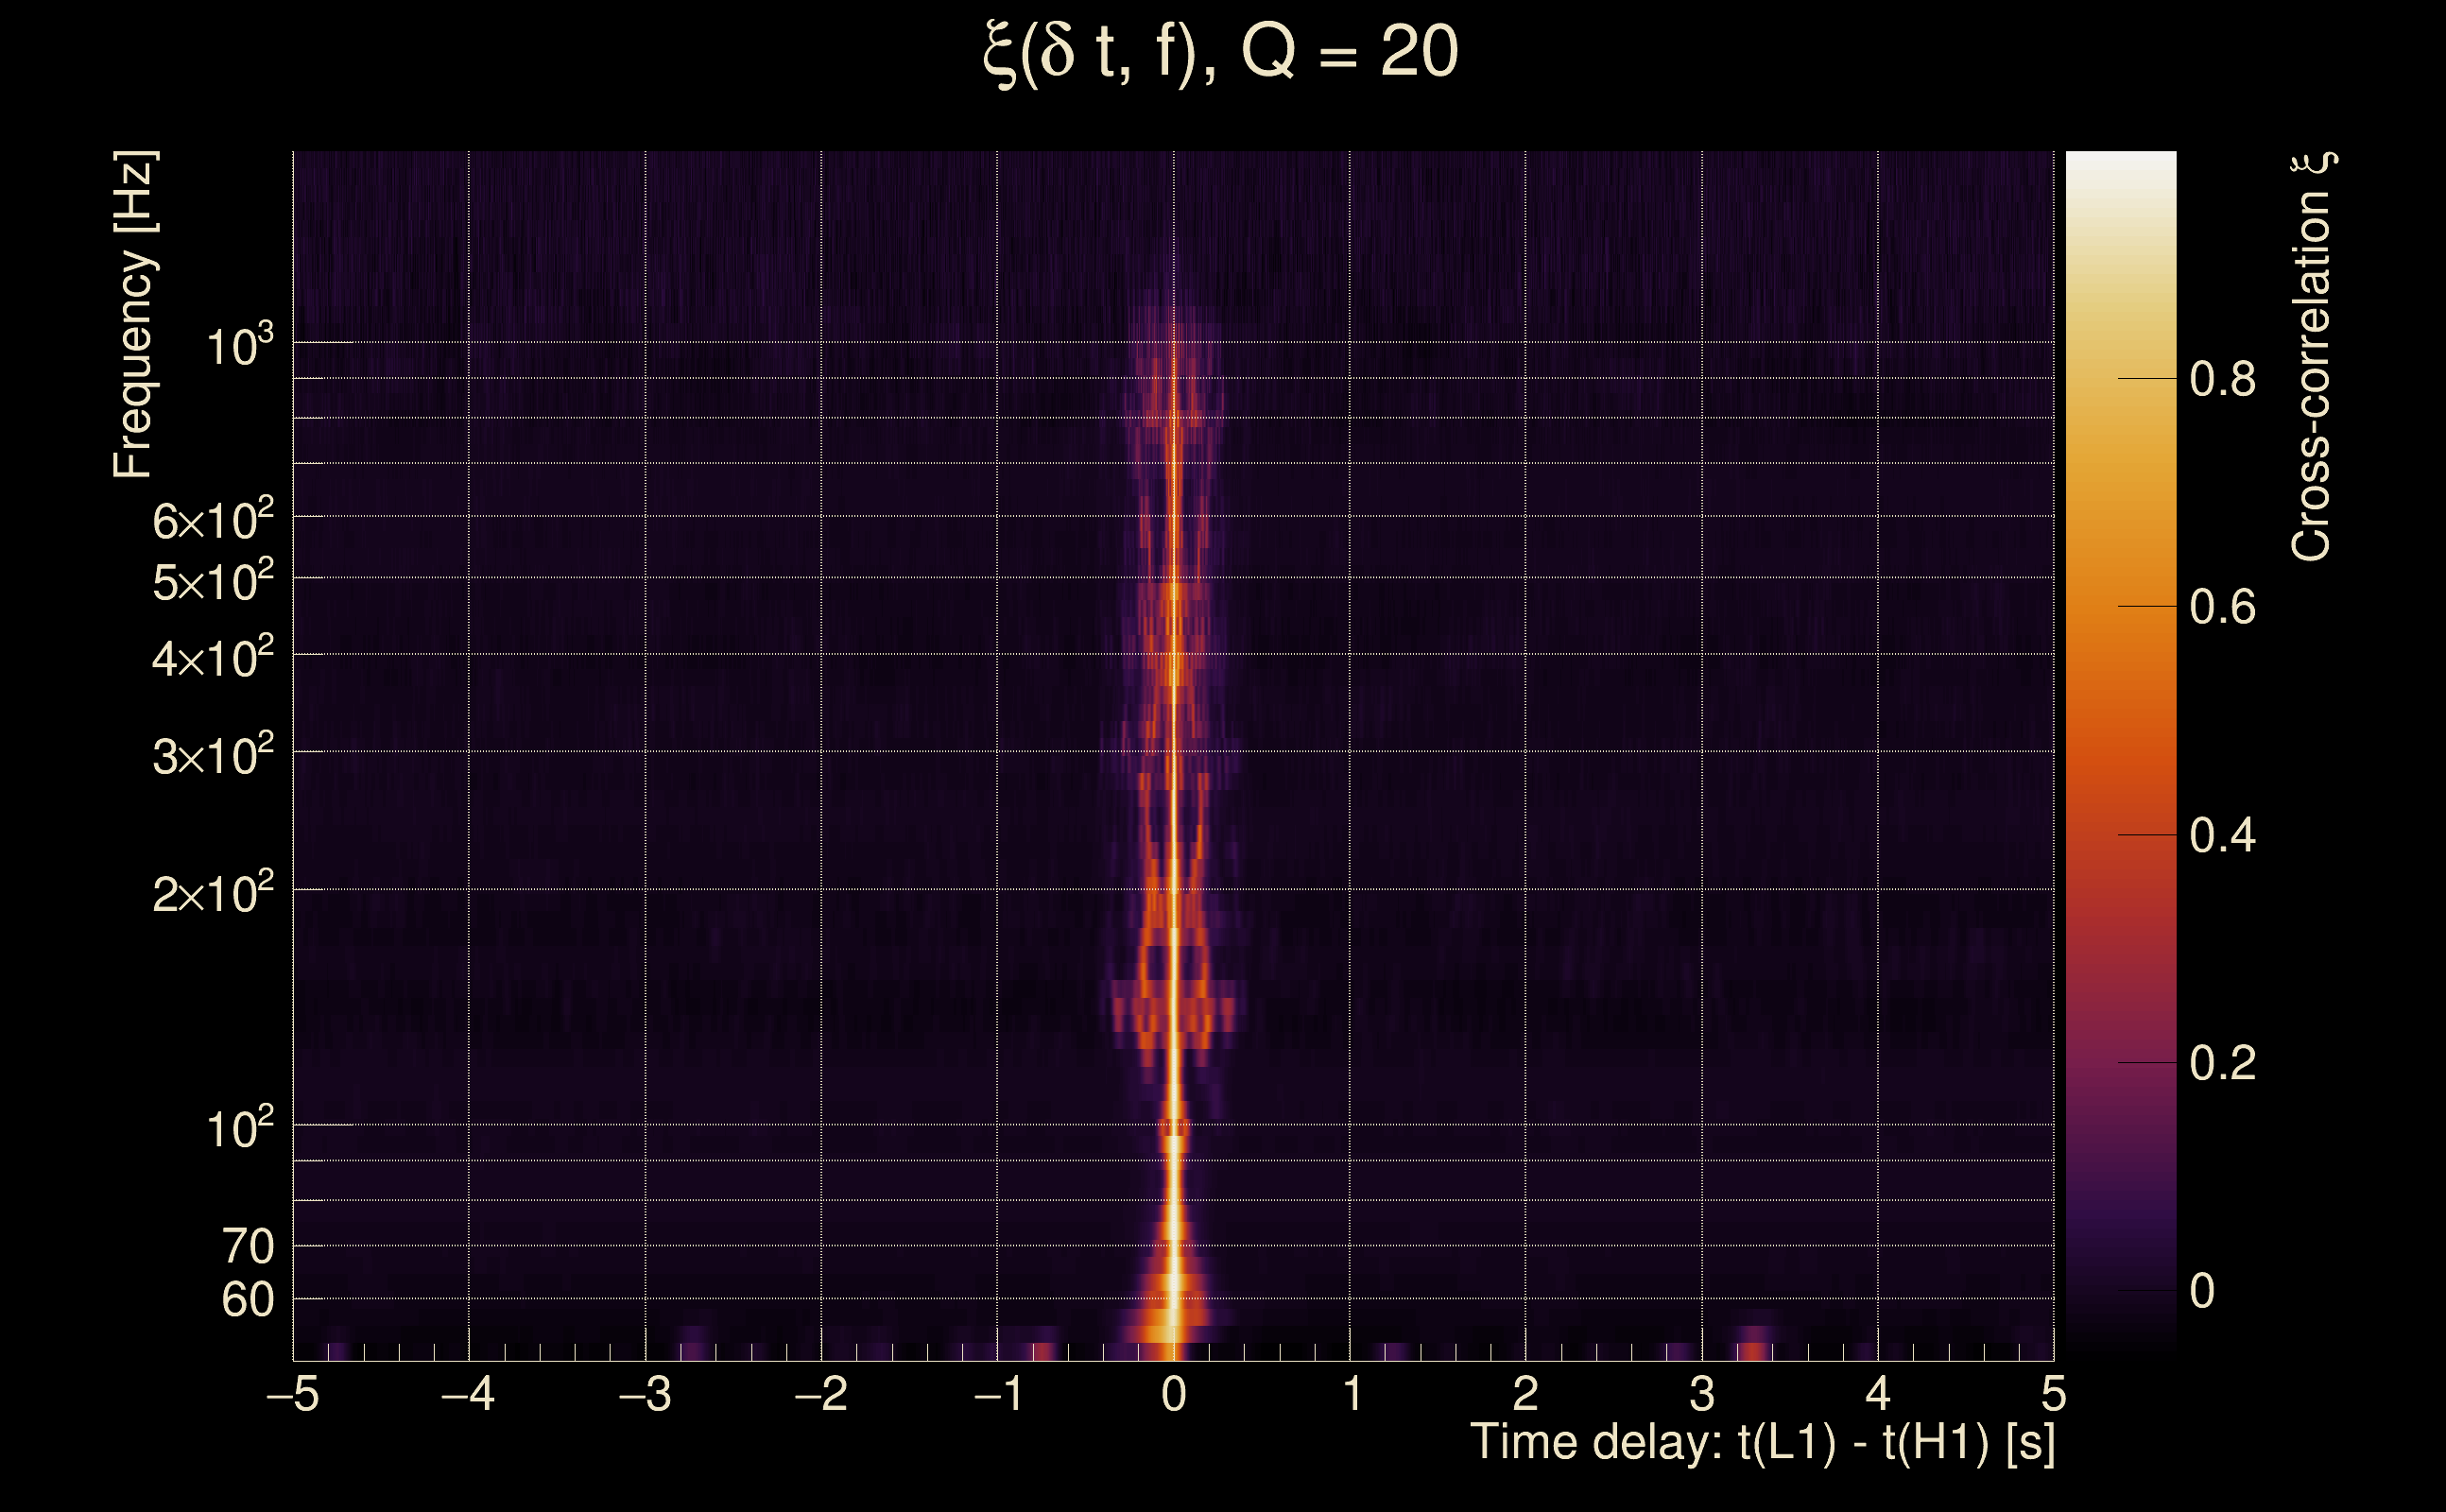
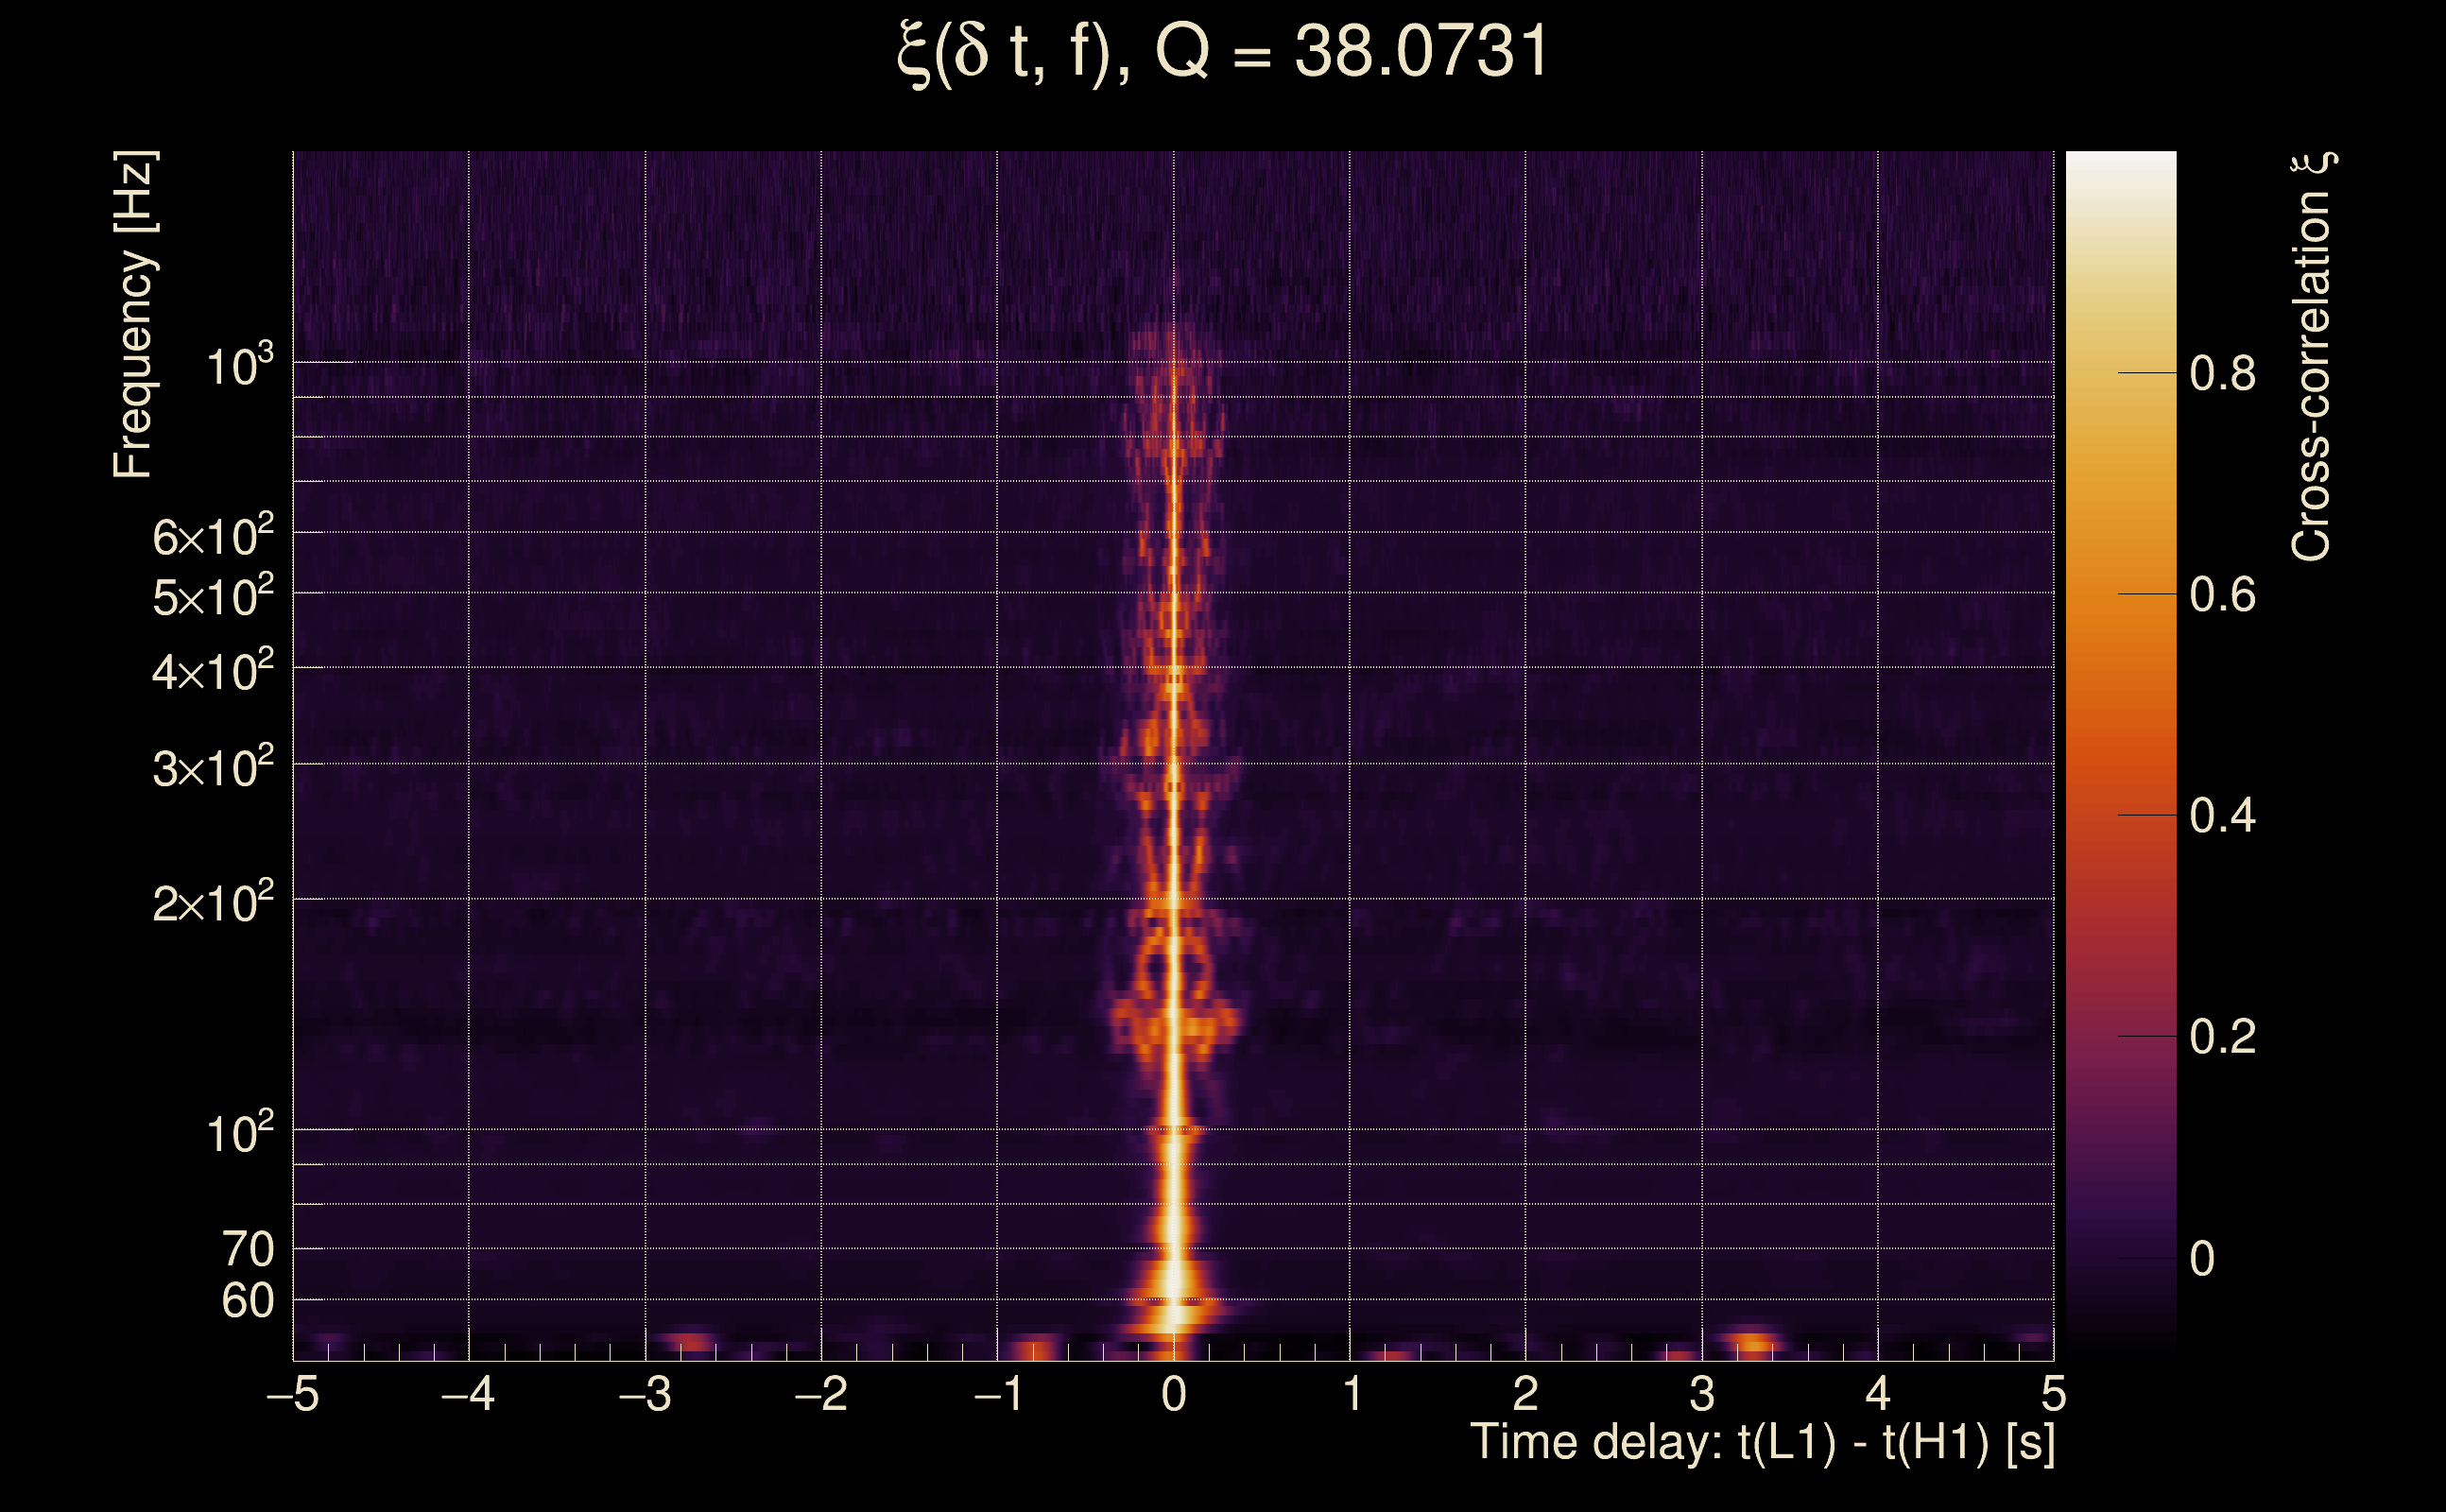
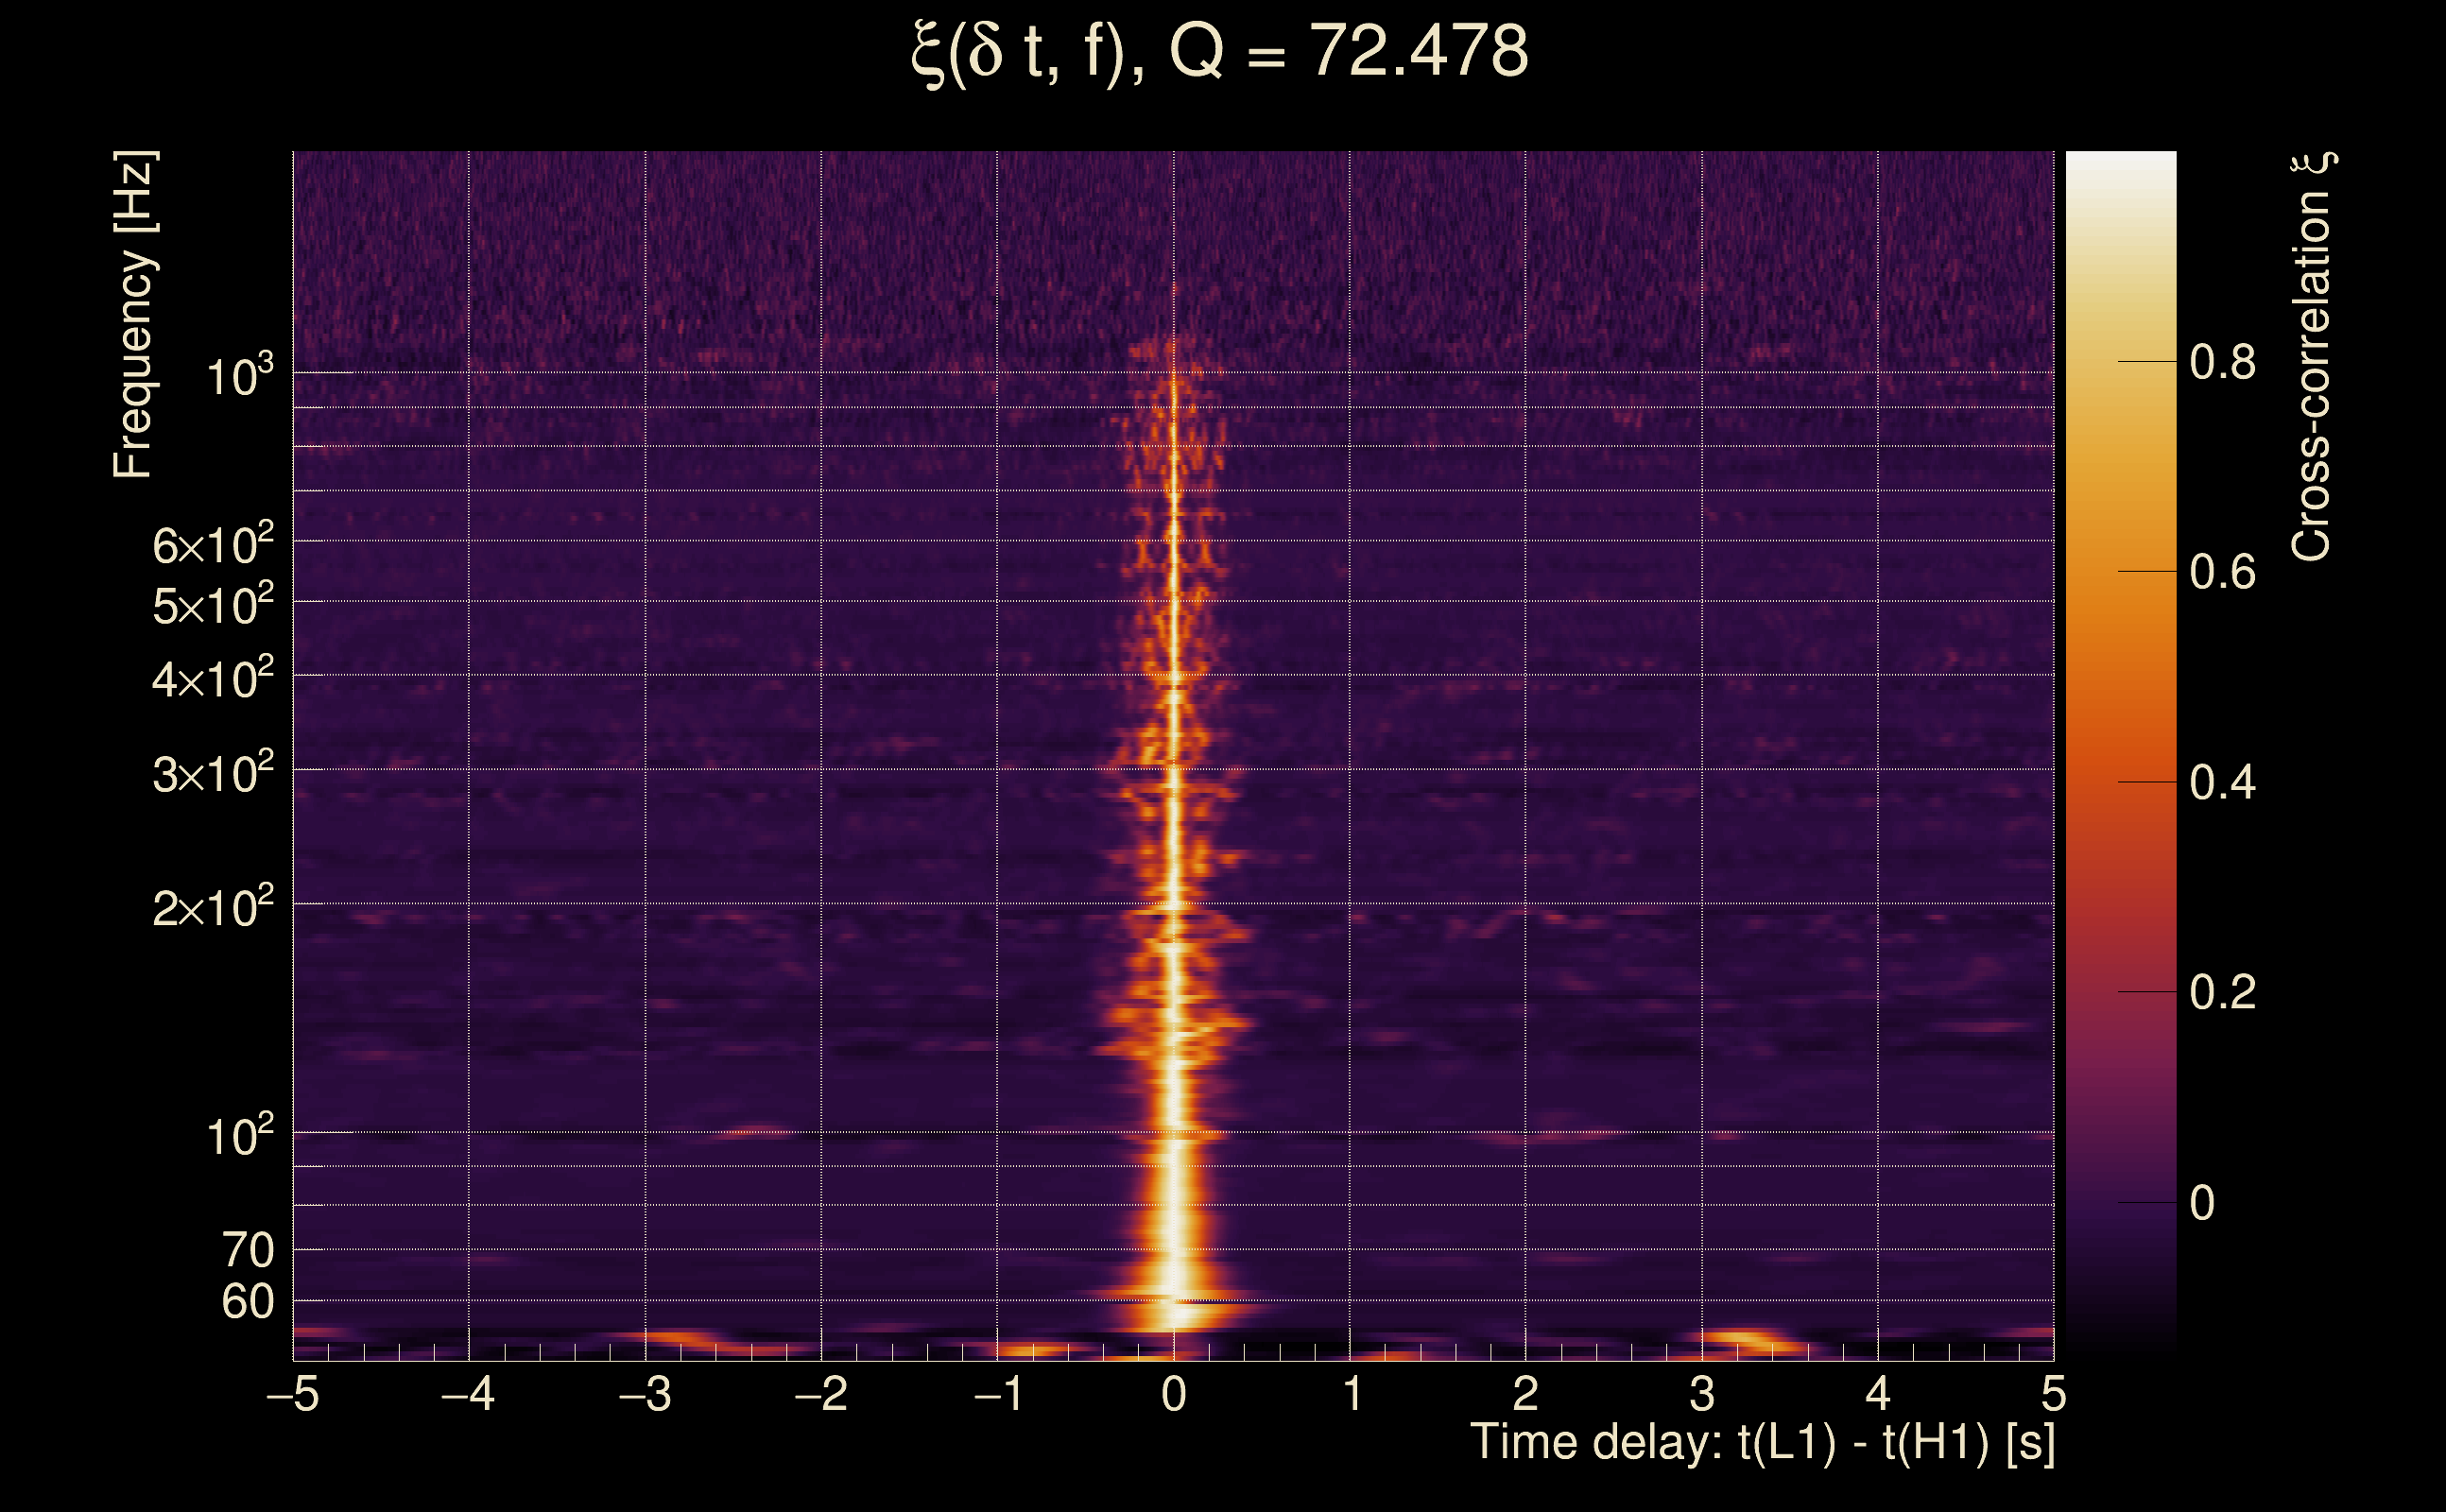
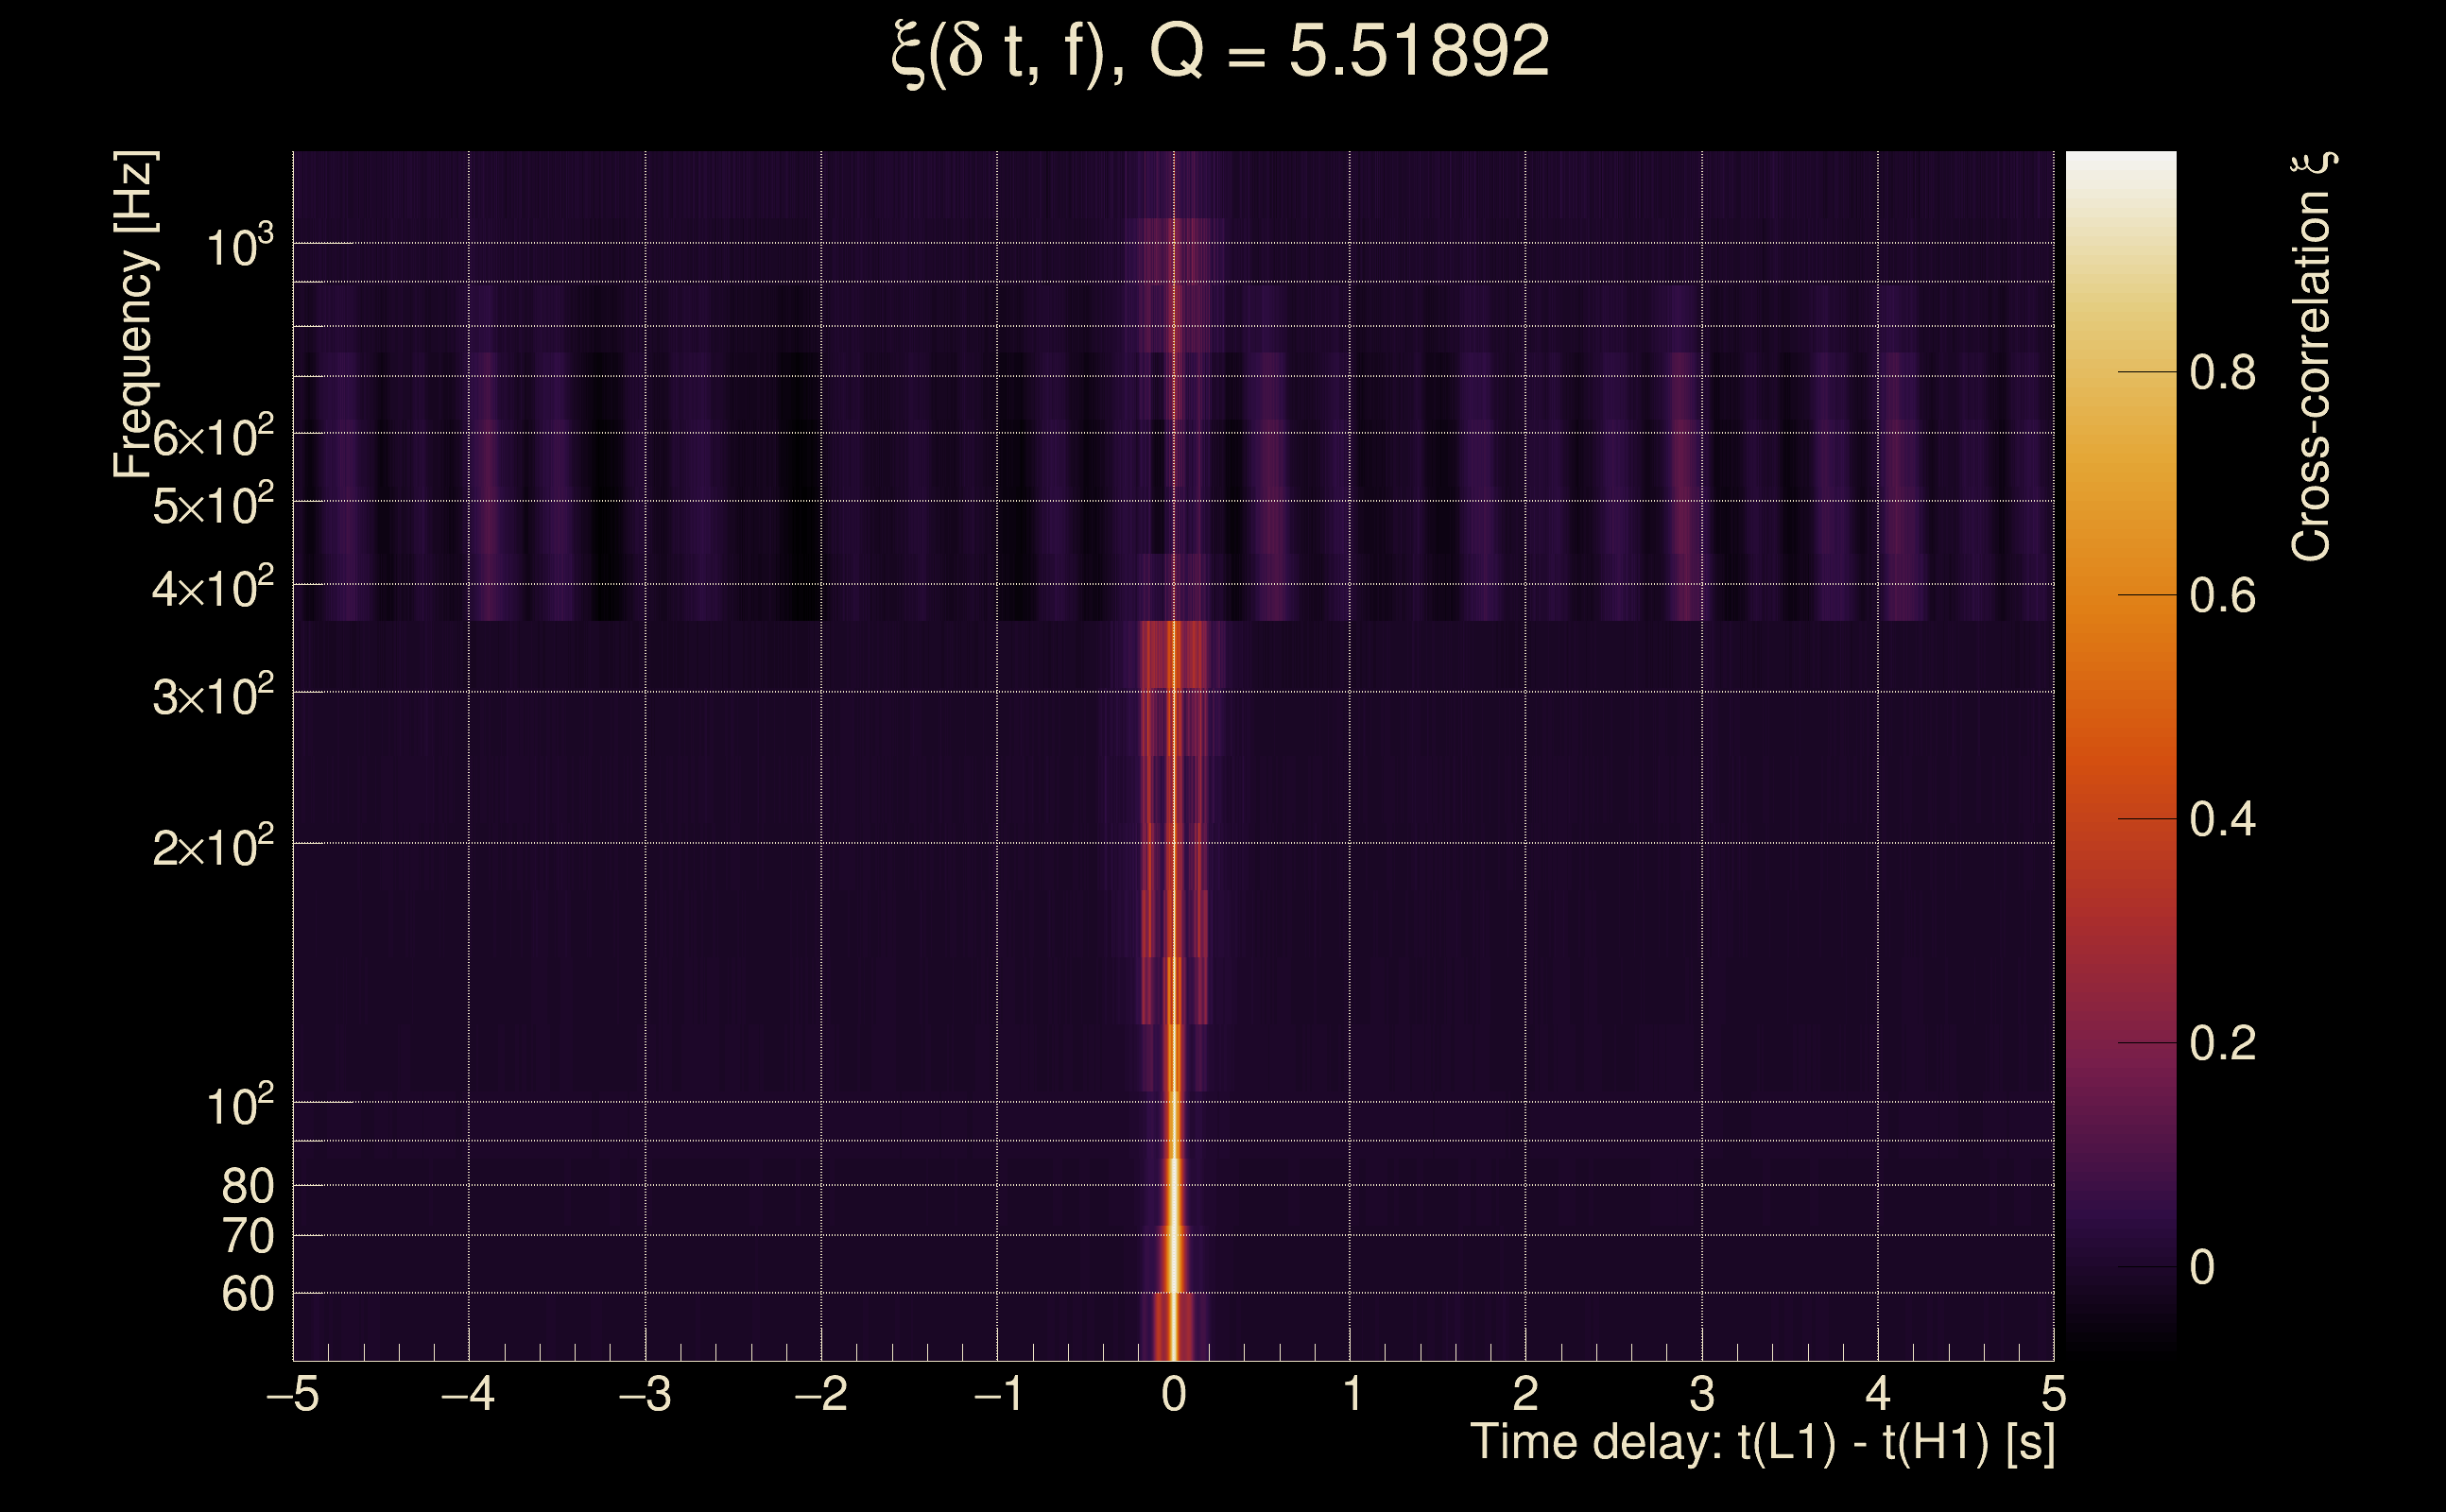
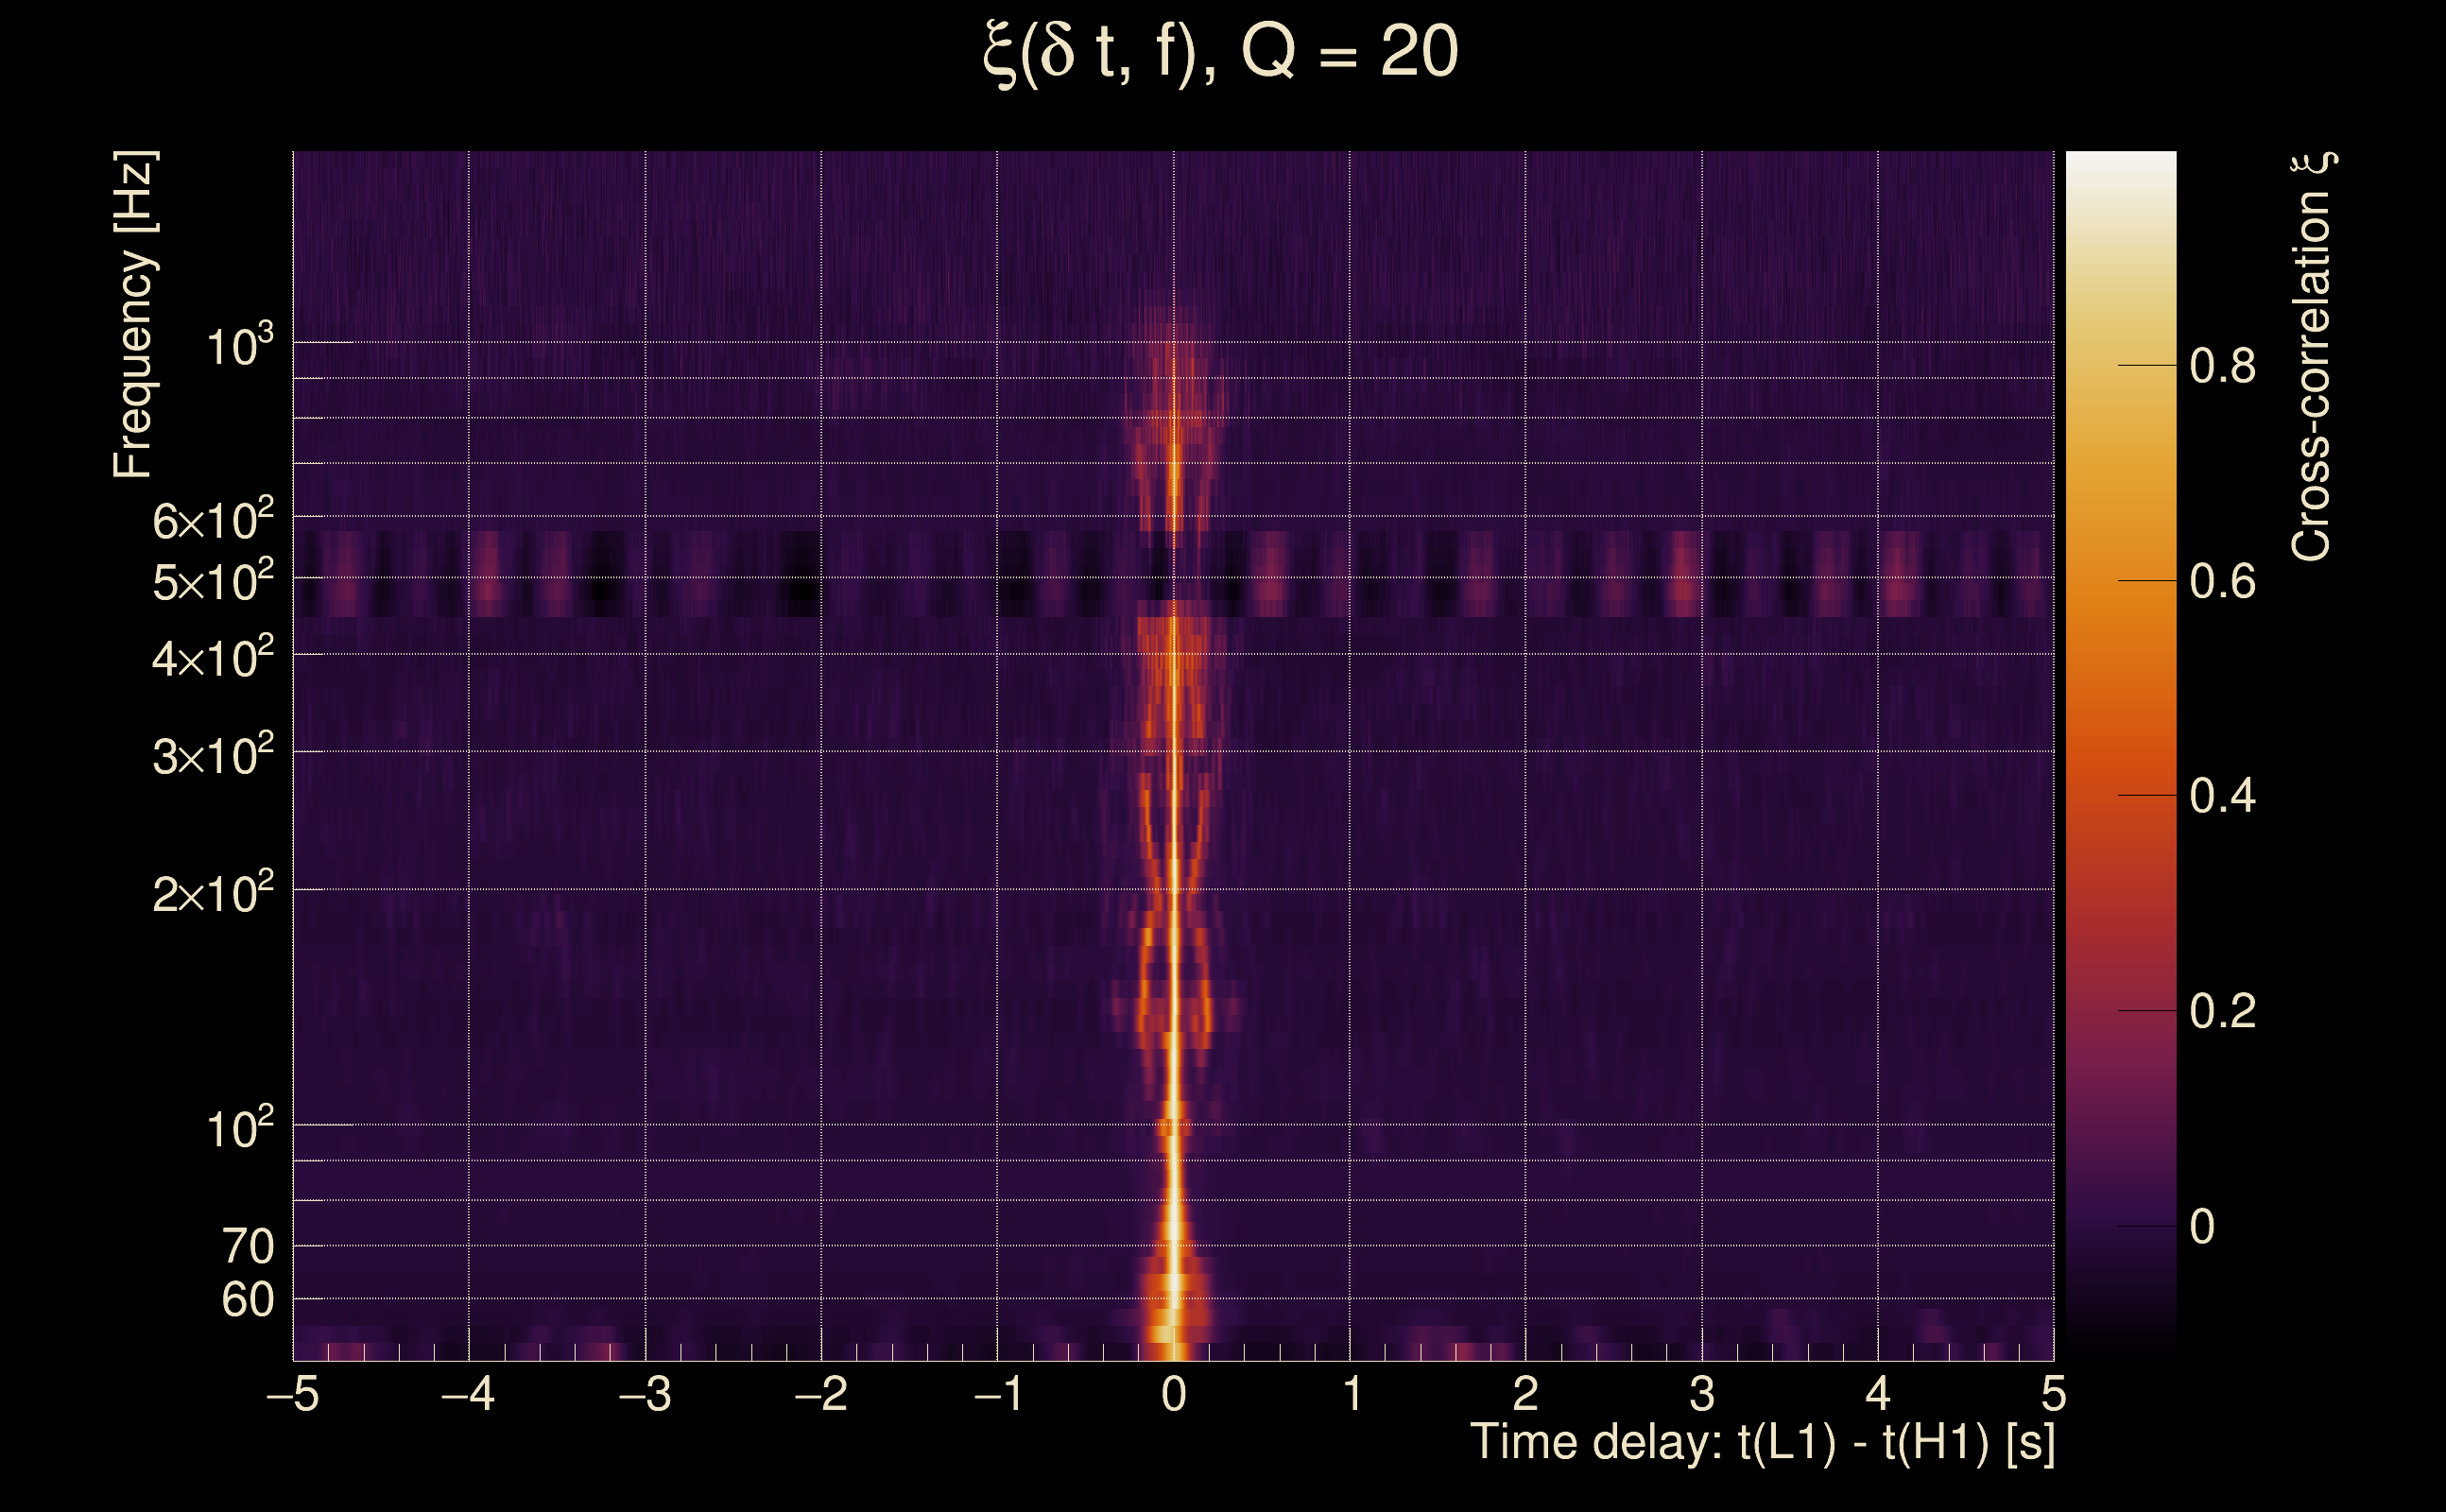
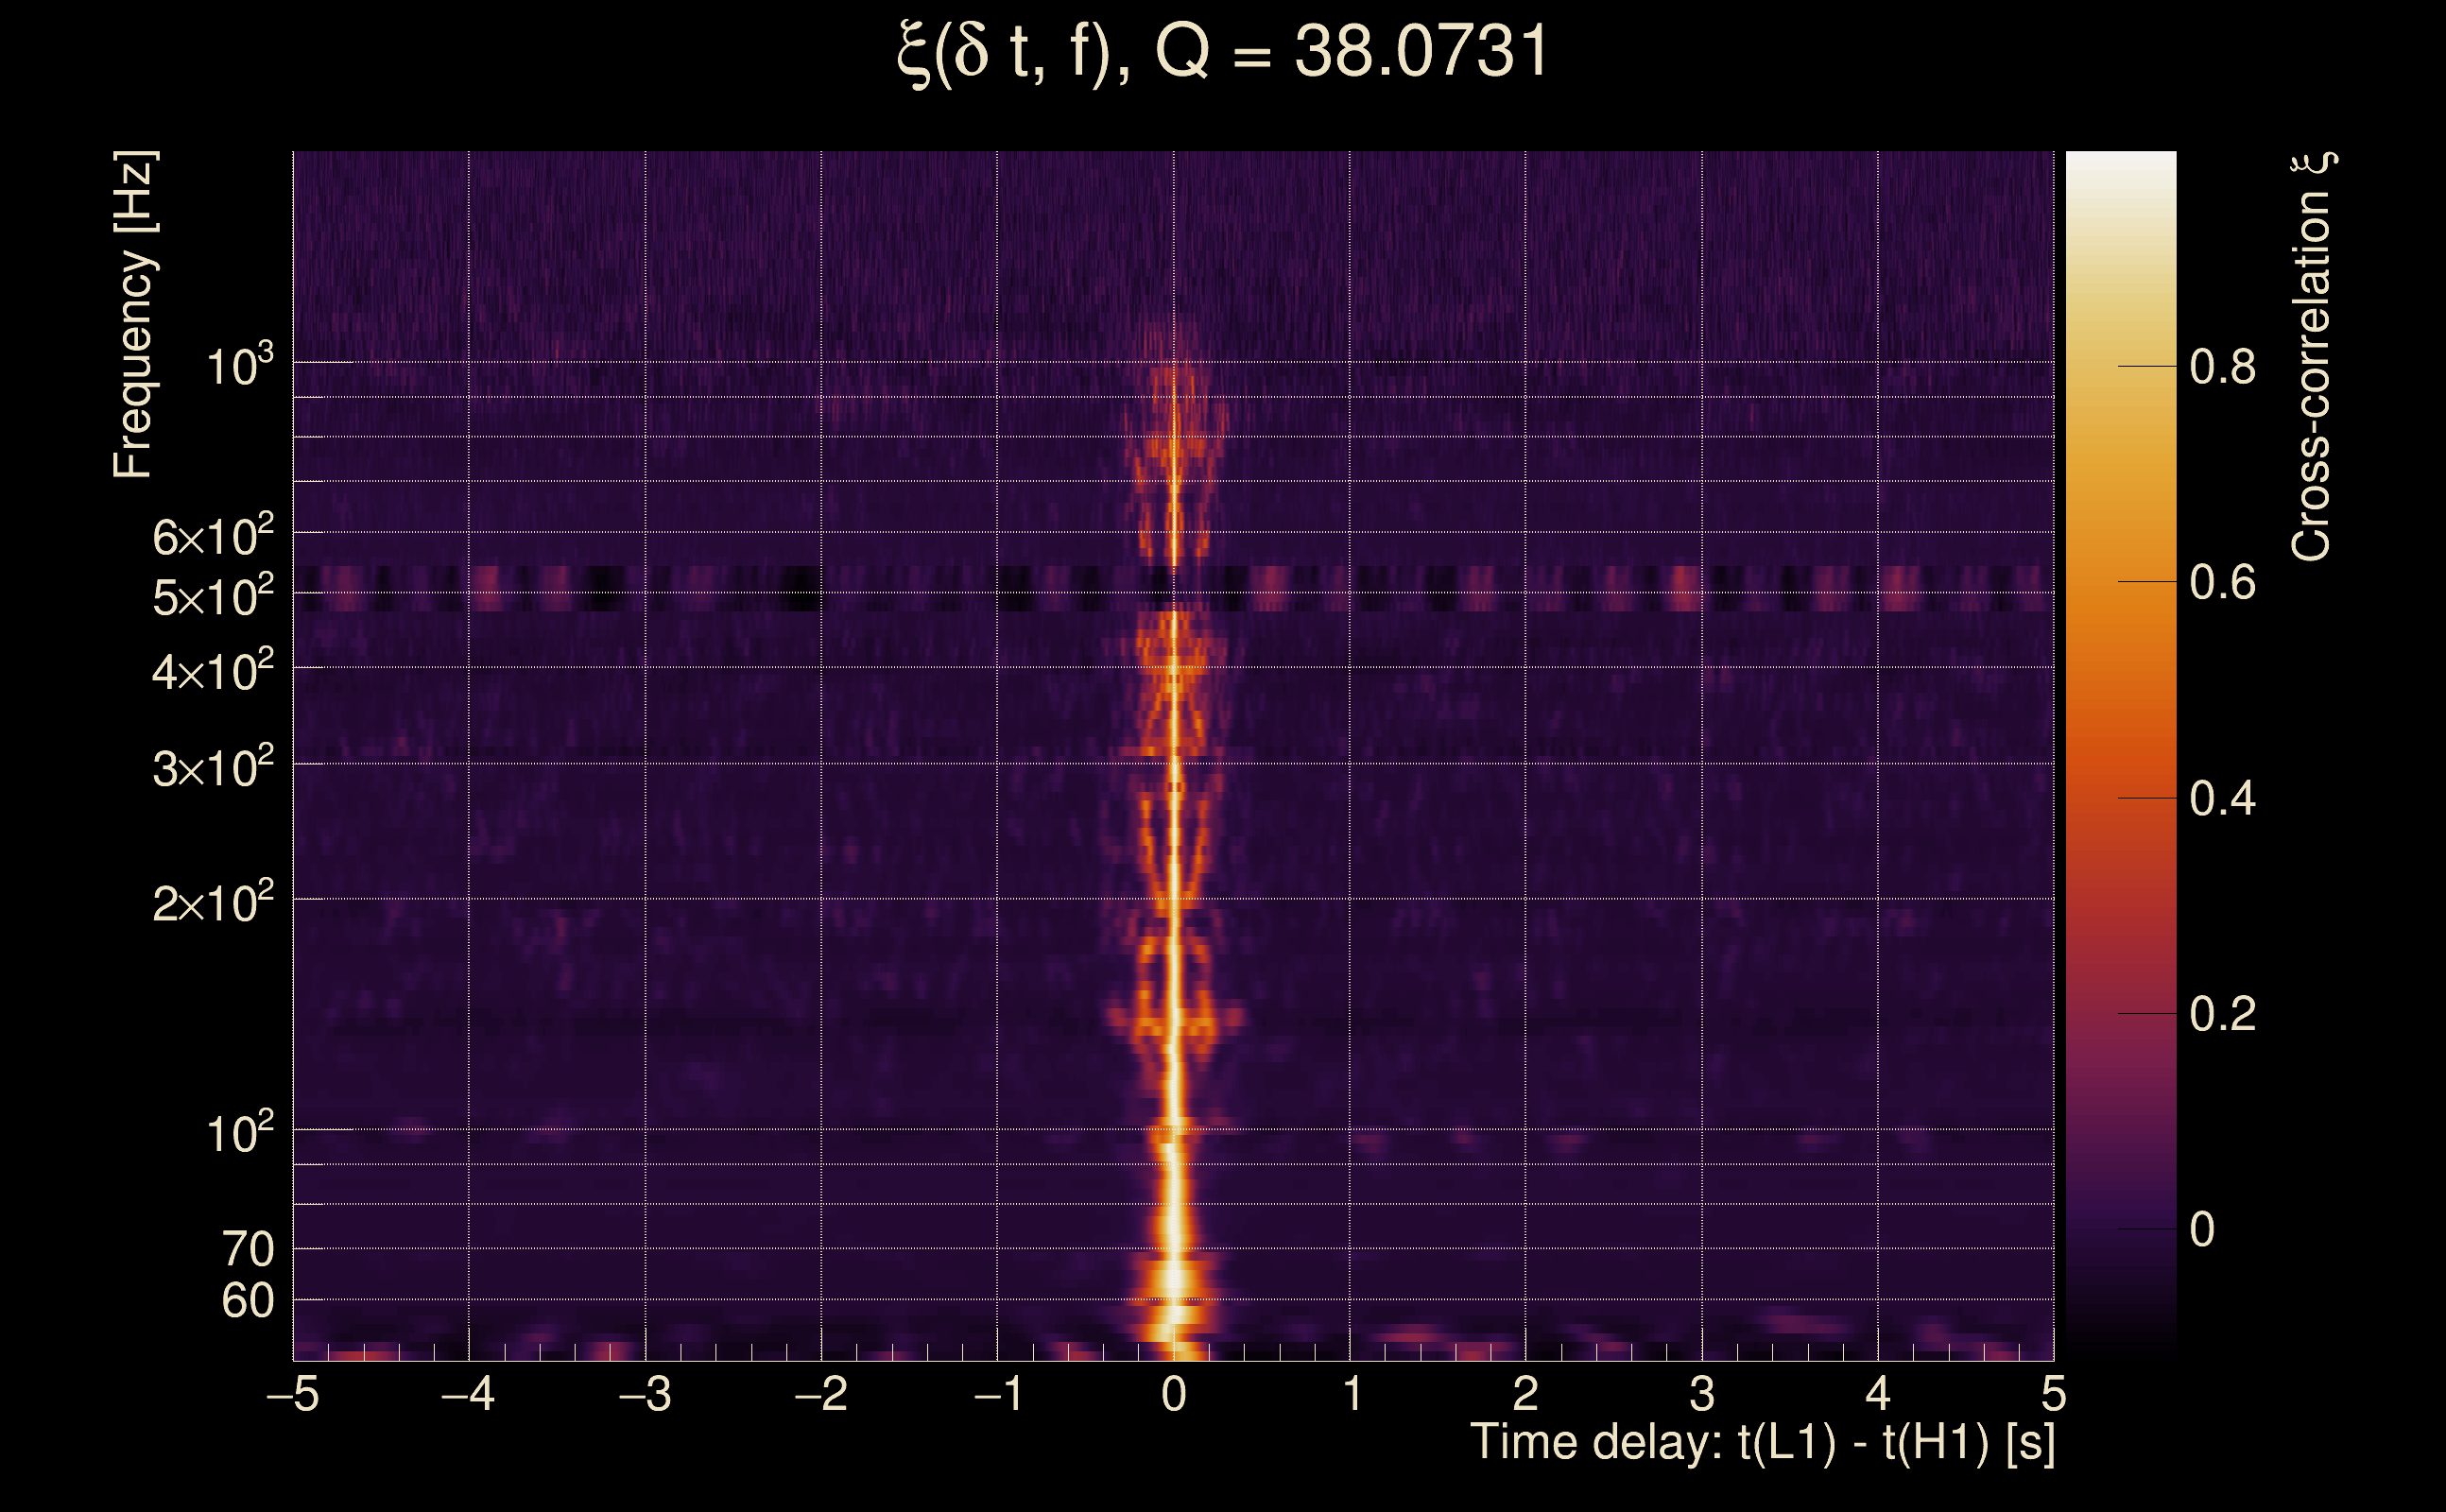
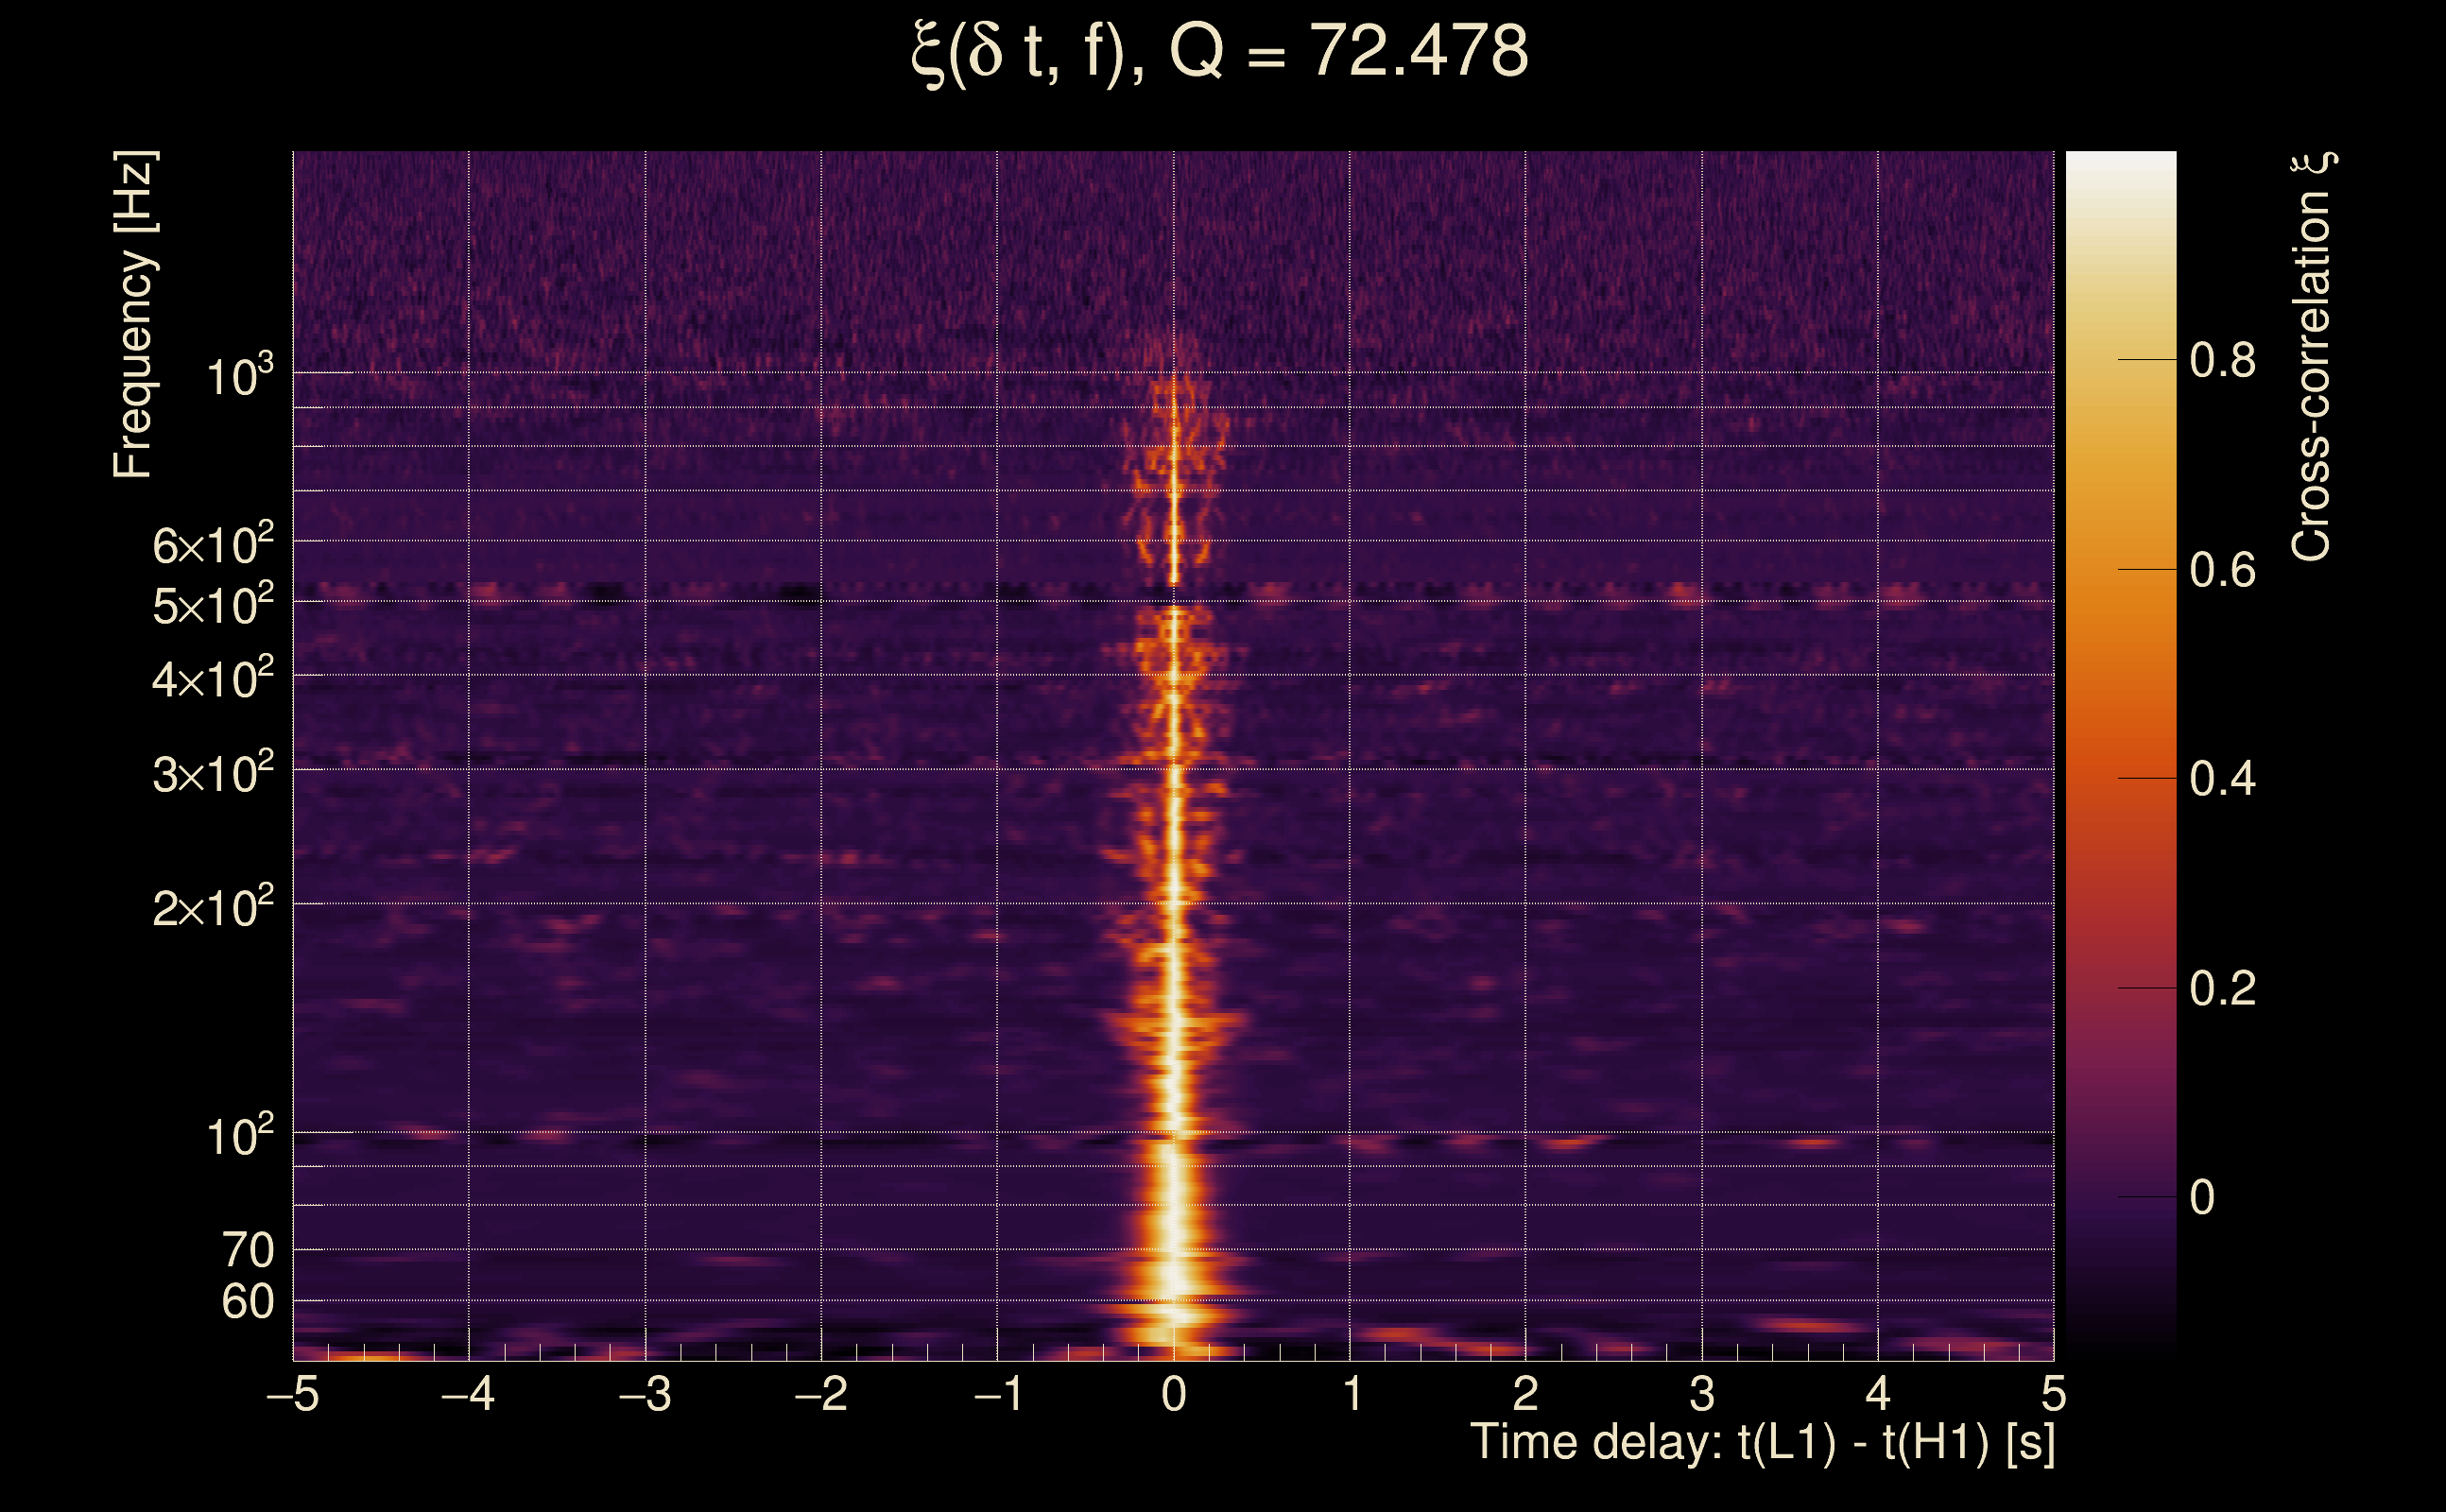
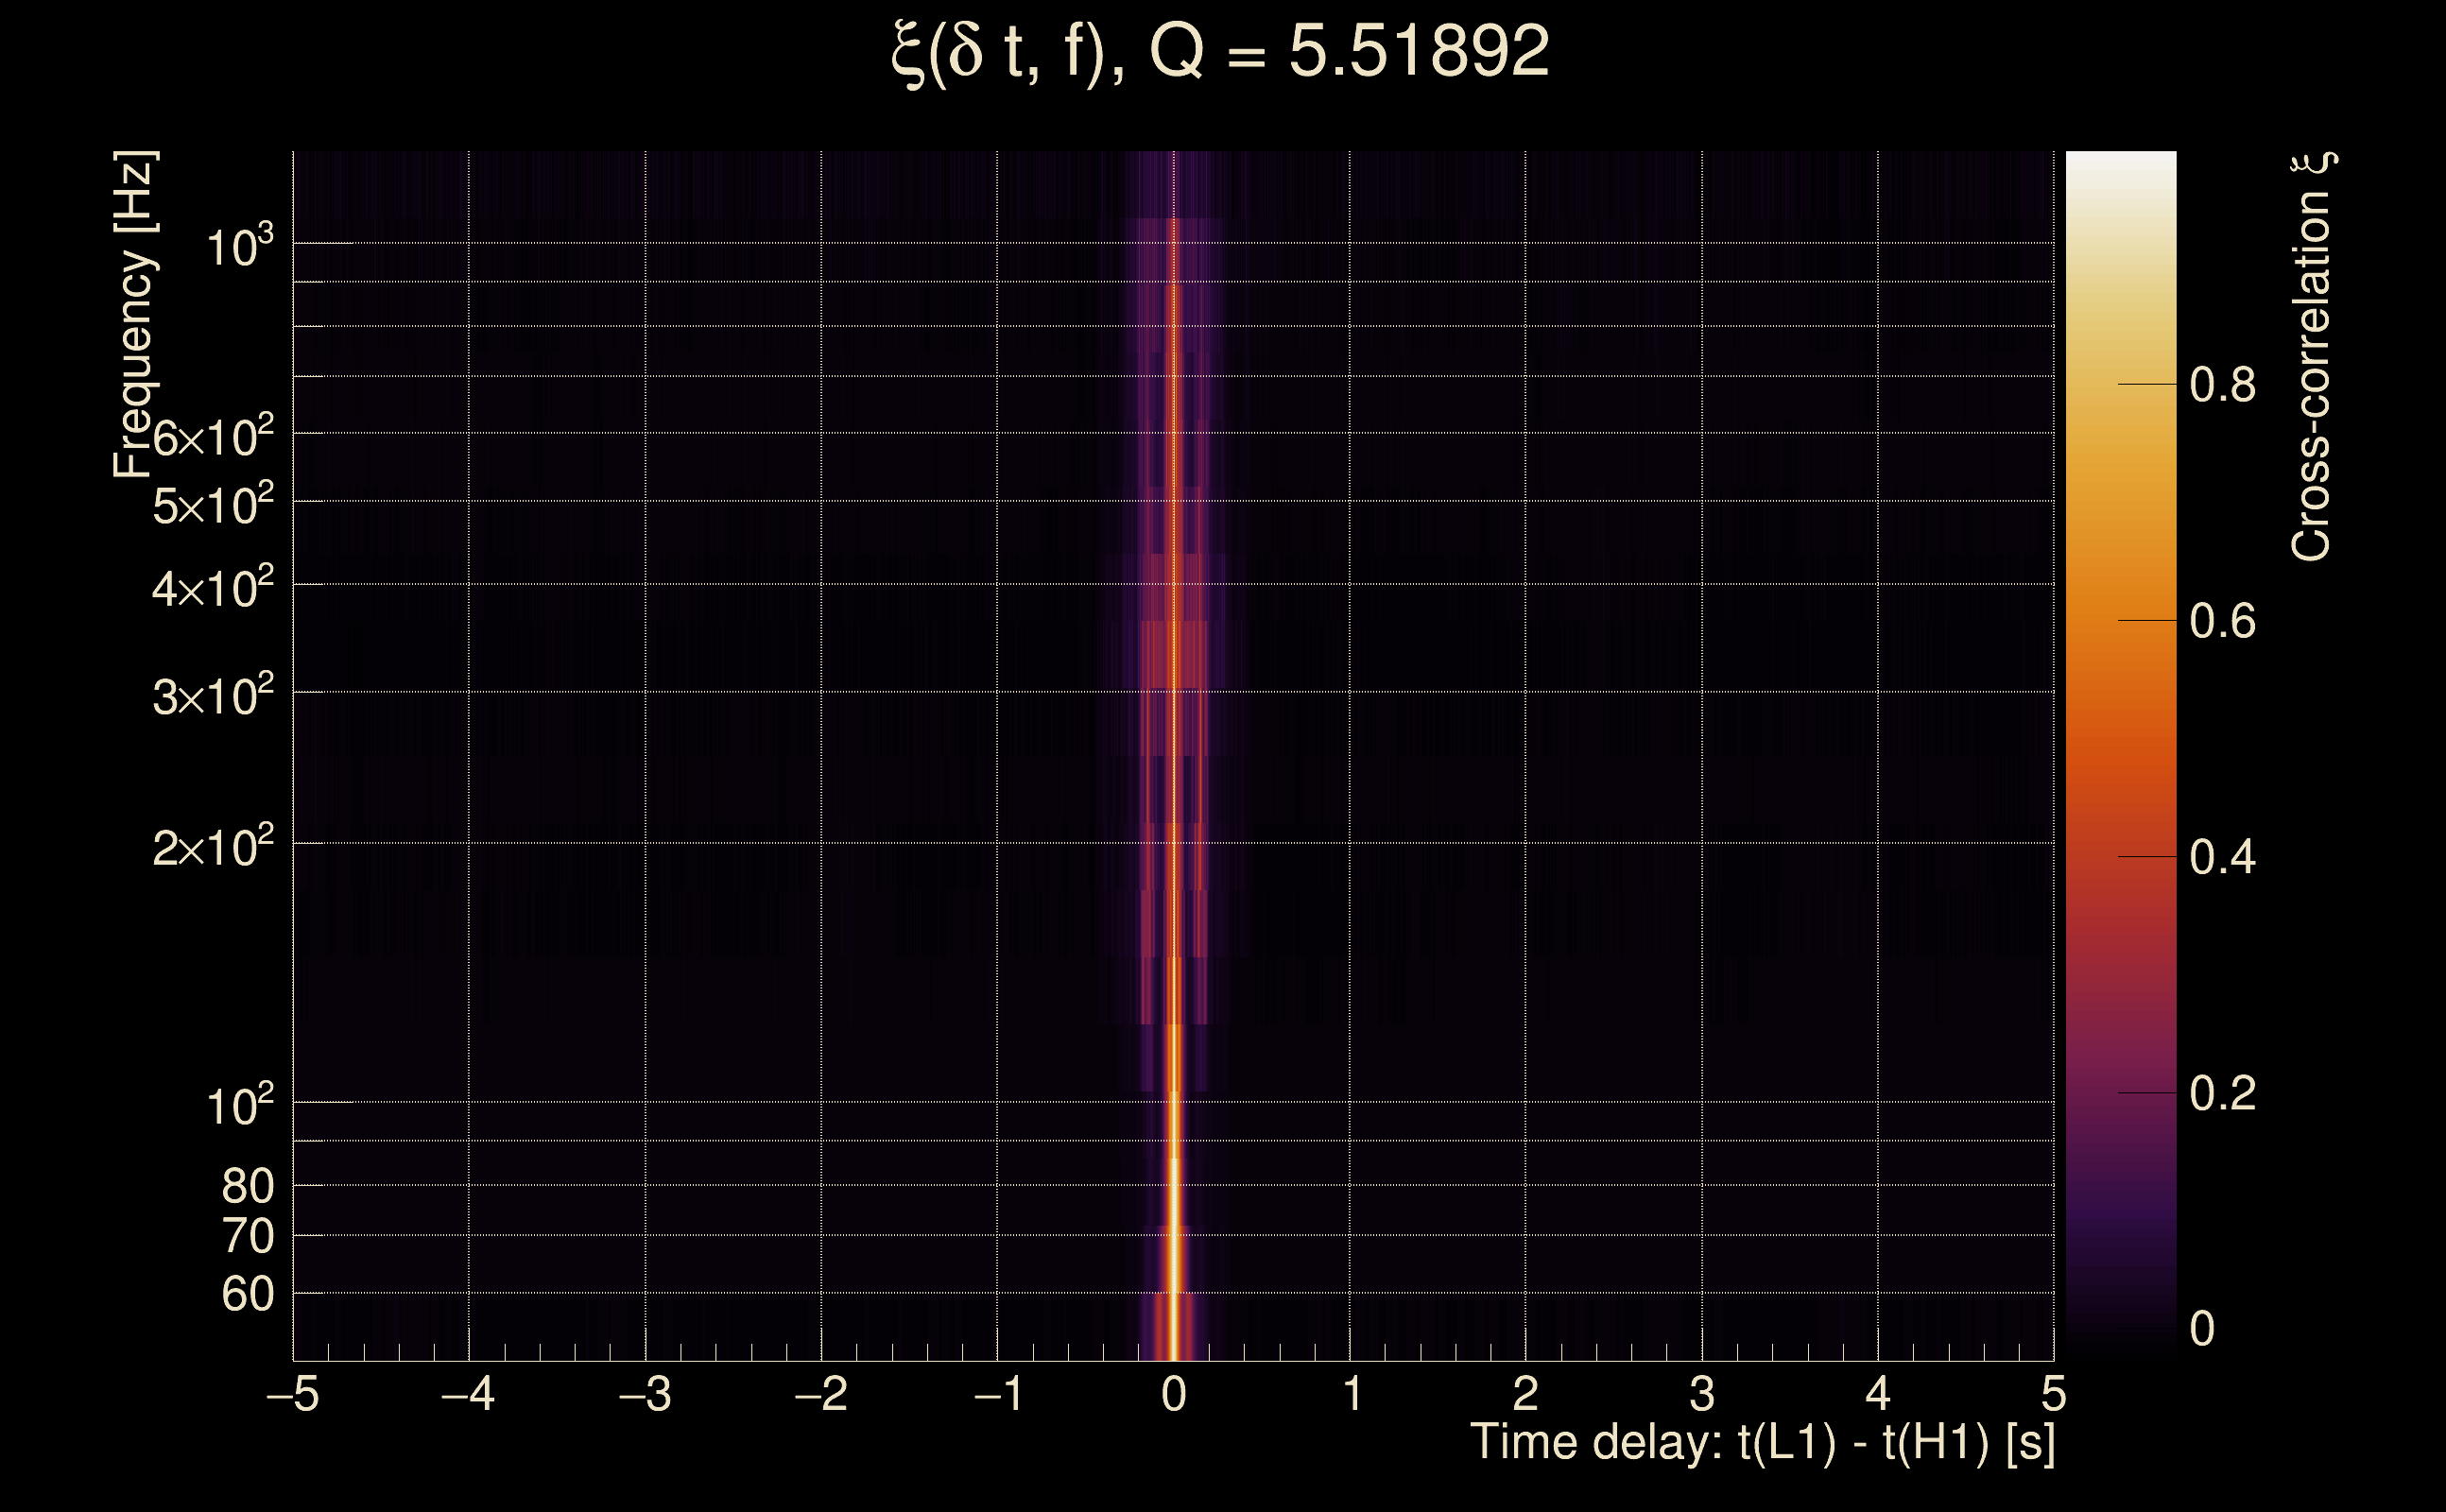
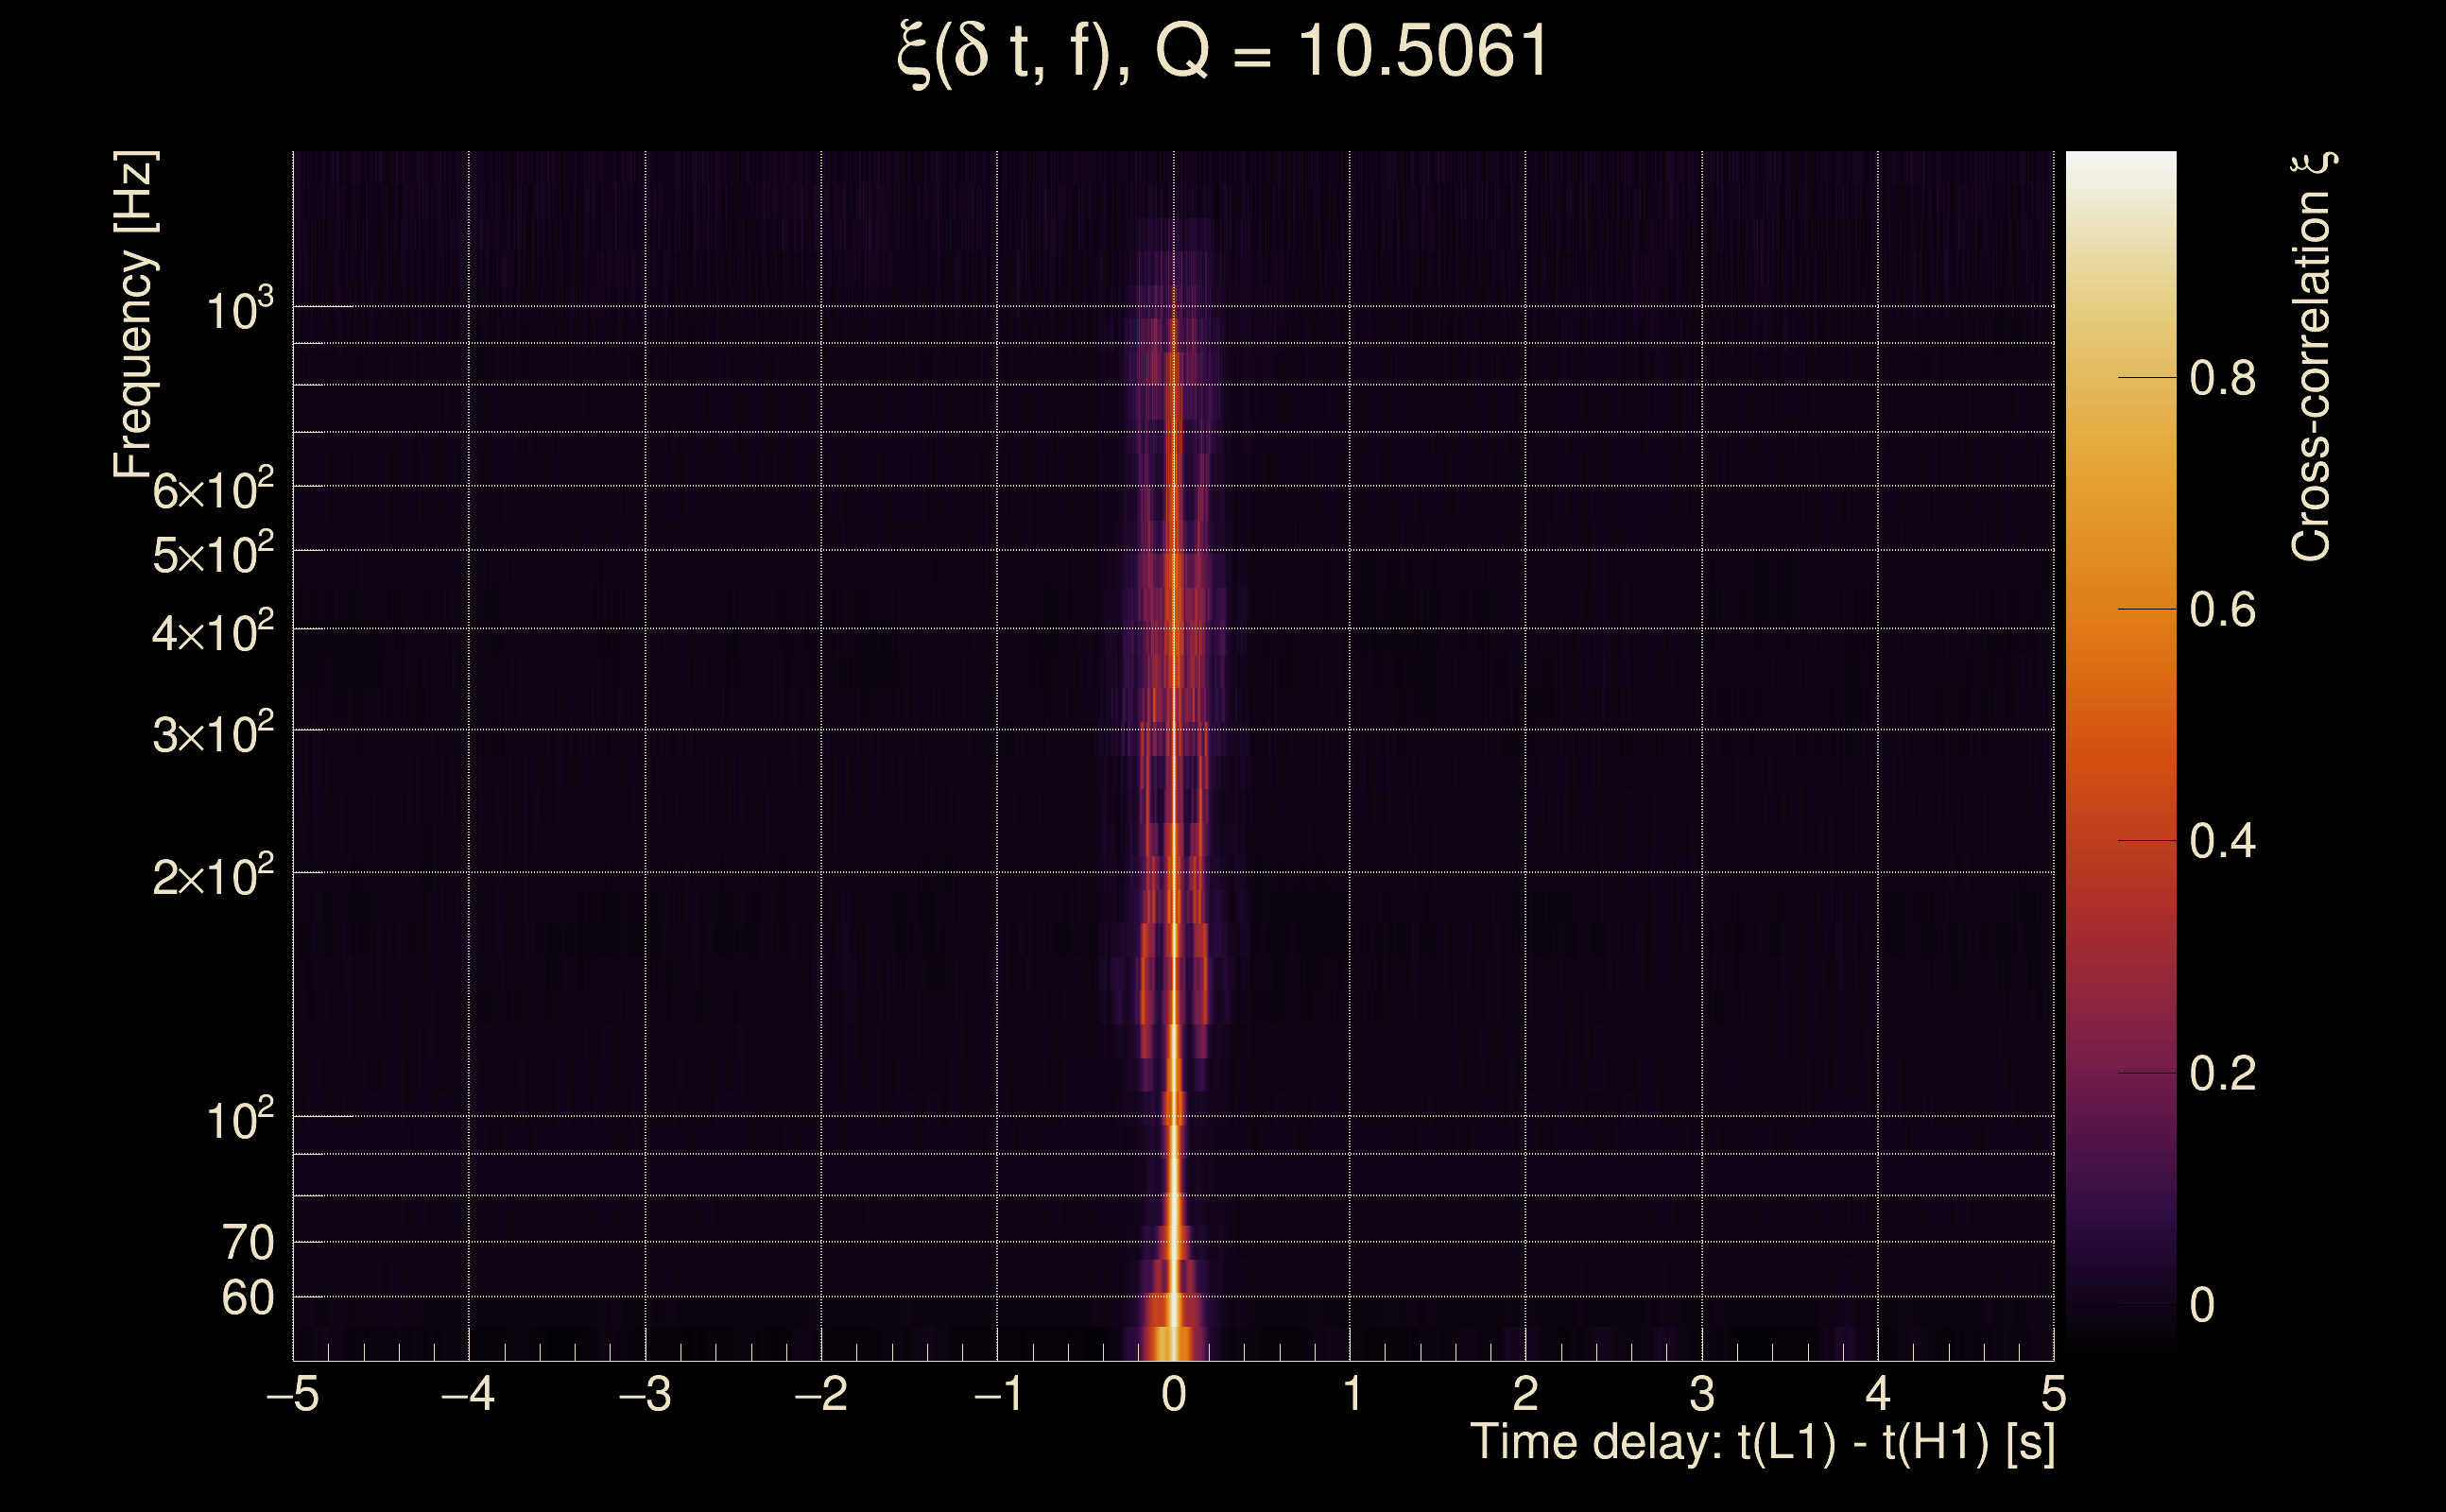
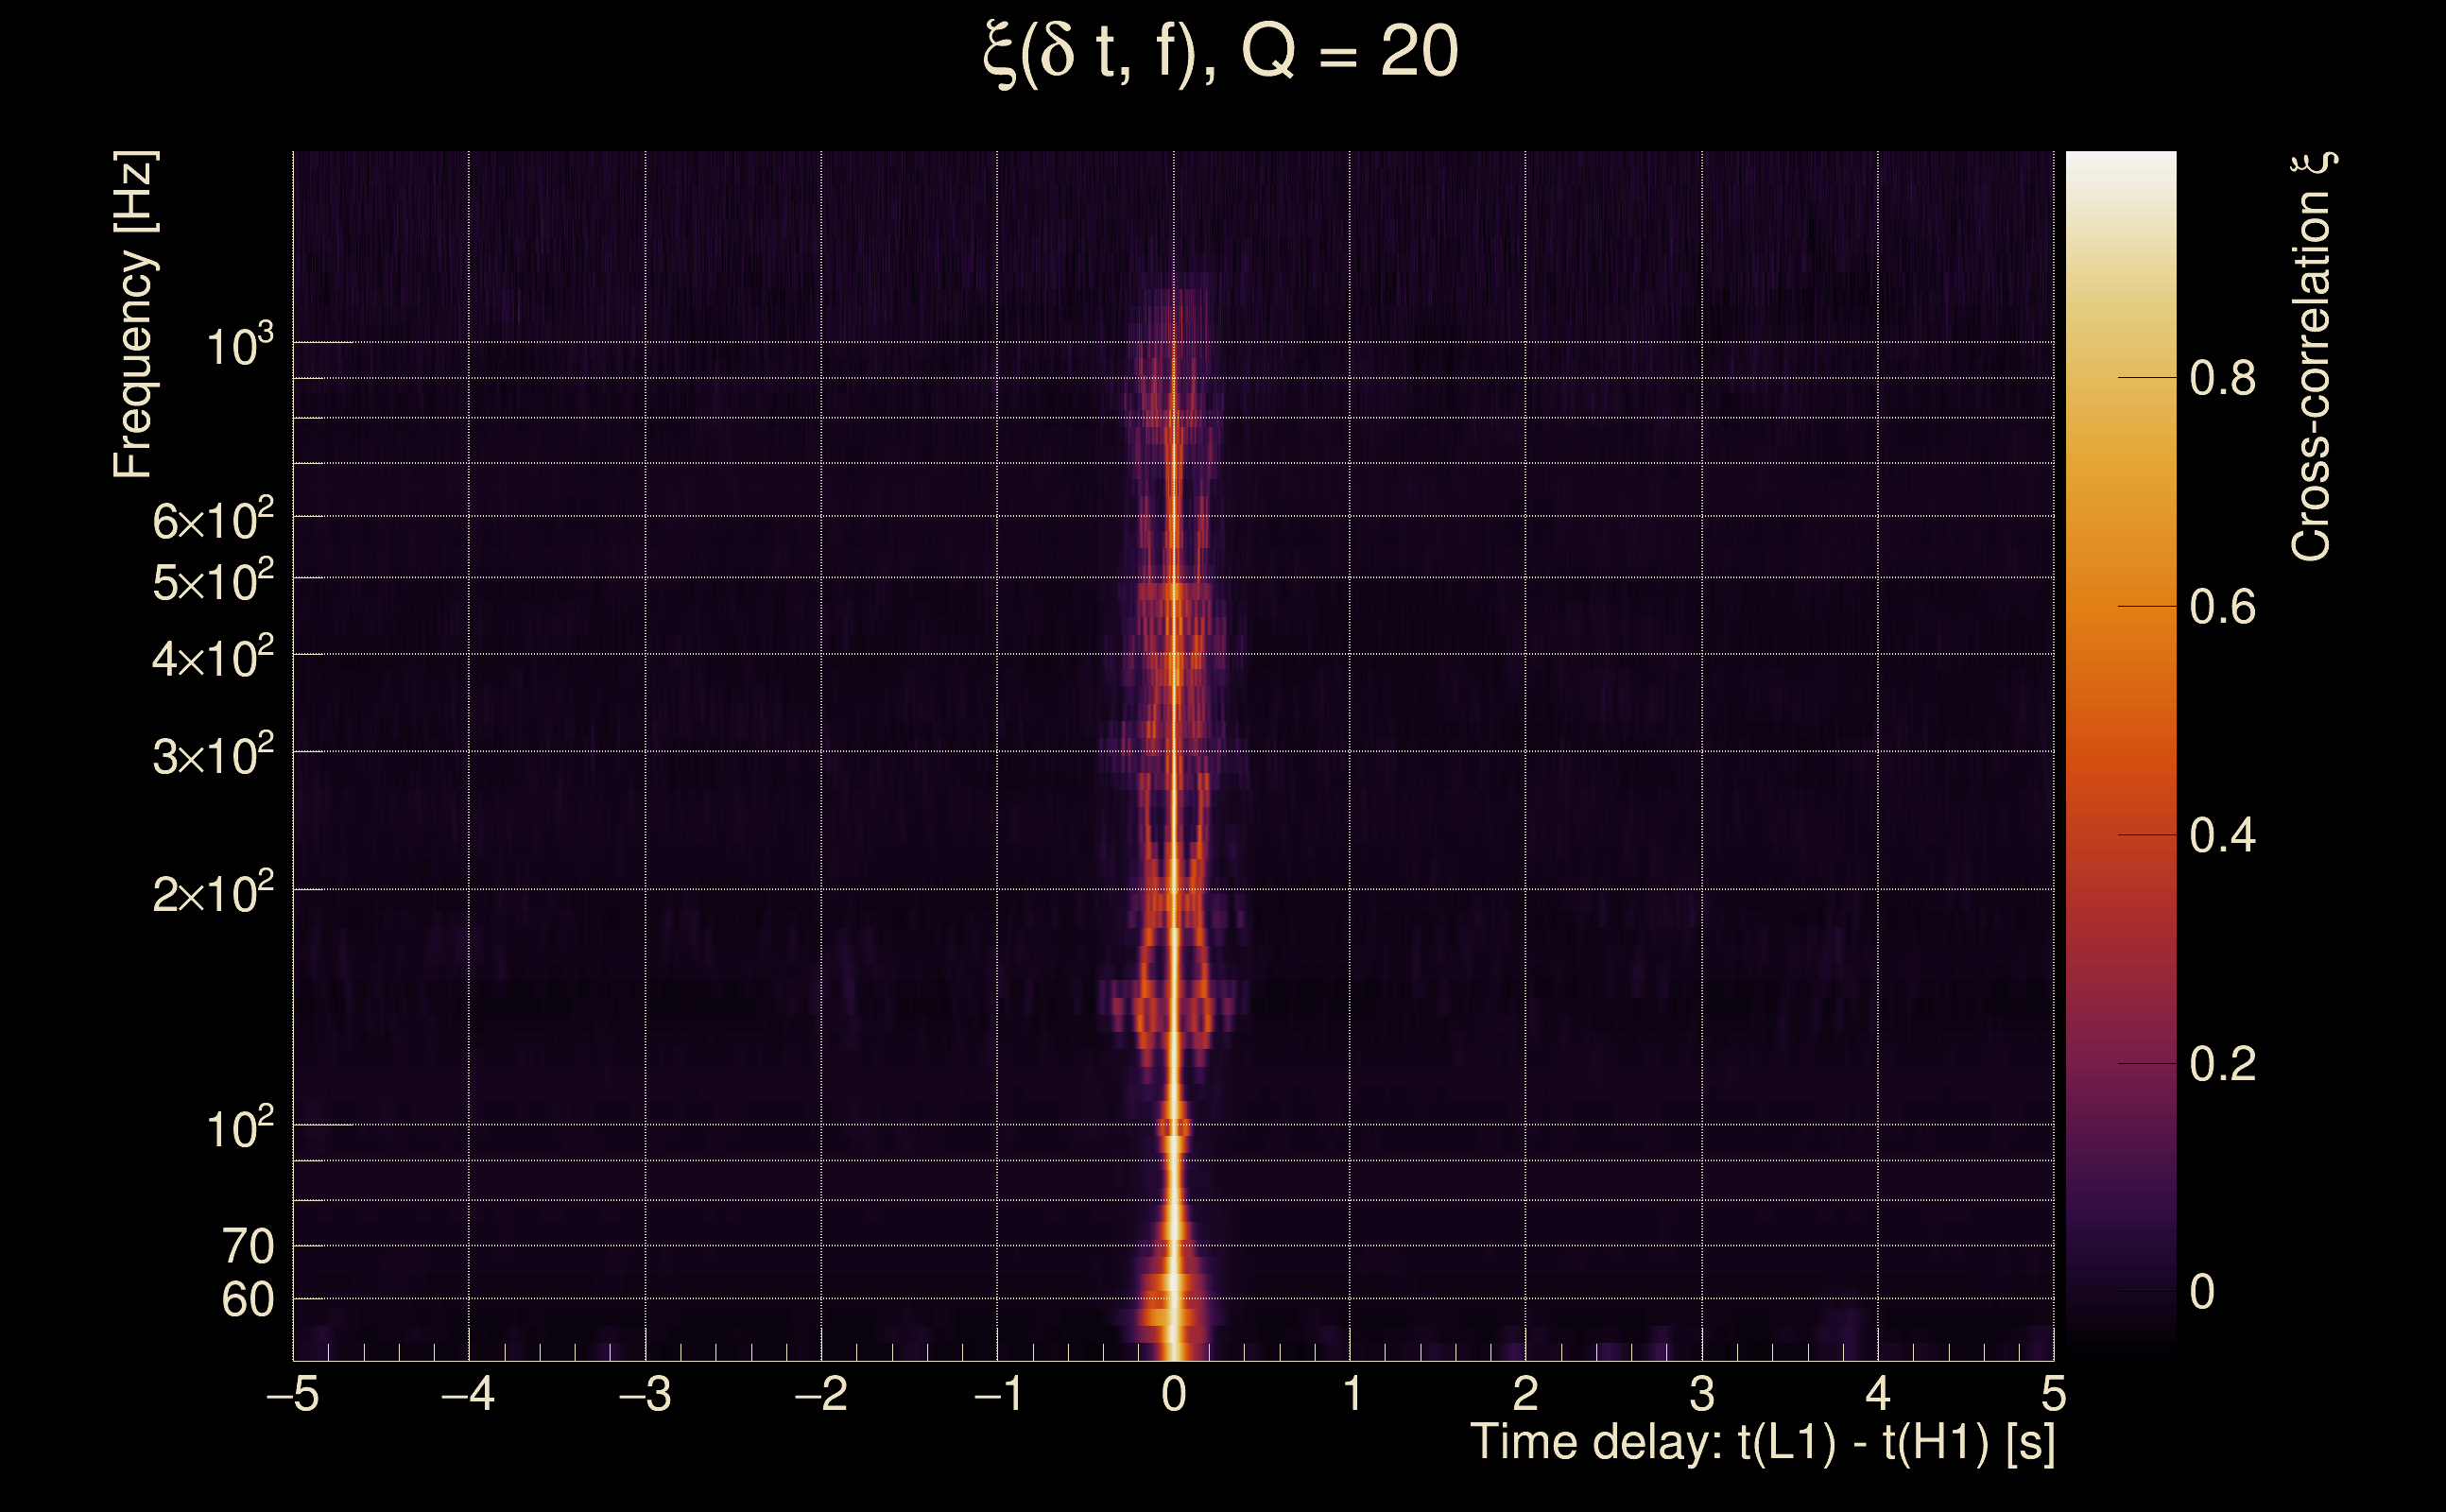
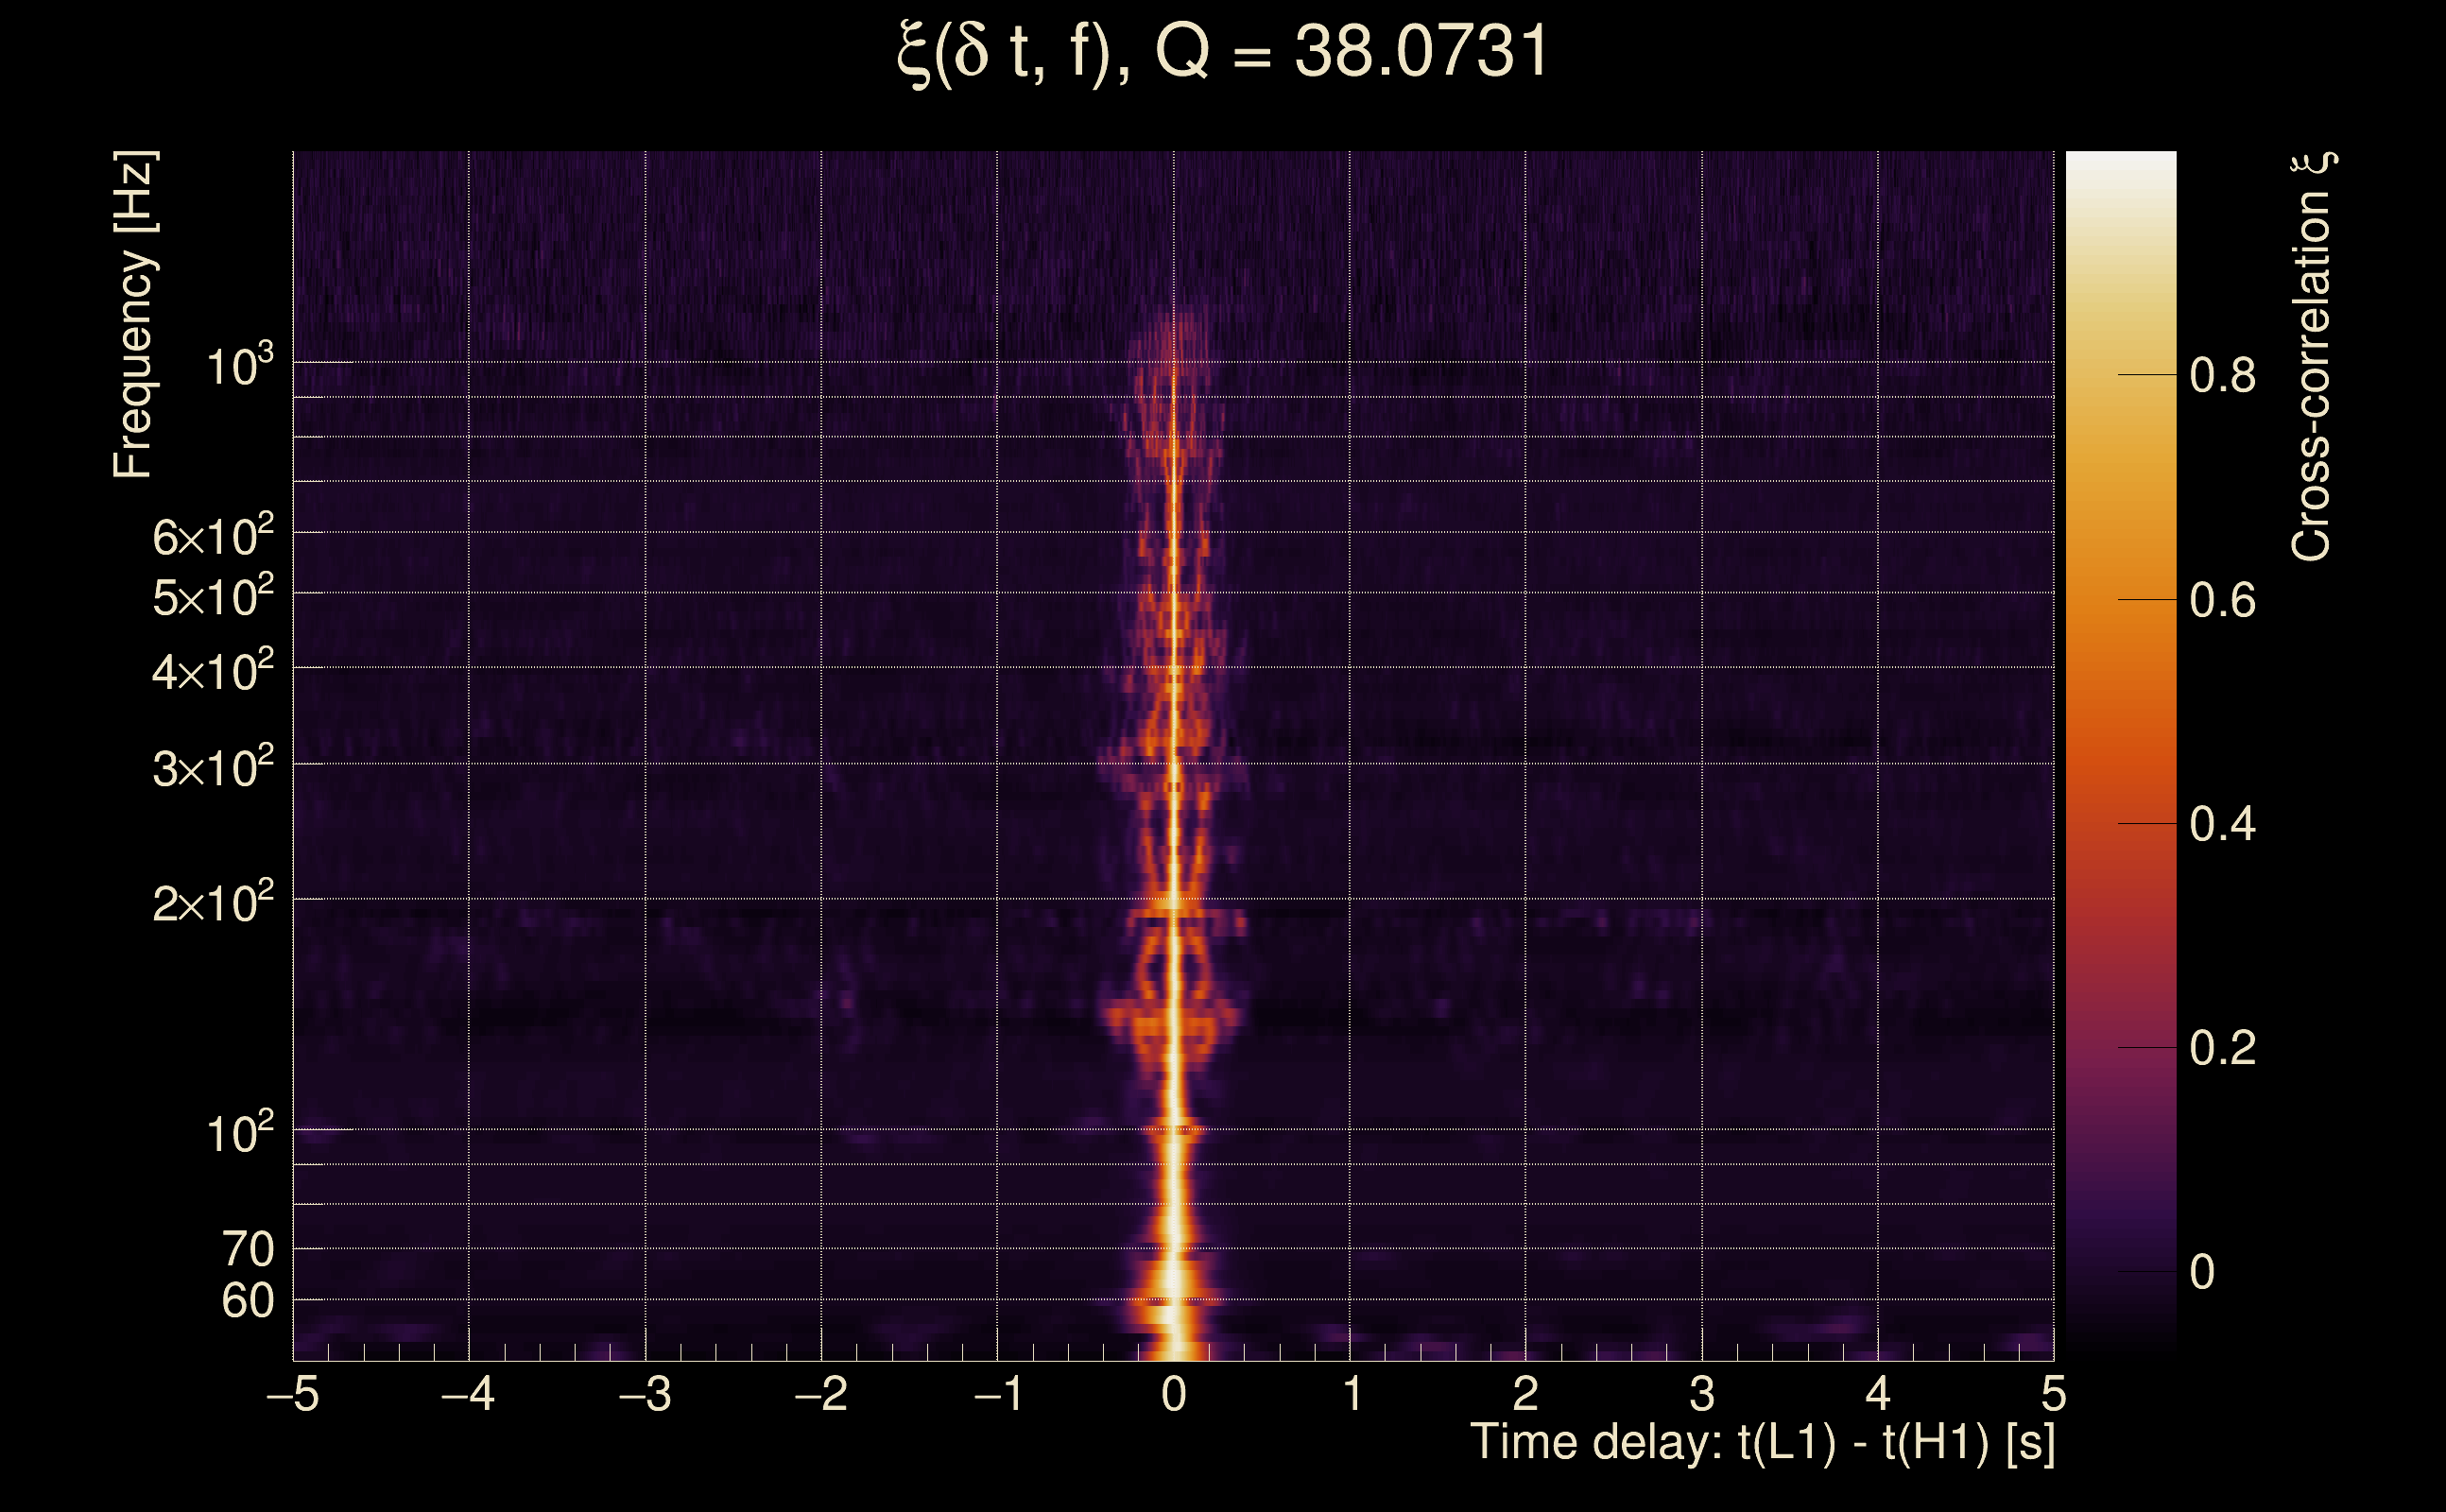
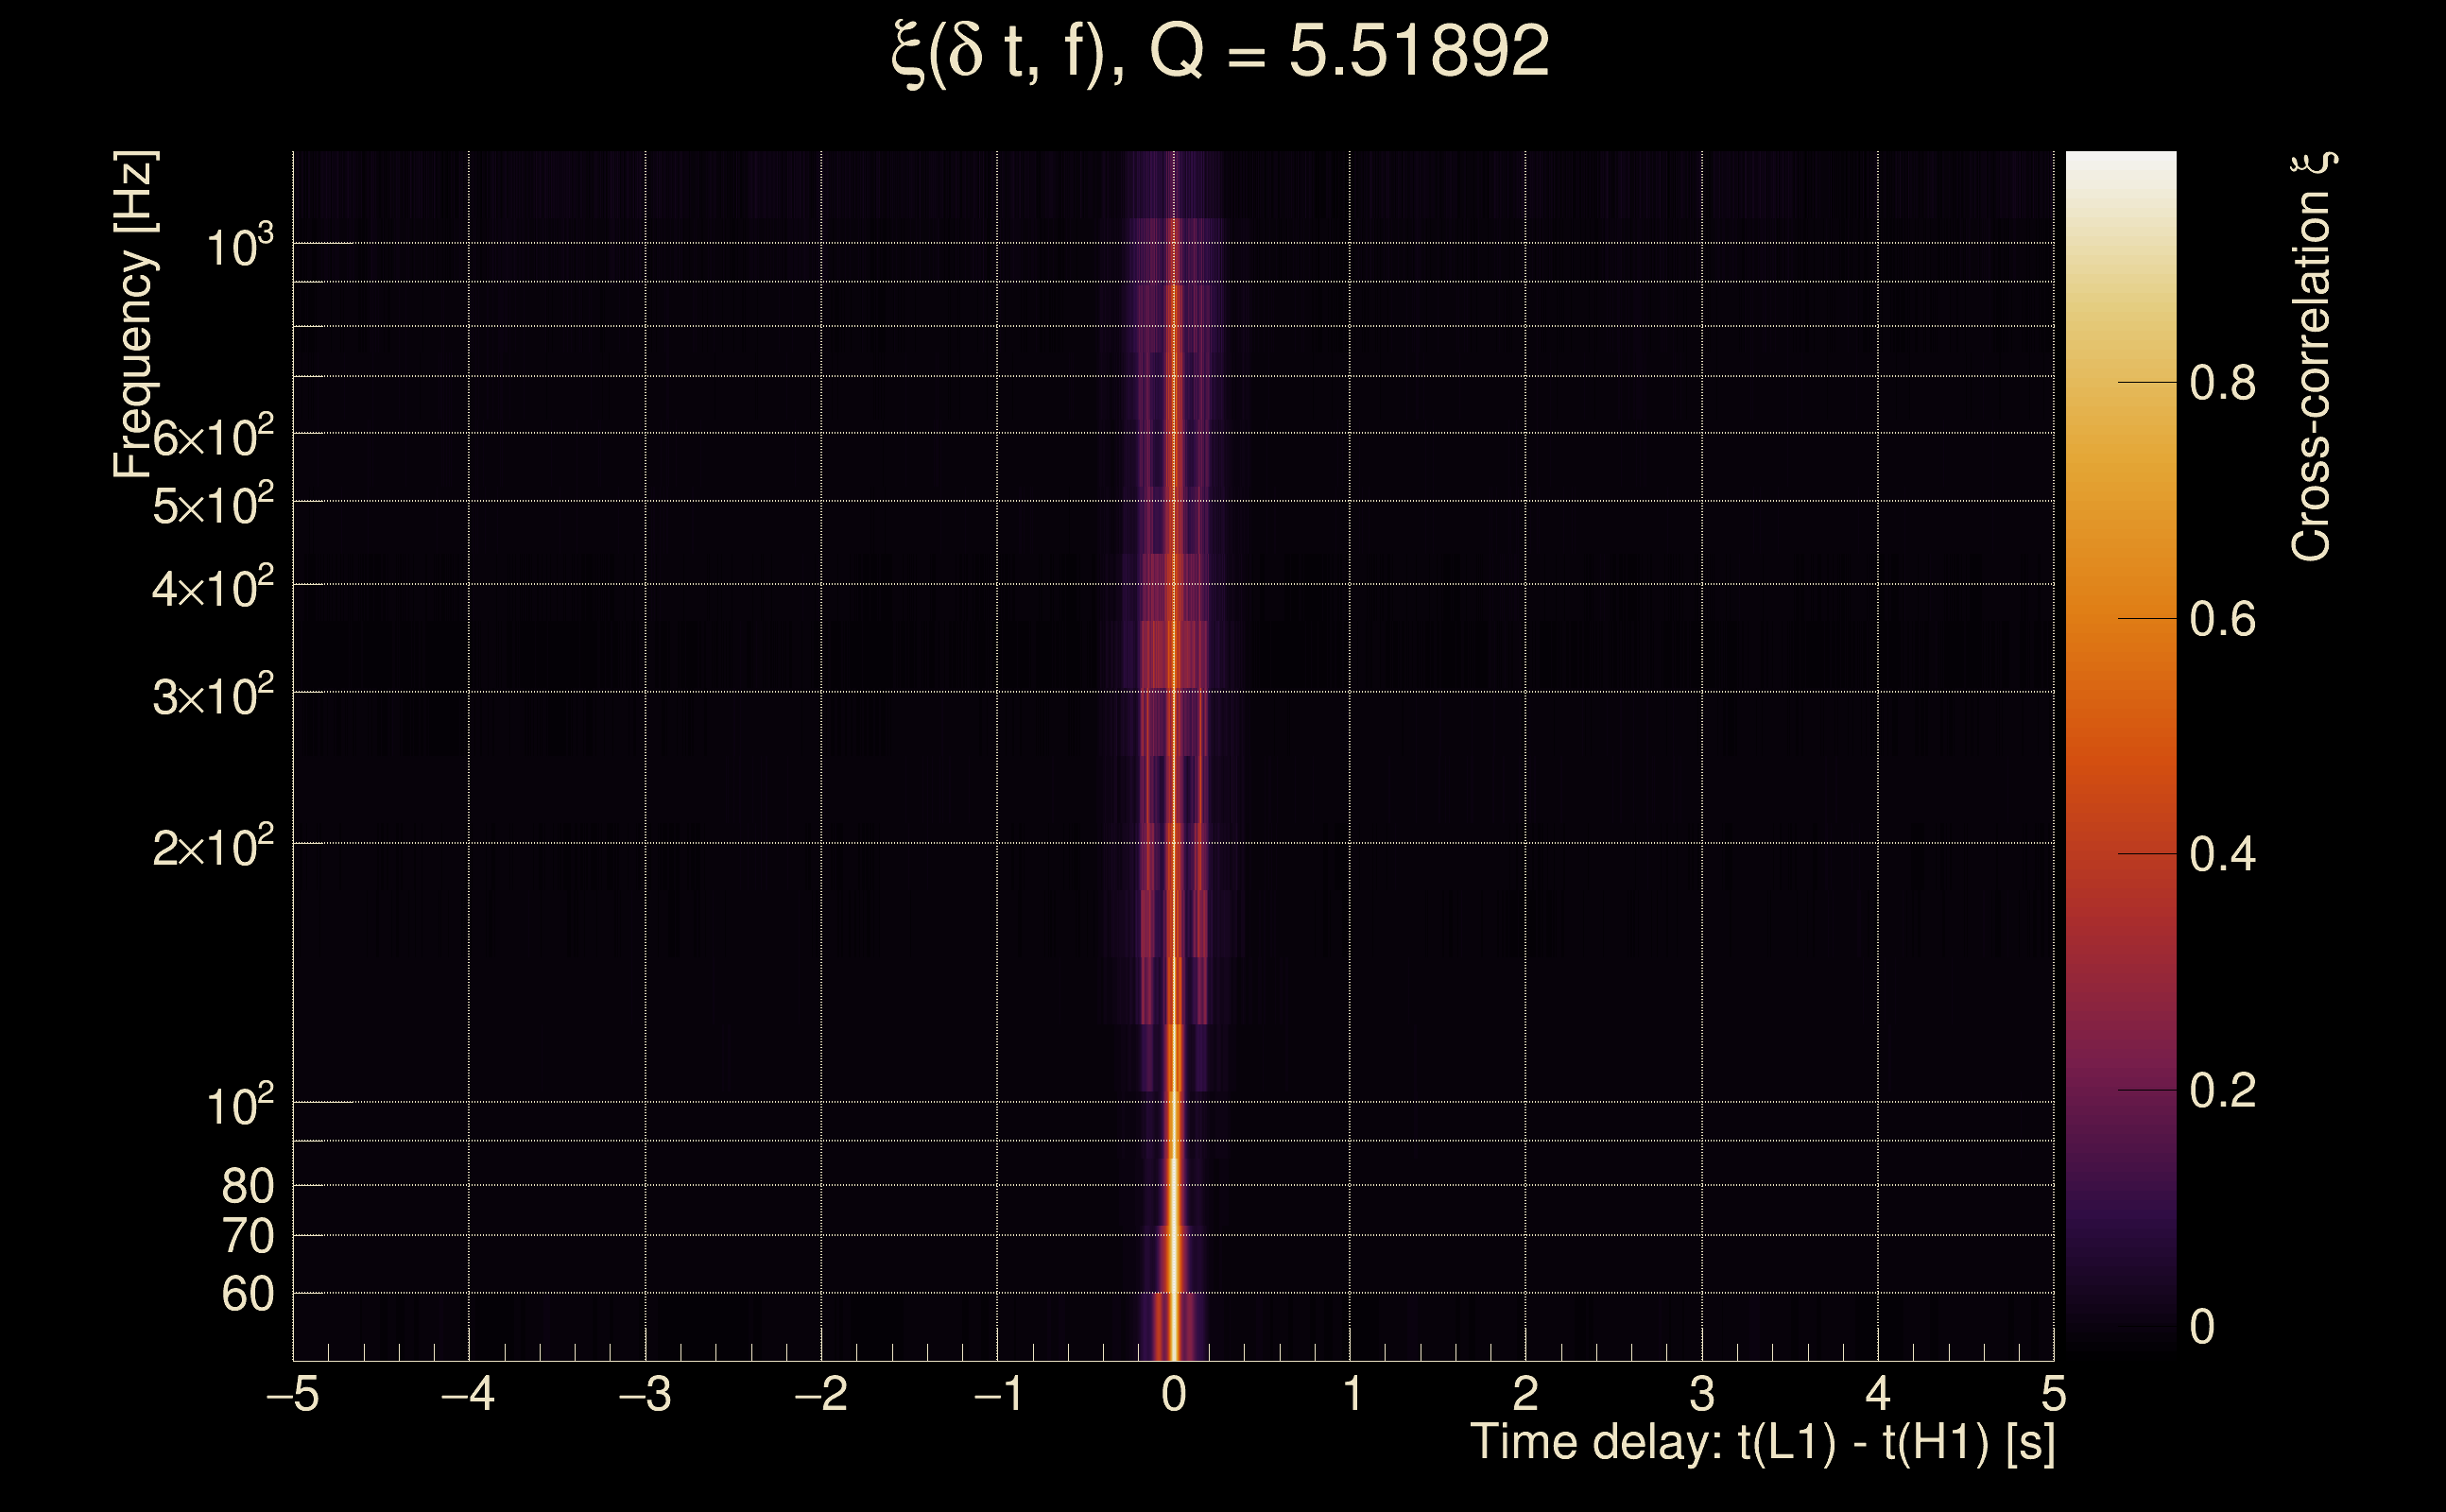
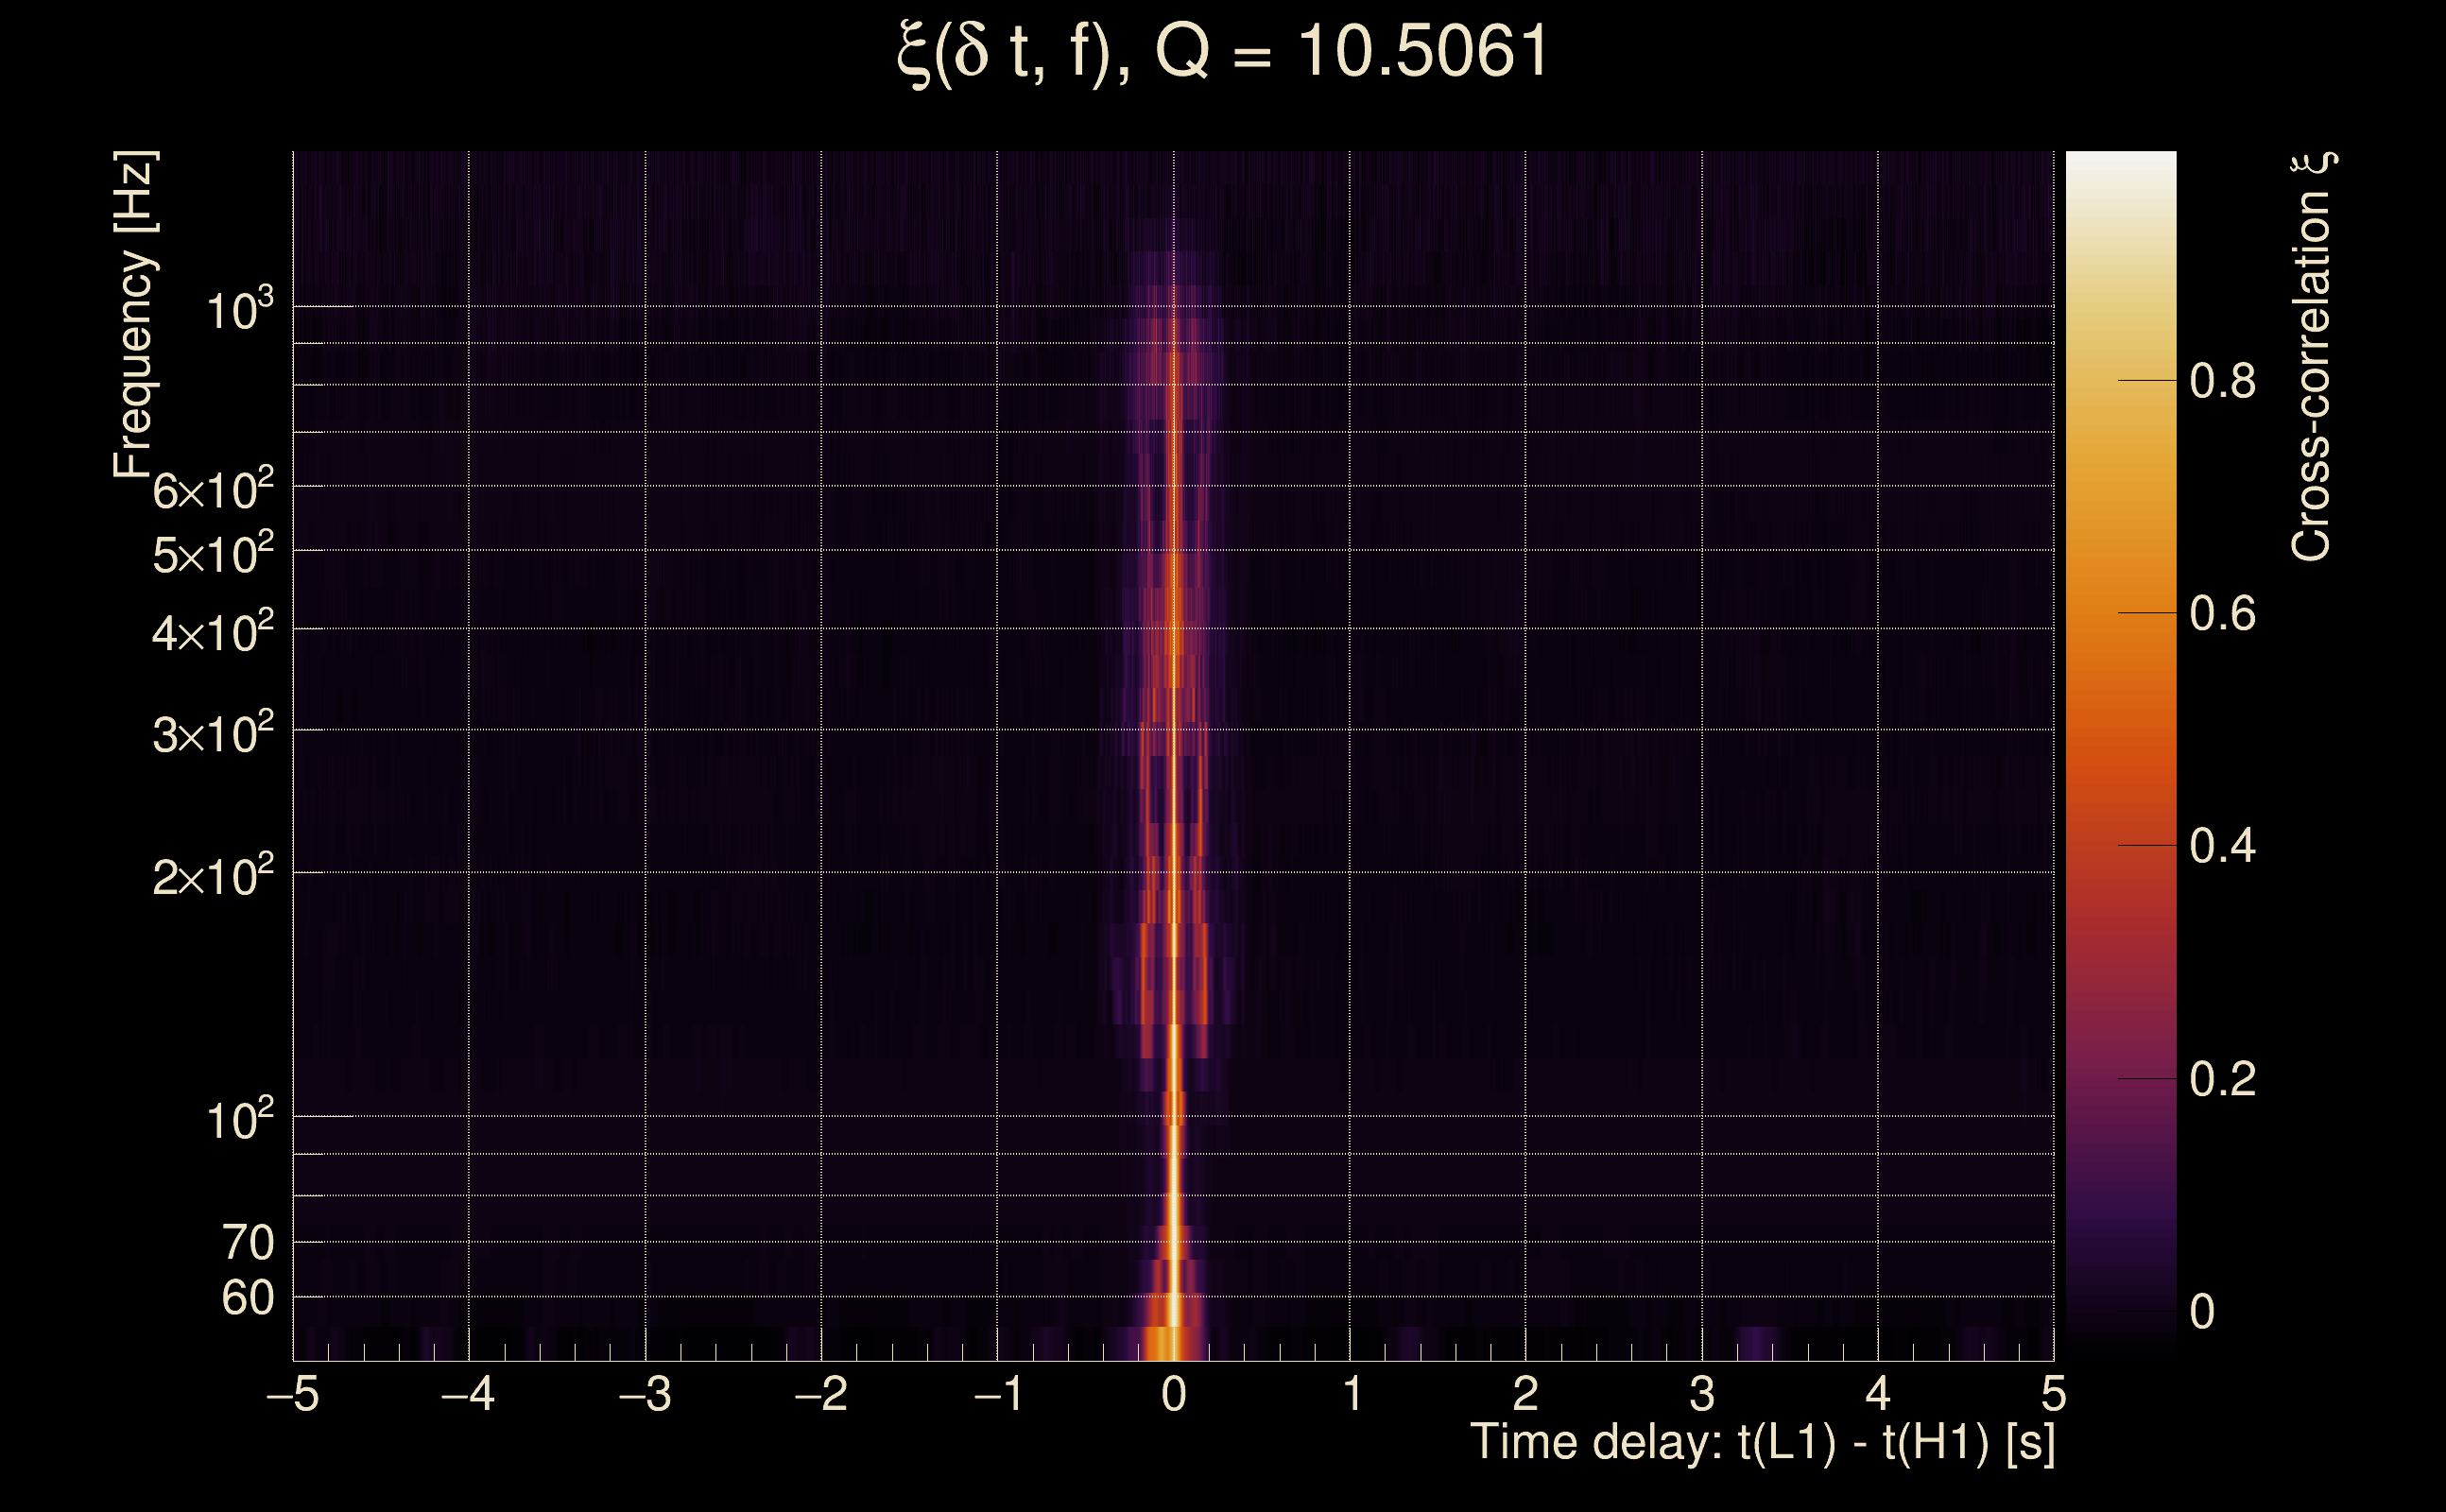
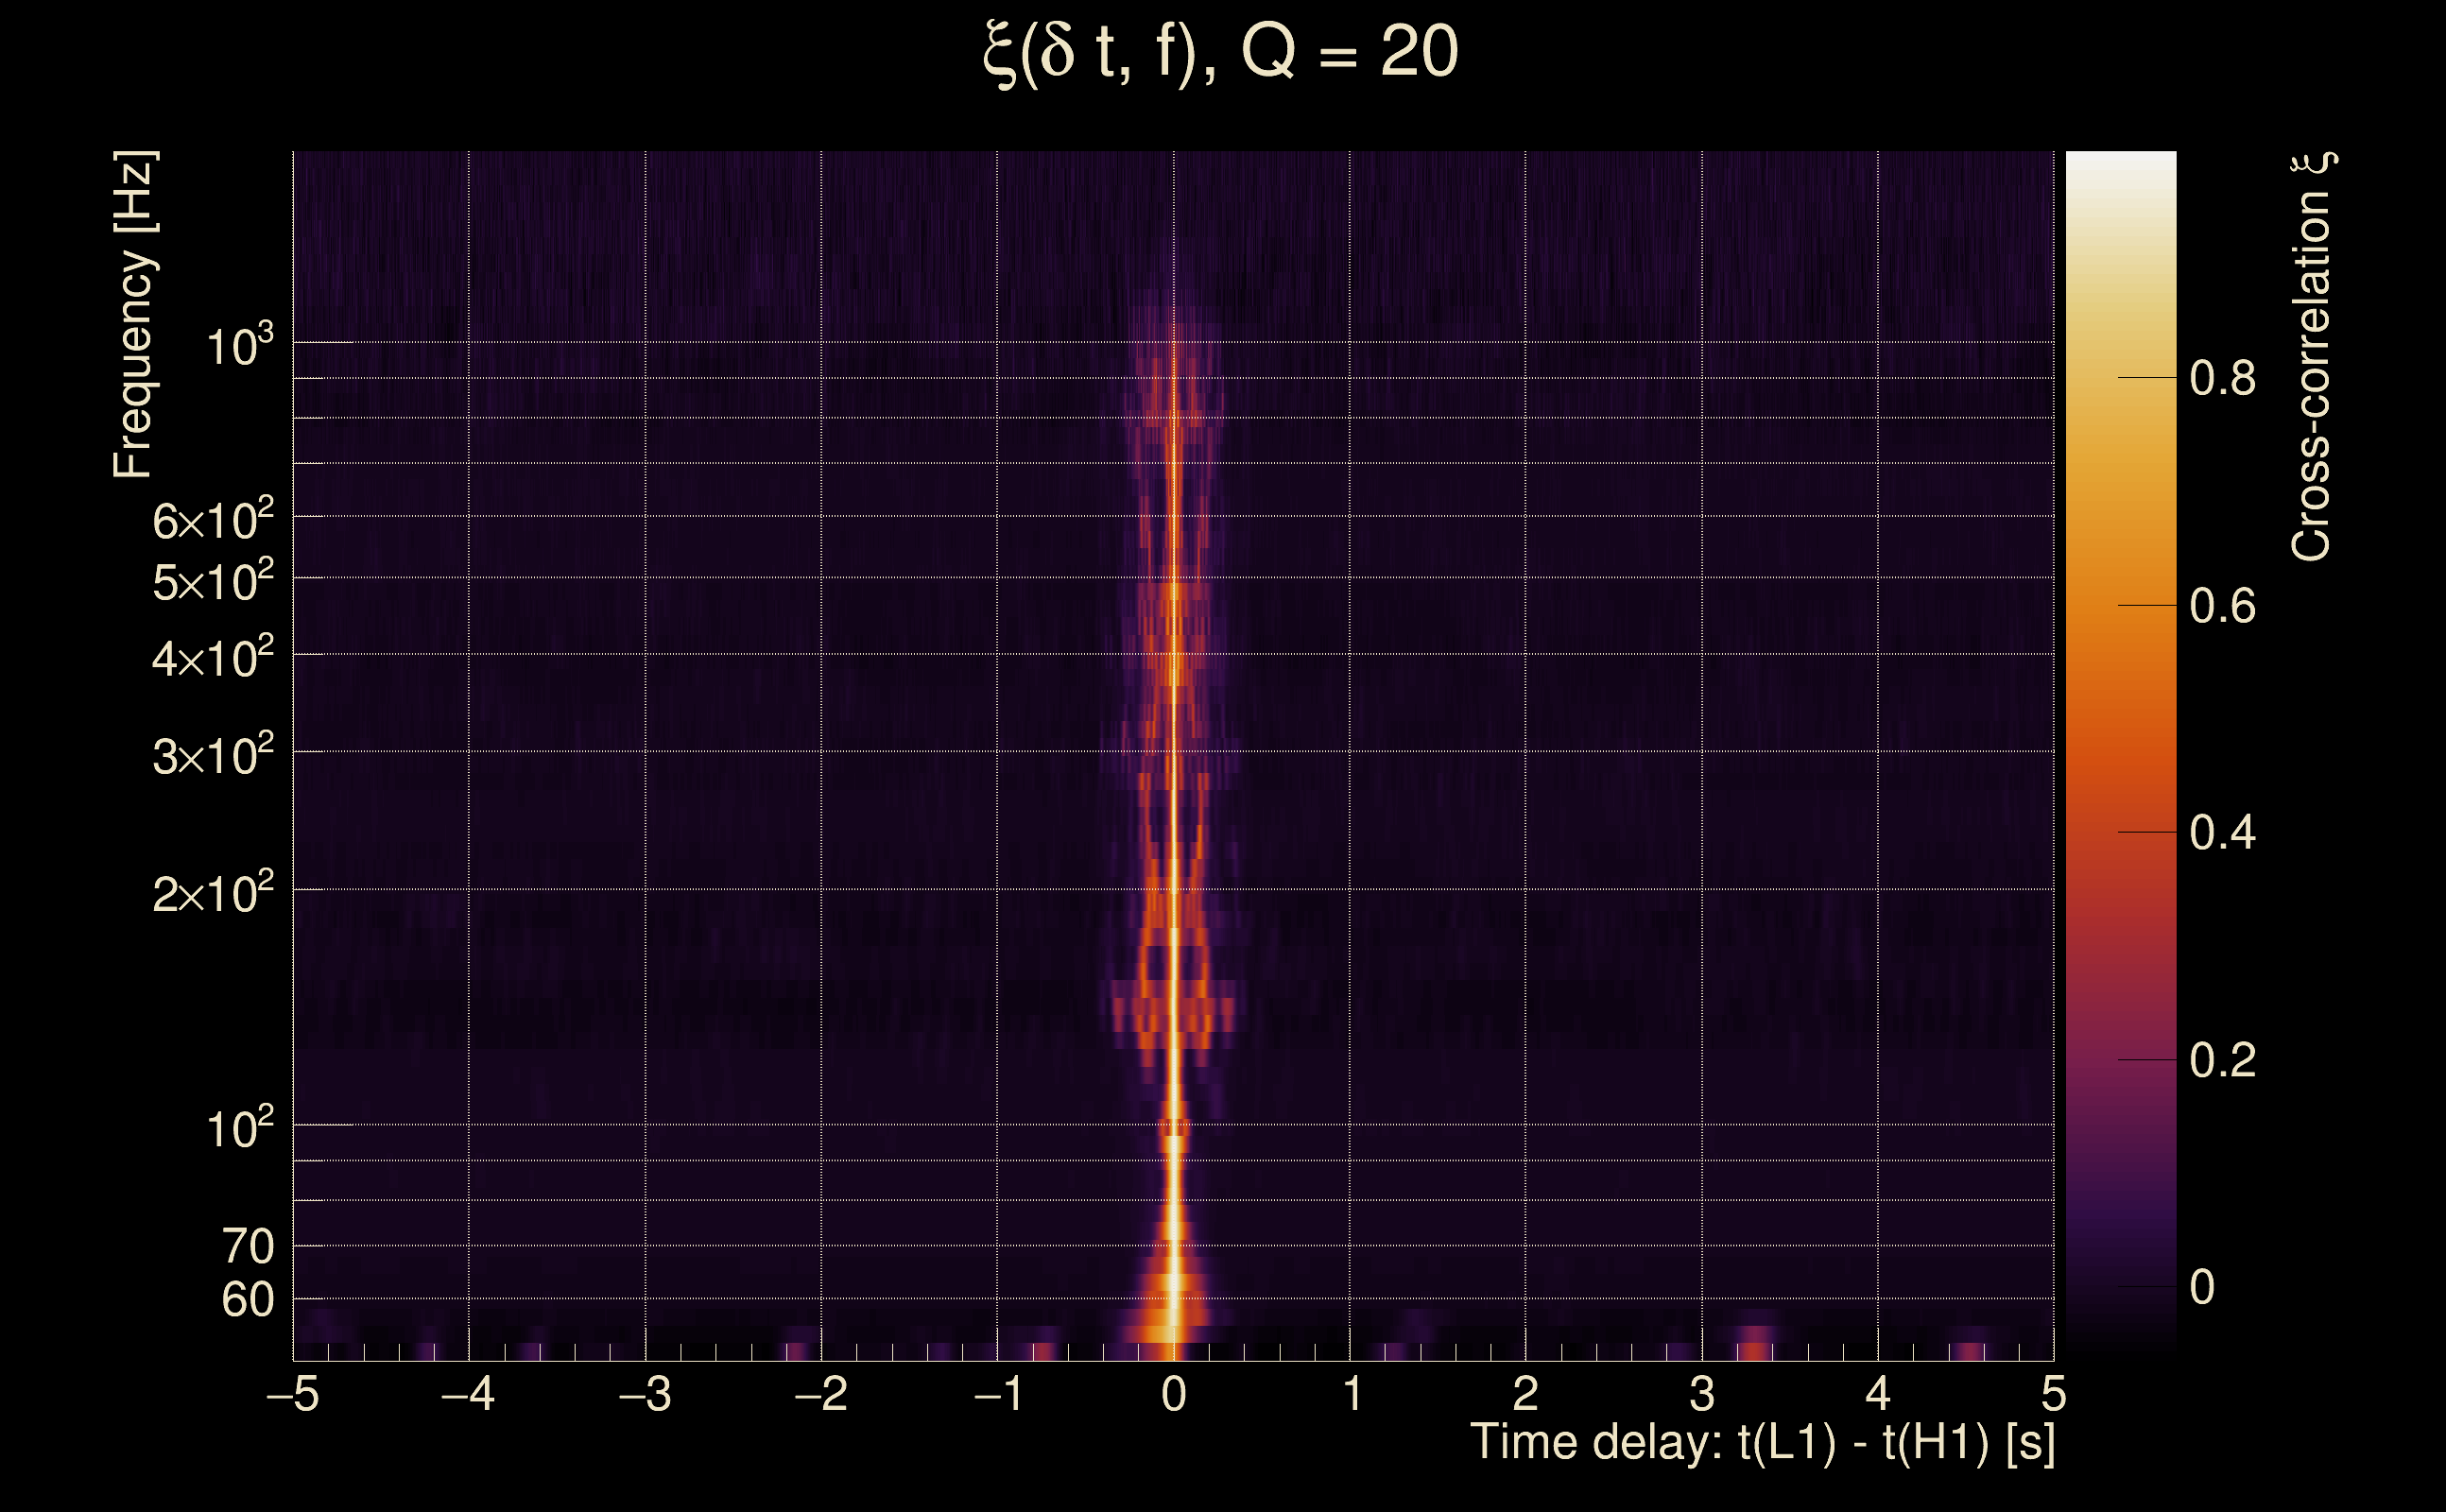
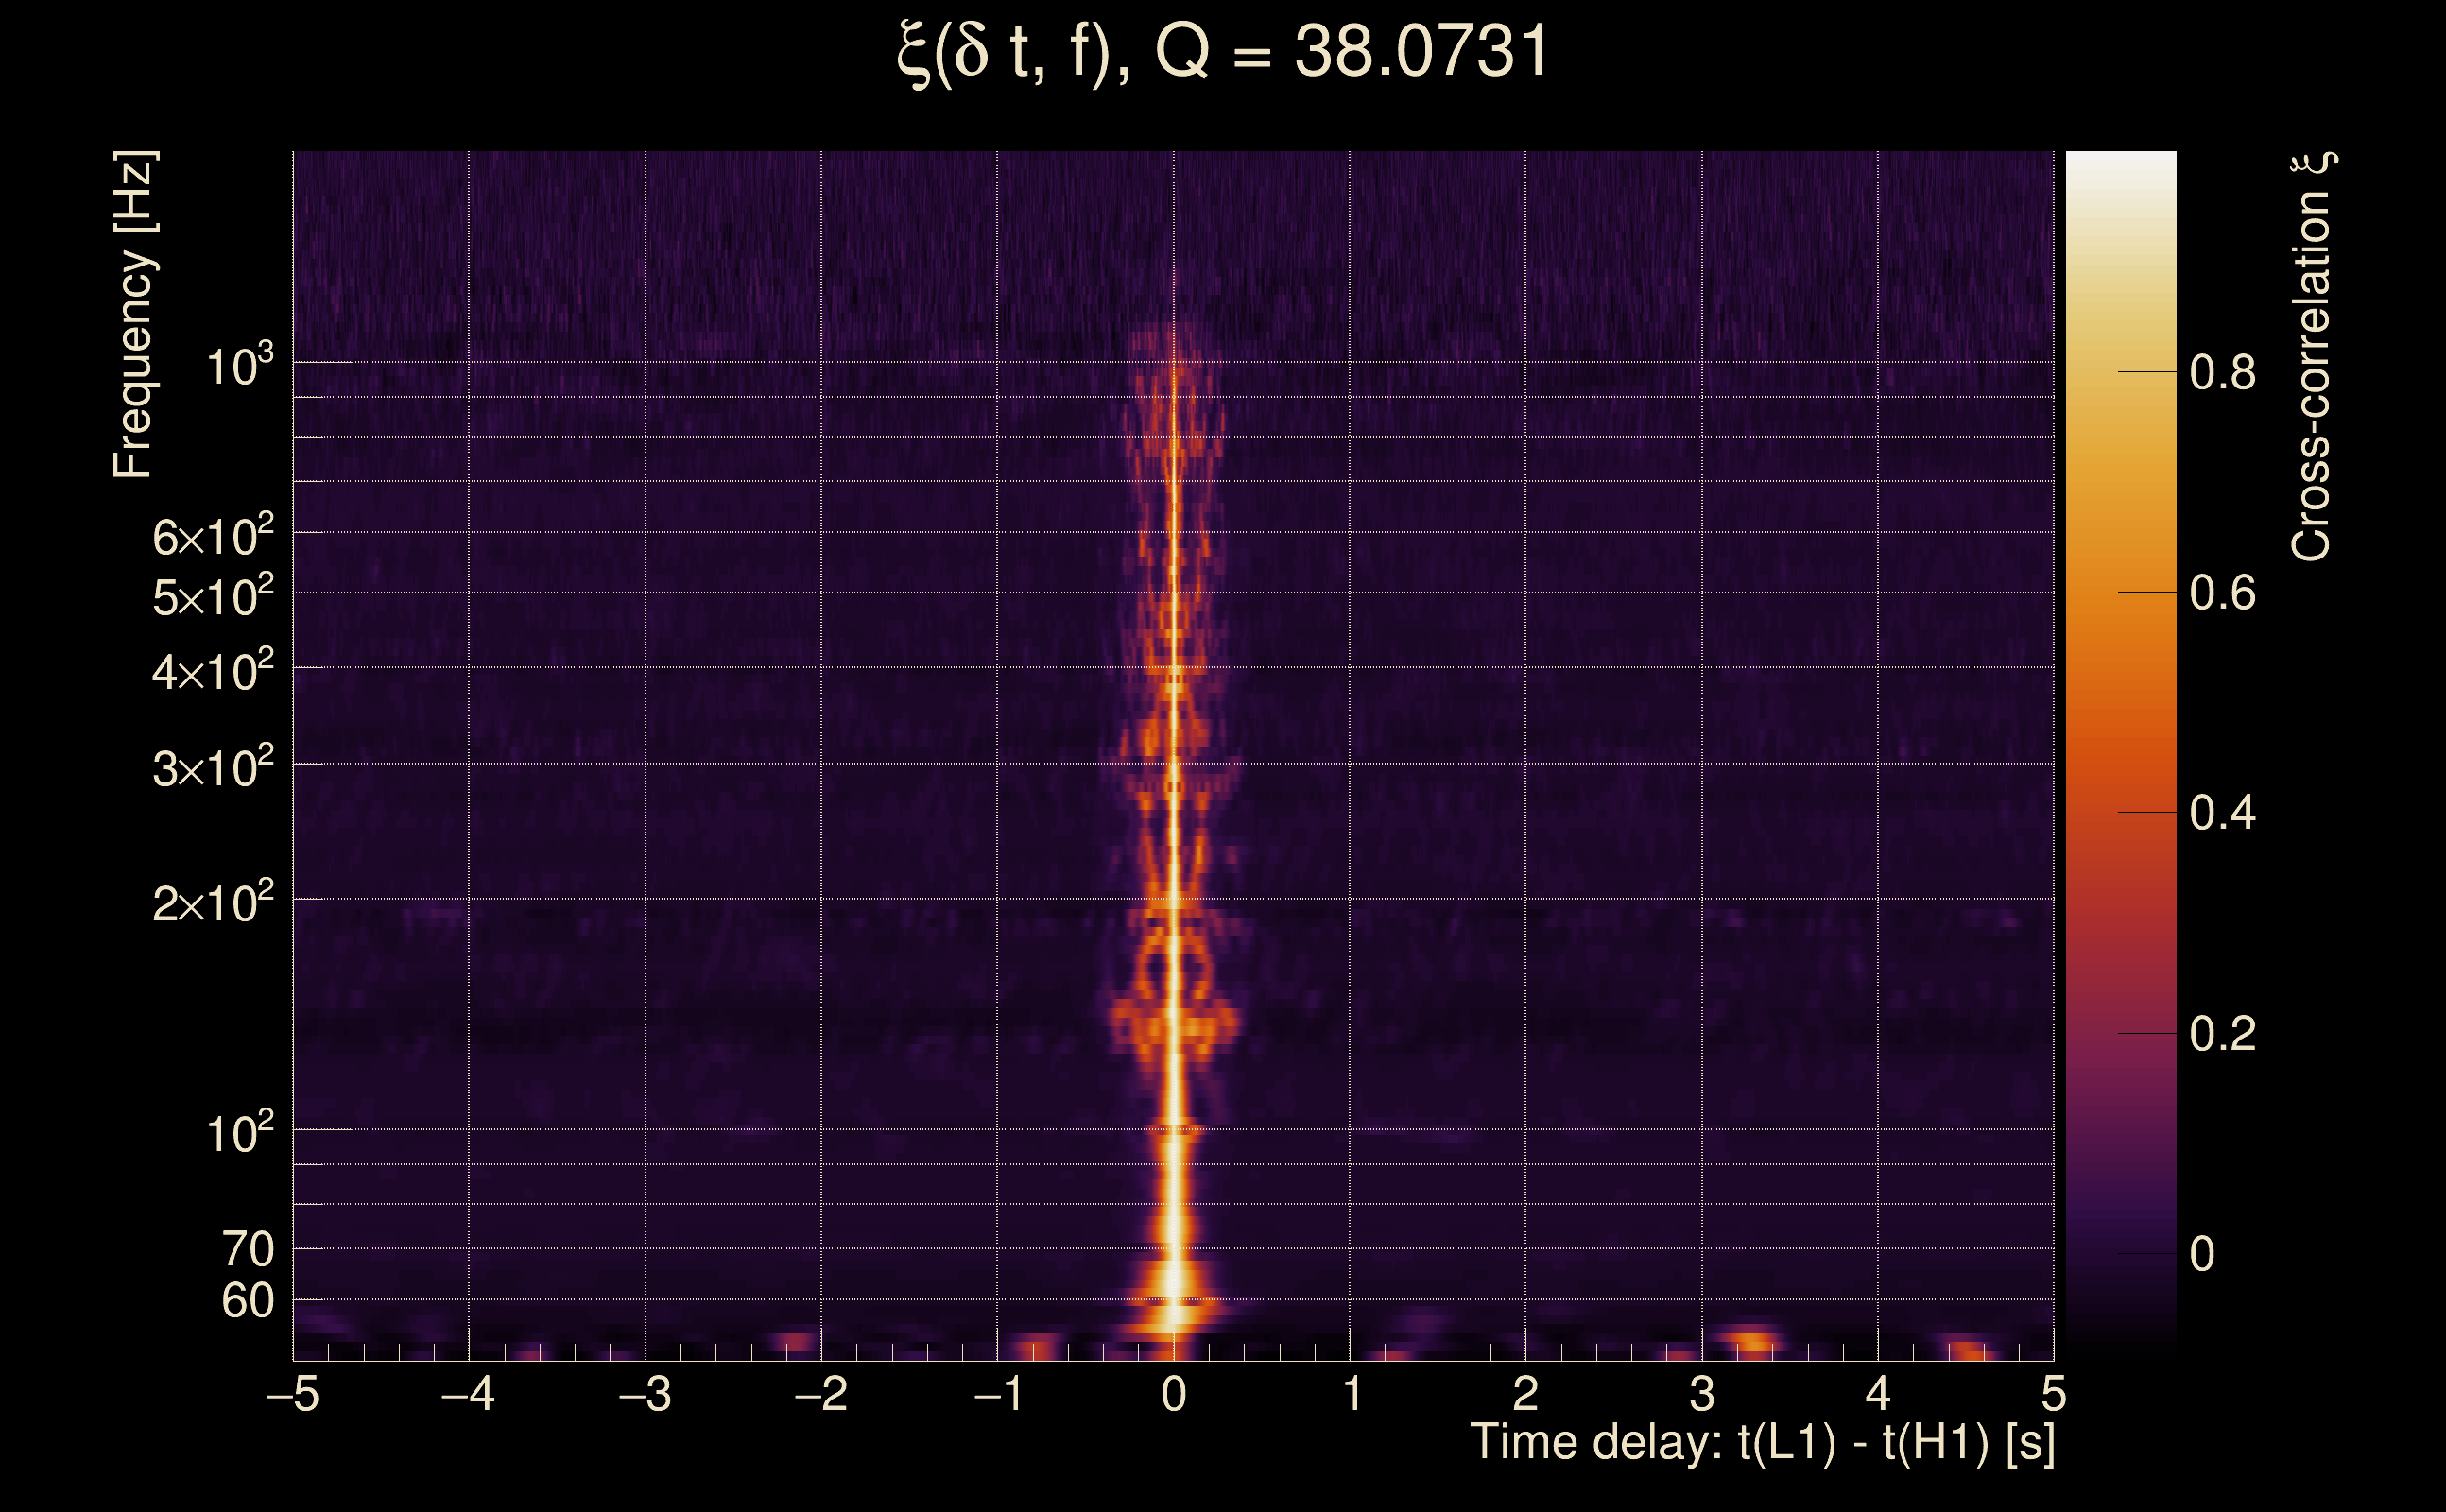
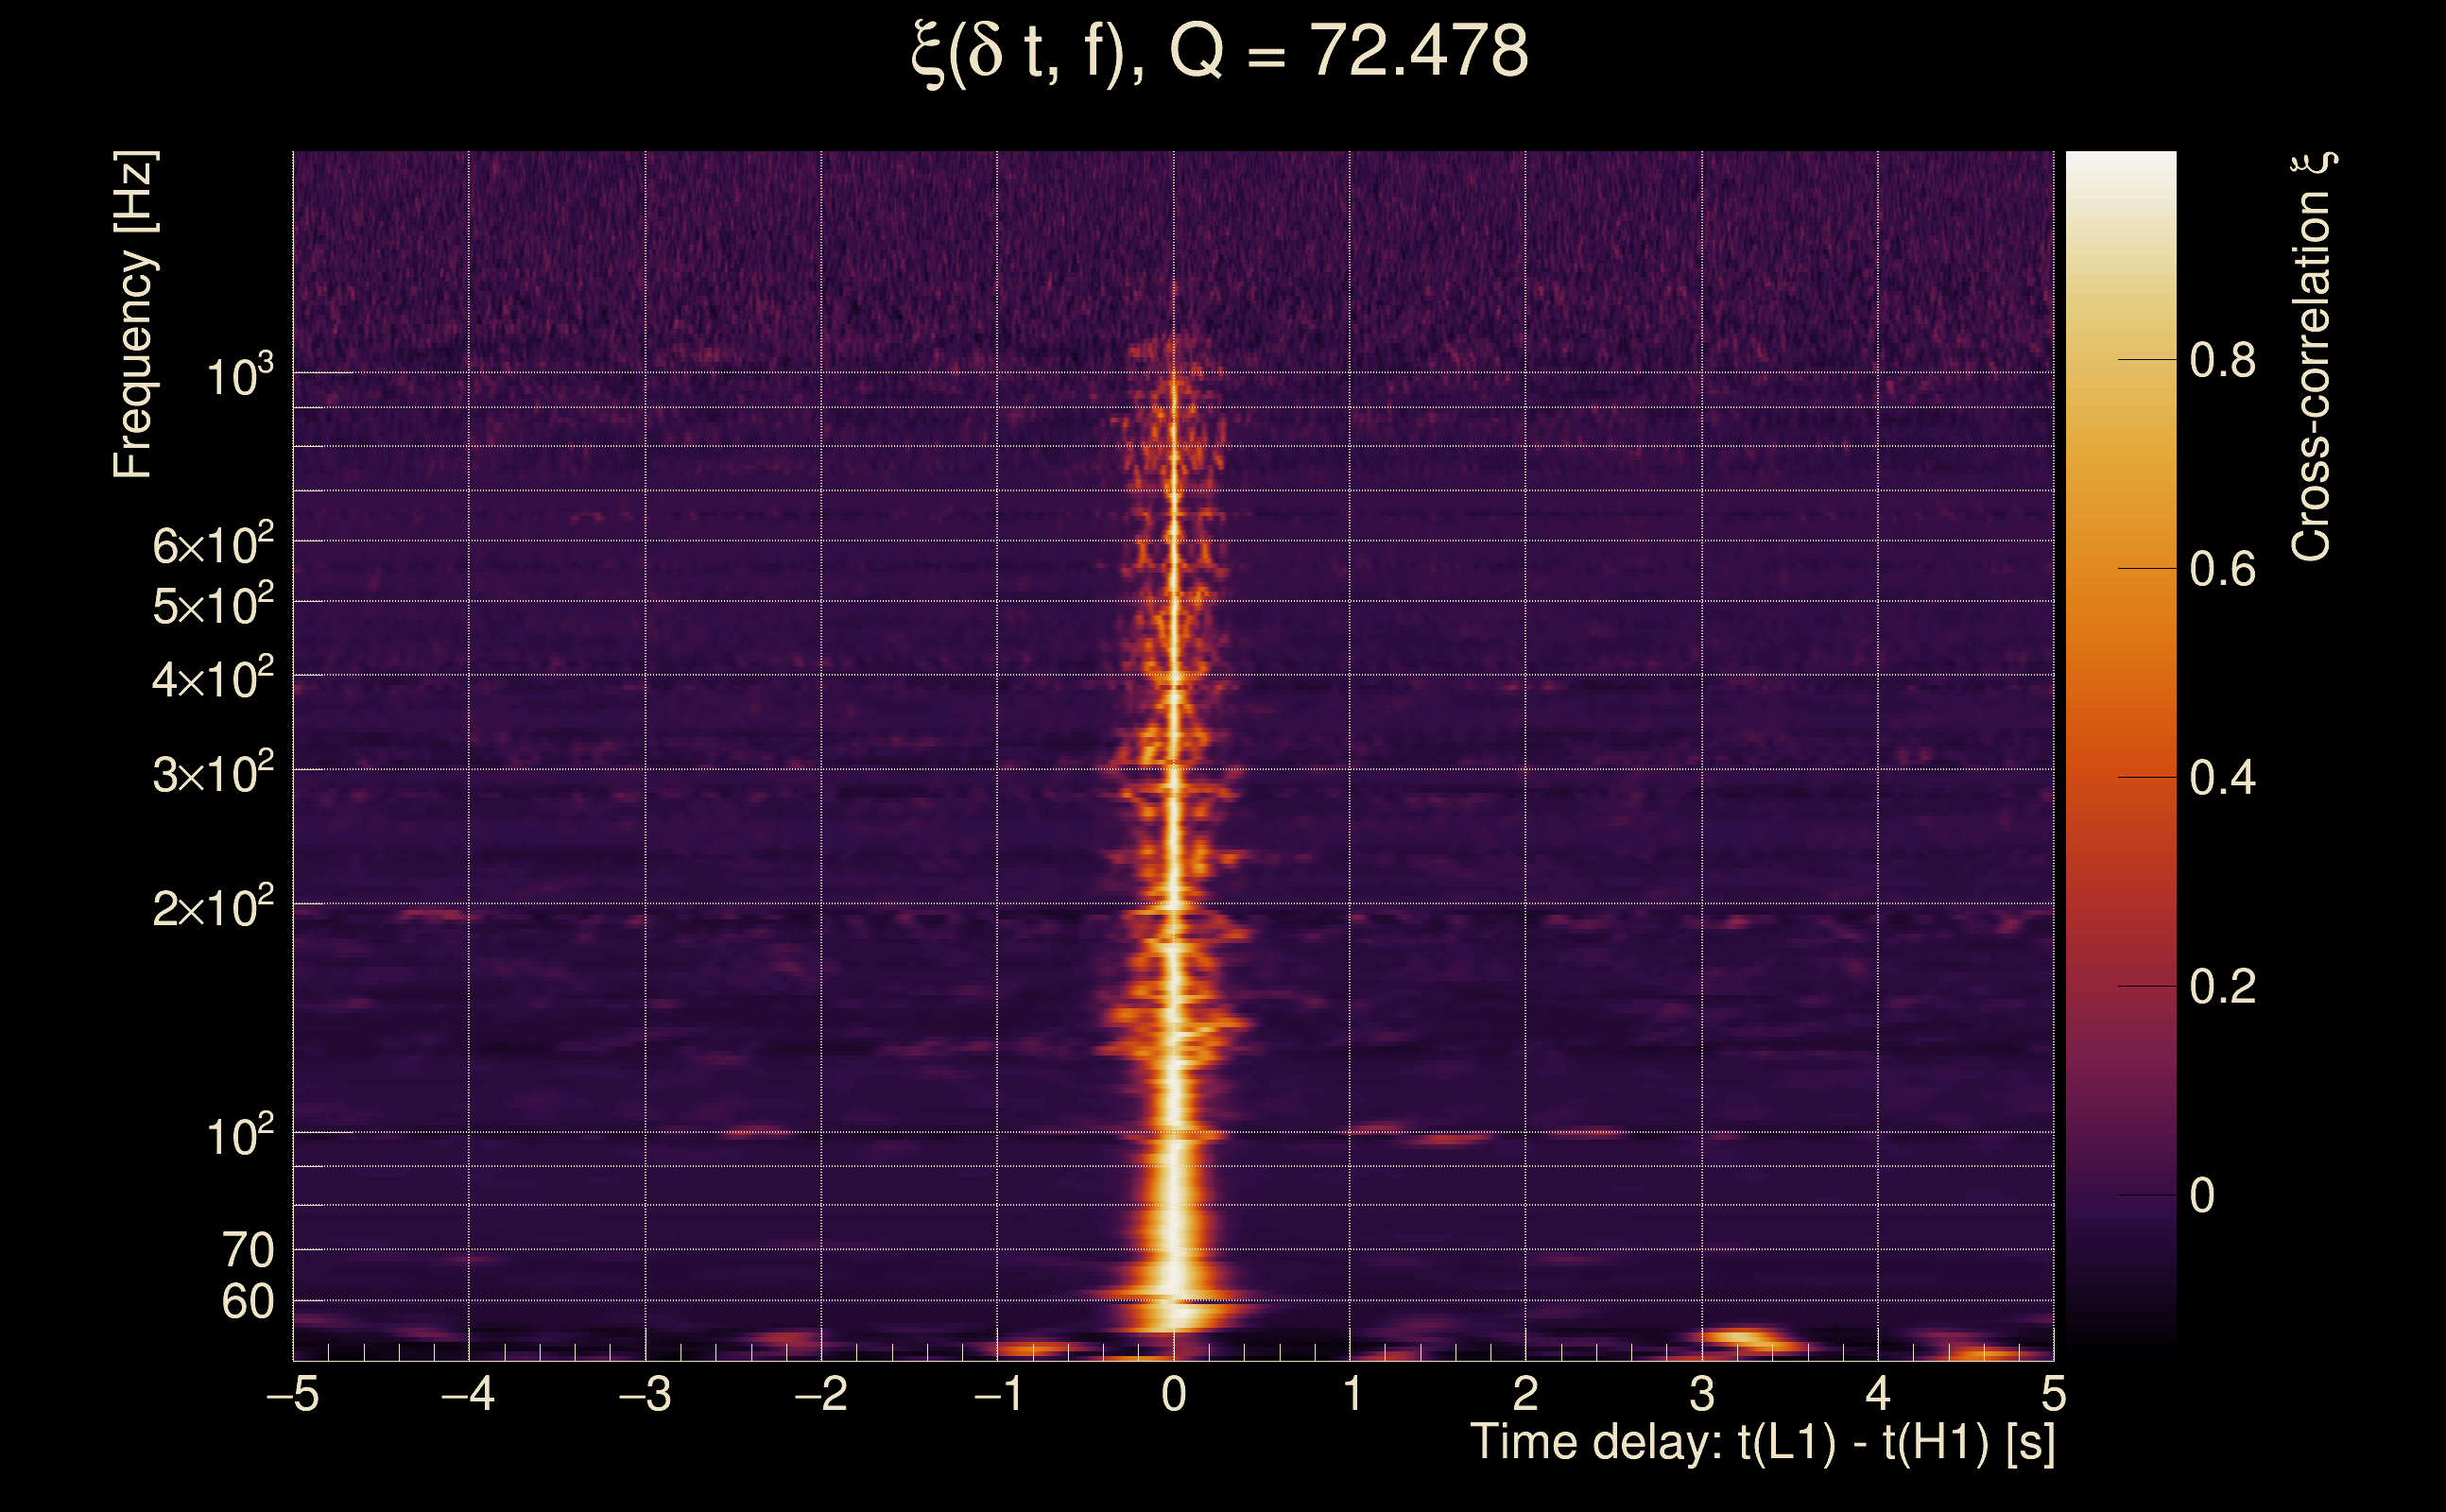
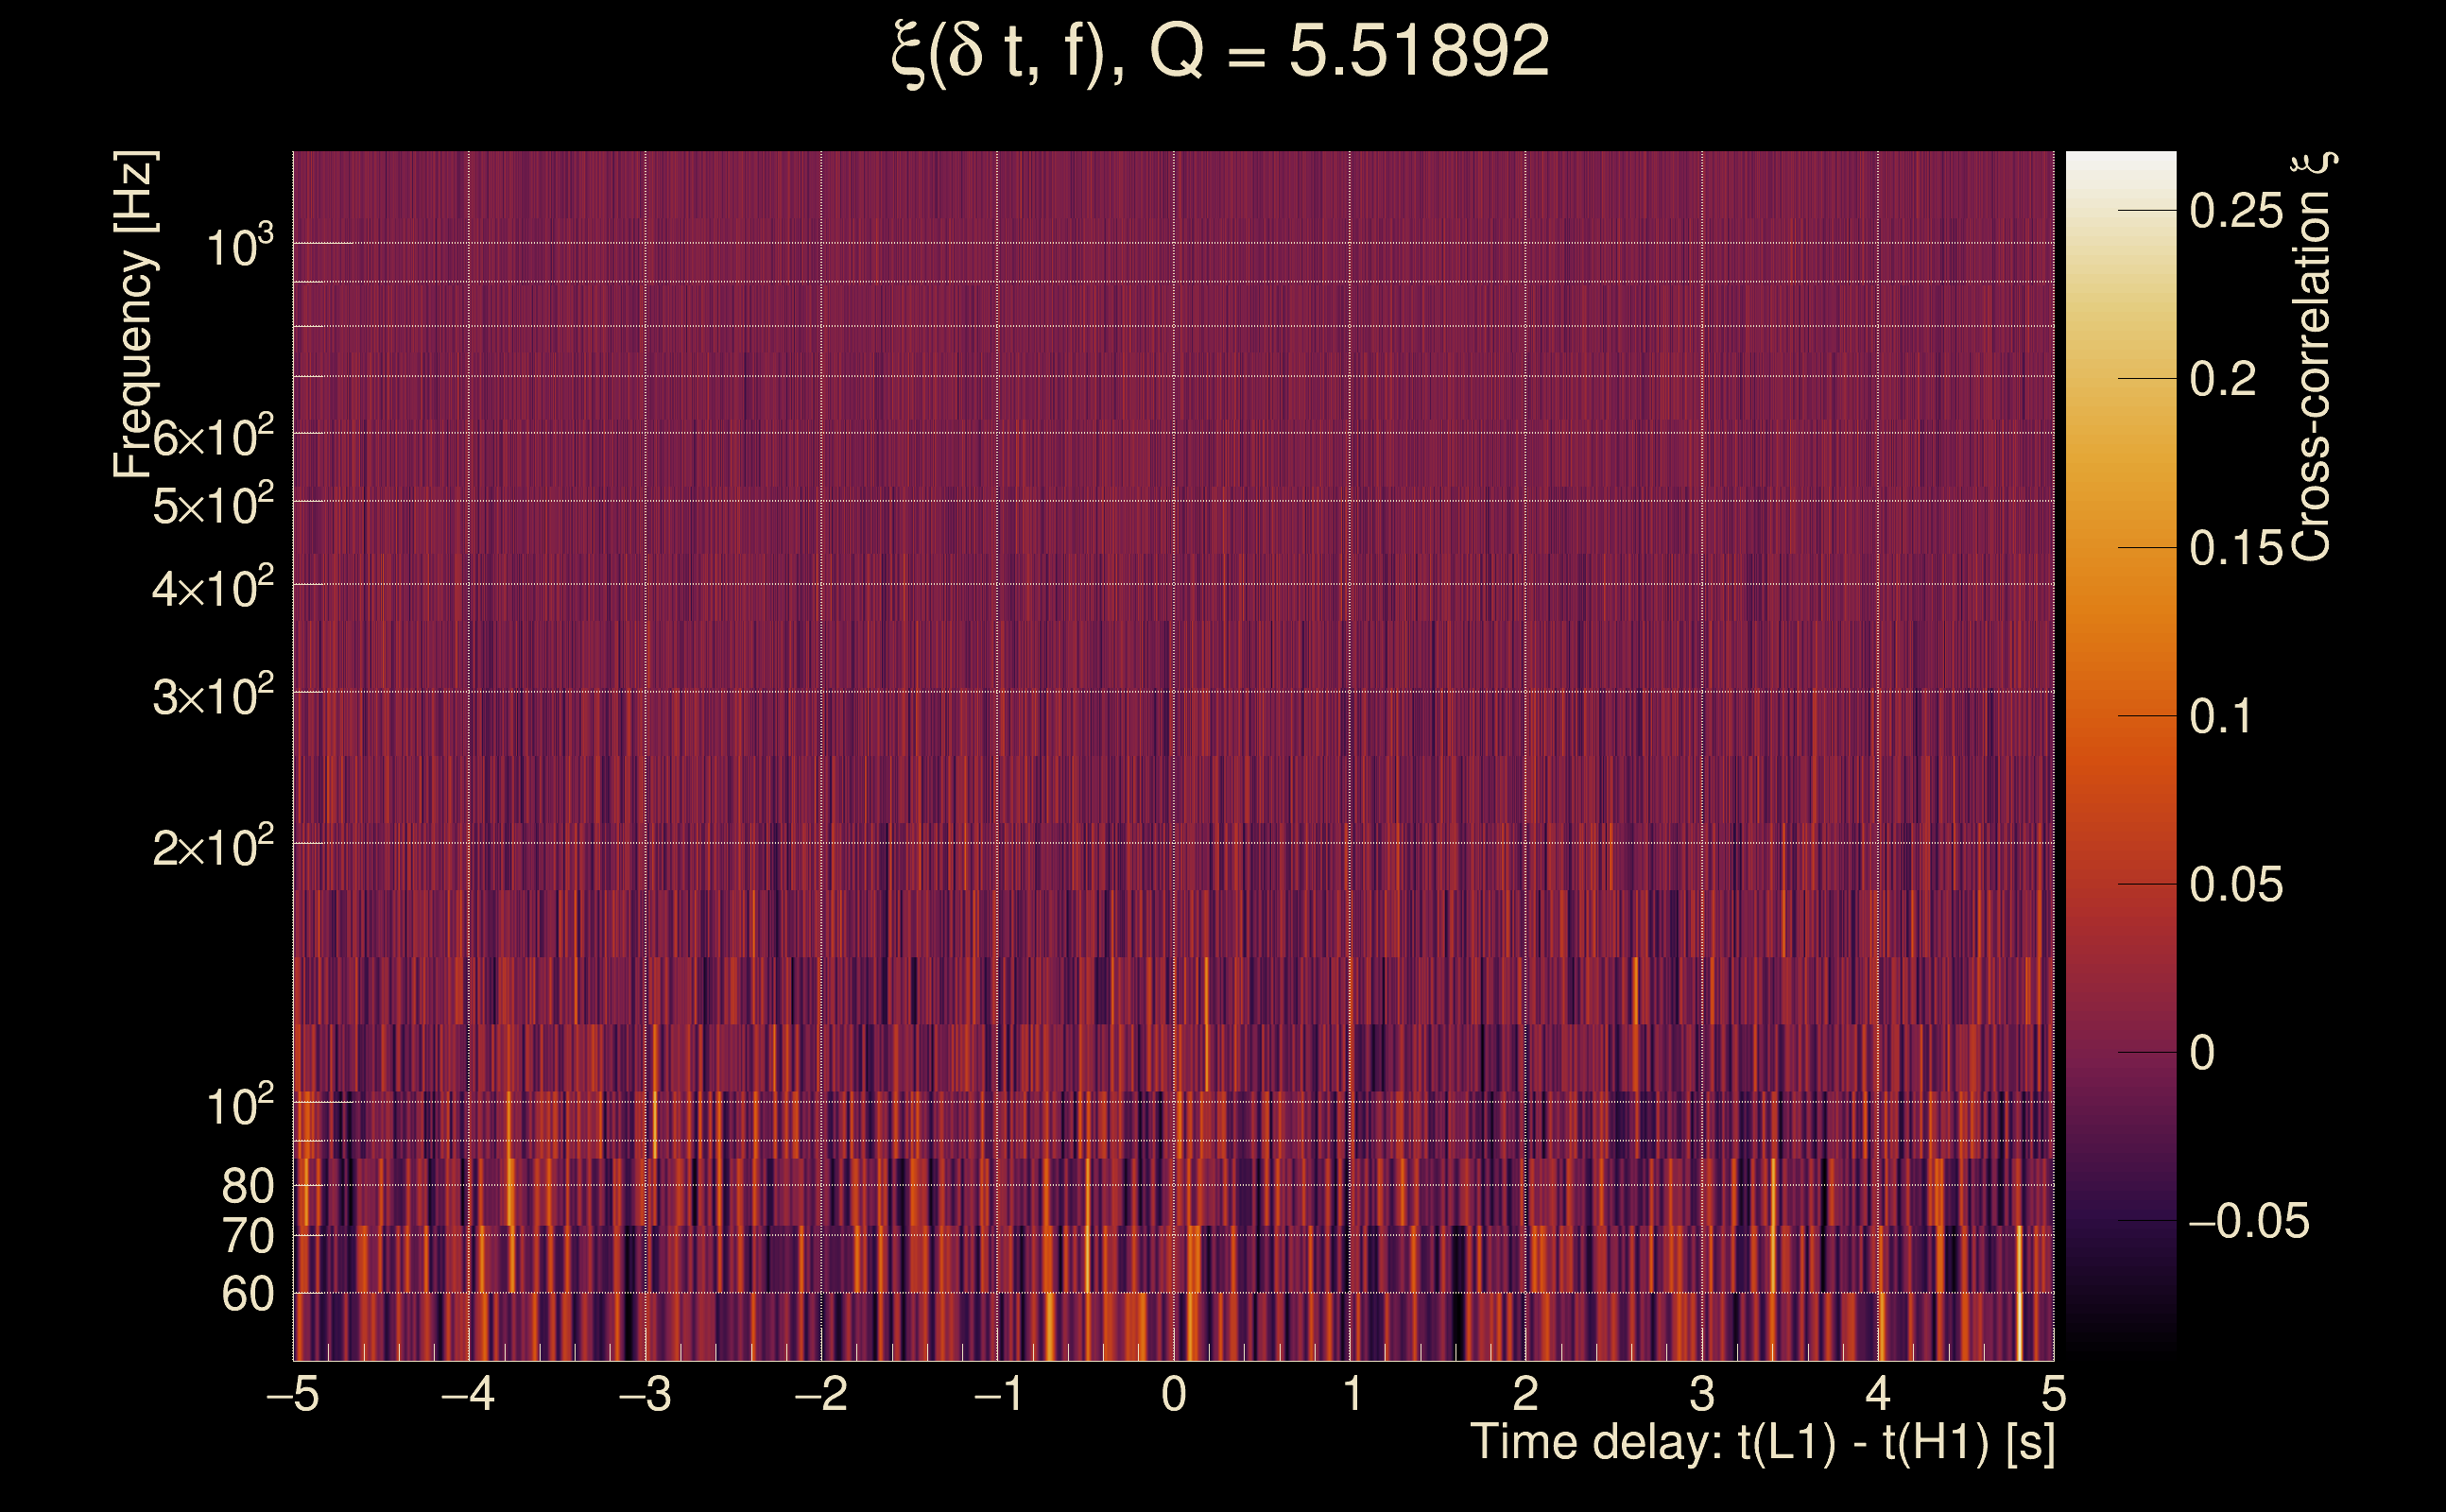
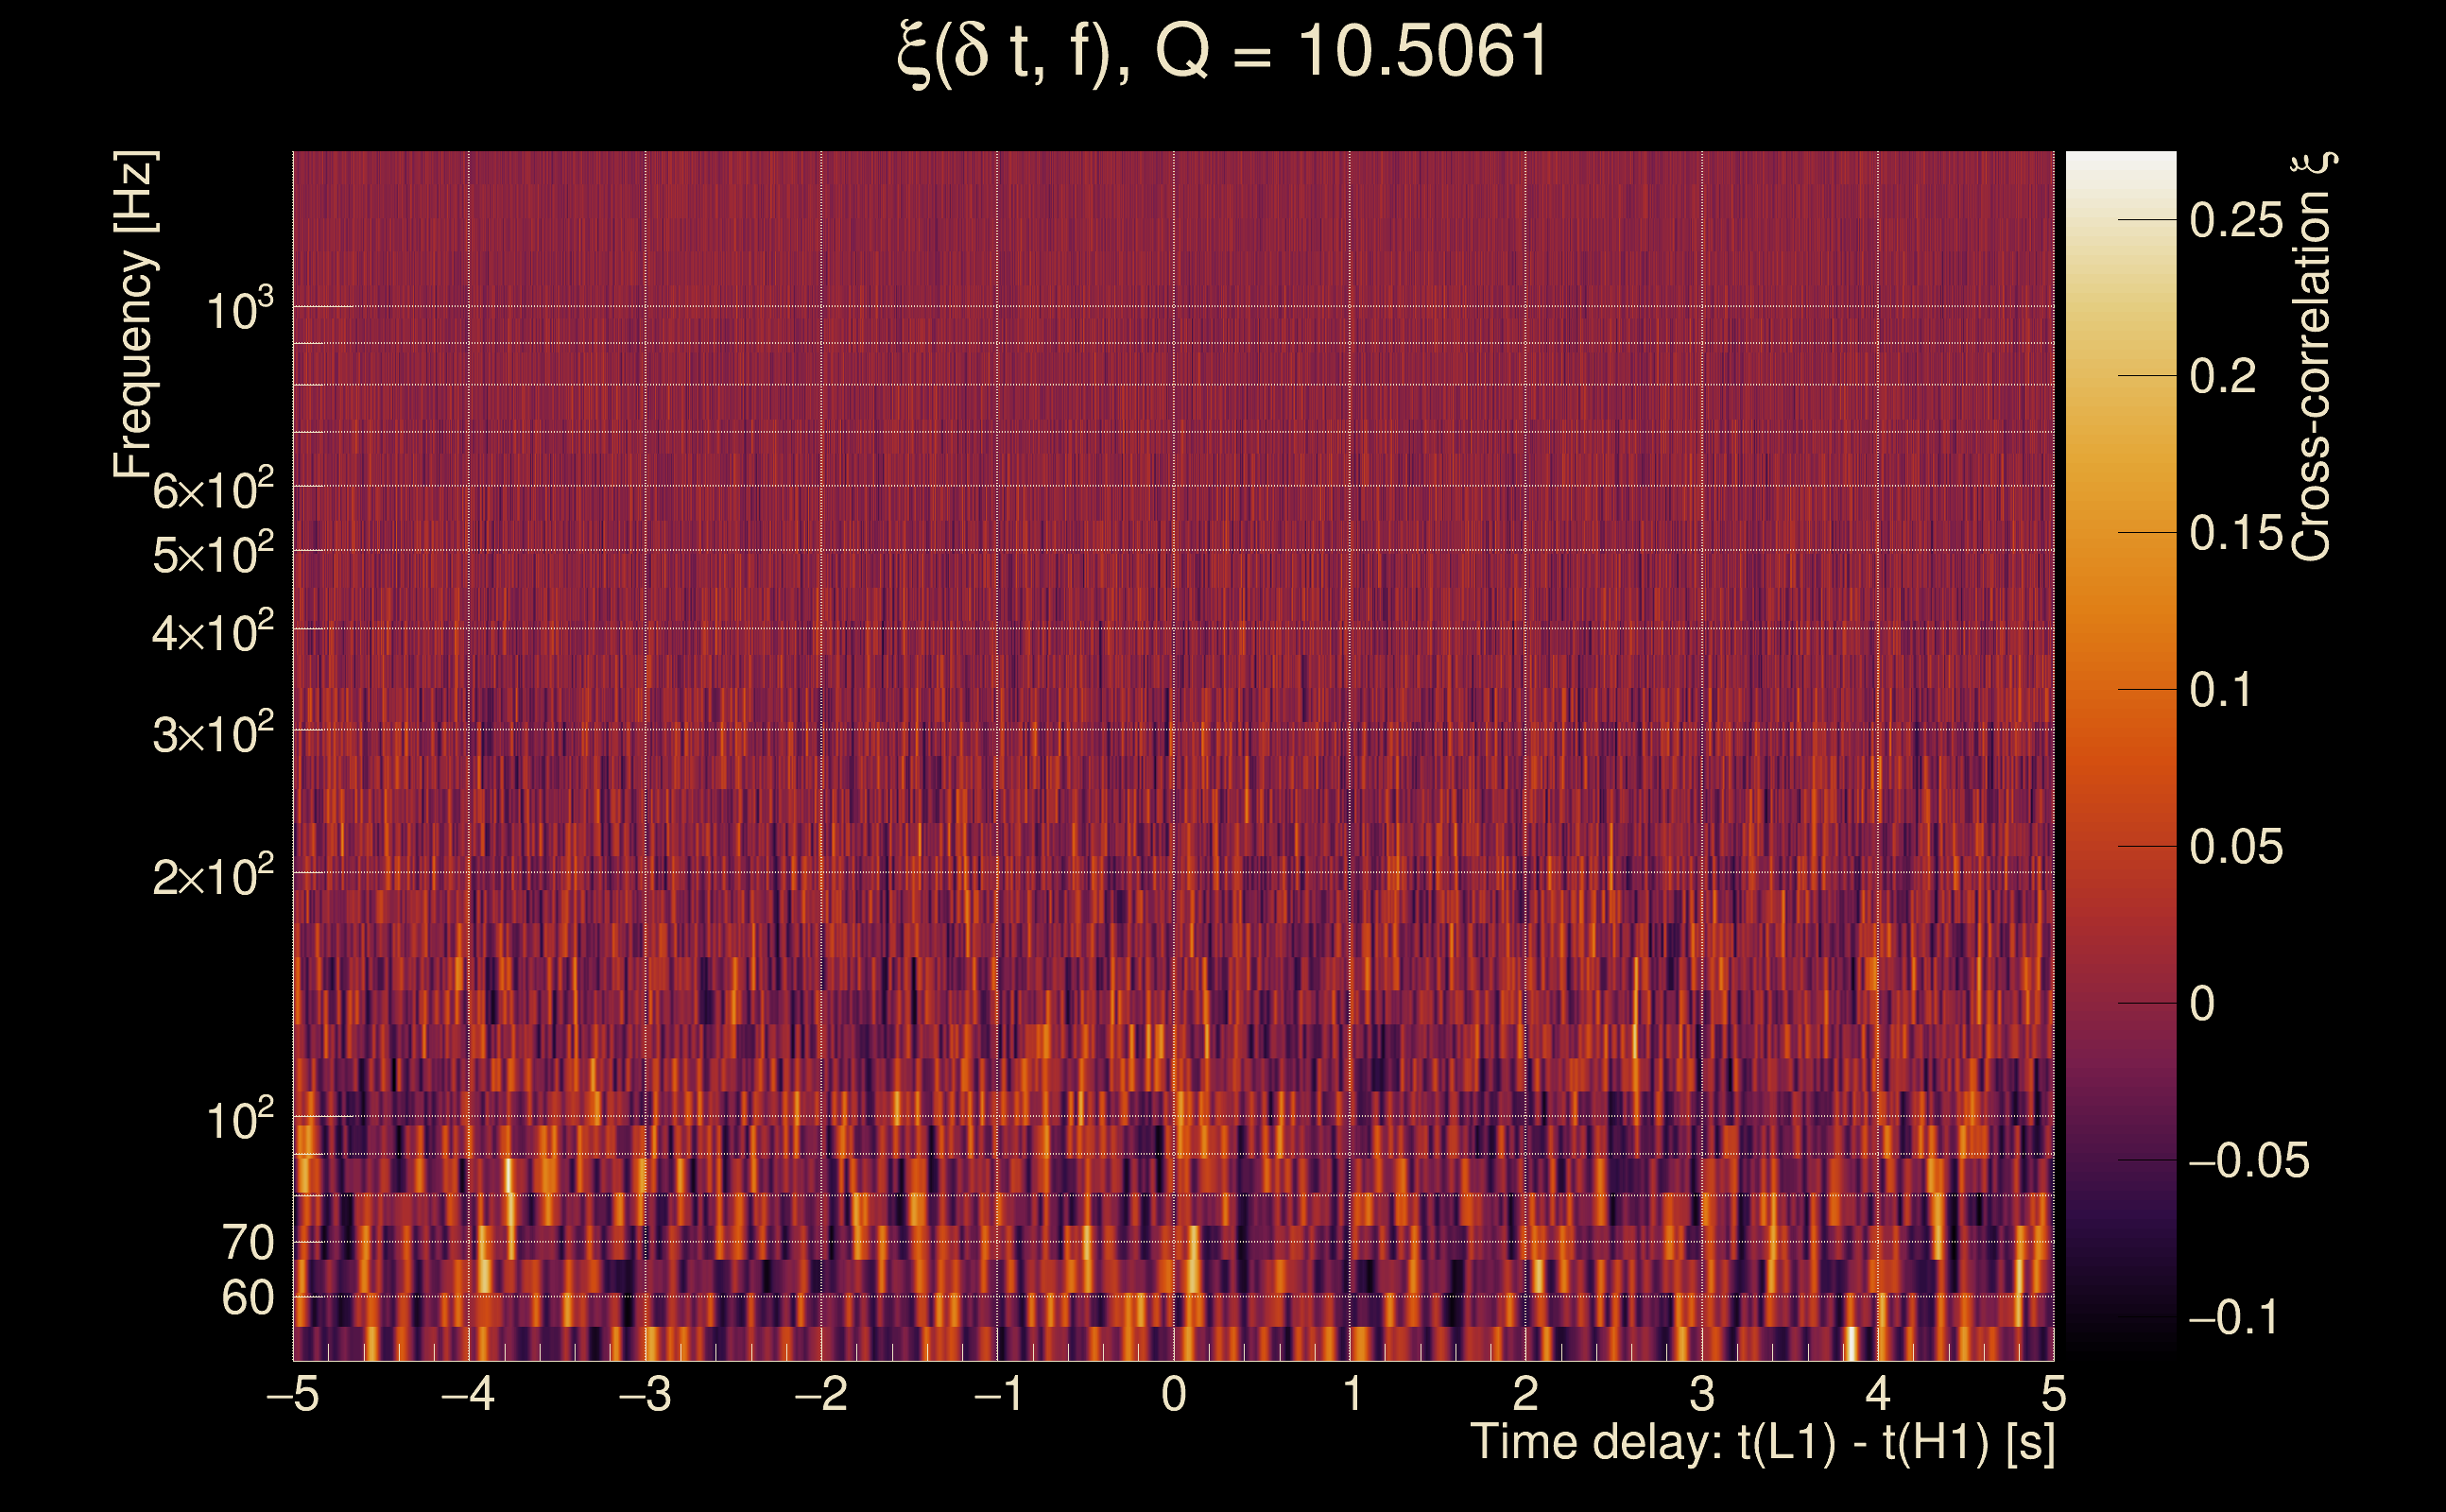
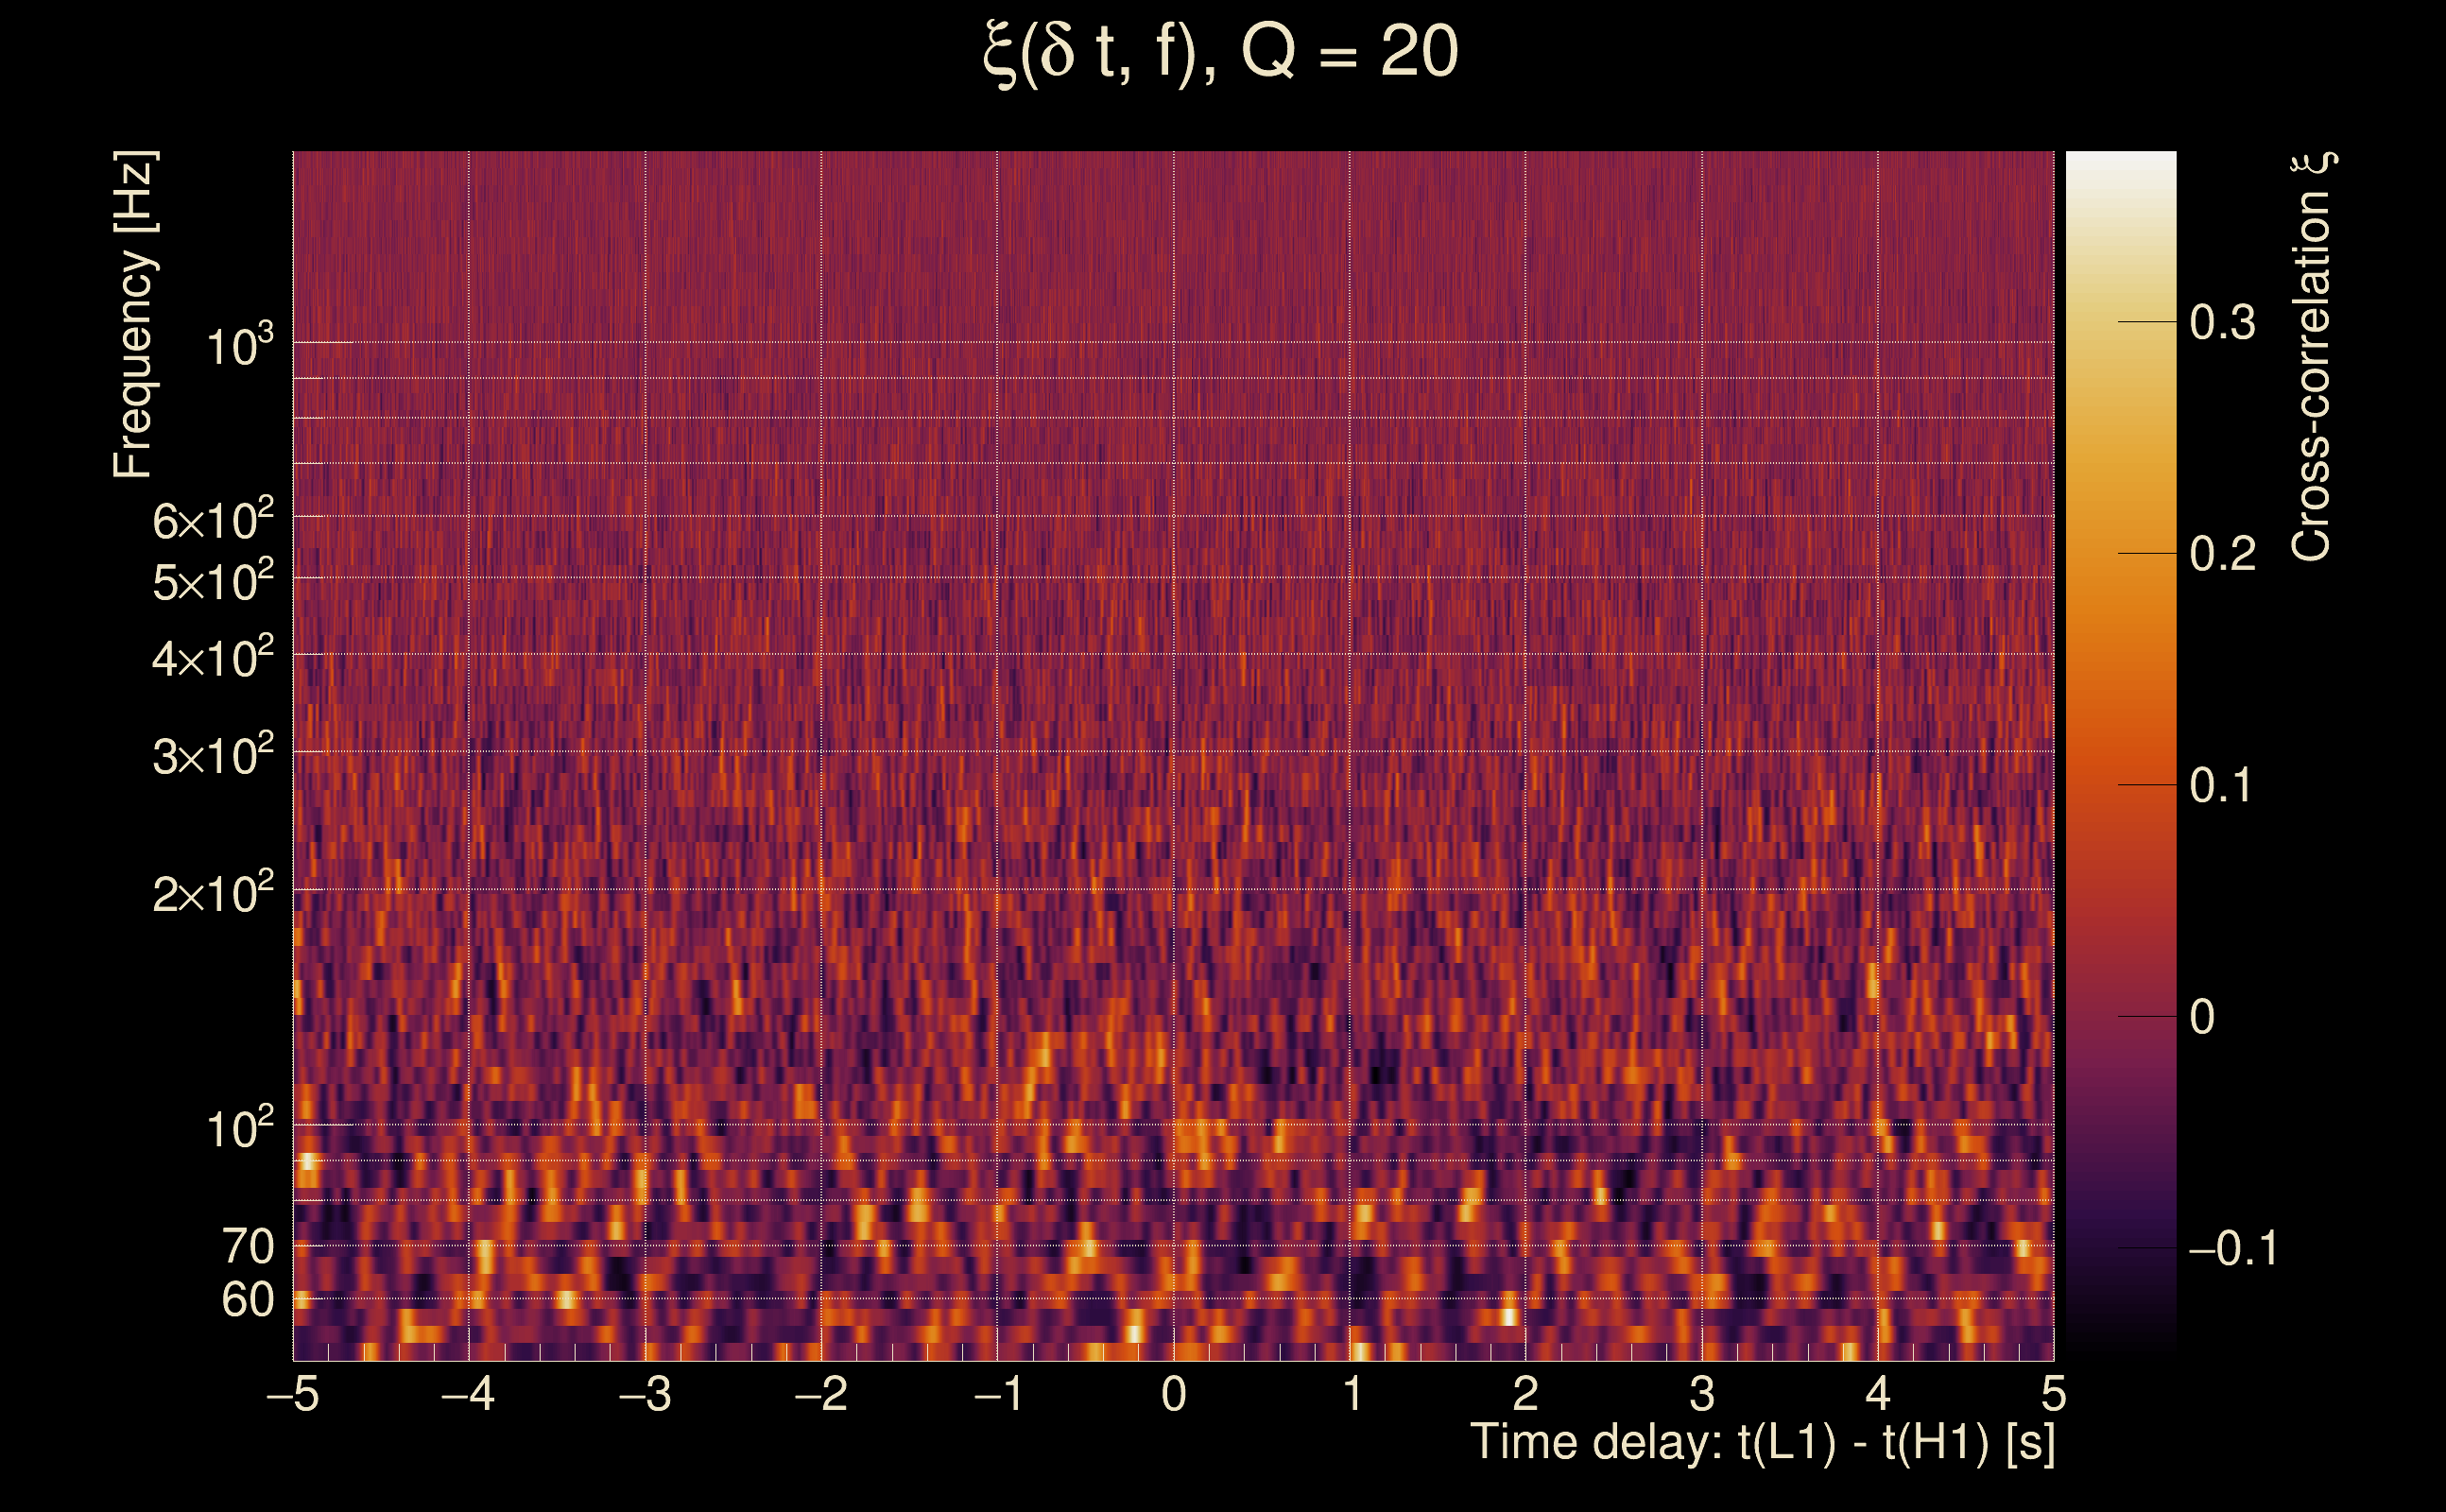
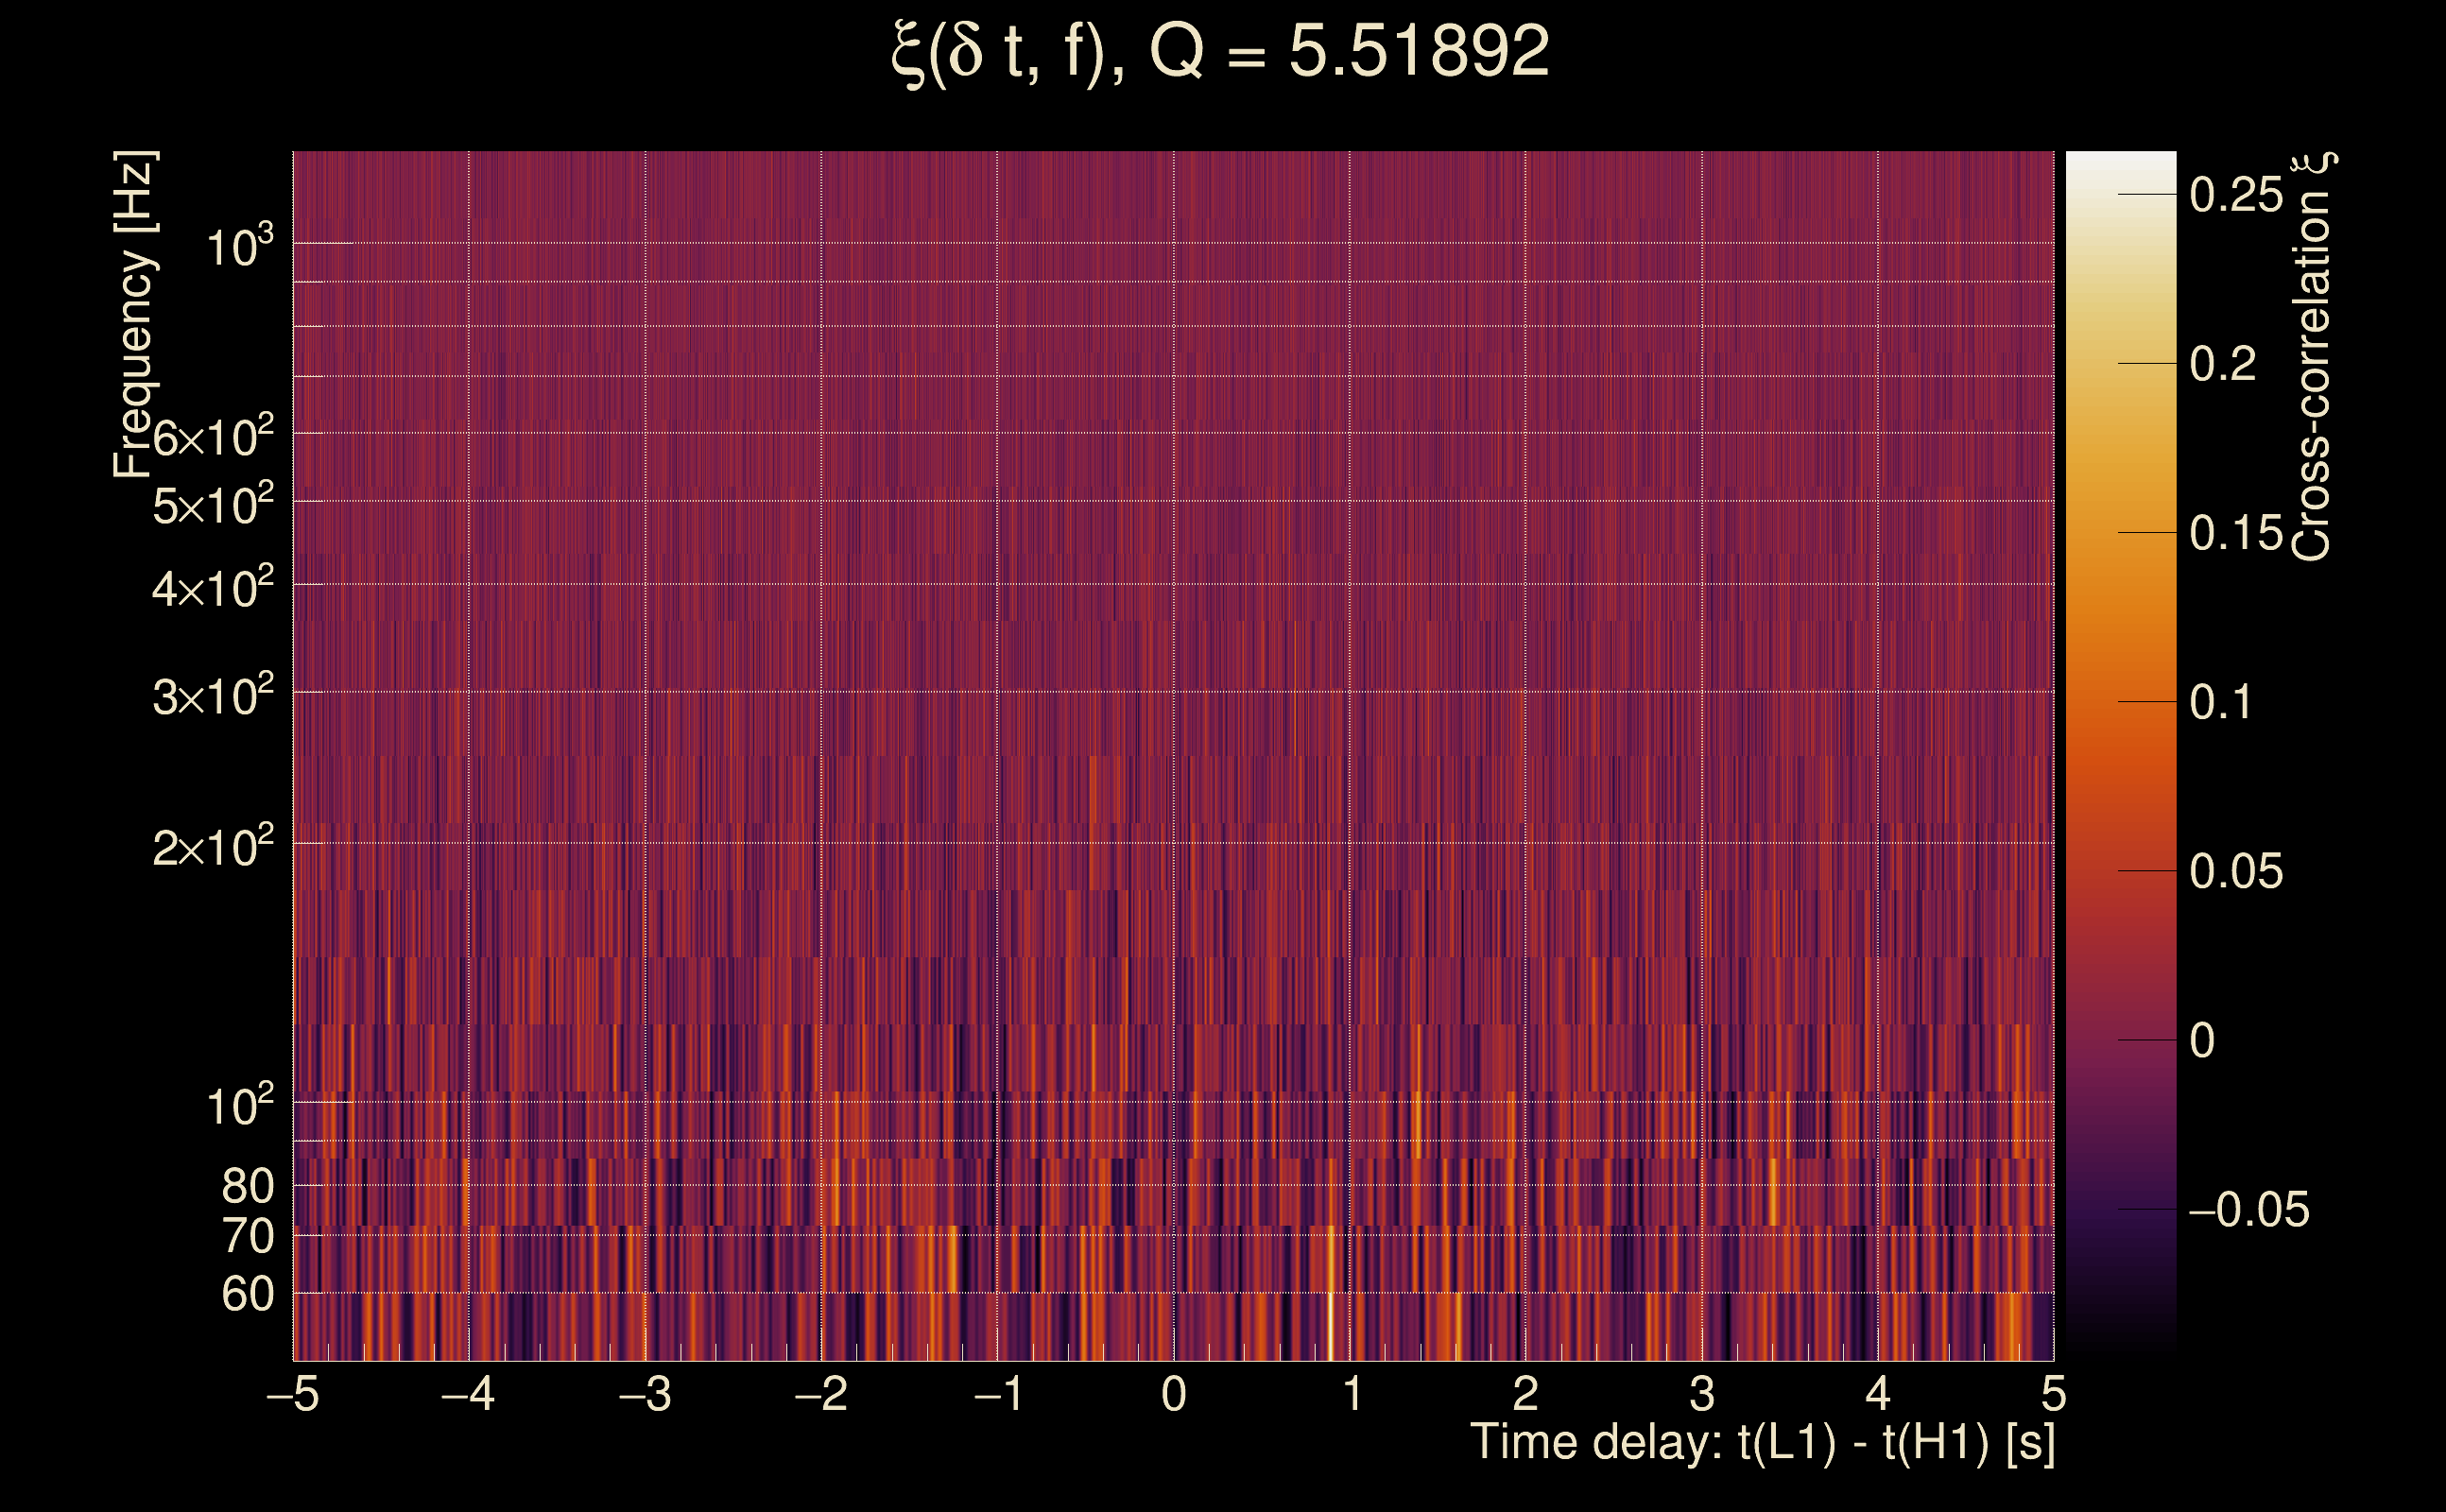
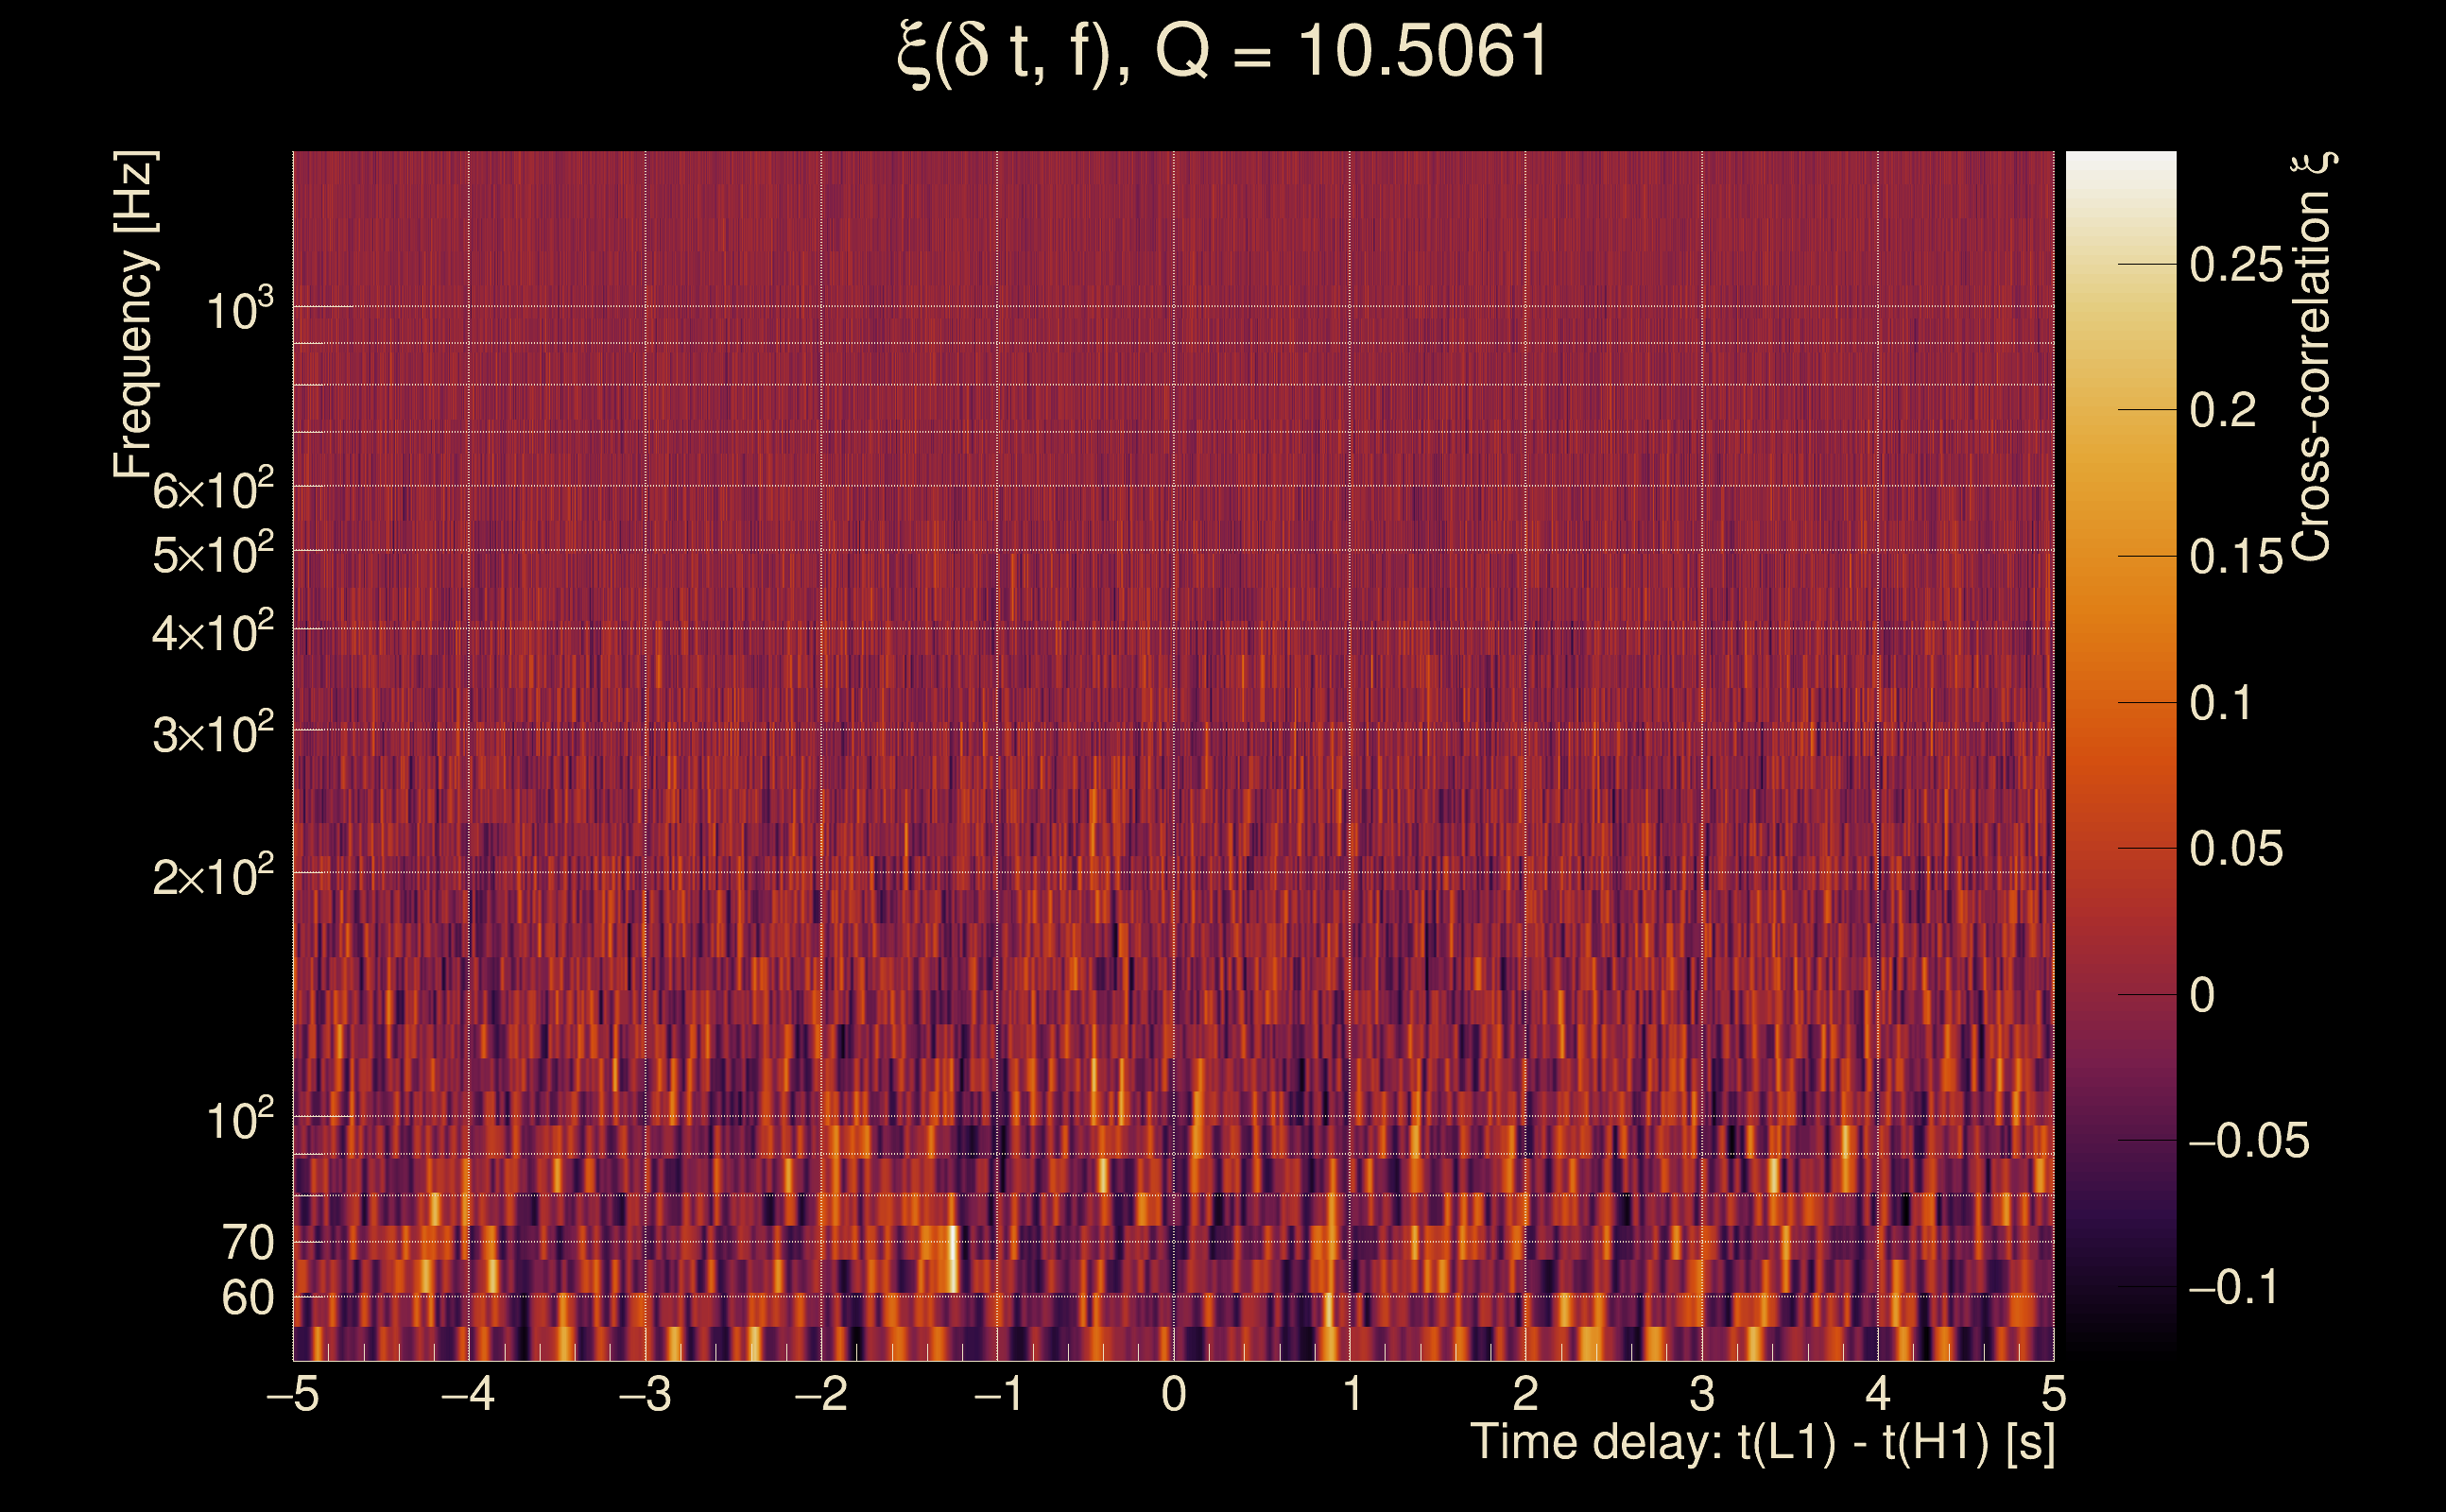
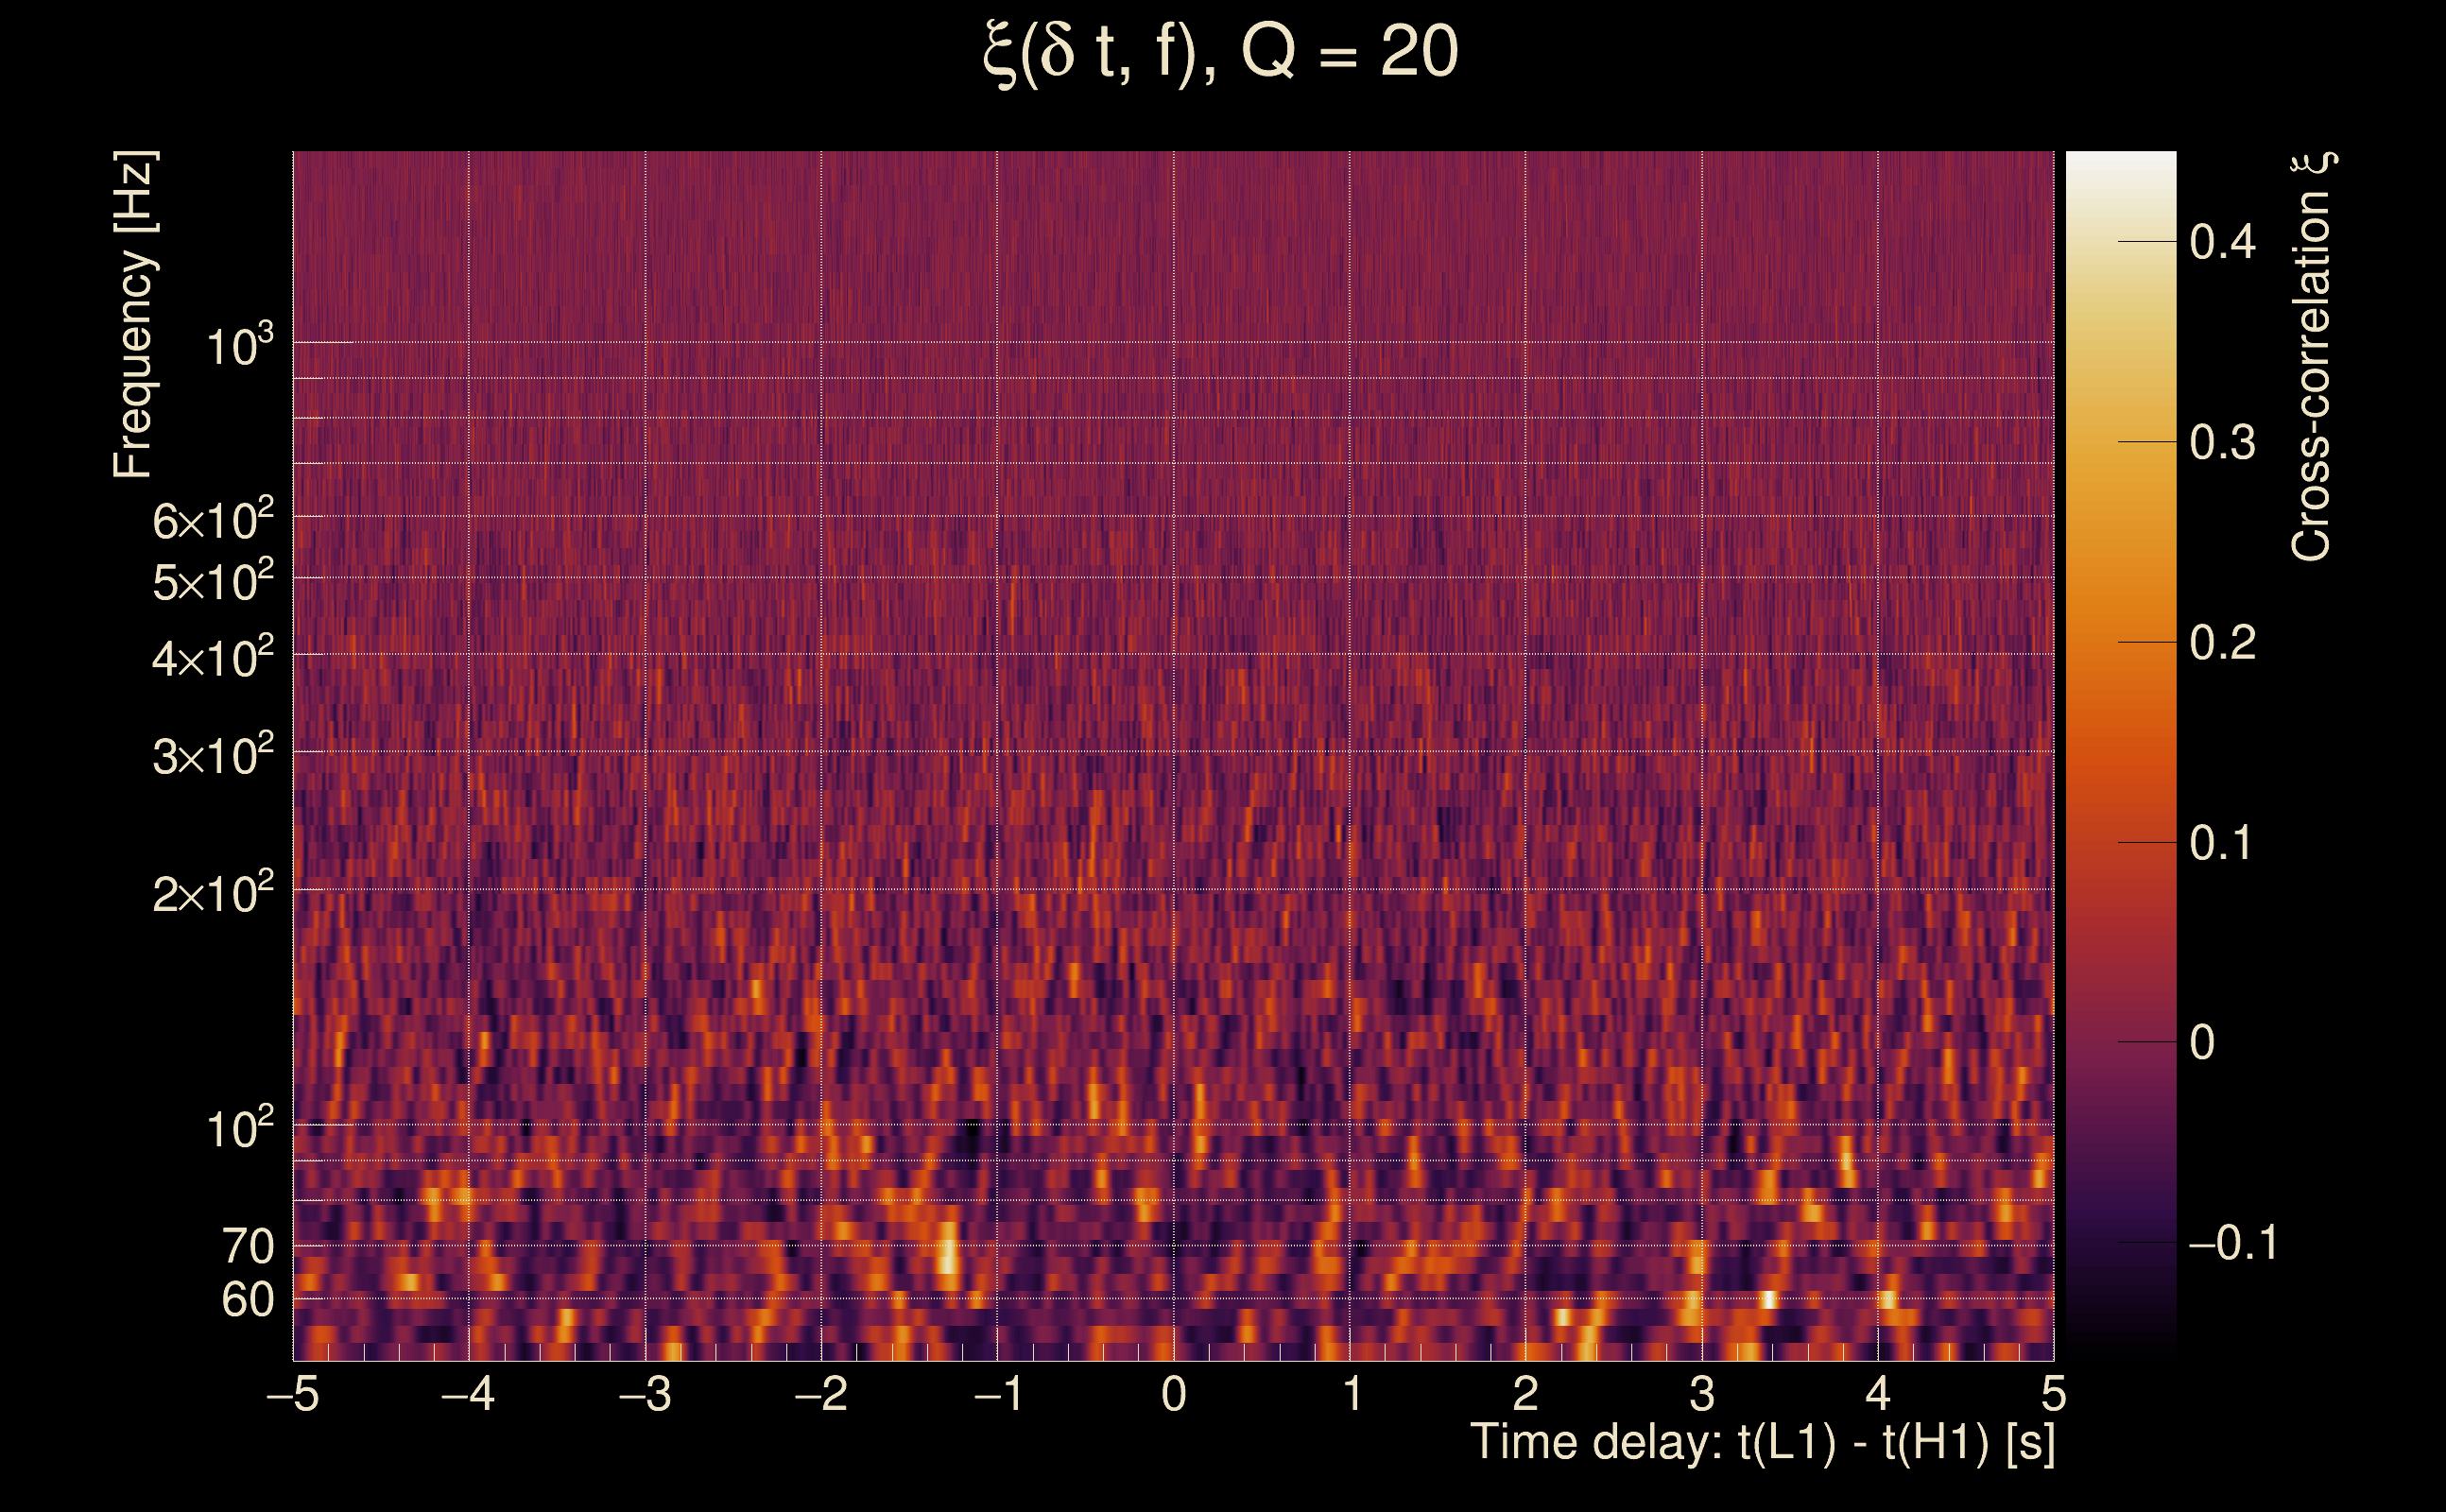
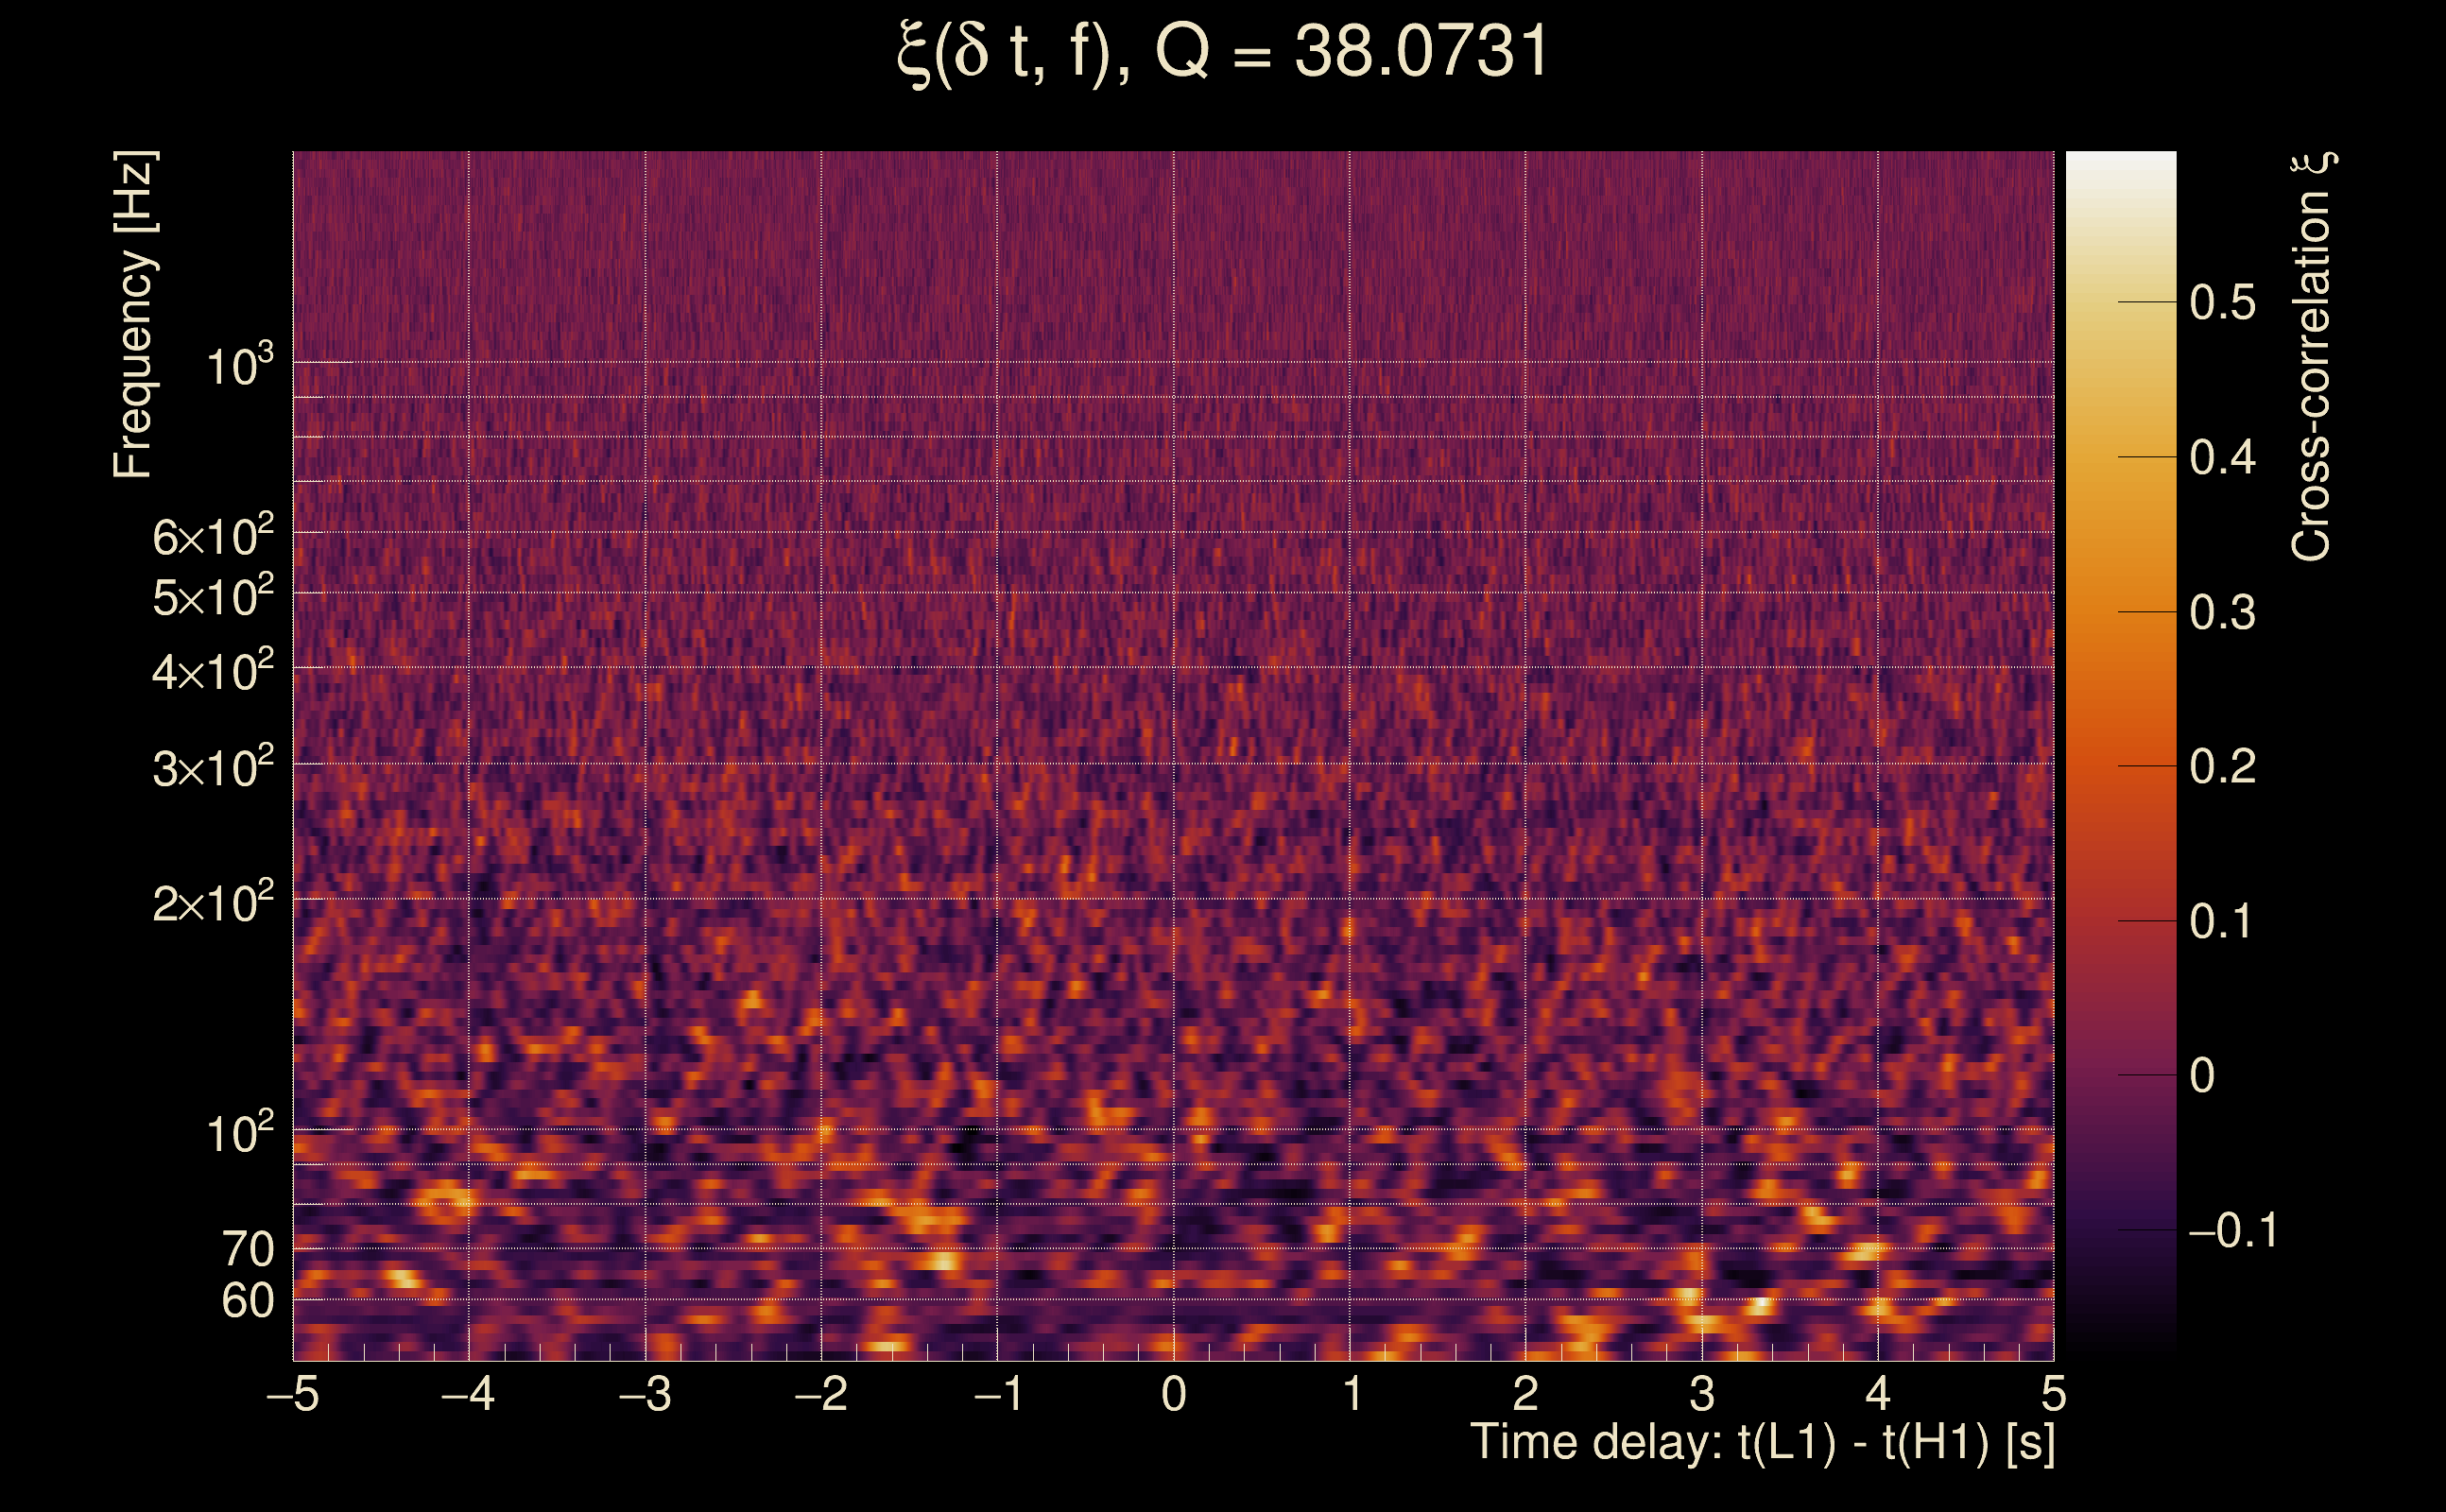
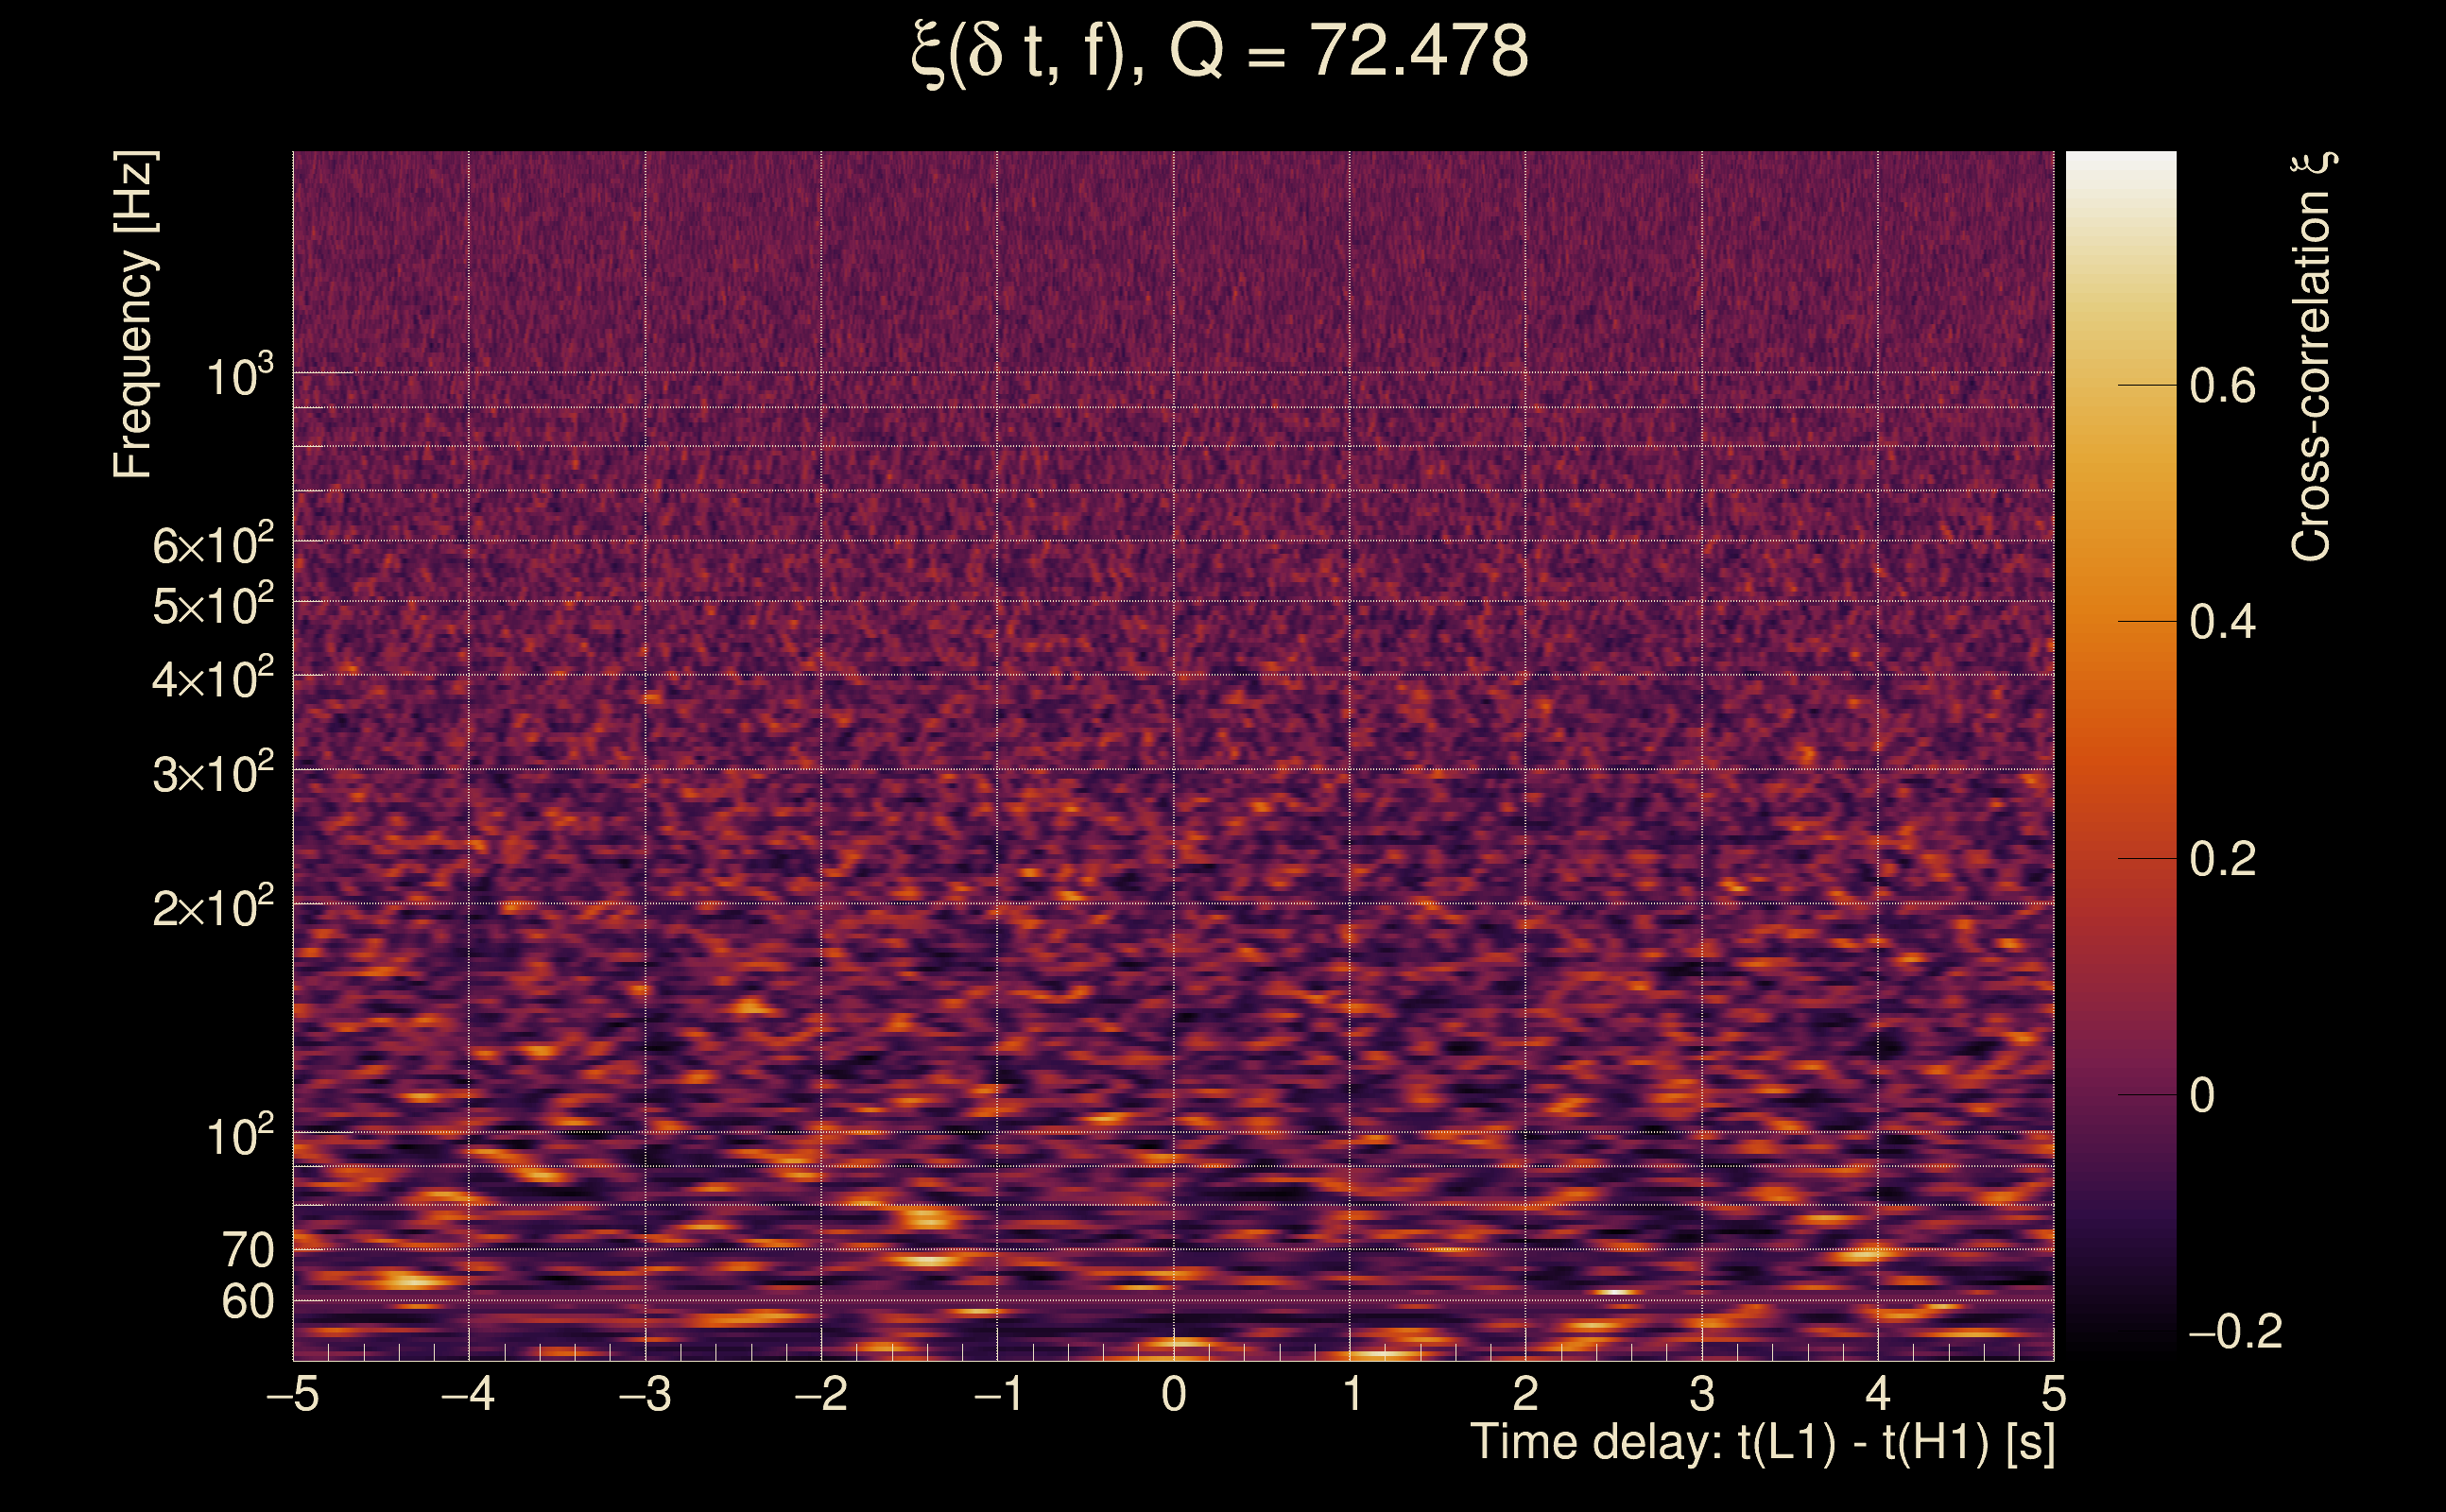
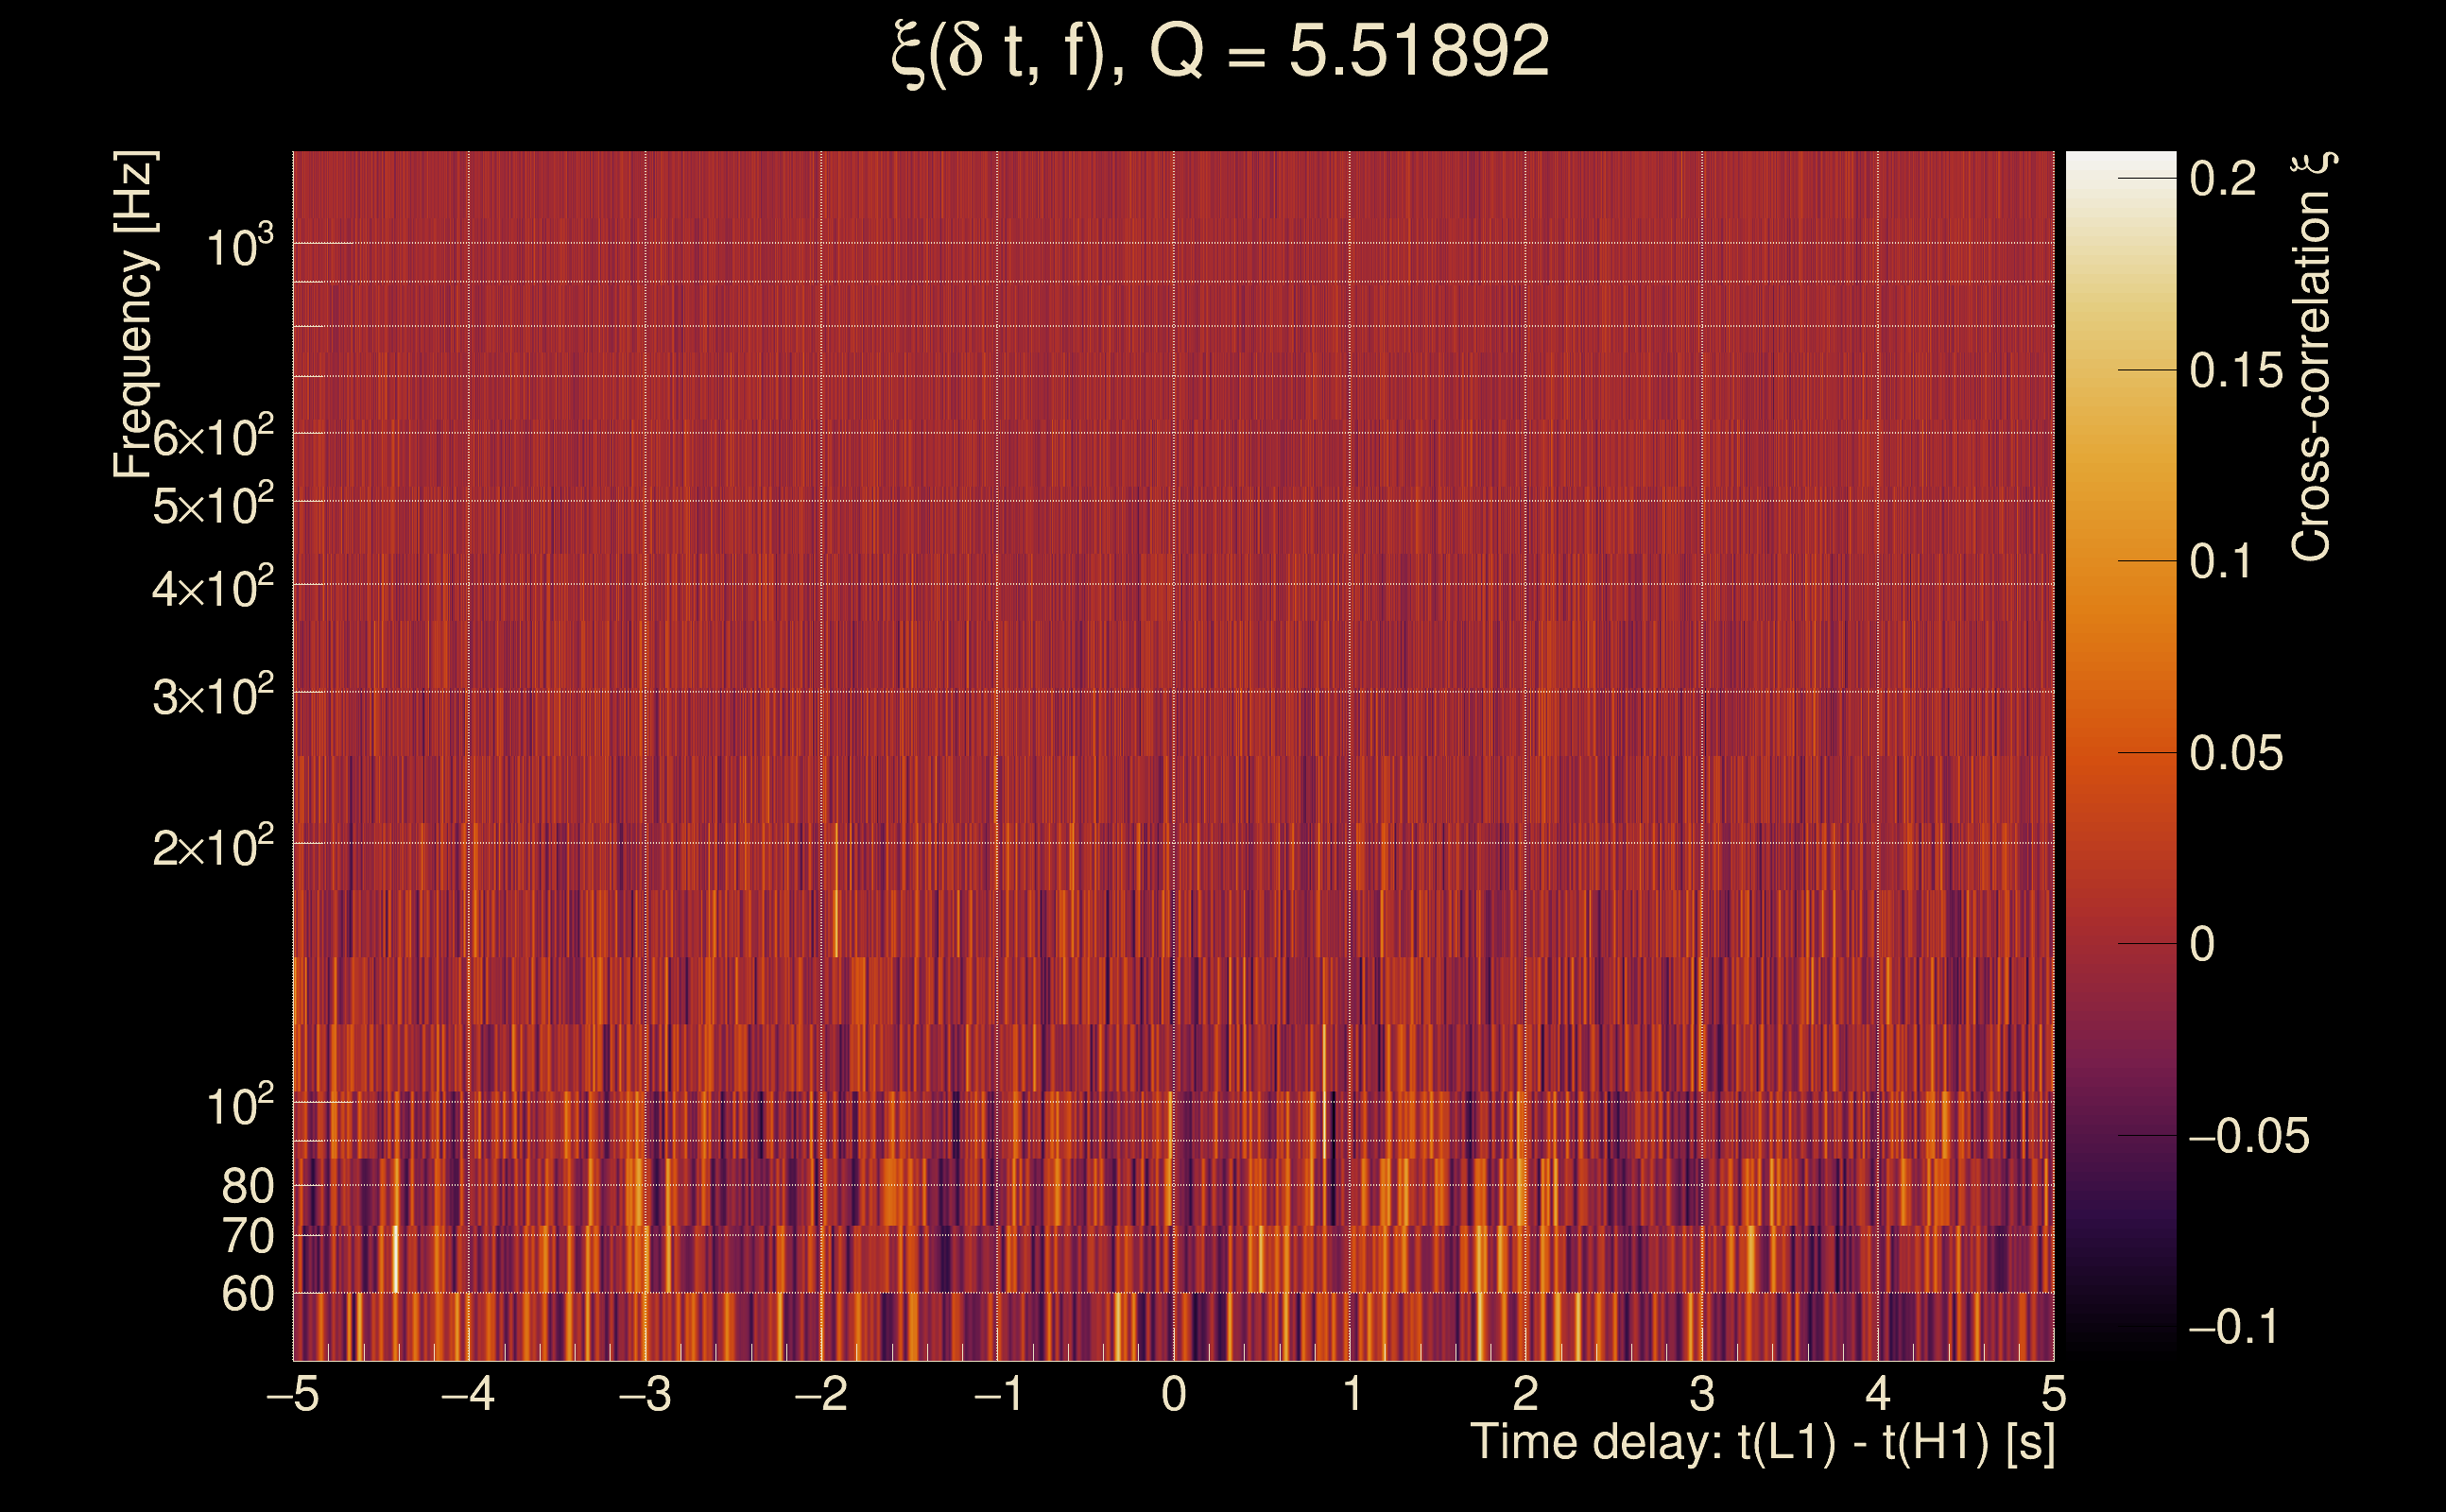
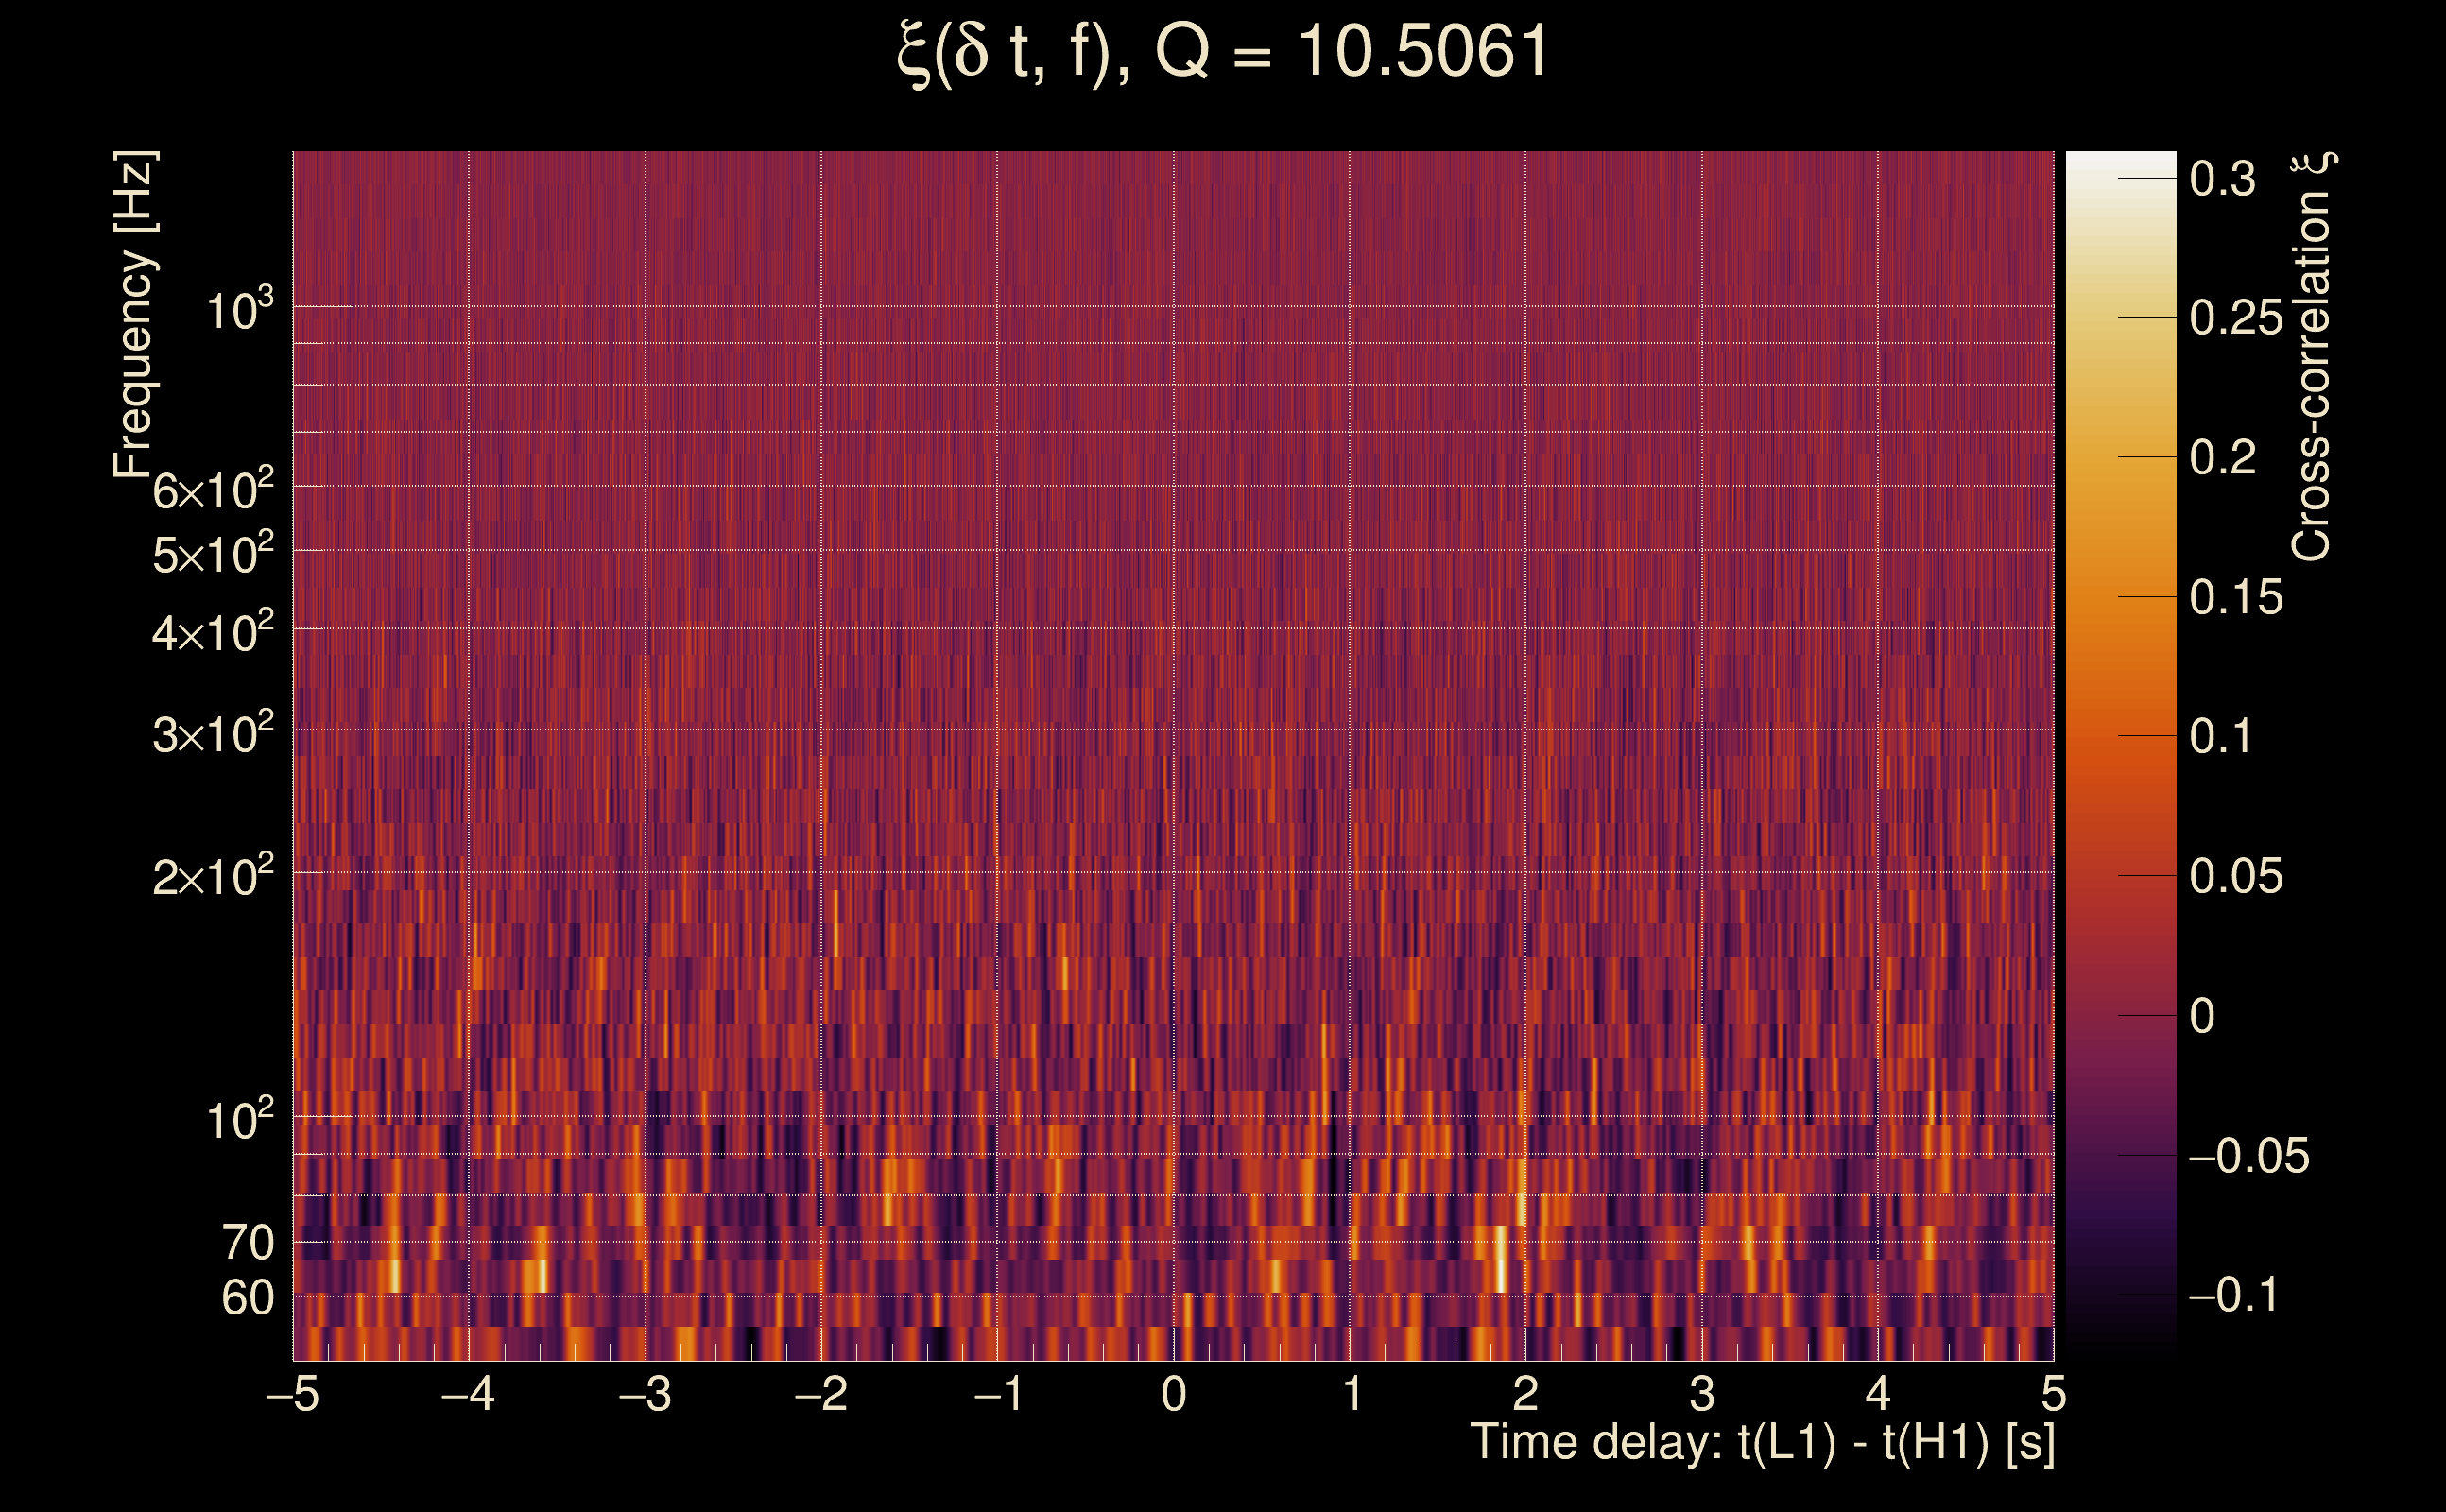
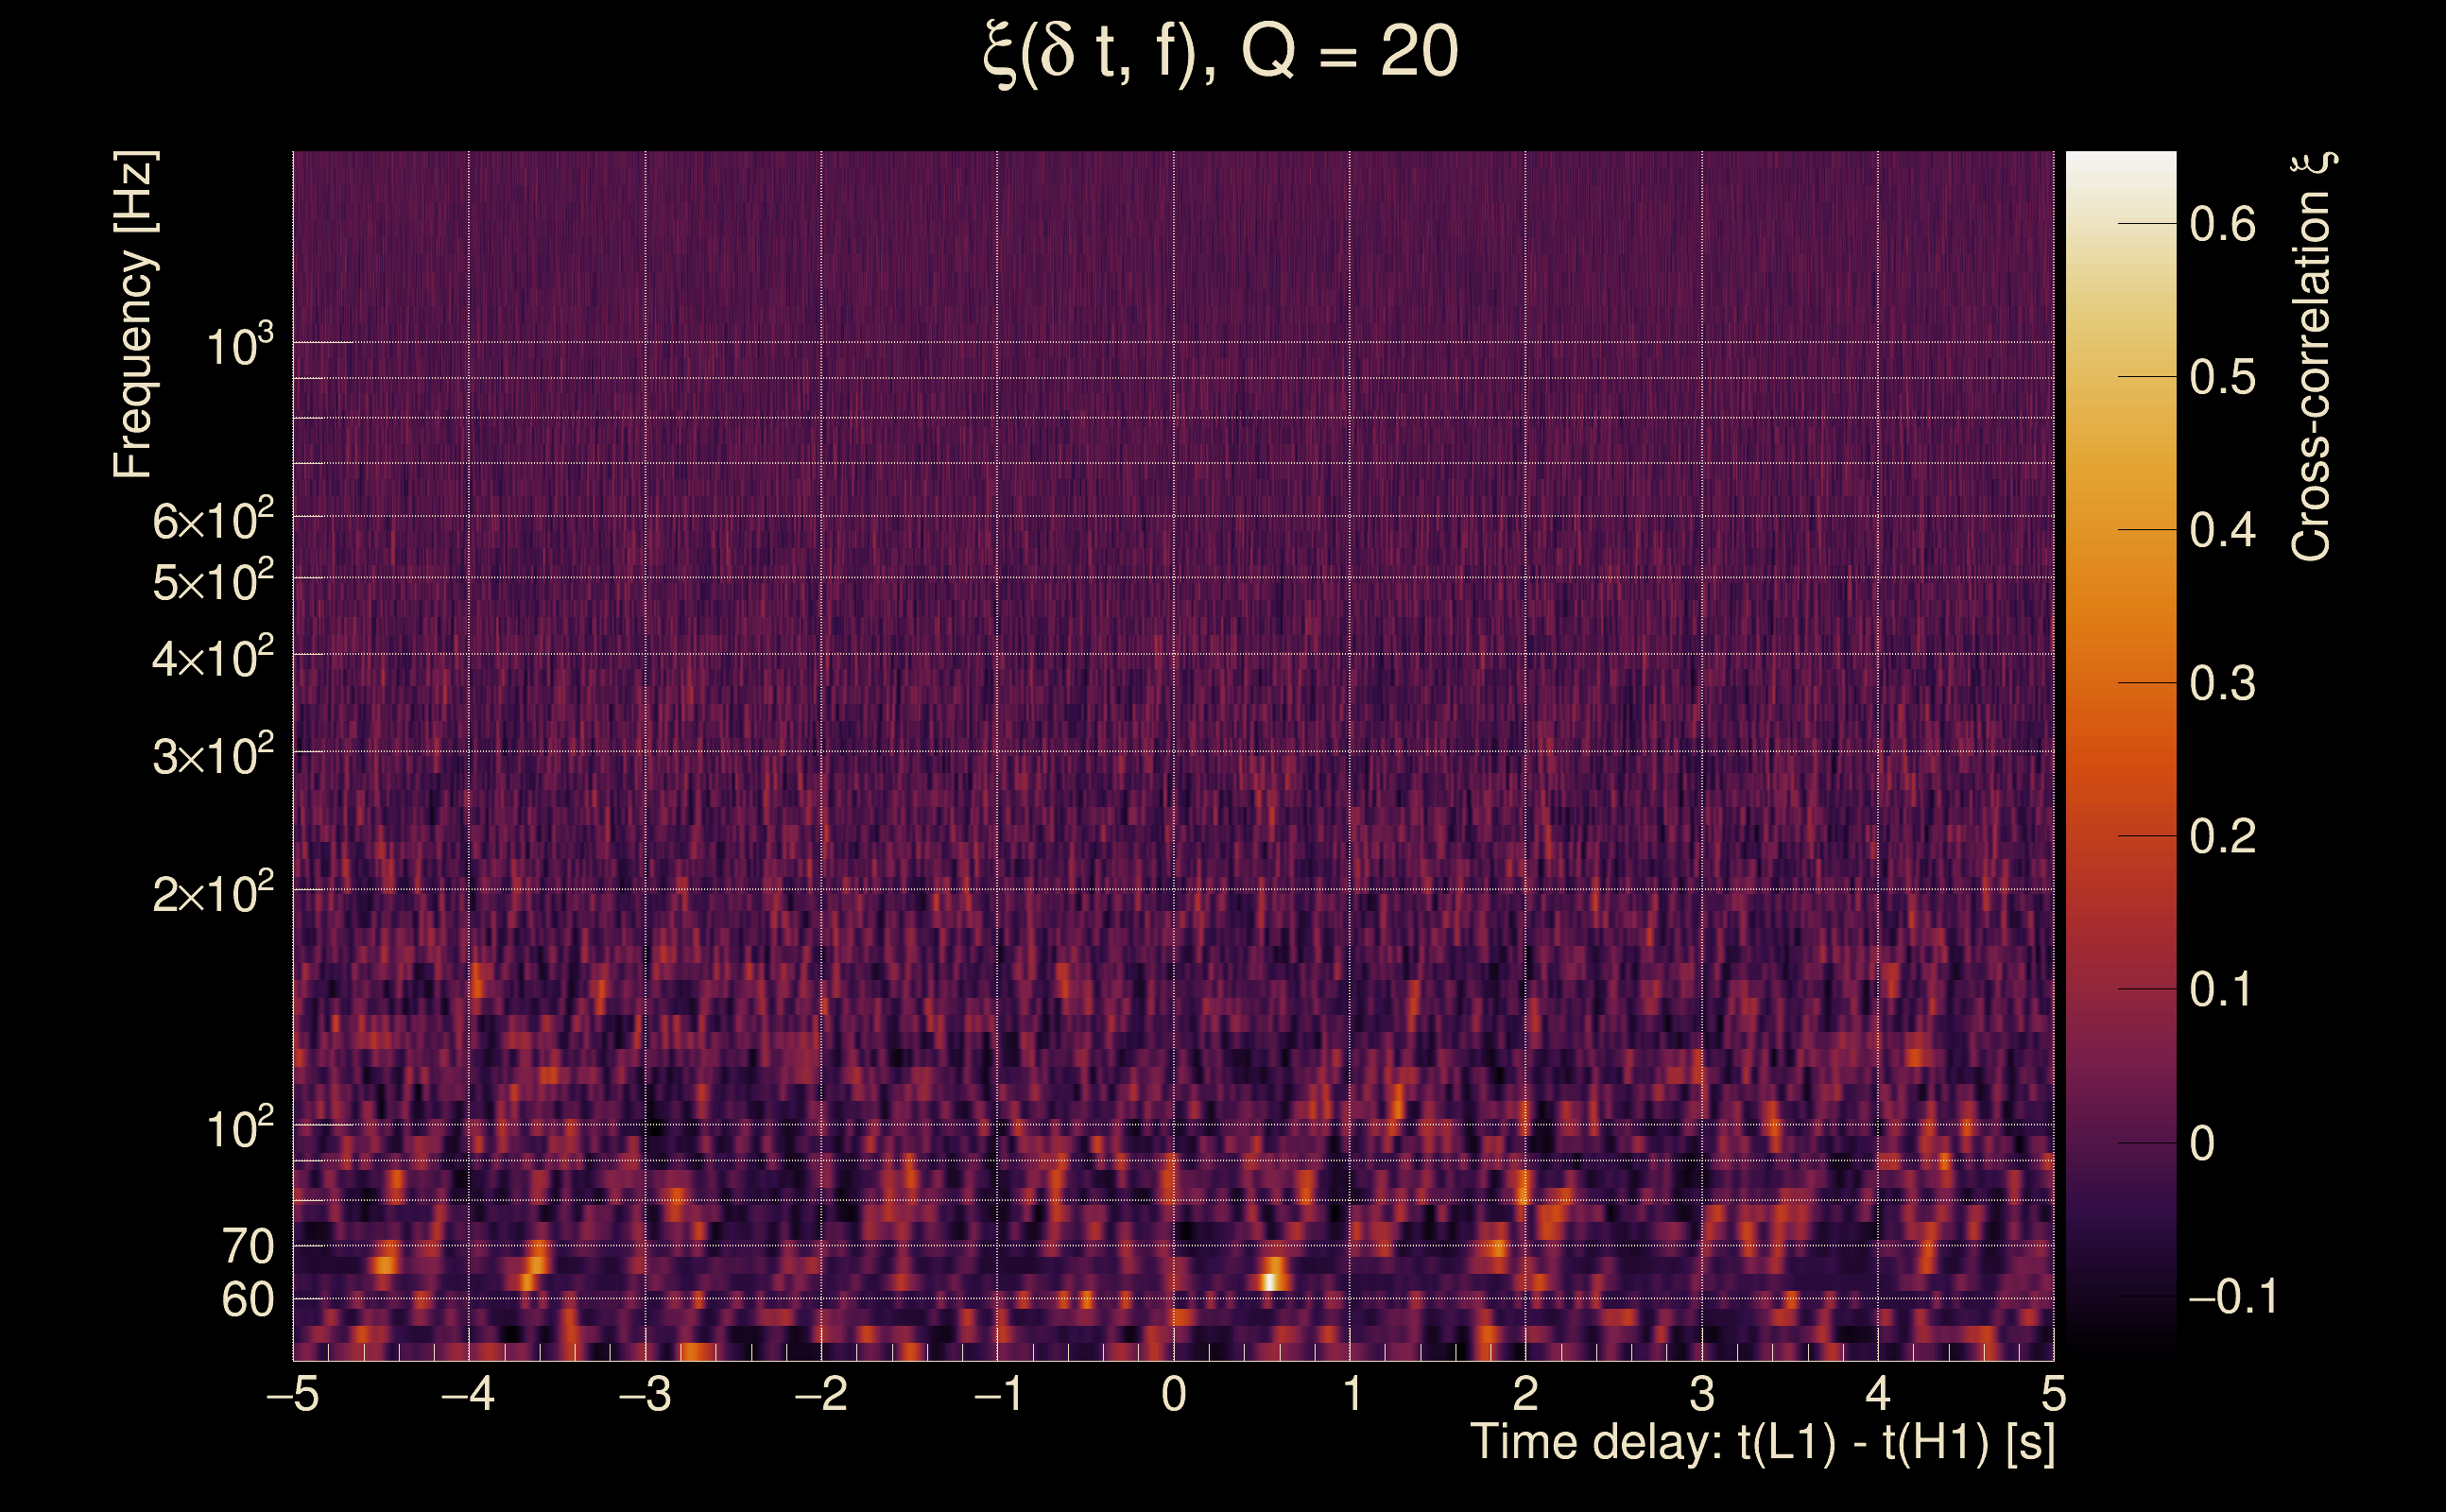
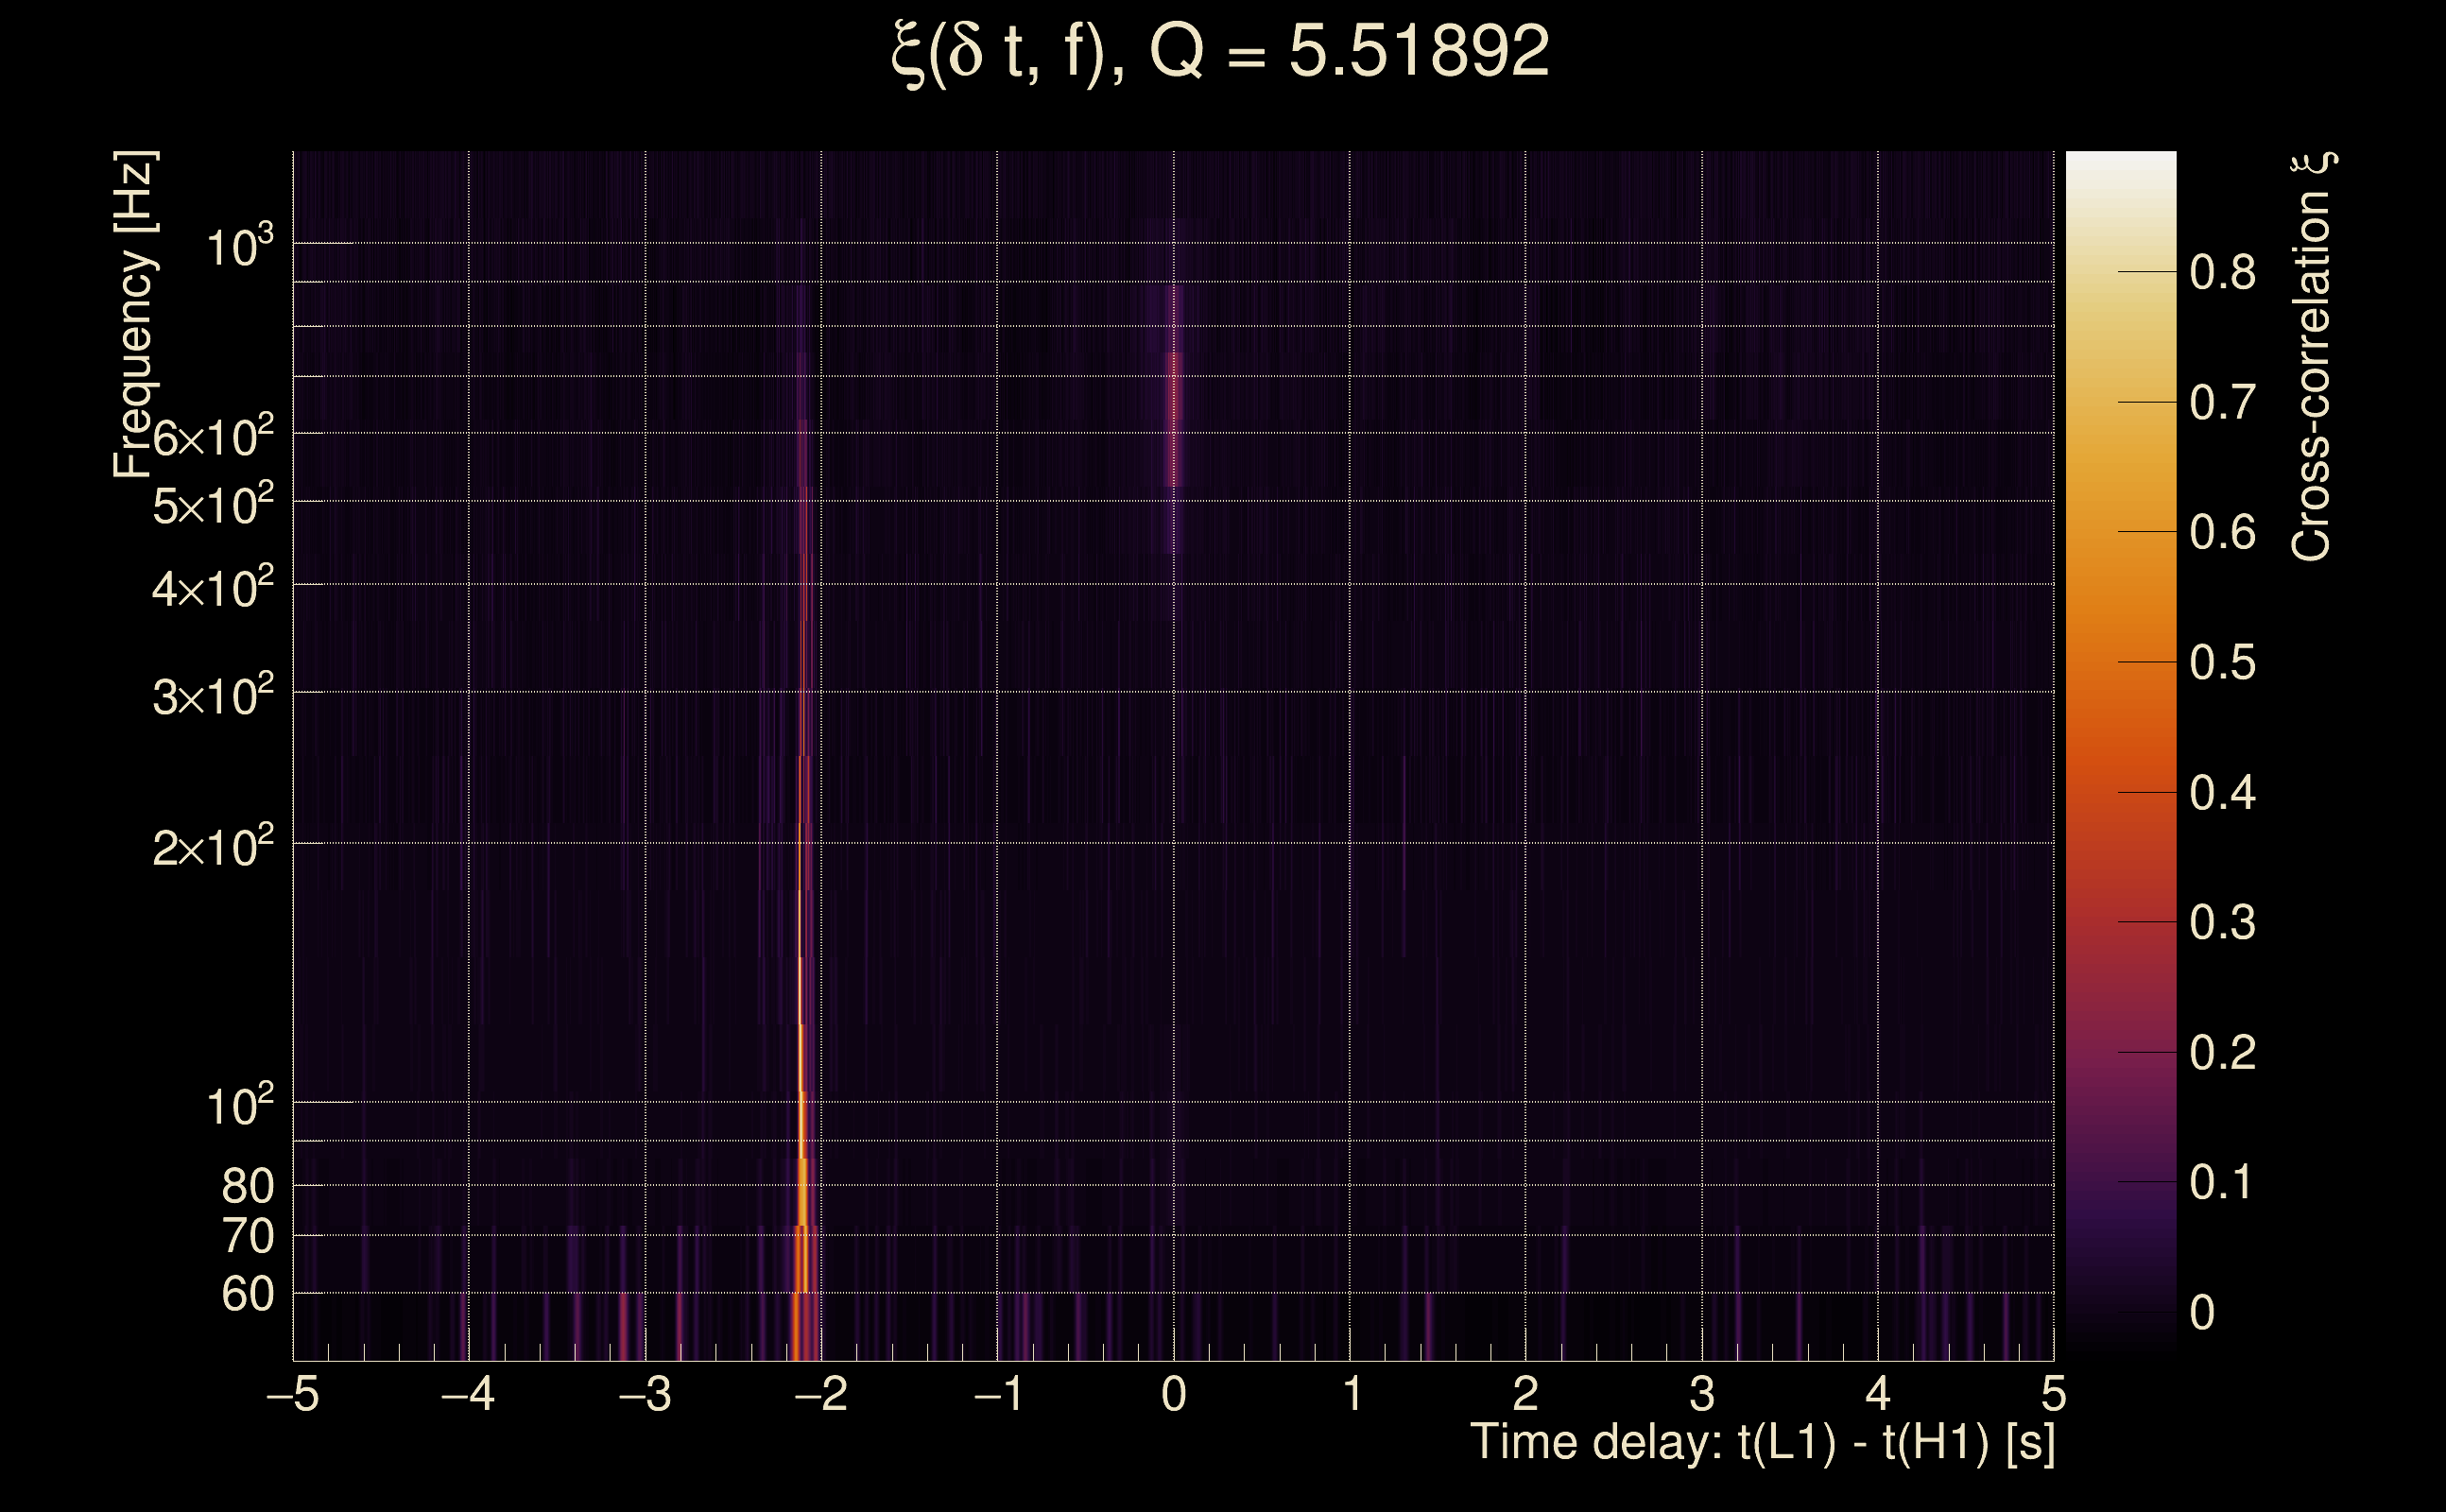
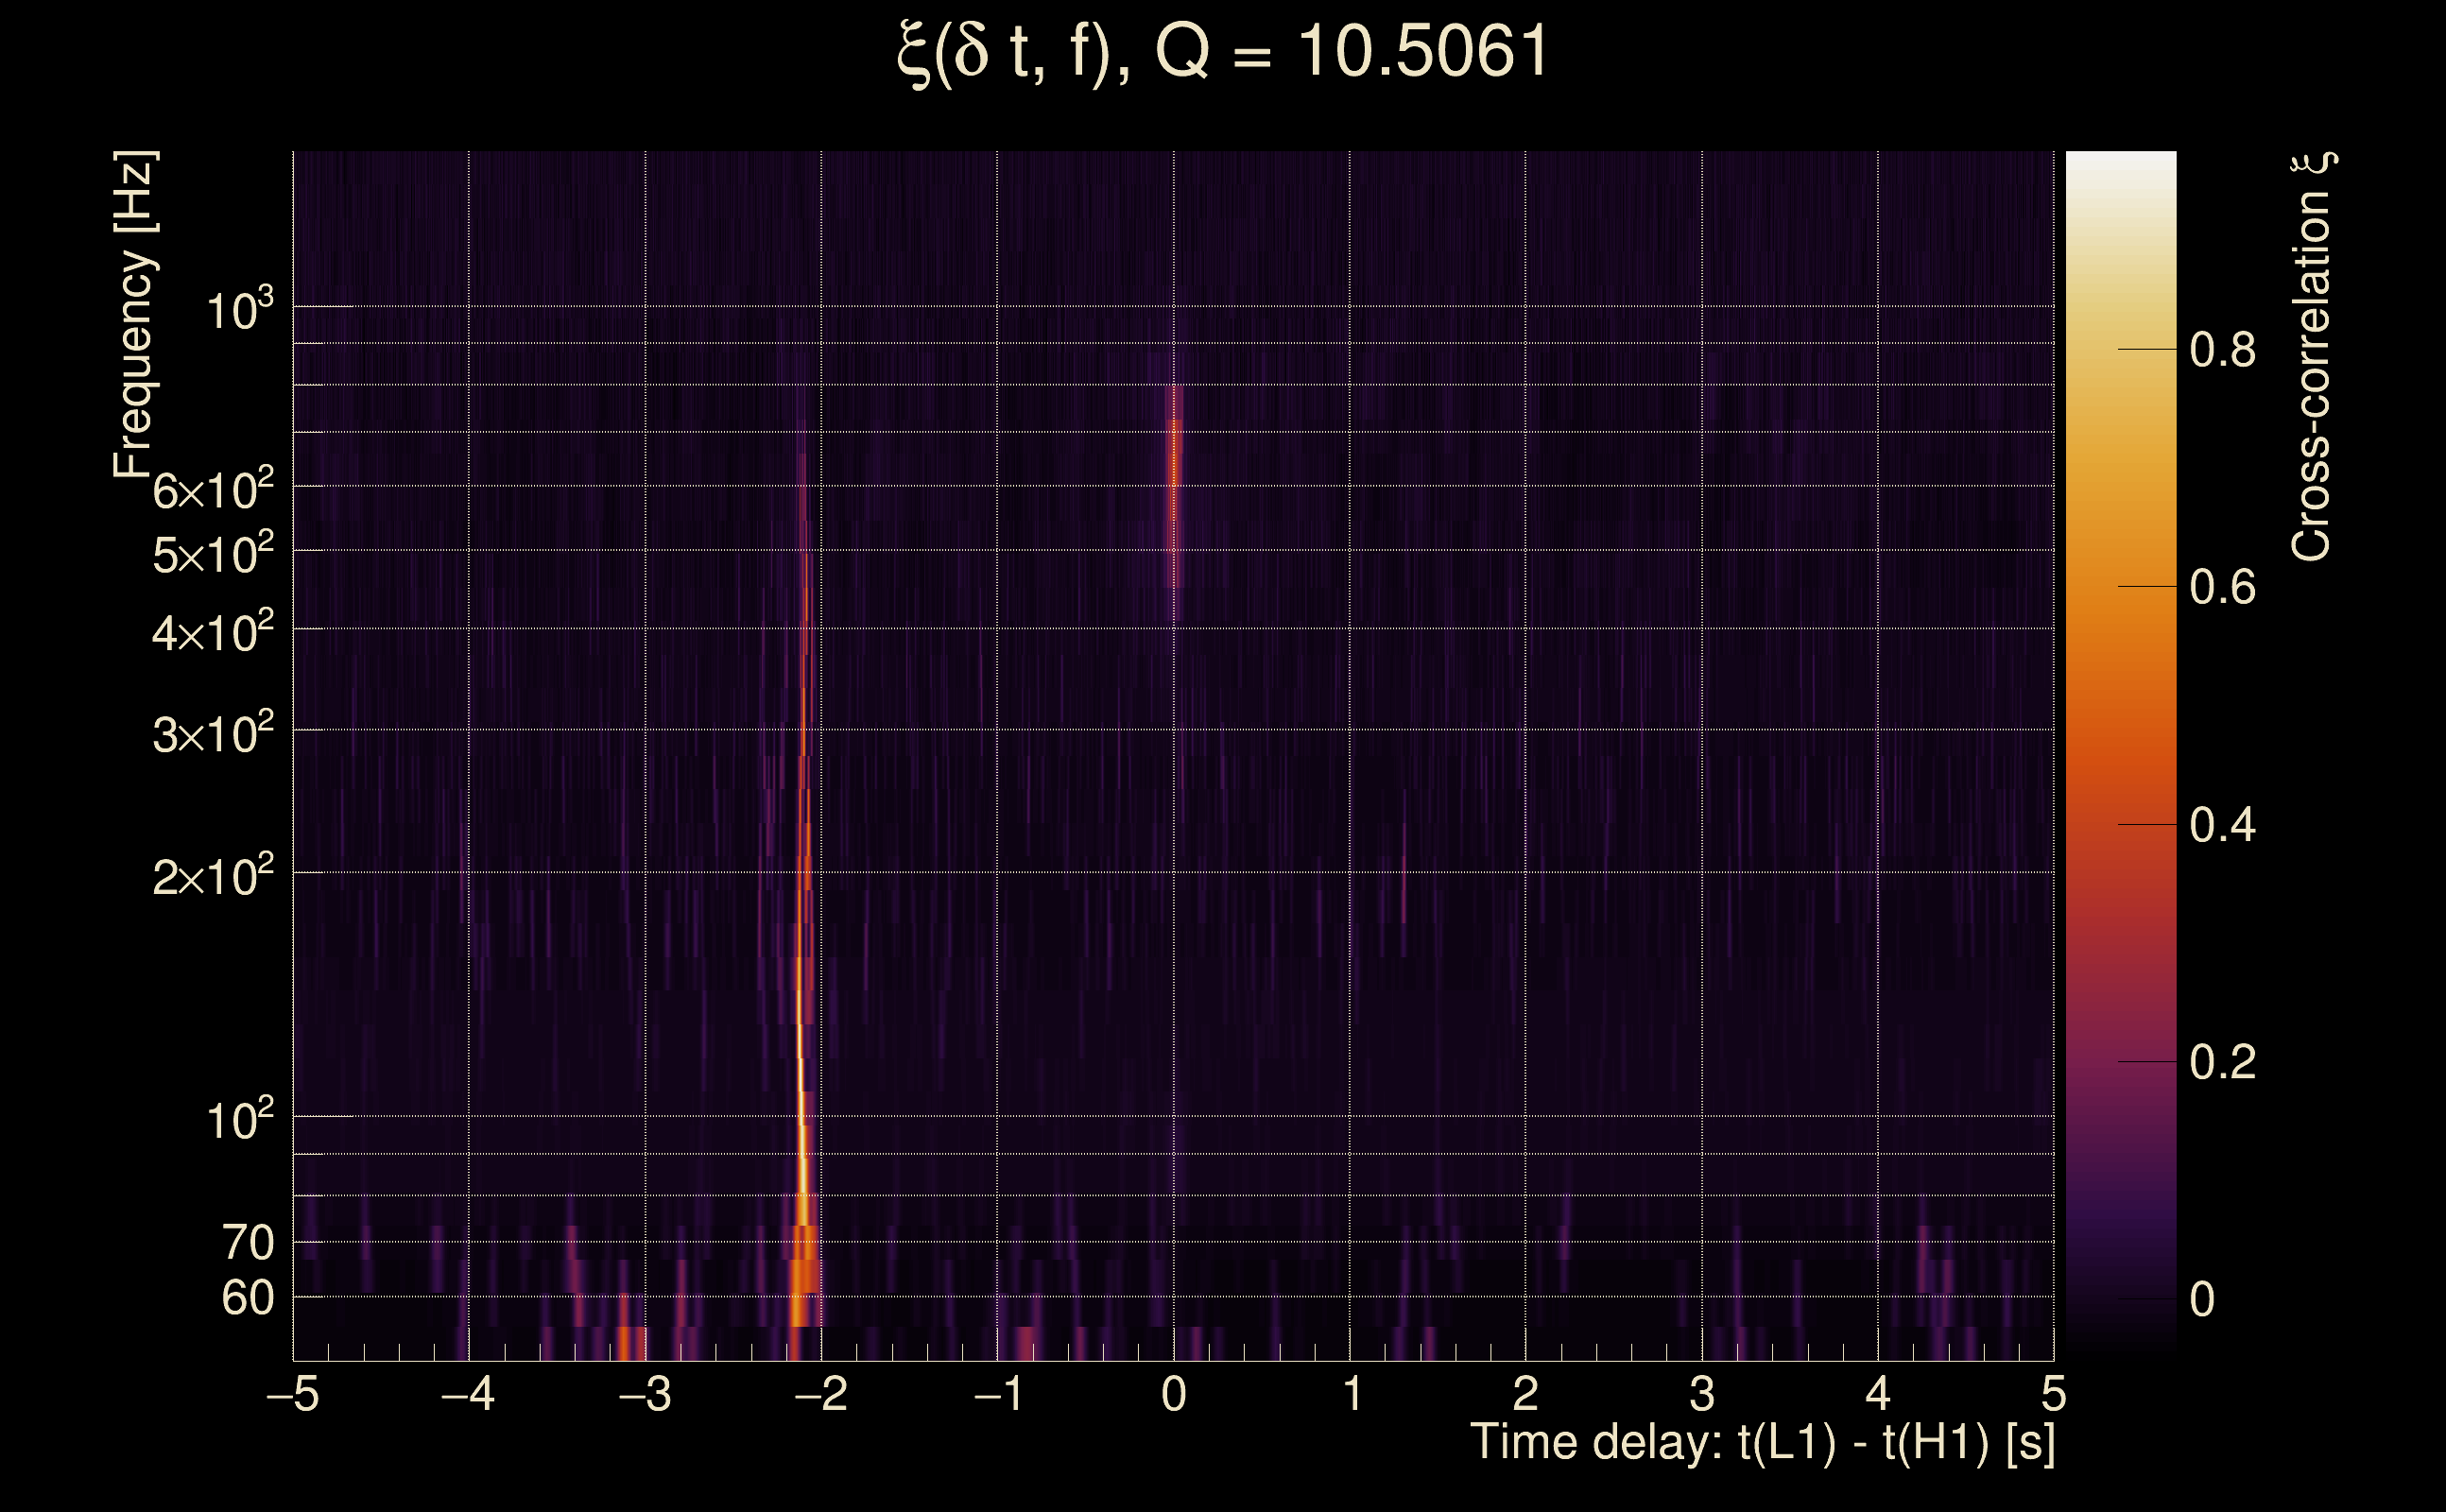
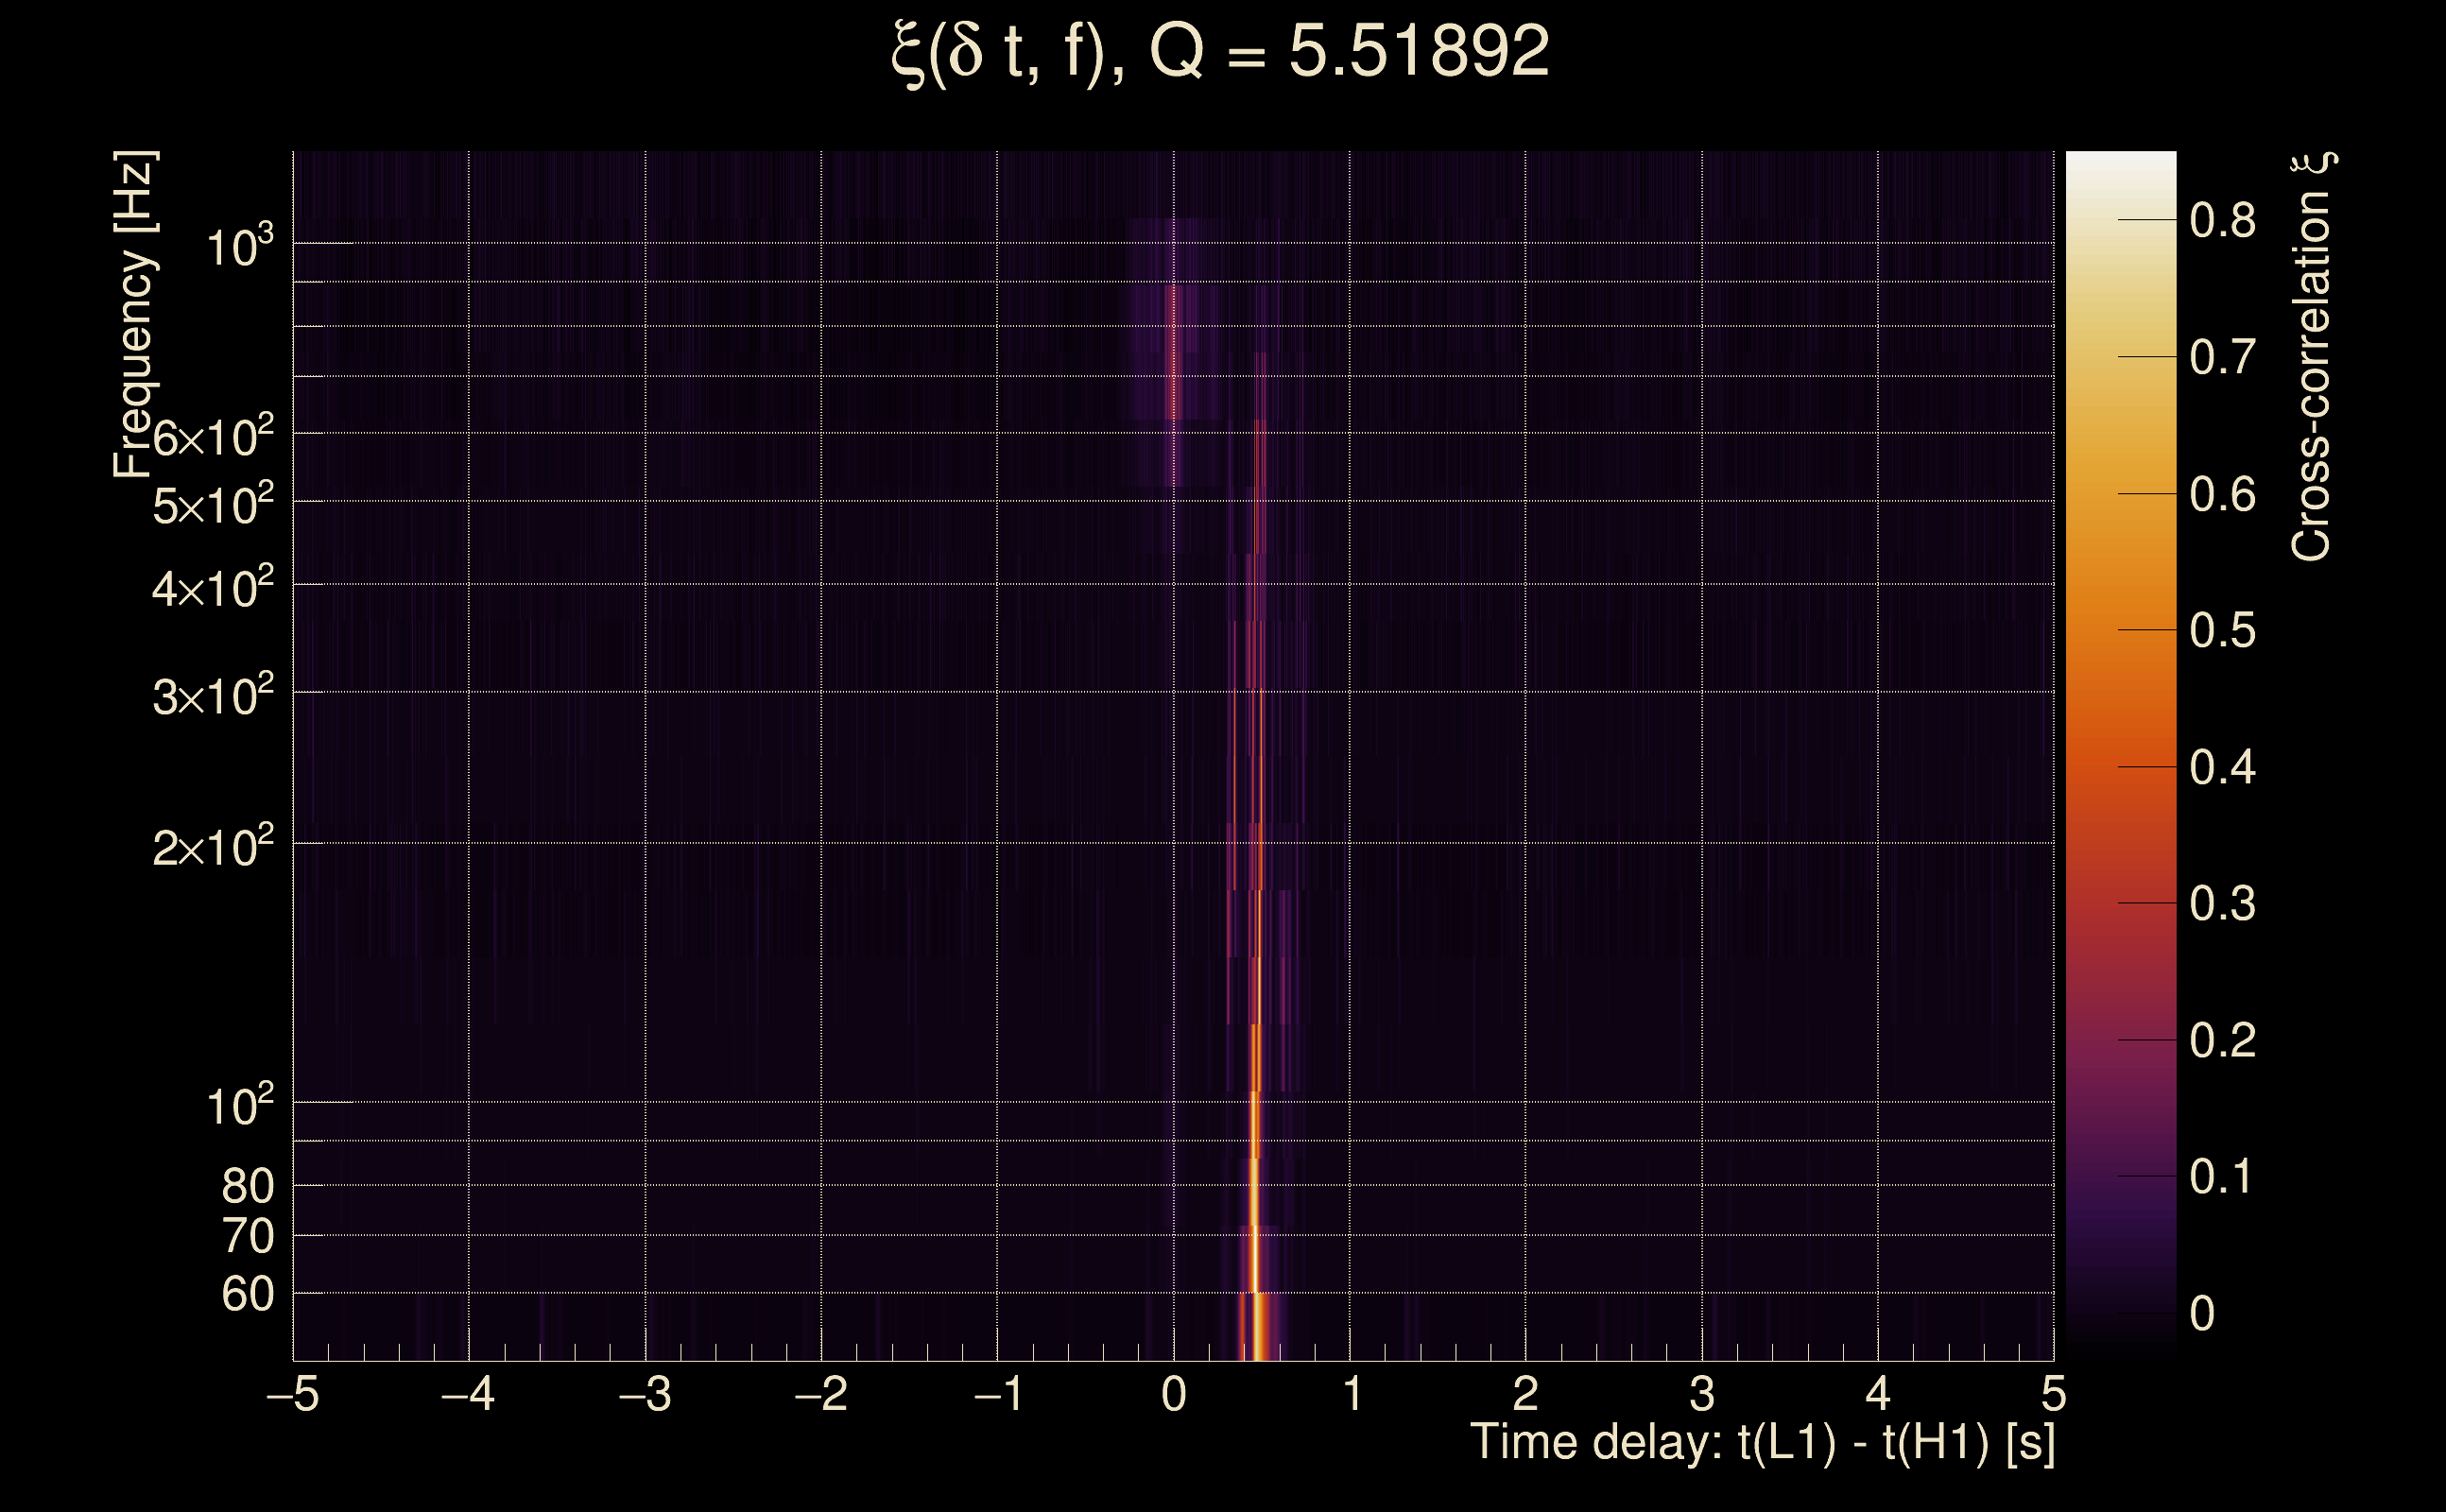
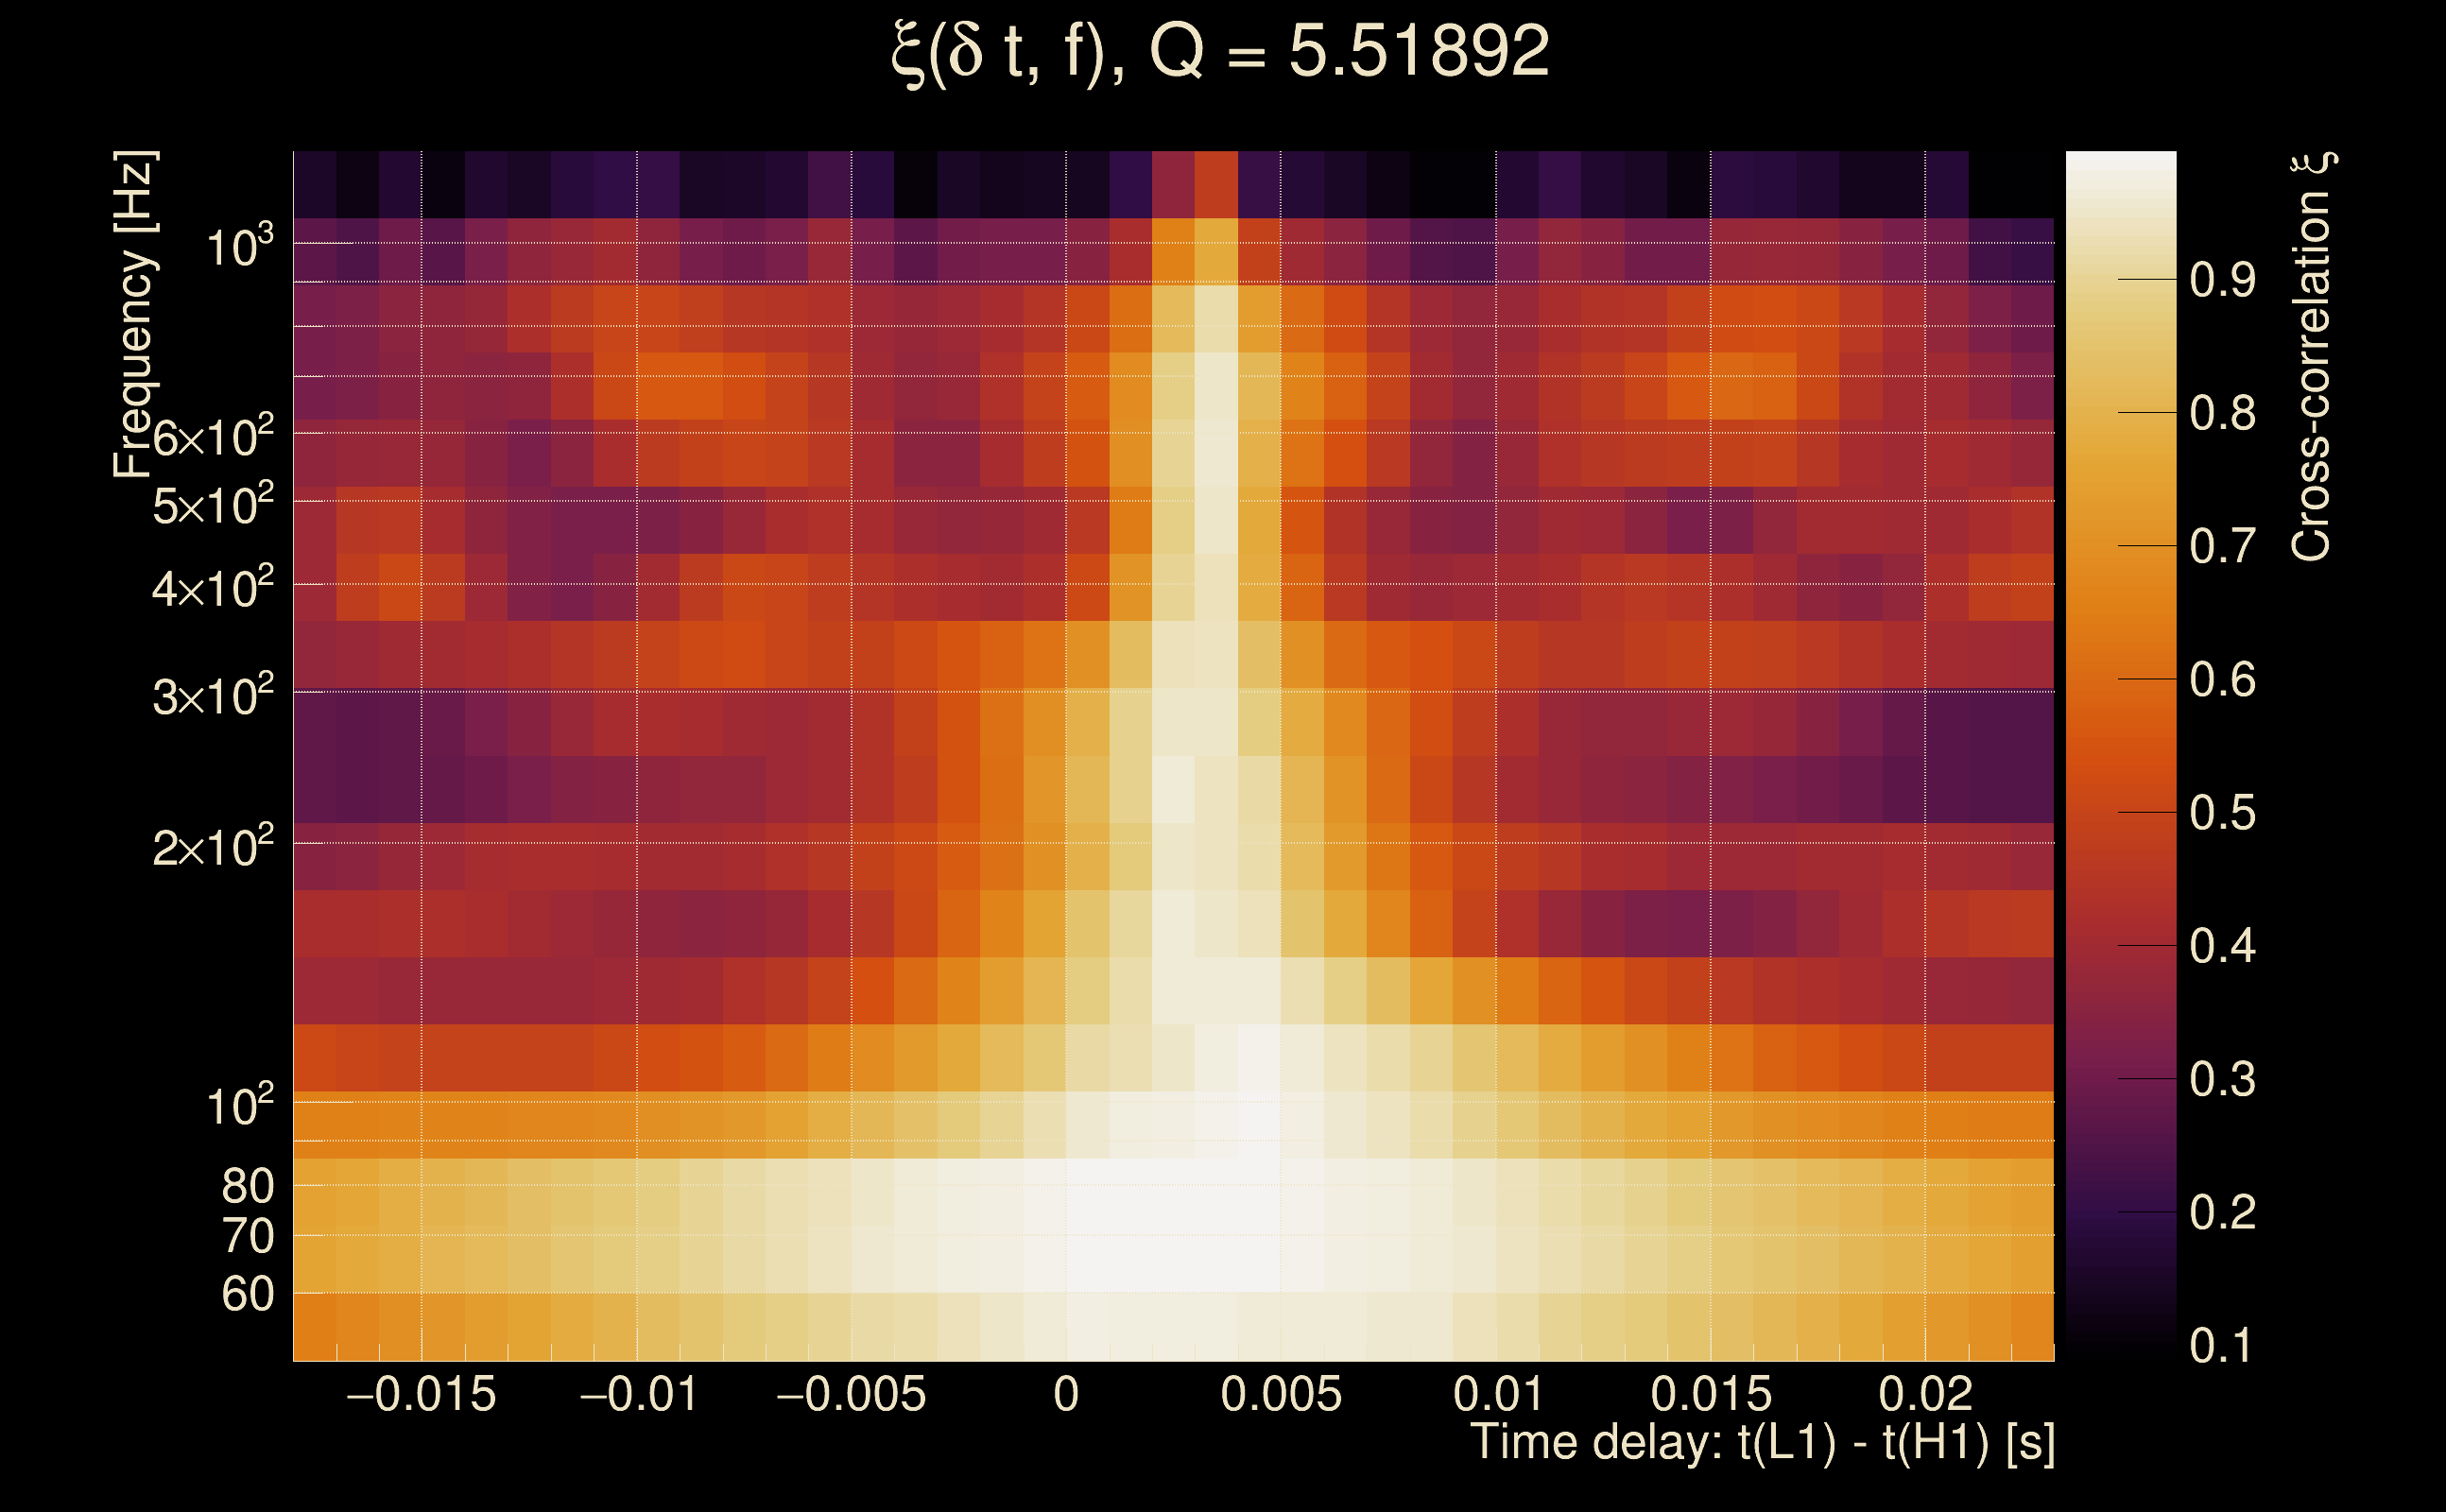
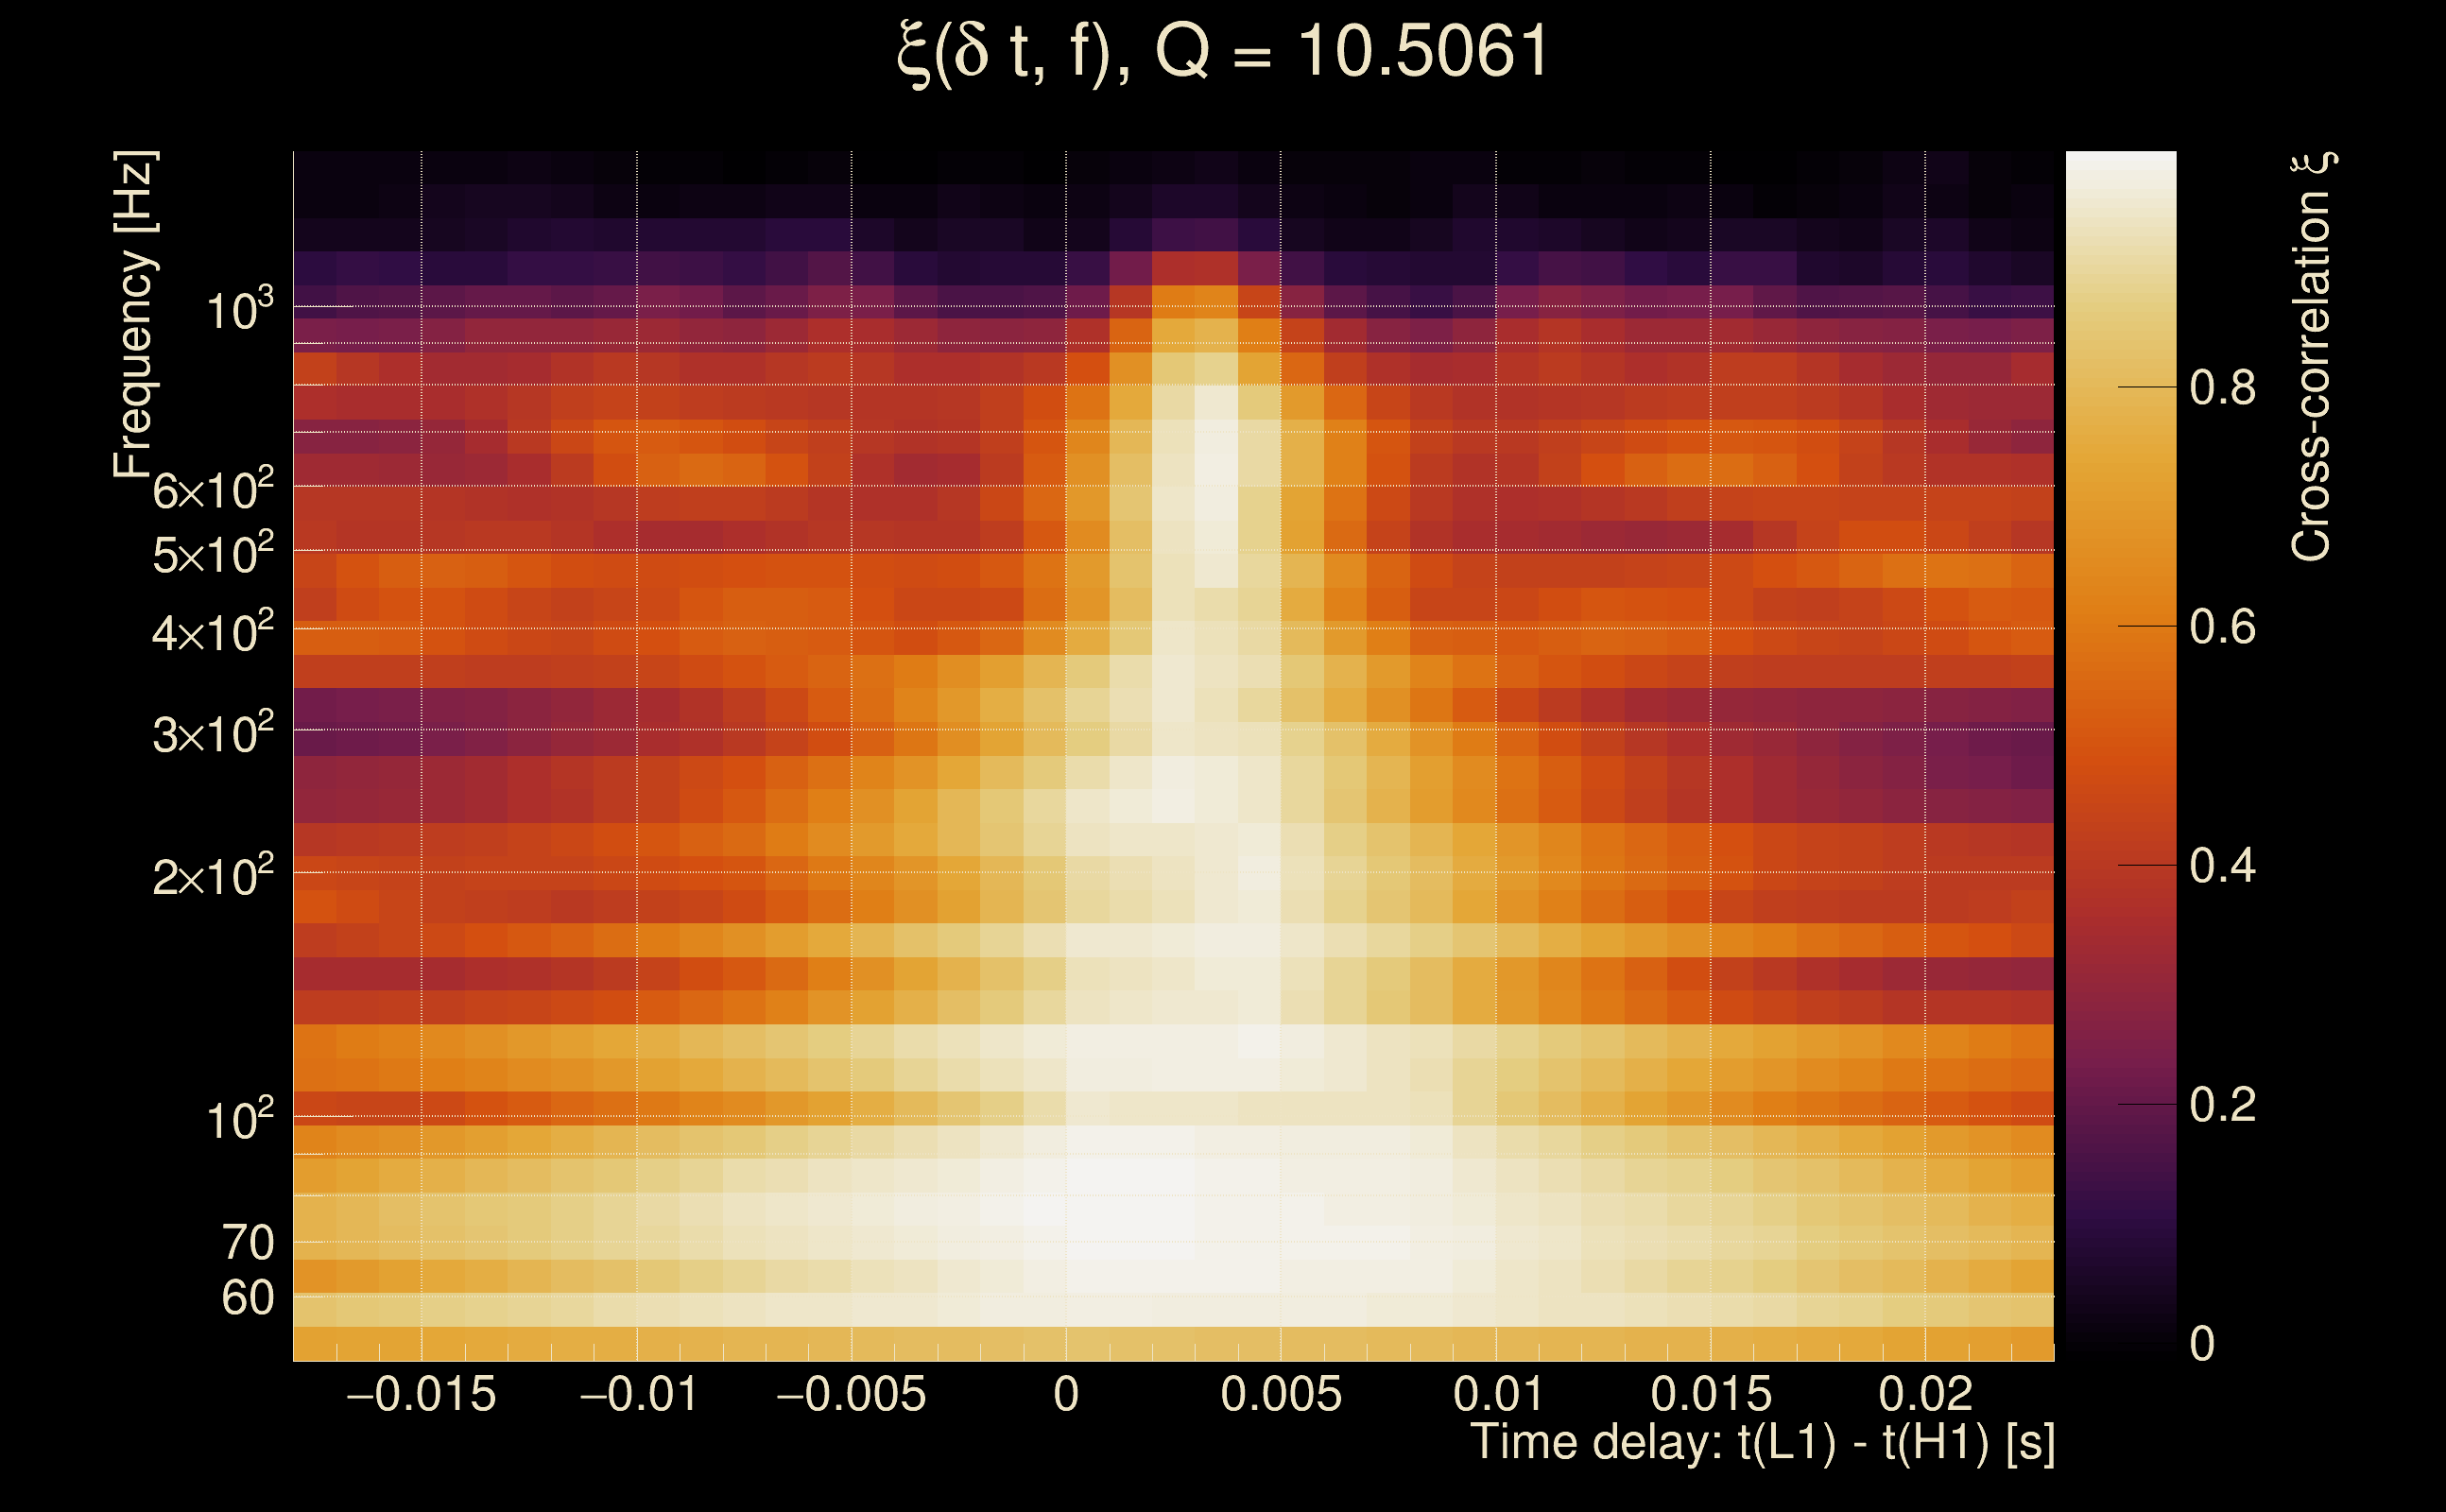
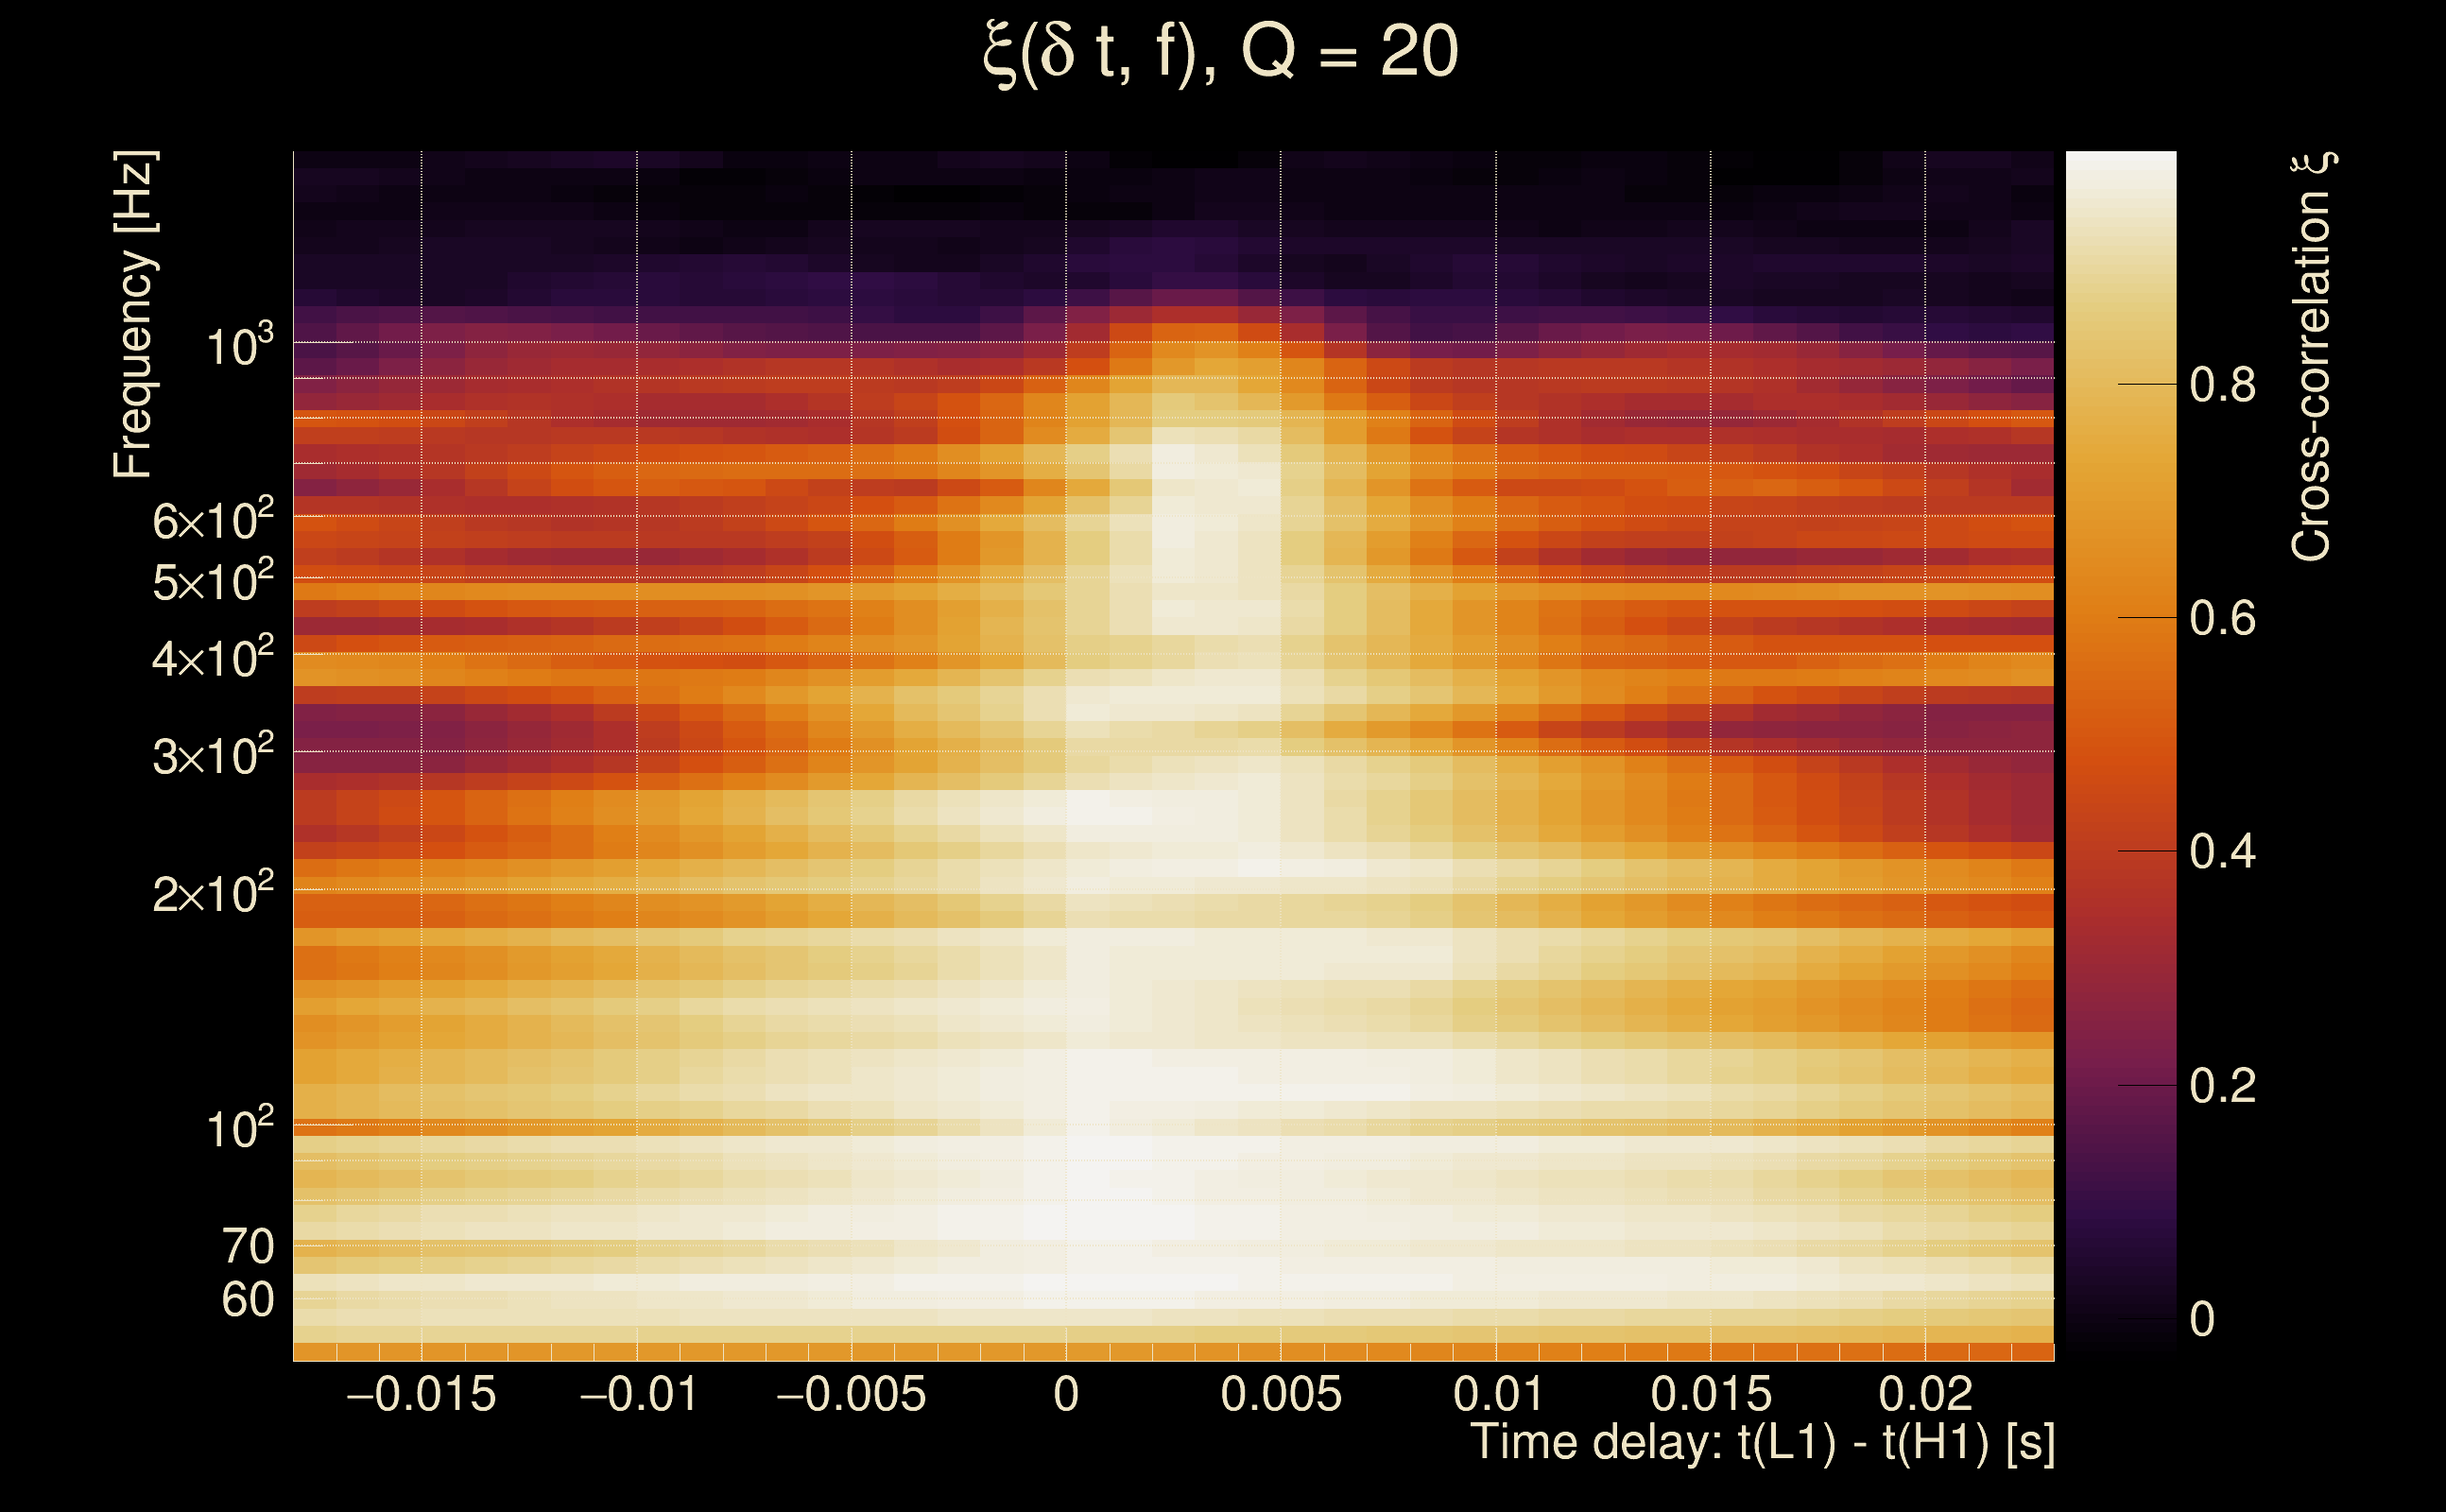
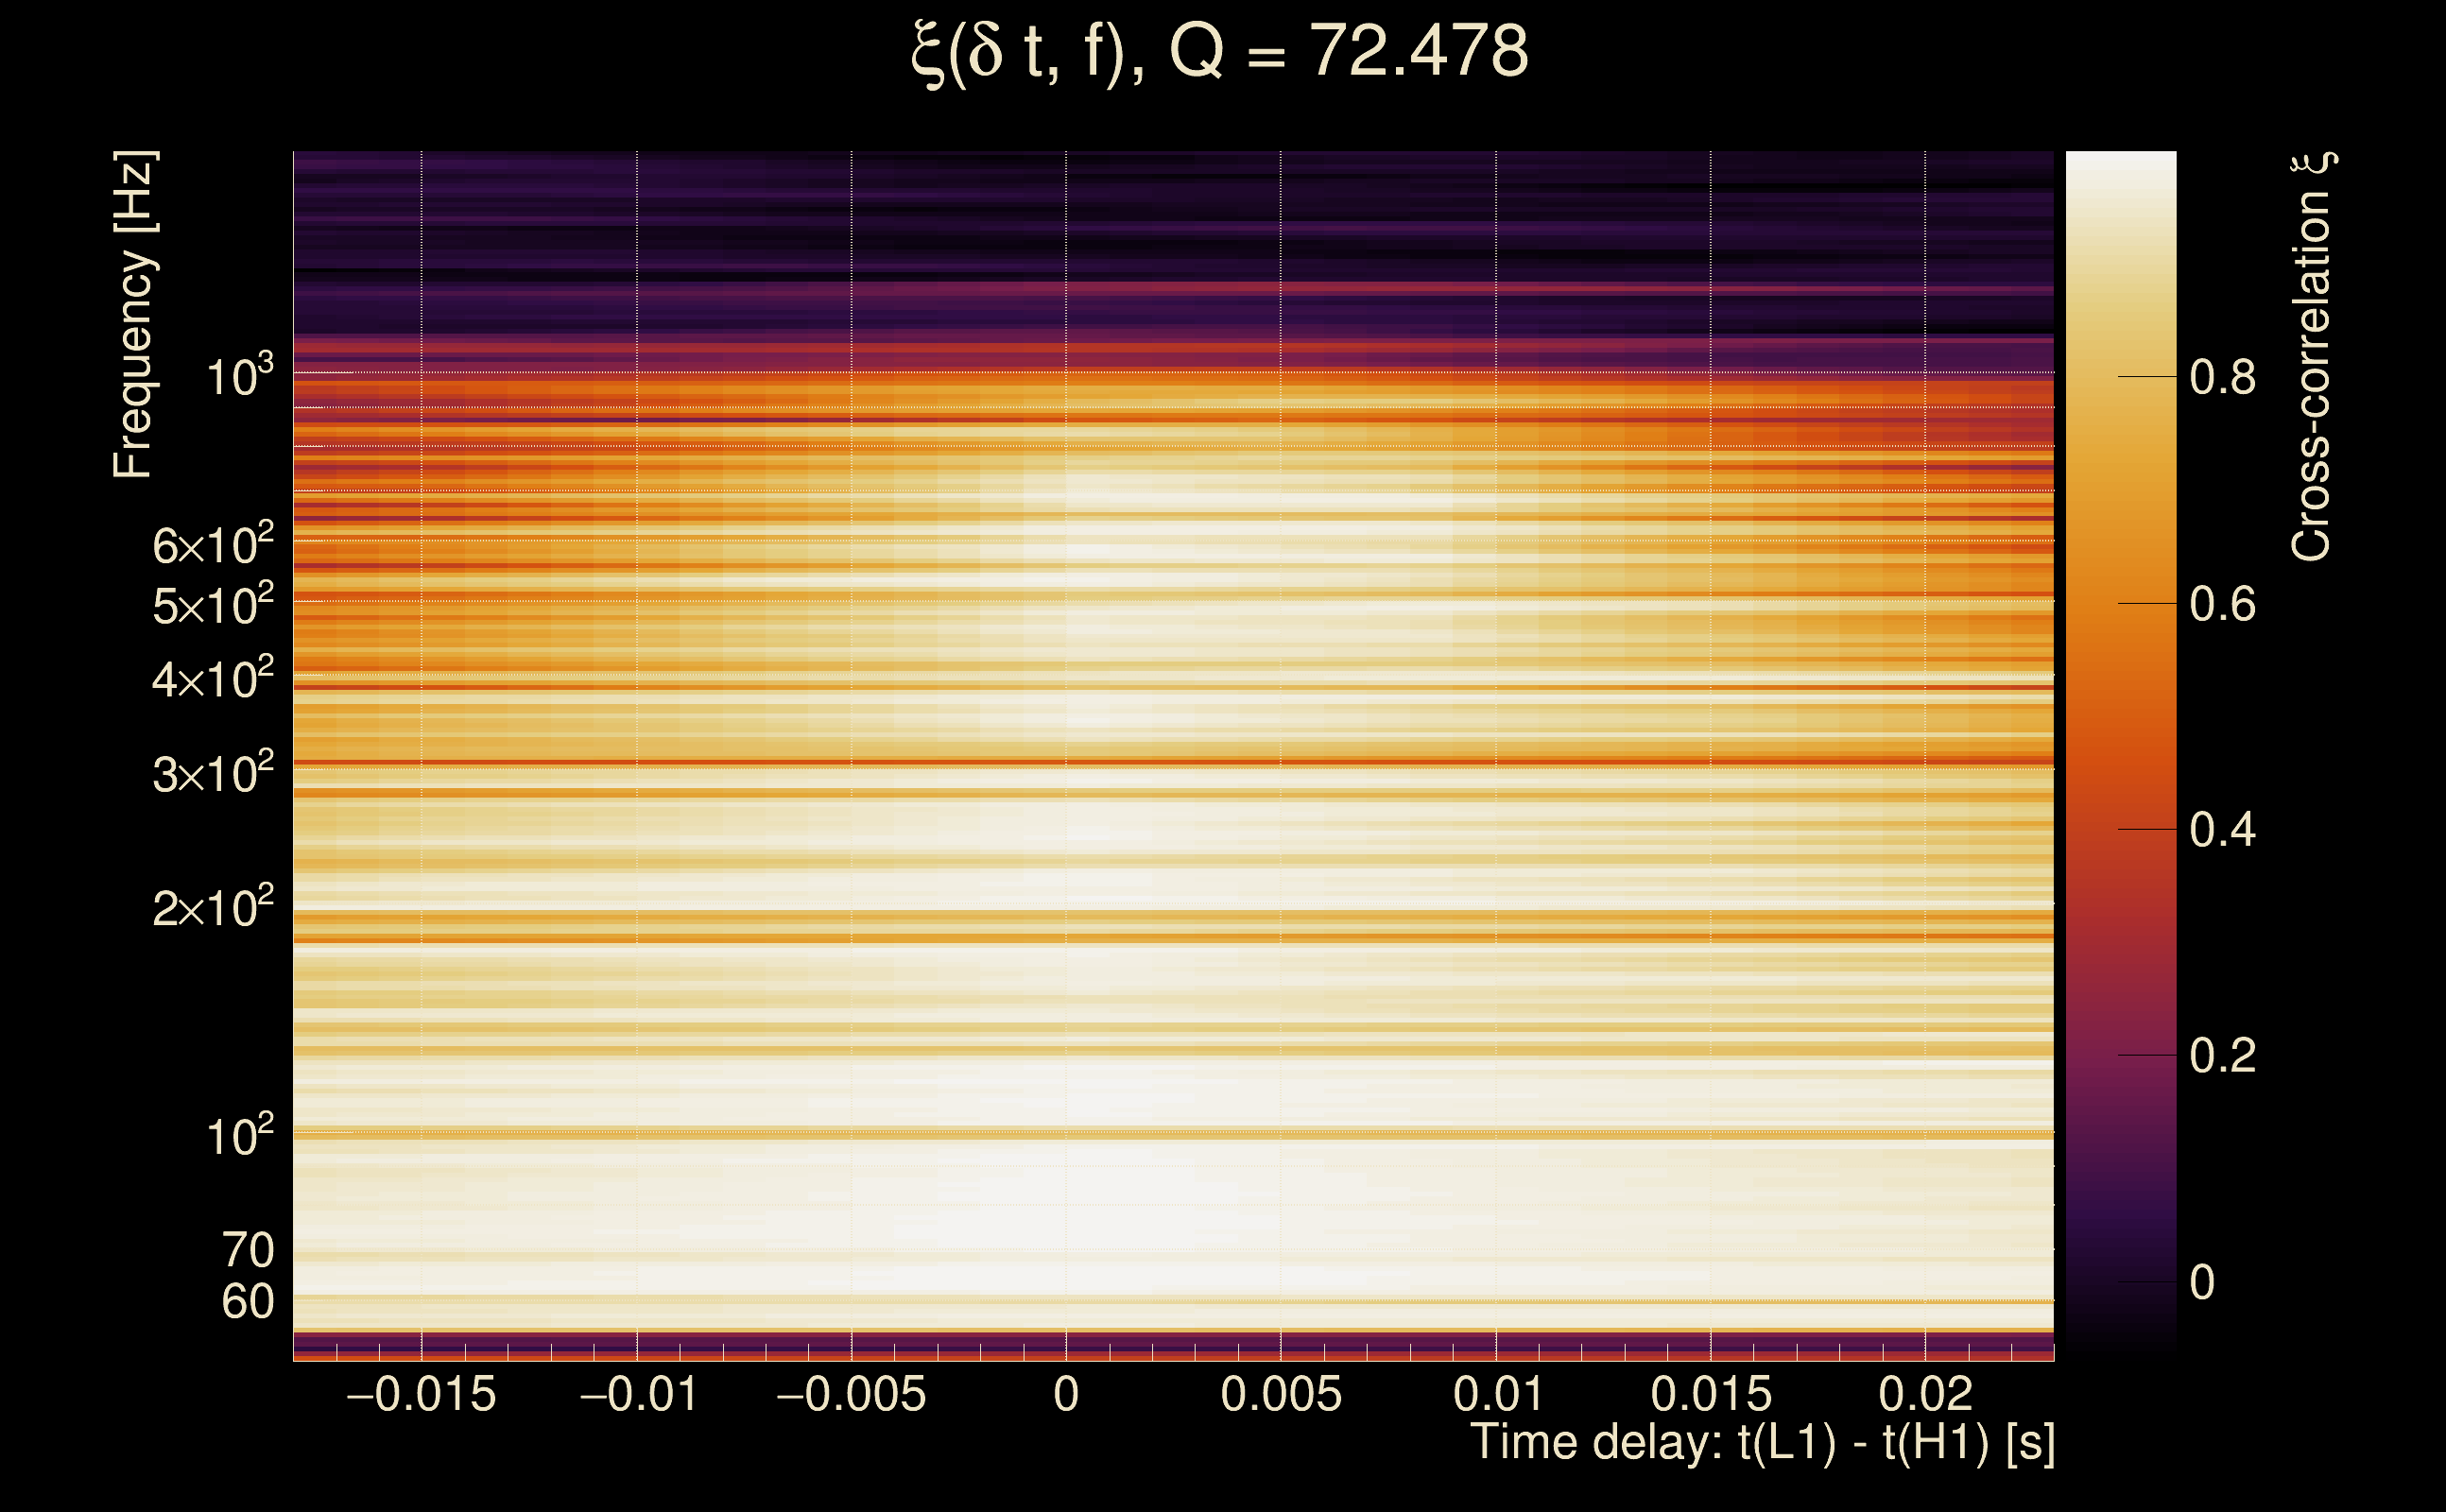
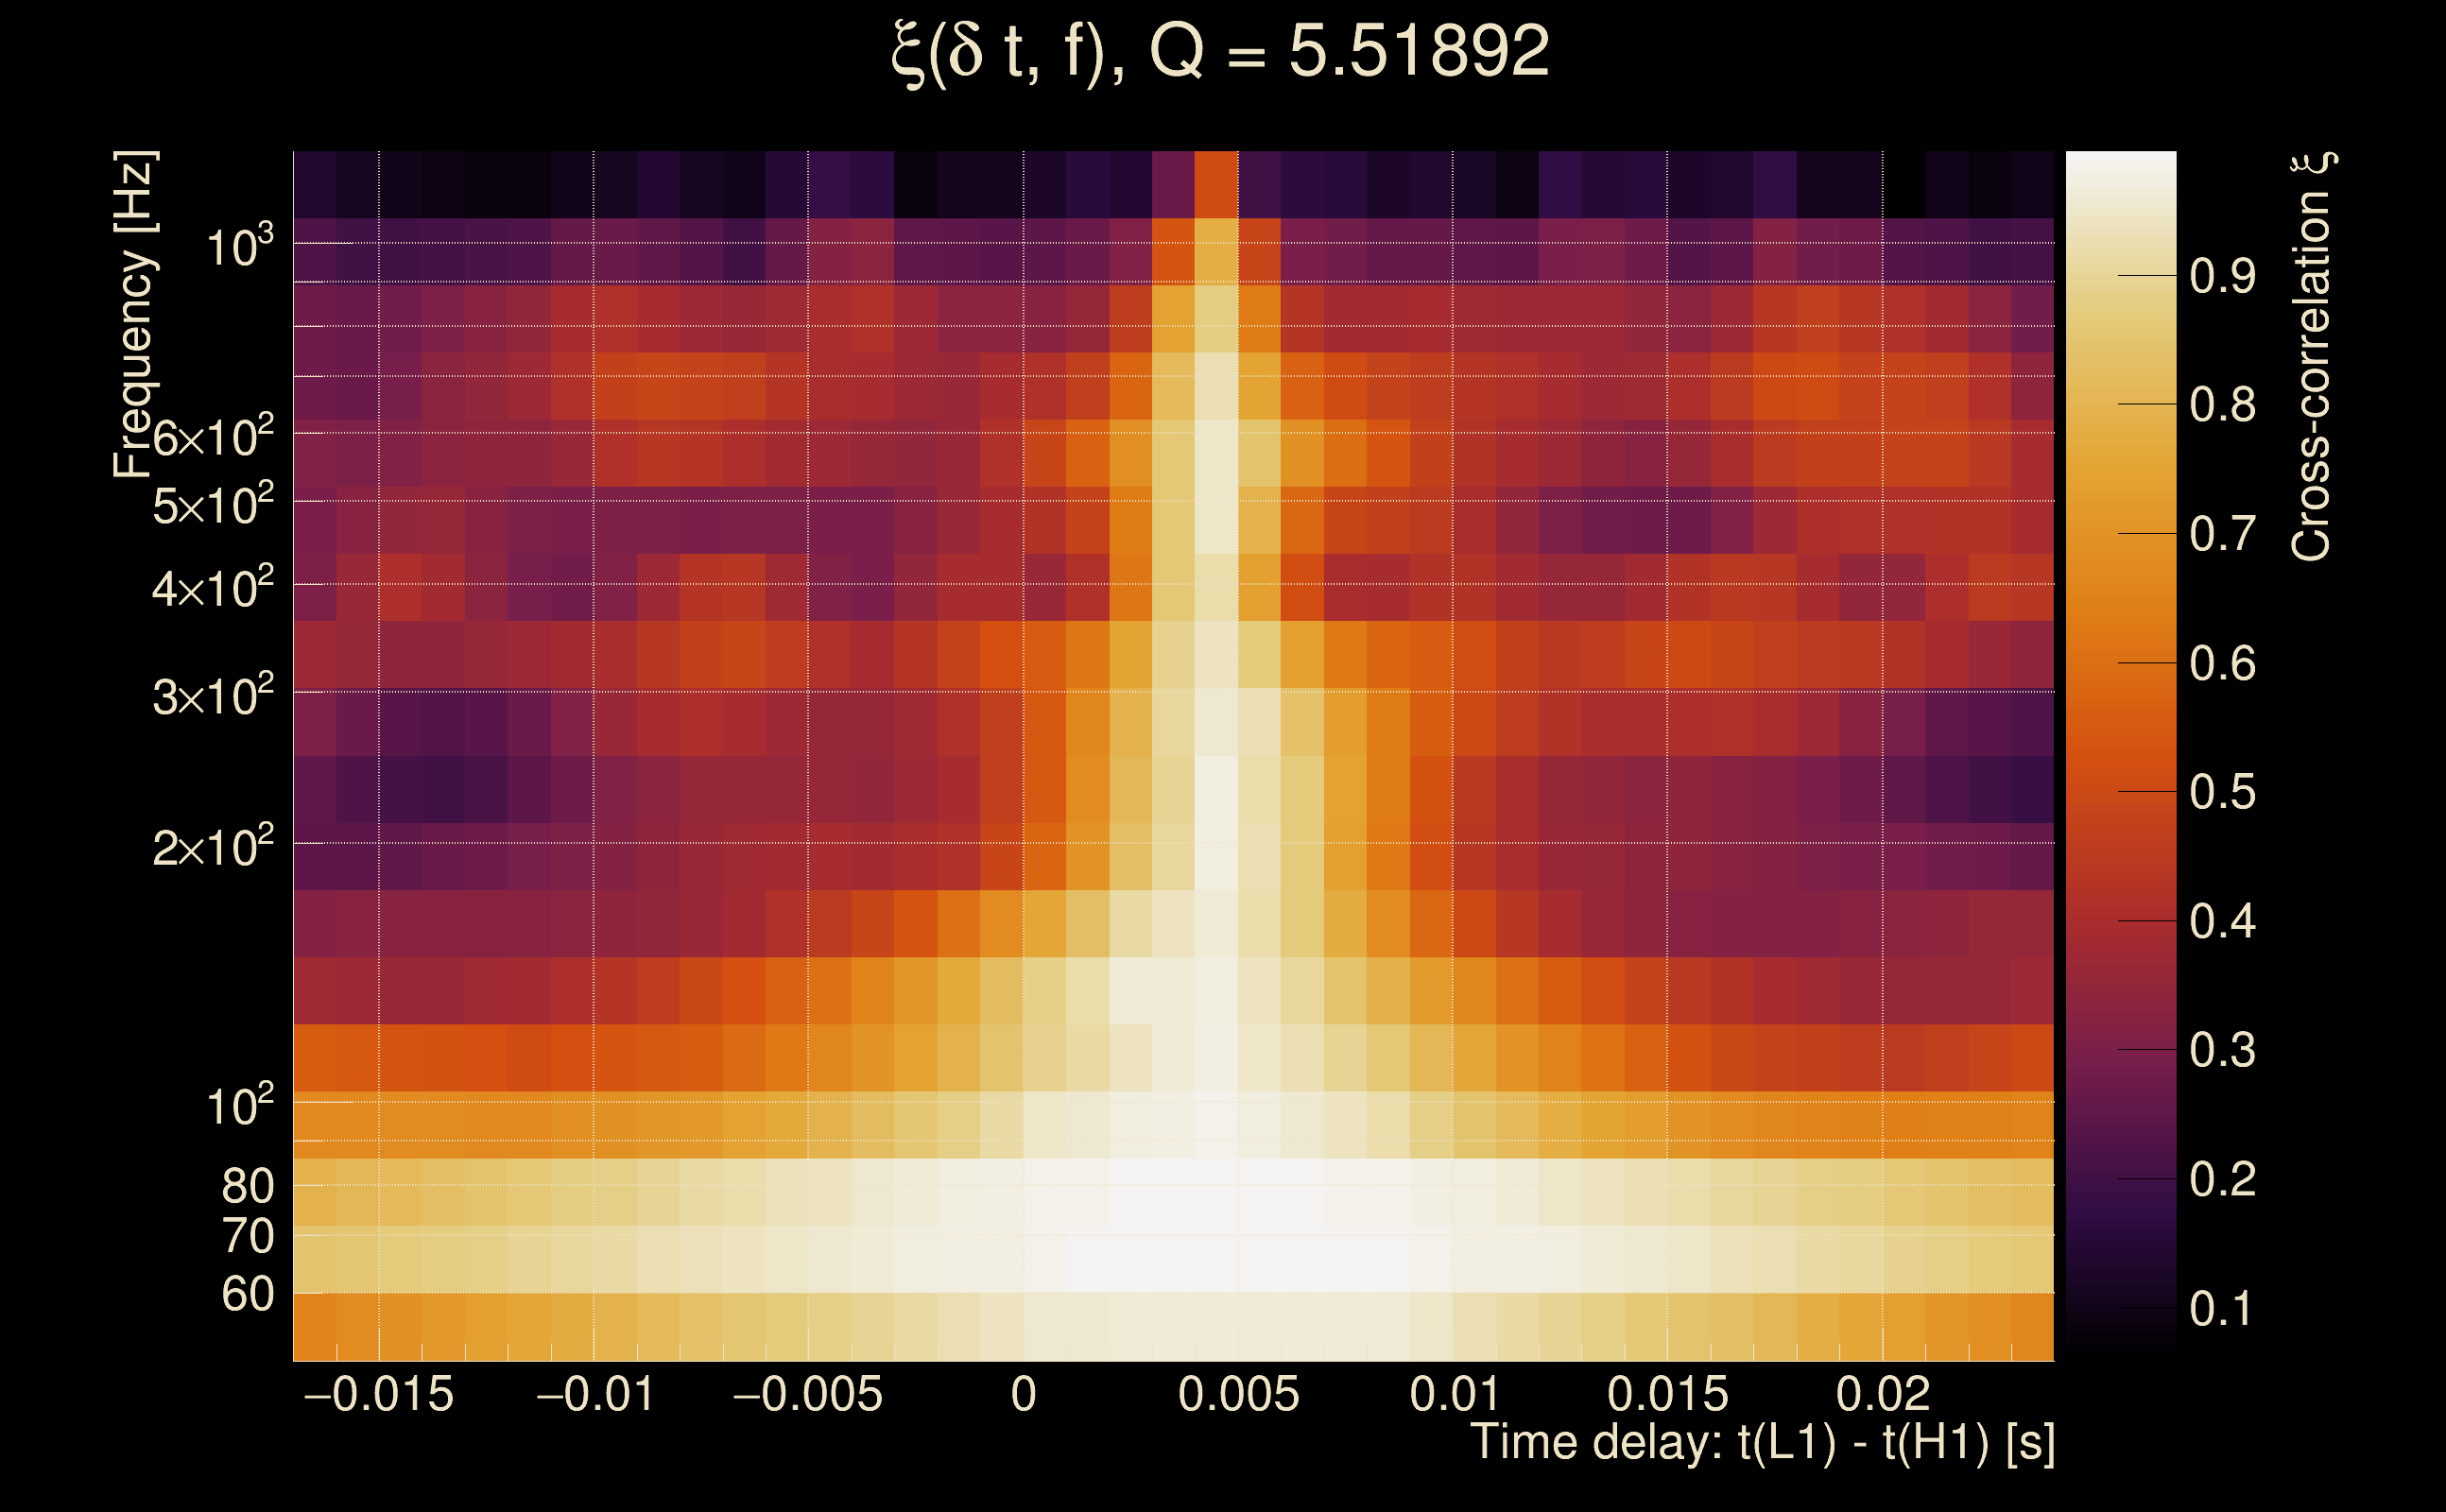
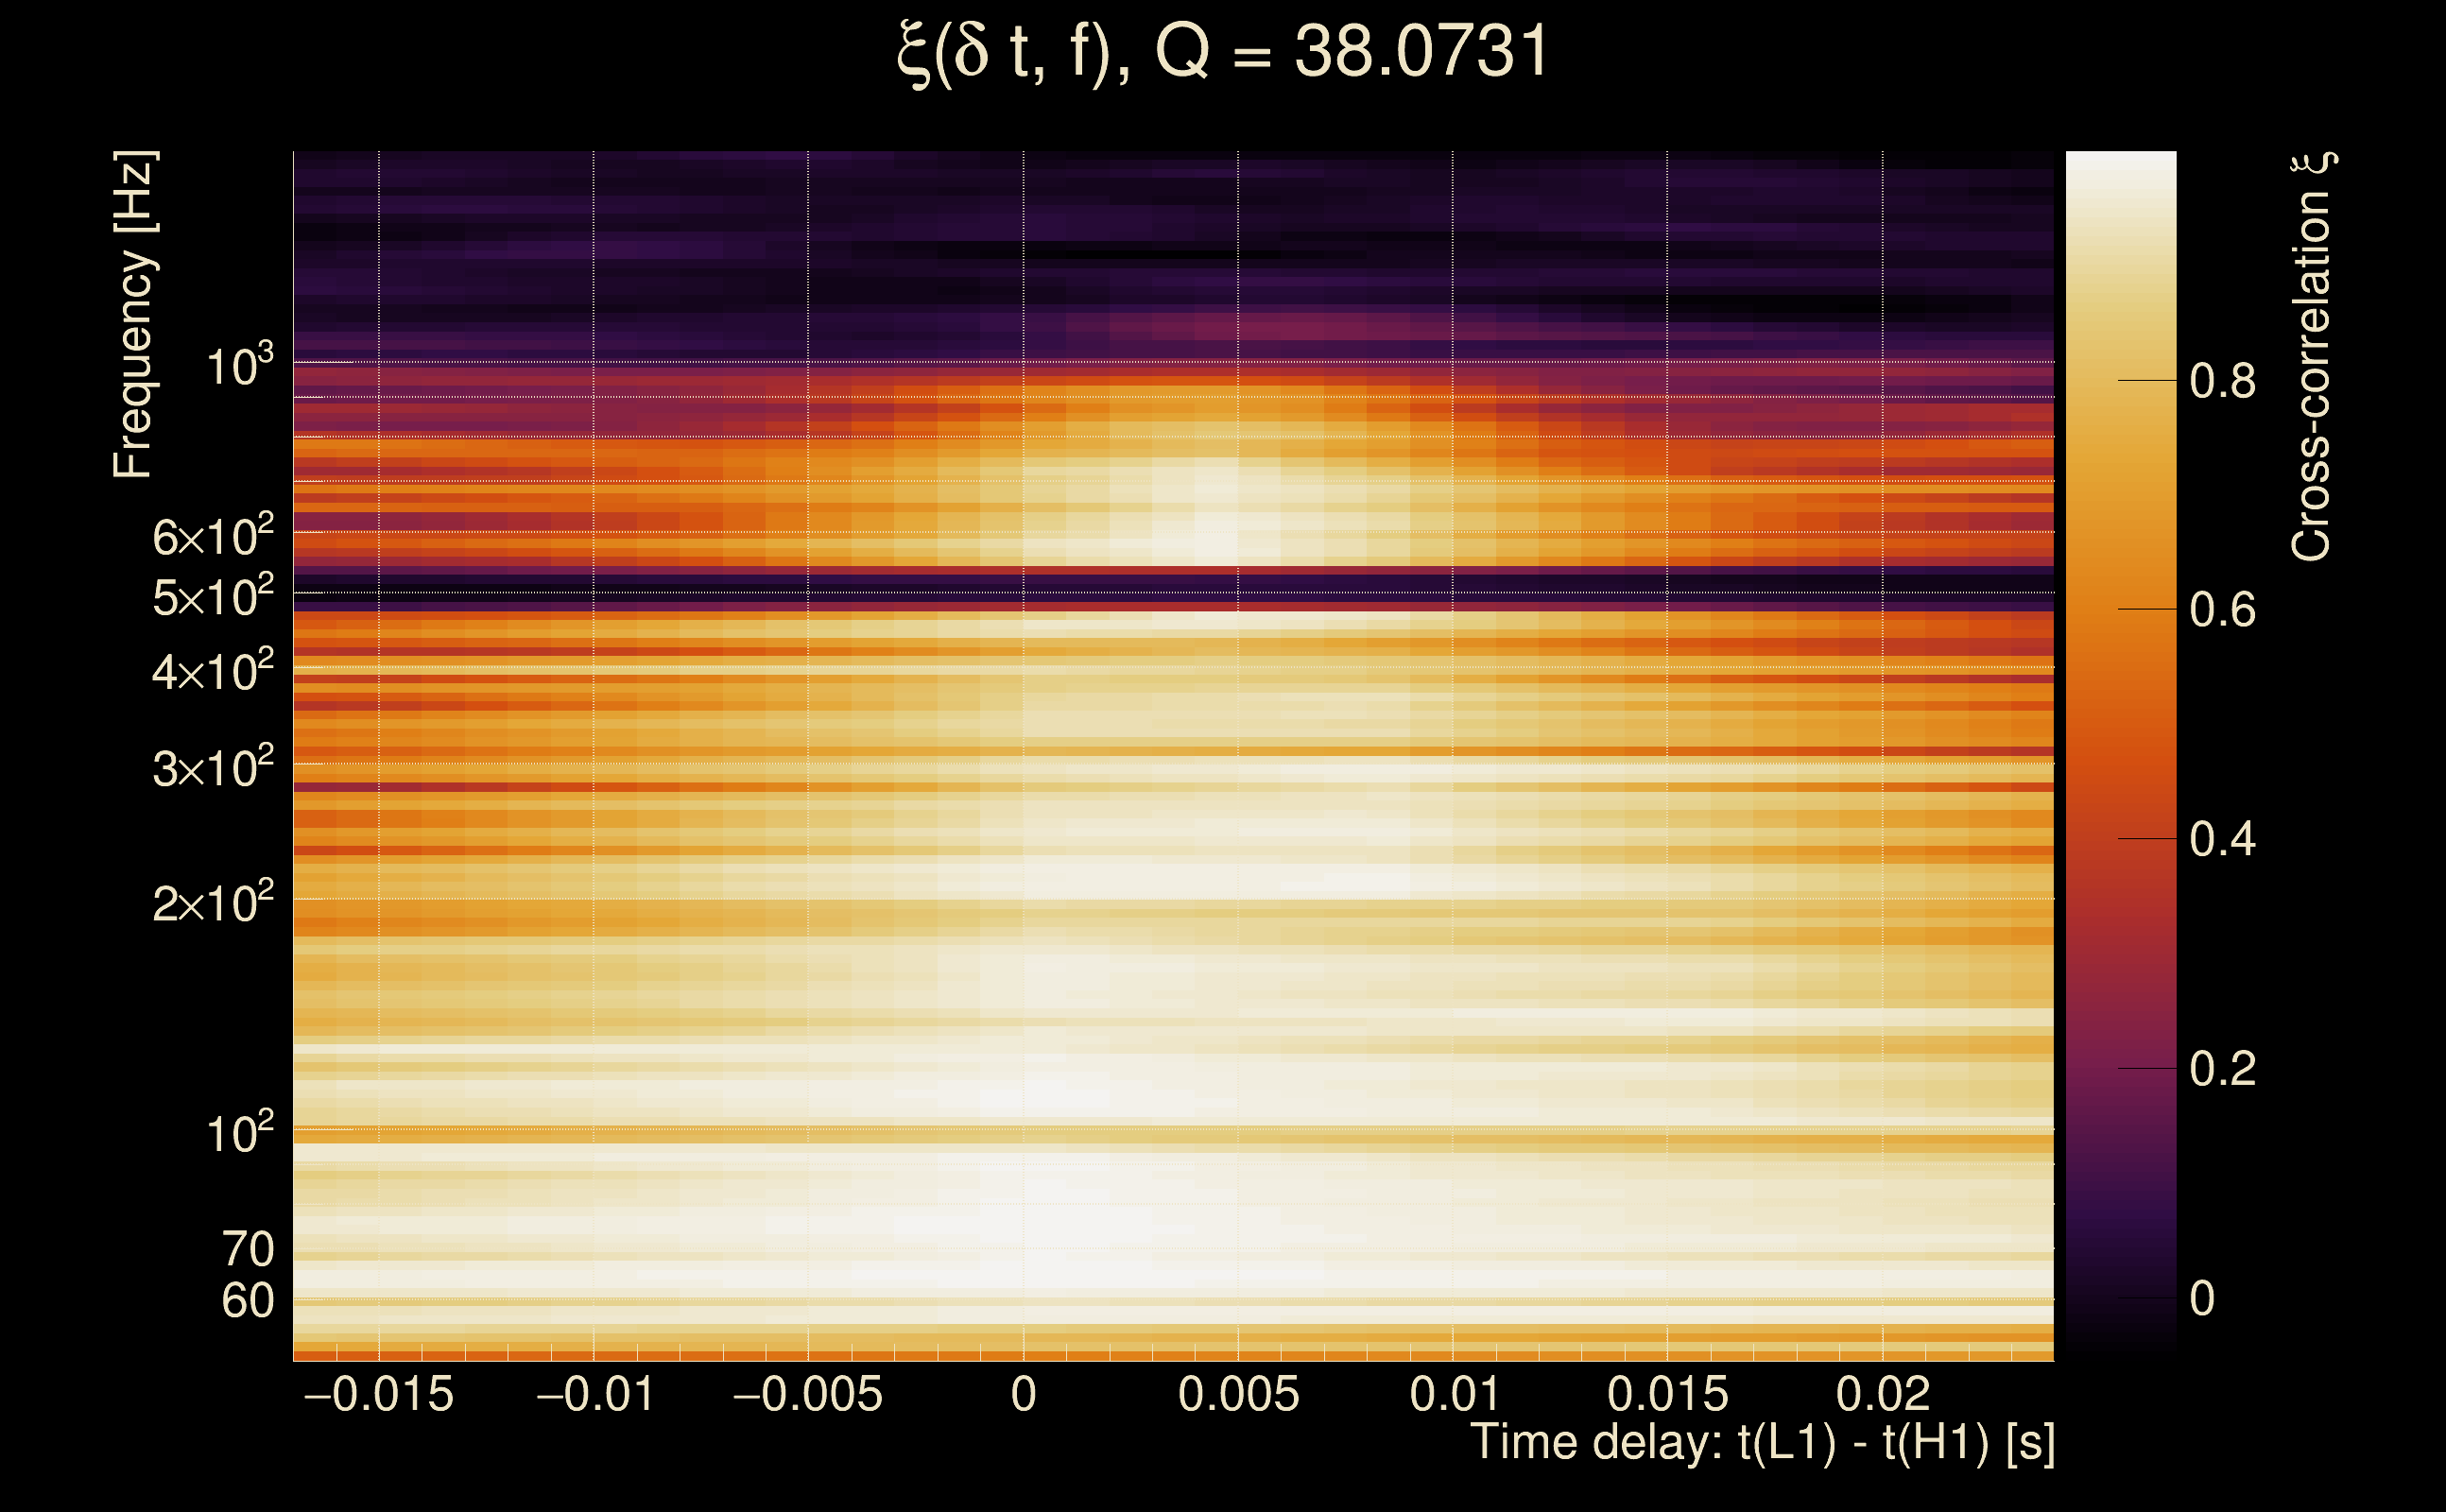
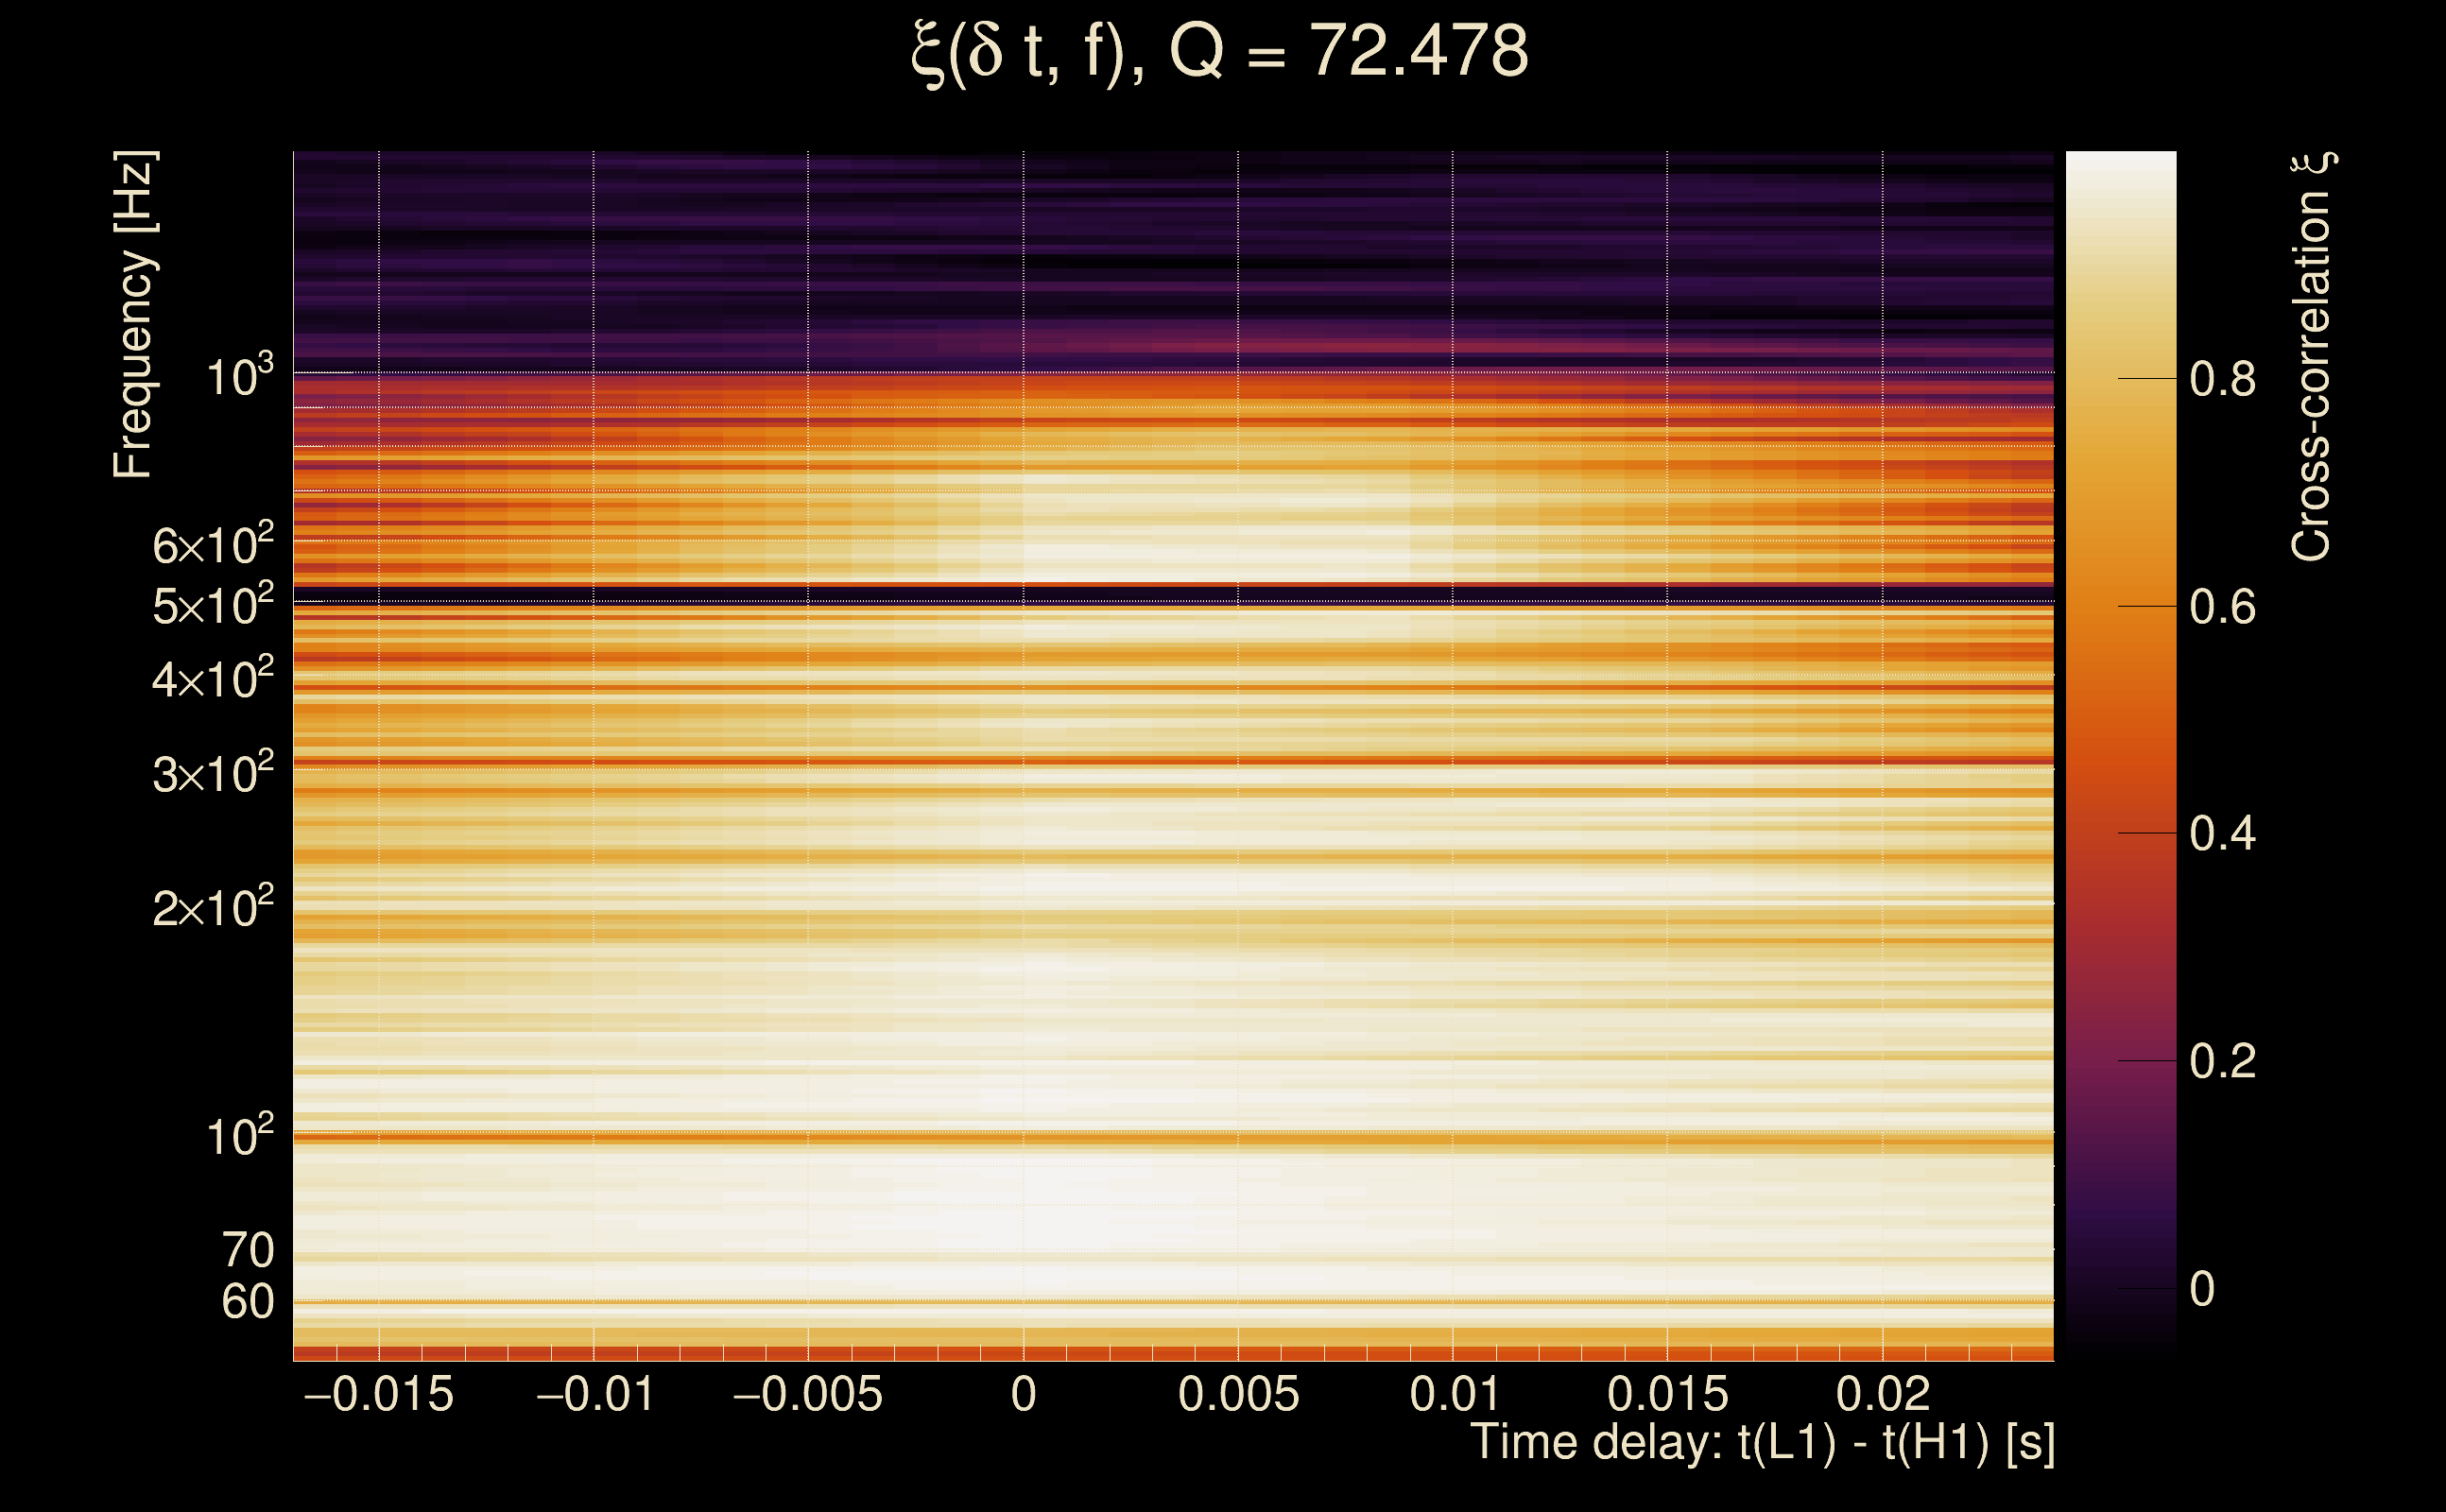
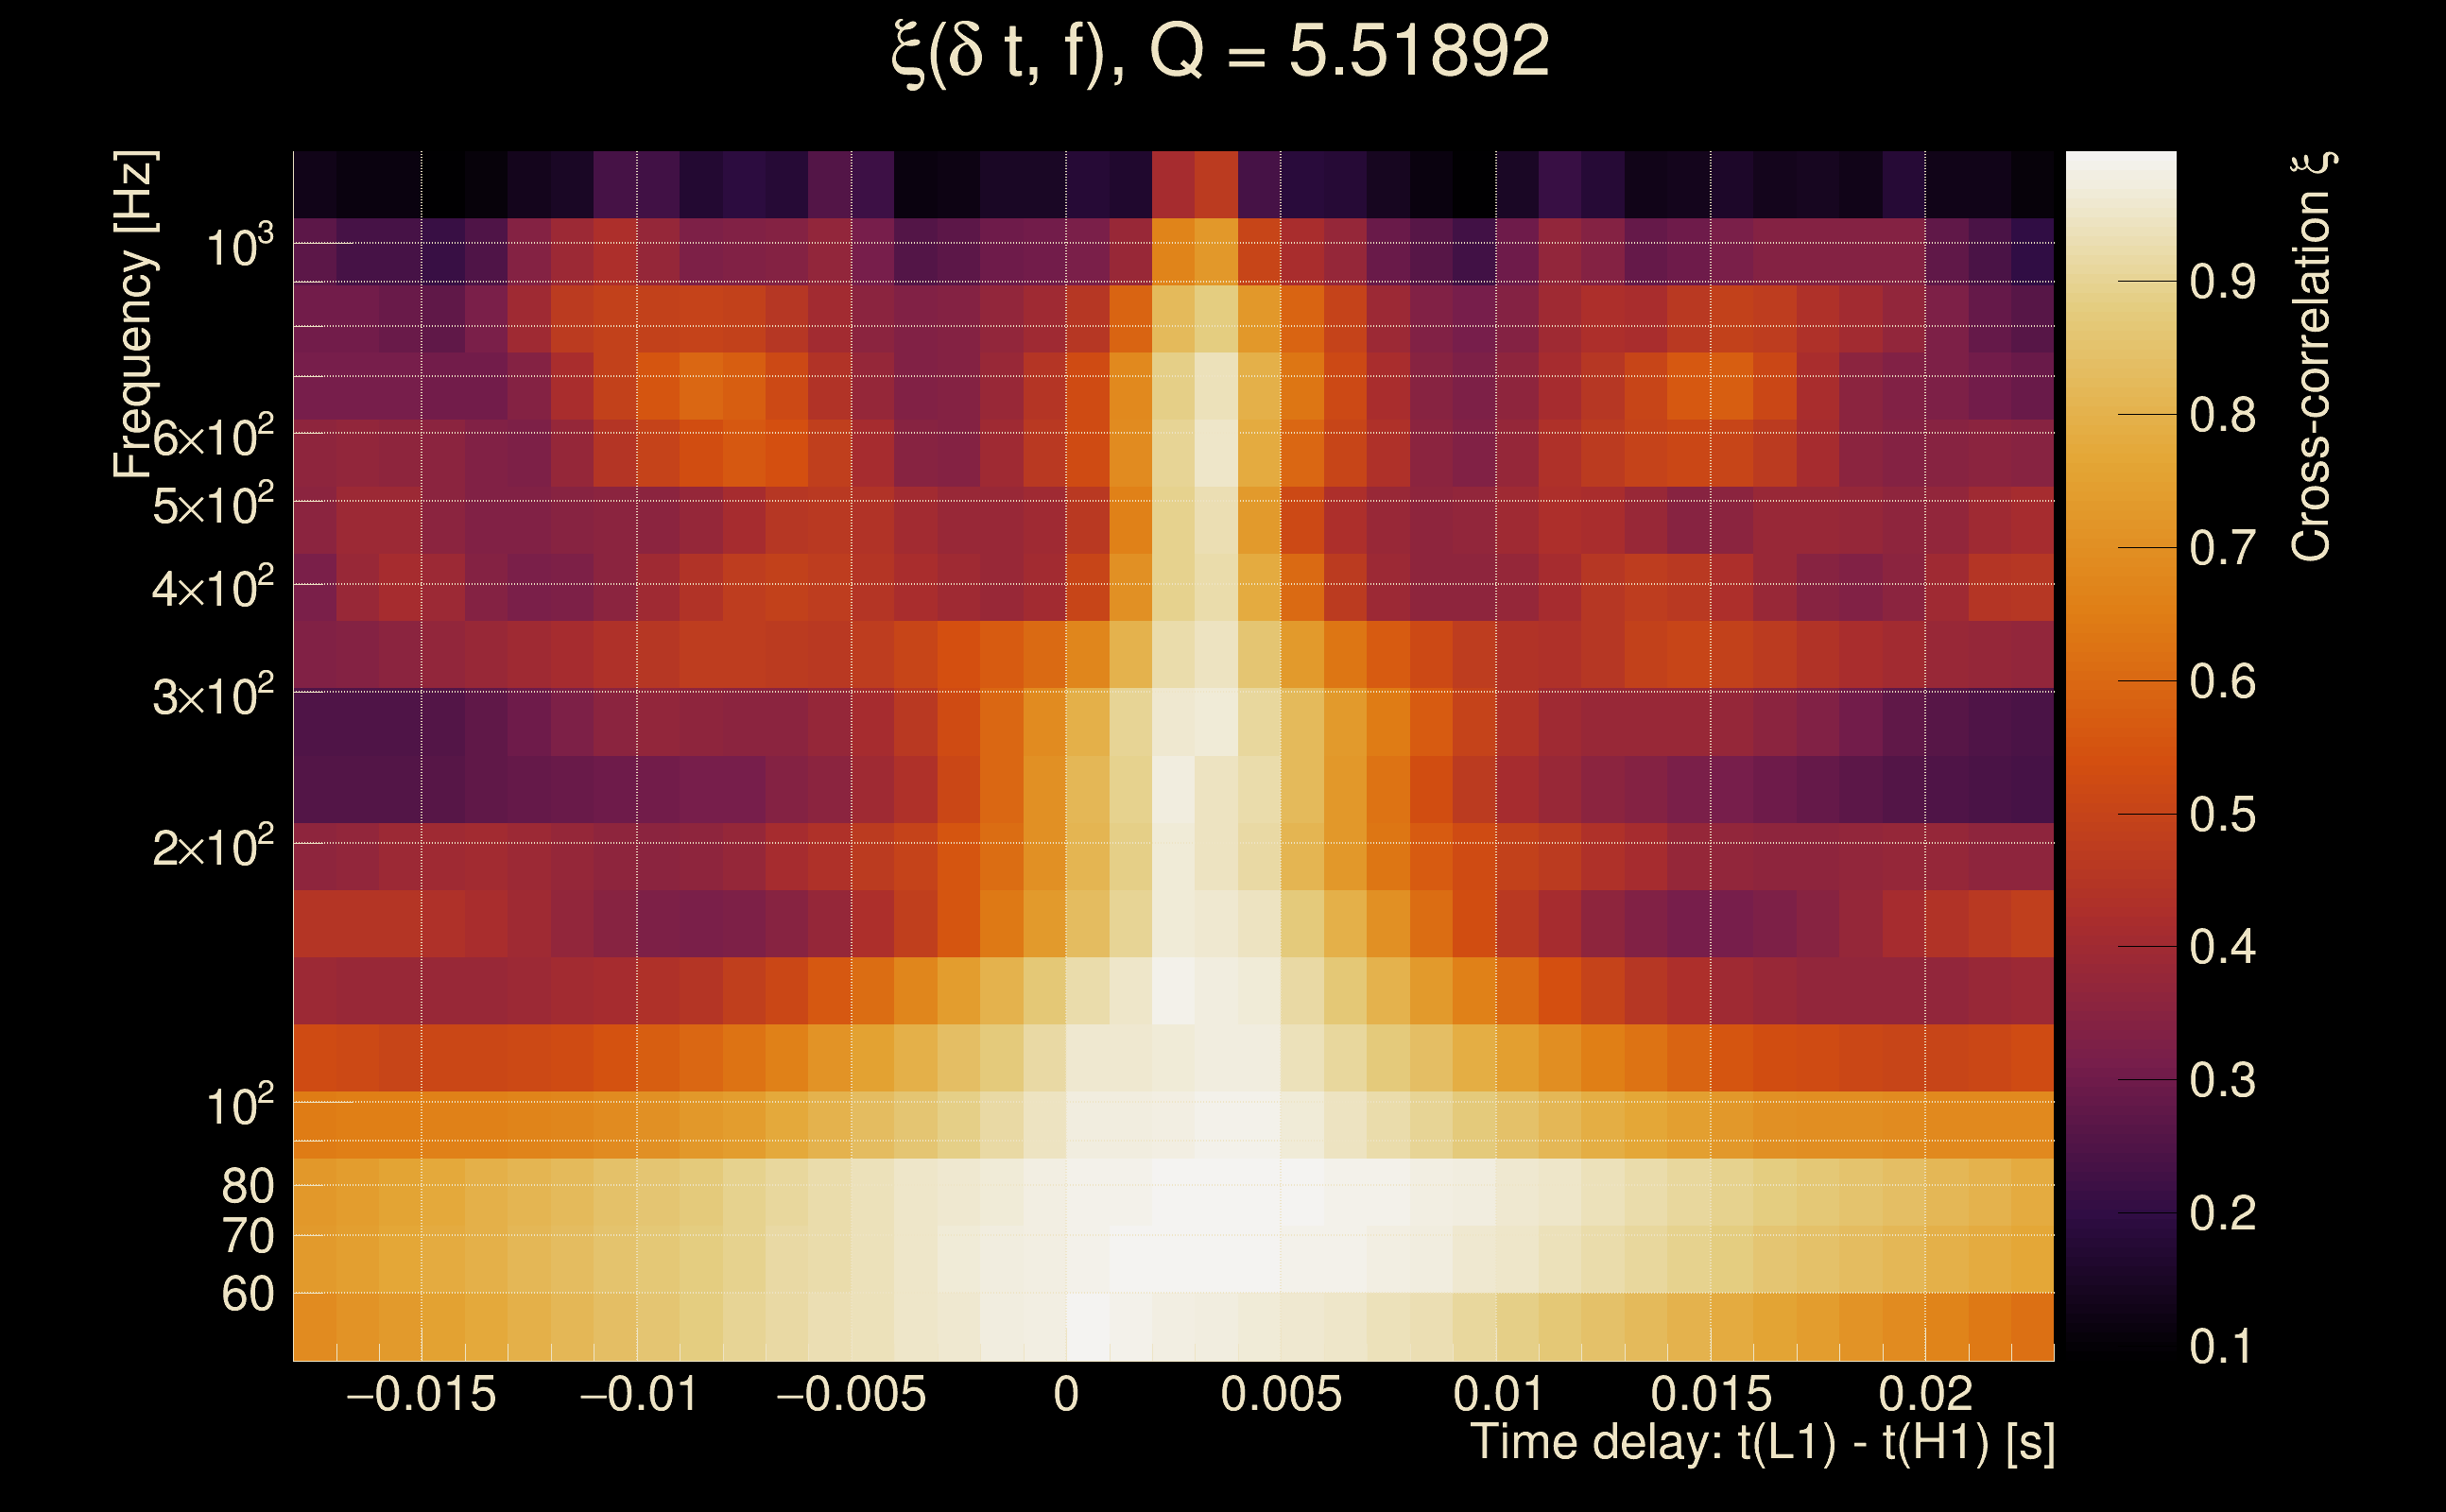
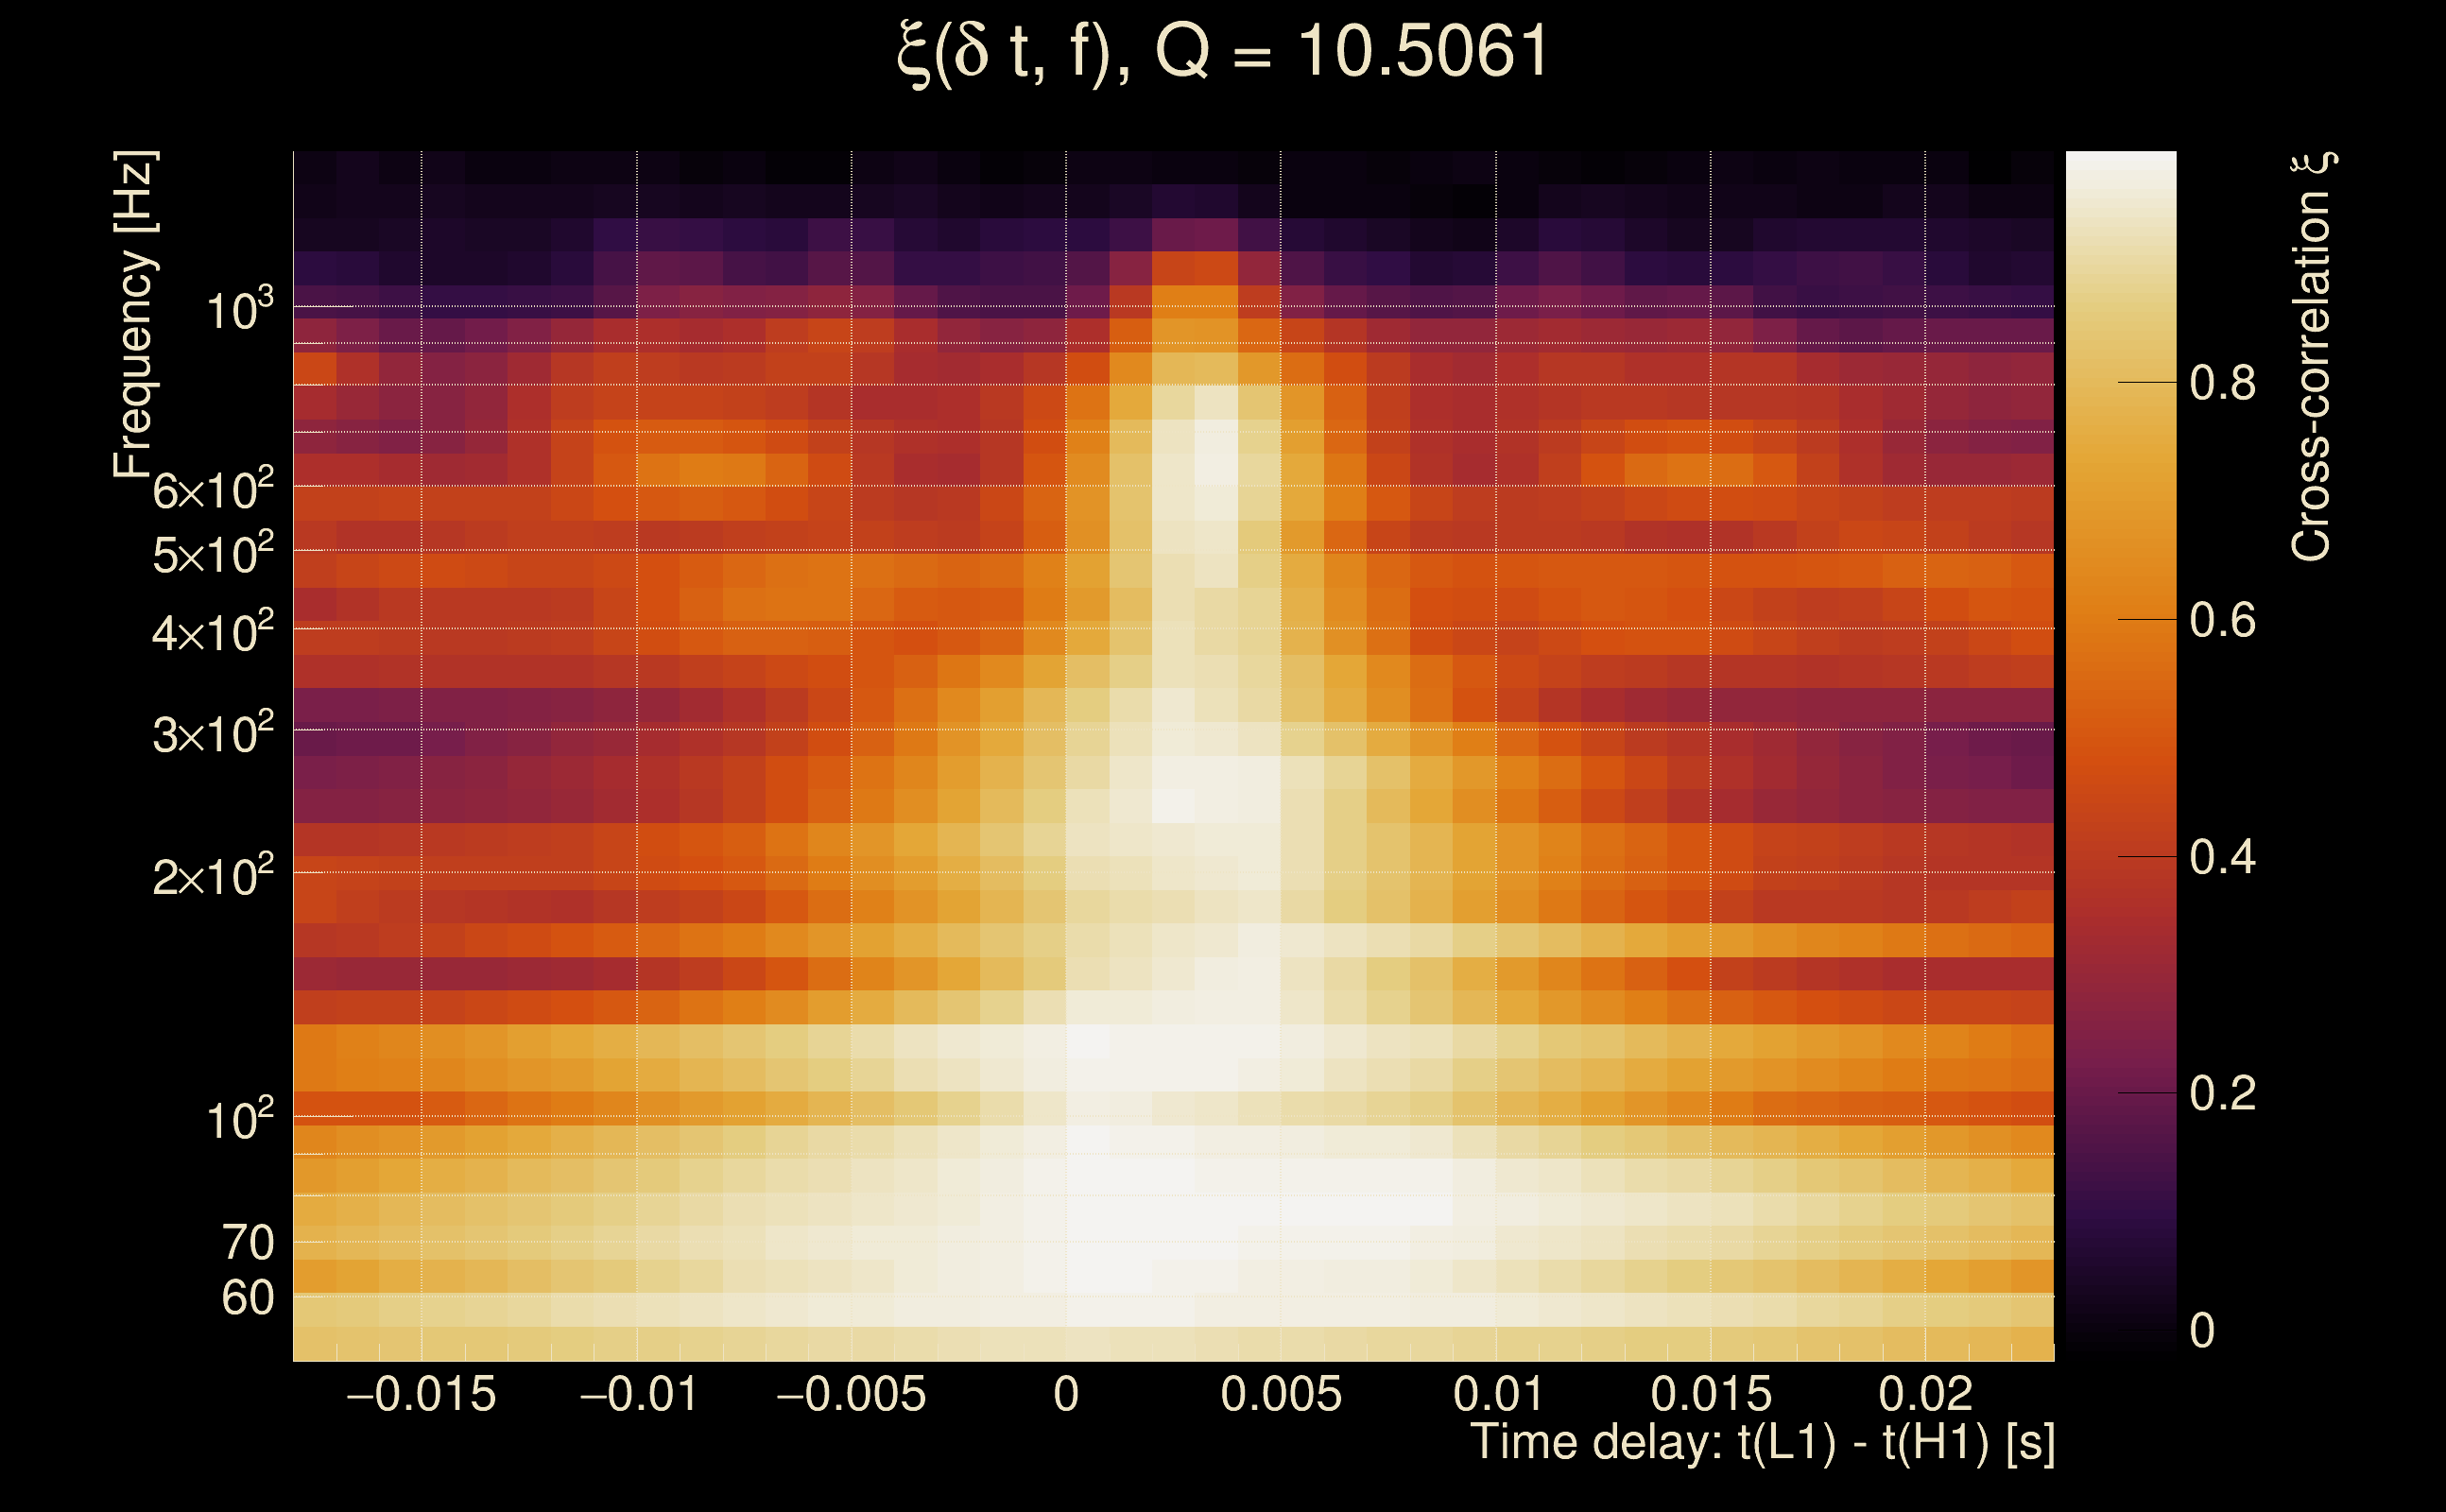
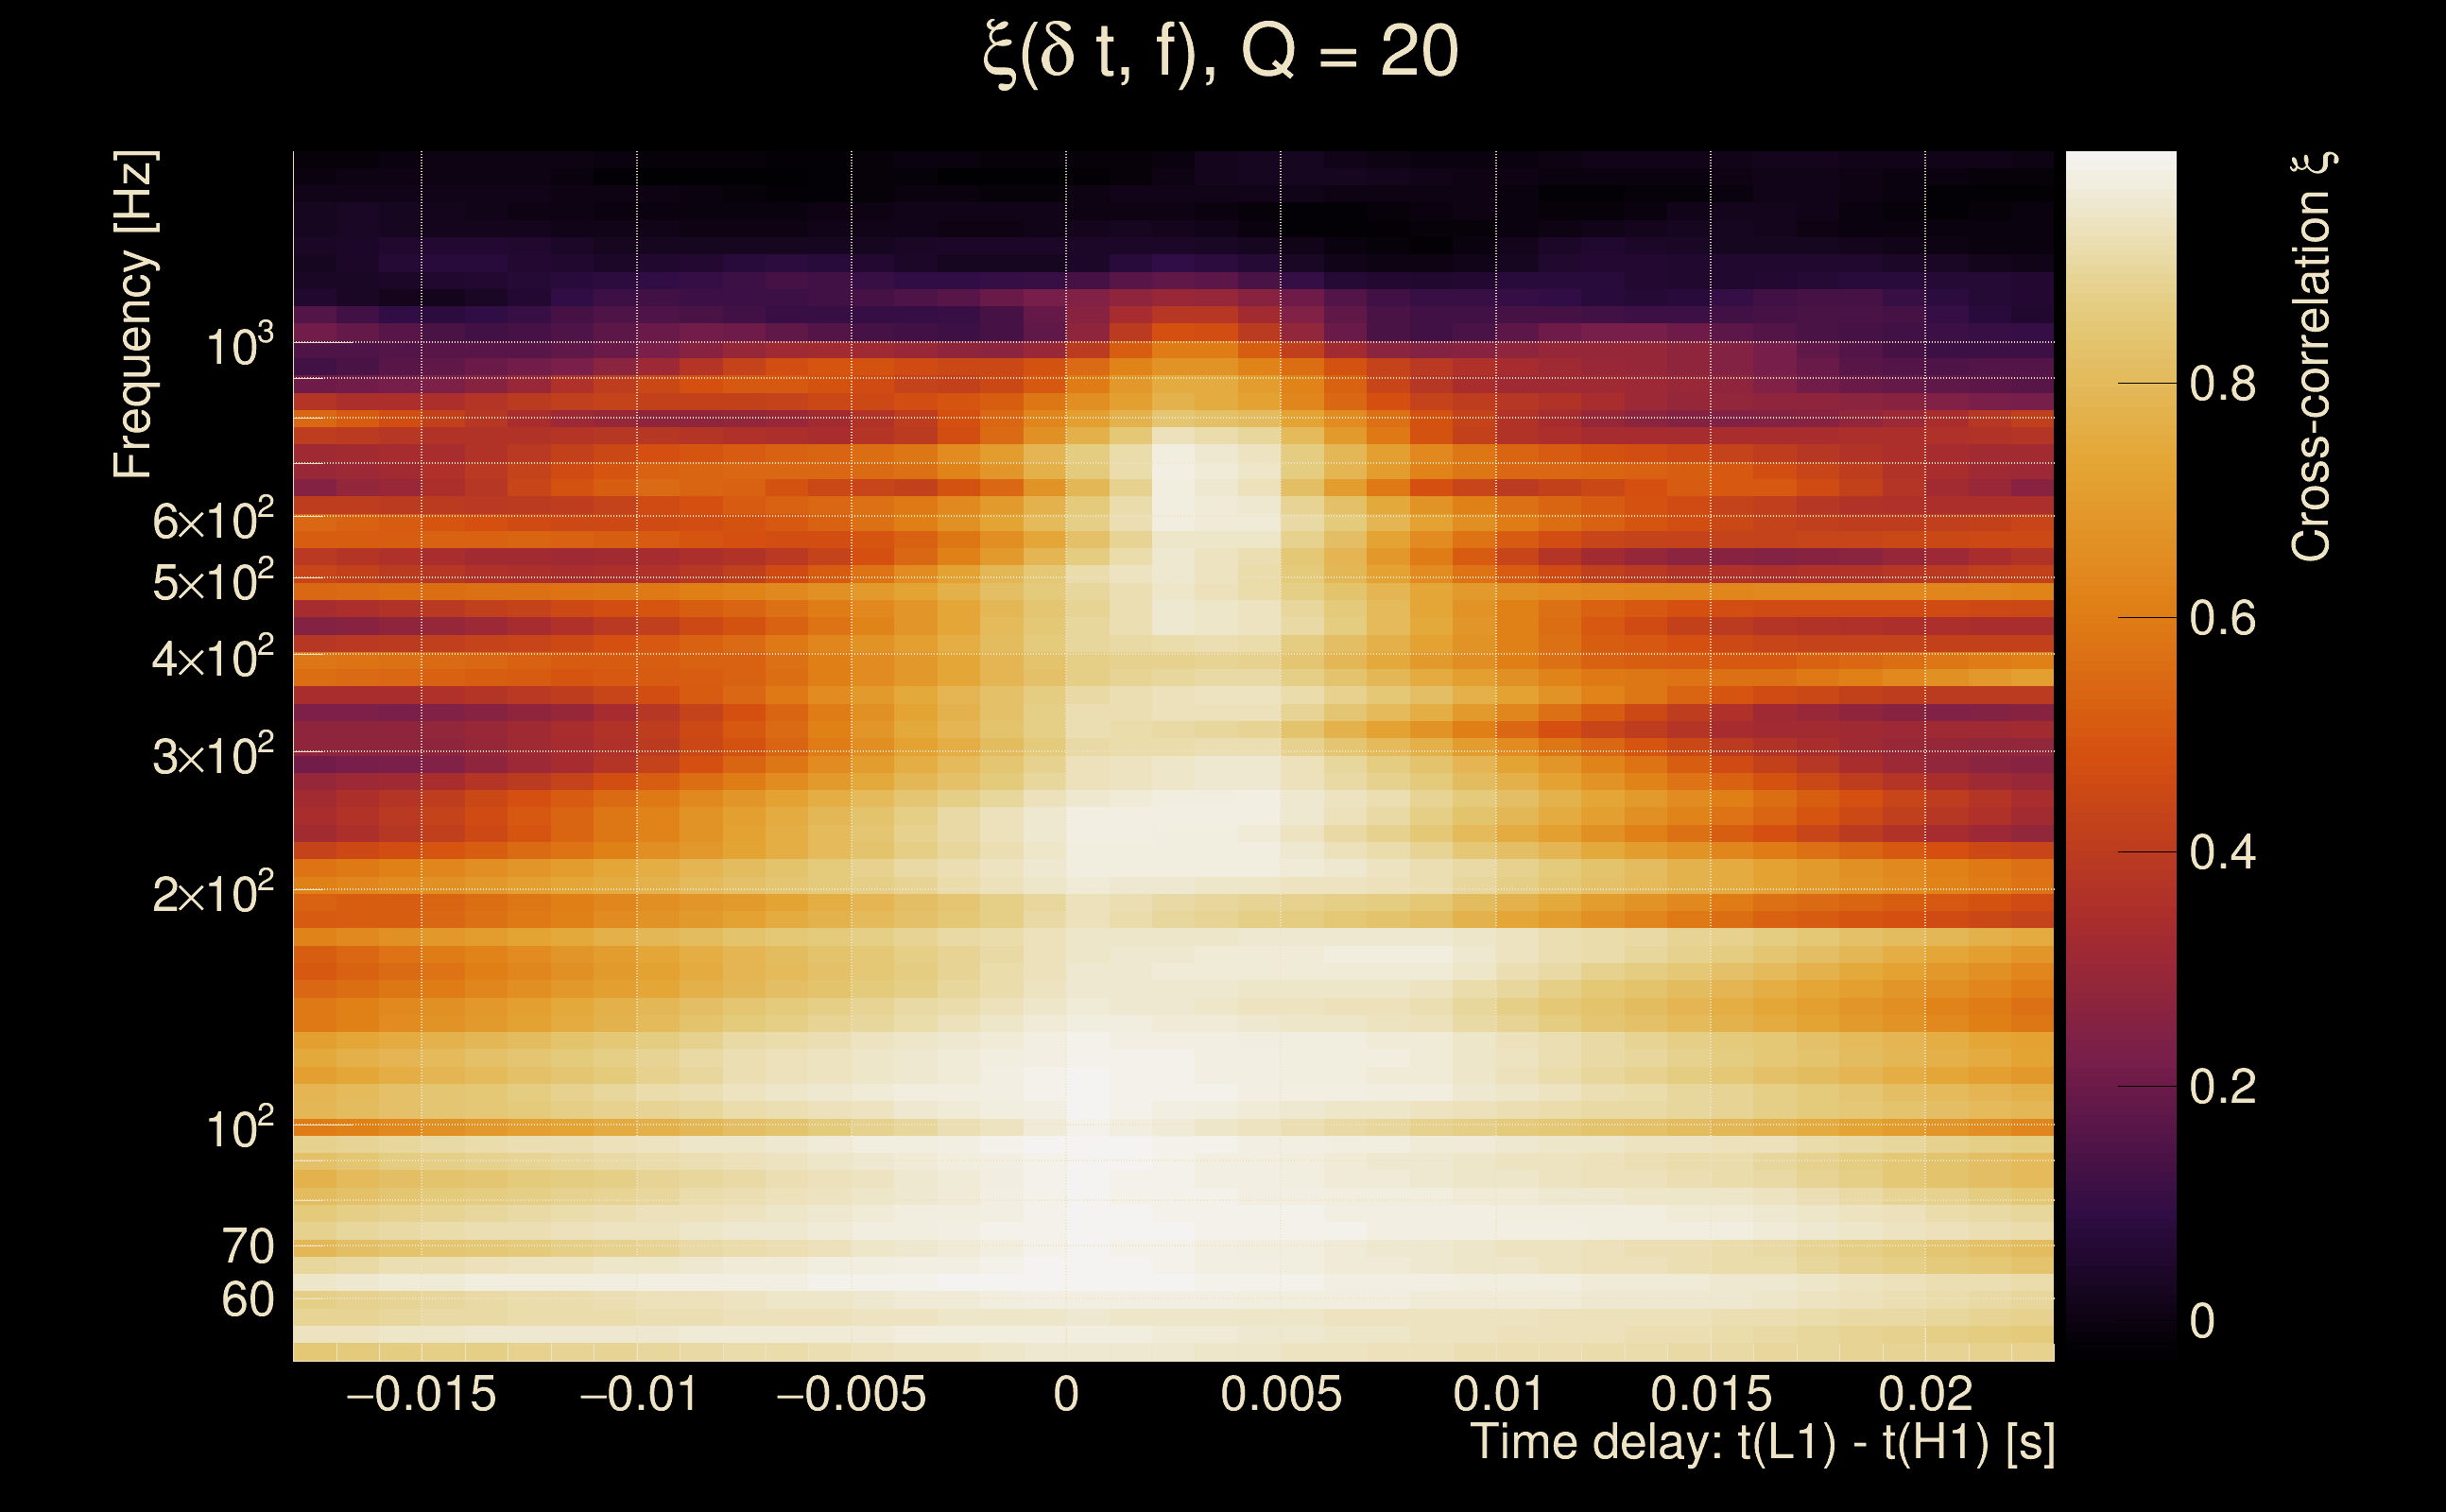
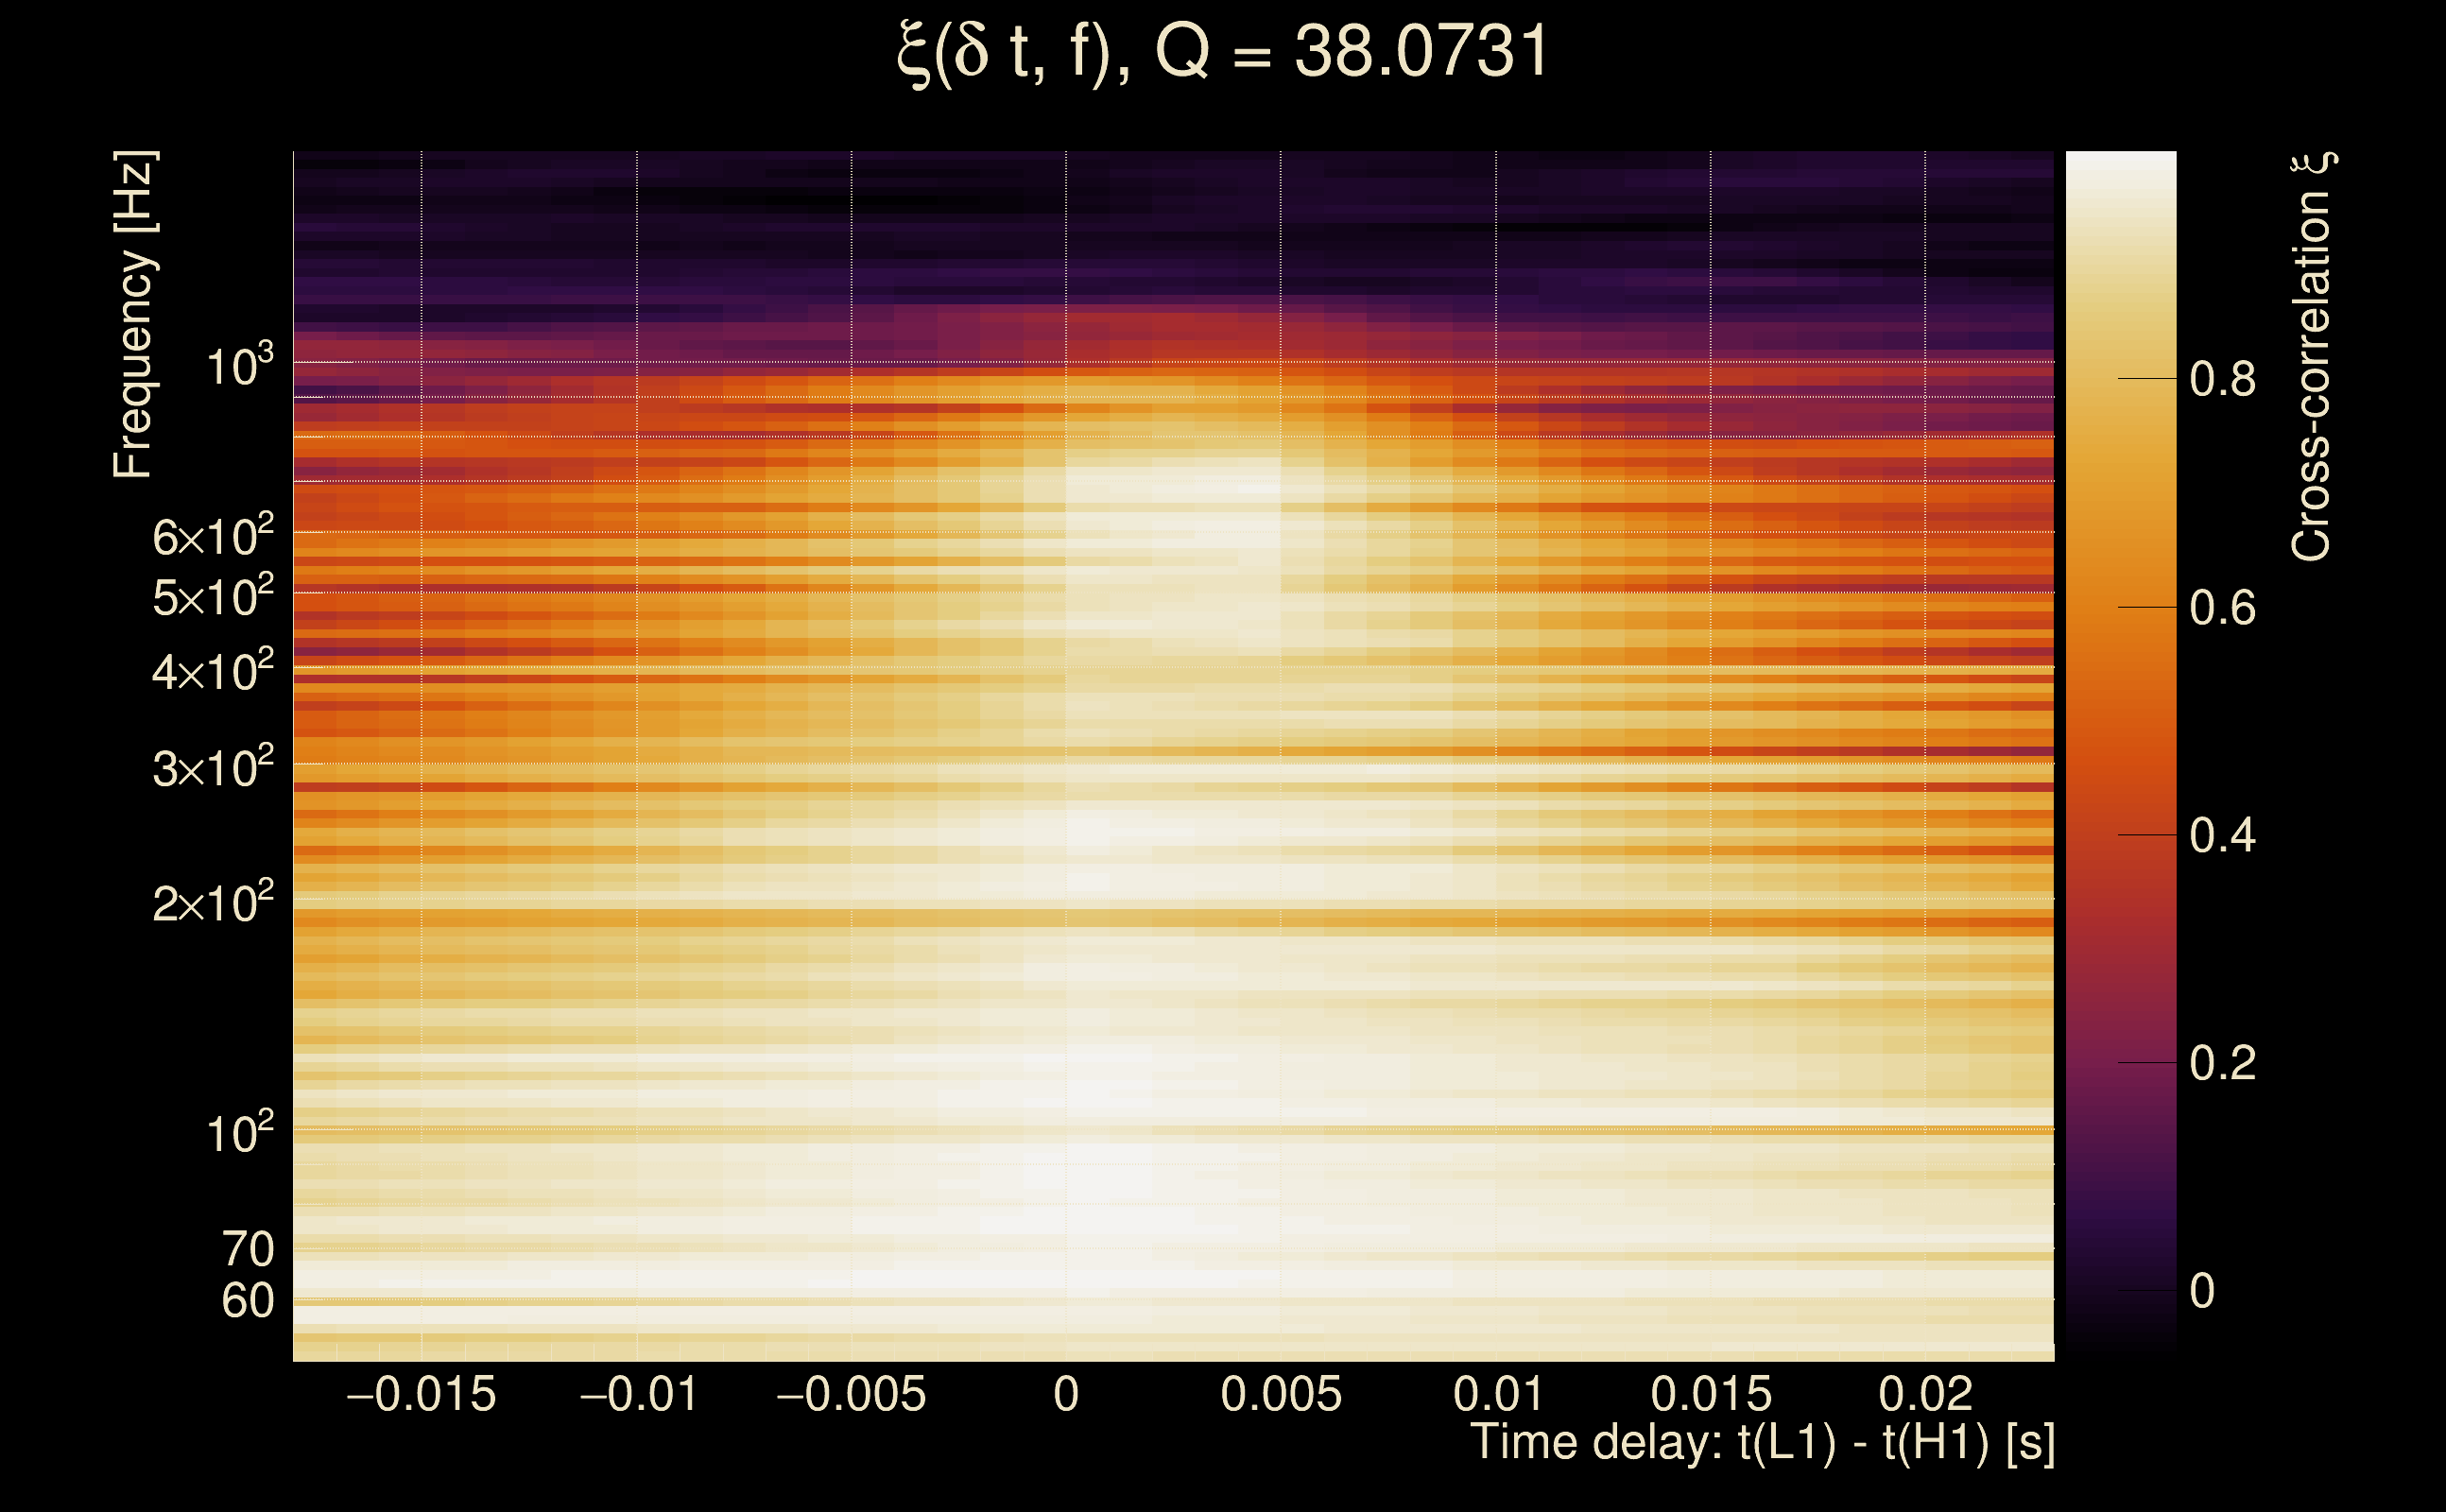
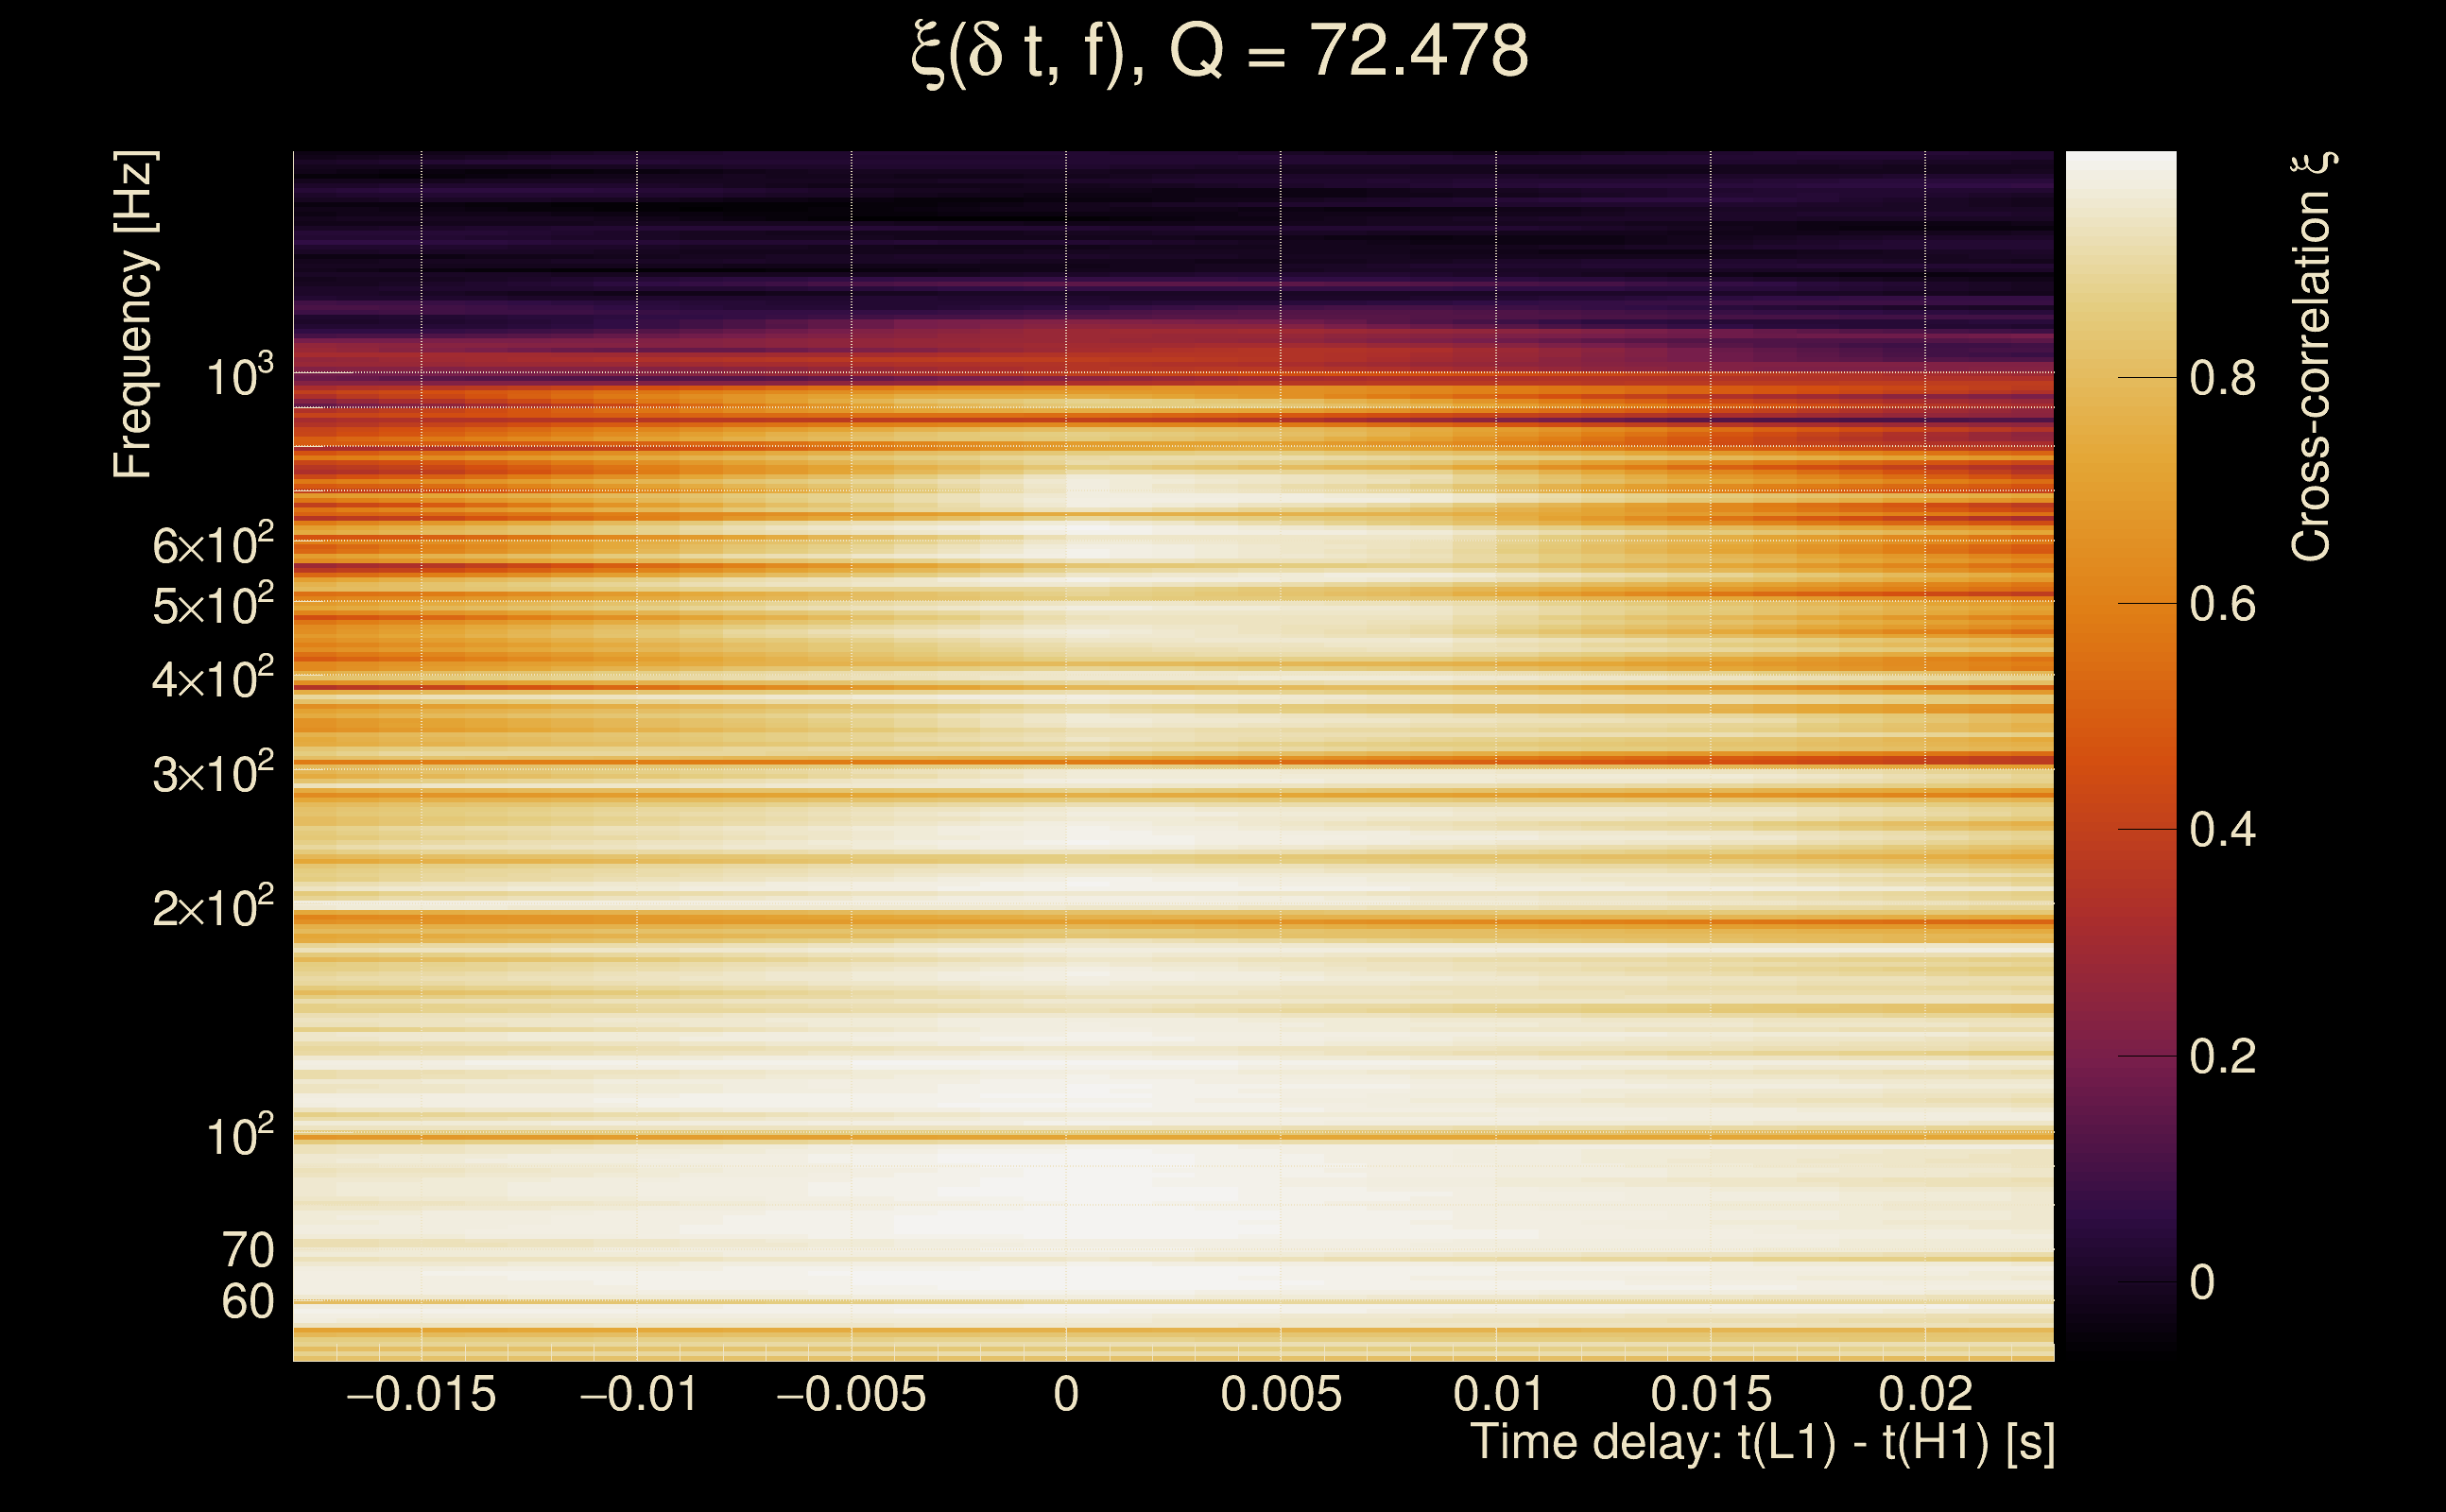
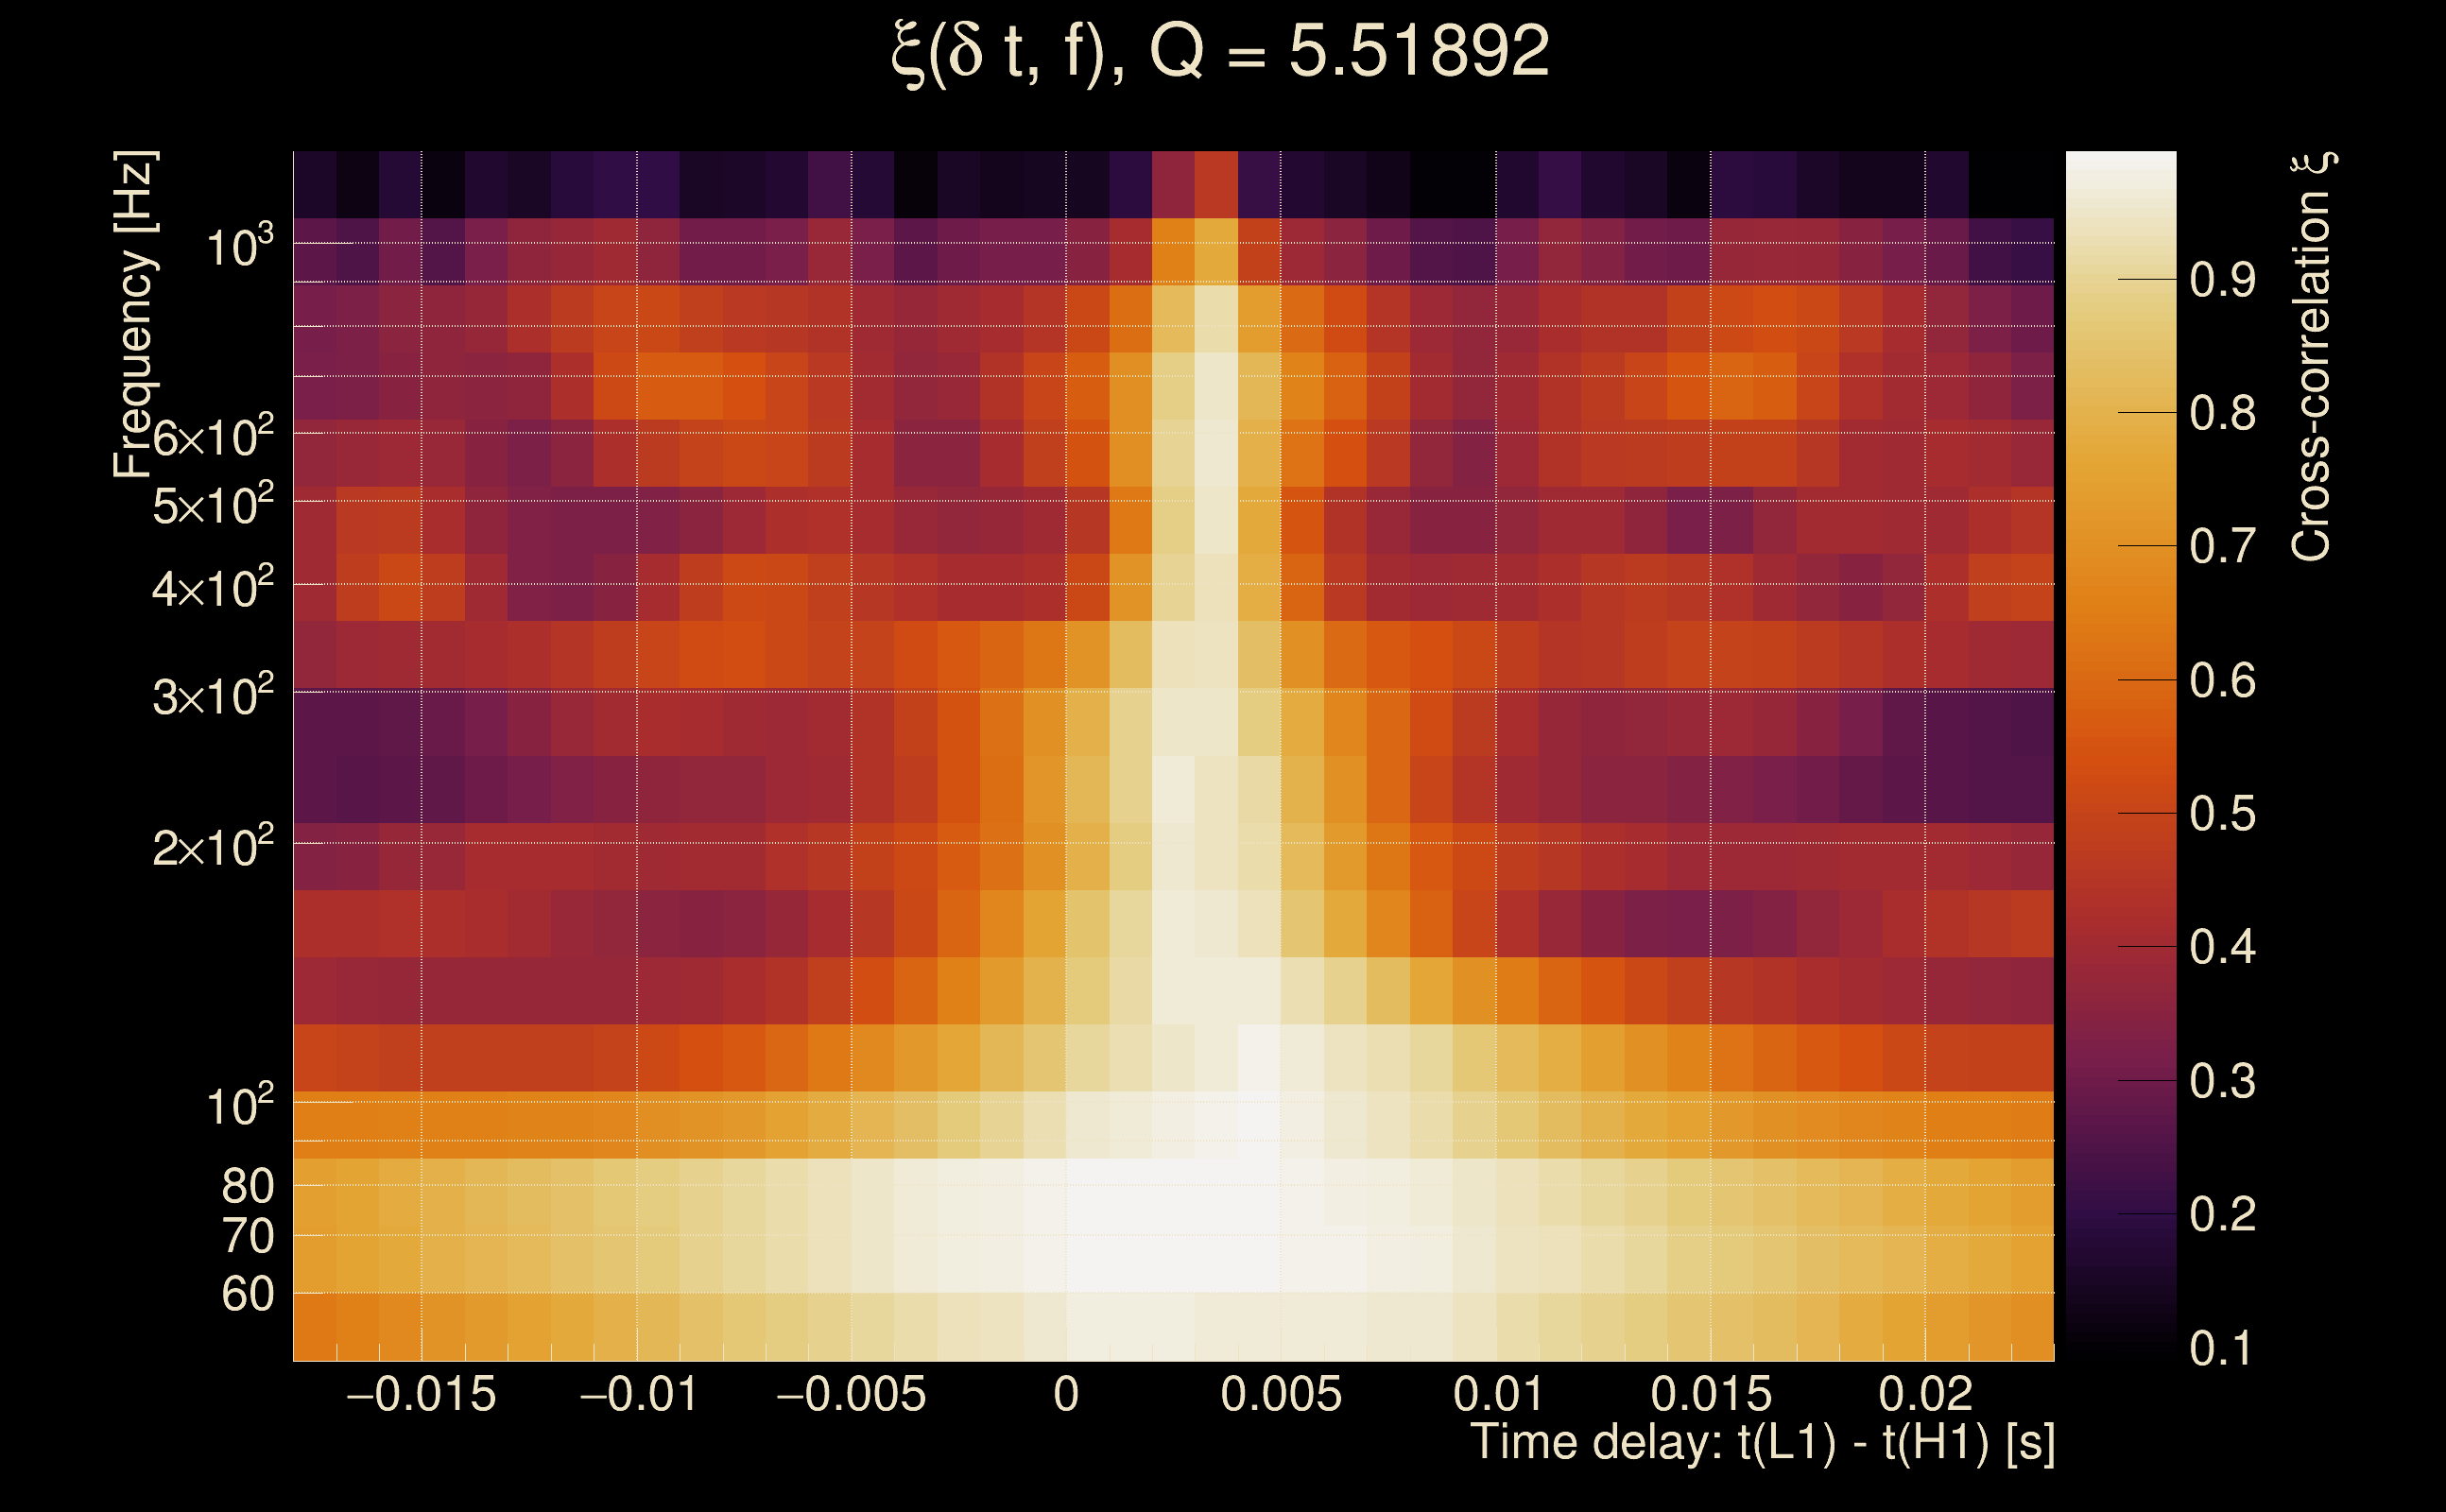
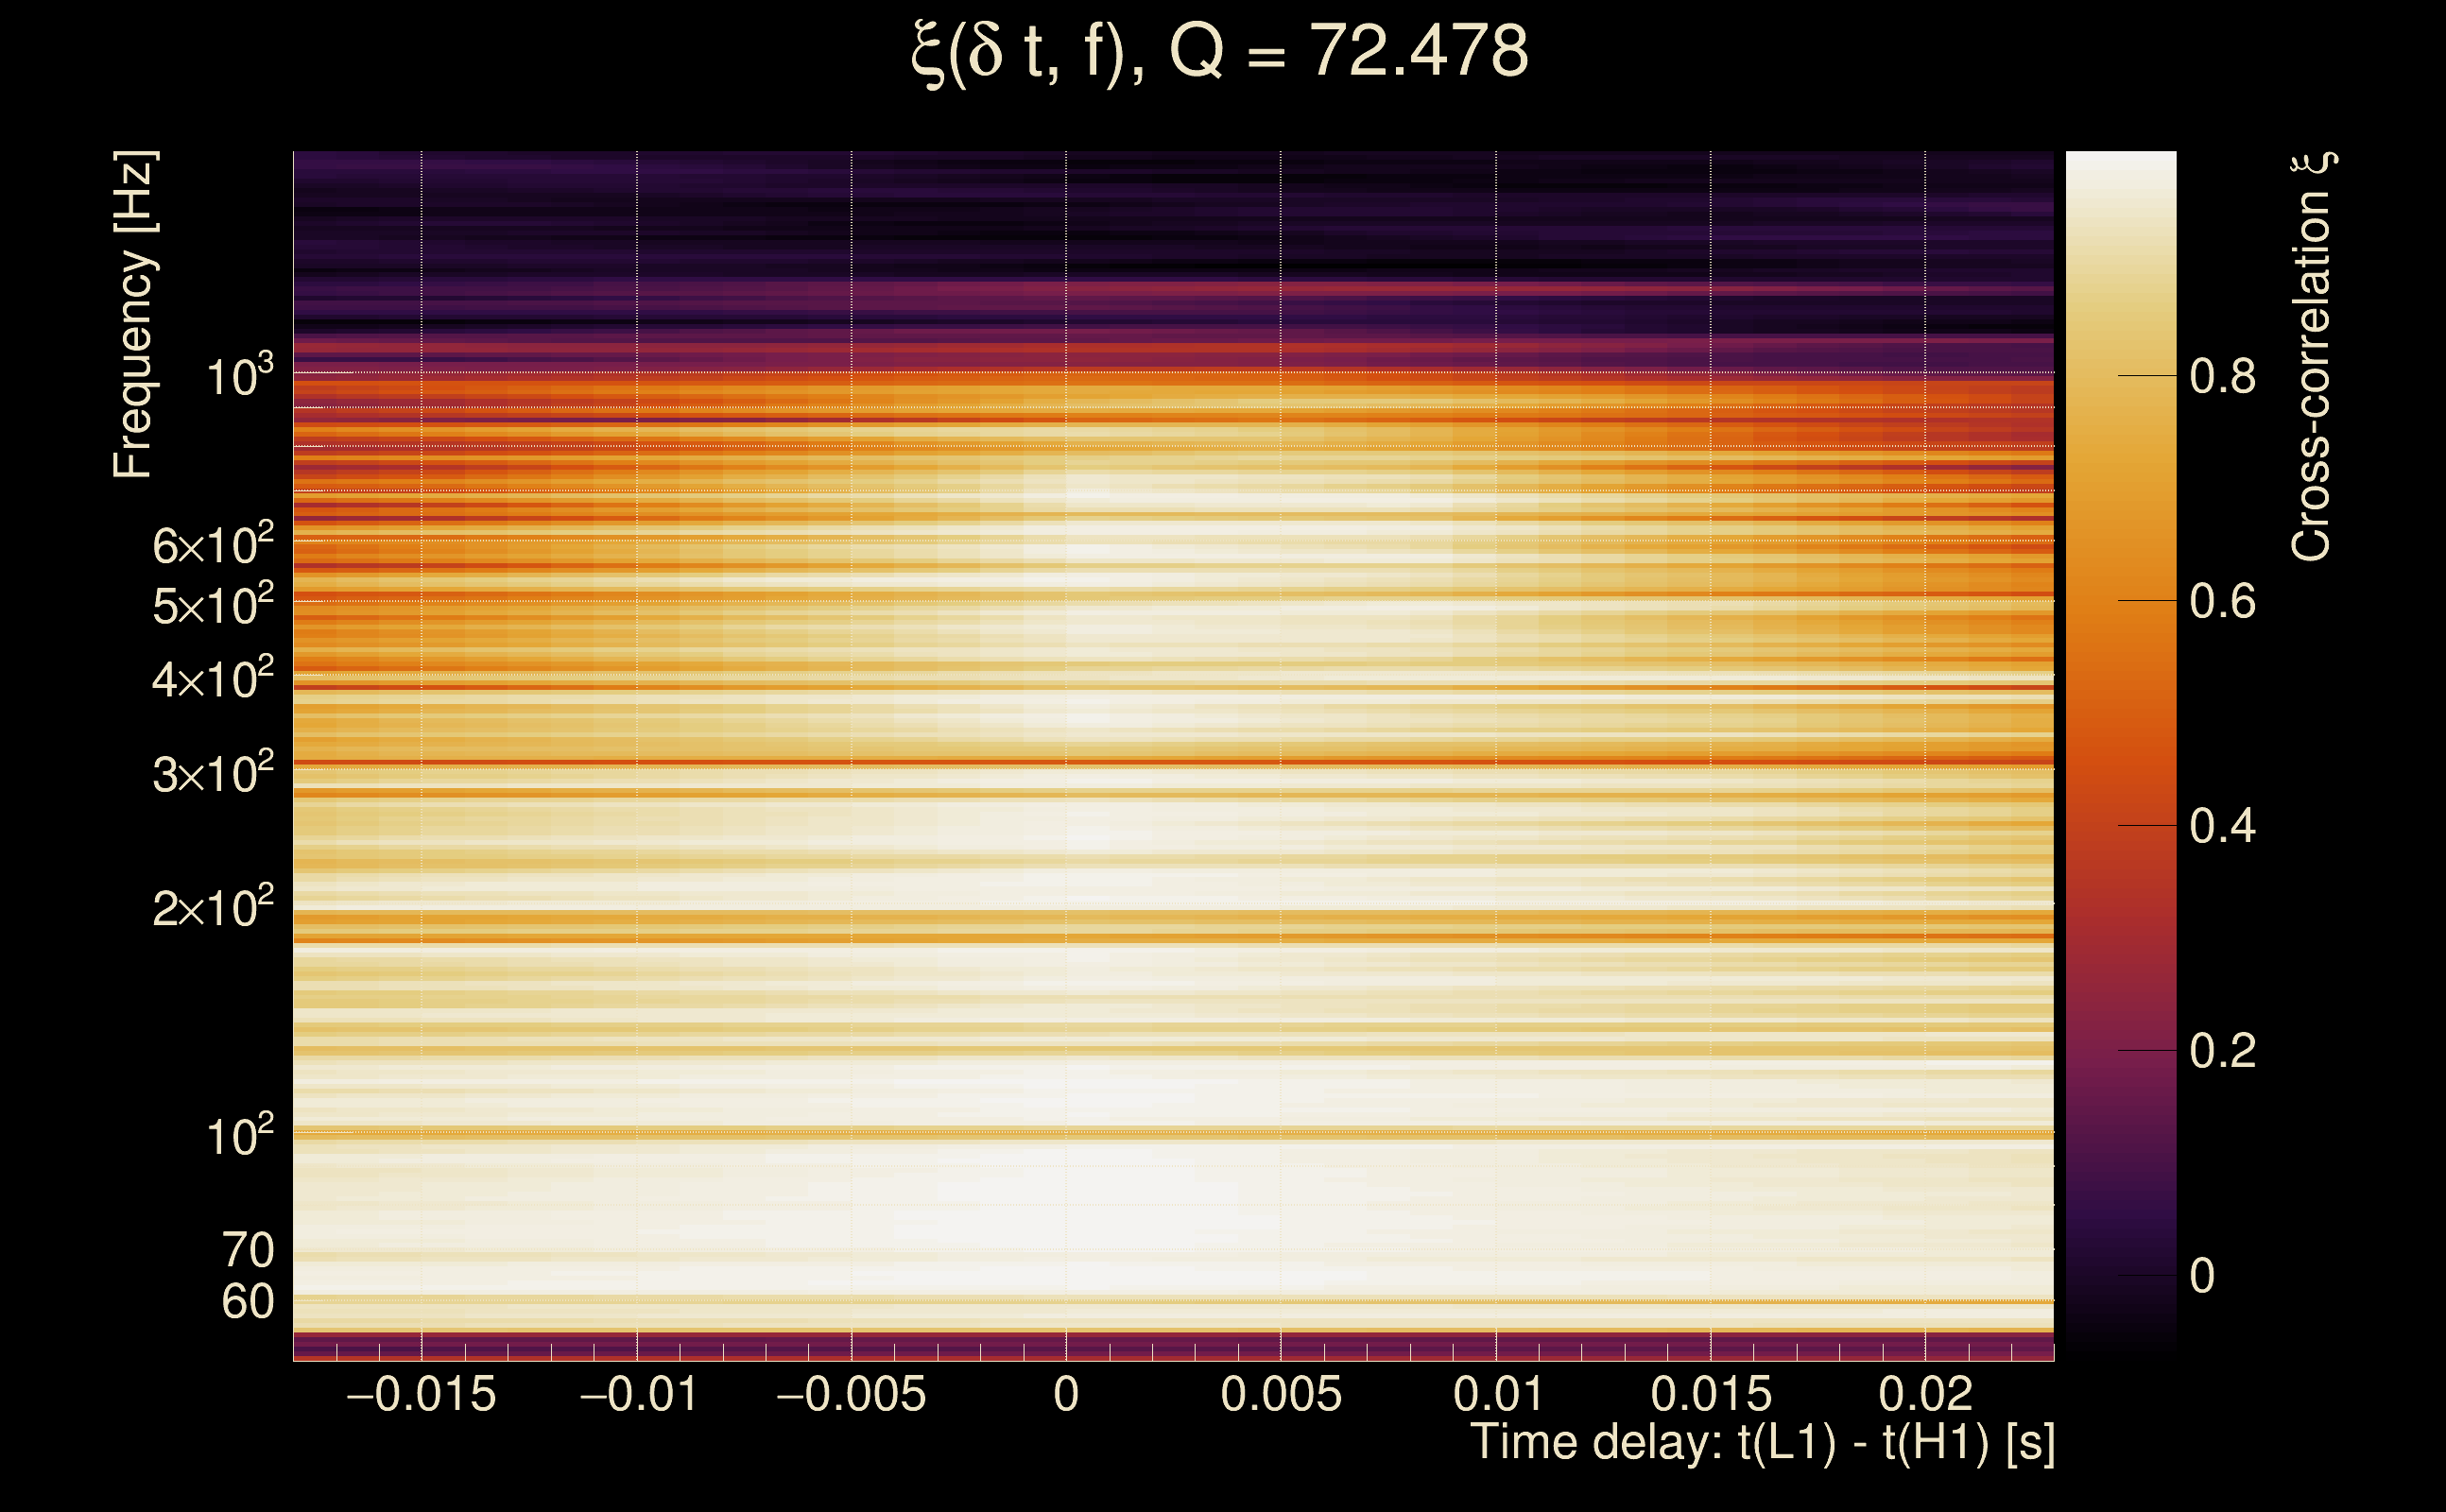
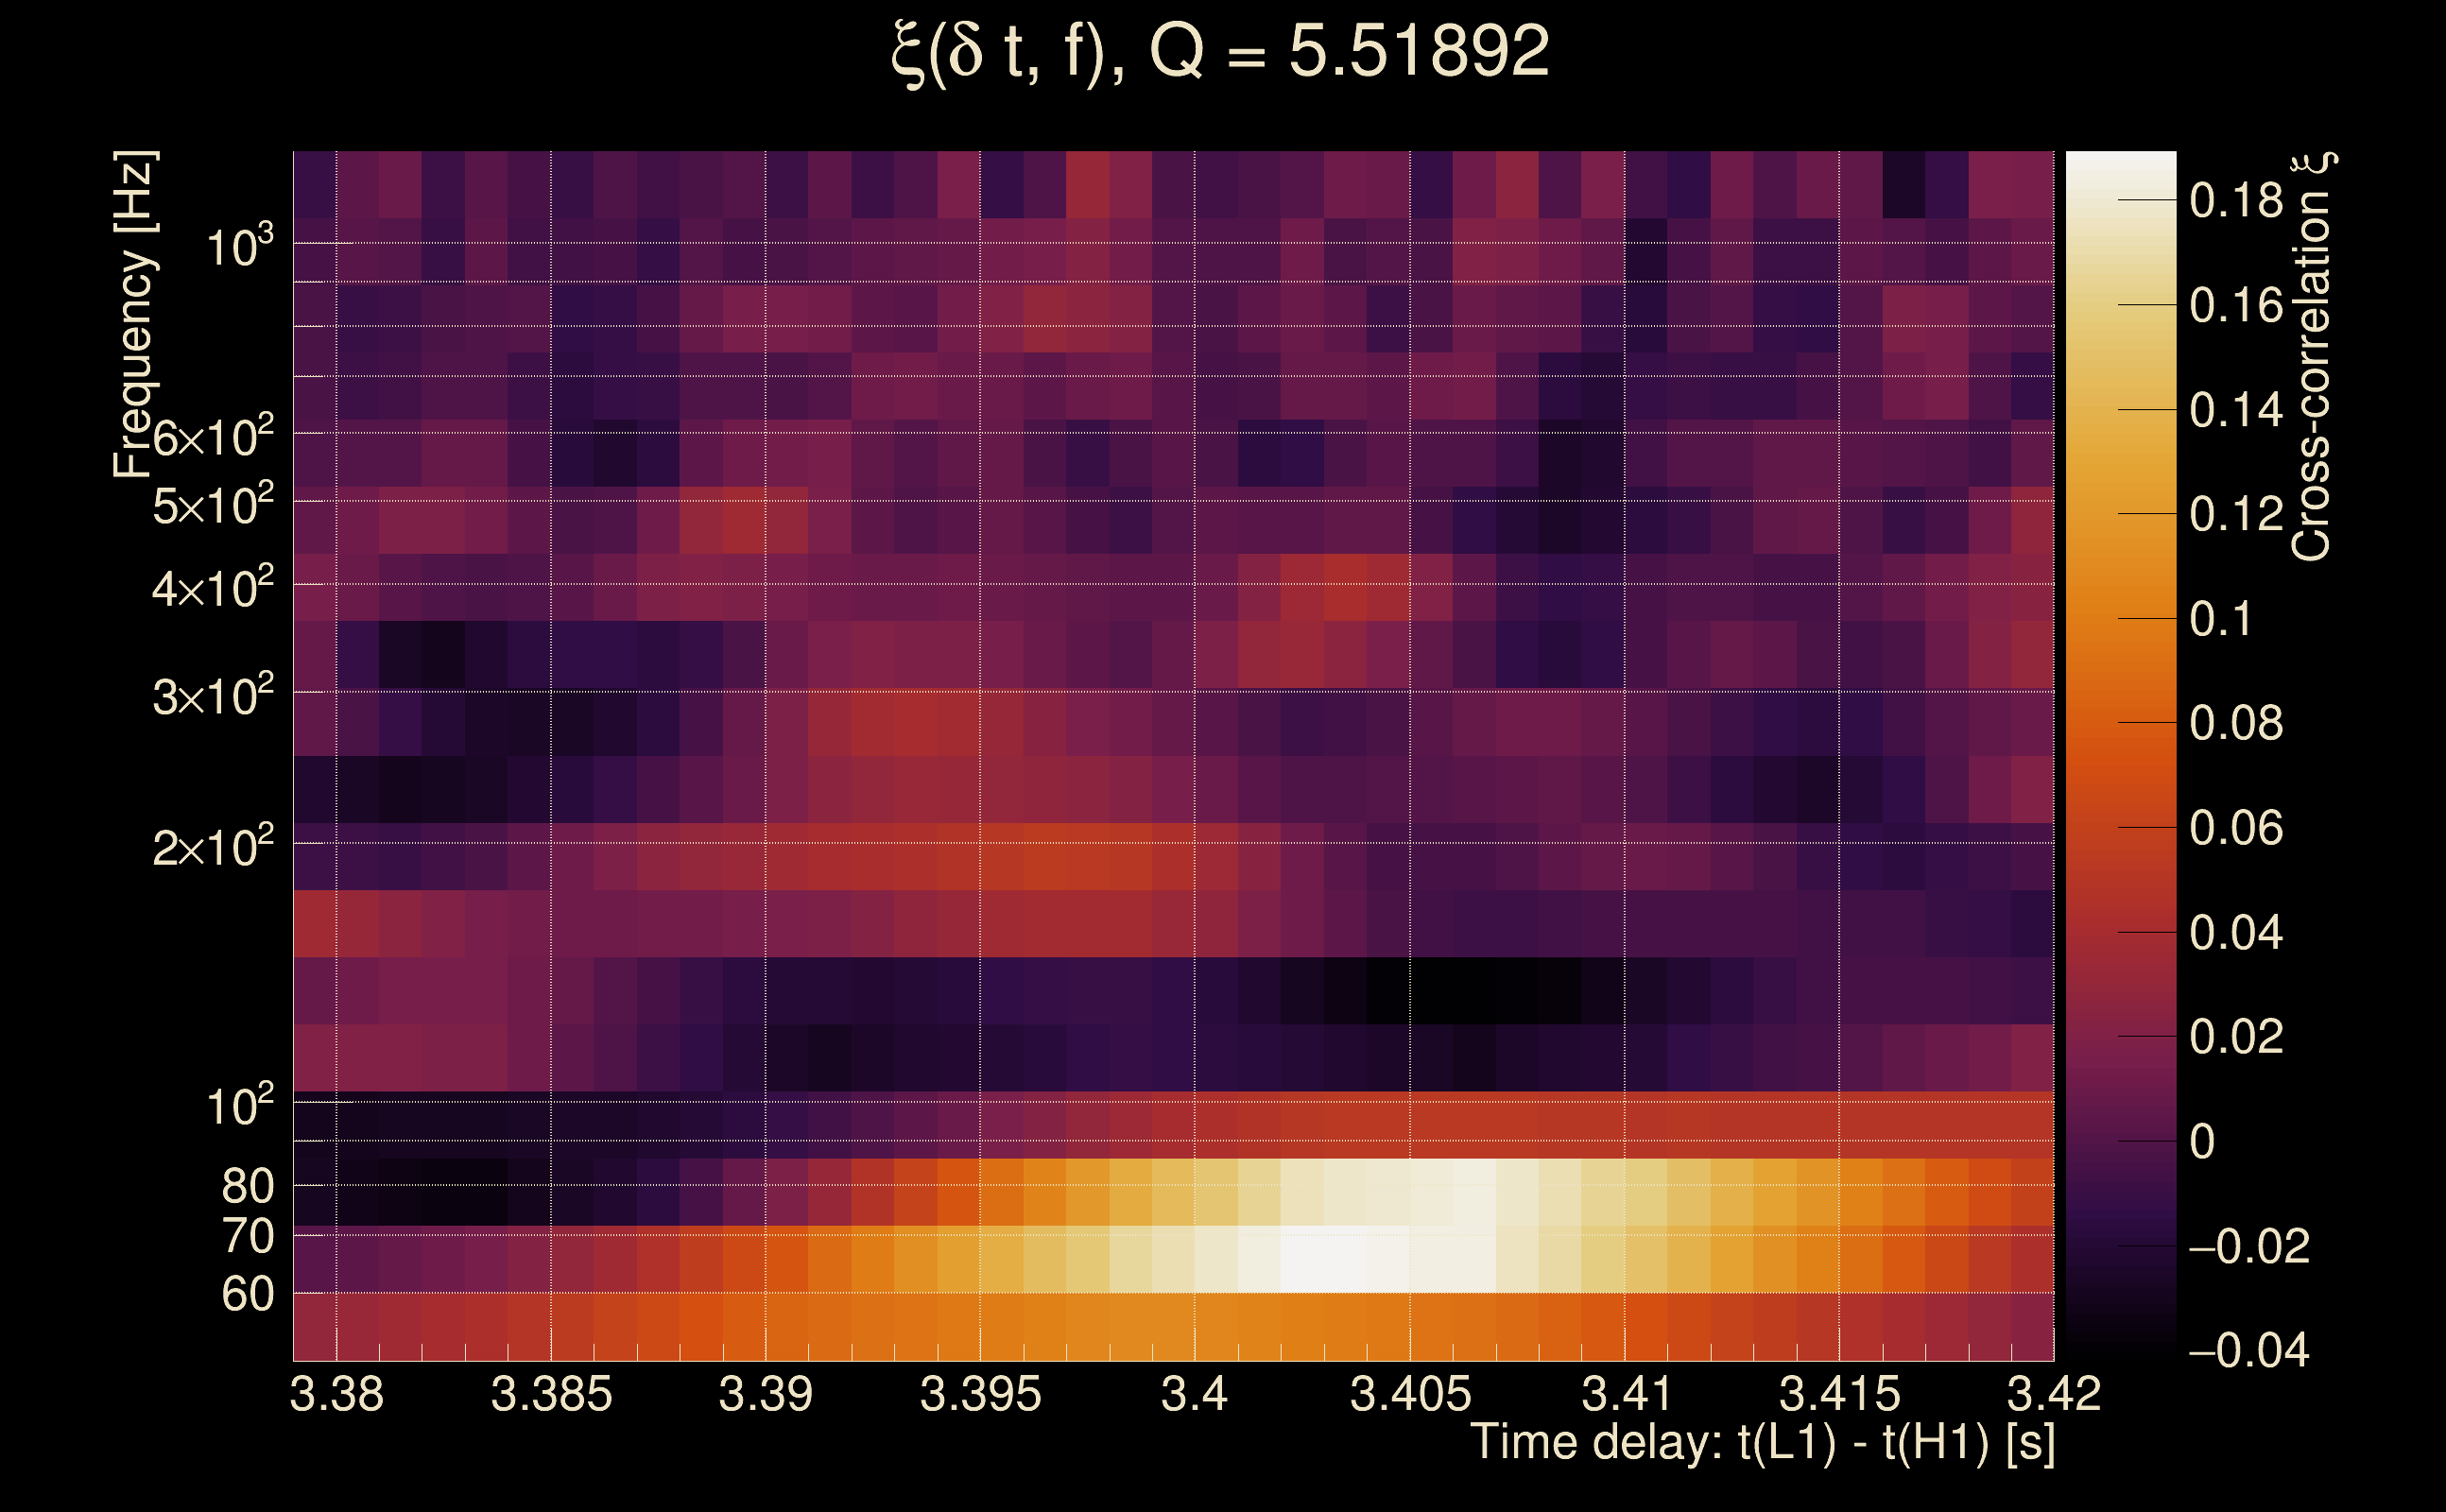
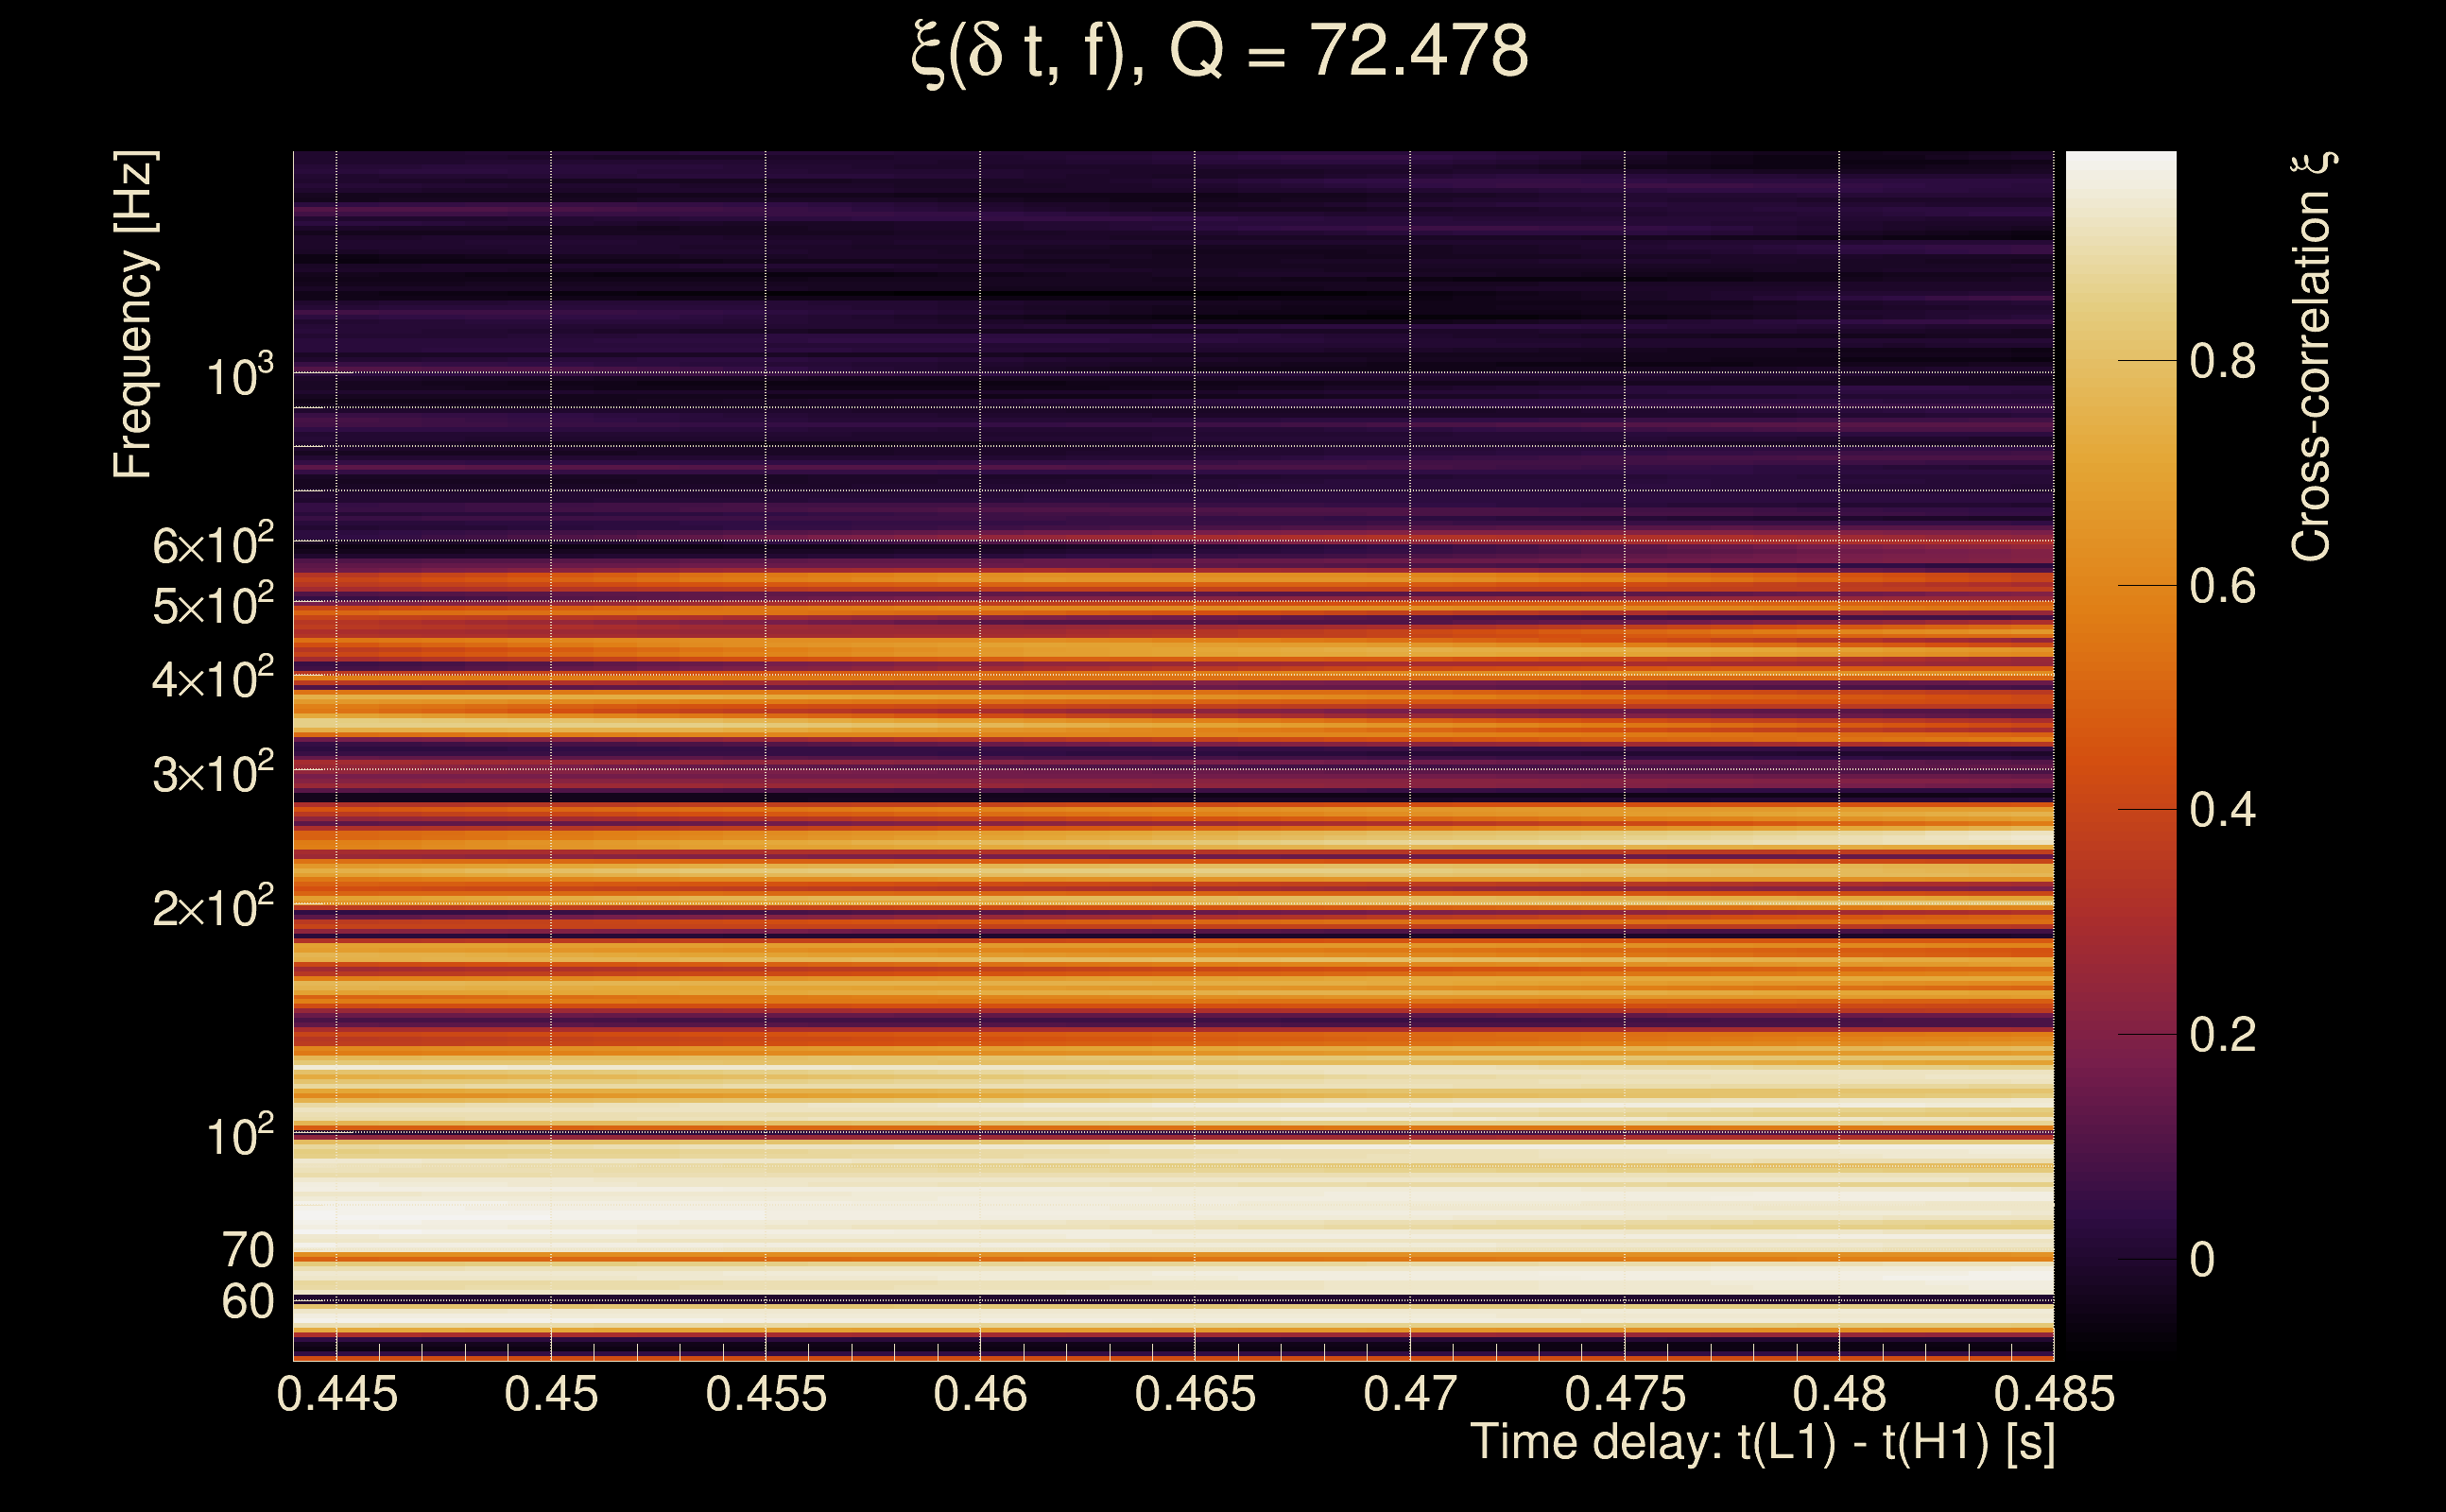
| Number of Q planes: | 5 (Q = 5.51892 → Q = 72.478) |
| Omicron frequency range: | 50 Hz → 1958.38 Hz |
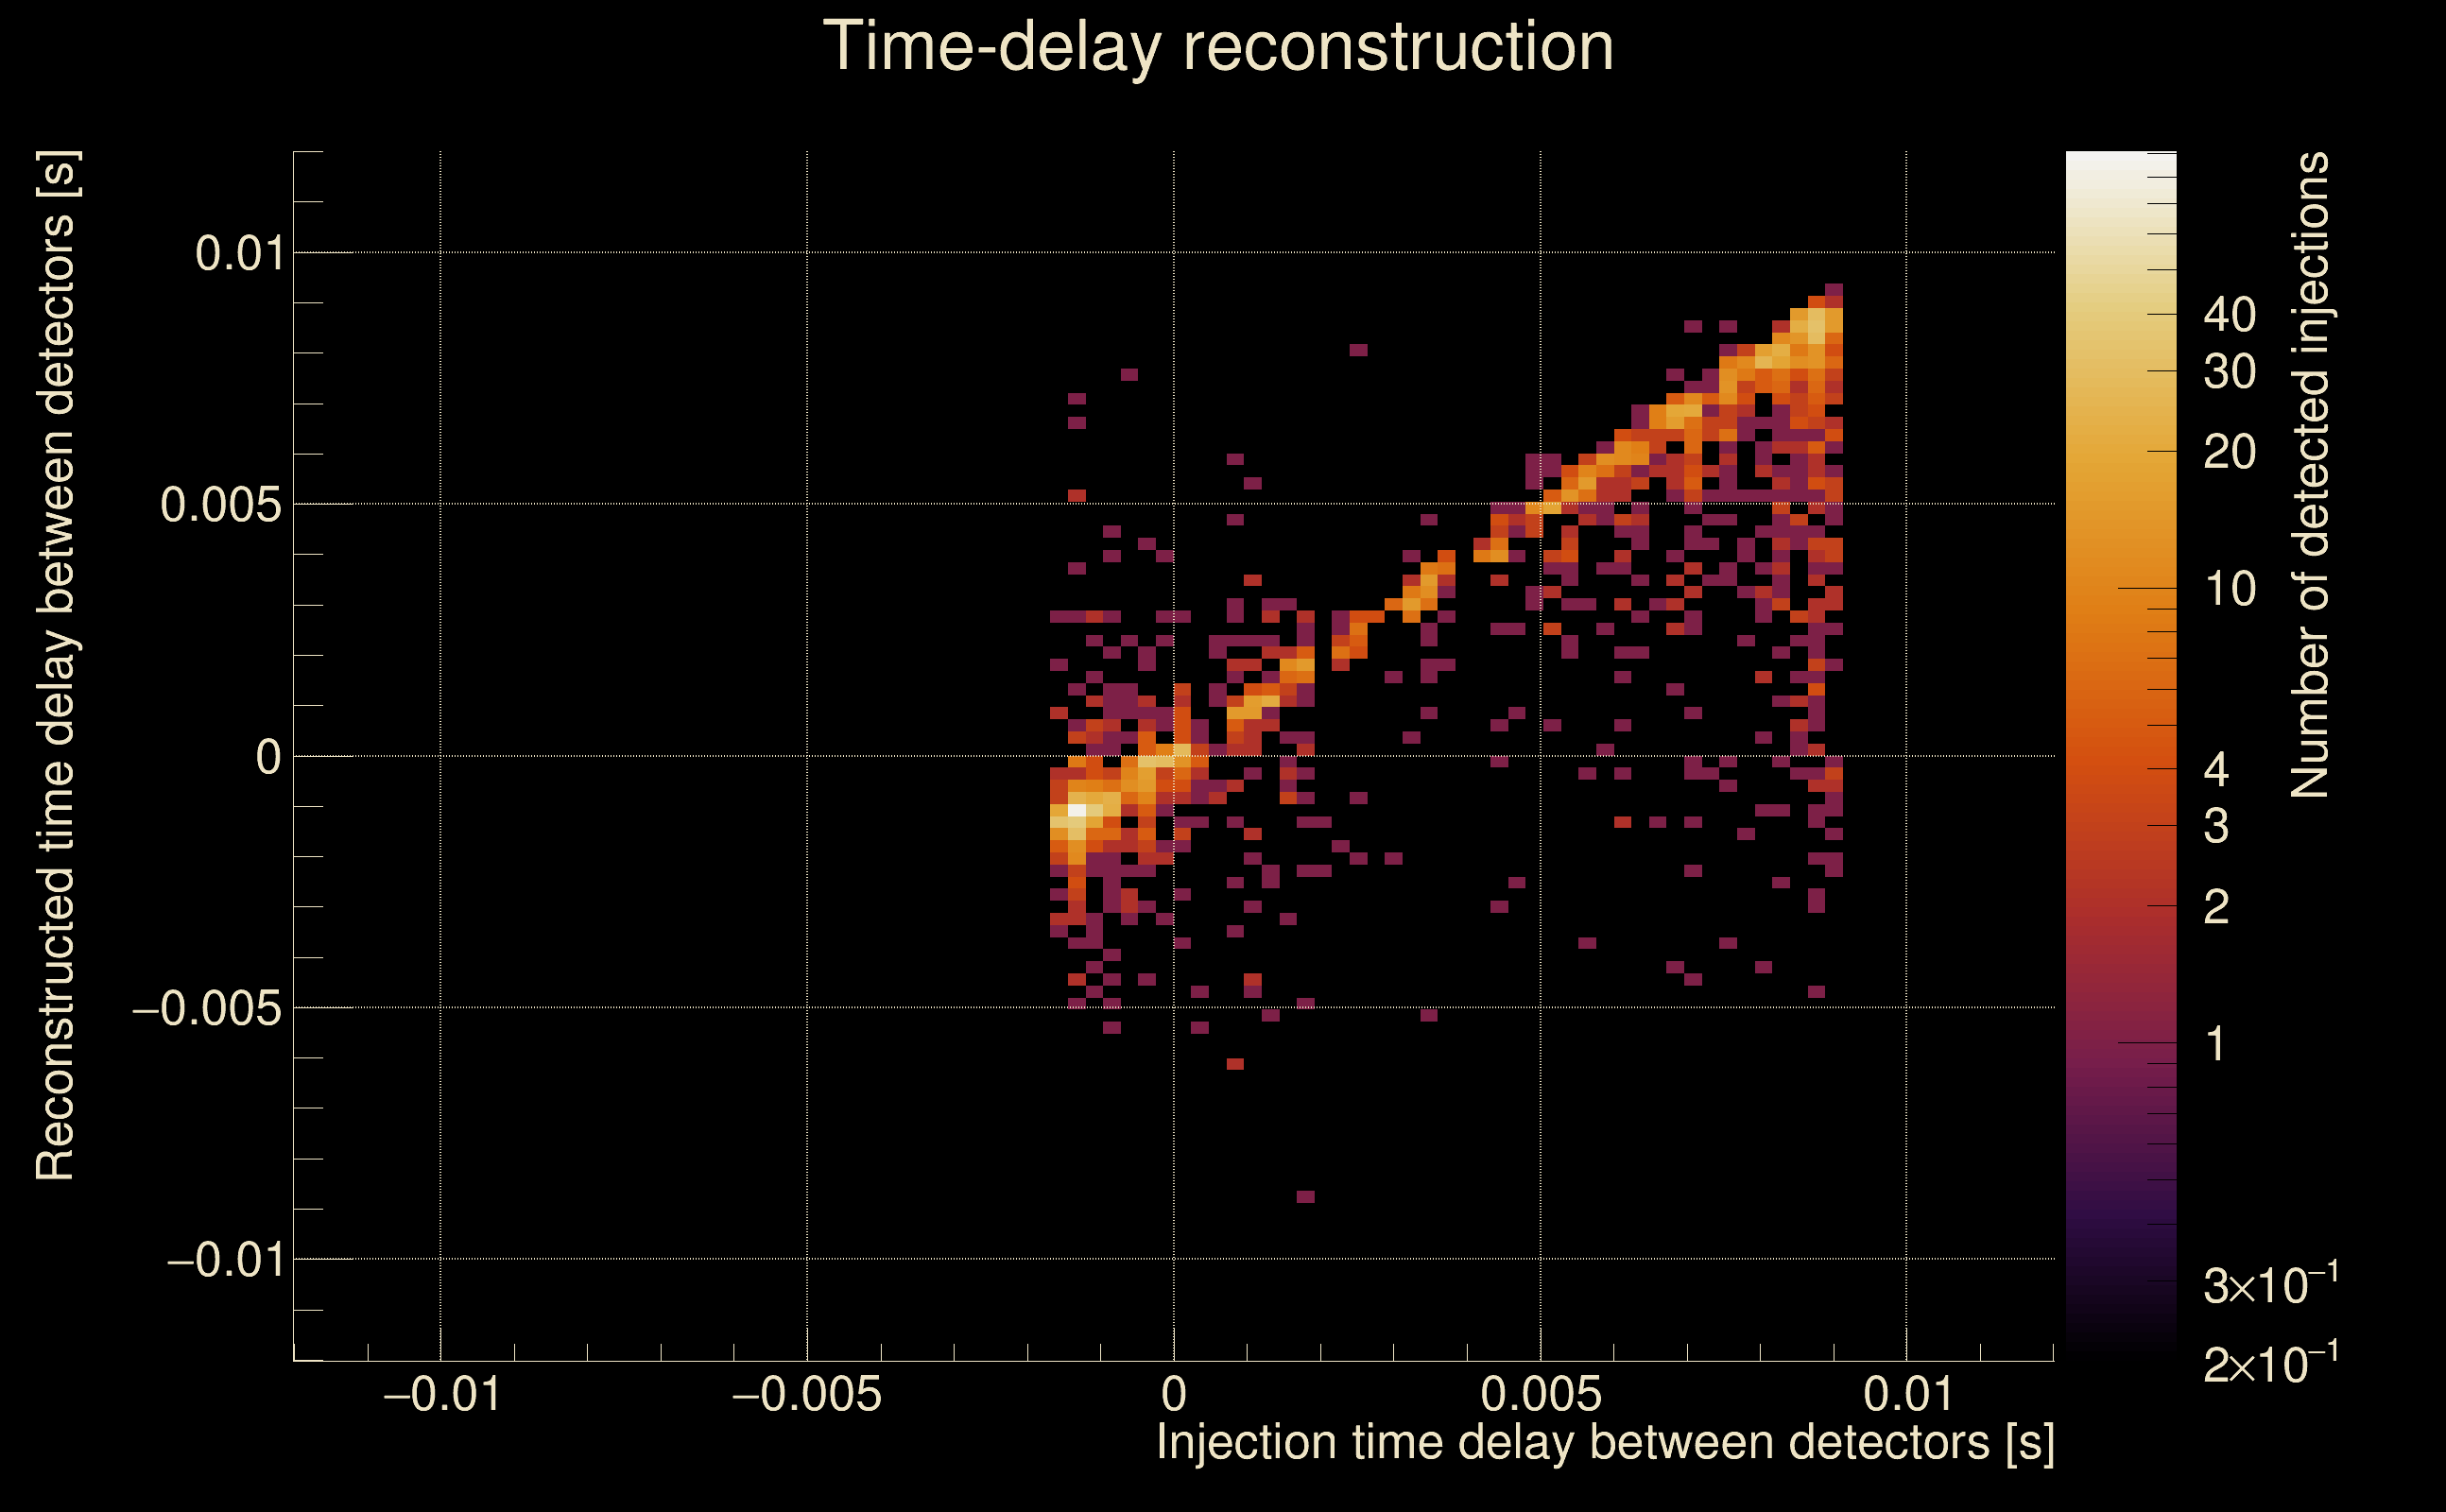
| Light travel time between detectors: | 0.0100128 s |
| Slice extra-time (calibration uncertainty + slice veto): | 0.0129872 s |
| Number of time-delay bins in a cross-correlation map: | 10000 |
| Number of slices in a cross-correlation map: | 217 |
| Number of time-delay bins in a slice: | 46 |
| SNR gating: | < 100 (detector 0), < 100 (detector 1) |
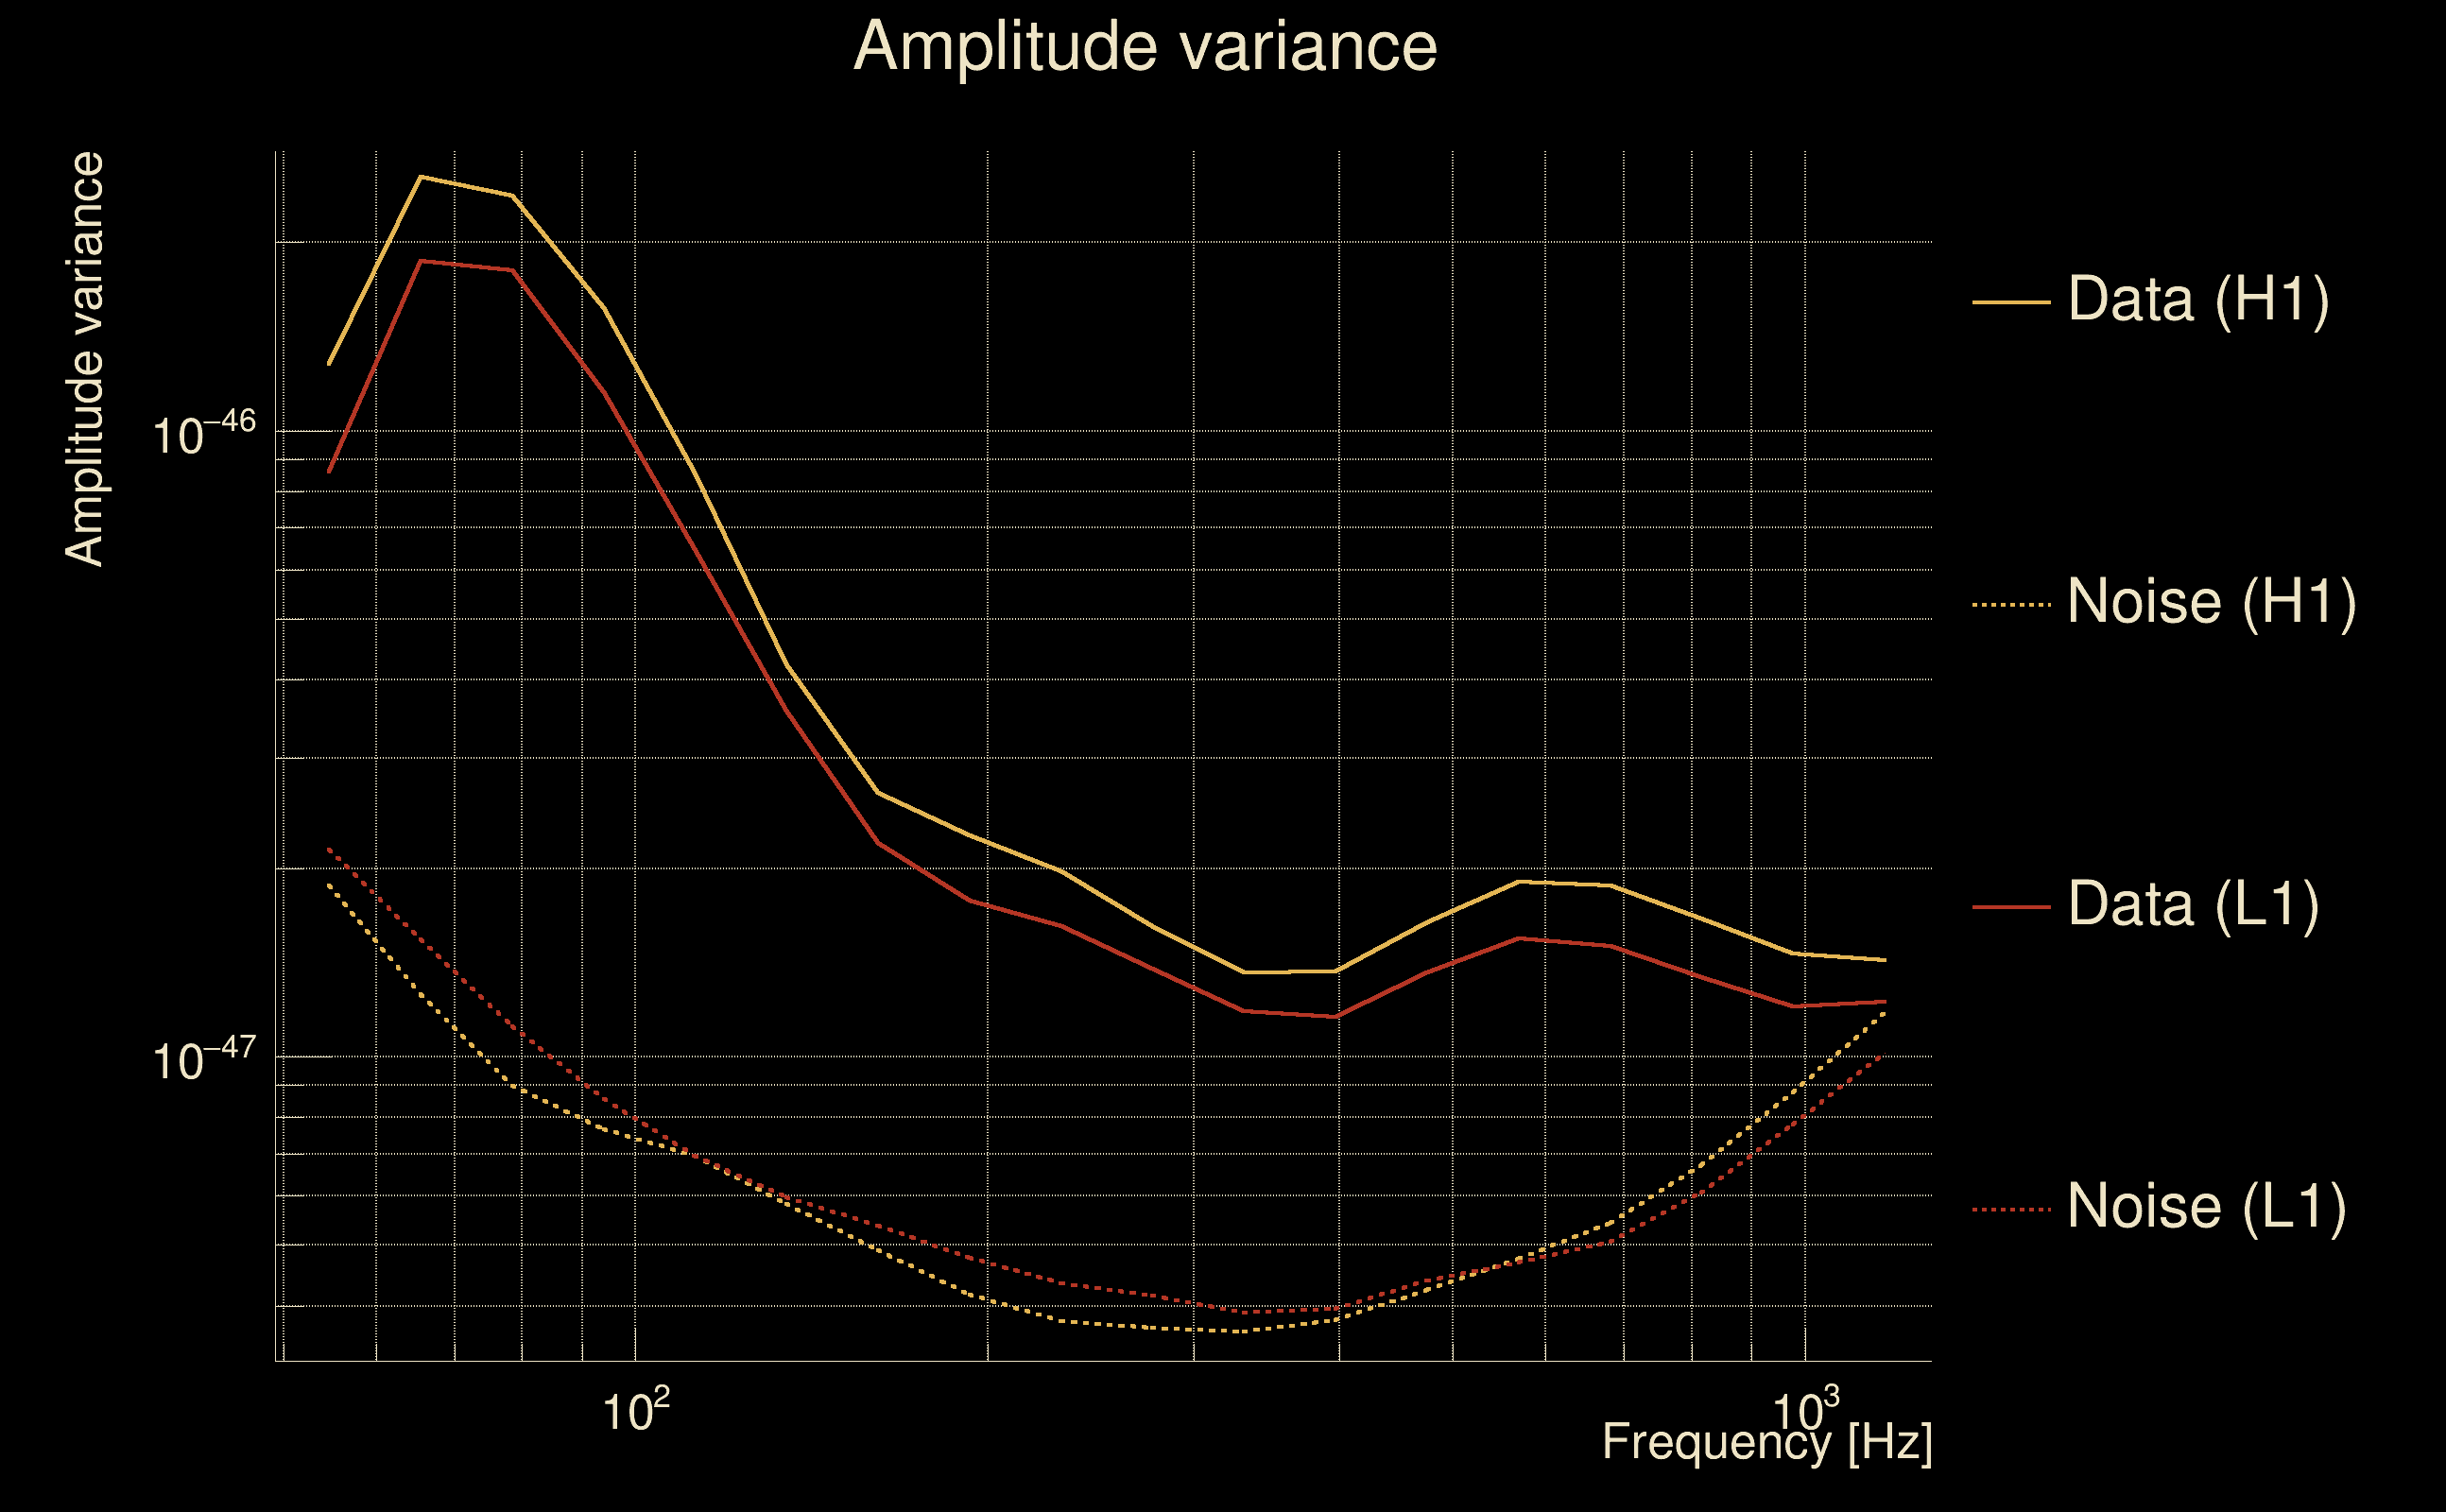
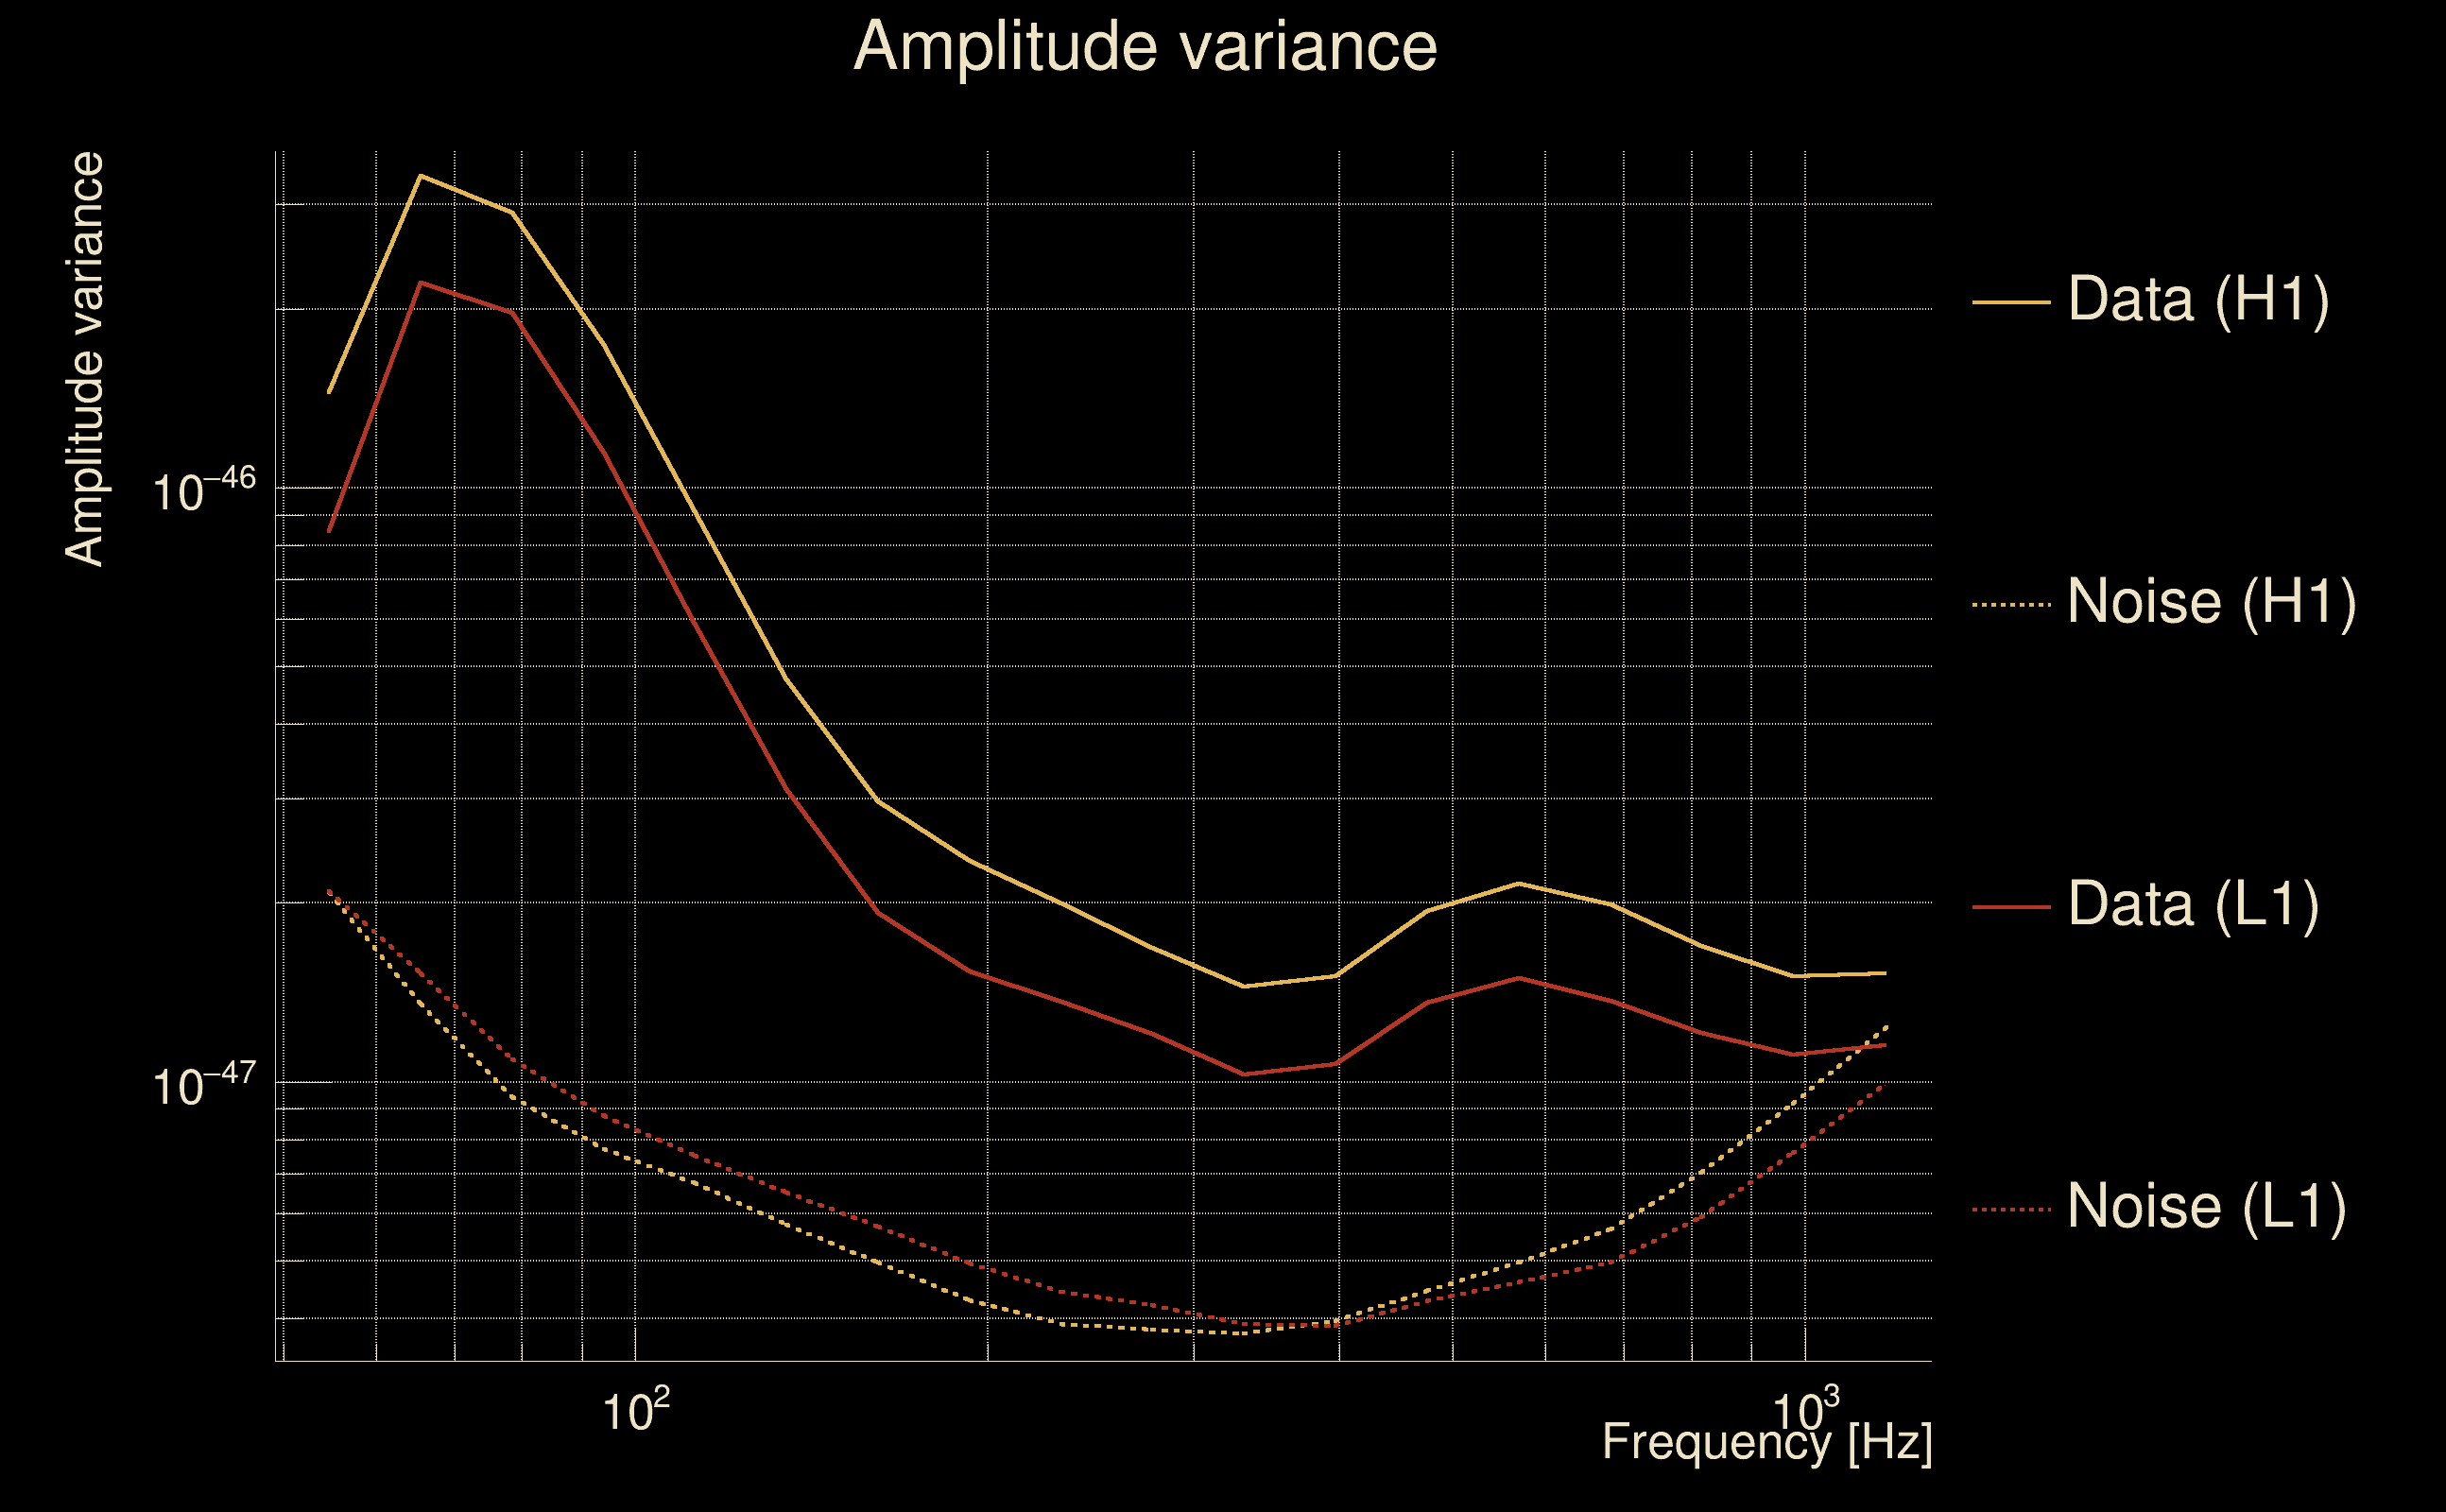
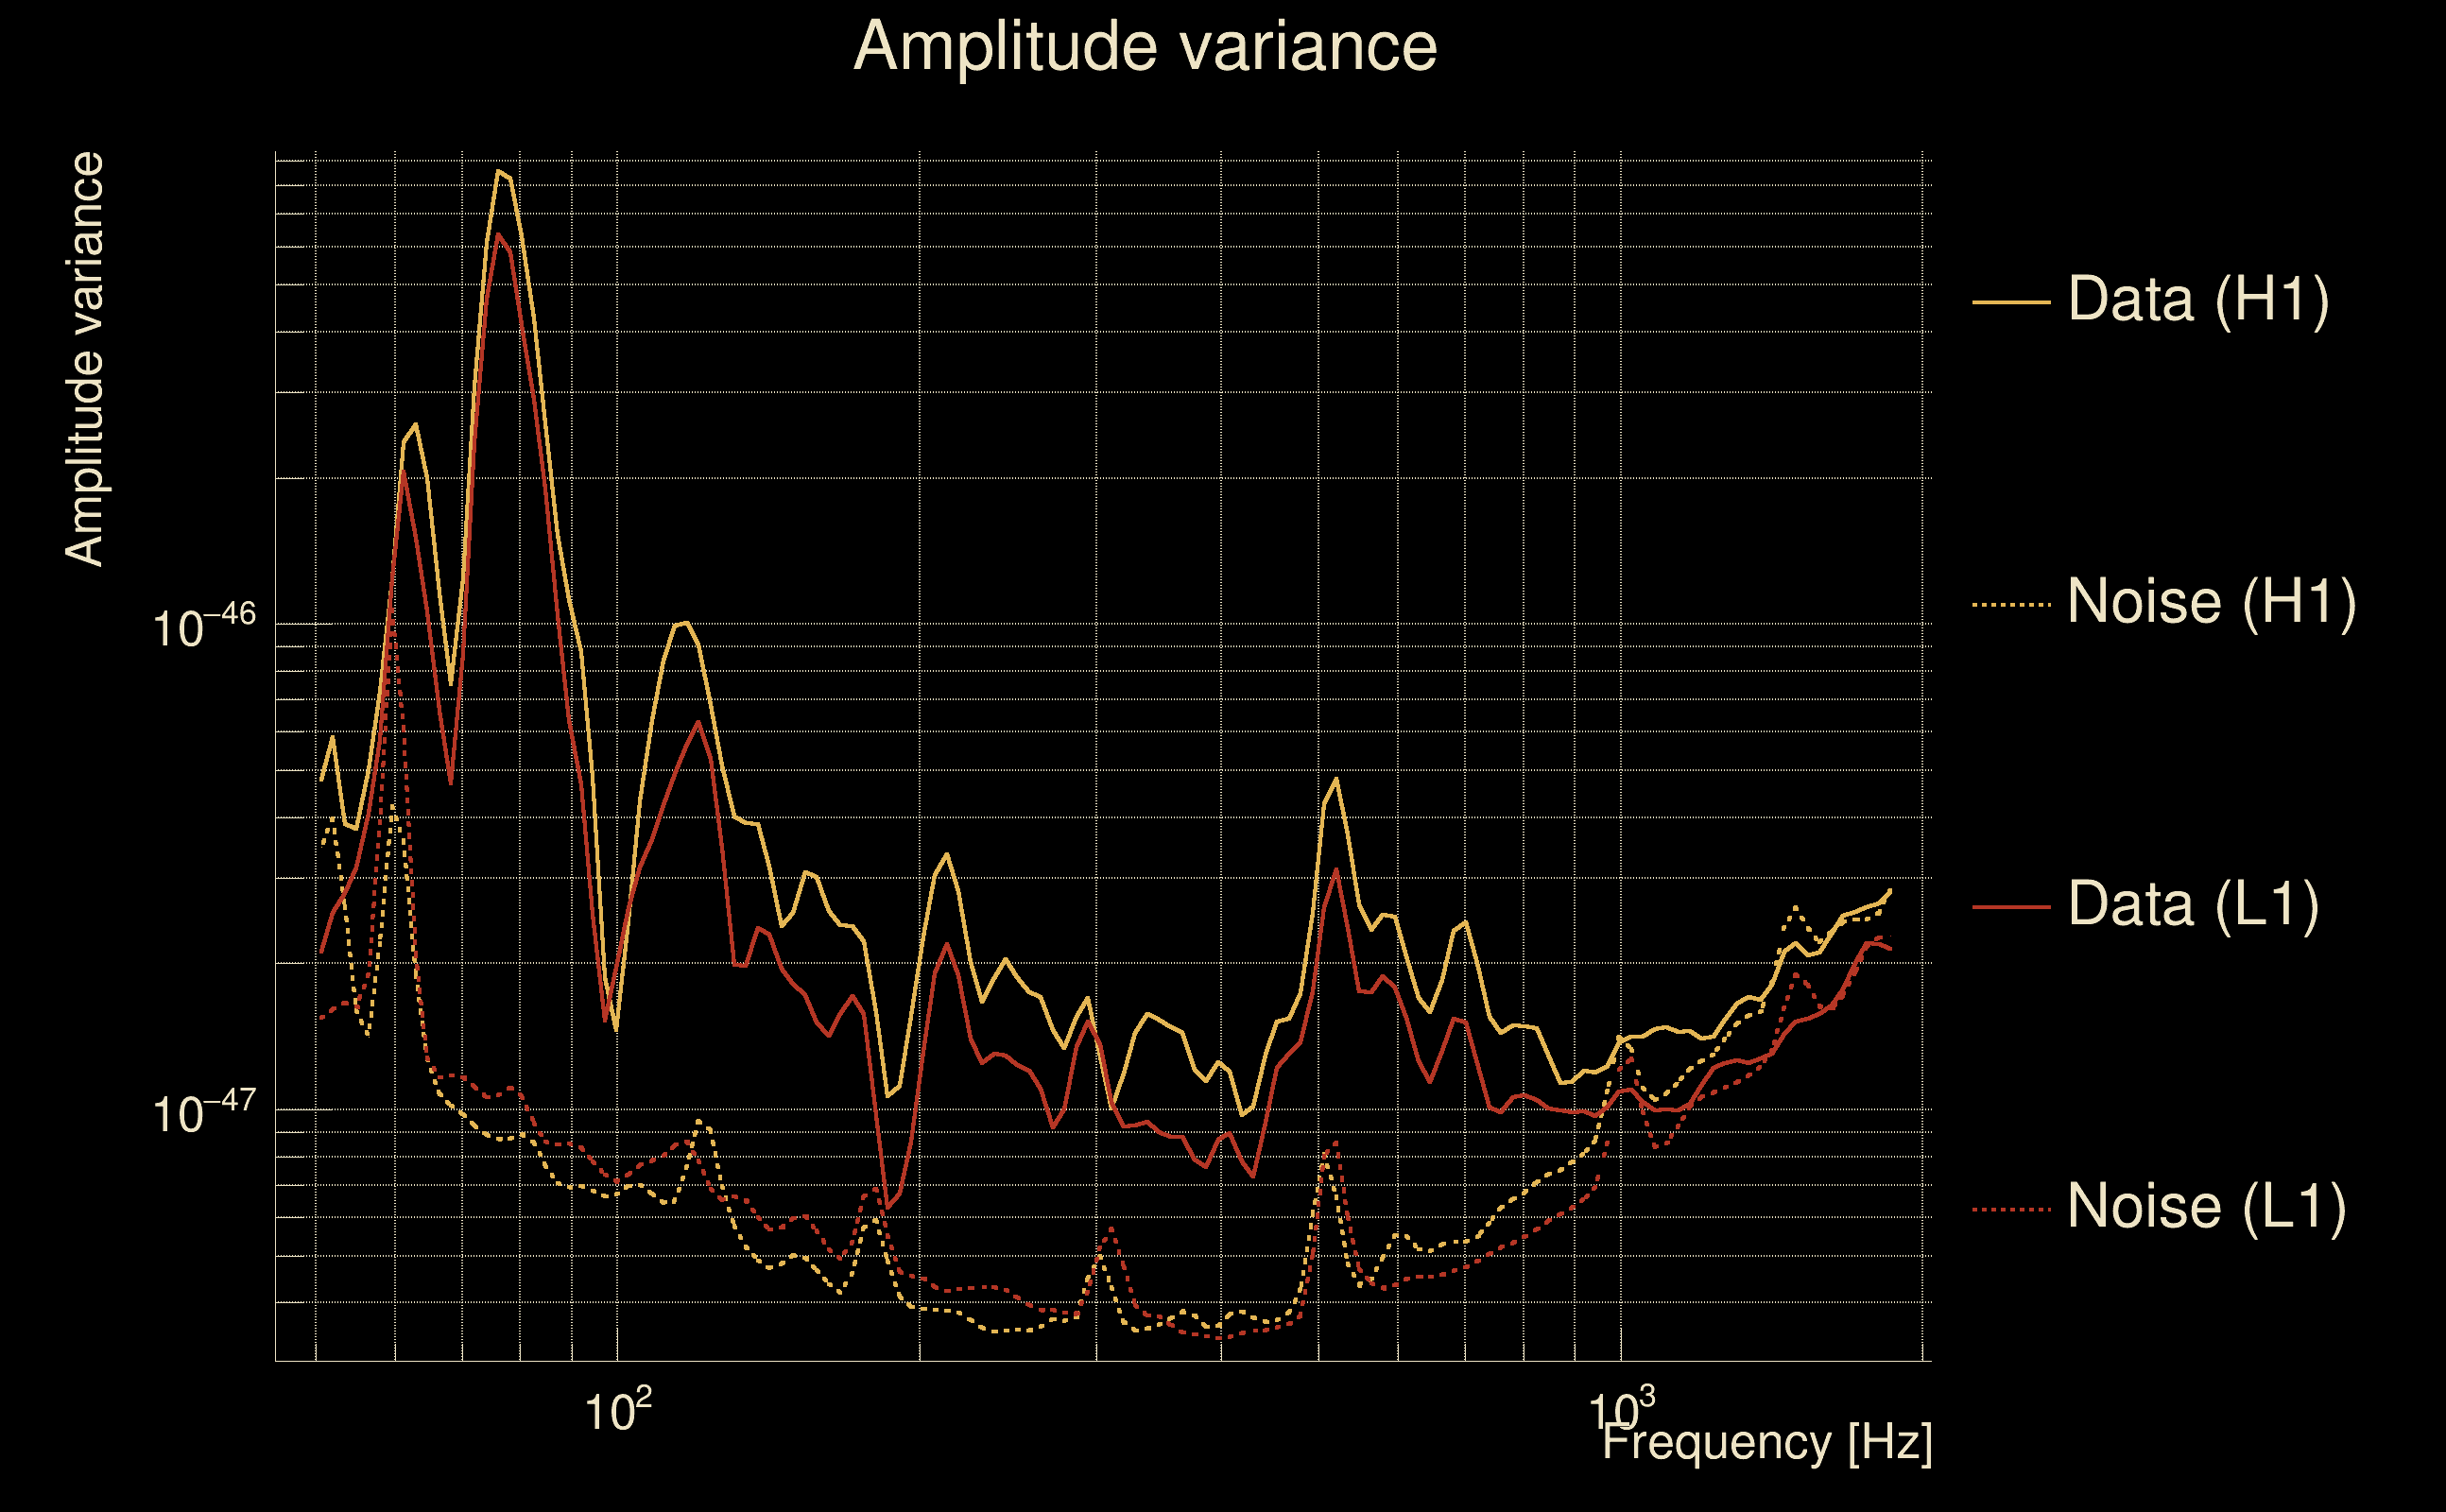
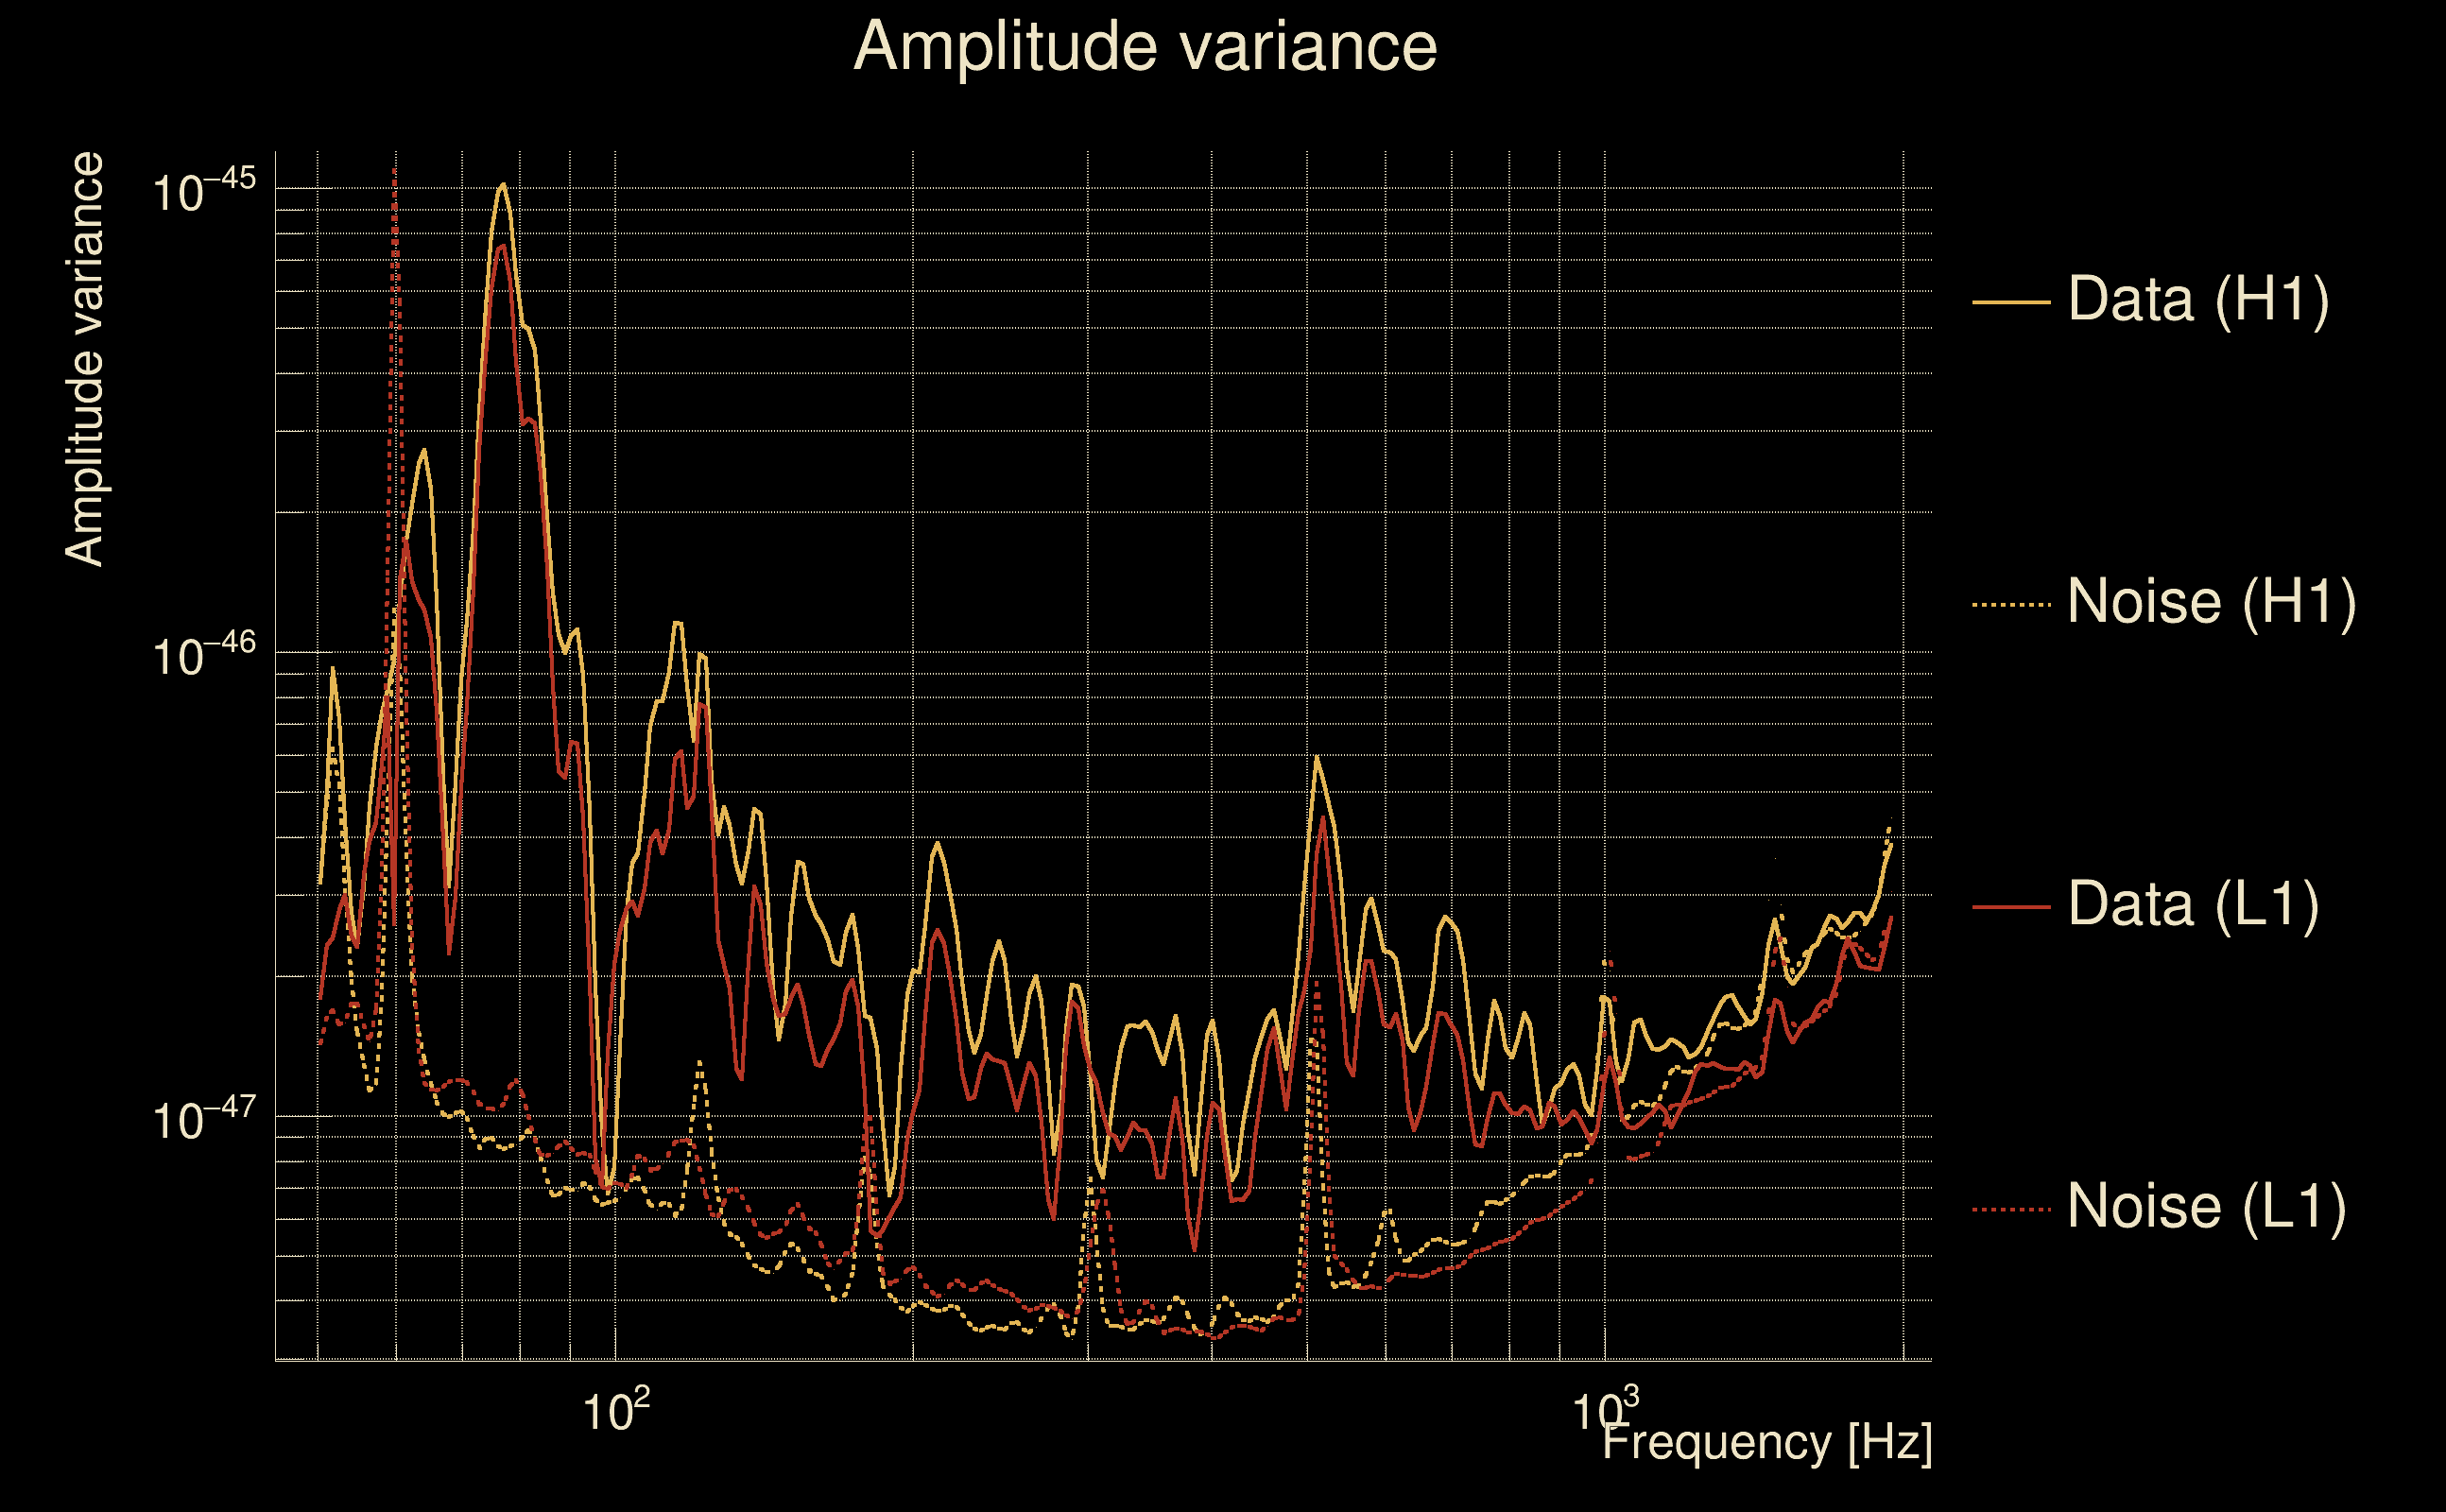
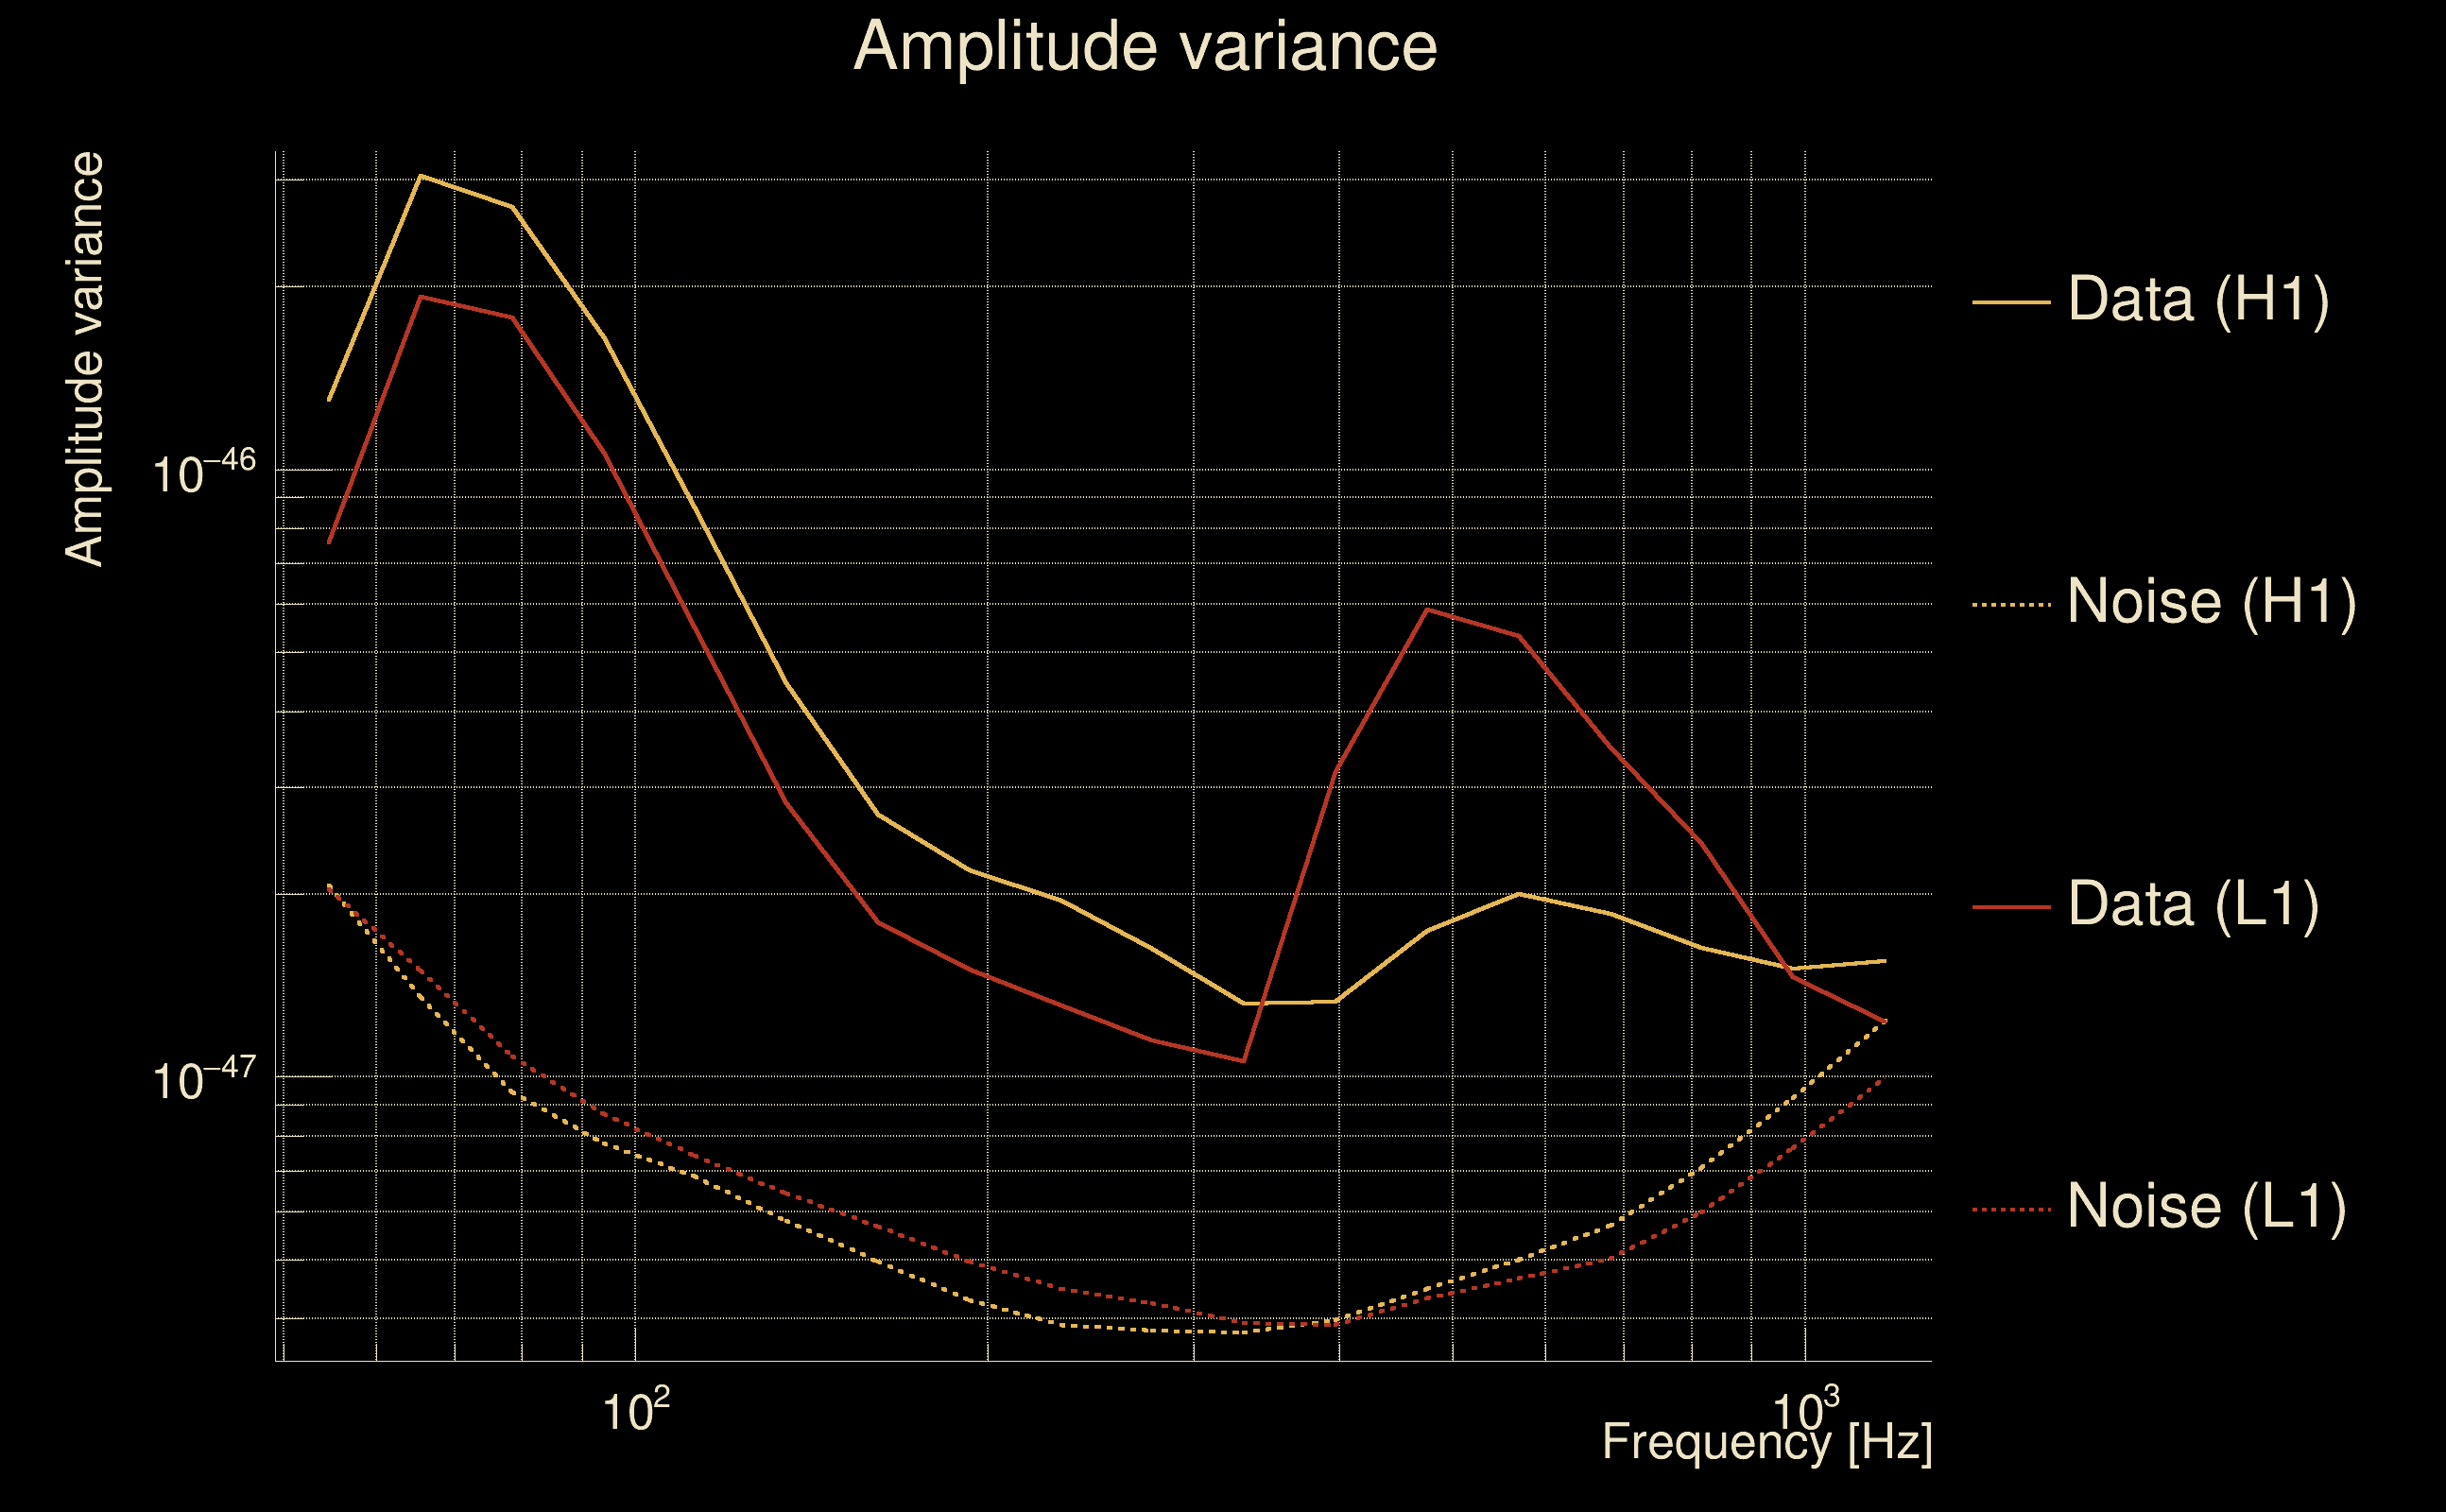
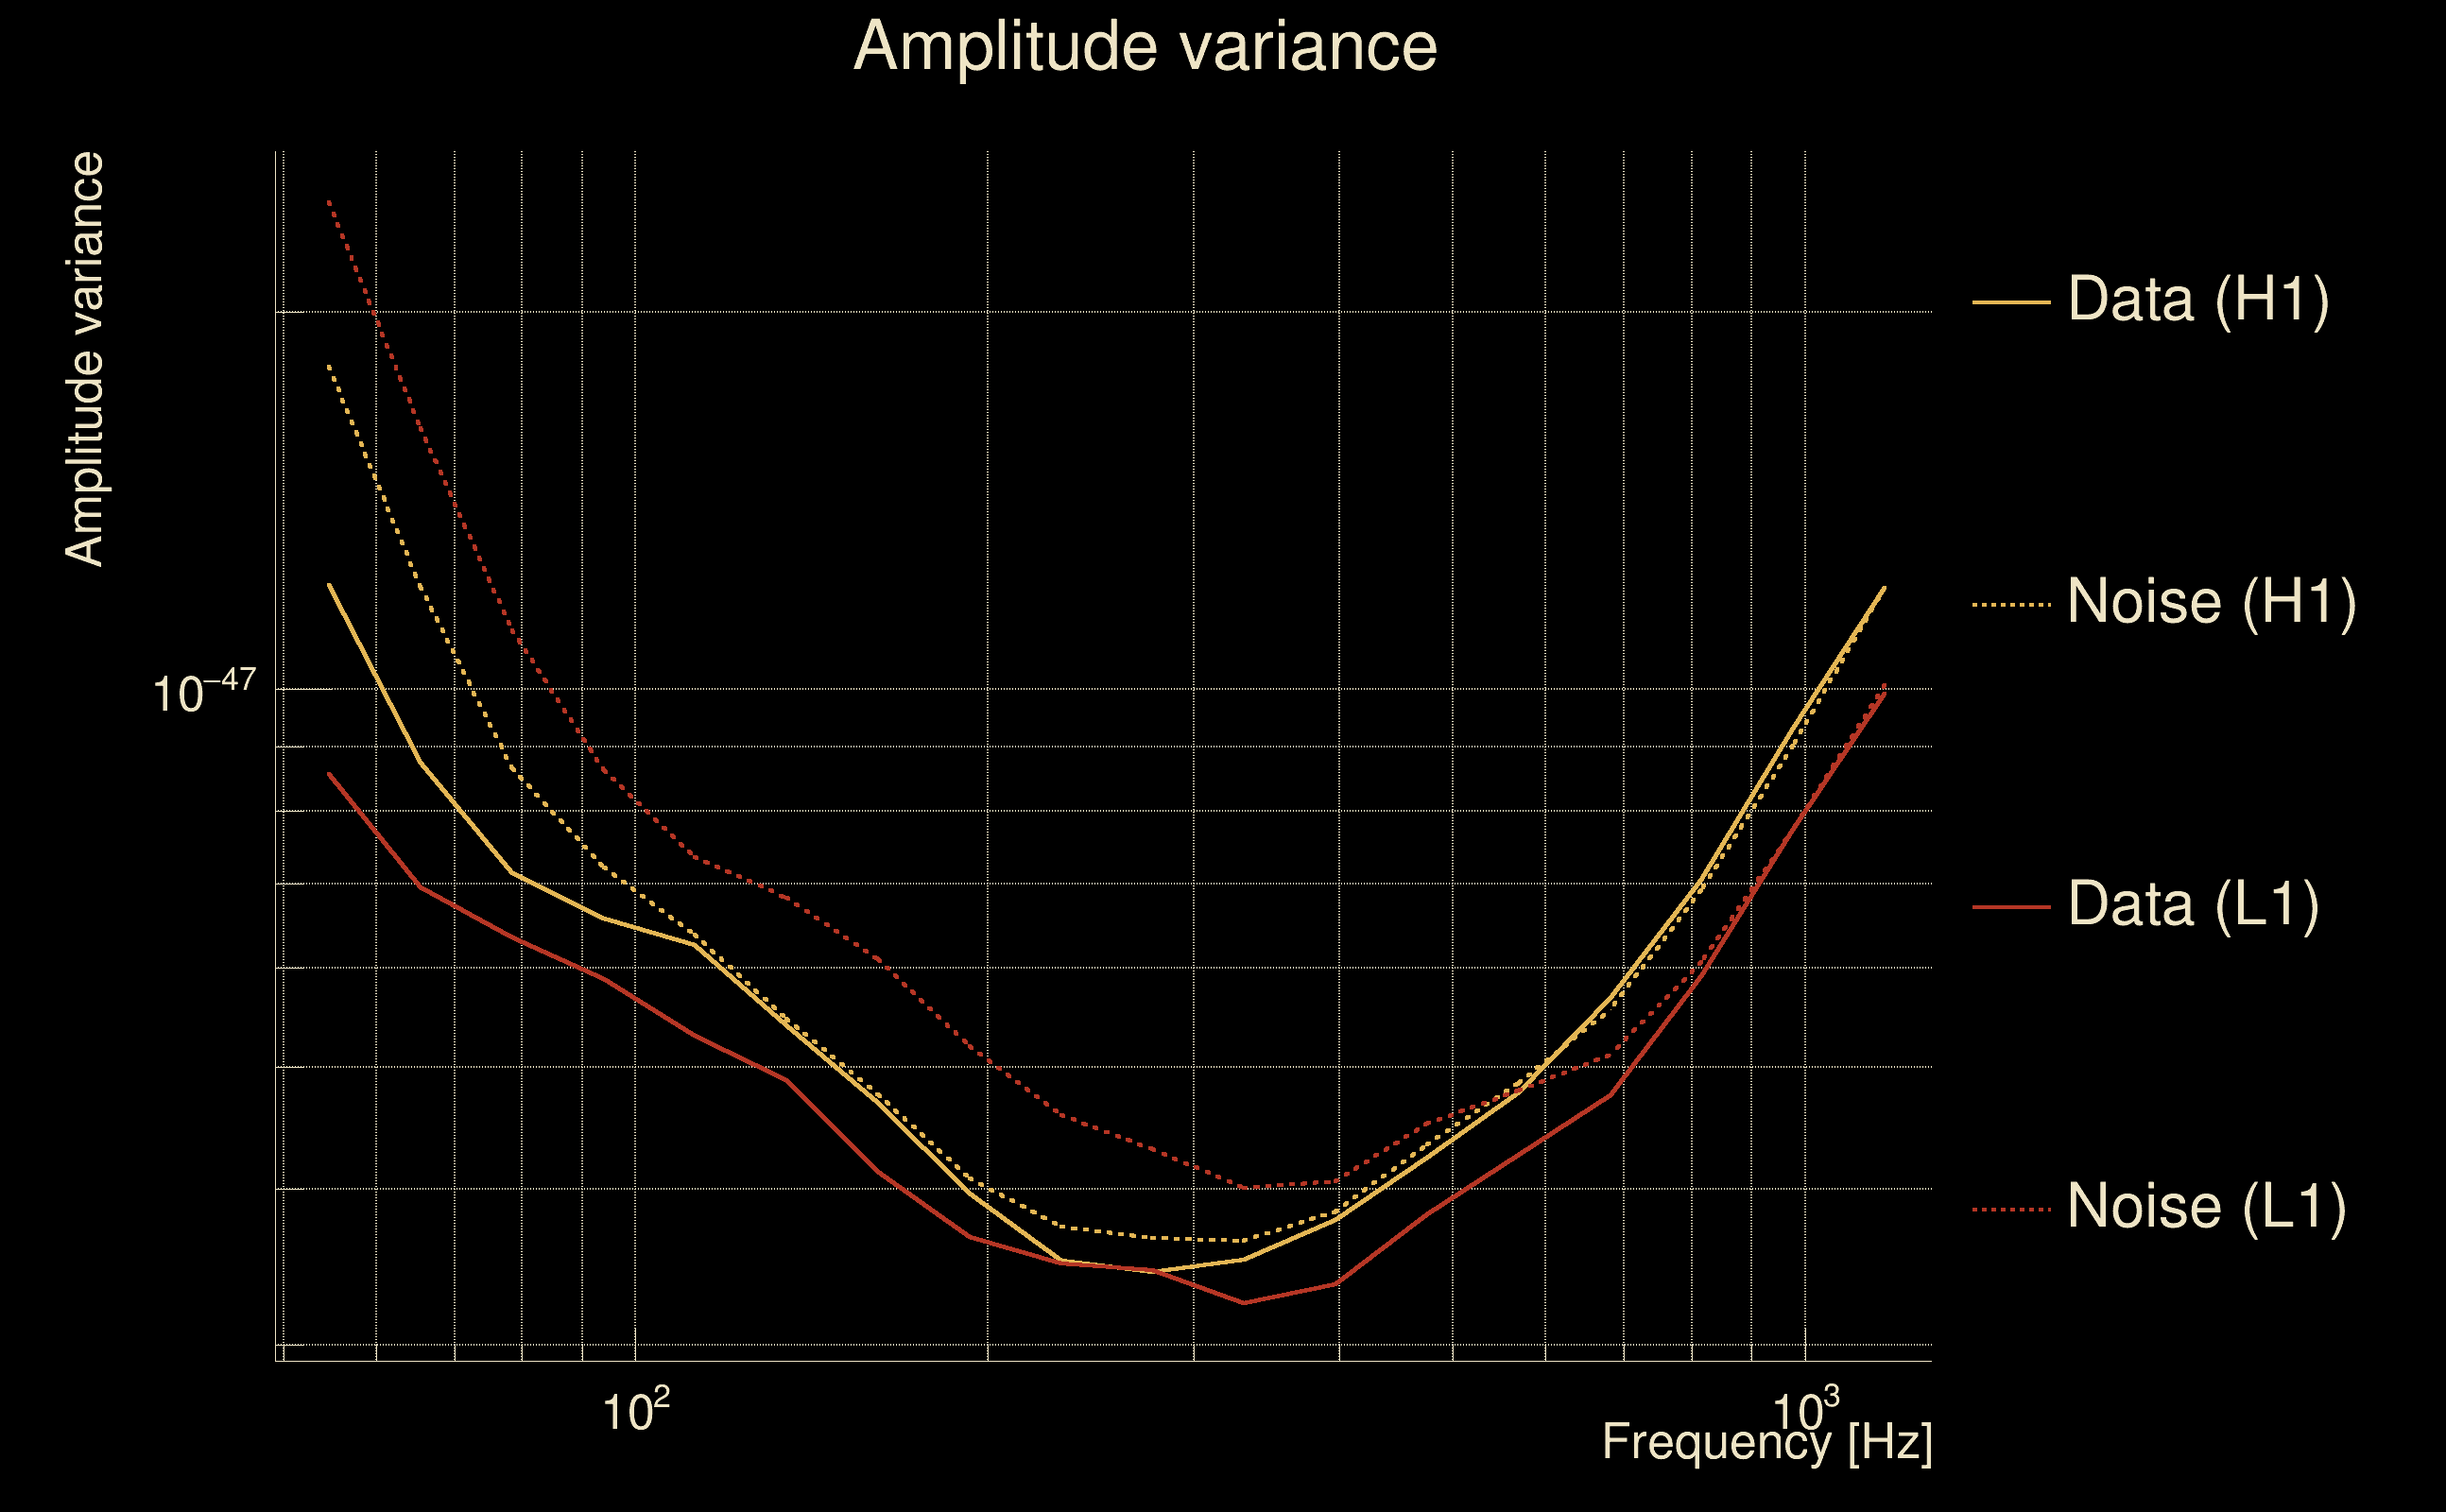
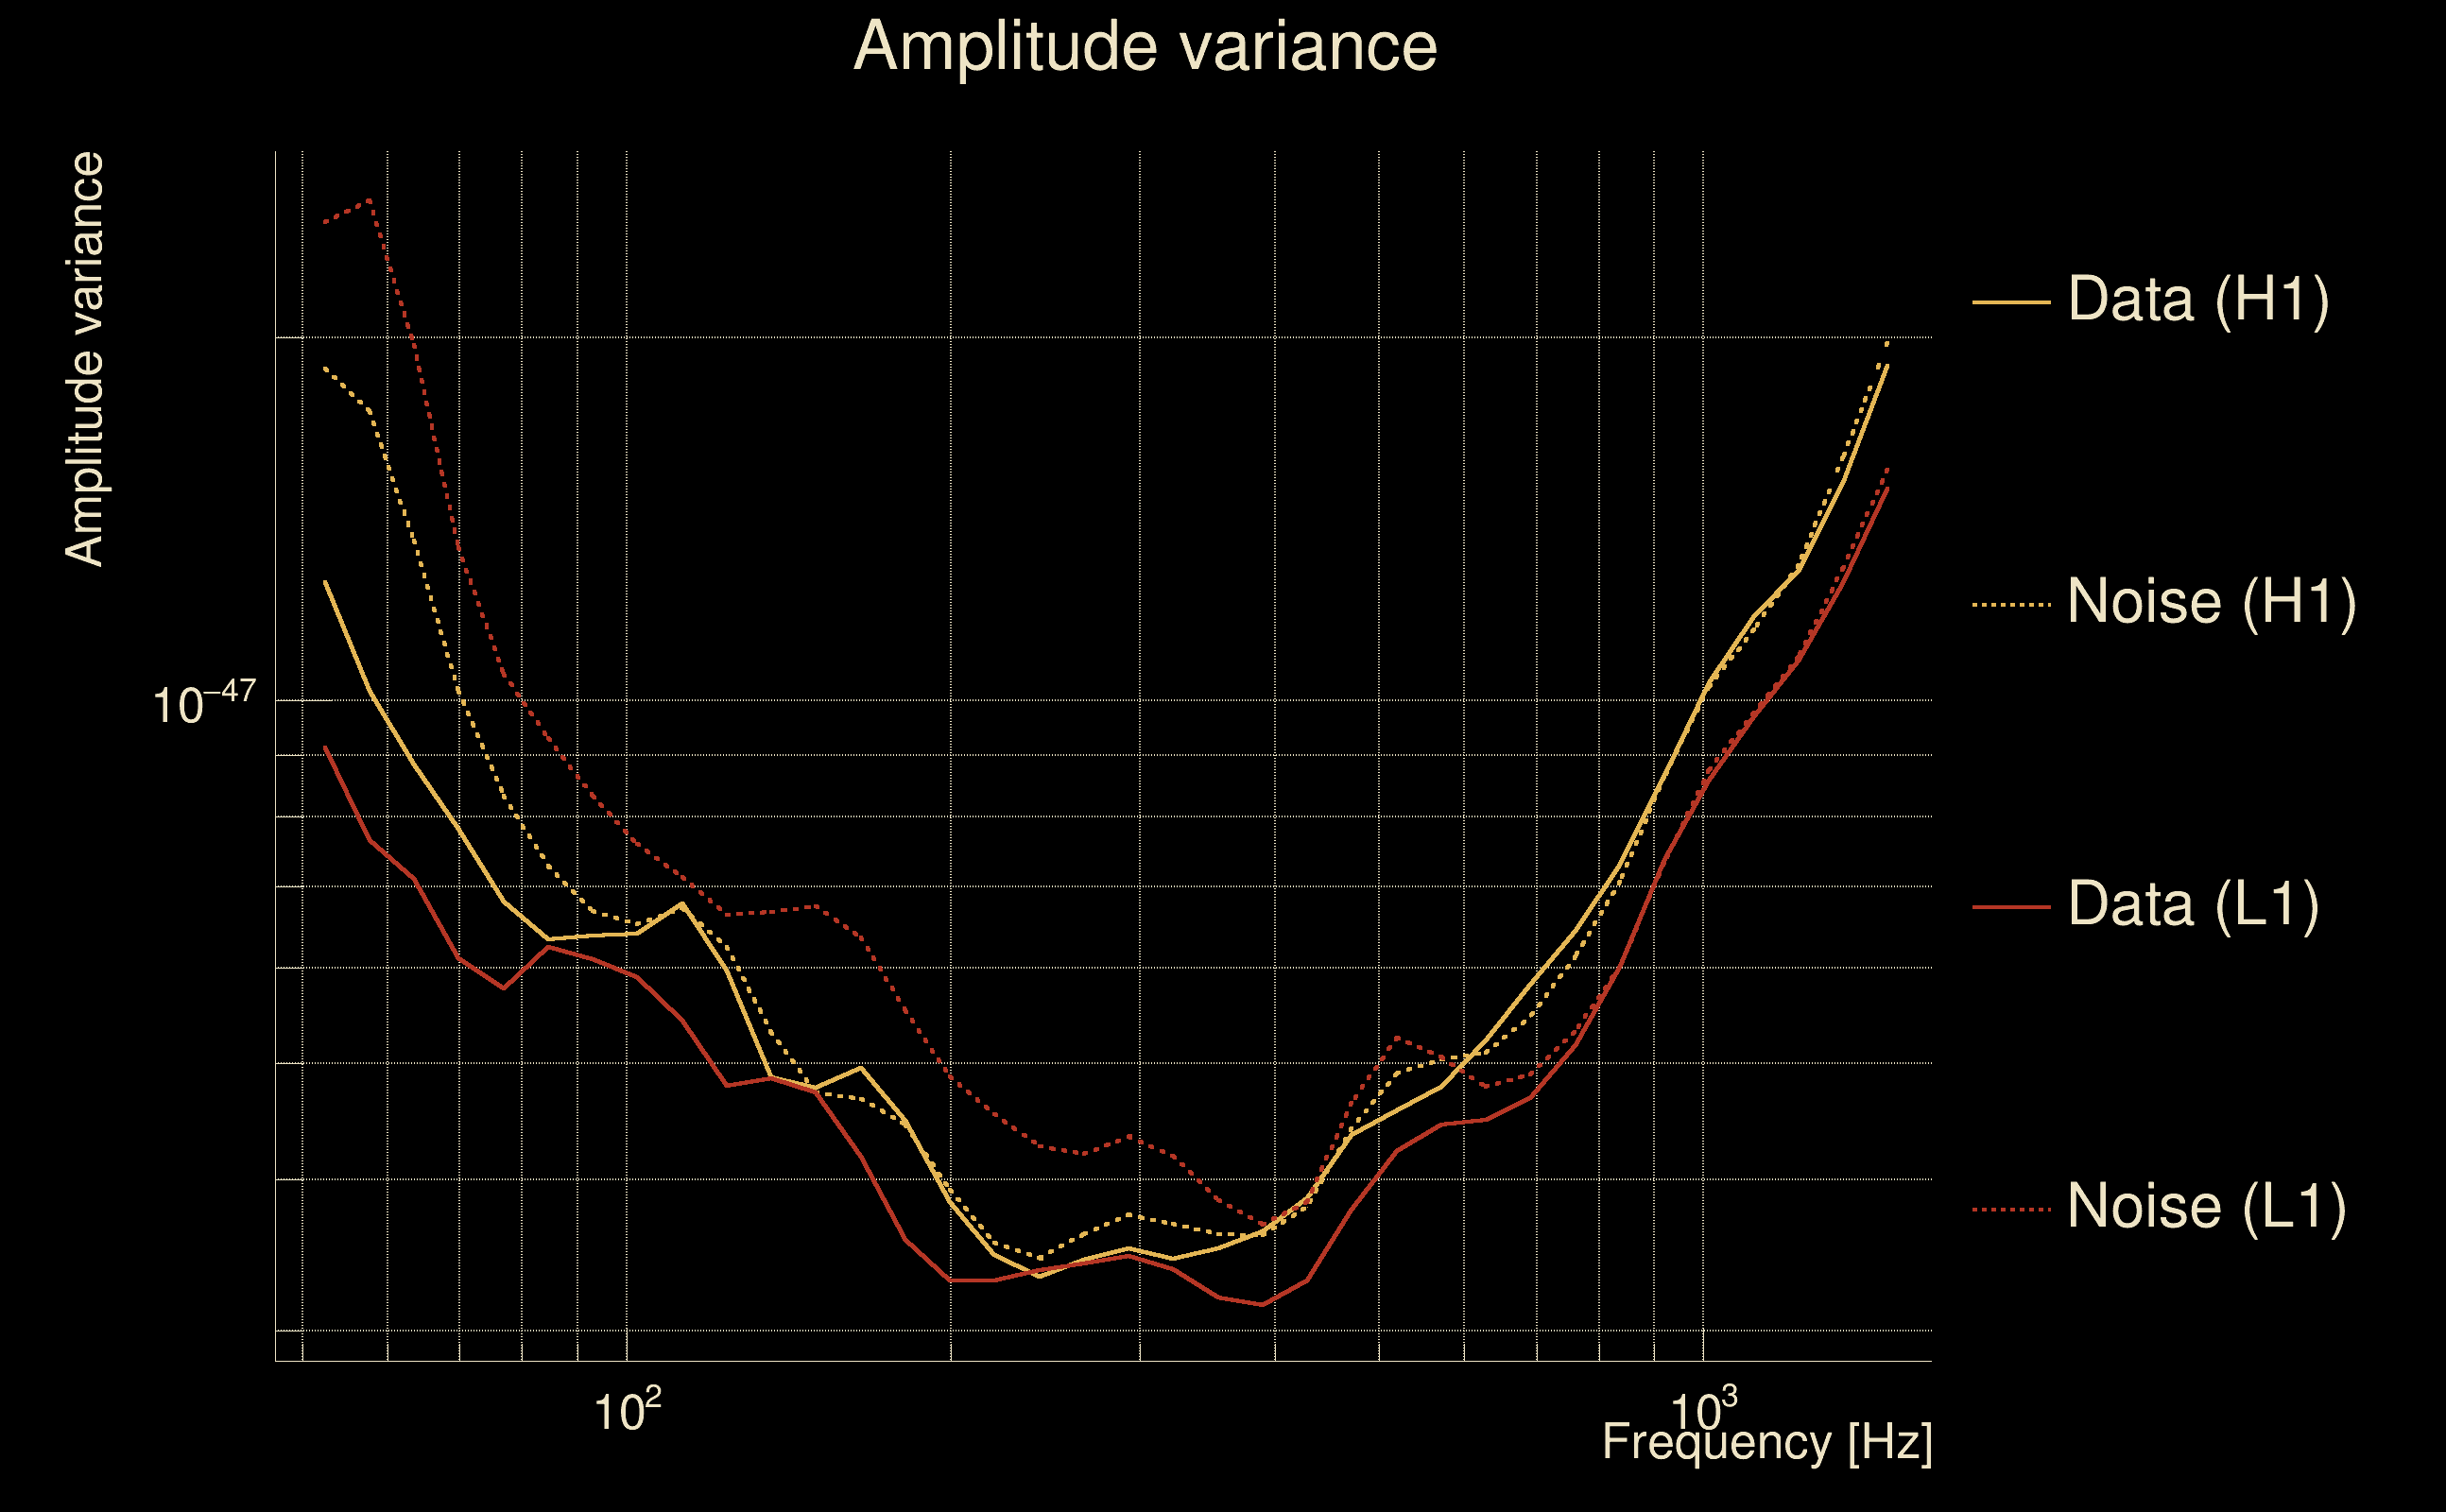
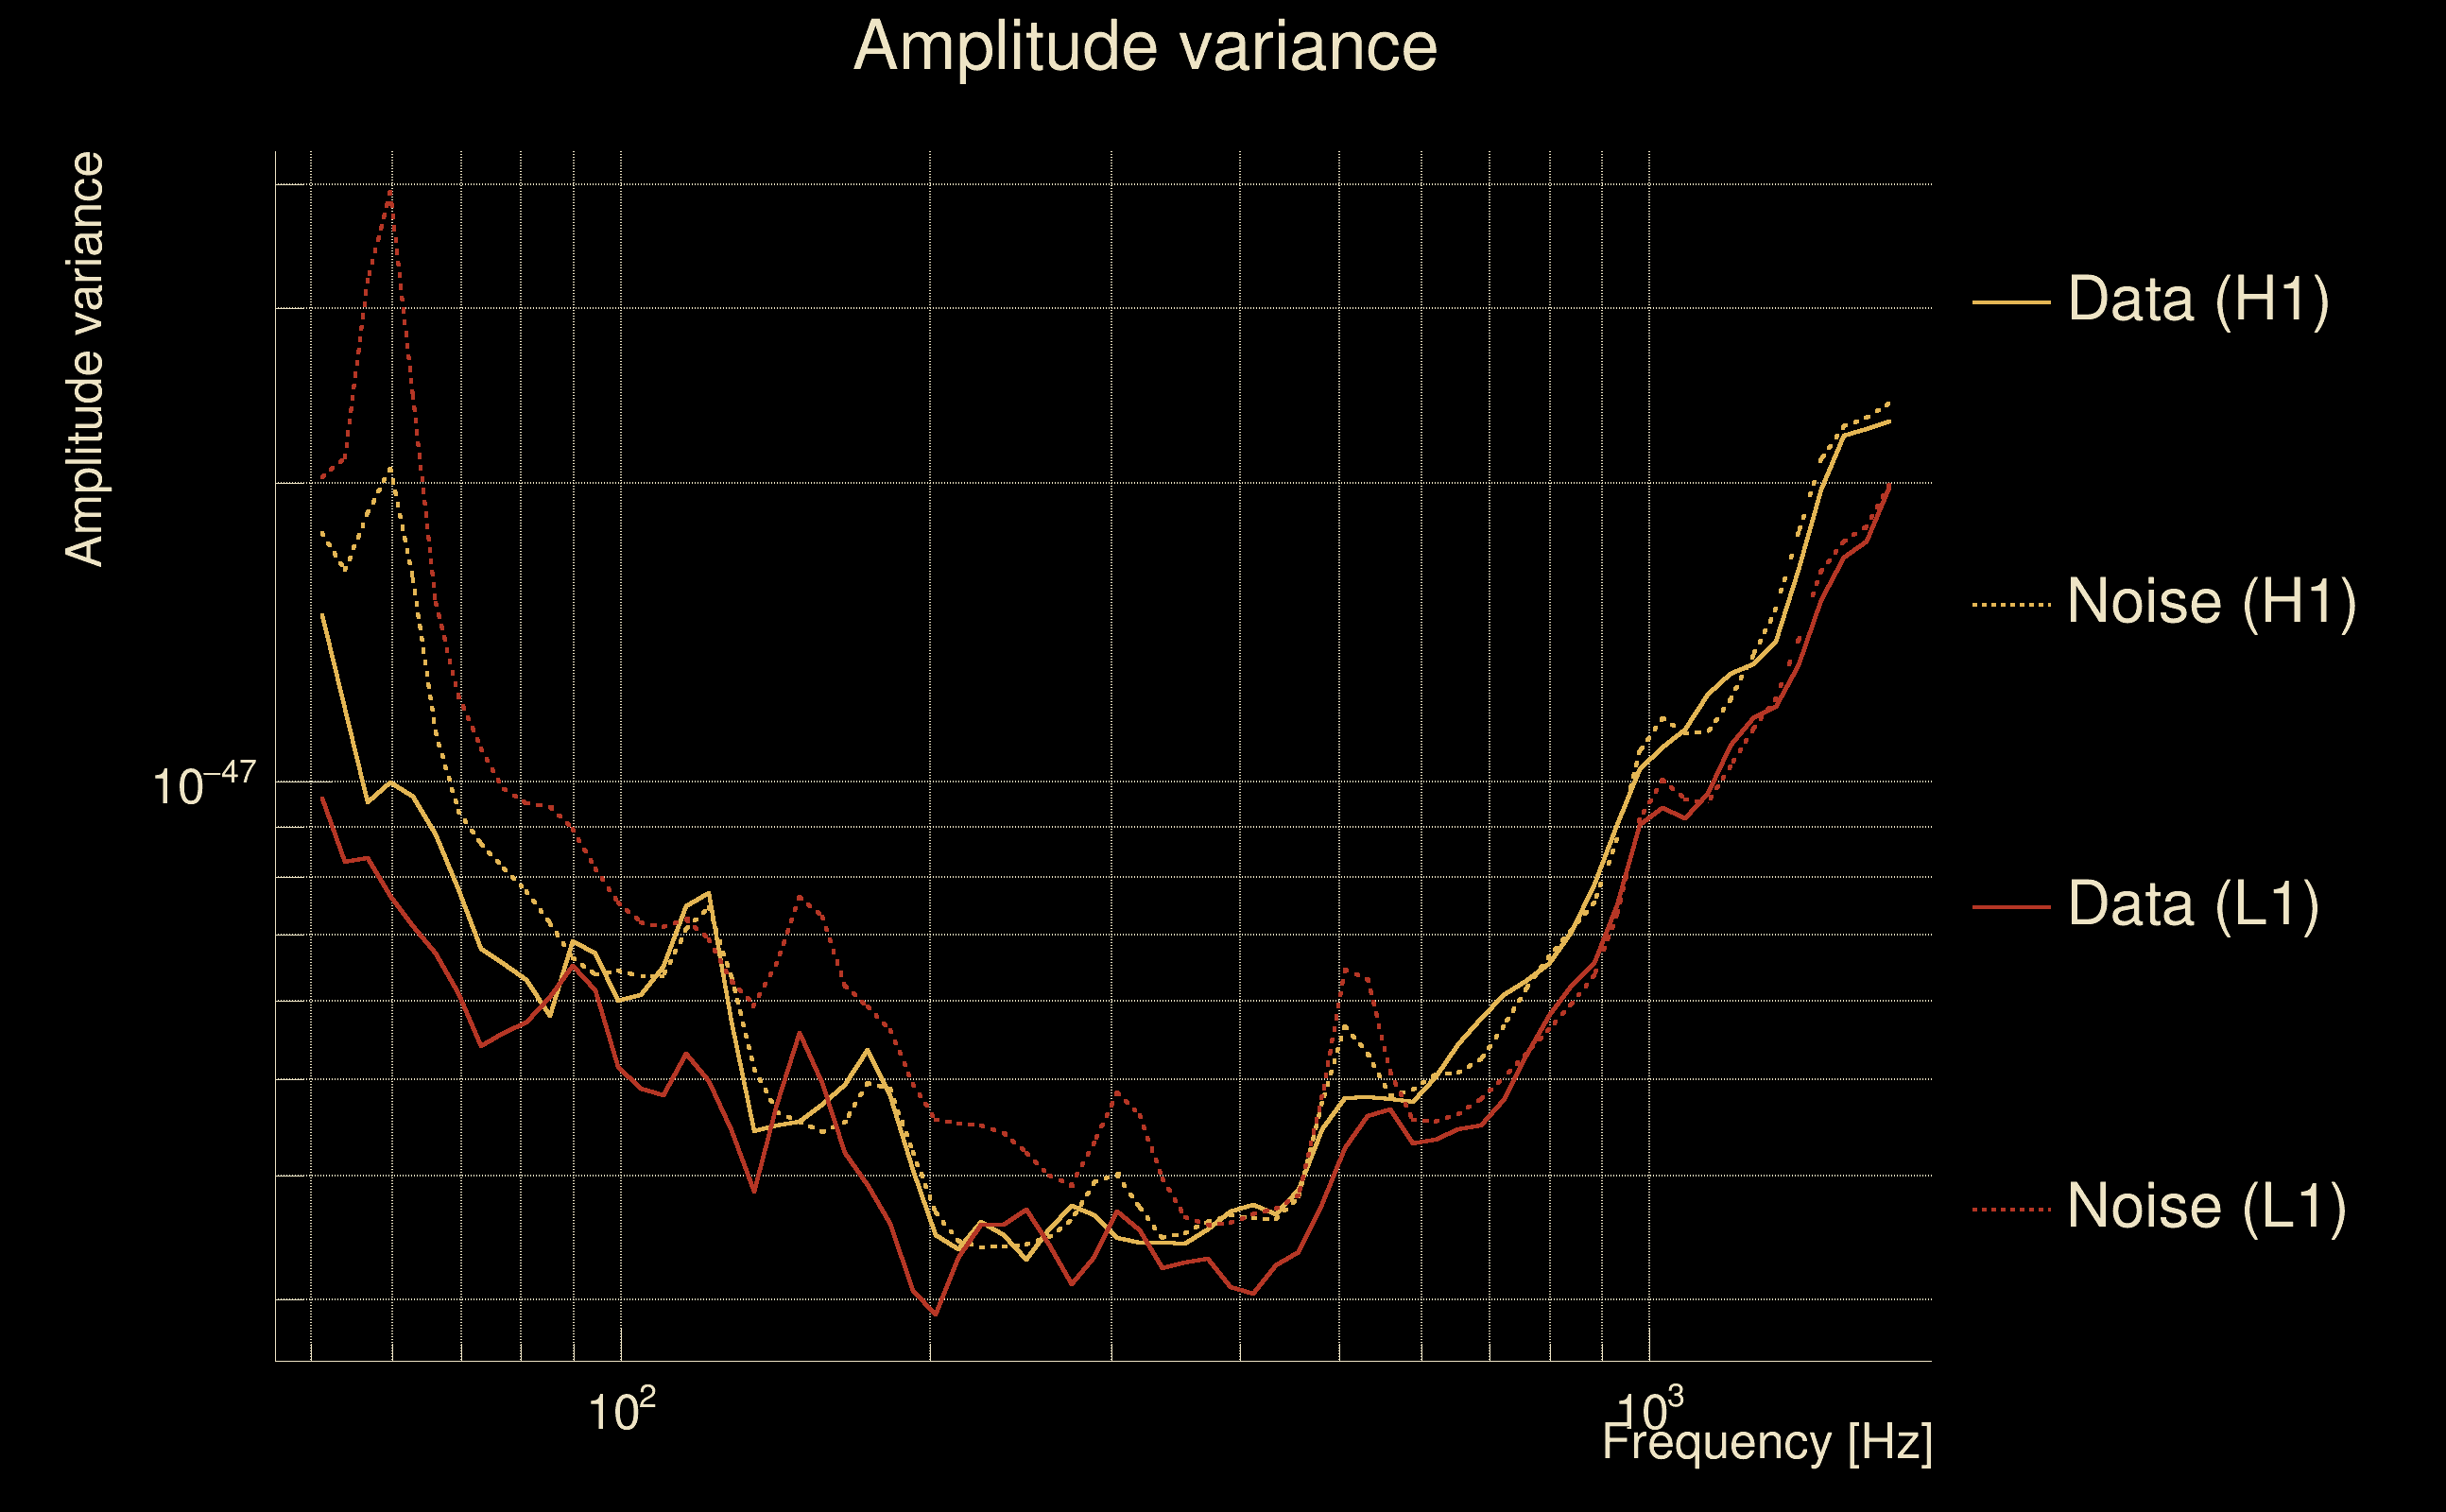
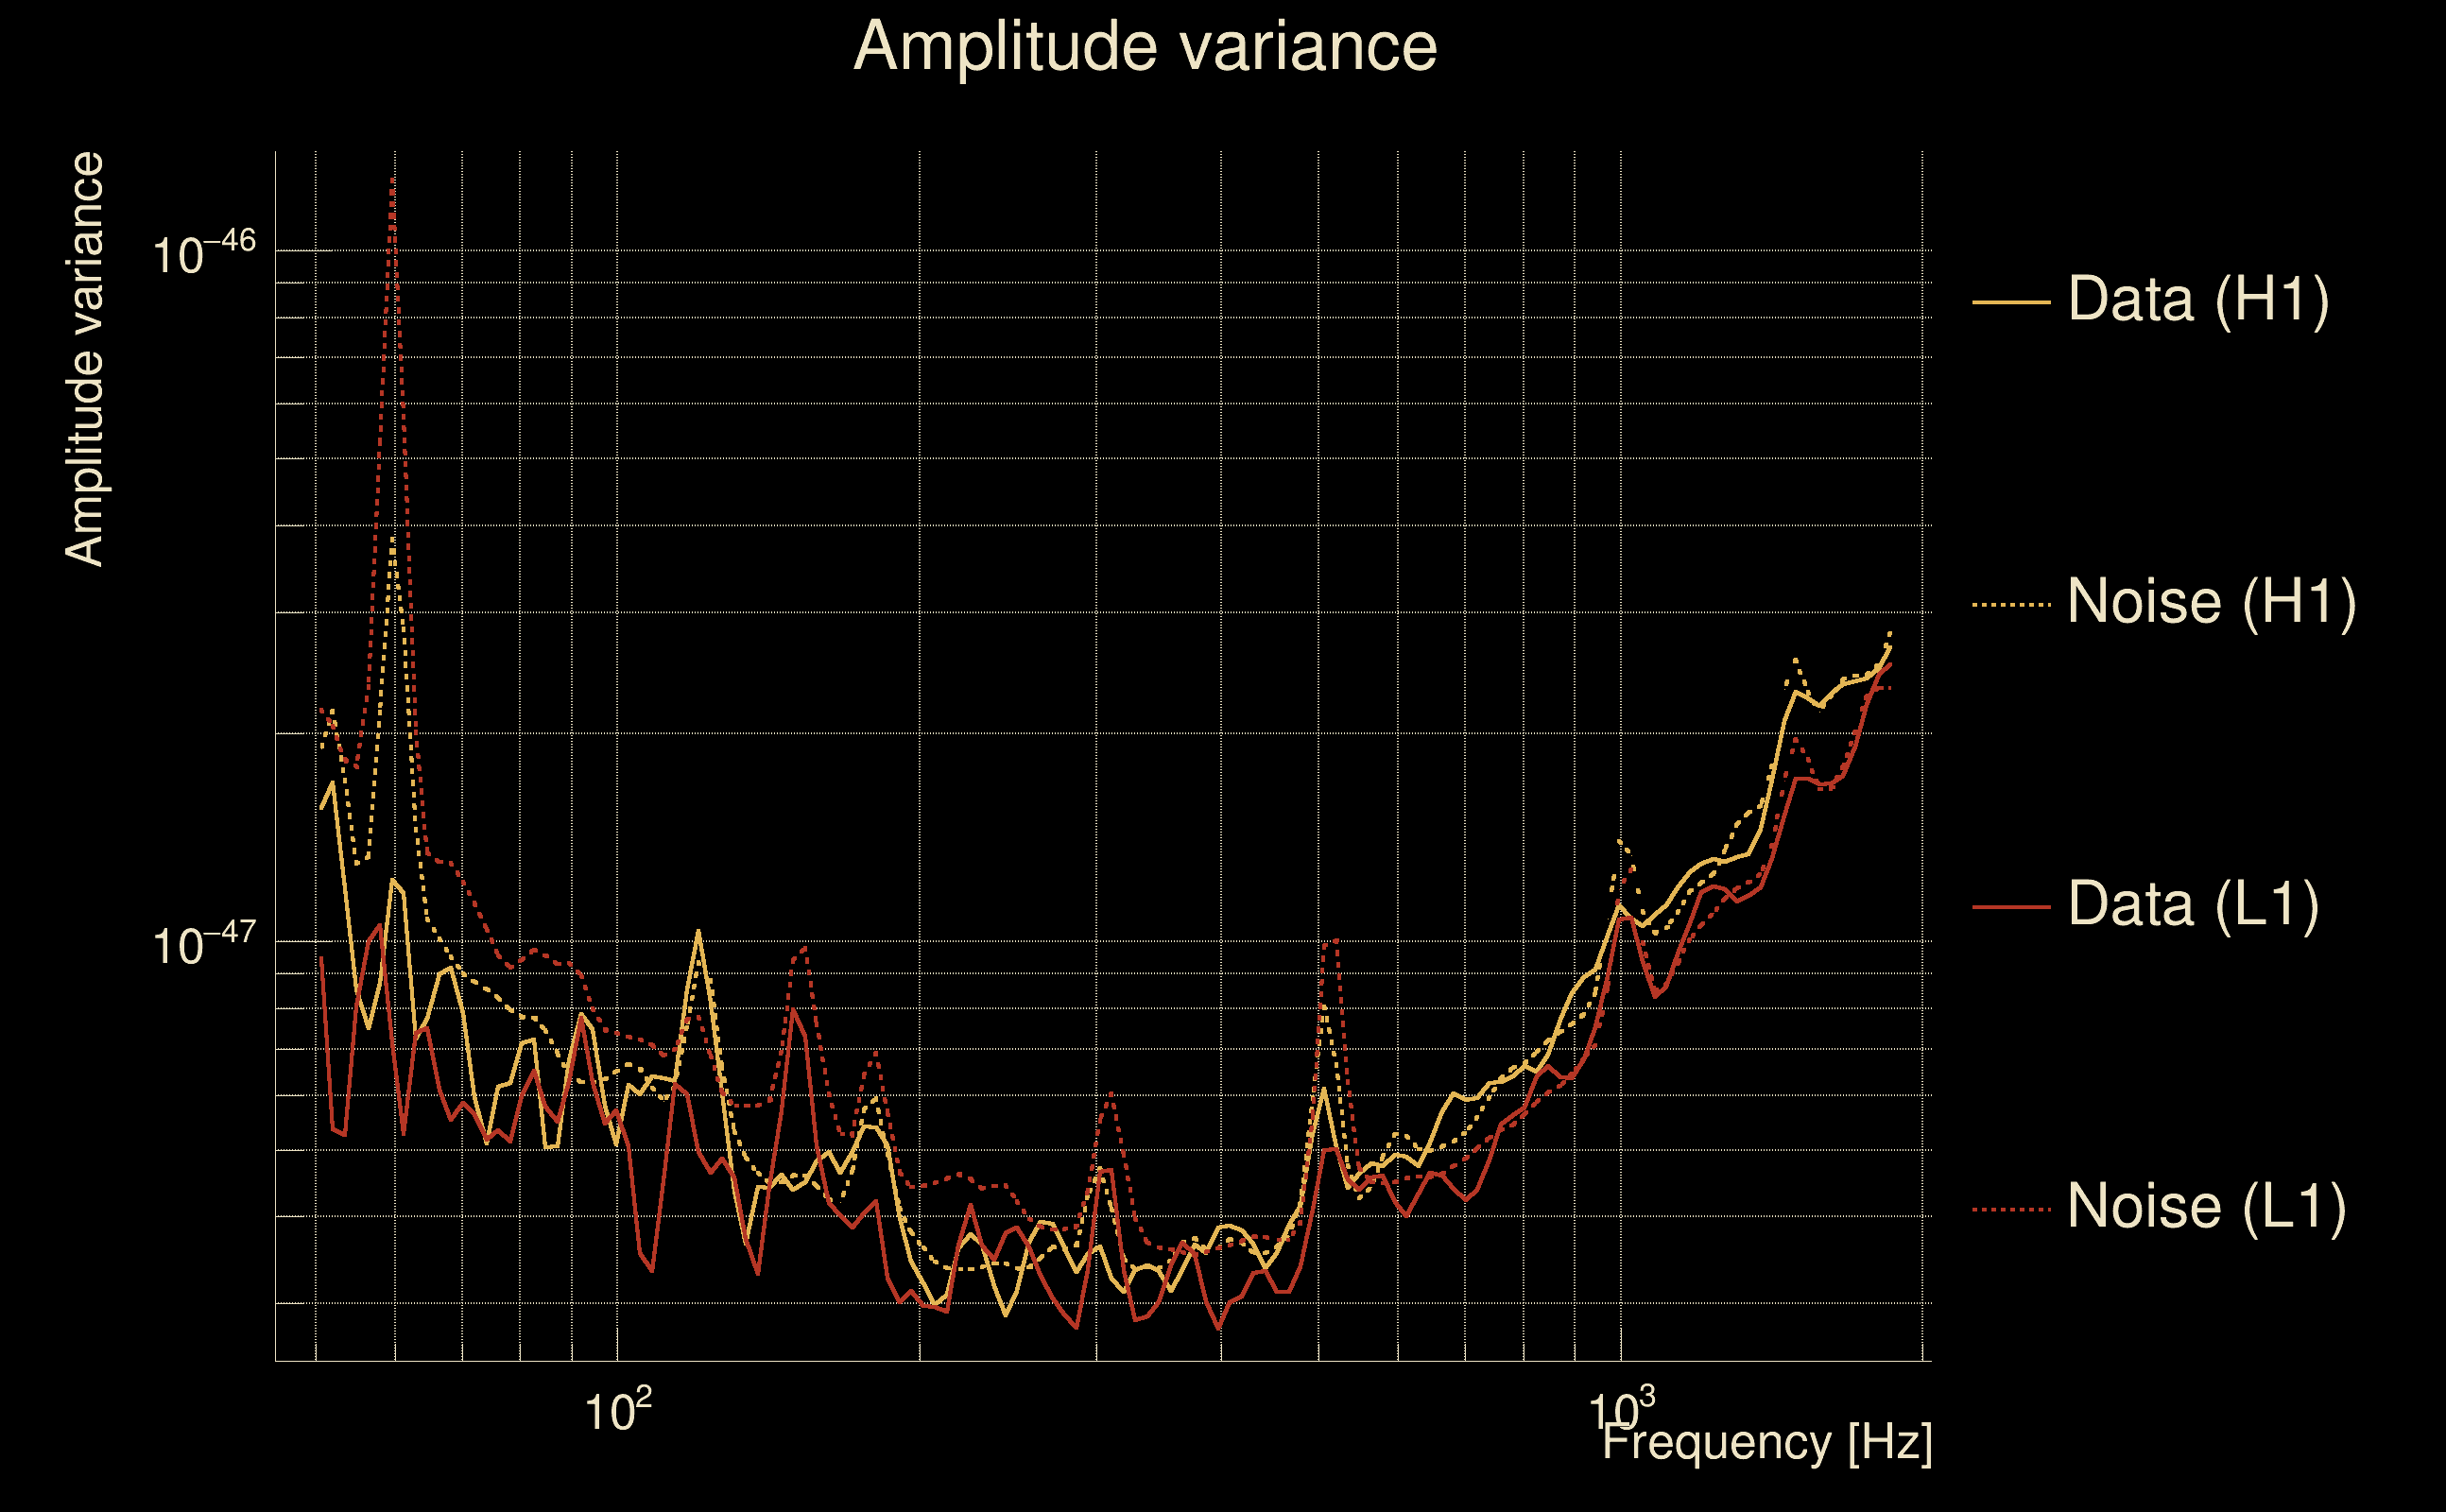
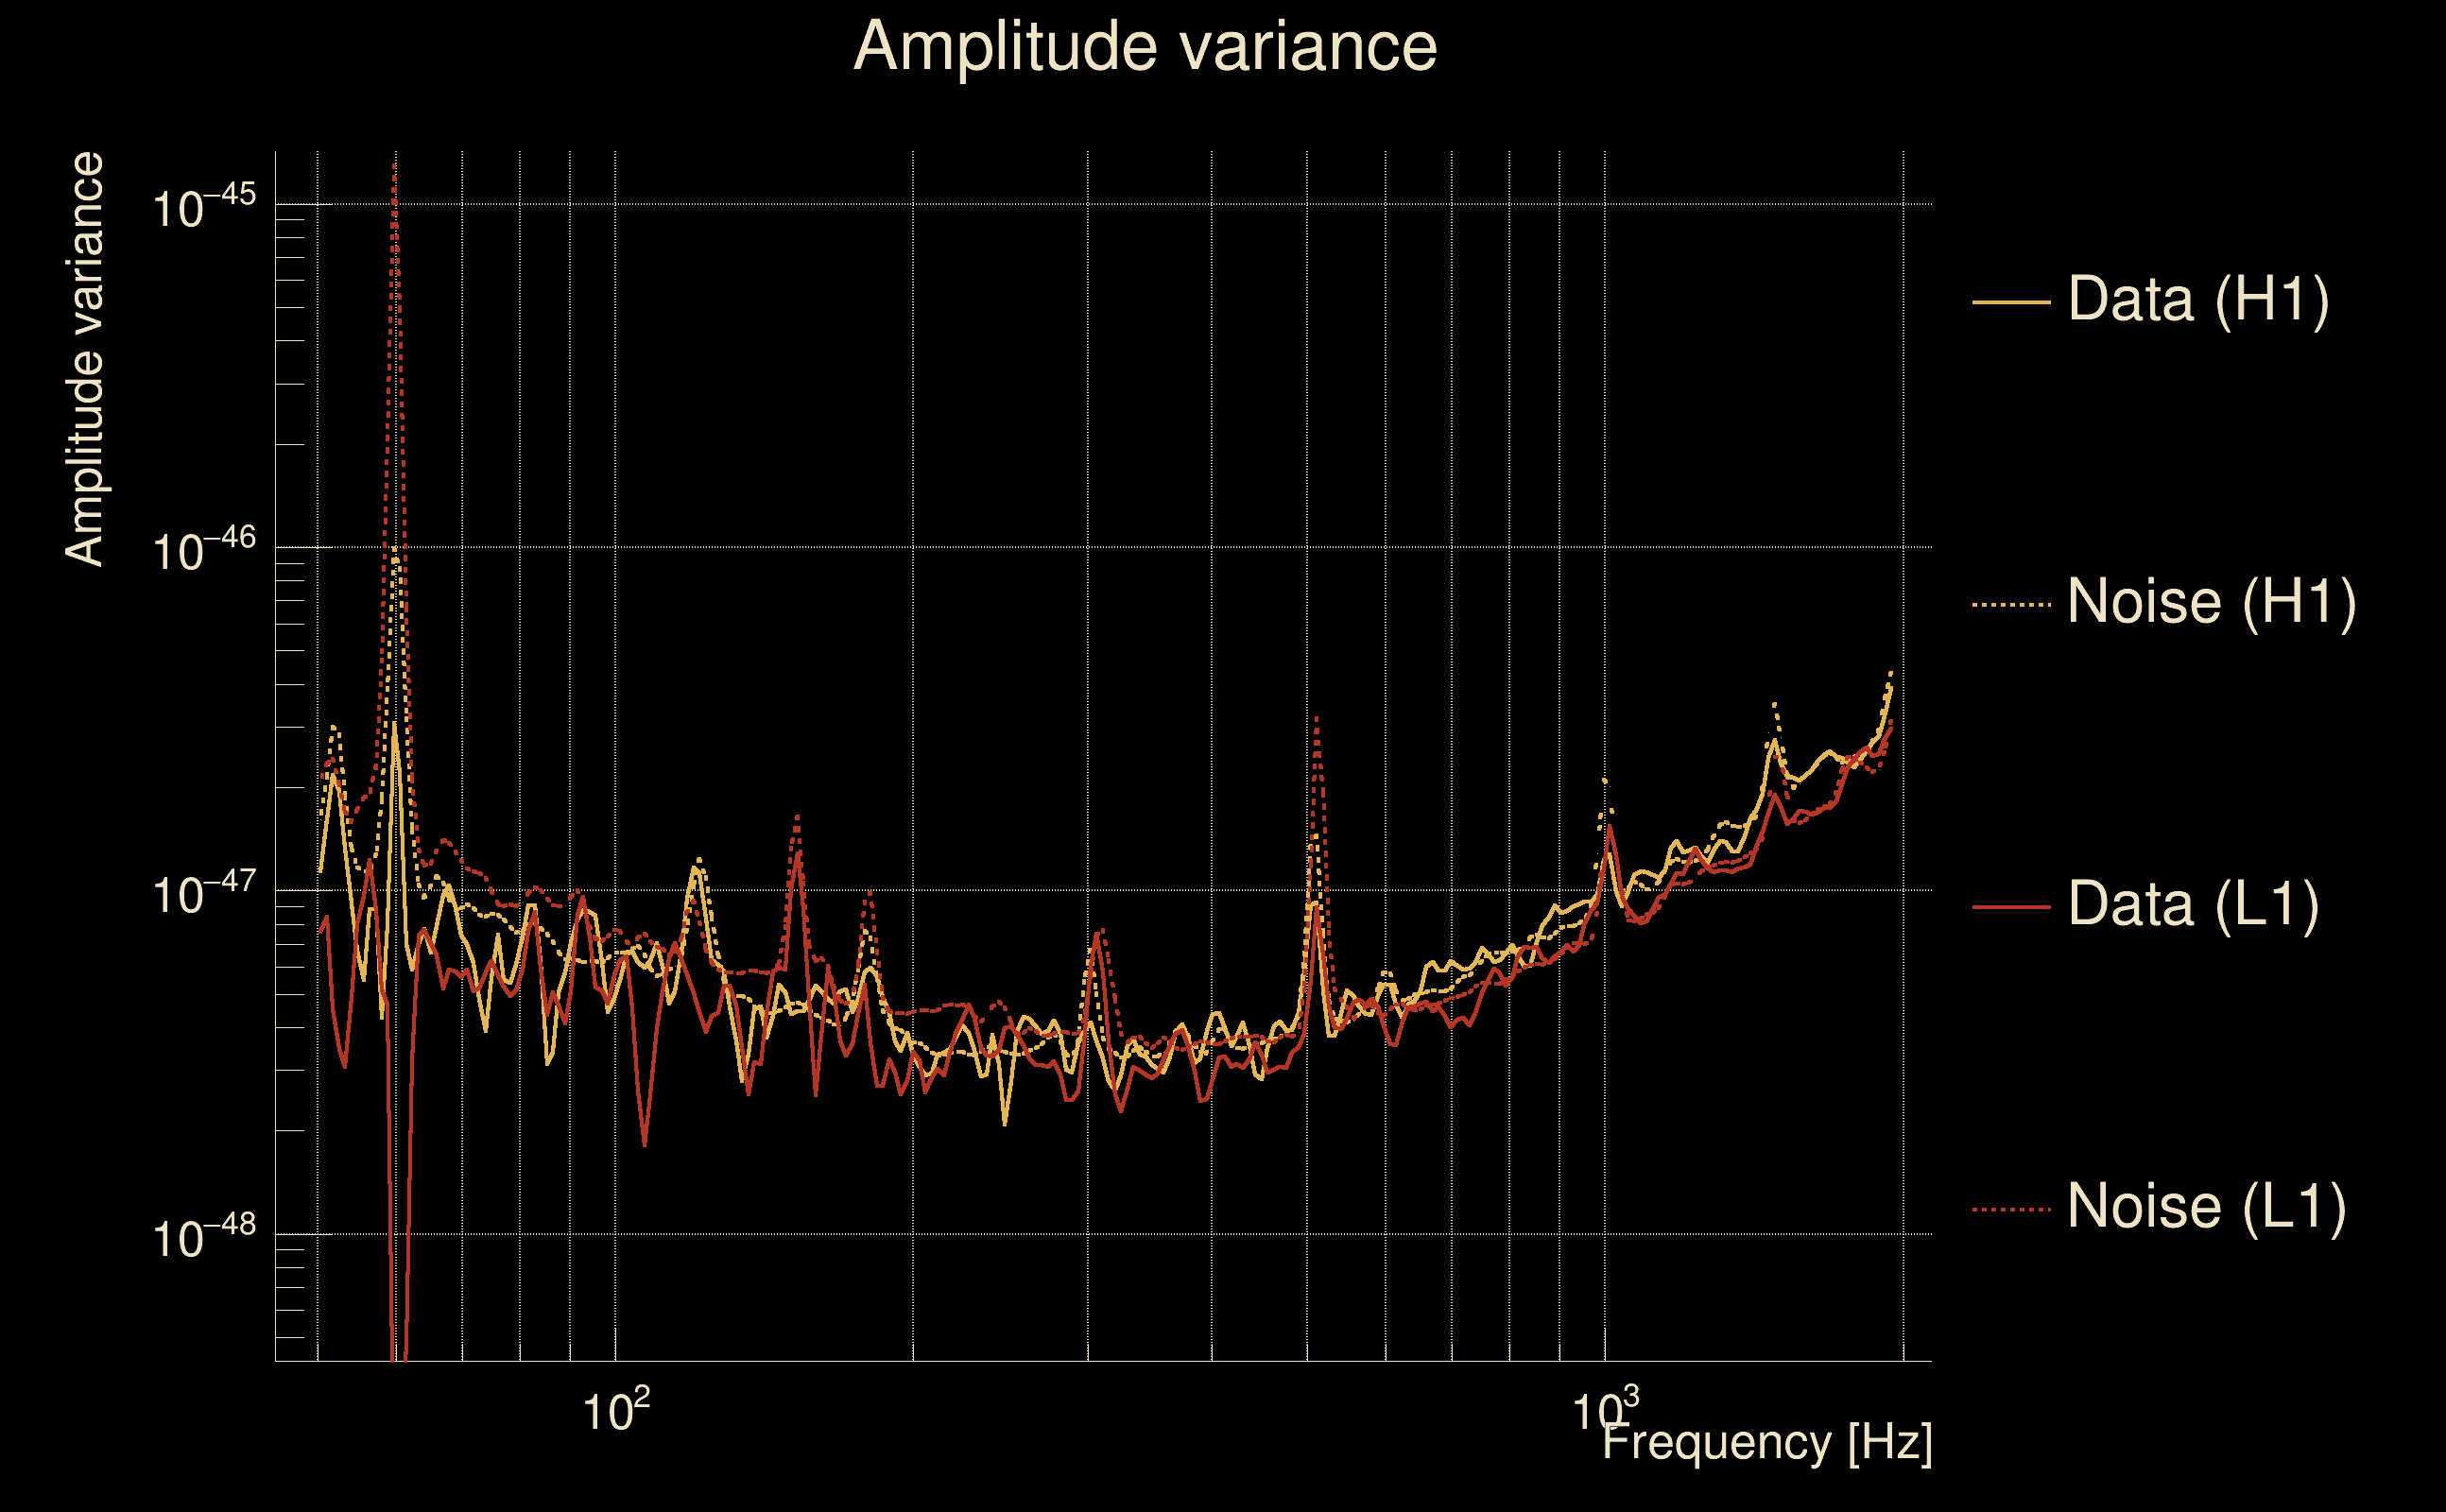
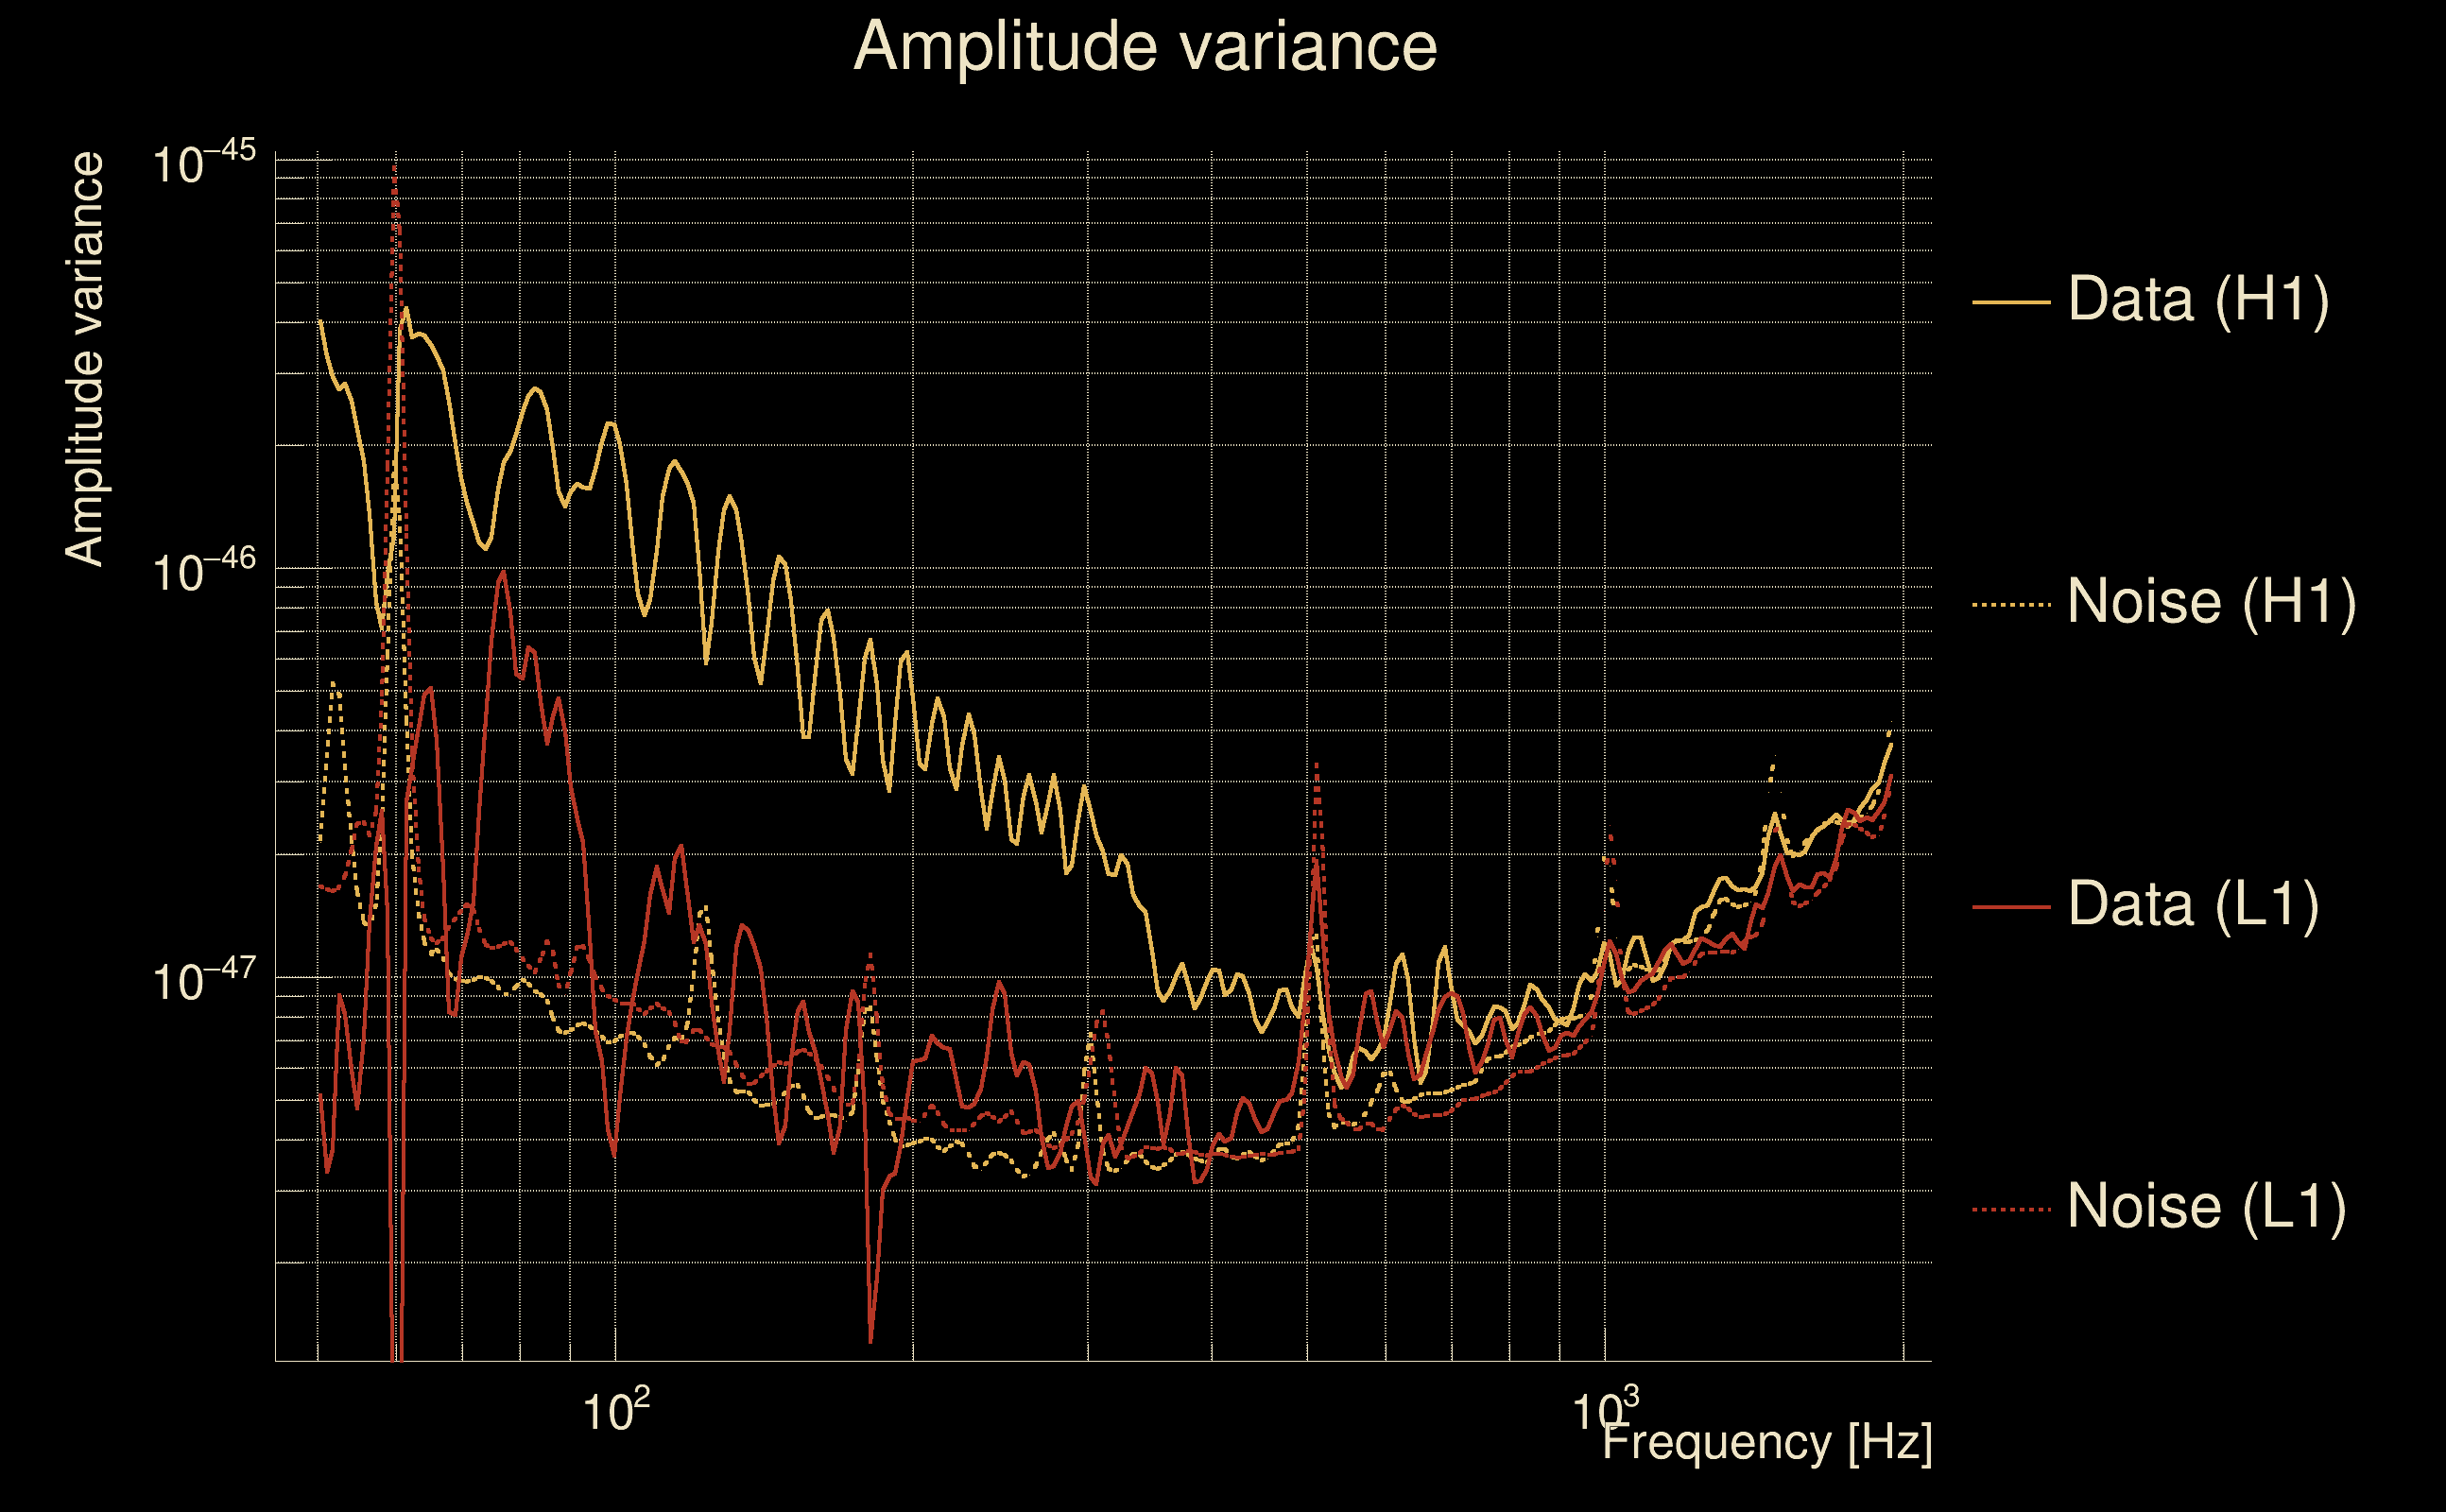
| Amplitude spectrograms: | normalization = 1e-22, power index = 2 |
| White noise SNR variance: | 0.523175 (after applying a correction factor = 1) |
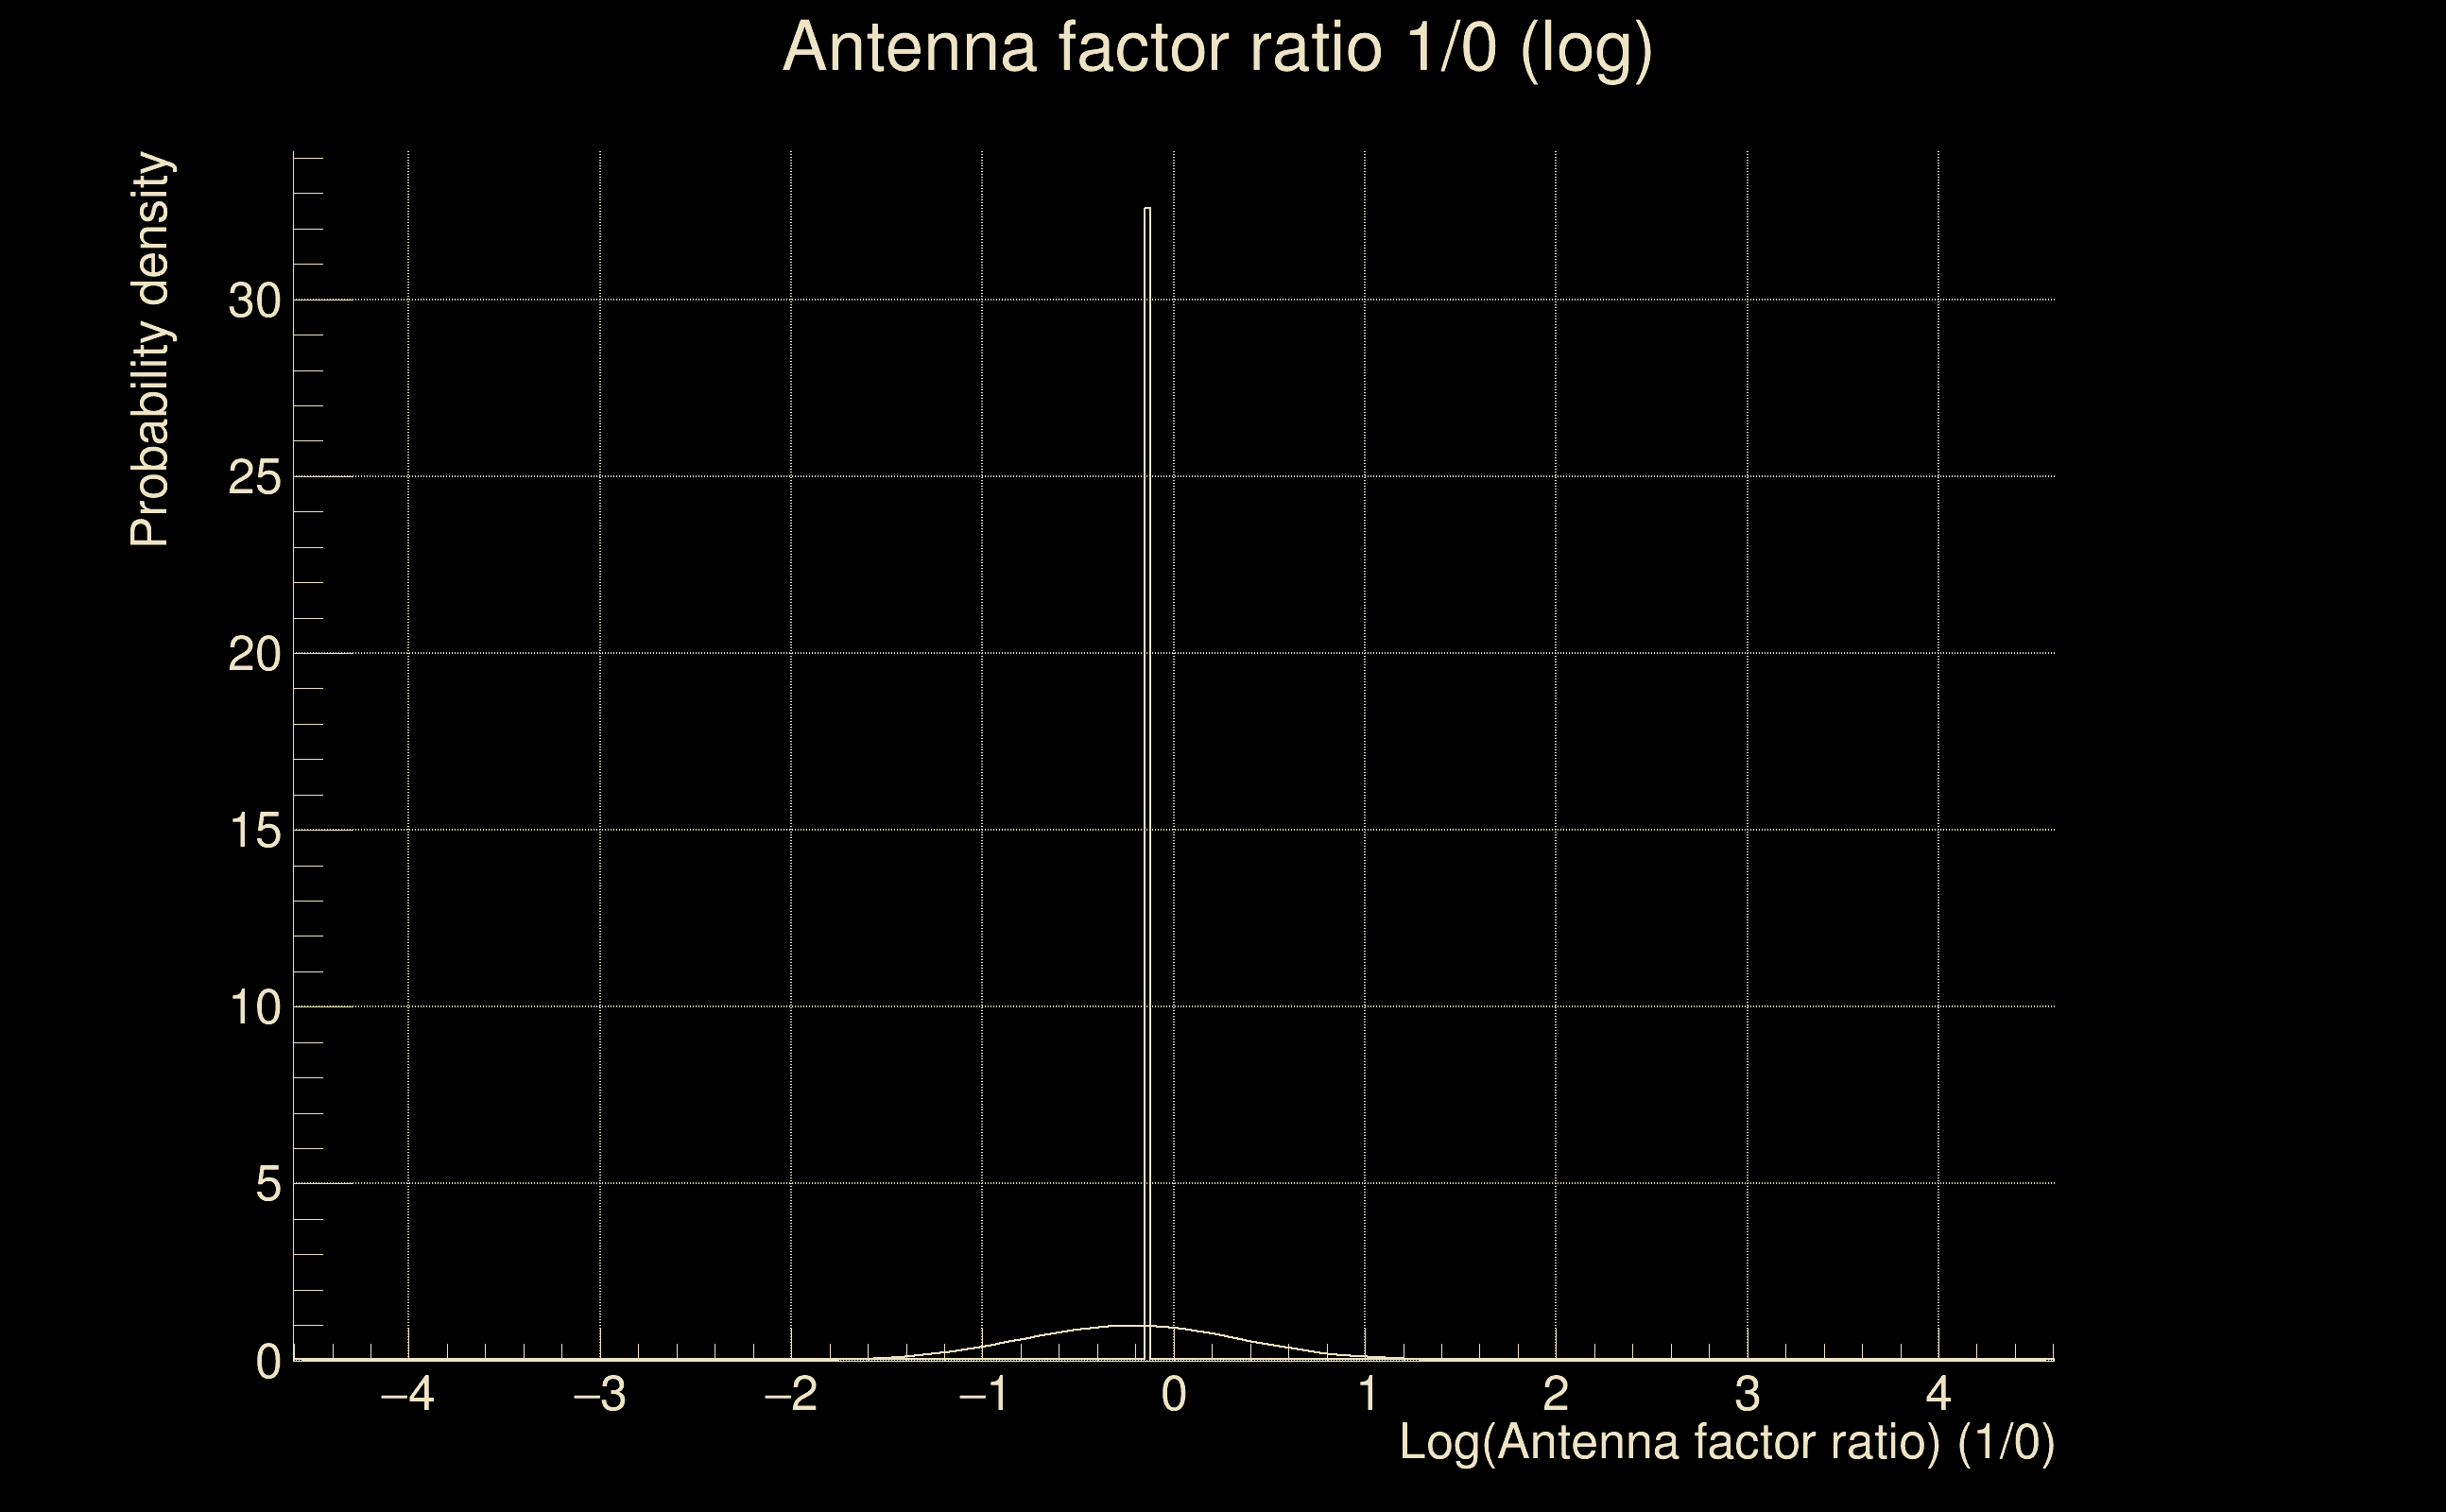
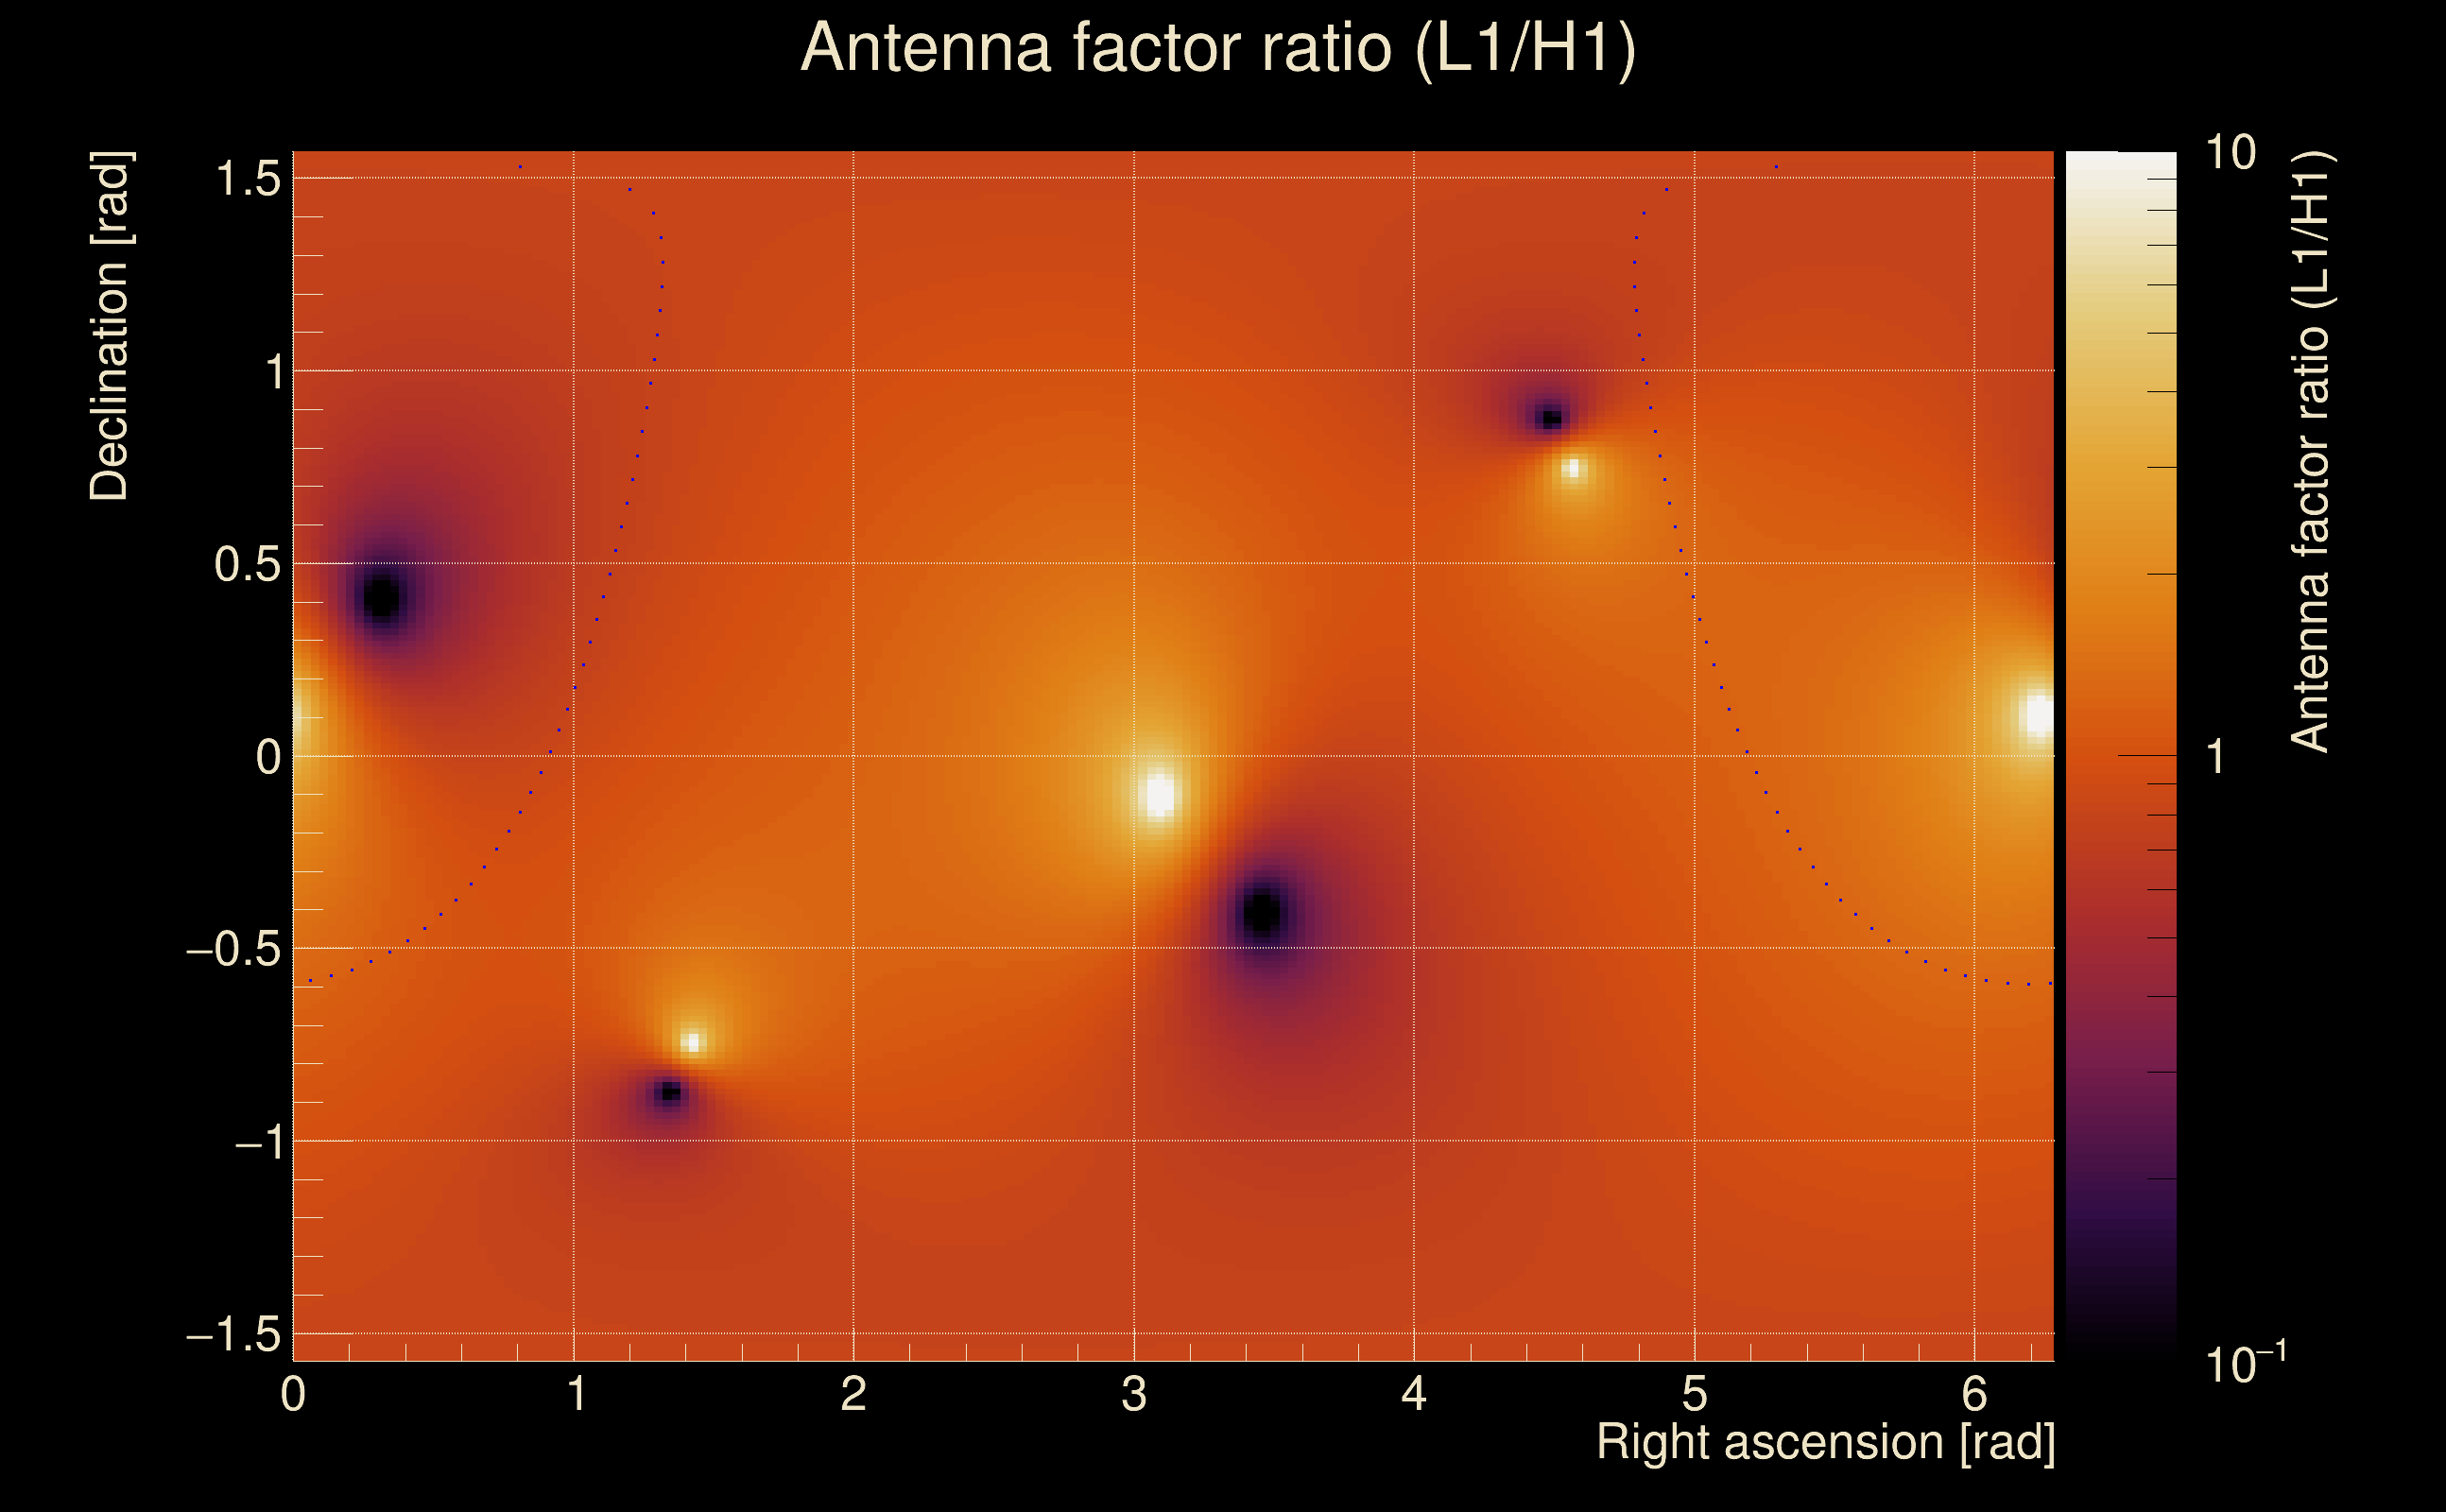
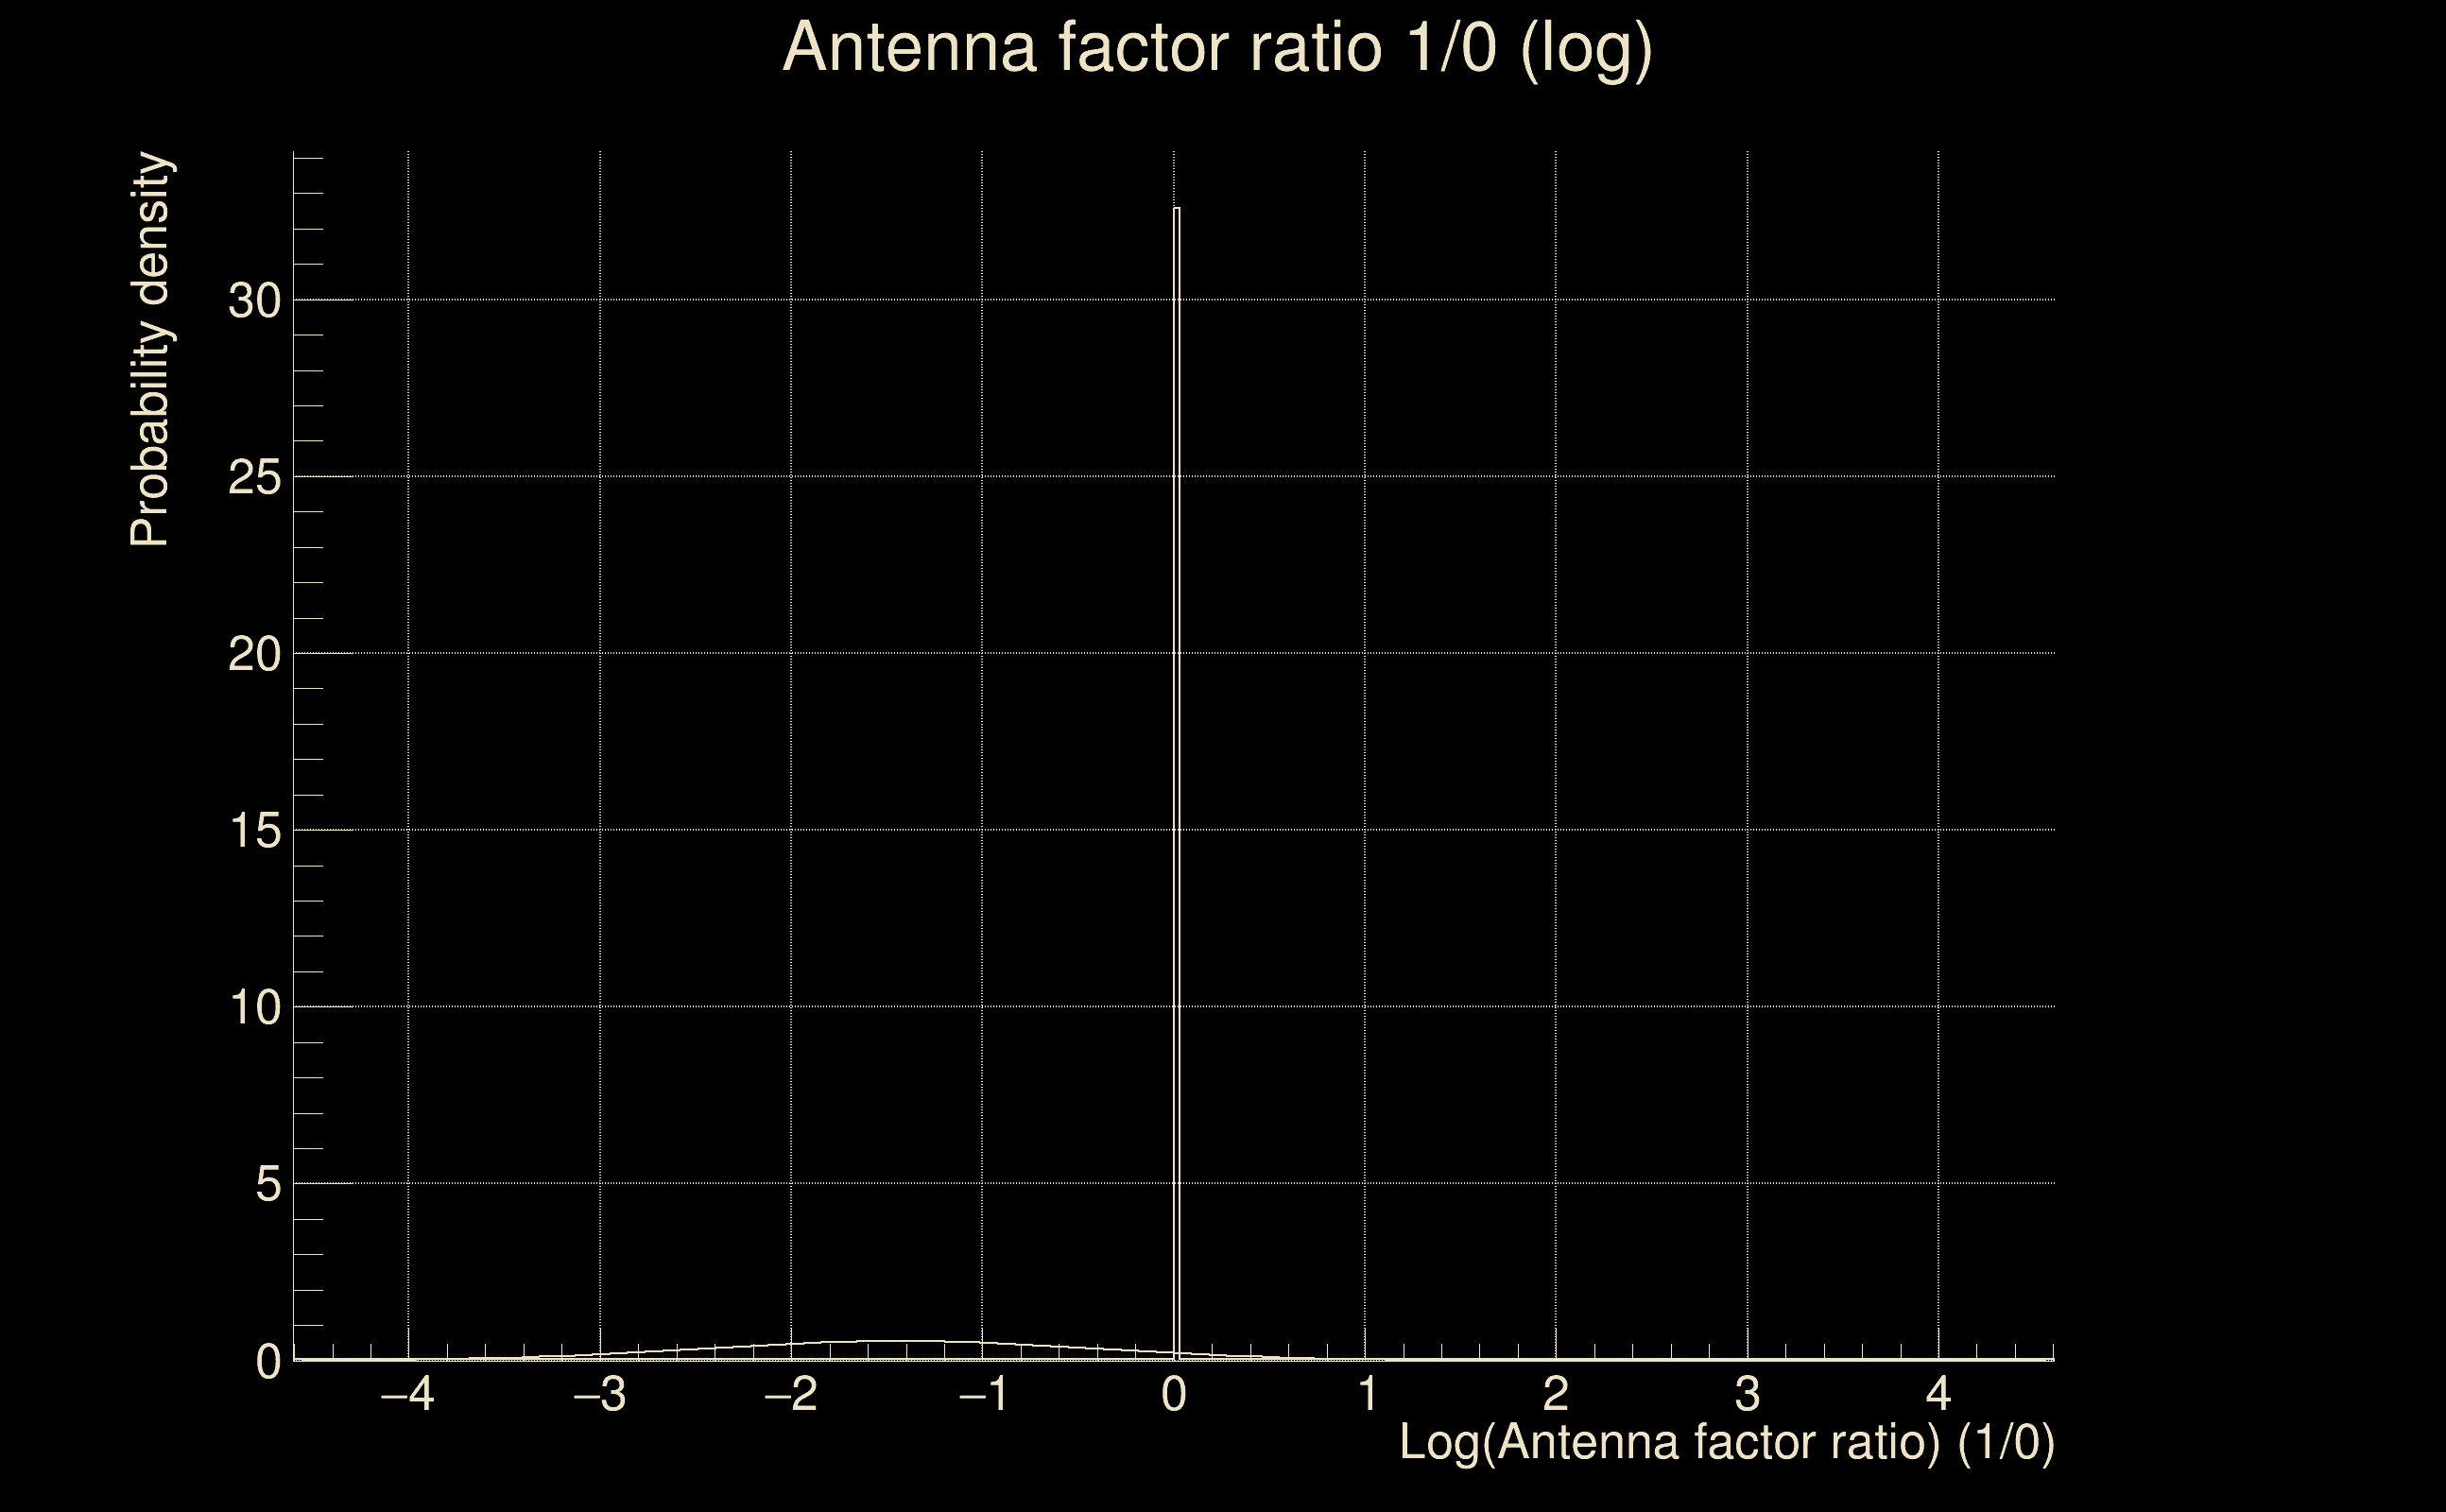
| Amplitude ratio confidence level: | 3 sigma |
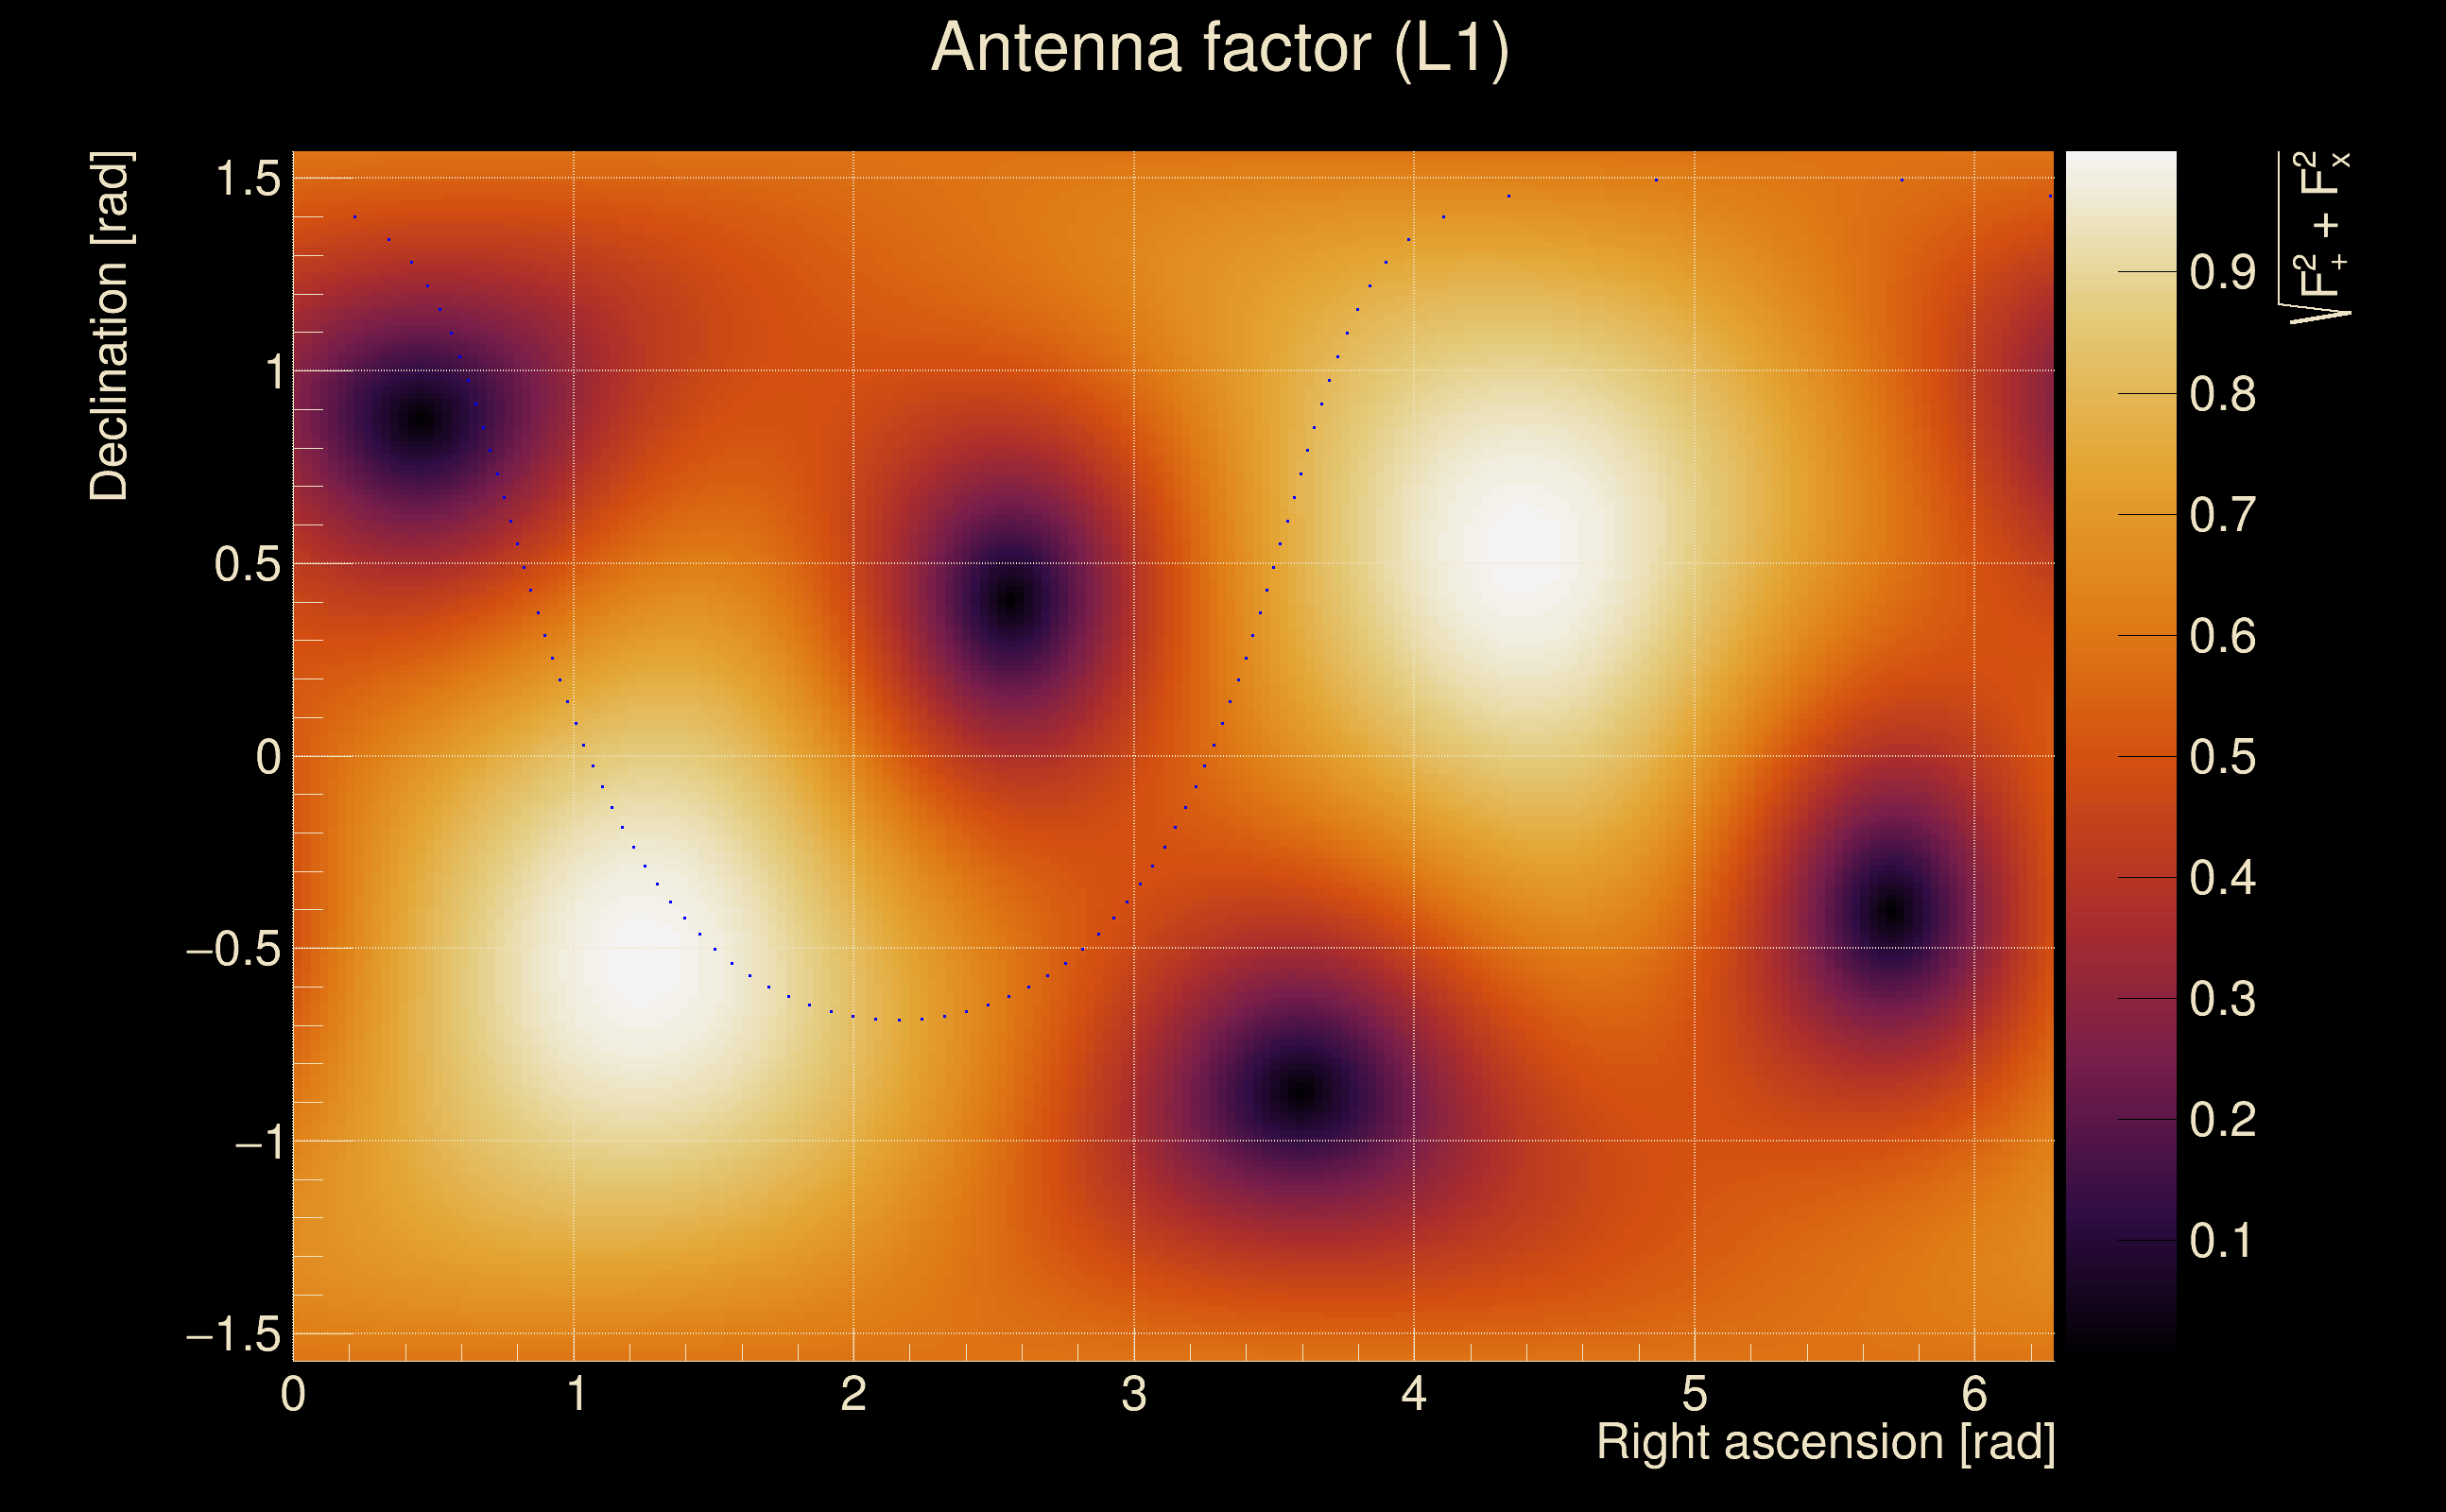
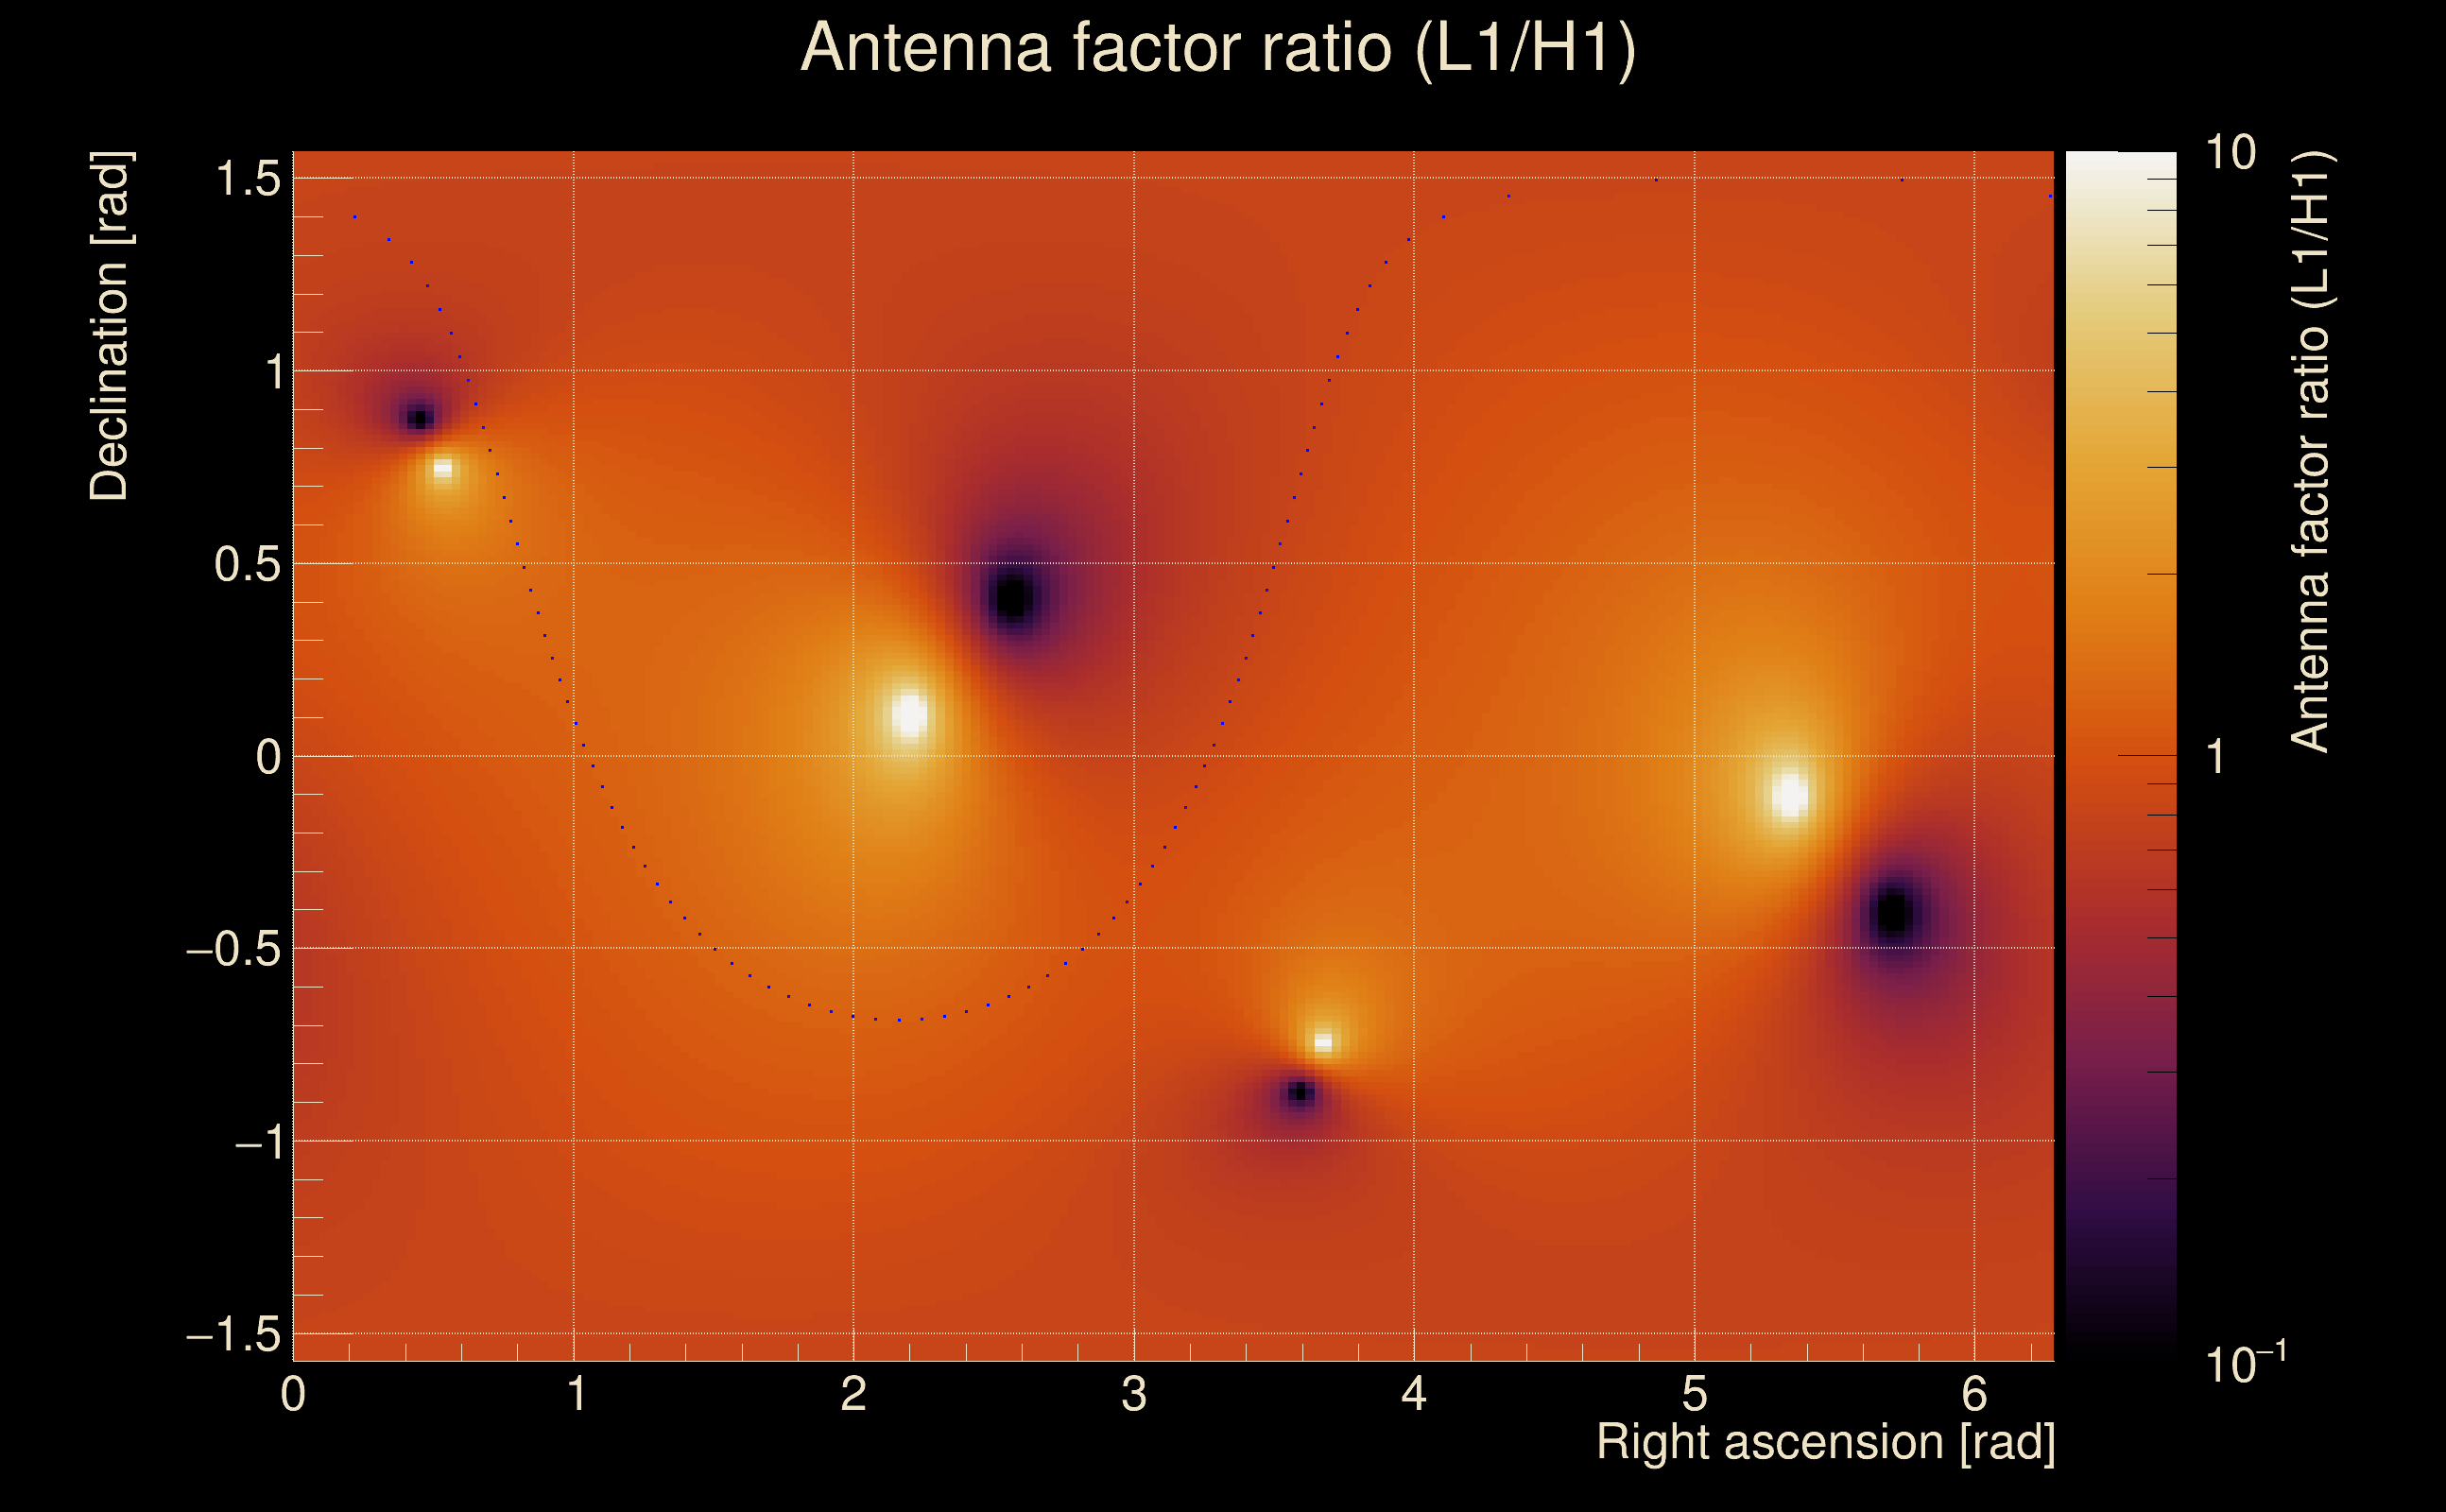
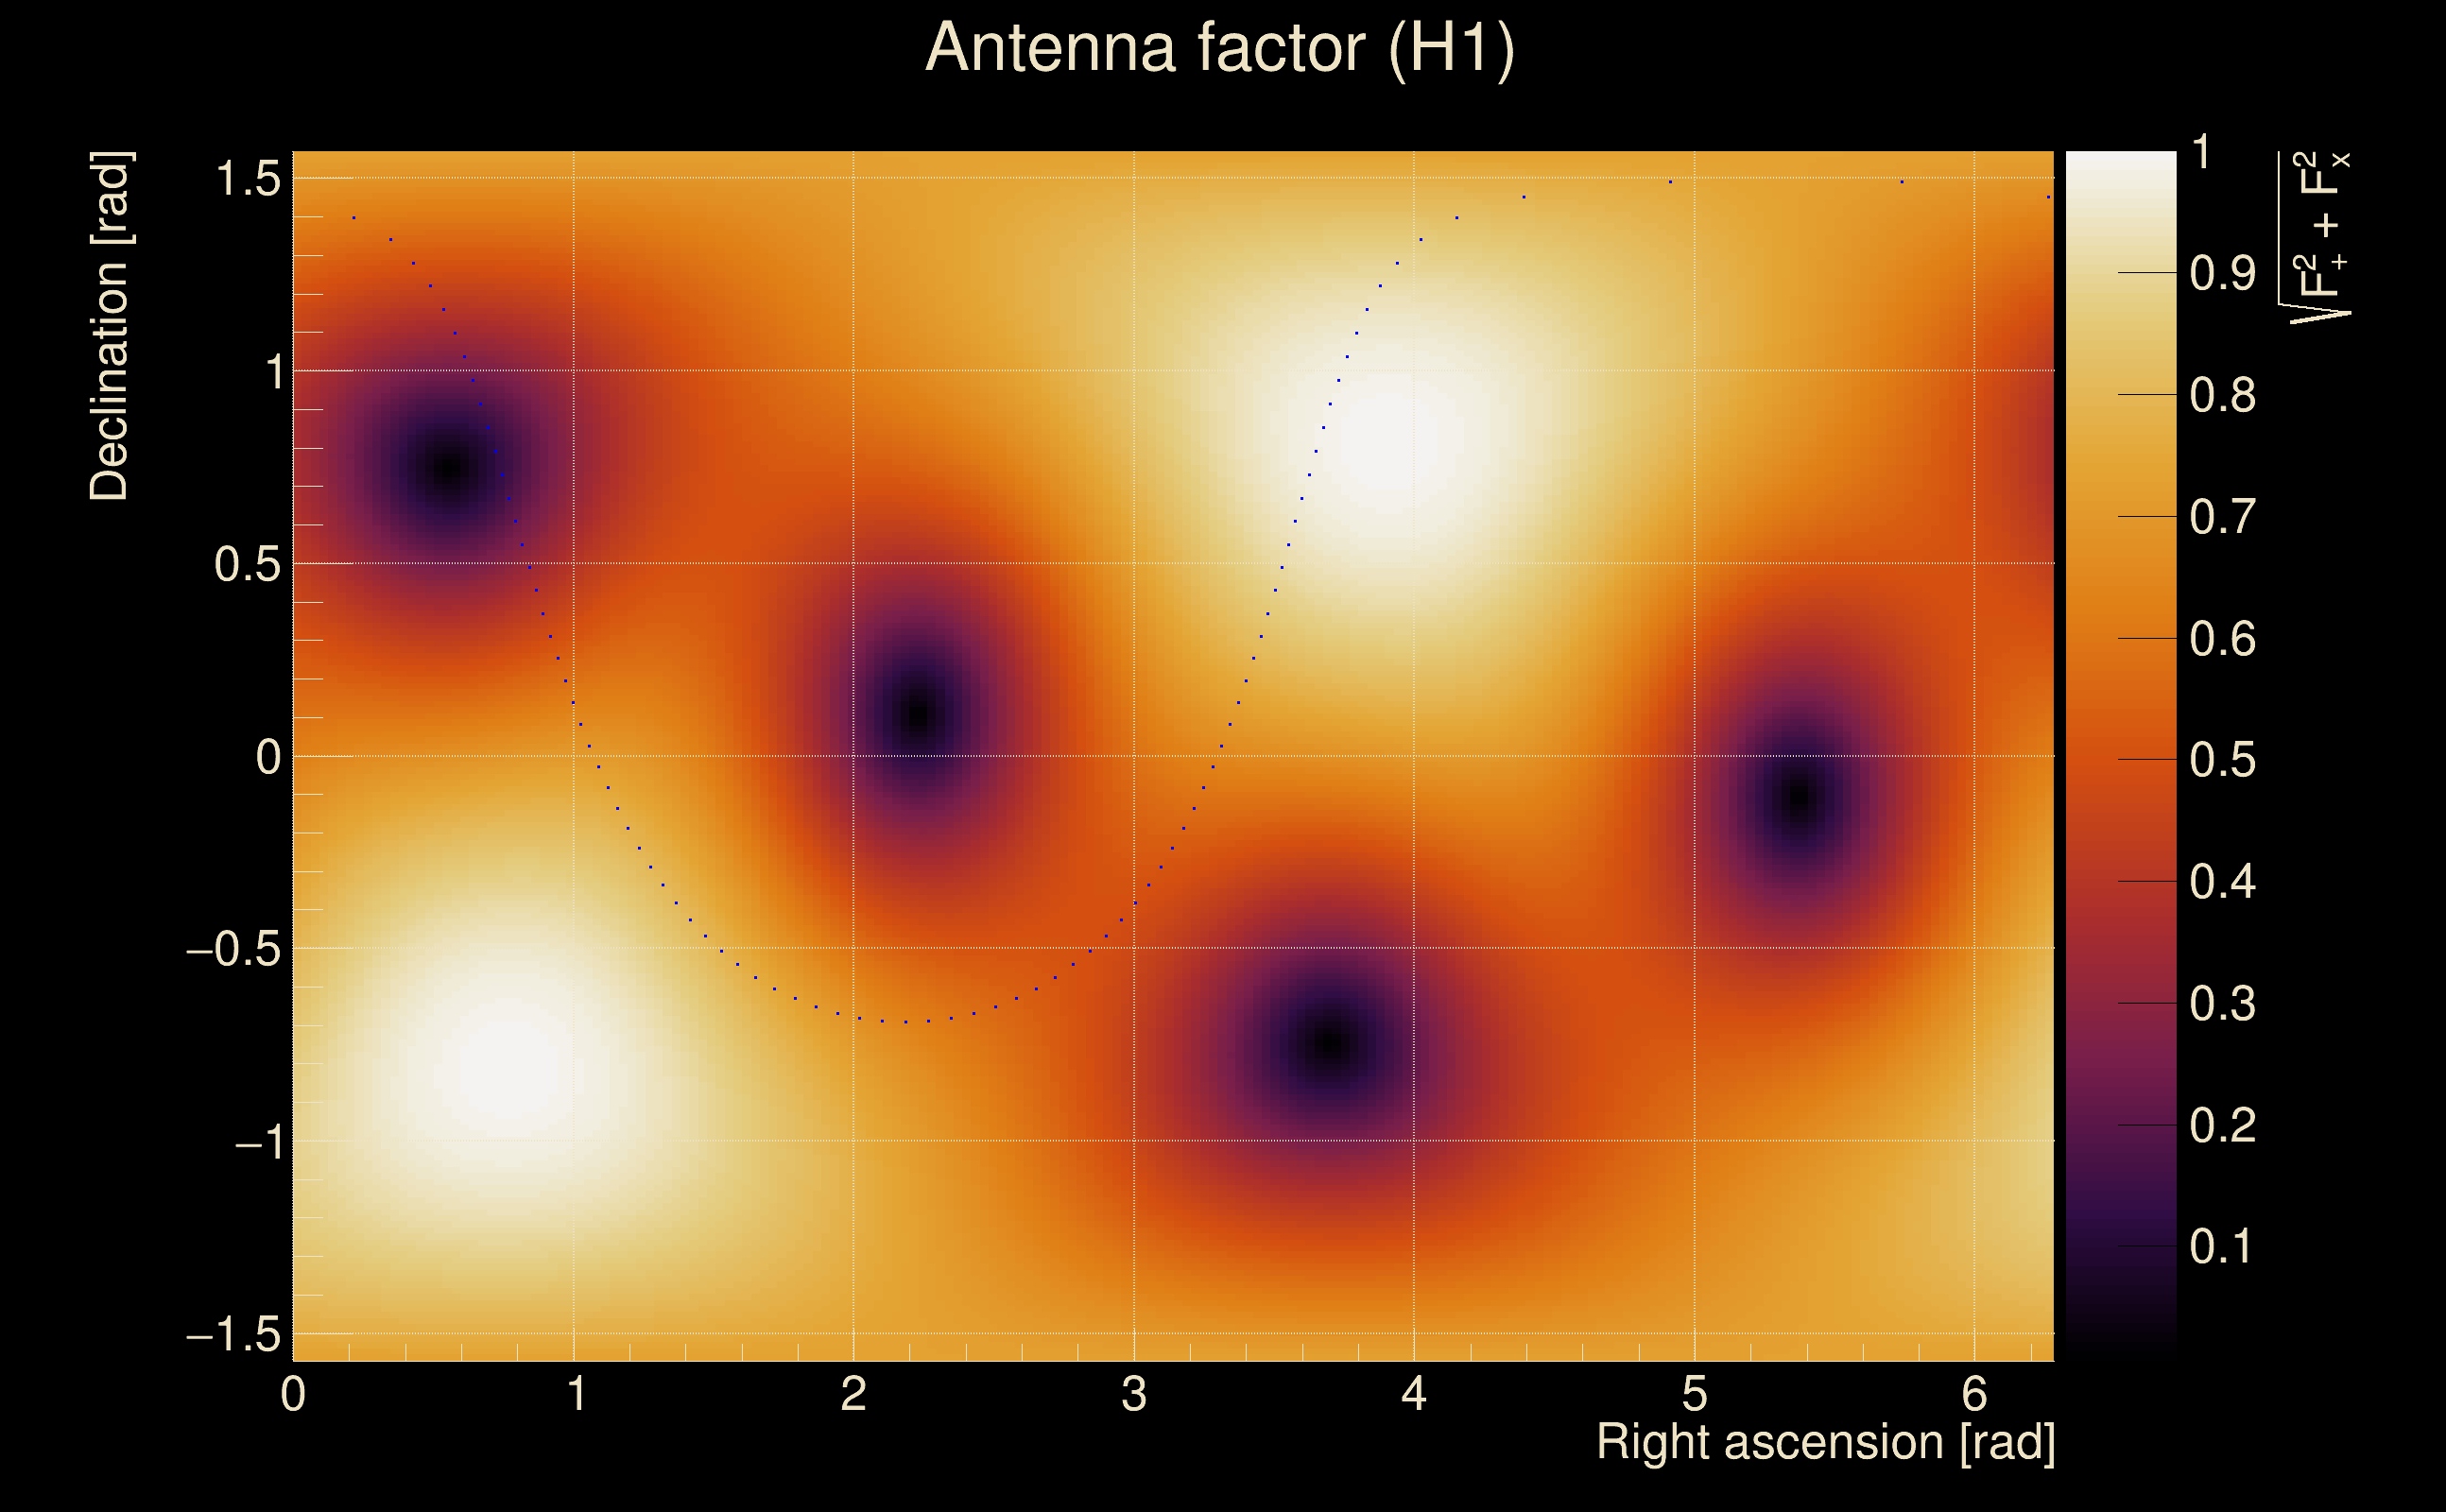
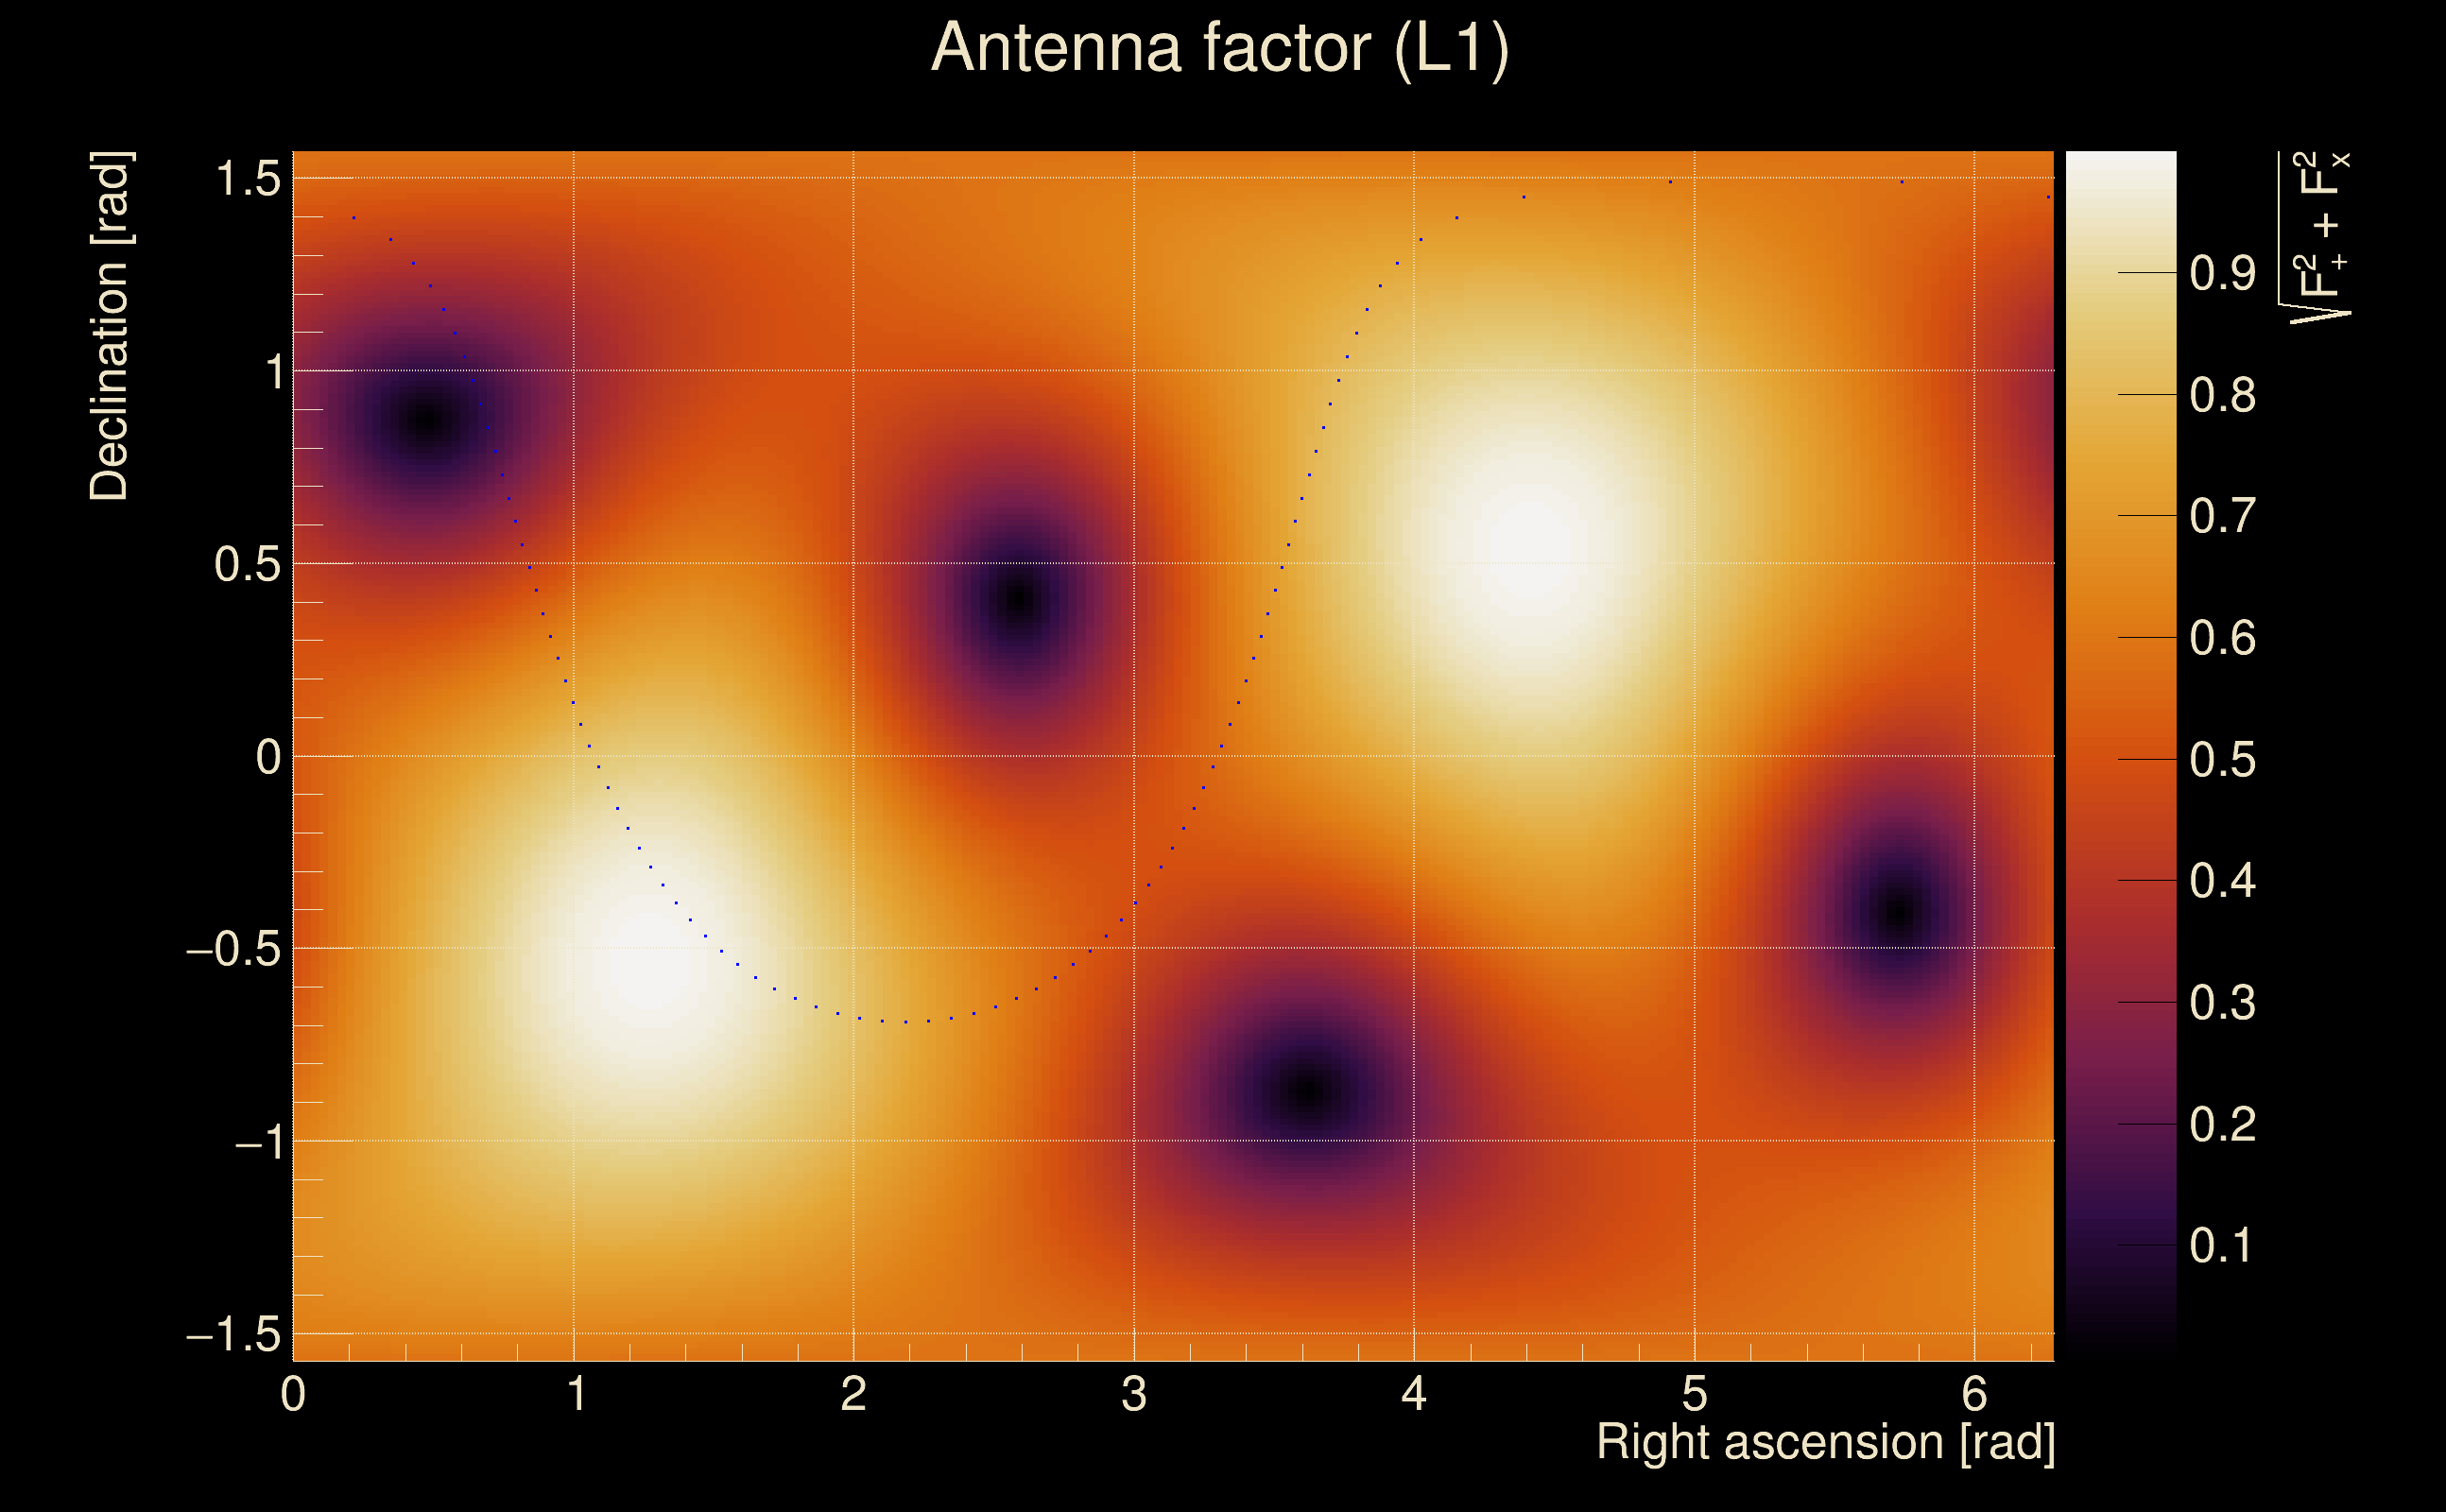
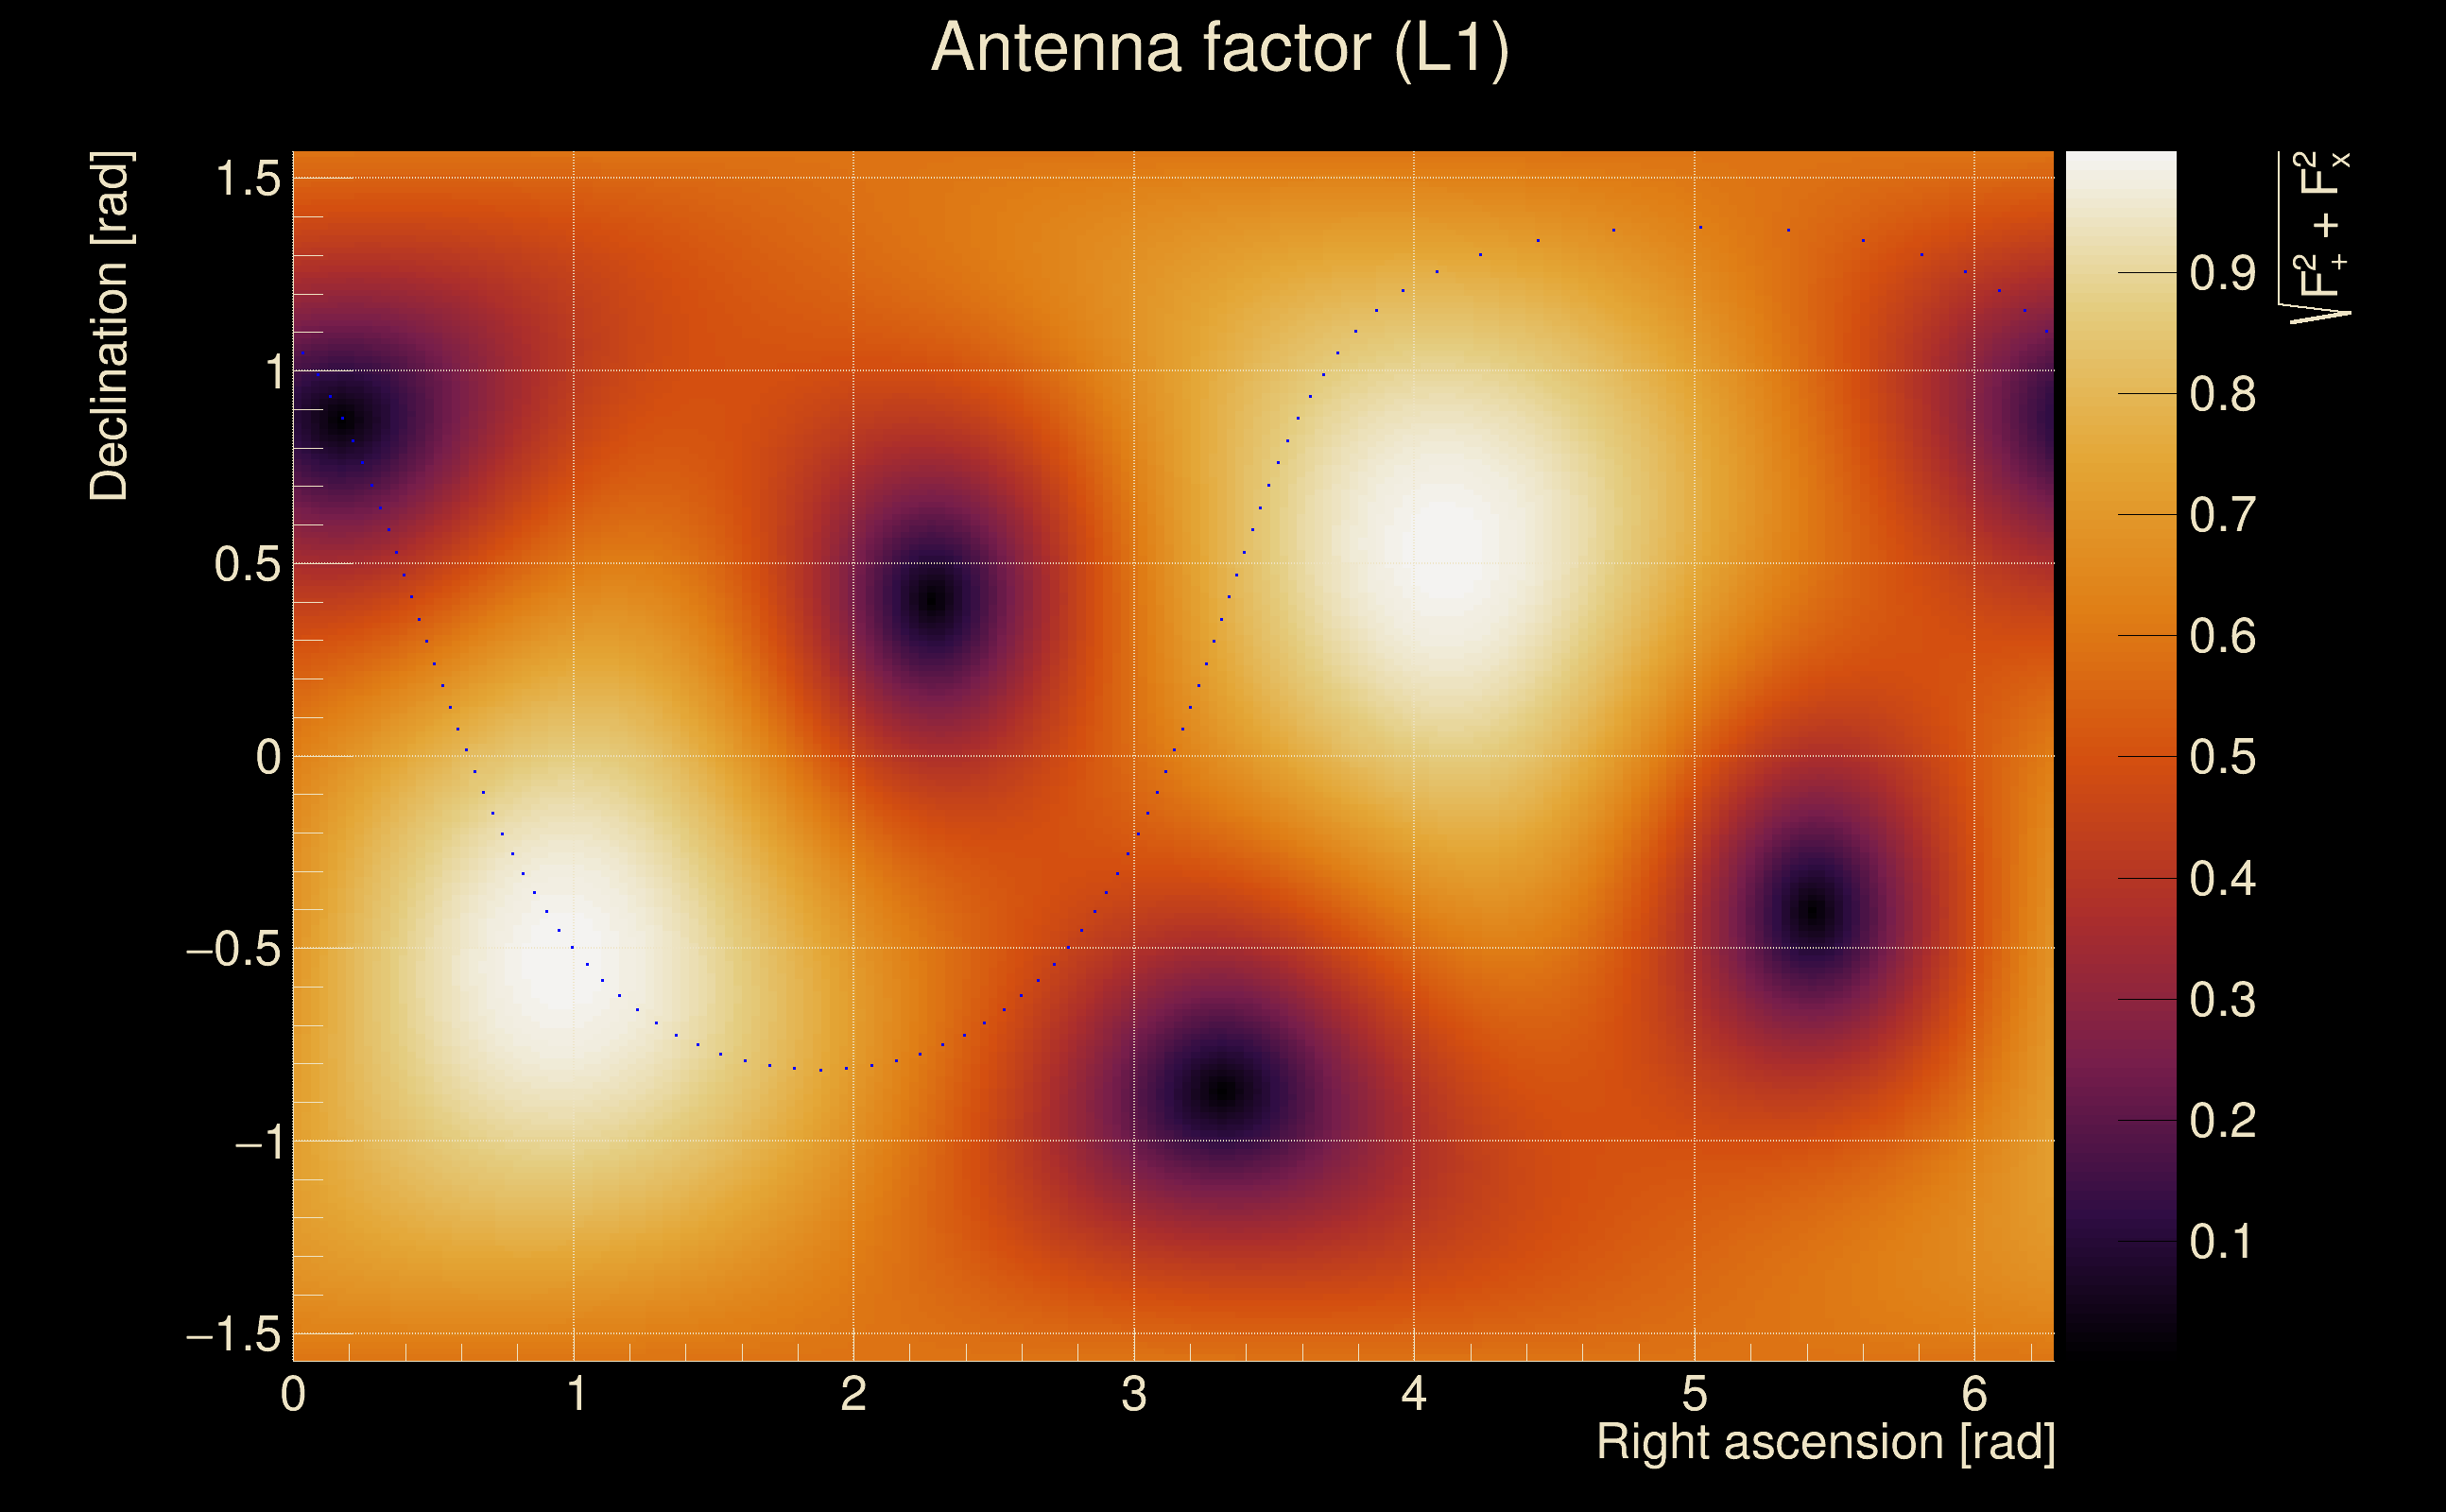
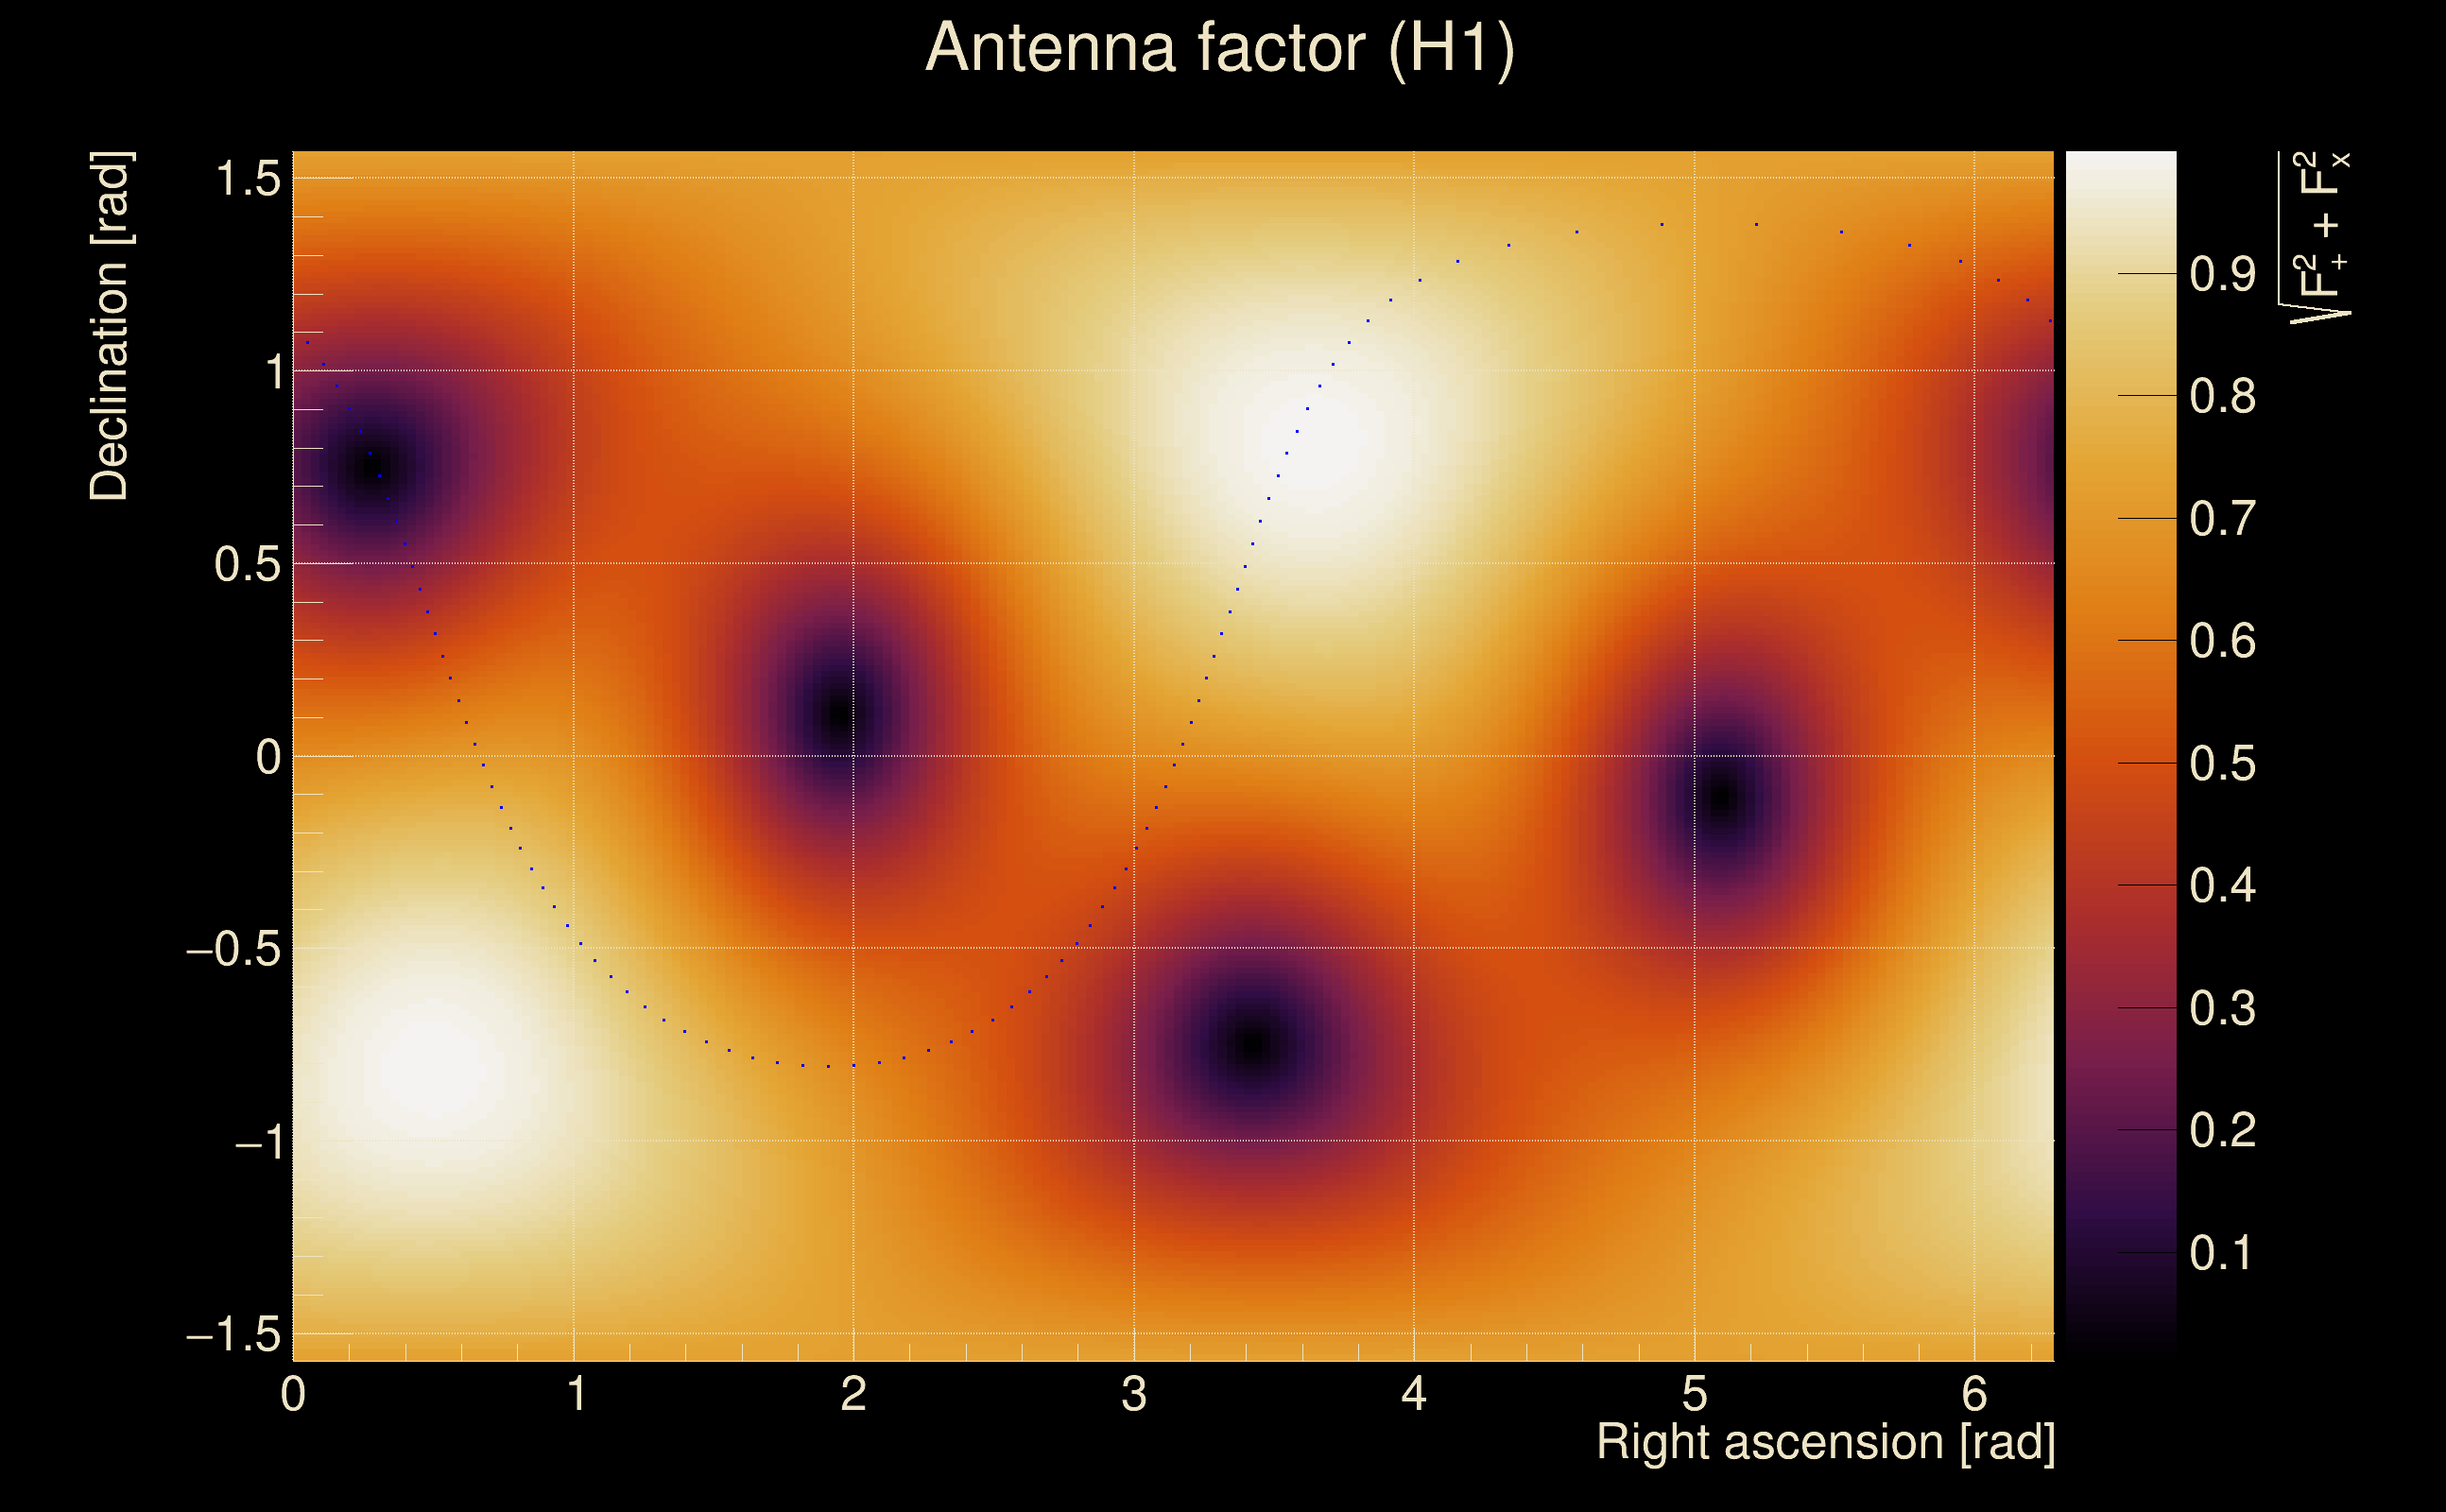
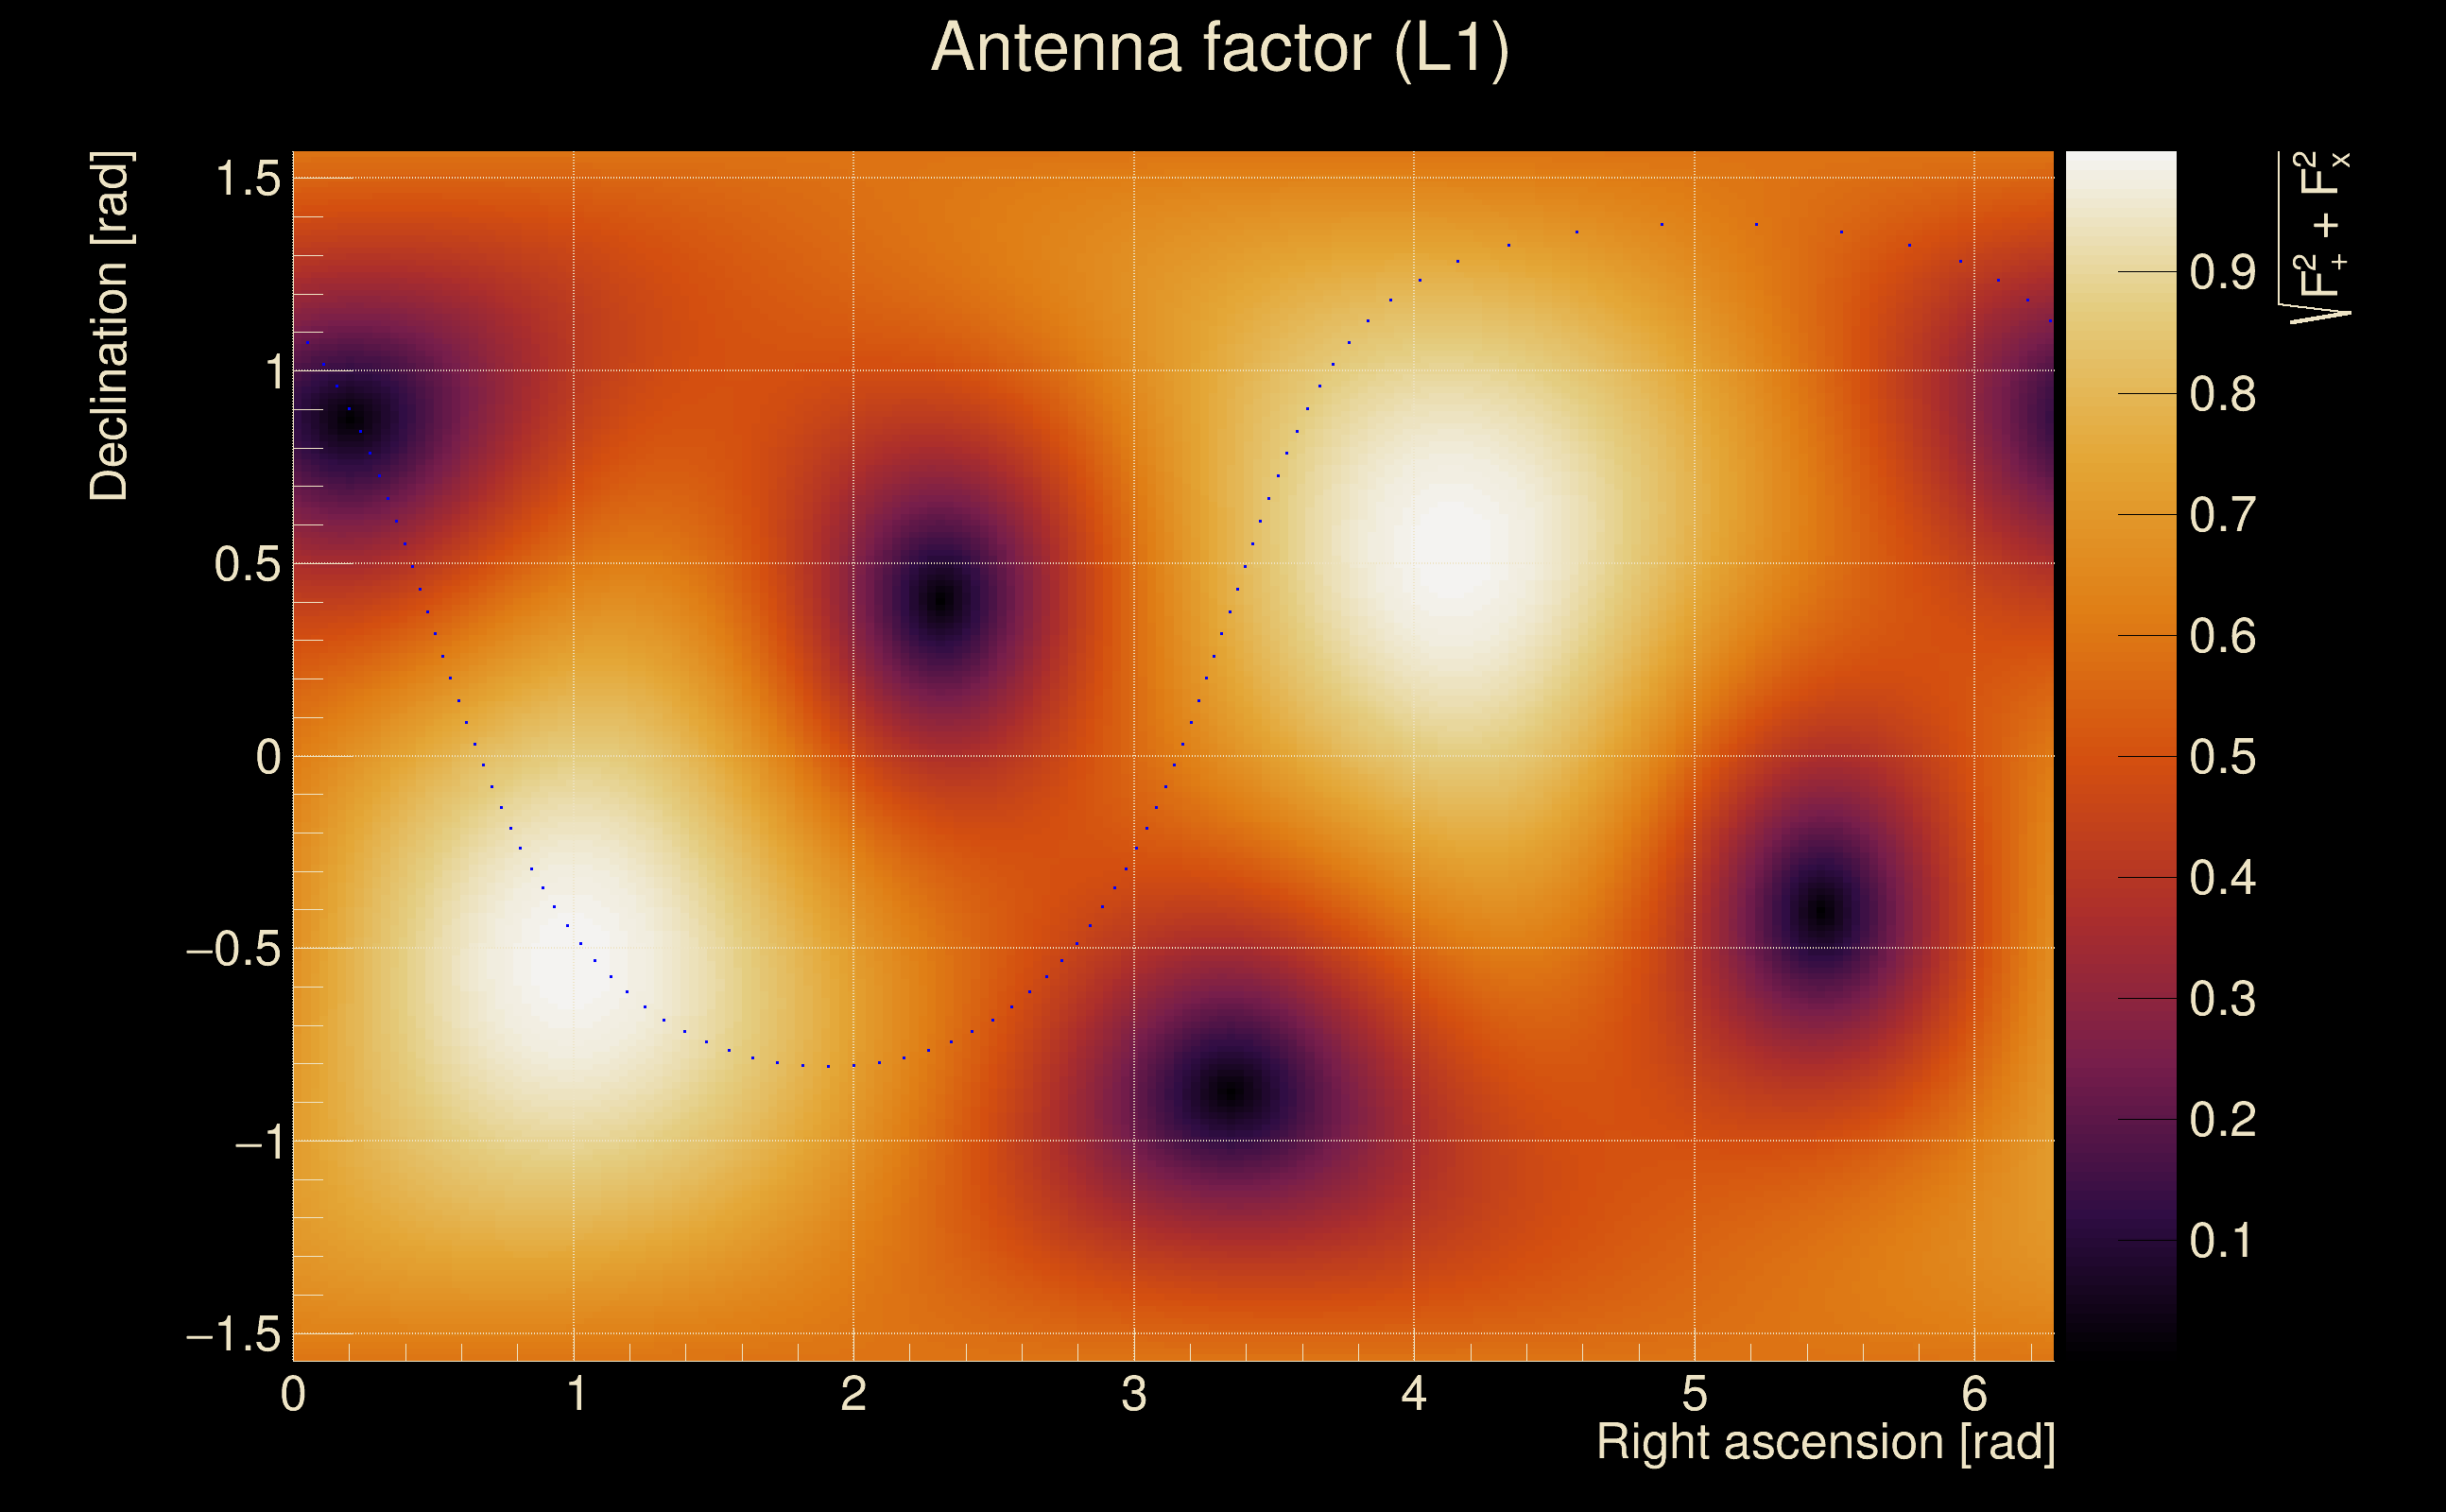
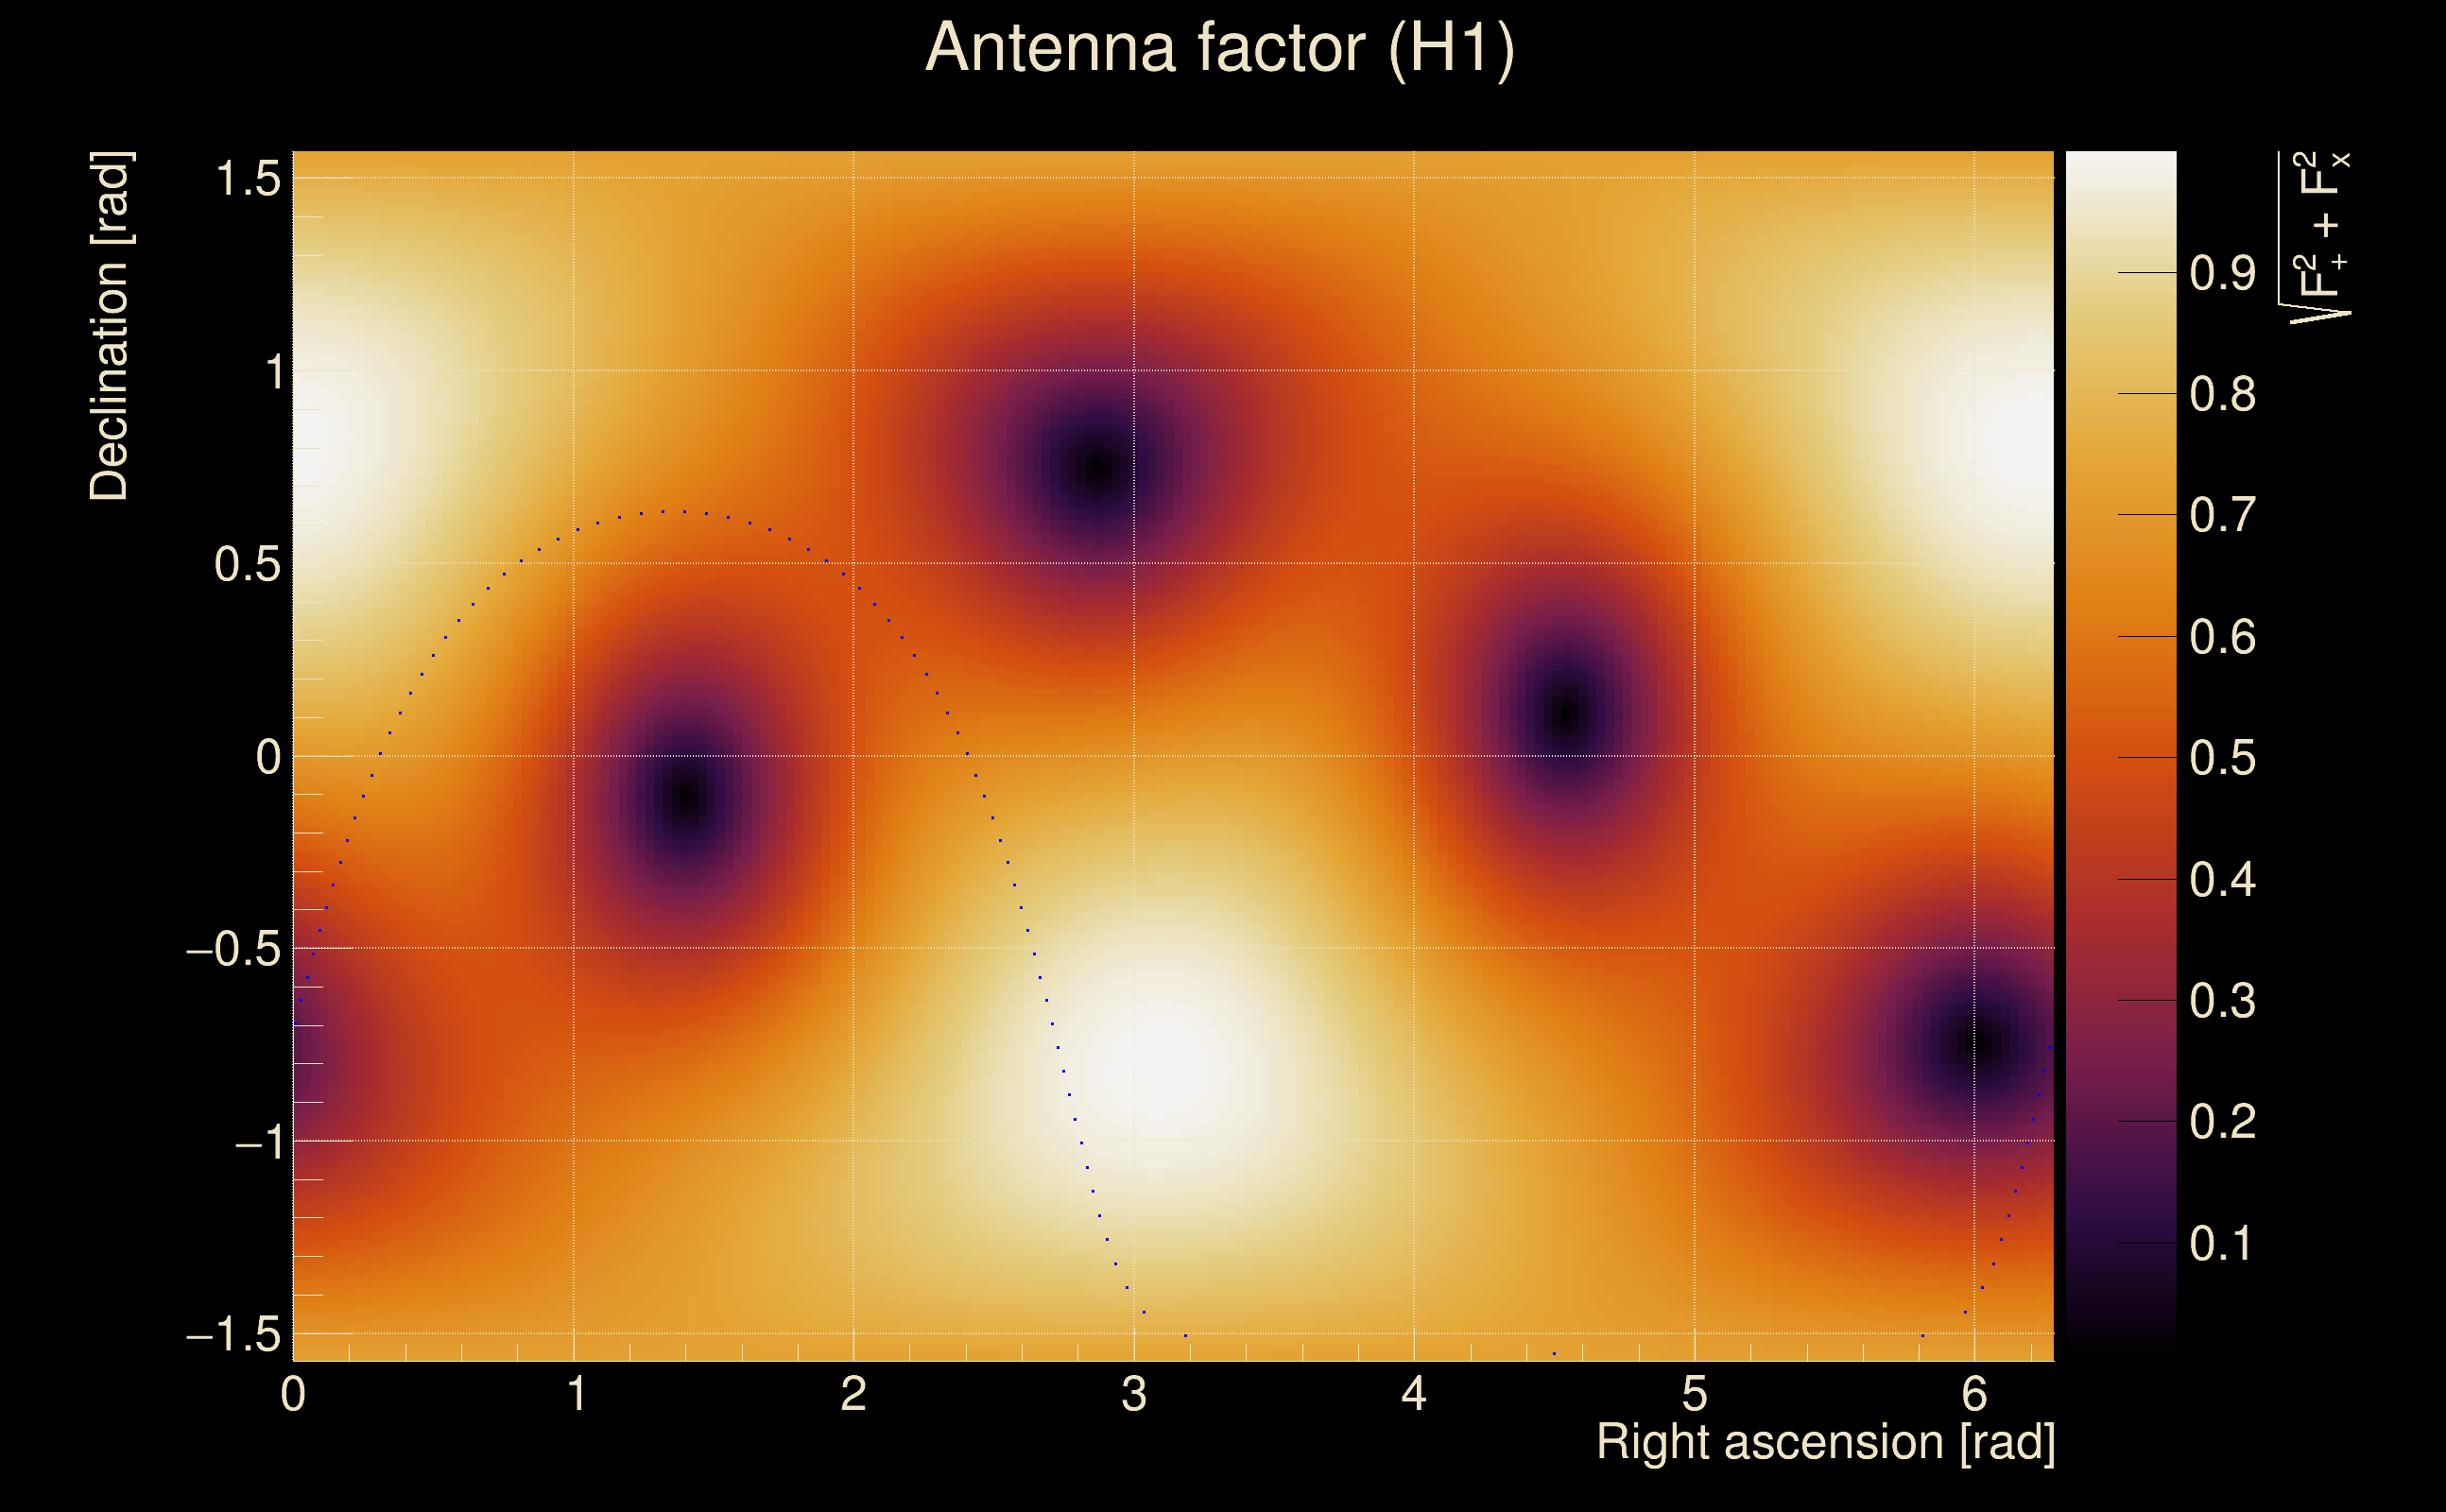
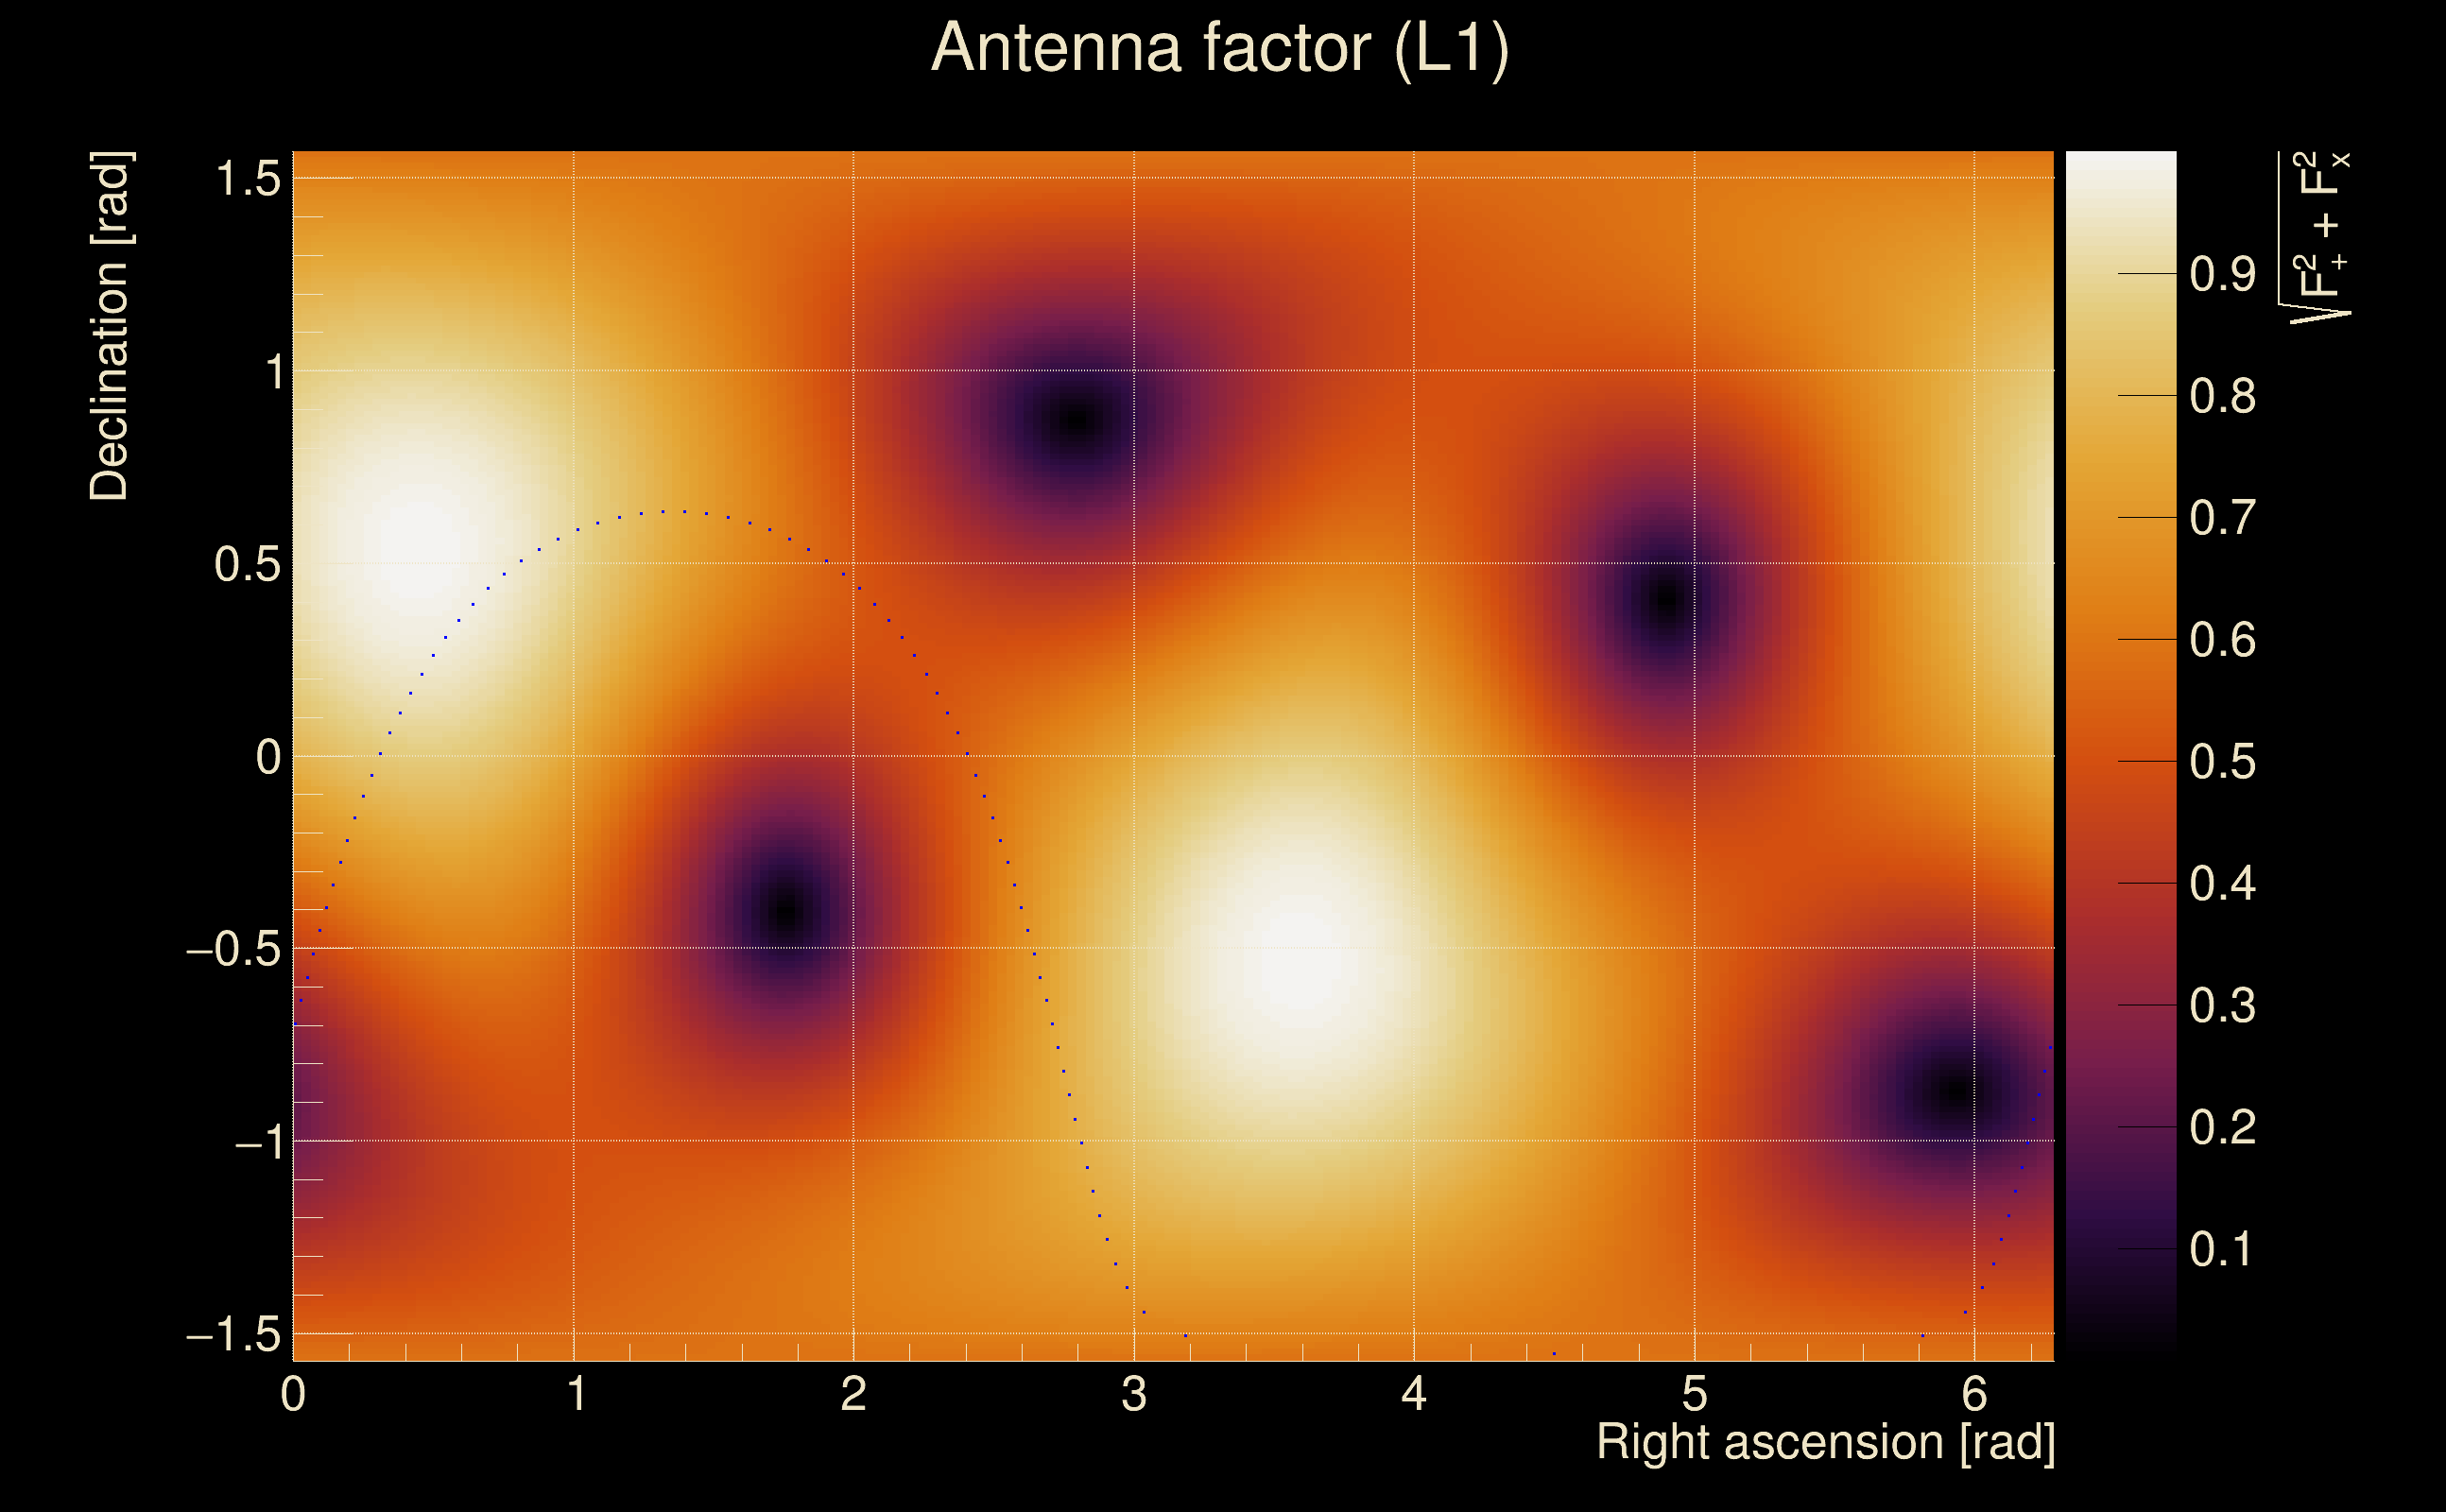
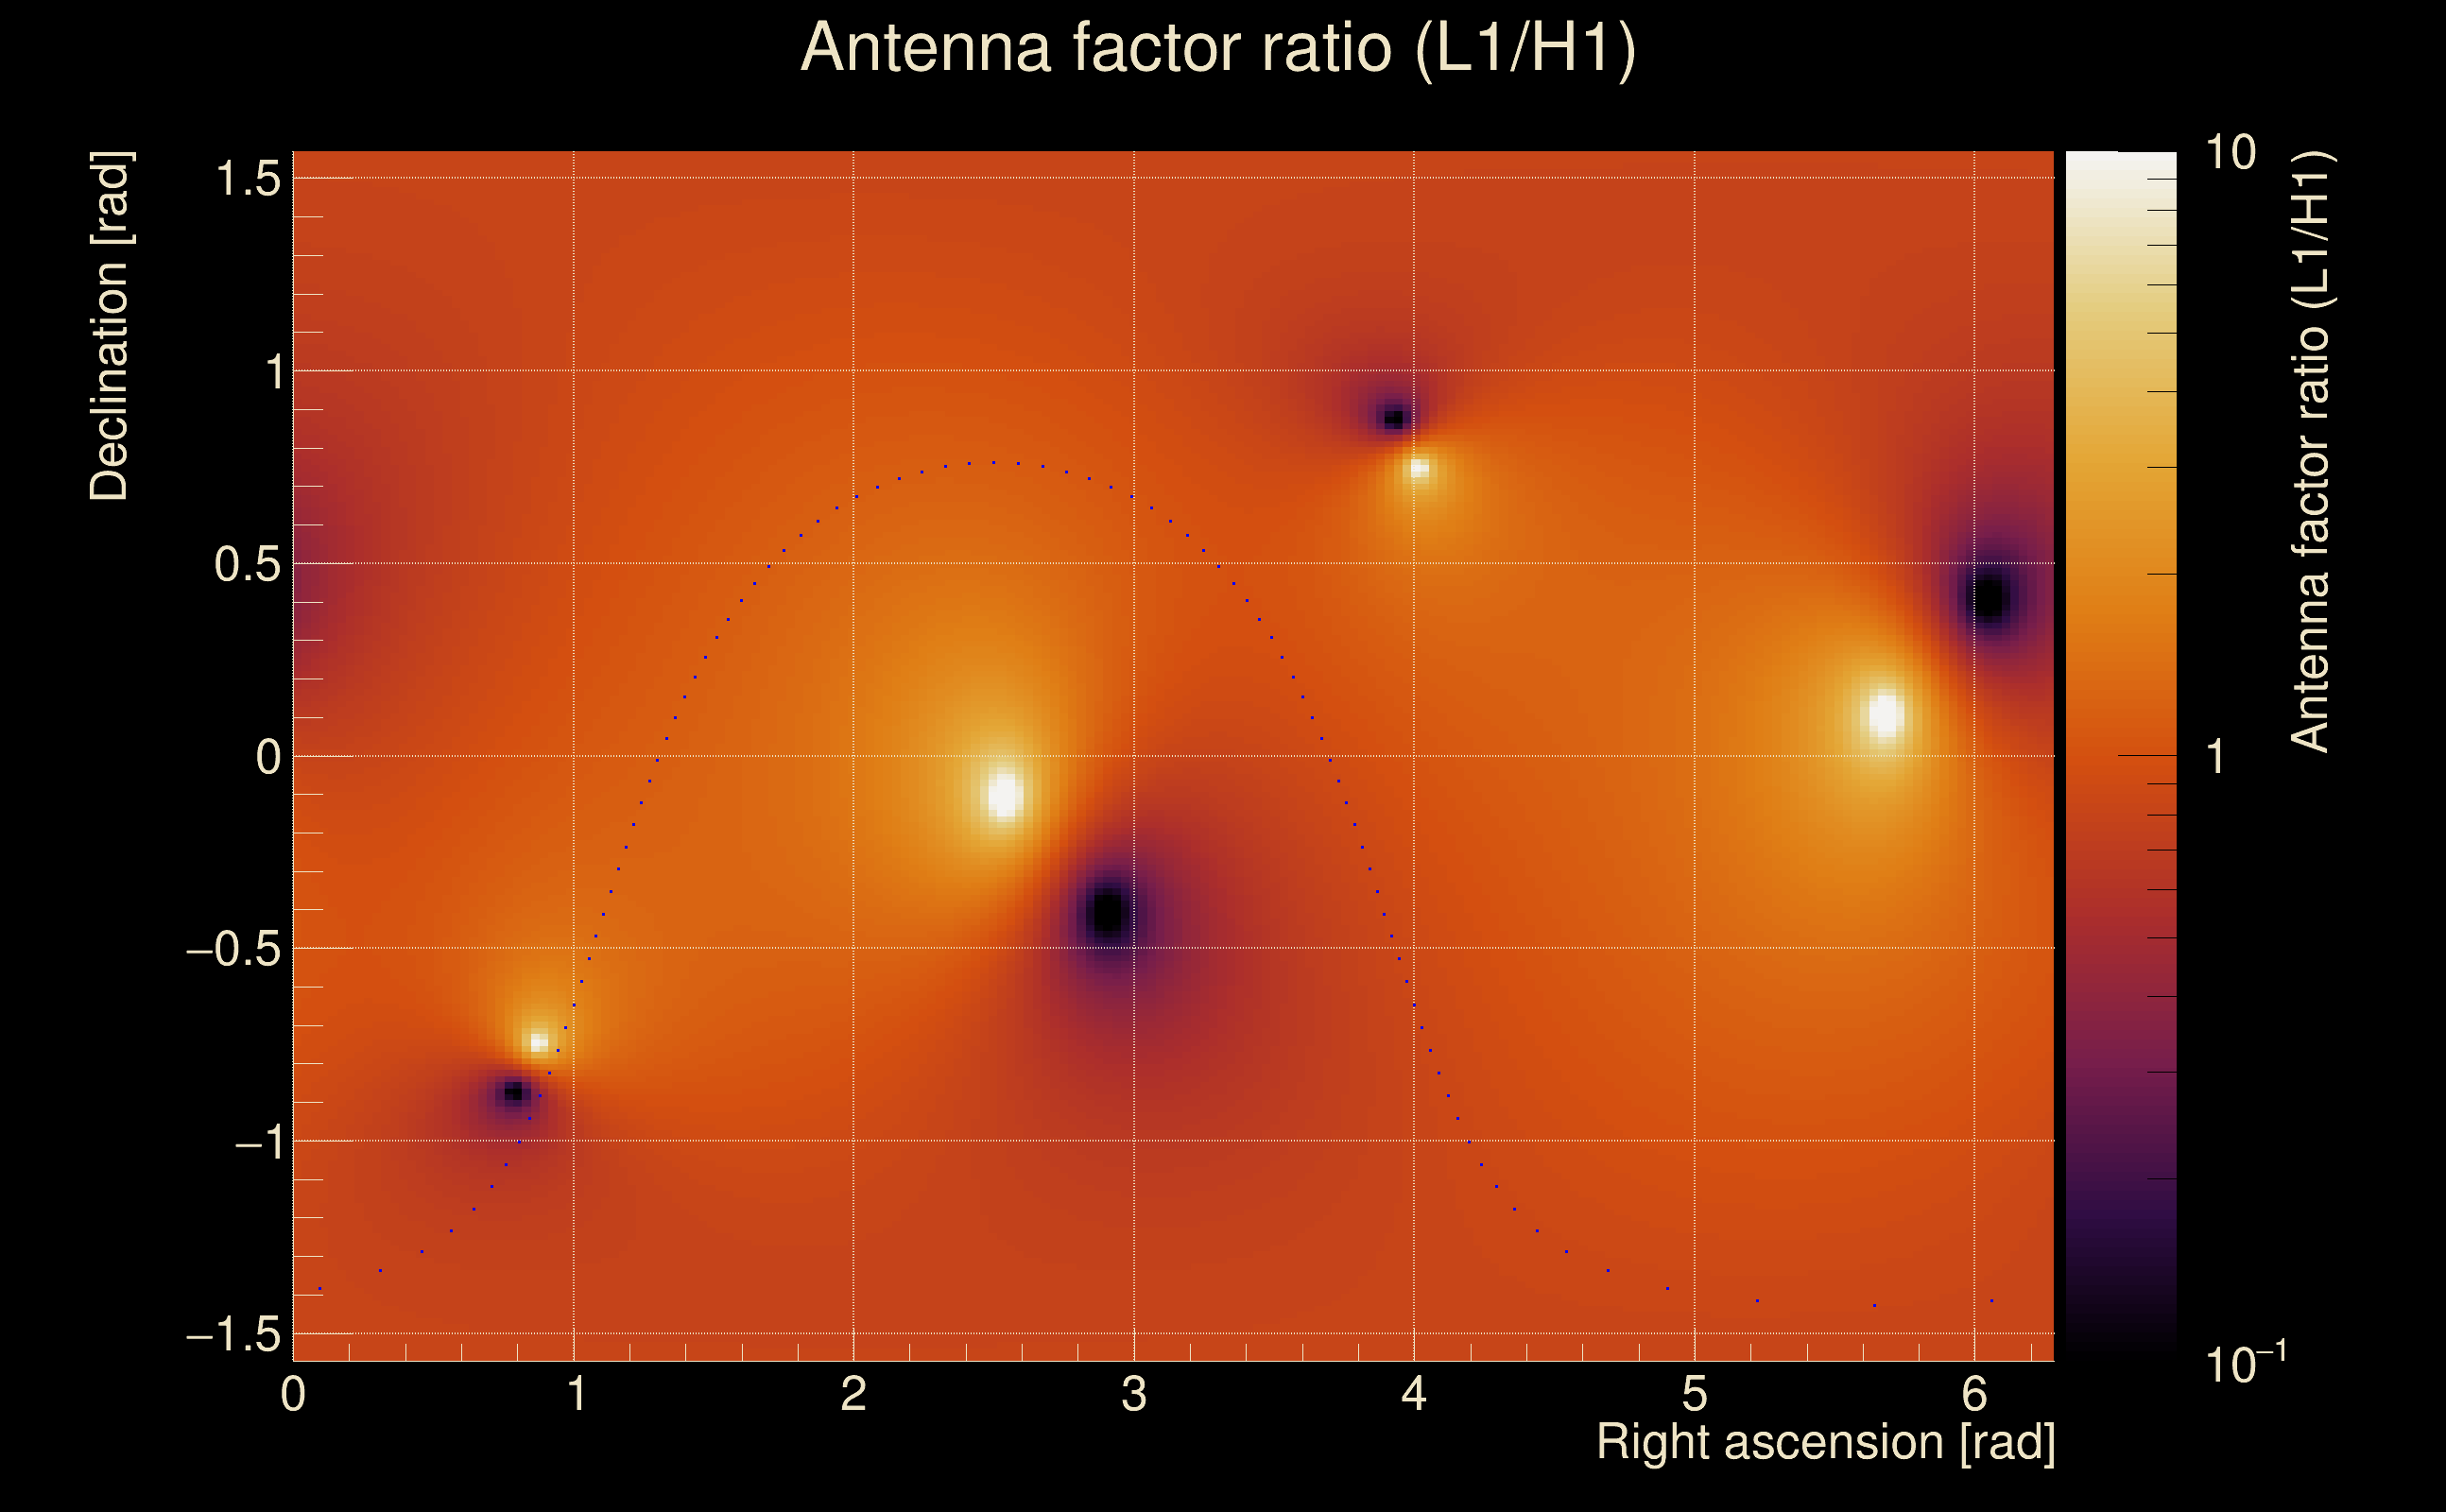
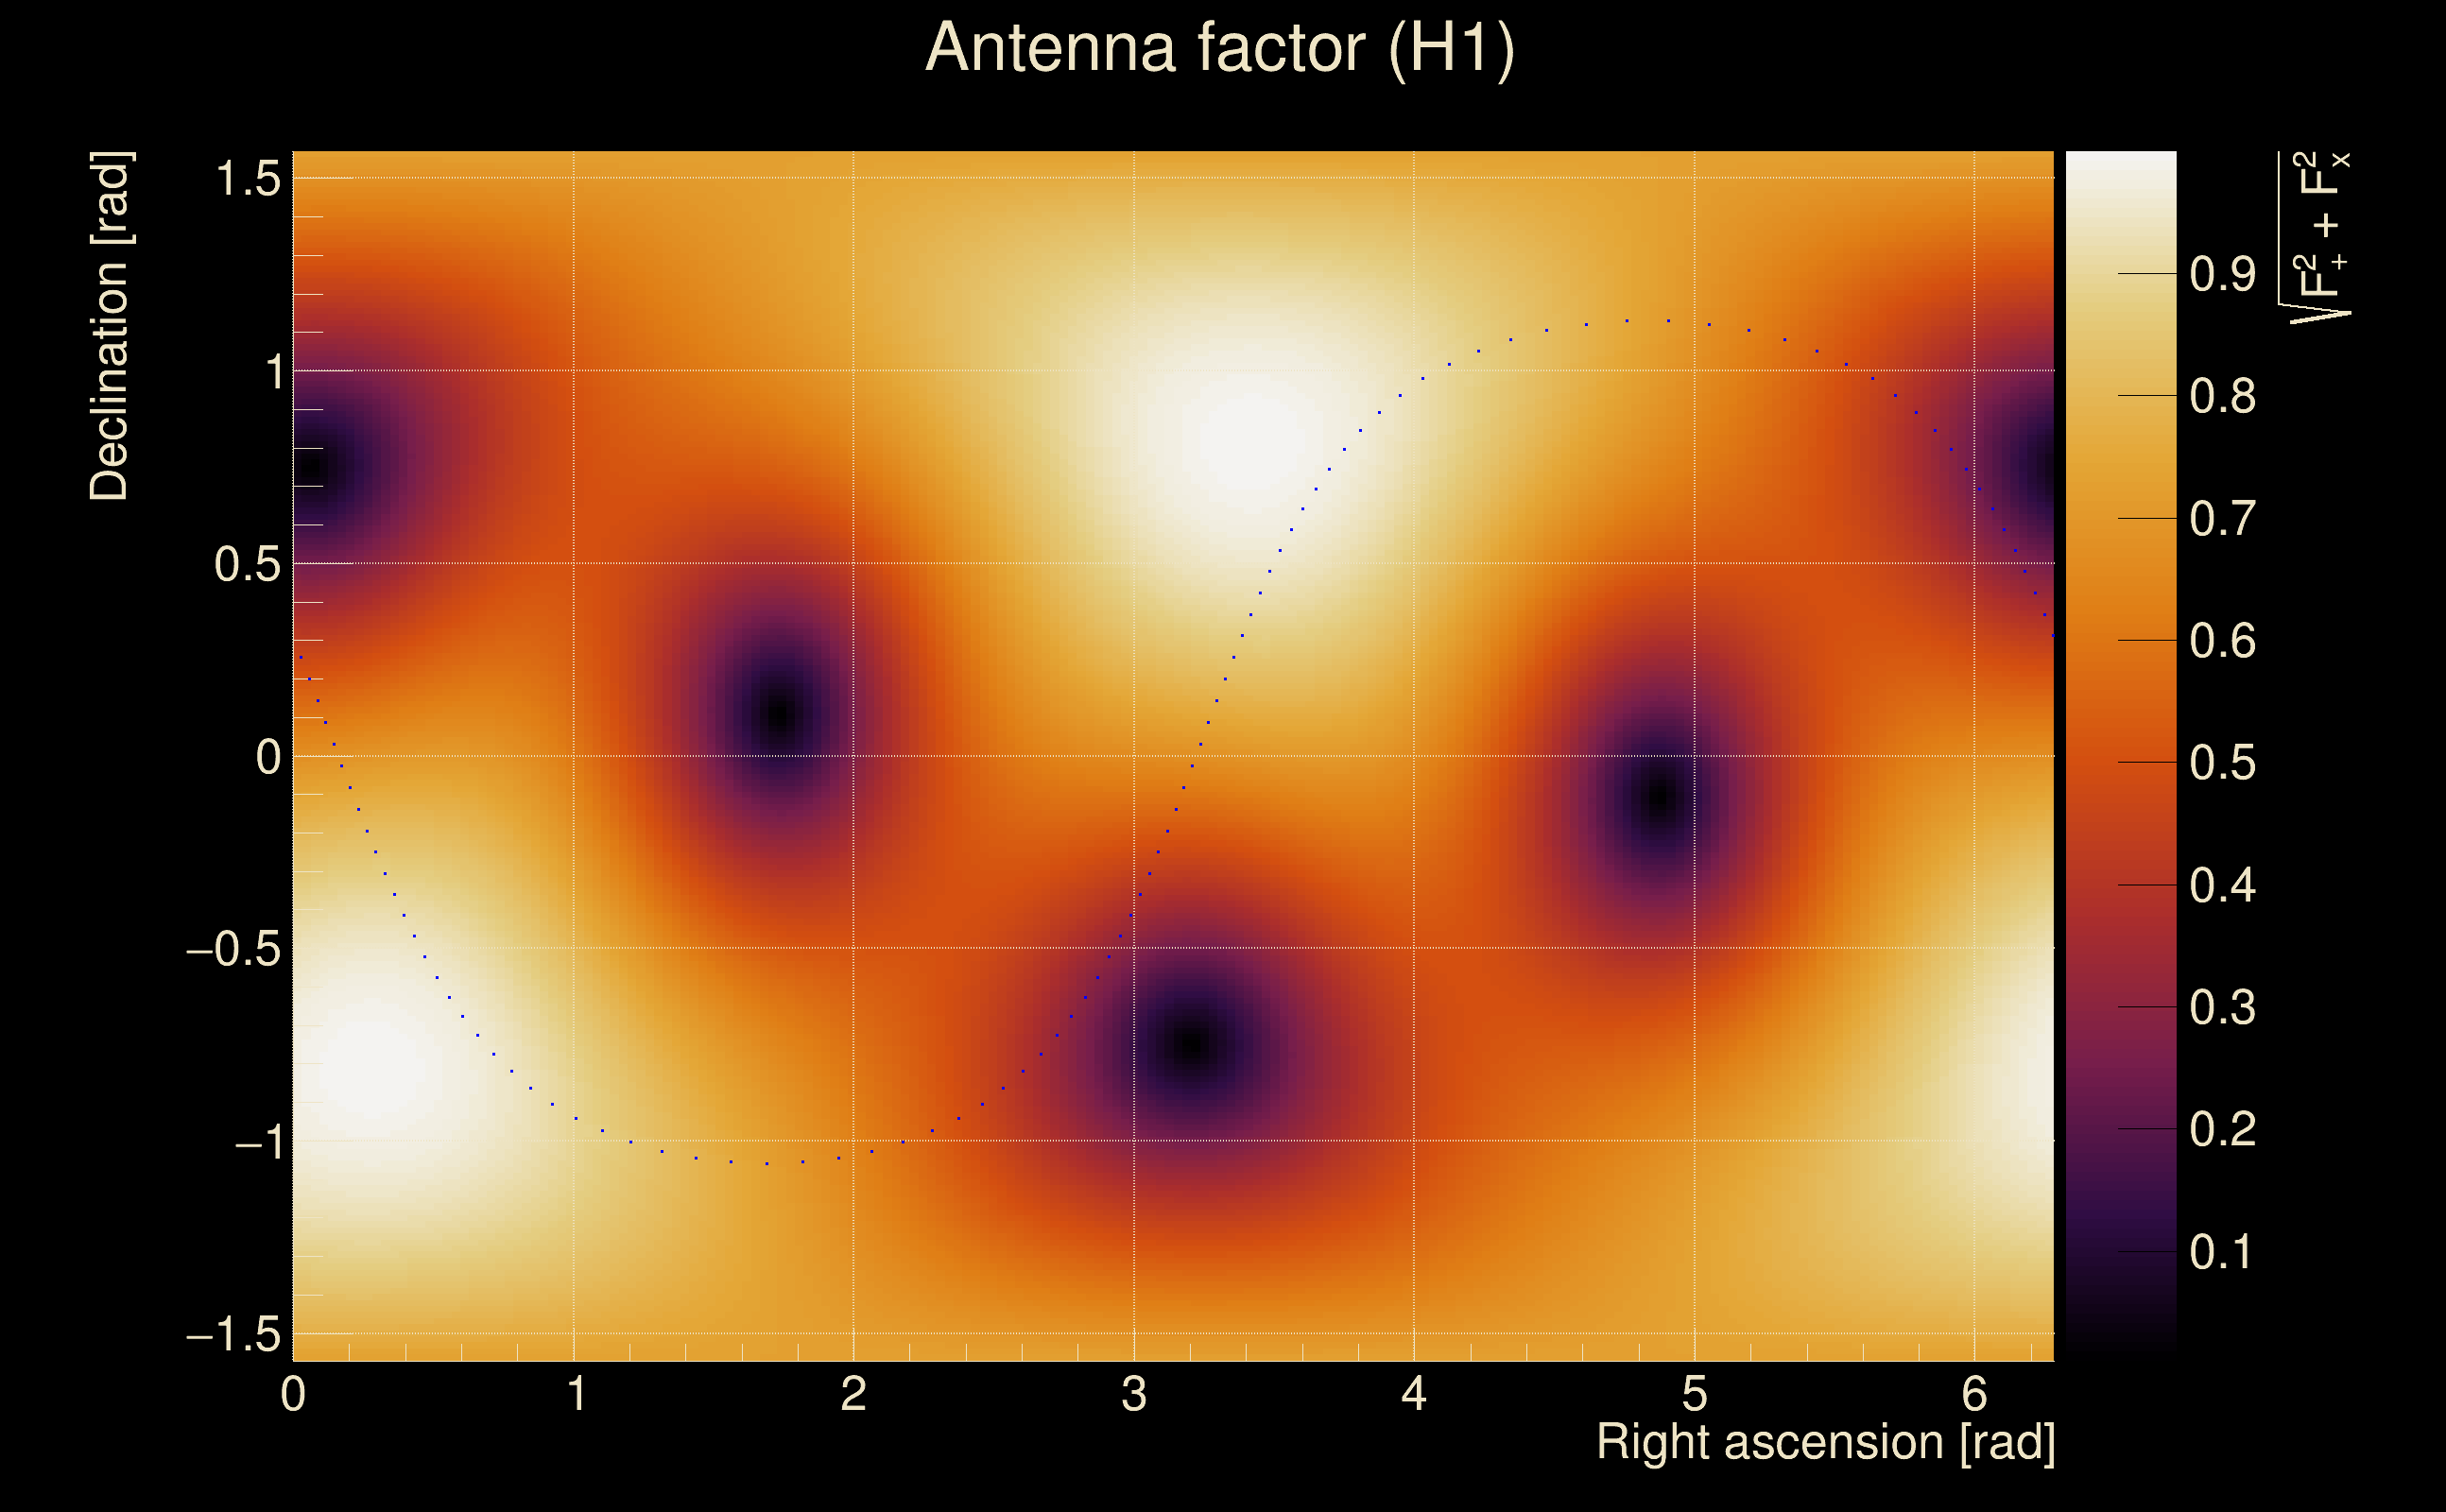
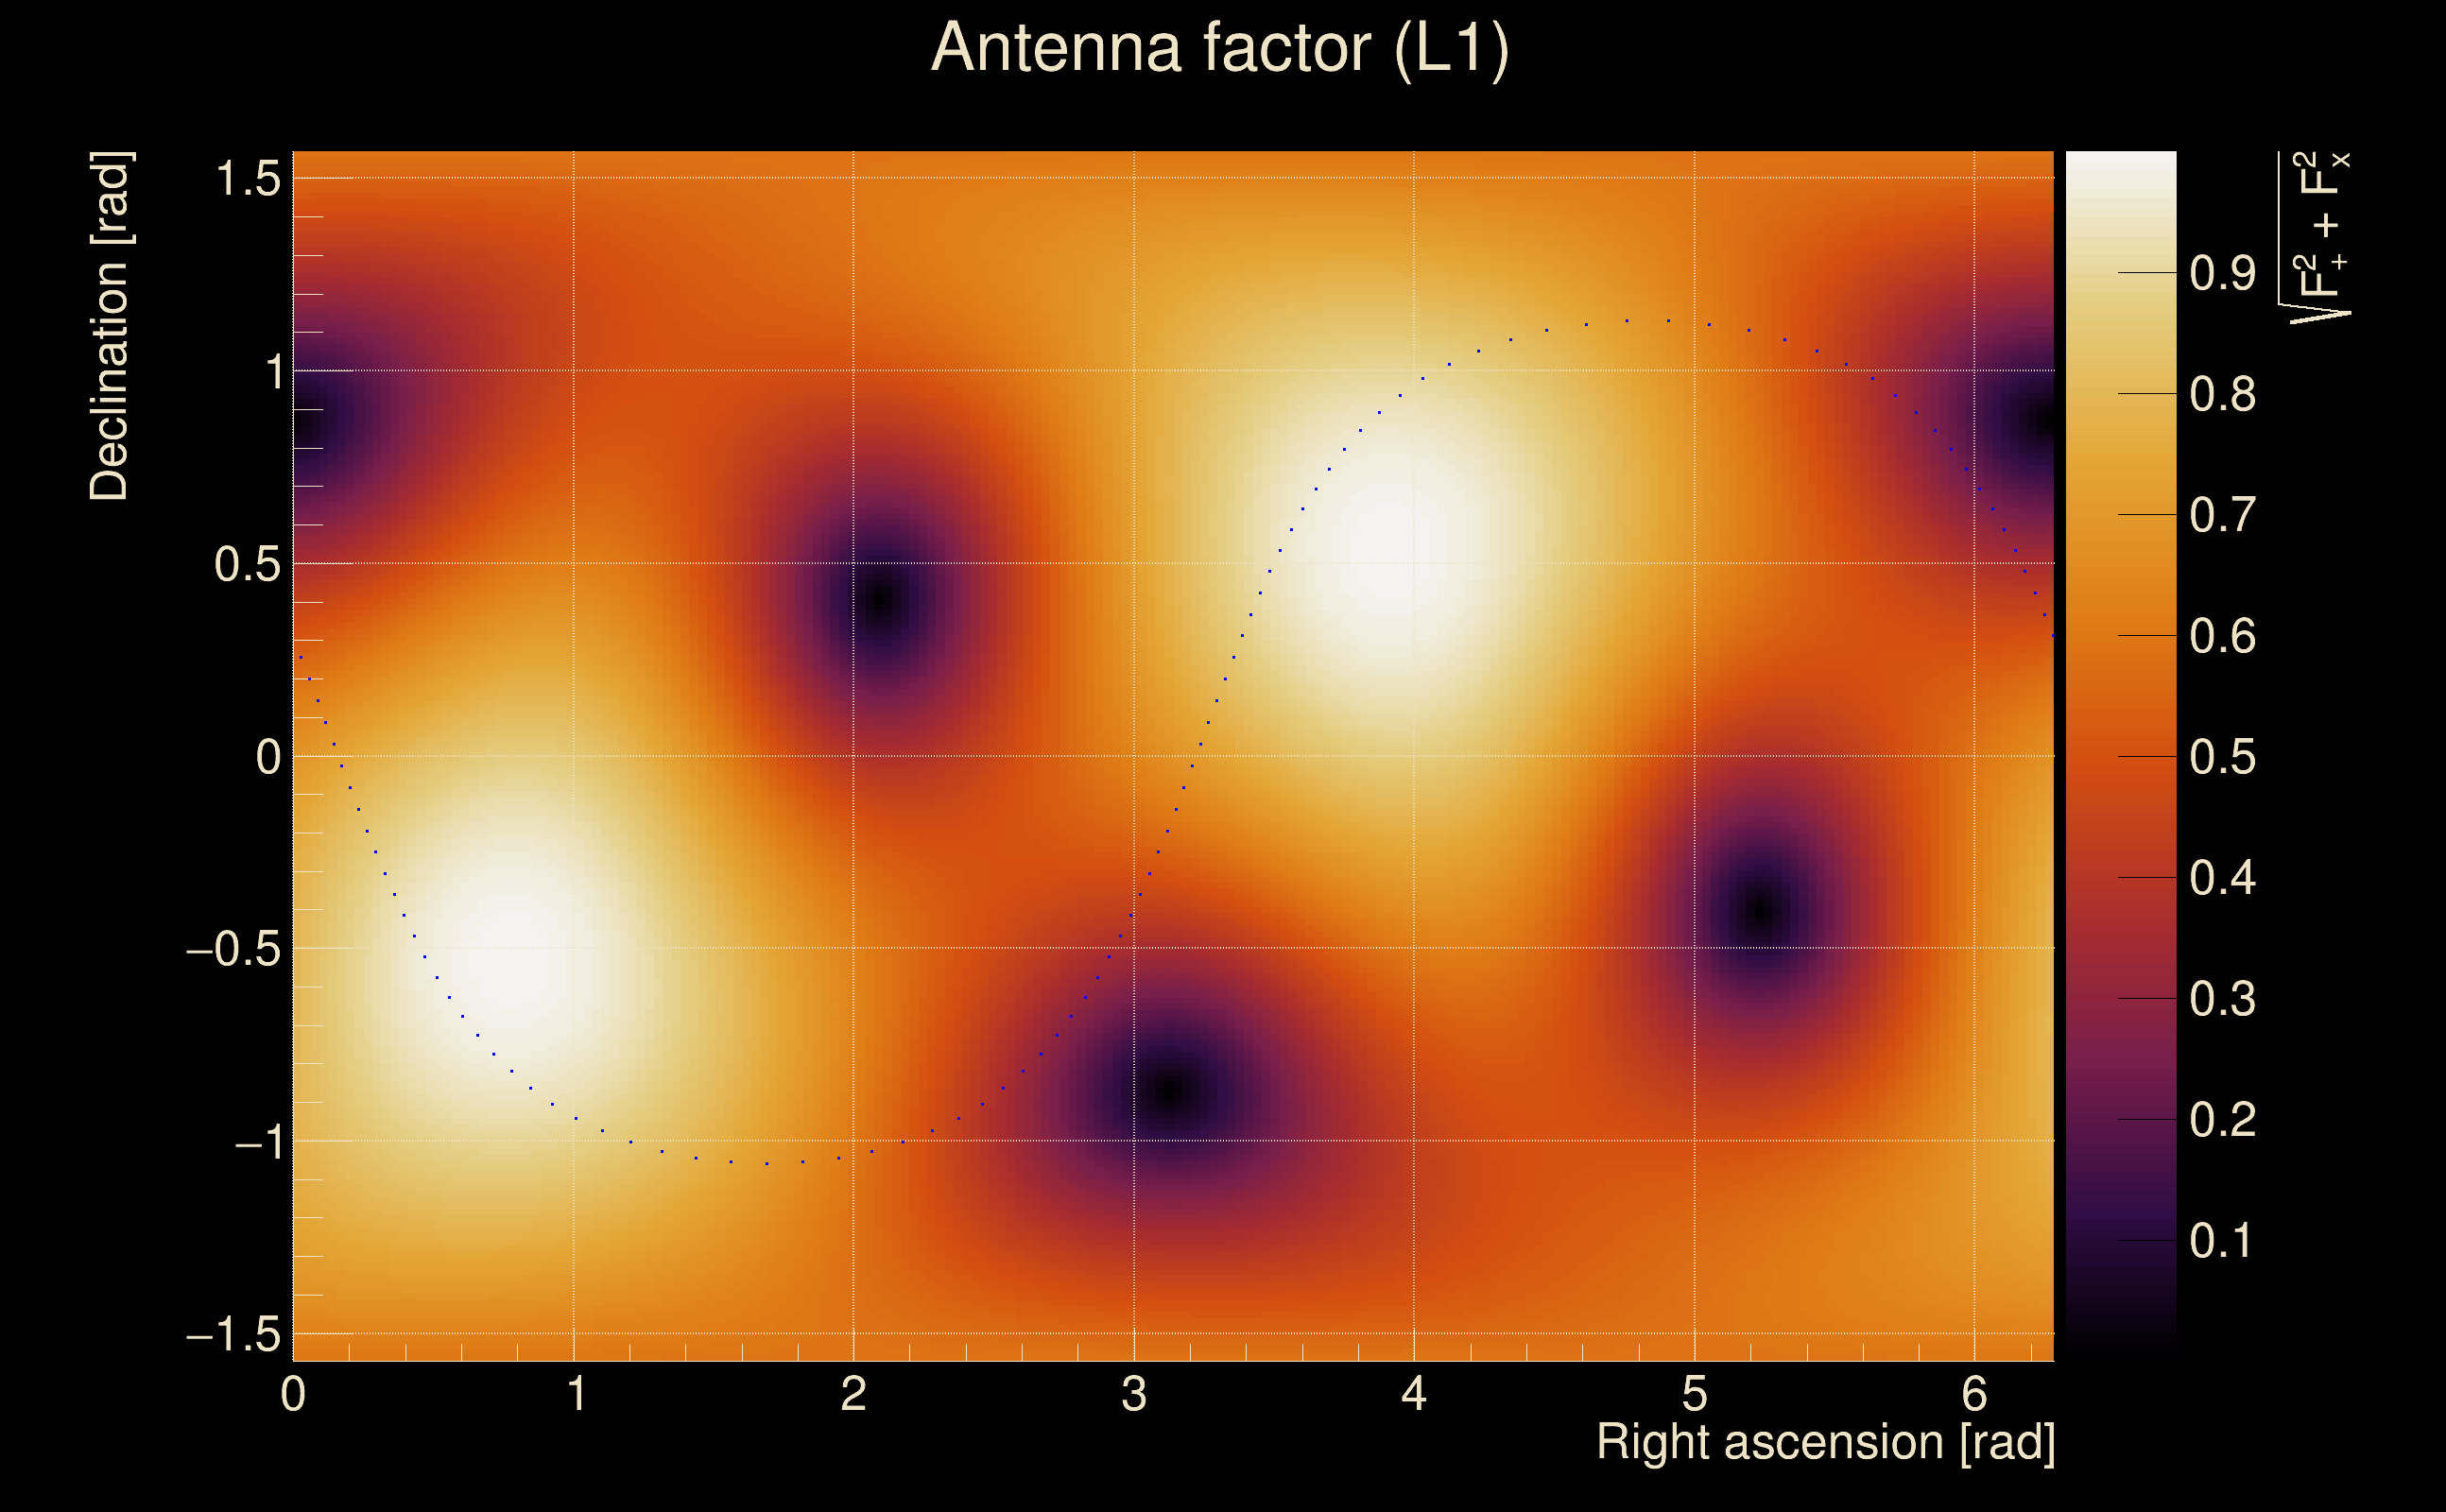
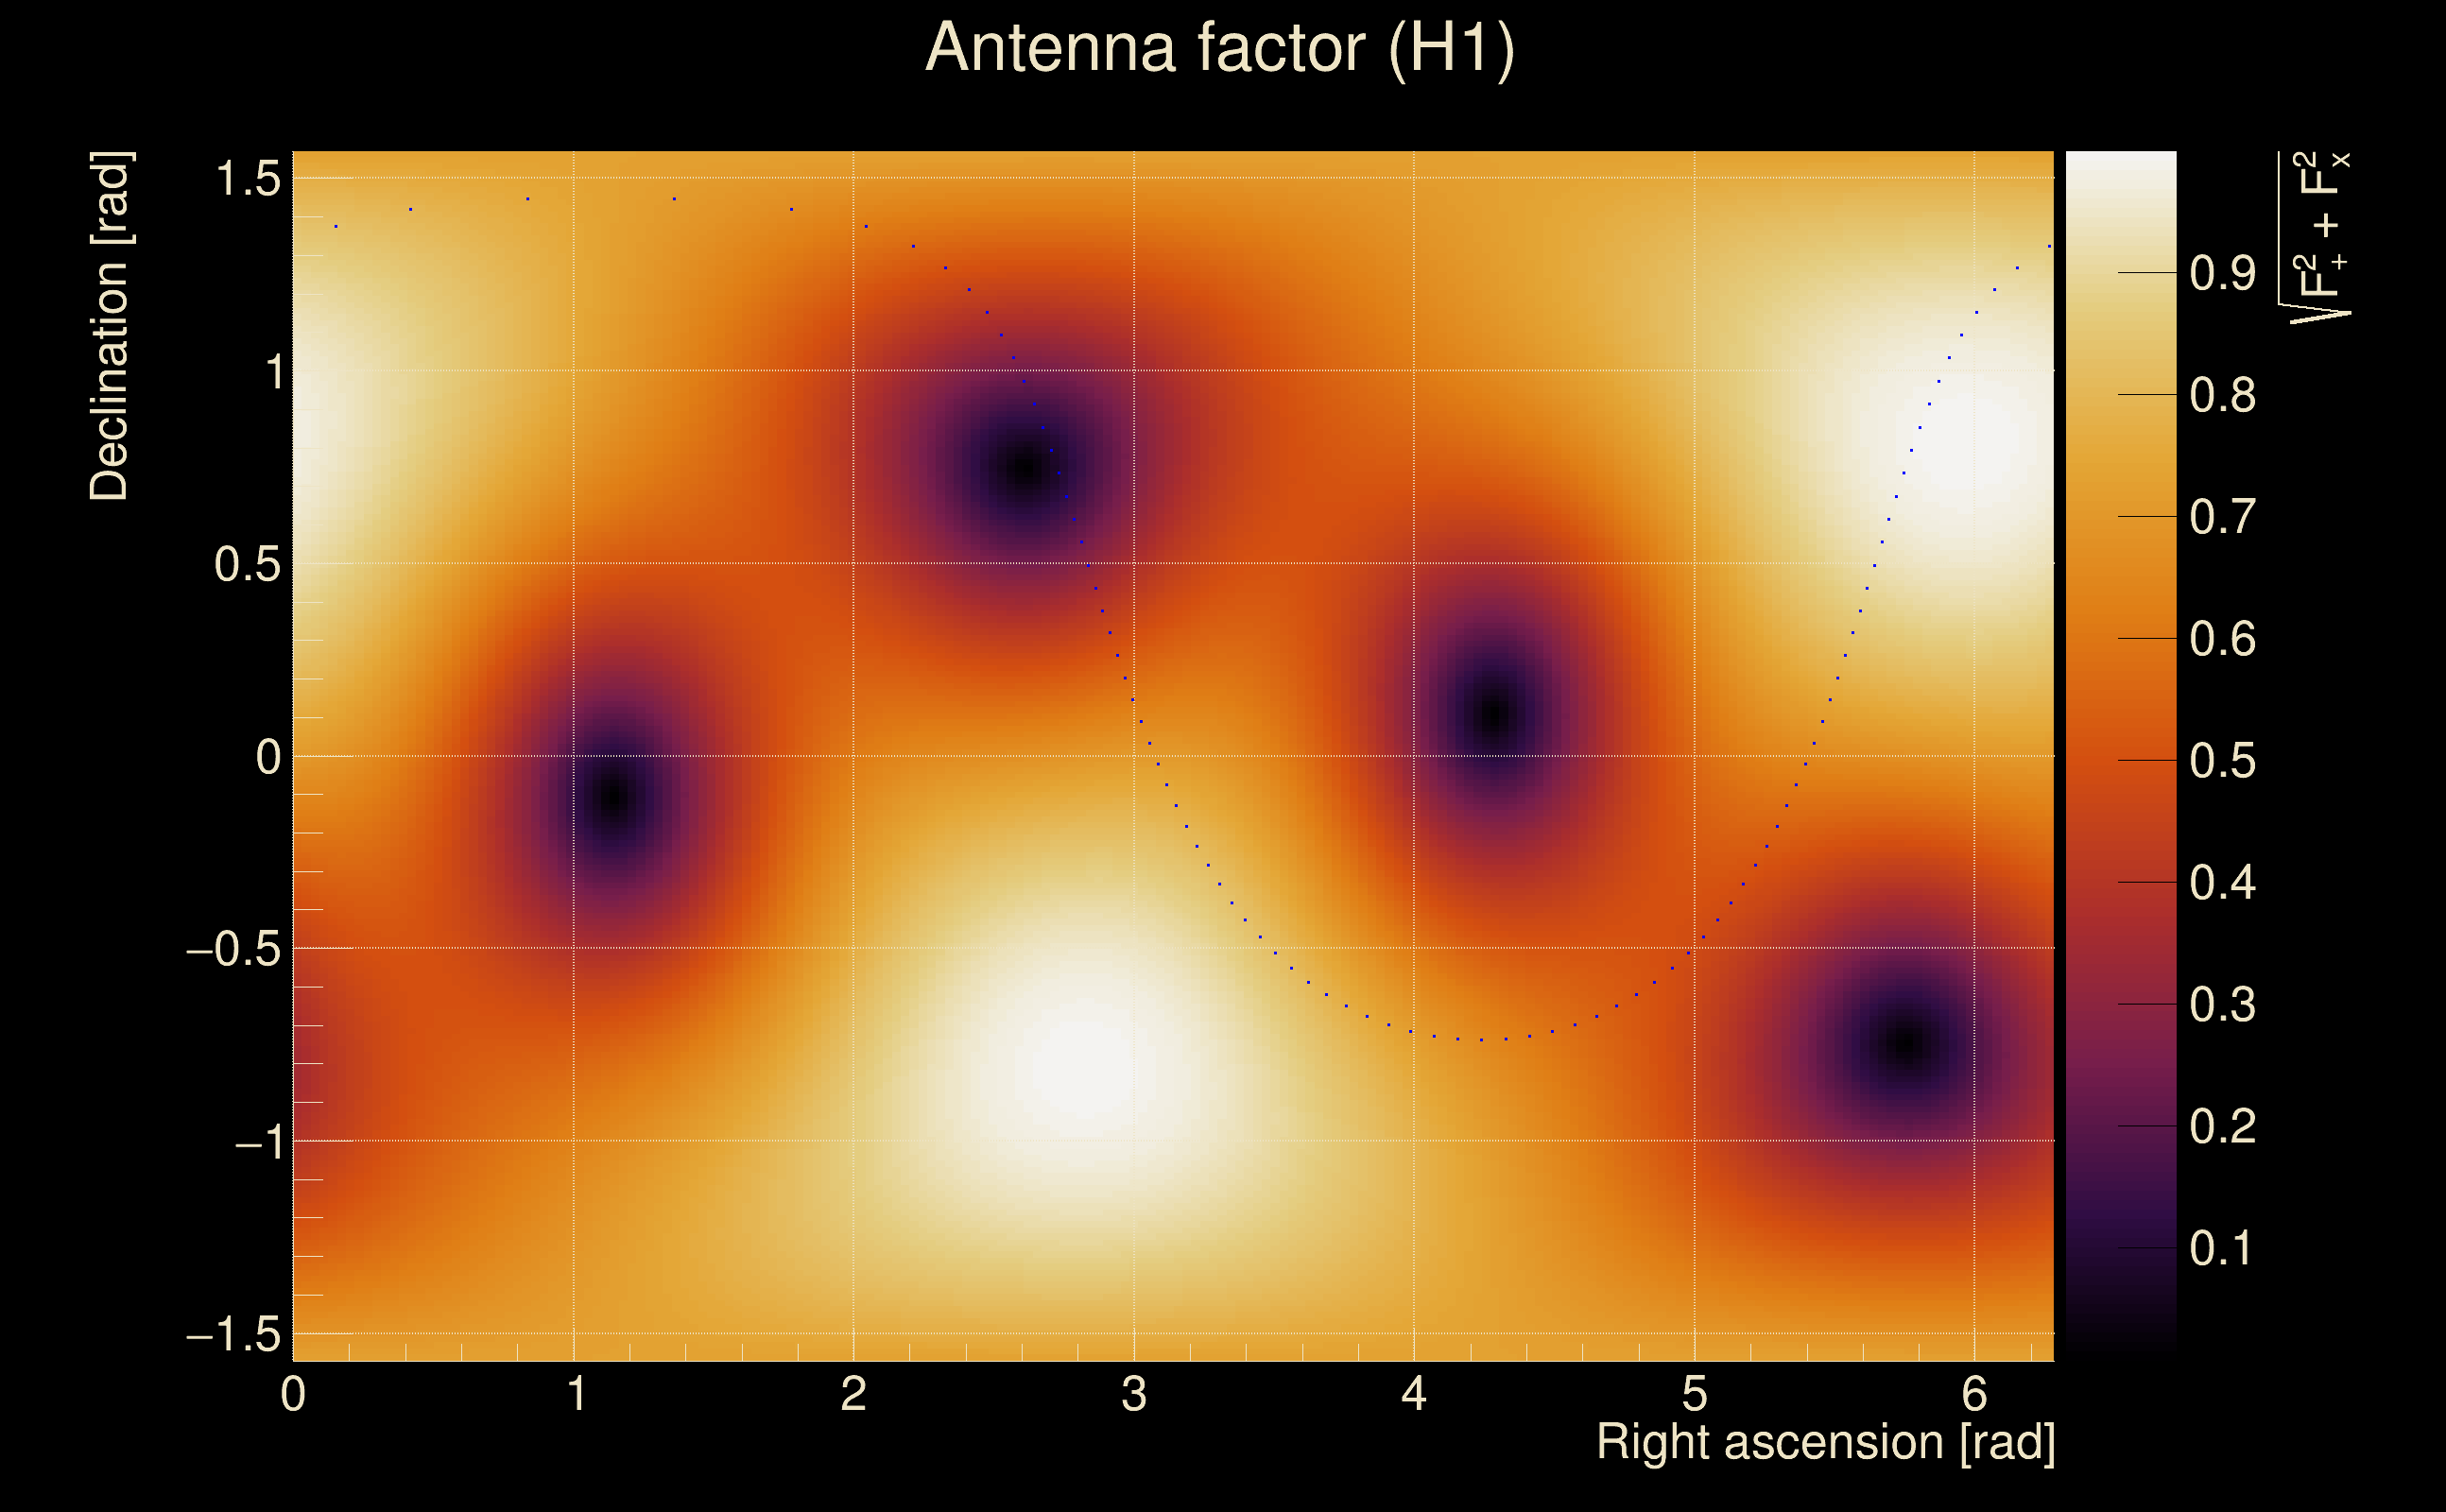
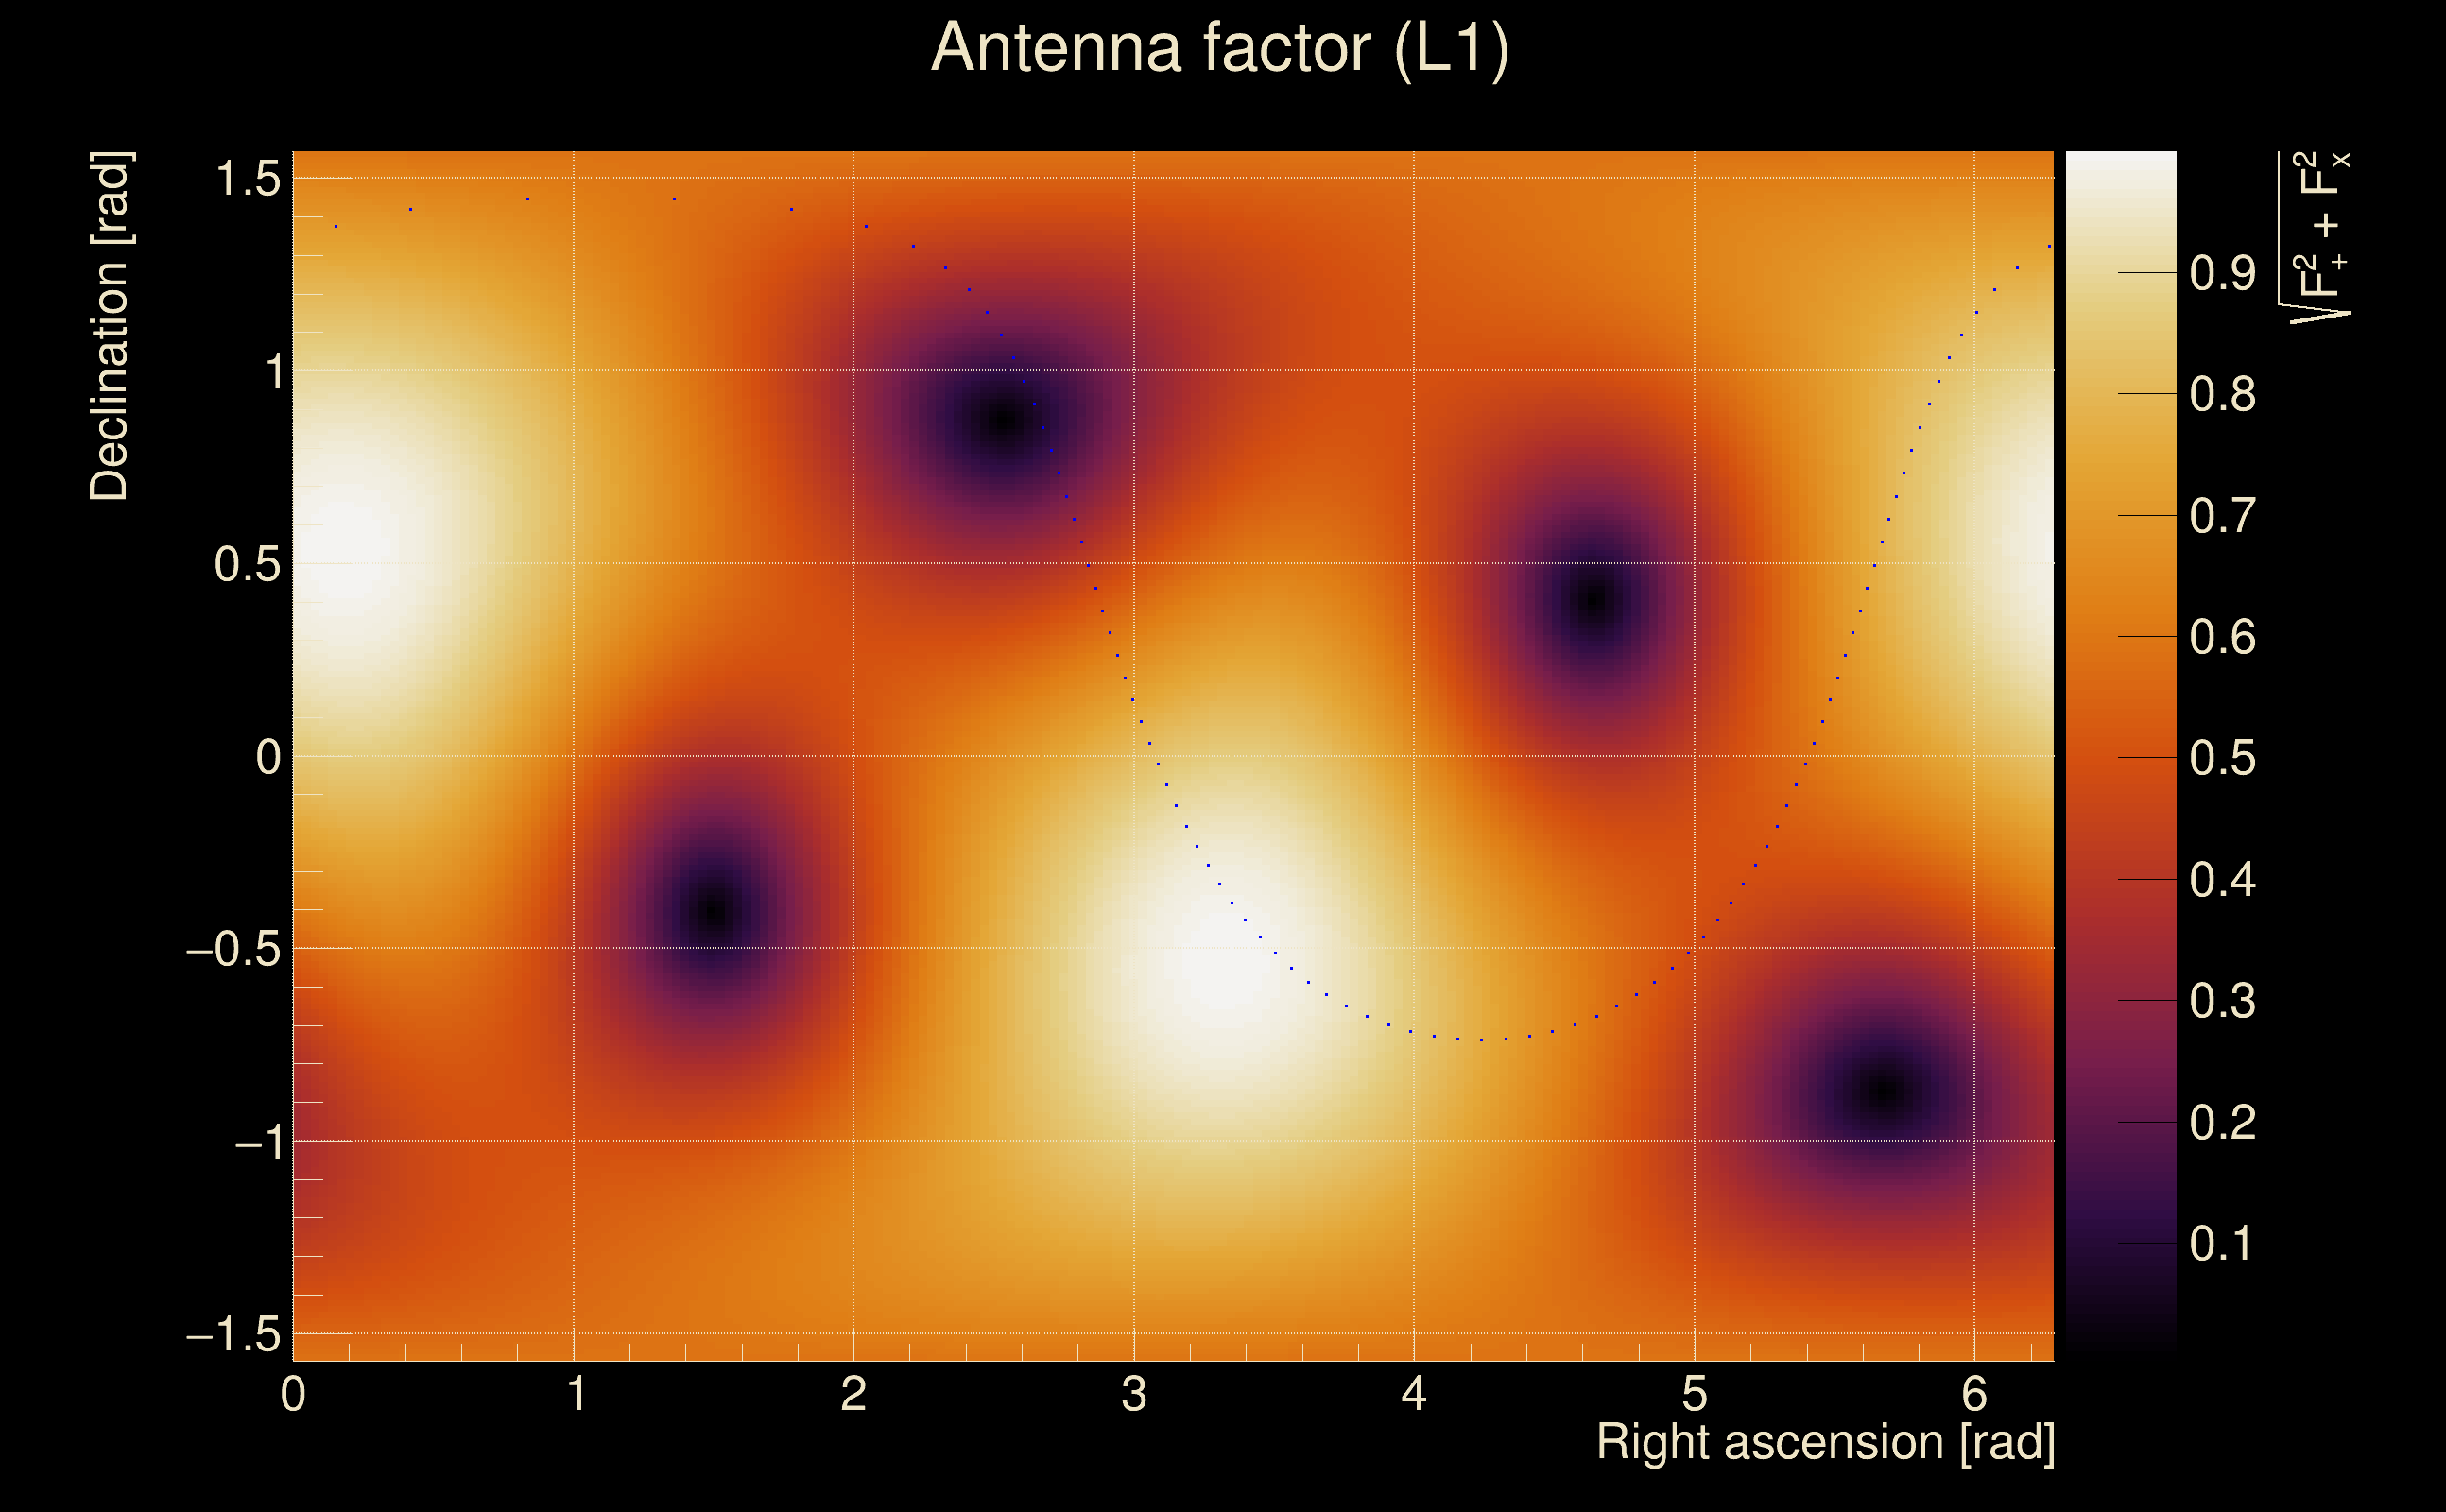
| Target sky positon: | Ra: 10, Dec: 10 [rad] |
| List of input Ox files: | Targ_FirstTest_O4bw_14days_file_list.txt (930 files) |
| Analysis result file: | Targ_FirstTest_O4bw_14days_results-0.root |
| Slice selected for the the fakeground: | slice index=34 (3.404 s), time lag = 0 s |
| Foreground | Fakeground | Background | ||
|---|---|---|---|---|
| Number of processed ox events | 175167 | 175167 | 37660905 | |
| Start Date (detector 0) | Sat Sep 2 04:54:54 2023 UTC | Sat Sep 2 04:54:54 2023 UTC | Sat Sep 2 04:54:54 2023 UTC | |
| End Date (detector 0) | Sun Sep 17 00:01:47 2023 UTC | Sun Sep 17 00:01:47 2023 UTC | Sun Sep 17 00:01:47 2023 UTC | |
| Start GPS (detector 0) | 1377665712 | 1377665712 | 1377665712 | |
| End GPS (detector 0) | 1378944125 | 1378944125 | 1378944125 | |
| Used livetime (detector 0) | 880485 s | 880485 s | 880485 s | |
| Start Date (detector 1) | Sat Sep 2 04:54:54 2023 UTC | Sat Sep 2 04:54:54 2023 UTC | Sat Sep 2 04:54:54 2023 UTC | |
| End Date (detector 1) | Sun Sep 17 00:01:47 2023 UTC | Sun Sep 17 00:01:47 2023 UTC | Sun Sep 17 00:01:47 2023 UTC | |
| Start GPS (detector 1) | 1377665712 | 1377665712 | 1377665712 | |
| End GPS (detector 1) | 1378944125 | 1378944125 | 1378944125 | |
| Used livetime (detector 1) | 880485 s | 880485 s | 880485 s | |
| Cumulative livetime | 1751670 s | 1751670 s | 376609050 s | |
| 0 years, 20 days, 6 hours, 34 min, 30 s | 0 years, 20 days, 6 hours, 34 min, 30 s | 11 years, 341 days, 21 hours, 37 min, 30 s |
|
|
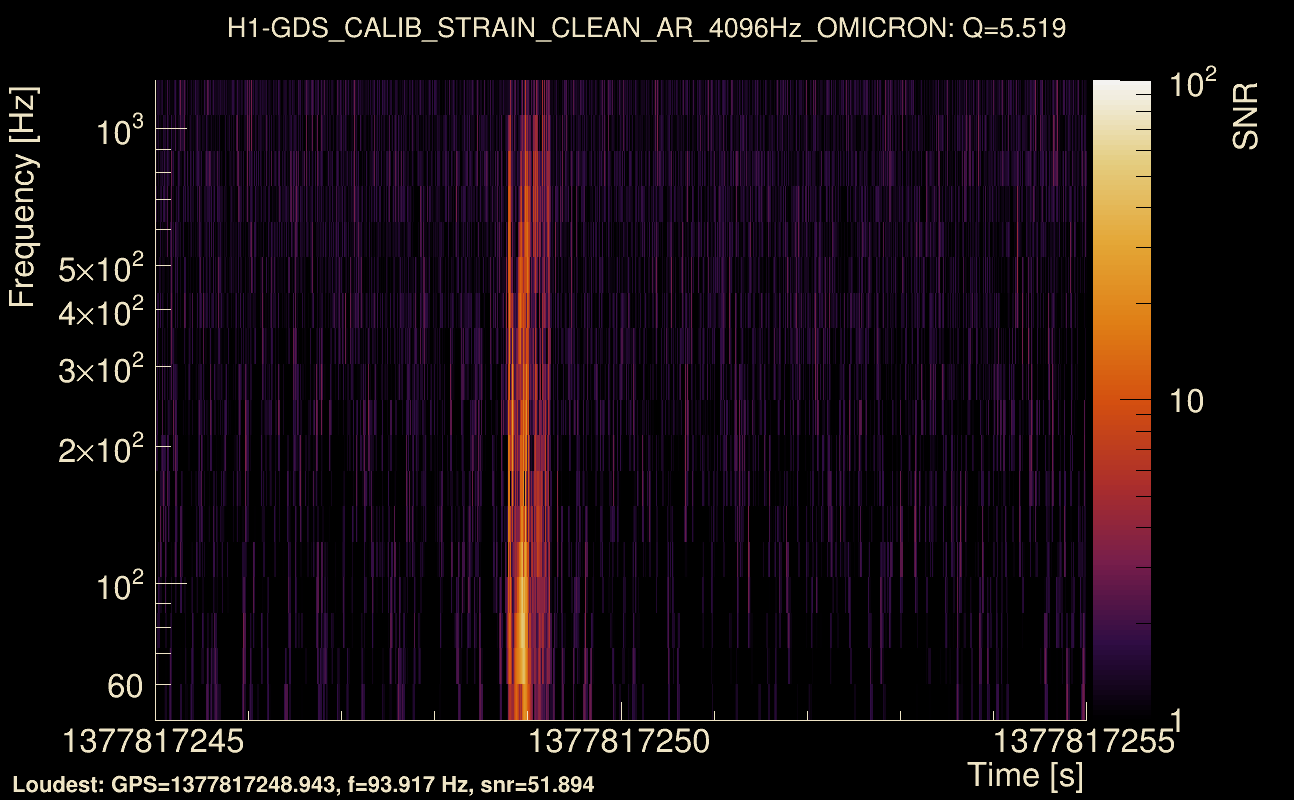
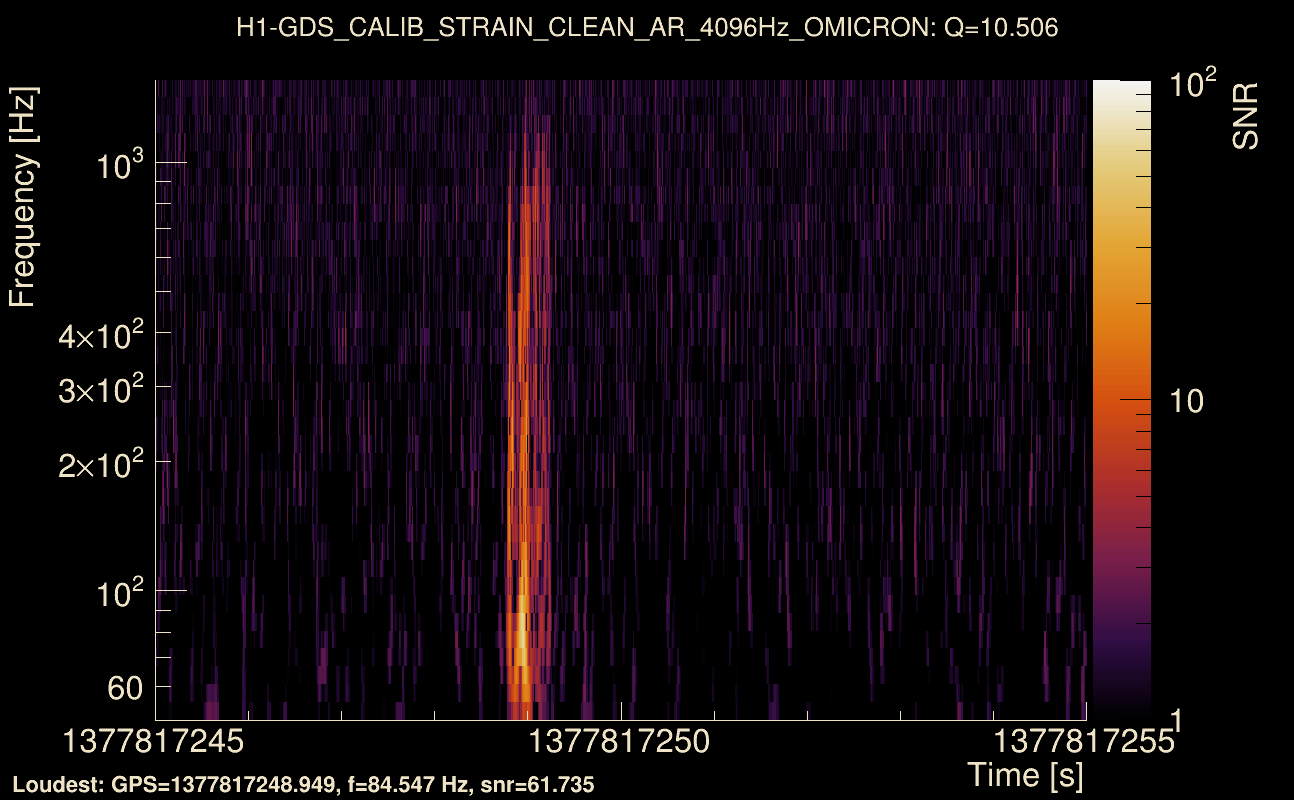
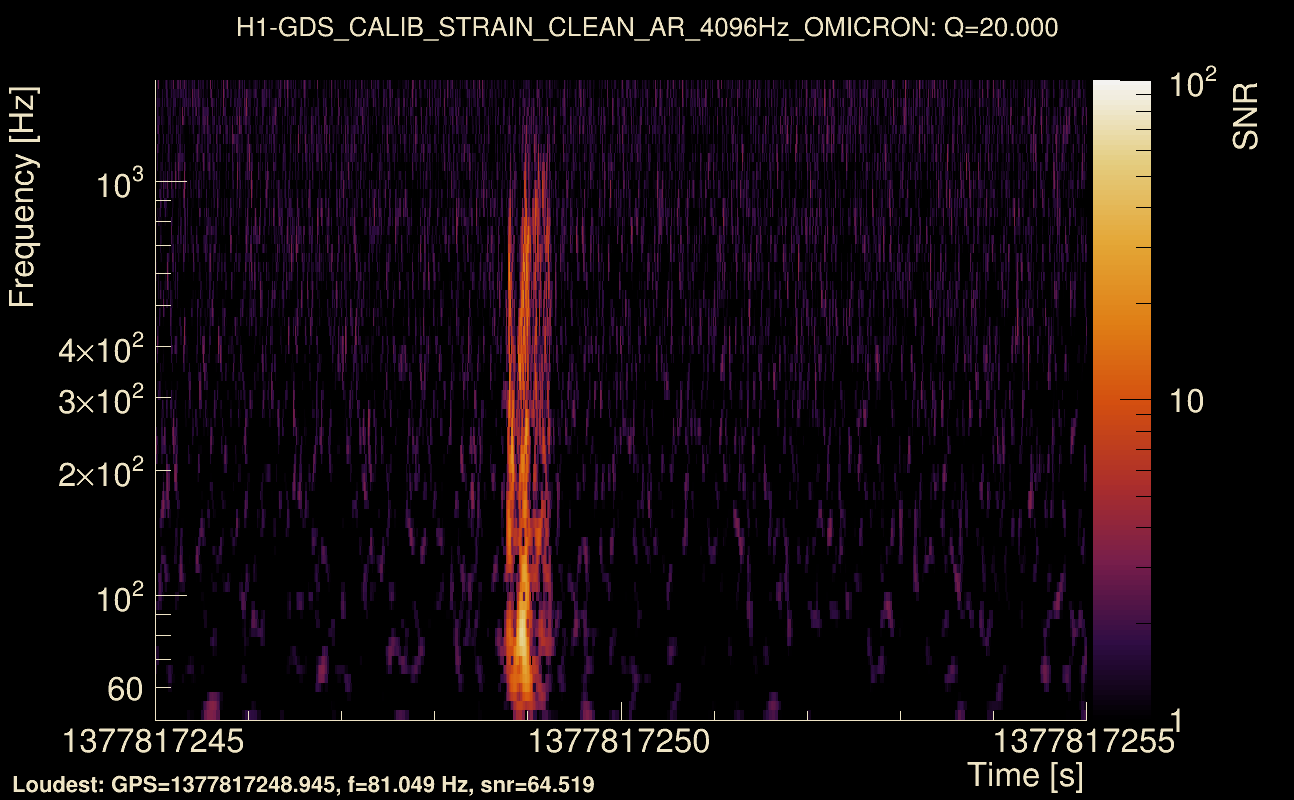
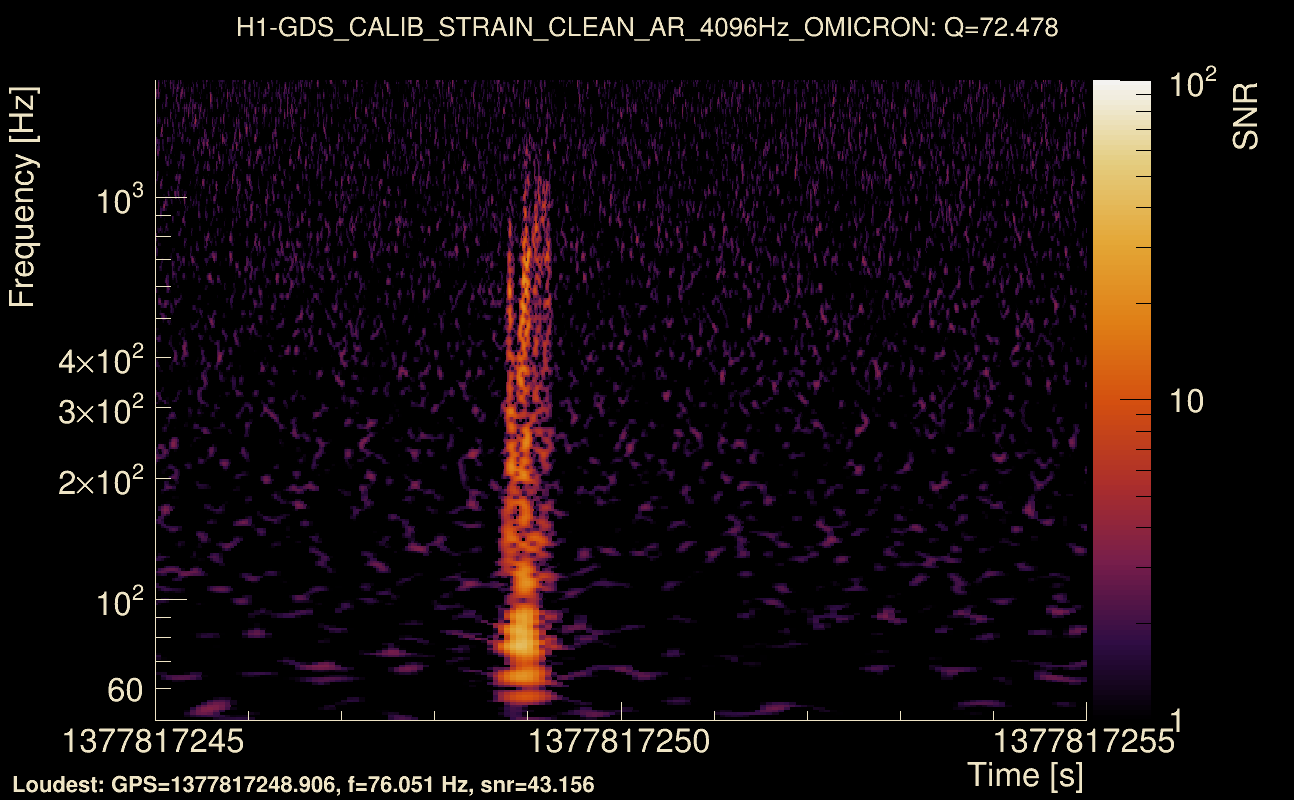
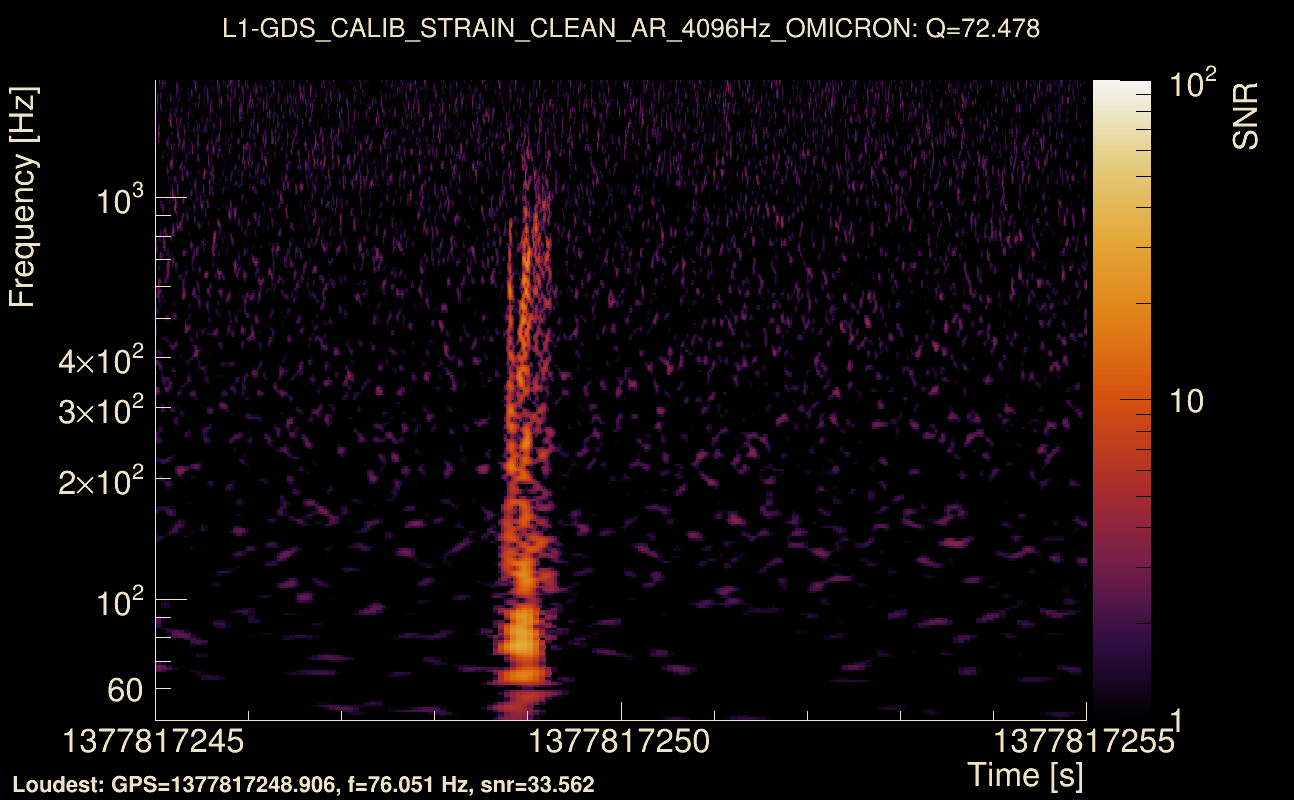
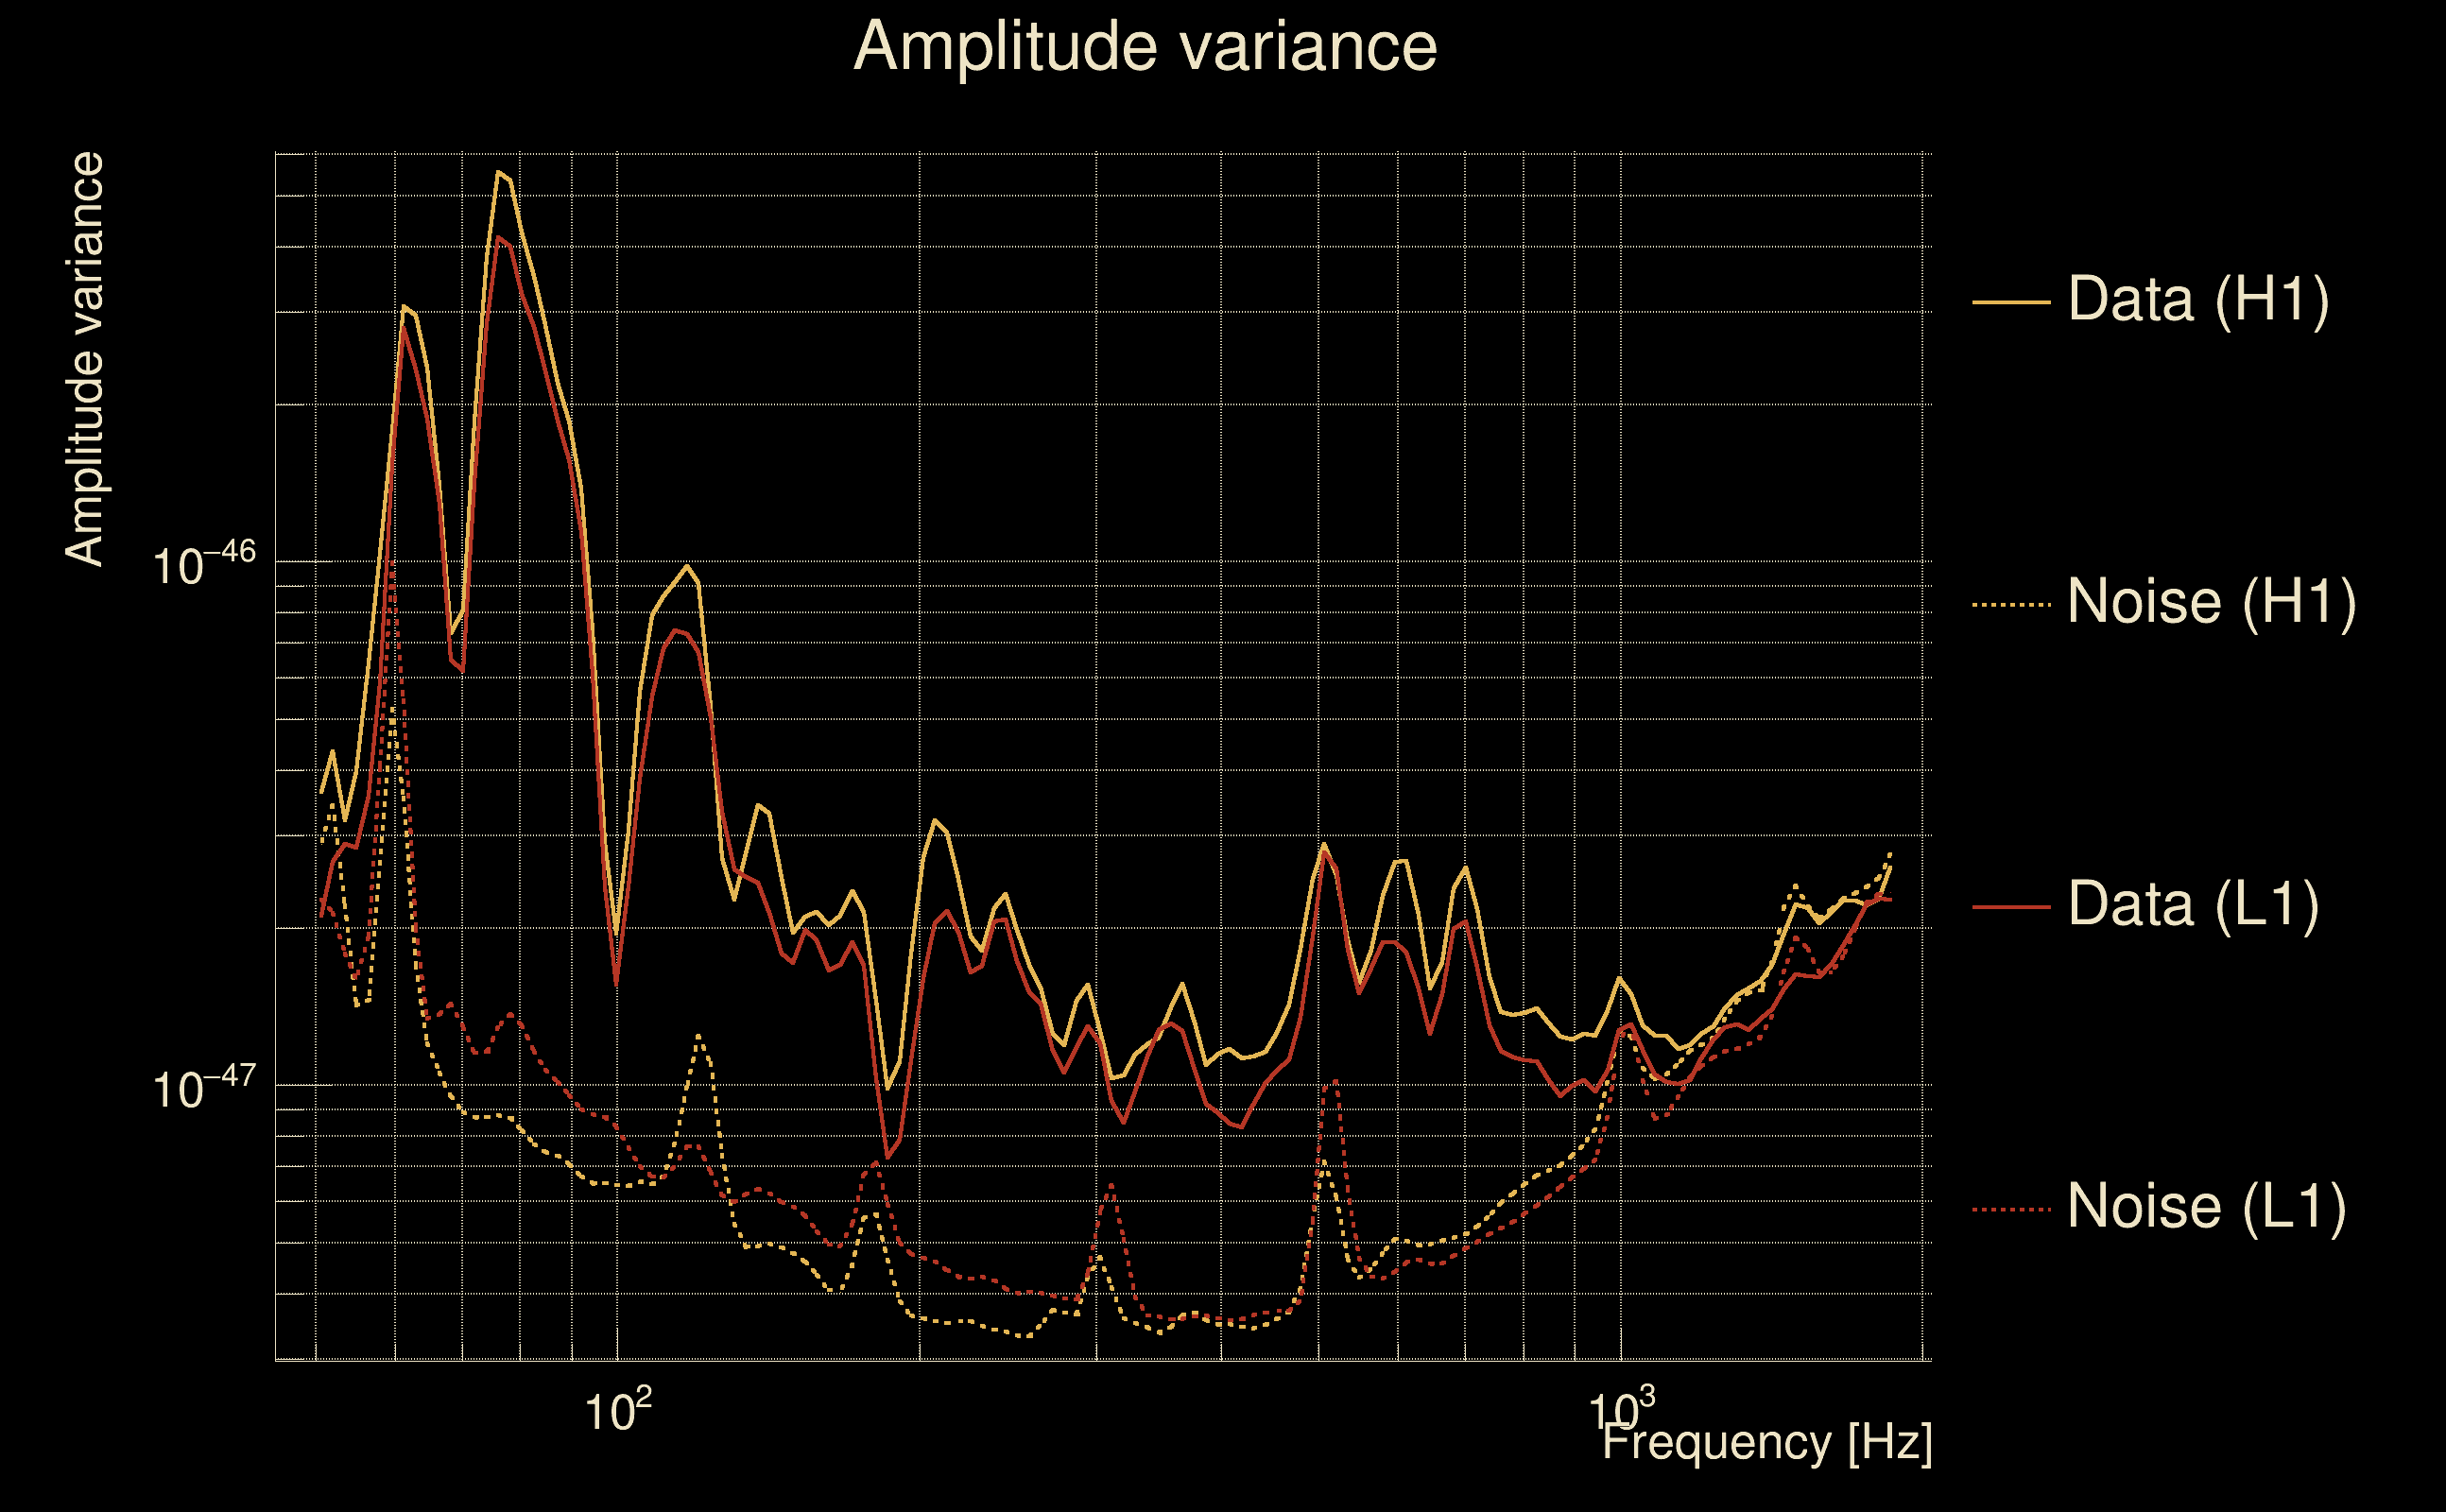
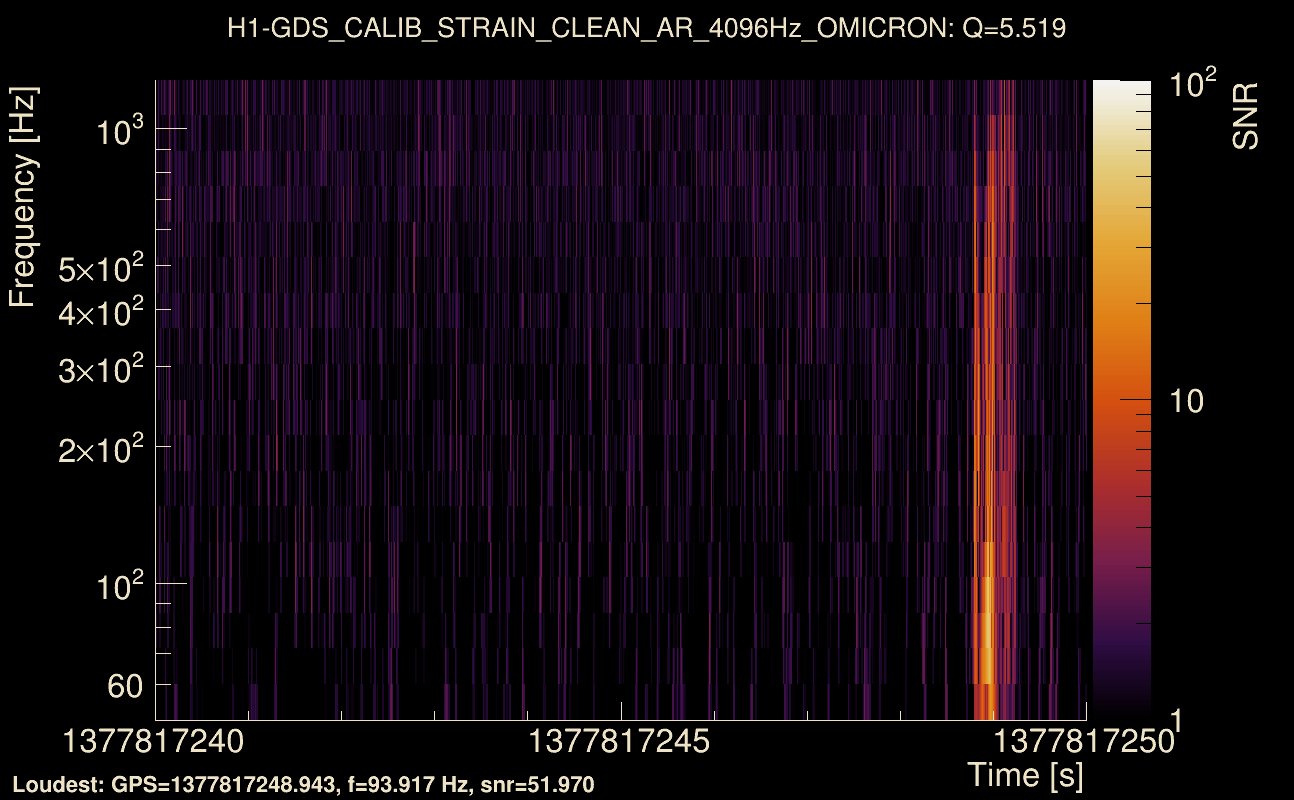
| Event time t(H1): | GPS = 1377817245 (Sun Sep 3 23:00:27 2023 ) → GPS = 1377817255 (Sun Sep 3 23:00:37 2023 ) |
| Event time t(L1): | GPS = 1377817245 (Sun Sep 3 23:00:37 2023 ) → GPS = 1377817255 (Sun Sep 3 23:00:37 2023 ) |
| Omicron analysis time window (H1): | GPS = 1377817242 → GPS = 1377817258 |
| Omicron analysis time window (L1): | GPS = 1377817242 → GPS = 1377817258 |
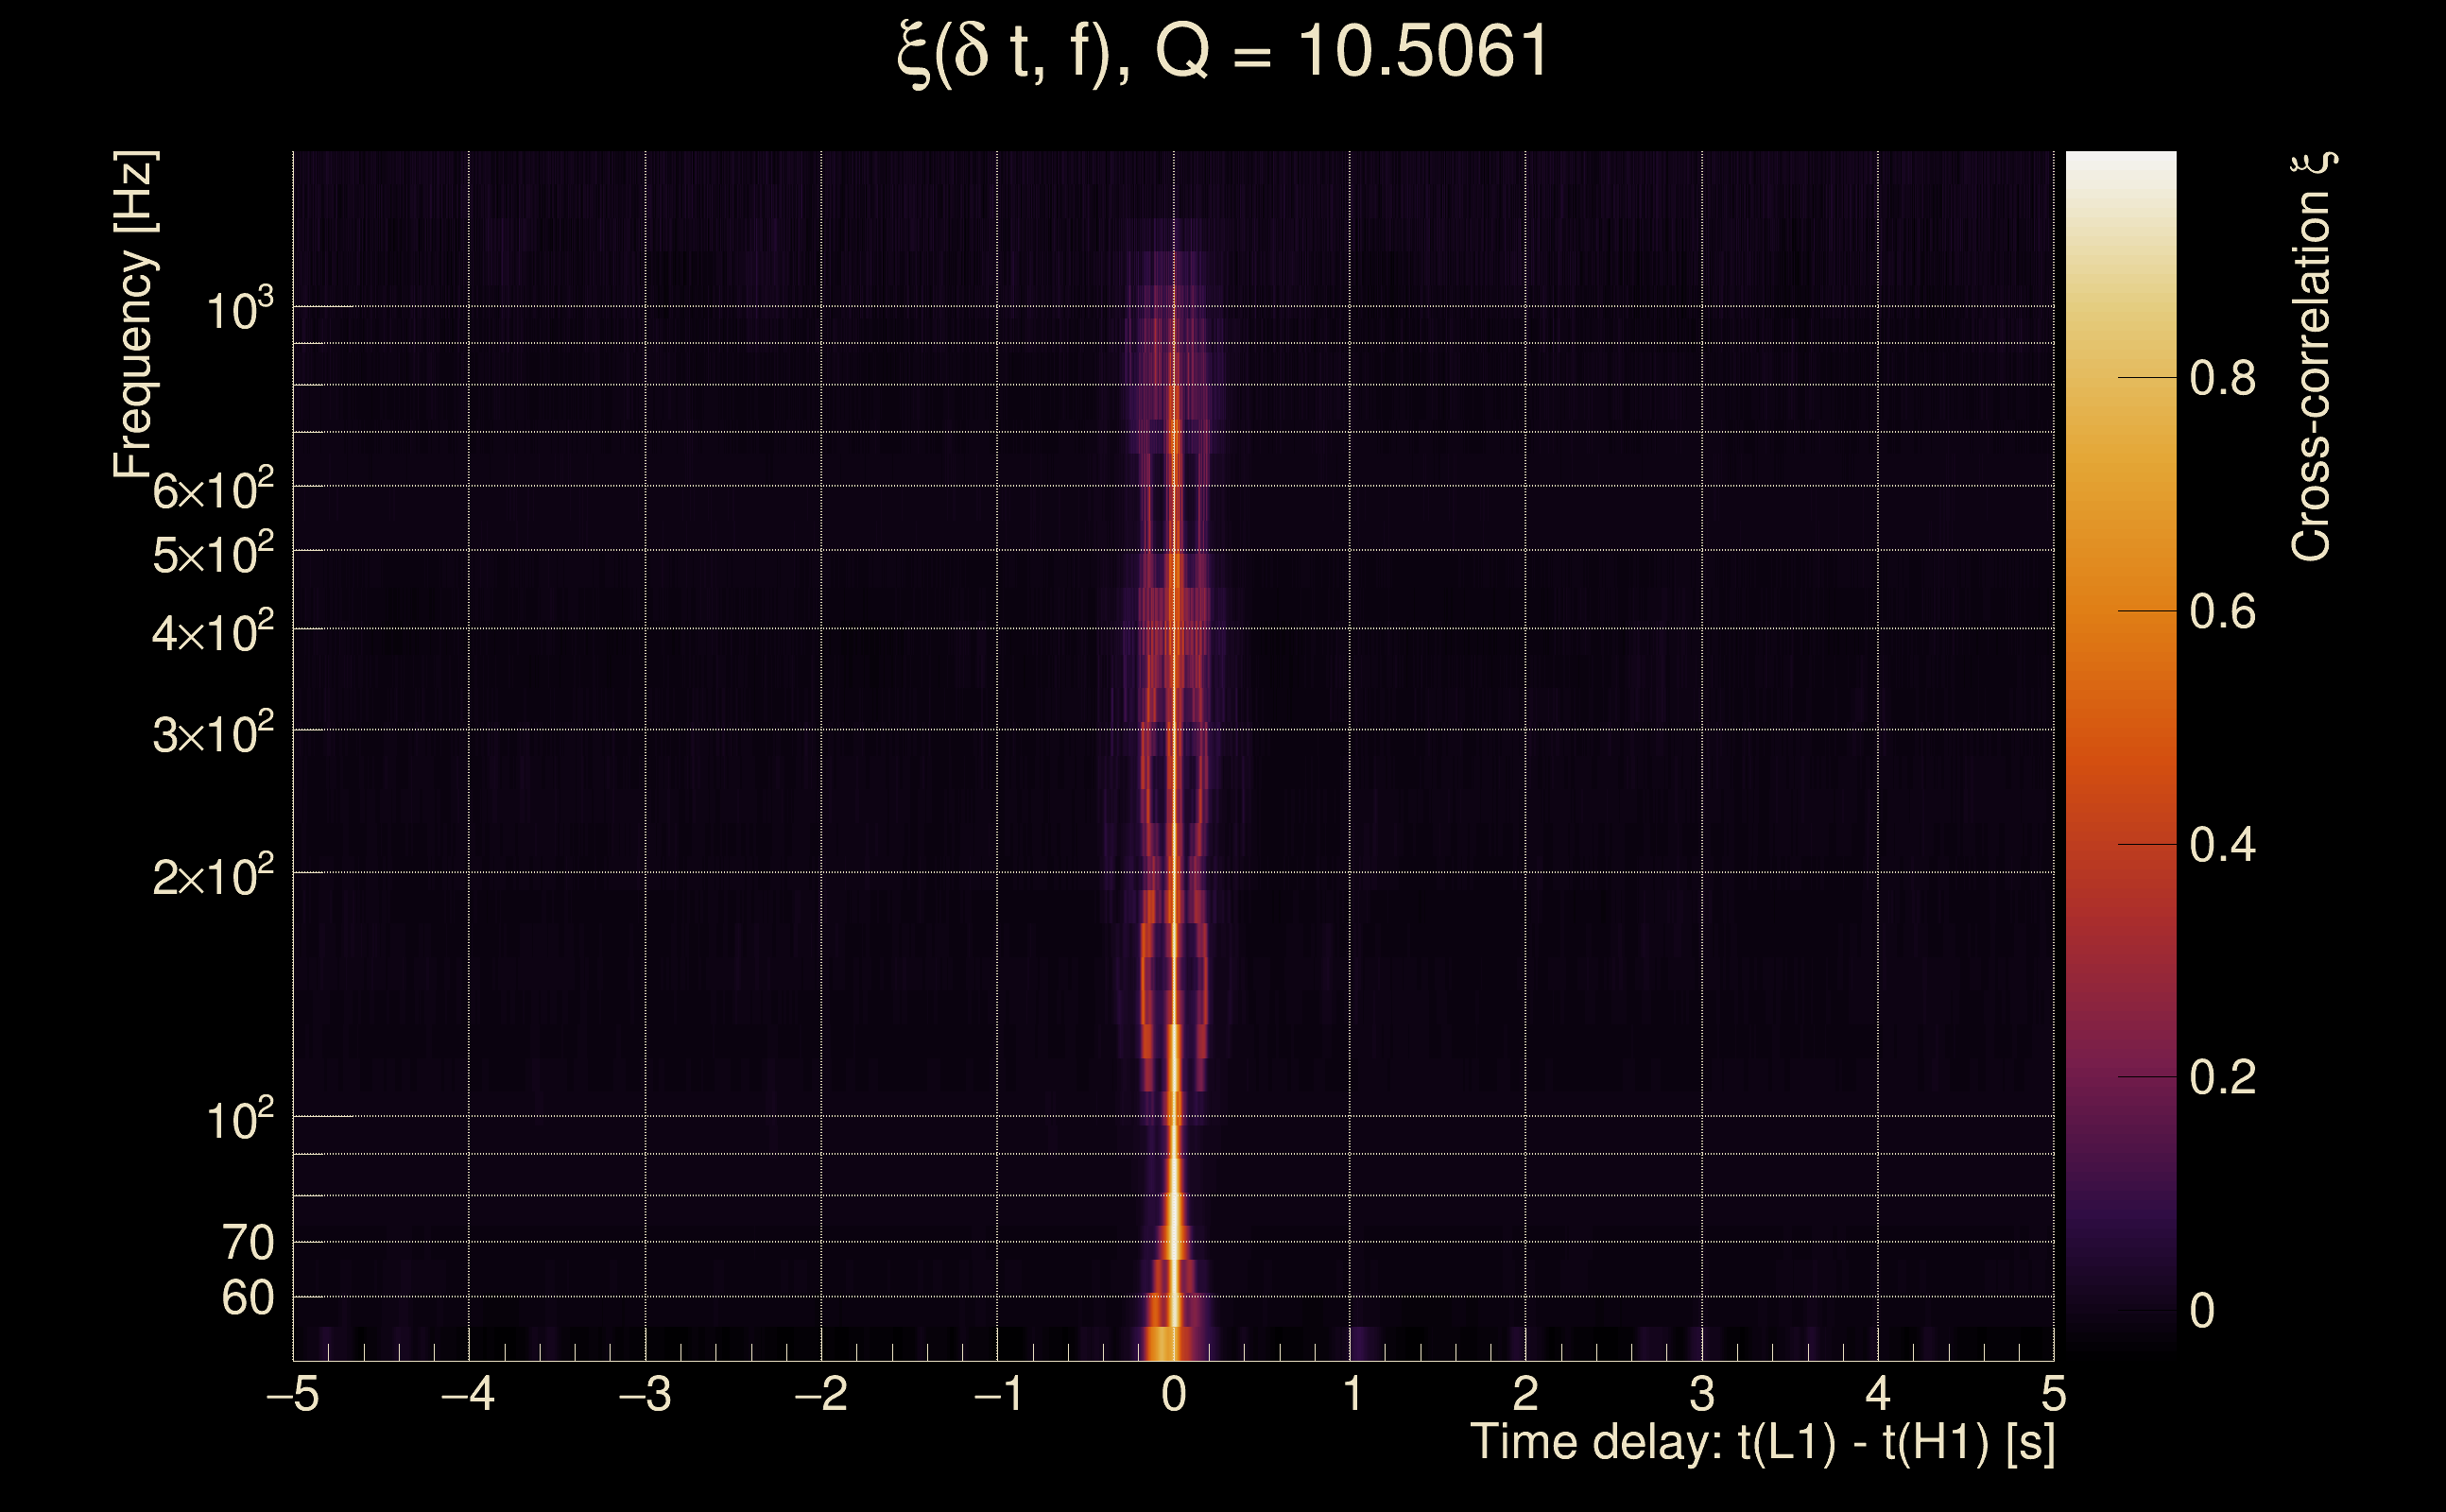
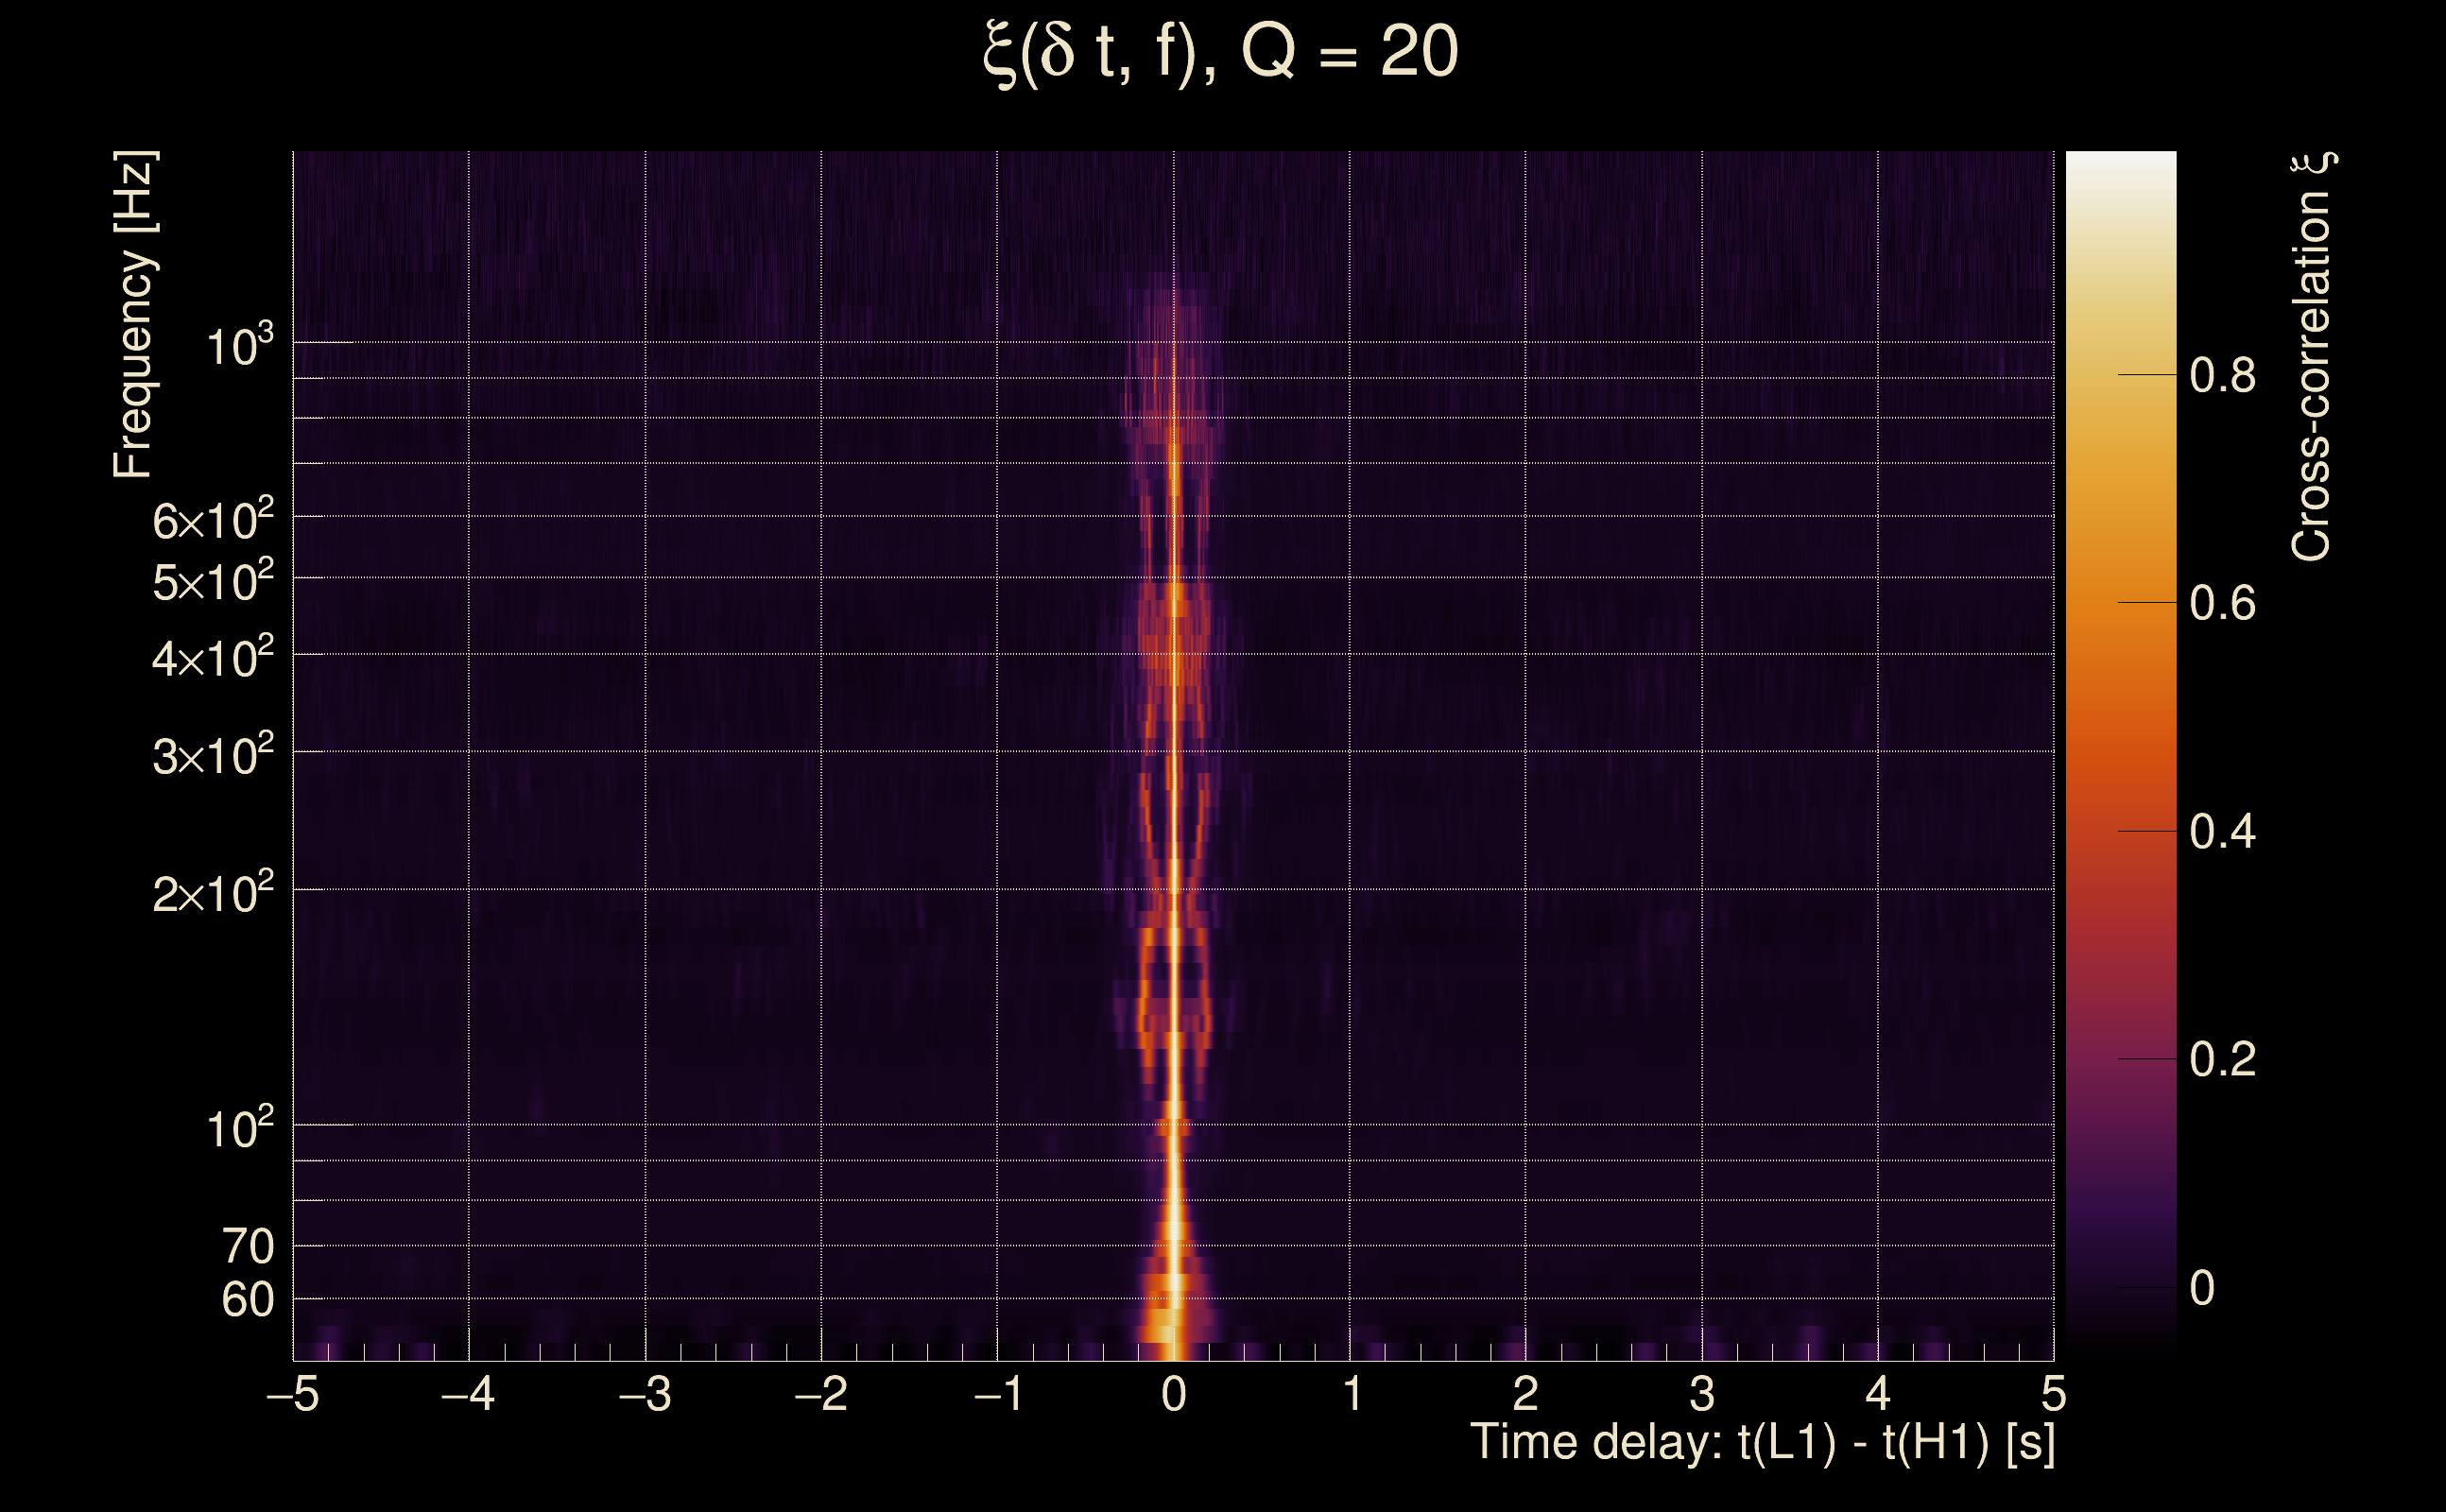
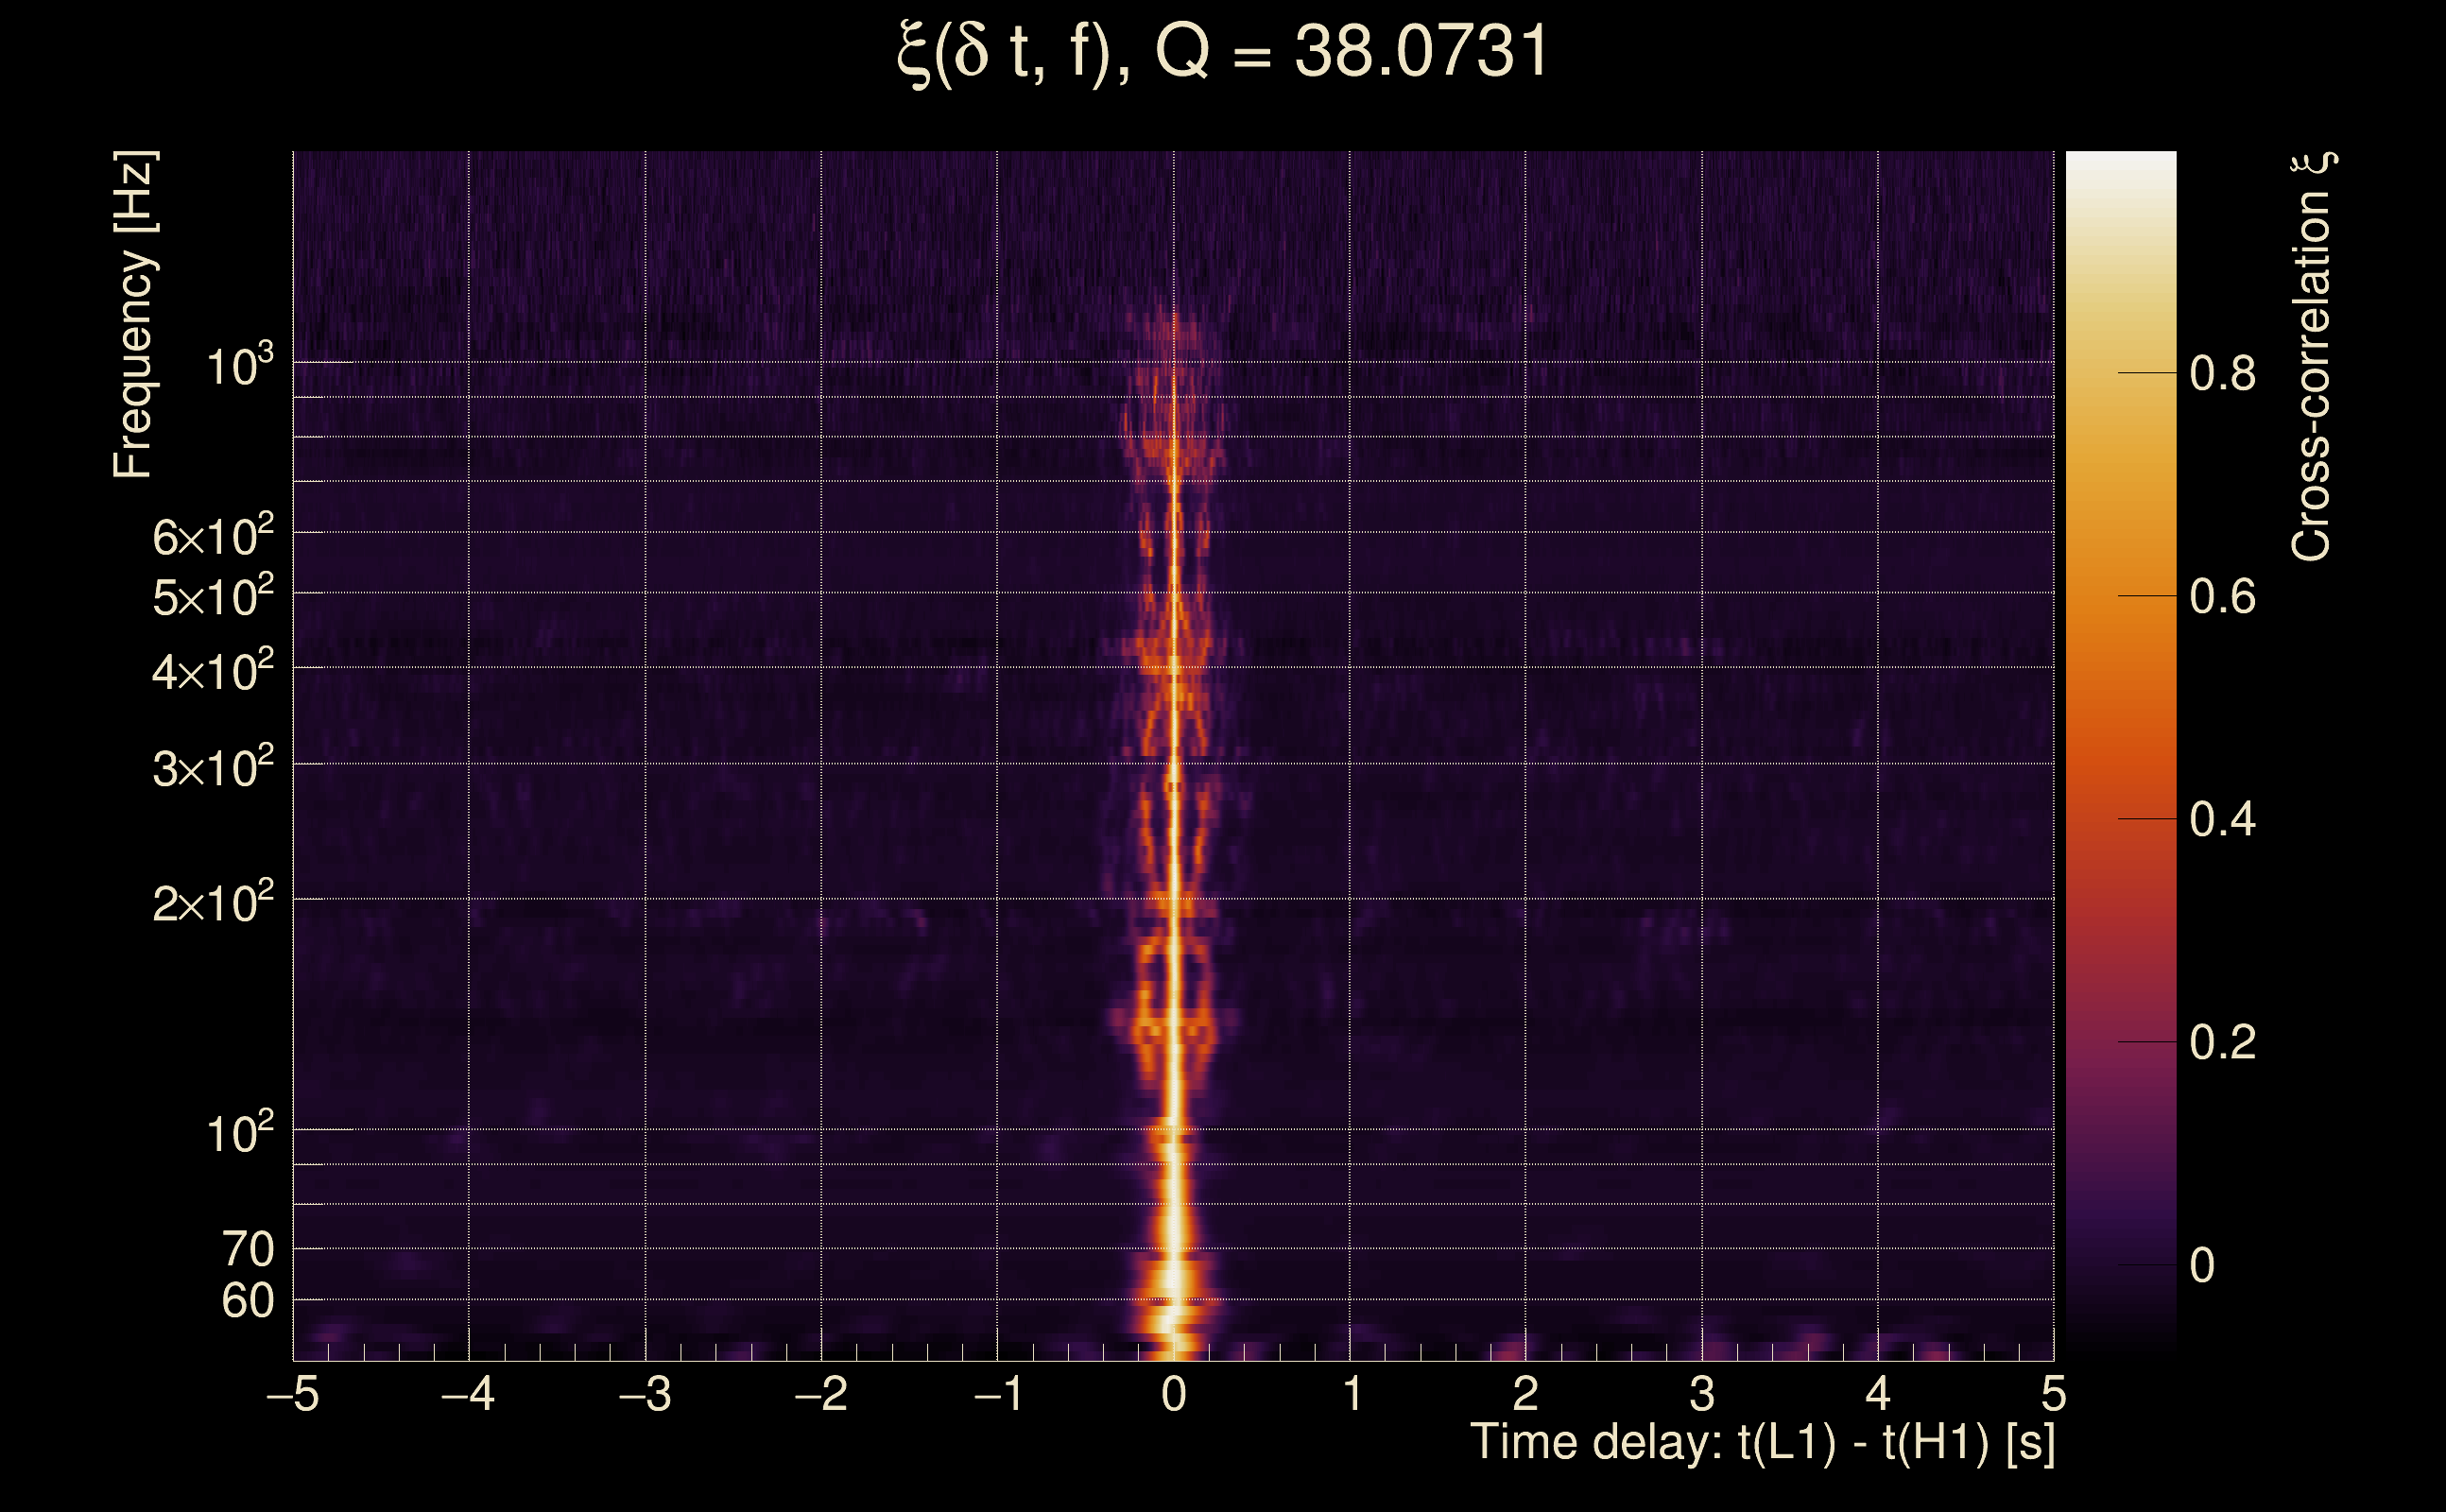
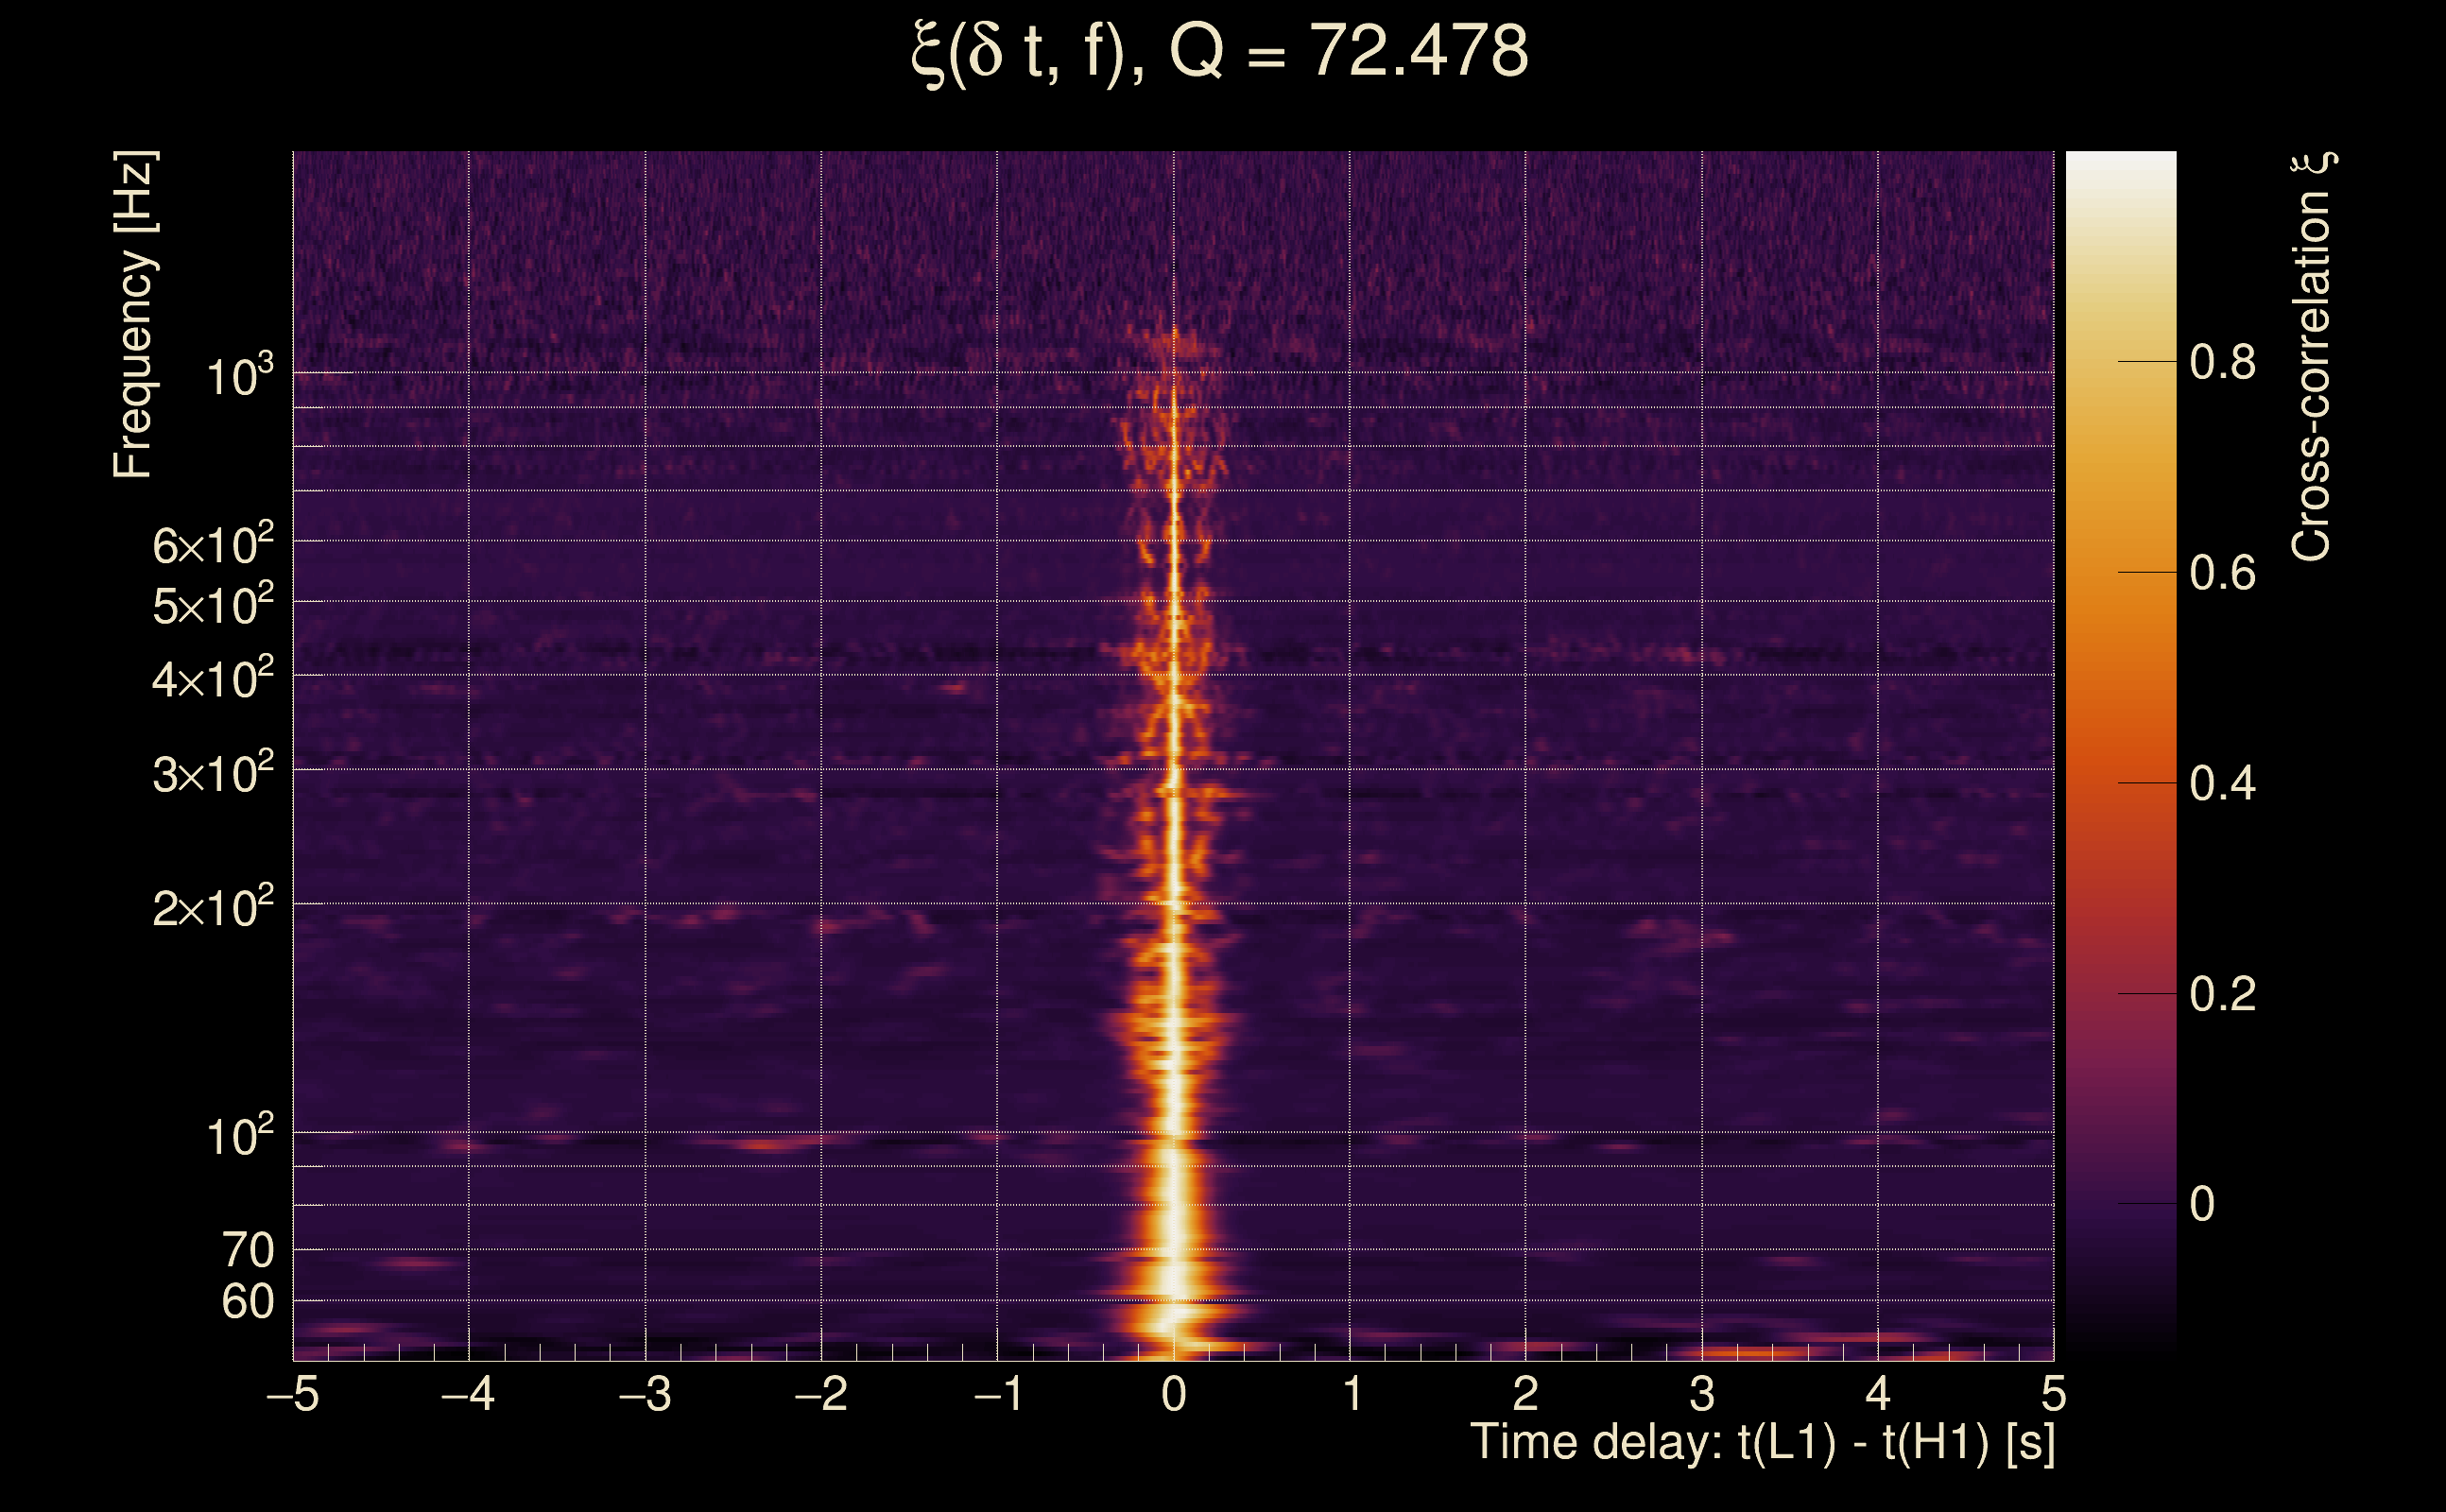
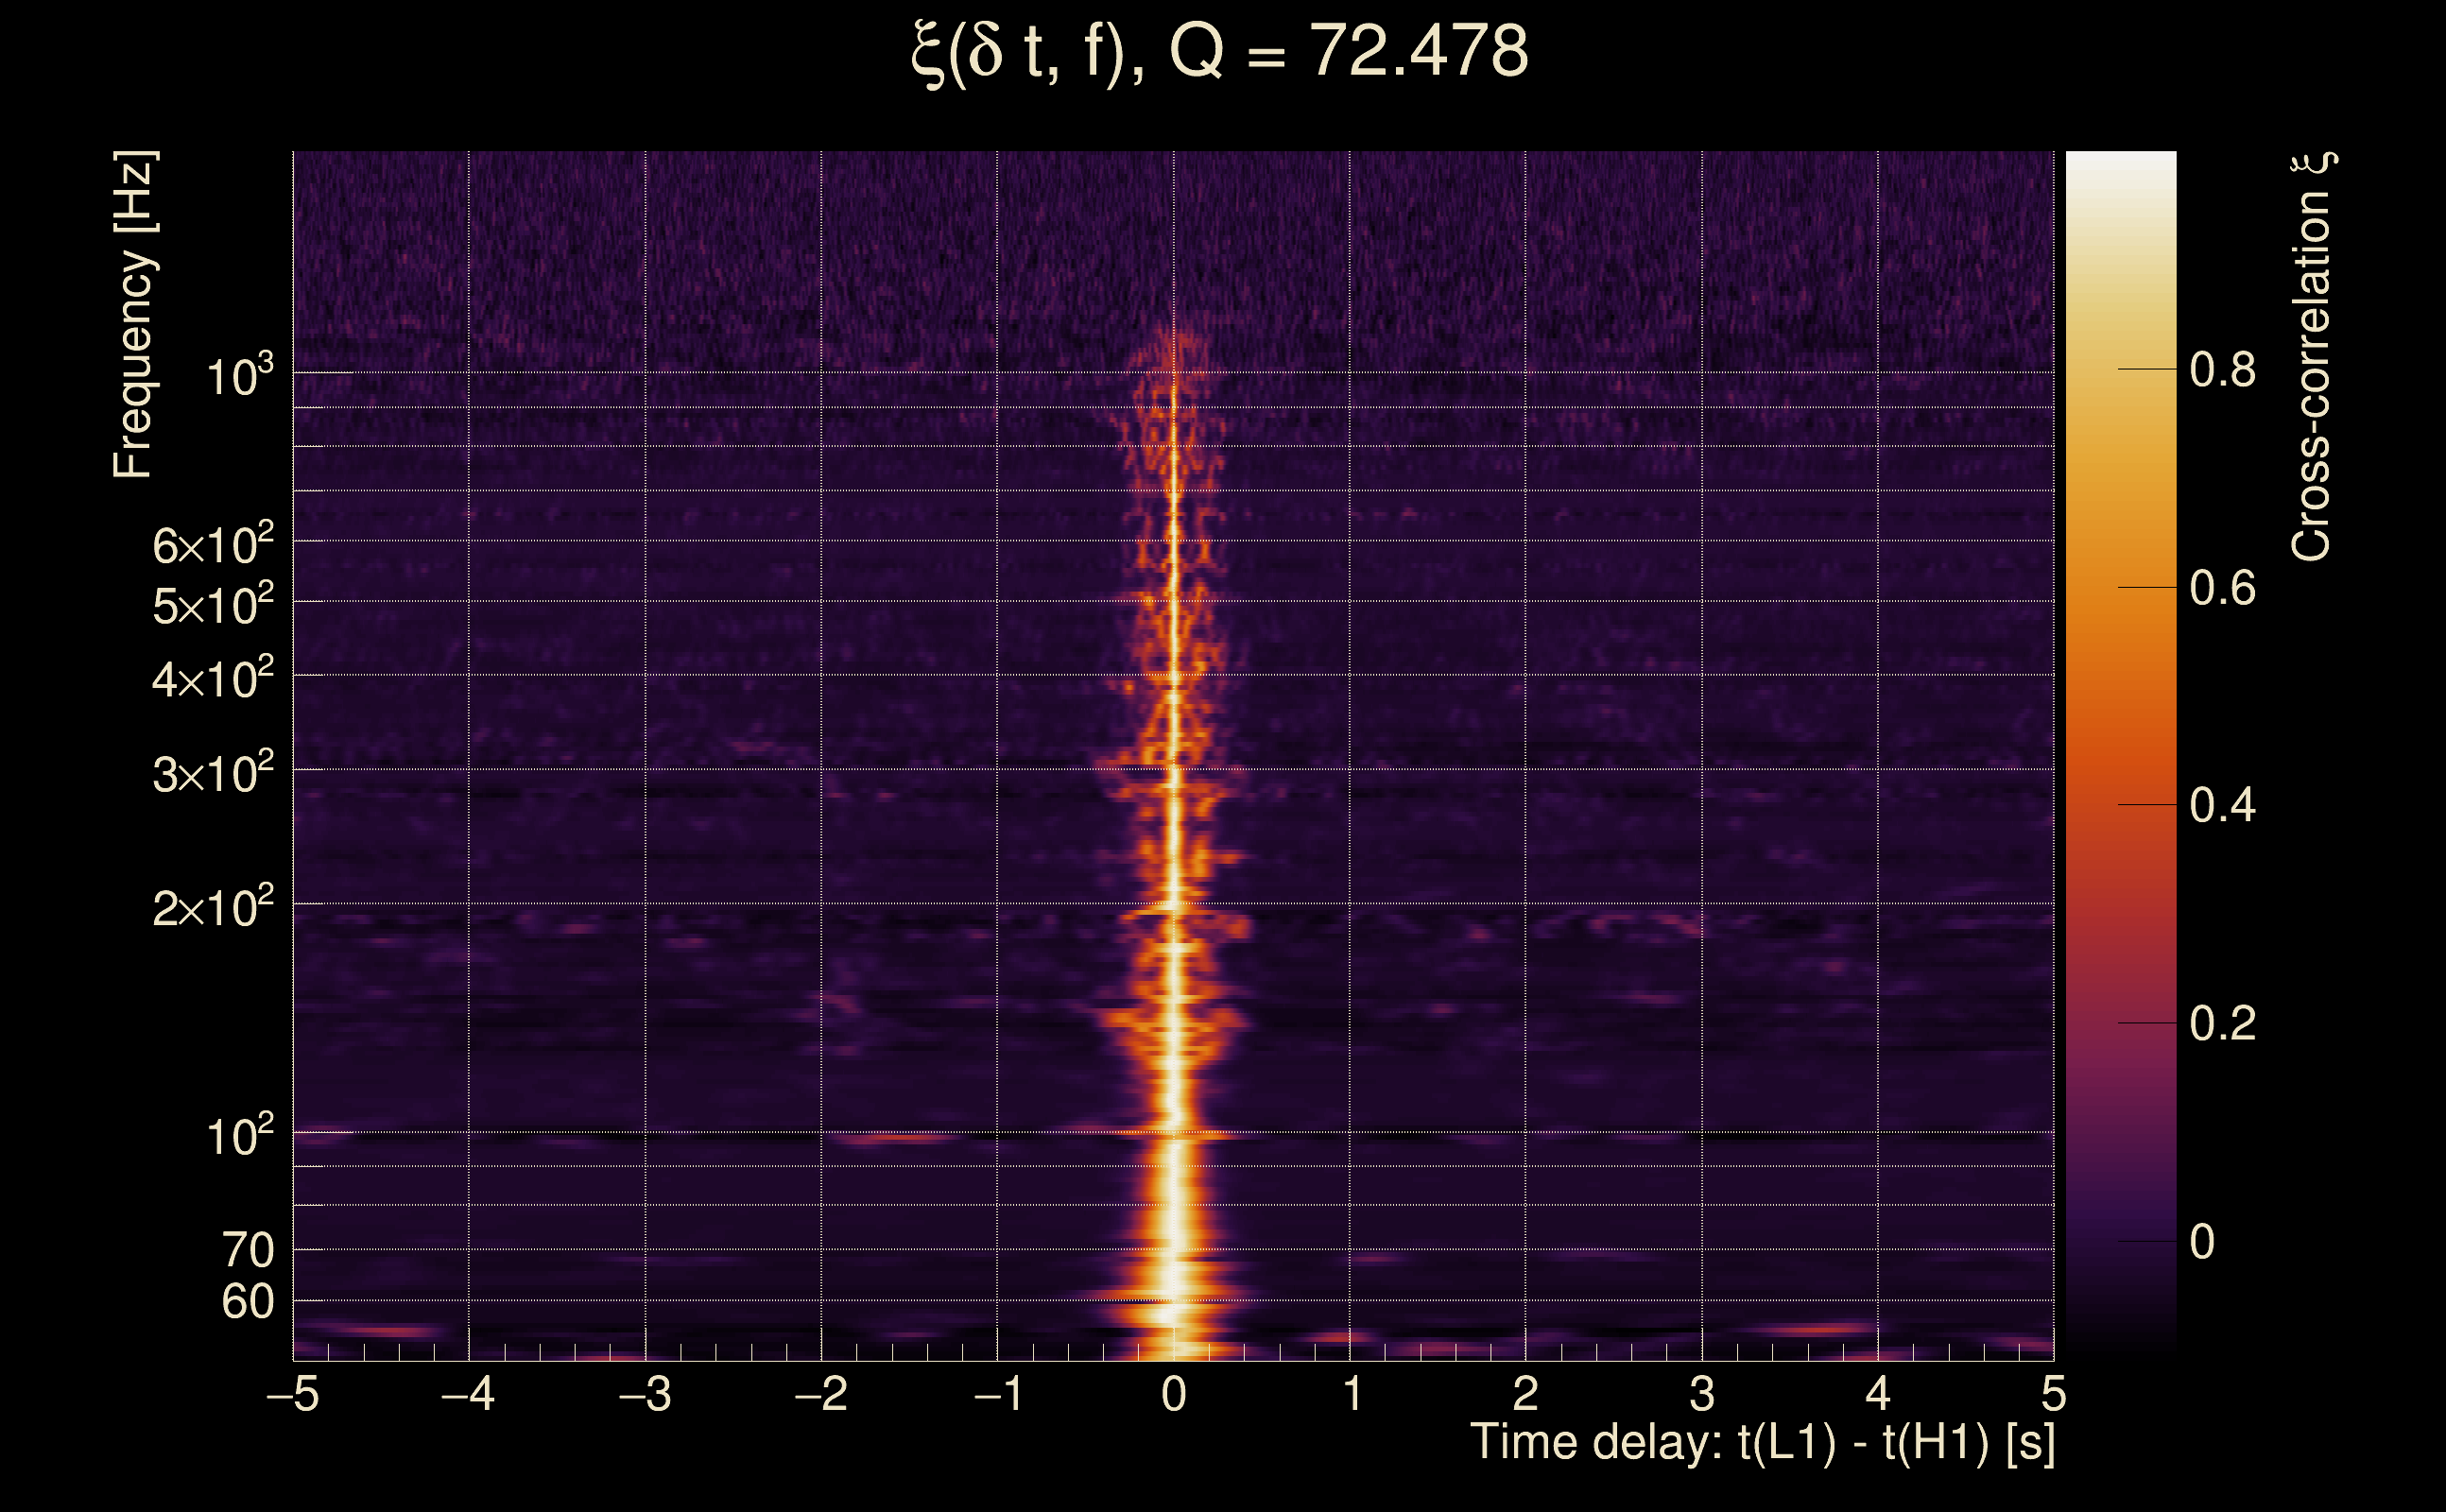
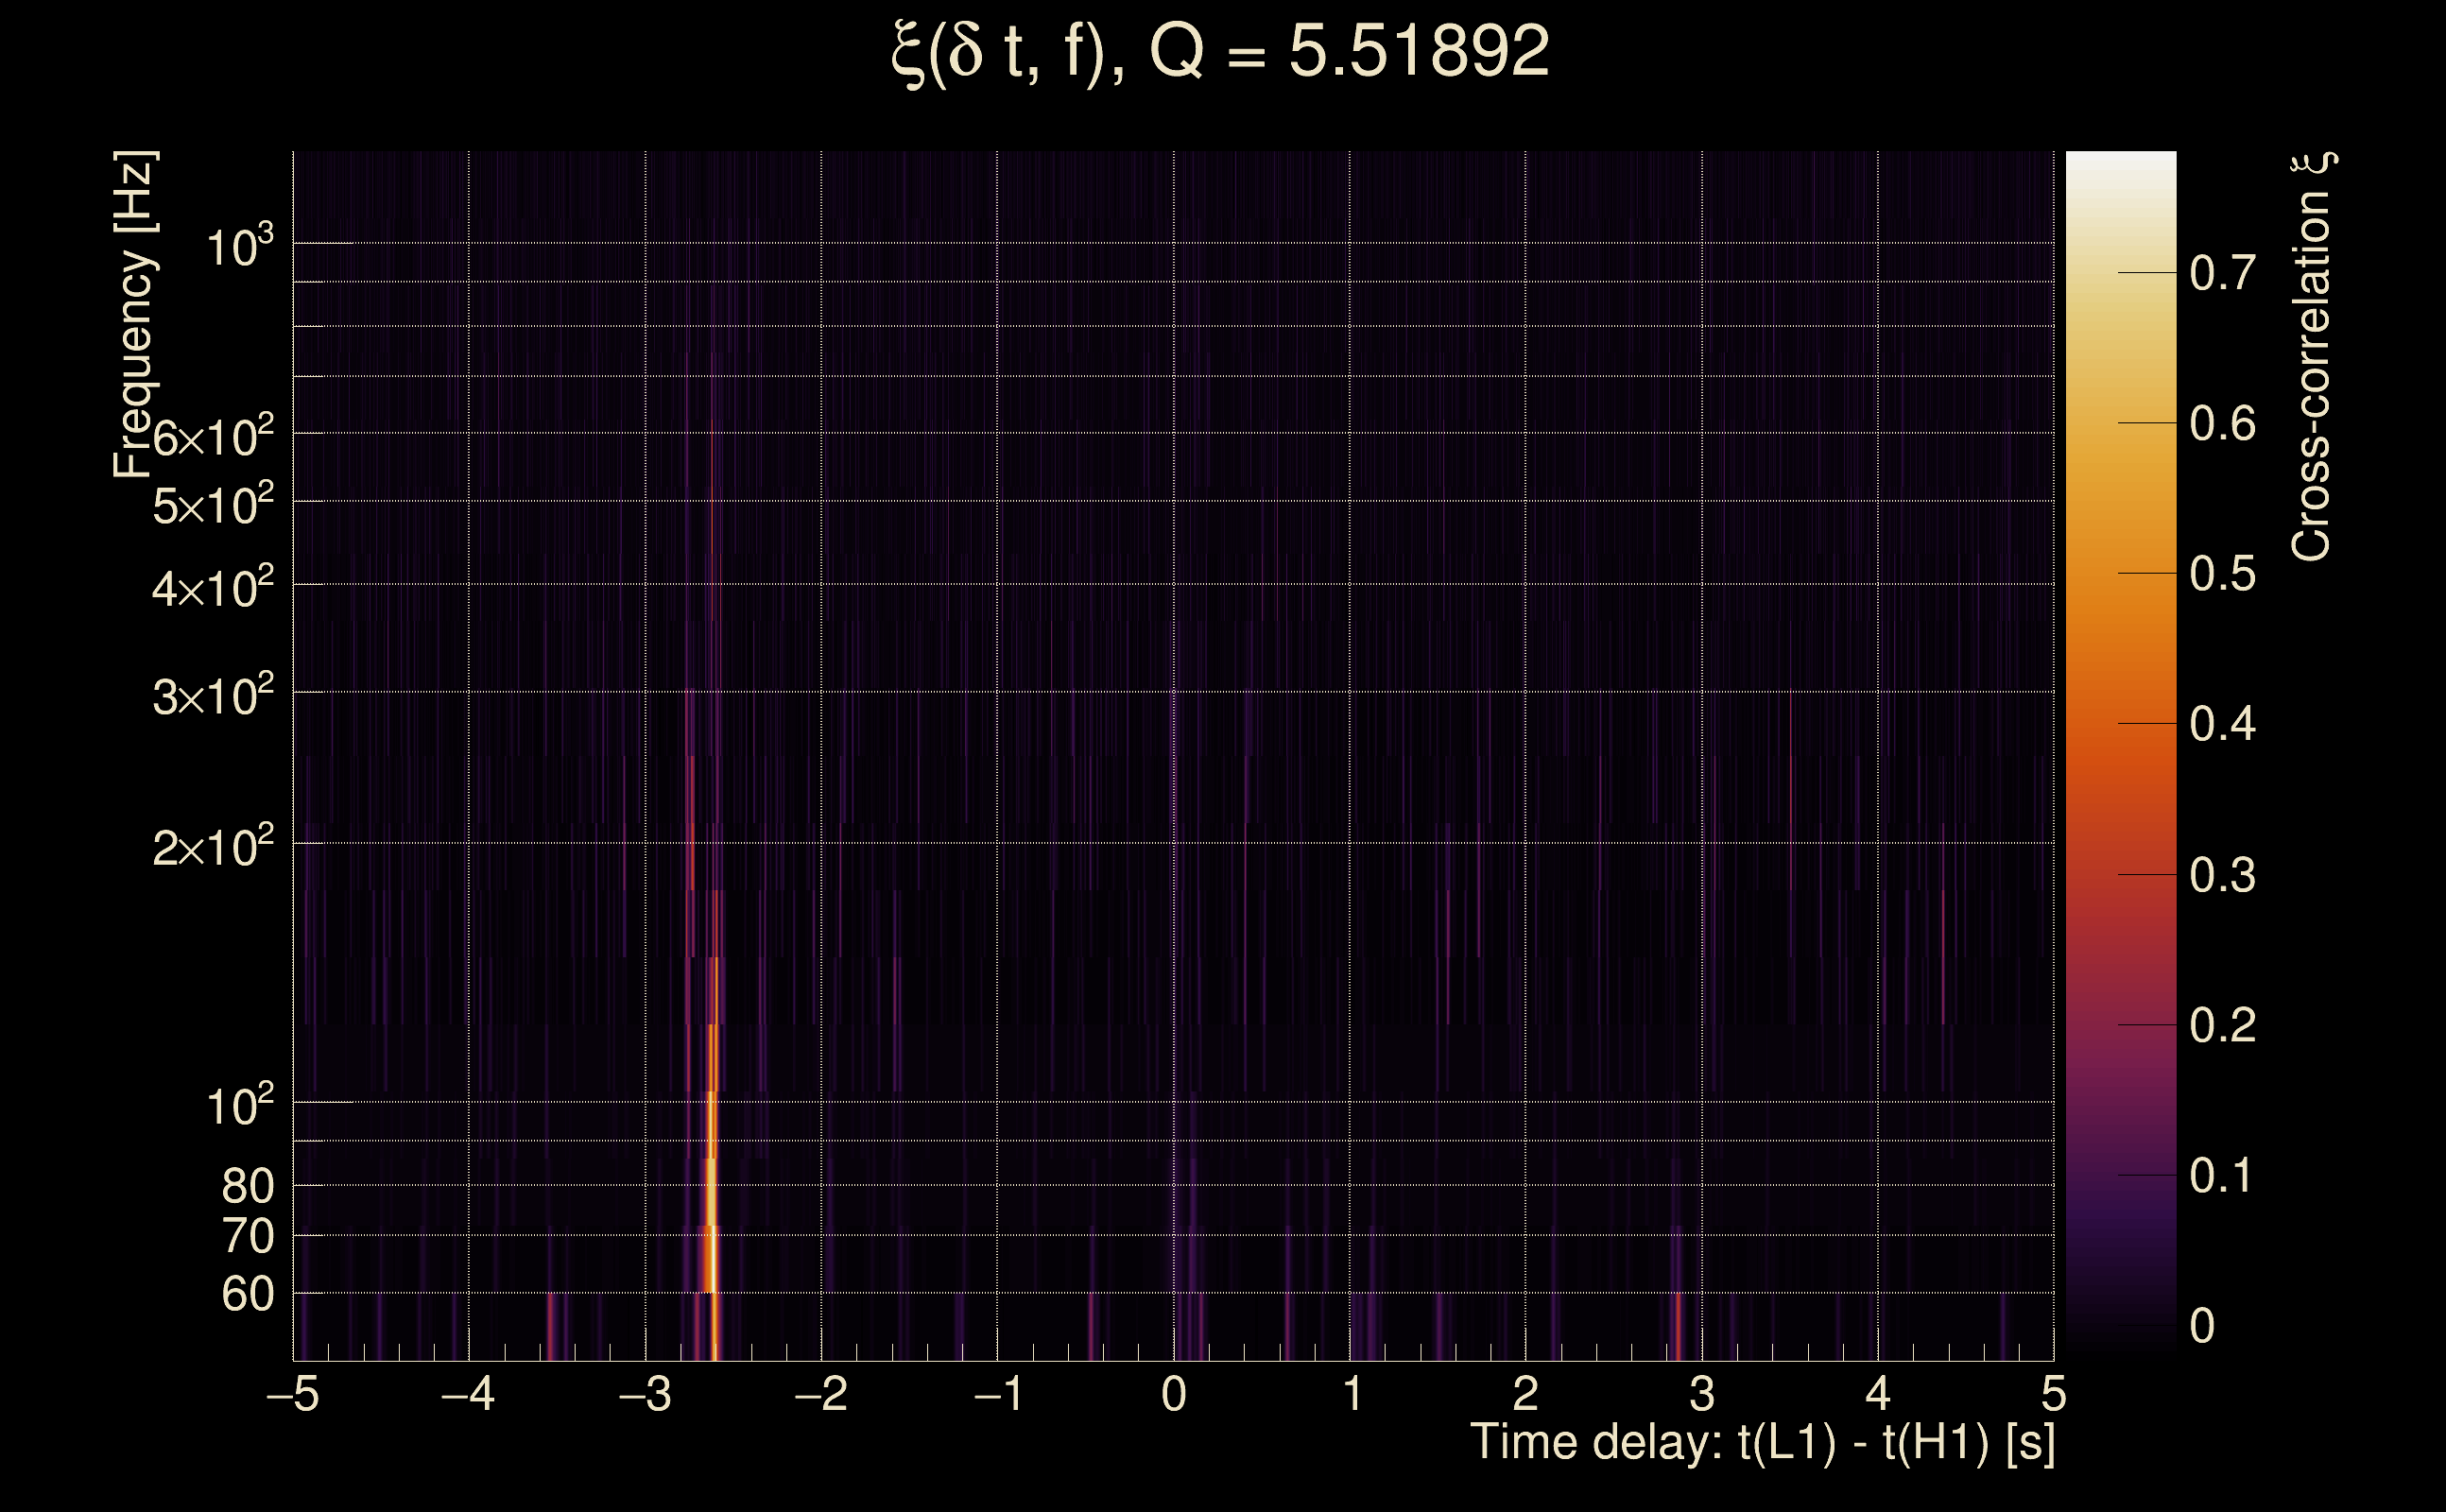
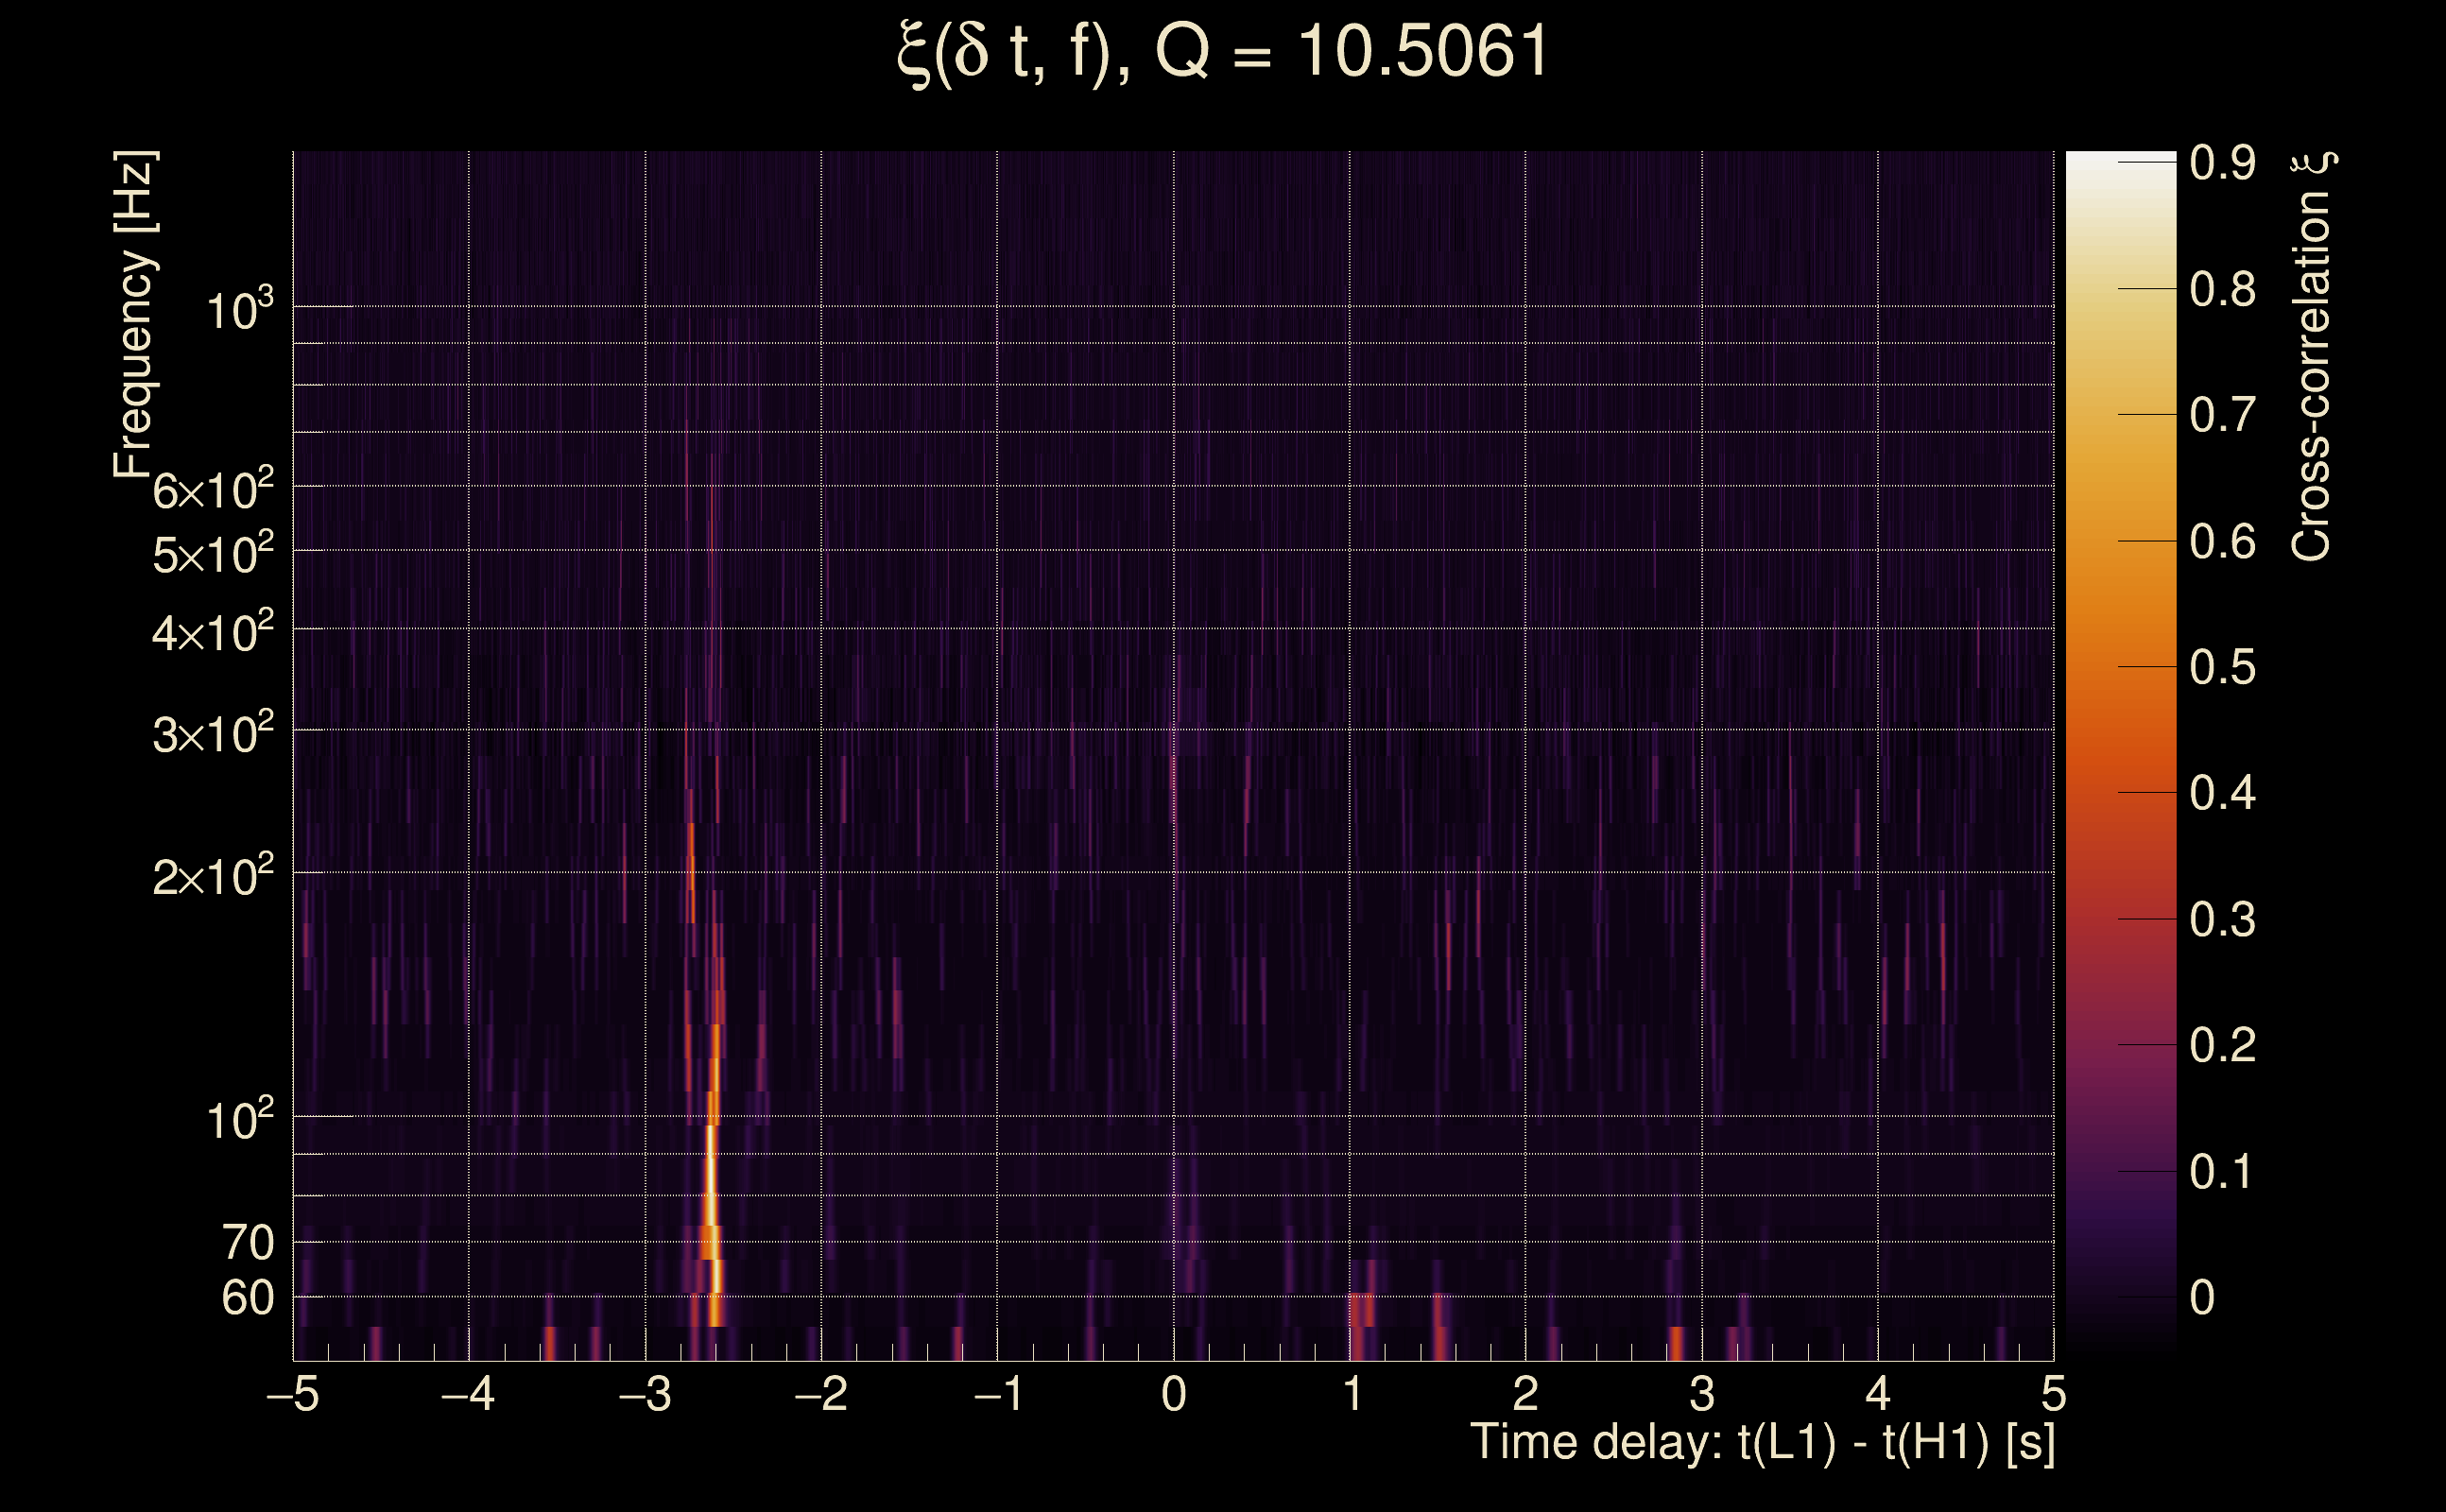
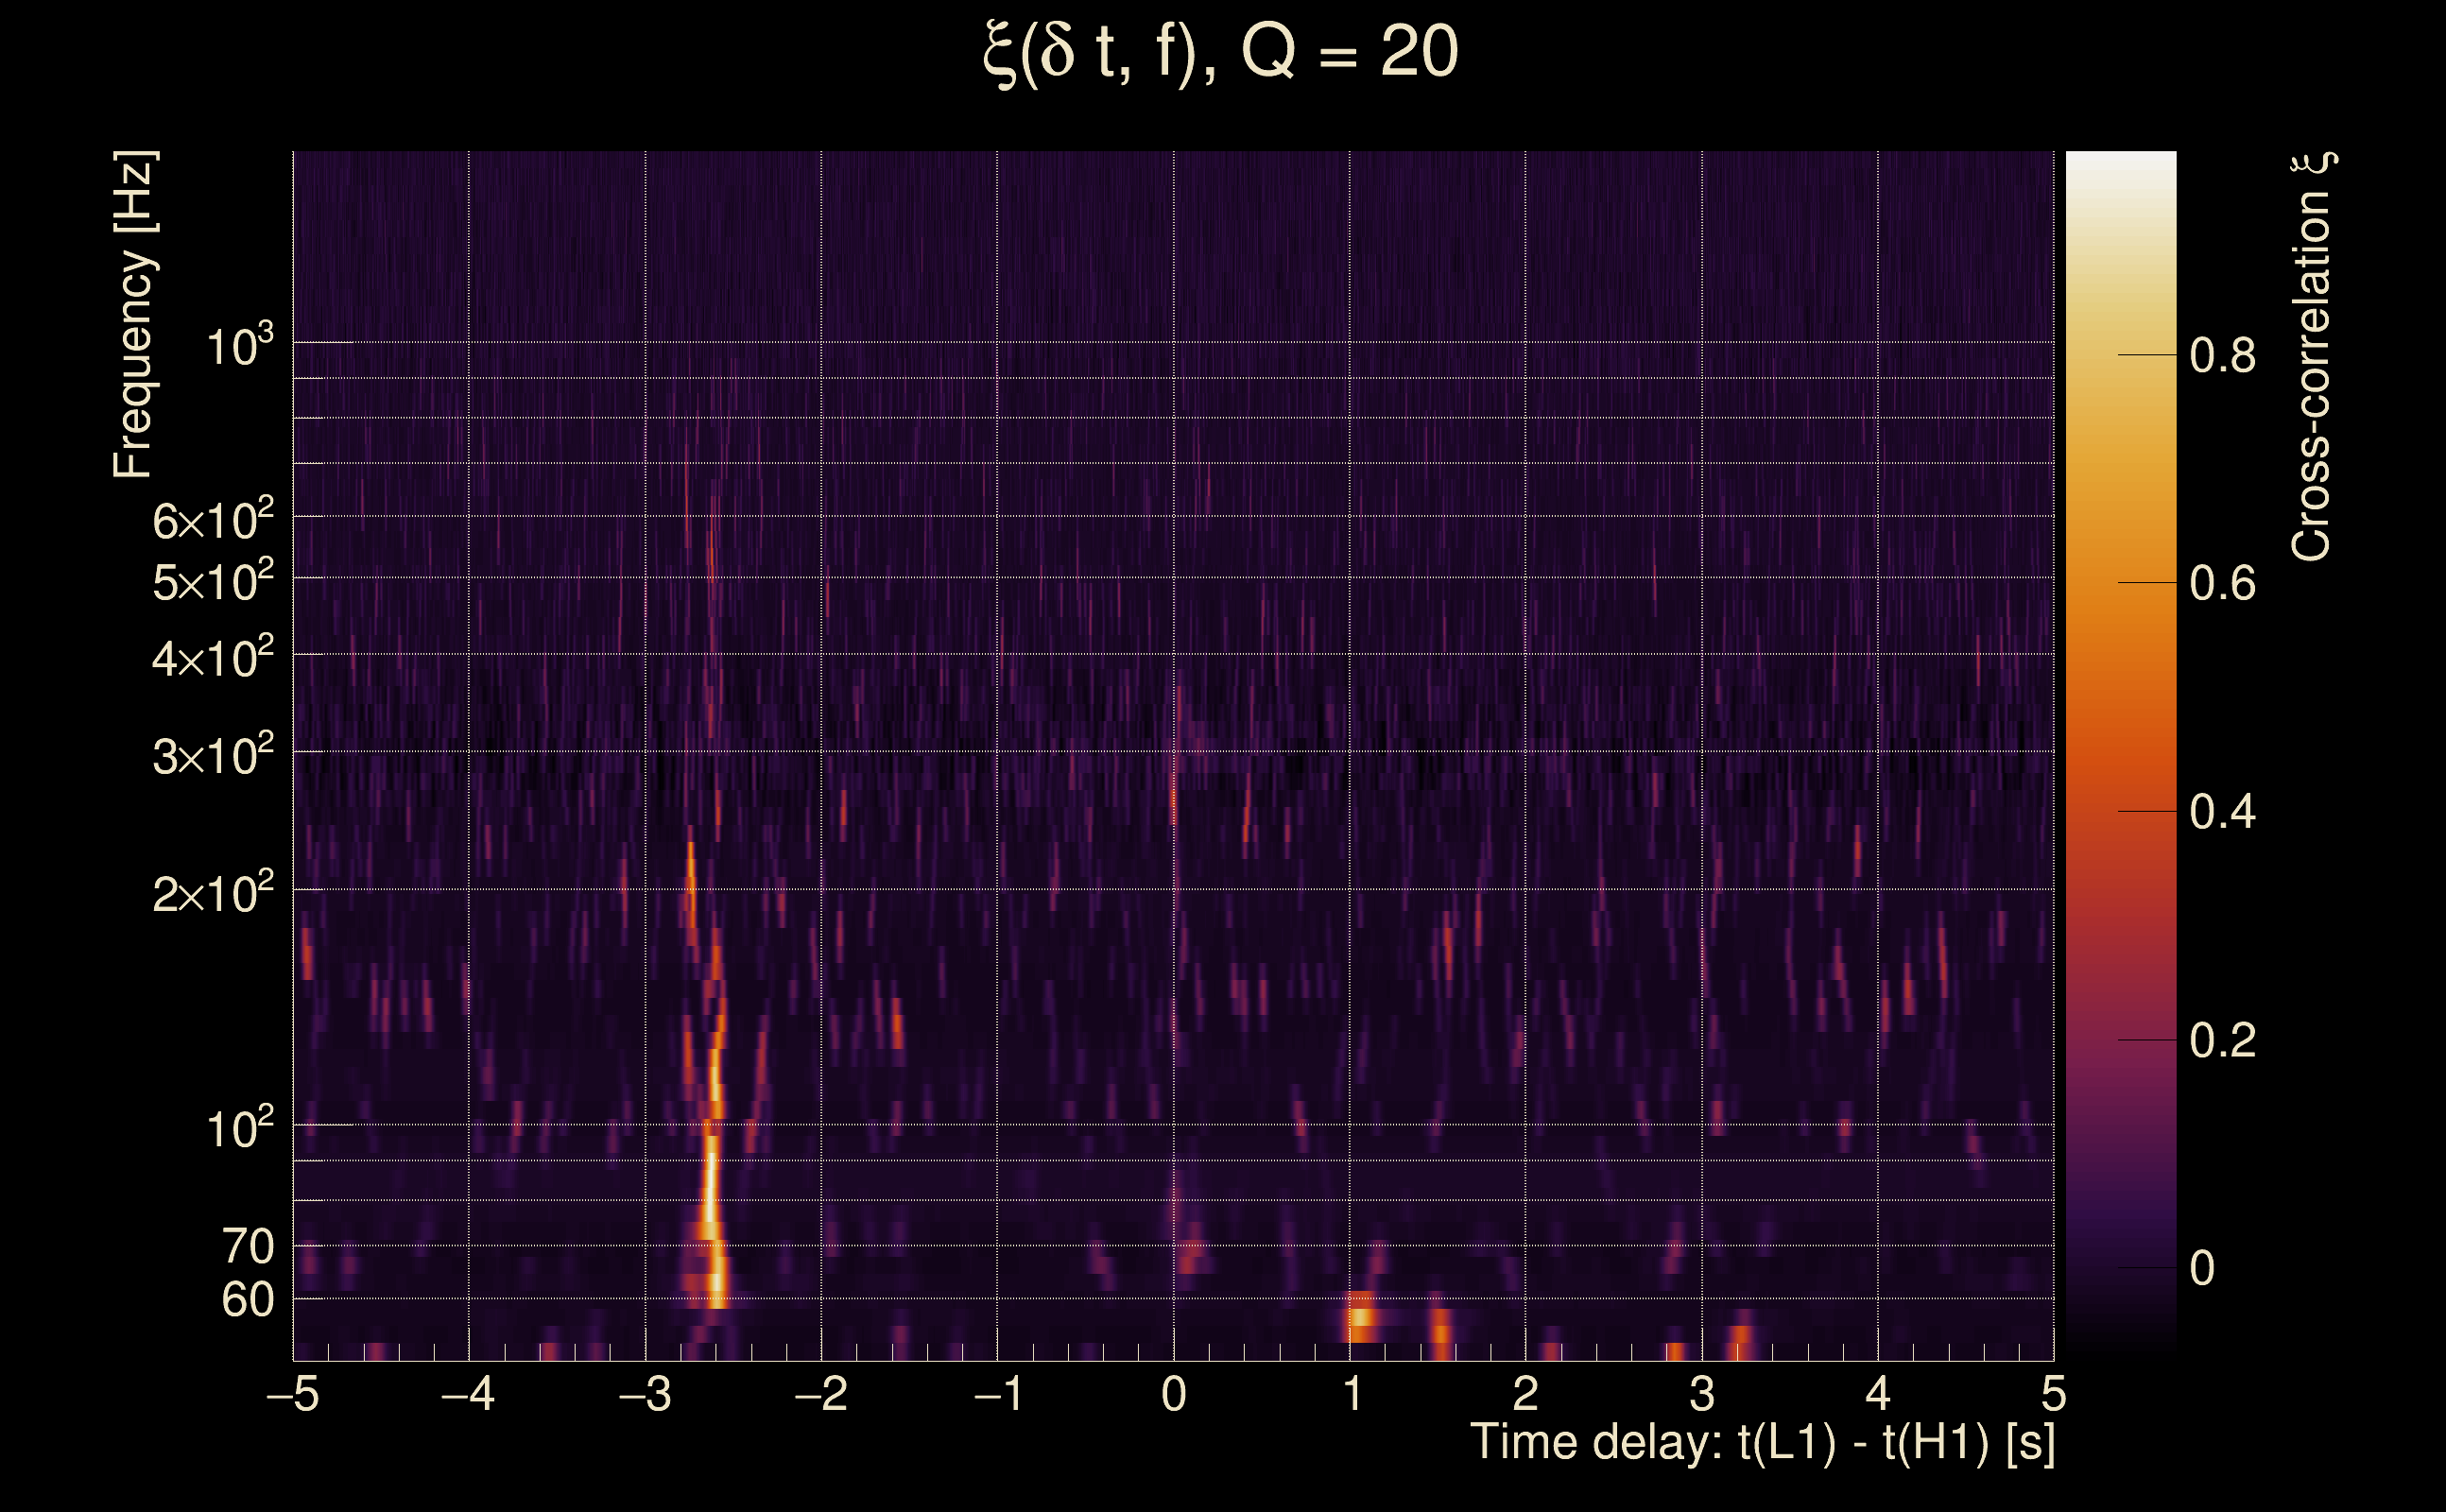
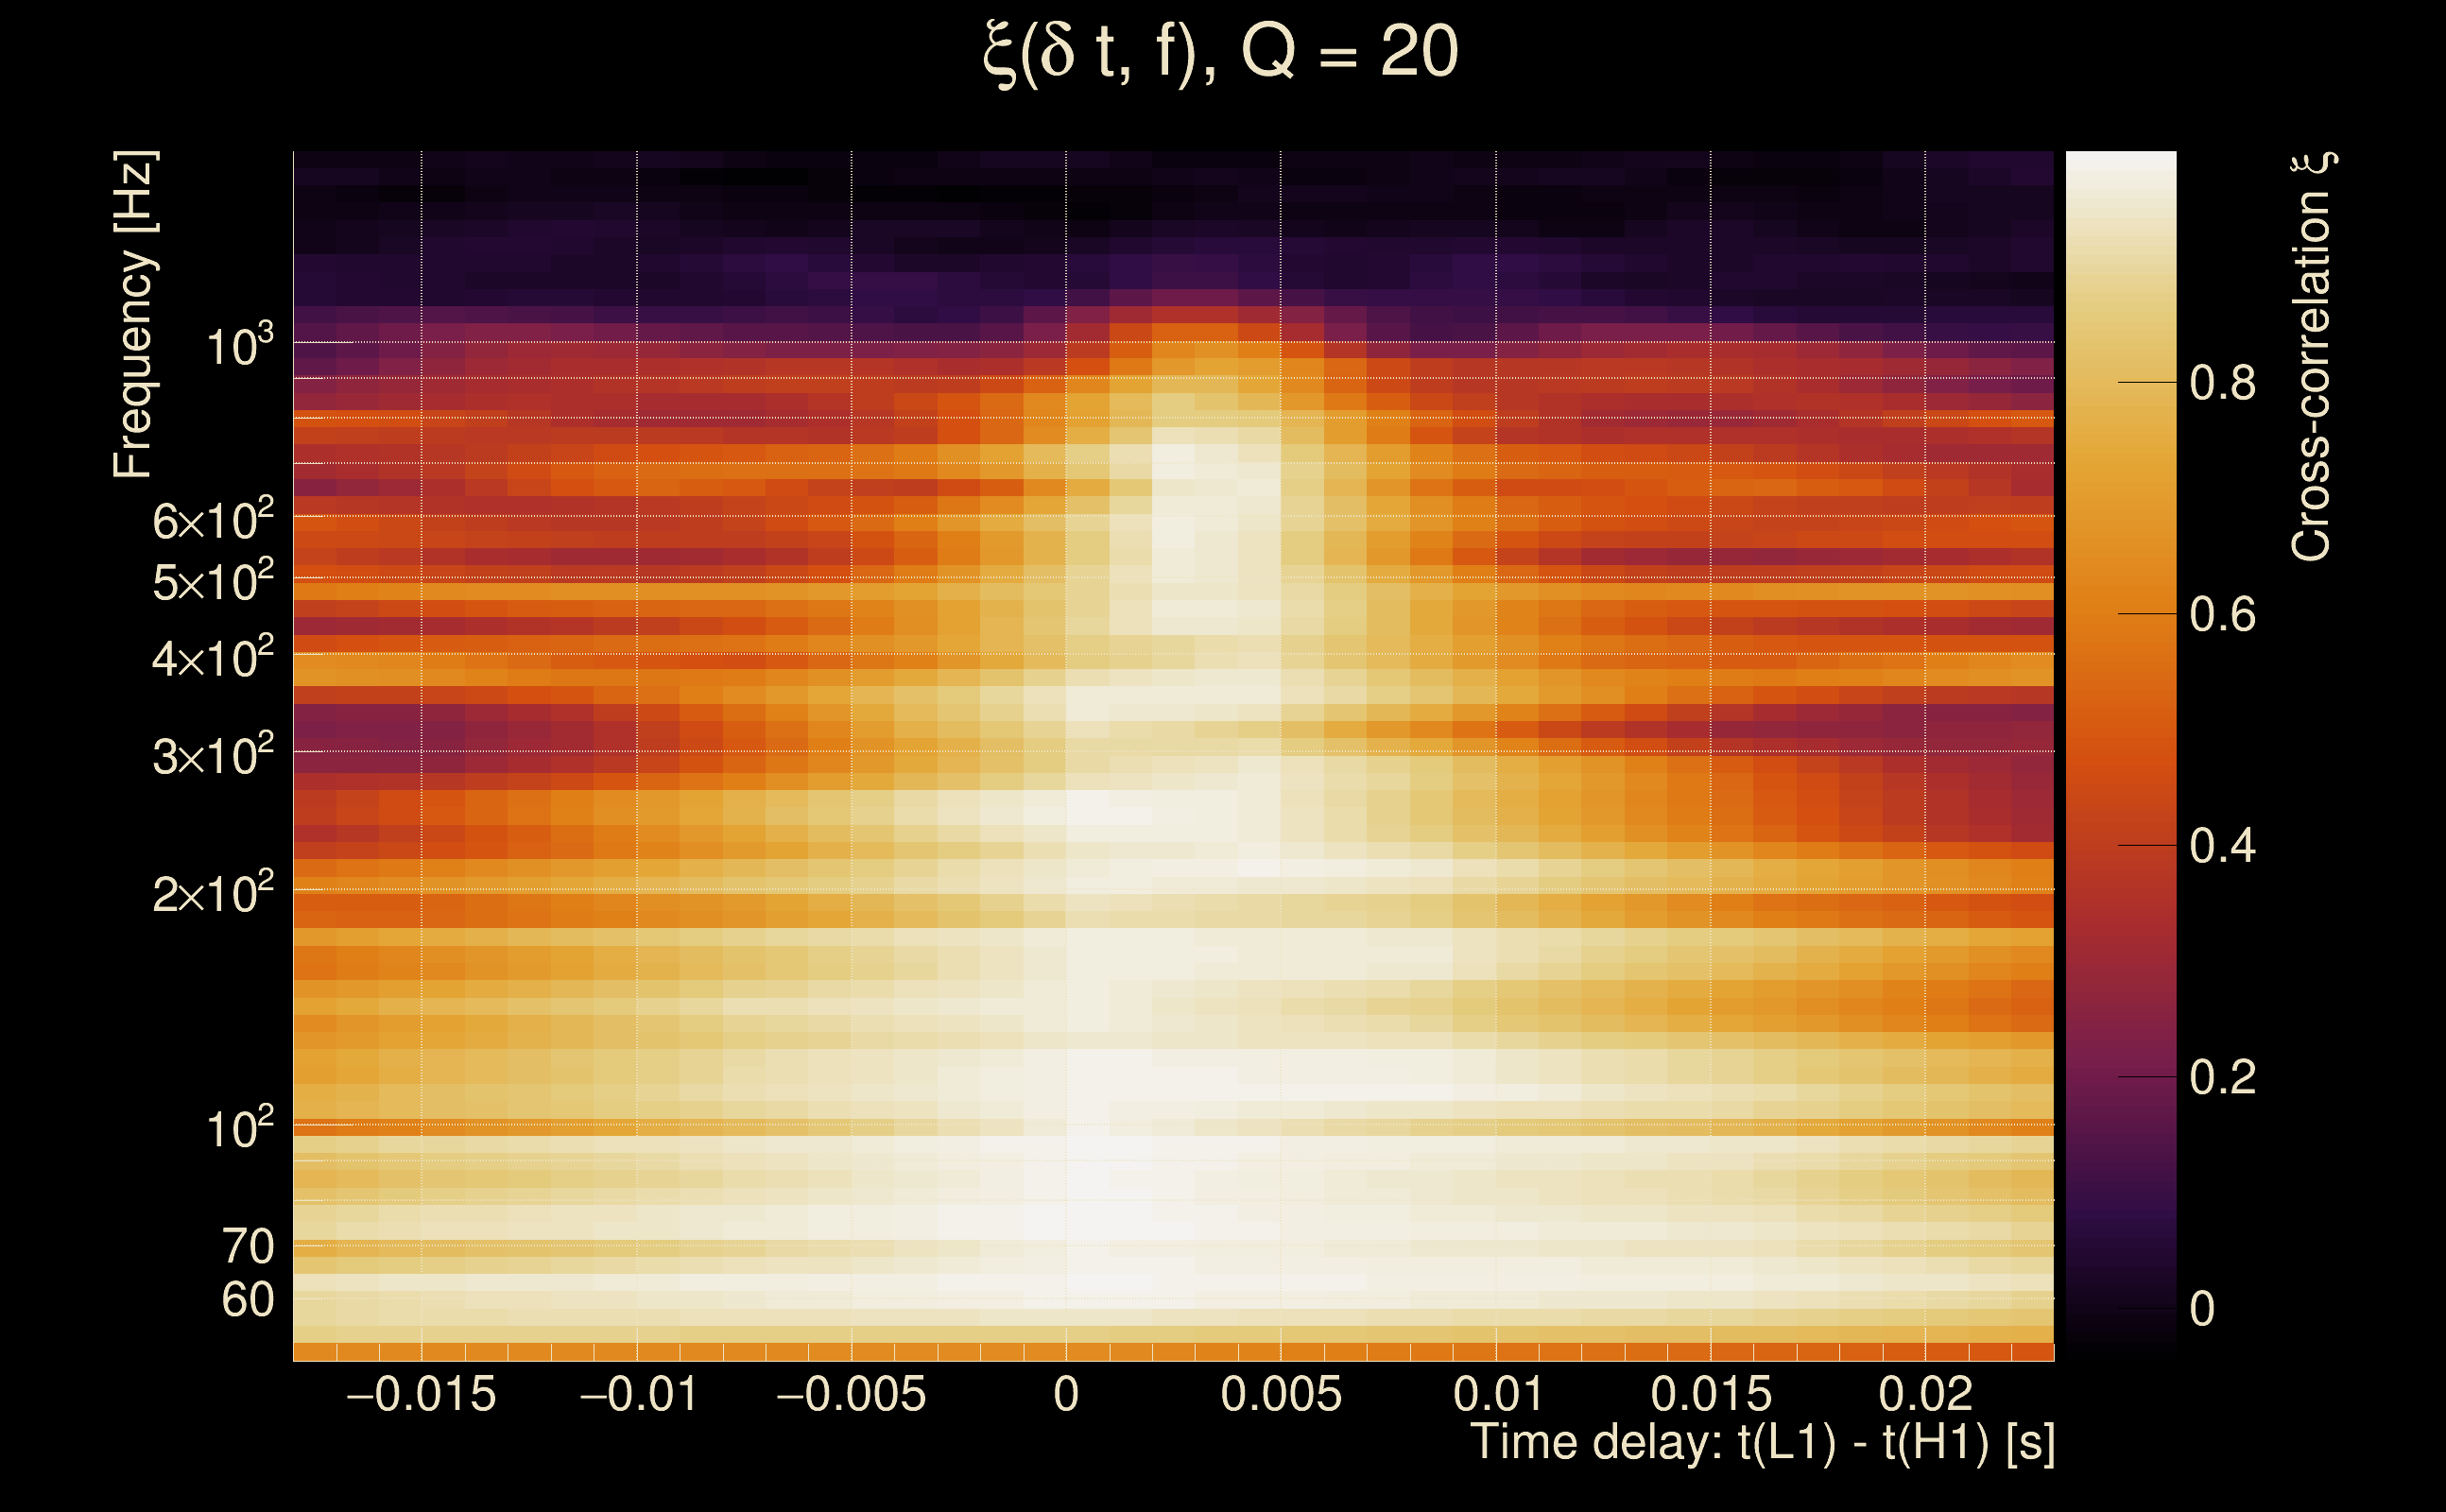
| Time delay between detectors t(L1) - t(H1): | 0.00283629 s (slice index = 108 / 217), δt_gw = 0.00283629 s |
| Time delay uncertainty: | 0.000649148 s |
| [targeted mode] Time delay probability: | 0.823794 (0.222668 sigmas), δt_target = 1.72247e+45 s |
| Frequency: | 233.331 Hz |
| Ξ: | 0.907523 ± 0.00323282 (variance = 1.04511e-05): Q0: 0.939766, Q1: 0.939044, Q2: 0.938612, Q3: 0.937097, Q4: 0.930848 |
| Rank: | R_A = 0.906998 |
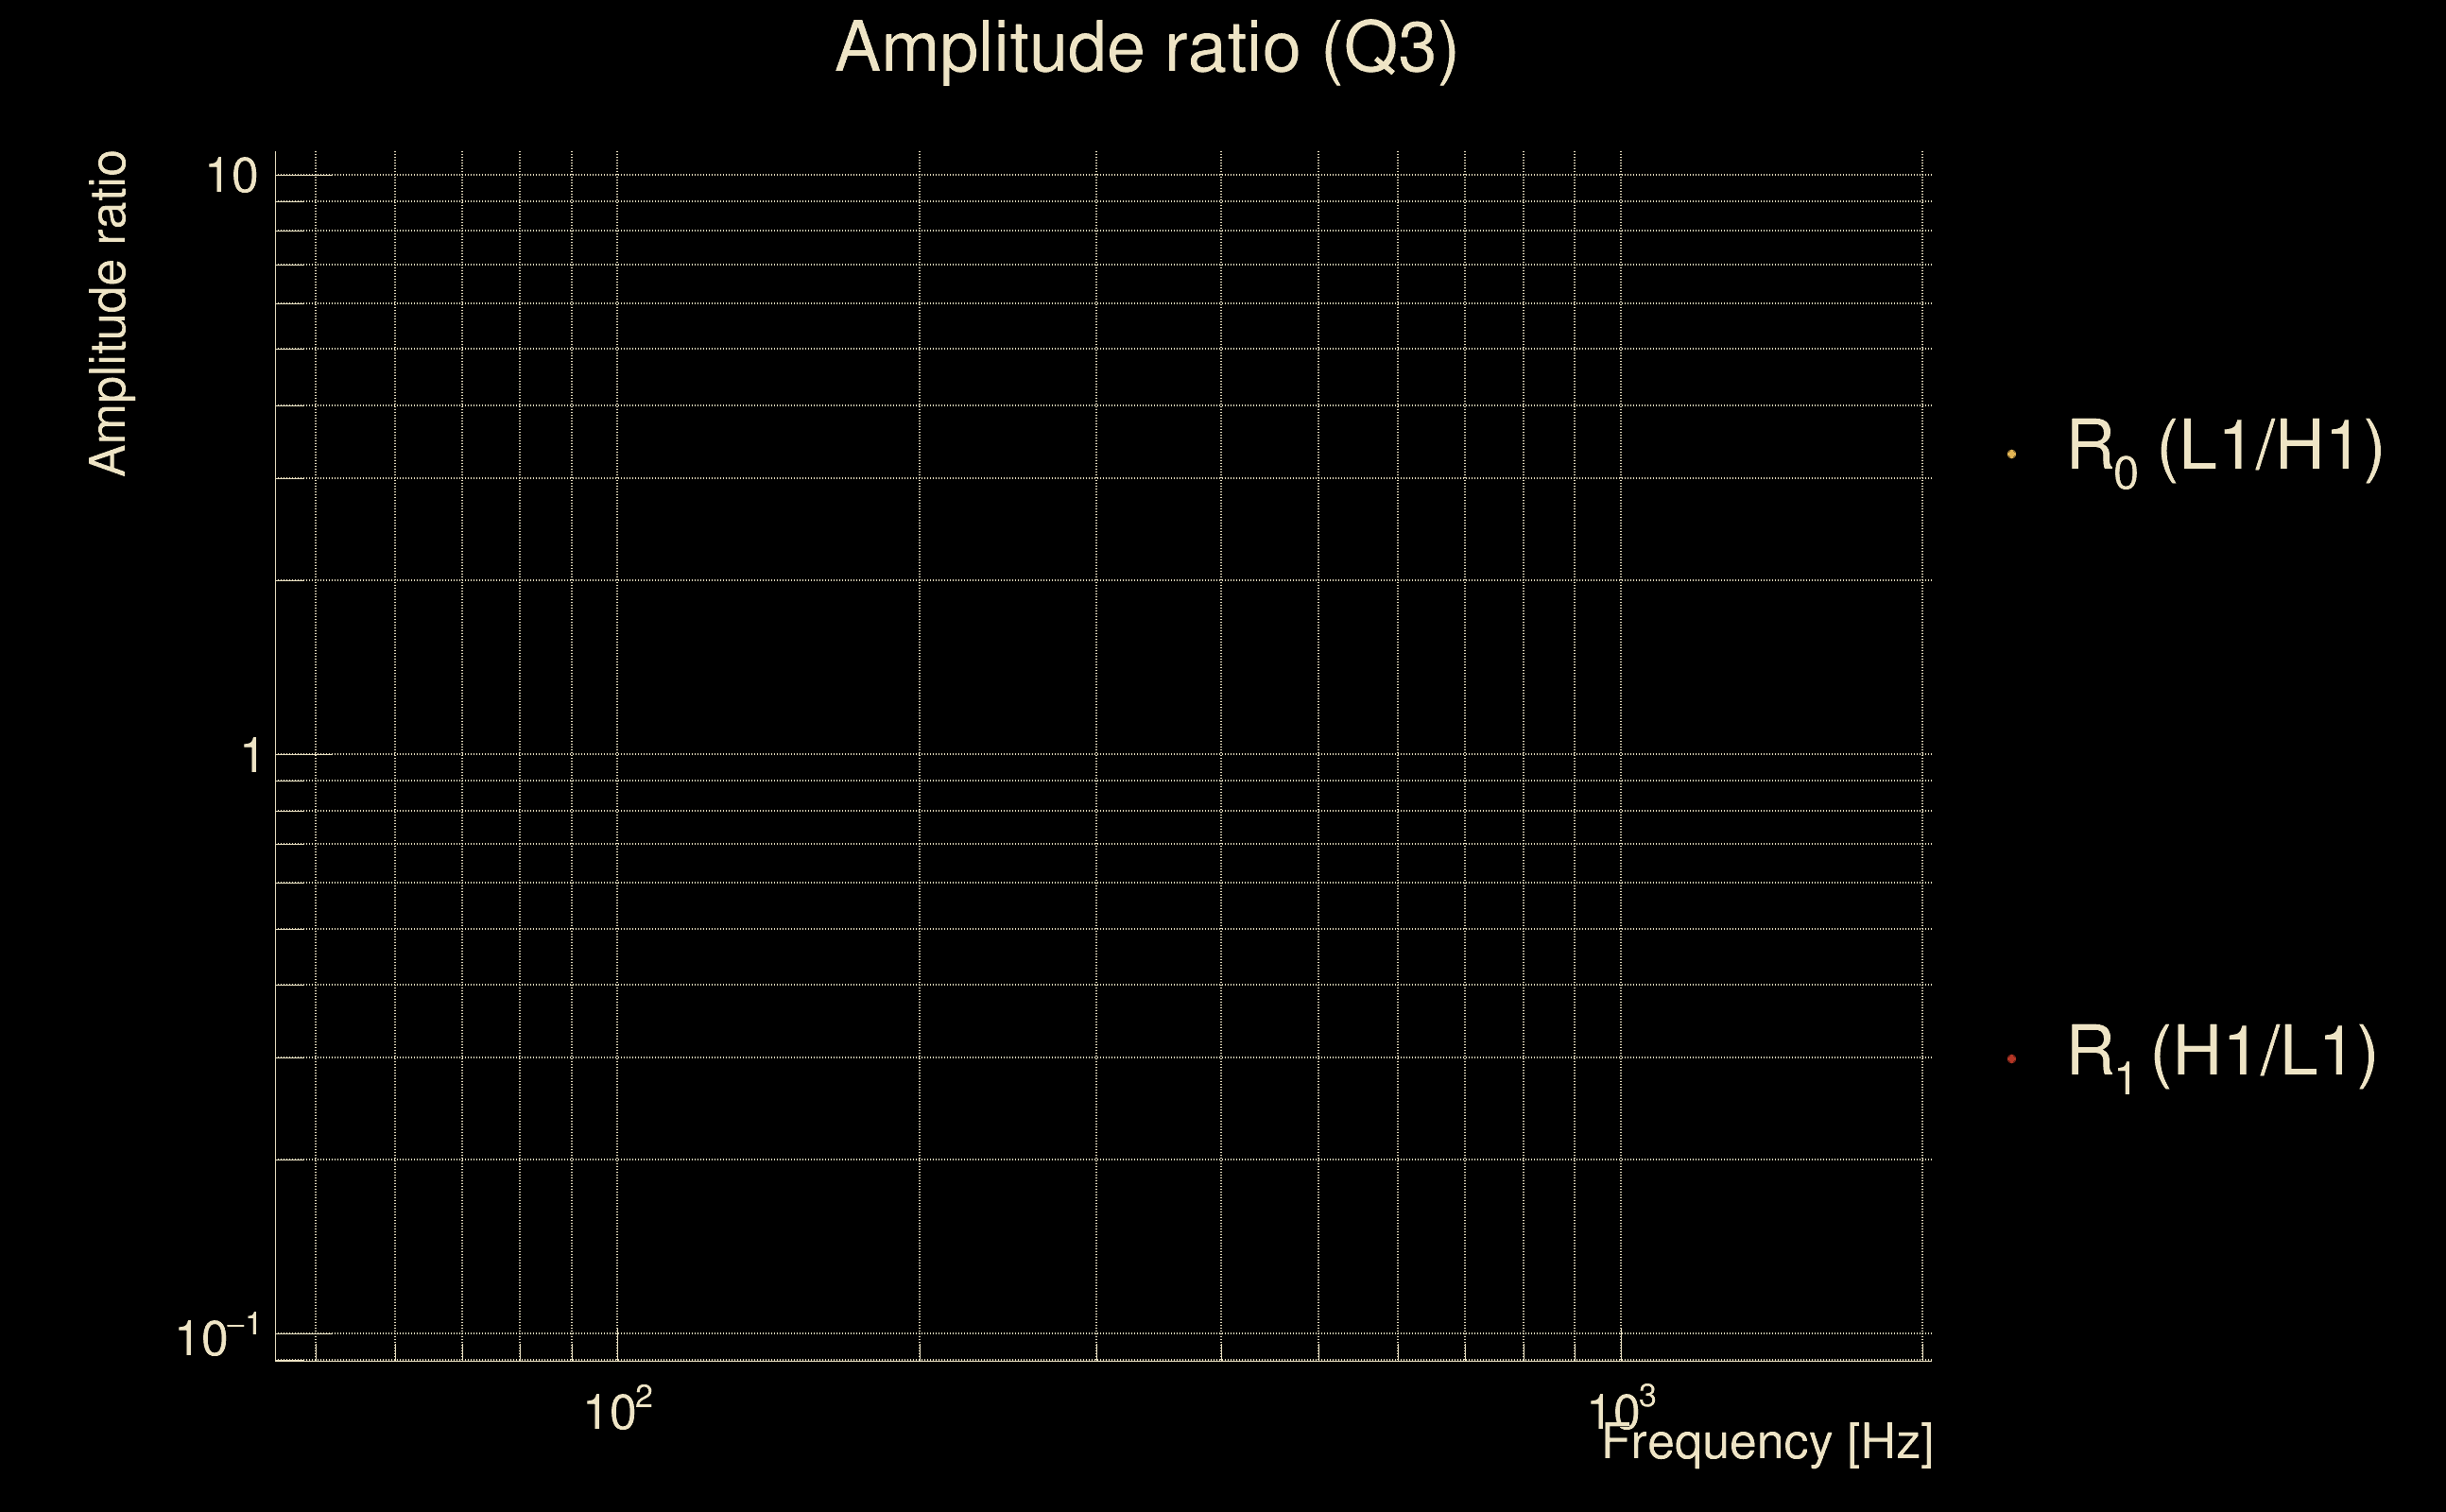
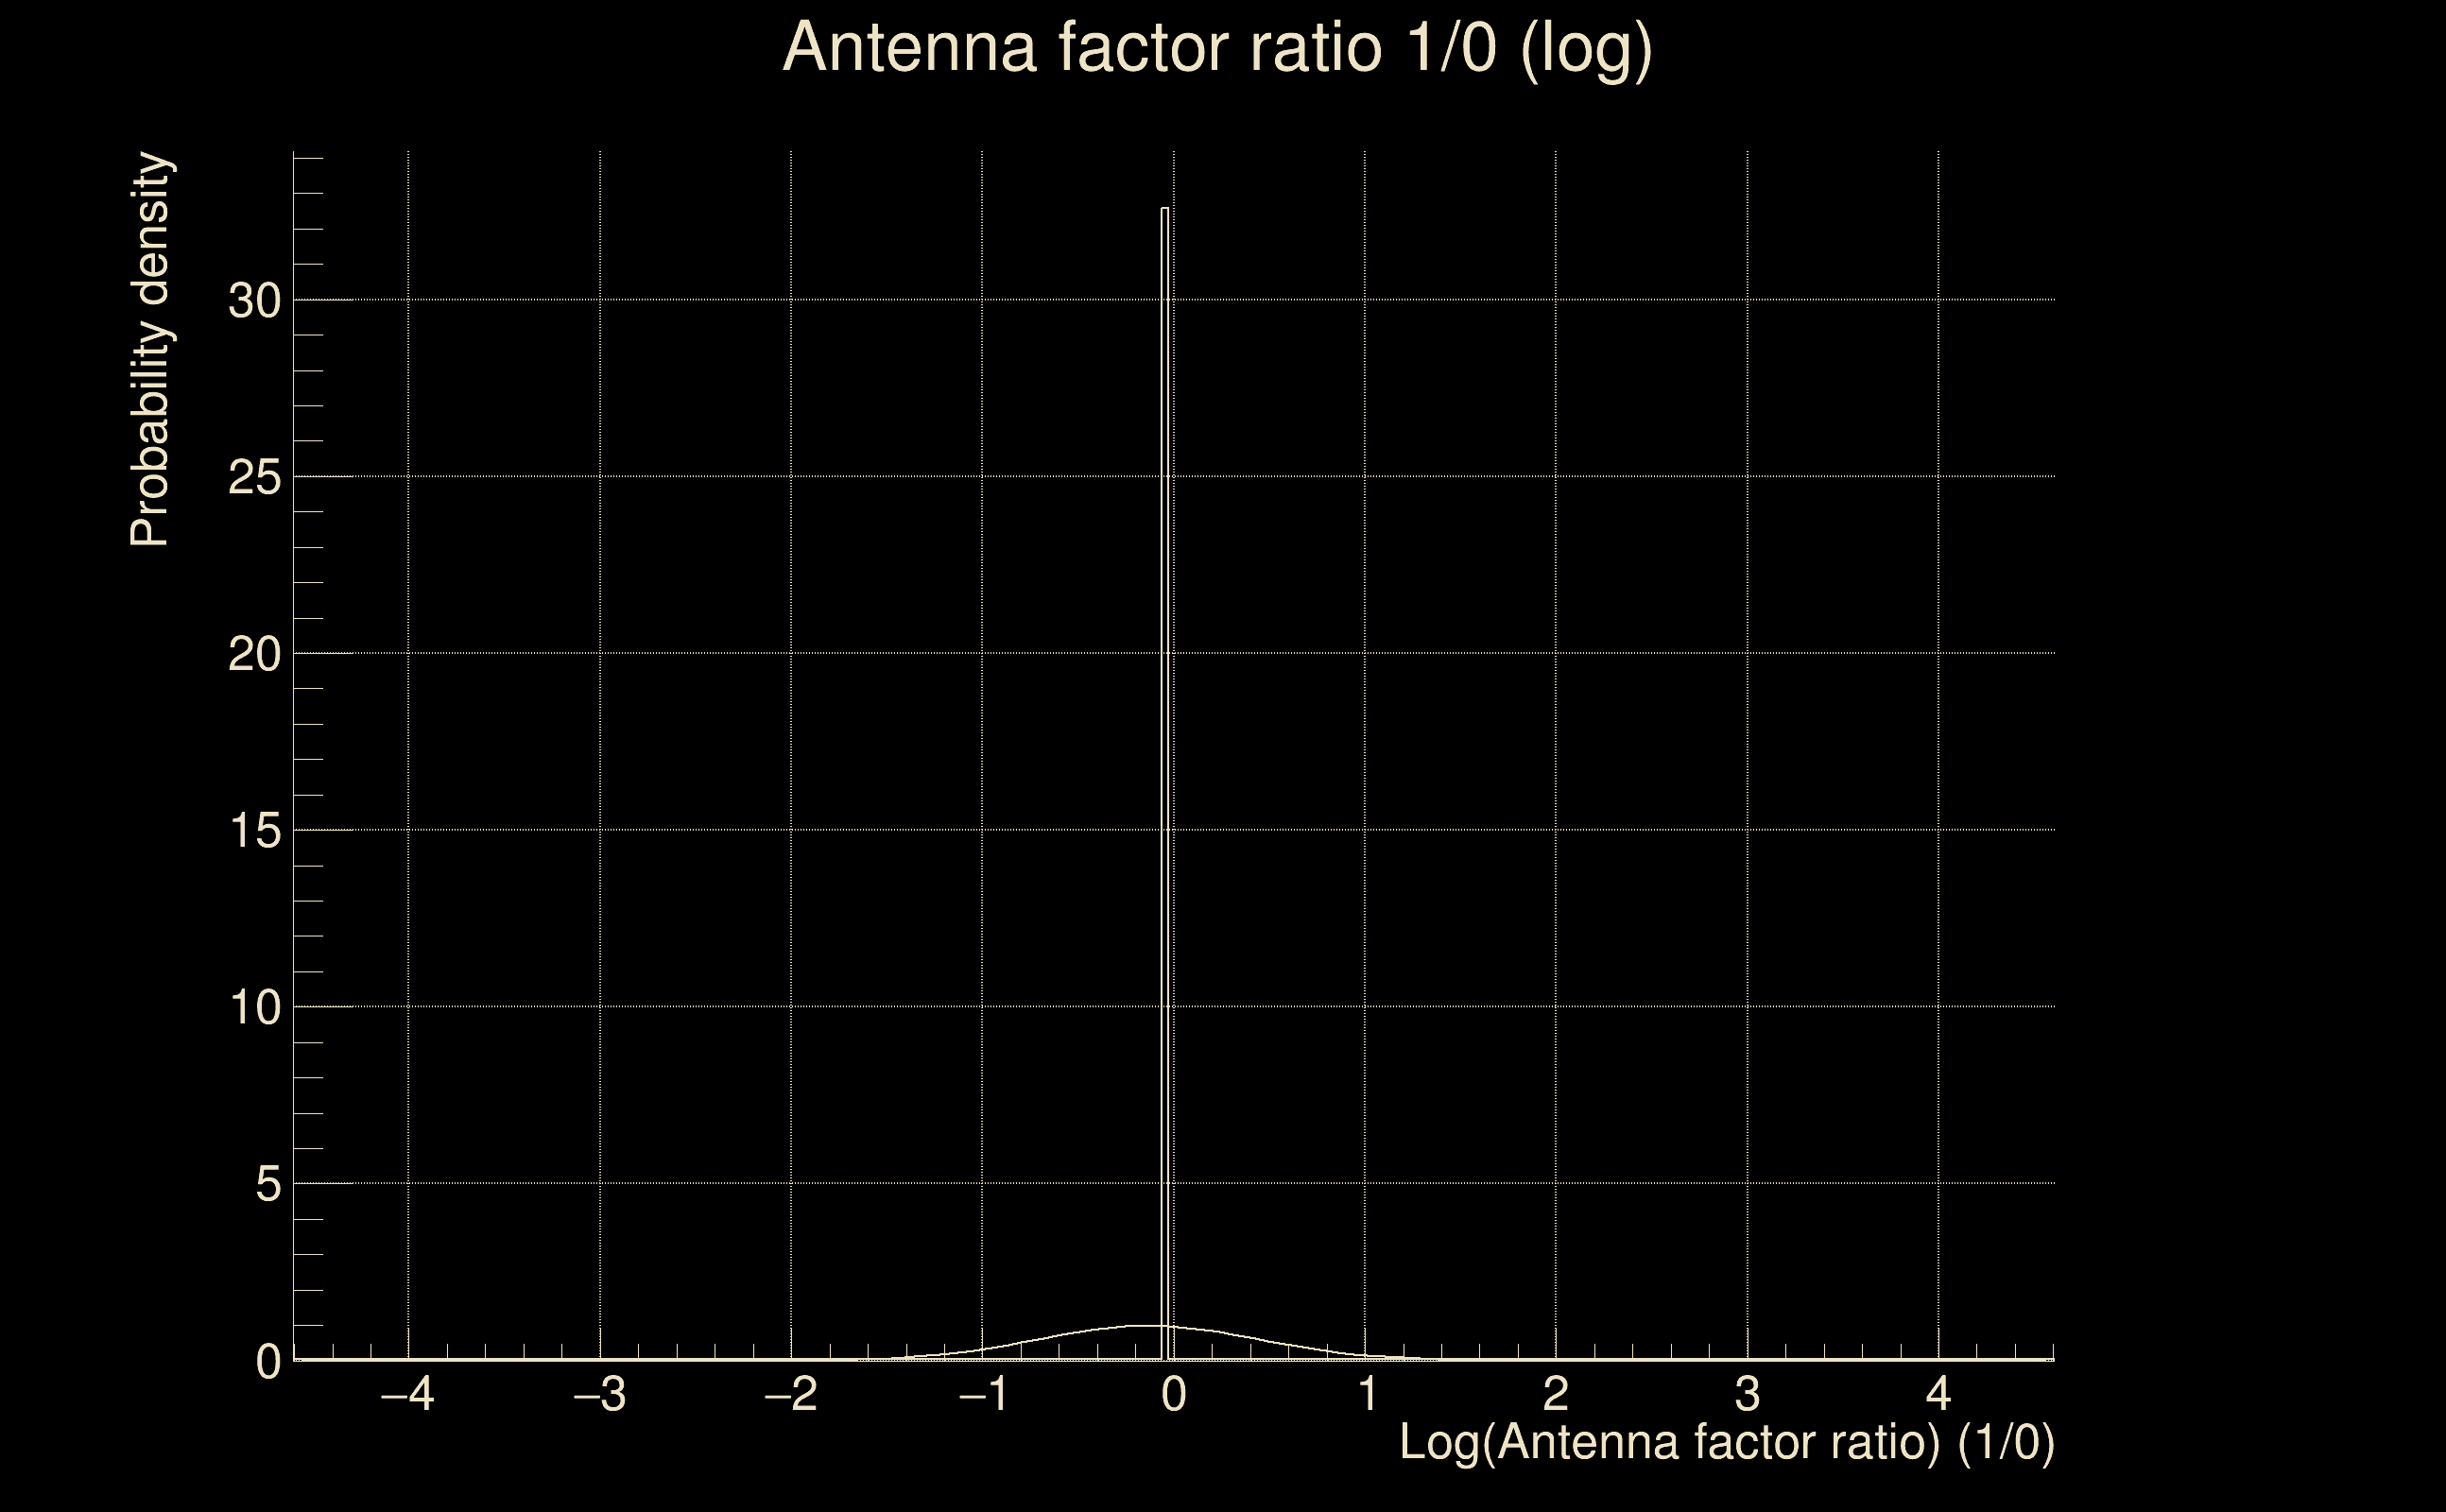
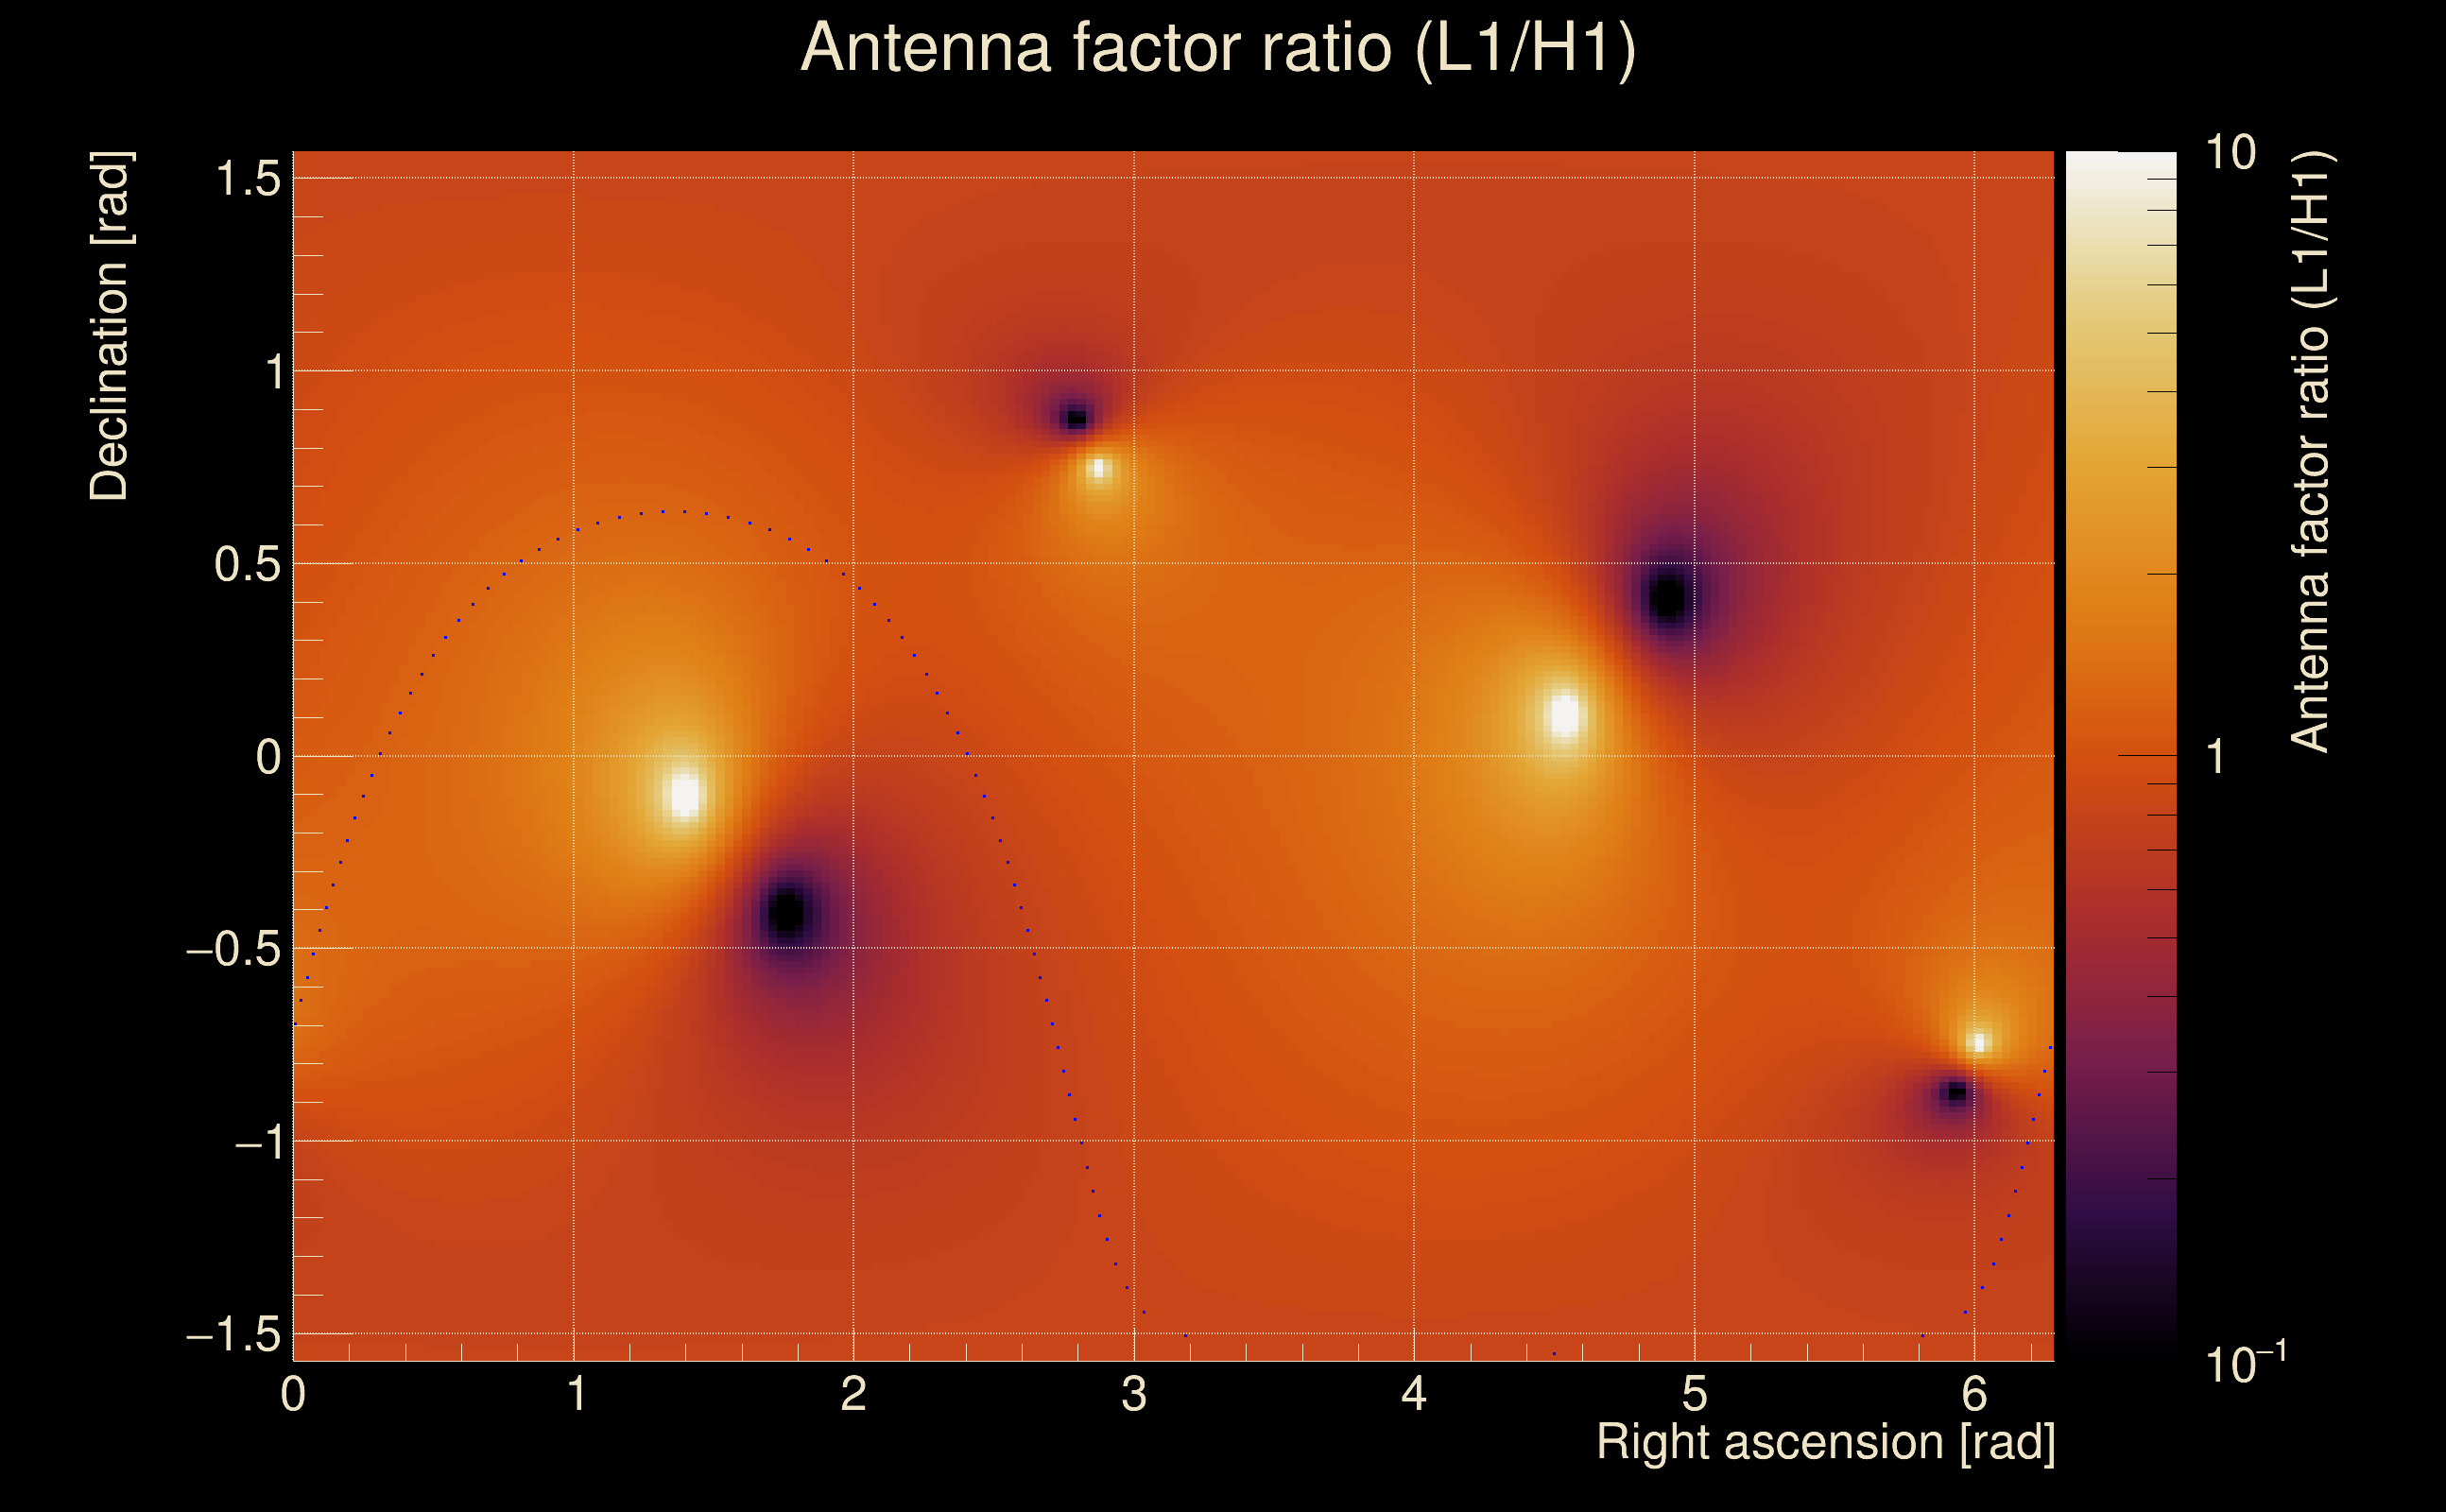
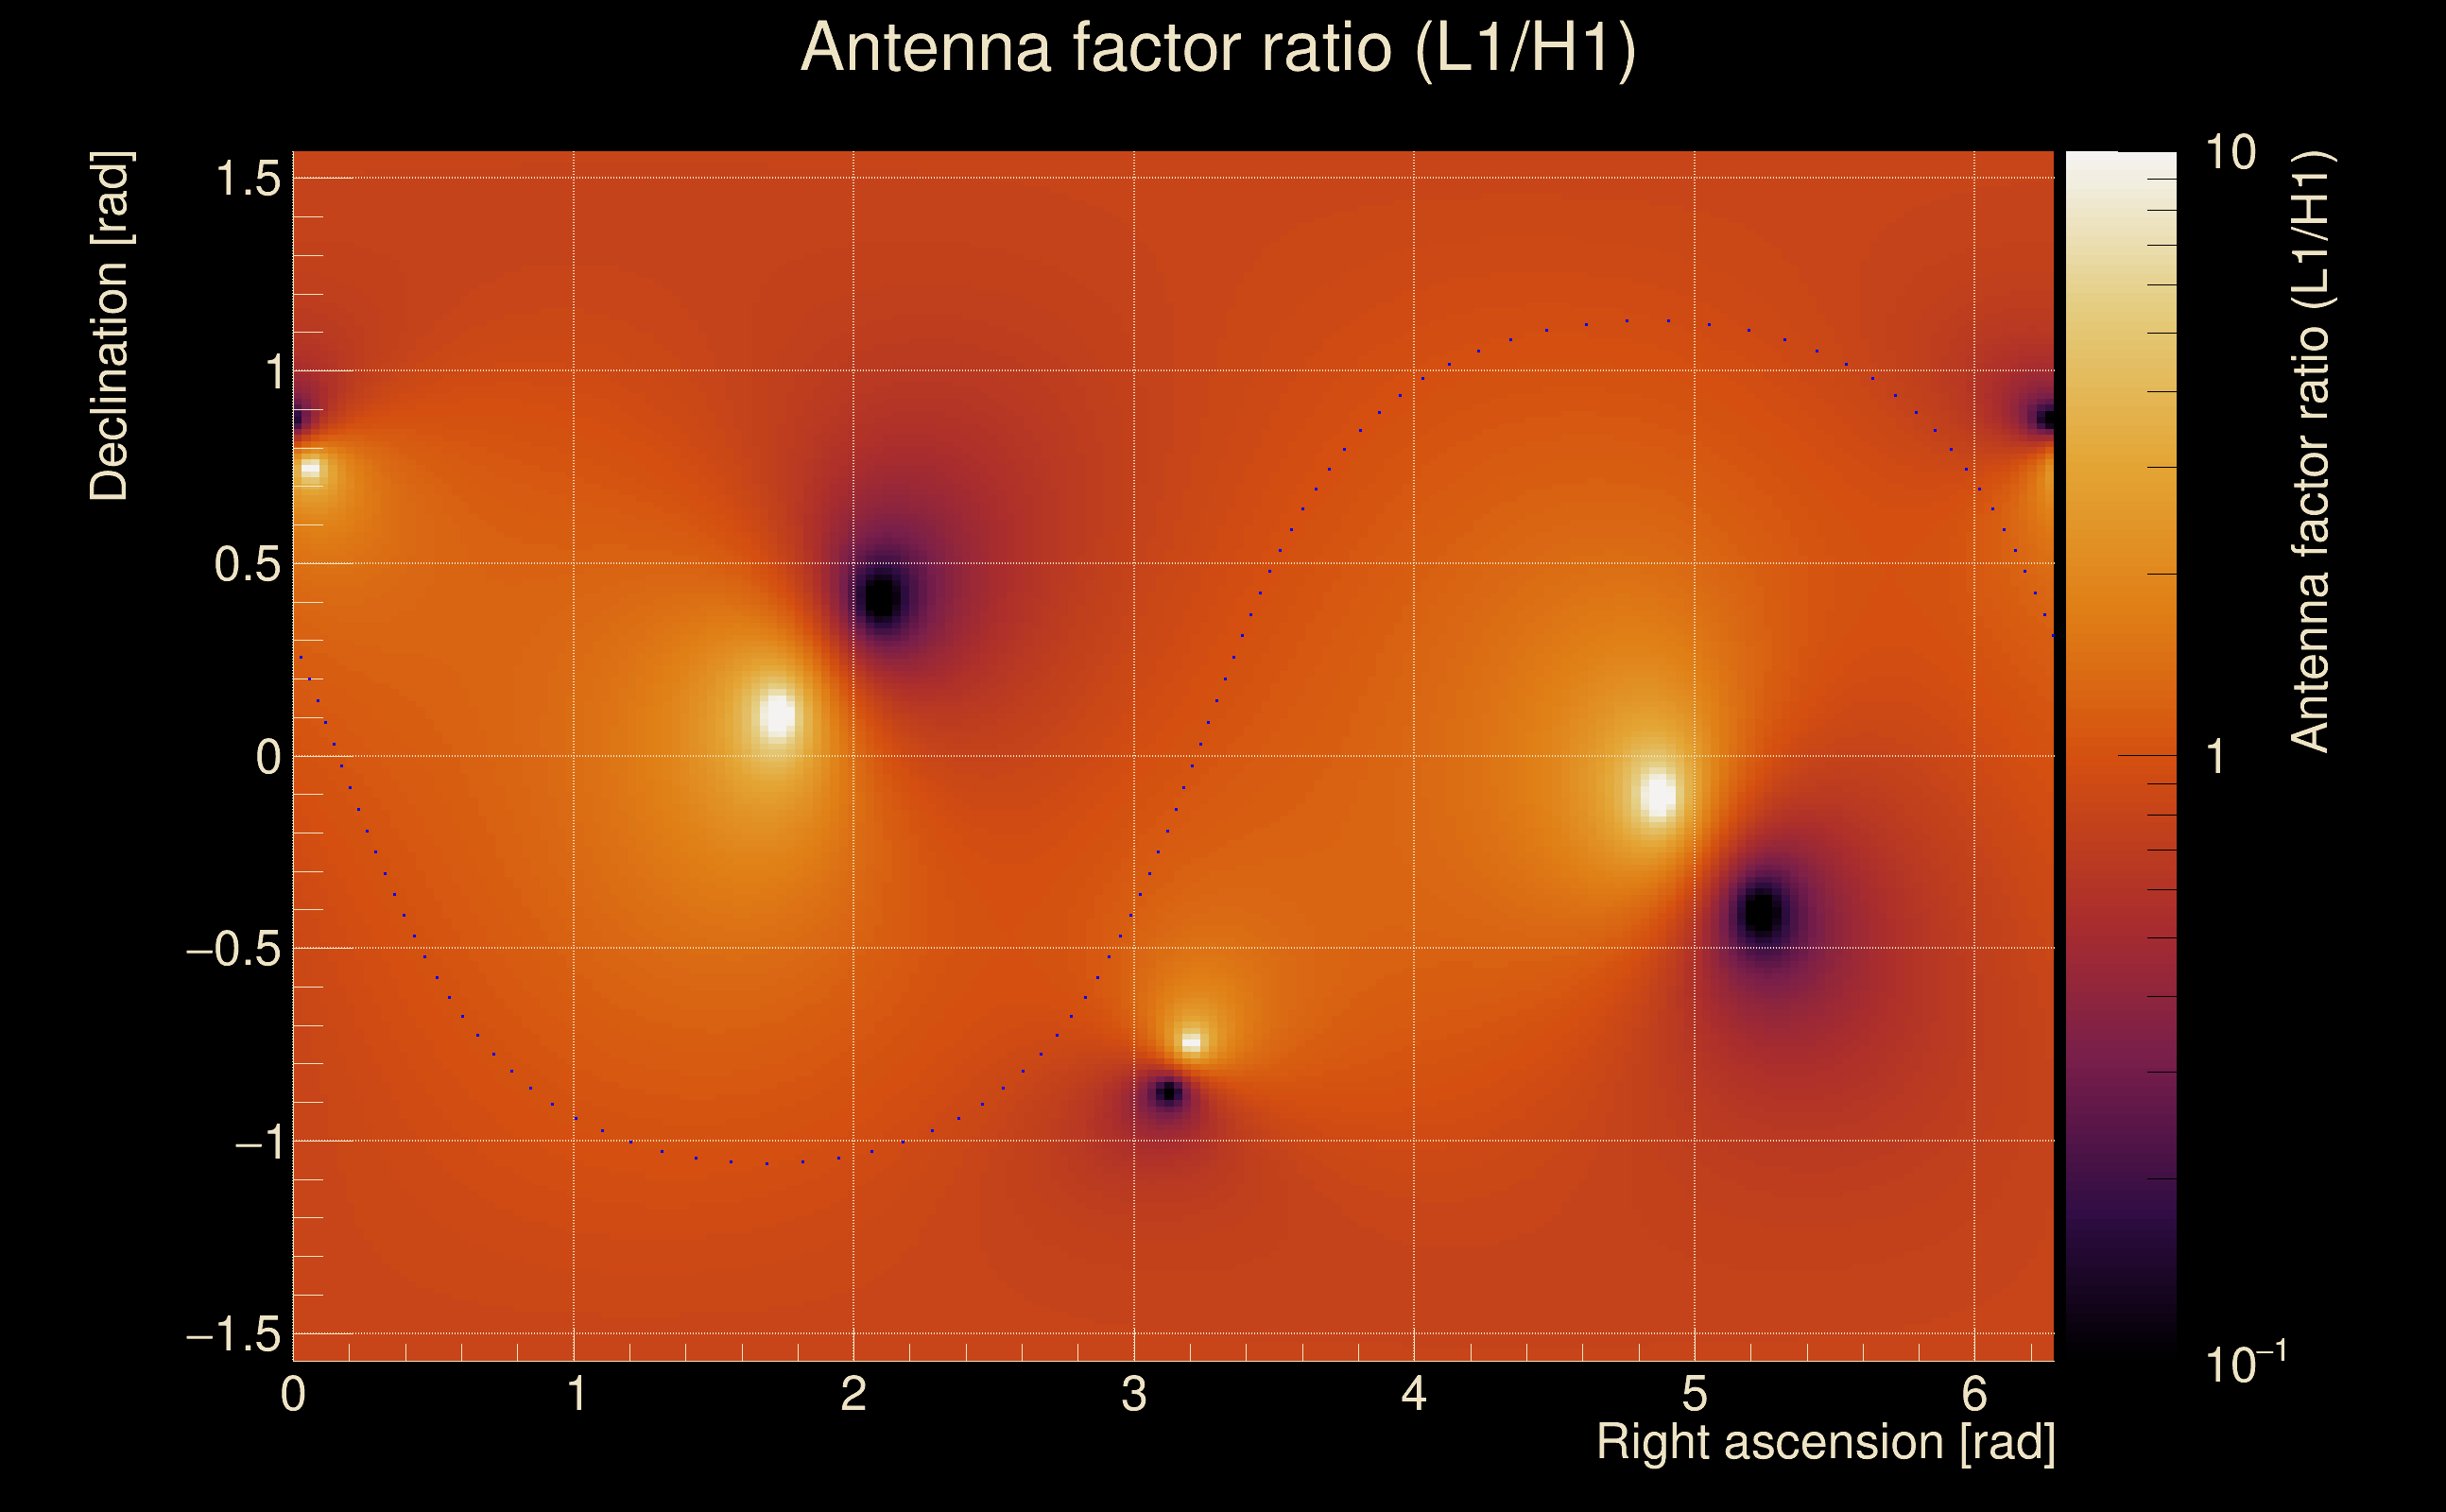
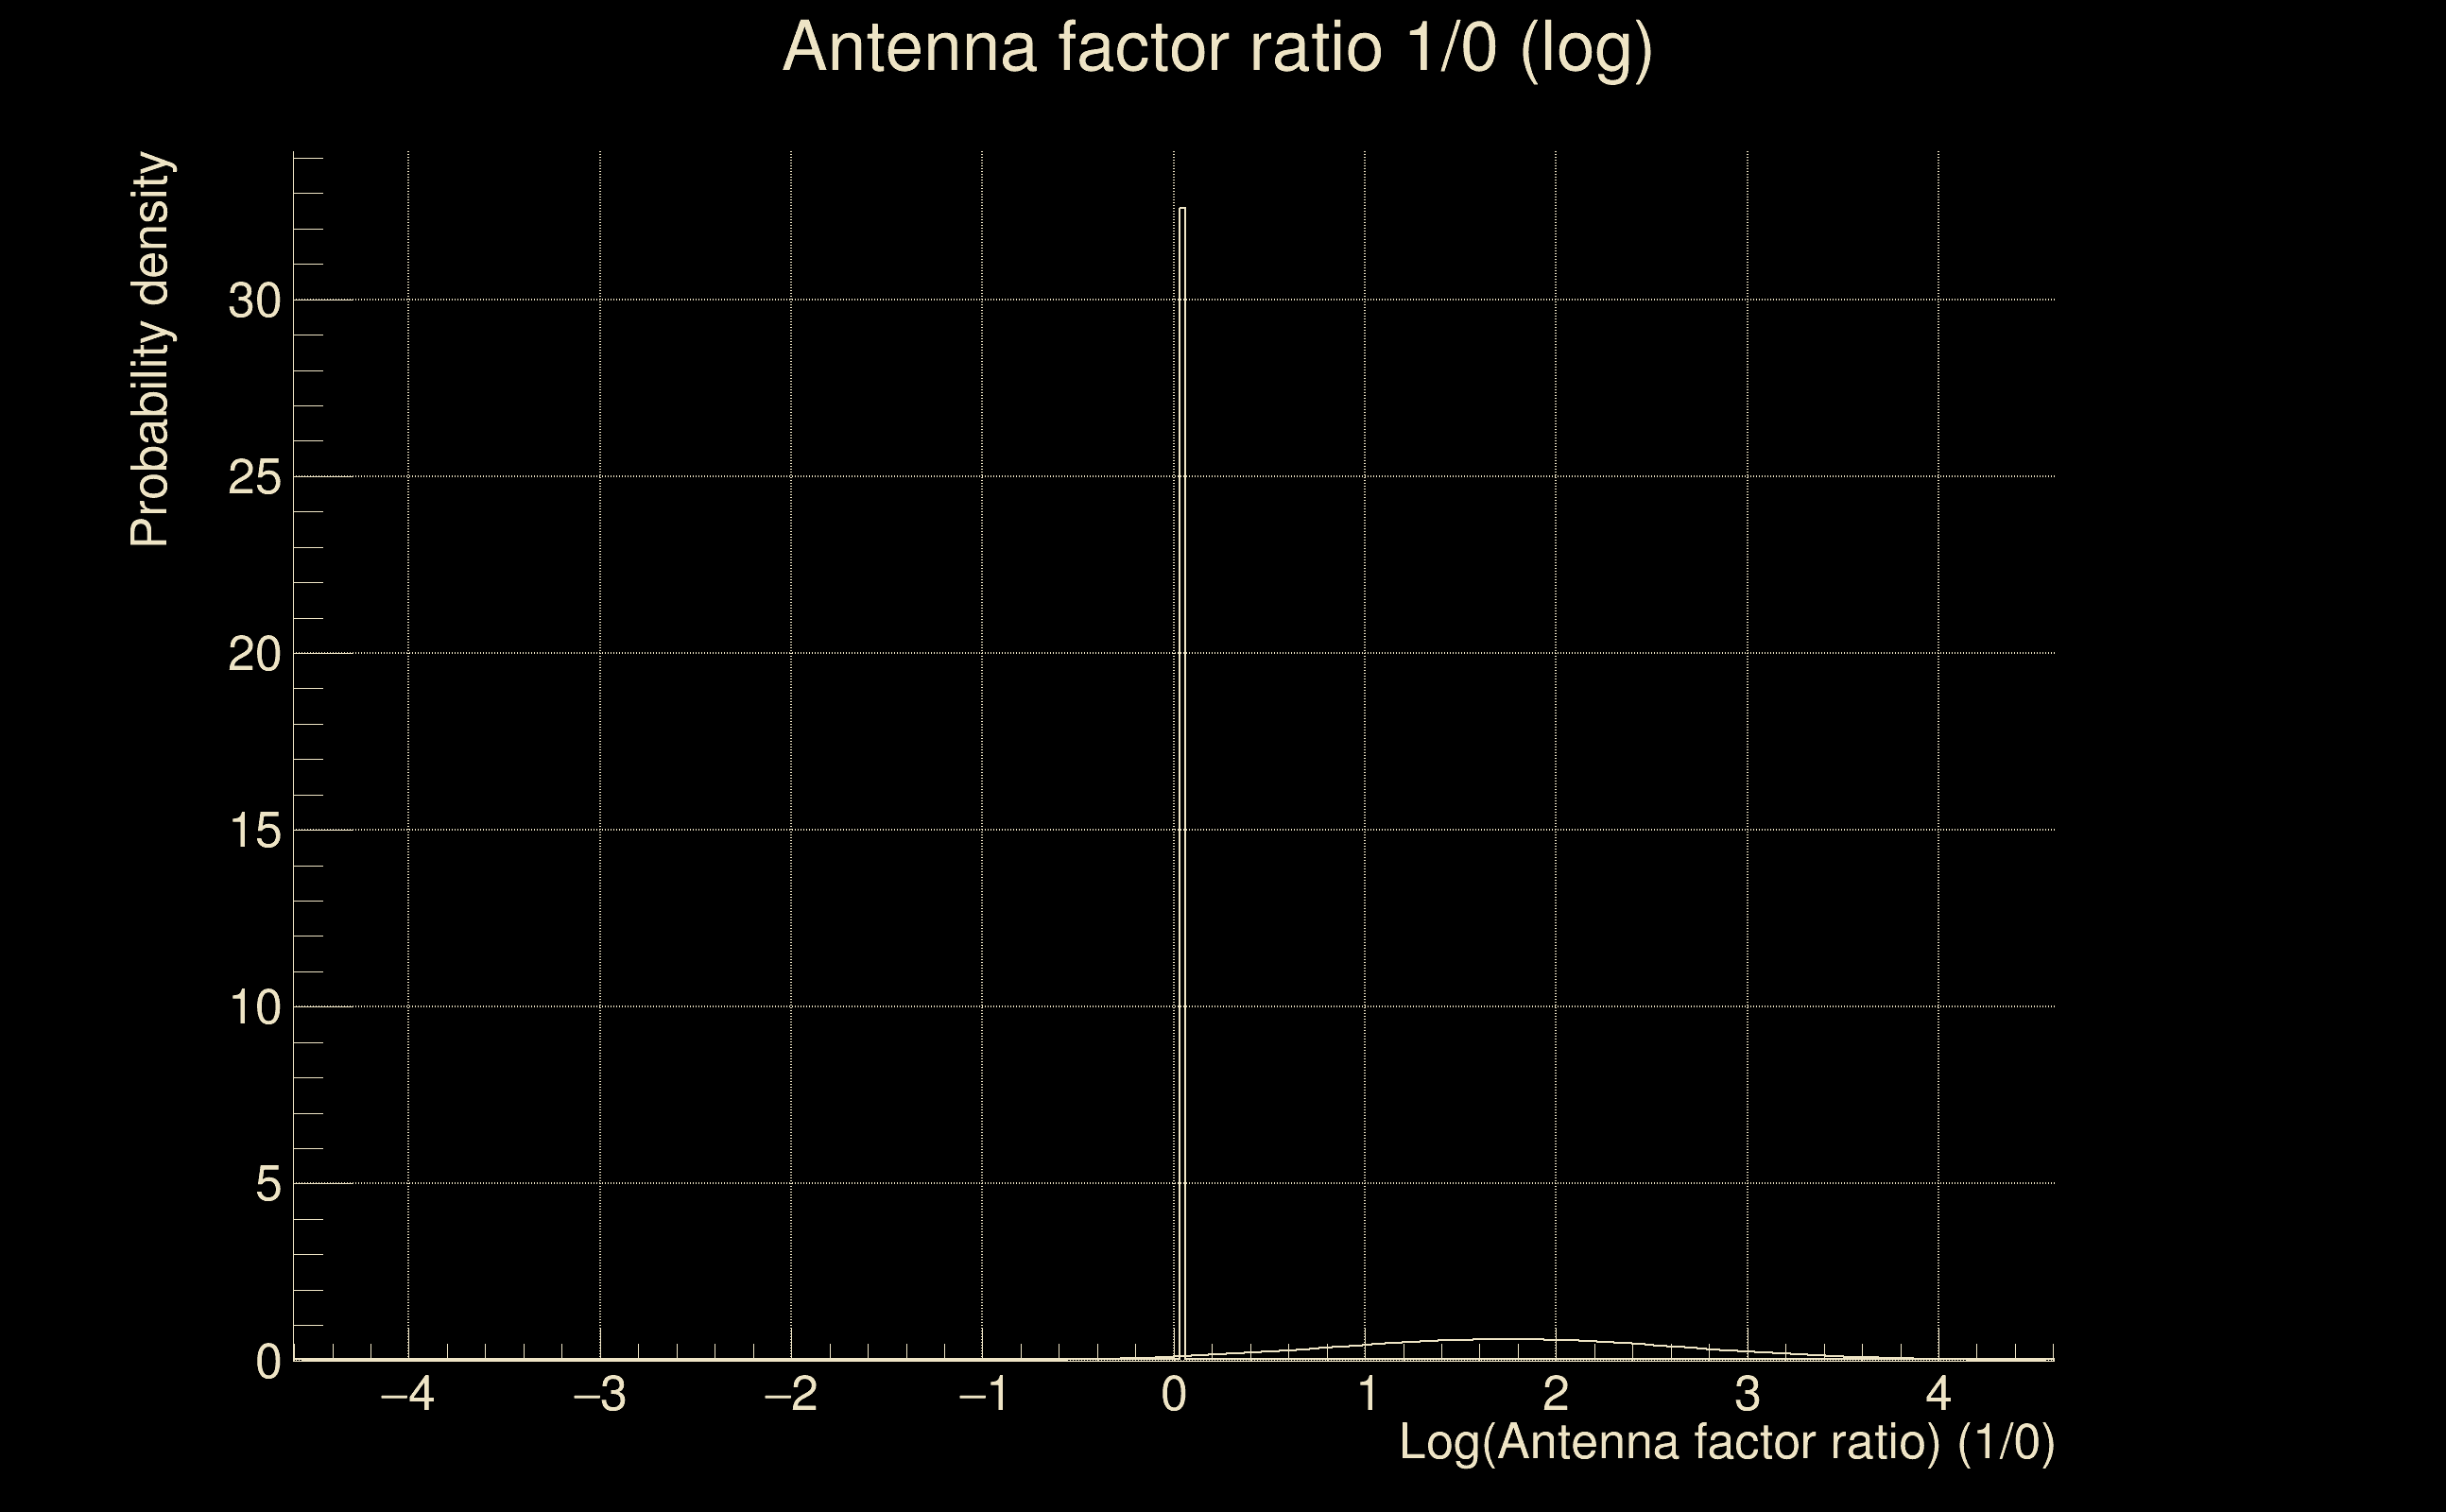
| Log of amplitude ratio (L1/H1): | -0.125888, variance = 0.155555 (L1/H1: -0.126127, variance = 0.302523, H1/L1: 0.125562, variance = 0.30596) |
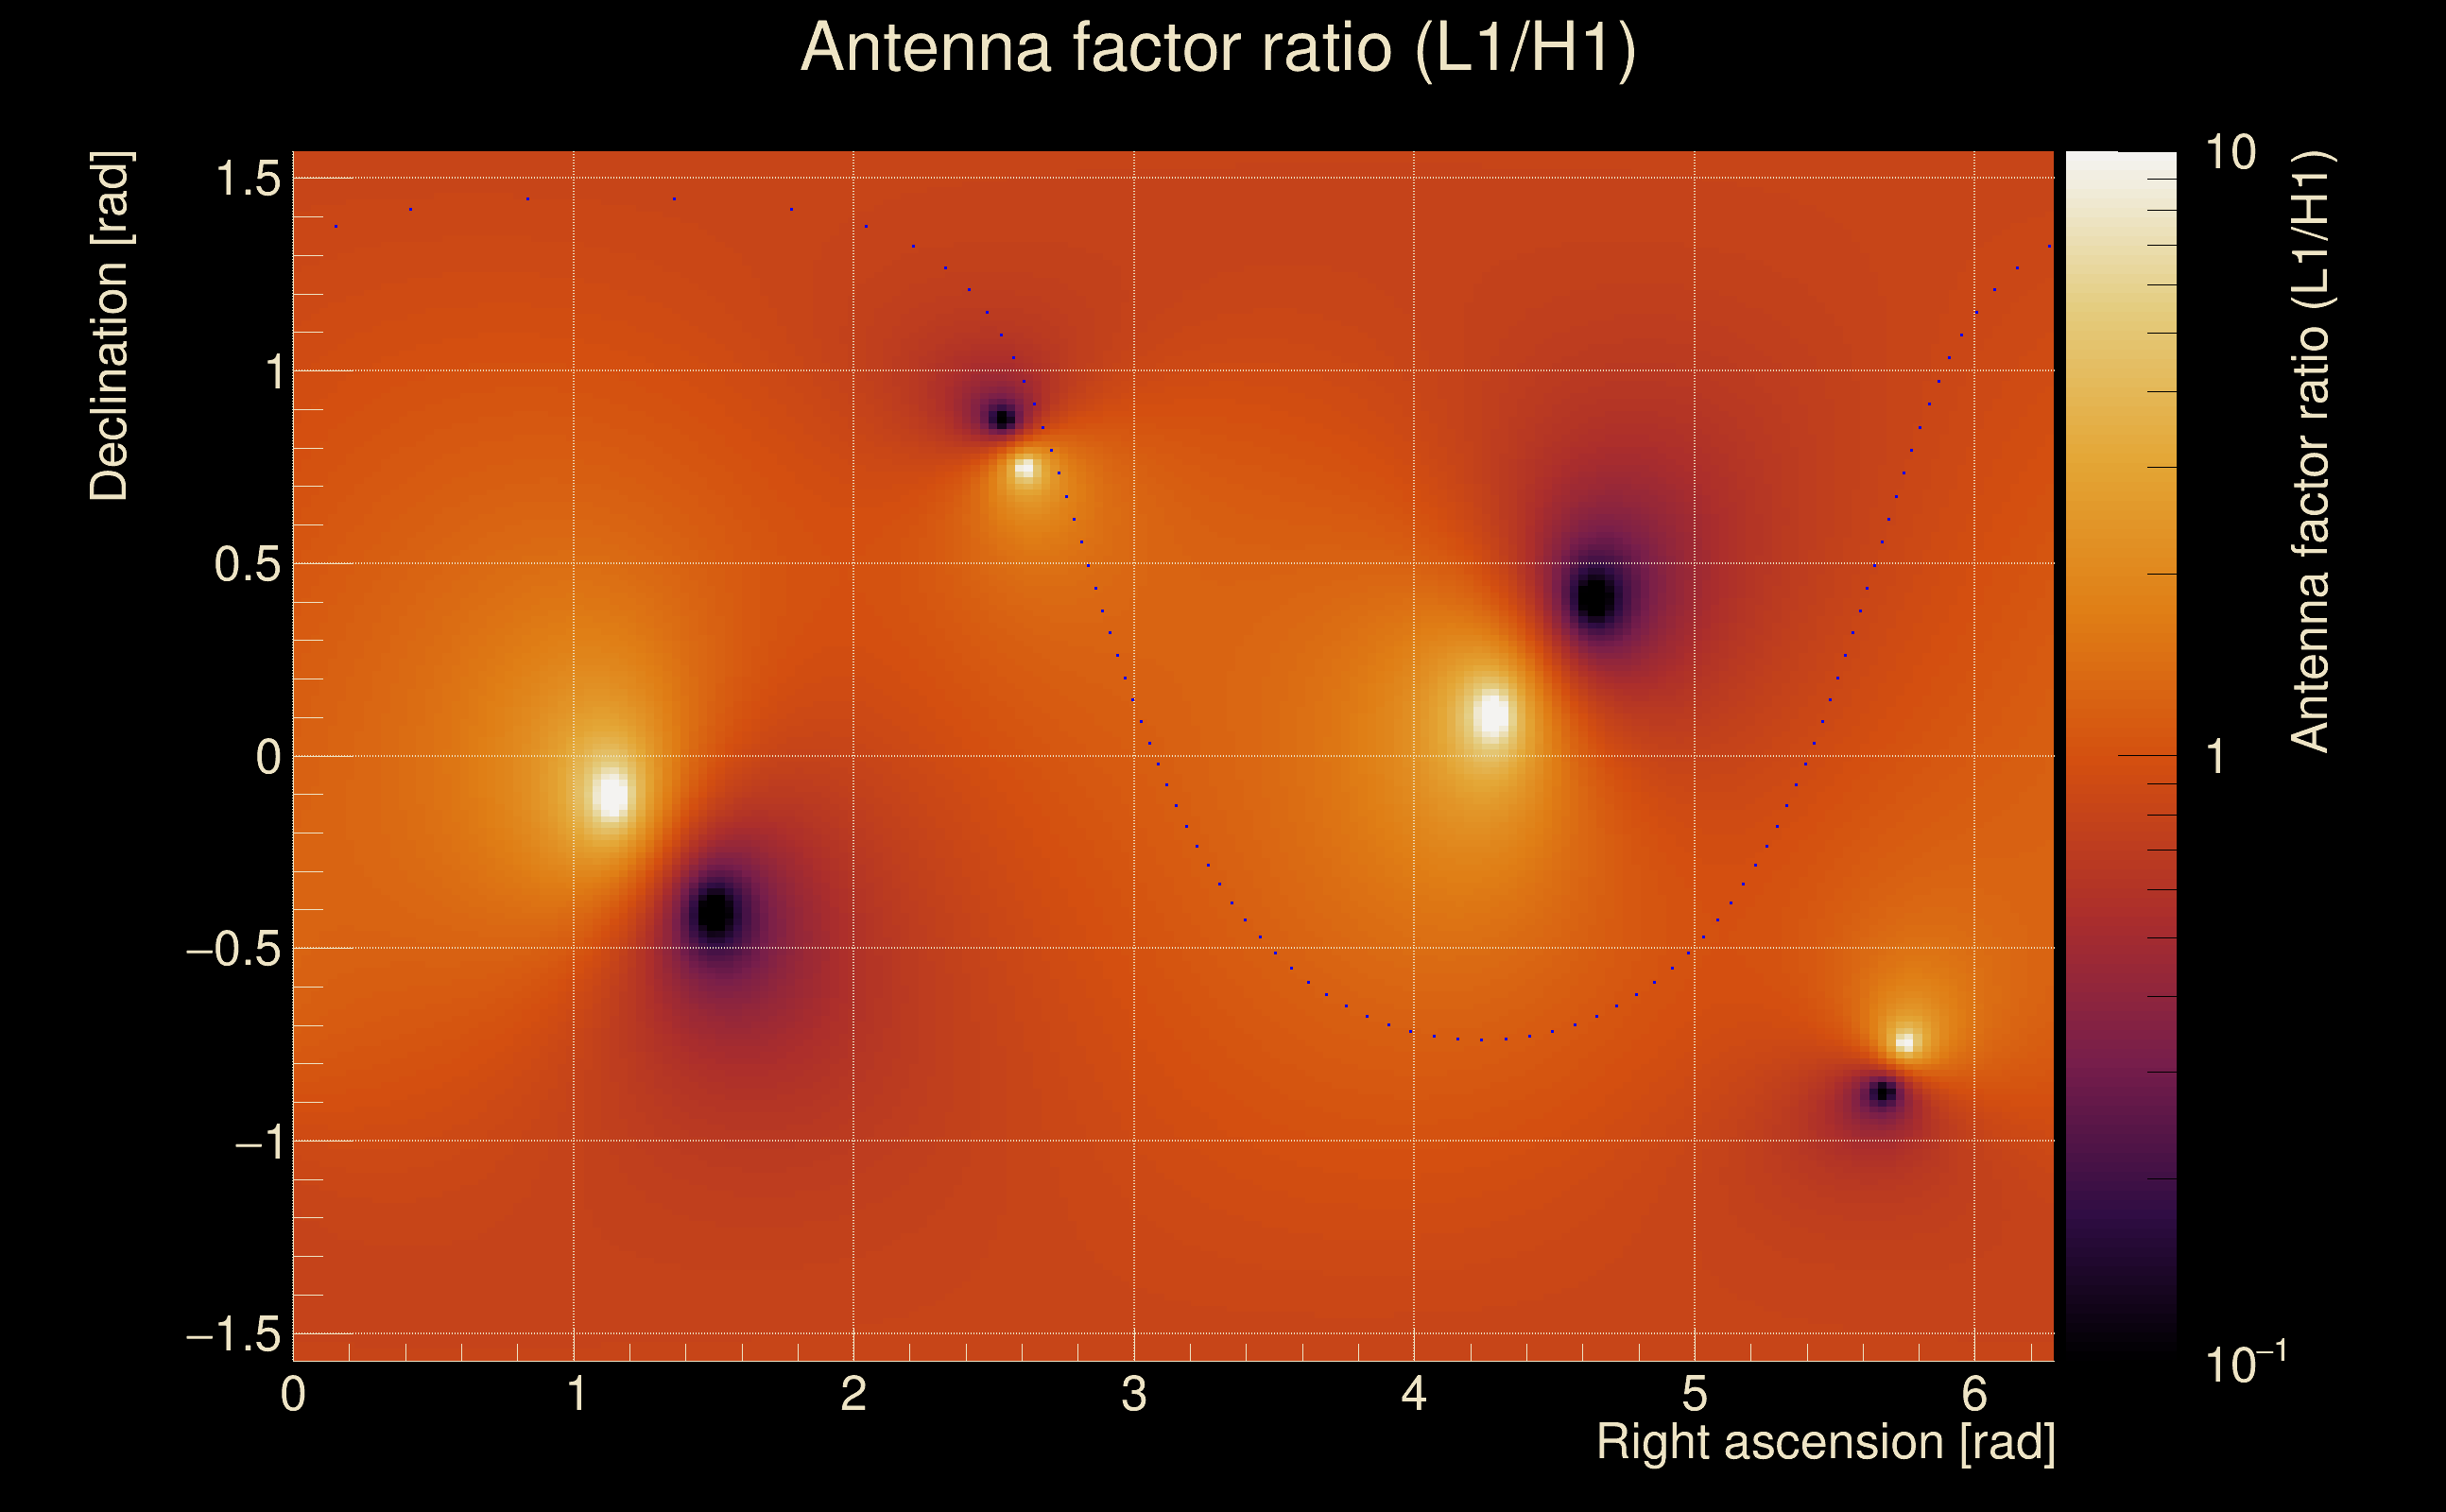
| Amplitude ratio (L1/H1): | 0.881713 ⋇ 1.4835 (L1/H1: 0.881503 ⋇ 1.73329, H1/L1: 1.13378 ⋇ 1.7387) |
| Amplitude ratio H1|L1 compatibility (probability): | 0.999422 |
| Antenna factor probability: | 1 |
| Number of rejected frequency rows: | Q0: 0 / 18, Q1: 1 / 36, Q2: 6 / 70, Q3: 16 / 134, Q4: 51 / 258 |
| Maximum signal-to-noise ratio: | H1: 67.454, L1: 57.637 |
| SNR variance: | H1: 3.93391, L1: 3.06702 |
| Click here for a zoomed plot | Click here for a zoomed plot | Click here for a zoomed plot | Click here for a zoomed plot | Click here for a zoomed plot |
 |
 |
 |
 |
 |
 |
 |
 |
 |
 |
 |
 |
 |
 |
 |
 |
 |
 |
 |
 |
 |
 |
 |
 |
 |
 |
 |
 |
 |
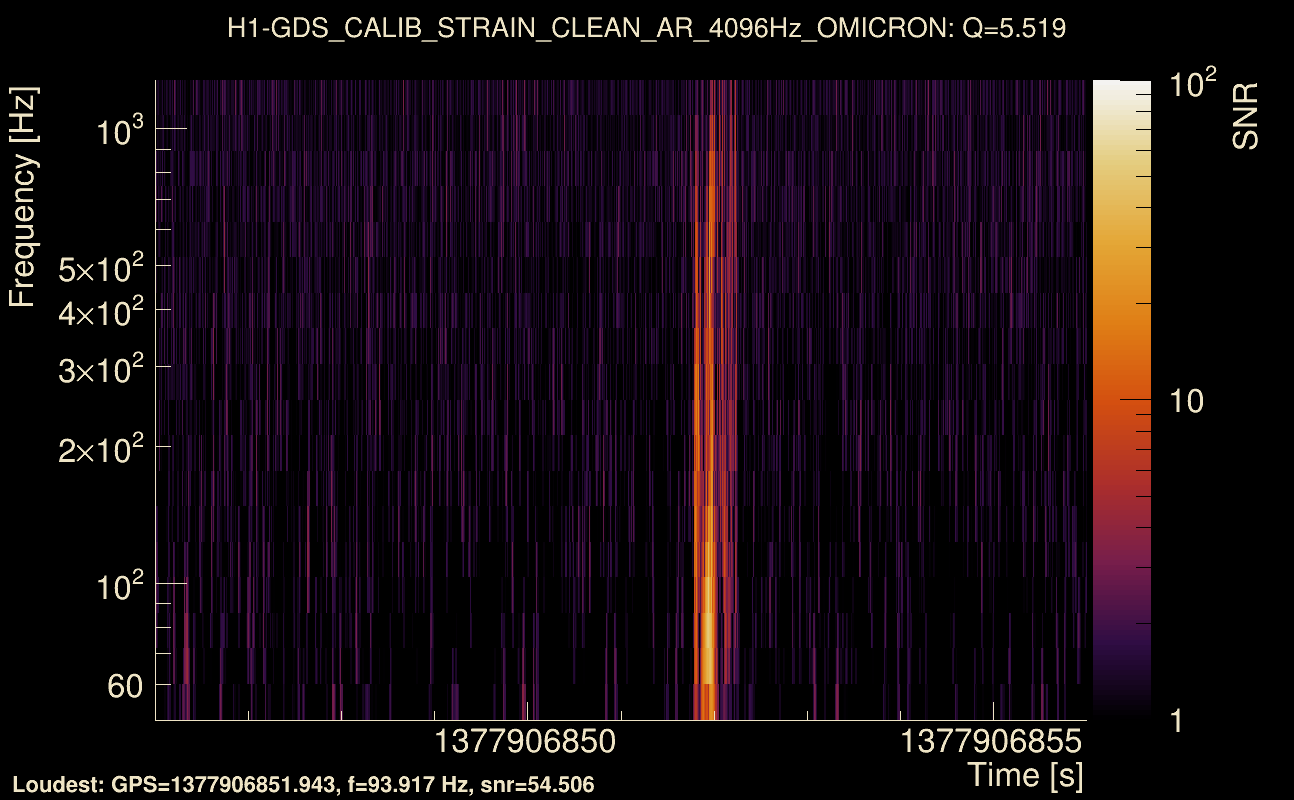
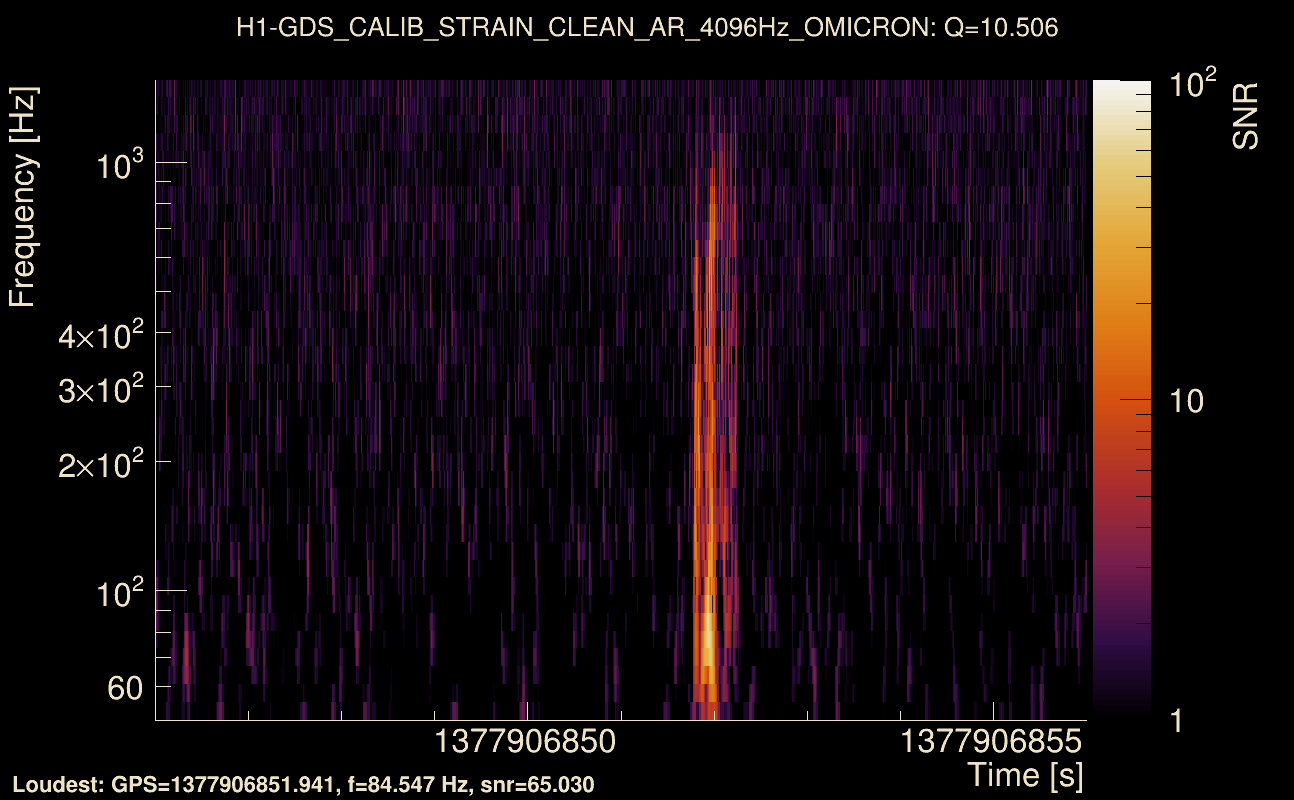
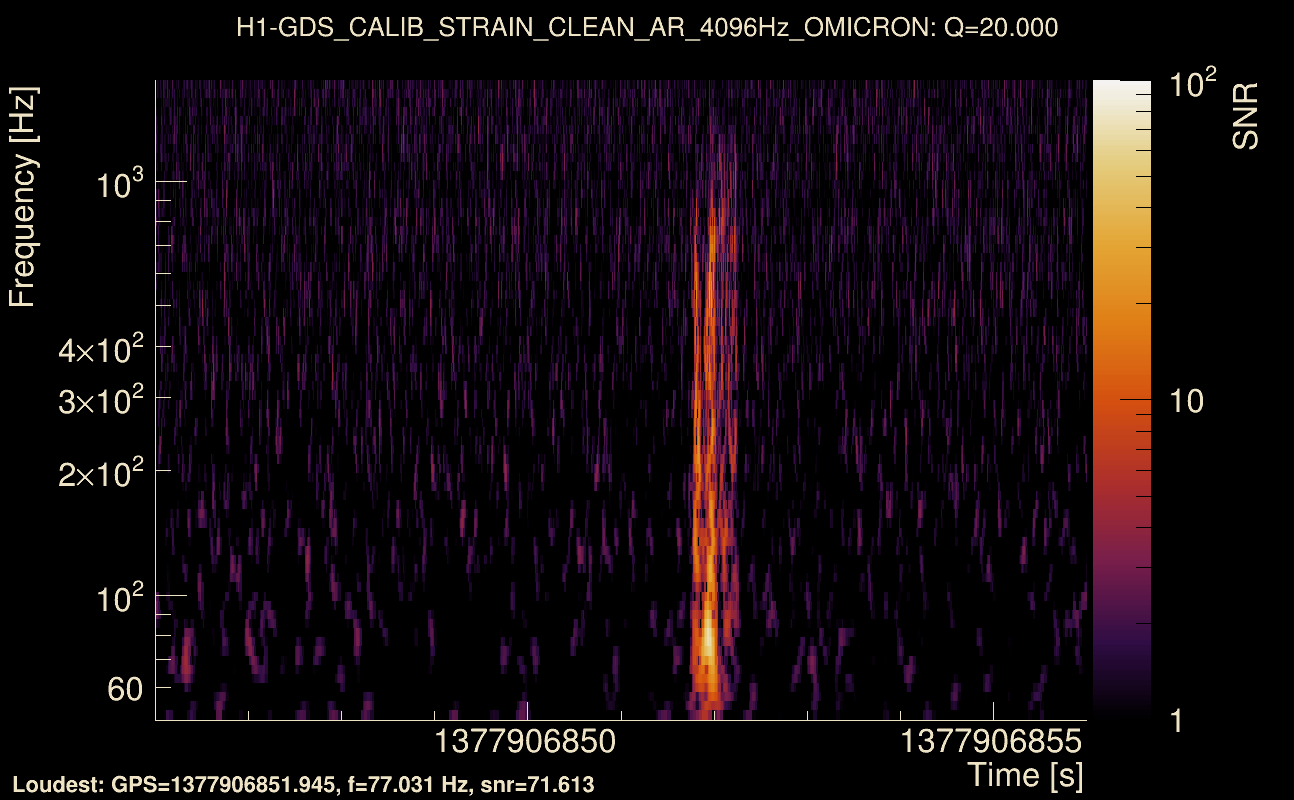
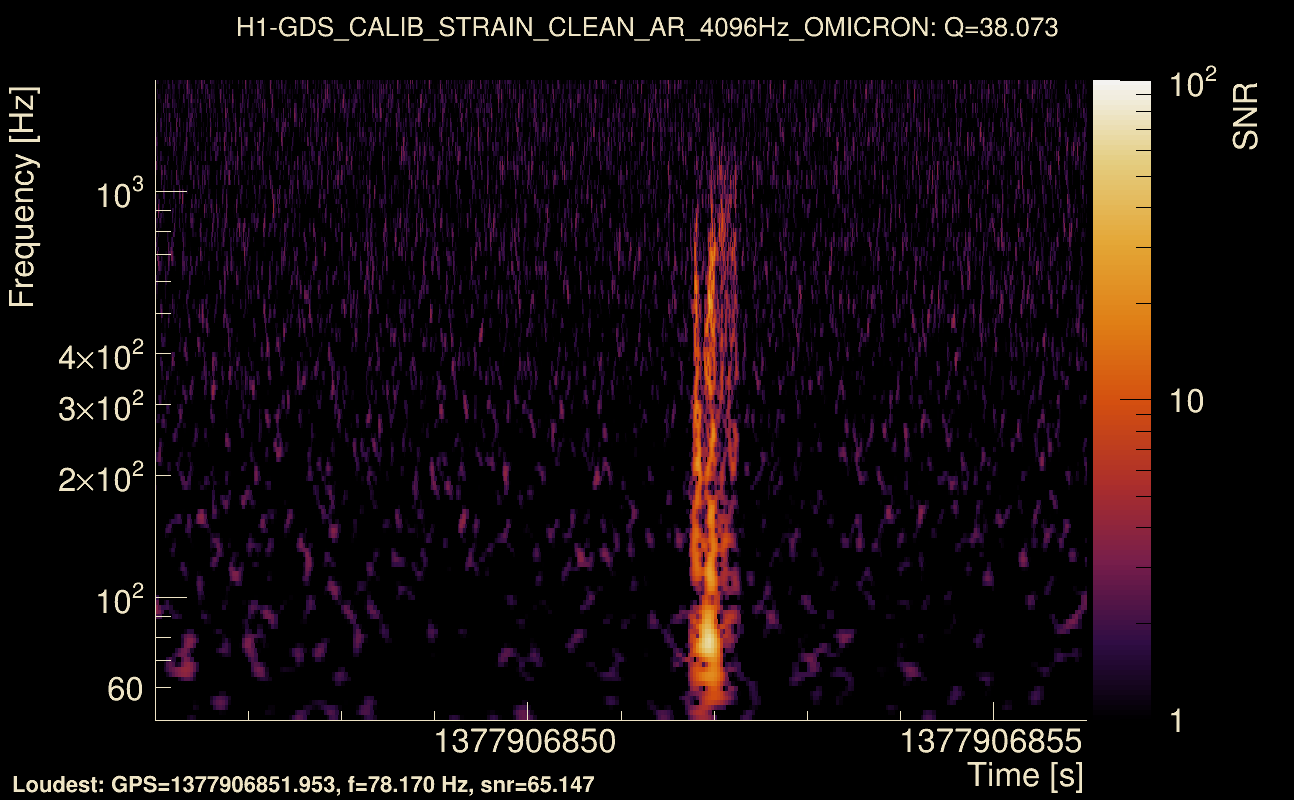
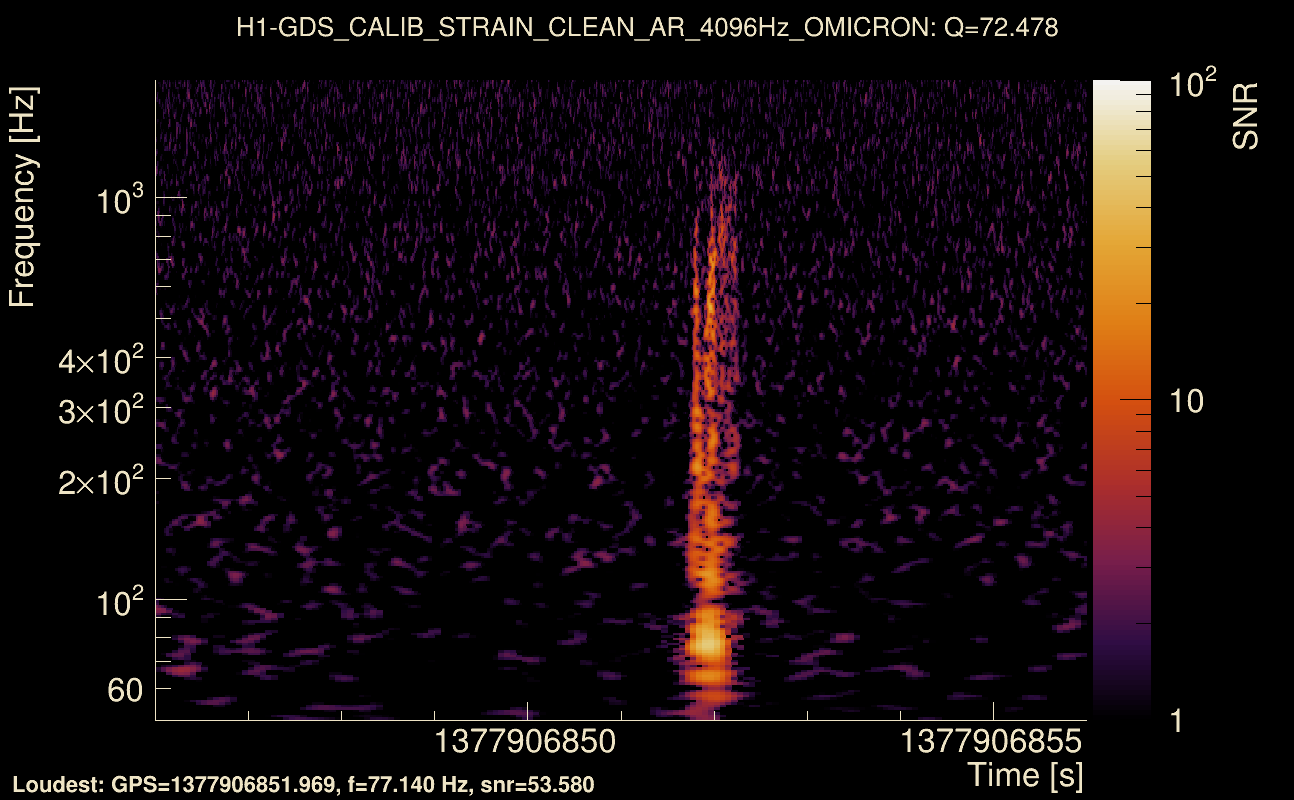
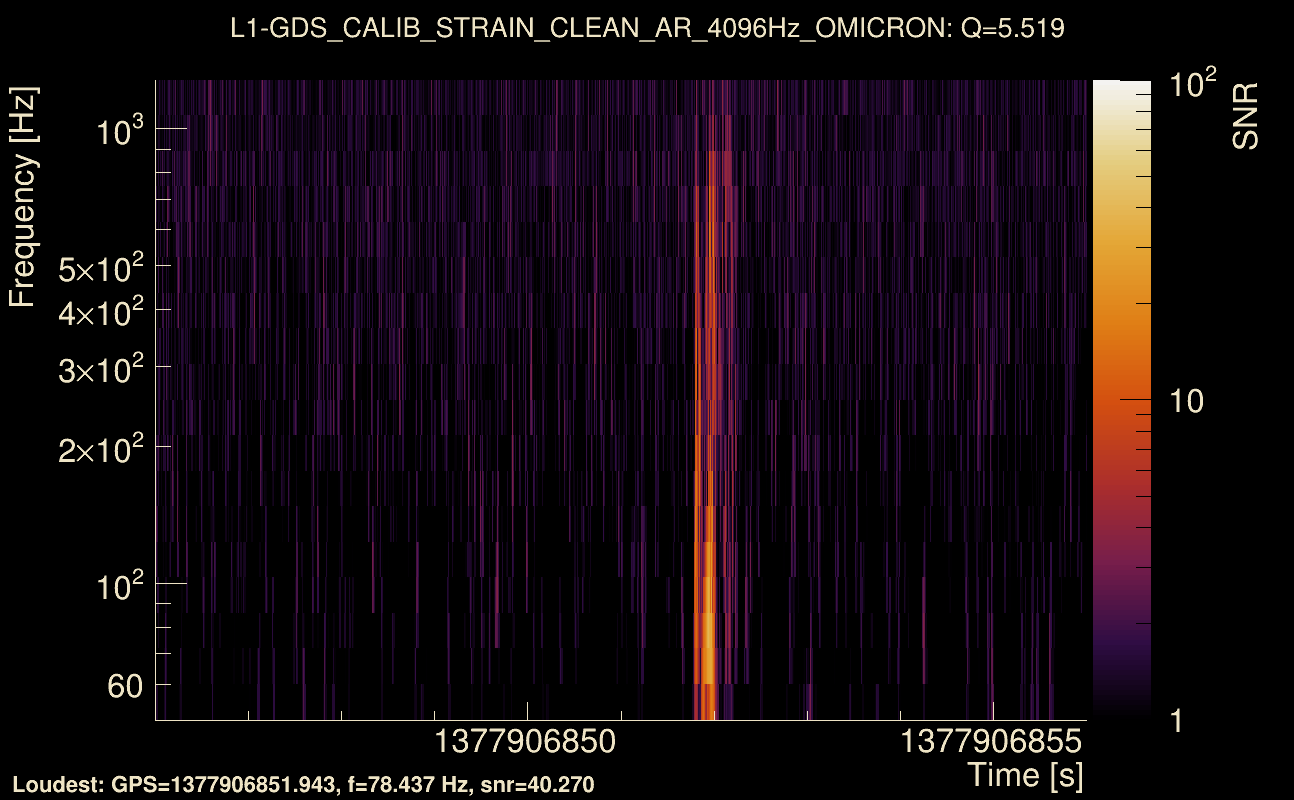
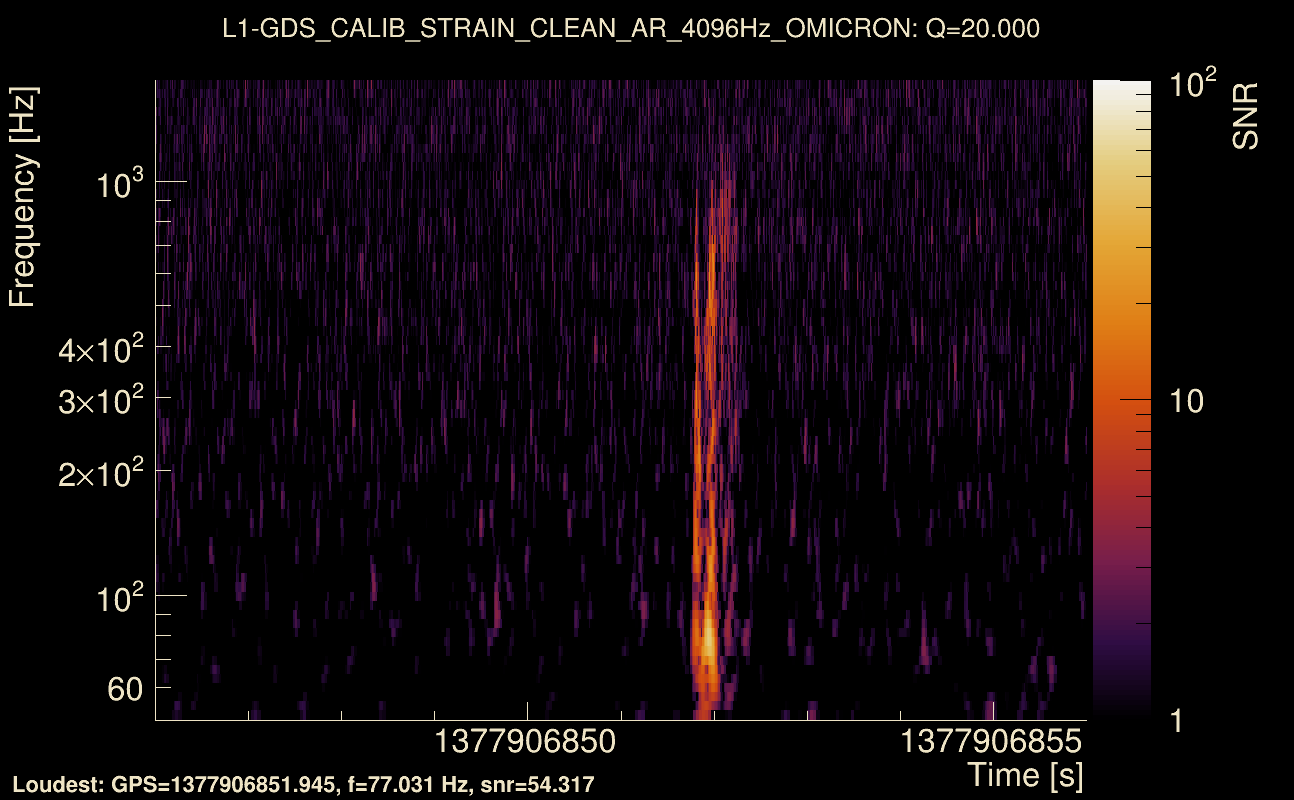
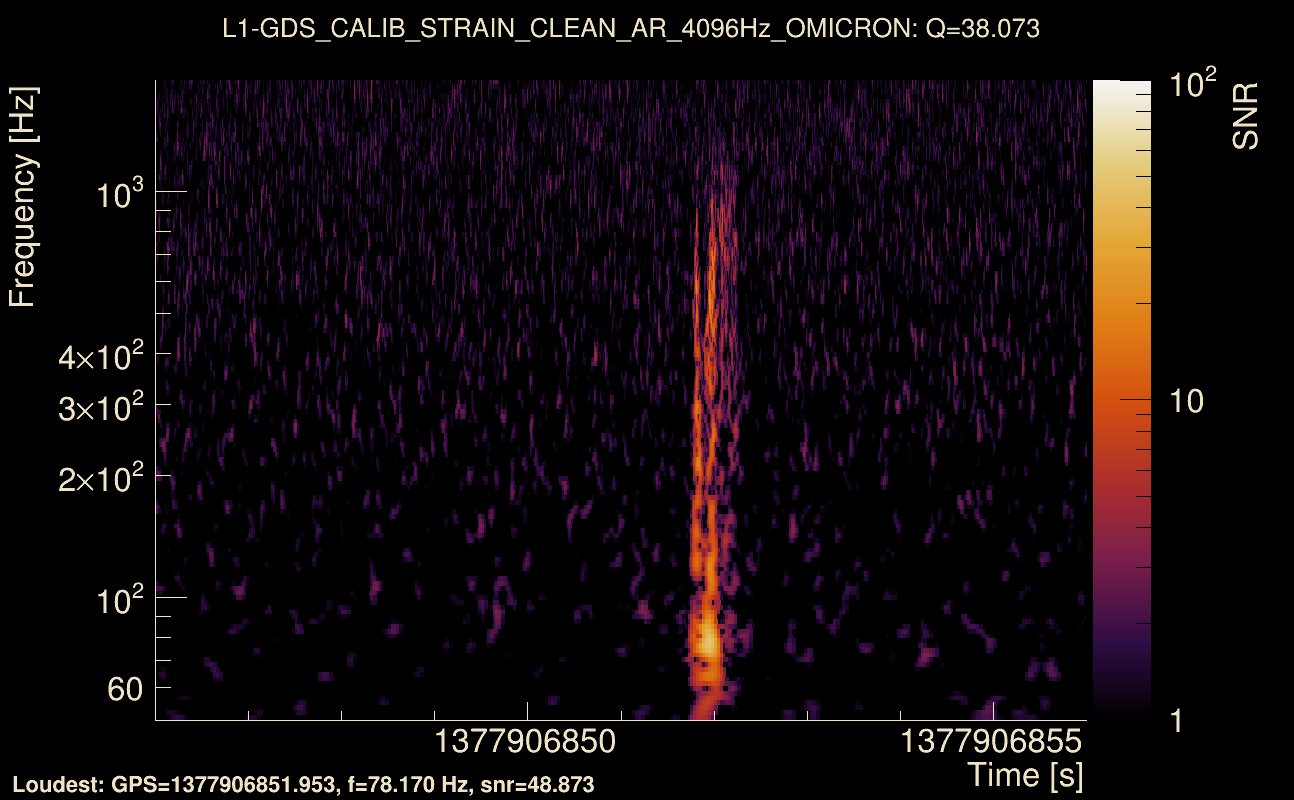
| Event time t(H1): | GPS = 1377906846 (Mon Sep 4 23:53:48 2023 ) → GPS = 1377906856 (Mon Sep 4 23:53:58 2023 ) |
| Event time t(L1): | GPS = 1377906846 (Mon Sep 4 23:53:58 2023 ) → GPS = 1377906856 (Mon Sep 4 23:53:58 2023 ) |
| Omicron analysis time window (H1): | GPS = 1377906843 → GPS = 1377906859 |
| Omicron analysis time window (L1): | GPS = 1377906843 → GPS = 1377906859 |
| Time delay between detectors t(L1) - t(H1): | 0.00396972 s (slice index = 108 / 217), δt_gw = 0.00396972 s |
| Time delay uncertainty: | 0.000586112 s |
| [targeted mode] Time delay probability: | 0.978321 (0.0271742 sigmas), δt_target = -0.00074625 s |
| Frequency: | 233.783 Hz |
| Ξ: | 0.900407 ± 0.00322769 (variance = 1.0418e-05): Q0: 0.936019, Q1: 0.932193, Q2: 0.932164, Q3: 0.934849, Q4: 0.926665 |
| Rank: | R_A = 0.895714 |
| Log of amplitude ratio (L1/H1): | -0.219681, variance = 0.158339 (L1/H1: -0.221752, variance = 0.305137, H1/L1: 0.216641, variance = 0.306804) |
| Amplitude ratio (L1/H1): | 0.802775 ⋇ 1.48872 (L1/H1: 0.801114 ⋇ 1.7374, H1/L1: 1.2419 ⋇ 1.74002) |
| Amplitude ratio H1|L1 compatibility (probability): | 0.994788 |
| Antenna factor probability: | 1 |
| Number of rejected frequency rows: | Q0: 0 / 18, Q1: 1 / 36, Q2: 7 / 70, Q3: 17 / 134, Q4: 53 / 258 |
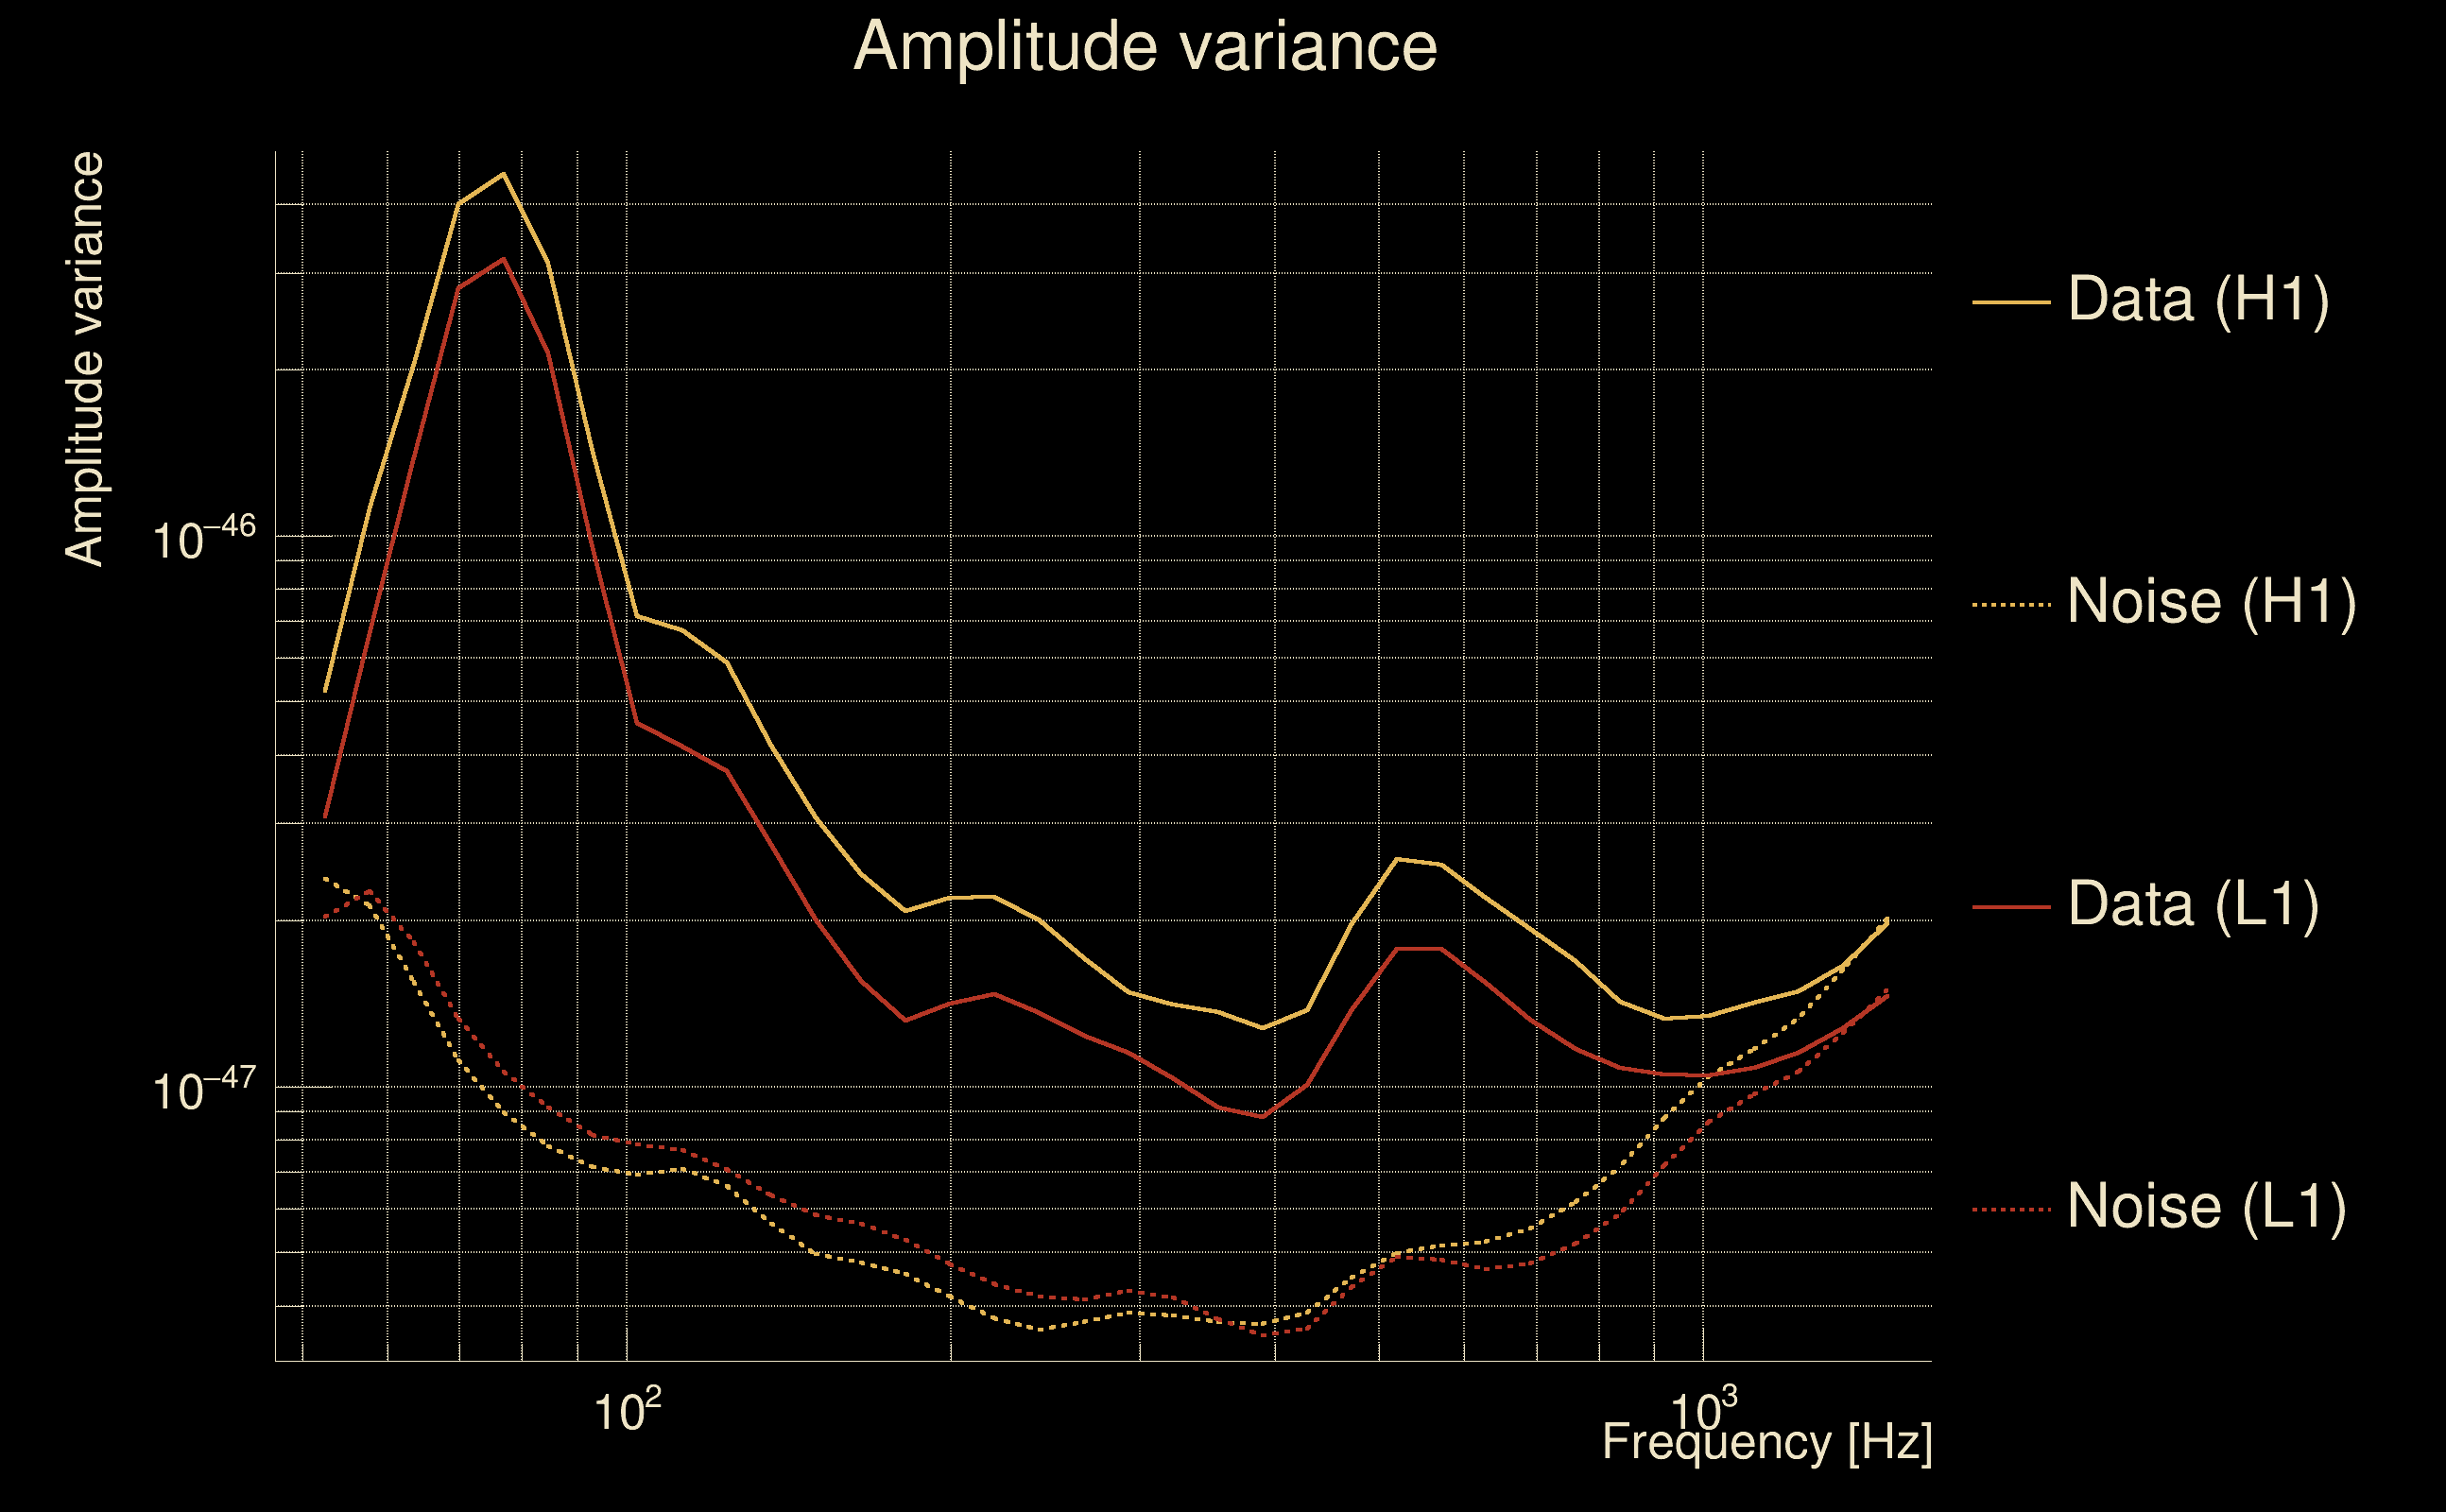
| Maximum signal-to-noise ratio: | H1: 74.6768, L1: 61.6227 |
| SNR variance: | H1: 0.505034, L1: 0.462022 |
| Click here for a zoomed plot | Click here for a zoomed plot | Click here for a zoomed plot | Click here for a zoomed plot | Click here for a zoomed plot |
 |
 |
 |
 |
 |
 |
 |
 |
 |
 |
 |
 |
 |
 |
 |
 |
 |
 |
 |
 |
 |
 |
 |
 |
 |
 |
 |
 |
 |
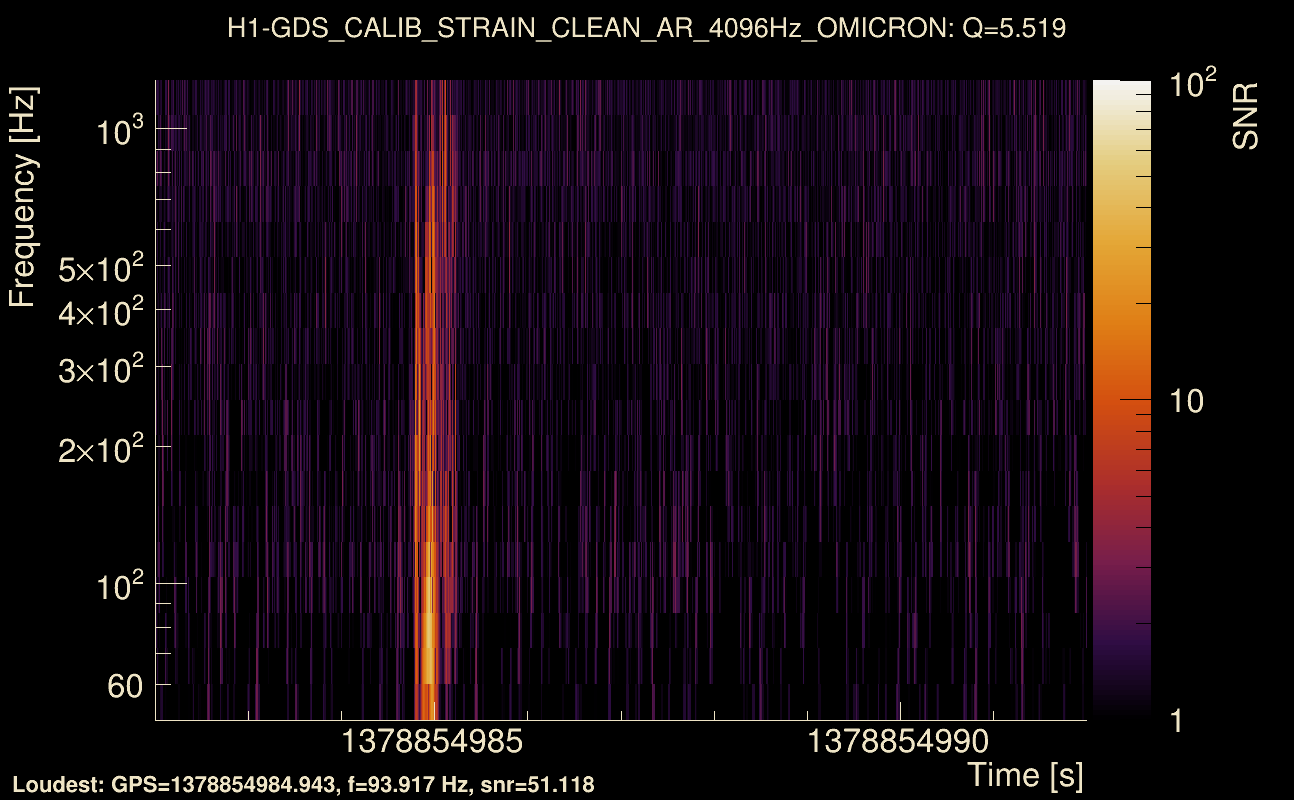
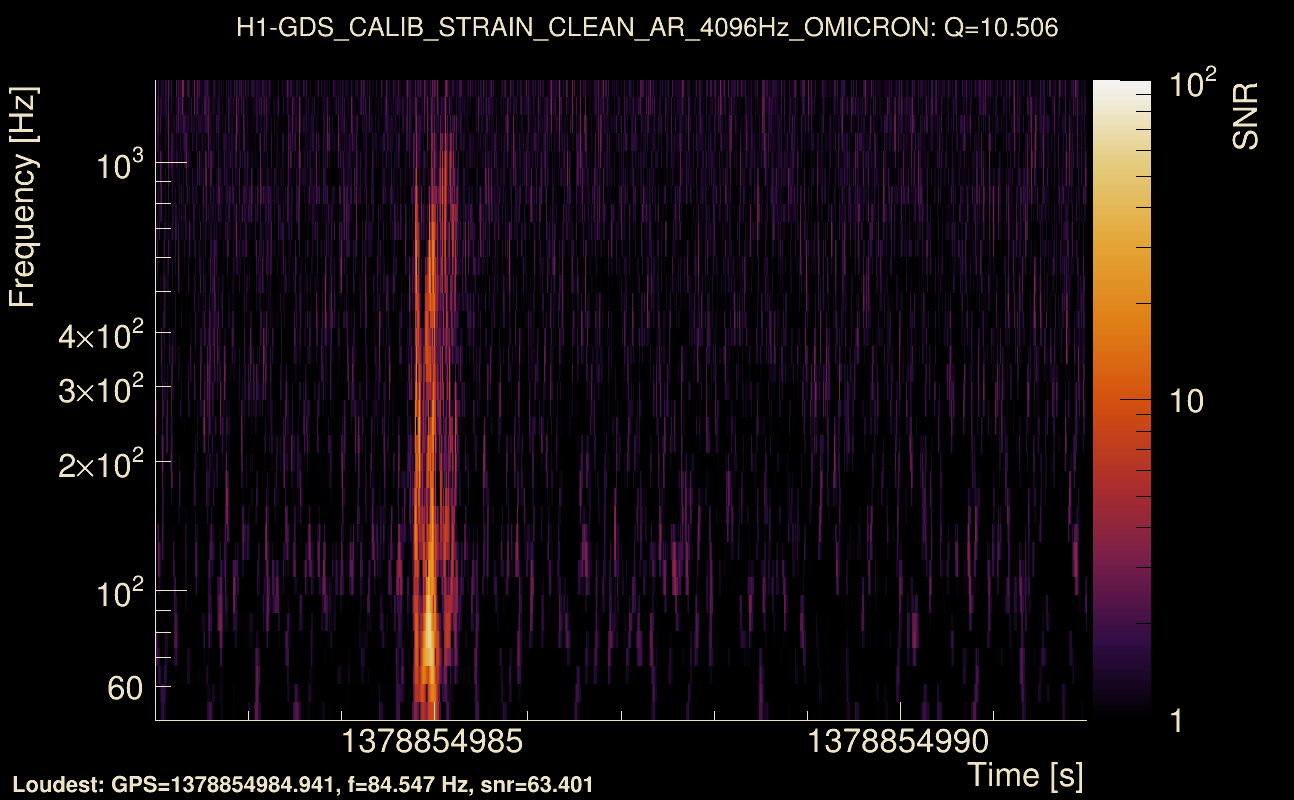
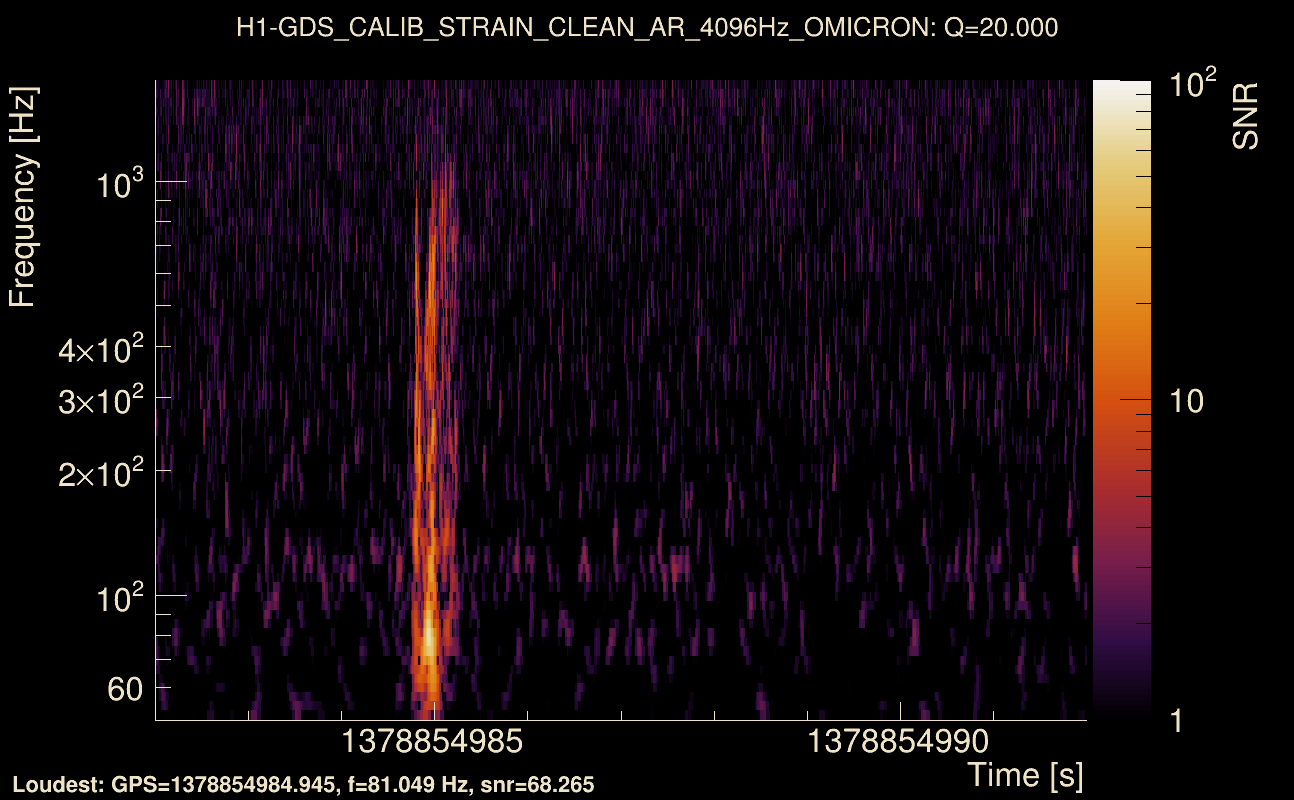
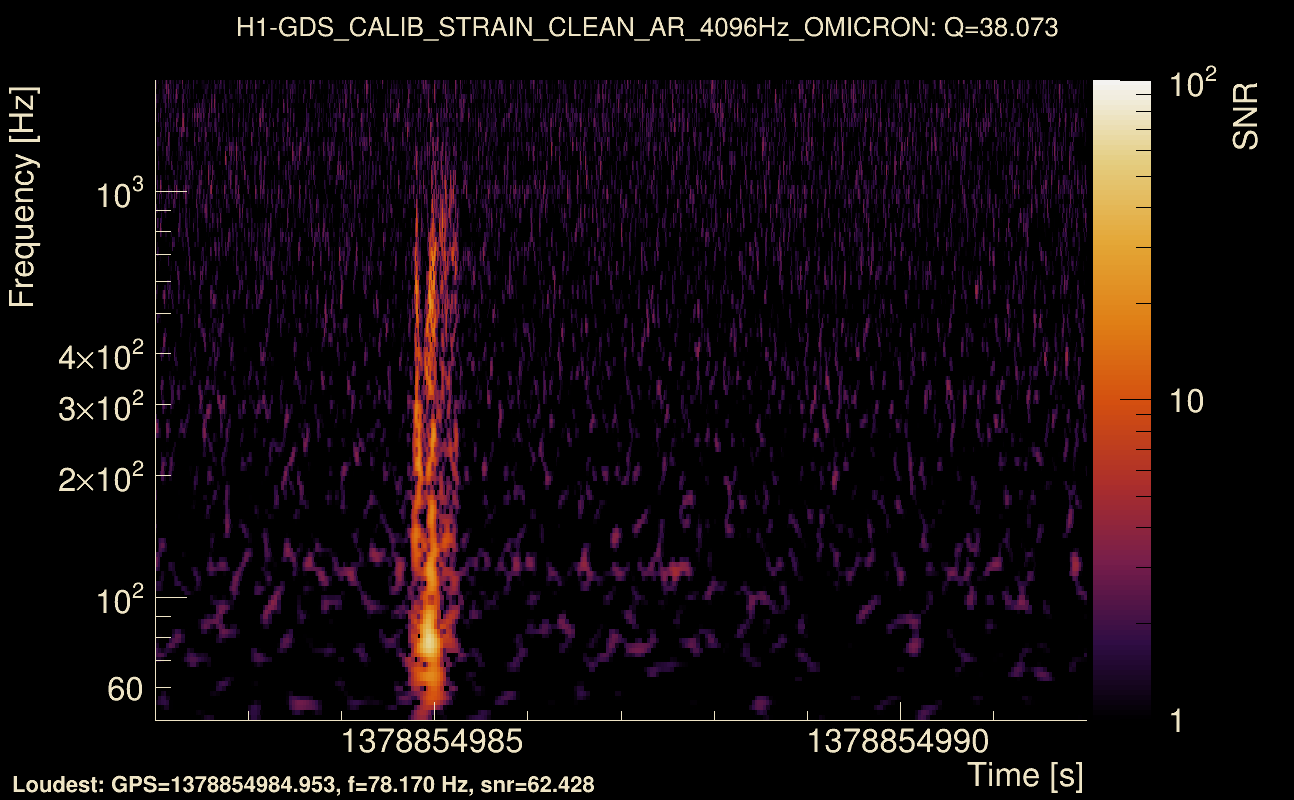
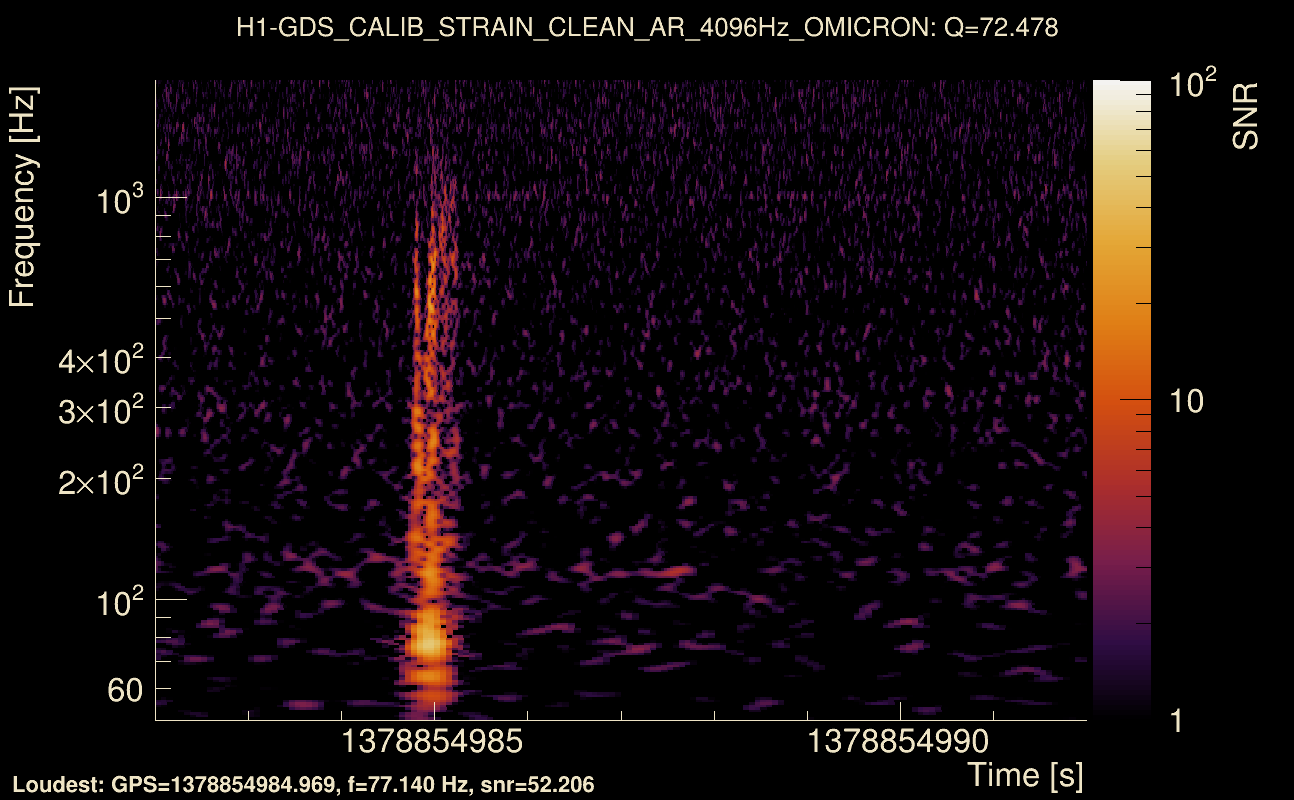
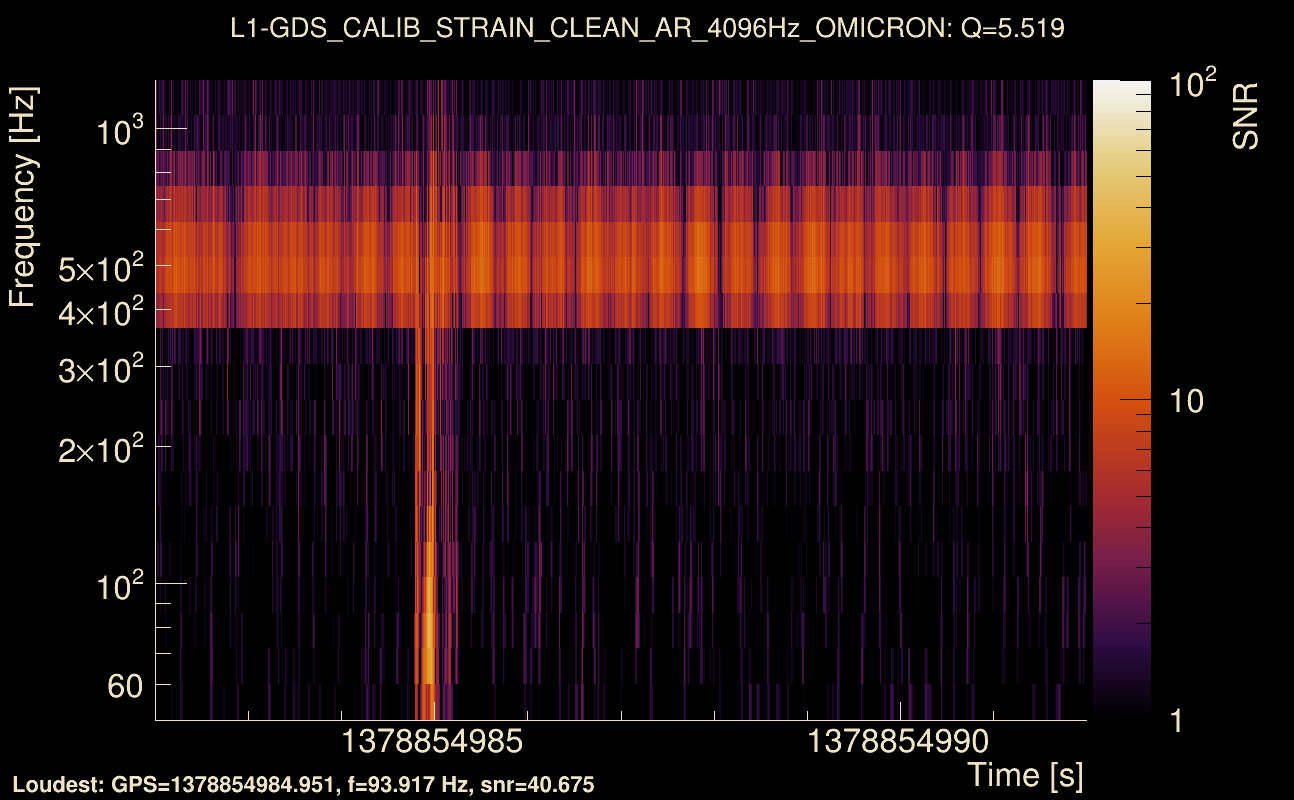
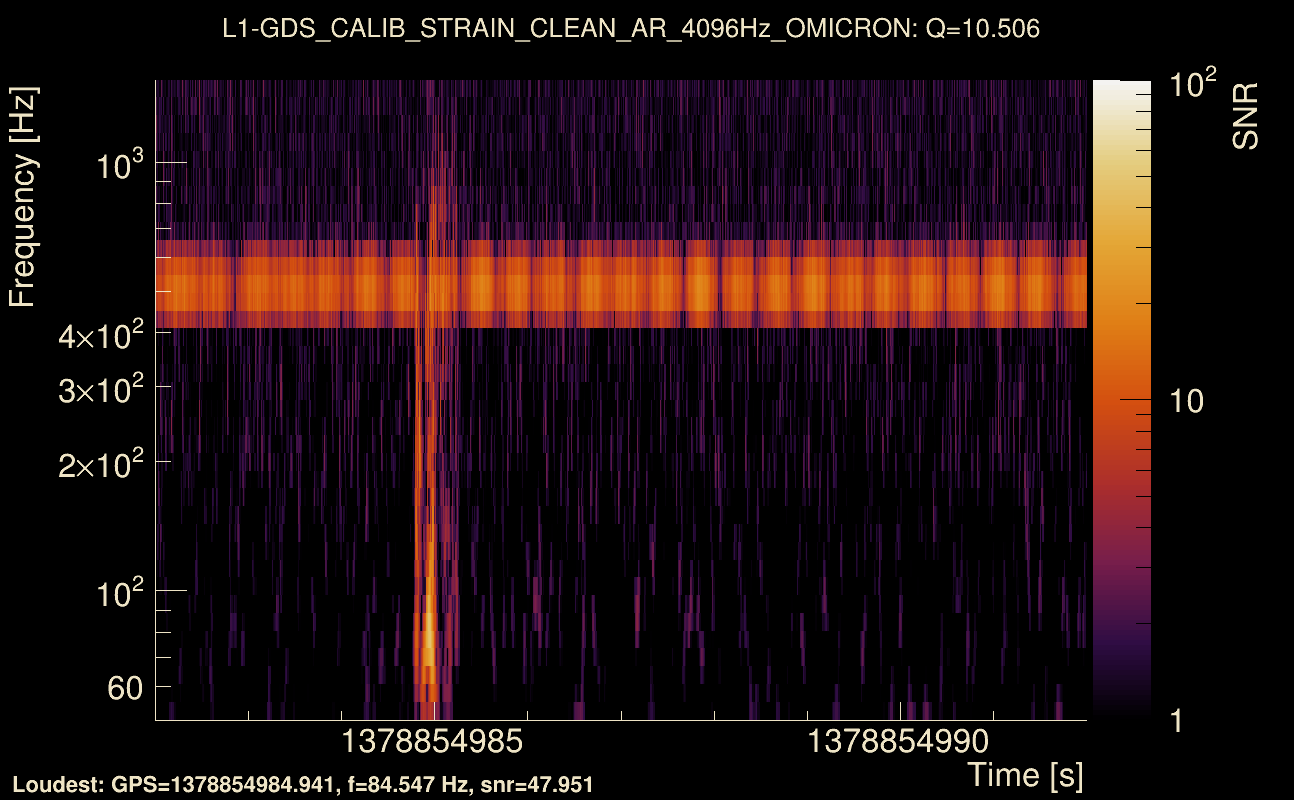
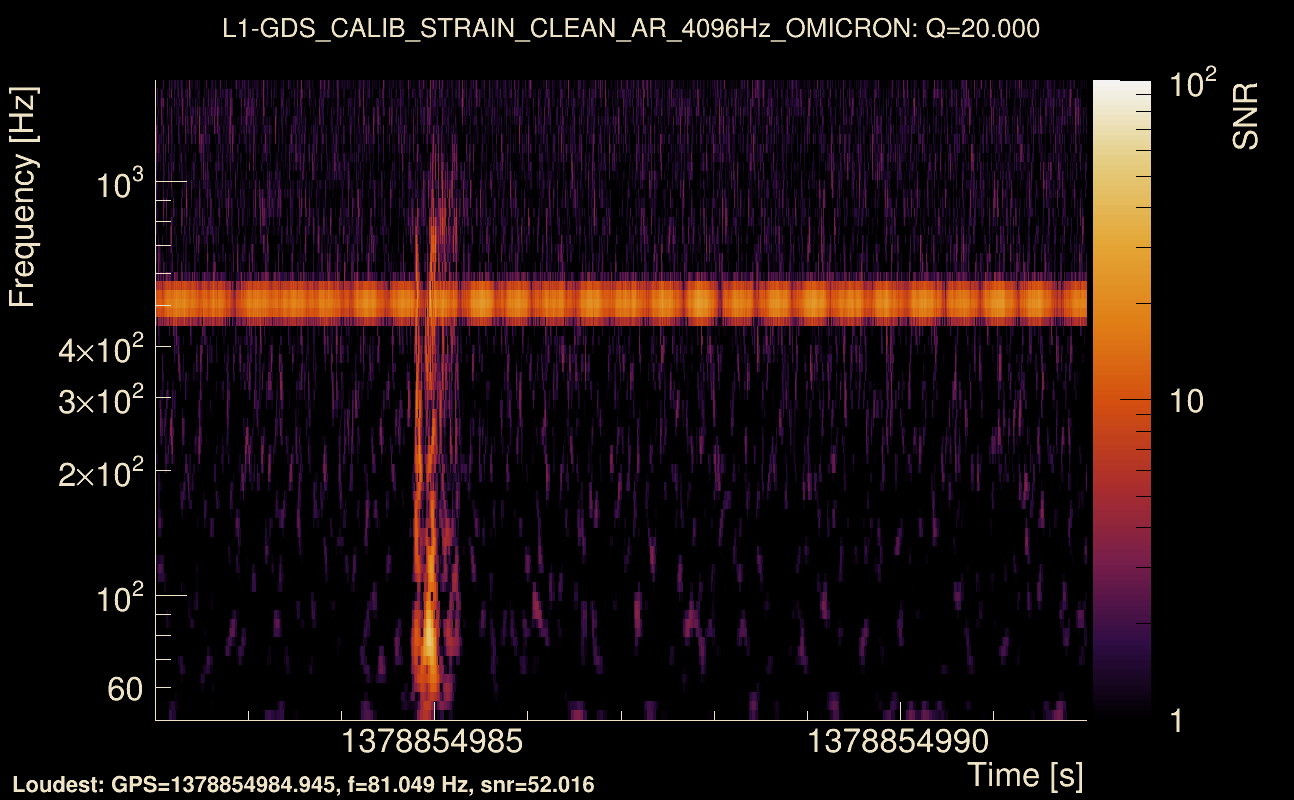
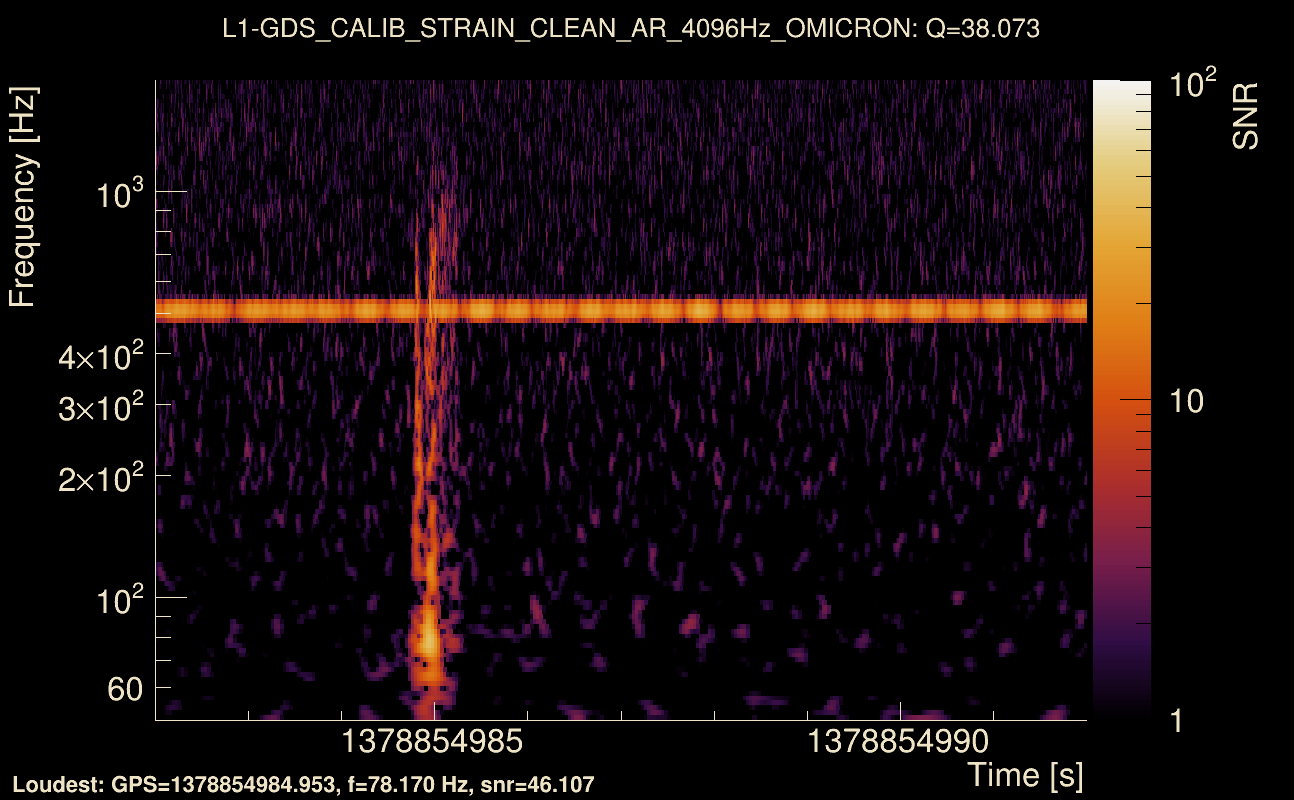
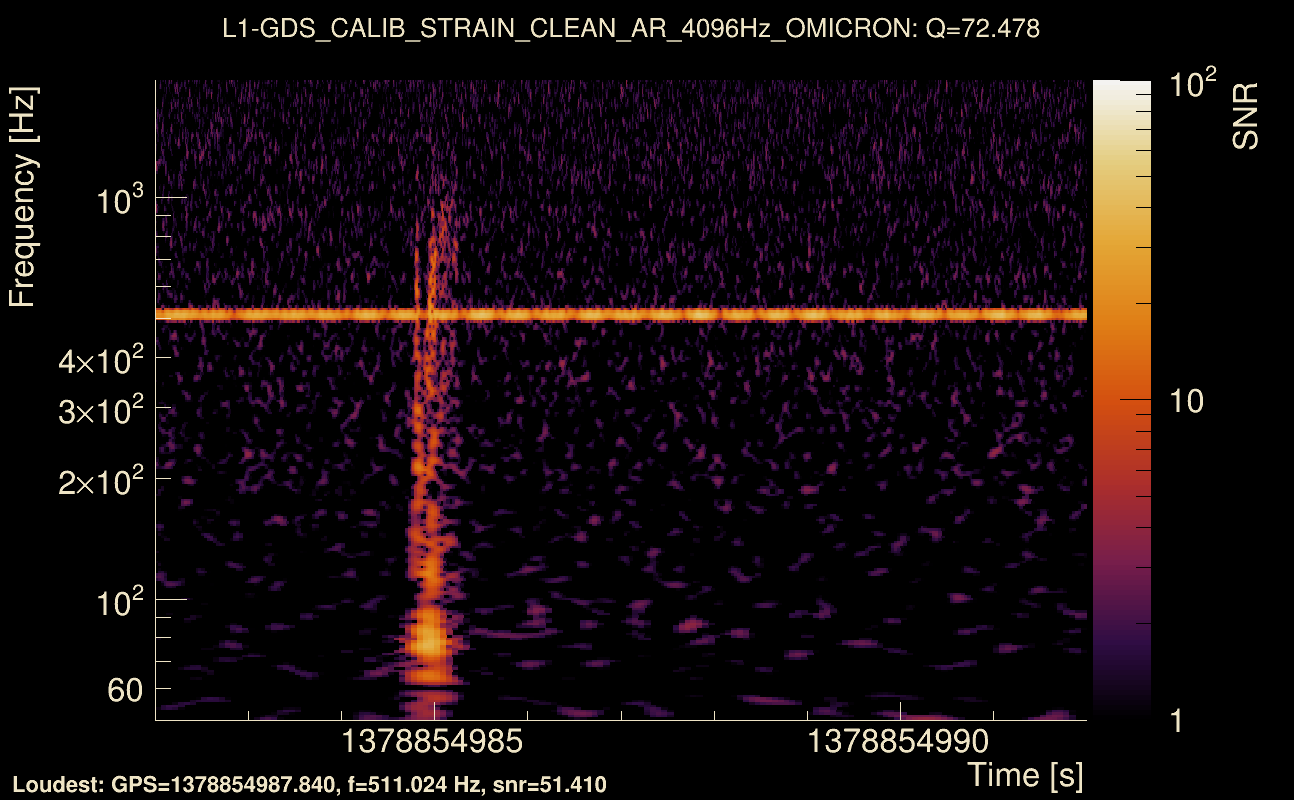
| Event time t(H1): | GPS = 1378854982 (Fri Sep 15 23:16:04 2023 ) → GPS = 1378854992 (Fri Sep 15 23:16:14 2023 ) |
| Event time t(L1): | GPS = 1378854982 (Fri Sep 15 23:16:14 2023 ) → GPS = 1378854992 (Fri Sep 15 23:16:14 2023 ) |
| Omicron analysis time window (H1): | GPS = 1378854979 → GPS = 1378854995 |
| Omicron analysis time window (L1): | GPS = 1378854979 → GPS = 1378854995 |
| Time delay between detectors t(L1) - t(H1): | 0.00392854 s (slice index = 108 / 217), δt_gw = 0.00392854 s |
| Time delay uncertainty: | 0.0011079 s |
| [targeted mode] Time delay probability: | 0.869155 (0.164733 sigmas), δt_target = -0.00260115 s |
| Frequency: | 229.89 Hz |
| Ξ: | 0.895596 ± 0.00415065 (variance = 1.72279e-05): Q0: 0.928676, Q1: 0.921729, Q2: 0.928672, Q3: 0.930992, Q4: 0.920636 |
| Rank: | R_A = 0.894652 |
| Log of amplitude ratio (L1/H1): | -0.228565, variance = 0.162874 (L1/H1: -0.228954, variance = 0.304937, H1/L1: 0.227917, variance = 0.311486) |
| Amplitude ratio (L1/H1): | 0.795675 ⋇ 1.49717 (L1/H1: 0.795365 ⋇ 1.73709, H1/L1: 1.25598 ⋇ 1.74737) |
| Amplitude ratio H1|L1 compatibility (probability): | 0.998946 |
| Antenna factor probability: | 1 |
| Number of rejected frequency rows: | Q0: 0 / 18, Q1: 0 / 36, Q2: 7 / 70, Q3: 25 / 134, Q4: 56 / 258 |
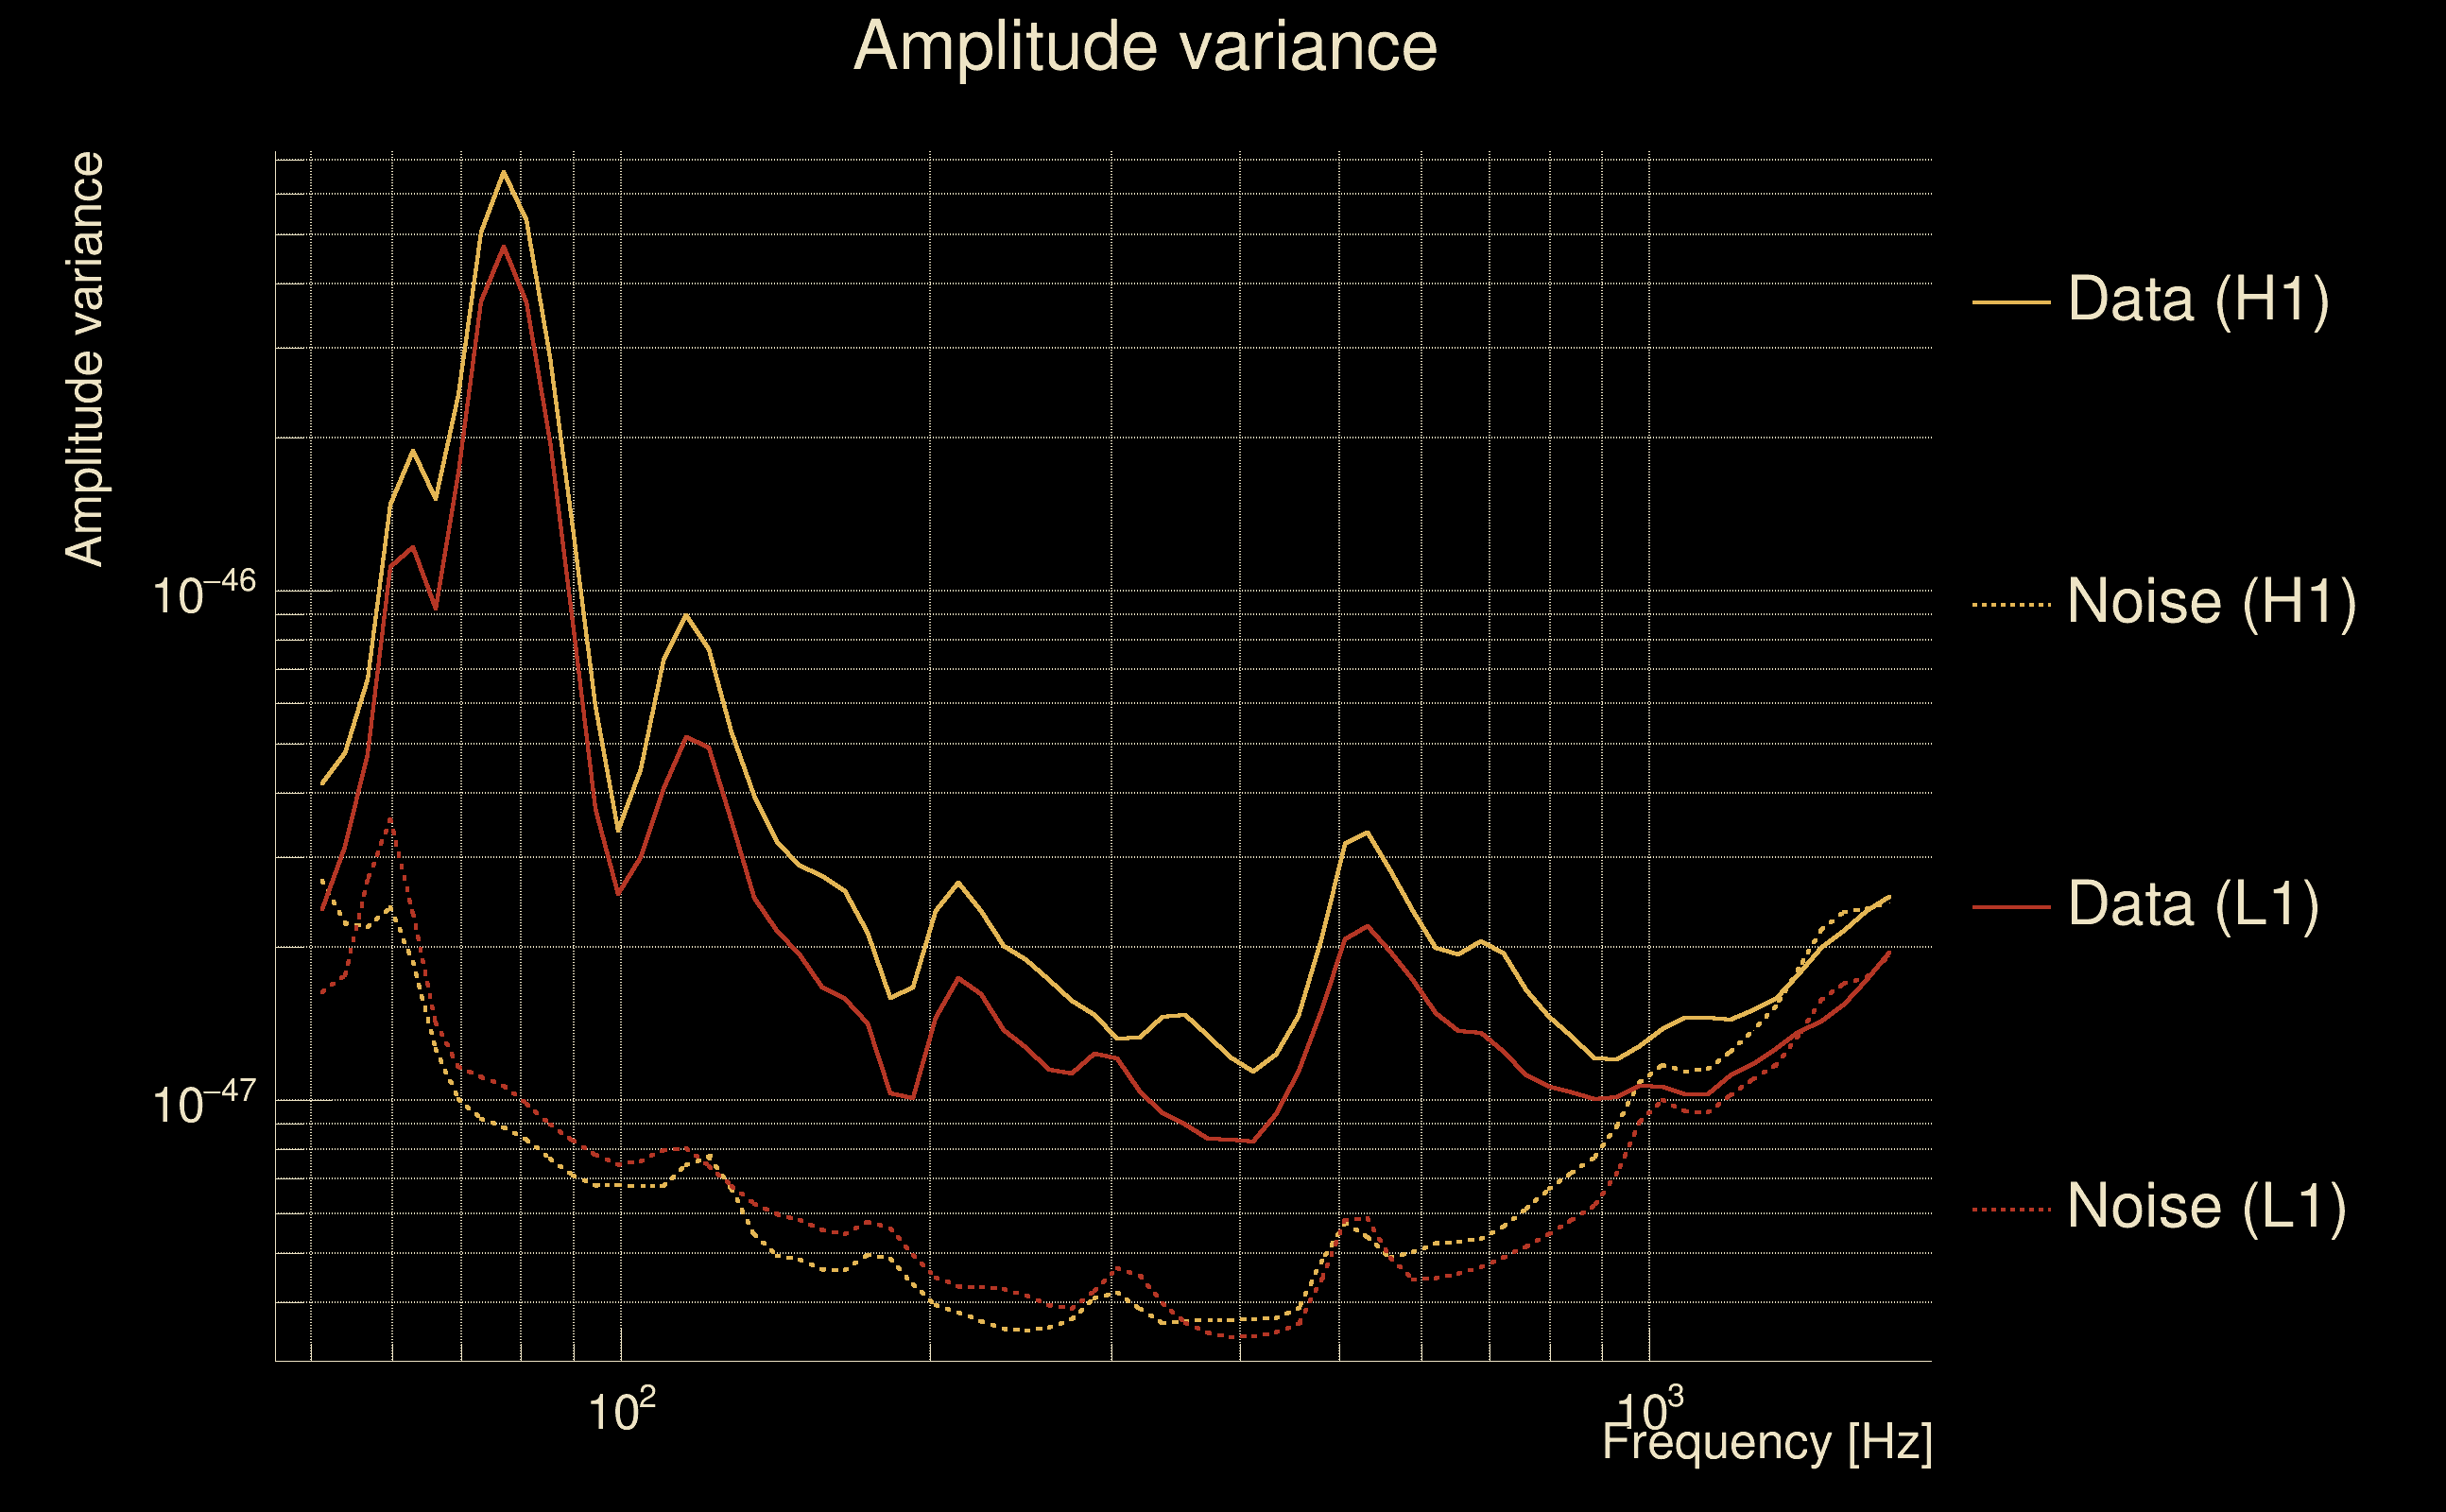
| Maximum signal-to-noise ratio: | H1: 71.5417, L1: 55.4522 |
| SNR variance: | H1: 0, L1: 0 |
| Click here for a zoomed plot | Click here for a zoomed plot | Click here for a zoomed plot | Click here for a zoomed plot | Click here for a zoomed plot |
 |
 |
 |
 |
 |
 |
 |
 |
 |
 |
 |
 |
 |
 |
 |
 |
 |
 |
 |
 |
 |
 |
 |
 |
 |
 |
 |
 |
 |
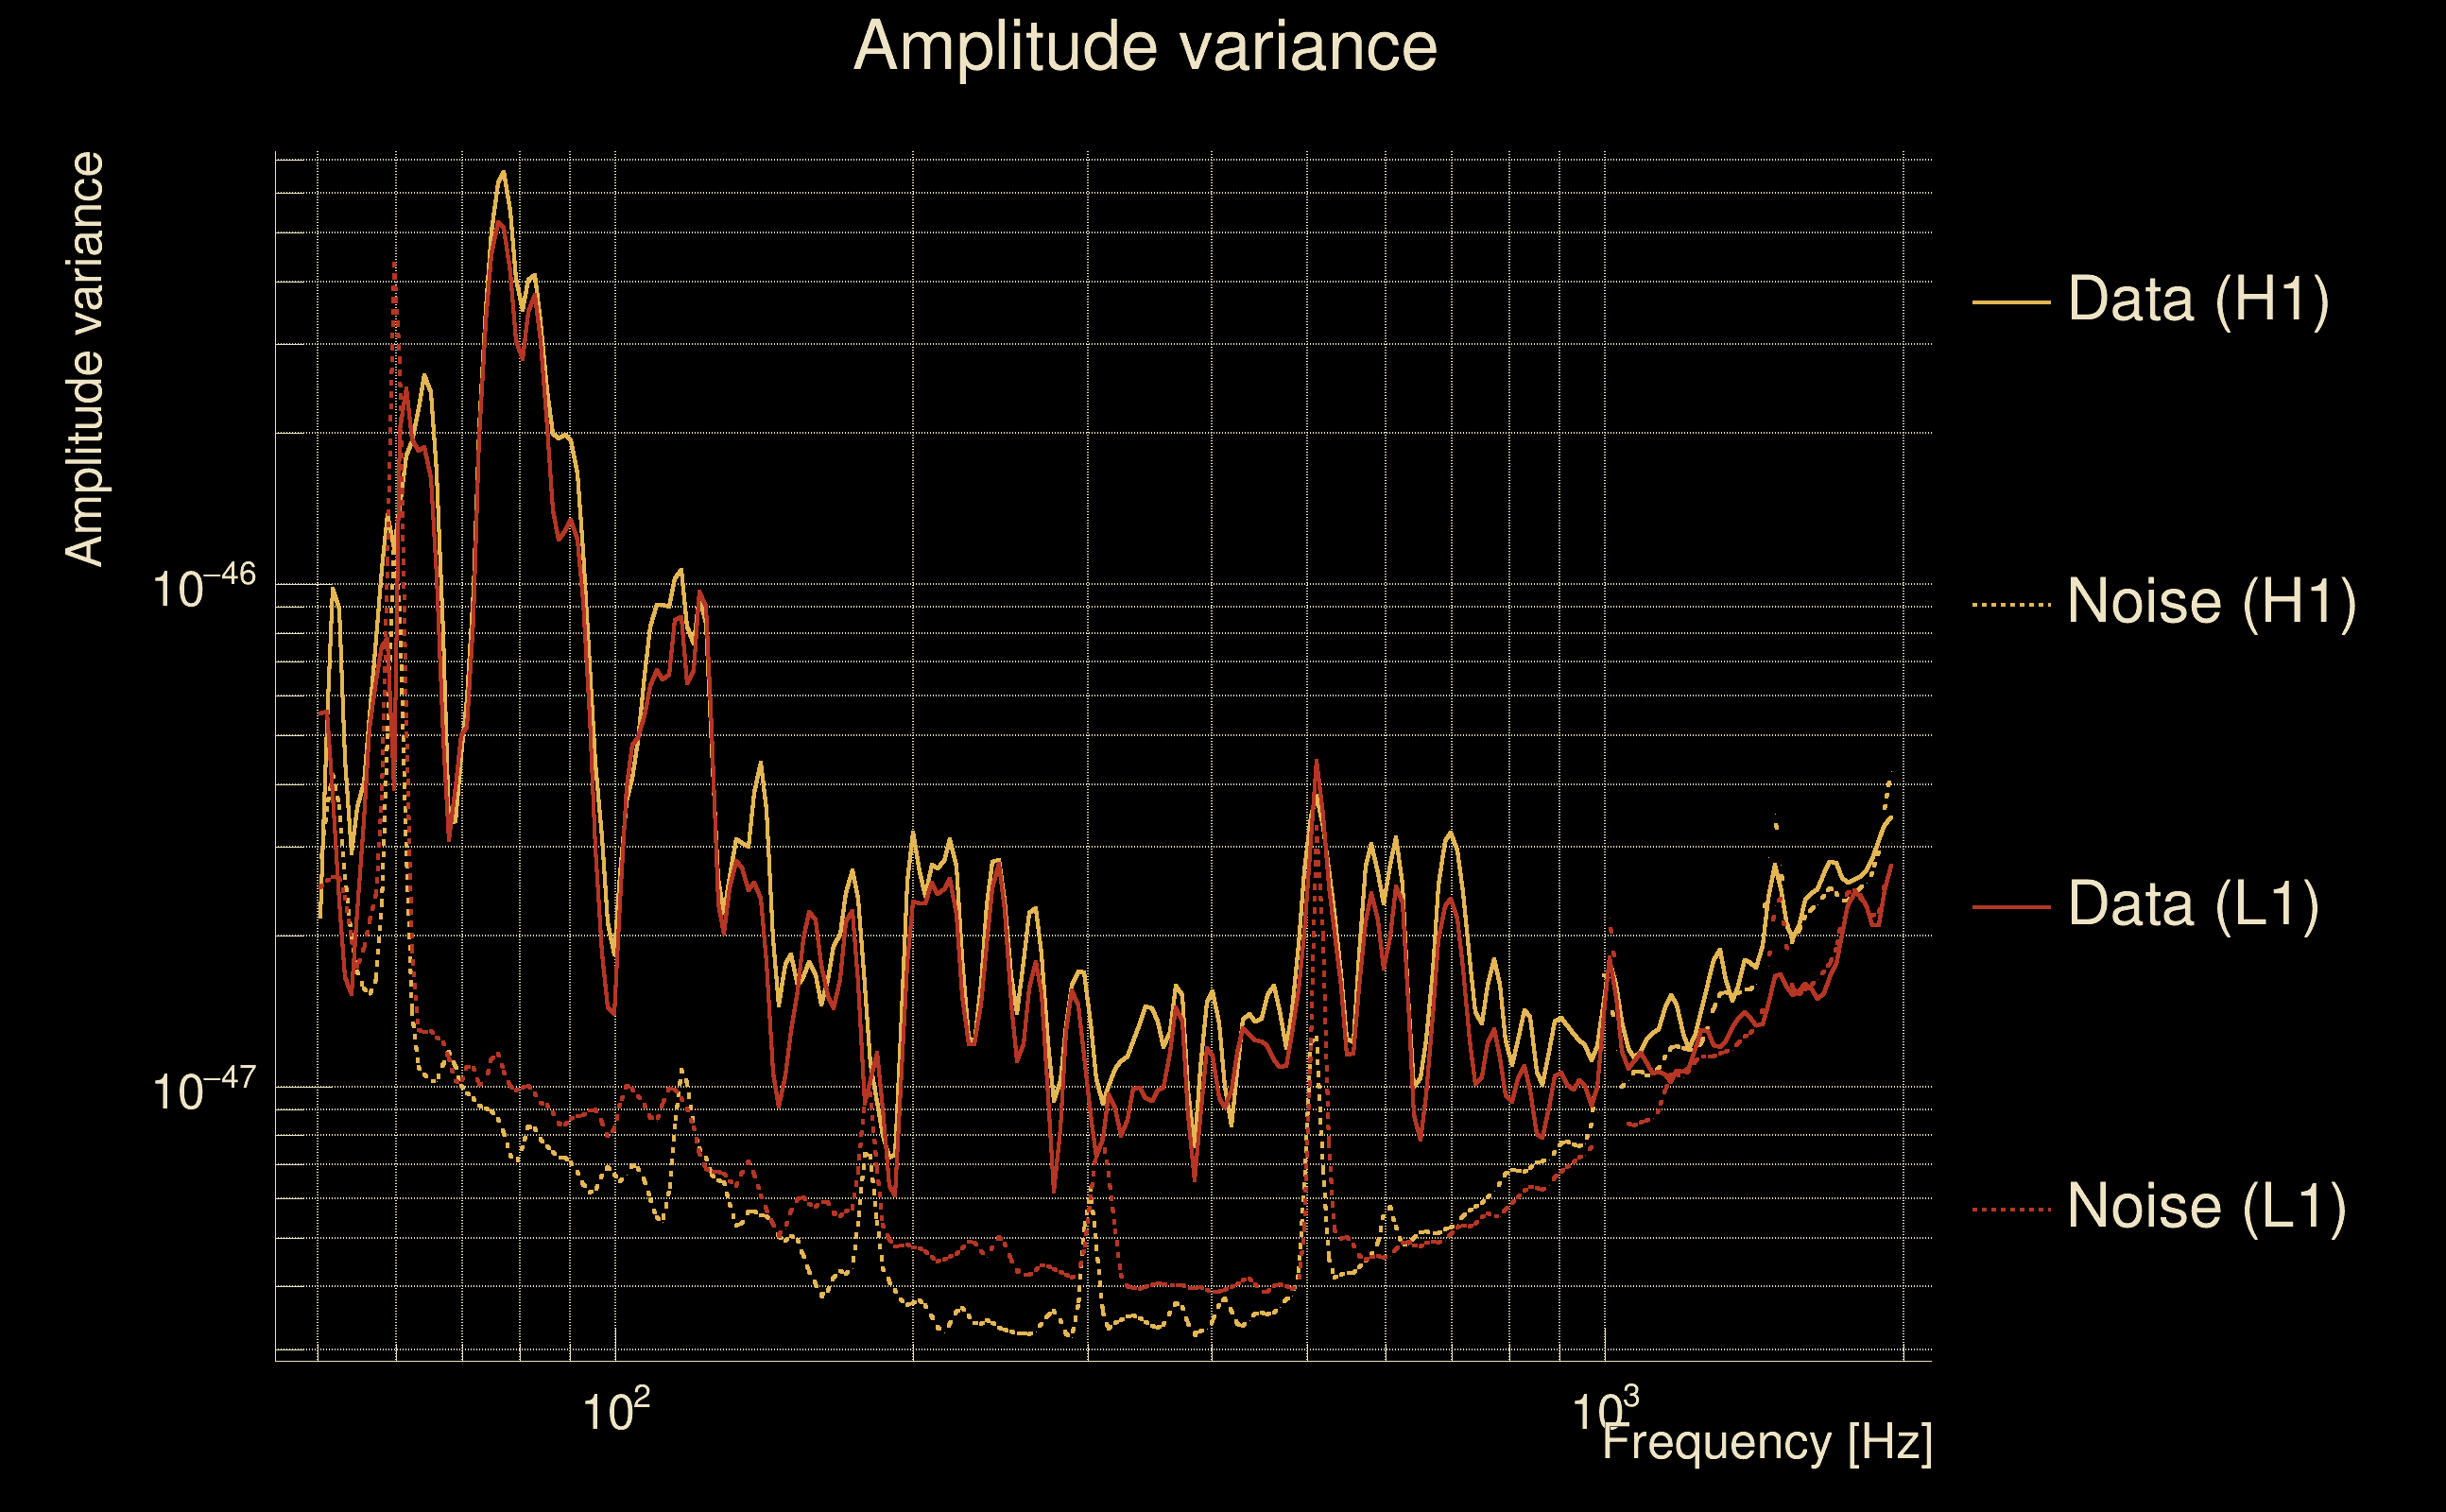
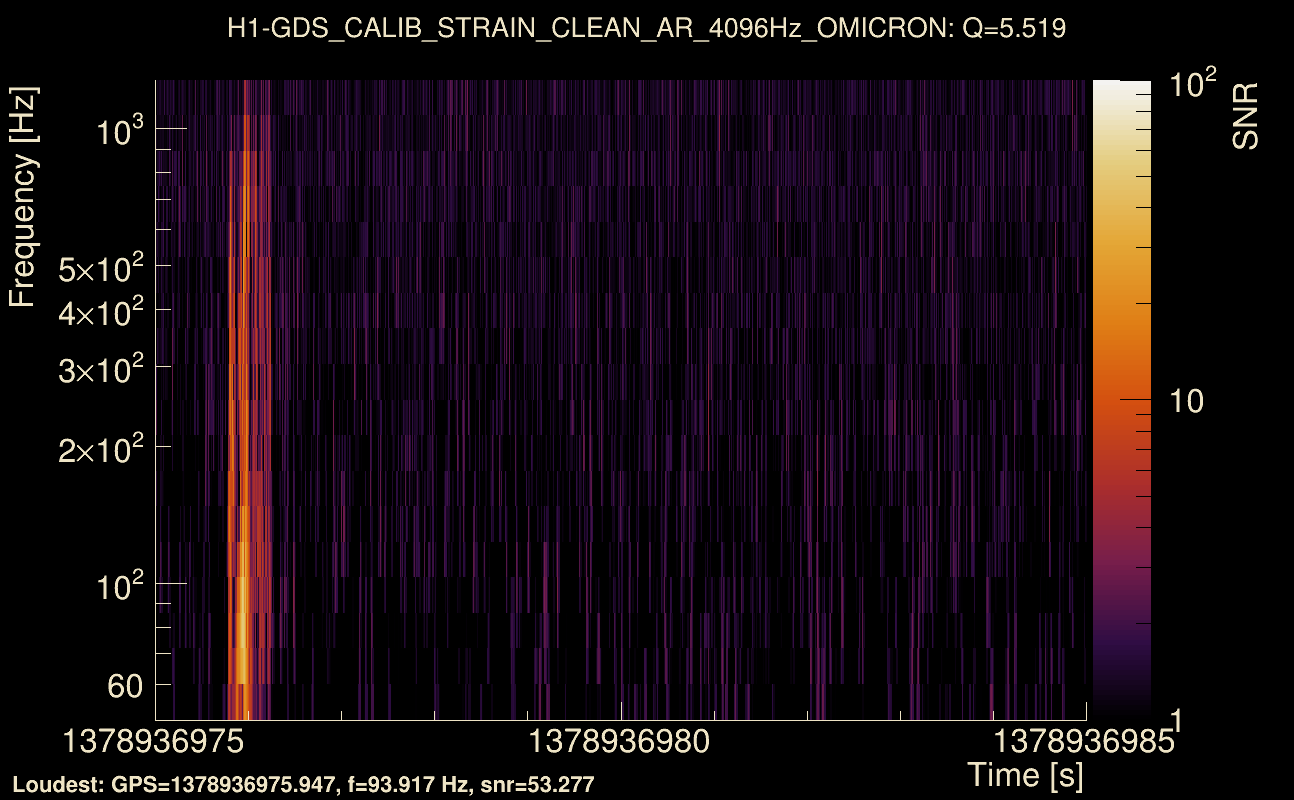
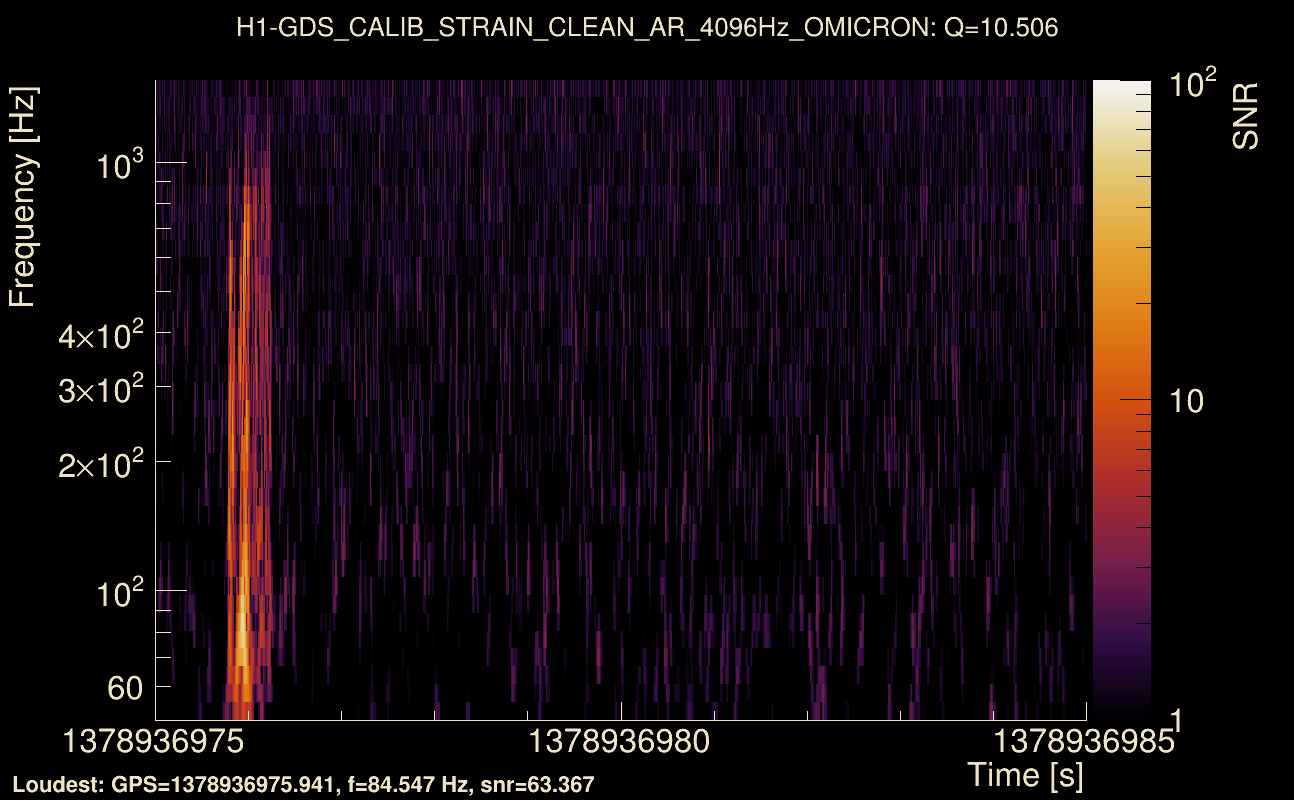
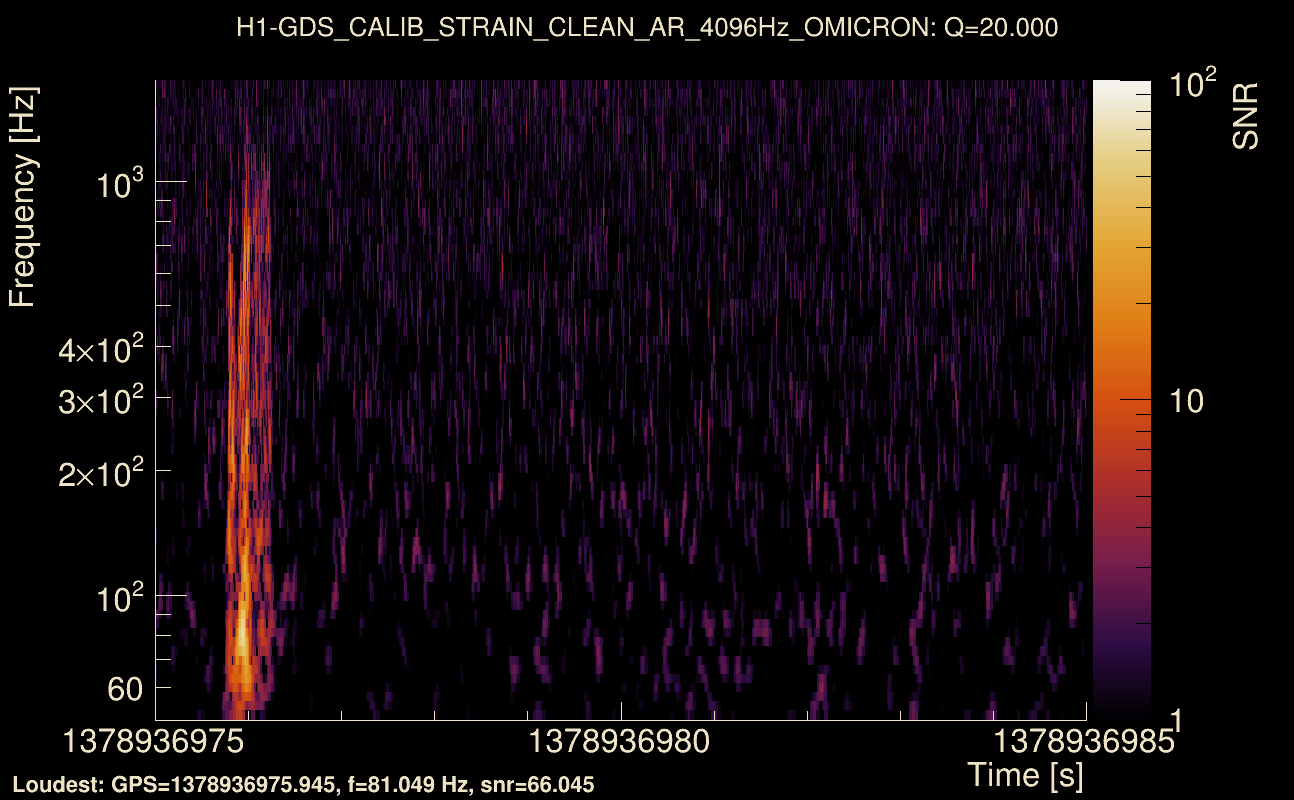
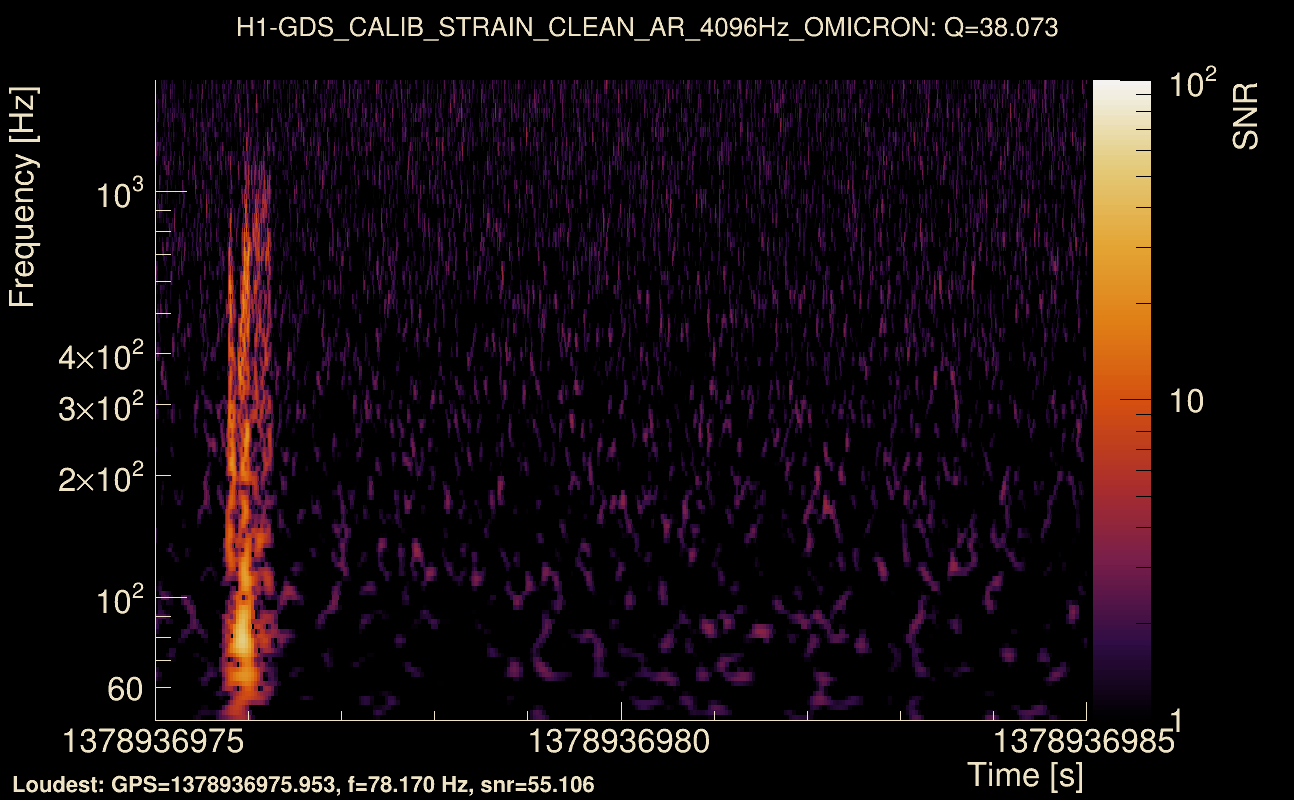
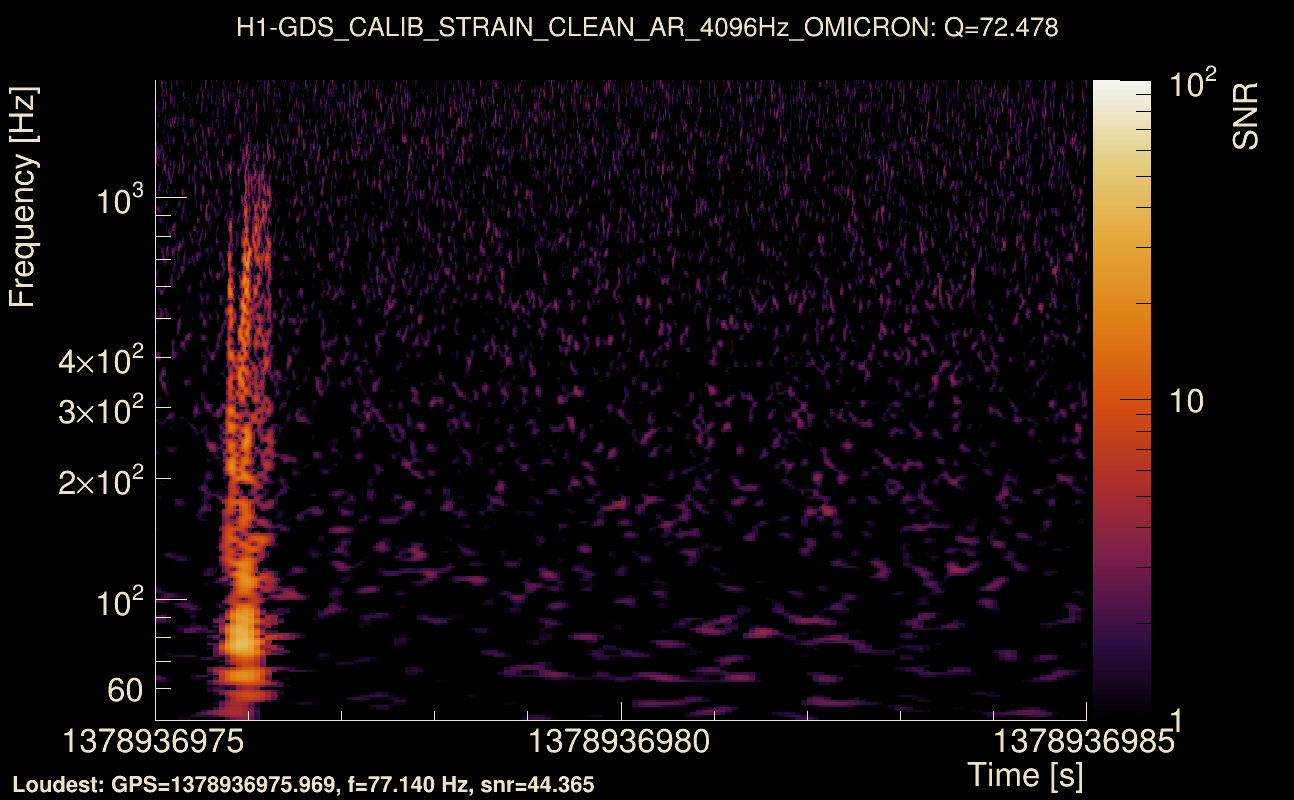
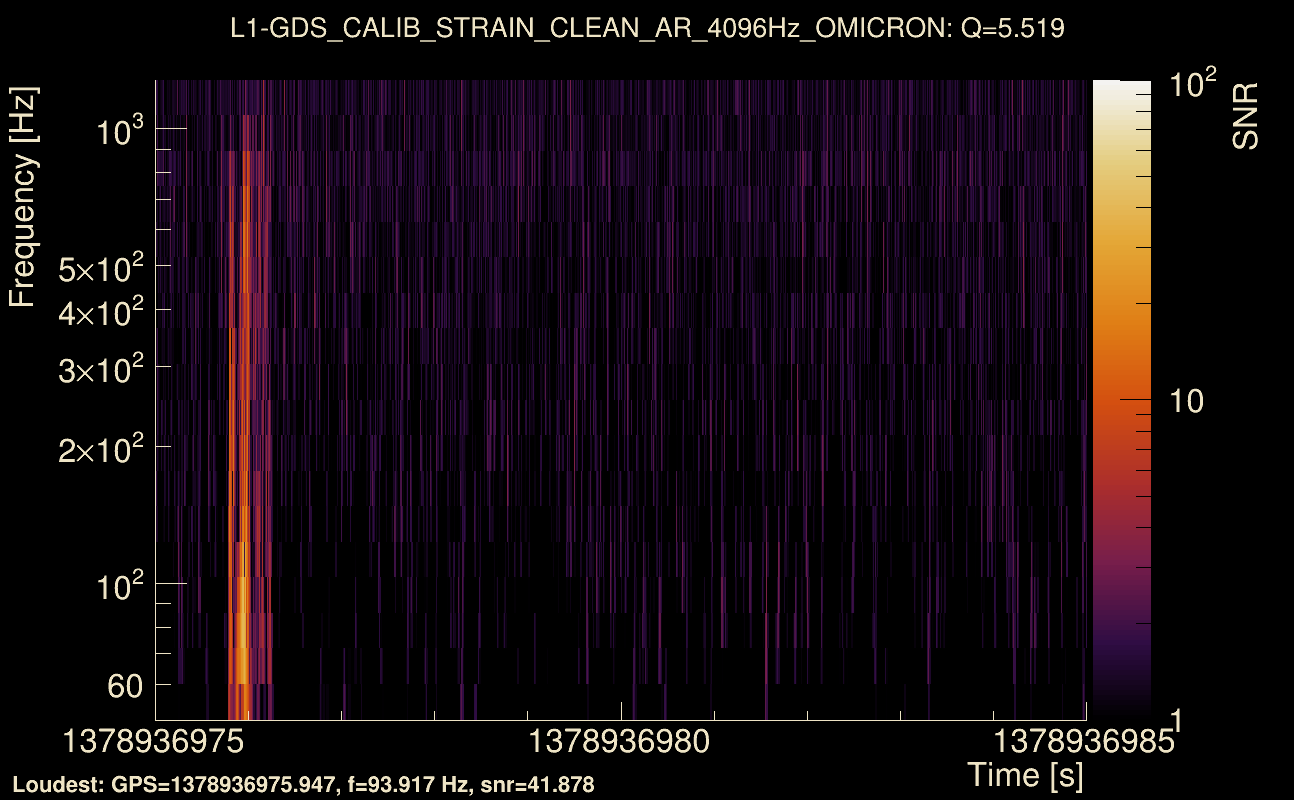
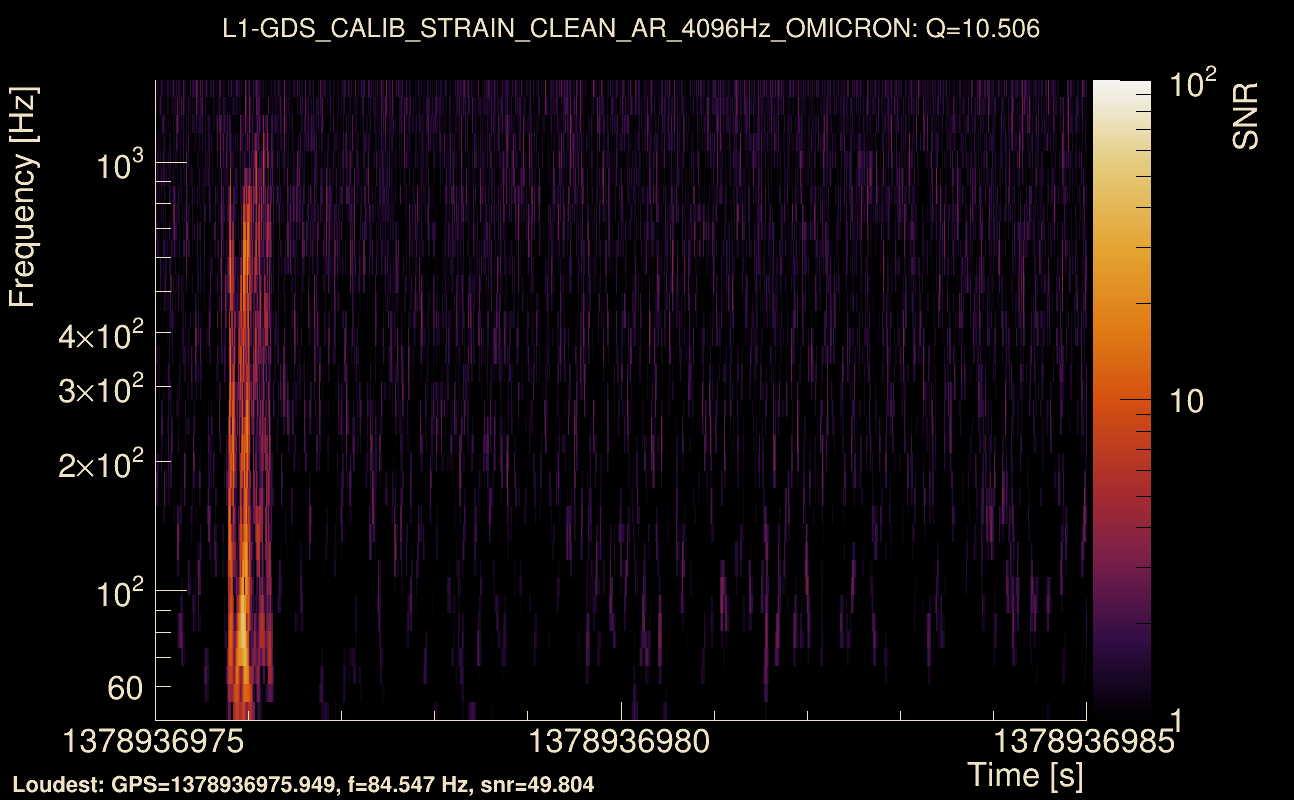
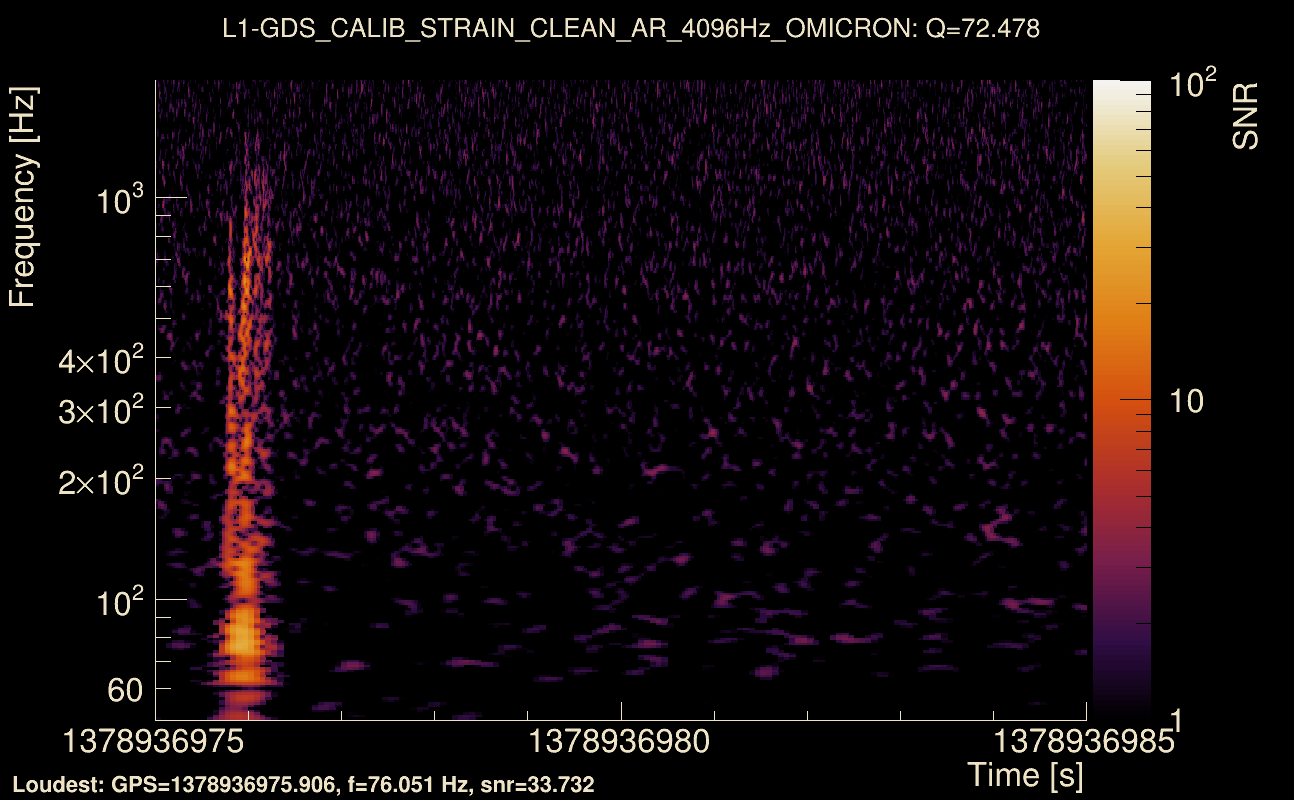
| Event time t(H1): | GPS = 1378936975 (Sat Sep 16 22:02:37 2023 ) → GPS = 1378936985 (Sat Sep 16 22:02:47 2023 ) |
| Event time t(L1): | GPS = 1378936975 (Sat Sep 16 22:02:47 2023 ) → GPS = 1378936985 (Sat Sep 16 22:02:47 2023 ) |
| Omicron analysis time window (H1): | GPS = 1378936972 → GPS = 1378936988 |
| Omicron analysis time window (L1): | GPS = 1378936972 → GPS = 1378936988 |
| Time delay between detectors t(L1) - t(H1): | 0.00276806 s (slice index = 108 / 217), δt_gw = 0.00276806 s |
| Time delay uncertainty: | 0.000693656 s |
| [targeted mode] Time delay probability: | 0.745308 (0.324832 sigmas), δt_target = -0.00278139 s |
| Frequency: | 228.615 Hz |
| Ξ: | 0.897198 ± 0.00215248 (variance = 4.63315e-06): Q0: 0.935848, Q1: 0.934737, Q2: 0.935052, Q3: 0.932472, Q4: 0.929934 |
| Rank: | R_A = 0.894067 |
| Log of amplitude ratio (L1/H1): | -0.135748, variance = 0.159503 (L1/H1: -0.134413, variance = 0.303869, H1/L1: 0.137829, variance = 0.306056) |
| Amplitude ratio (L1/H1): | 0.873063 ⋇ 1.4909 (L1/H1: 0.874229 ⋇ 1.73541, H1/L1: 1.14778 ⋇ 1.73885) |
| Amplitude ratio H1|L1 compatibility (probability): | 0.99651 |
| Antenna factor probability: | 1 |
| Number of rejected frequency rows: | Q0: 0 / 18, Q1: 2 / 36, Q2: 6 / 70, Q3: 15 / 134, Q4: 54 / 258 |
| Maximum signal-to-noise ratio: | H1: 67.4259, L1: 54.0147 |
| SNR variance: | H1: 3.93957, L1: 2.67566 |
| Click here for a zoomed plot | Click here for a zoomed plot | Click here for a zoomed plot | Click here for a zoomed plot | Click here for a zoomed plot |
 |
 |
 |
 |
 |
 |
 |
 |
 |
 |
 |
 |
 |
 |
 |
 |
 |
 |
 |
 |
 |
 |
 |
 |
 |
 |
 |
 |
 |
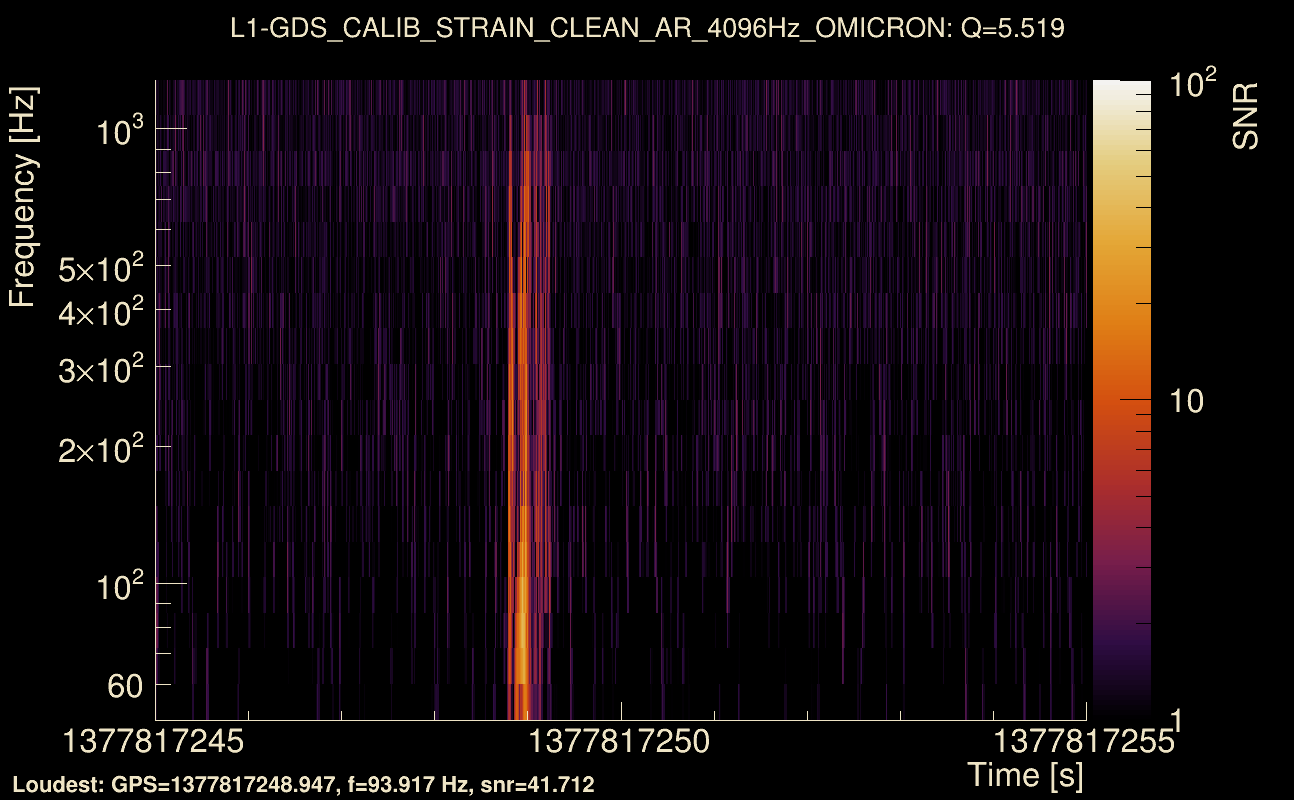
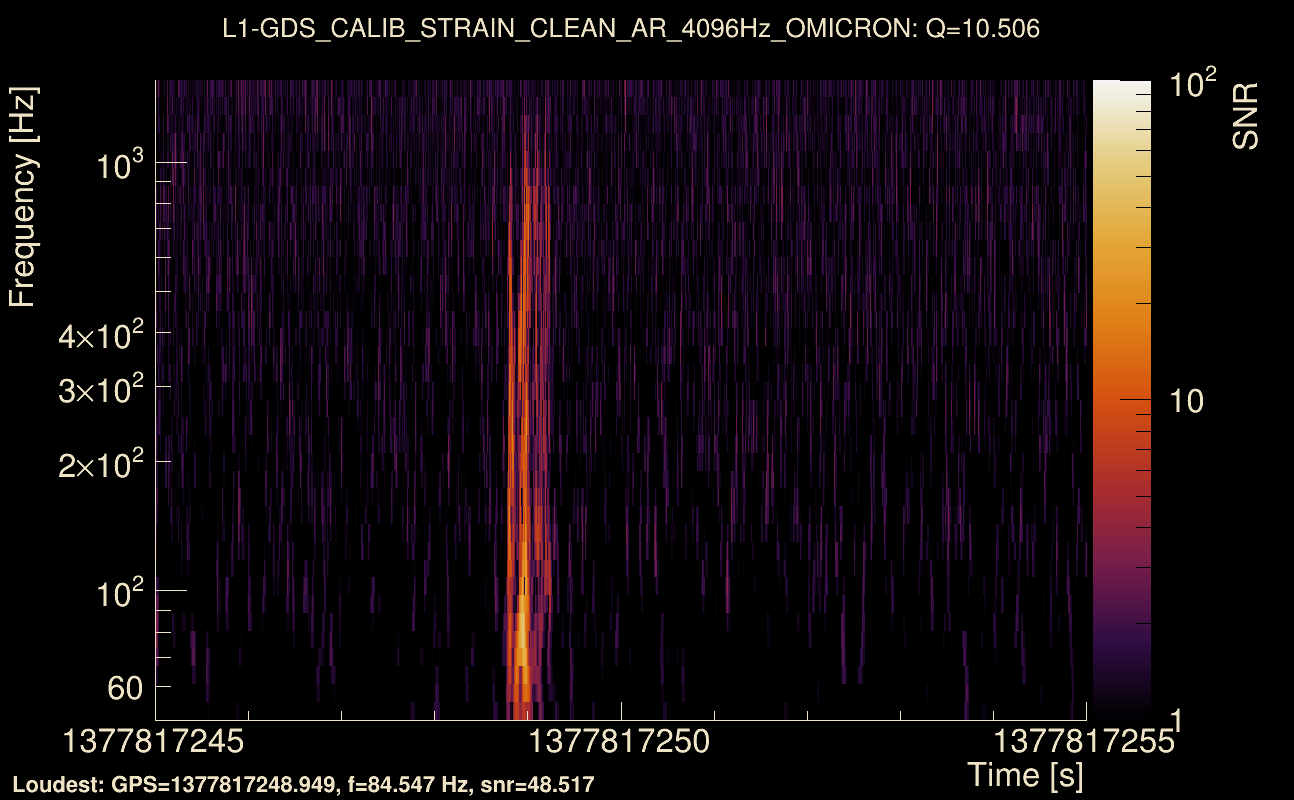
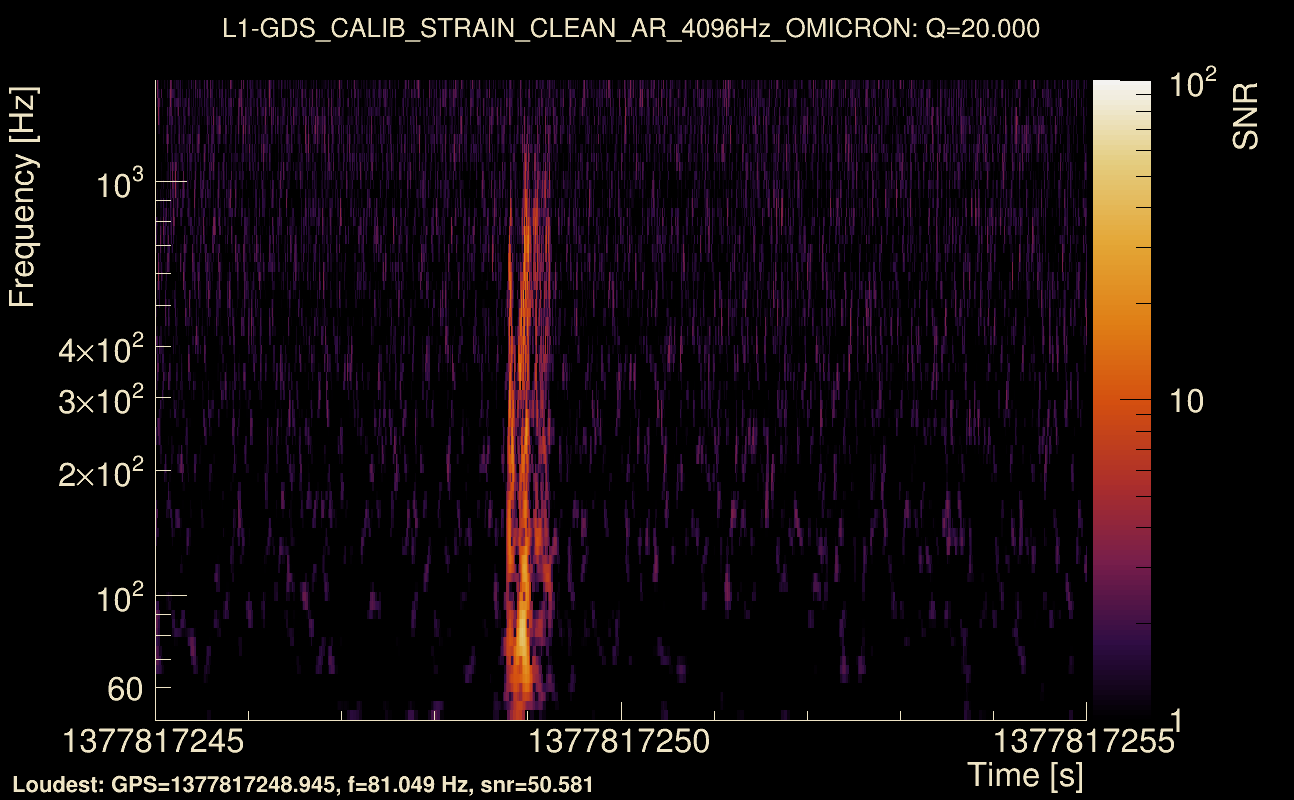
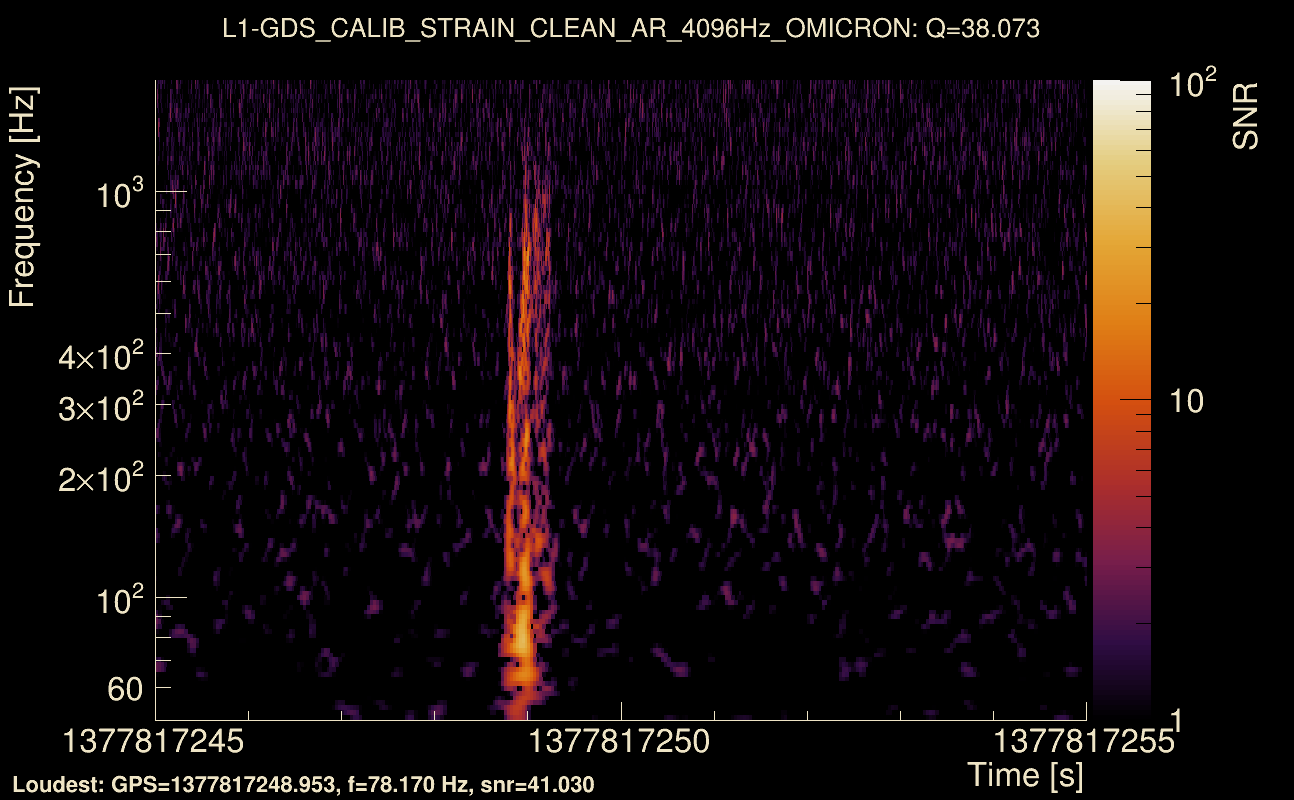
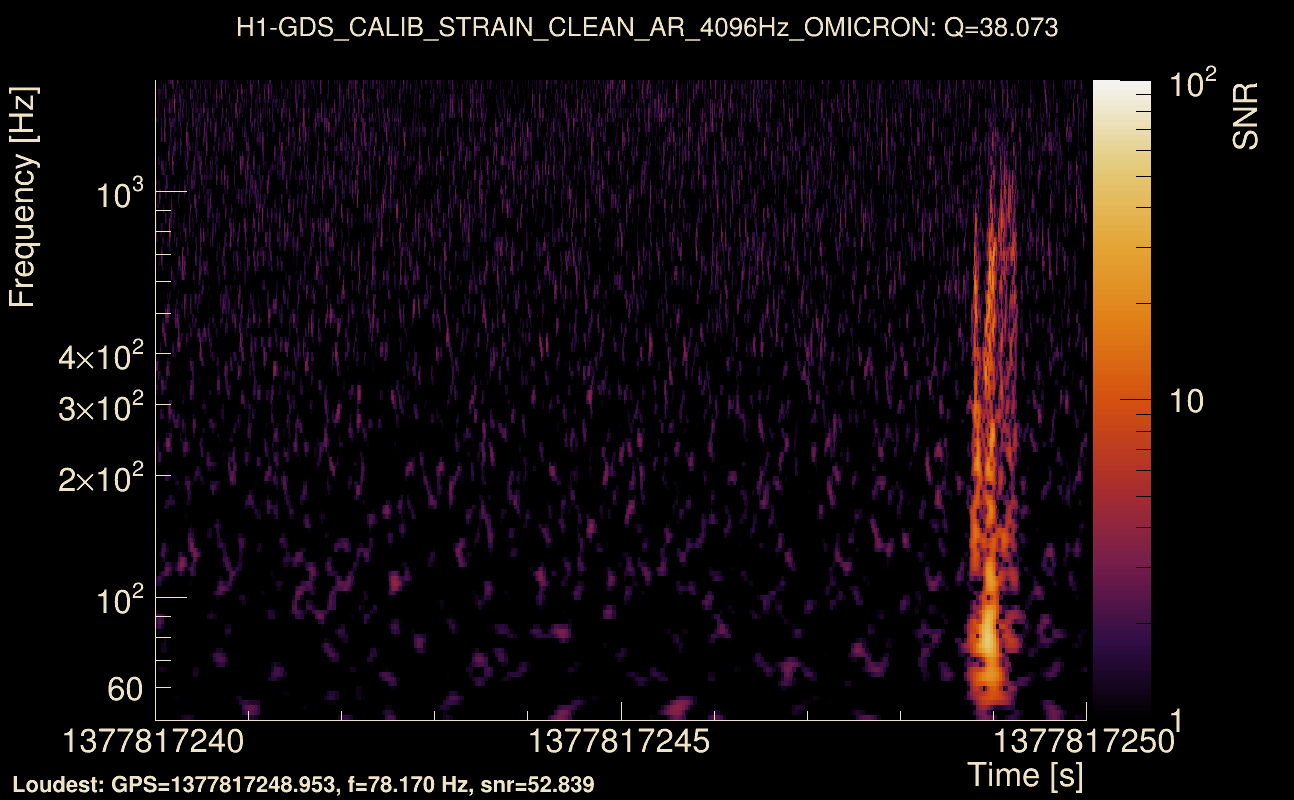
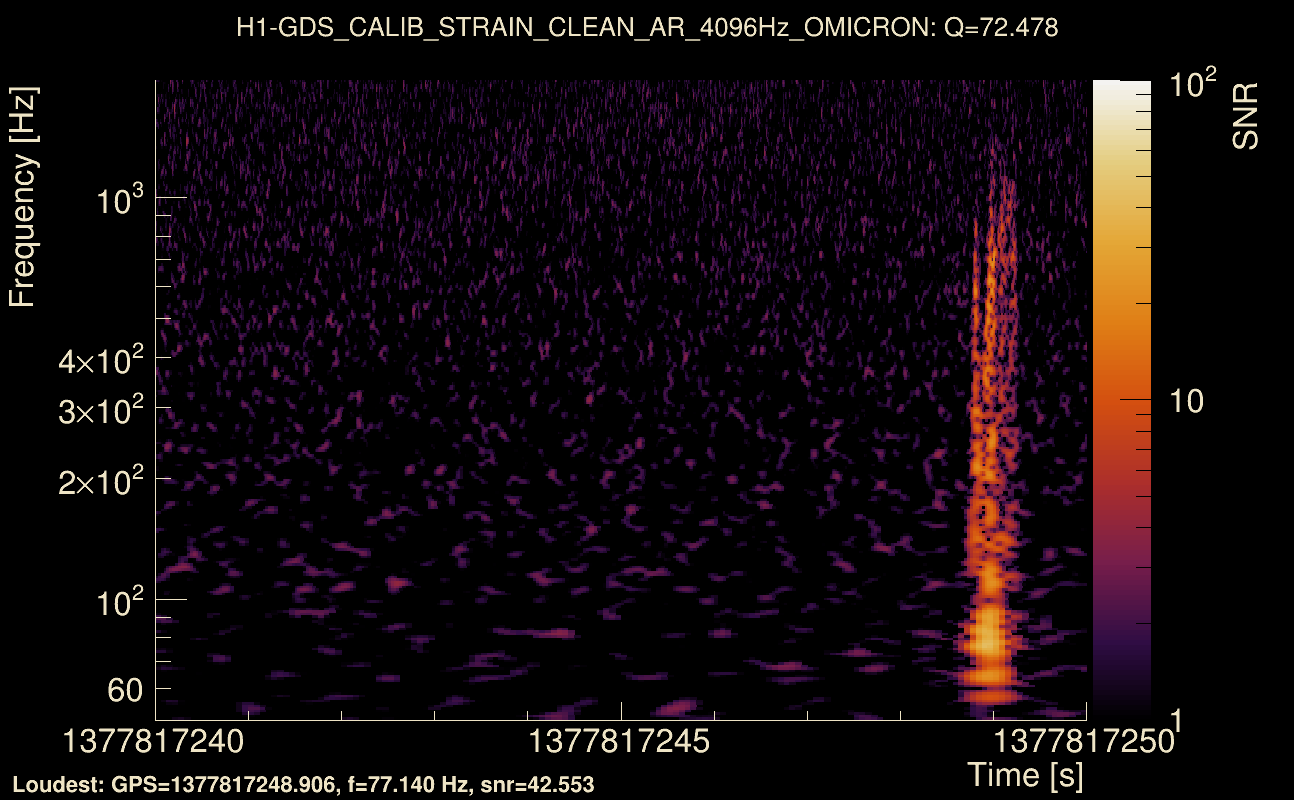
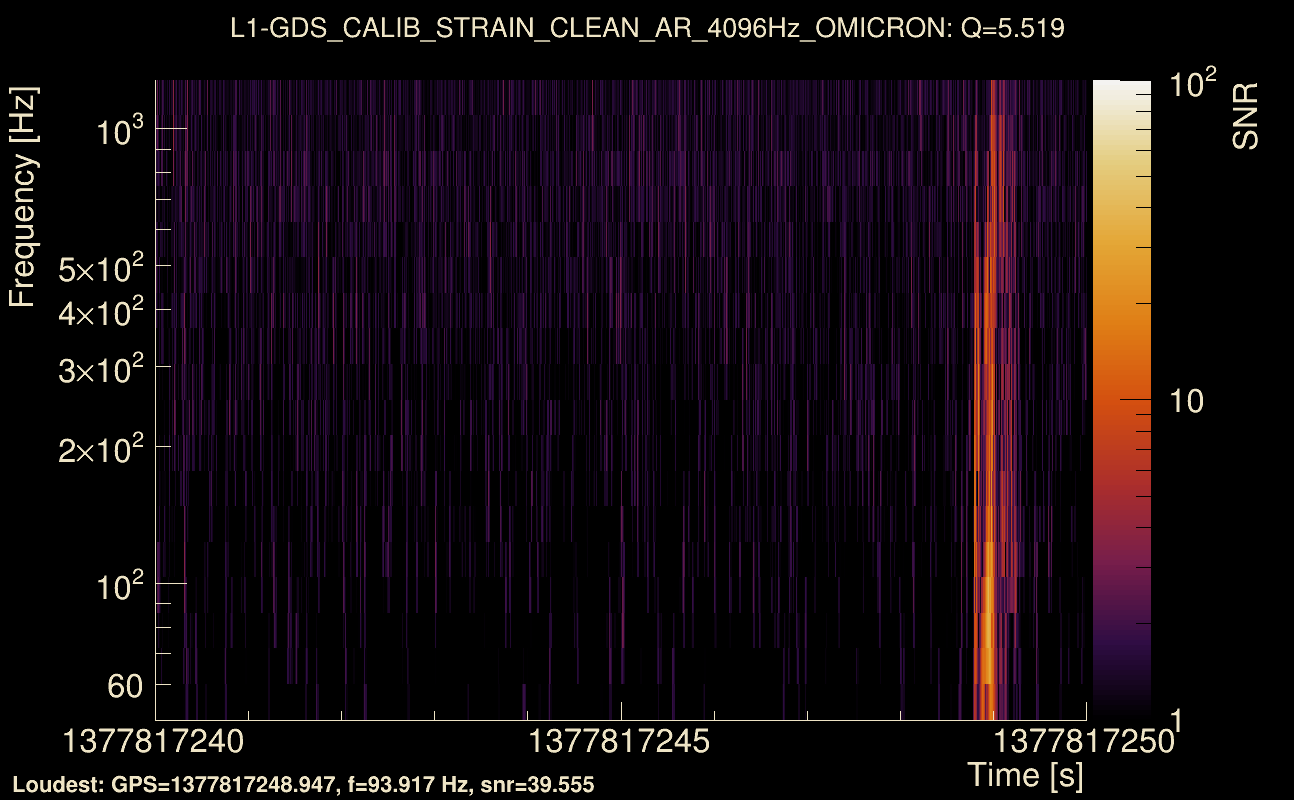
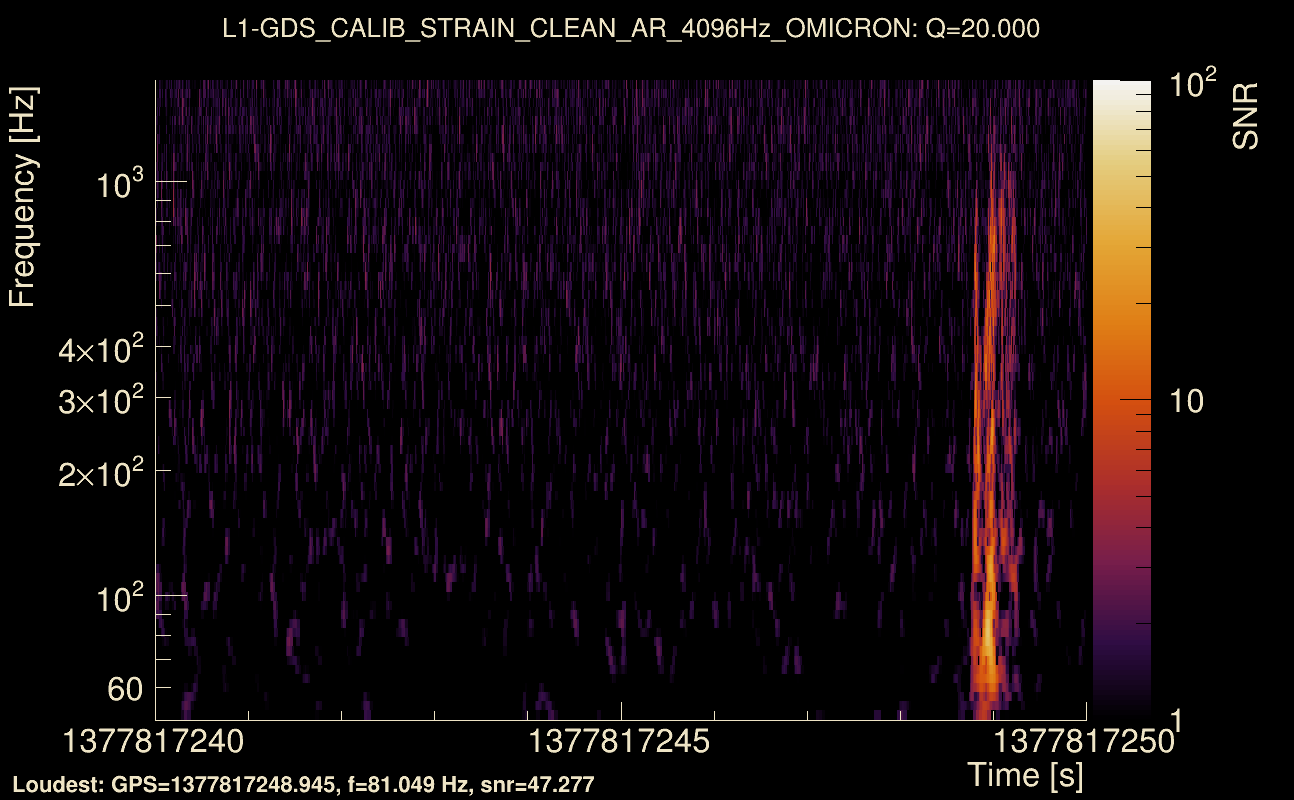
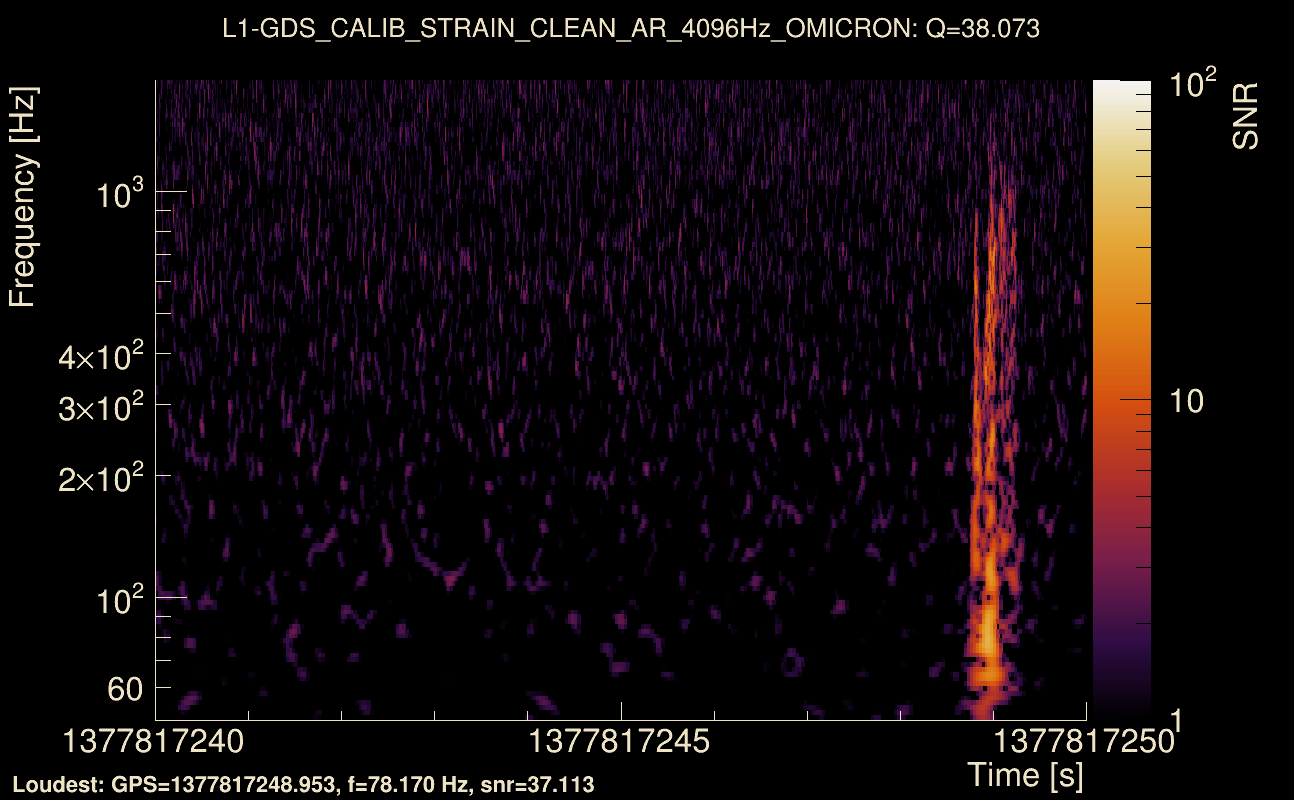
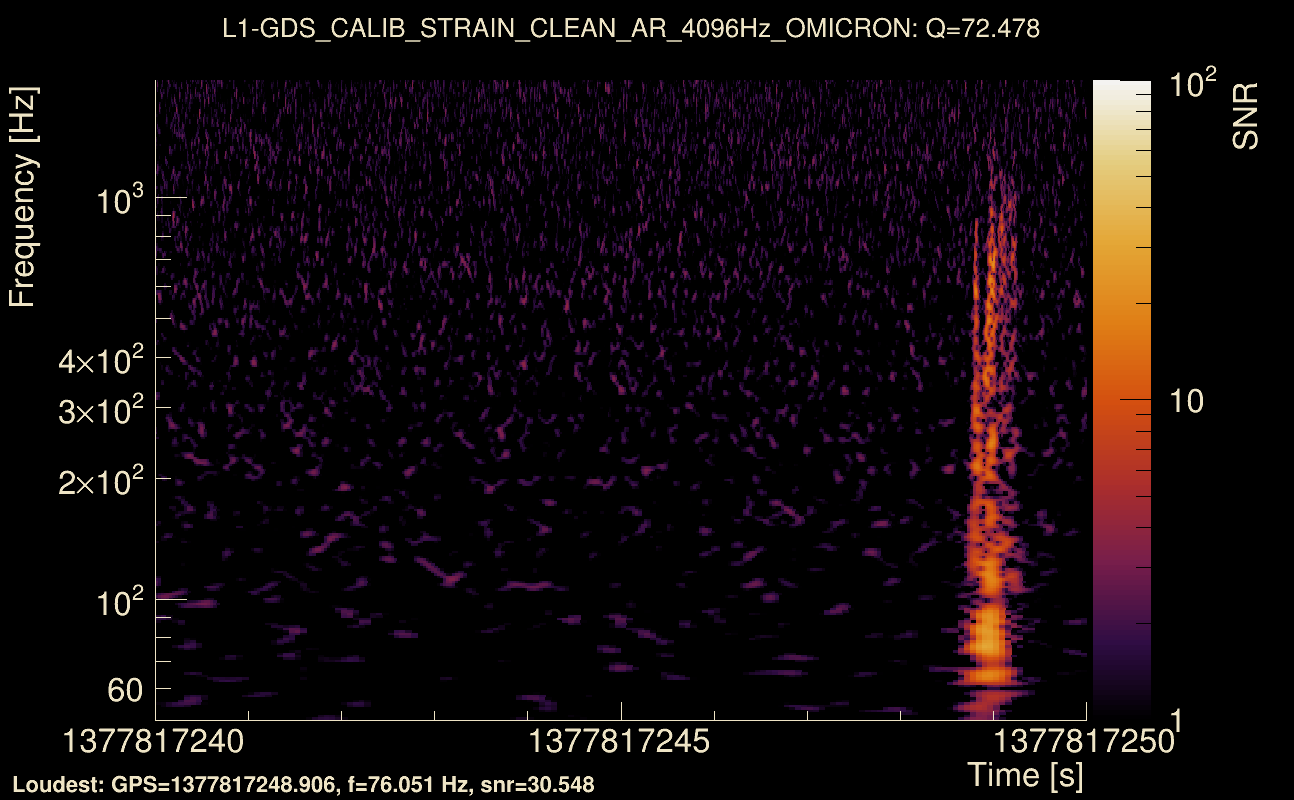
| Event time t(H1): | GPS = 1377817240 (Sun Sep 3 23:00:22 2023 ) → GPS = 1377817250 (Sun Sep 3 23:00:32 2023 ) |
| Event time t(L1): | GPS = 1377817240 (Sun Sep 3 23:00:32 2023 ) → GPS = 1377817250 (Sun Sep 3 23:00:32 2023 ) |
| Omicron analysis time window (H1): | GPS = 1377817237 → GPS = 1377817253 |
| Omicron analysis time window (L1): | GPS = 1377817237 → GPS = 1377817253 |
| Time delay between detectors t(L1) - t(H1): | 0.00283424 s (slice index = 108 / 217), δt_gw = 0.00283424 s |
| Time delay uncertainty: | 0.000743102 s |
| [targeted mode] Time delay probability: | 0.845925 (0.194321 sigmas), δt_target = -0.000533581 s |
| Frequency: | 233.988 Hz |
| Ξ: | 0.903355 ± 0.00432051 (variance = 1.86668e-05): Q0: 0.939539, Q1: 0.940278, Q2: 0.937106, Q3: 0.936101, Q4: 0.928155 |
| Rank: | R_A = 0.893725 |
| Log of amplitude ratio (L1/H1): | -0.130045, variance = 0.156159 (L1/H1: -0.134387, variance = 0.303196, H1/L1: 0.123966, variance = 0.305228) |
| Amplitude ratio (L1/H1): | 0.878056 ⋇ 1.48464 (L1/H1: 0.874251 ⋇ 1.73435, H1/L1: 1.13198 ⋇ 1.73755) |
| Amplitude ratio H1|L1 compatibility (probability): | 0.98934 |
| Antenna factor probability: | 1 |
| Number of rejected frequency rows: | Q0: 0 / 18, Q1: 2 / 36, Q2: 5 / 70, Q3: 15 / 134, Q4: 48 / 258 |
| Maximum signal-to-noise ratio: | H1: 67.3956, L1: 56.9623 |
| SNR variance: | H1: 0.491614, L1: 0.502455 |
| Click here for a zoomed plot | Click here for a zoomed plot | Click here for a zoomed plot | Click here for a zoomed plot | Click here for a zoomed plot |
 |
 |
 |
 |
 |
 |
 |
 |
 |
 |
 |
 |
 |
 |
 |
 |
 |
 |
 |
 |
 |
 |
 |
 |
 |
 |
 |
 |
 |
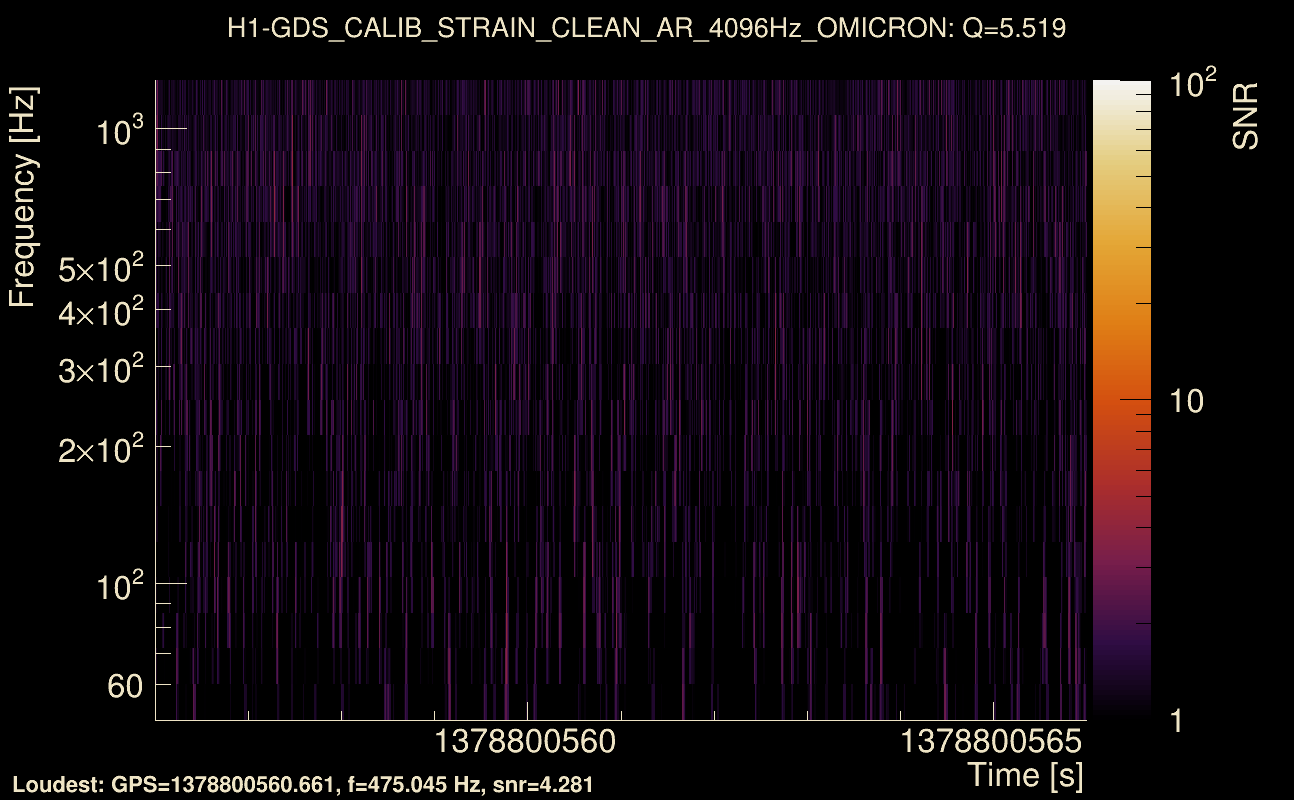
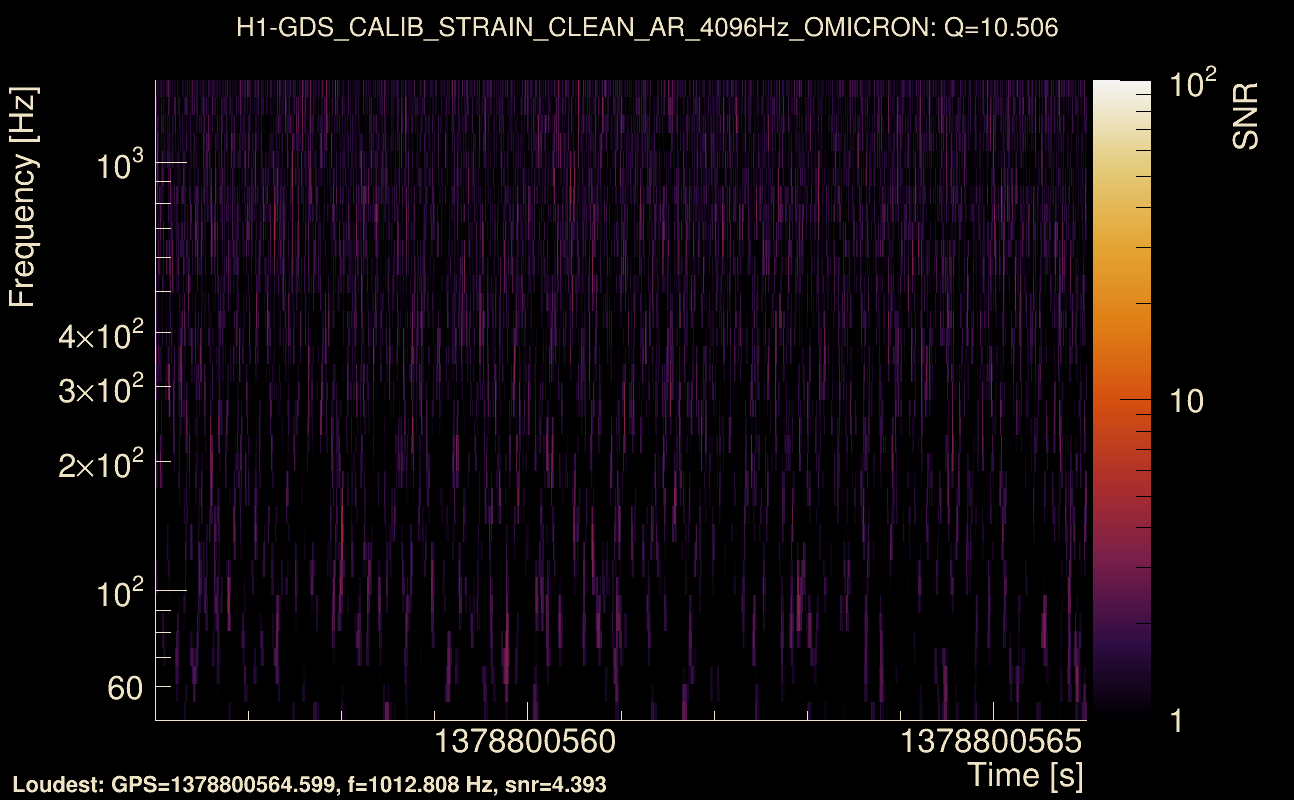
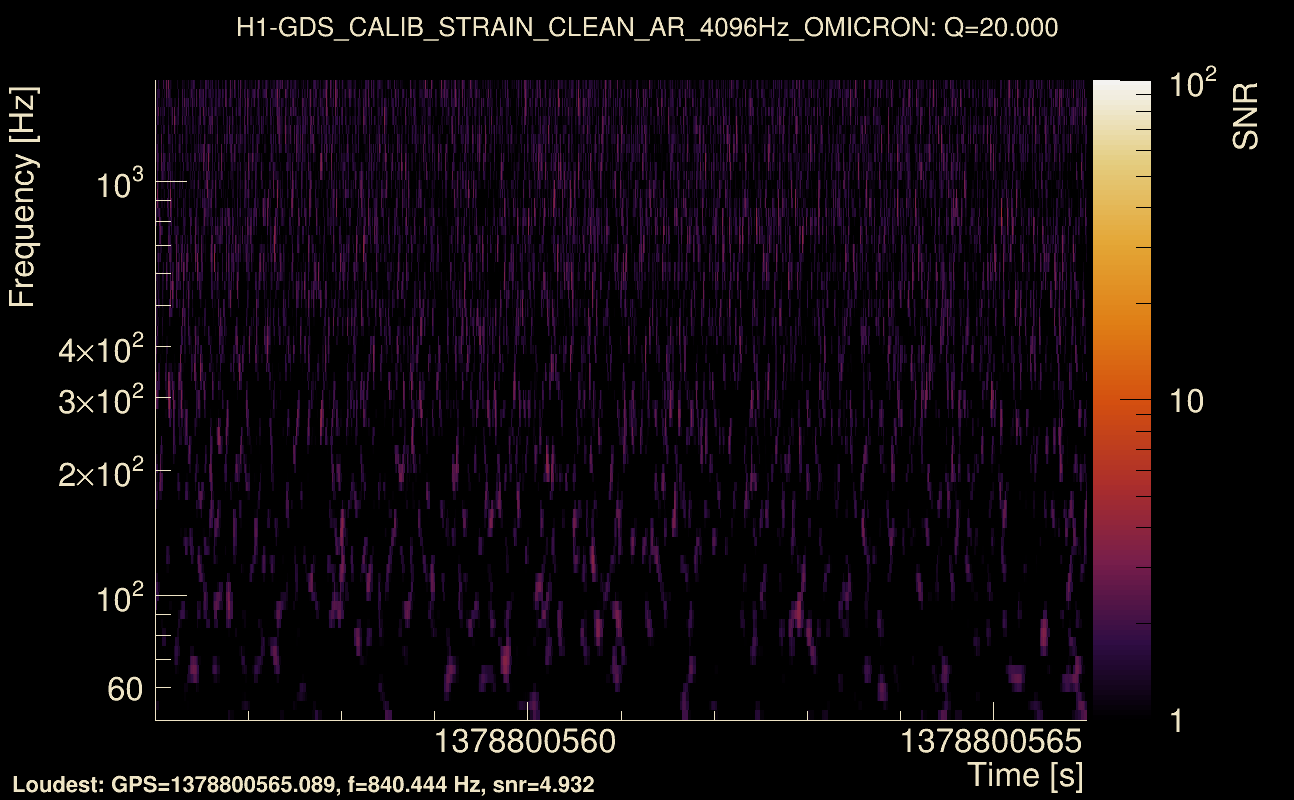
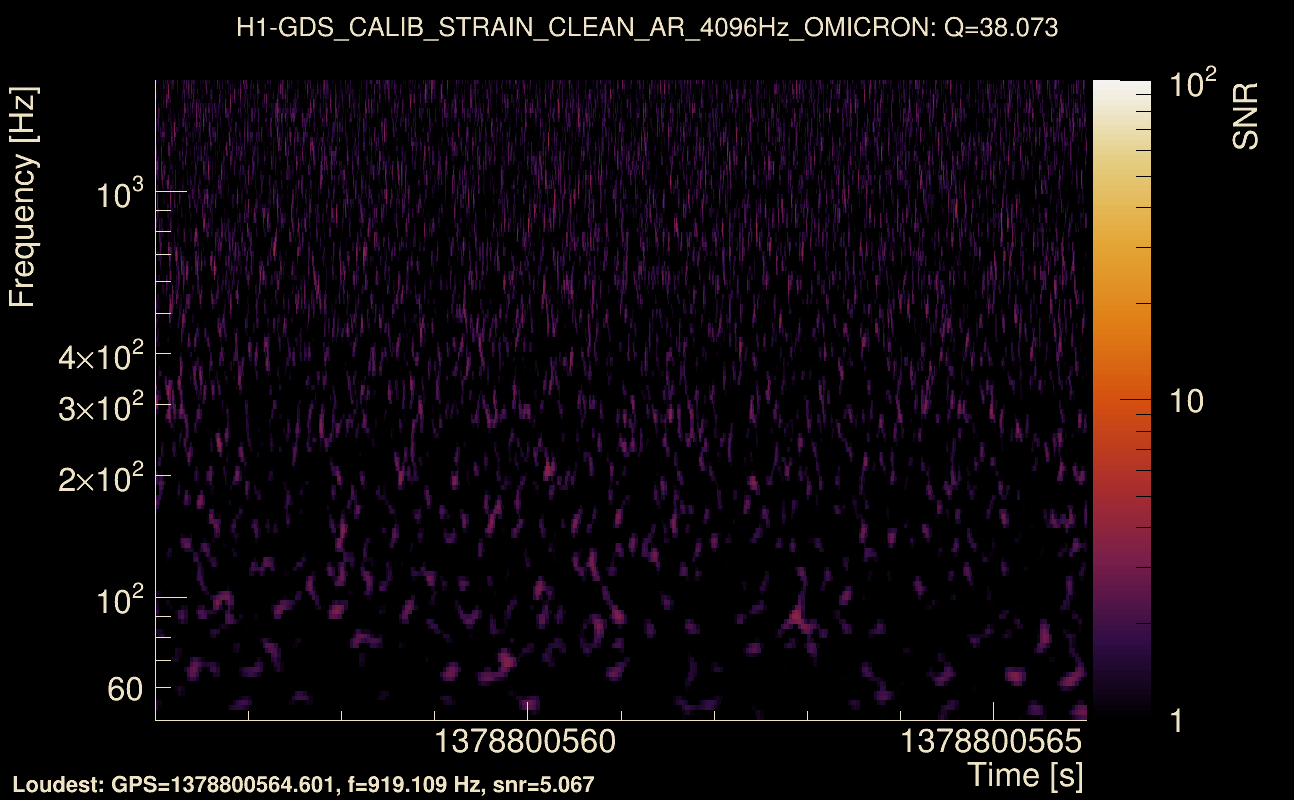
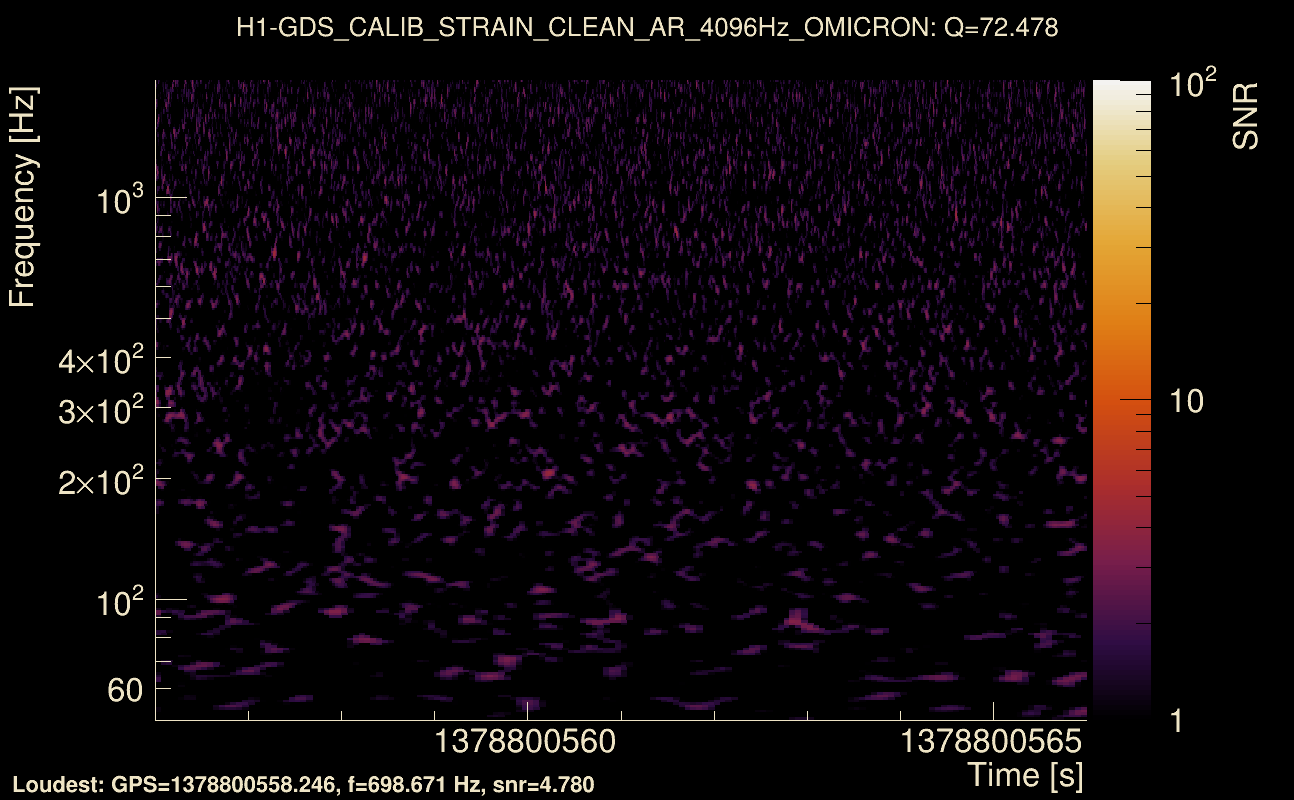
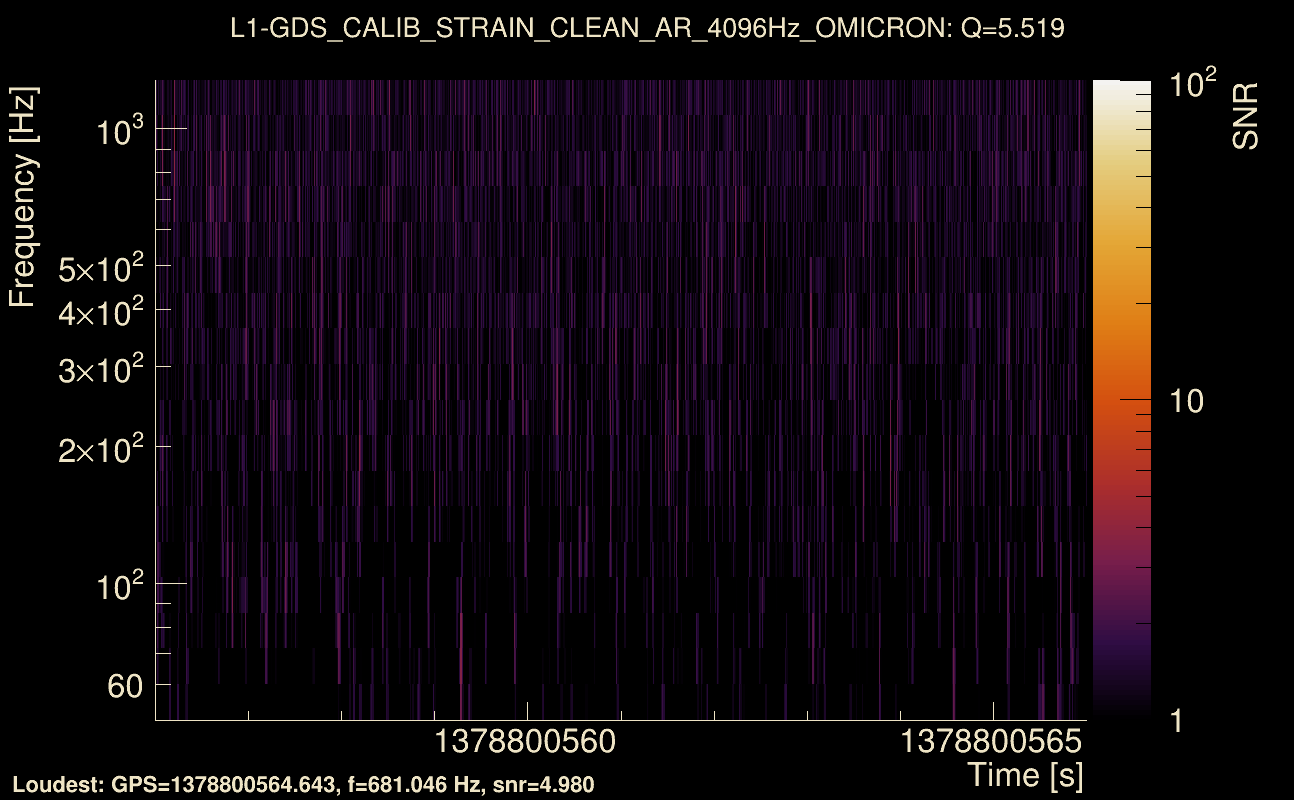
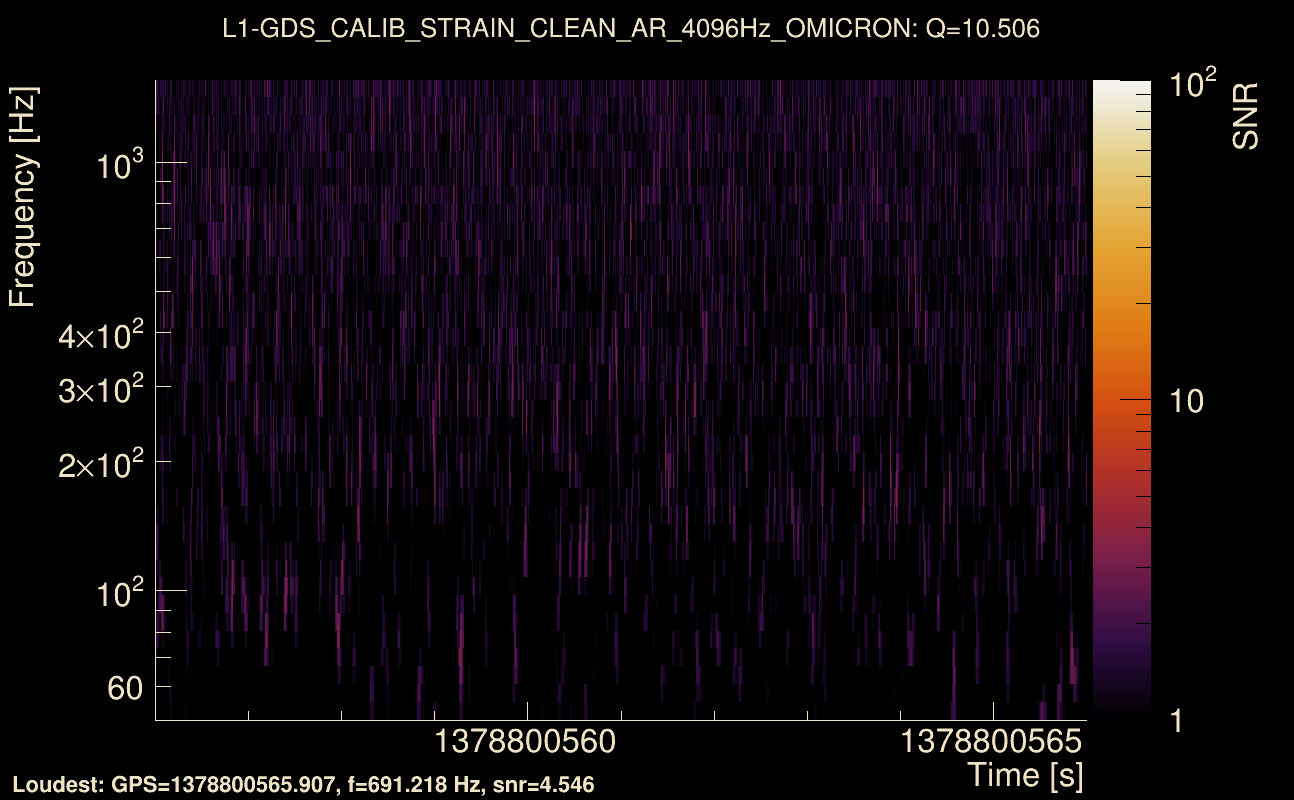
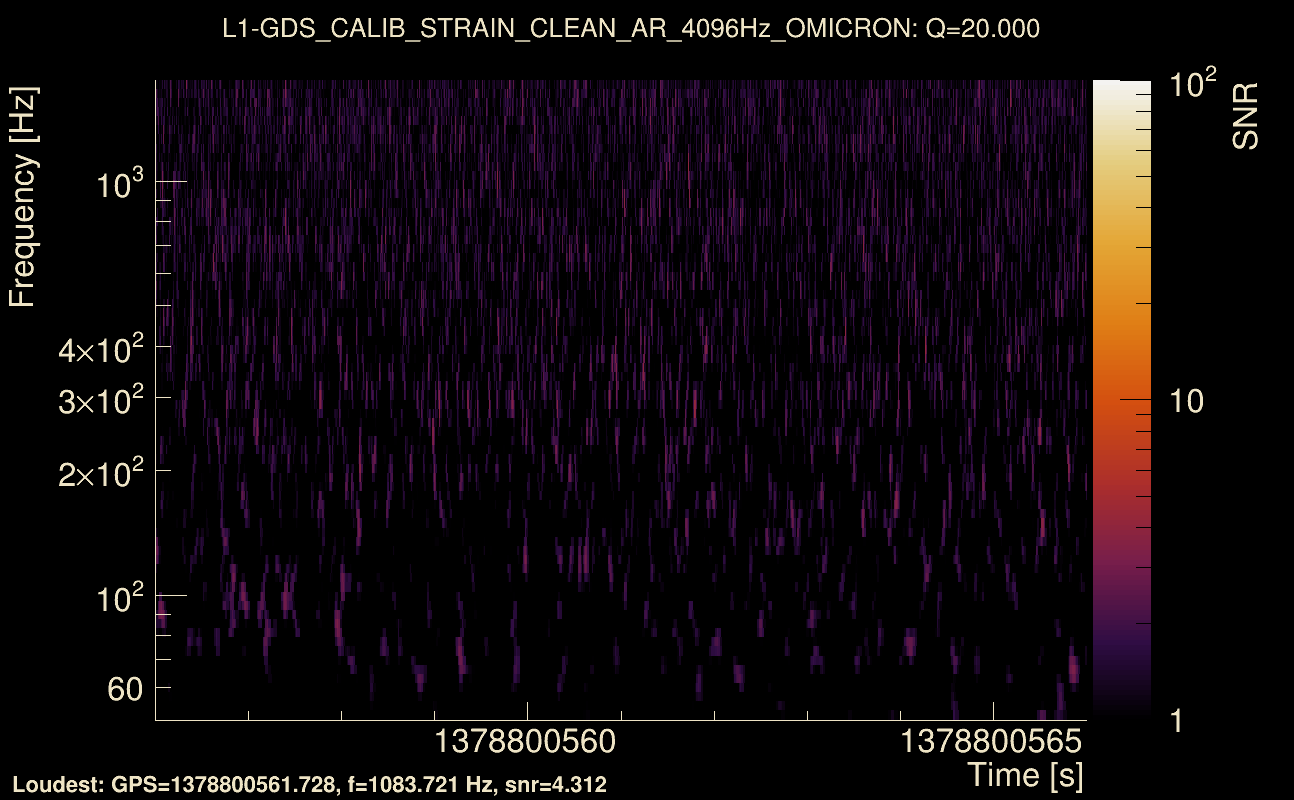
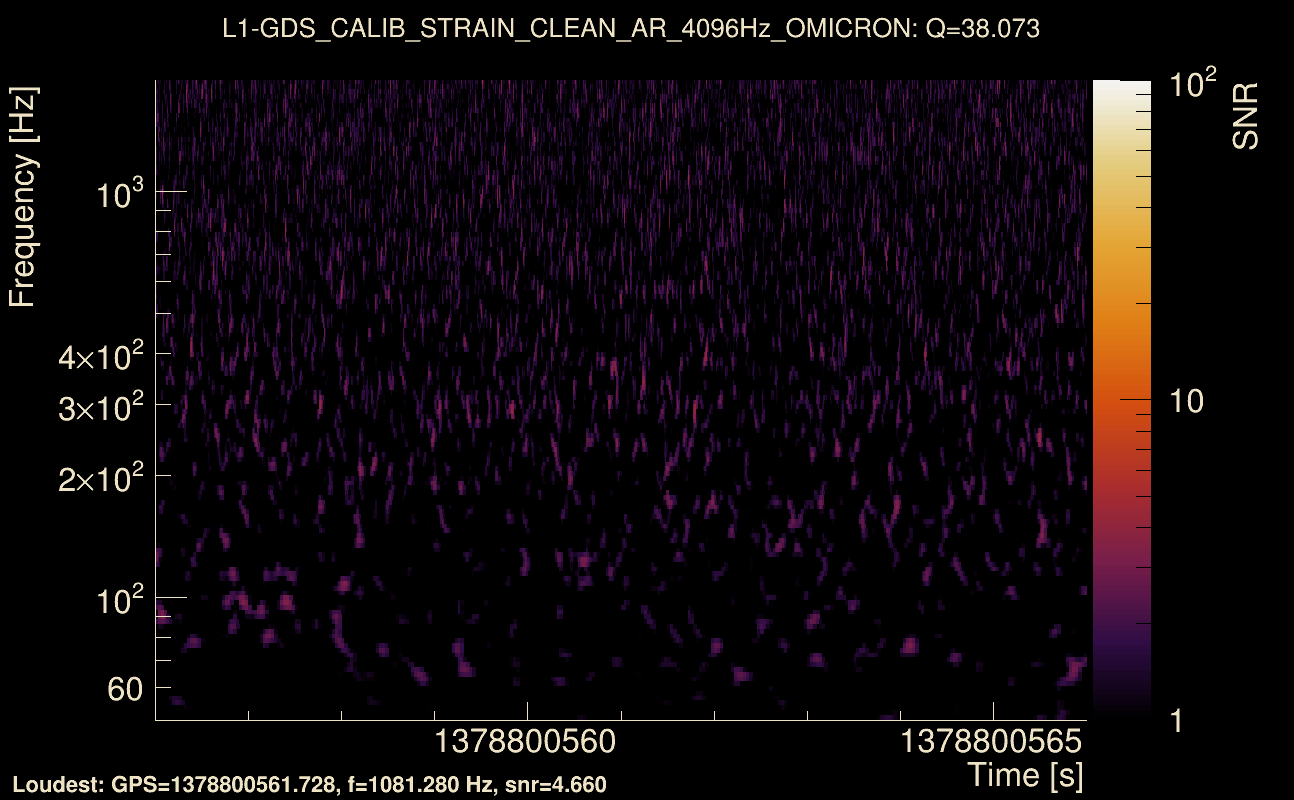
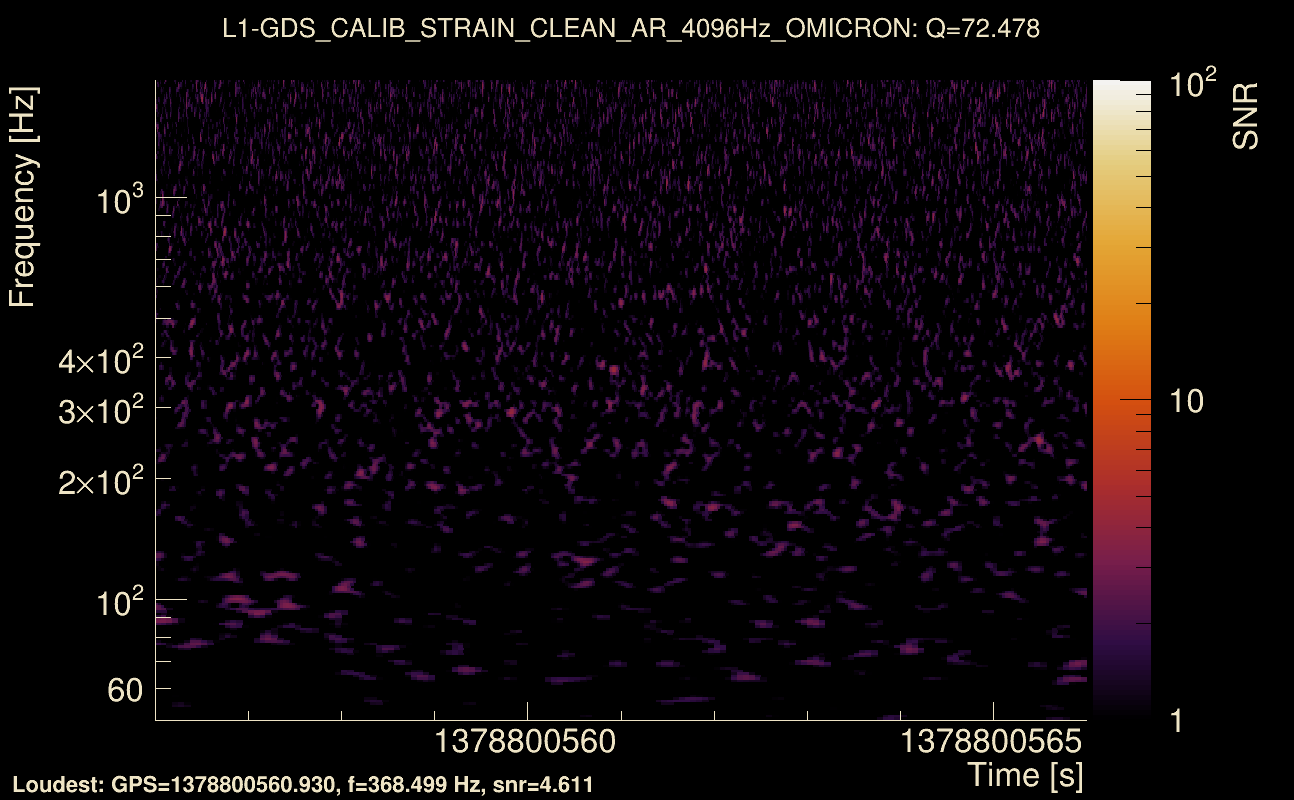
| Event time t(H1): | GPS = 1378800556 (Fri Sep 15 08:08:58 2023 ) → GPS = 1378800566 (Fri Sep 15 08:09:08 2023 ) |
| Event time t(L1): | GPS = 1378800556 (Fri Sep 15 08:09:08 2023 ) → GPS = 1378800566 (Fri Sep 15 08:09:08 2023 ) |
| Omicron analysis time window (H1): | GPS = 1378800553 → GPS = 1378800569 |
| Omicron analysis time window (L1): | GPS = 1378800553 → GPS = 1378800569 |
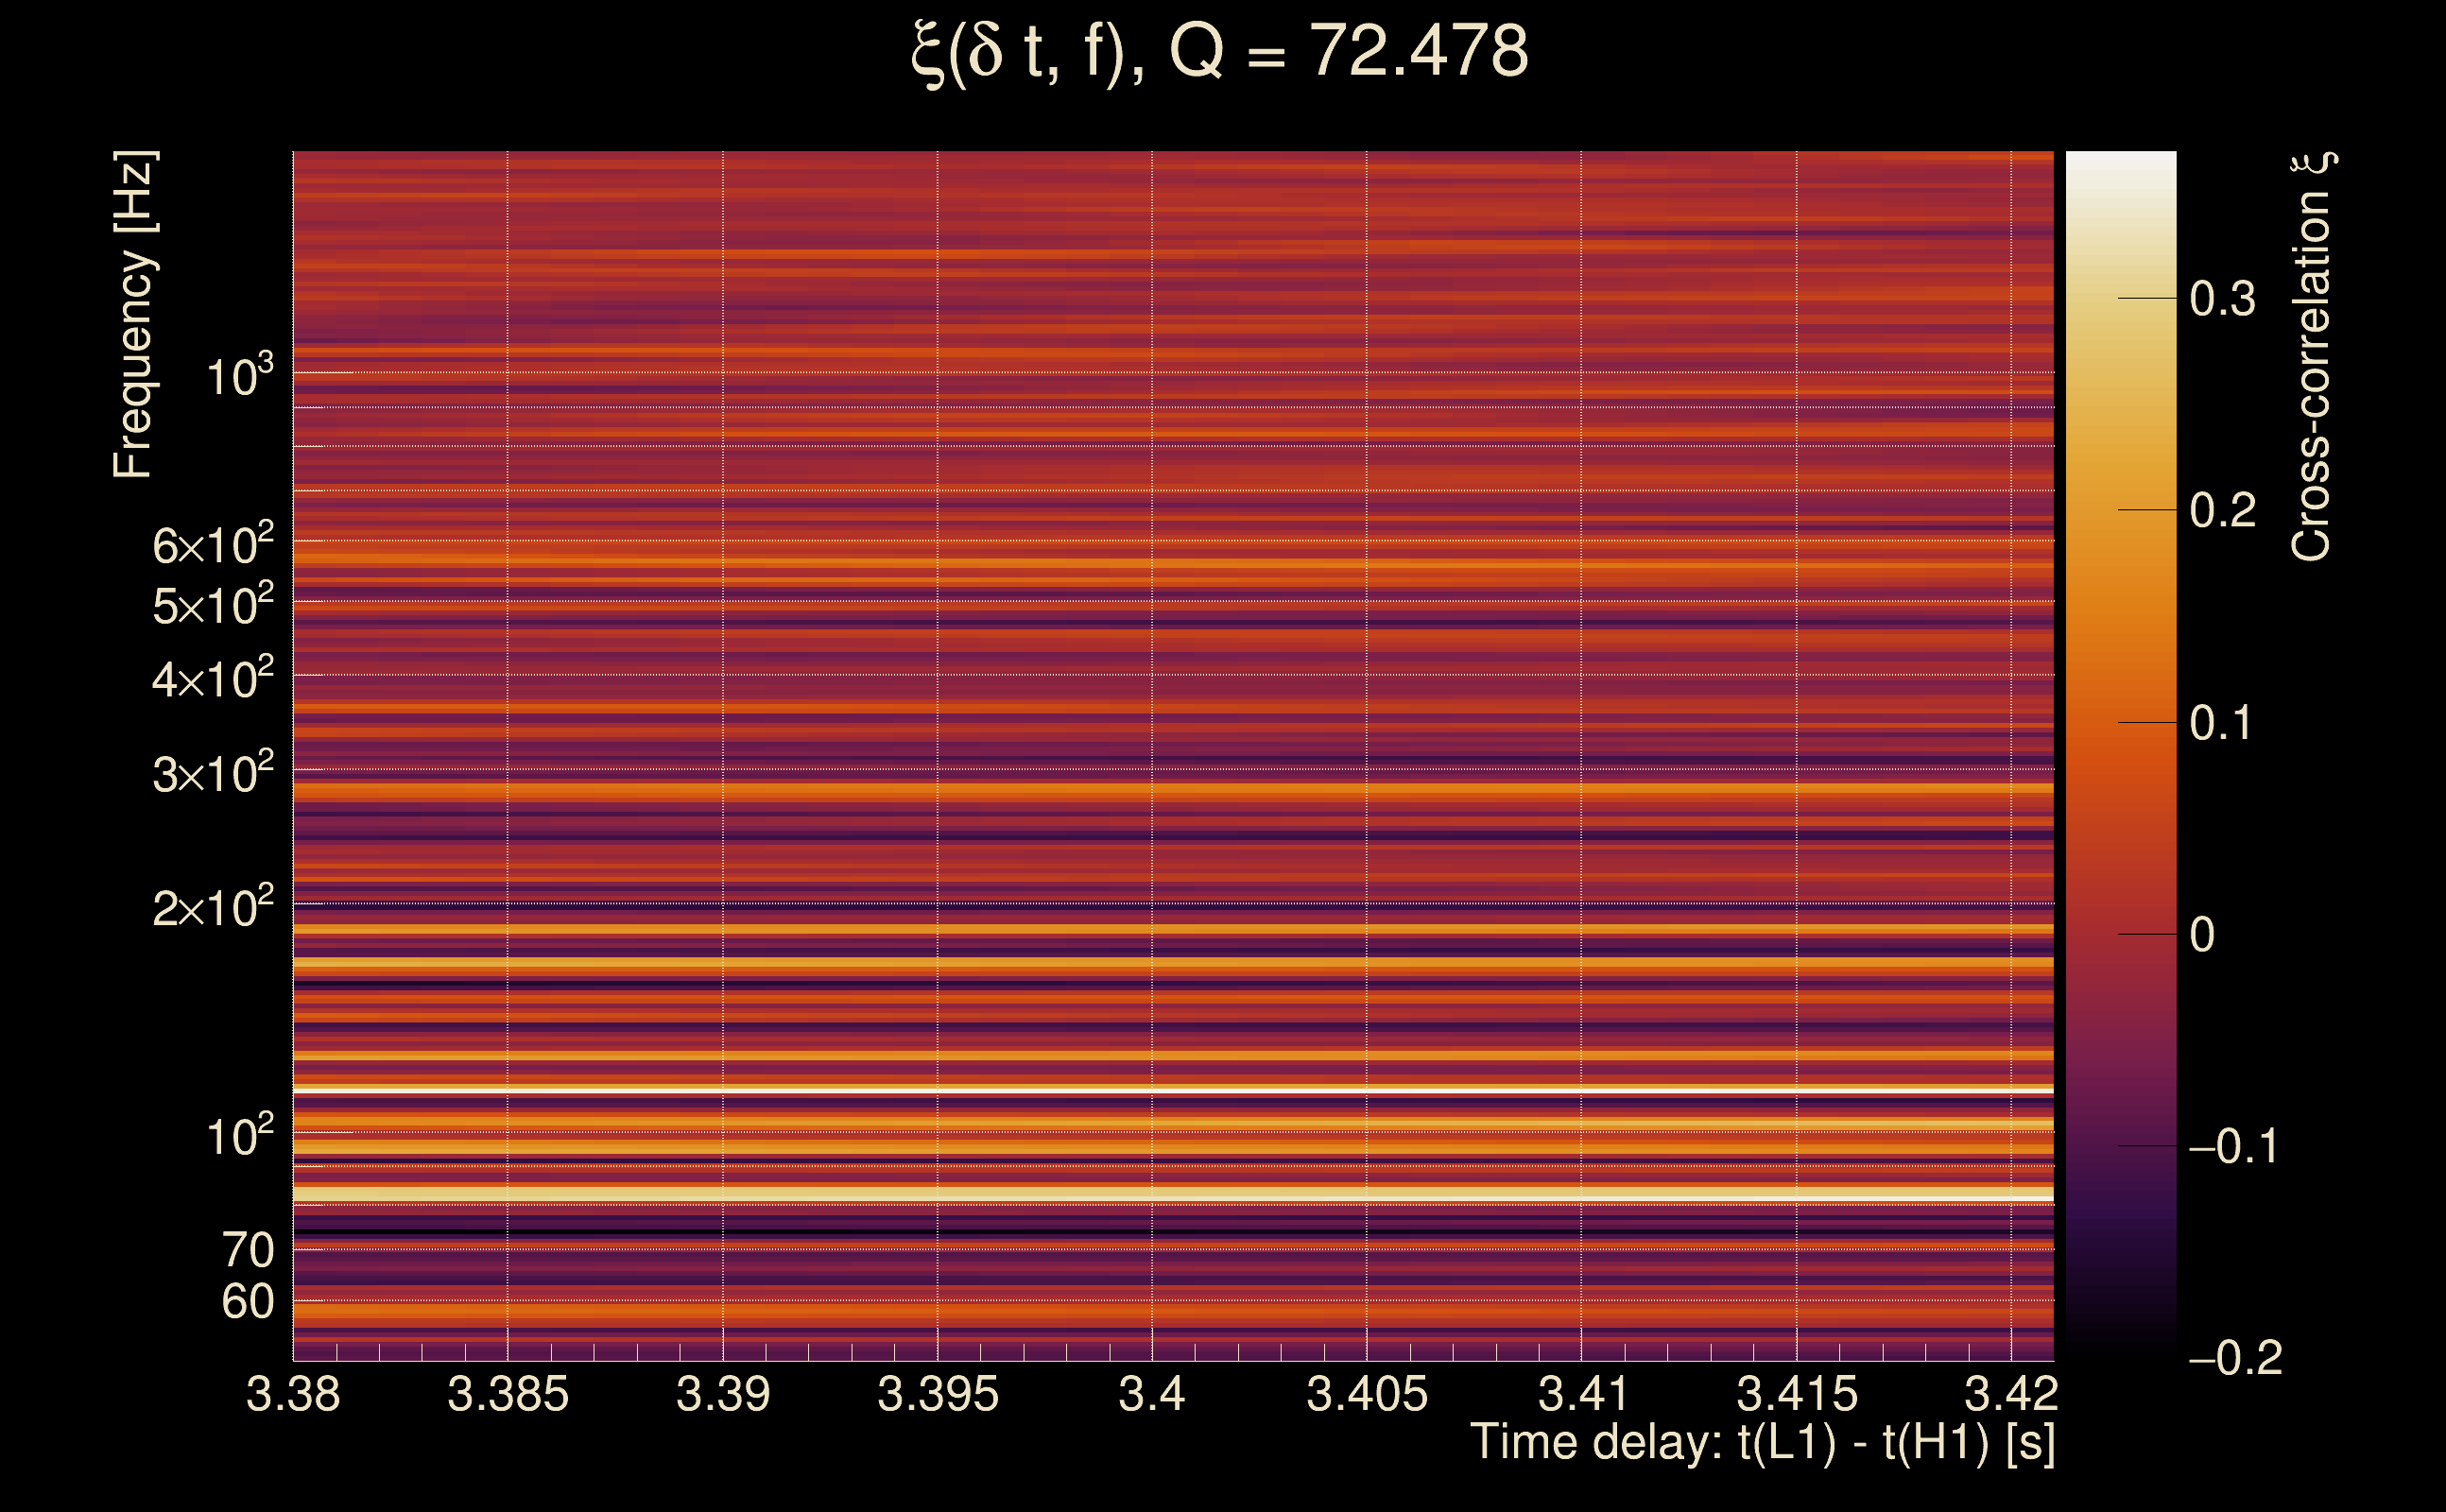
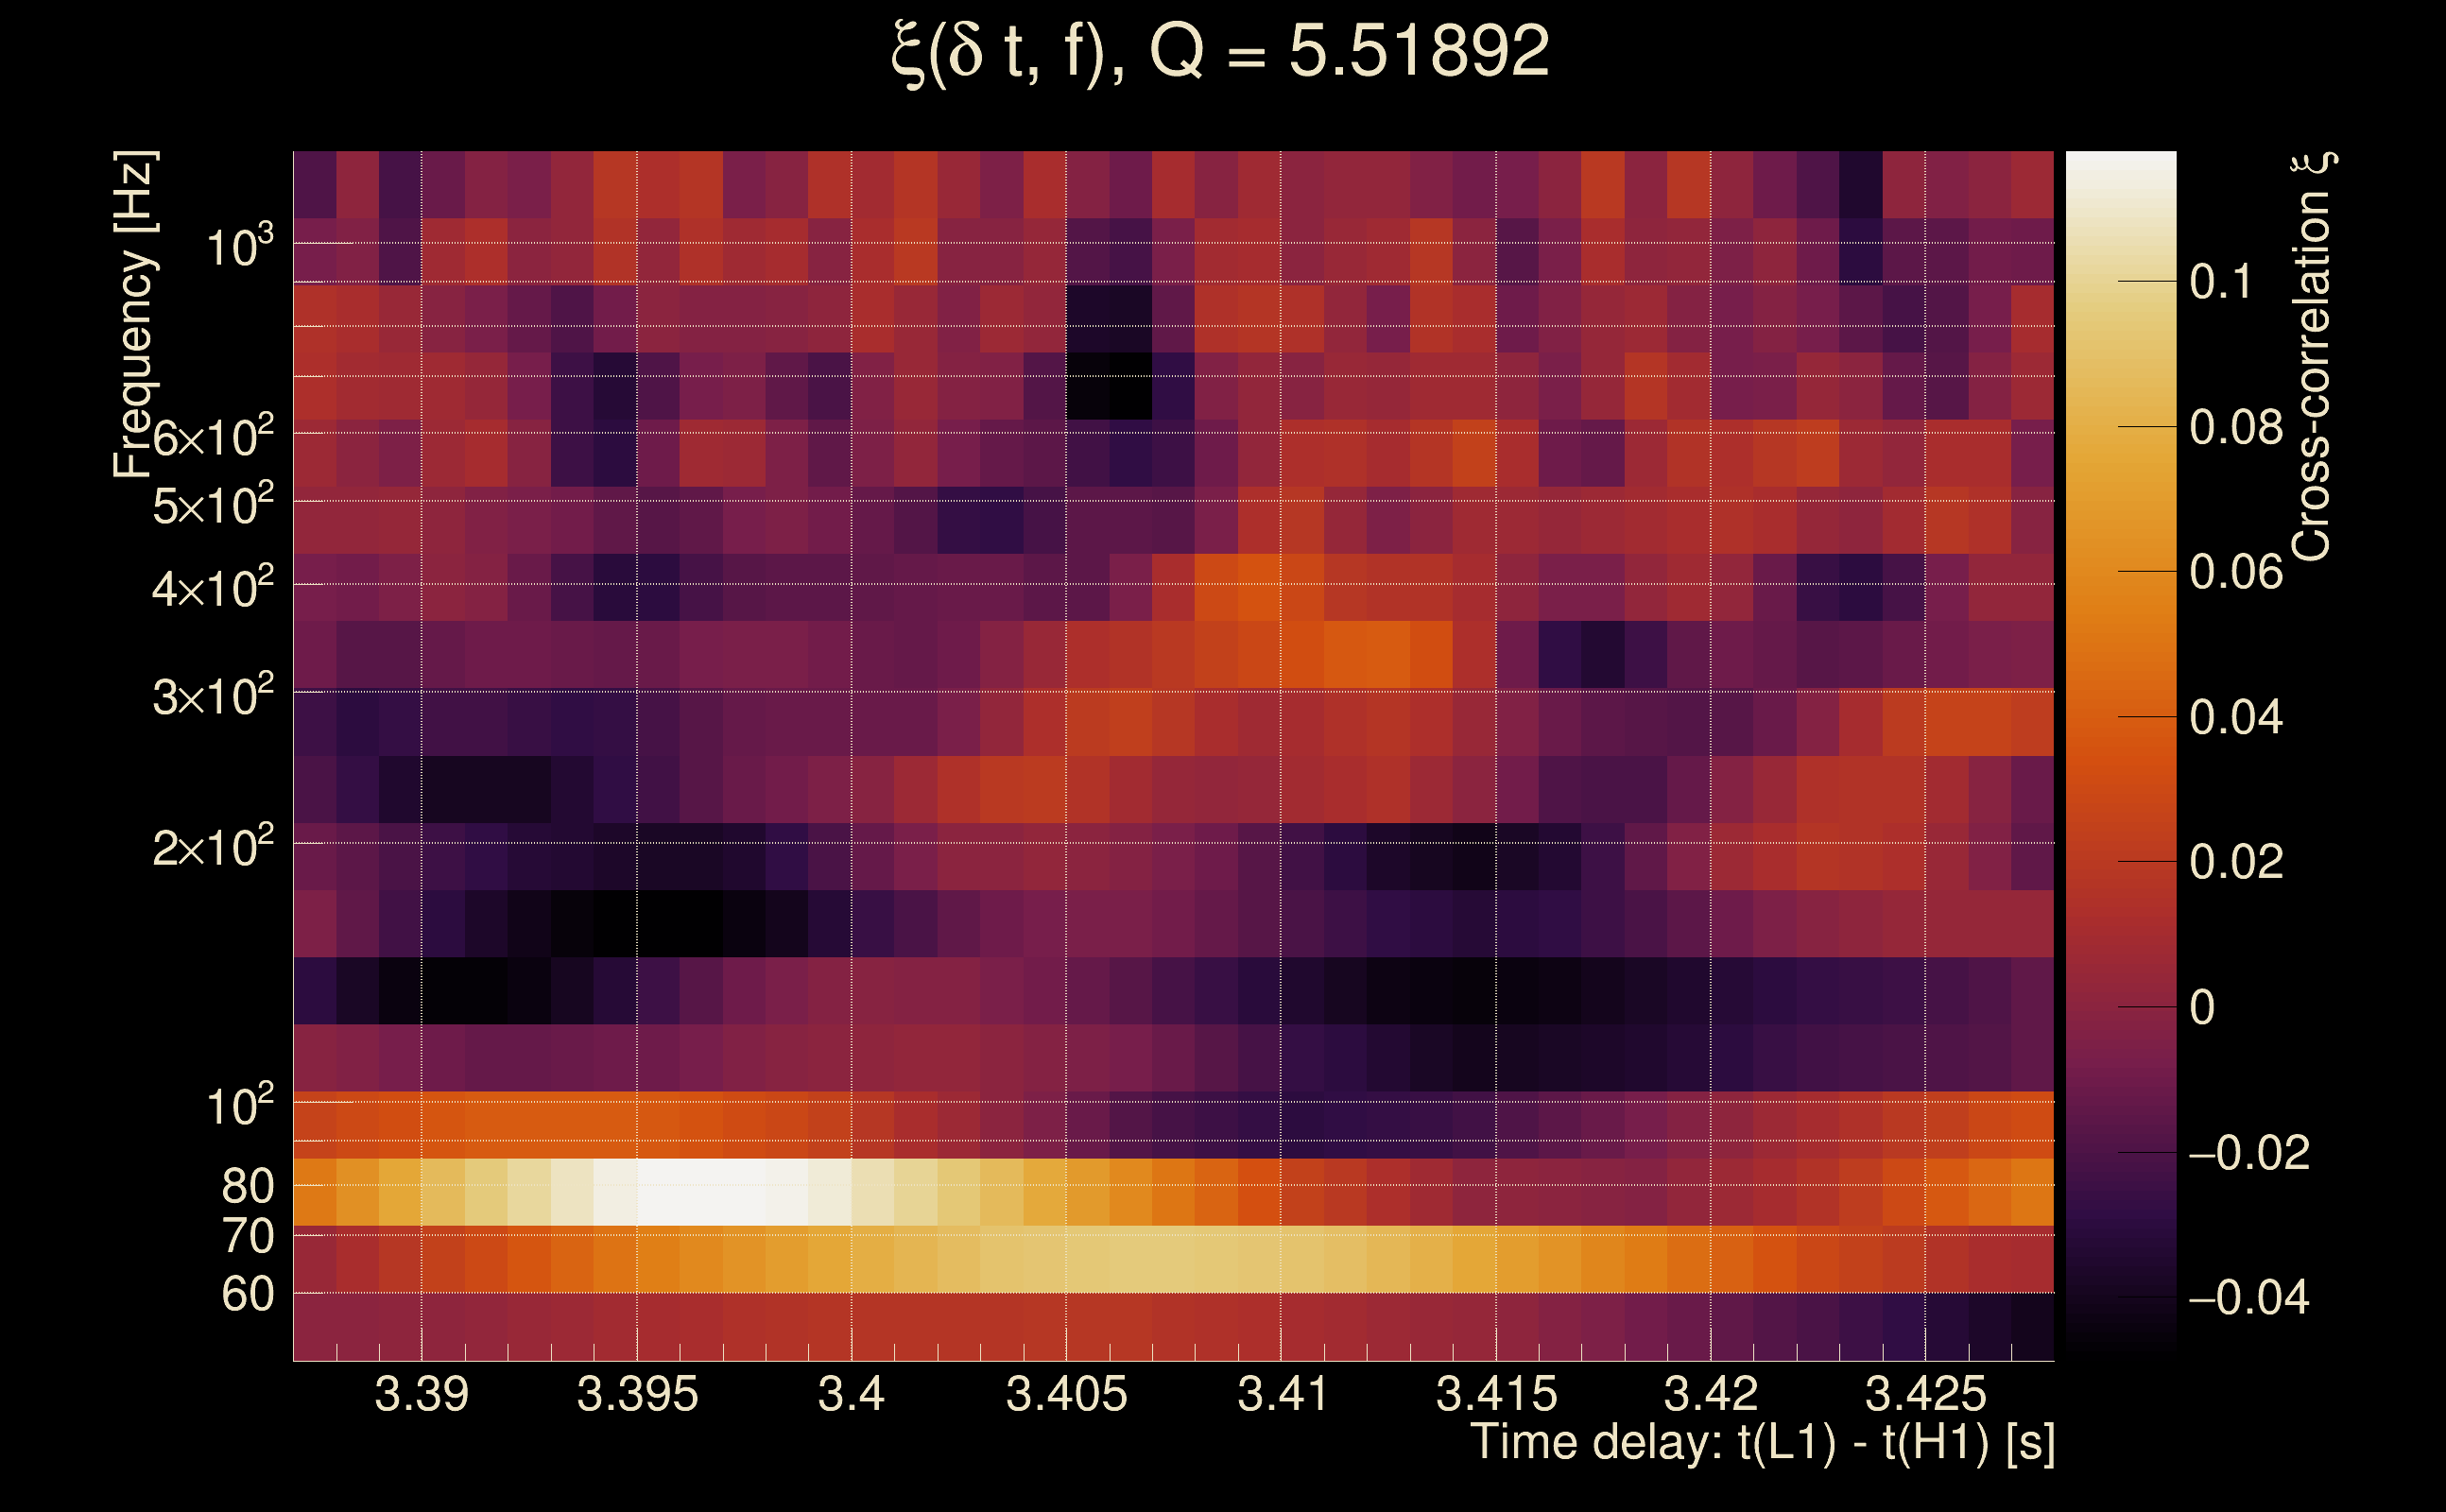
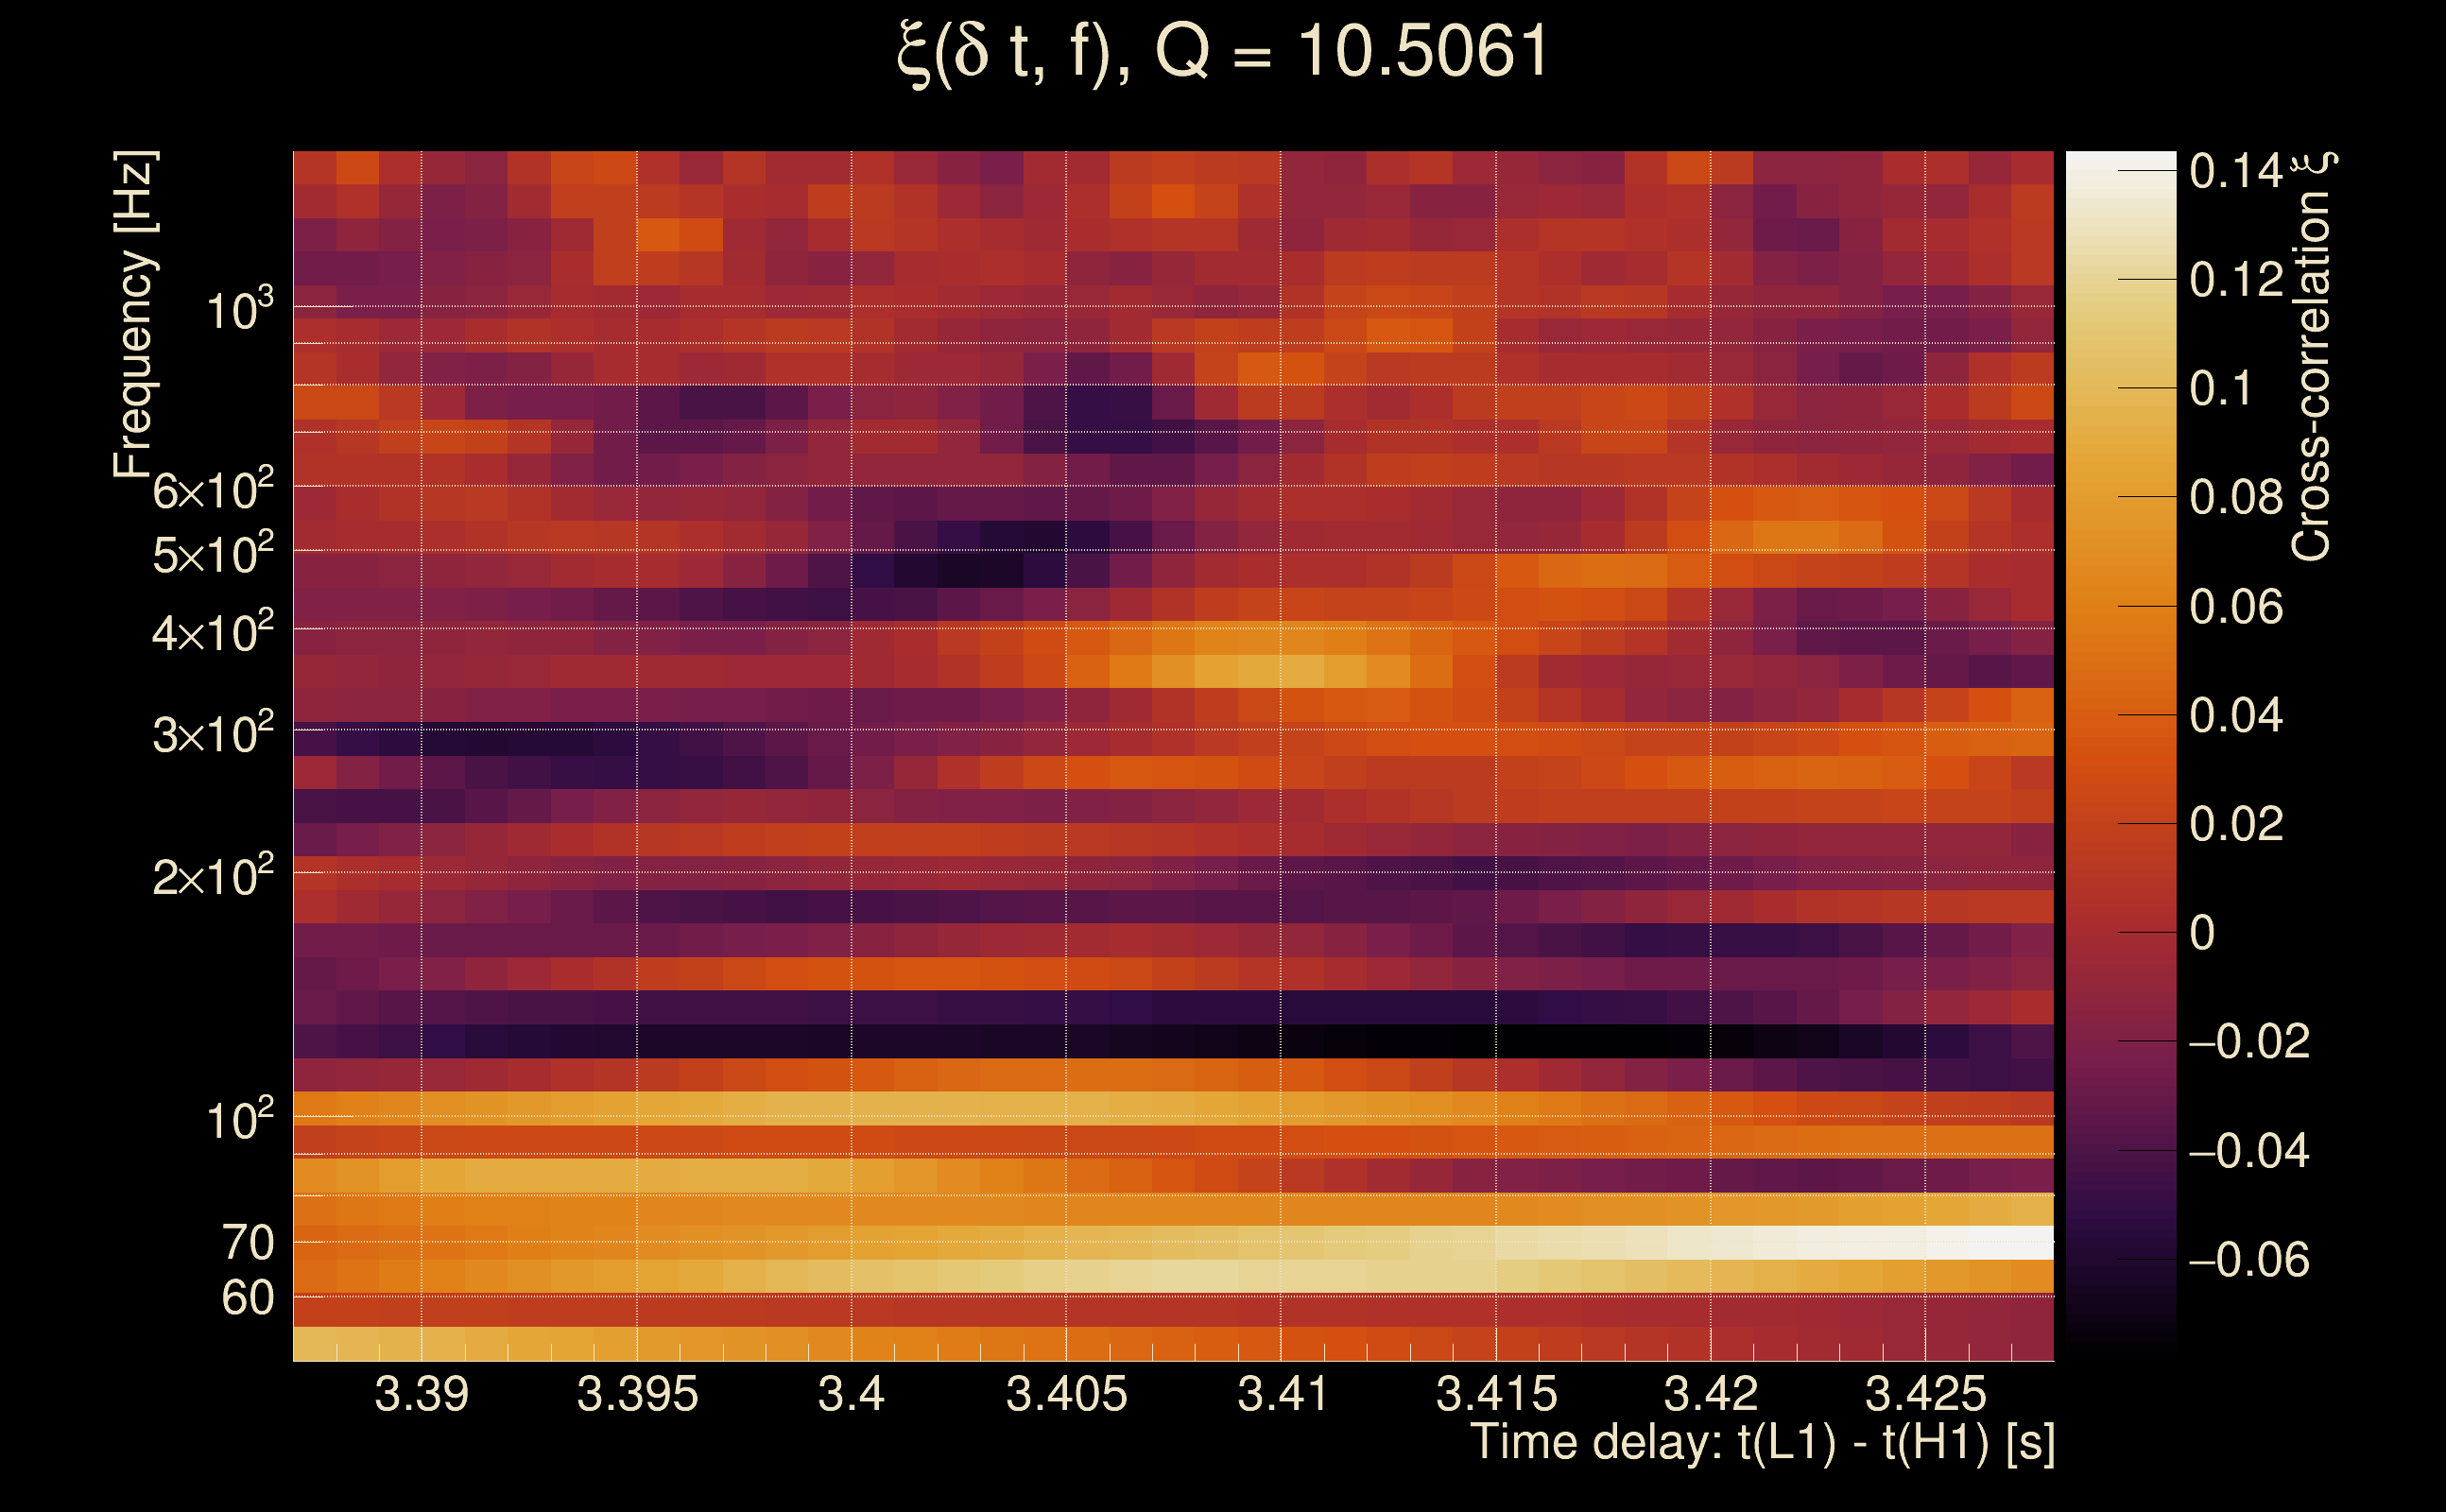
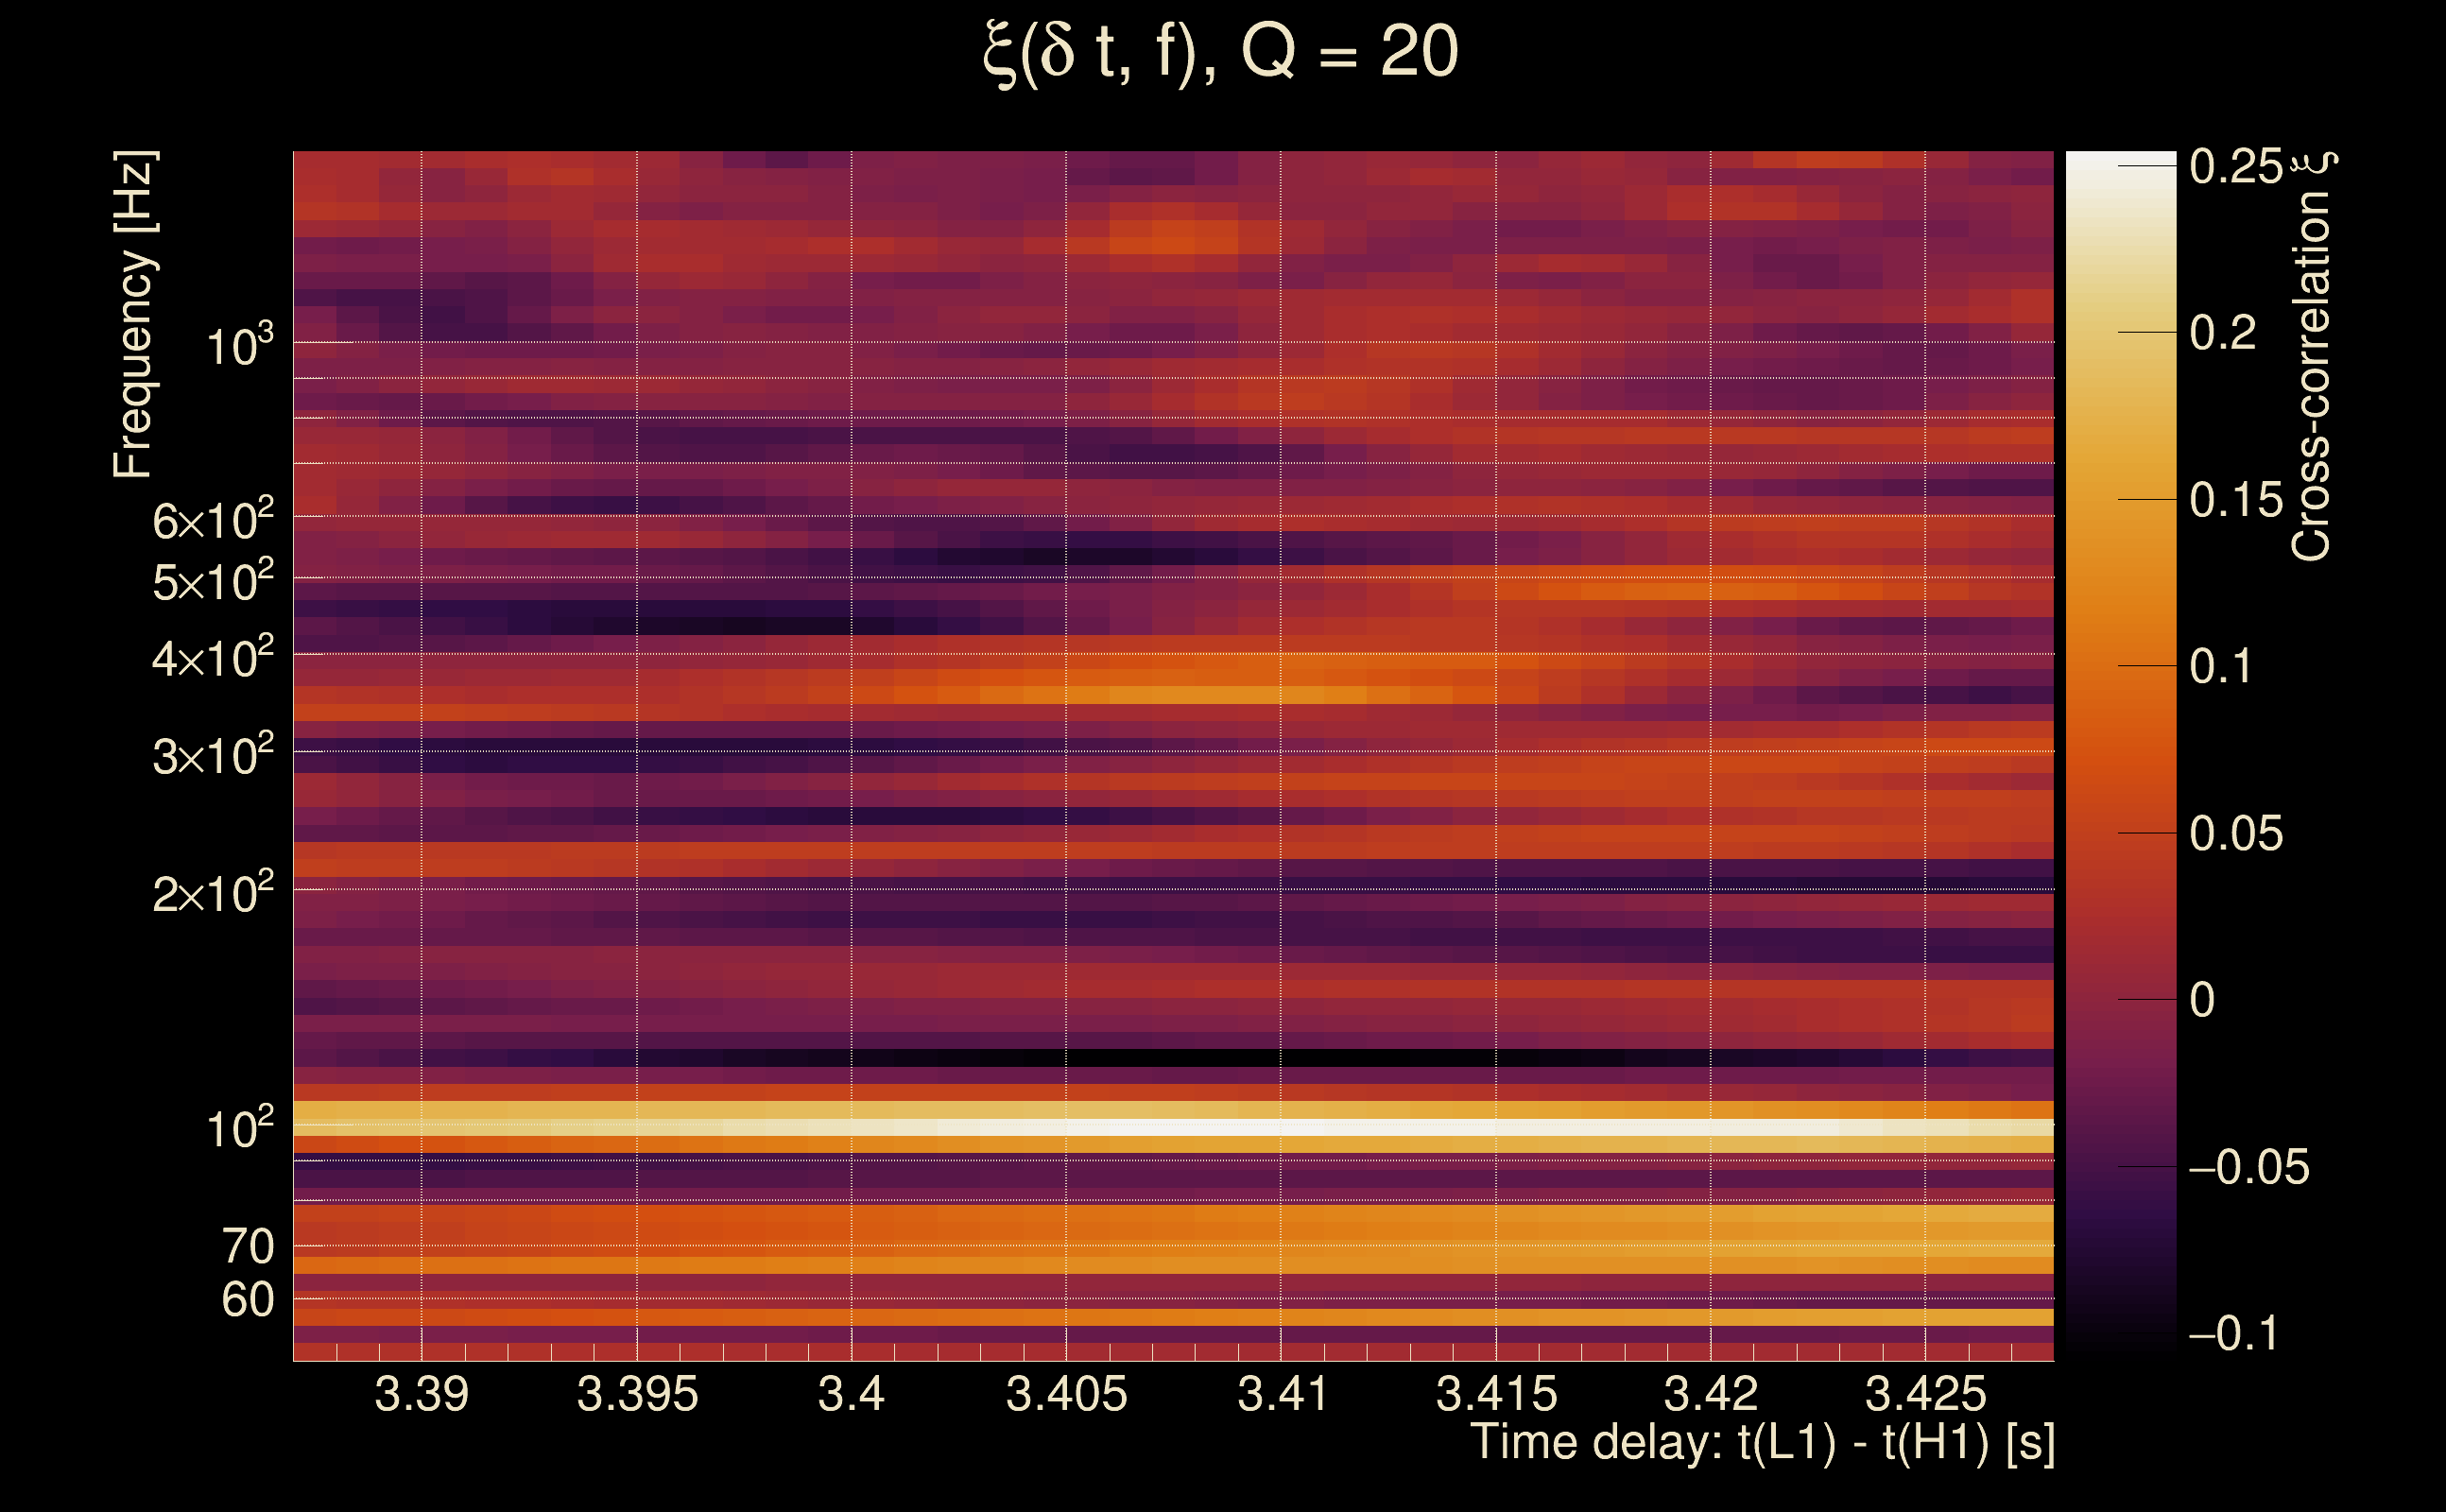
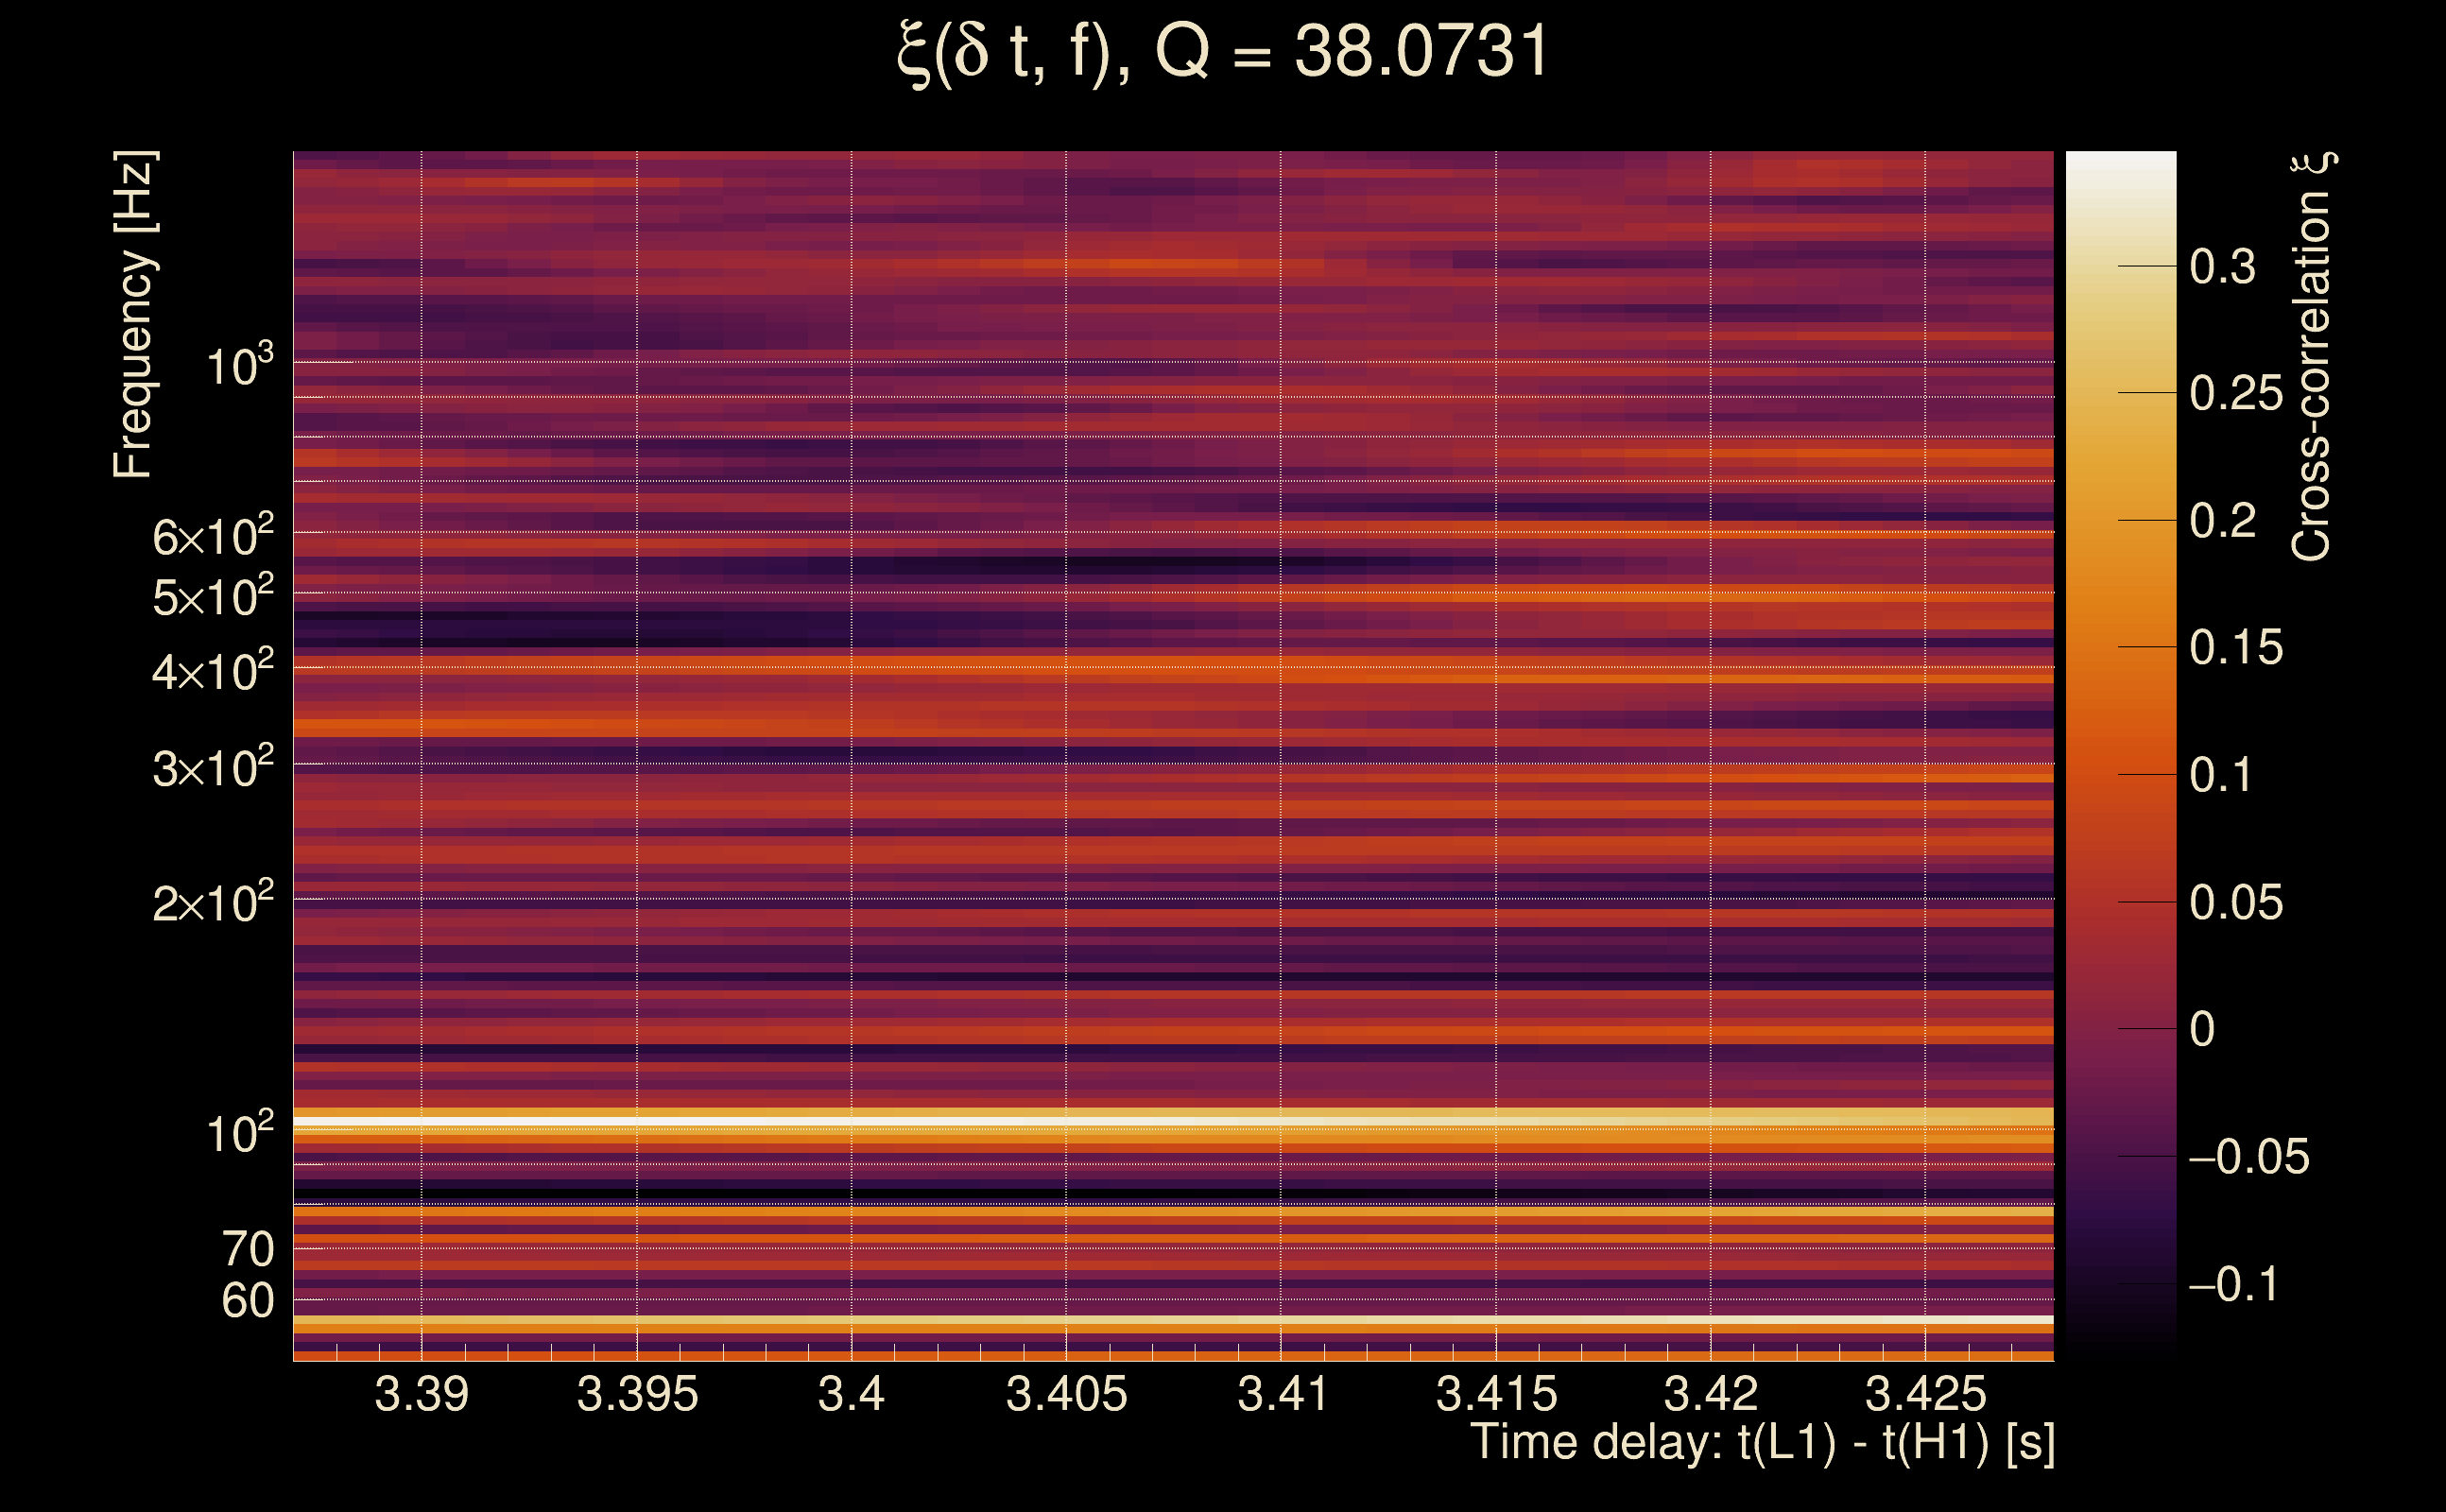
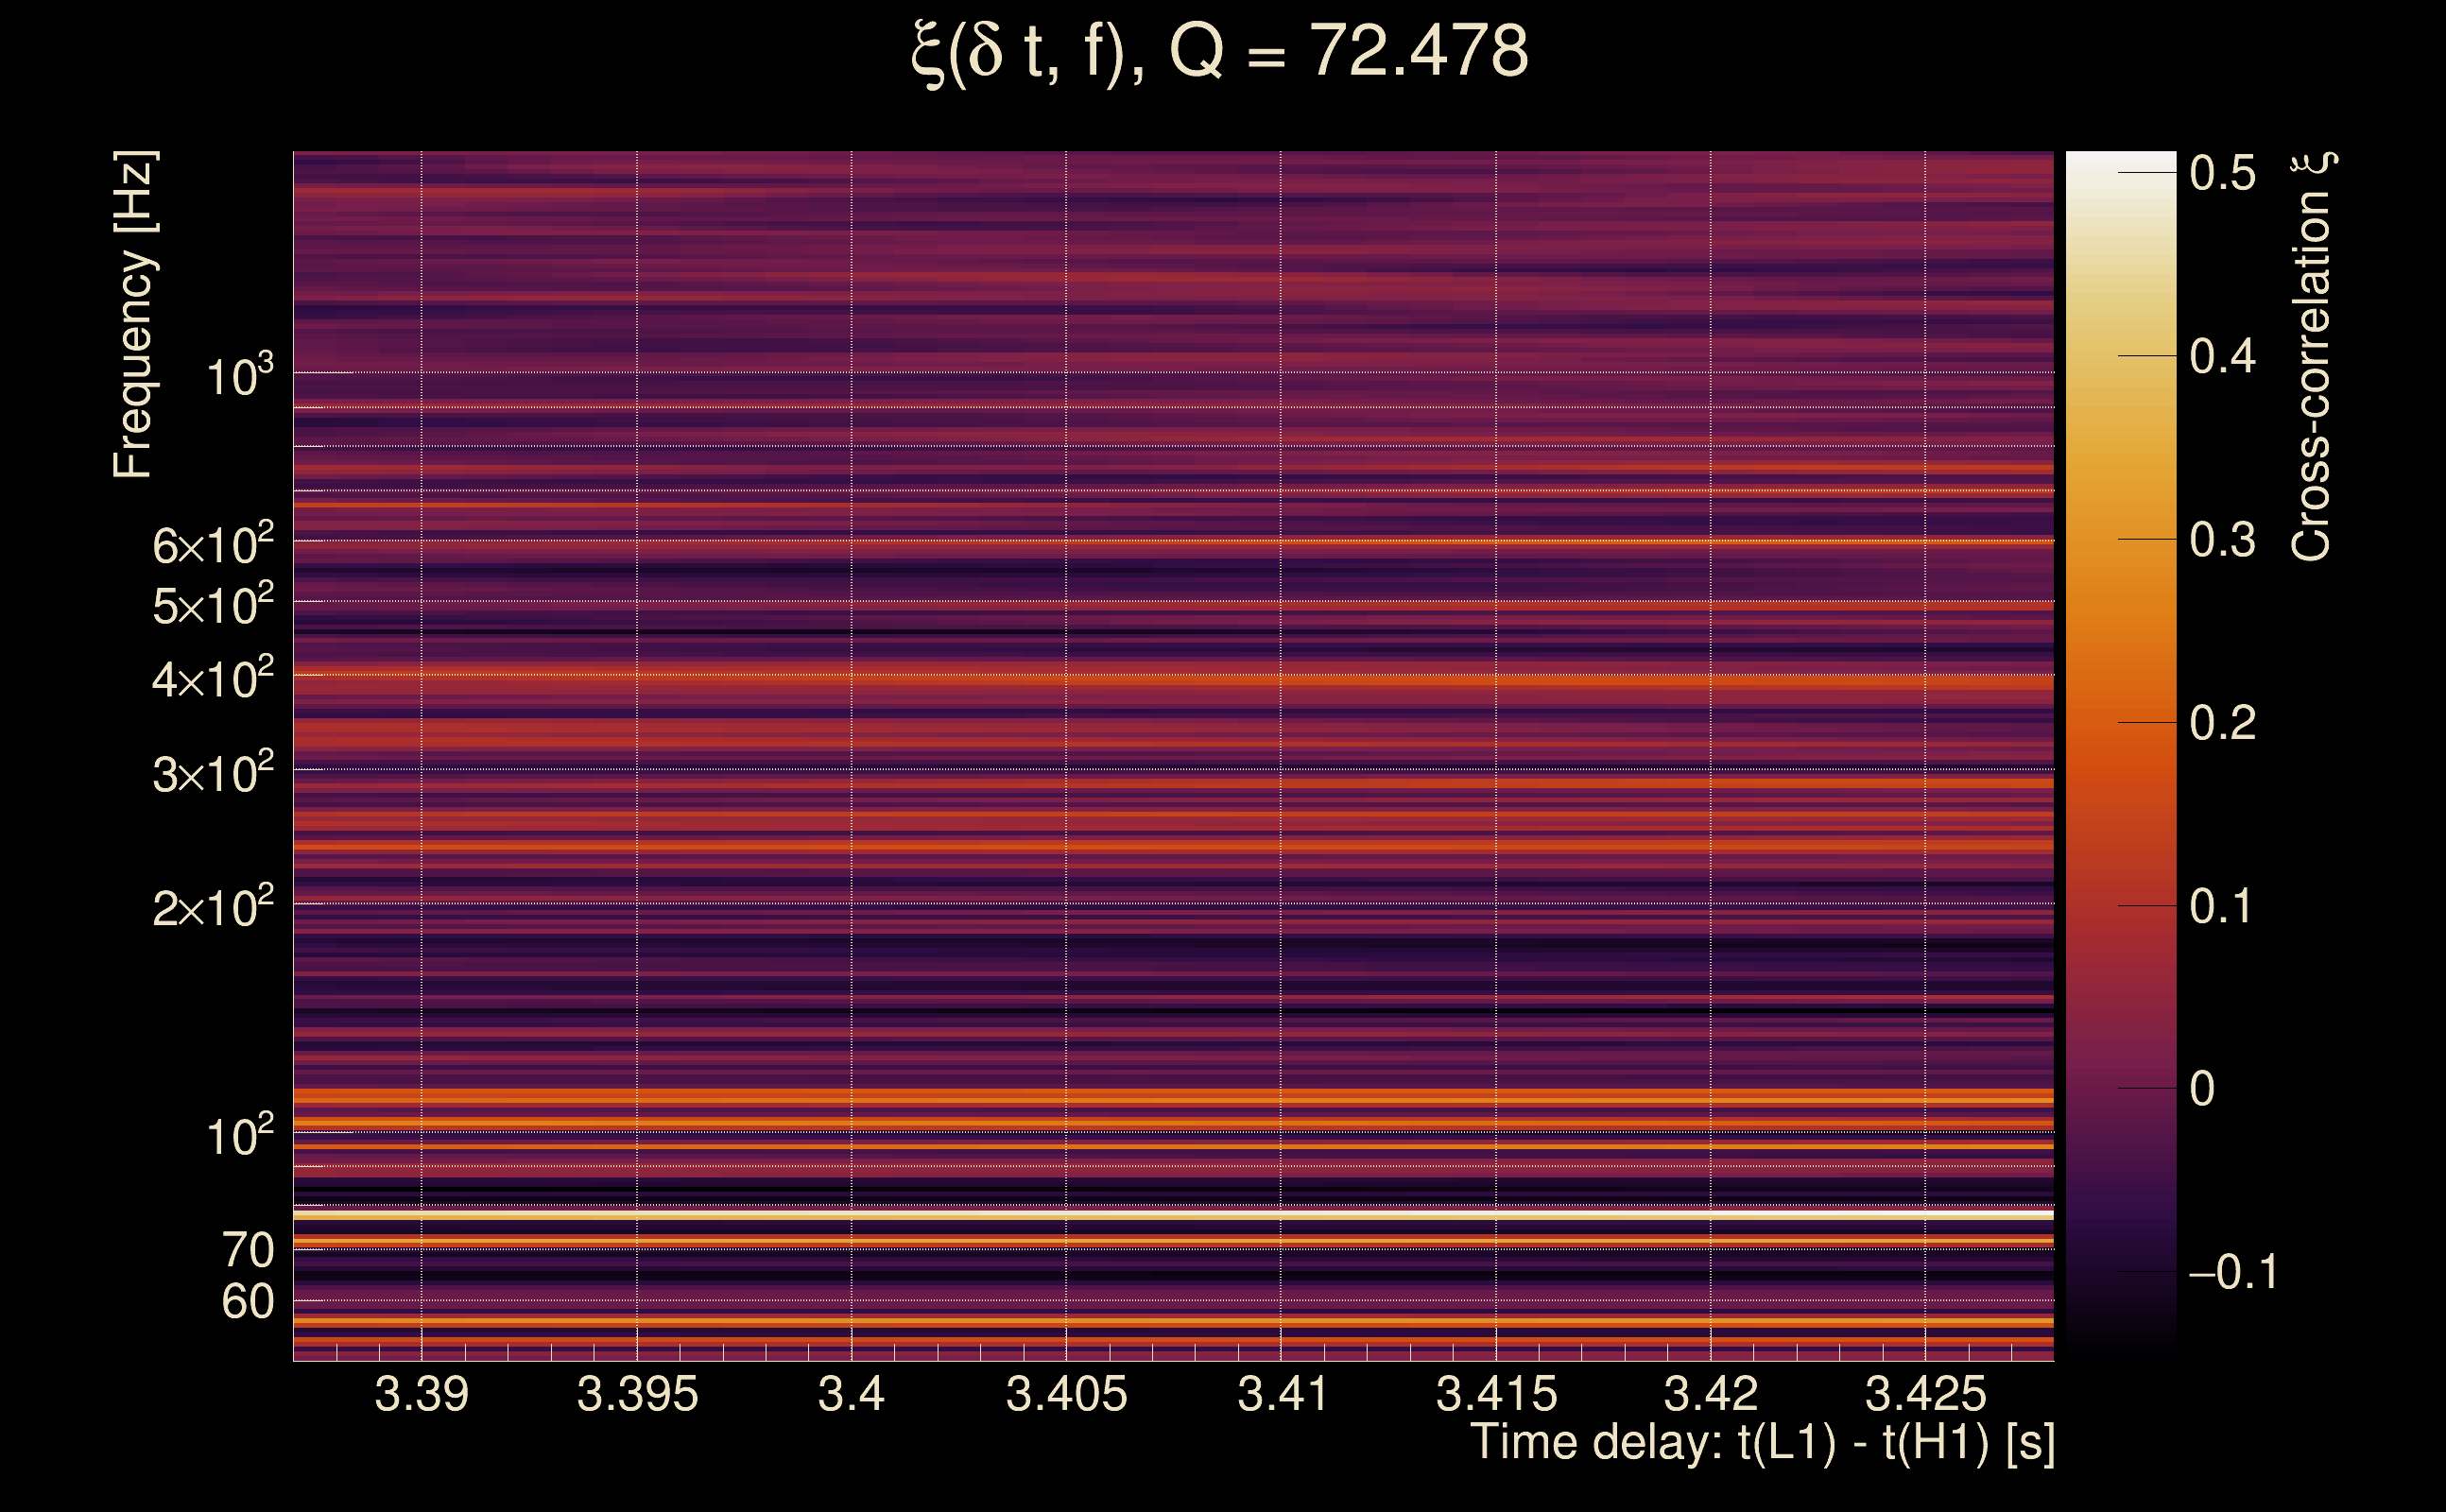
| Time delay between detectors t(L1) - t(H1): | 3.39956 s (slice index = 34 / 217), δt_gw = -0.0044374 s |
| Time delay uncertainty: | 0.00532073 s |
| [targeted mode] Time delay probability: | 0.0276548 (2.20215 sigmas), δt_target = -0.000743628 s |
| Frequency: | 131.099 Hz |
| Ξ: | 0.028408 ± 0.0314778 (variance = 0.000990855): Q0: 0.121414, Q1: 0.121621, Q2: 0.048995, Q3: 0.0594432, Q4: 0.066344 |
| Rank: | R_A = 0.0252266 |
| Log of amplitude ratio (L1/H1): | -0.161882, variance = 0.430432 (L1/H1: -0.252684, variance = 0.842923, H1/L1: 0.0678653, variance = 0.879559) |
| Amplitude ratio (L1/H1): | 0.850542 ⋇ 1.92721 (L1/H1: 0.776714 ⋇ 2.50455, H1/L1: 1.07022 ⋇ 2.55448) |
| Amplitude ratio H1|L1 compatibility (probability): | 0.888011 |
| Antenna factor probability: | 1 |
| Number of rejected frequency rows: | Q0: 12 / 18, Q1: 28 / 36, Q2: 64 / 70, Q3: 127 / 134, Q4: 245 / 258 |
| Maximum signal-to-noise ratio: | H1: 5.17622, L1: 5.08696 |
| SNR variance: | H1: 0.533243, L1: 0.497772 |
| Click here for a zoomed plot | Click here for a zoomed plot | Click here for a zoomed plot | Click here for a zoomed plot | Click here for a zoomed plot |
 |
 |
 |
 |
 |
 |
 |
 |
 |
 |
 |
 |
 |
 |
 |
 |
 |
 |
 |
 |
 |
 |
 |
 |
 |
 |
 |
 |
 |
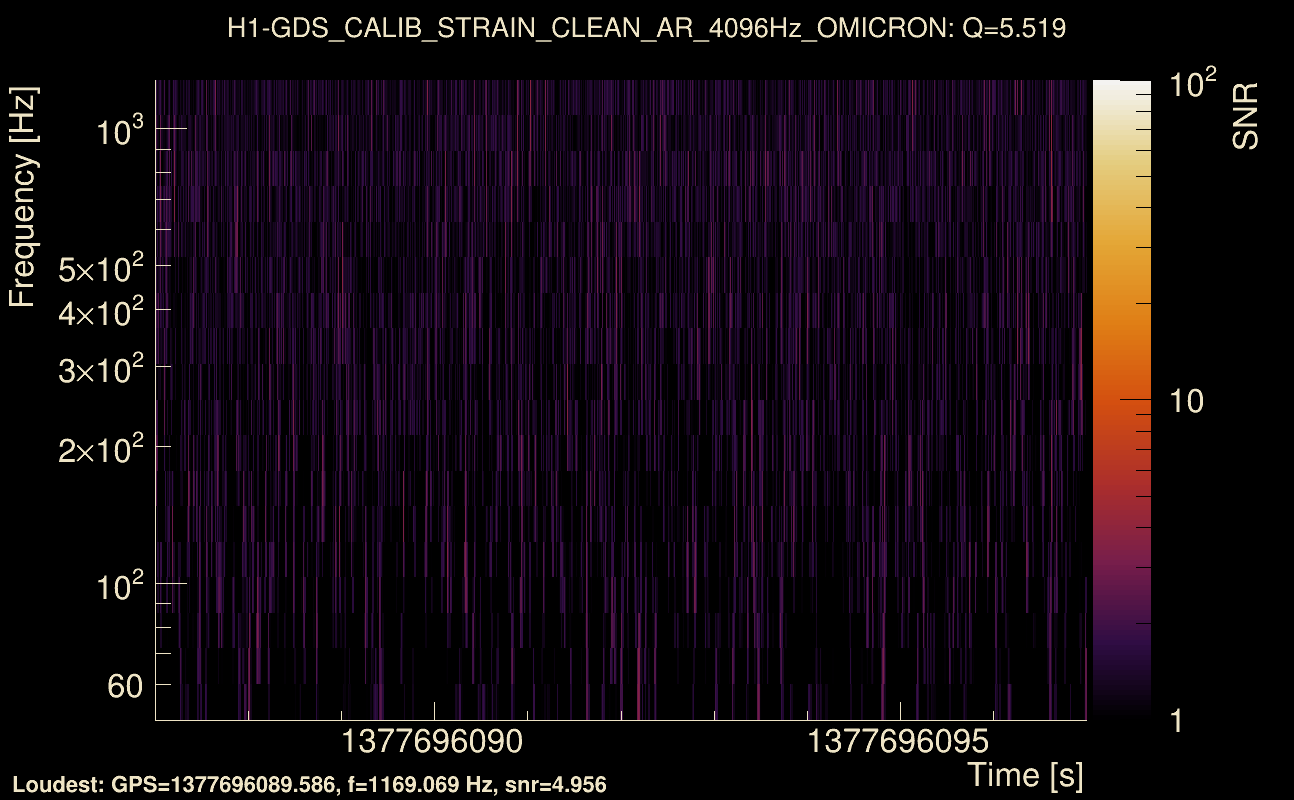
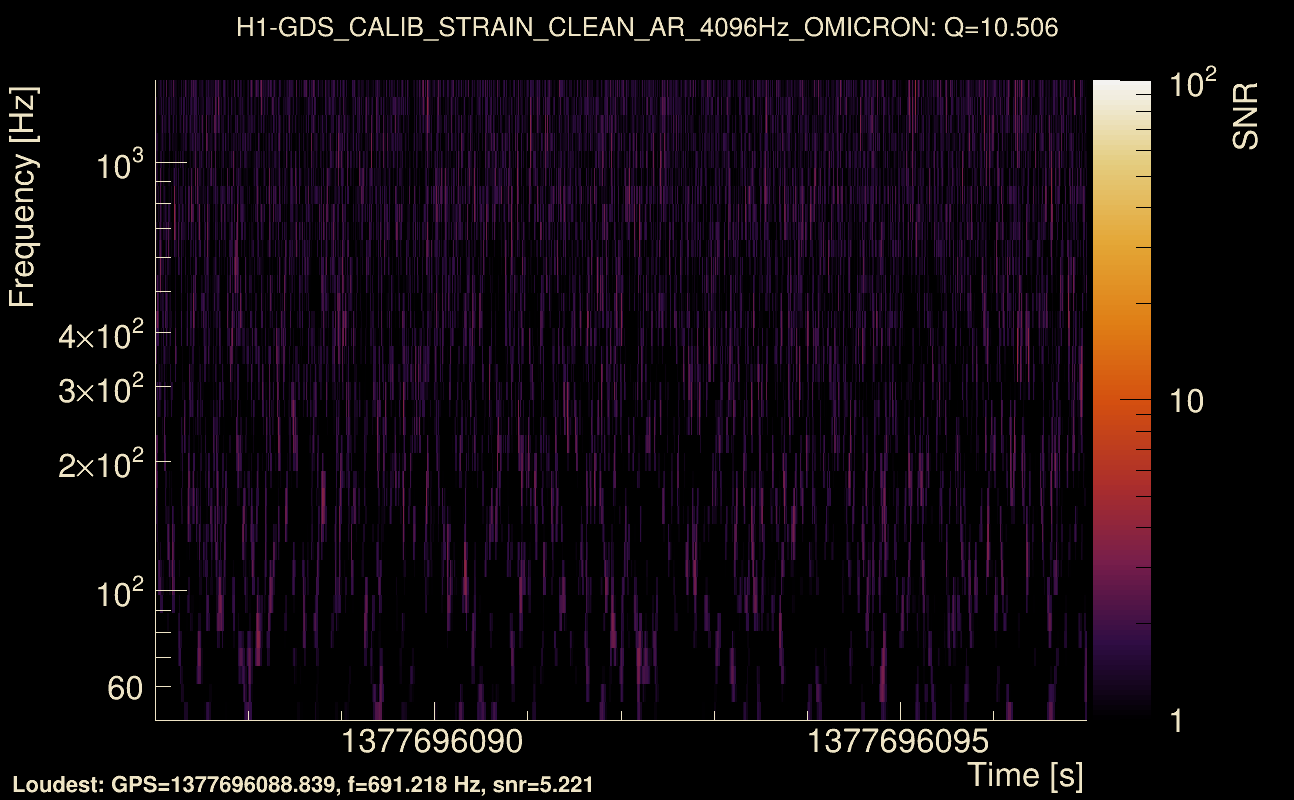
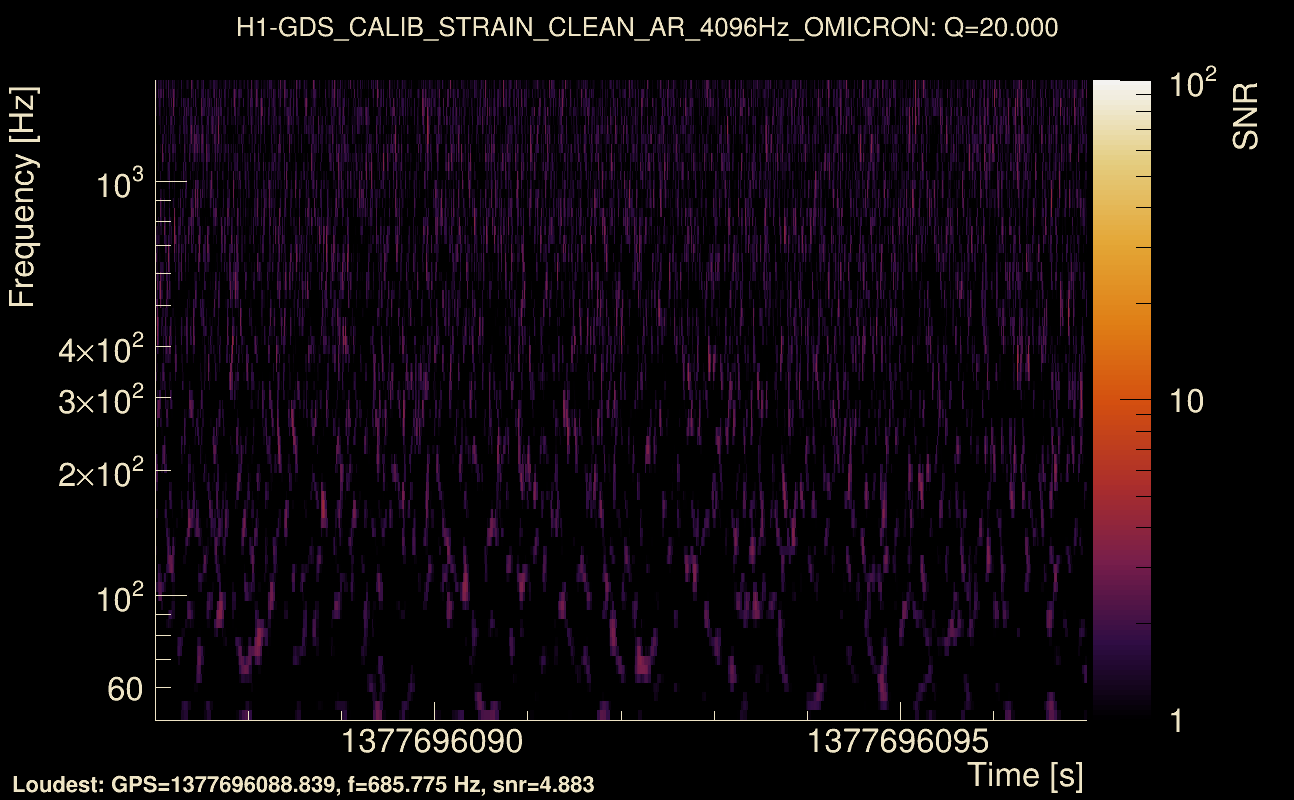
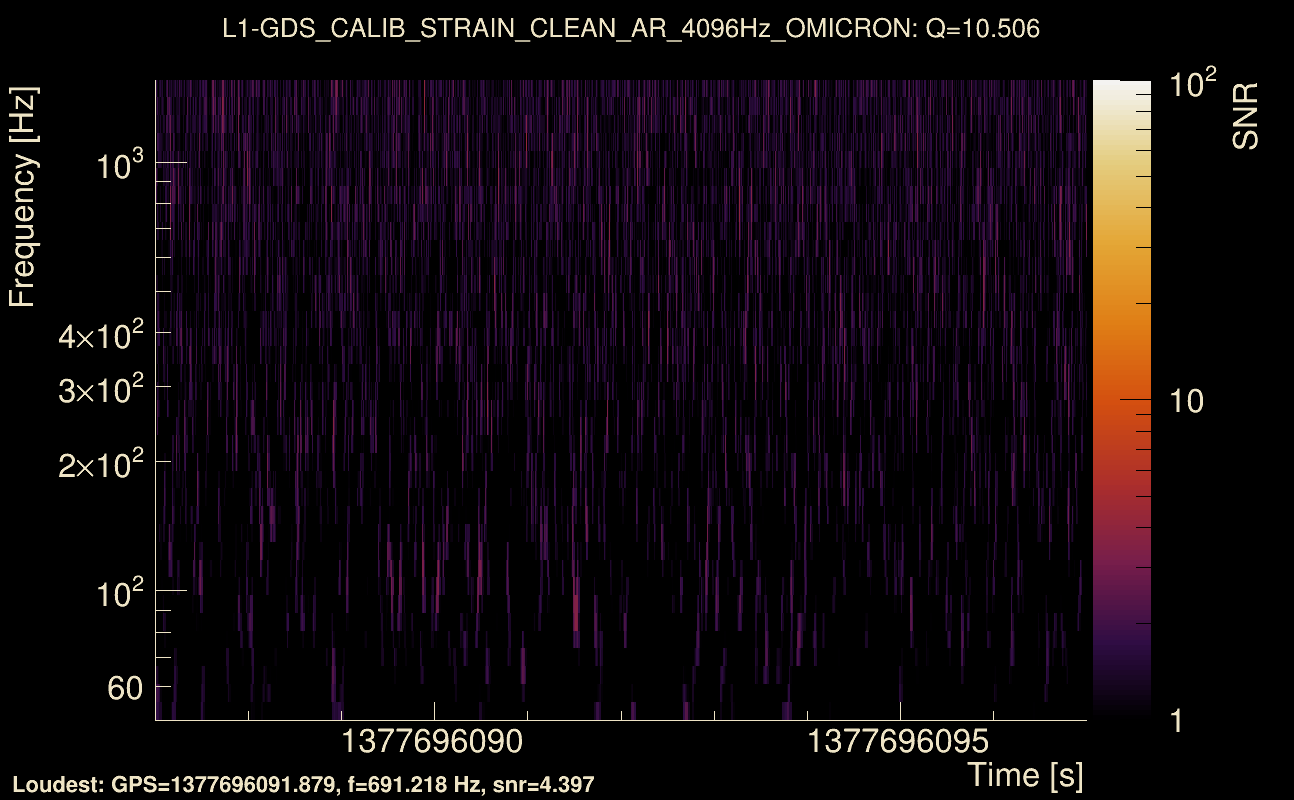
| Event time t(H1): | GPS = 1377696087 (Sat Sep 2 13:21:09 2023 ) → GPS = 1377696097 (Sat Sep 2 13:21:19 2023 ) |
| Event time t(L1): | GPS = 1377696087 (Sat Sep 2 13:21:19 2023 ) → GPS = 1377696097 (Sat Sep 2 13:21:19 2023 ) |
| Omicron analysis time window (H1): | GPS = 1377696084 → GPS = 1377696100 |
| Omicron analysis time window (L1): | GPS = 1377696084 → GPS = 1377696100 |
| Time delay between detectors t(L1) - t(H1): | 3.40073 s (slice index = 34 / 217), δt_gw = -0.00326799 s |
| Time delay uncertainty: | 0.00631676 s |
| [targeted mode] Time delay probability: | 0.426046 (0.795976 sigmas), δt_target = -0.00779653 s |
| Frequency: | 202.387 Hz |
| Ξ: | 0.0332454 ± 0.0290423 (variance = 0.000843453): Q0: 0.082404, Q1: 0.133023, Q2: 0.045842, Q3: 0.0646208, Q4: 0.0788573 |
| Rank: | R_A = 0.0223937 |
| Log of amplitude ratio (L1/H1): | -0.118929, variance = 0.519556 (L1/H1: -0.405234, variance = 1.09525, H1/L1: -0.199149, variance = 0.963424) |
| Amplitude ratio (L1/H1): | 0.88787 ⋇ 2.05608 (L1/H1: 0.666821 ⋇ 2.84778, H1/L1: 0.819428 ⋇ 2.66857) |
| Amplitude ratio H1|L1 compatibility (probability): | 0.673588 |
| Antenna factor probability: | 1 |
| Number of rejected frequency rows: | Q0: 9 / 18, Q1: 25 / 36, Q2: 58 / 70, Q3: 116 / 134, Q4: 235 / 258 |
| Maximum signal-to-noise ratio: | H1: 5.36515, L1: 5.09013 |
| SNR variance: | H1: 0.547915, L1: 0.548688 |
| Click here for a zoomed plot | Click here for a zoomed plot | Click here for a zoomed plot | Click here for a zoomed plot | Click here for a zoomed plot |
 |
 |
 |
 |
 |
 |
 |
 |
 |
 |
 |
 |
 |
 |
 |
 |
 |
 |
 |
 |
 |
 |
 |
 |
 |
 |
 |
 |
 |
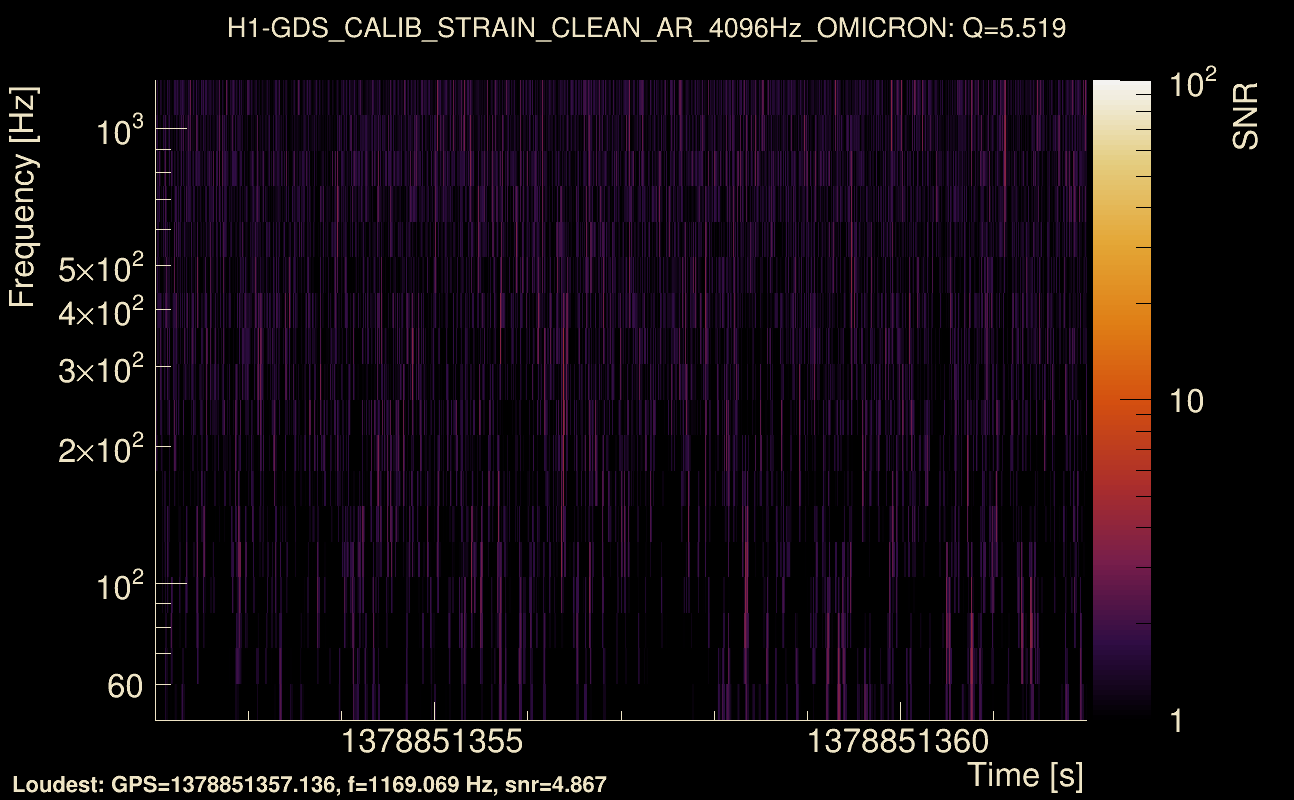
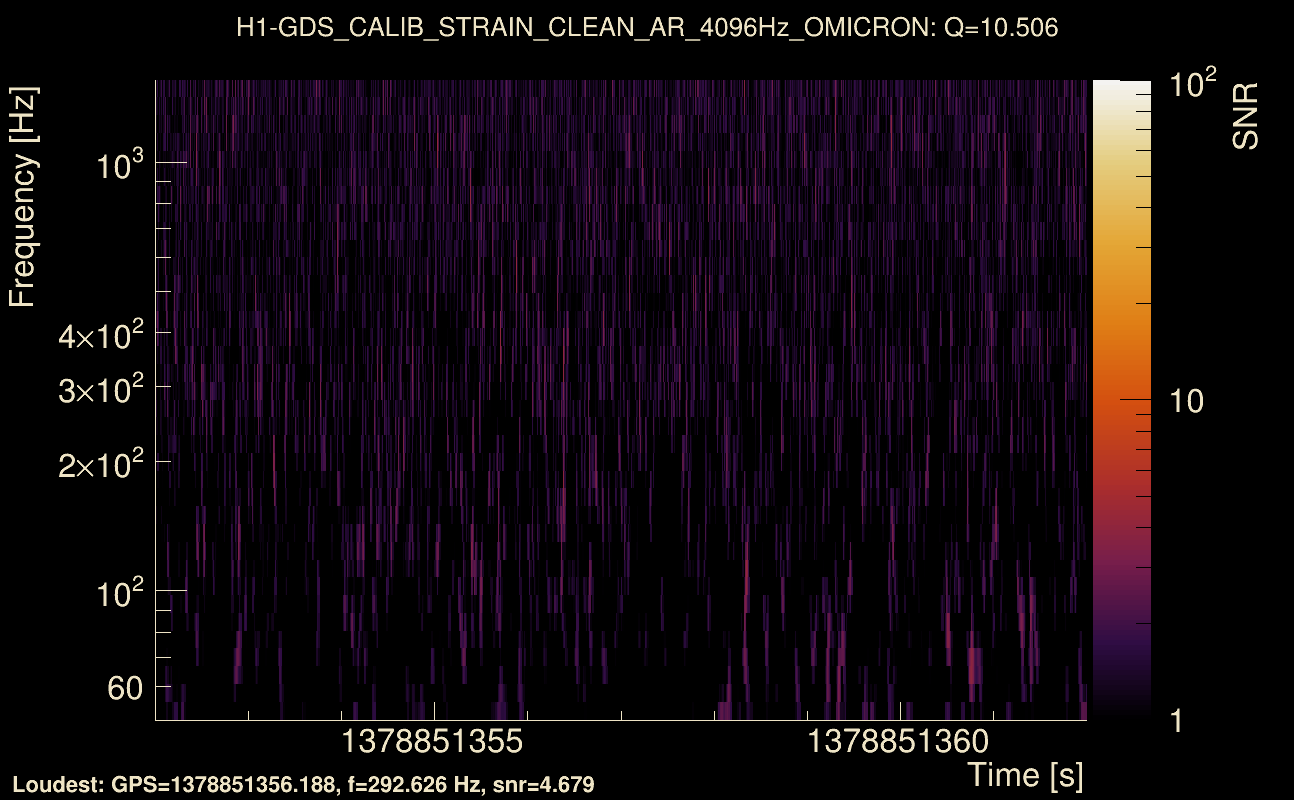
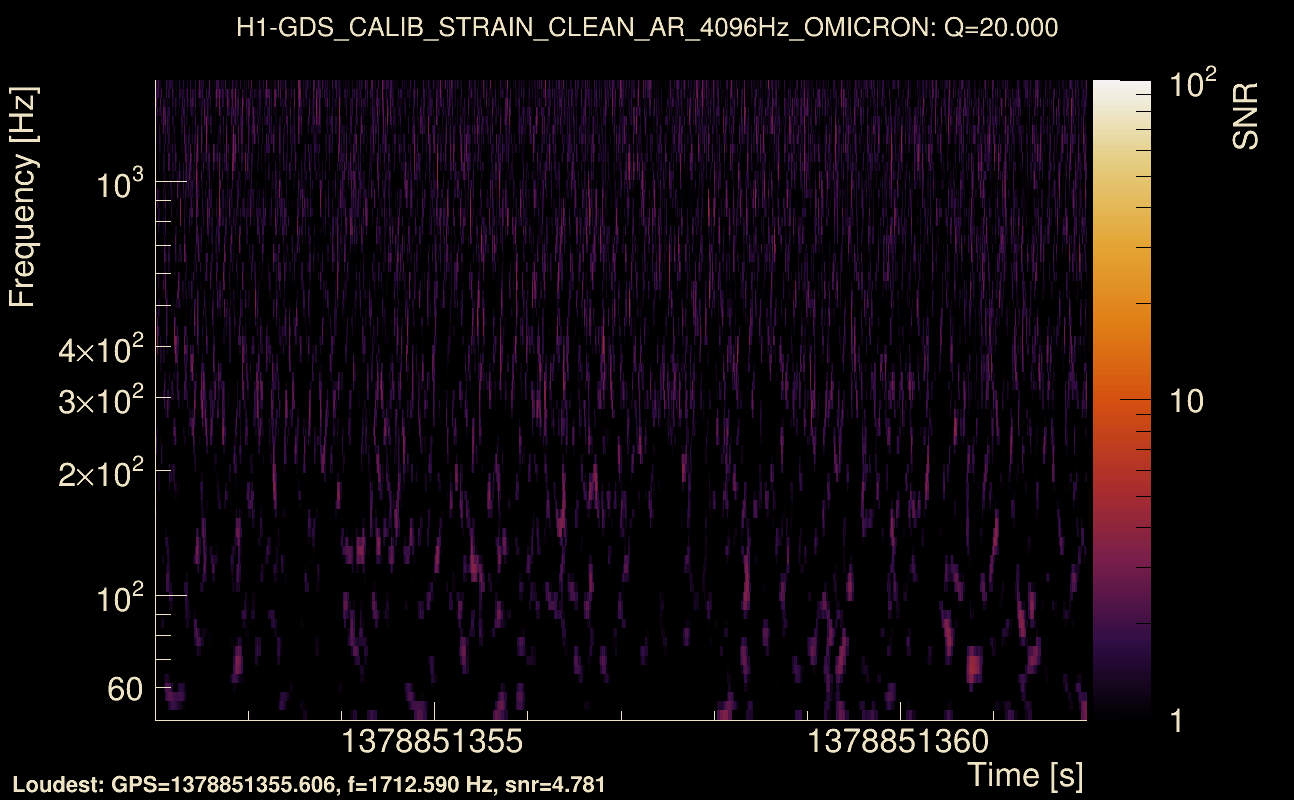
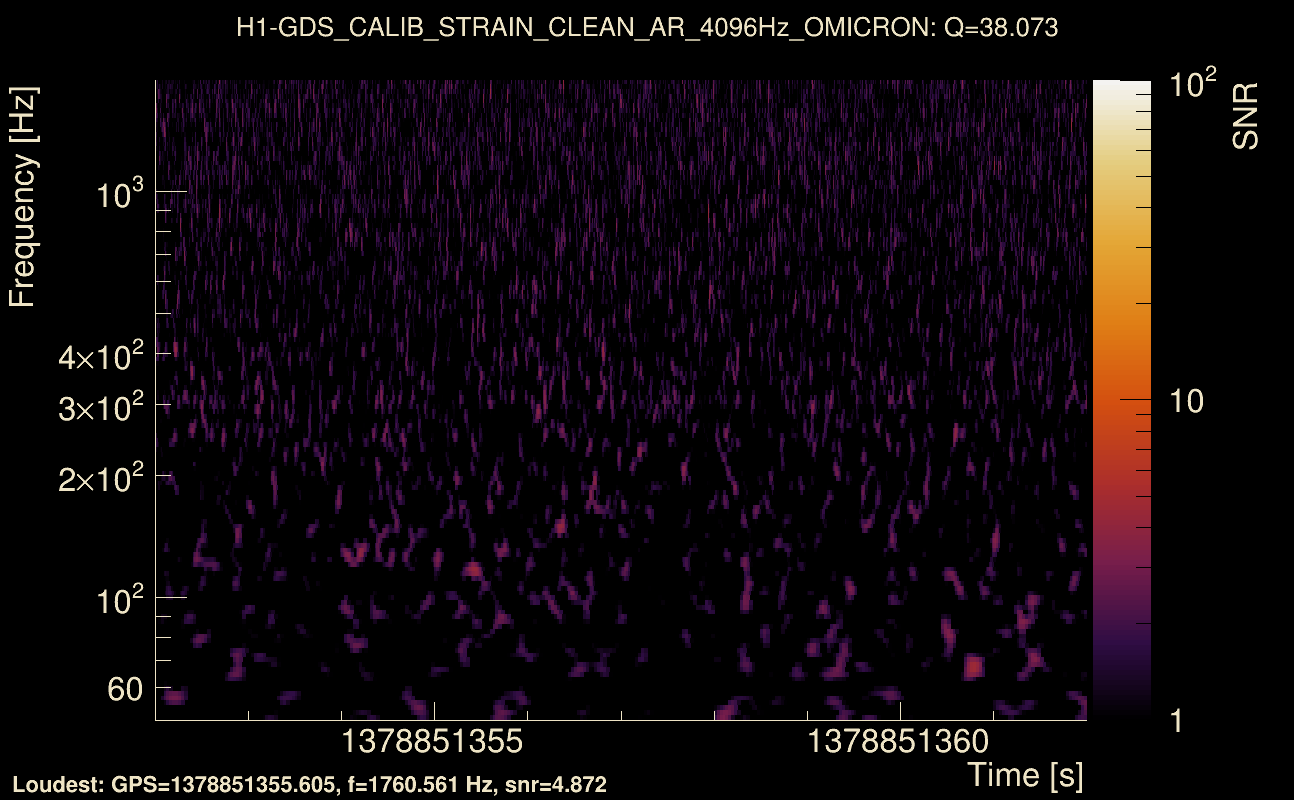
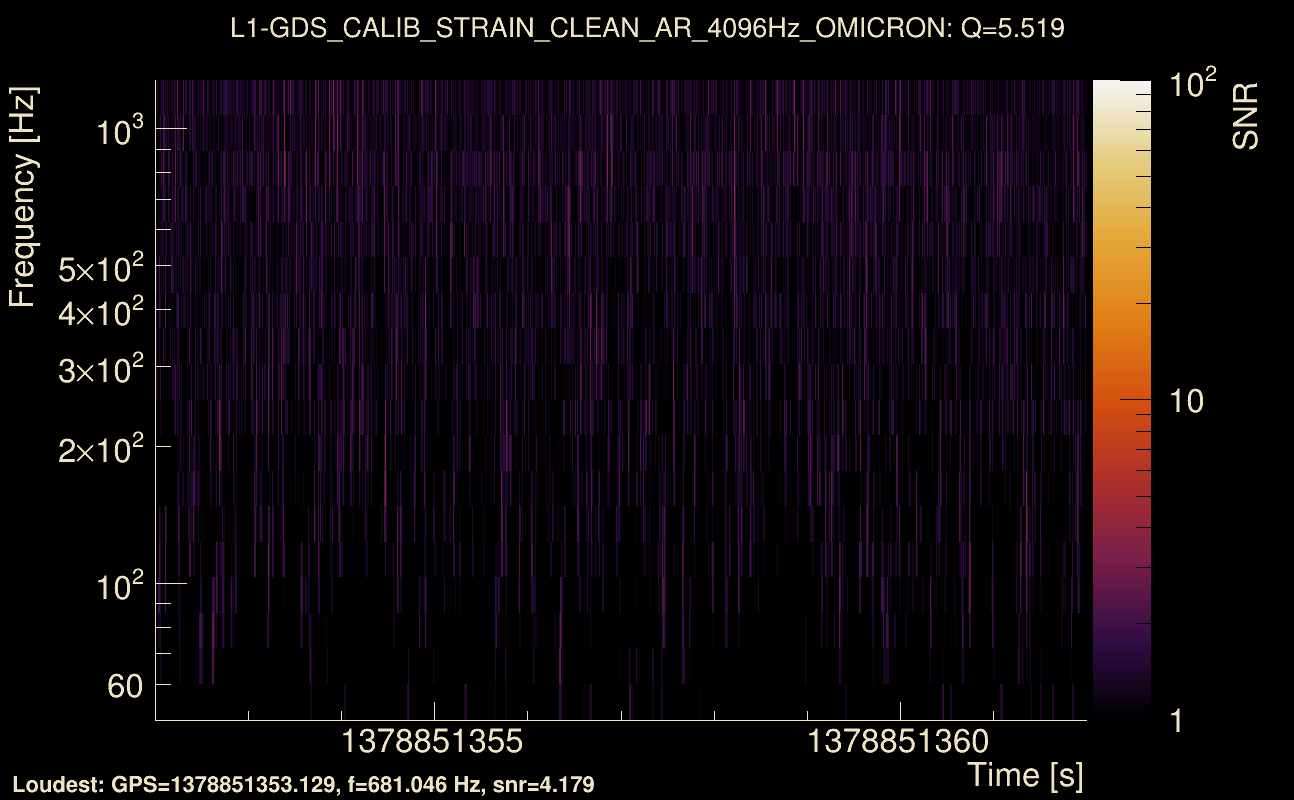
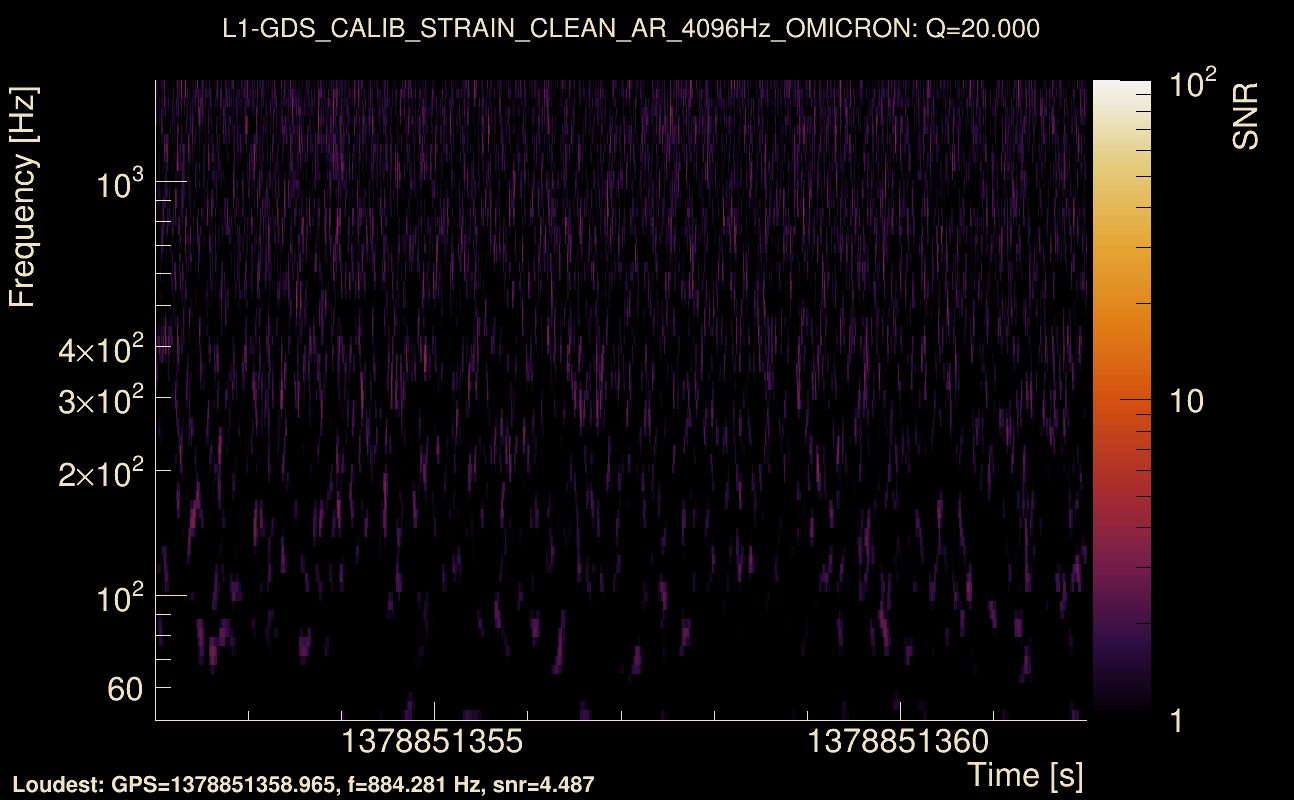
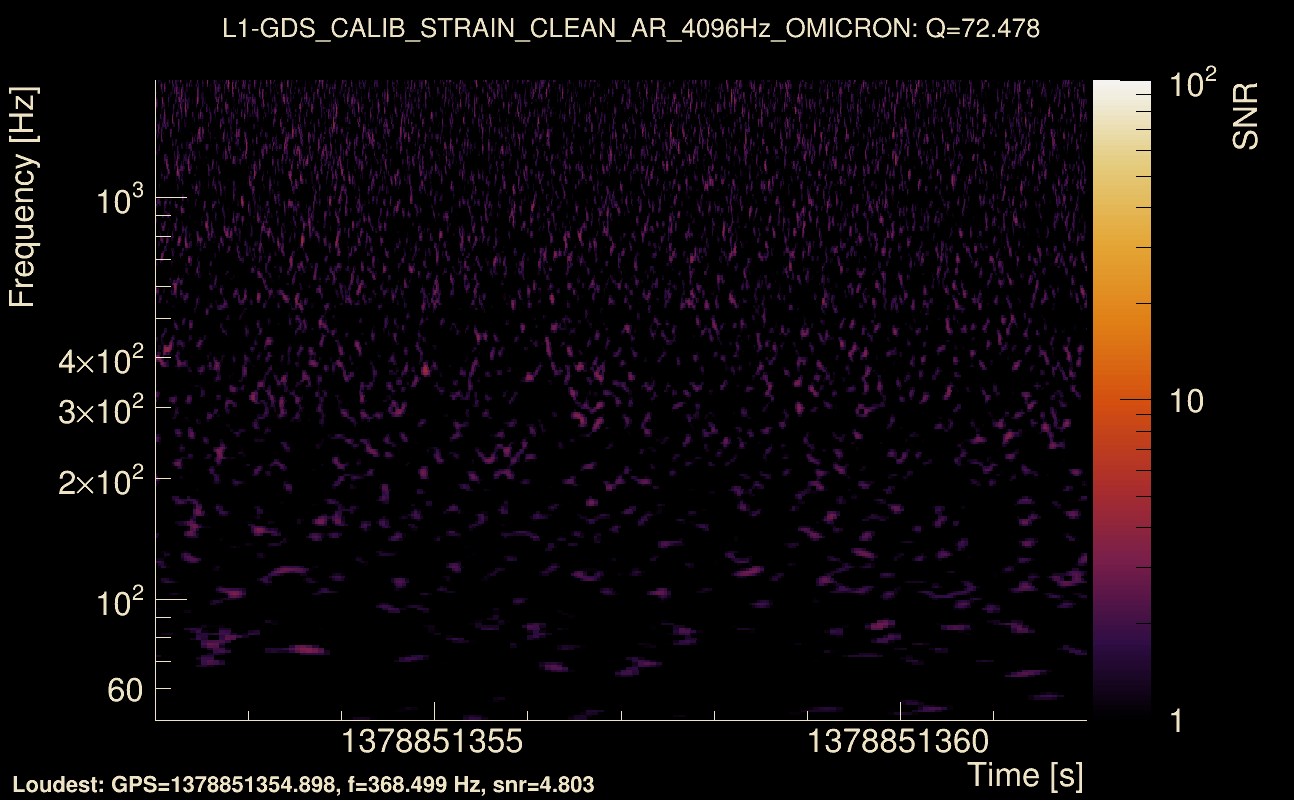
| Event time t(H1): | GPS = 1378851352 (Fri Sep 15 22:15:34 2023 ) → GPS = 1378851362 (Fri Sep 15 22:15:44 2023 ) |
| Event time t(L1): | GPS = 1378851352 (Fri Sep 15 22:15:44 2023 ) → GPS = 1378851362 (Fri Sep 15 22:15:44 2023 ) |
| Omicron analysis time window (H1): | GPS = 1378851349 → GPS = 1378851365 |
| Omicron analysis time window (L1): | GPS = 1378851349 → GPS = 1378851365 |
| Time delay between detectors t(L1) - t(H1): | 3.40795 s (slice index = 34 / 217), δt_gw = 0.00395441 s |
| Time delay uncertainty: | 0.0033821 s |
| [targeted mode] Time delay probability: | 0.720208 (0.358181 sigmas), δt_target = 8.51154e-05 s |
| Frequency: | 146.755 Hz |
| Ξ: | 0.0295221 ± 0.00936555 (variance = 8.77136e-05): Q0: 0.120051, Q1: 0.113915, Q2: 0.130461, Q3: 0.101583, Q4: 0.114981 |
| Rank: | R_A = 0.0222893 |
| Log of amplitude ratio (L1/H1): | -0.0367947, variance = 0.436452 (L1/H1: -0.246871, variance = 0.635091, H1/L1: -0.162469, variance = 1.08571) |
| Amplitude ratio (L1/H1): | 0.963874 ⋇ 1.93604 (L1/H1: 0.781242 ⋇ 2.21871, H1/L1: 0.850043 ⋇ 2.83481) |
| Amplitude ratio H1|L1 compatibility (probability): | 0.755006 |
| Antenna factor probability: | 1 |
| Number of rejected frequency rows: | Q0: 12 / 18, Q1: 28 / 36, Q2: 62 / 70, Q3: 124 / 134, Q4: 246 / 258 |
| Maximum signal-to-noise ratio: | H1: 5.03034, L1: 5.16502 |
| SNR variance: | H1: 0.544873, L1: 0.549733 |
| Click here for a zoomed plot | Click here for a zoomed plot | Click here for a zoomed plot | Click here for a zoomed plot | Click here for a zoomed plot |
 |
 |
 |
 |
 |
 |
 |
 |
 |
 |
 |
 |
 |
 |
 |
 |
 |
 |
 |
 |
 |
 |
 |
 |
 |
 |
 |
 |
 |
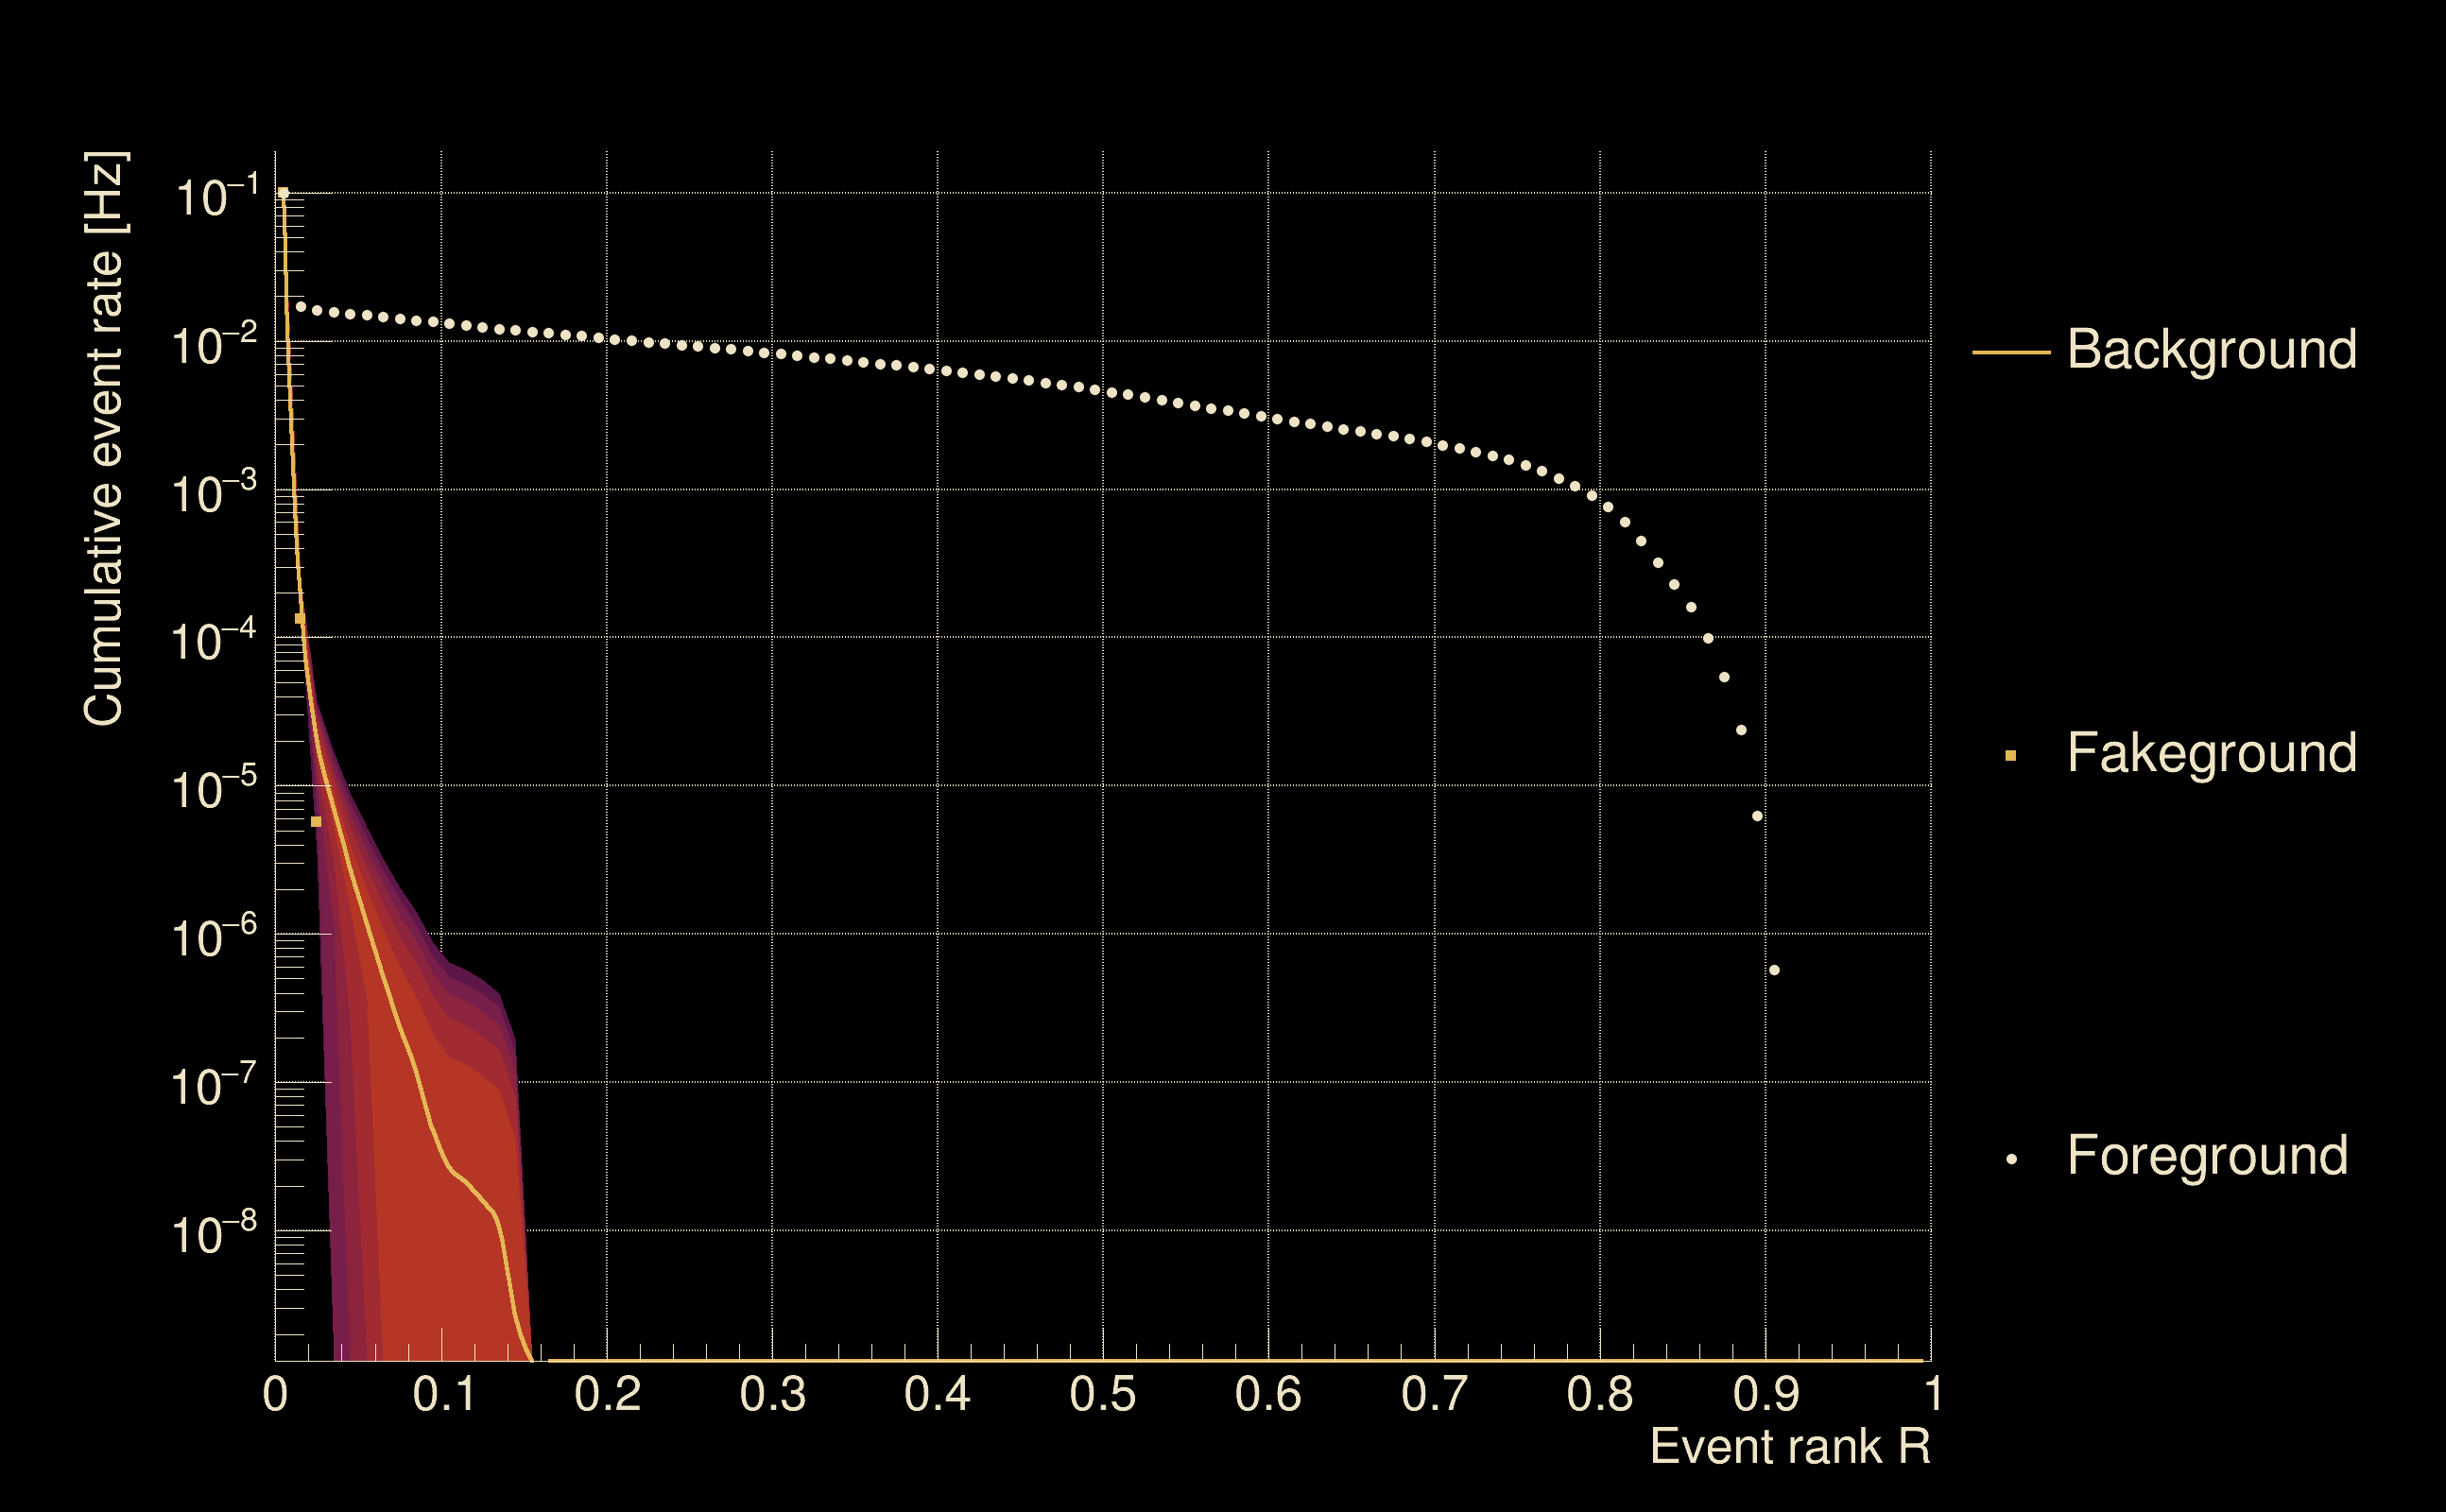
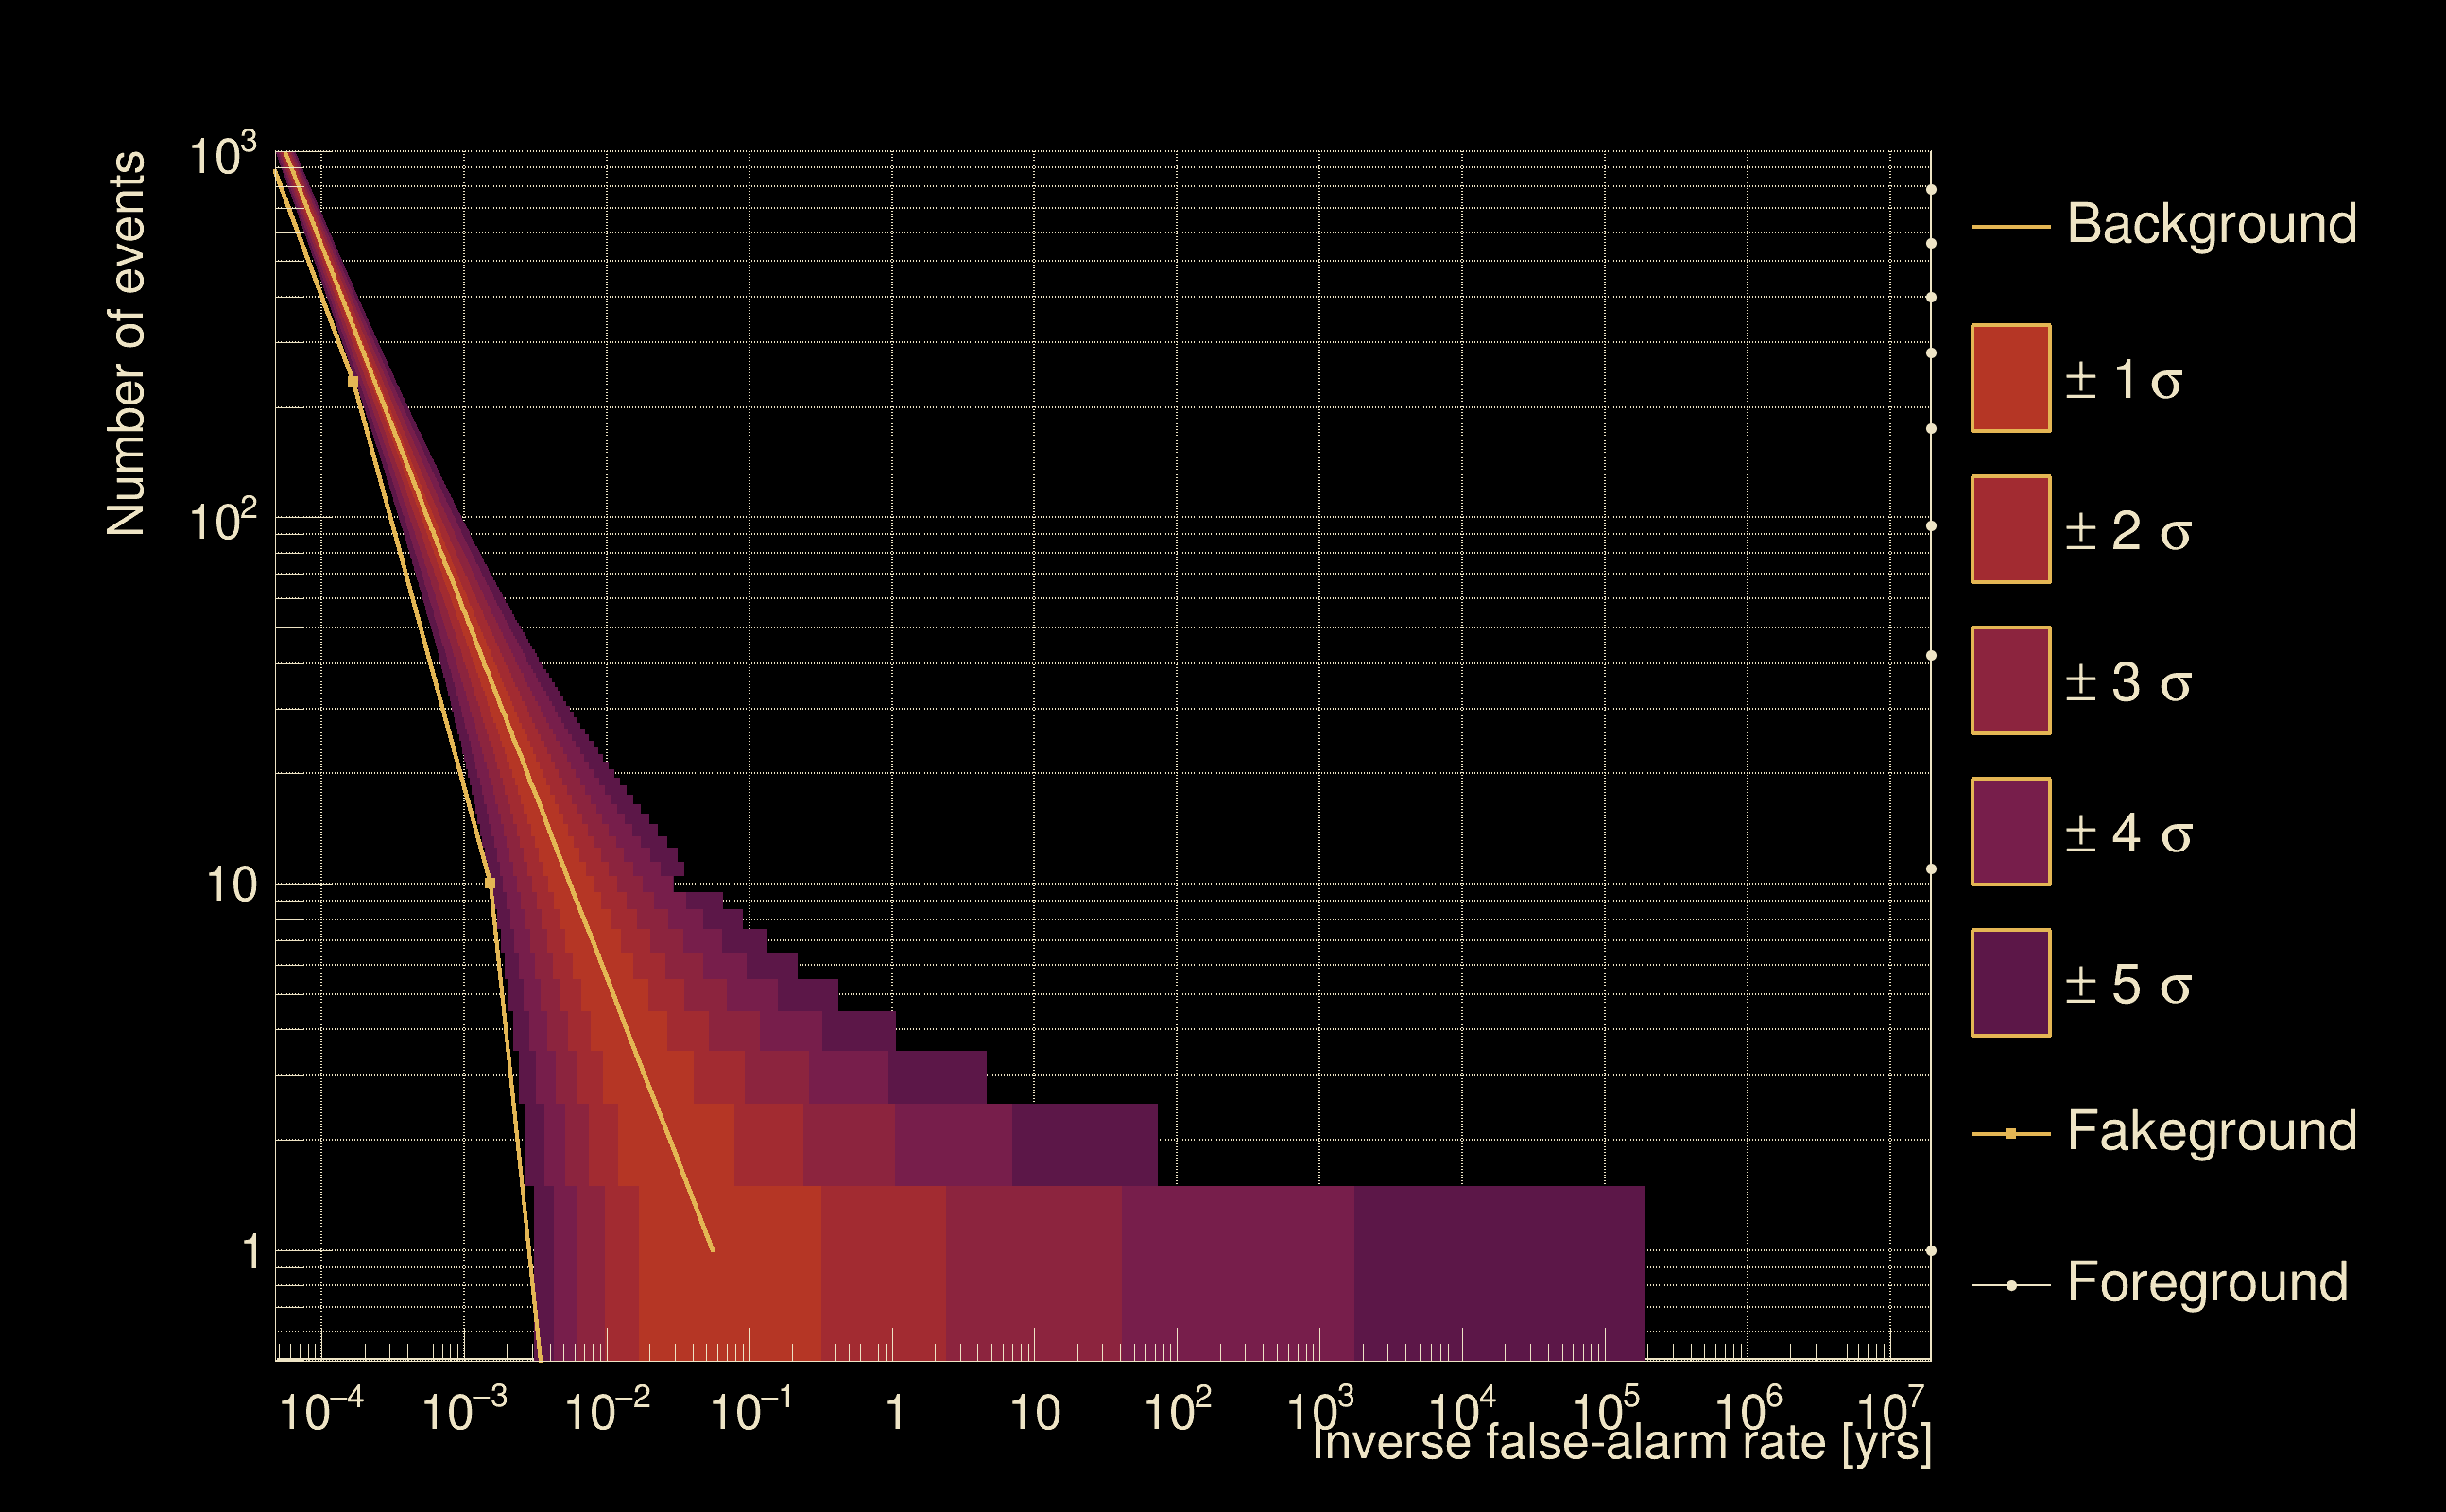
| Detection threshold: | R > 0.0668116 |
| False-alarm rate above that detection threshold: | 3.26791e-07 |
| Alternative threshold at 1/1000 yrs: | R > 0.145 |
| Alternative threshold at 1/100 yrs: | R > 0.145 |
| Alternative threshold at 1/10 yrs: | R > 0.146009 |
| Alternative threshold at 1/1 yr: | R > 0.0969764 |
| Alternative threshold at 1/1 d: | R > 0.0256772 |
 |
|
 |
 |
 |
 |
 |
 |
 |
 |
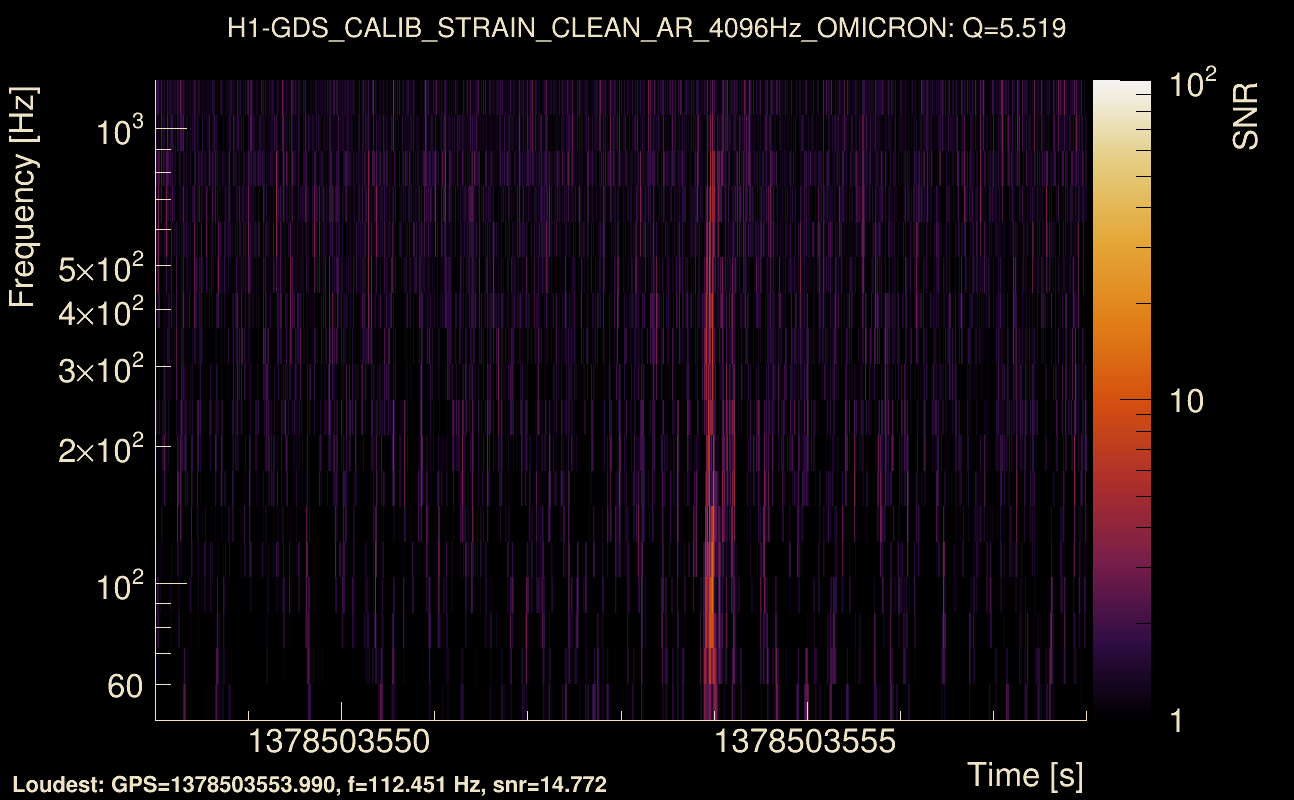
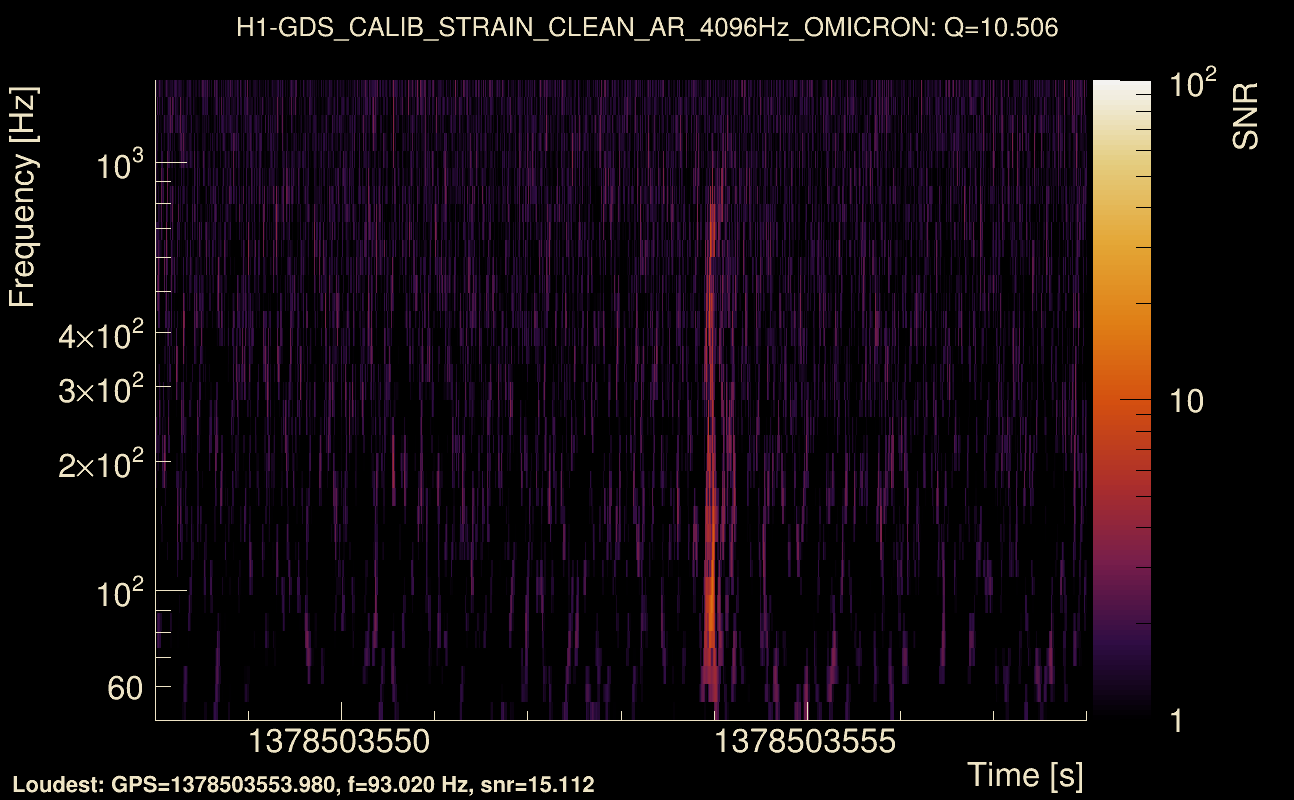
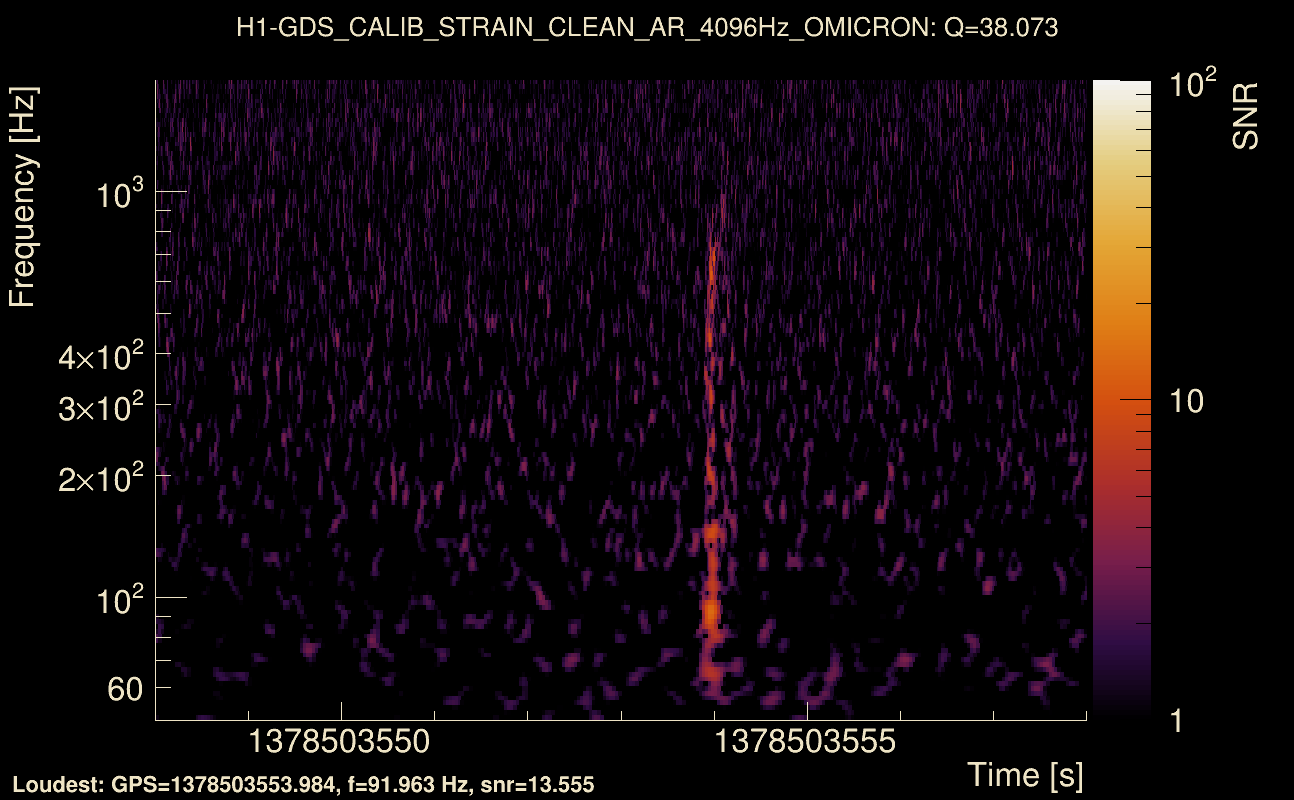
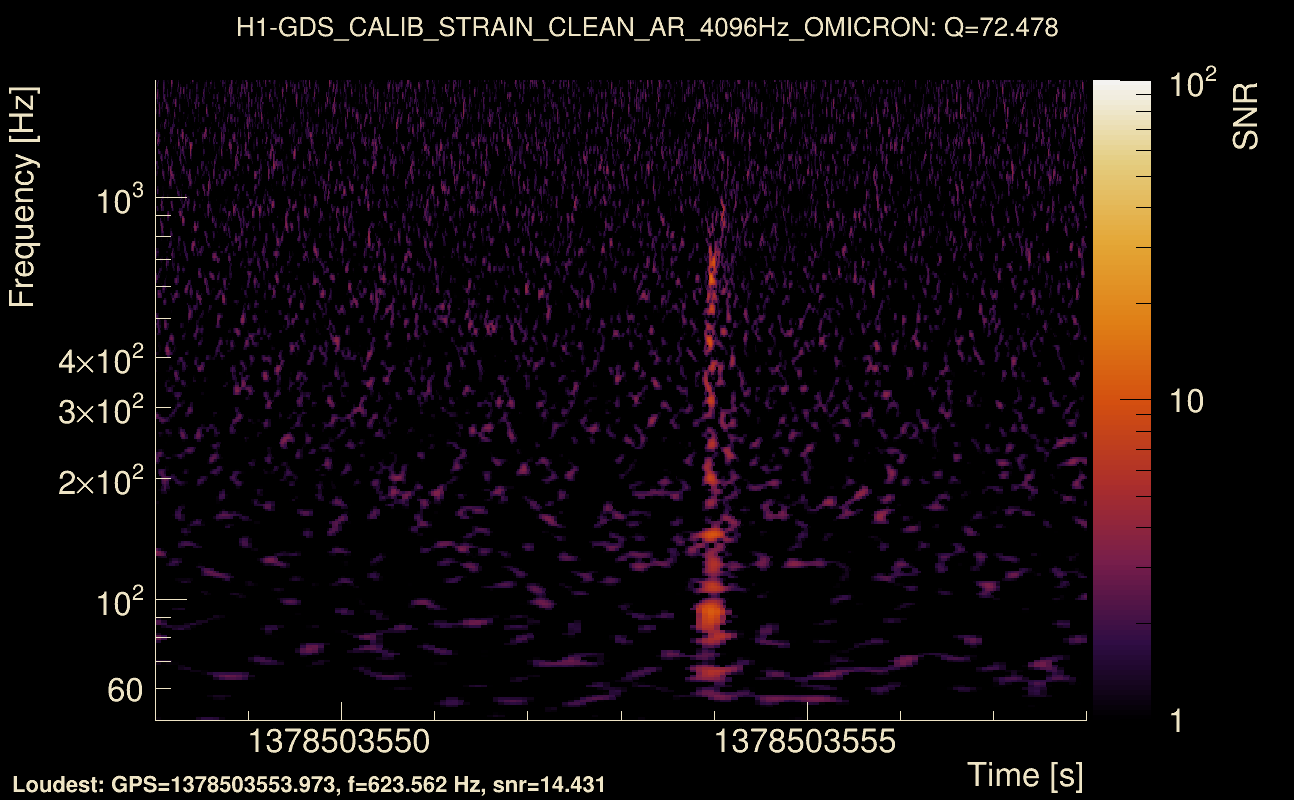
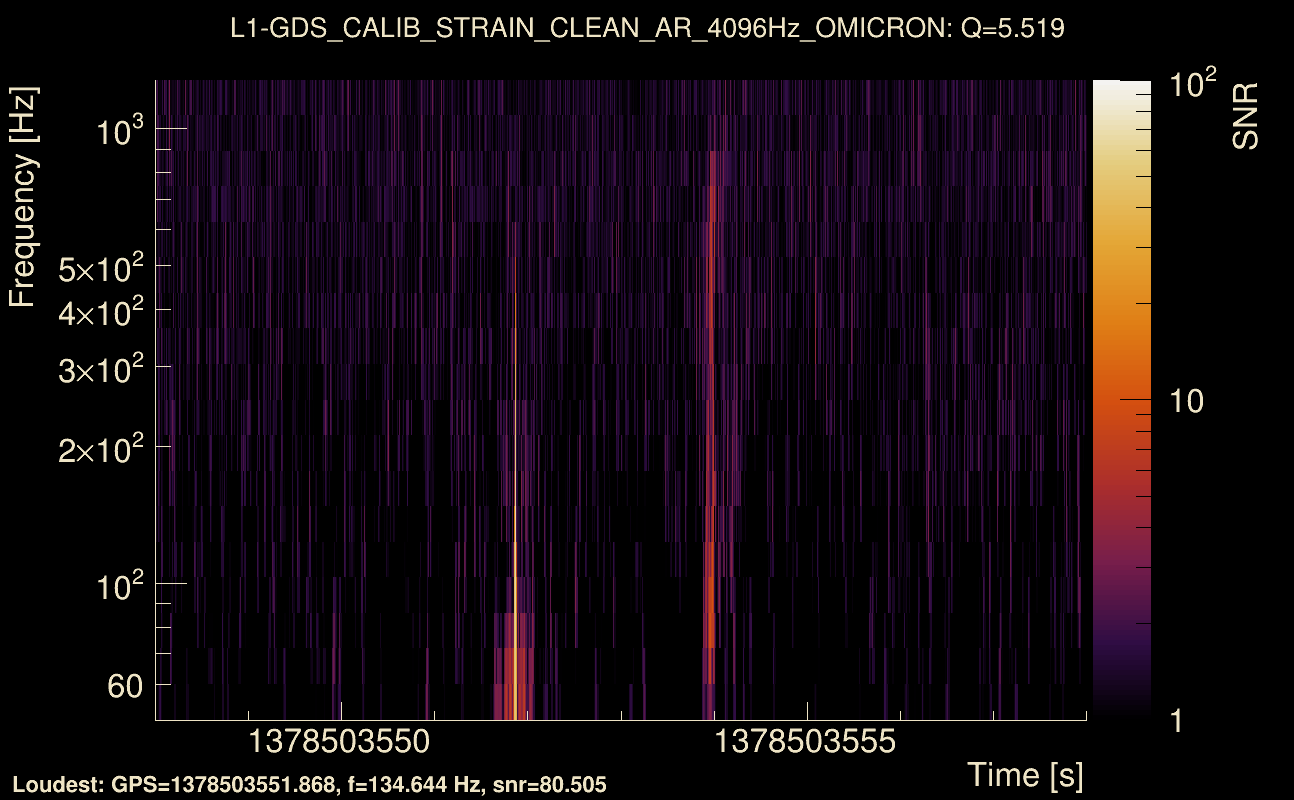
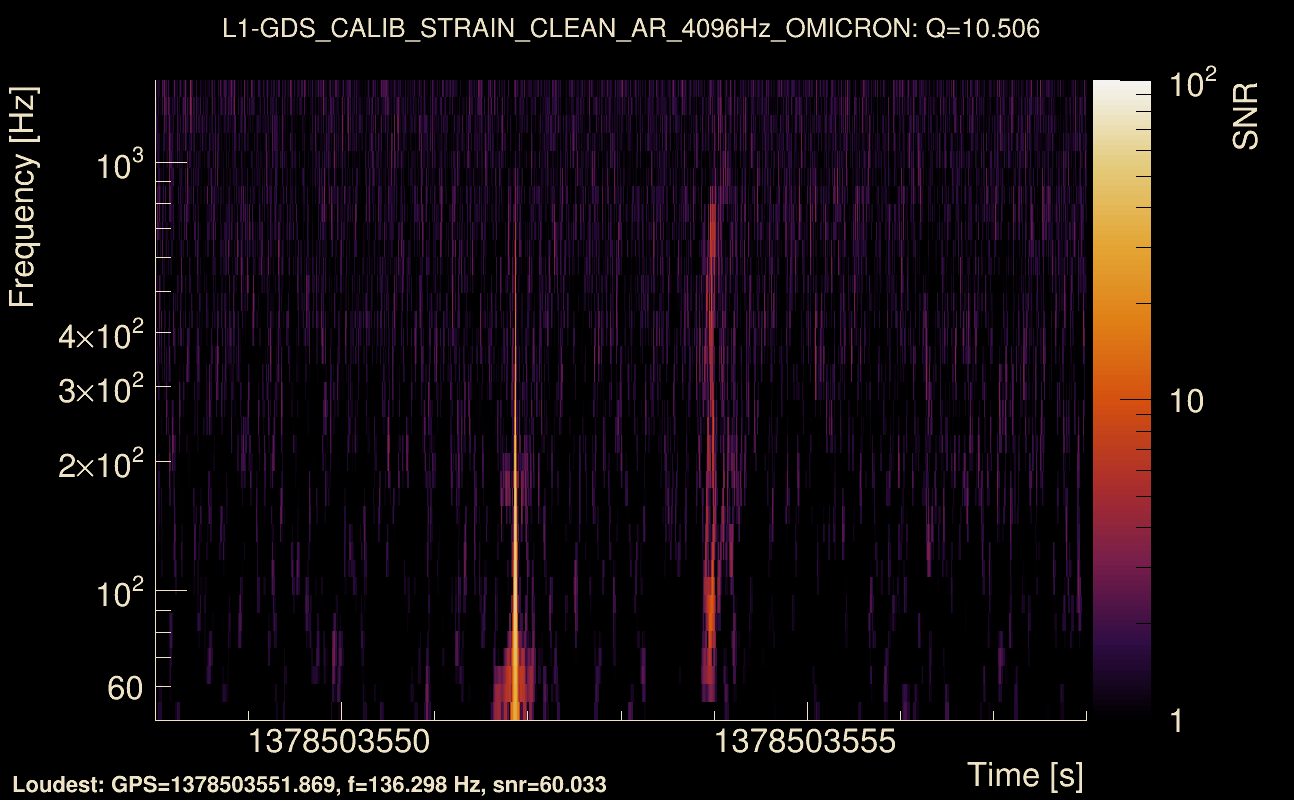
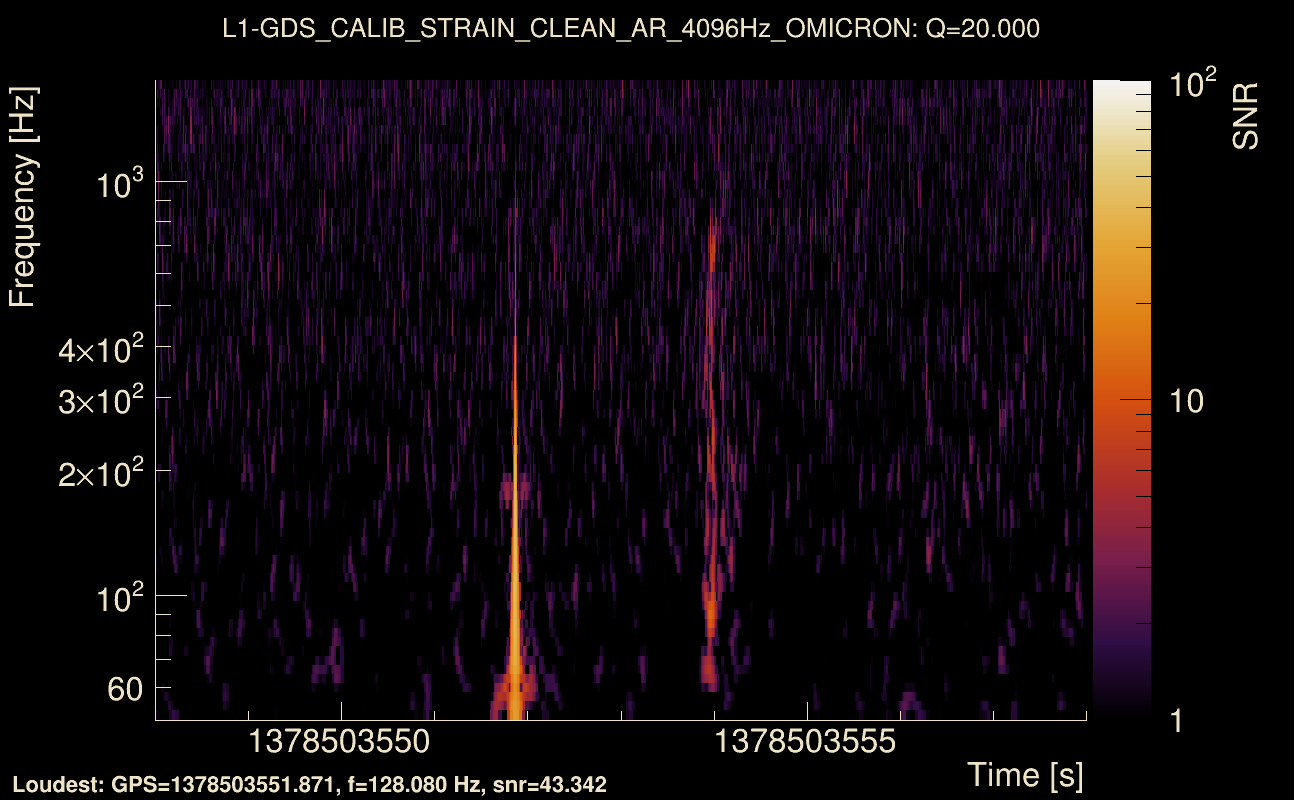
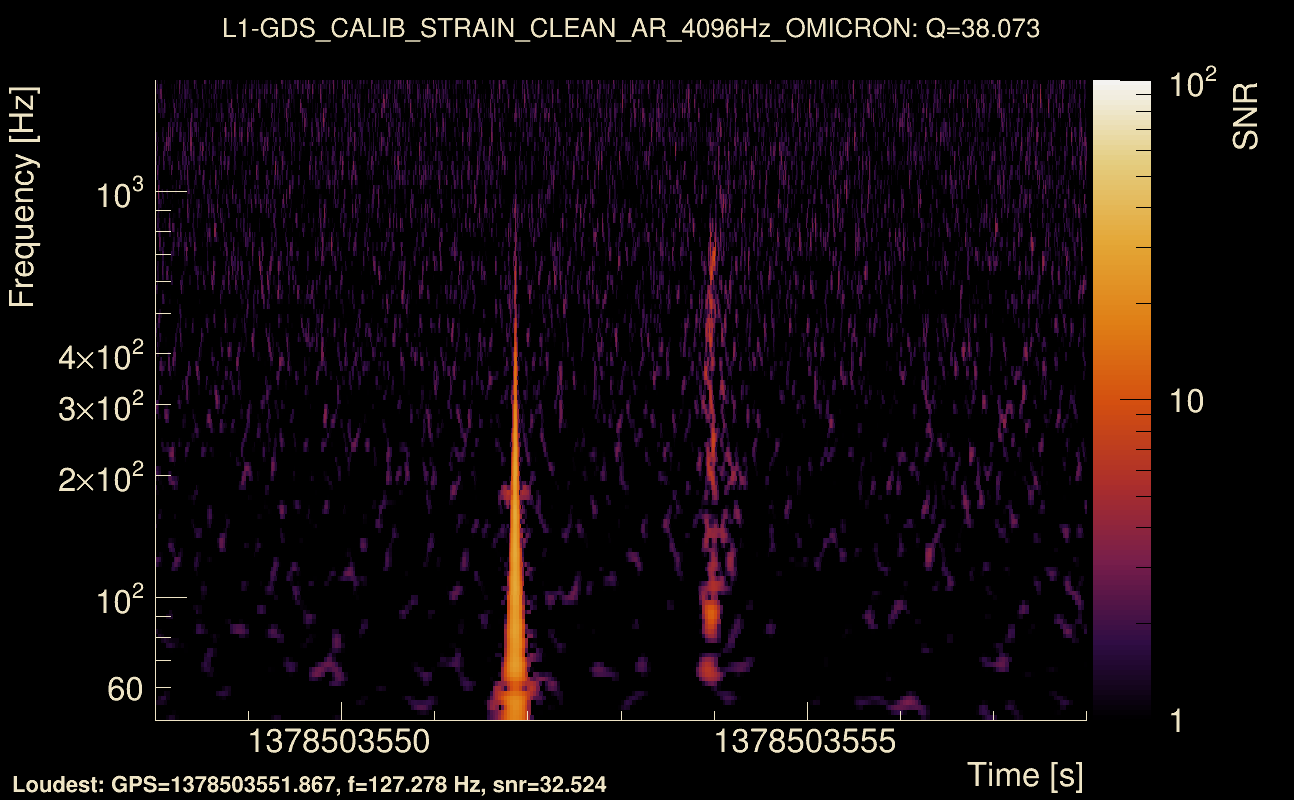
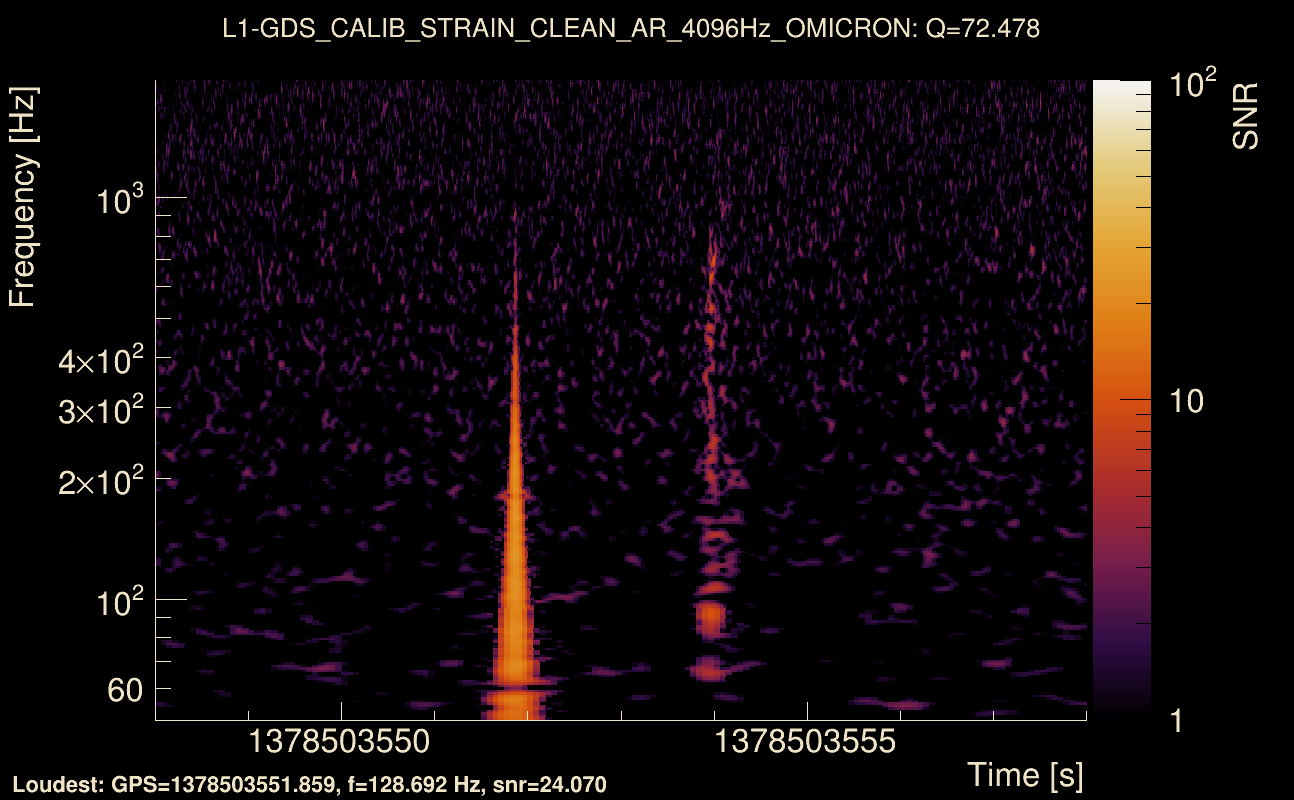
| Event time t(H1): | GPS = 1378503548 (Mon Sep 11 21:38:50 2023 ) → GPS = 1378503558 (Mon Sep 11 21:39:00 2023 ) |
| Event time t(L1): | GPS = 1378503548 (Mon Sep 11 21:39:00 2023 ) → GPS = 1378503558 (Mon Sep 11 21:39:00 2023 ) |
| Omicron analysis time window (H1): | GPS = 1378503545 → GPS = 1378503561 |
| Omicron analysis time window (L1): | GPS = 1378503545 → GPS = 1378503561 |
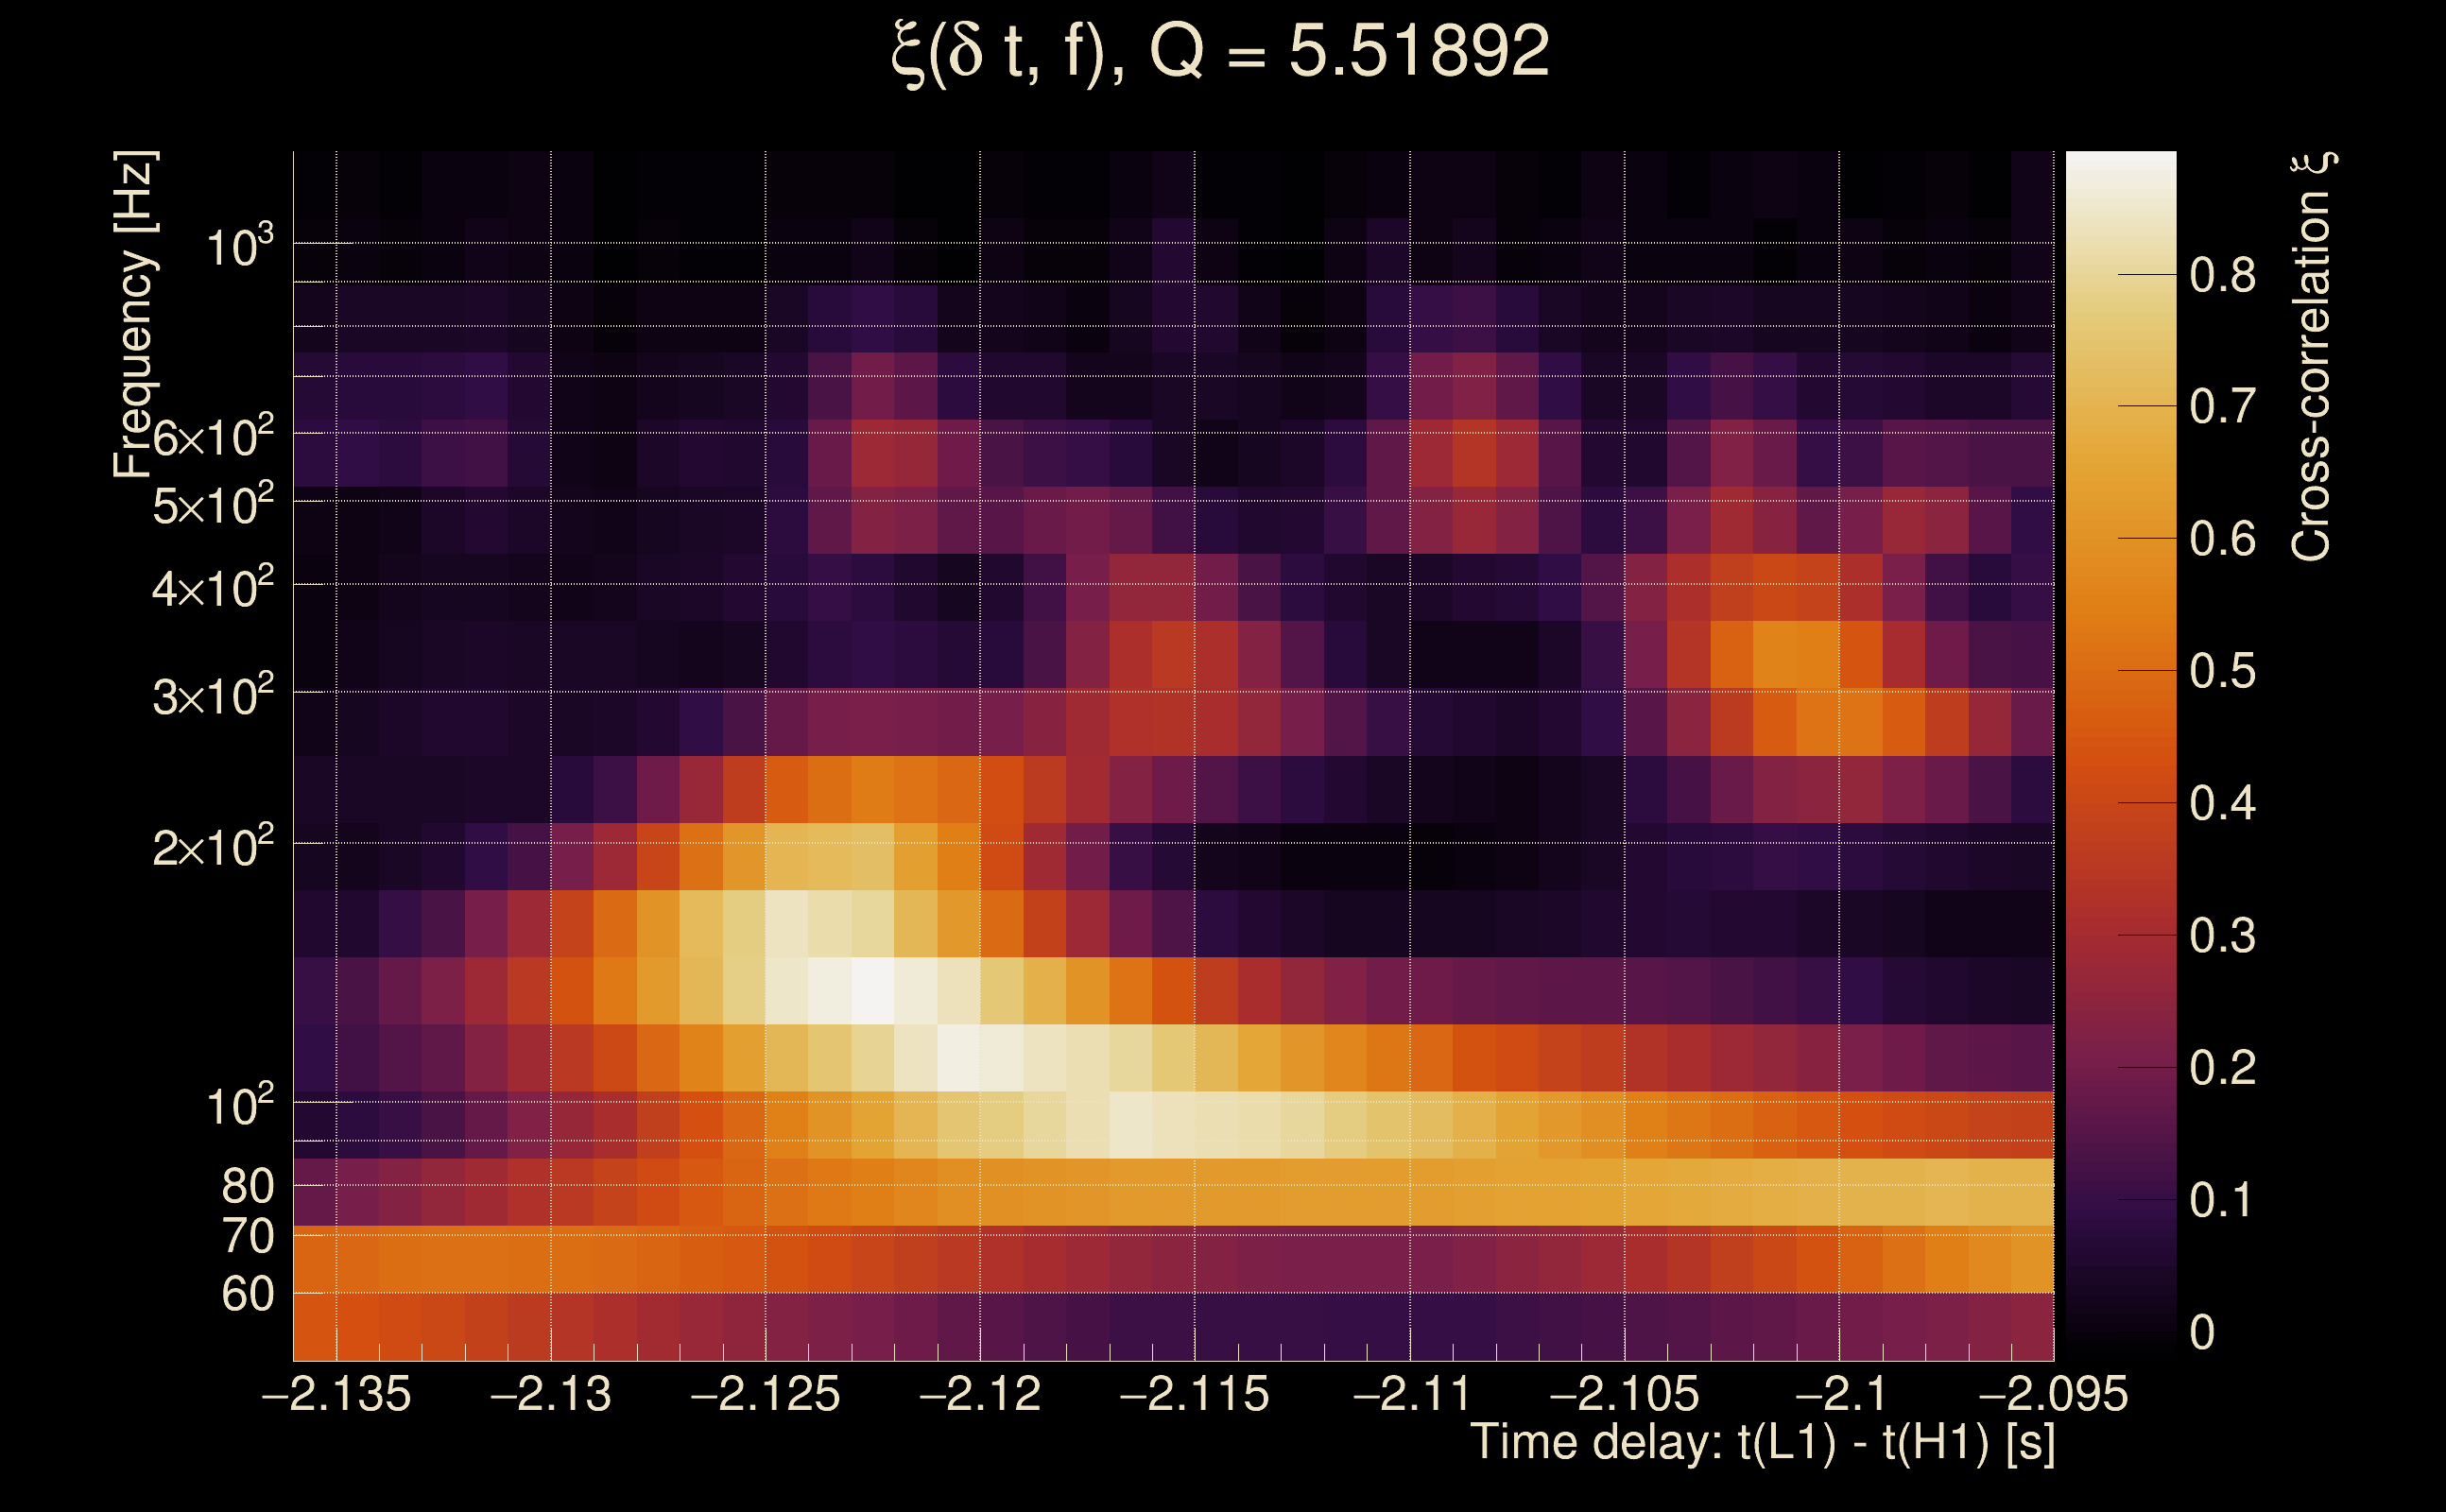
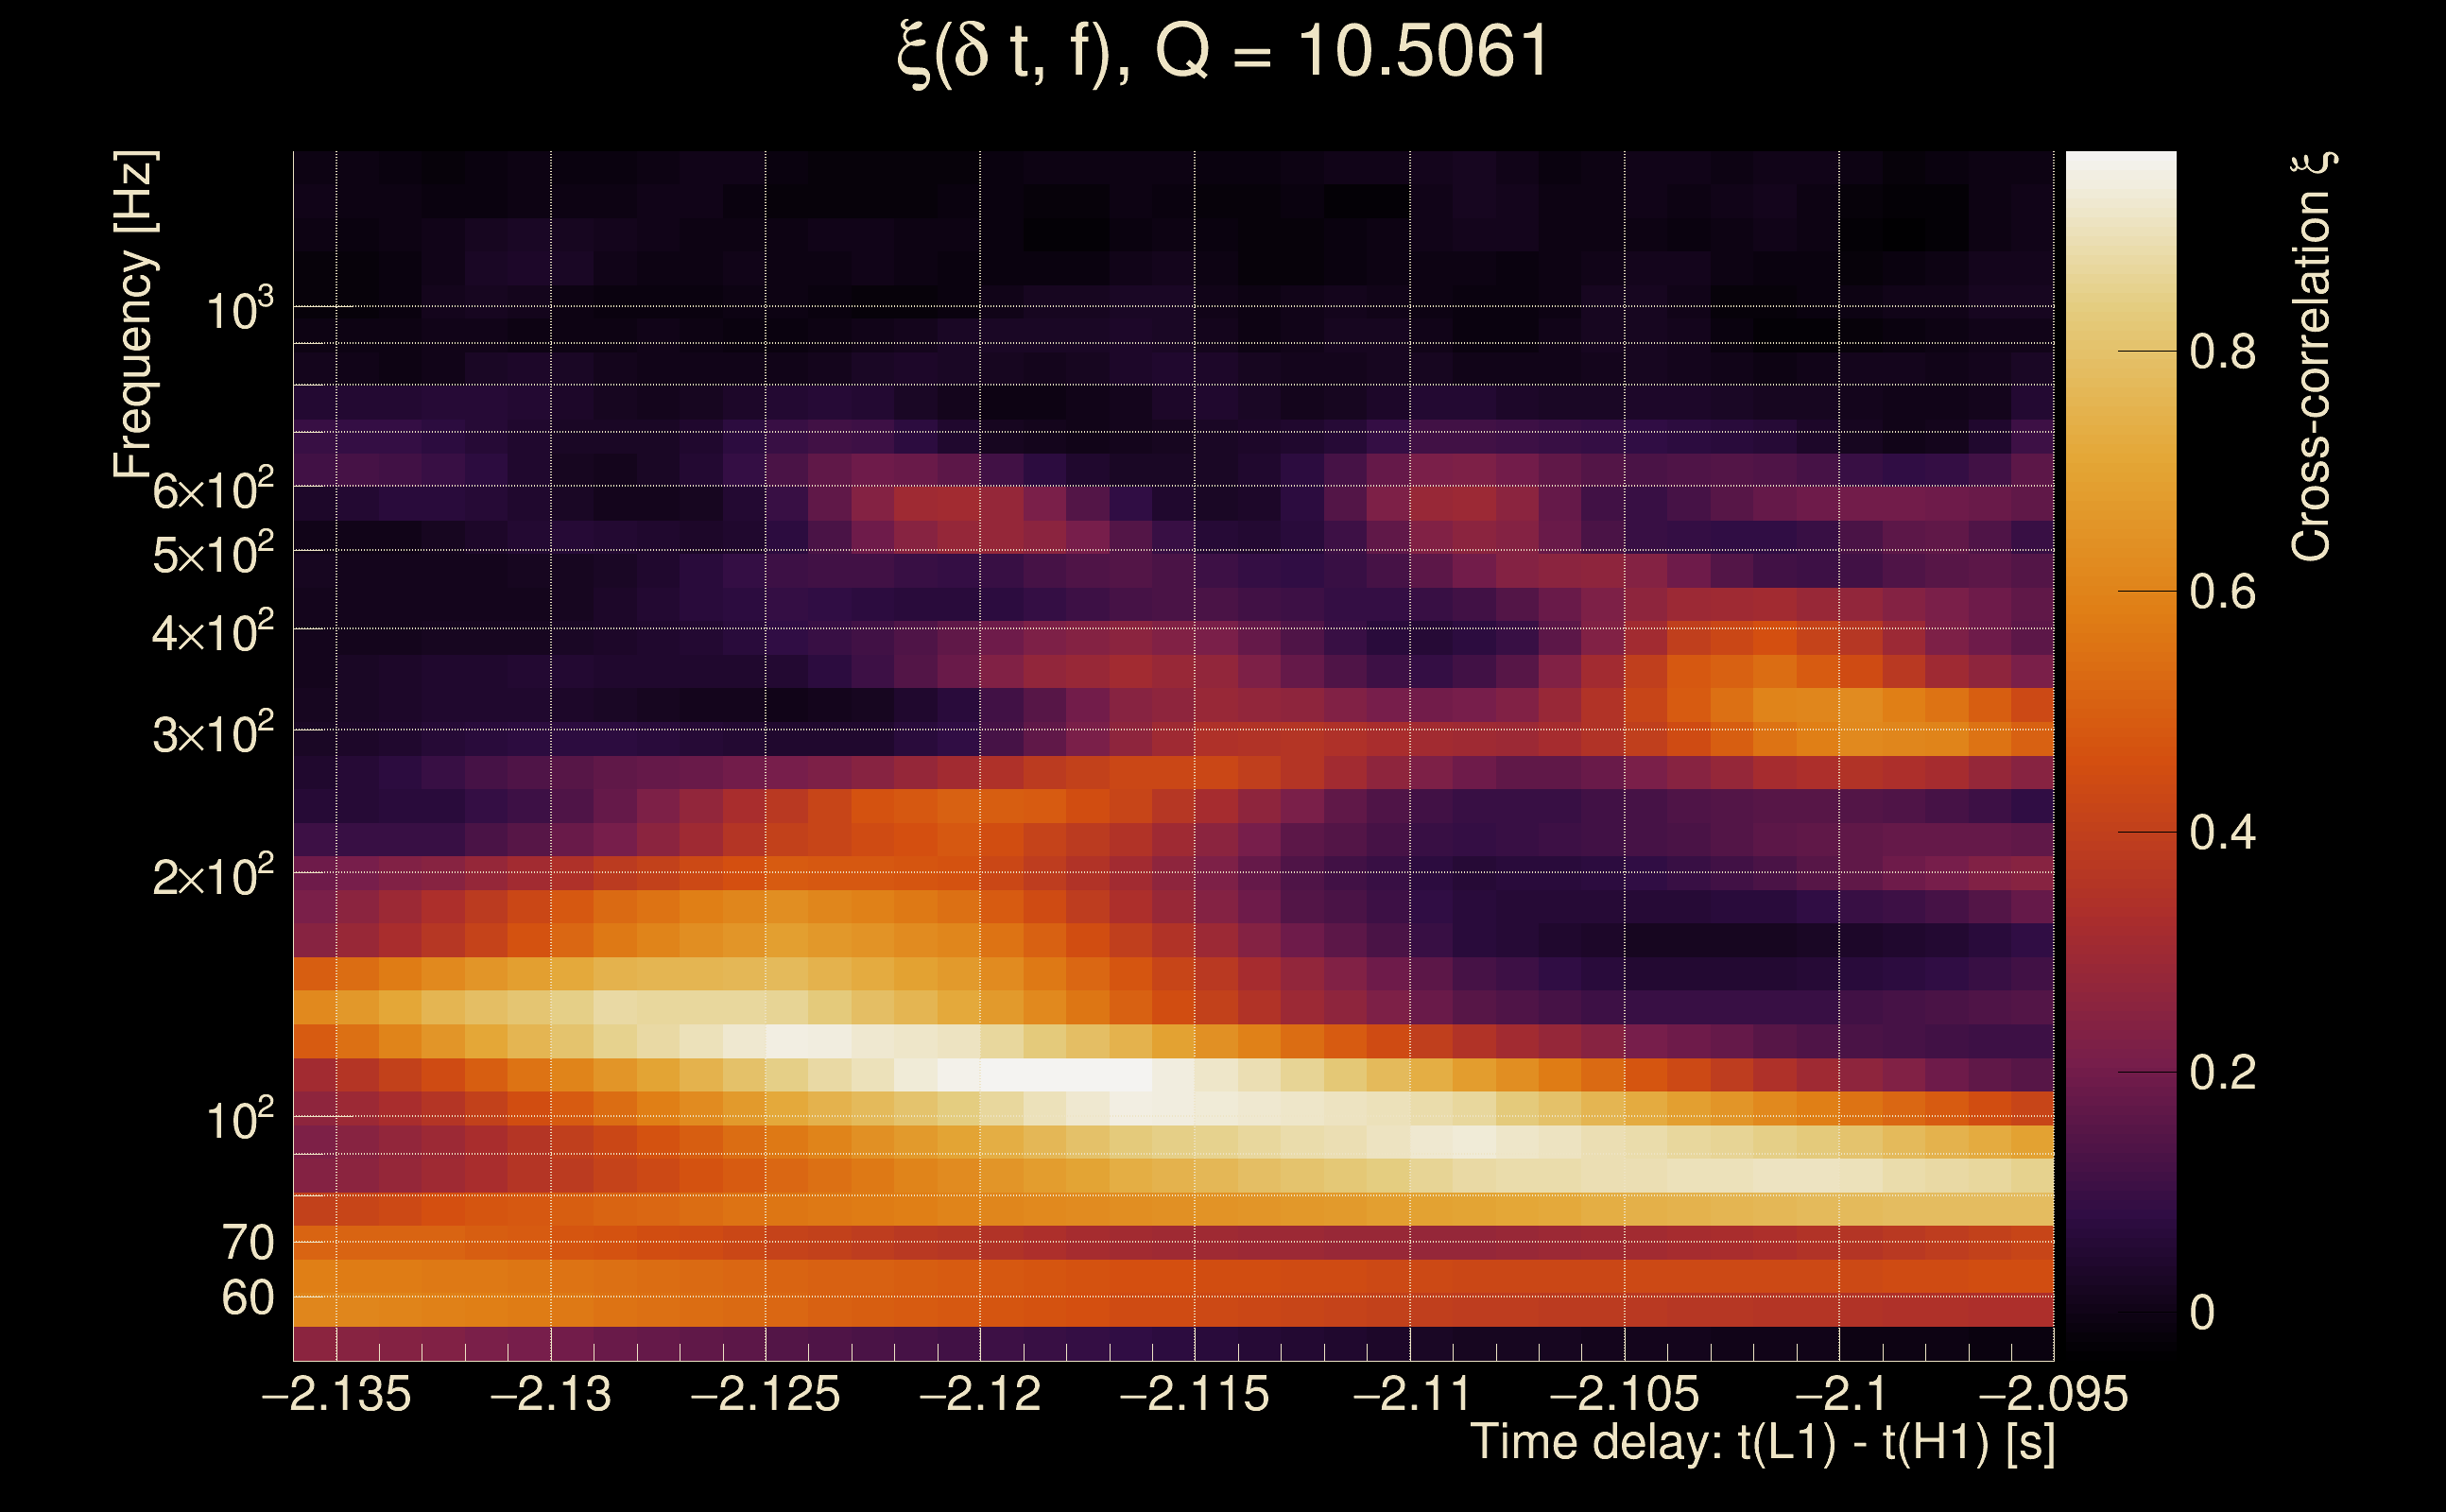
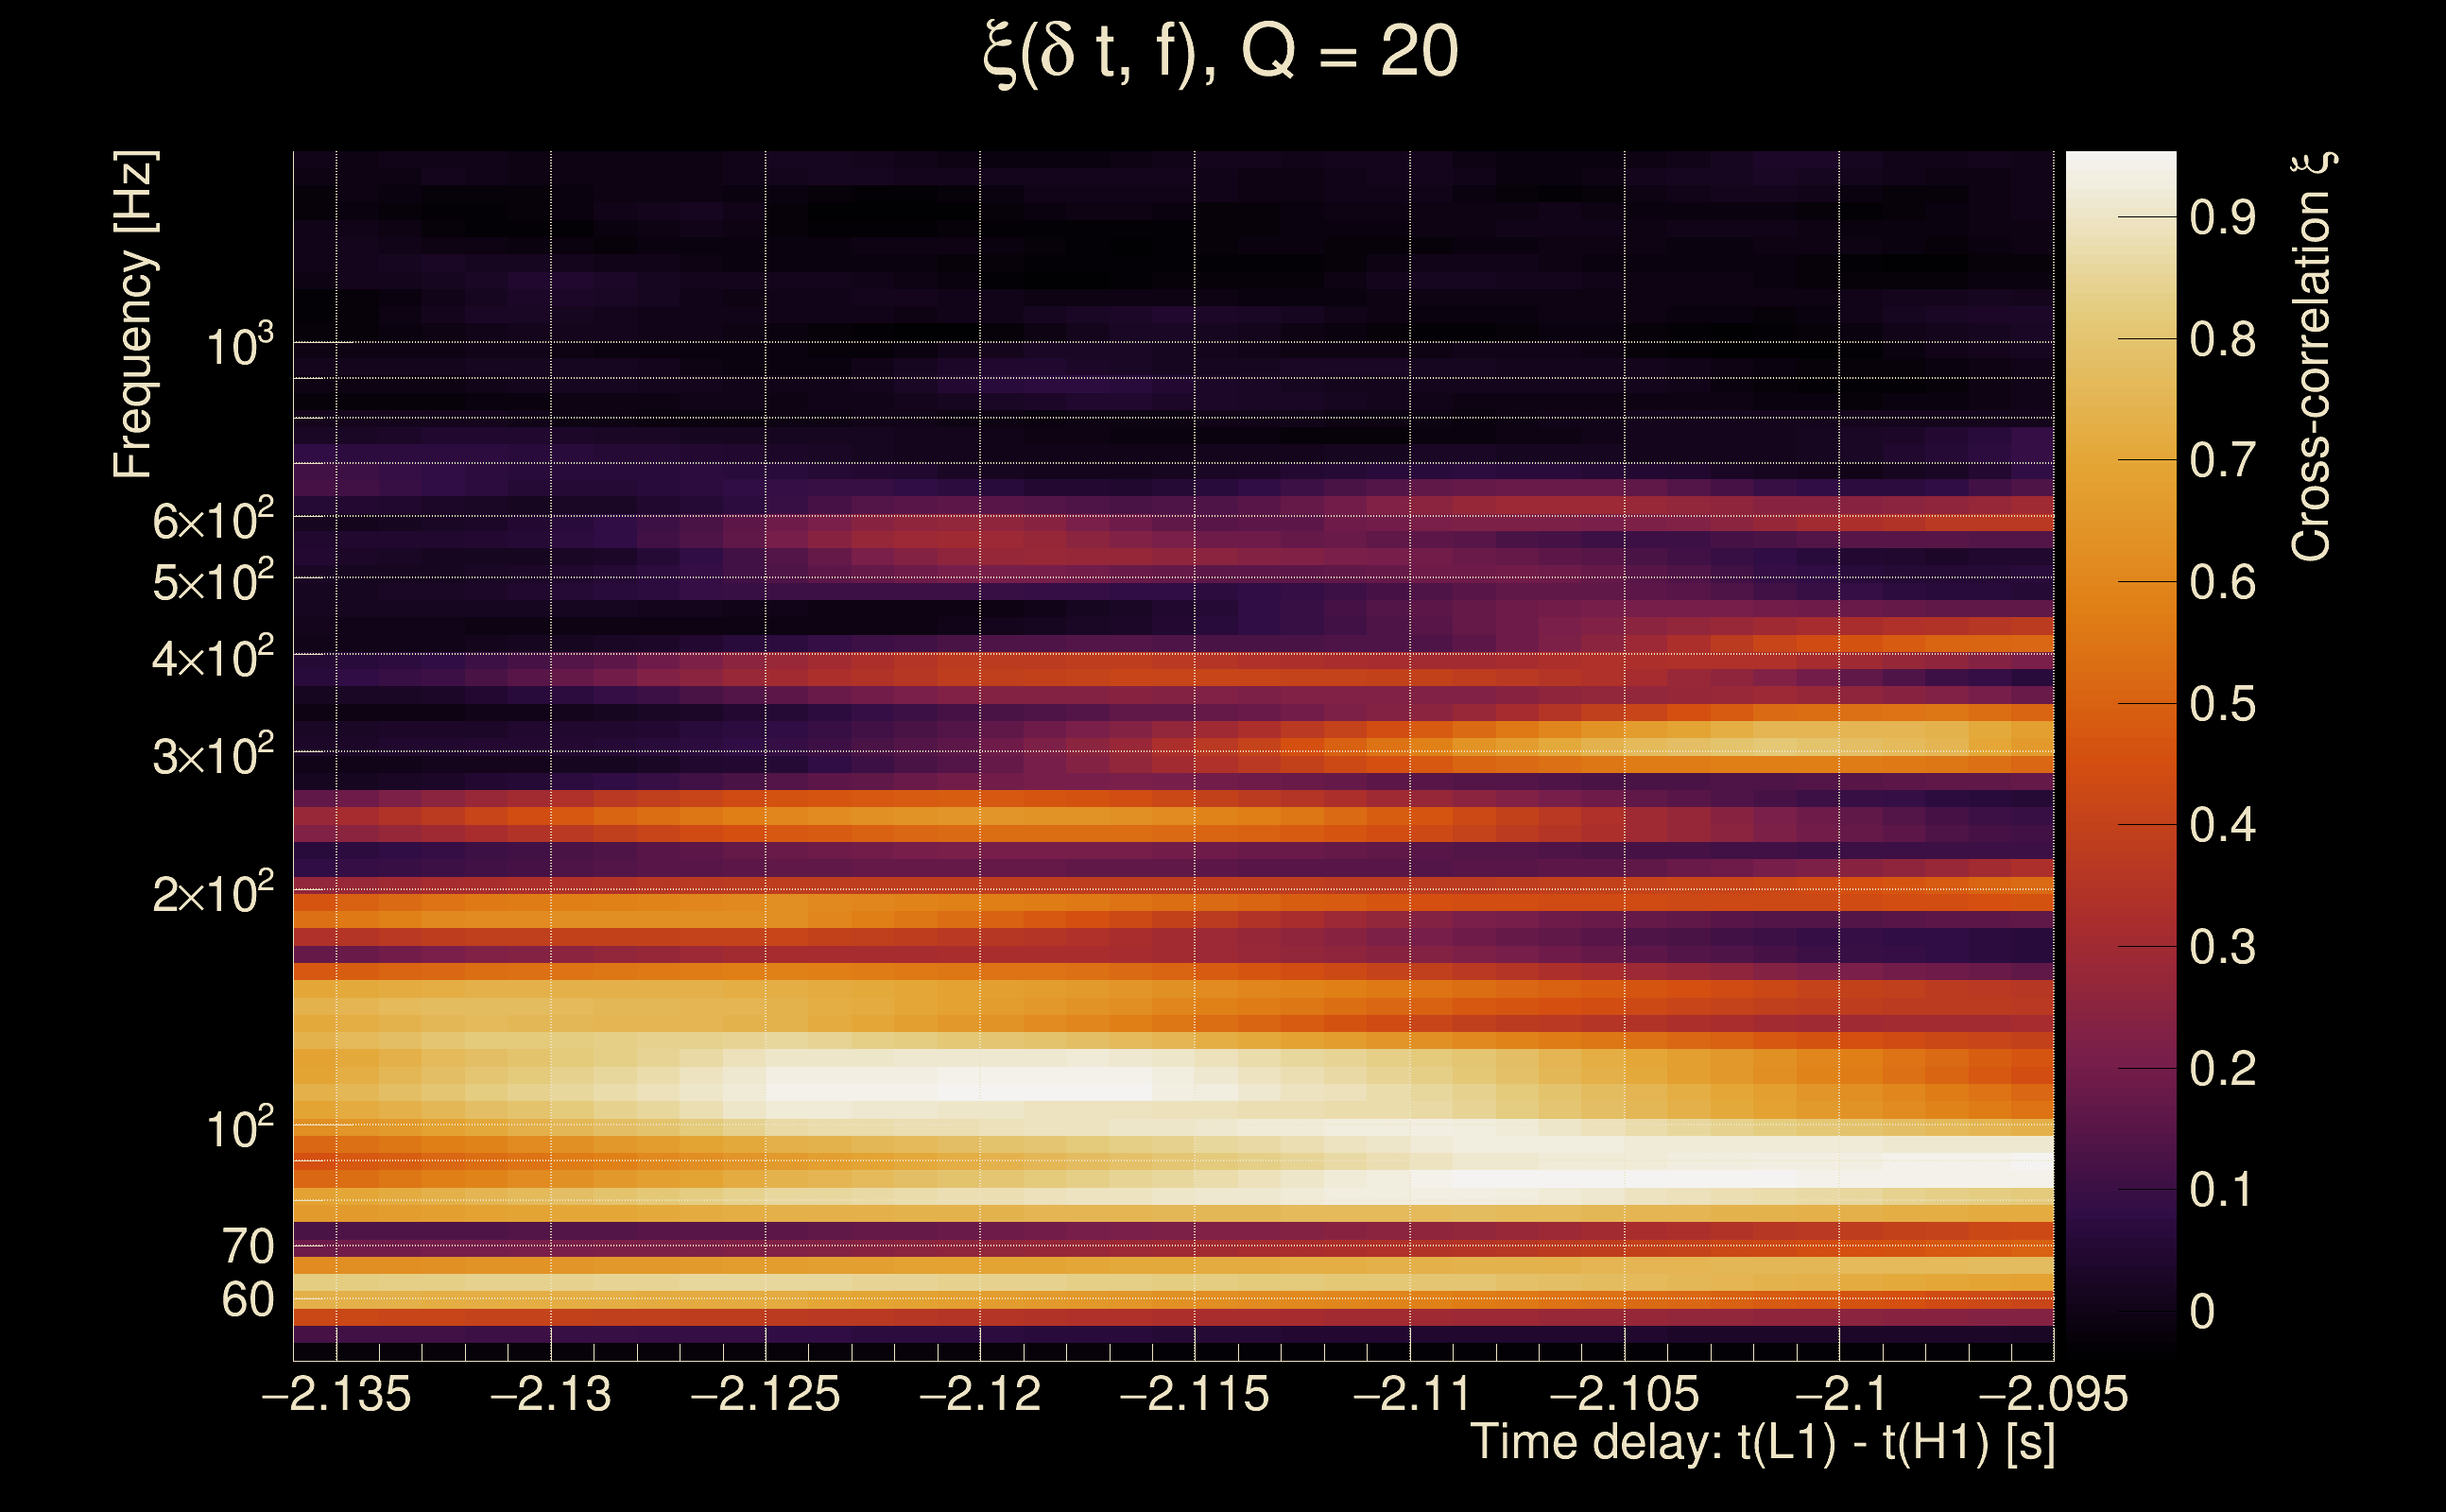
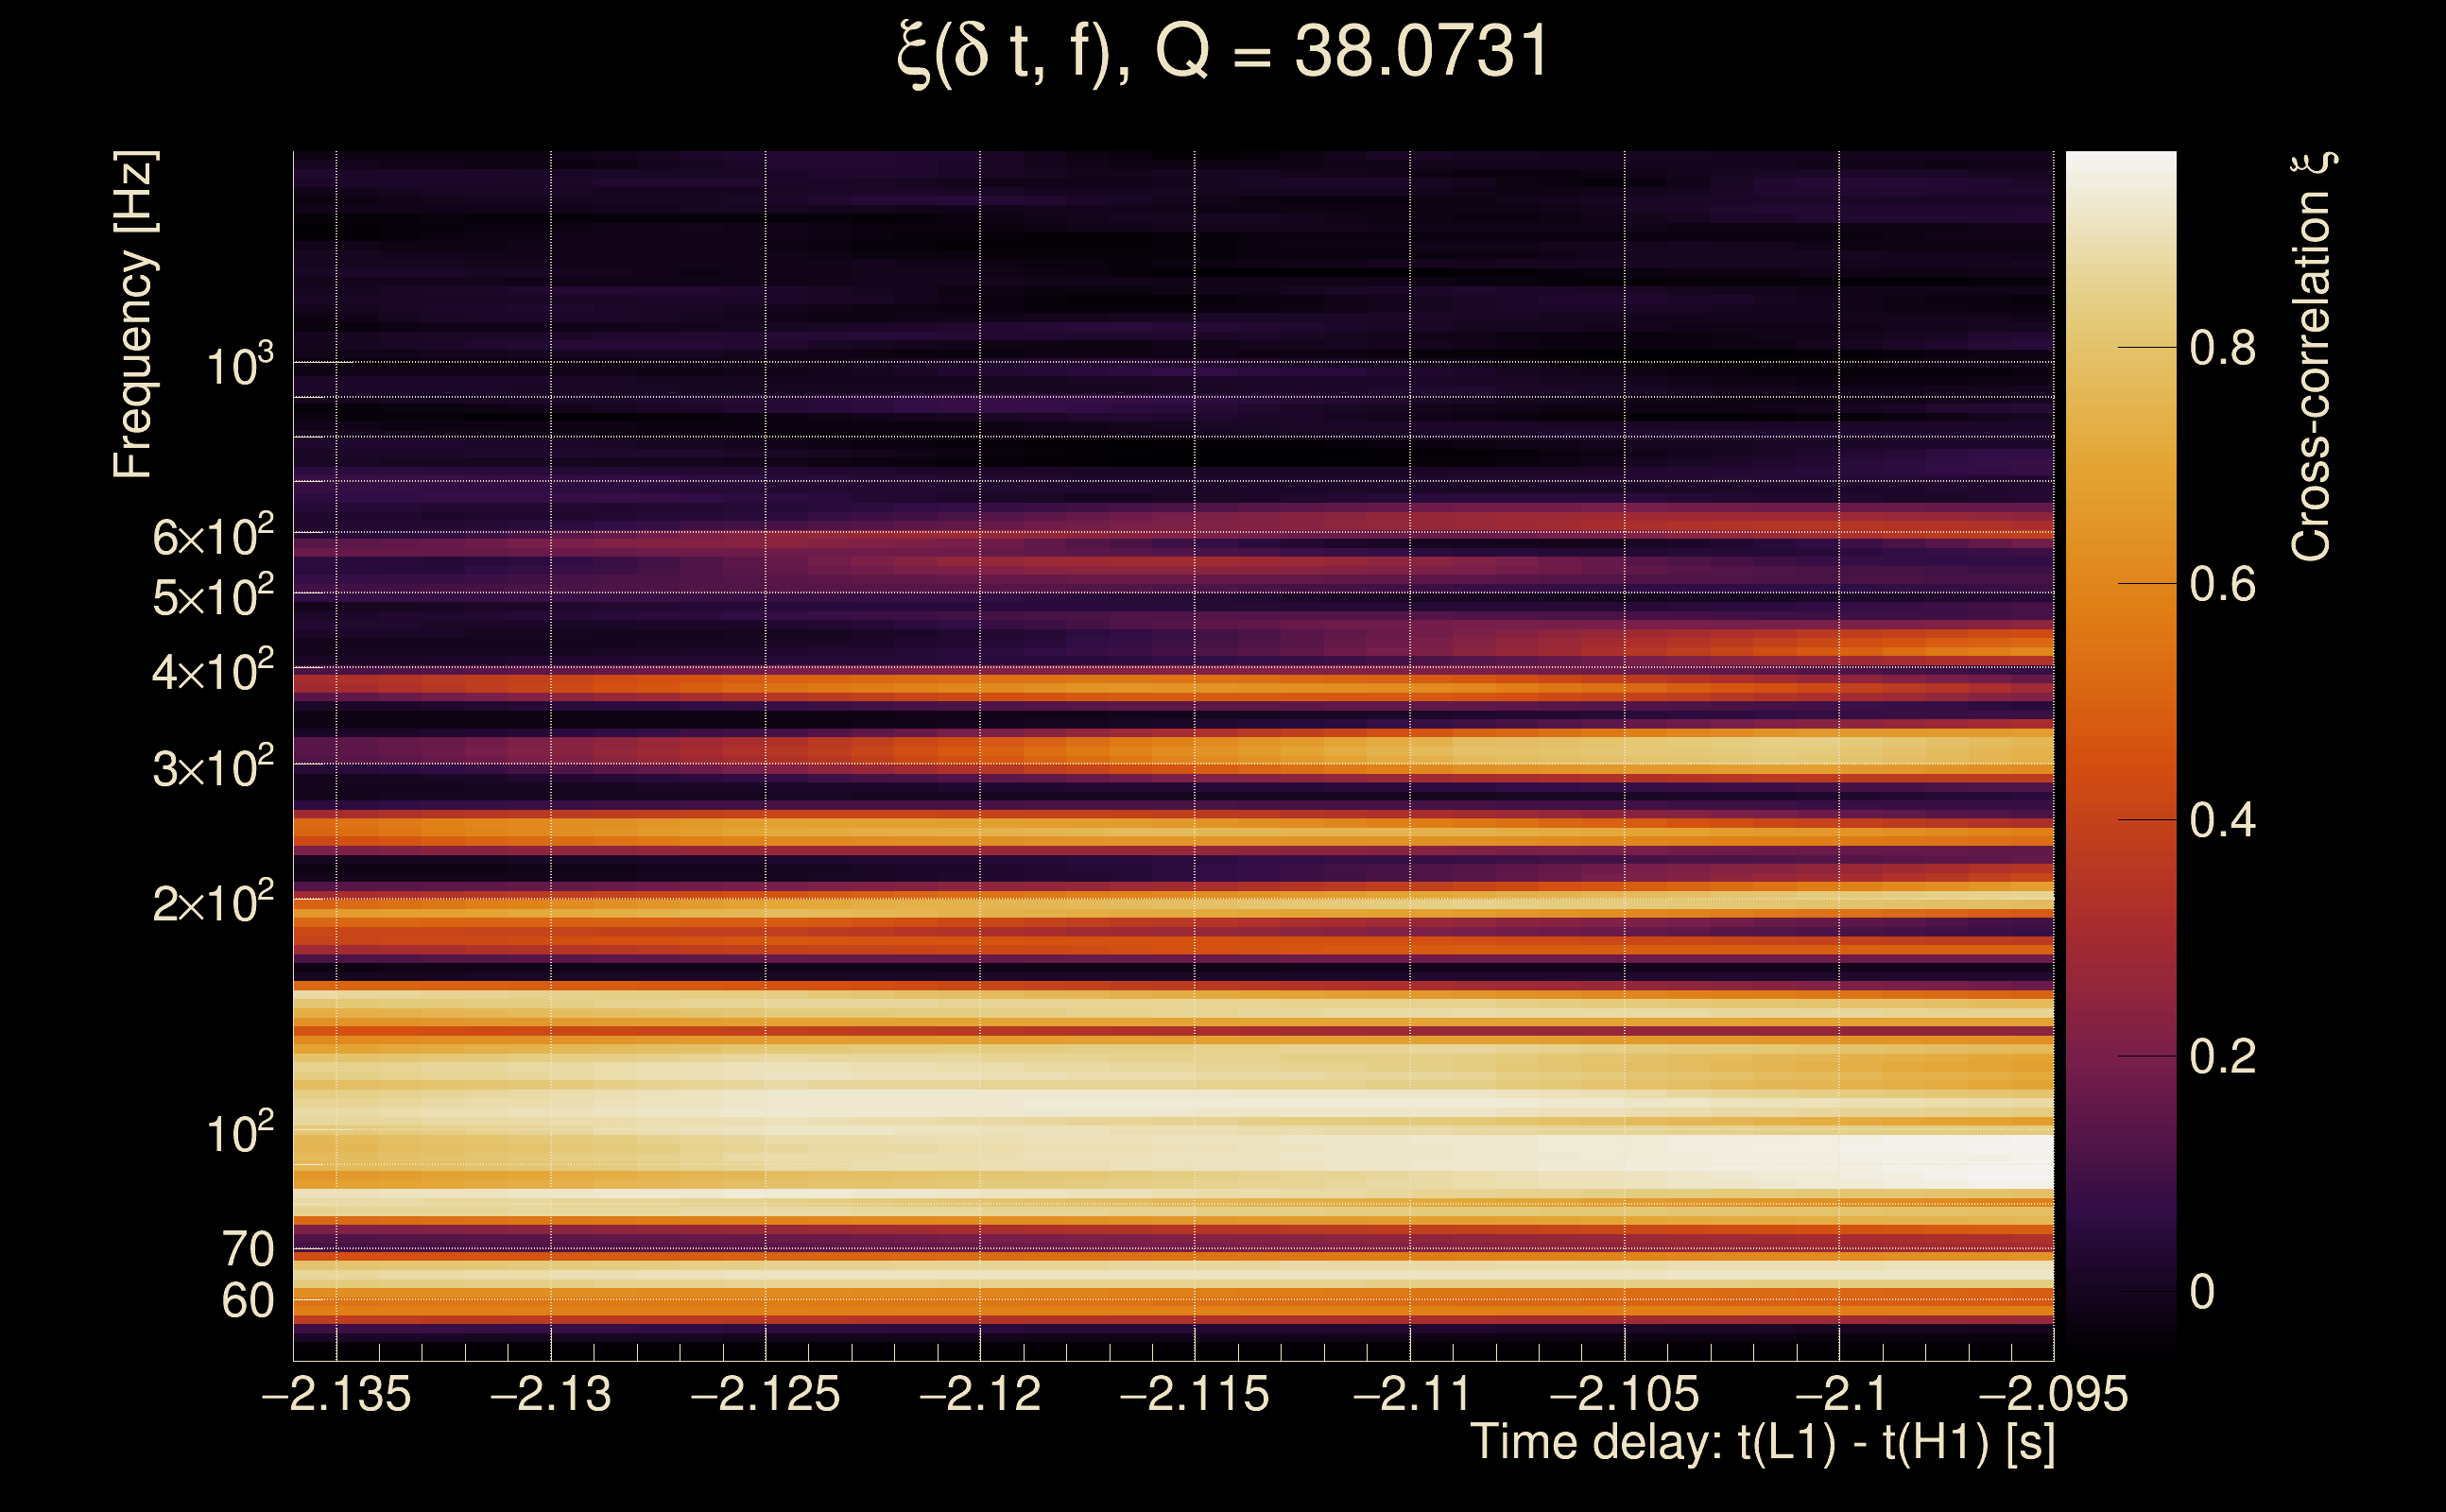
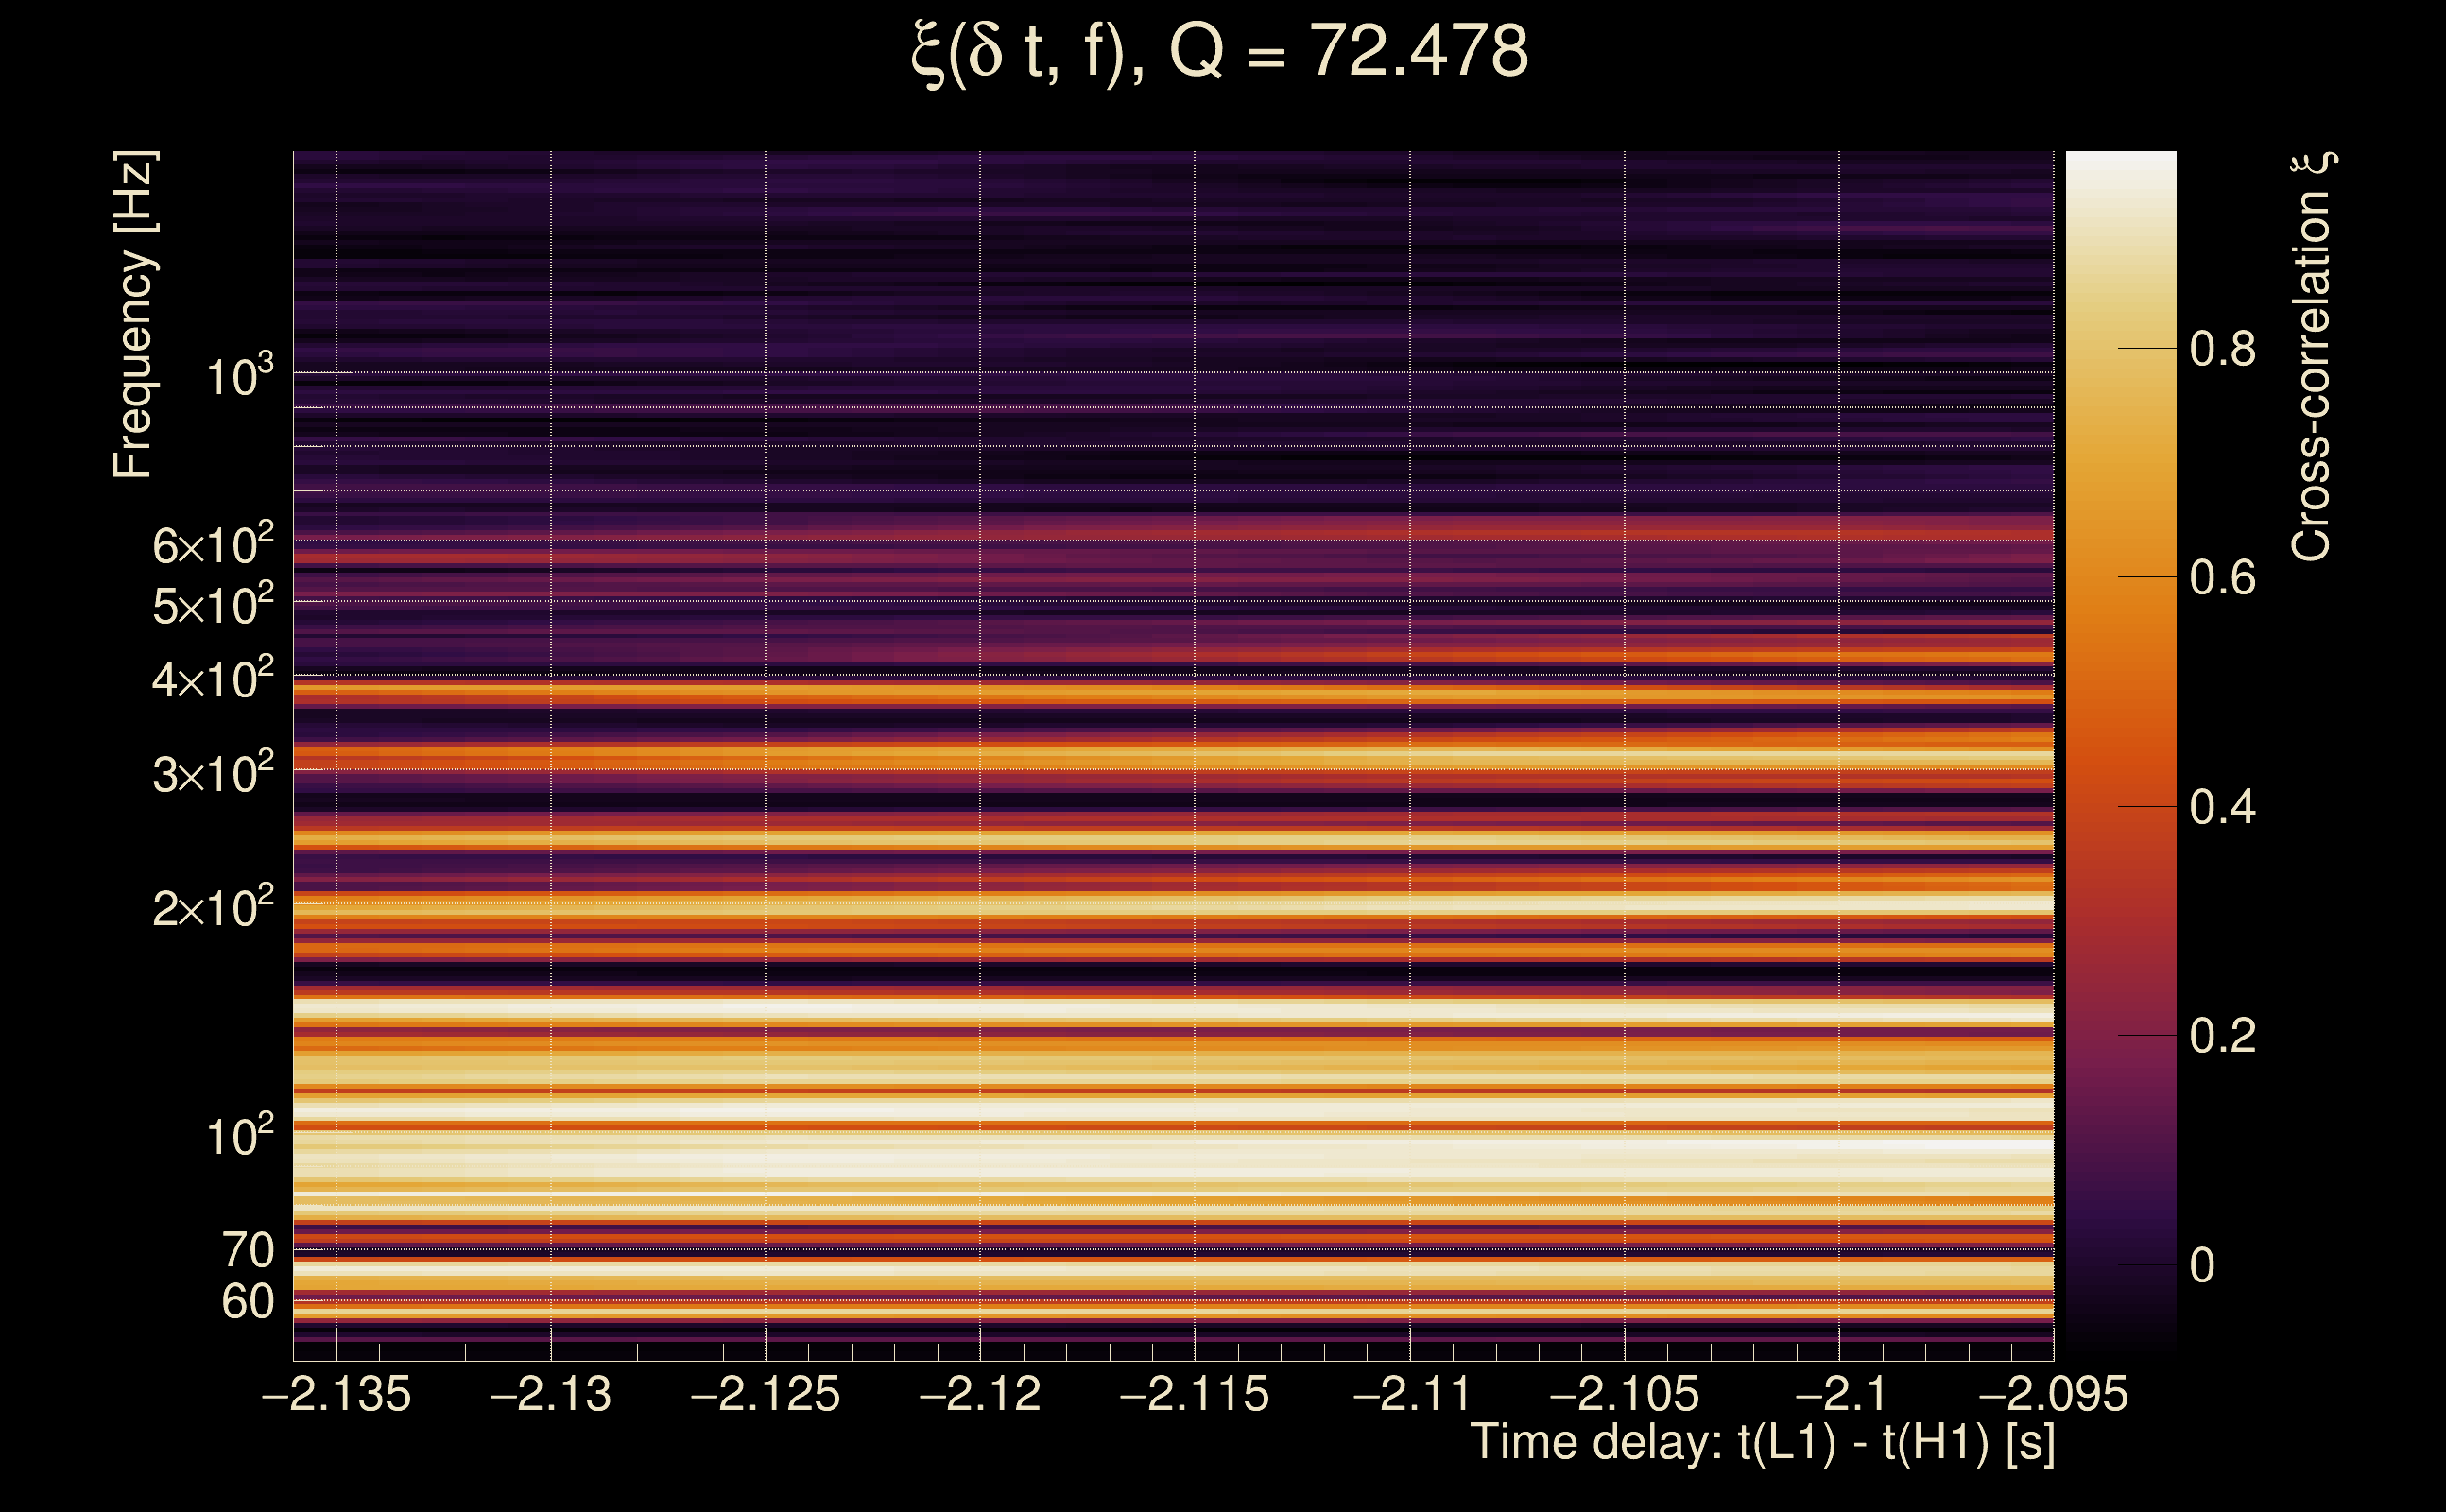
| Time delay between detectors t(L1) - t(H1): | -2.11563 s (slice index = 154 / 217), δt_gw = 0.000368274 s |
| Time delay uncertainty: | 0.00611706 s |
| [targeted mode] Time delay probability: | 0.839226 (0.202884 sigmas), δt_target = -0.000819445 s |
| Frequency: | 153.813 Hz |
| Ξ: | 0.306547 ± 0.0224173 (variance = 0.000502534): Q0: 0.759711, Q1: 0.715872, Q2: 0.726295, Q3: 0.733138, Q4: 0.77652 |
| Rank: | R_A = 0.146407 |
| Log of amplitude ratio (L1/H1): | 1.75903, variance = 0.445214 (L1/H1: 1.02222, variance = 0.671541, H1/L1: -1.78183, variance = 0.472544) |
| Amplitude ratio (L1/H1): | 5.80683 ⋇ 1.94886 (L1/H1: 2.77936 ⋇ 2.26931, H1/L1: 0.16833 ⋇ 1.98858) |
| Amplitude ratio H1|L1 compatibility (probability): | 0.4776 |
| Antenna factor probability: | 1 |
| Number of rejected frequency rows: | Q0: 10 / 18, Q1: 22 / 36, Q2: 42 / 70, Q3: 85 / 134, Q4: 193 / 258 |
| Maximum signal-to-noise ratio: | H1: 15.9673, L1: 90.7804 |
| SNR variance: | H1: 0.497871, L1: 3.88307 |
| Click here for a zoomed plot | Click here for a zoomed plot | Click here for a zoomed plot | Click here for a zoomed plot | Click here for a zoomed plot |
 |
 |
 |
 |
 |
 |
 |
 |
 |
 |
 |
 |
 |
 |
 |
 |
 |
 |
 |
 |
 |
 |
 |
 |
 |
 |
 |
 |
 |
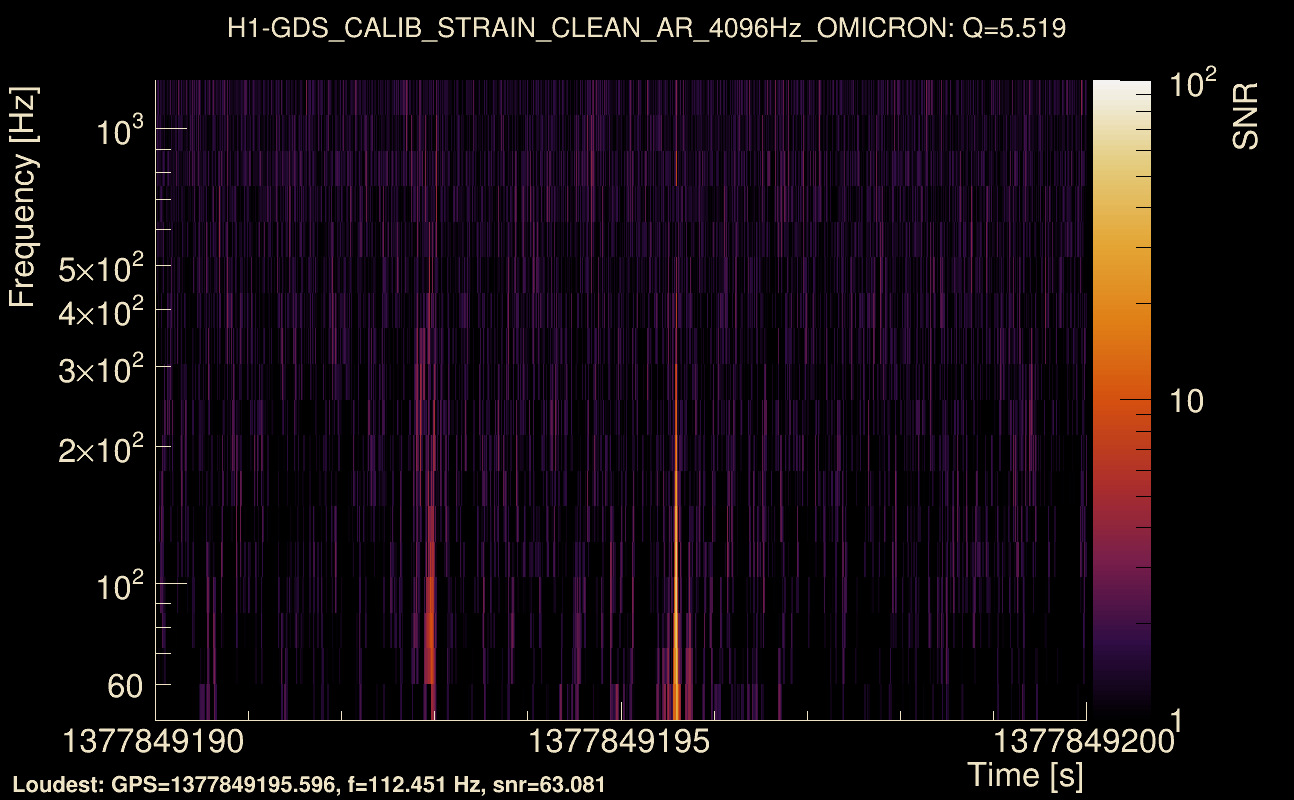
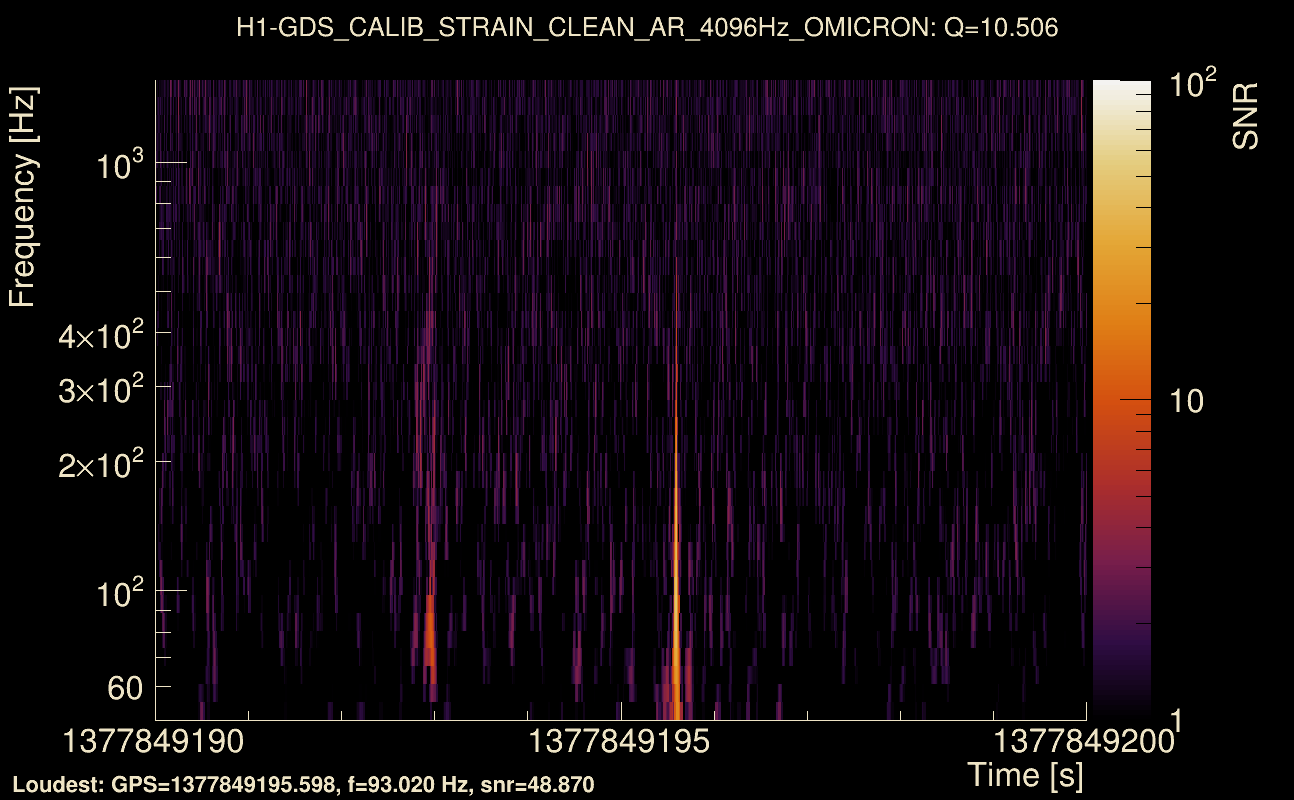
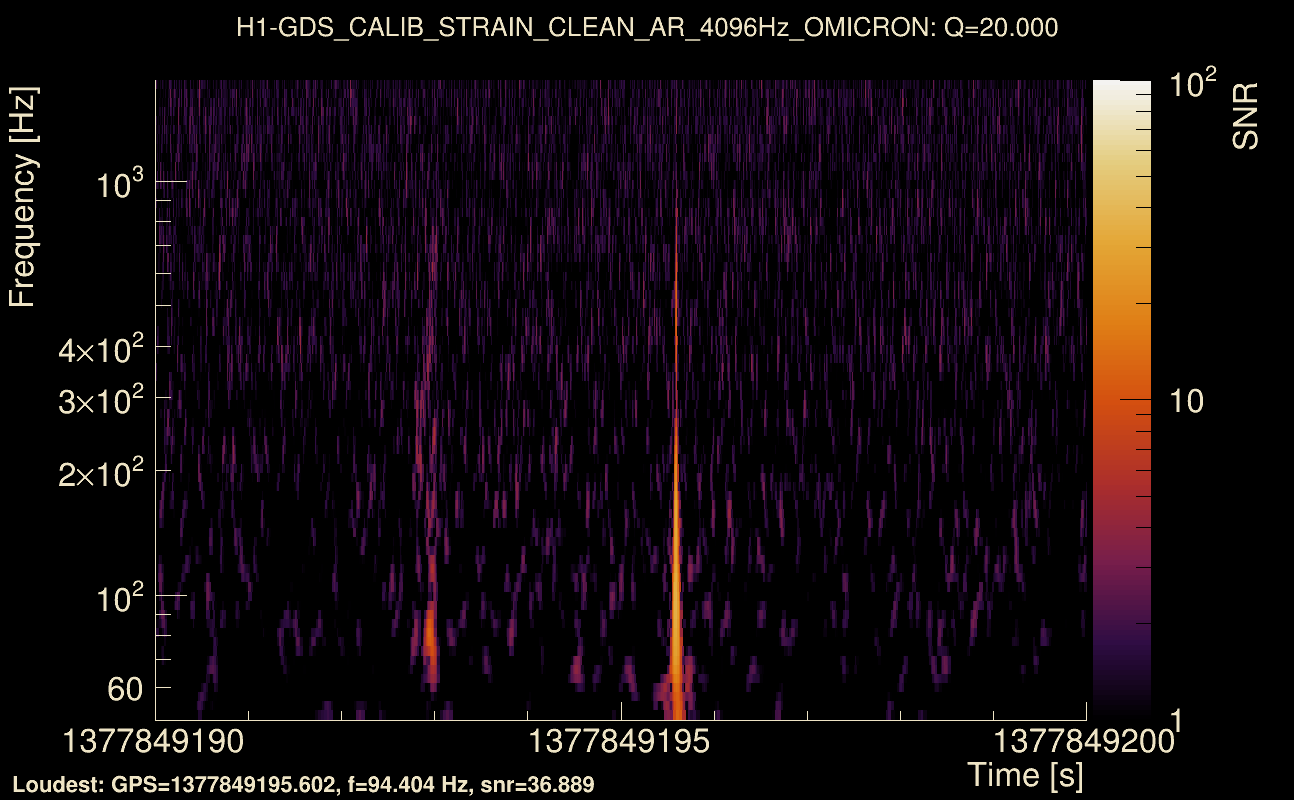
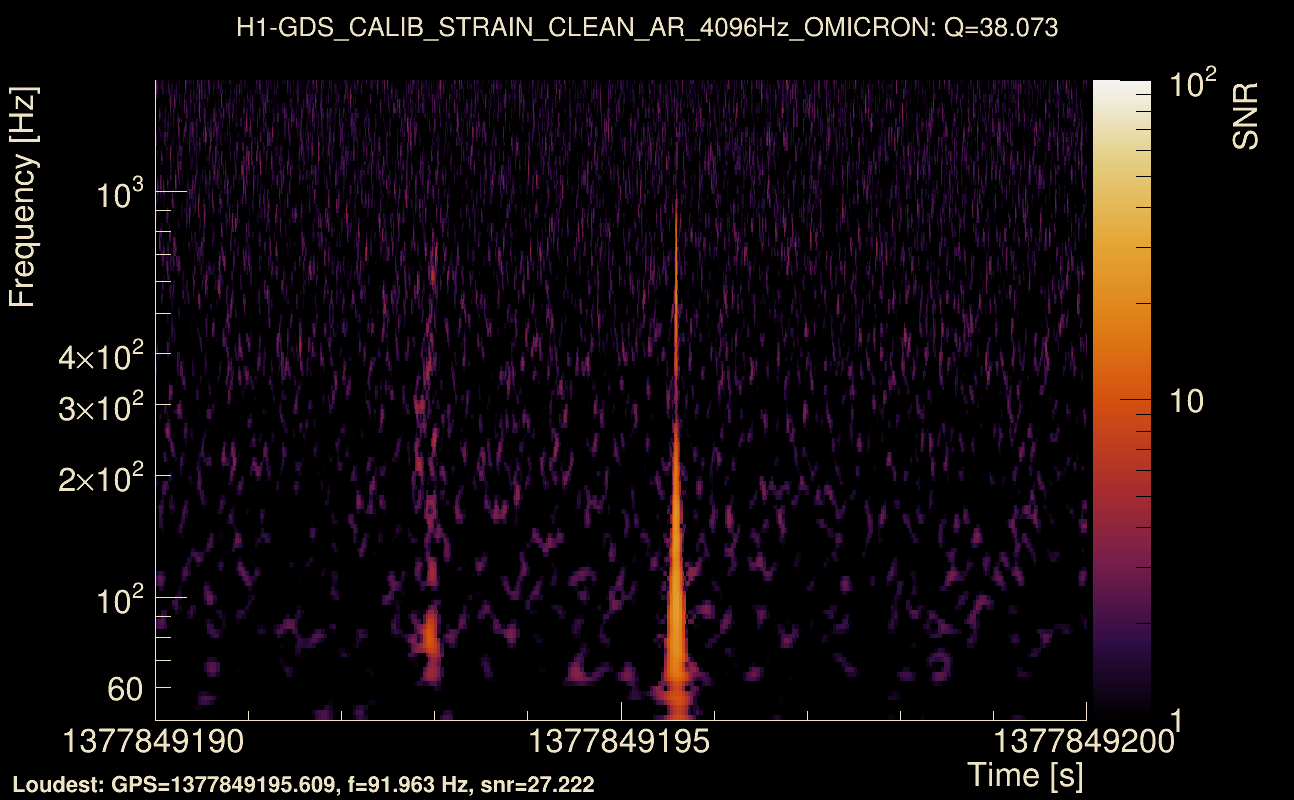
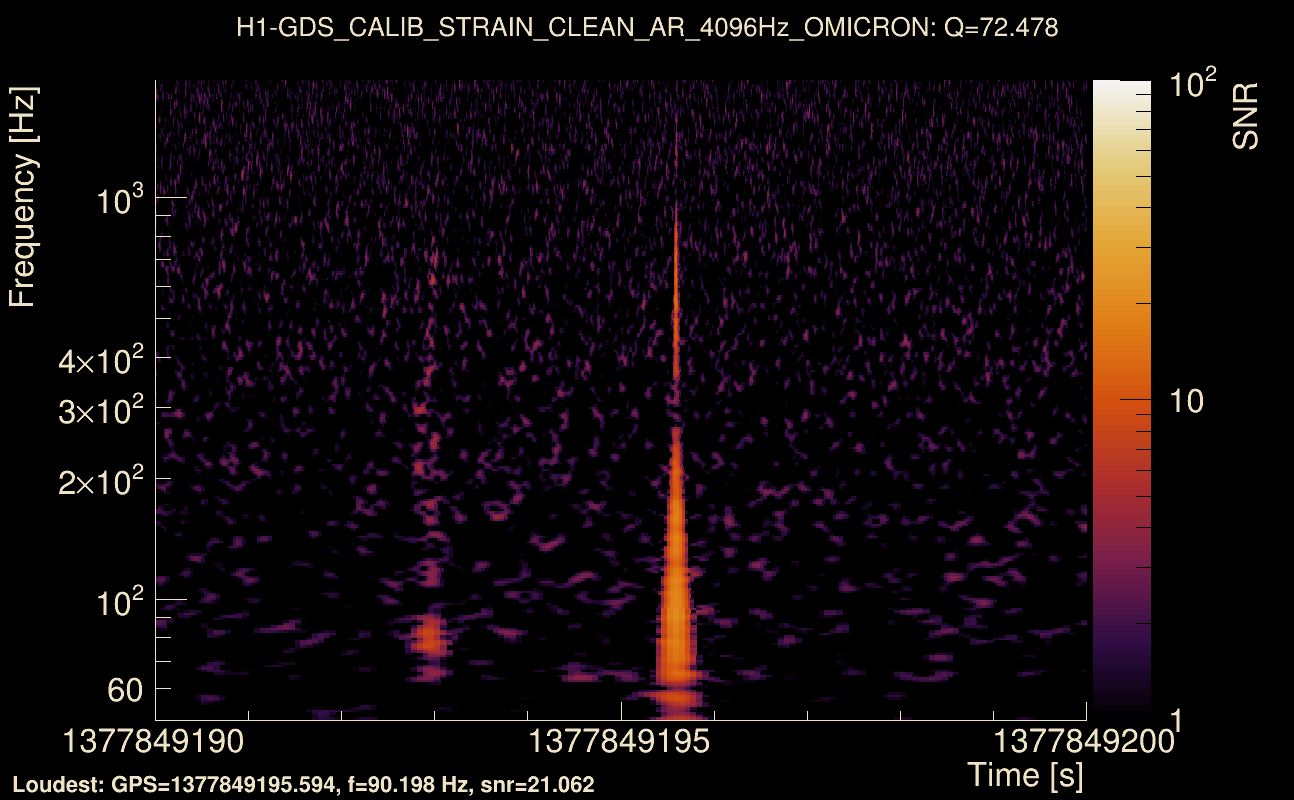
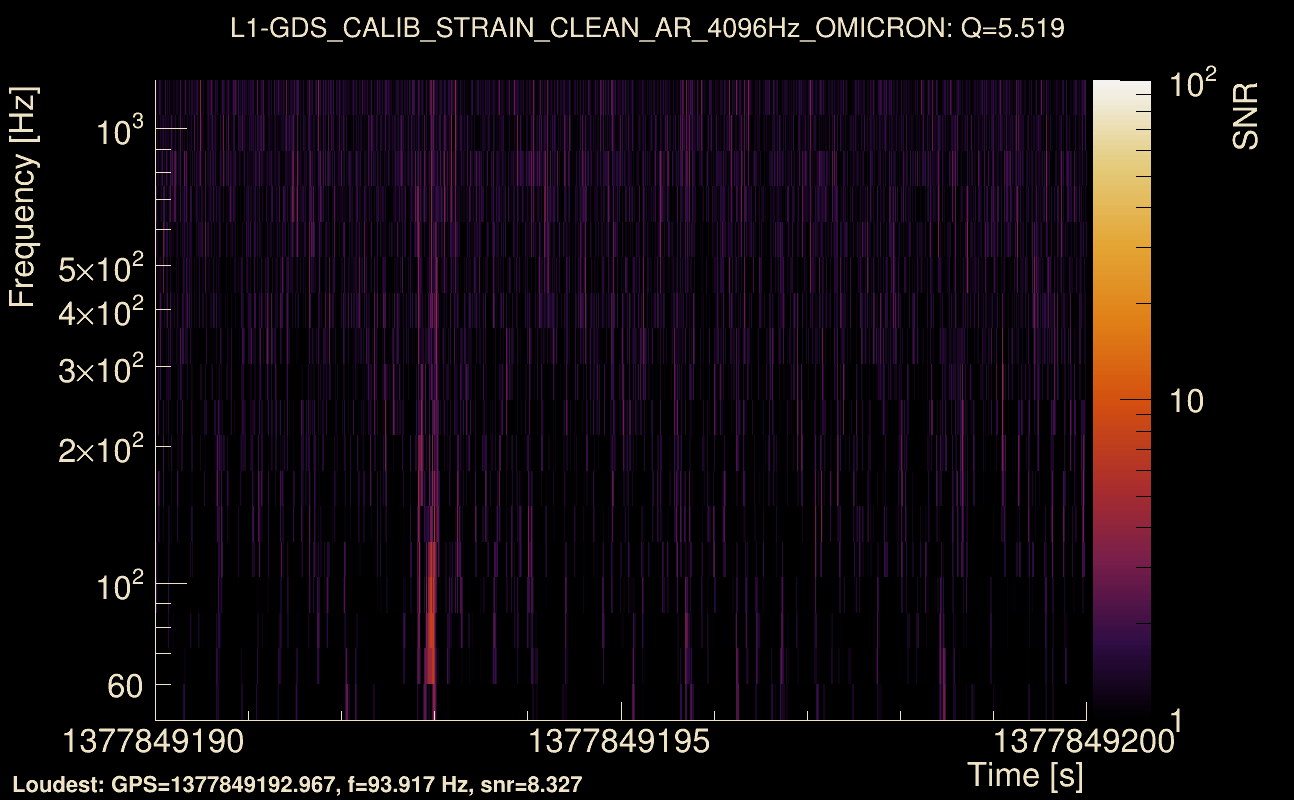
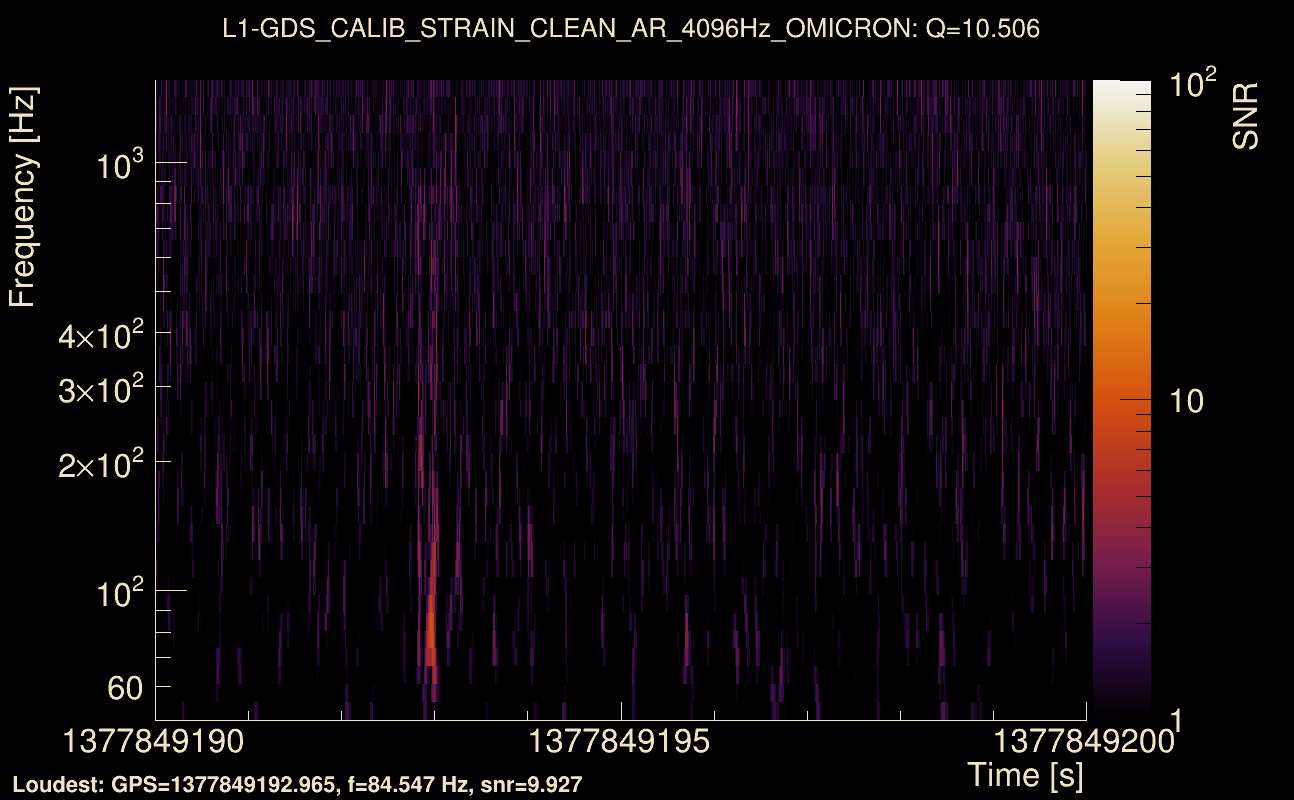
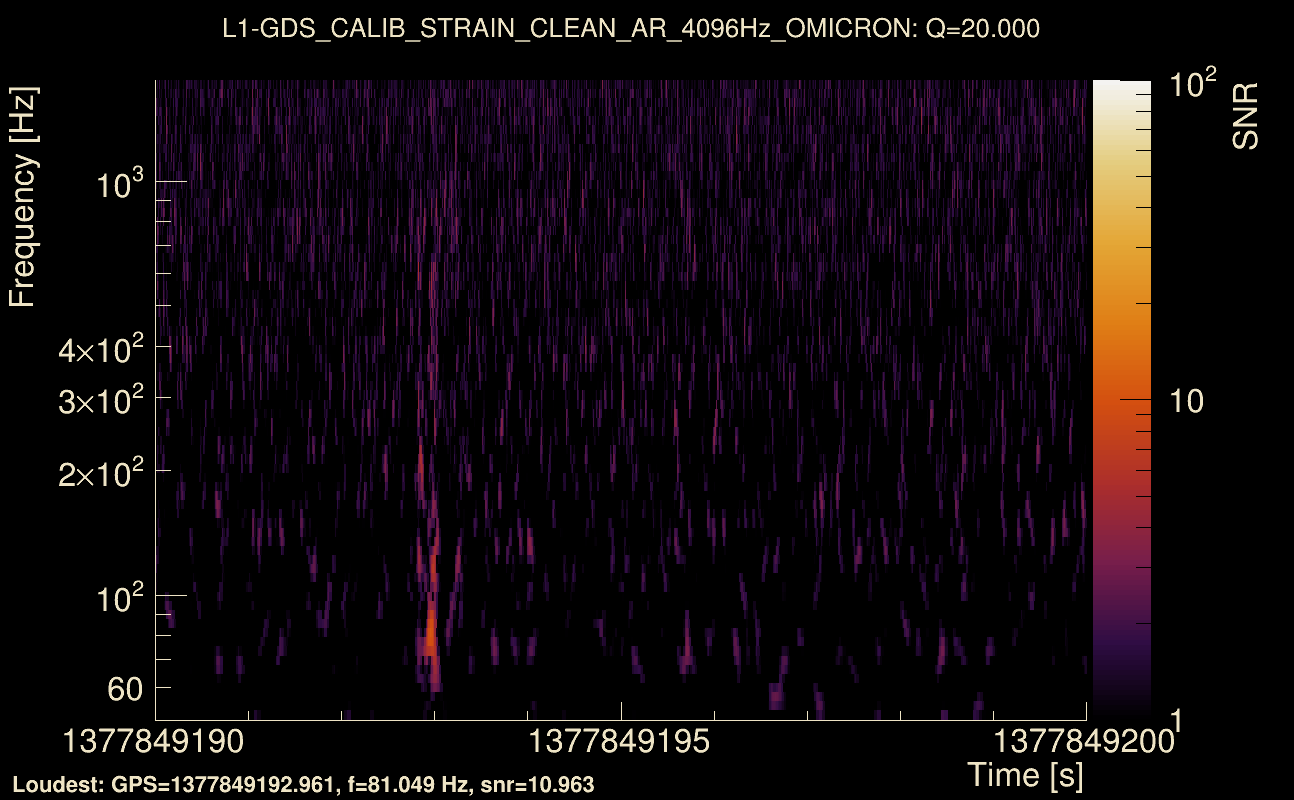
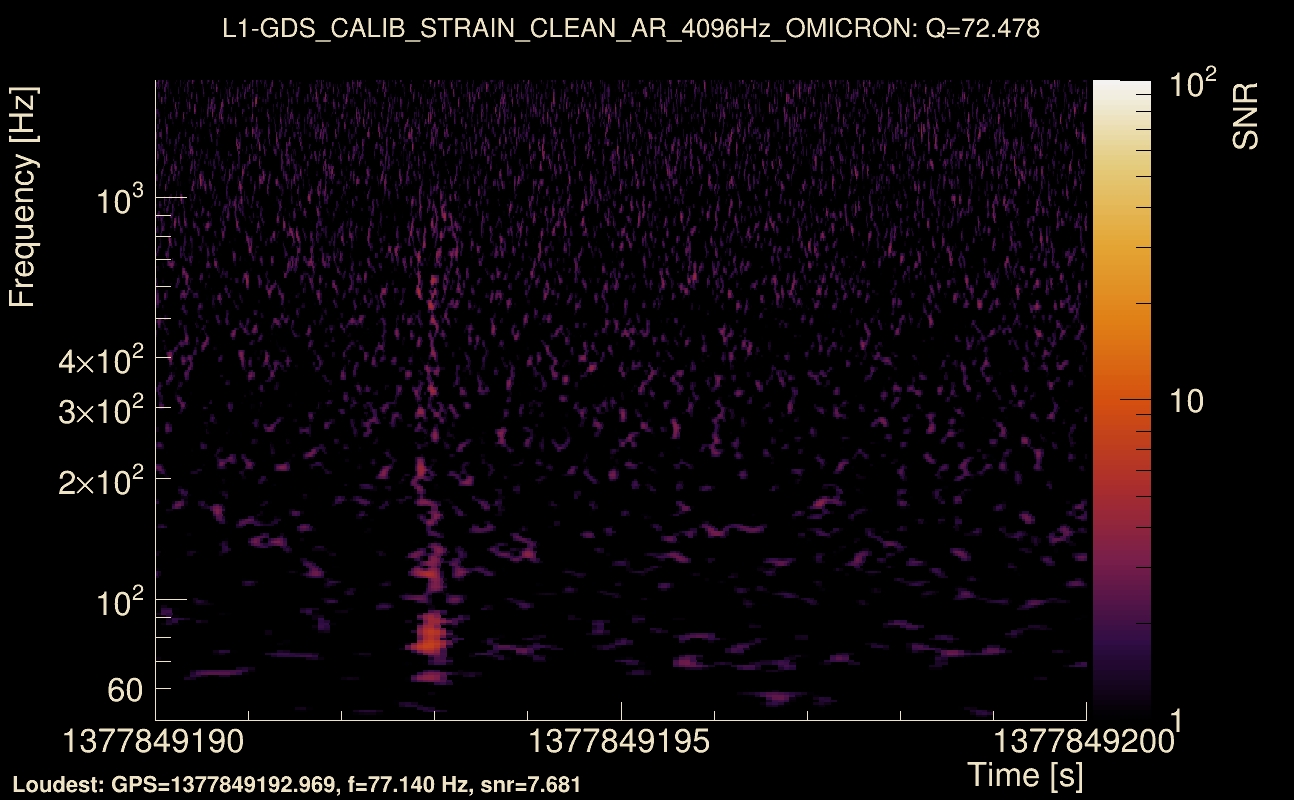
| Event time t(H1): | GPS = 1377849190 (Mon Sep 4 07:52:52 2023 ) → GPS = 1377849200 (Mon Sep 4 07:53:02 2023 ) |
| Event time t(L1): | GPS = 1377849190 (Mon Sep 4 07:53:02 2023 ) → GPS = 1377849200 (Mon Sep 4 07:53:02 2023 ) |
| Omicron analysis time window (H1): | GPS = 1377849187 → GPS = 1377849203 |
| Omicron analysis time window (L1): | GPS = 1377849187 → GPS = 1377849203 |
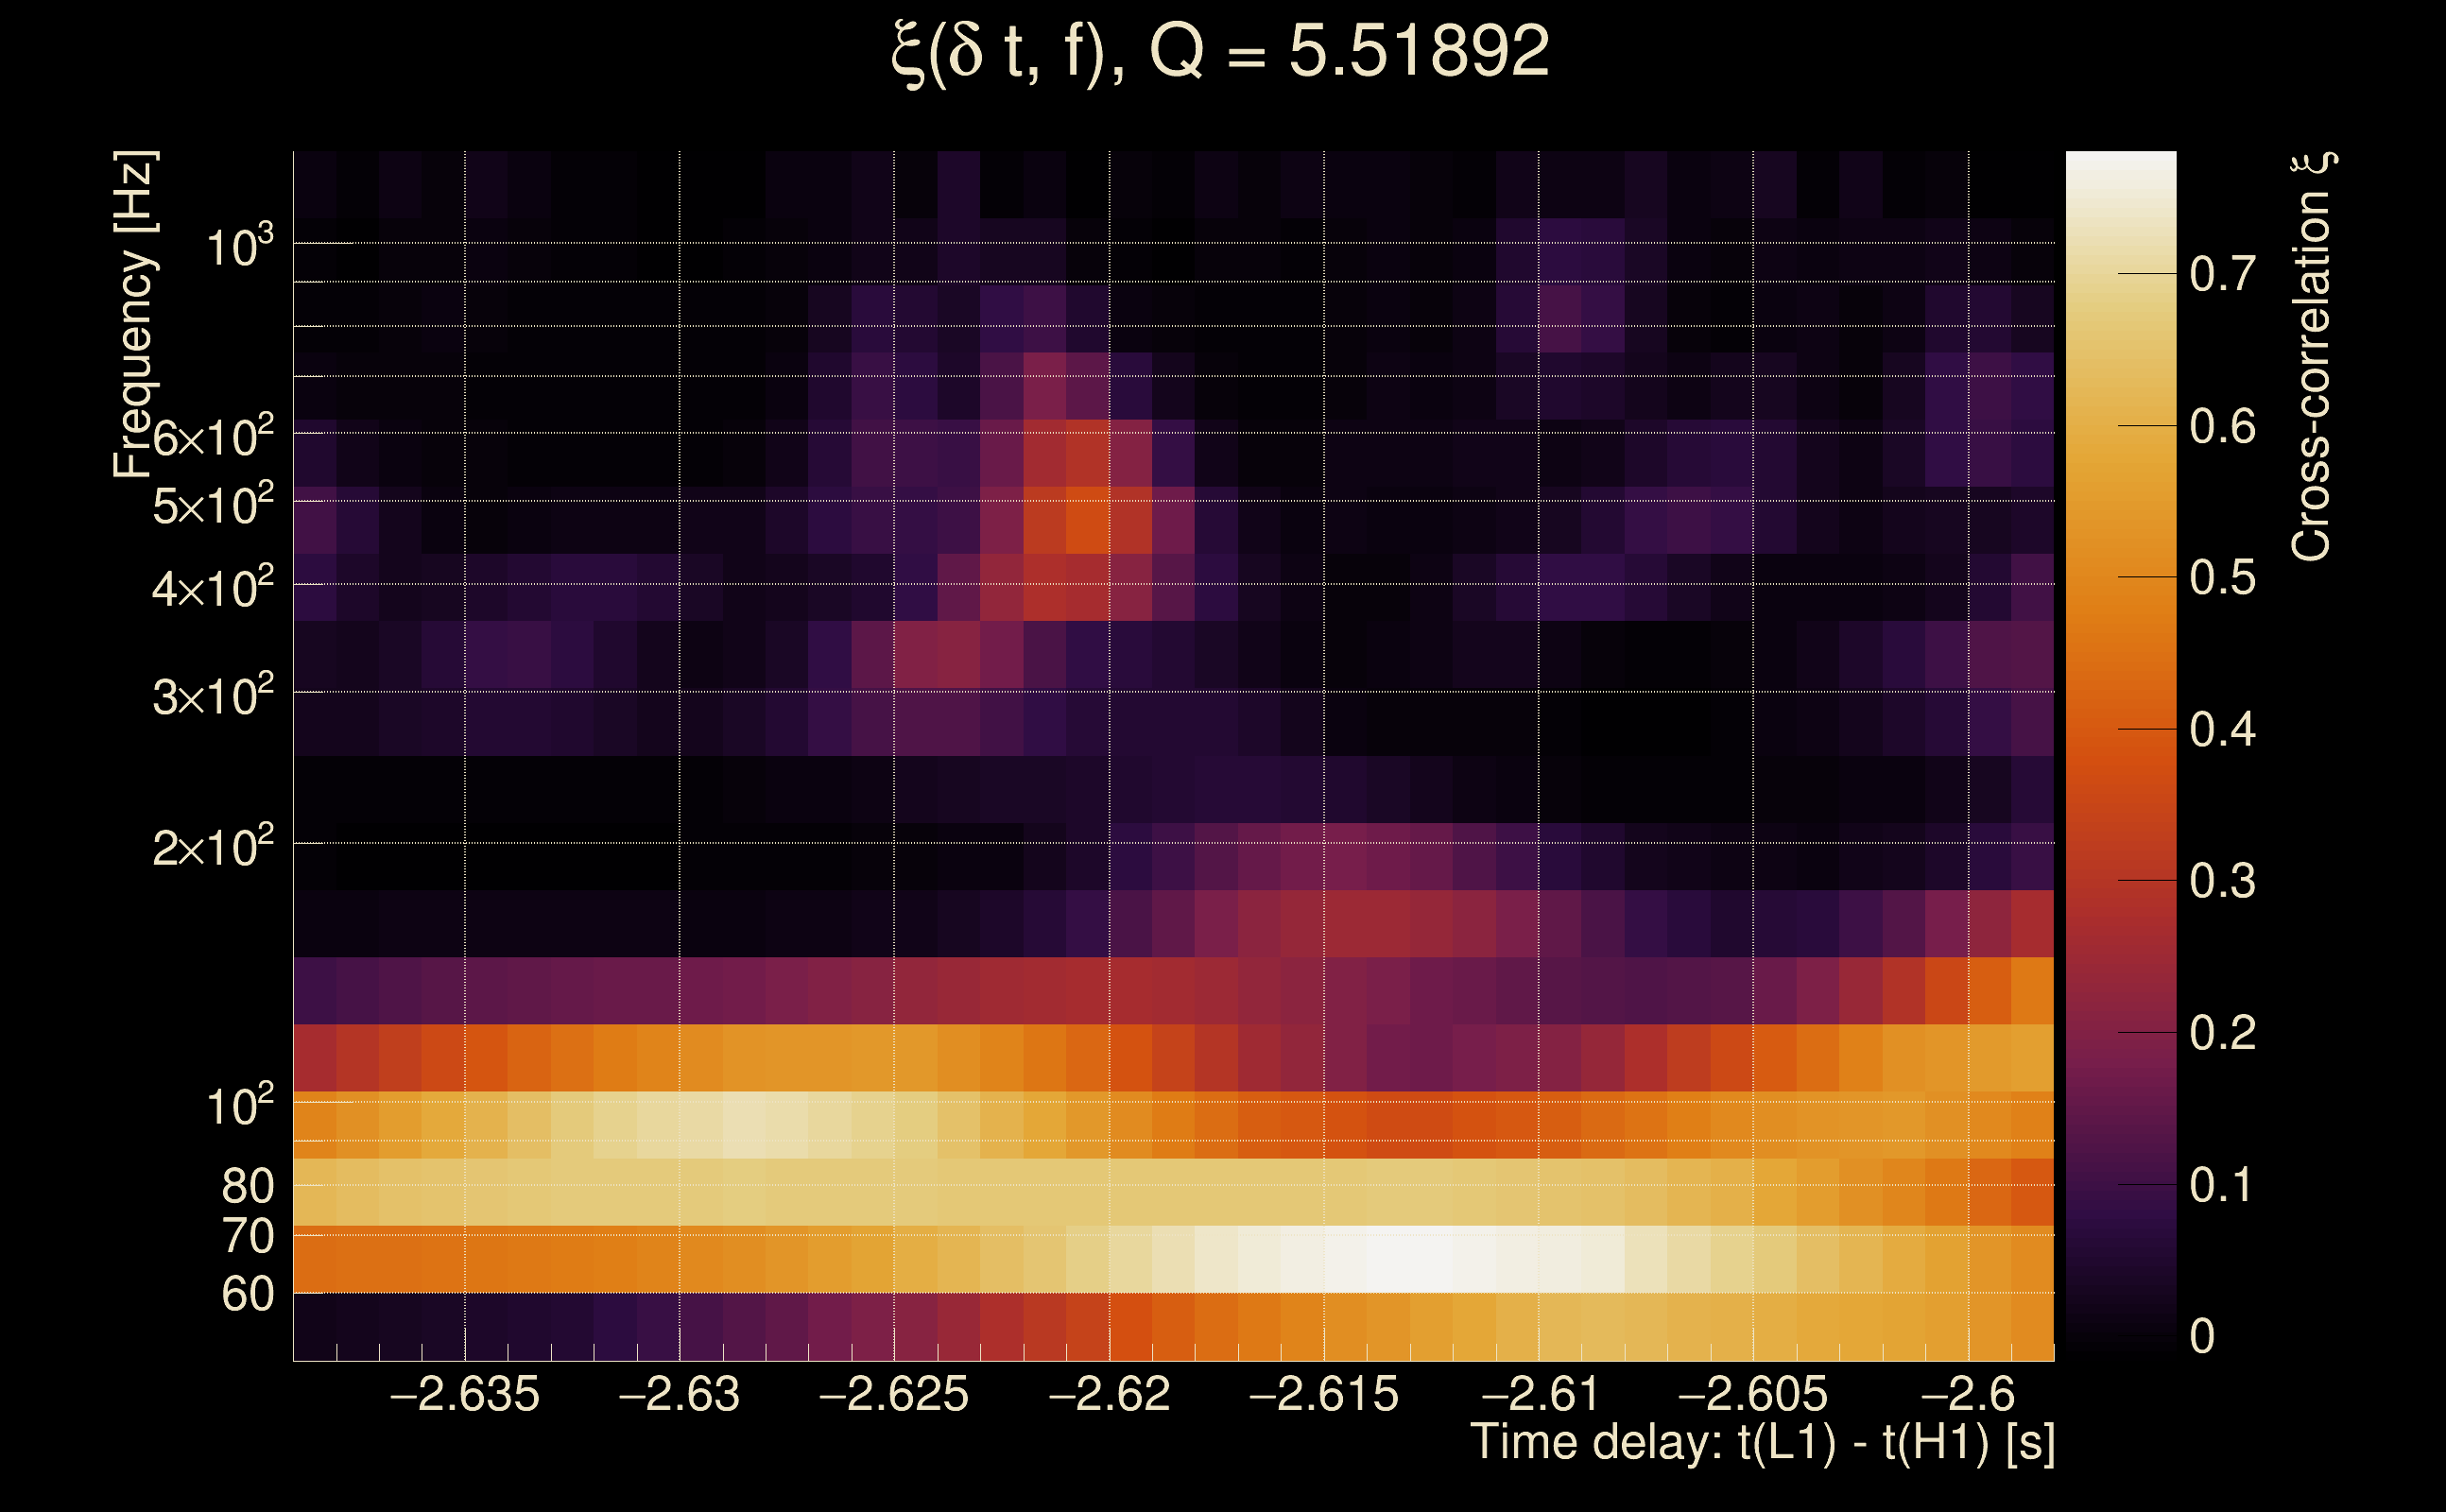
| Time delay between detectors t(L1) - t(H1): | -2.6185 s (slice index = 165 / 217), δt_gw = 0.00349738 s |
| Time delay uncertainty: | 0.00555118 s |
| [targeted mode] Time delay probability: | 0.403685 (0.835057 sigmas), δt_target = 0.000791788 s |
| Frequency: | 157.889 Hz |
| Ξ: | 0.296282 ± 0.100196 (variance = 0.0100392): Q0: 0.473832, Q1: 0.558993, Q2: 0.65035, Q3: 0.688056, Q4: 0.760565 |
| Rank: | R_A = 0.139545 |
| Log of amplitude ratio (L1/H1): | -1.73, variance = 0.490517 (L1/H1: -1.75704, variance = 0.524305, H1/L1: 0.951498, variance = 0.724374) |
| Amplitude ratio (L1/H1): | 0.177284 ⋇ 2.0145 (L1/H1: 0.172555 ⋇ 2.06285, H1/L1: 2.58959 ⋇ 2.34223) |
| Amplitude ratio H1|L1 compatibility (probability): | 0.470985 |
| Antenna factor probability: | 1 |
| Number of rejected frequency rows: | Q0: 4 / 18, Q1: 19 / 36, Q2: 50 / 70, Q3: 99 / 134, Q4: 216 / 258 |
| Maximum signal-to-noise ratio: | H1: 67.4809, L1: 12.5755 |
| SNR variance: | H1: 0.631365, L1: 0.615465 |
| Click here for a zoomed plot | Click here for a zoomed plot | Click here for a zoomed plot | Click here for a zoomed plot | Click here for a zoomed plot |
 |
 |
 |
 |
 |
 |
 |
 |
 |
 |
 |
 |
 |
 |
 |
 |
 |
 |
 |
 |
 |
 |
 |
 |
 |
 |
 |
 |
 |
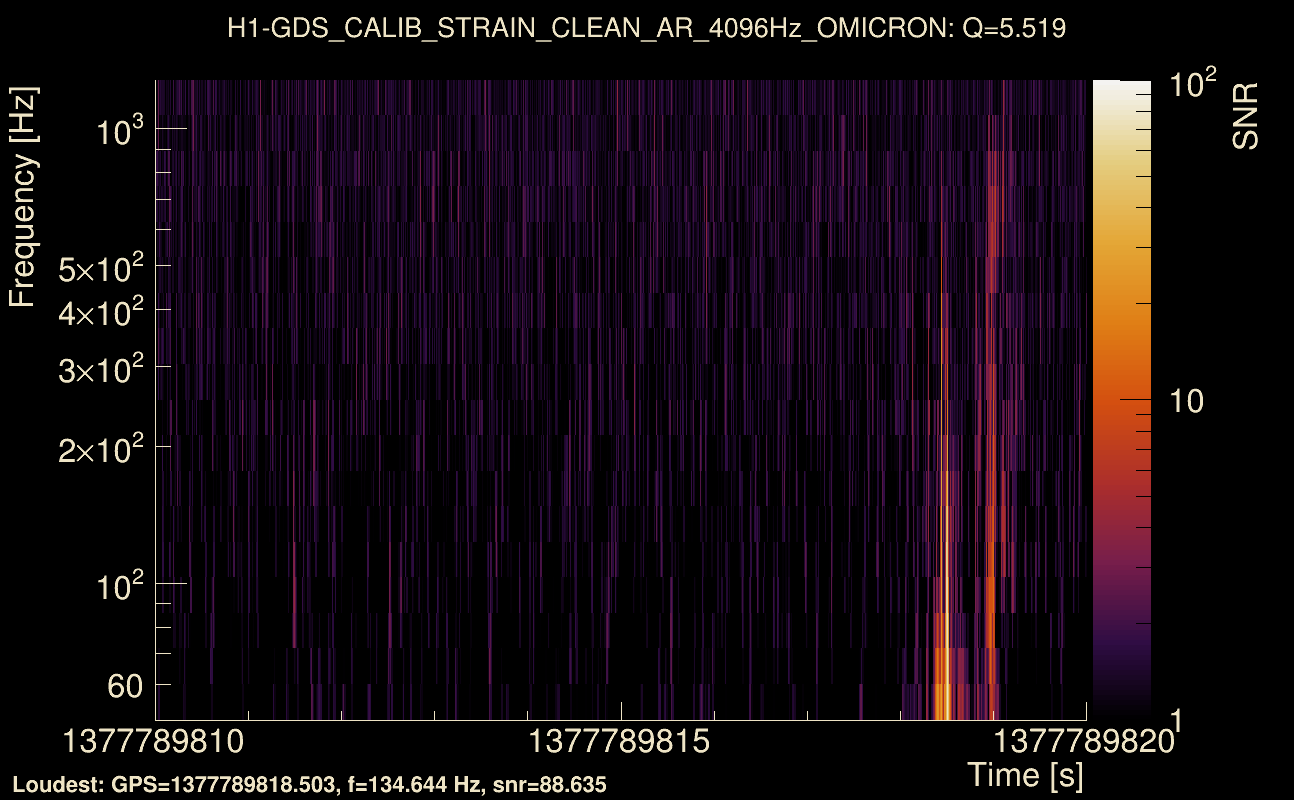
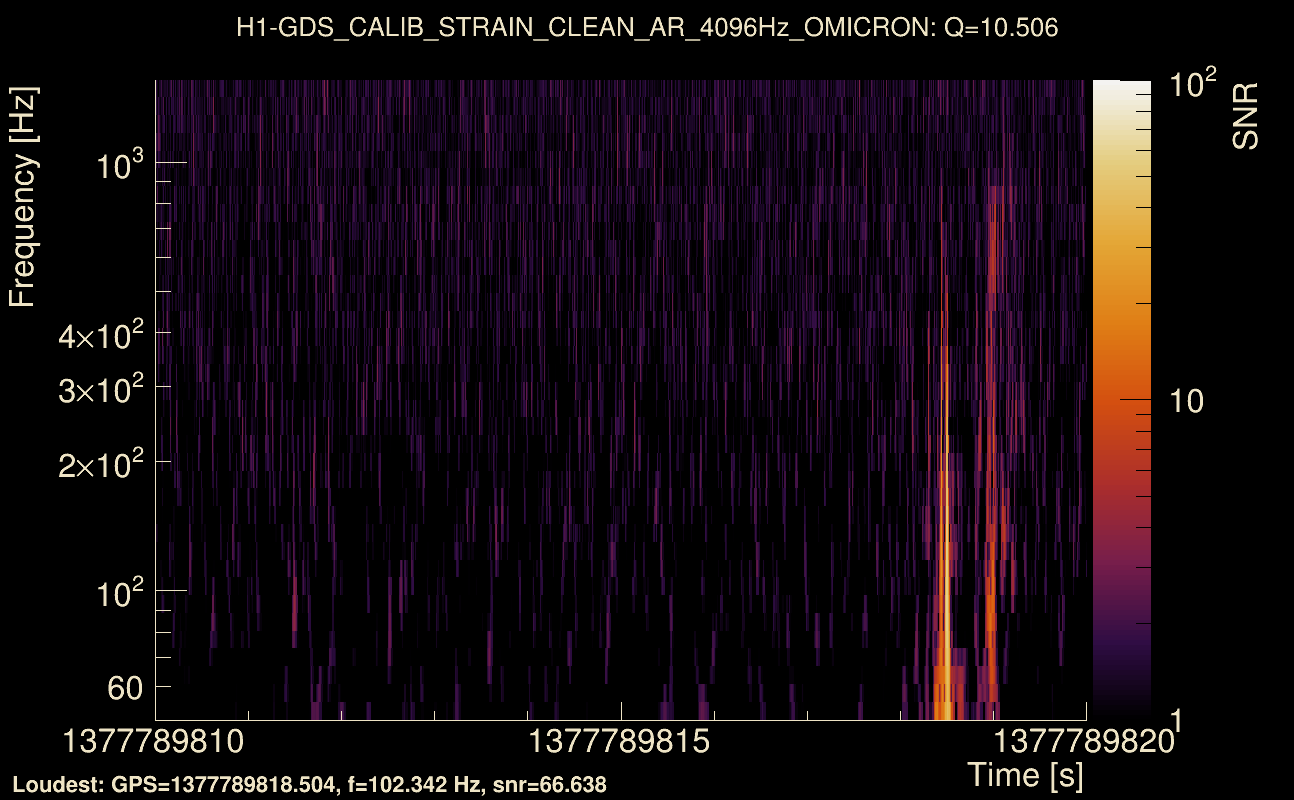
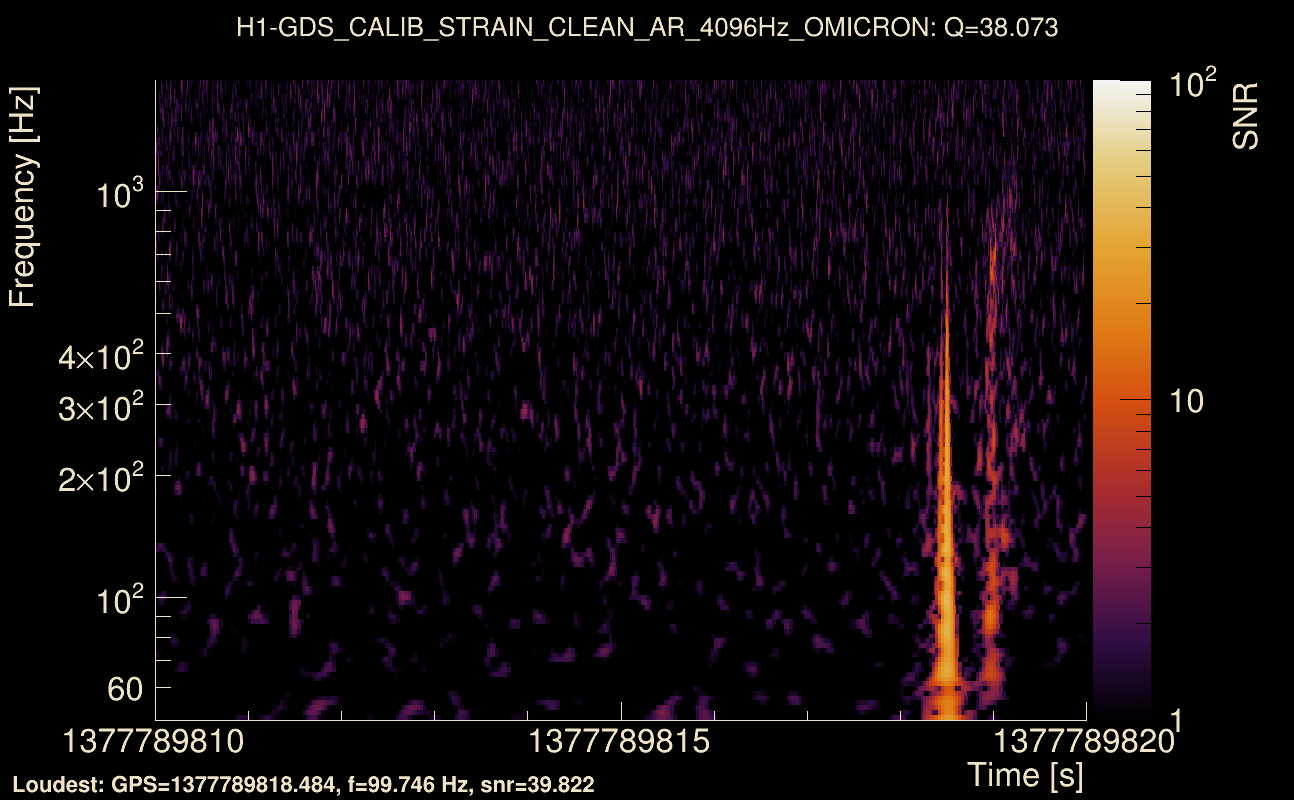
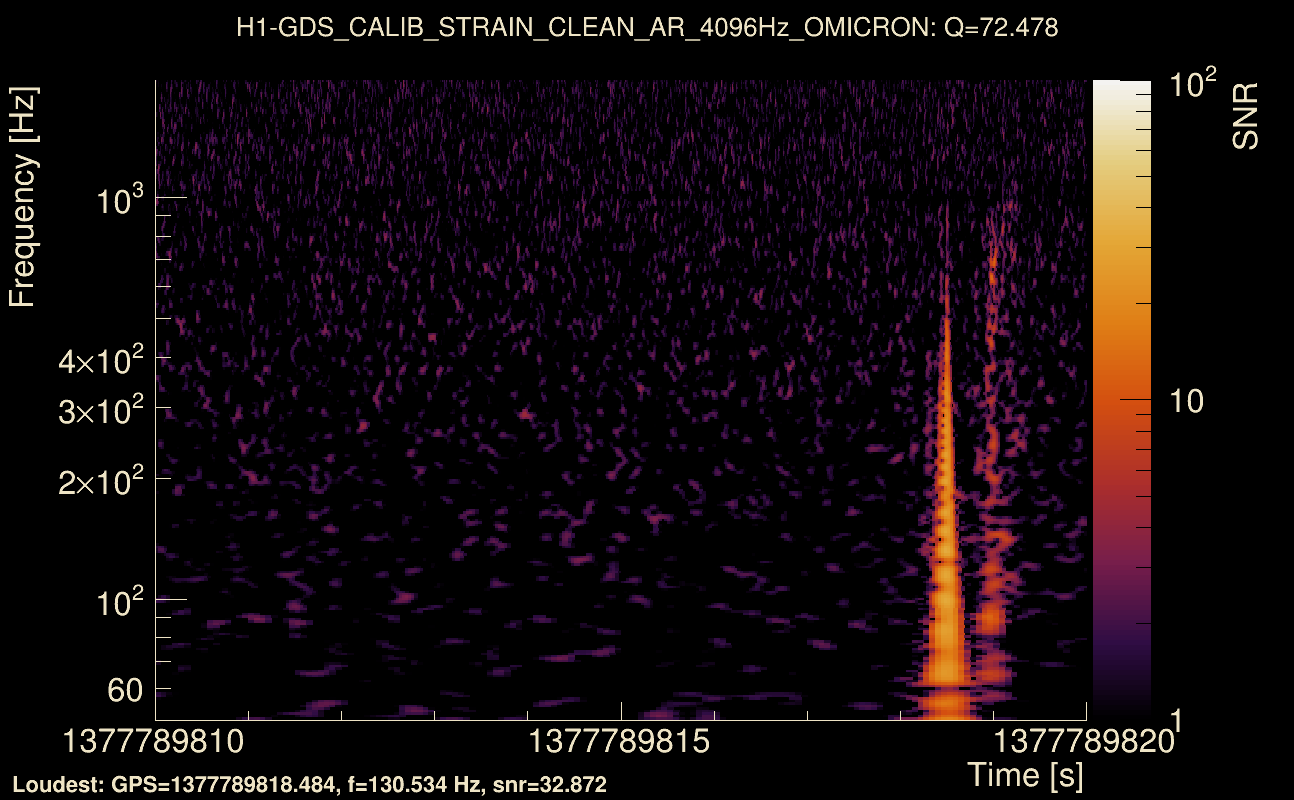
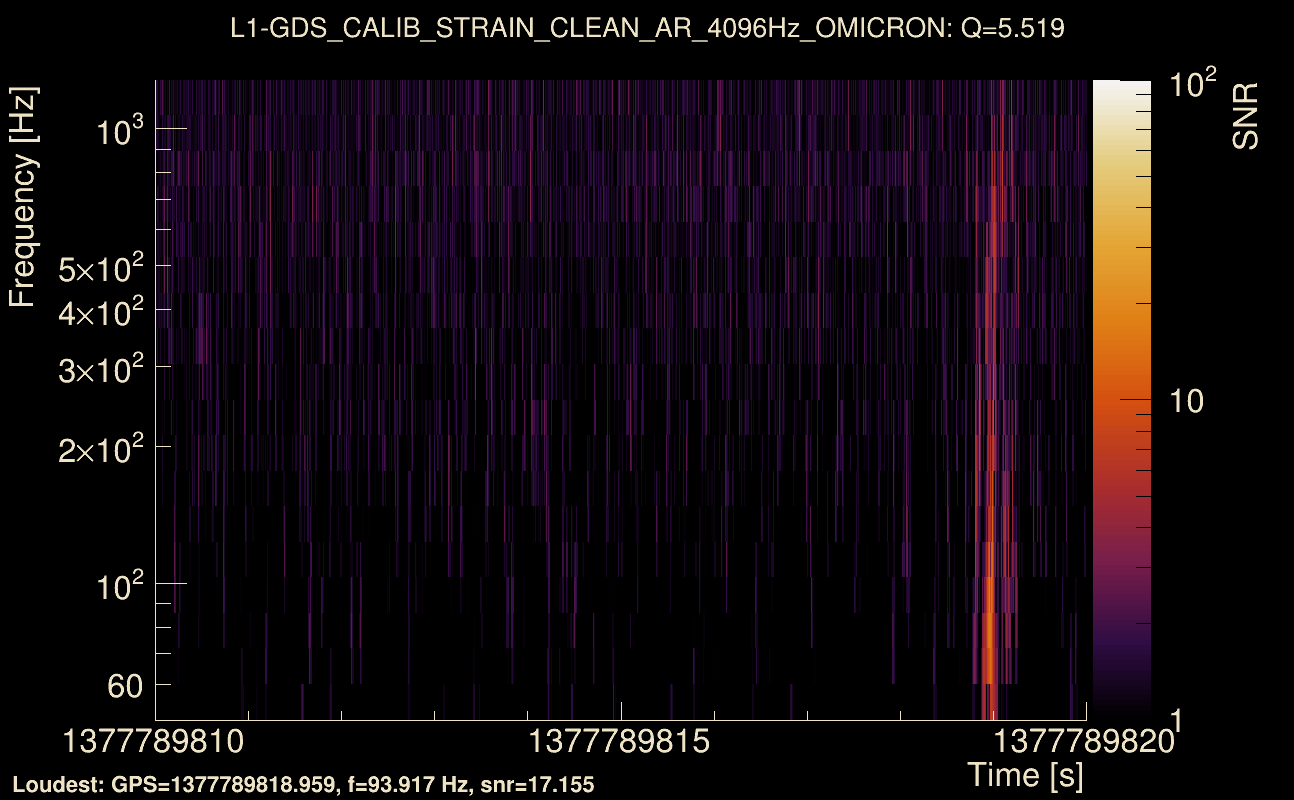
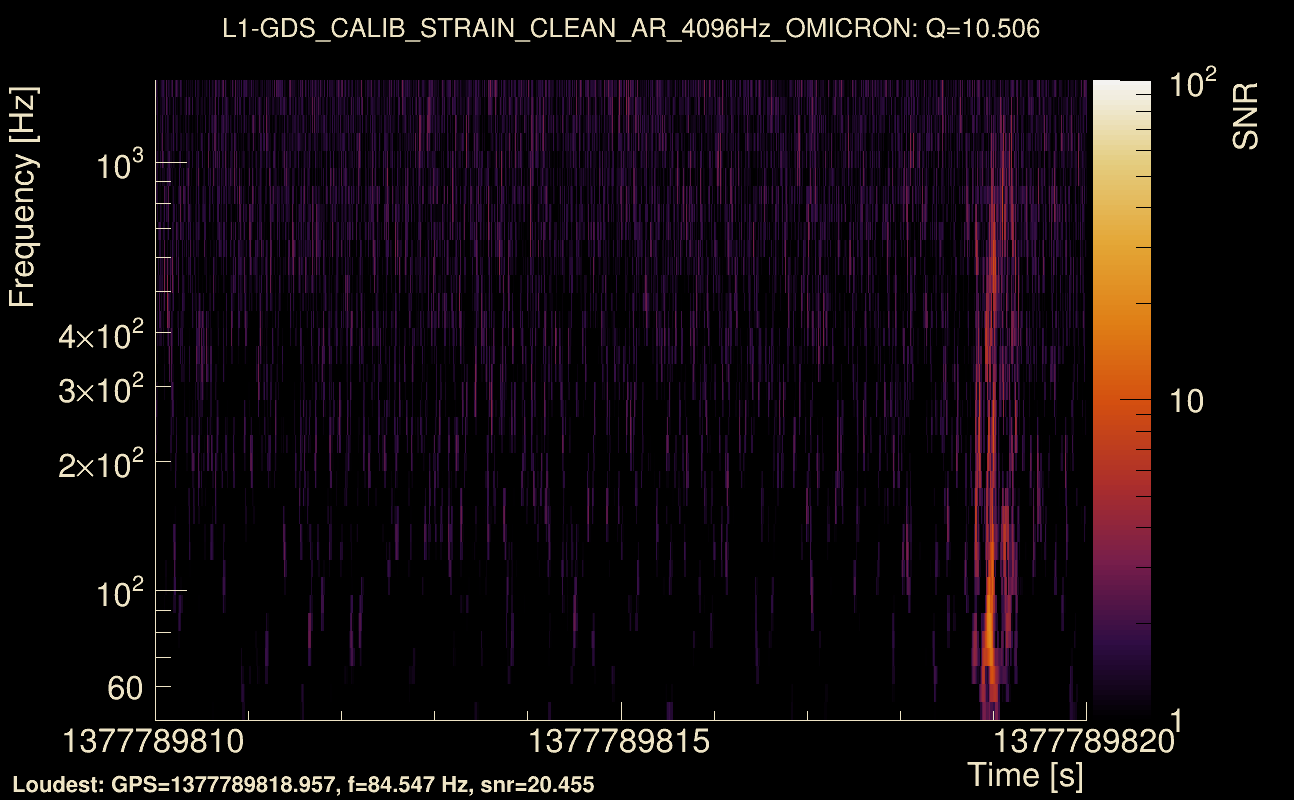
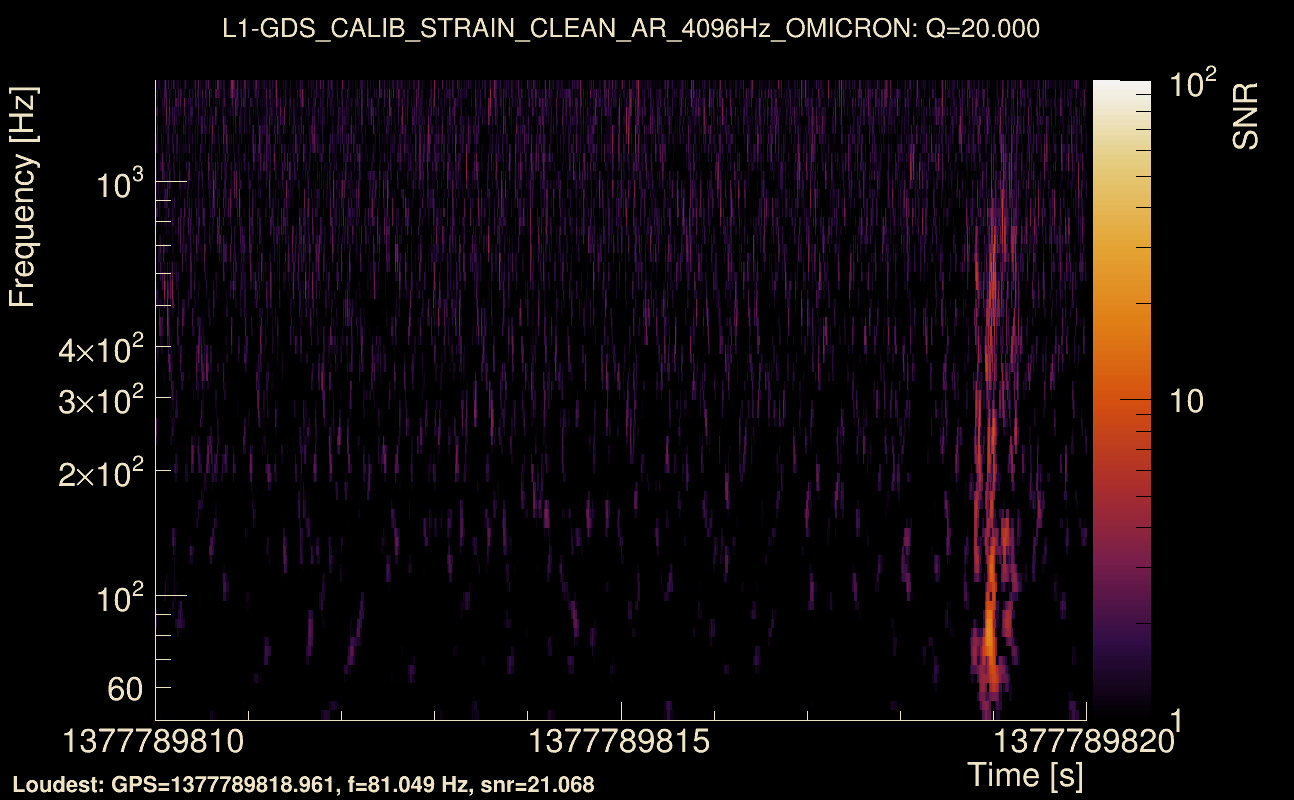
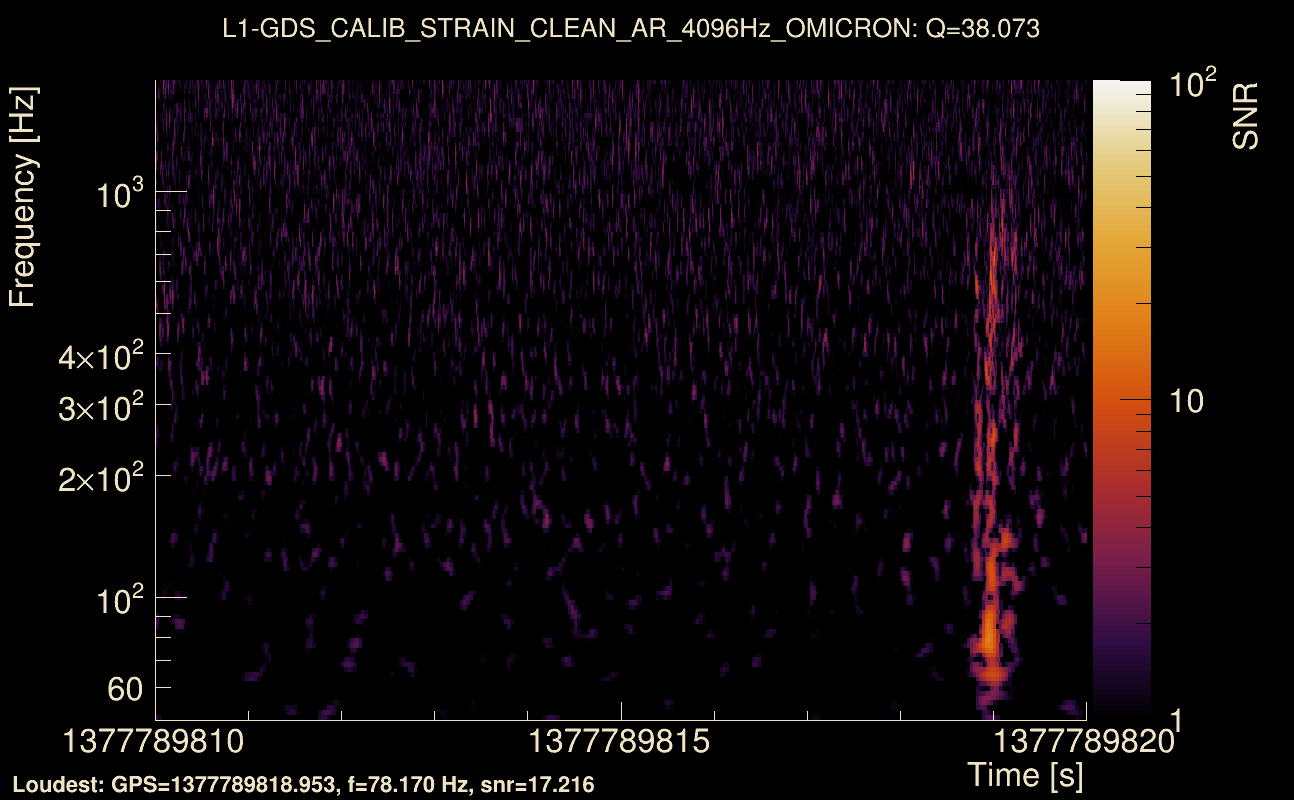
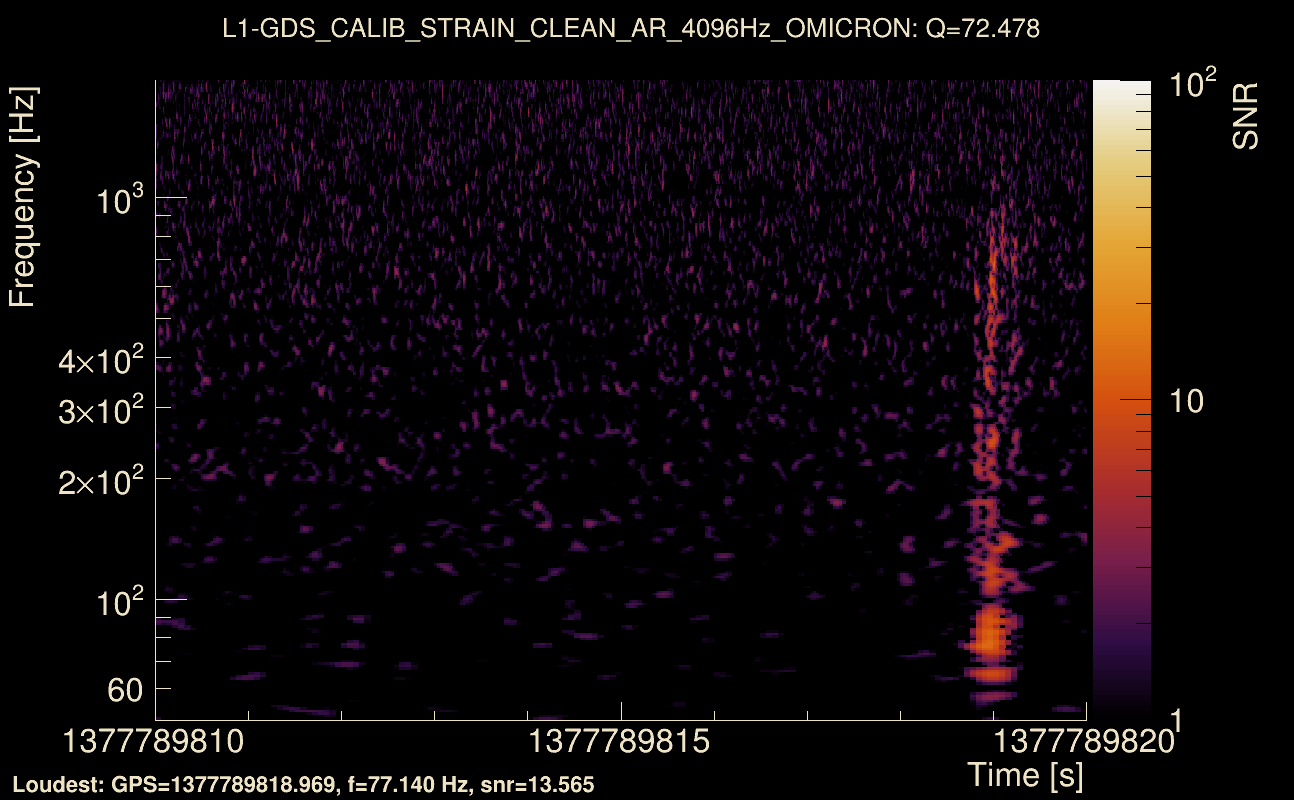
| Event time t(H1): | GPS = 1377789810 (Sun Sep 3 15:23:12 2023 ) → GPS = 1377789820 (Sun Sep 3 15:23:22 2023 ) |
| Event time t(L1): | GPS = 1377789810 (Sun Sep 3 15:23:22 2023 ) → GPS = 1377789820 (Sun Sep 3 15:23:22 2023 ) |
| Omicron analysis time window (H1): | GPS = 1377789807 → GPS = 1377789823 |
| Omicron analysis time window (L1): | GPS = 1377789807 → GPS = 1377789823 |
| Time delay between detectors t(L1) - t(H1): | 0.464813 s (slice index = 98 / 217), δt_gw = 0.00481251 s |
| Time delay uncertainty: | 0.00691271 s |
| [targeted mode] Time delay probability: | 0.445264 (0.763335 sigmas), δt_target = -0.00896955 s |
| Frequency: | 191.718 Hz |
| Ξ: | 0.353598 ± 0.0664978 (variance = 0.00442195): Q0: 0.568824, Q1: 0.601408, Q2: 0.699721, Q3: 0.752656, Q4: 0.674244 |
| Rank: | R_A = 0.139232 |
| Log of amplitude ratio (L1/H1): | -1.41402, variance = 0.50544 (L1/H1: -1.48984, variance = 0.585753, H1/L1: 0.482947, variance = 0.80821) |
| Amplitude ratio (L1/H1): | 0.243164 ⋇ 2.03591 (L1/H1: 0.225408 ⋇ 2.14974, H1/L1: 1.62084 ⋇ 2.45716) |
| Amplitude ratio H1|L1 compatibility (probability): | 0.393758 |
| Antenna factor probability: | 1 |
| Number of rejected frequency rows: | Q0: 6 / 18, Q1: 12 / 36, Q2: 44 / 70, Q3: 86 / 134, Q4: 199 / 258 |
| Maximum signal-to-noise ratio: | H1: 93.0124, L1: 26.5428 |
| SNR variance: | H1: 0.515996, L1: 0.501822 |
| Click here for a zoomed plot | Click here for a zoomed plot | Click here for a zoomed plot | Click here for a zoomed plot | Click here for a zoomed plot |
 |
 |
 |
 |
 |
 |
 |
 |
 |
 |
 |
 |
 |
 |
 |
 |
 |
 |
 |
 |
 |
 |
 |
 |
 |
 |
 |
 |
 |
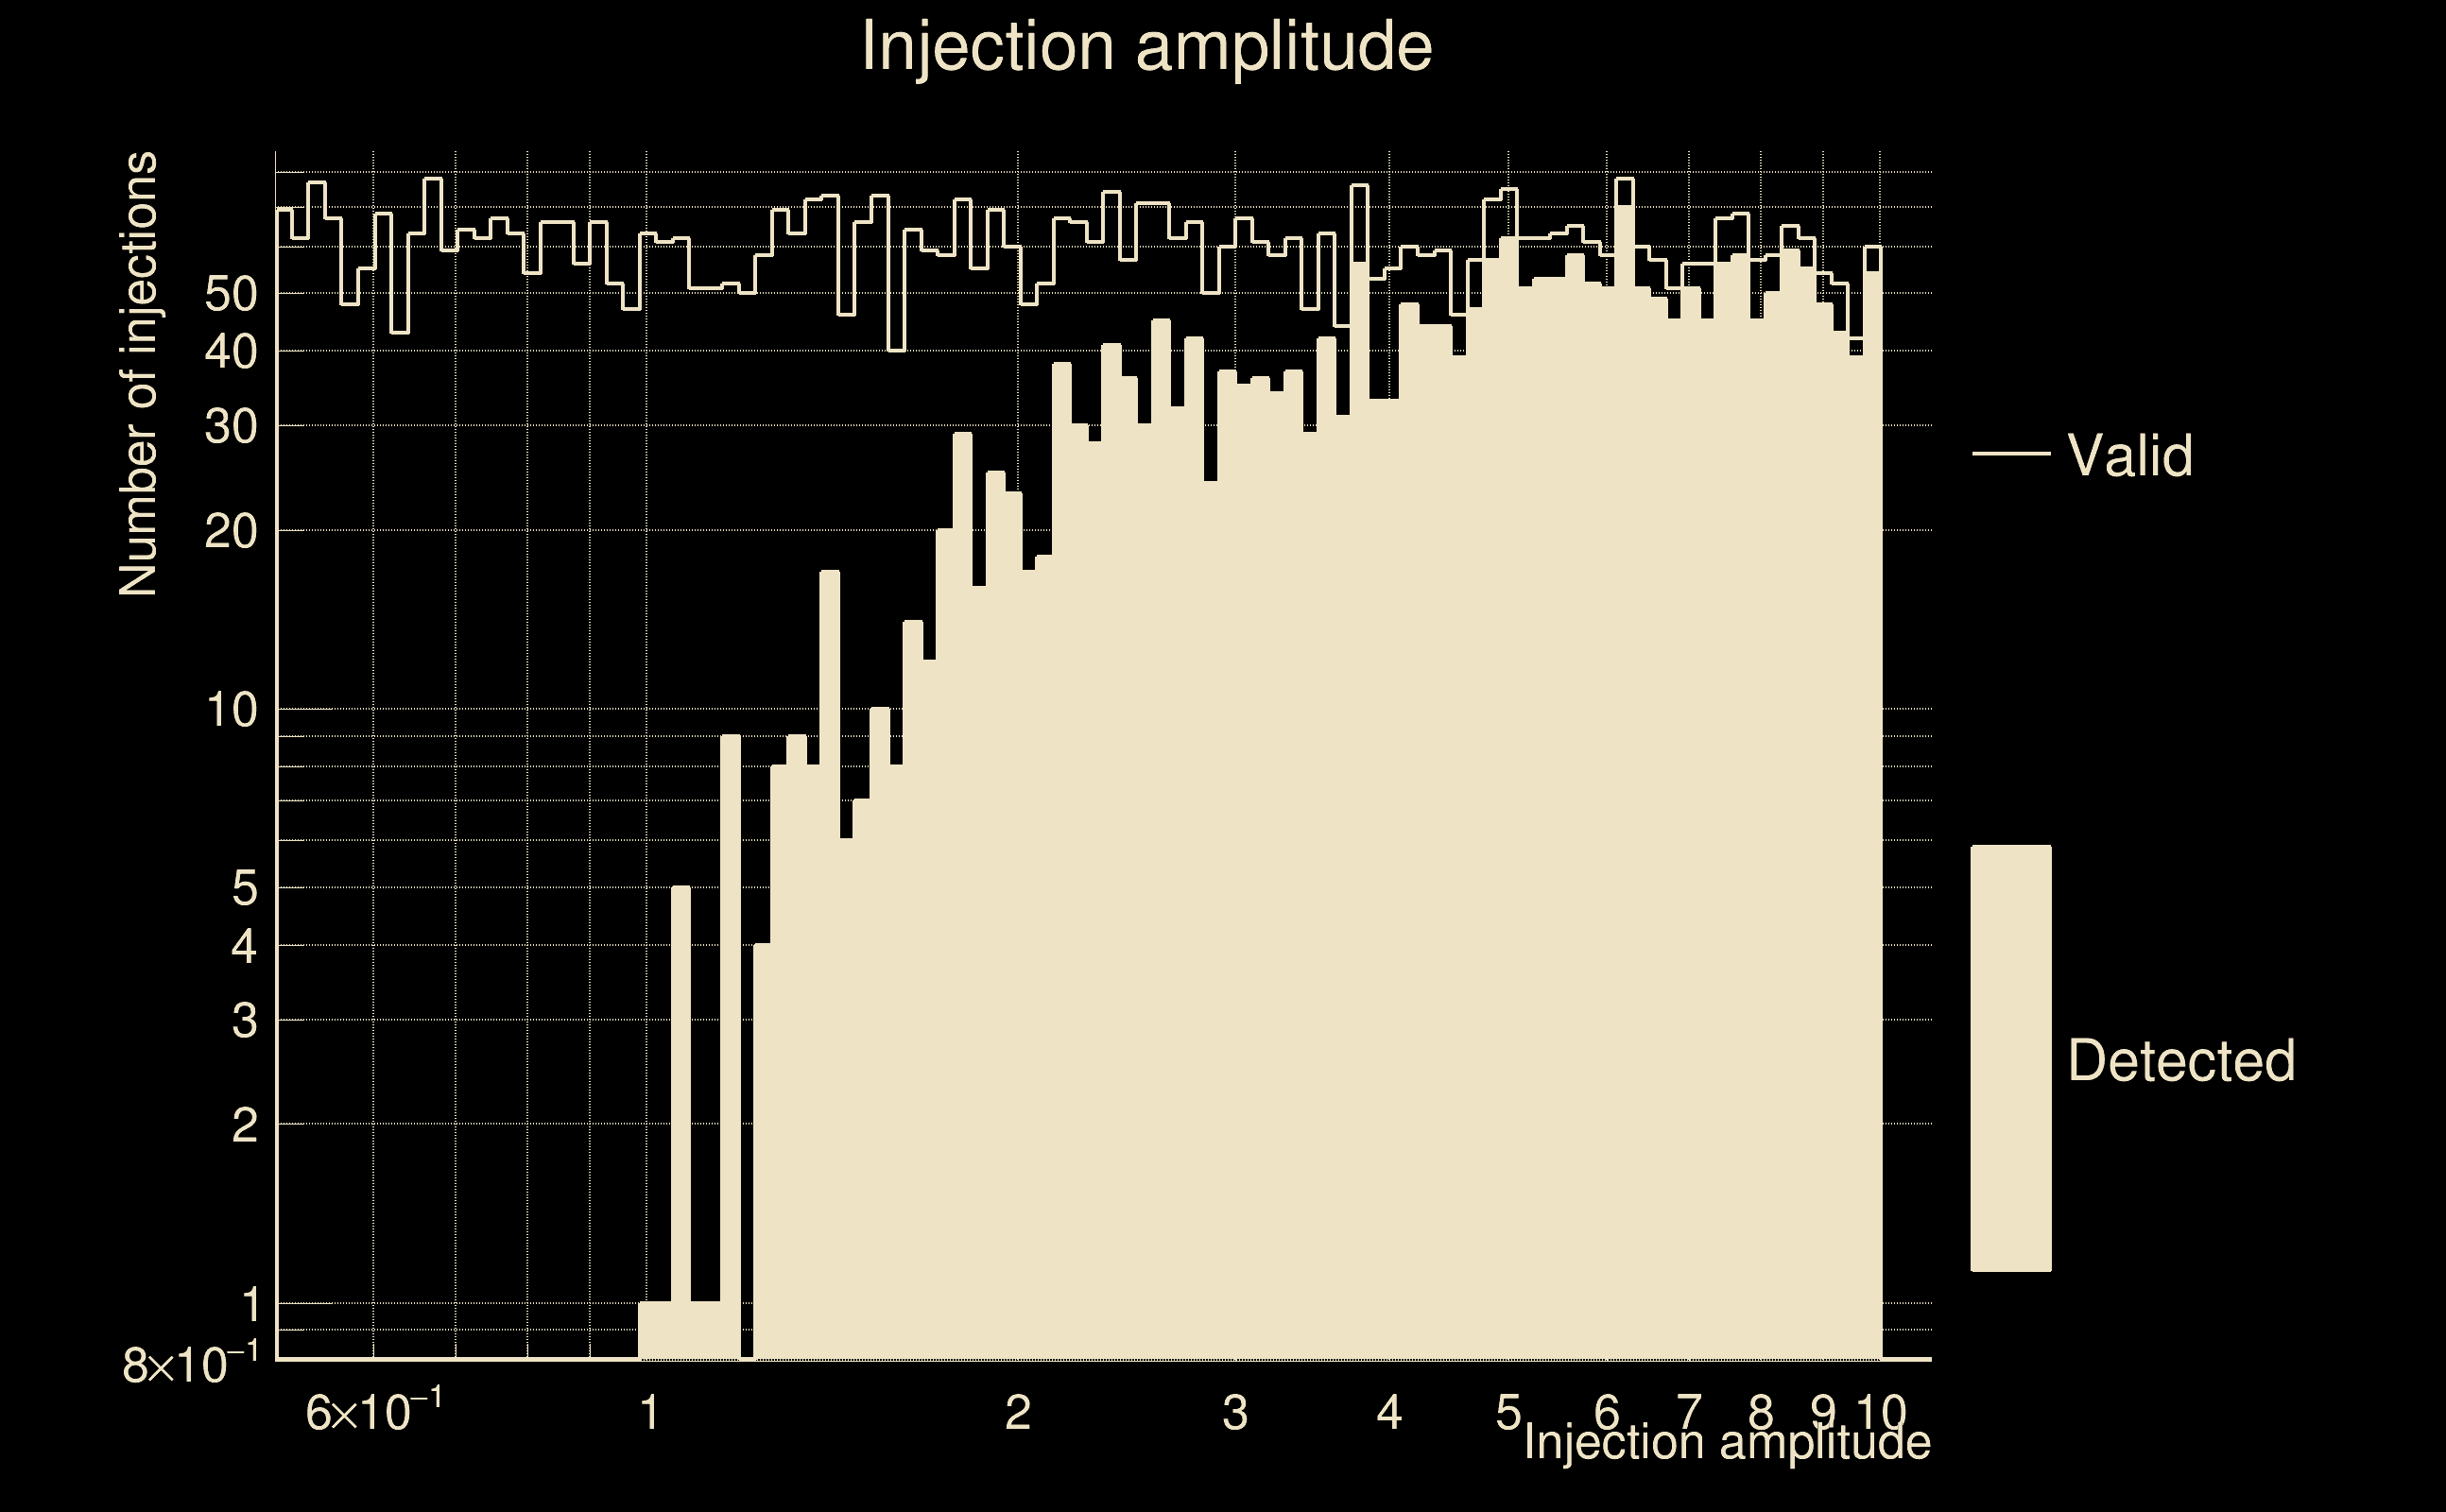
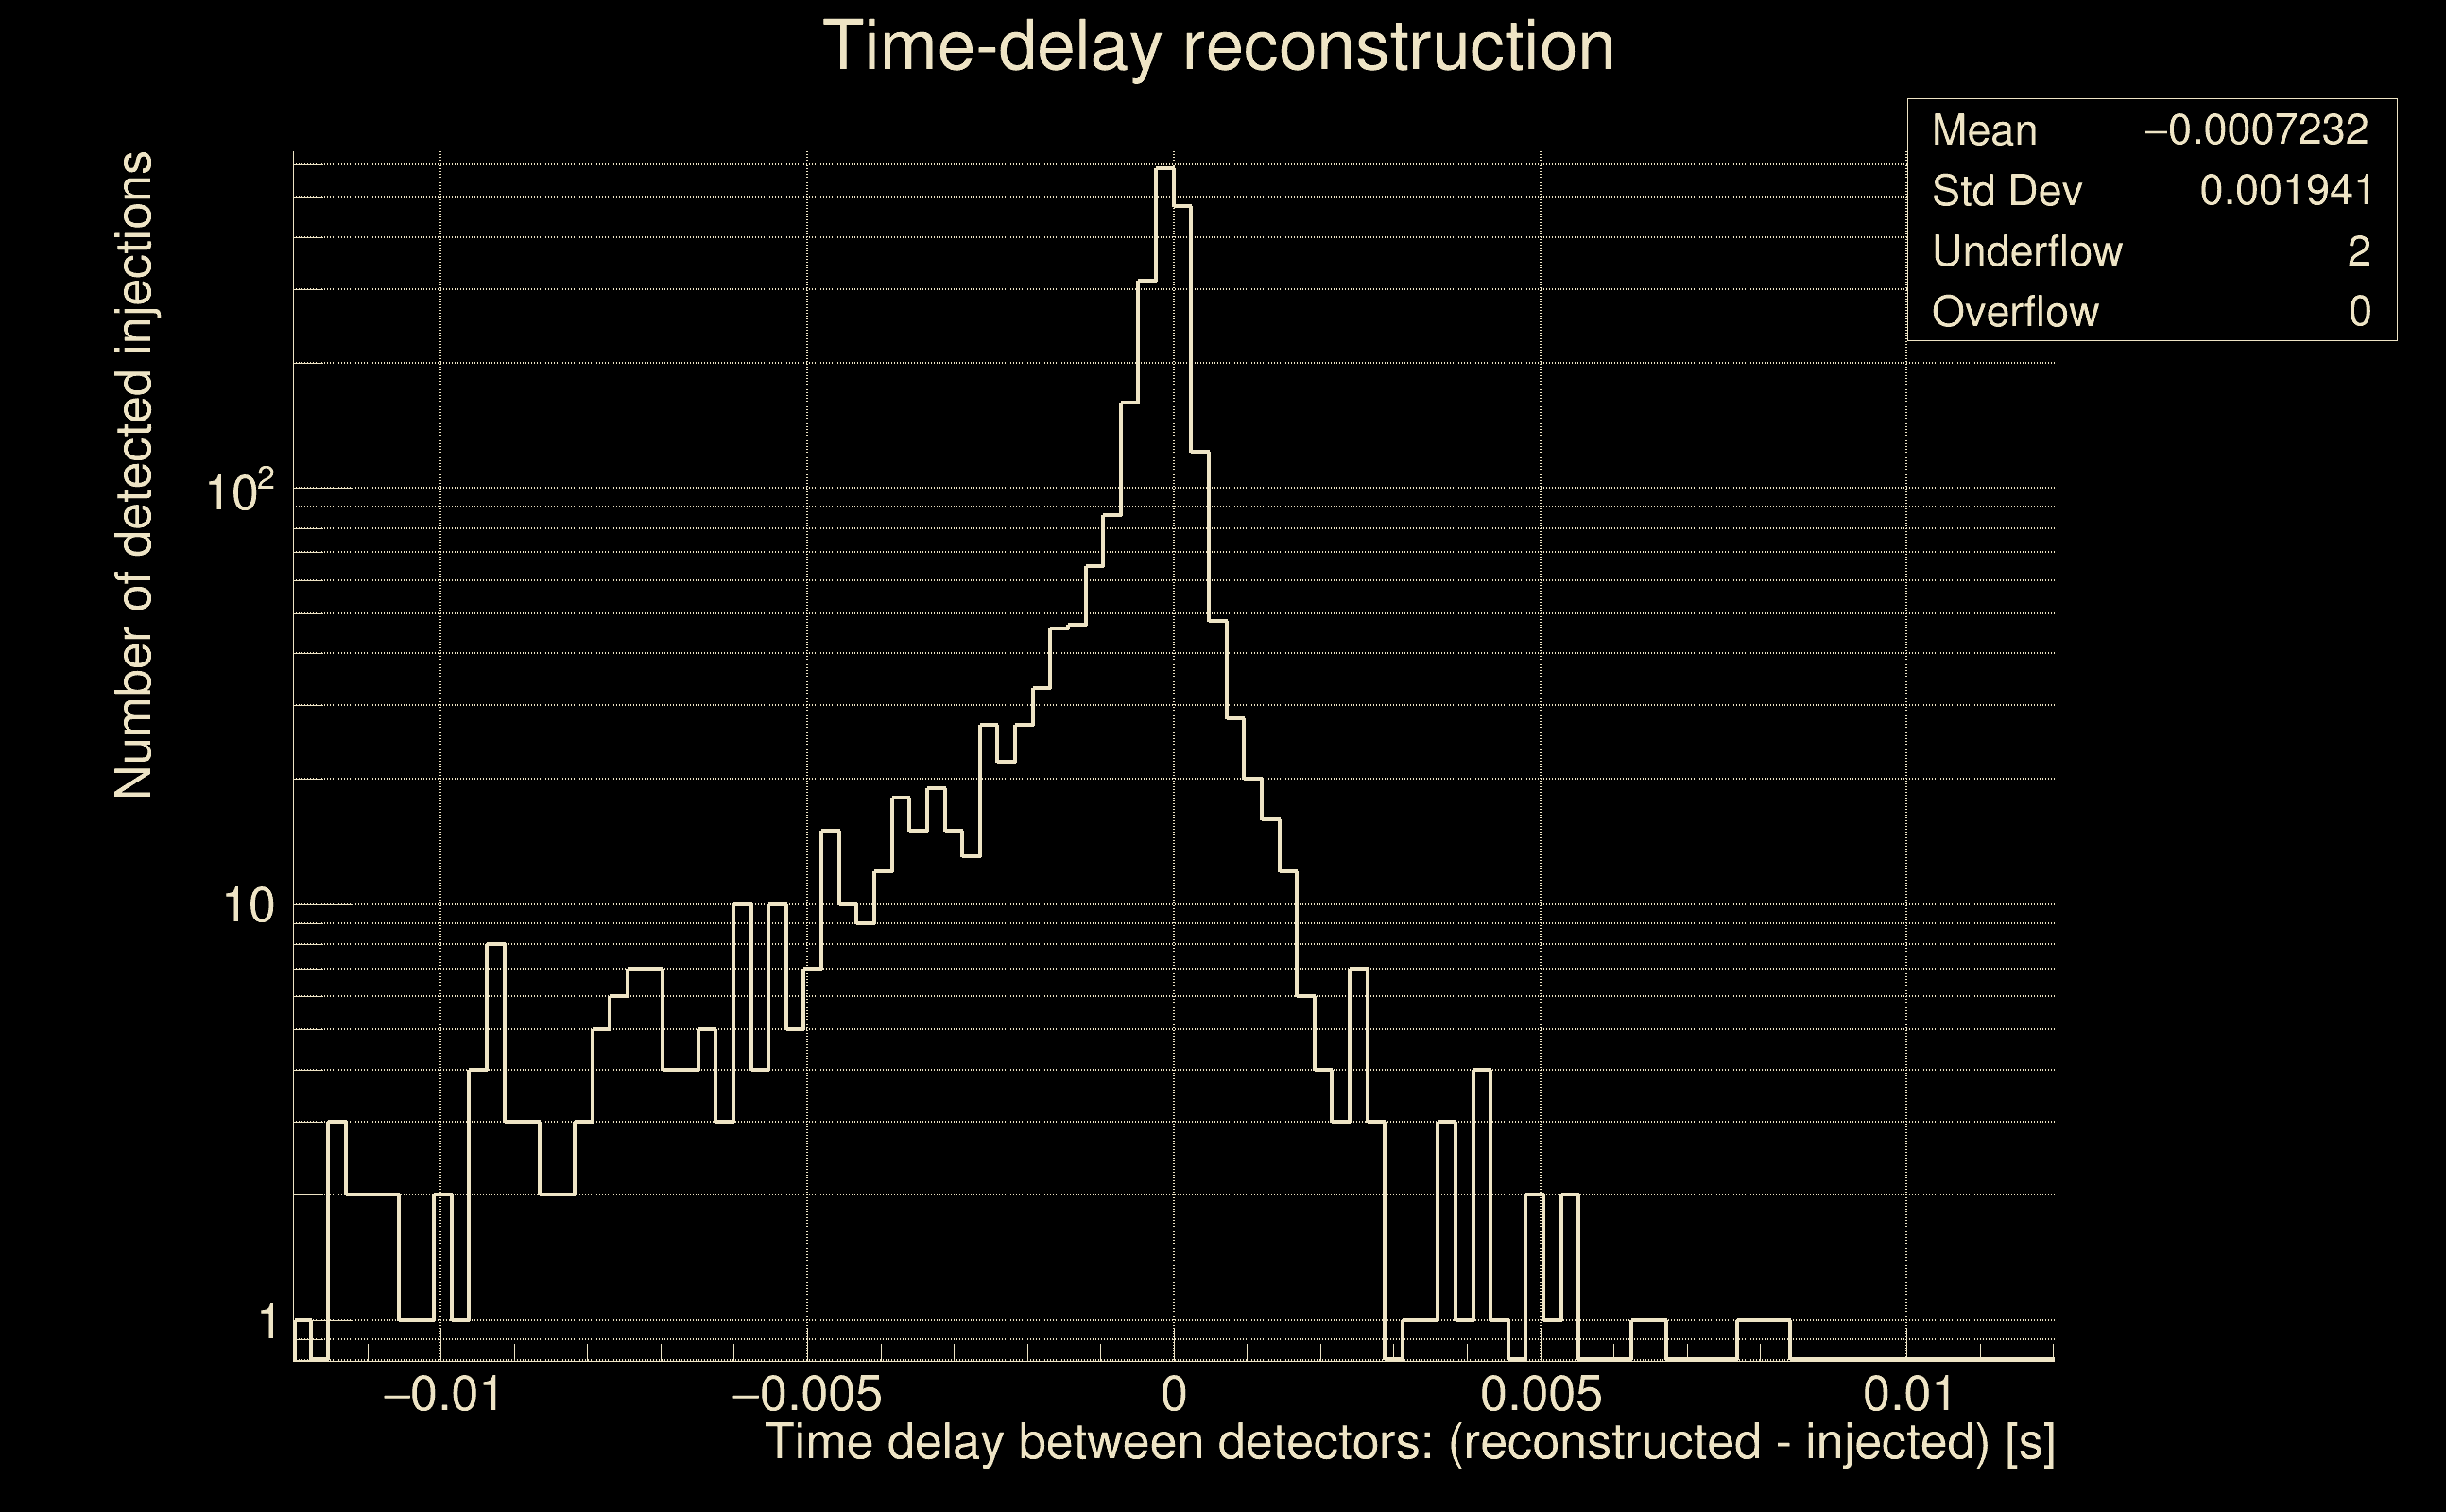
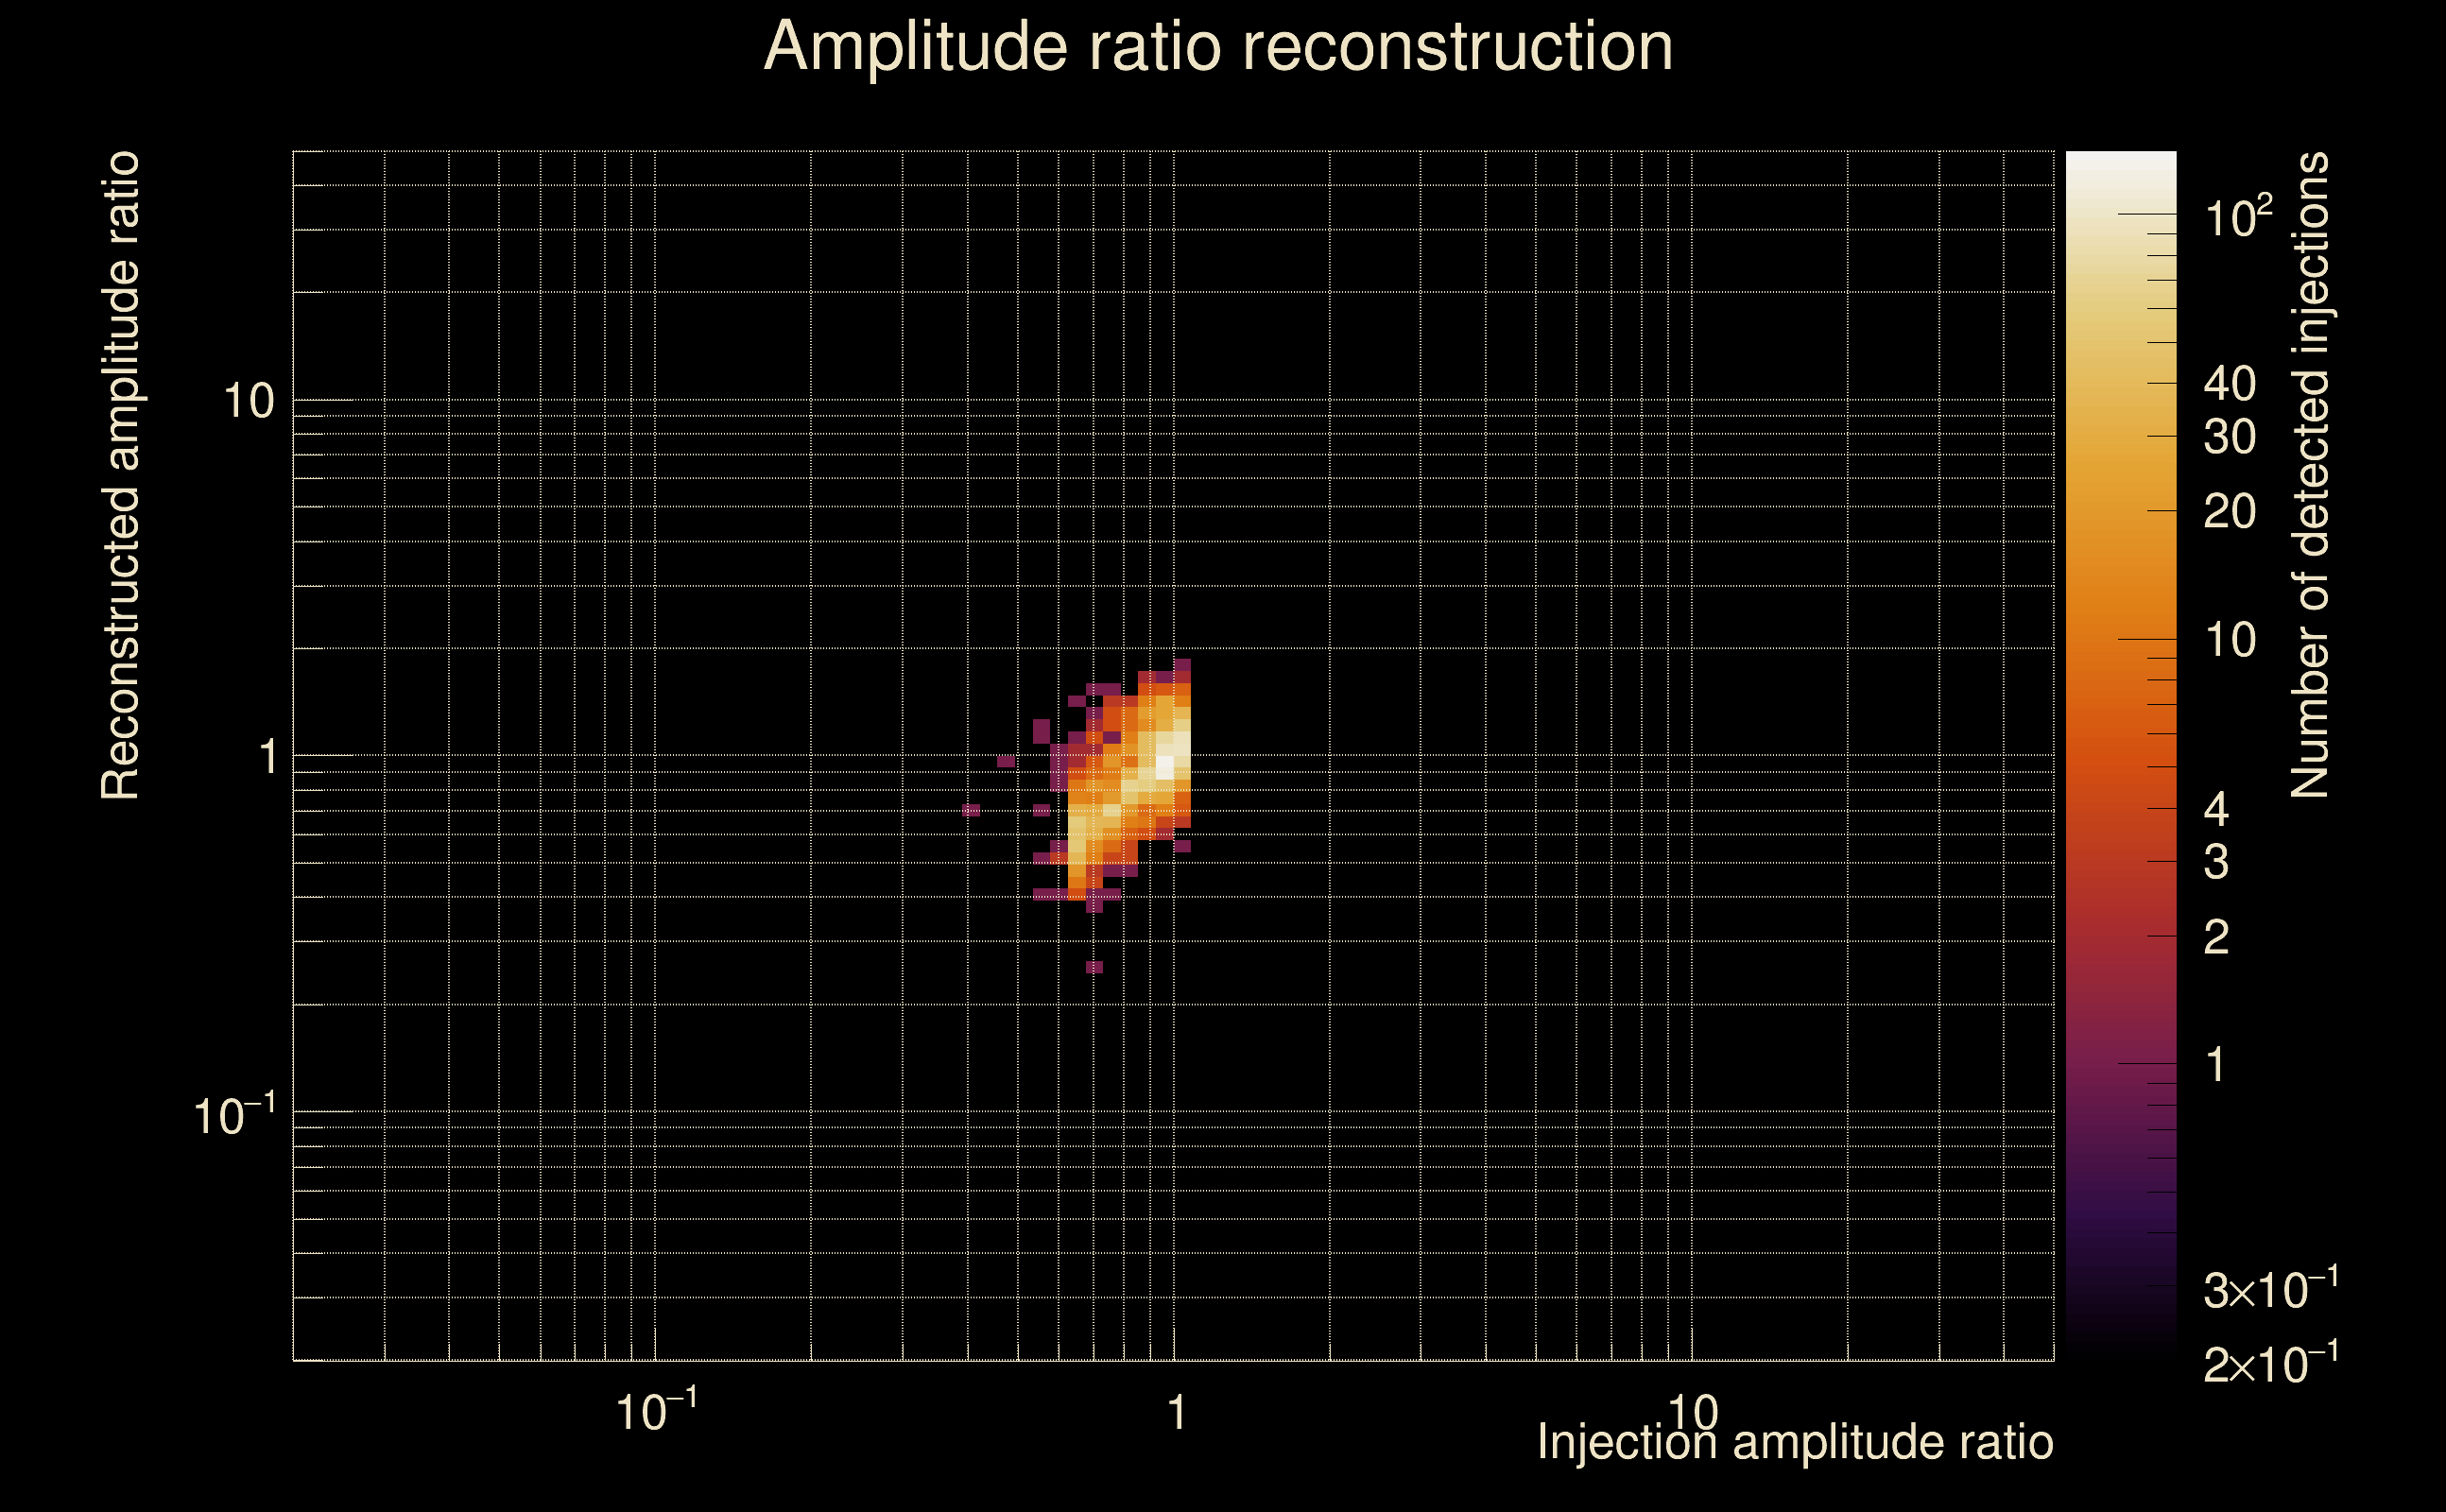
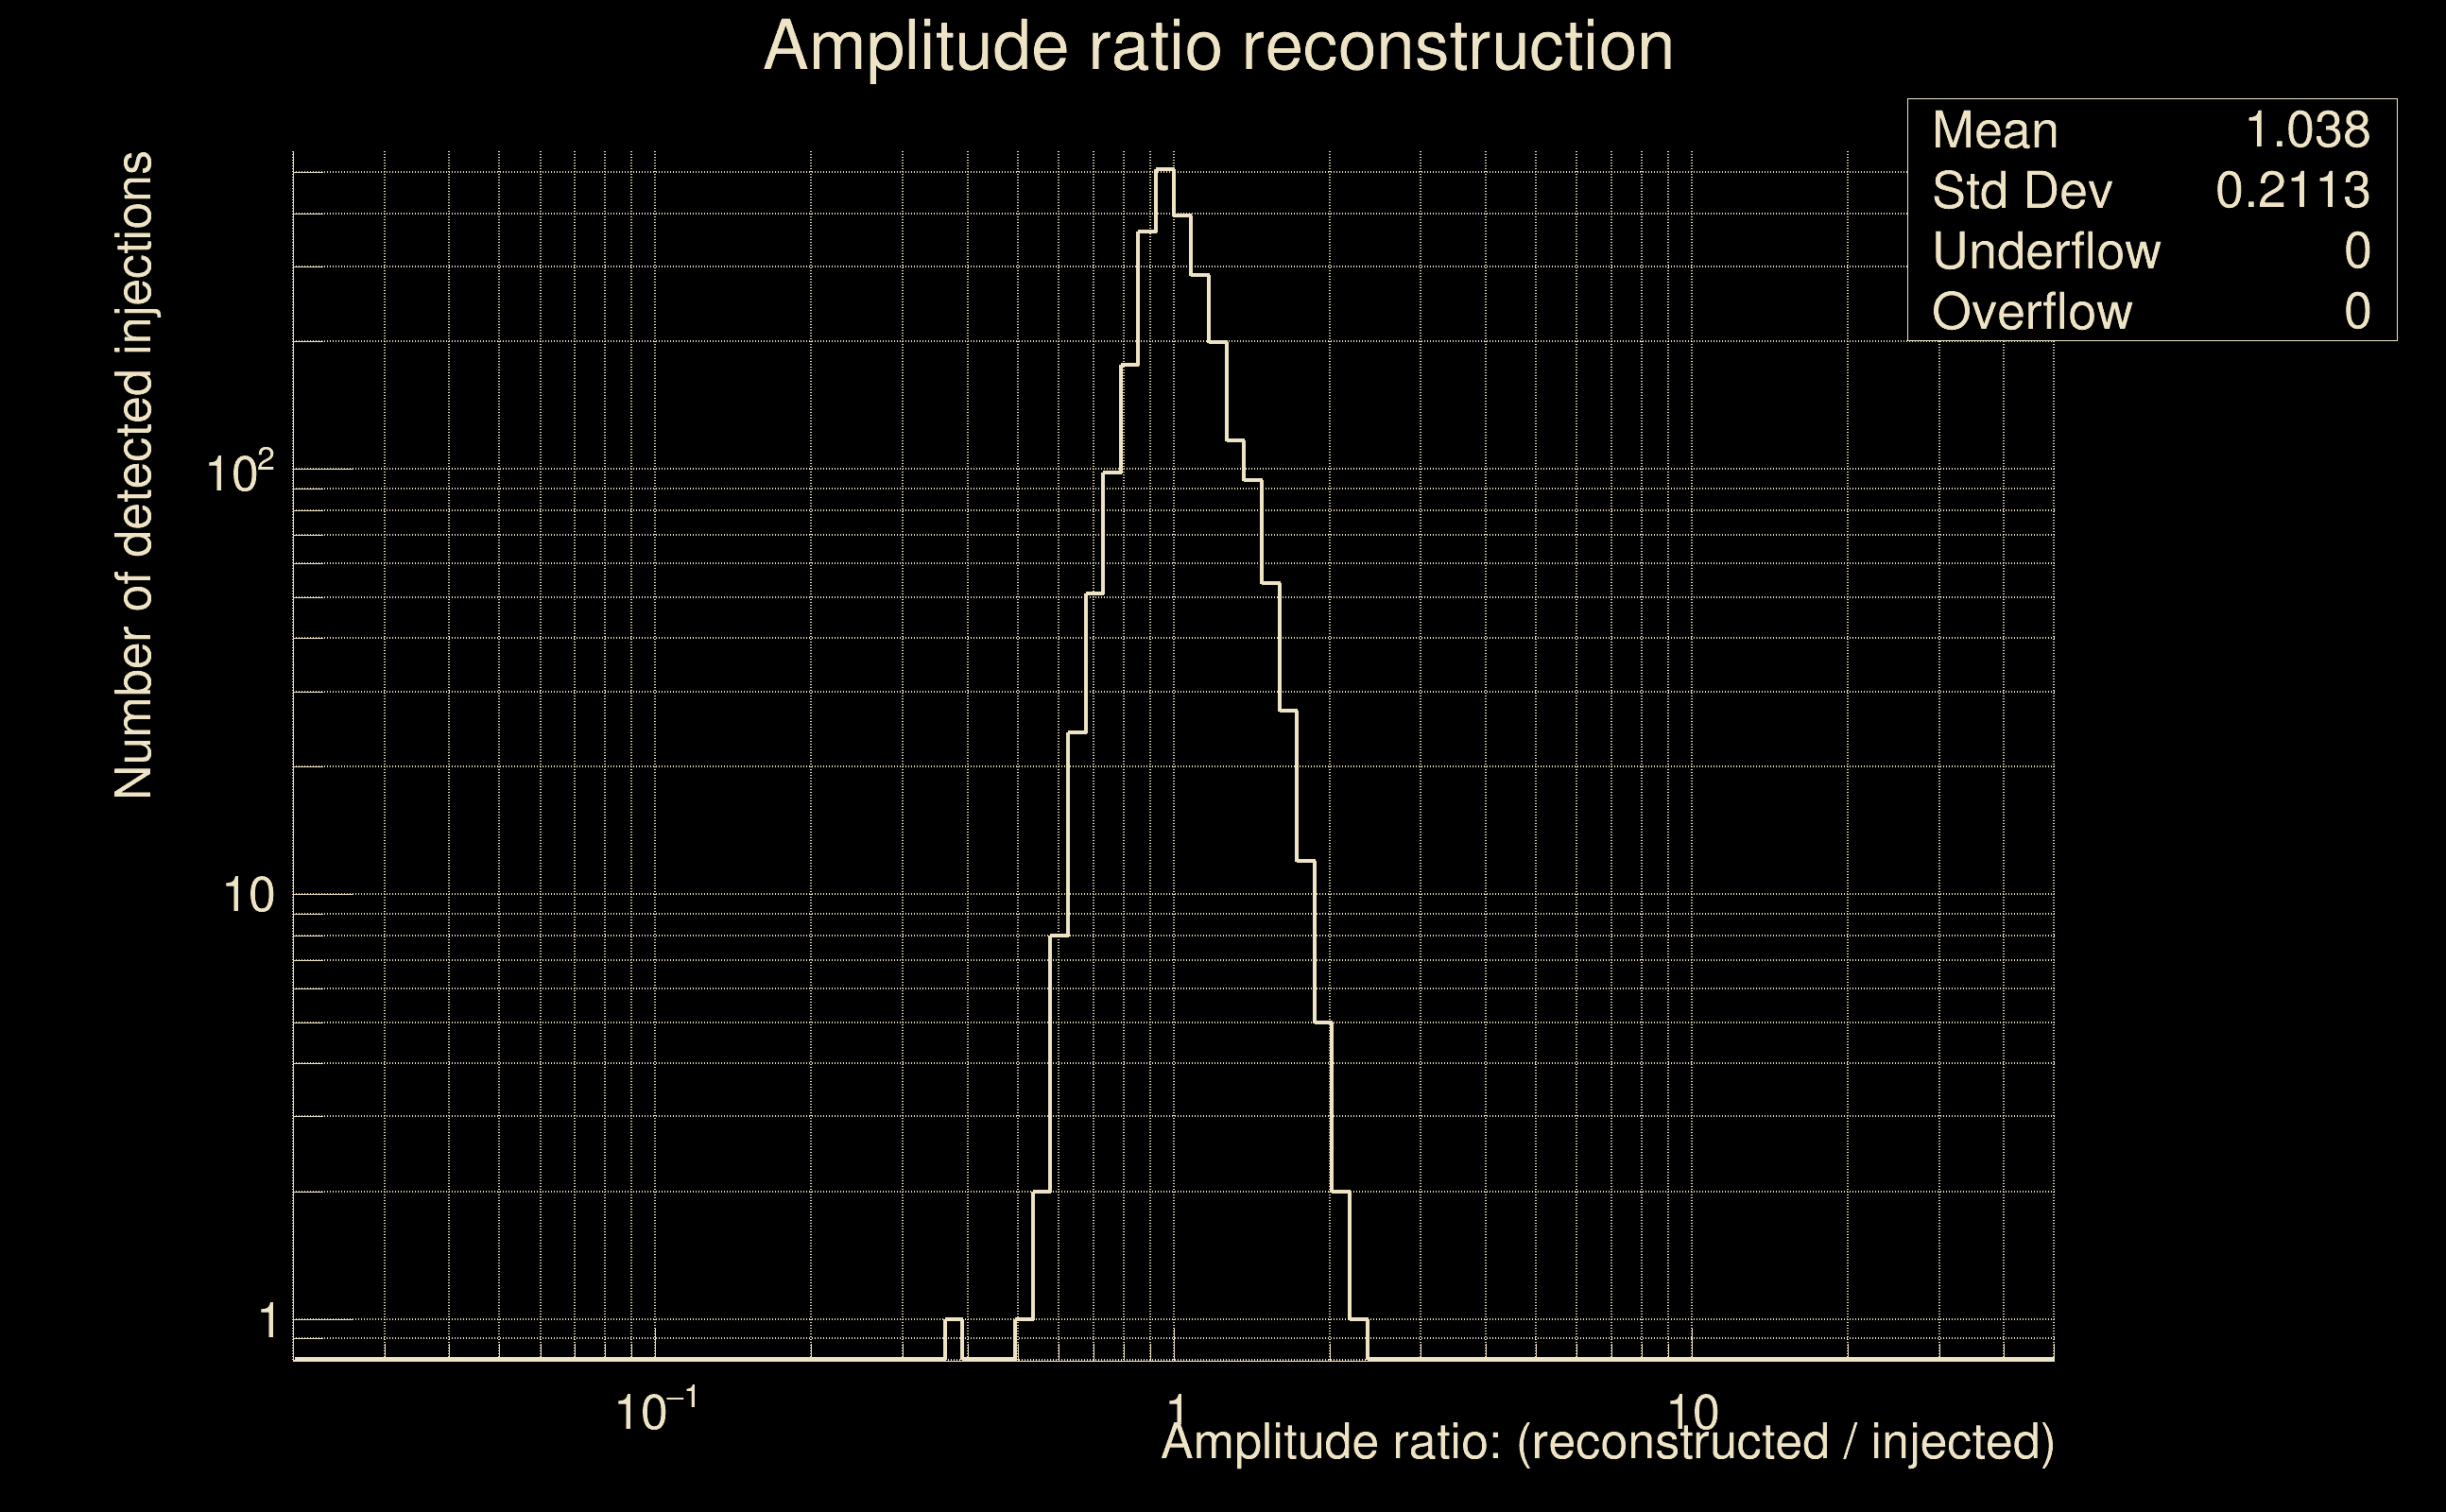
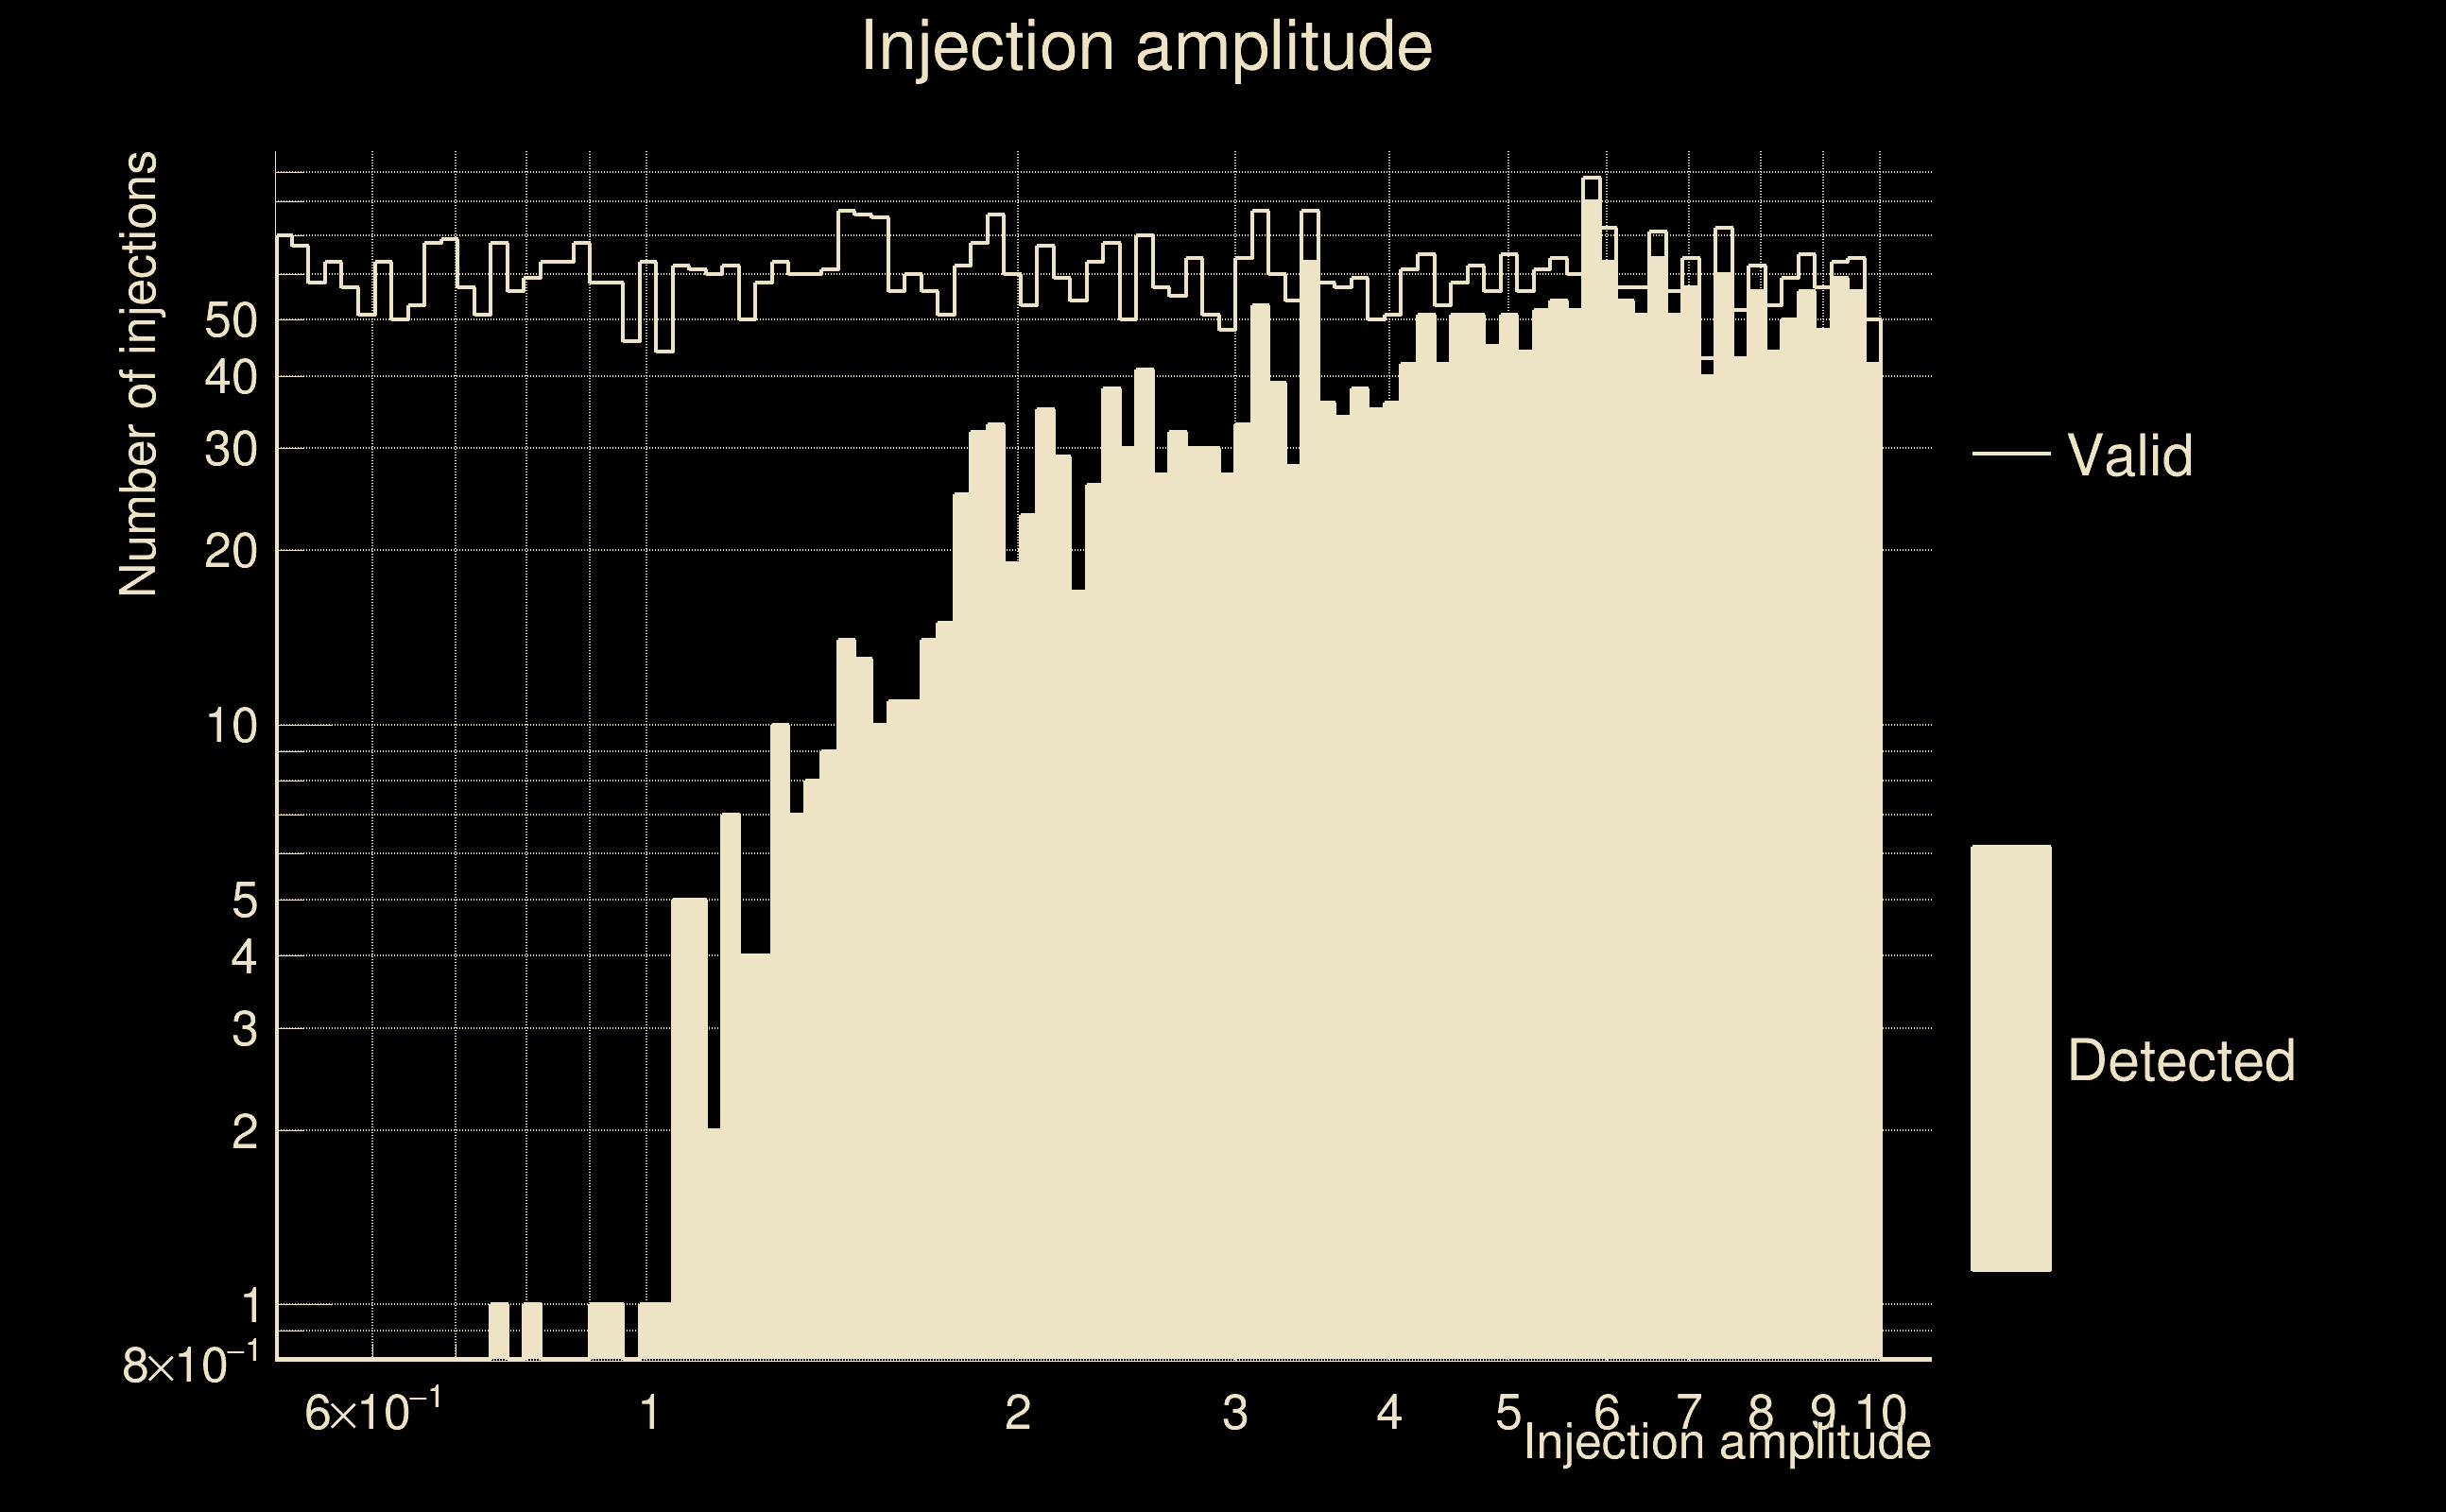
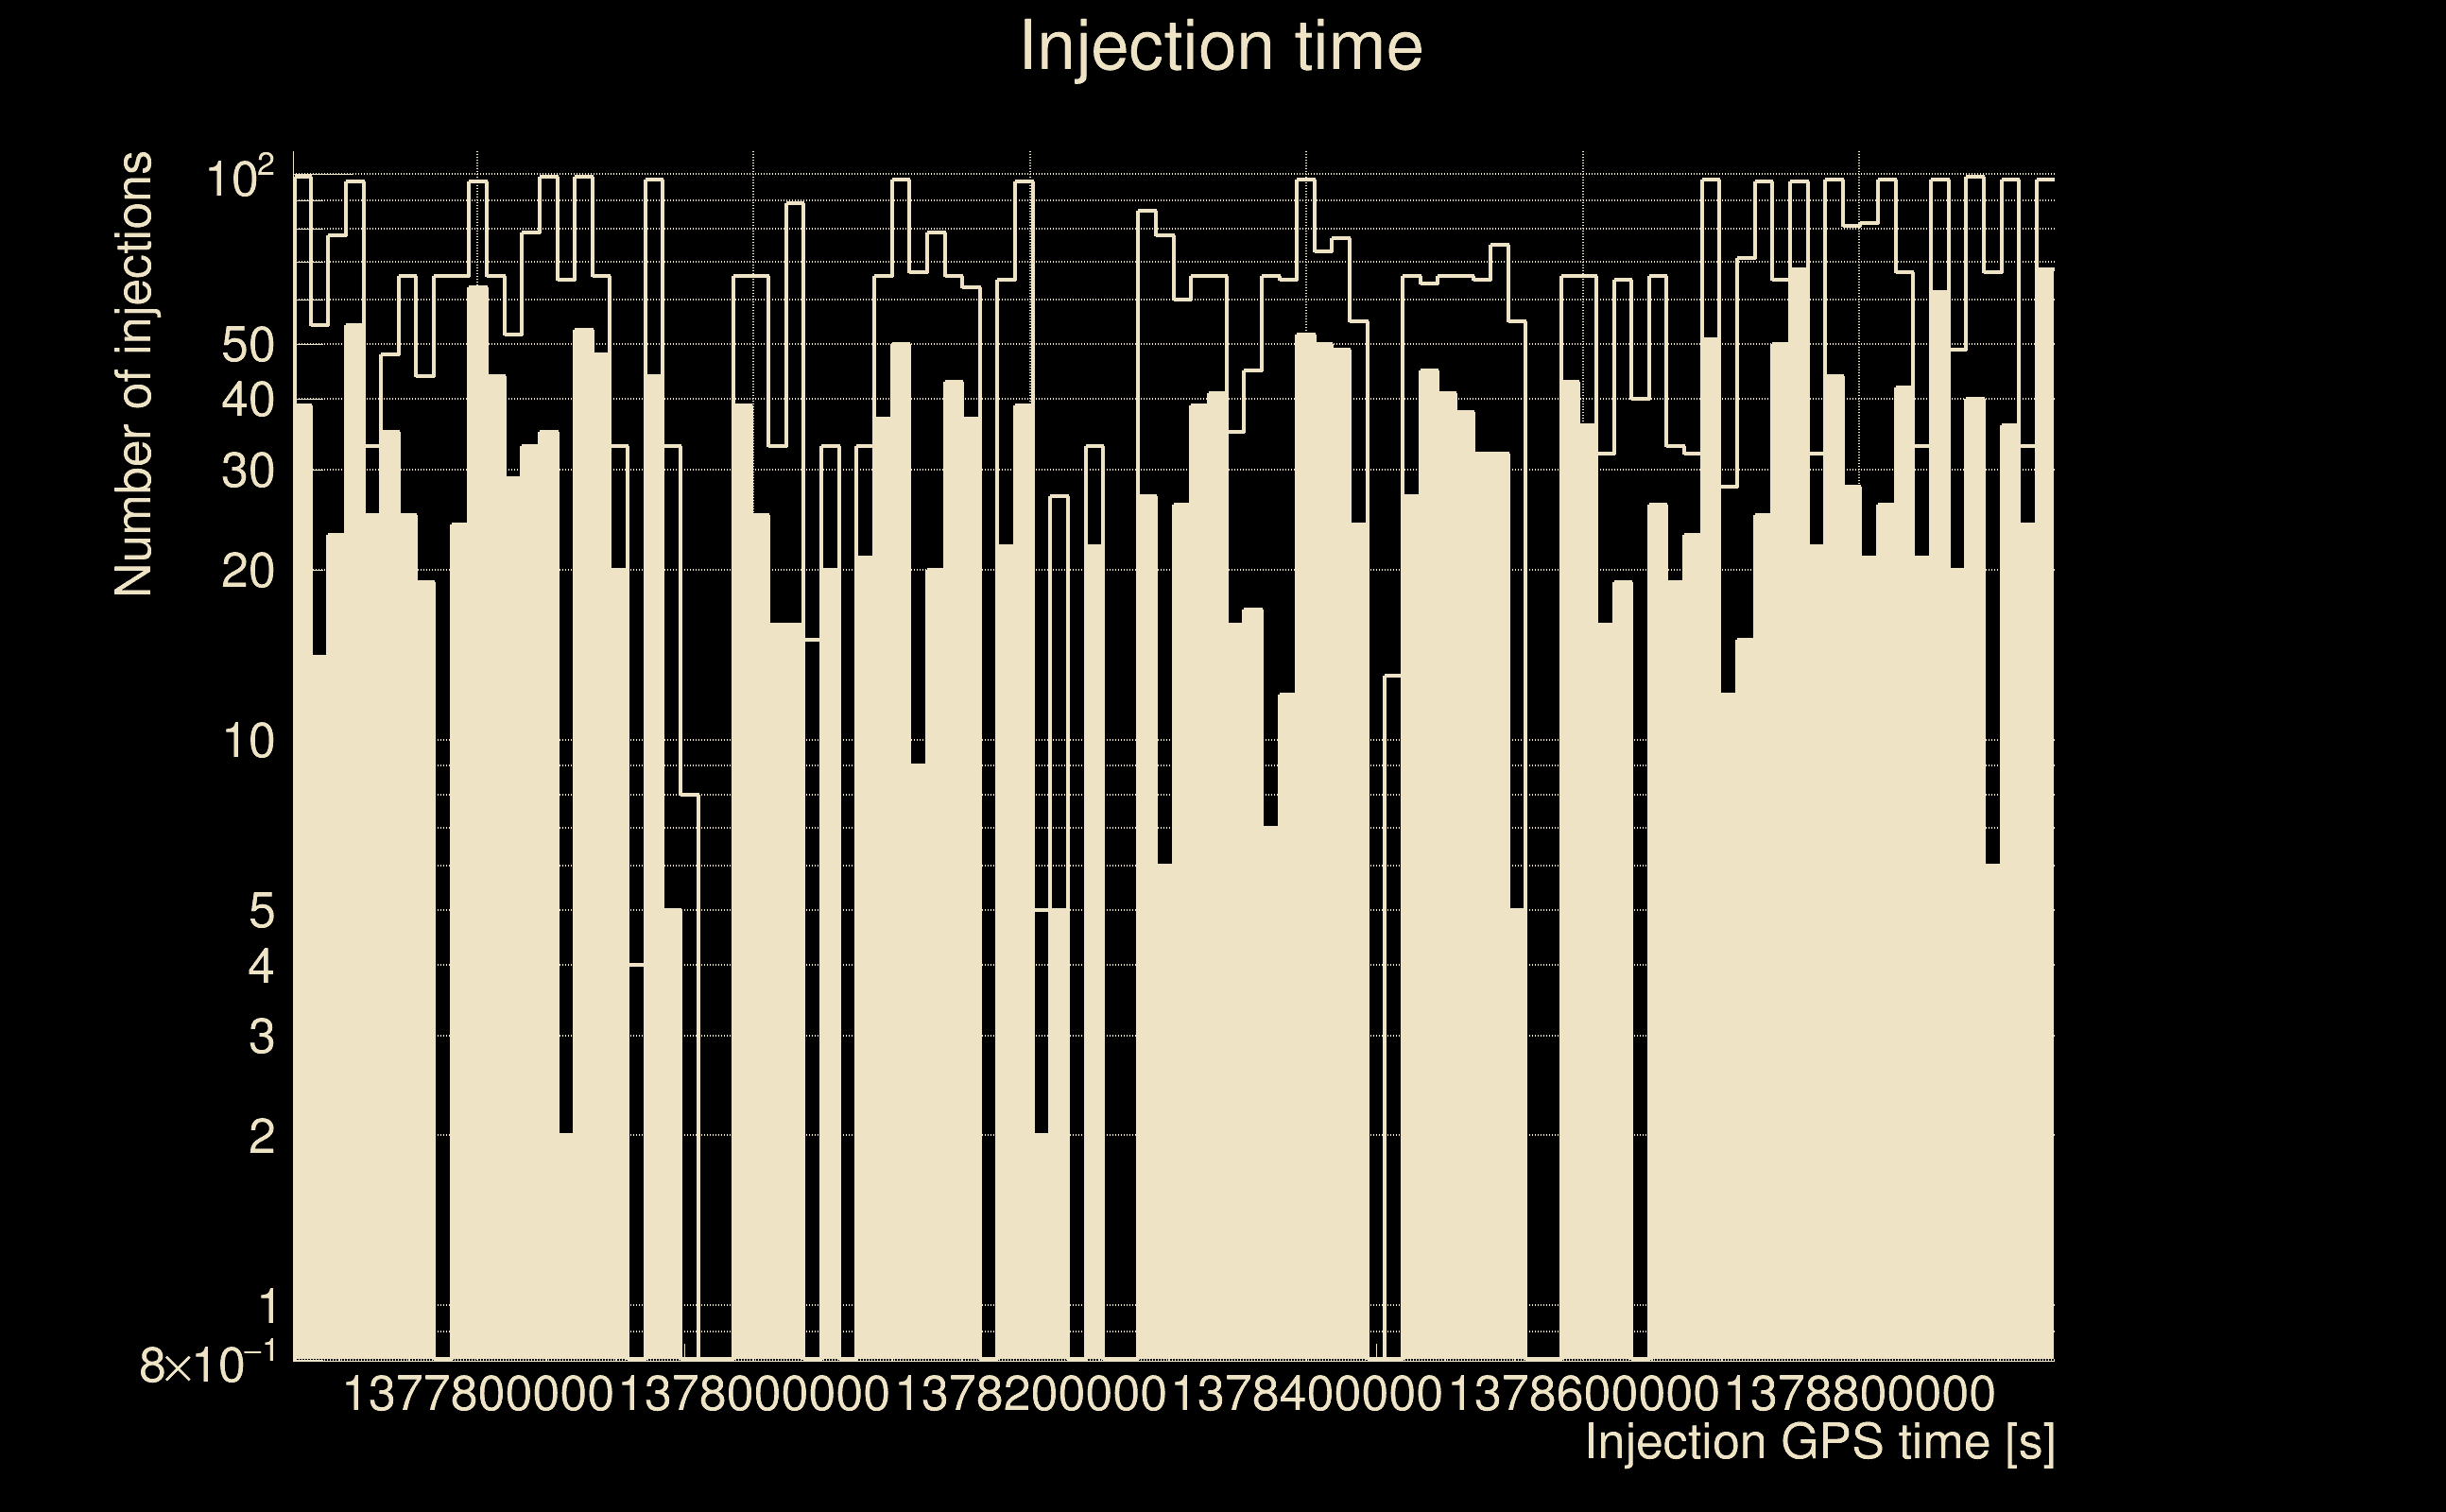
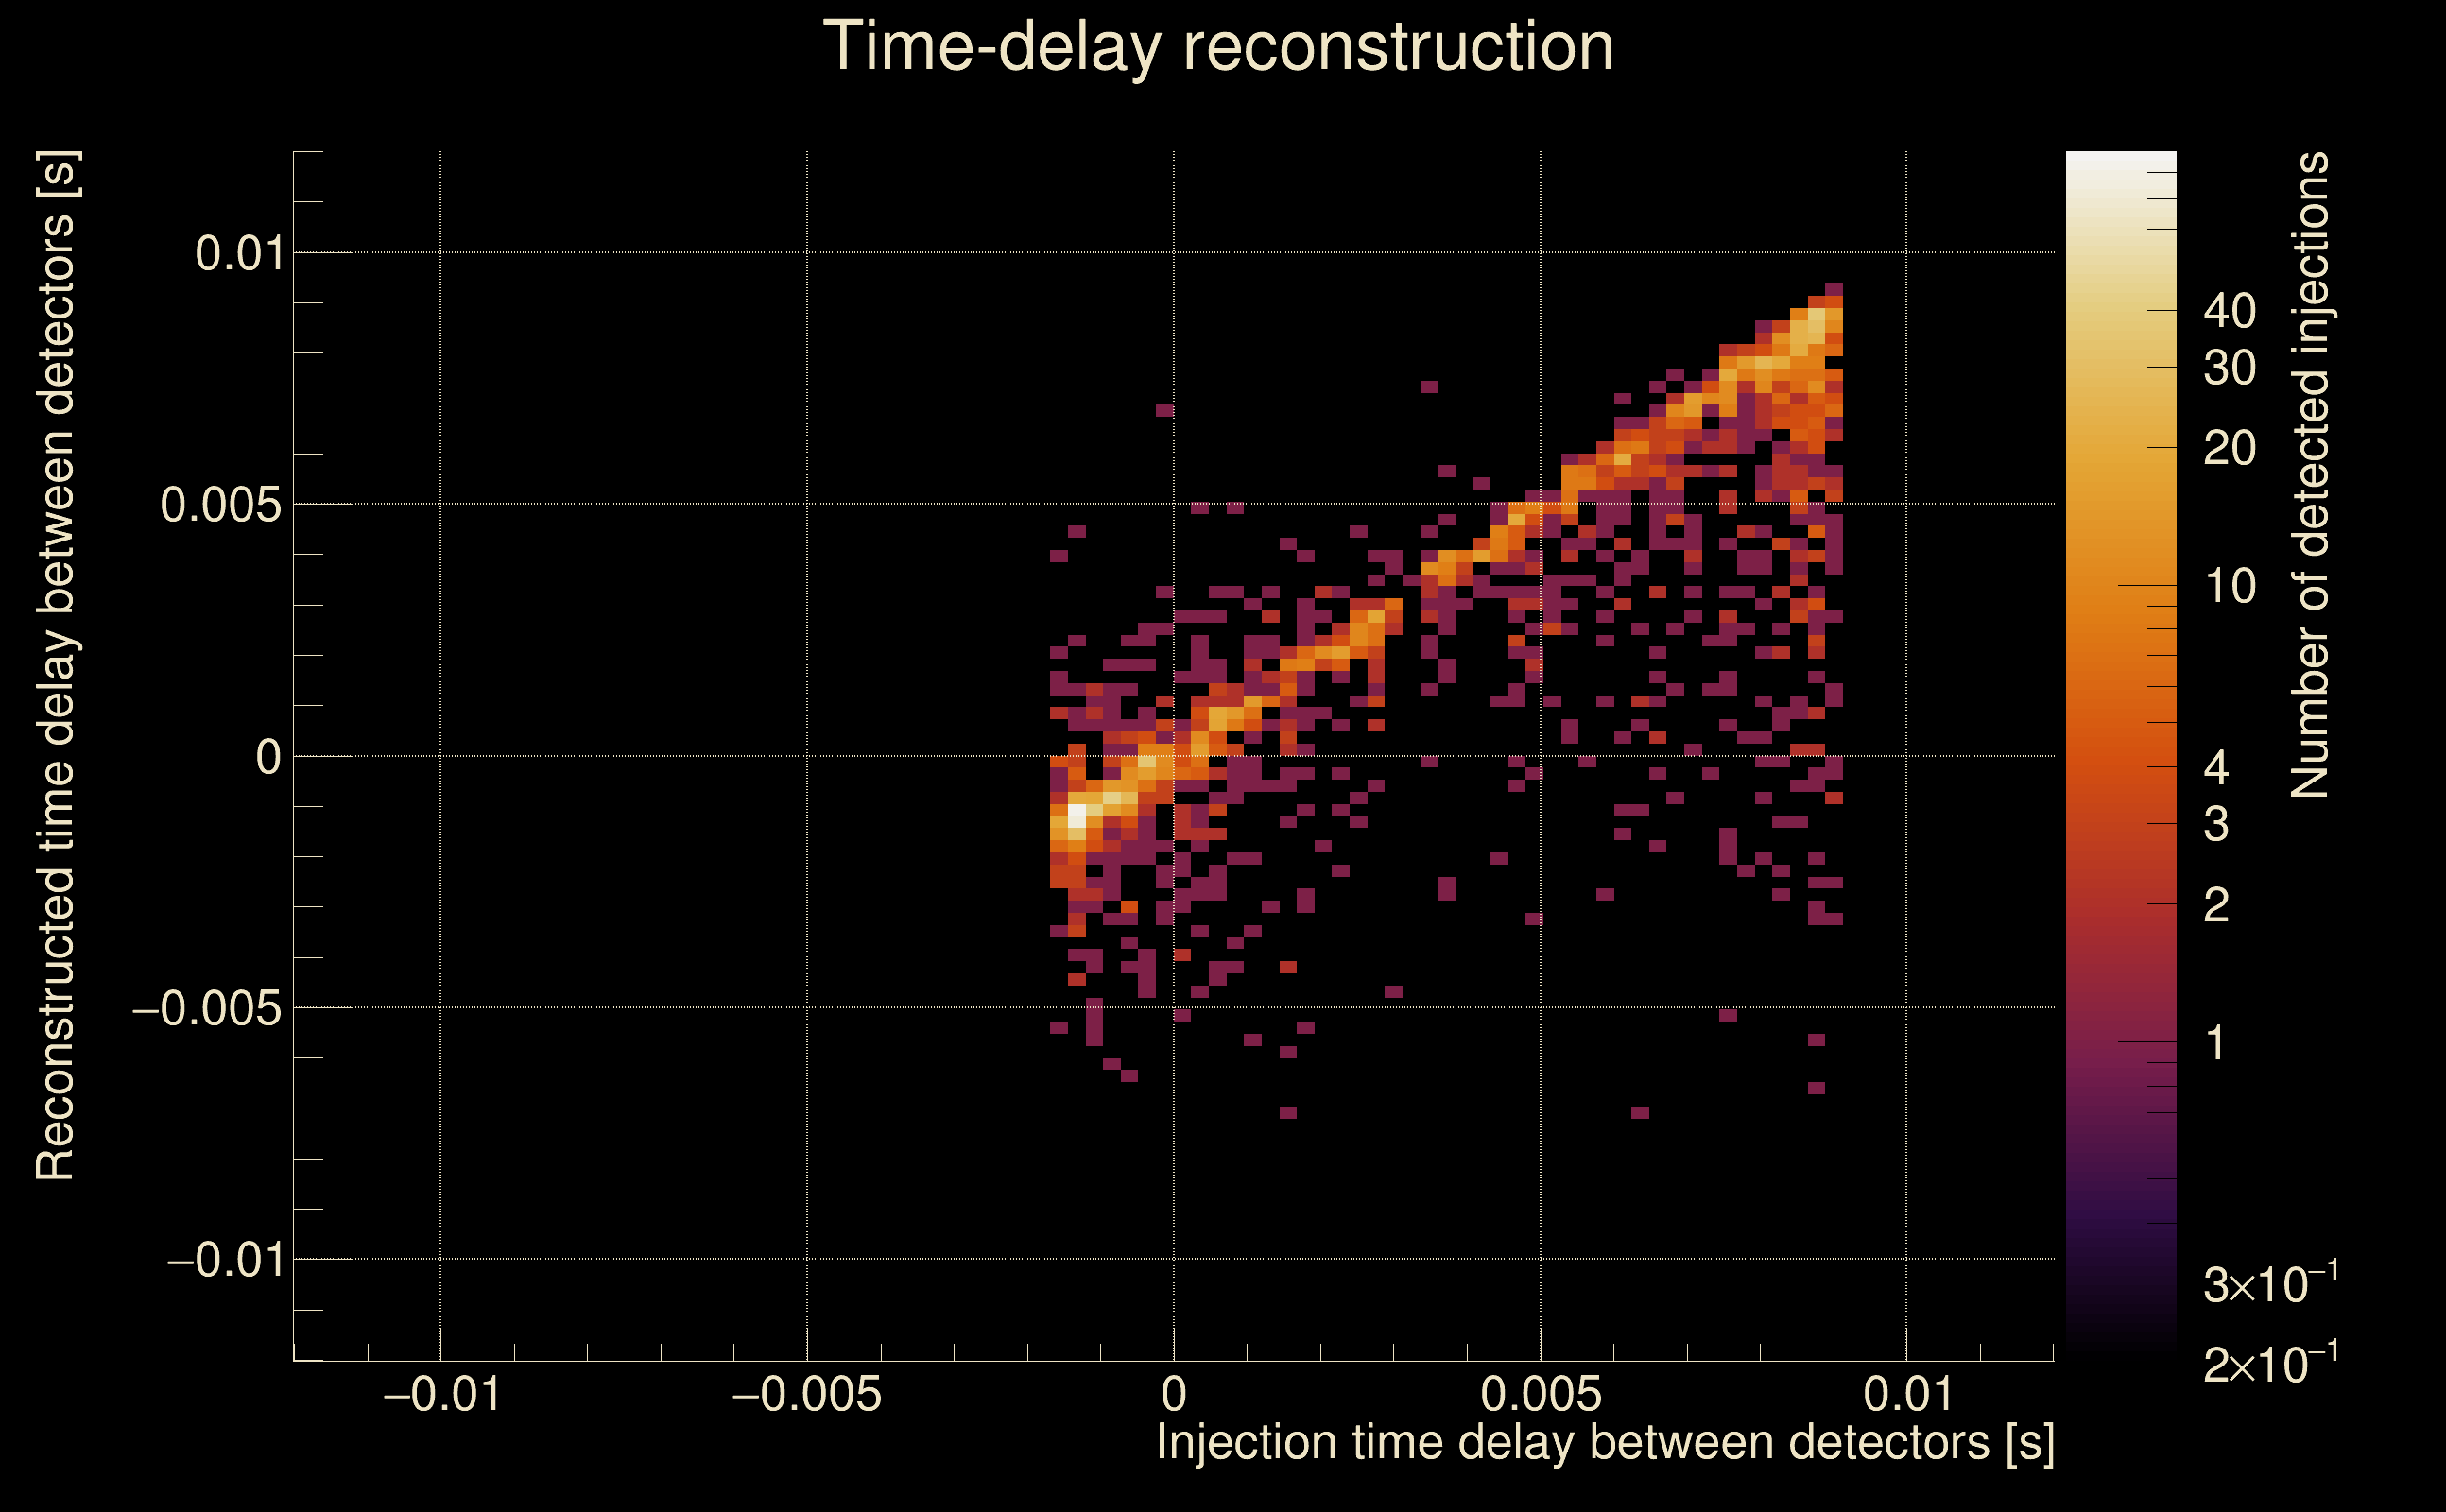
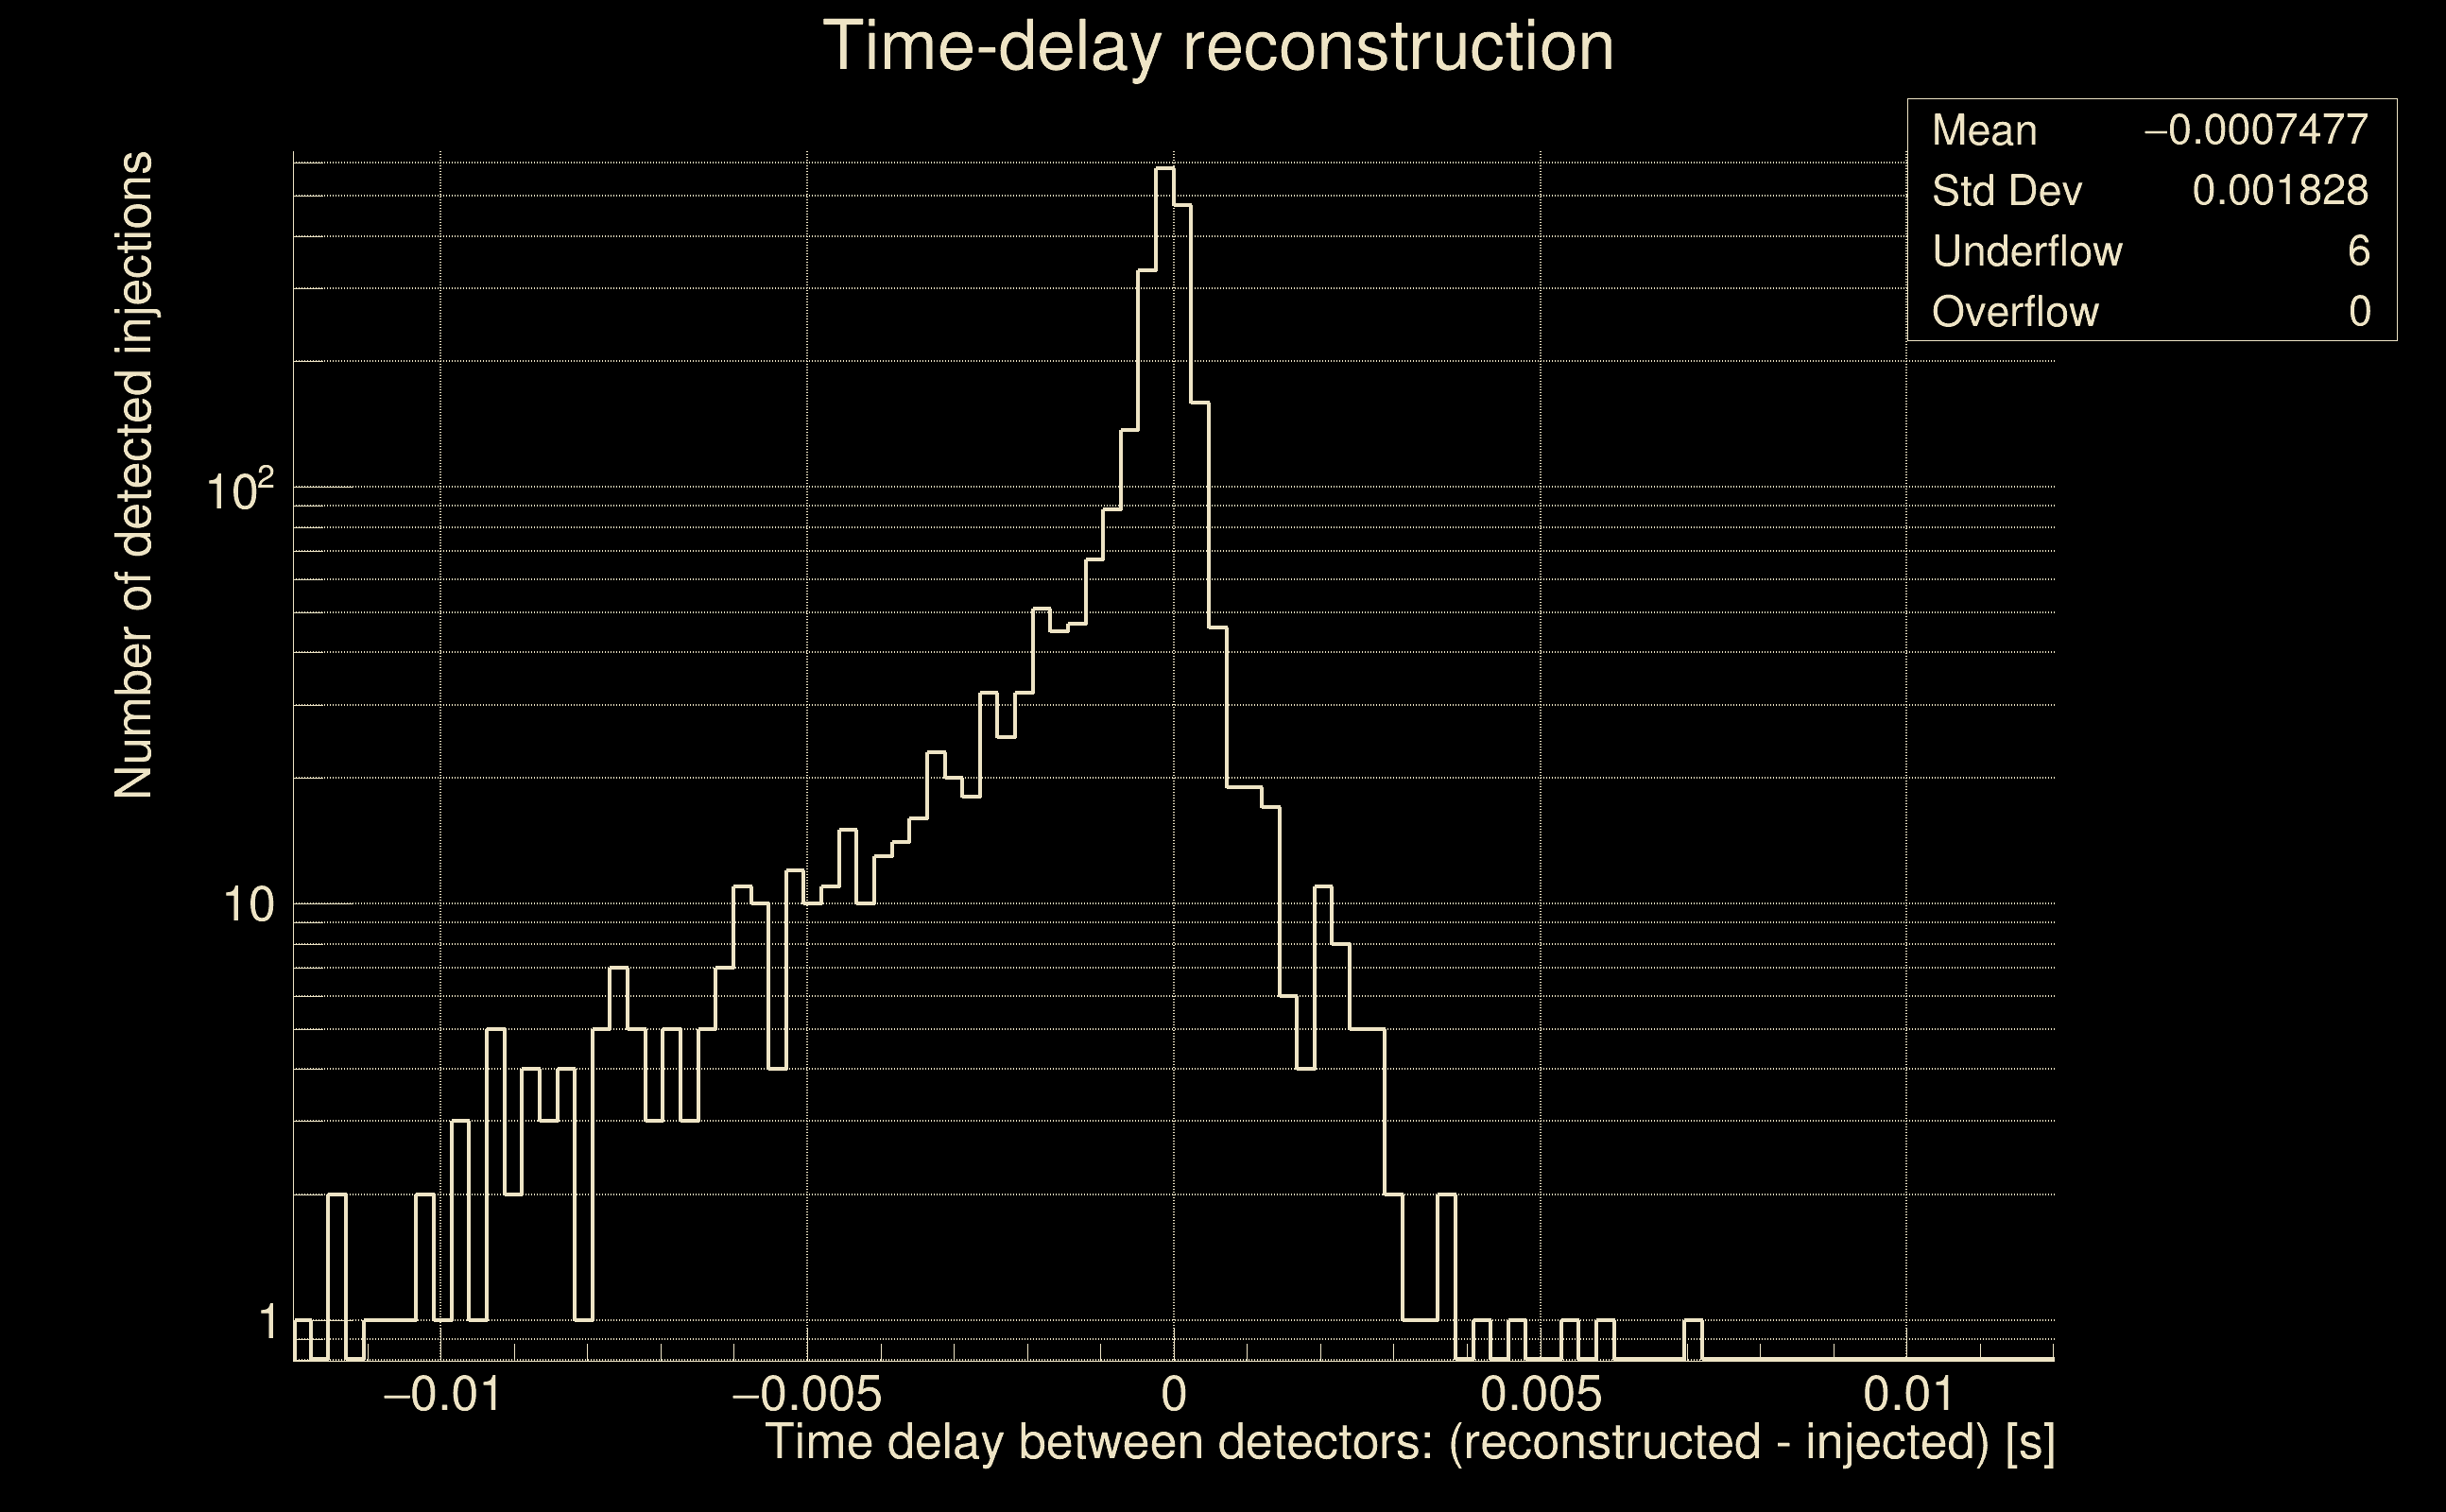
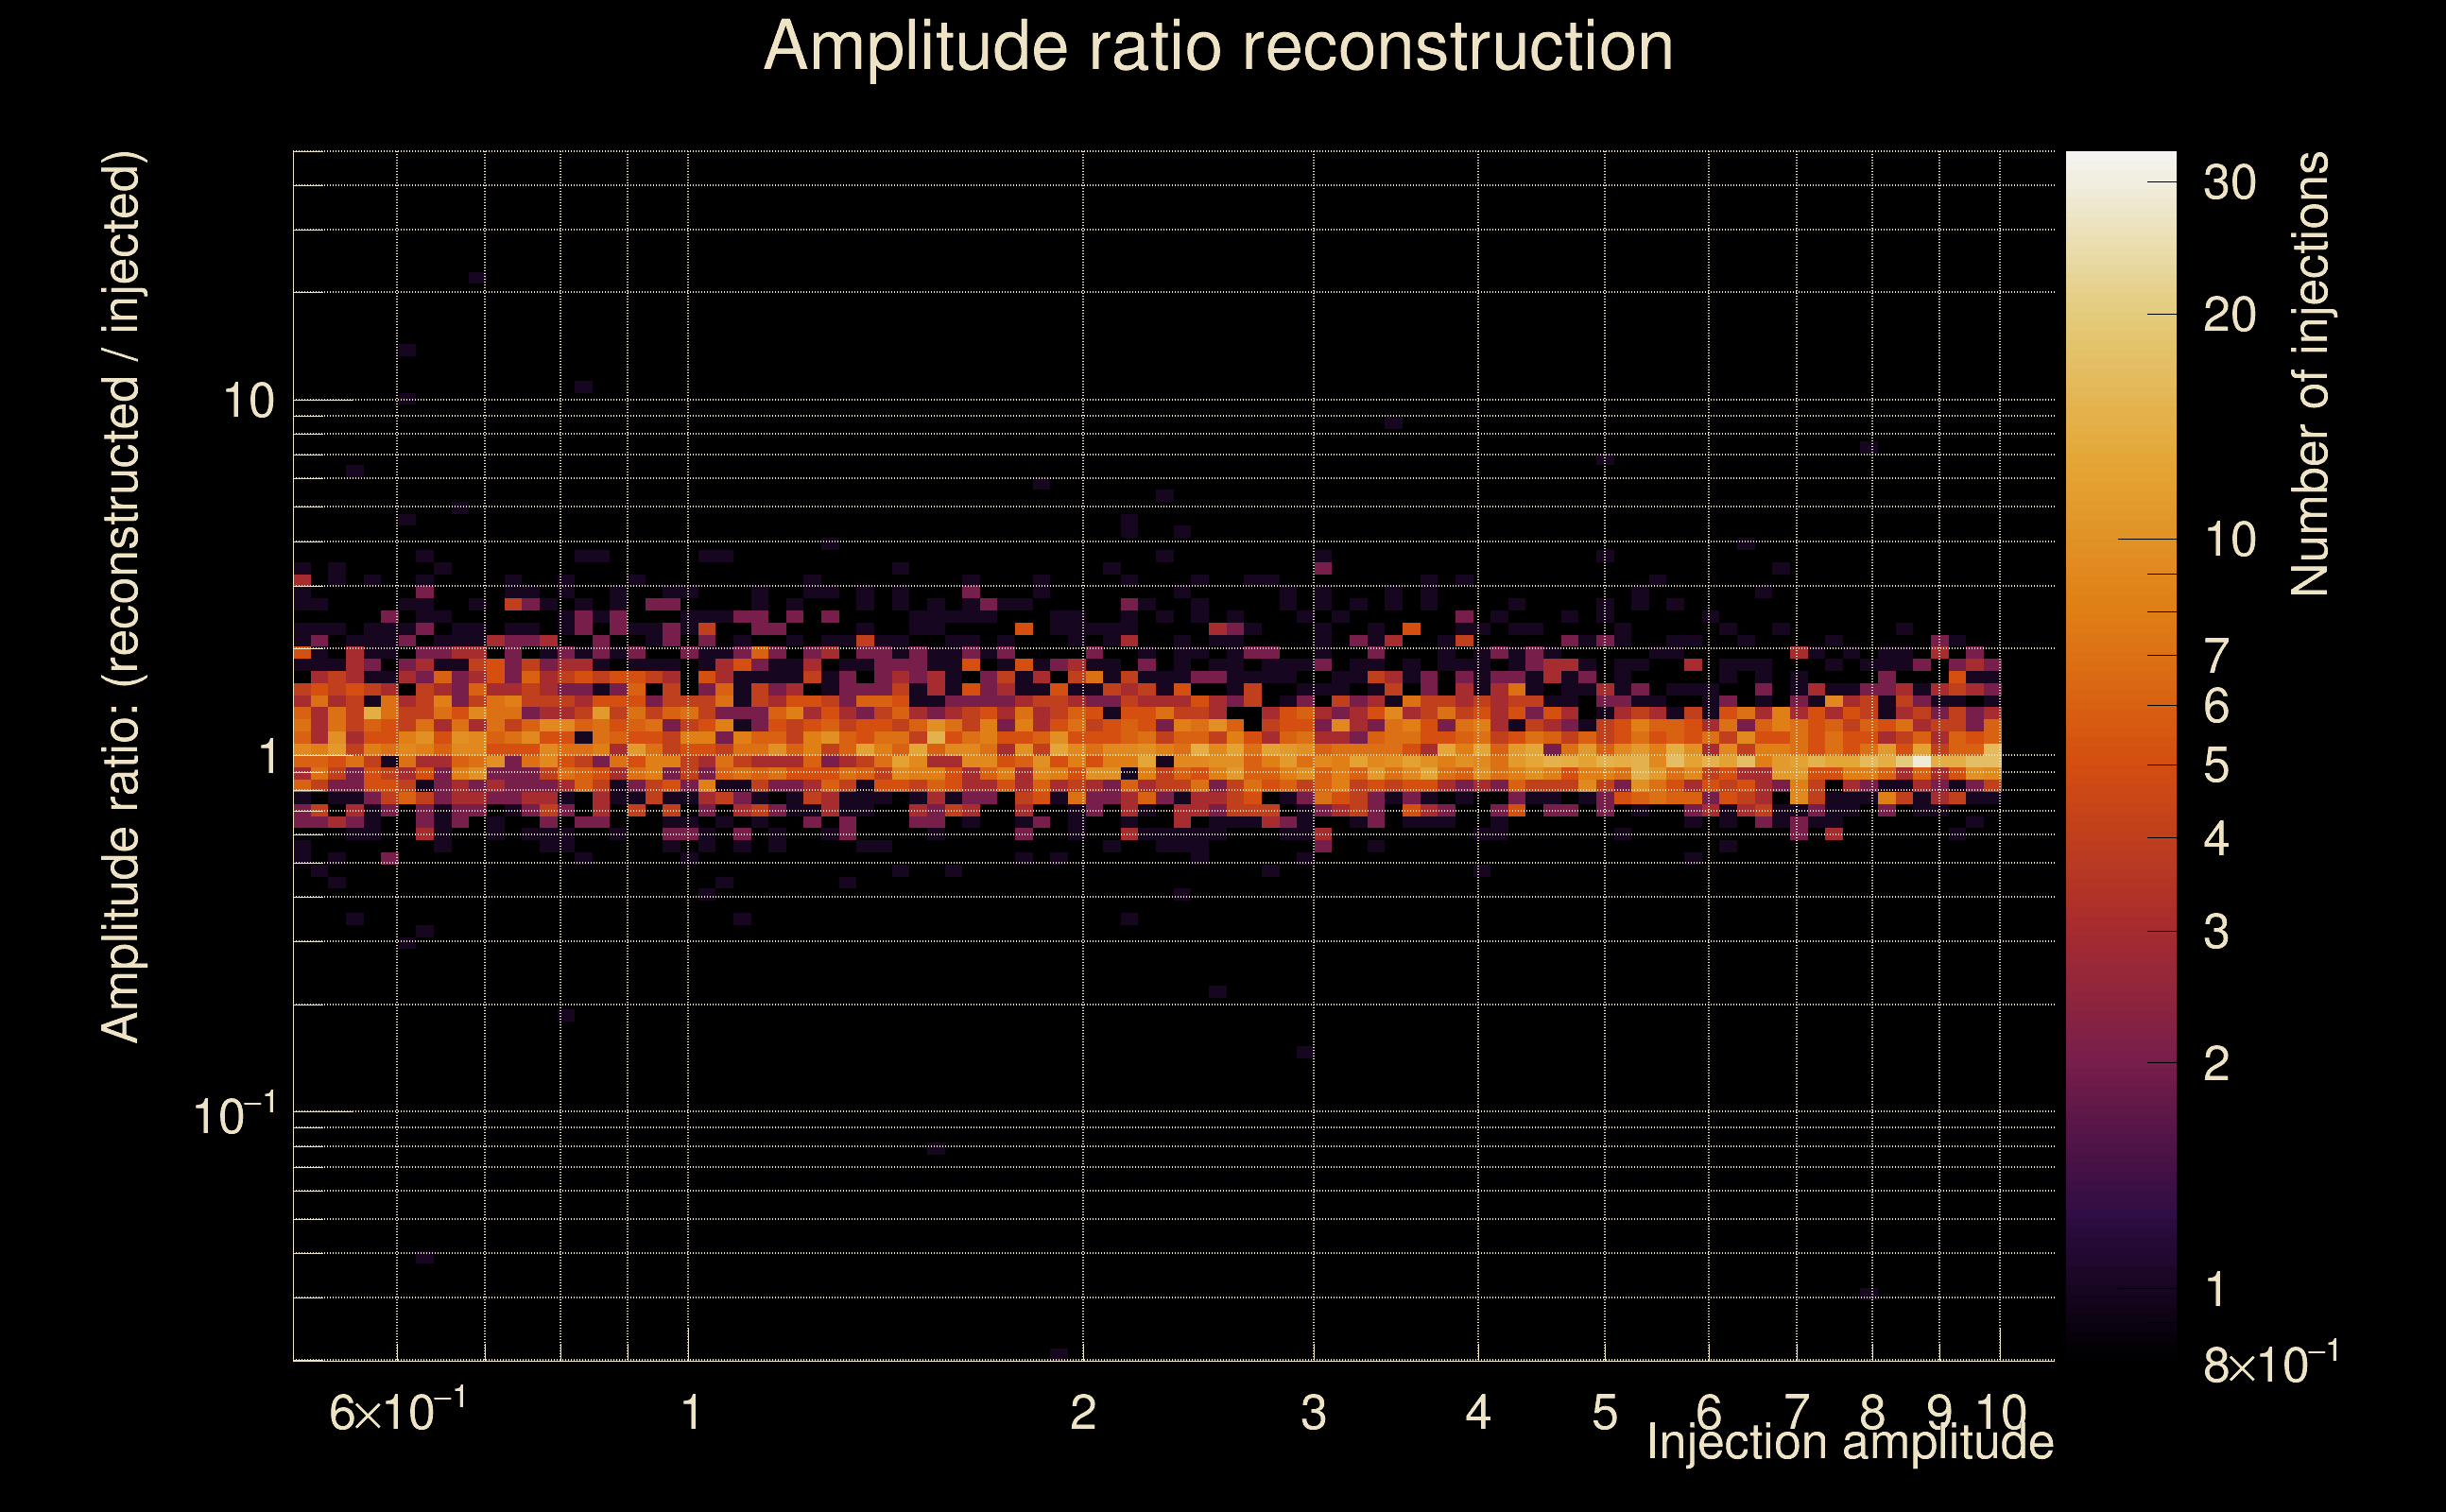
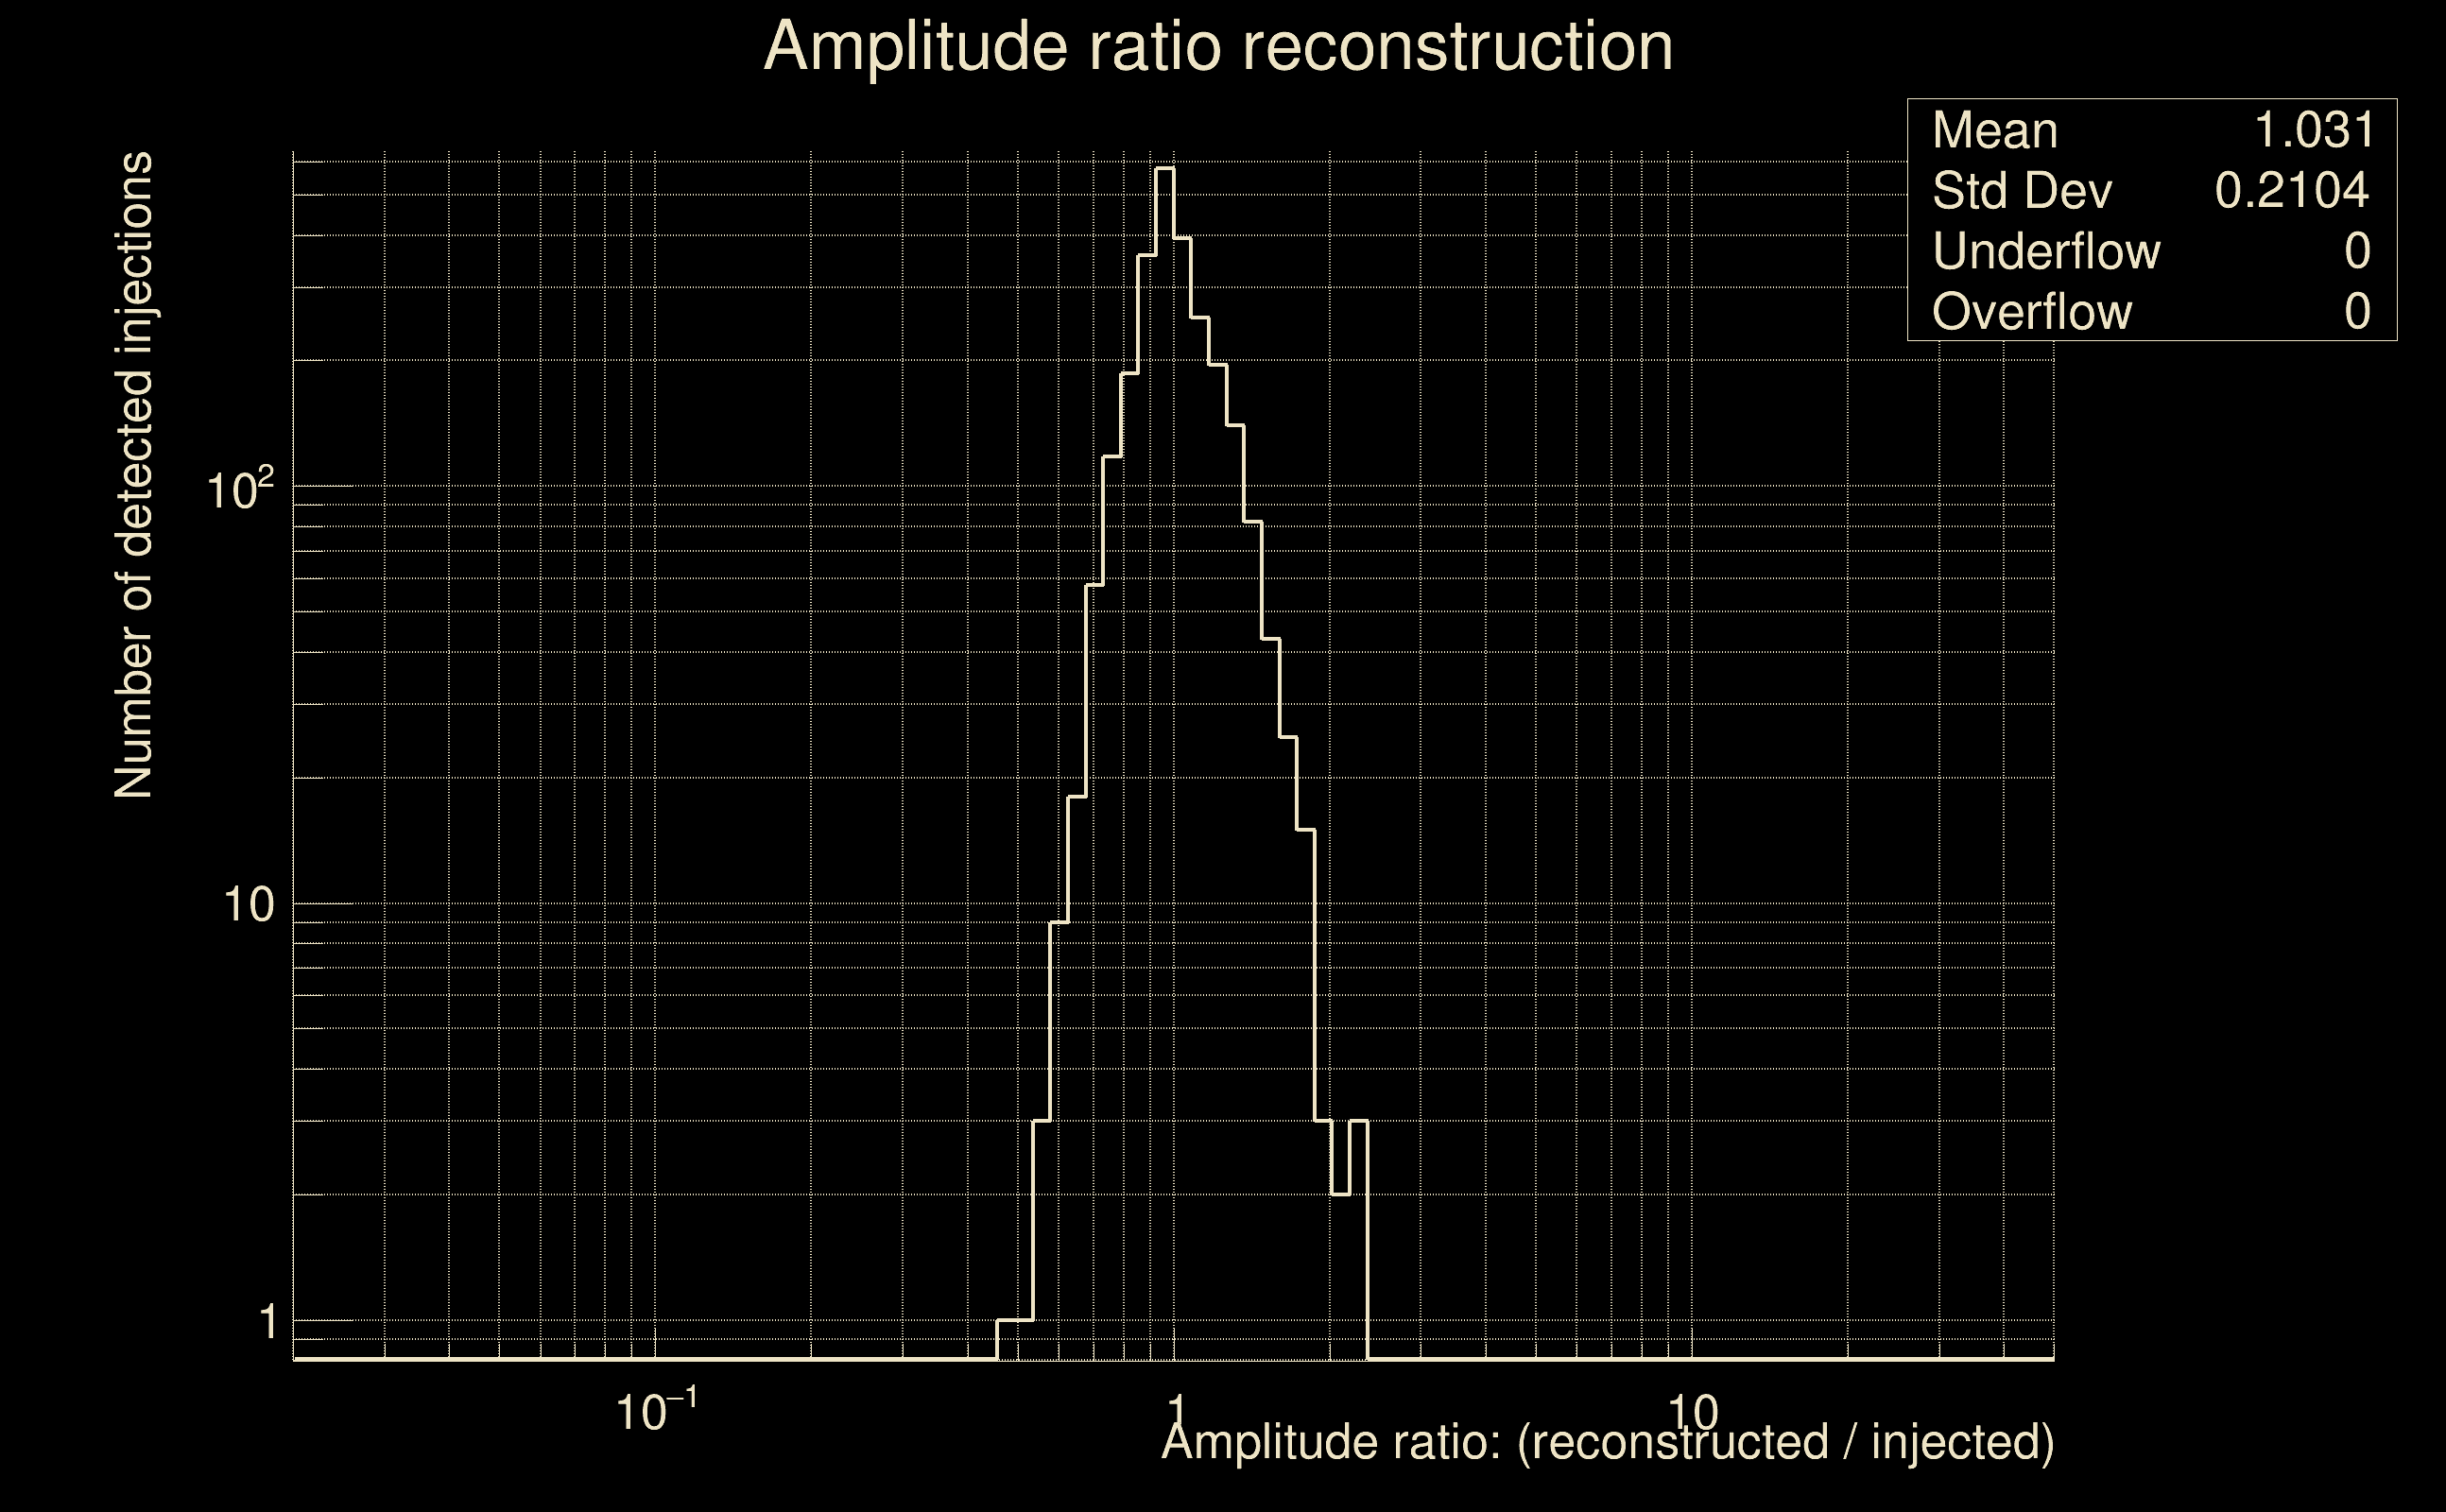
| Number of injections (total/valid/detected): | 5923 / 5871 / 2495 |
| List of missed injections: | ./AND19-S15FR_missed.txt |
| Injection amplitude at 90% detection efficiency: | 9.48947 |
| Injection amplitude at 50% detection efficiency: | 2.88041 |
| Injection amplitude at 10% detection efficiency: | 1.27042 |
 |
 |
 |
 |
 |
 |
|
 |
 |
|
 |
 |
 |
 |
 |
 |
 |
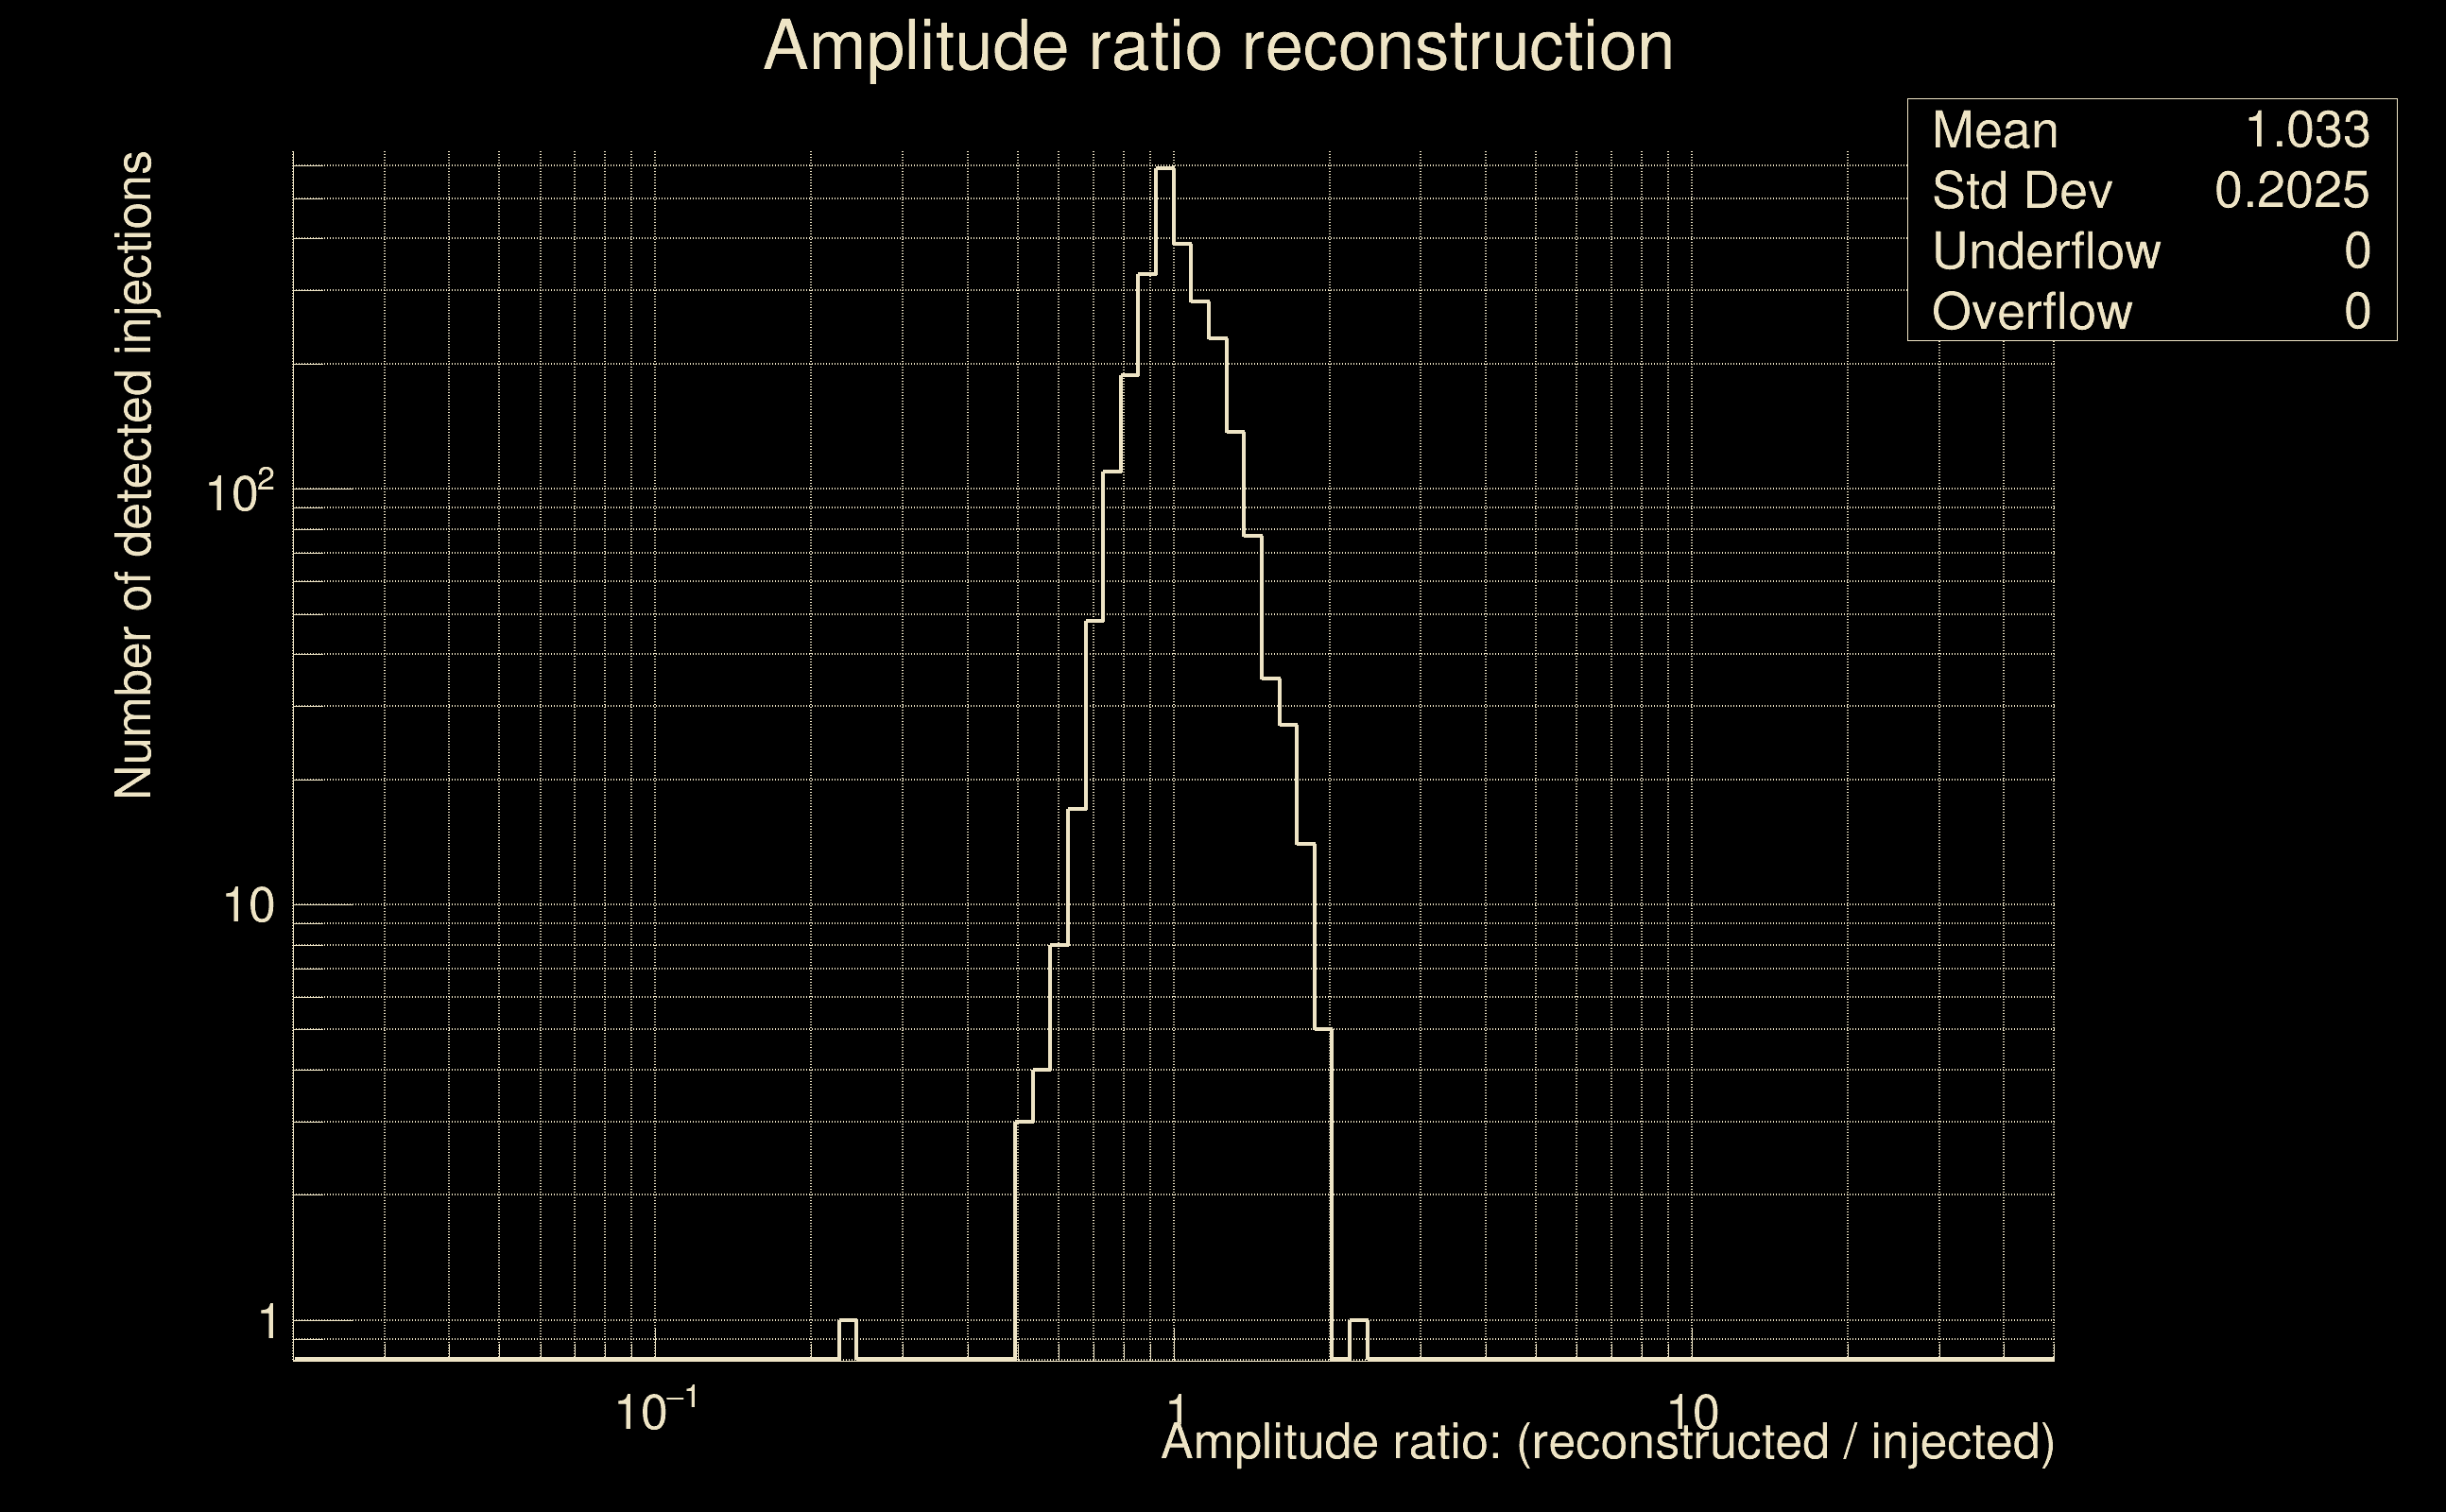 |
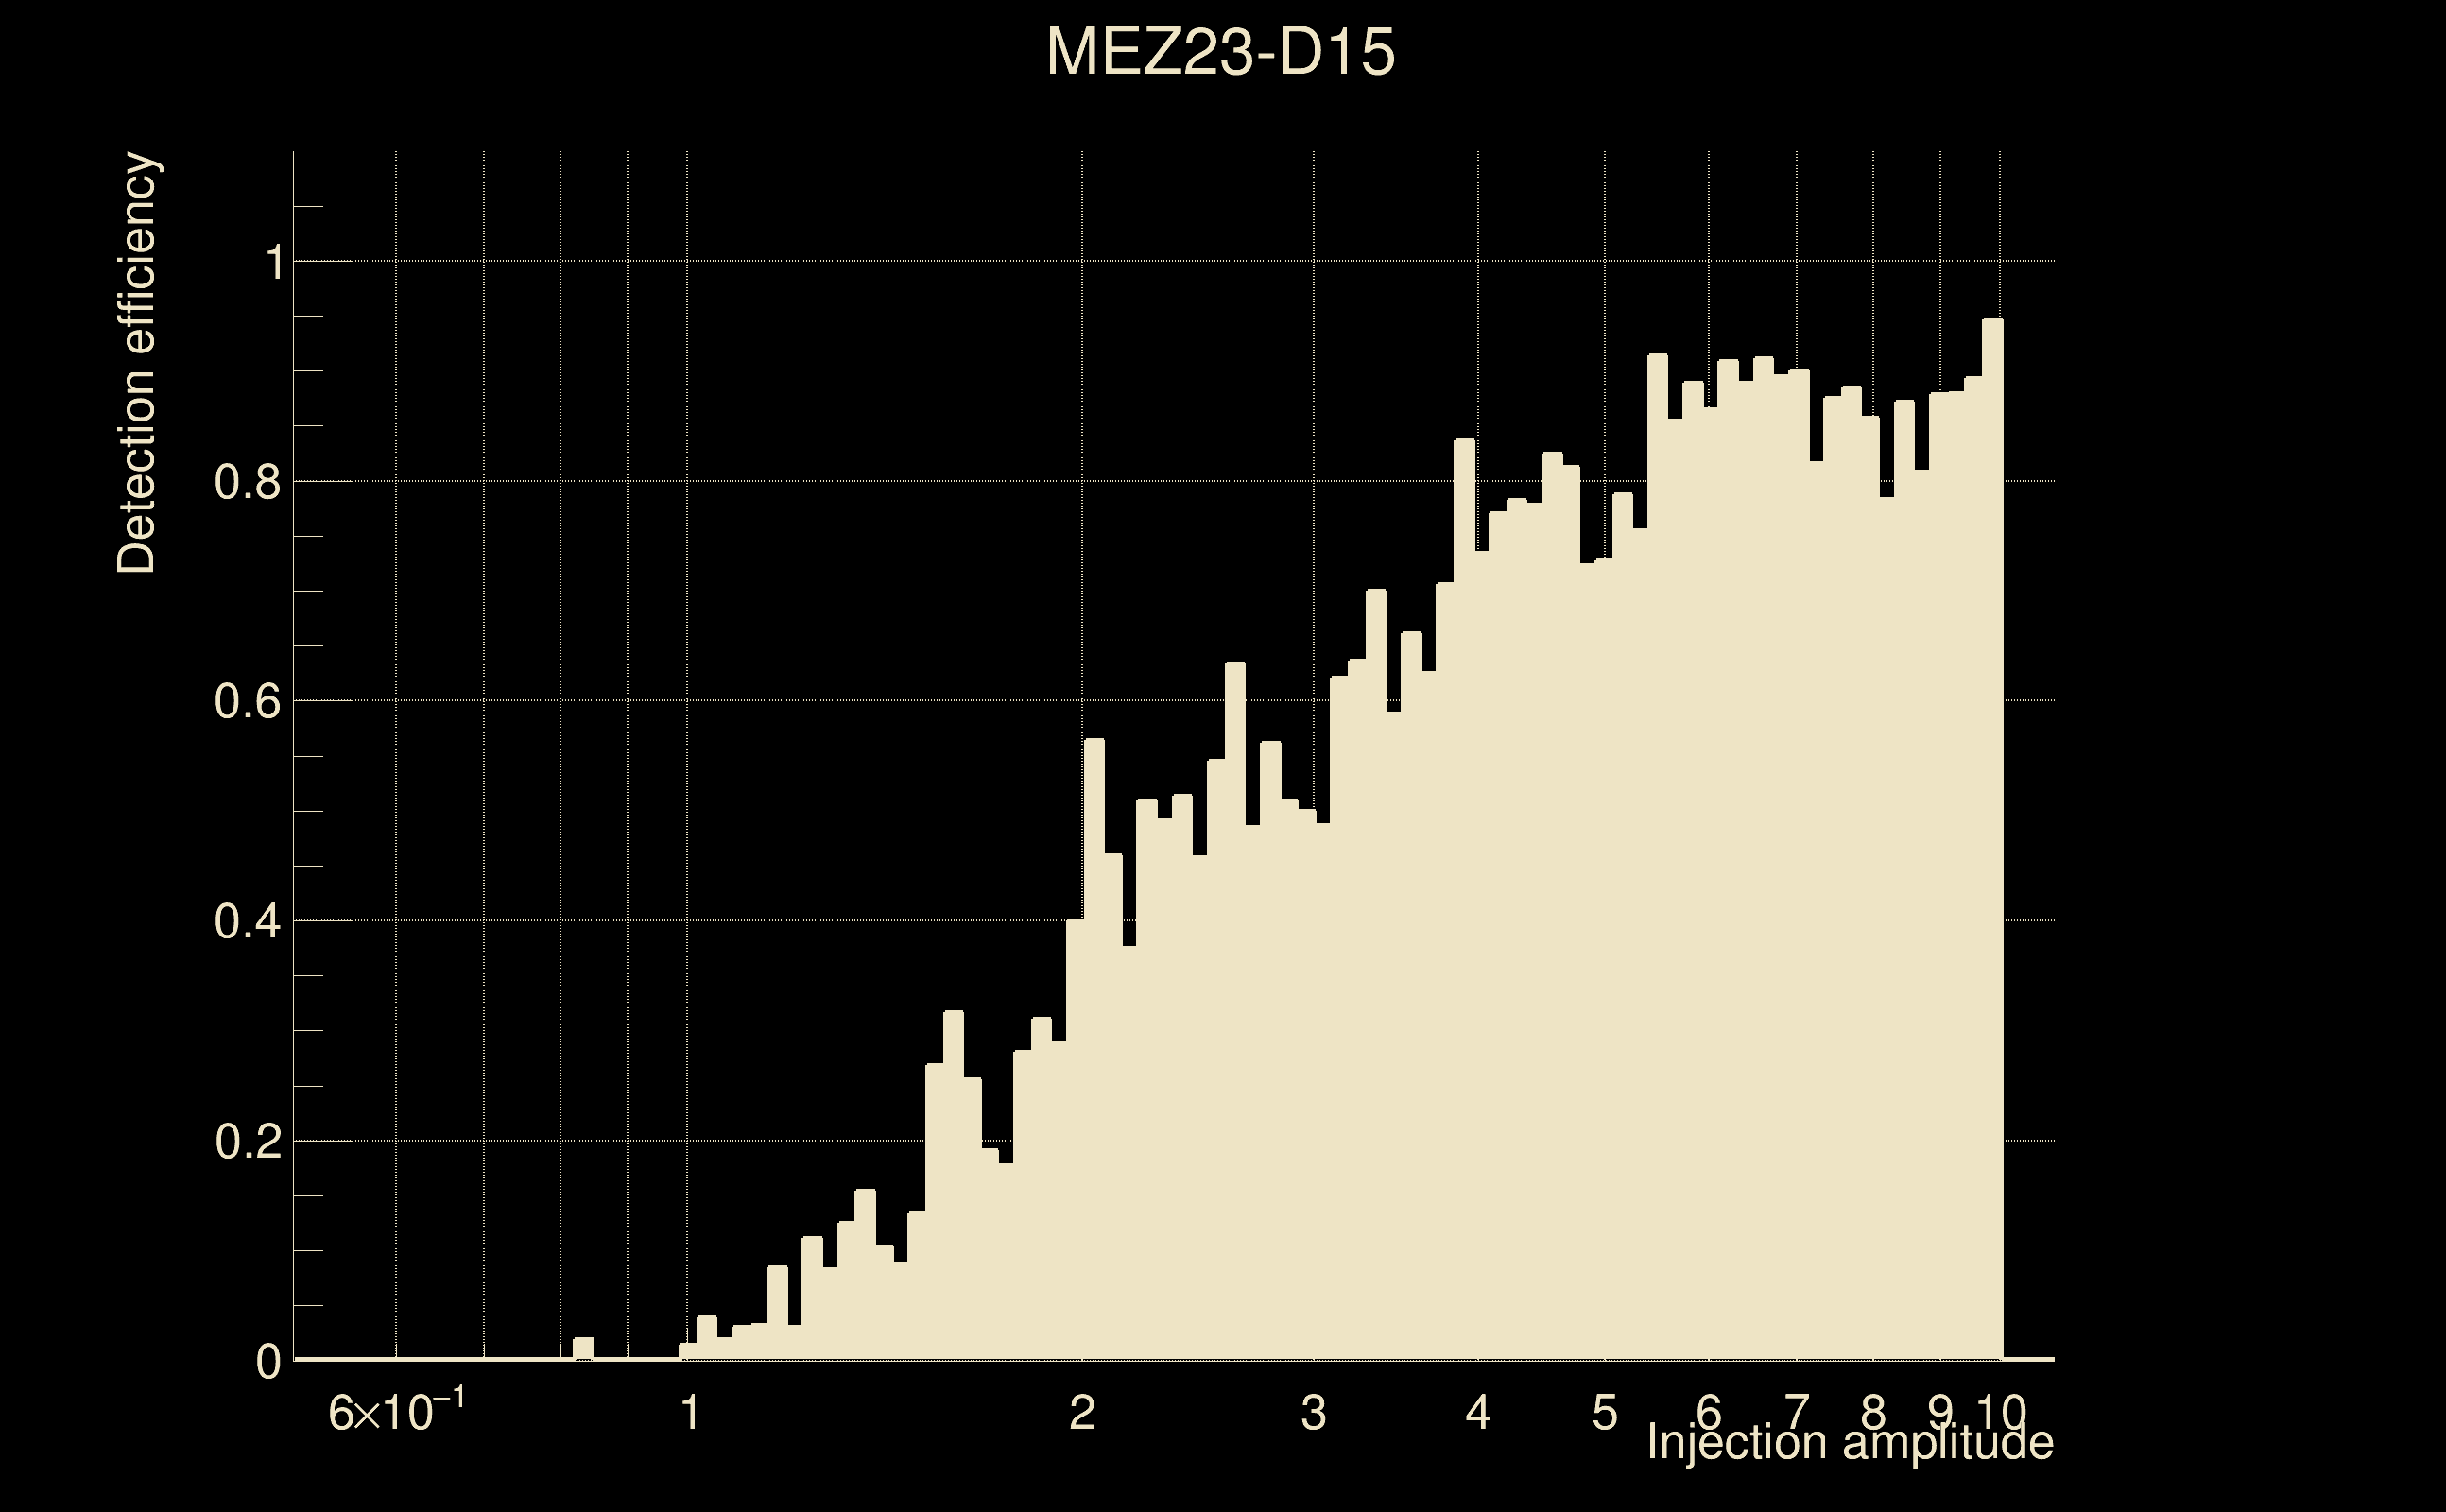
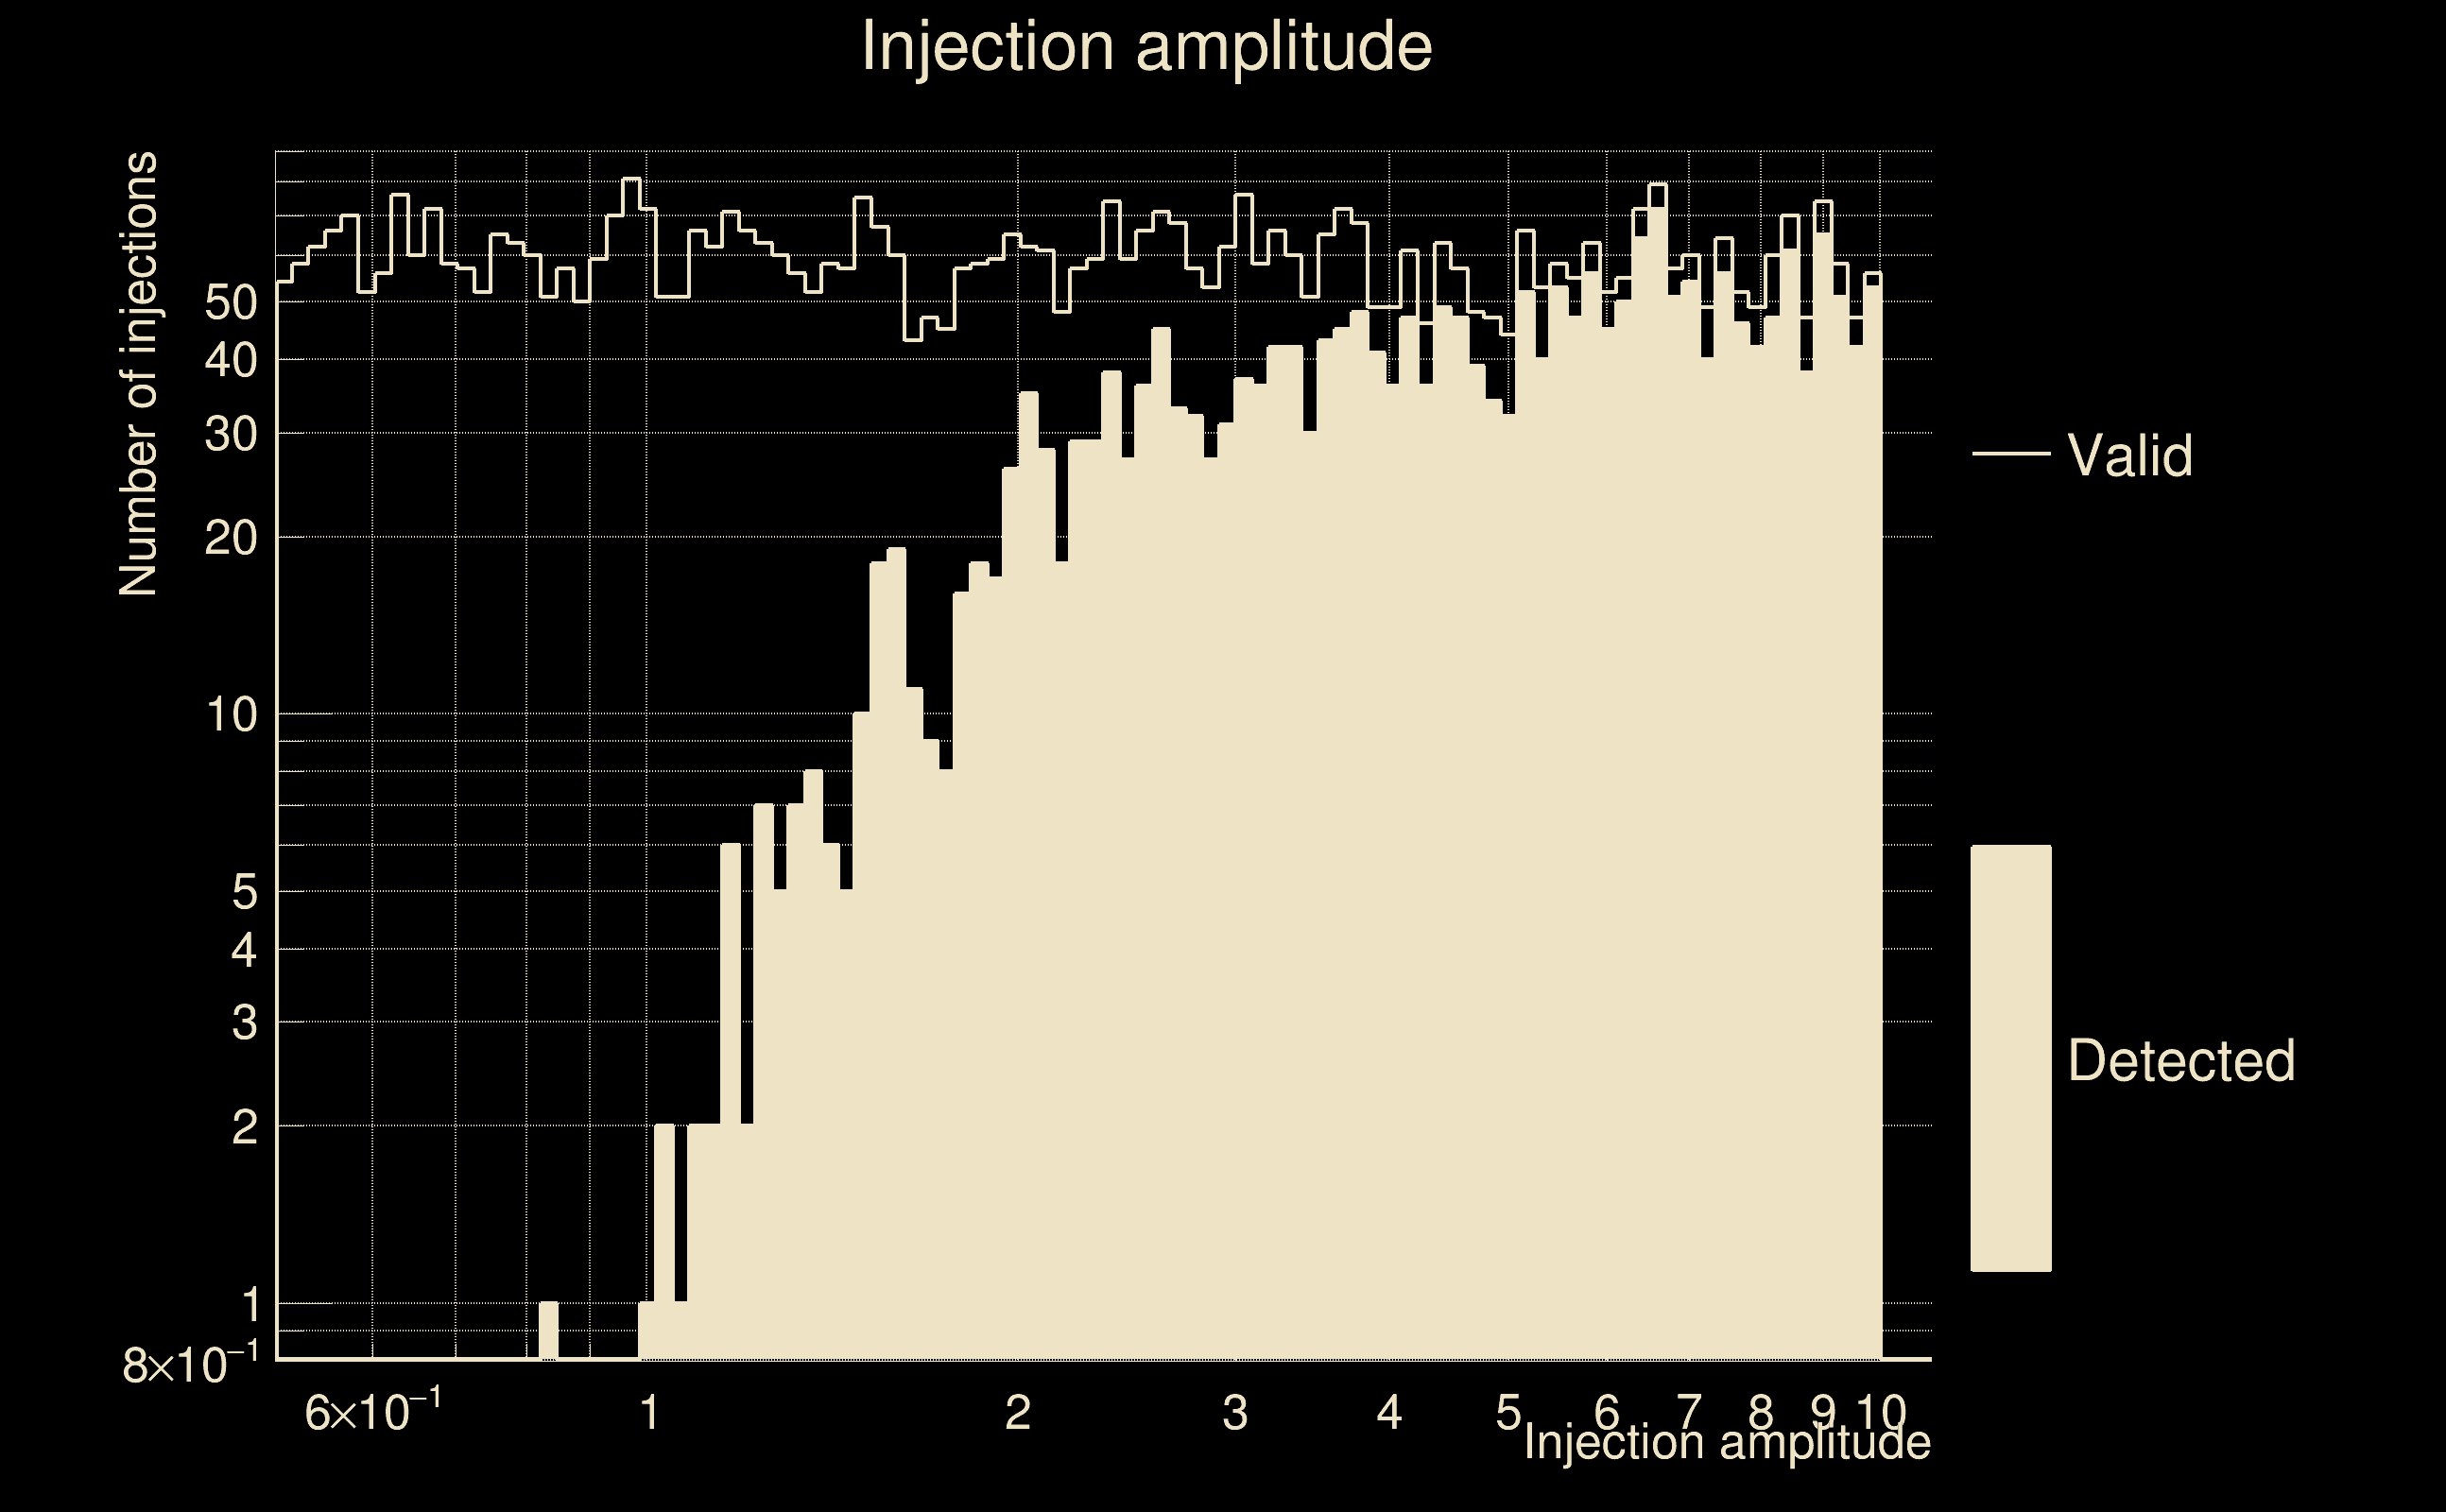
| Number of injections (total/valid/detected): | 5836 / 5783 / 2424 |
| List of missed injections: | ./MEZ23-D15_missed.txt |
| Injection amplitude at 90% detection efficiency: | 9.60498 |
| Injection amplitude at 50% detection efficiency: | 3.06012 |
| Injection amplitude at 10% detection efficiency: | 1.46565 |
 |
 |
 |
 |
 |
 |
|
 |
 |
|
 |
 |
 |
 |
 |
 |
 |
 |
| Number of injections (total/valid/detected): | 5911 / 5869 / 2553 |
| List of missed injections: | ./MEZ23-D9_missed.txt |
| Injection amplitude at 90% detection efficiency: | 6.0843 |
| Injection amplitude at 50% detection efficiency: | 2.80289 |
| Injection amplitude at 10% detection efficiency: | 1.2585 |
 |
 |
 |
 |
 |
 |
|
 |
 |
|
 |
 |
 |
 |
 |
 |
 |
 |
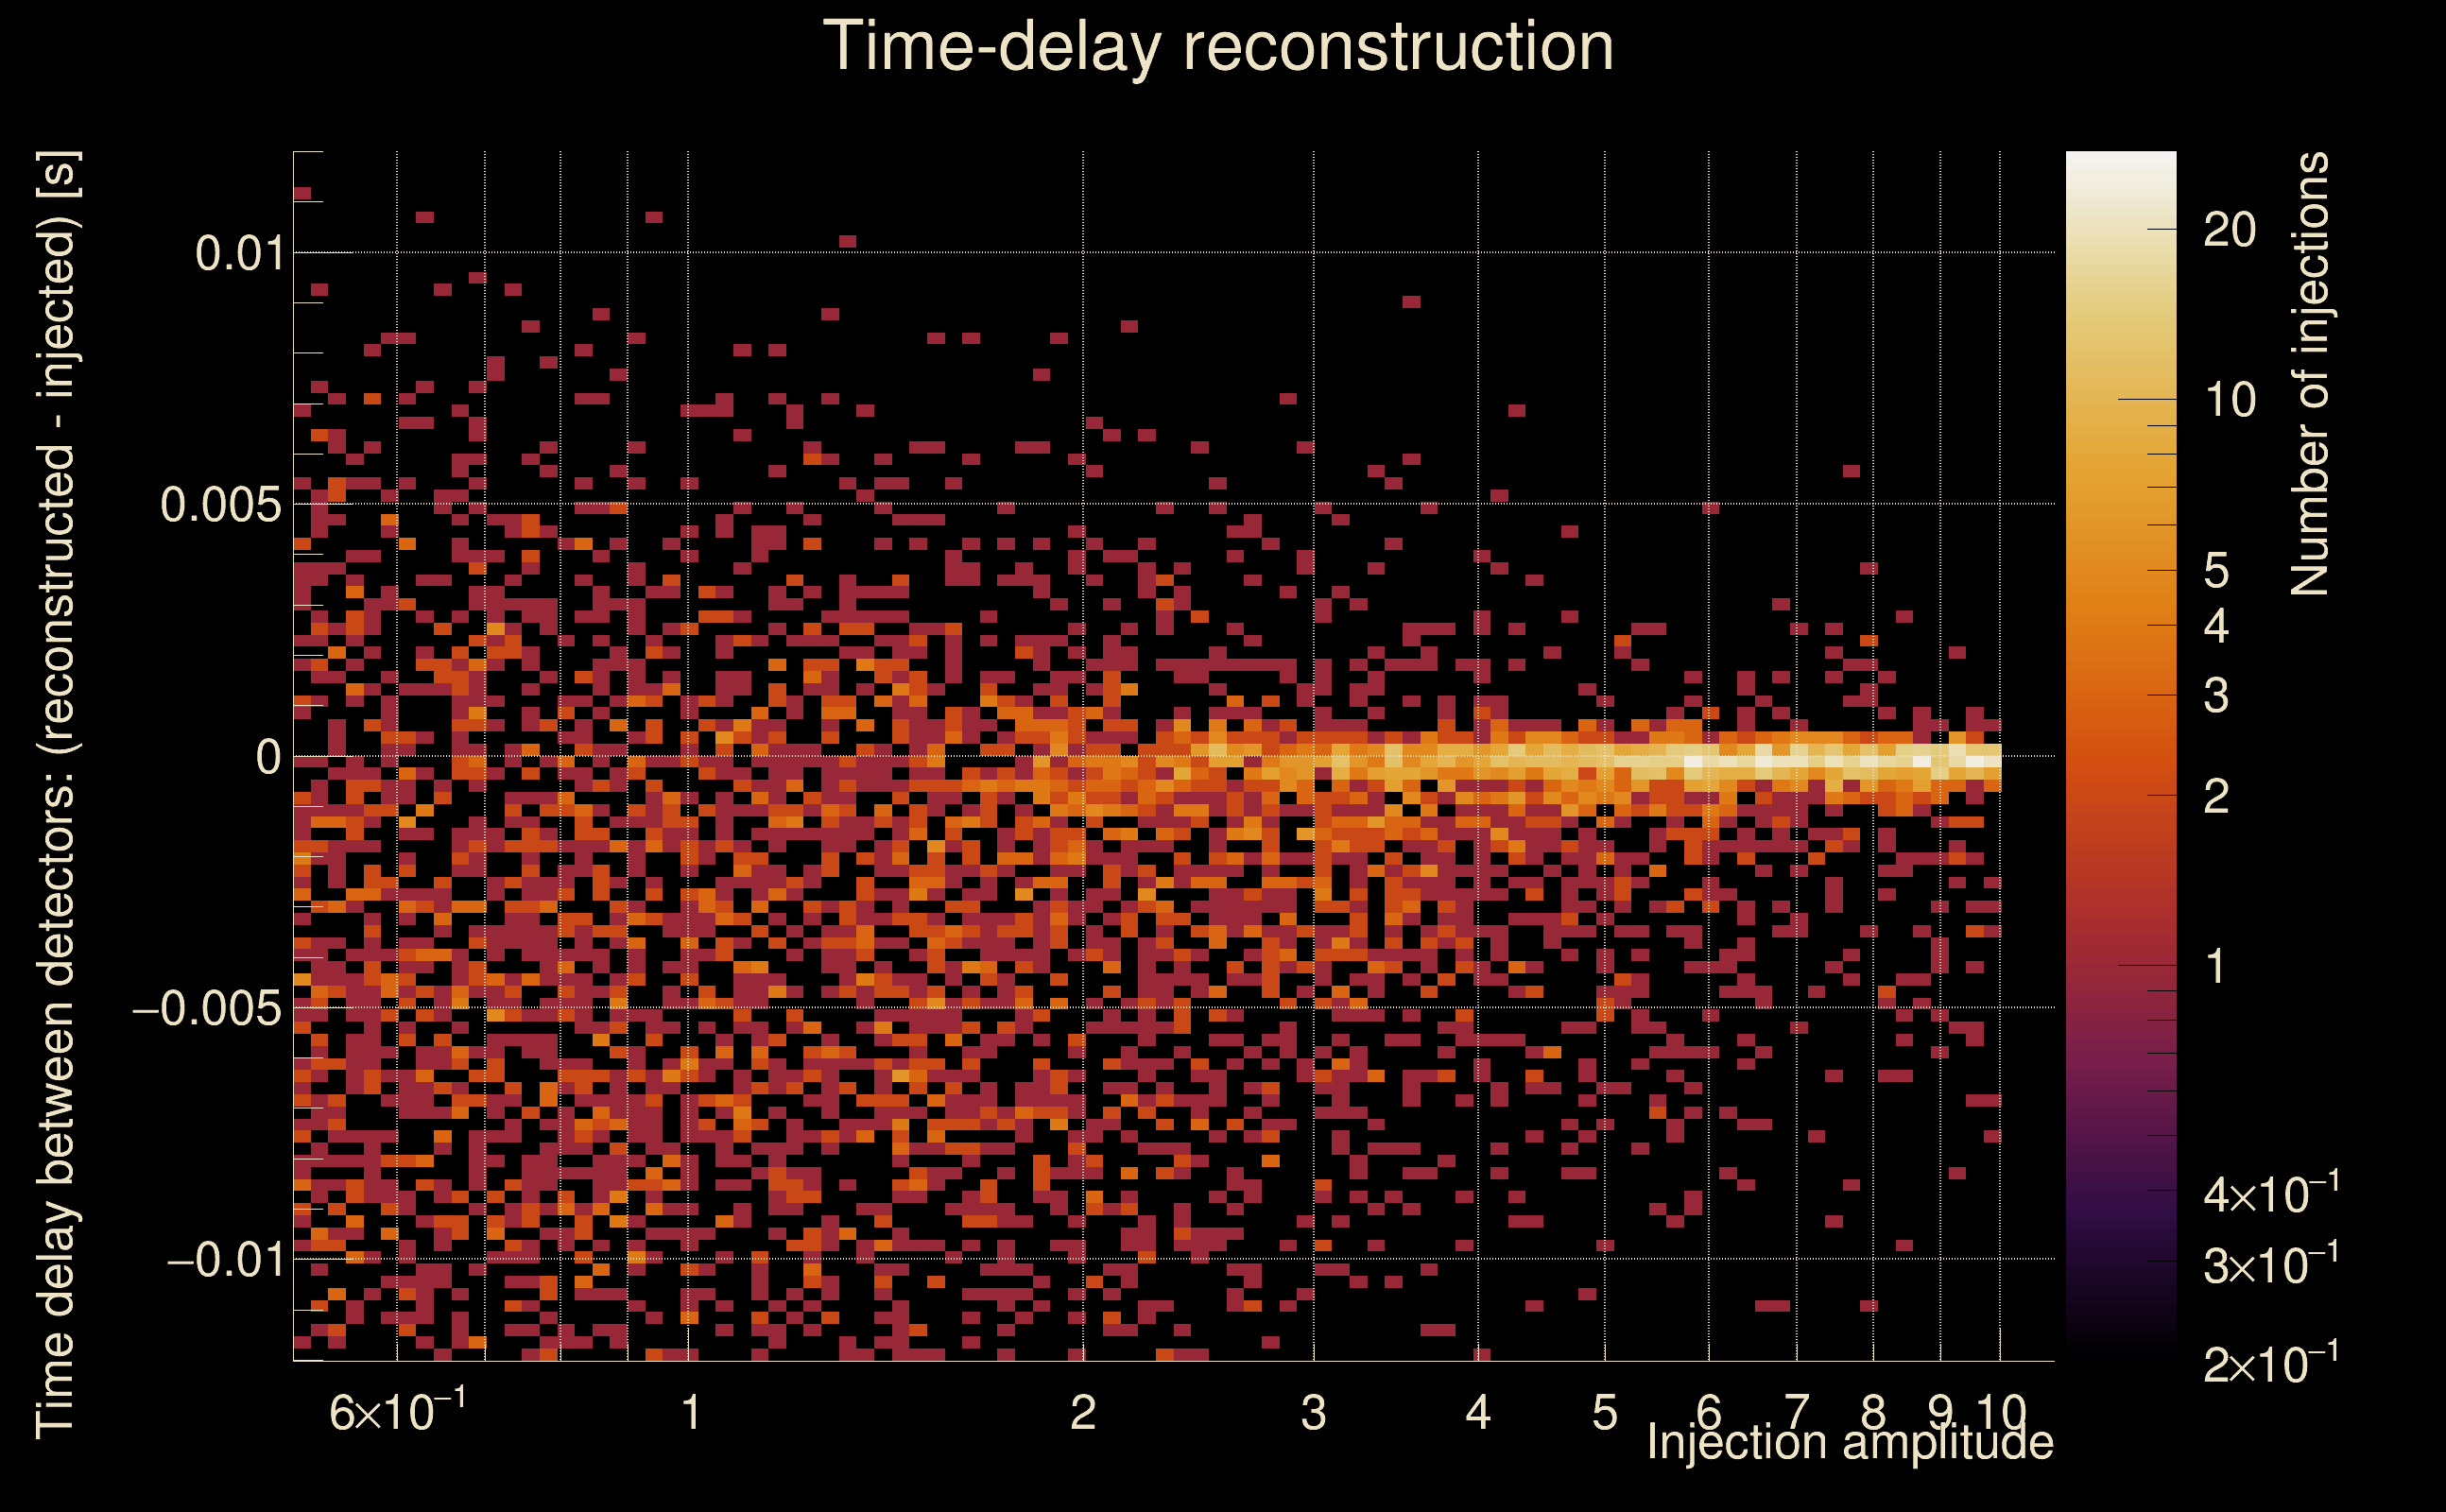
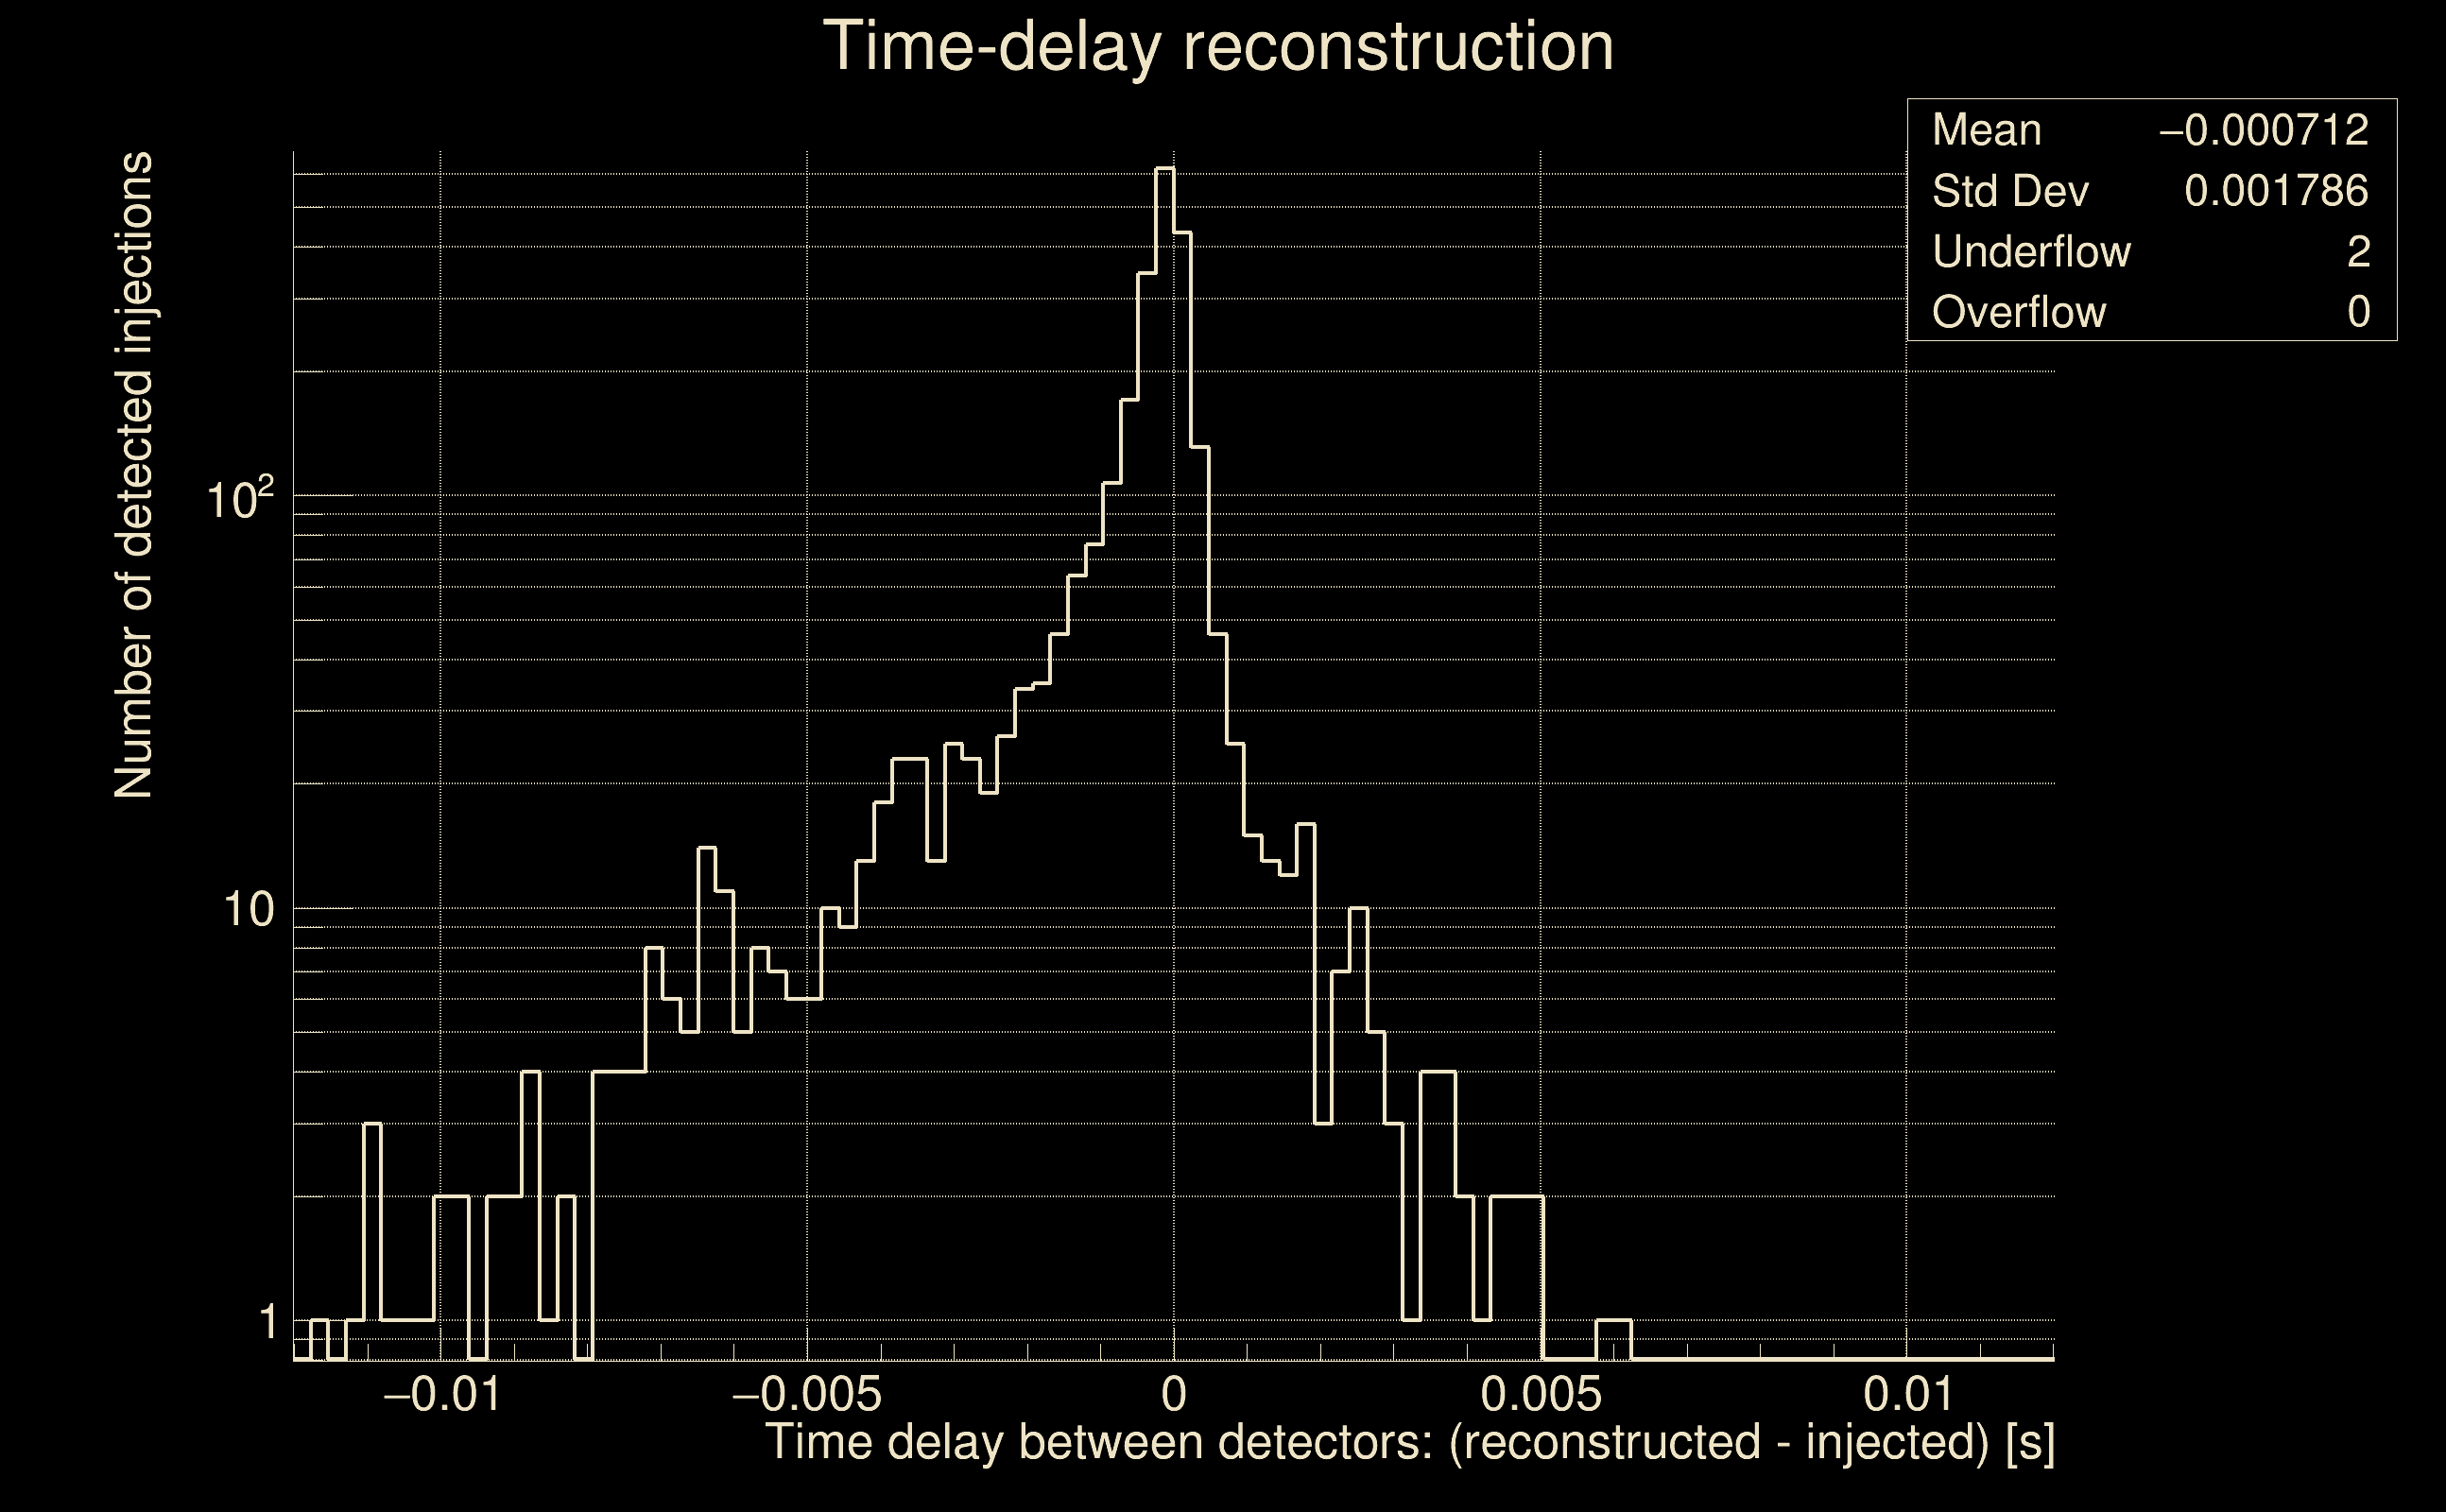
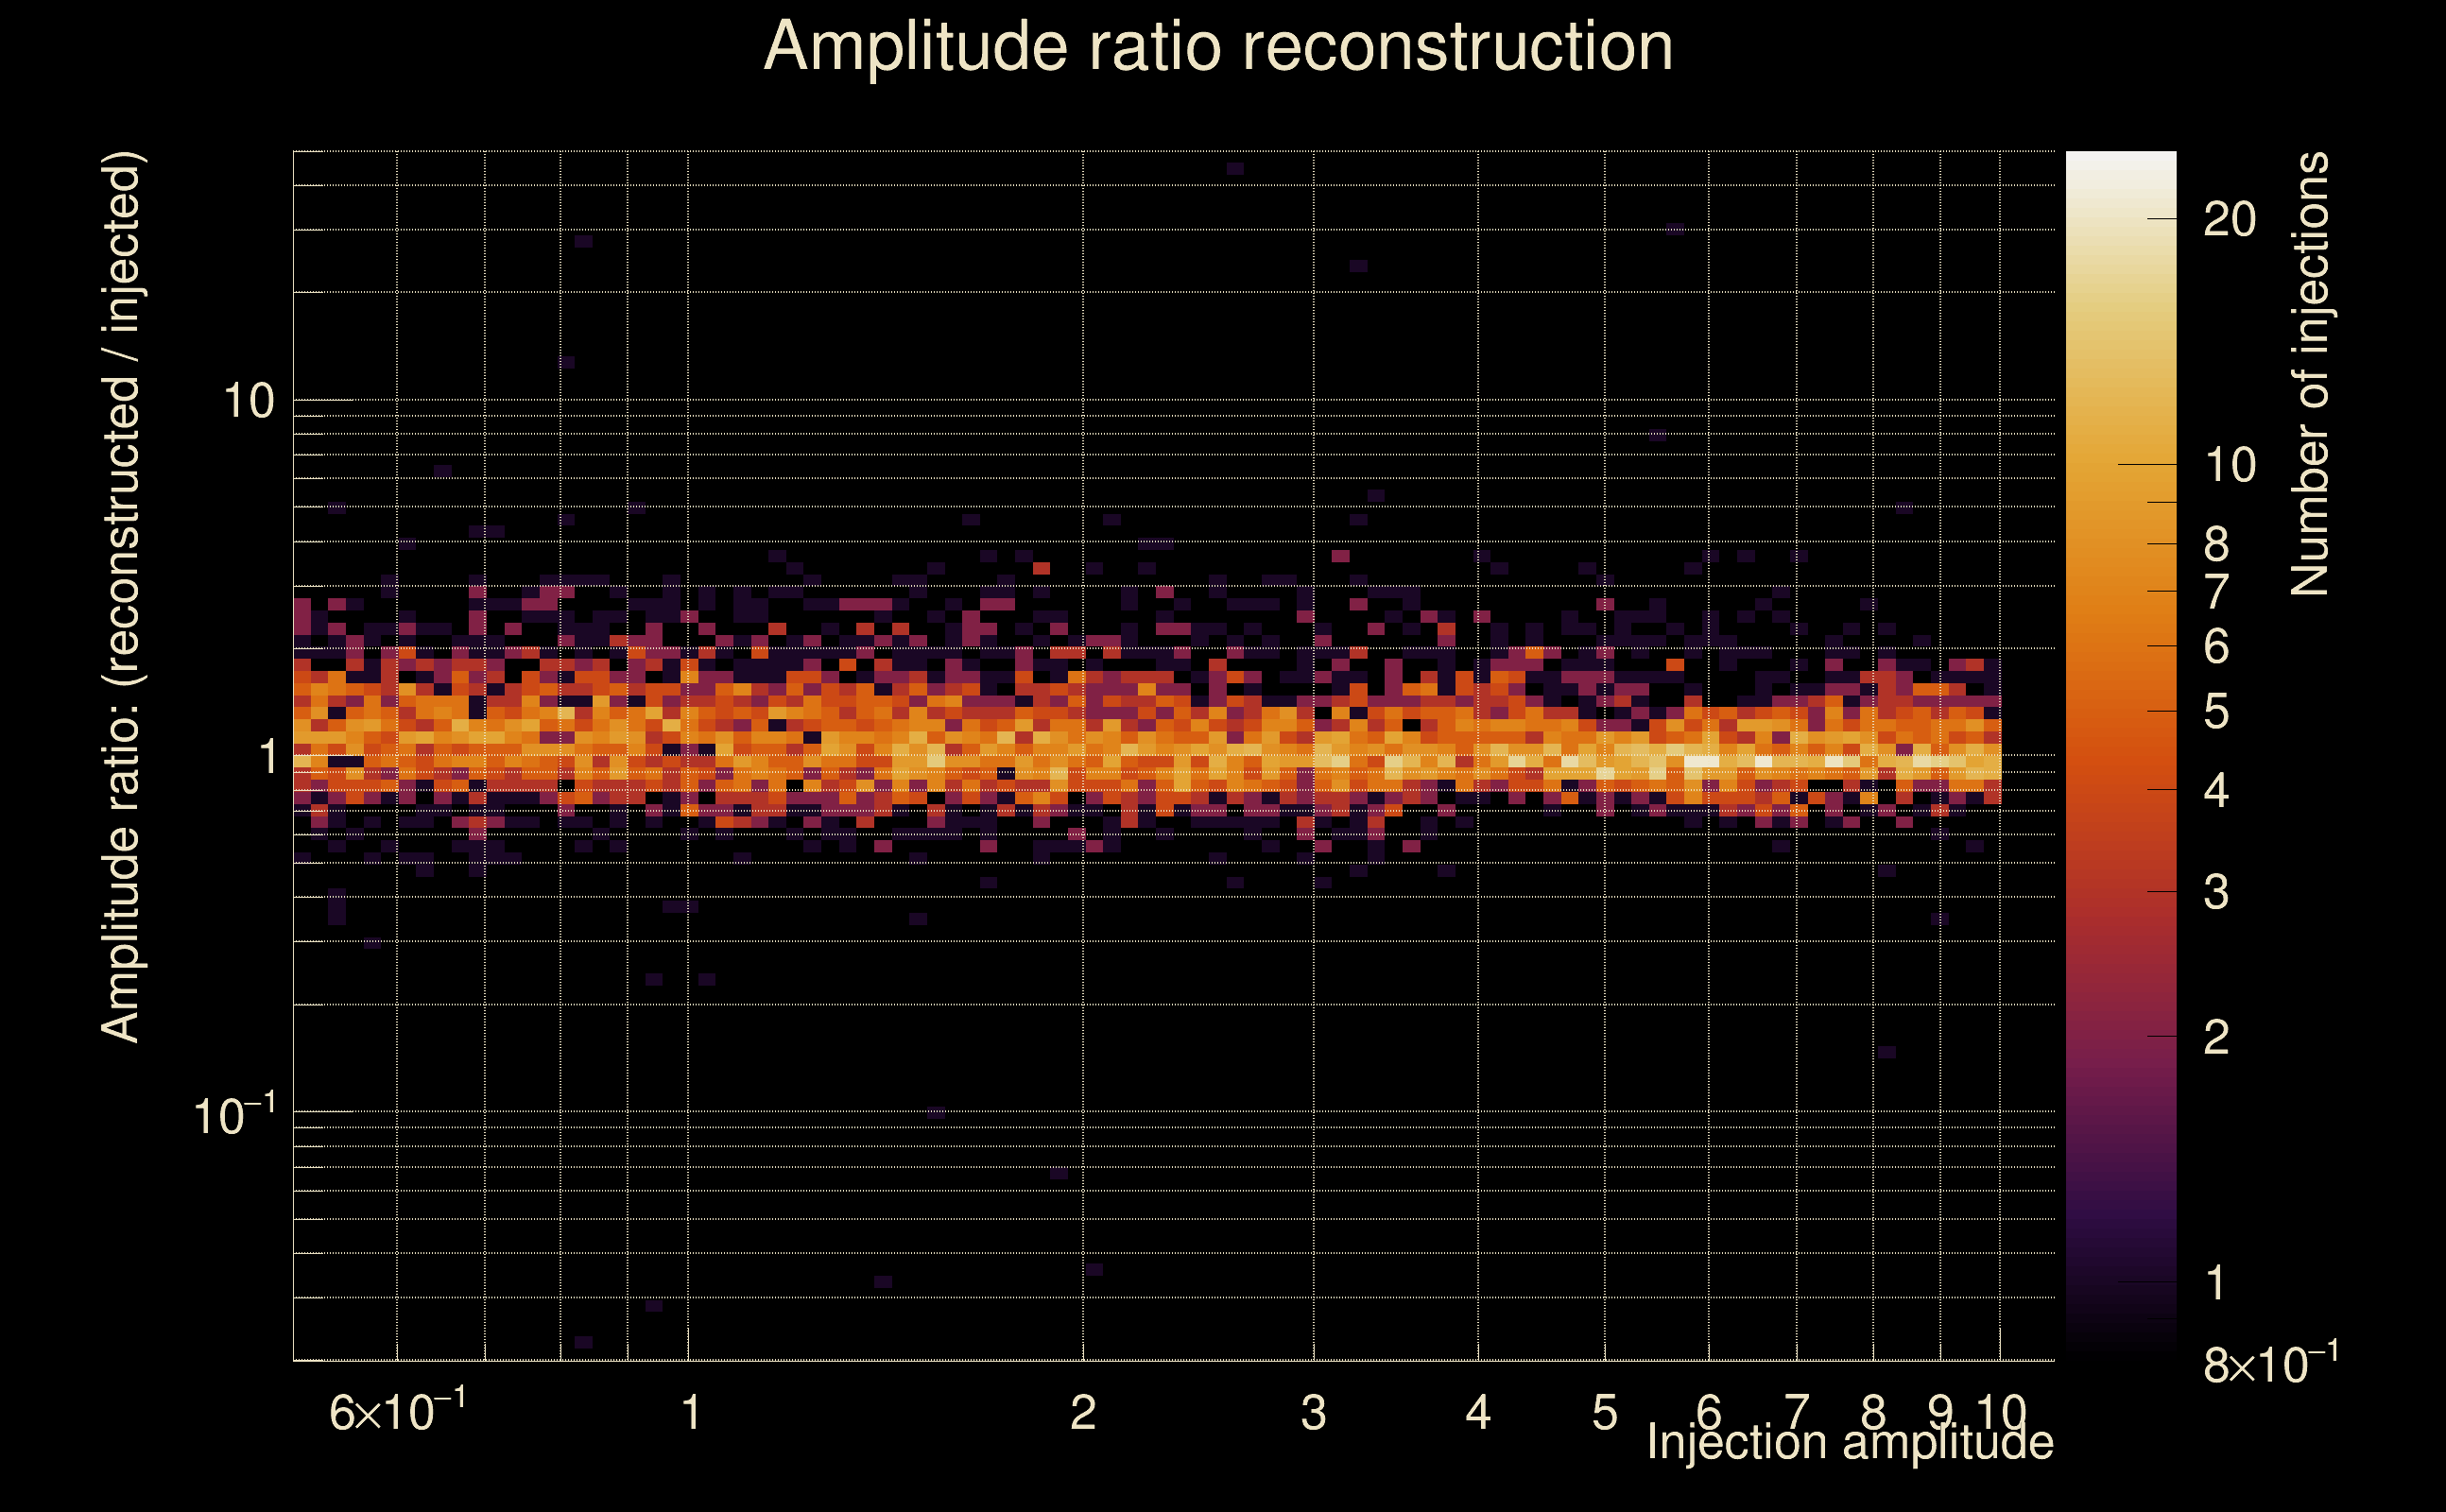
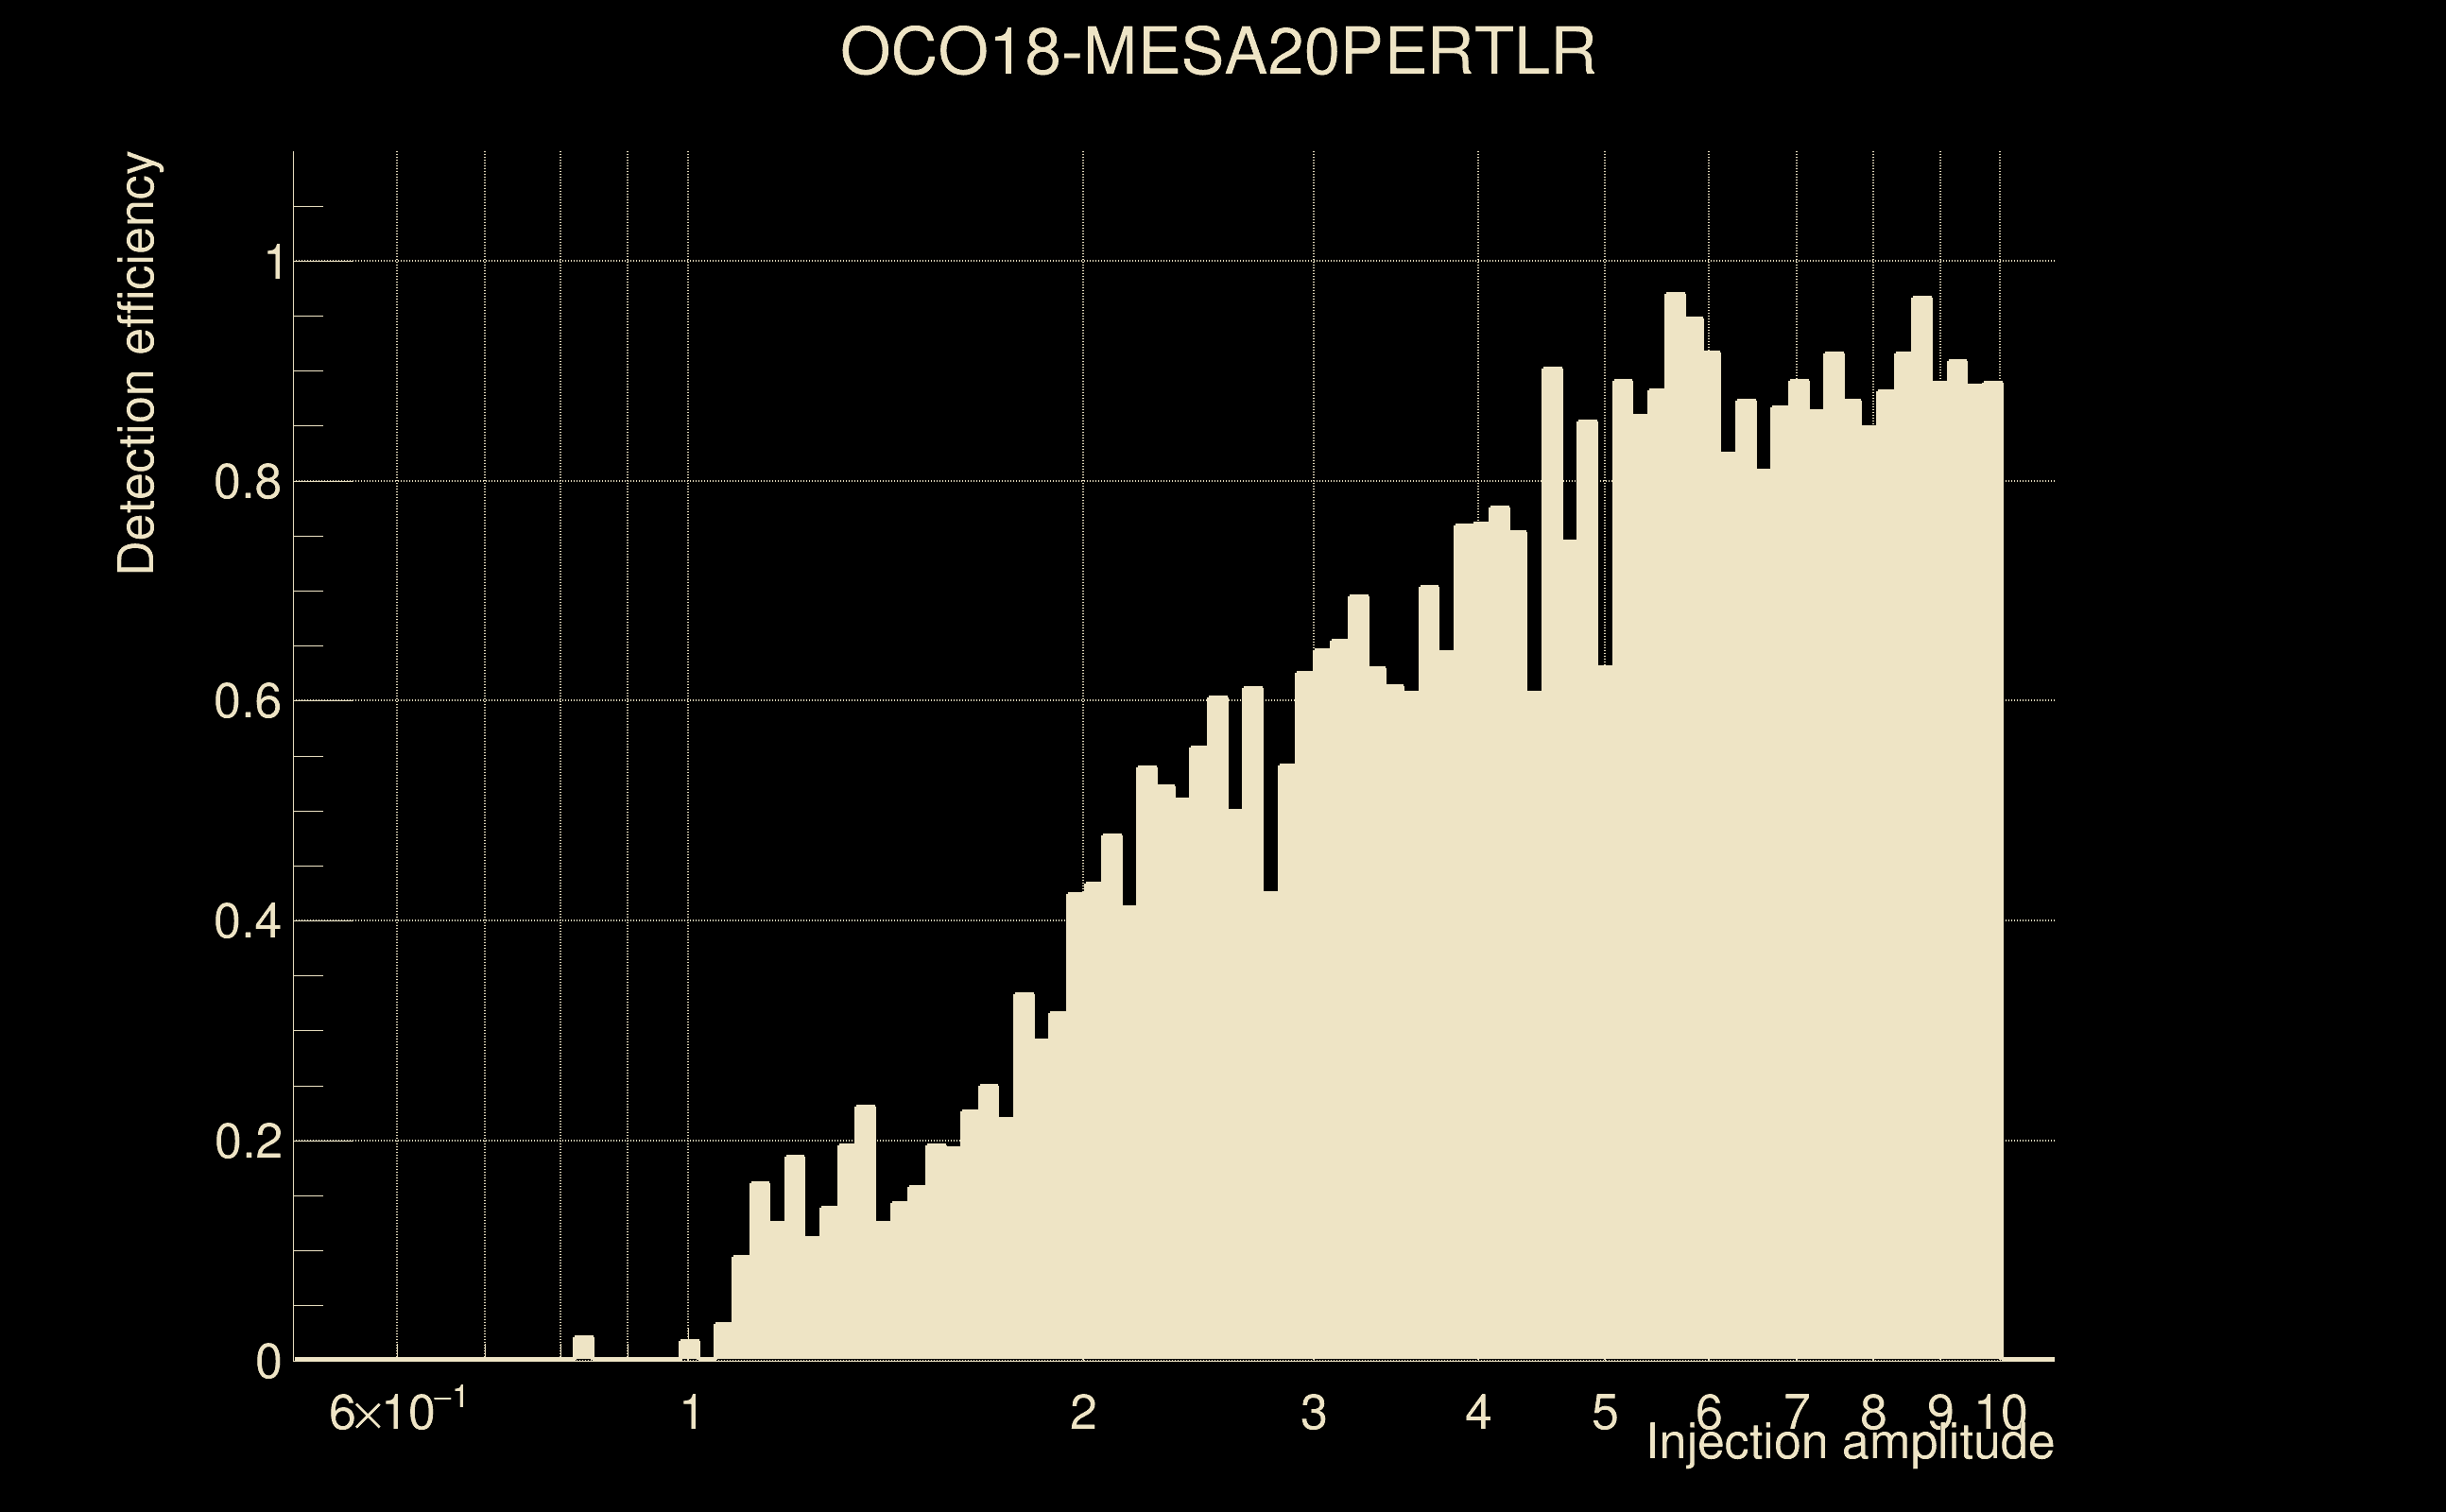
| Number of injections (total/valid/detected): | 5730 / 5680 / 2506 |
| List of missed injections: | ./OCO18-MESA20PERTLR_missed.txt |
| Injection amplitude at 90% detection efficiency: | 5.52011 |
| Injection amplitude at 50% detection efficiency: | 2.83578 |
| Injection amplitude at 10% detection efficiency: | 1.10266 |
 |
 |
 |
 |
 |
 |
|
 |
 |
|
 |
 |
 |
 |
 |
 |
 |
 |
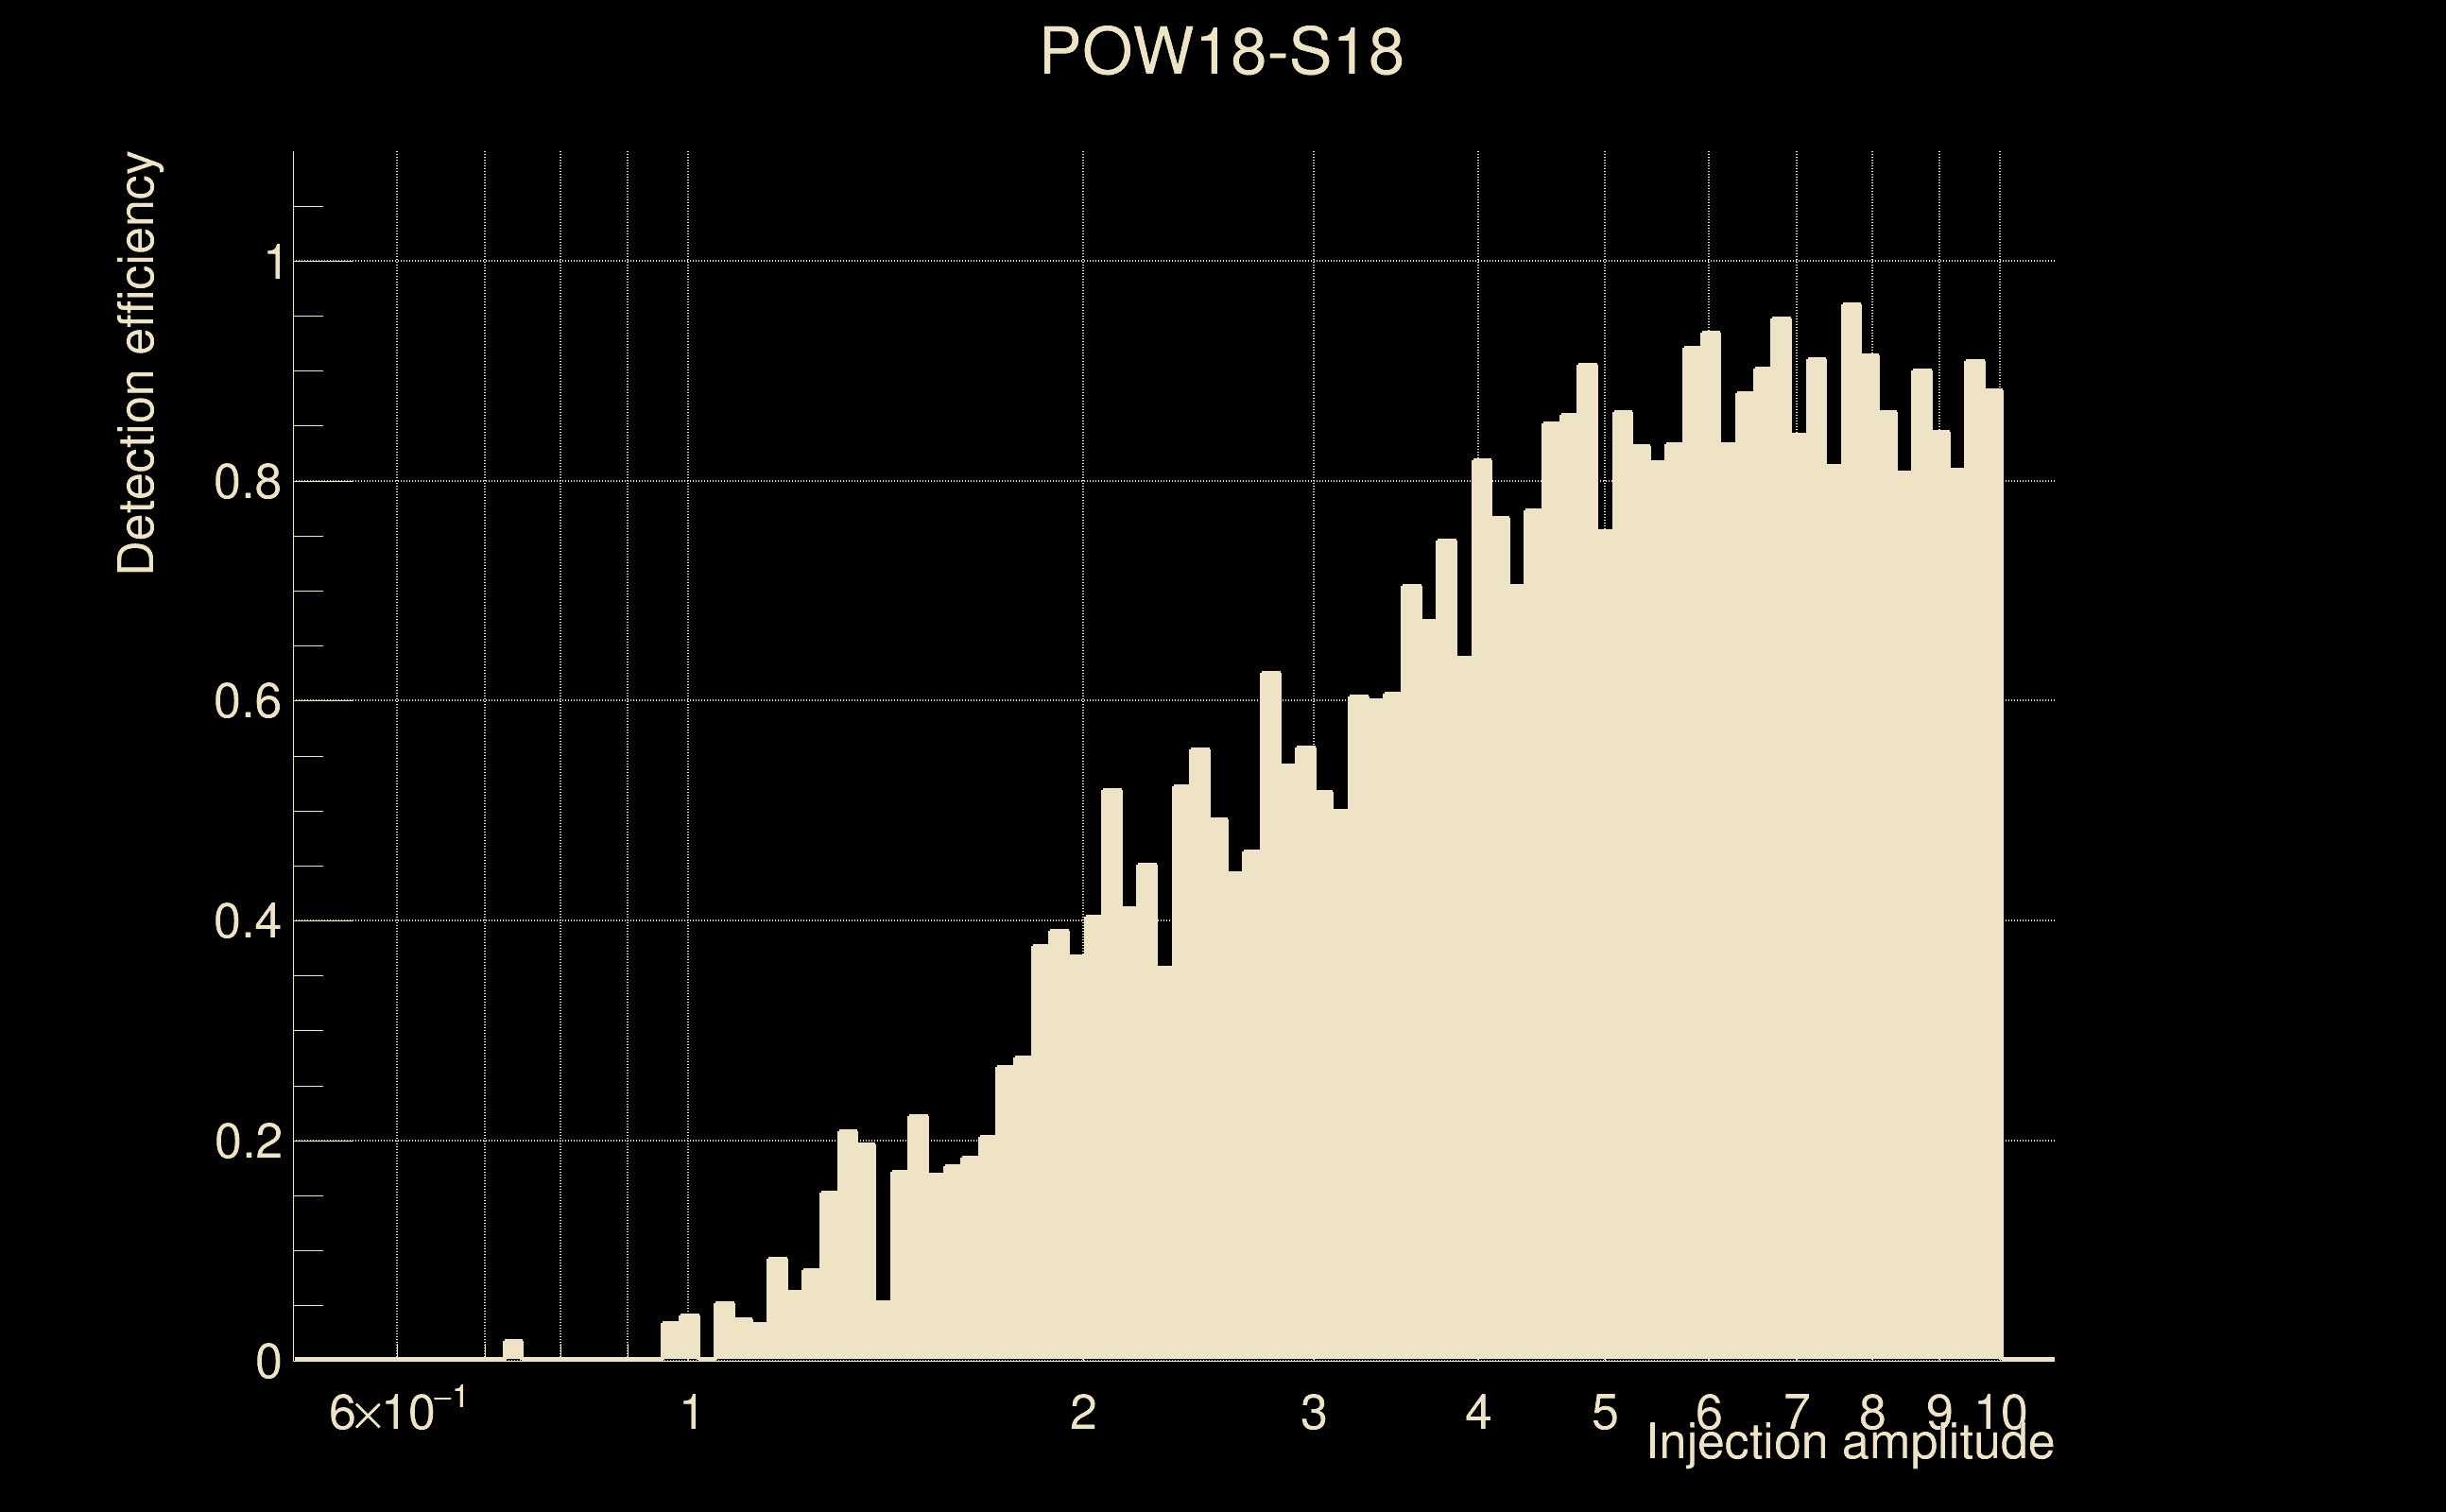
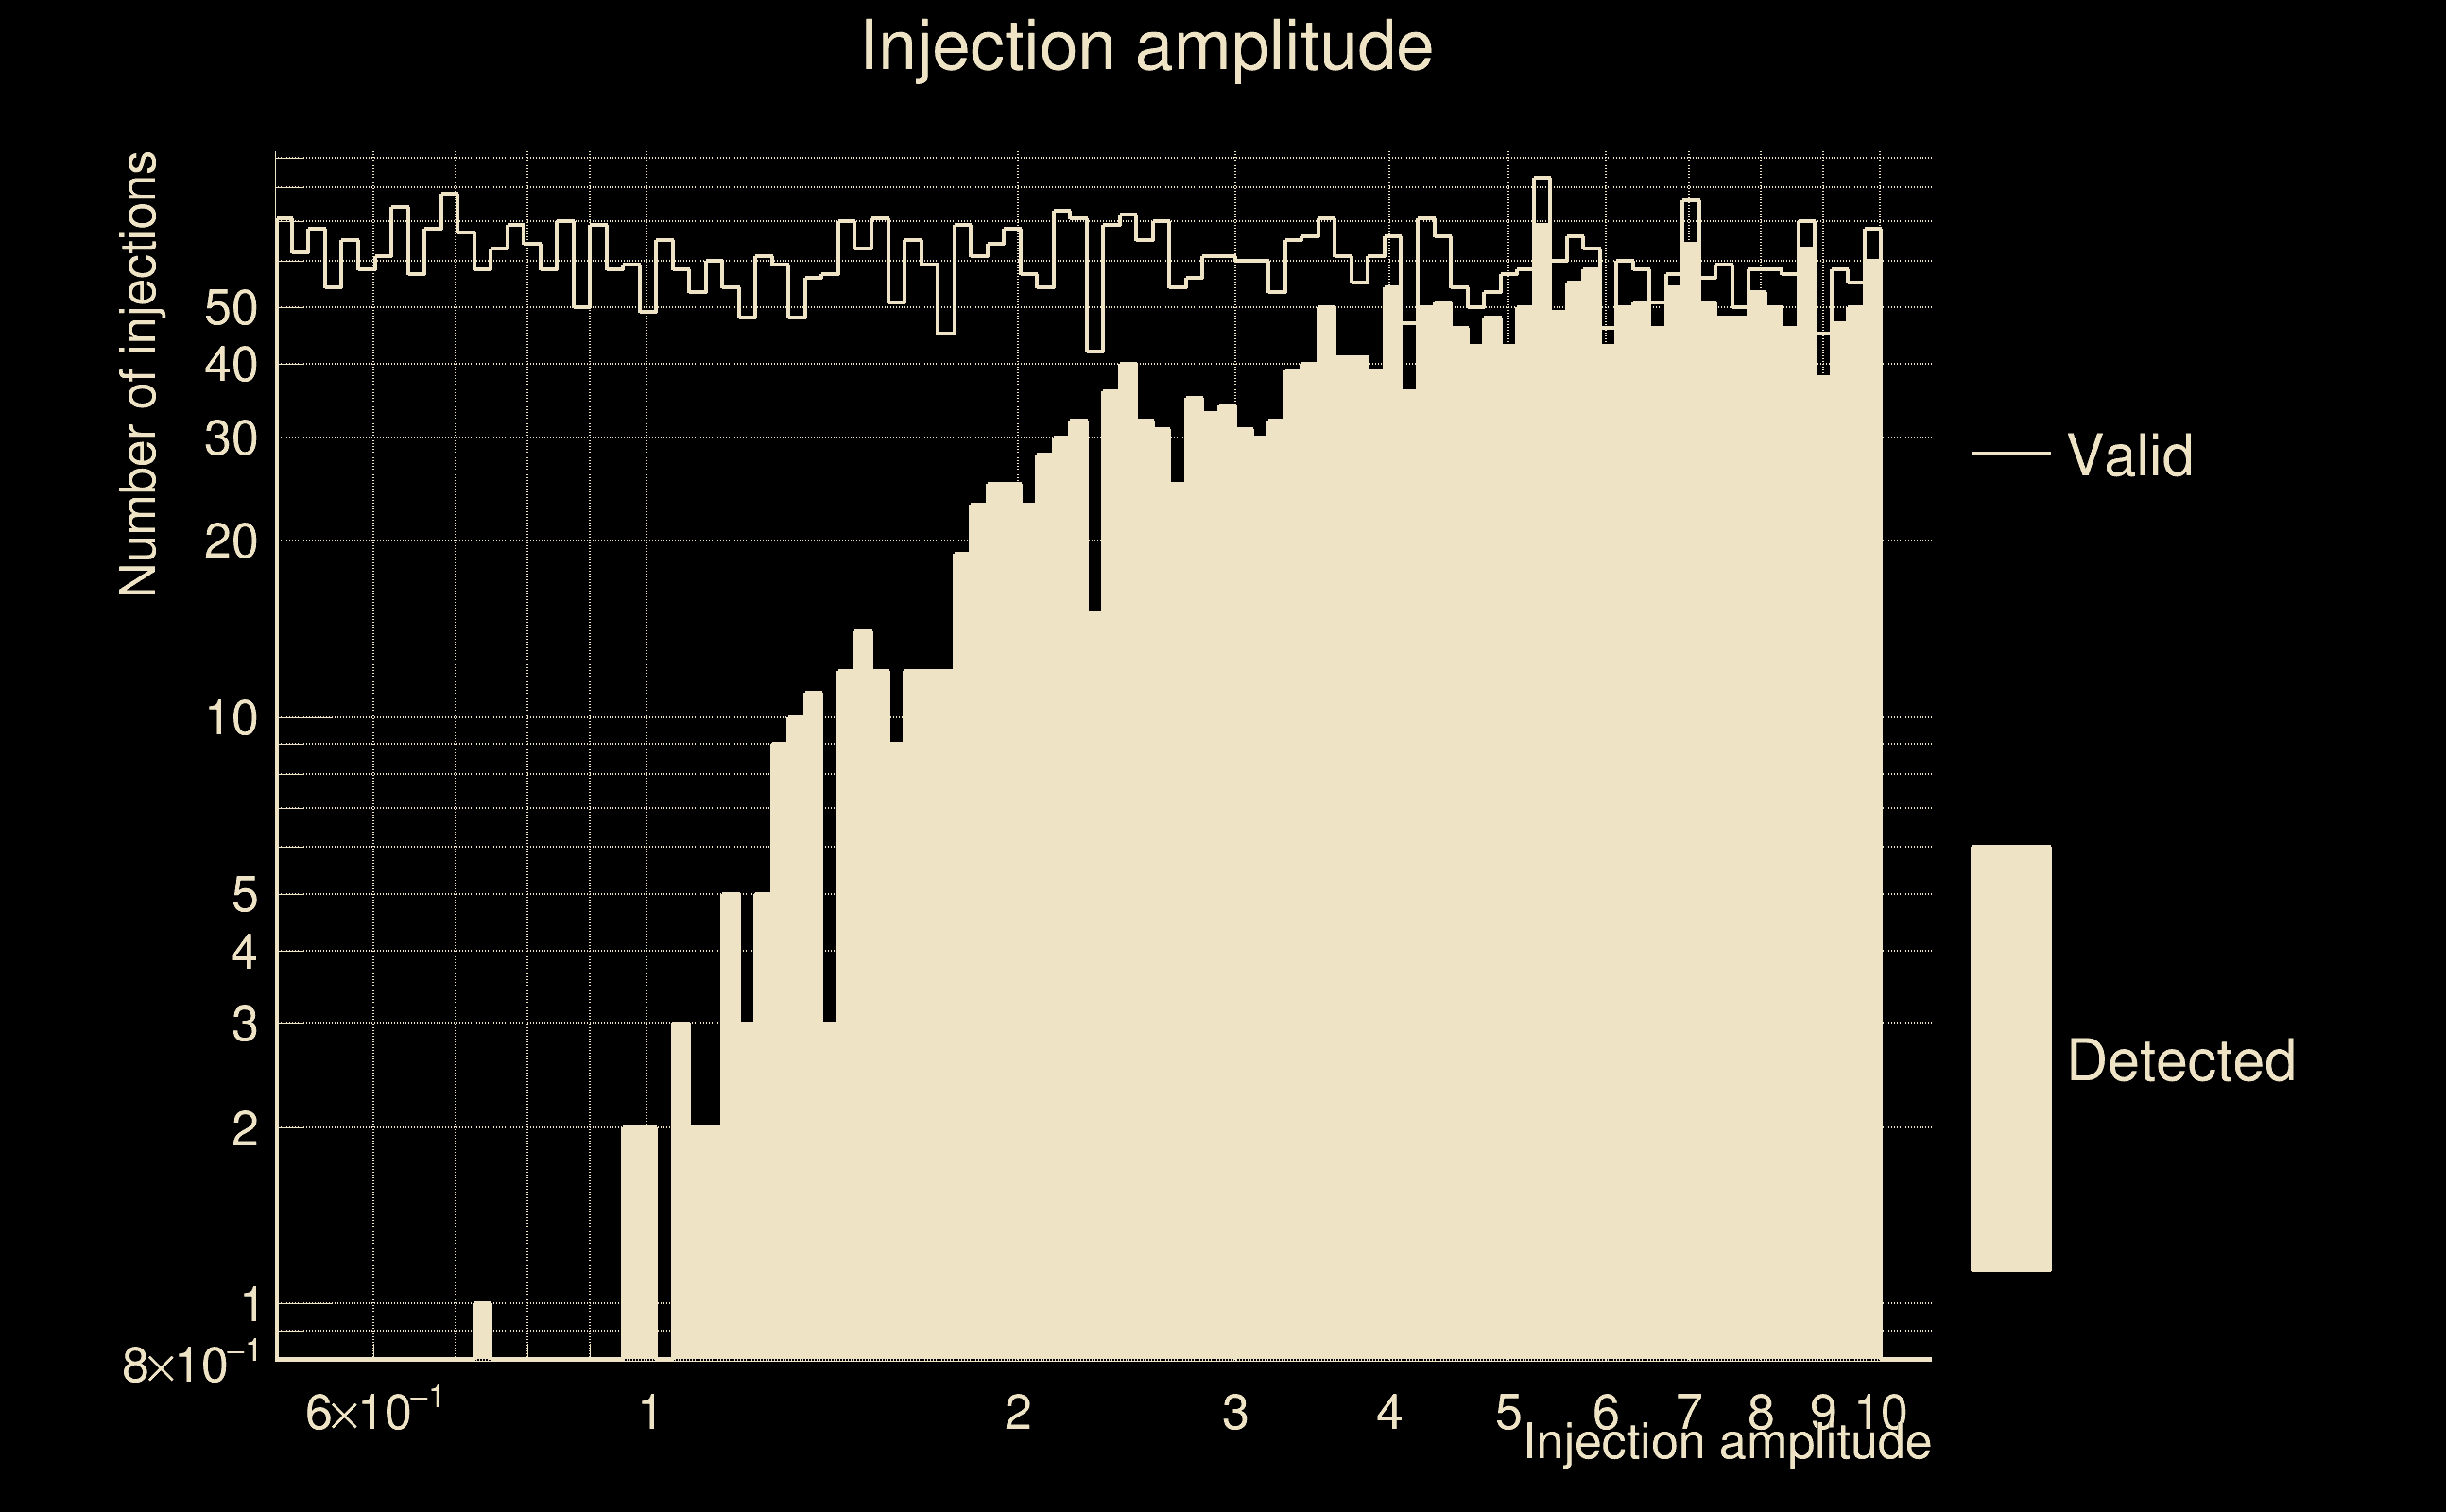
| Number of injections (total/valid/detected): | 5932 / 5888 / 2484 |
| List of missed injections: | ./POW18-S18_missed.txt |
| Injection amplitude at 90% detection efficiency: | 7.61328 |
| Injection amplitude at 50% detection efficiency: | 2.71497 |
| Injection amplitude at 10% detection efficiency: | 1.42624 |
 |
 |
 |
 |
 |
 |
|
 |
 |
|
 |
 |
 |
 |
 |
 |
 |
 |
| florent.robinet@ijclab.in2p3.fr |