| Omicron version: | 4.2.0: documentation gitlab repository |
| Omicron run by: | unknown |
| Report produced on: | Sat Nov 1 18:47:35 2025 UTC |
| Ox option file: | Targ_FirstTest_O4bw_14days_options.txt |
| Omicron option files: | detector 0, detector 1 |
| Detector channel names: | H1:GDS-CALIB_STRAIN_CLEAN_AR_4096Hz, L1:GDS-CALIB_STRAIN_CLEAN_AR_4096Hz |
| Omicron analysis time window and overlap: | 16 s, 6 s |
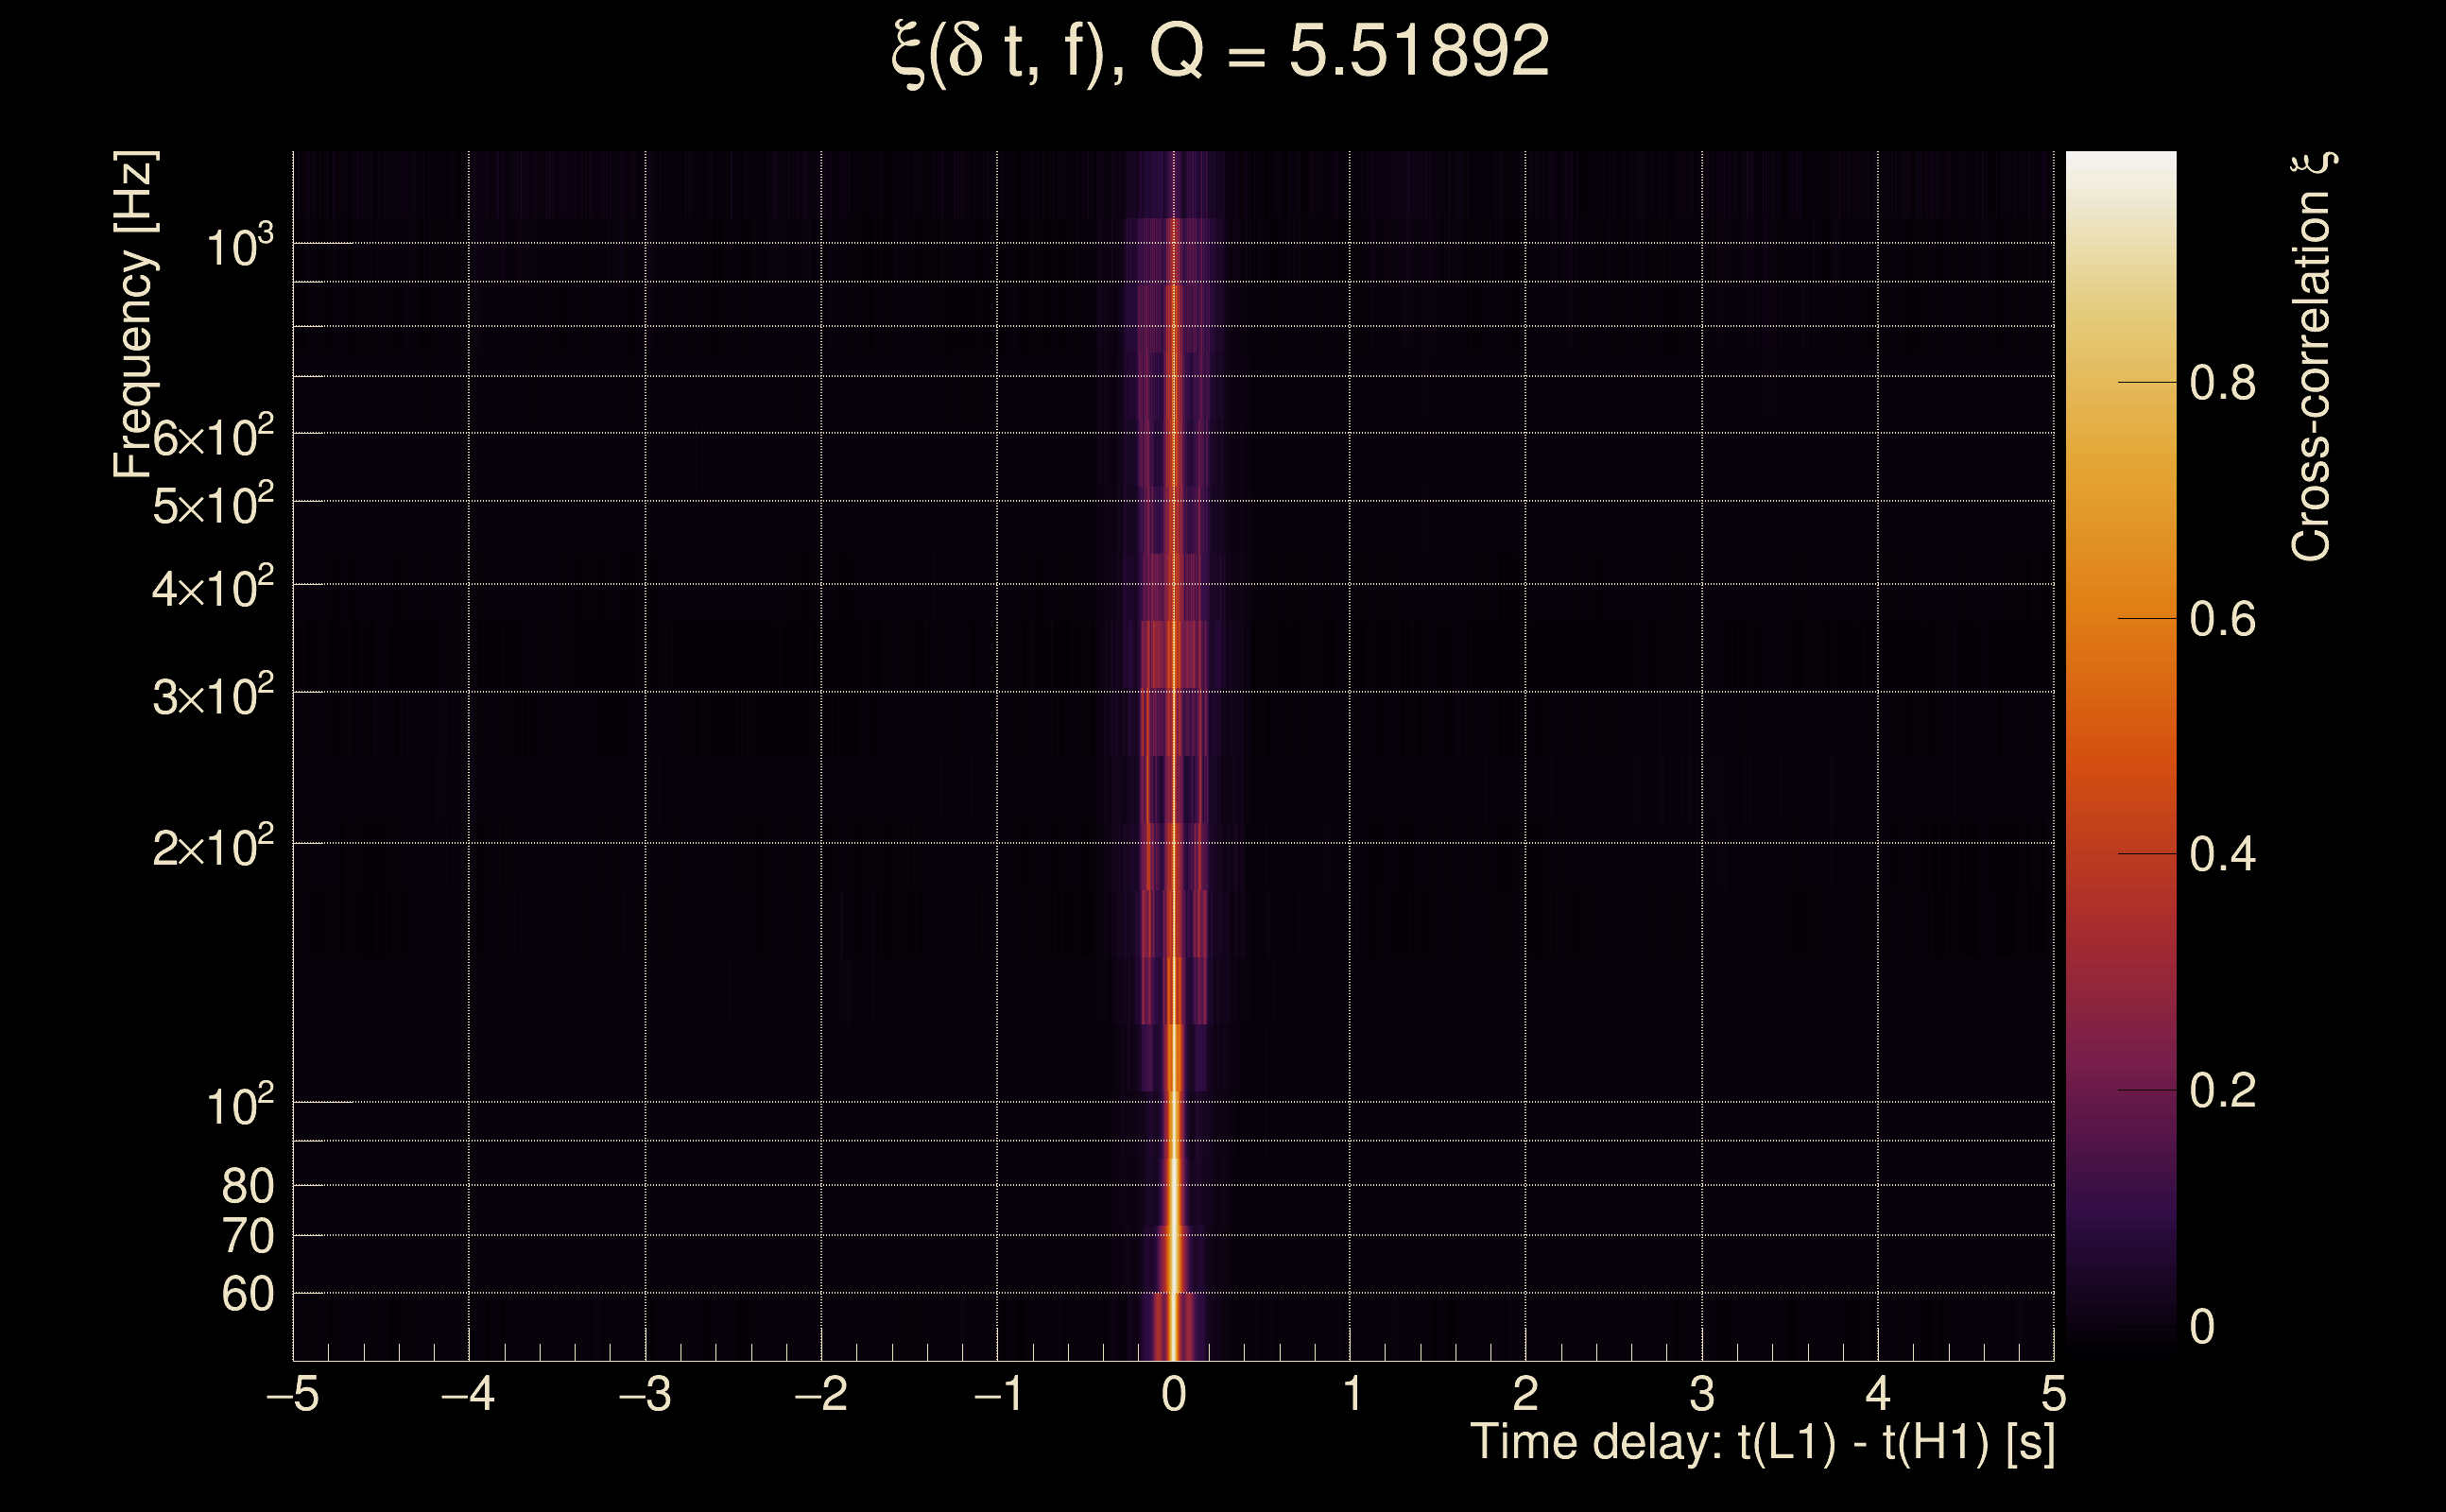
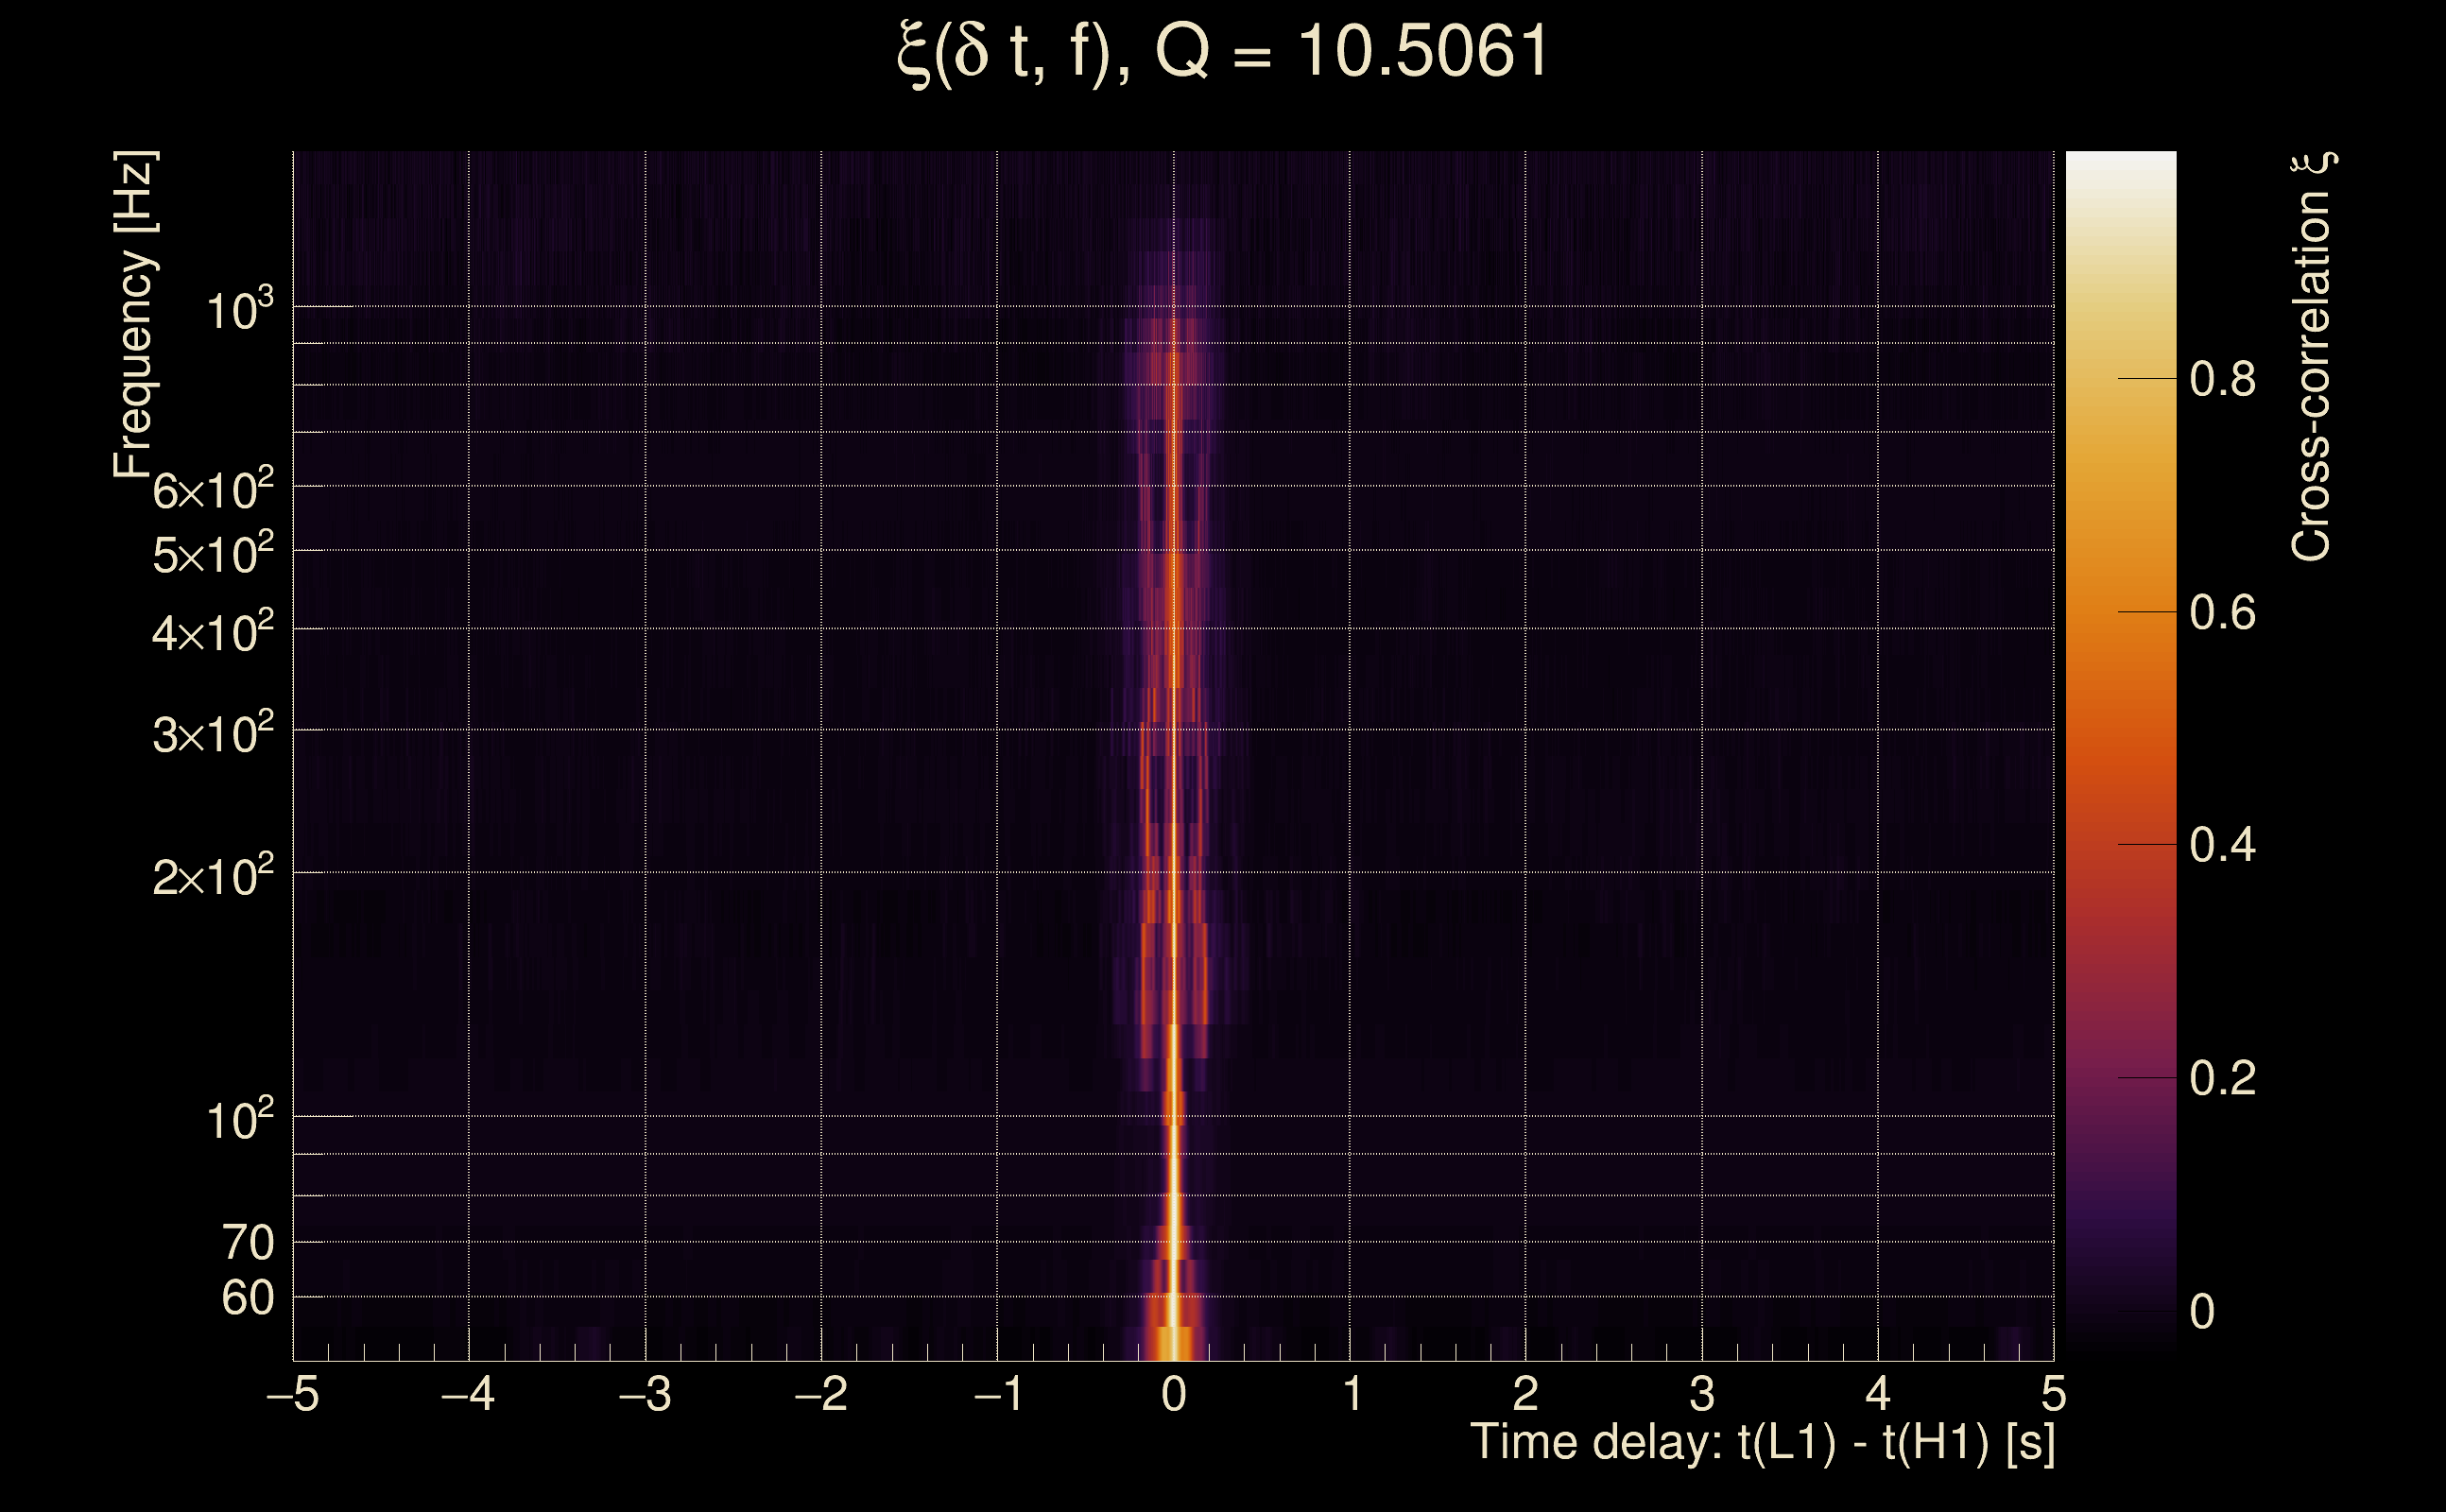
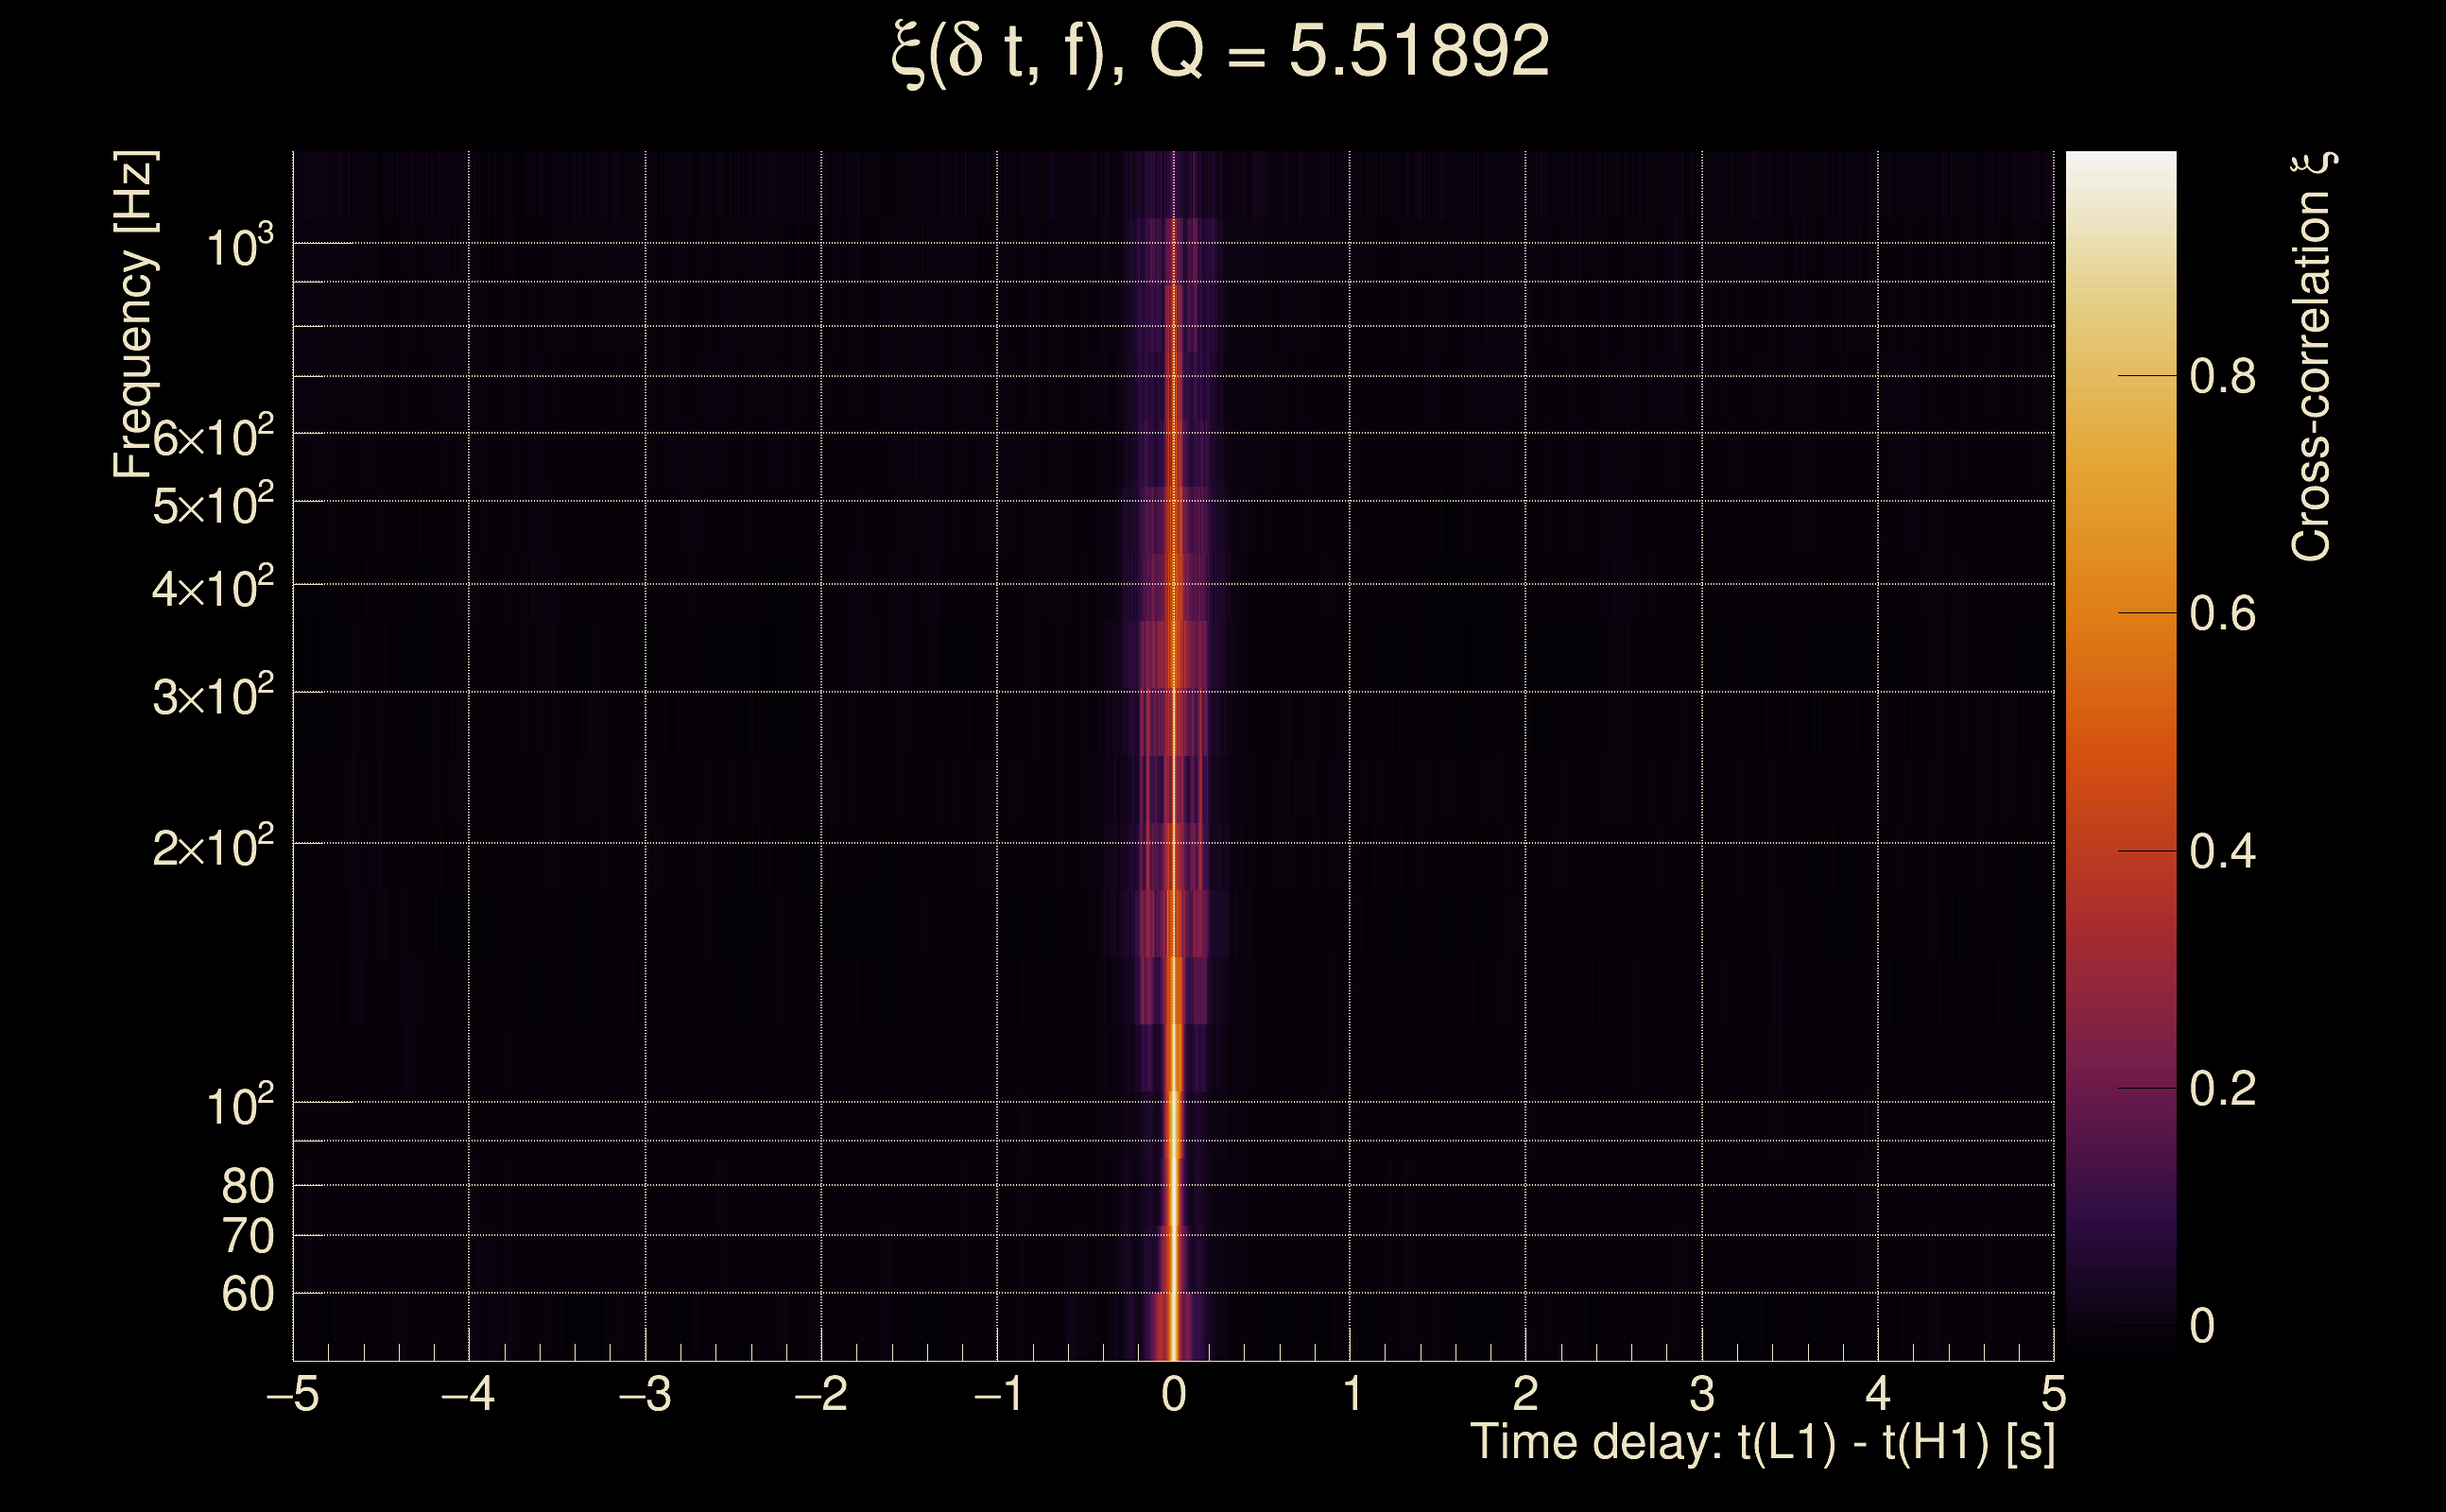
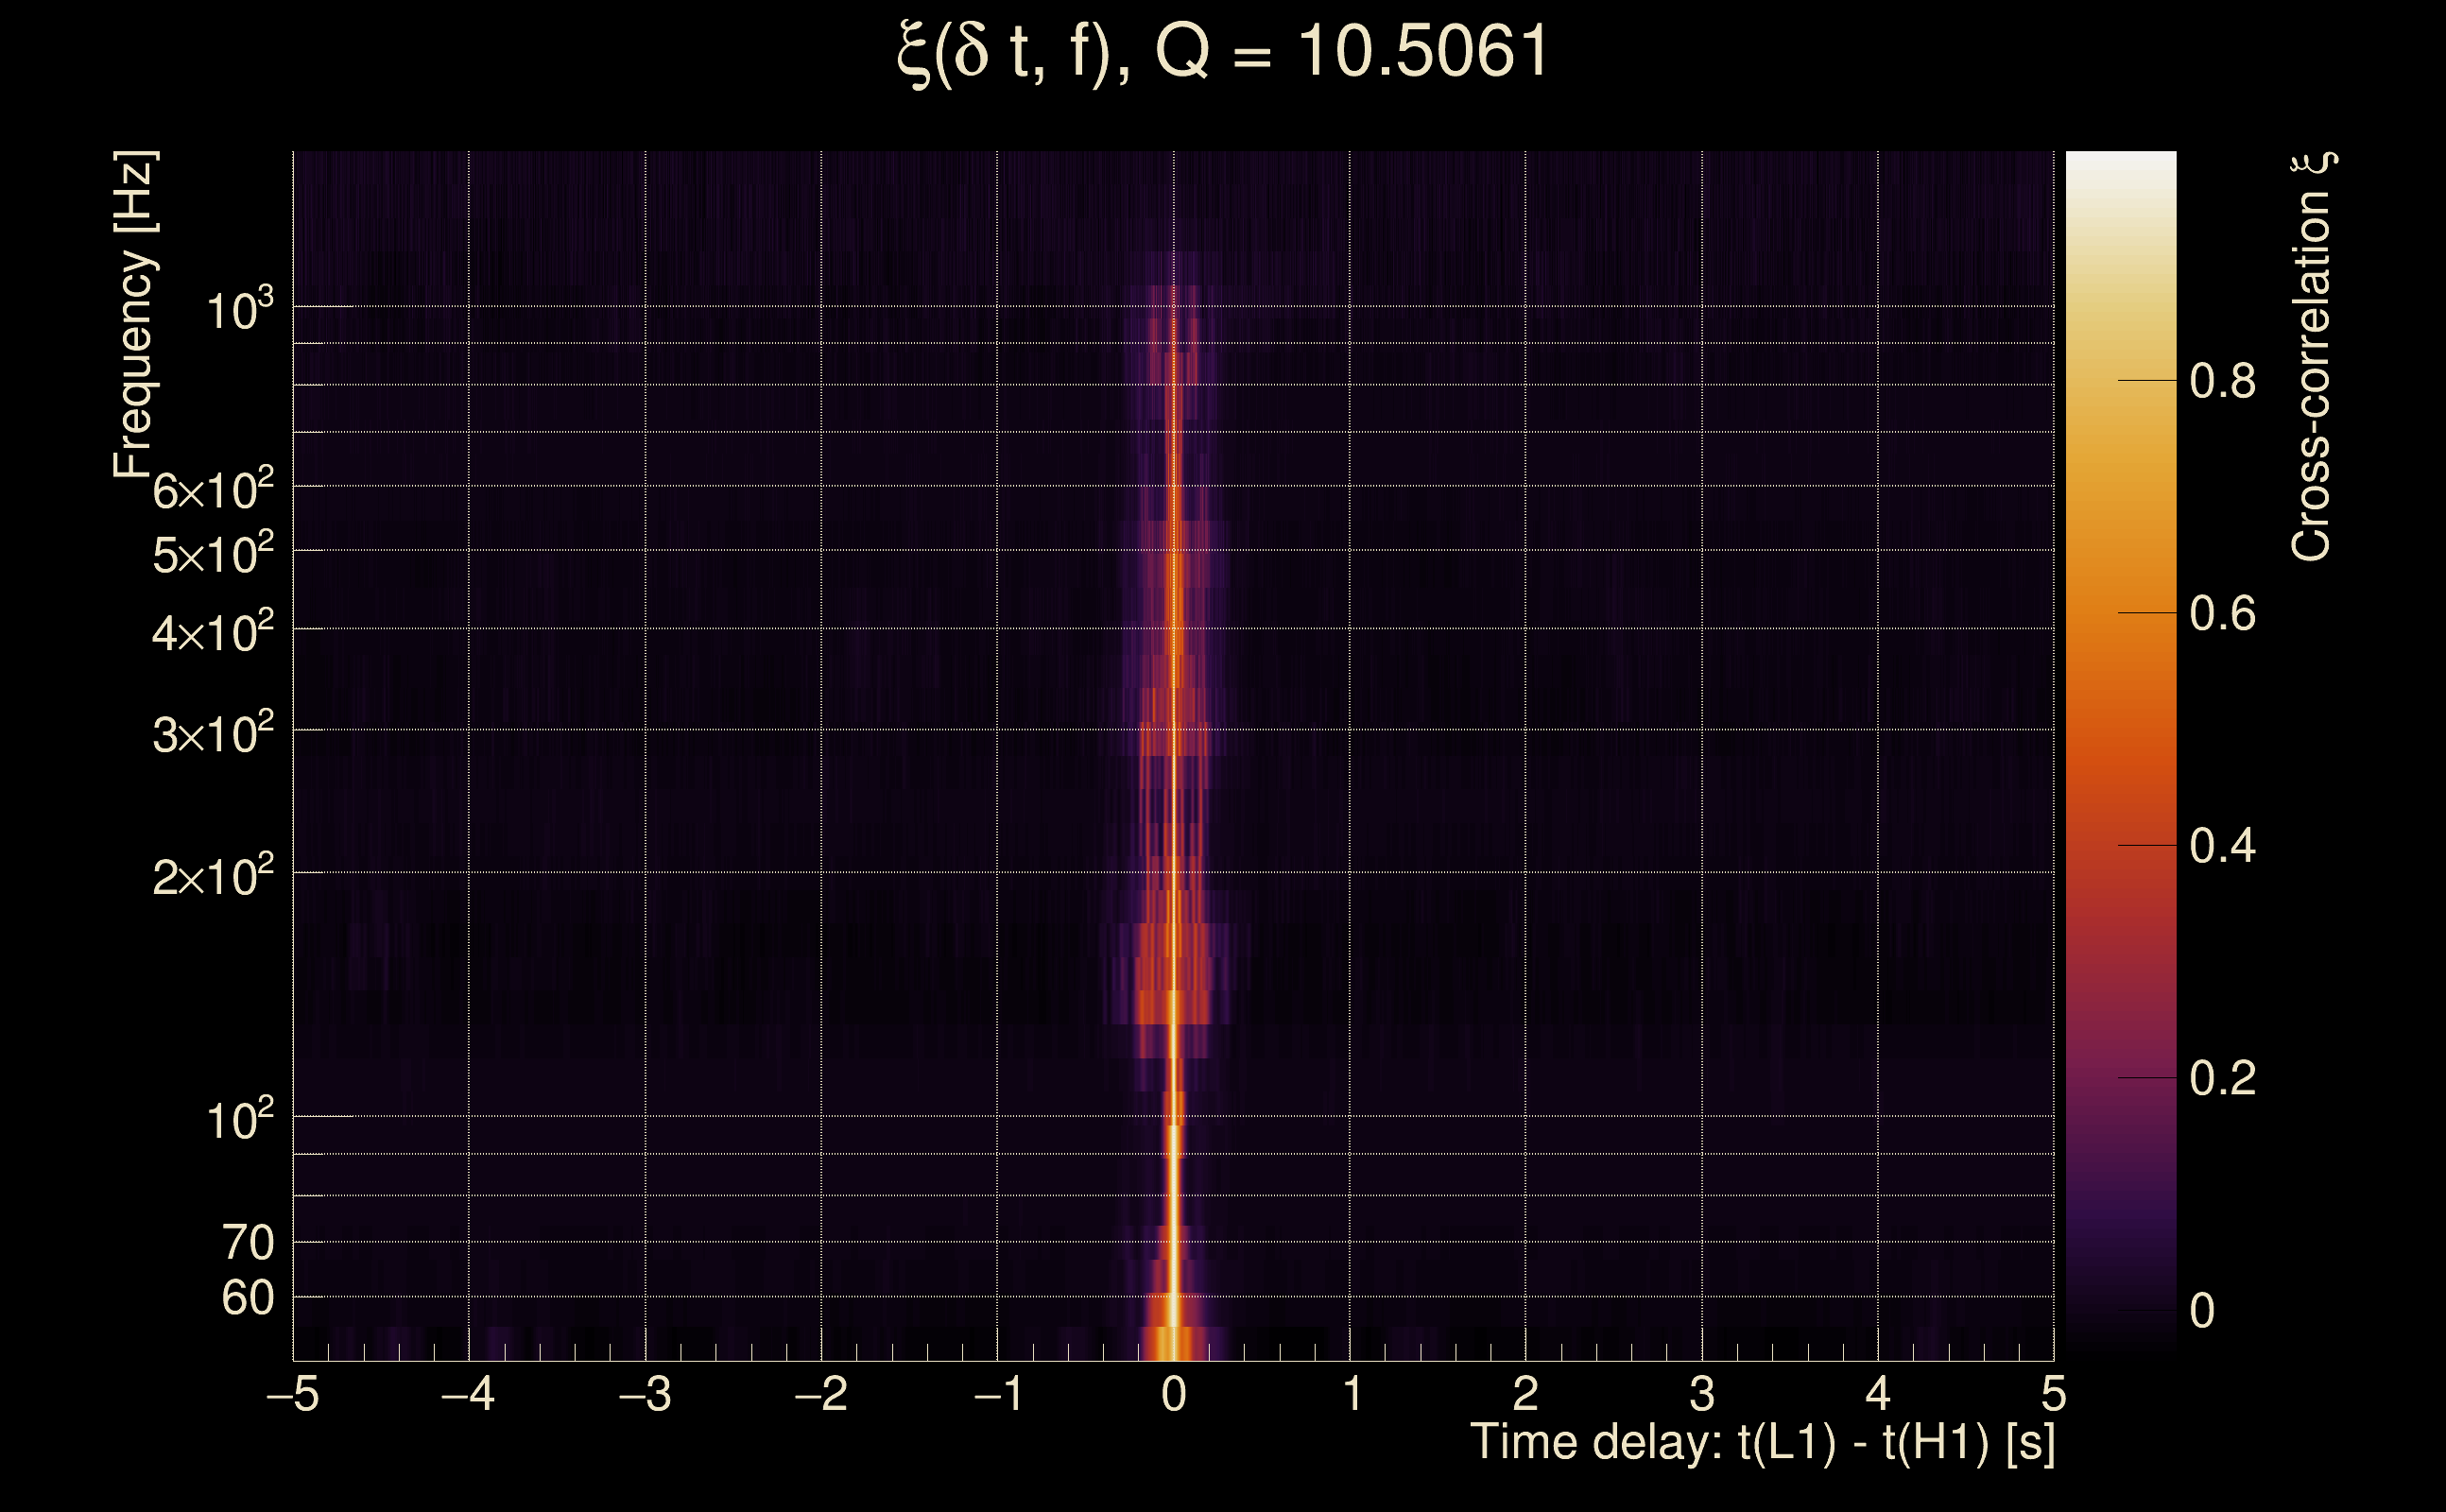
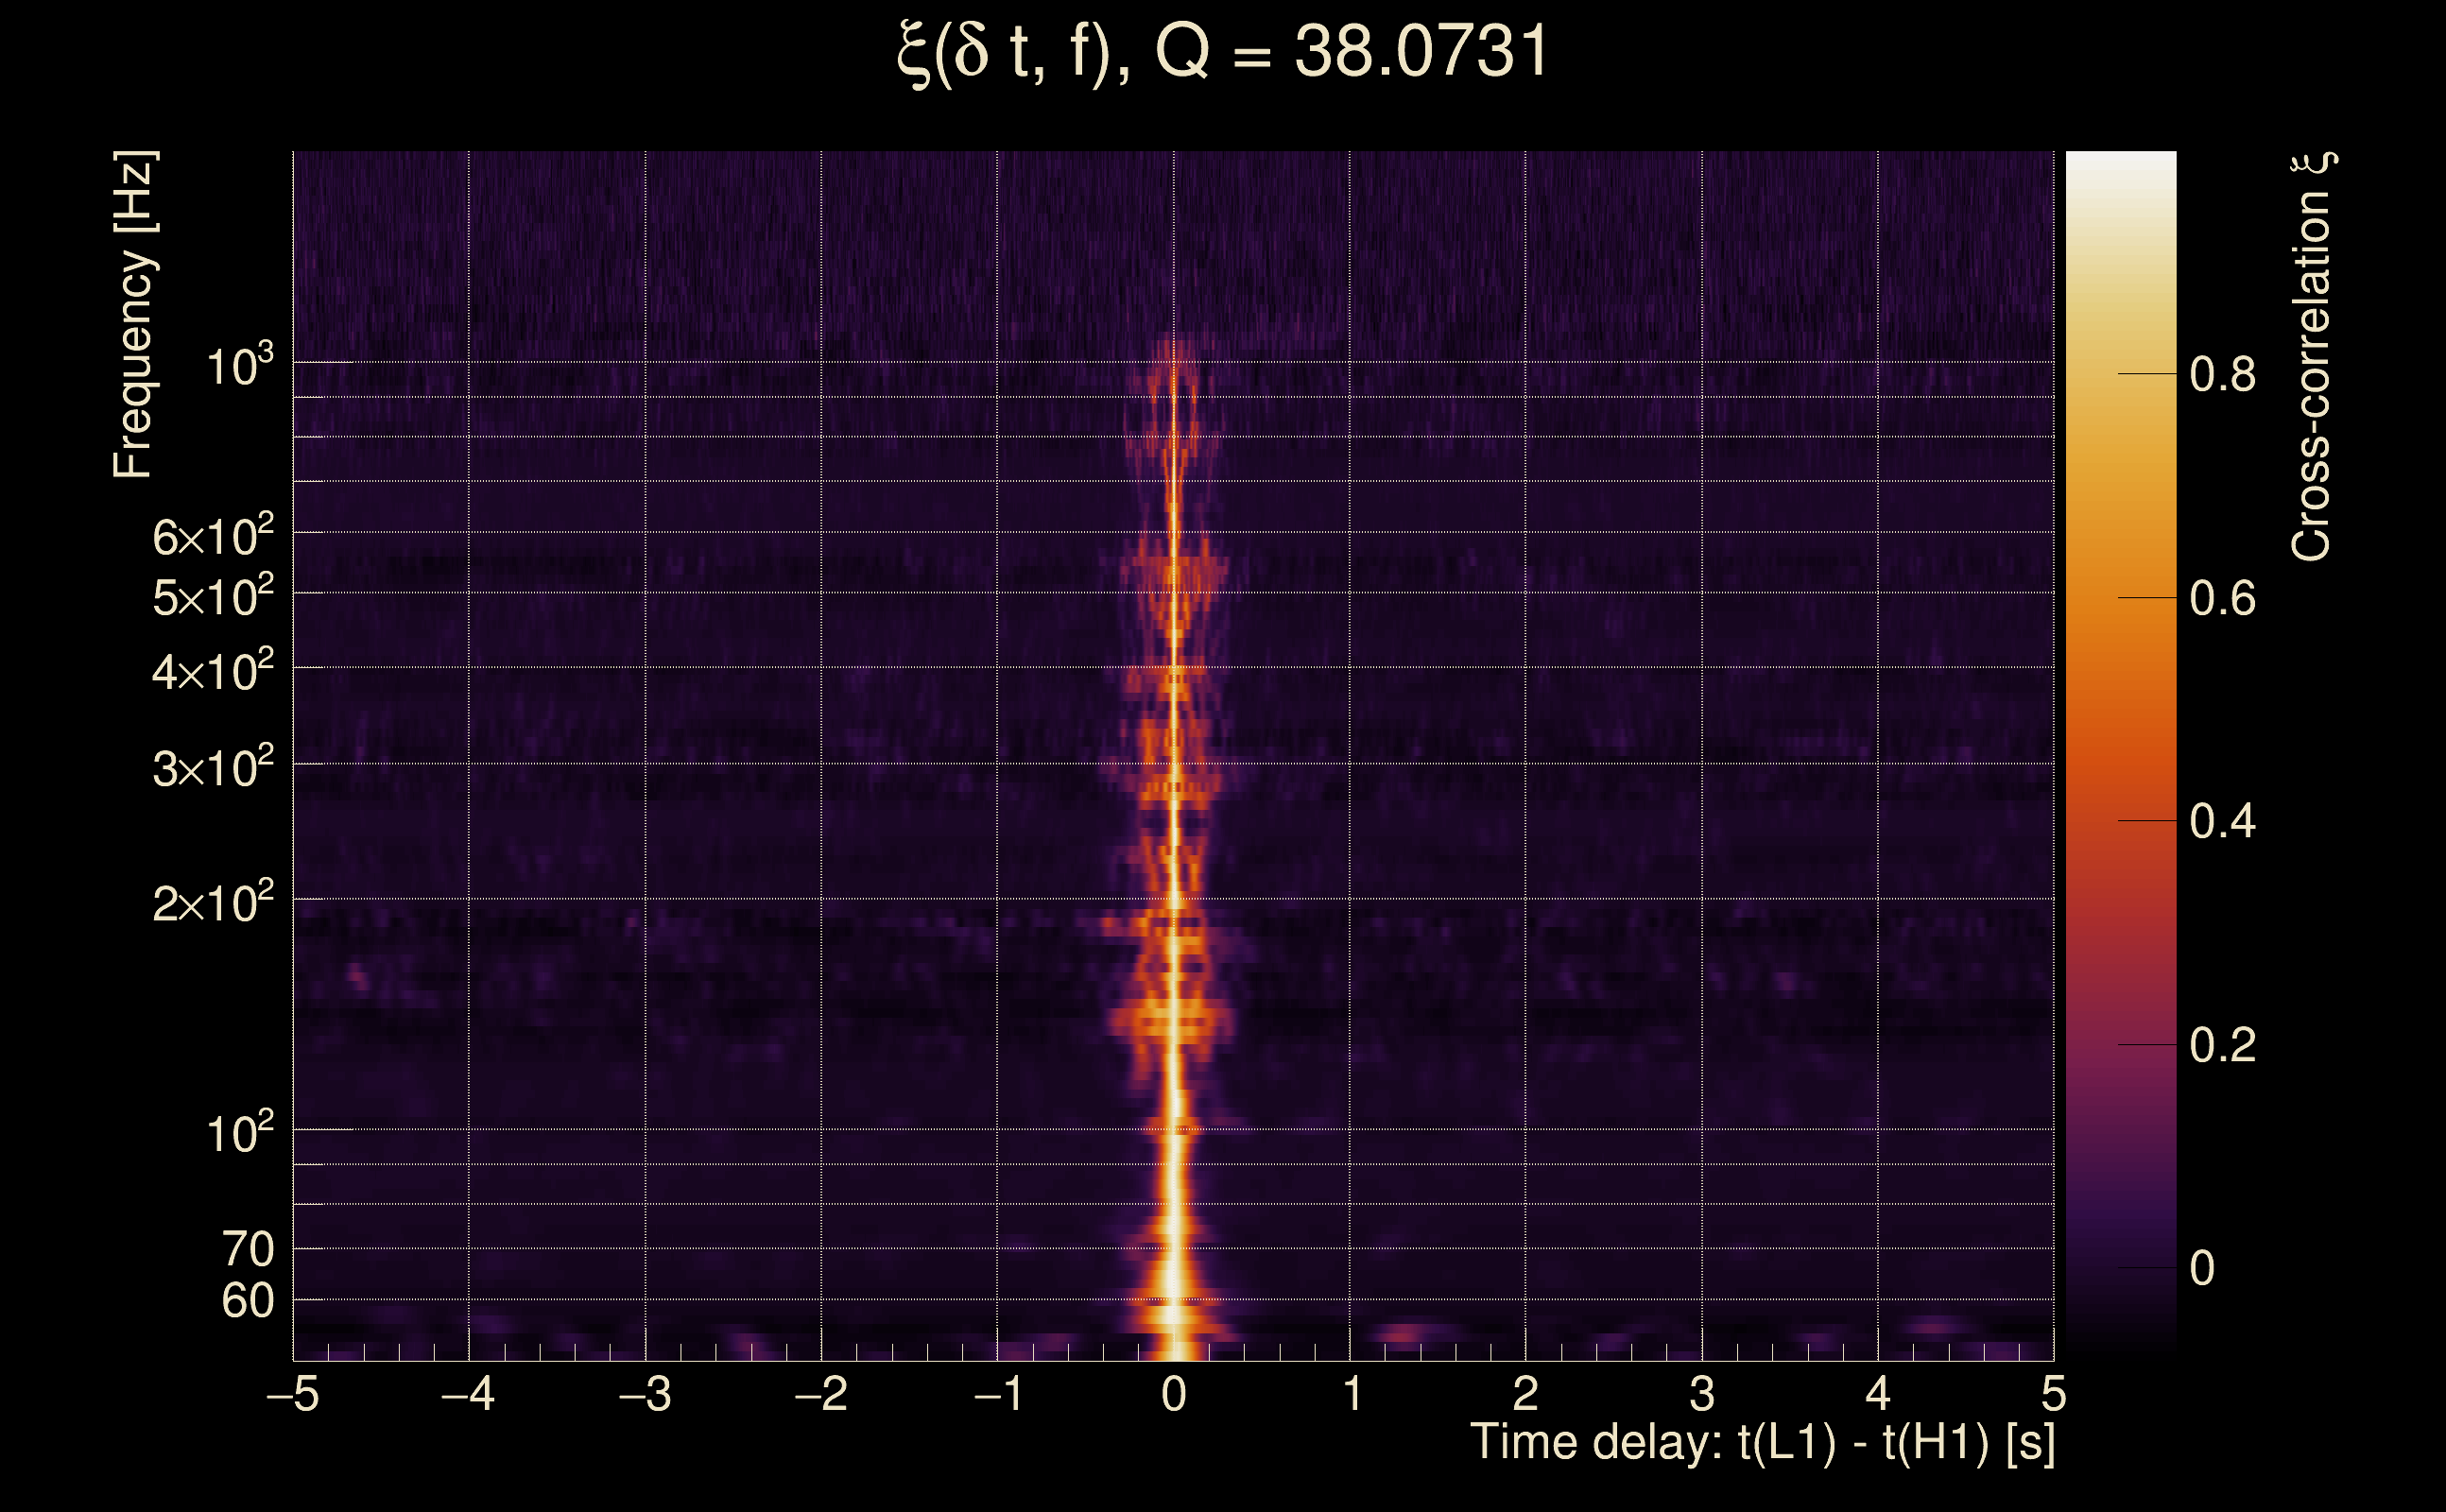
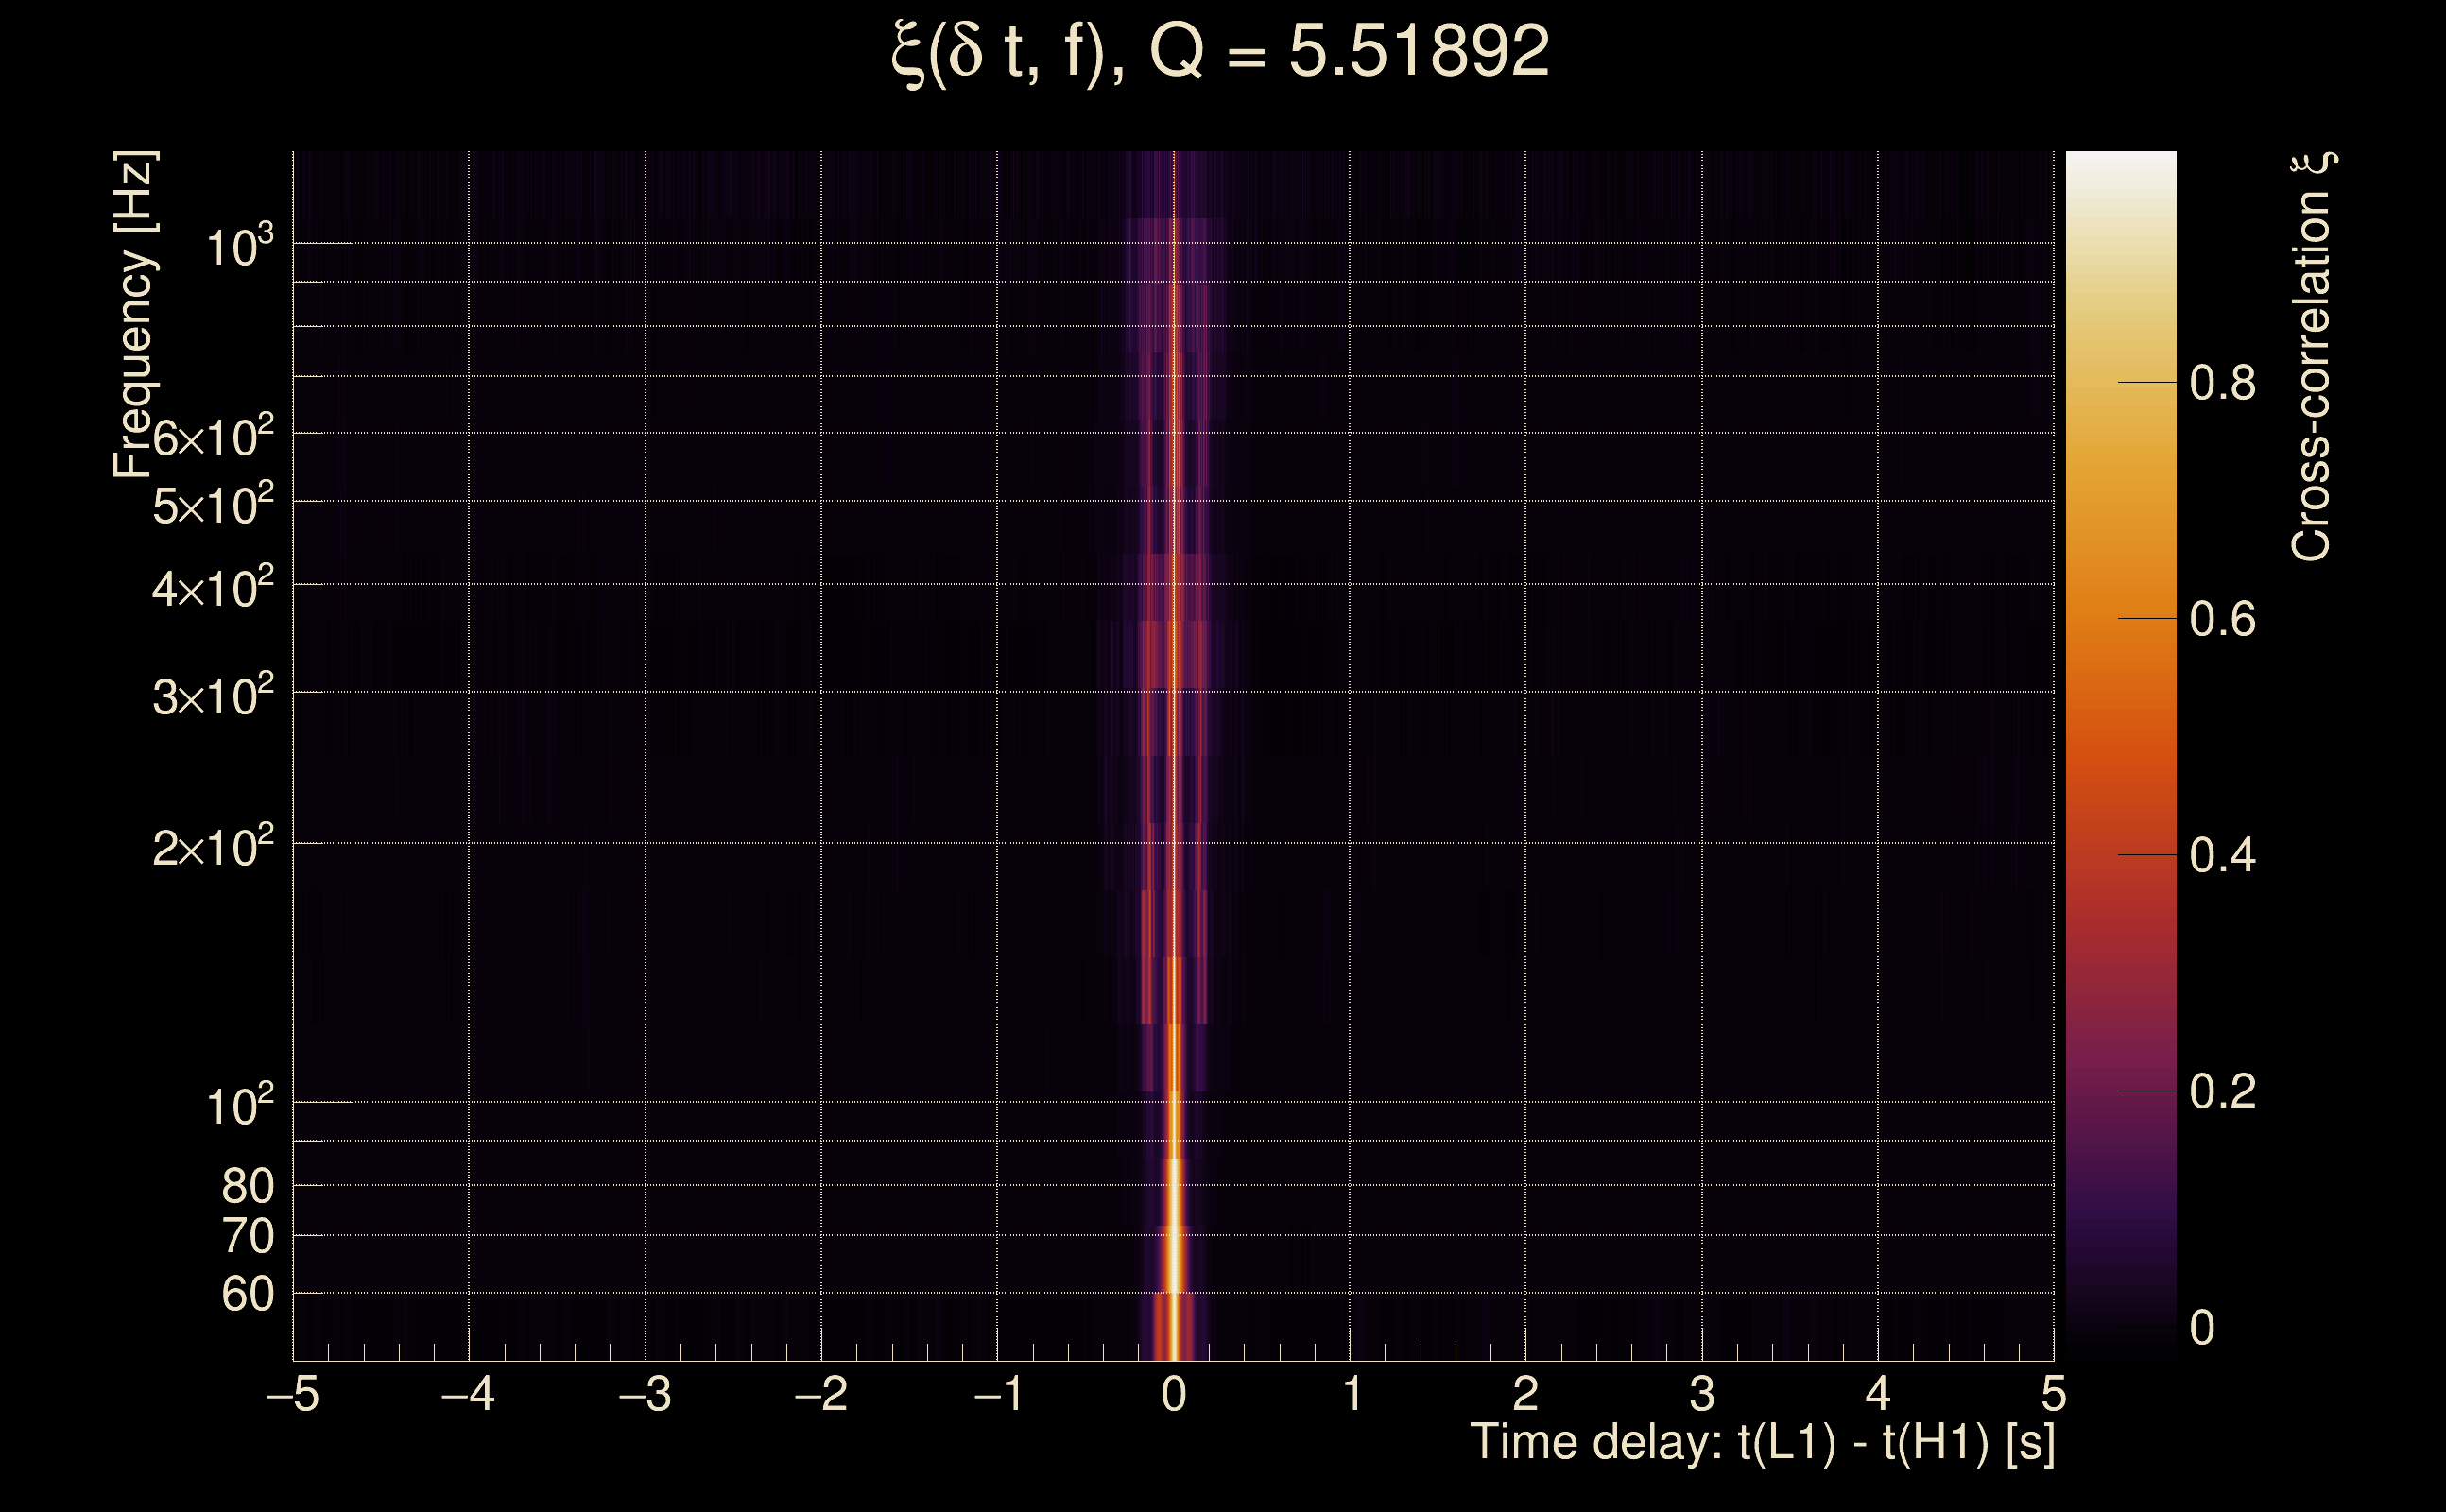
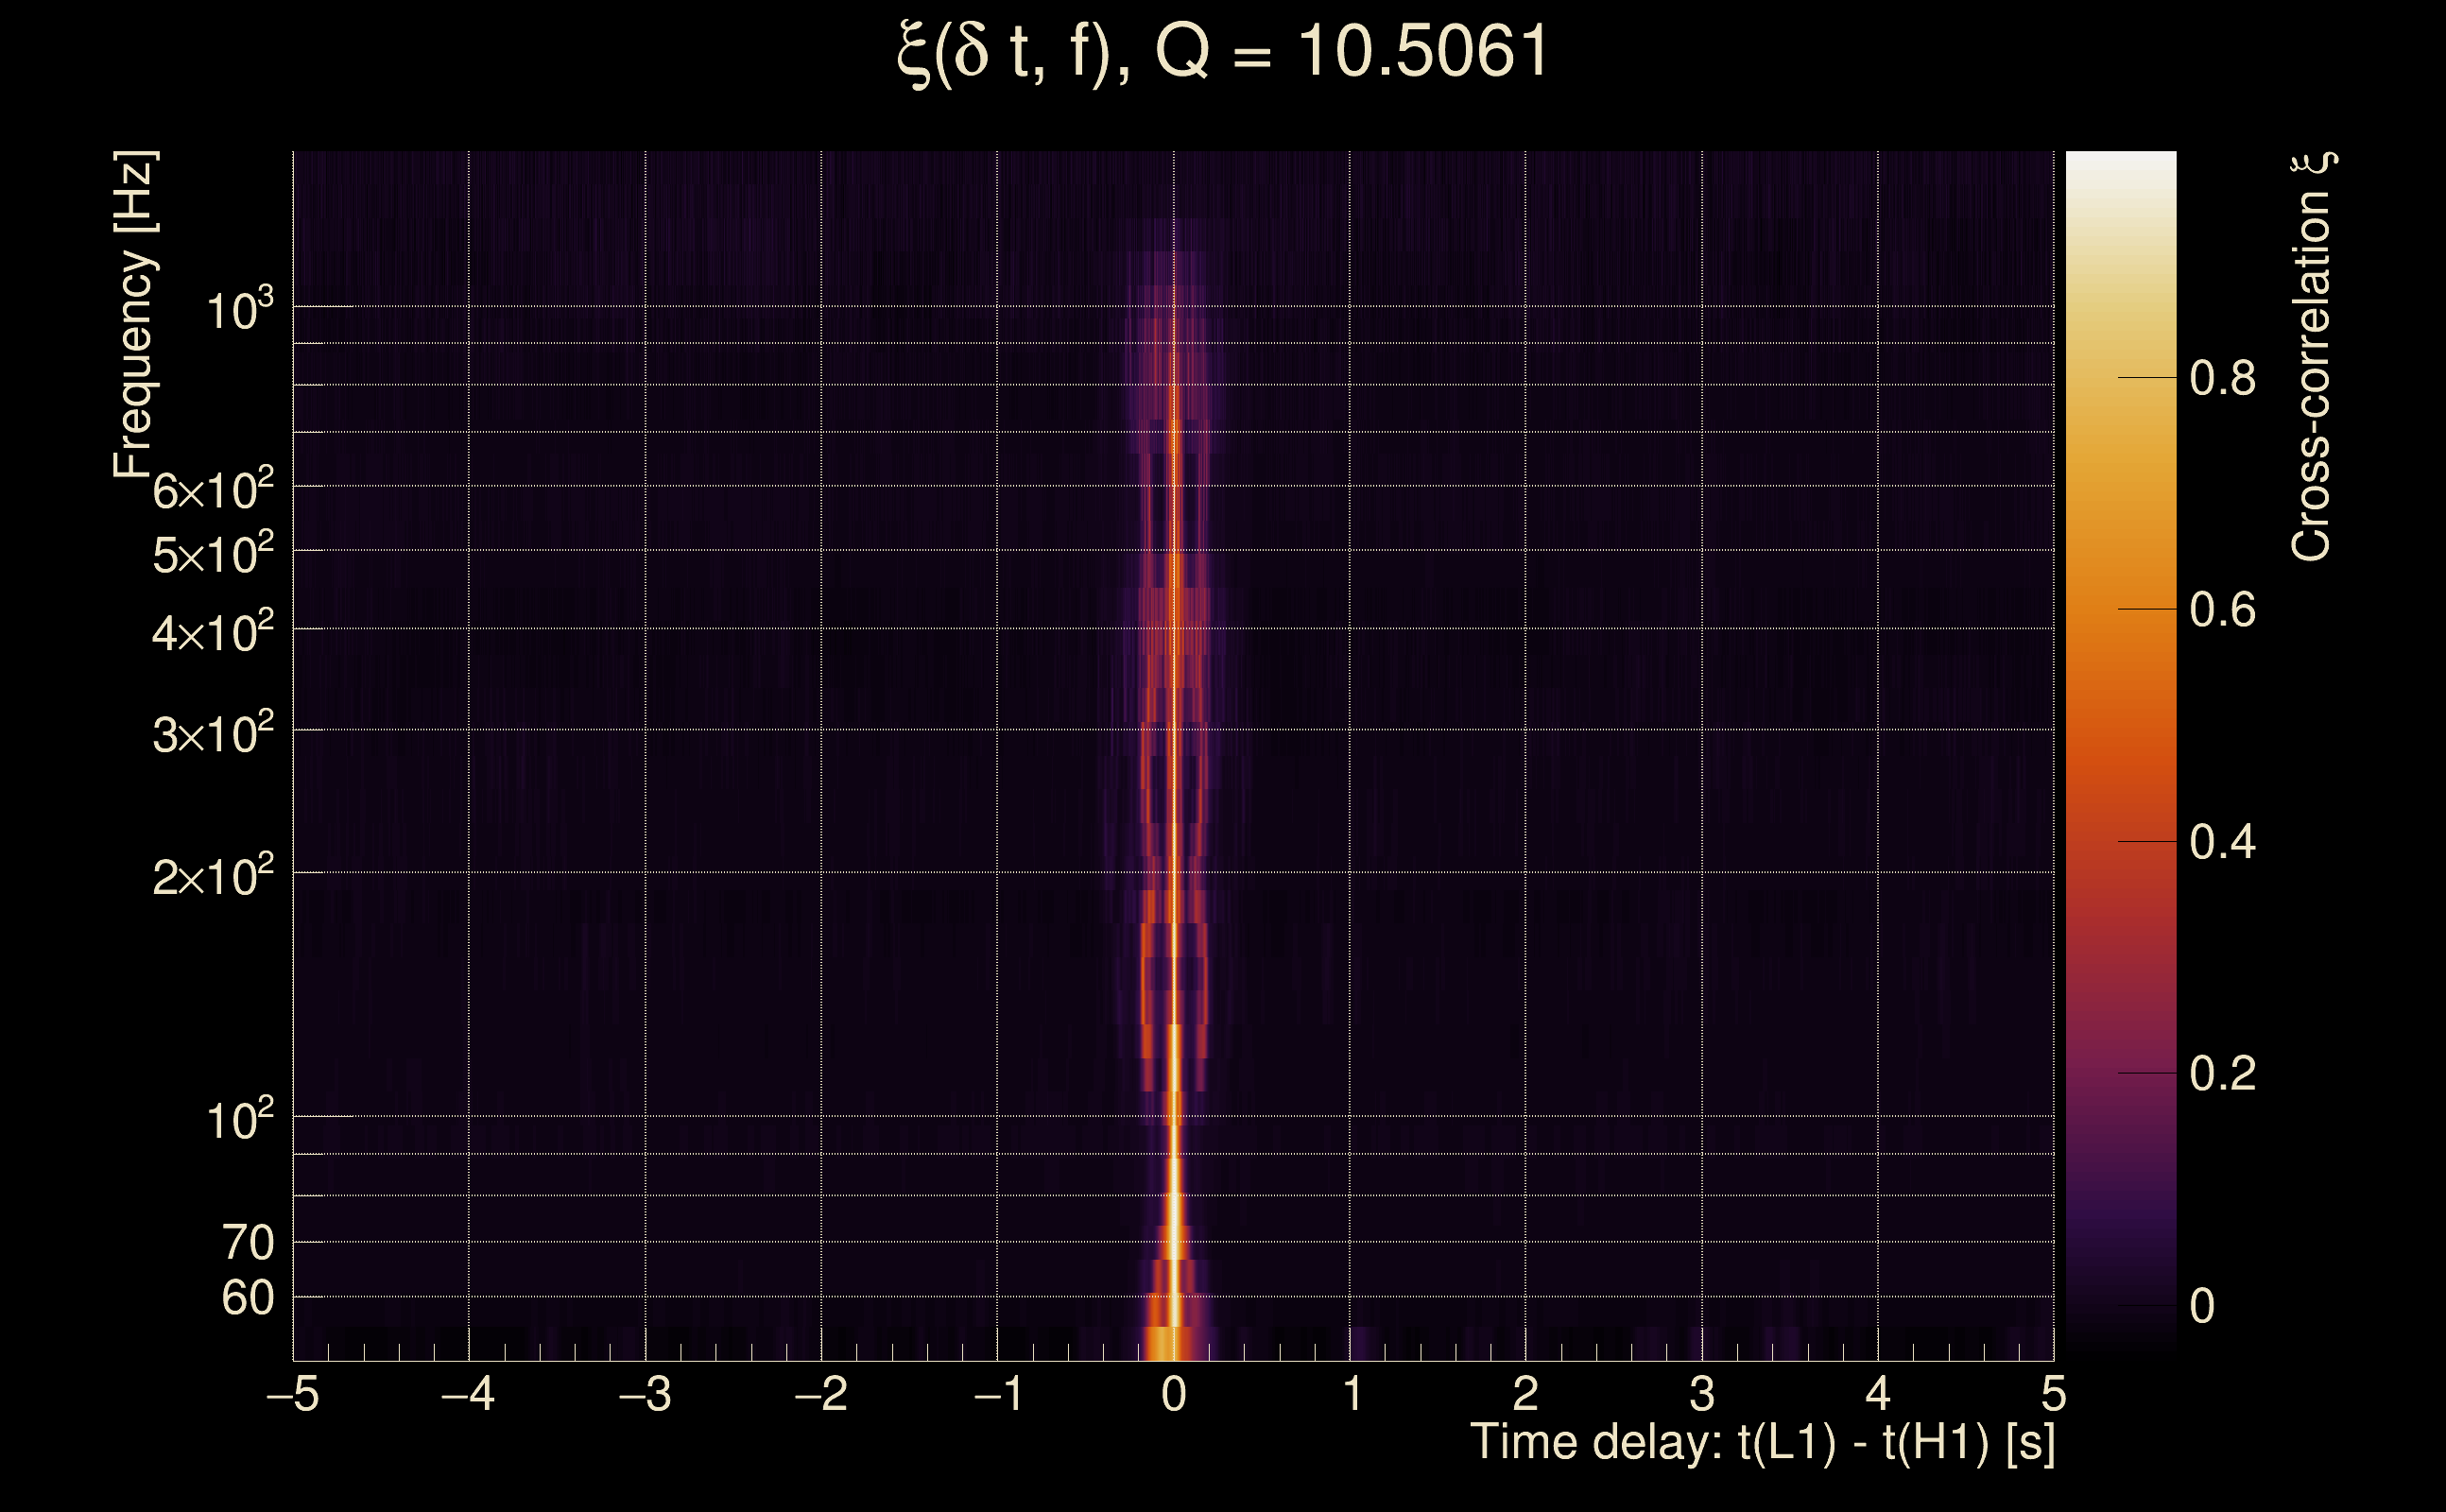
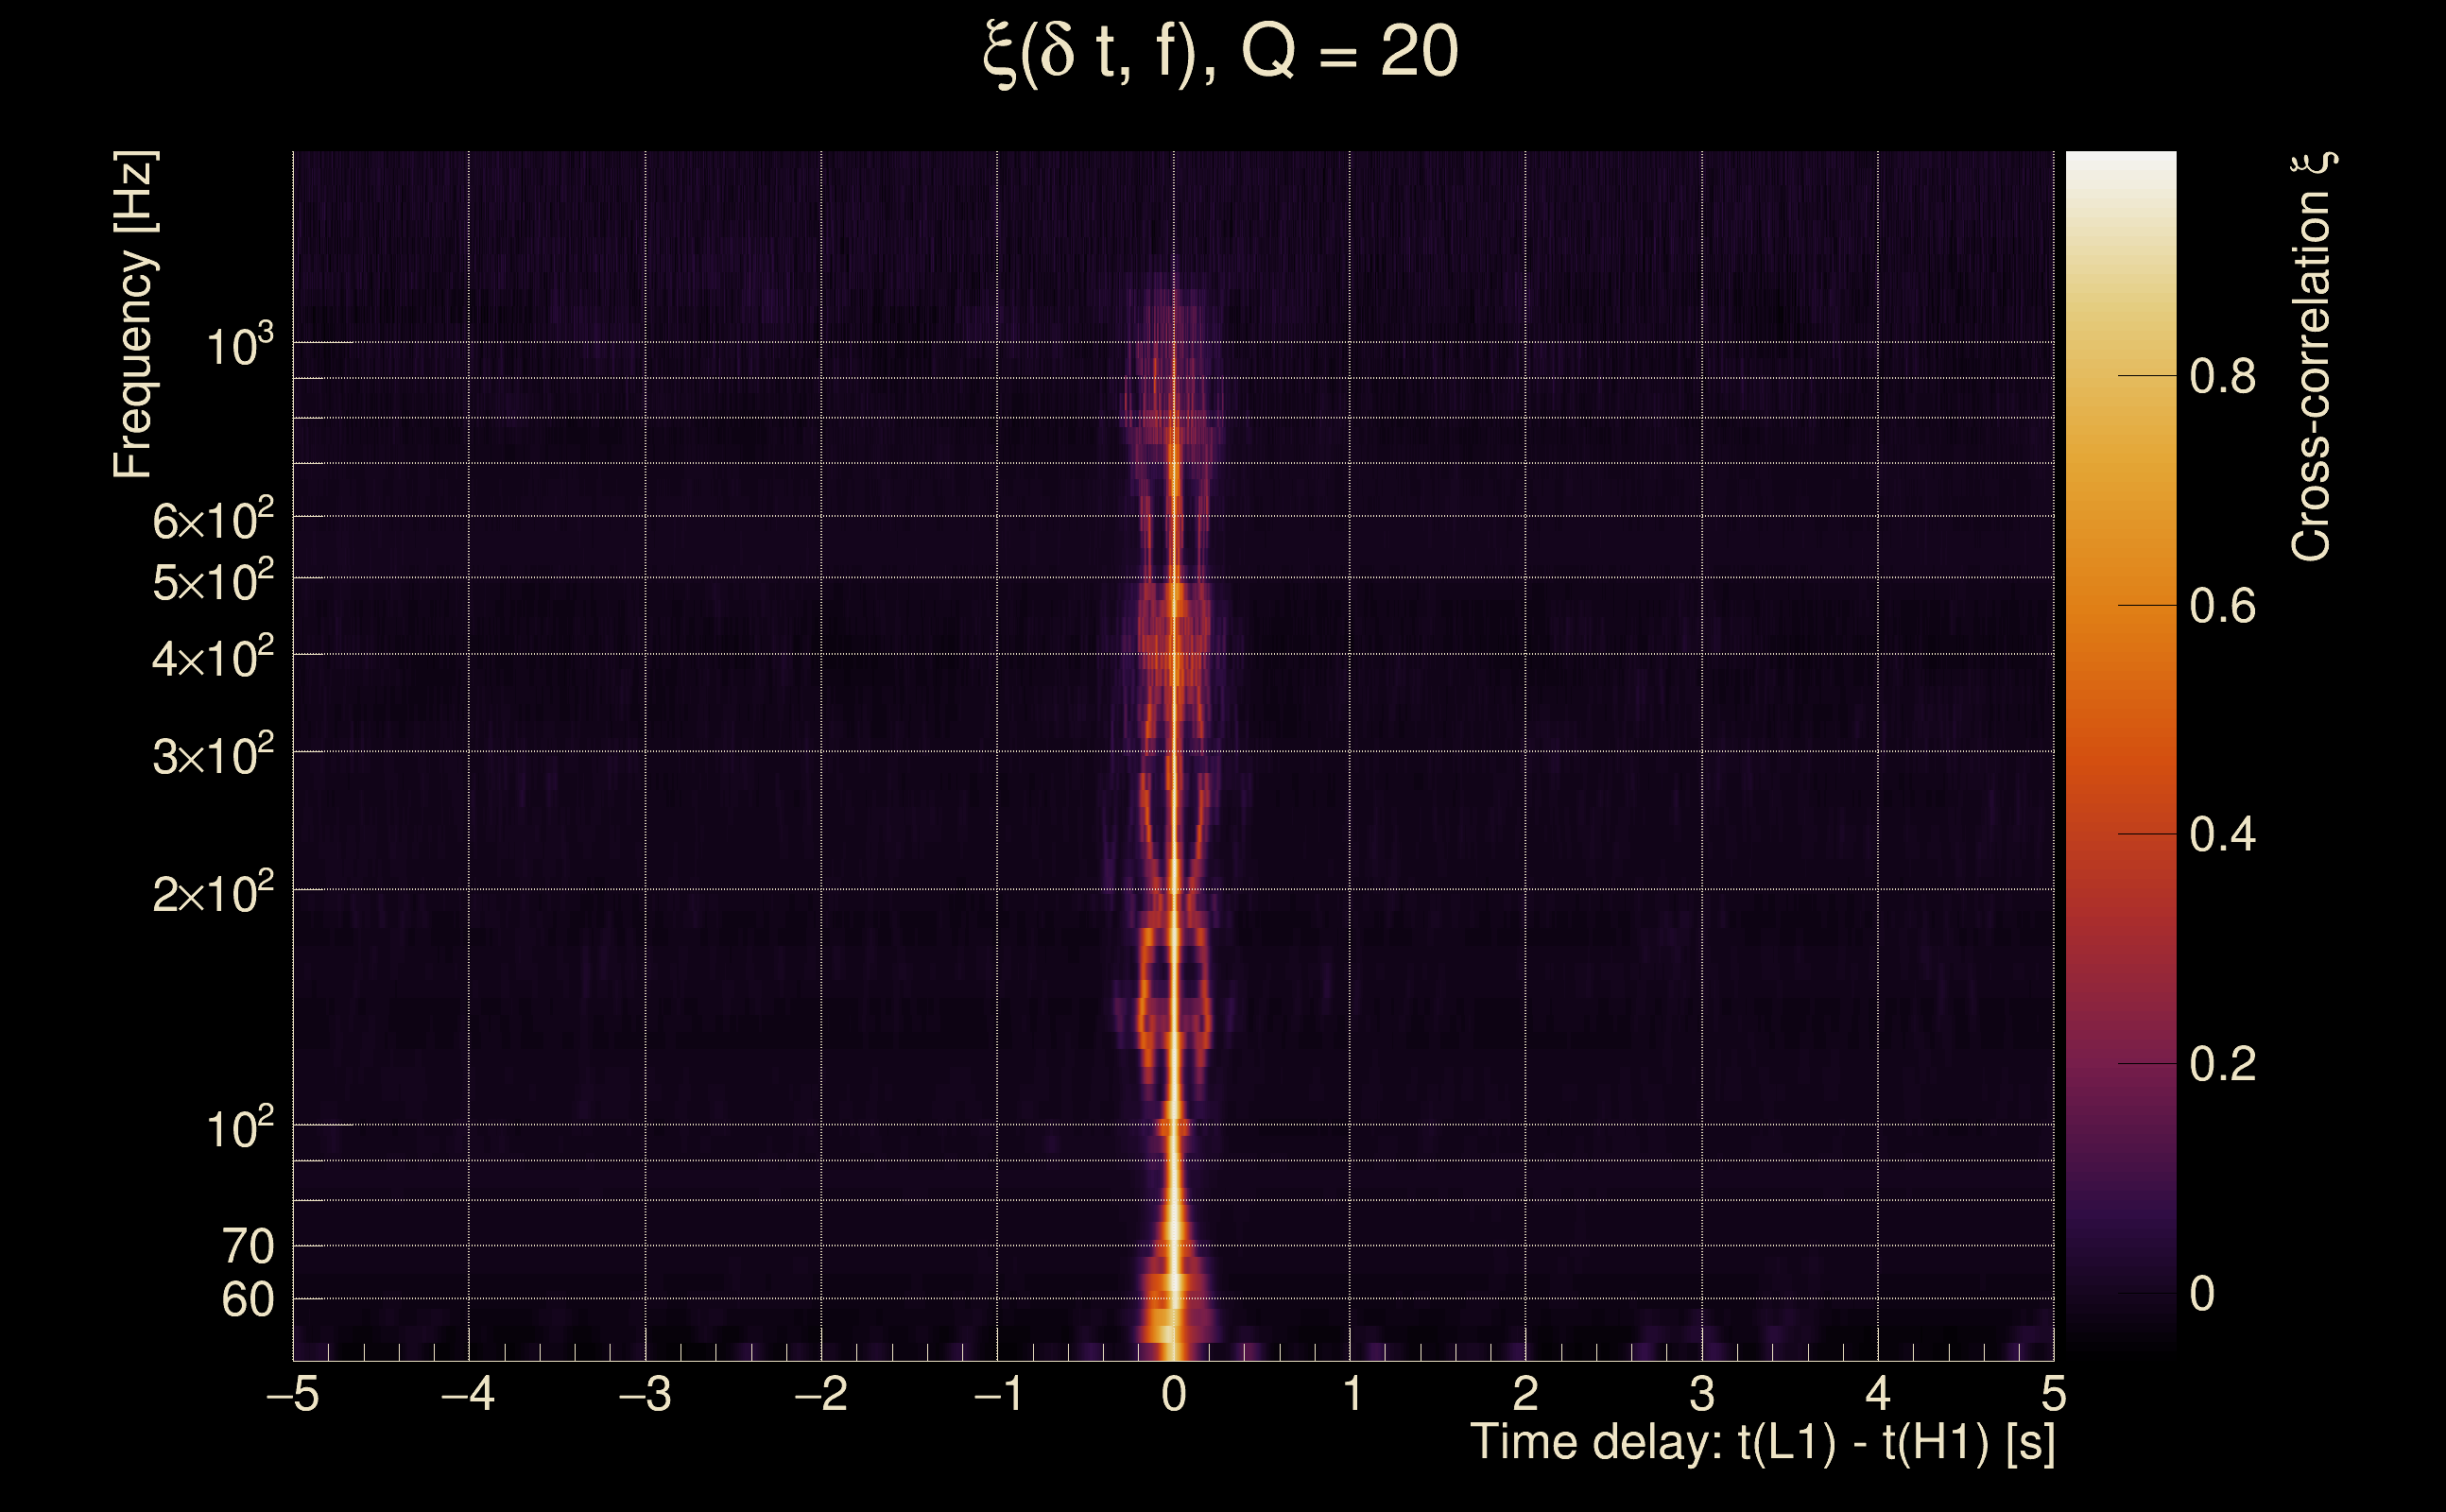
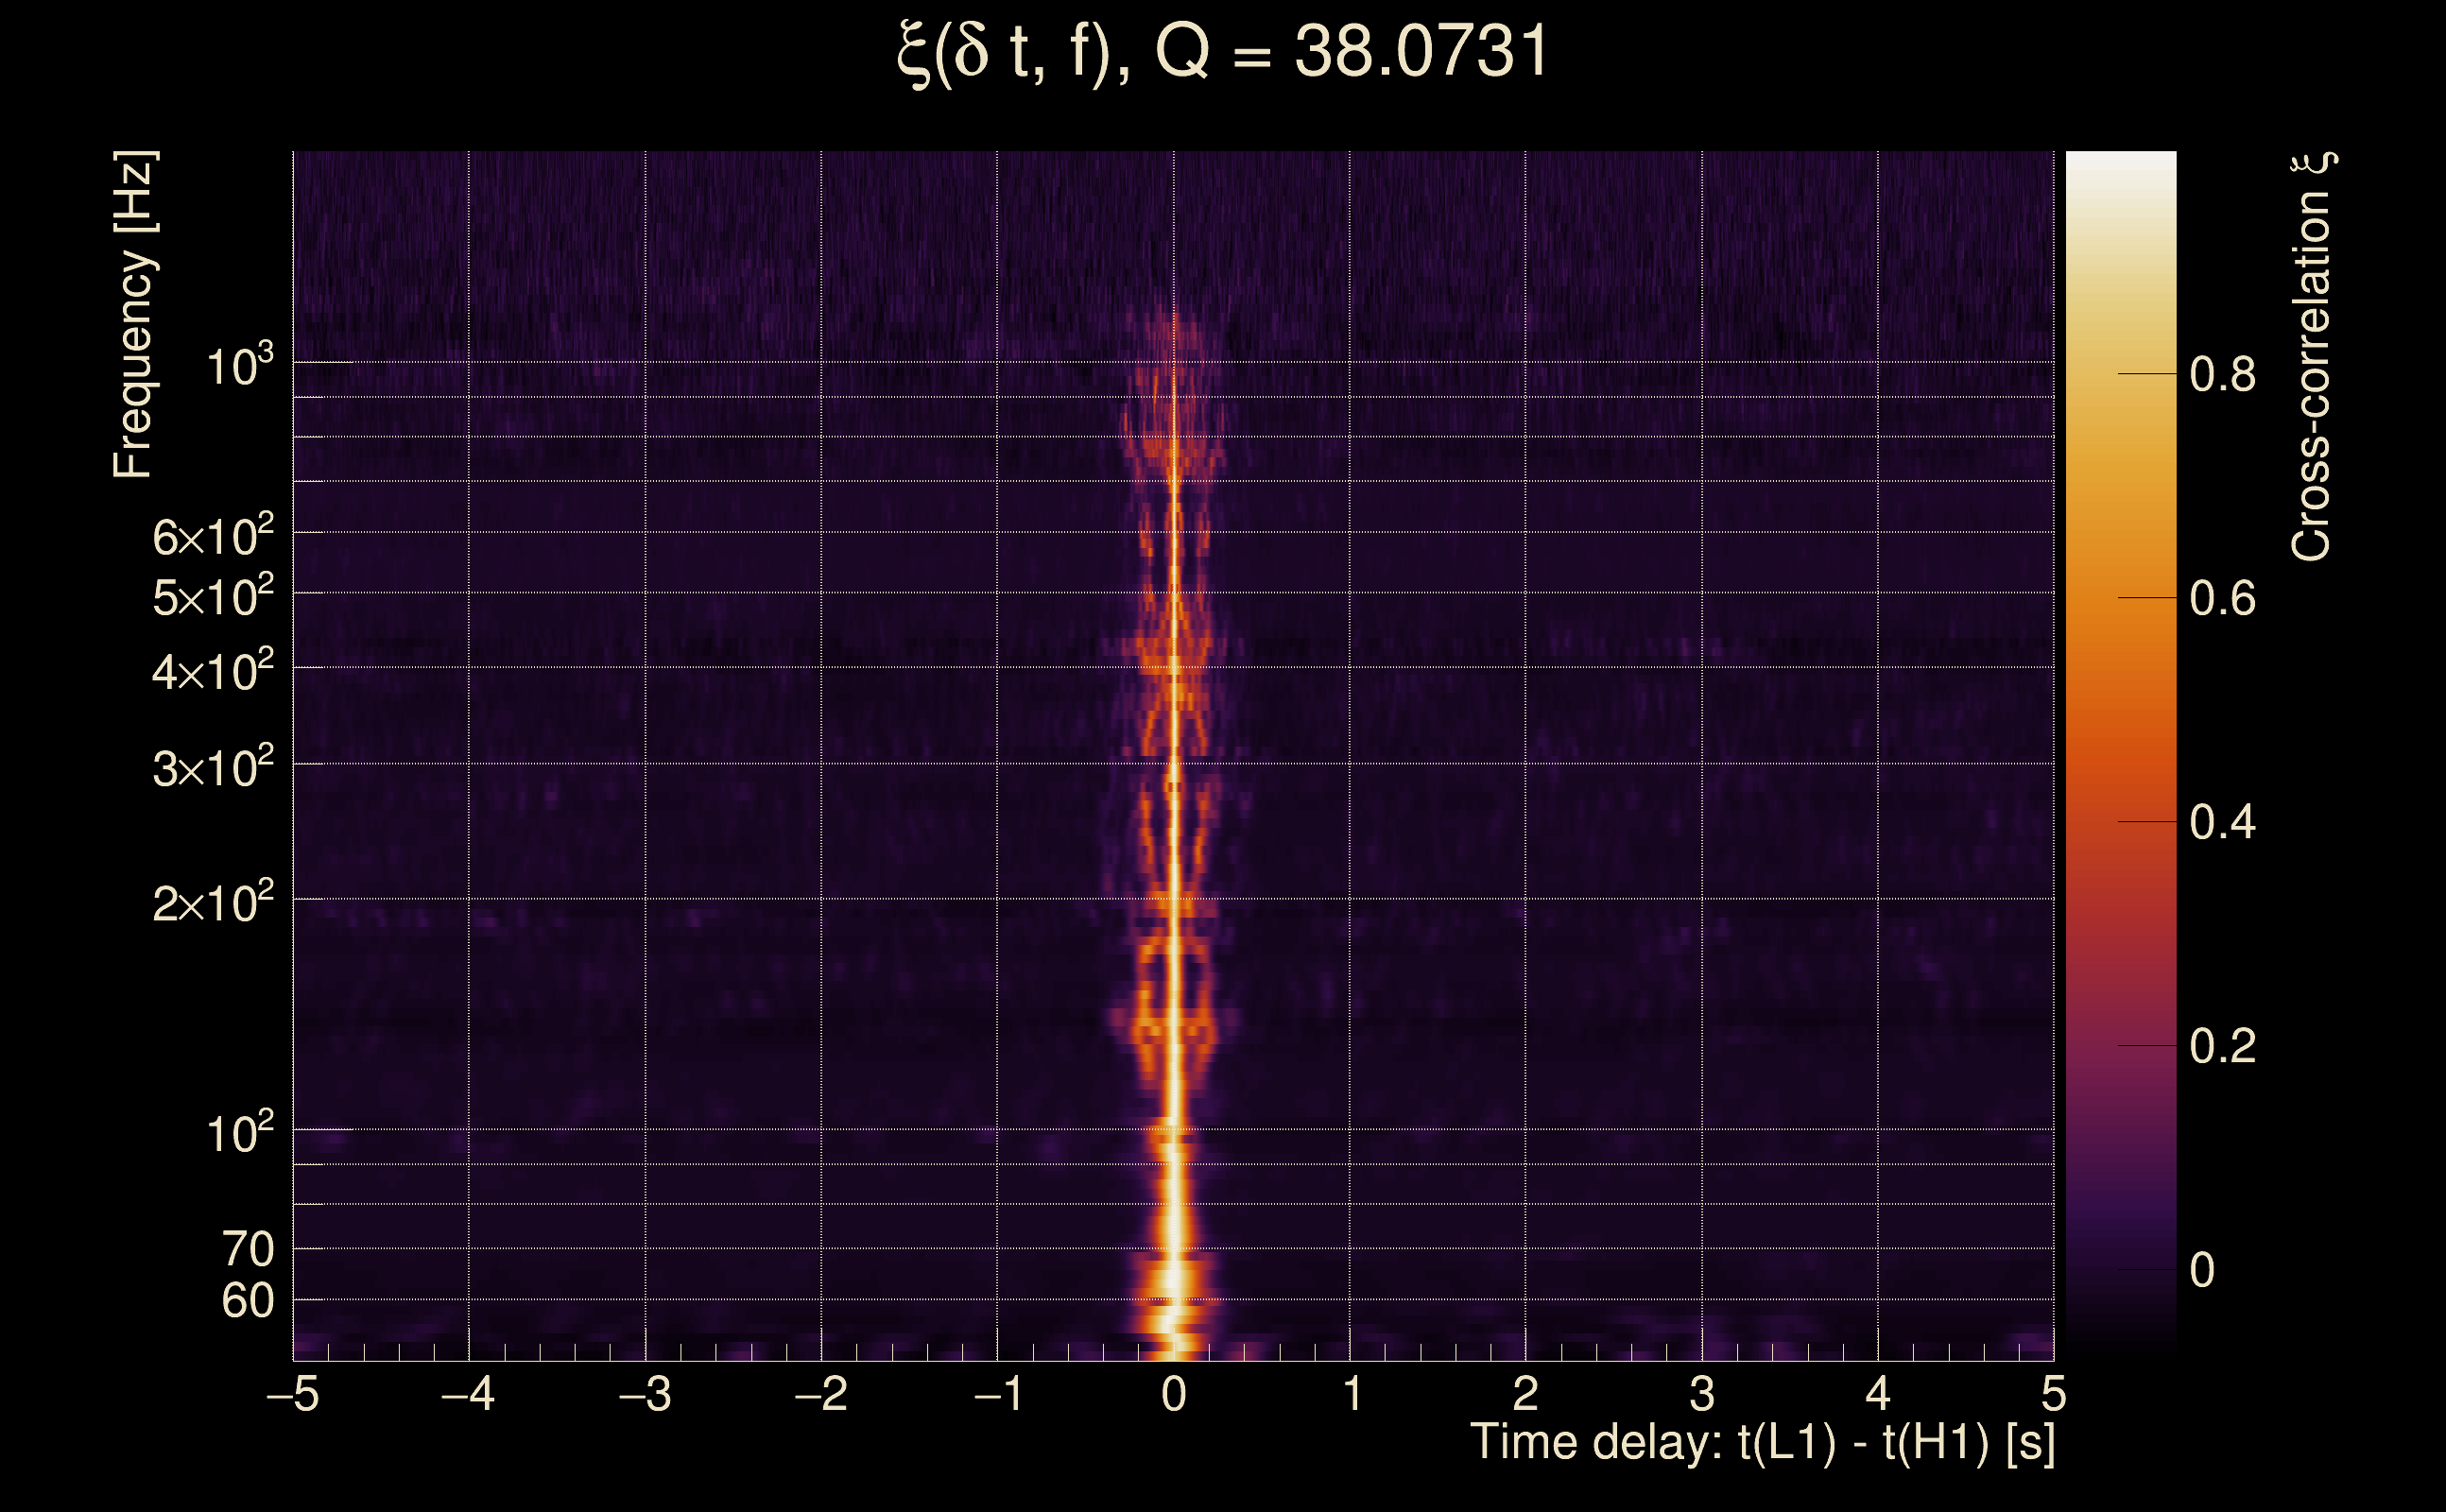
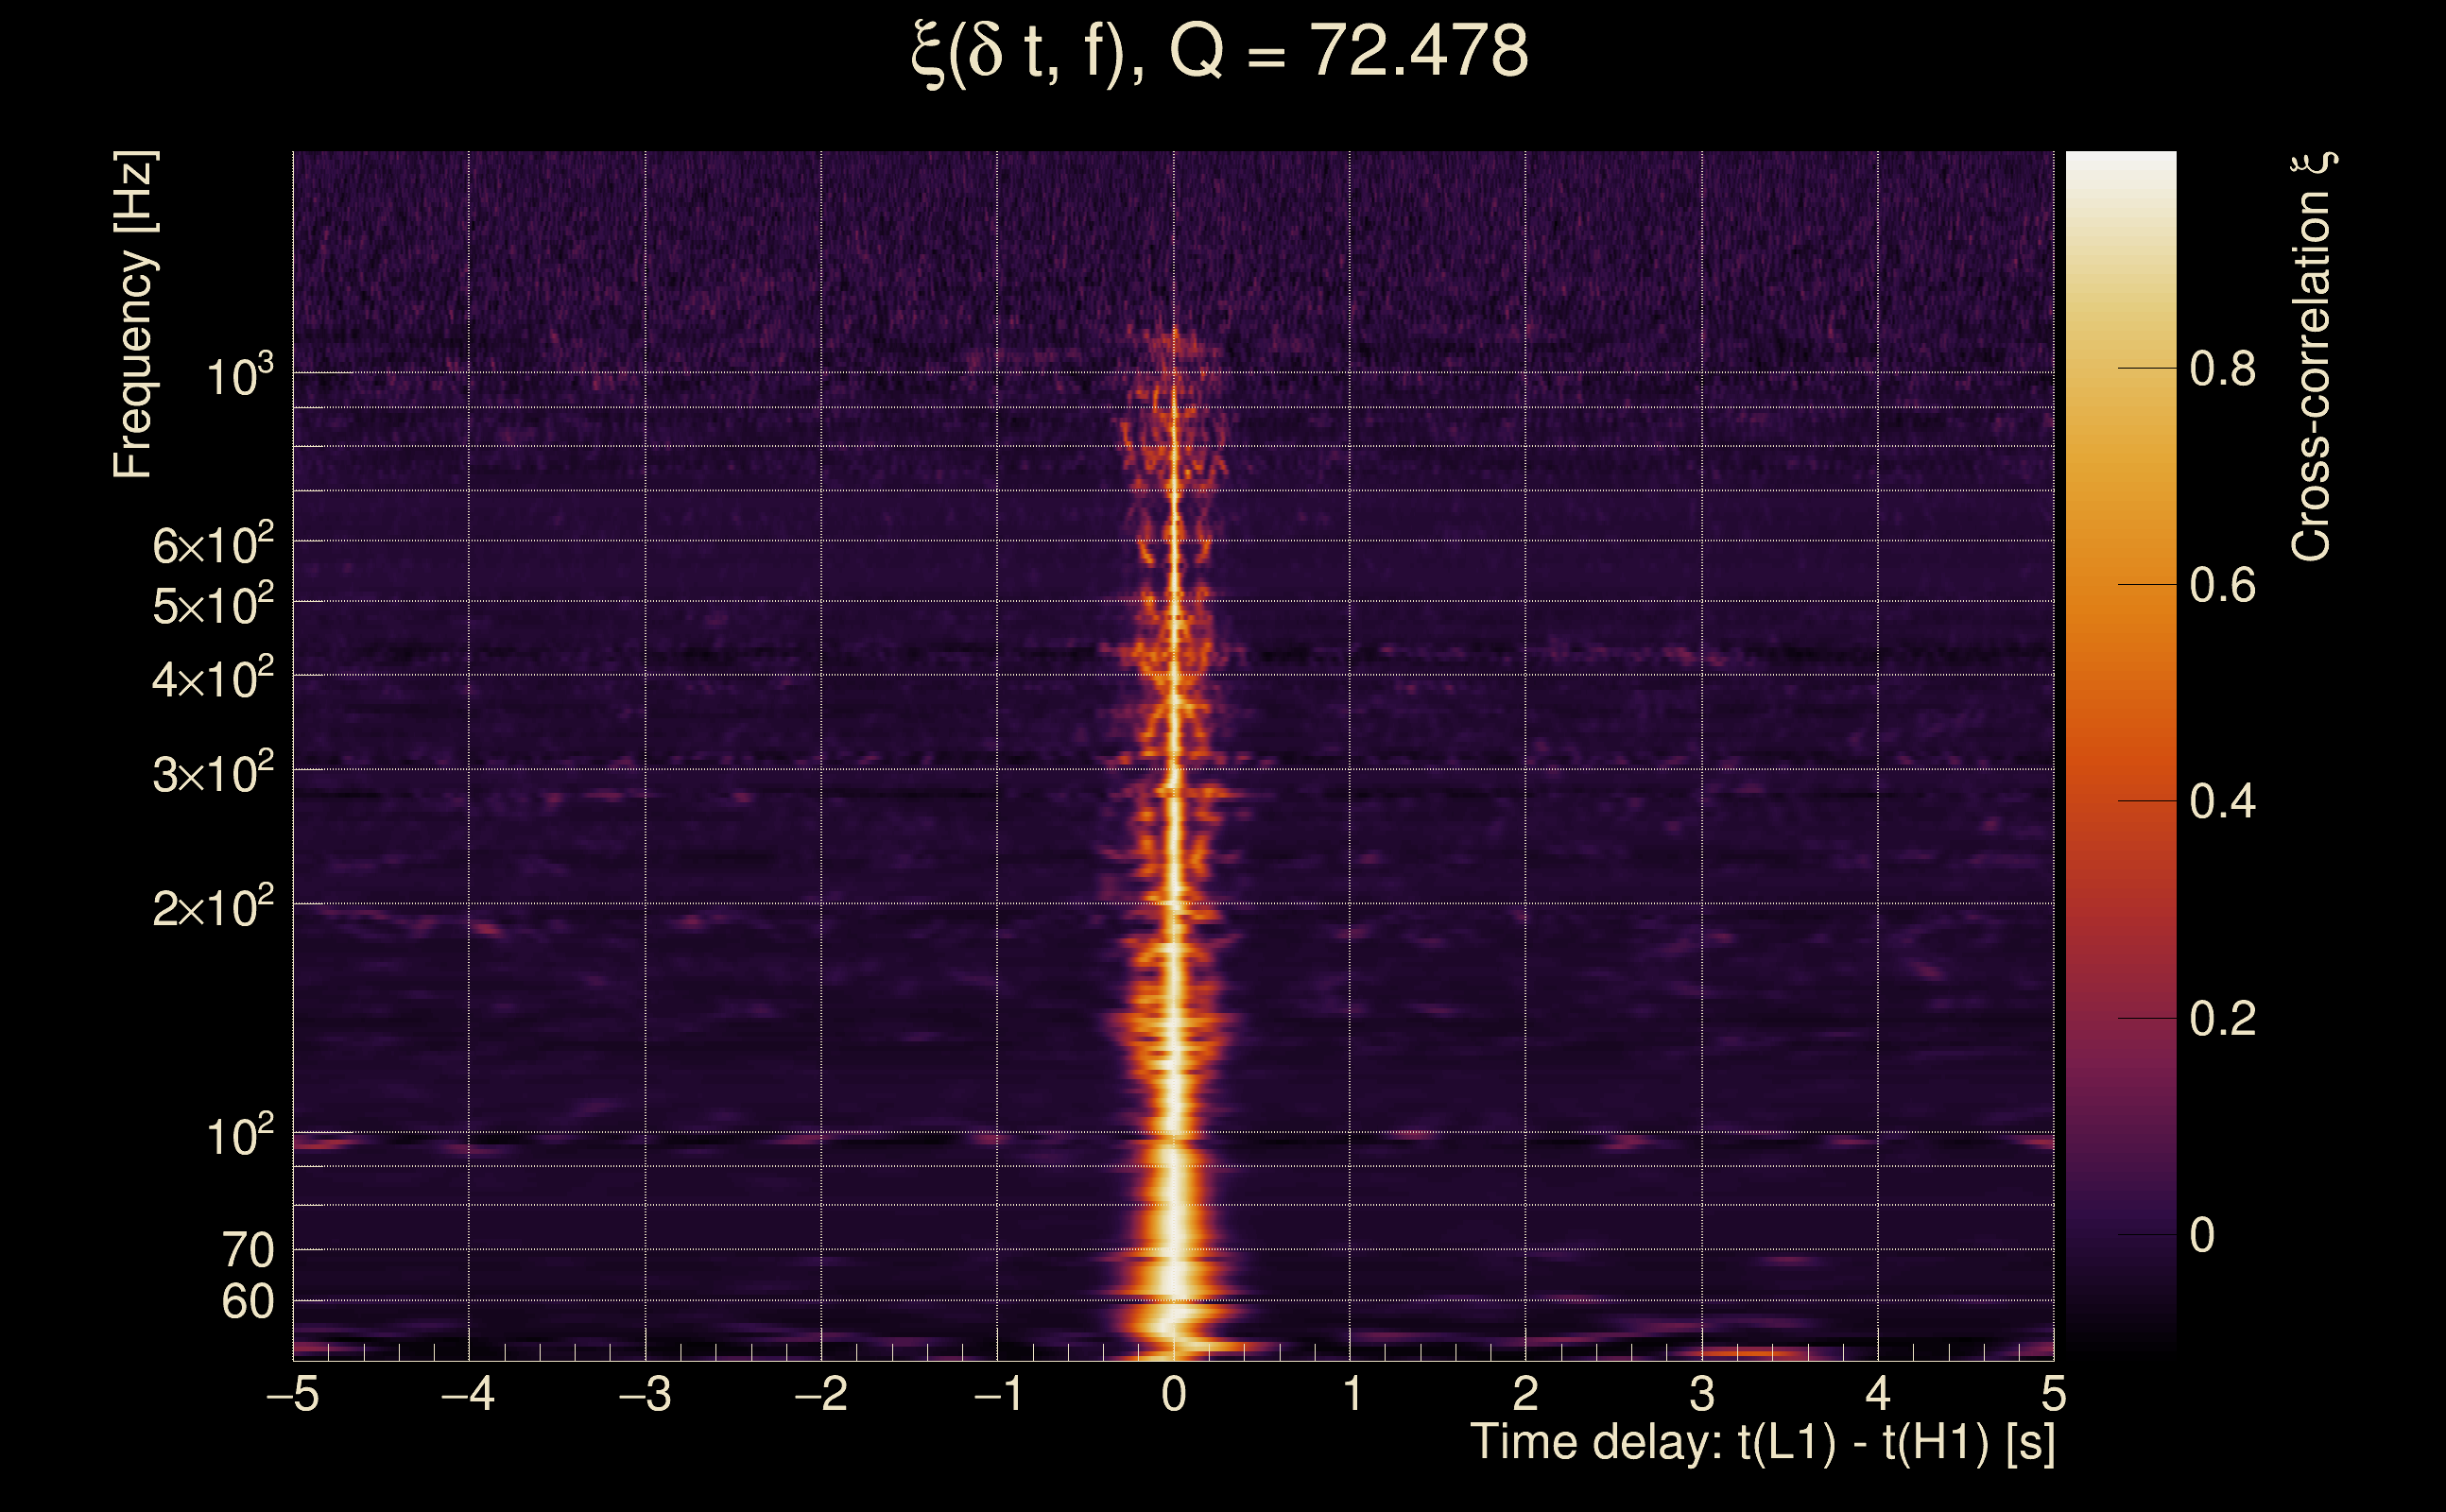
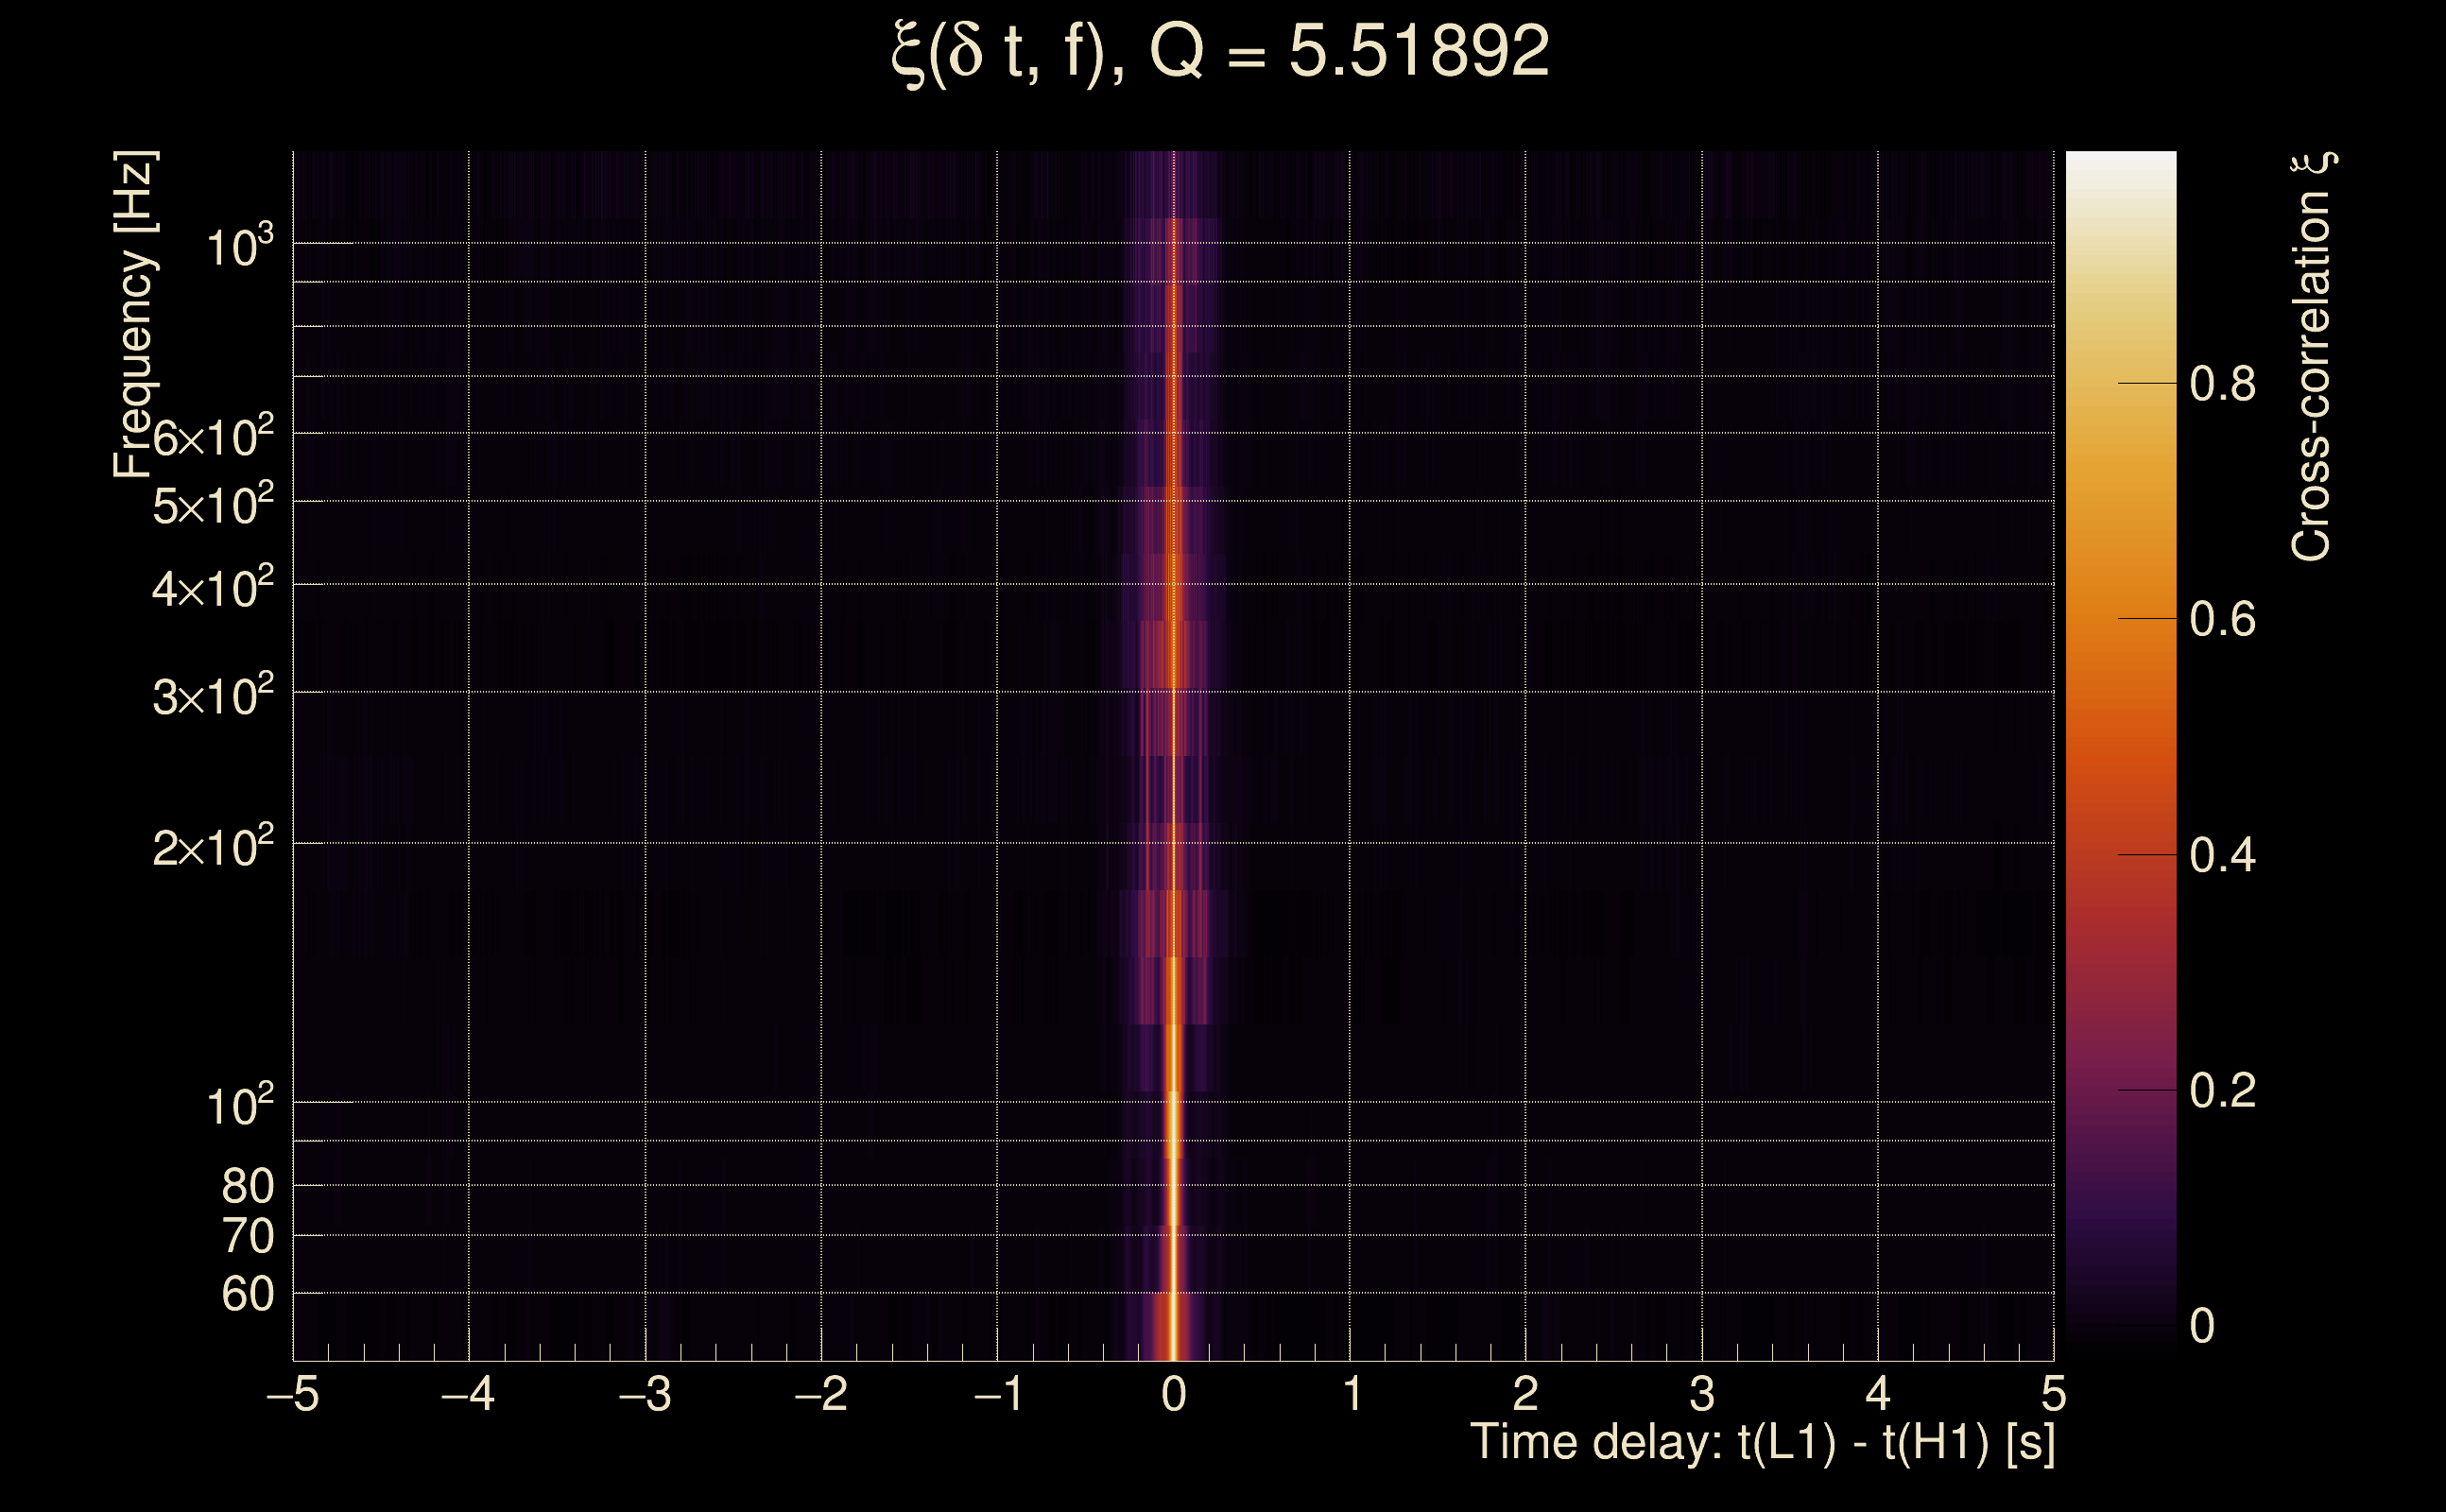
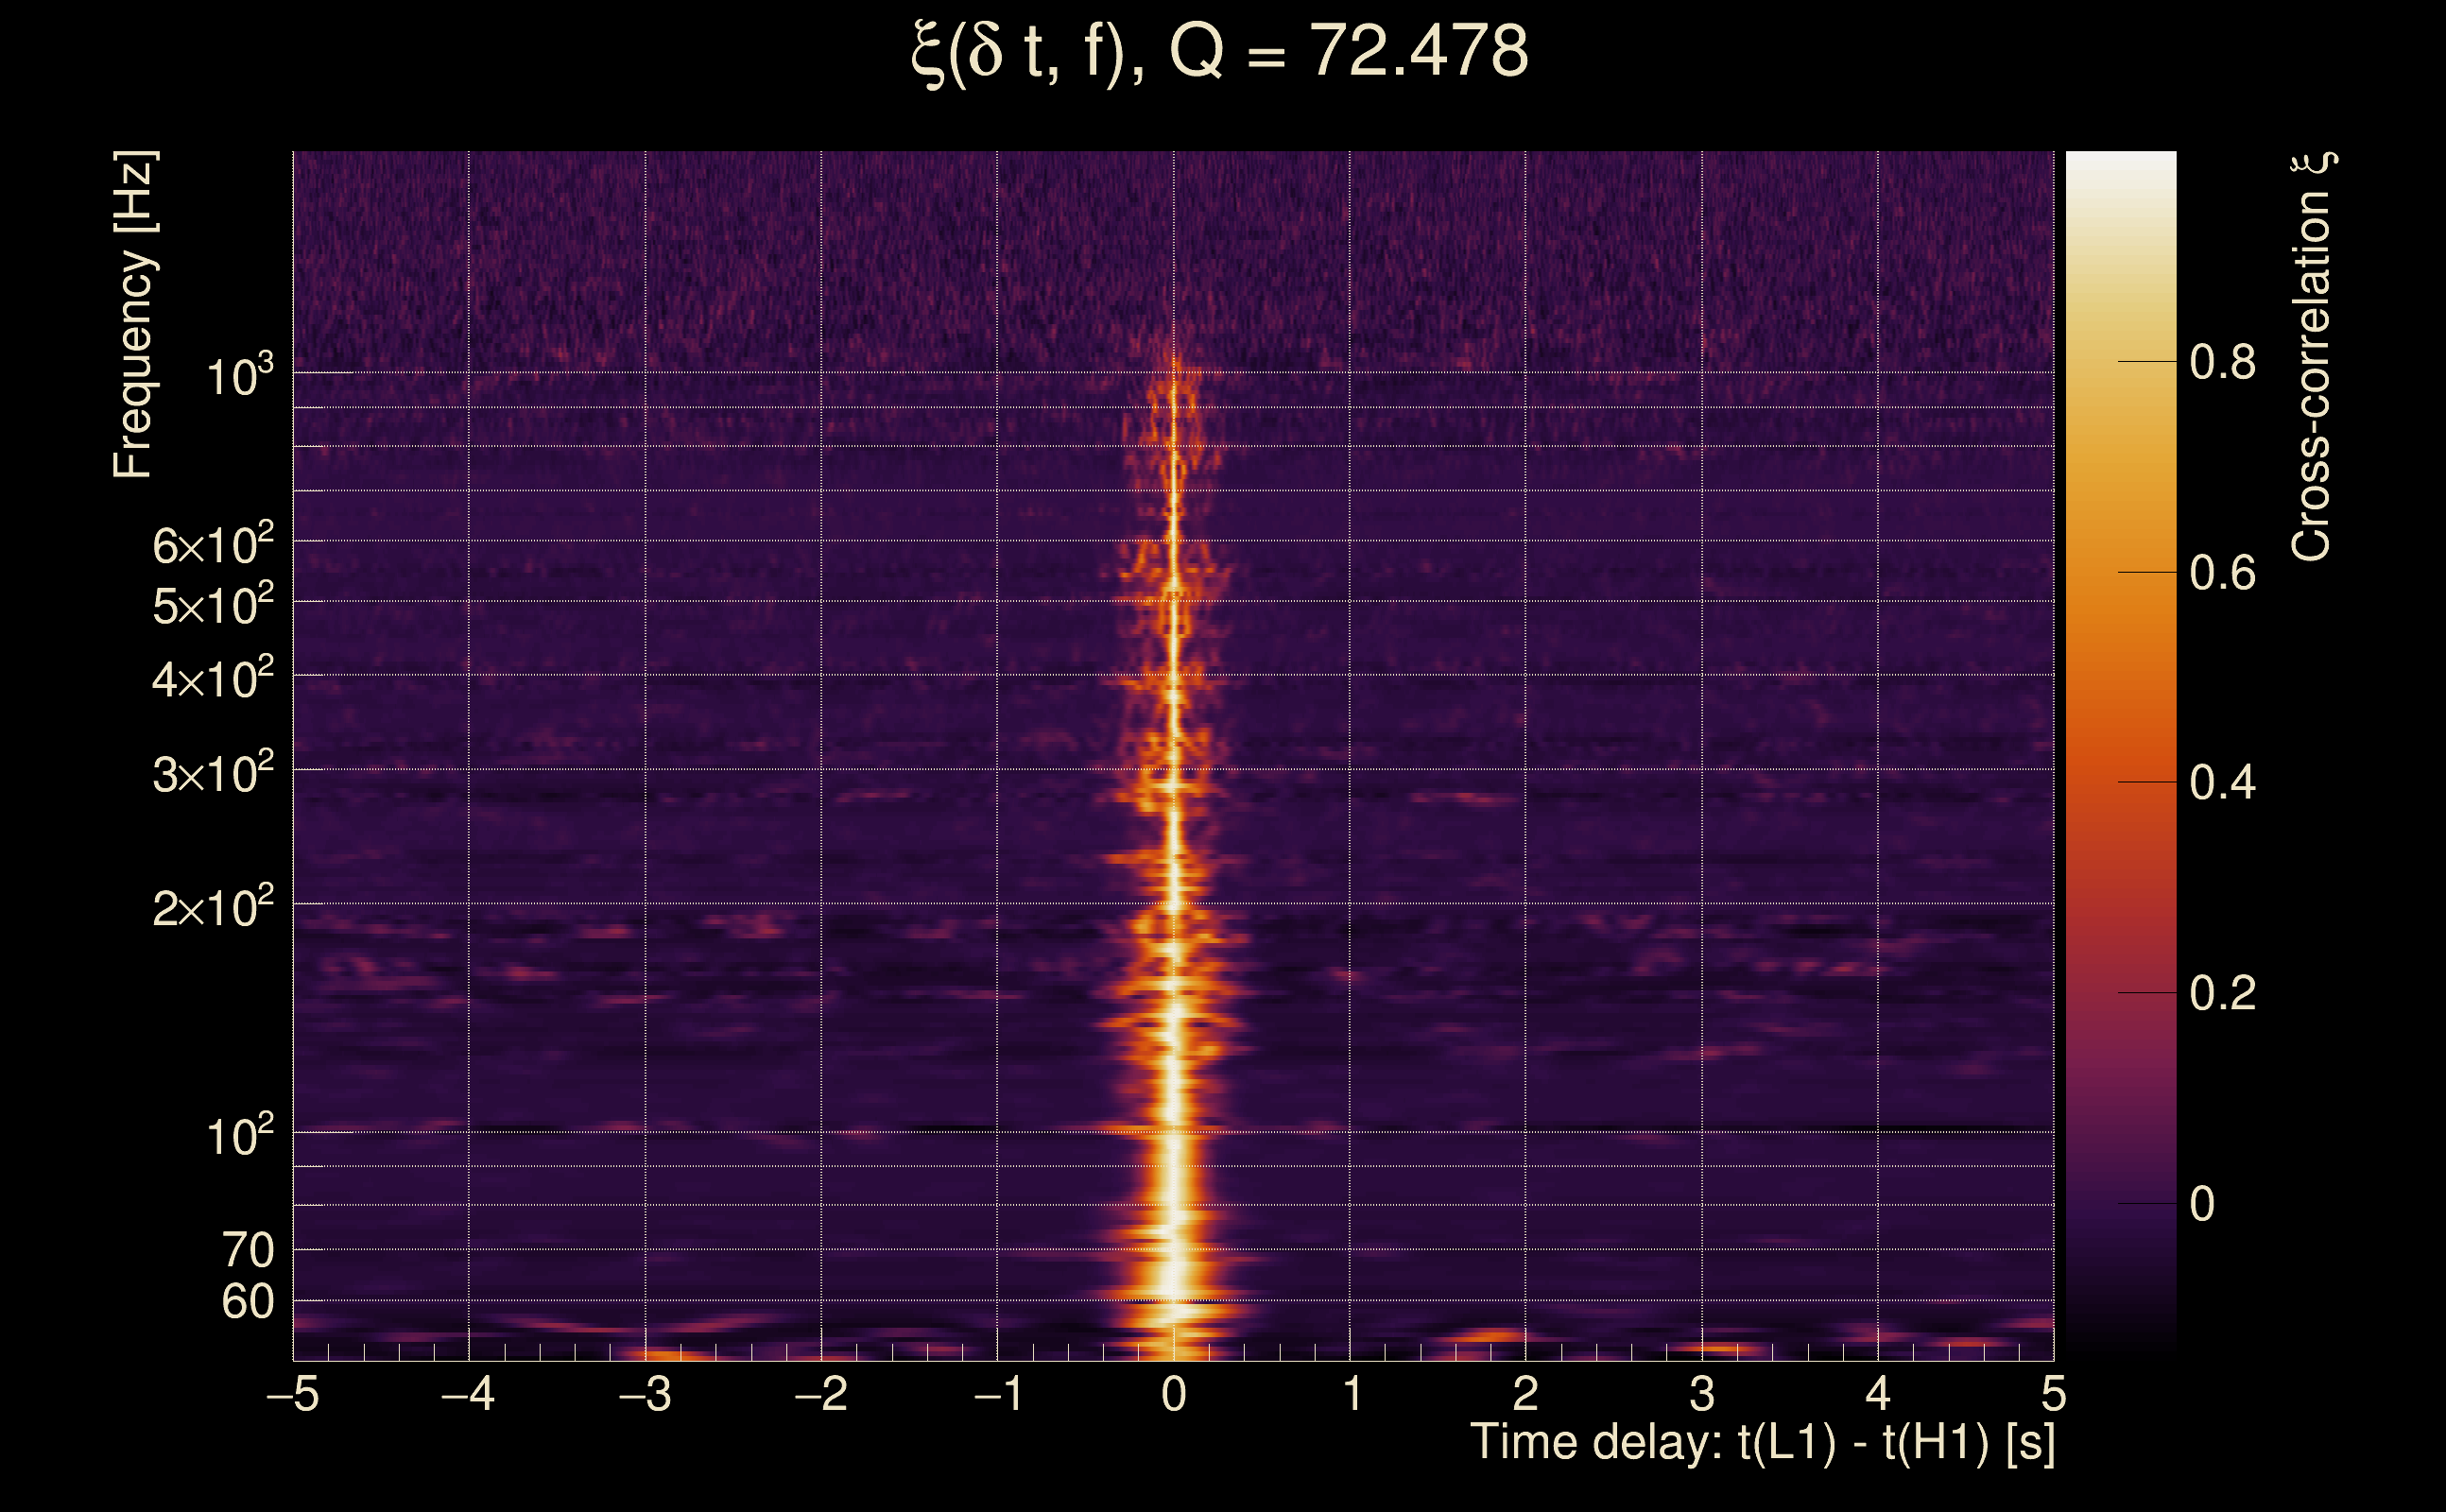
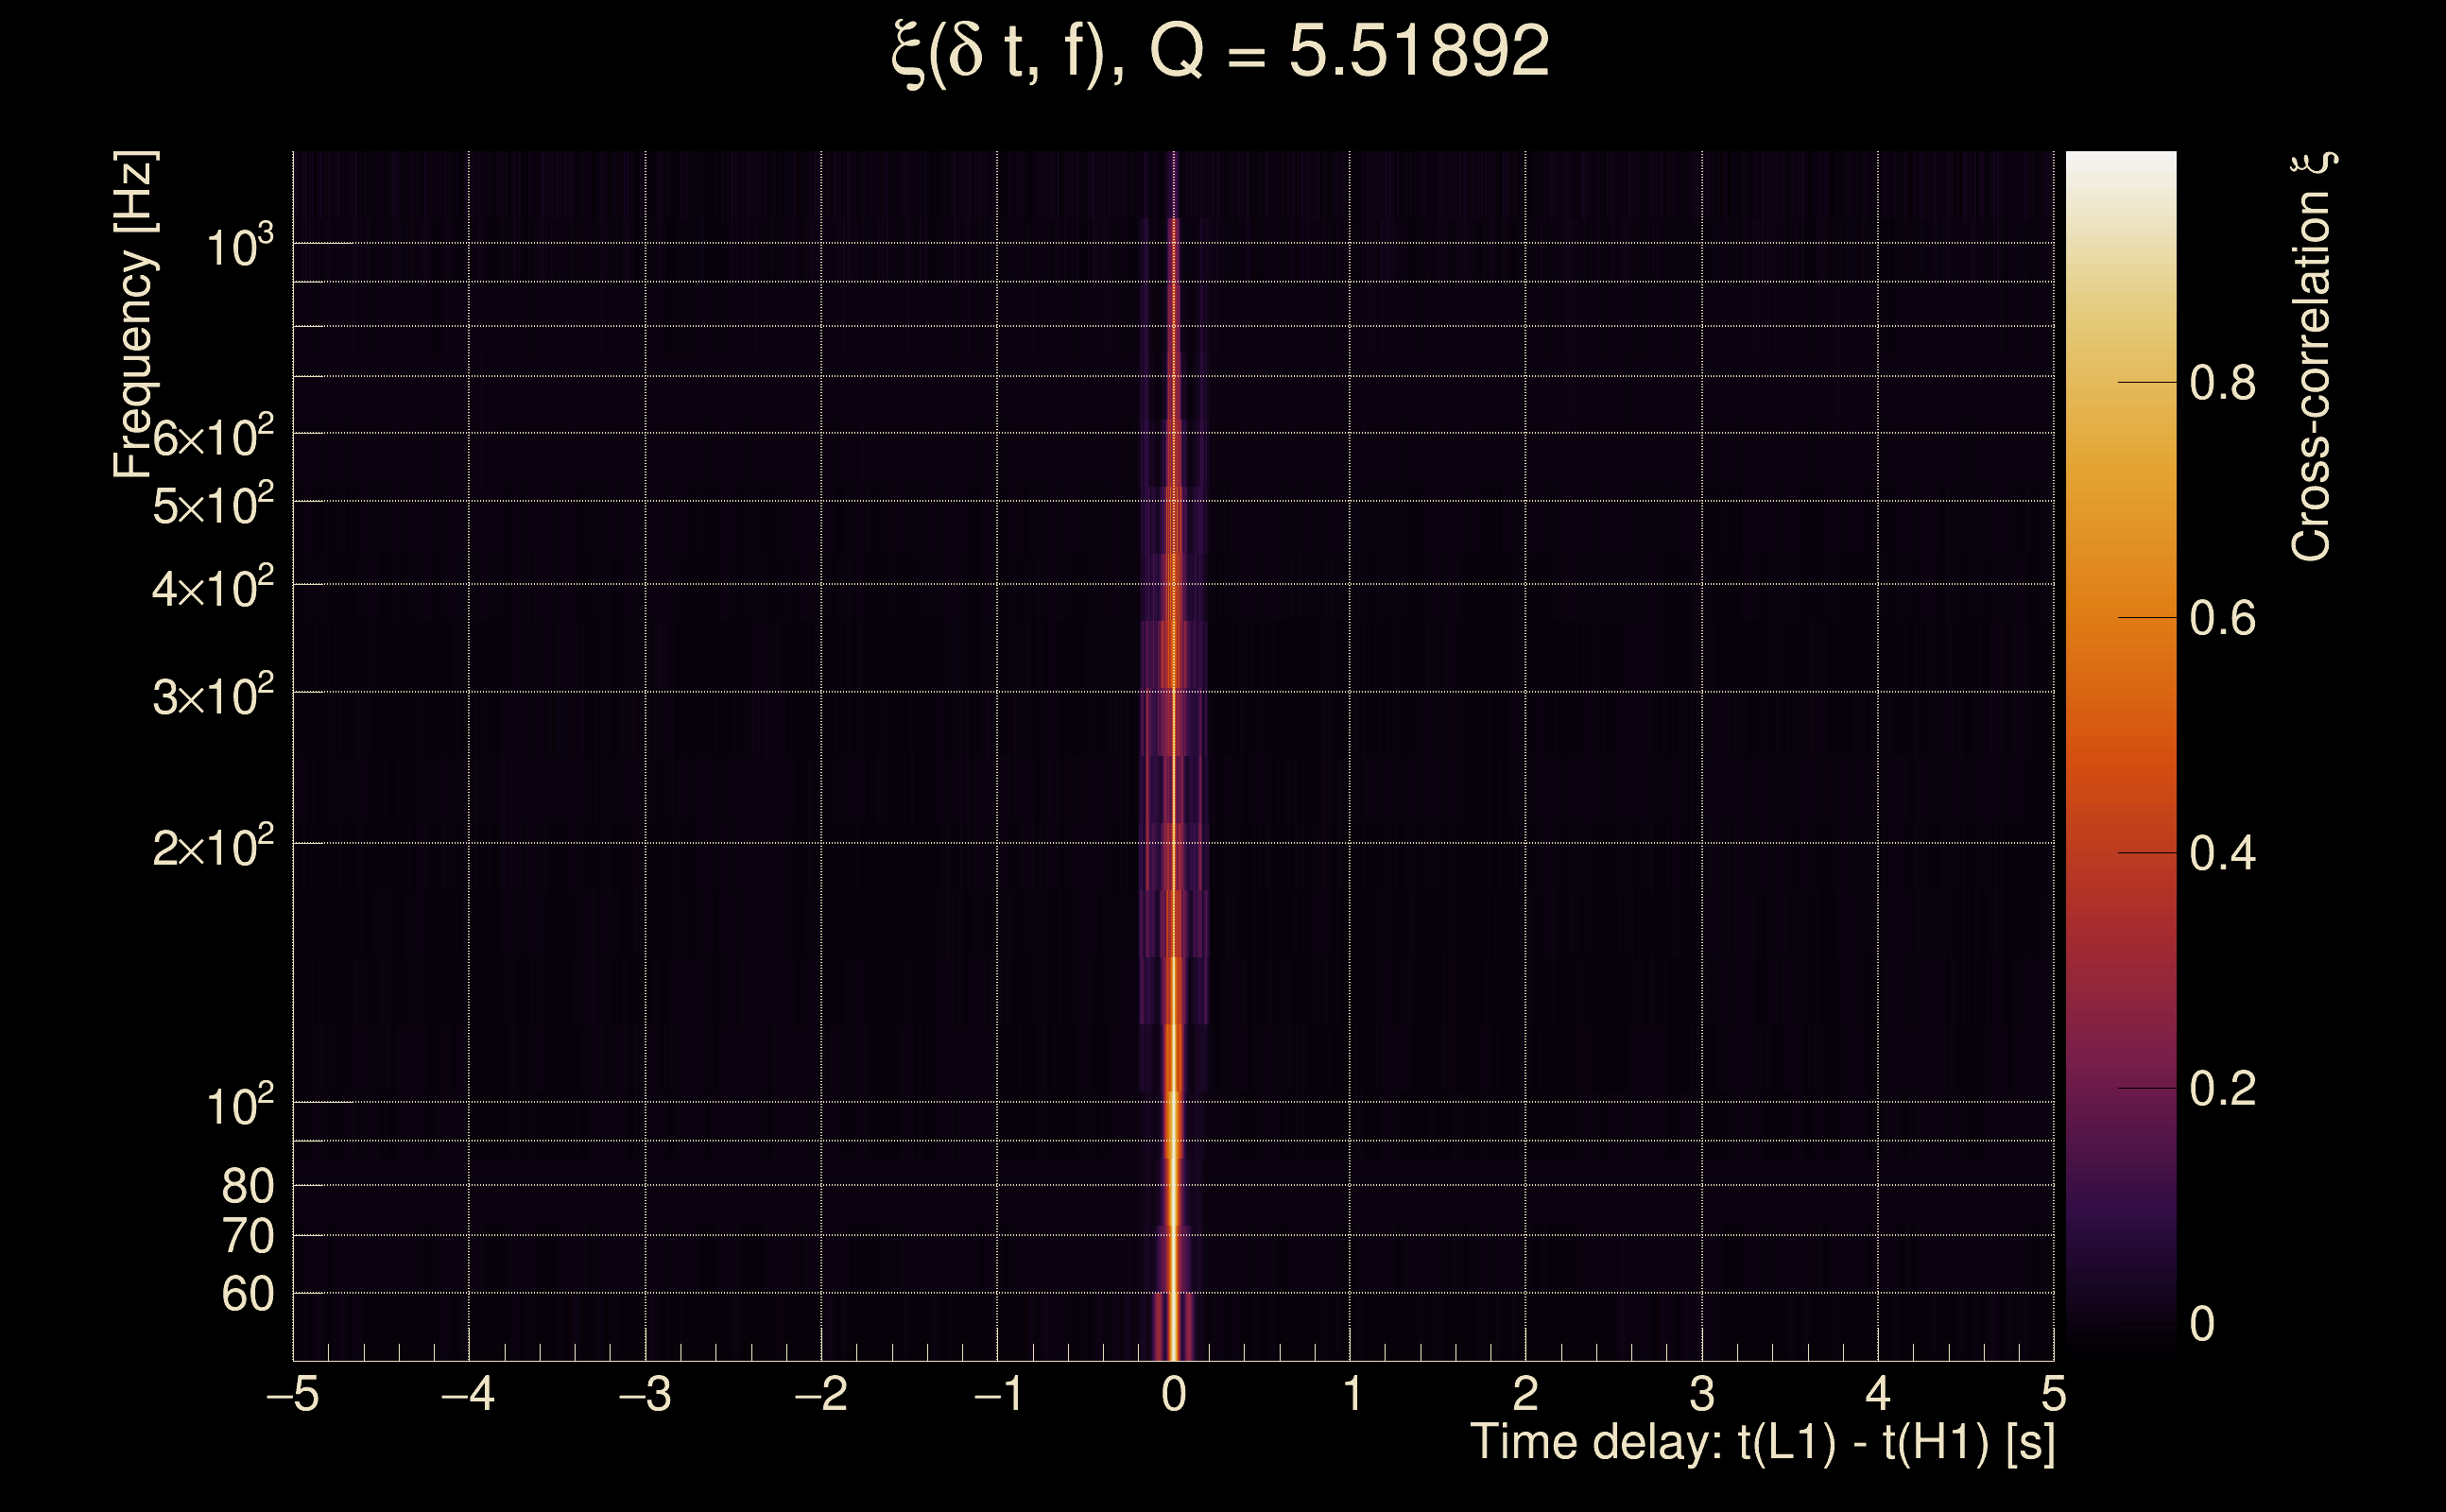
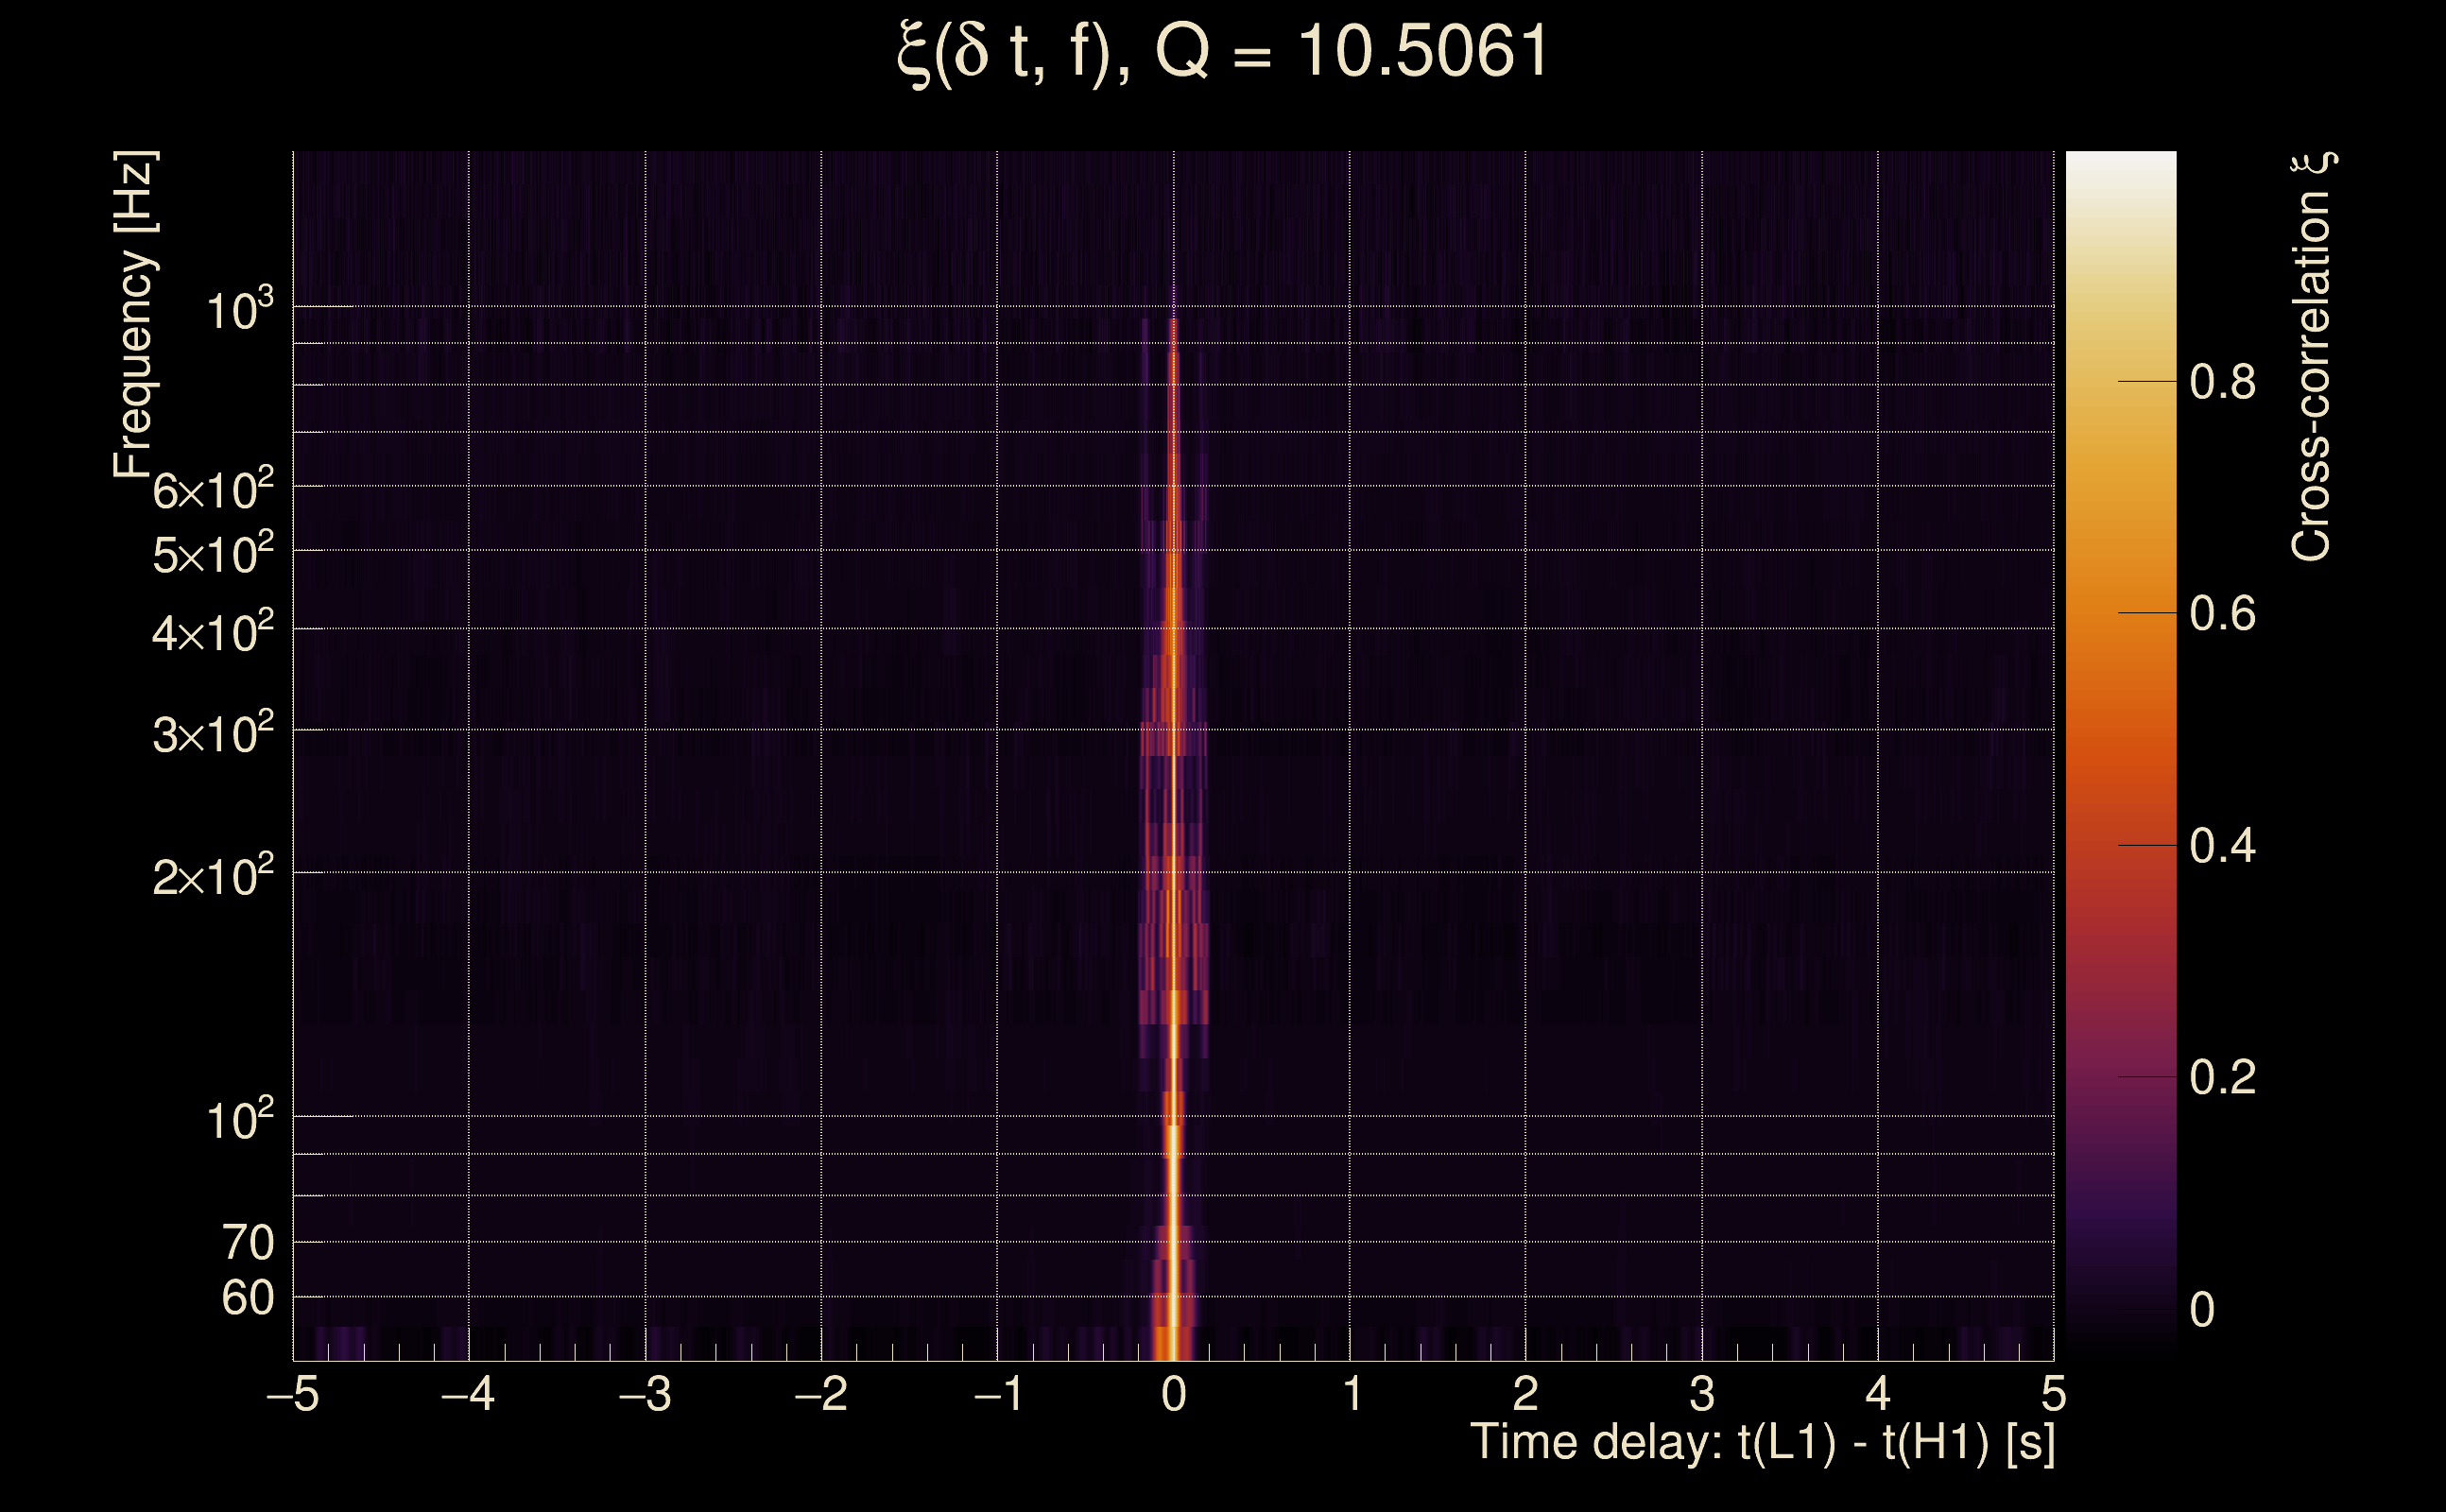
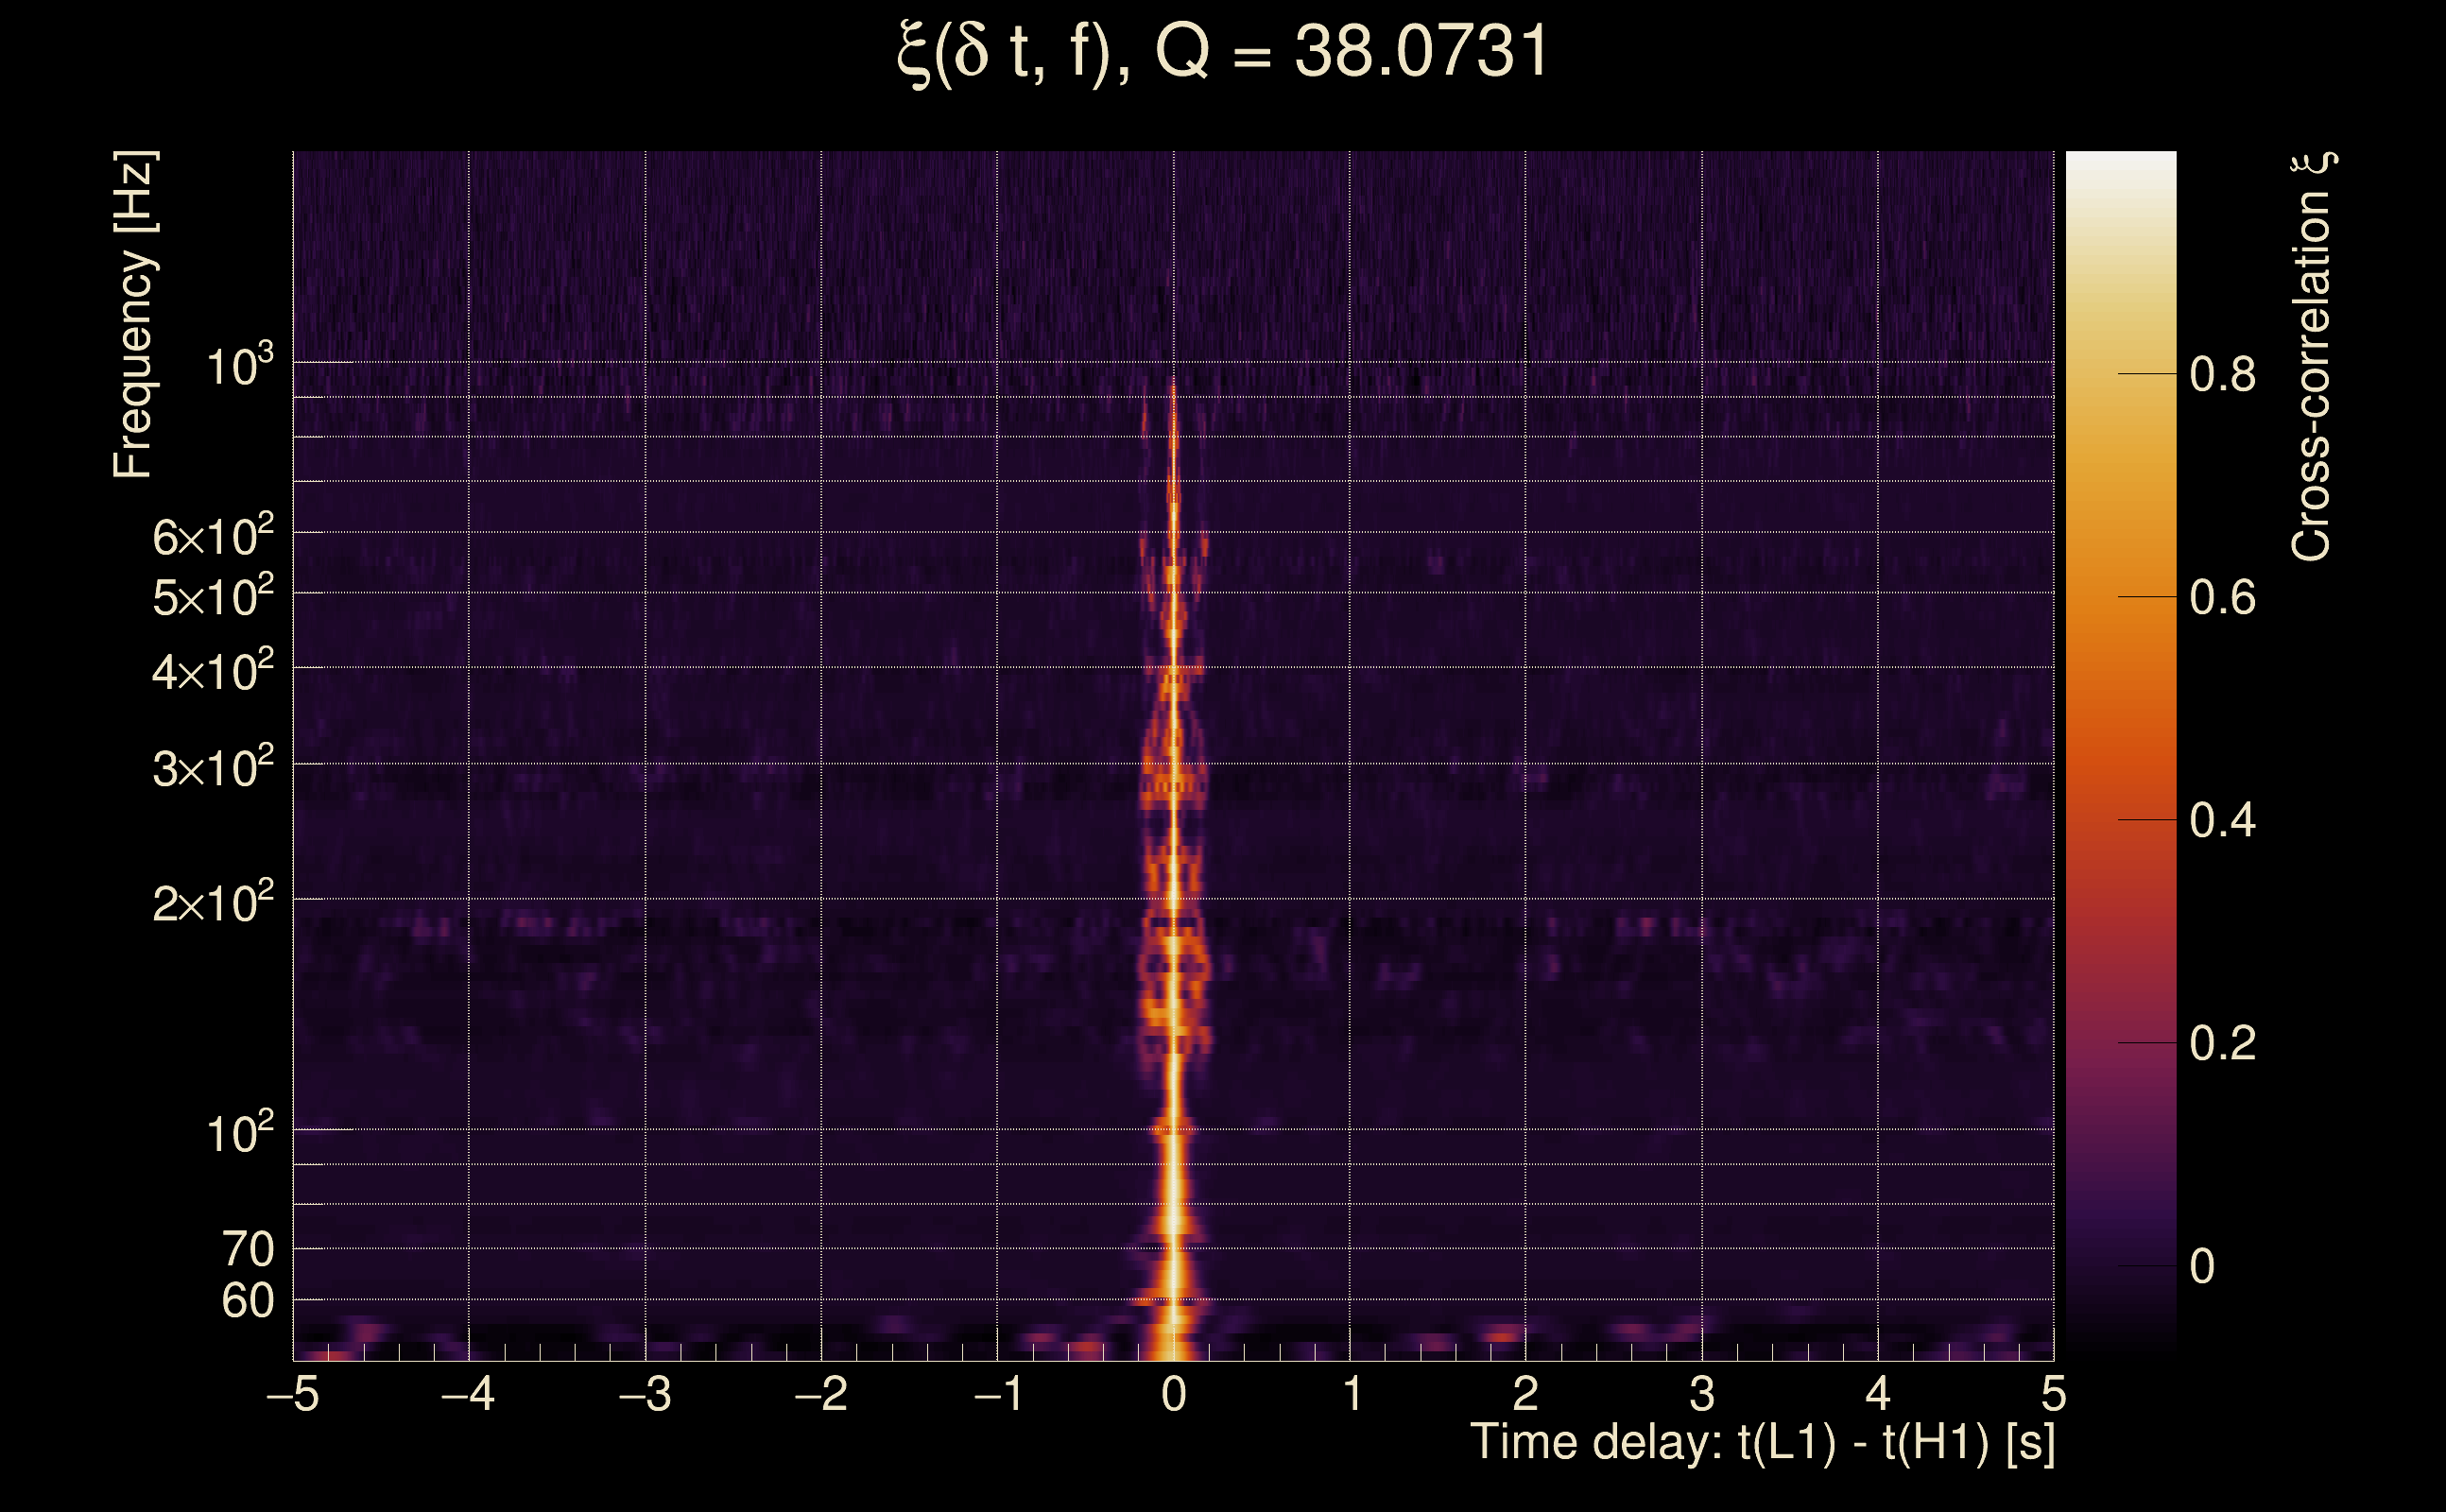
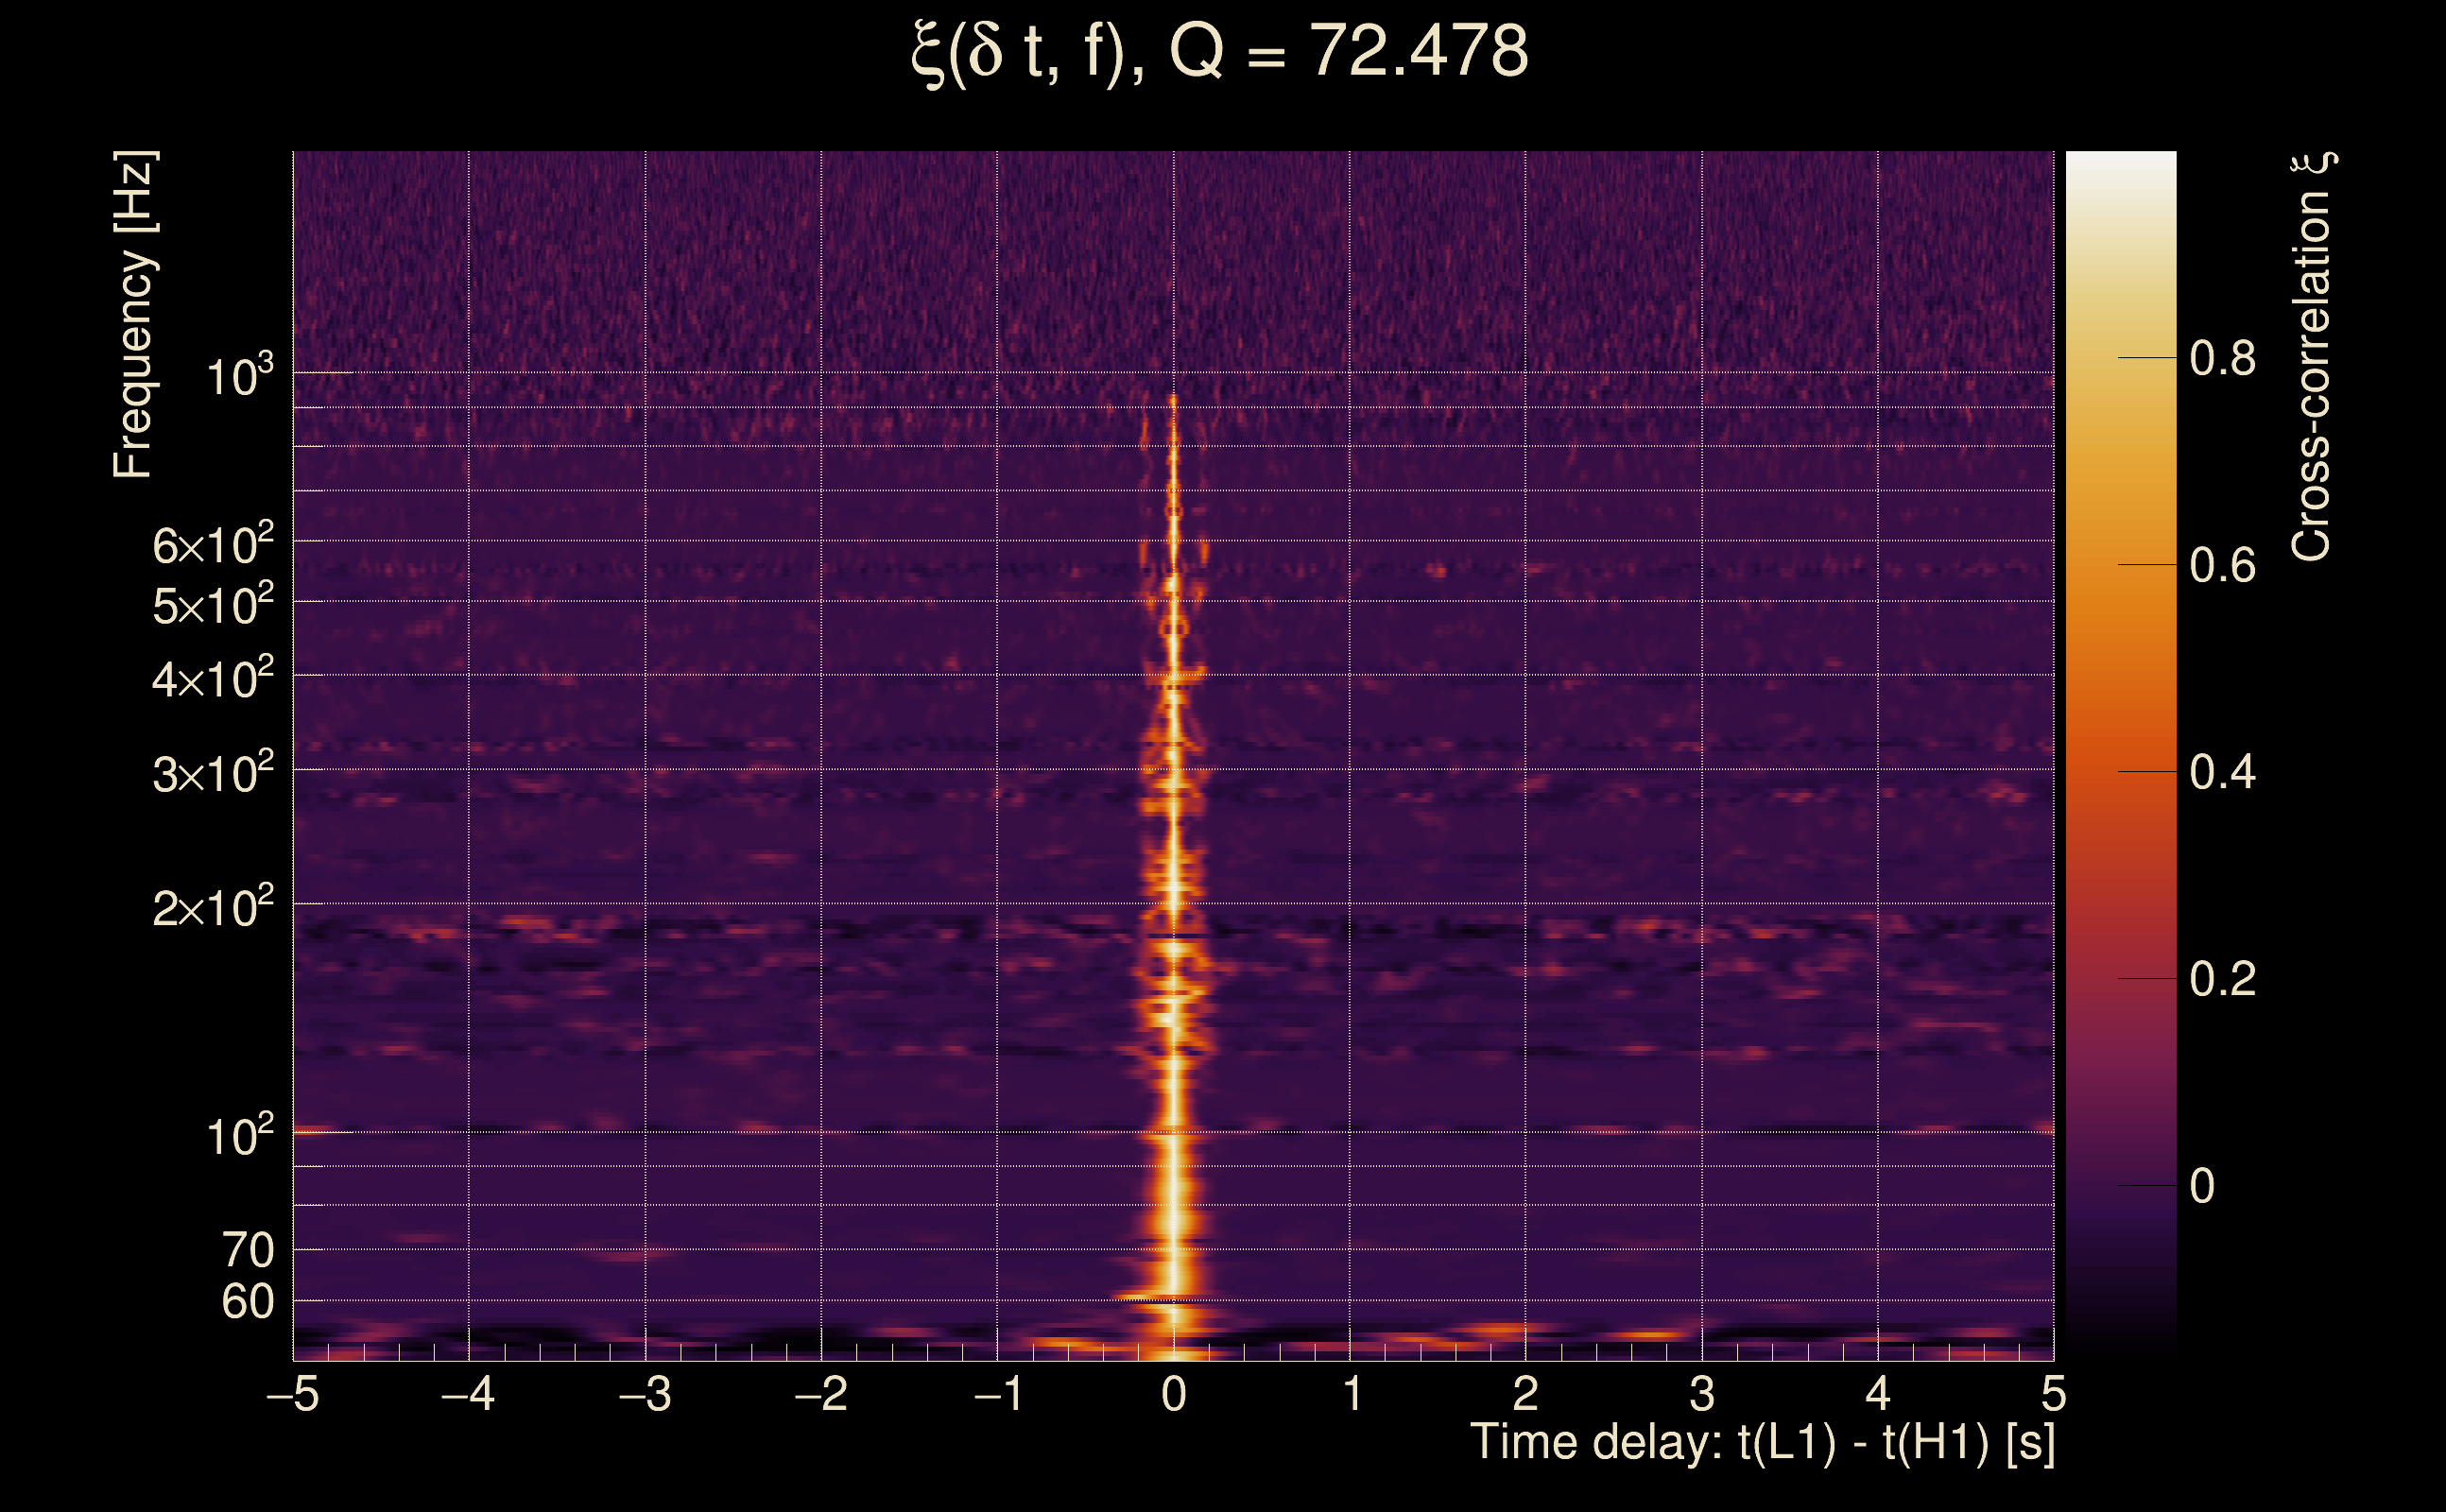
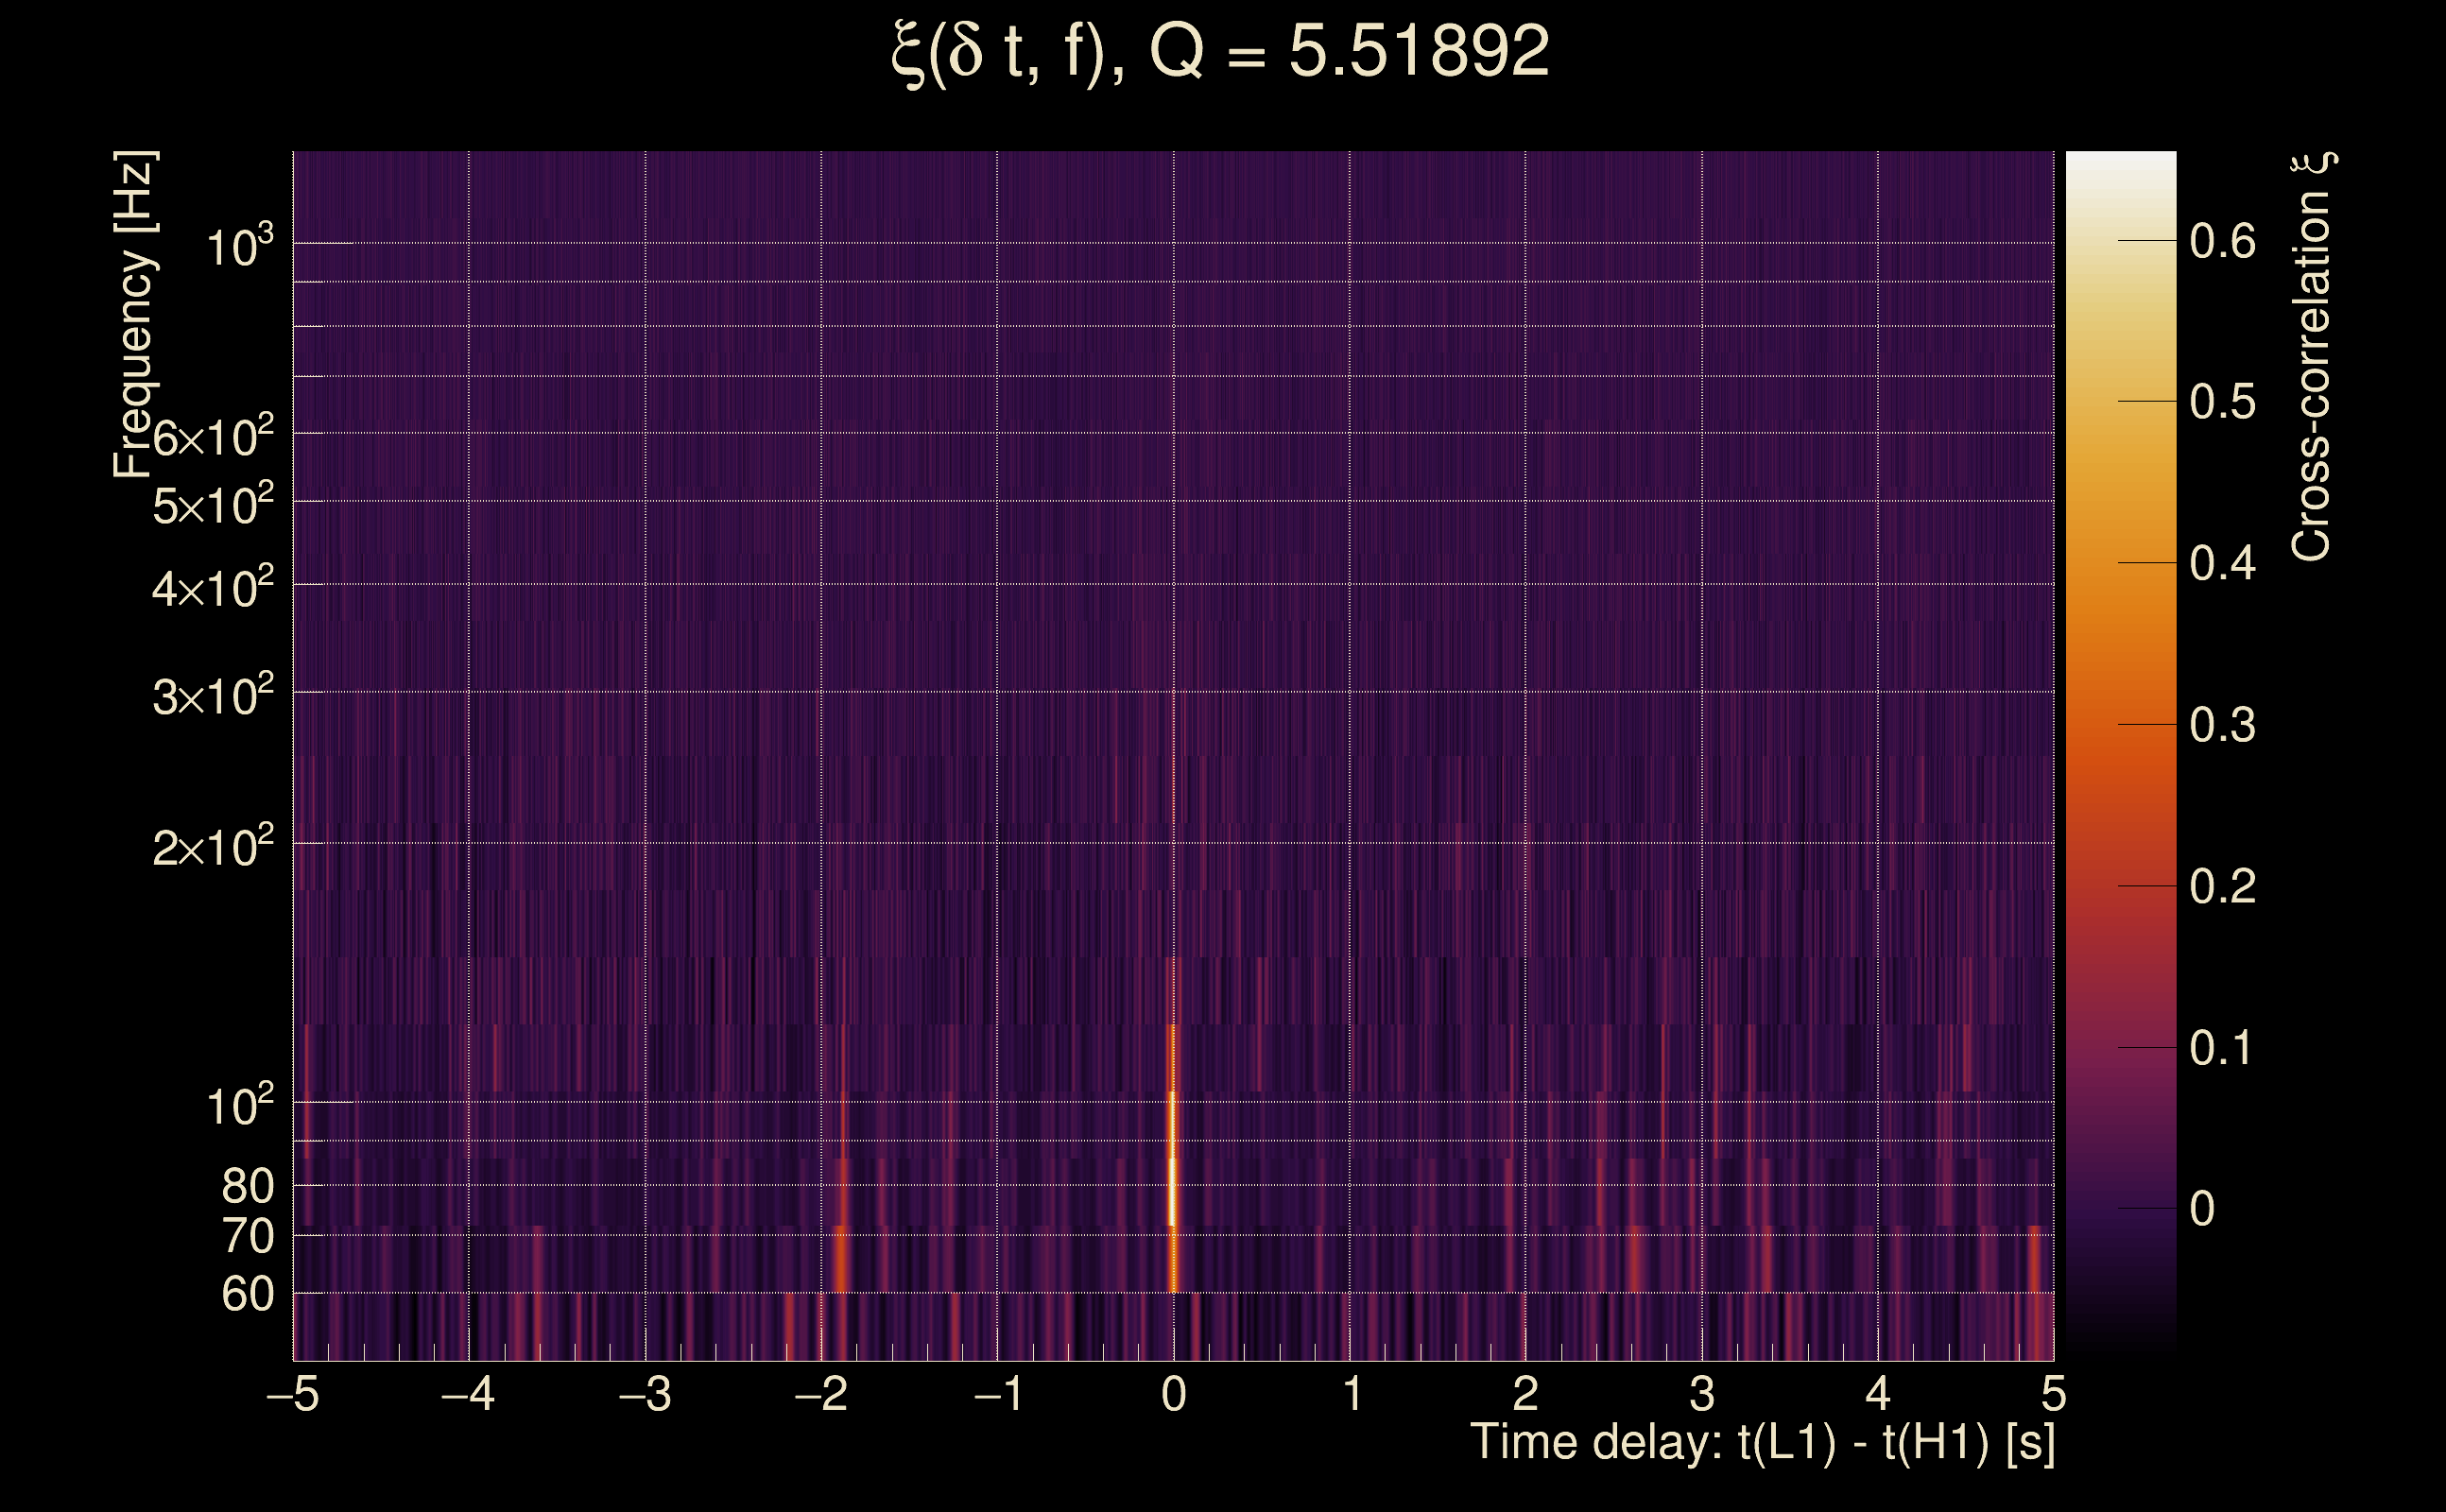
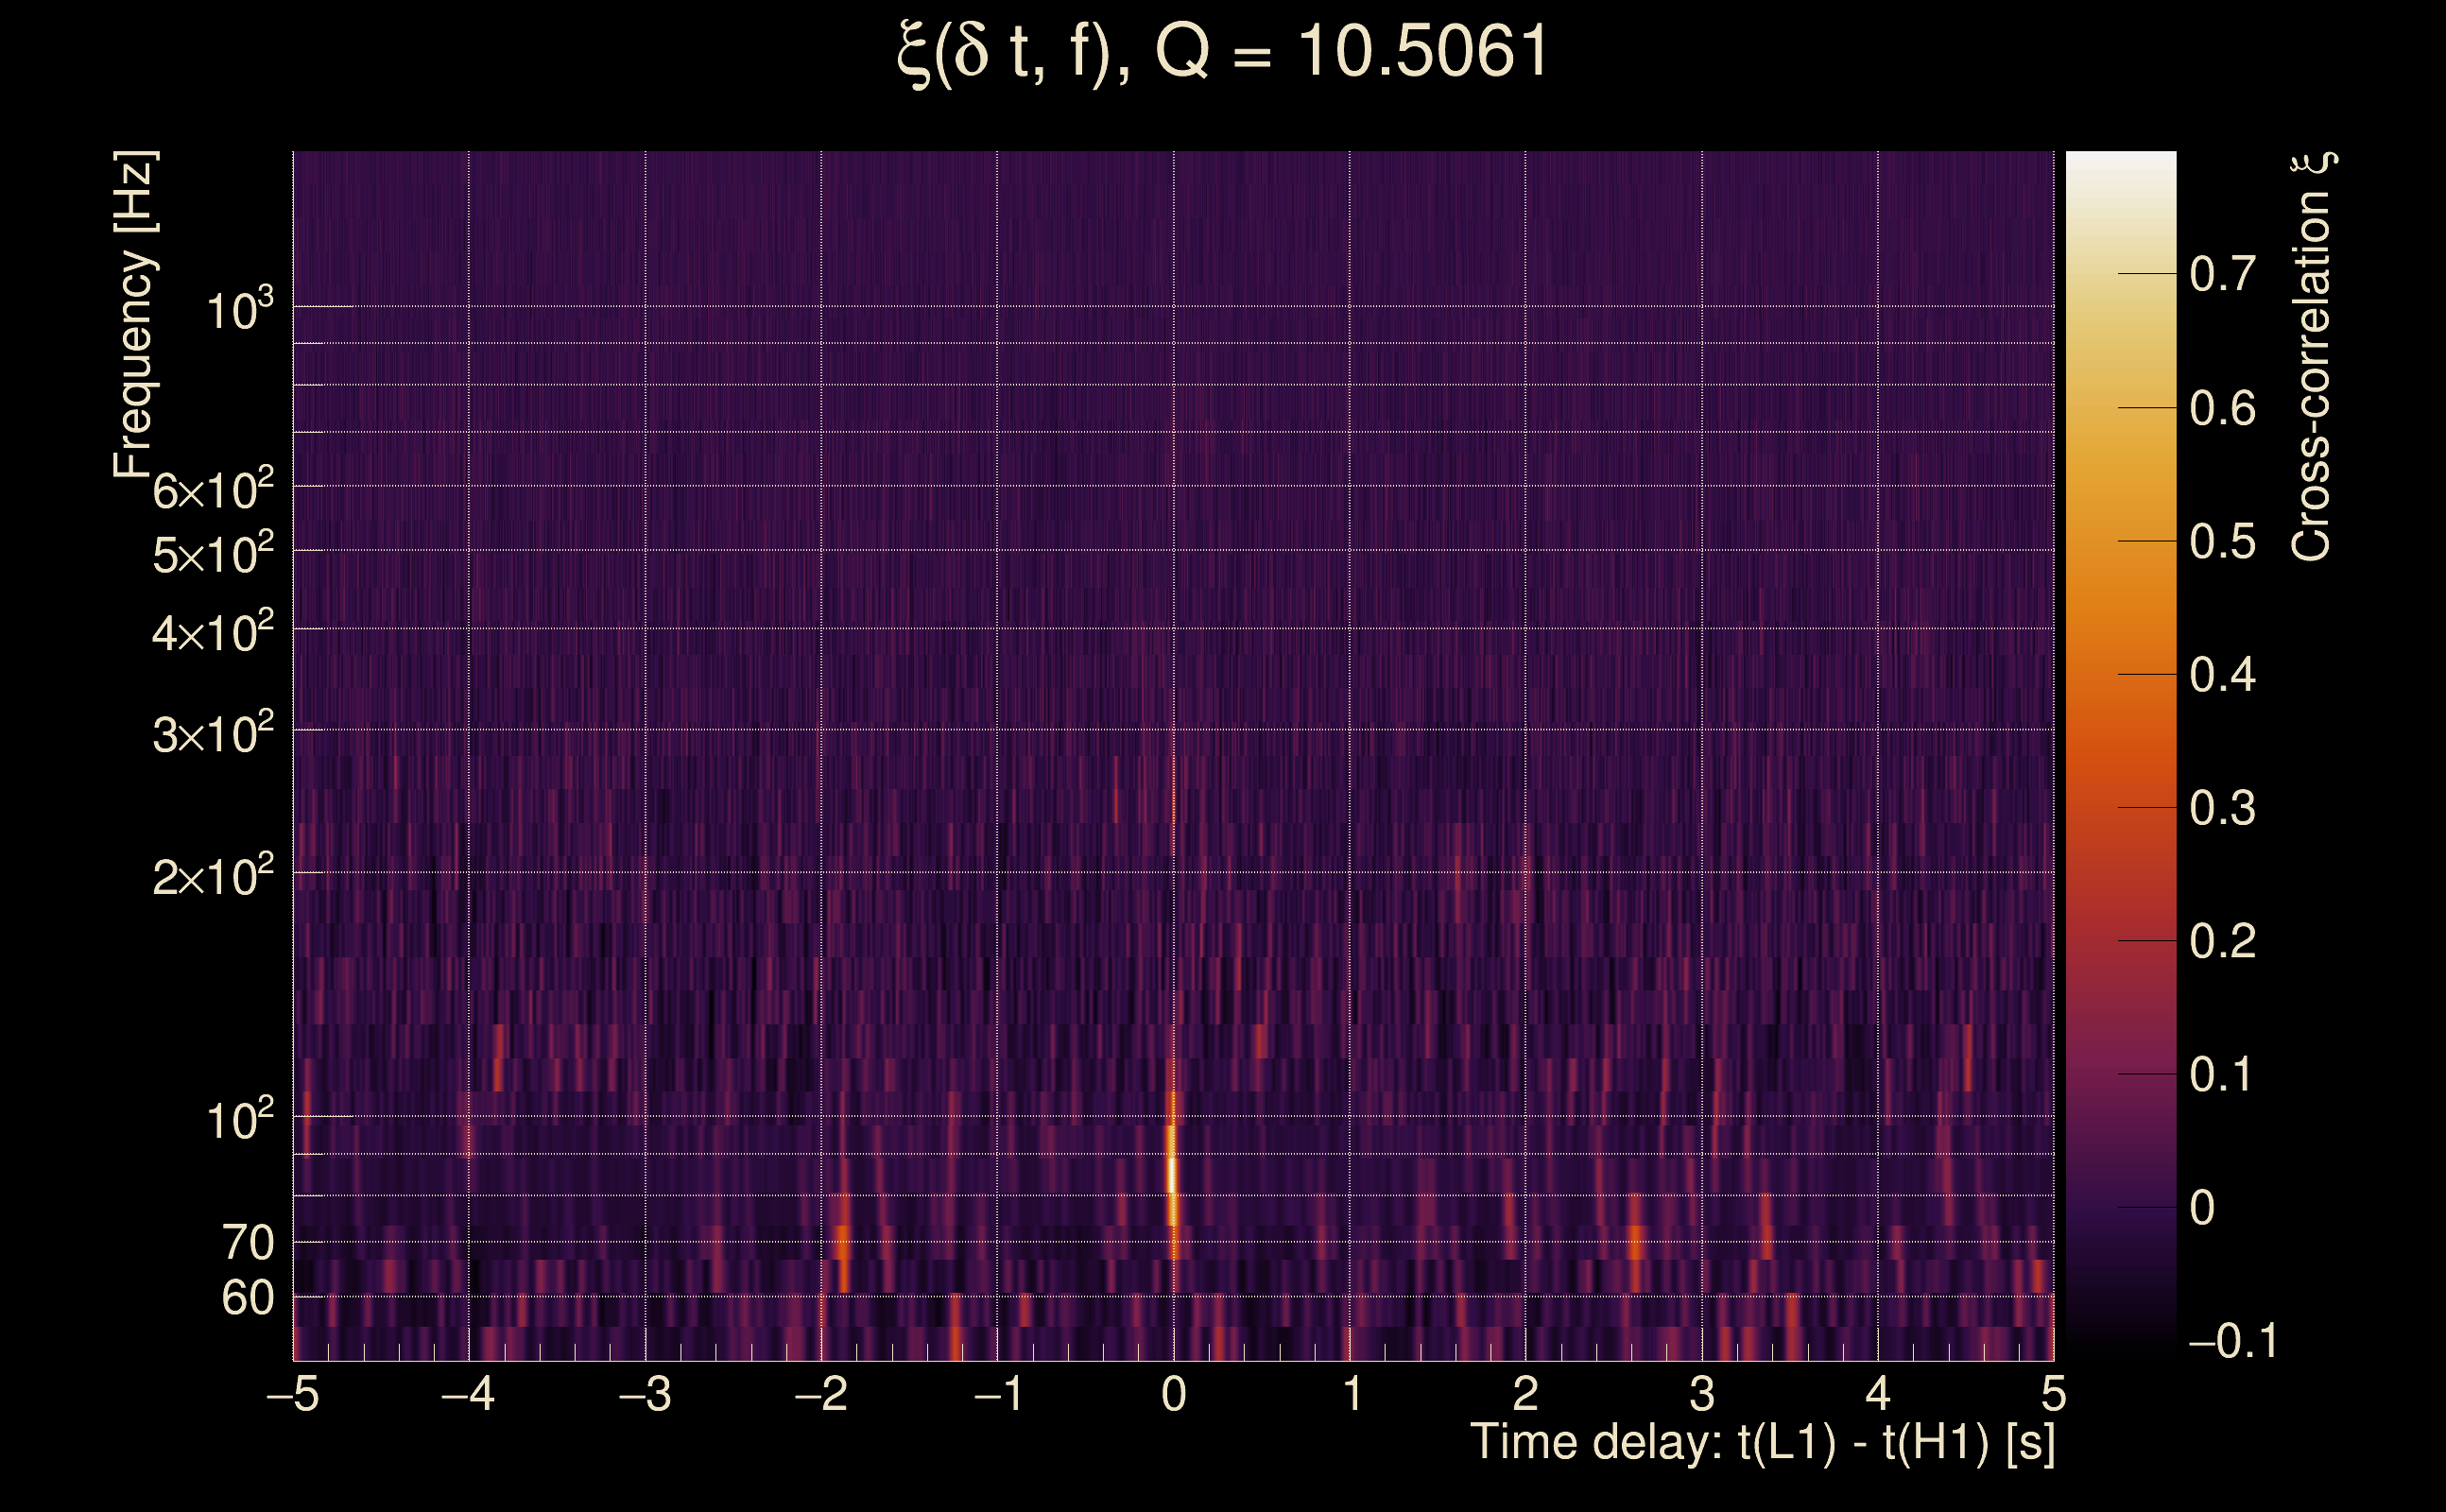
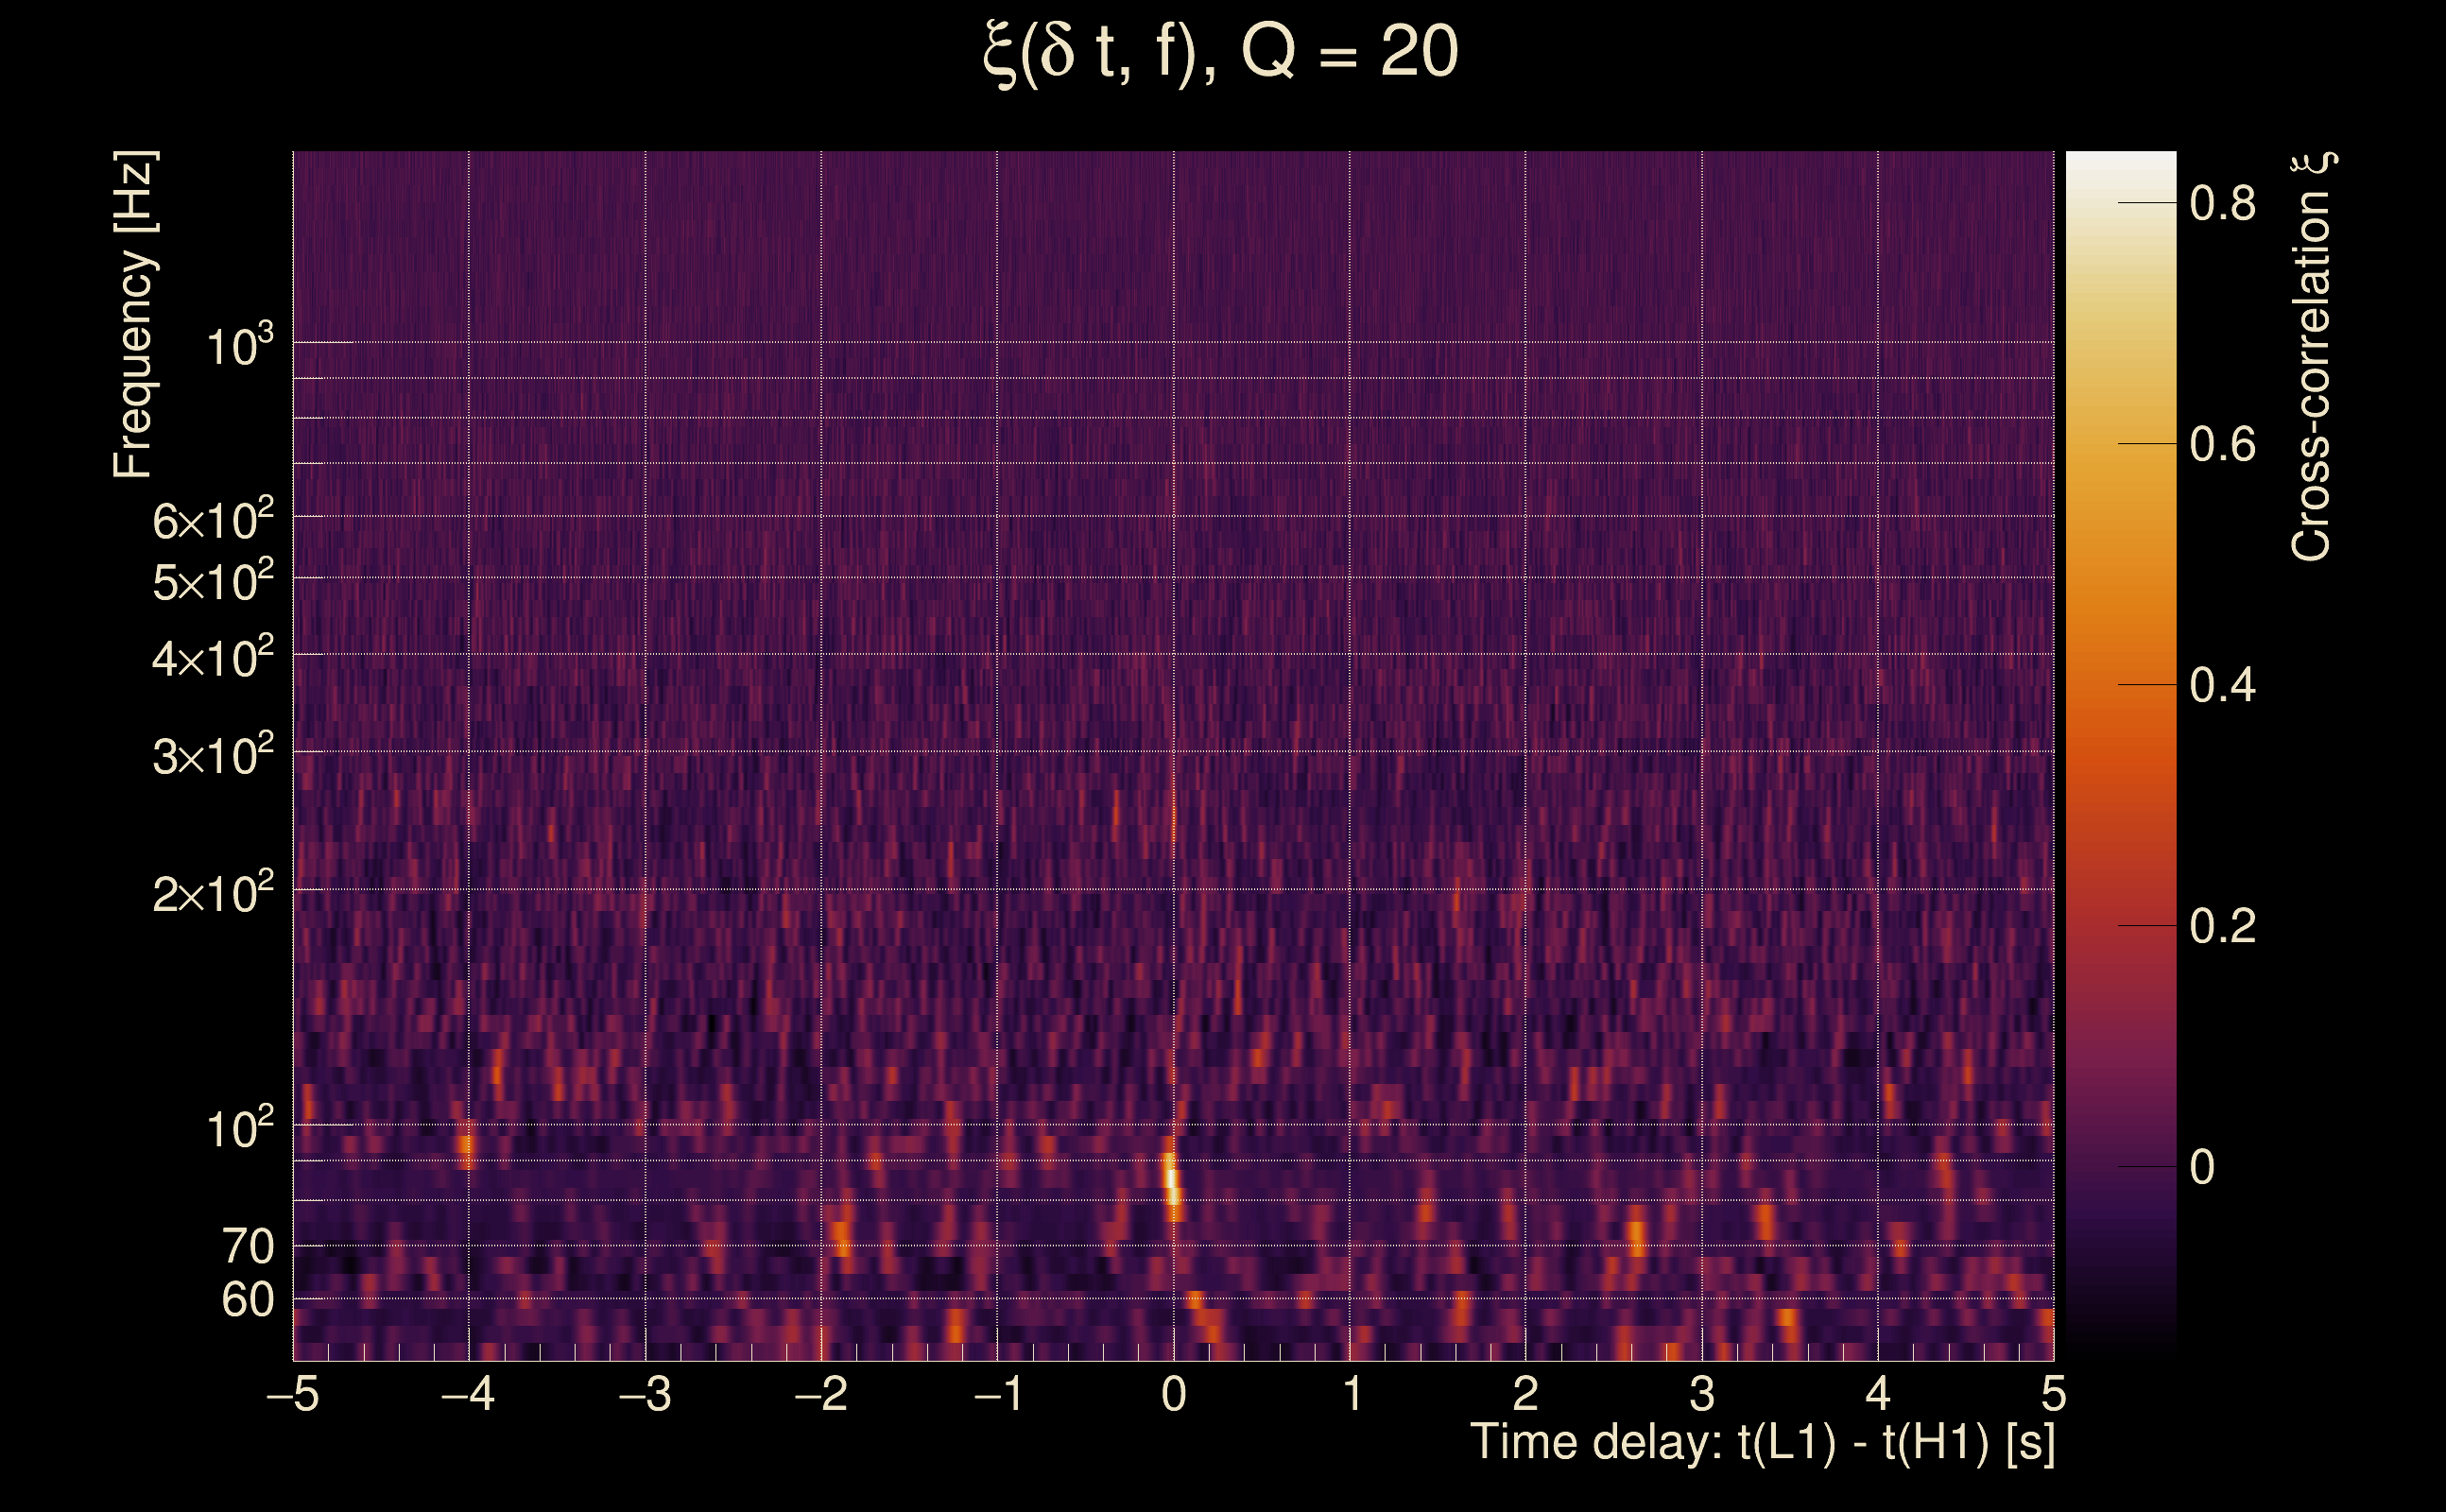
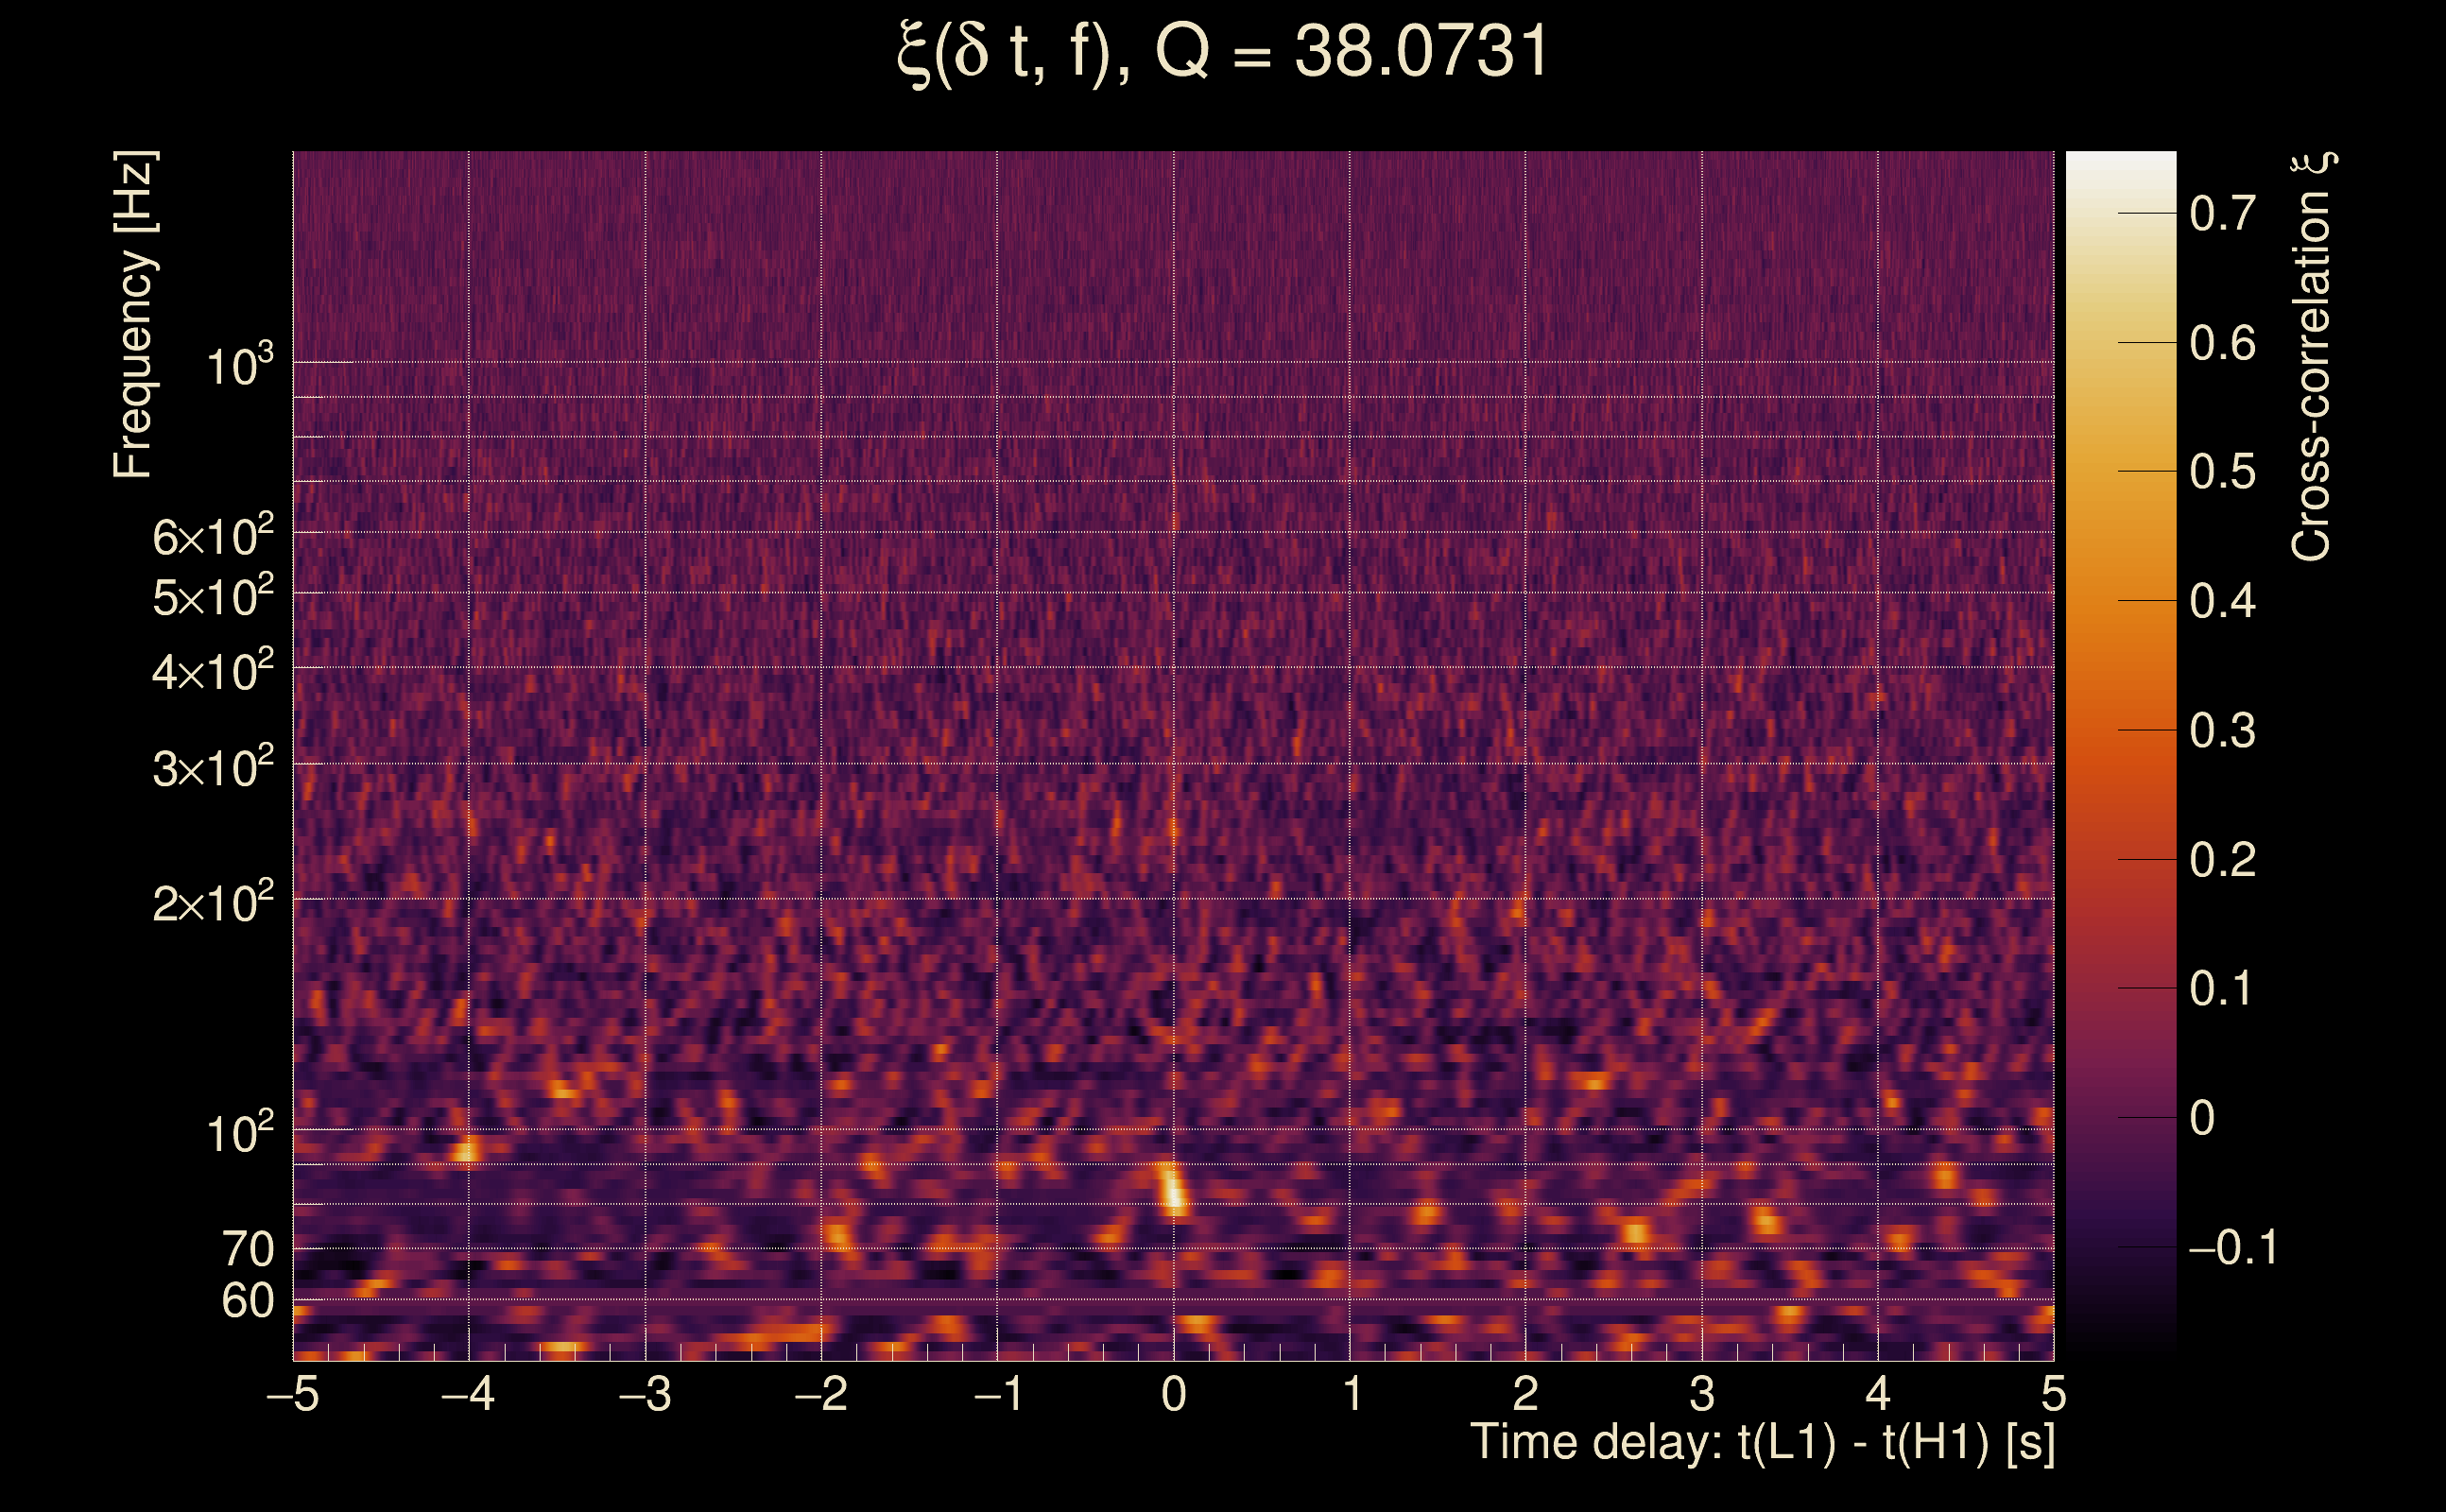
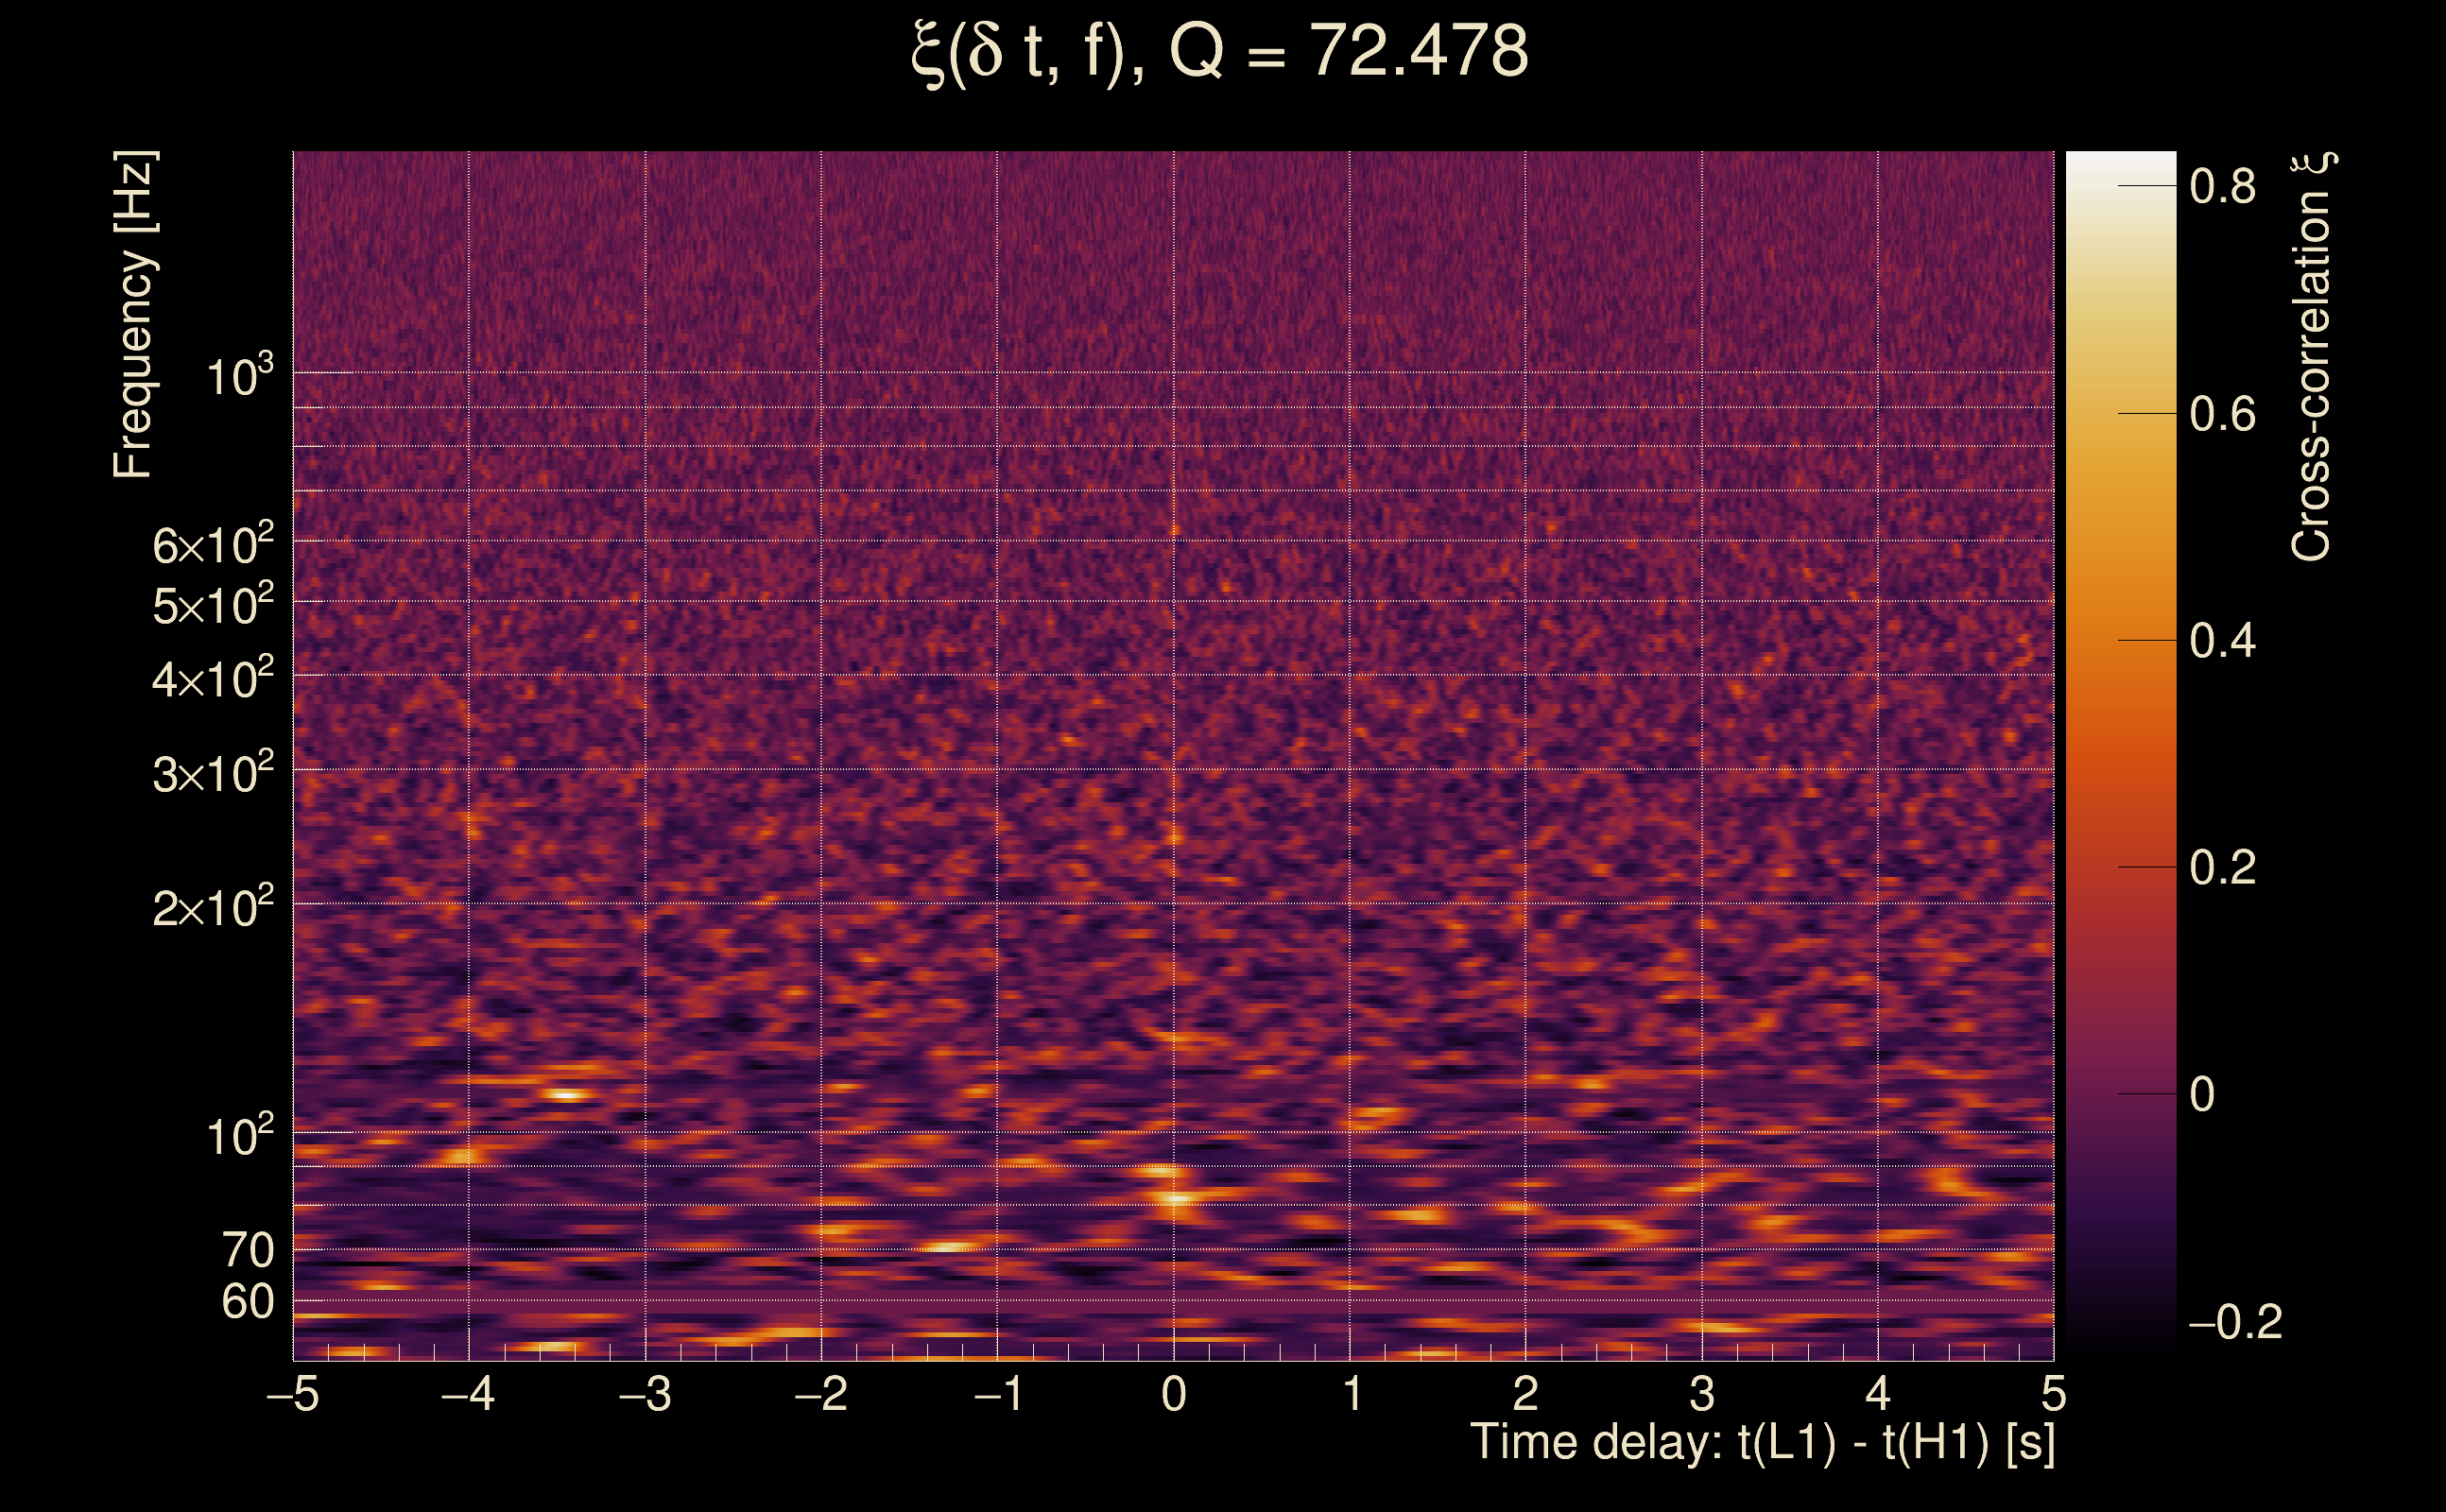
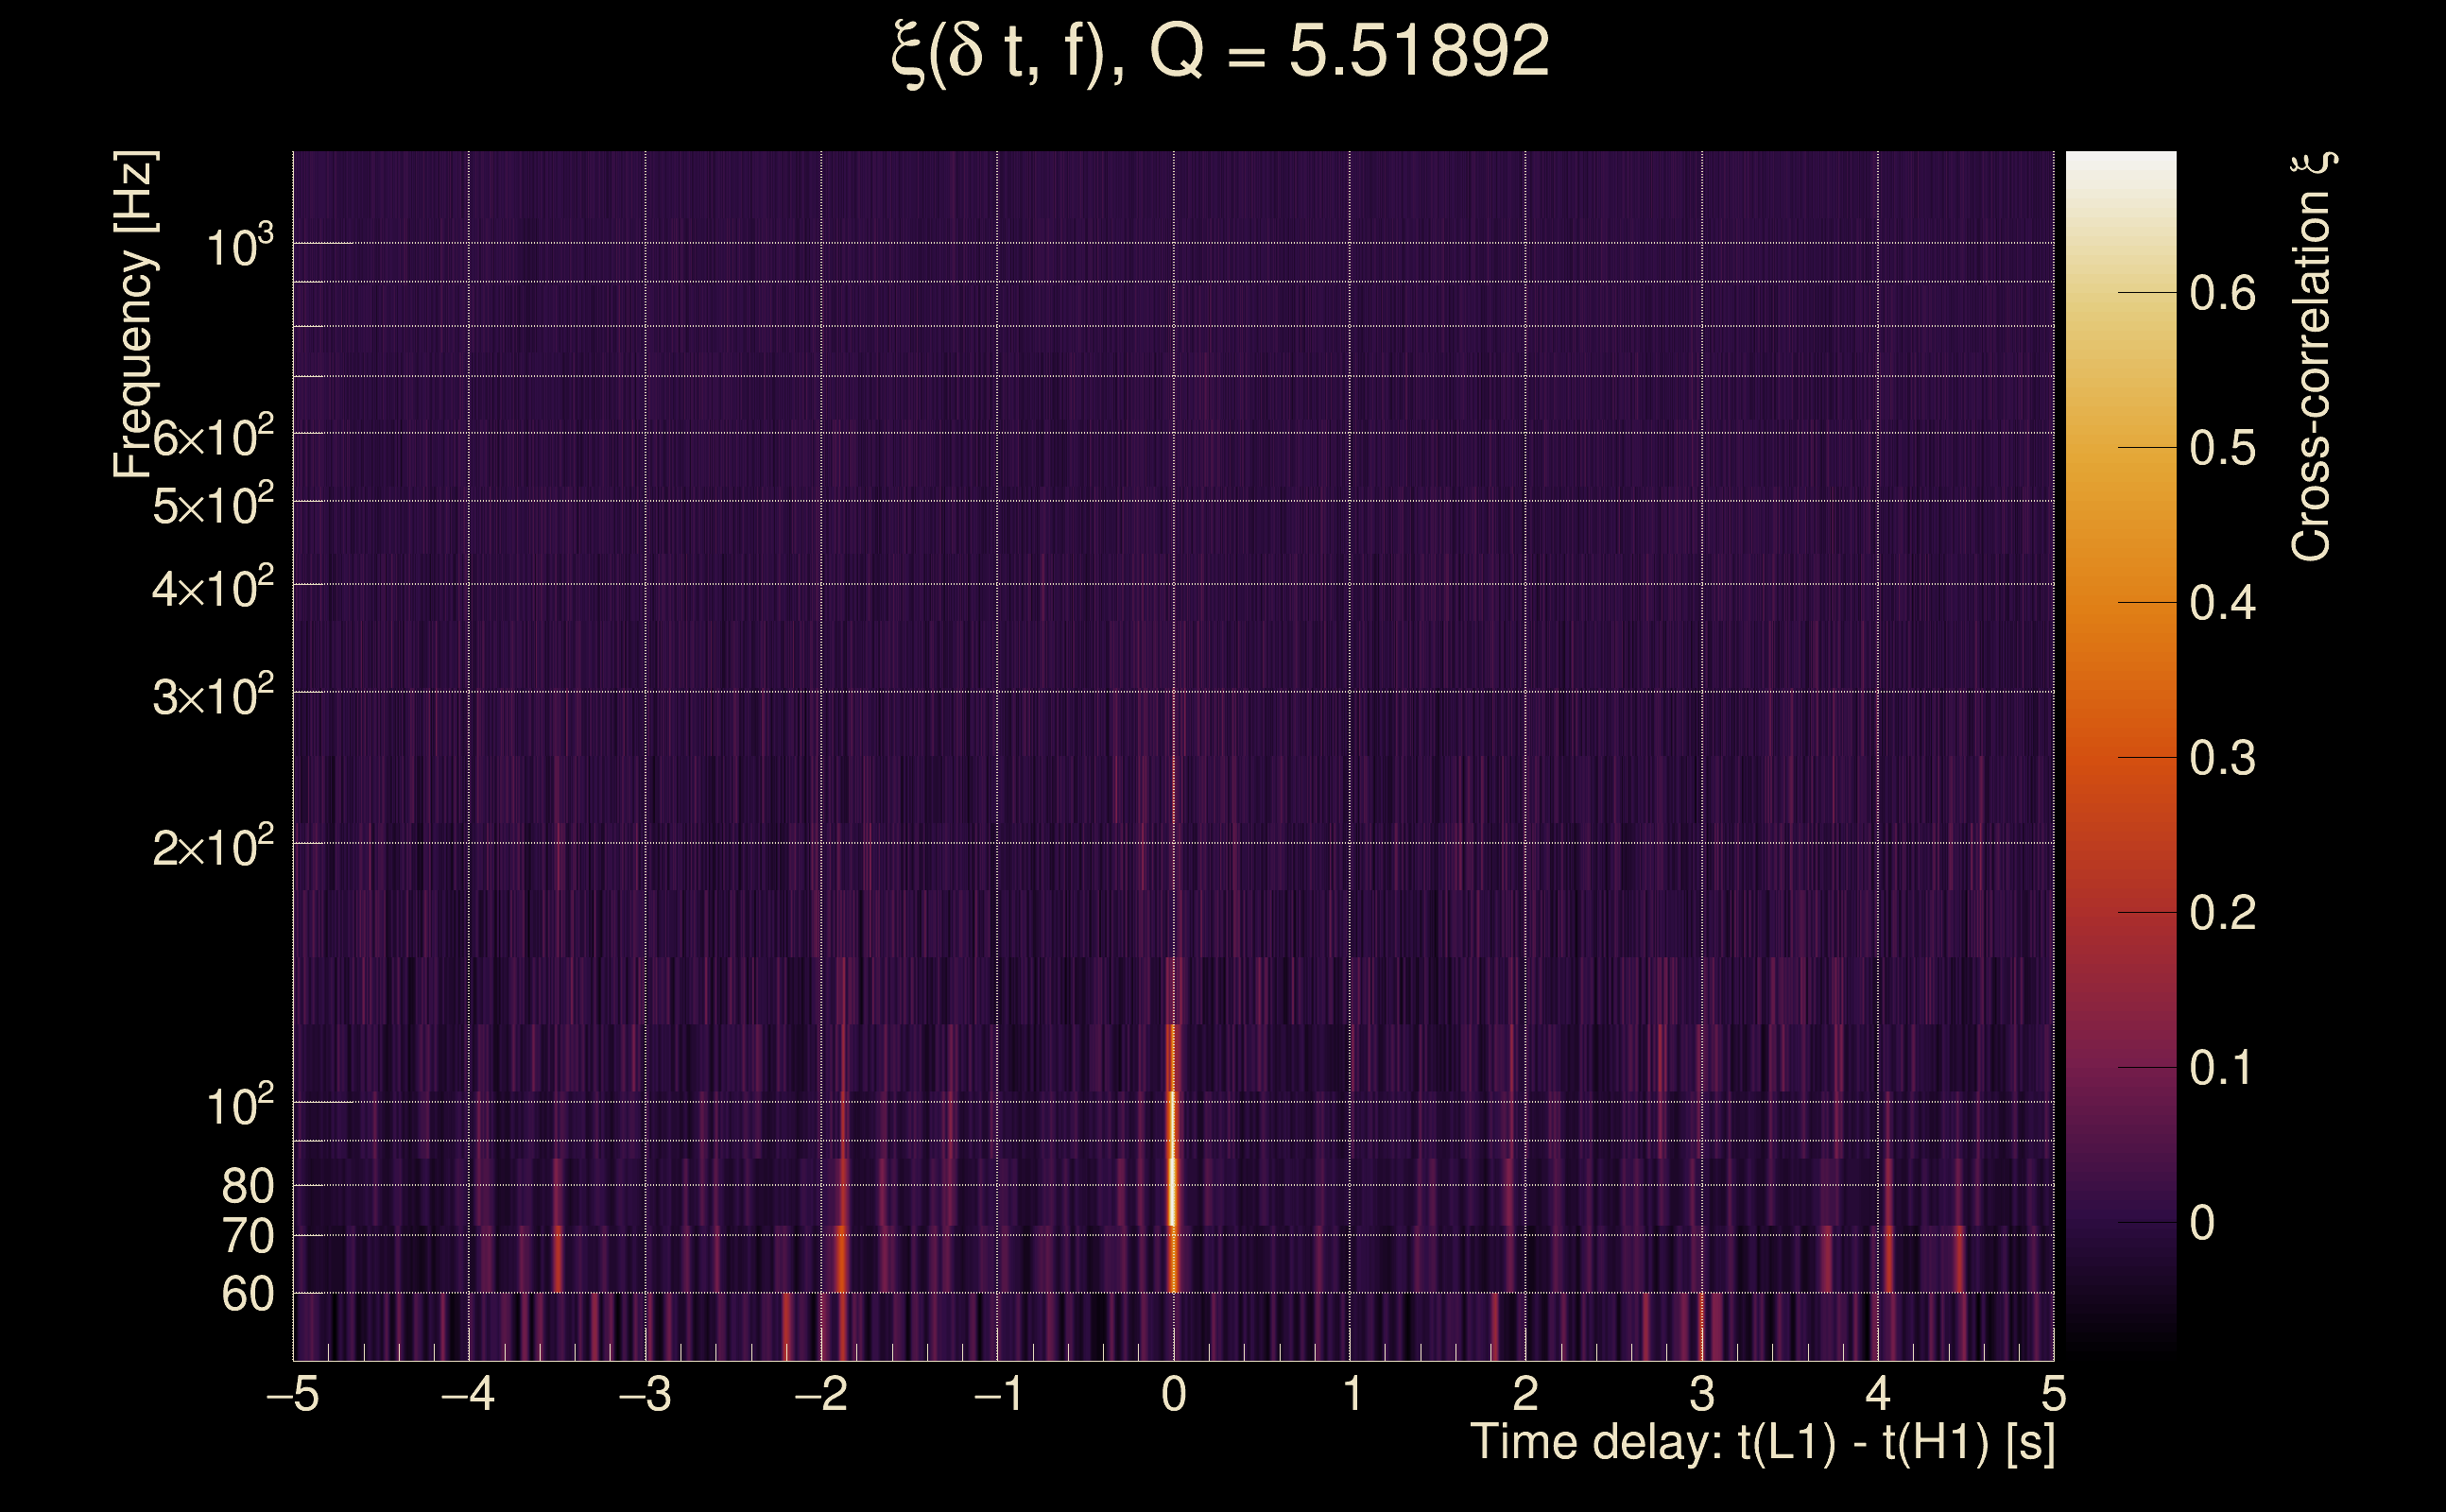
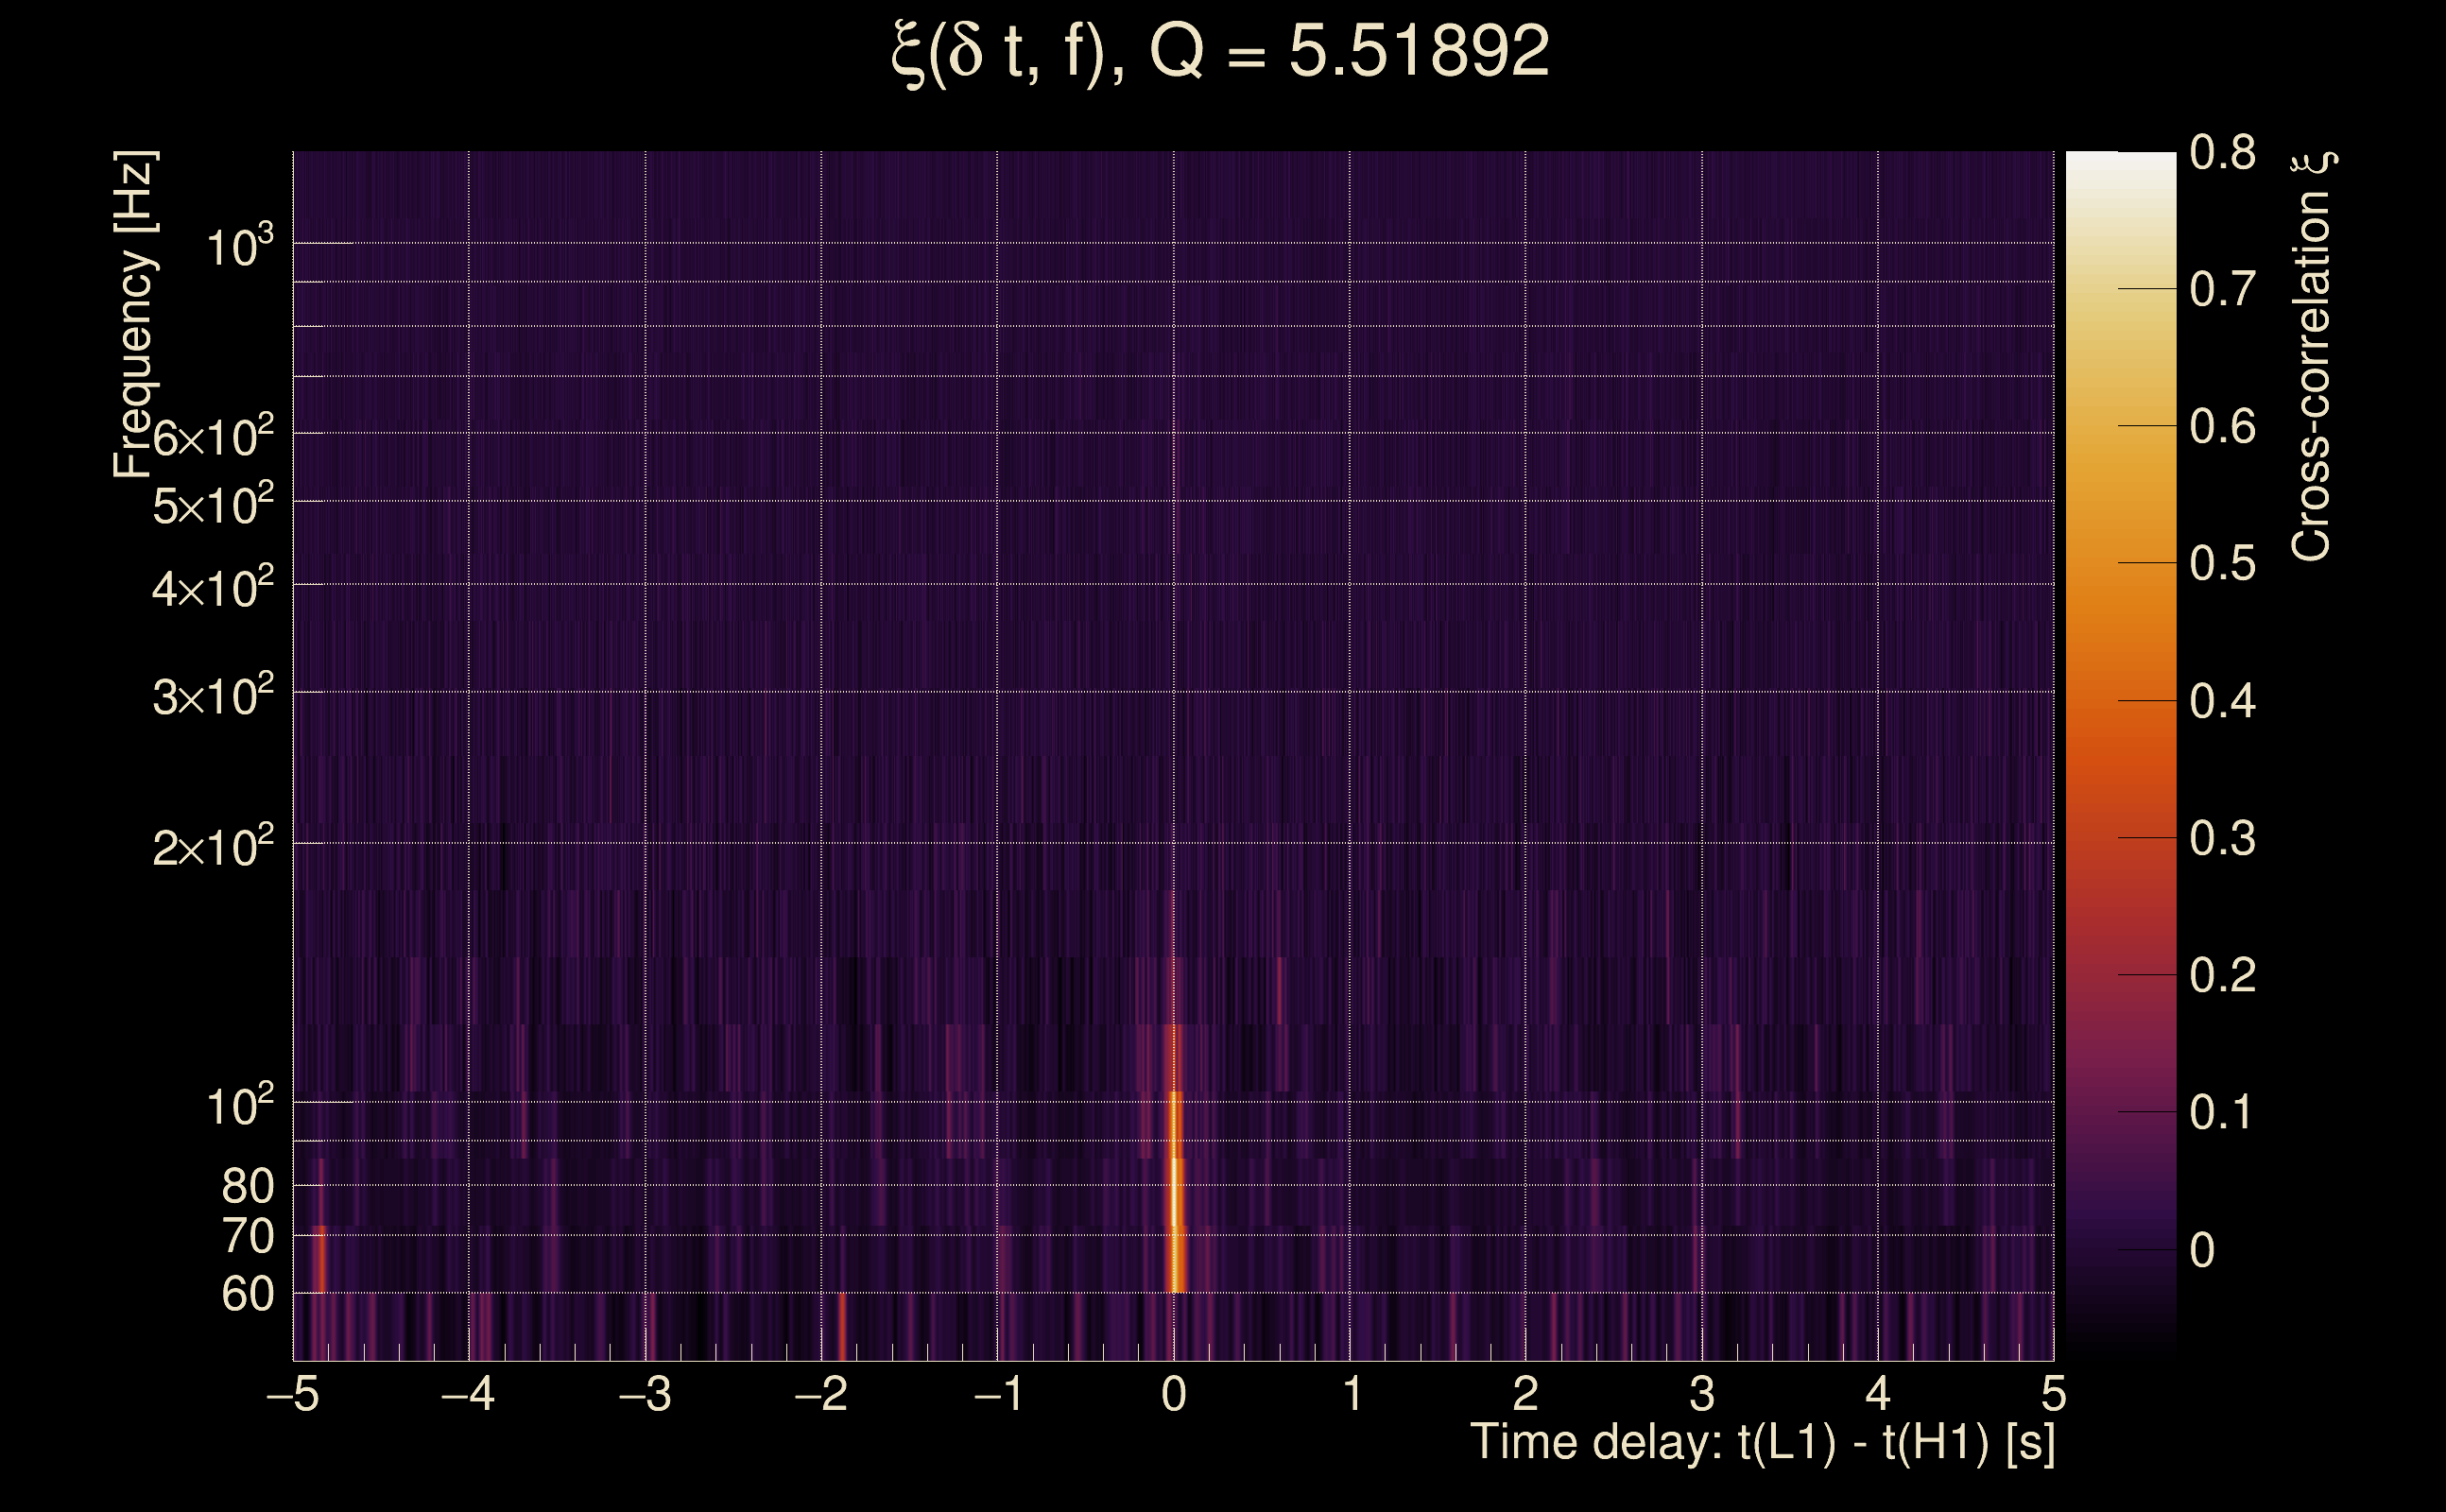
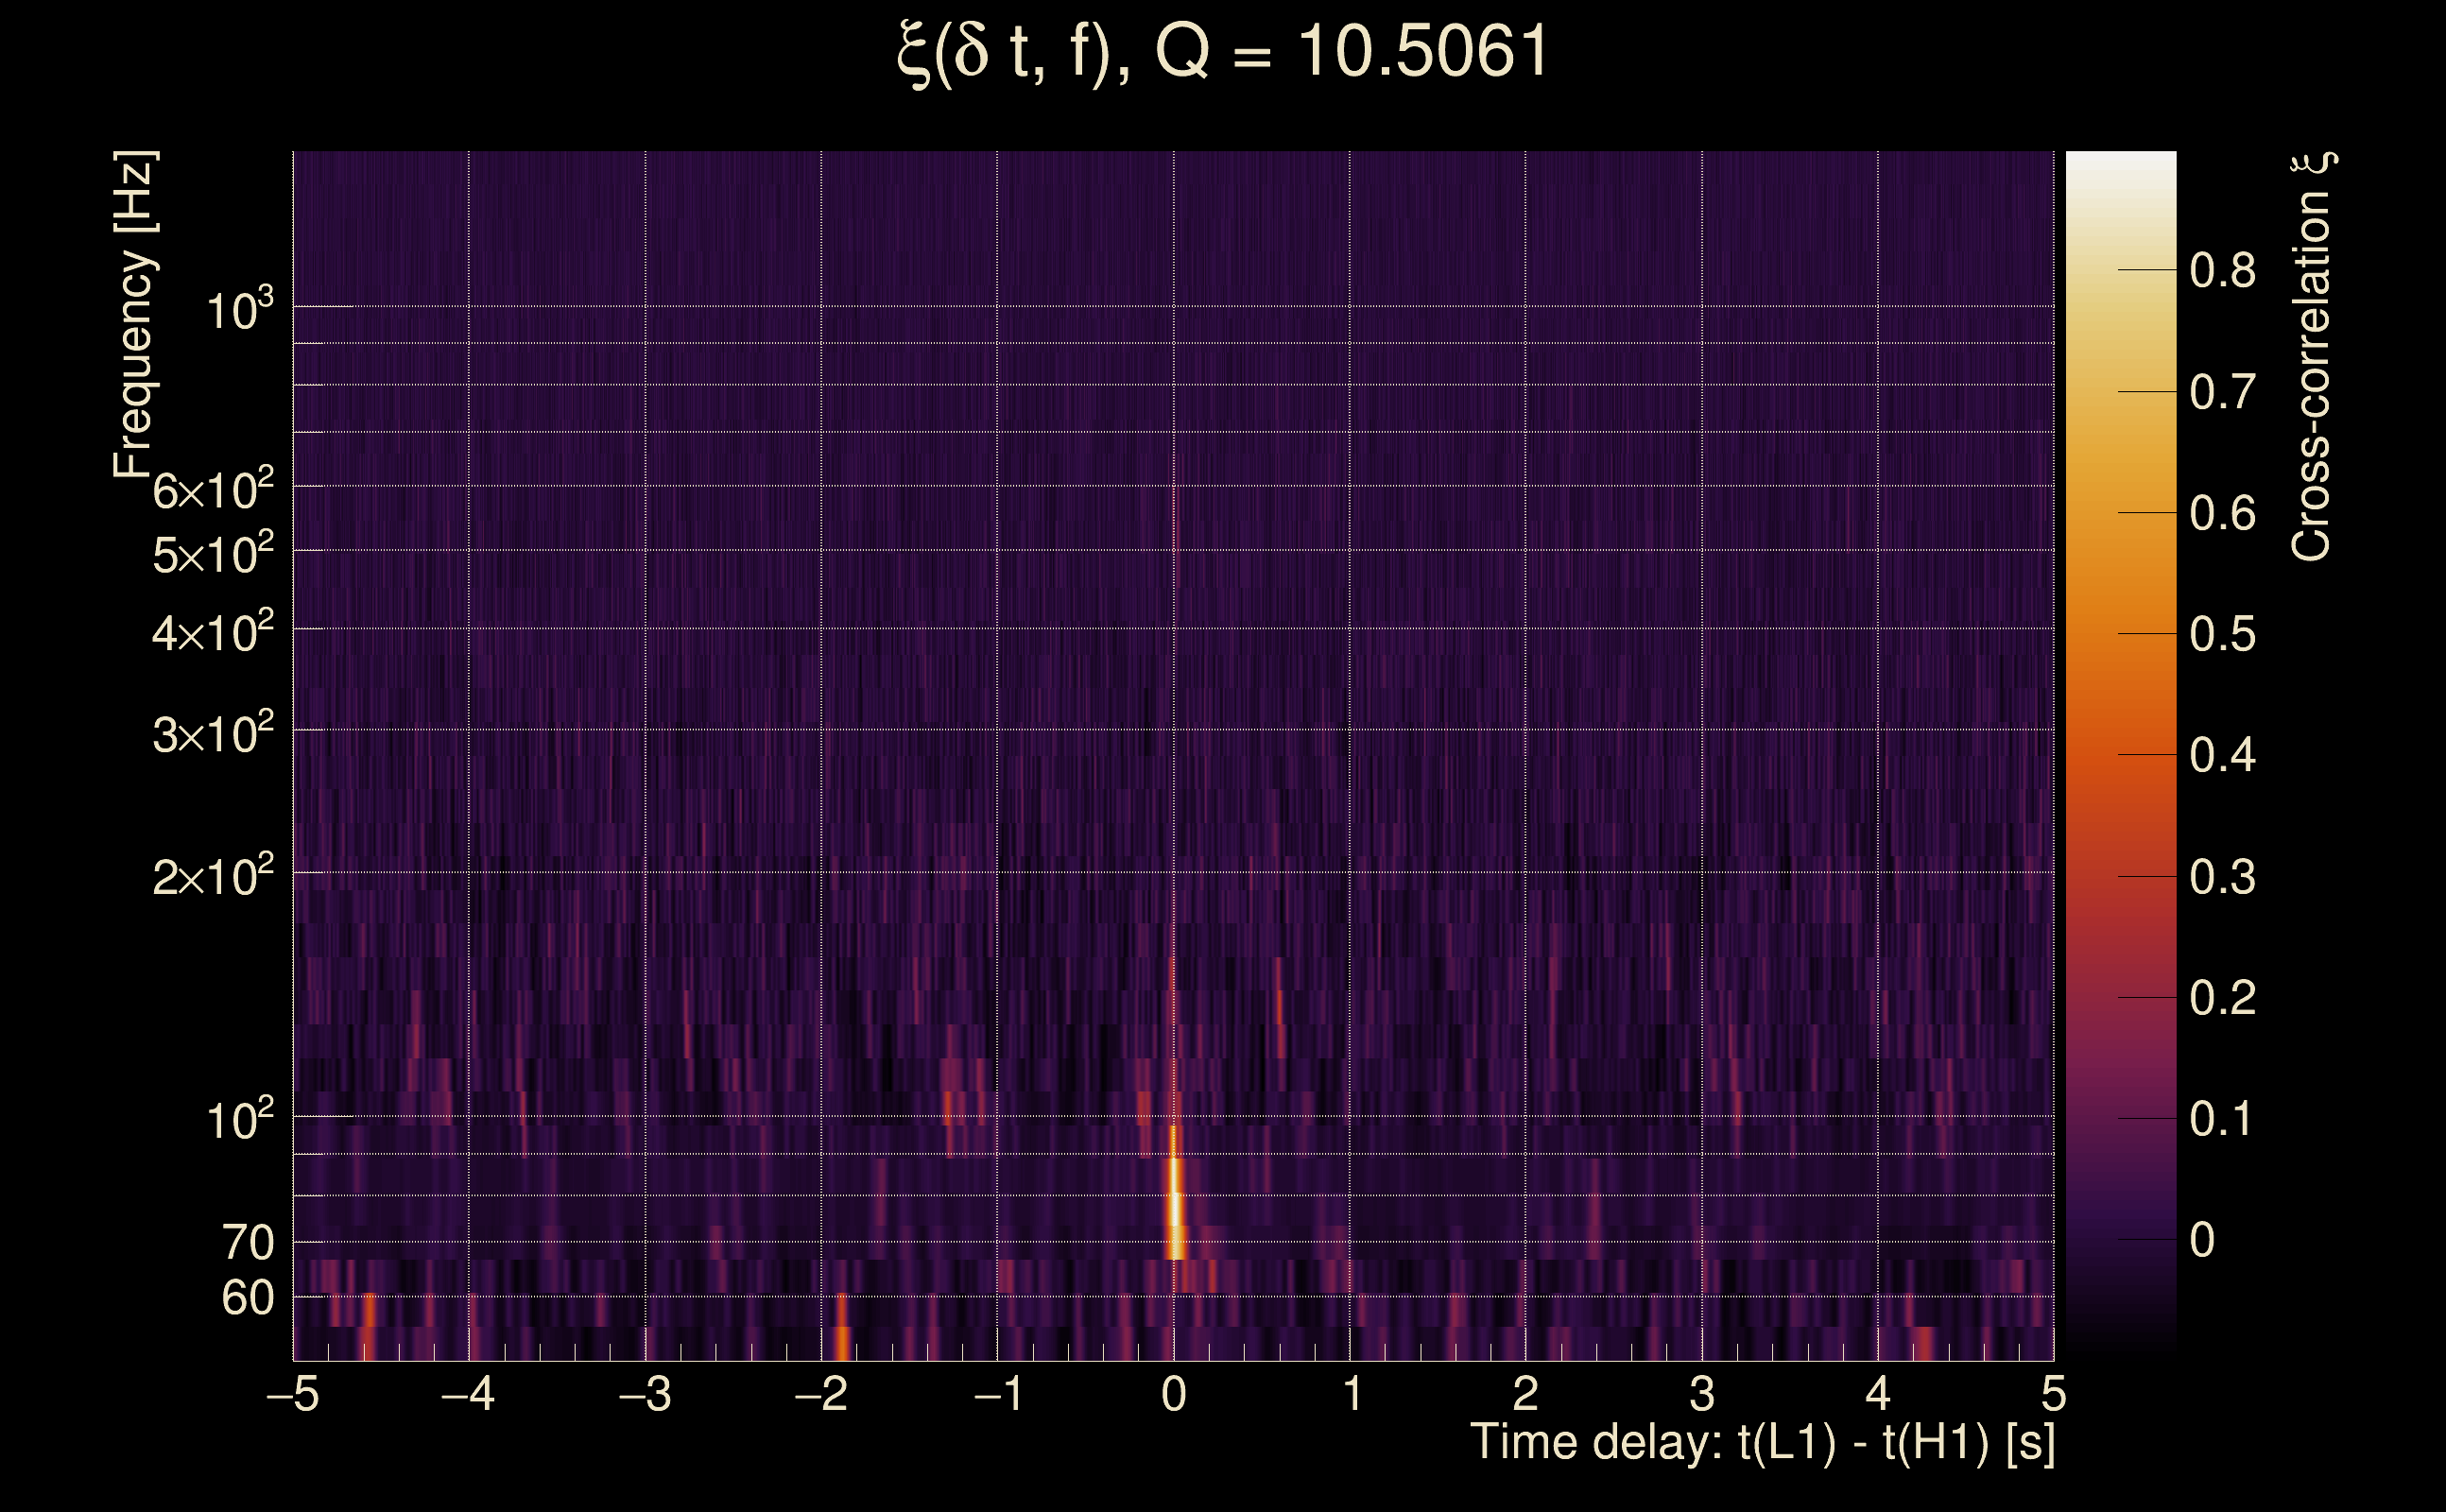
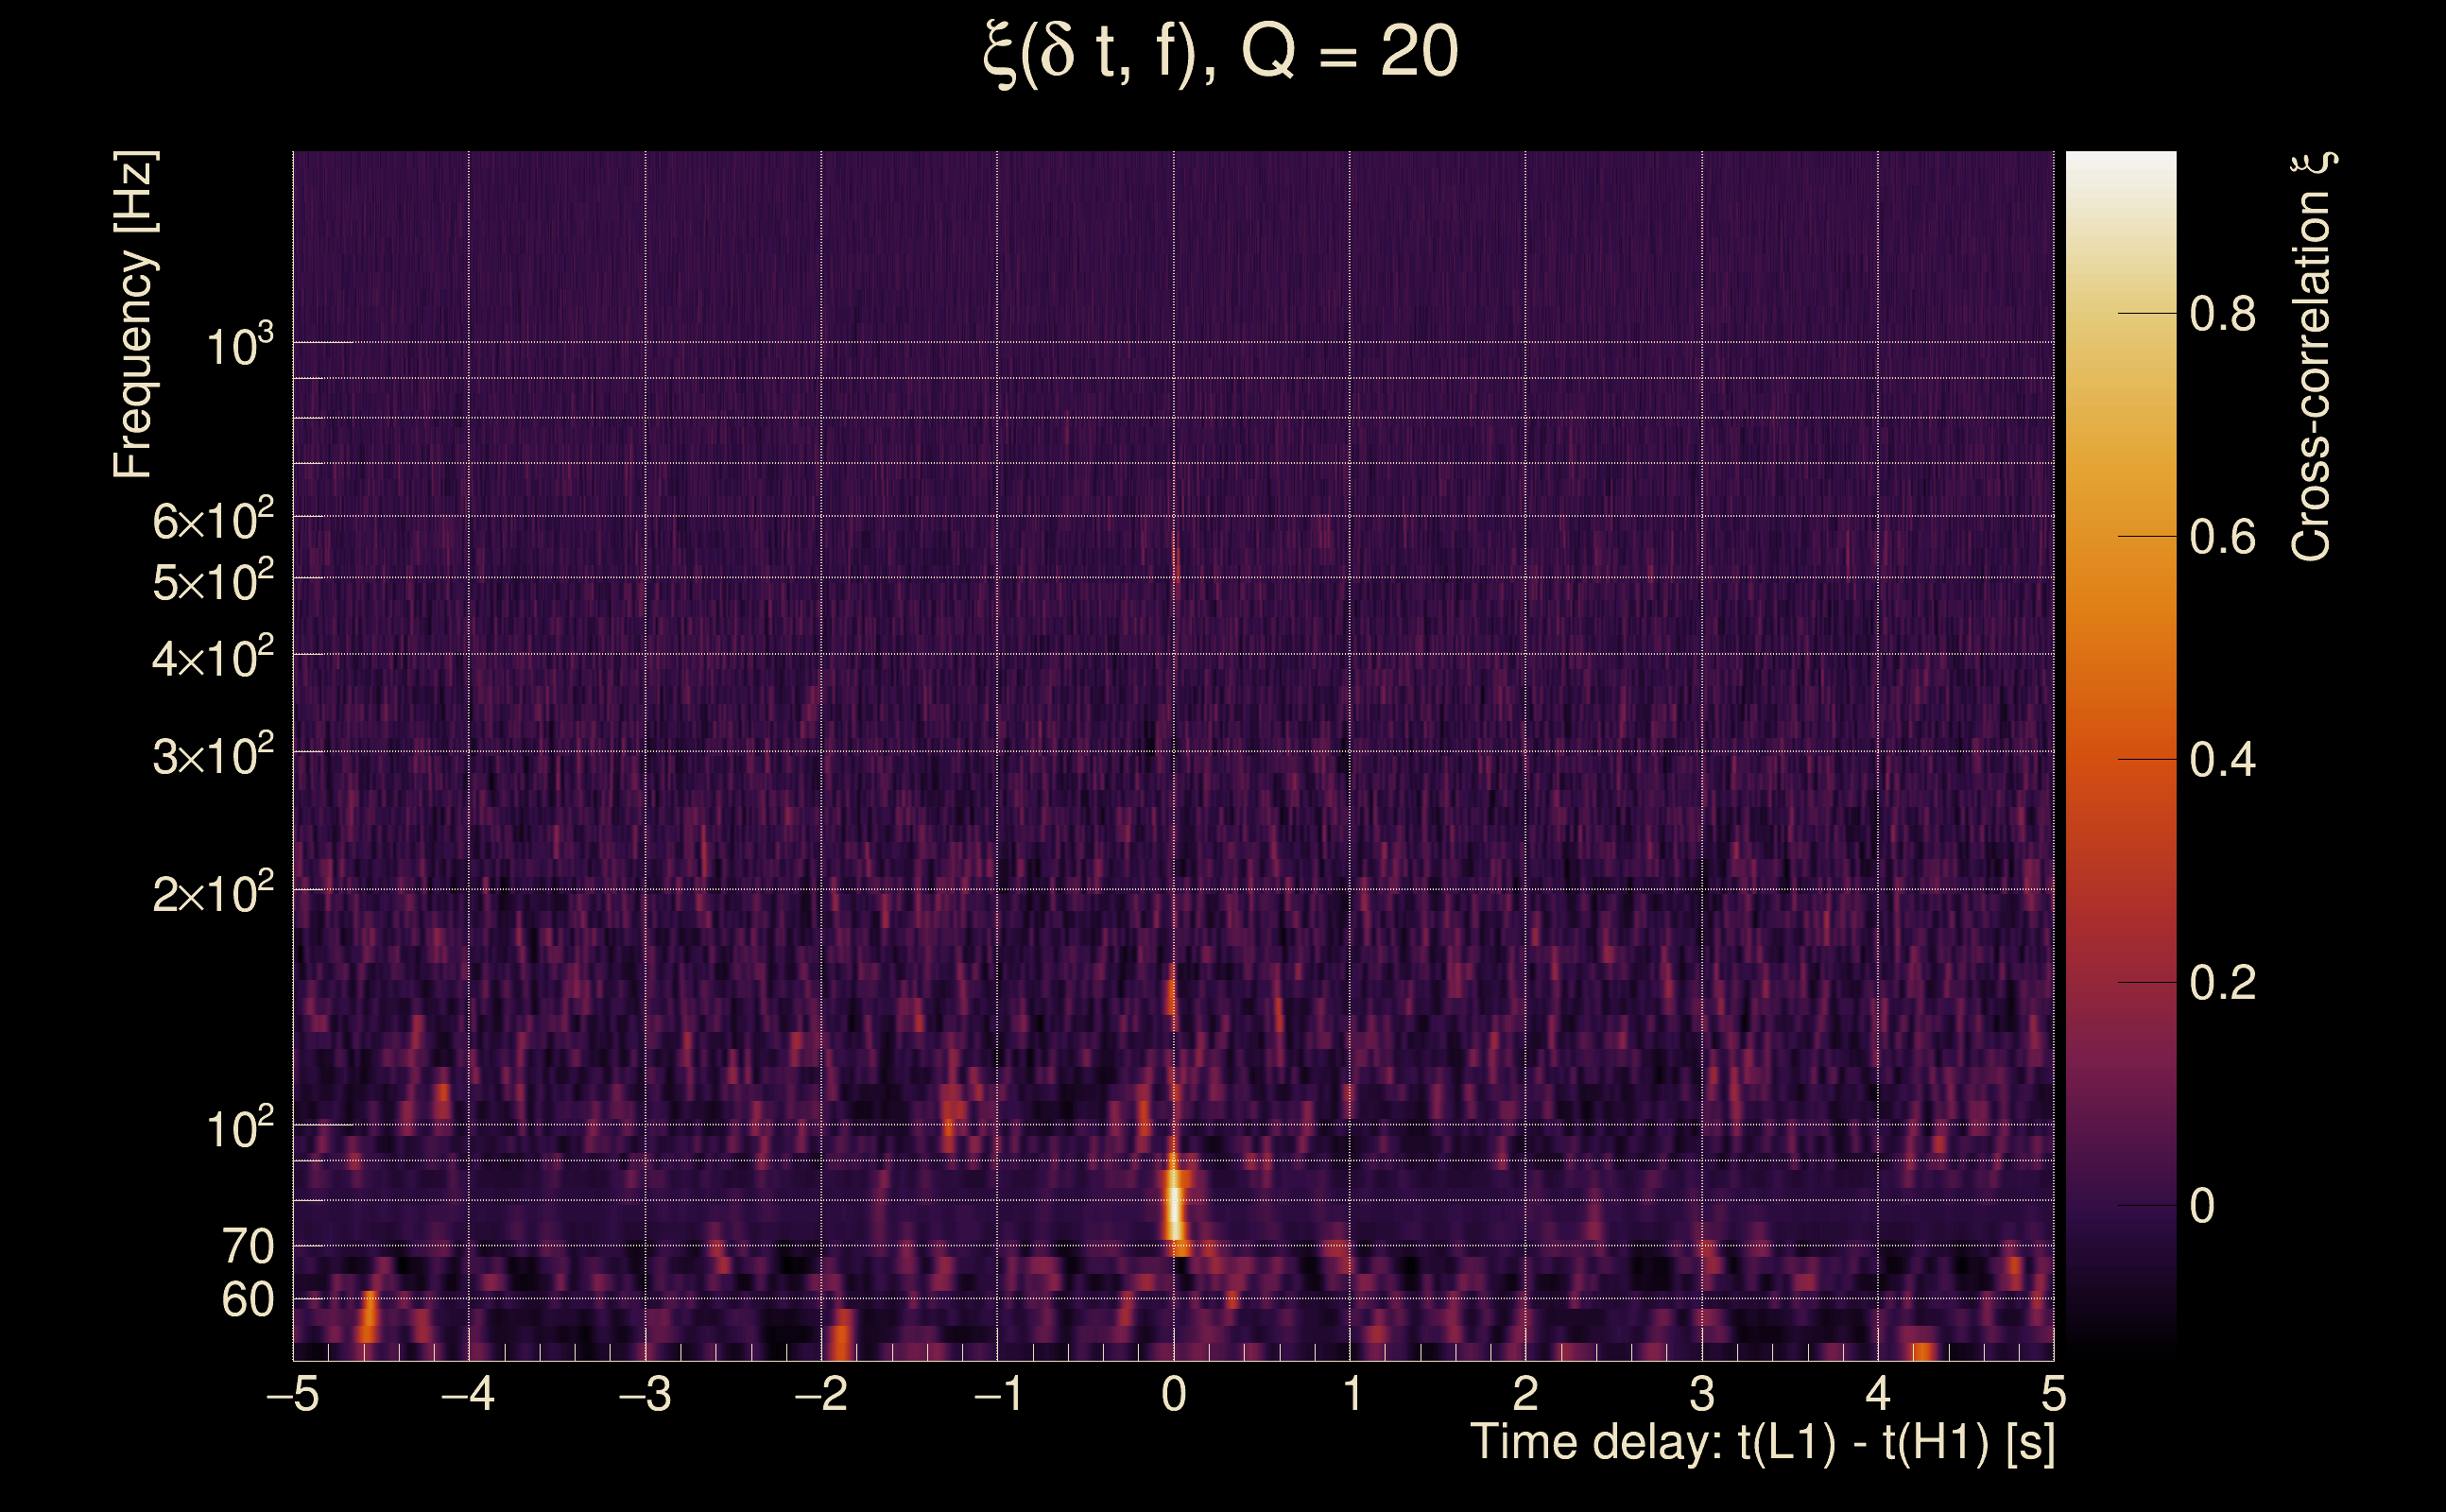
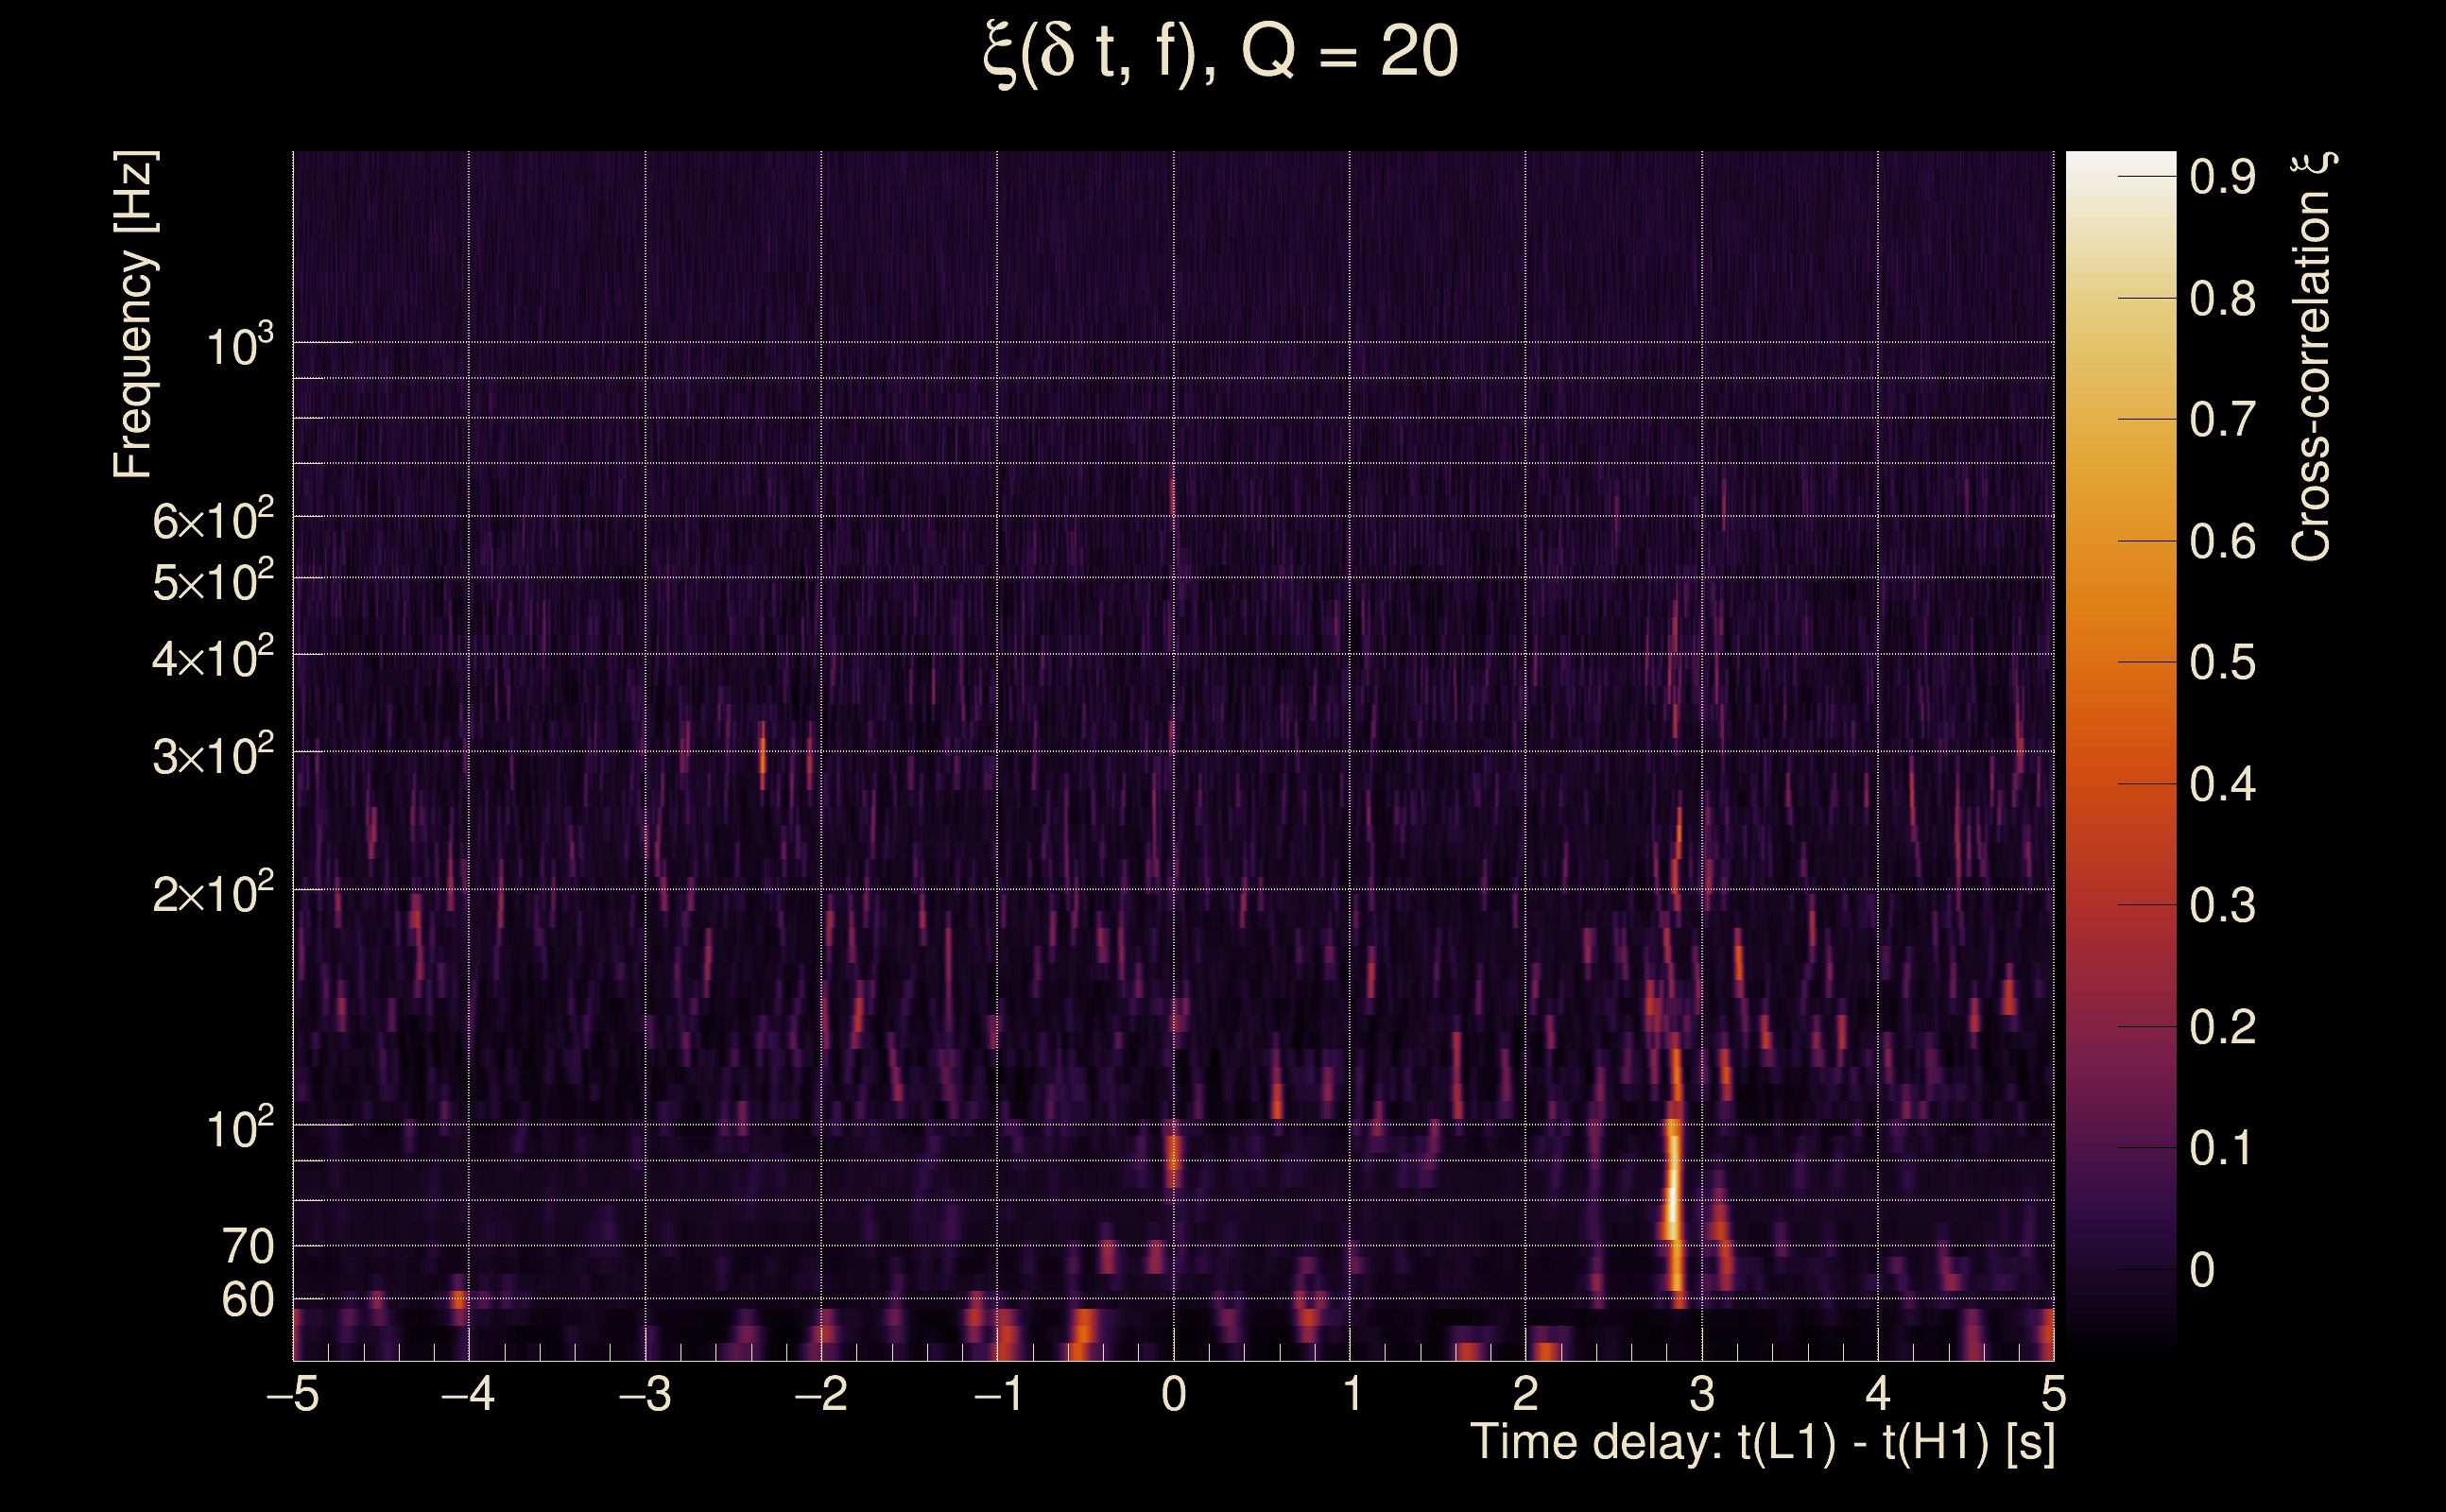
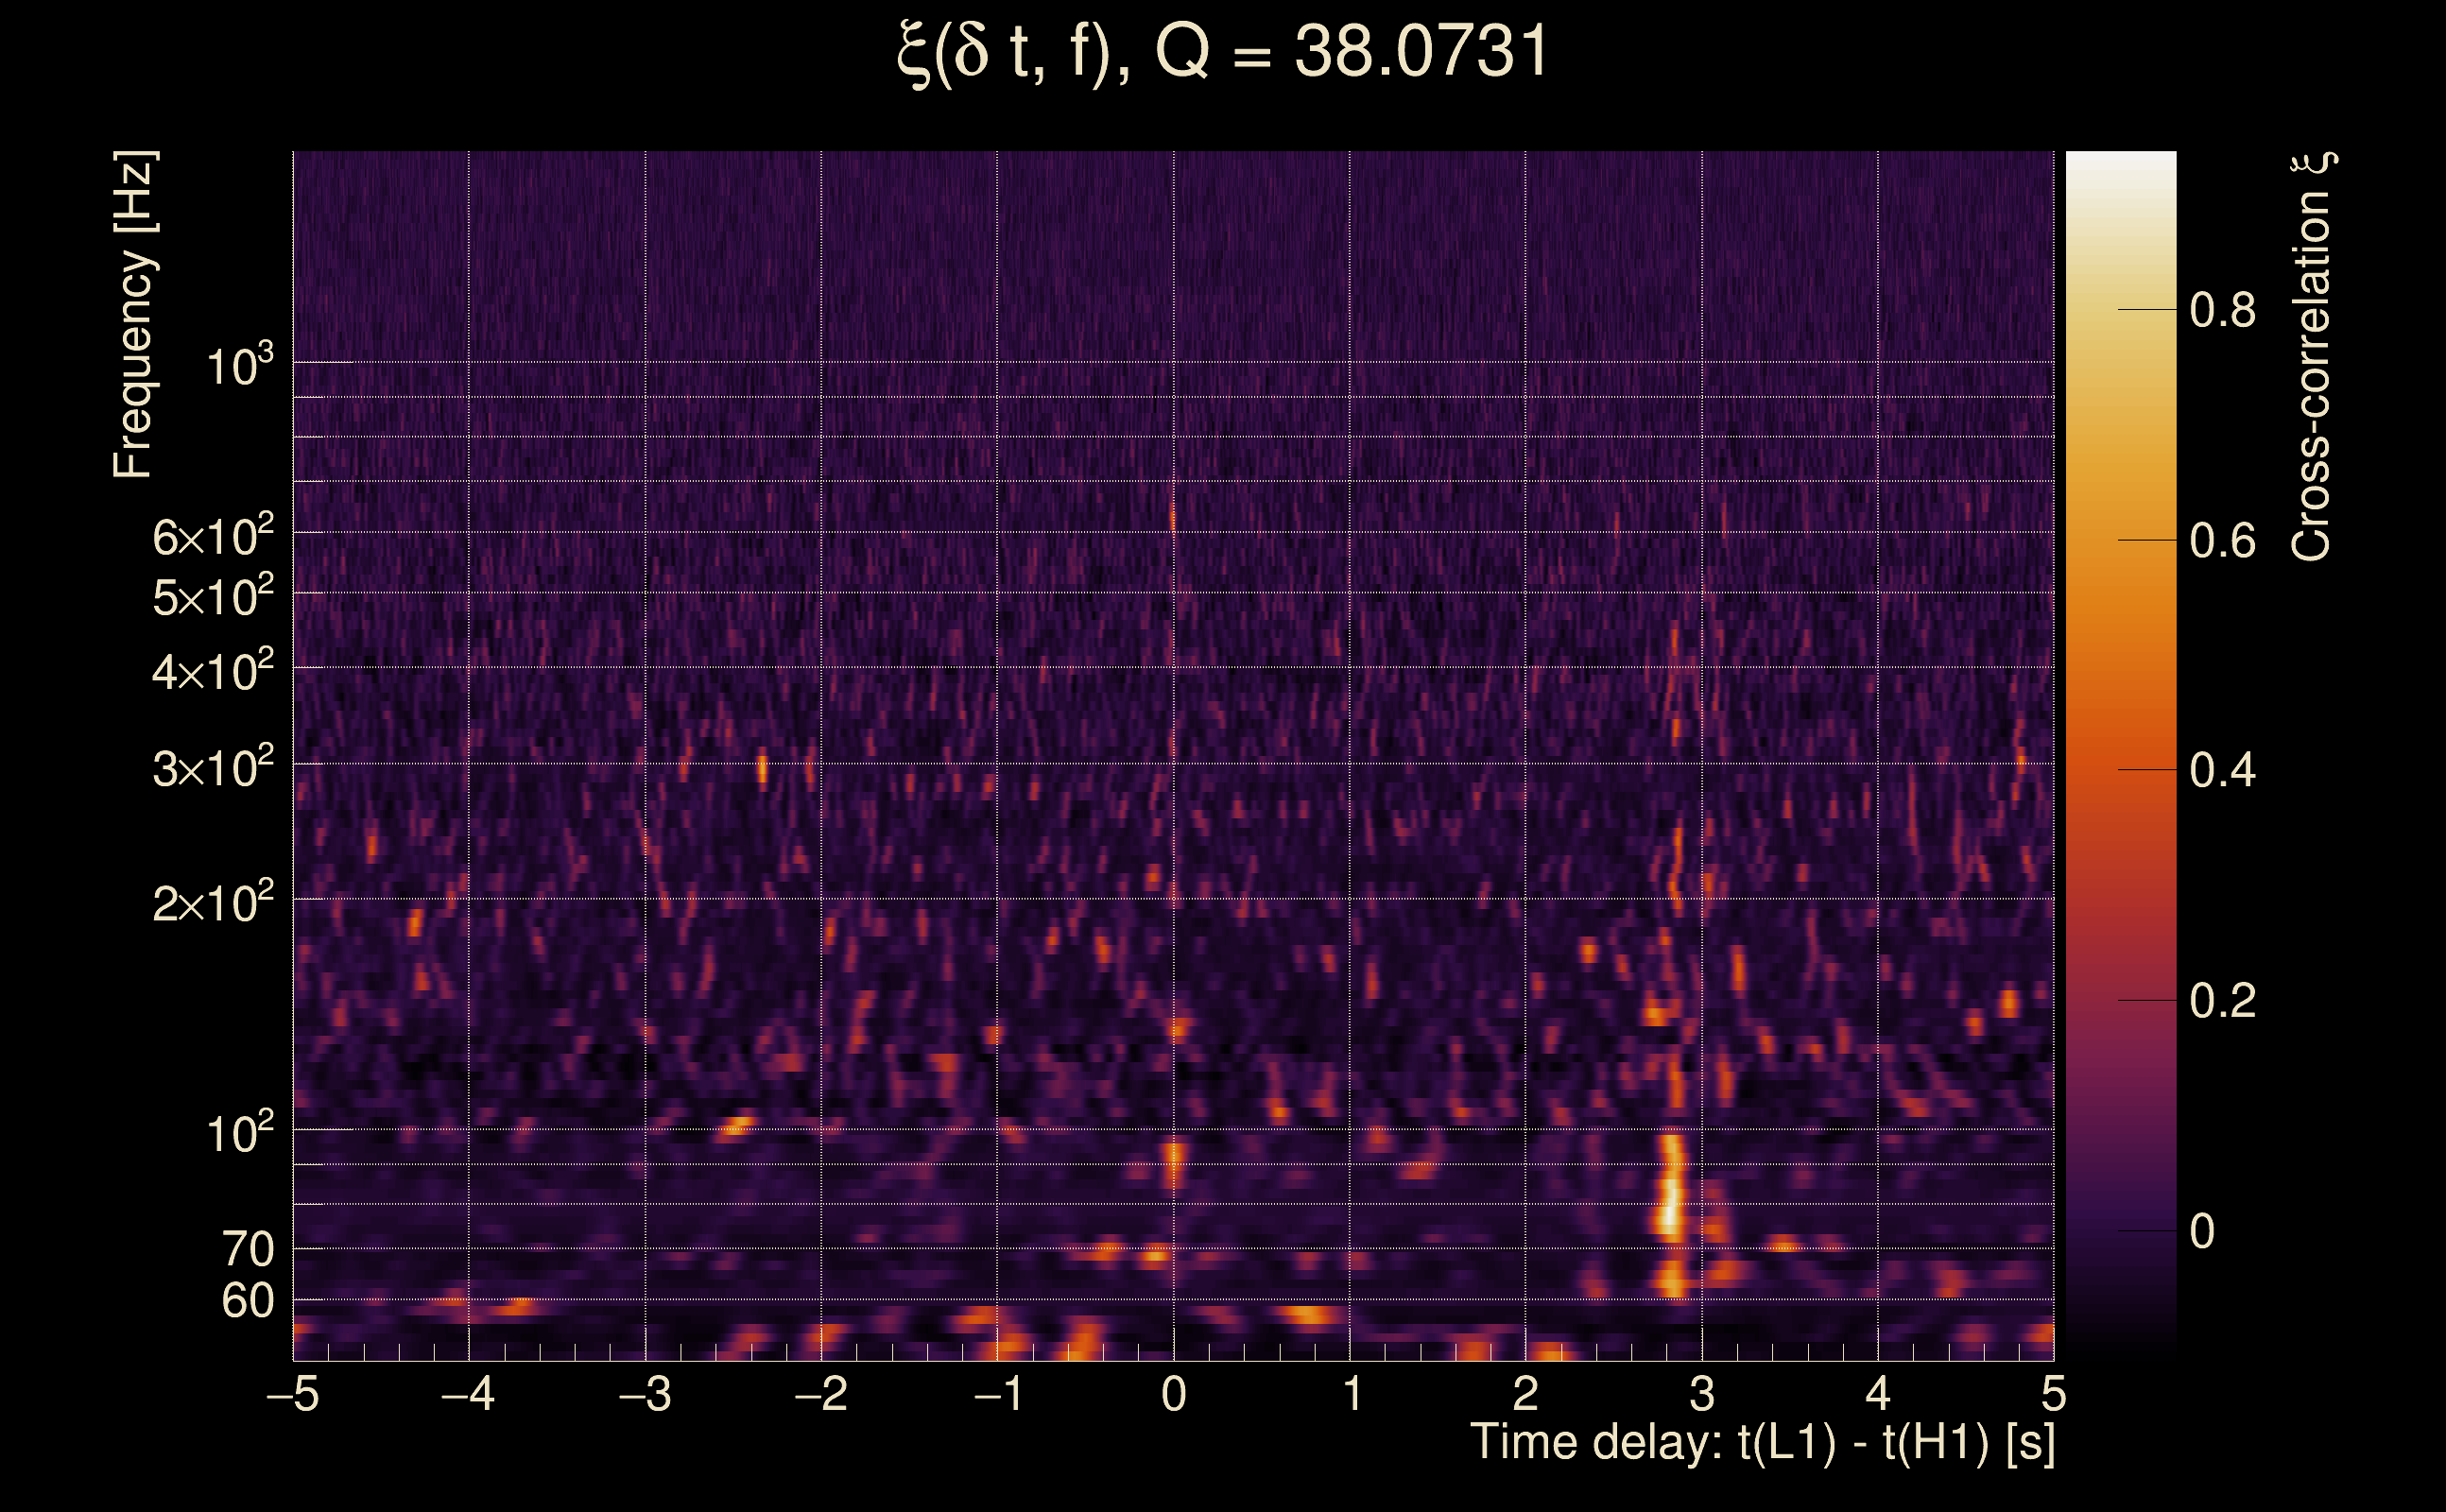
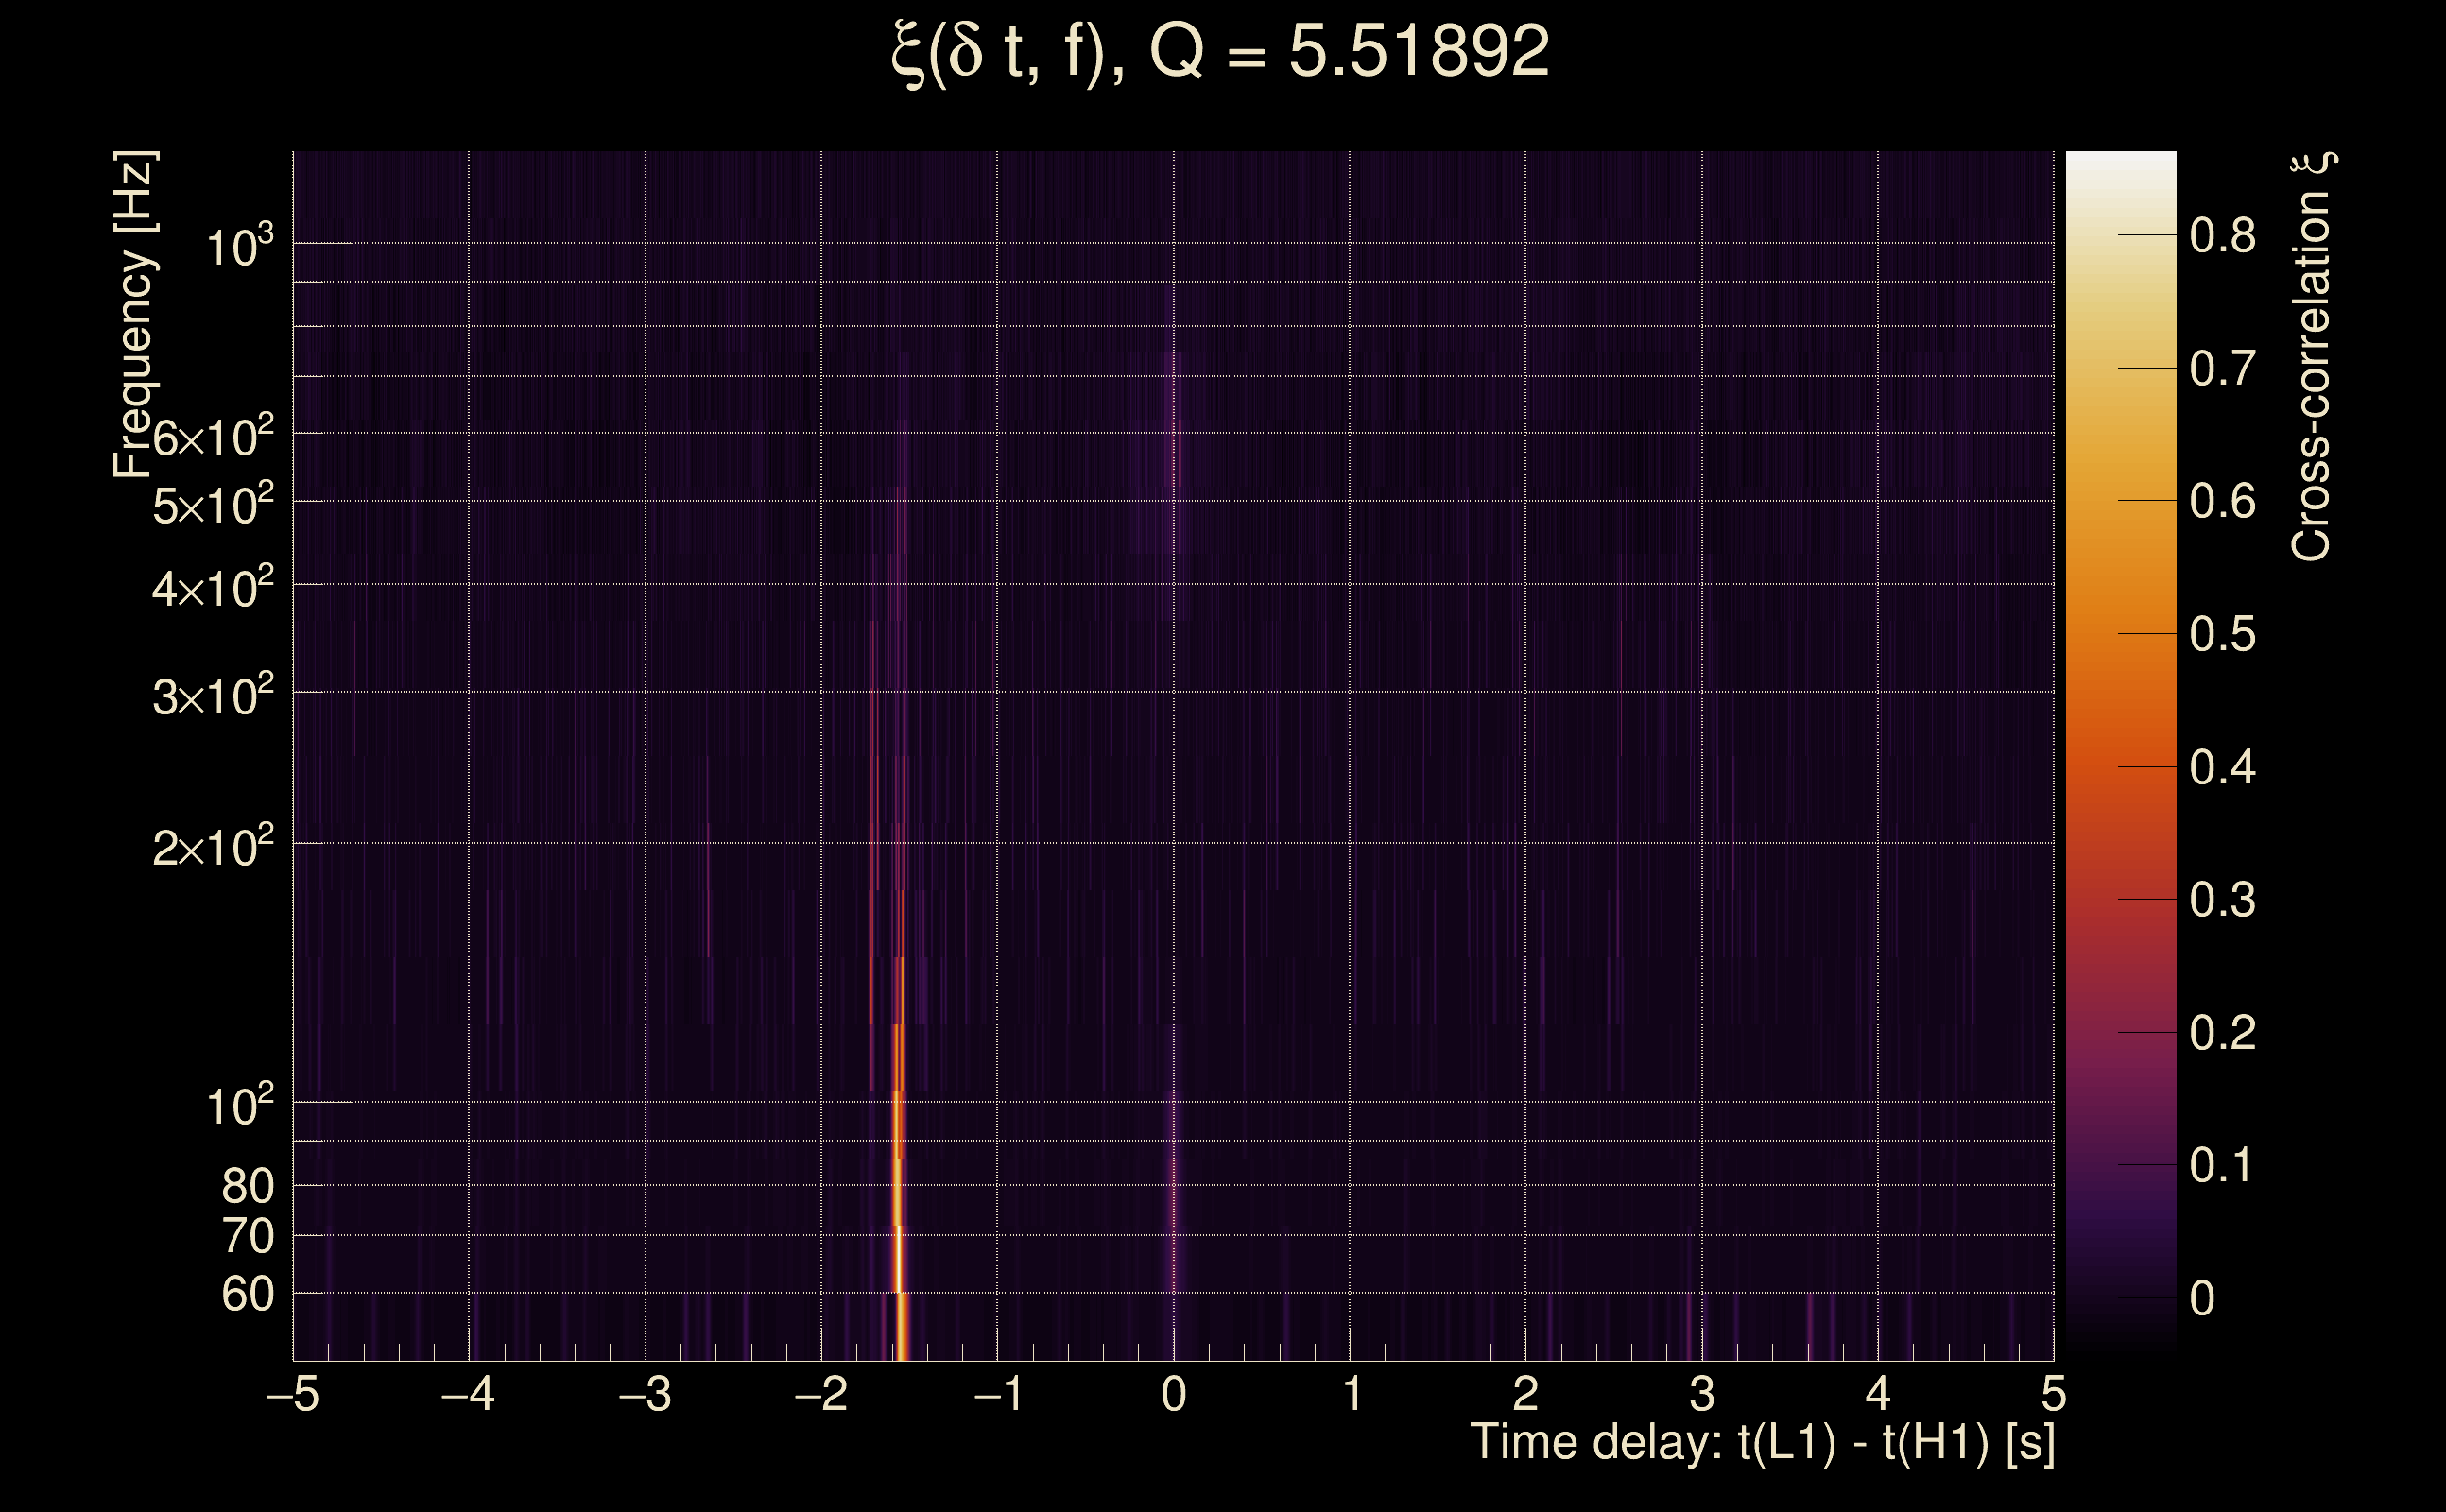
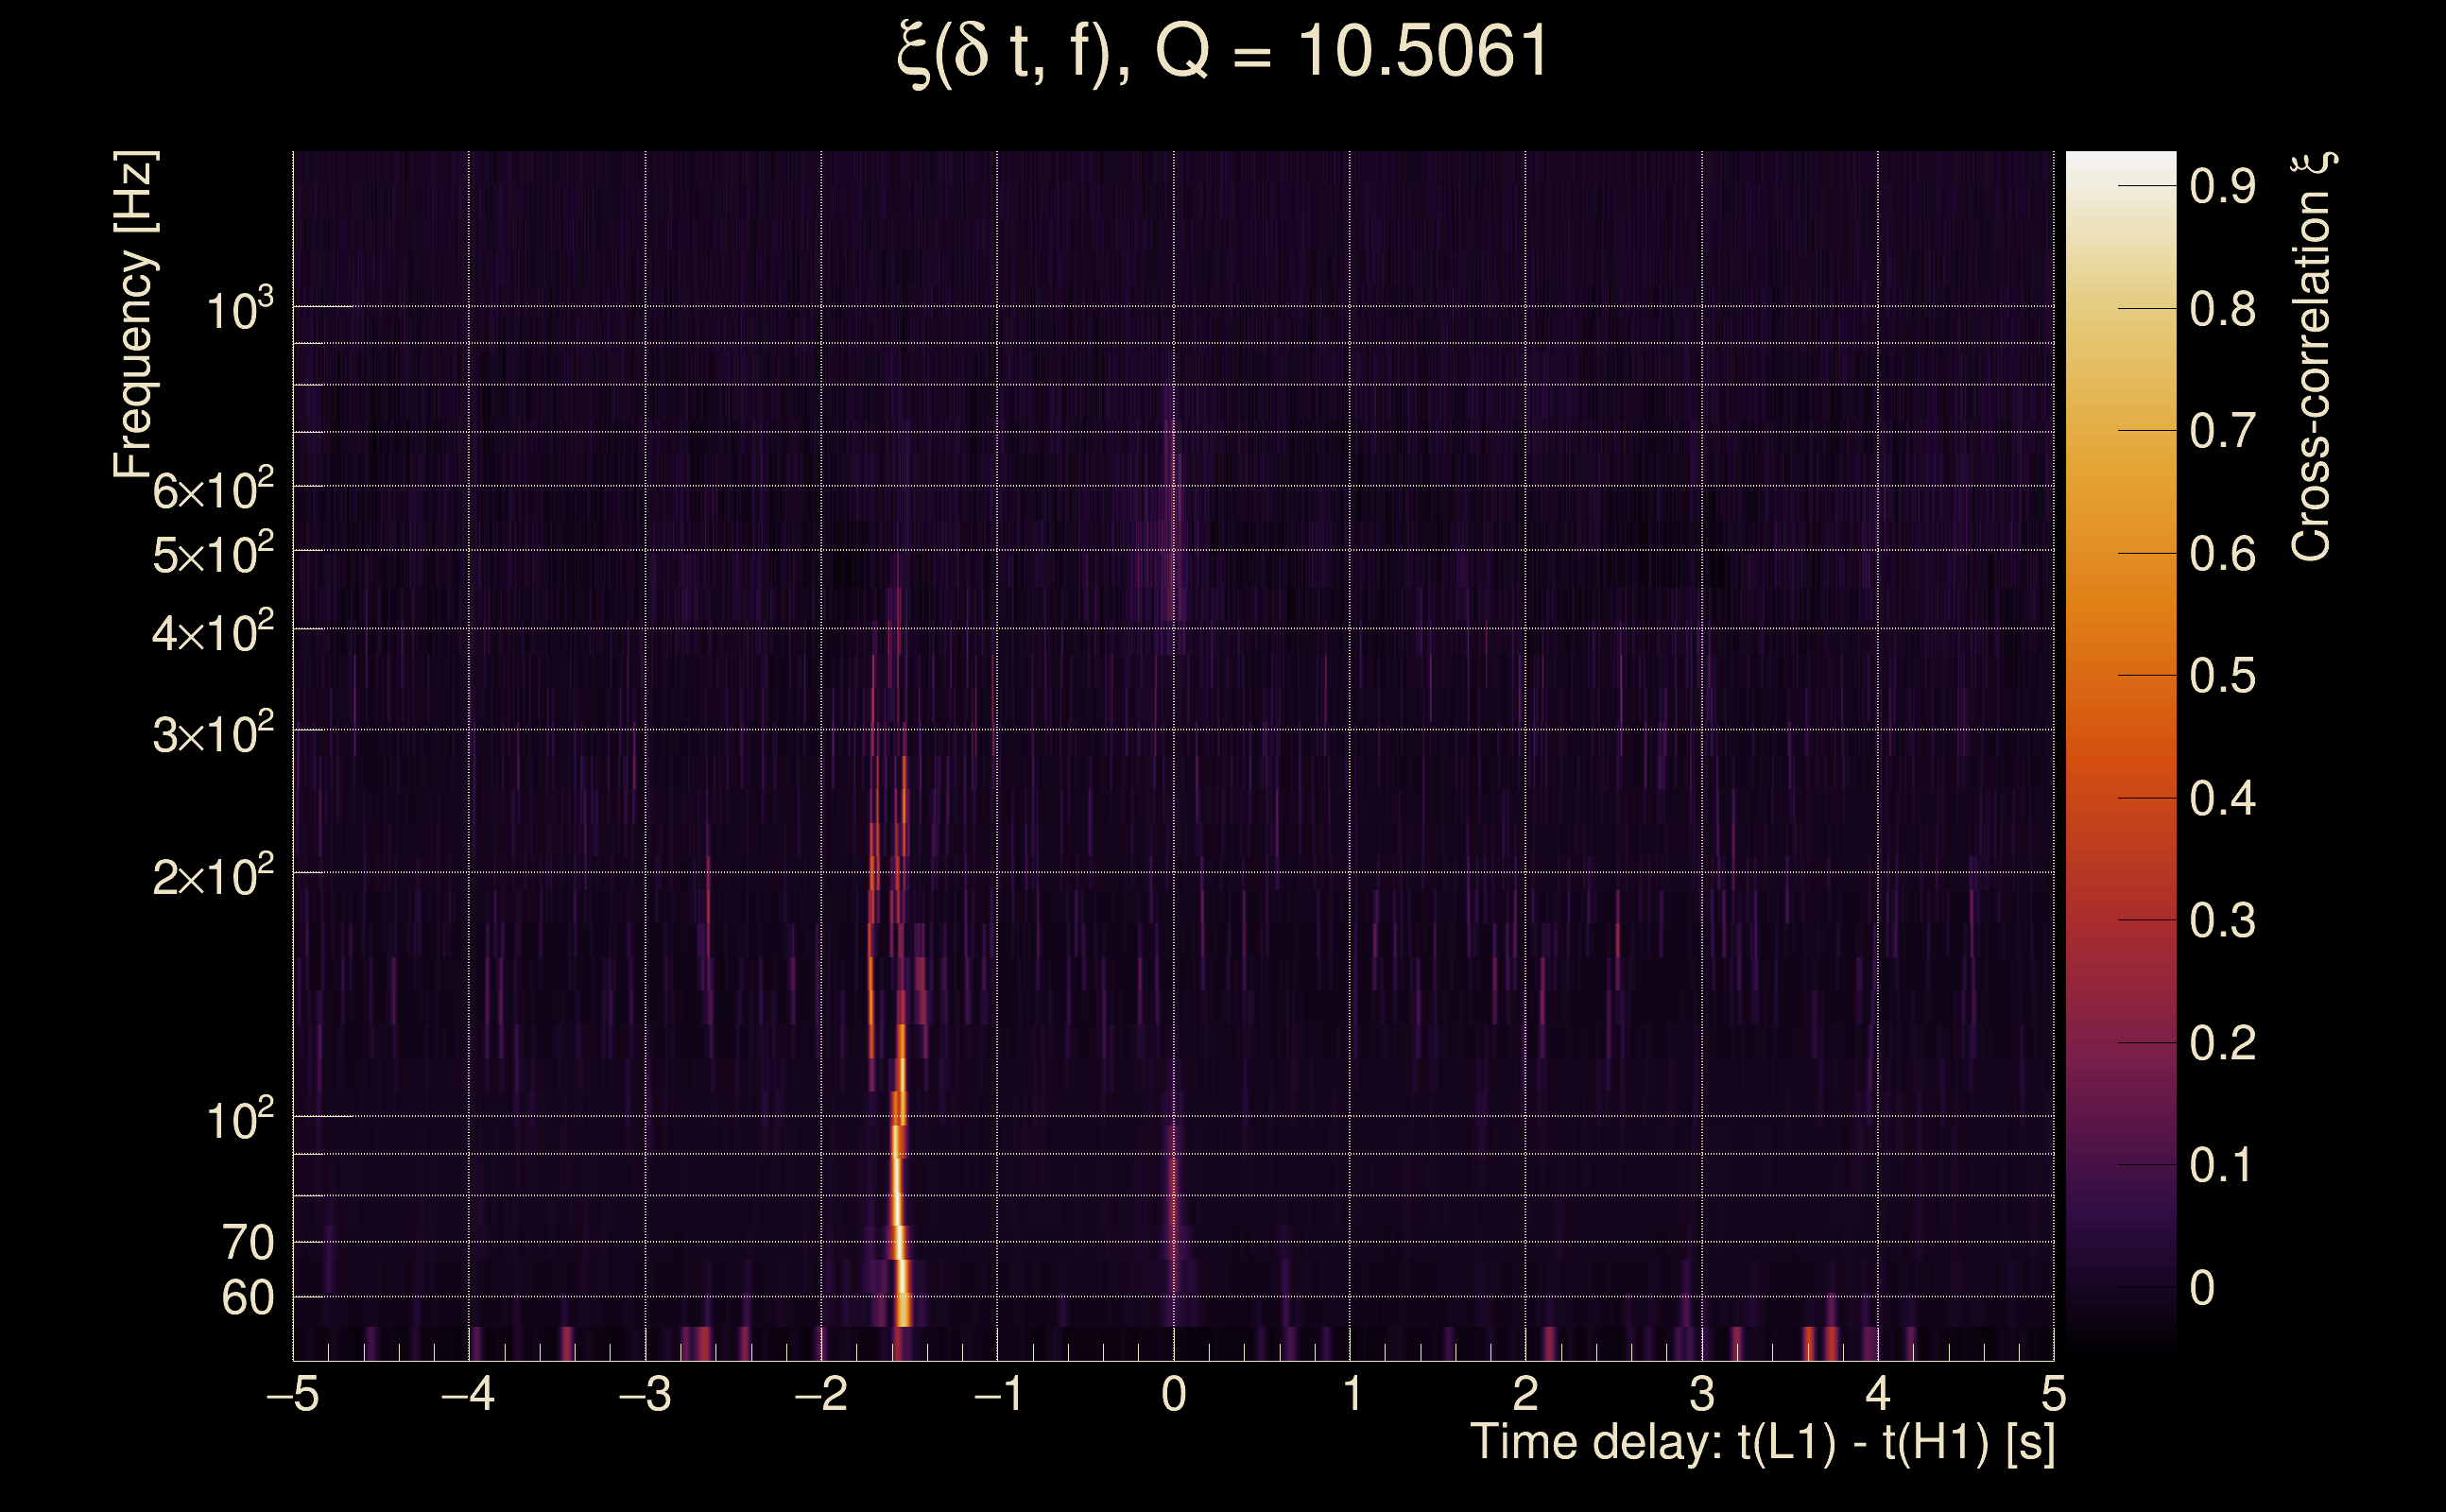
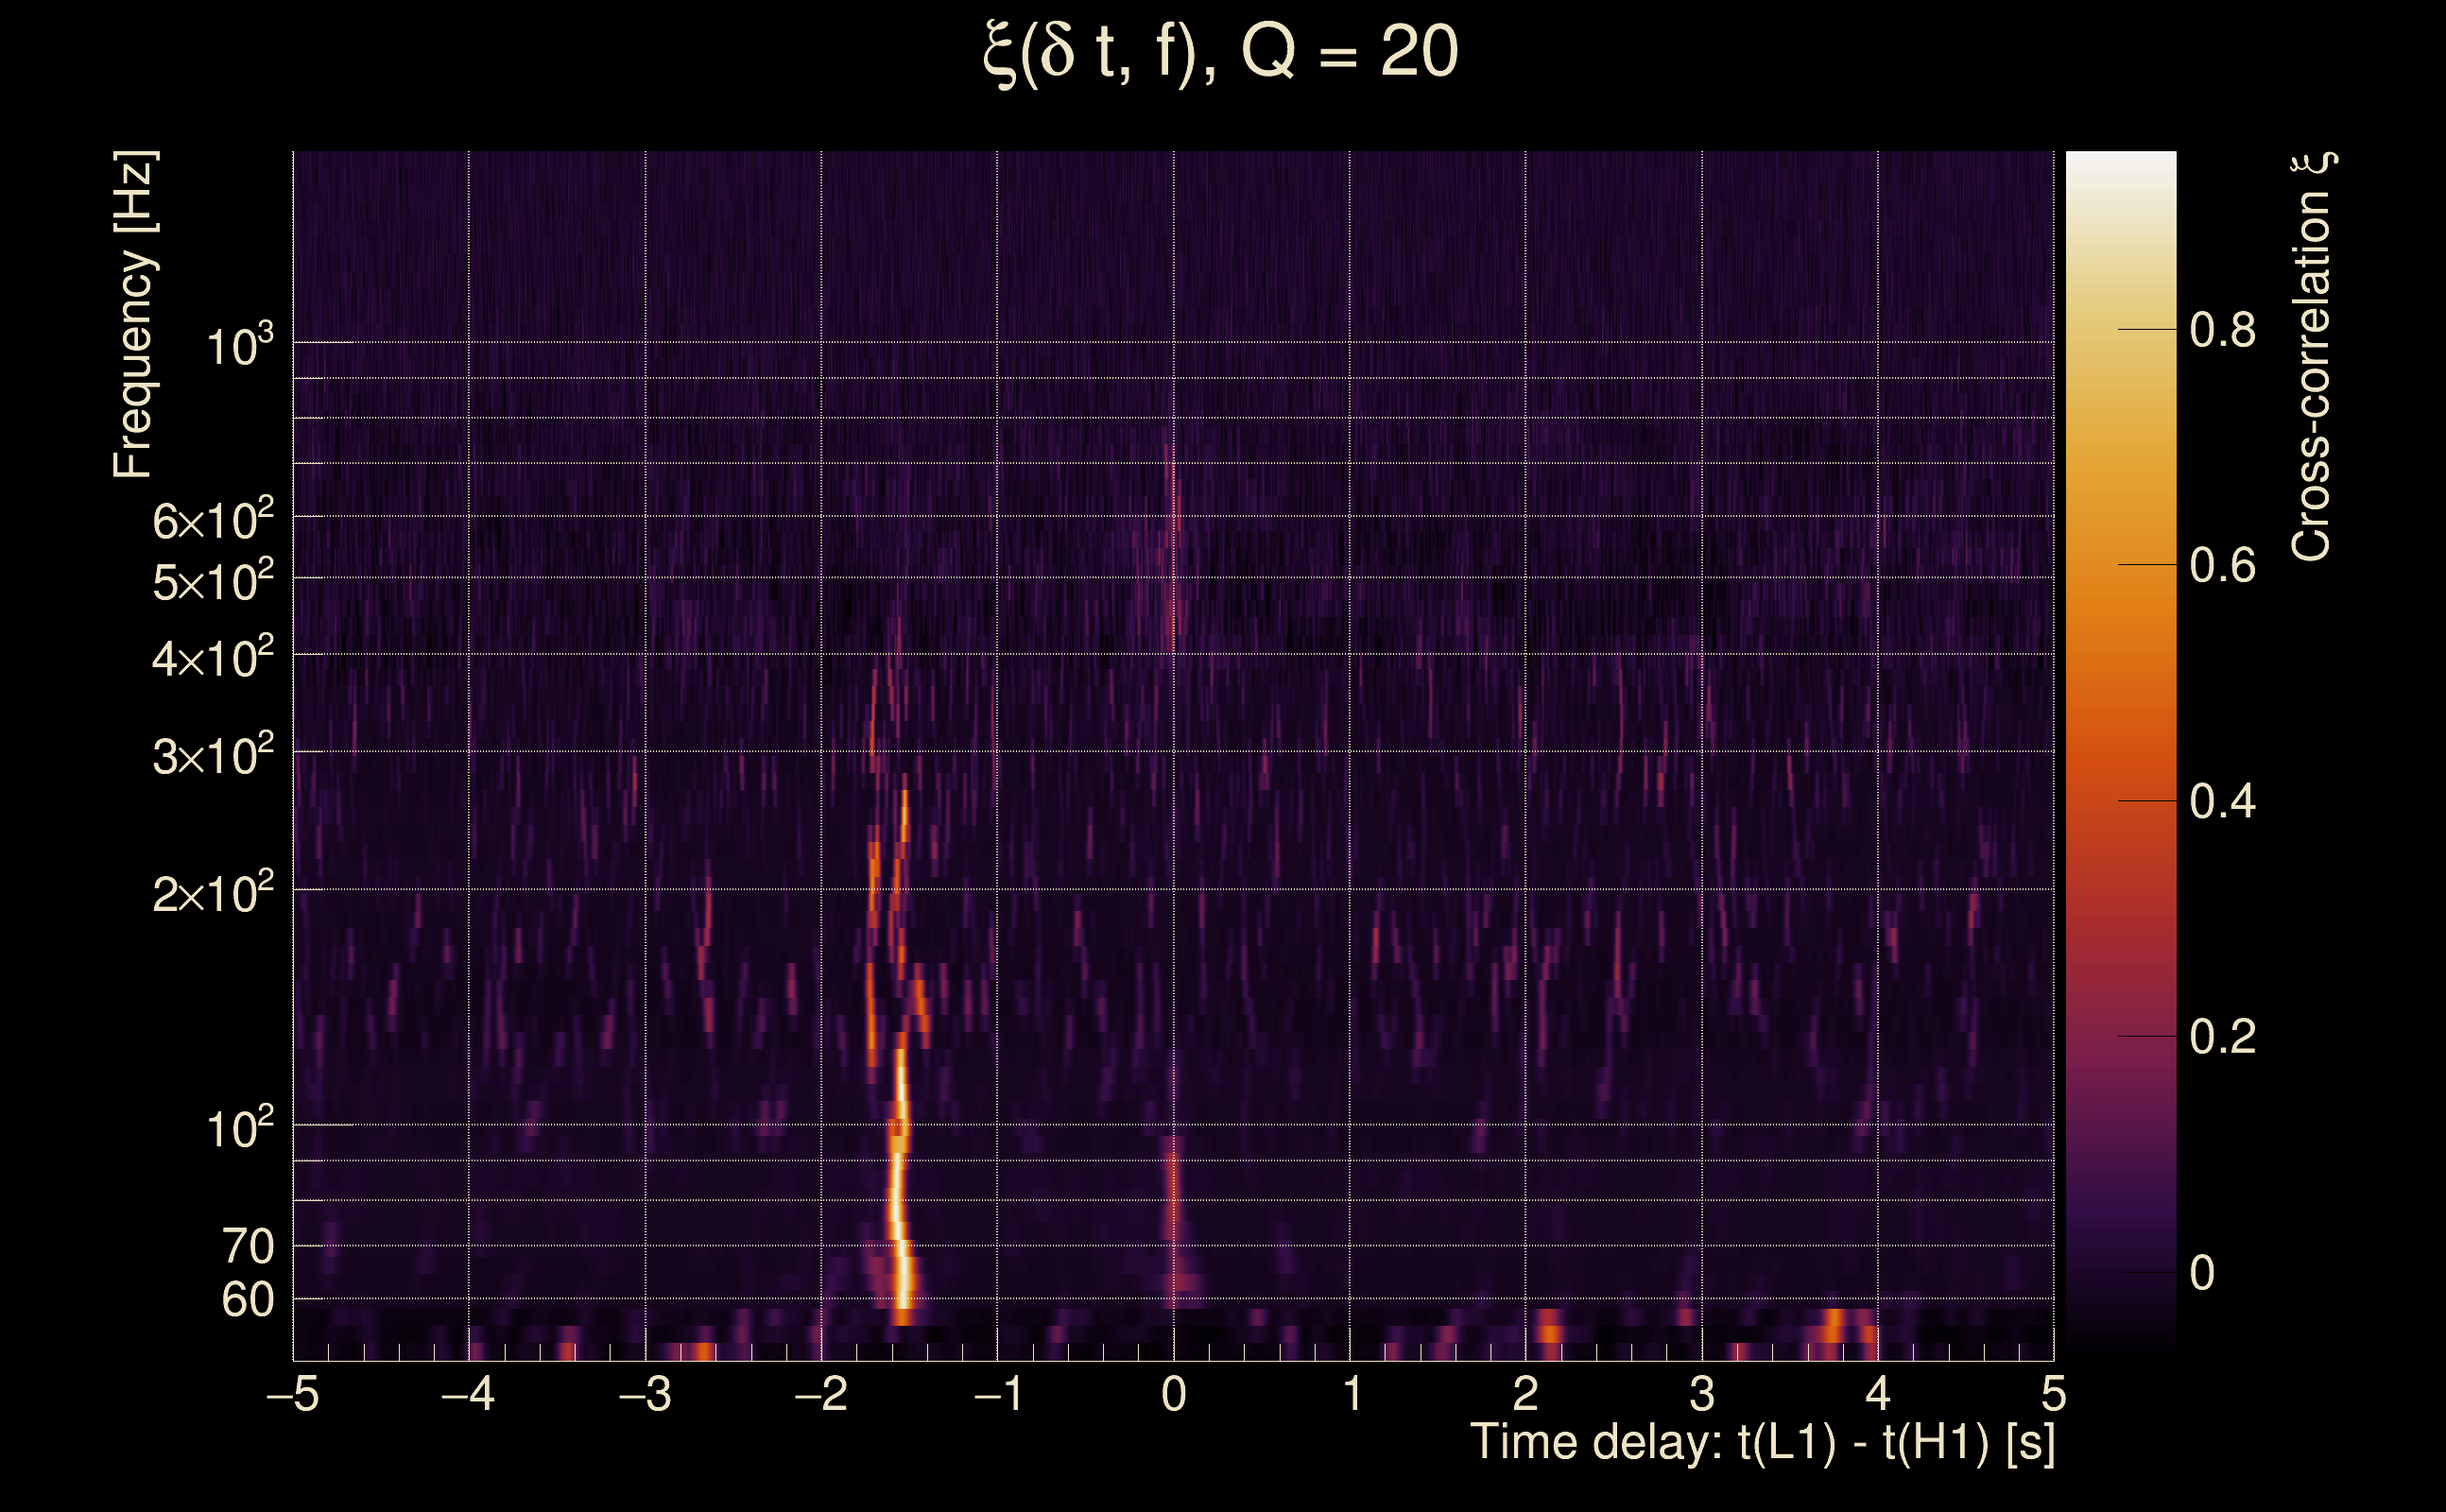
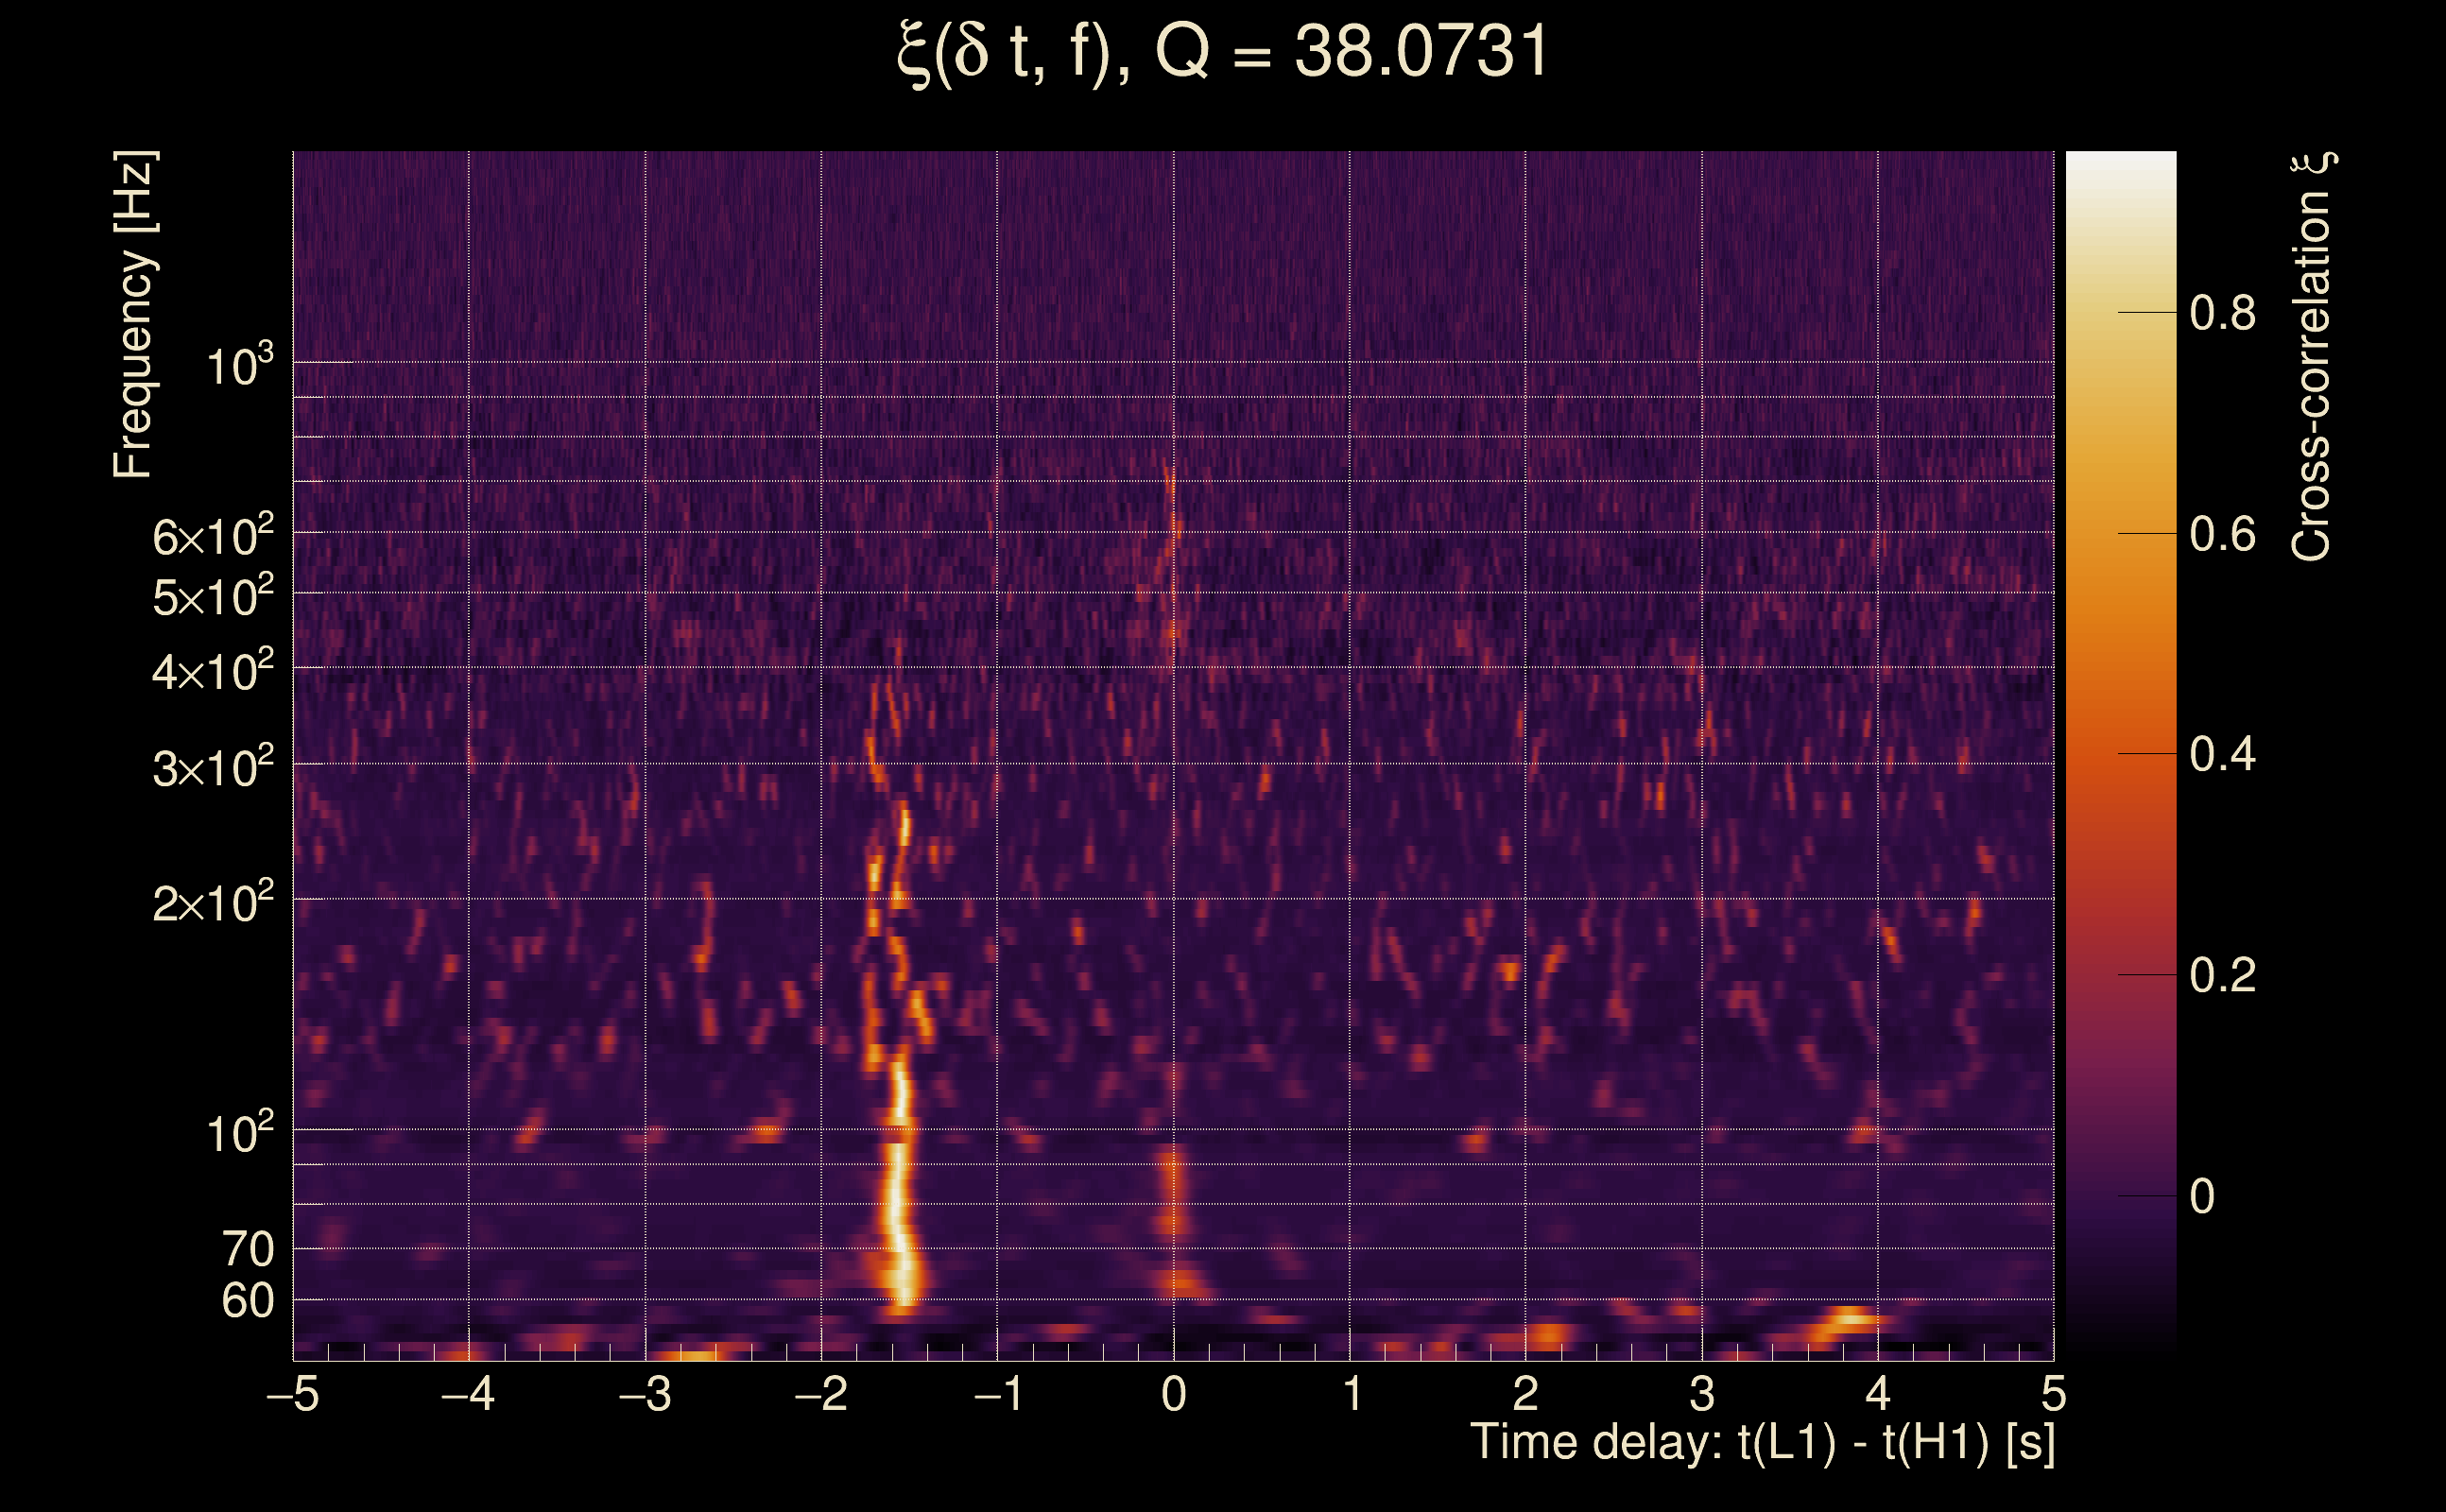
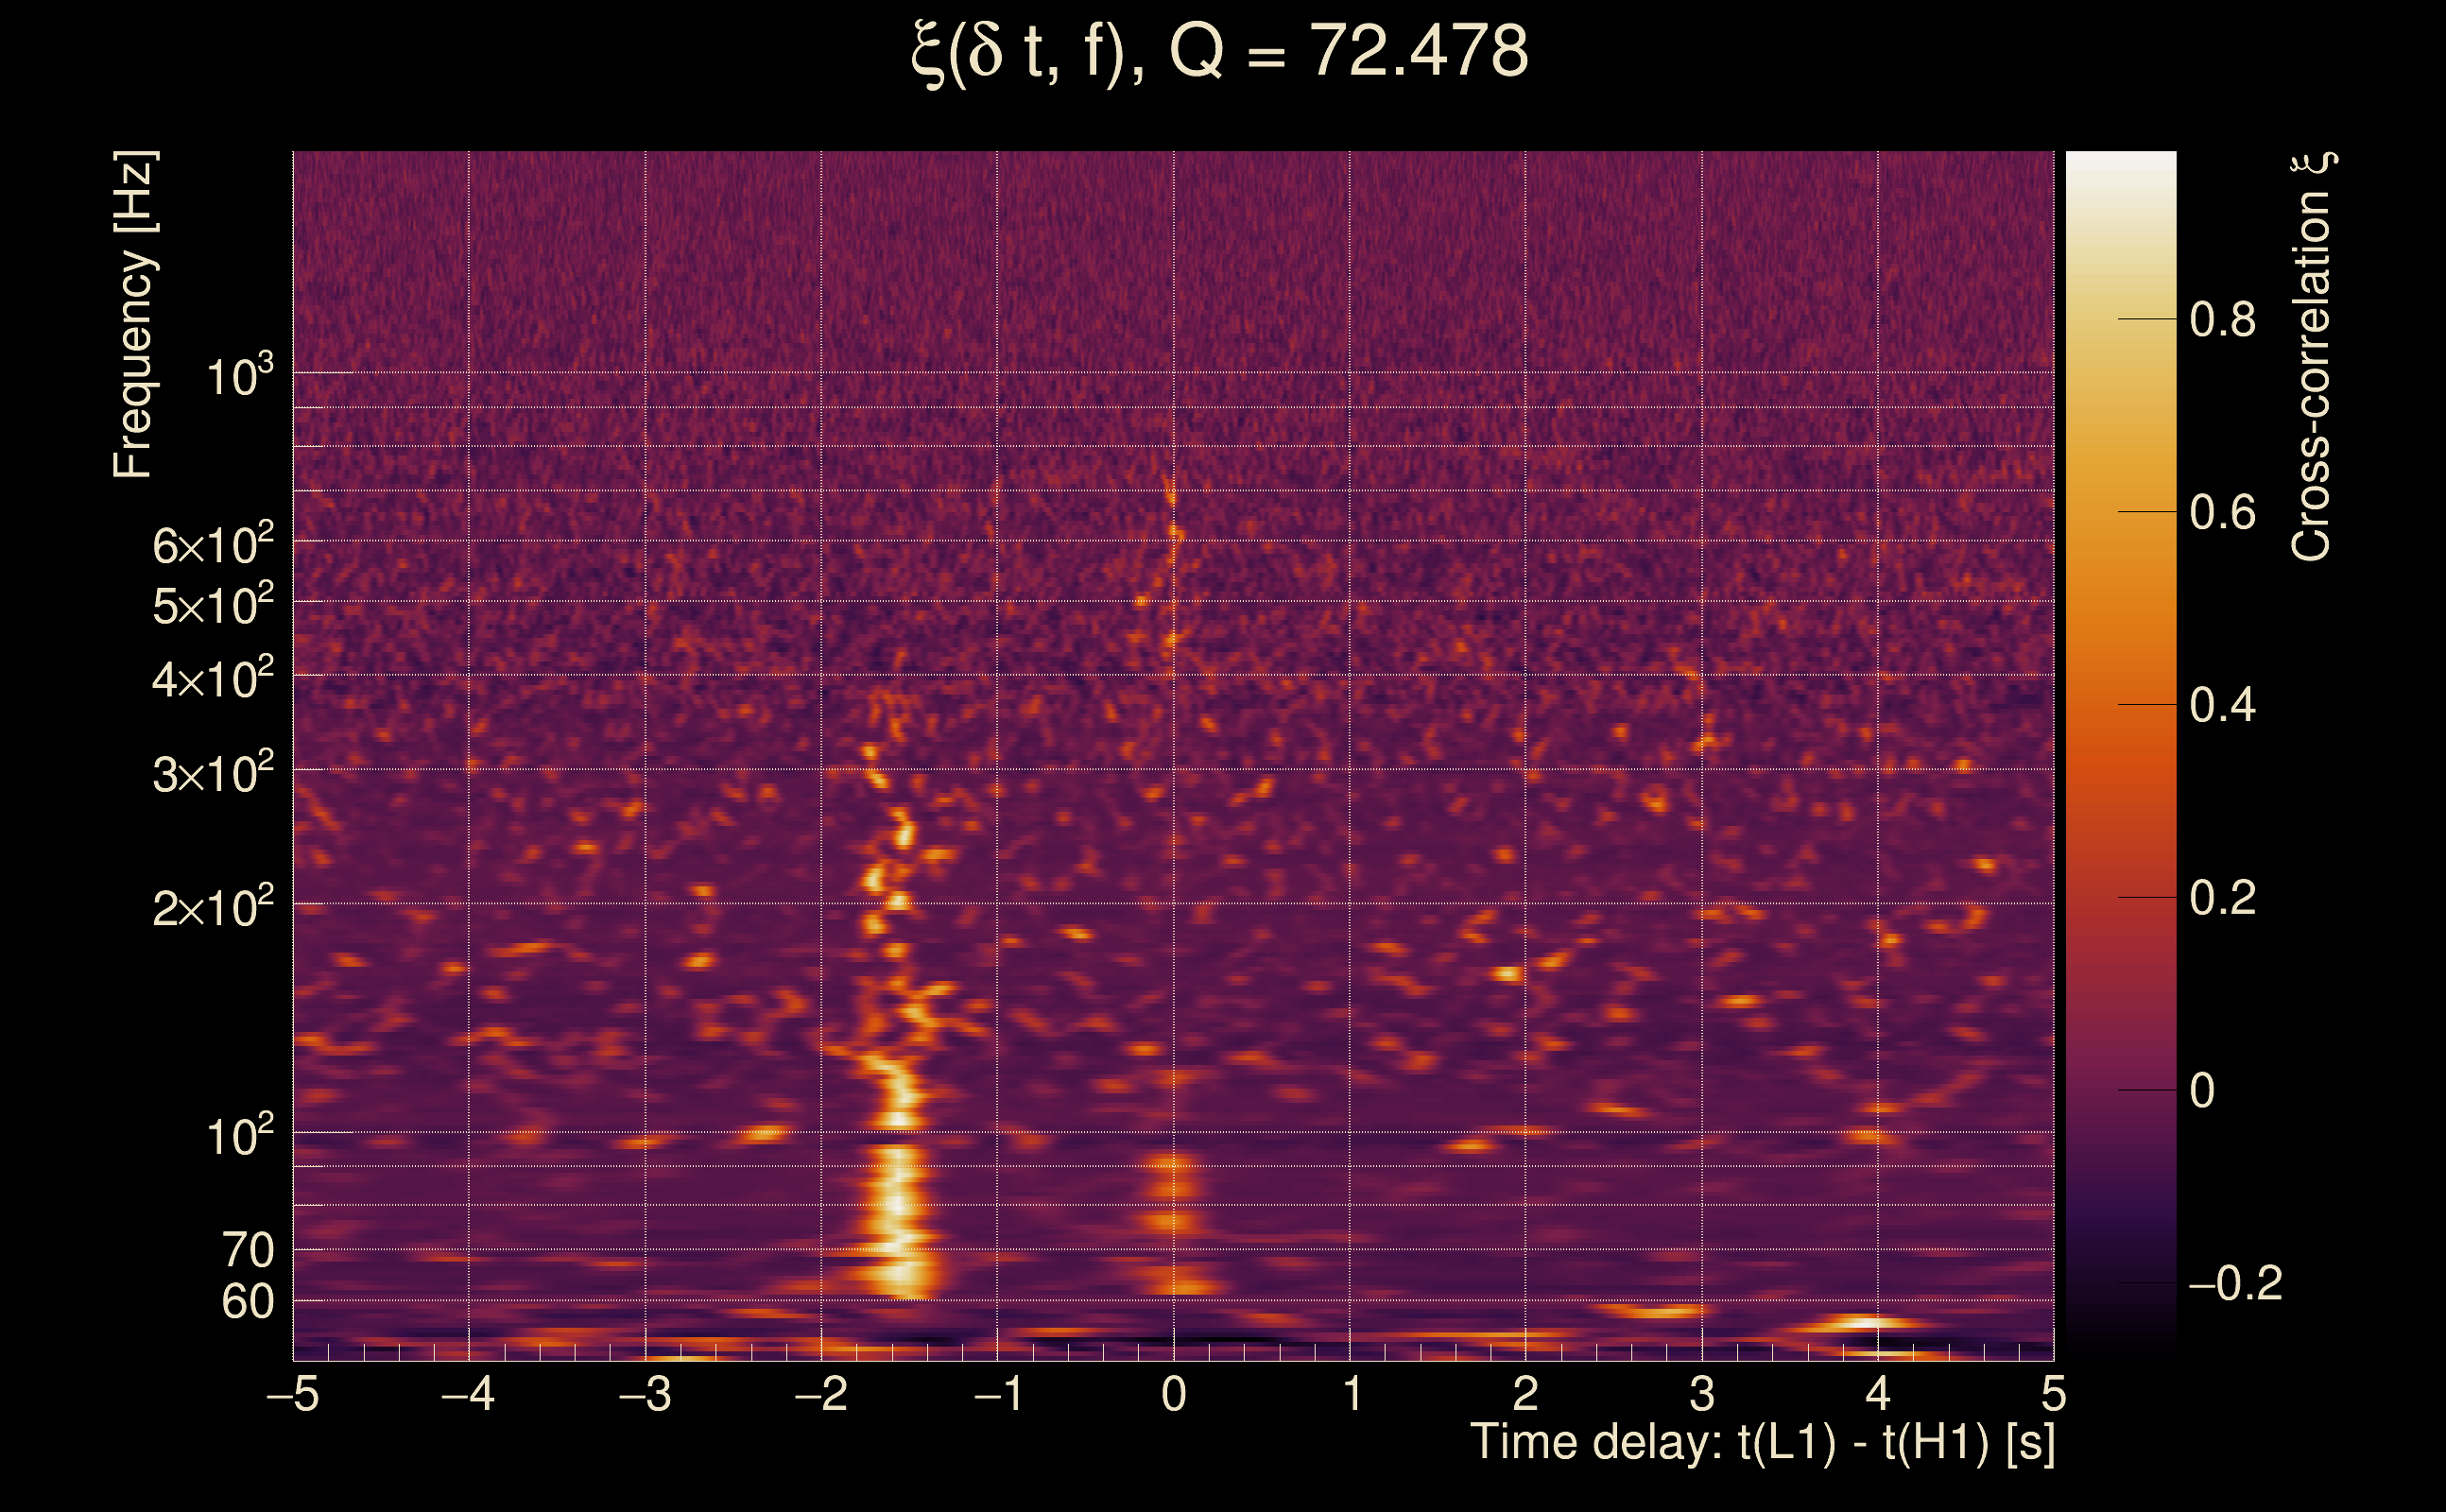
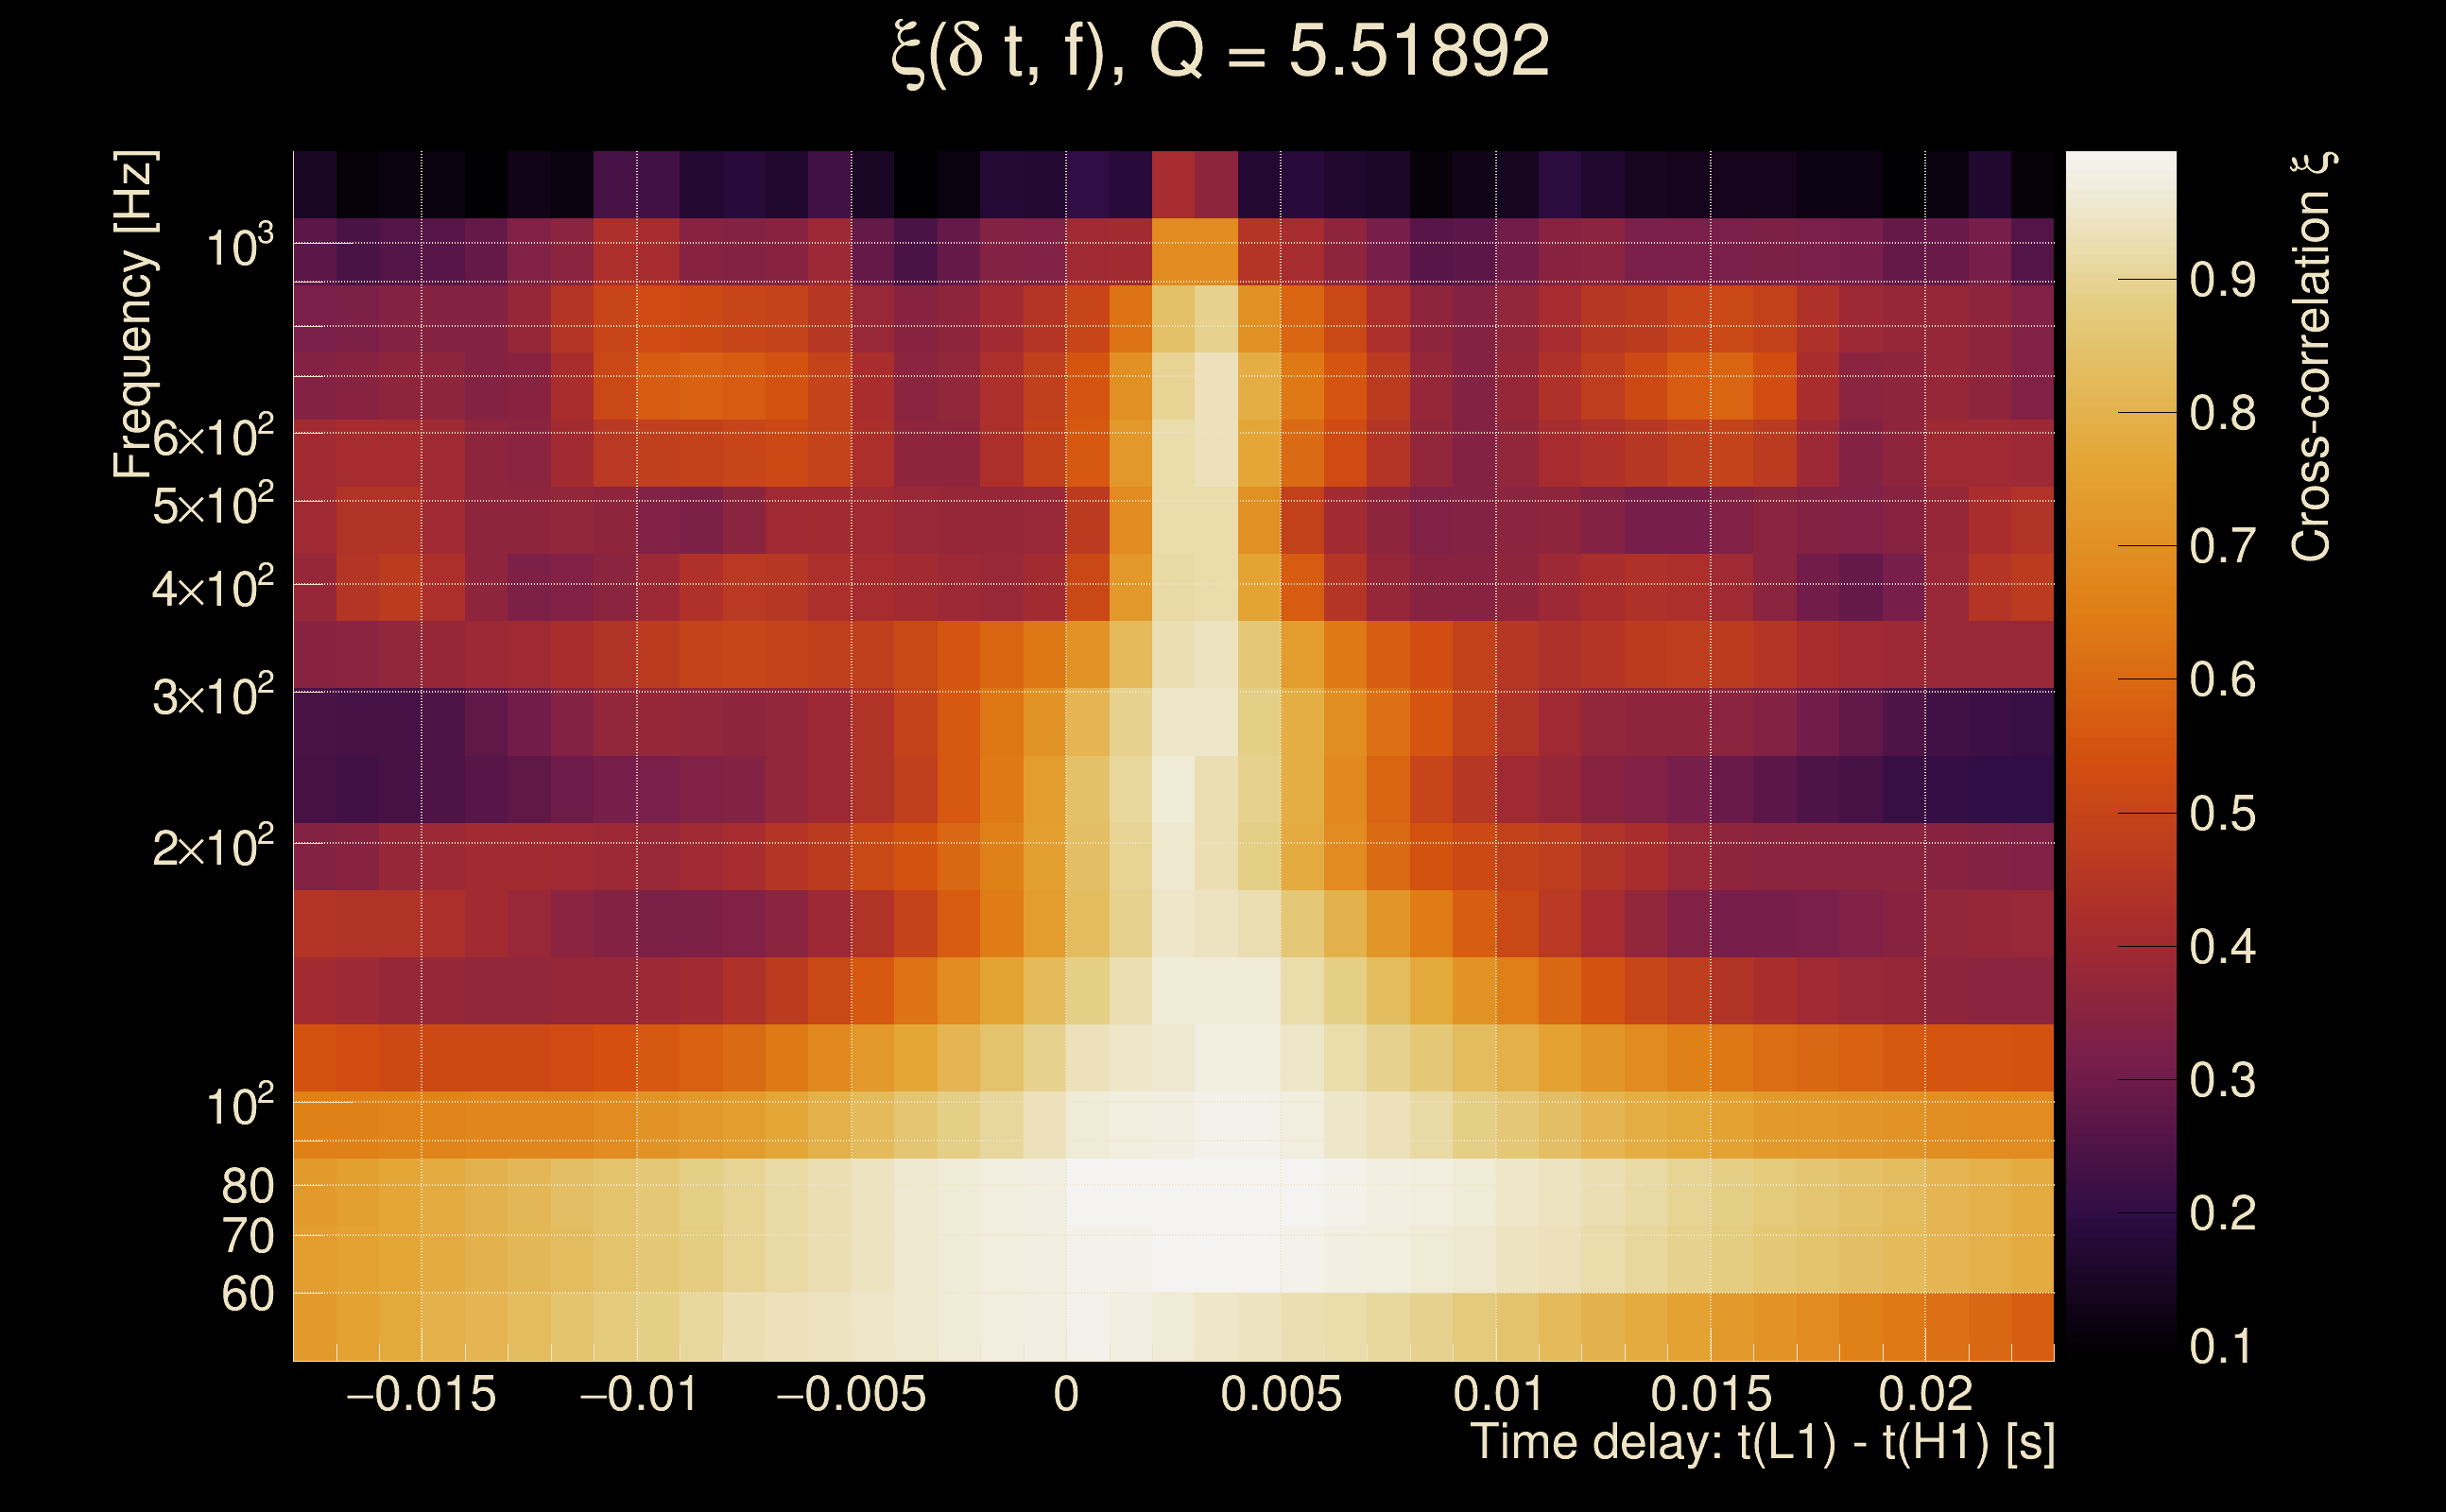
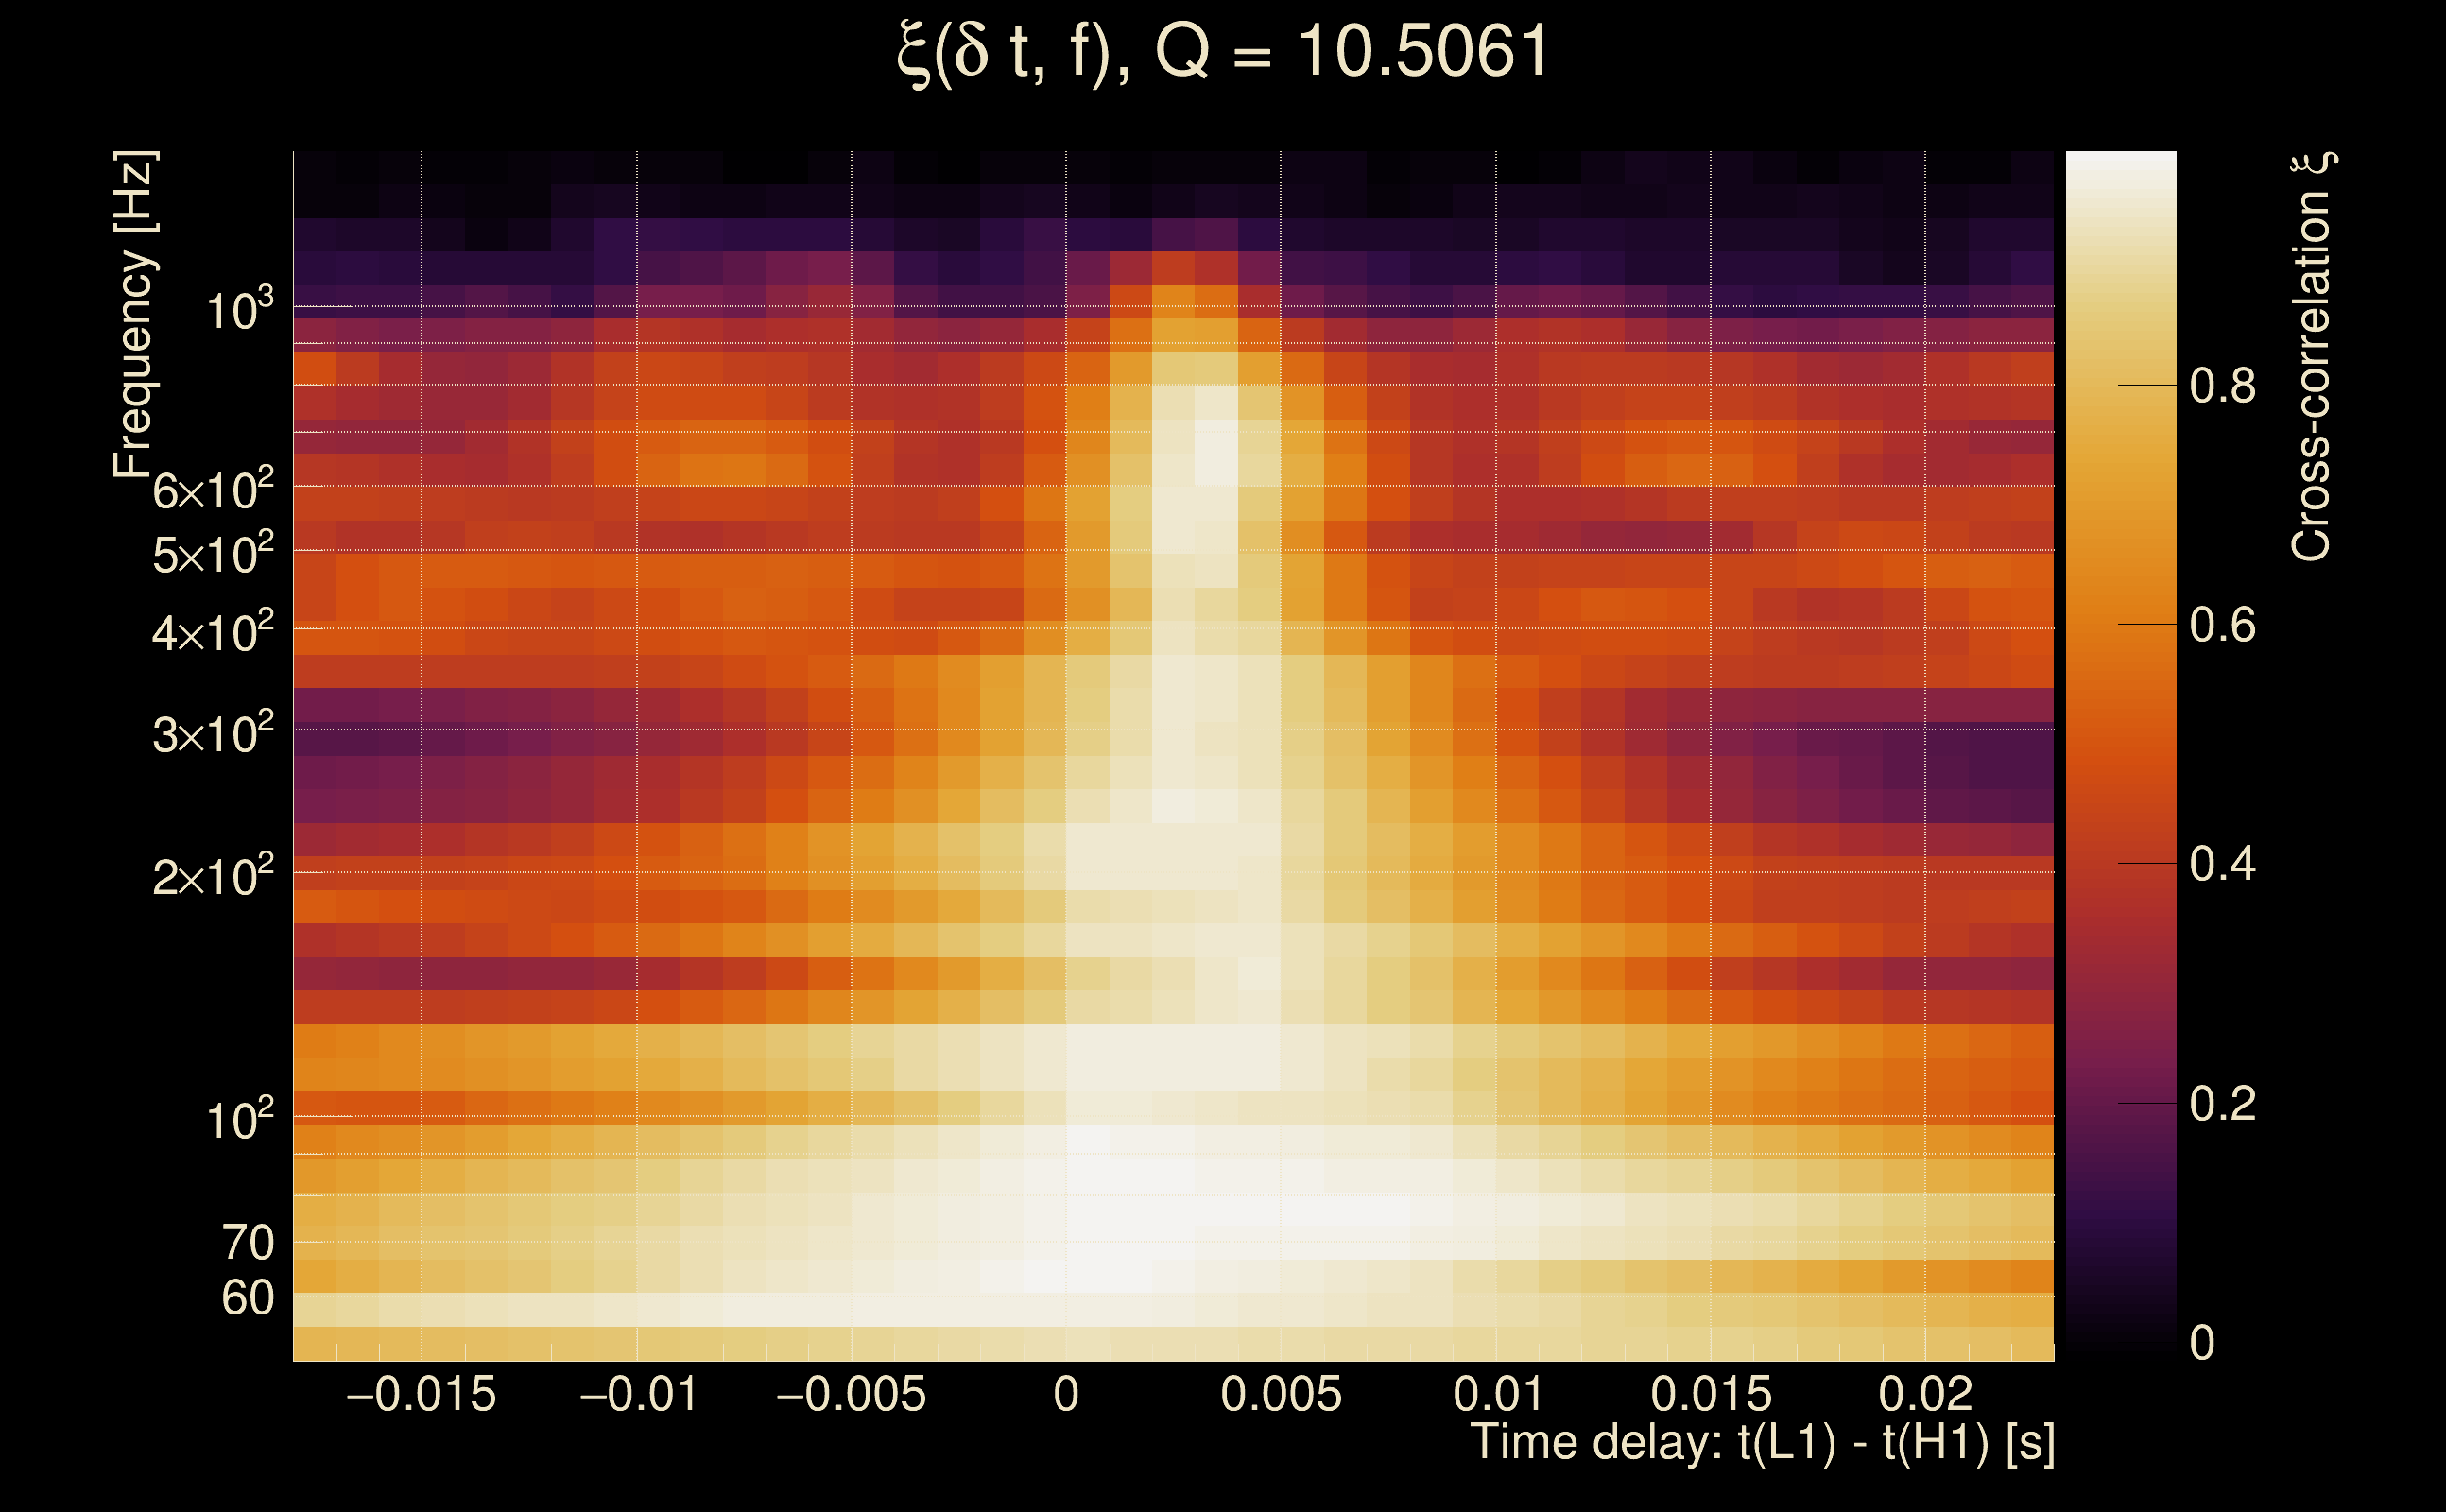
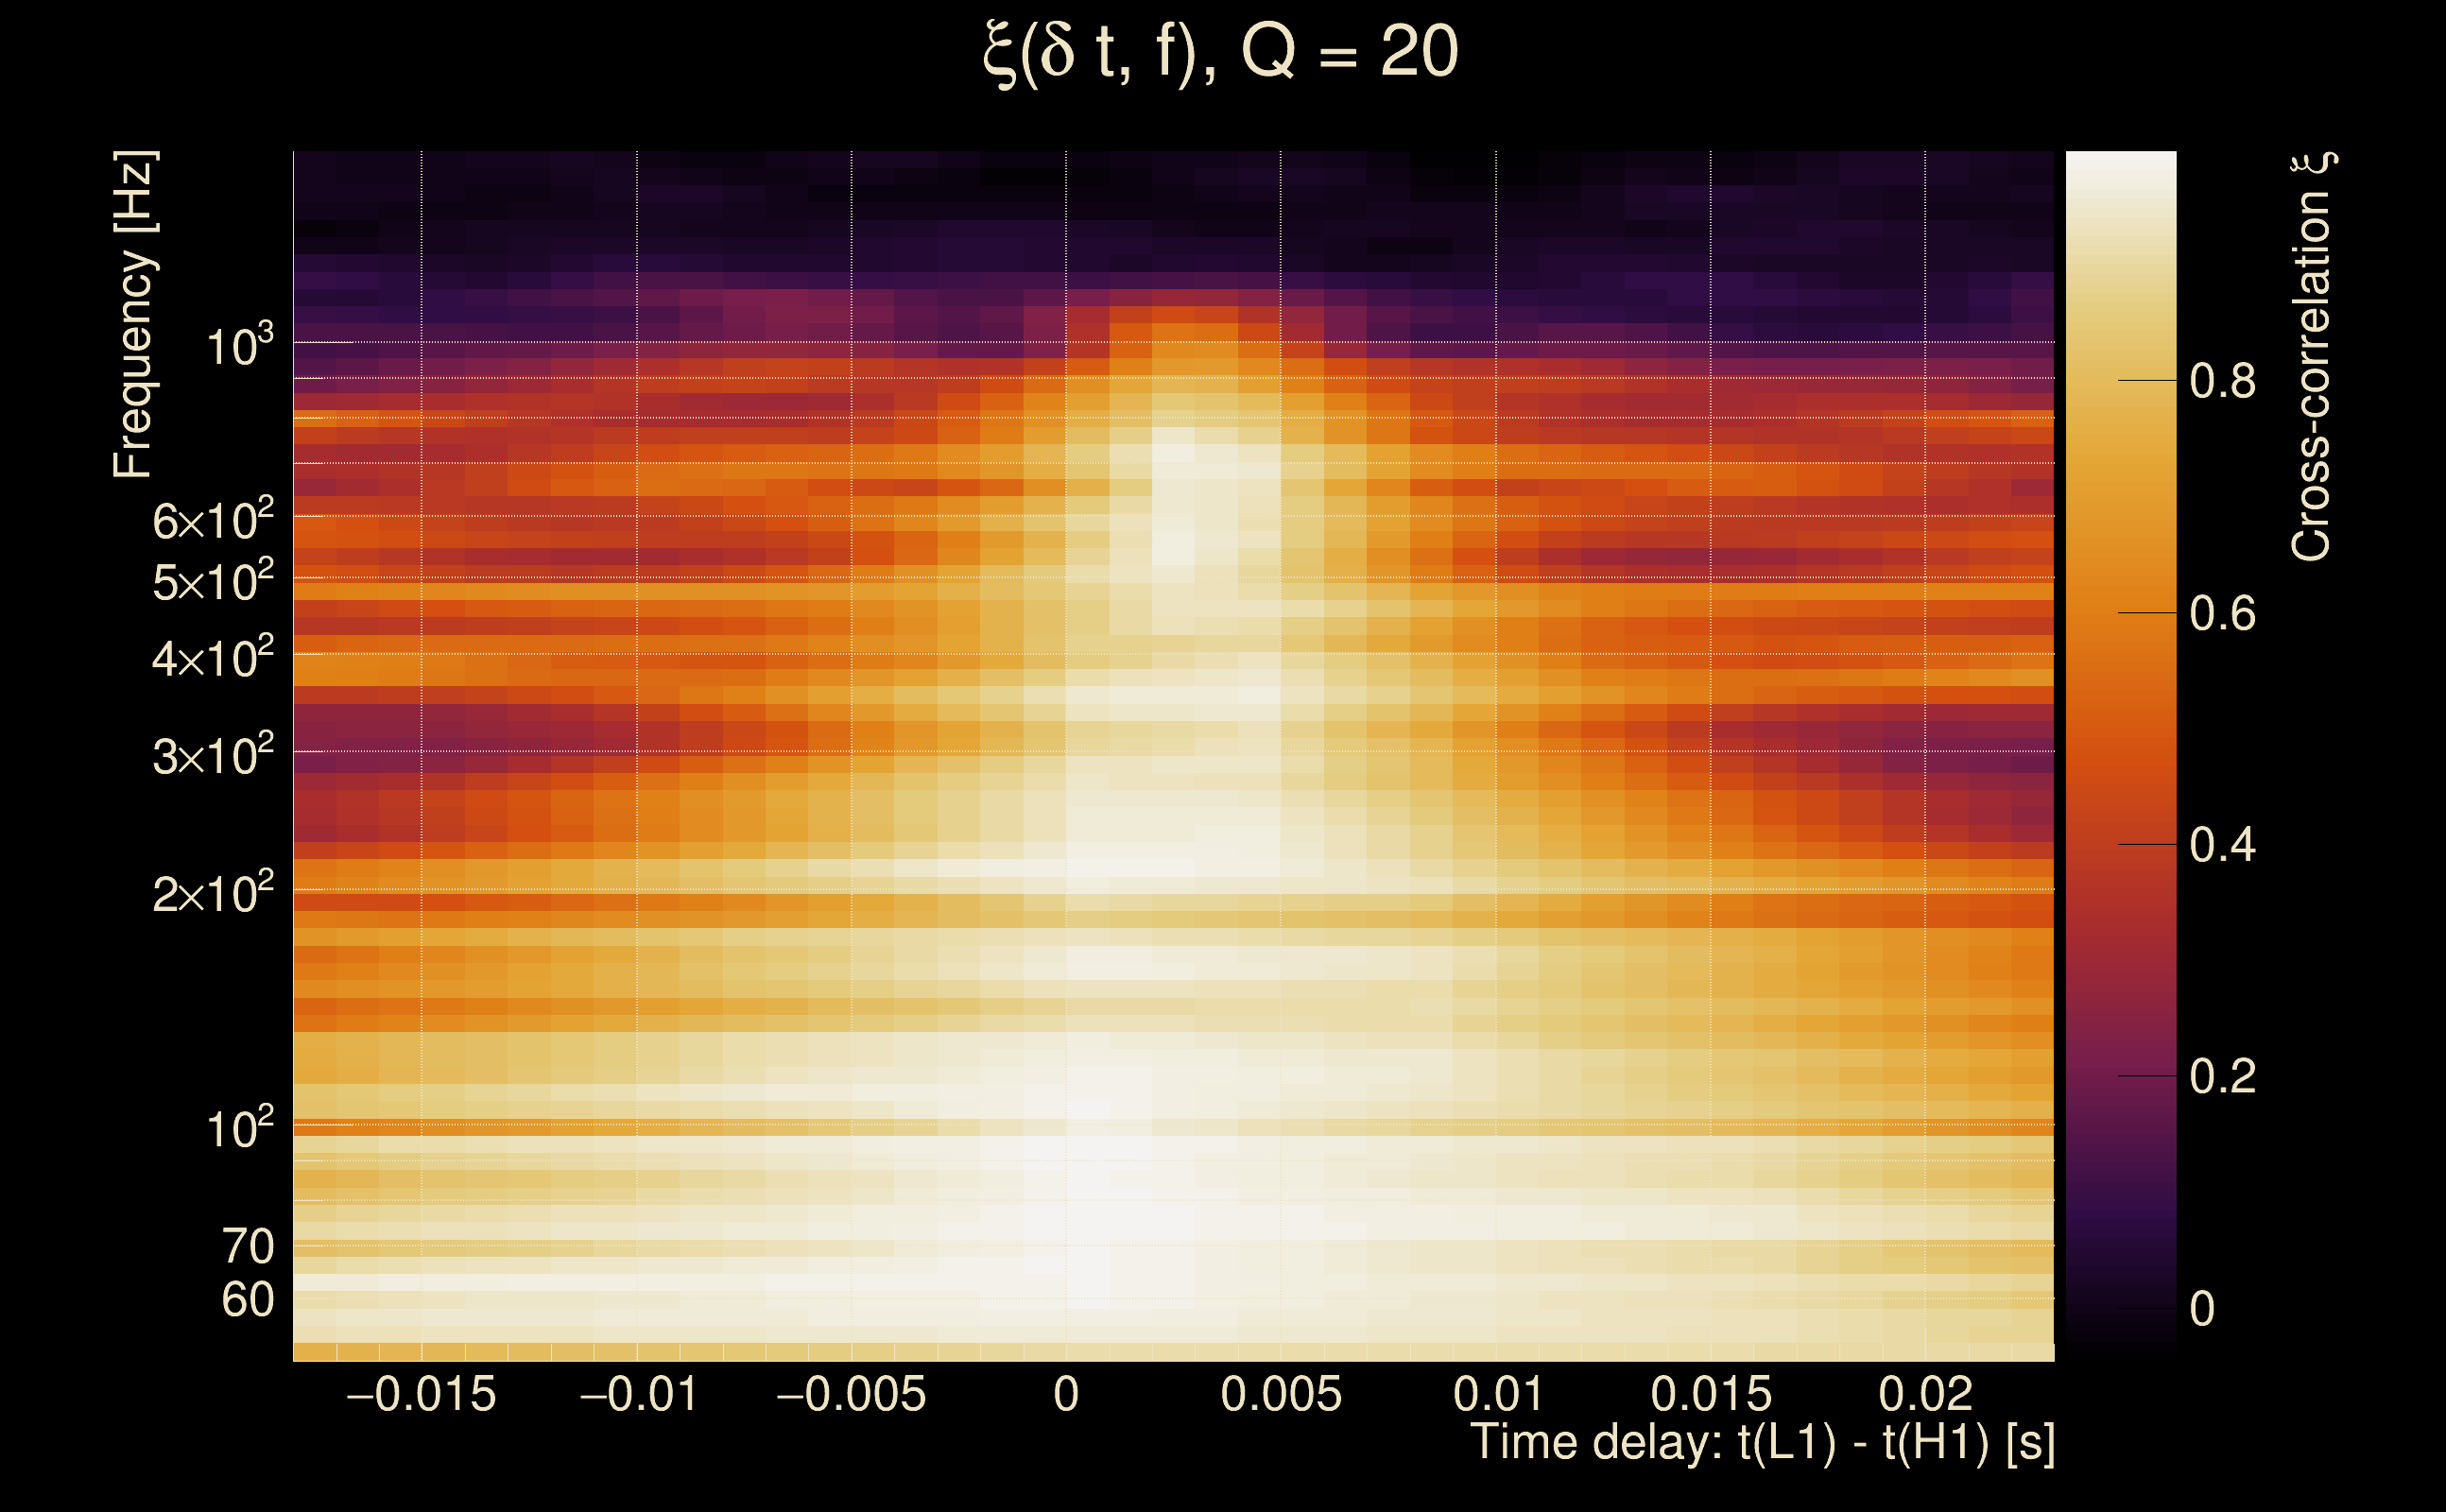
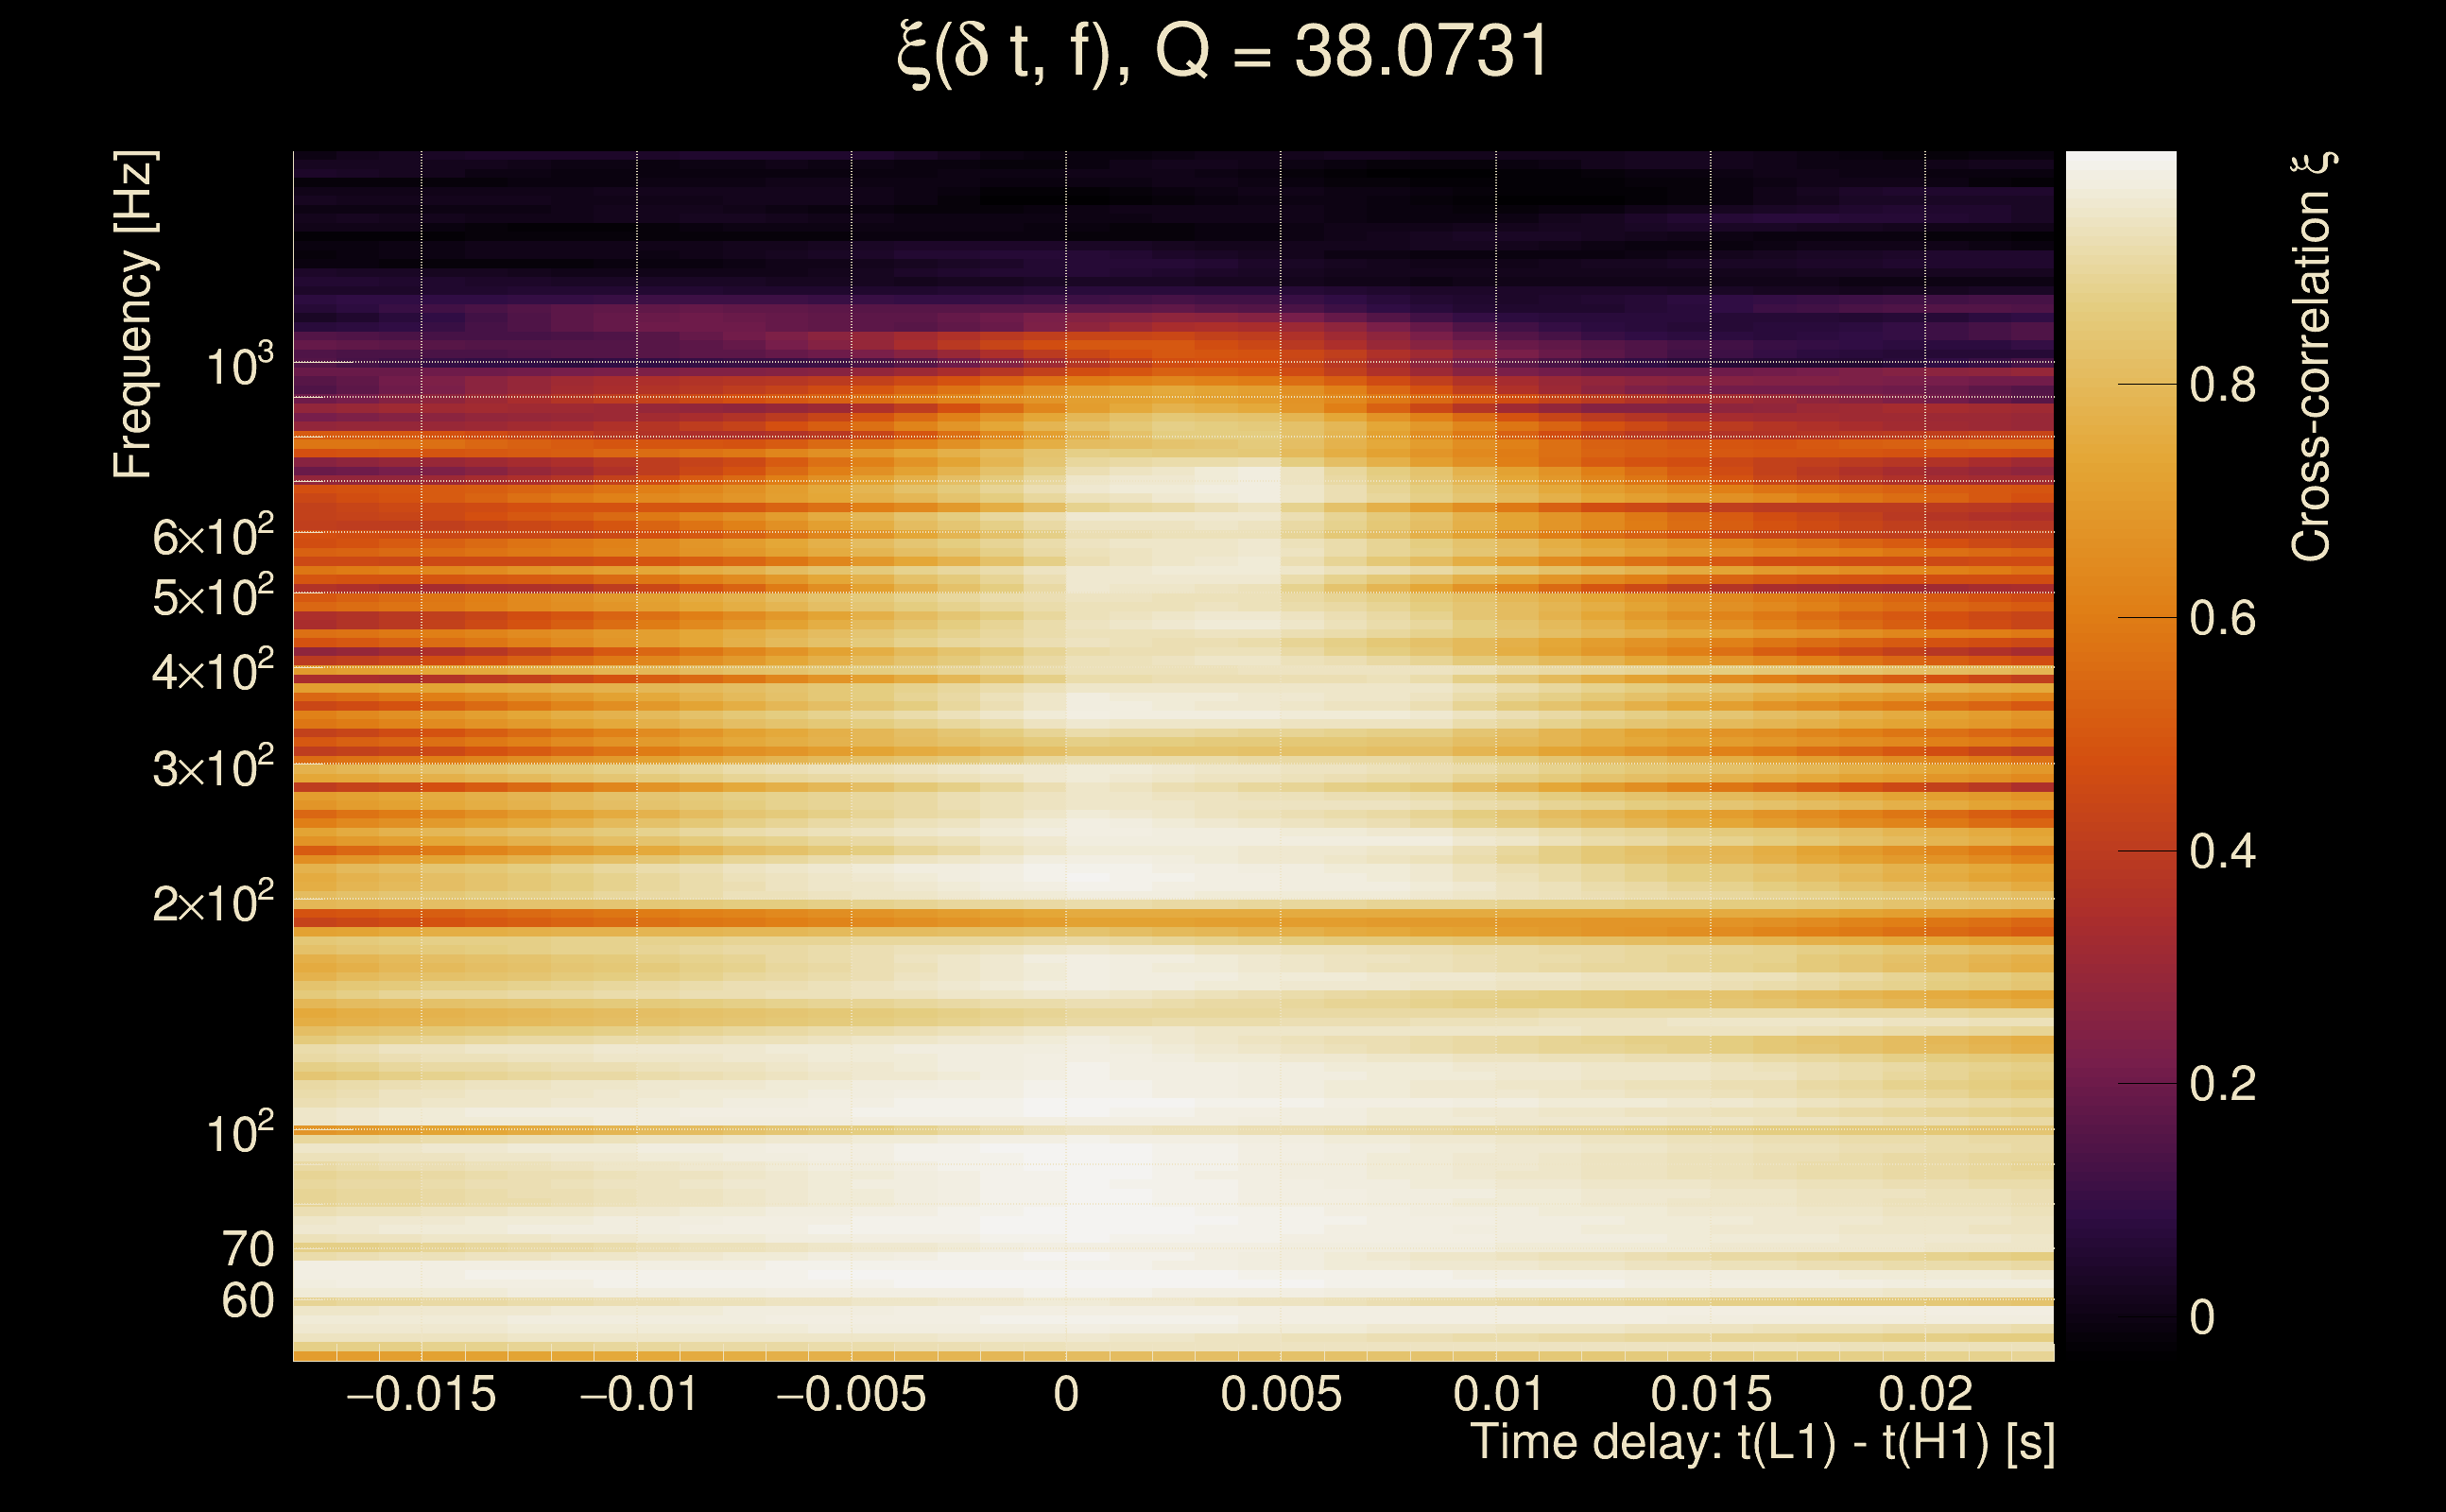
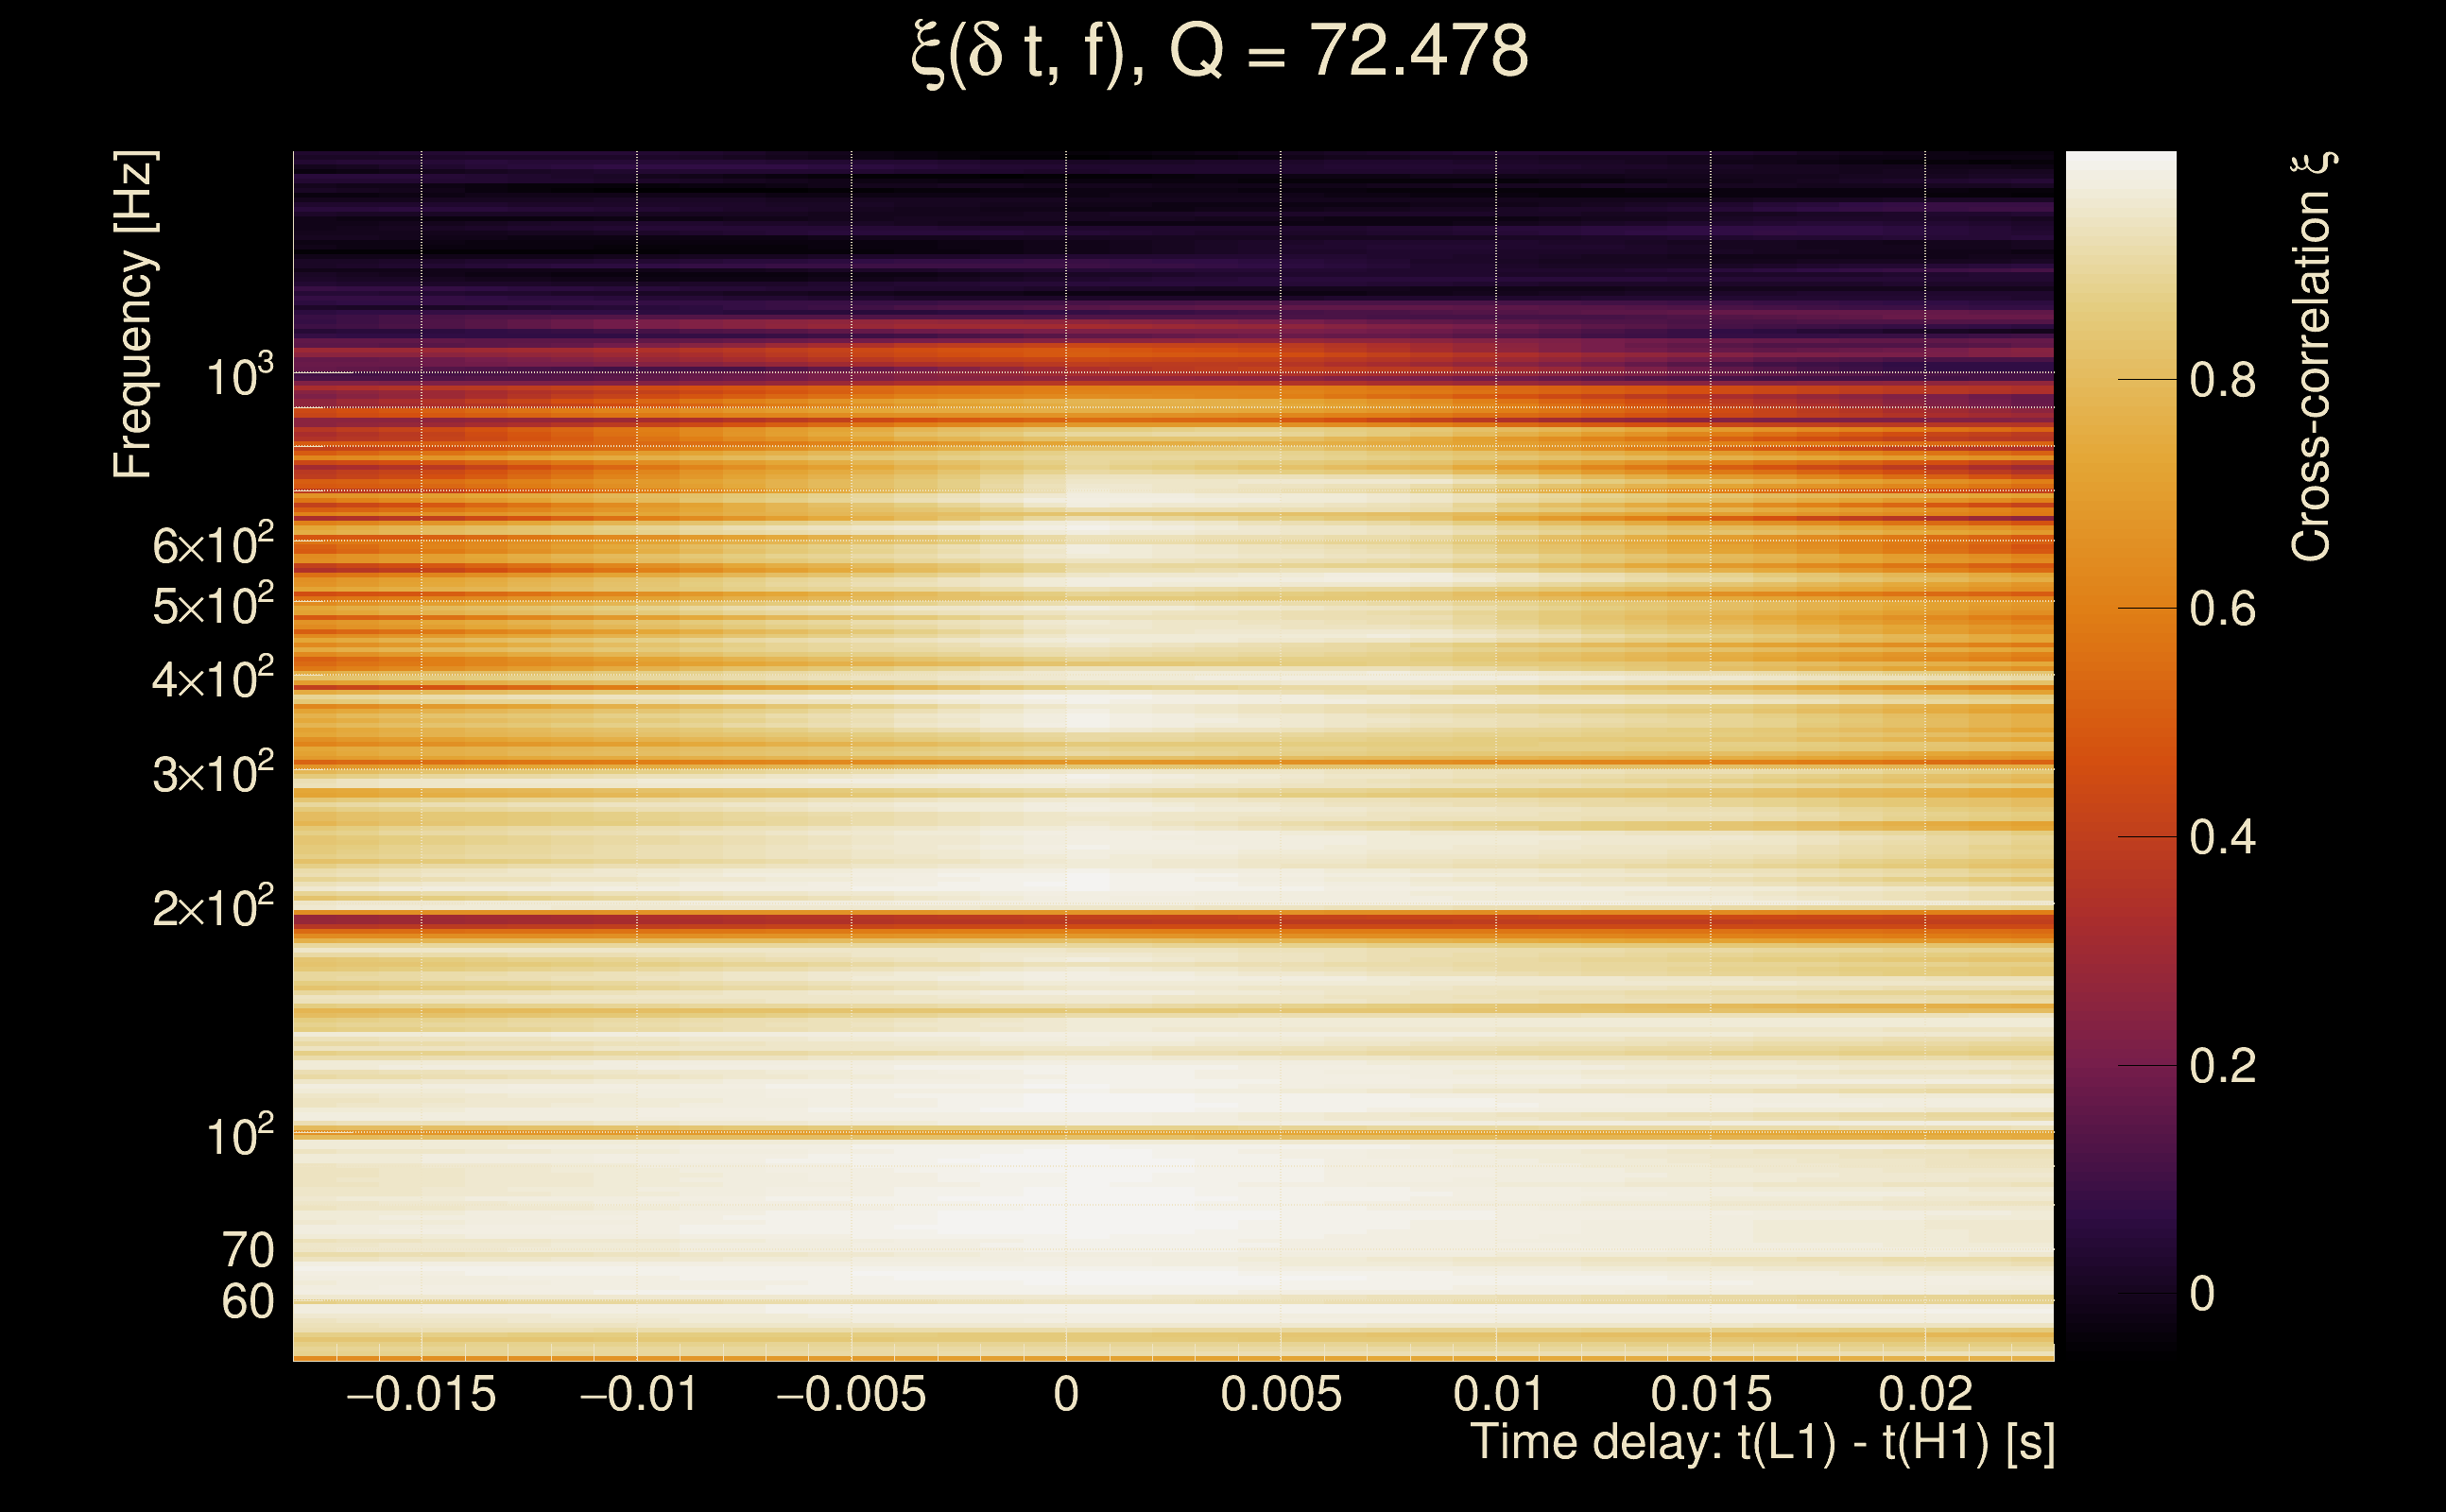
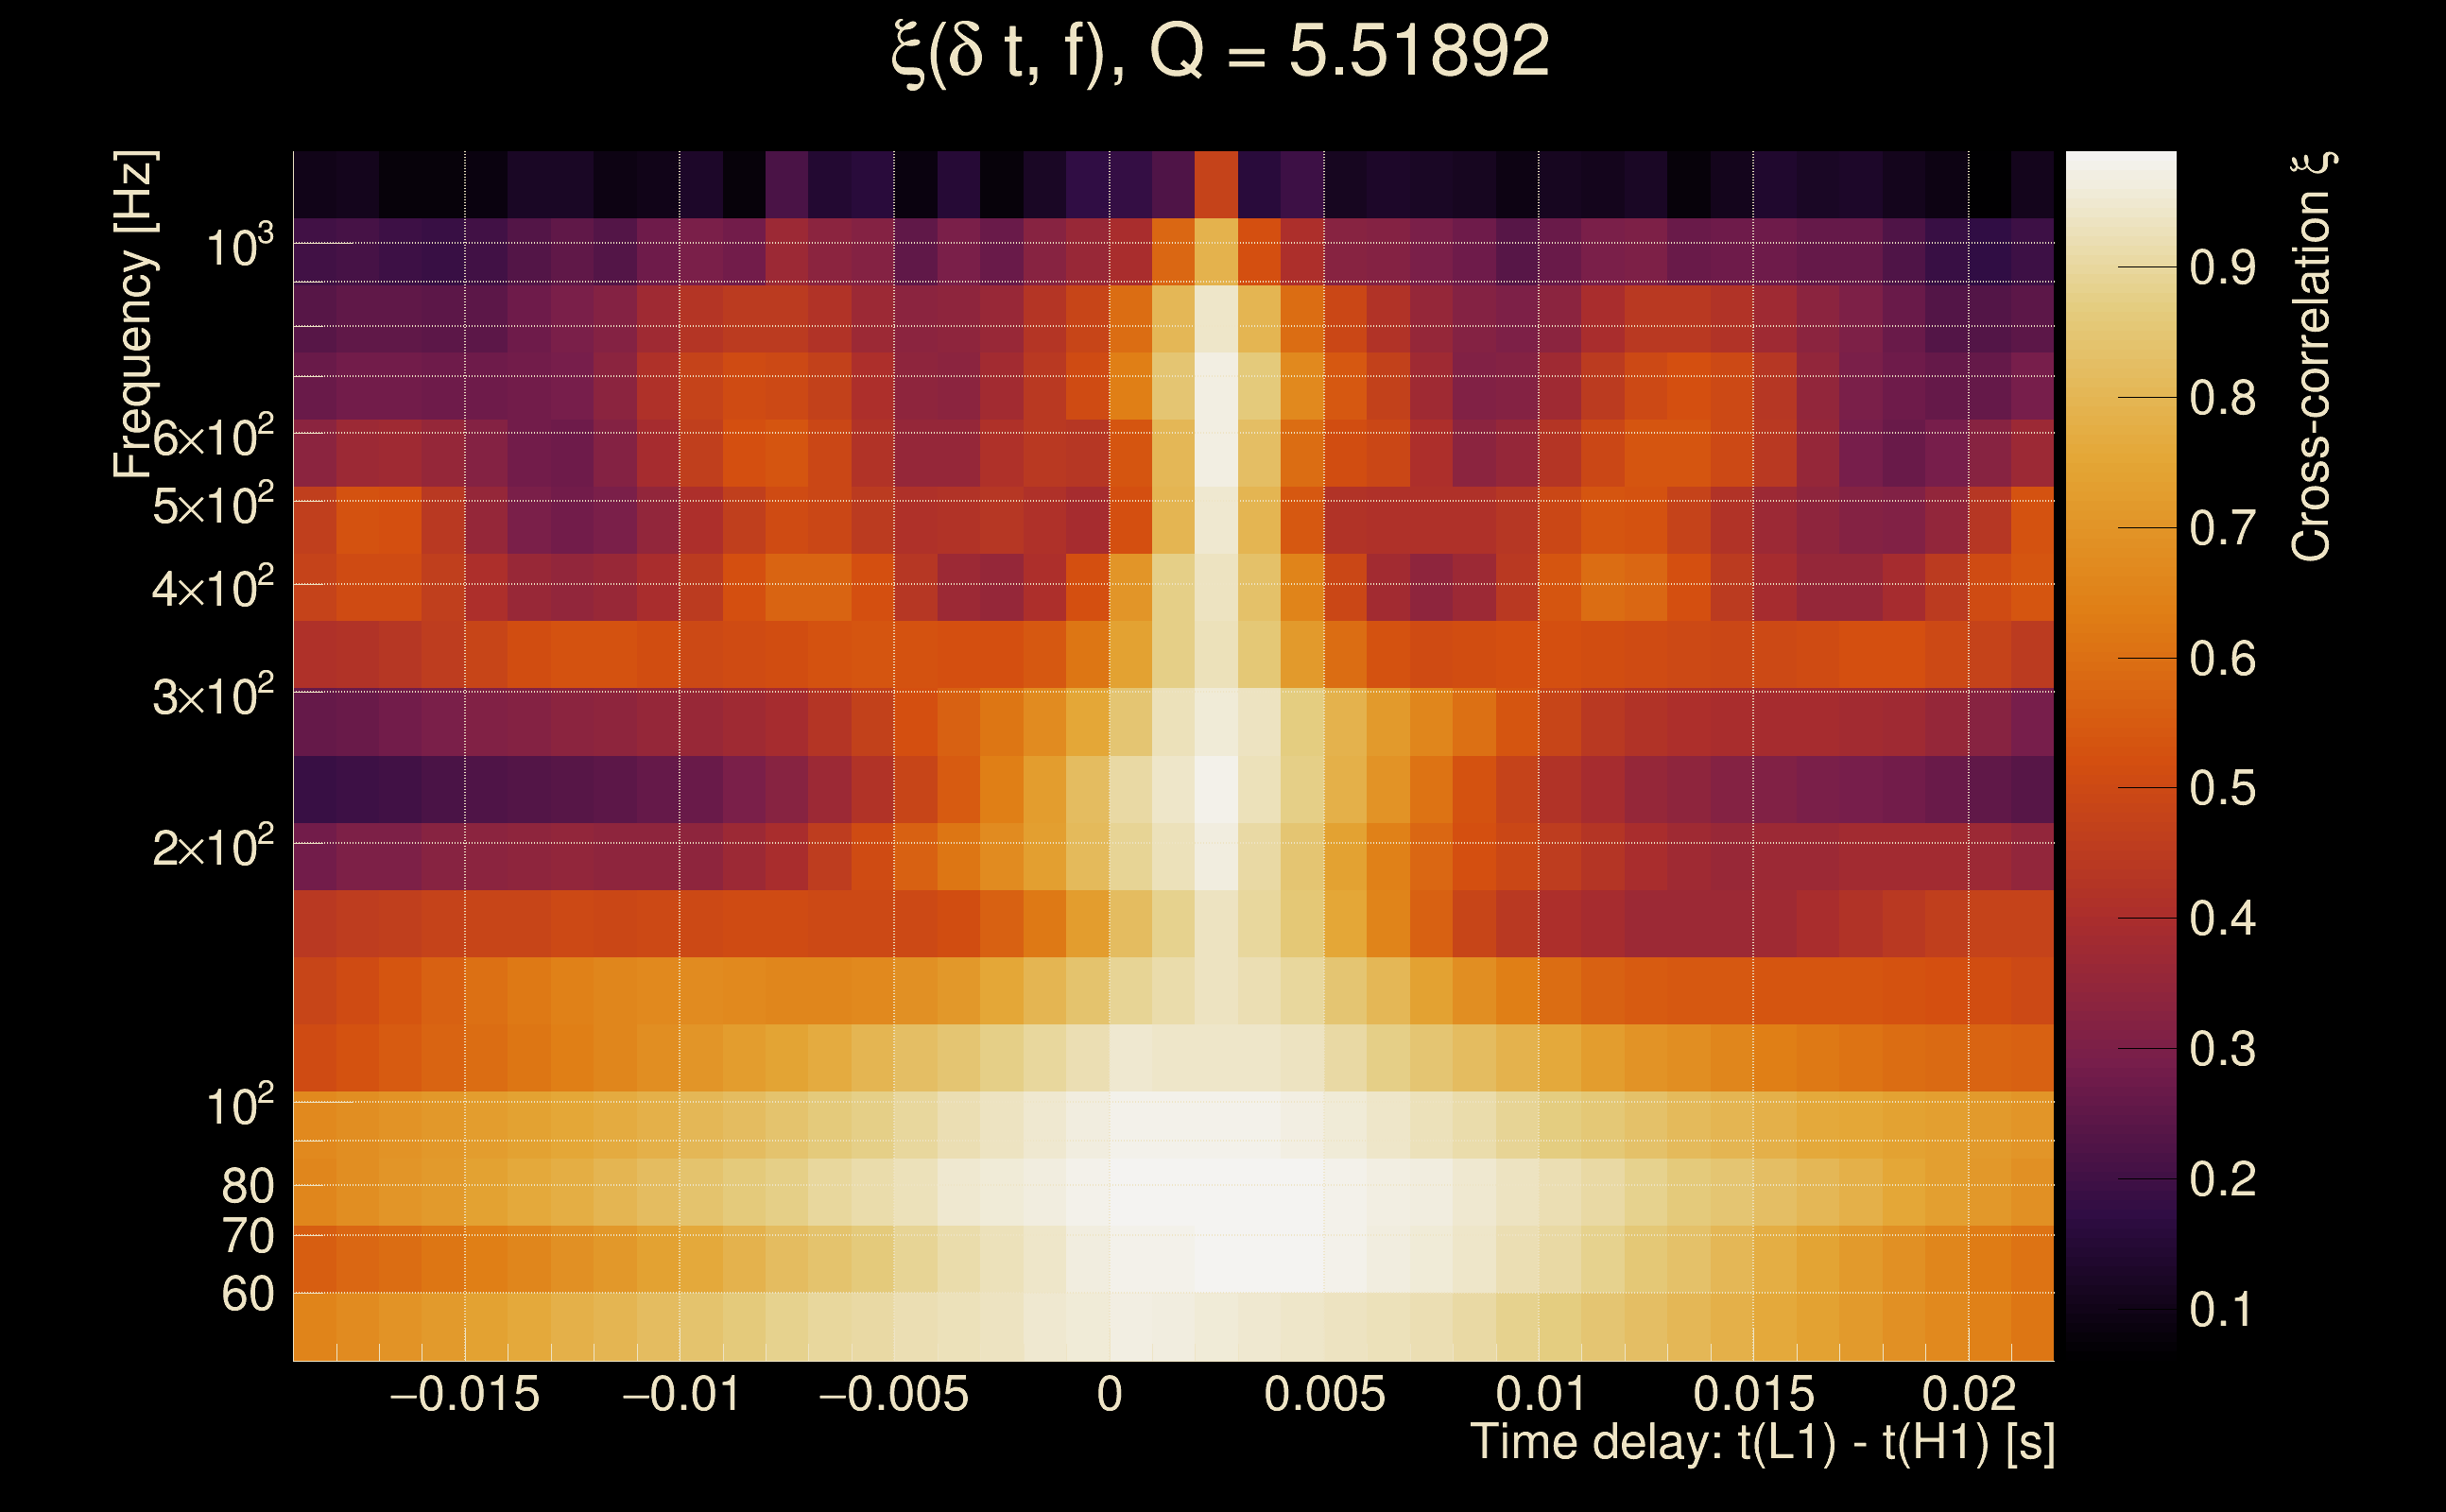
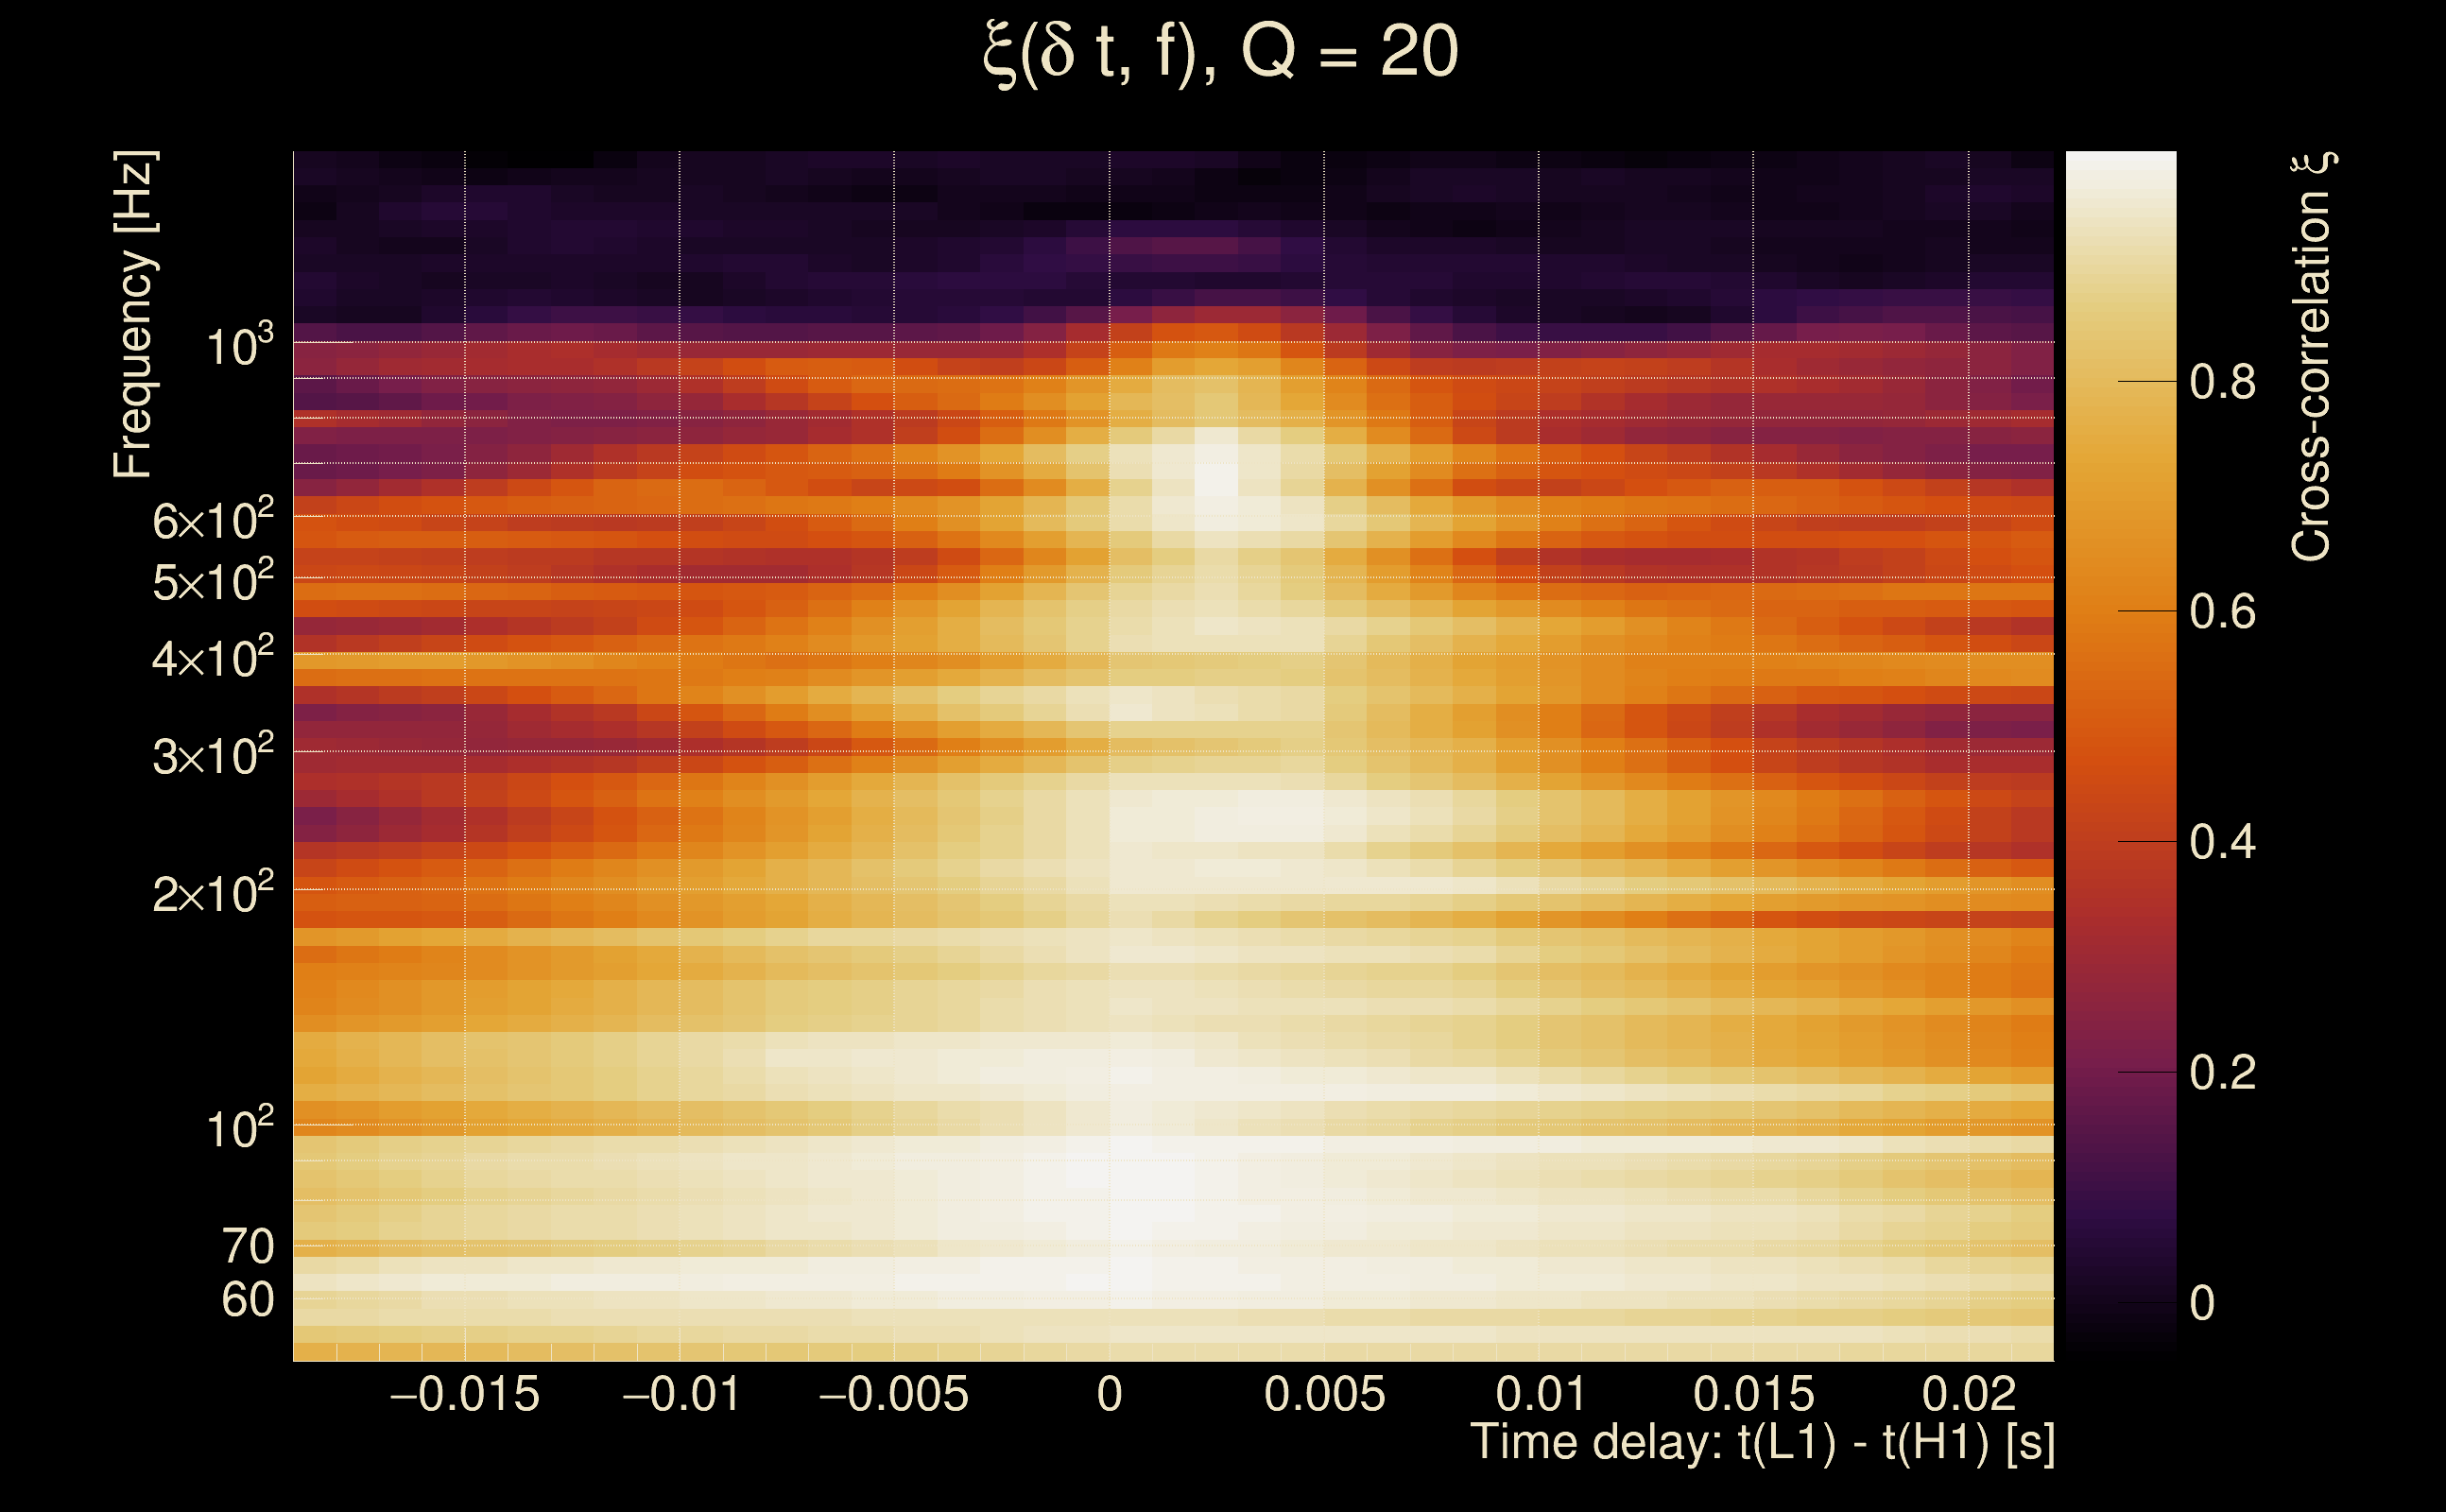
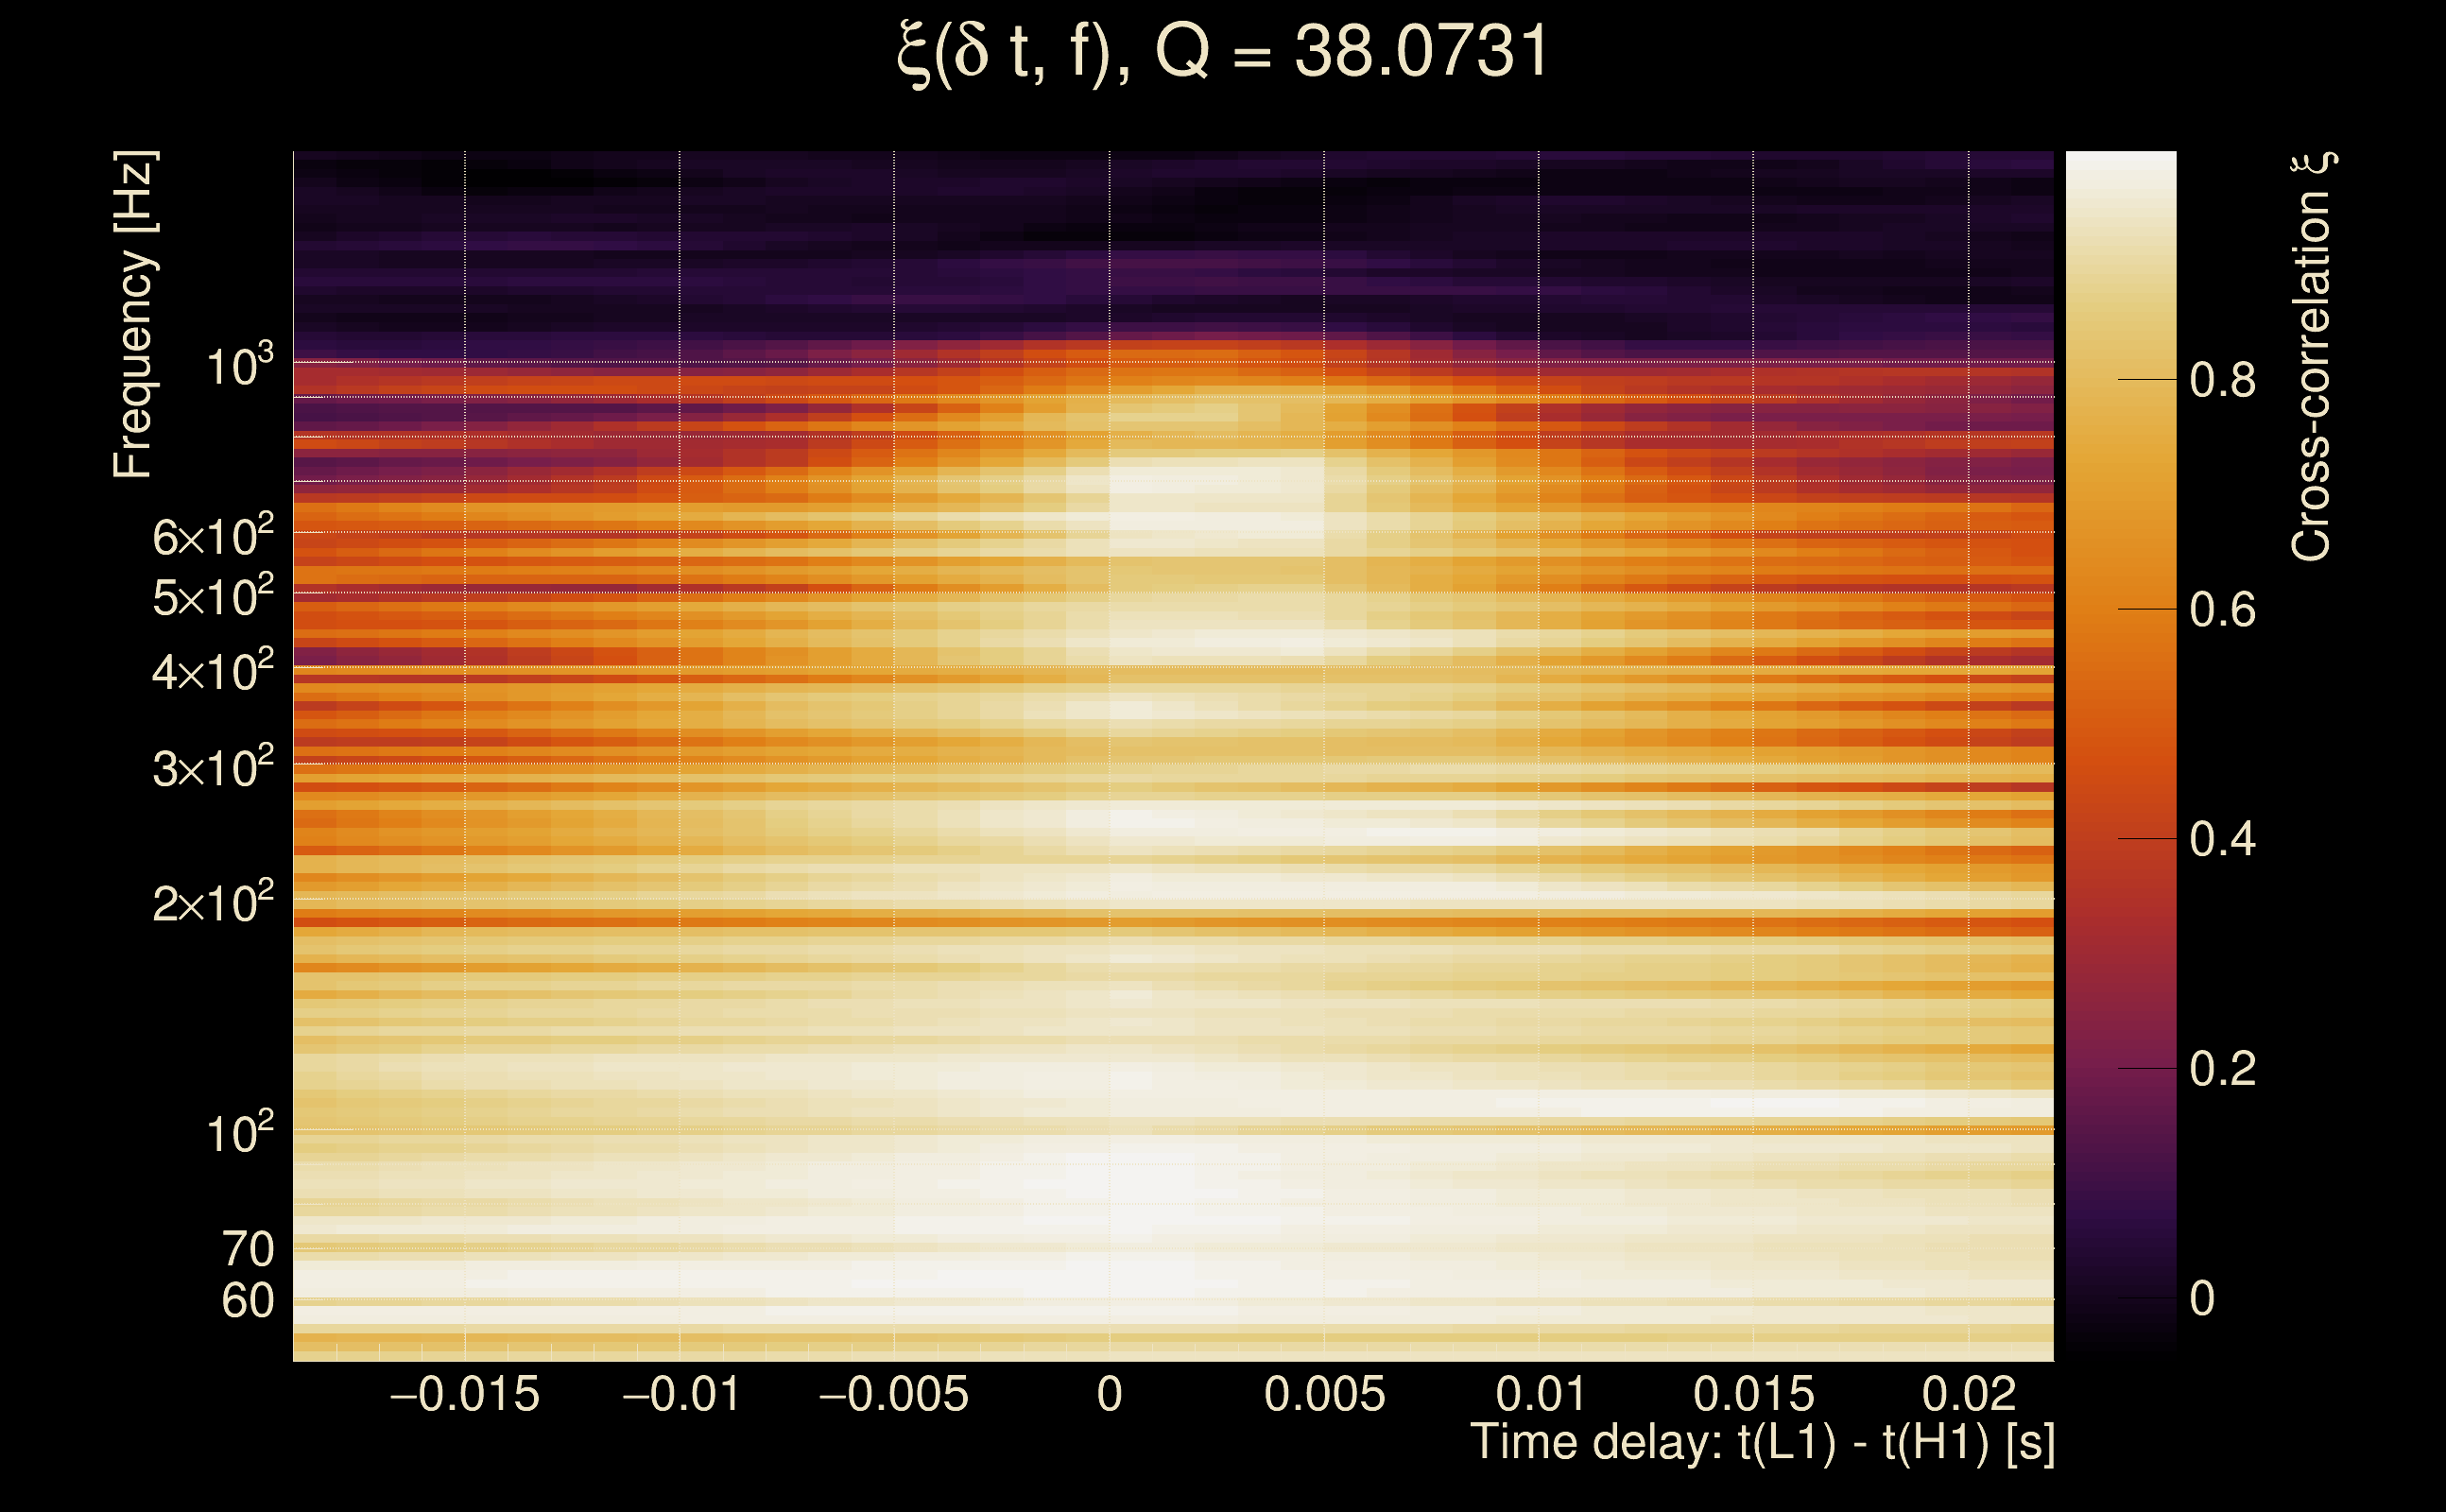
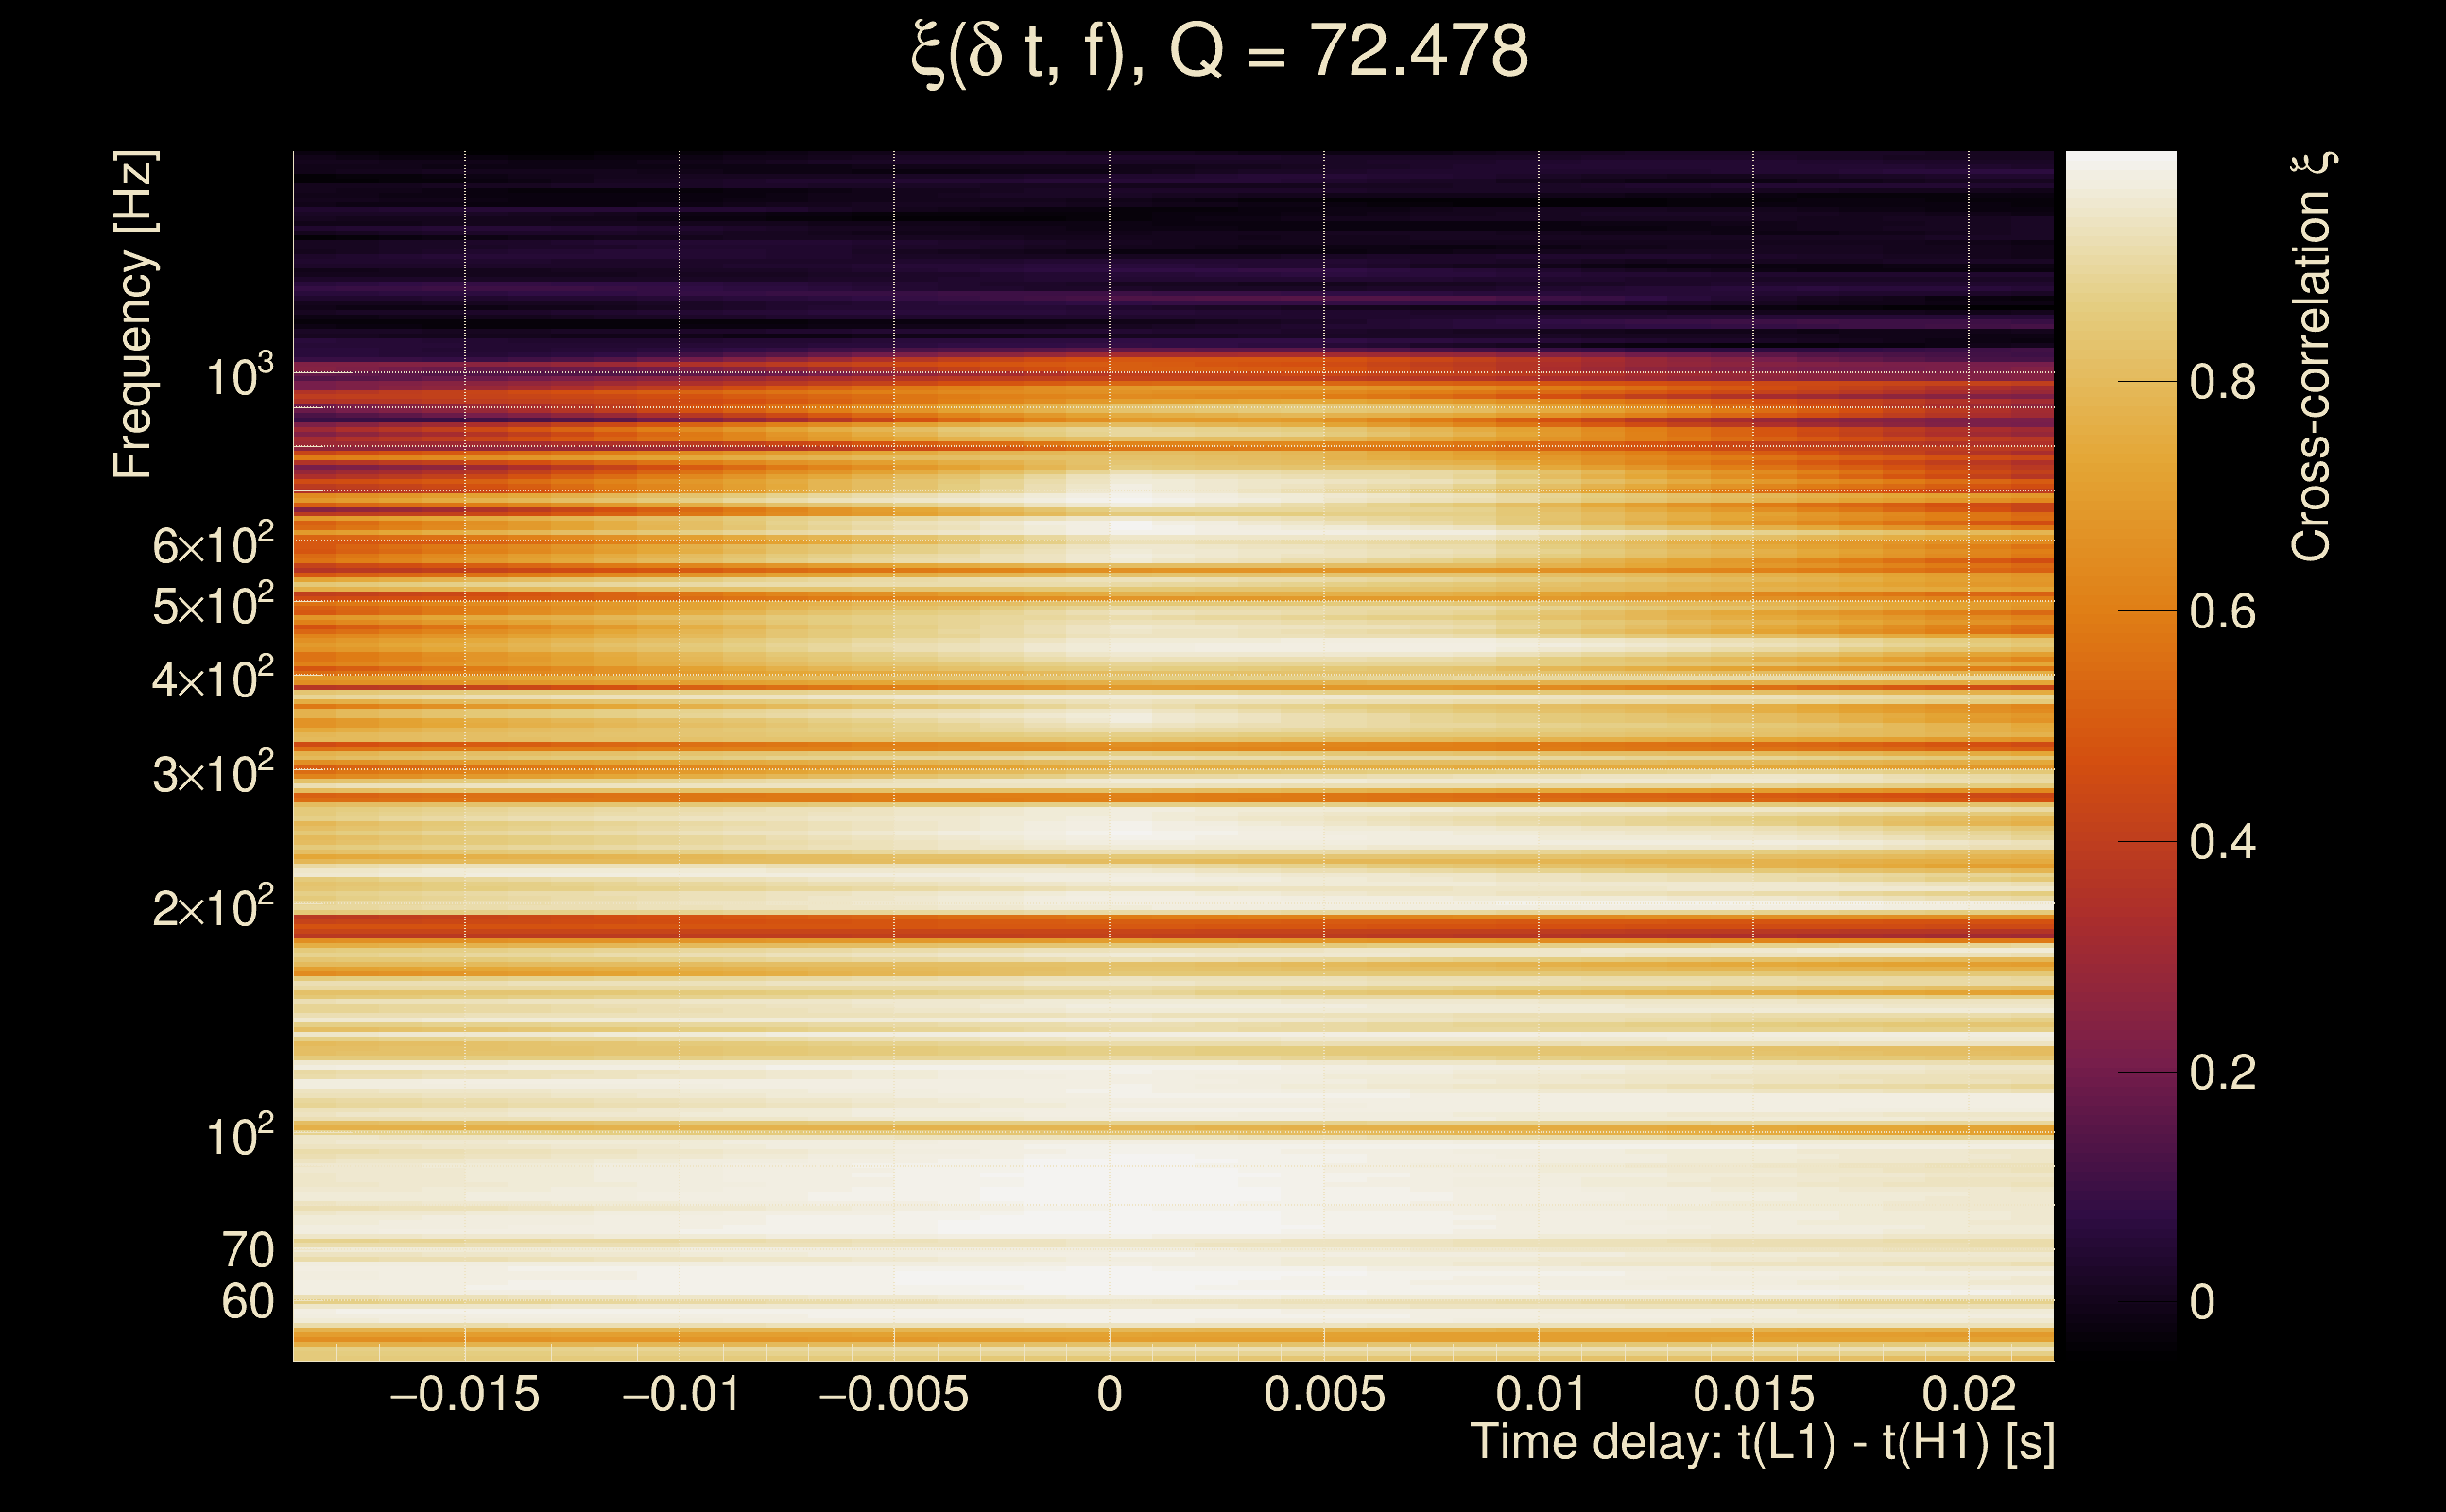
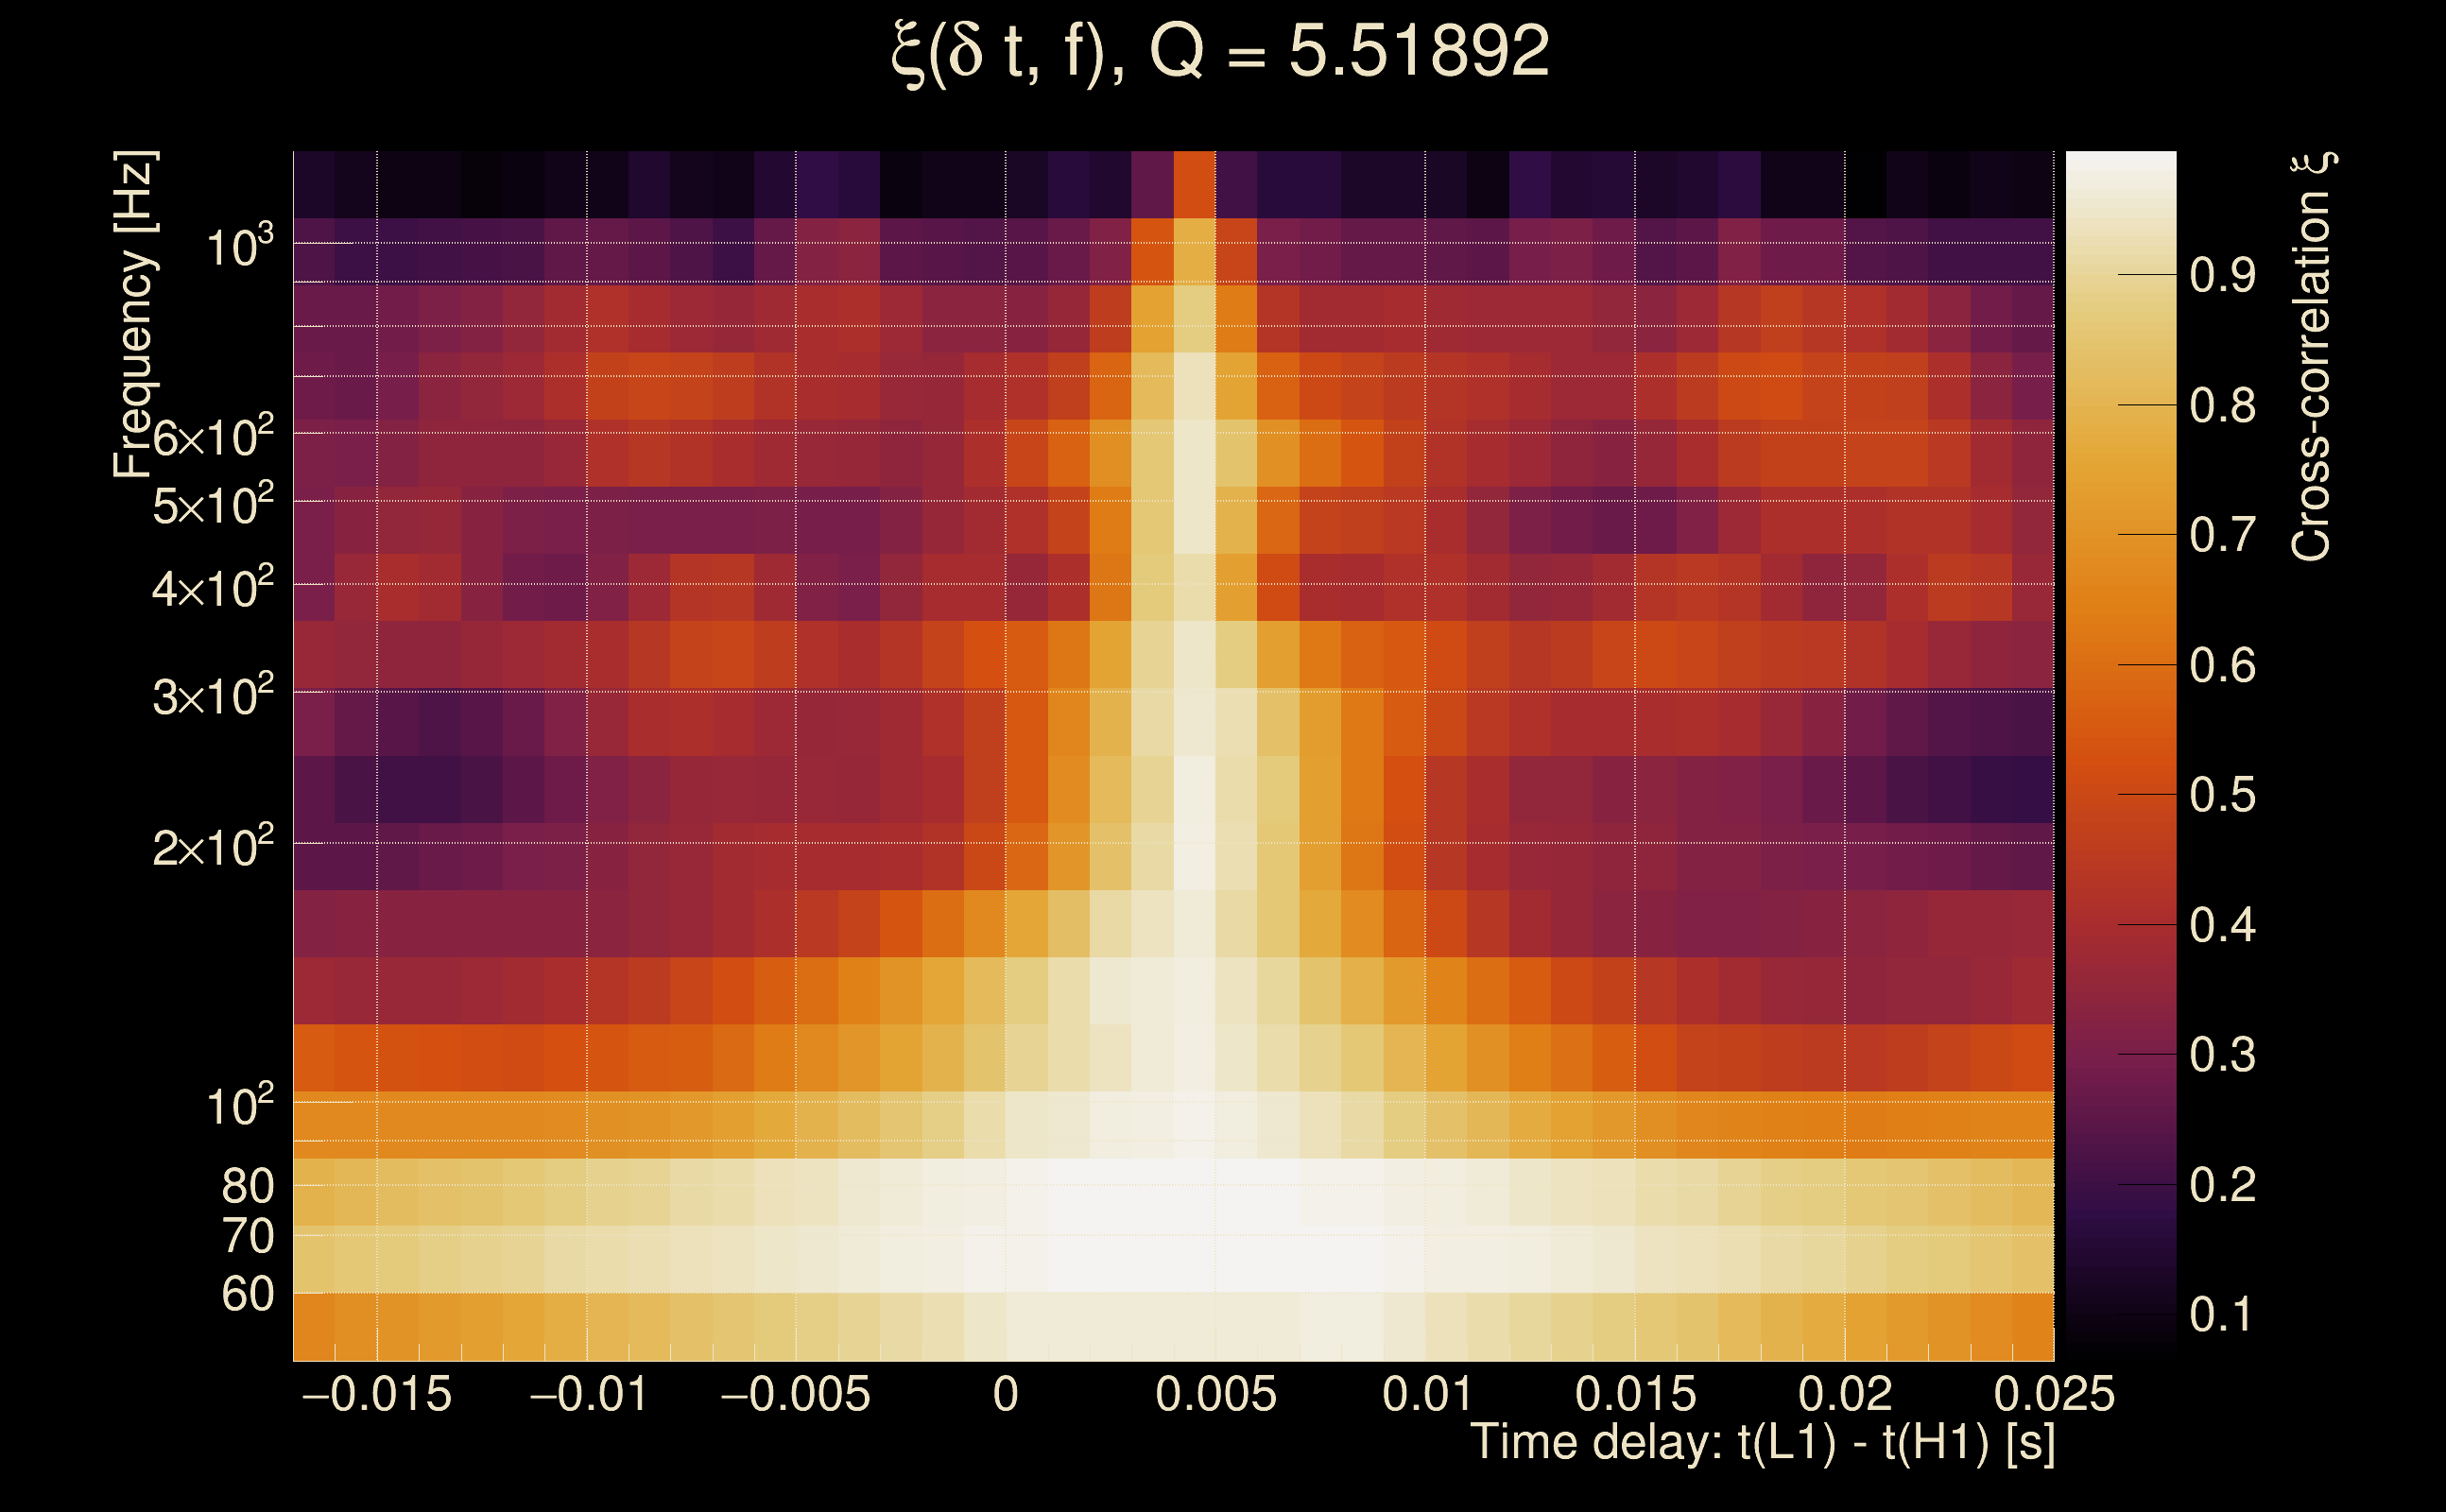
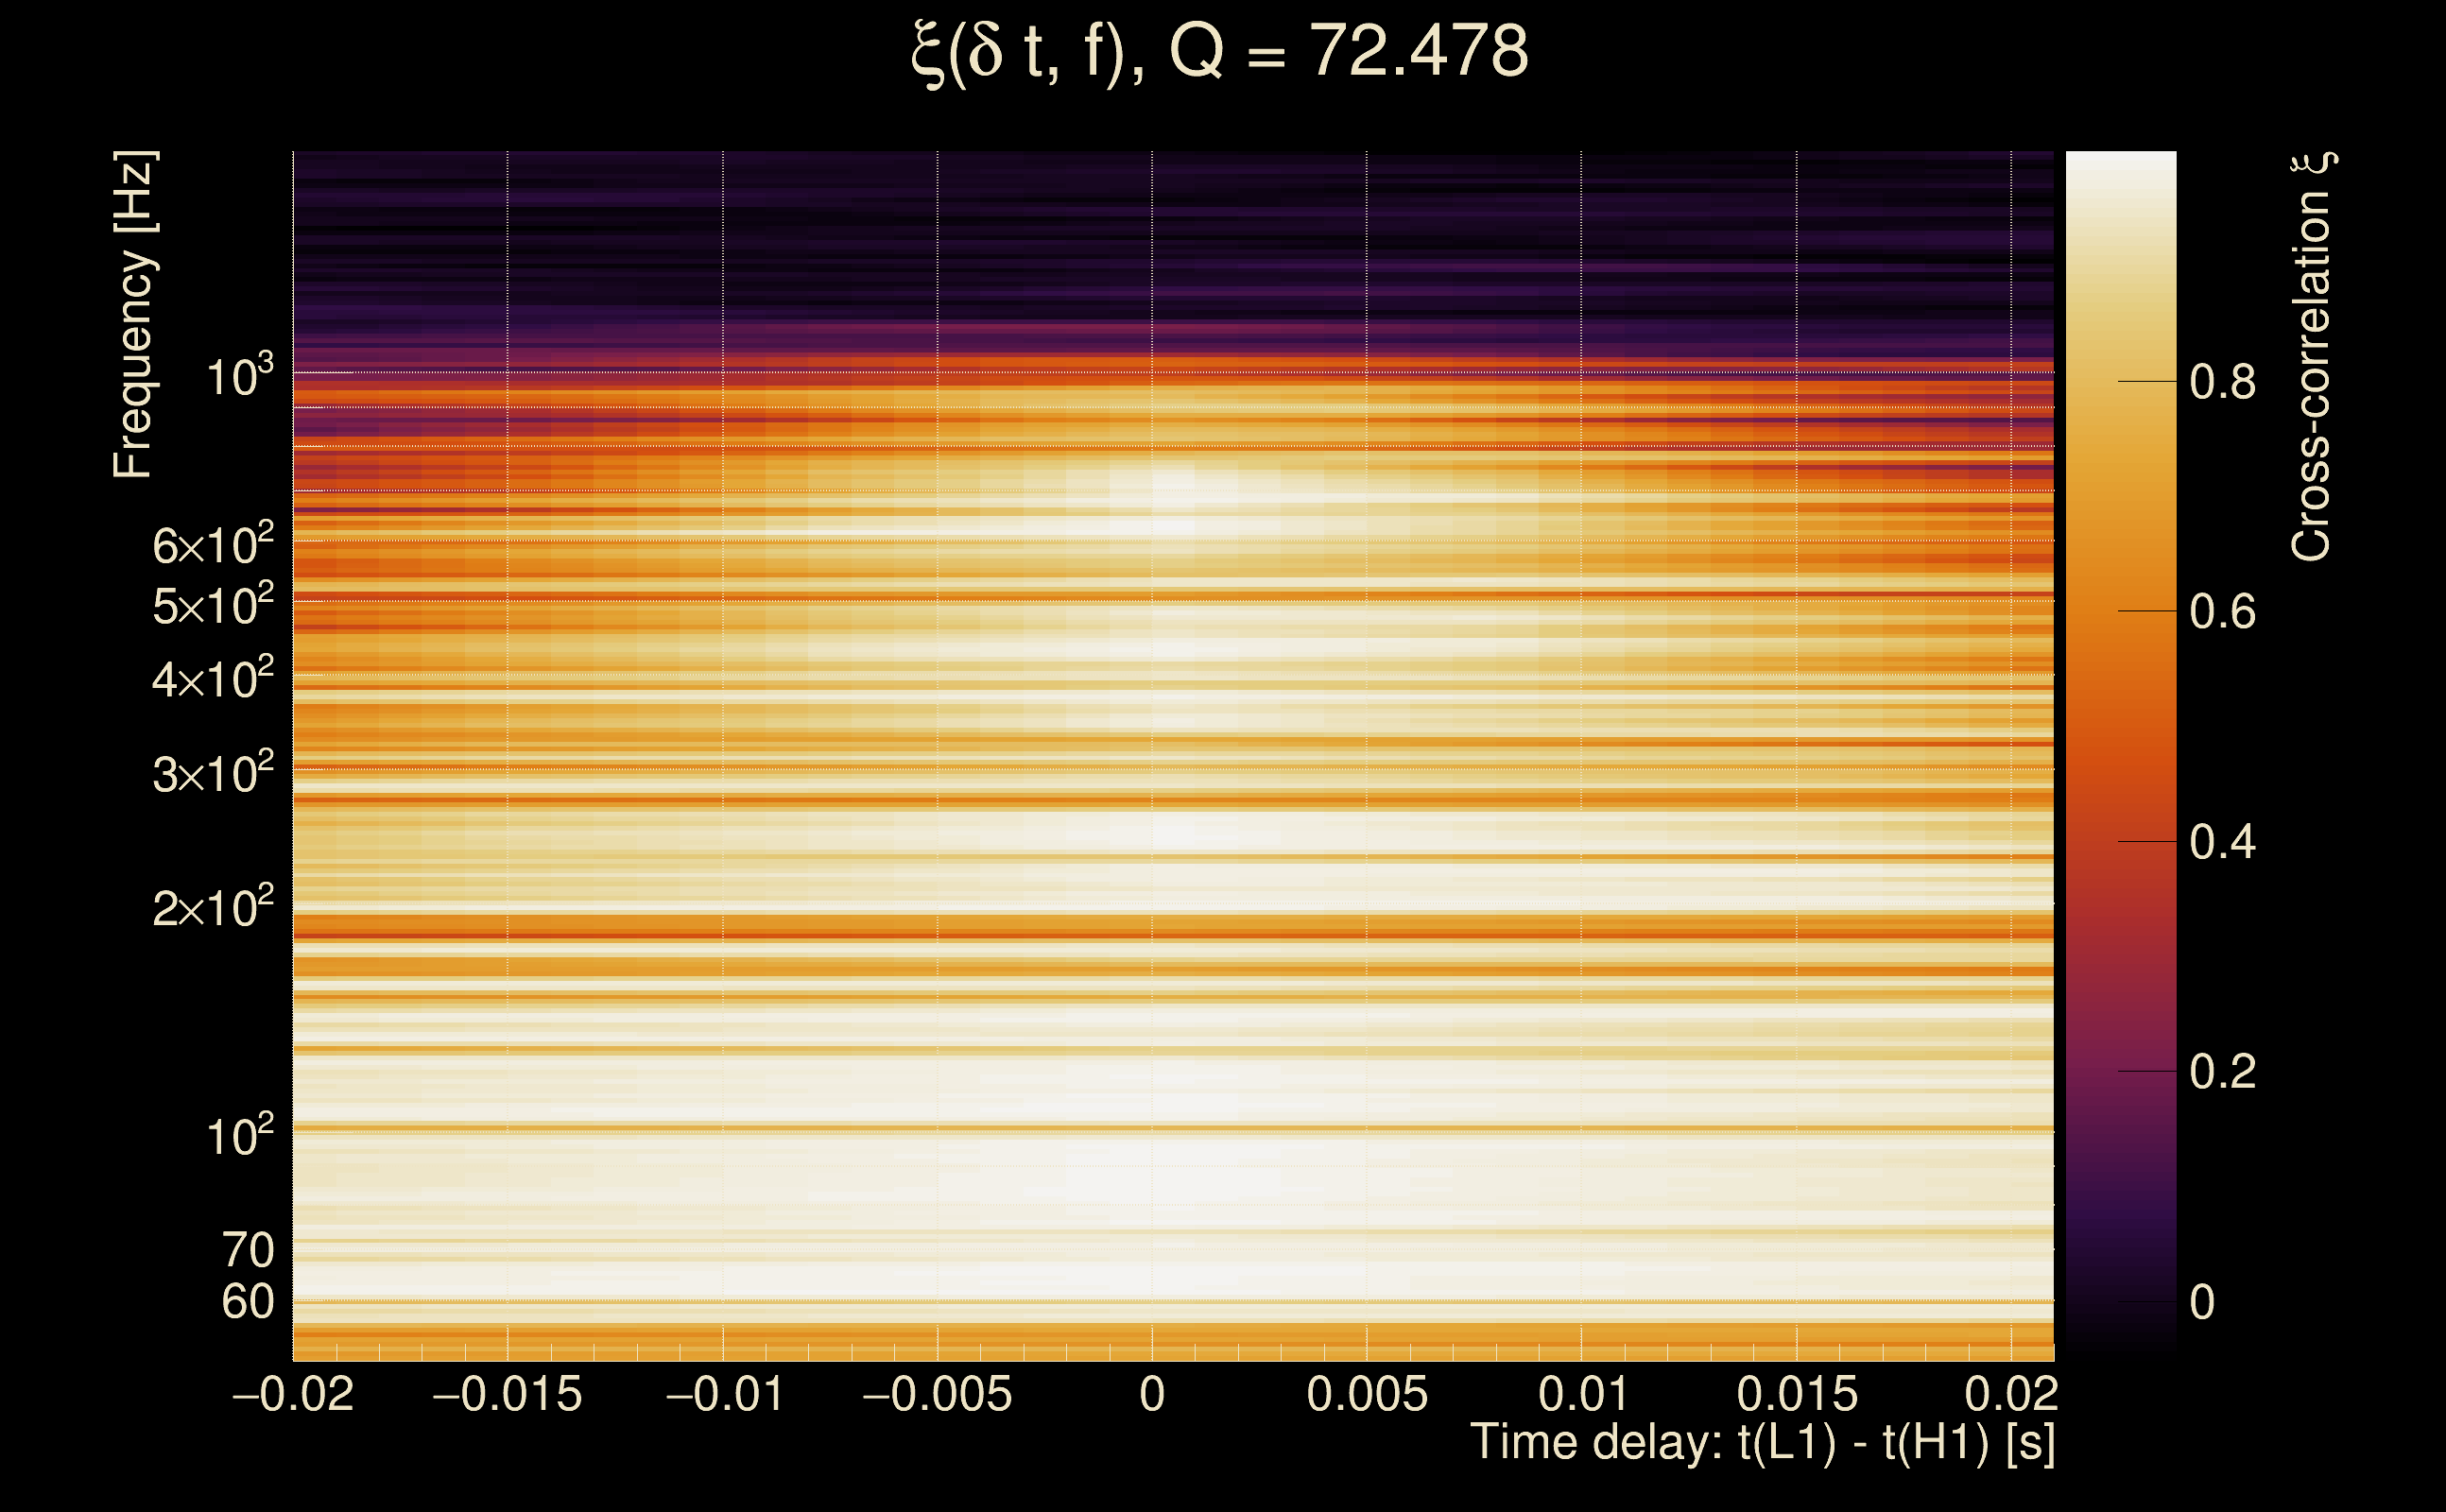
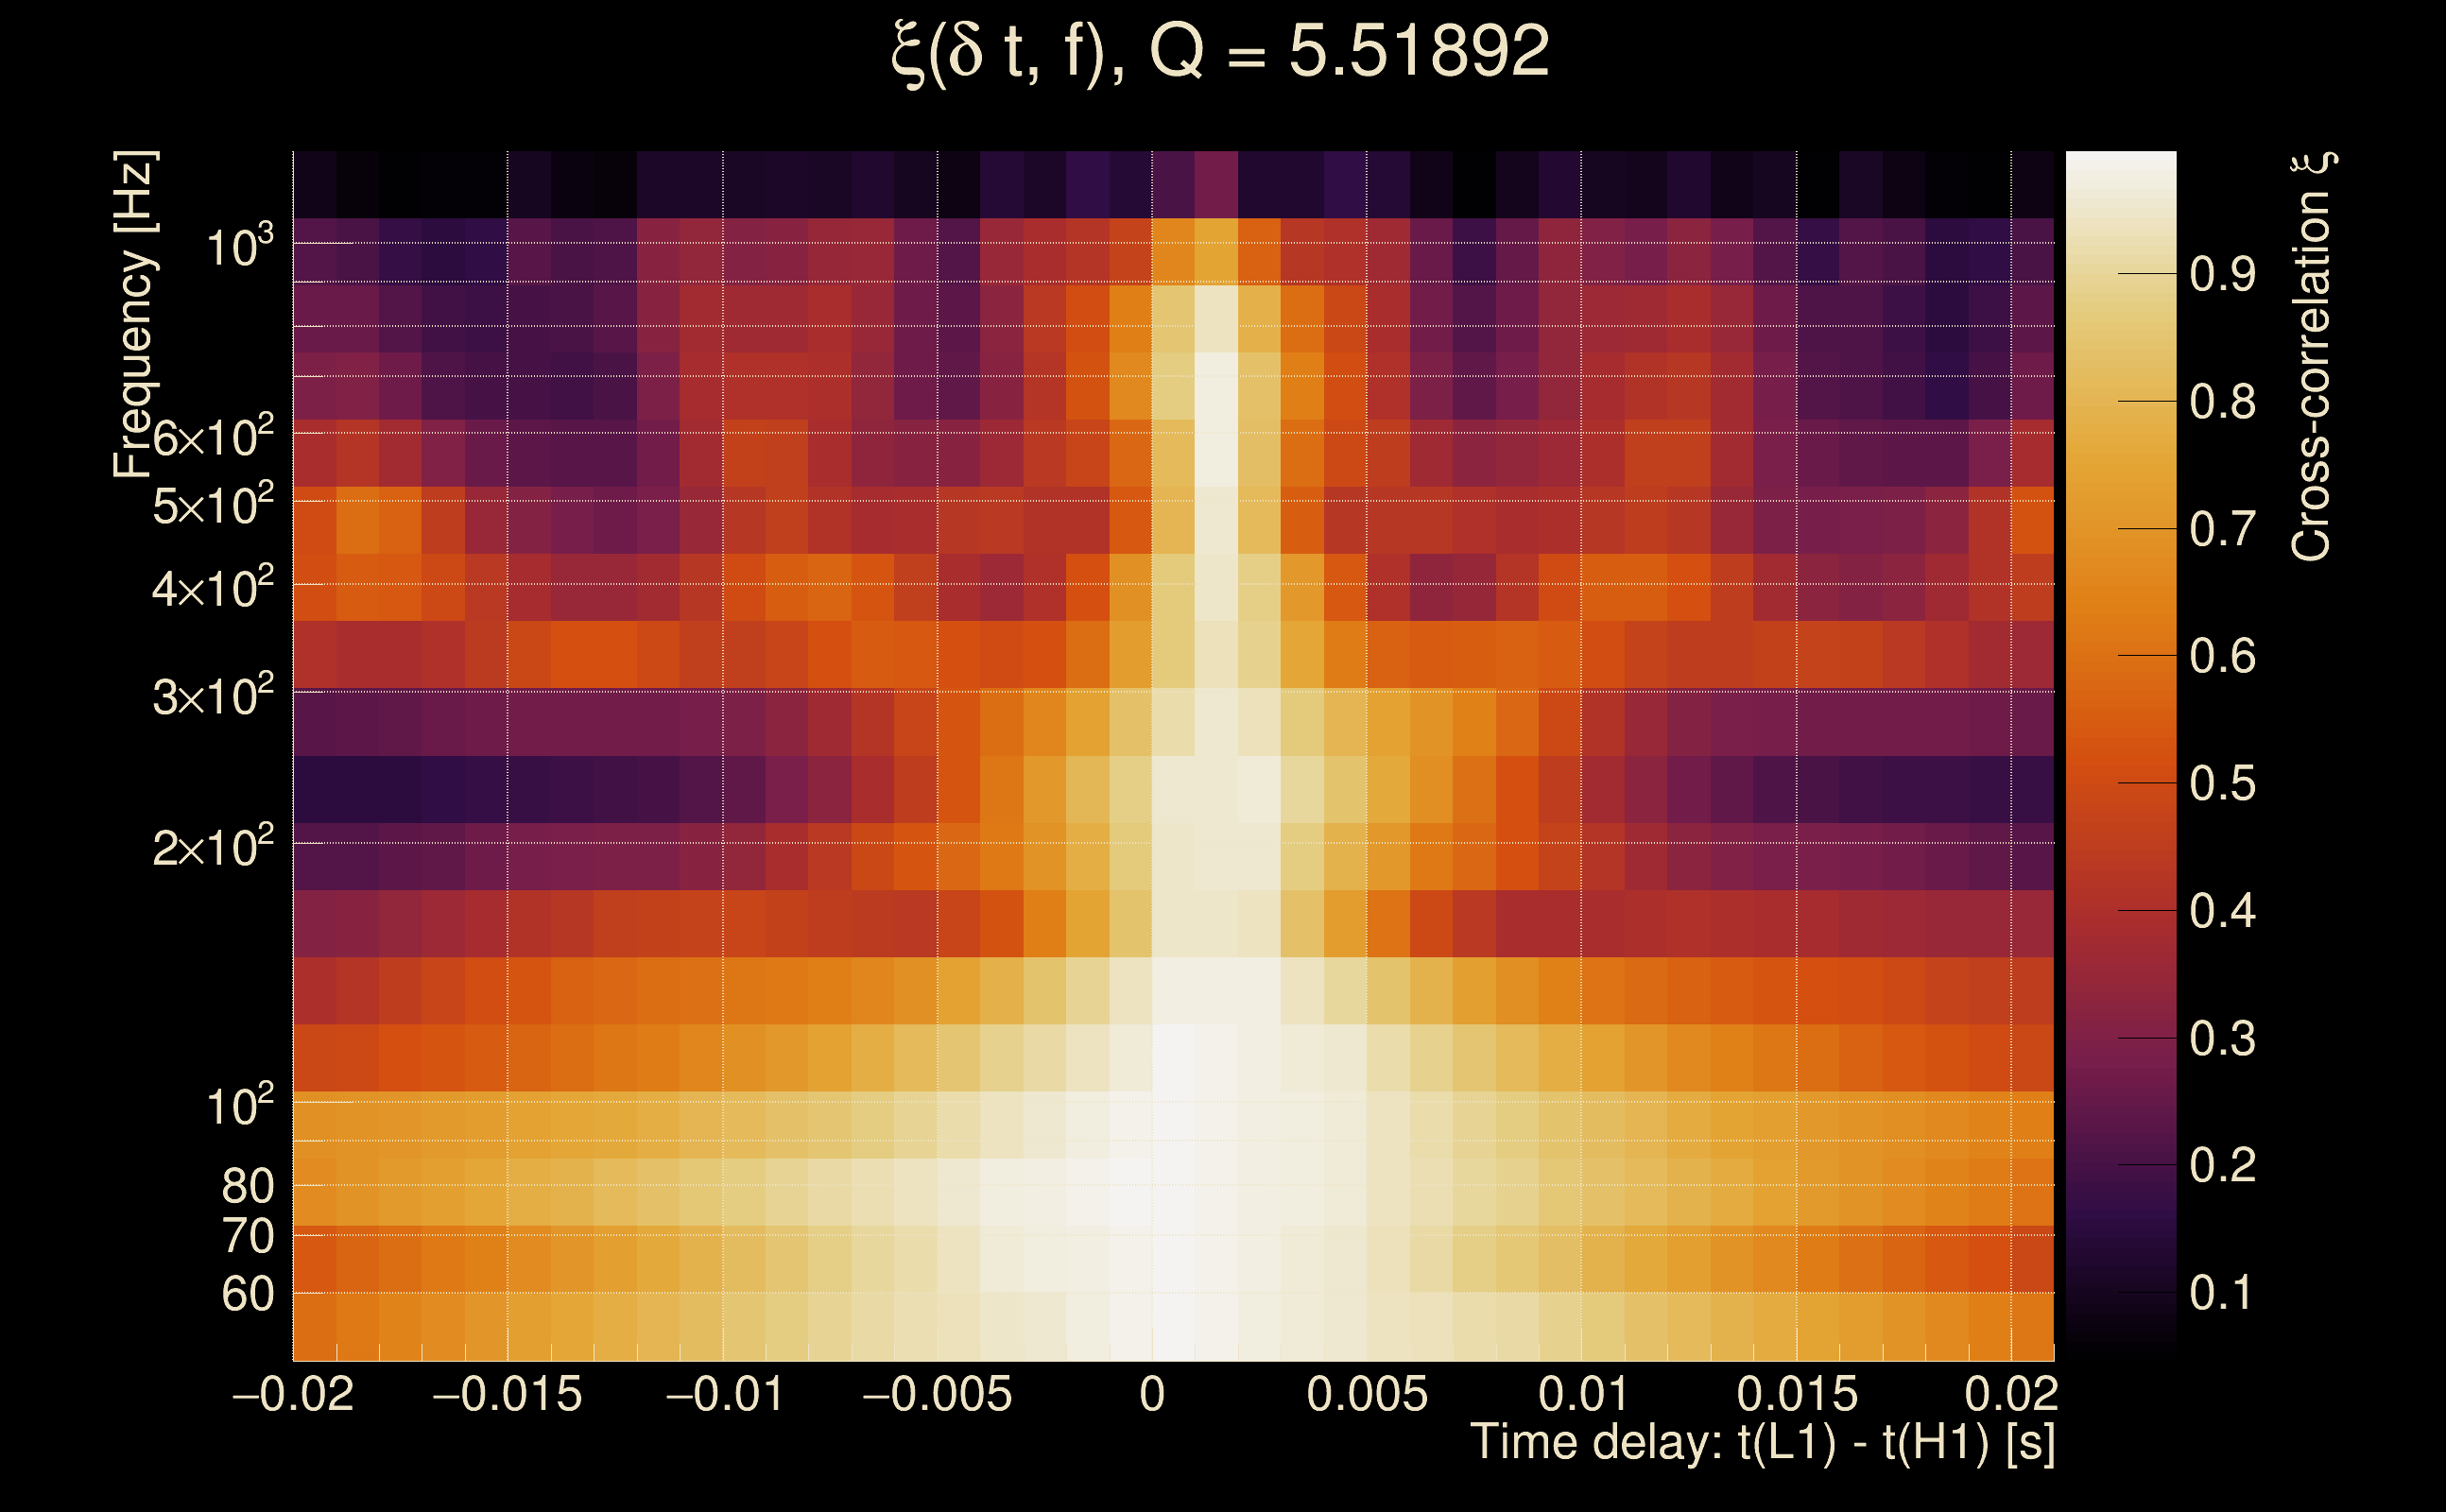
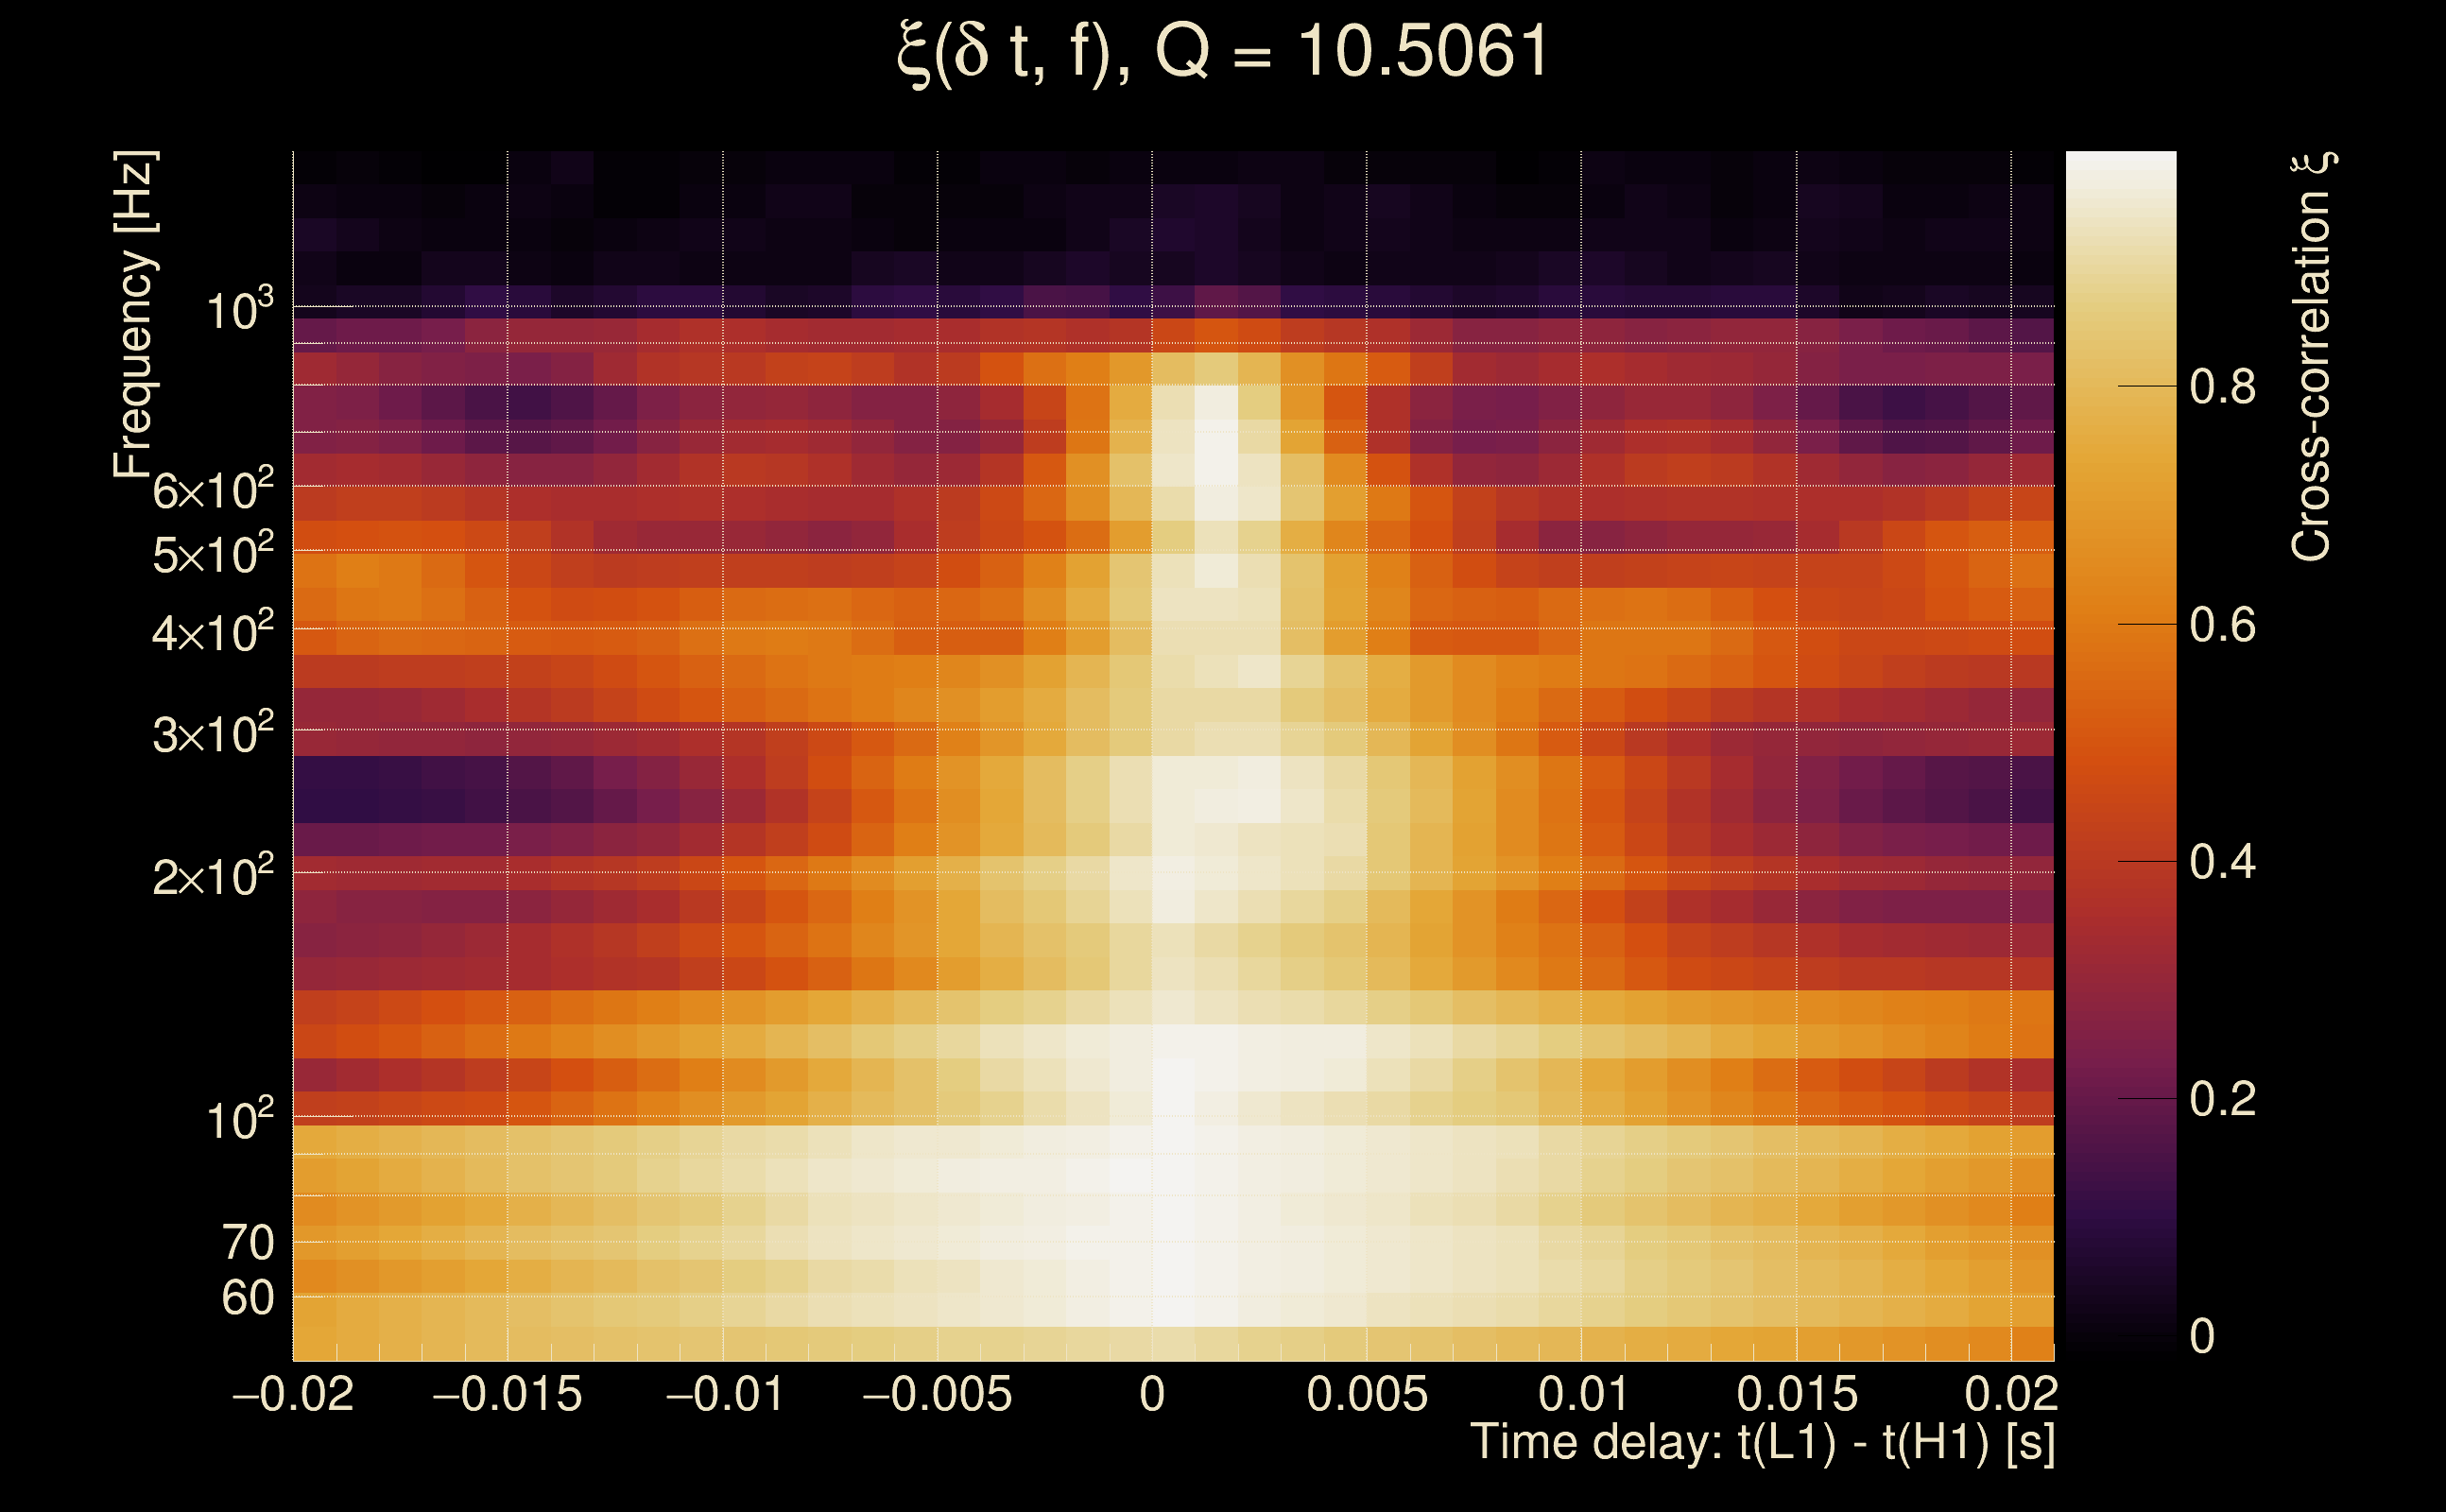
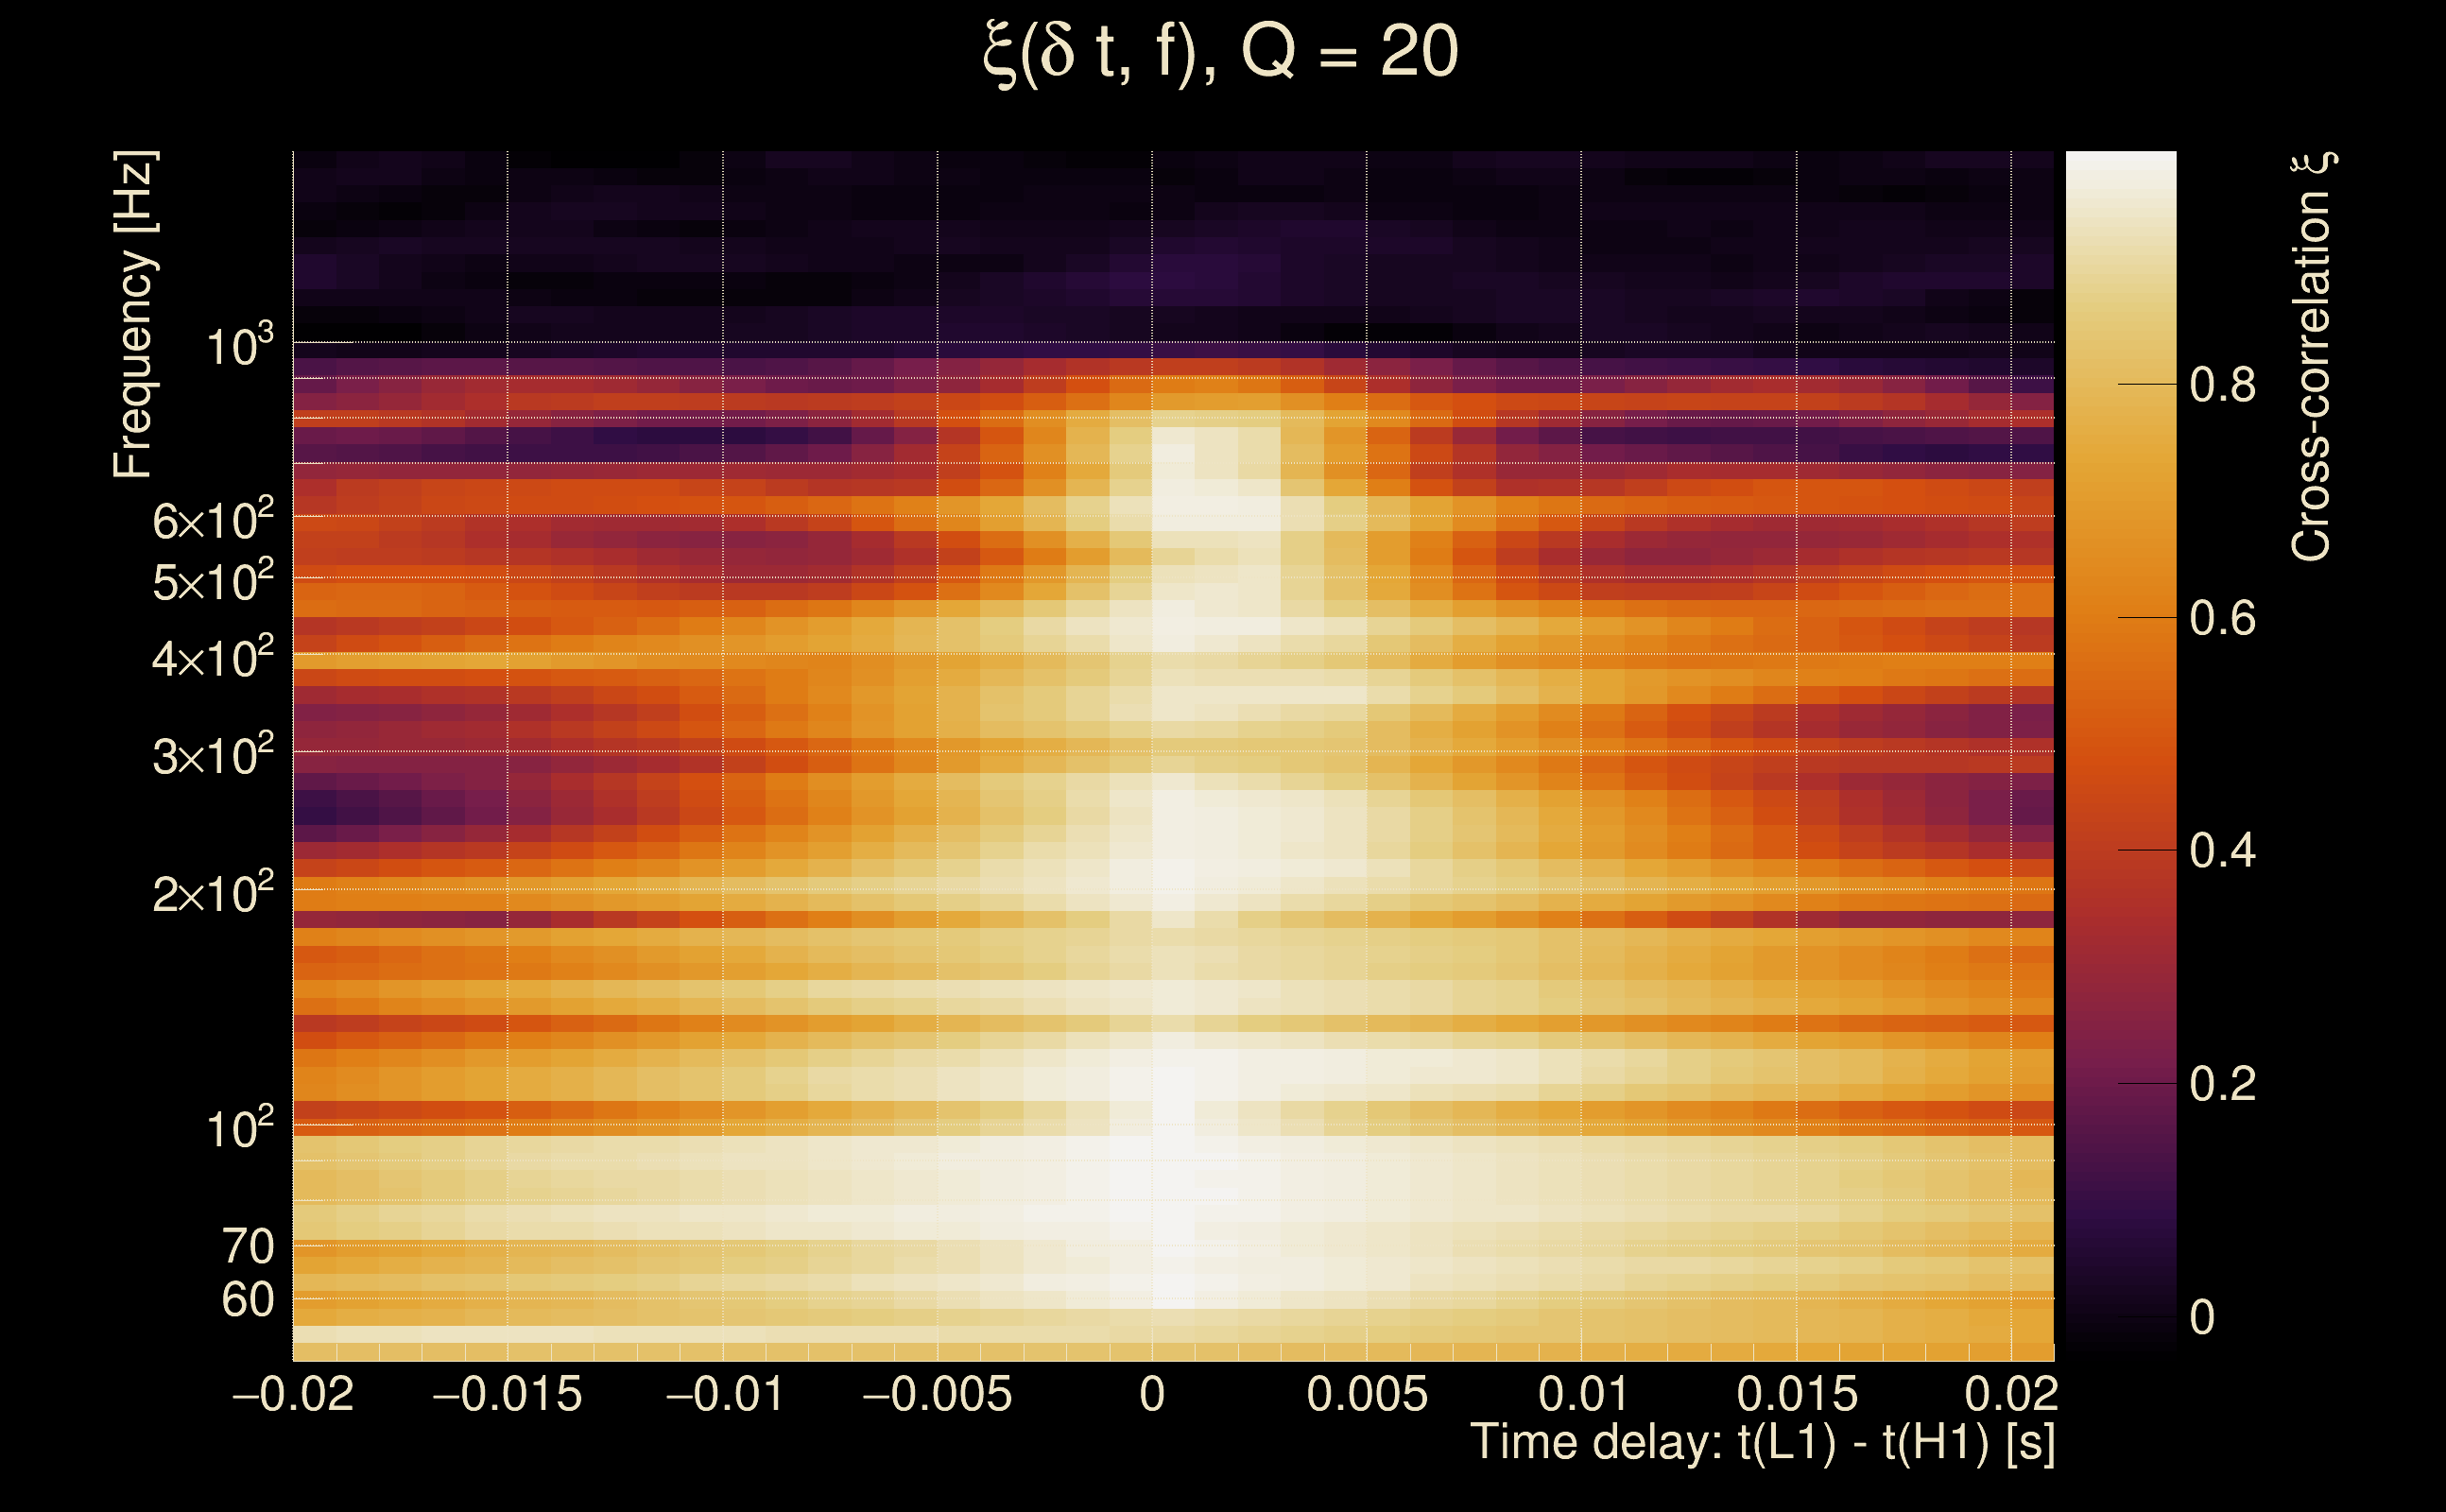
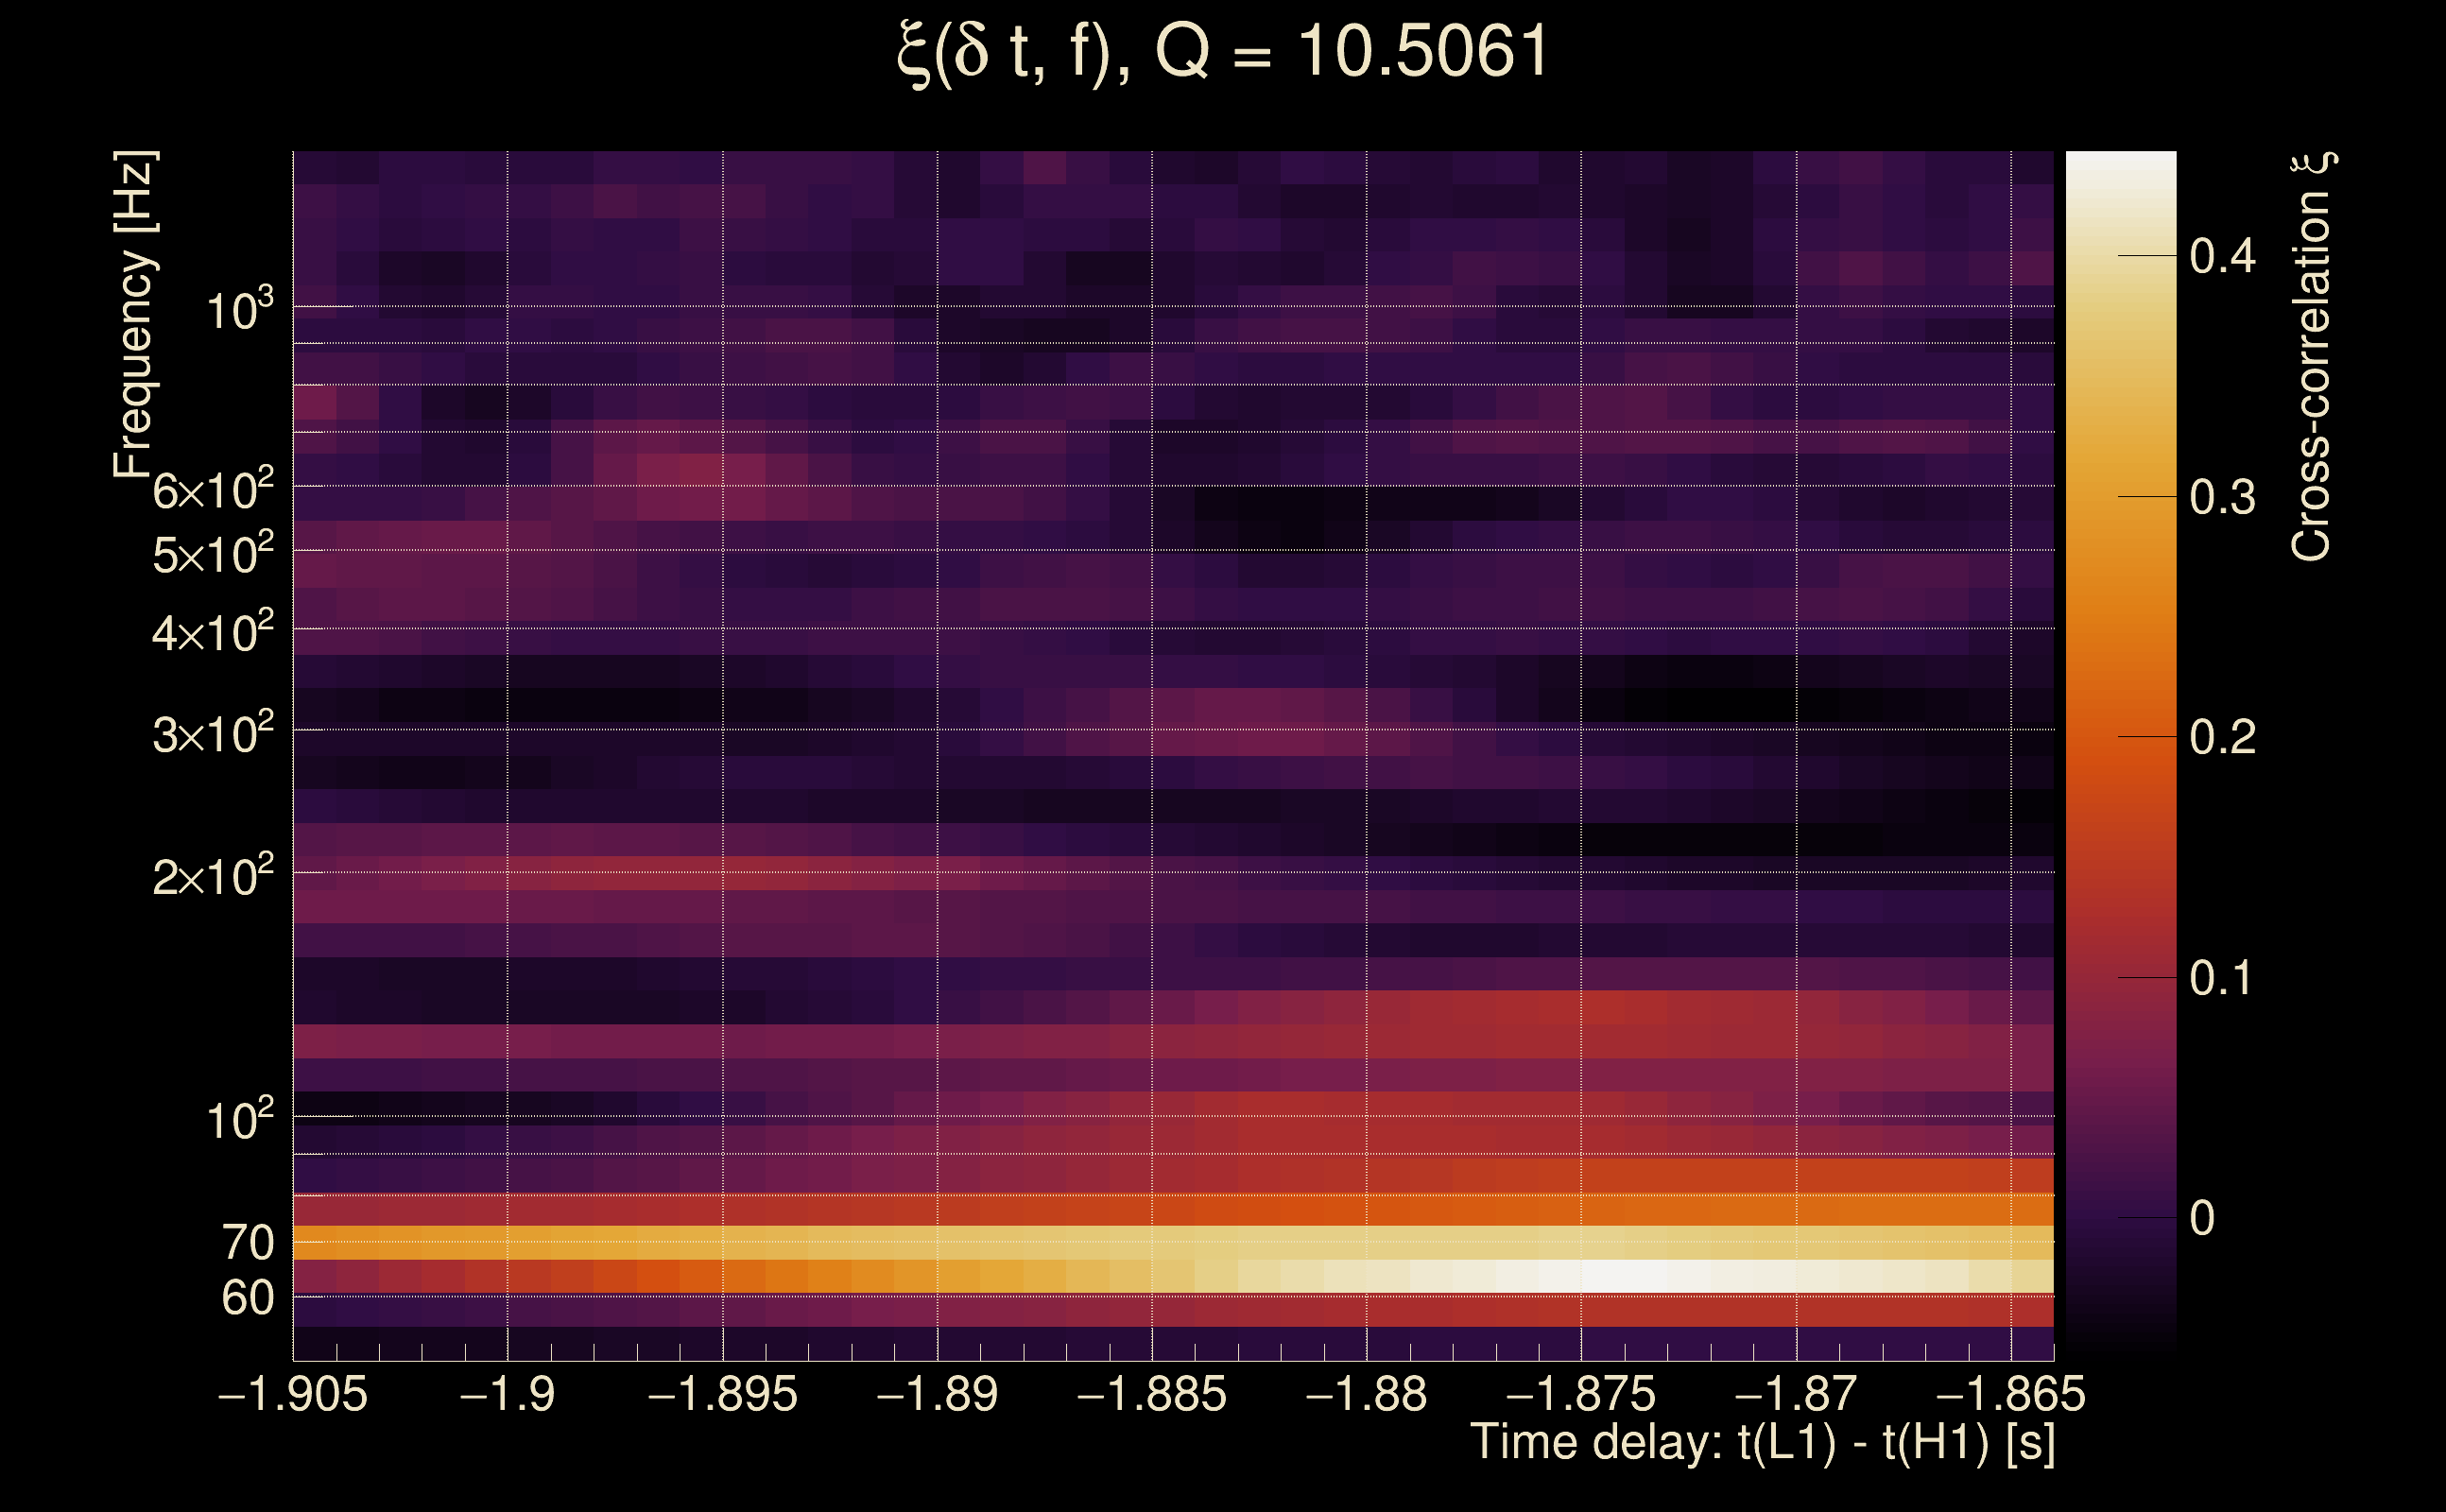
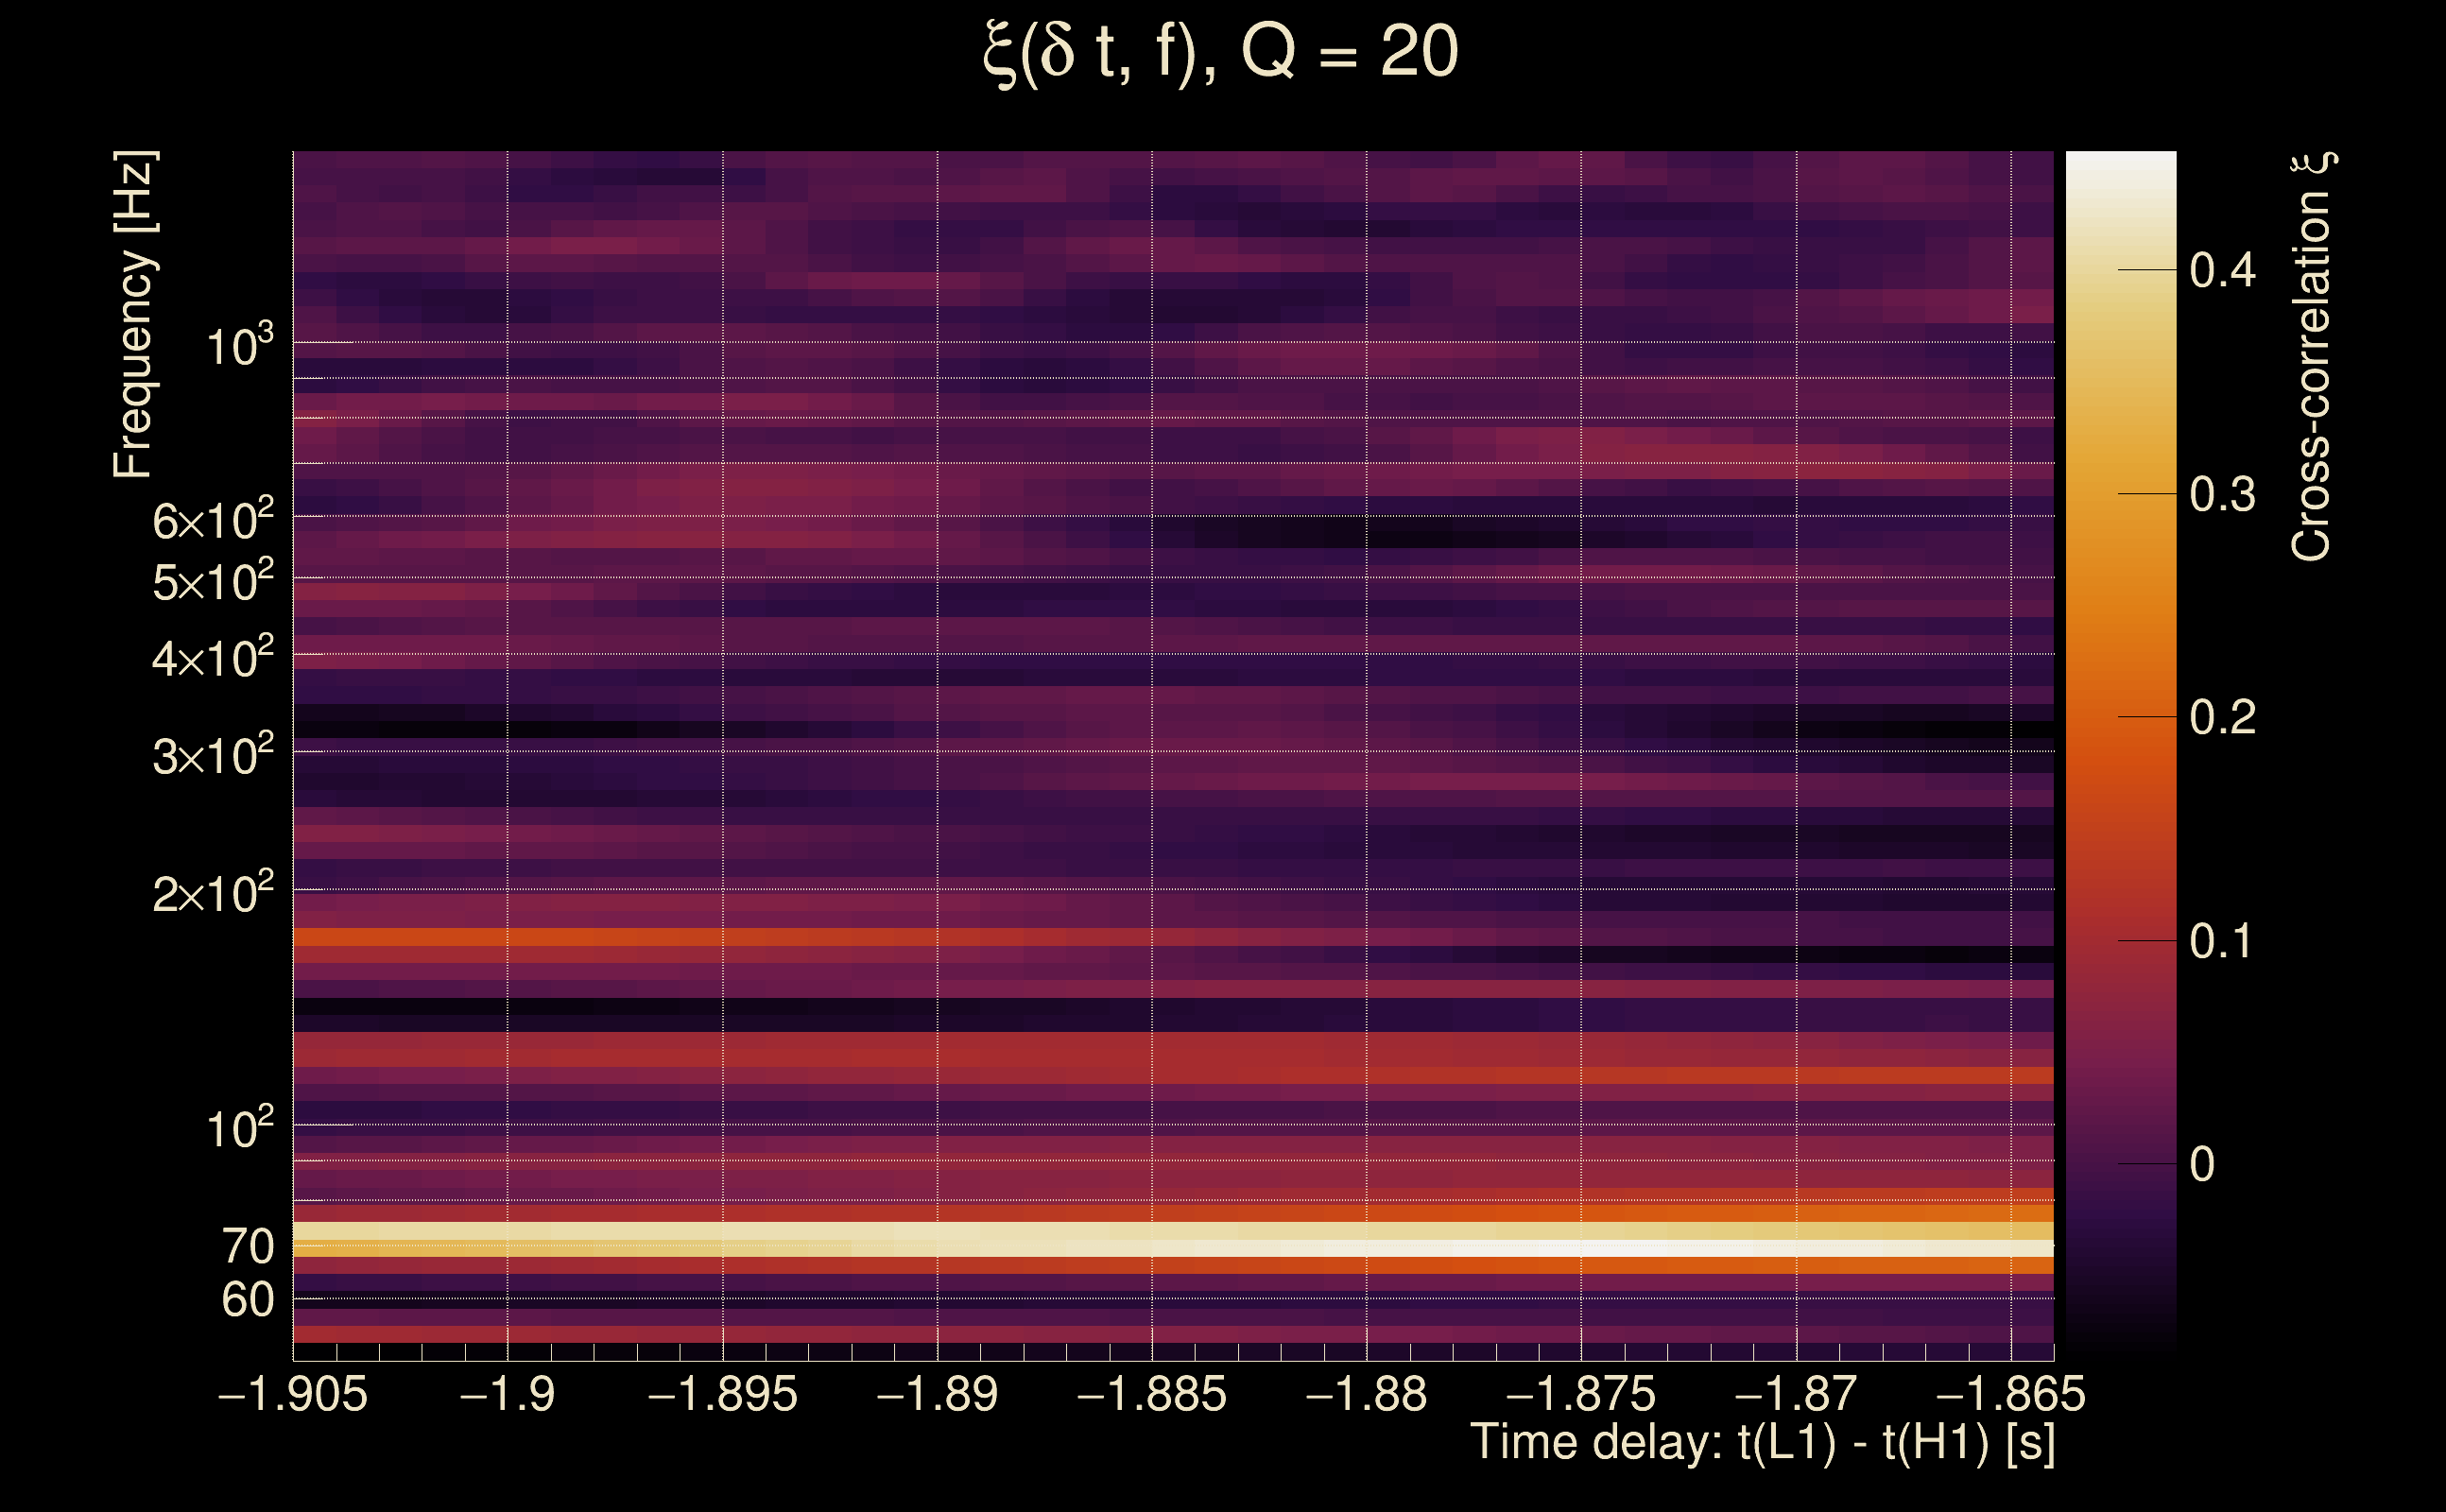
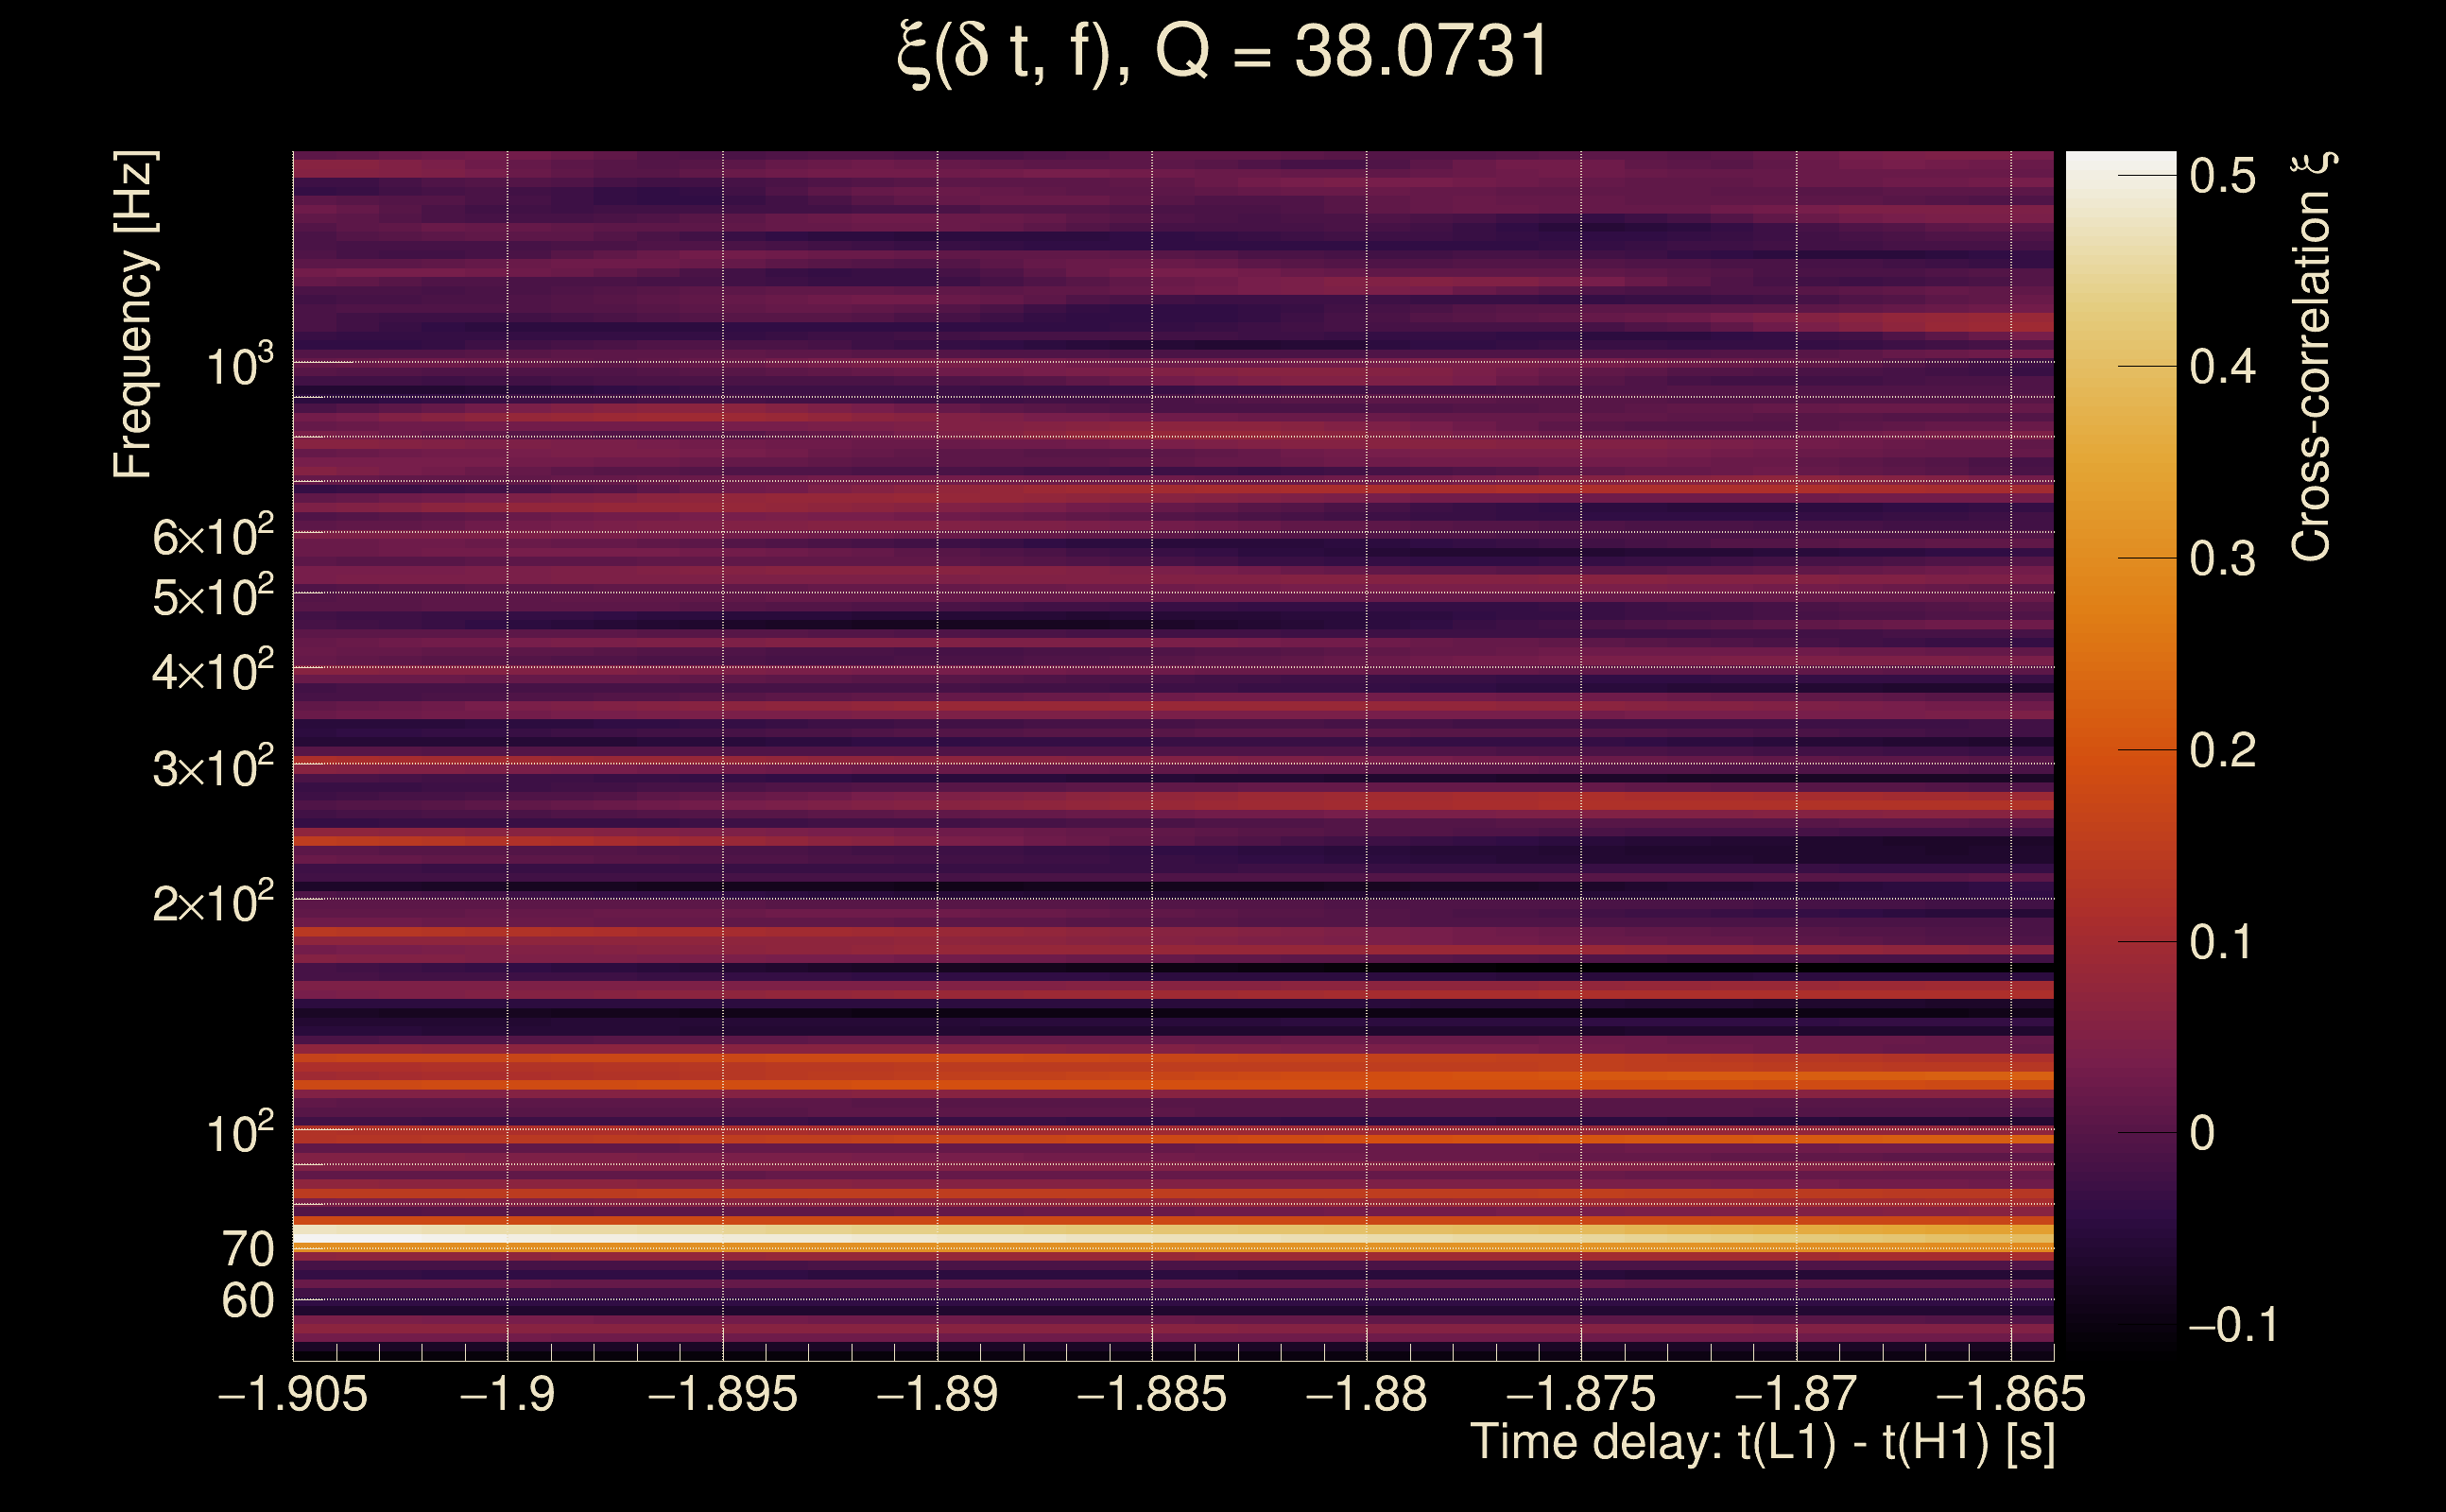
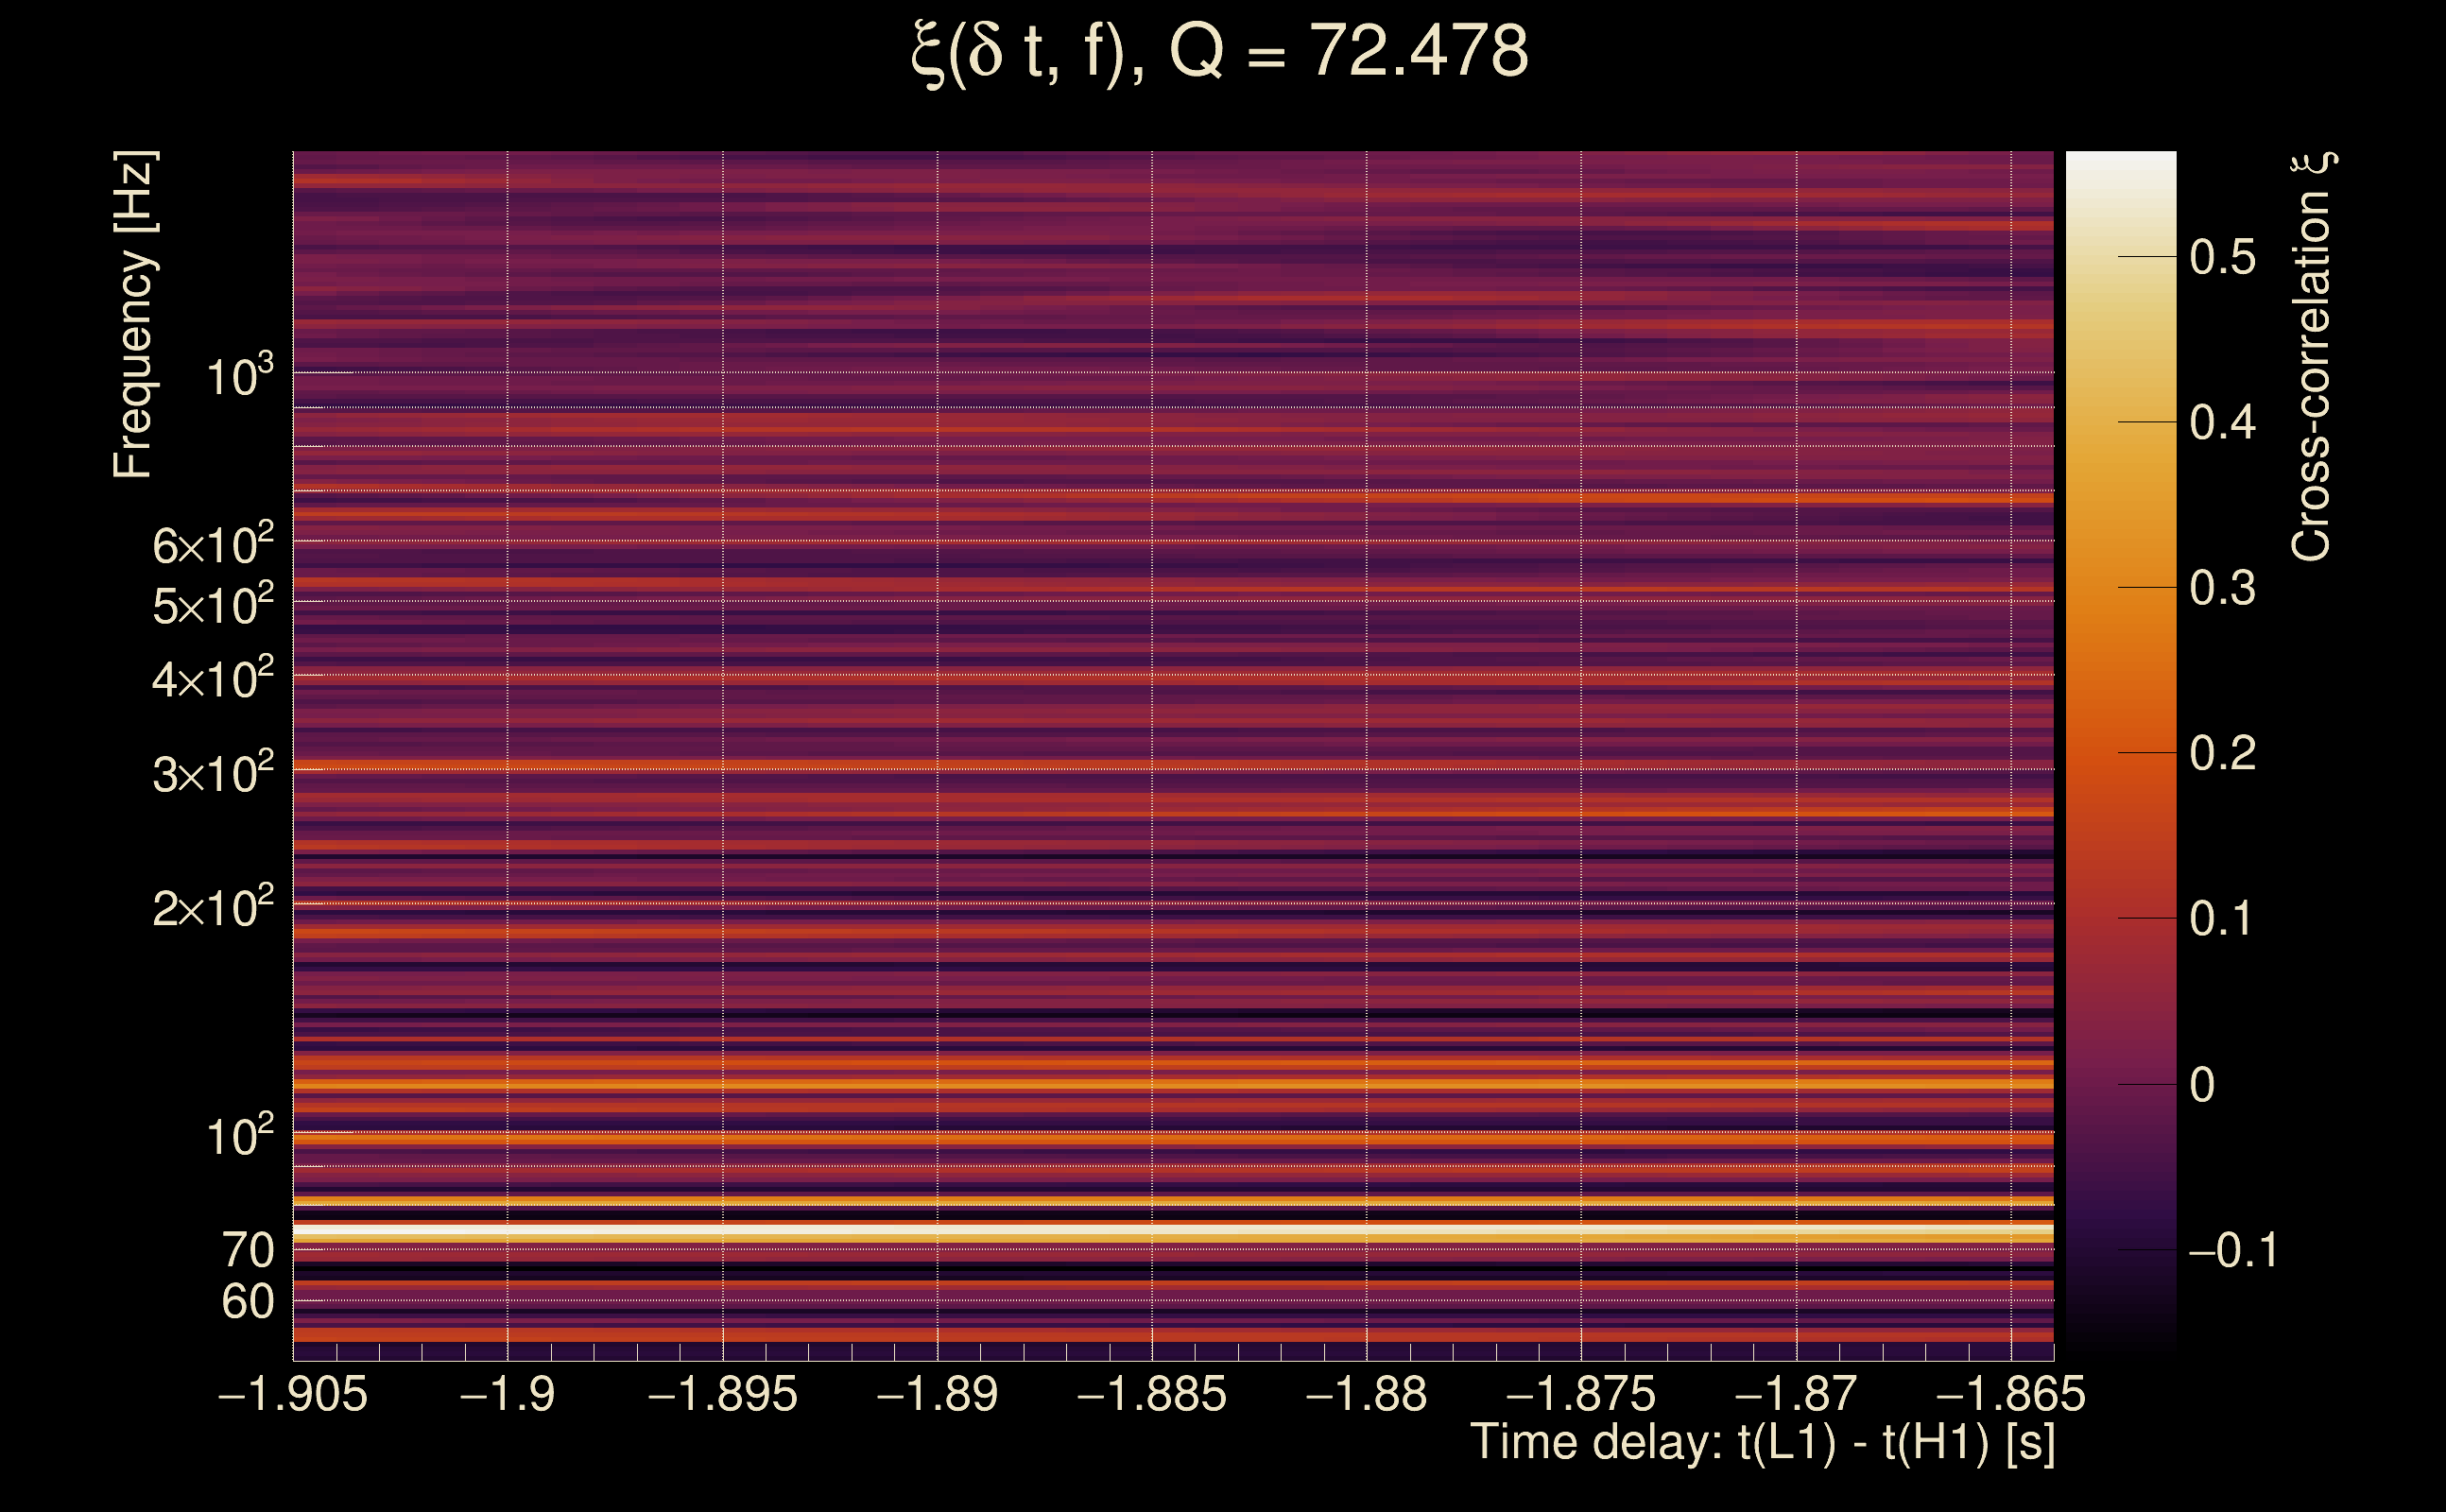
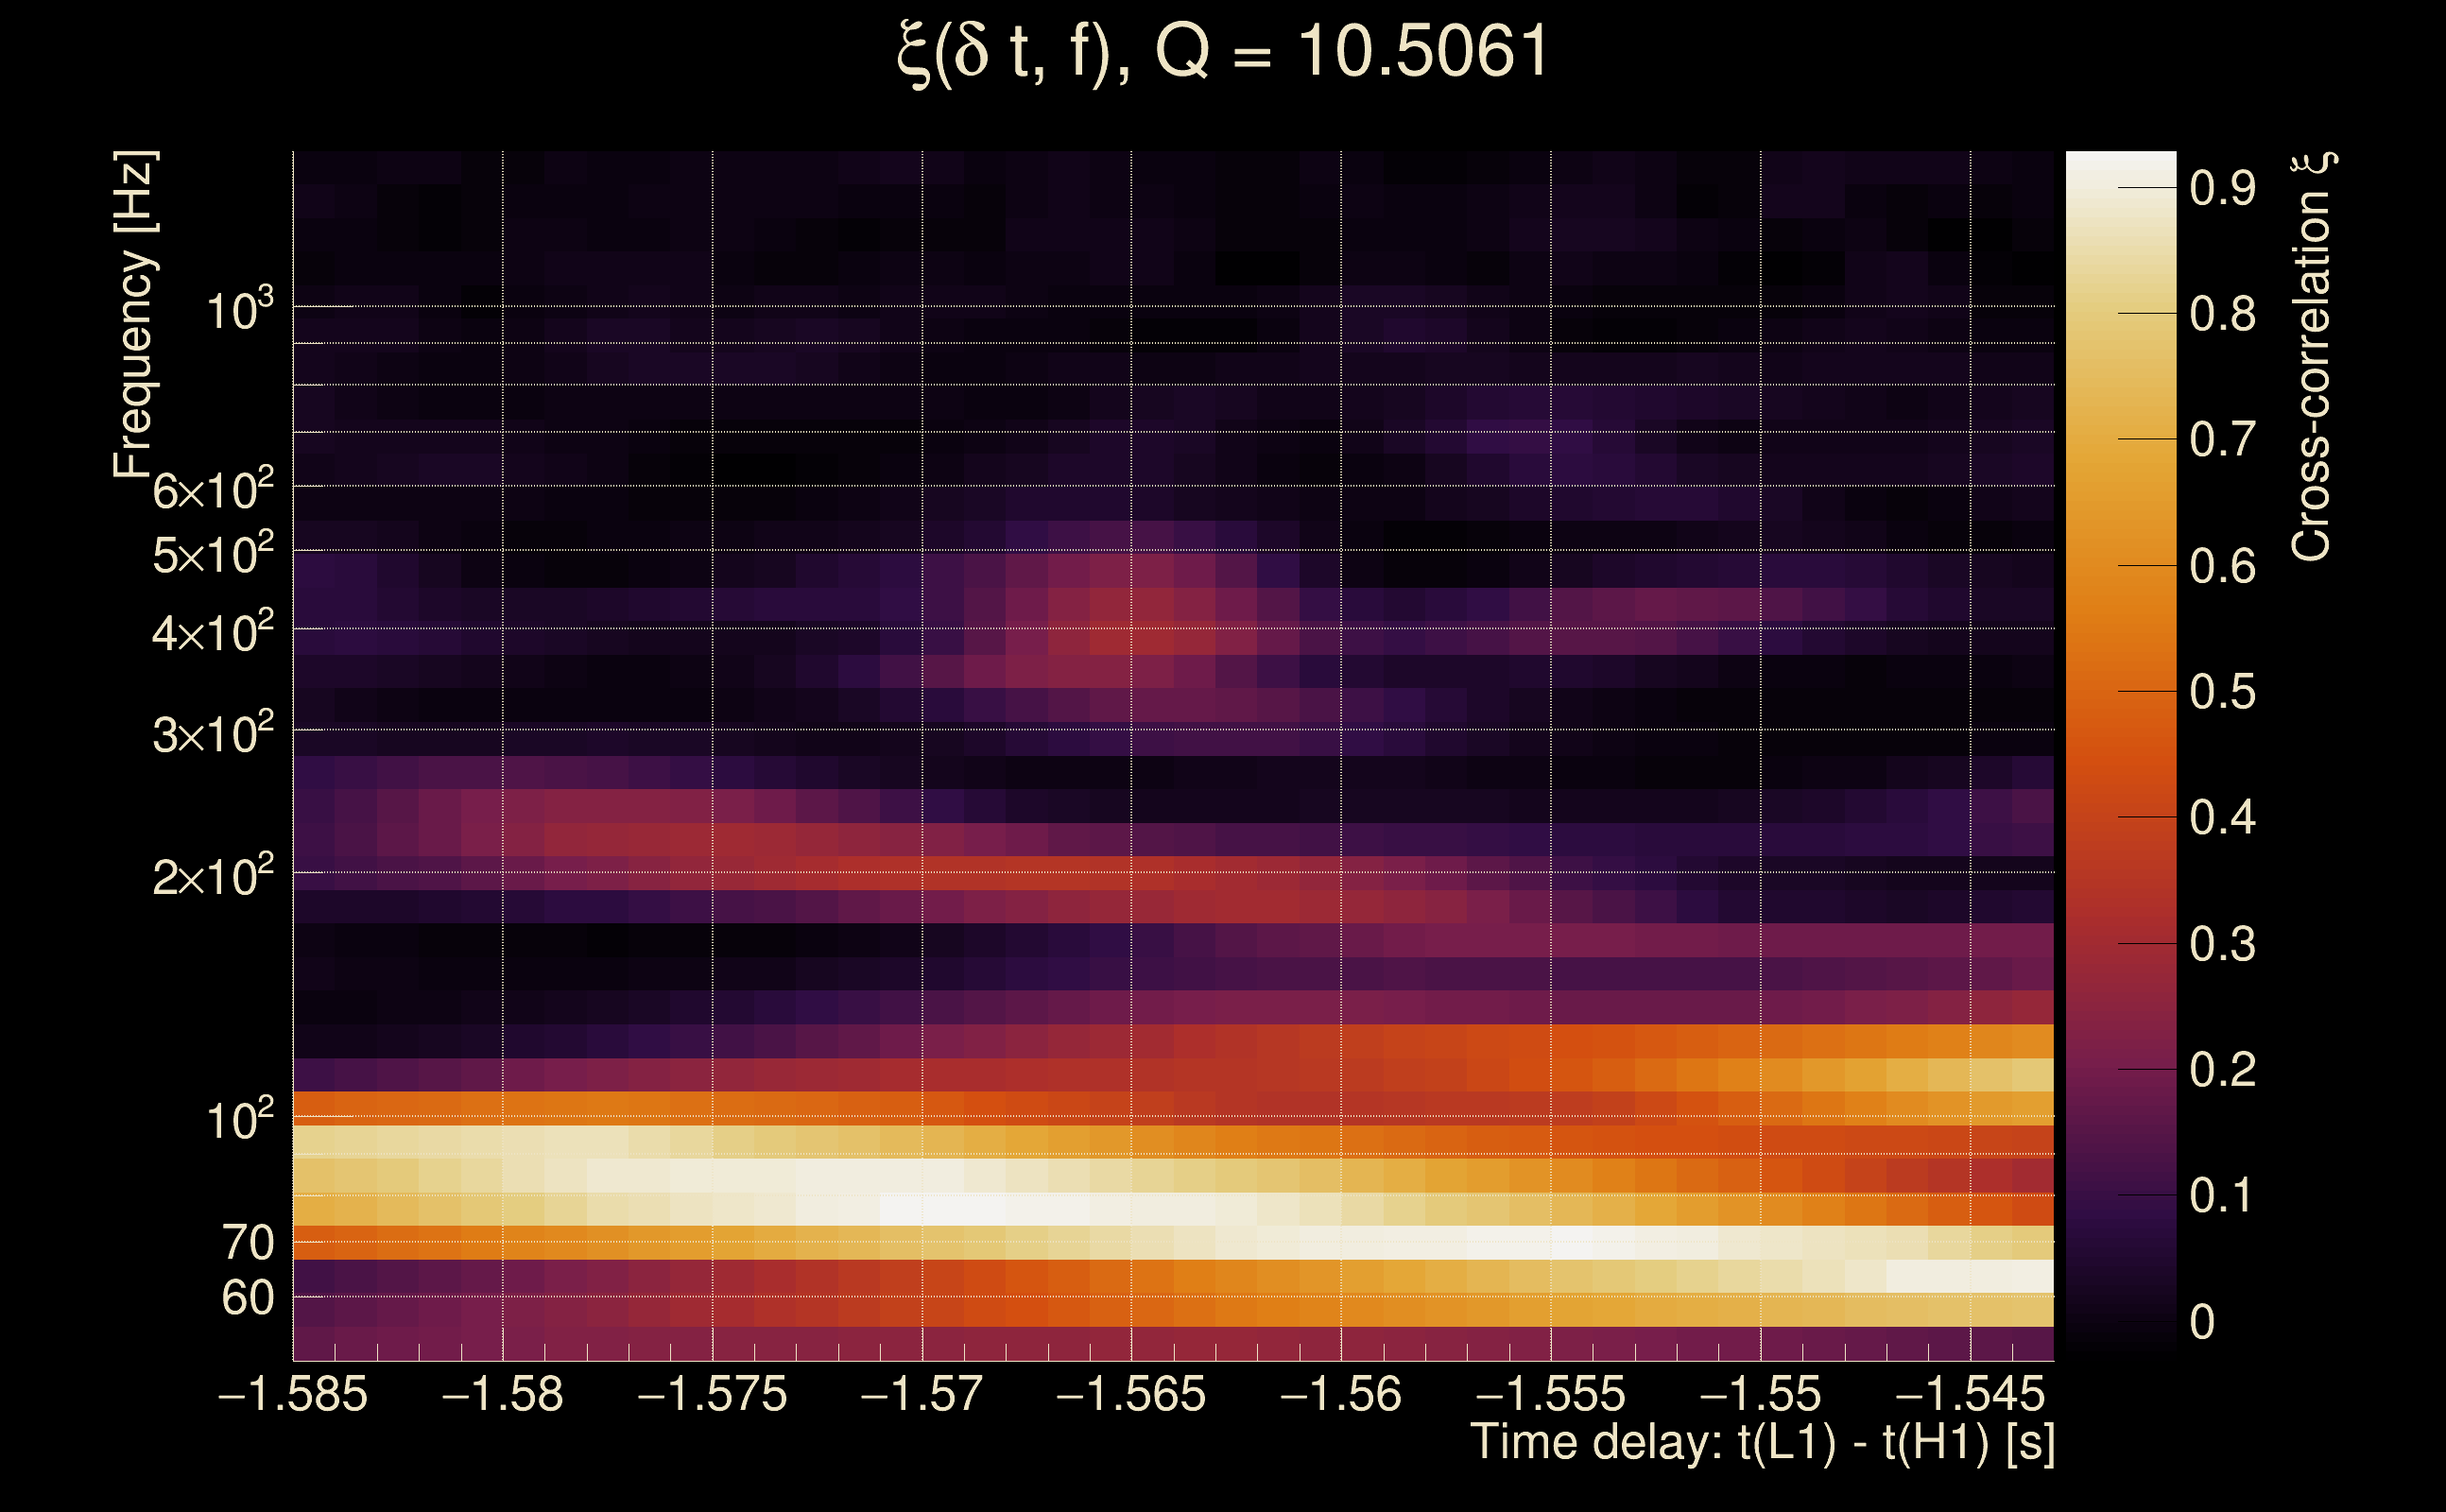
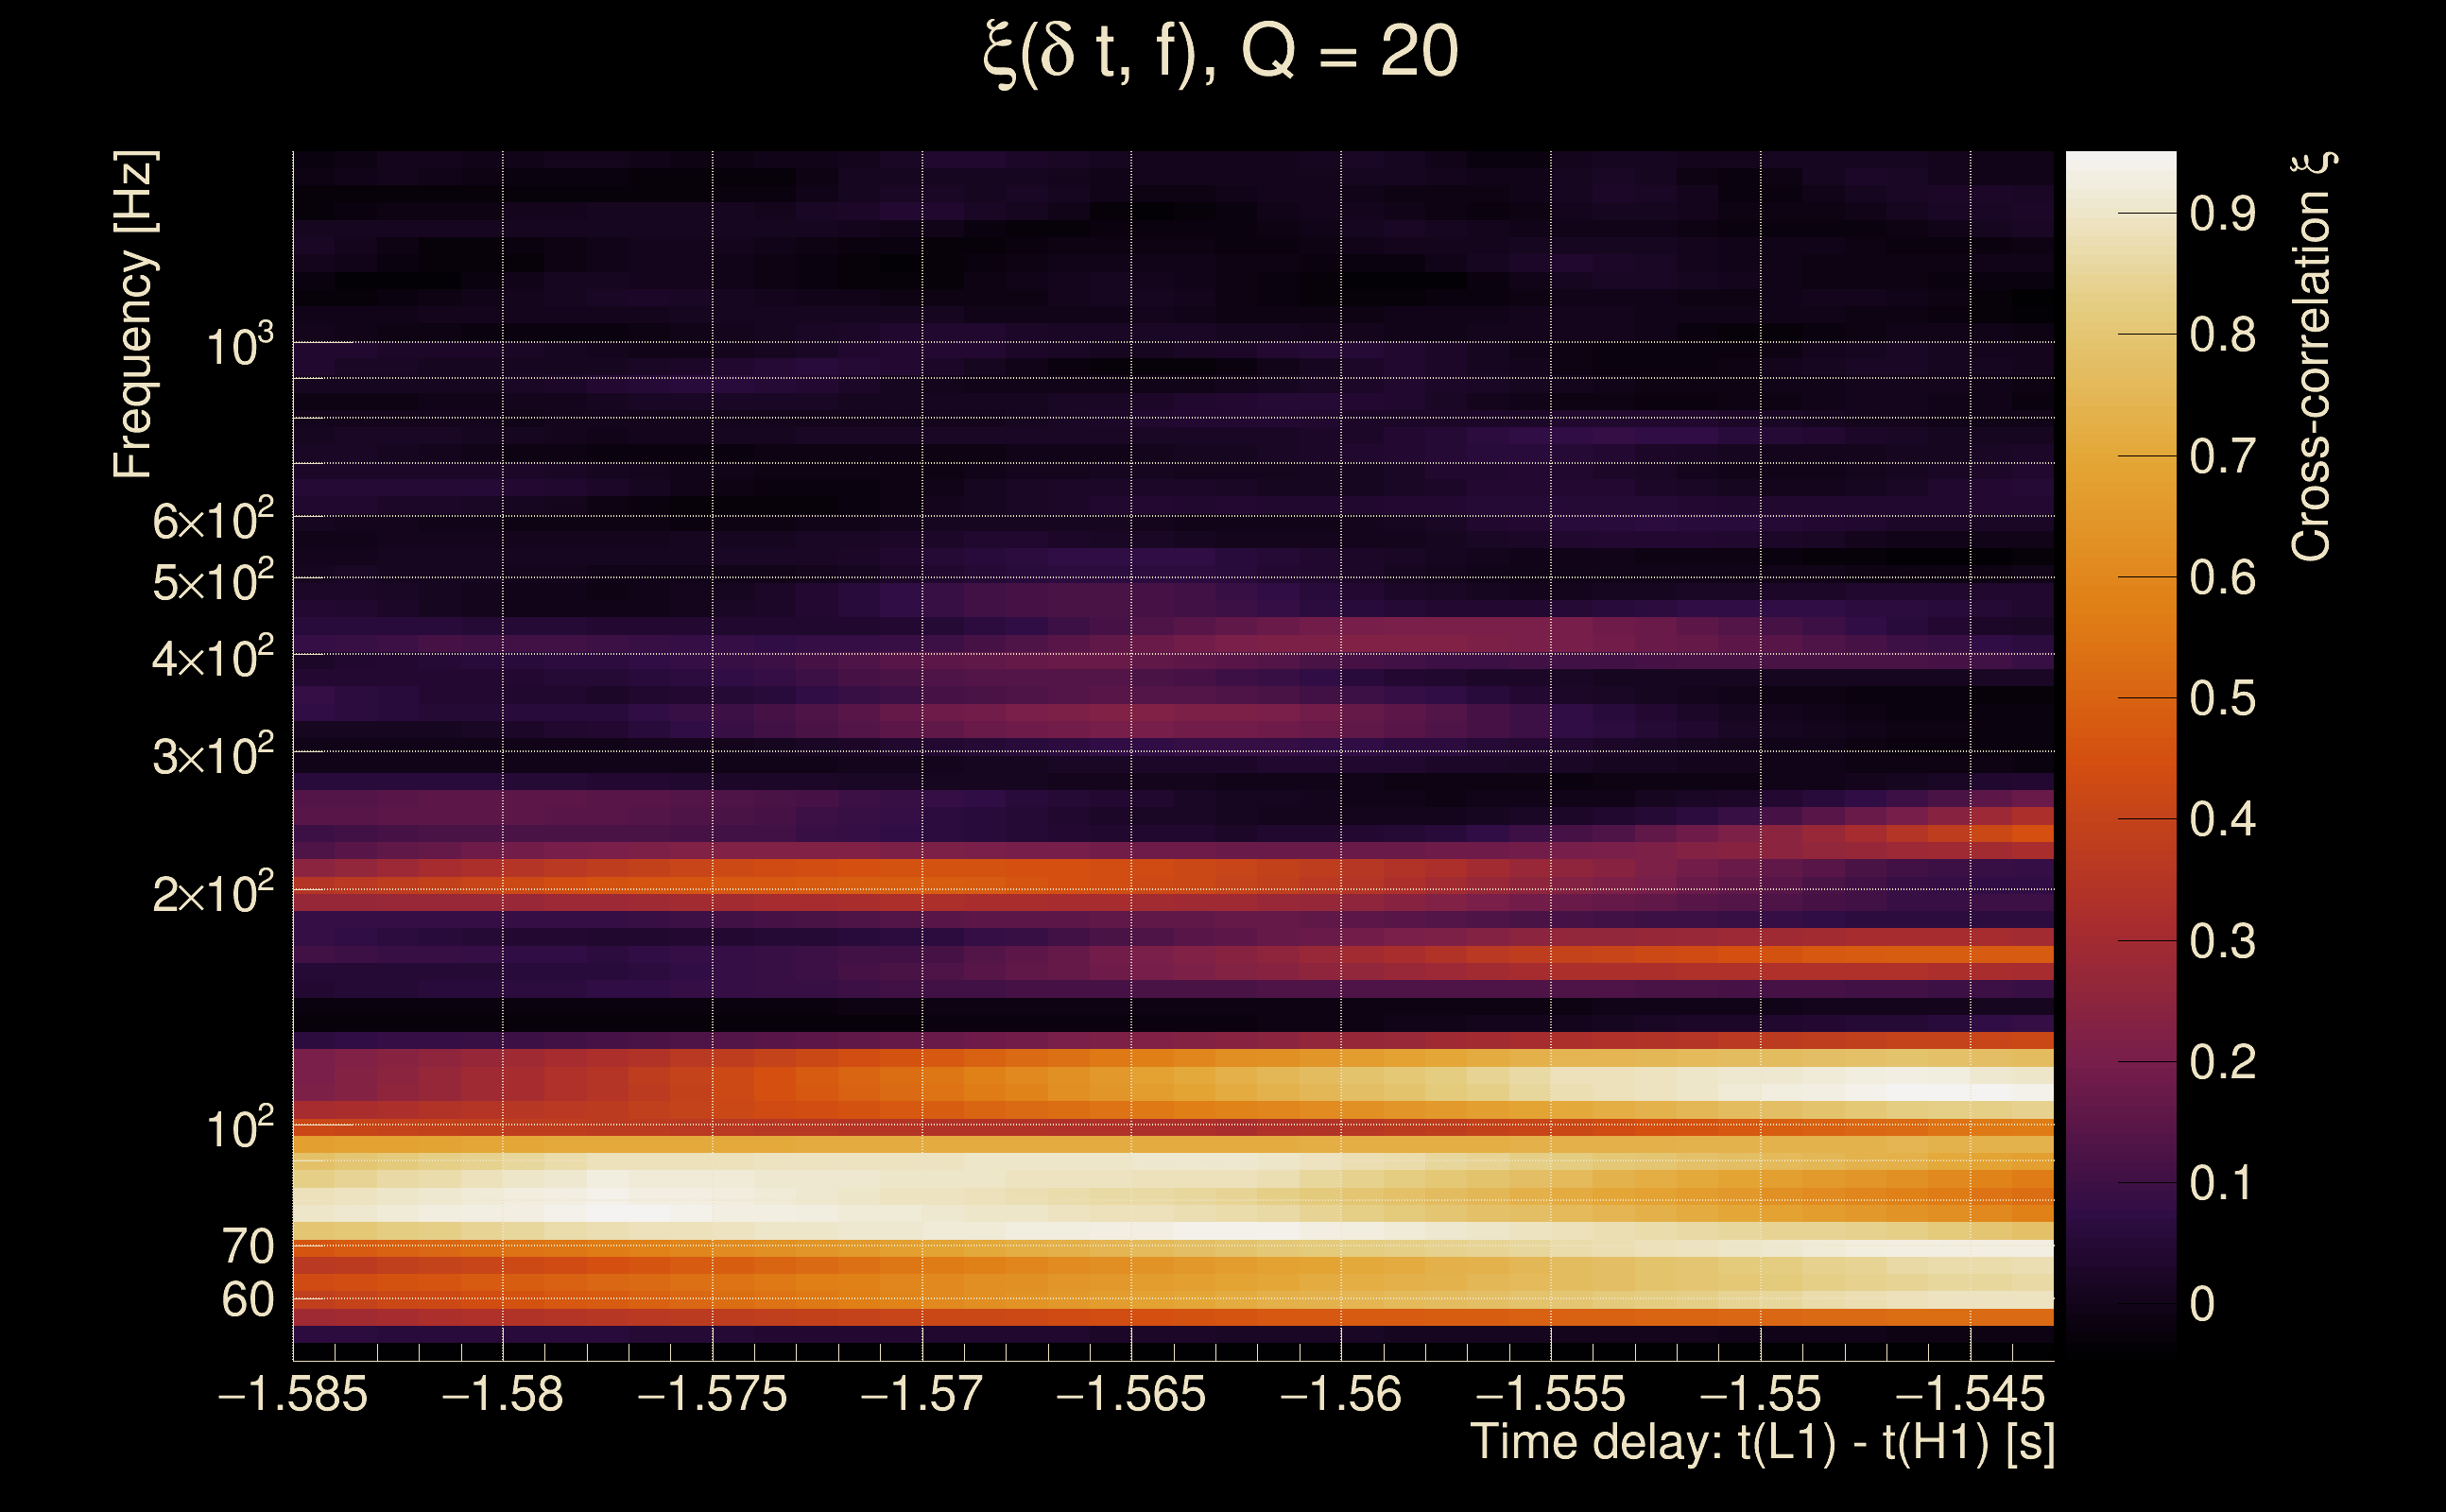
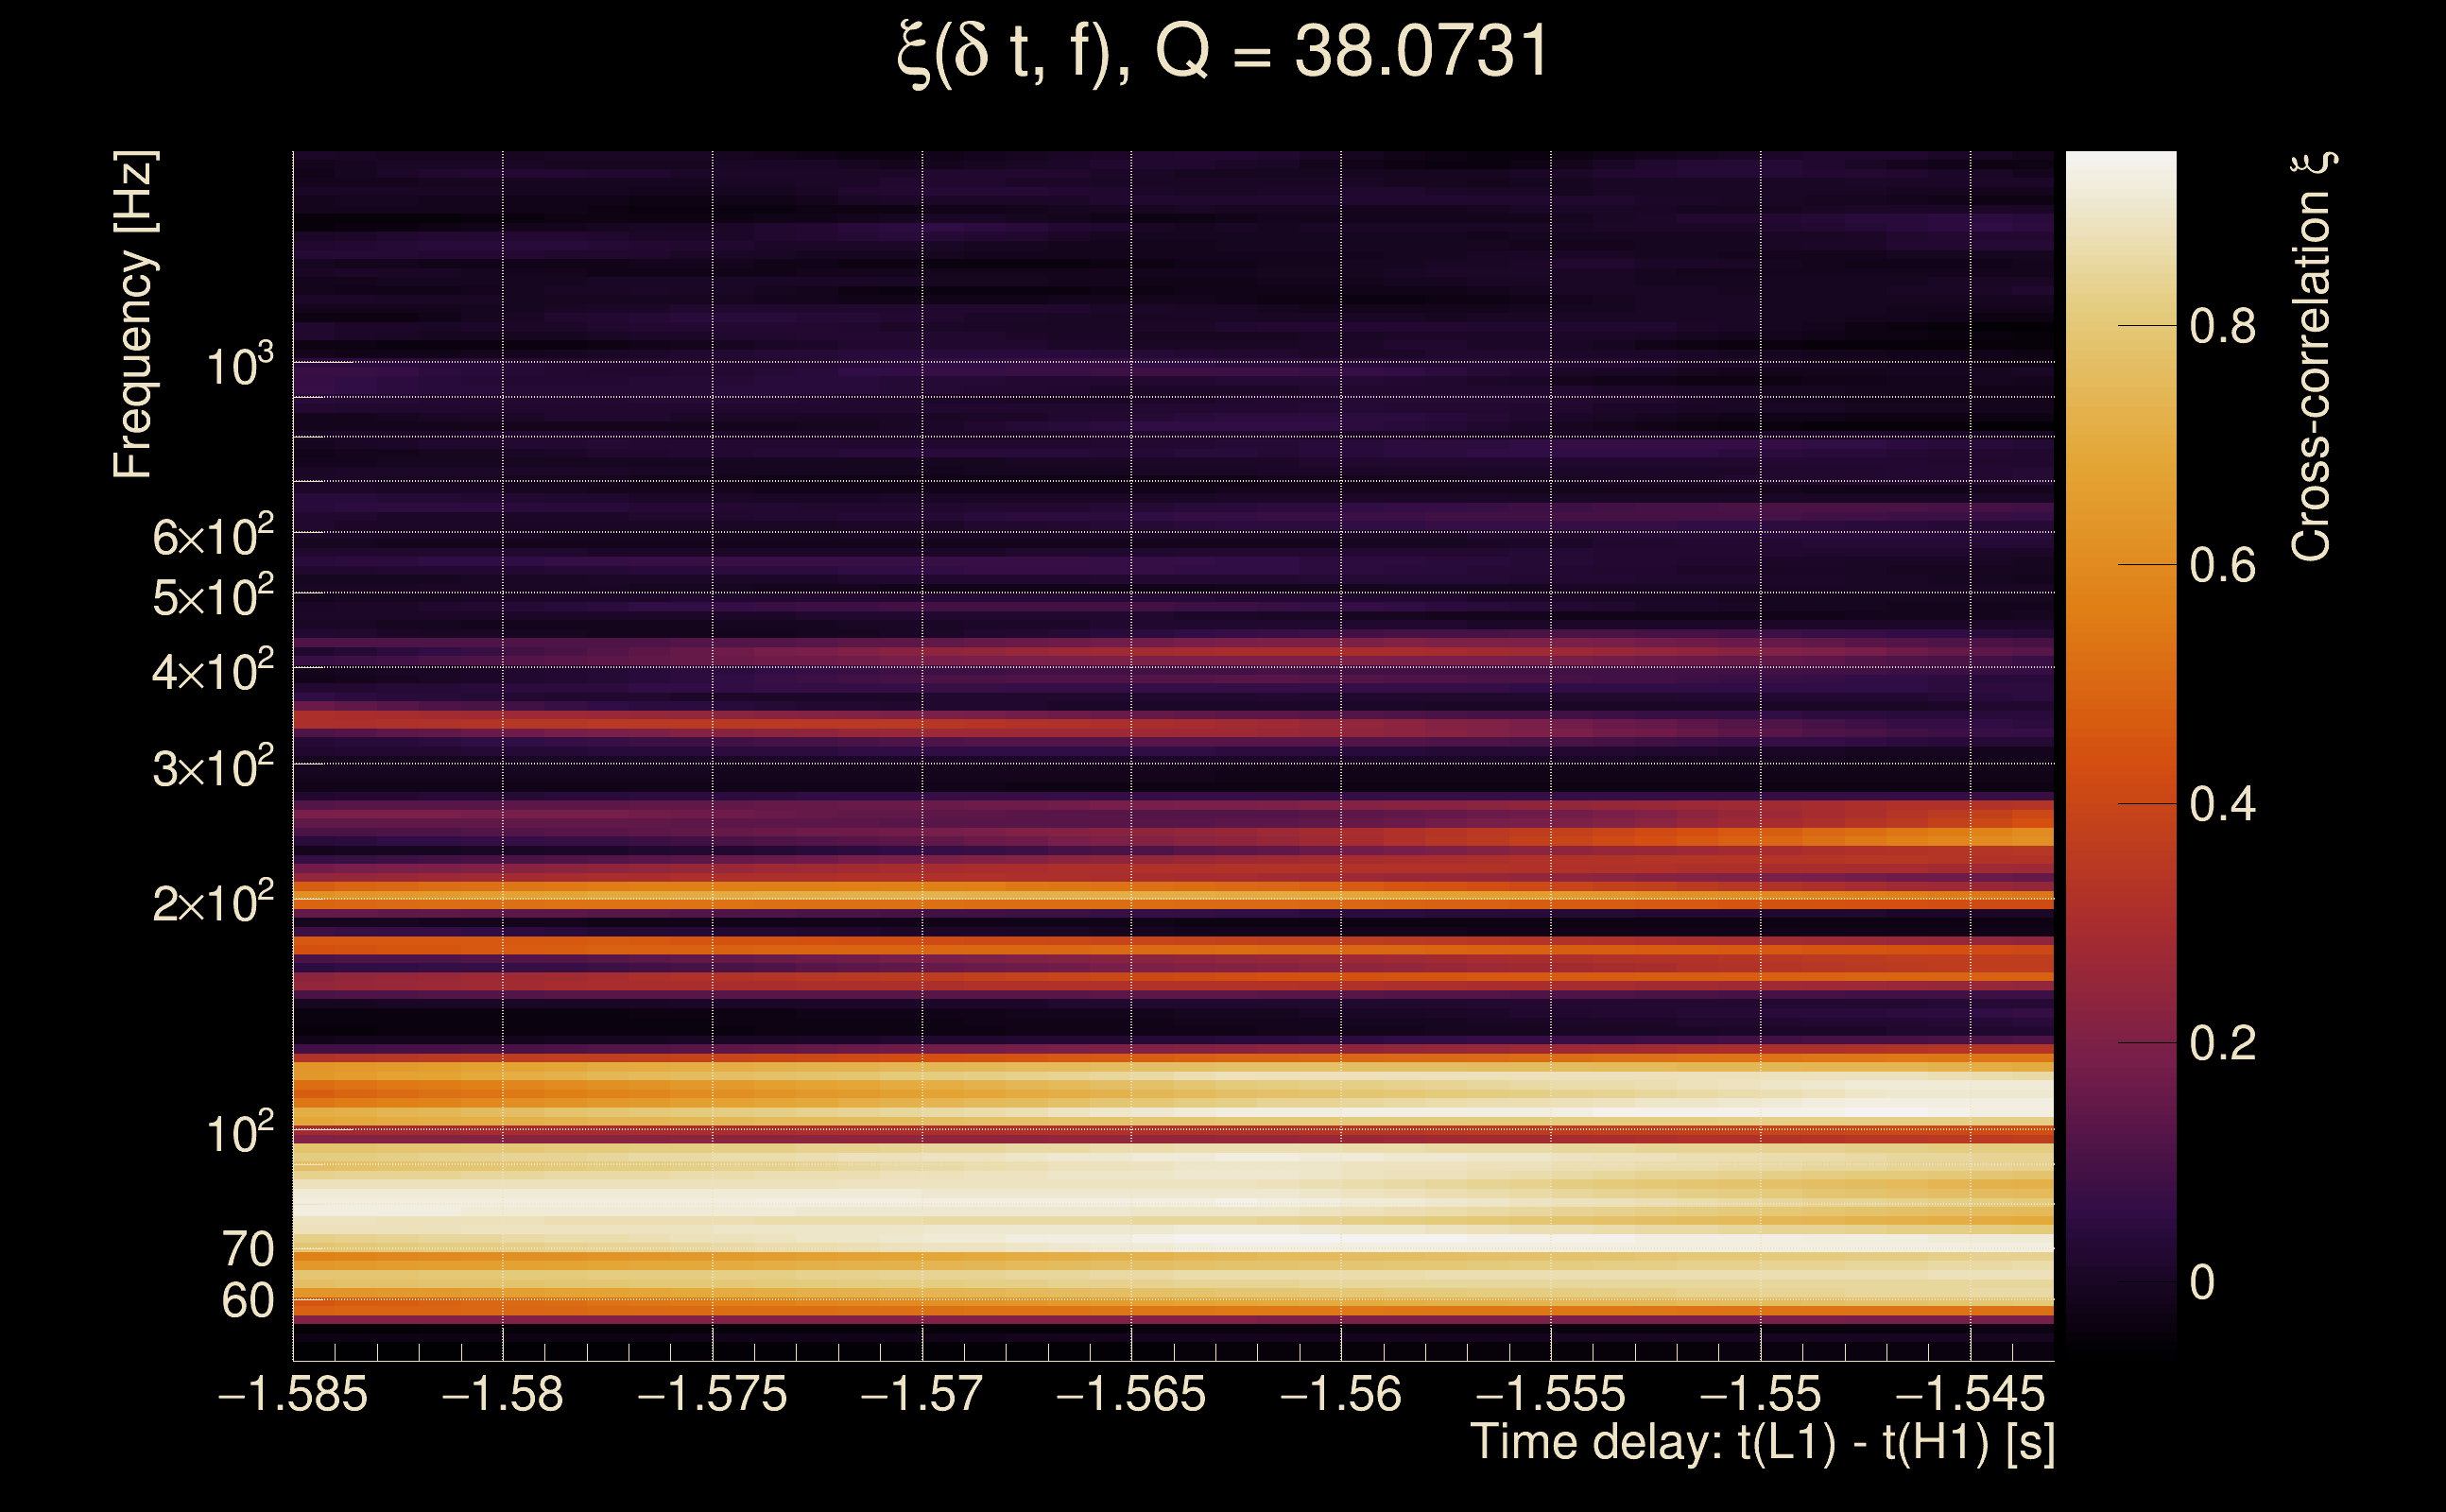
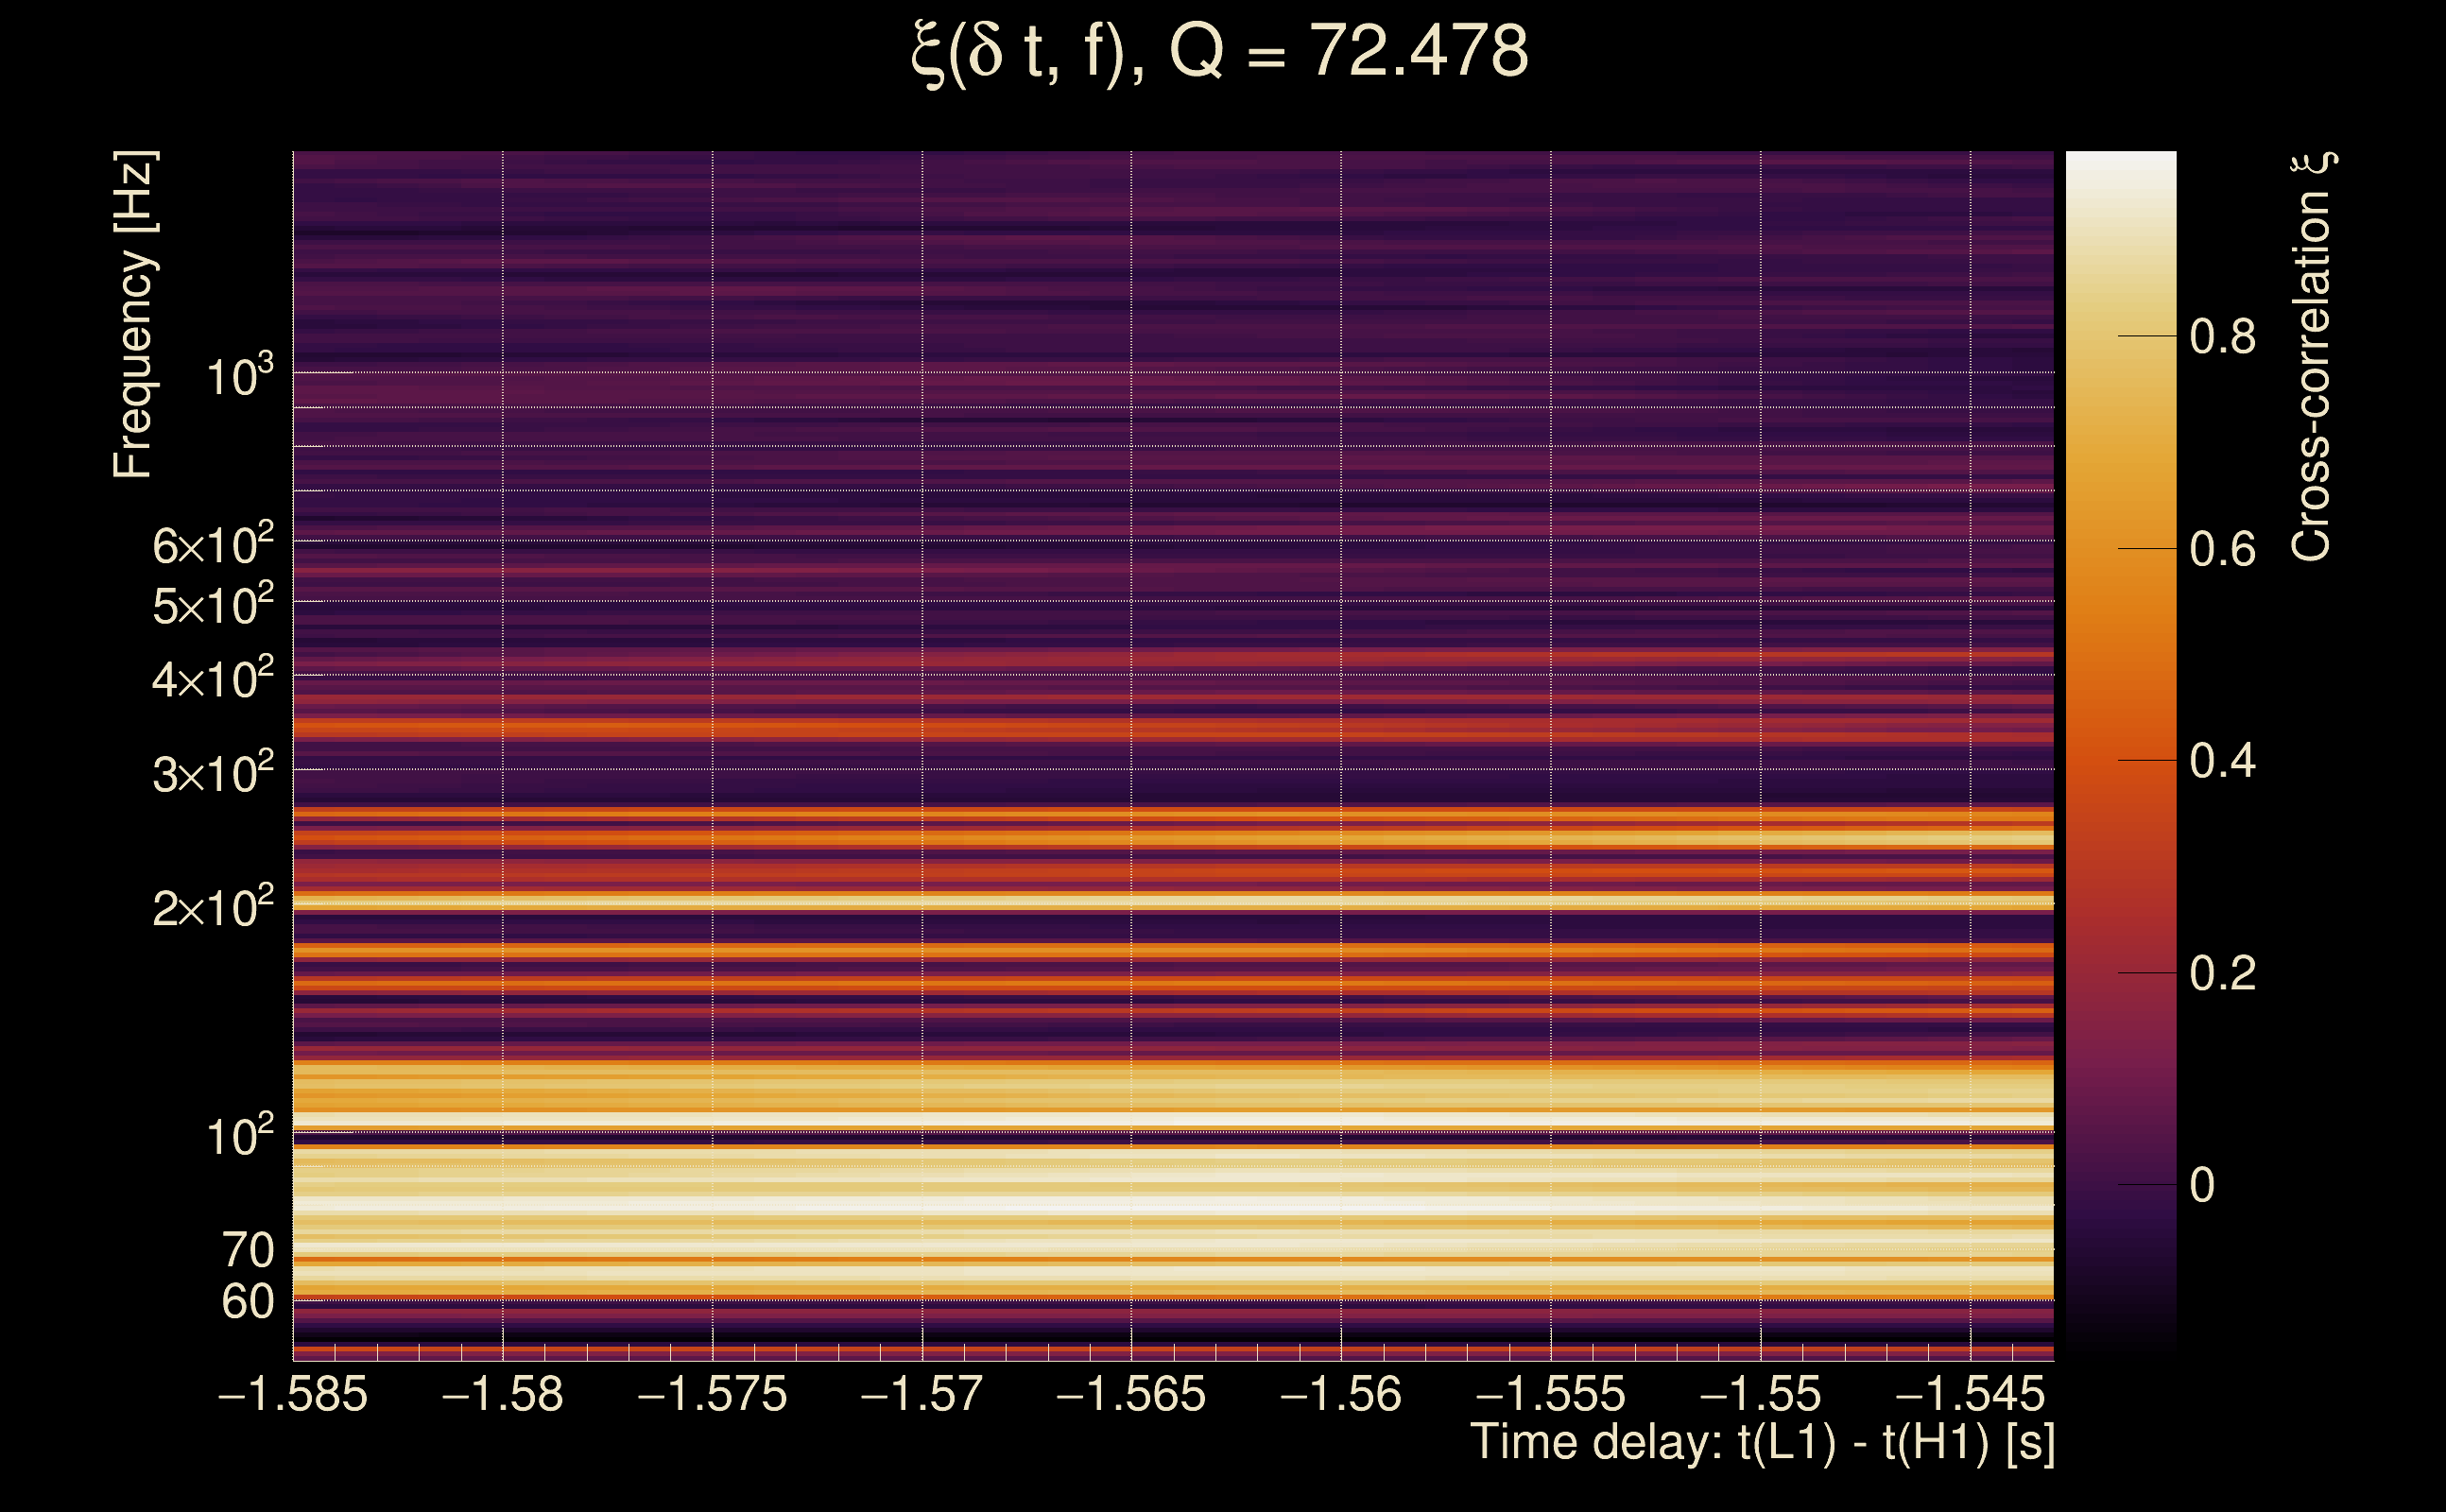
| Number of Q planes: | 5 (Q = 5.51892 → Q = 72.478) |
| Omicron frequency range: | 50 Hz → 1958.38 Hz |
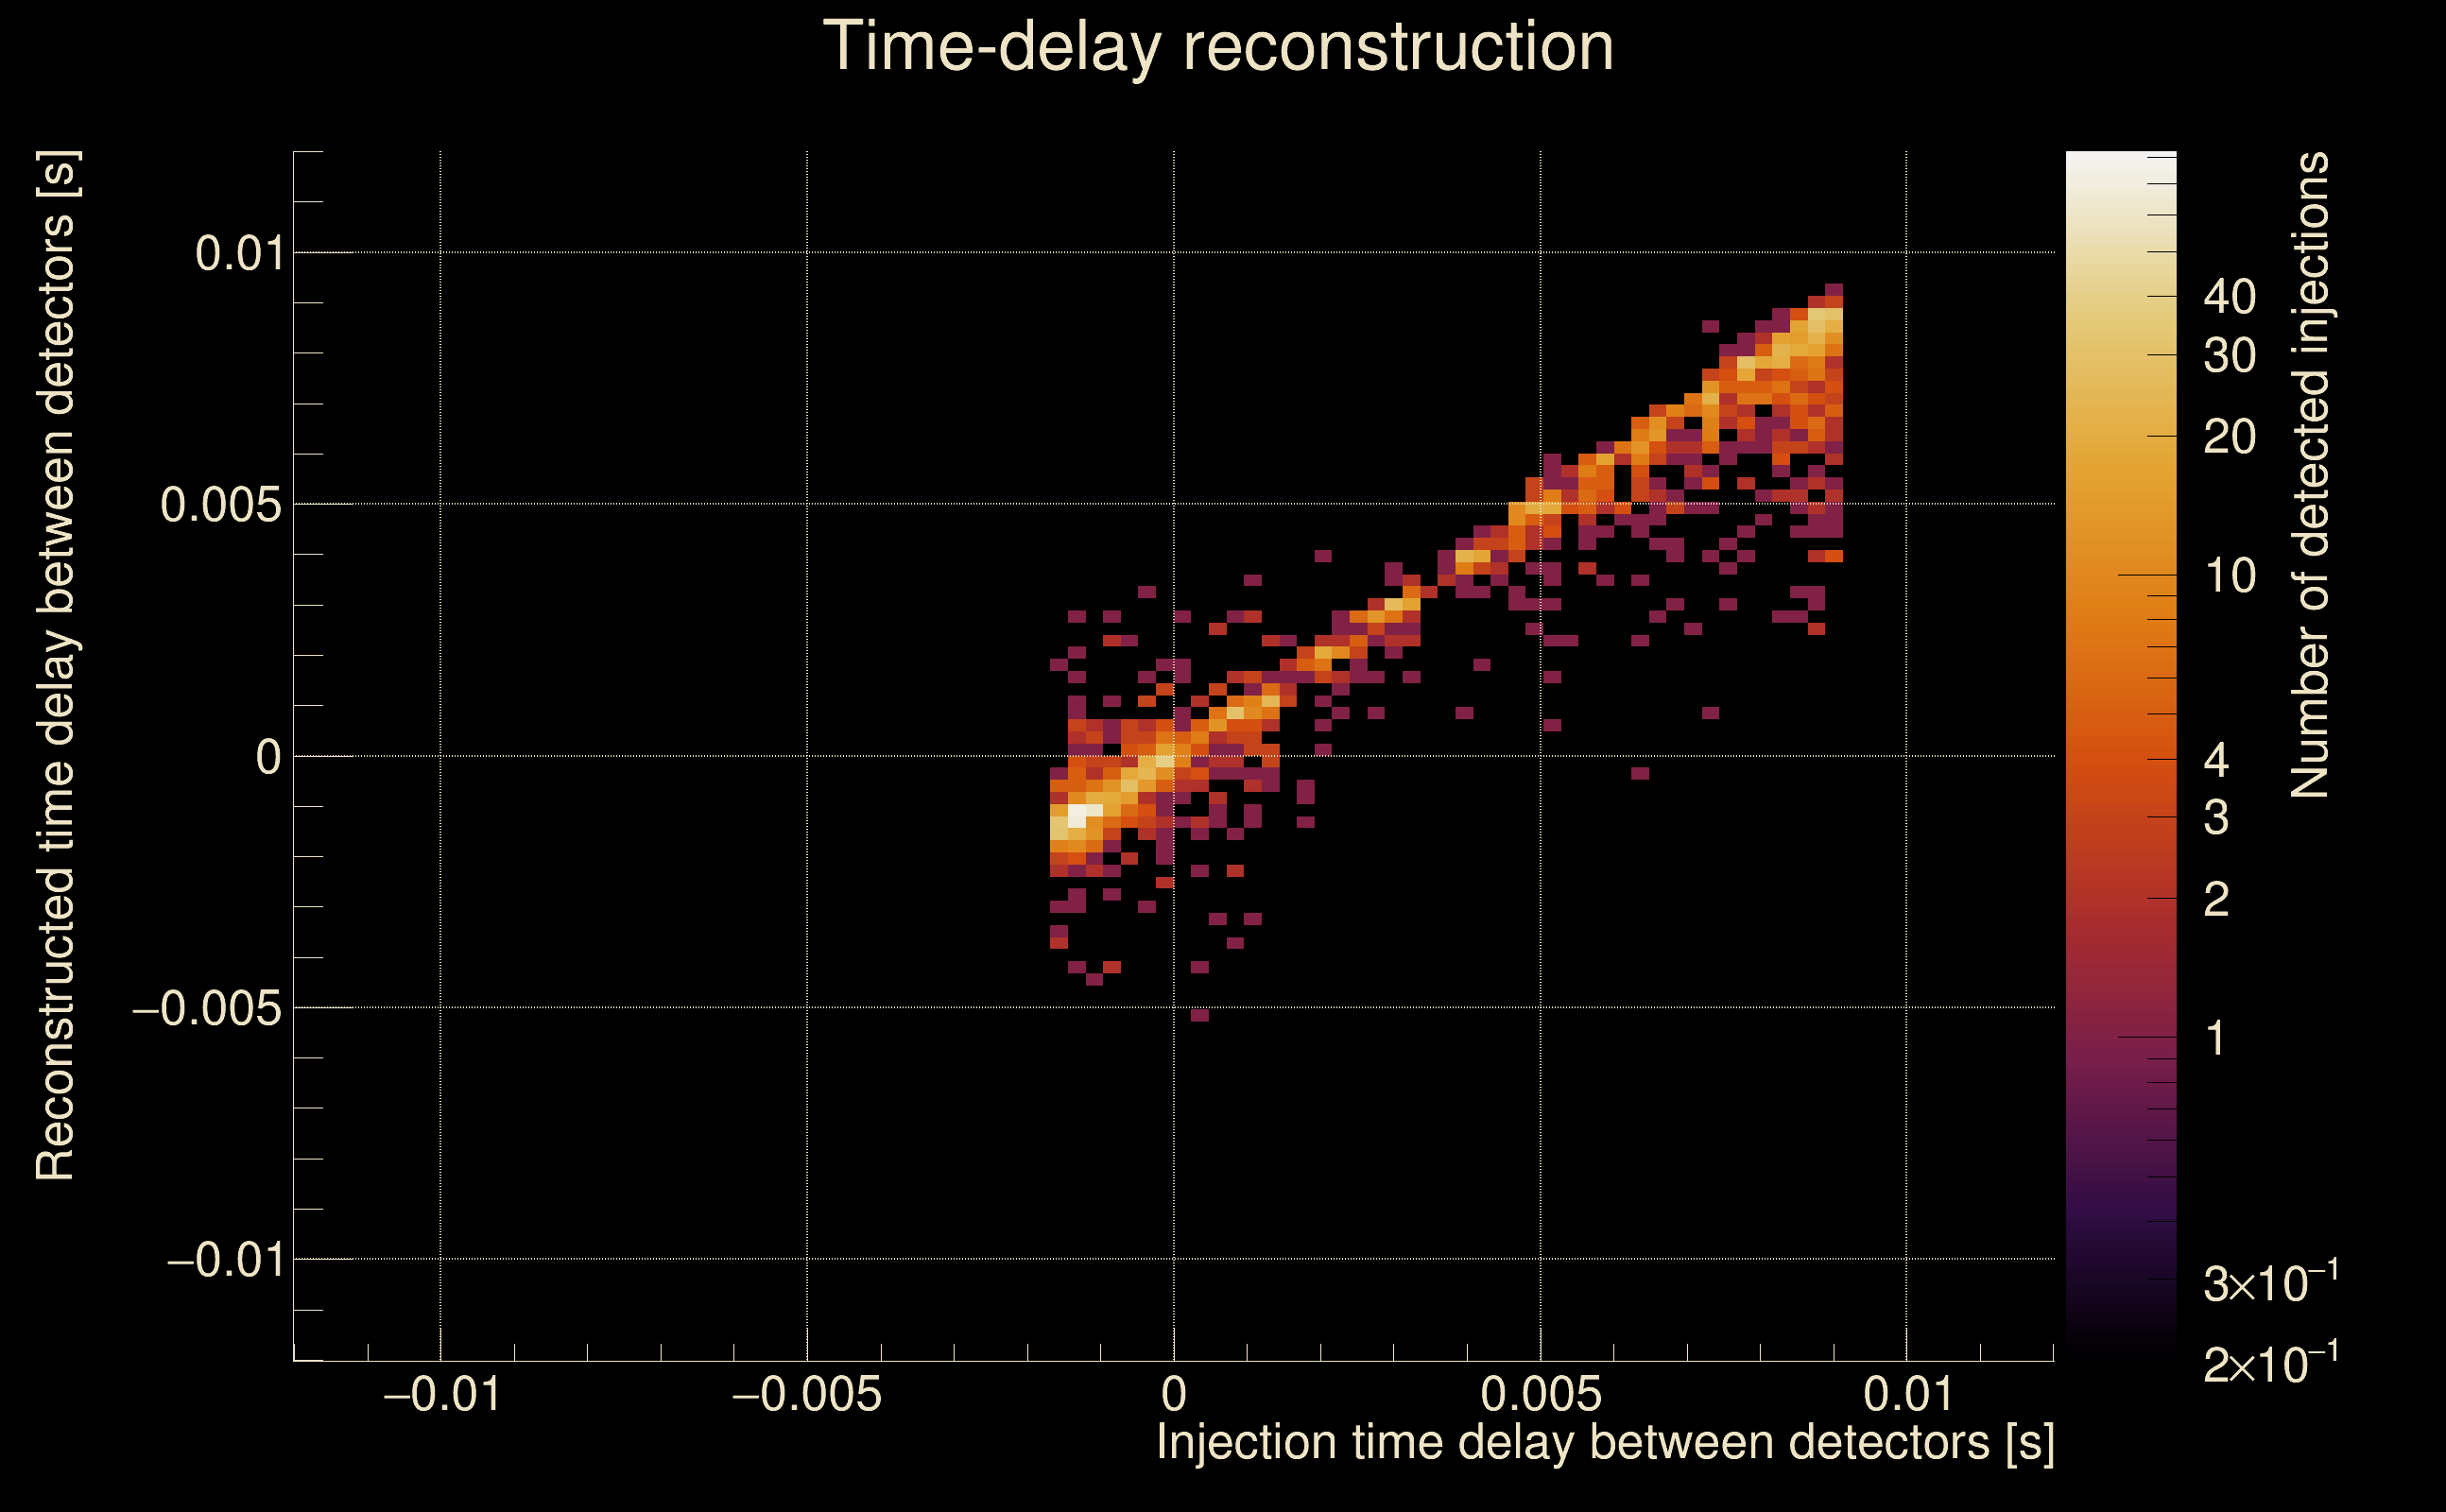
| Light travel time between detectors: | 0.0100128 s |
| Slice extra-time (calibration uncertainty + slice veto): | 0.0129872 s |
| Number of time-delay bins in a cross-correlation map: | 10000 |
| Number of slices in a cross-correlation map: | 217 |
| Number of time-delay bins in a slice: | 46 |
| SNR gating: | < 100 (detector 0), < 100 (detector 1) |
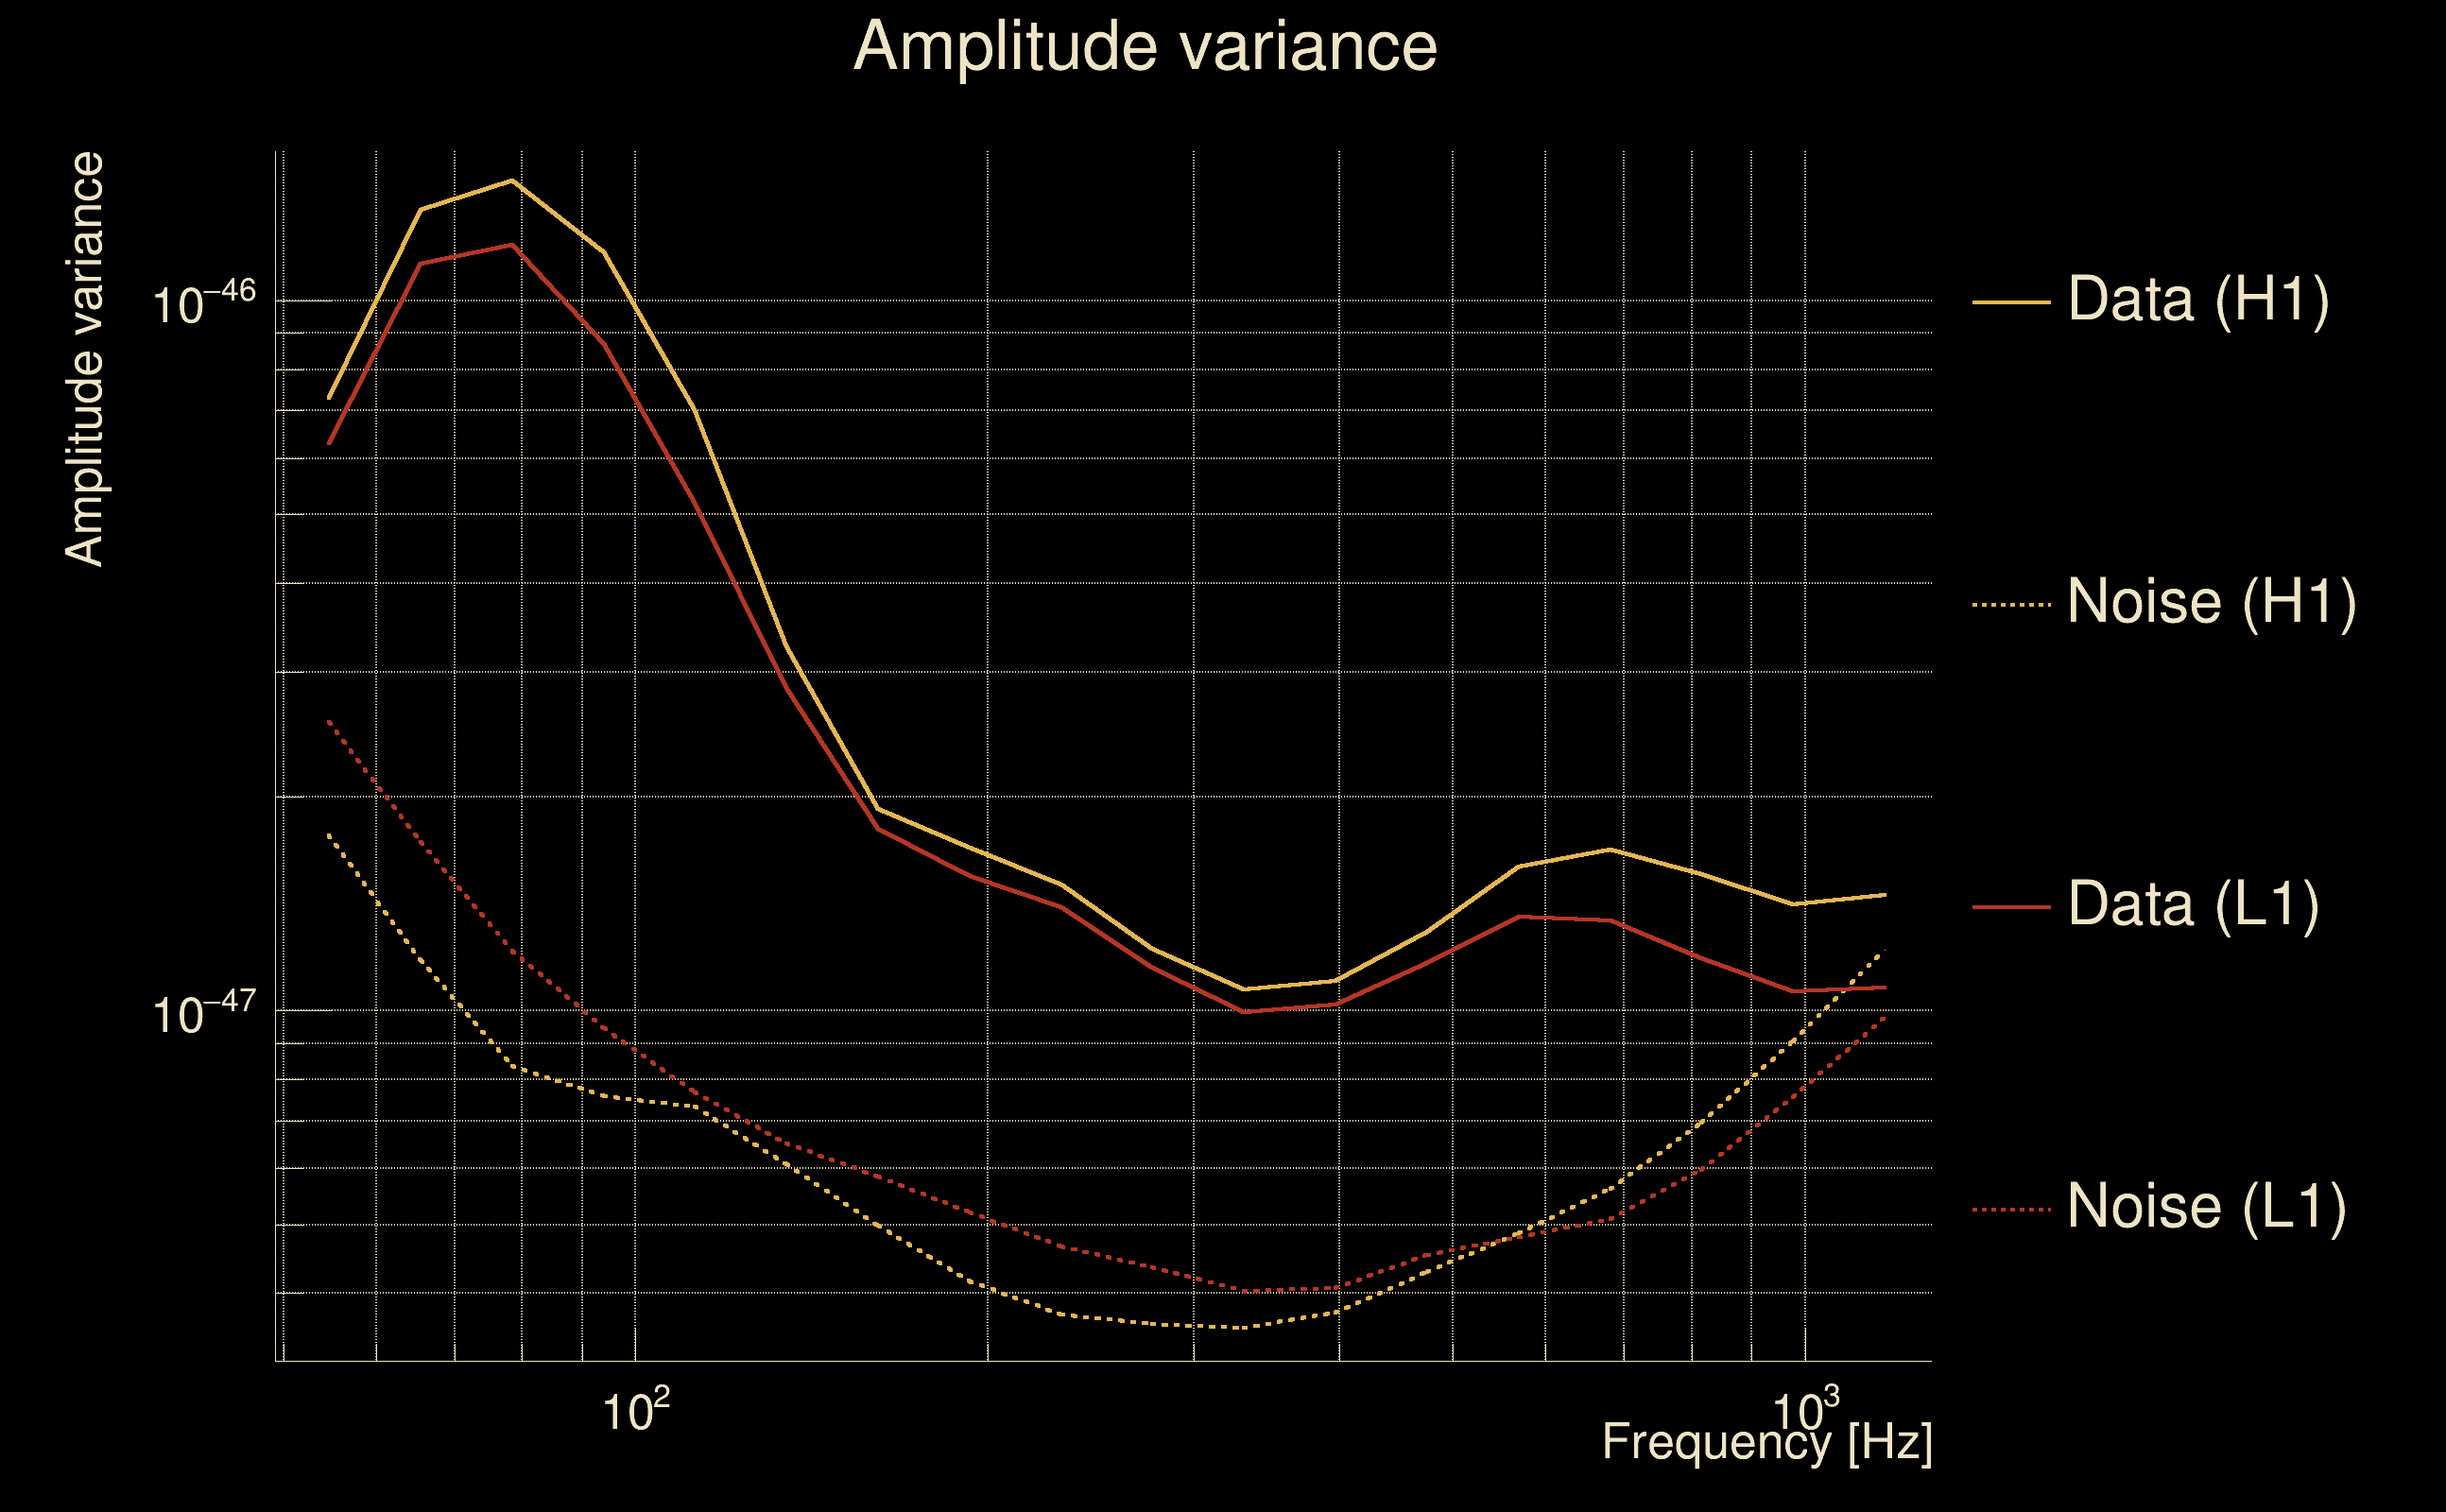
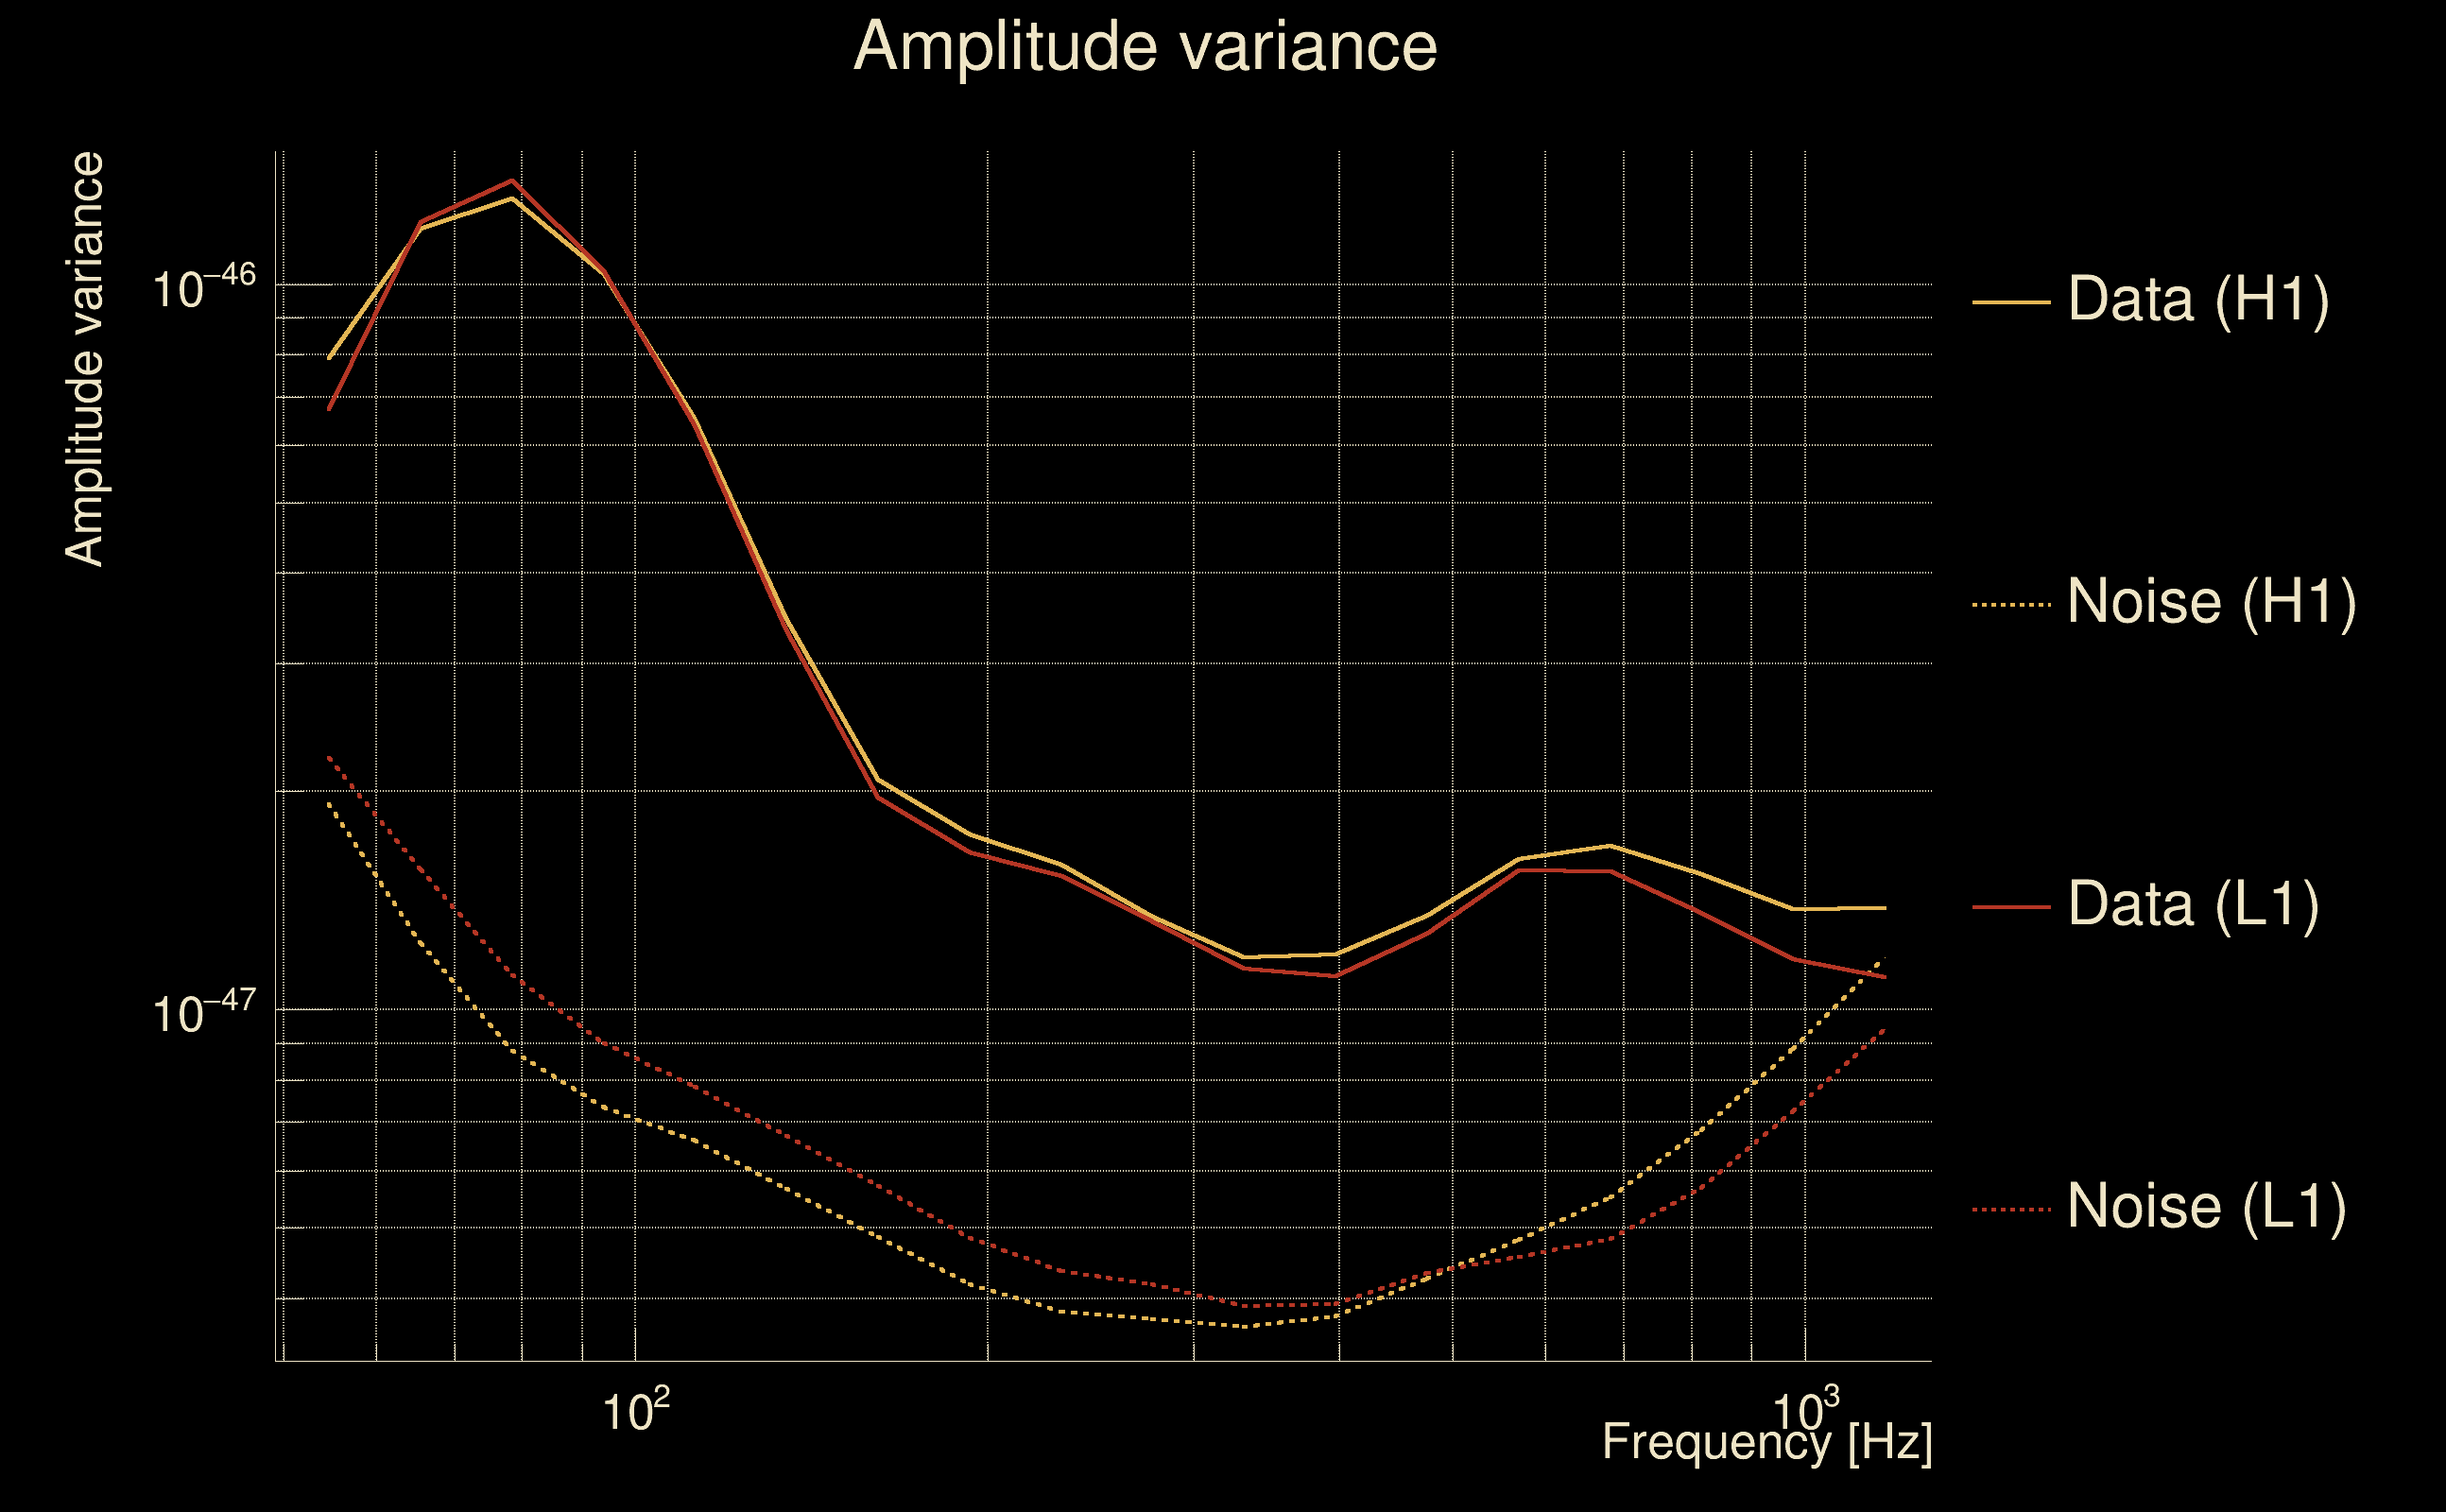
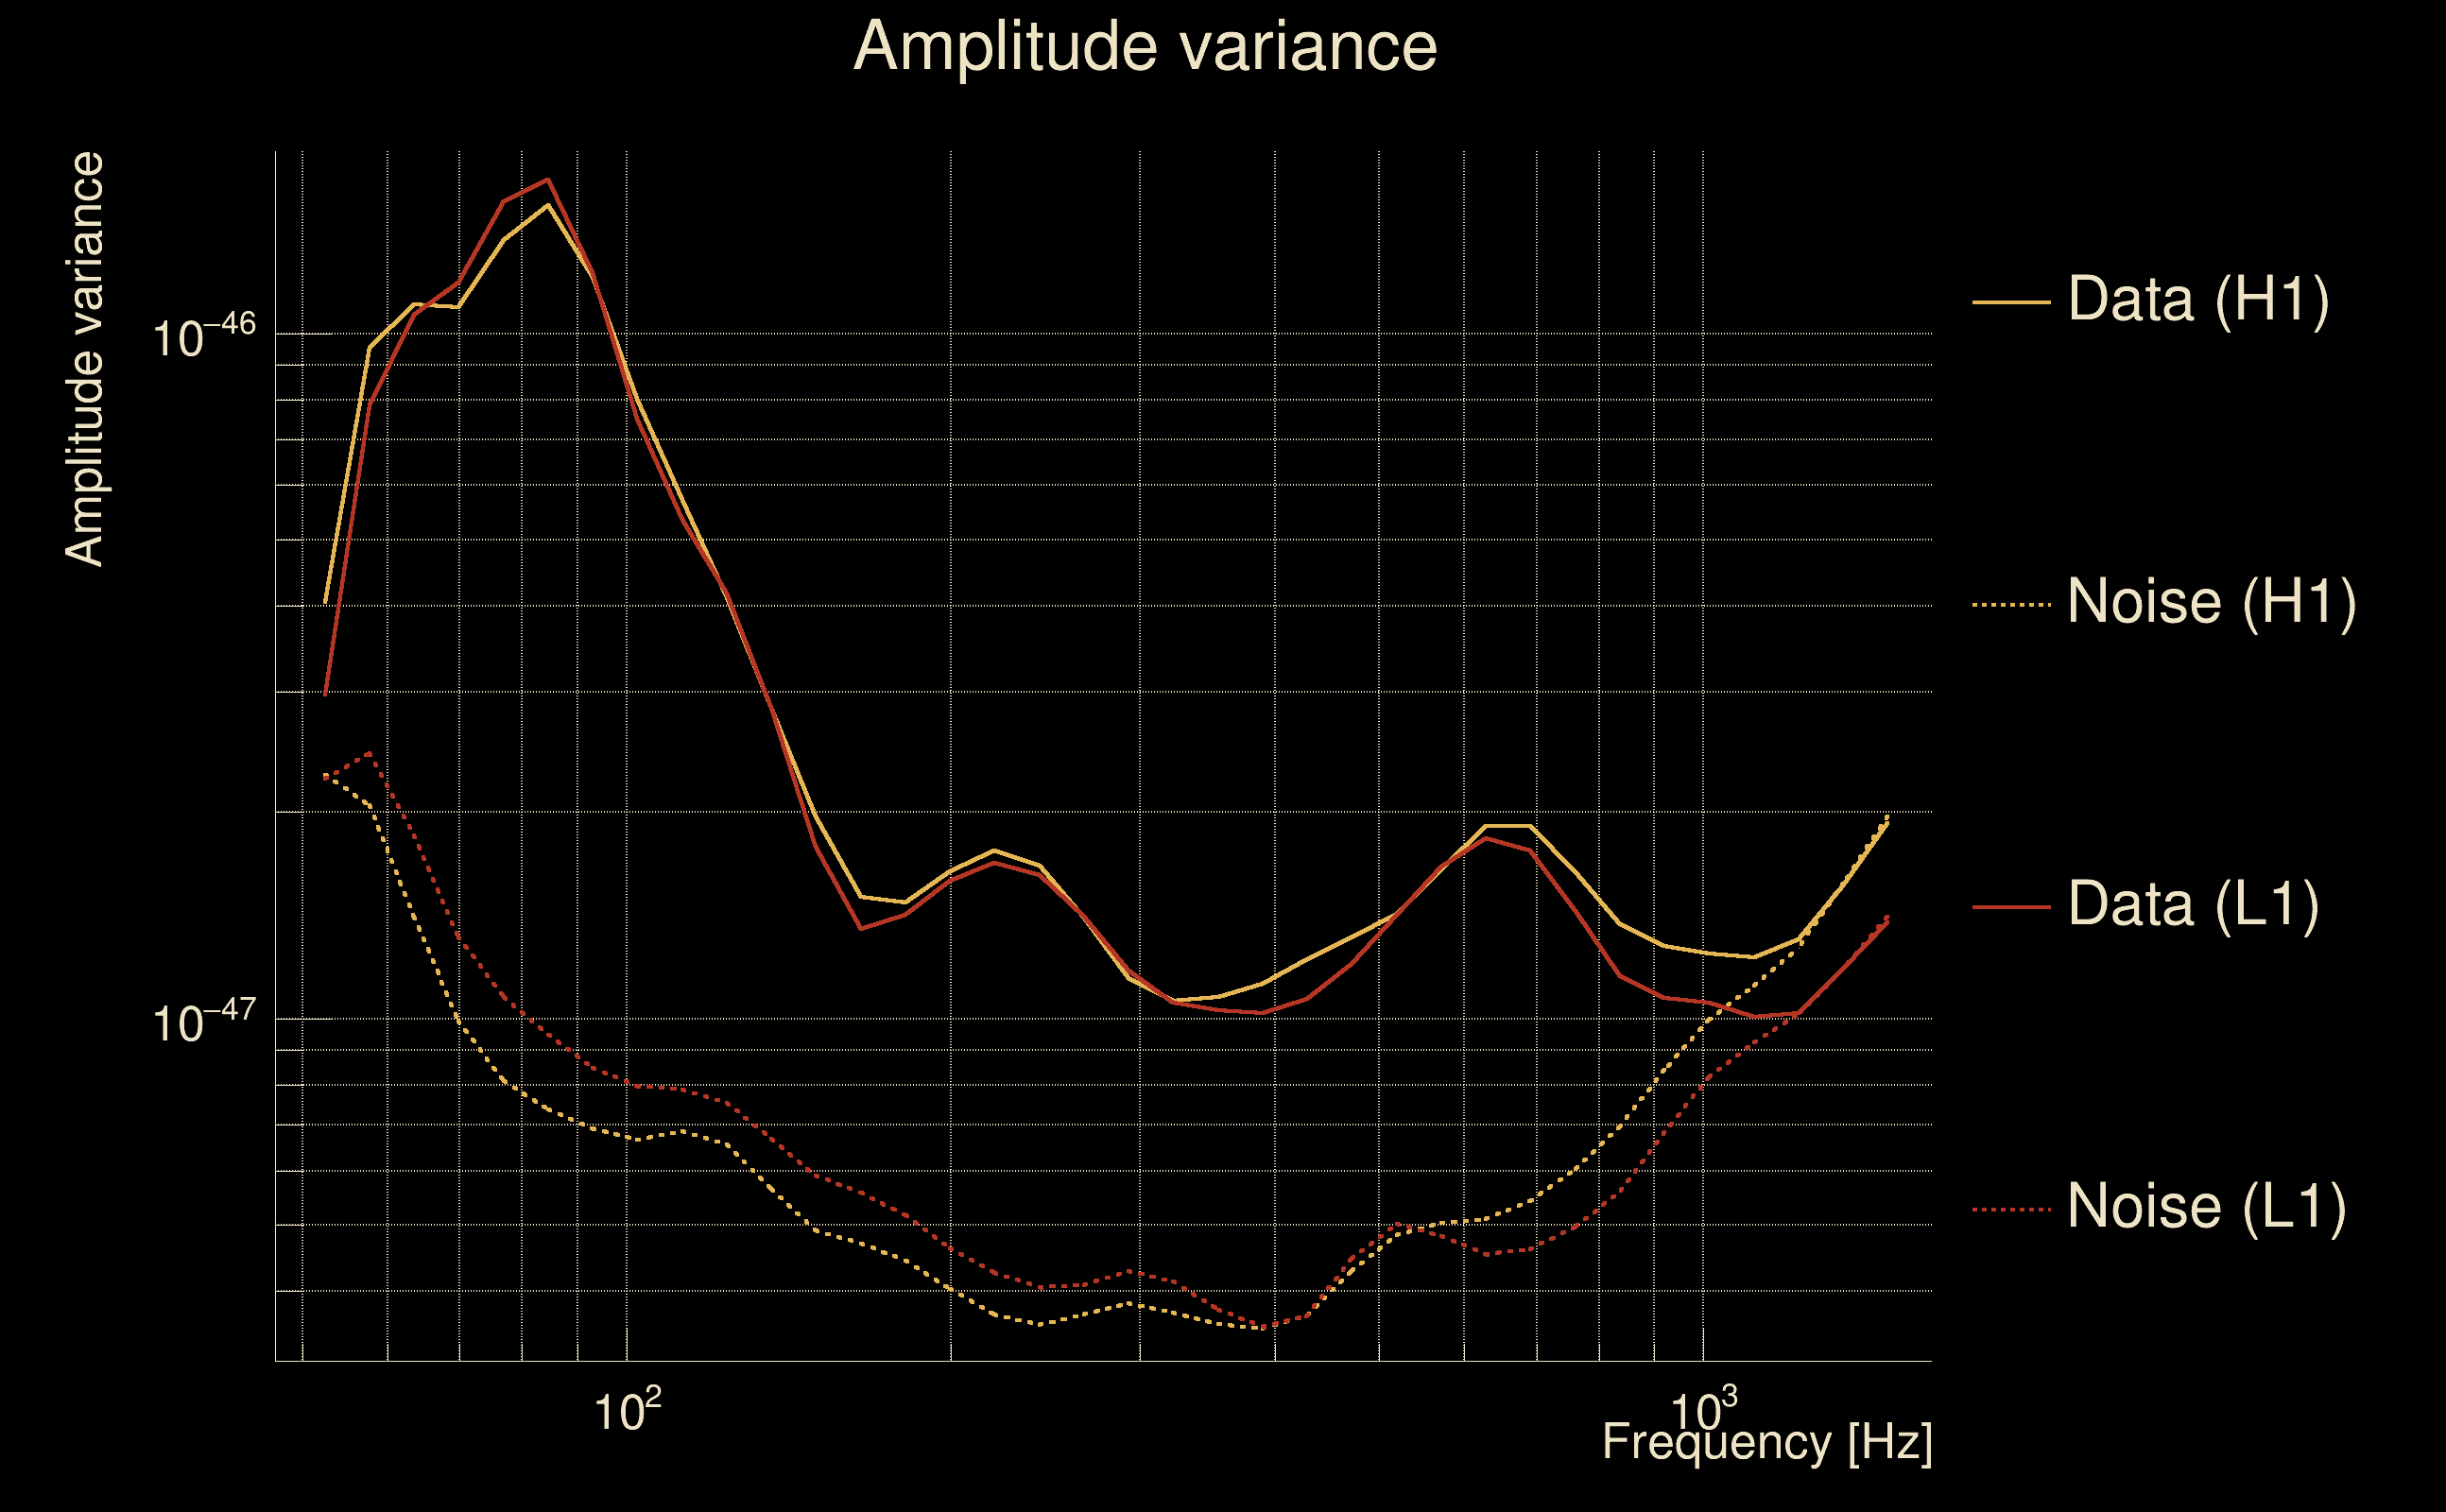
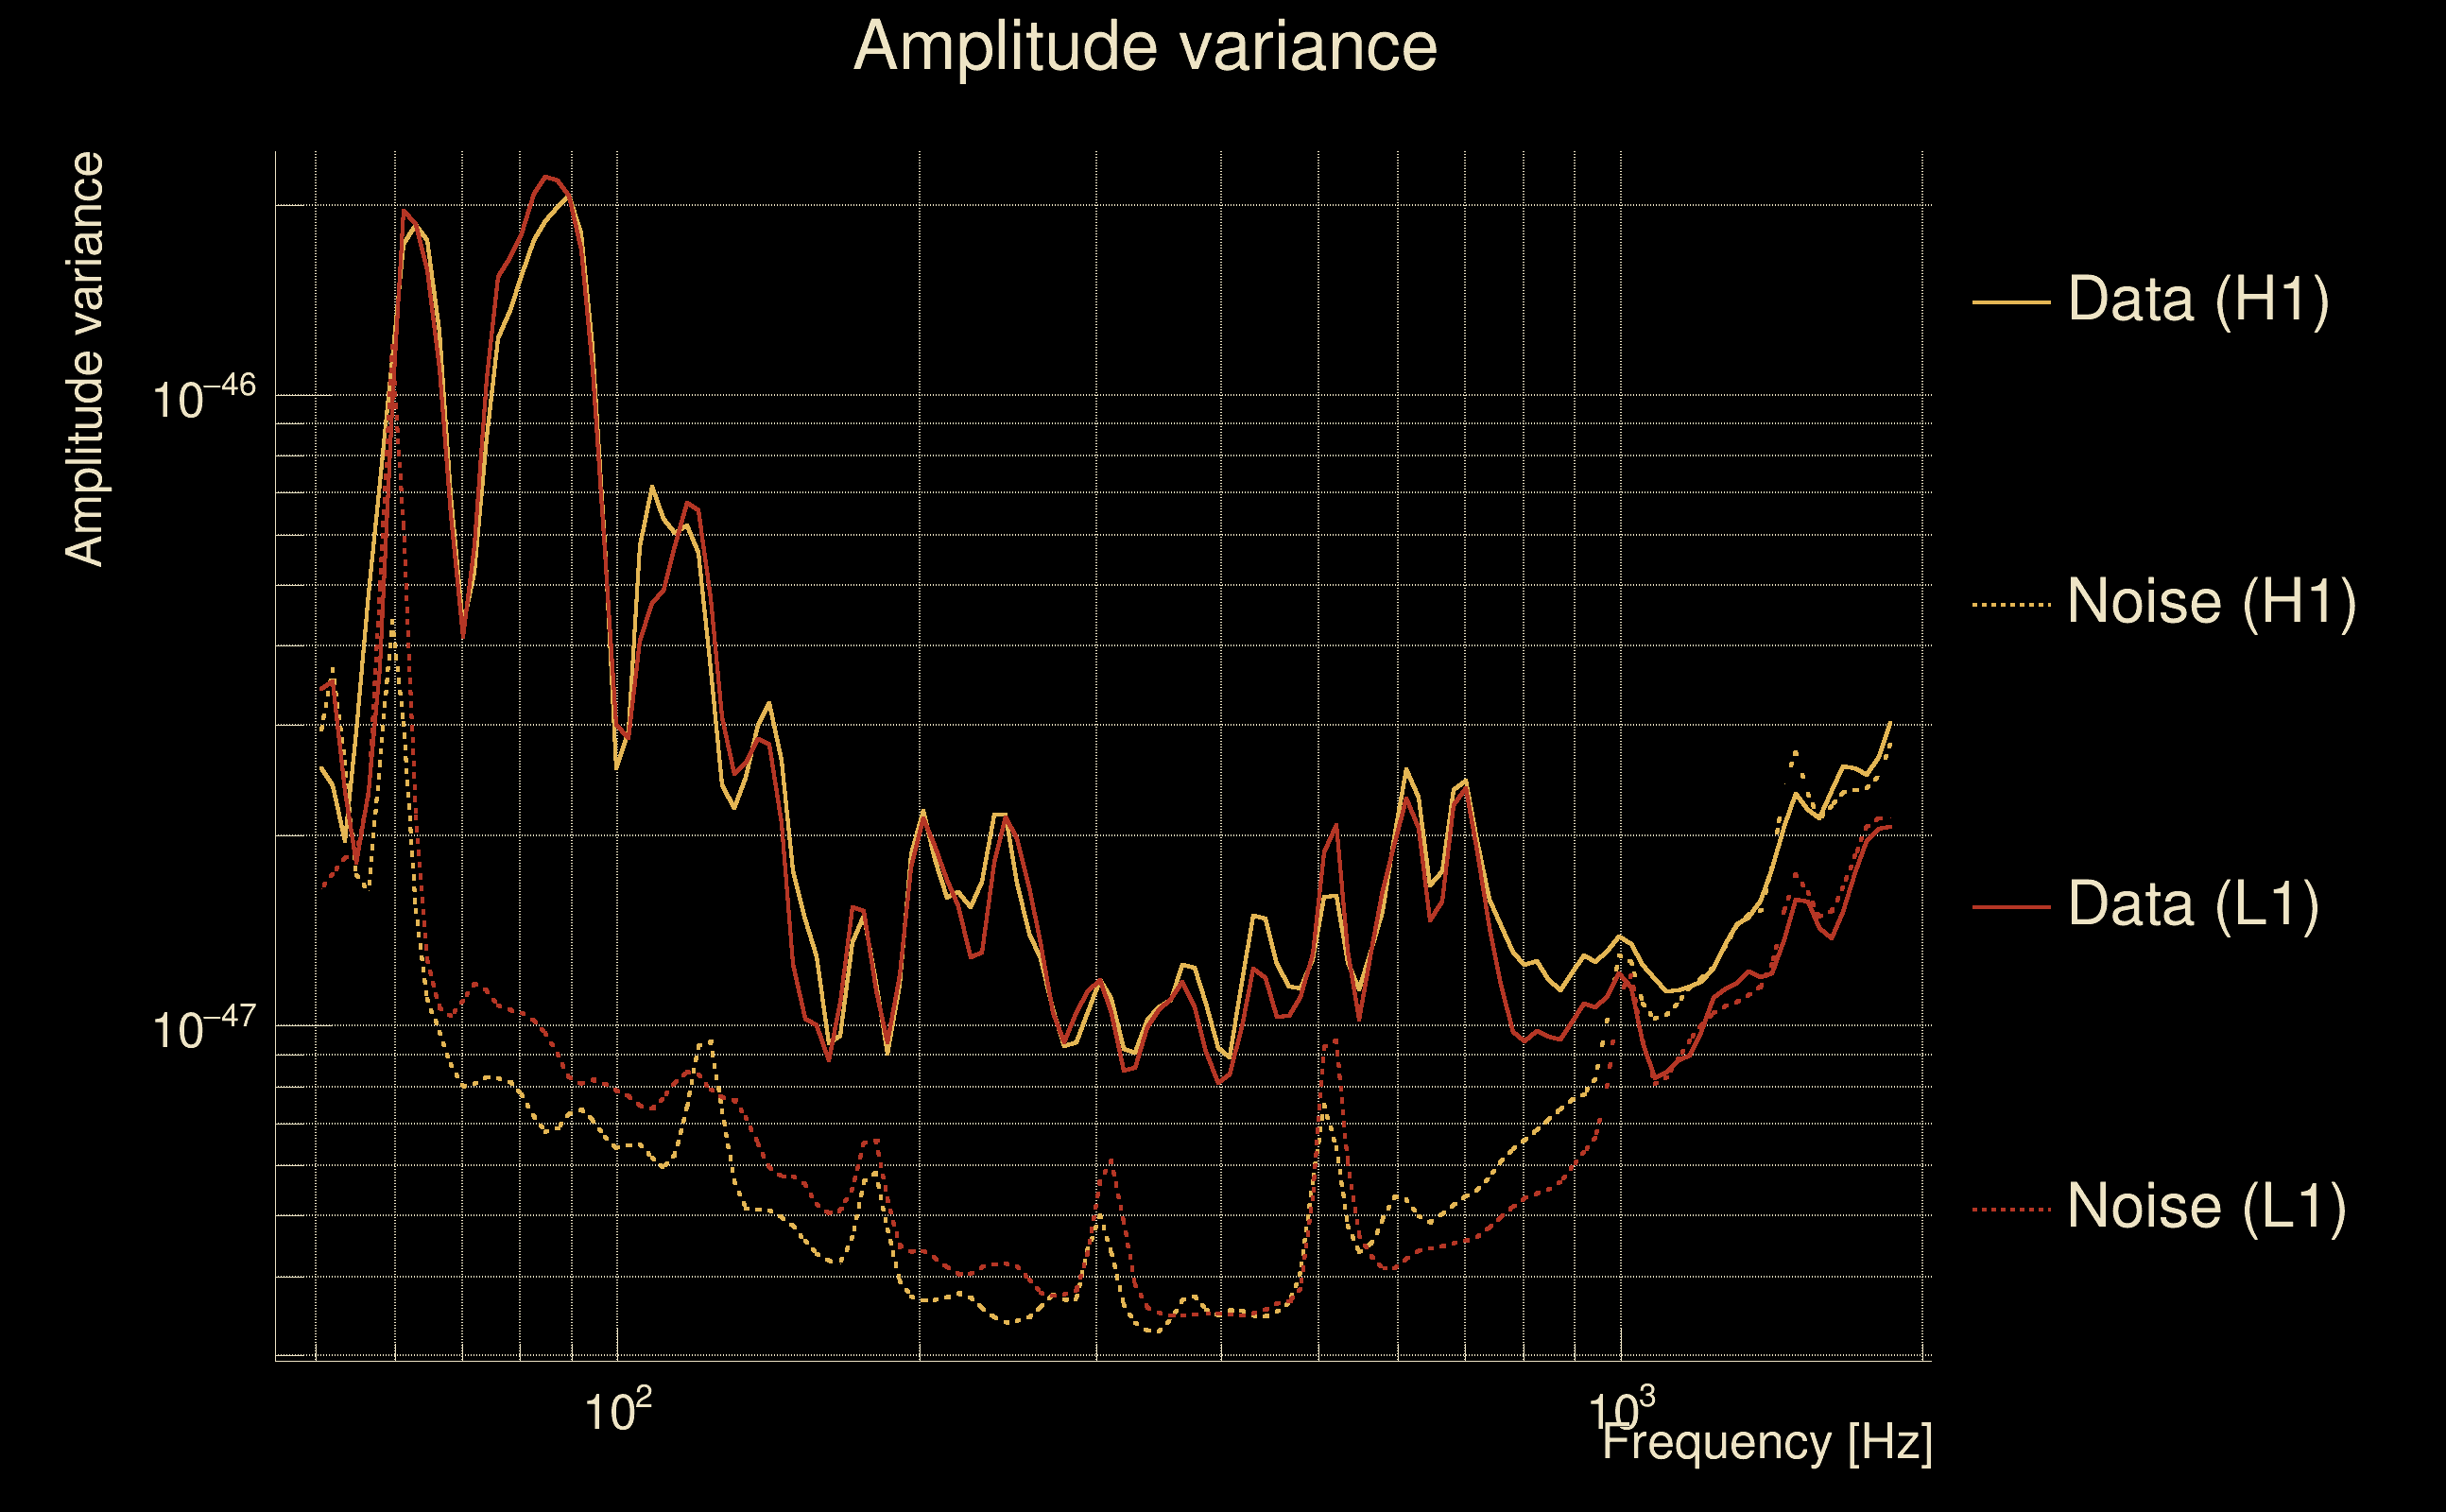
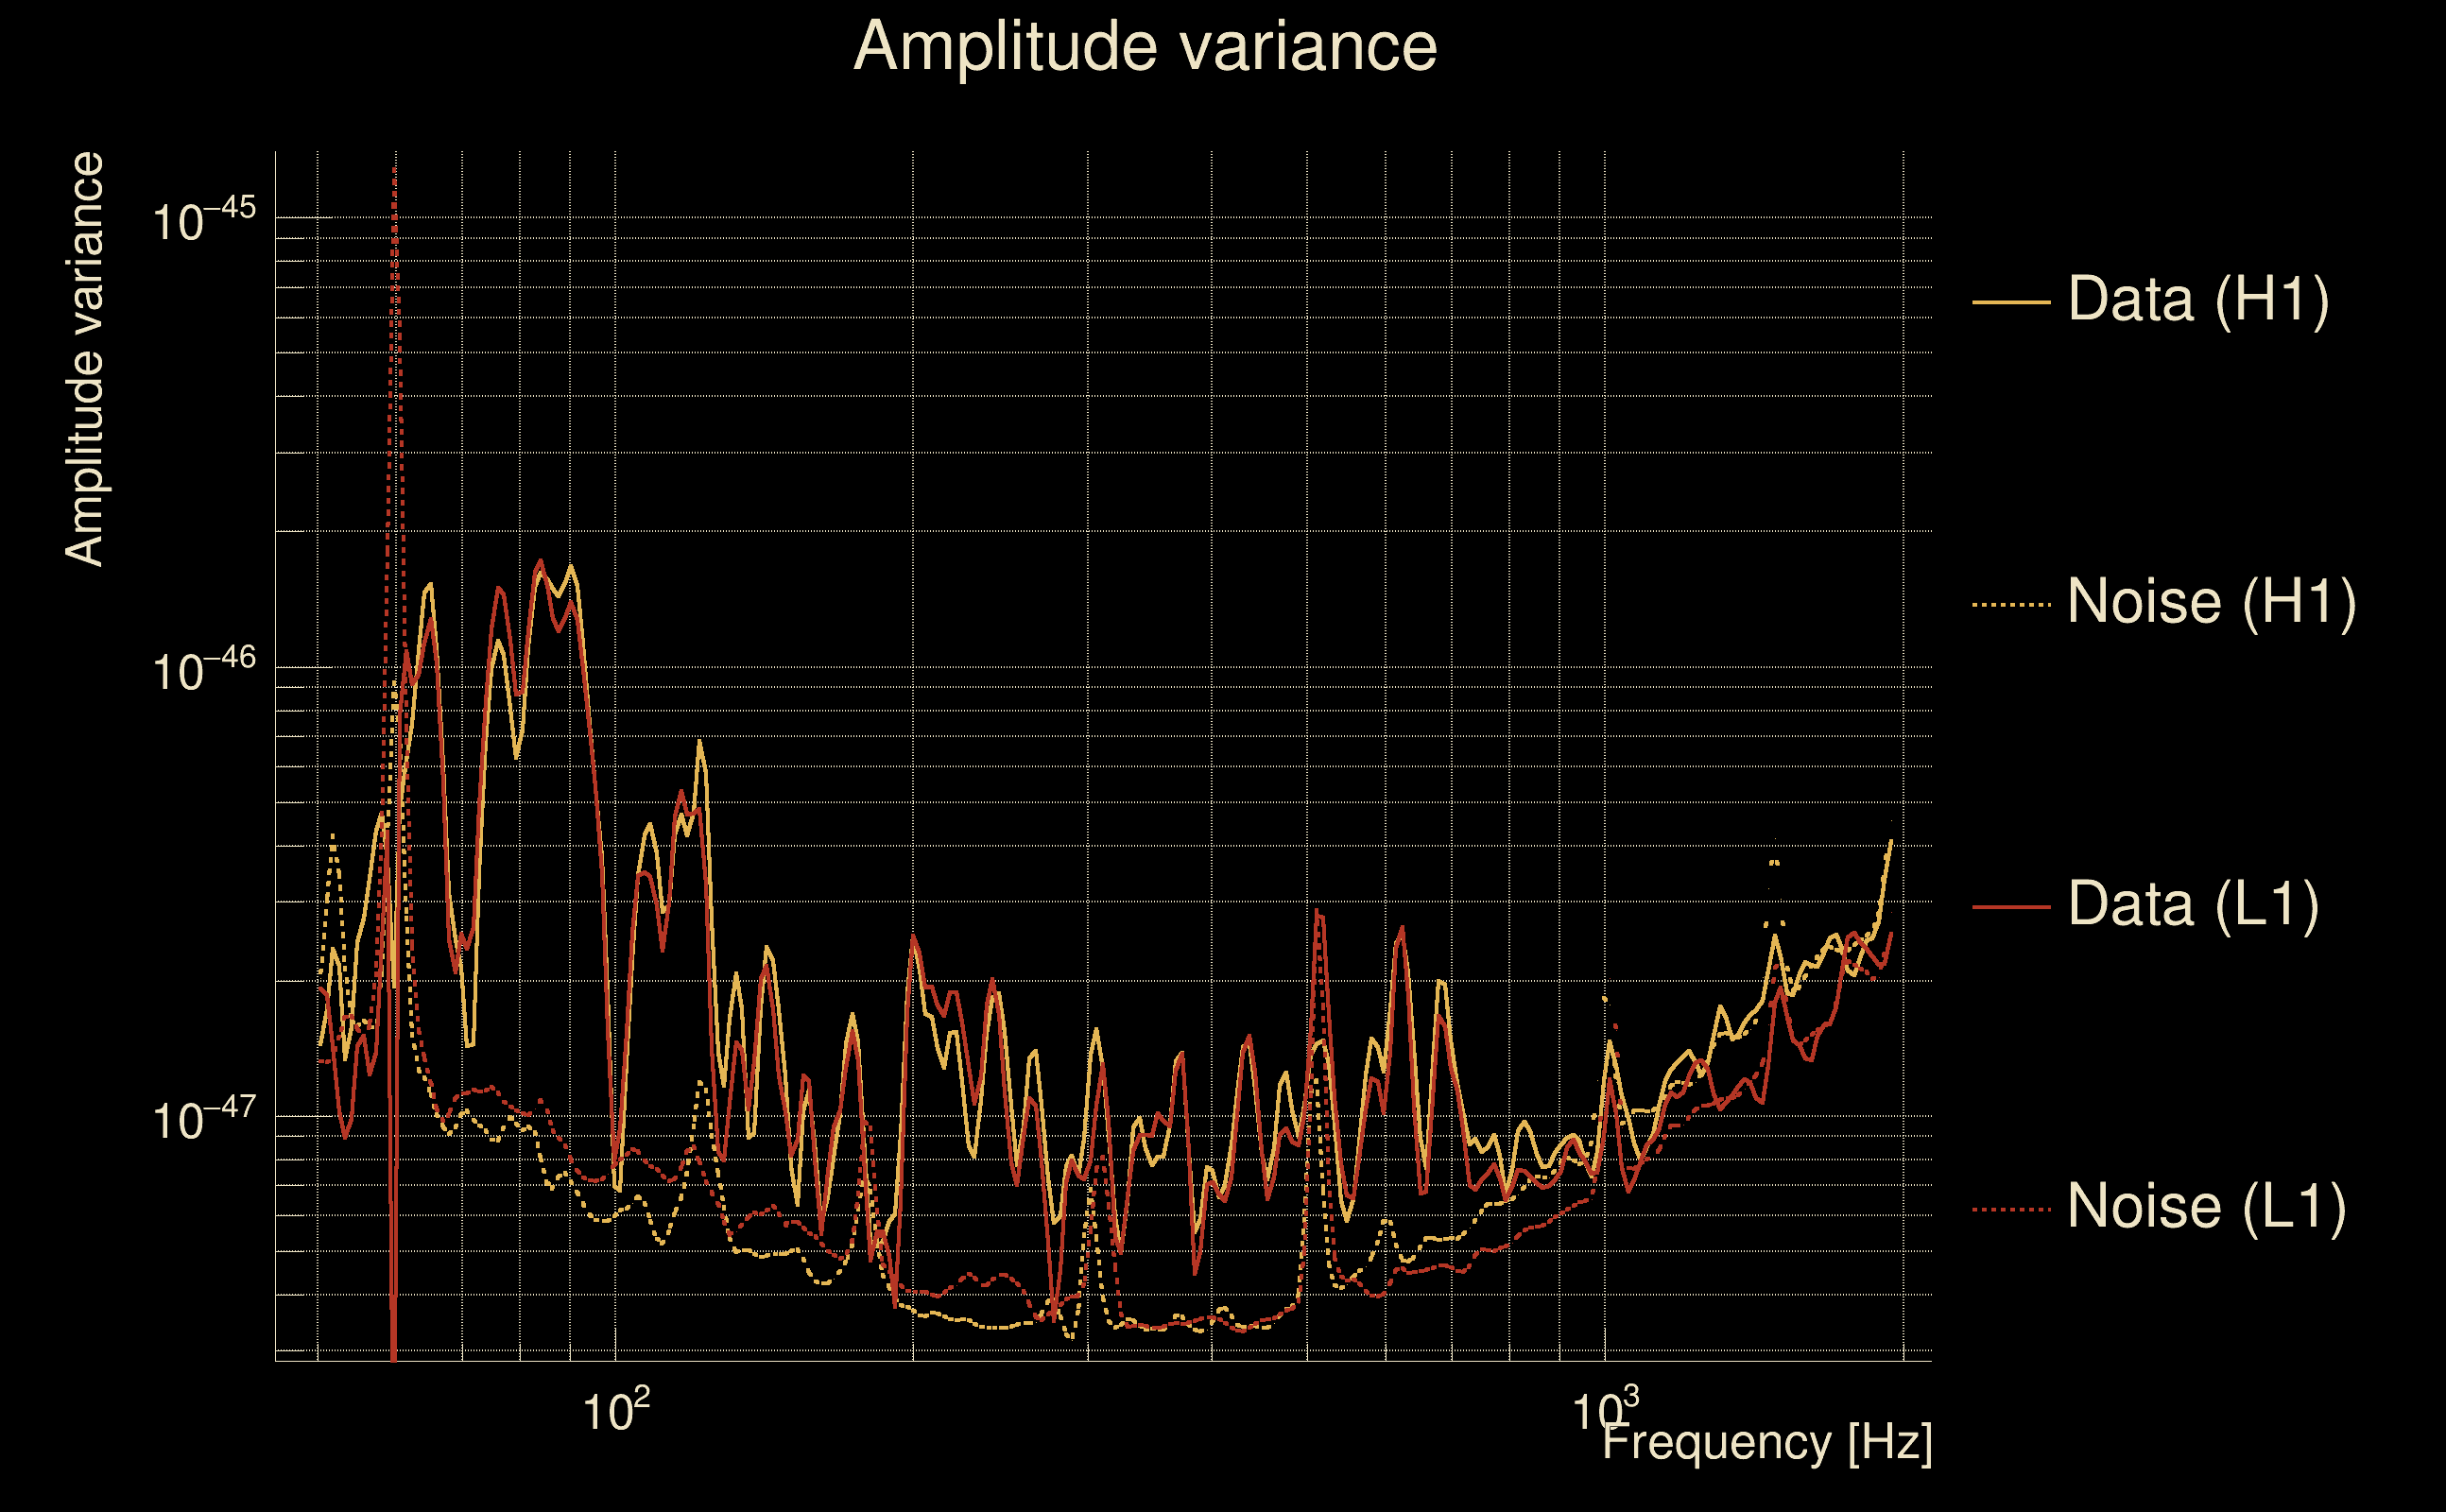
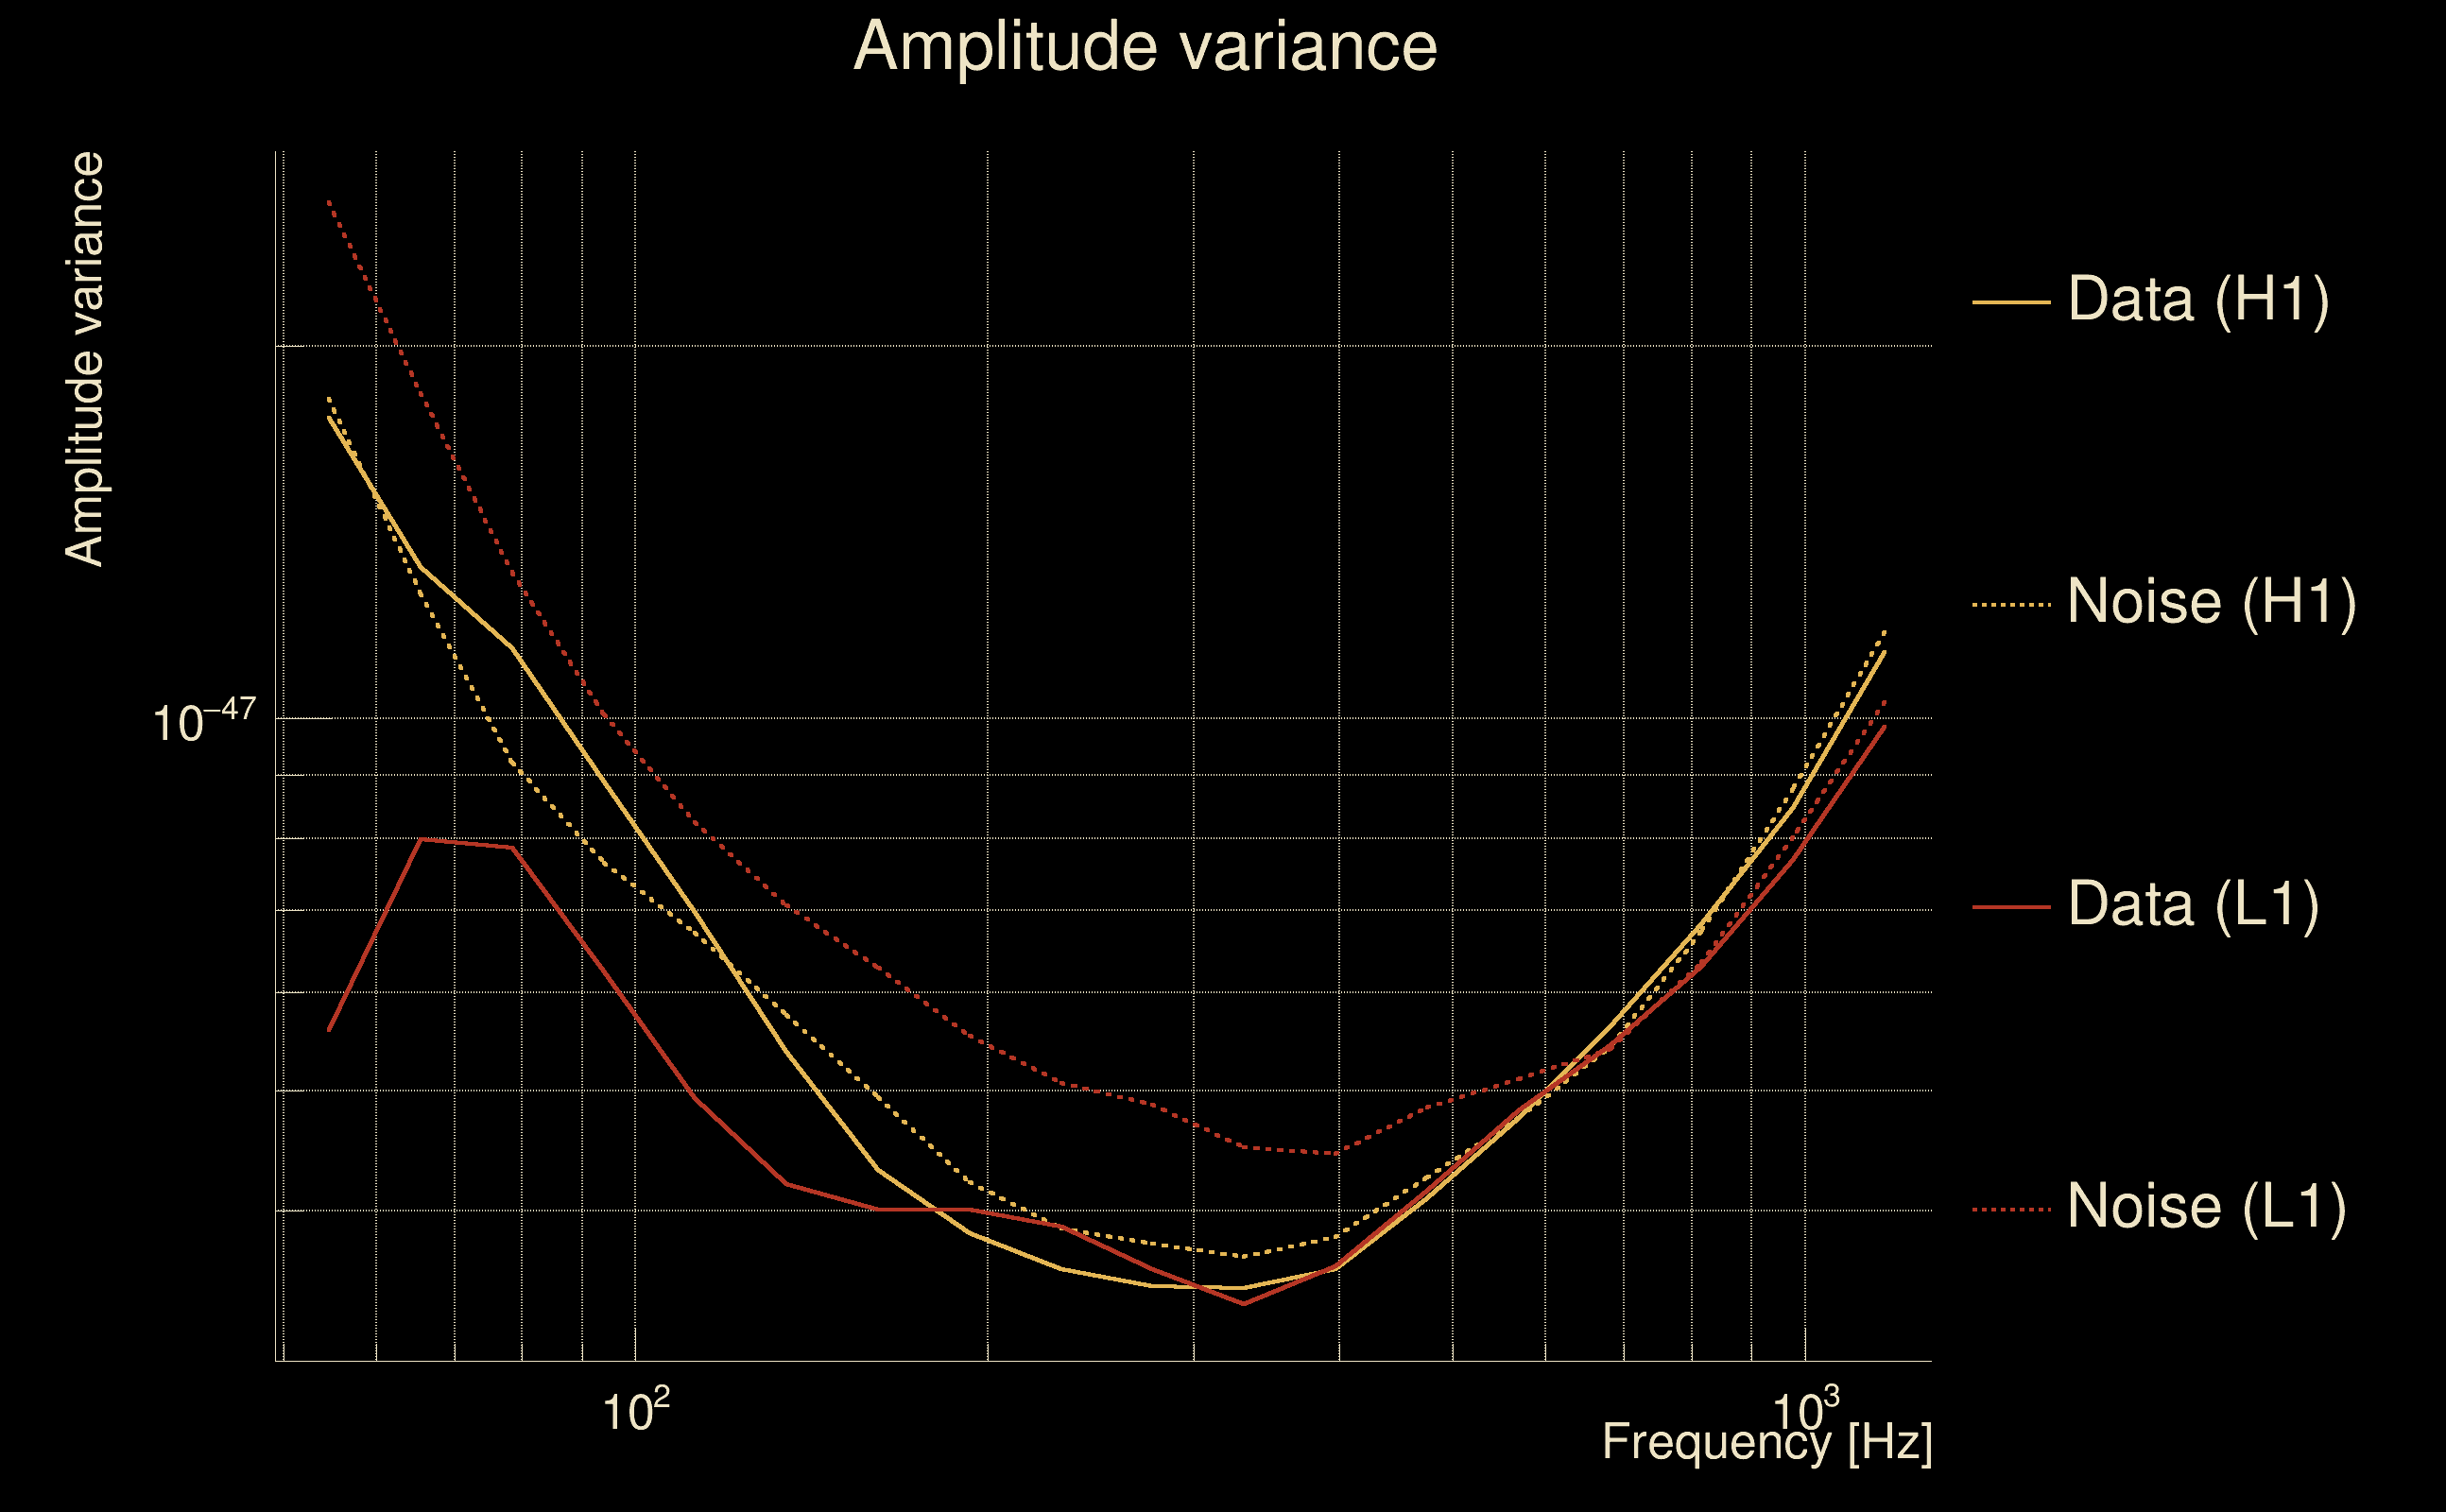
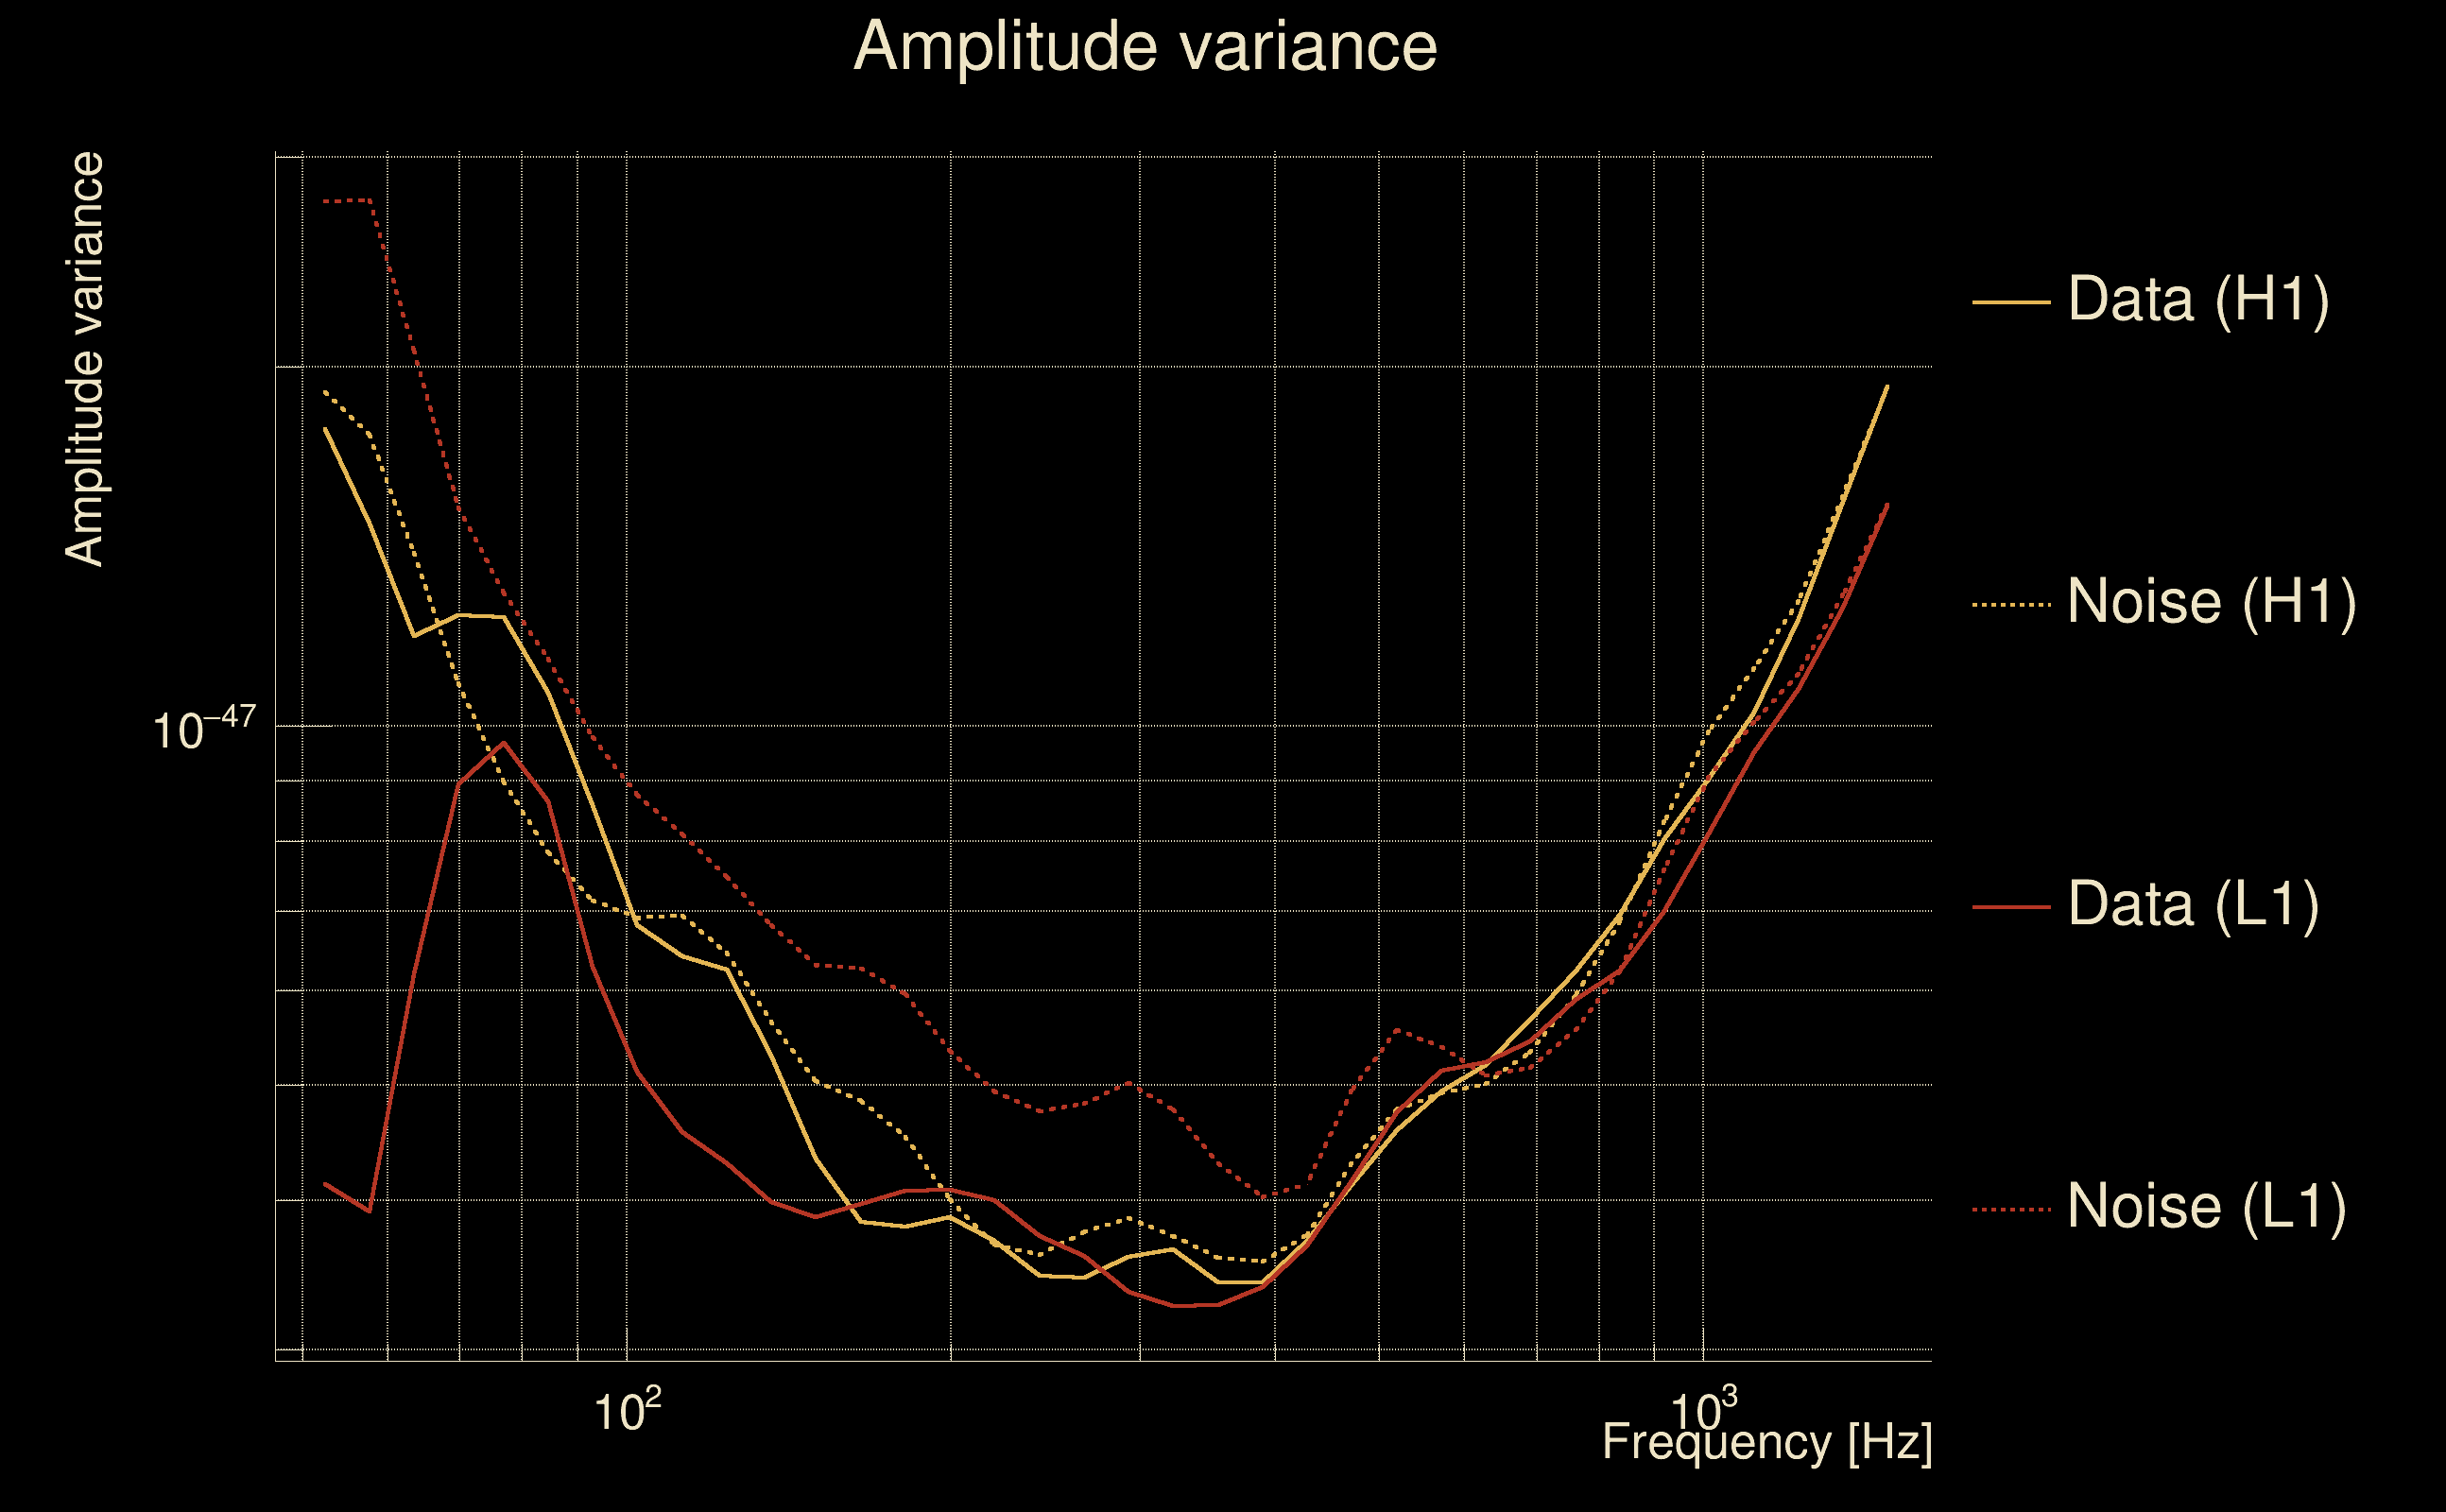
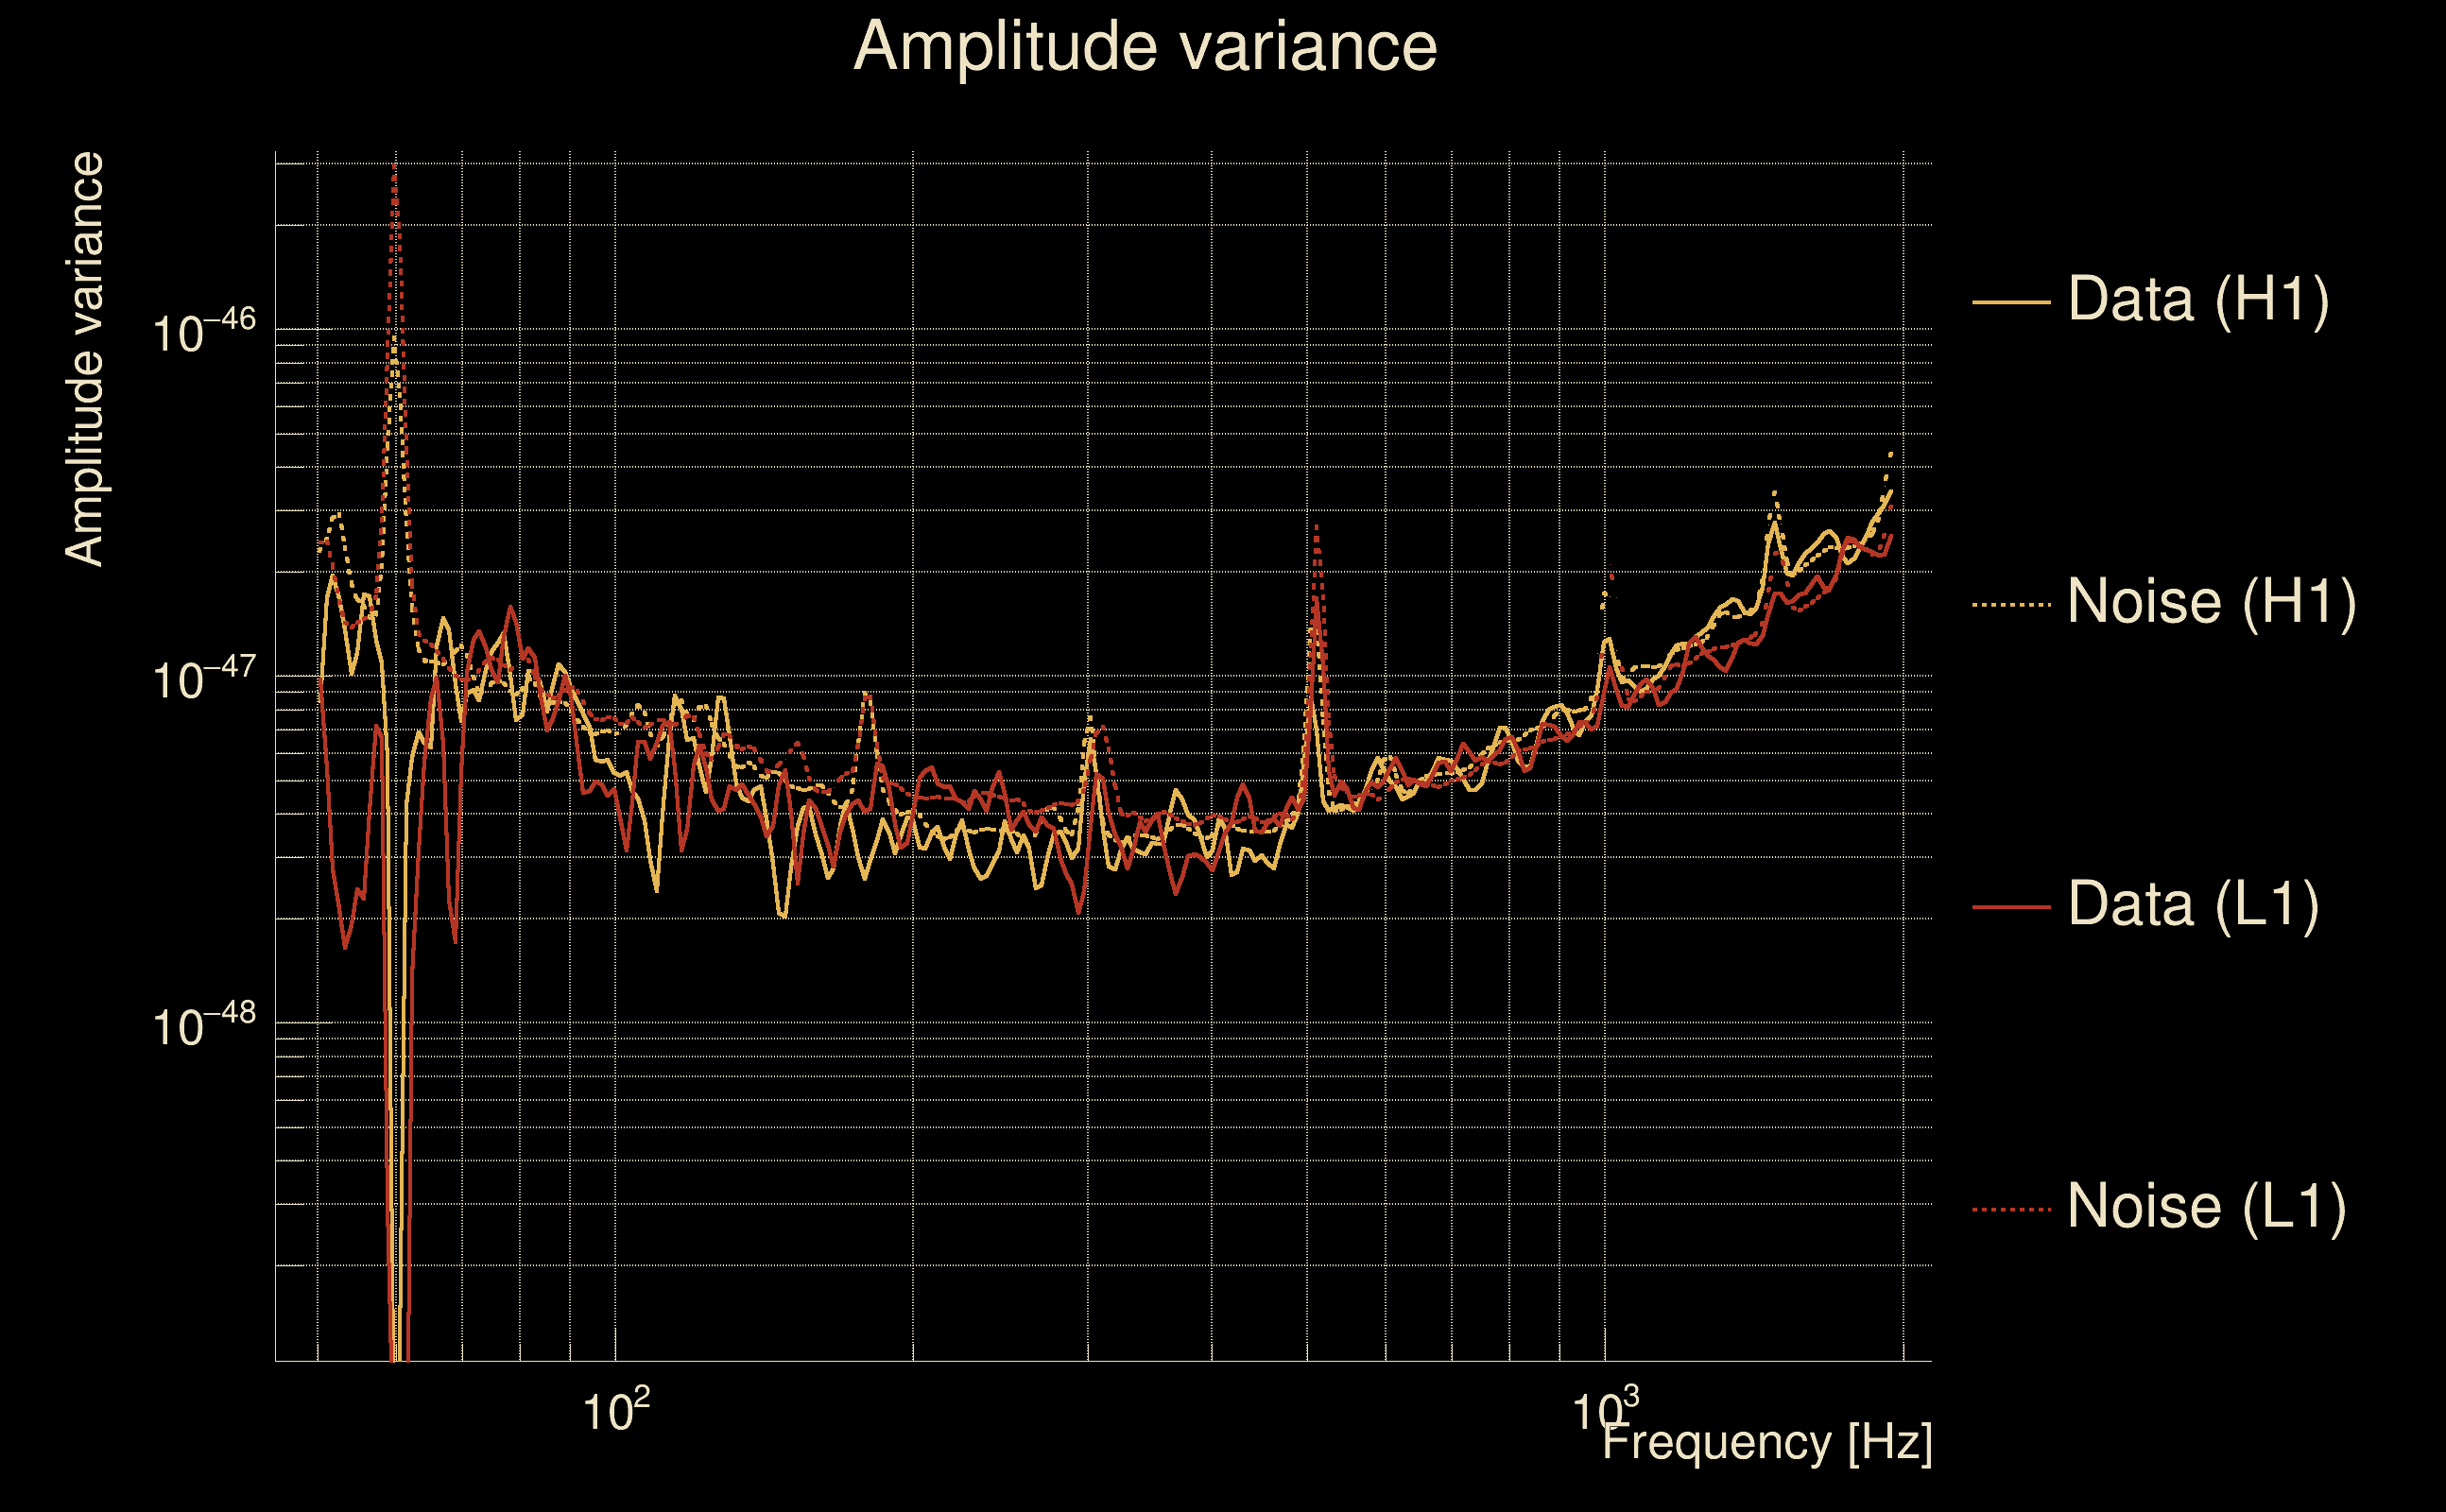
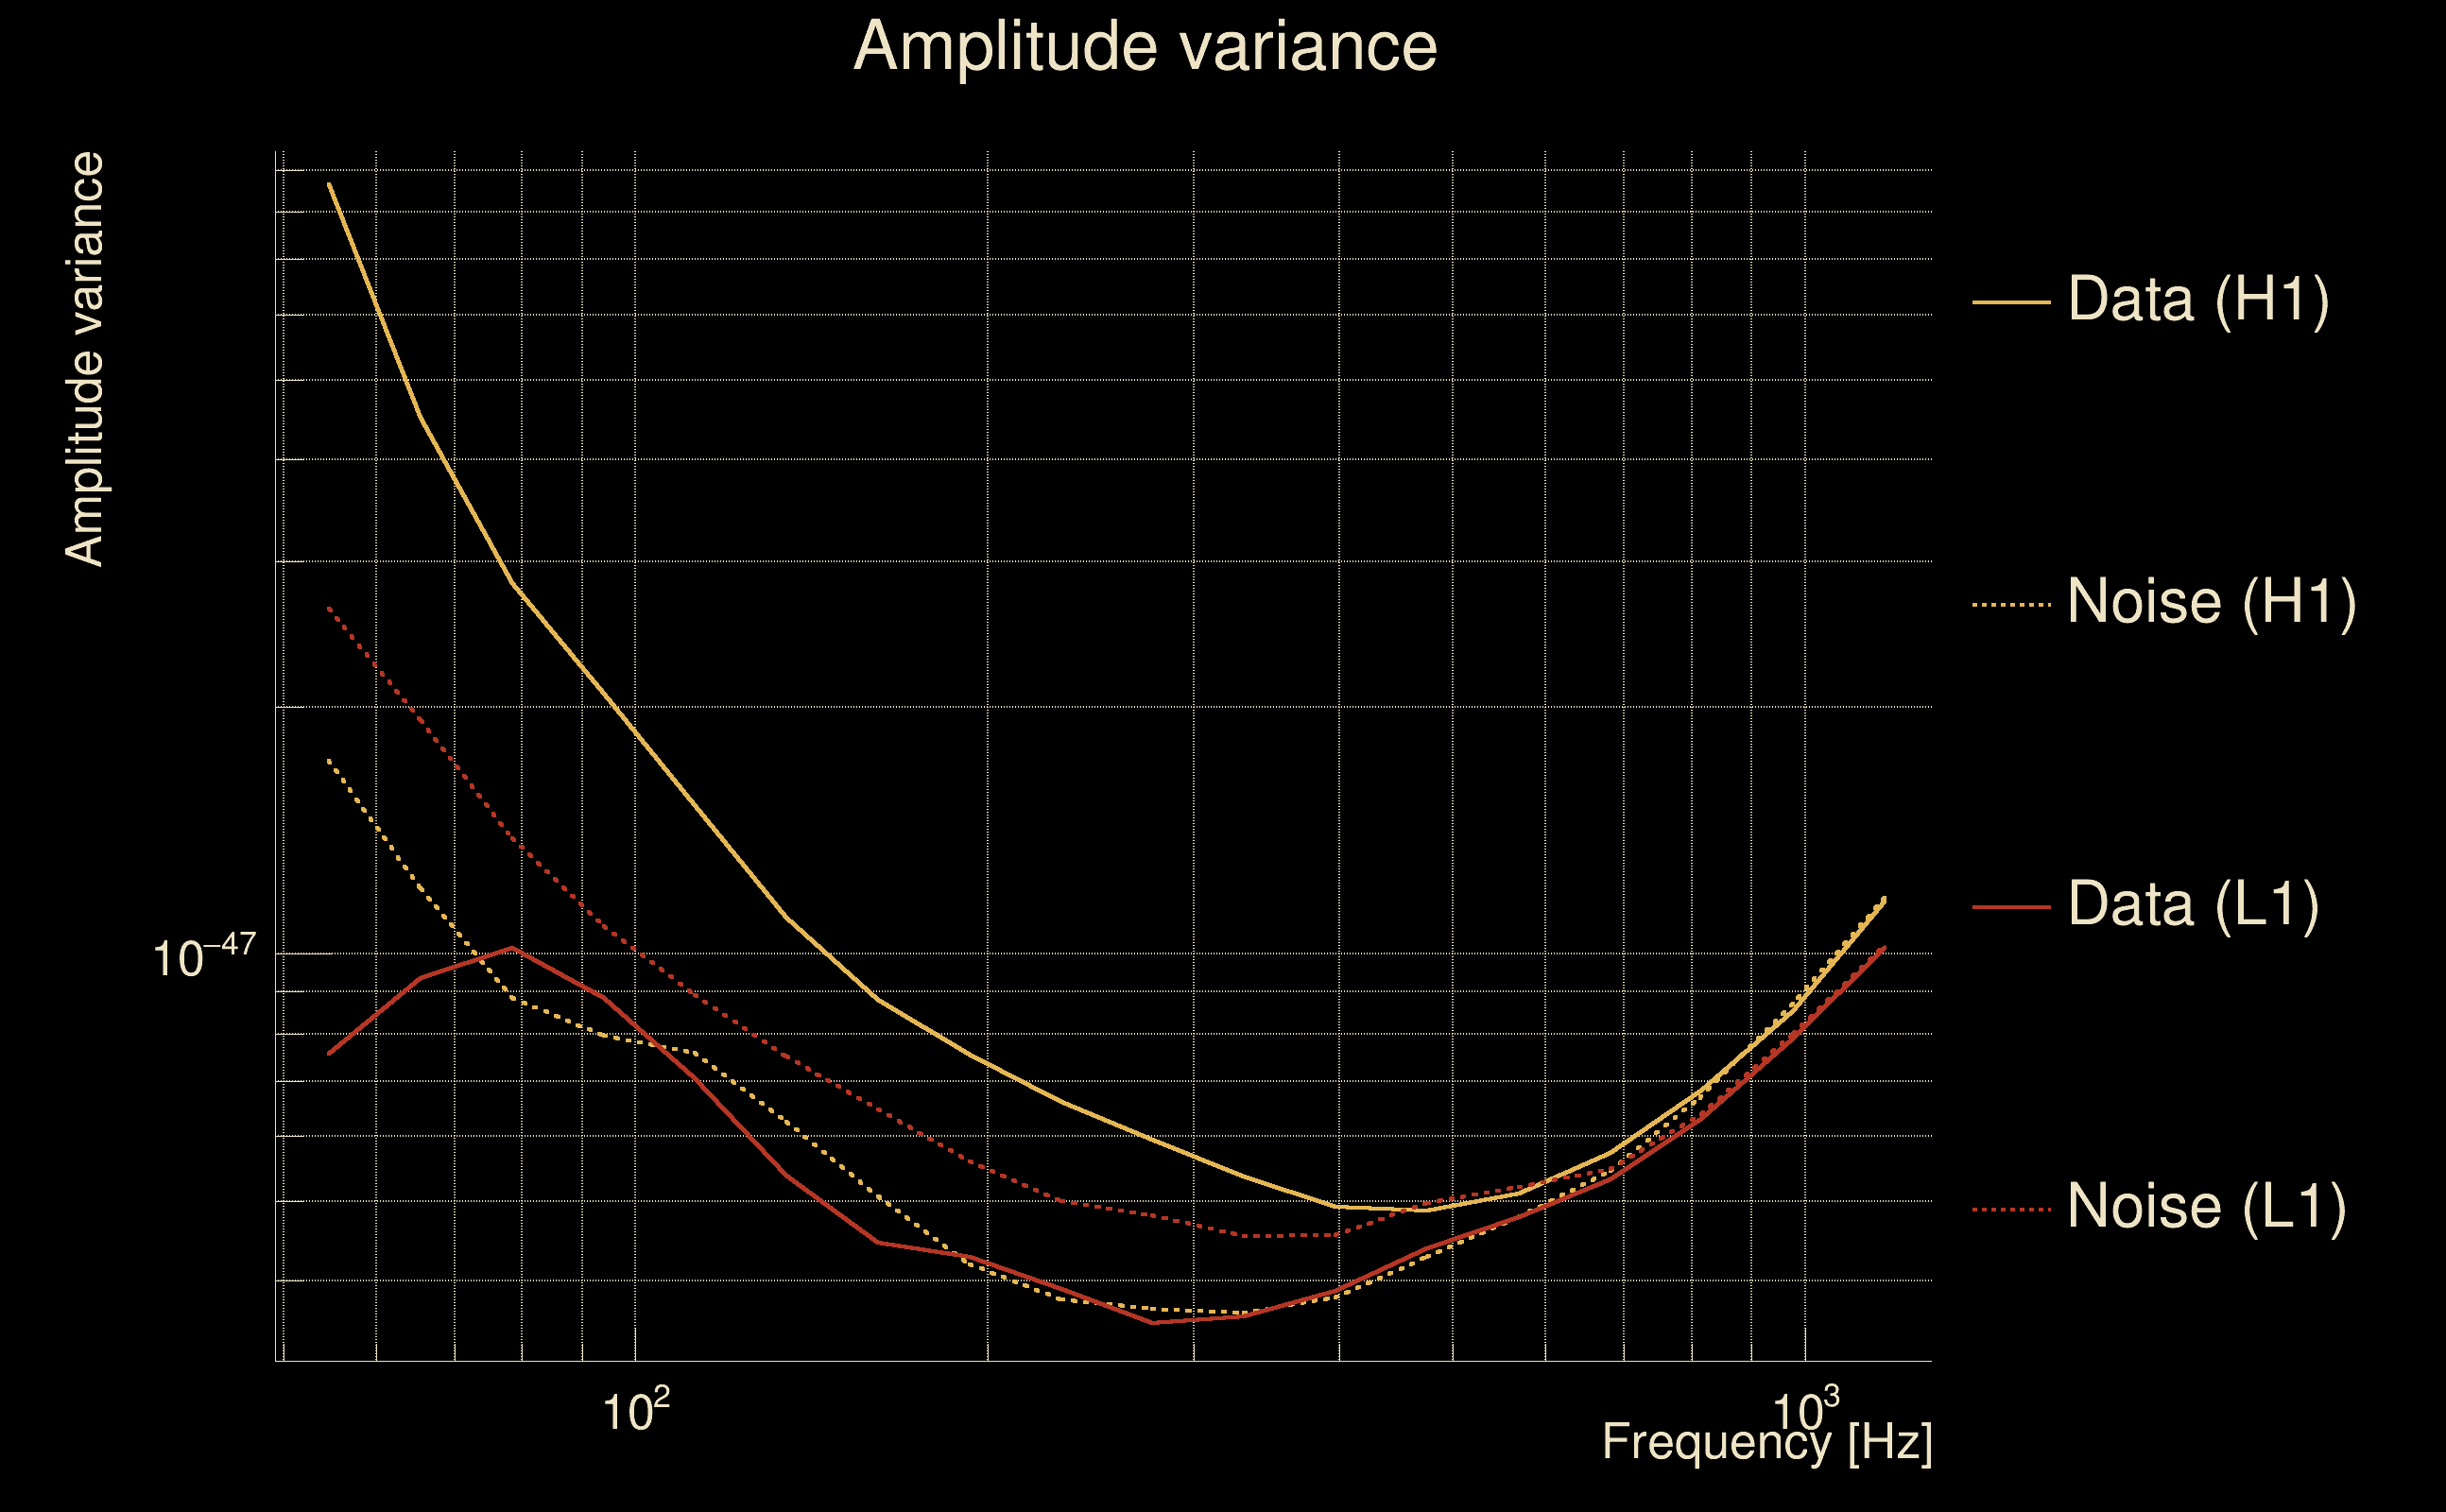
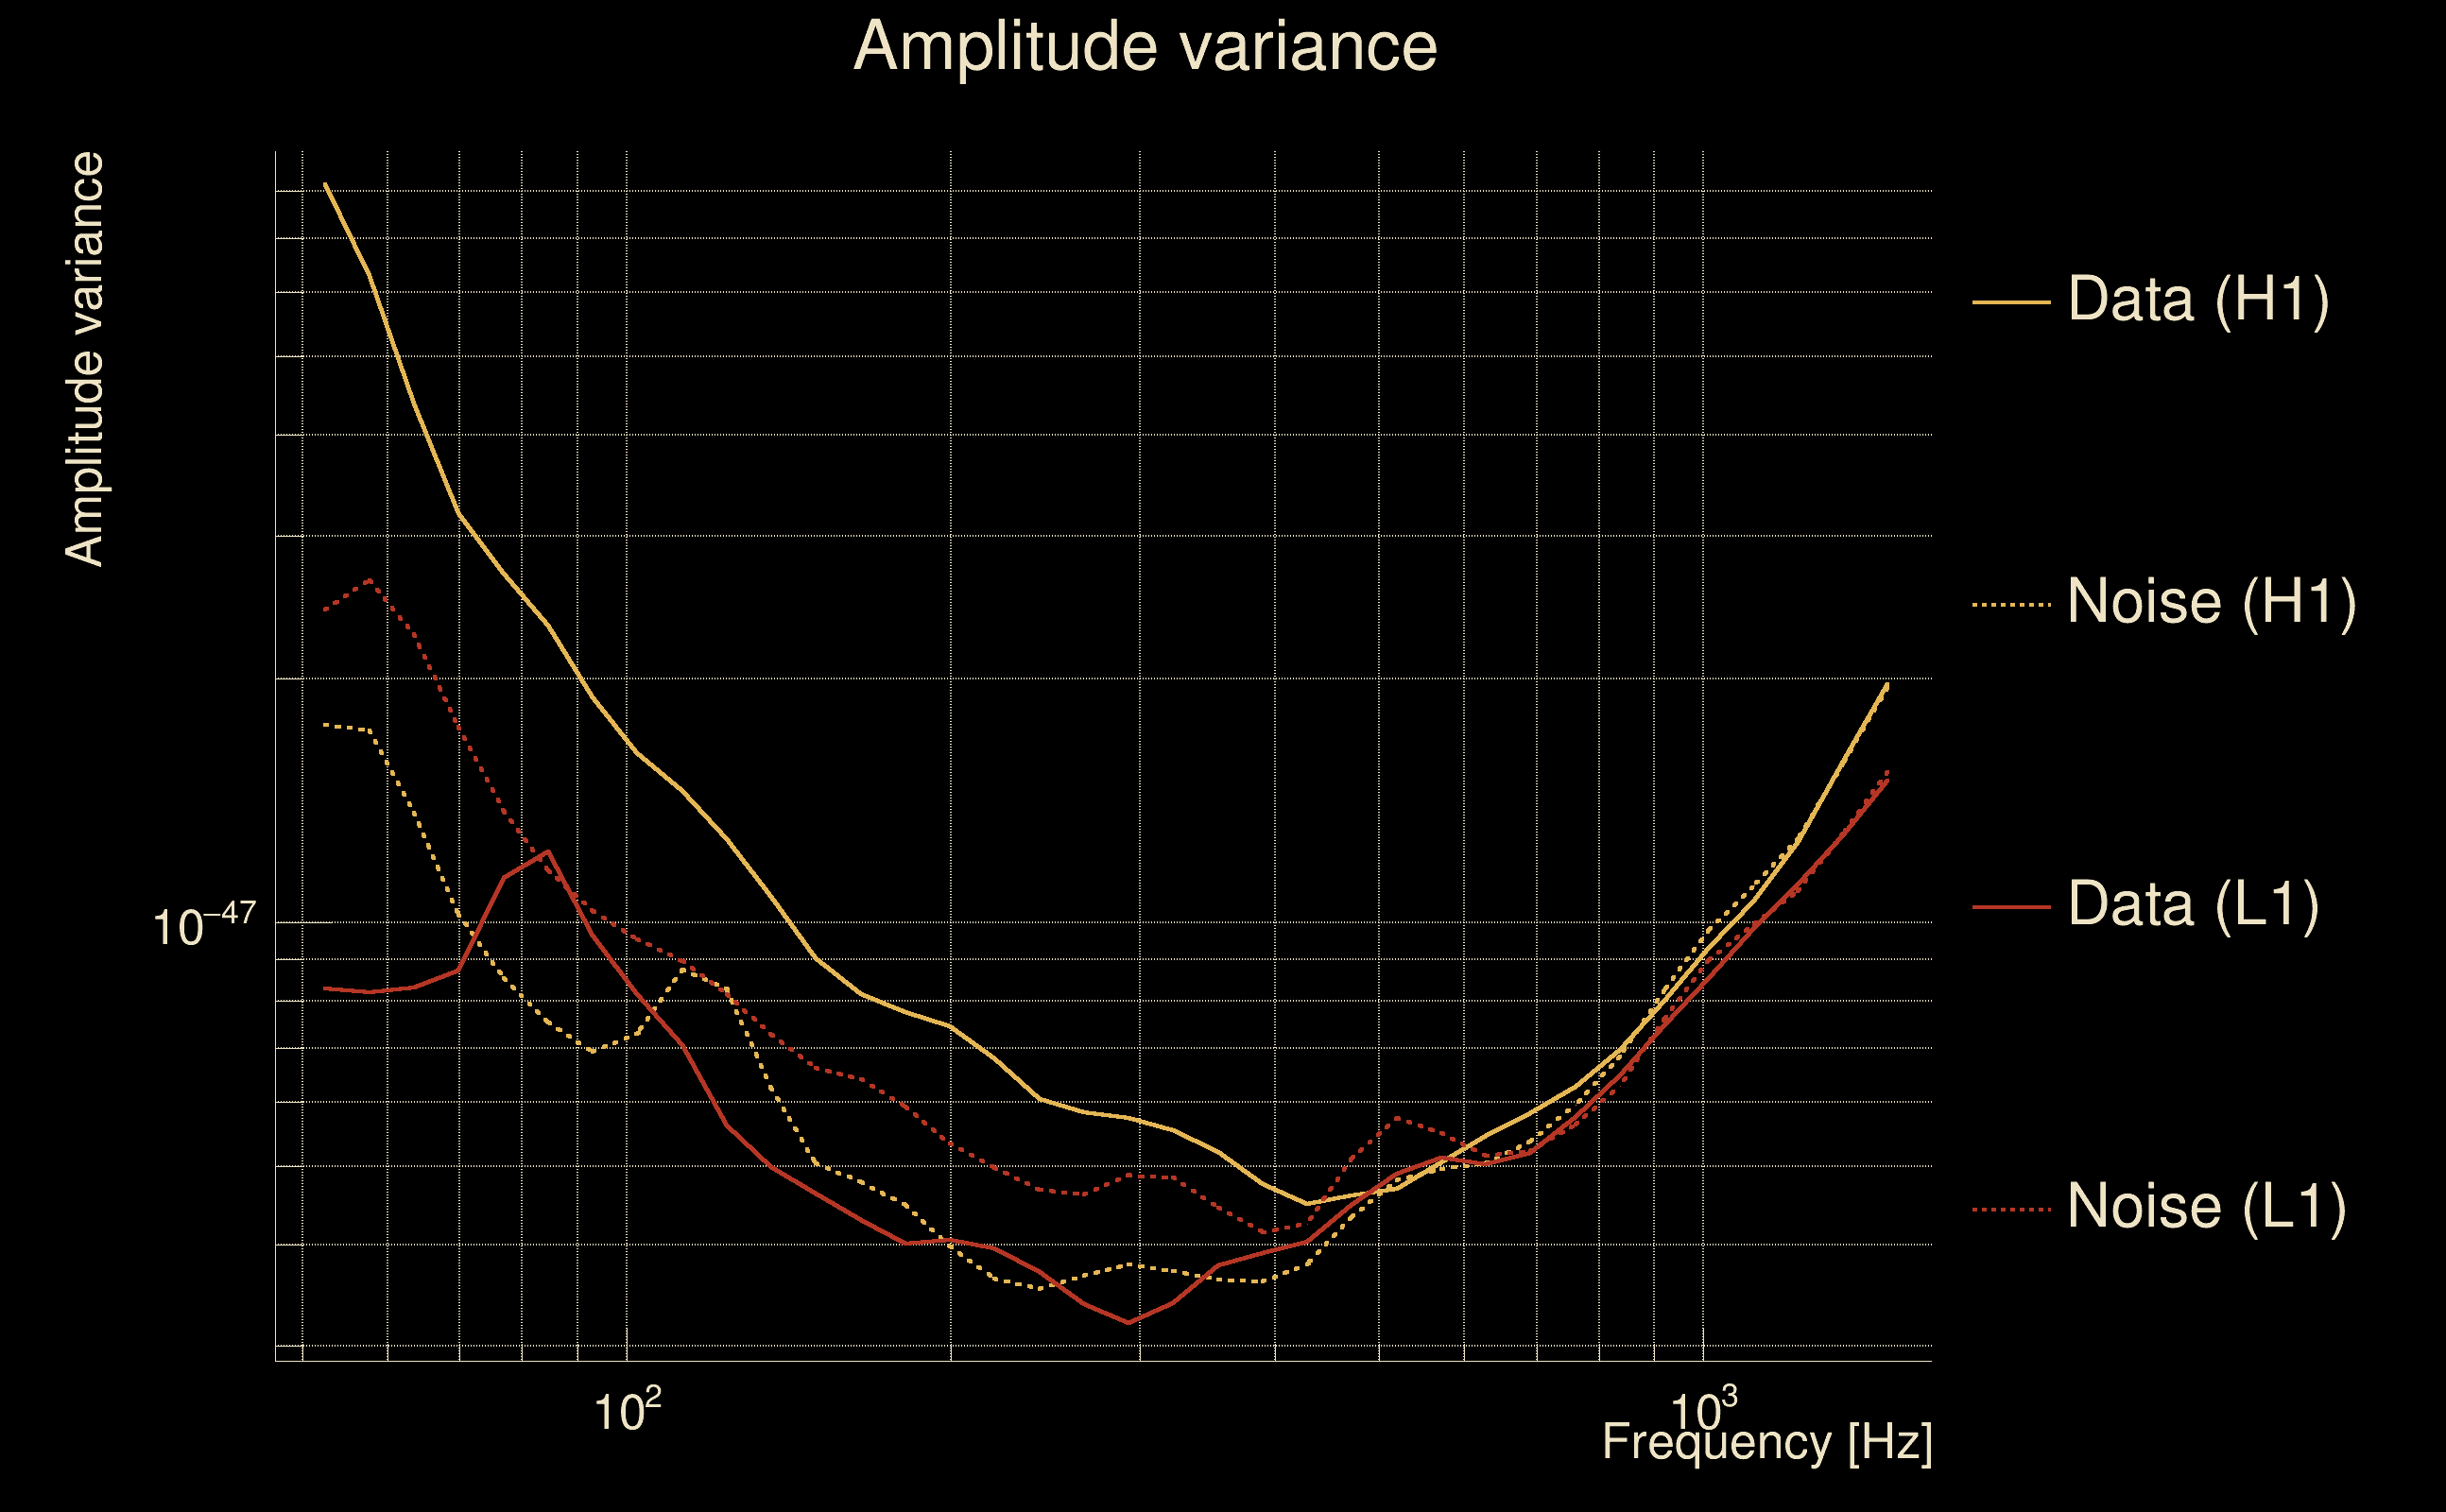
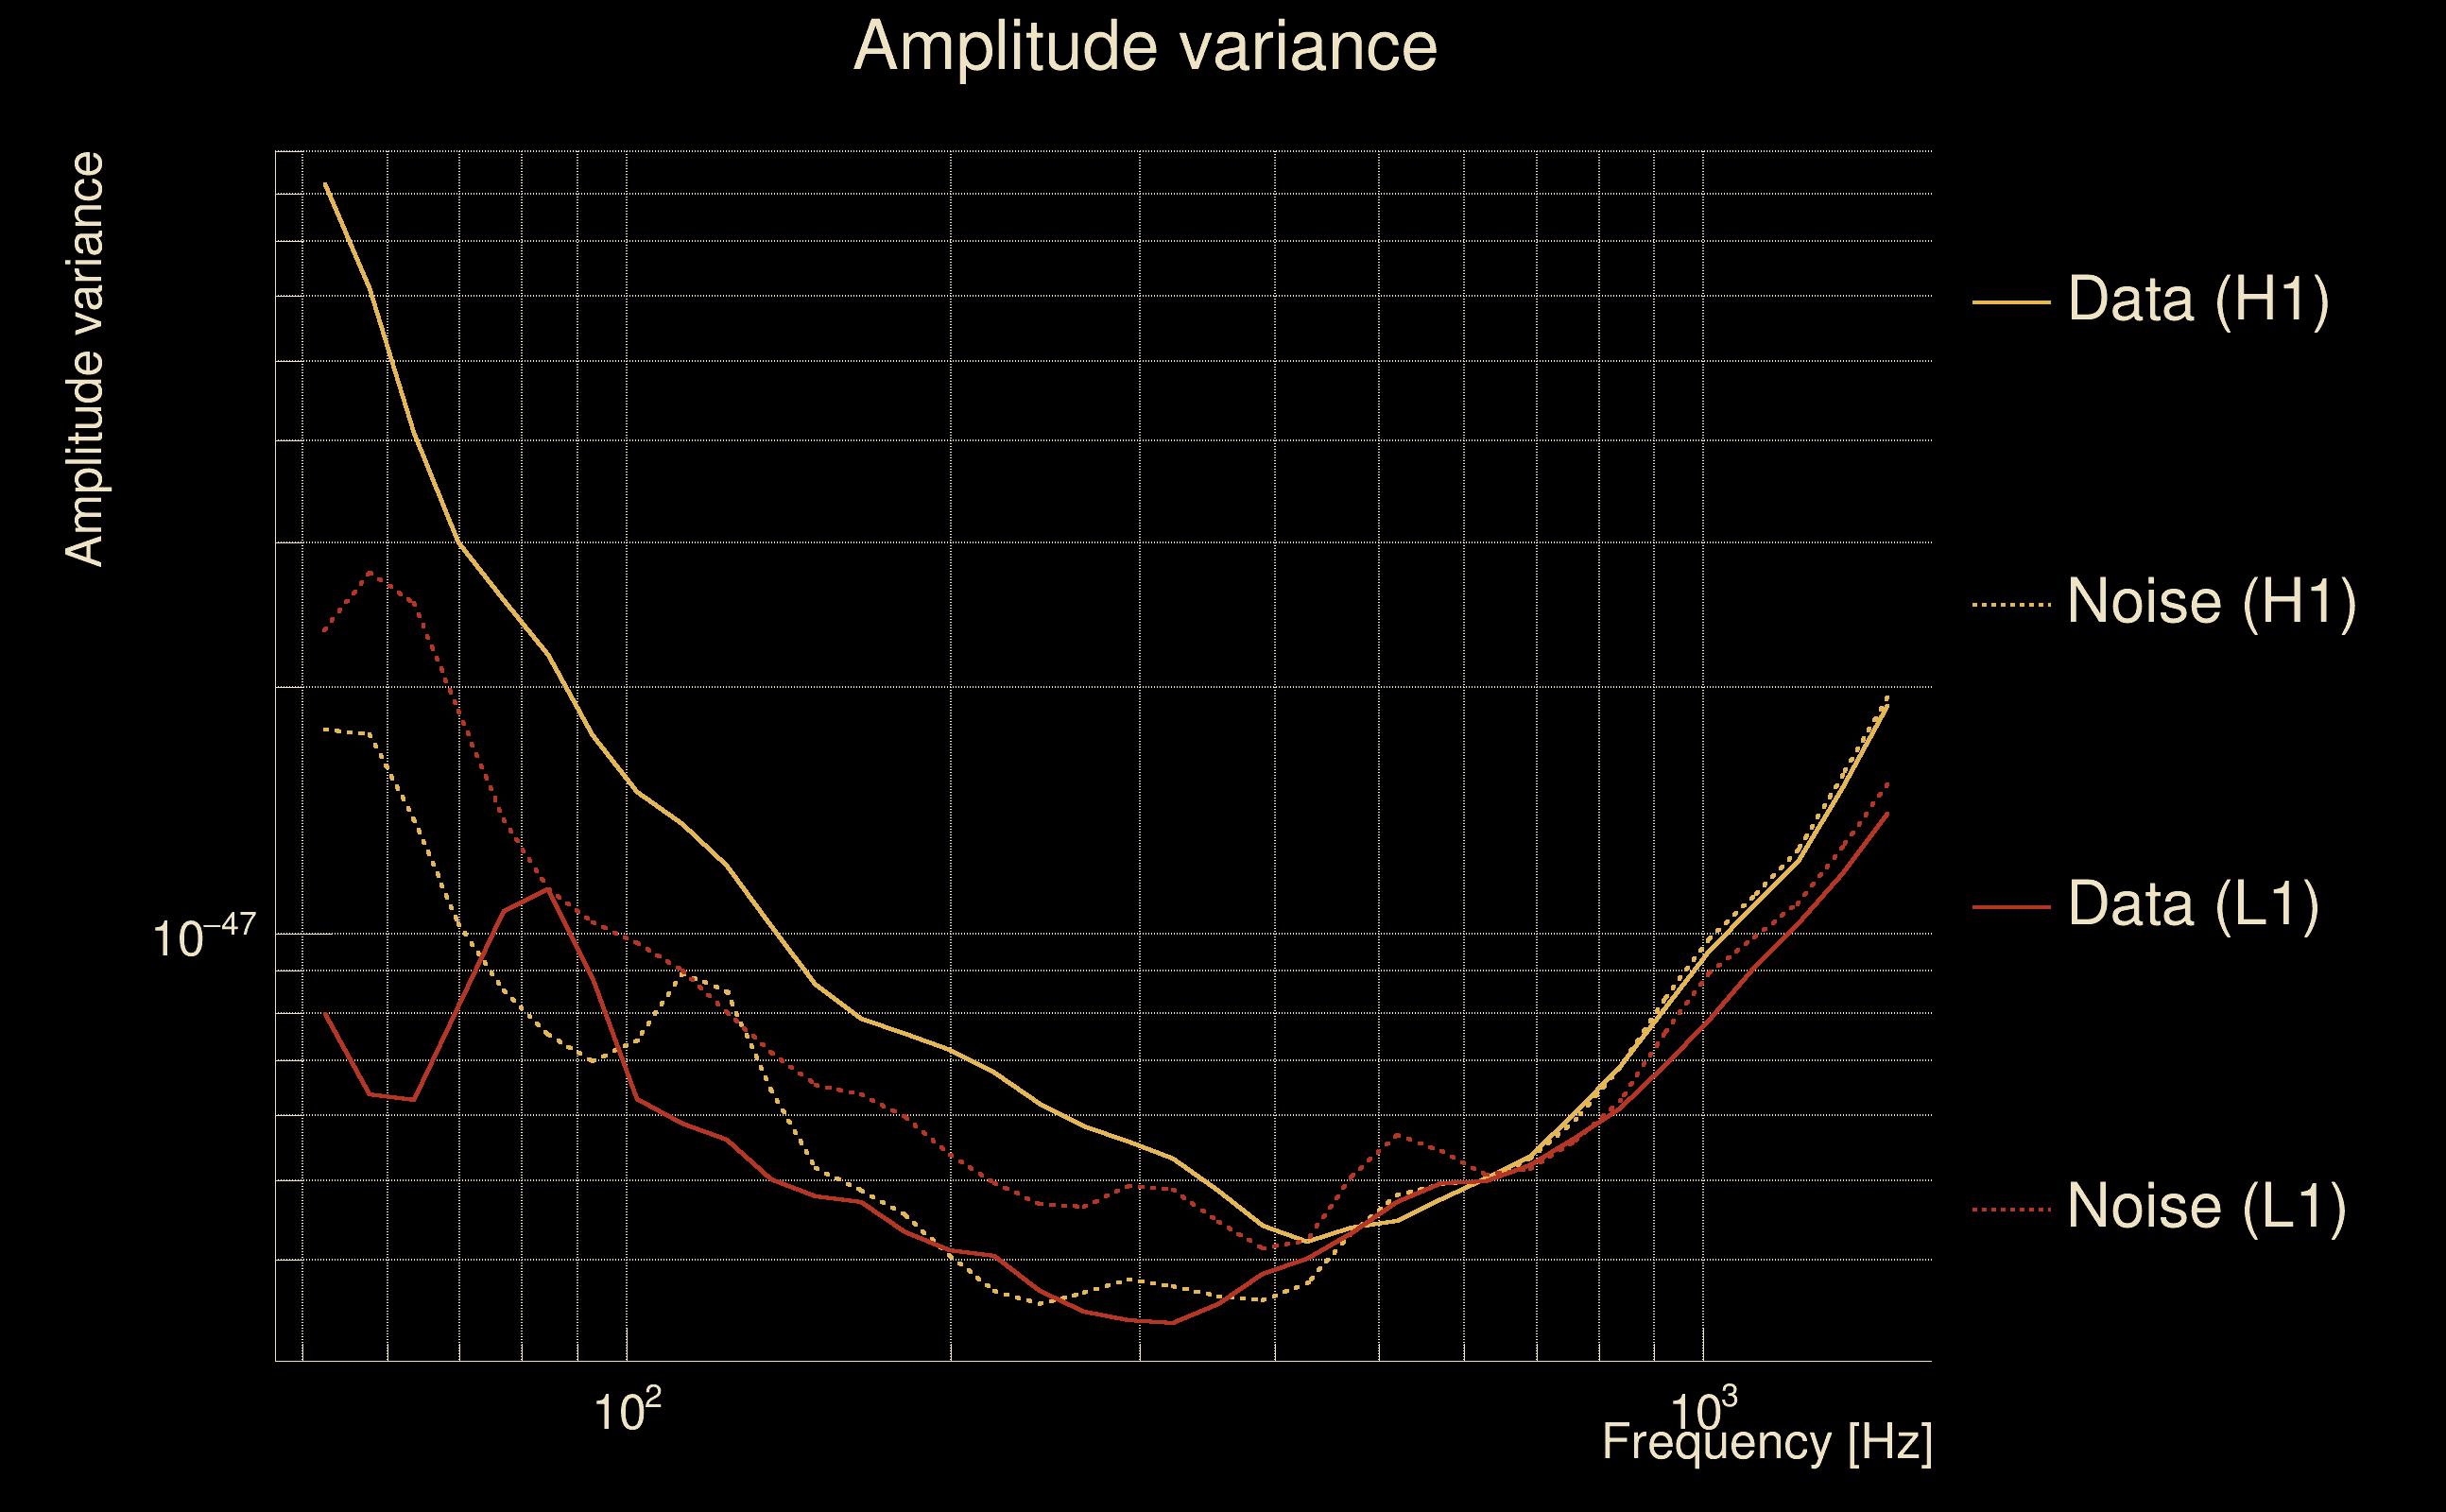
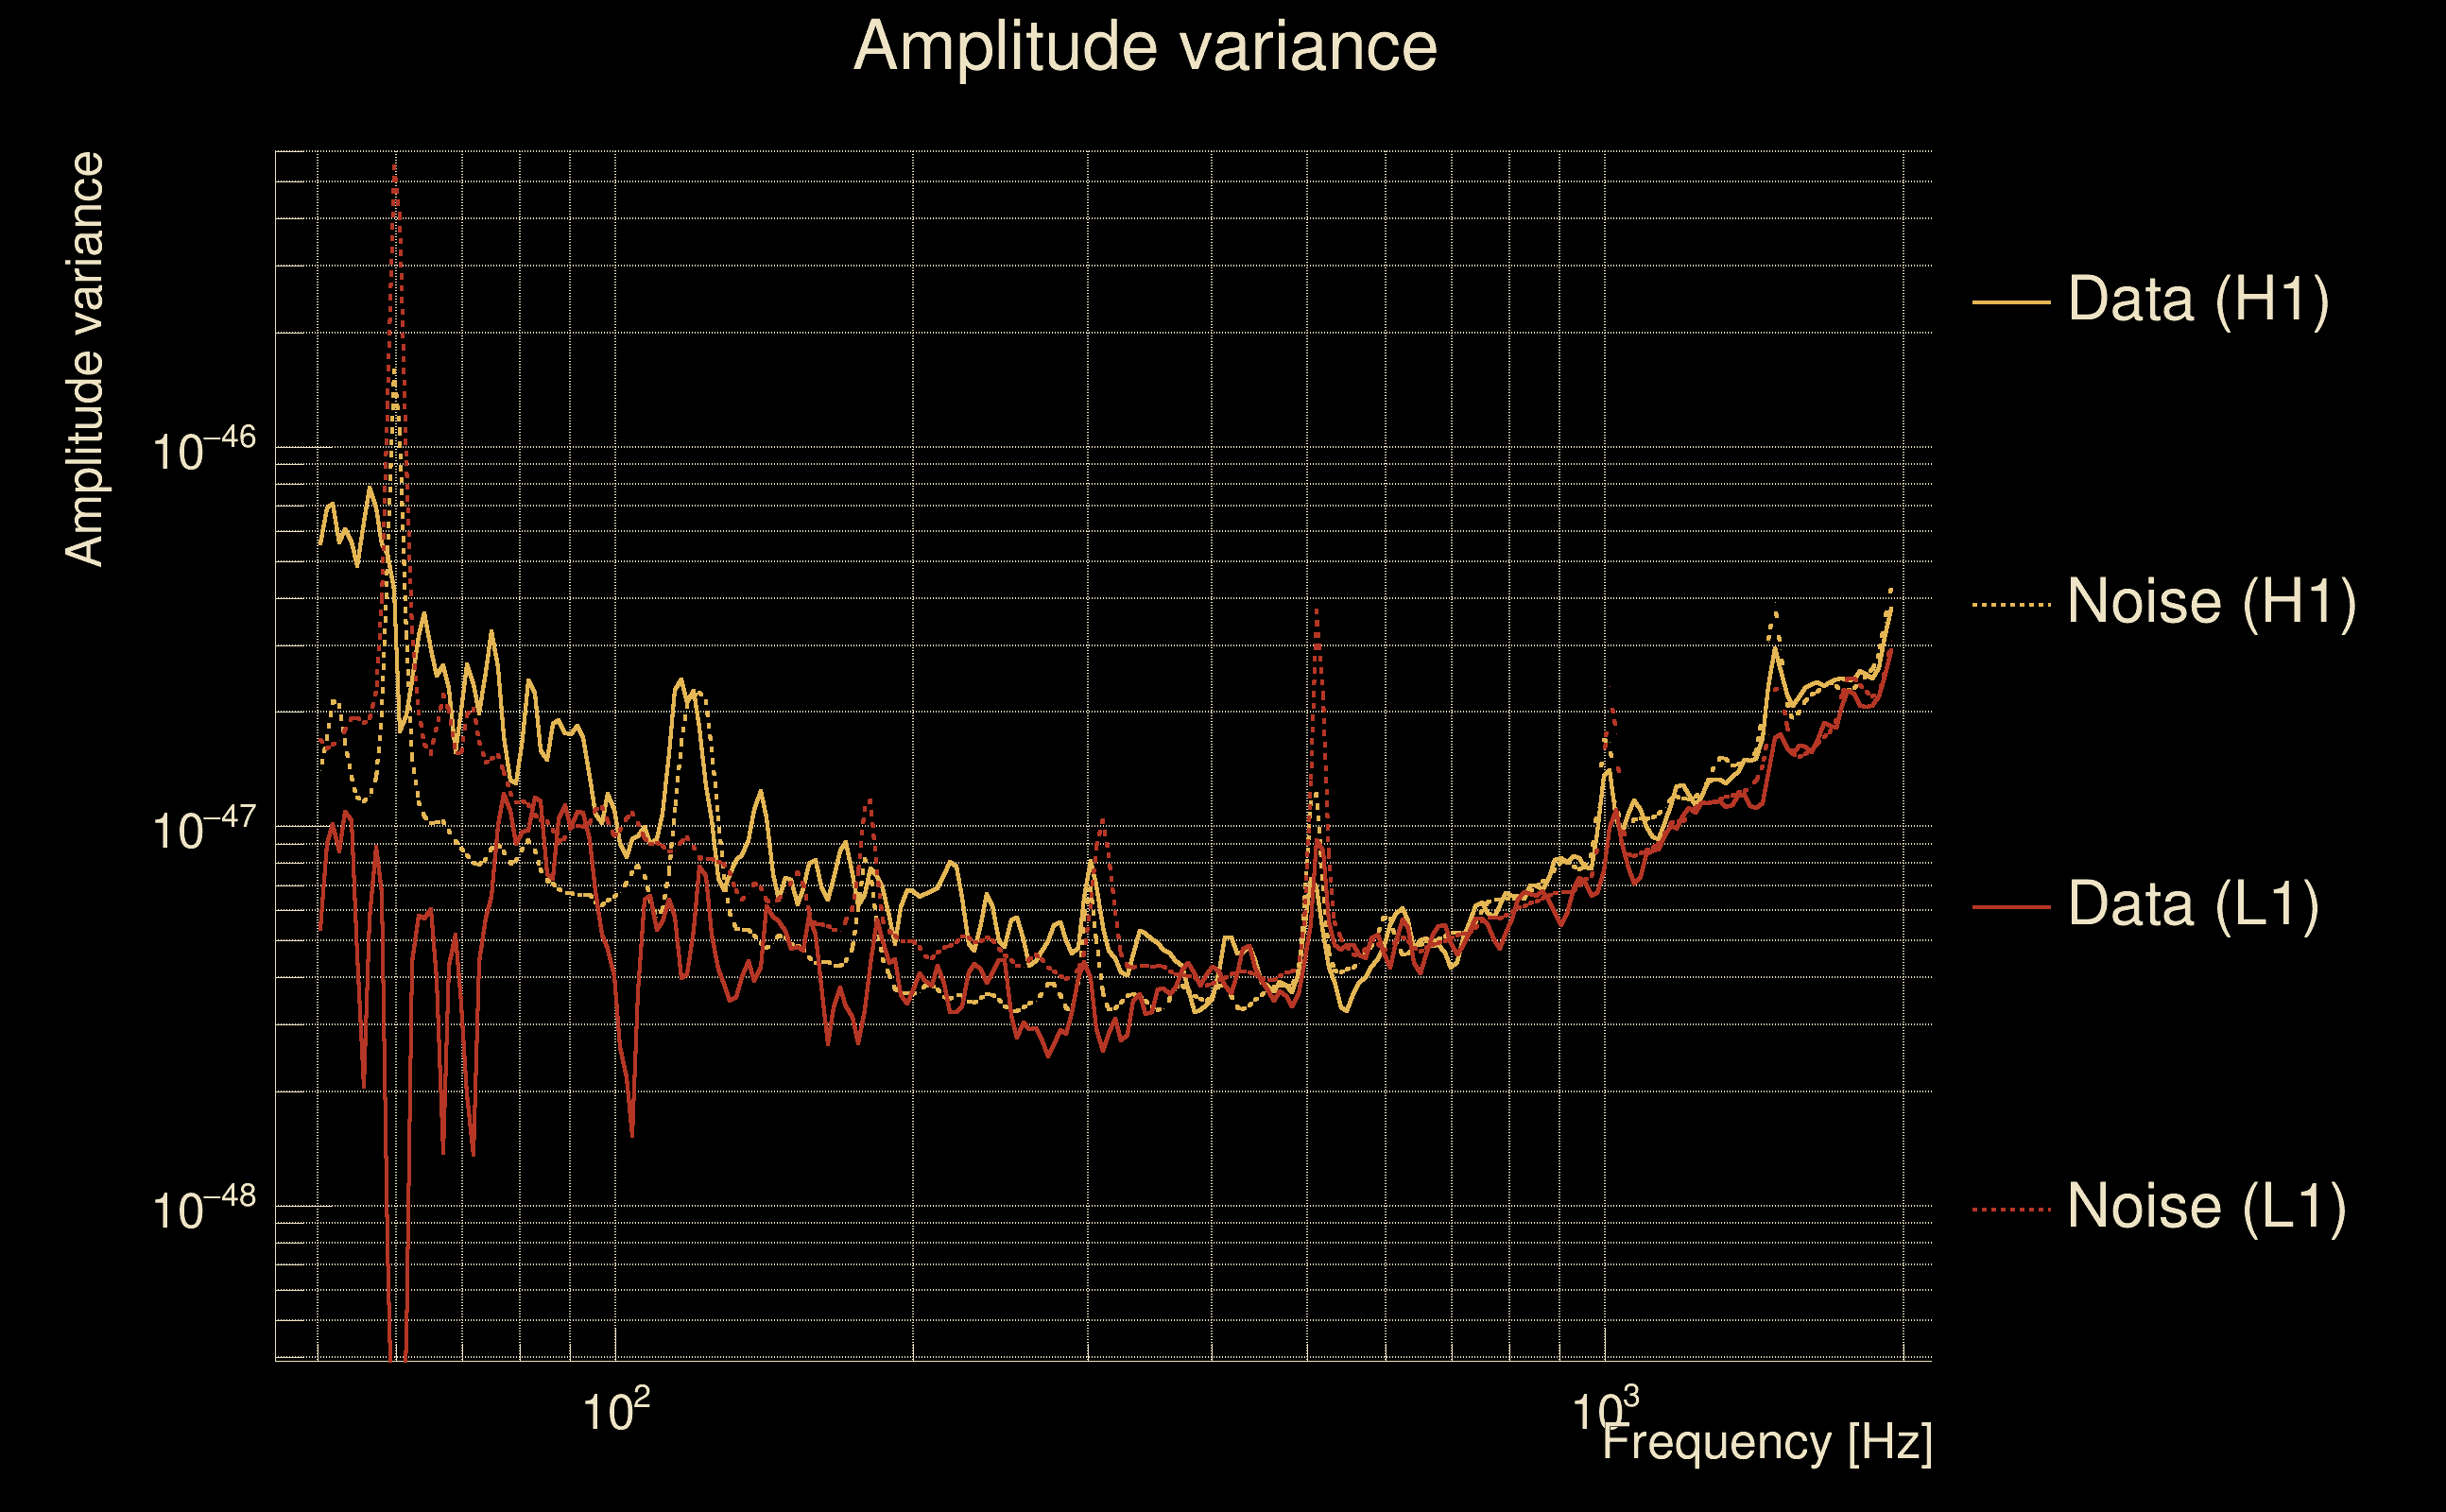
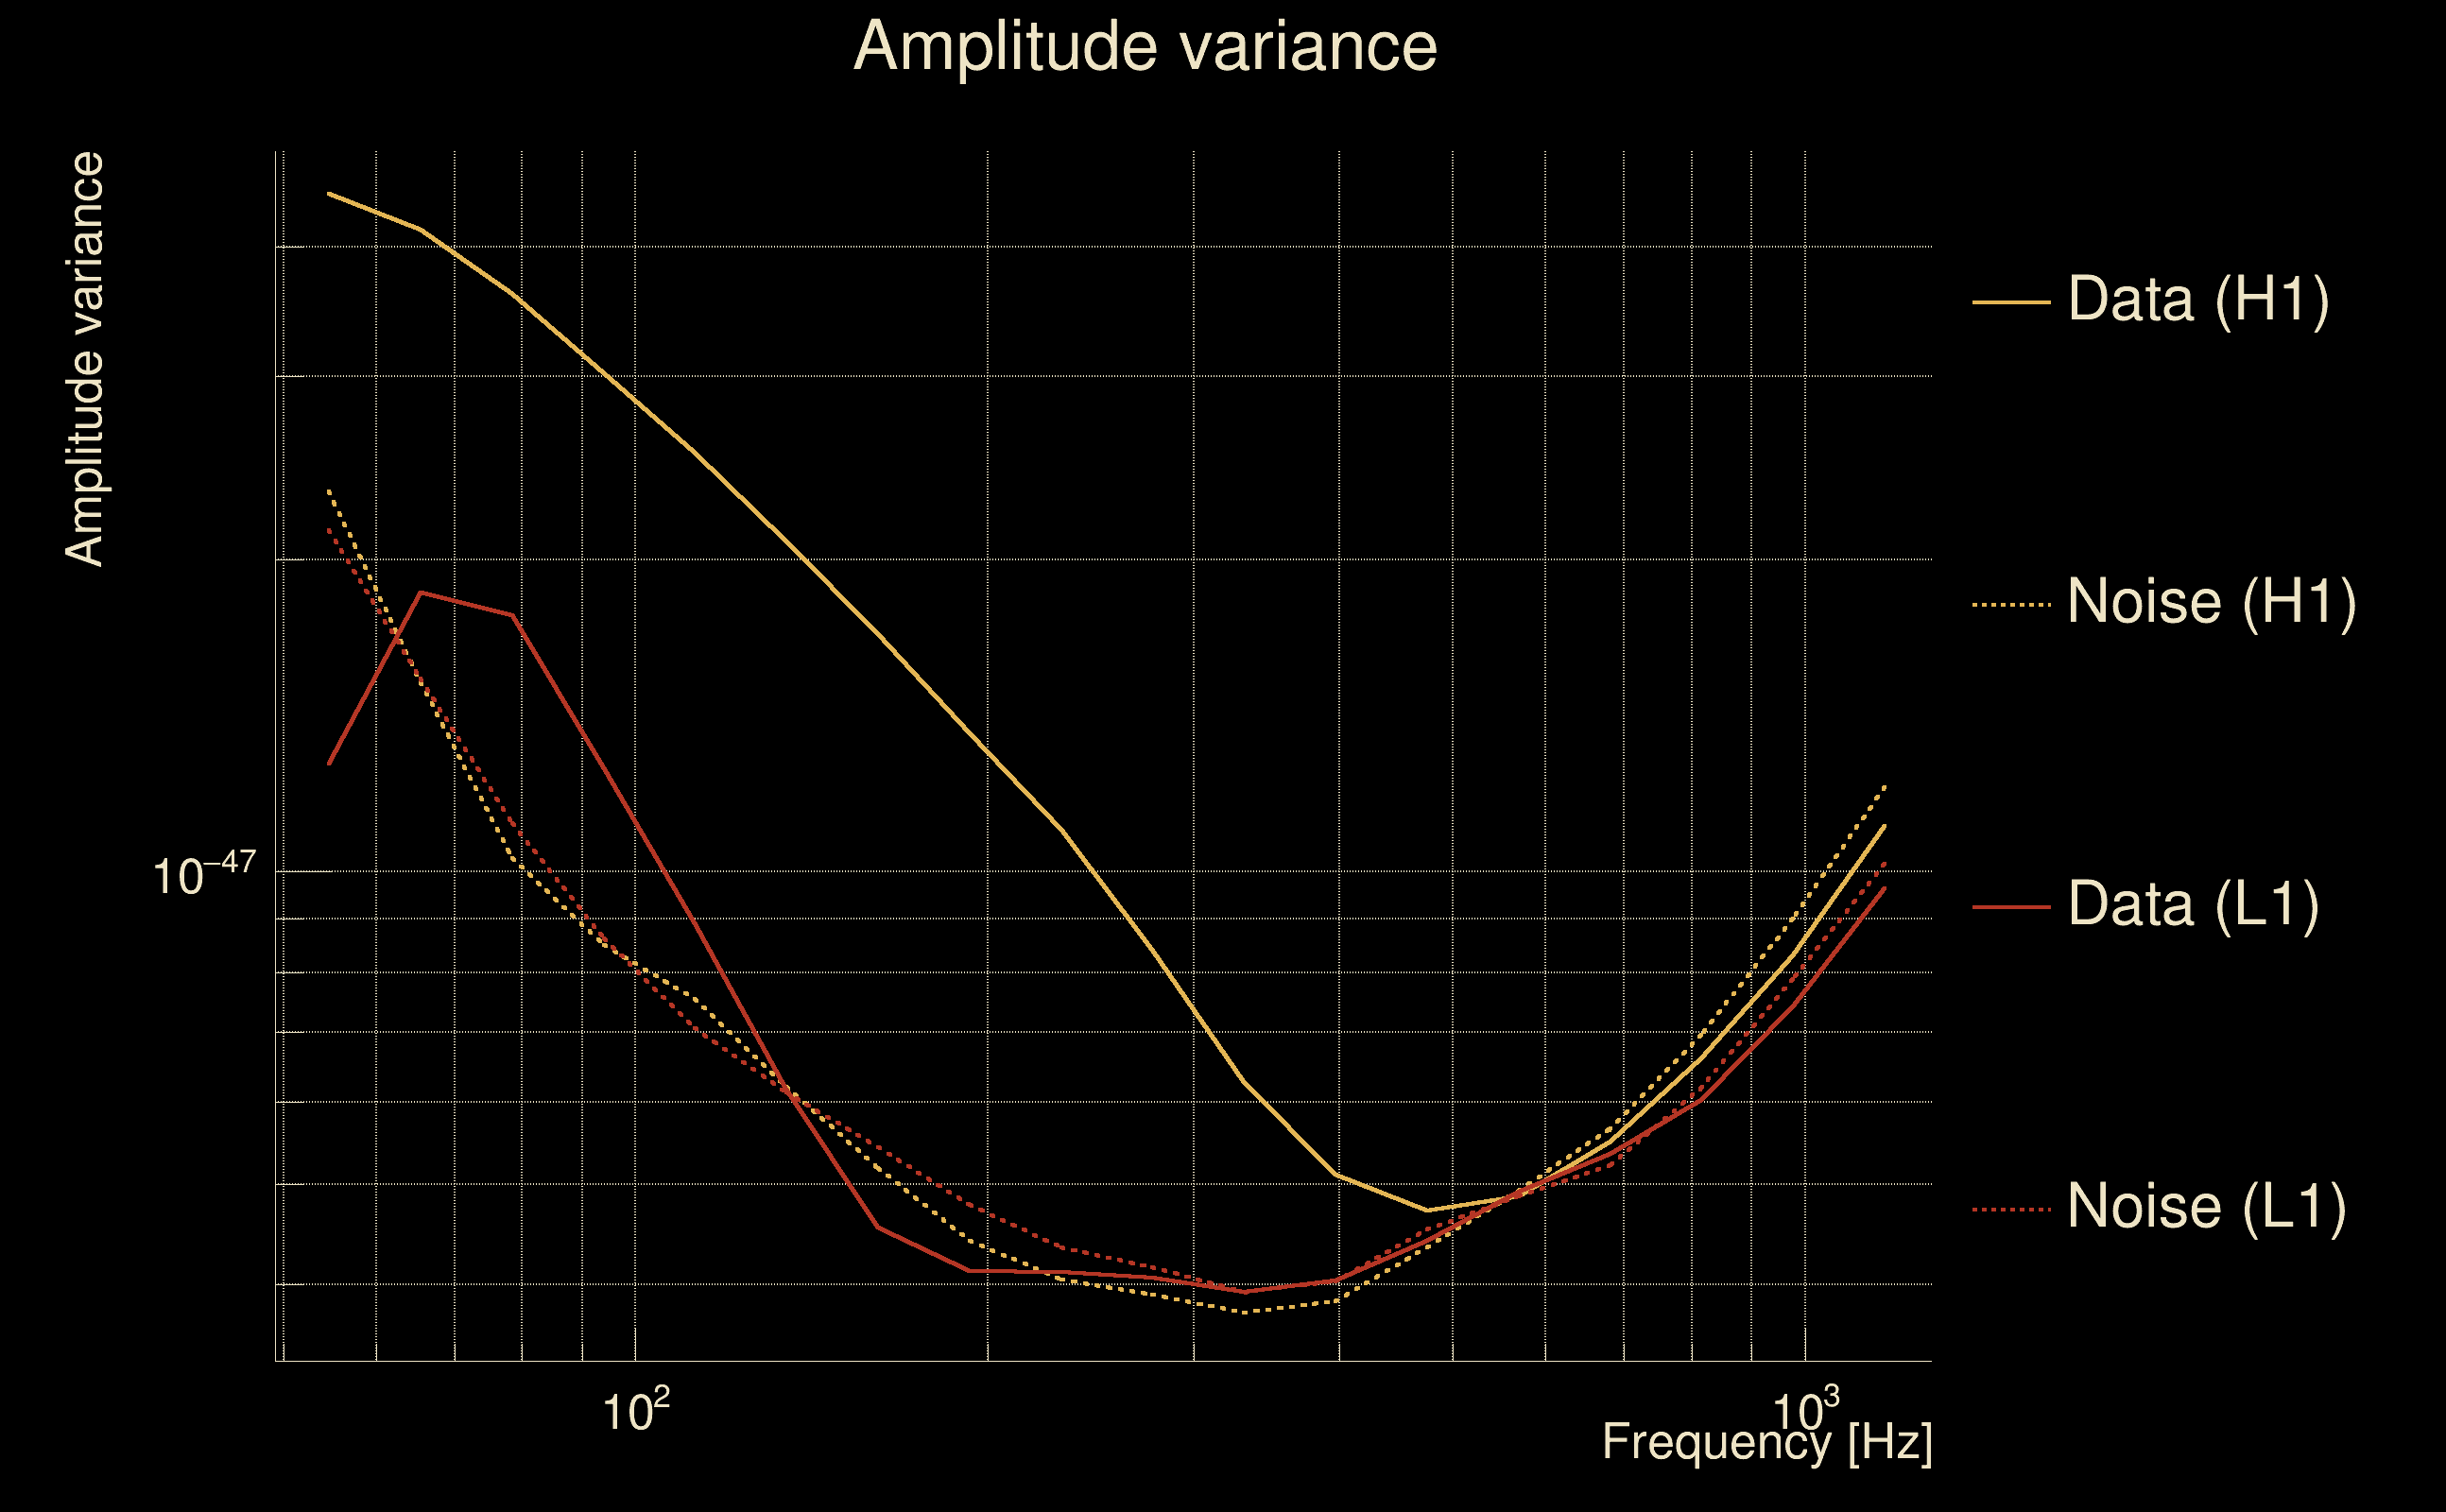
| Amplitude spectrograms: | normalization = 1e-22, power index = 2 |
| White noise SNR variance: | 0.523175 (after applying a correction factor = 1) |
| Amplitude ratio confidence level: | 3 sigma |
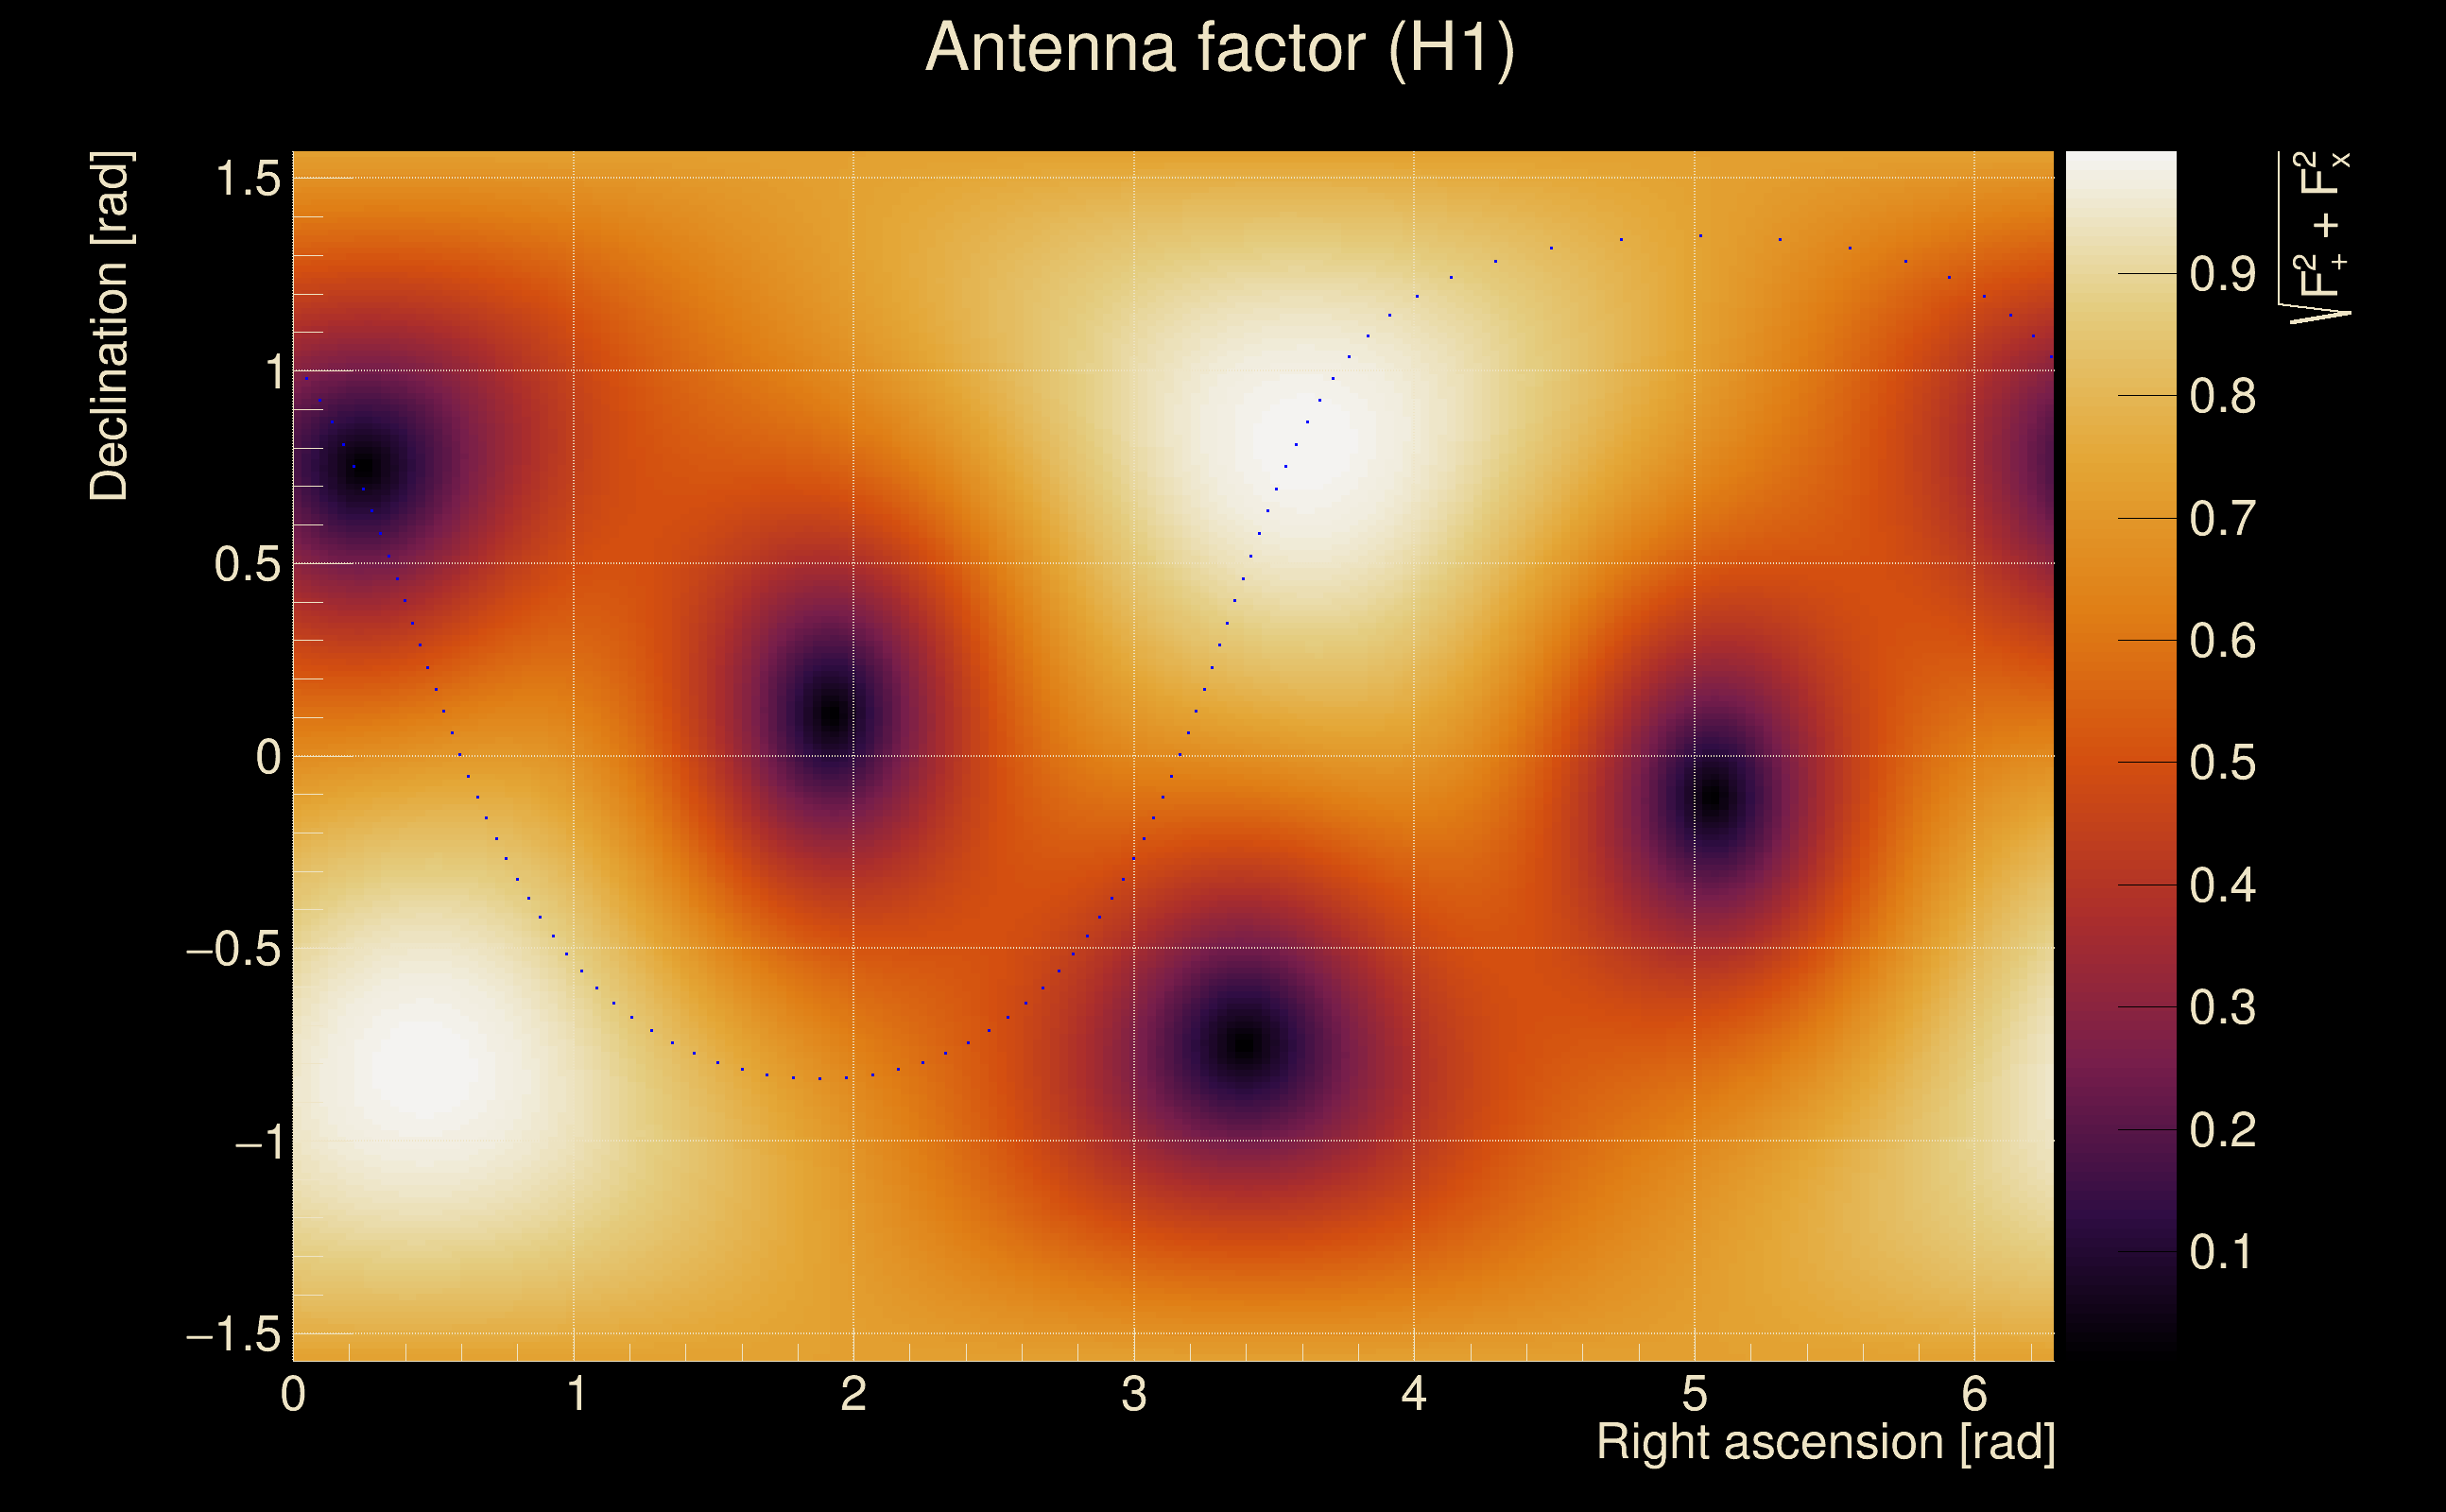
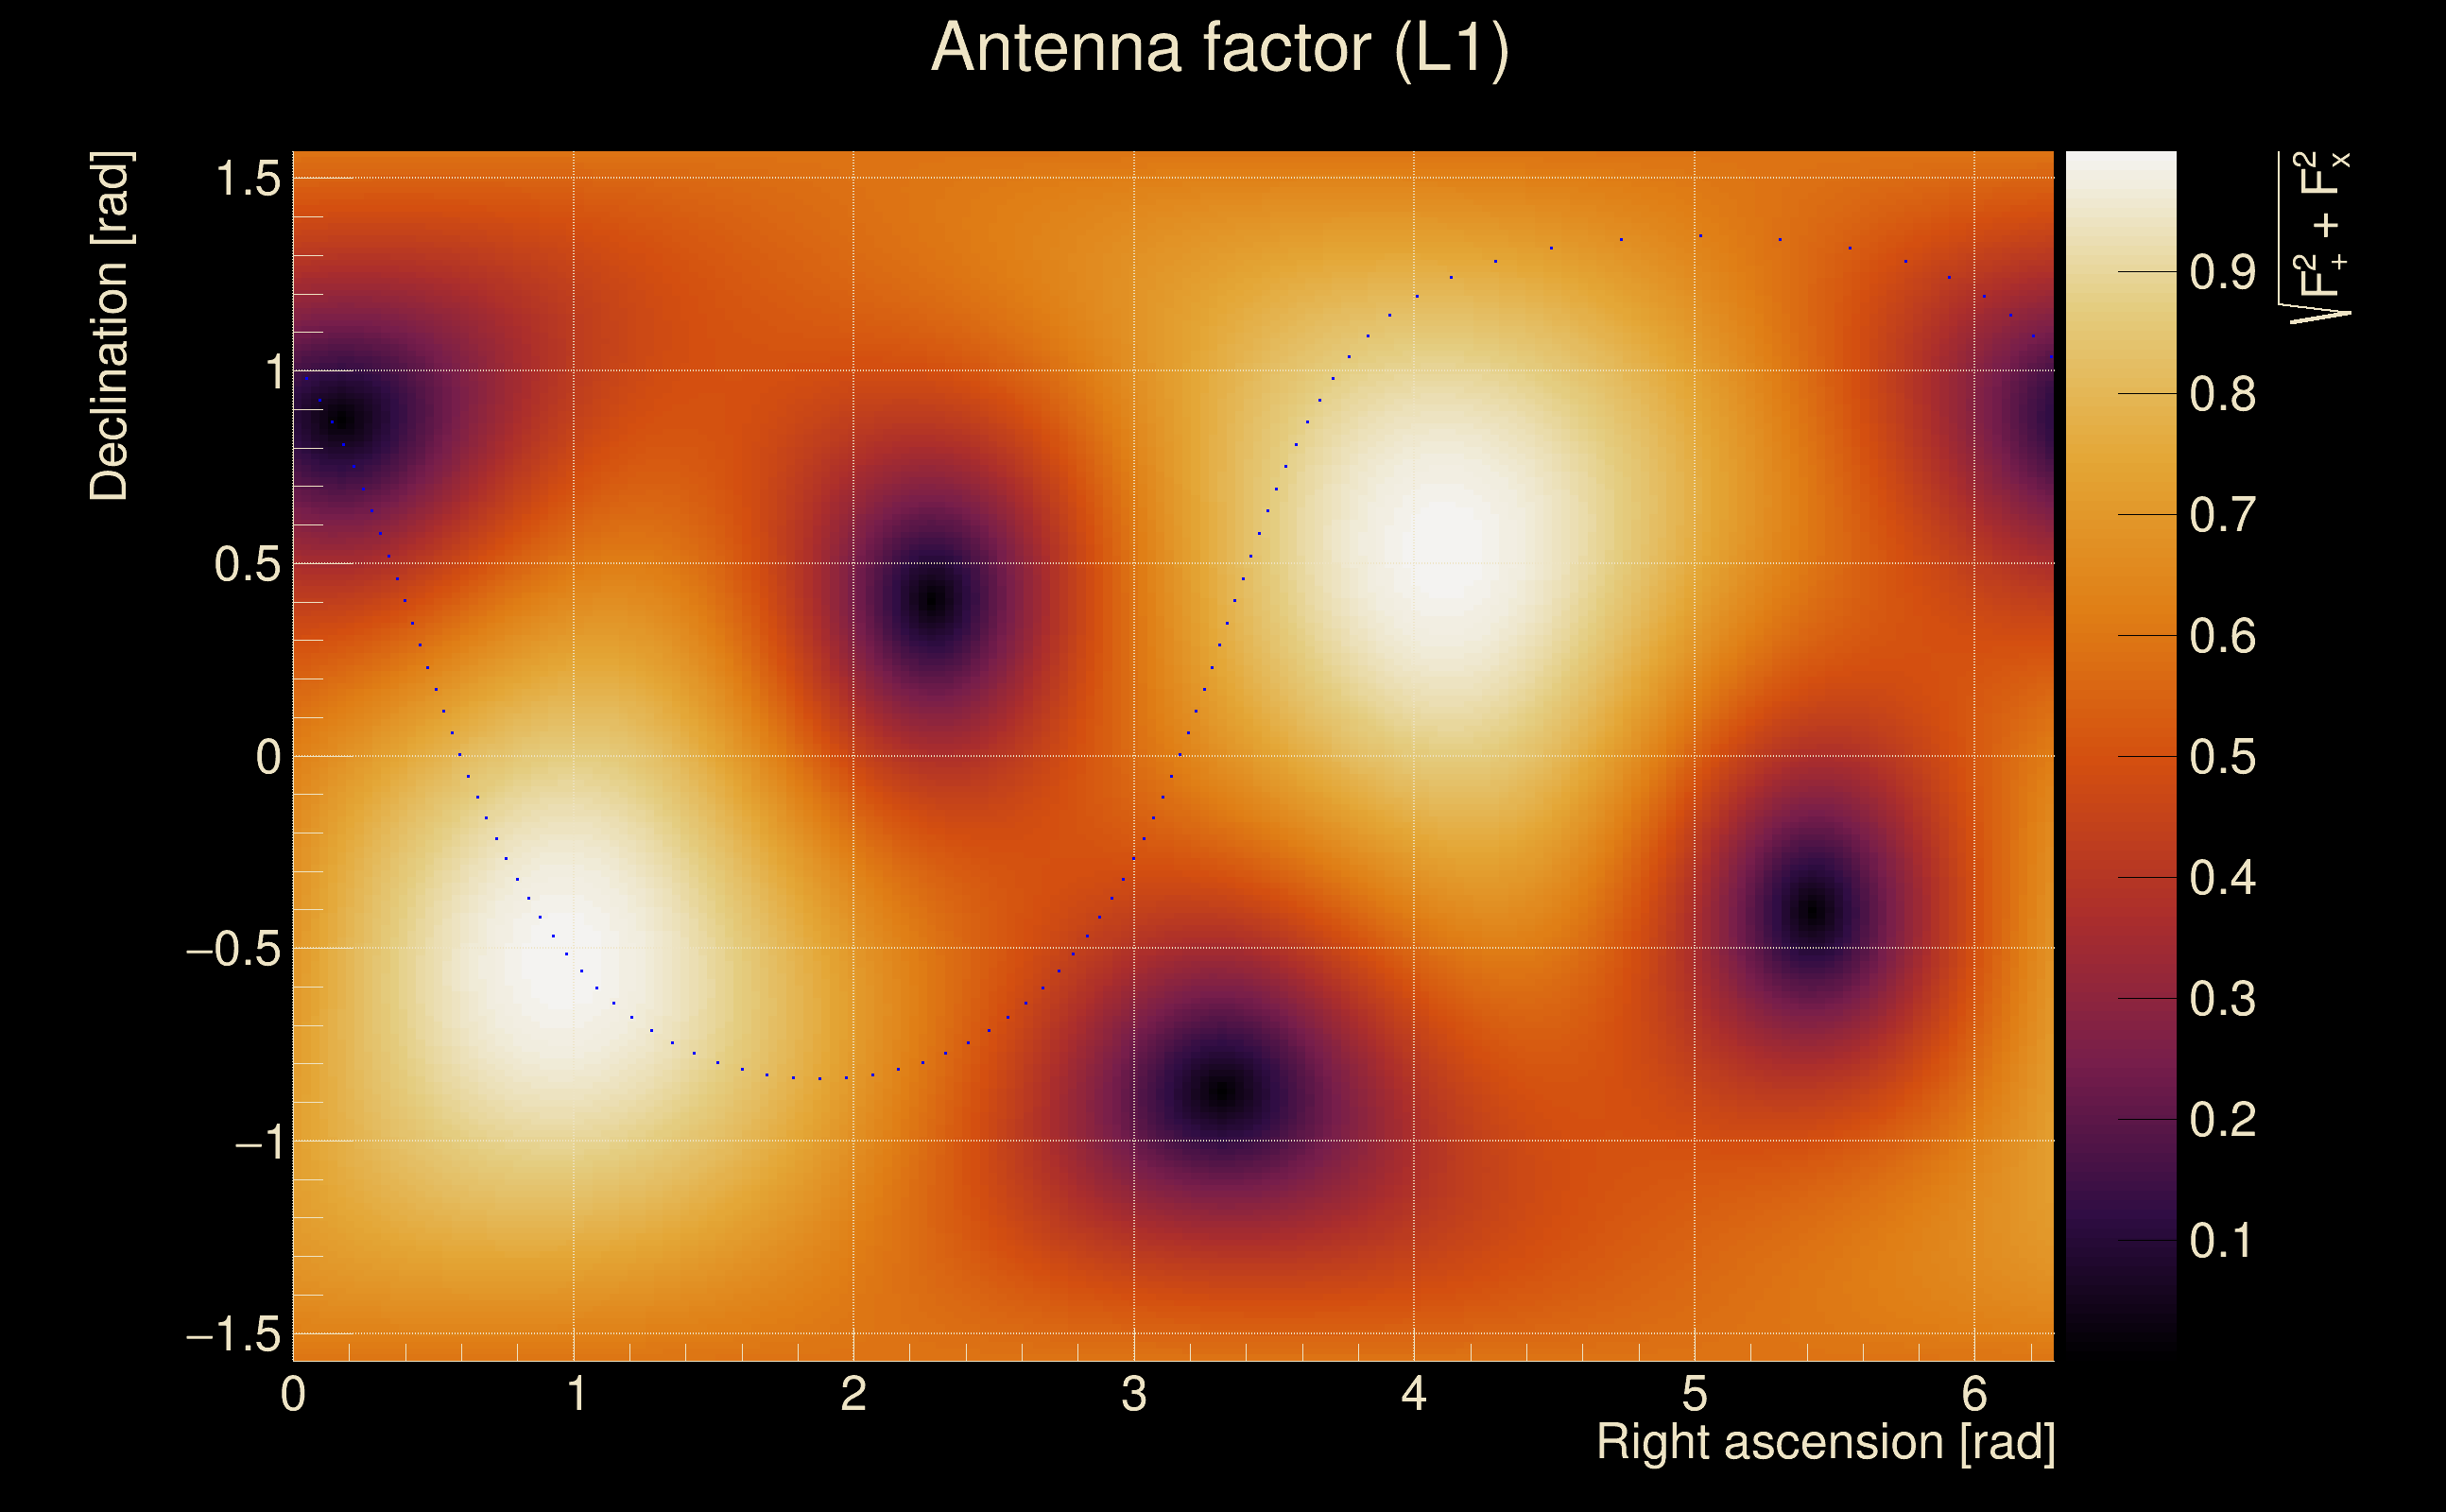
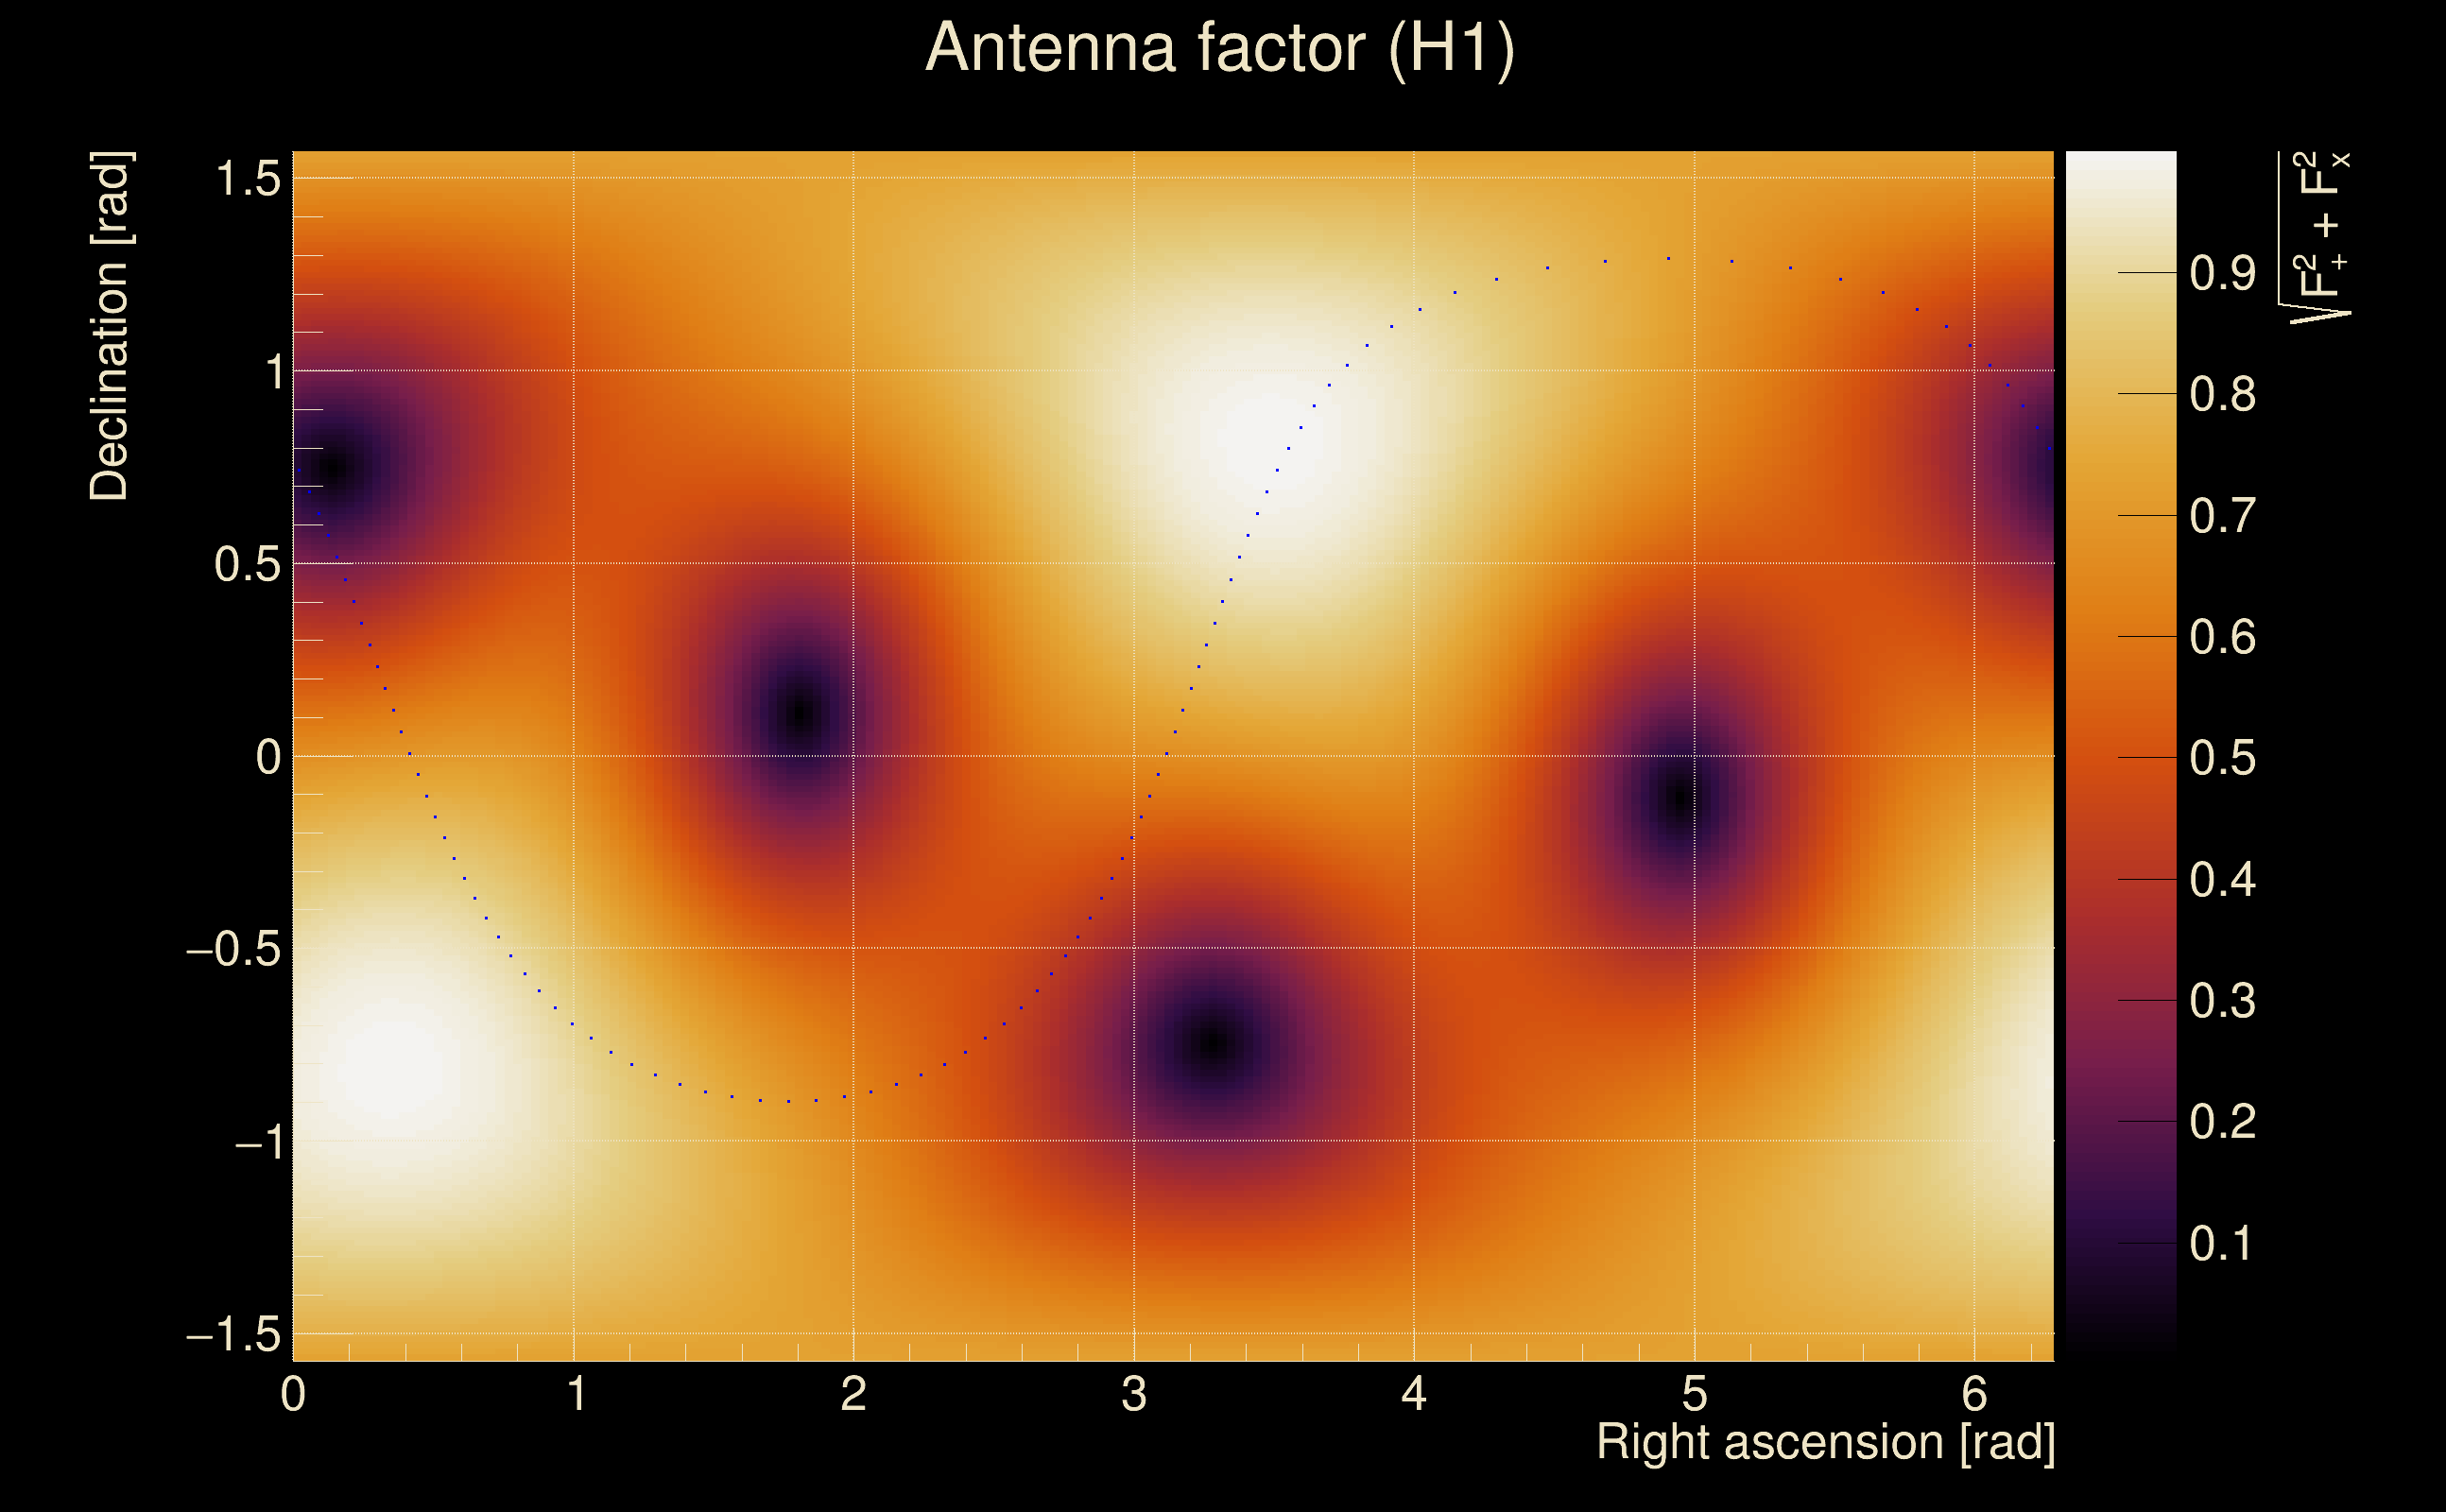
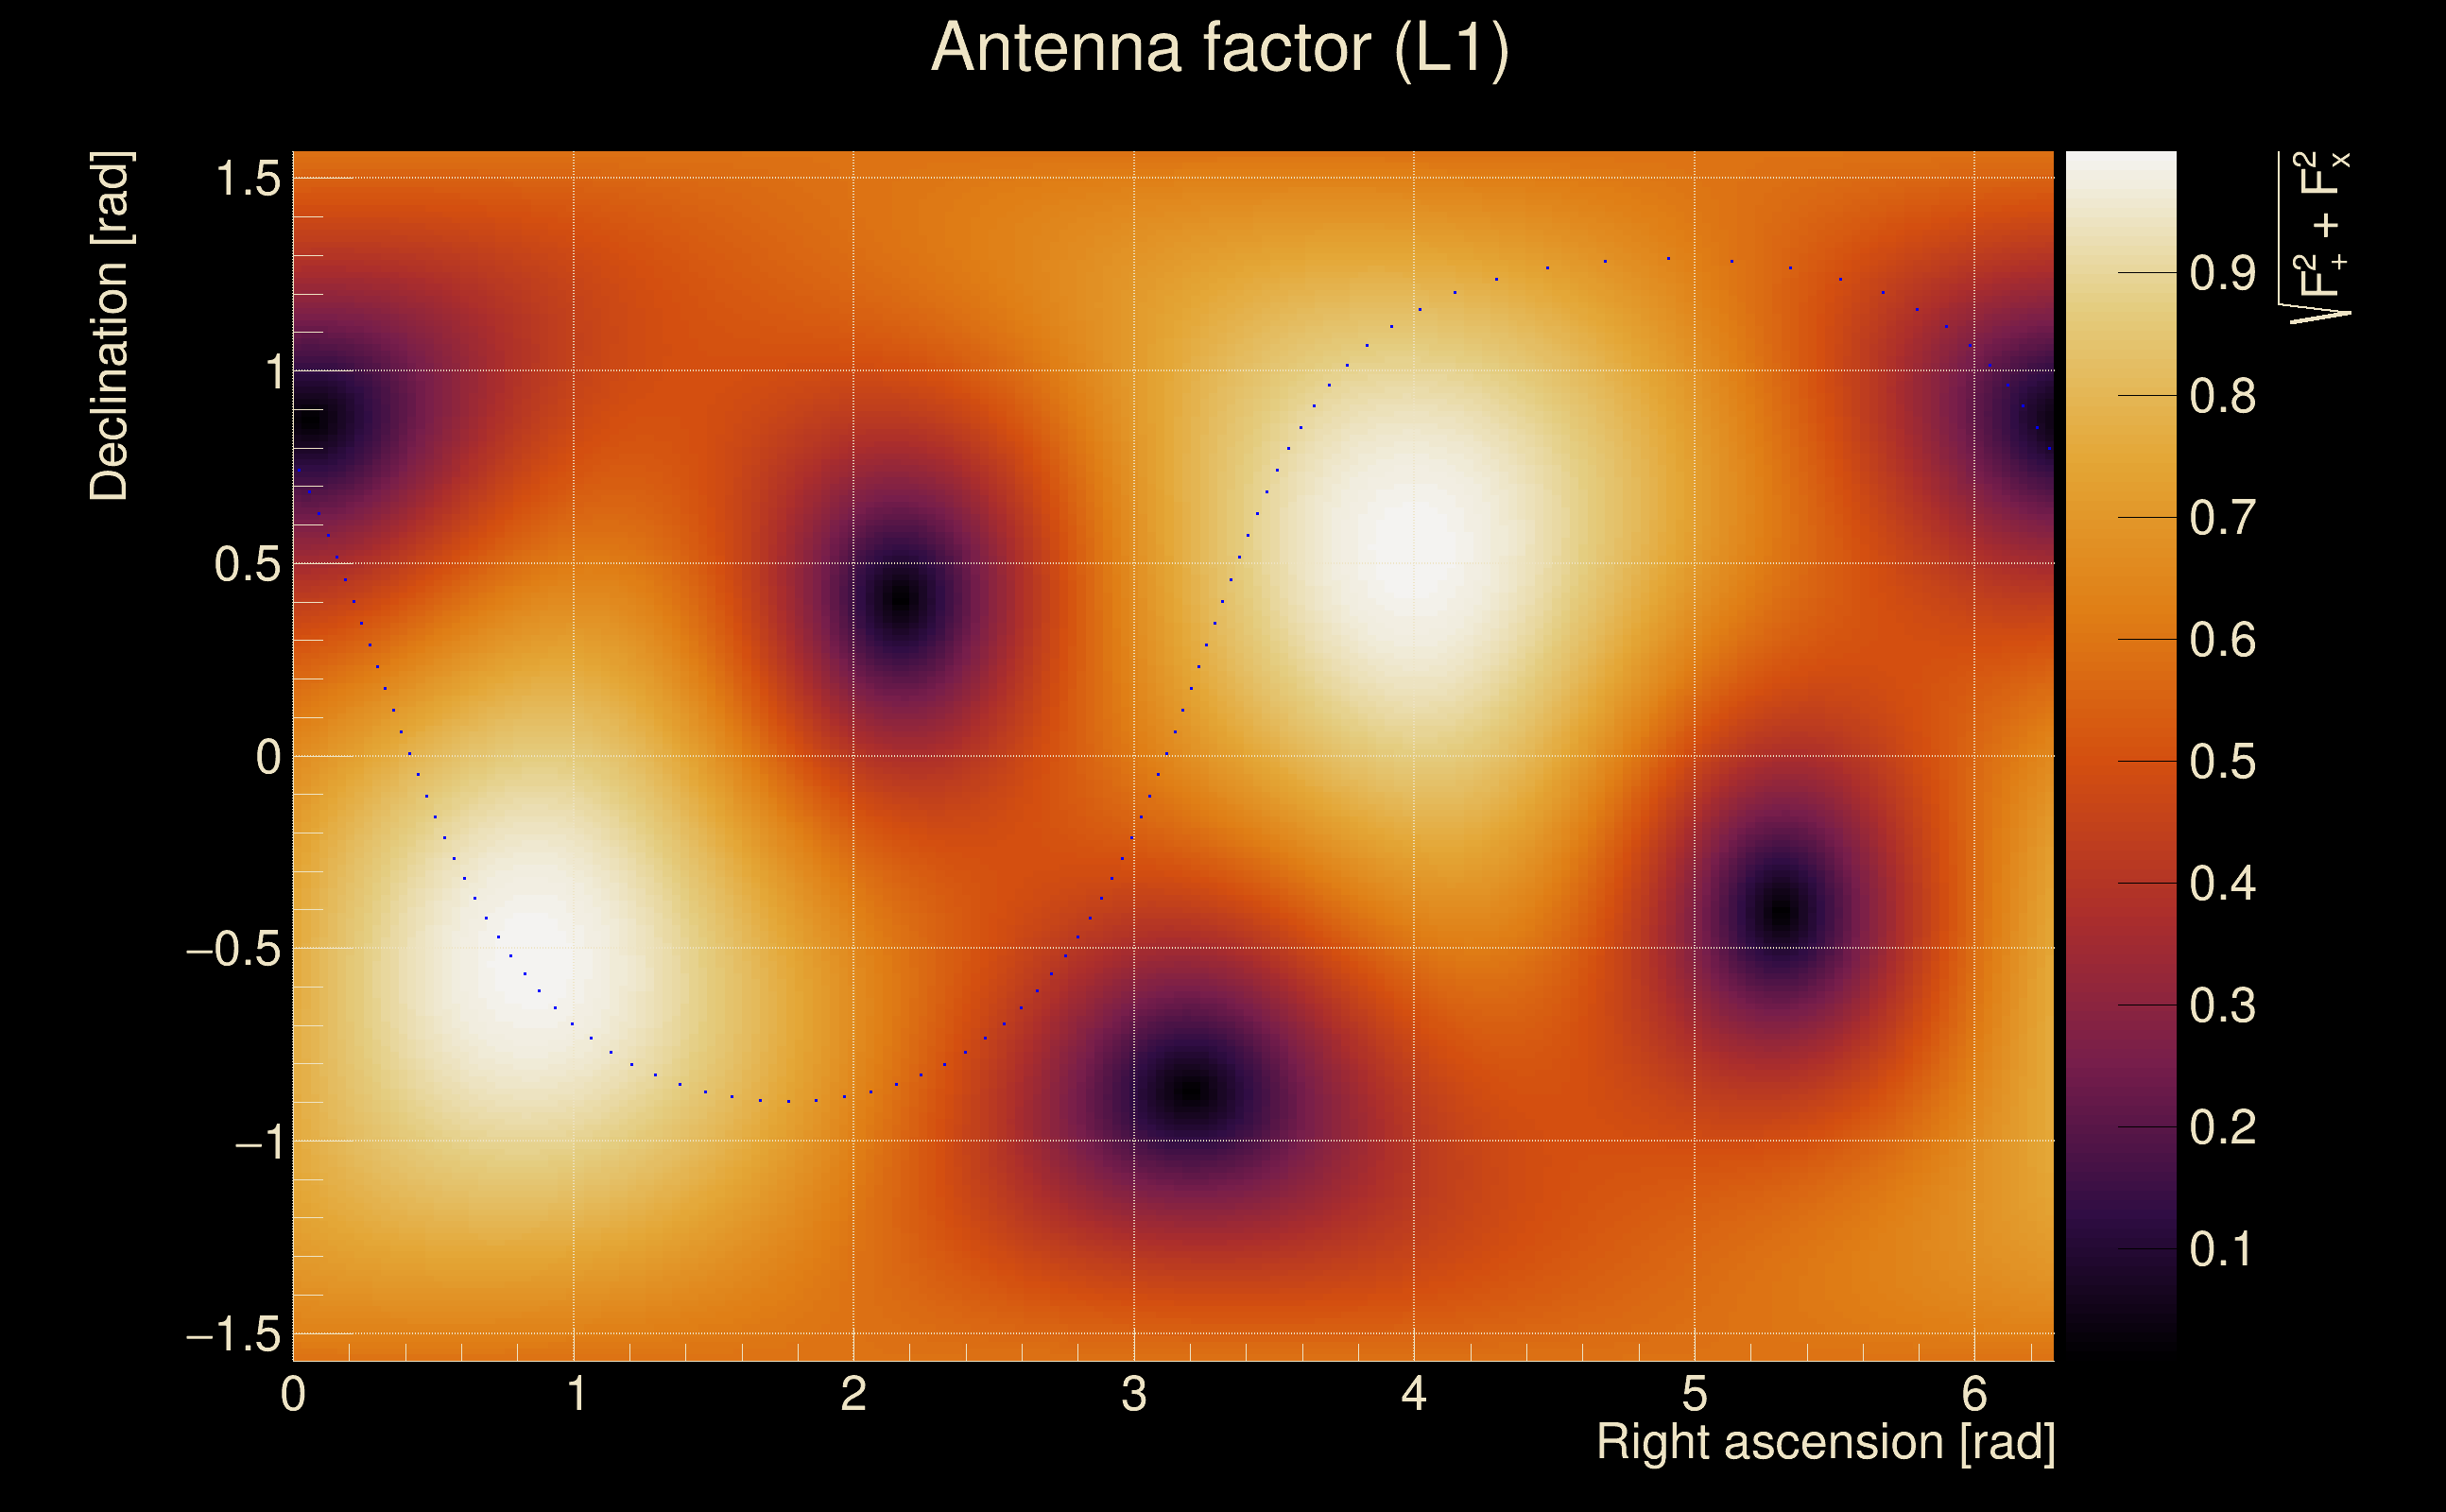
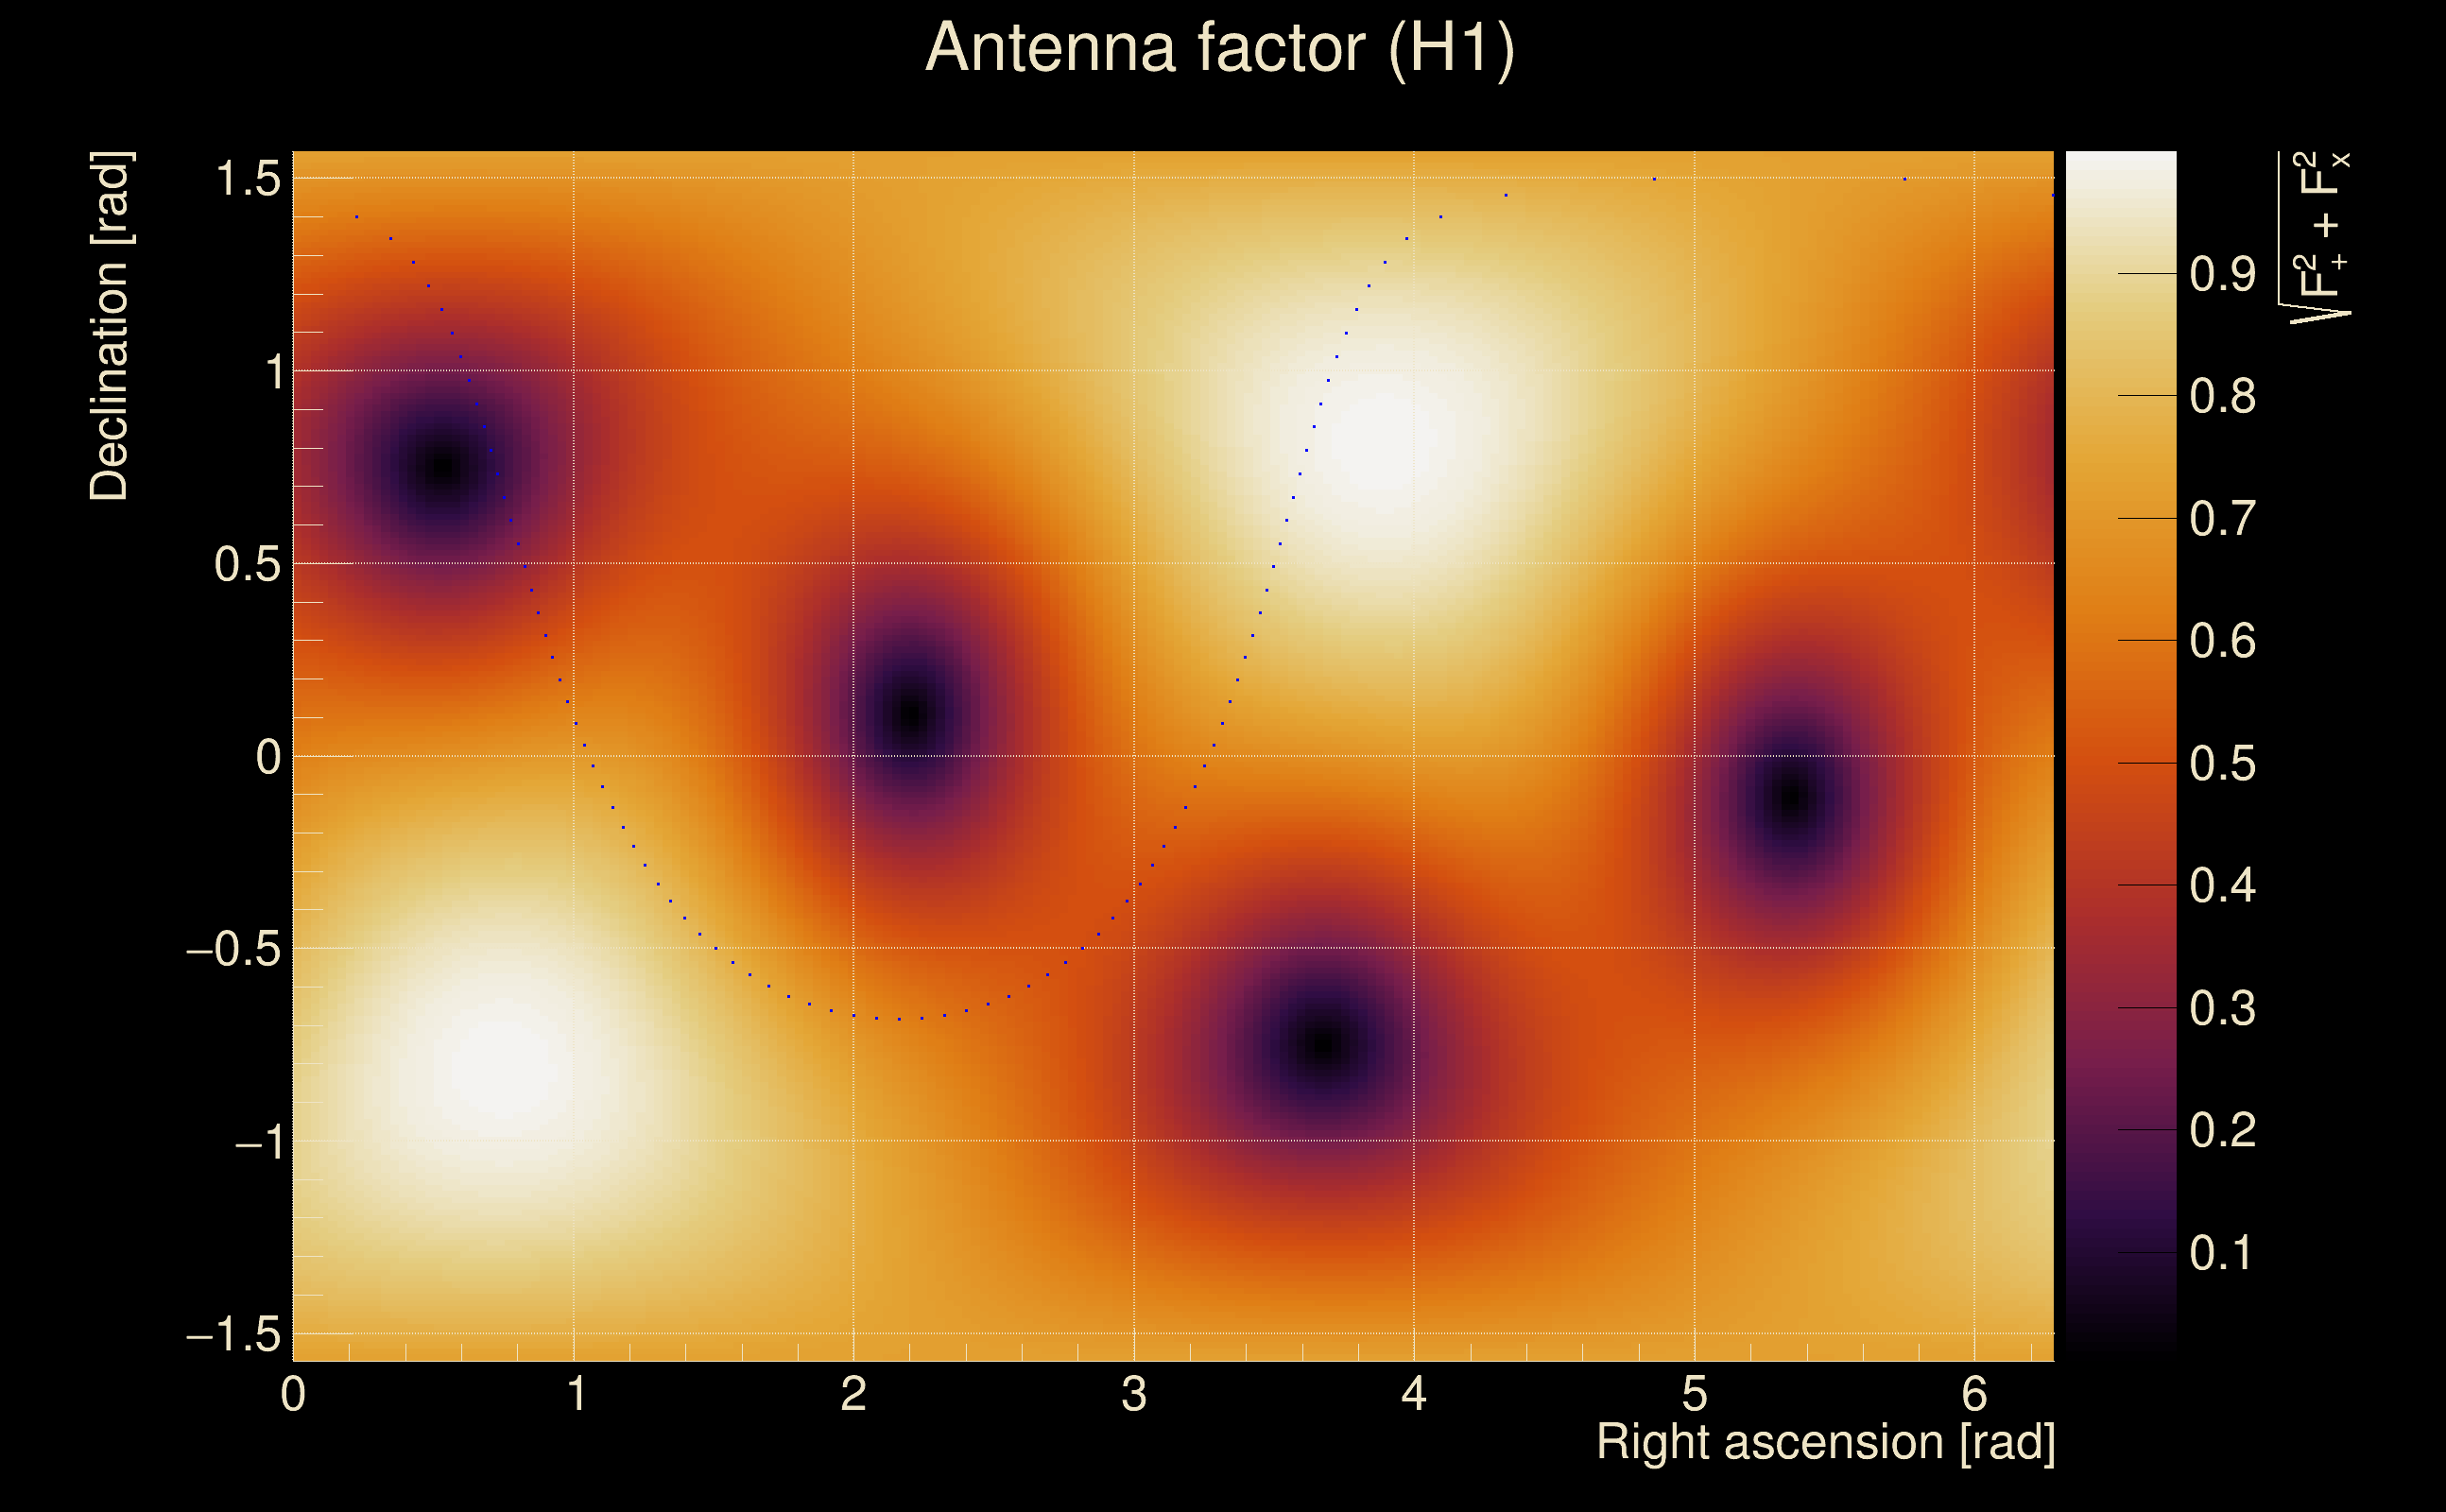
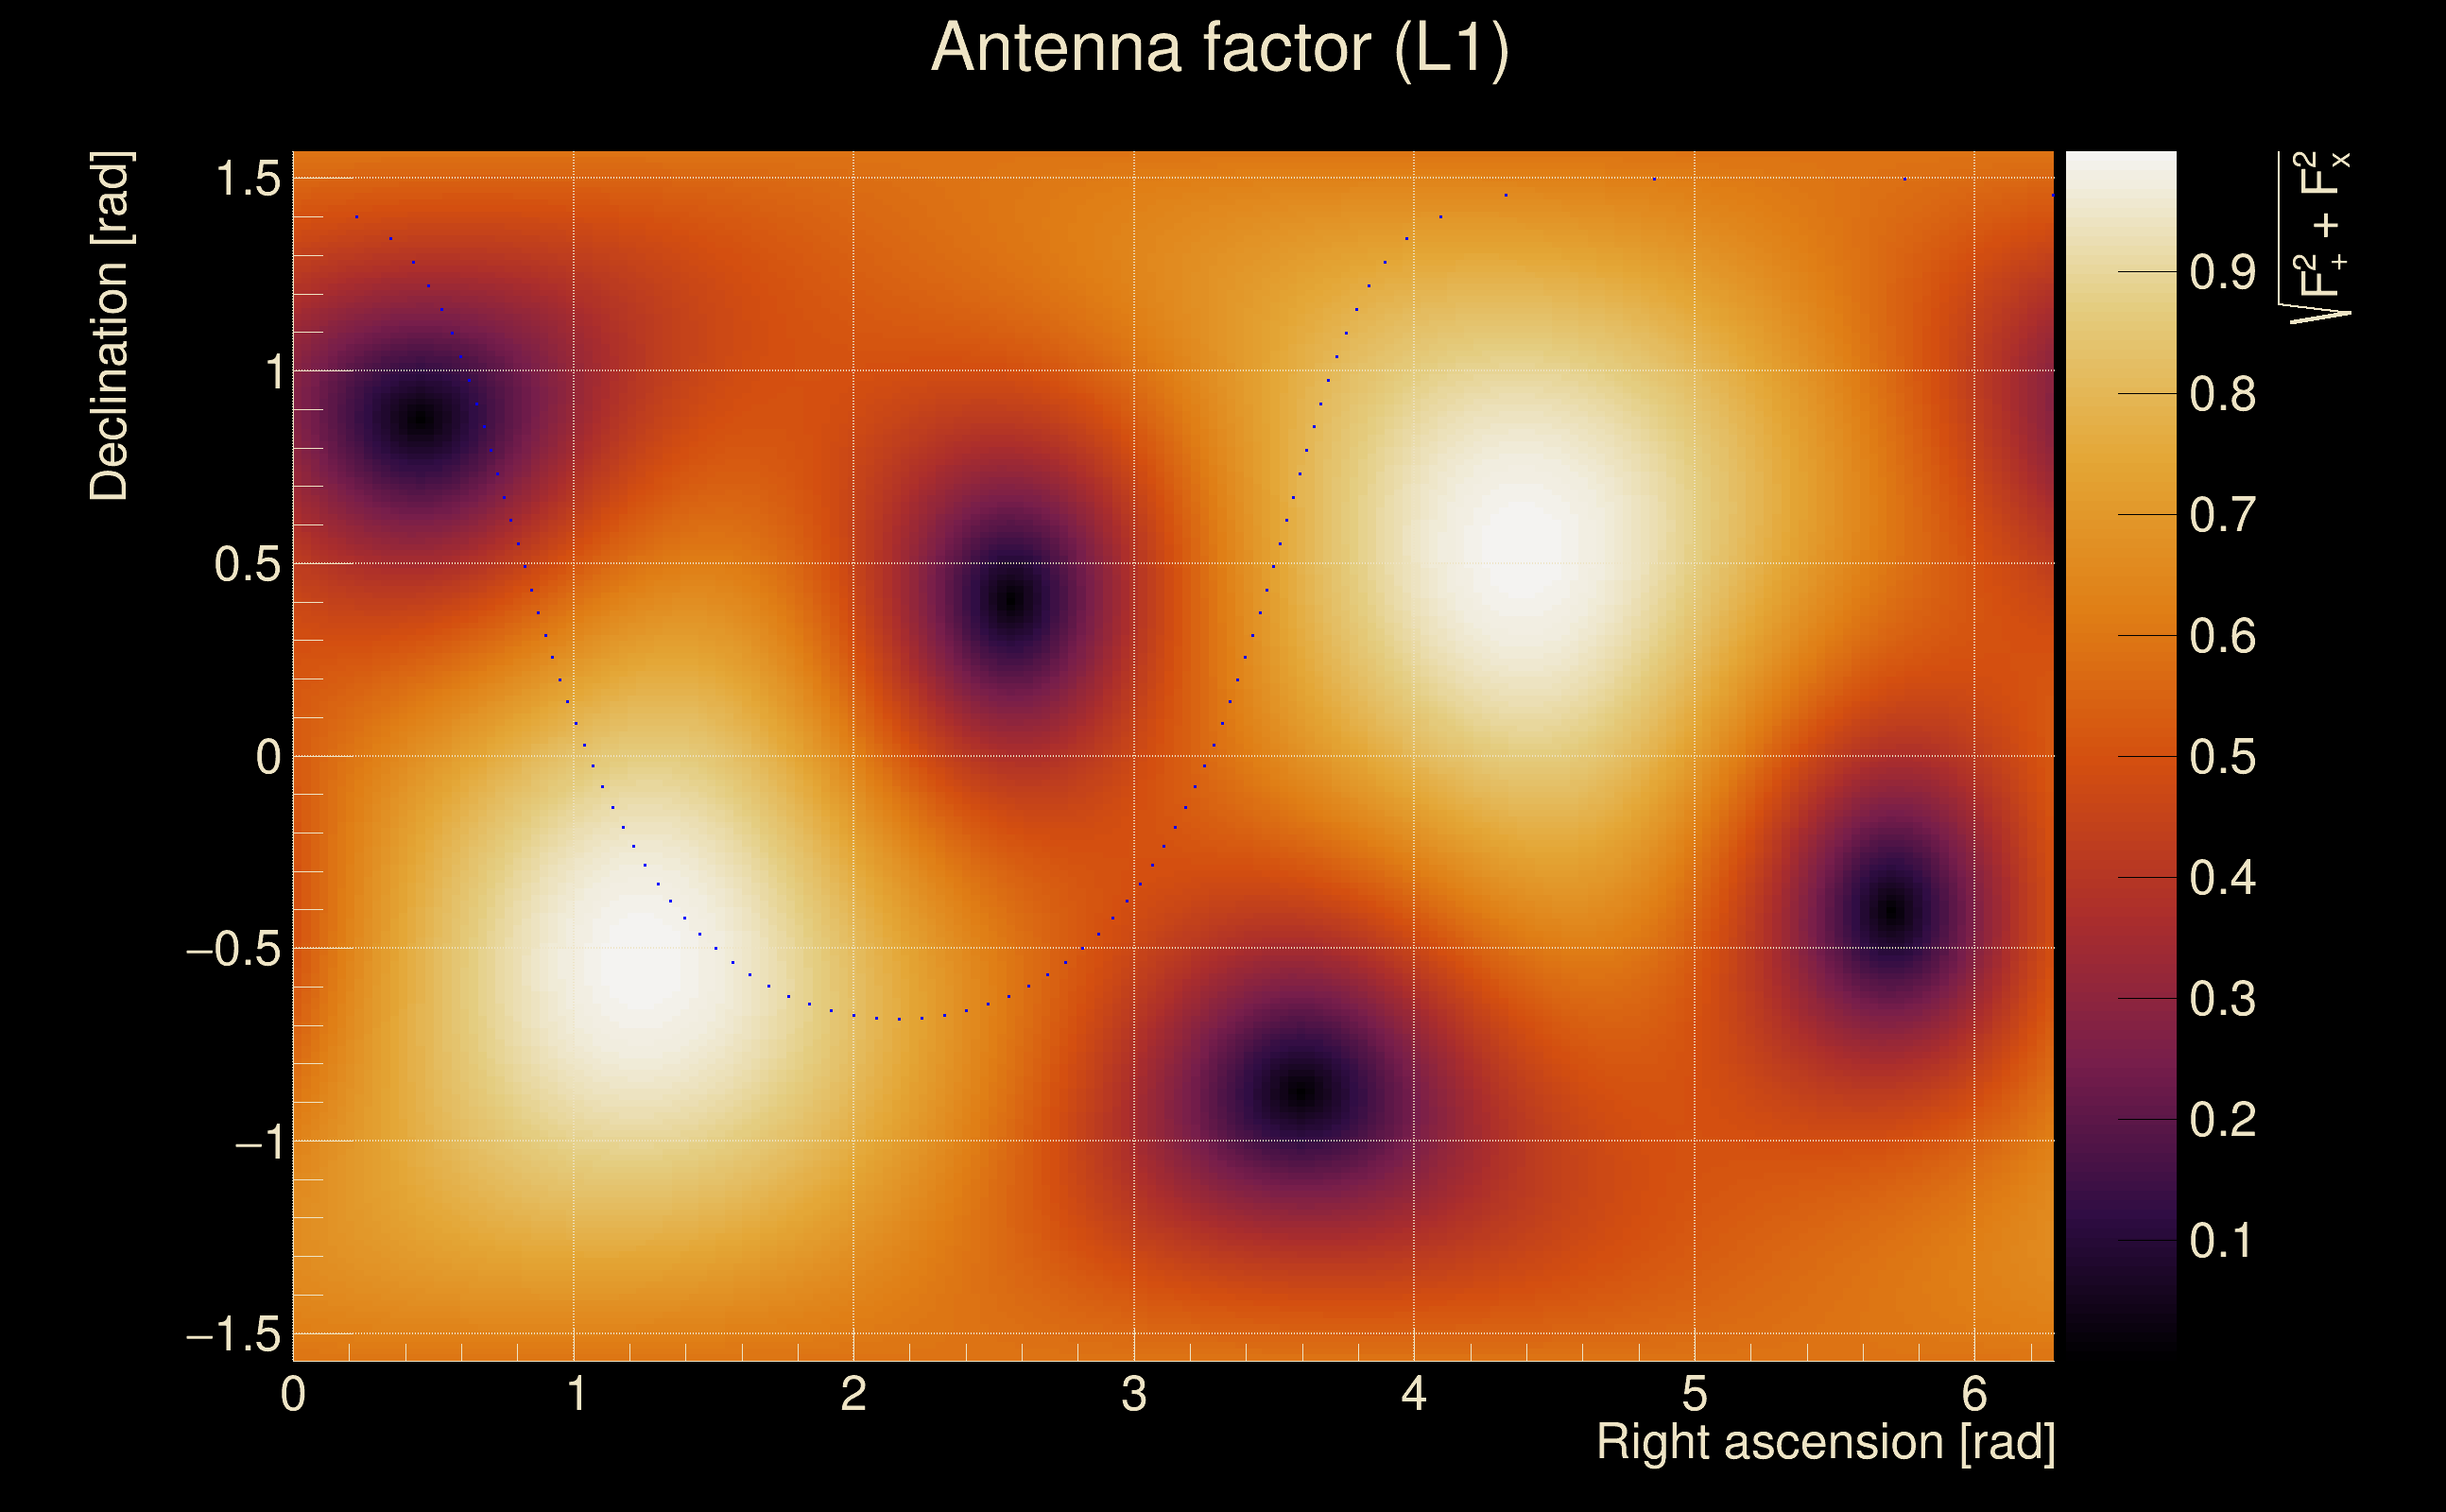
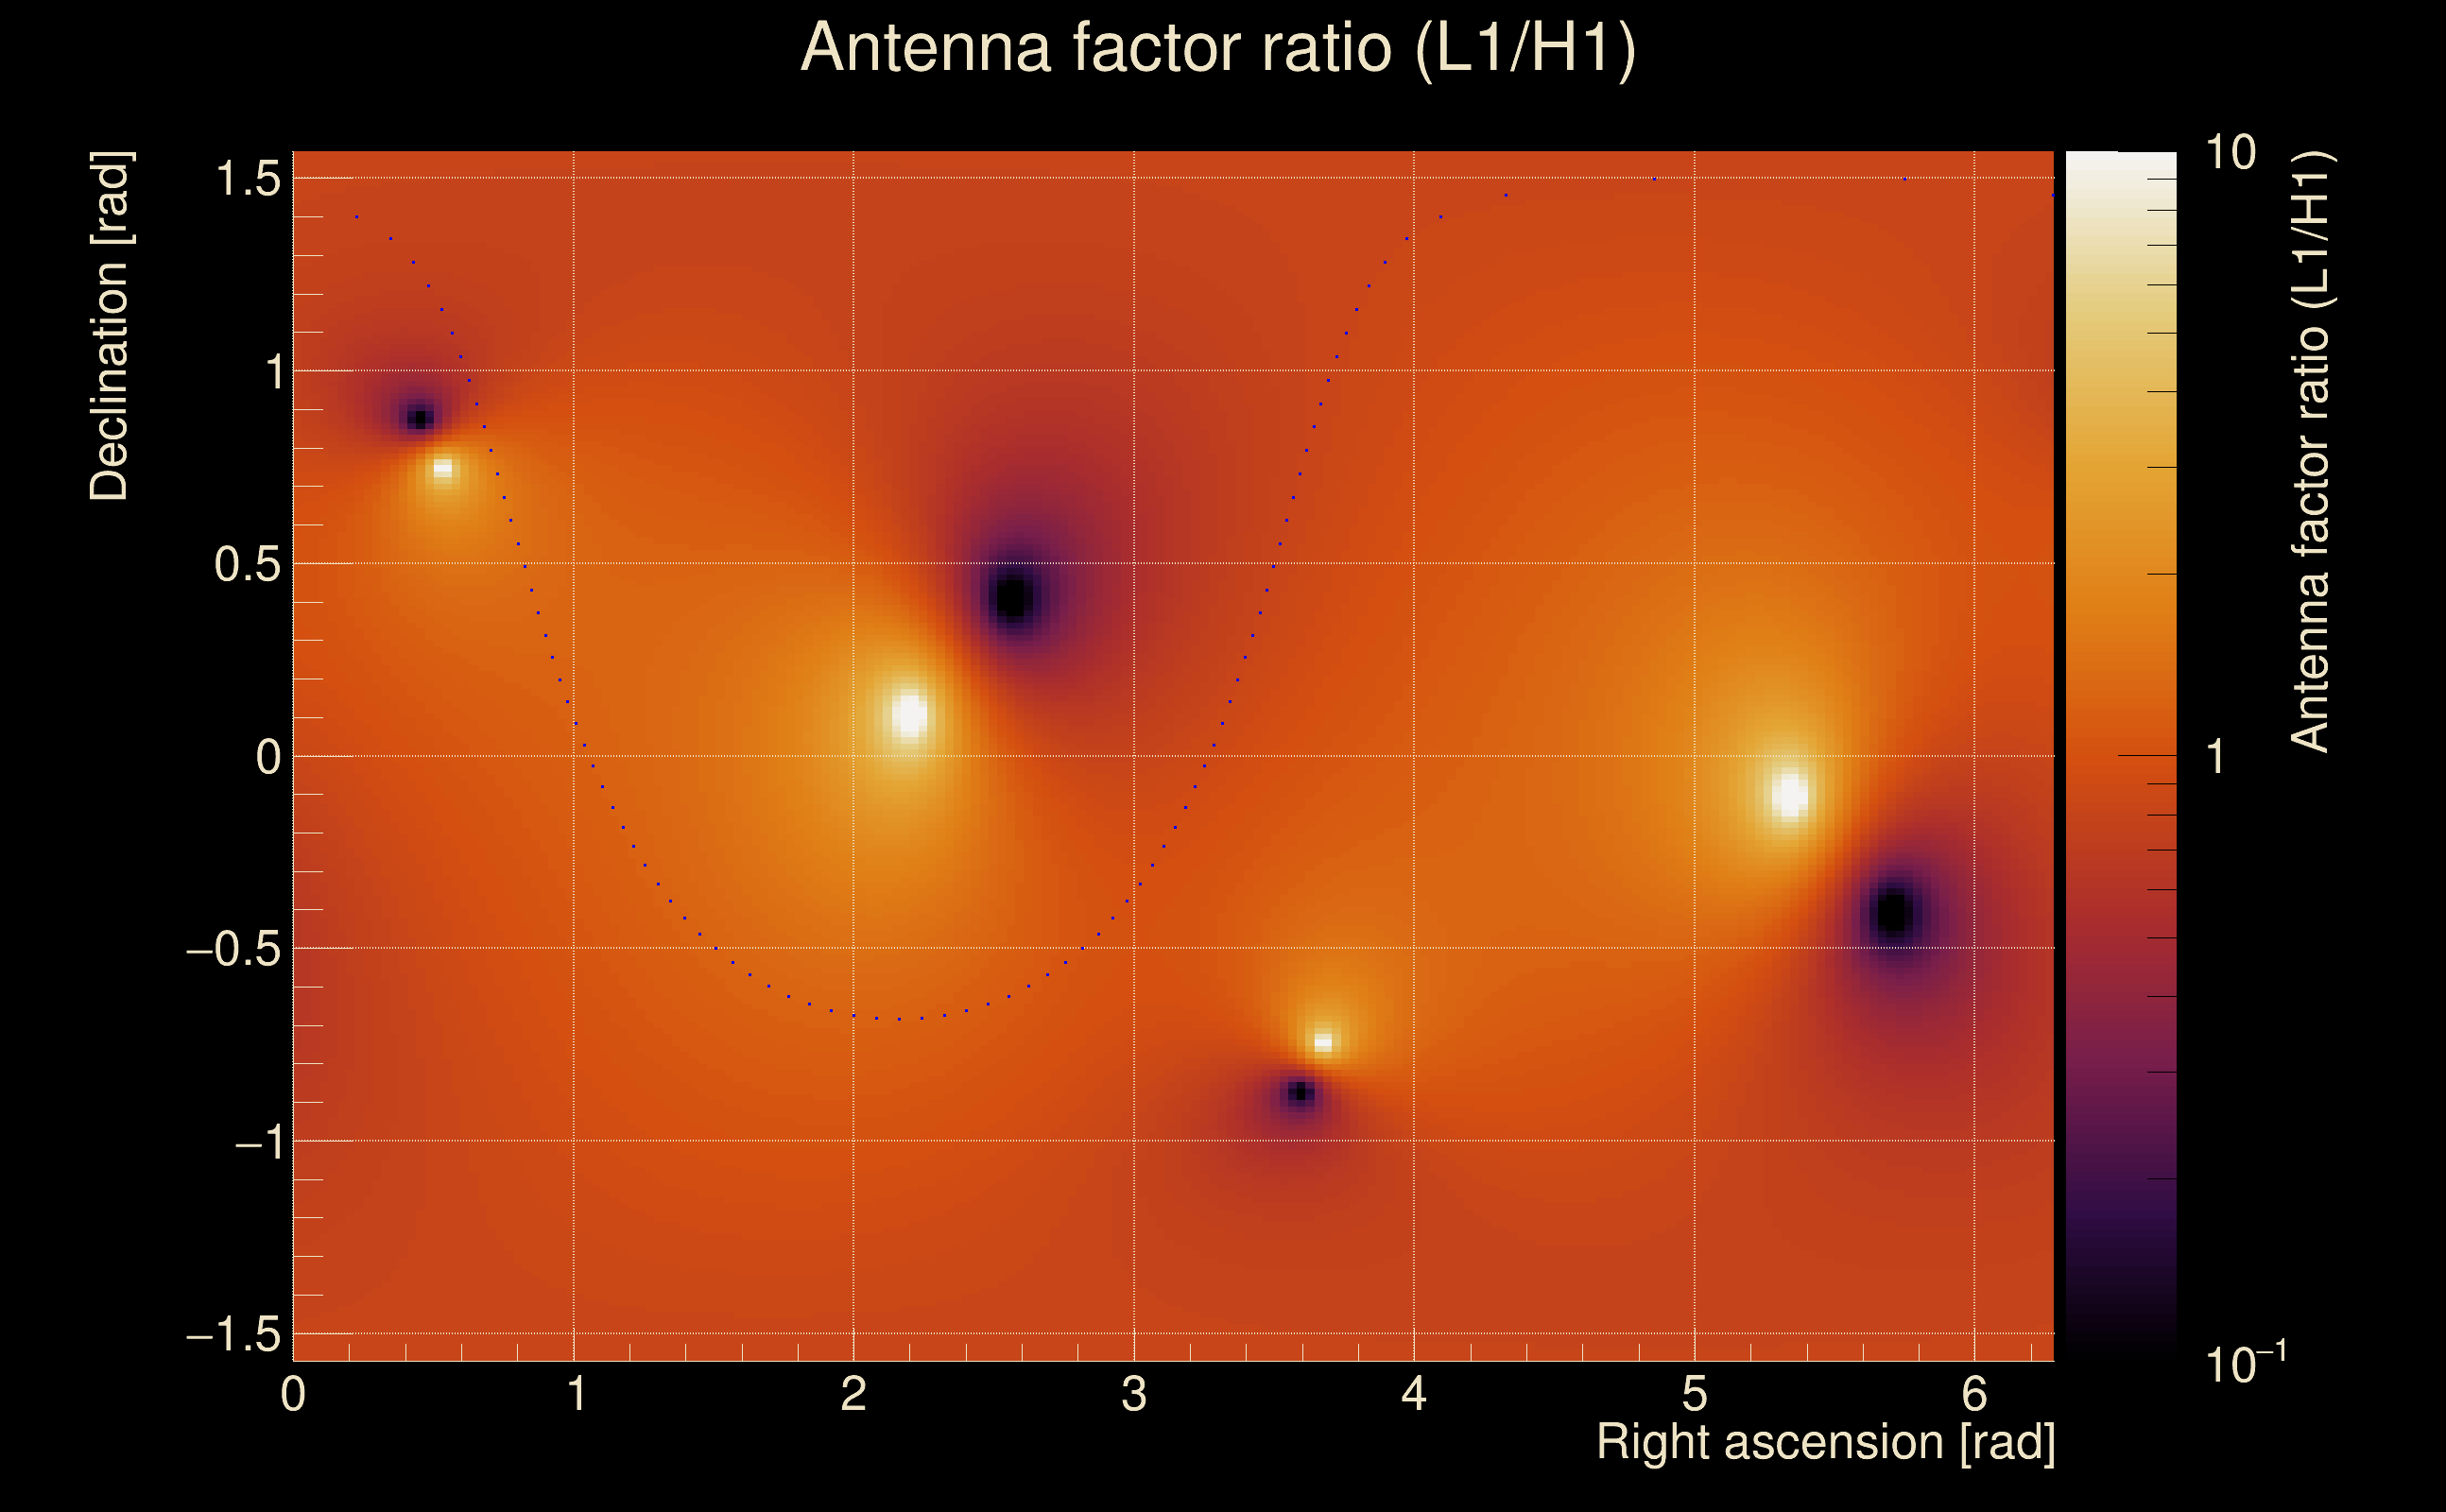
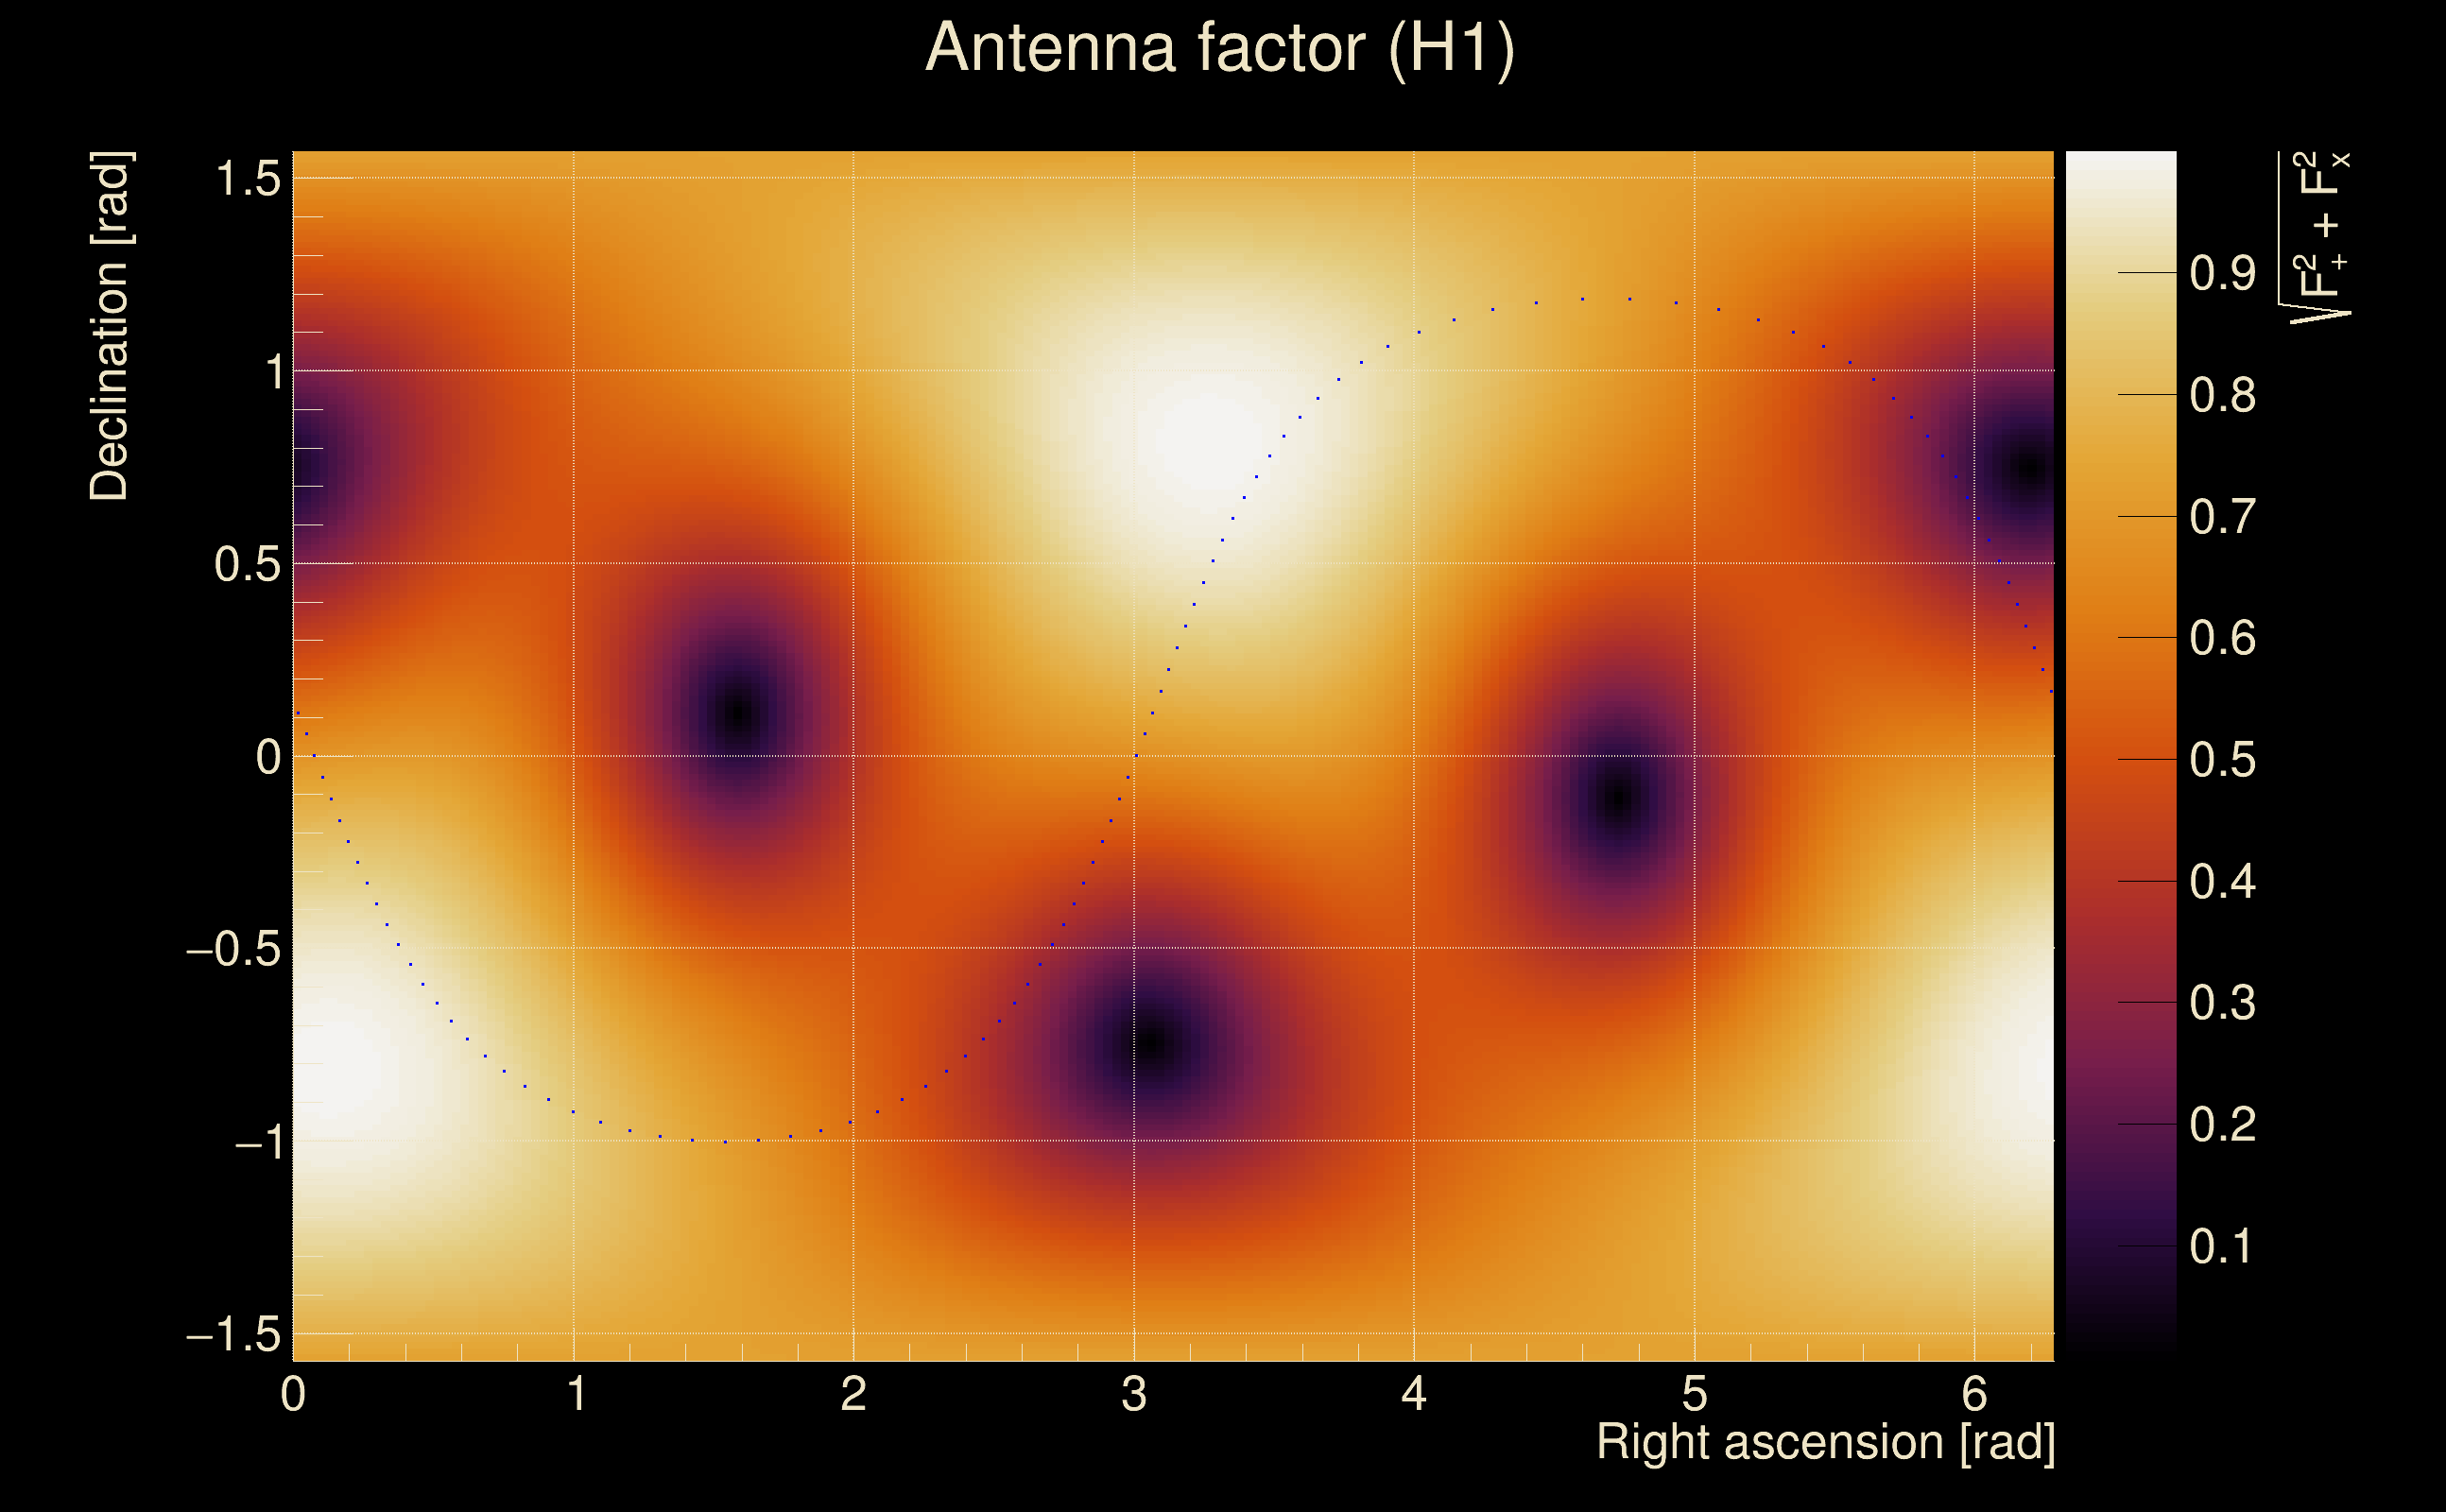
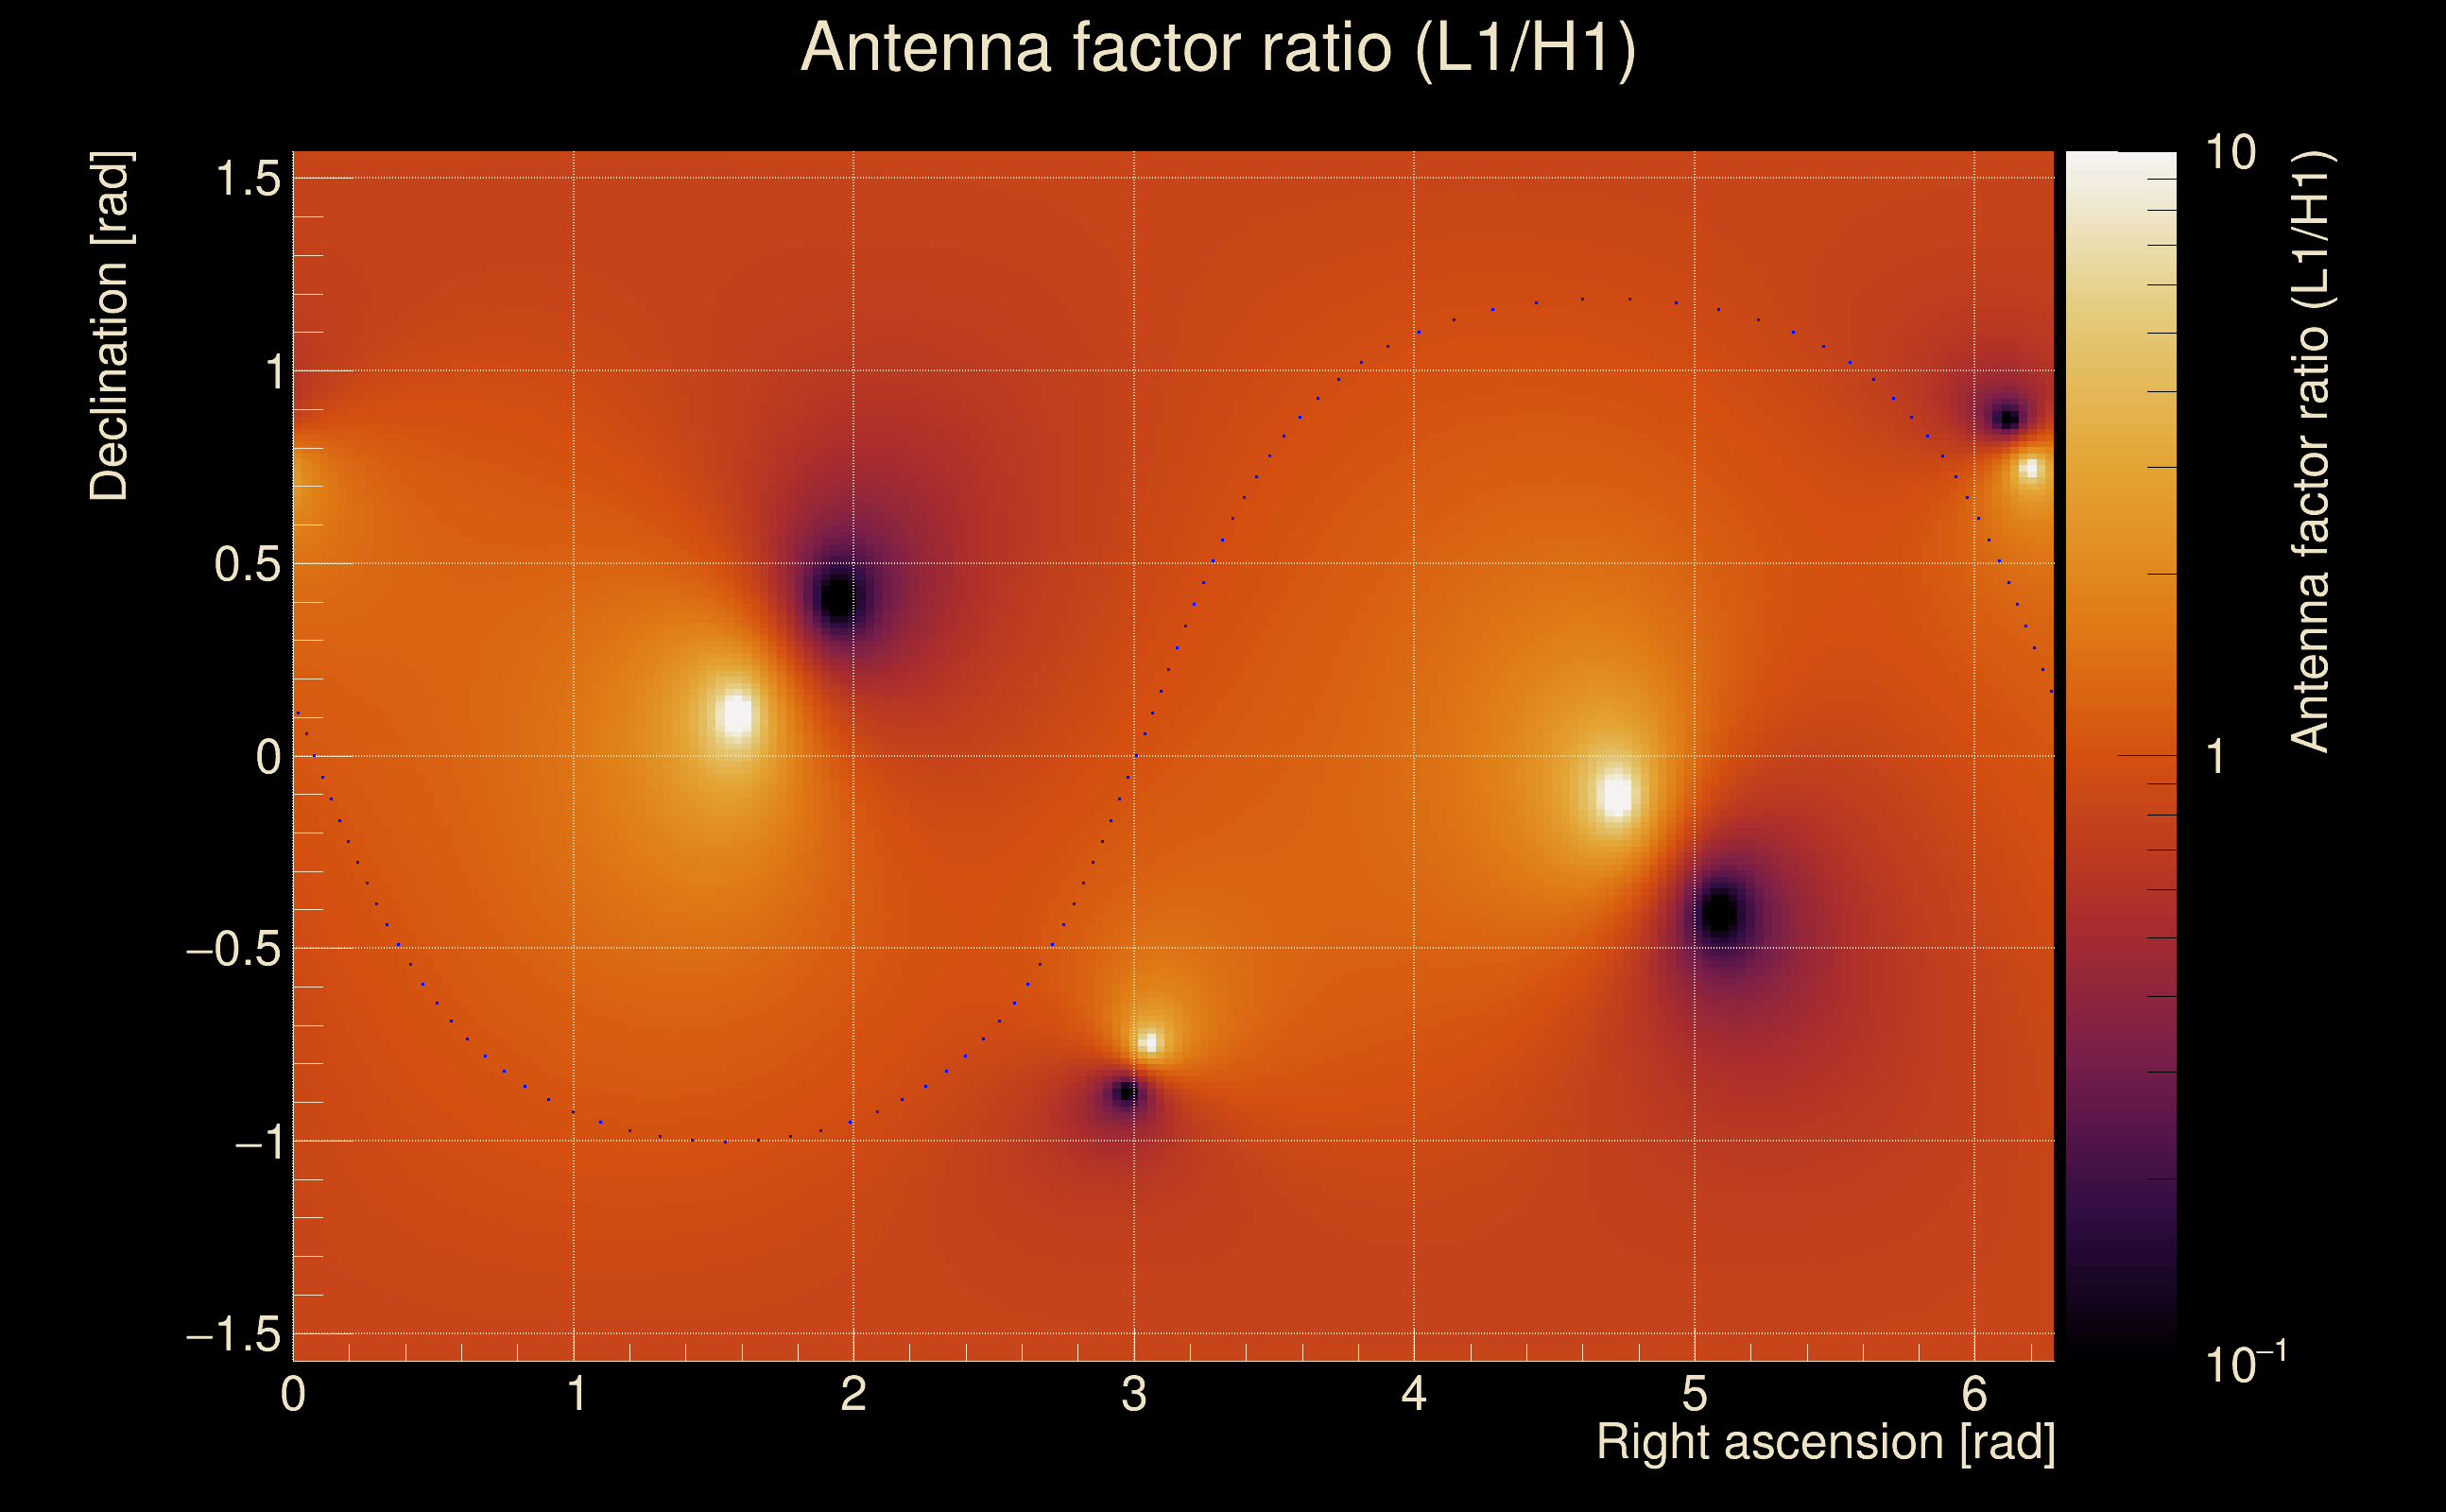
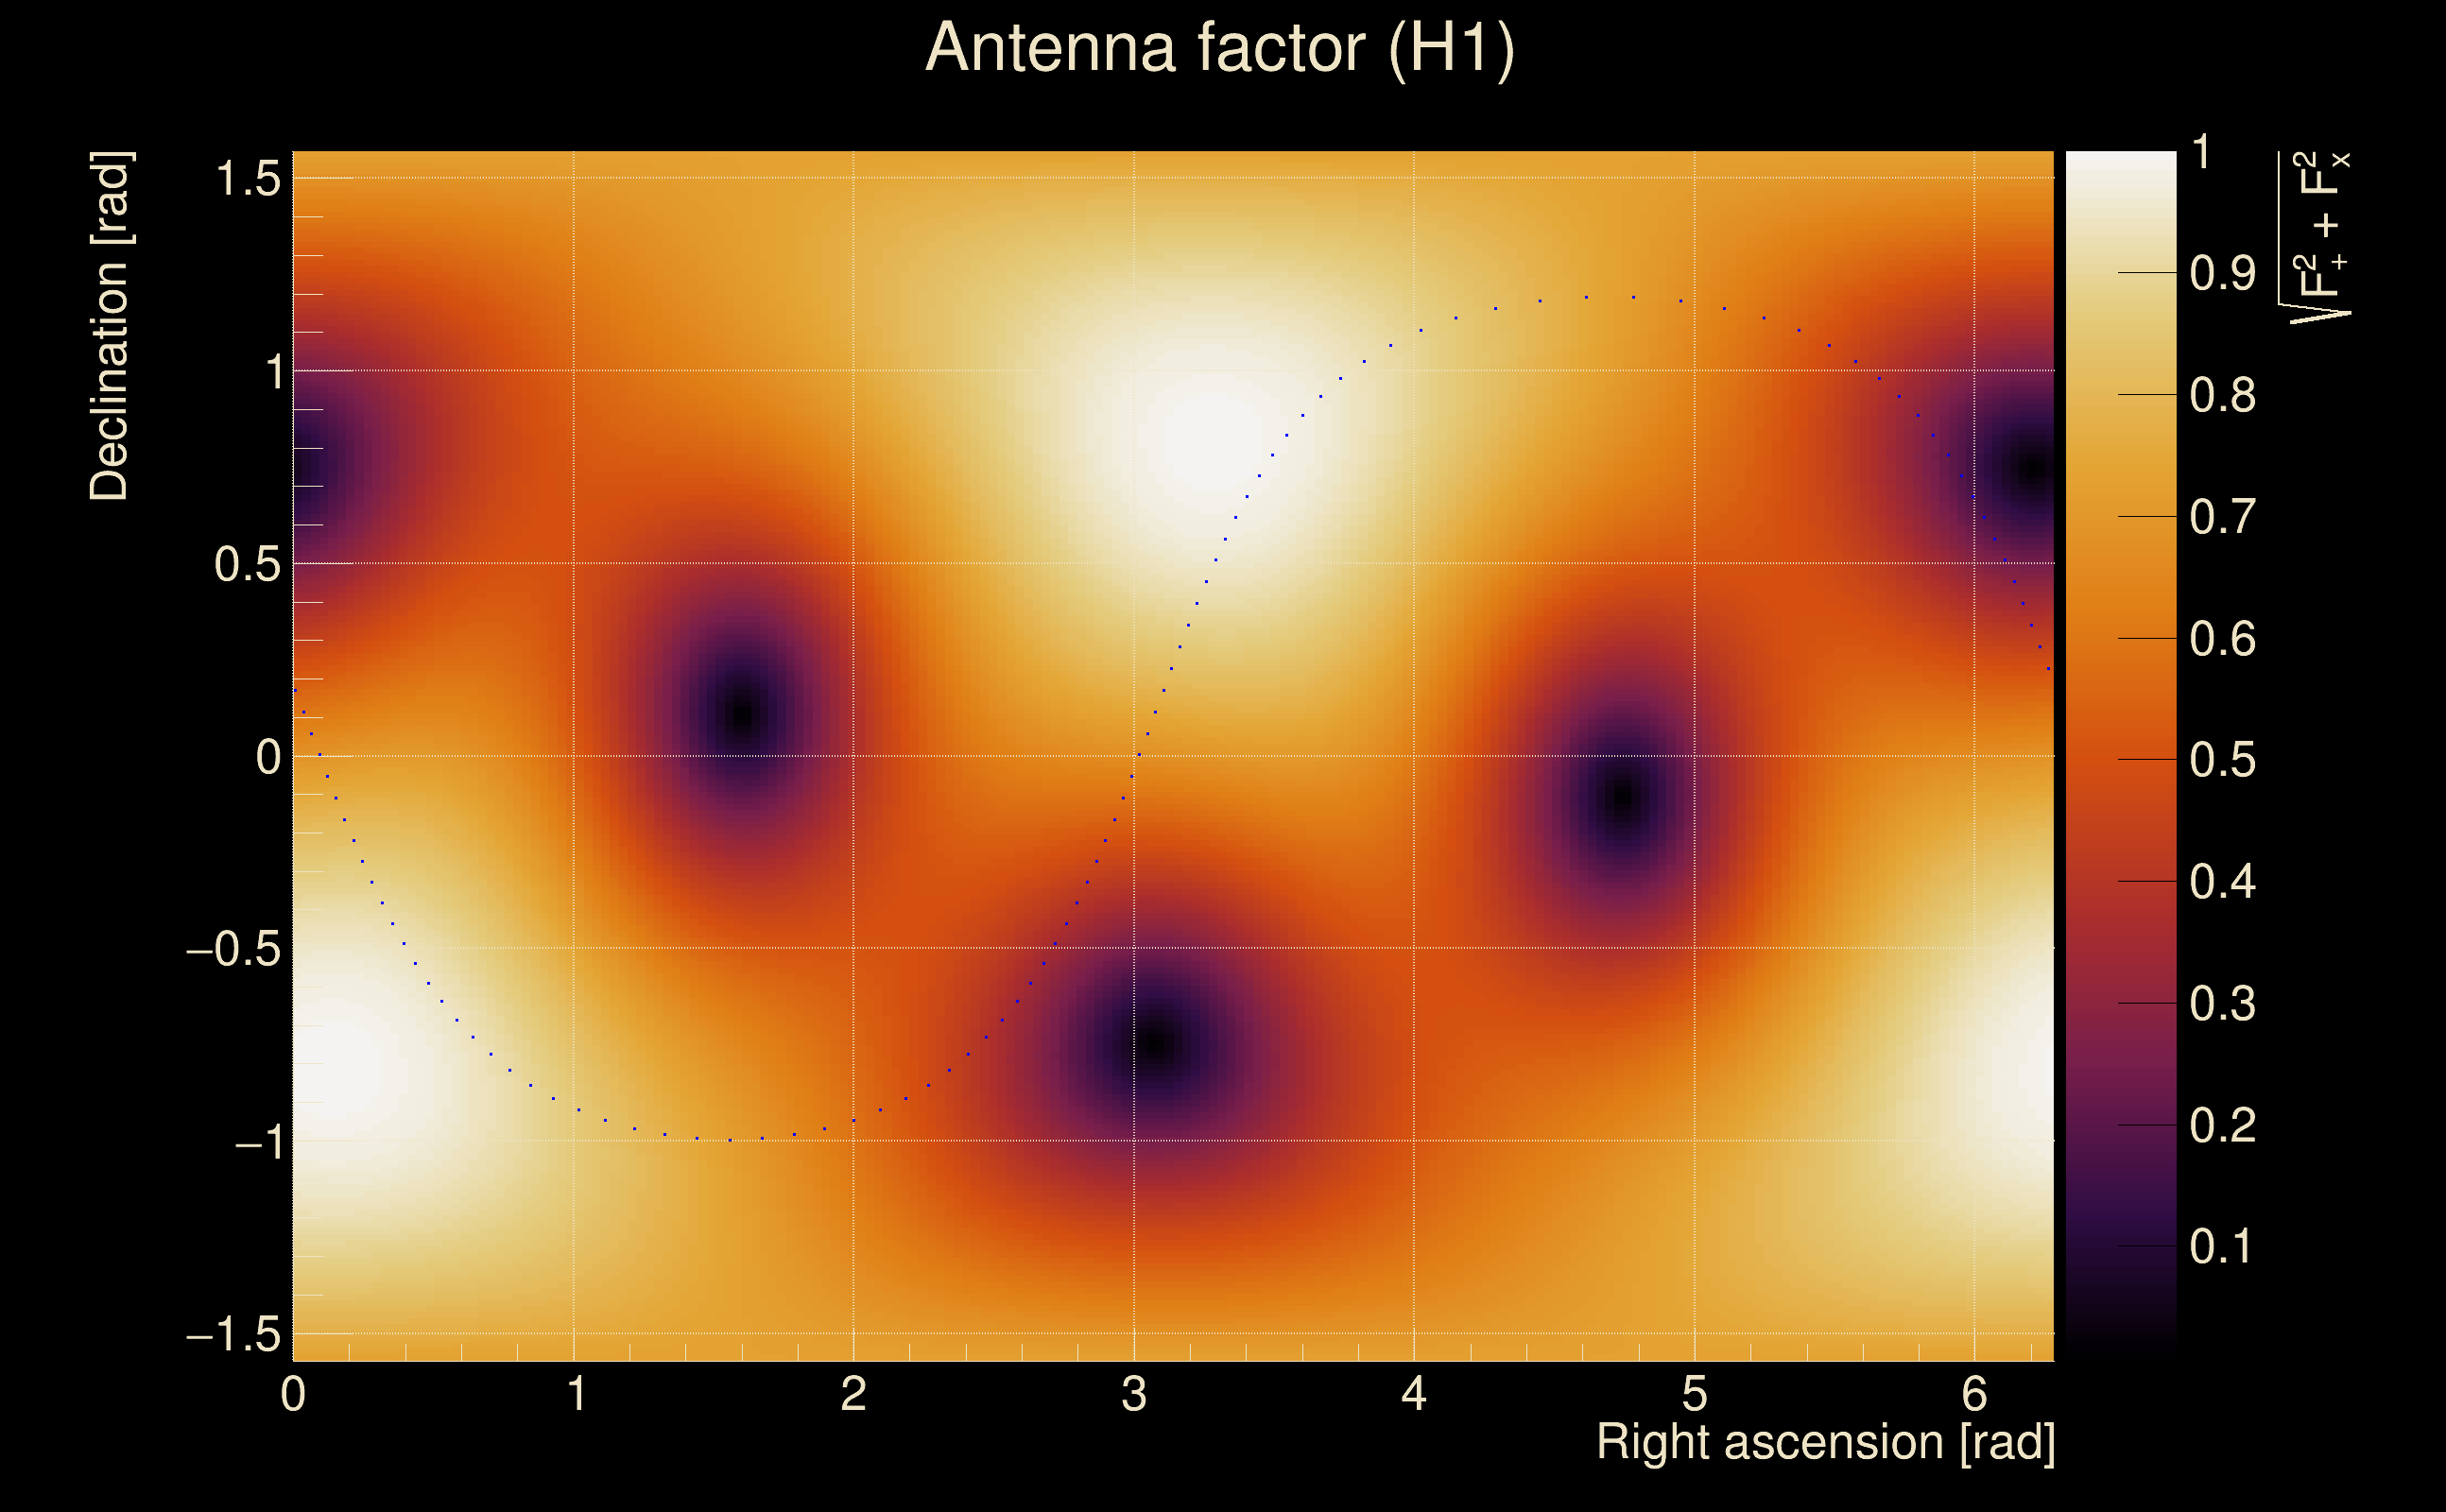
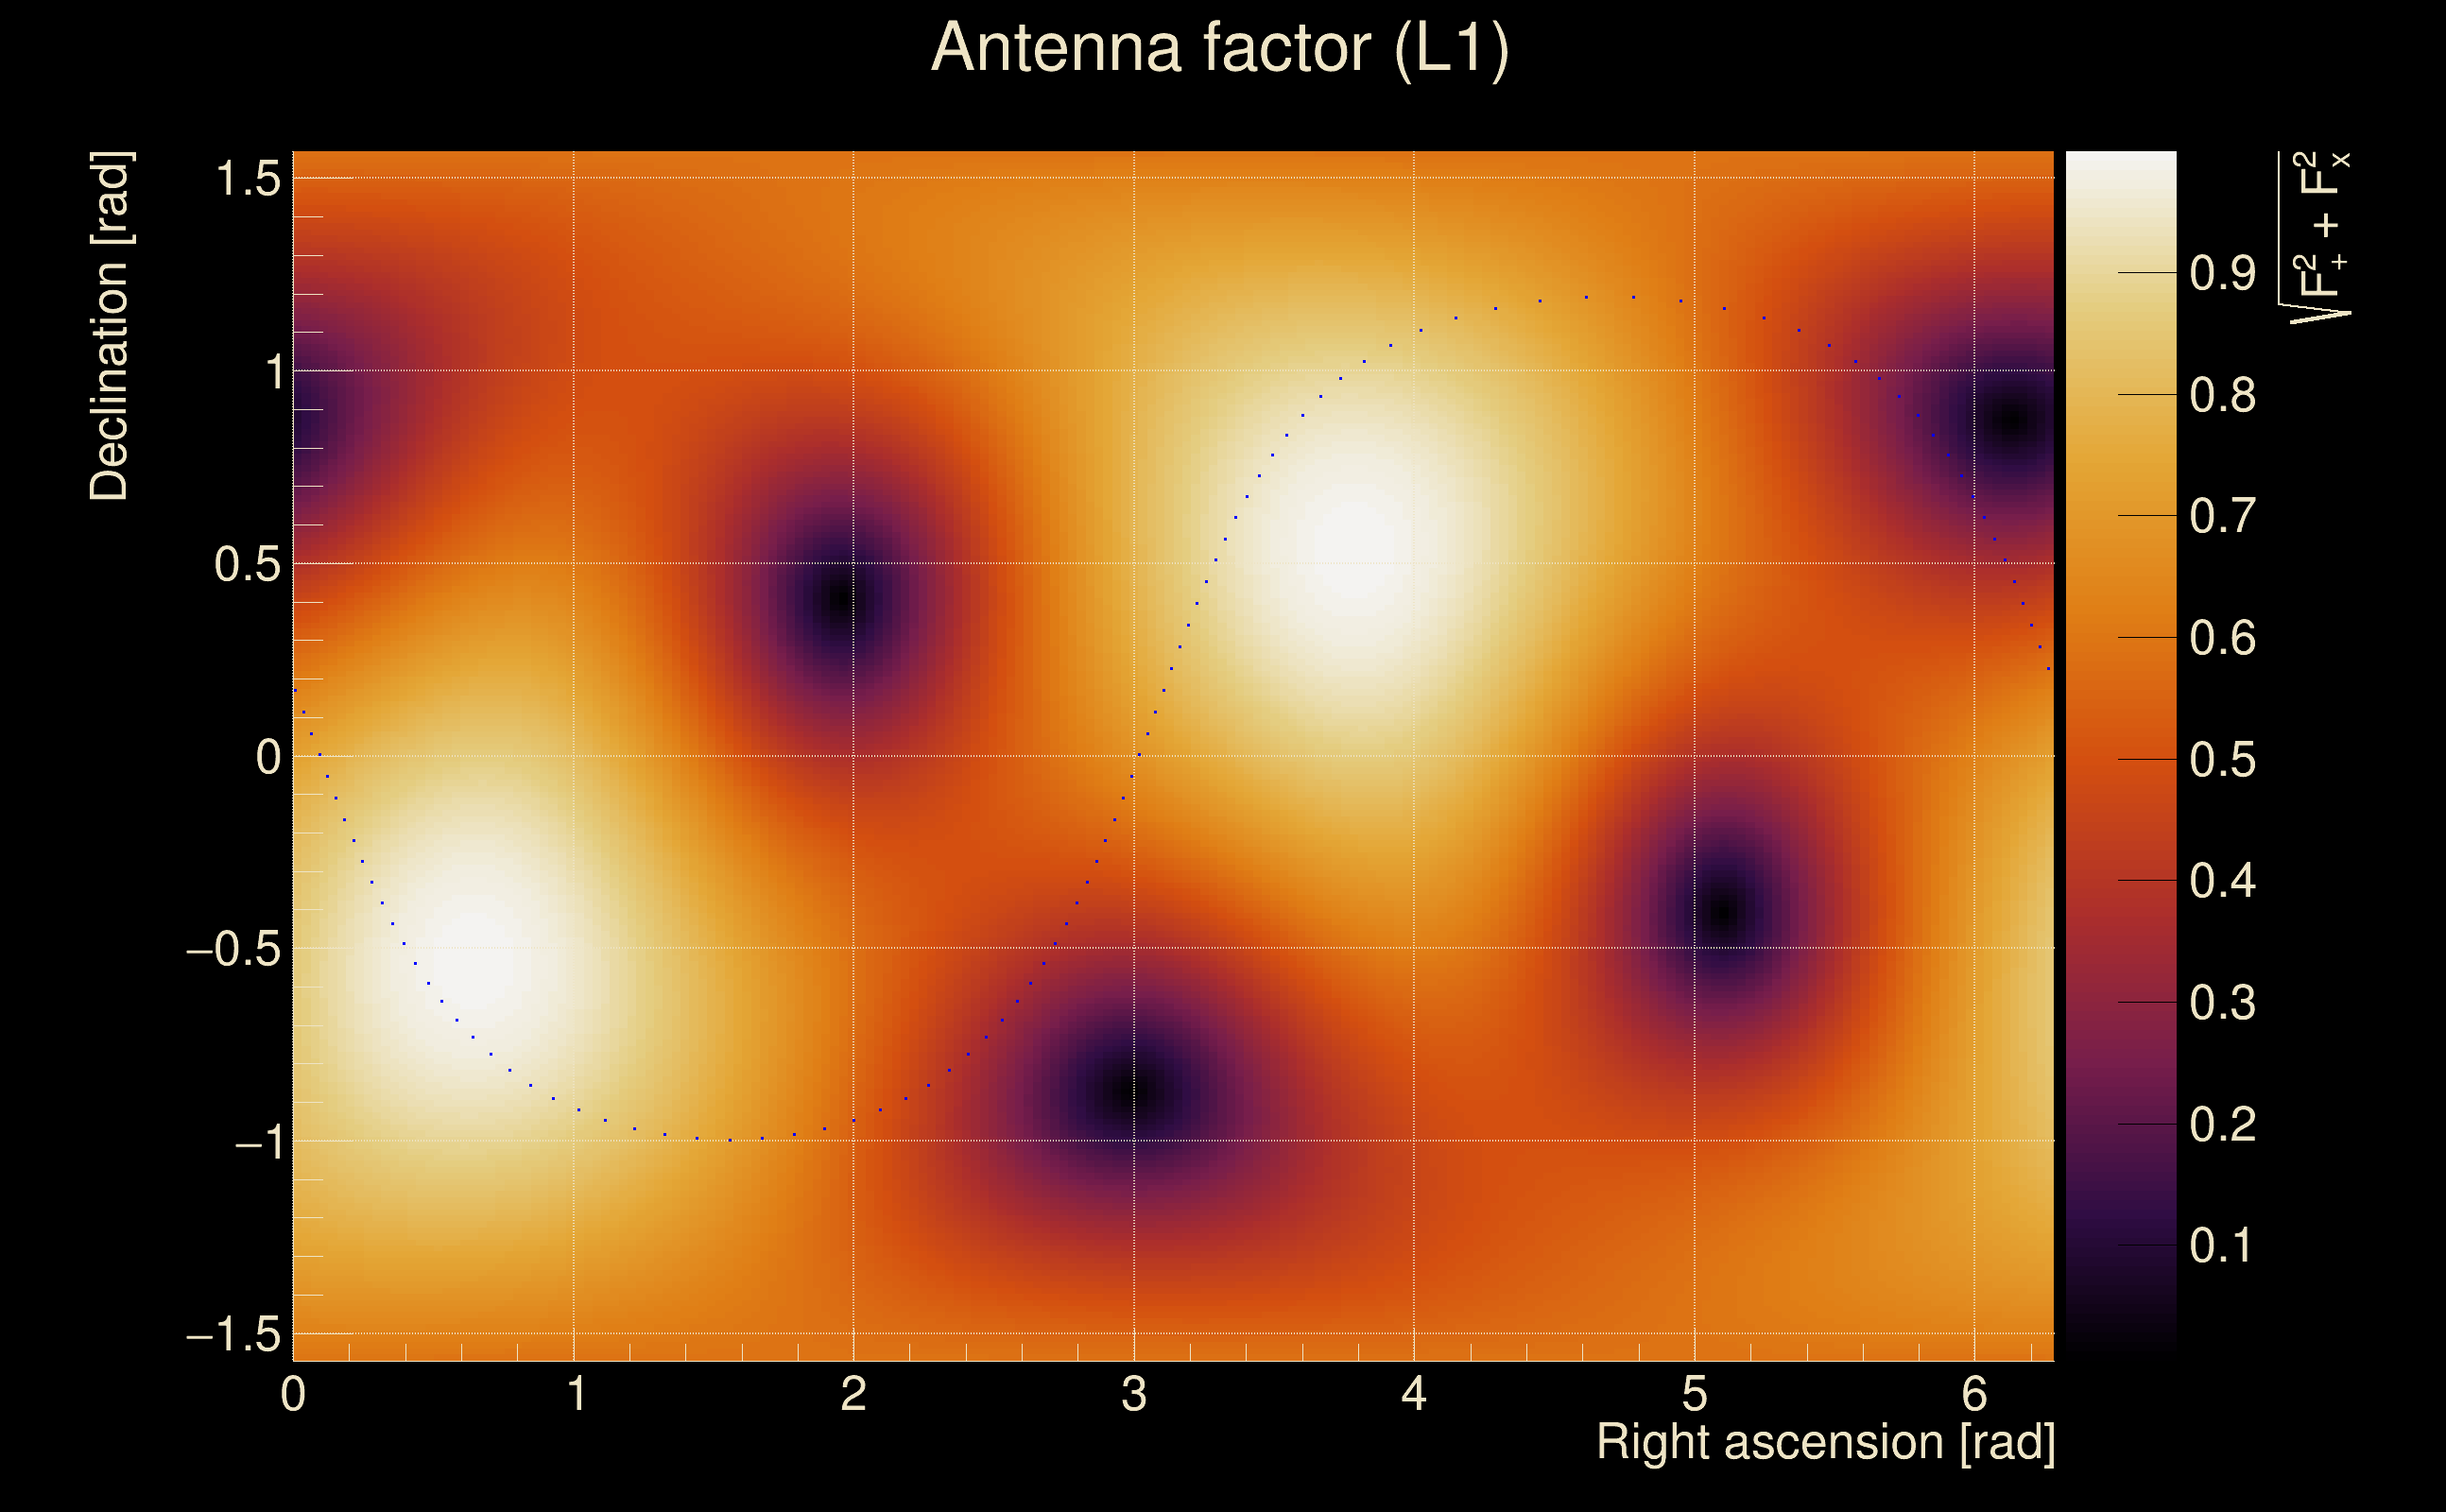
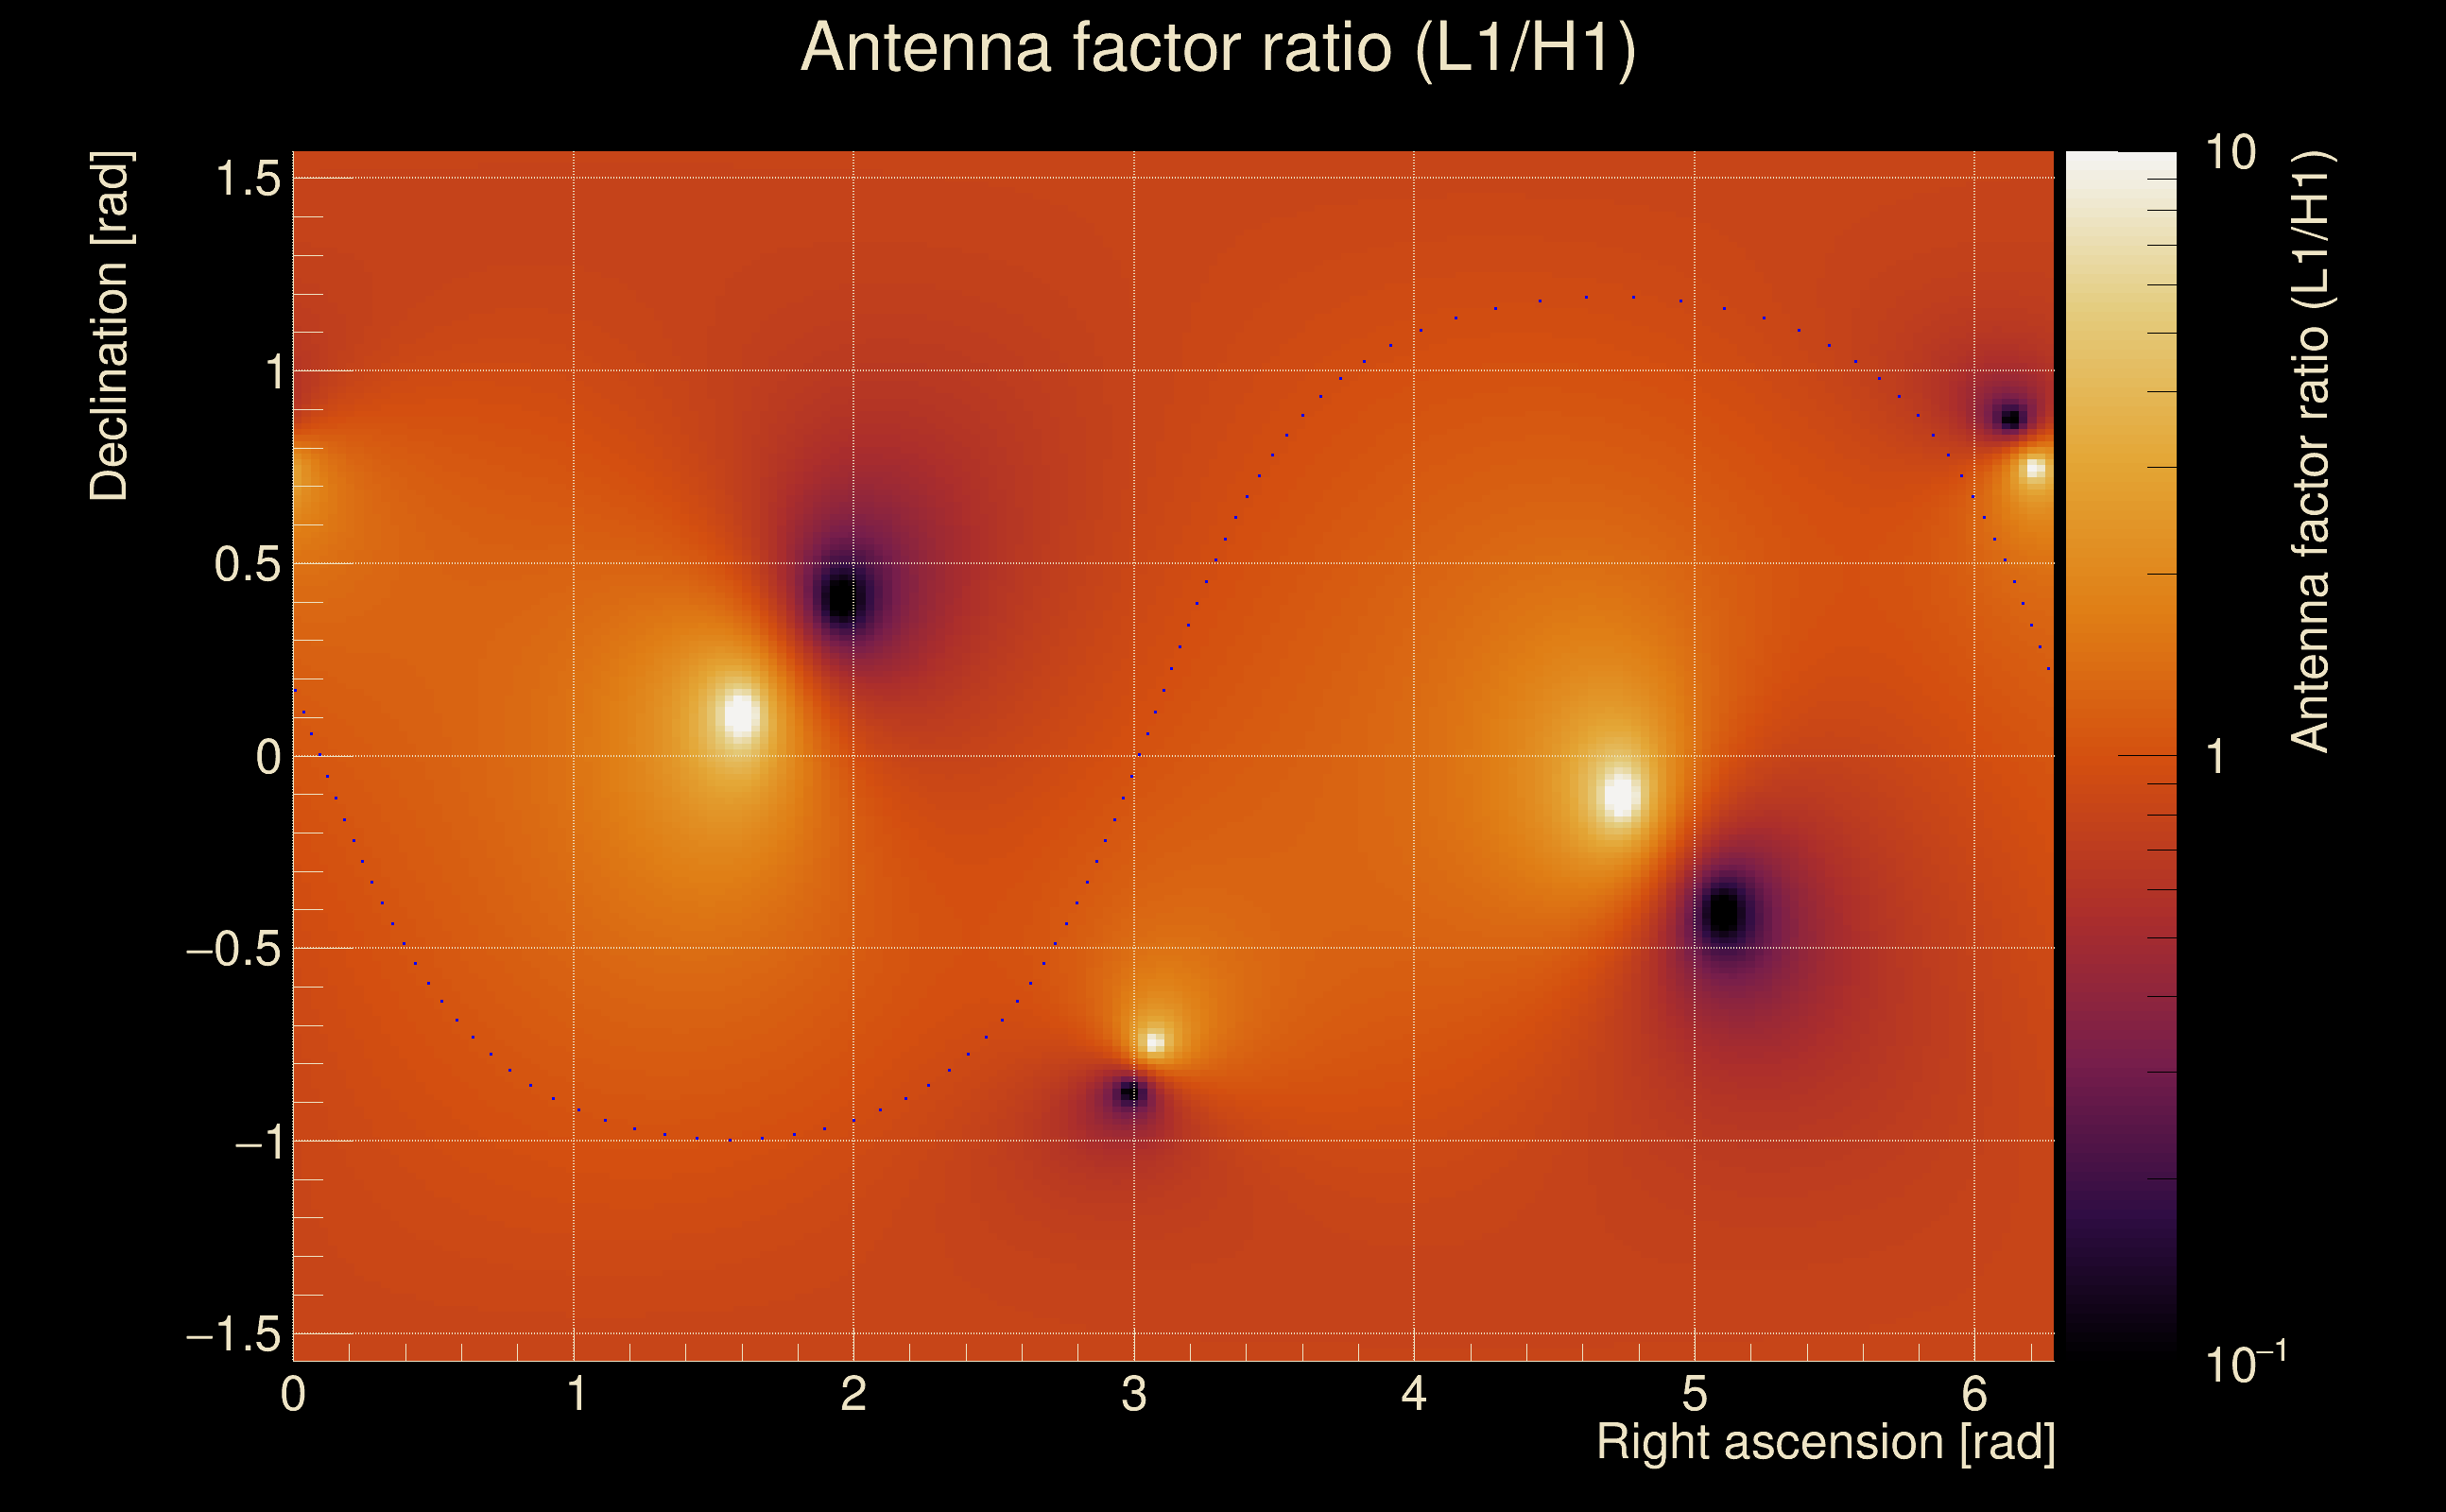
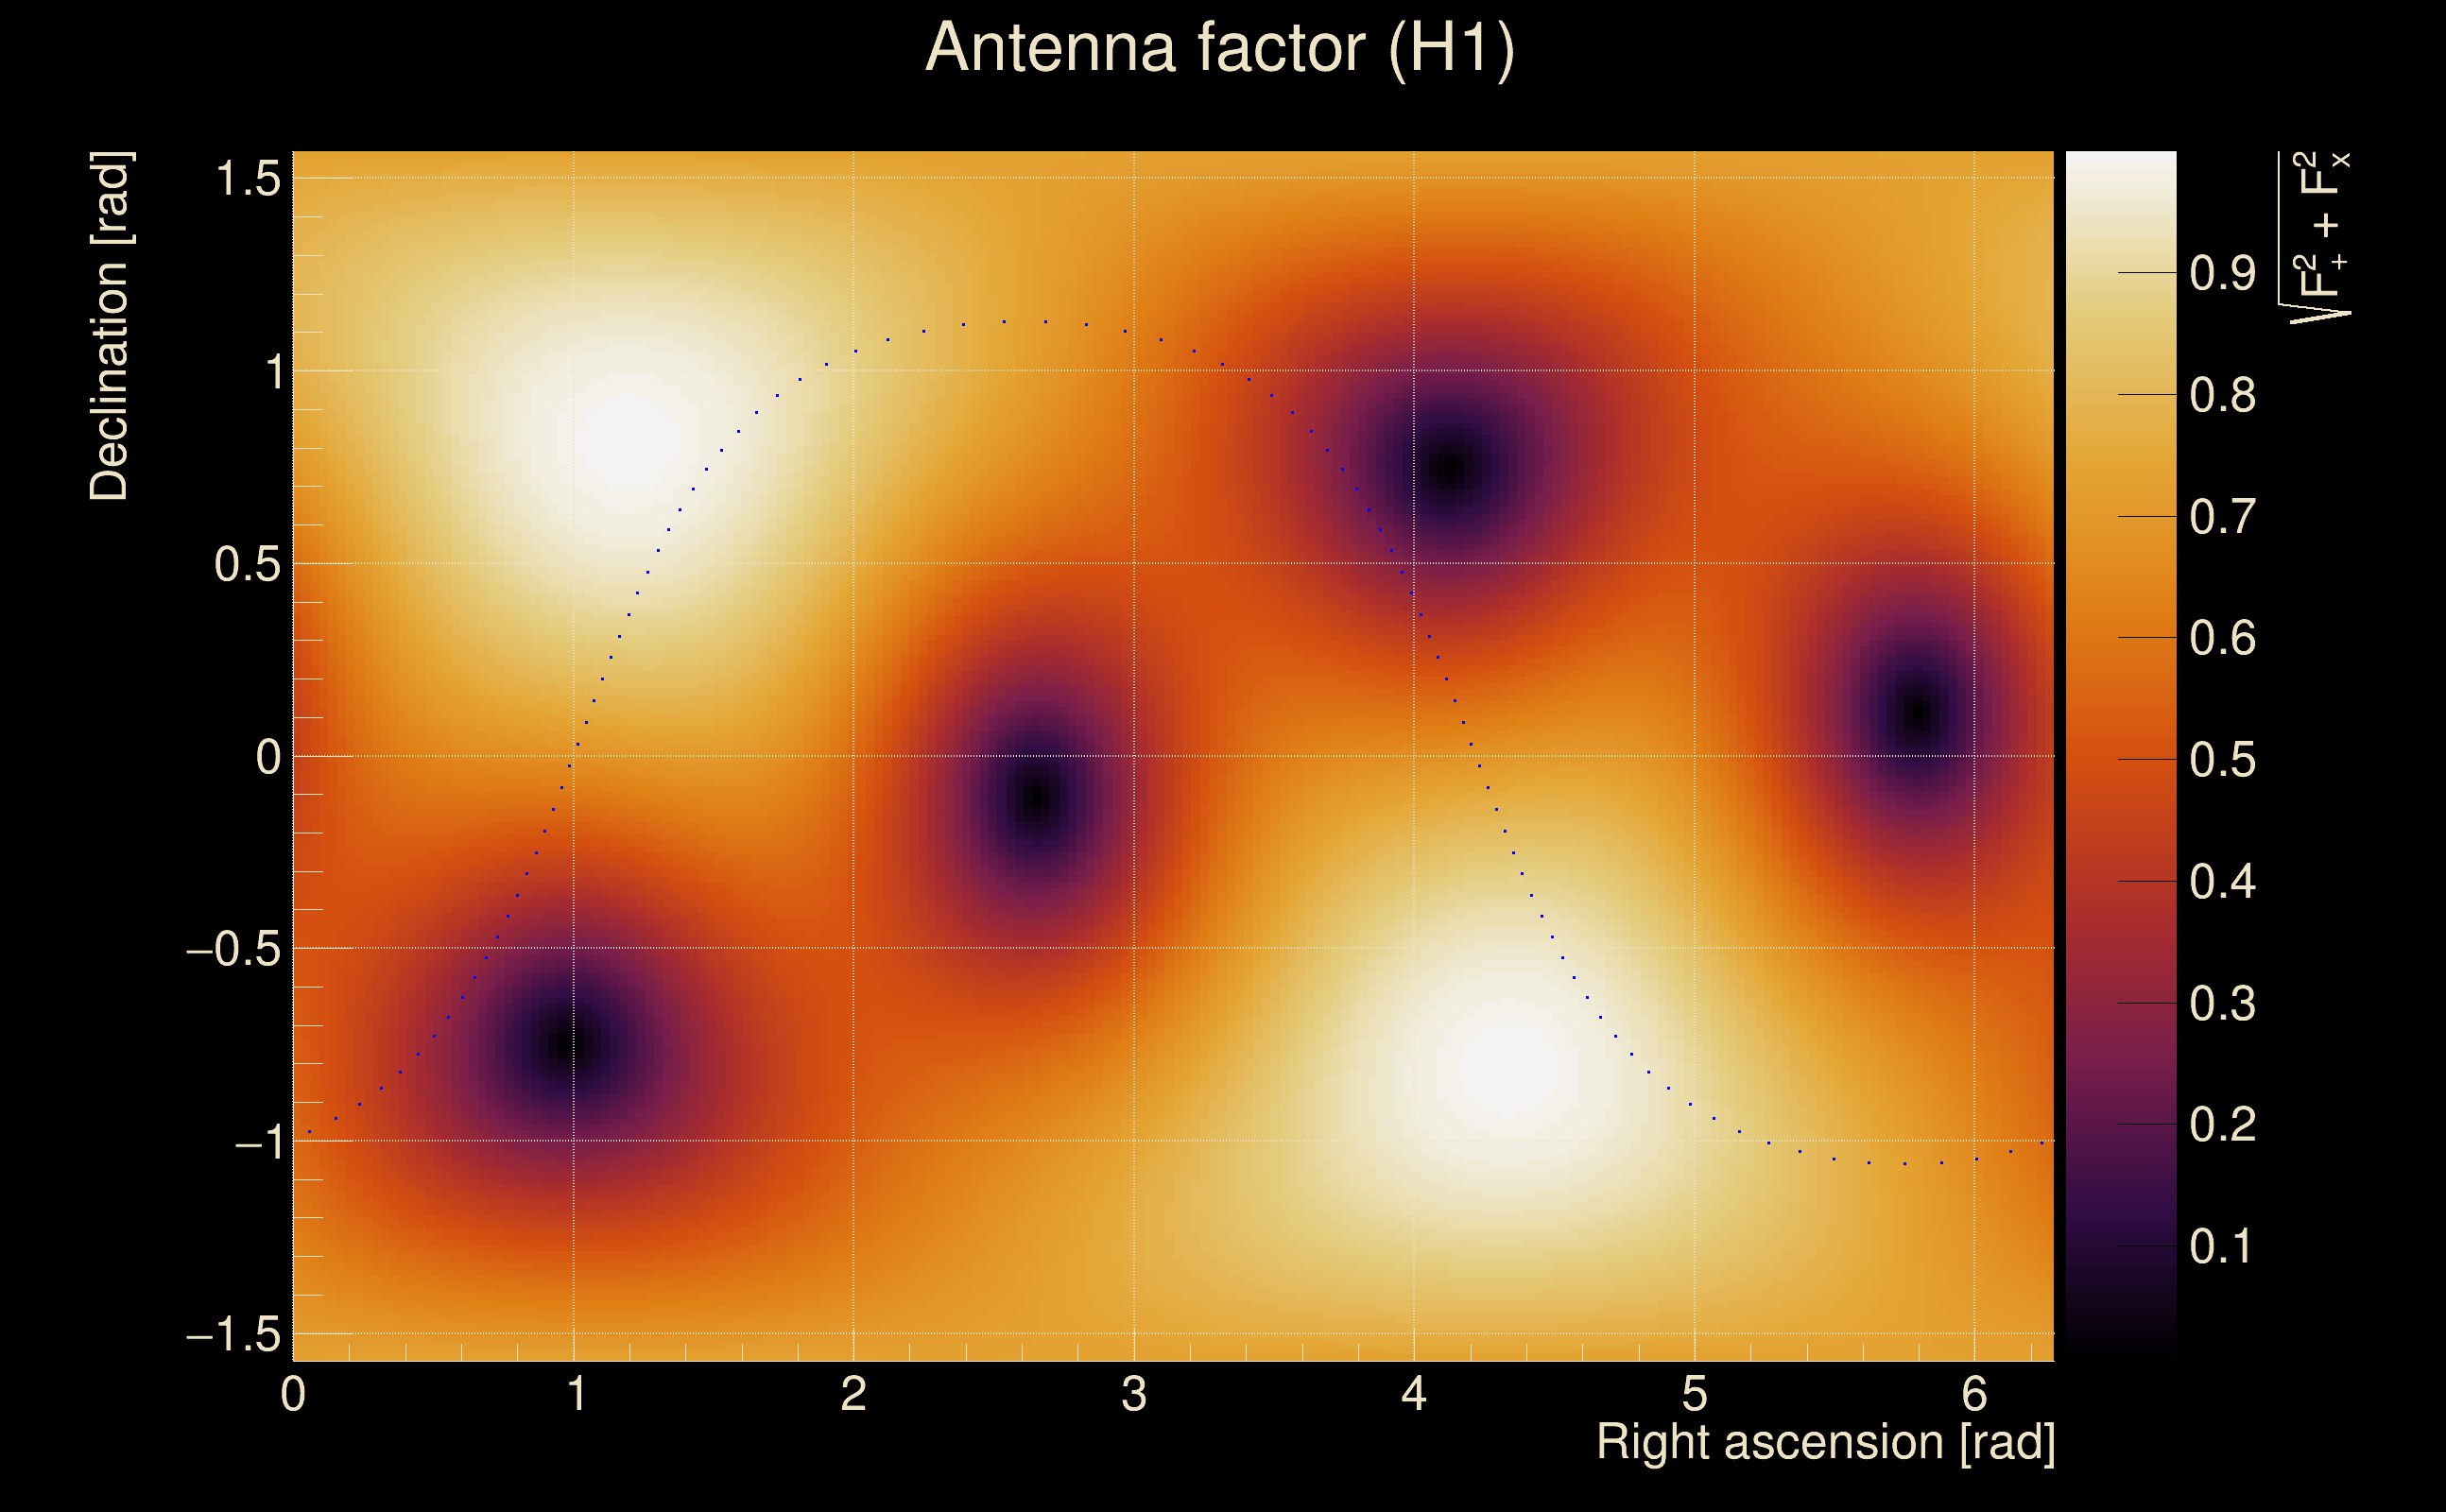
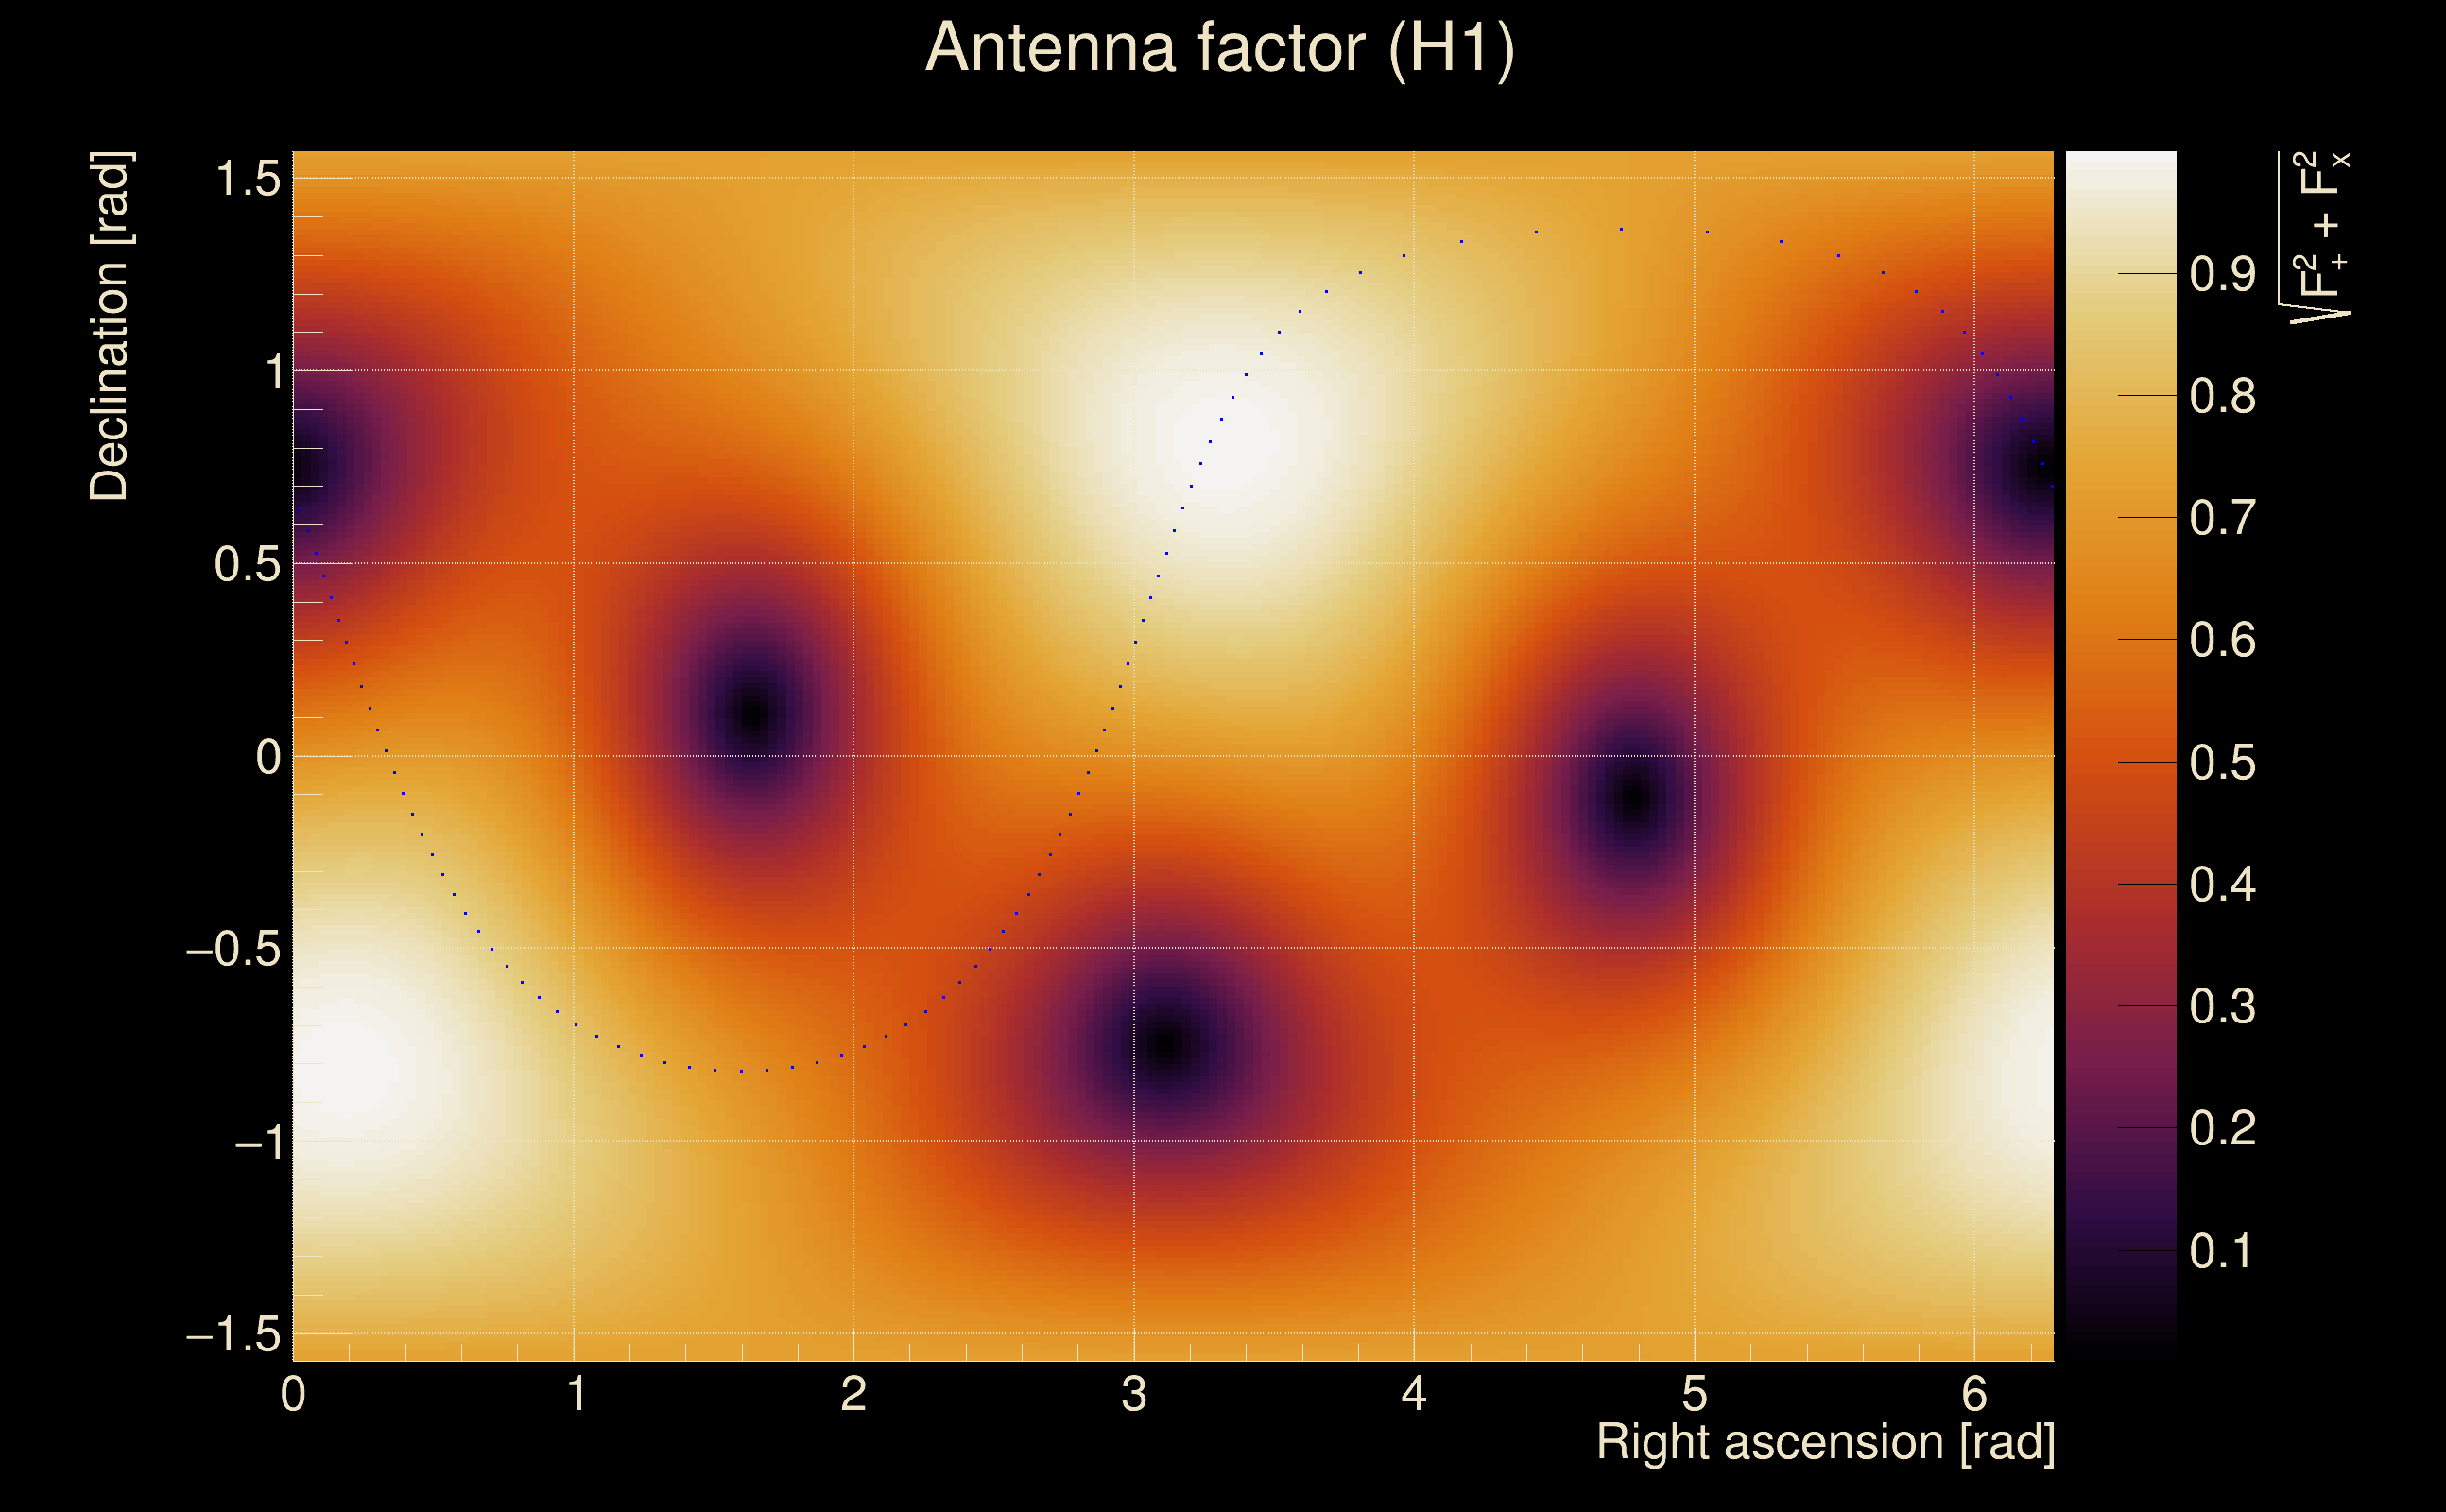
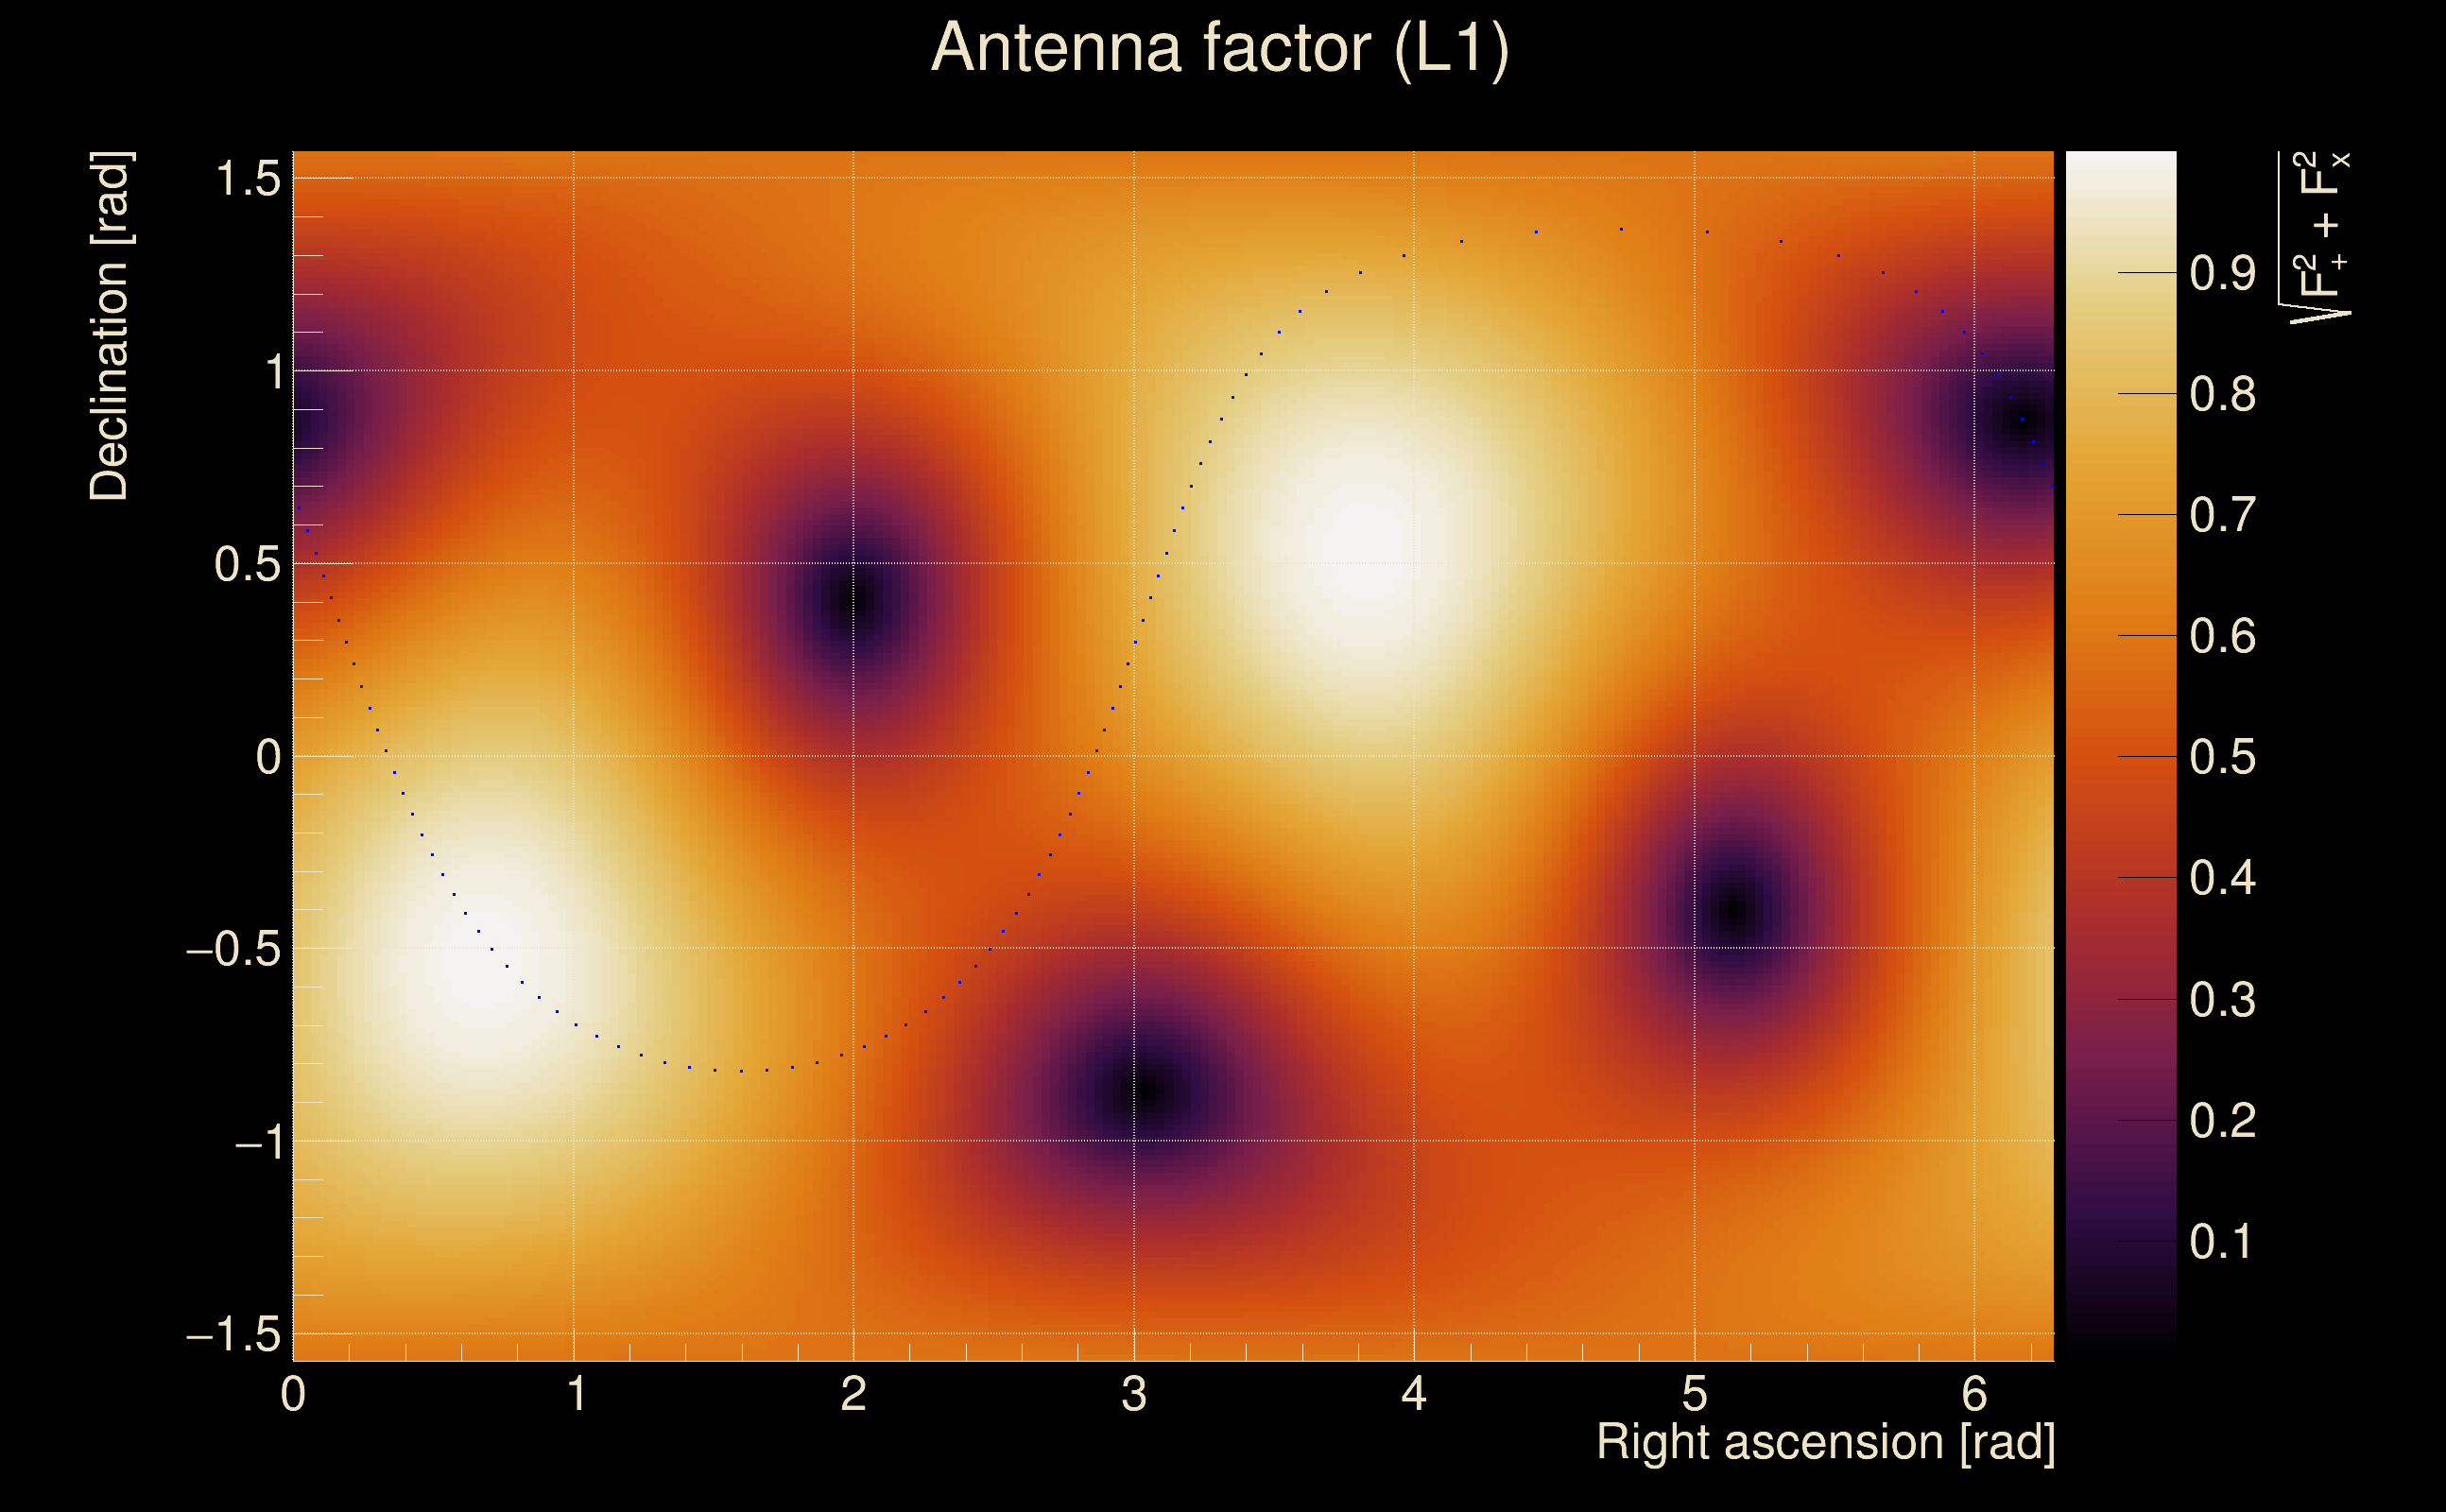
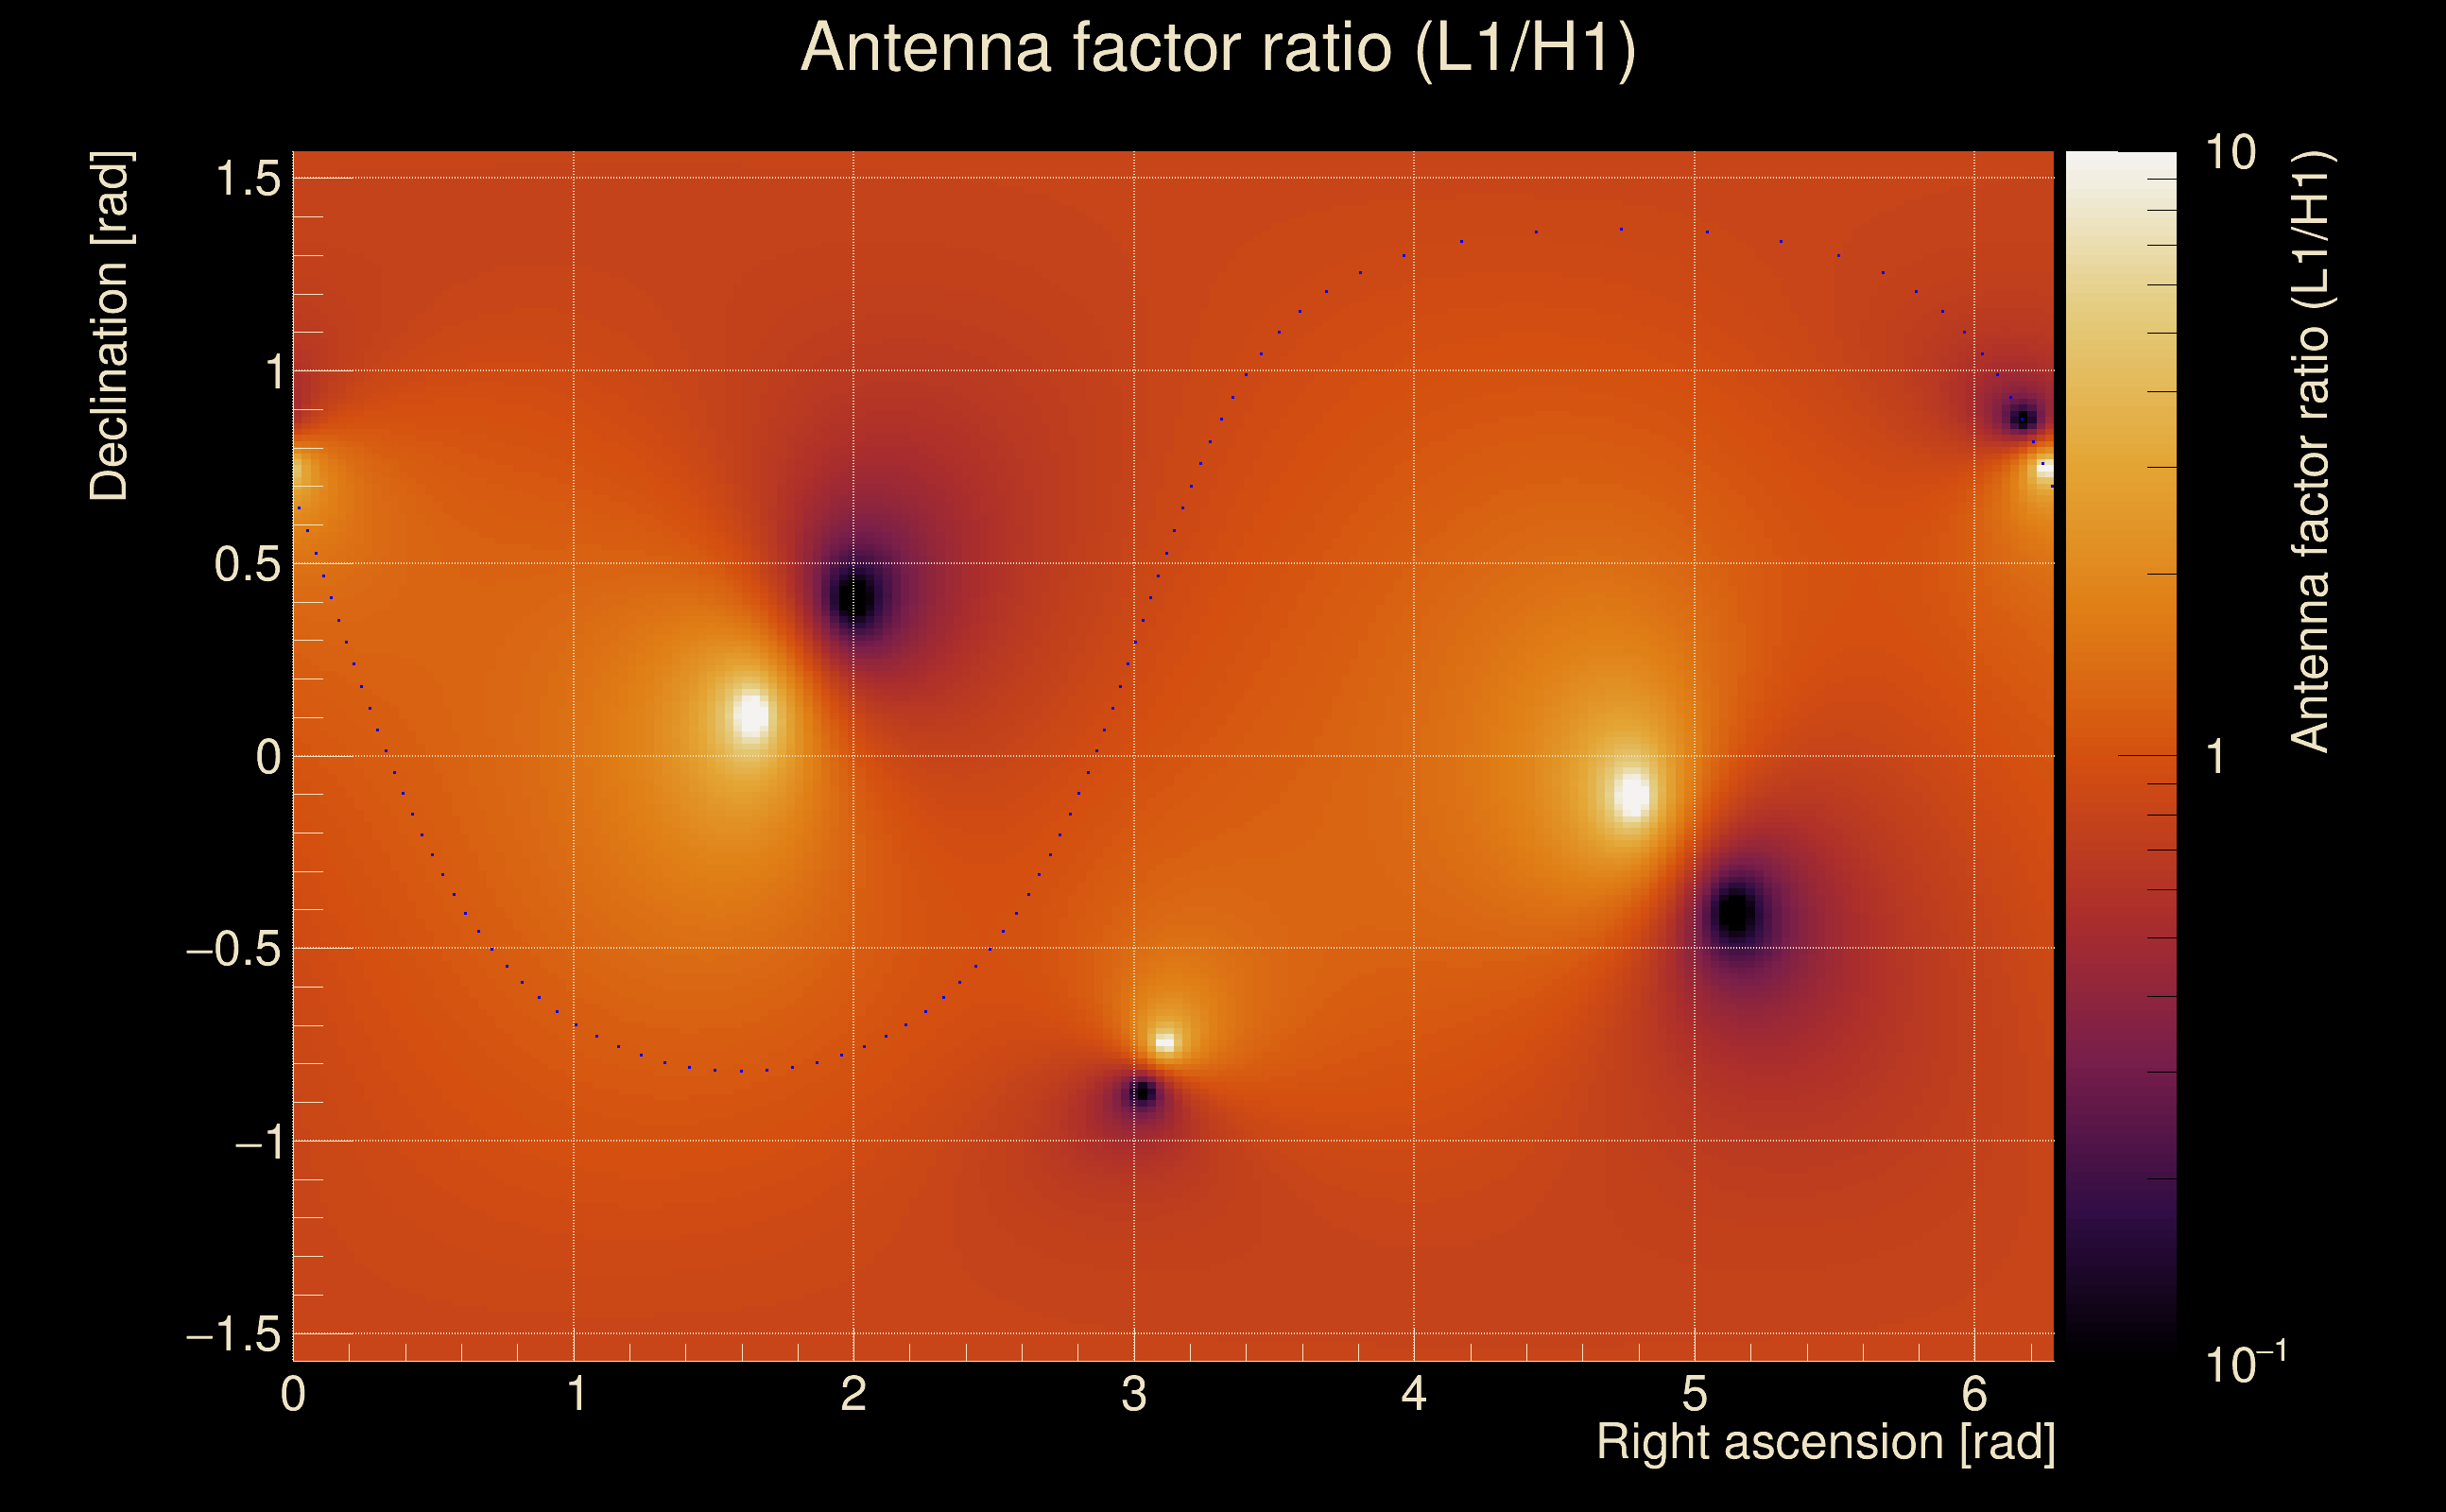
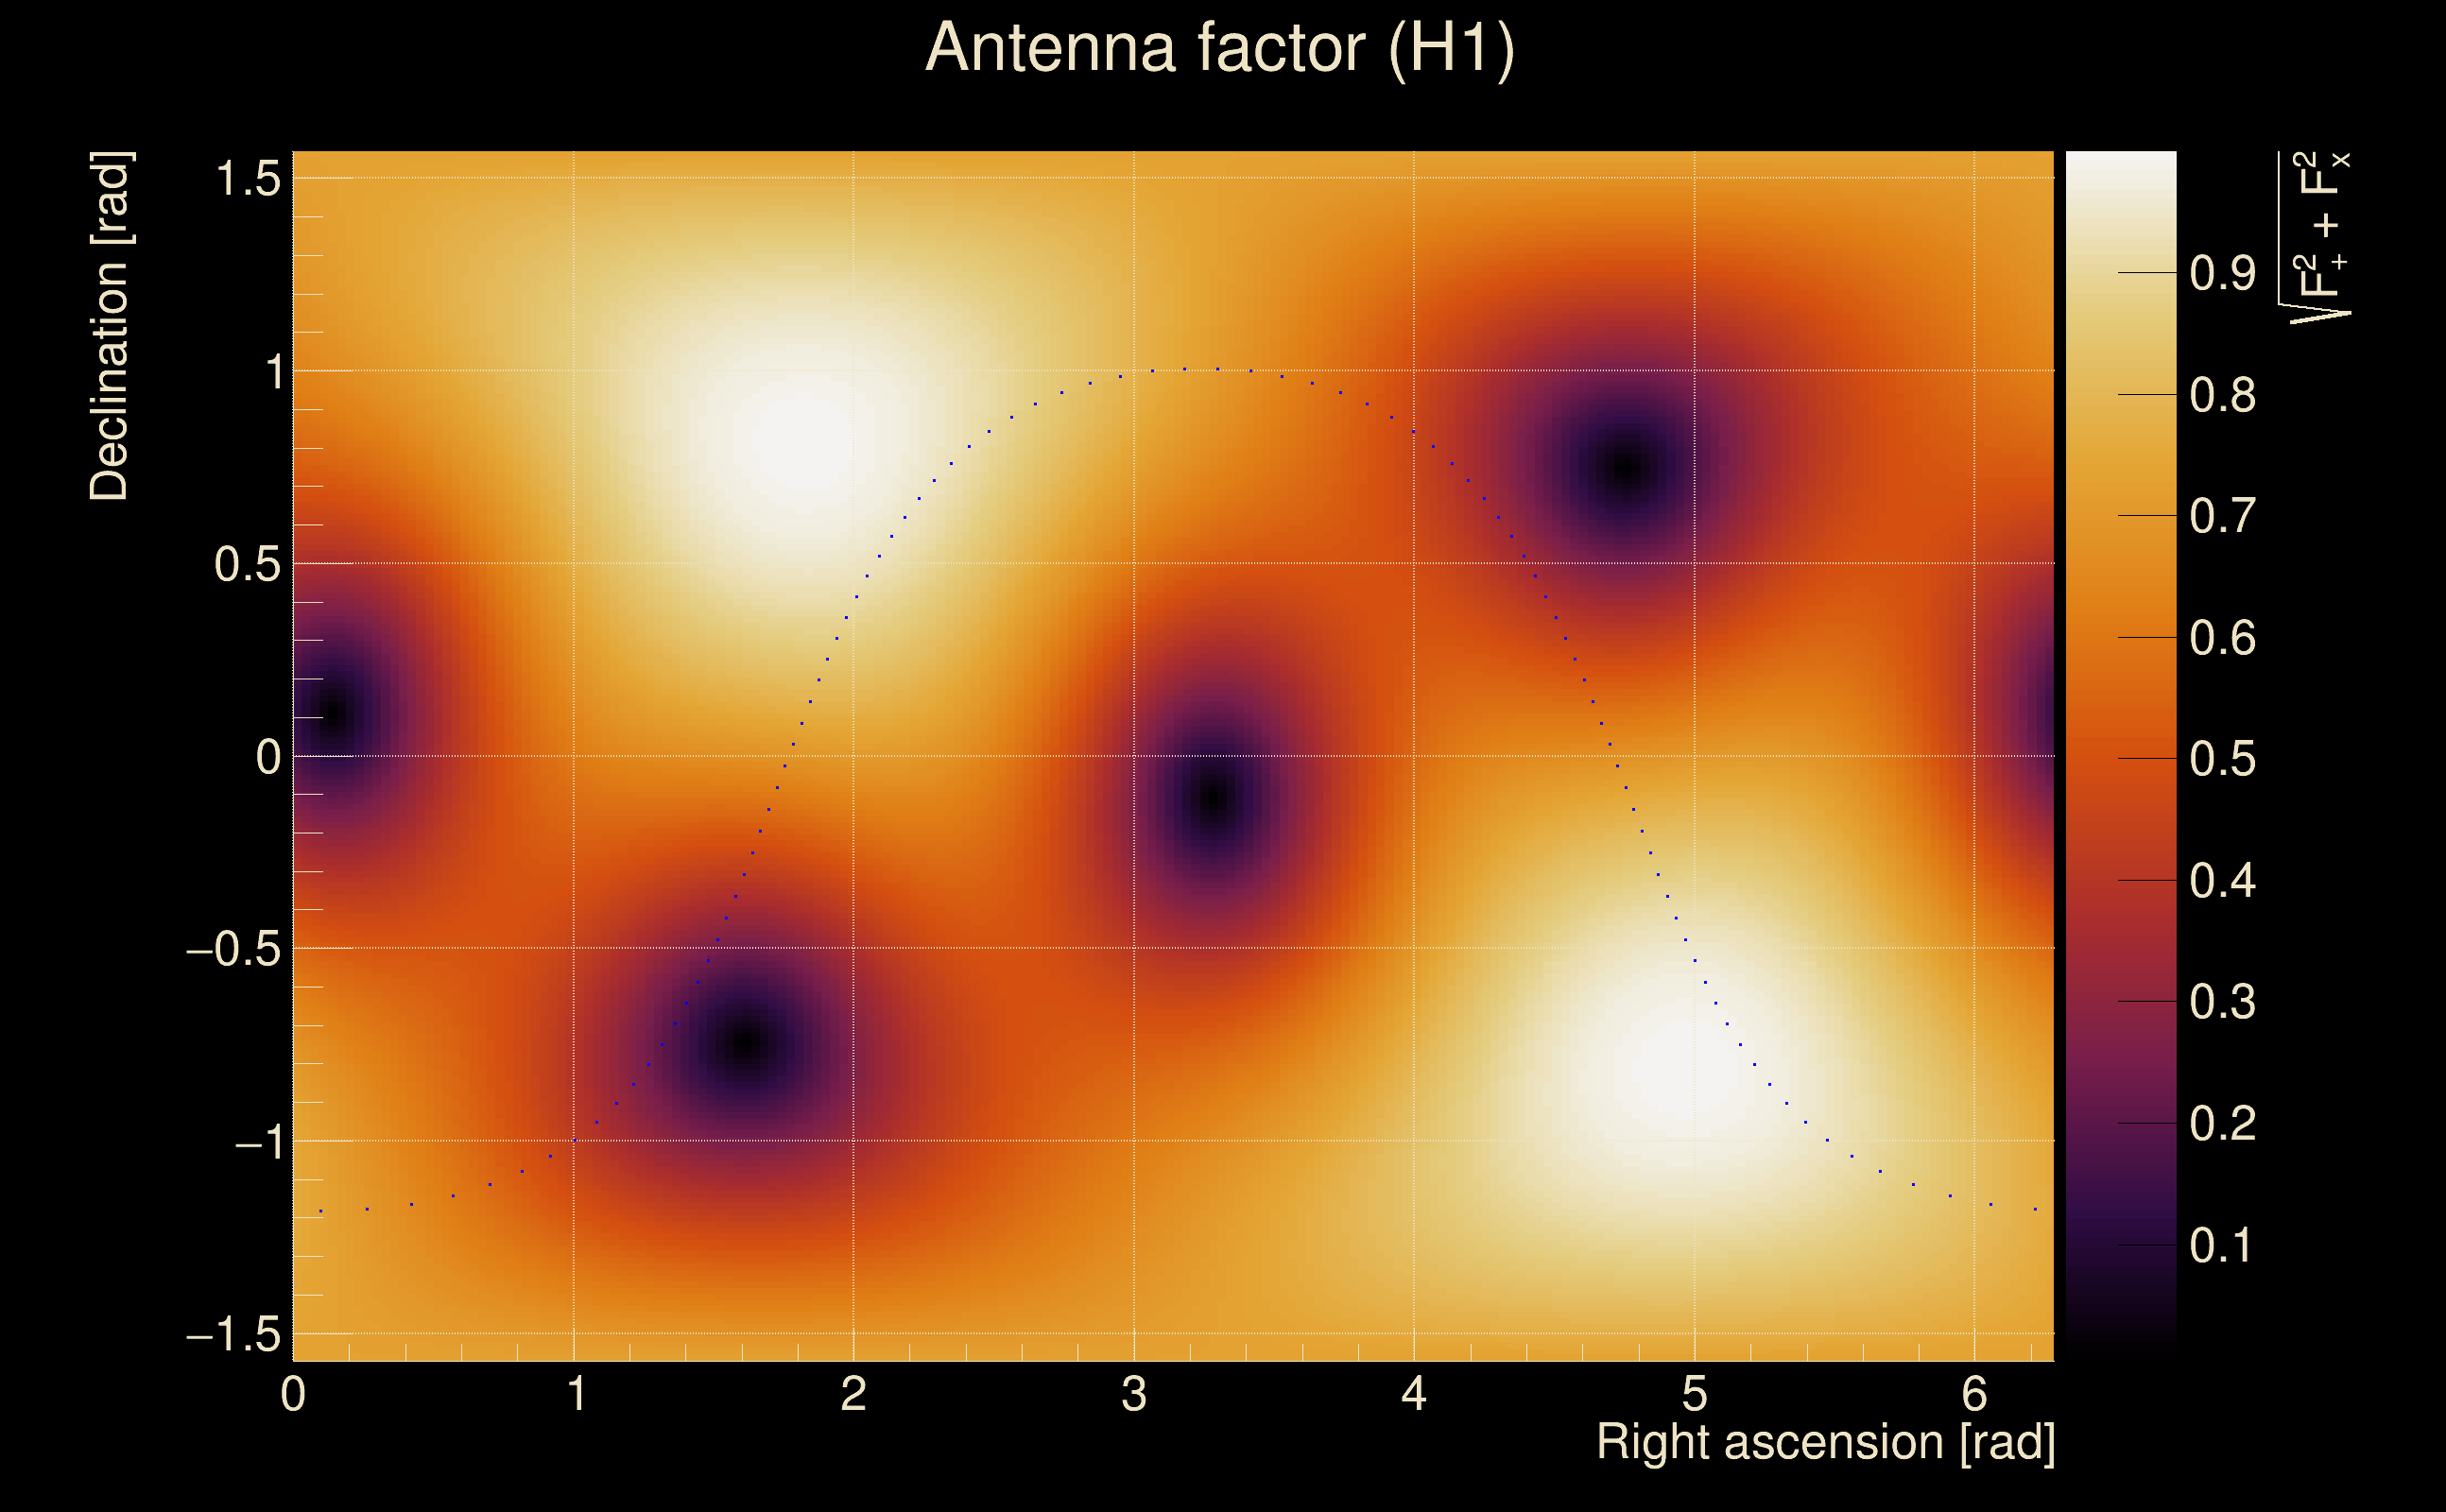
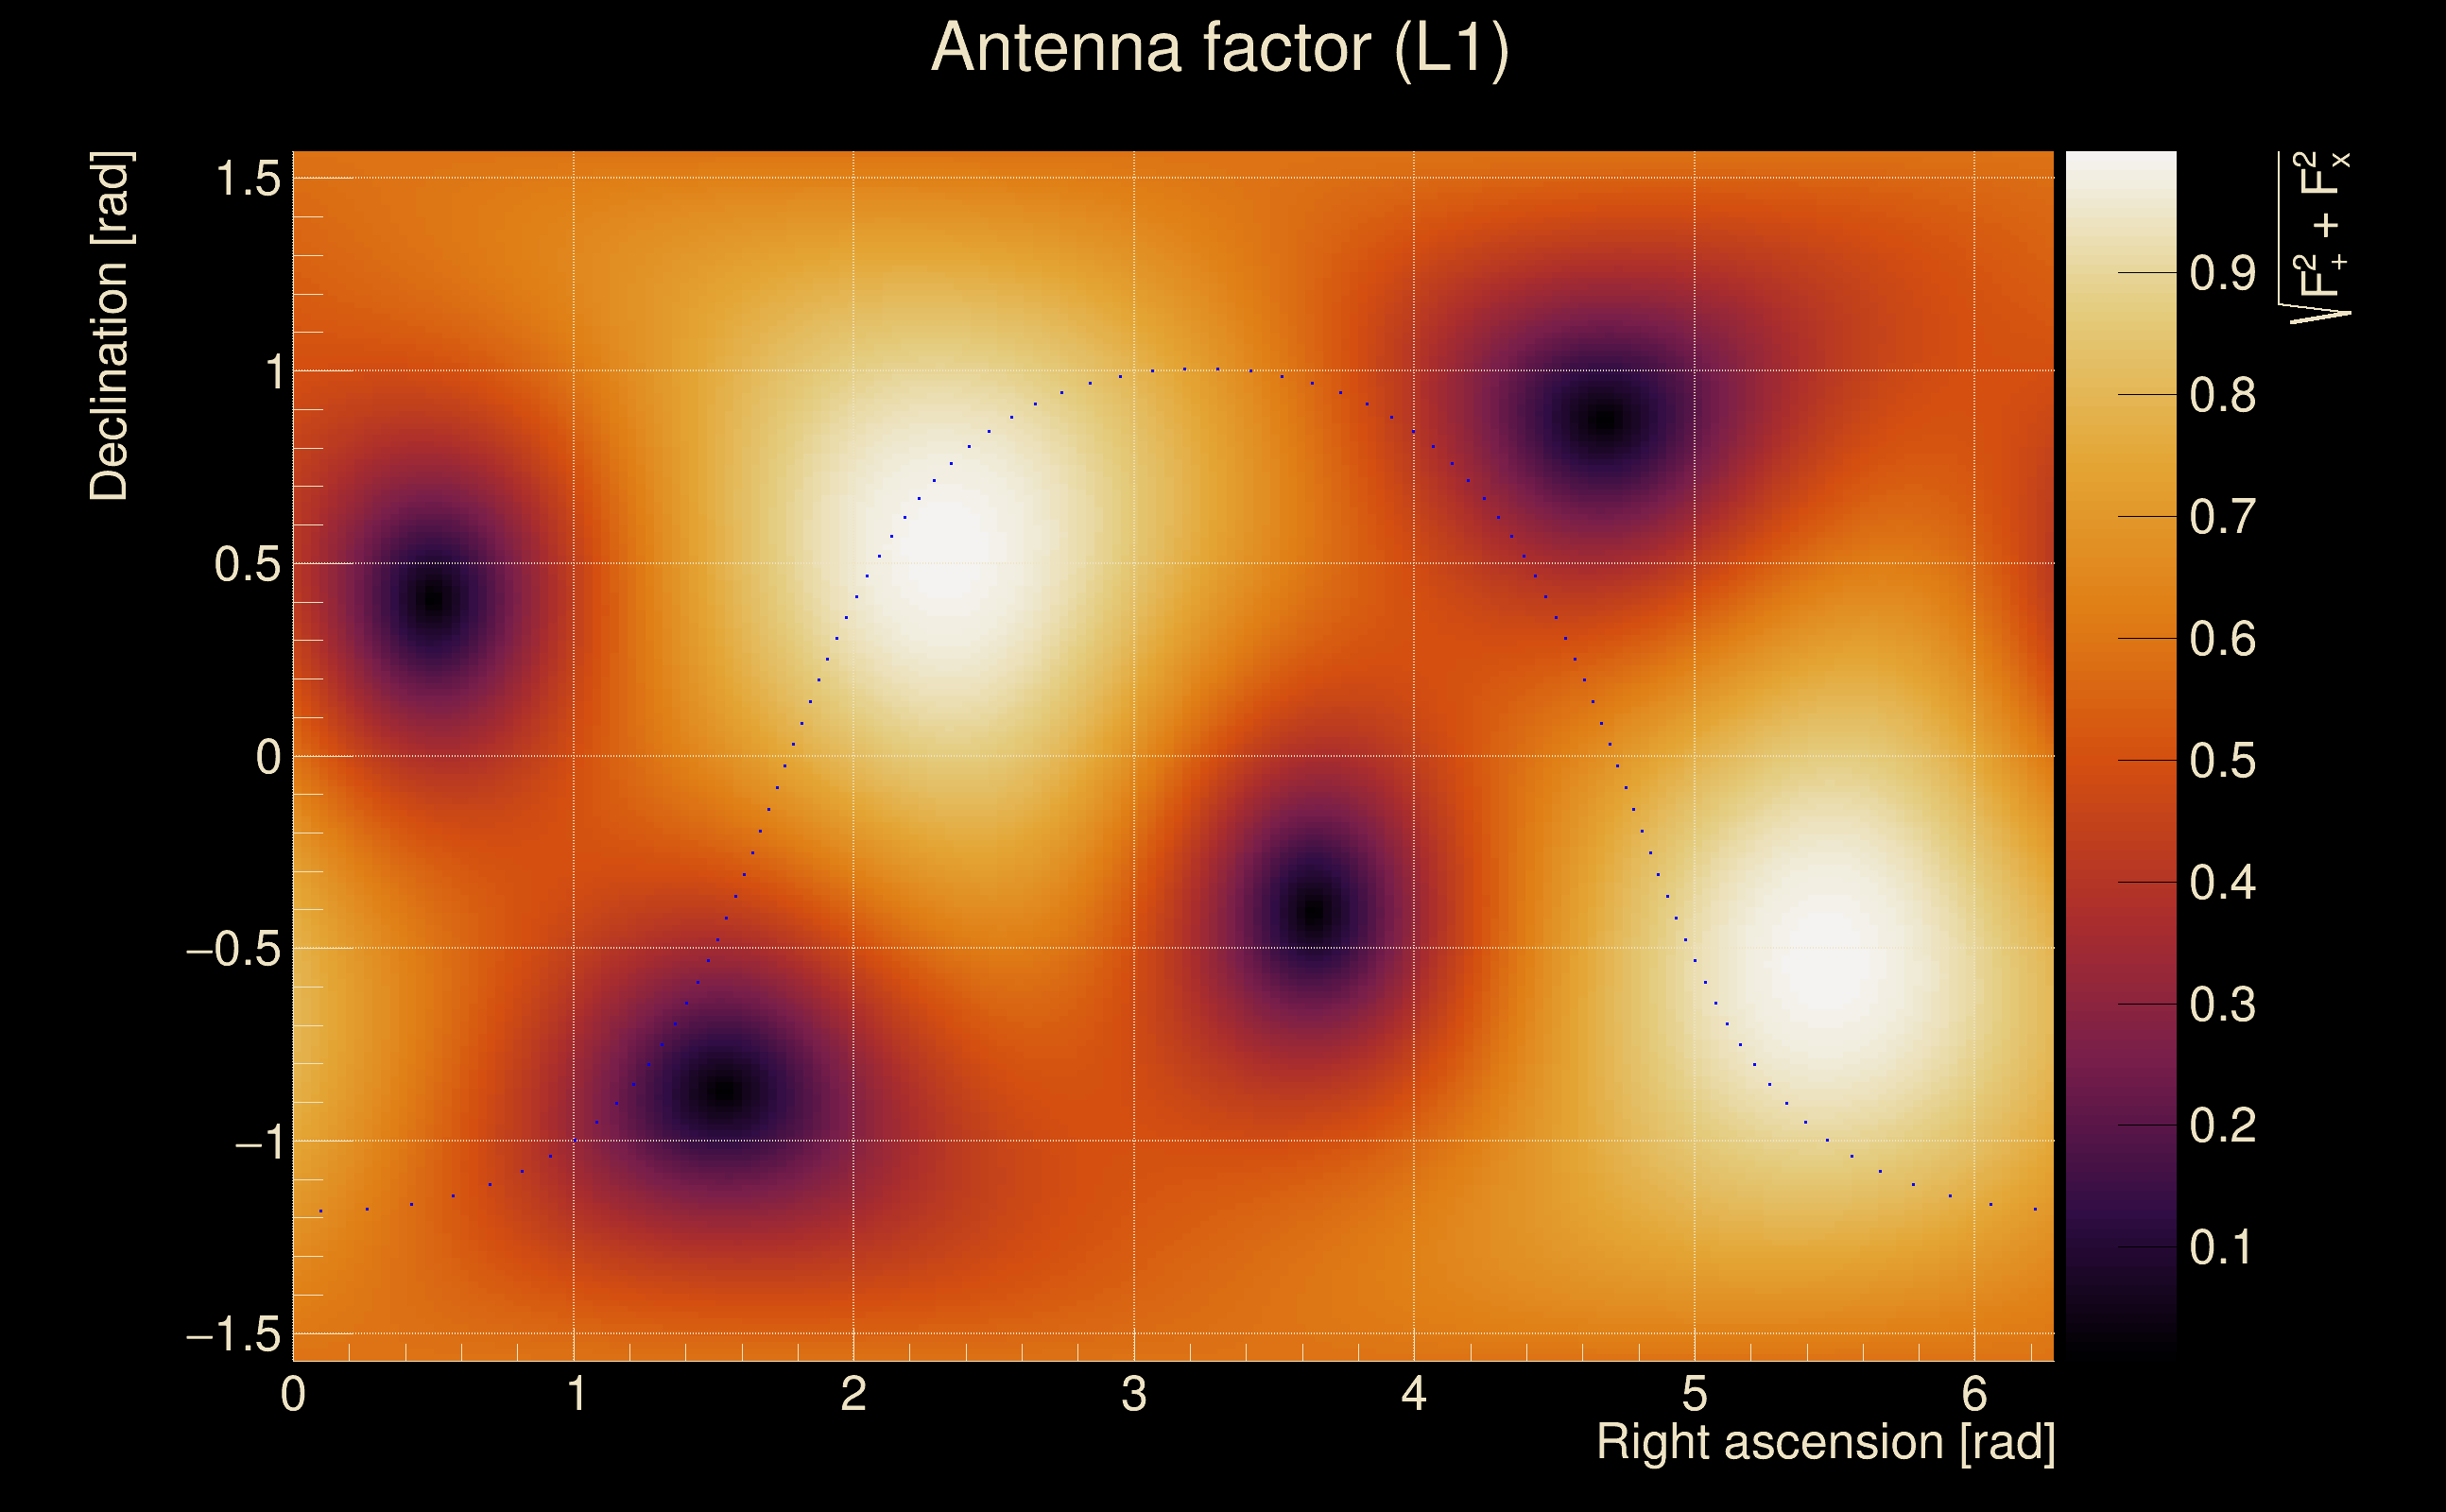
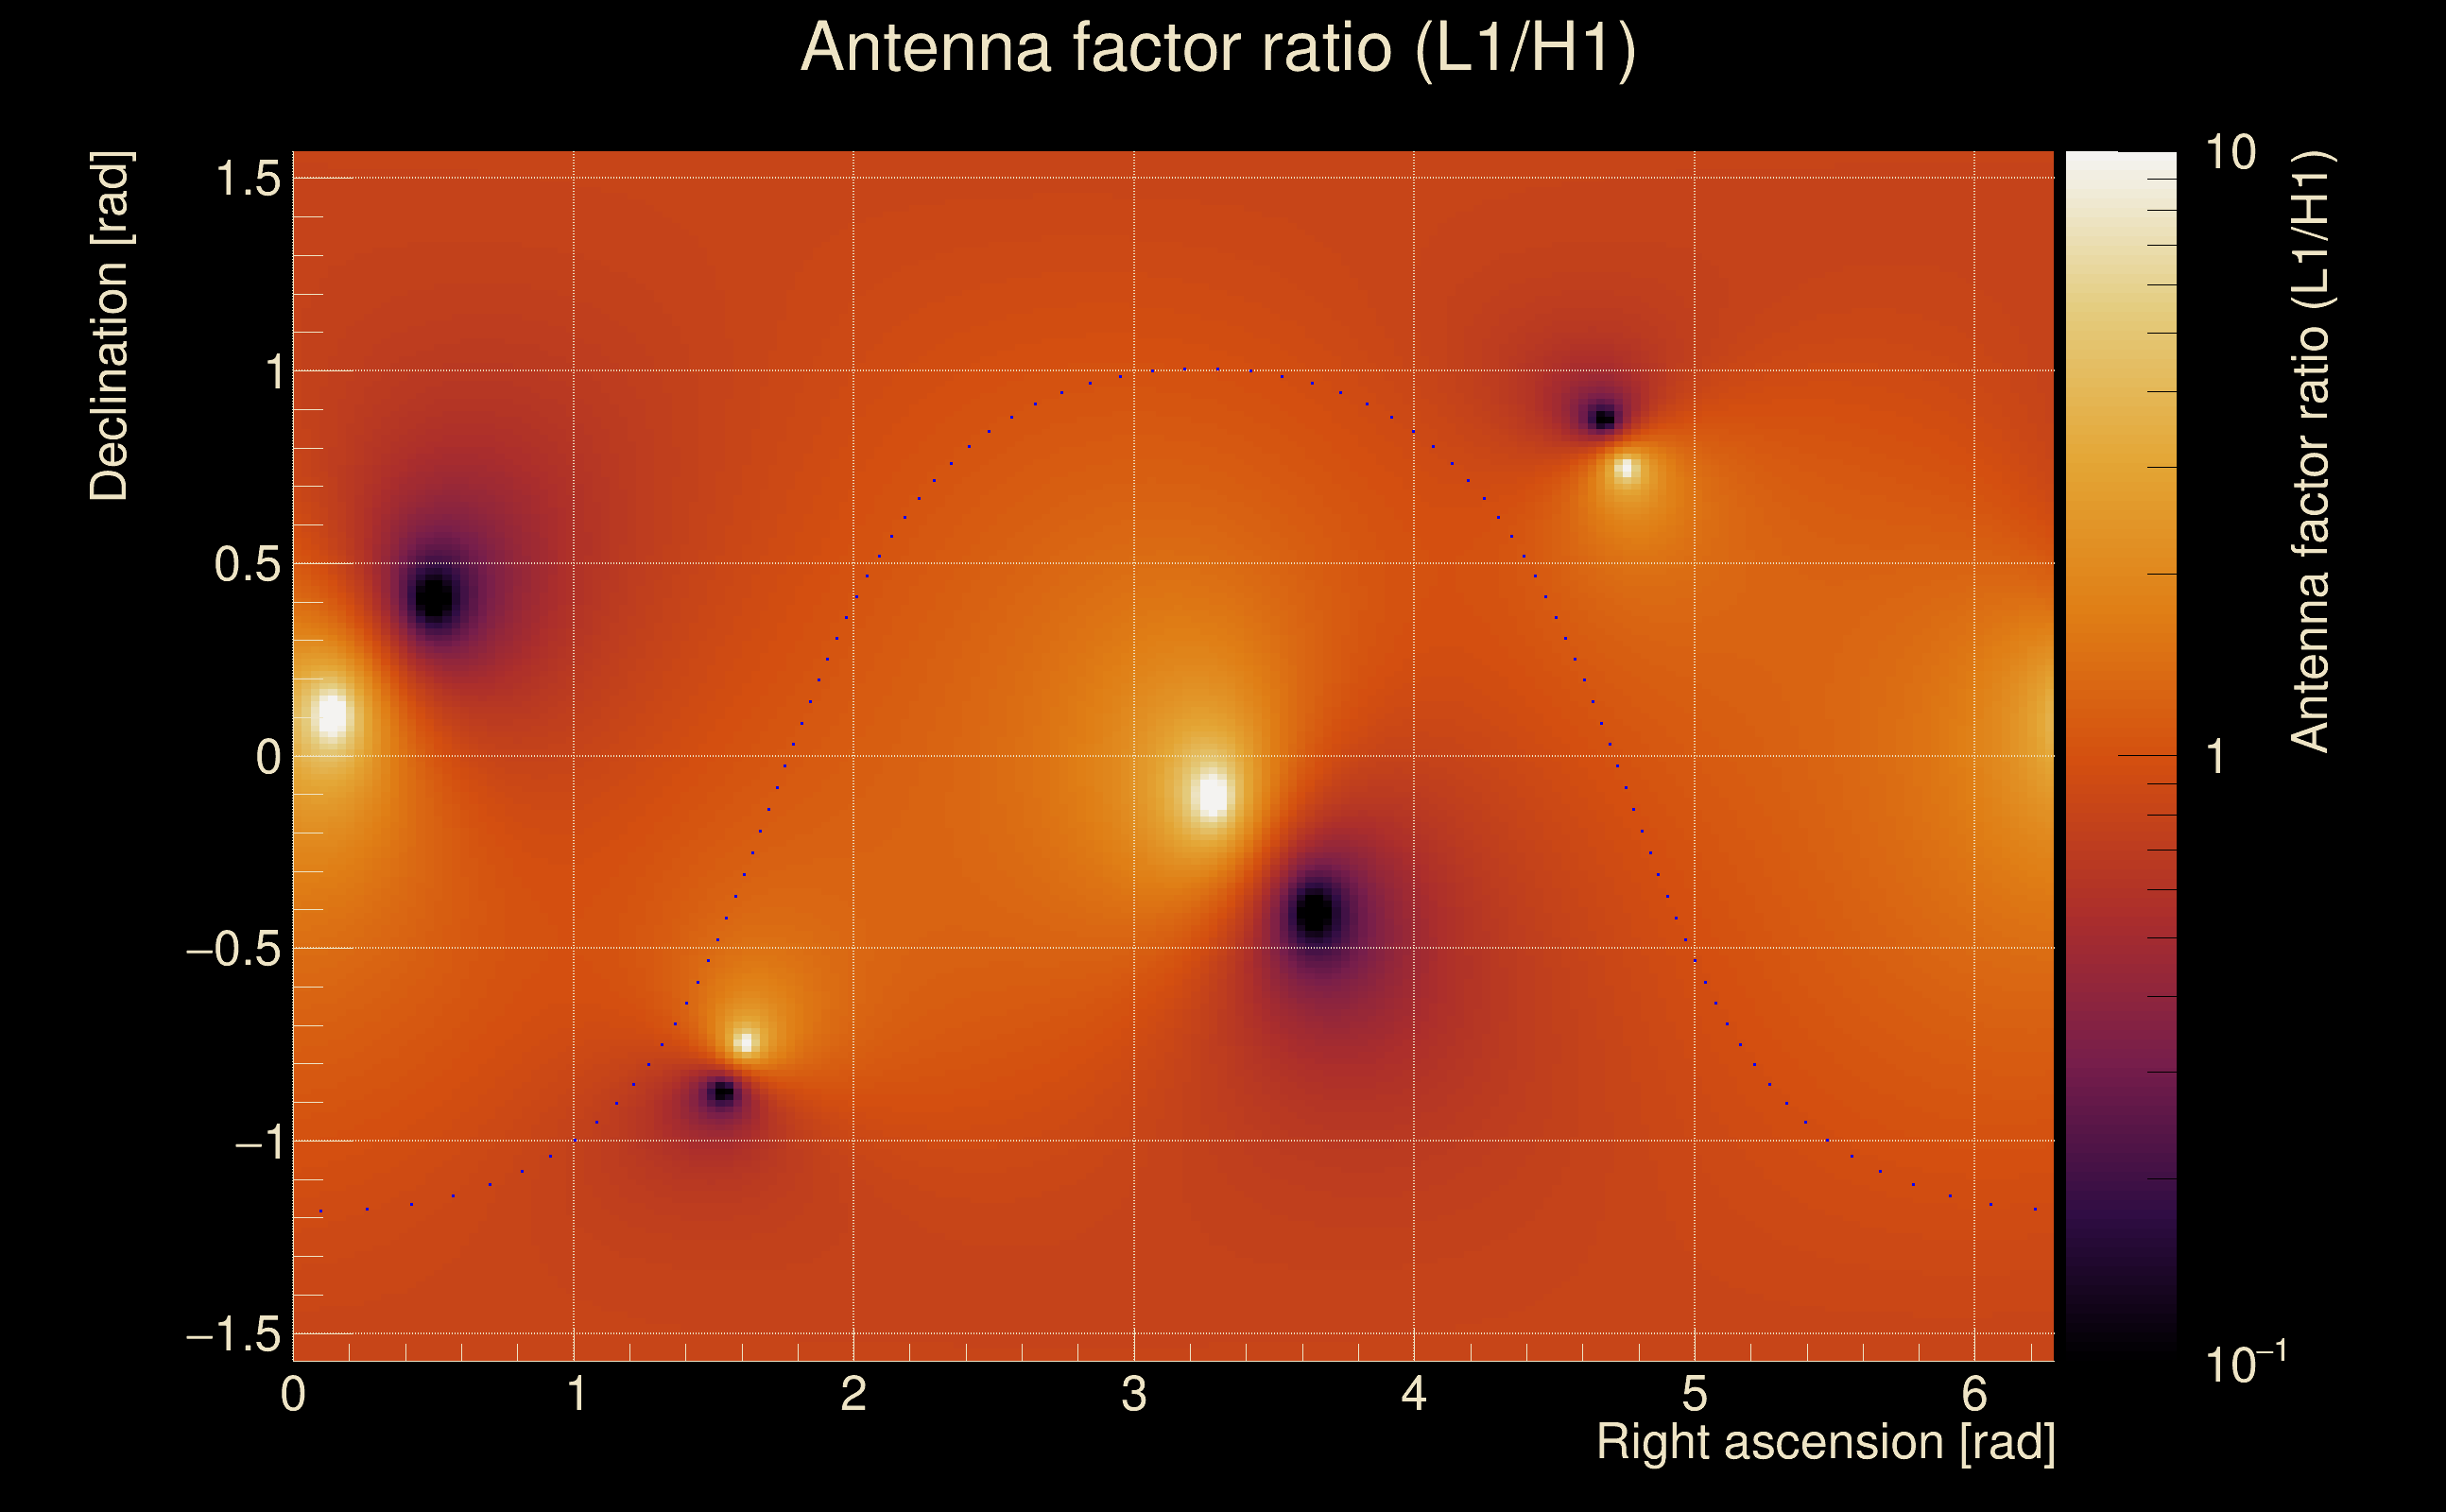
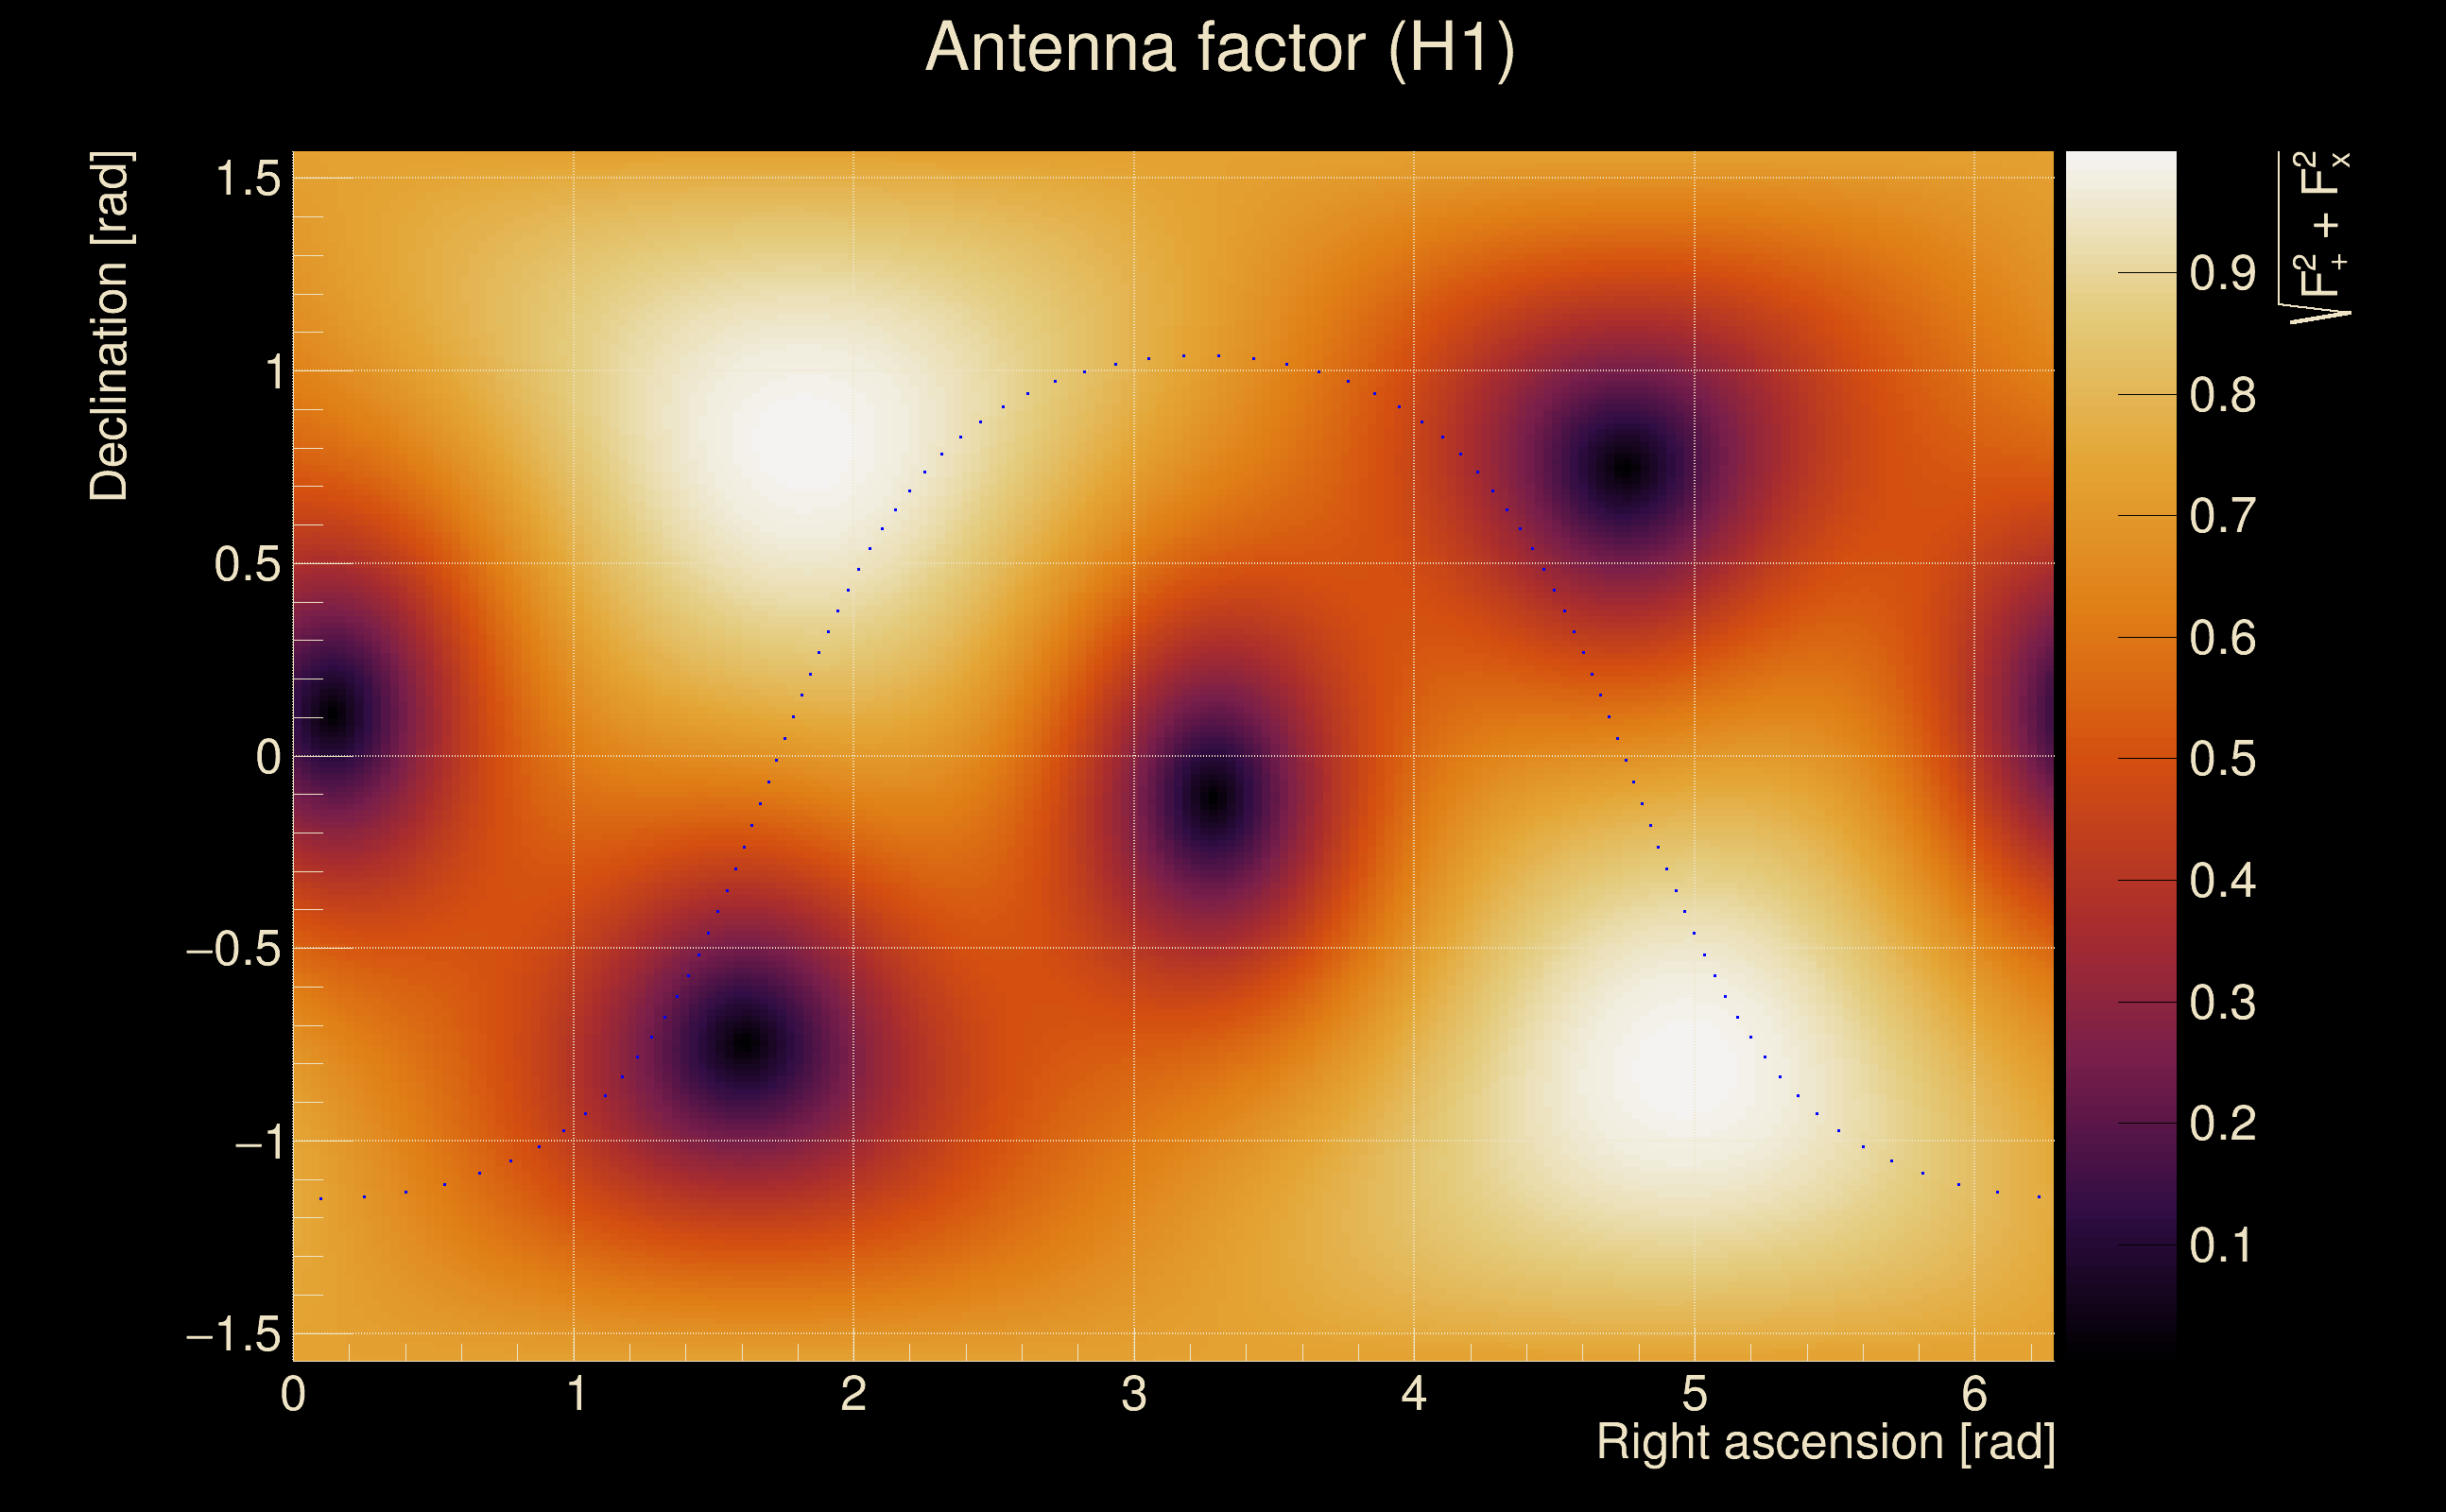
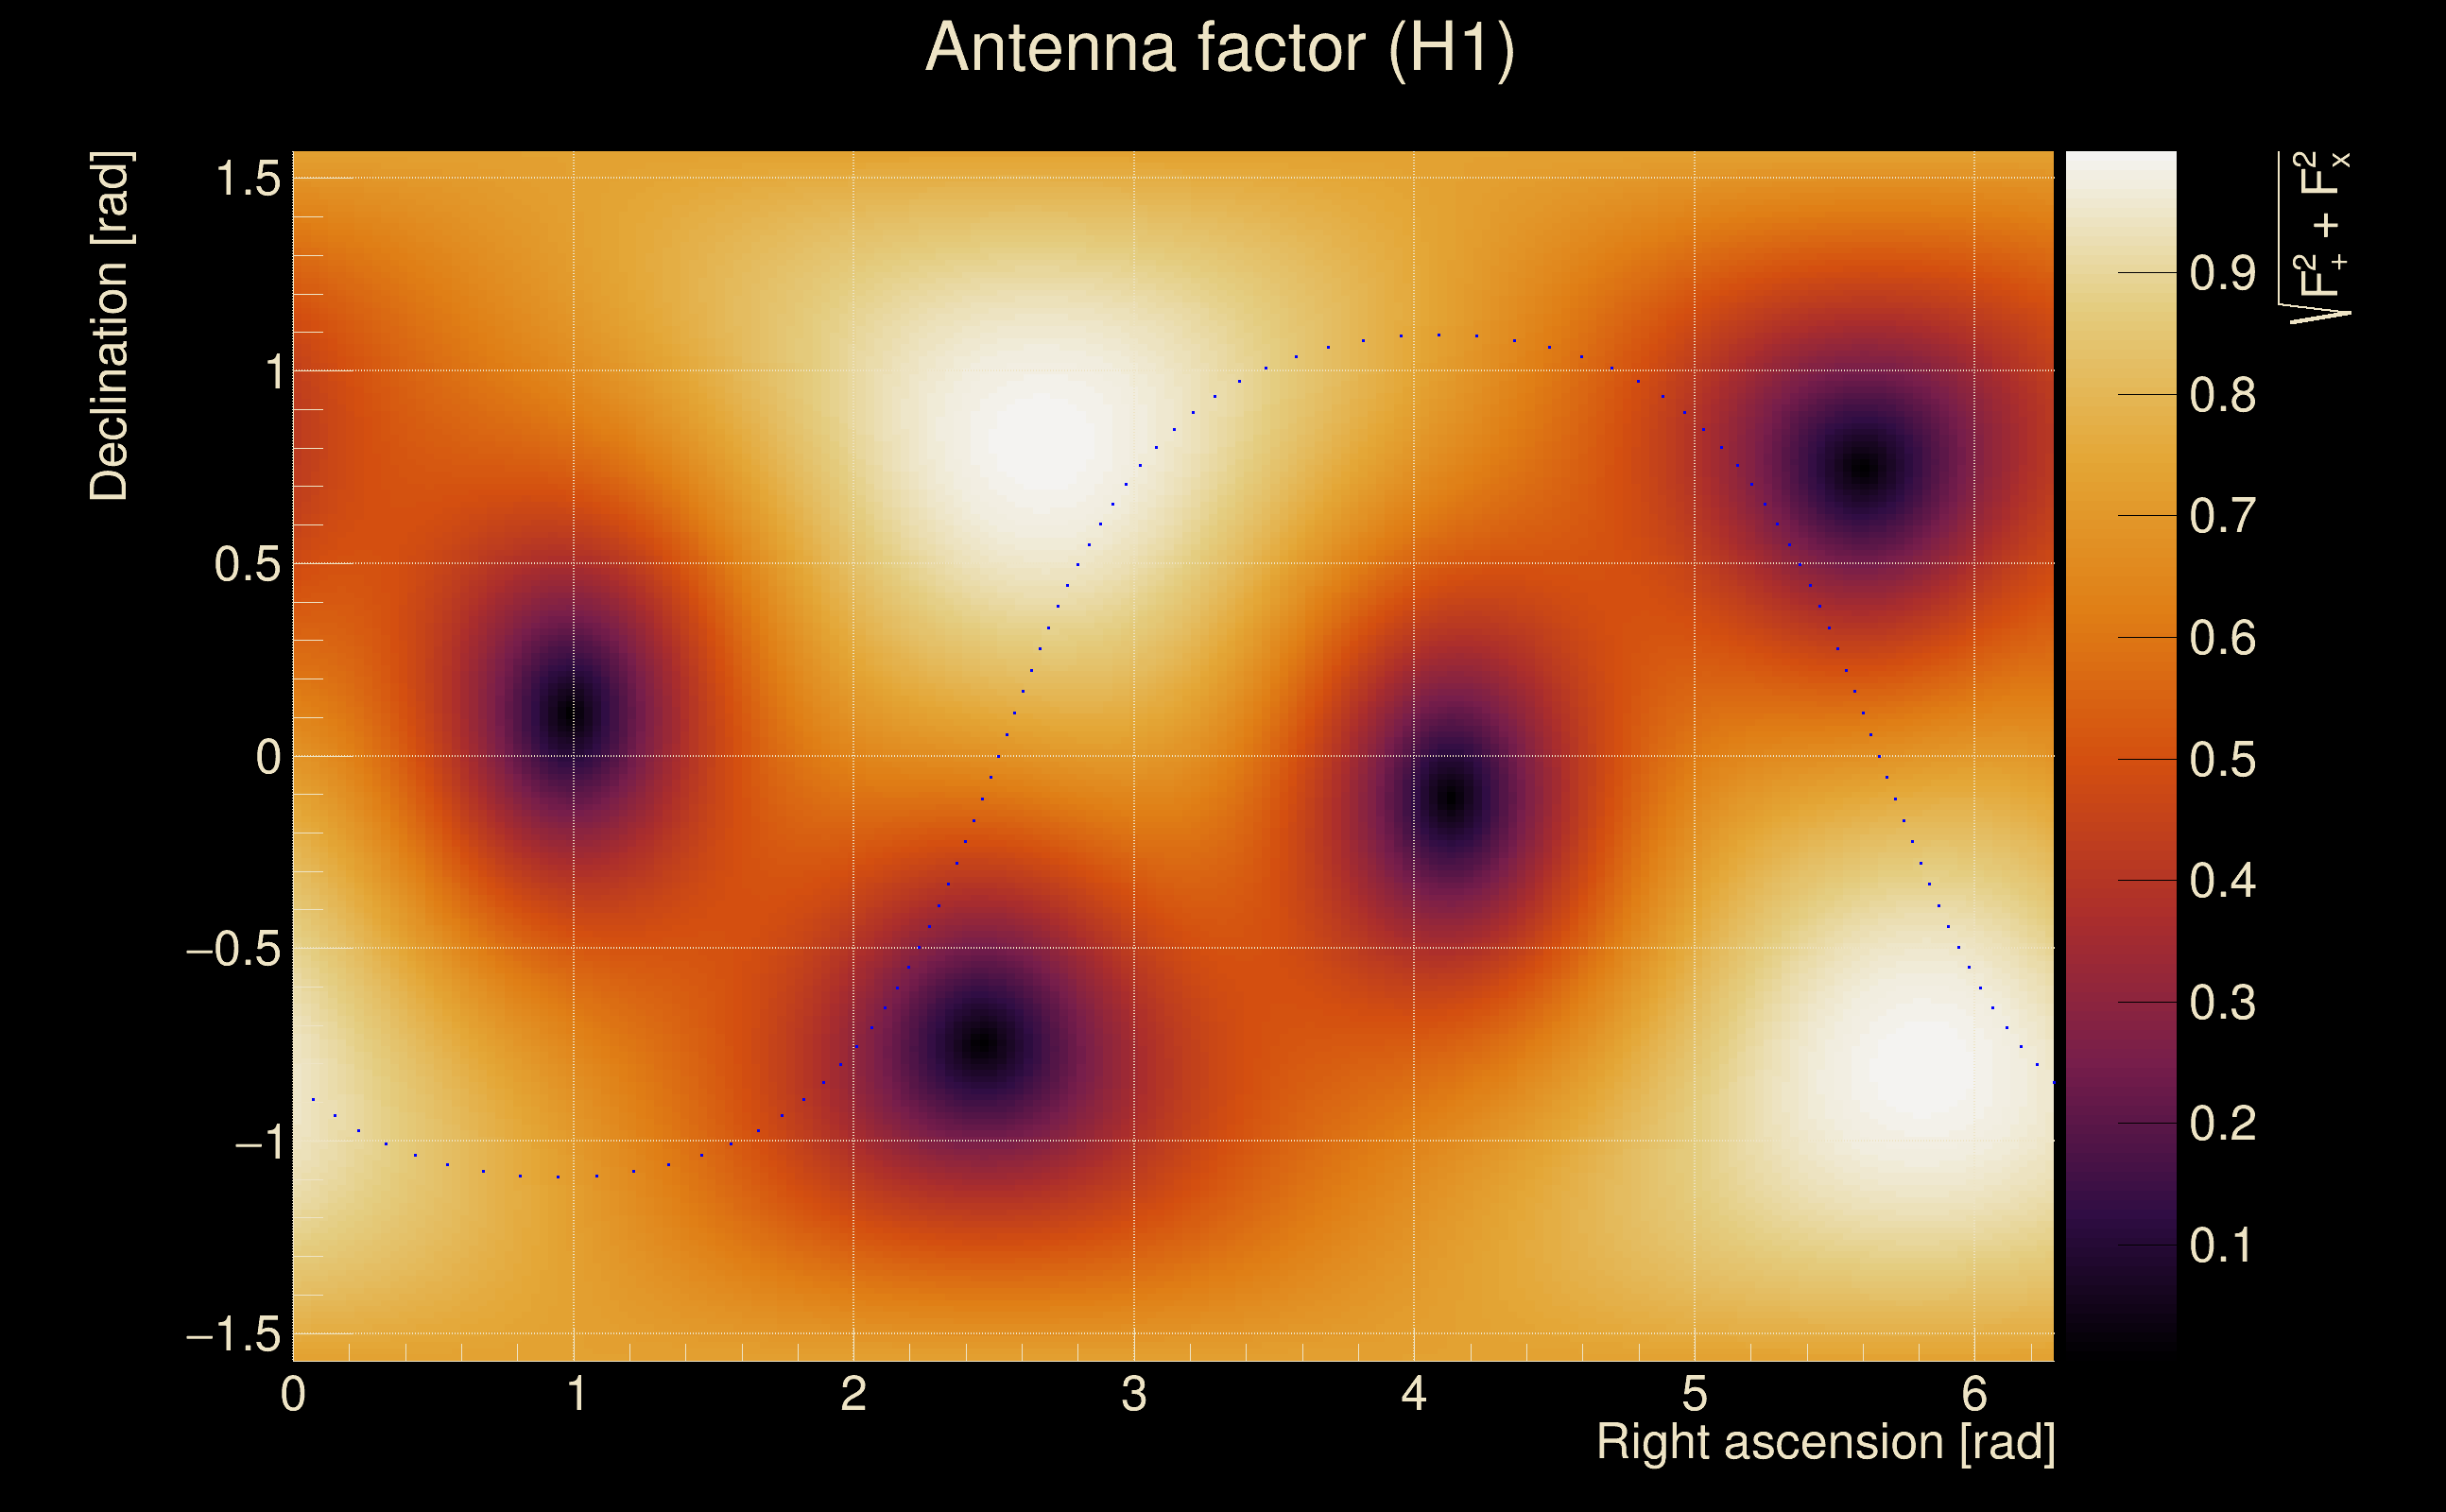
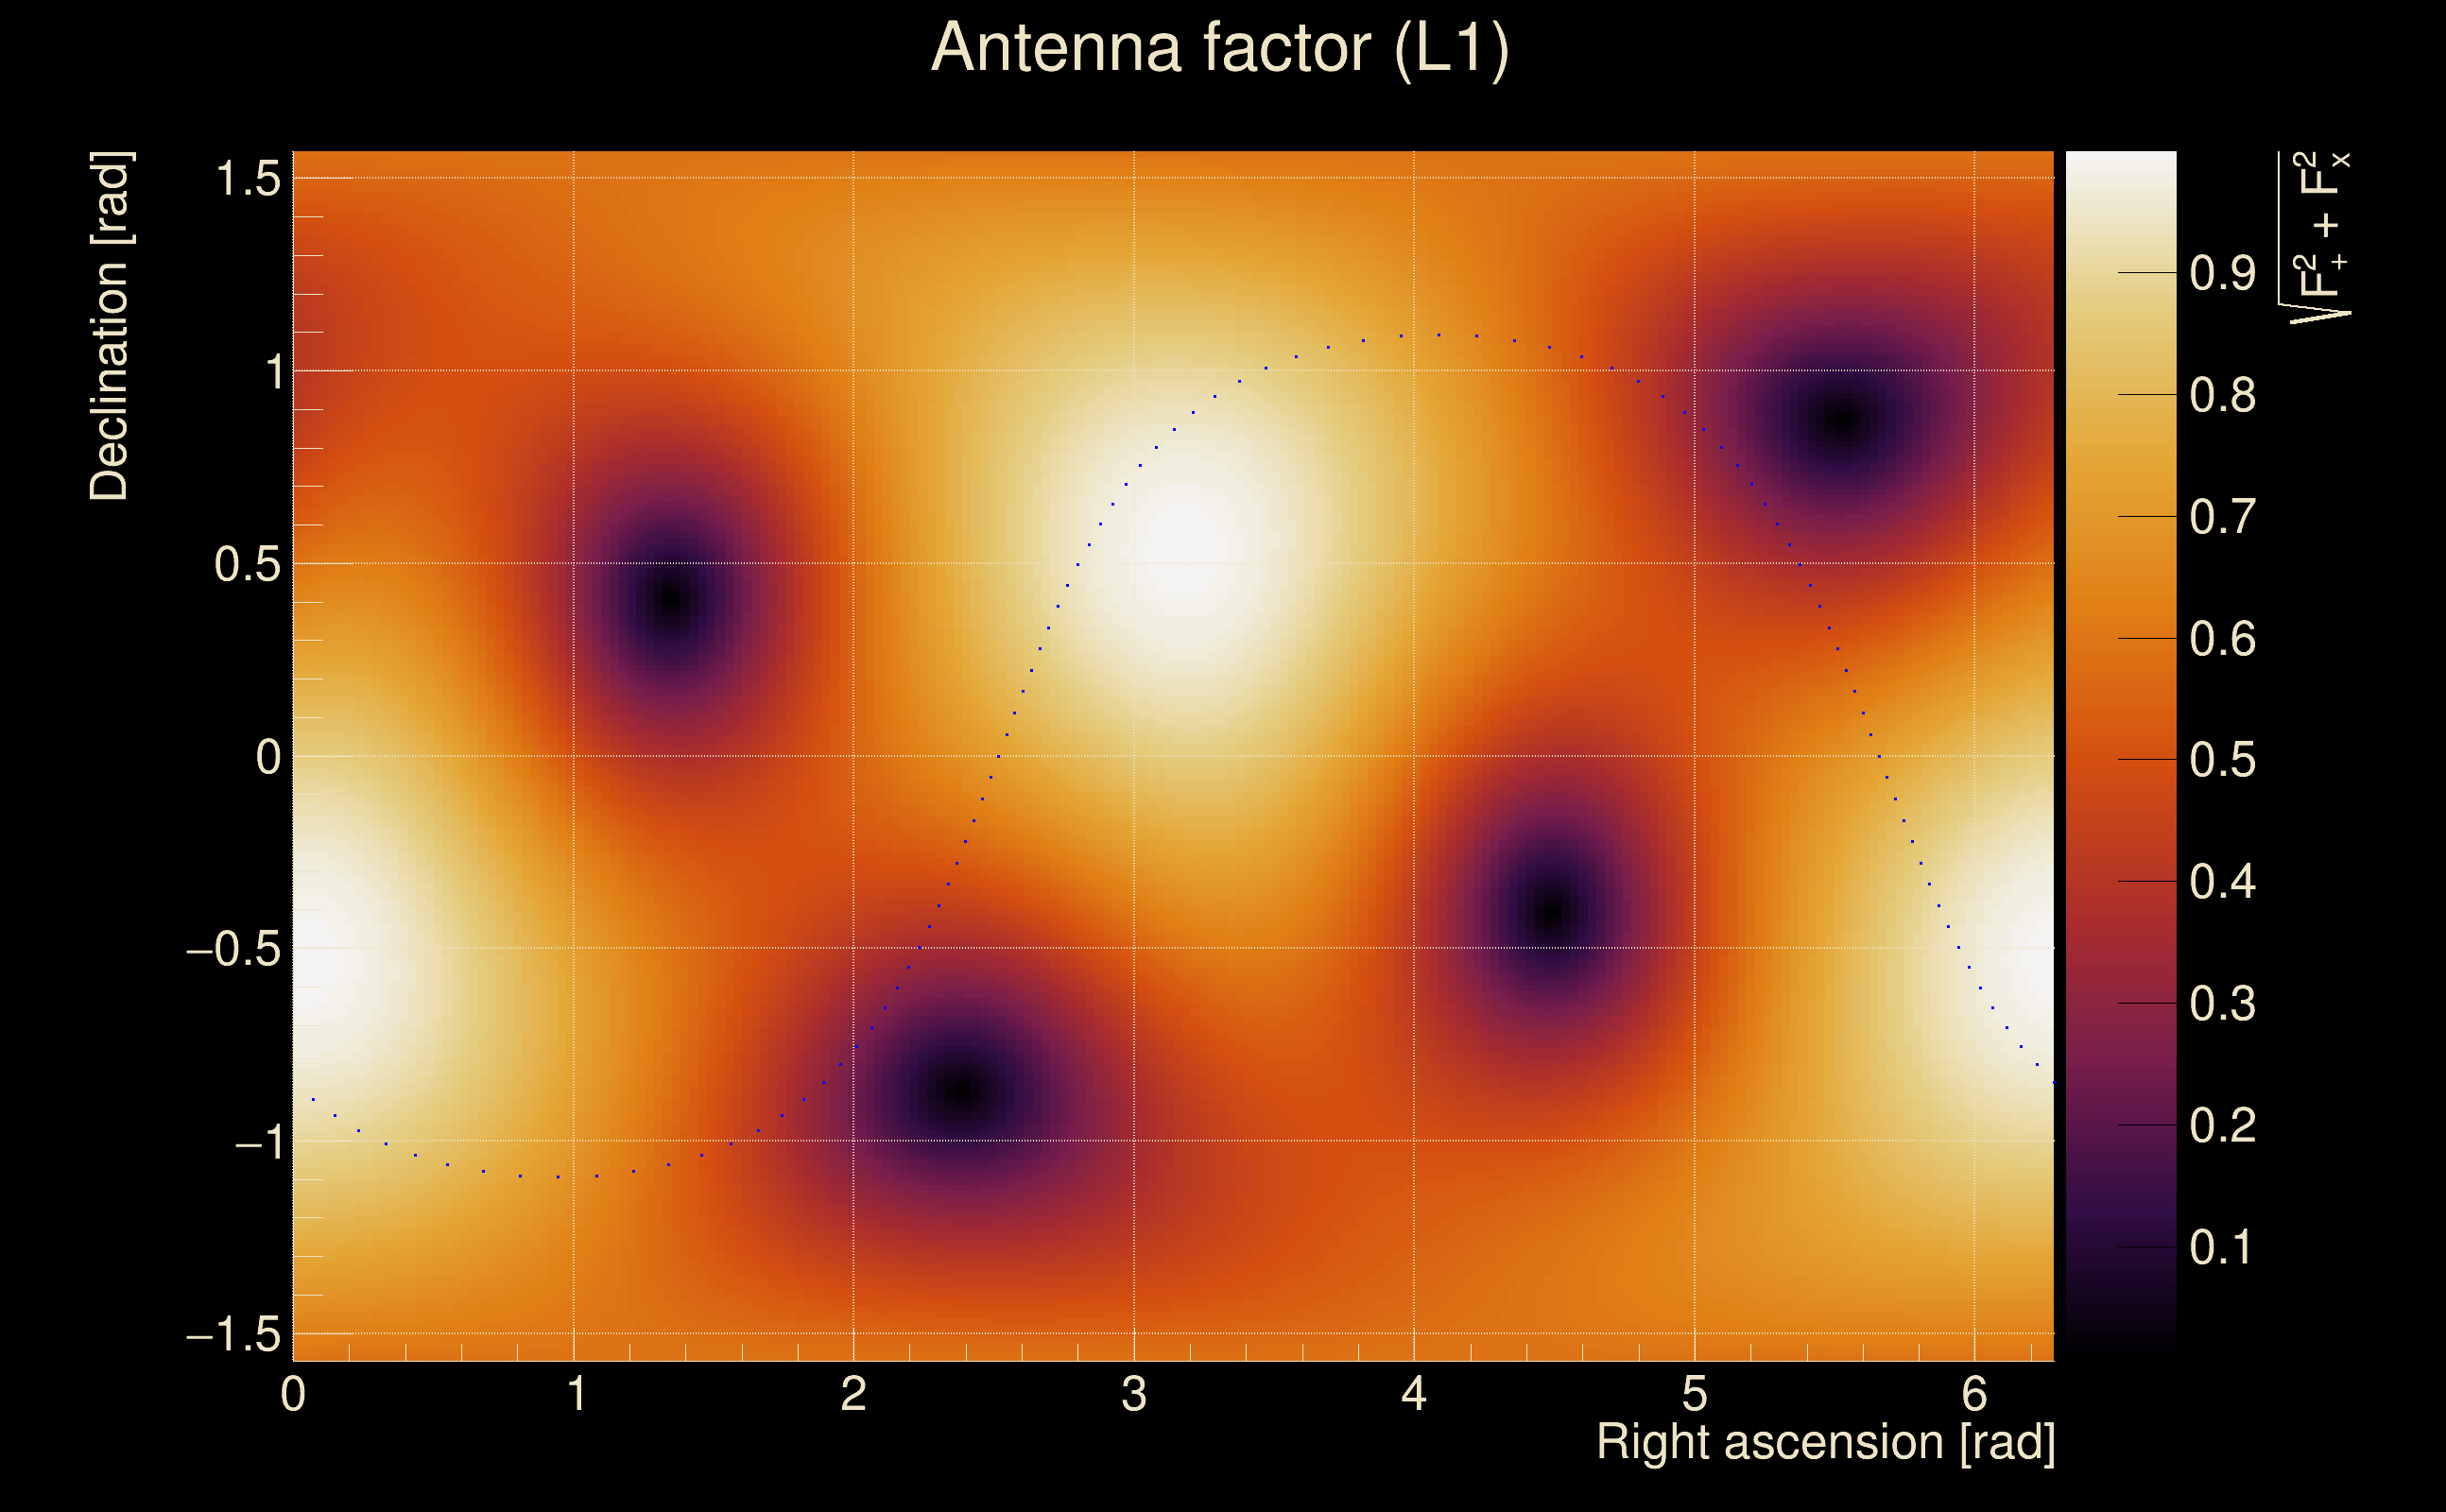
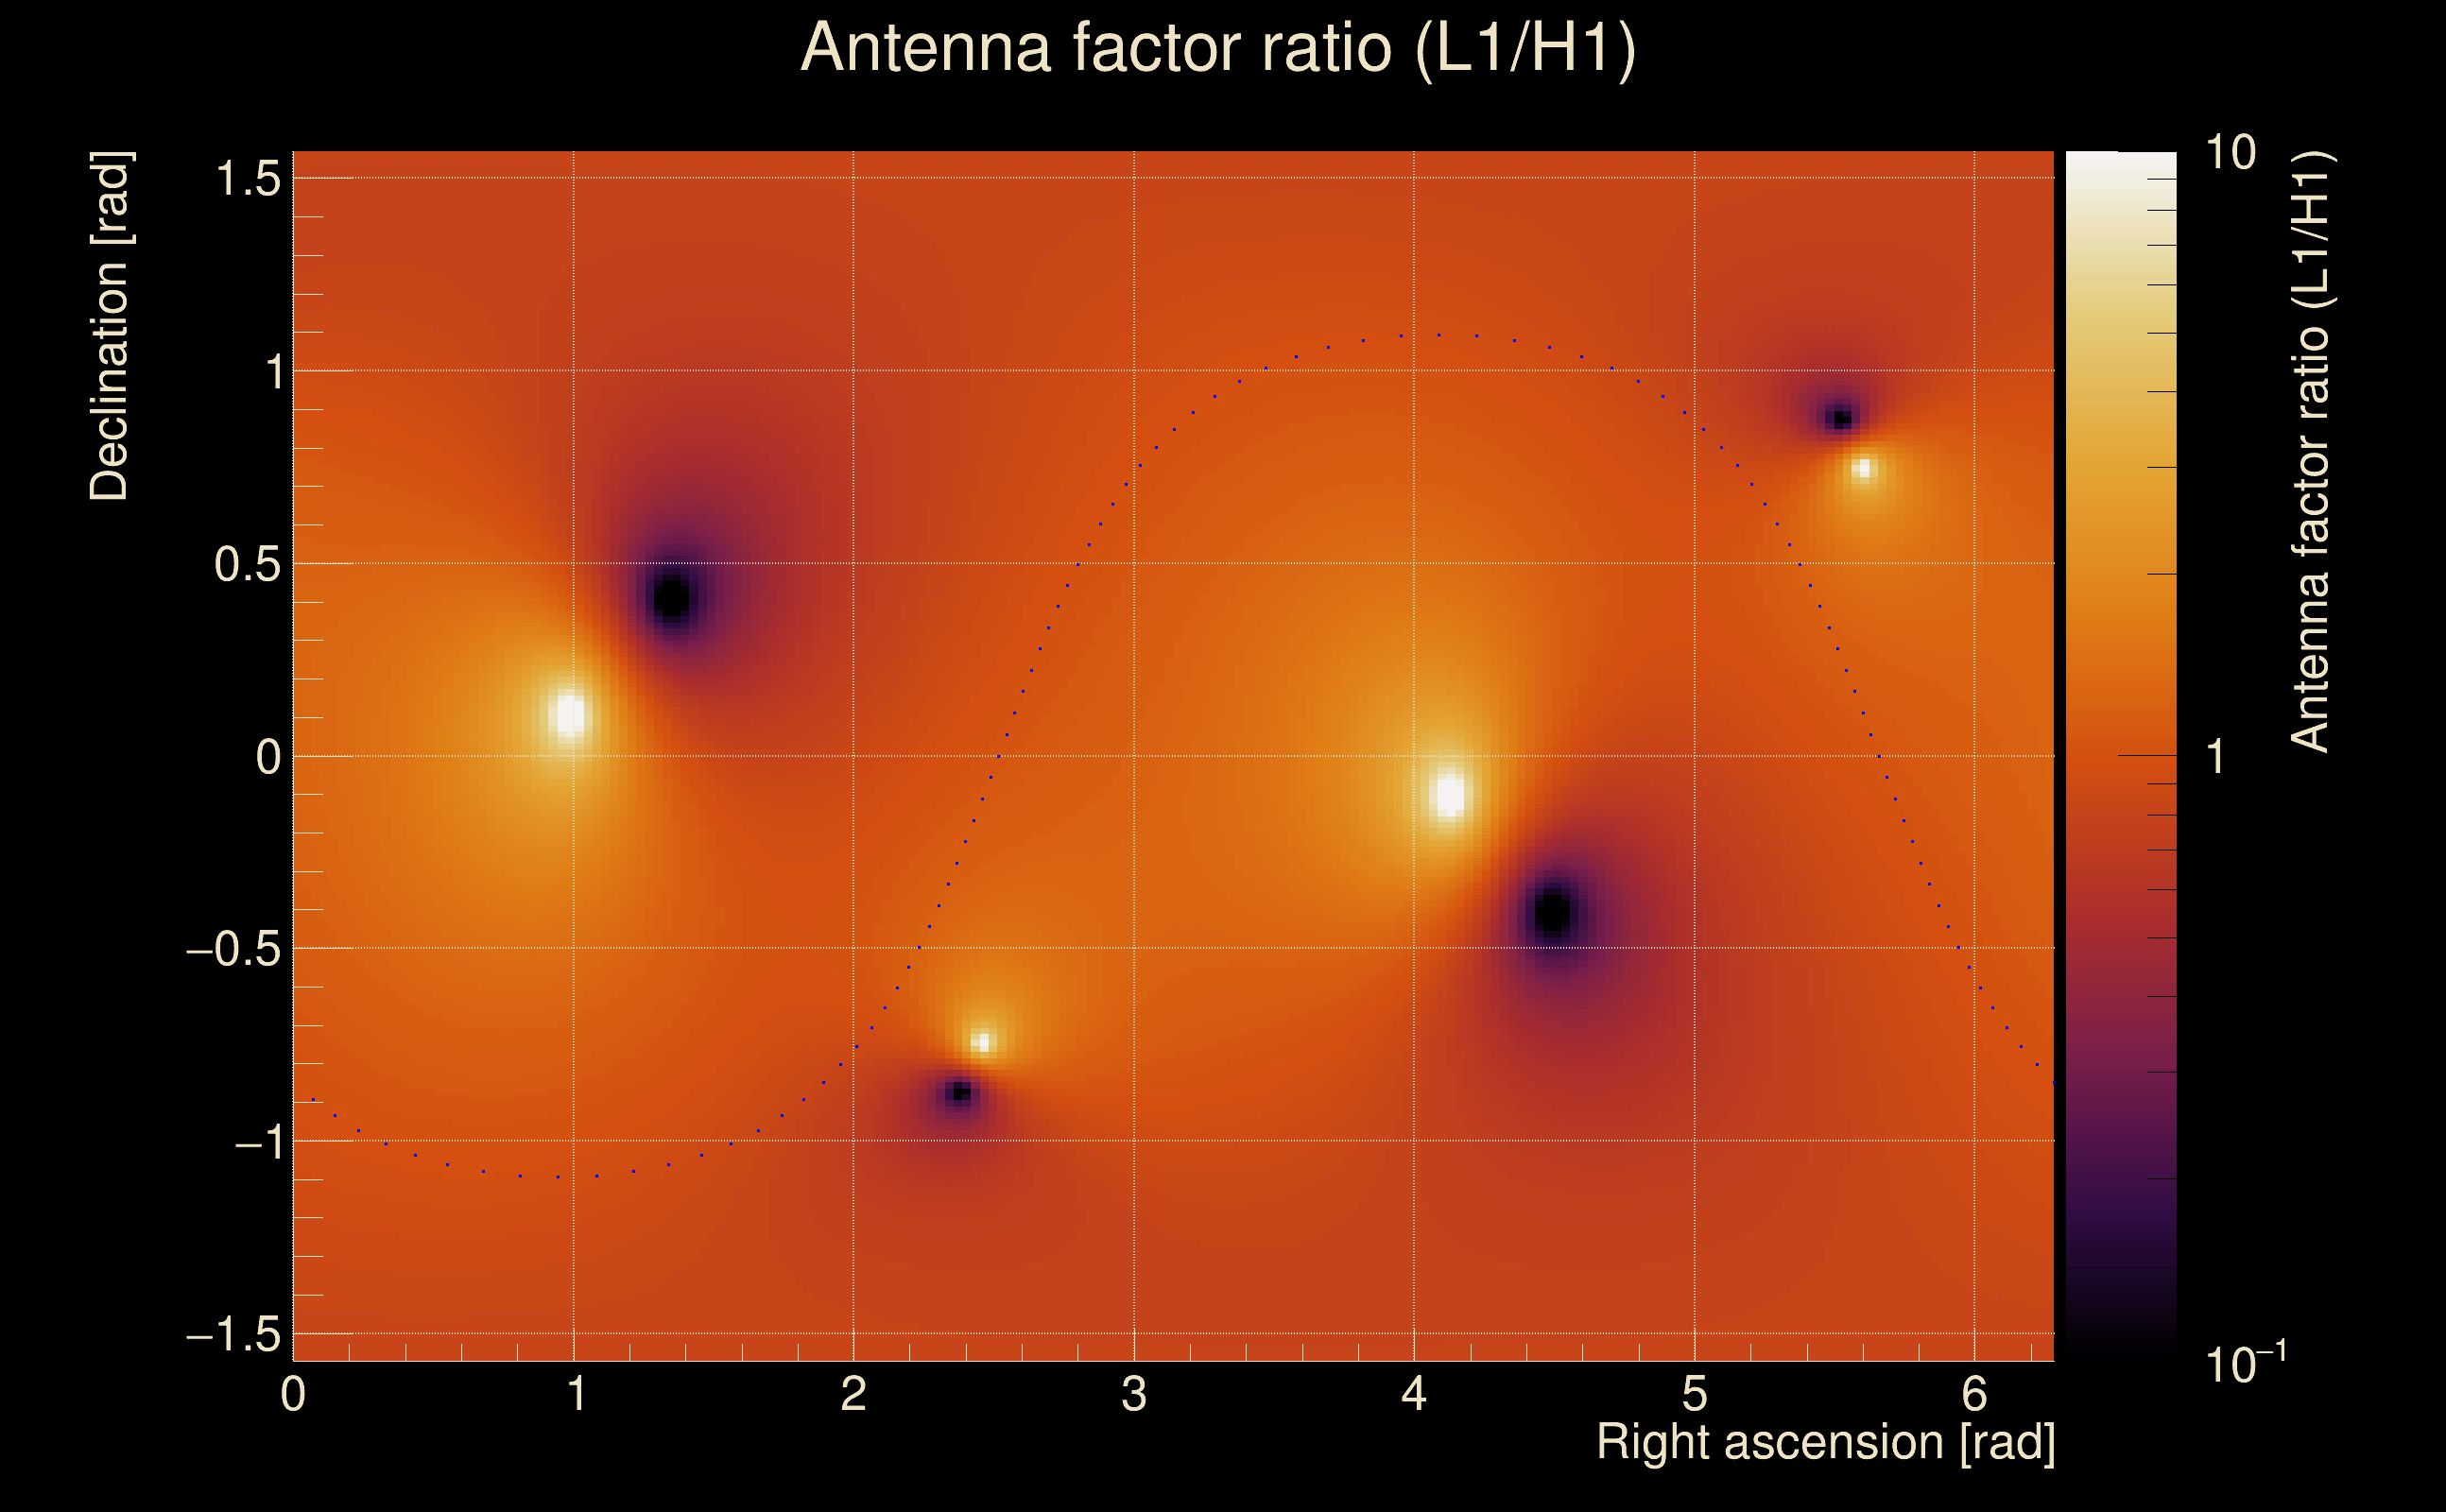
| Target sky positon: | Ra: 3.68109, Dec: 0.94792 [rad] |
| List of input Ox files: | Targ_FirstTest_O4bw_14days_file_list.txt (930 files) |
| Analysis result file: | Targ_FirstTest_O4bw_14days_results-0.root |
| Slice selected for the the fakeground: | slice index=149 (-1.886 s), time lag = 0 s |
| Foreground | Fakeground | Background | ||
|---|---|---|---|---|
| Number of processed ox events | 175167 | 175167 | 37660905 | |
| Start Date (detector 0) | Sat Sep 2 04:54:54 2023 UTC | Sat Sep 2 04:54:54 2023 UTC | Sat Sep 2 04:54:54 2023 UTC | |
| End Date (detector 0) | Sun Sep 17 00:01:47 2023 UTC | Sun Sep 17 00:01:47 2023 UTC | Sun Sep 17 00:01:47 2023 UTC | |
| Start GPS (detector 0) | 1377665712 | 1377665712 | 1377665712 | |
| End GPS (detector 0) | 1378944125 | 1378944125 | 1378944125 | |
| Used livetime (detector 0) | 880485 s | 880485 s | 880485 s | |
| Start Date (detector 1) | Sat Sep 2 04:54:54 2023 UTC | Sat Sep 2 04:54:54 2023 UTC | Sat Sep 2 04:54:54 2023 UTC | |
| End Date (detector 1) | Sun Sep 17 00:01:47 2023 UTC | Sun Sep 17 00:01:47 2023 UTC | Sun Sep 17 00:01:47 2023 UTC | |
| Start GPS (detector 1) | 1377665712 | 1377665712 | 1377665712 | |
| End GPS (detector 1) | 1378944125 | 1378944125 | 1378944125 | |
| Used livetime (detector 1) | 880485 s | 880485 s | 880485 s | |
| Cumulative livetime | 1751670 s | 1751670 s | 376609050 s | |
| 0 years, 20 days, 6 hours, 34 min, 30 s | 0 years, 20 days, 6 hours, 34 min, 30 s | 11 years, 341 days, 21 hours, 37 min, 30 s |
|
|
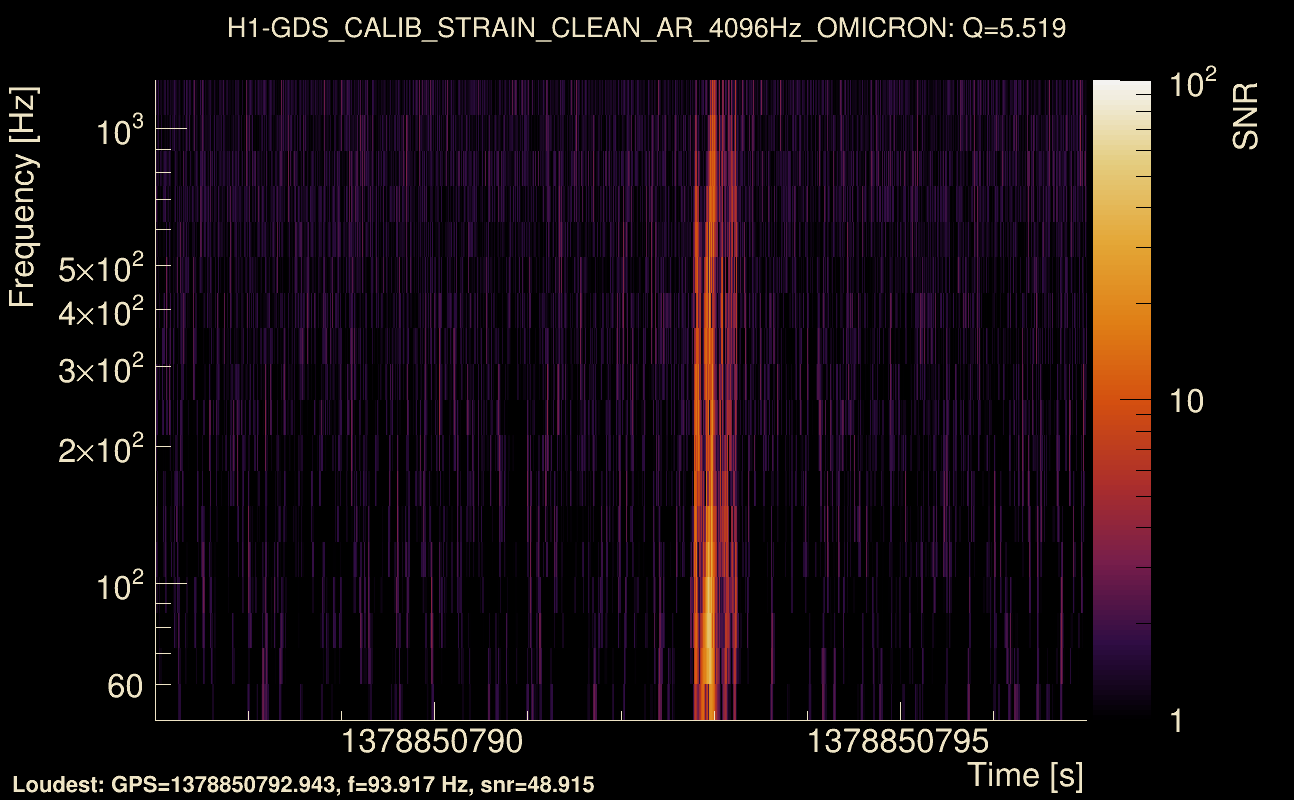
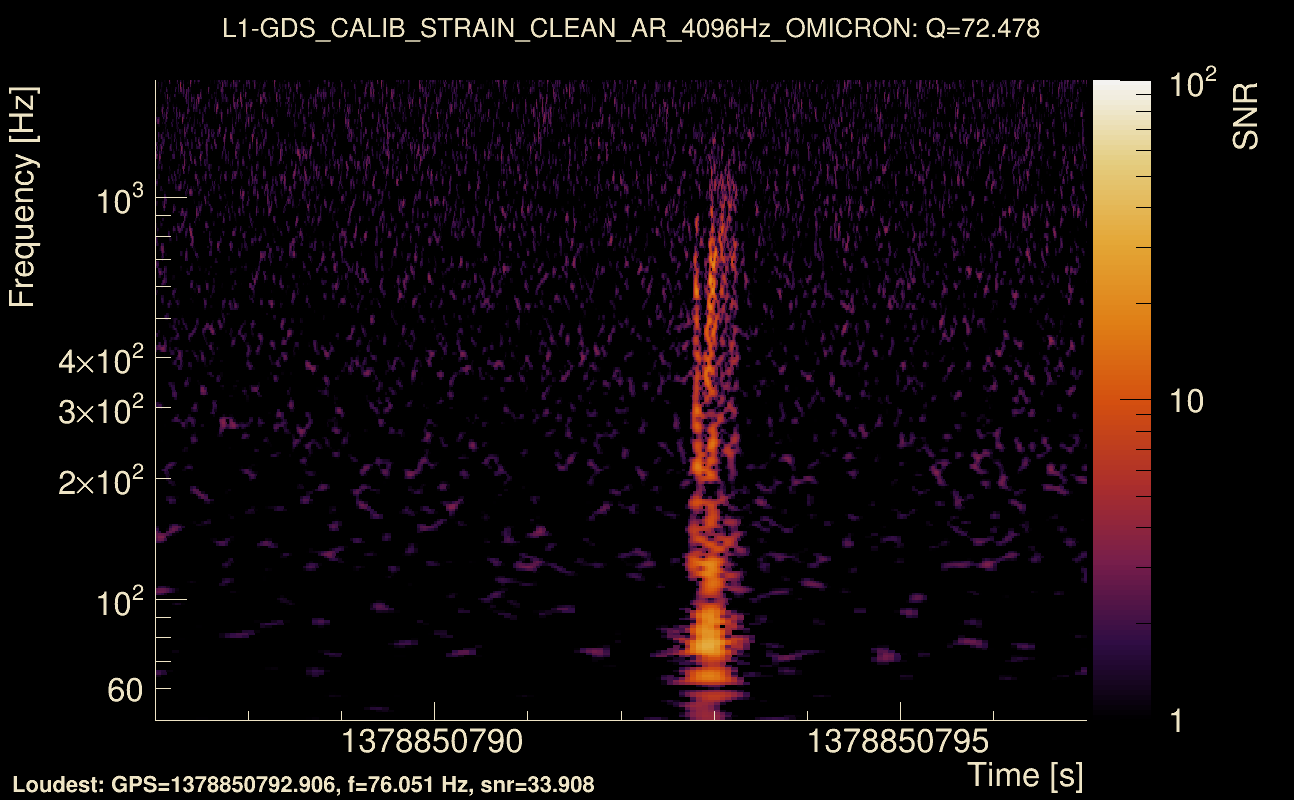
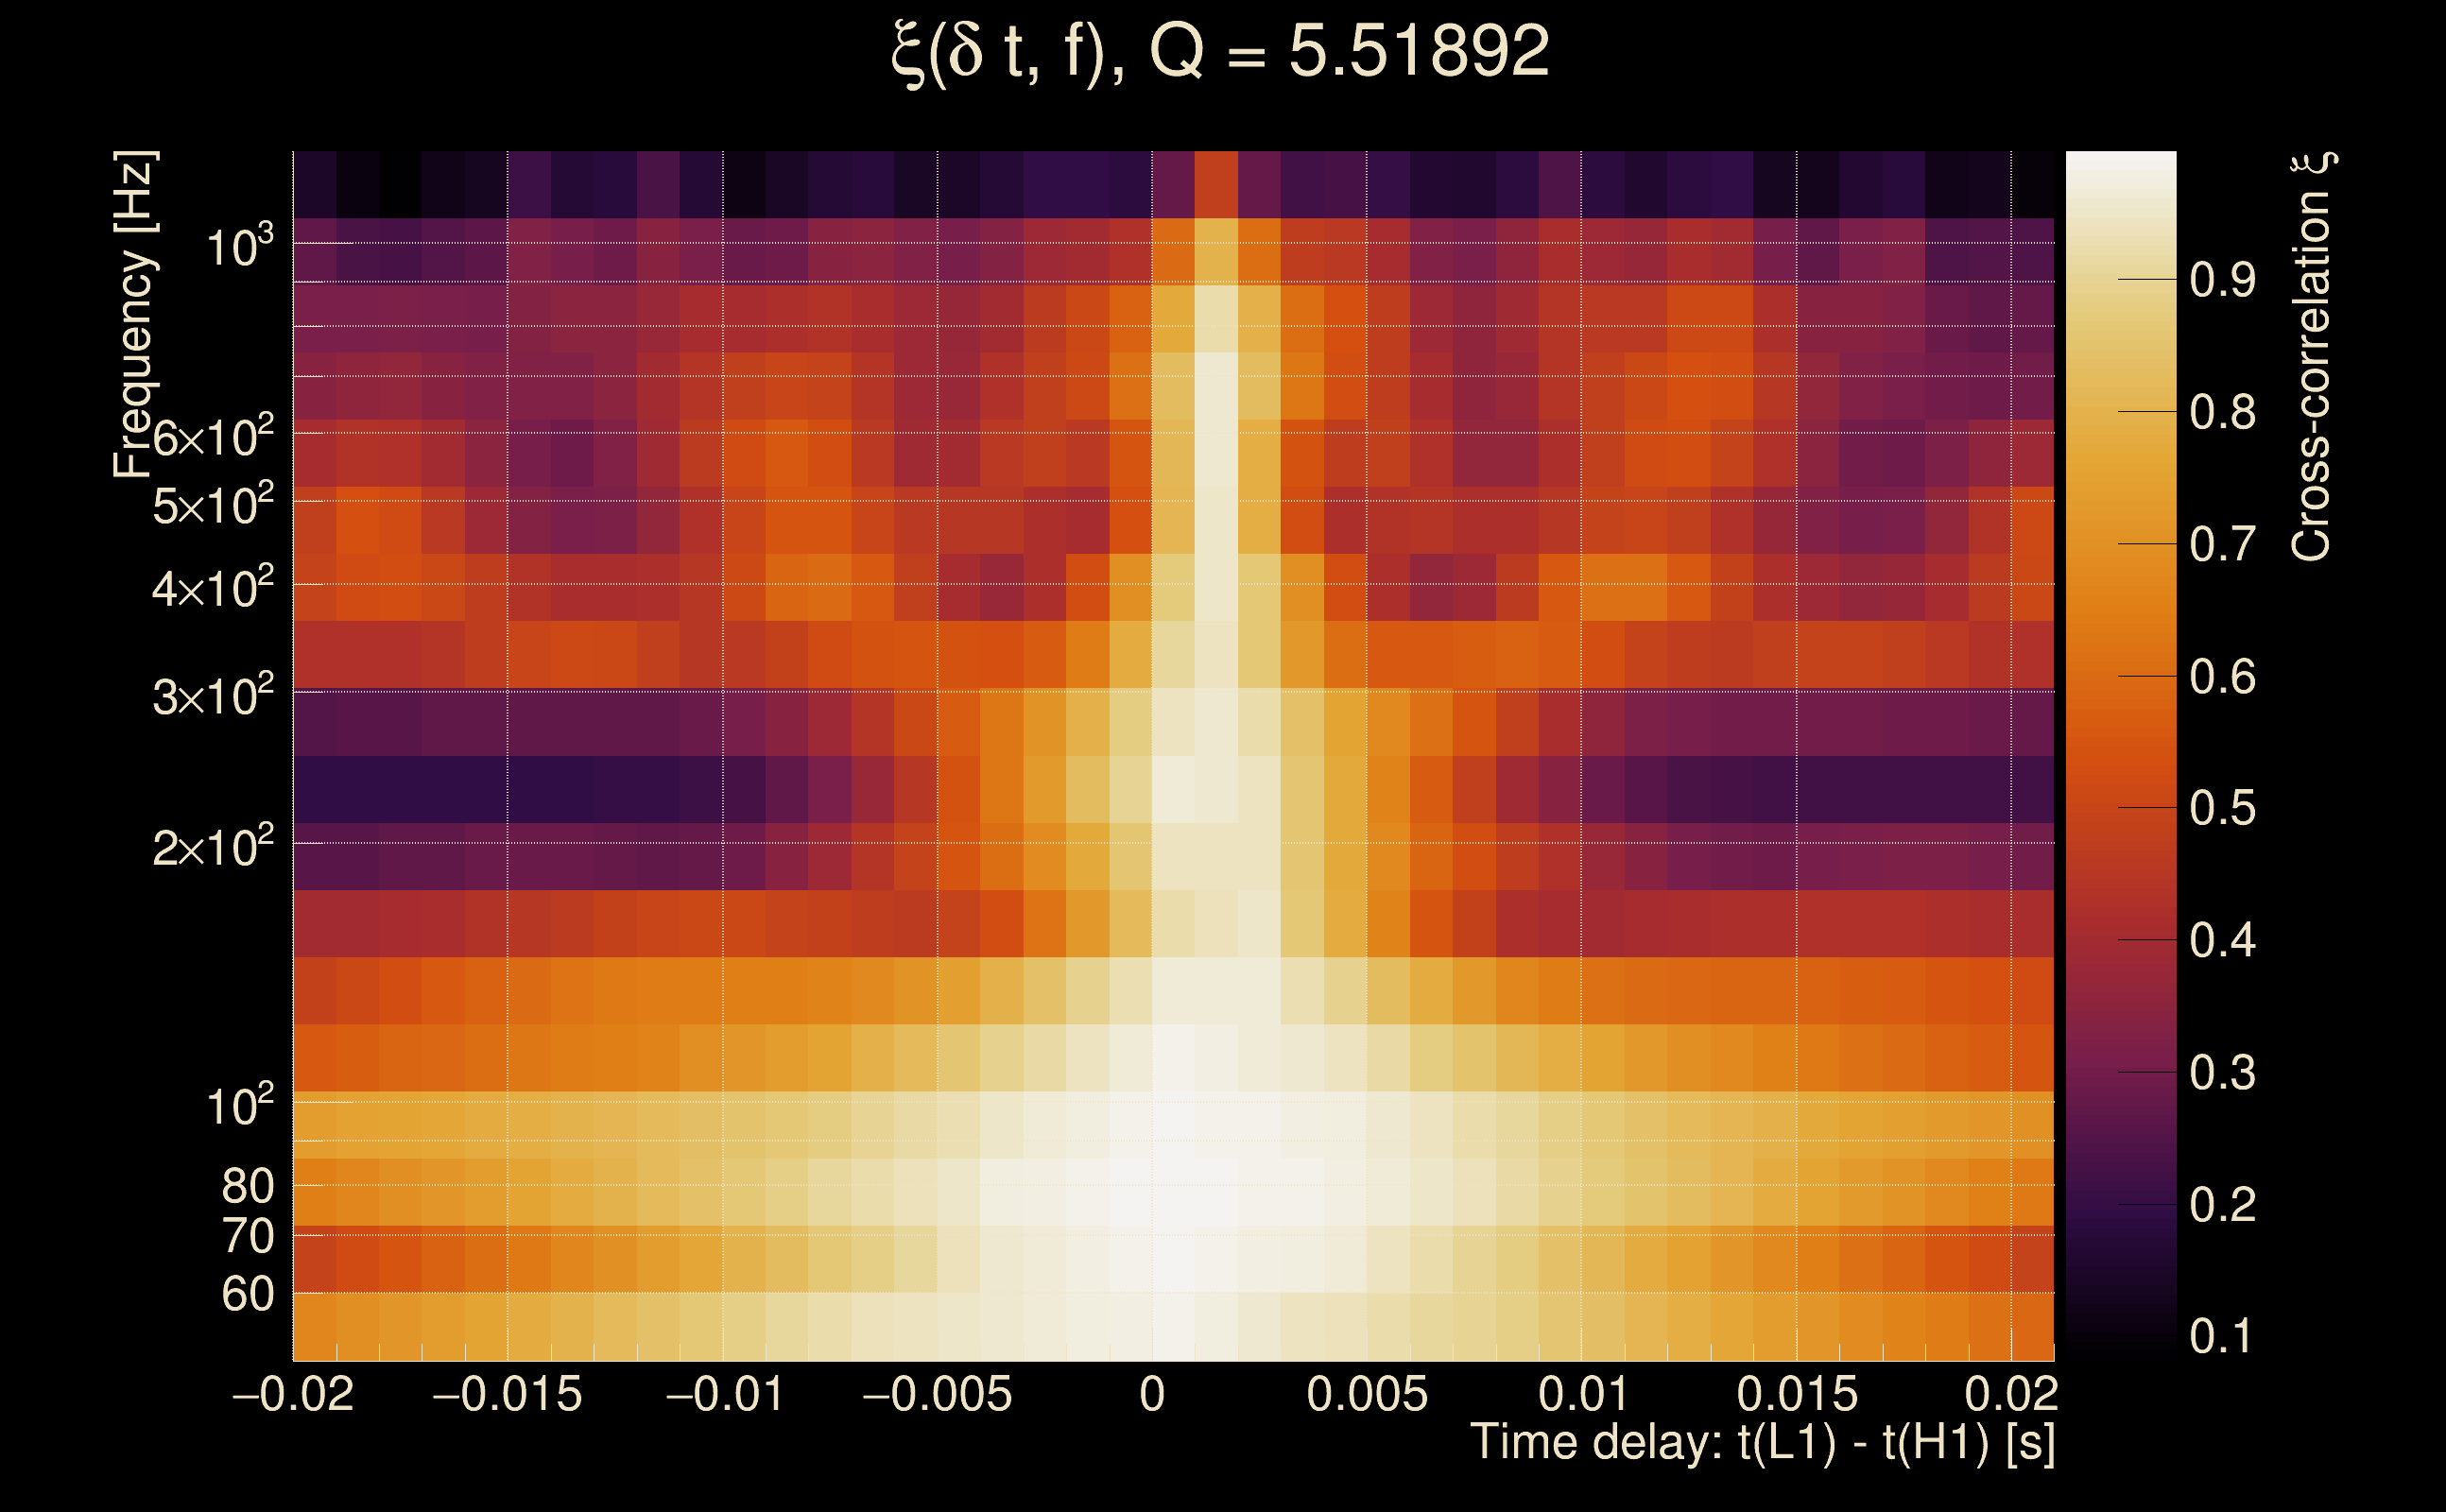
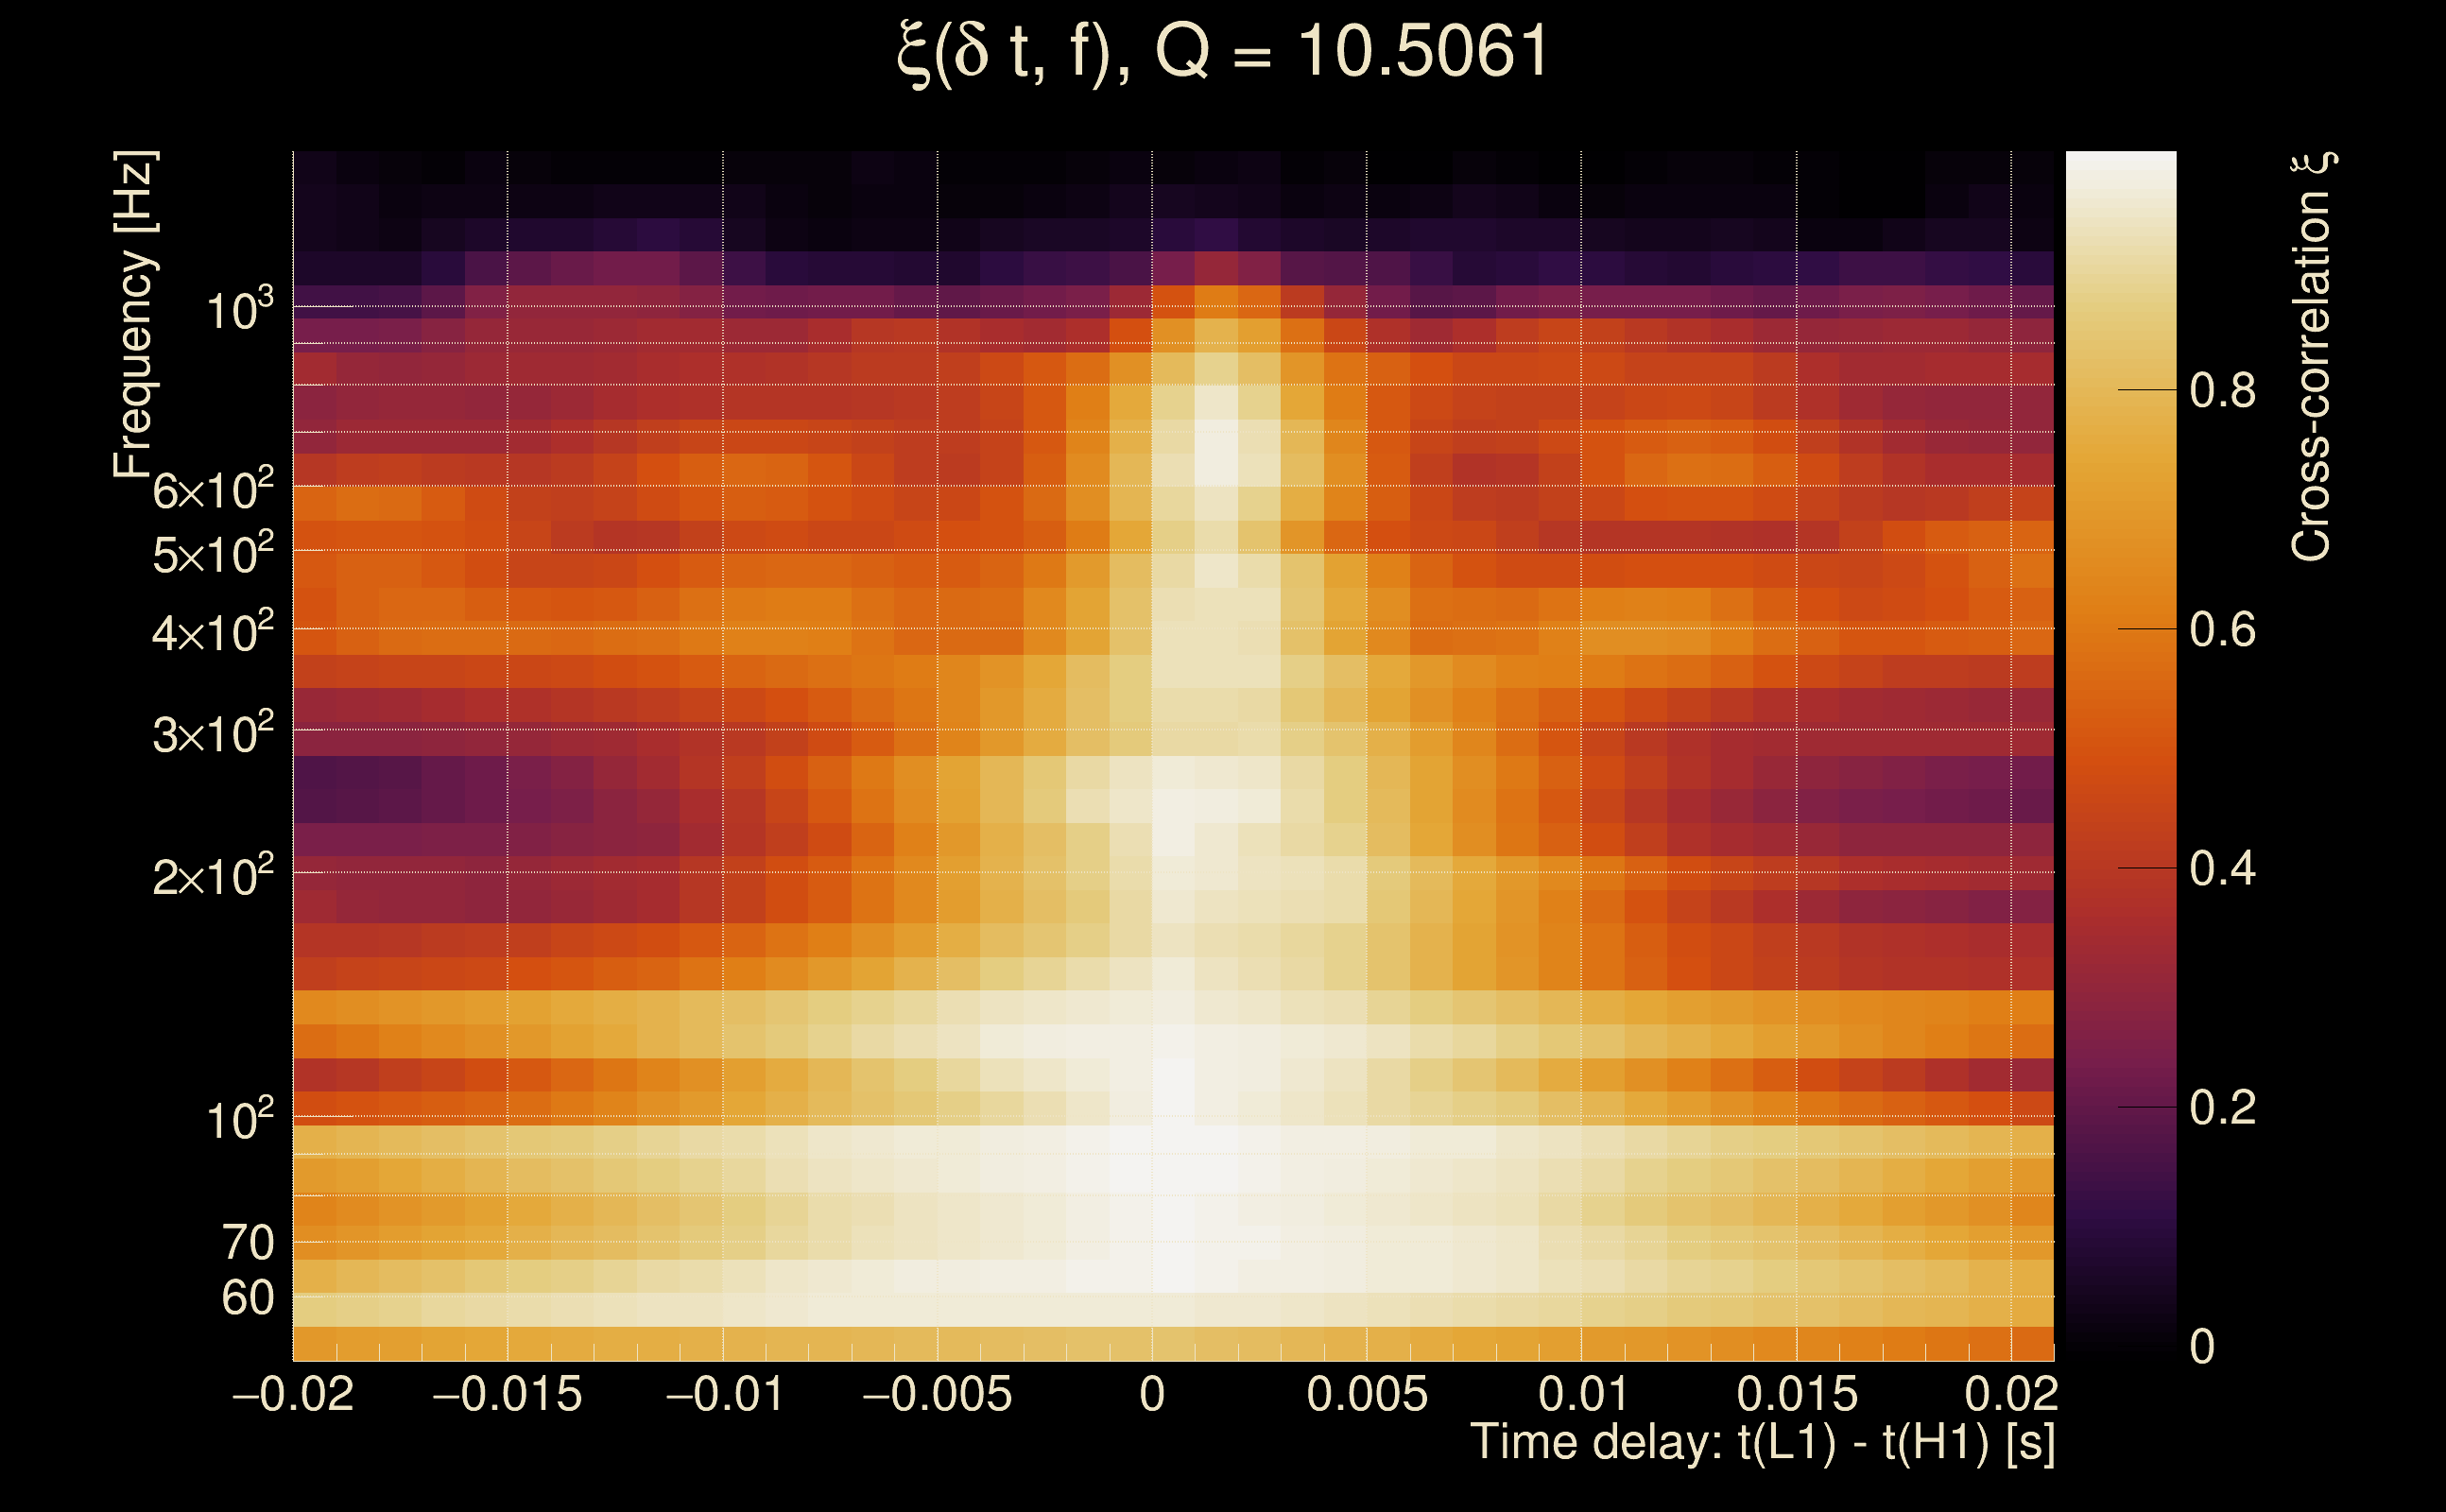
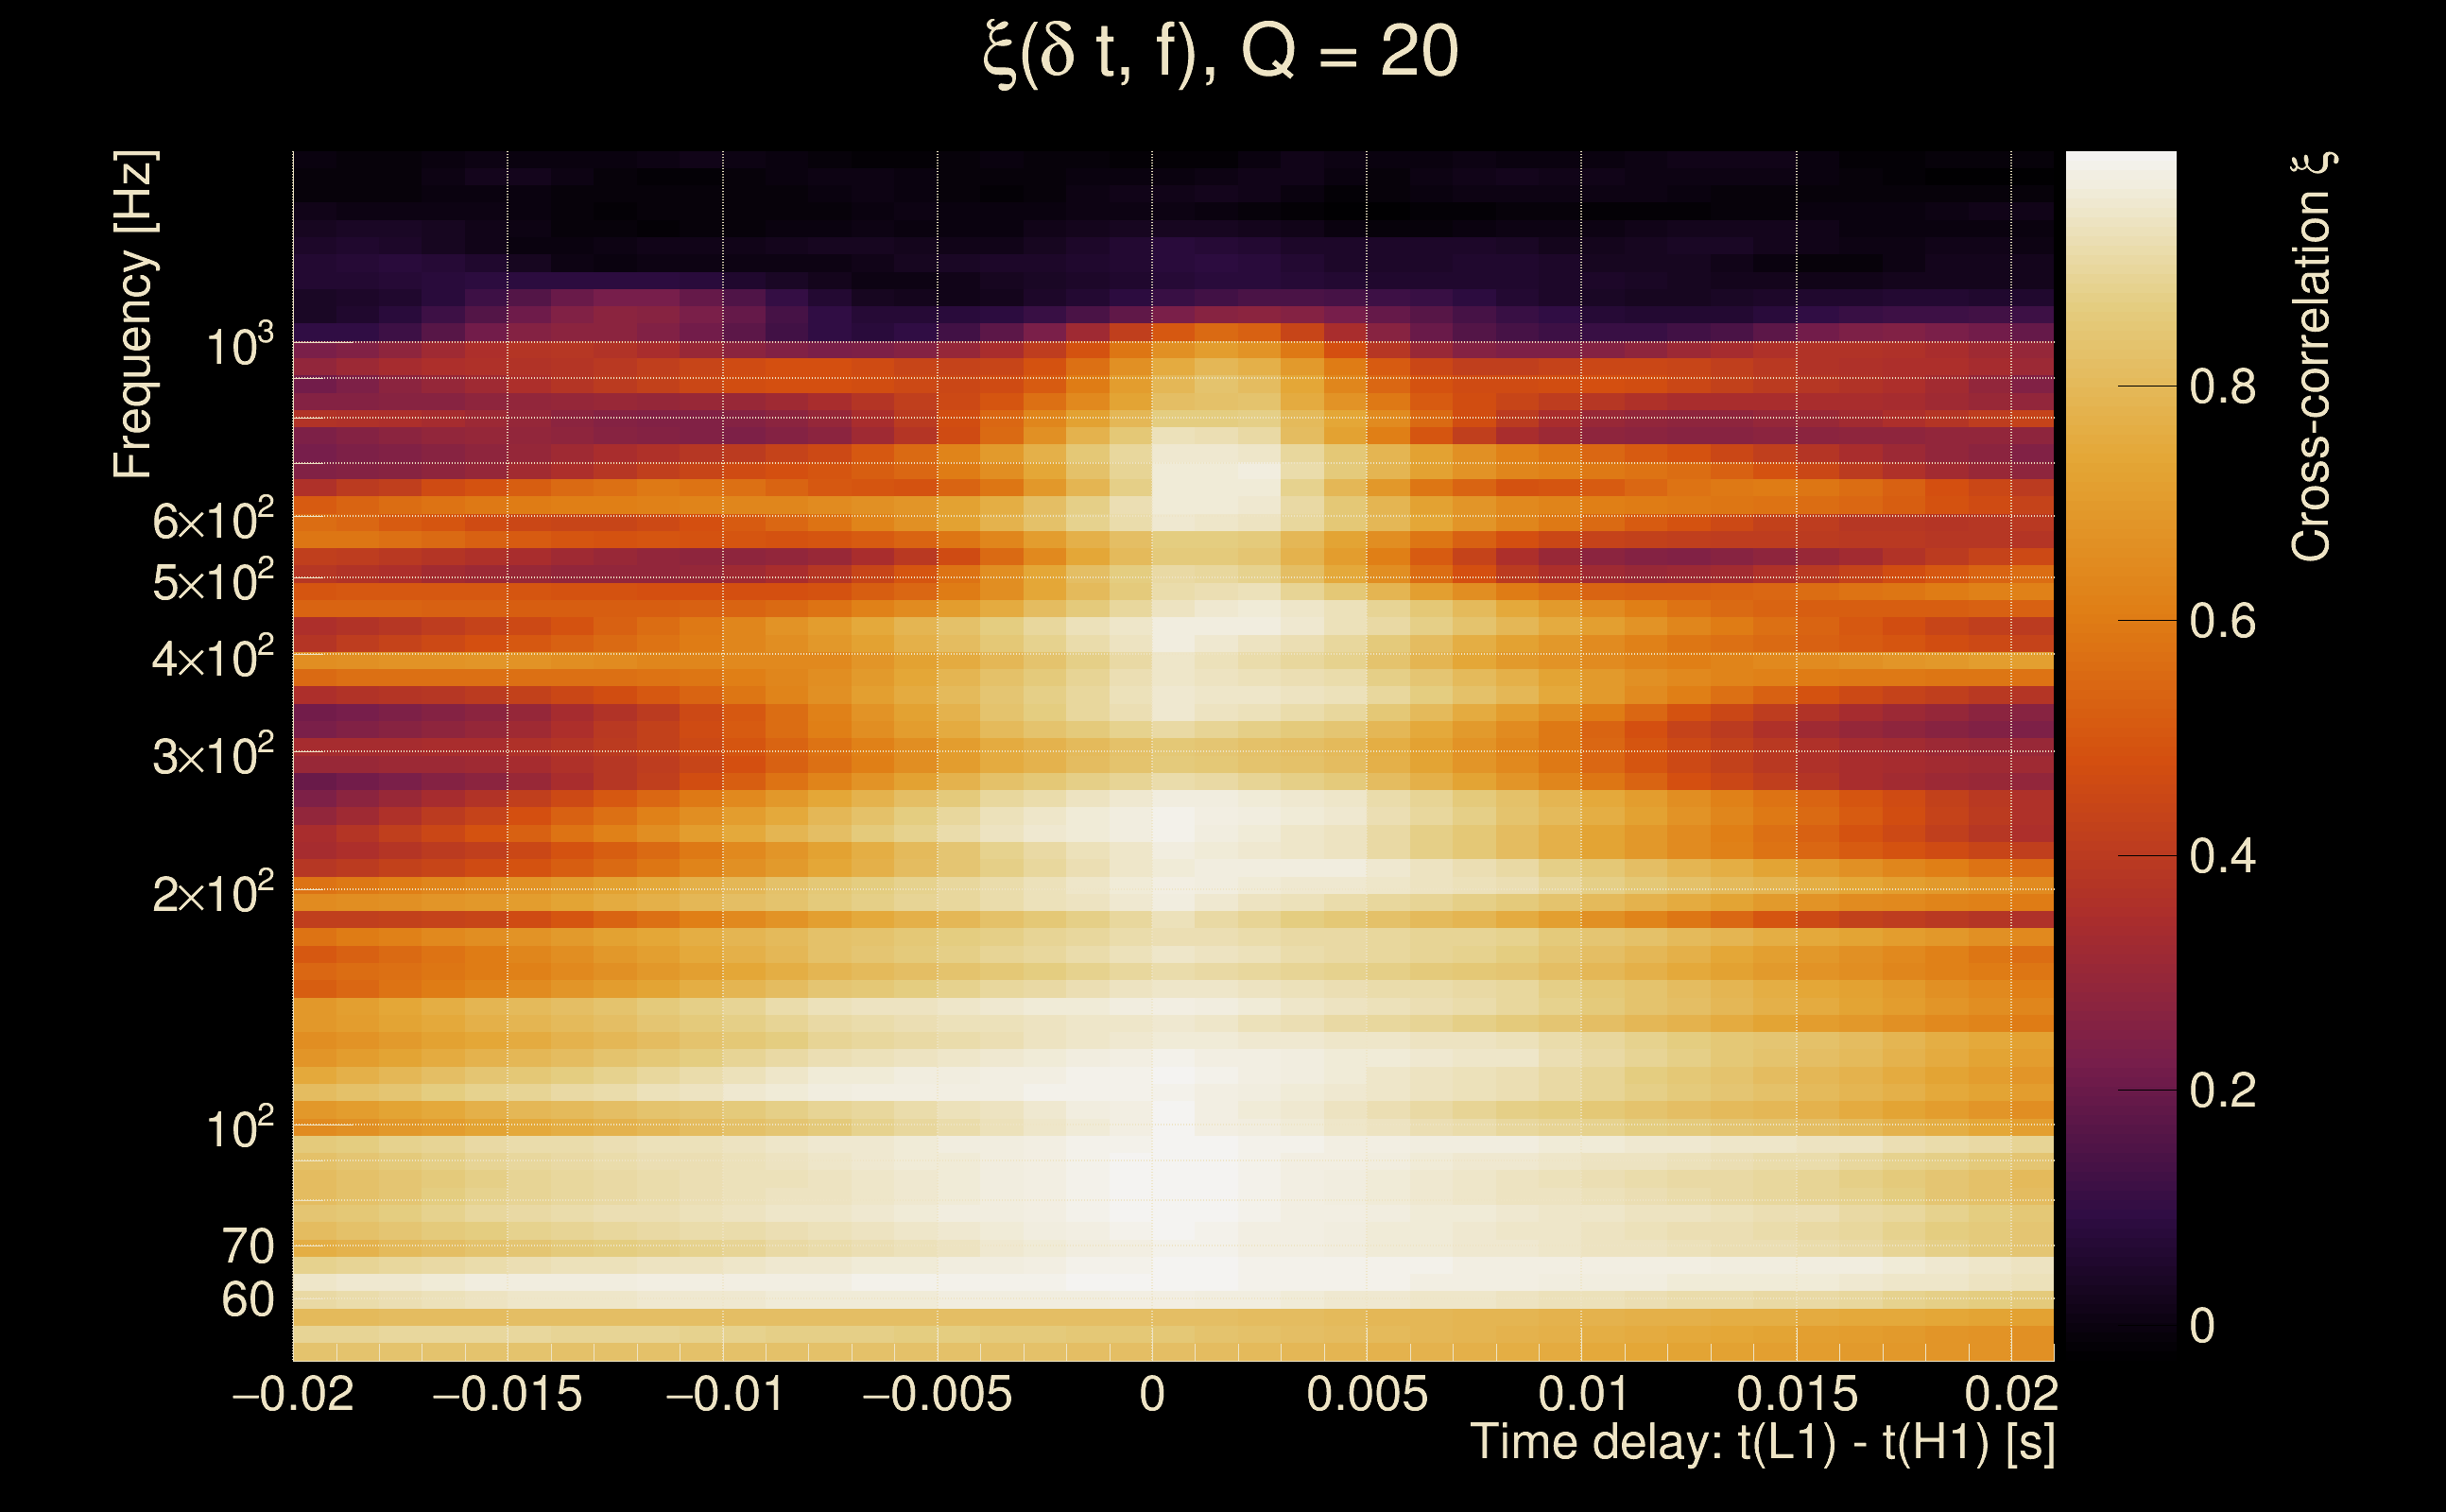
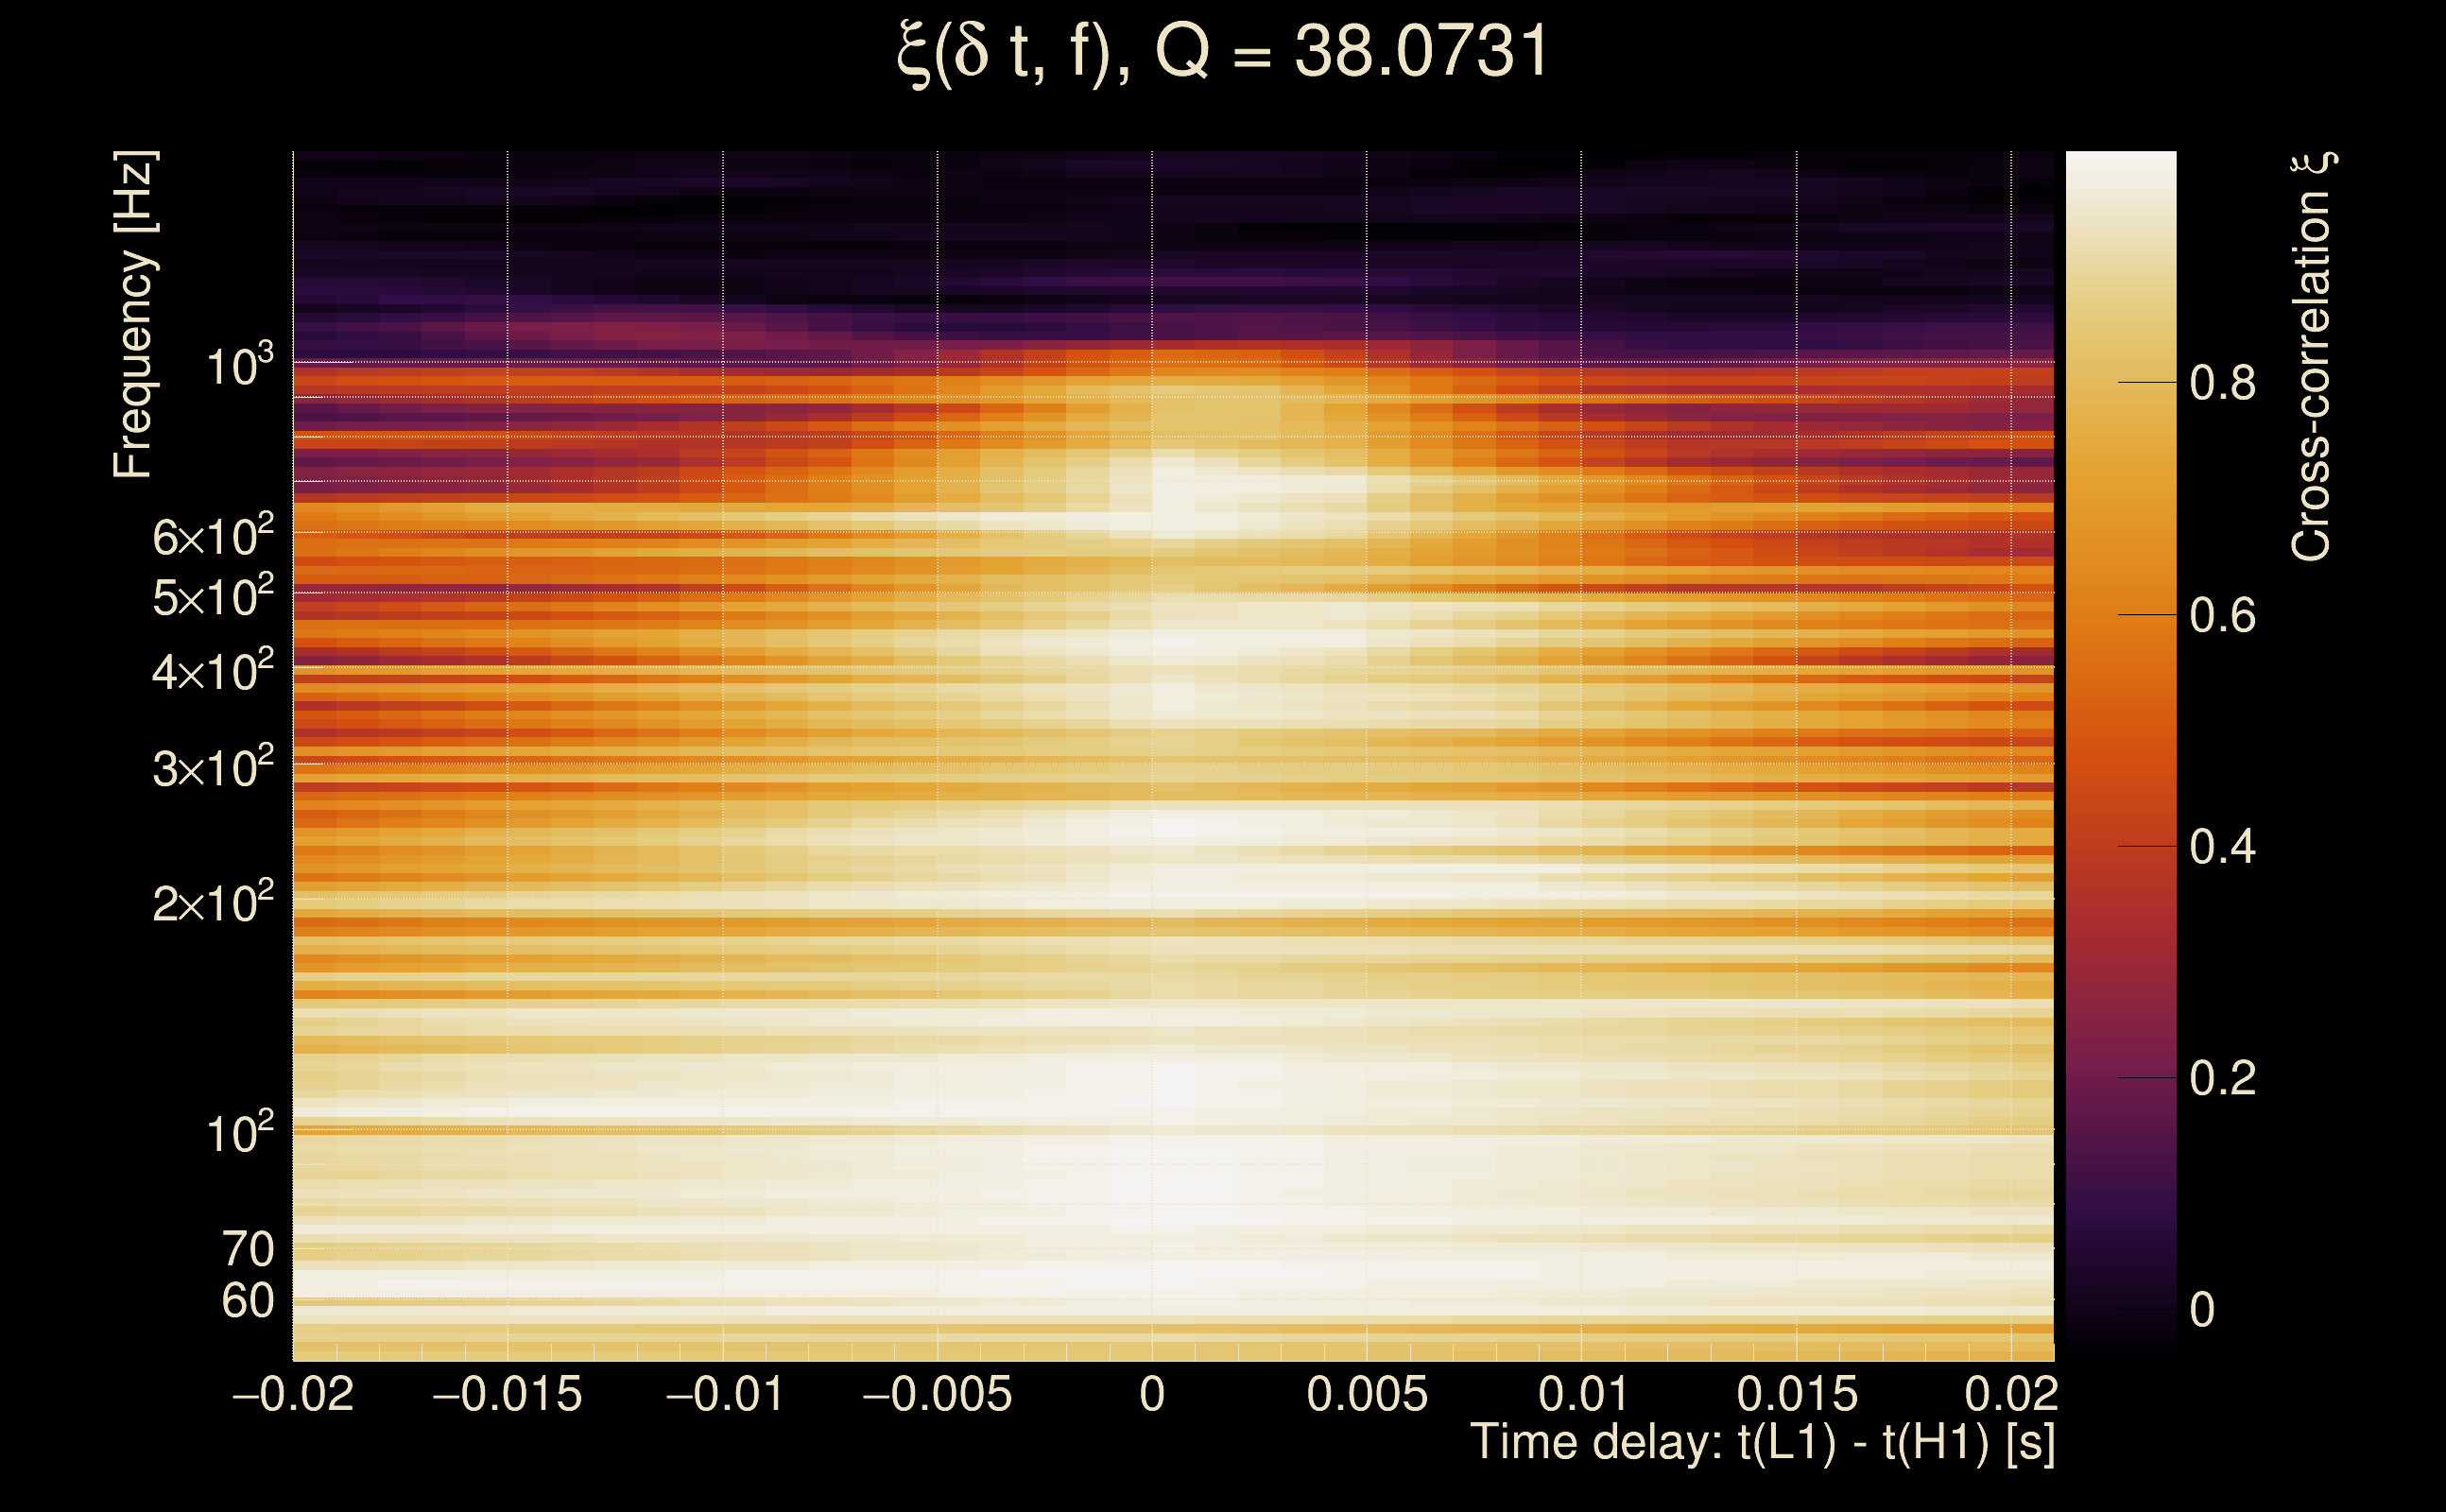
| Event time t(H1): | GPS = 1378850787 (Fri Sep 15 22:06:09 2023 ) → GPS = 1378850797 (Fri Sep 15 22:06:19 2023 ) |
| Event time t(L1): | GPS = 1378850787 (Fri Sep 15 22:06:19 2023 ) → GPS = 1378850797 (Fri Sep 15 22:06:19 2023 ) |
| Omicron analysis time window (H1): | GPS = 1378850784 → GPS = 1378850800 |
| Omicron analysis time window (L1): | GPS = 1378850784 → GPS = 1378850800 |
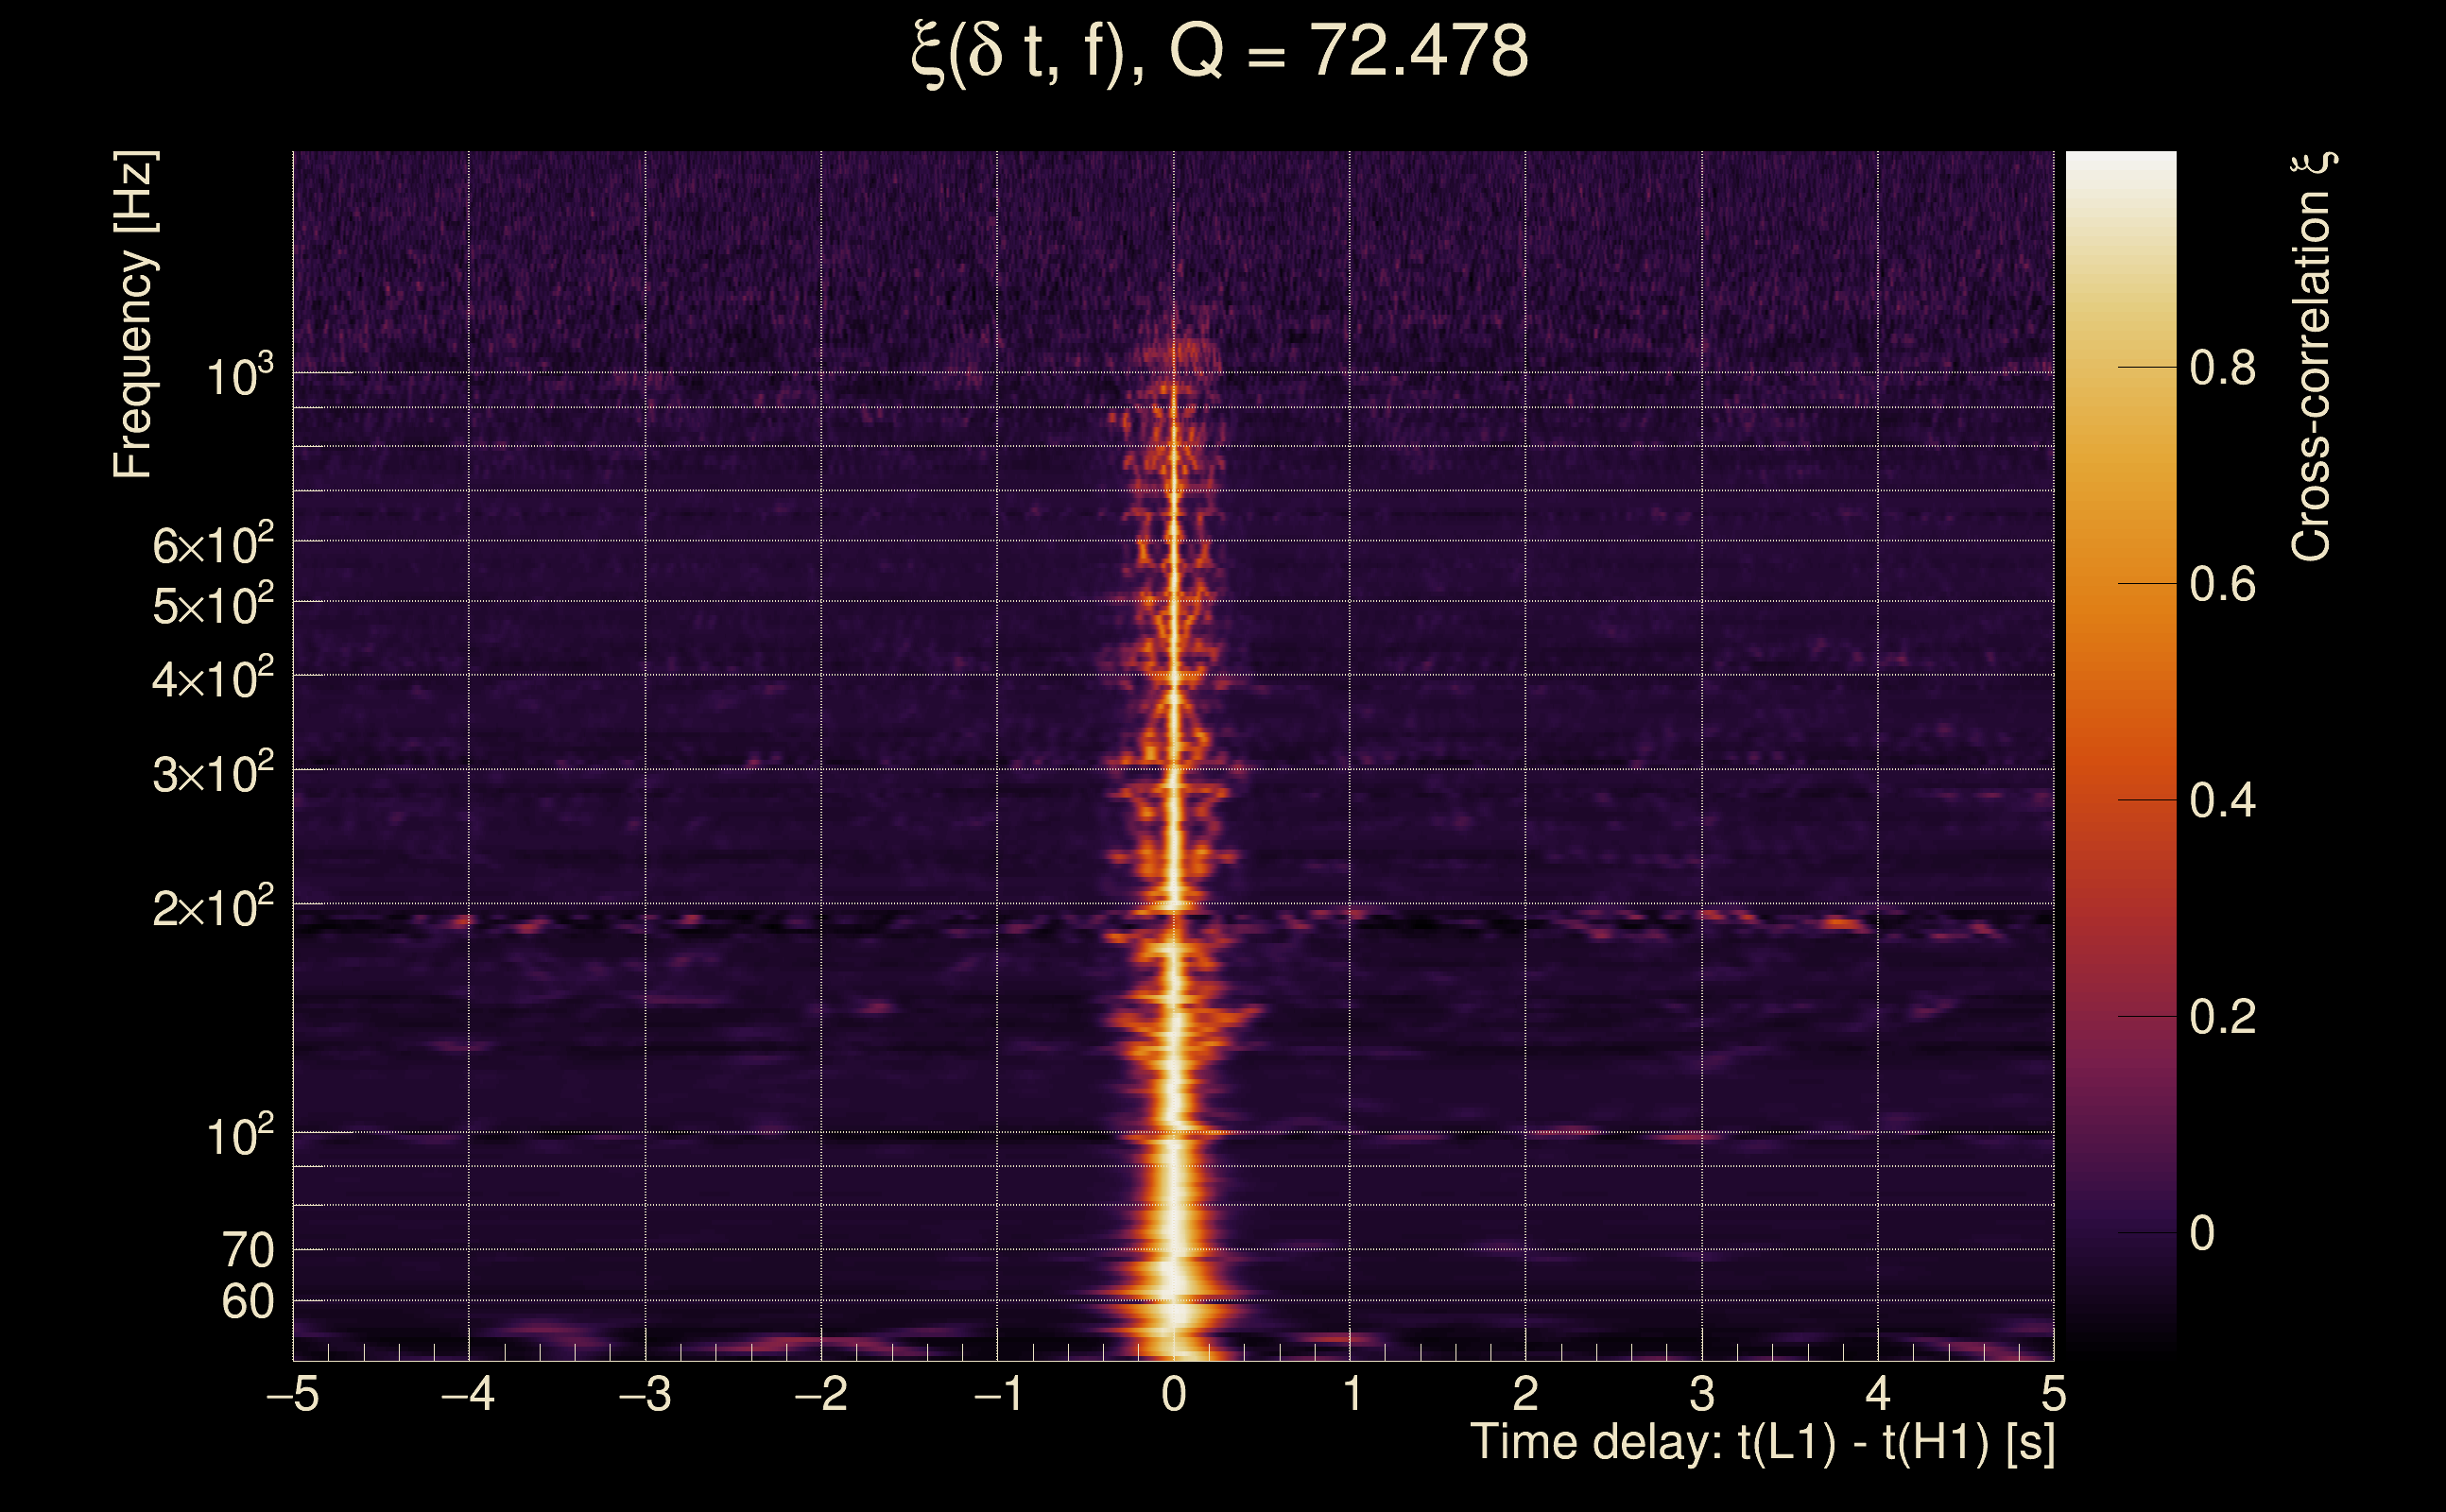
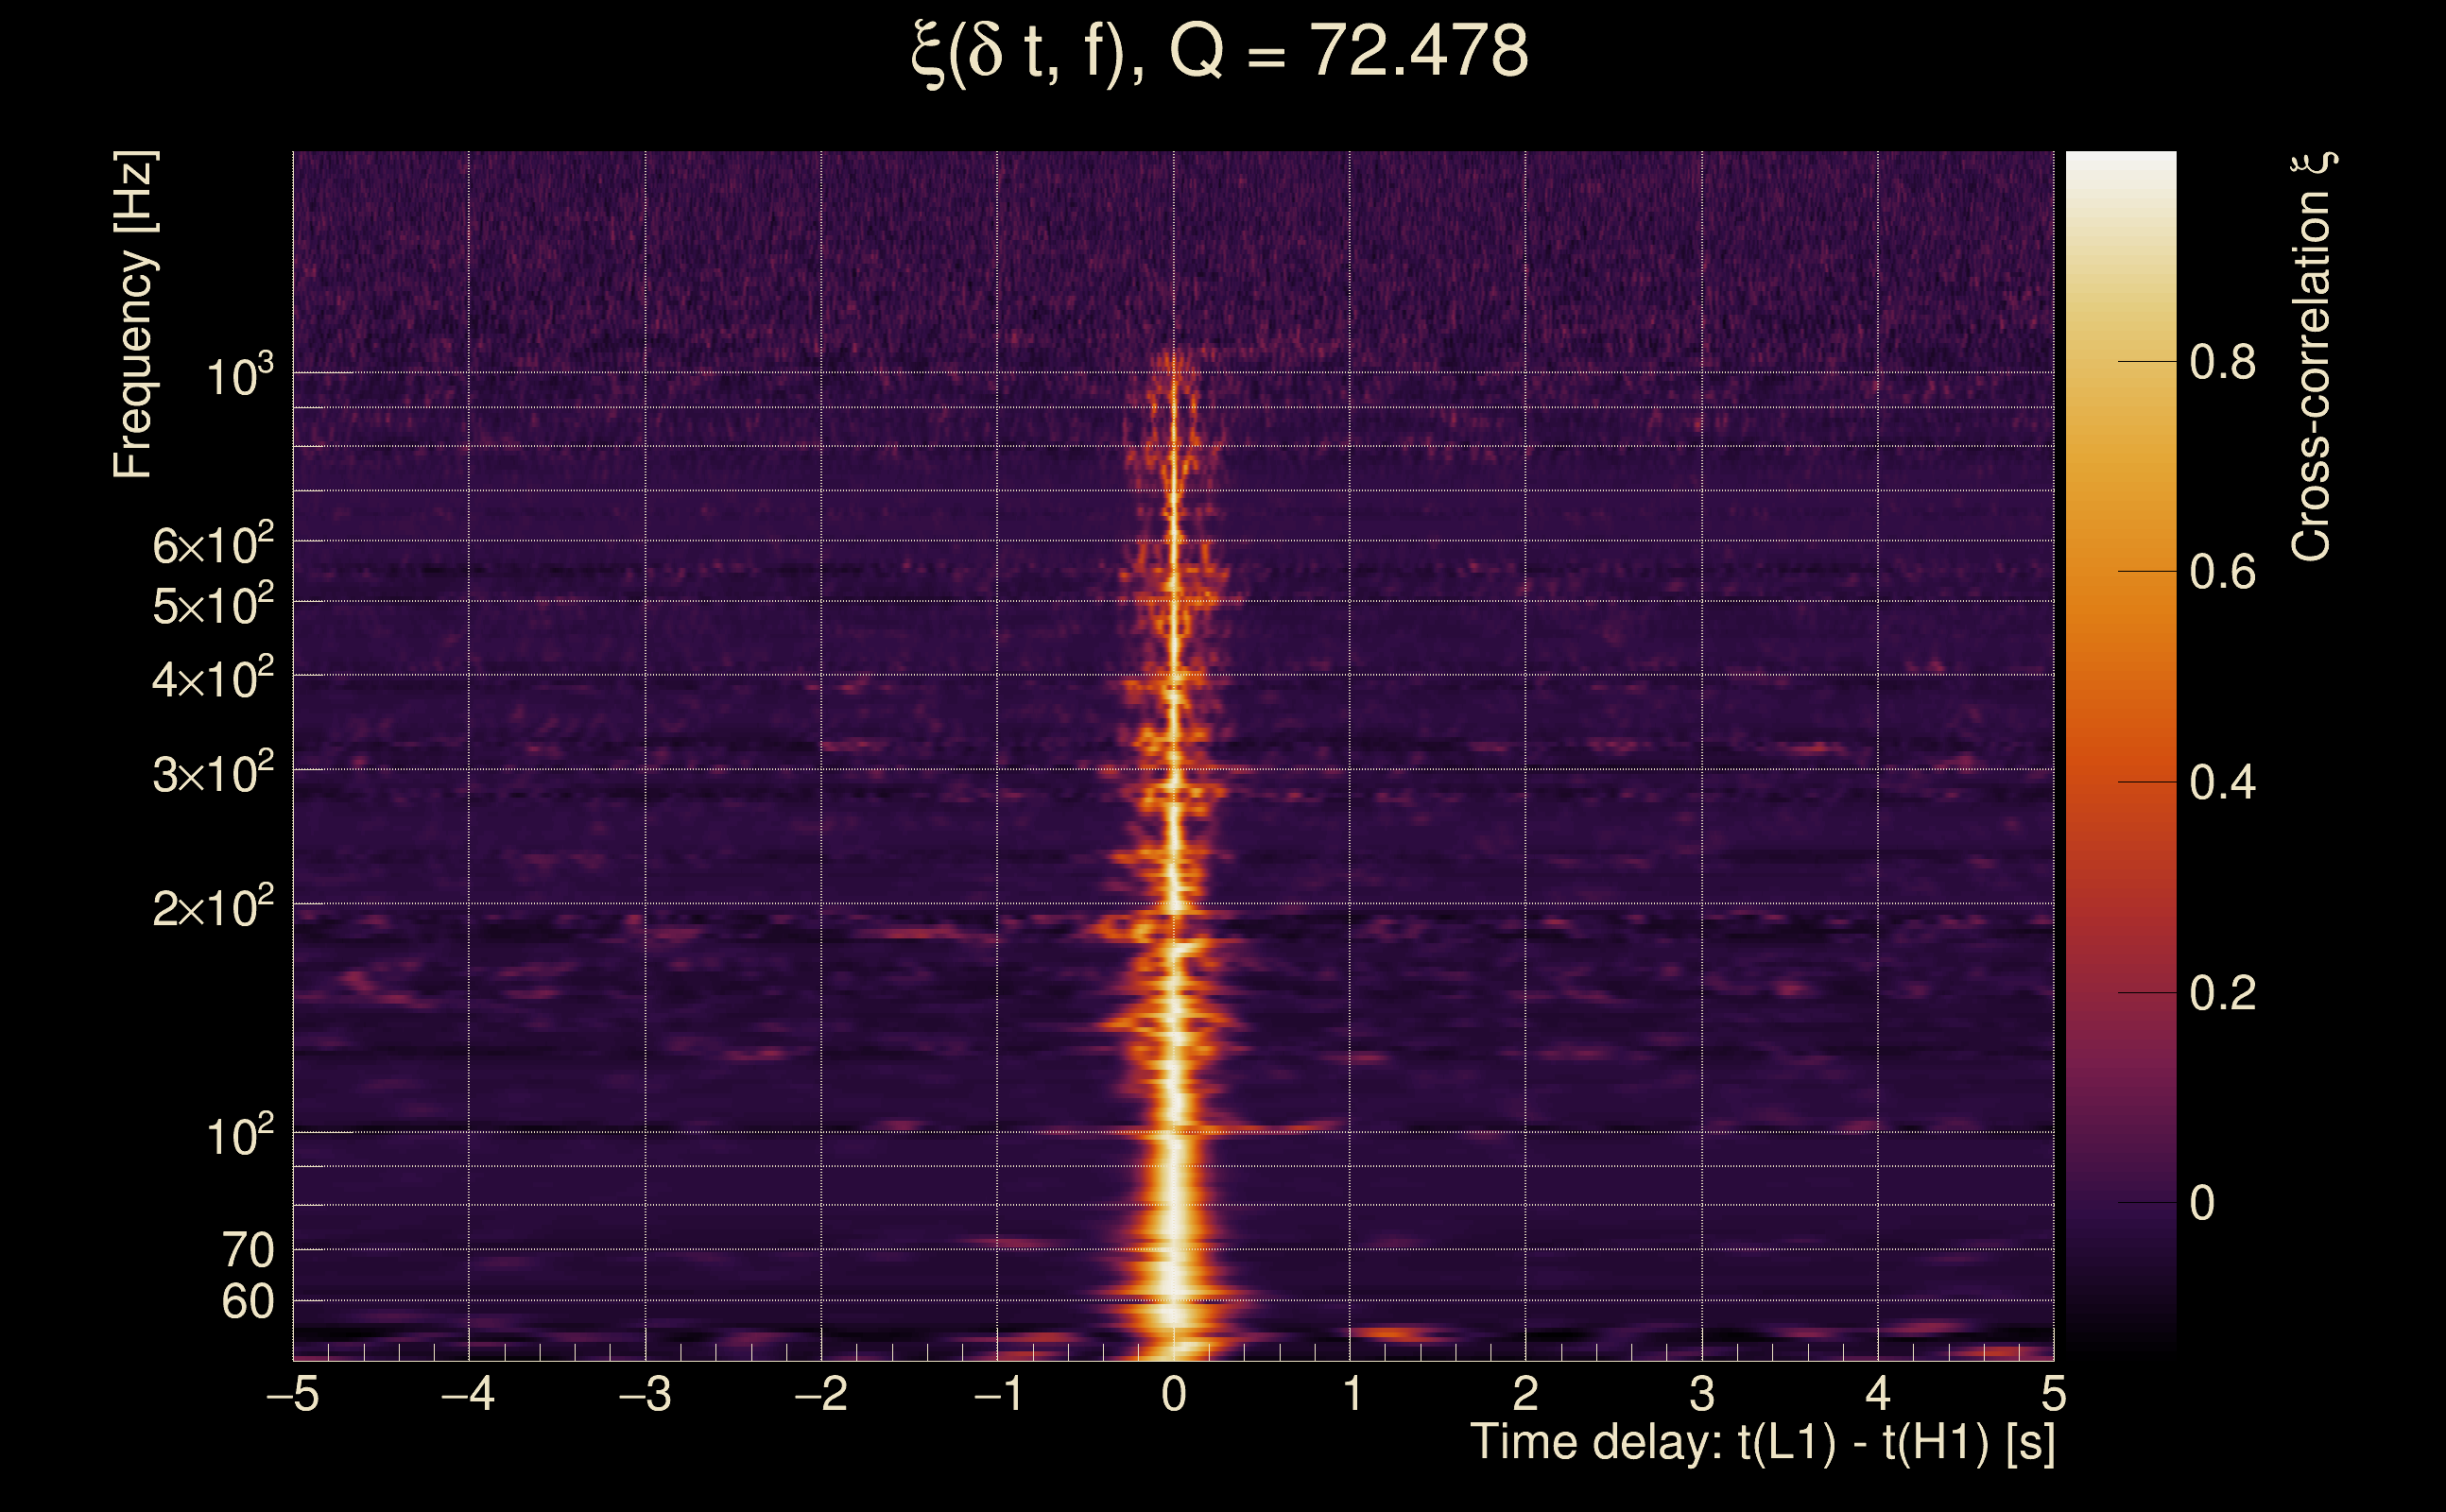
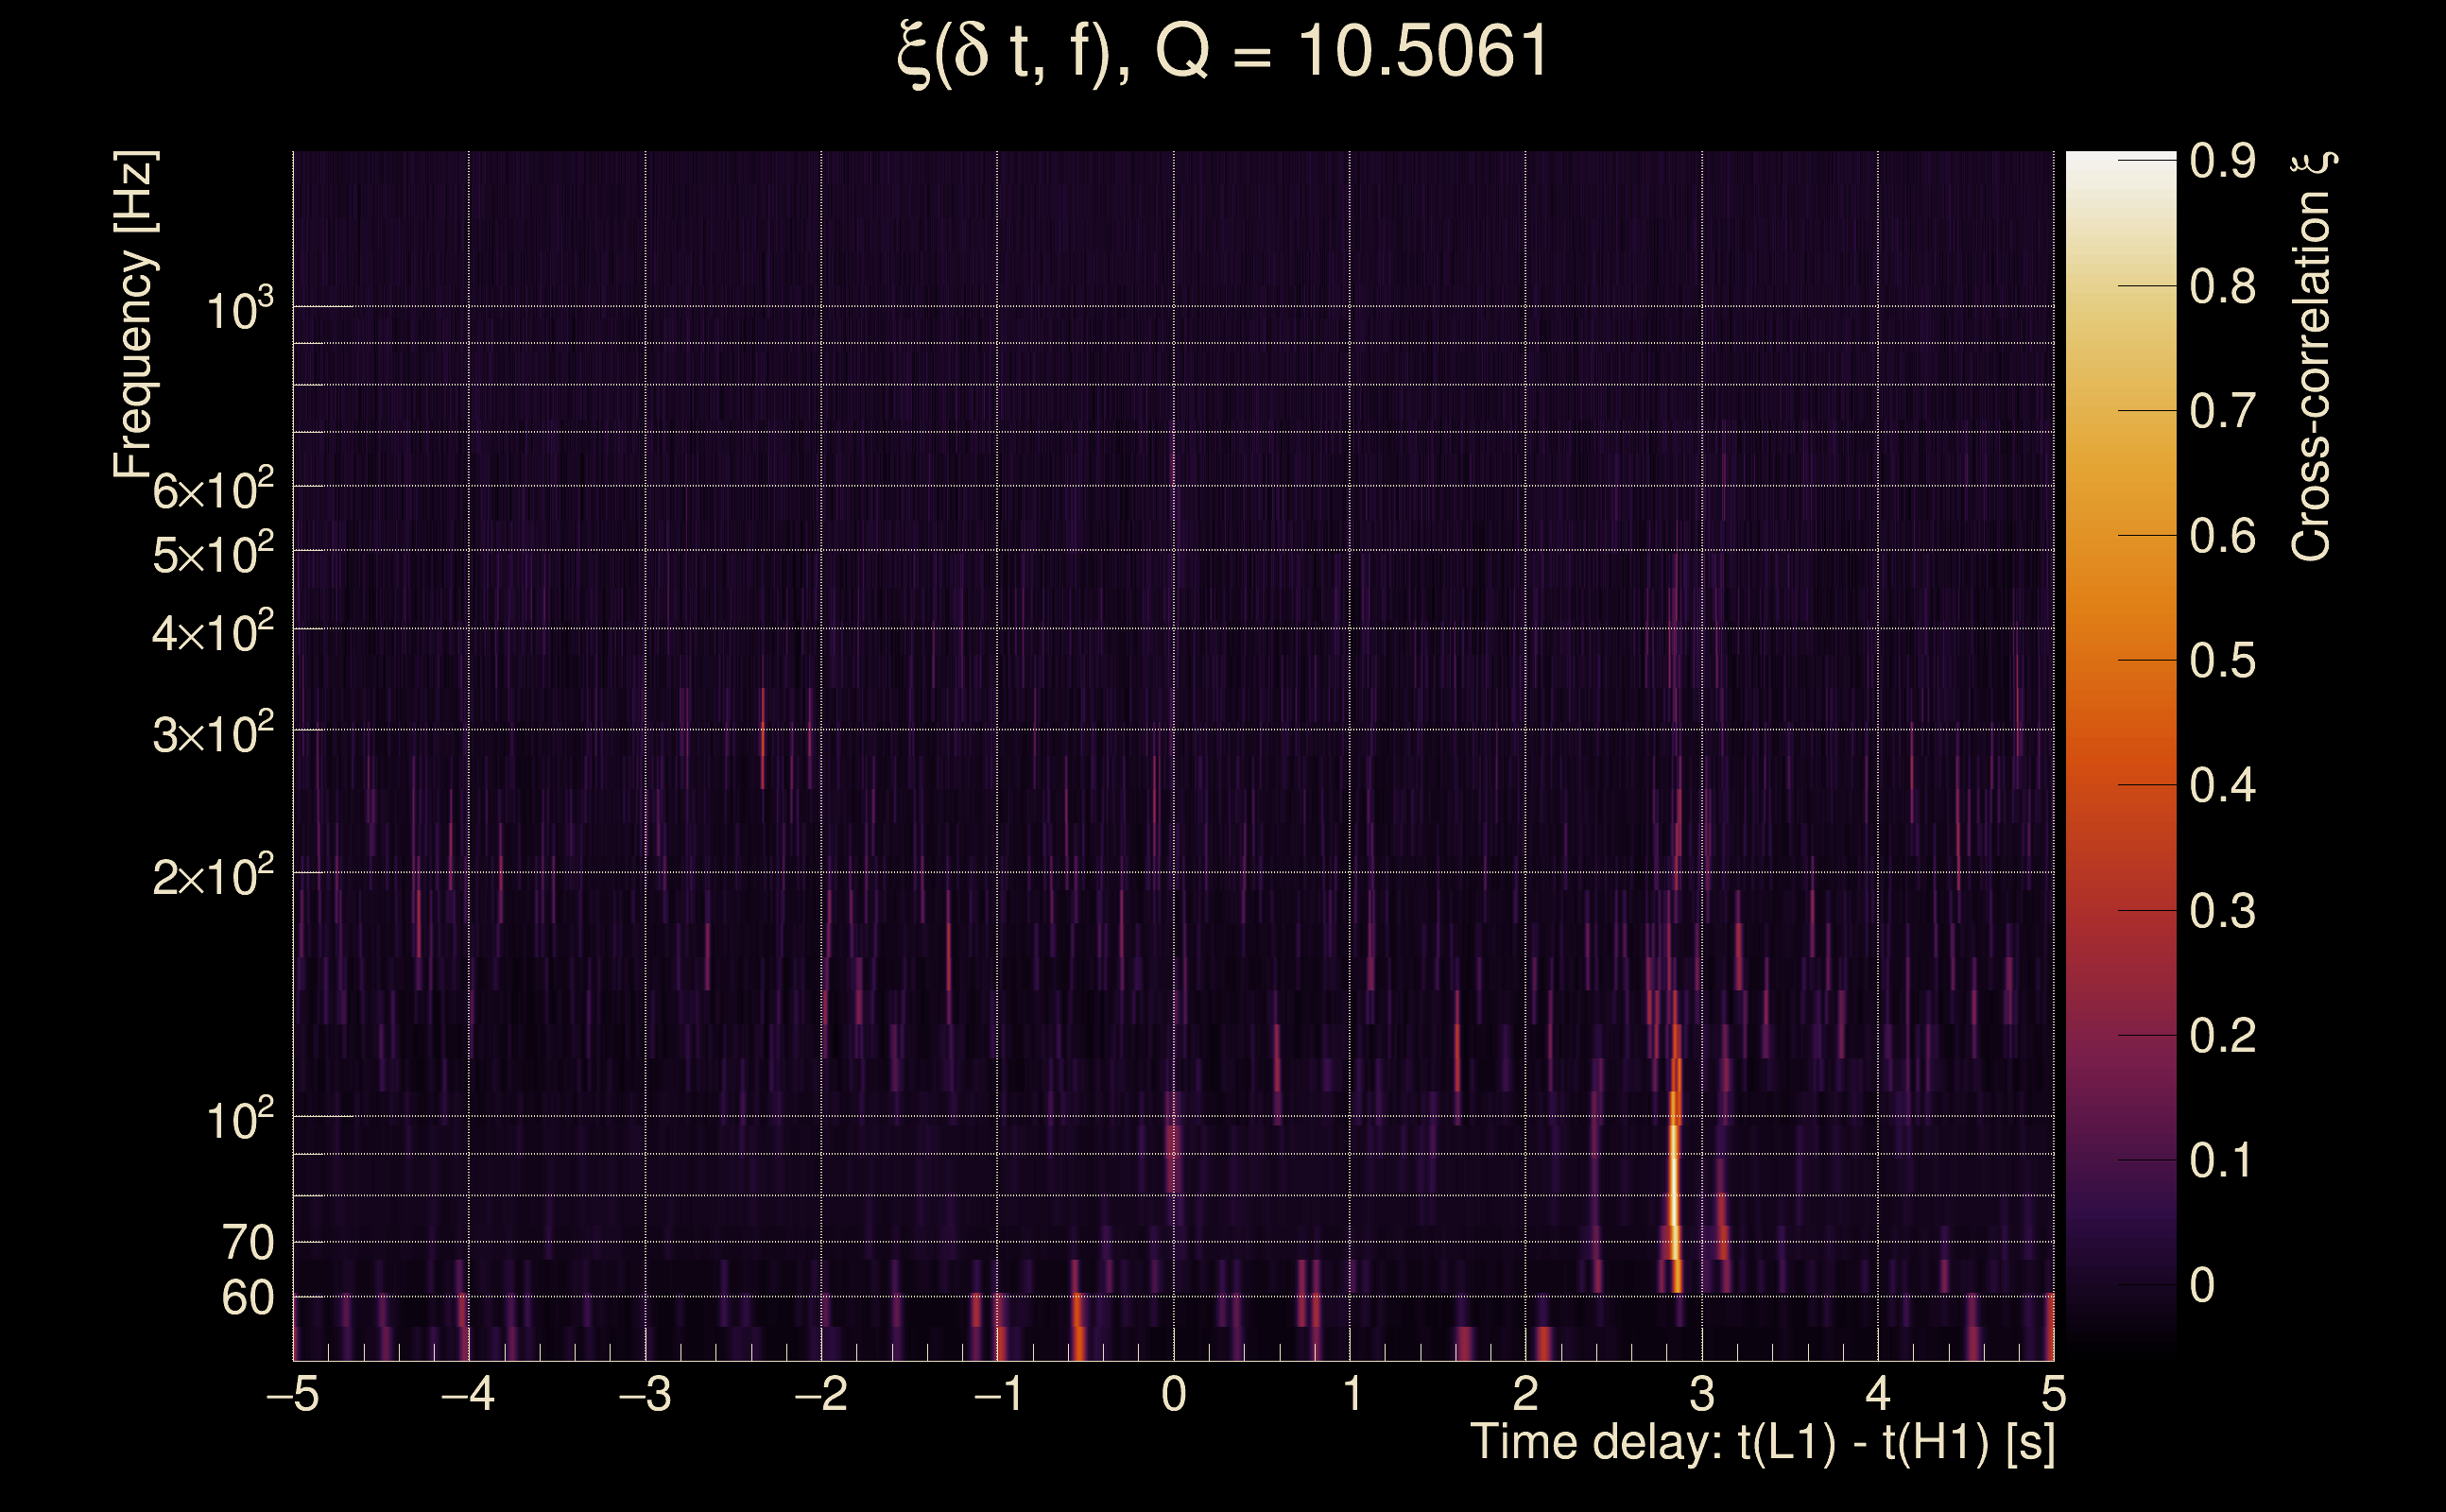
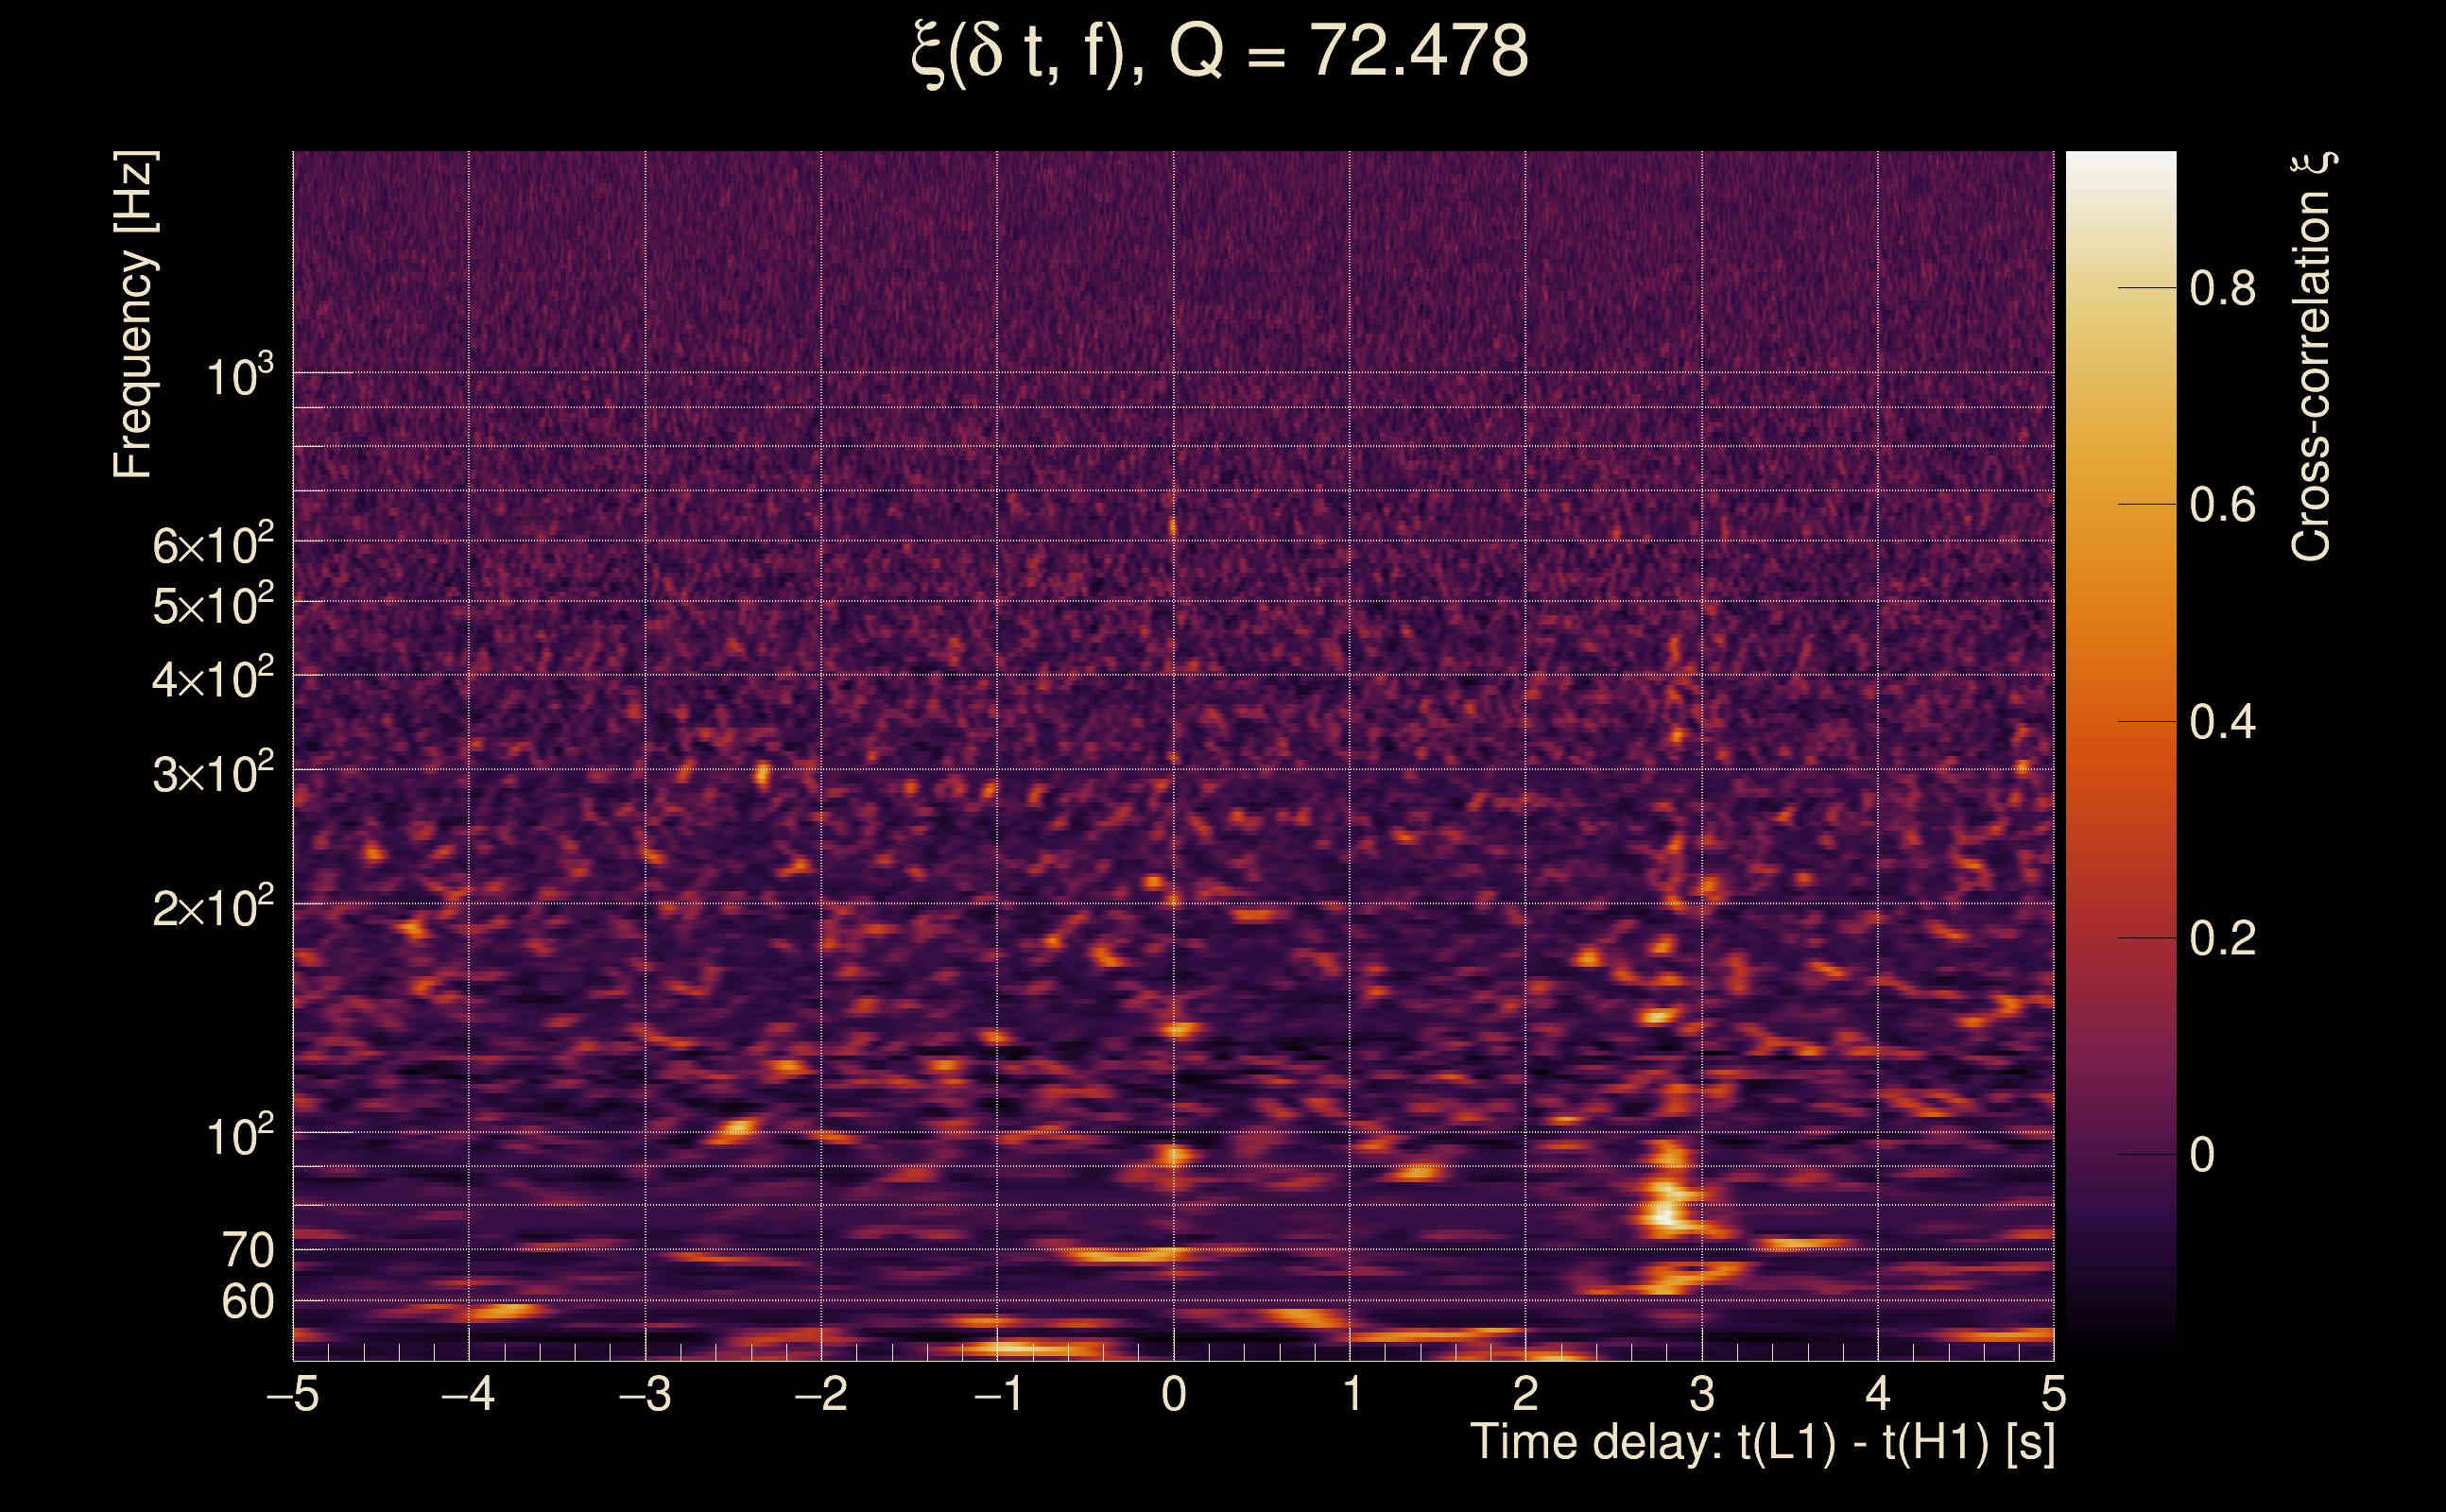
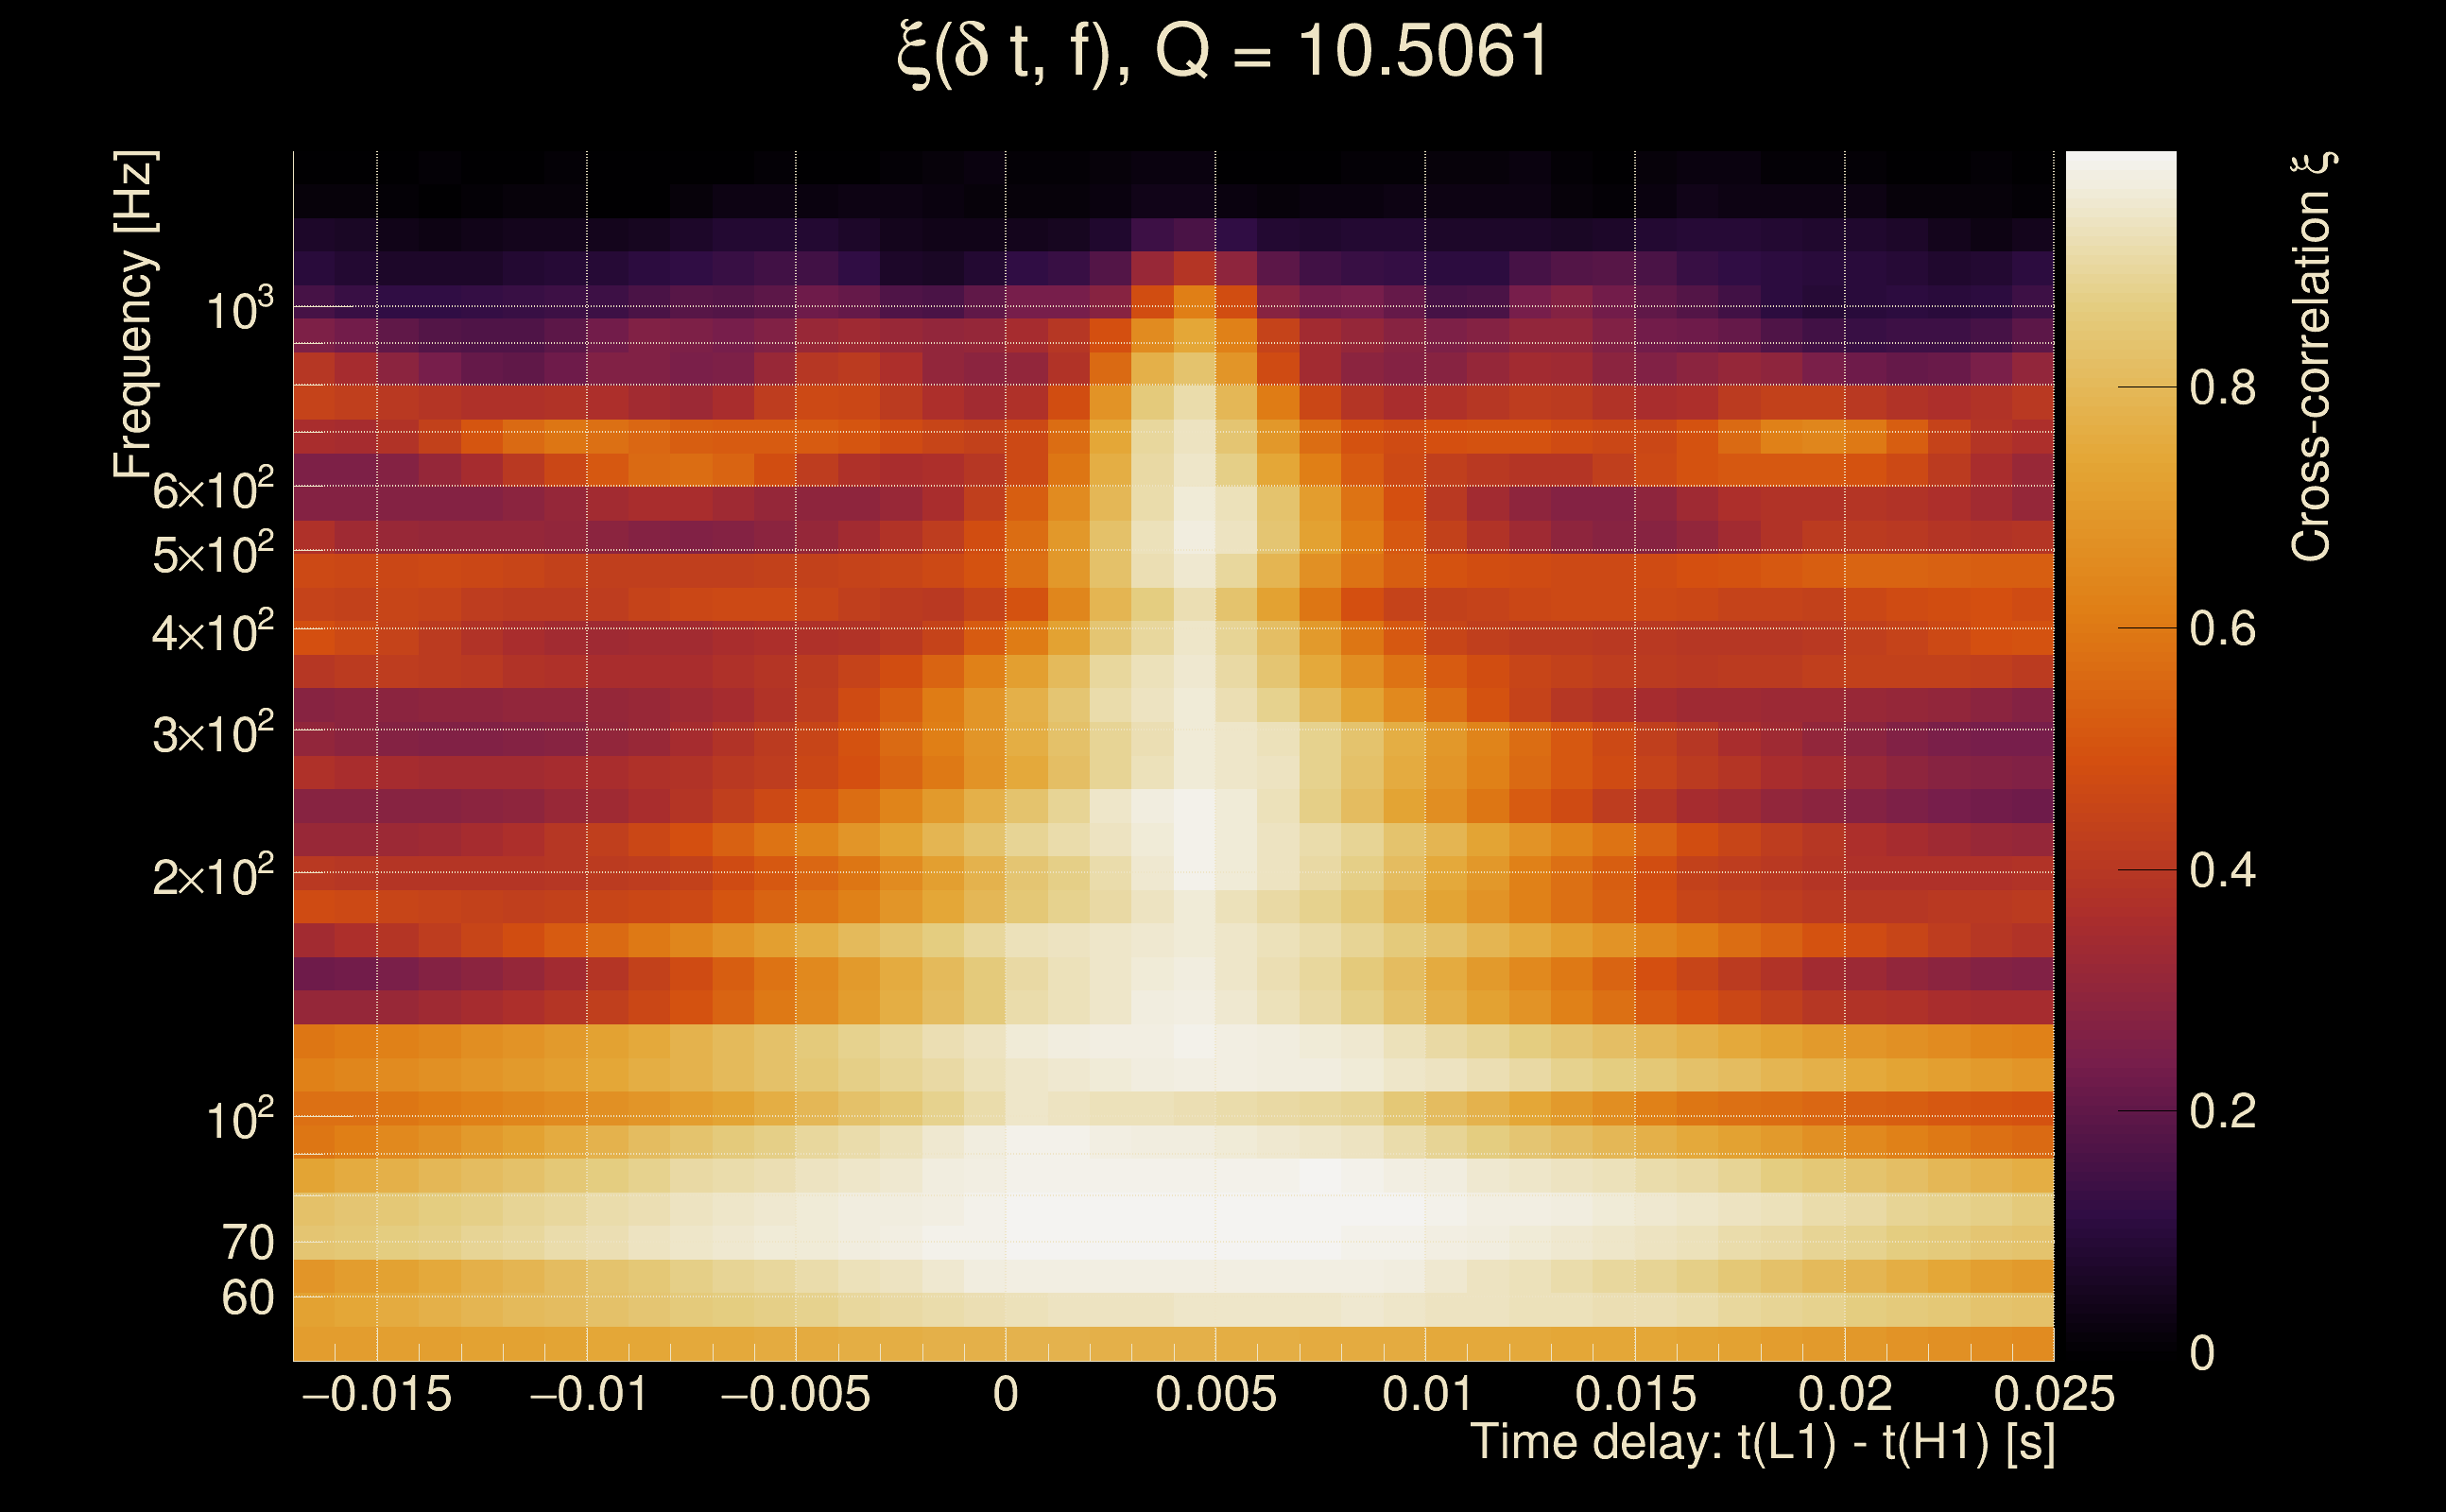
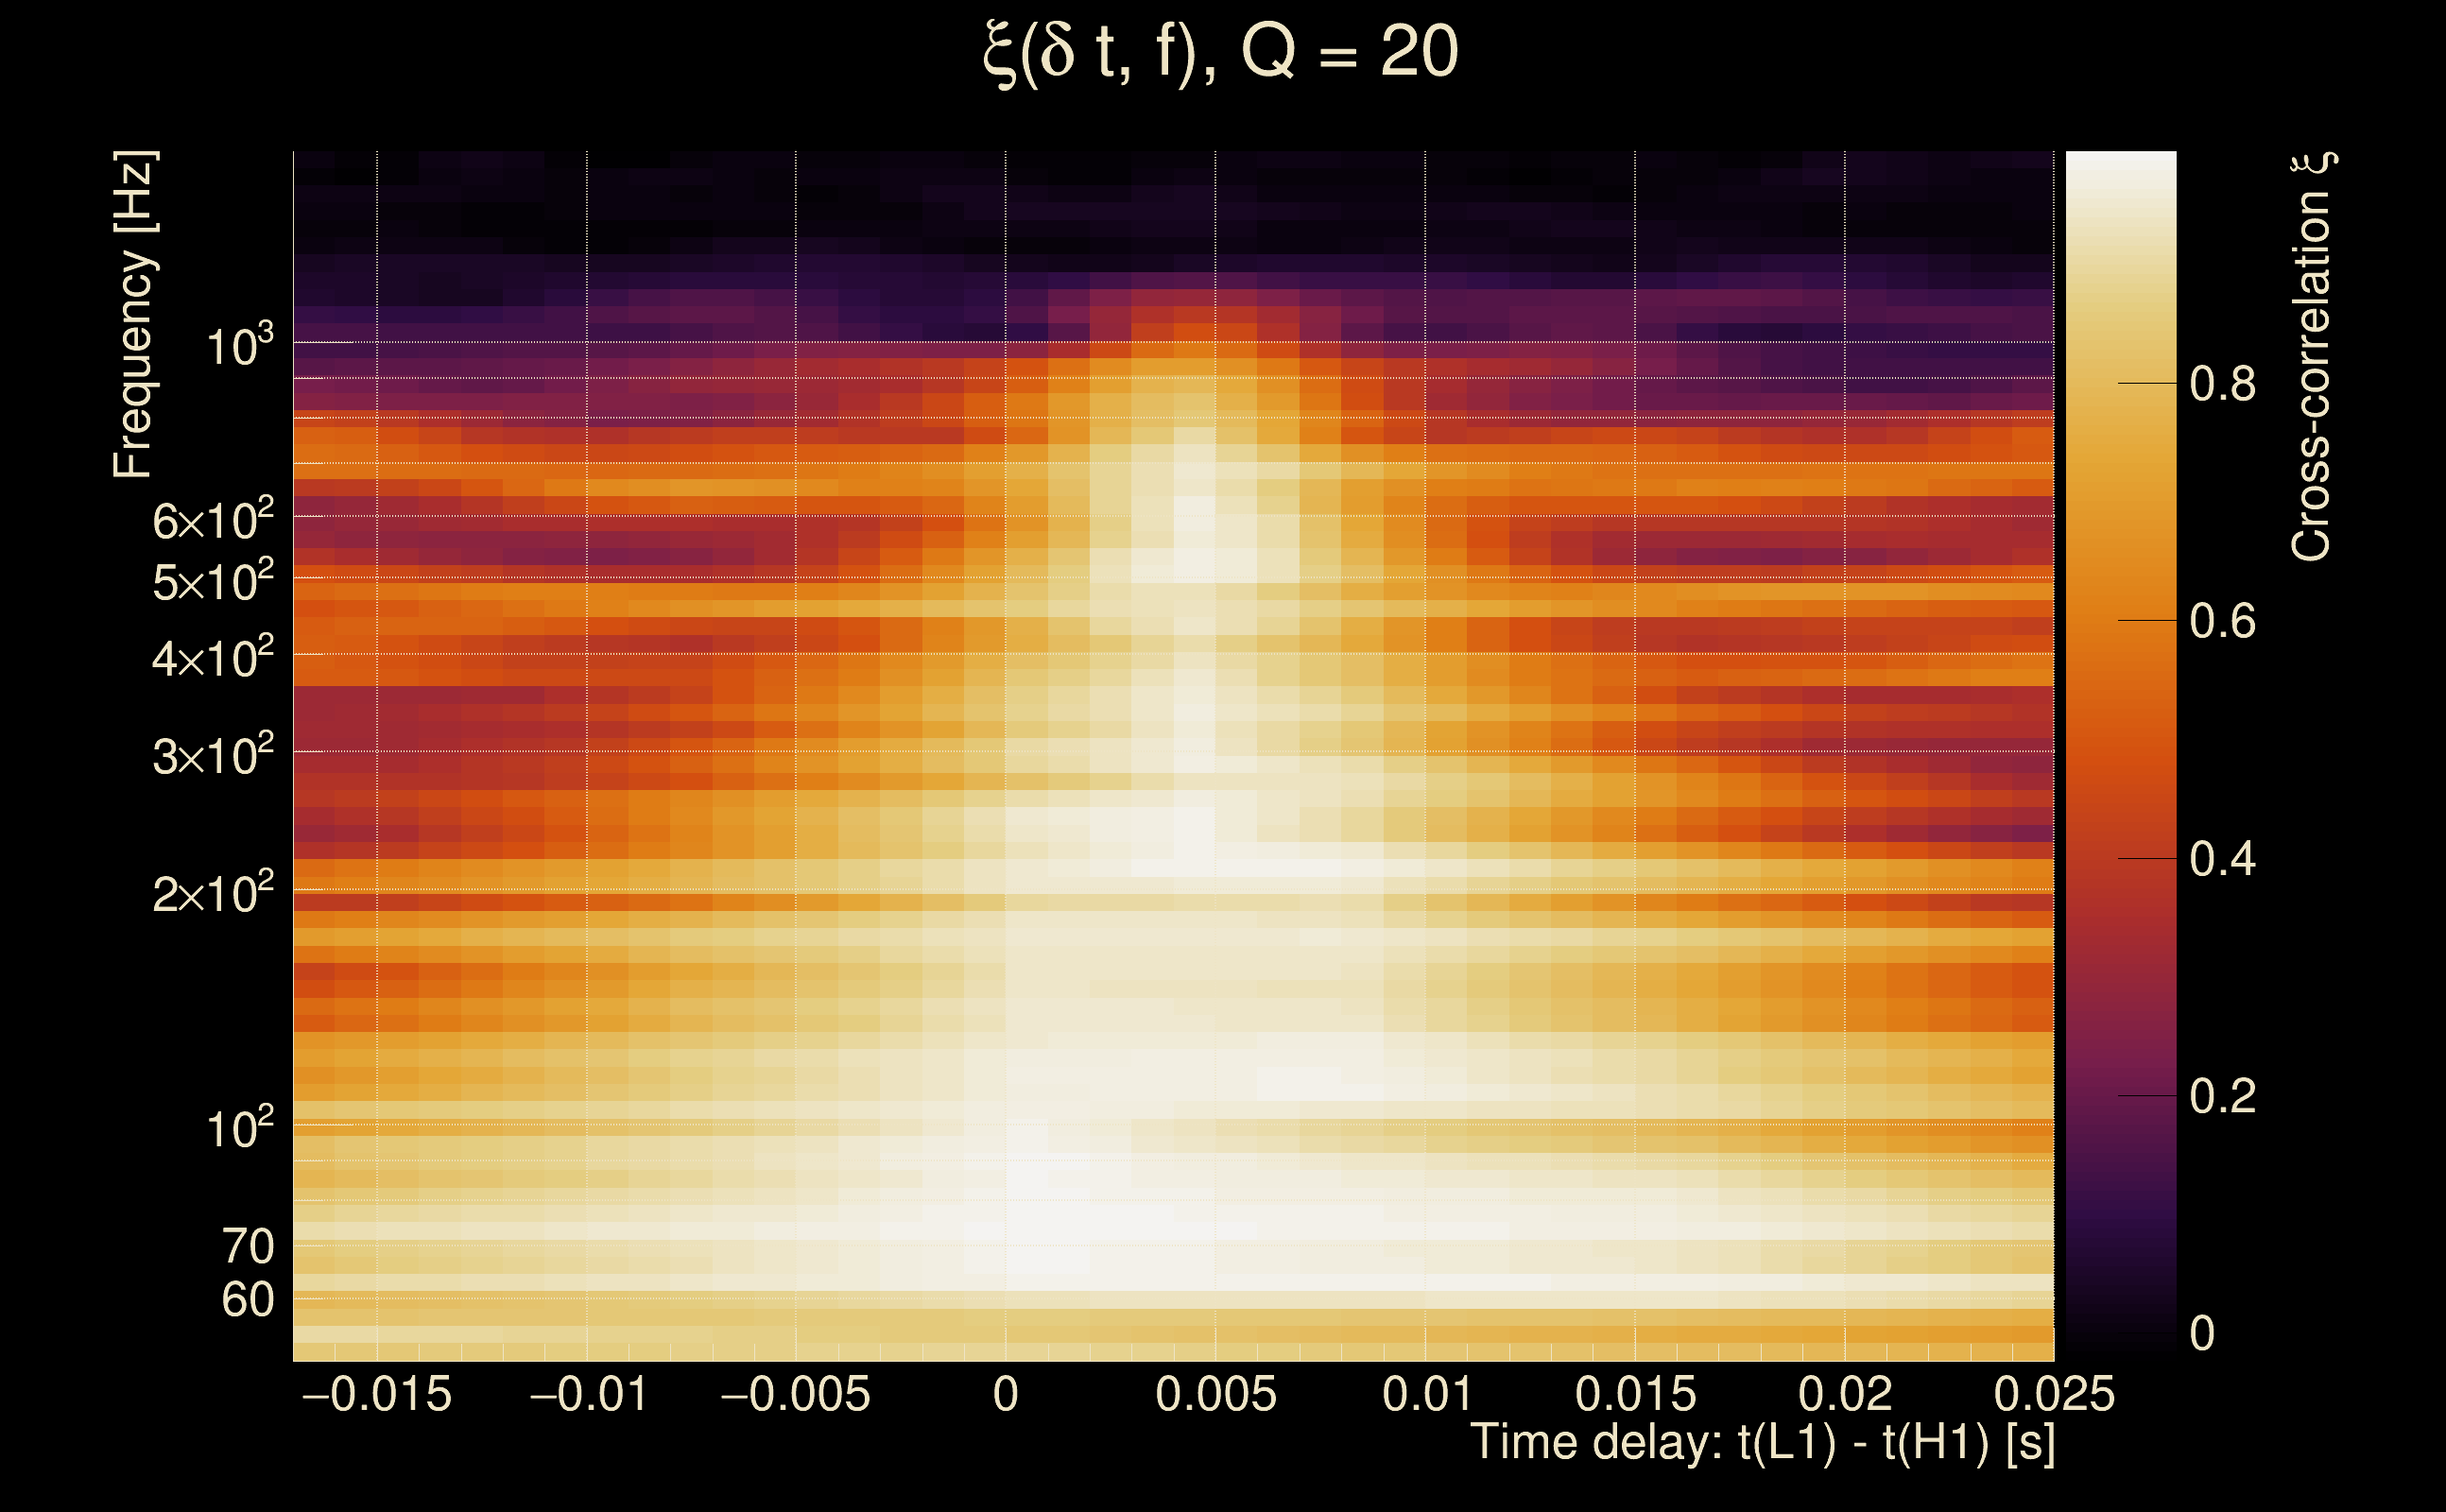
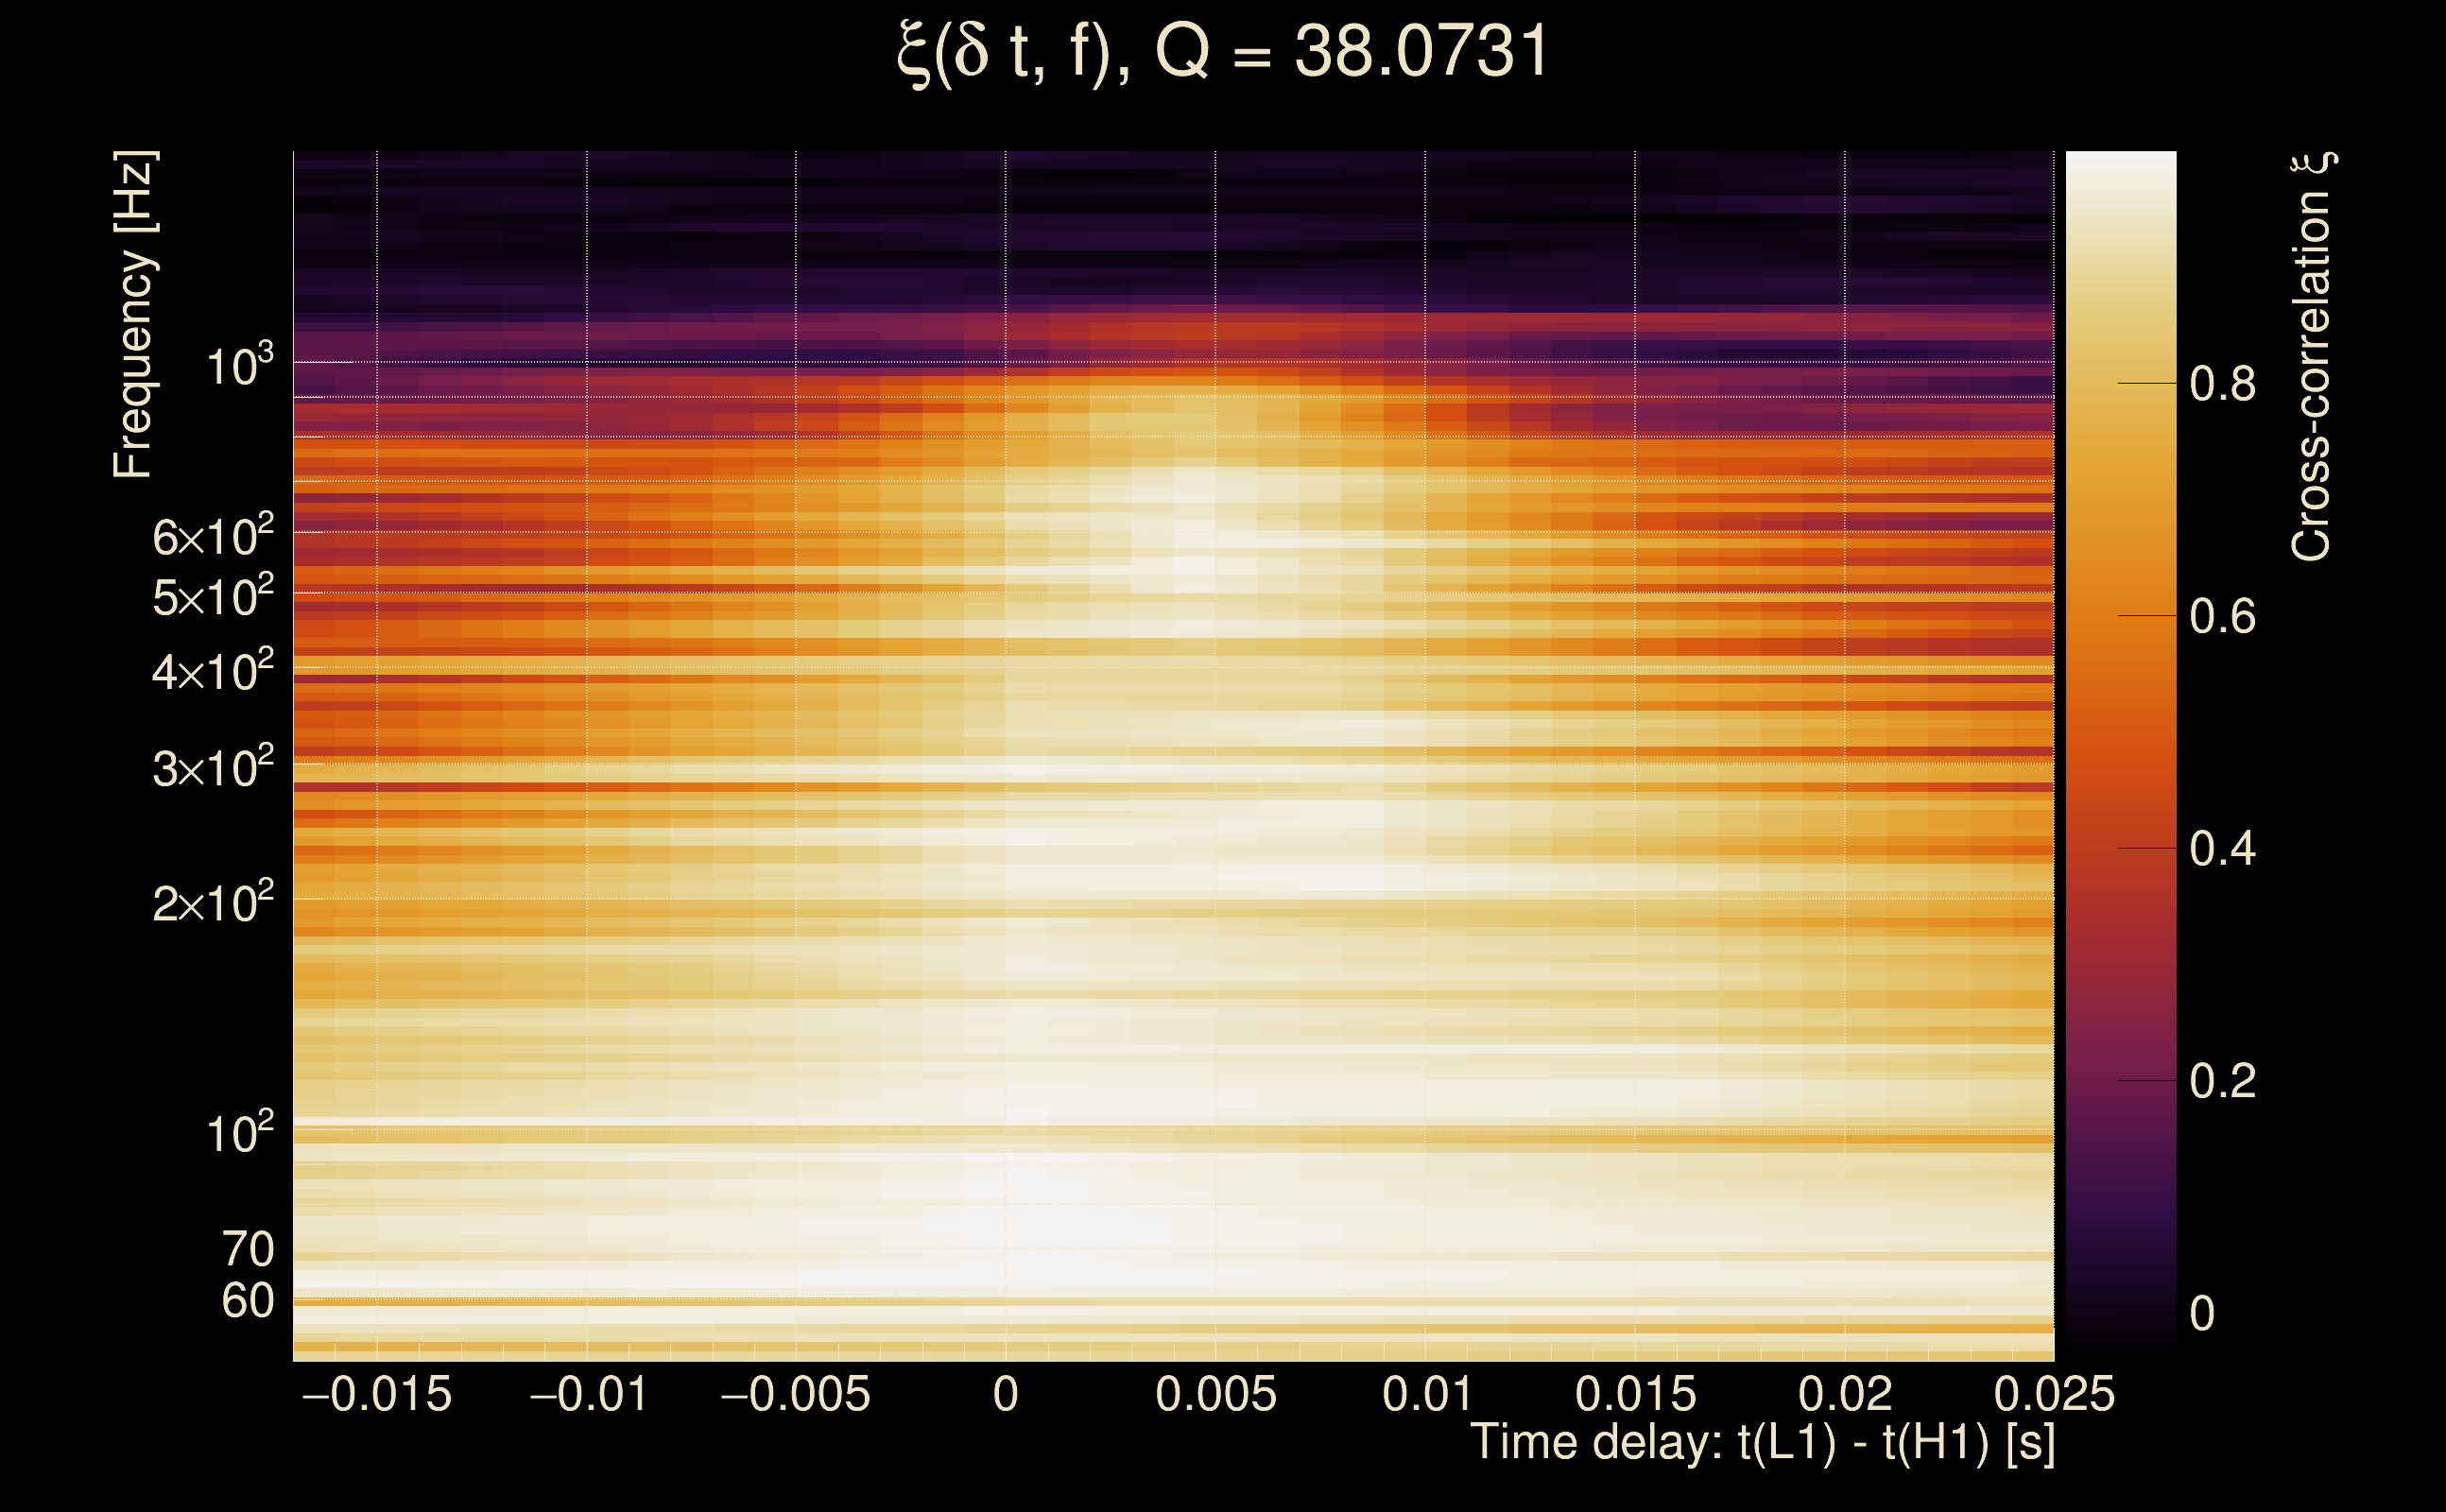
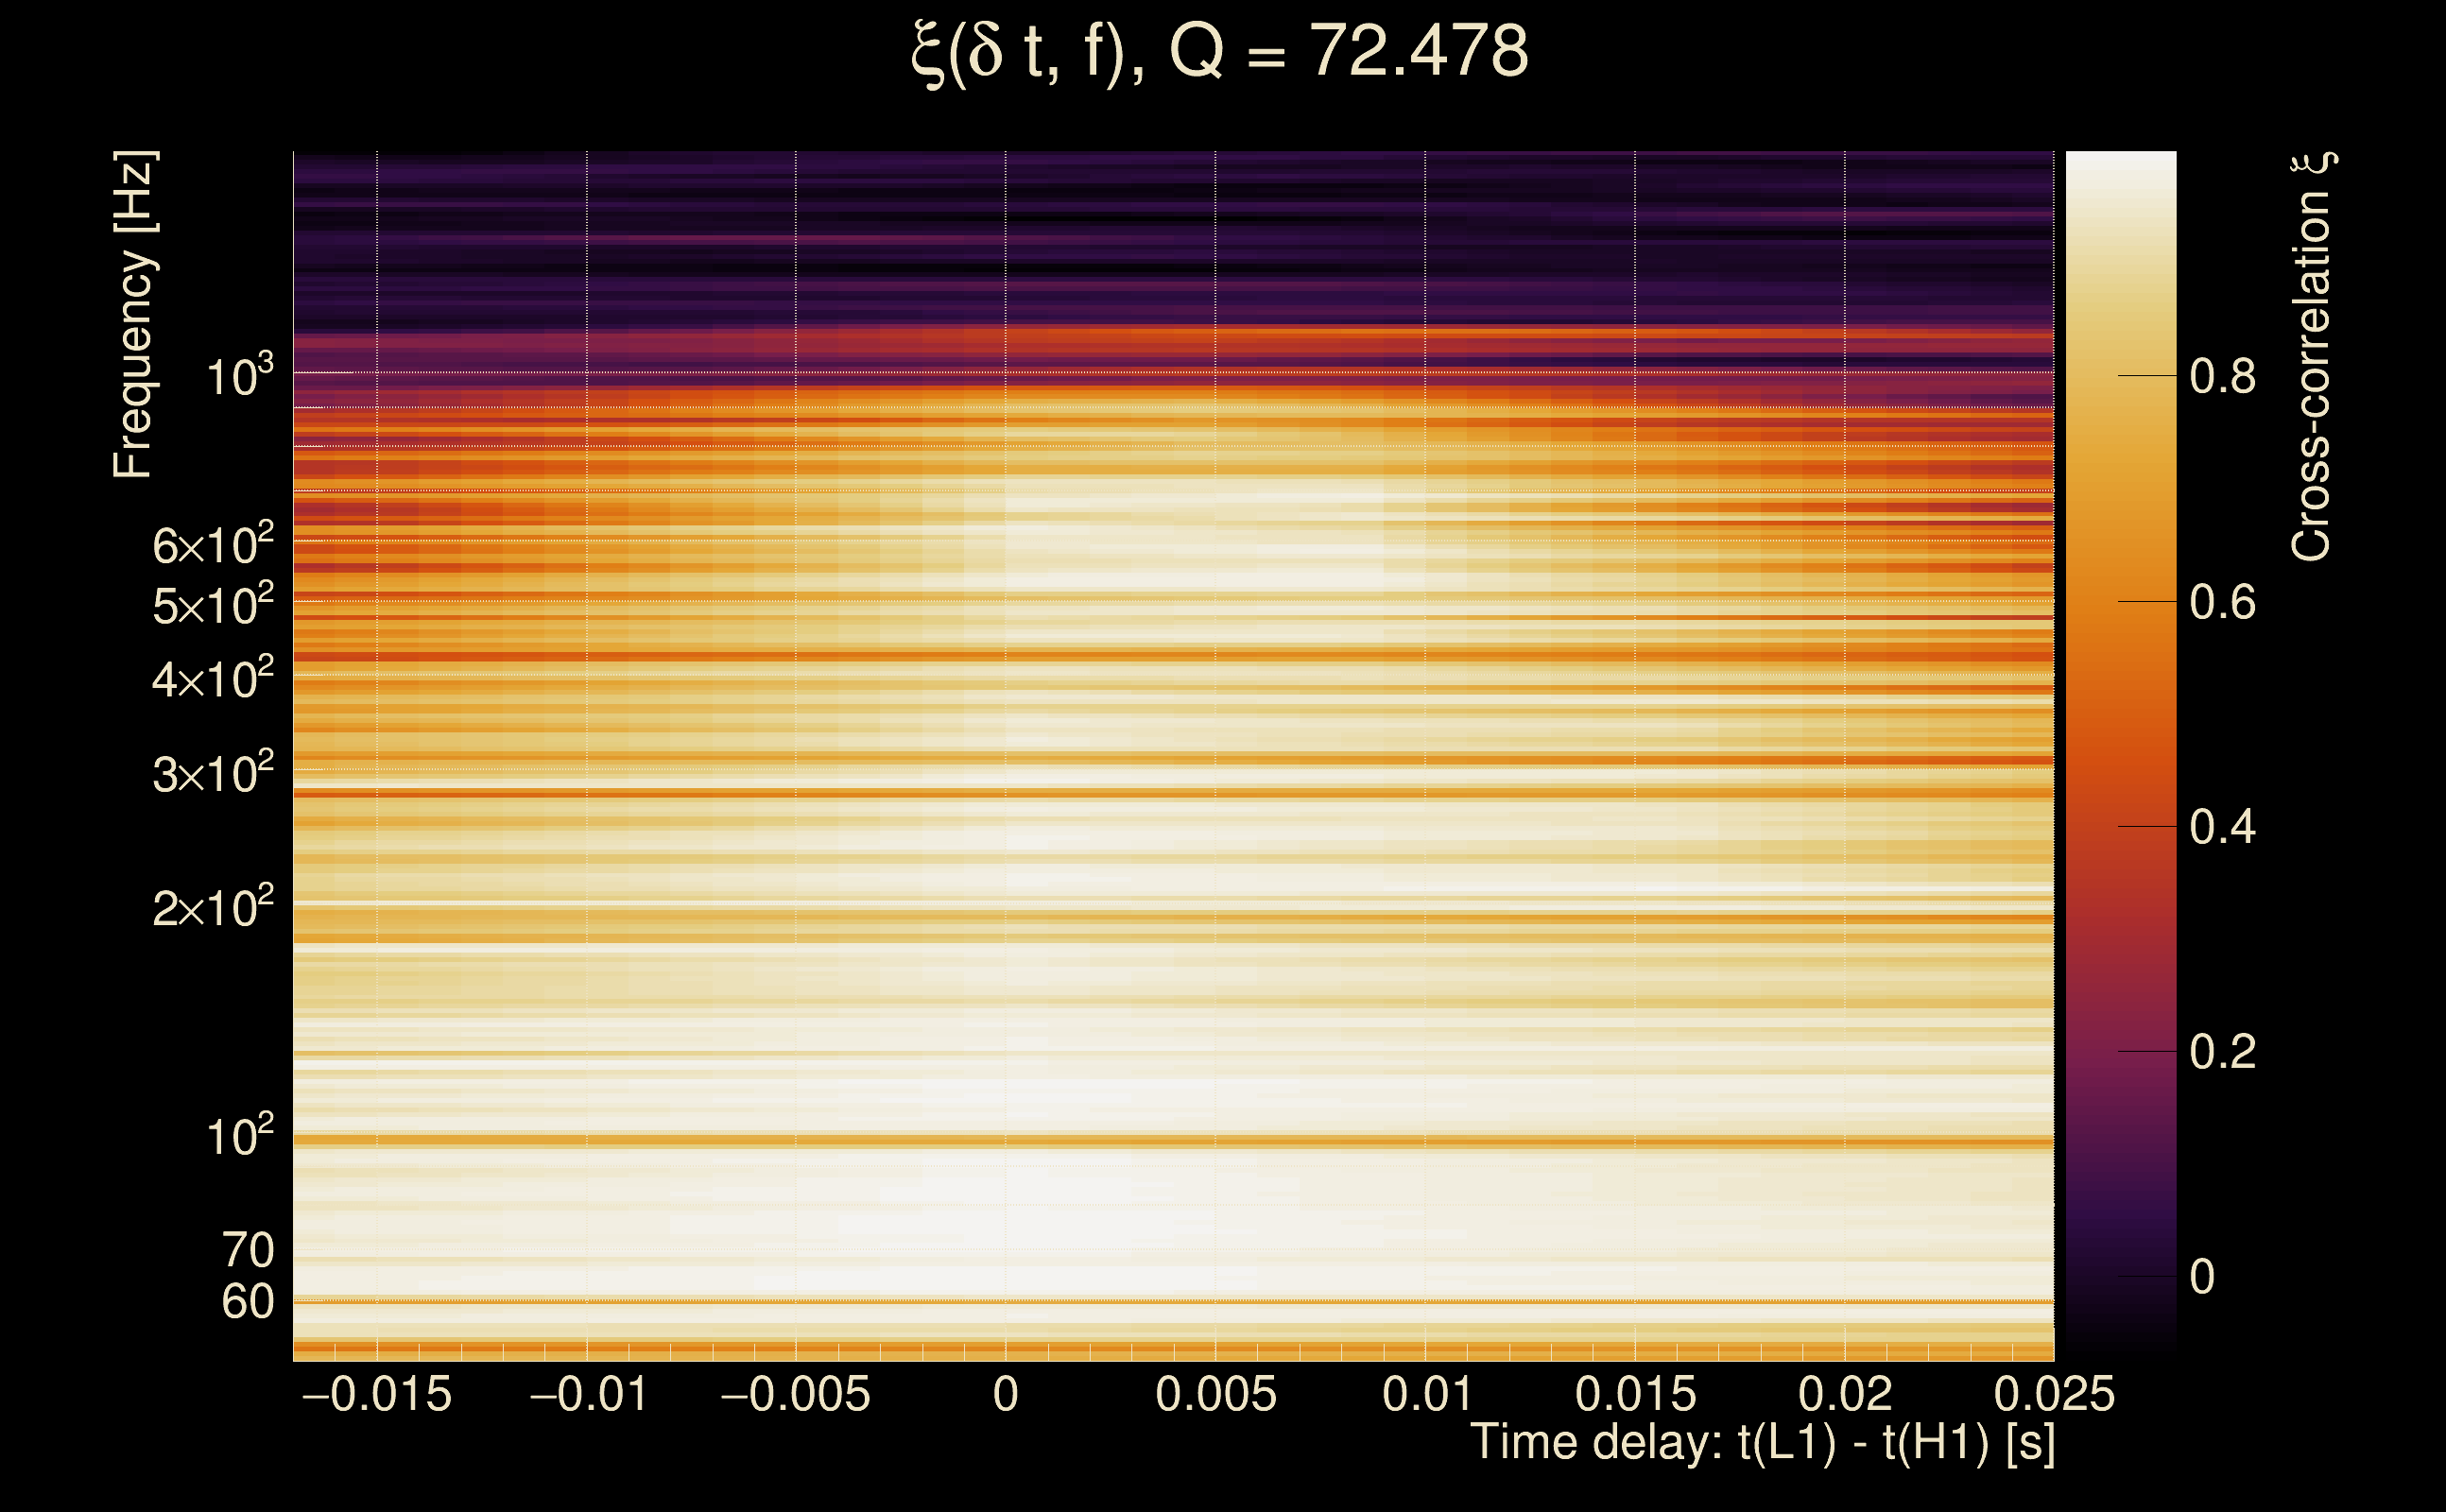
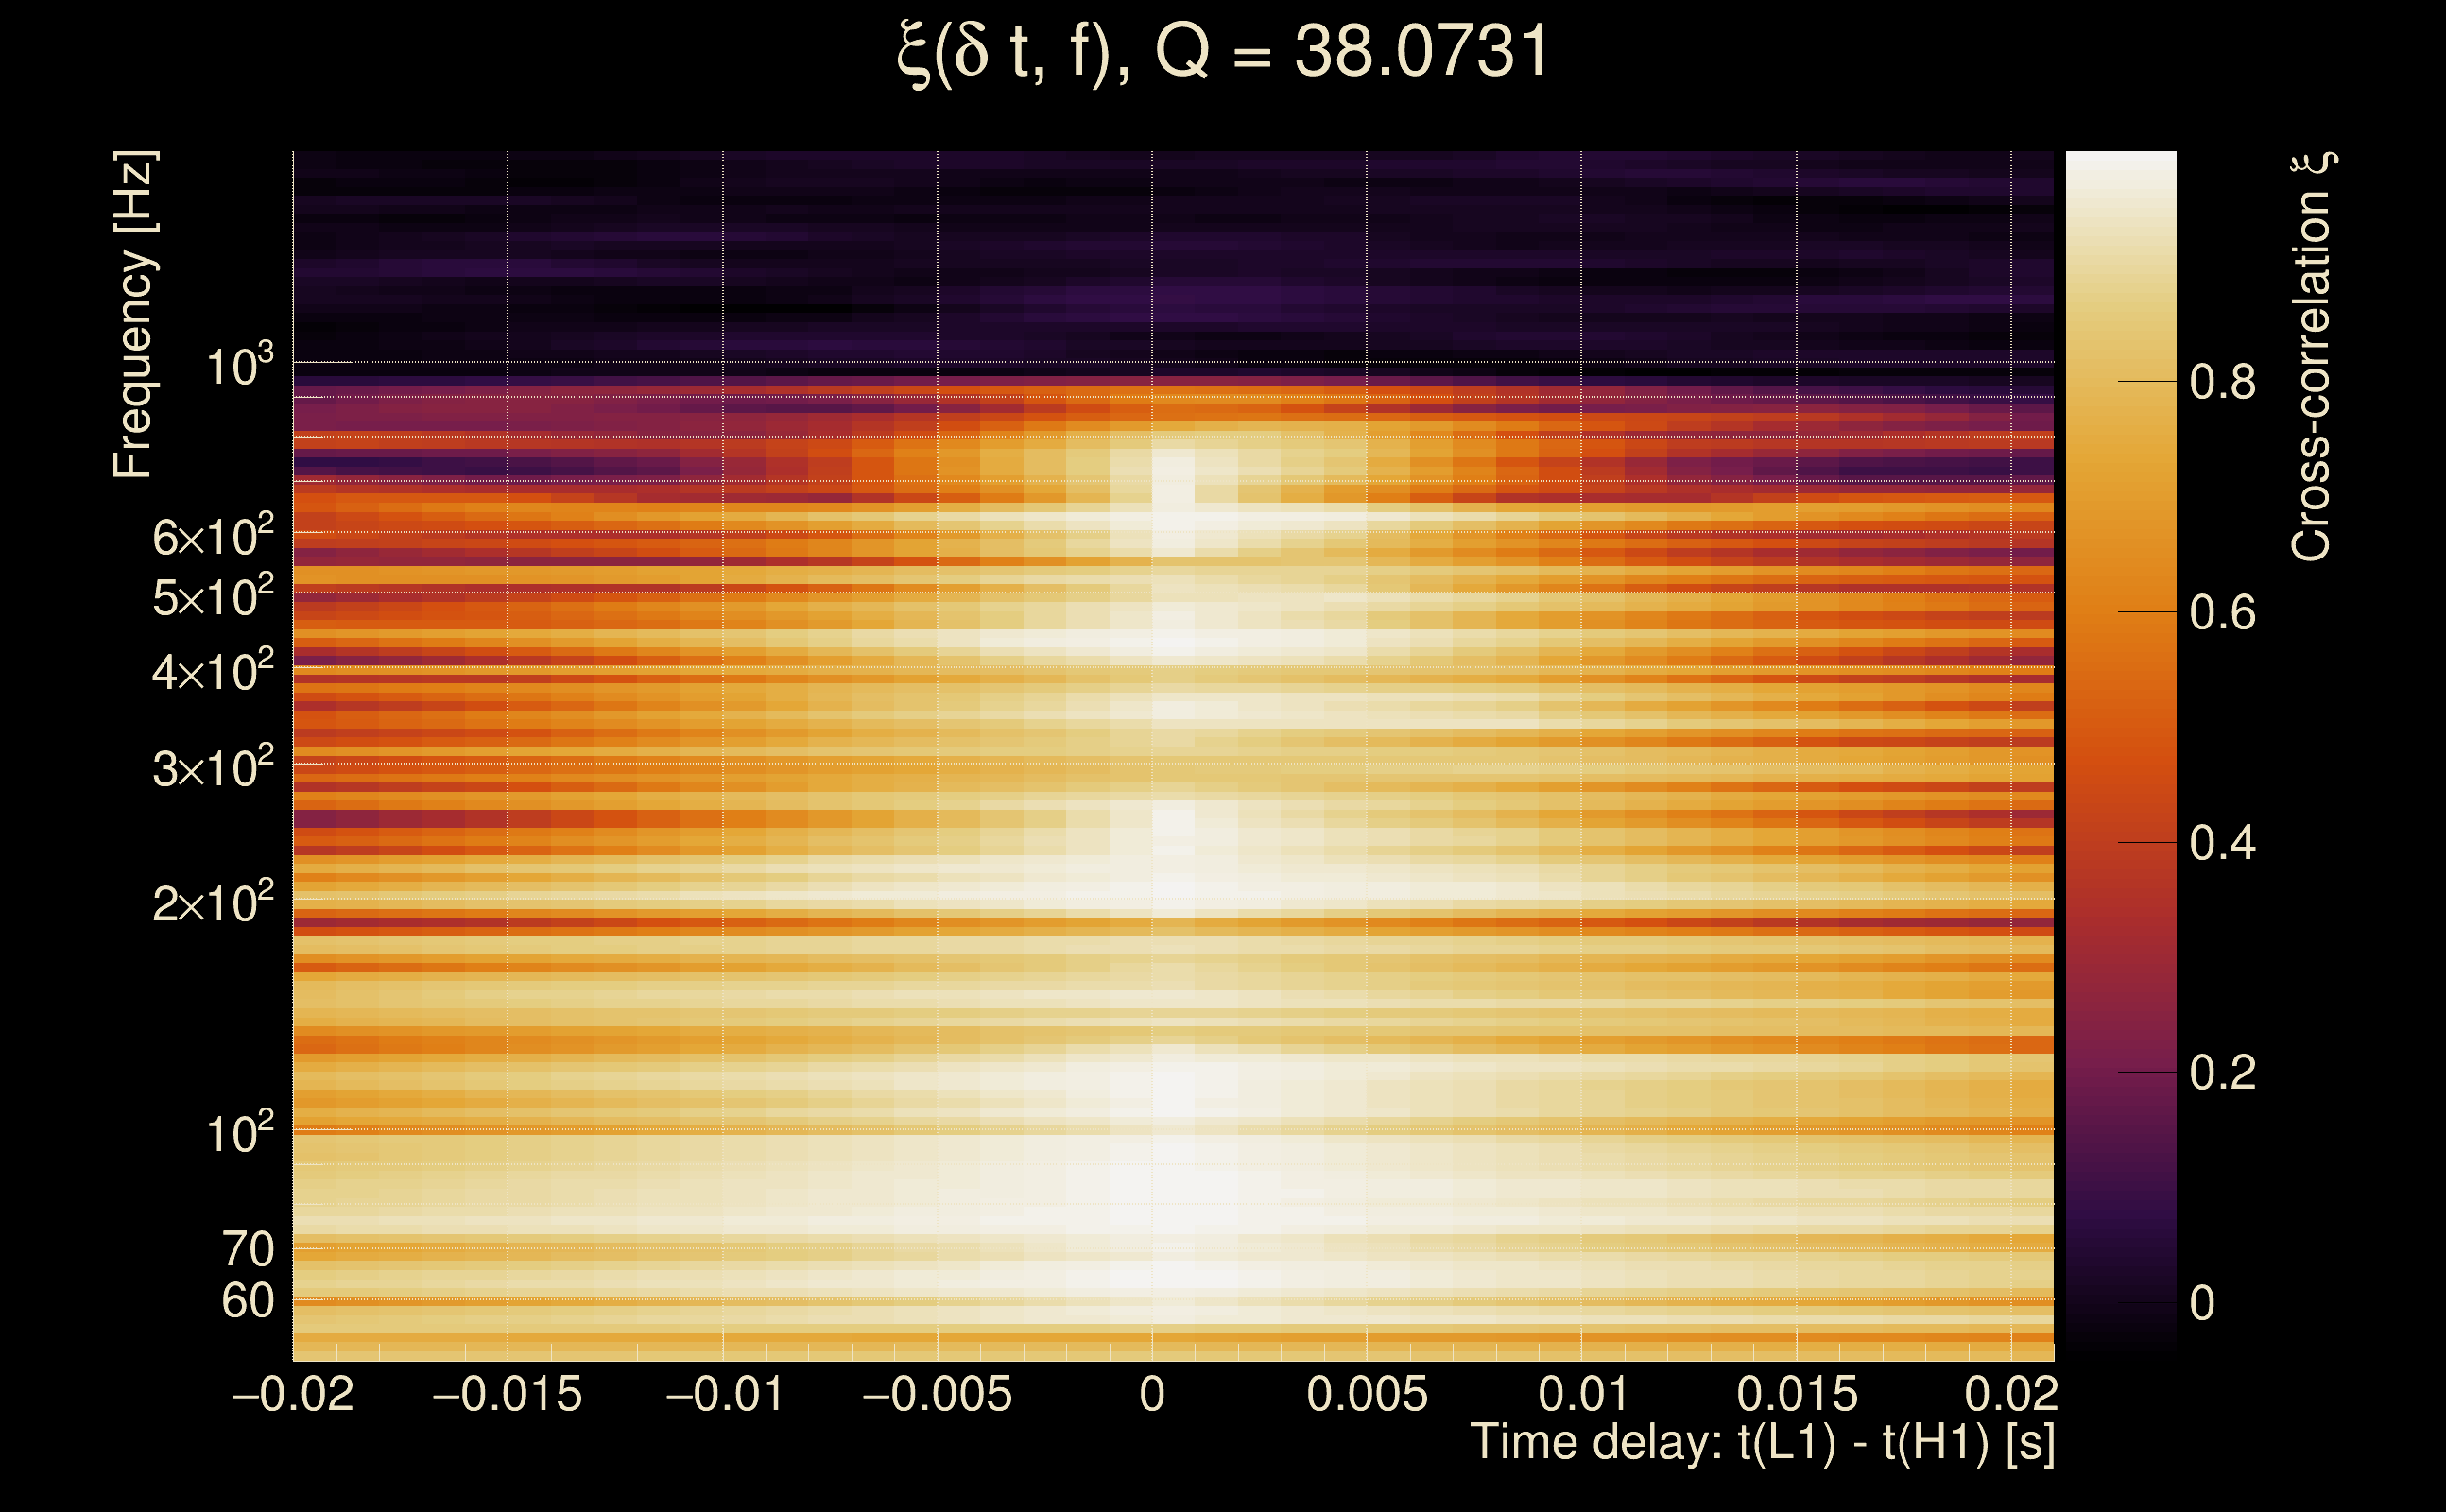
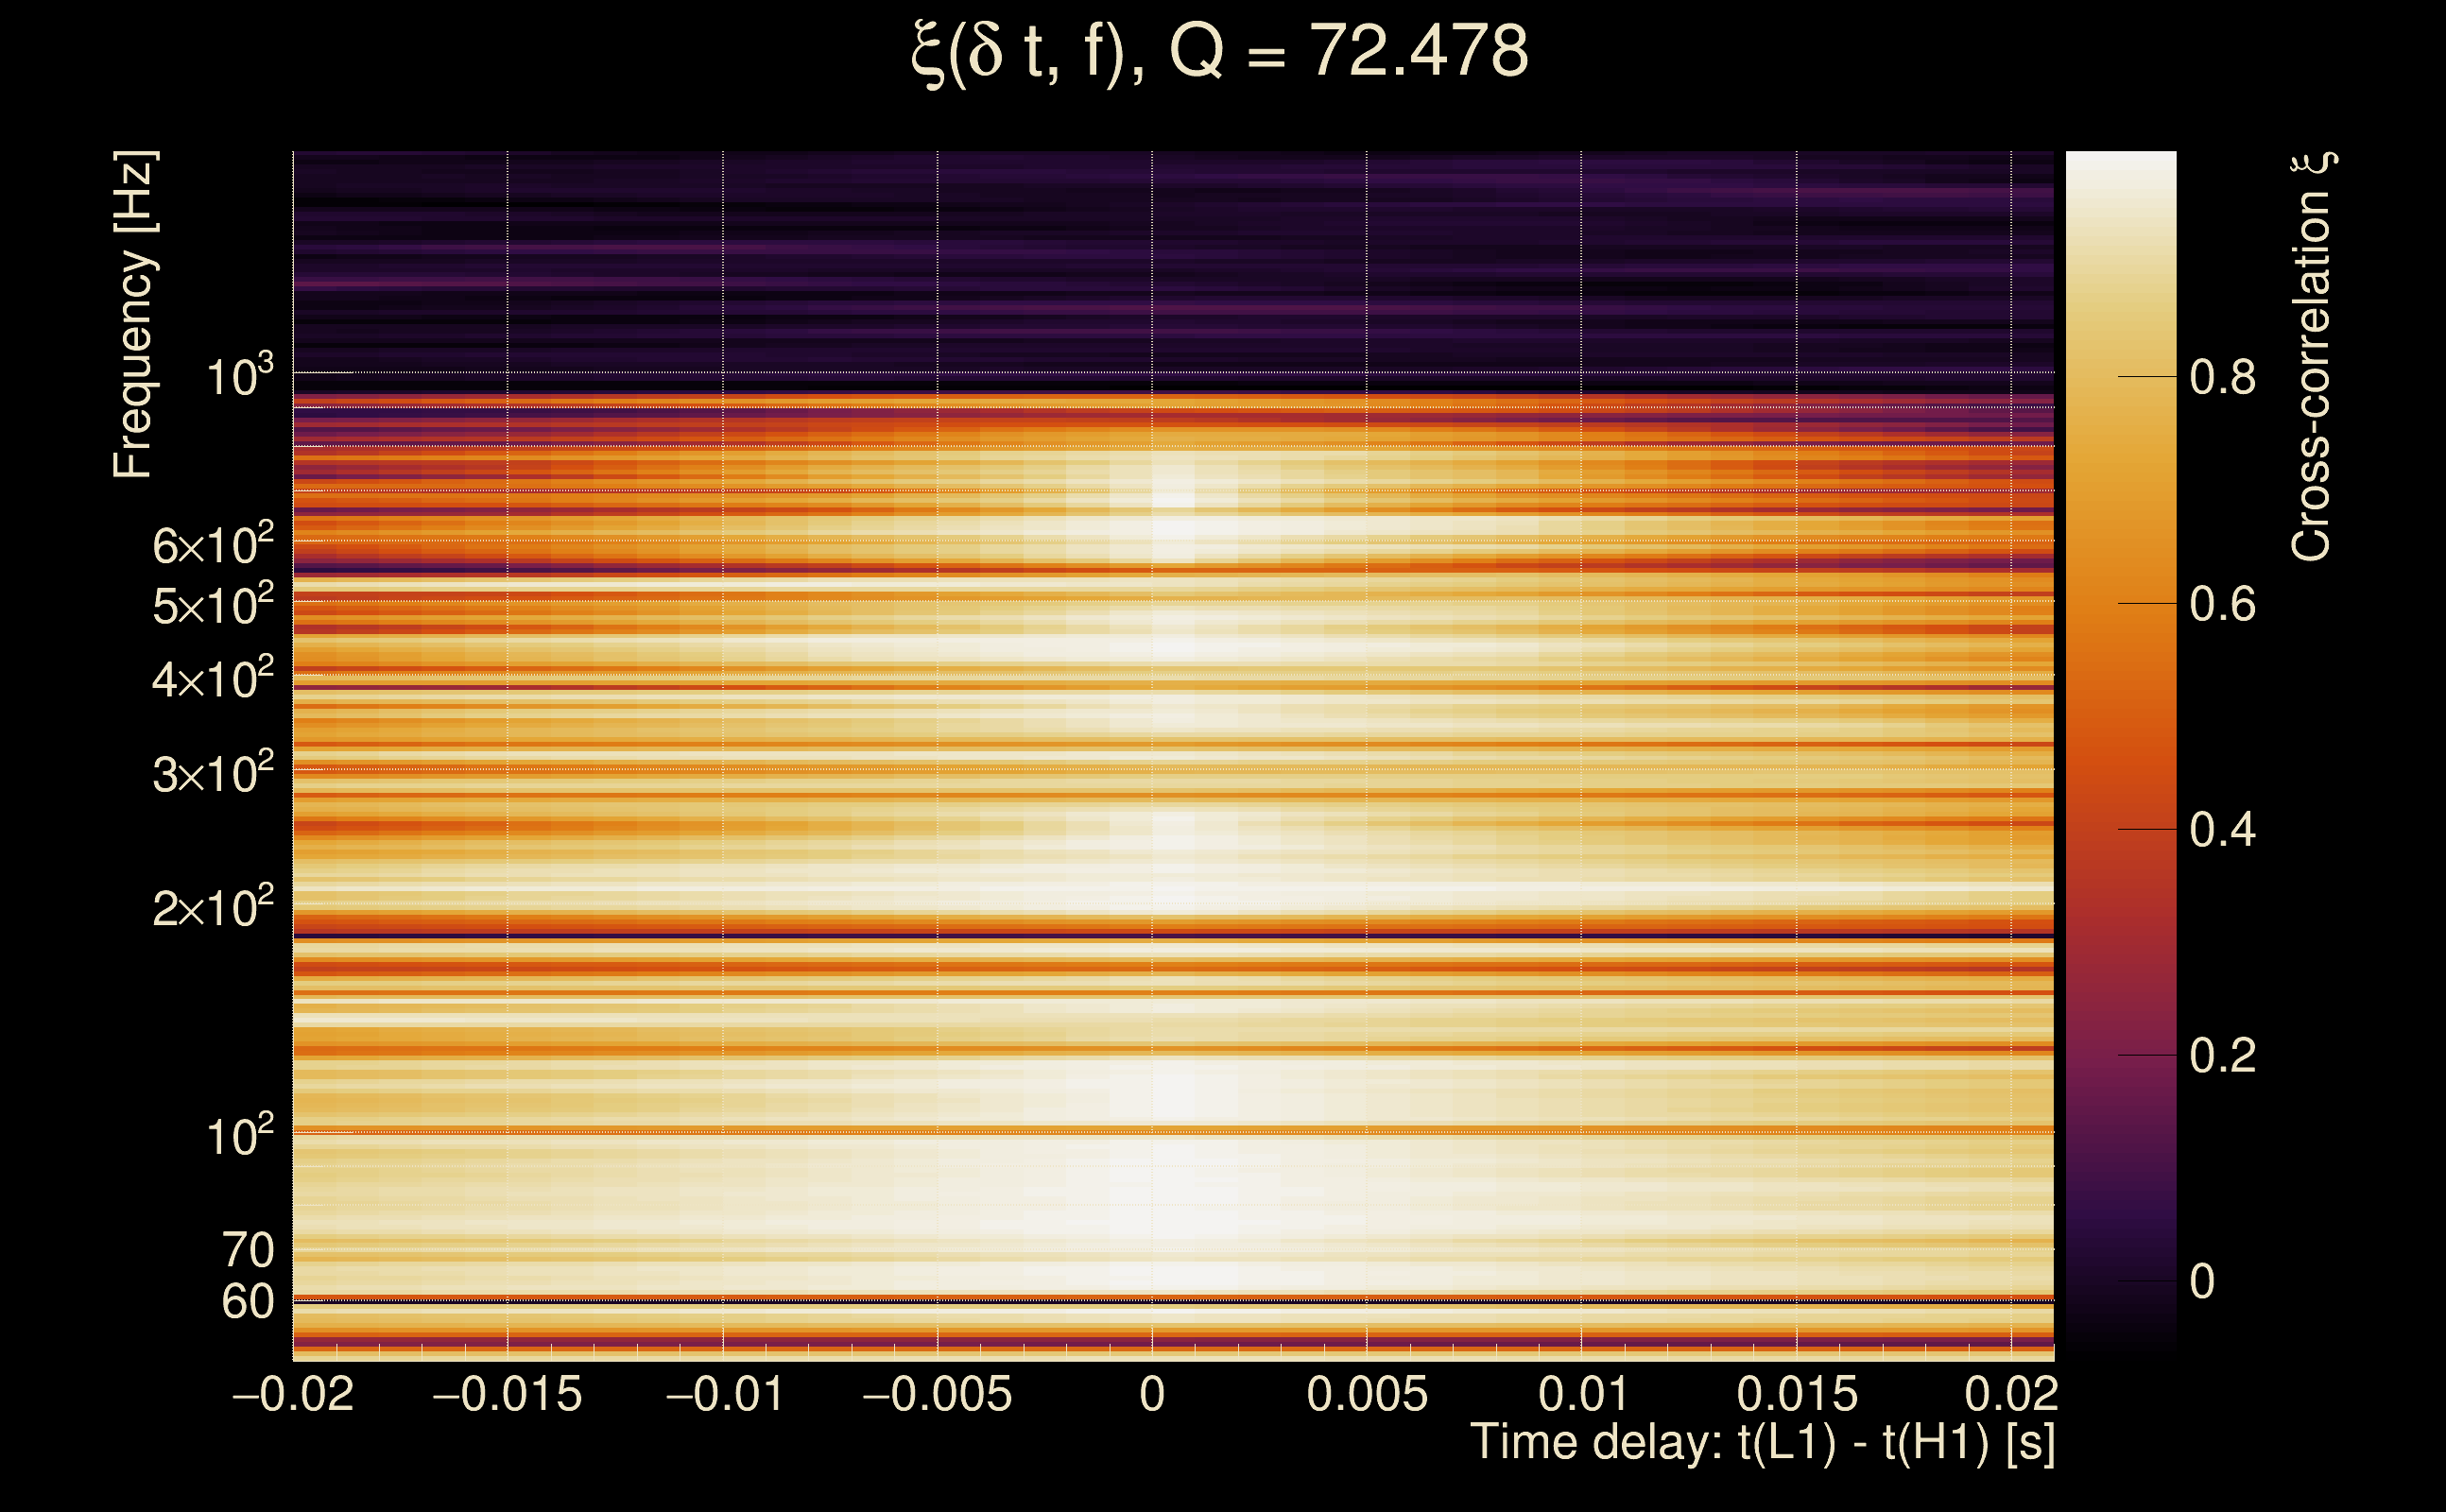
| Time delay between detectors t(L1) - t(H1): | 0.00253771 s (slice index = 108 / 217), δt_gw = 0.00253771 s |
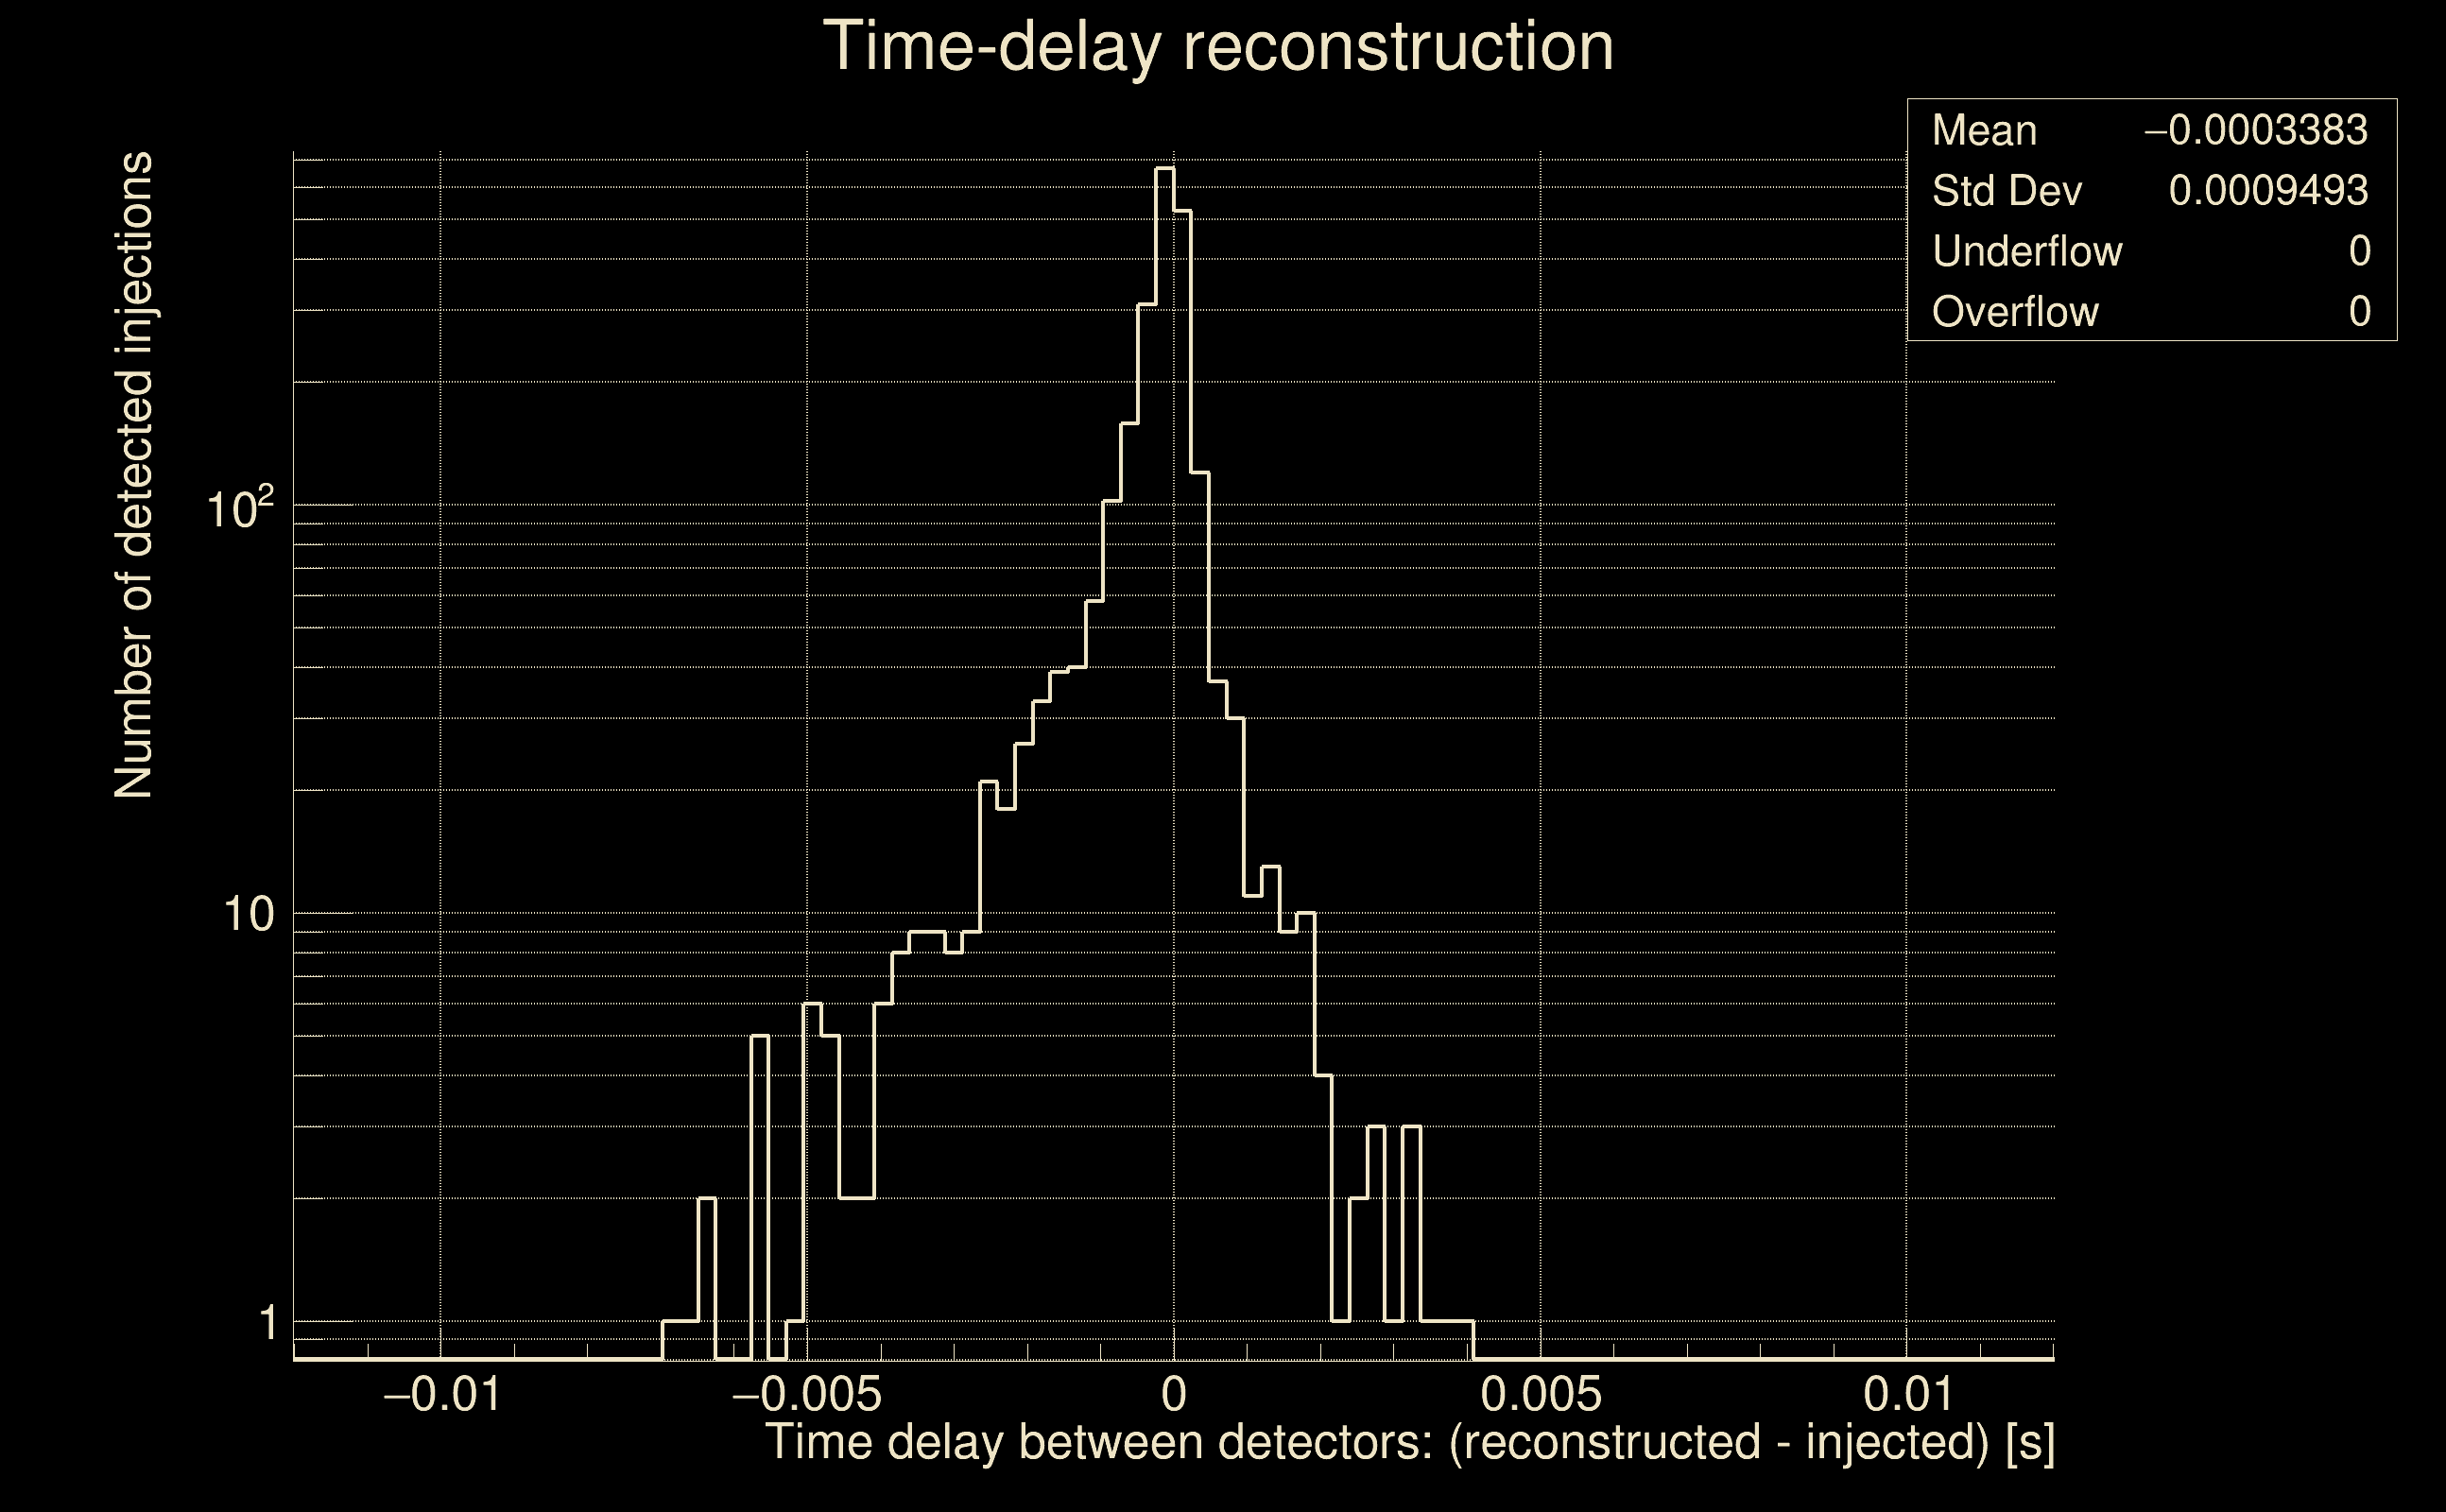
| Time delay uncertainty: | 0.000940985 s |
| [targeted mode] Time delay probability: | 0.996777 (0.00403937 sigmas), δt_target = 1.72247e+45 s |
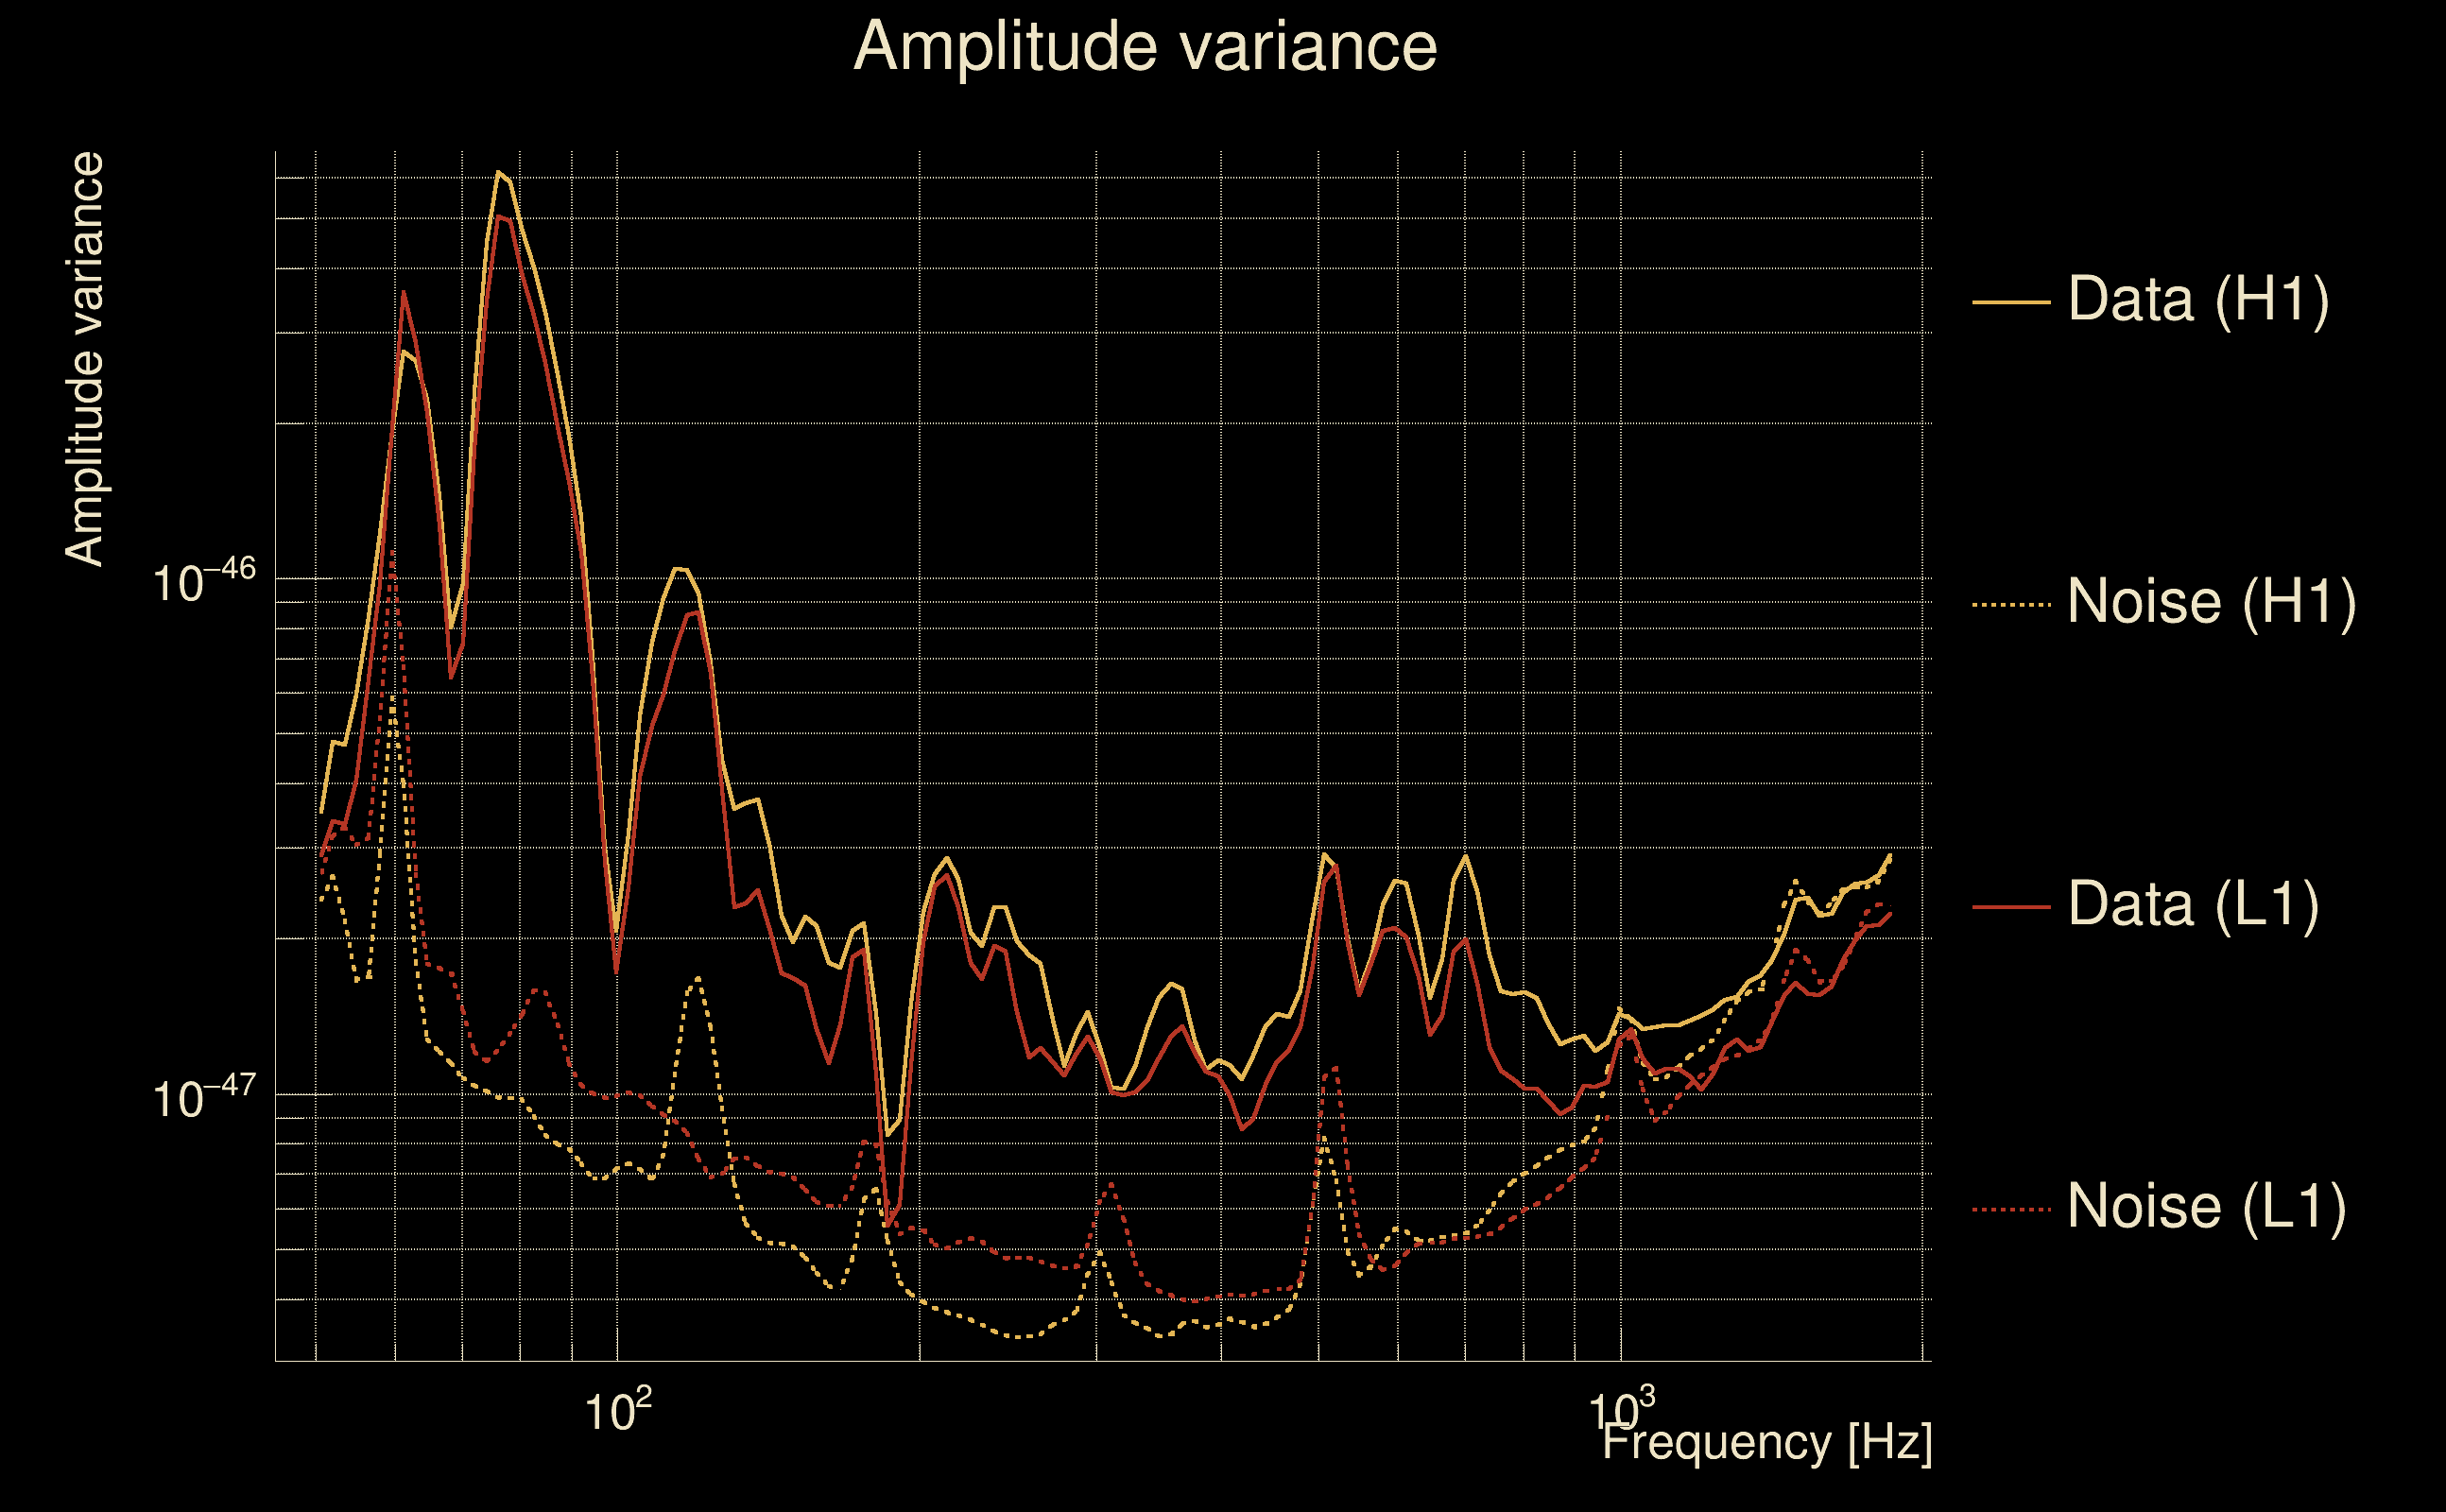
| Frequency: | 230.624 Hz |
| Ξ: | 0.899785 ± 0.00154342 (variance = 2.38216e-06): Q0: 0.927836, Q1: 0.92822, Q2: 0.930143, Q3: 0.929679, Q4: 0.925772 |
| Rank: | R_A = 0.896885 |
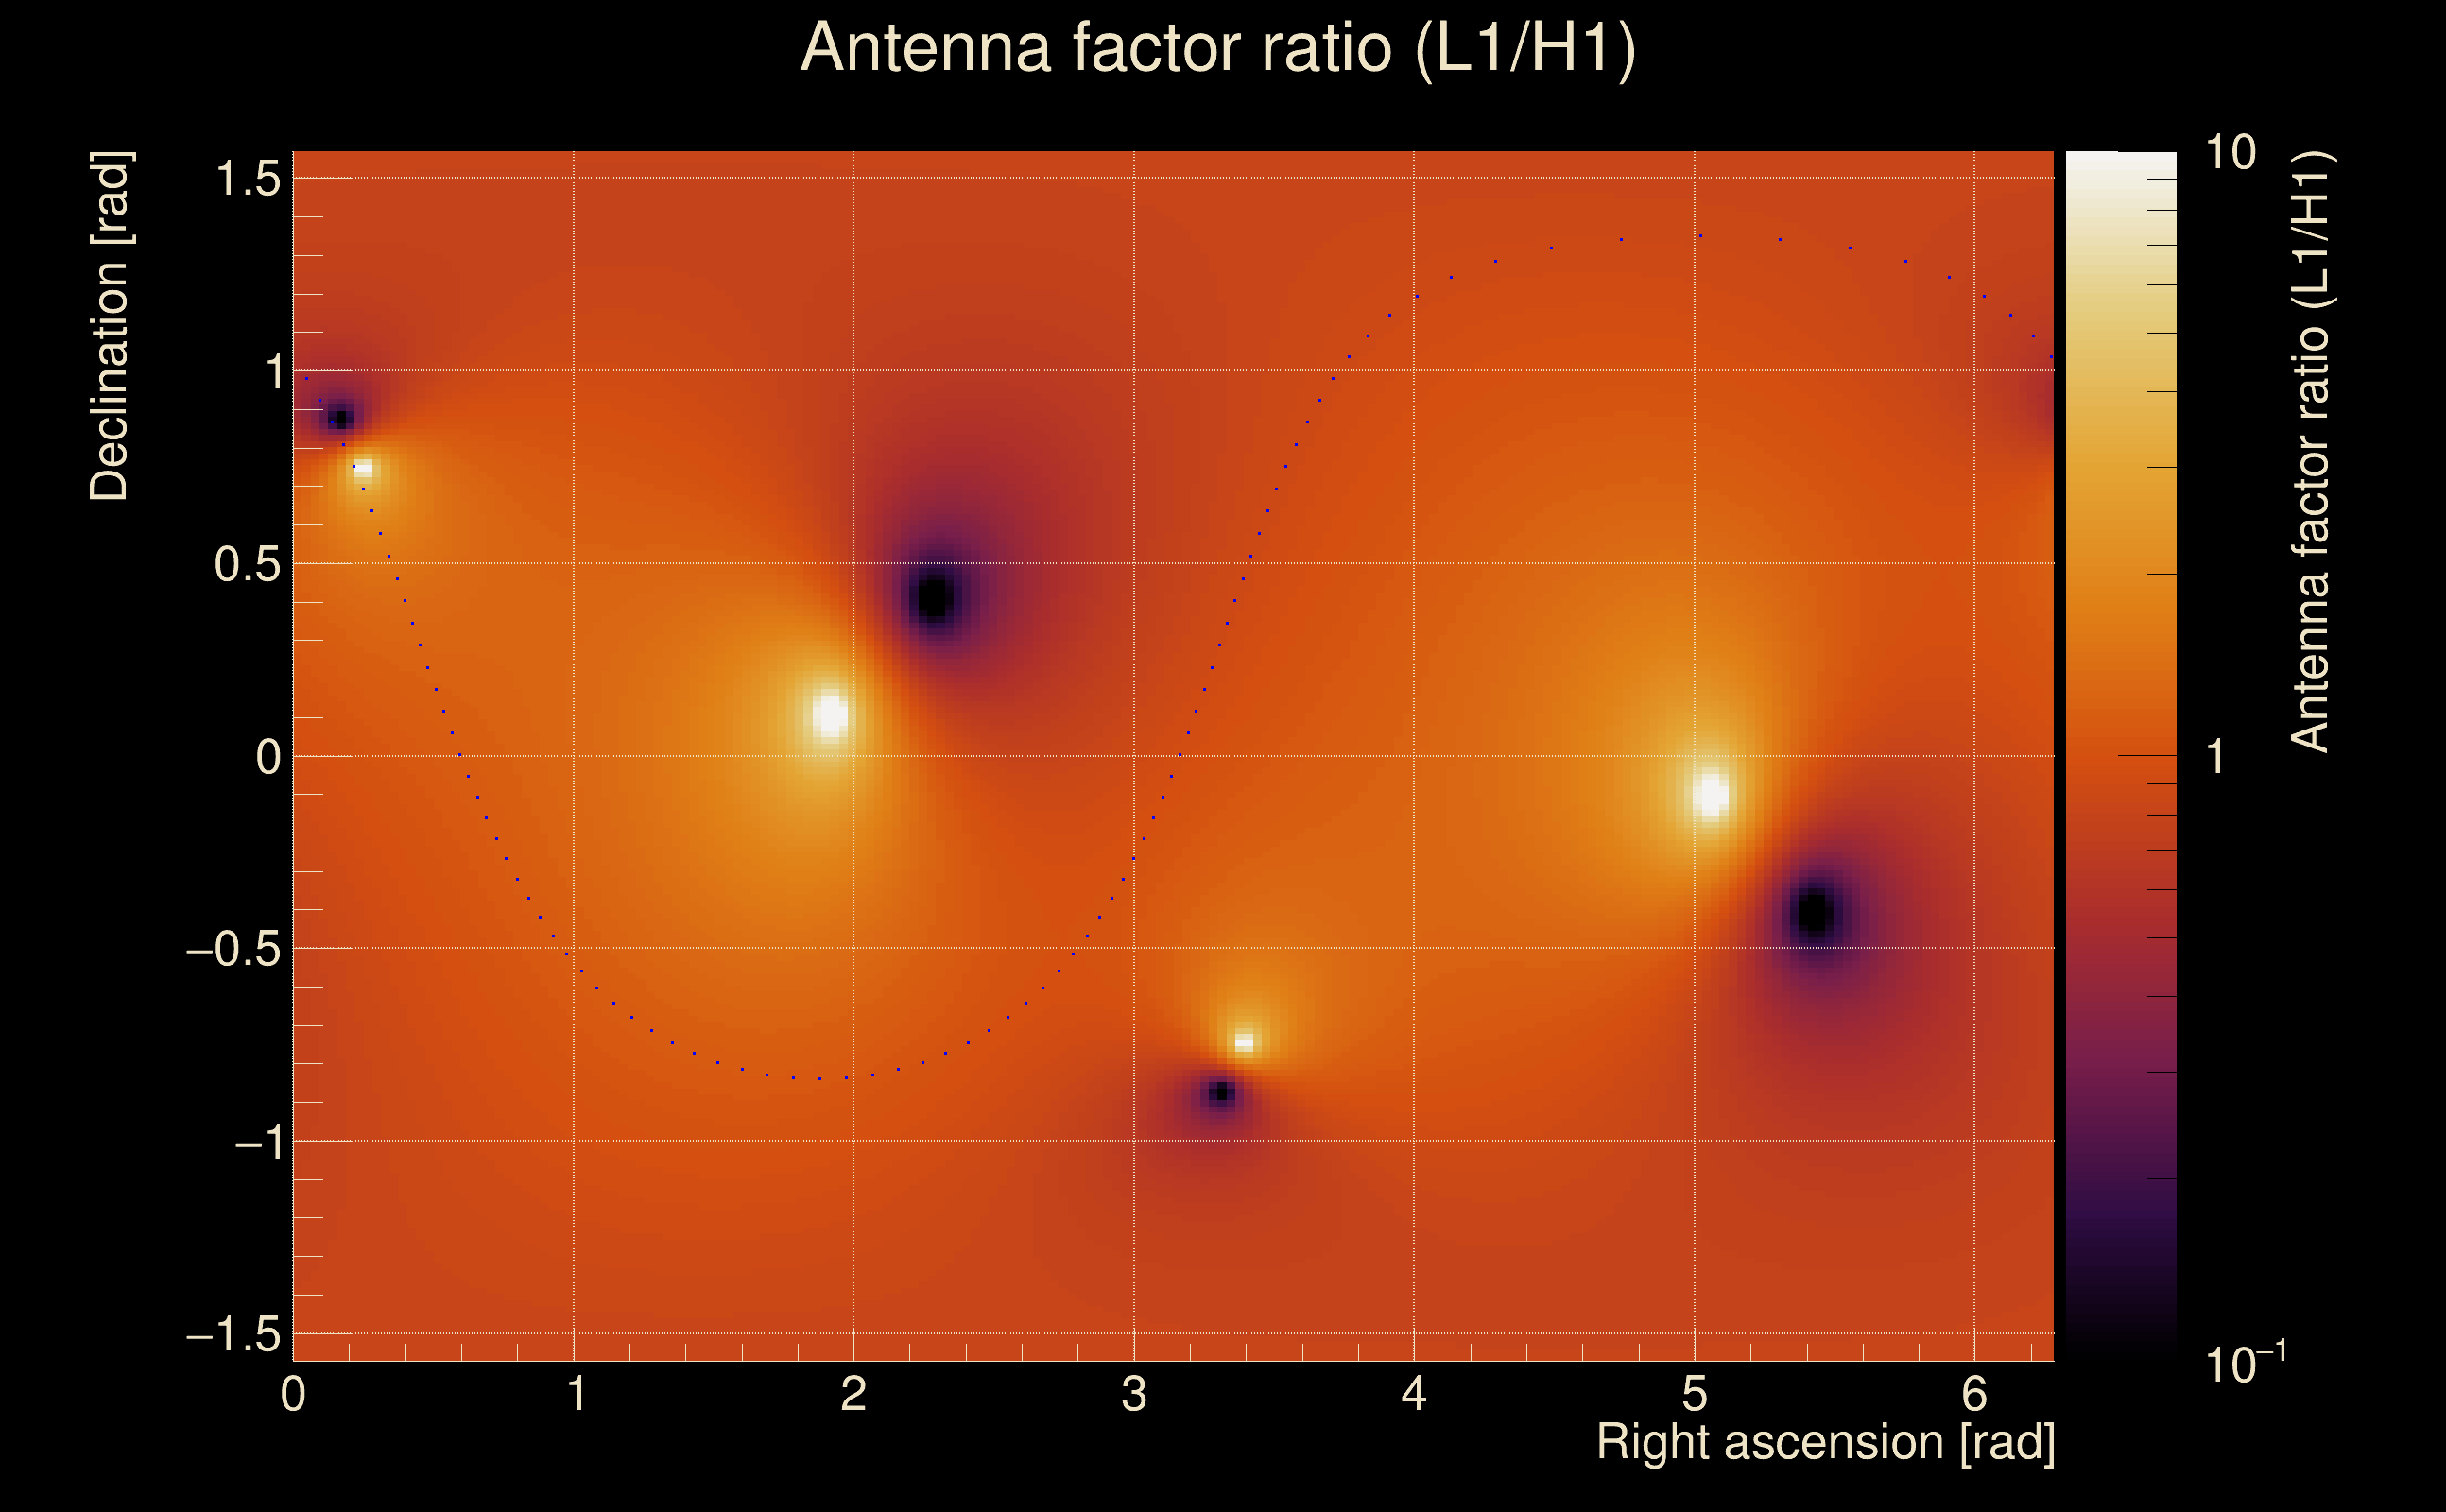
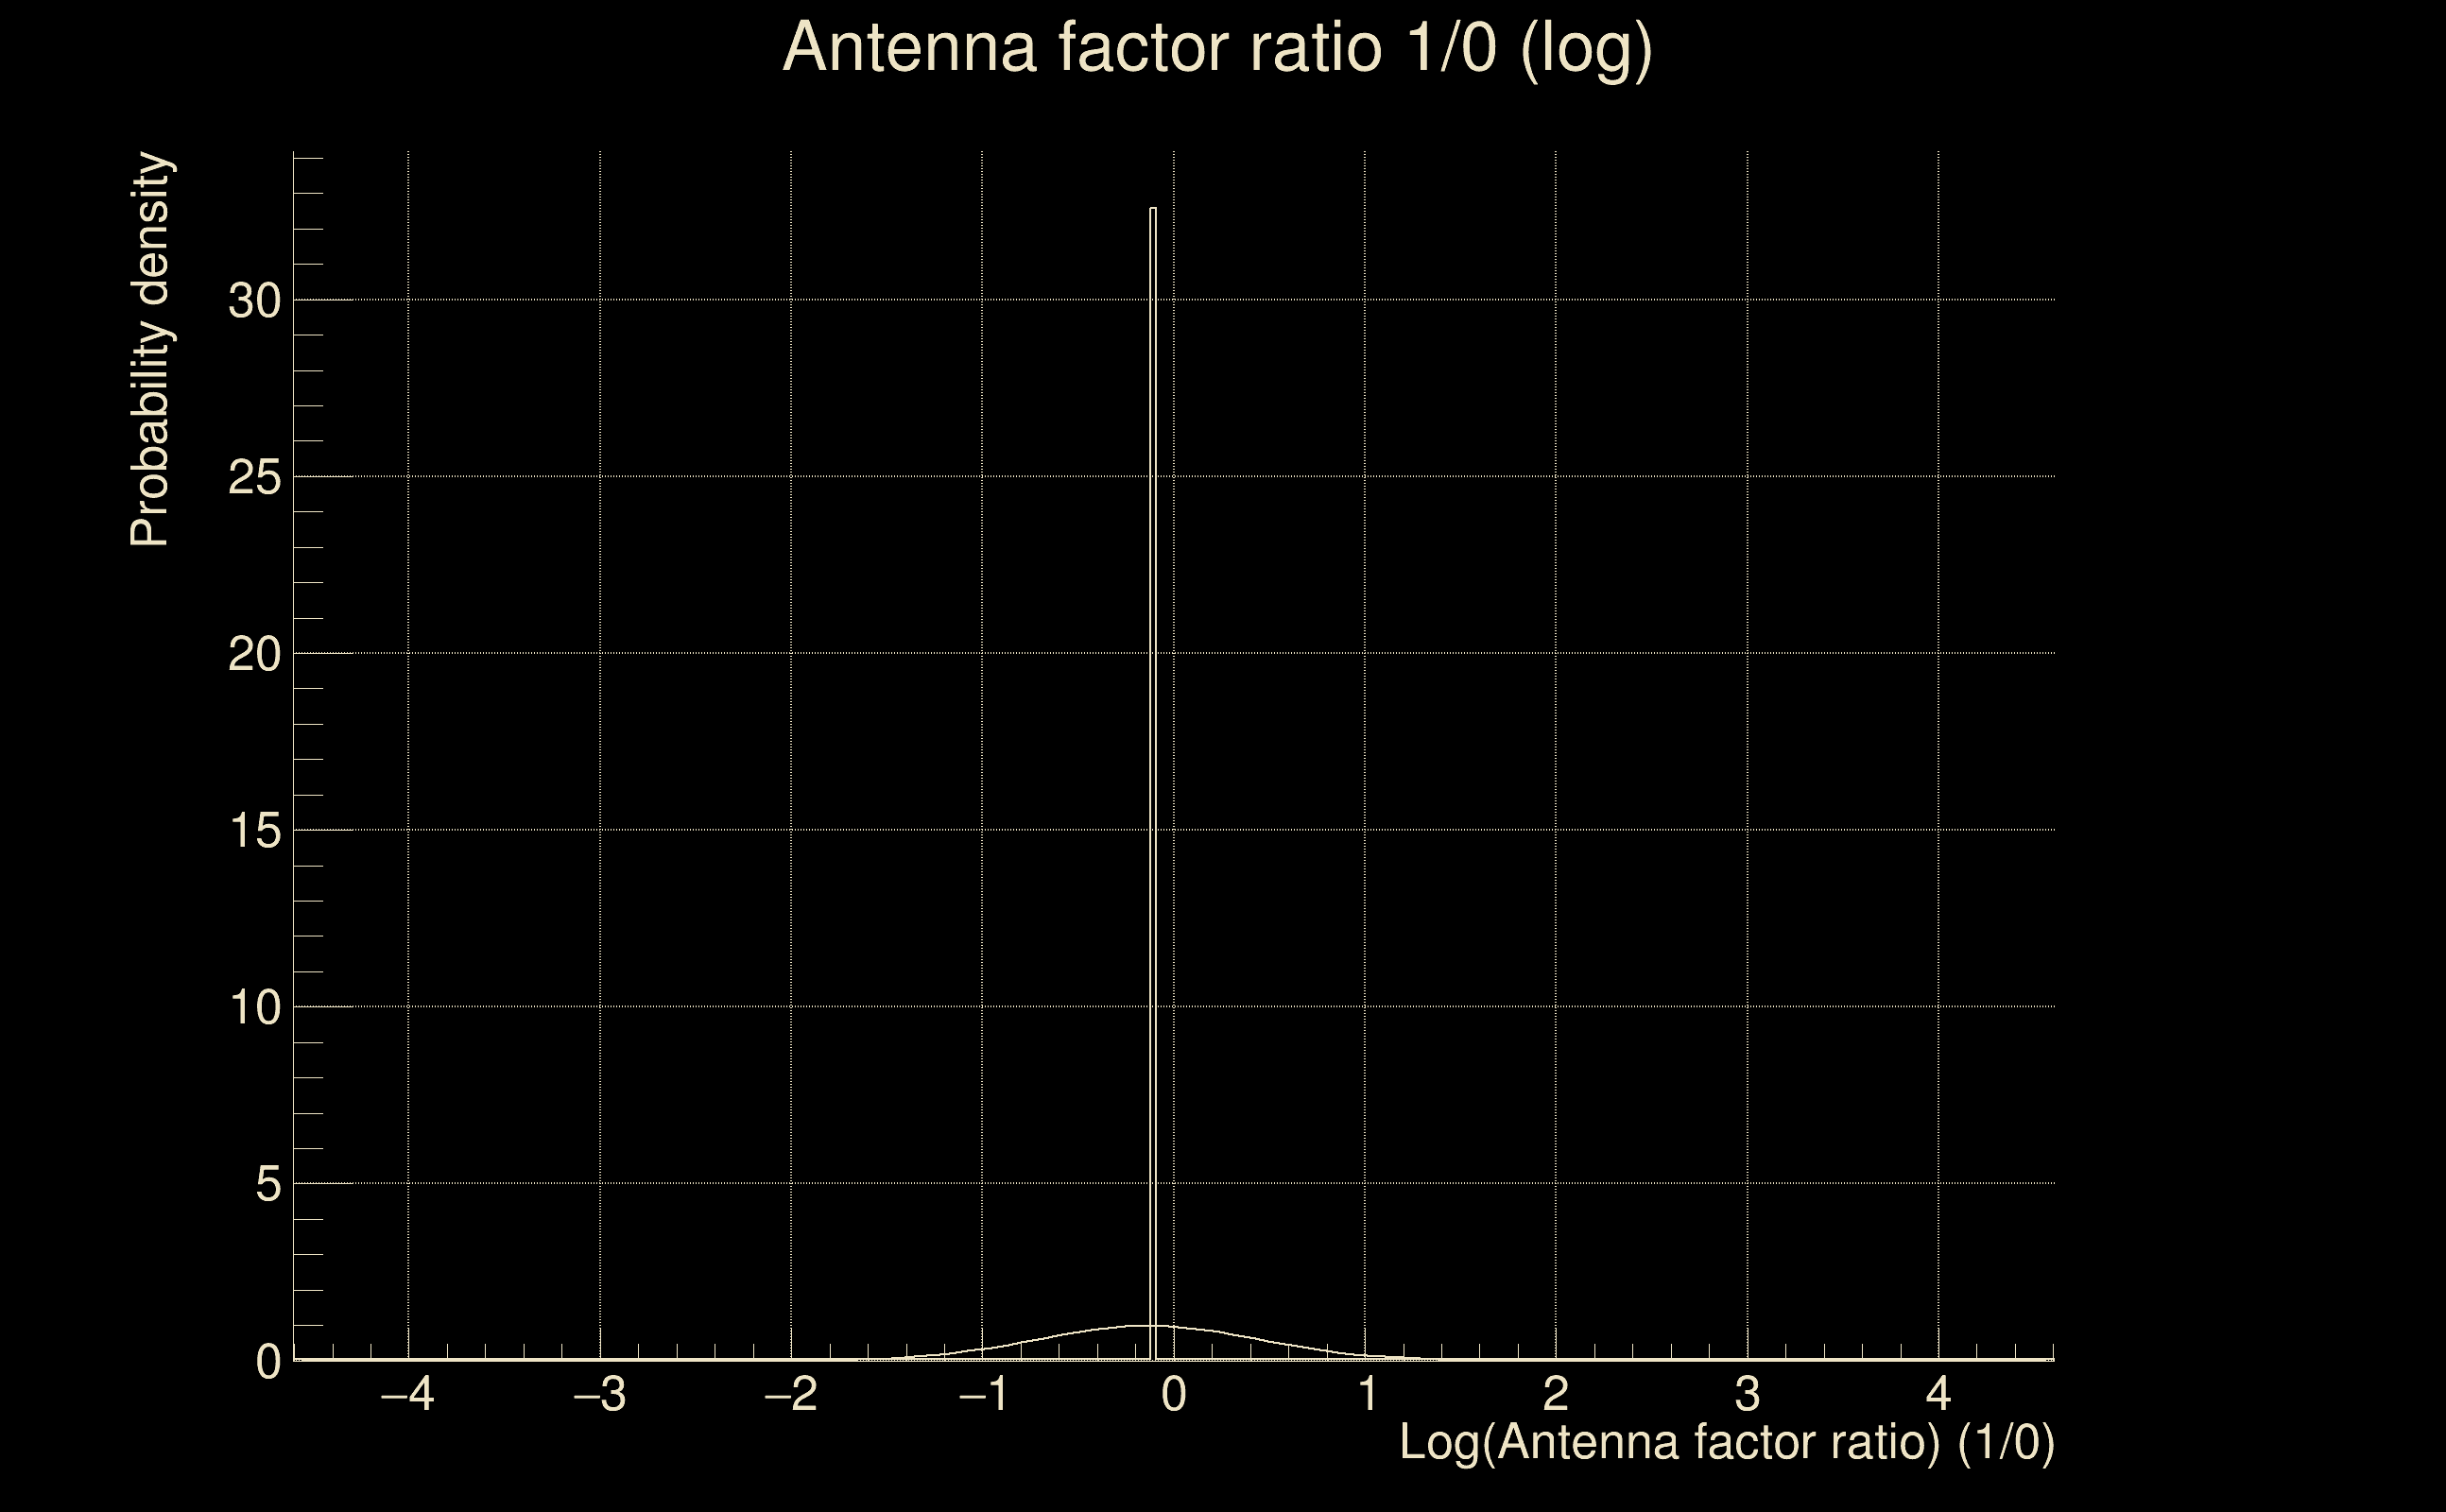
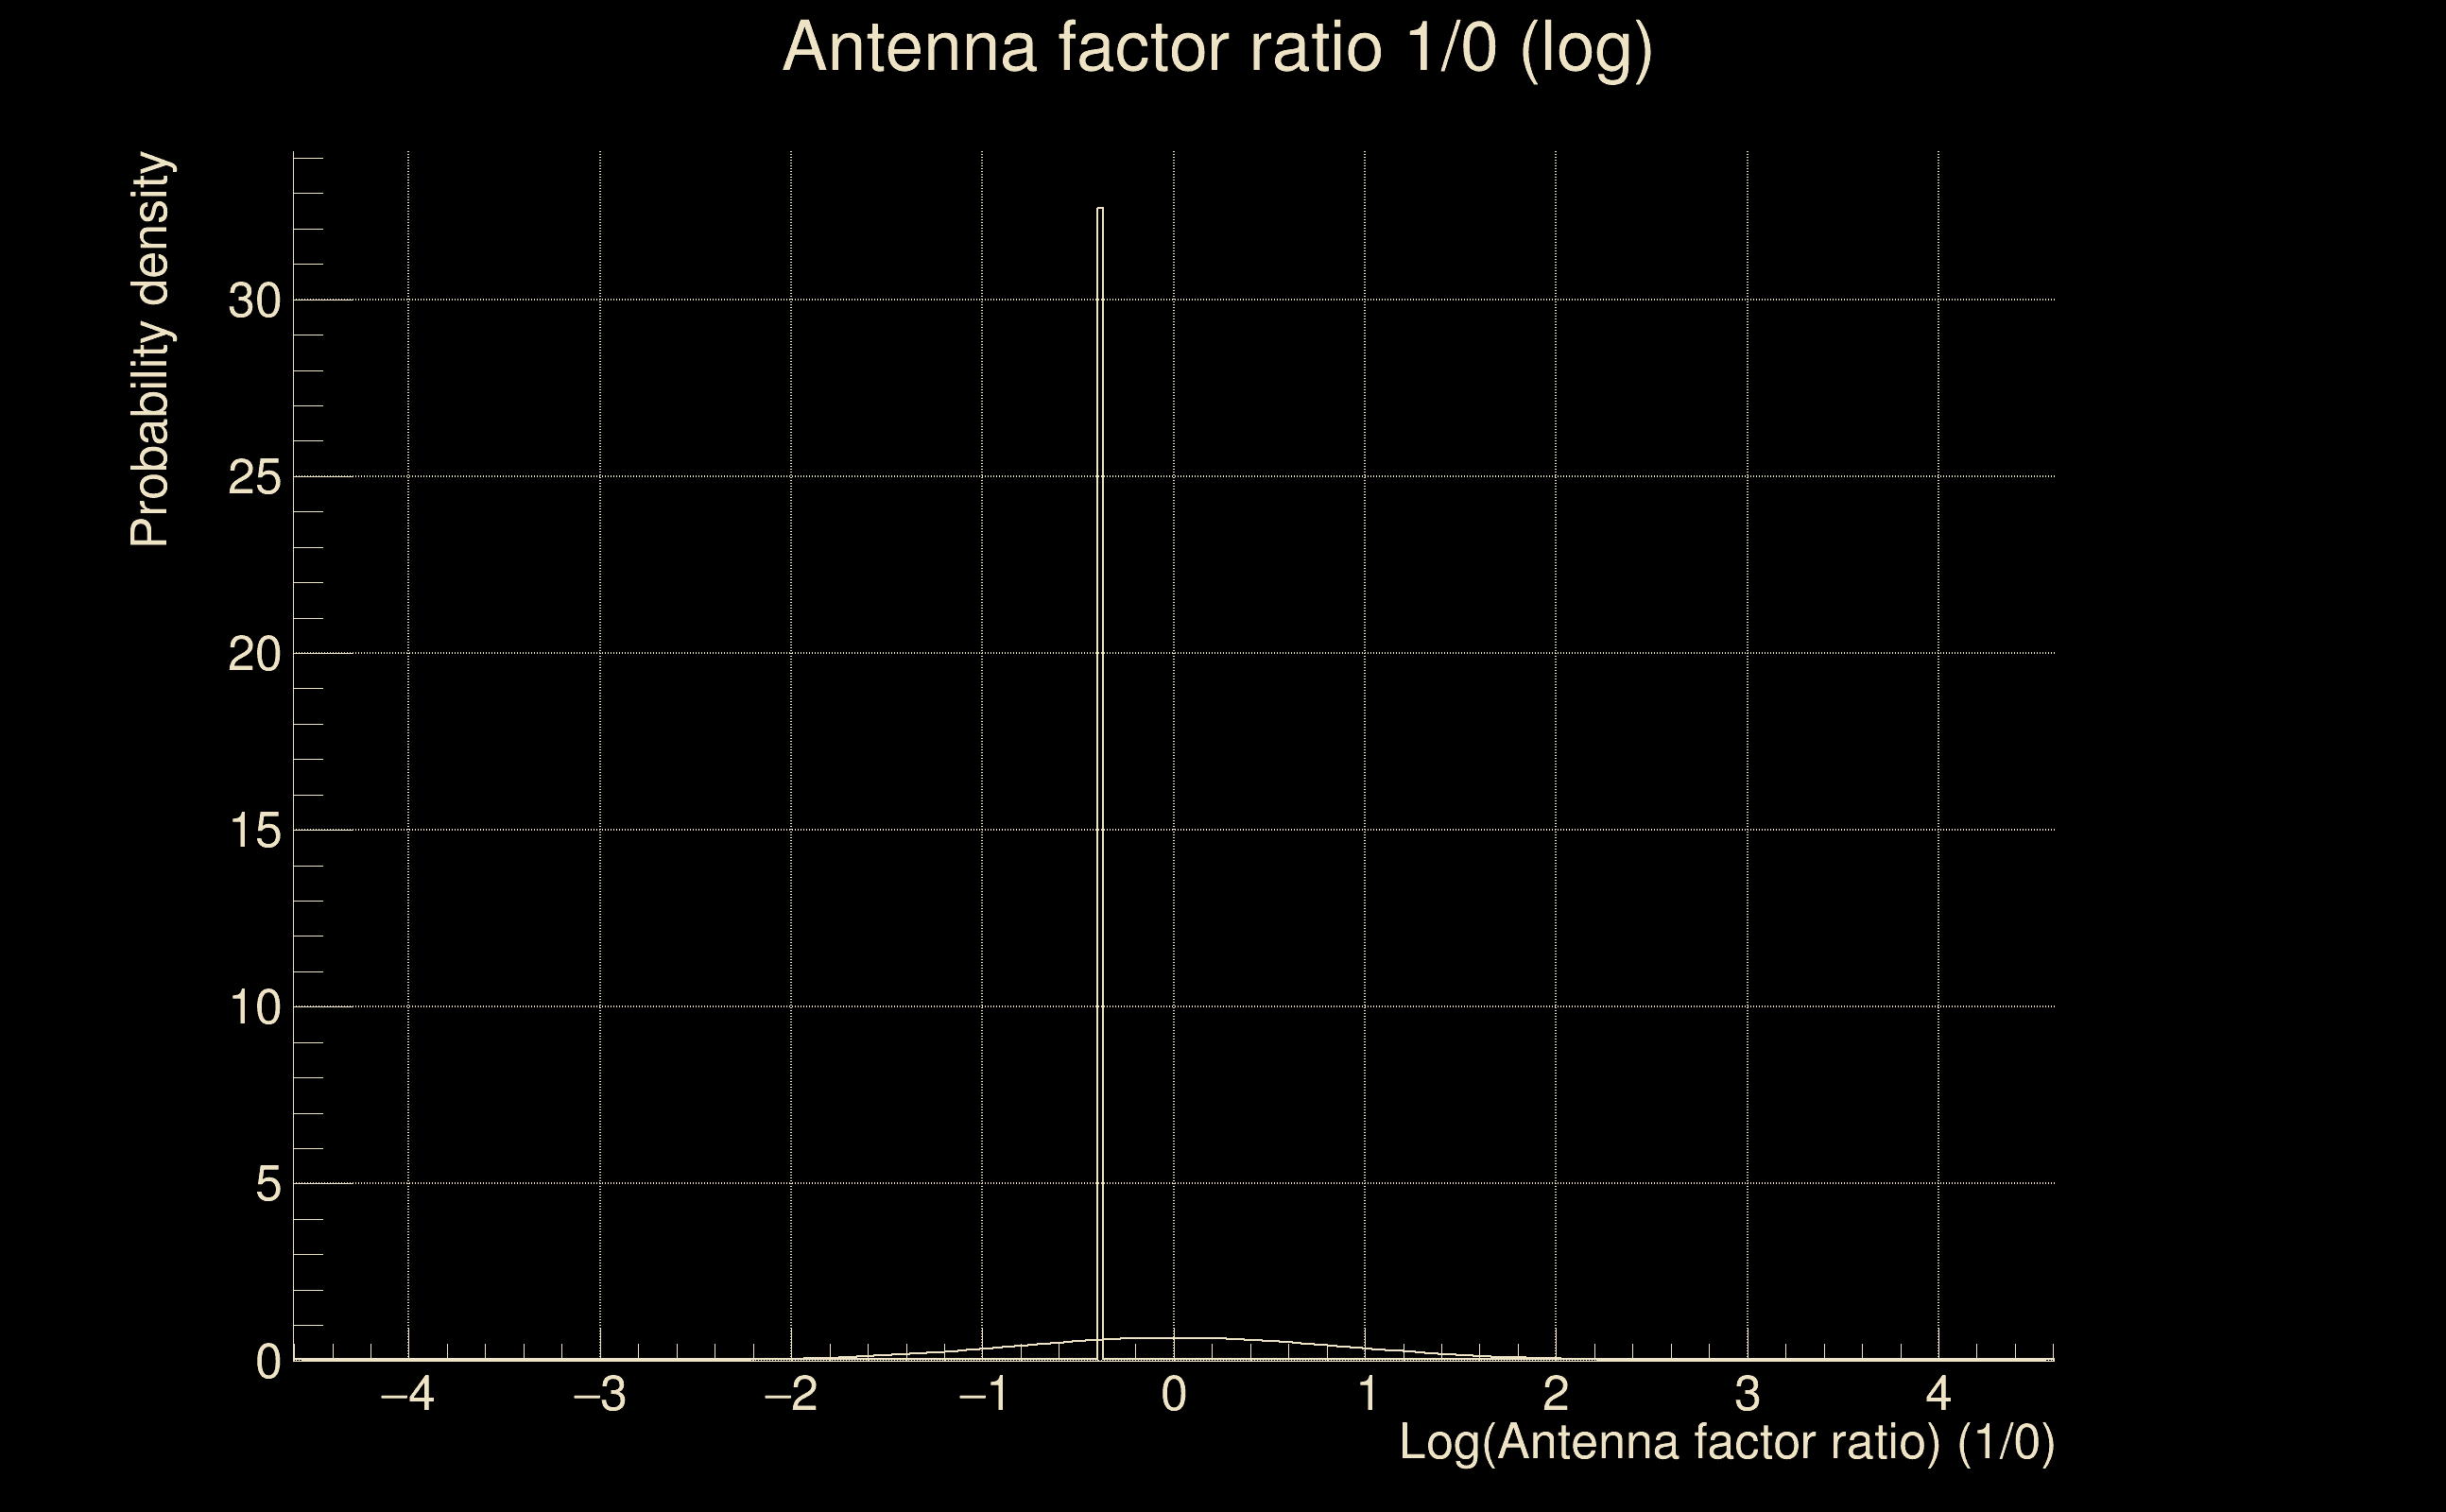
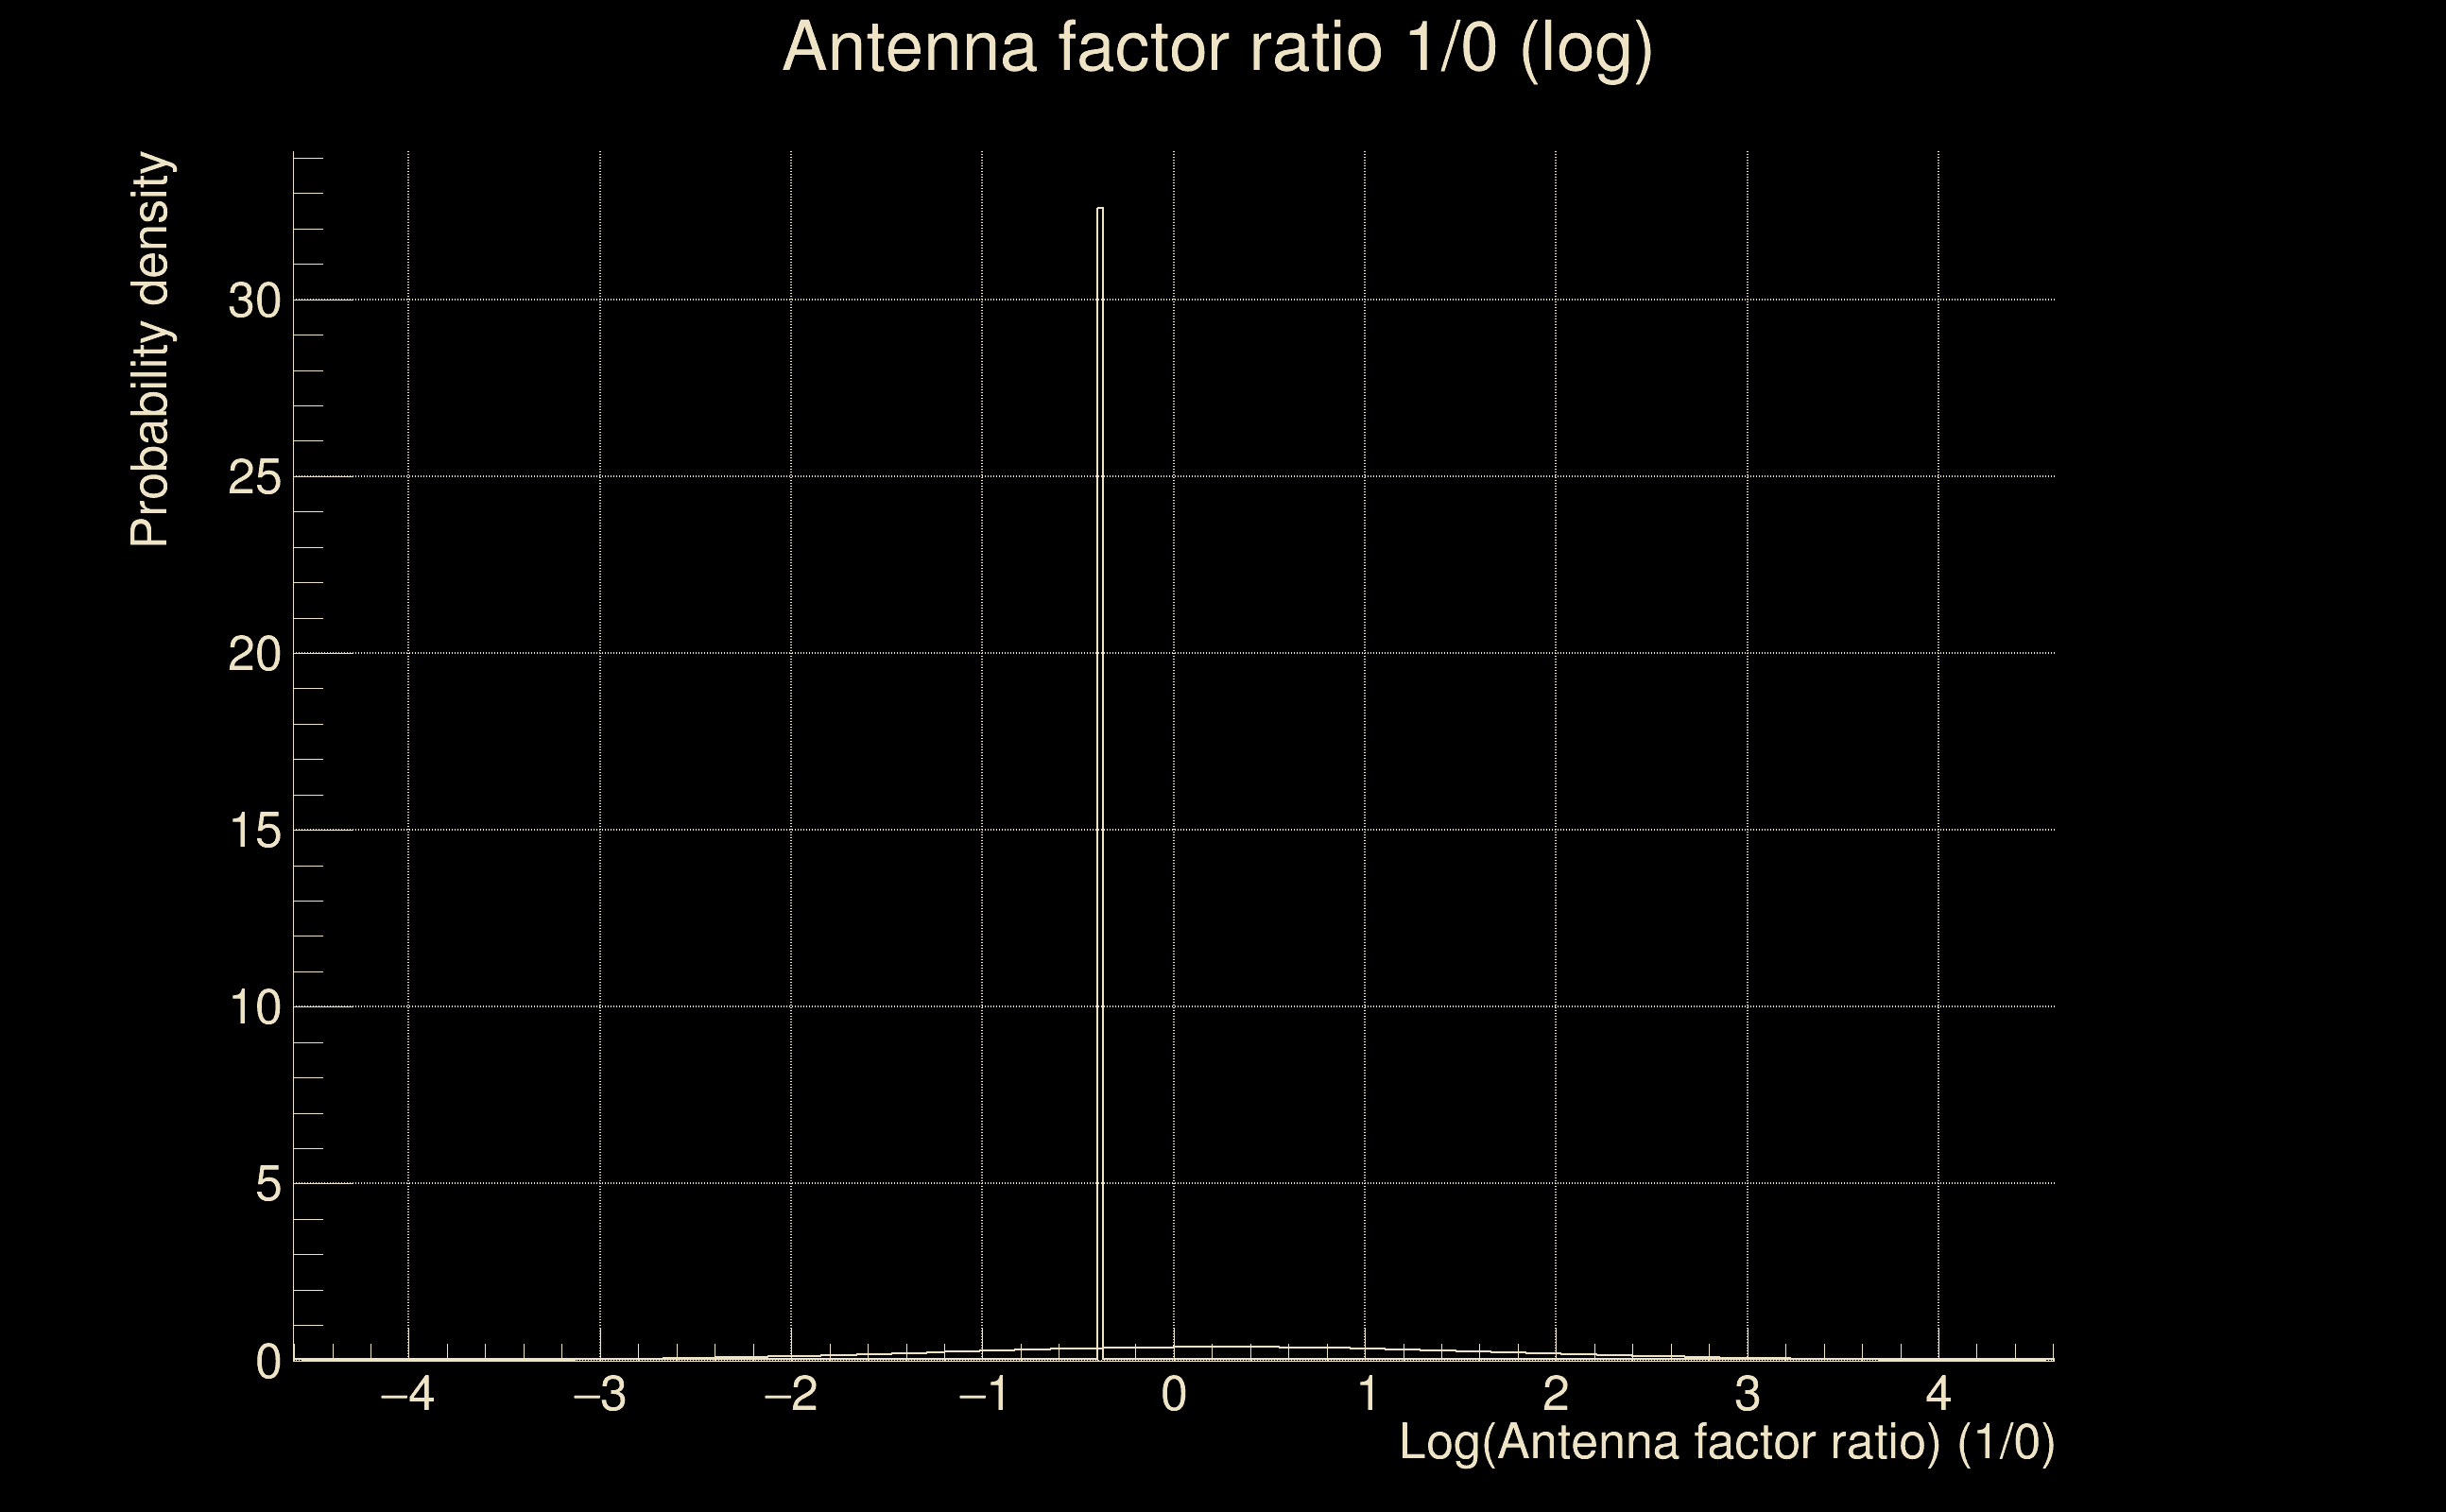
| Log of amplitude ratio (L1/H1): | -0.129554, variance = 0.155927 (L1/H1: -0.142975, variance = 0.304354, H1/L1: 0.111078, variance = 0.303941) |
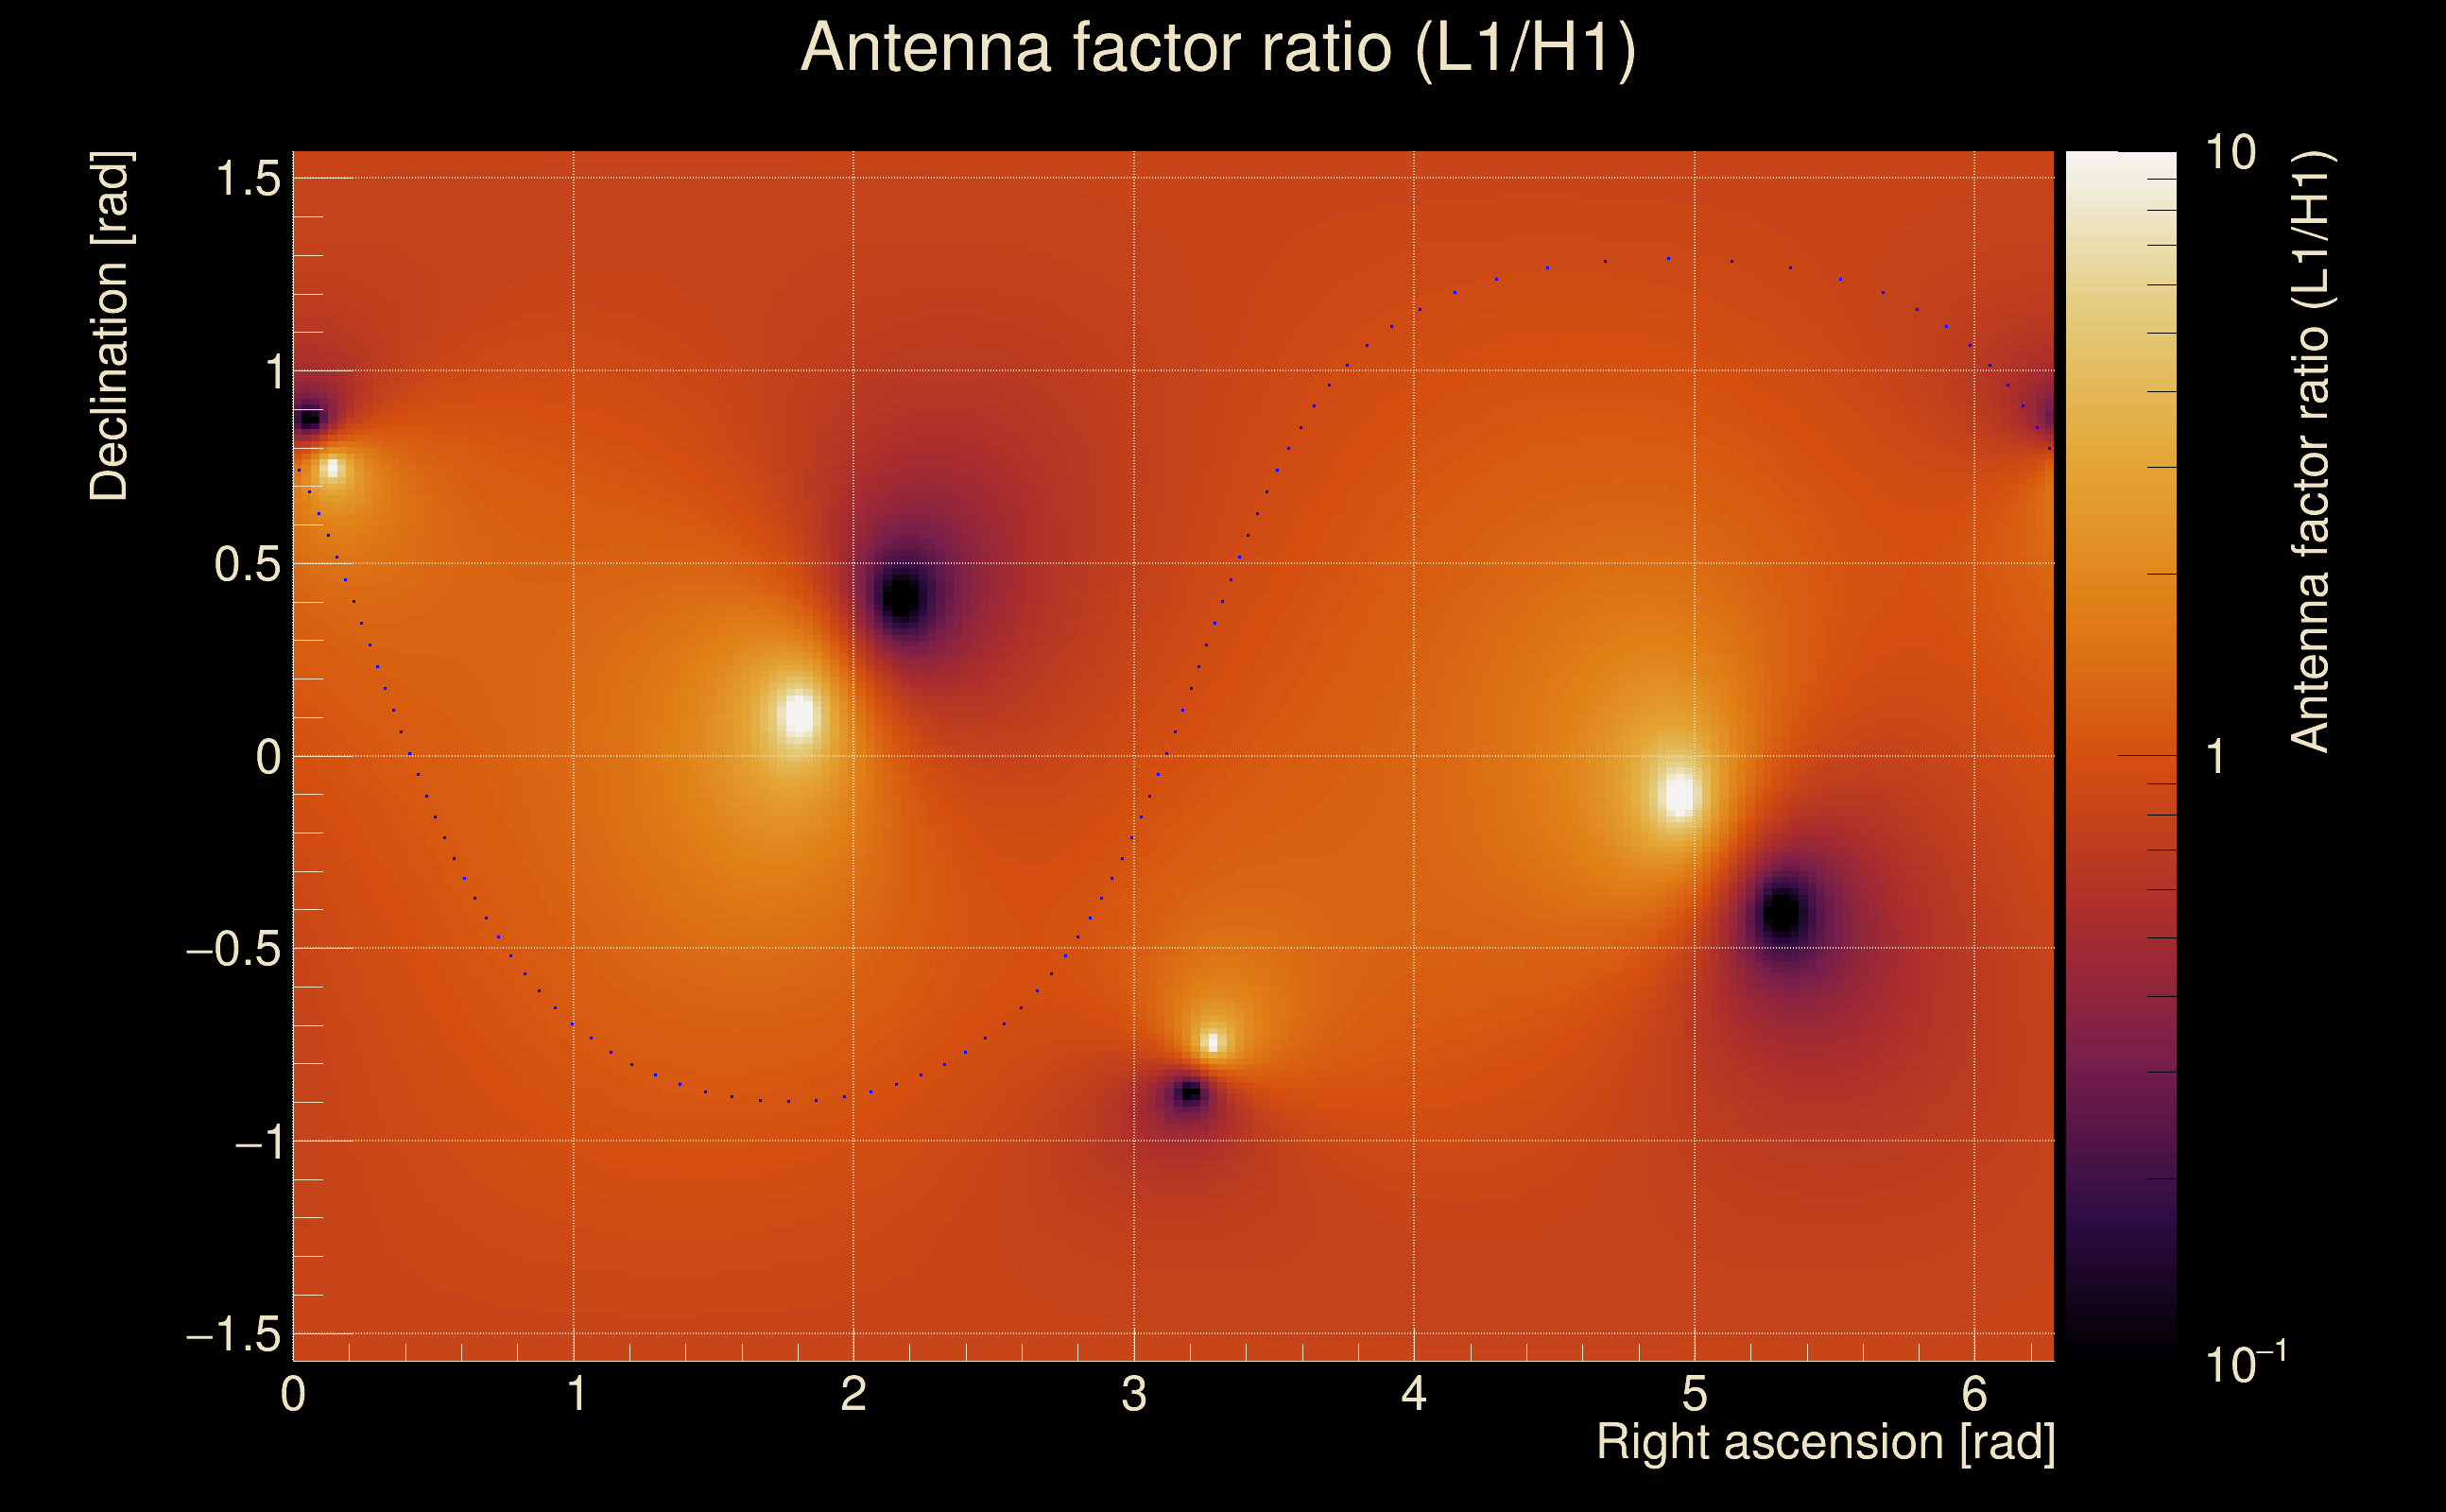
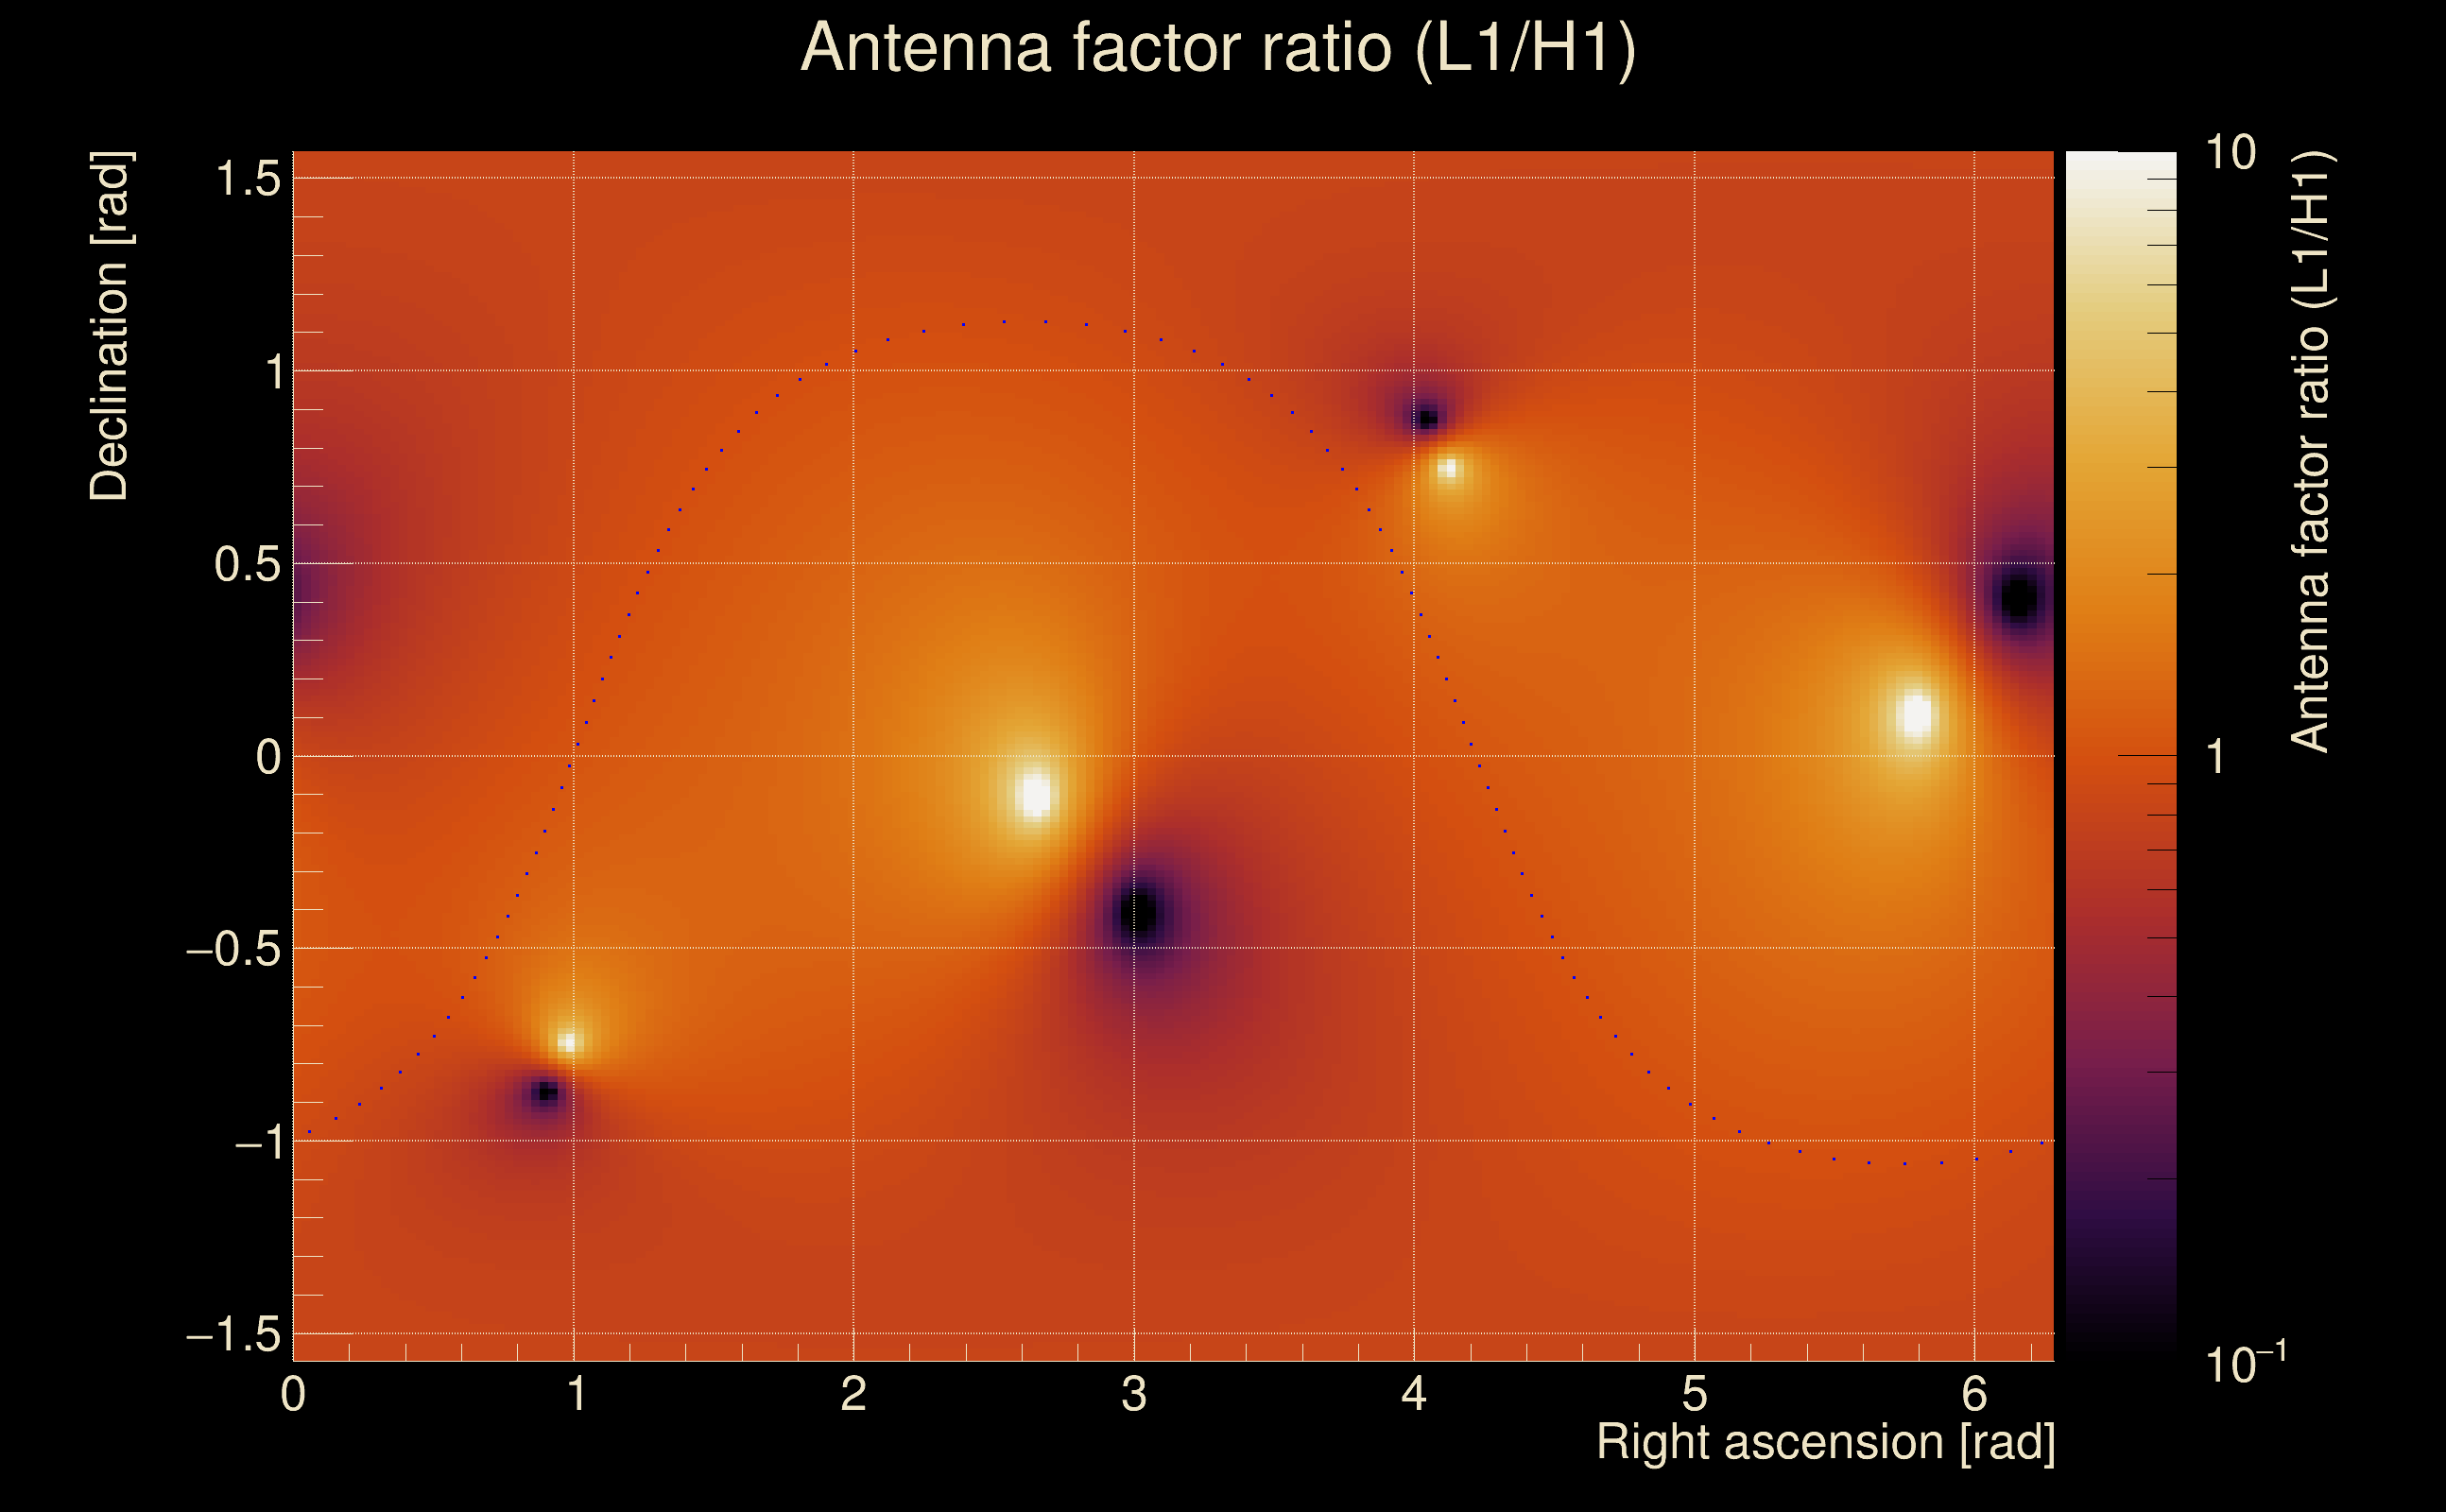
| Amplitude ratio (L1/H1): | 0.878487 ⋇ 1.4842 (L1/H1: 0.866776 ⋇ 1.73617, H1/L1: 1.11748 ⋇ 1.73552) |
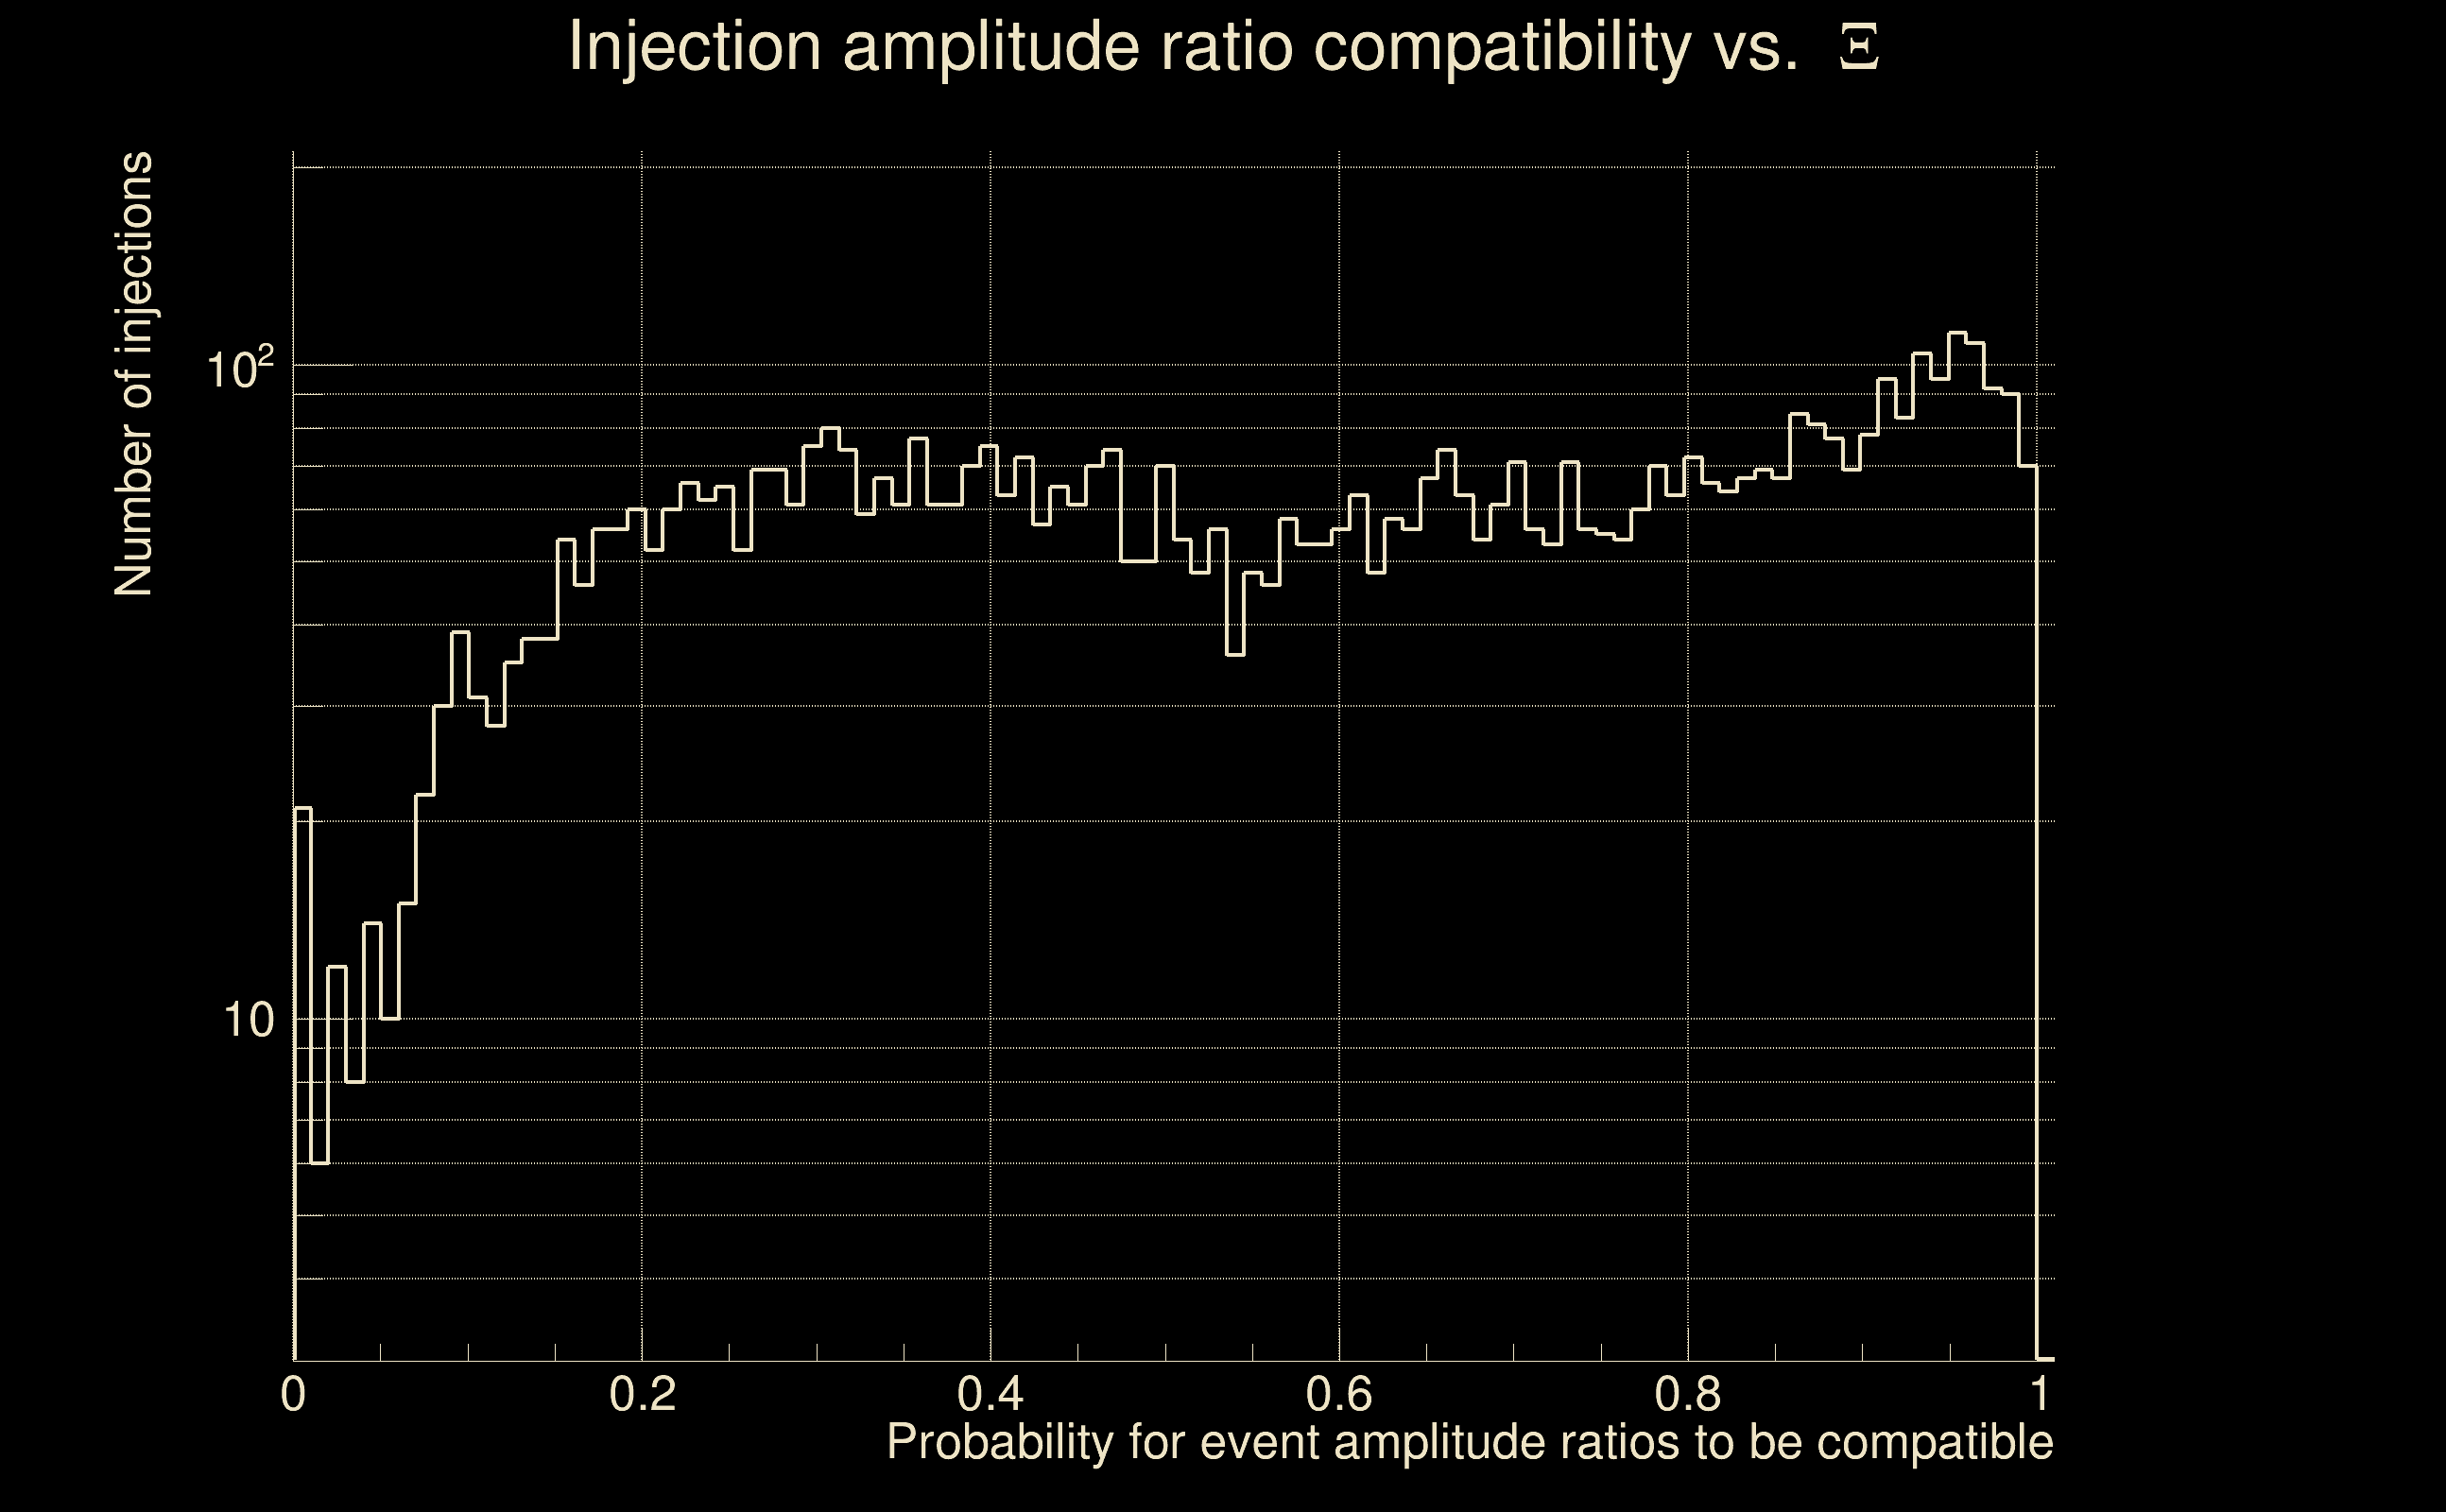
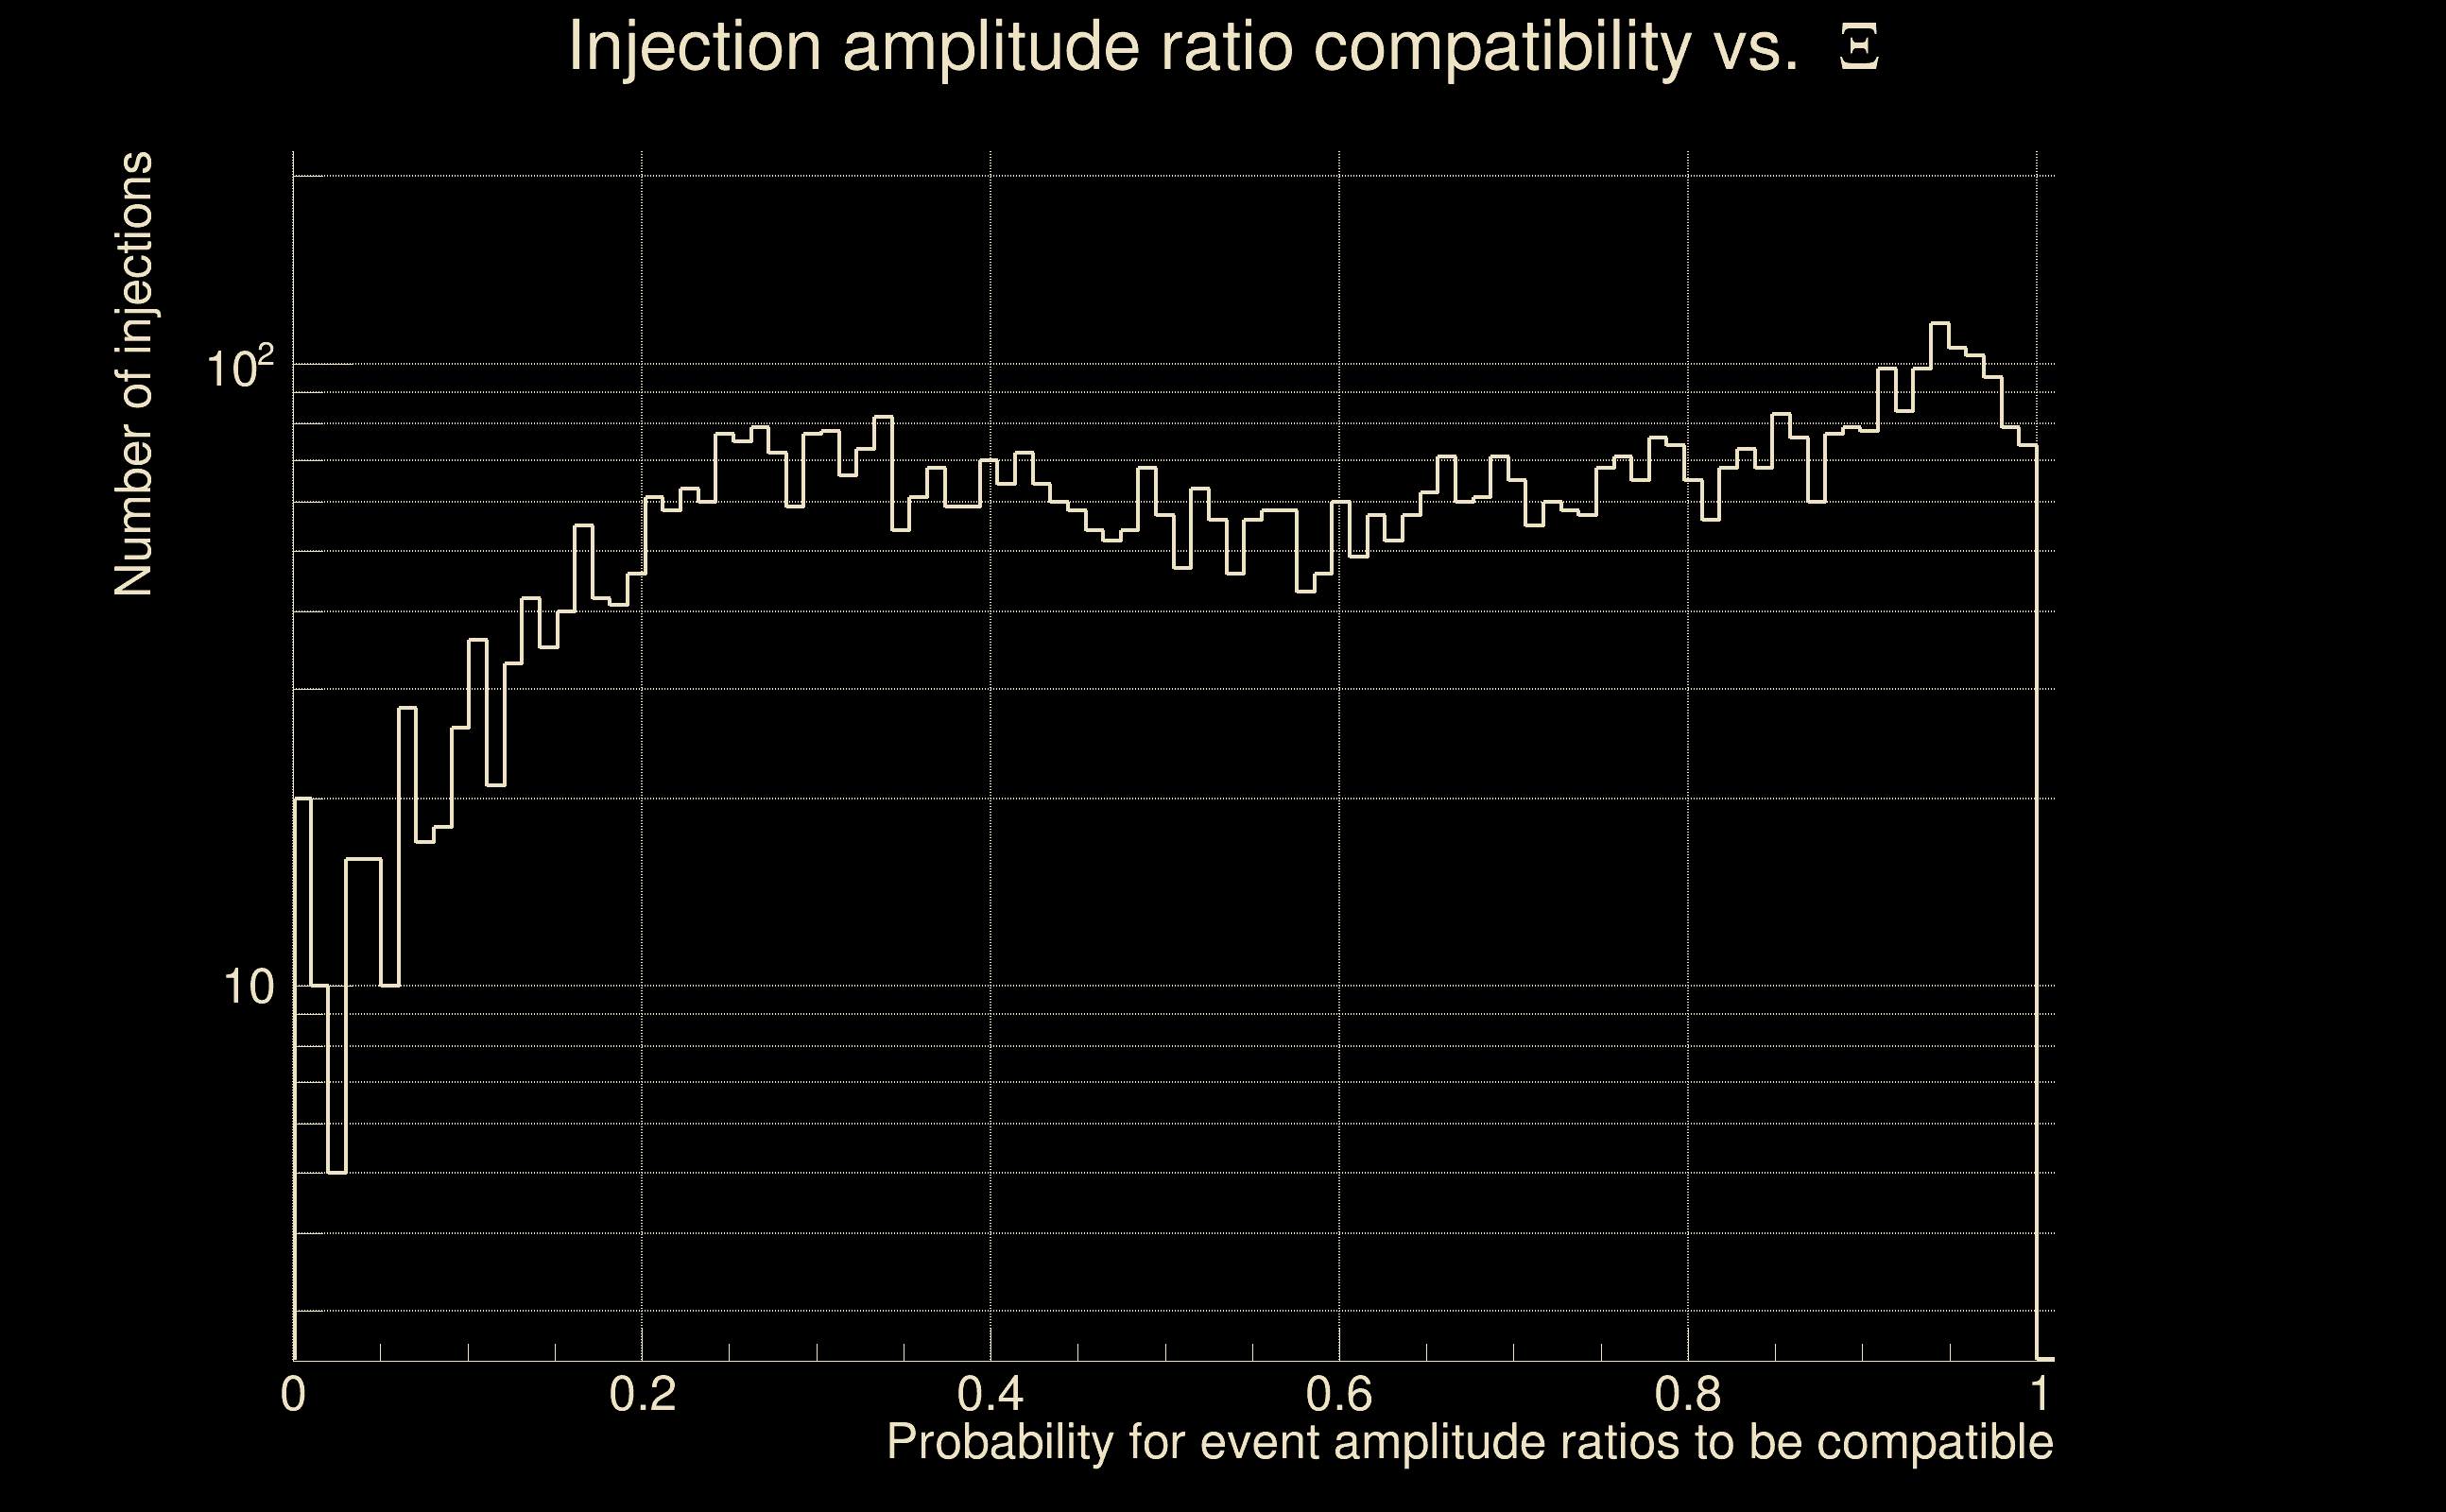
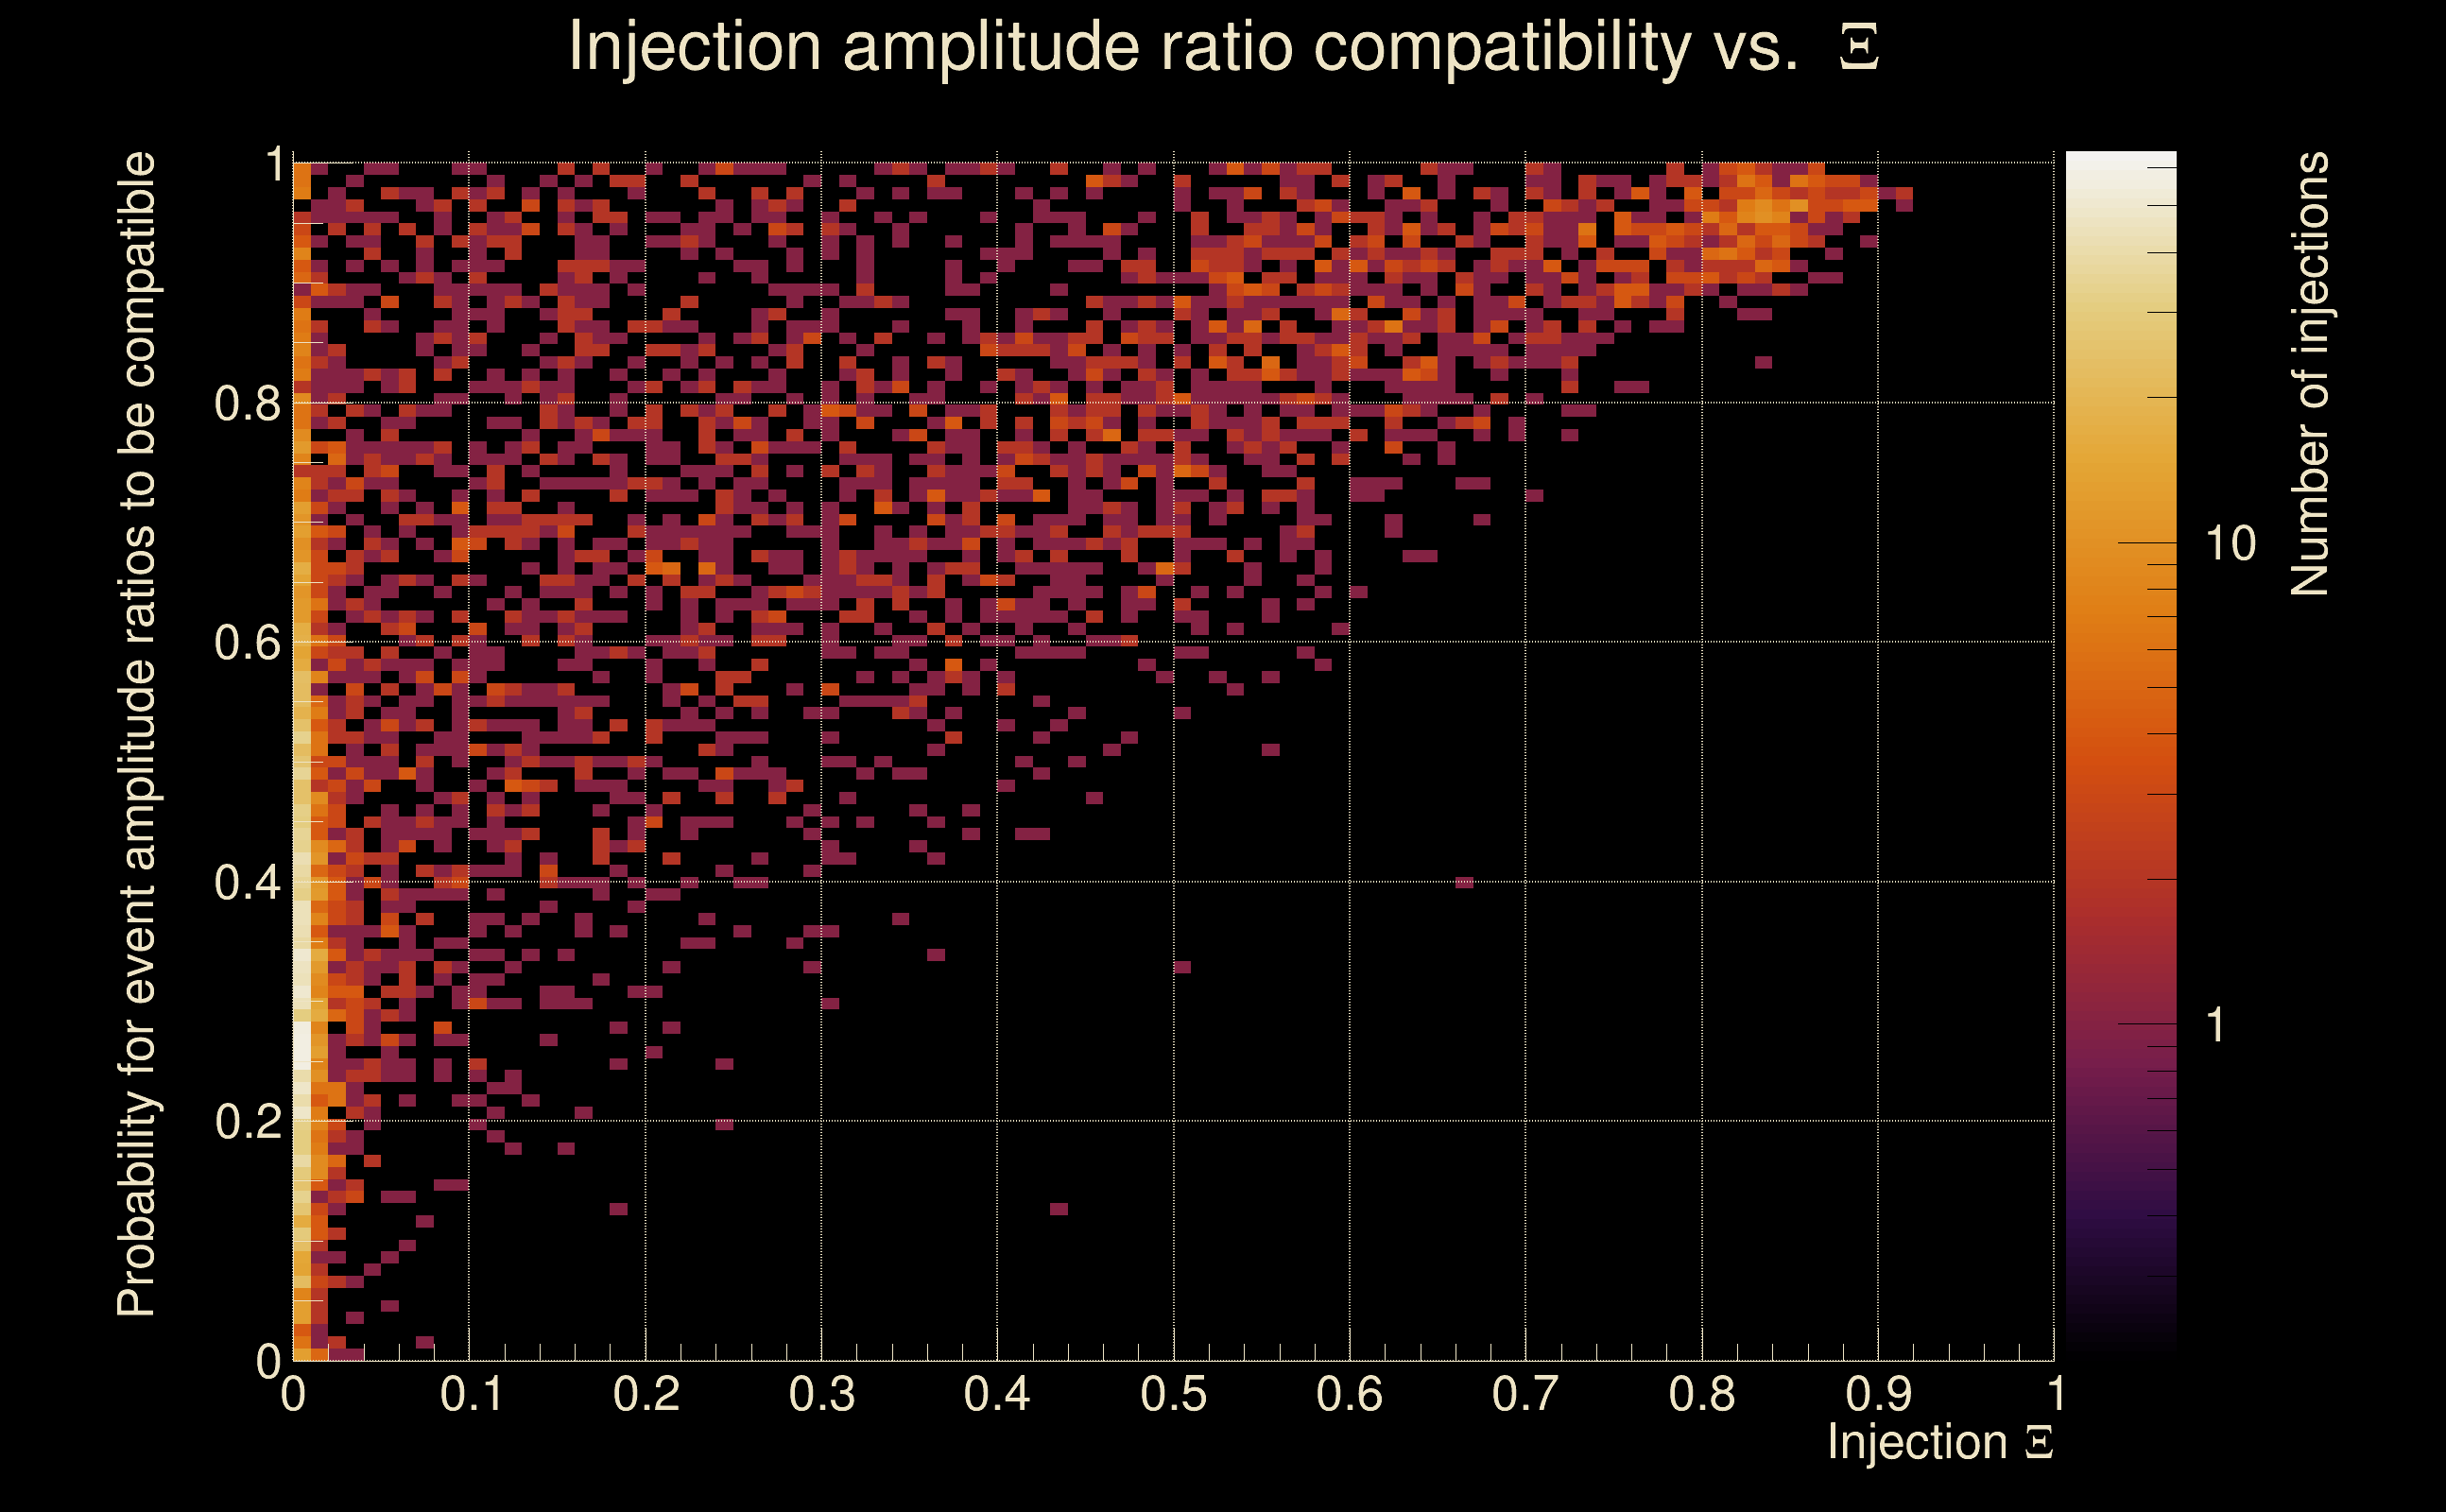
| Amplitude ratio H1|L1 compatibility (probability): | 0.967378 |
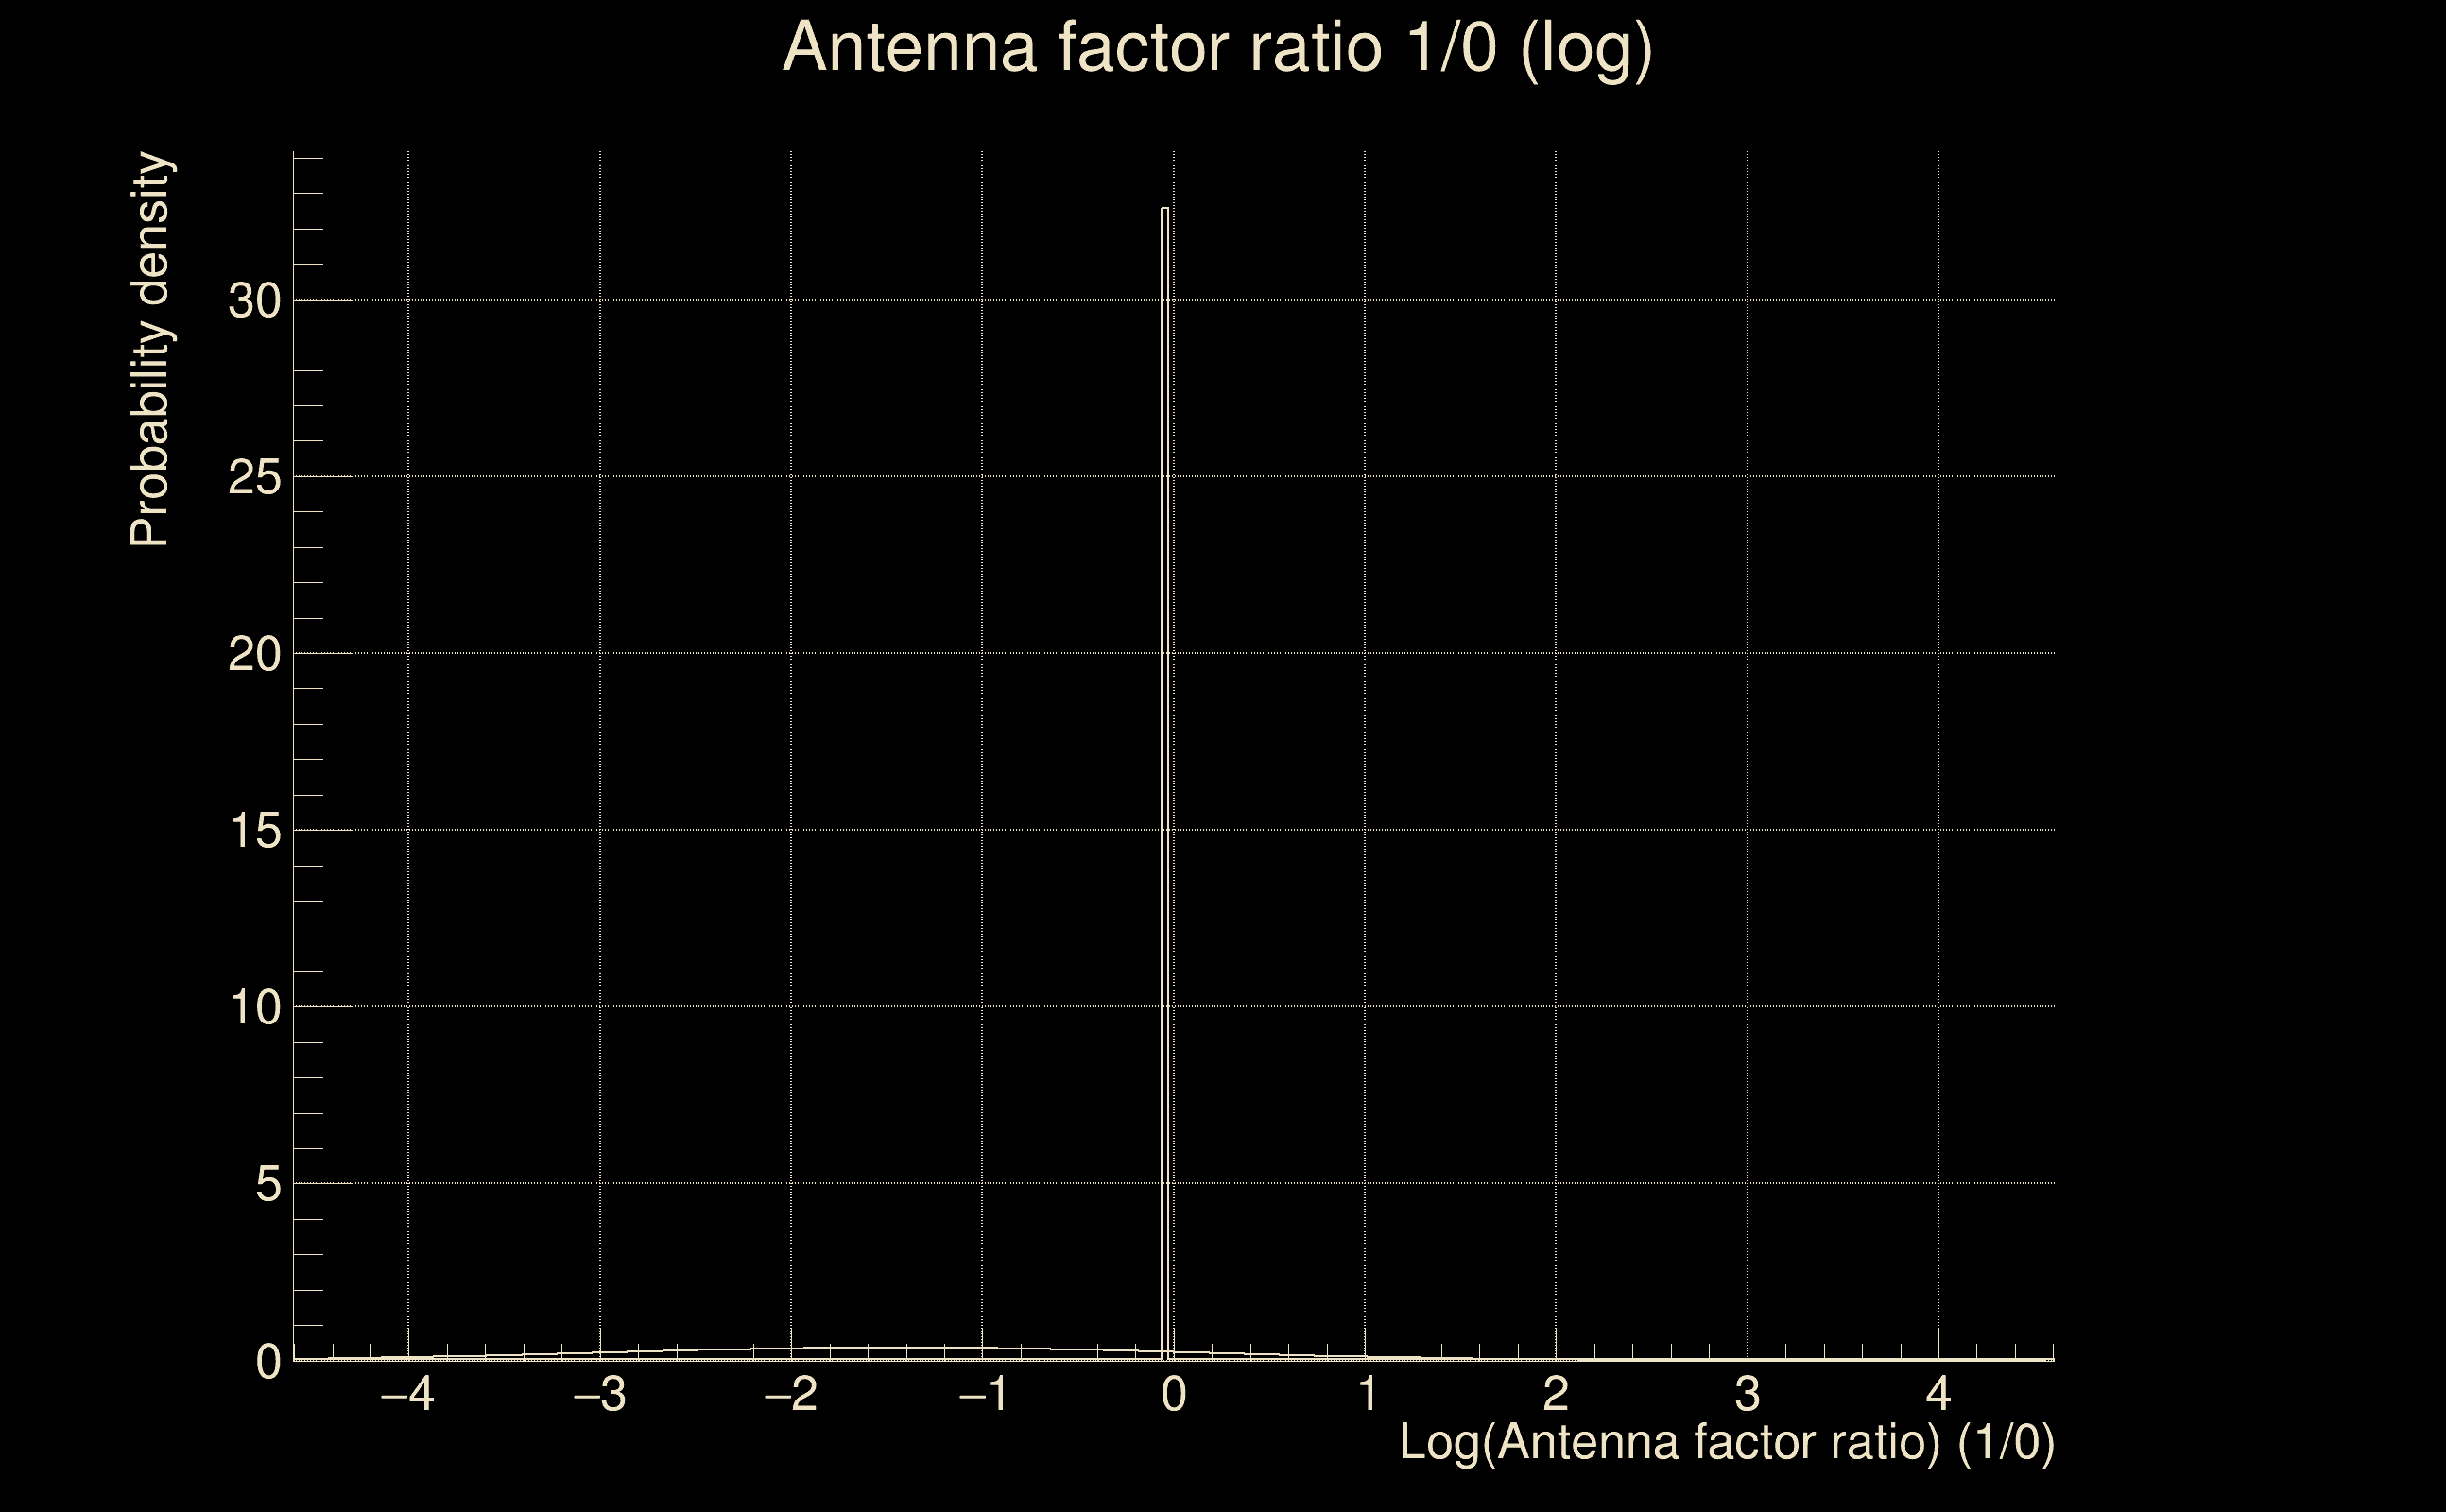
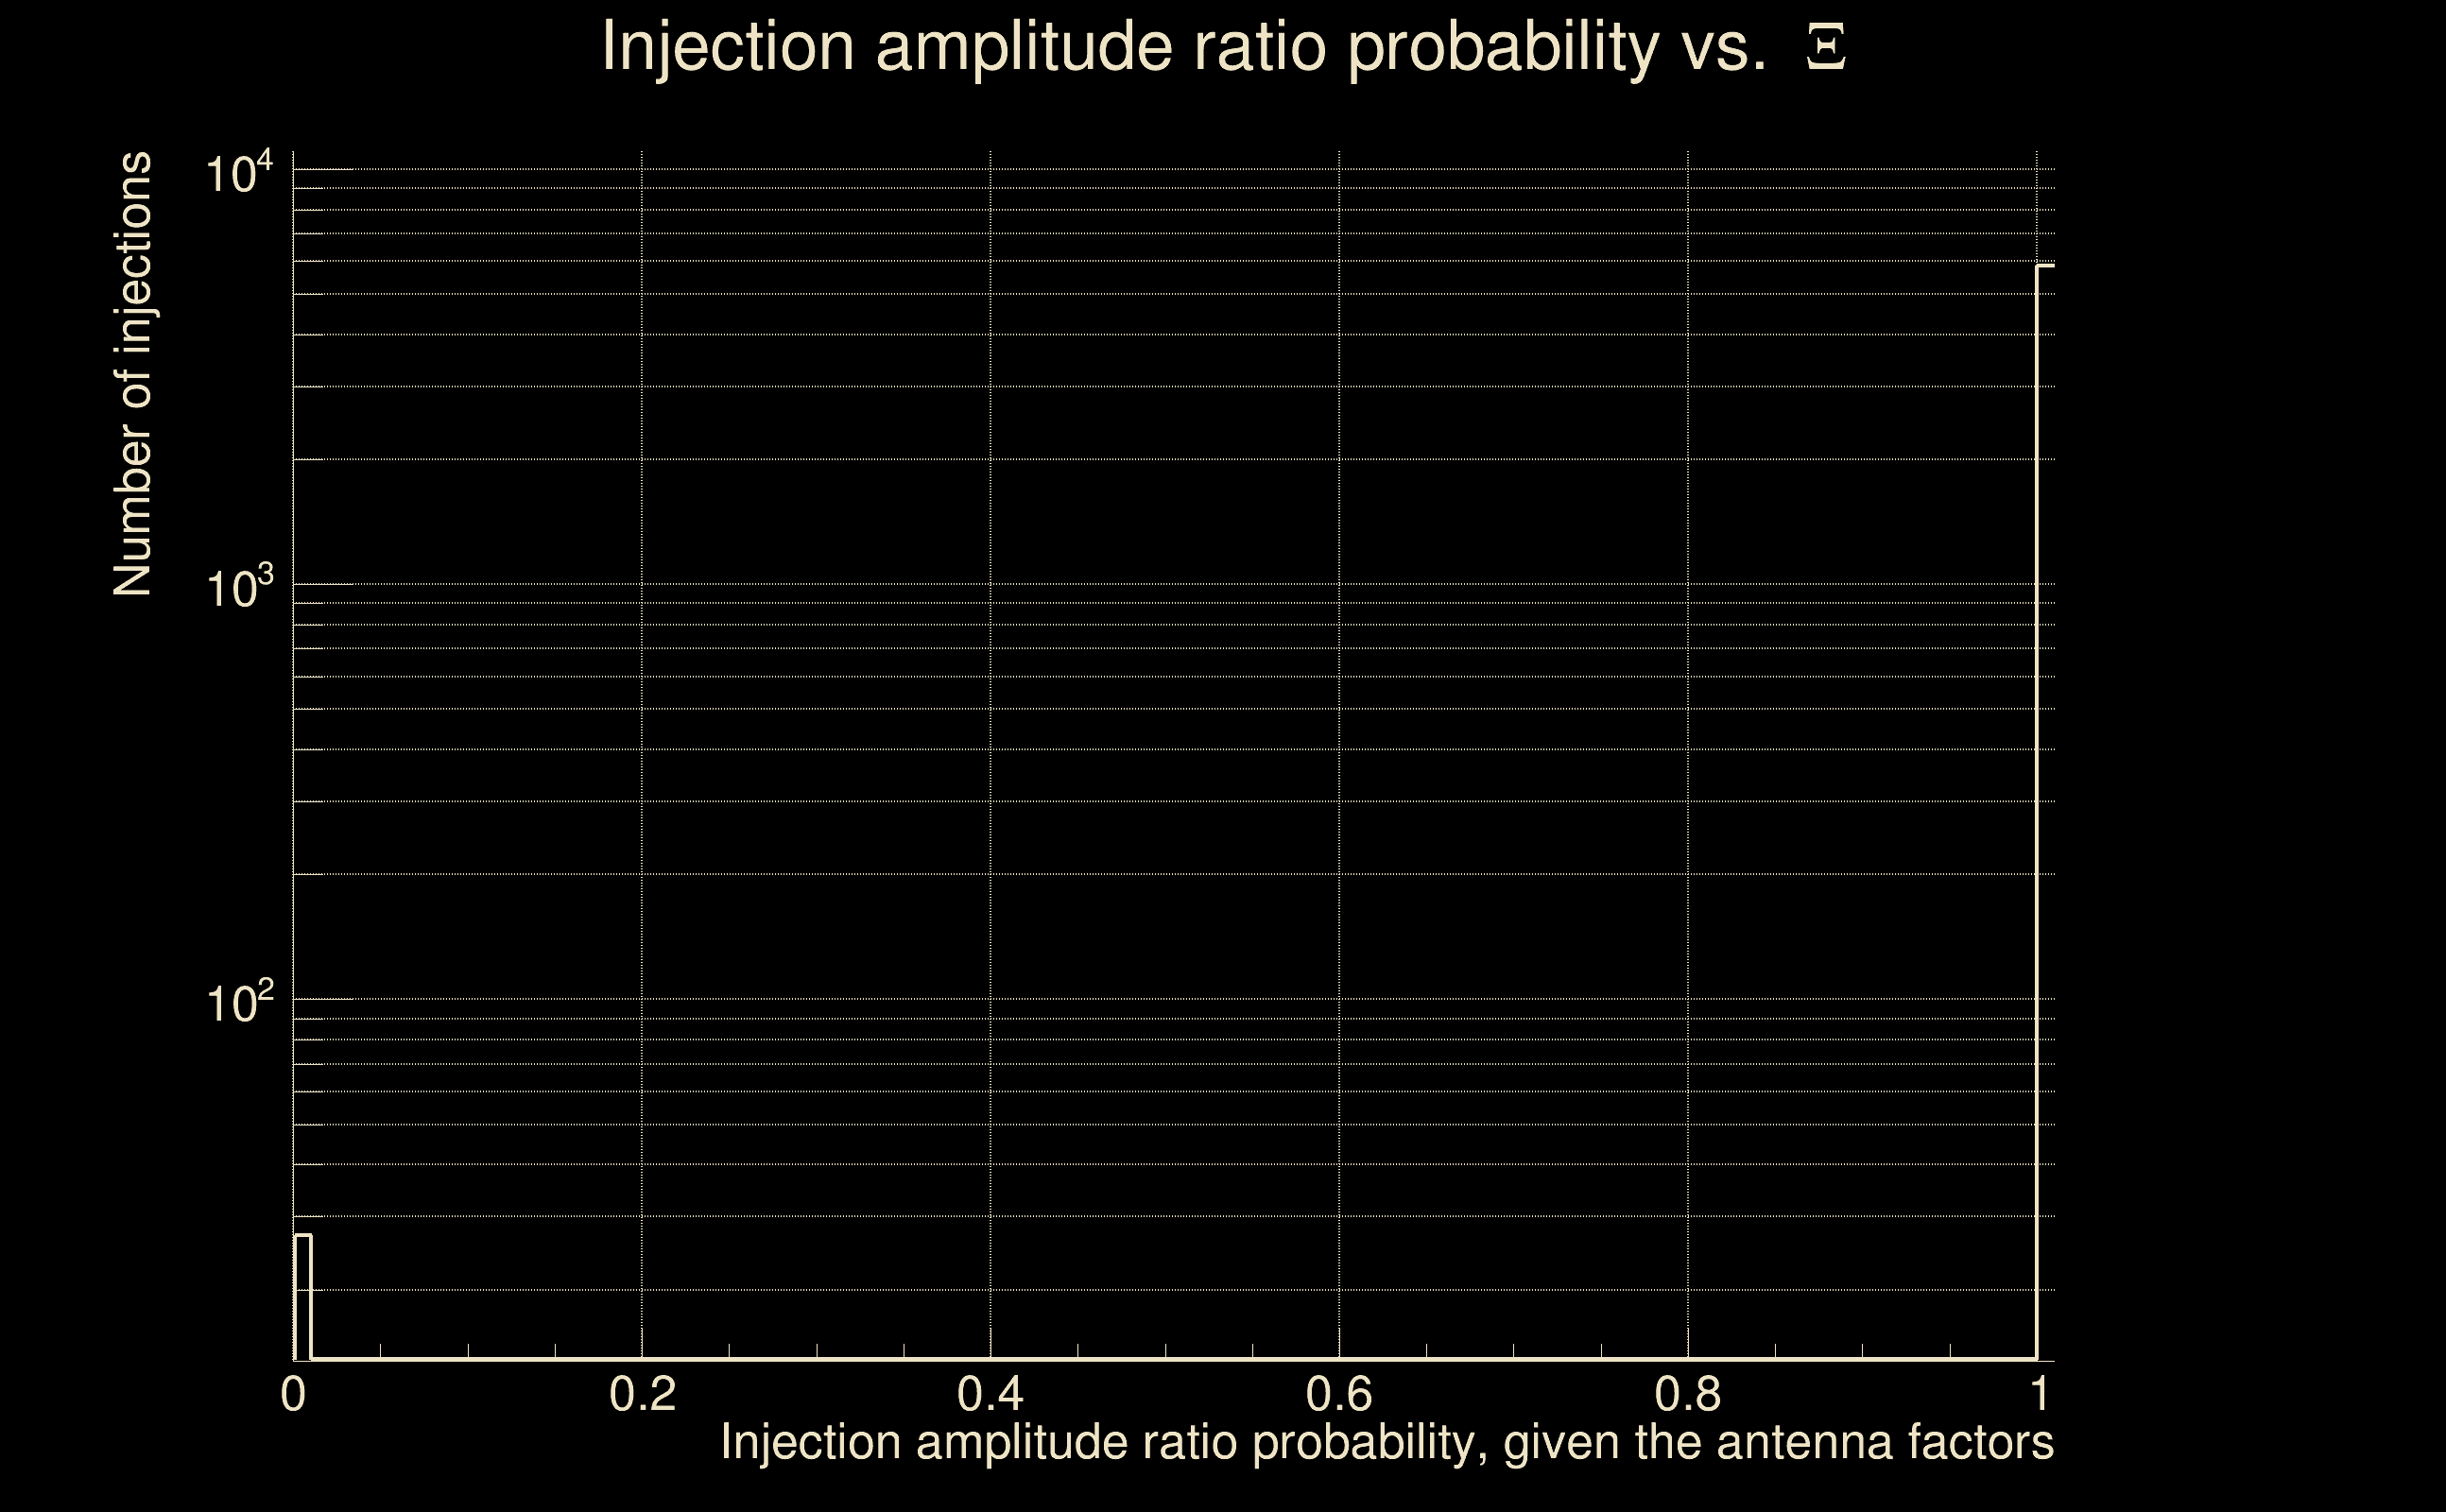
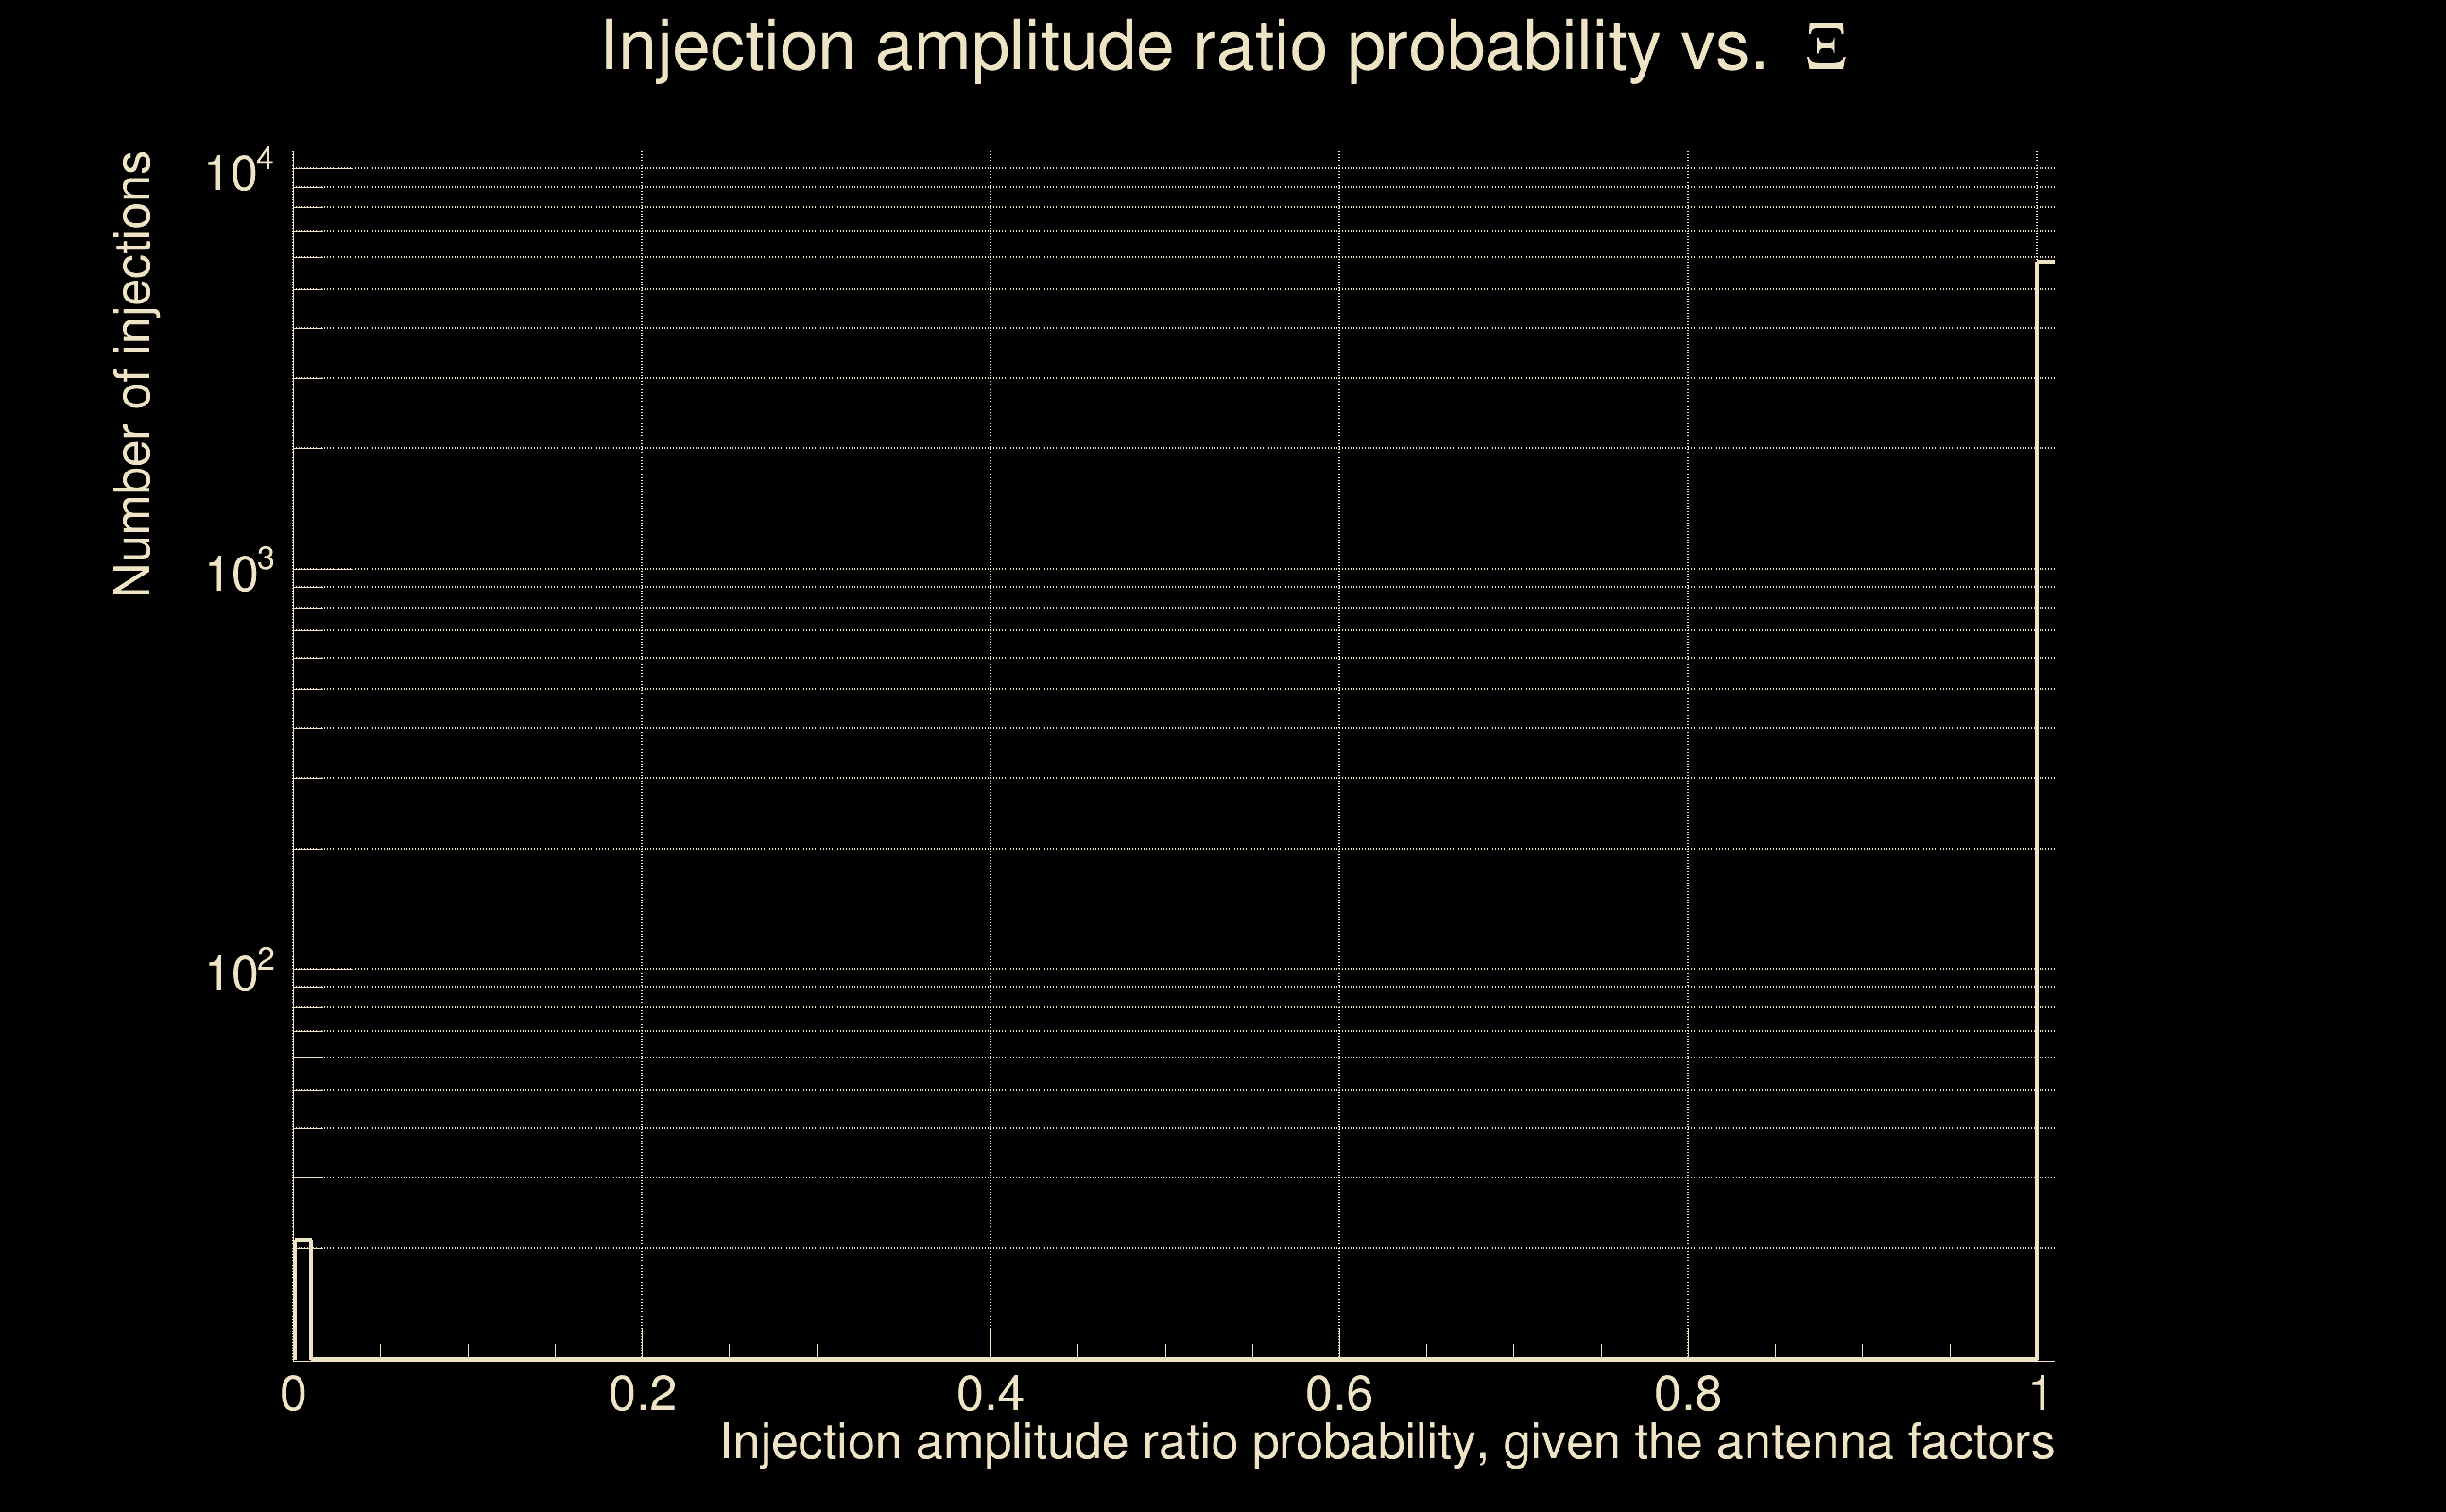
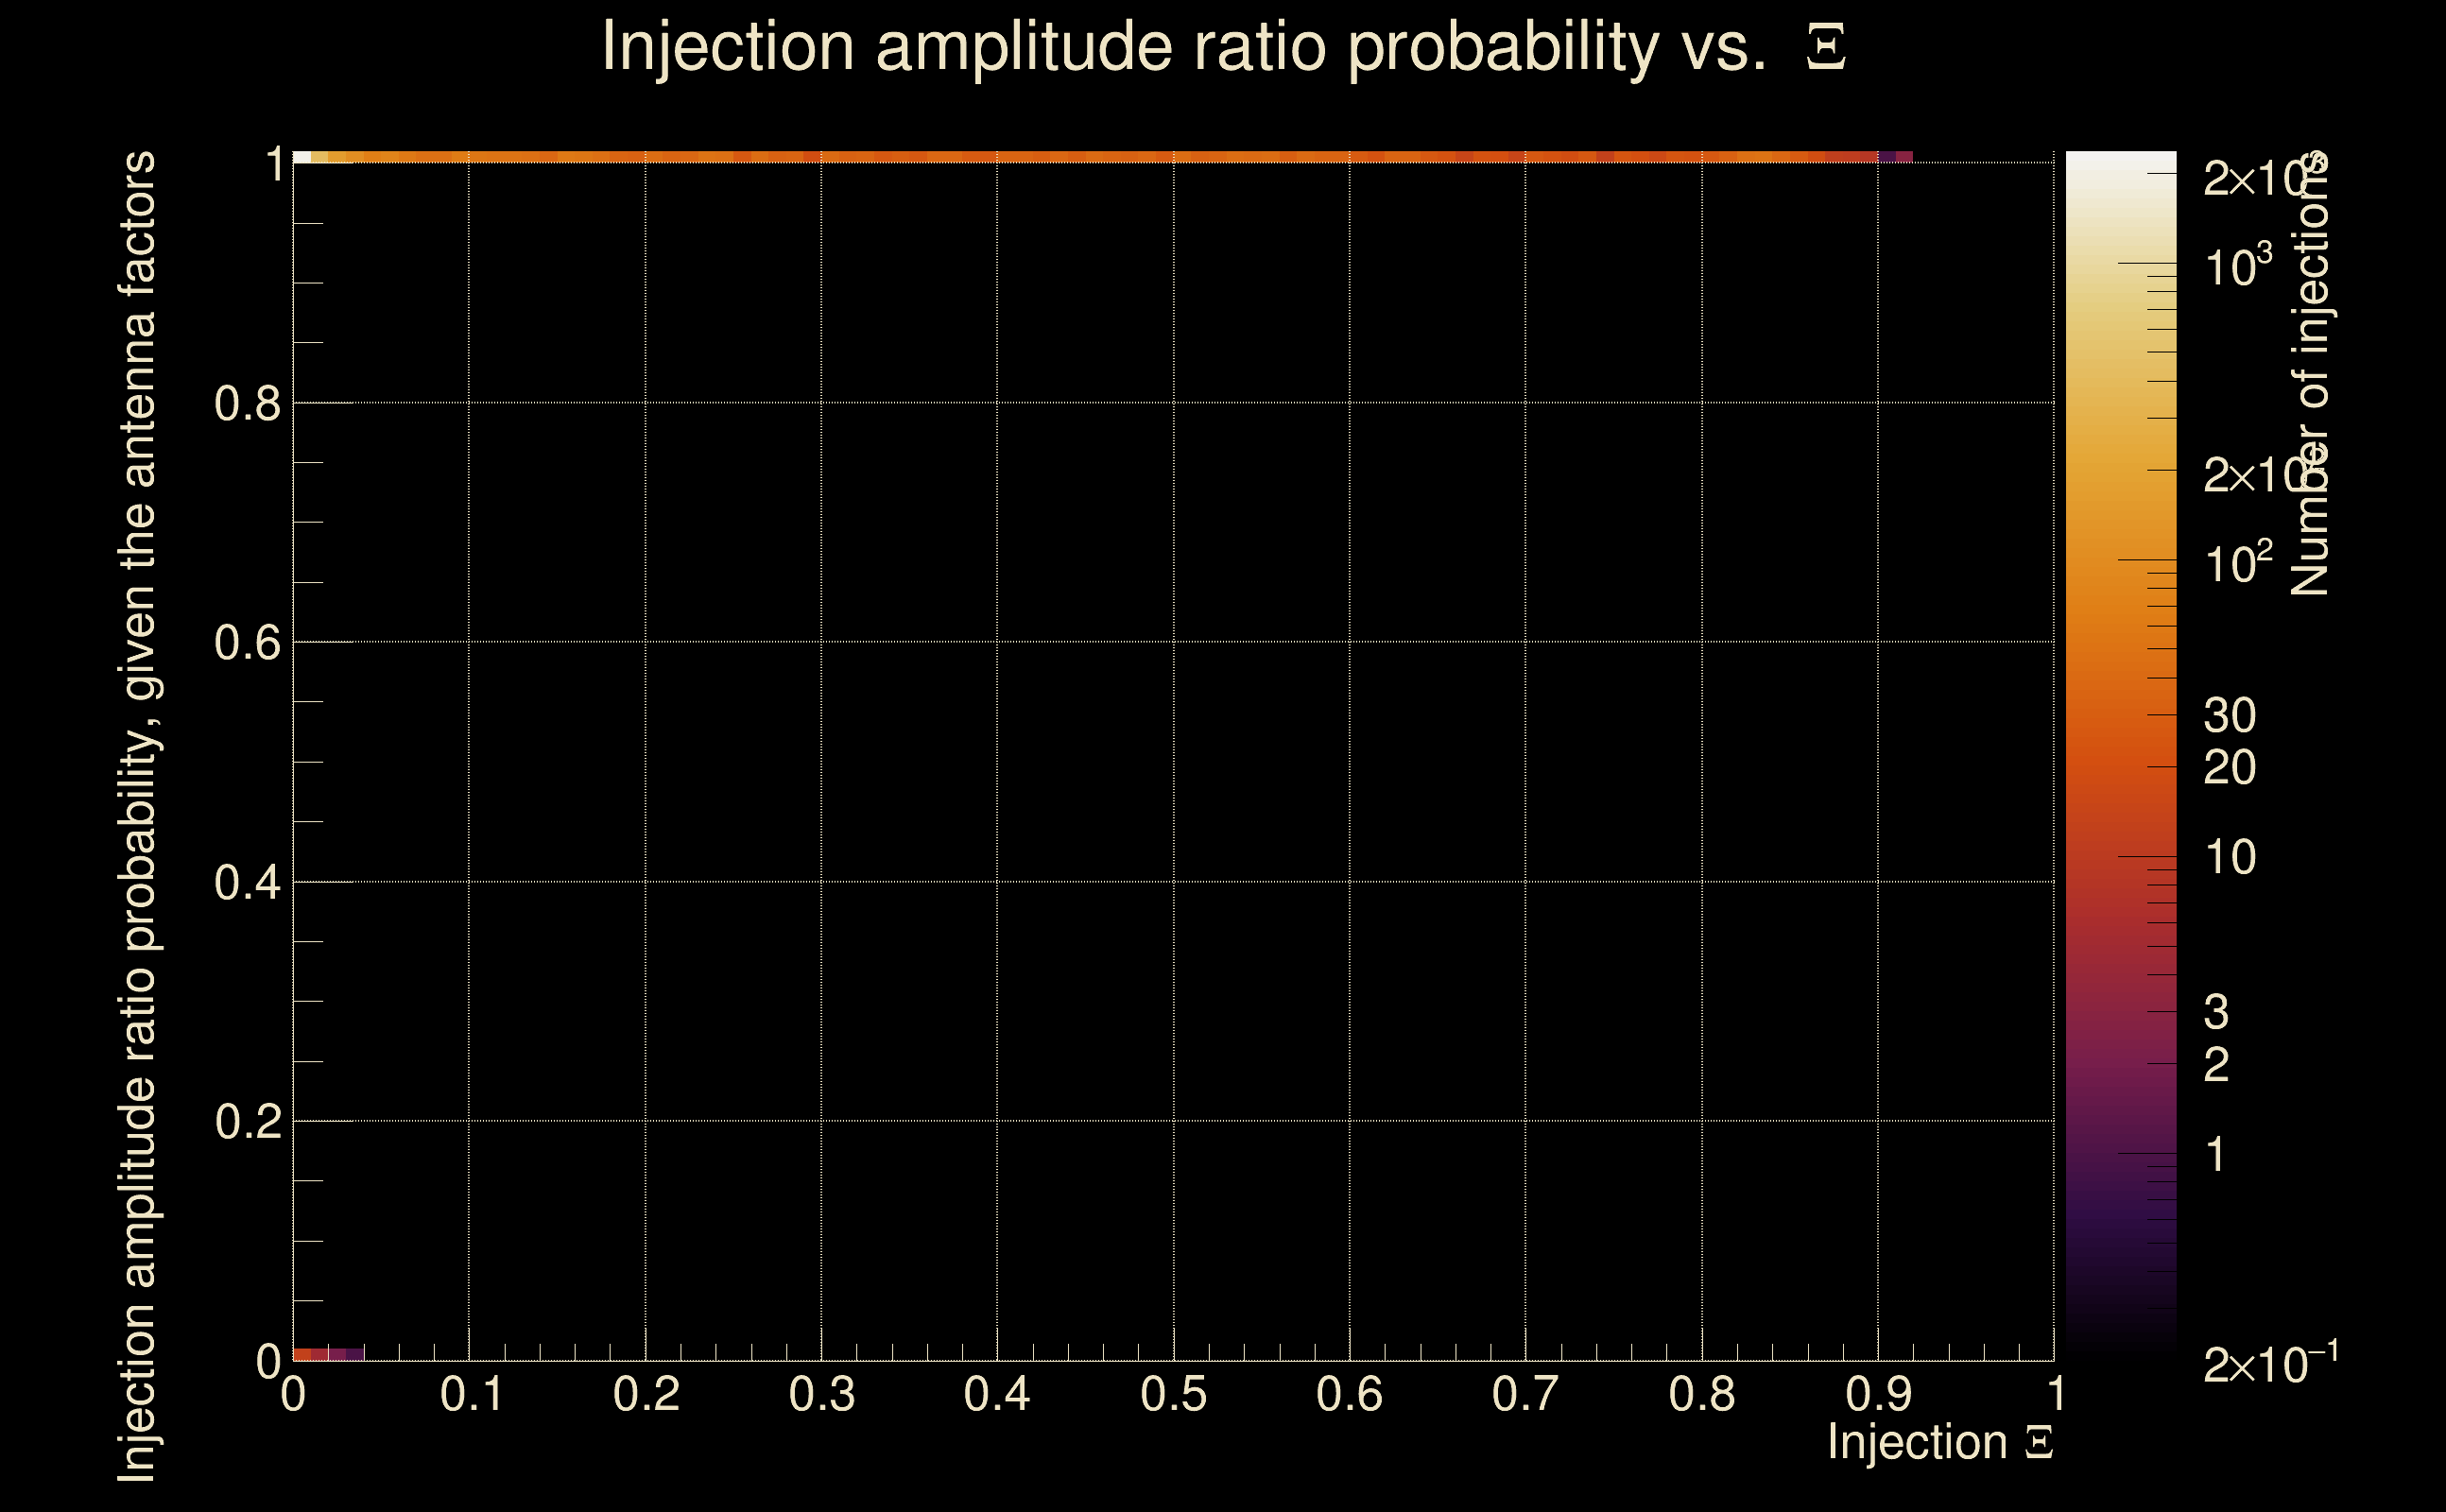
| Antenna factor probability: | 1 |
| Number of rejected frequency rows: | Q0: 0 / 18, Q1: 1 / 36, Q2: 5 / 70, Q3: 16 / 134, Q4: 44 / 258 |
| Maximum signal-to-noise ratio: | H1: 70.5587, L1: 60.1356 |
| SNR variance: | H1: 0.518885, L1: 0.495891 |
| Click here for a zoomed plot | Click here for a zoomed plot | Click here for a zoomed plot | Click here for a zoomed plot | Click here for a zoomed plot |
 |
 |
 |
 |
 |
 |
 |
 |
 |
 |
 |
 |
 |
 |
 |
 |
 |
 |
 |
 |
 |
 |
 |
 |
 |
 |
 |
 |
 |
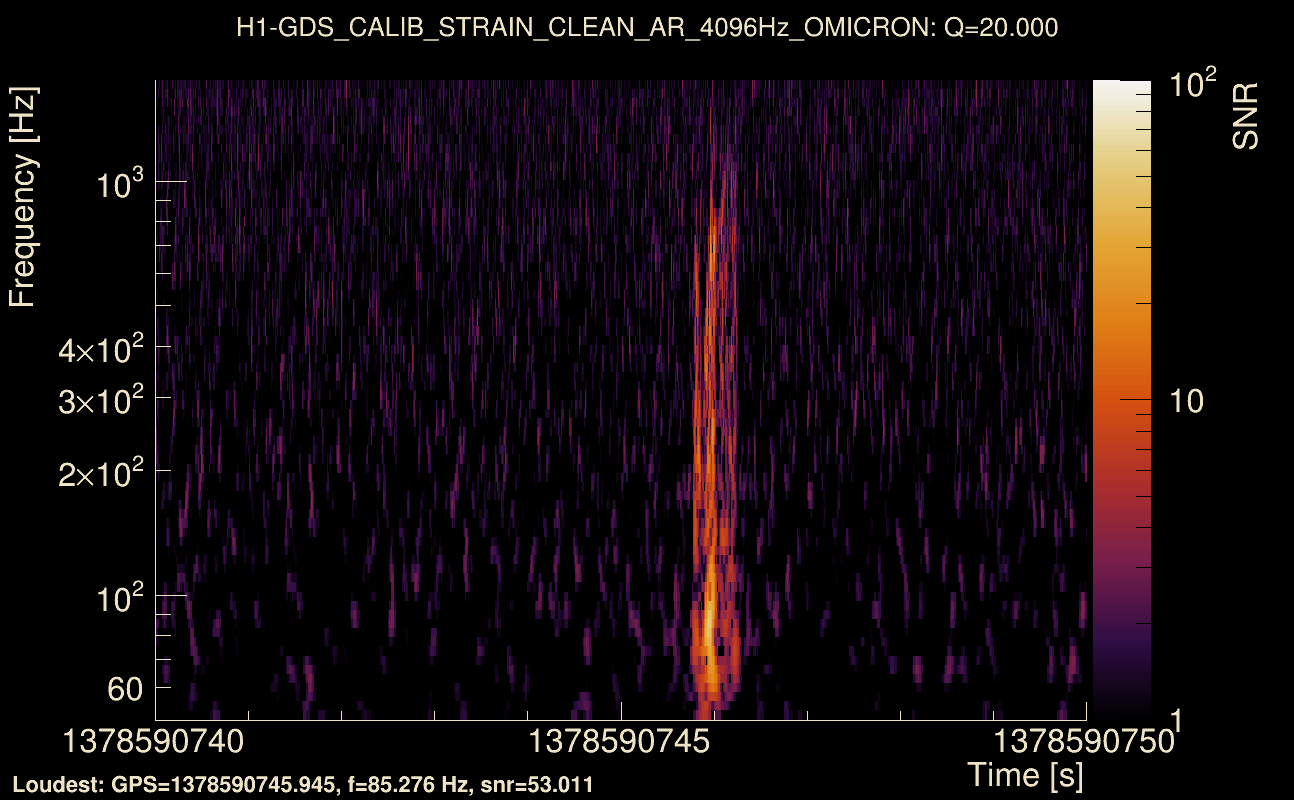
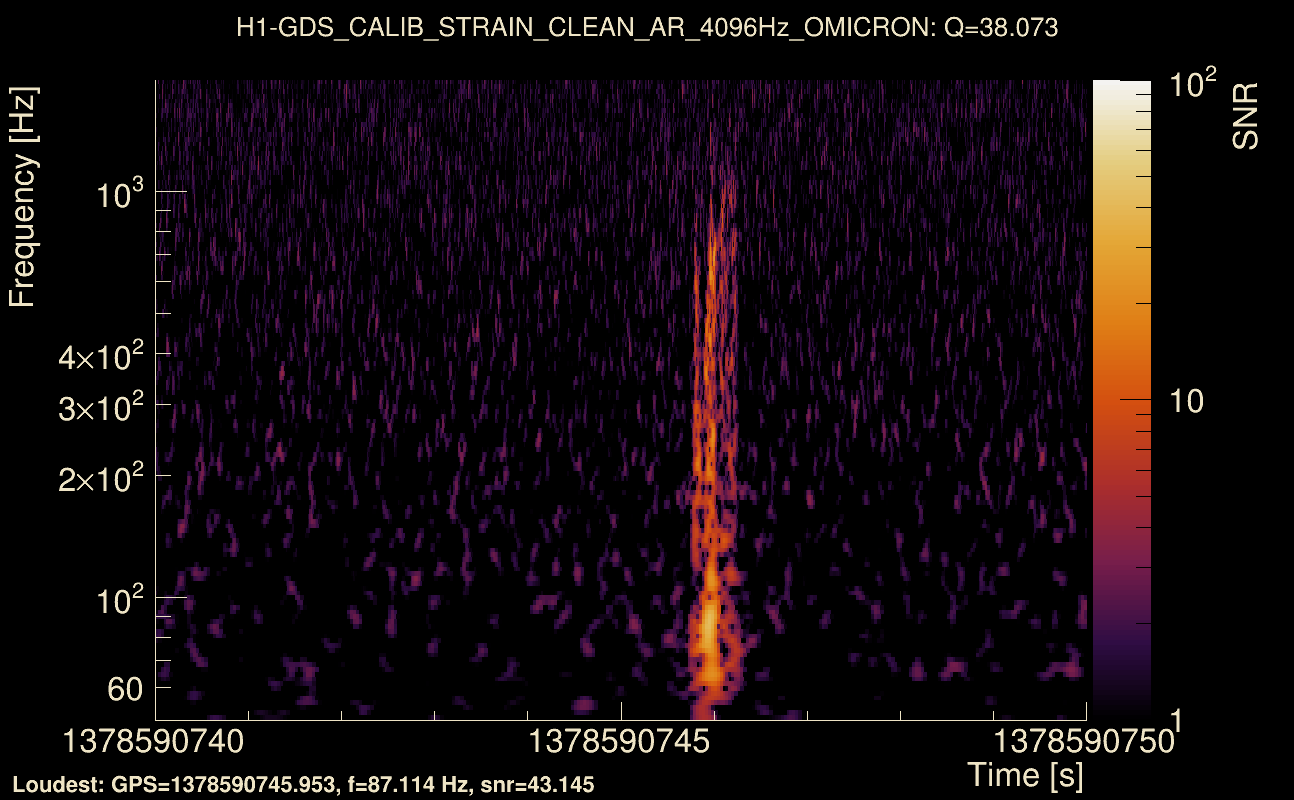
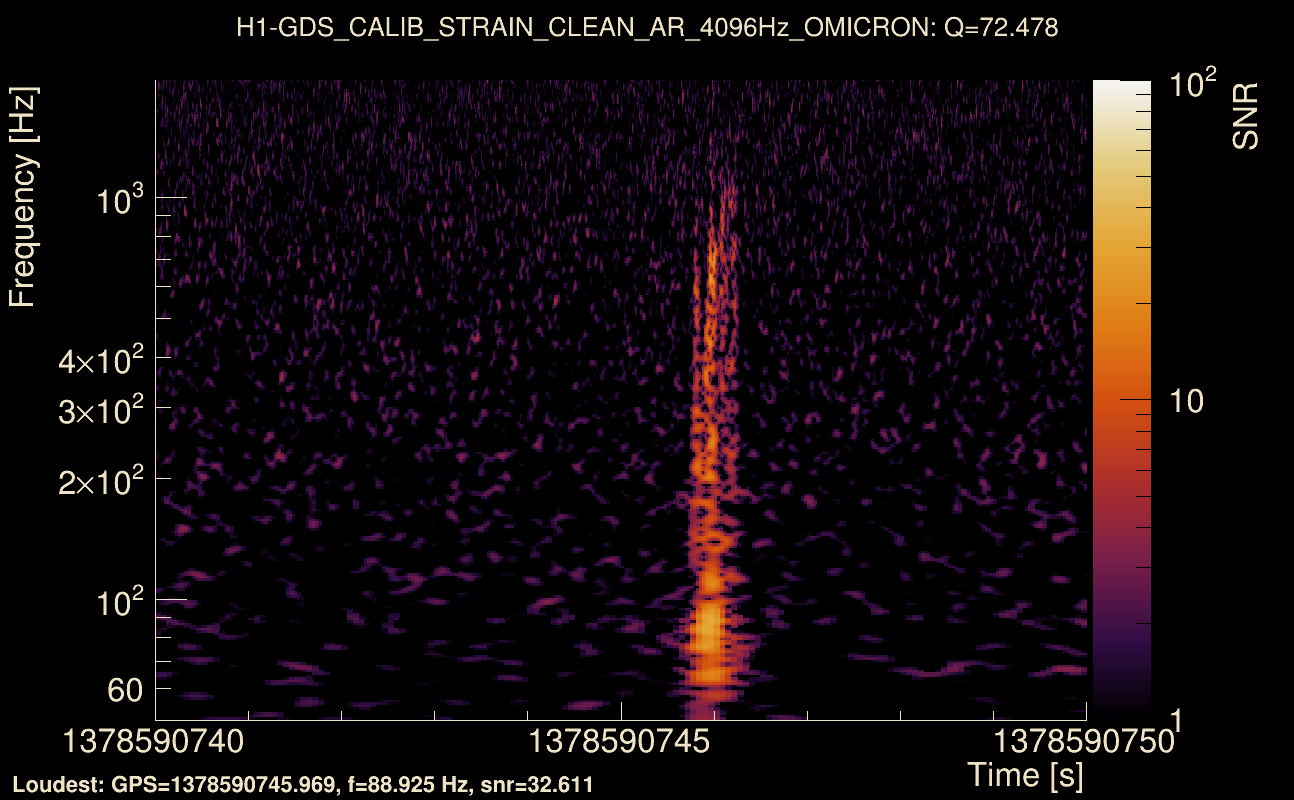
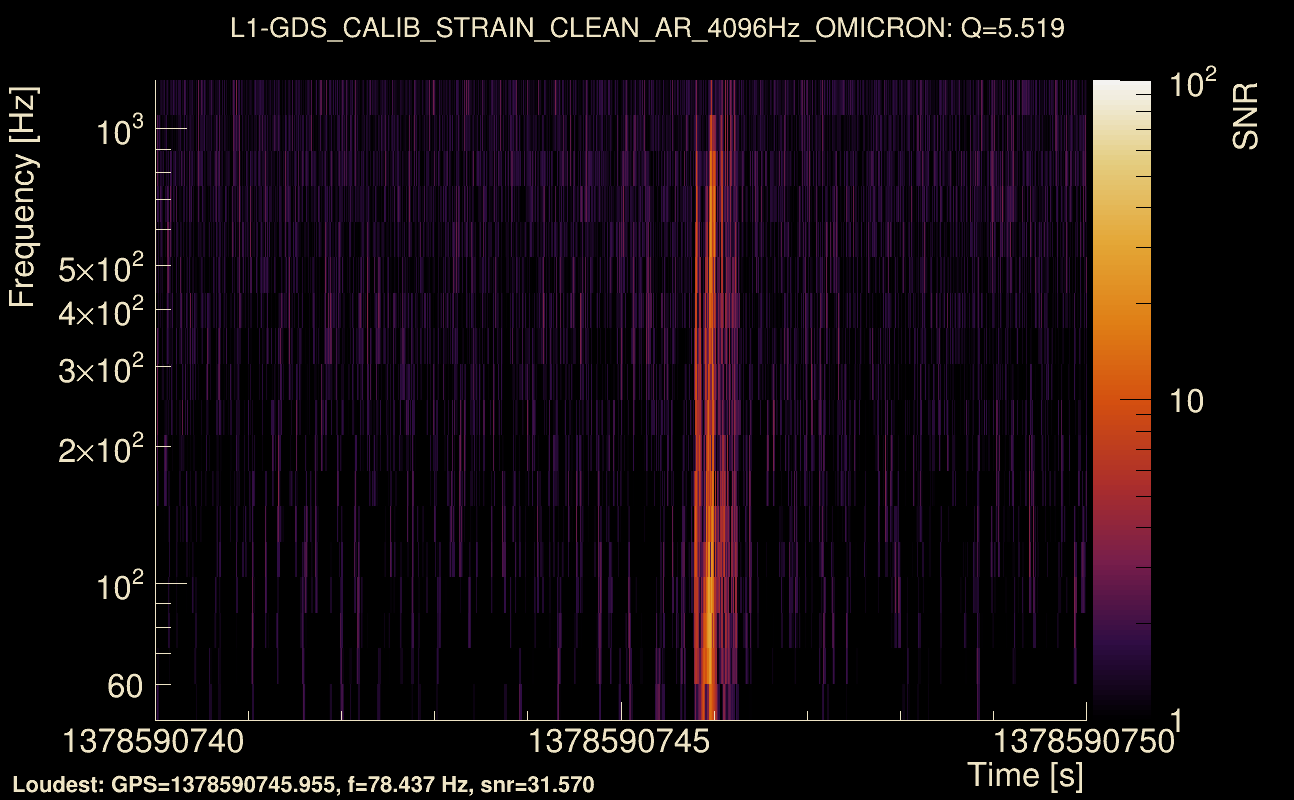
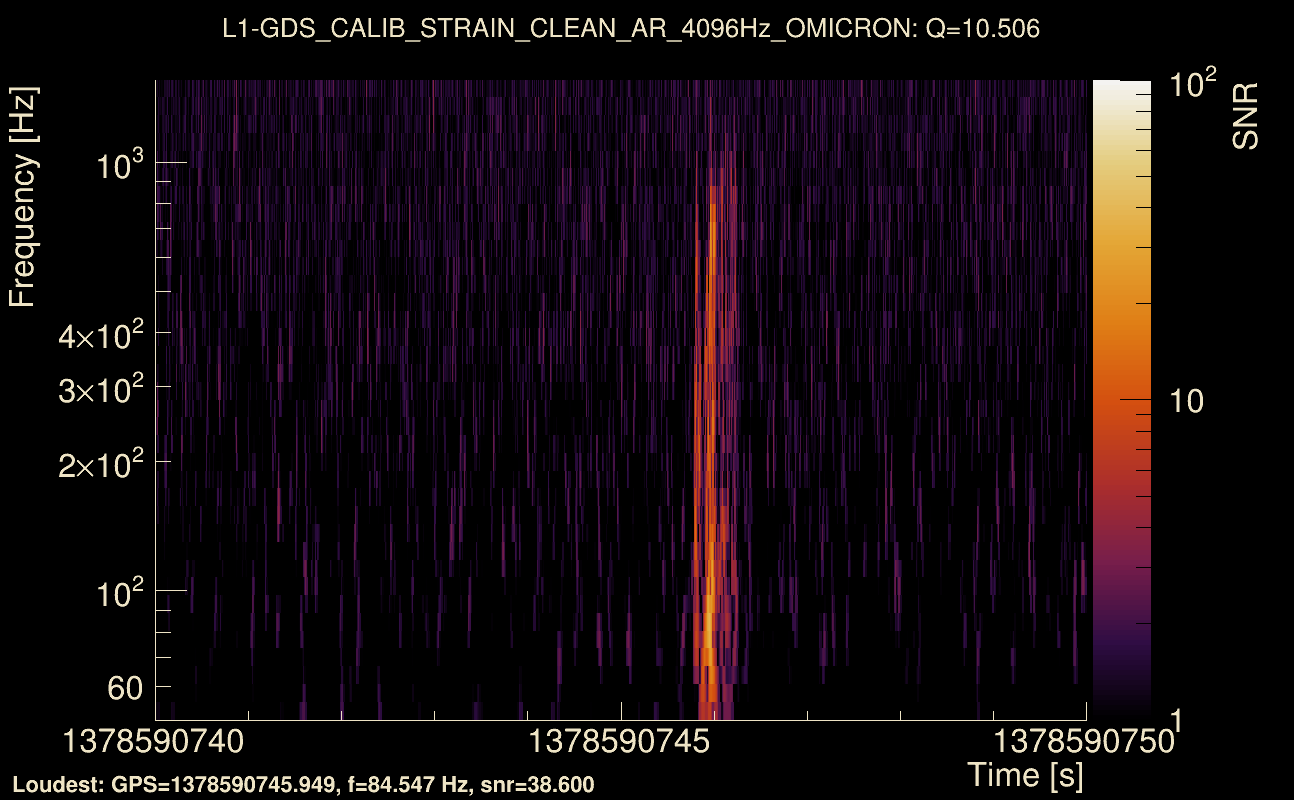
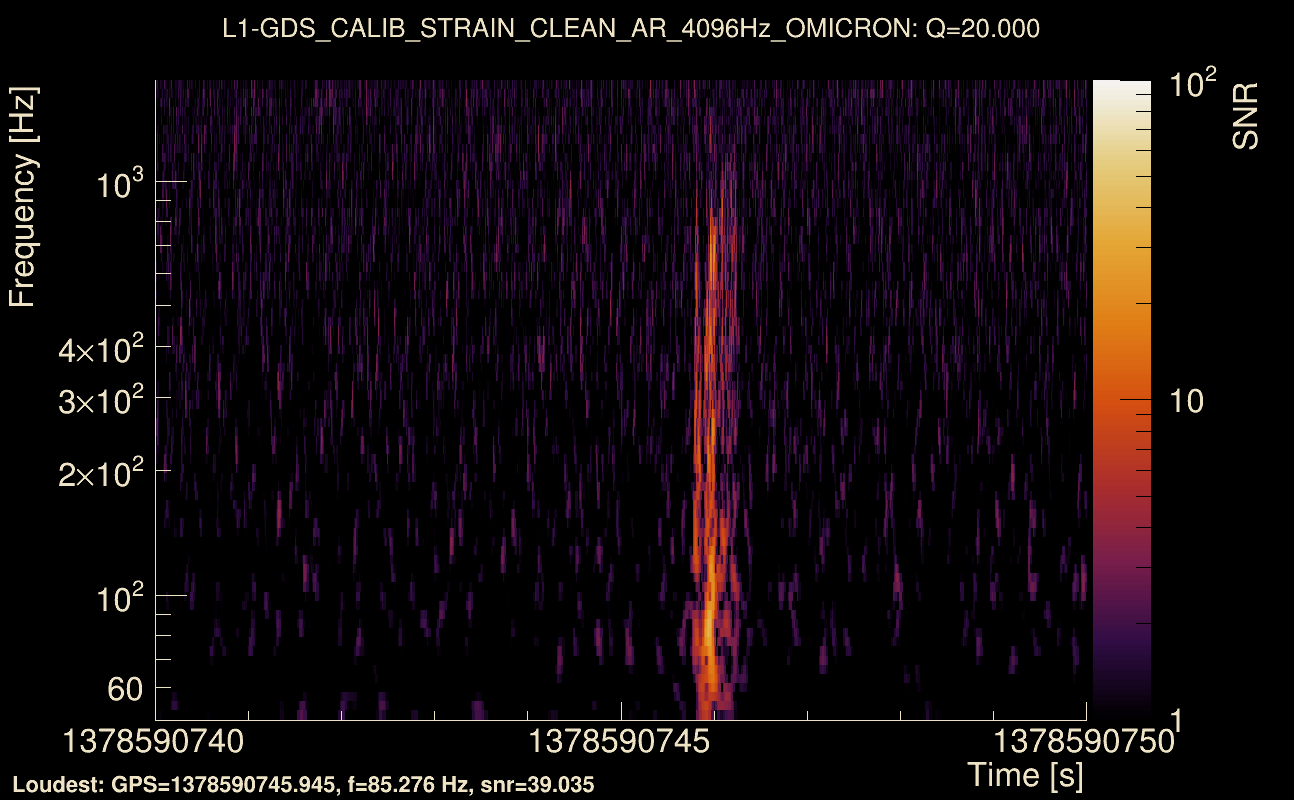
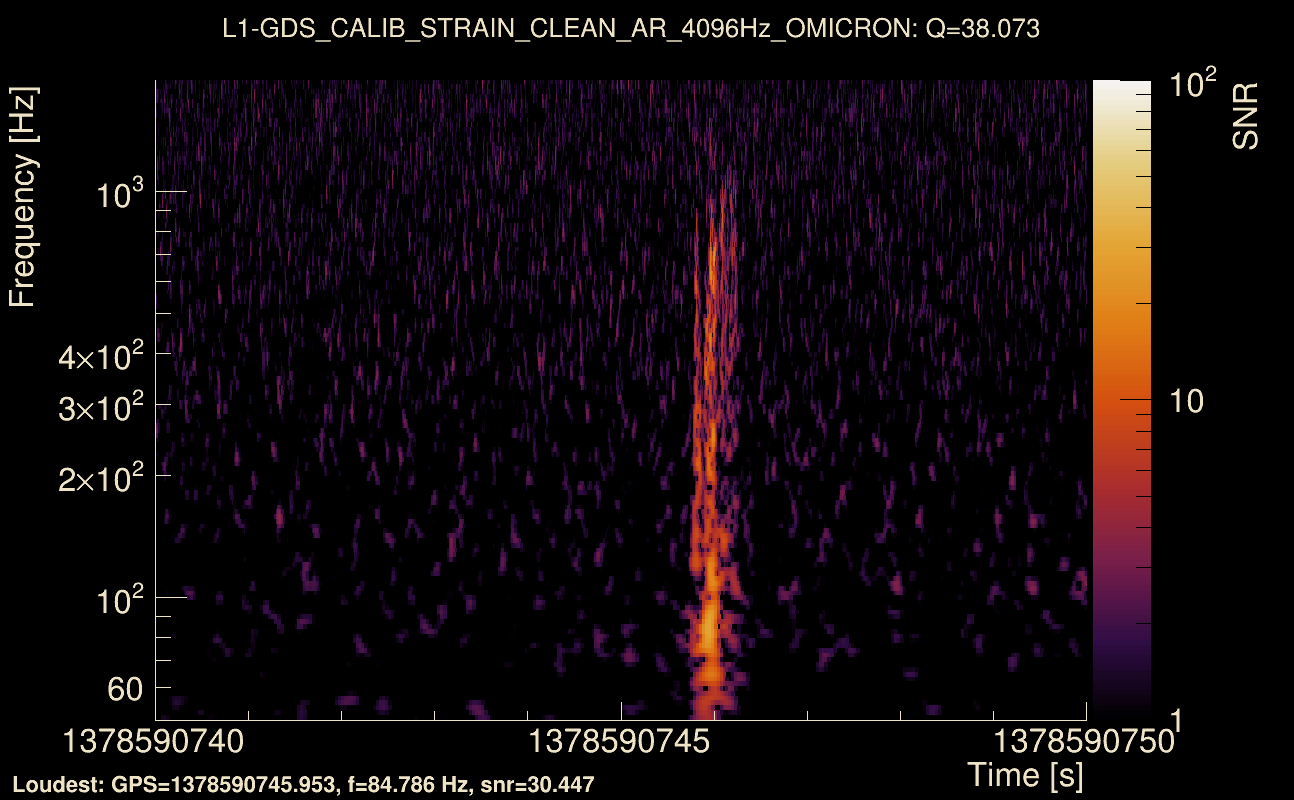
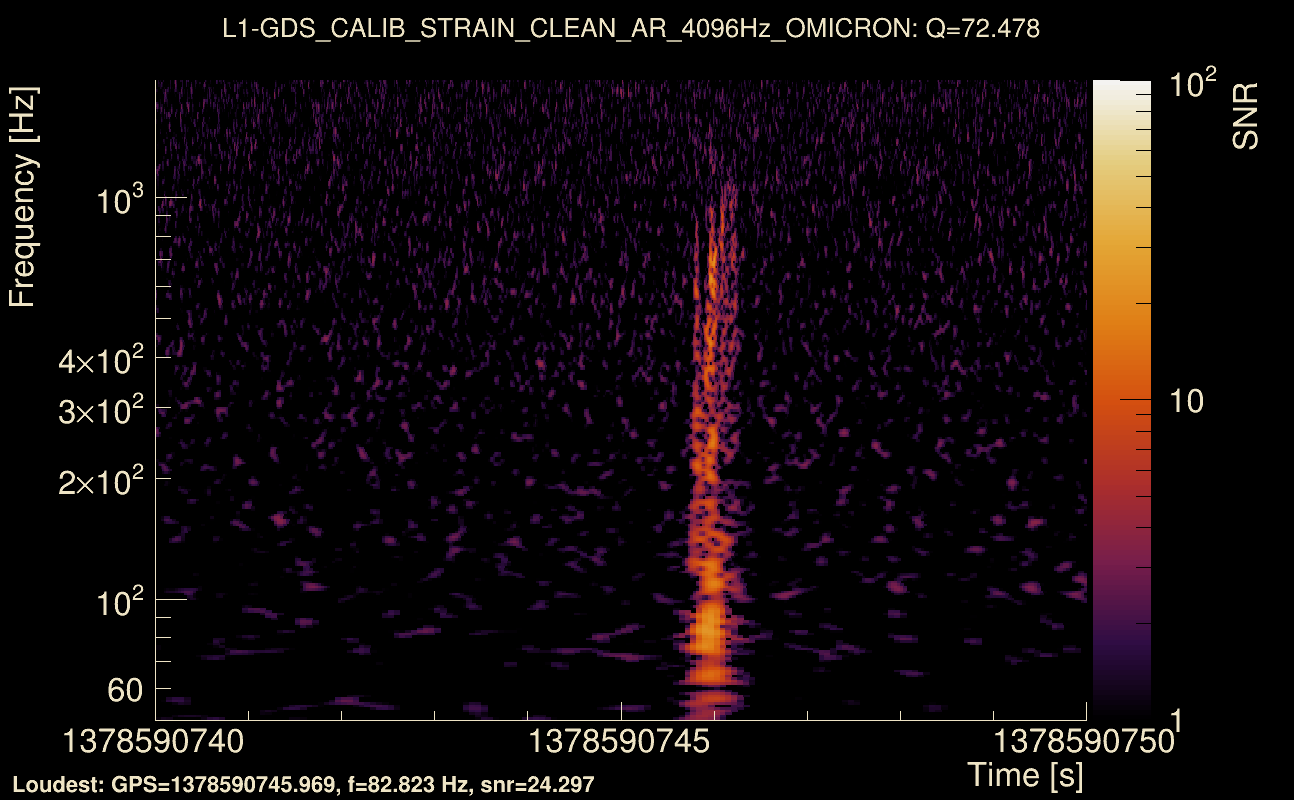
| Event time t(H1): | GPS = 1378590740 (Tue Sep 12 21:52:02 2023 ) → GPS = 1378590750 (Tue Sep 12 21:52:12 2023 ) |
| Event time t(L1): | GPS = 1378590740 (Tue Sep 12 21:52:12 2023 ) → GPS = 1378590750 (Tue Sep 12 21:52:12 2023 ) |
| Omicron analysis time window (H1): | GPS = 1378590737 → GPS = 1378590753 |
| Omicron analysis time window (L1): | GPS = 1378590737 → GPS = 1378590753 |
| Time delay between detectors t(L1) - t(H1): | 0.0019715 s (slice index = 108 / 217), δt_gw = 0.0019715 s |
| Time delay uncertainty: | 0.000608778 s |
| [targeted mode] Time delay probability: | 0.998103 (0.00237693 sigmas), δt_target = 0.00253391 s |
| Frequency: | 230.543 Hz |
| Ξ: | 0.895181 ± 0.0101898 (variance = 0.000103832): Q0: 0.938281, Q1: 0.932147, Q2: 0.929241, Q3: 0.921553, Q4: 0.908671 |
| Rank: | R_A = 0.893484 |
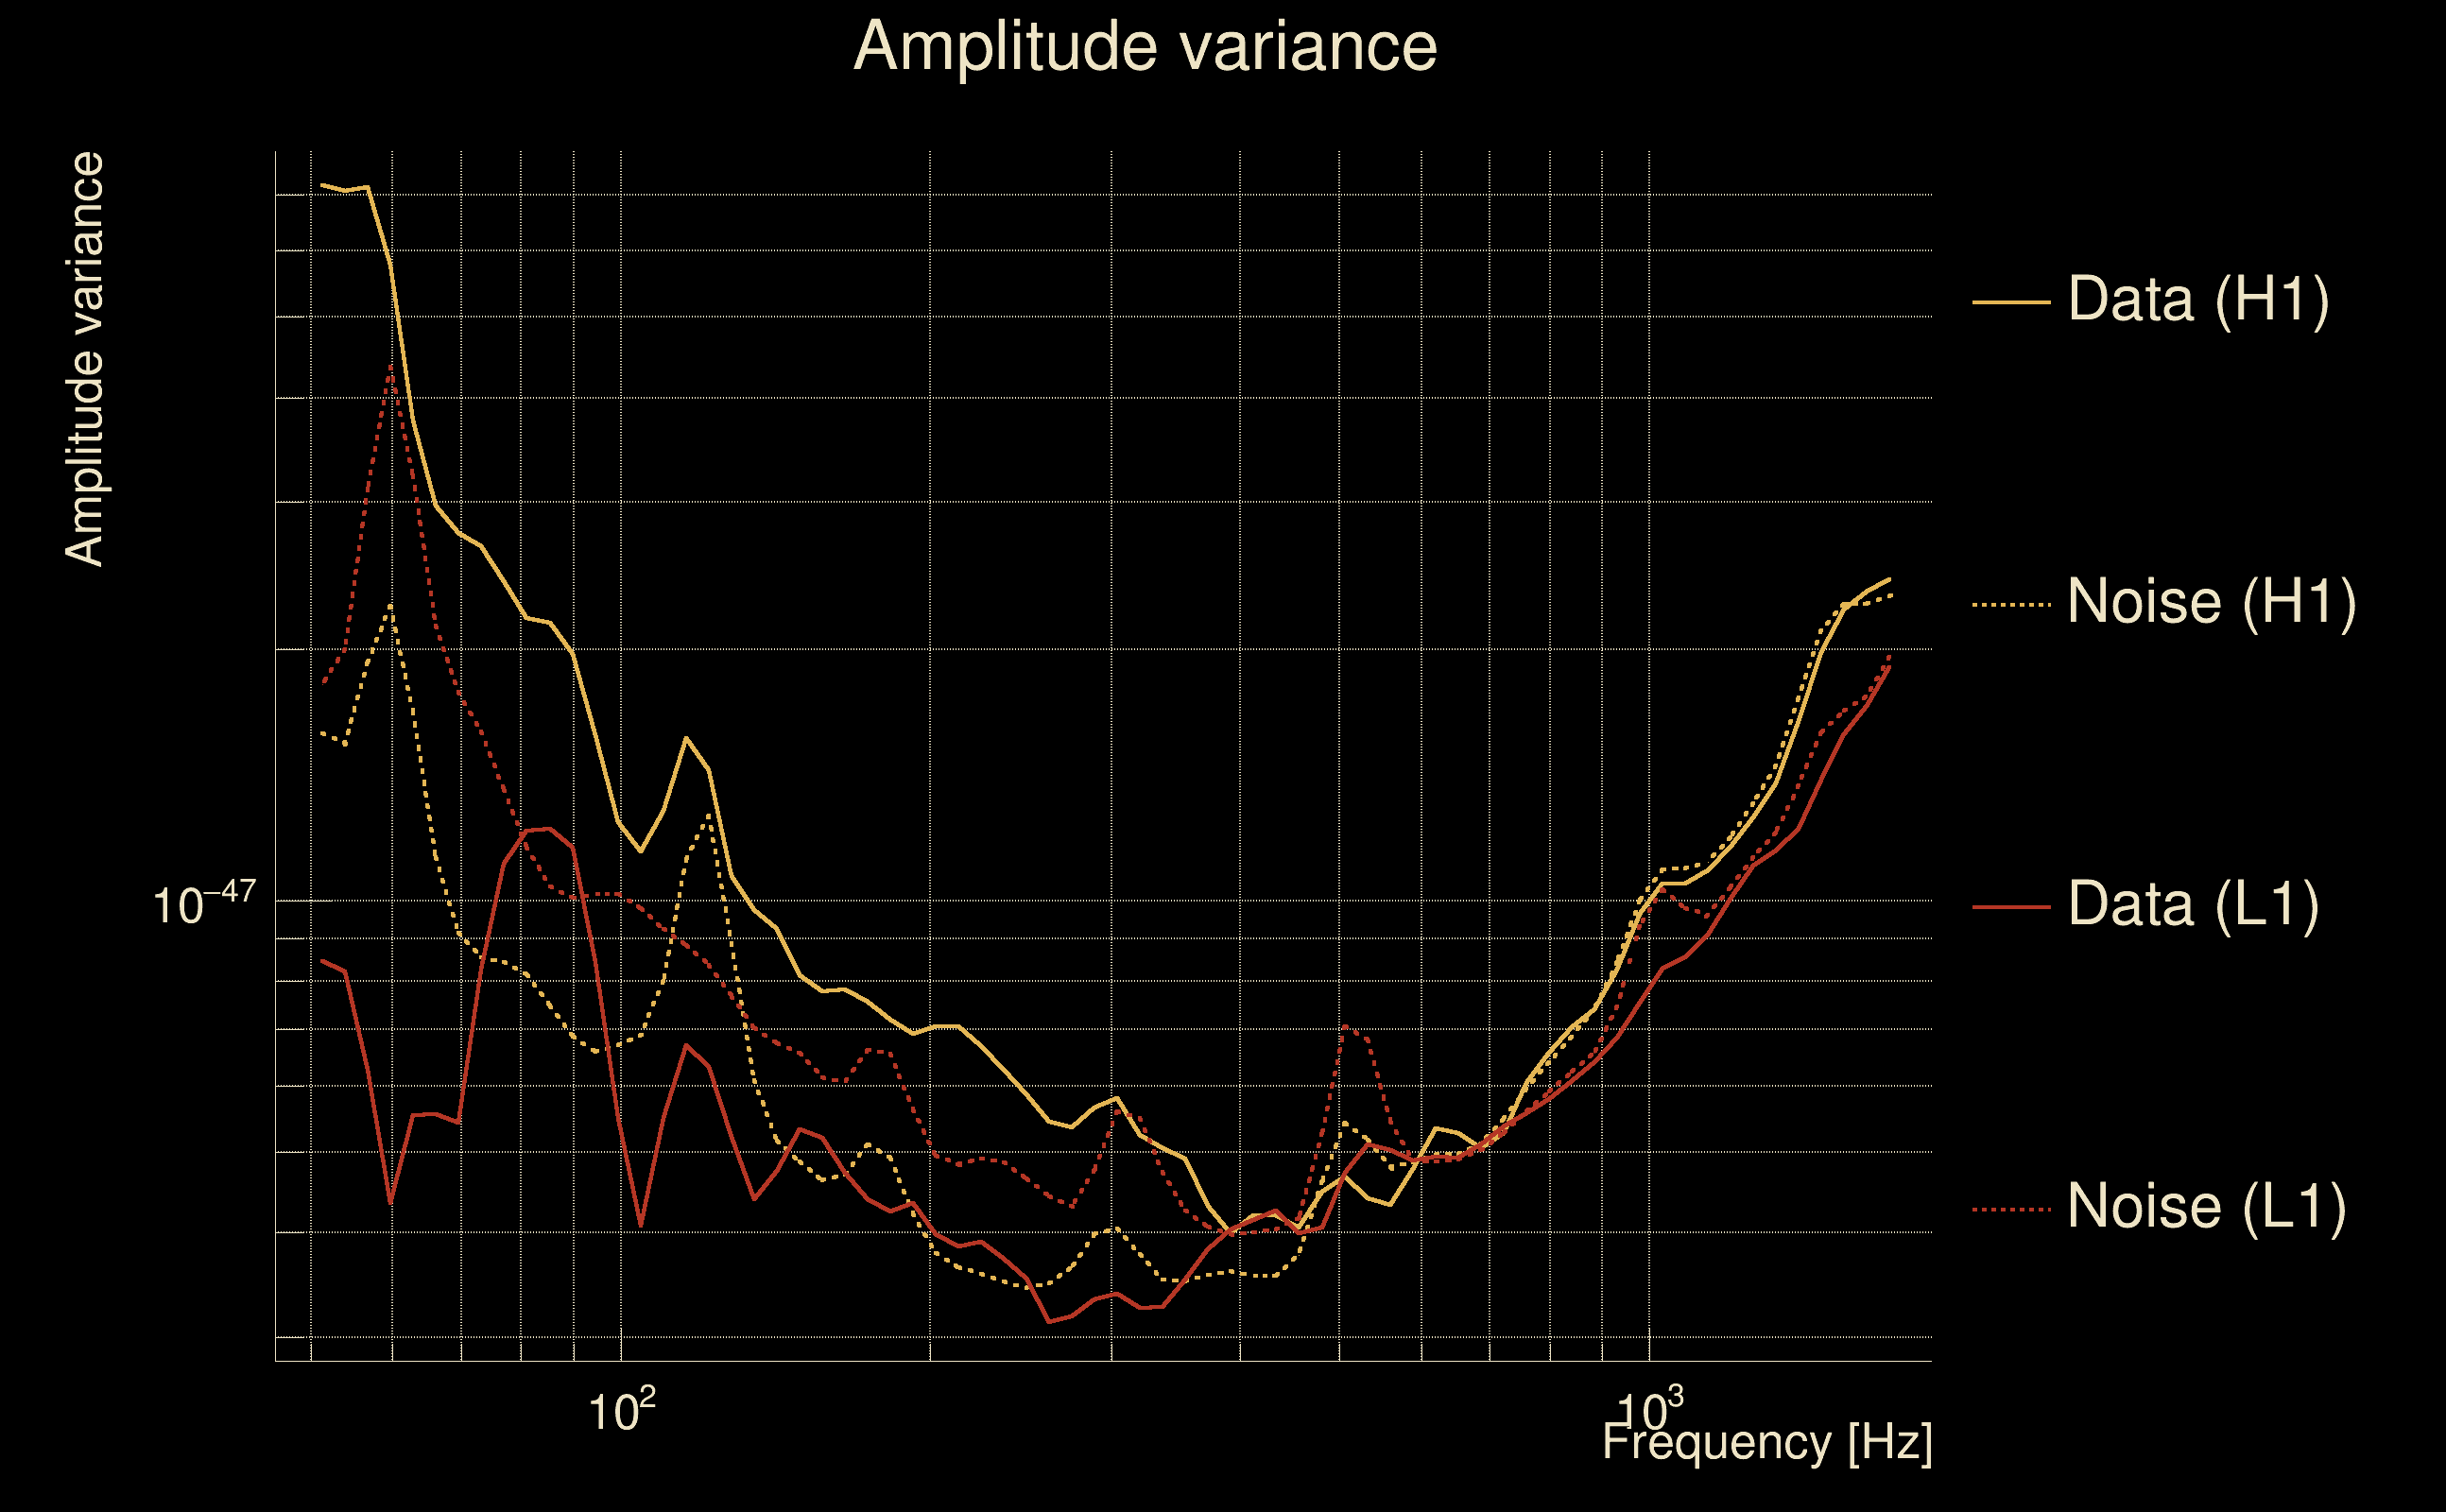
| Log of amplitude ratio (L1/H1): | -0.0976493, variance = 0.159476 (L1/H1: -0.102727, variance = 0.306962, H1/L1: 0.0901038, variance = 0.307764) |
| Amplitude ratio (L1/H1): | 0.906967 ⋇ 1.49085 (L1/H1: 0.902373 ⋇ 1.74027, H1/L1: 1.09429 ⋇ 1.74153) |
| Amplitude ratio H1|L1 compatibility (probability): | 0.987154 |
| Antenna factor probability: | 1 |
| Number of rejected frequency rows: | Q0: 0 / 18, Q1: 2 / 36, Q2: 5 / 70, Q3: 18 / 134, Q4: 62 / 258 |
| Maximum signal-to-noise ratio: | H1: 53.4076, L1: 43.8122 |
| SNR variance: | H1: 0.500049, L1: 0.445656 |
| Click here for a zoomed plot | Click here for a zoomed plot | Click here for a zoomed plot | Click here for a zoomed plot | Click here for a zoomed plot |
 |
 |
 |
 |
 |
 |
 |
 |
 |
 |
 |
 |
 |
 |
 |
 |
 |
 |
 |
 |
 |
 |
 |
 |
 |
 |
 |
 |
 |
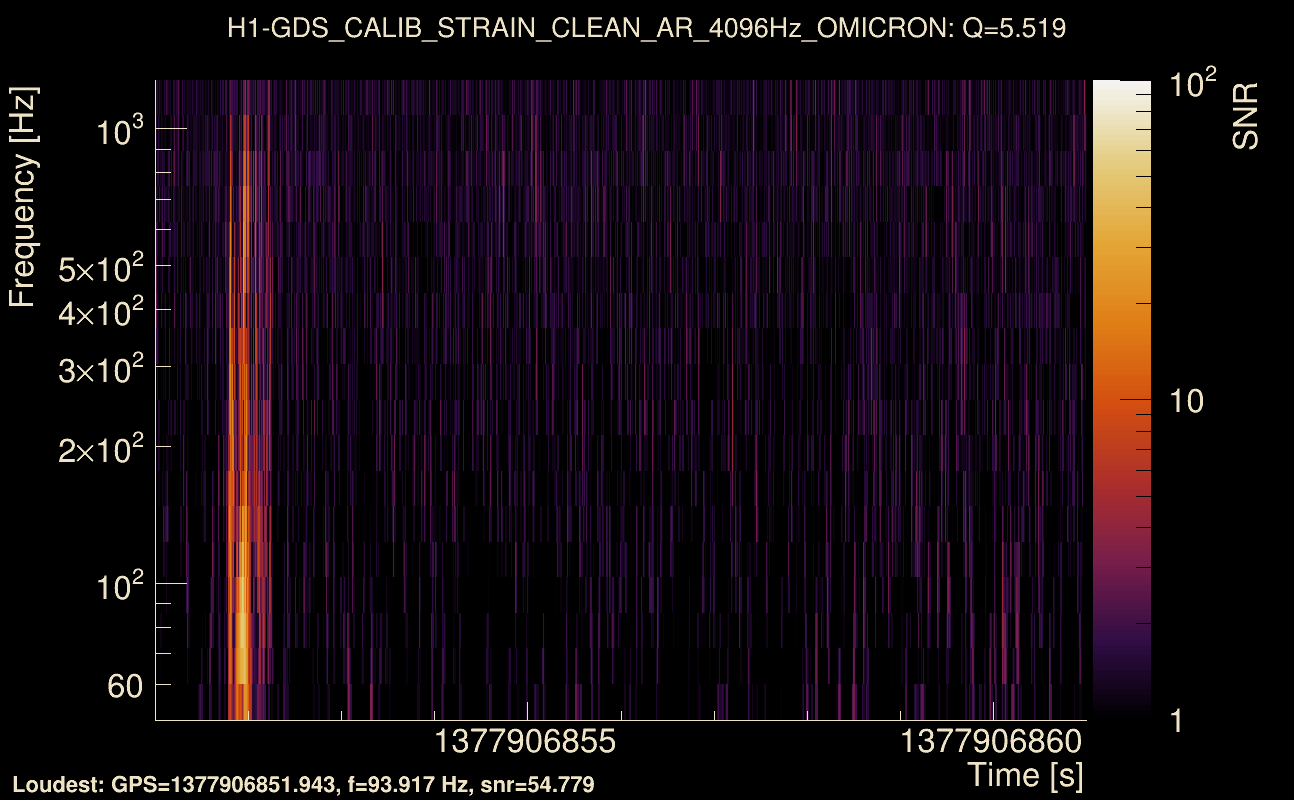
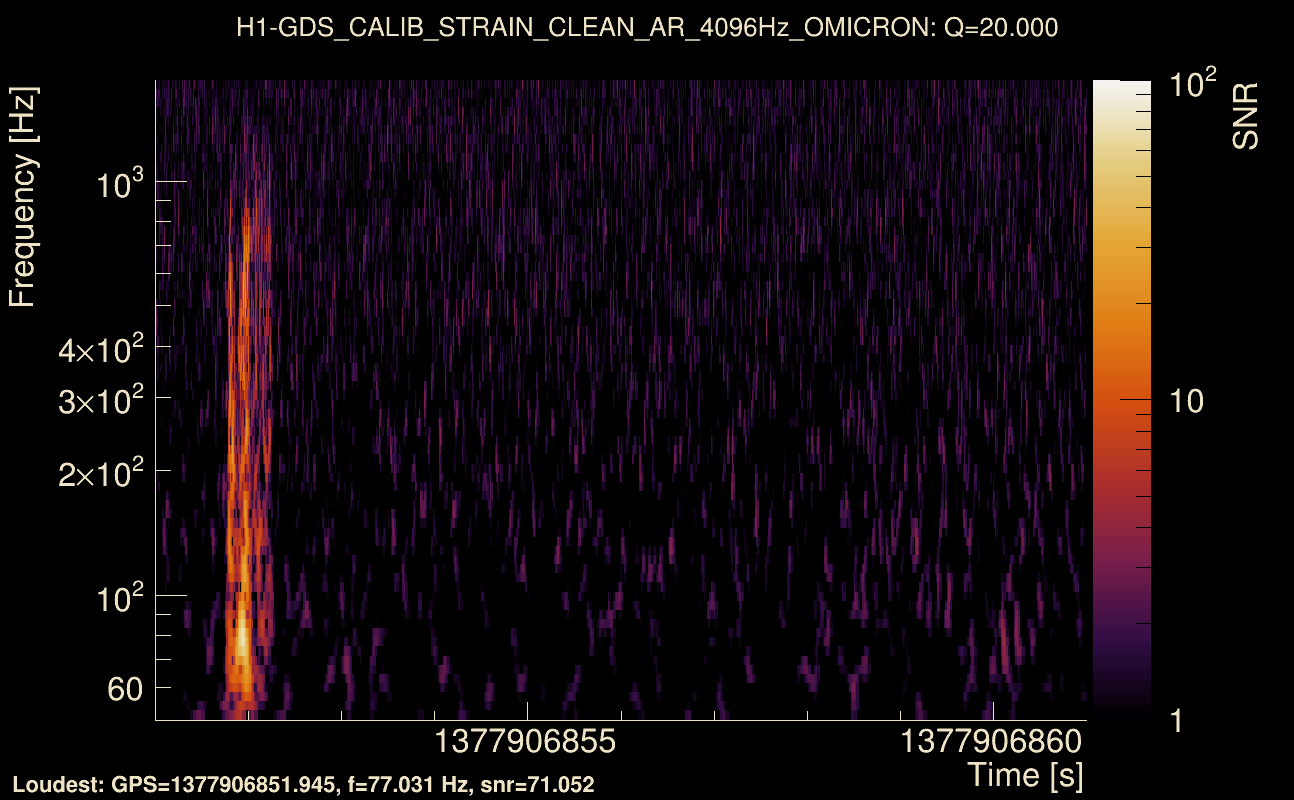
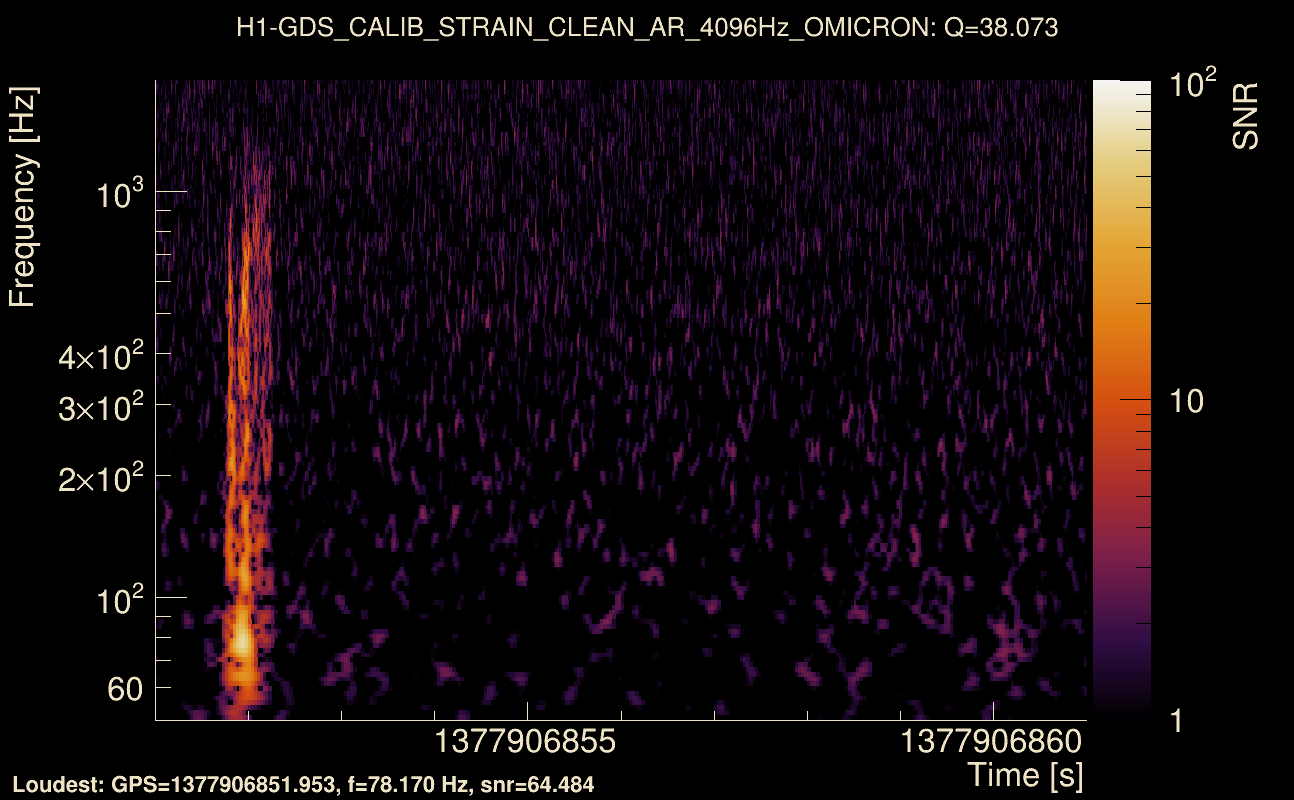
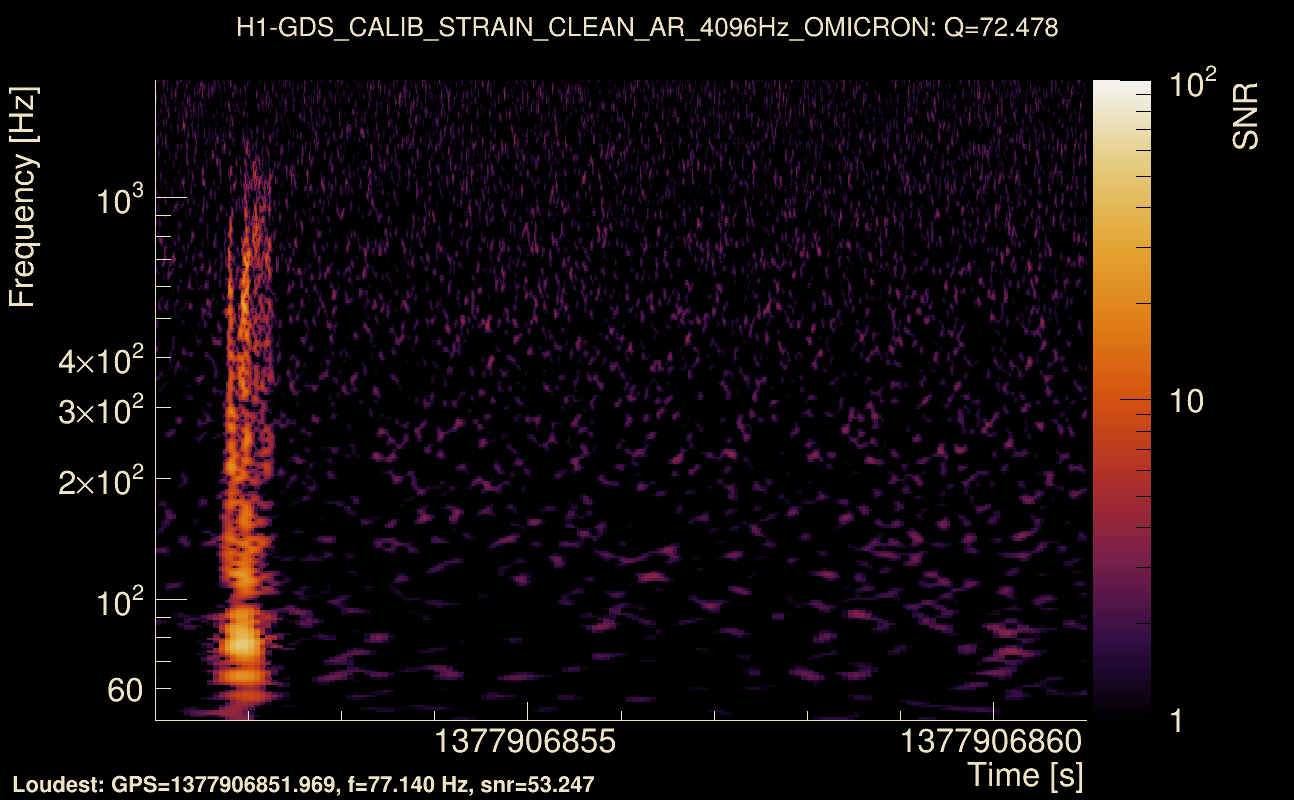
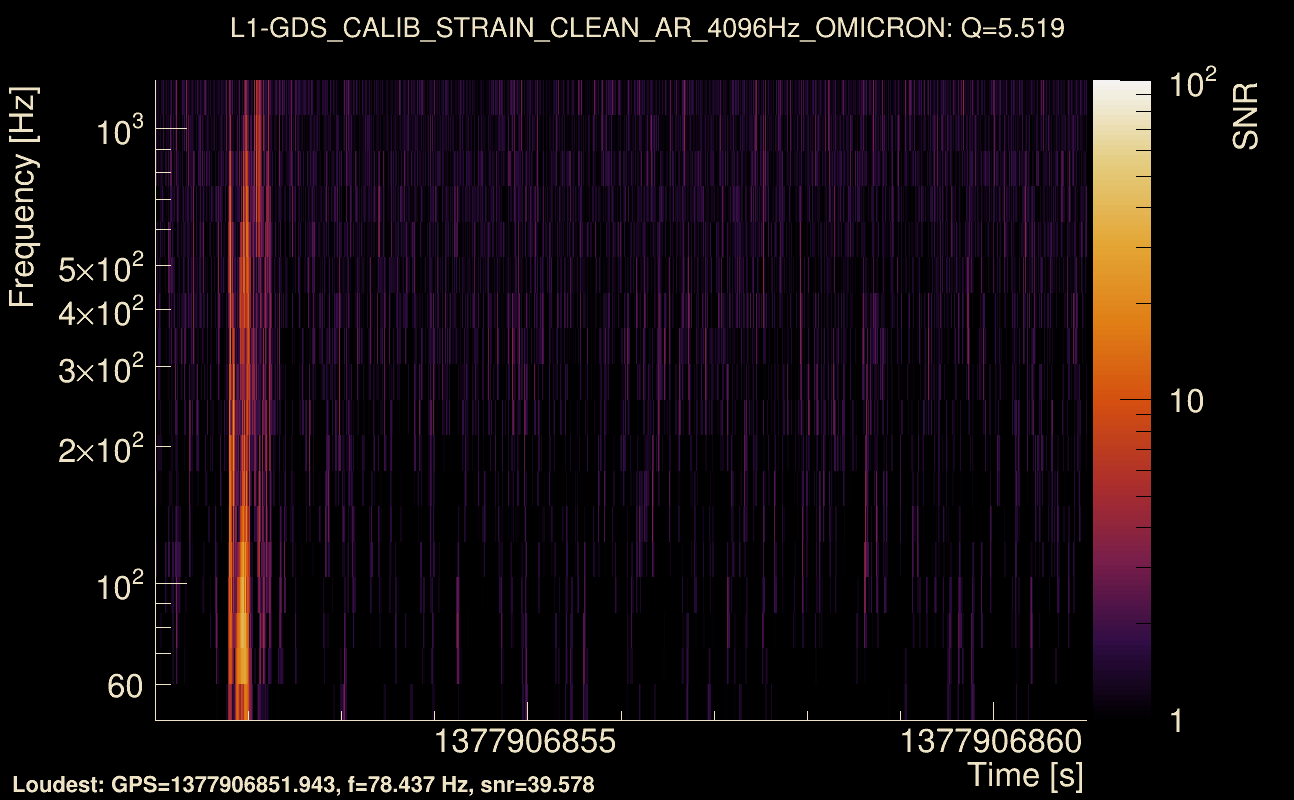
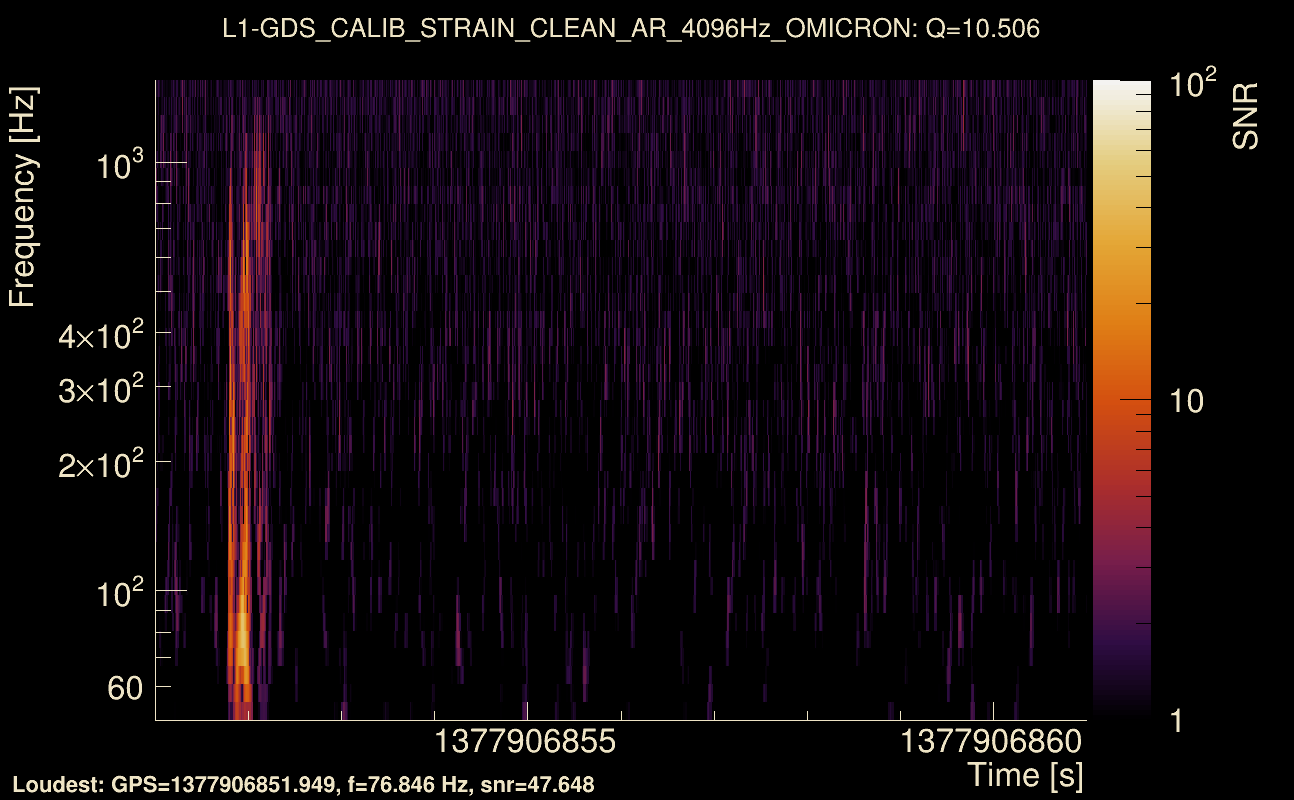
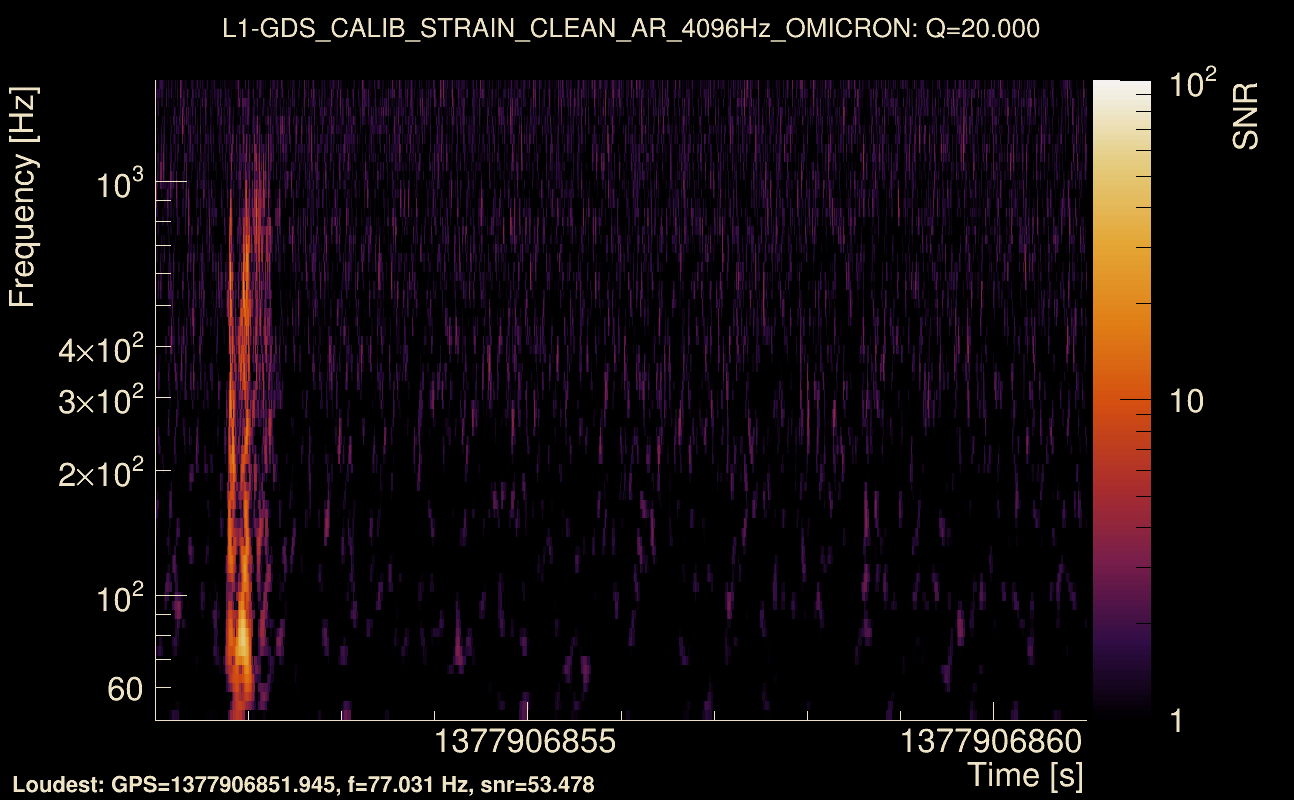
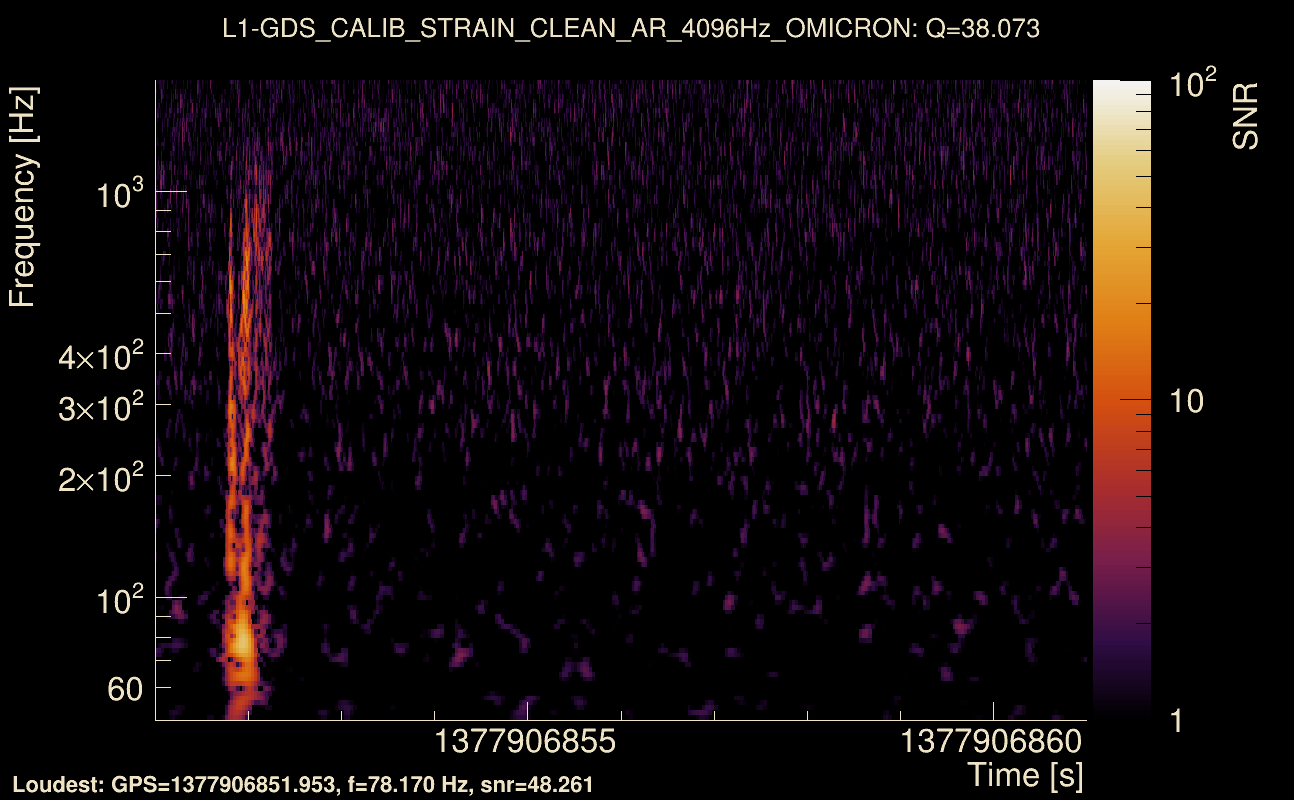
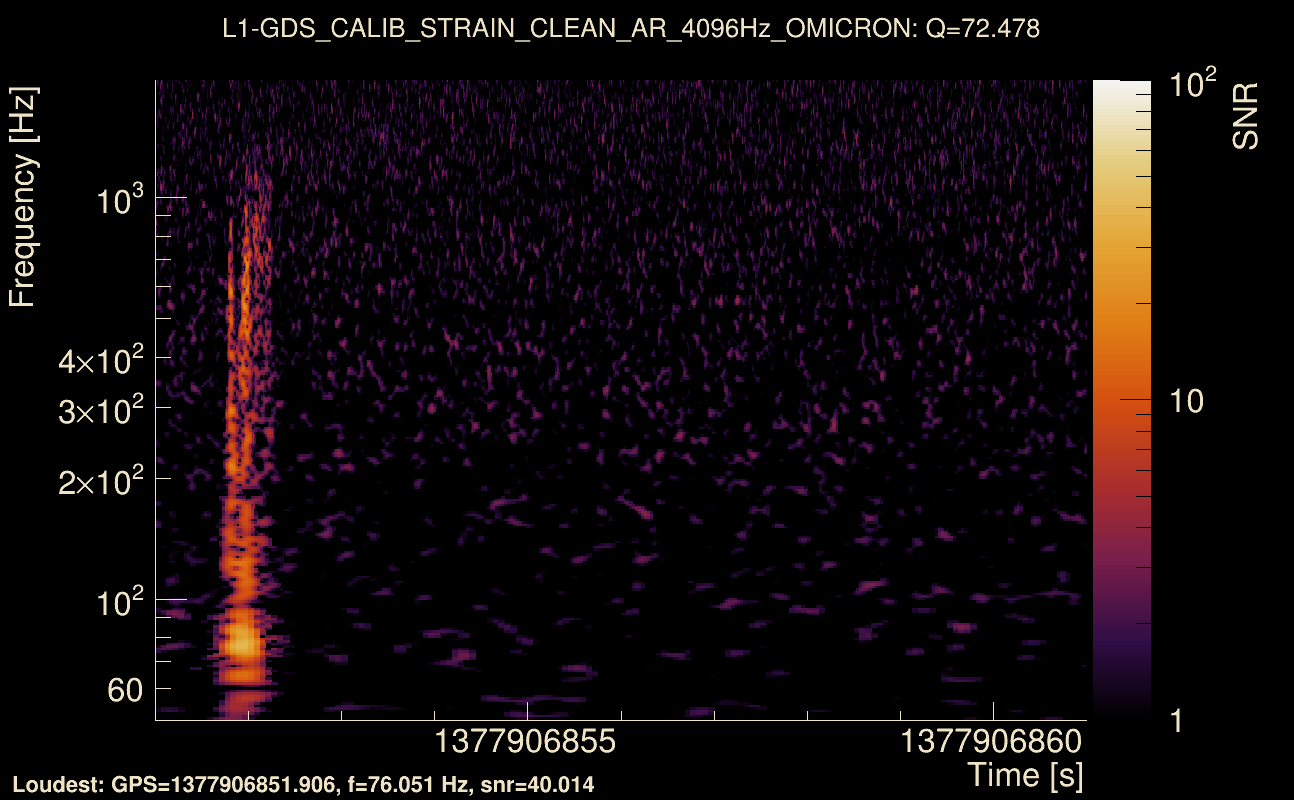
| Event time t(H1): | GPS = 1377906851 (Mon Sep 4 23:53:53 2023 ) → GPS = 1377906861 (Mon Sep 4 23:54:03 2023 ) |
| Event time t(L1): | GPS = 1377906851 (Mon Sep 4 23:54:03 2023 ) → GPS = 1377906861 (Mon Sep 4 23:54:03 2023 ) |
| Omicron analysis time window (H1): | GPS = 1377906848 → GPS = 1377906864 |
| Omicron analysis time window (L1): | GPS = 1377906848 → GPS = 1377906864 |
| Time delay between detectors t(L1) - t(H1): | 0.00398762 s (slice index = 108 / 217), δt_gw = 0.00398762 s |
| Time delay uncertainty: | 0.000510775 s |
| [targeted mode] Time delay probability: | 0.999742 (0.000322924 sigmas), δt_target = 0.00197005 s |
| Frequency: | 232.489 Hz |
| Ξ: | 0.89164 ± 0.00323714 (variance = 1.04791e-05): Q0: 0.936108, Q1: 0.933804, Q2: 0.933947, Q3: 0.936931, Q4: 0.927693 |
| Rank: | R_A = 0.89141 |
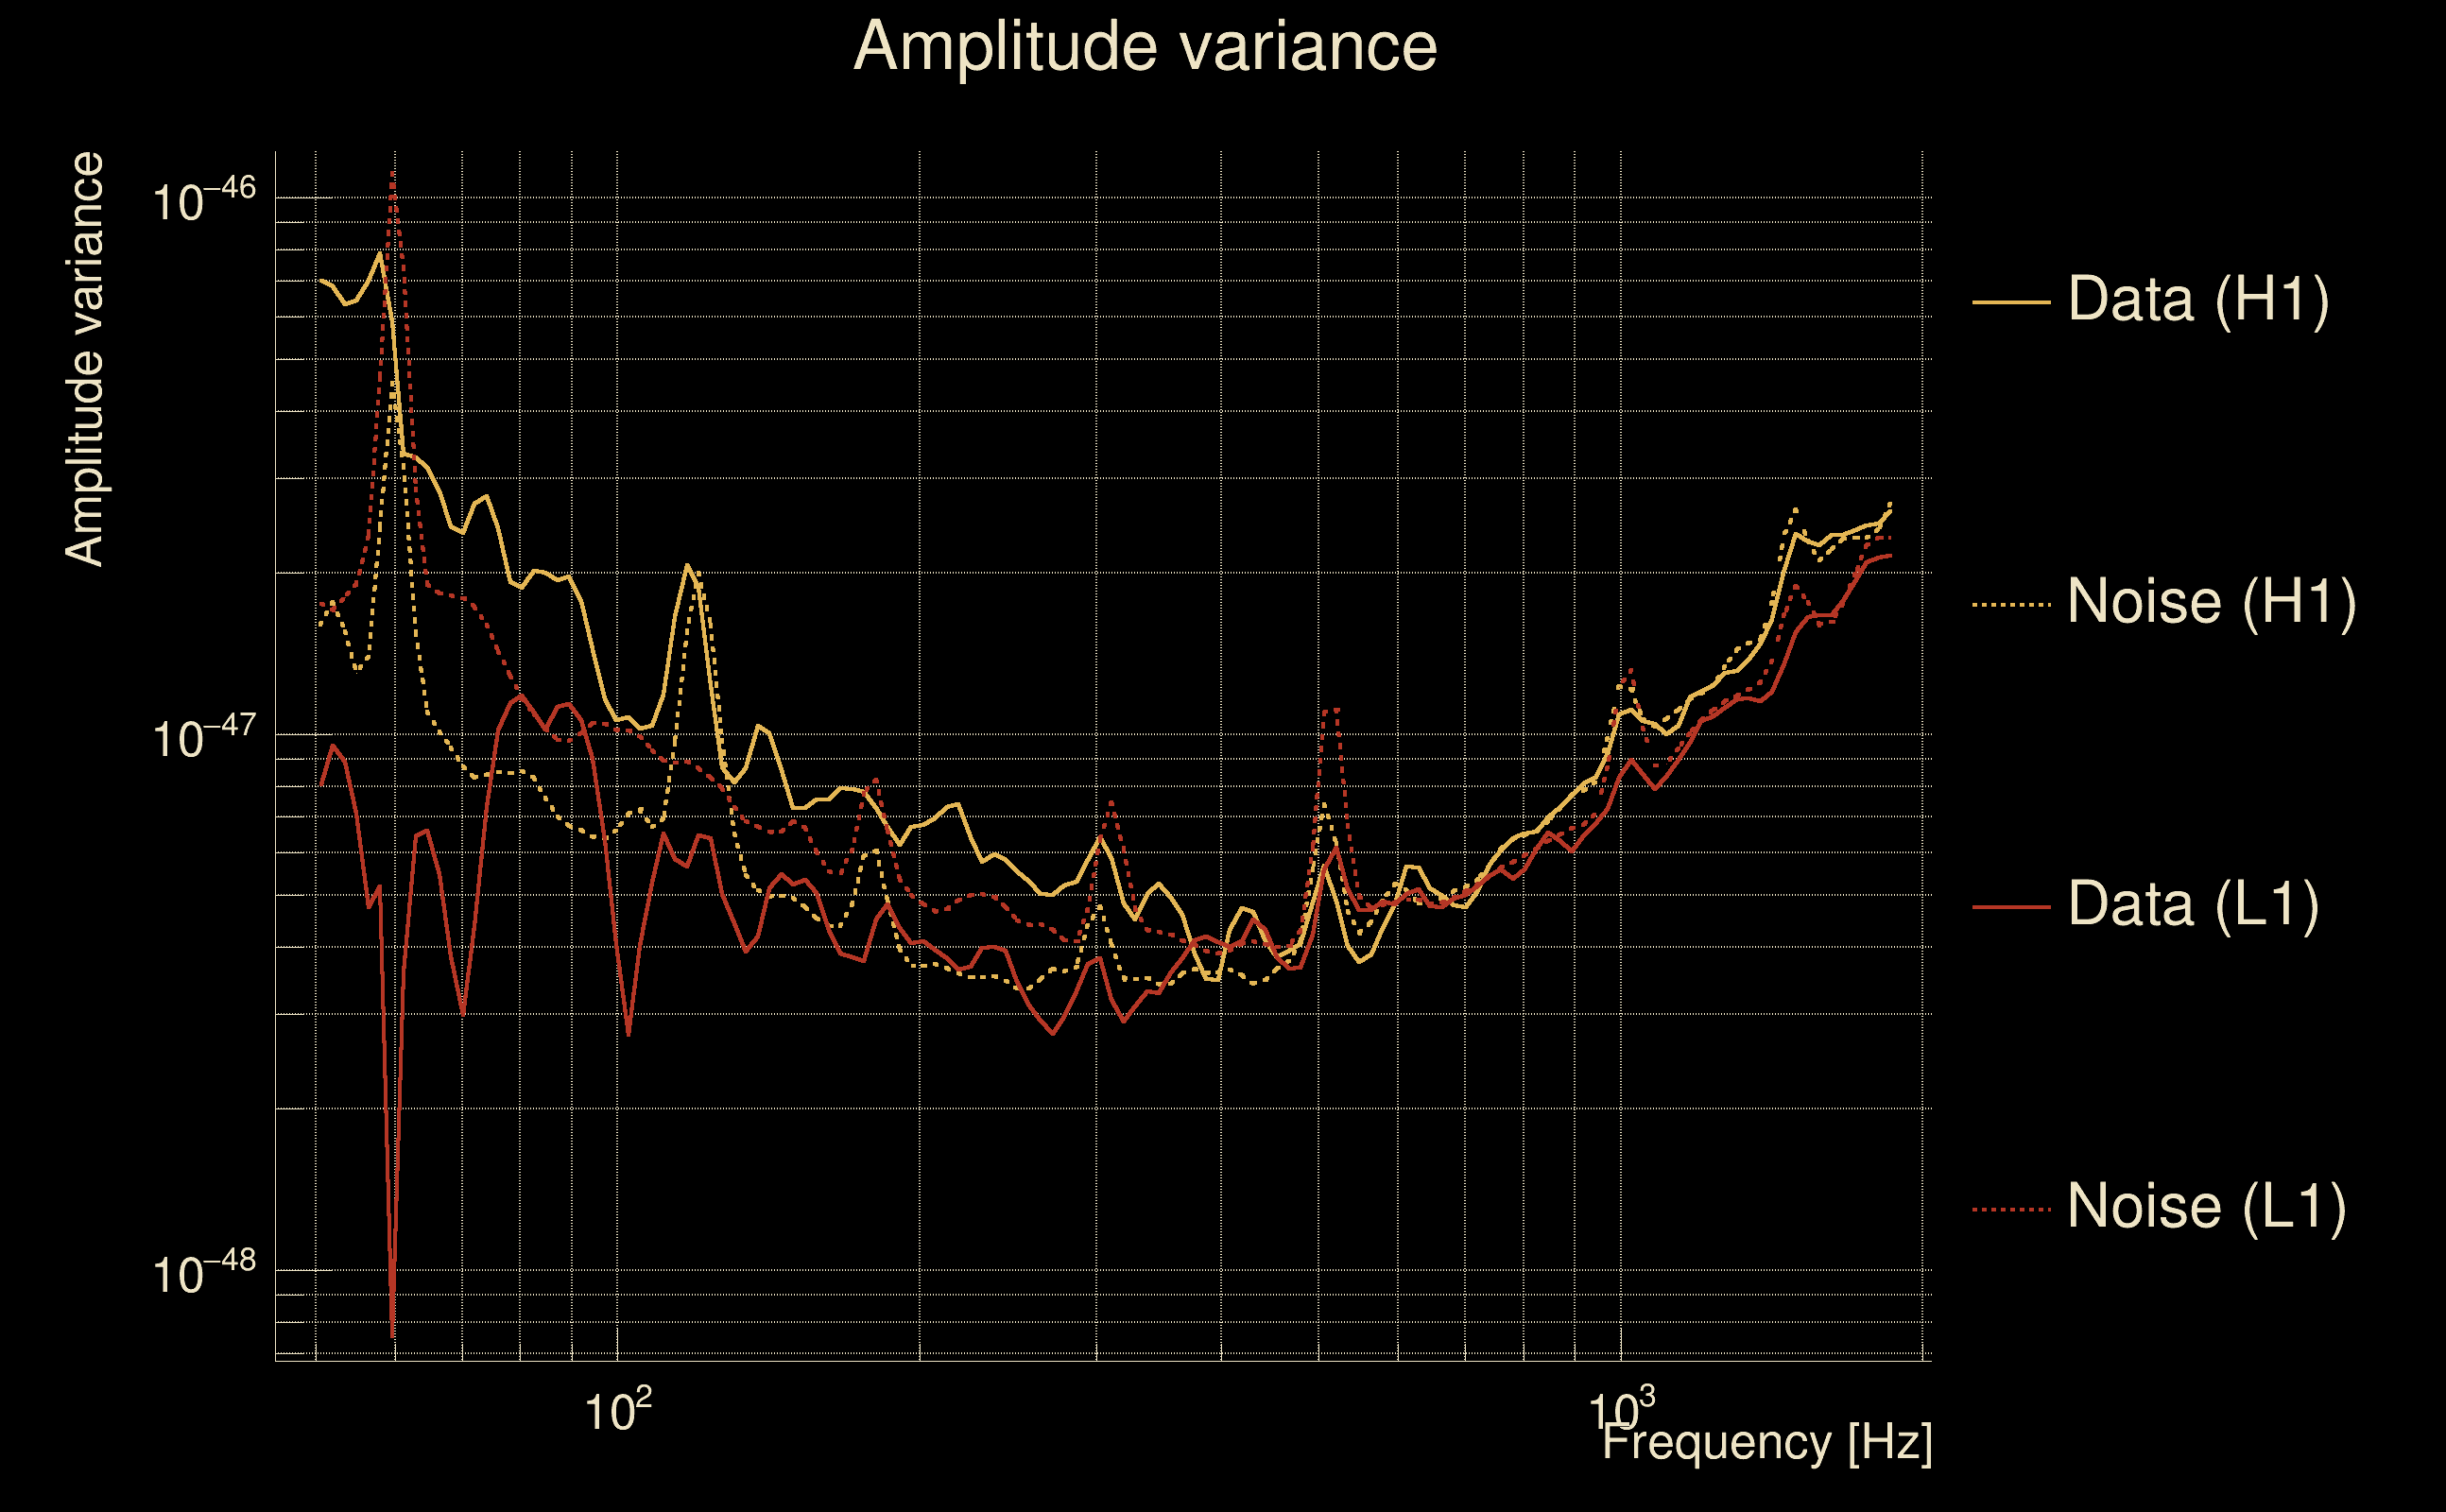
| Log of amplitude ratio (L1/H1): | -0.221549, variance = 0.158399 (L1/H1: -0.222873, variance = 0.304326, H1/L1: 0.219576, variance = 0.306481) |
| Amplitude ratio (L1/H1): | 0.801277 ⋇ 1.48884 (L1/H1: 0.800216 ⋇ 1.73613, H1/L1: 1.24555 ⋇ 1.73952) |
| Amplitude ratio H1|L1 compatibility (probability): | 0.996634 |
| Antenna factor probability: | 1 |
| Number of rejected frequency rows: | Q0: 0 / 18, Q1: 2 / 36, Q2: 8 / 70, Q3: 19 / 134, Q4: 55 / 258 |
| Maximum signal-to-noise ratio: | H1: 74.9145, L1: 61.3767 |
| SNR variance: | H1: 4.31197, L1: 2.9972 |
| Click here for a zoomed plot | Click here for a zoomed plot | Click here for a zoomed plot | Click here for a zoomed plot | Click here for a zoomed plot |
 |
 |
 |
 |
 |
 |
 |
 |
 |
 |
 |
 |
 |
 |
 |
 |
 |
 |
 |
 |
 |
 |
 |
 |
 |
 |
 |
 |
 |
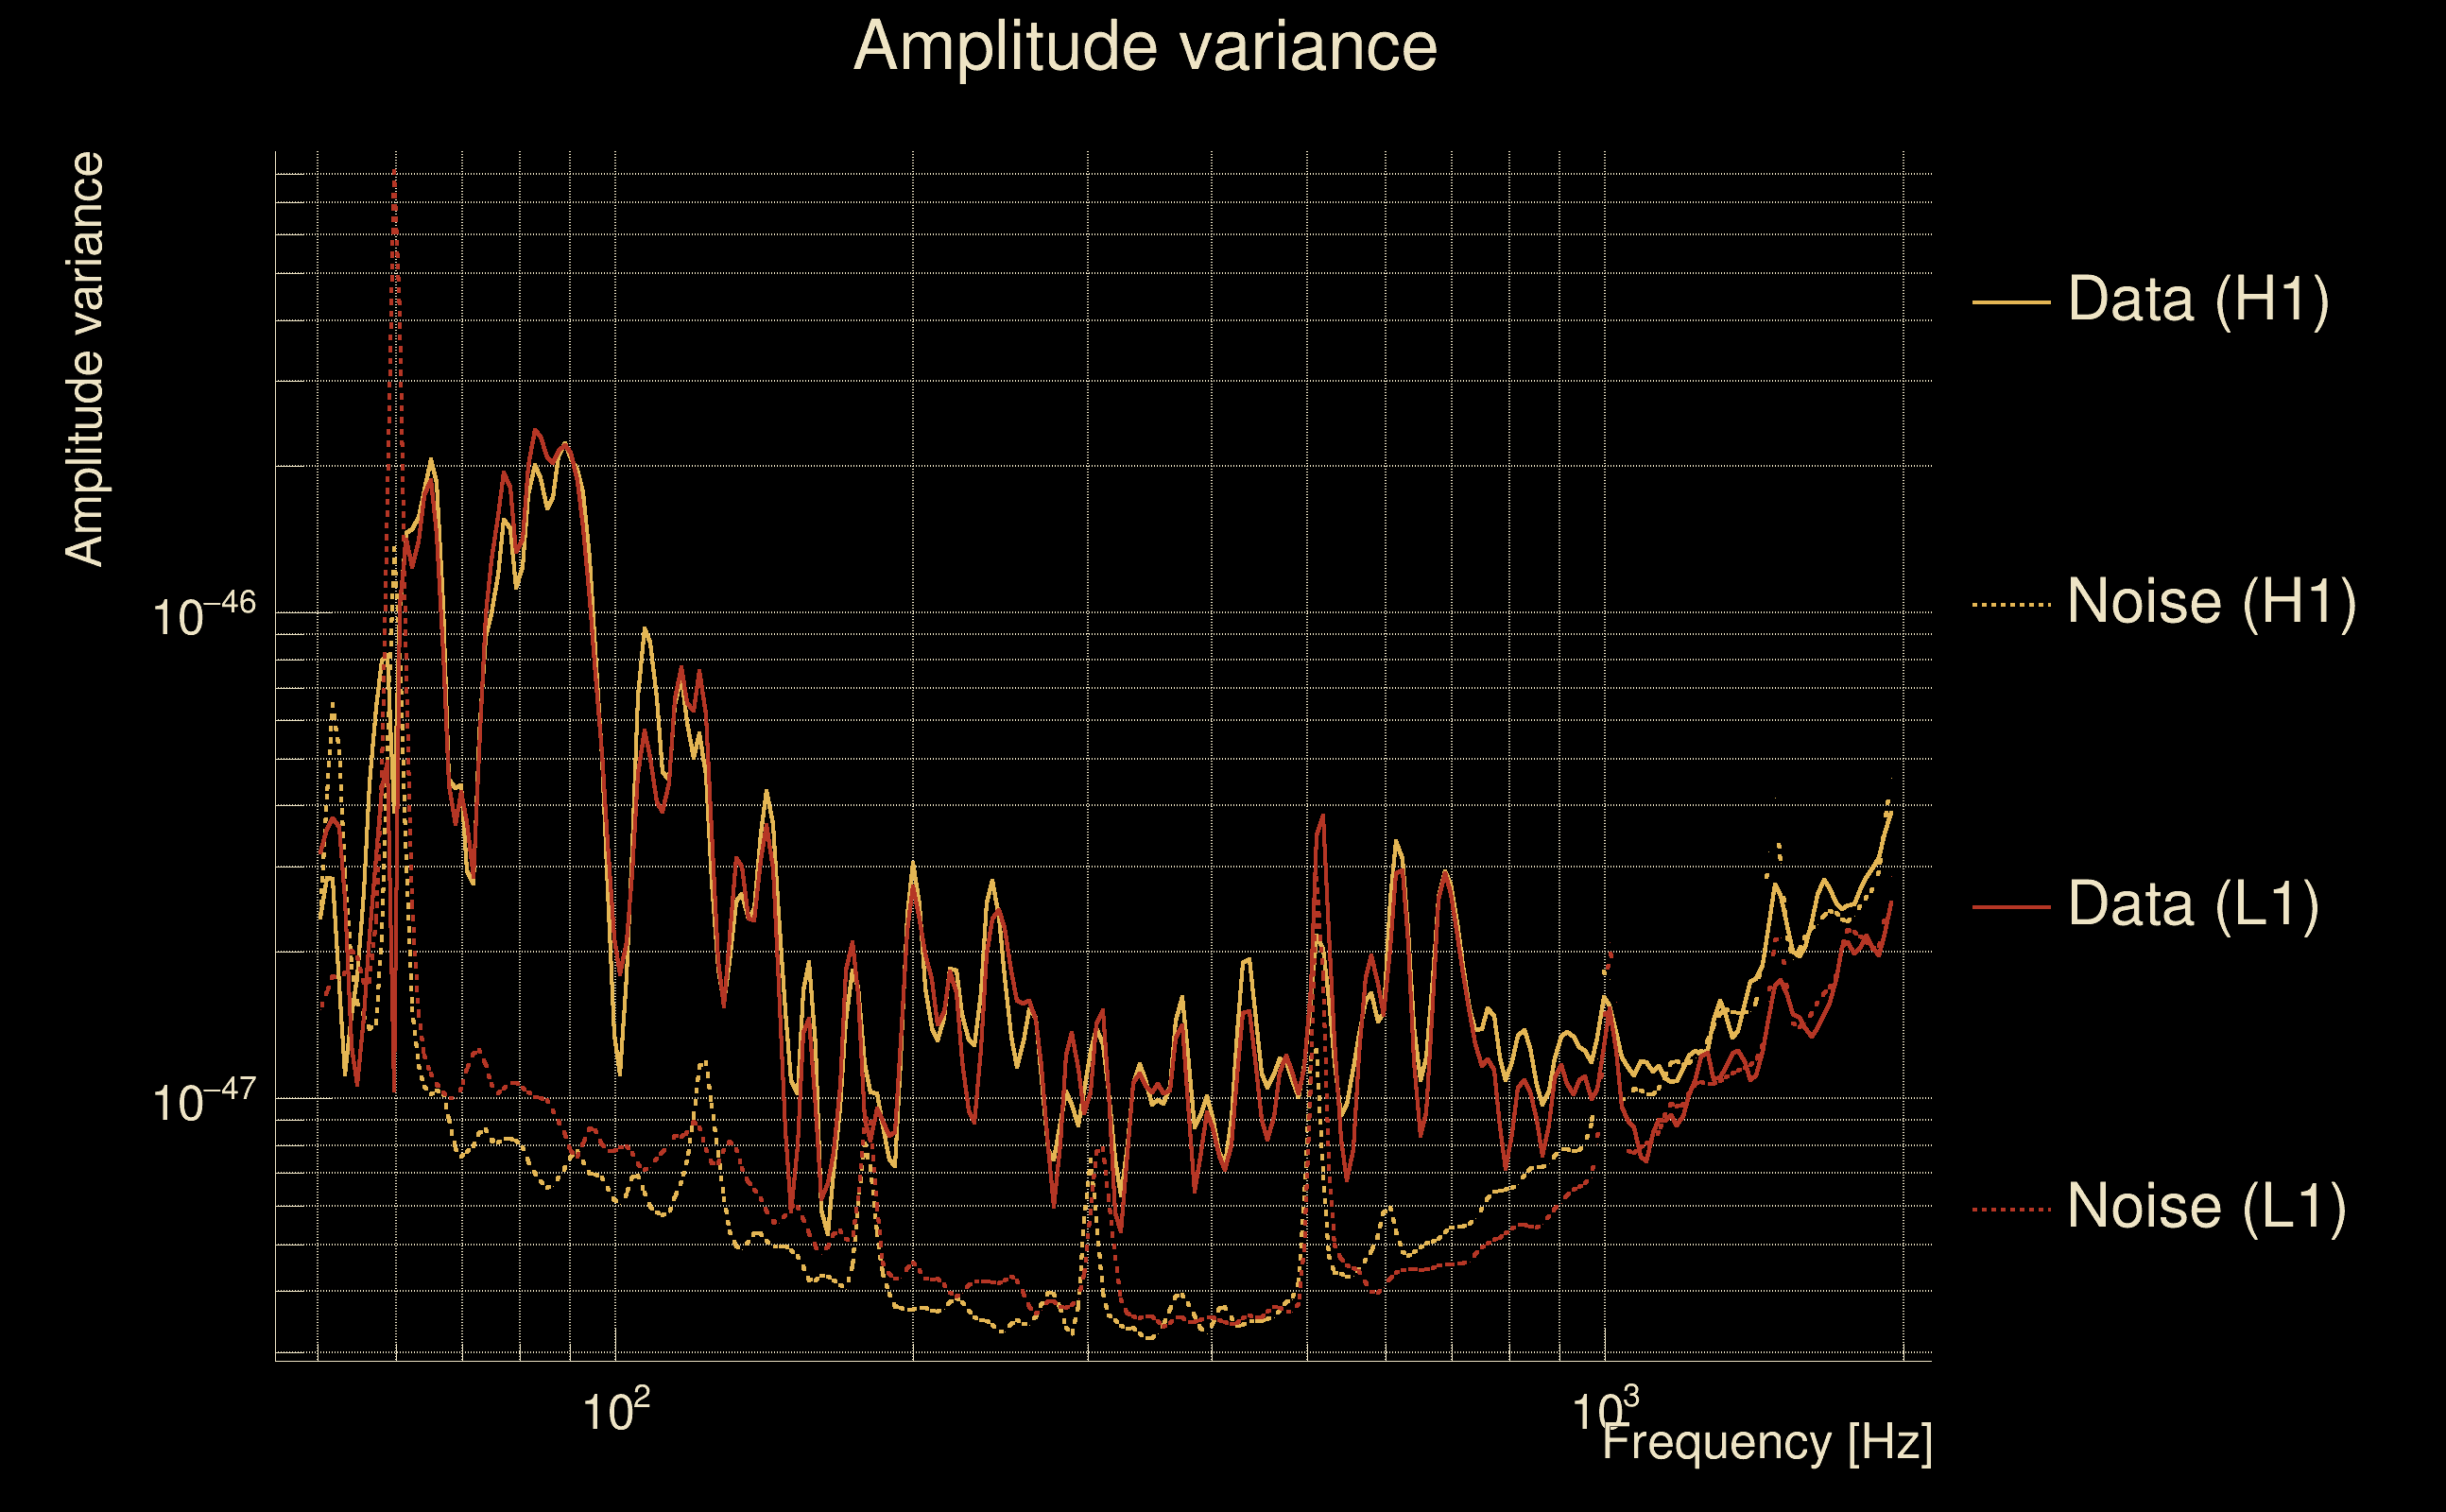
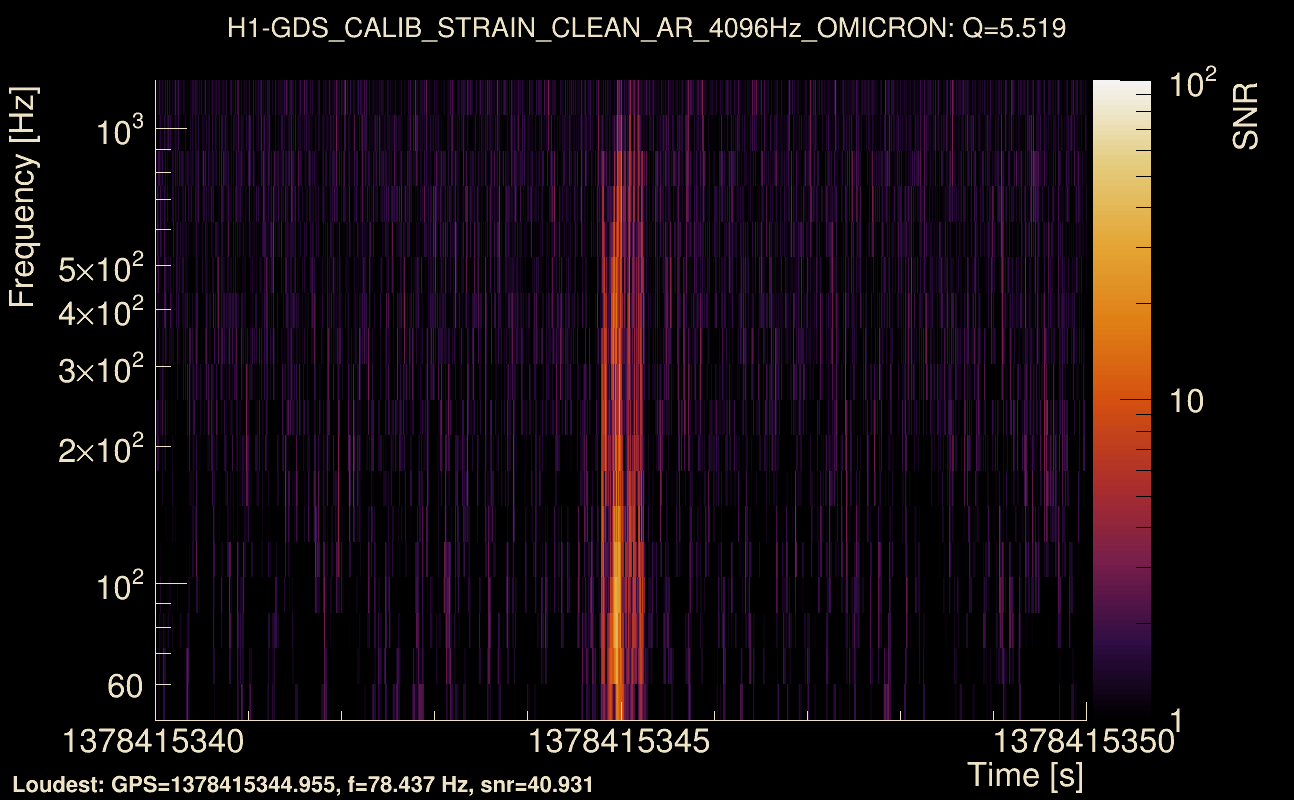
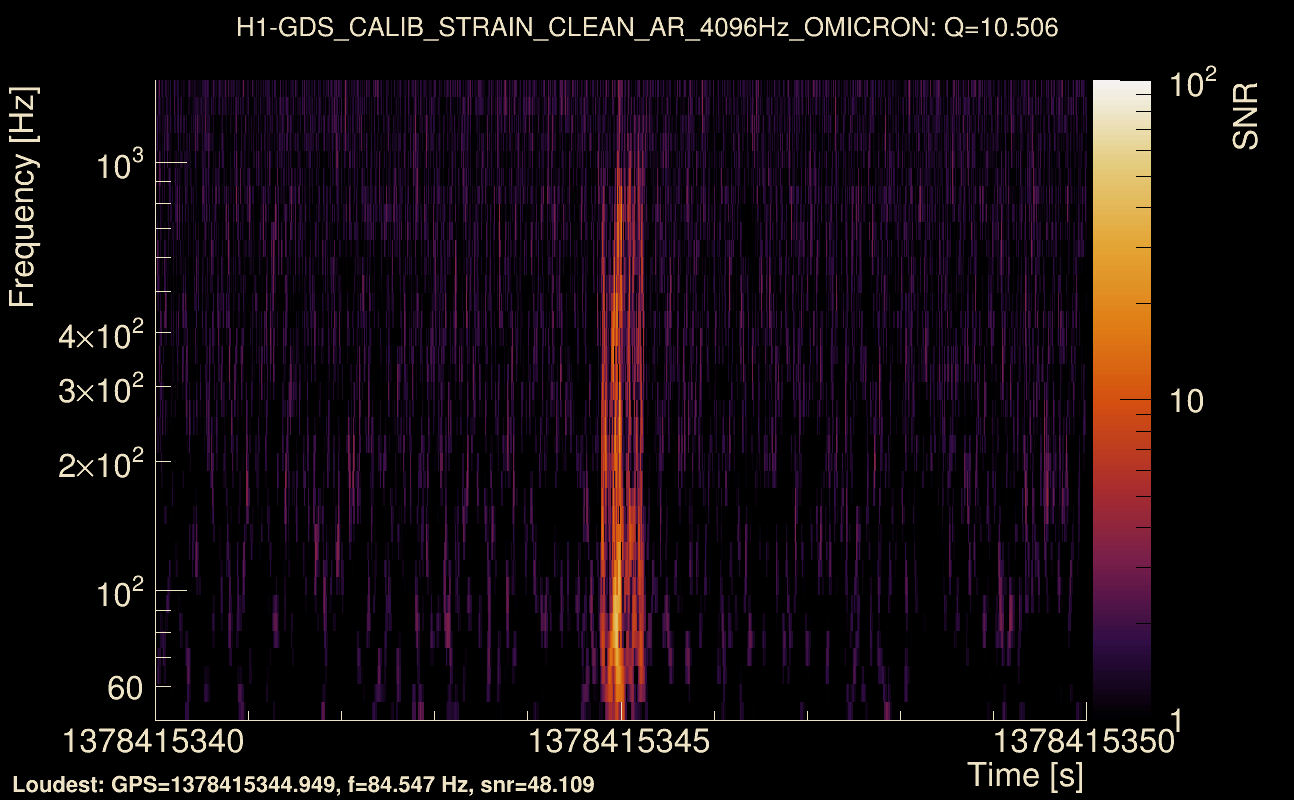
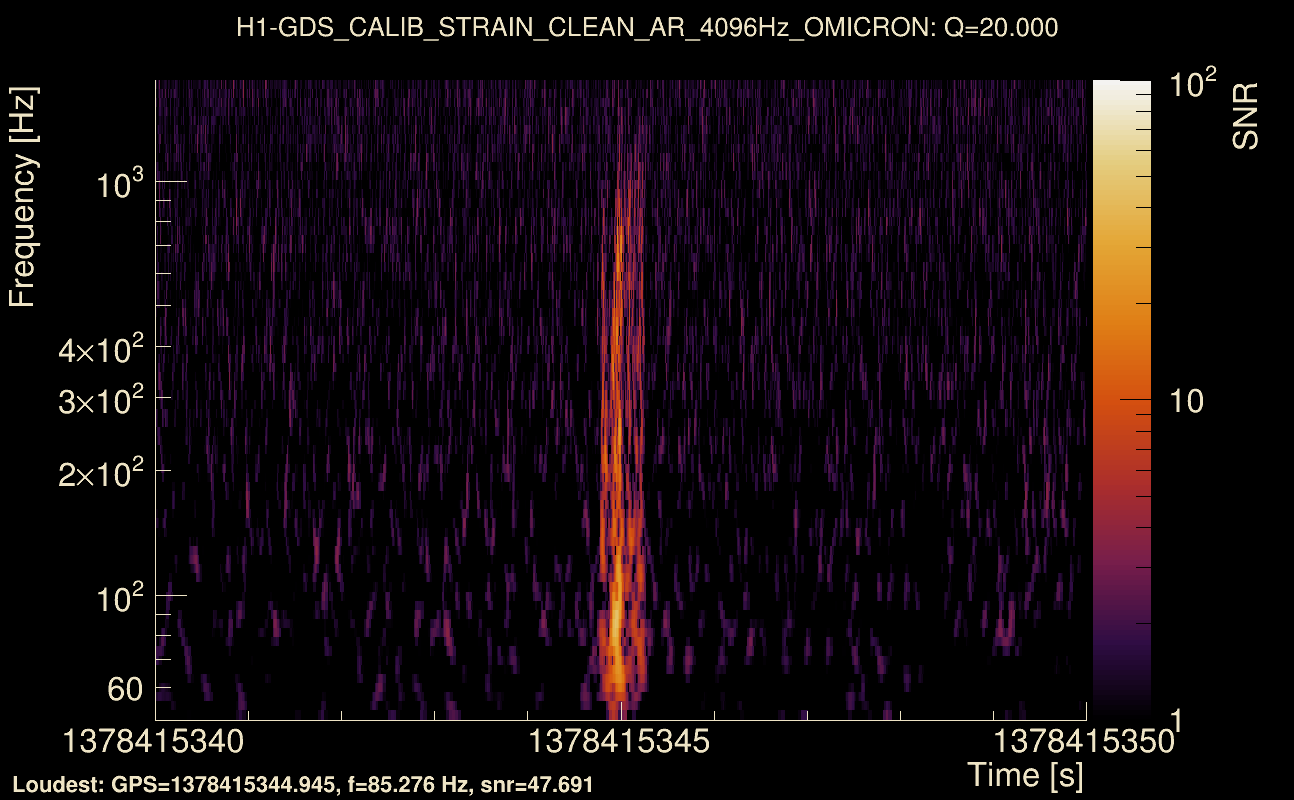
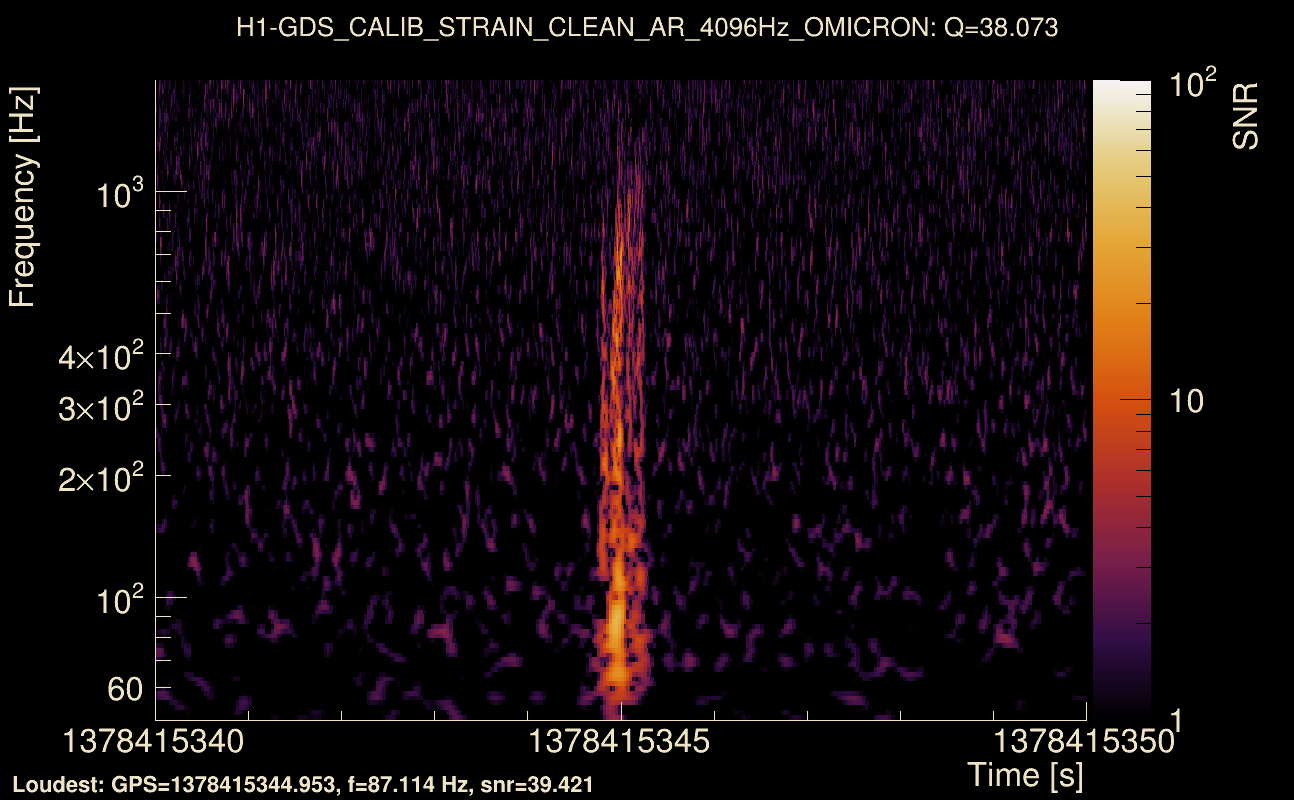
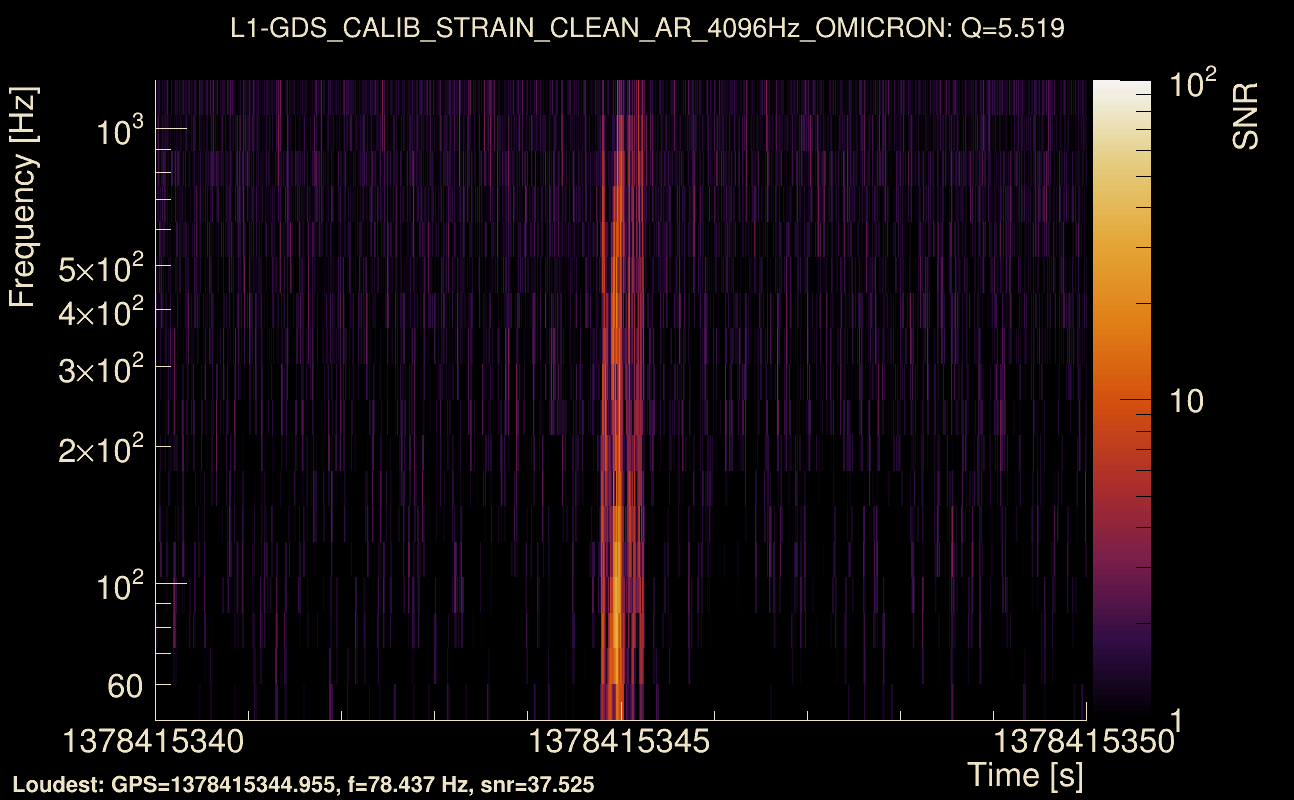
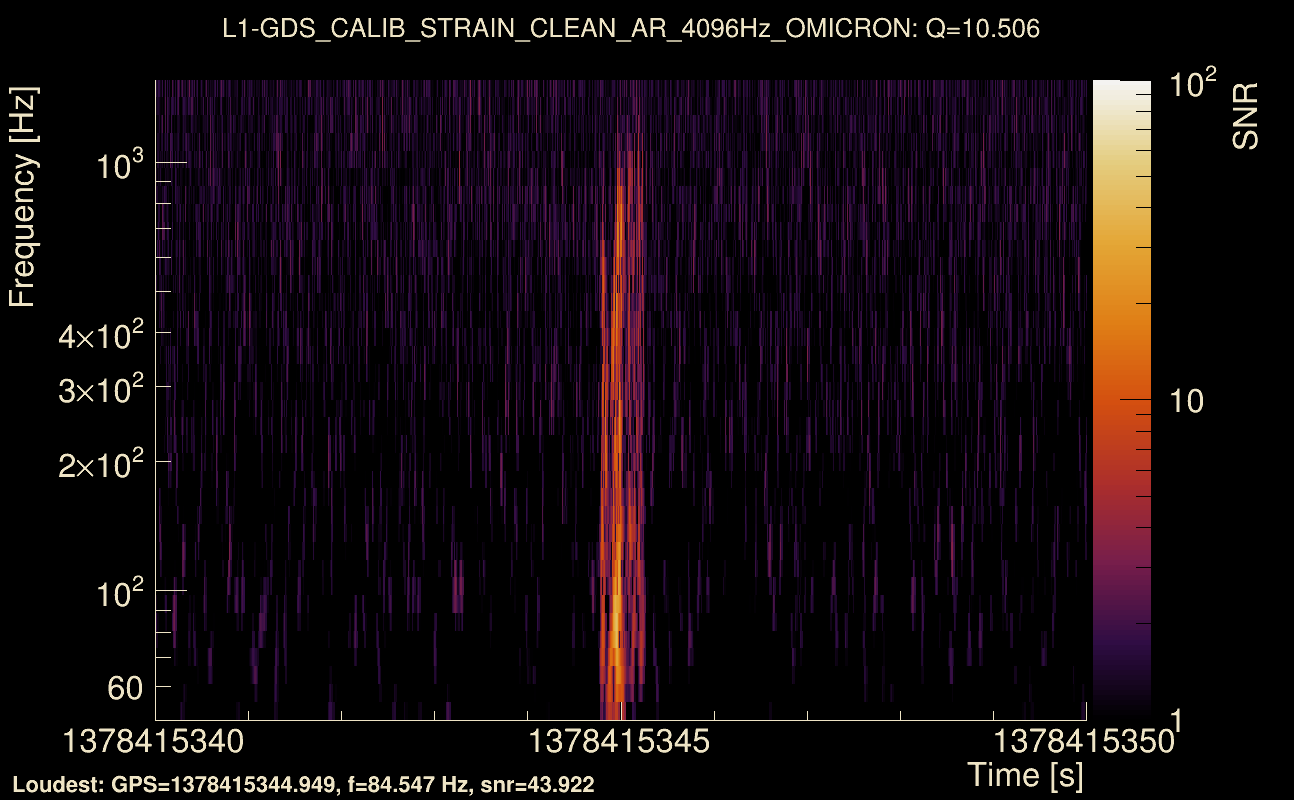
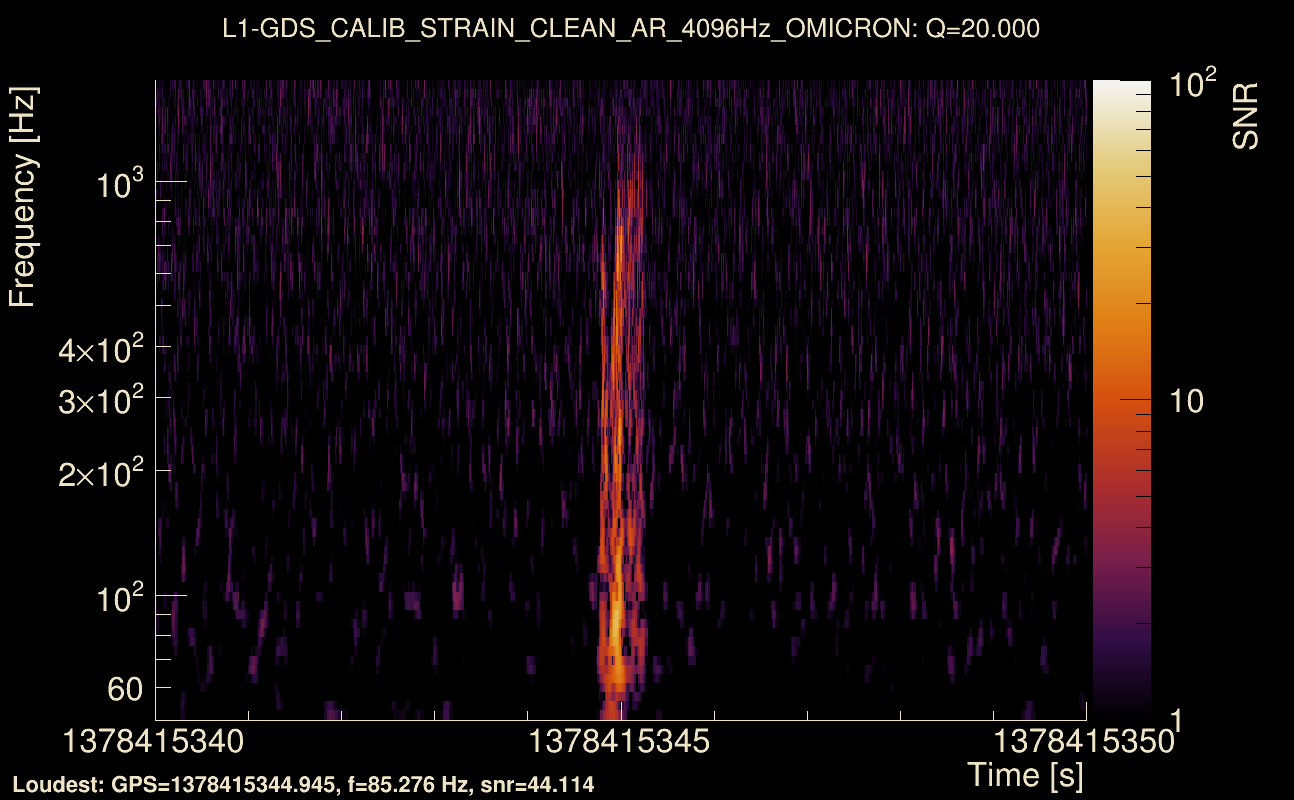
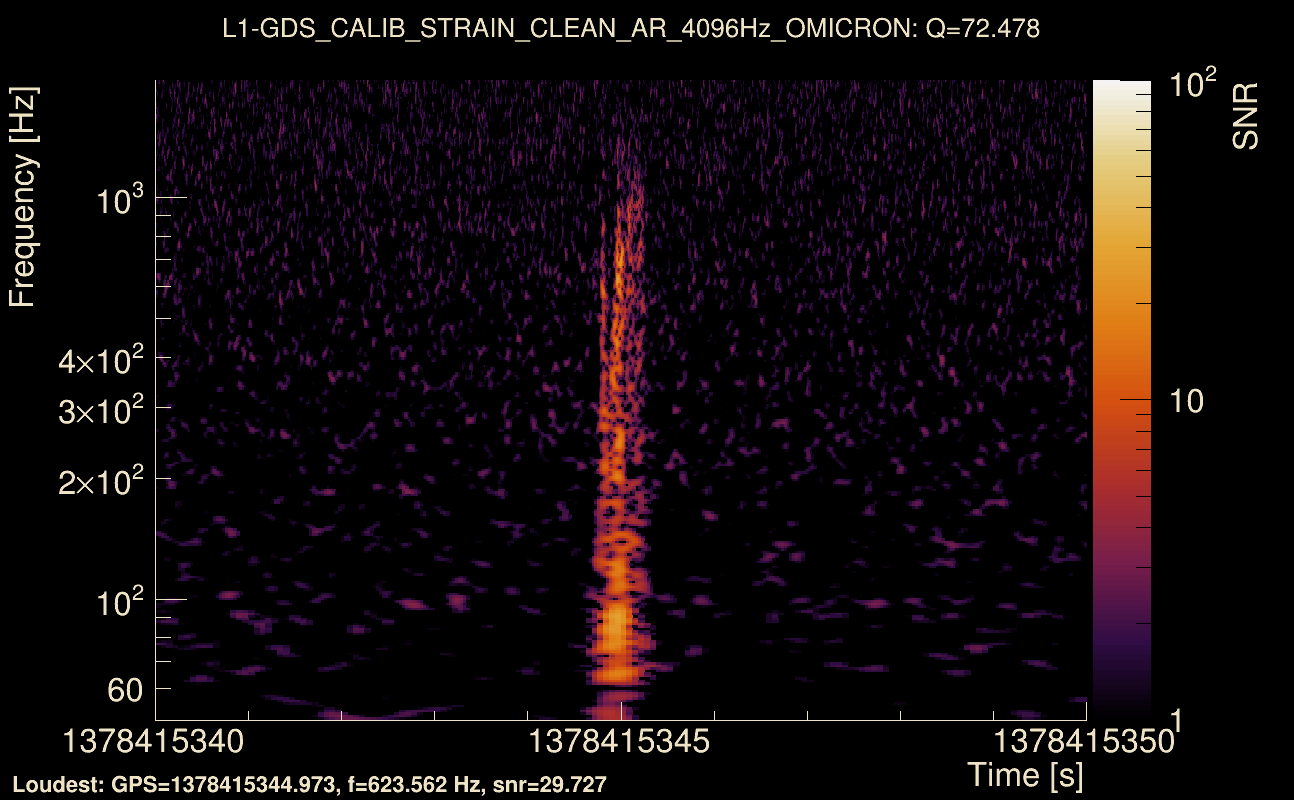
| Event time t(H1): | GPS = 1378415340 (Sun Sep 10 21:08:42 2023 ) → GPS = 1378415350 (Sun Sep 10 21:08:52 2023 ) |
| Event time t(L1): | GPS = 1378415340 (Sun Sep 10 21:08:52 2023 ) → GPS = 1378415350 (Sun Sep 10 21:08:52 2023 ) |
| Omicron analysis time window (H1): | GPS = 1378415337 → GPS = 1378415353 |
| Omicron analysis time window (L1): | GPS = 1378415337 → GPS = 1378415353 |
| Time delay between detectors t(L1) - t(H1): | 0.000928658 s (slice index = 108 / 217), δt_gw = 0.000928658 s |
| Time delay uncertainty: | 0.000759602 s |
| [targeted mode] Time delay probability: | 0.999768 (0.000291261 sigmas), δt_target = 0.00398779 s |
| Frequency: | 231.823 Hz |
| Ξ: | 0.889037 ± 0.00737476 (variance = 5.43871e-05): Q0: 0.941547, Q1: 0.936136, Q2: 0.942112, Q3: 0.929488, Q4: 0.922814 |
| Rank: | R_A = 0.88883 |
| Log of amplitude ratio (L1/H1): | -0.00687912, variance = 0.153914 (L1/H1: -0.0204812, variance = 0.307514, H1/L1: -0.00664626, variance = 0.308135) |
| Amplitude ratio (L1/H1): | 0.993144 ⋇ 1.48041 (L1/H1: 0.979727 ⋇ 1.74114, H1/L1: 0.993376 ⋇ 1.74211) |
| Amplitude ratio H1|L1 compatibility (probability): | 0.97242 |
| Antenna factor probability: | 1 |
| Number of rejected frequency rows: | Q0: 0 / 18, Q1: 2 / 36, Q2: 11 / 70, Q3: 19 / 134, Q4: 63 / 258 |
| Maximum signal-to-noise ratio: | H1: 50.3707, L1: 50.5132 |
| SNR variance: | H1: 2.16564, L1: 2.17023 |
| Click here for a zoomed plot | Click here for a zoomed plot | Click here for a zoomed plot | Click here for a zoomed plot | Click here for a zoomed plot |
 |
 |
 |
 |
 |
 |
 |
 |
 |
 |
 |
 |
 |
 |
 |
 |
 |
 |
 |
 |
 |
 |
 |
 |
 |
 |
 |
 |
 |
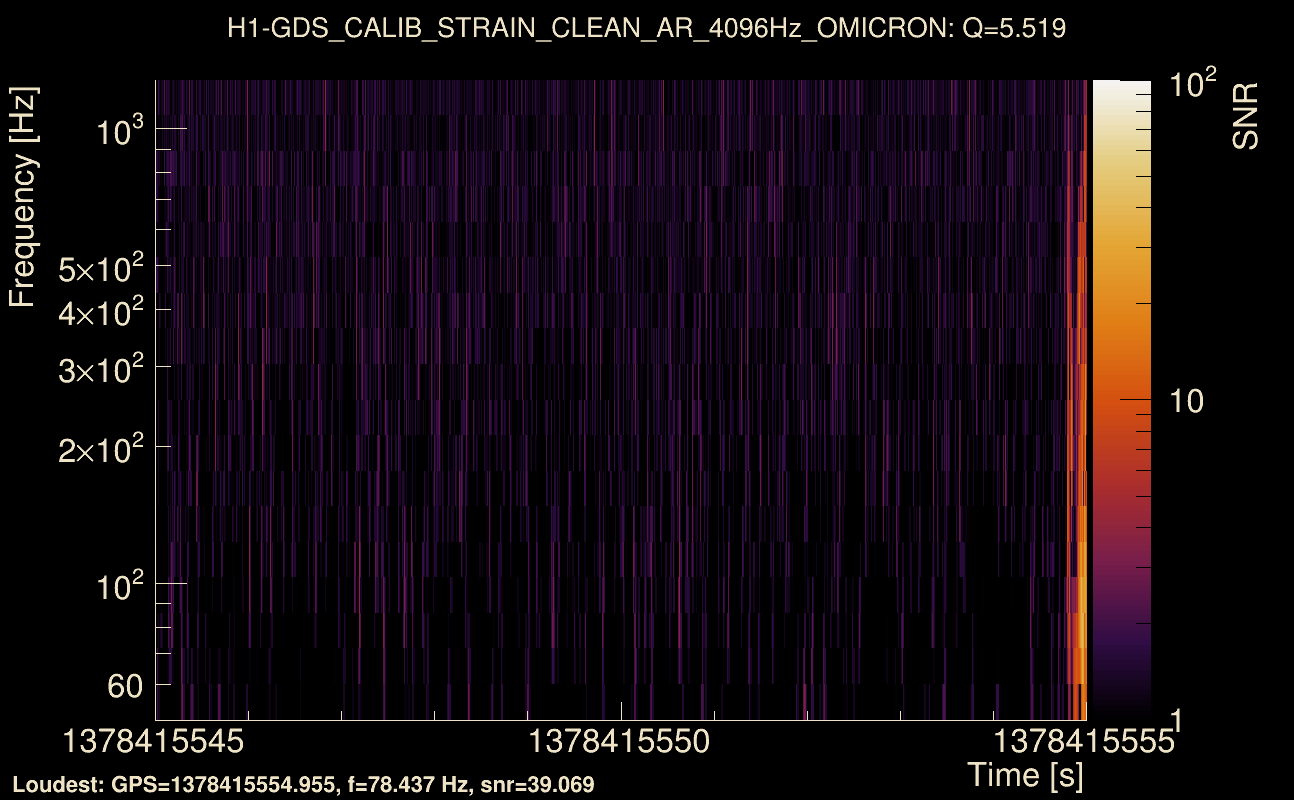
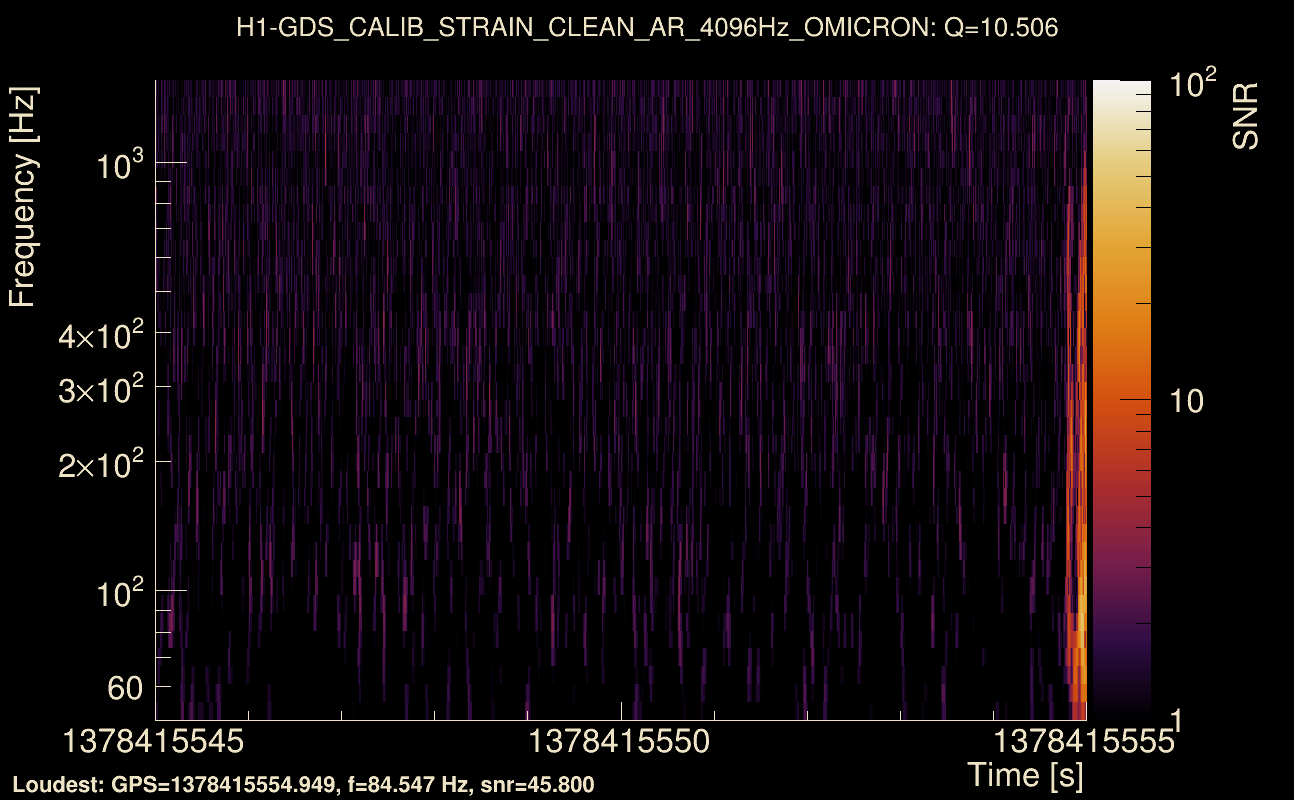
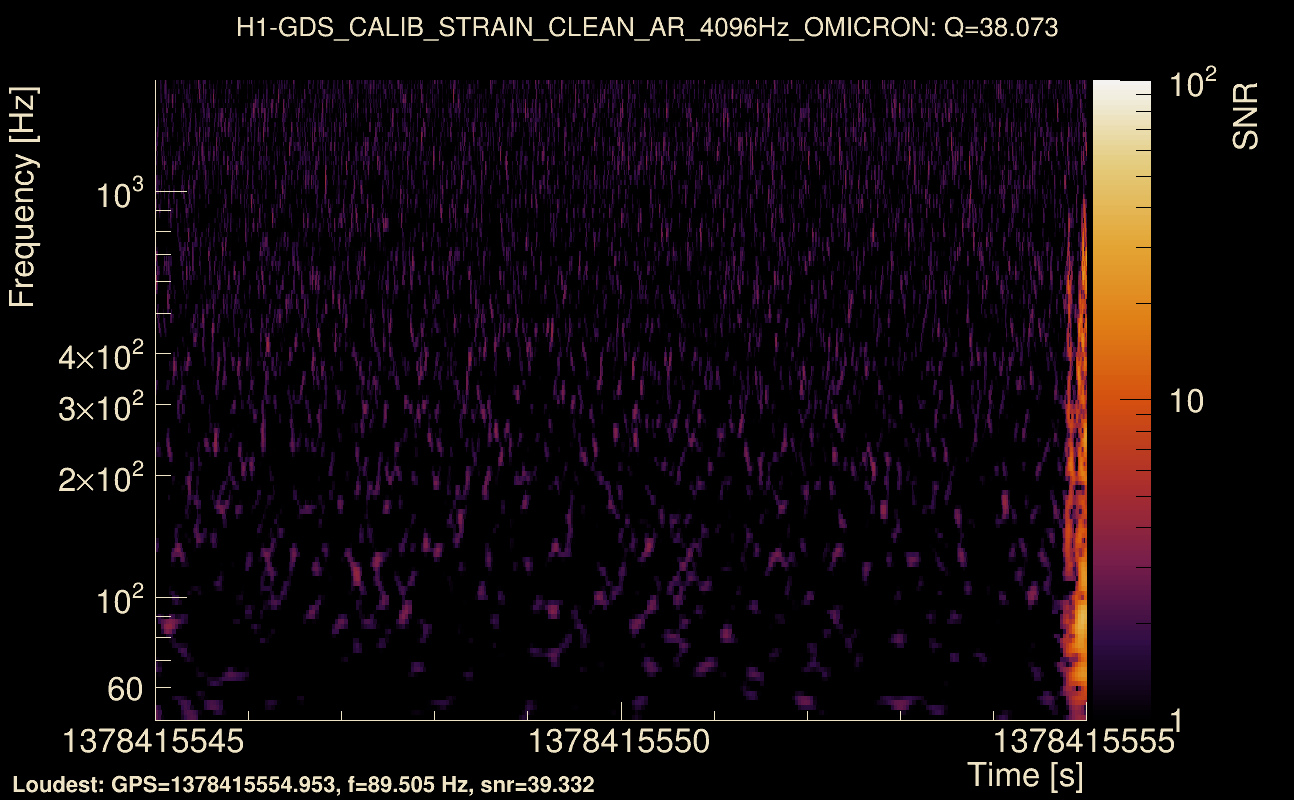
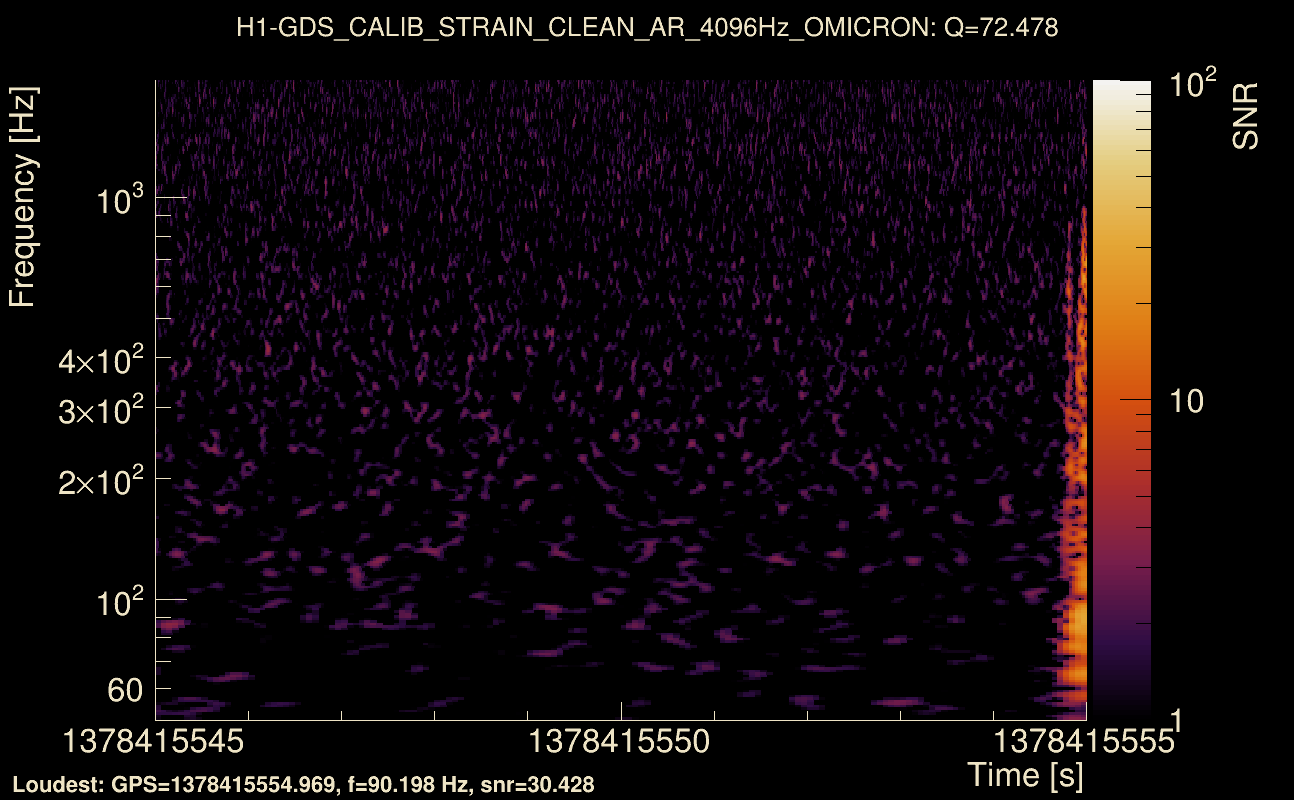
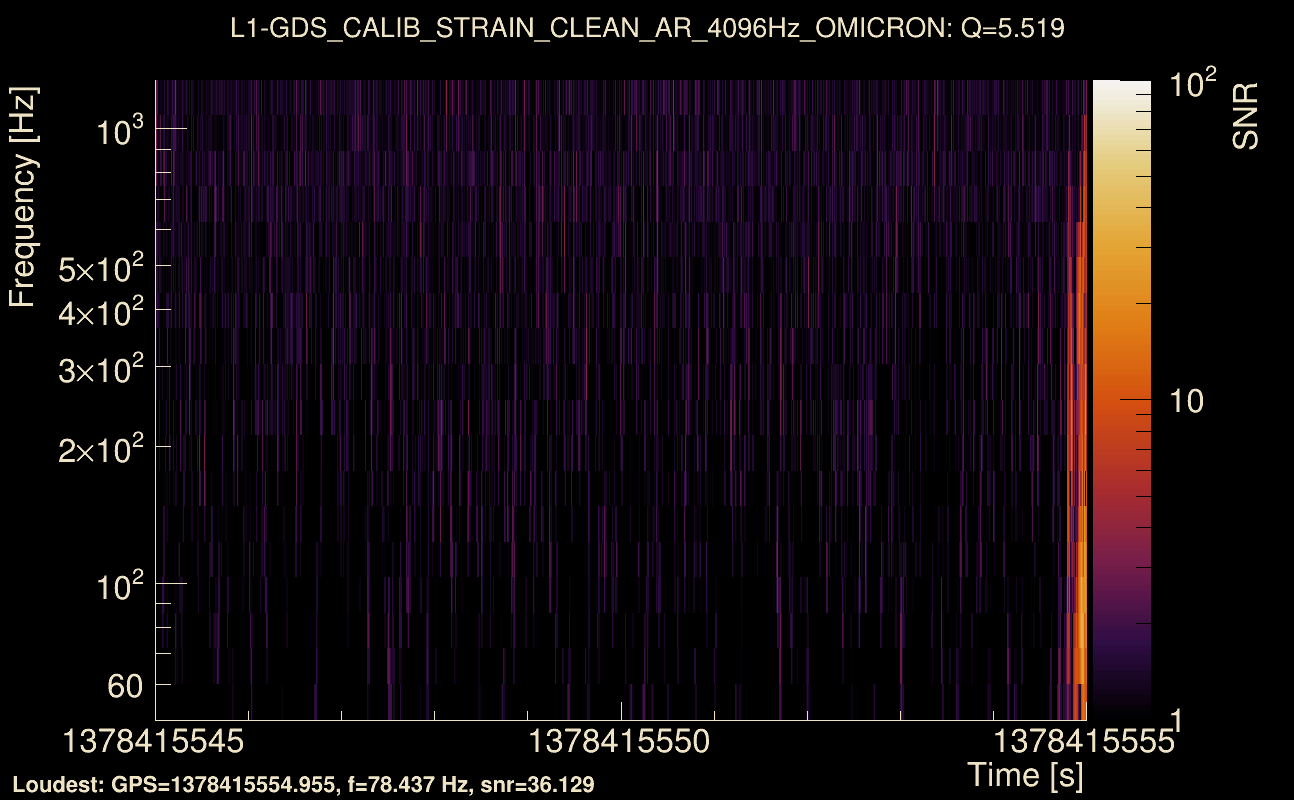
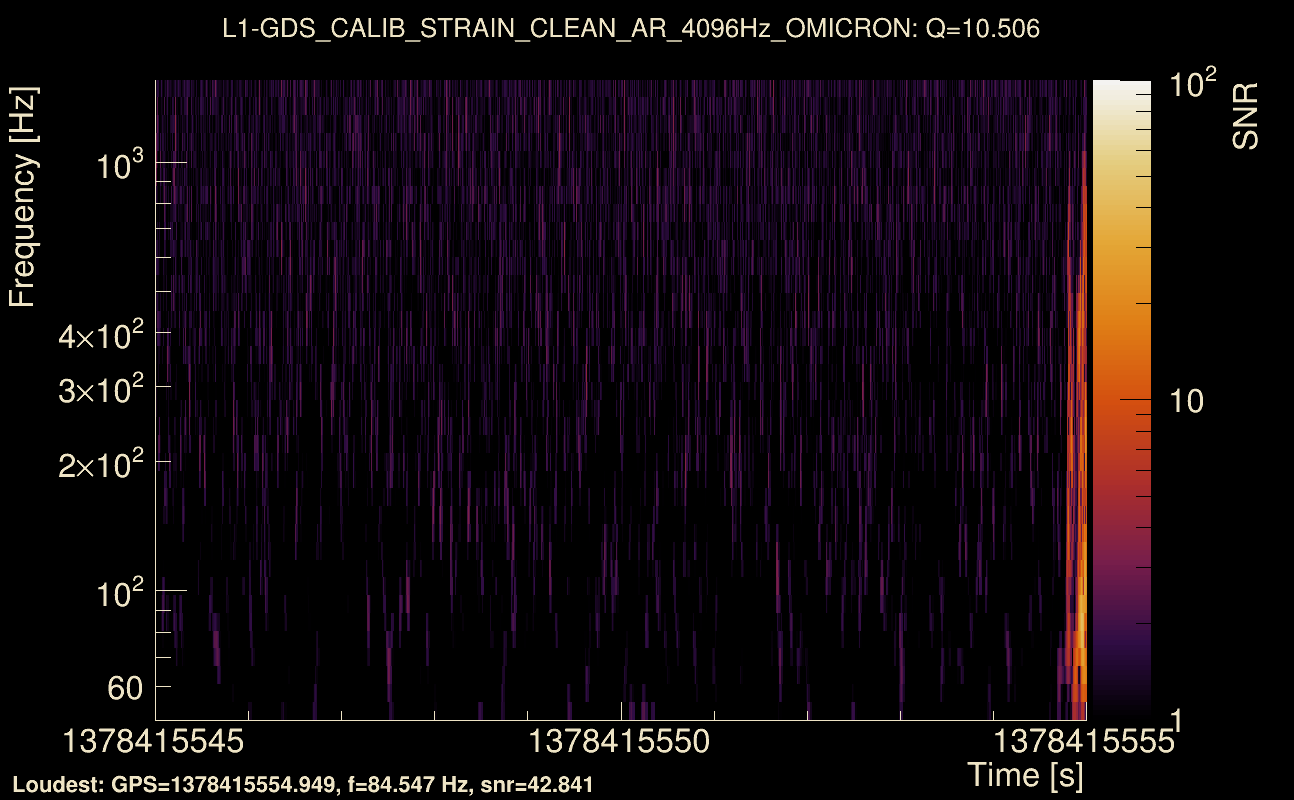
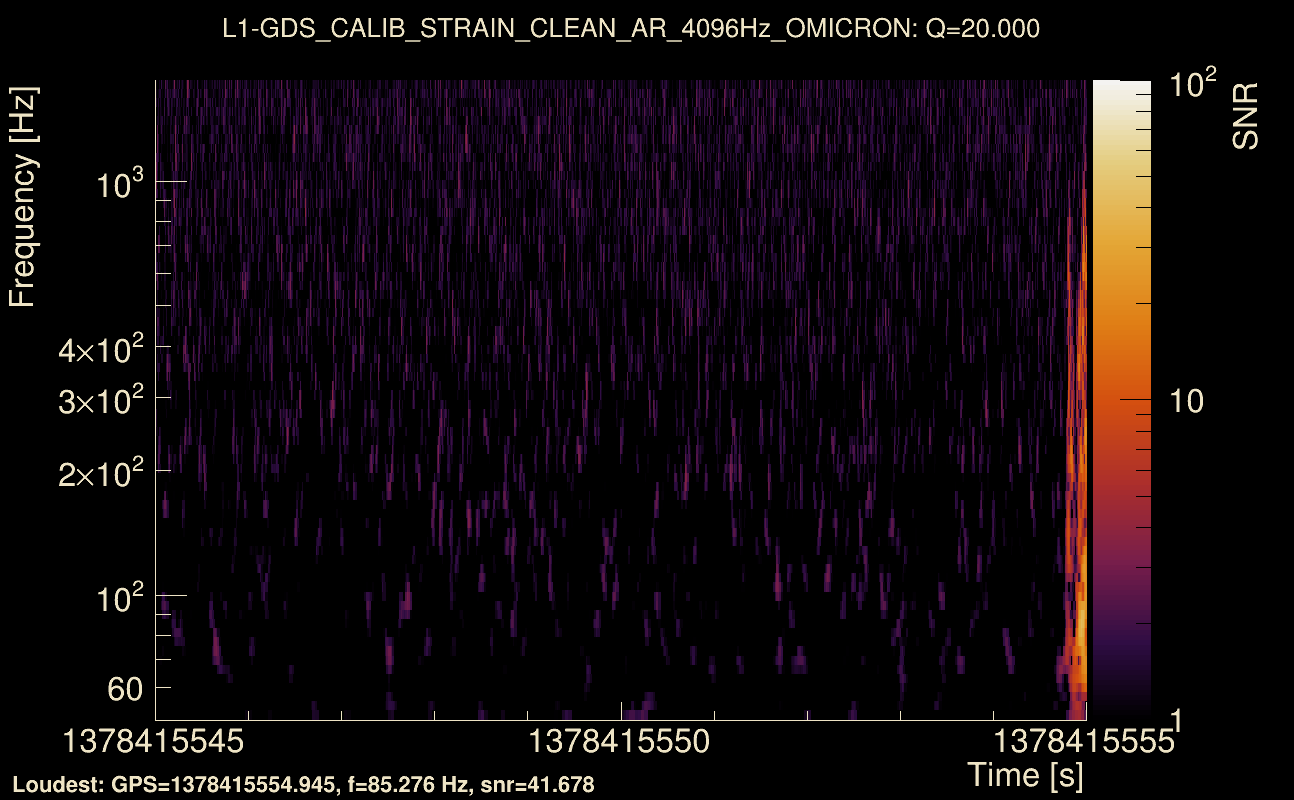
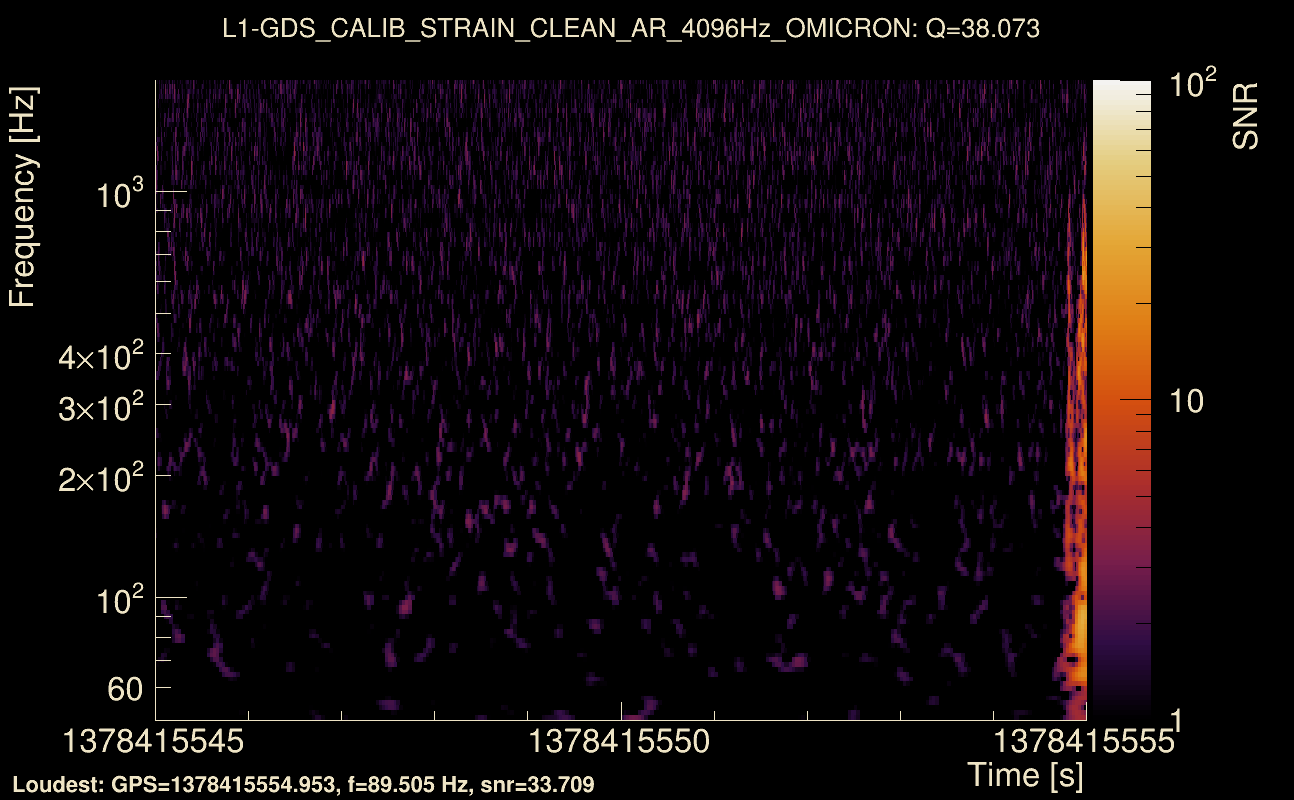
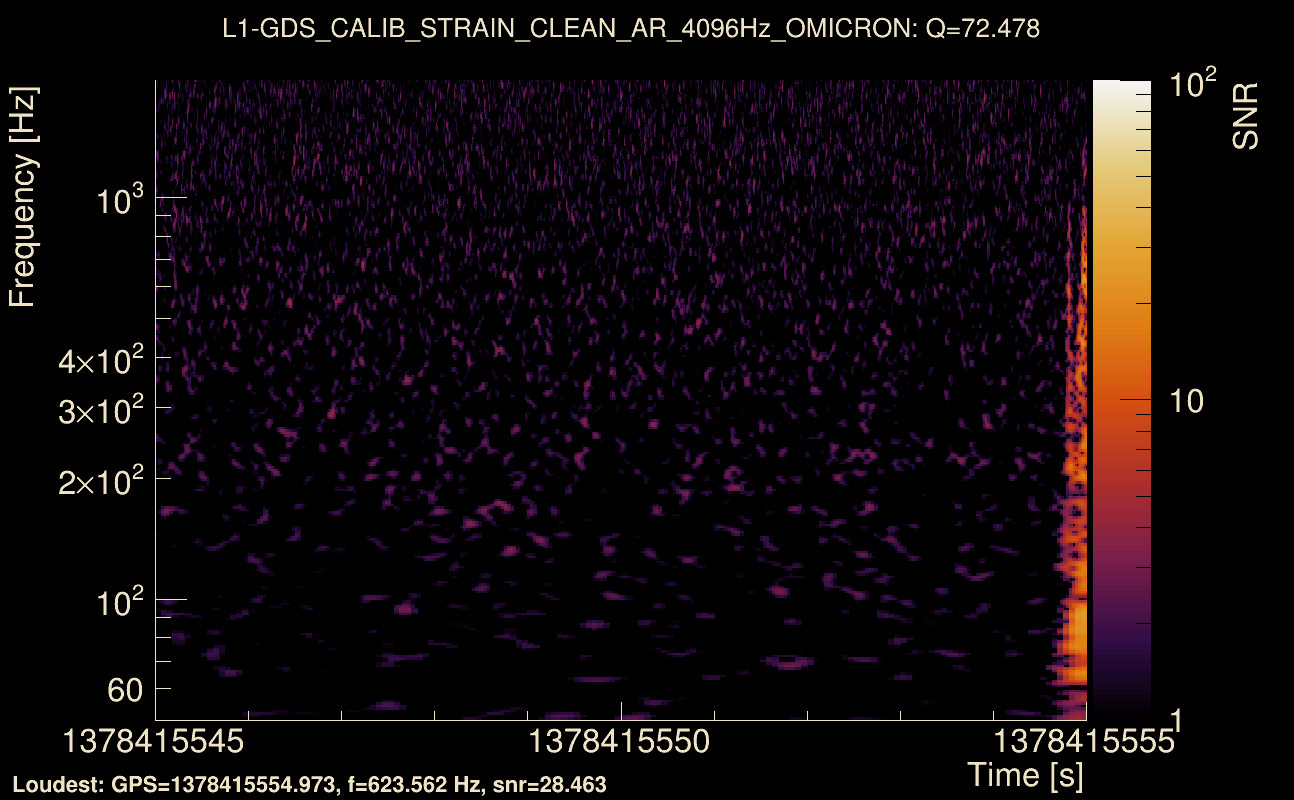
| Event time t(H1): | GPS = 1378415545 (Sun Sep 10 21:12:07 2023 ) → GPS = 1378415555 (Sun Sep 10 21:12:17 2023 ) |
| Event time t(L1): | GPS = 1378415545 (Sun Sep 10 21:12:17 2023 ) → GPS = 1378415555 (Sun Sep 10 21:12:17 2023 ) |
| Omicron analysis time window (H1): | GPS = 1378415542 → GPS = 1378415558 |
| Omicron analysis time window (L1): | GPS = 1378415542 → GPS = 1378415558 |
| Time delay between detectors t(L1) - t(H1): | 0.000973774 s (slice index = 108 / 217), δt_gw = 0.000973774 s |
| Time delay uncertainty: | 0.000735502 s |
| [targeted mode] Time delay probability: | 0.977321 (0.0284275 sigmas), δt_target = 0.000928879 s |
| Frequency: | 218.961 Hz |
| Ξ: | 0.907174 ± 0.0111278 (variance = 0.000123827): Q0: 0.9475, Q1: 0.944211, Q2: 0.945529, Q3: 0.938004, Q4: 0.917149 |
| Rank: | R_A = 0.886601 |
| Log of amplitude ratio (L1/H1): | -0.00856279, variance = 0.155812 (L1/H1: -0.0222105, variance = 0.309213, H1/L1: -0.0043063, variance = 0.313262) |
| Amplitude ratio (L1/H1): | 0.991474 ⋇ 1.48398 (L1/H1: 0.978034 ⋇ 1.7438, H1/L1: 0.995703 ⋇ 1.75014) |
| Amplitude ratio H1|L1 compatibility (probability): | 0.973189 |
| Antenna factor probability: | 1 |
| Number of rejected frequency rows: | Q0: 0 / 18, Q1: 1 / 36, Q2: 8 / 70, Q3: 21 / 134, Q4: 52 / 258 |
| Maximum signal-to-noise ratio: | H1: 49.2433, L1: 50.7111 |
| SNR variance: | H1: 0.512981, L1: 0.527315 |
| Click here for a zoomed plot | Click here for a zoomed plot | Click here for a zoomed plot | Click here for a zoomed plot | Click here for a zoomed plot |
 |
 |
 |
 |
 |
 |
 |
 |
 |
 |
 |
 |
 |
 |
 |
 |
 |
 |
 |
 |
 |
 |
 |
 |
 |
 |
 |
 |
 |
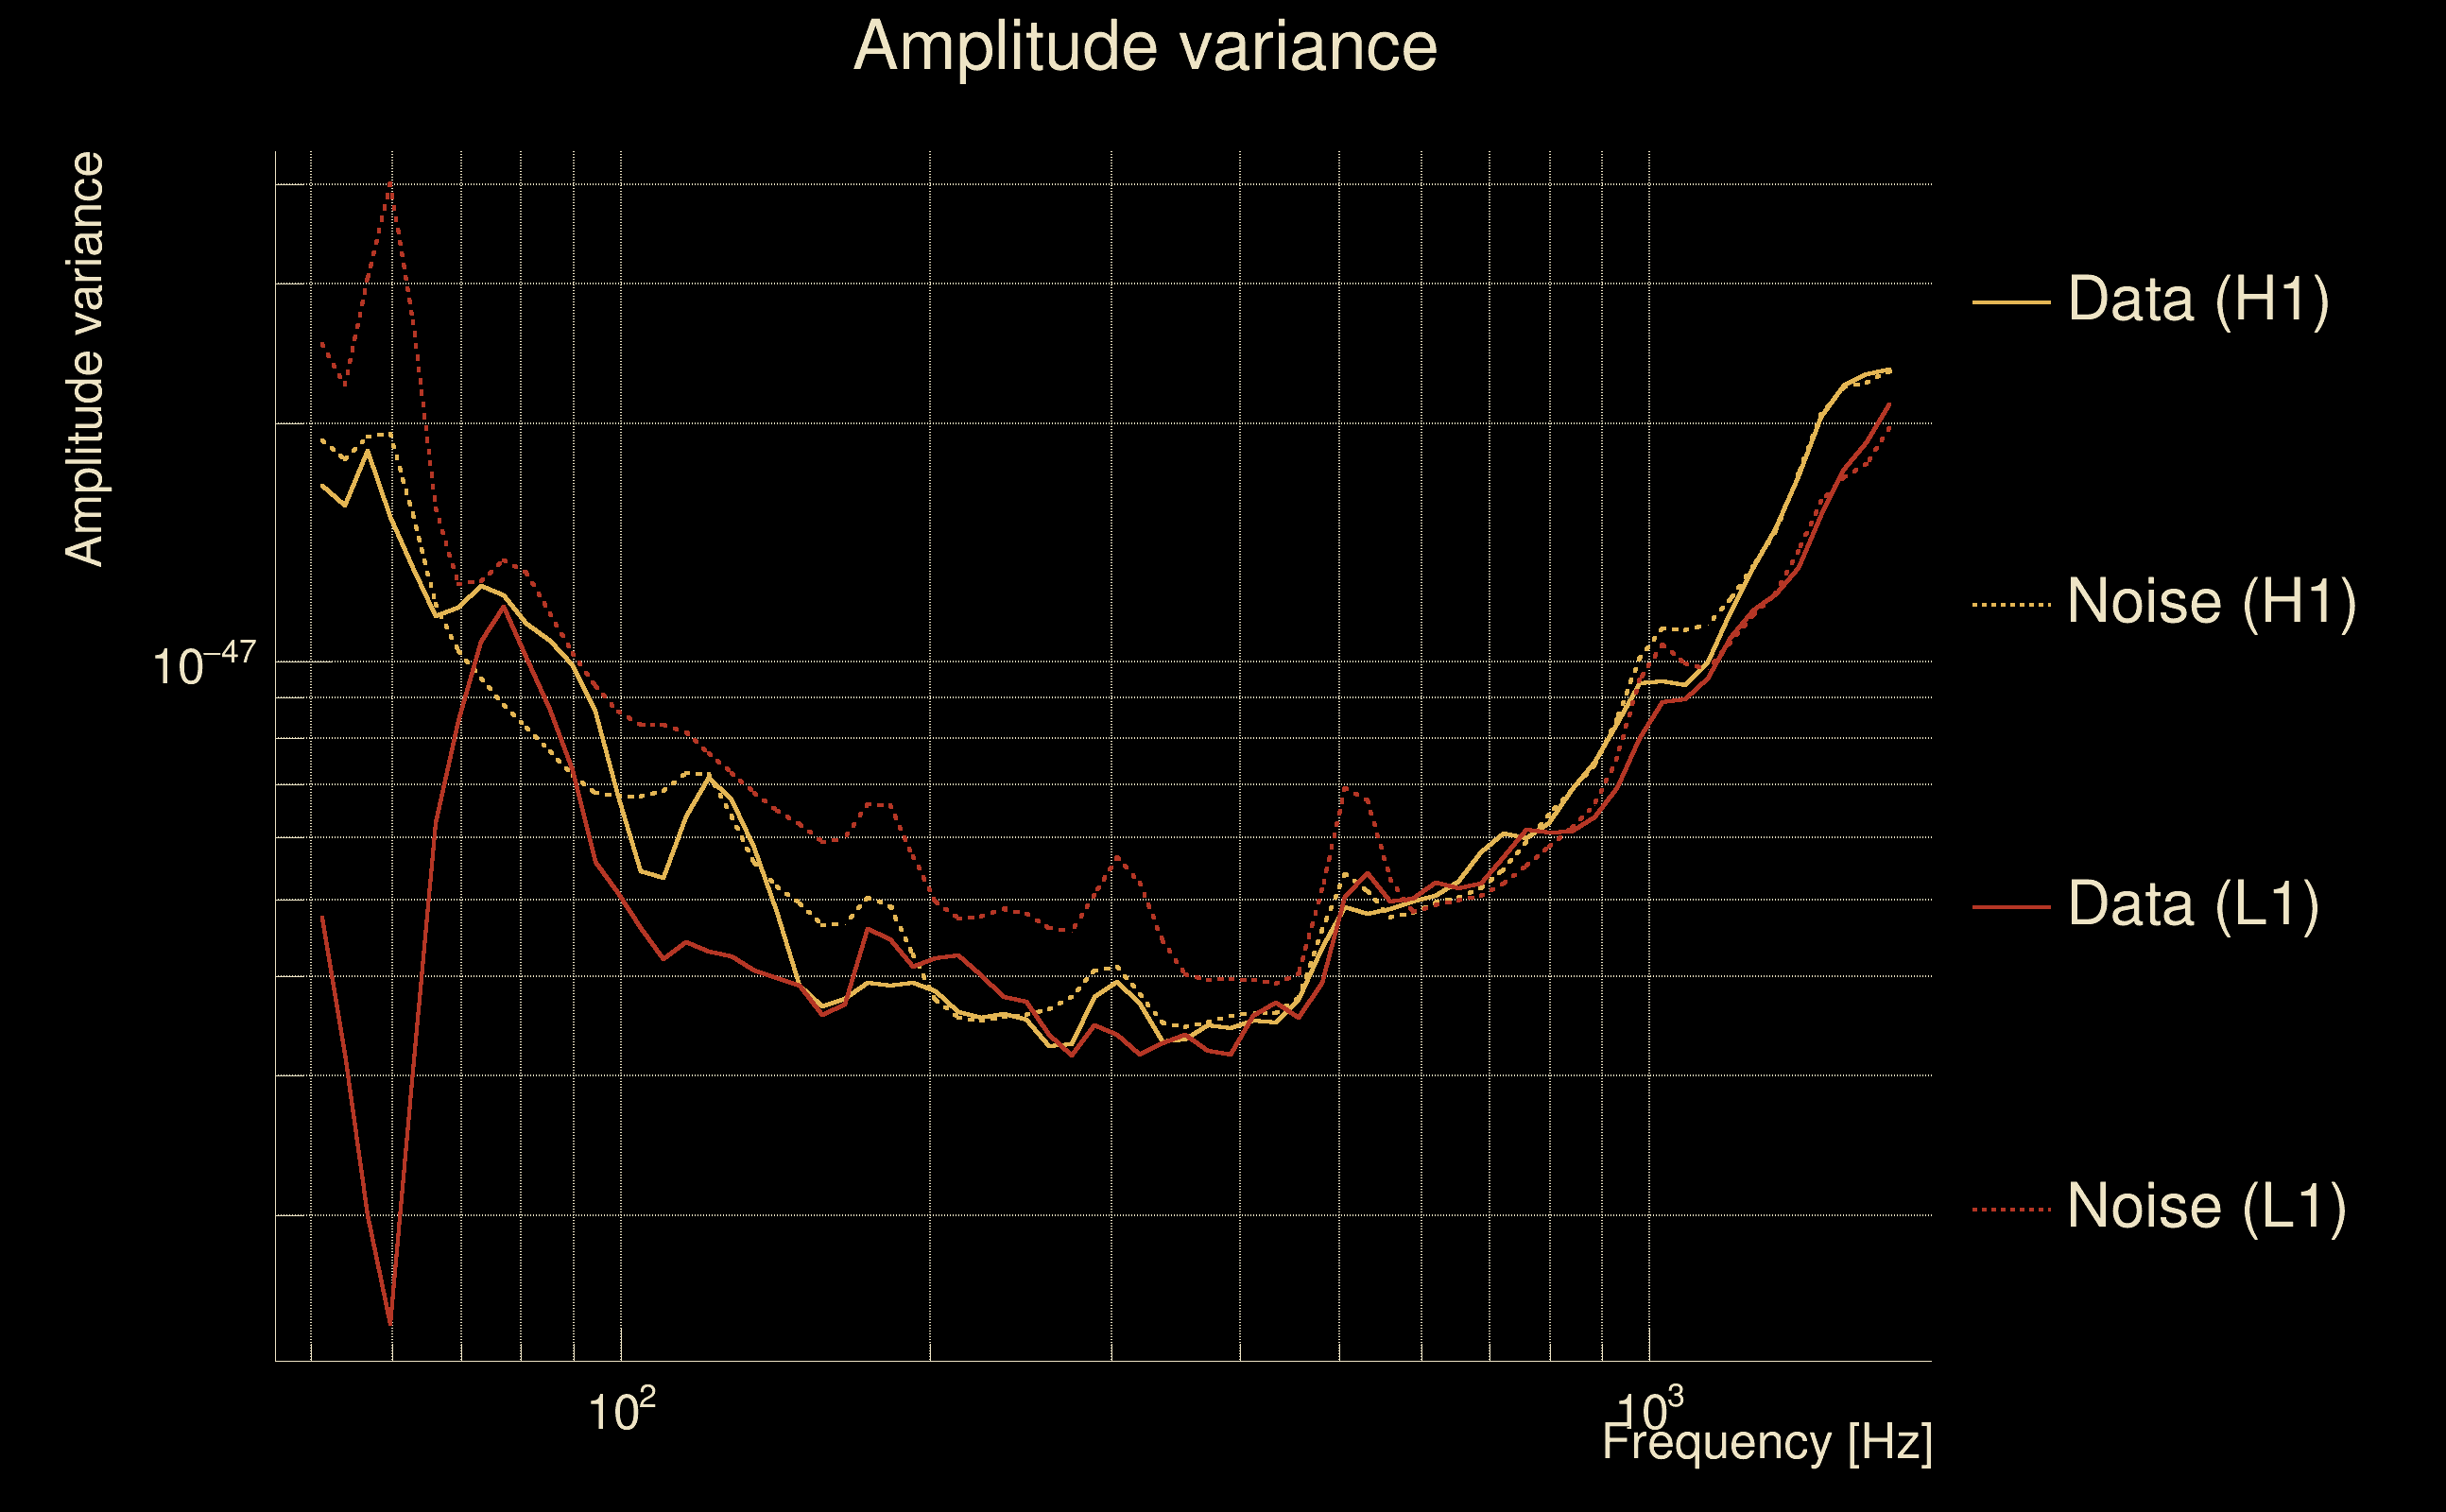
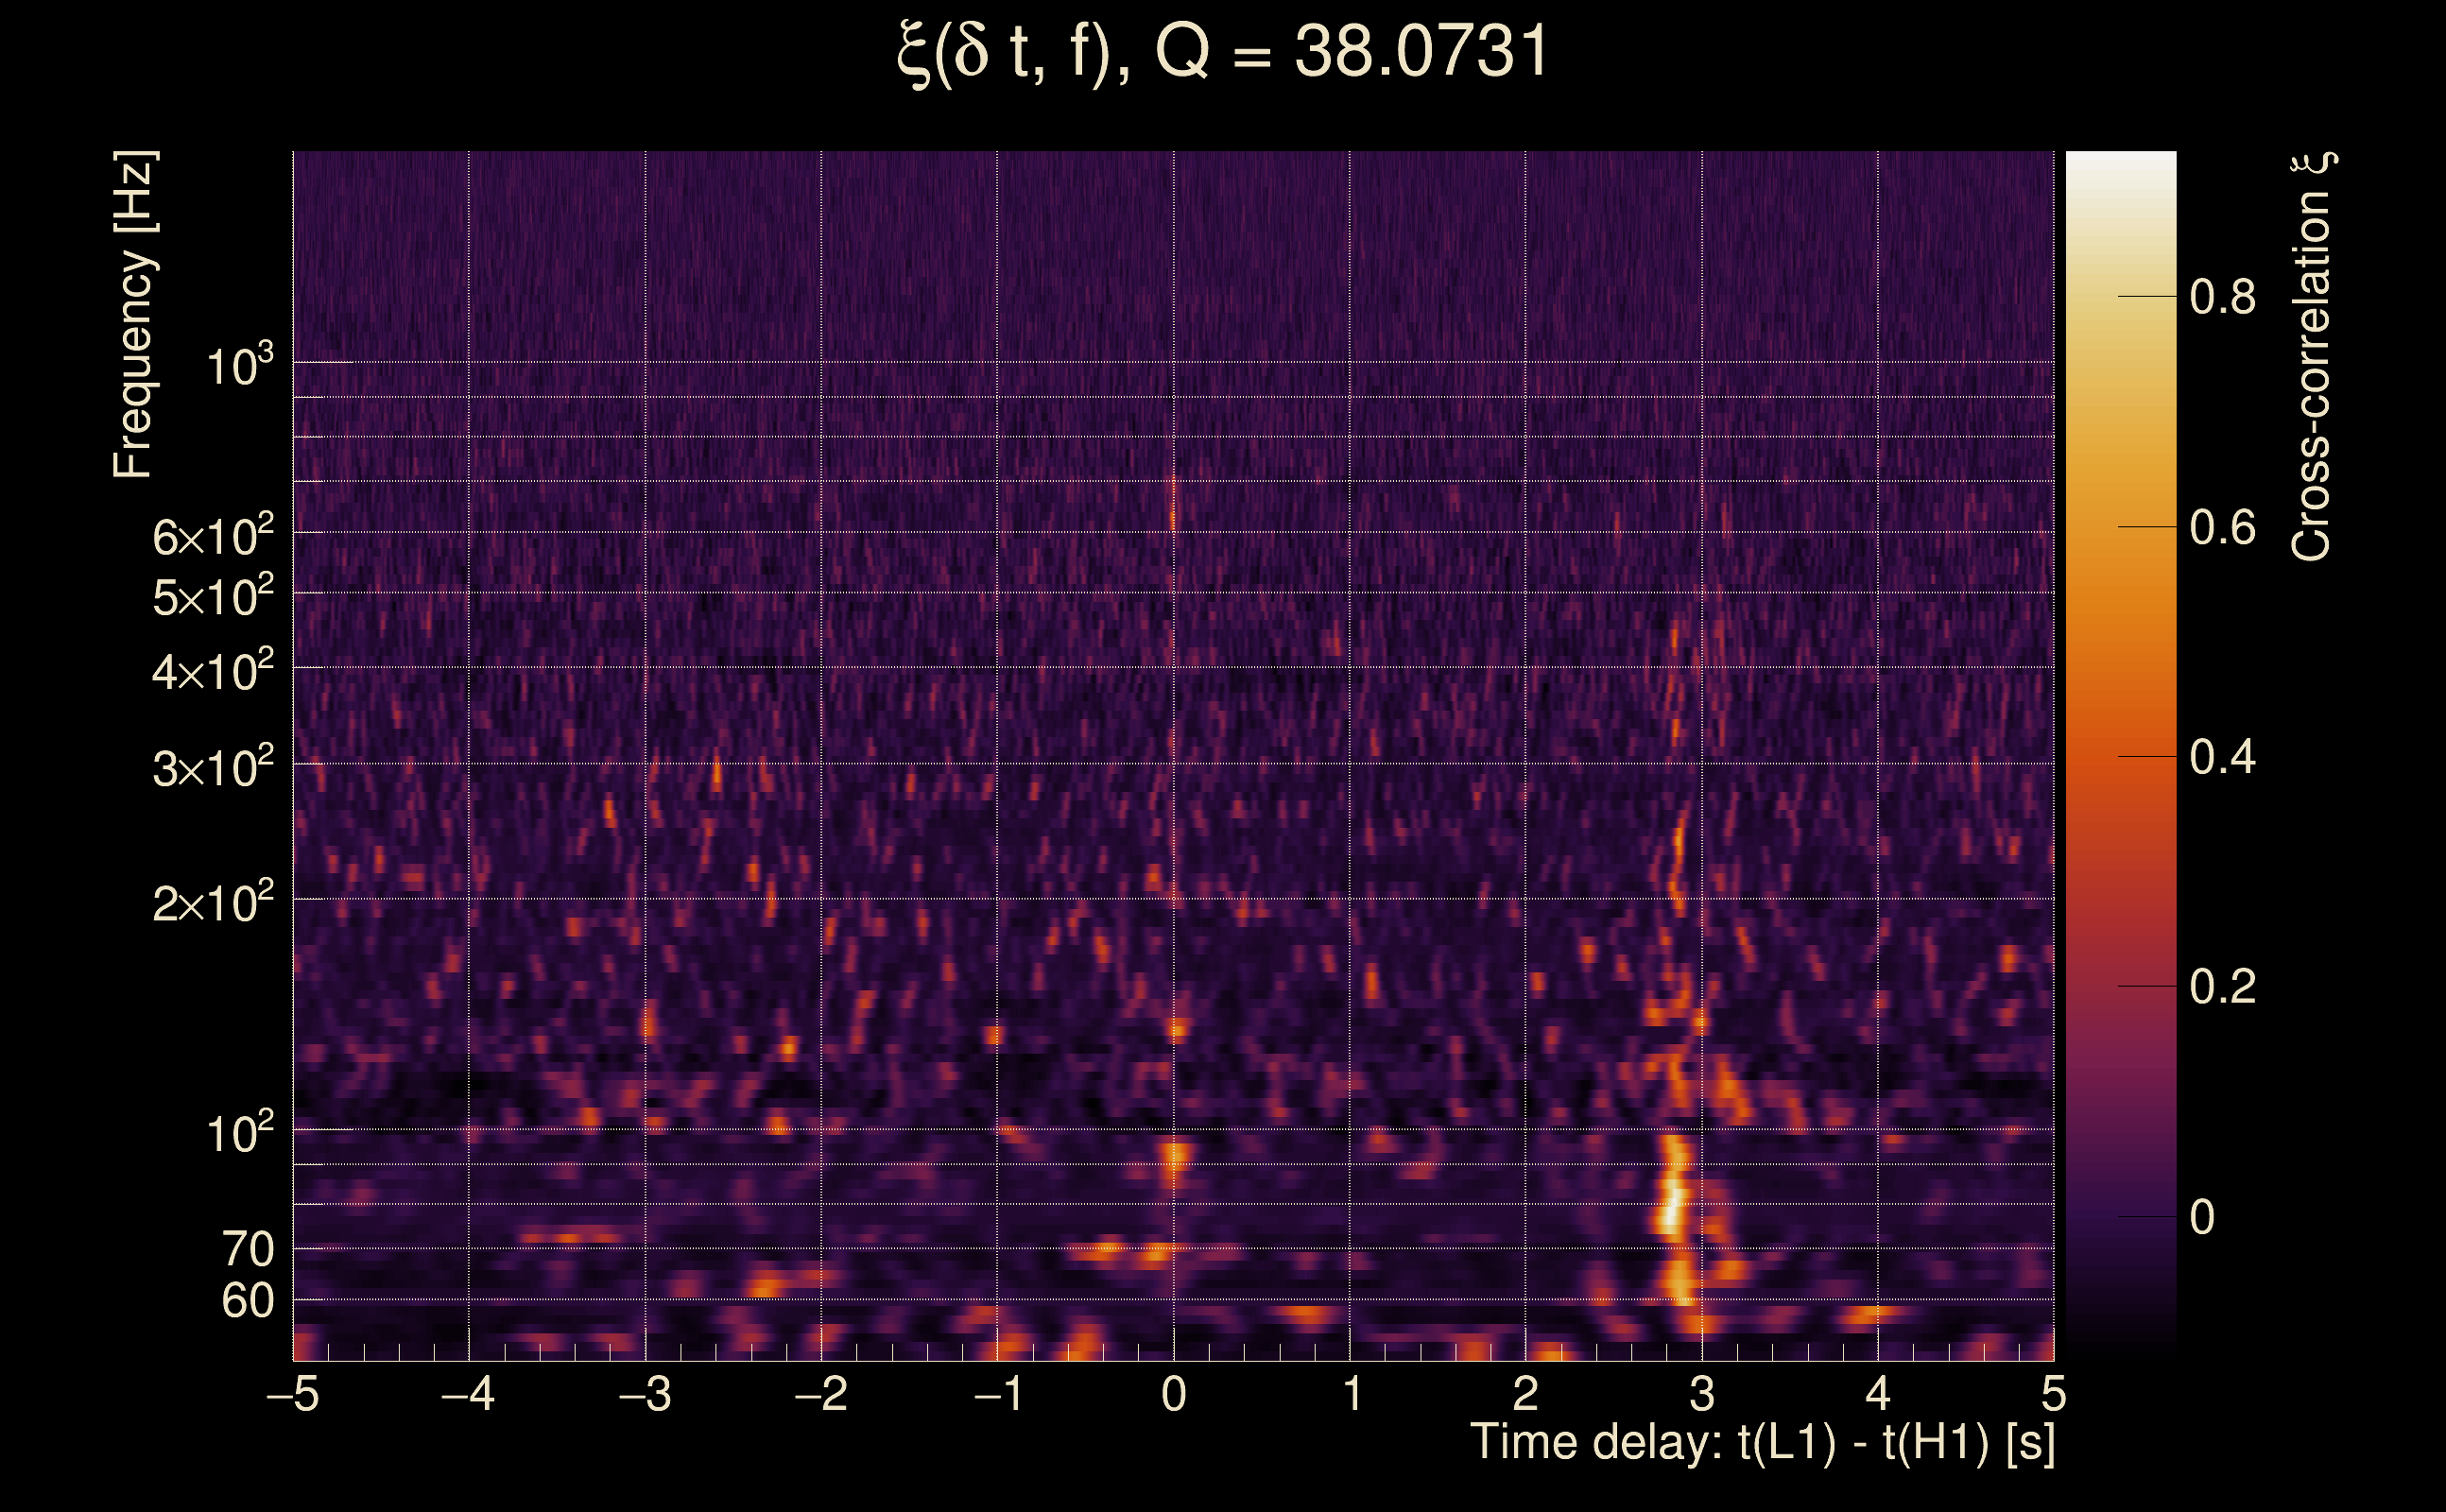
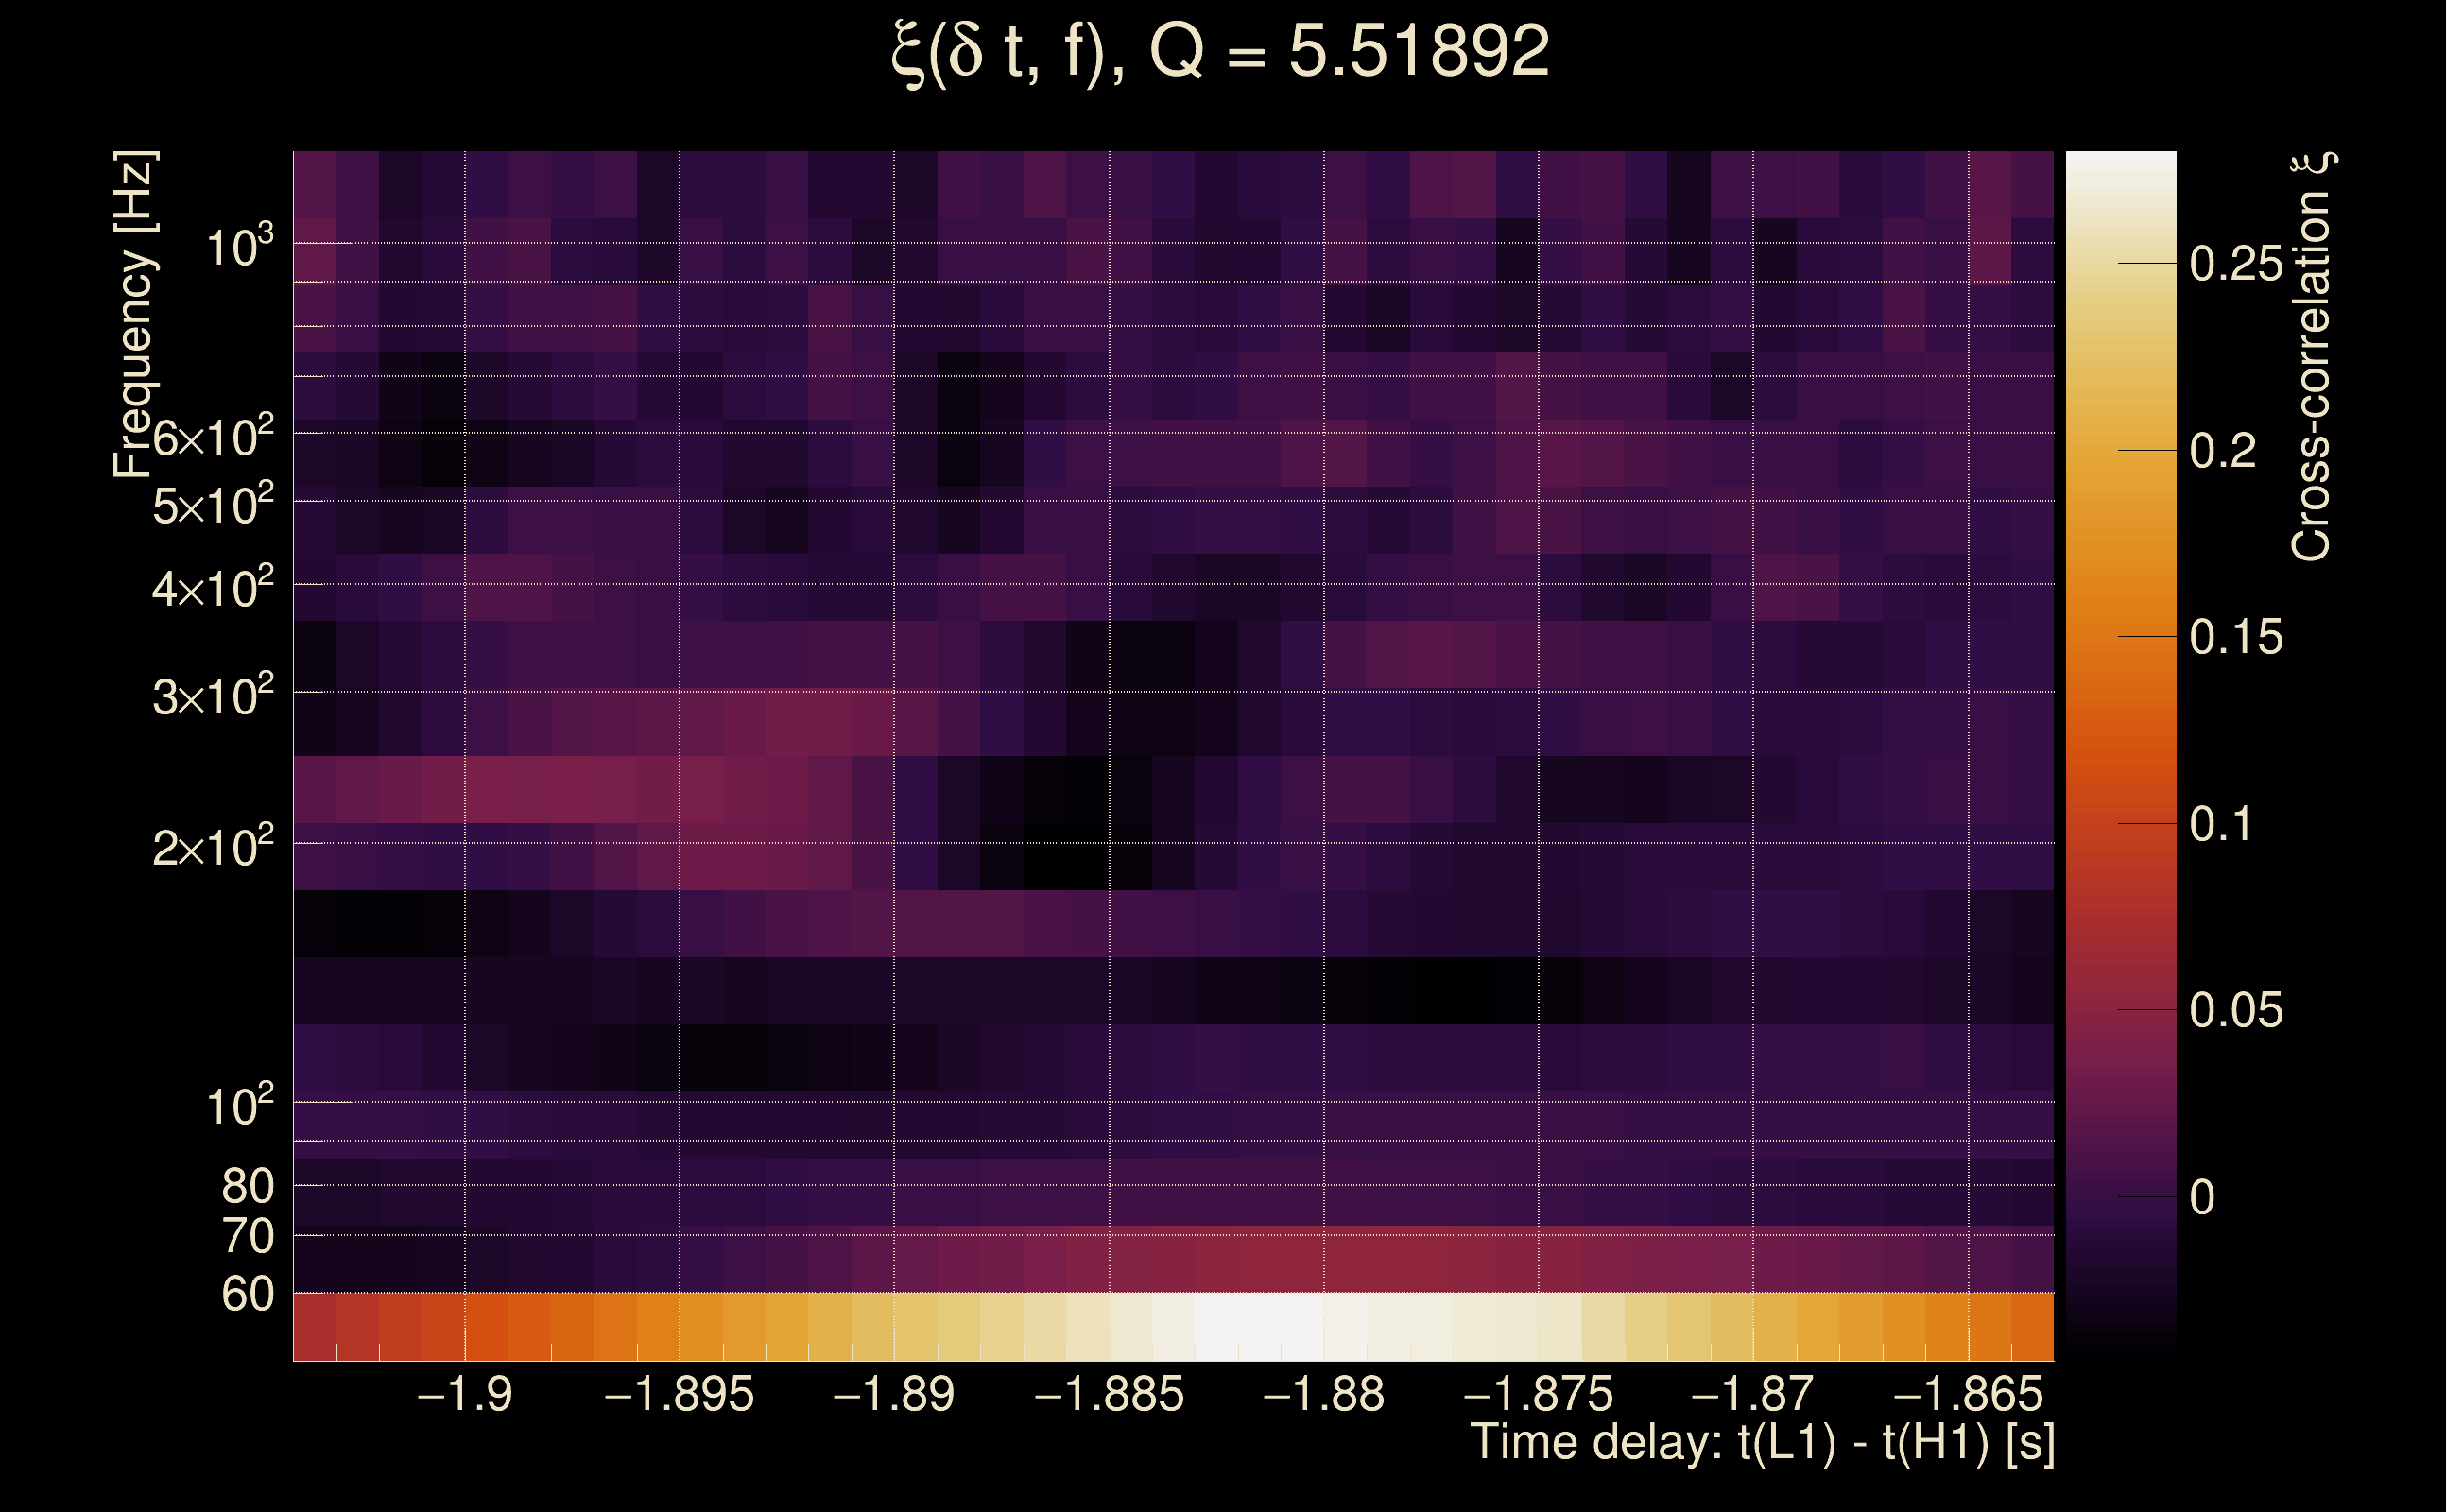
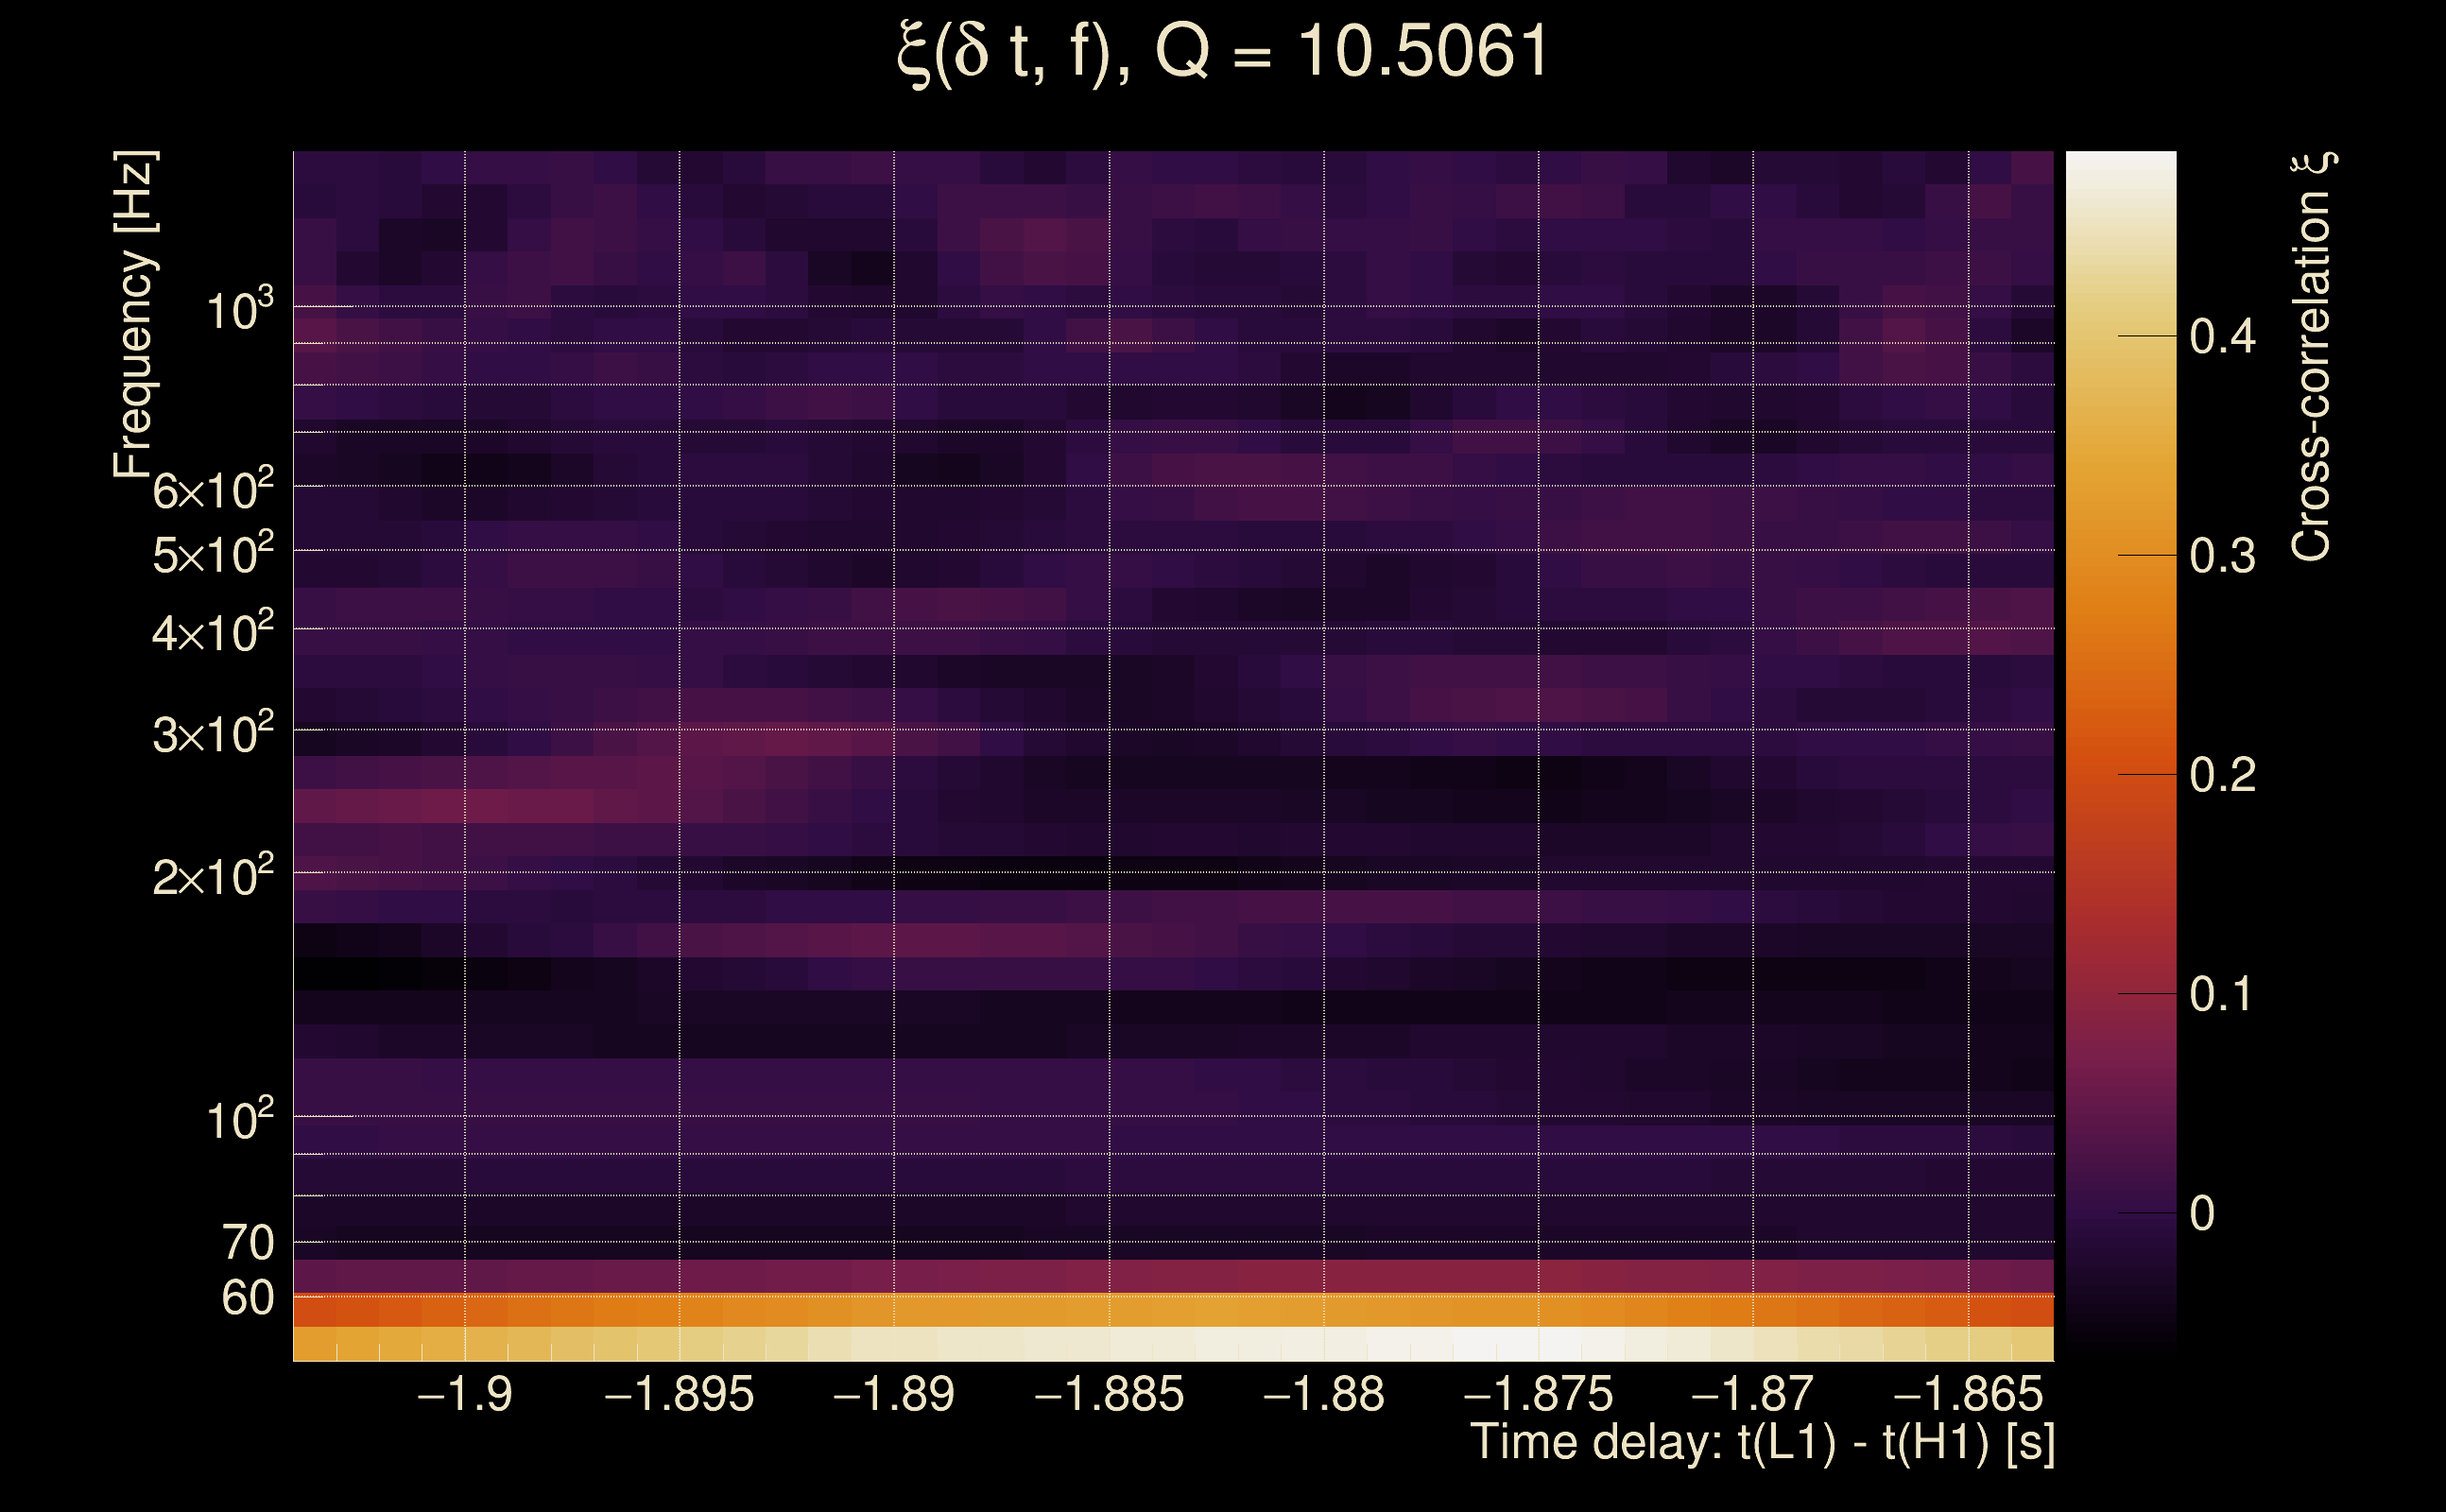
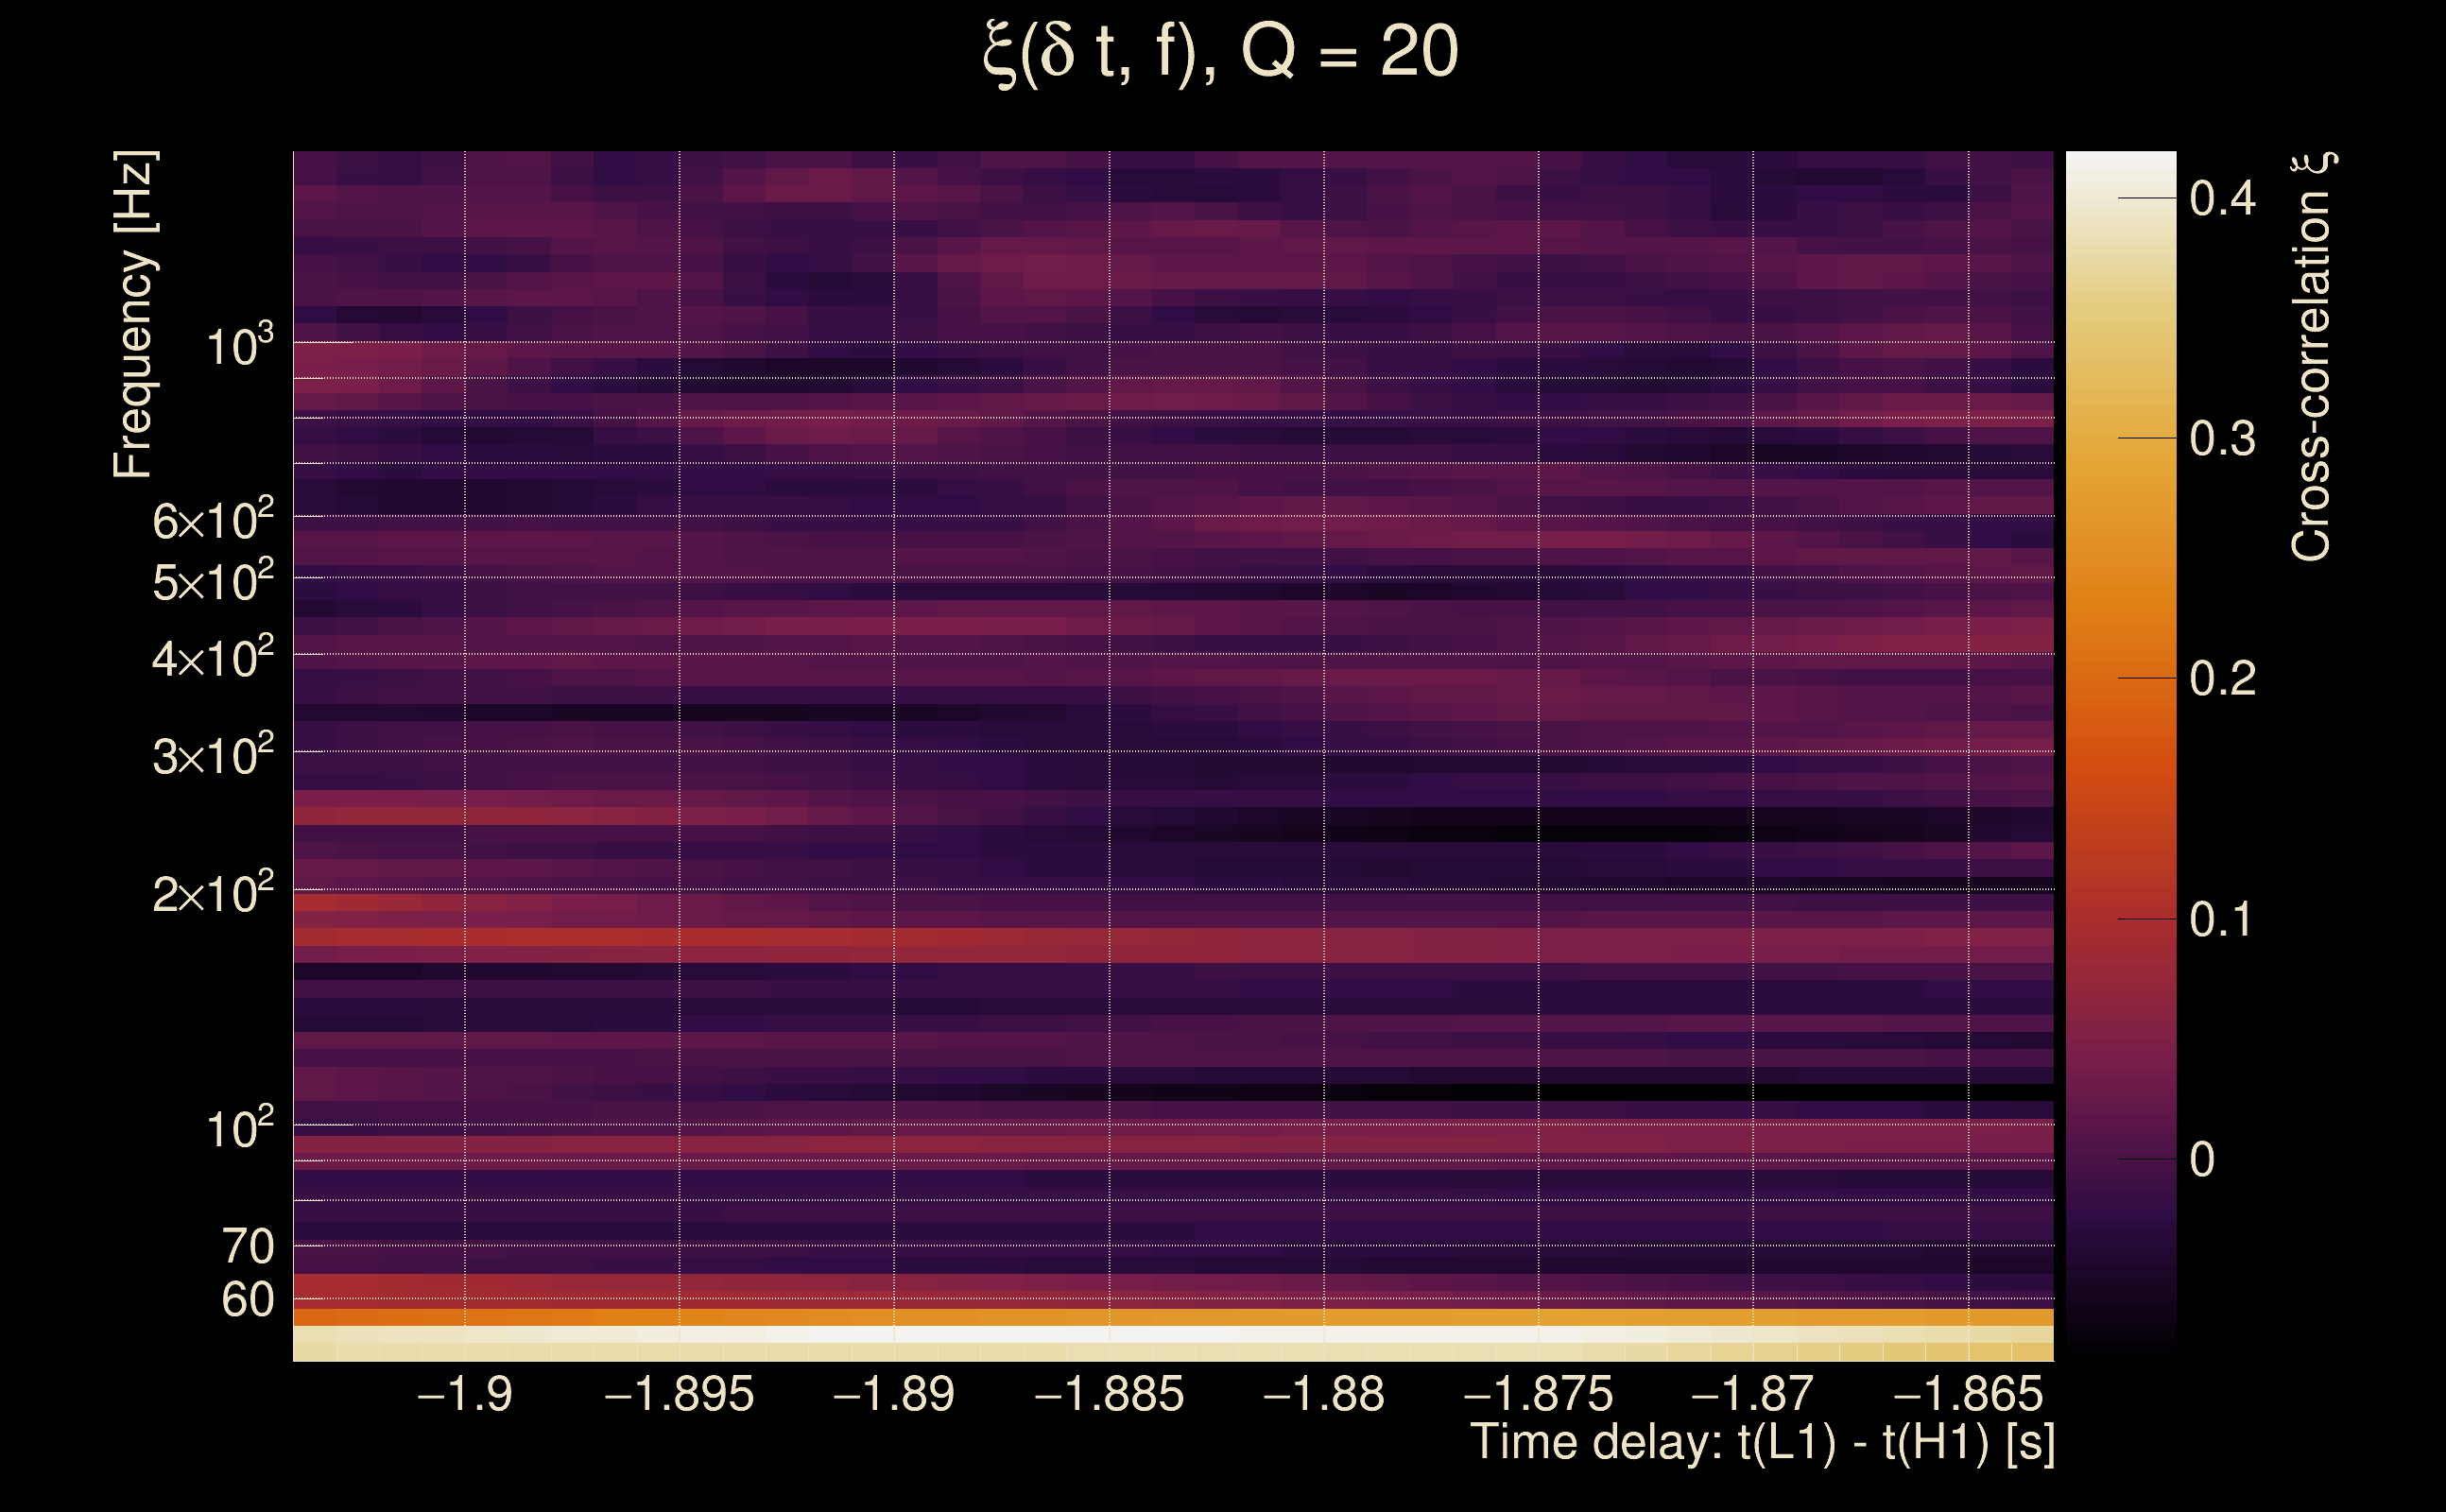
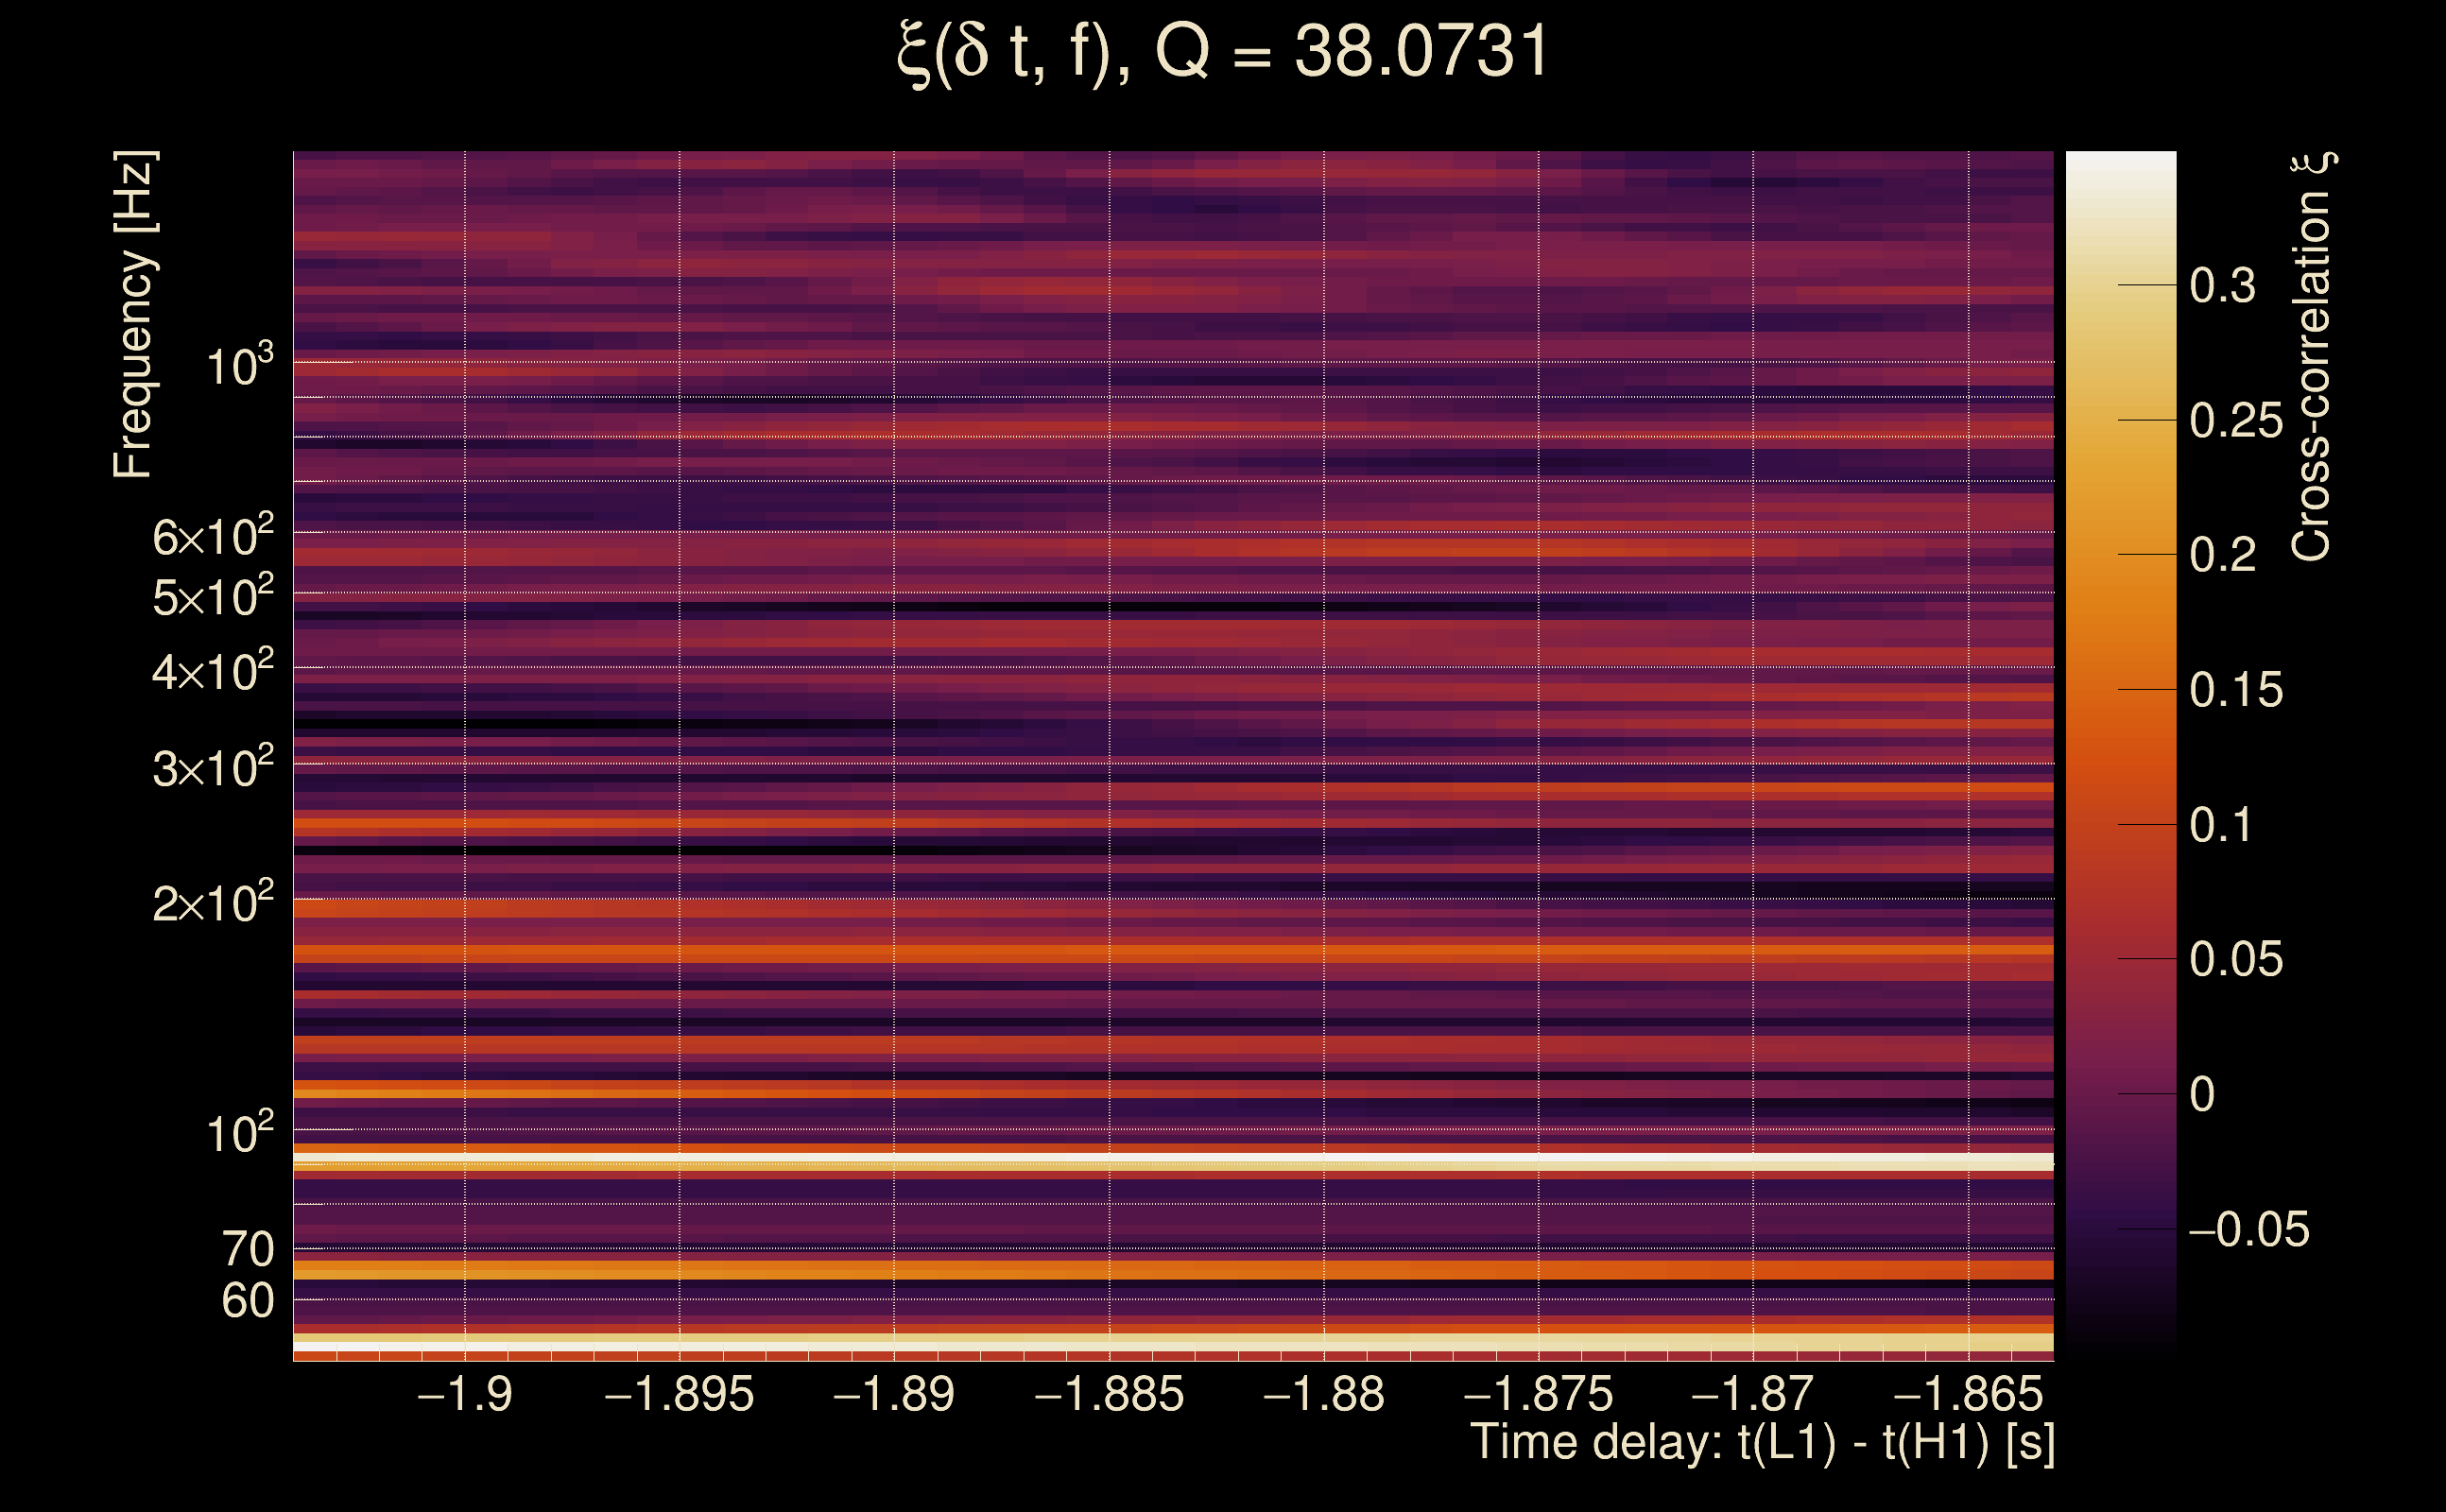
| Event time t(H1): | GPS = 1378903884 (Sat Sep 16 12:51:06 2023 ) → GPS = 1378903894 (Sat Sep 16 12:51:16 2023 ) |
| Event time t(L1): | GPS = 1378903884 (Sat Sep 16 12:51:16 2023 ) → GPS = 1378903894 (Sat Sep 16 12:51:16 2023 ) |
| Omicron analysis time window (H1): | GPS = 1378903881 → GPS = 1378903897 |
| Omicron analysis time window (L1): | GPS = 1378903881 → GPS = 1378903897 |
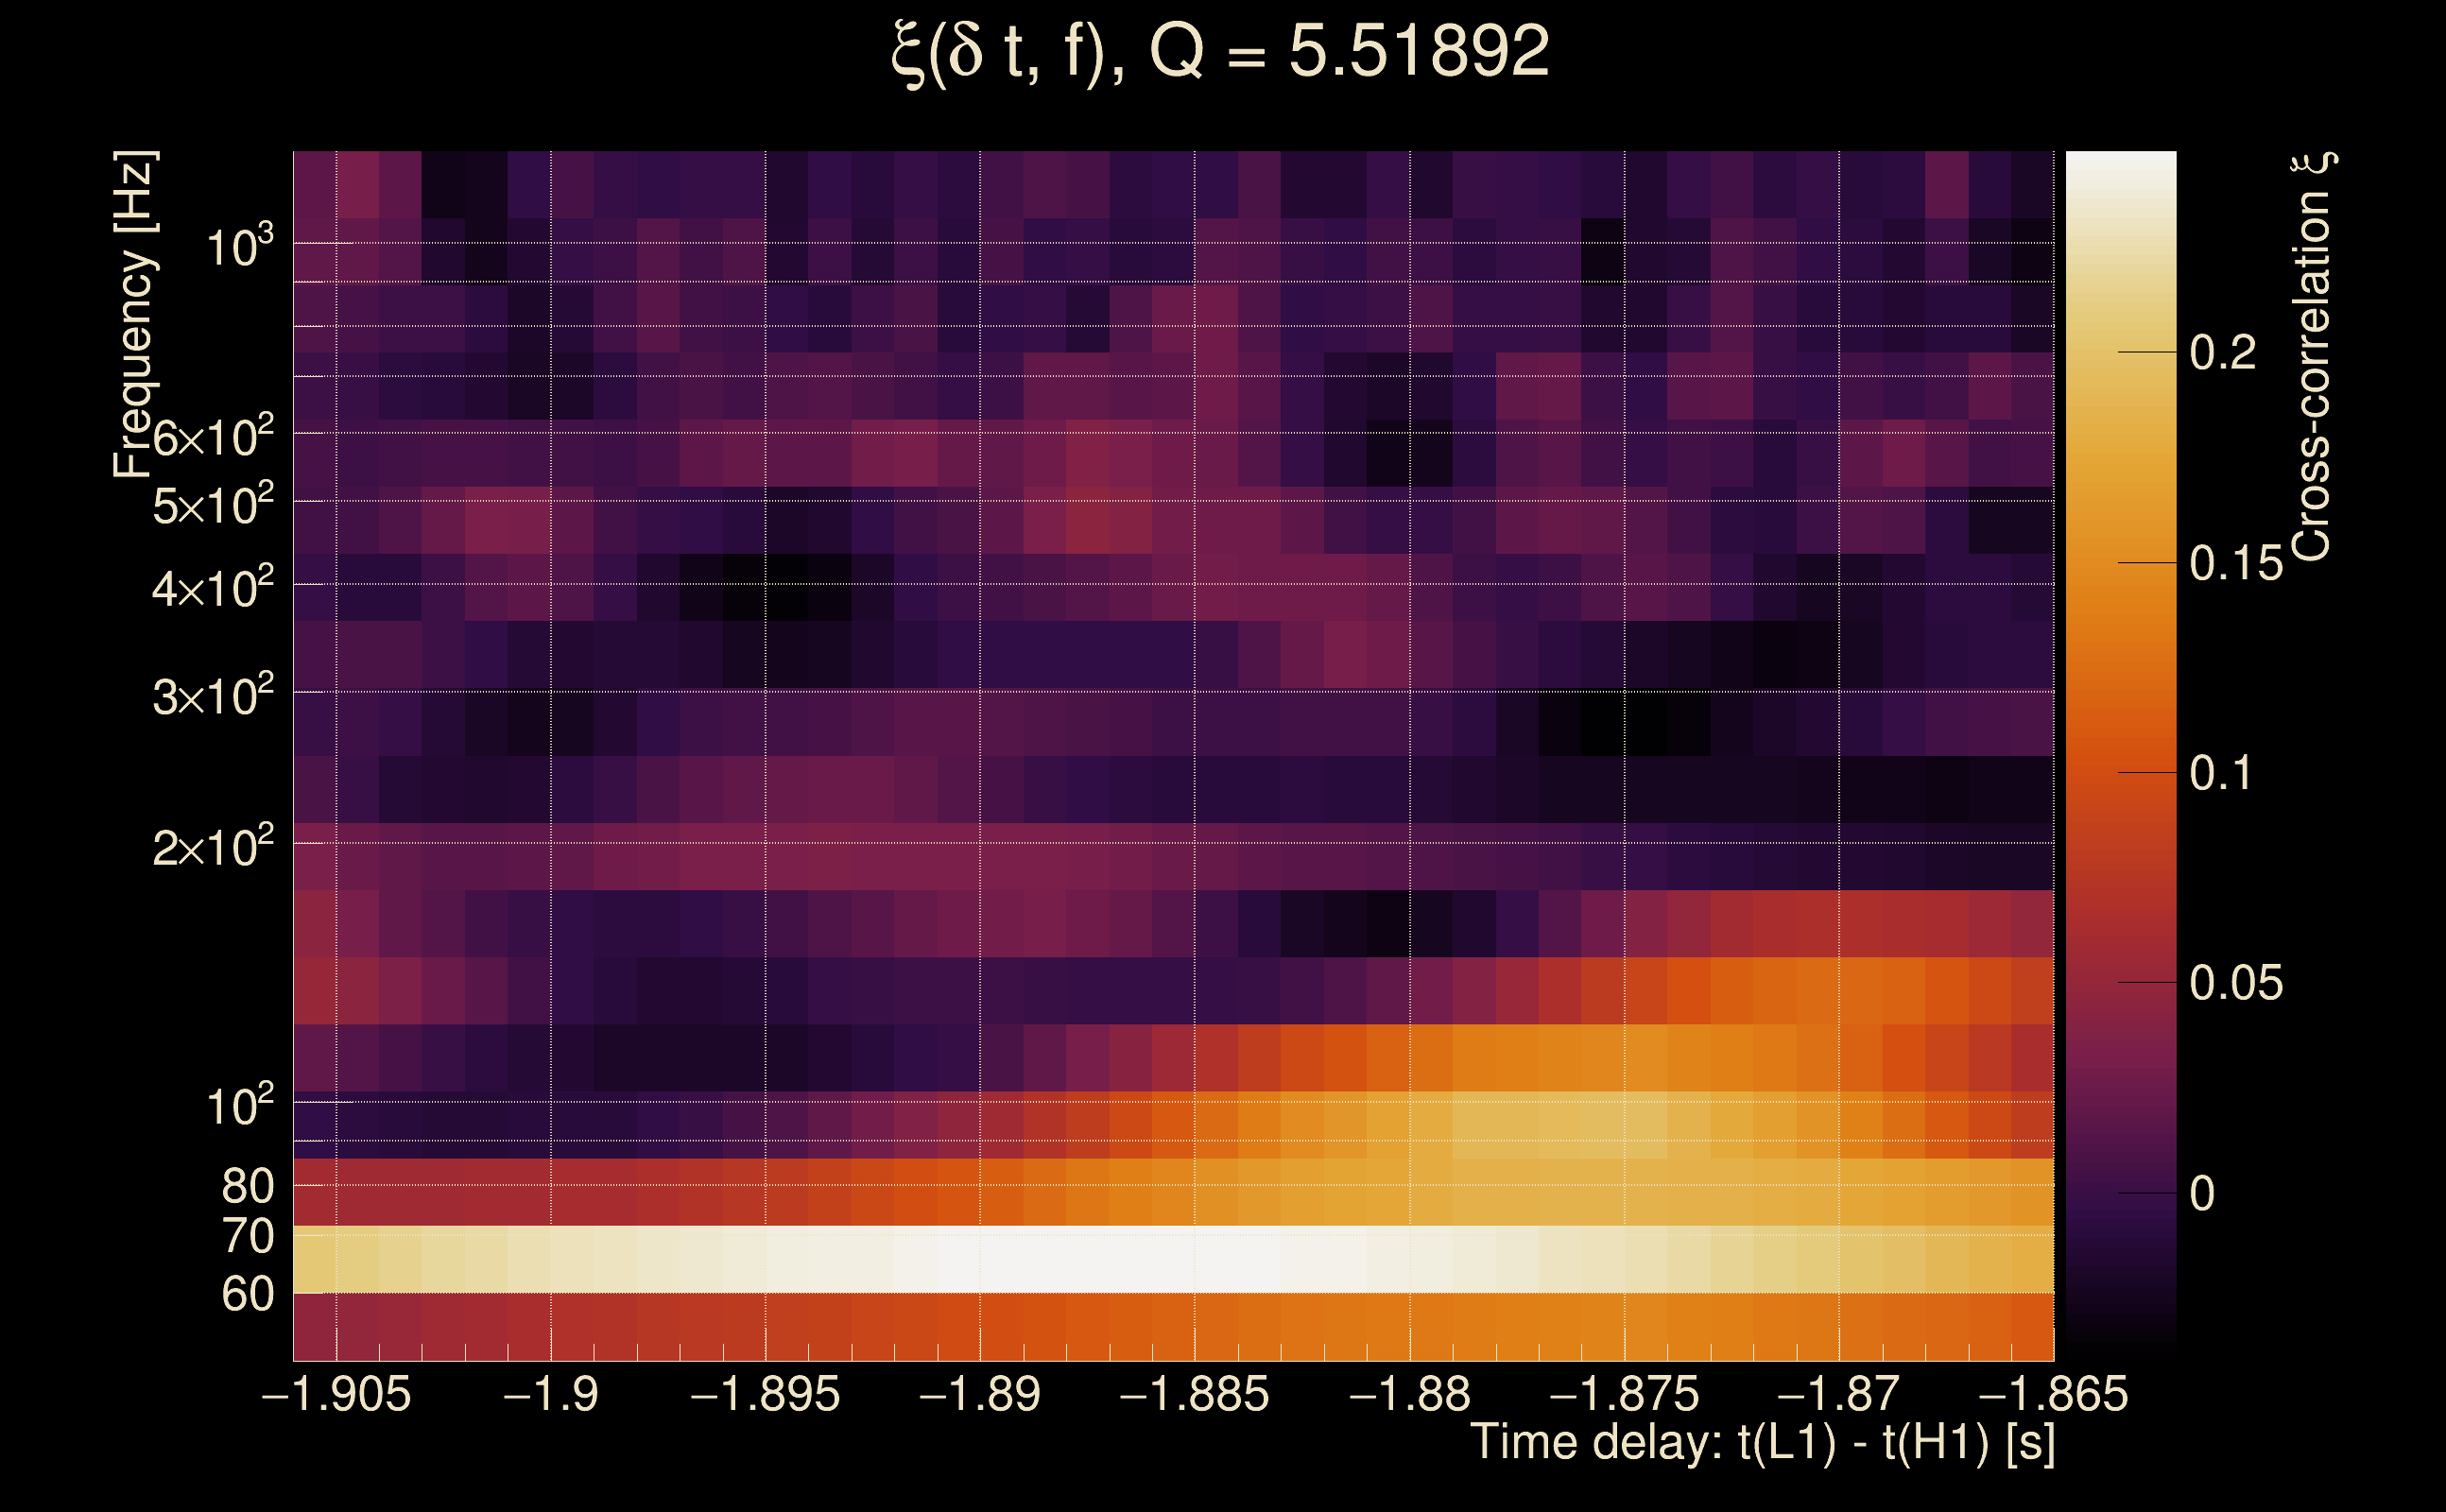
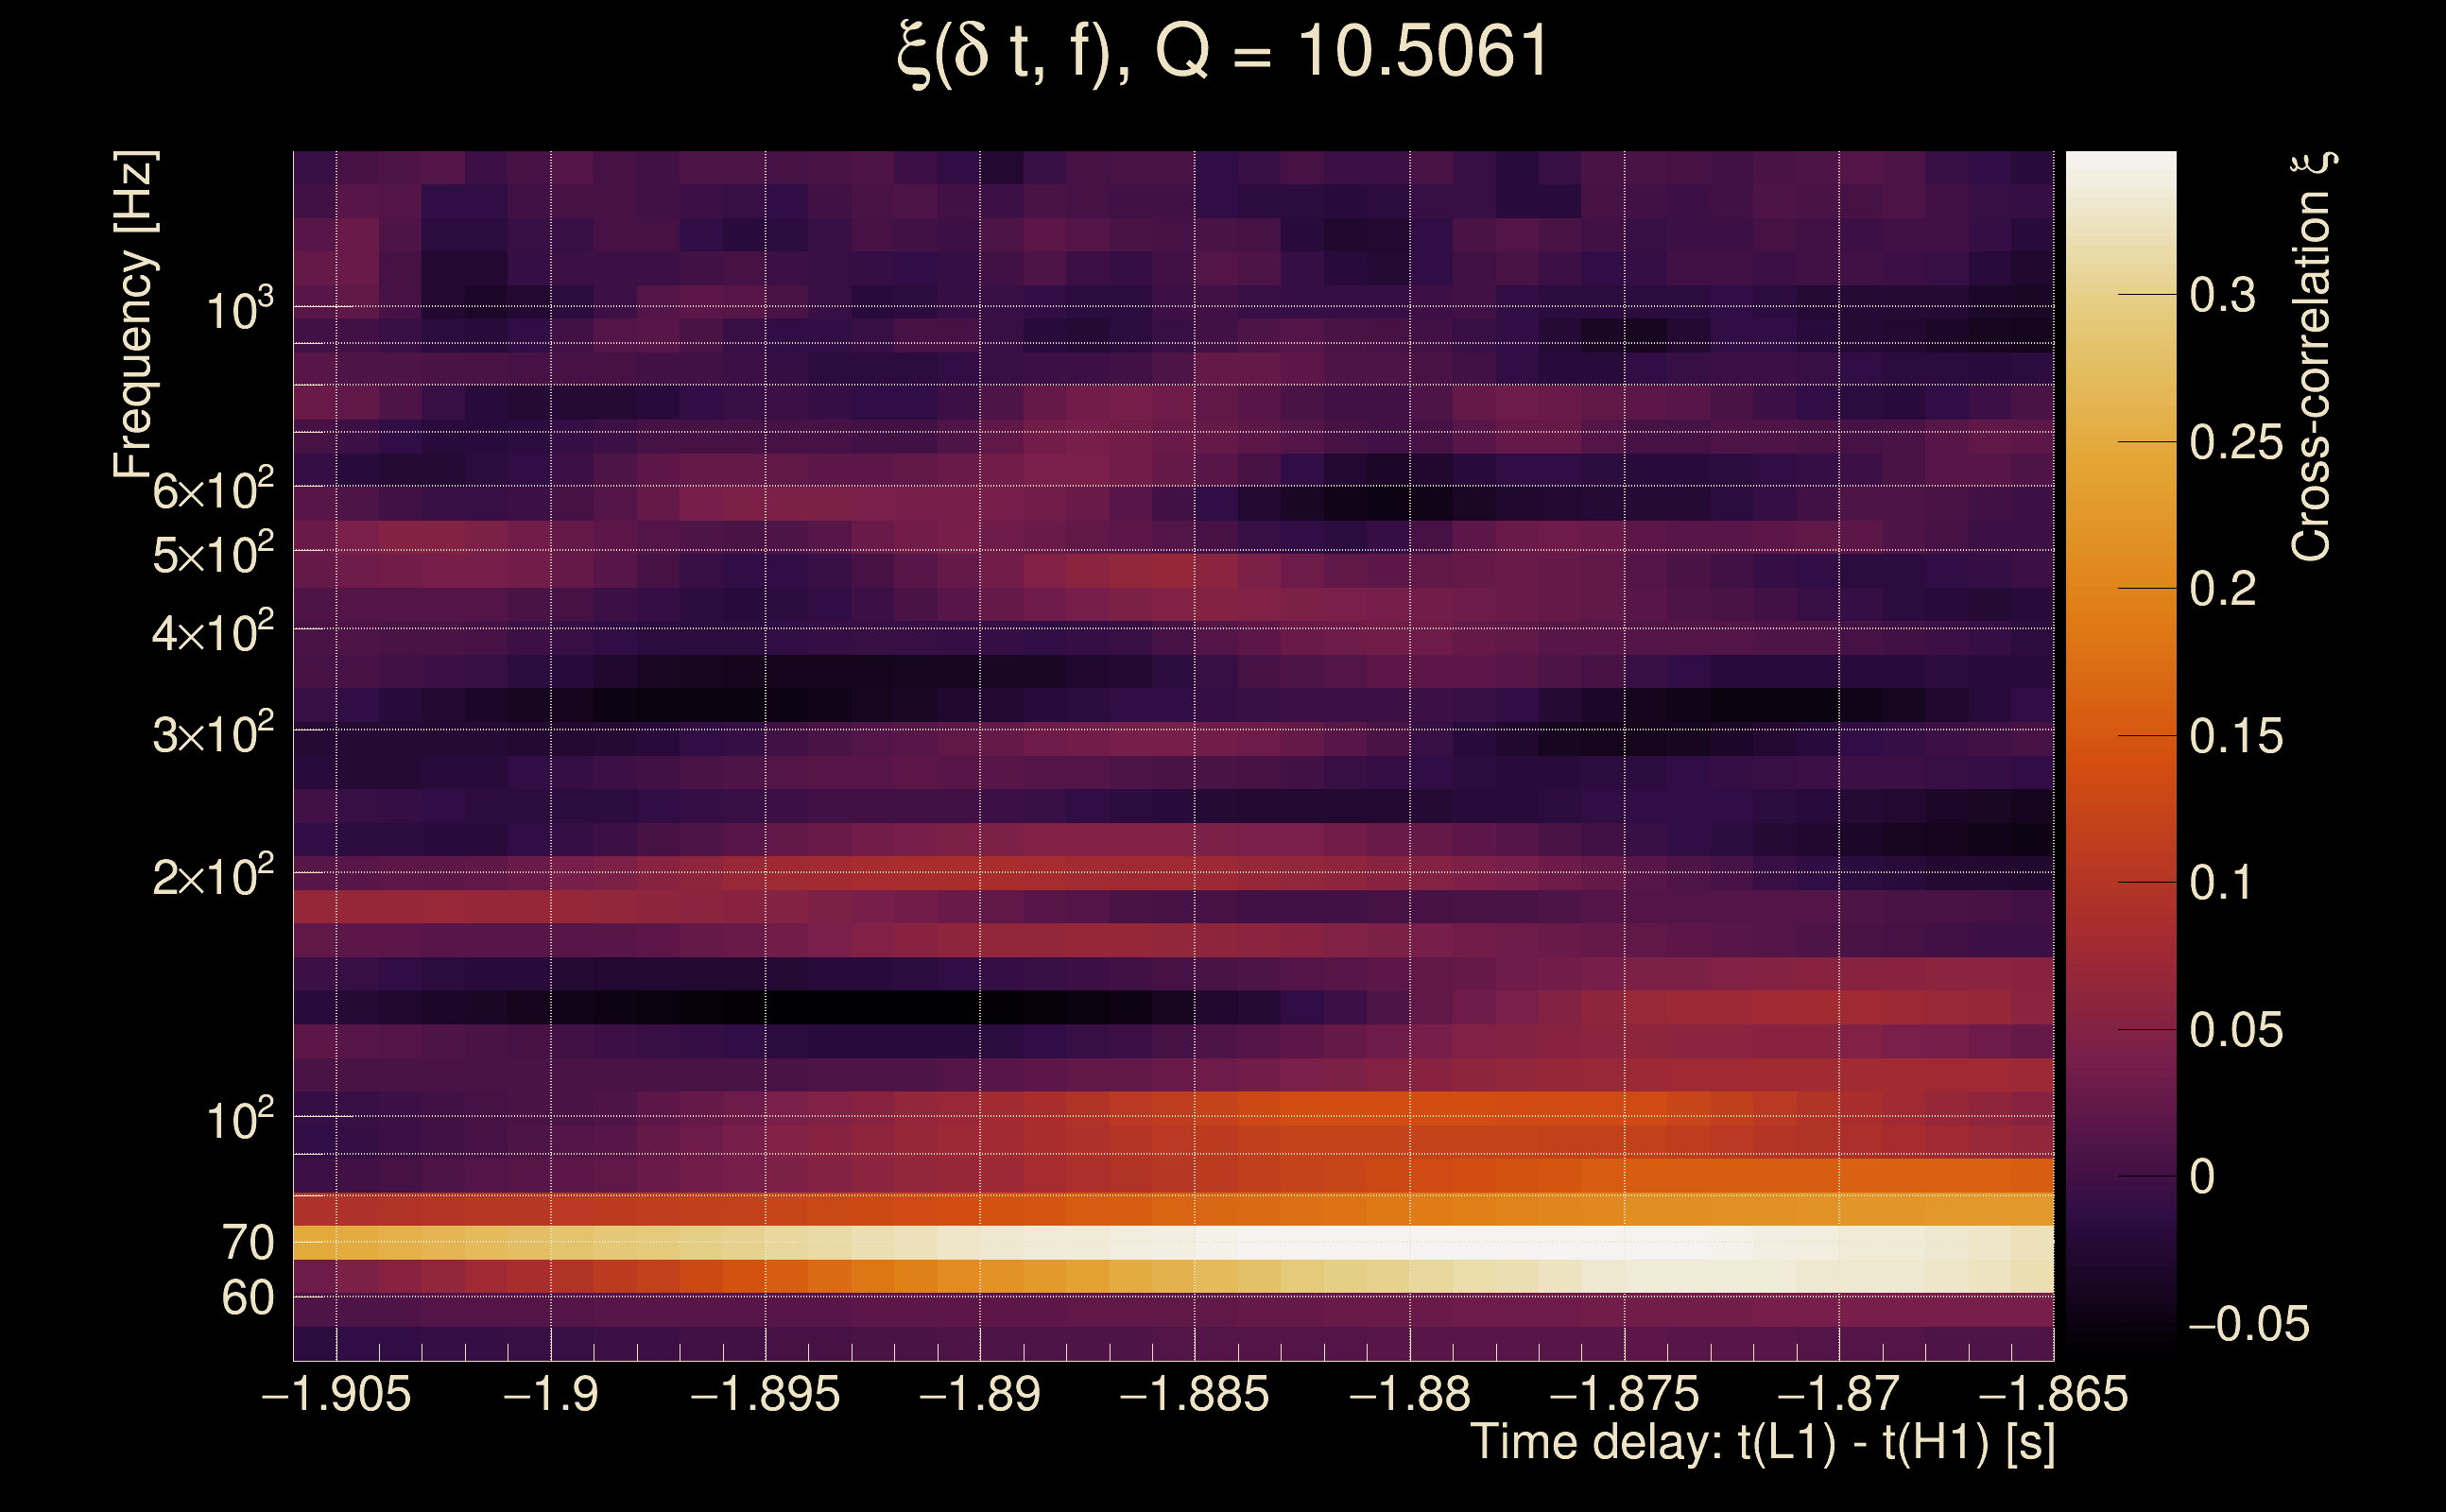
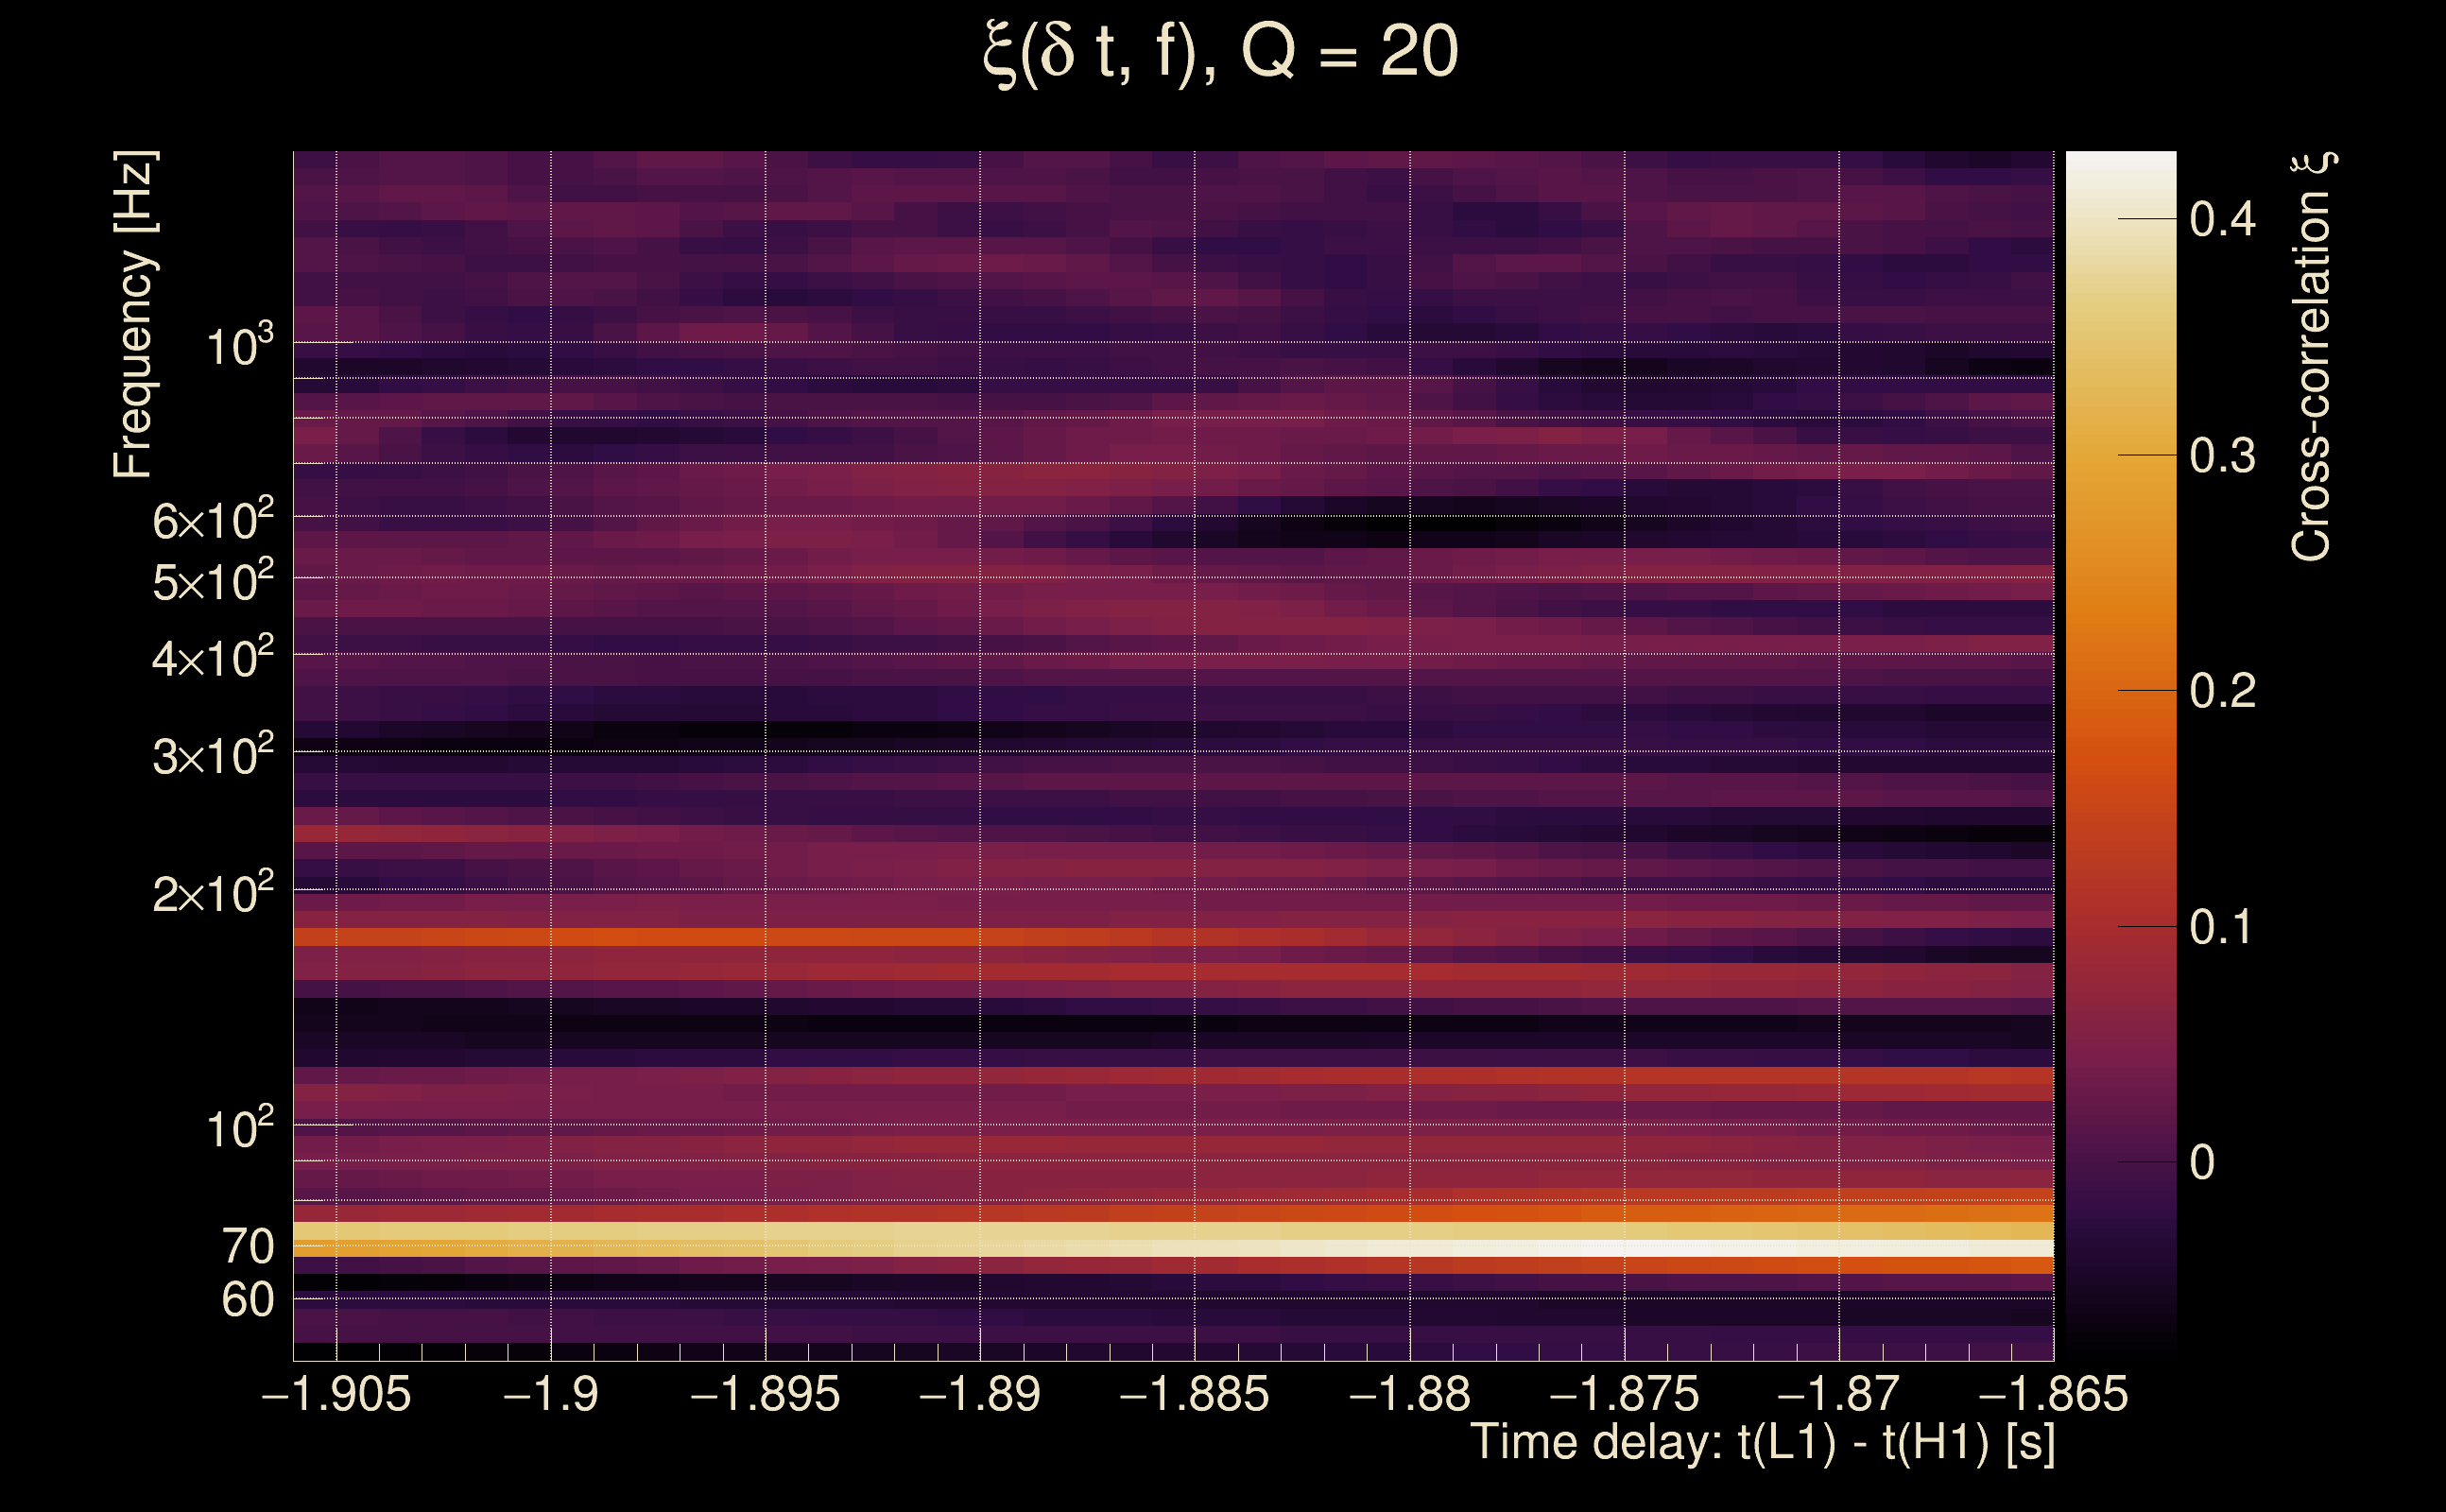
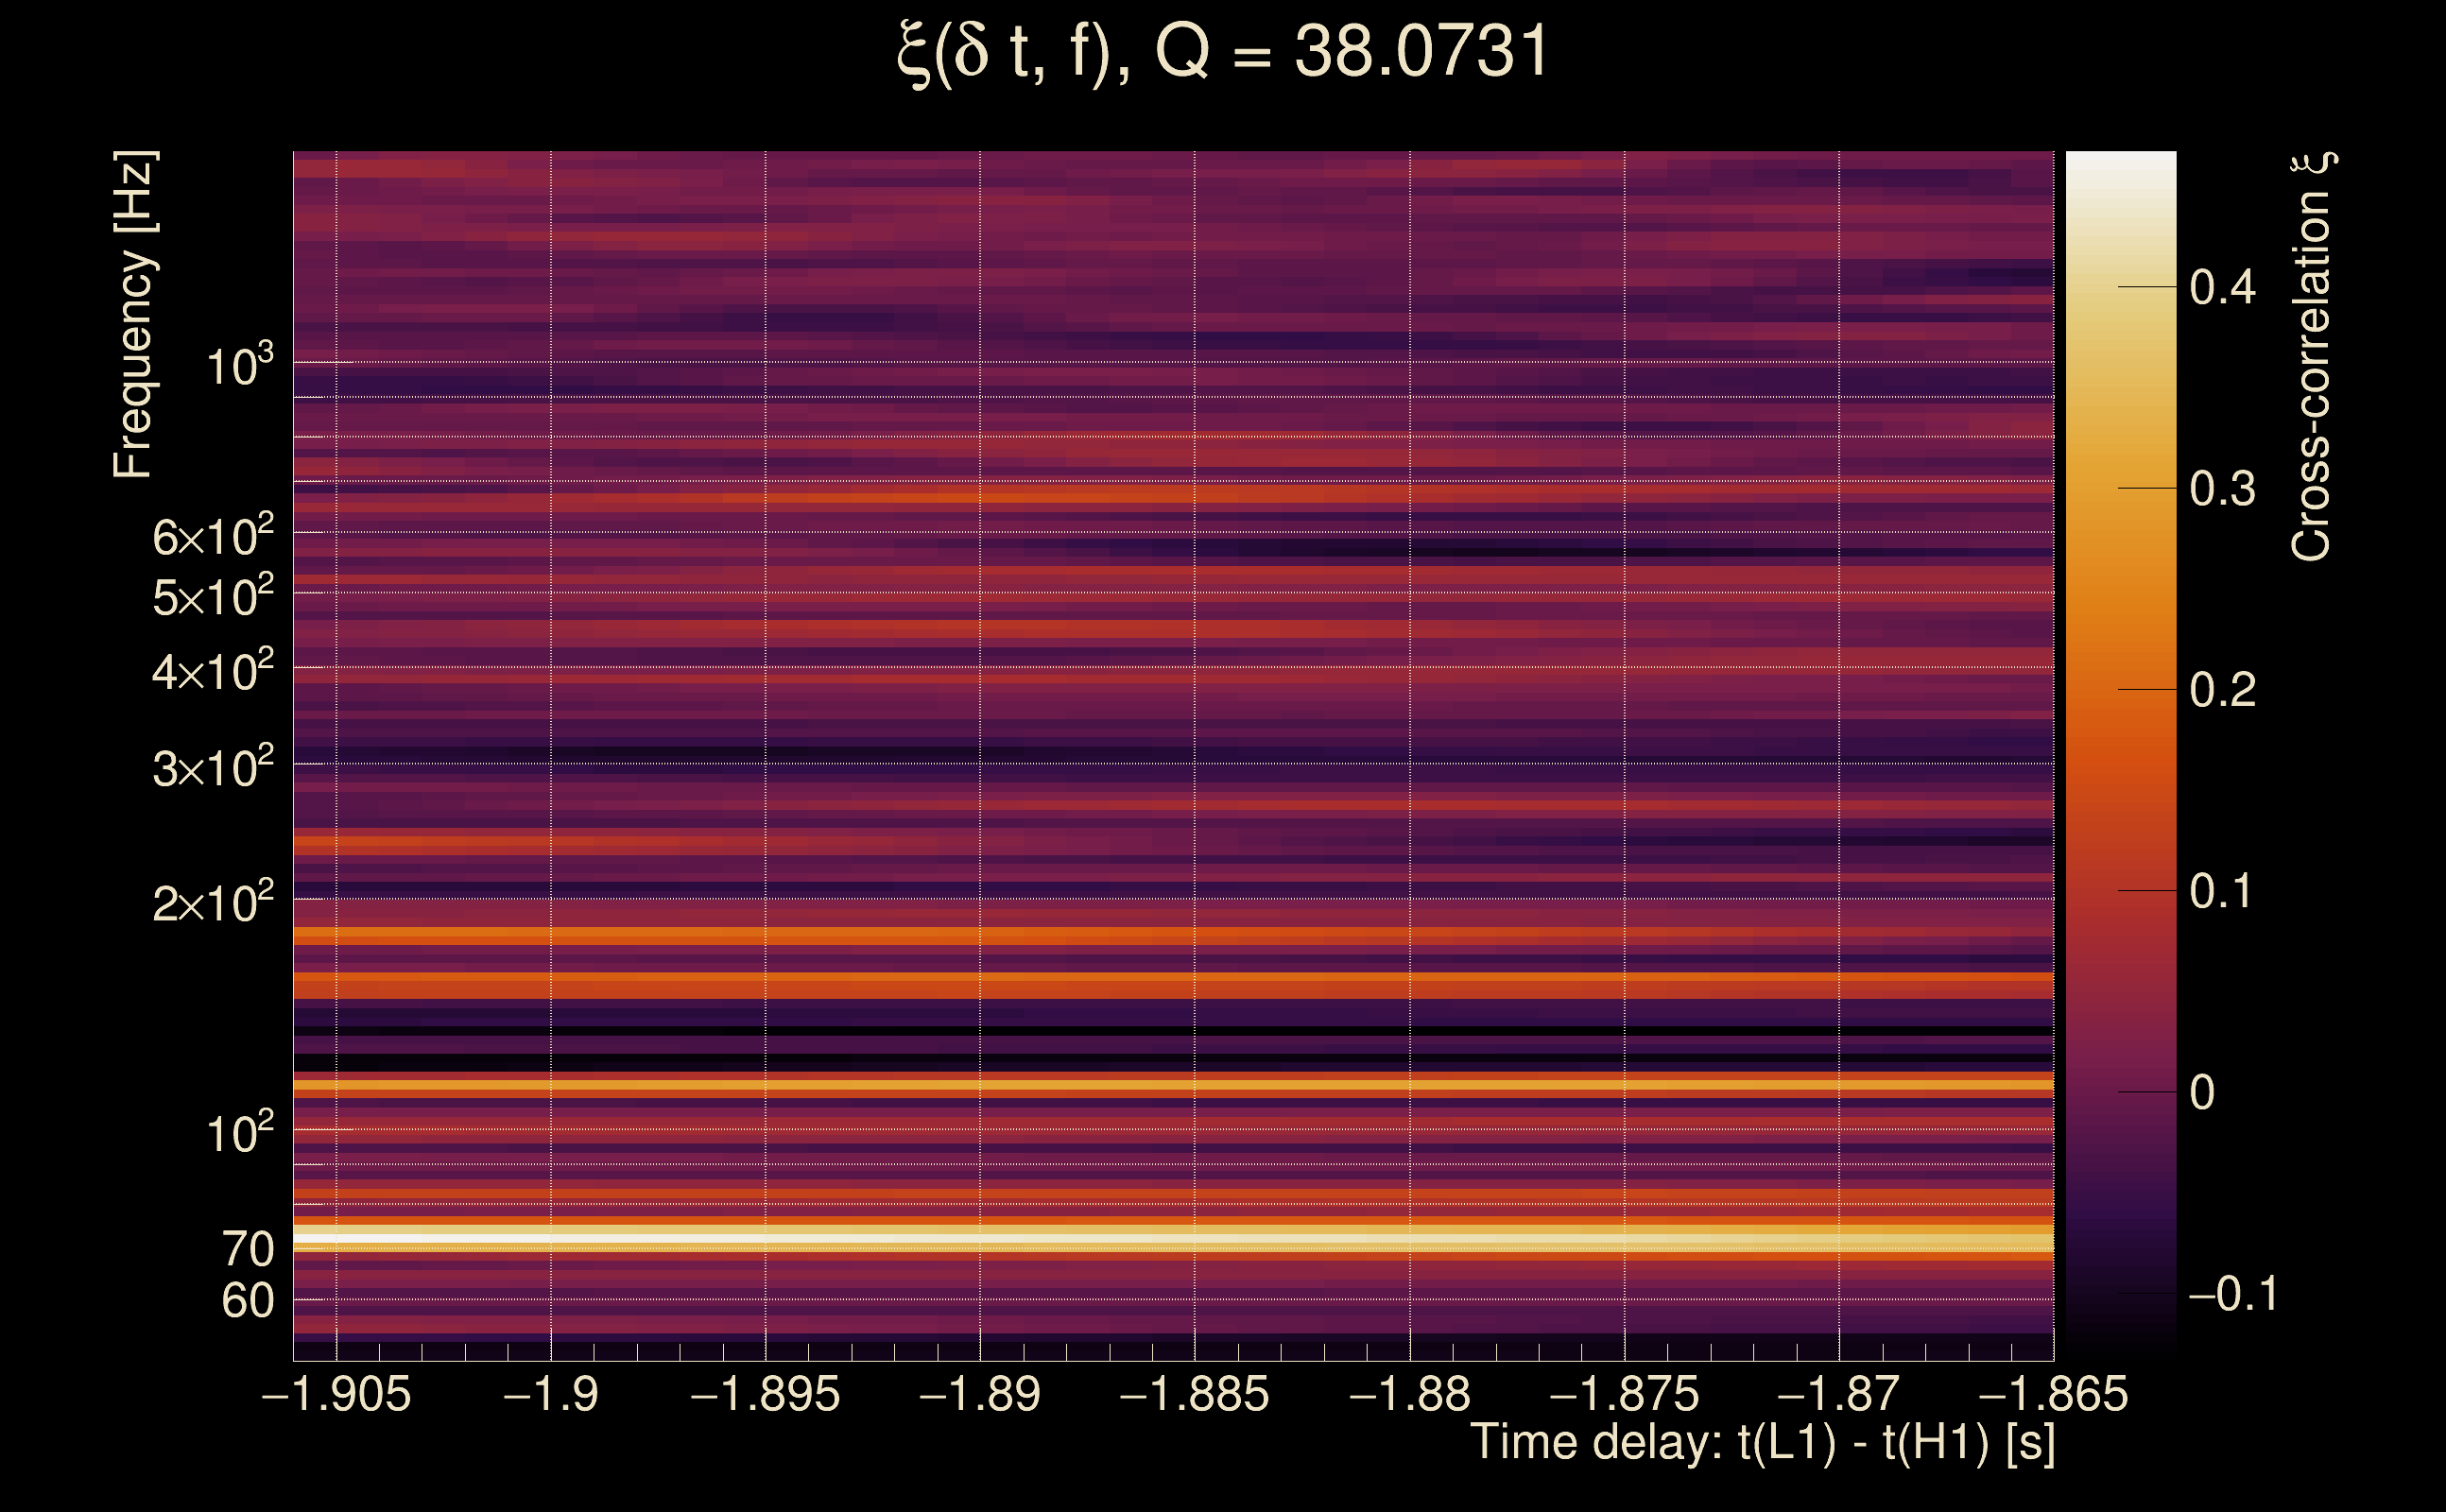
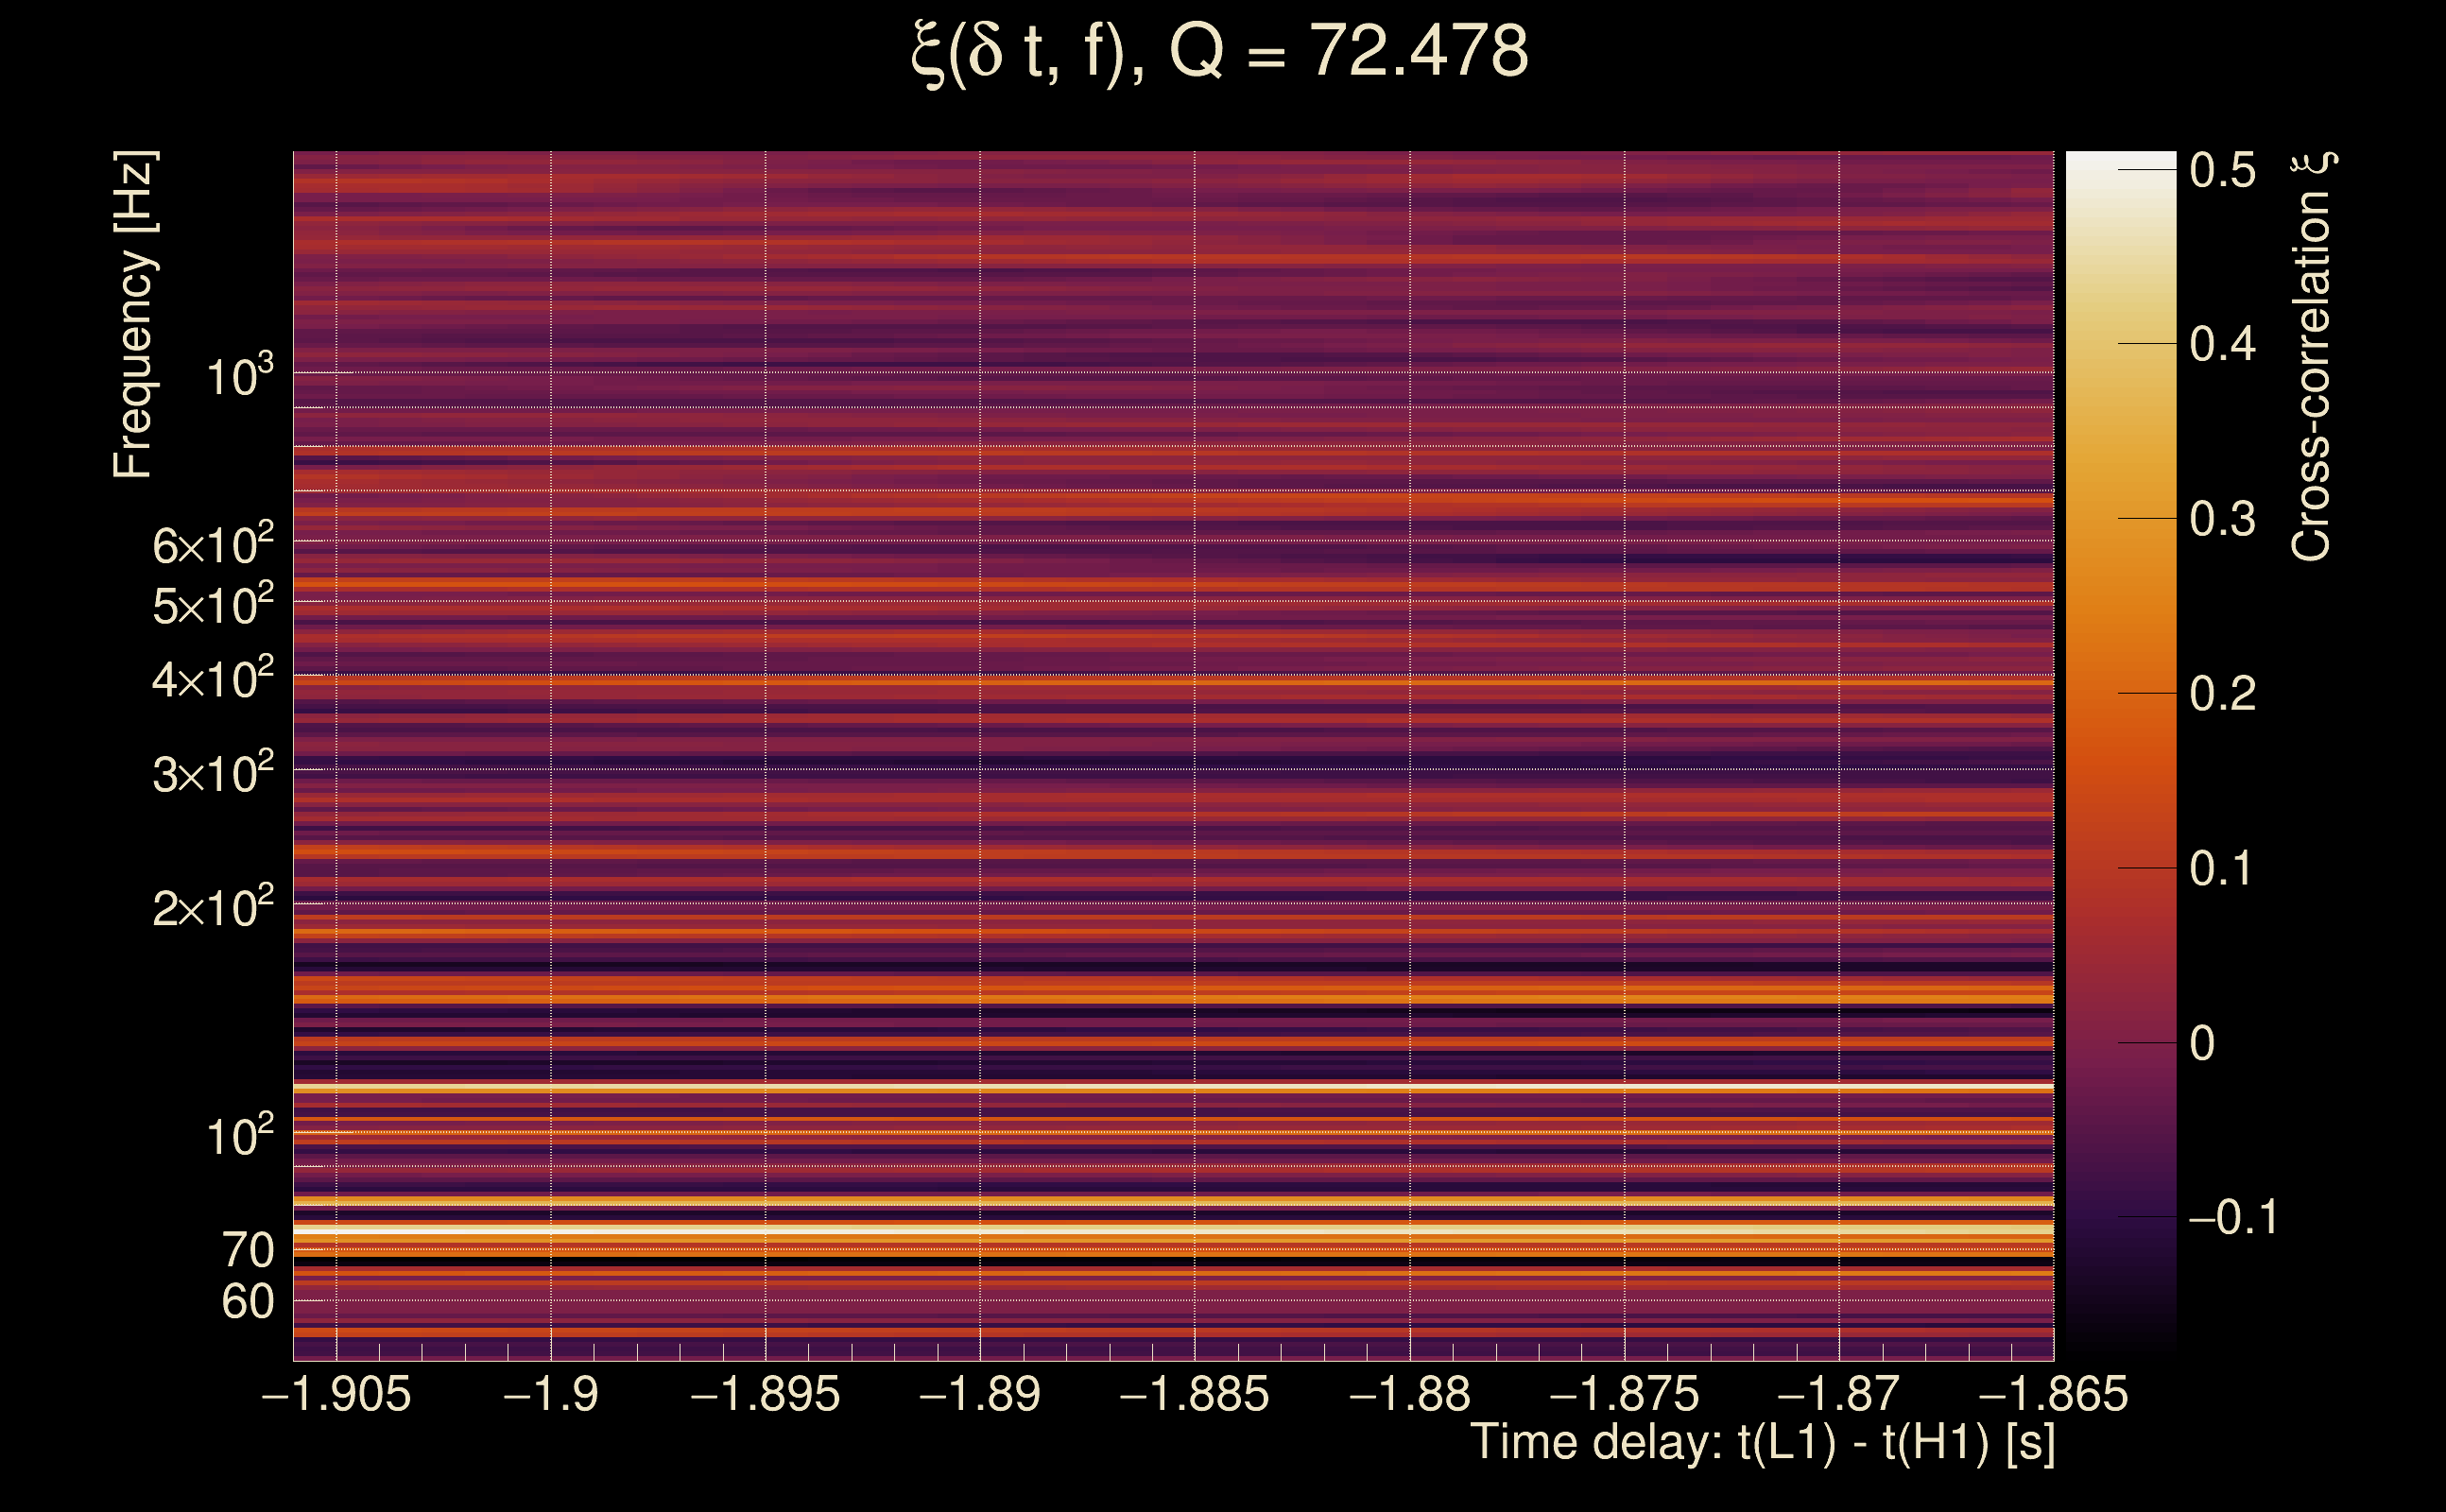
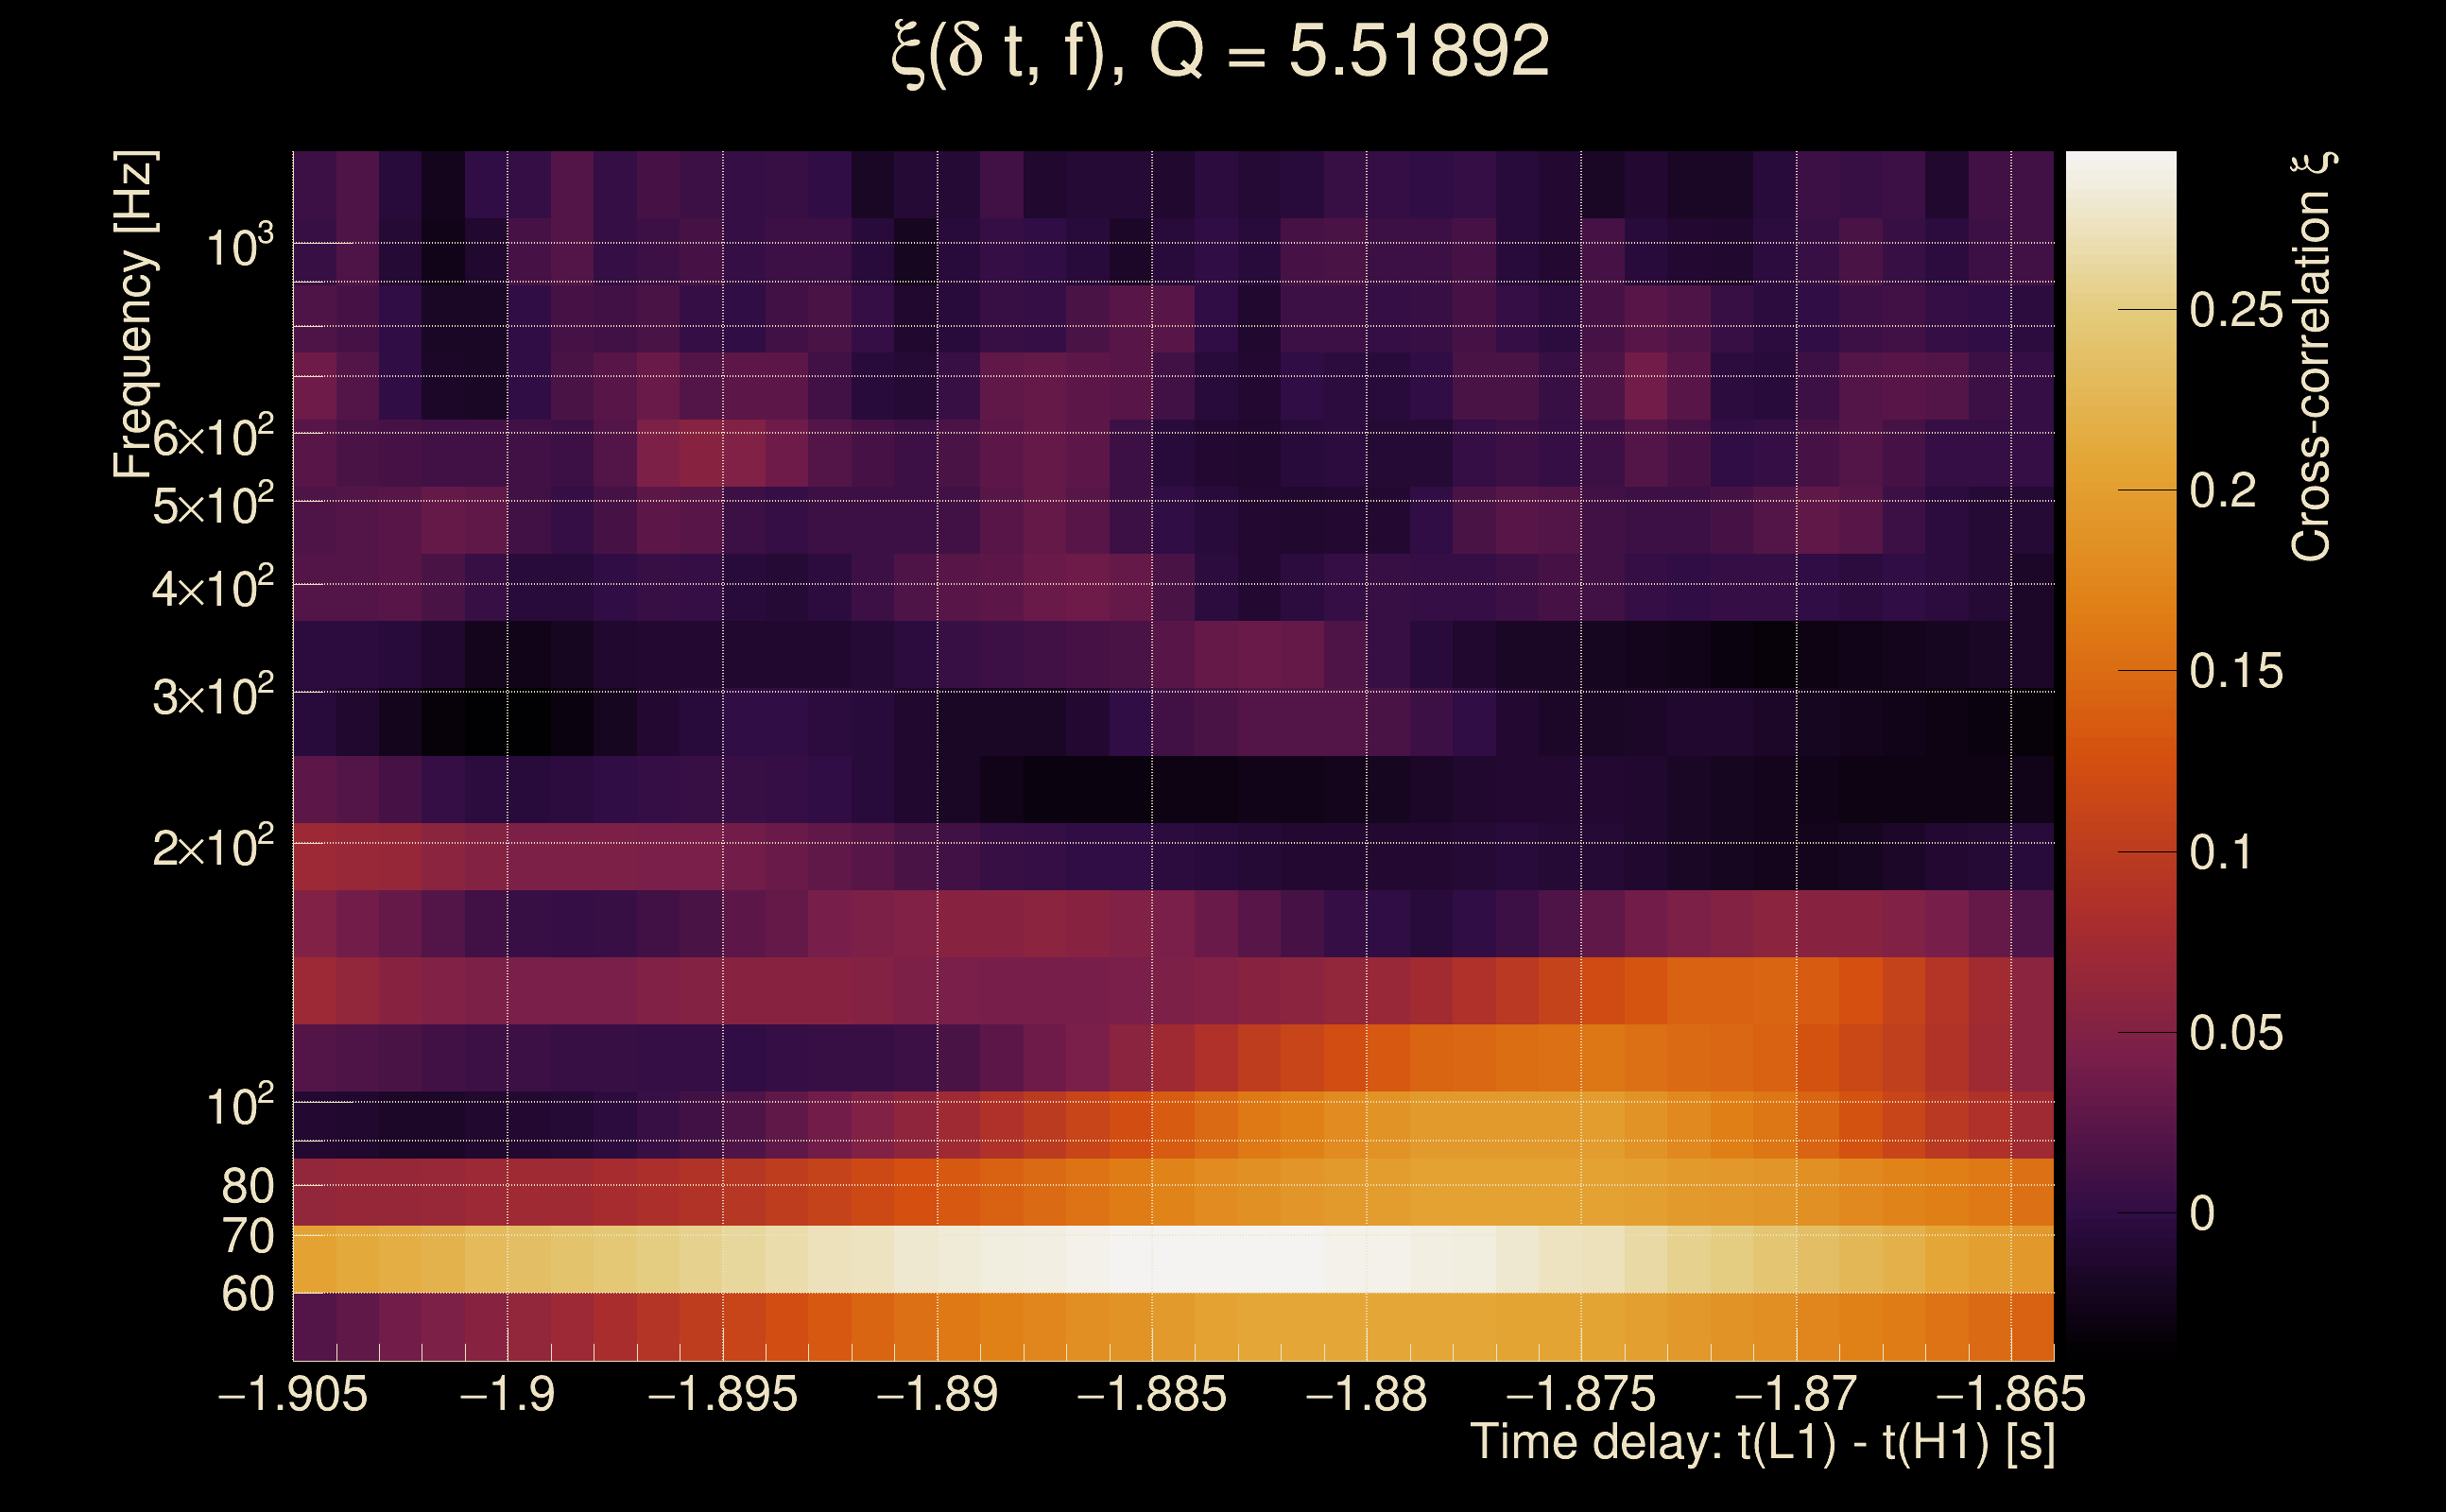
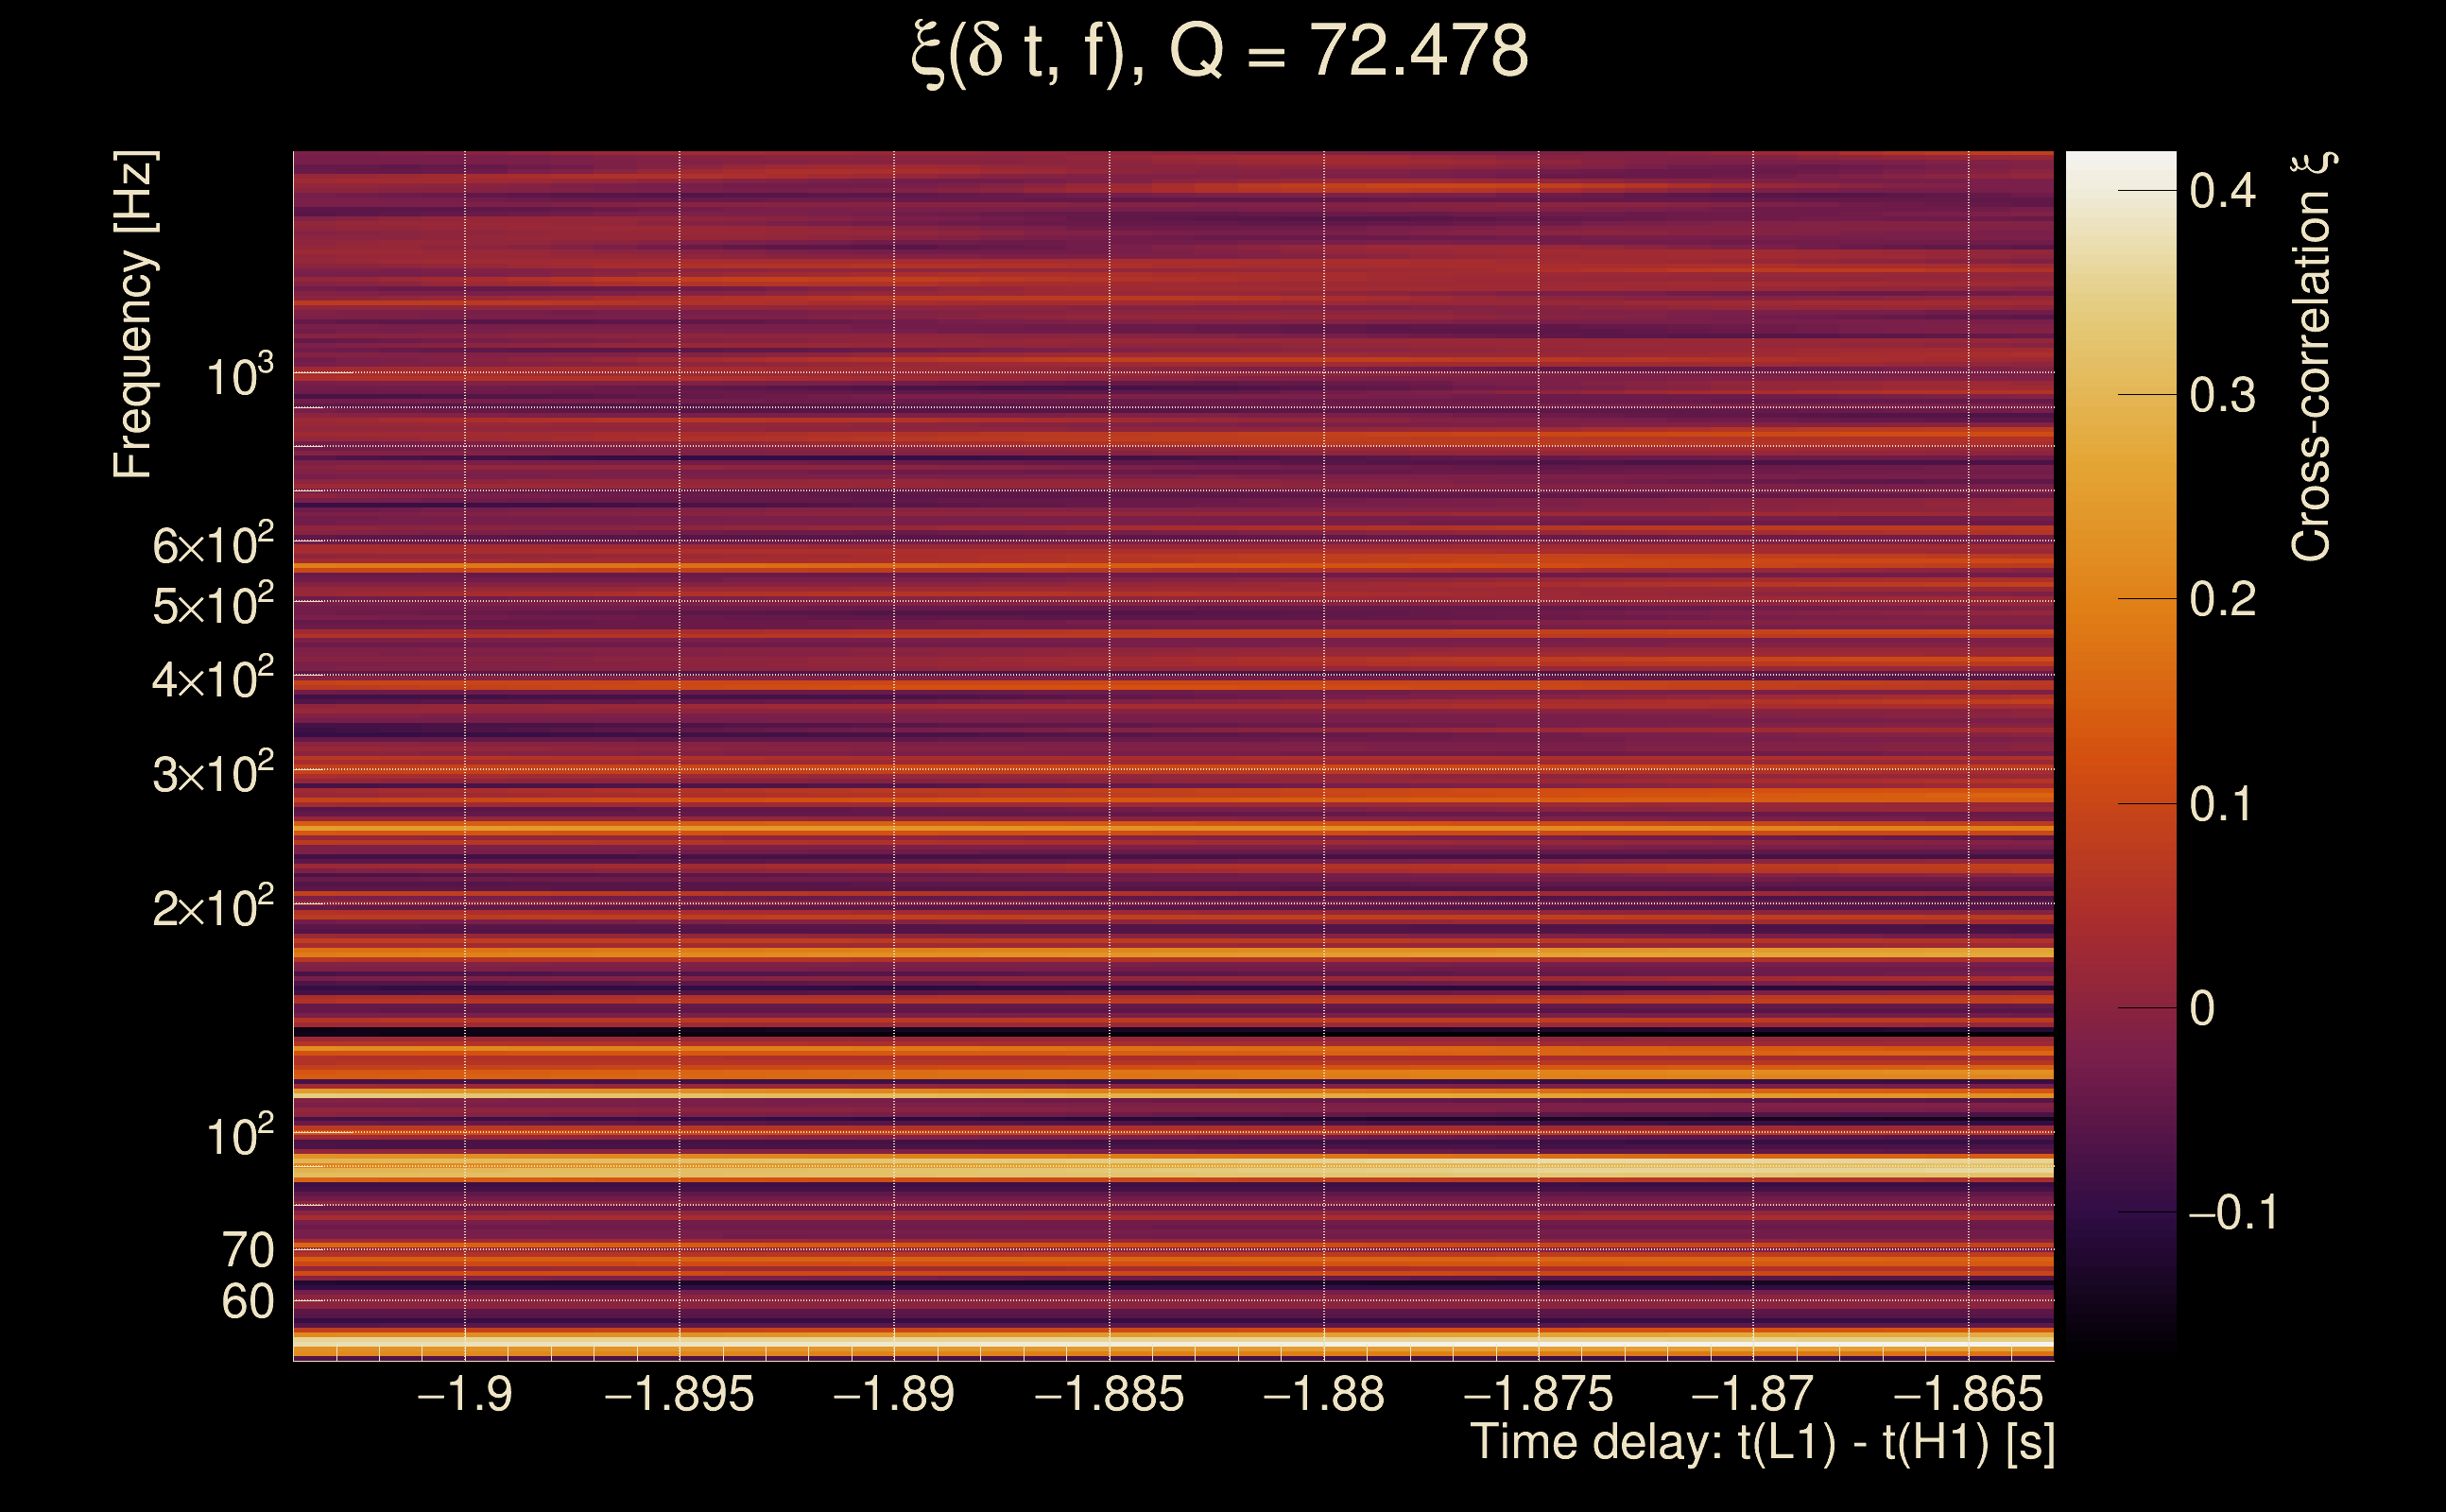
| Time delay between detectors t(L1) - t(H1): | -1.88565 s (slice index = 149 / 217), δt_gw = 0.000346513 s |
| Time delay uncertainty: | 0.00515383 s |
| [targeted mode] Time delay probability: | 0.861236 (0.174801 sigmas), δt_target = 0.000994682 s |
| Frequency: | 114.502 Hz |
| Ξ: | 0.06399 ± 0.0424162 (variance = 0.00179913): Q0: 0.160202, Q1: 0.161996, Q2: 0.215929, Q3: 0.178124, Q4: 0.272528 |
| Rank: | R_A = 0.0551105 |
| Log of amplitude ratio (L1/H1): | 0.331932, variance = 0.42374 (L1/H1: -1.15647, variance = 0.744897, H1/L1: -1.21339, variance = 0.812995) |
| Amplitude ratio (L1/H1): | 1.39366 ⋇ 1.91737 (L1/H1: 0.314594 ⋇ 2.37044, H1/L1: 0.297189 ⋇ 2.46369) |
| Amplitude ratio H1|L1 compatibility (probability): | 0.0576055 |
| Antenna factor probability: | 1 |
| Number of rejected frequency rows: | Q0: 9 / 18, Q1: 23 / 36, Q2: 54 / 70, Q3: 120 / 134, Q4: 245 / 258 |
| Maximum signal-to-noise ratio: | H1: 7.5868, L1: 9.85868 |
| SNR variance: | H1: 0.534642, L1: 0.506942 |
| Click here for a zoomed plot | Click here for a zoomed plot | Click here for a zoomed plot | Click here for a zoomed plot | Click here for a zoomed plot |
 |
 |
 |
 |
 |
 |
 |
 |
 |
 |
 |
 |
 |
 |
 |
 |
 |
 |
 |
 |
 |
 |
 |
 |
 |
 |
 |
 |
 |
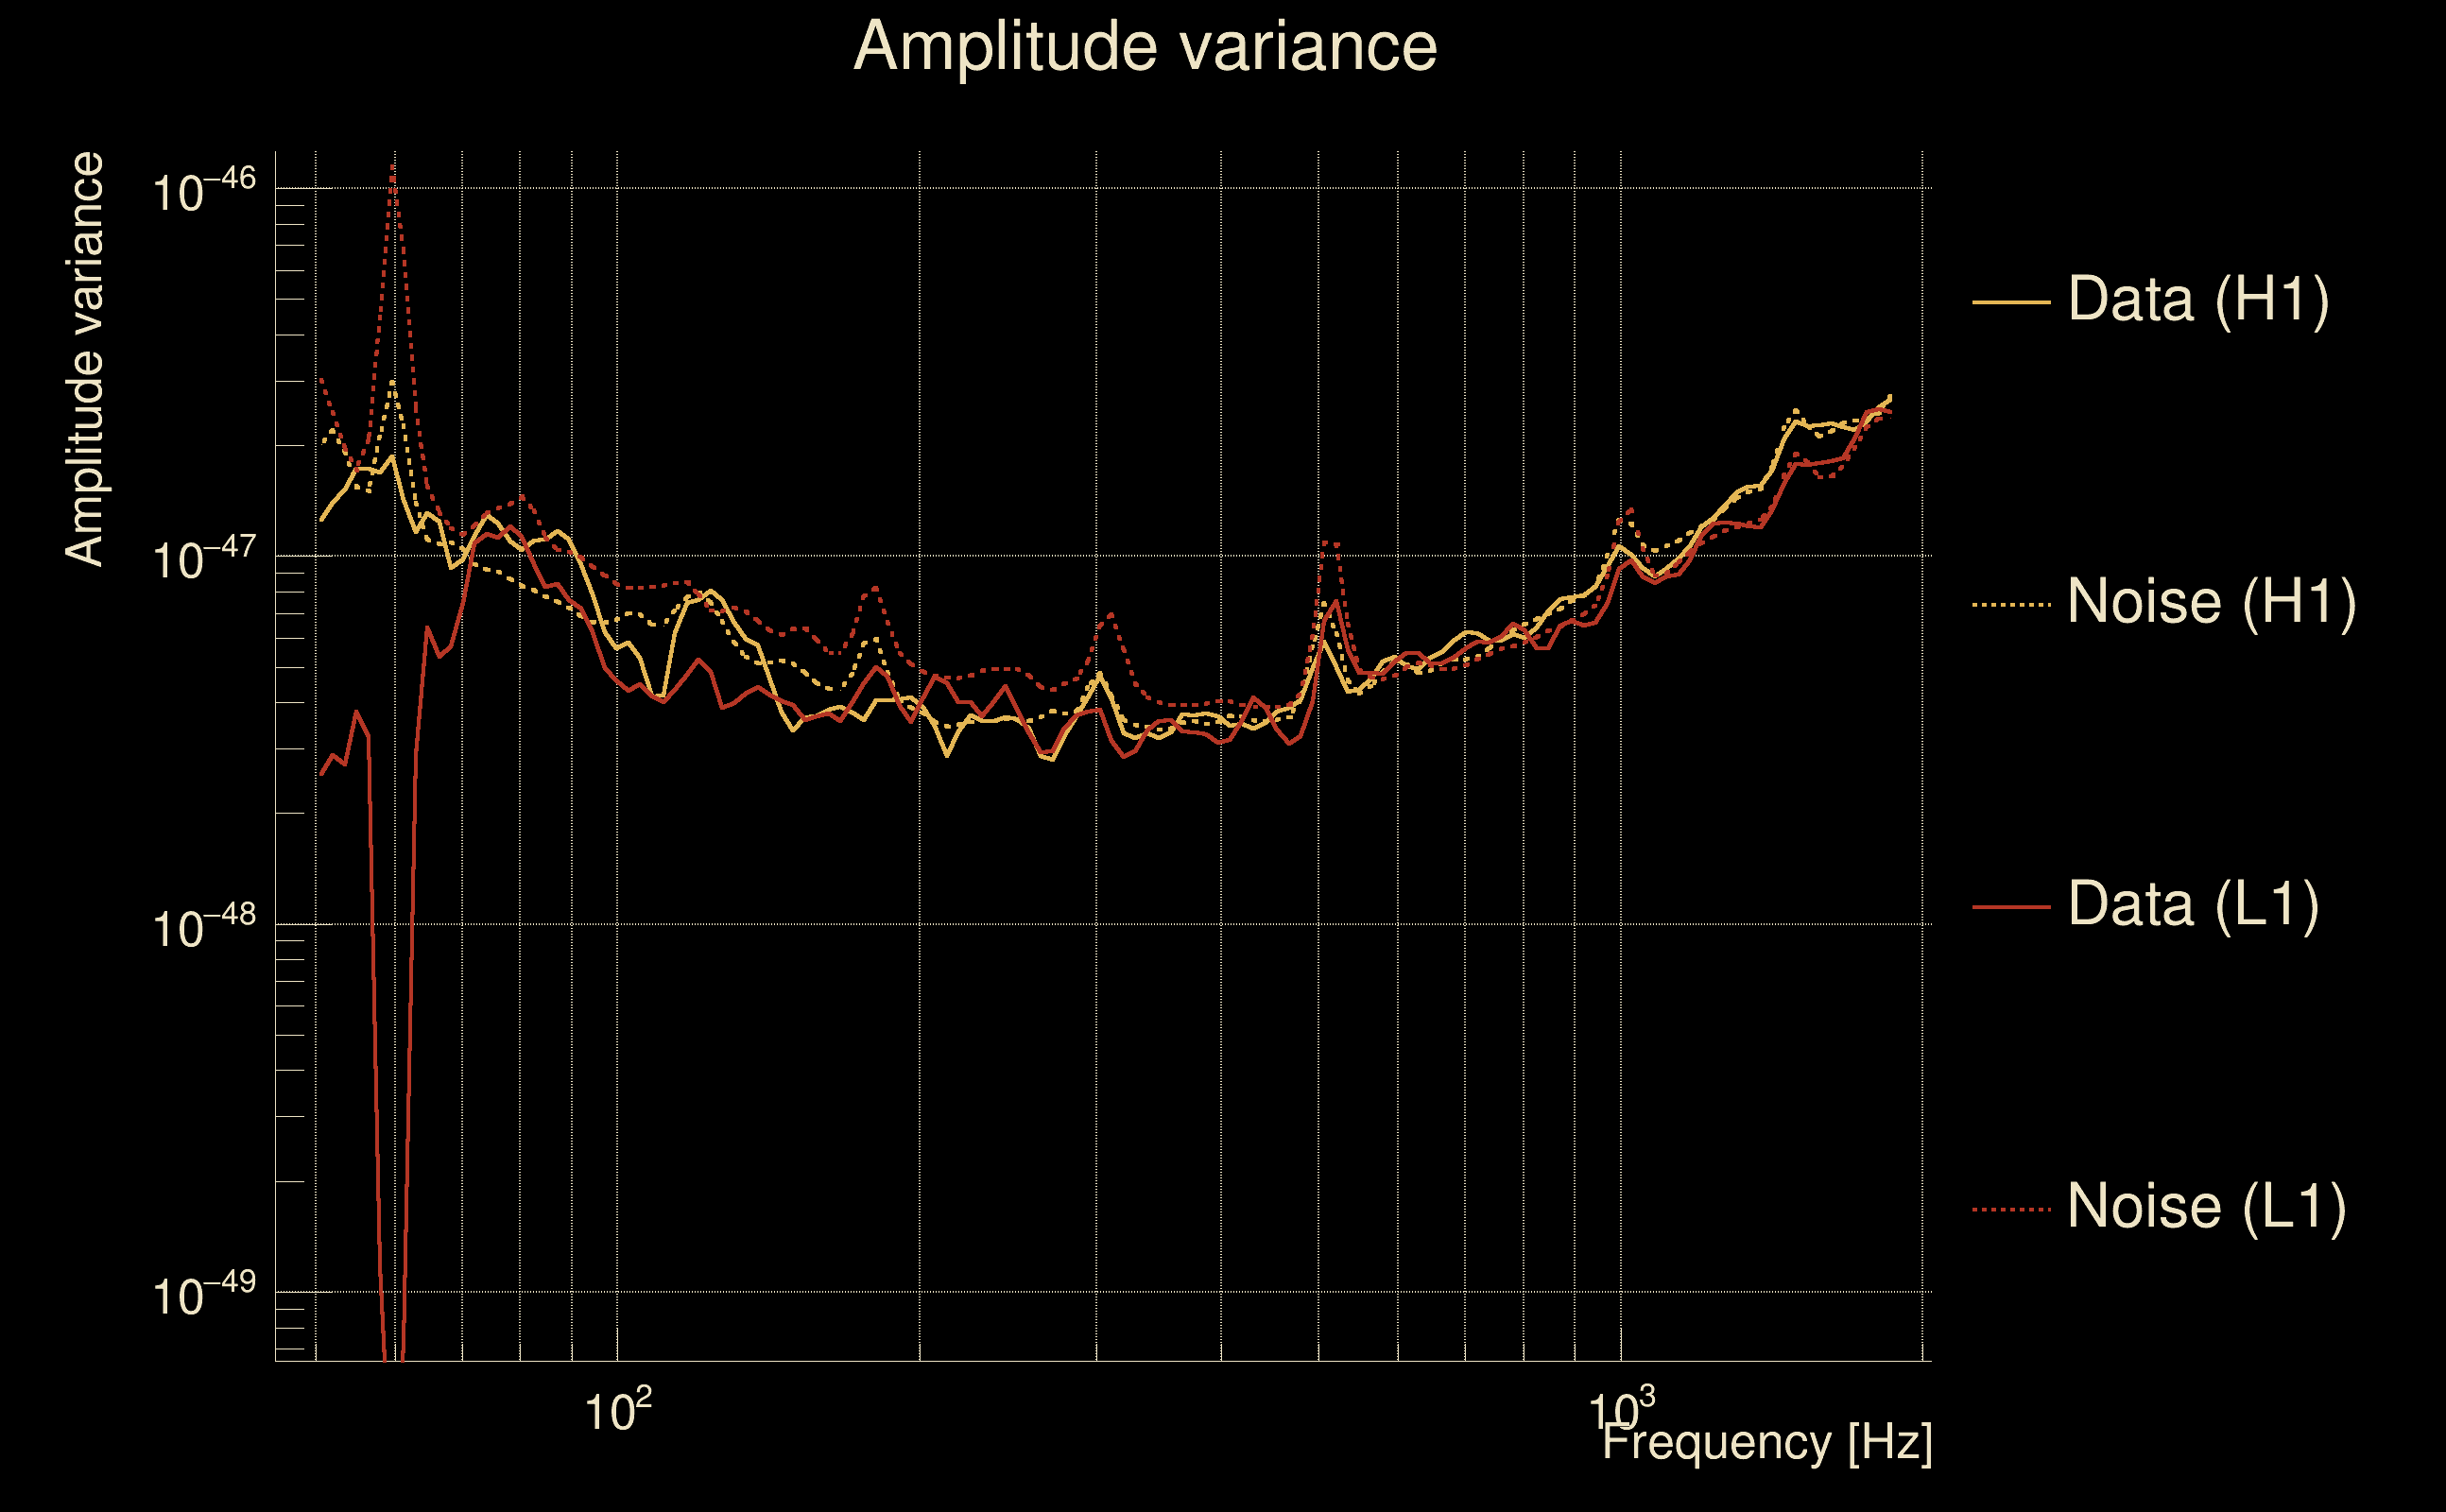
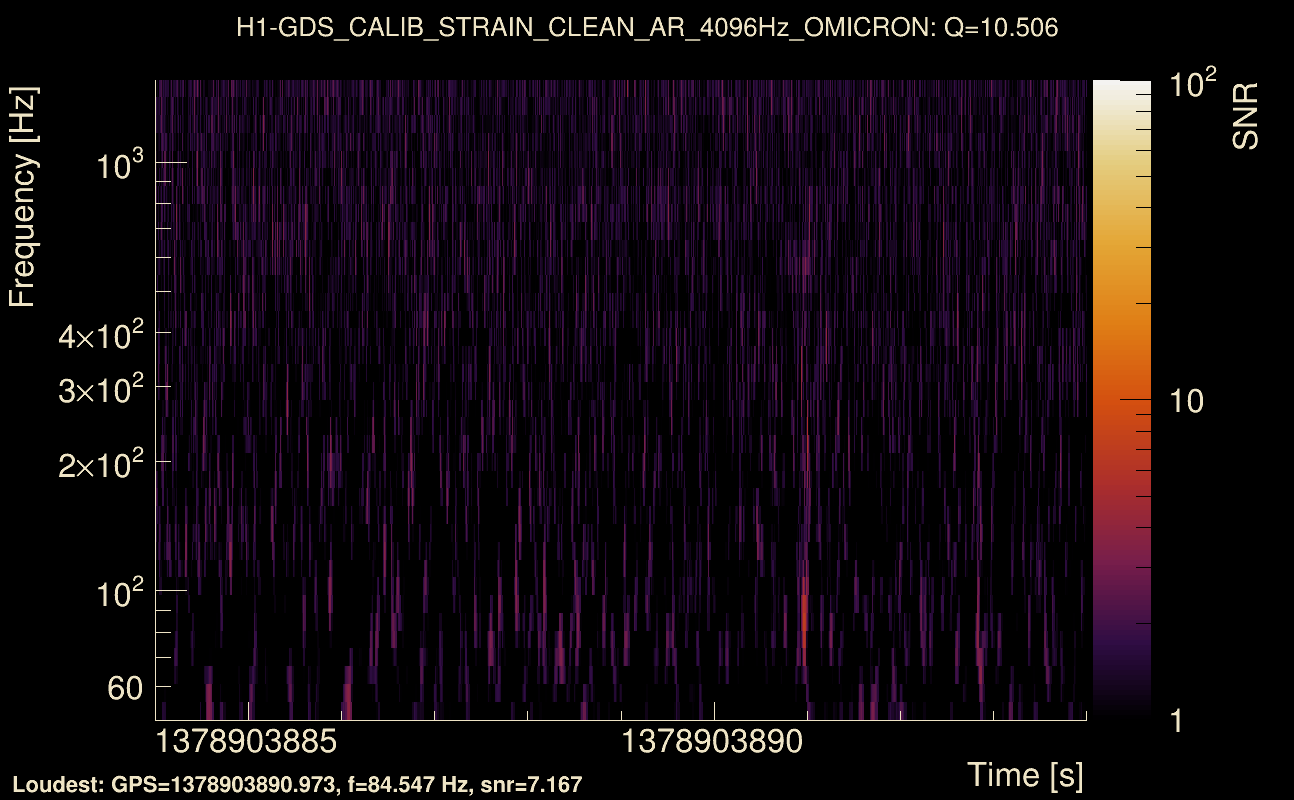
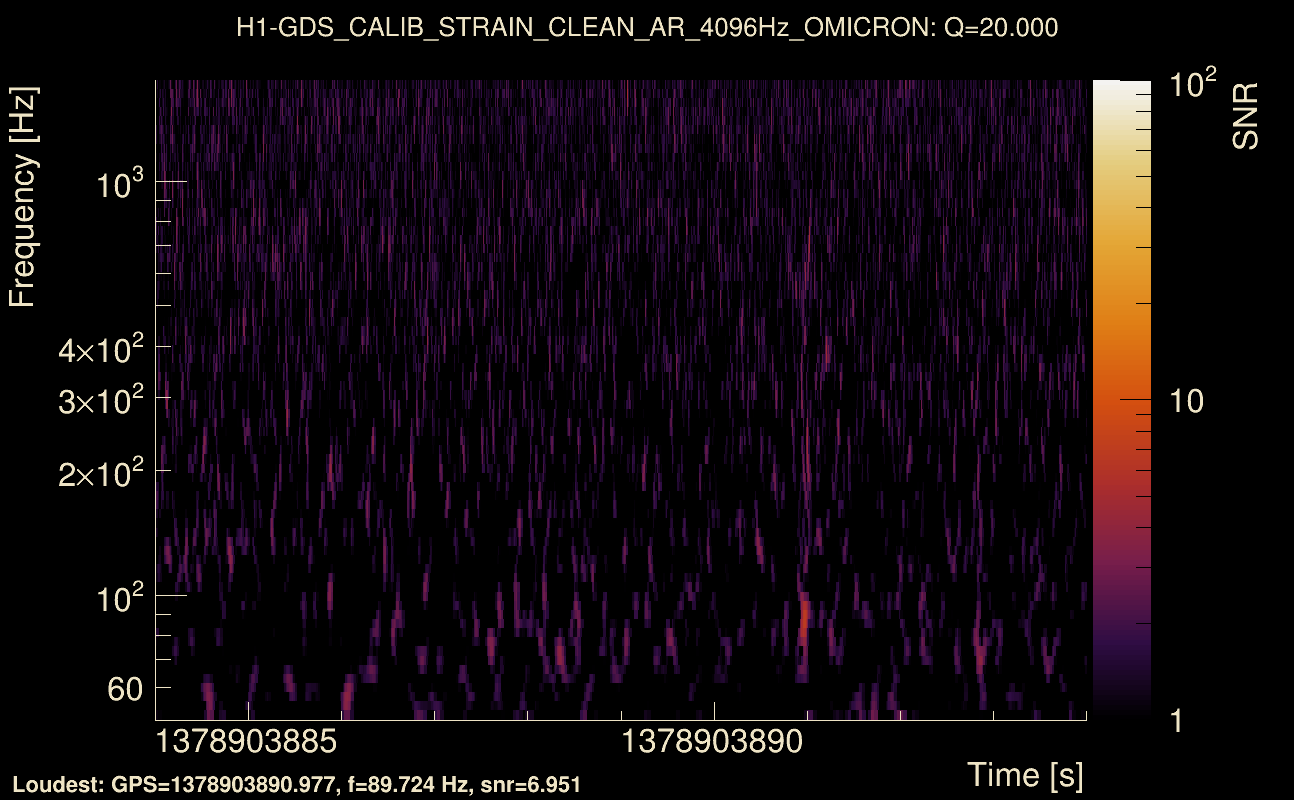
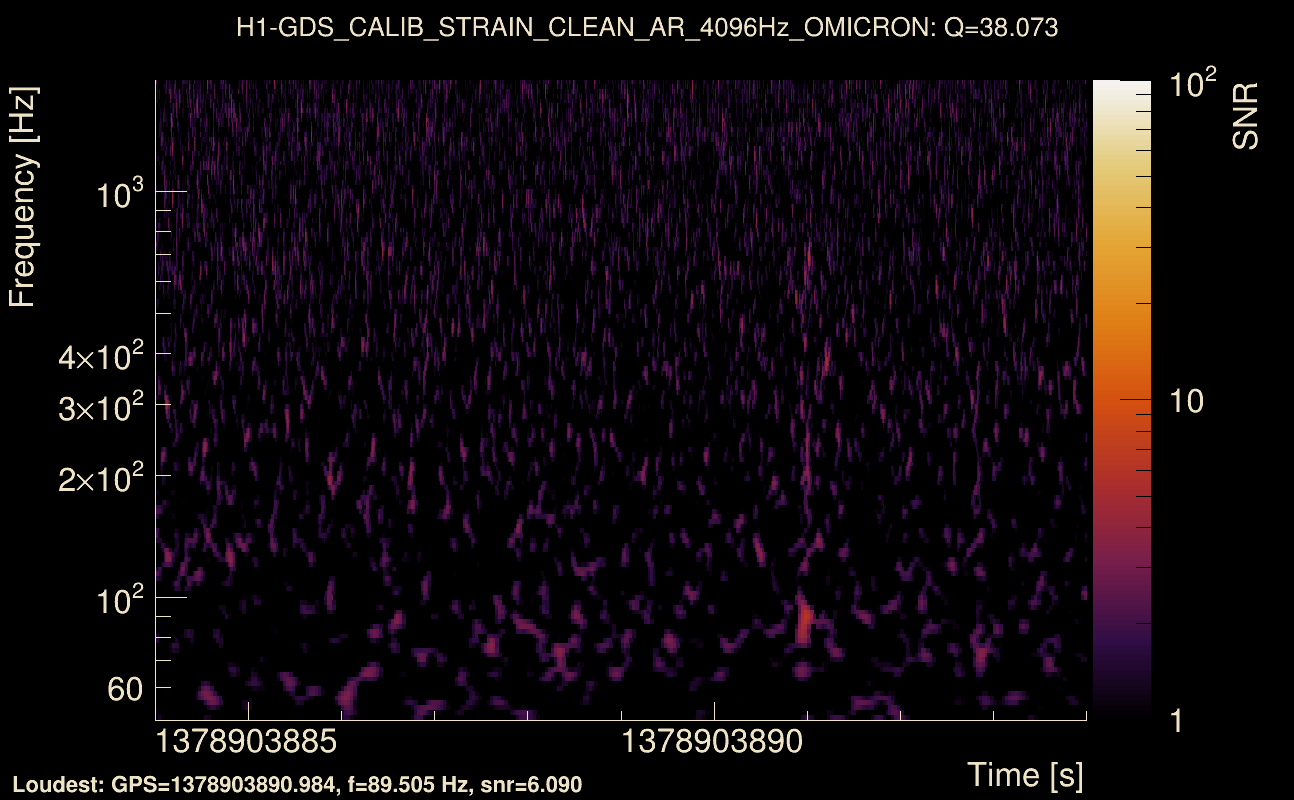
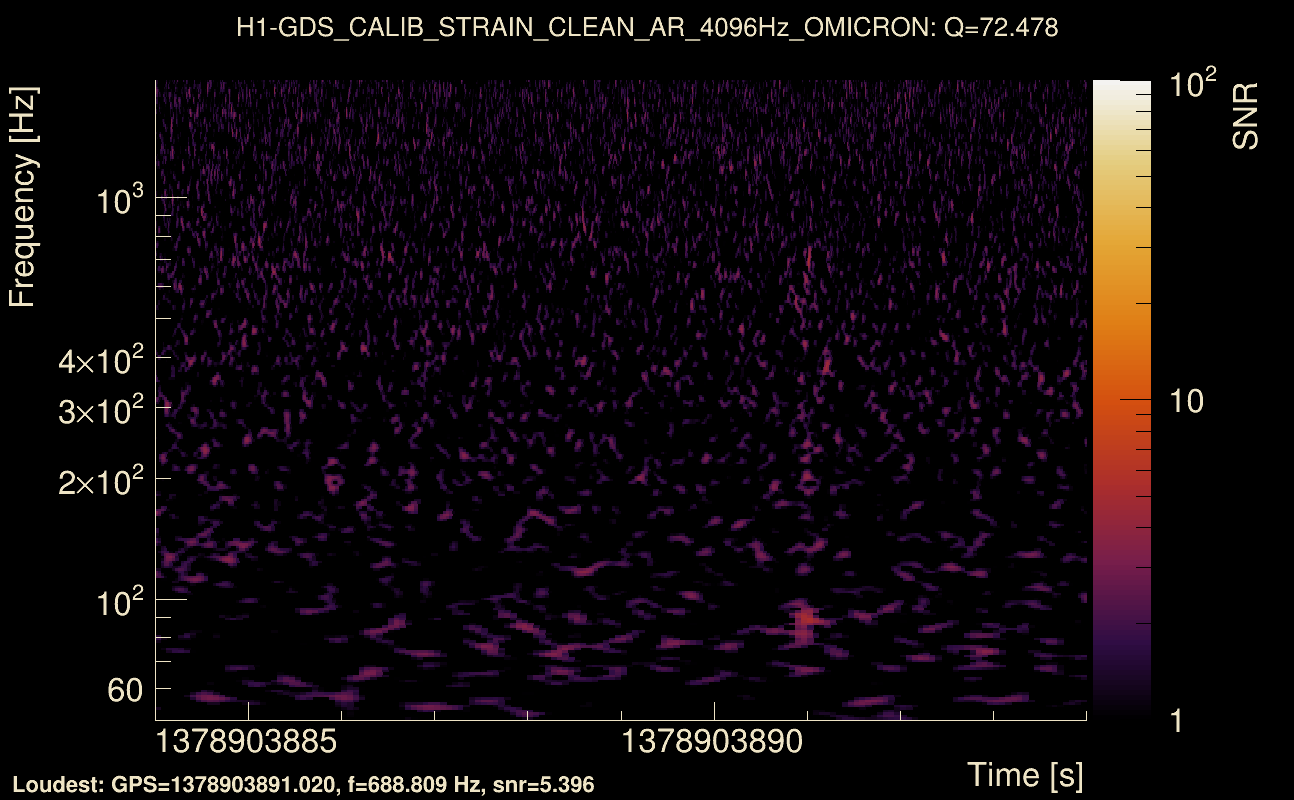
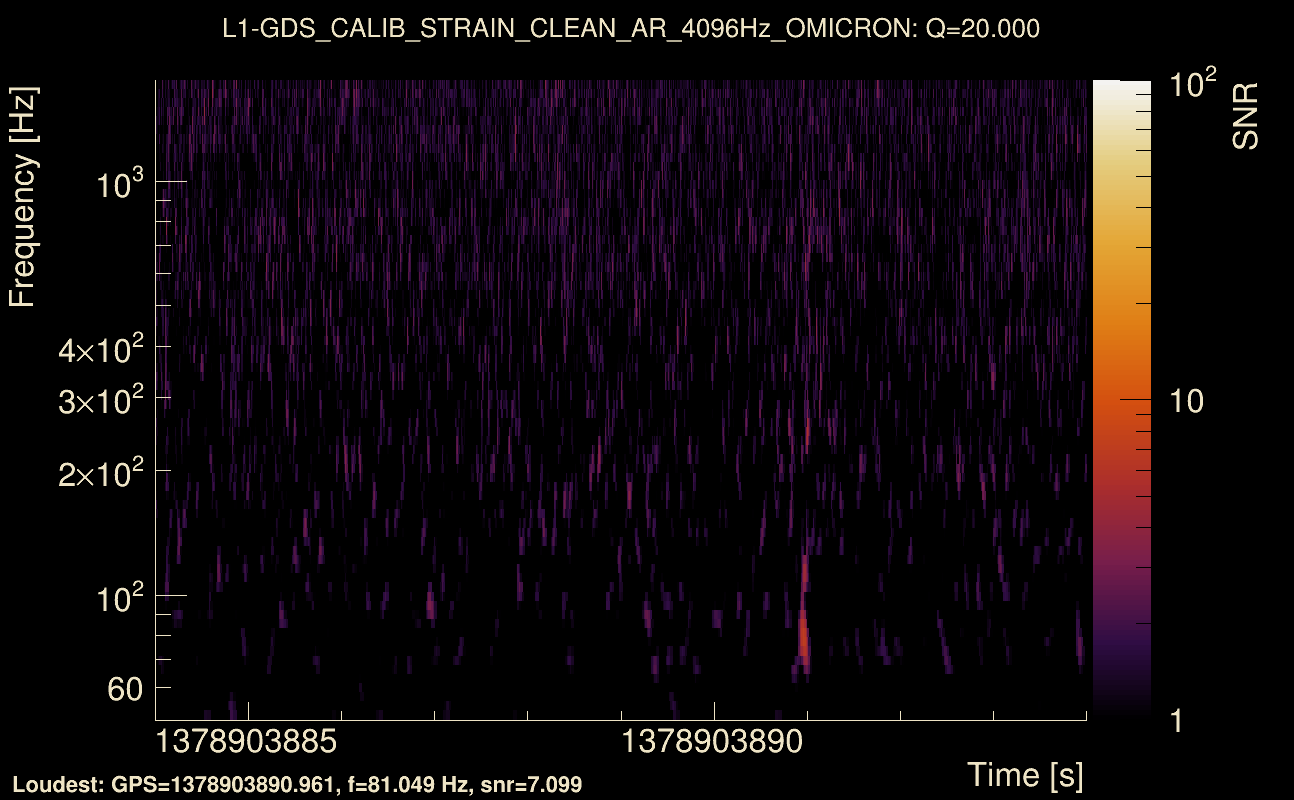
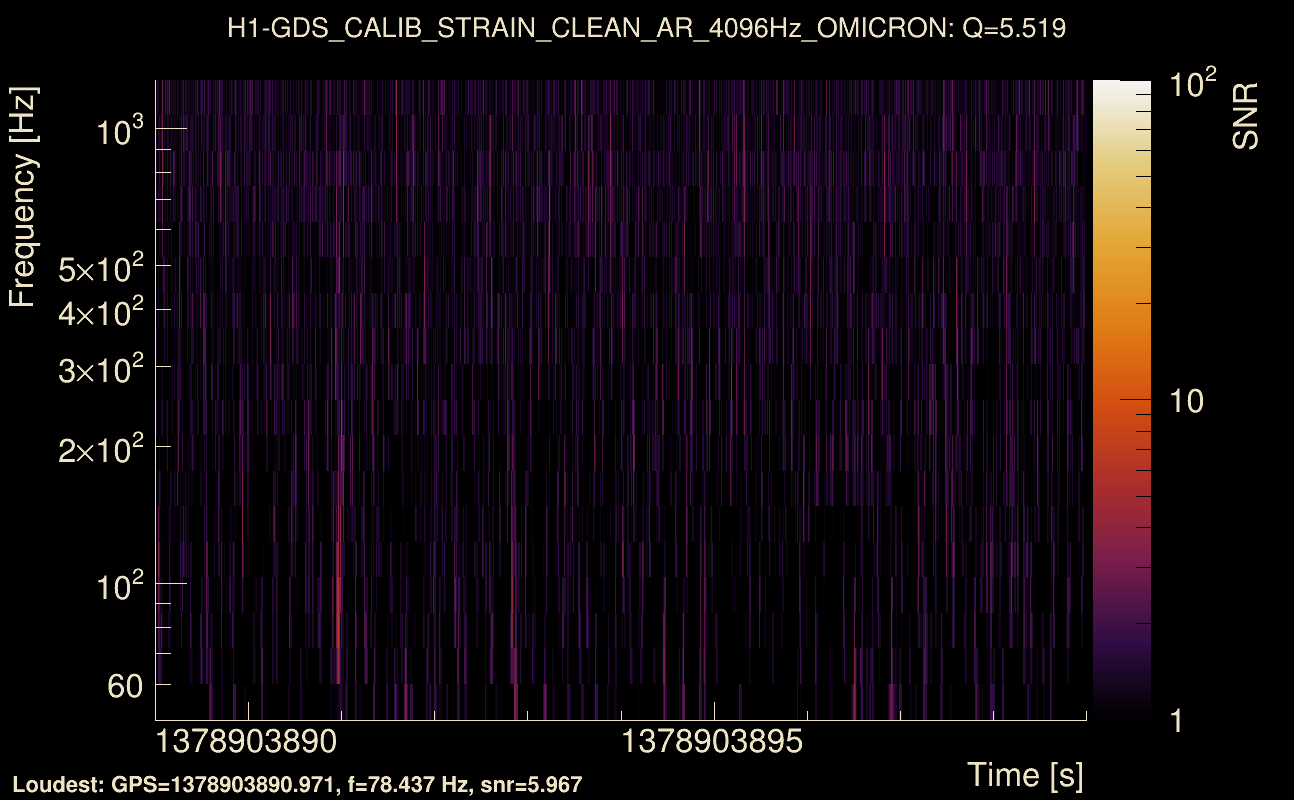
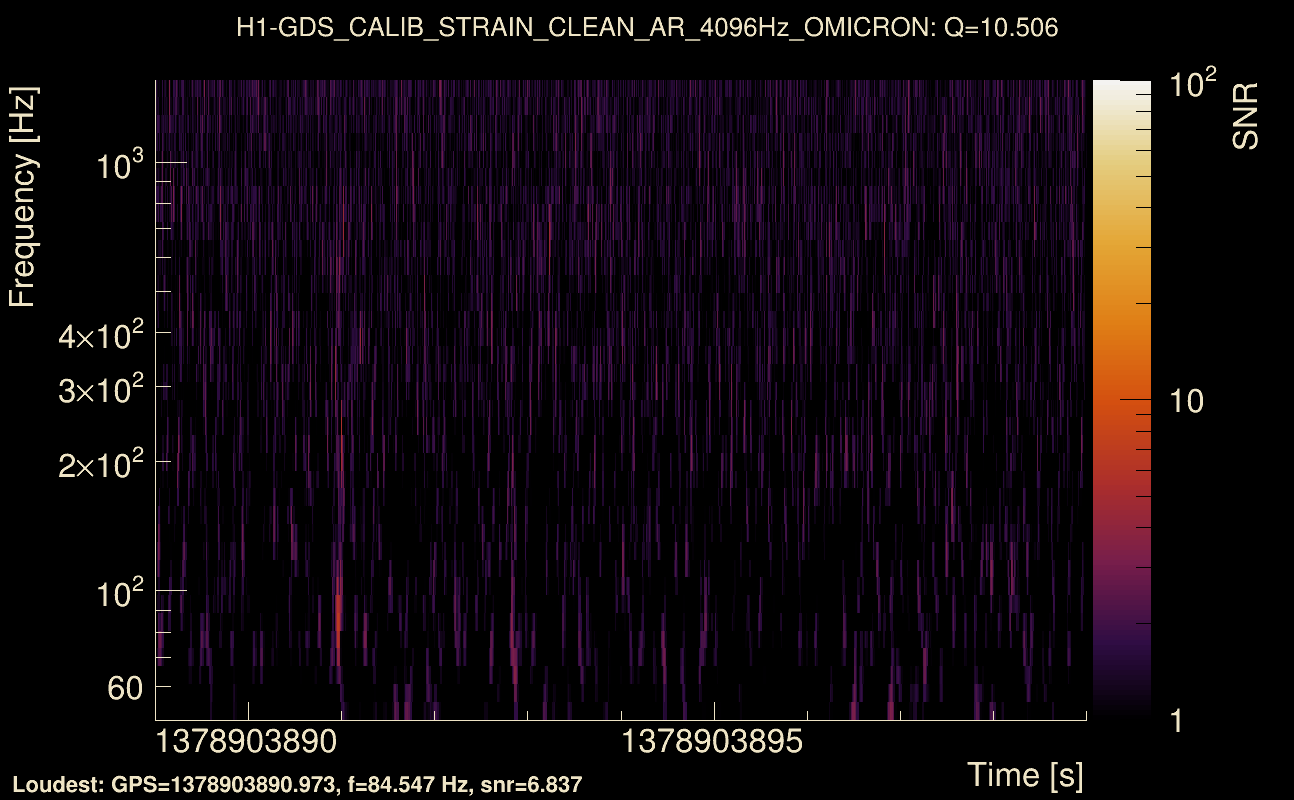
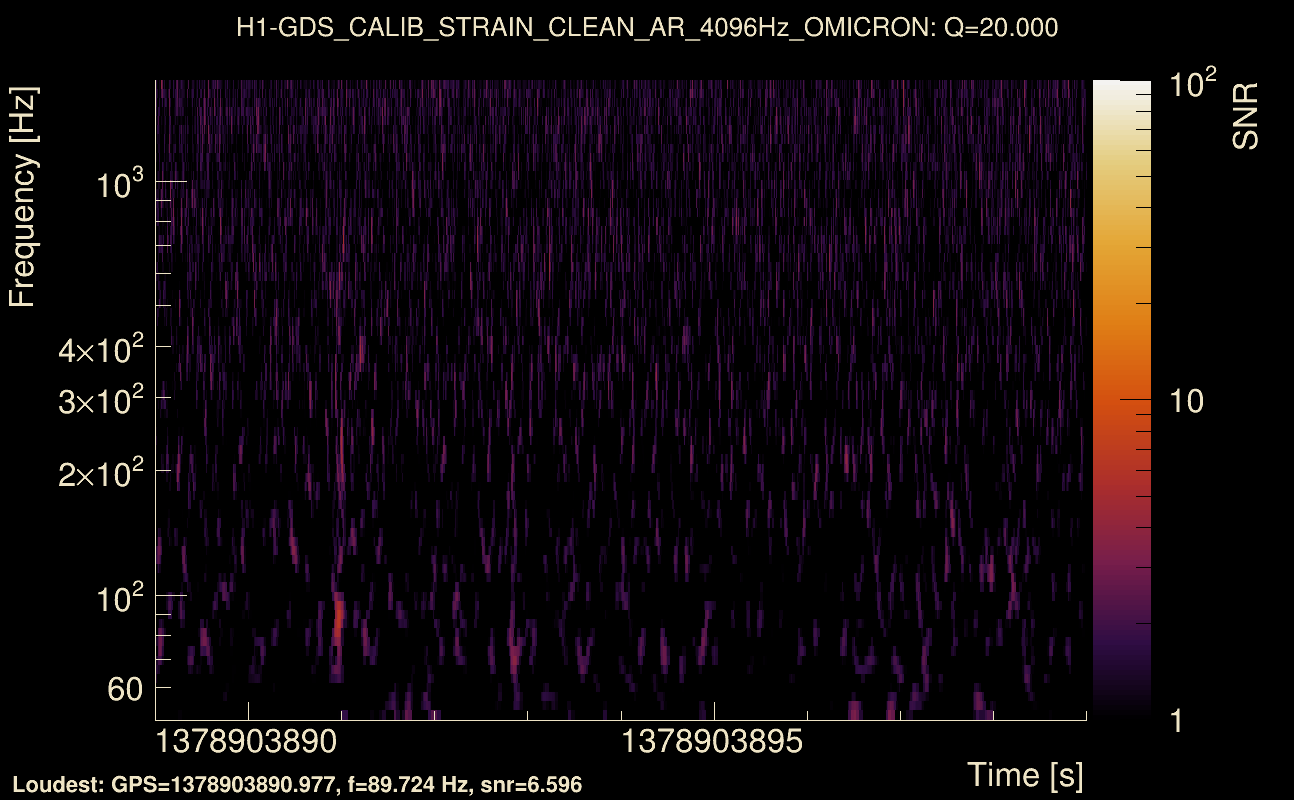
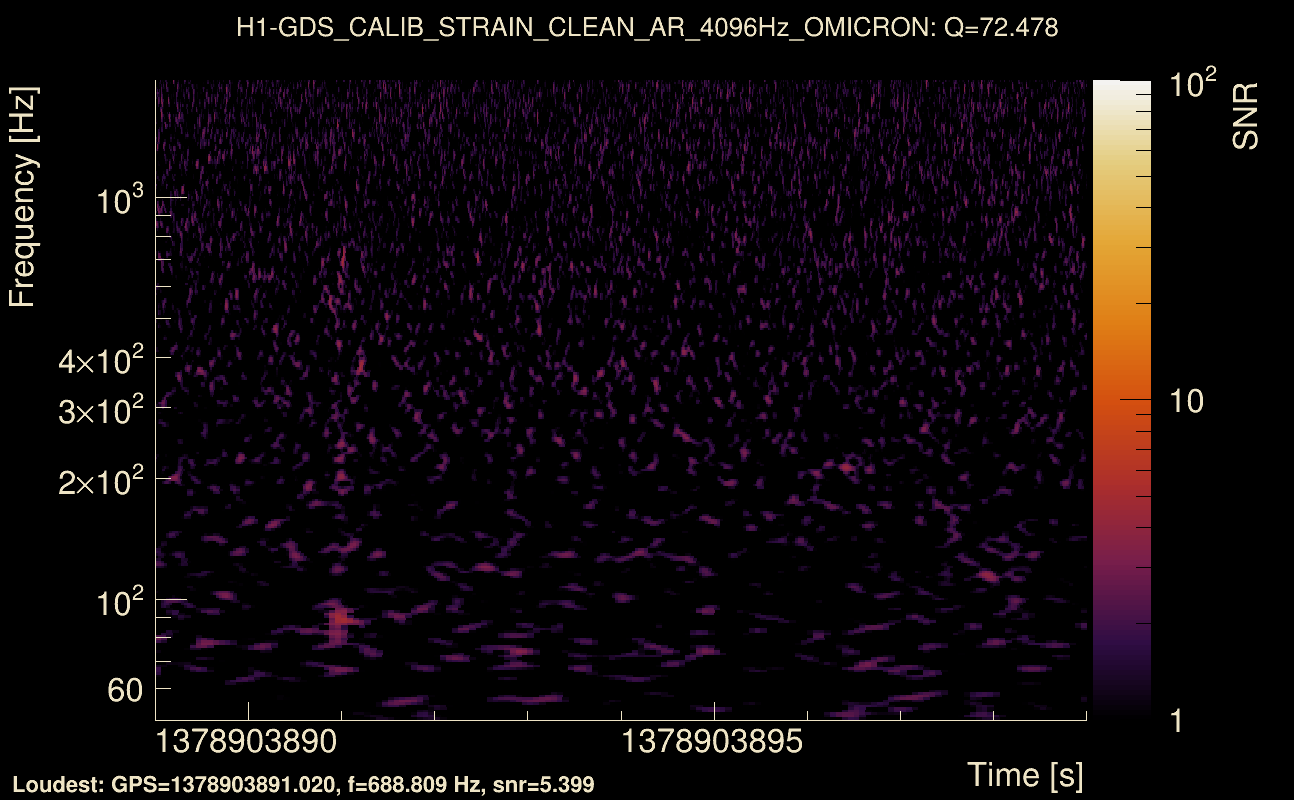
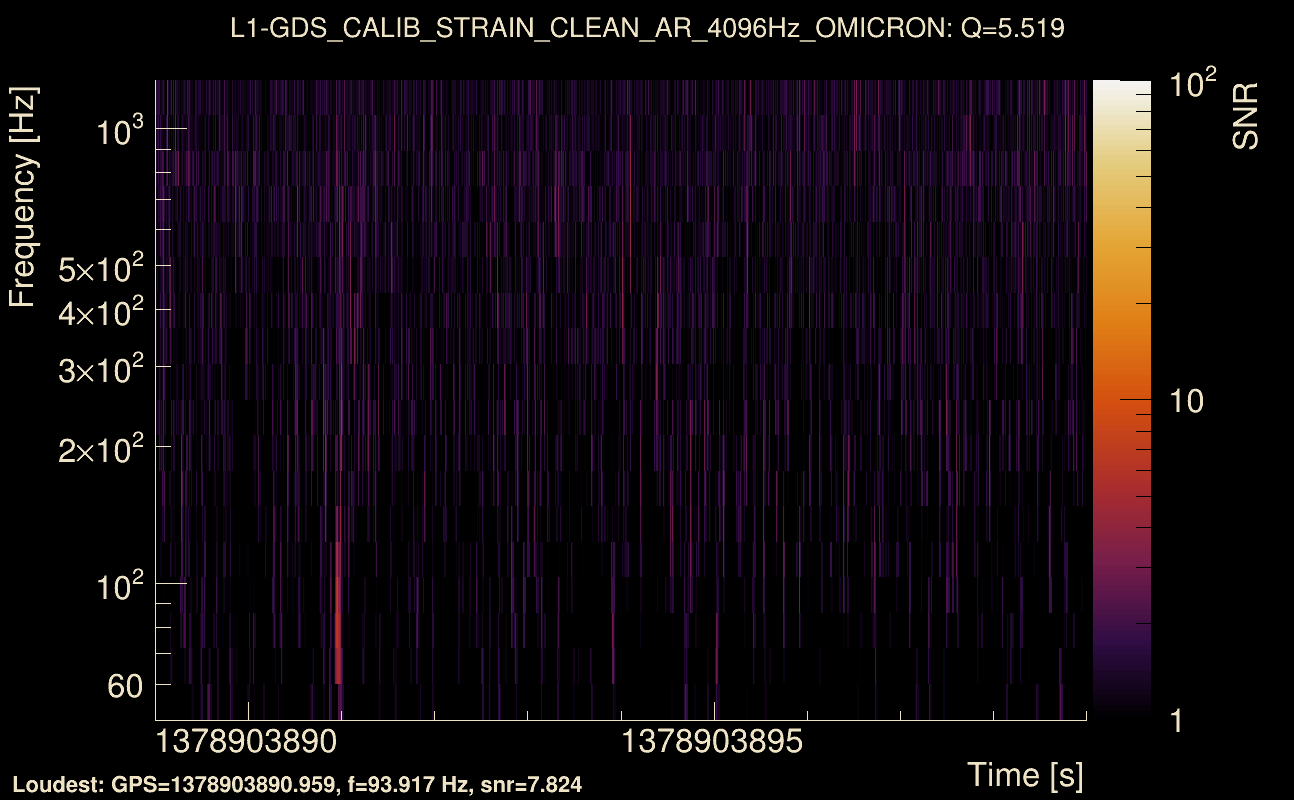
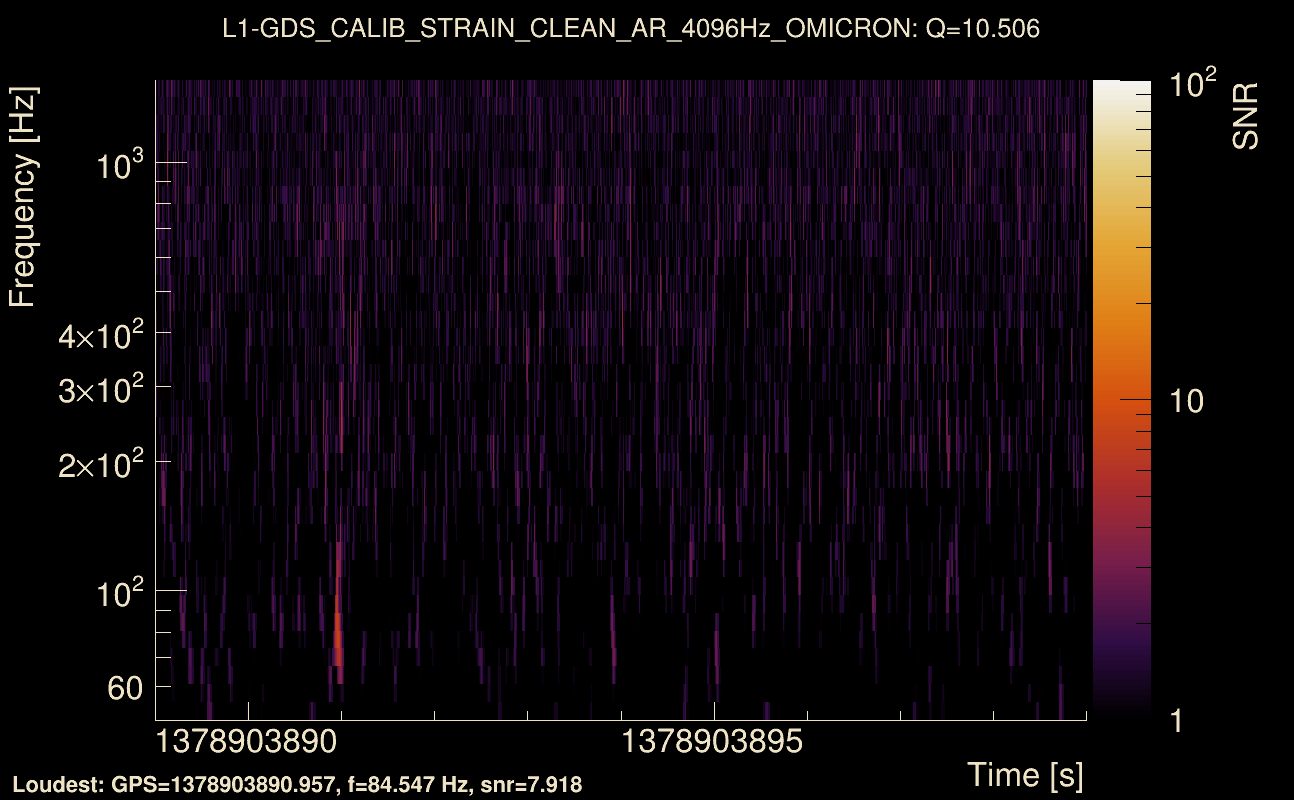
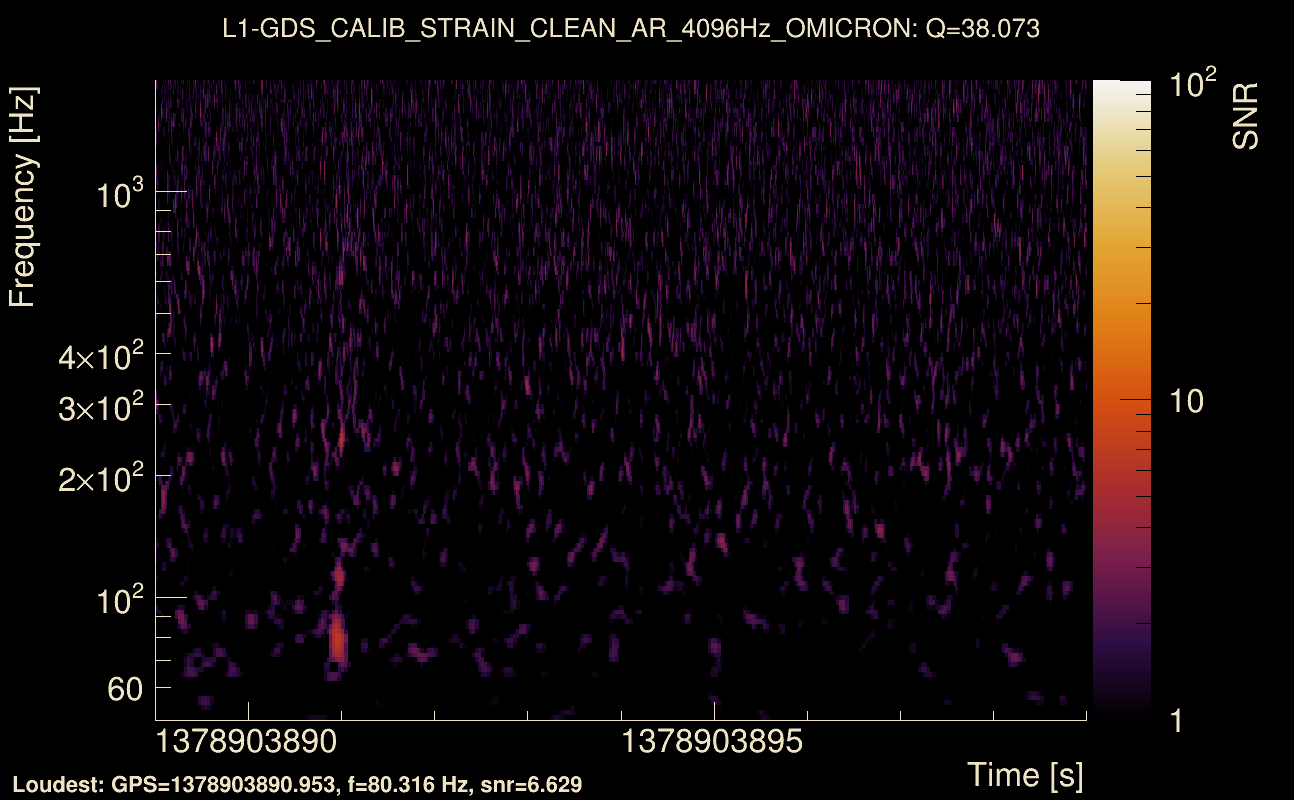
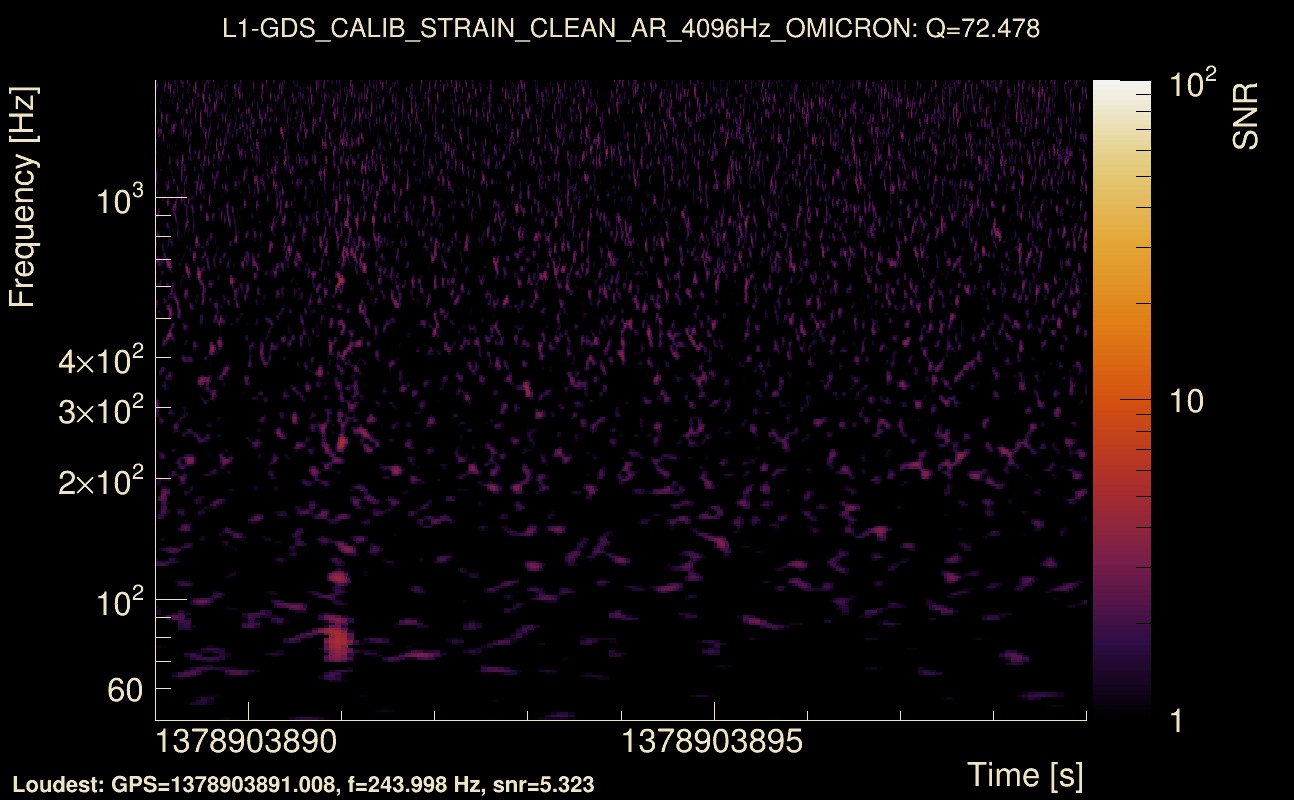
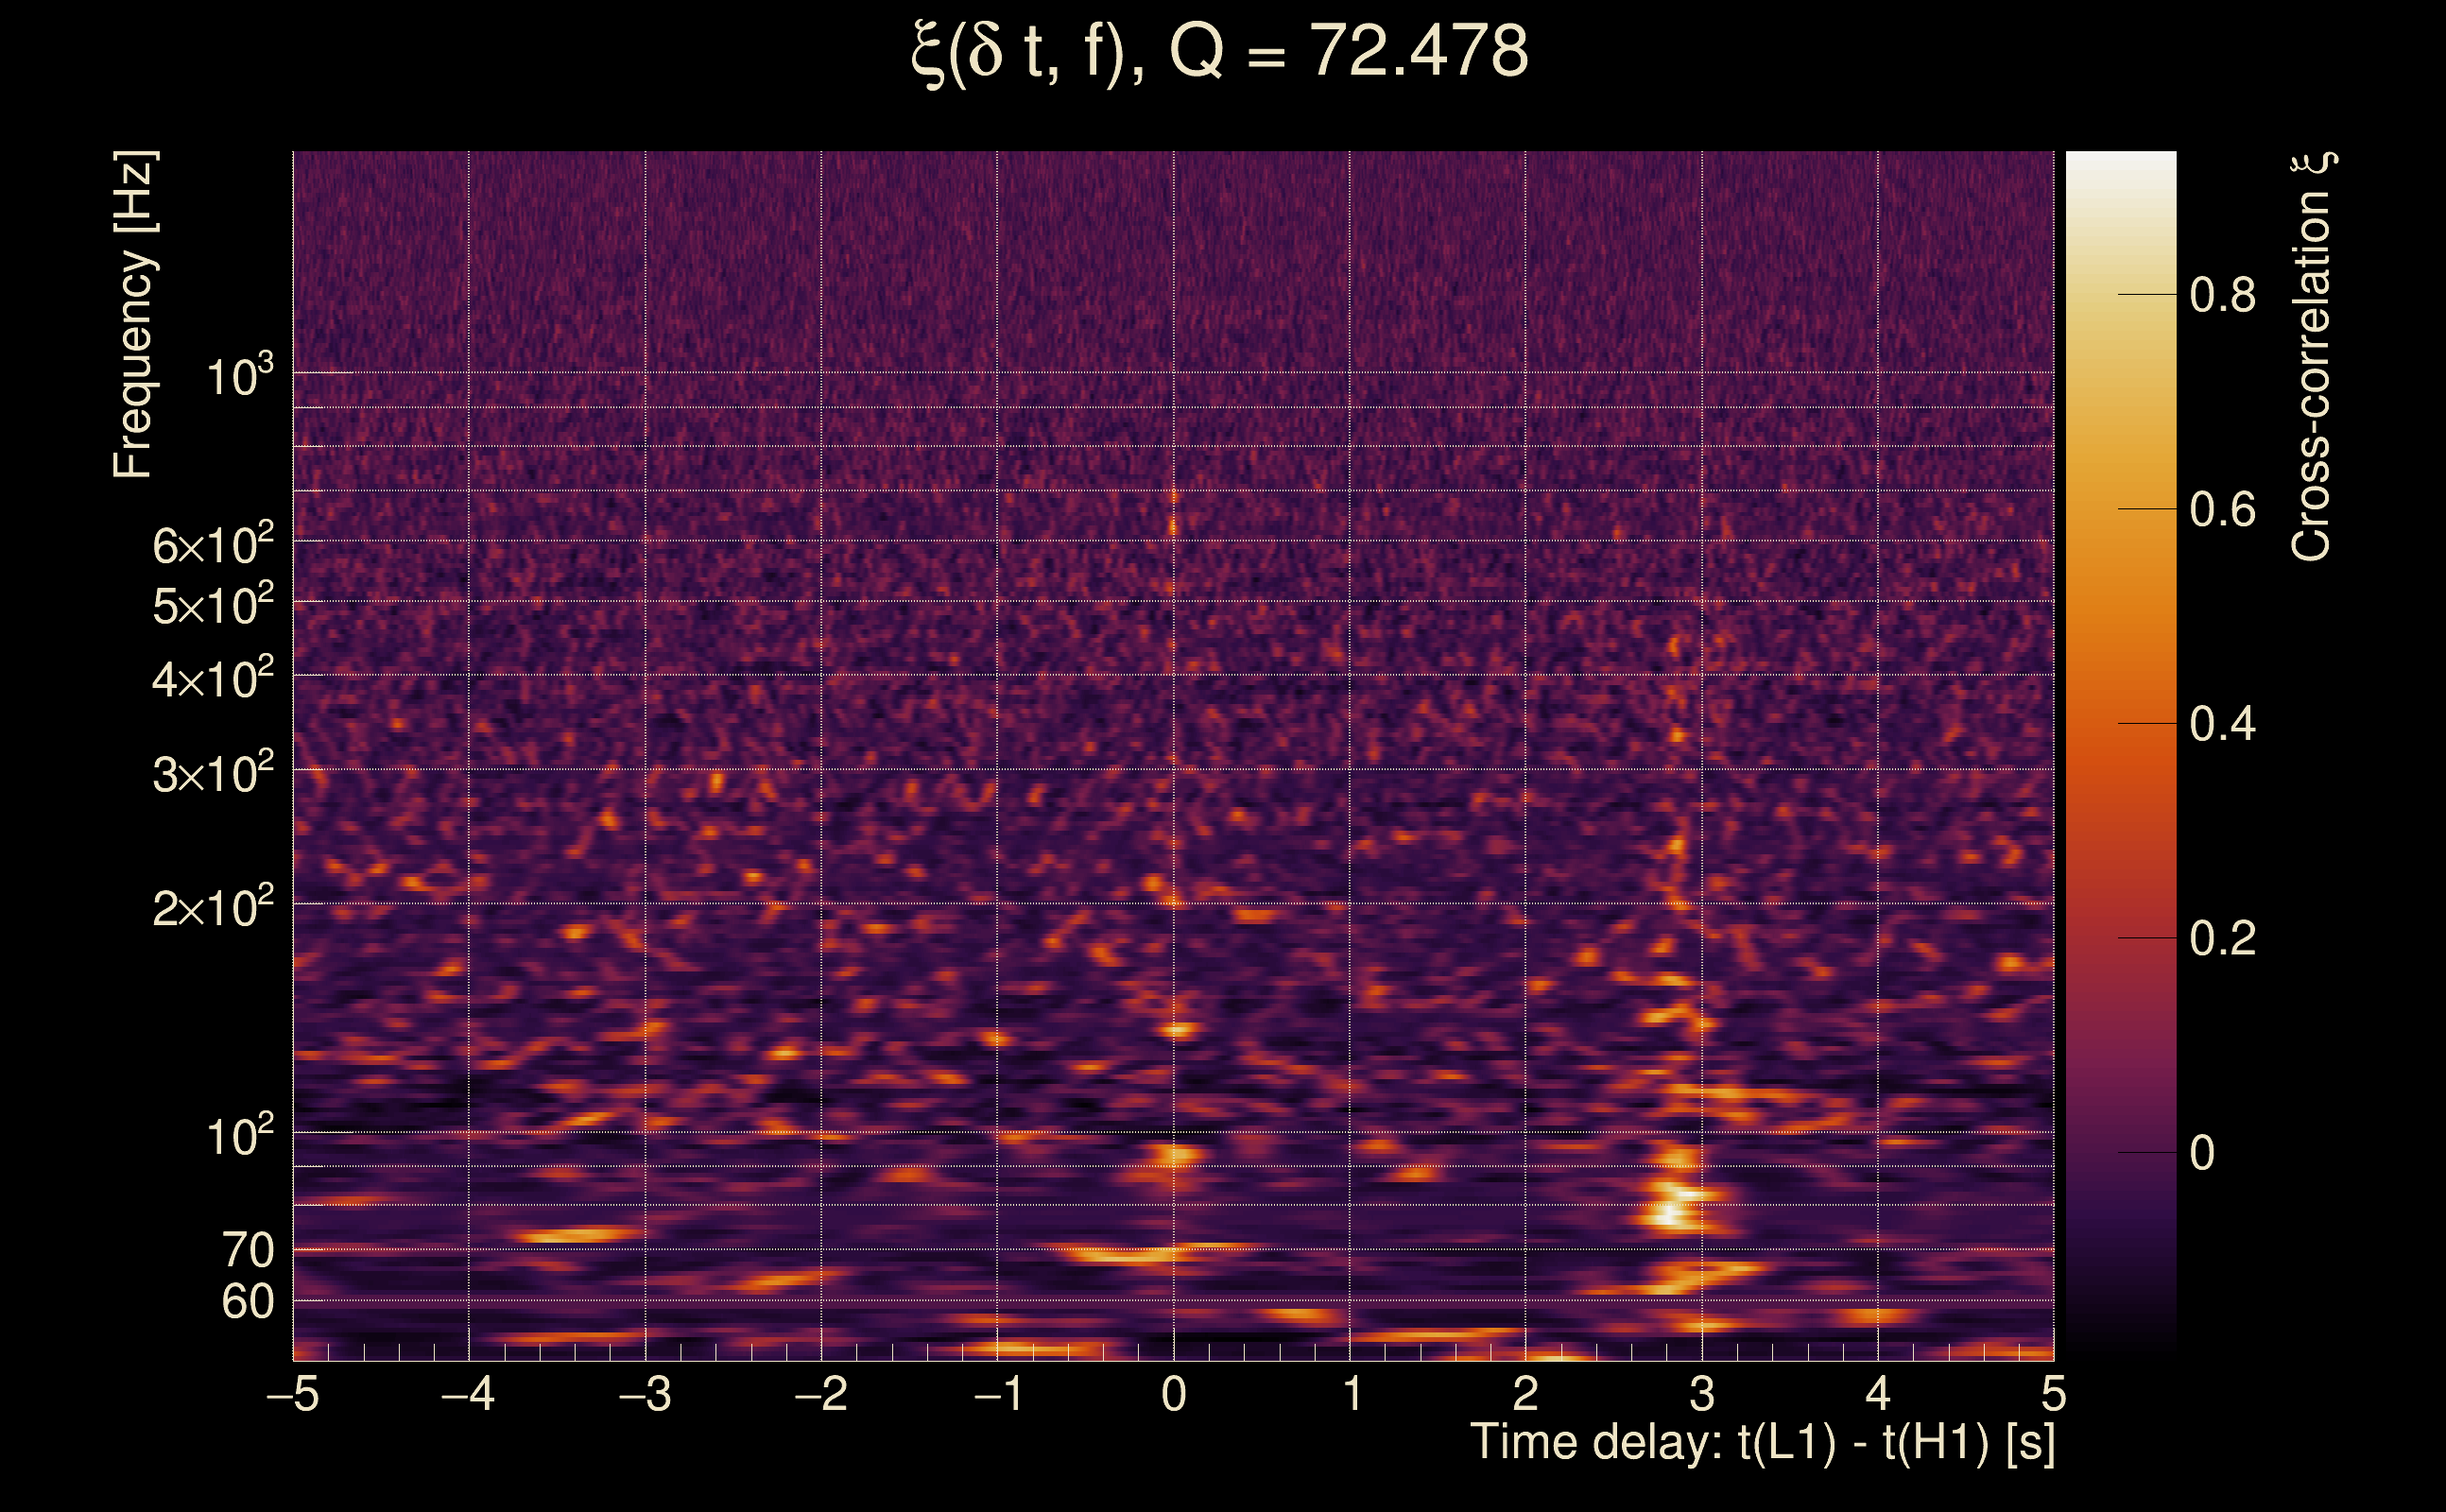
| Event time t(H1): | GPS = 1378903889 (Sat Sep 16 12:51:11 2023 ) → GPS = 1378903899 (Sat Sep 16 12:51:21 2023 ) |
| Event time t(L1): | GPS = 1378903889 (Sat Sep 16 12:51:21 2023 ) → GPS = 1378903899 (Sat Sep 16 12:51:21 2023 ) |
| Omicron analysis time window (H1): | GPS = 1378903886 → GPS = 1378903902 |
| Omicron analysis time window (L1): | GPS = 1378903886 → GPS = 1378903902 |
| Time delay between detectors t(L1) - t(H1): | -1.88426 s (slice index = 149 / 217), δt_gw = 0.00174299 s |
| Time delay uncertainty: | 0.00826464 s |
| [targeted mode] Time delay probability: | 0.952023 (0.0601668 sigmas), δt_target = 0.00124741 s |
| Frequency: | 112.55 Hz |
| Ξ: | 0.0537096 ± 0.0305647 (variance = 0.000934199): Q0: 0.201182, Q1: 0.197534, Q2: 0.242482, Q3: 0.147415, Q4: 0.184605 |
| Rank: | R_A = 0.0511328 |
| Log of amplitude ratio (L1/H1): | 0.333454, variance = 1.13065 (L1/H1: -0.823529, variance = 2.2044, H1/L1: -1.02351, variance = 2.09738) |
| Amplitude ratio (L1/H1): | 1.39578 ⋇ 2.89597 (L1/H1: 0.43888 ⋇ 4.41374, H1/L1: 0.359332 ⋇ 4.25559) |
| Amplitude ratio H1|L1 compatibility (probability): | 0.373178 |
| Antenna factor probability: | 1 |
| Number of rejected frequency rows: | Q0: 12 / 18, Q1: 28 / 36, Q2: 56 / 70, Q3: 116 / 134, Q4: 234 / 258 |
| Maximum signal-to-noise ratio: | H1: 7.57843, L1: 9.81298 |
| SNR variance: | H1: 0.566423, L1: 0.568923 |
| Click here for a zoomed plot | Click here for a zoomed plot | Click here for a zoomed plot | Click here for a zoomed plot | Click here for a zoomed plot |
 |
 |
 |
 |
 |
 |
 |
 |
 |
 |
 |
 |
 |
 |
 |
 |
 |
 |
 |
 |
 |
 |
 |
 |
 |
 |
 |
 |
 |
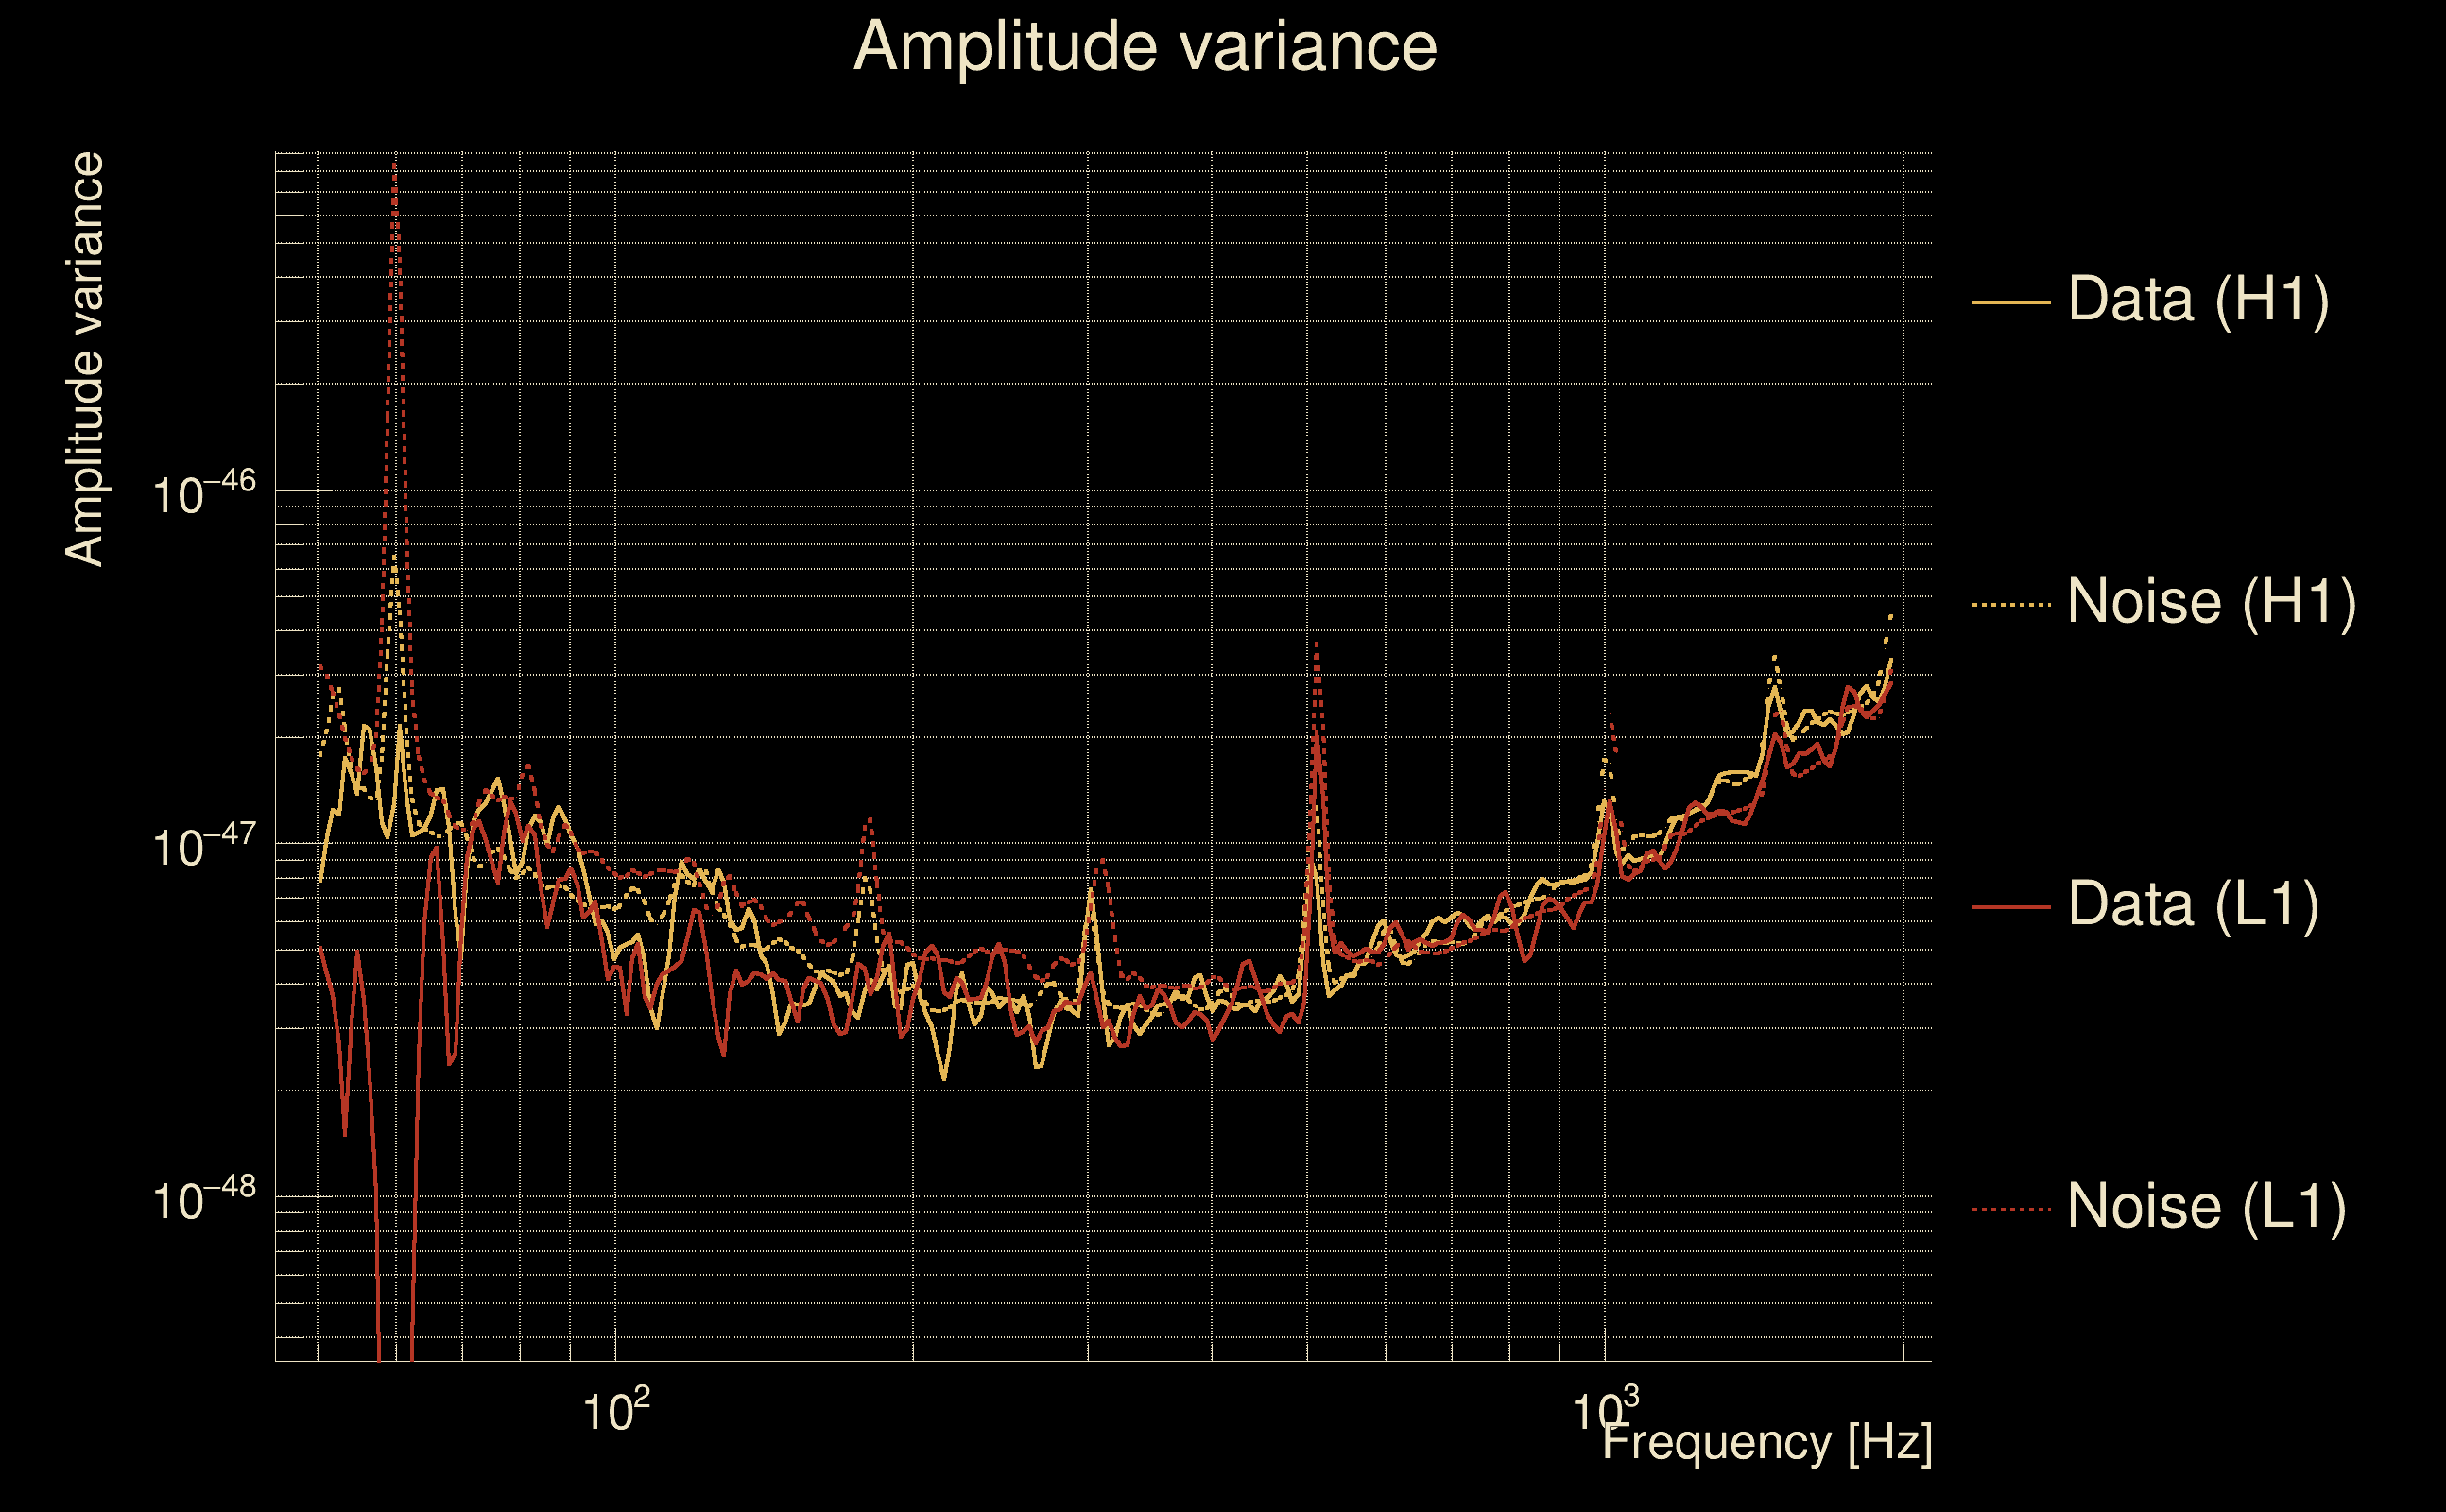
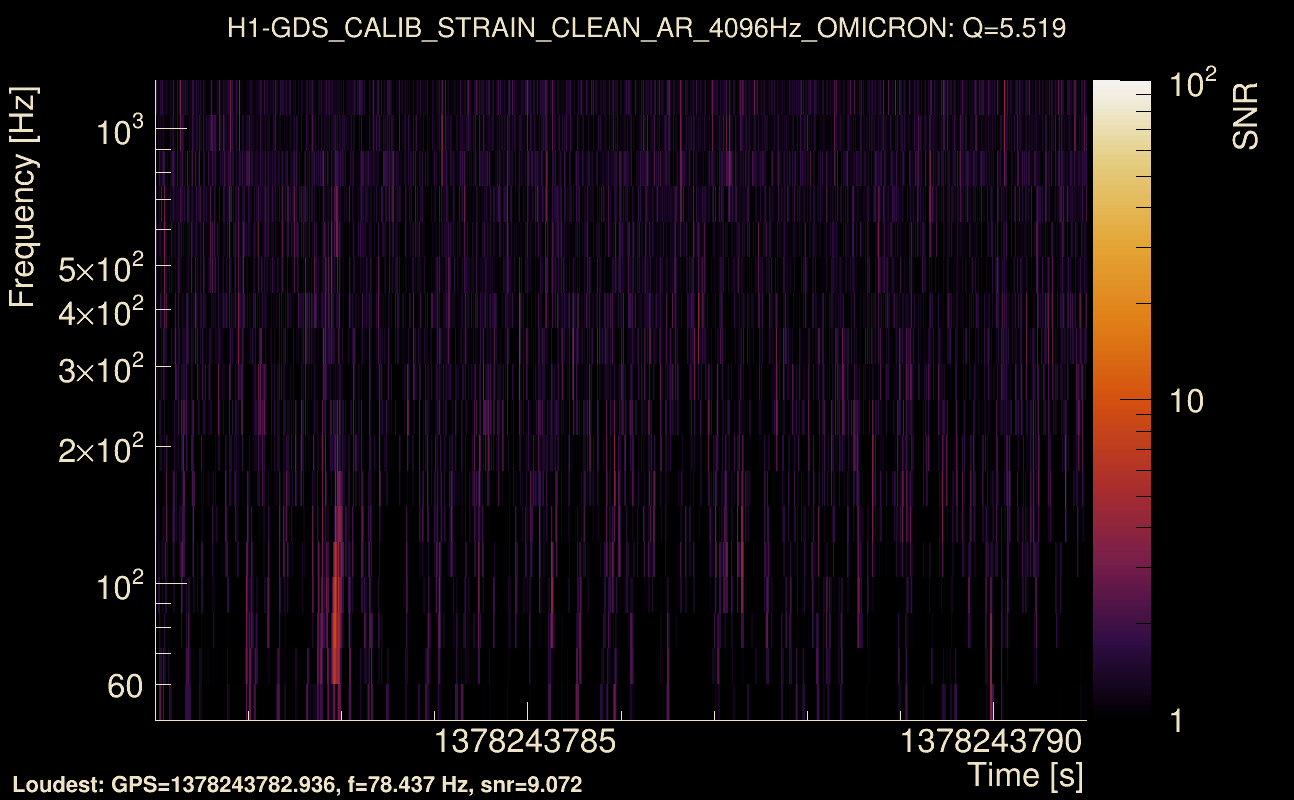
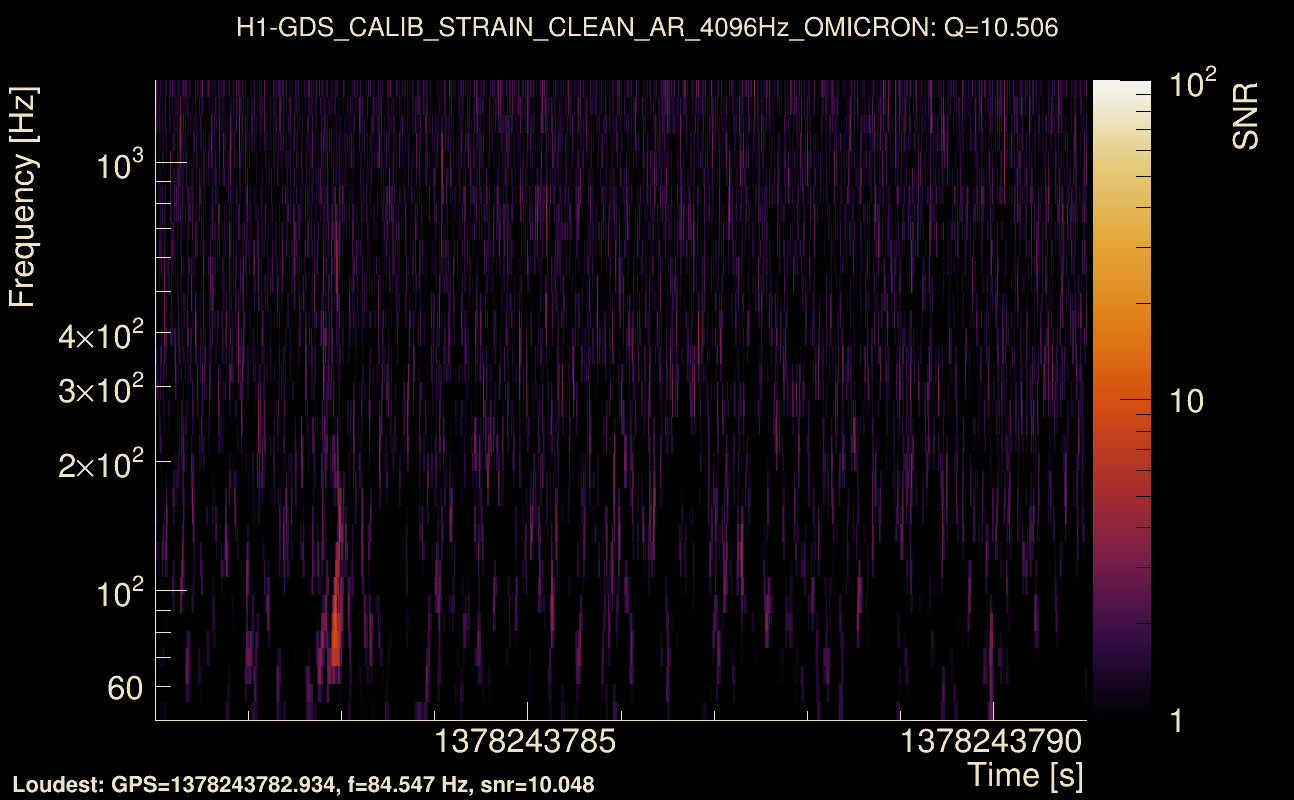
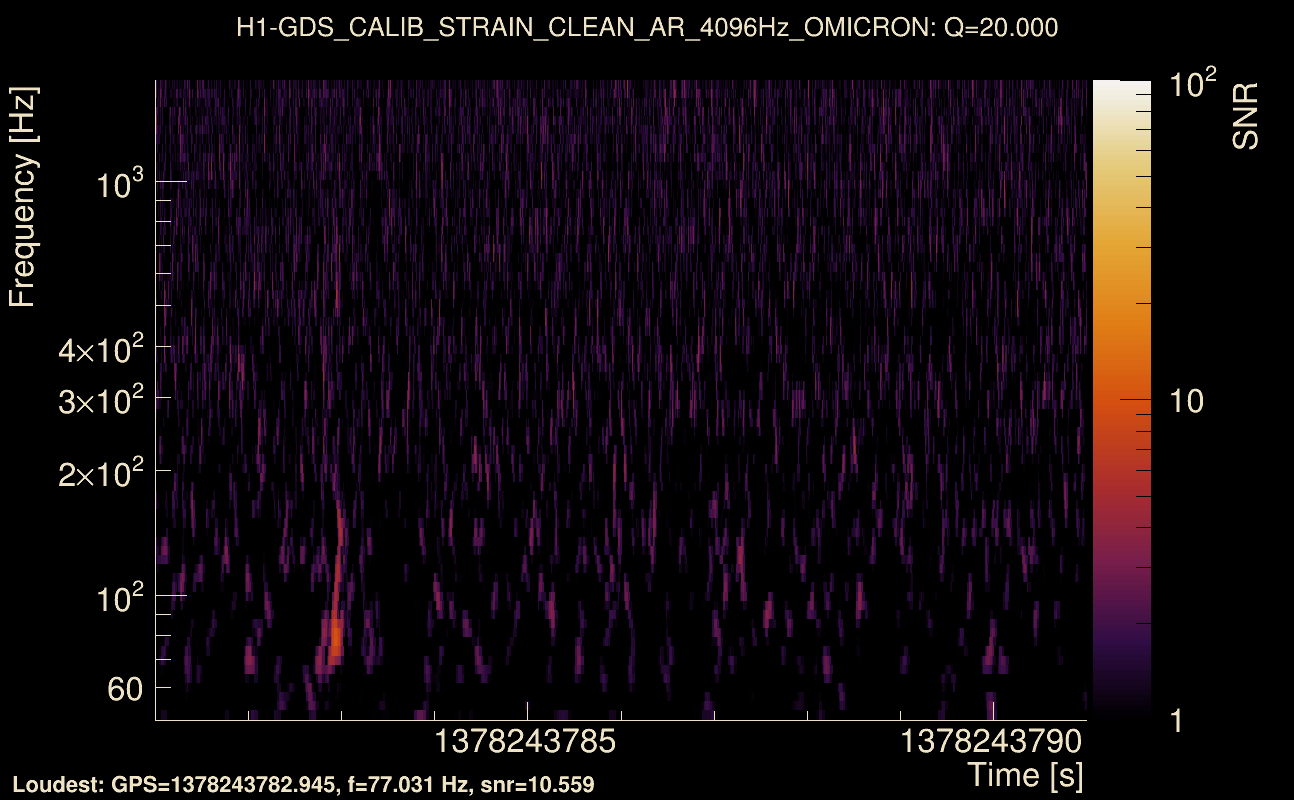
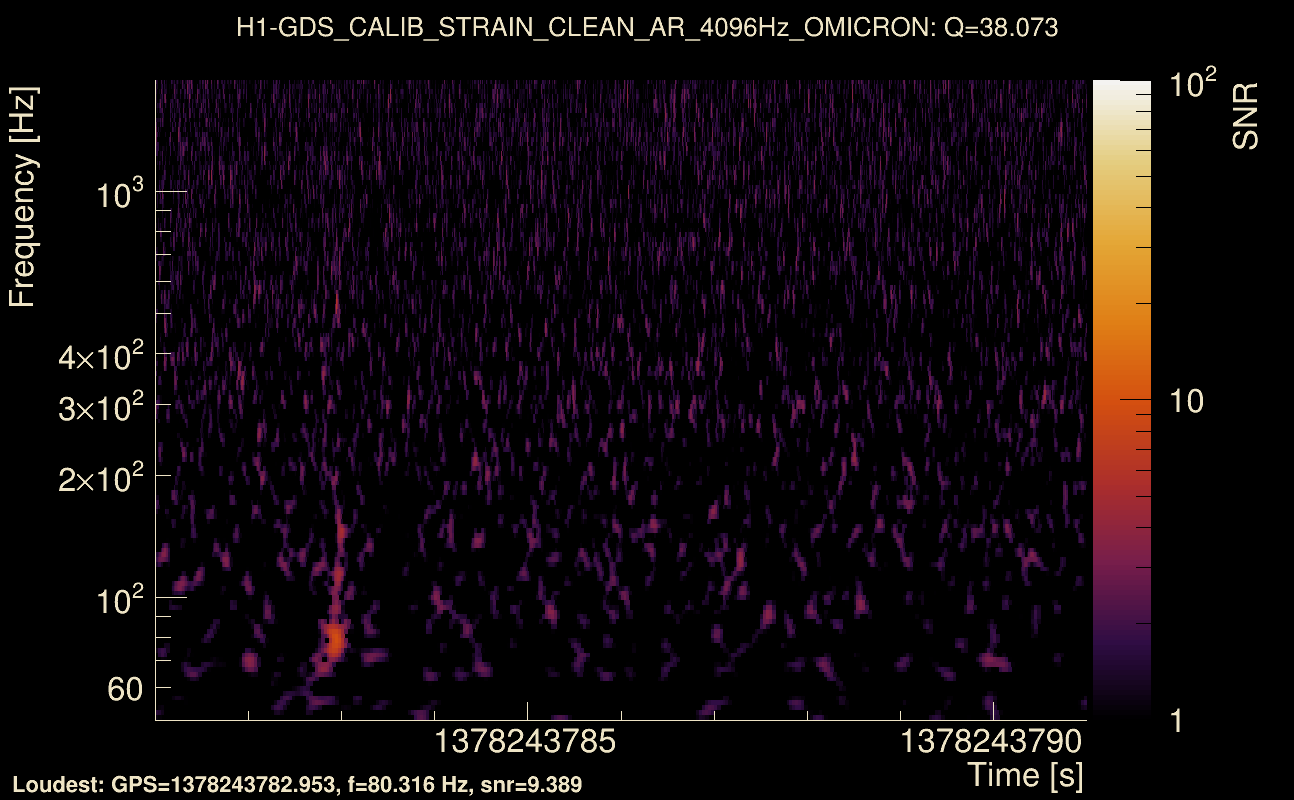
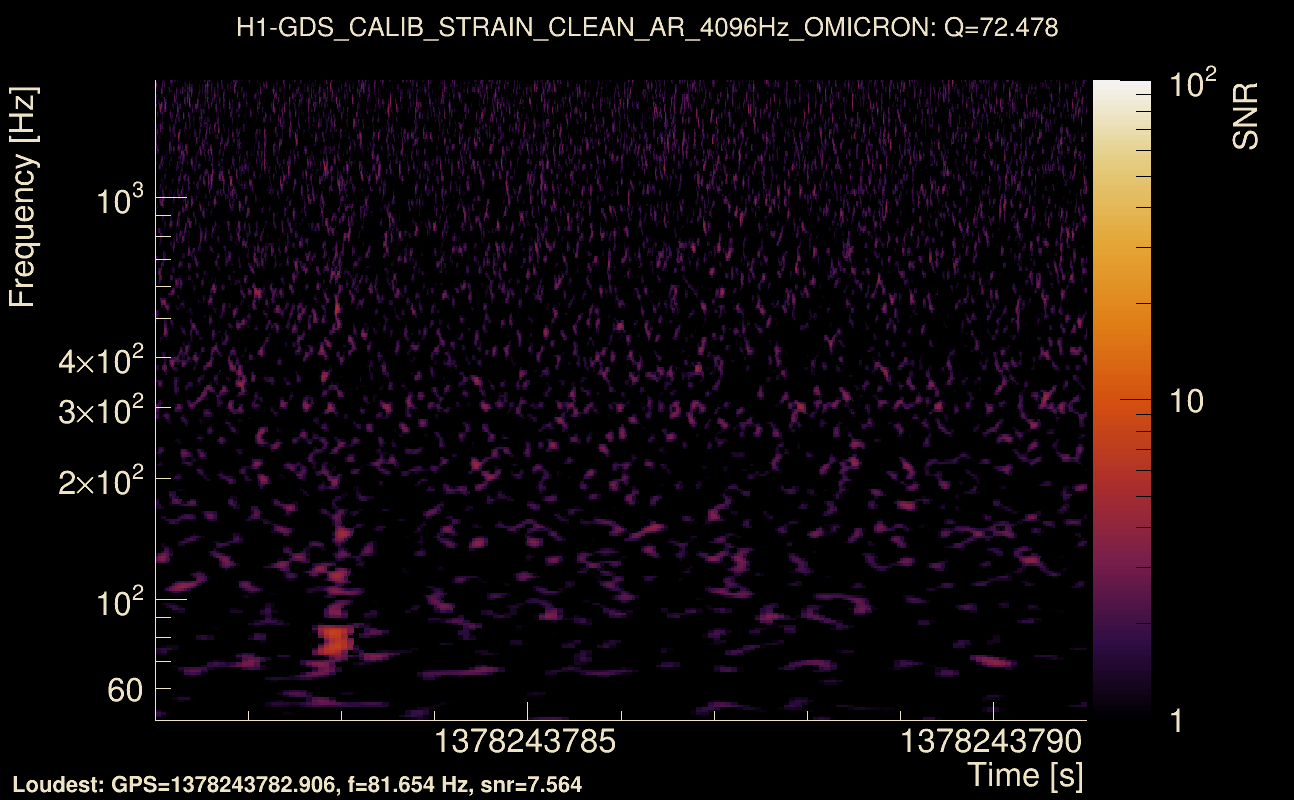
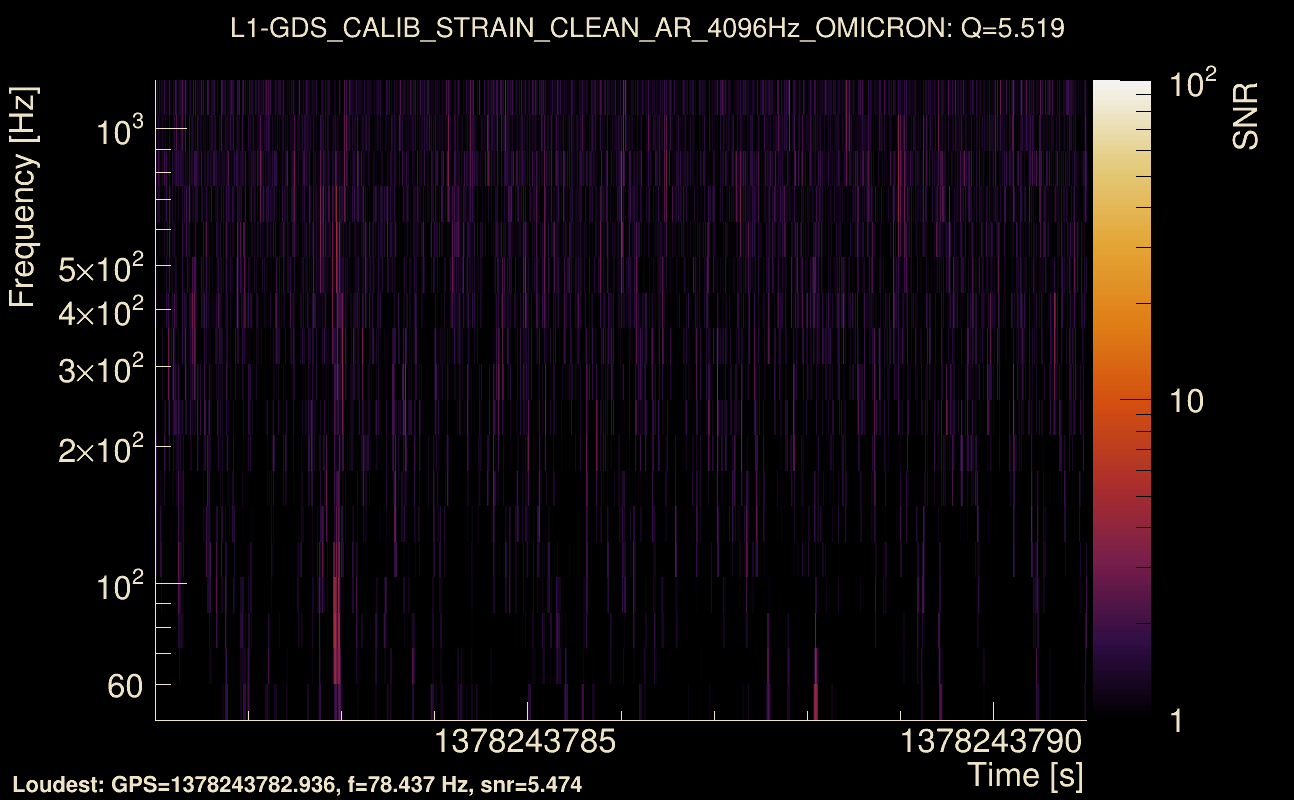
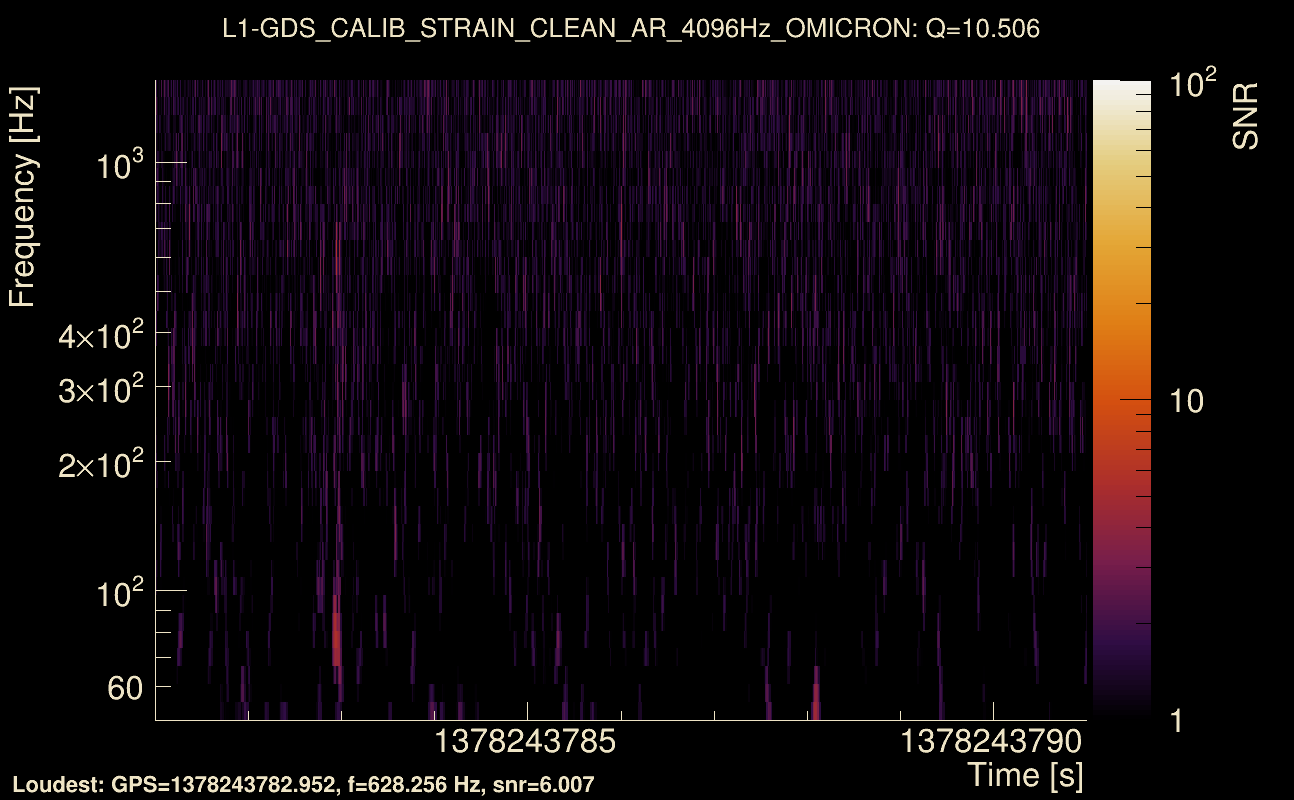
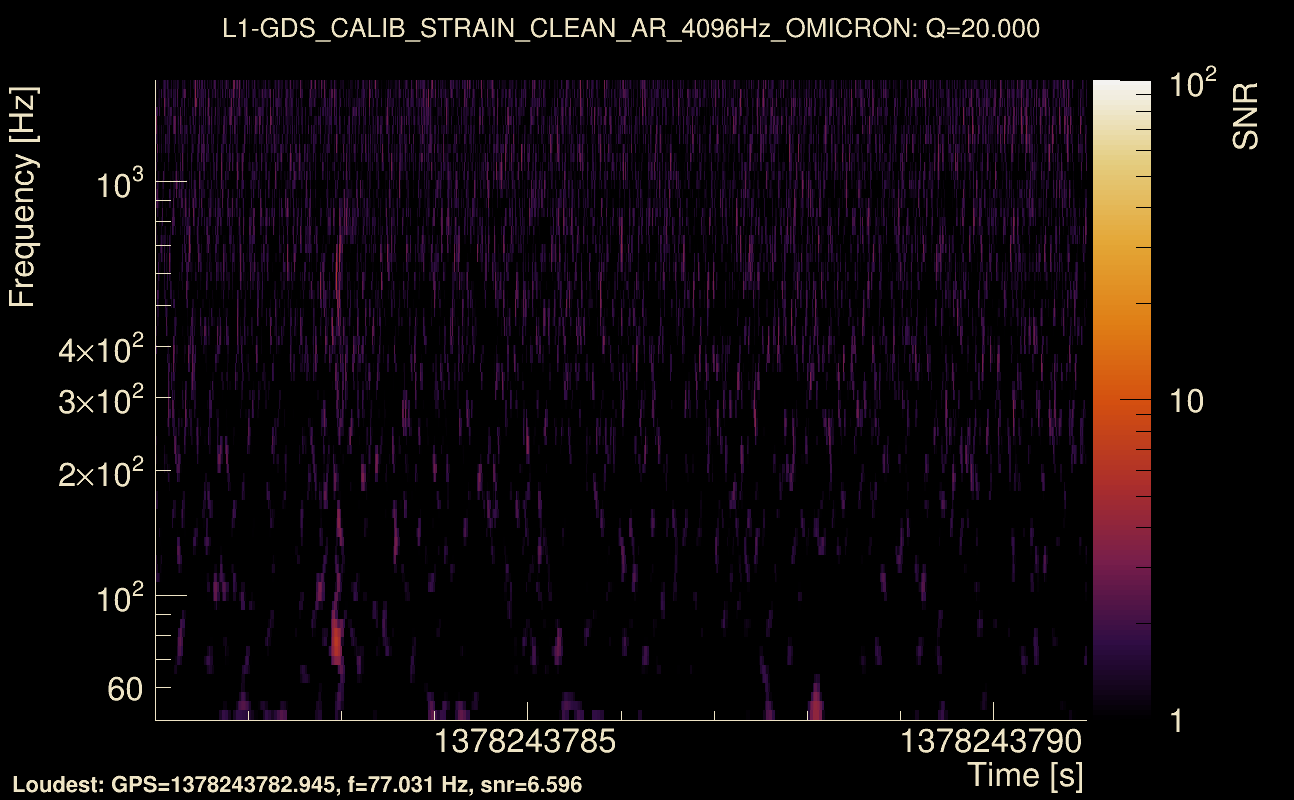
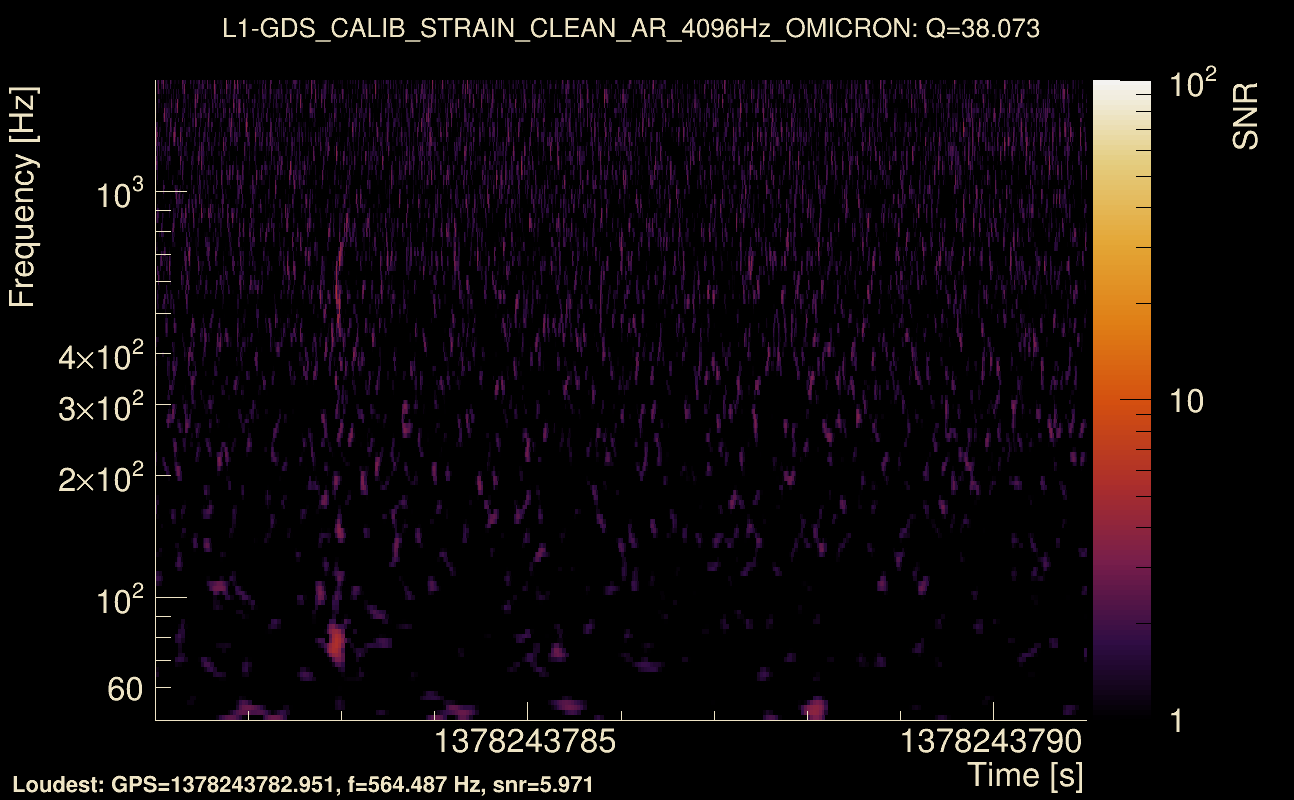
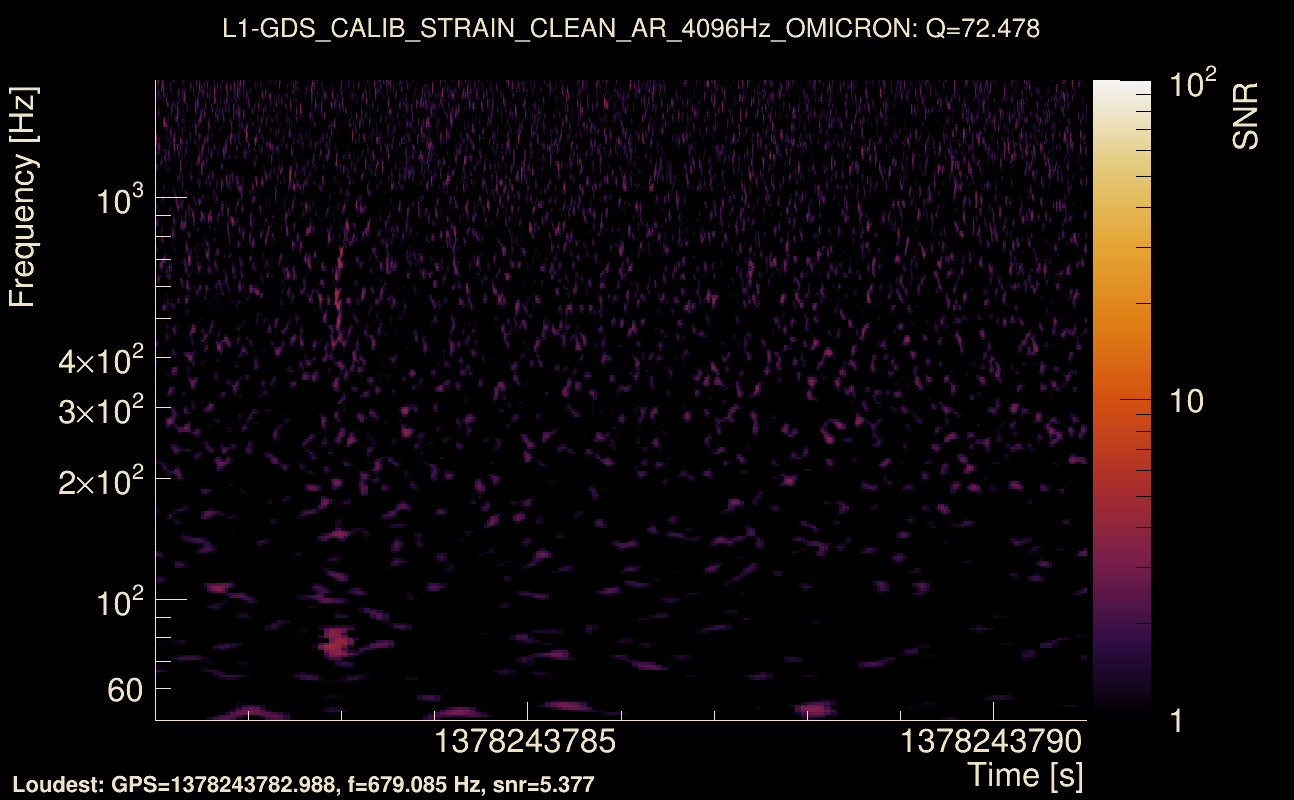
| Event time t(H1): | GPS = 1378243781 (Fri Sep 8 21:29:23 2023 ) → GPS = 1378243791 (Fri Sep 8 21:29:33 2023 ) |
| Event time t(L1): | GPS = 1378243781 (Fri Sep 8 21:29:33 2023 ) → GPS = 1378243791 (Fri Sep 8 21:29:33 2023 ) |
| Omicron analysis time window (H1): | GPS = 1378243778 → GPS = 1378243794 |
| Omicron analysis time window (L1): | GPS = 1378243778 → GPS = 1378243794 |
| Time delay between detectors t(L1) - t(H1): | -1.88328 s (slice index = 149 / 217), δt_gw = 0.00272416 s |
| Time delay uncertainty: | 0.00567954 s |
| [targeted mode] Time delay probability: | 0.785511 (0.272144 sigmas), δt_target = 0.00124574 s |
| Frequency: | 125.092 Hz |
| Ξ: | 0.0507734 ± 0.0611402 (variance = 0.00373813): Q0: 0.179087, Q1: 0.157424, Q2: 0.0286011, Q3: 0.0706813, Q4: 0.175104 |
| Rank: | R_A = 0.039883 |
| Log of amplitude ratio (L1/H1): | -1.13534, variance = 1.04779 (L1/H1: -2.48983, variance = 2.07248, H1/L1: -1.31931, variance = 1.48021) |
| Amplitude ratio (L1/H1): | 0.321314 ⋇ 2.78324 (L1/H1: 0.0829237 ⋇ 4.21905, H1/L1: 0.267319 ⋇ 3.37582) |
| Amplitude ratio H1|L1 compatibility (probability): | 0.0432879 |
| Antenna factor probability: | 1 |
| Number of rejected frequency rows: | Q0: 10 / 18, Q1: 28 / 36, Q2: 60 / 70, Q3: 123 / 134, Q4: 244 / 258 |
| Maximum signal-to-noise ratio: | H1: 11.4595, L1: 8.51252 |
| SNR variance: | H1: 0.574705, L1: 0.552241 |
| Click here for a zoomed plot | Click here for a zoomed plot | Click here for a zoomed plot | Click here for a zoomed plot | Click here for a zoomed plot |
 |
 |
 |
 |
 |
 |
 |
 |
 |
 |
 |
 |
 |
 |
 |
 |
 |
 |
 |
 |
 |
 |
 |
 |
 |
 |
 |
 |
 |
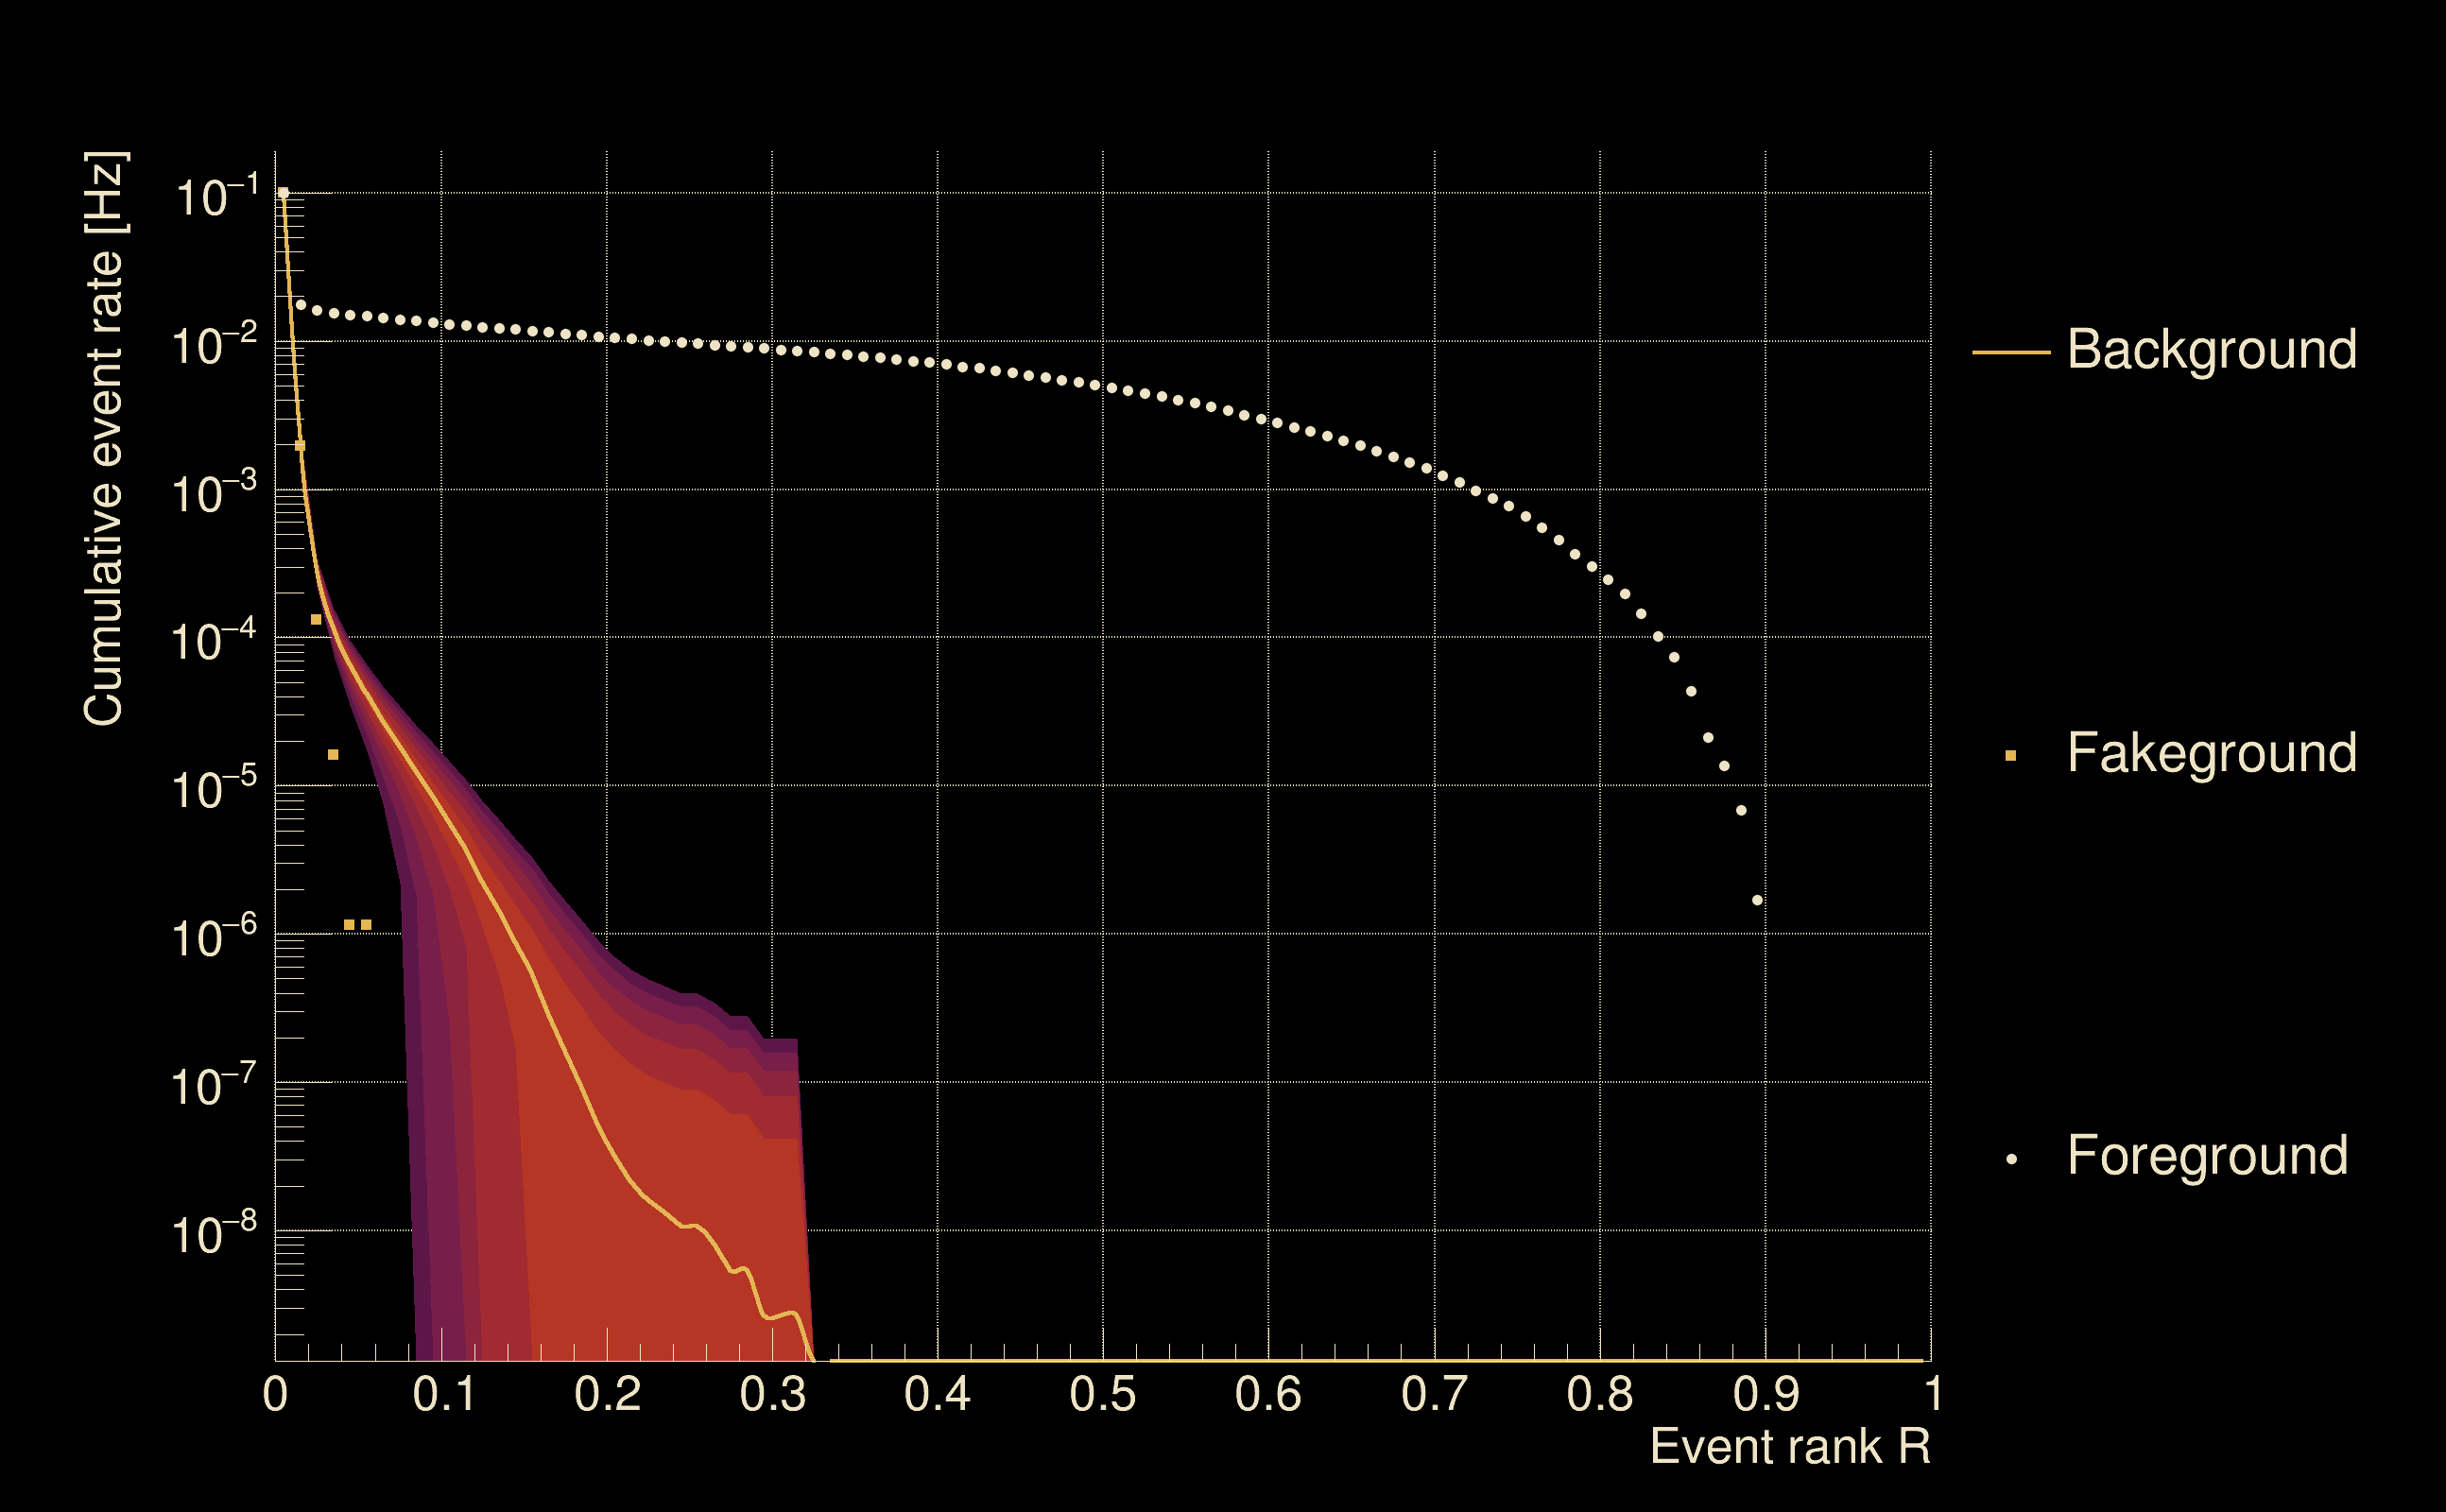
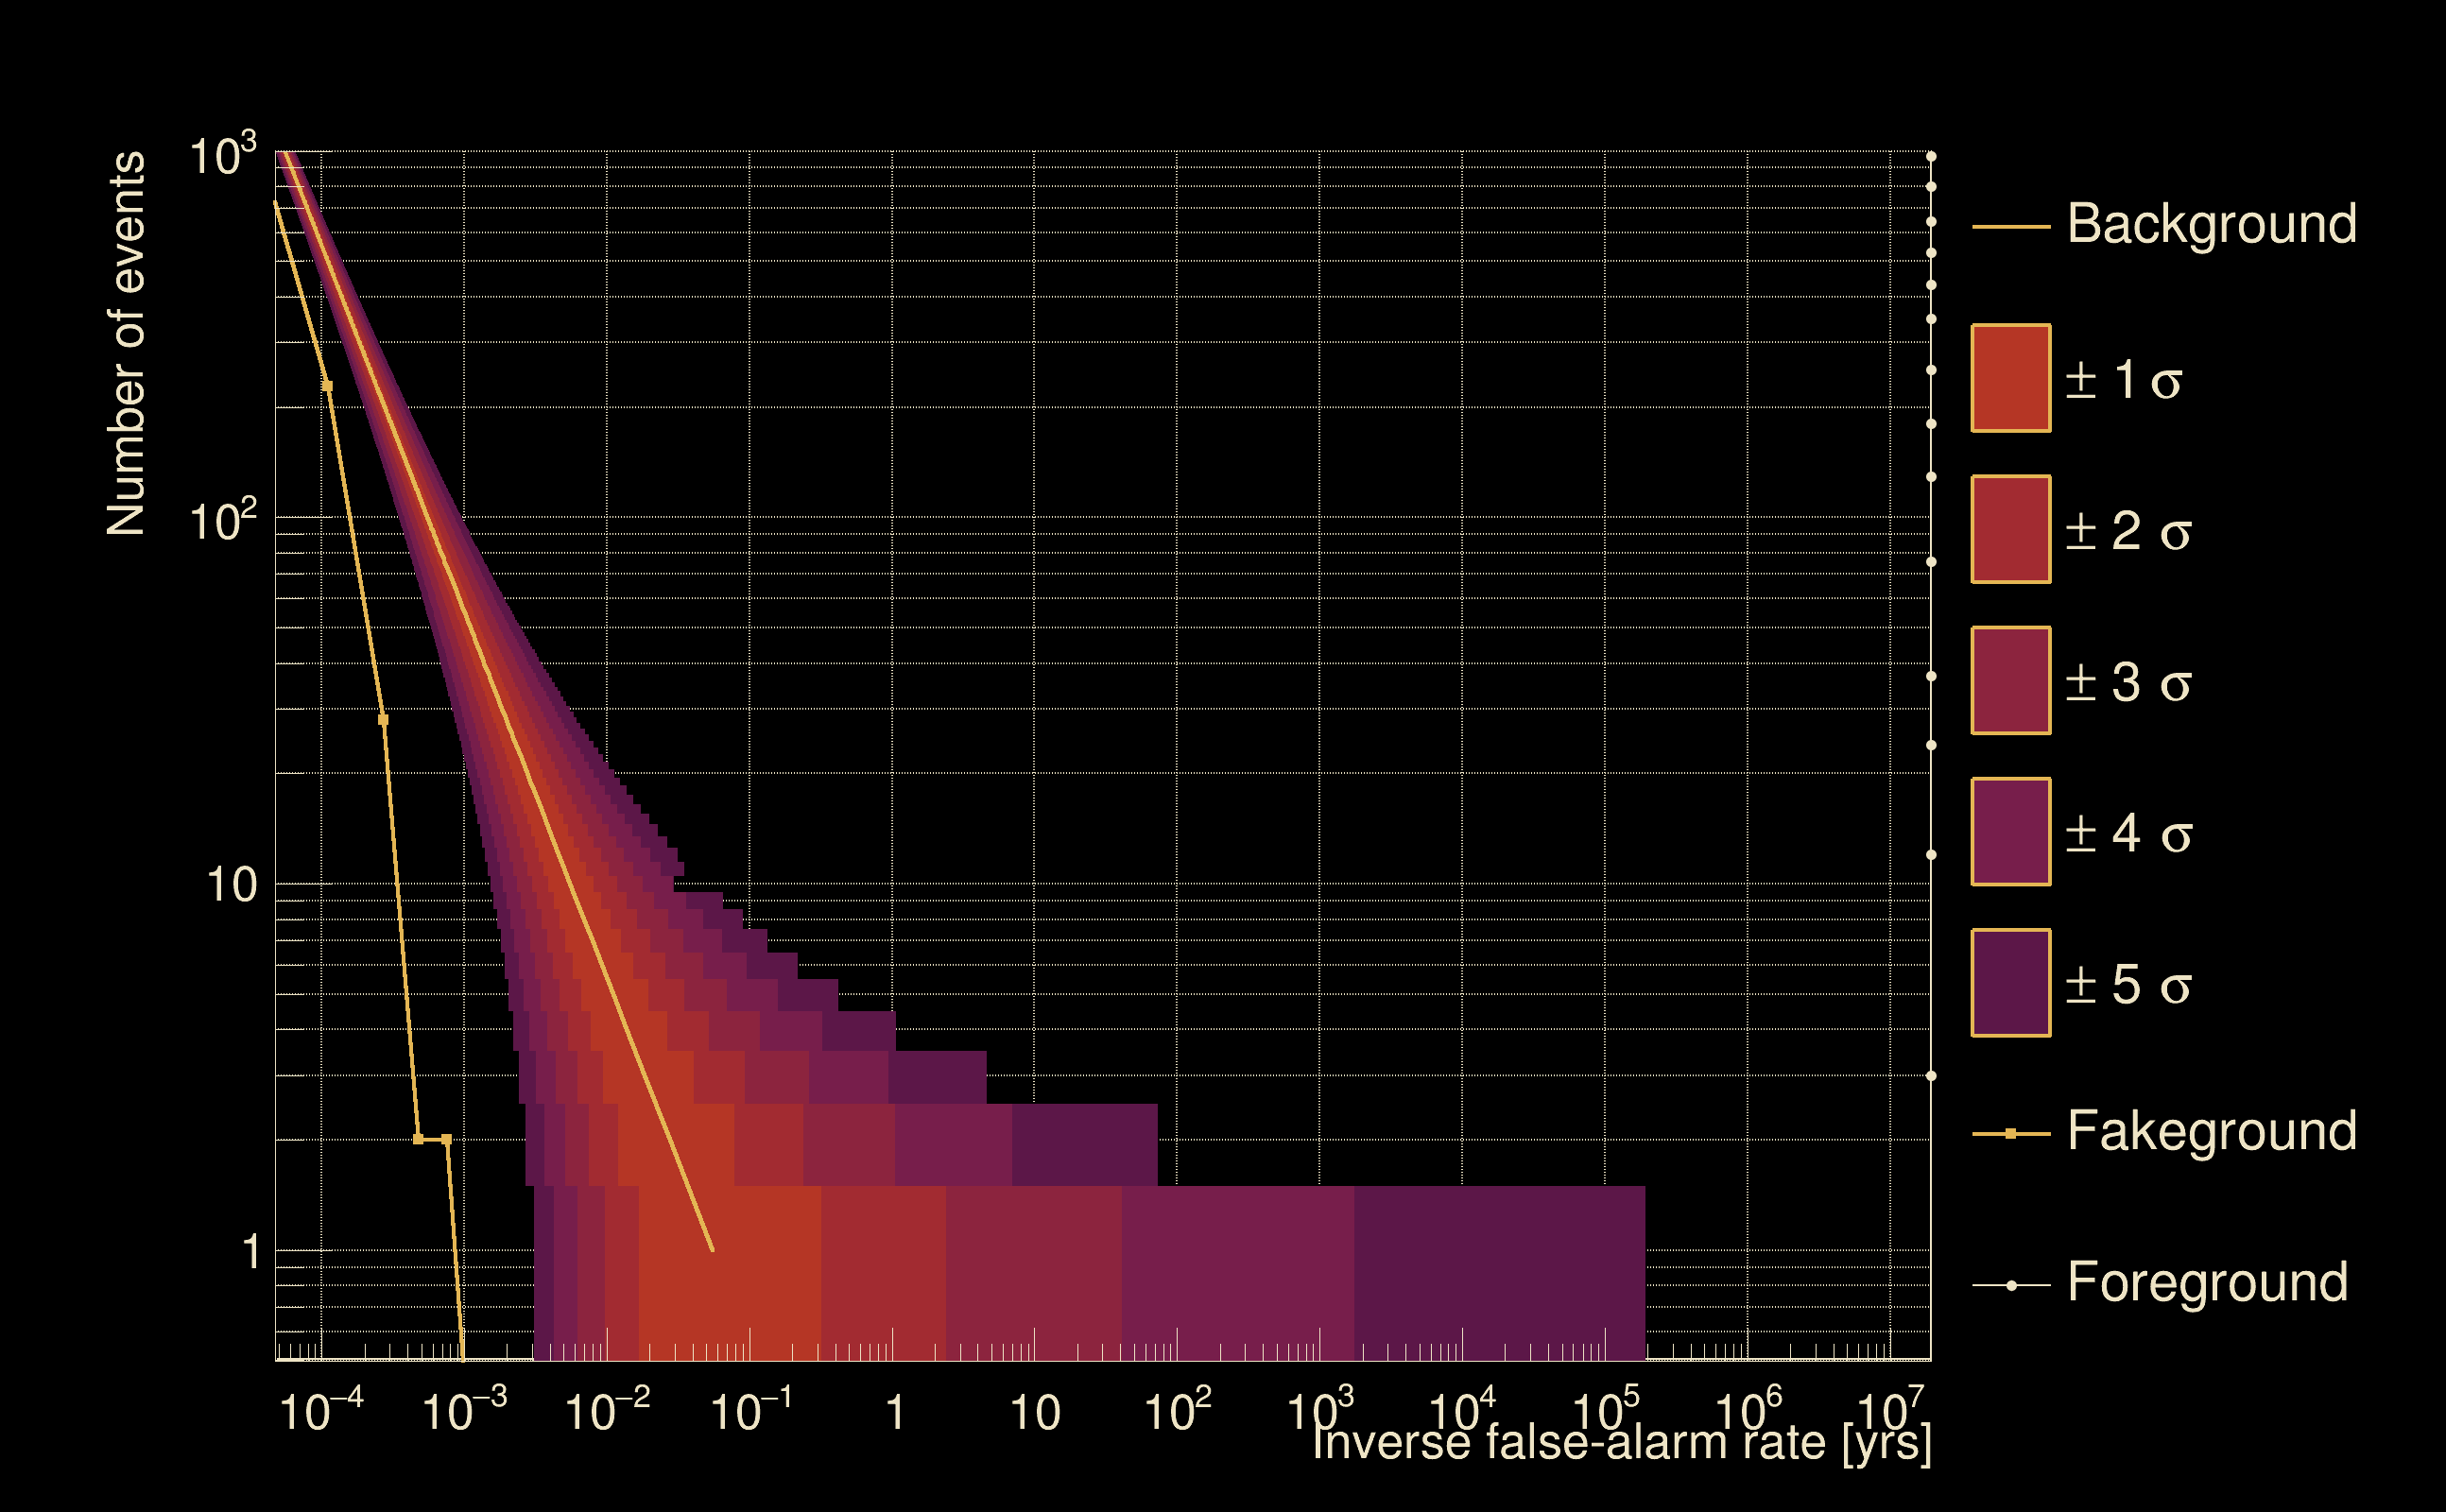
| Detection threshold: | R > 0.0979025 |
| False-alarm rate above that detection threshold: | 6.21611e-06 |
| Alternative threshold at 1/1000 yrs: | R > 0.315 |
| Alternative threshold at 1/100 yrs: | R > 0.315 |
| Alternative threshold at 1/10 yrs: | R > inf |
| Alternative threshold at 1/1 yr: | R > 0.20504 |
| Alternative threshold at 1/1 d: | R > 0.0851018 |
 |
|
 |
 |
 |
 |
 |
 |
 |
 |
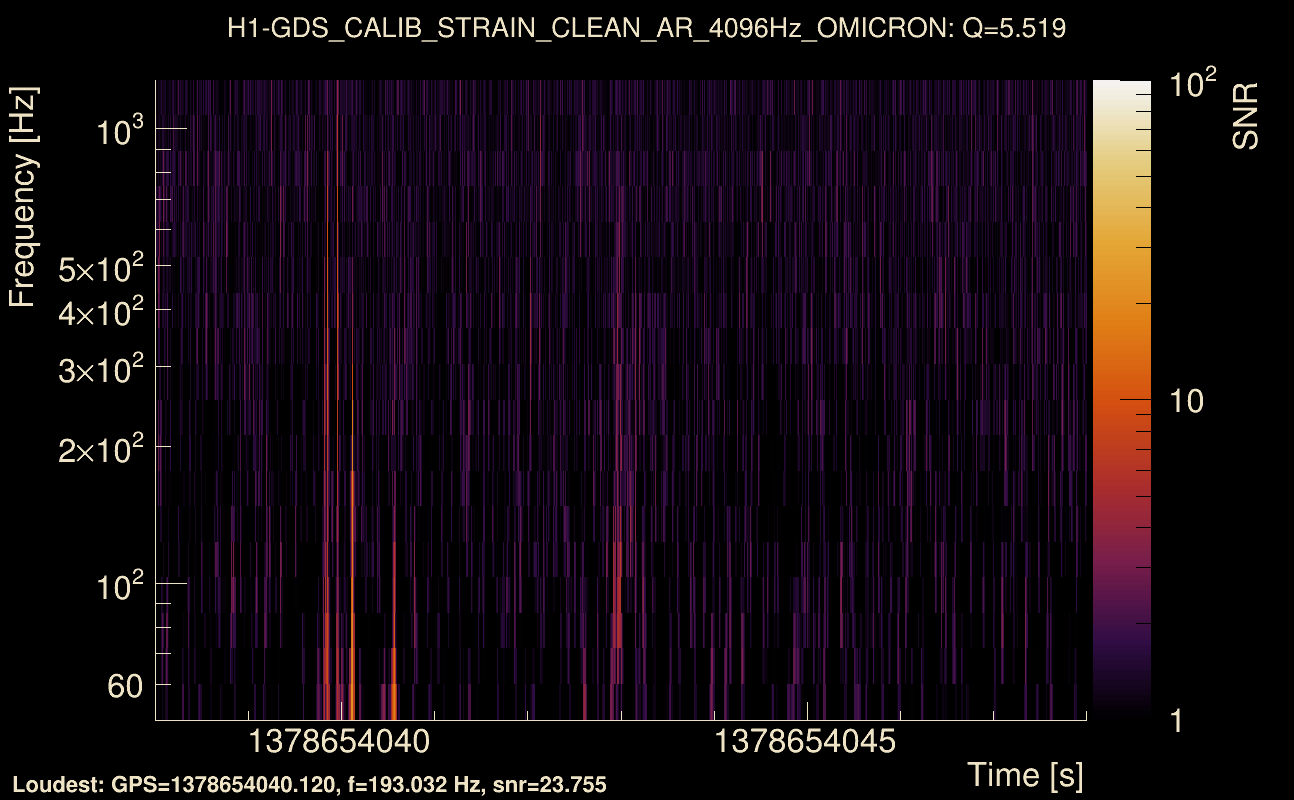
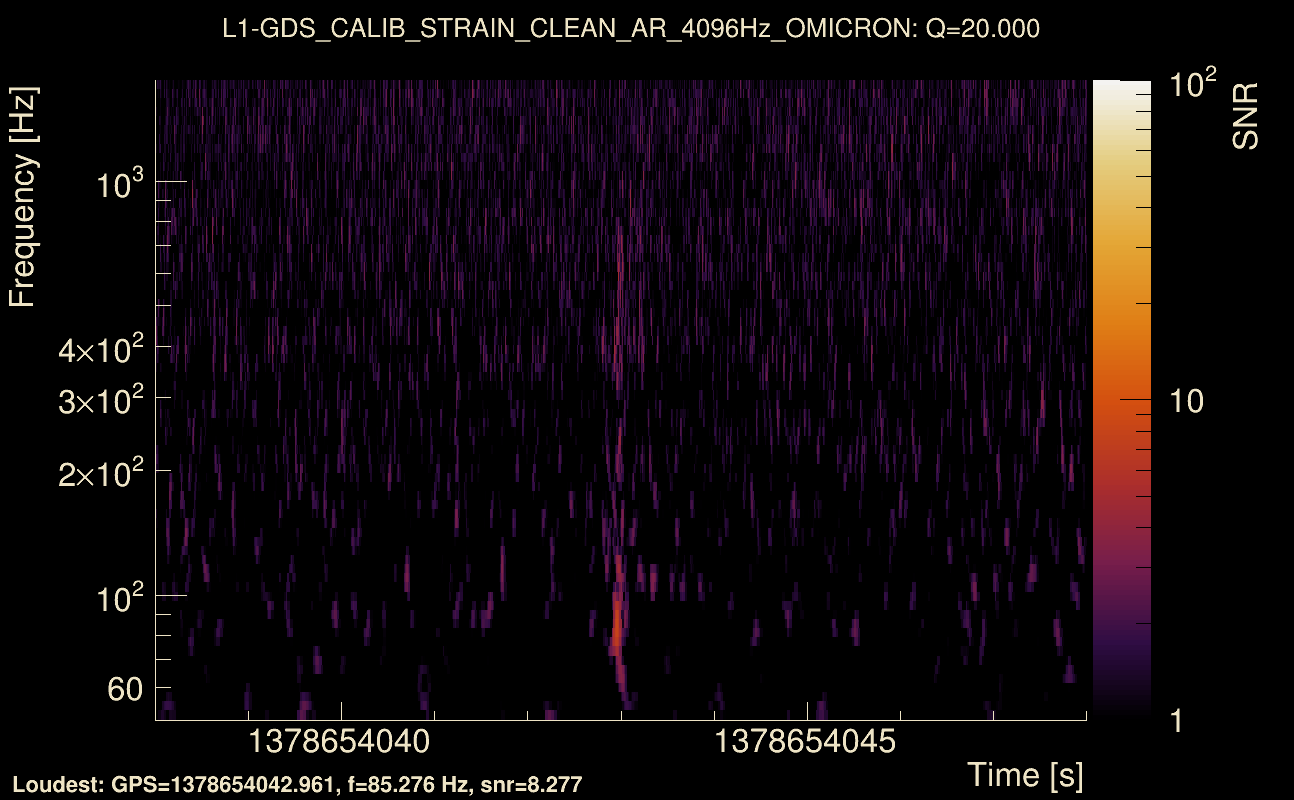
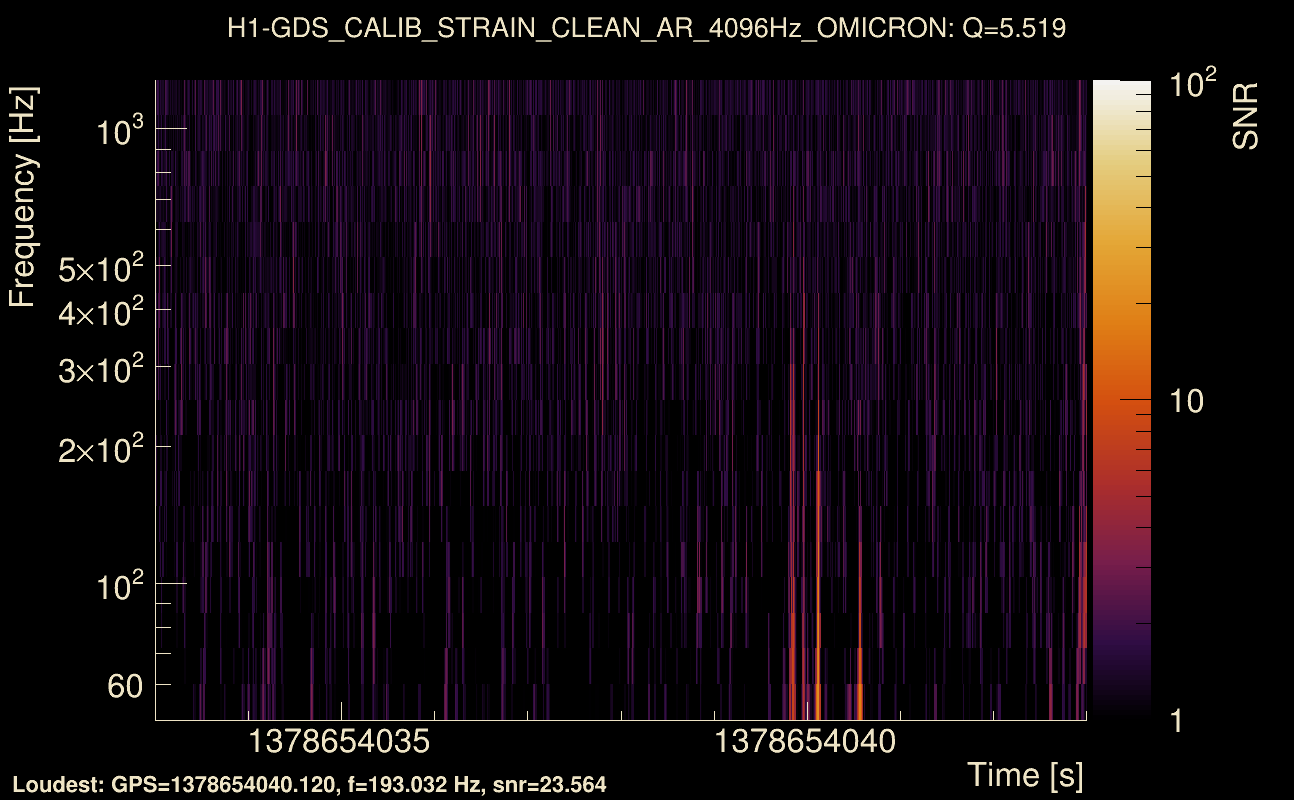
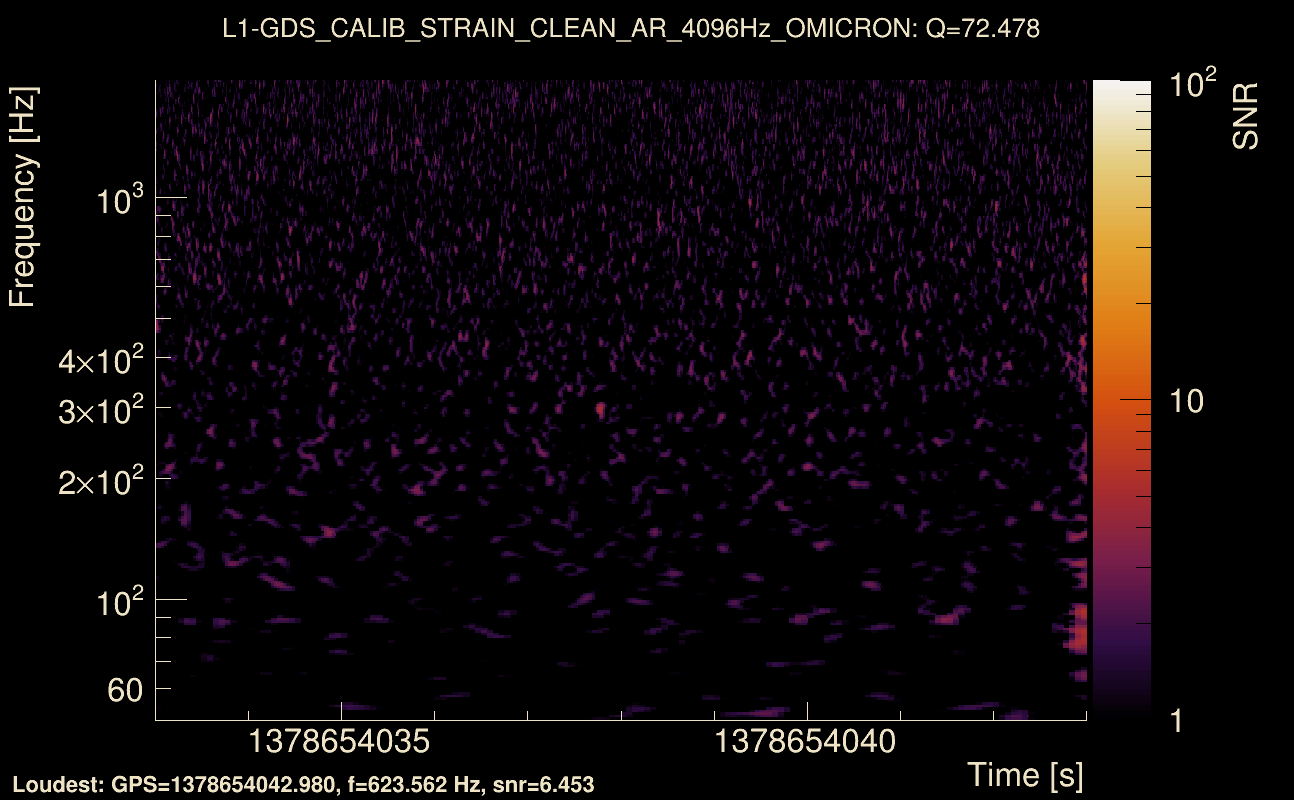
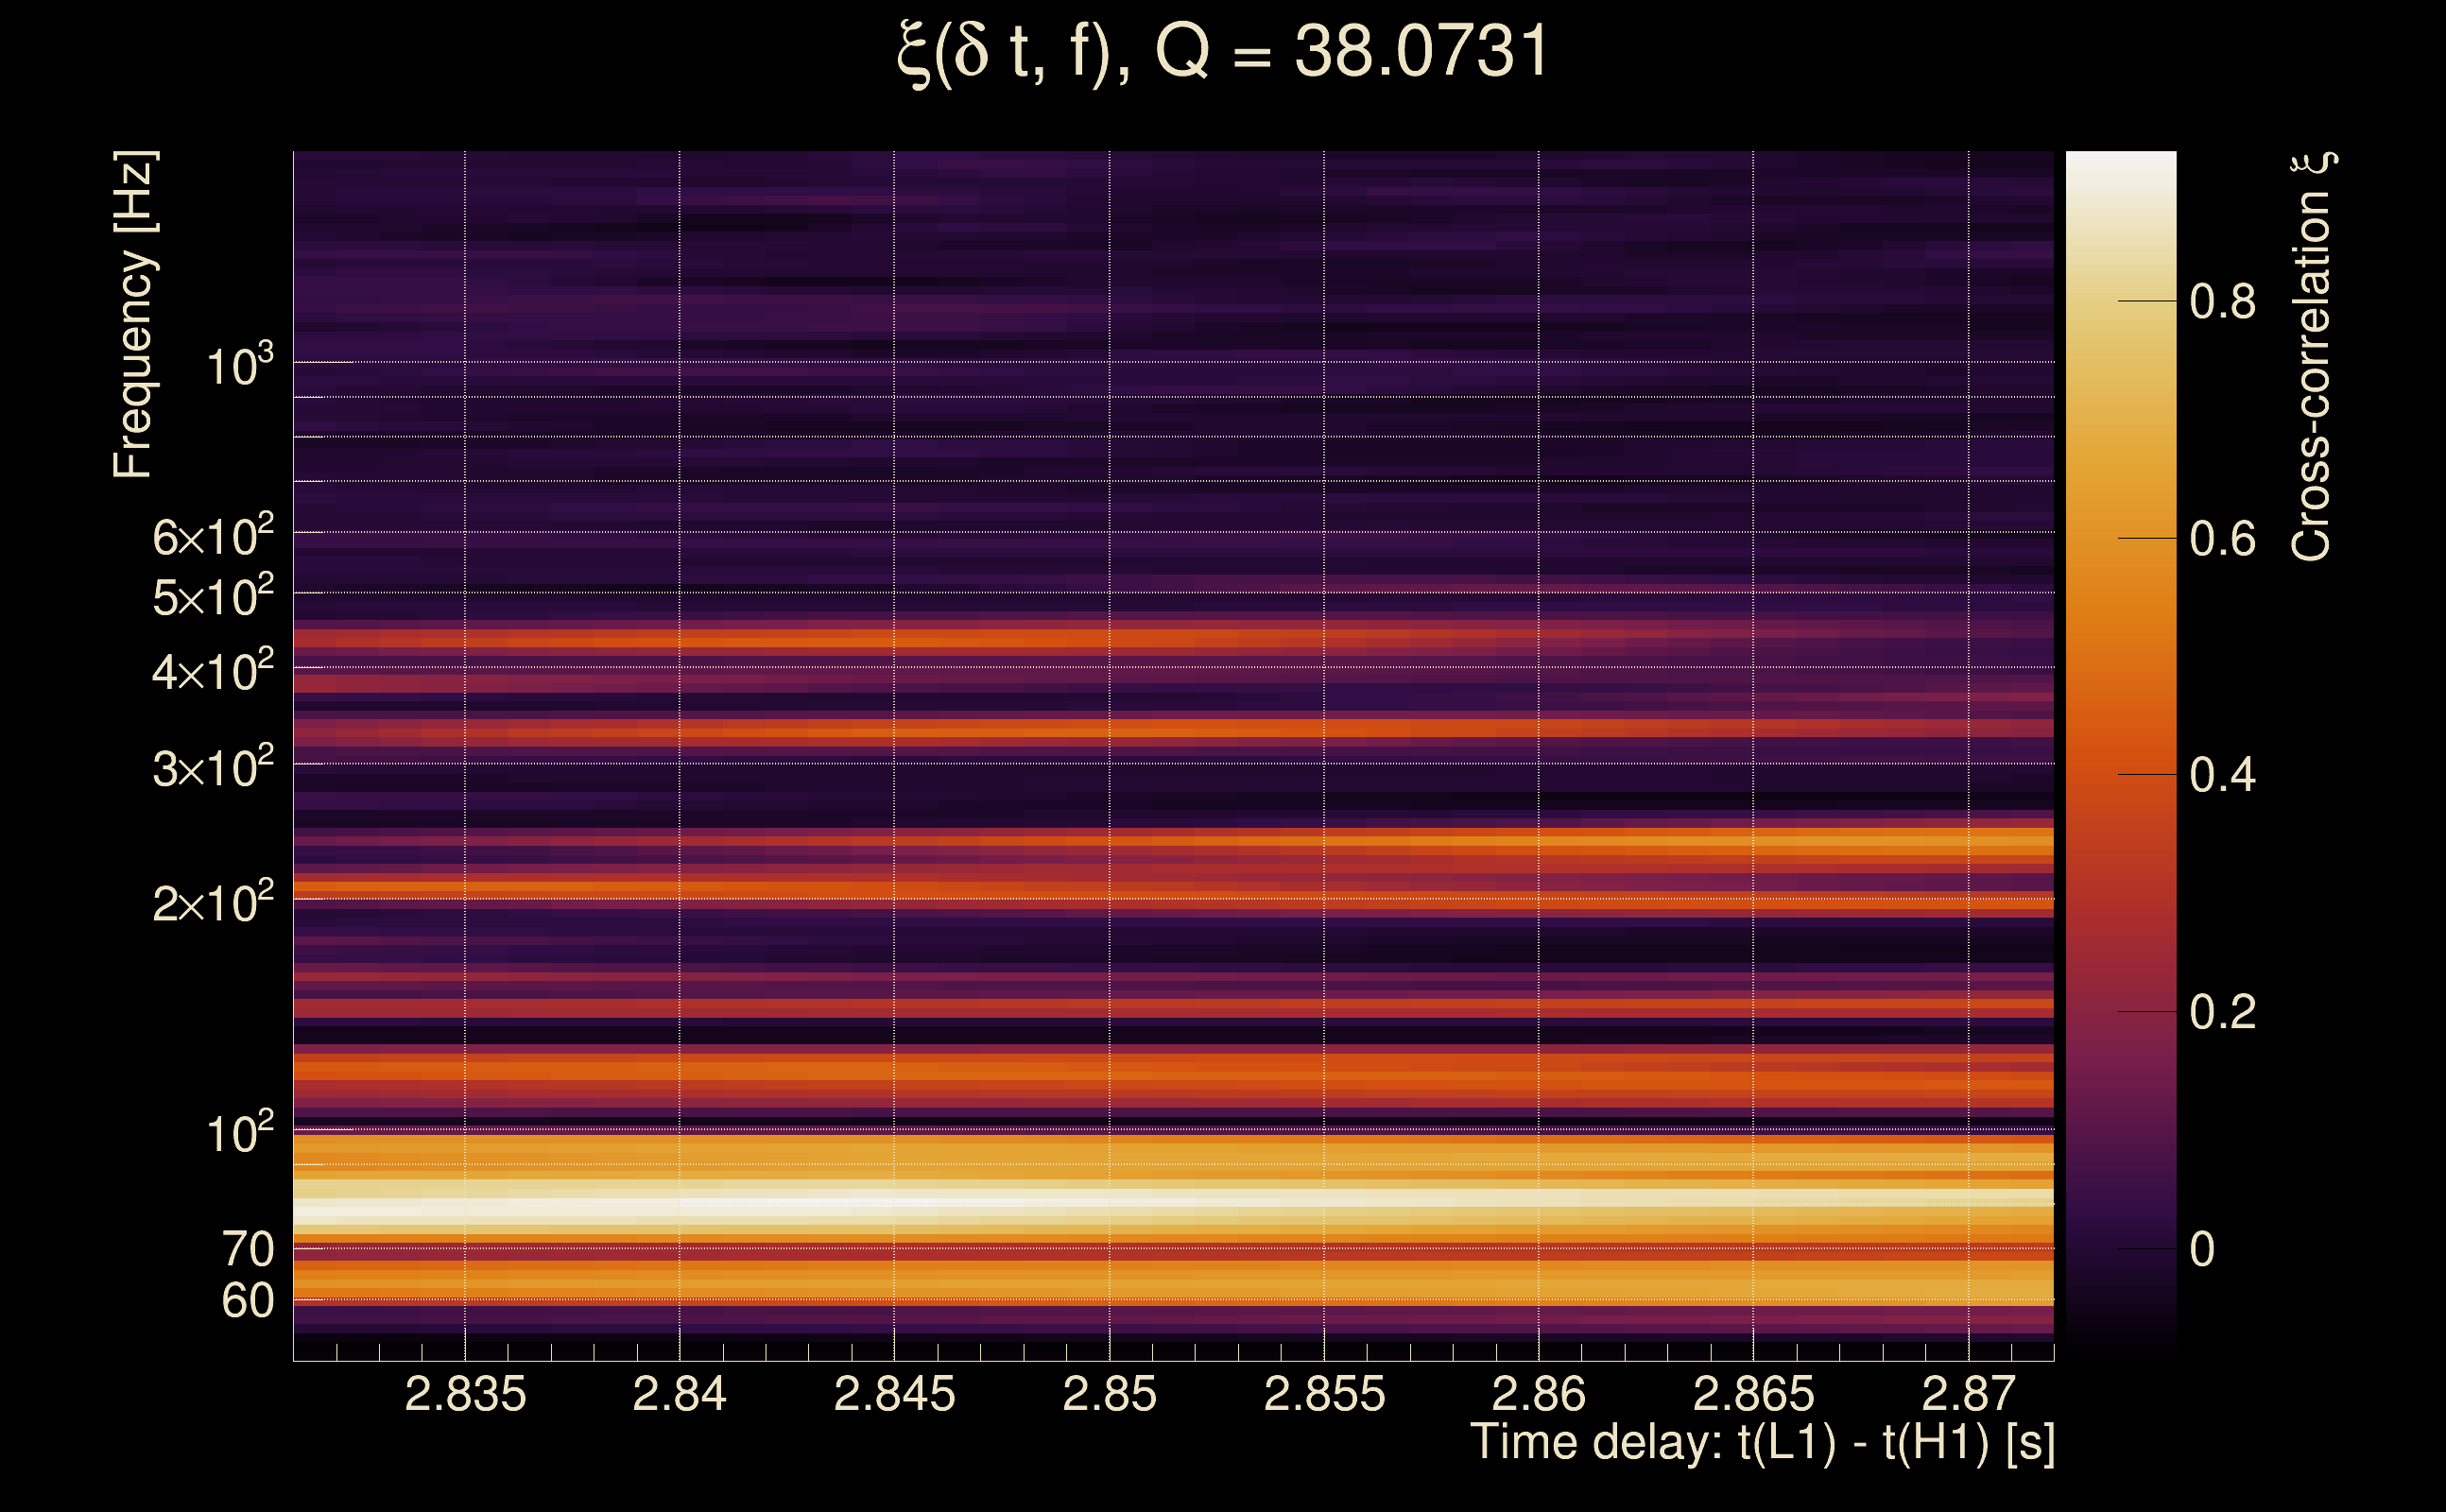
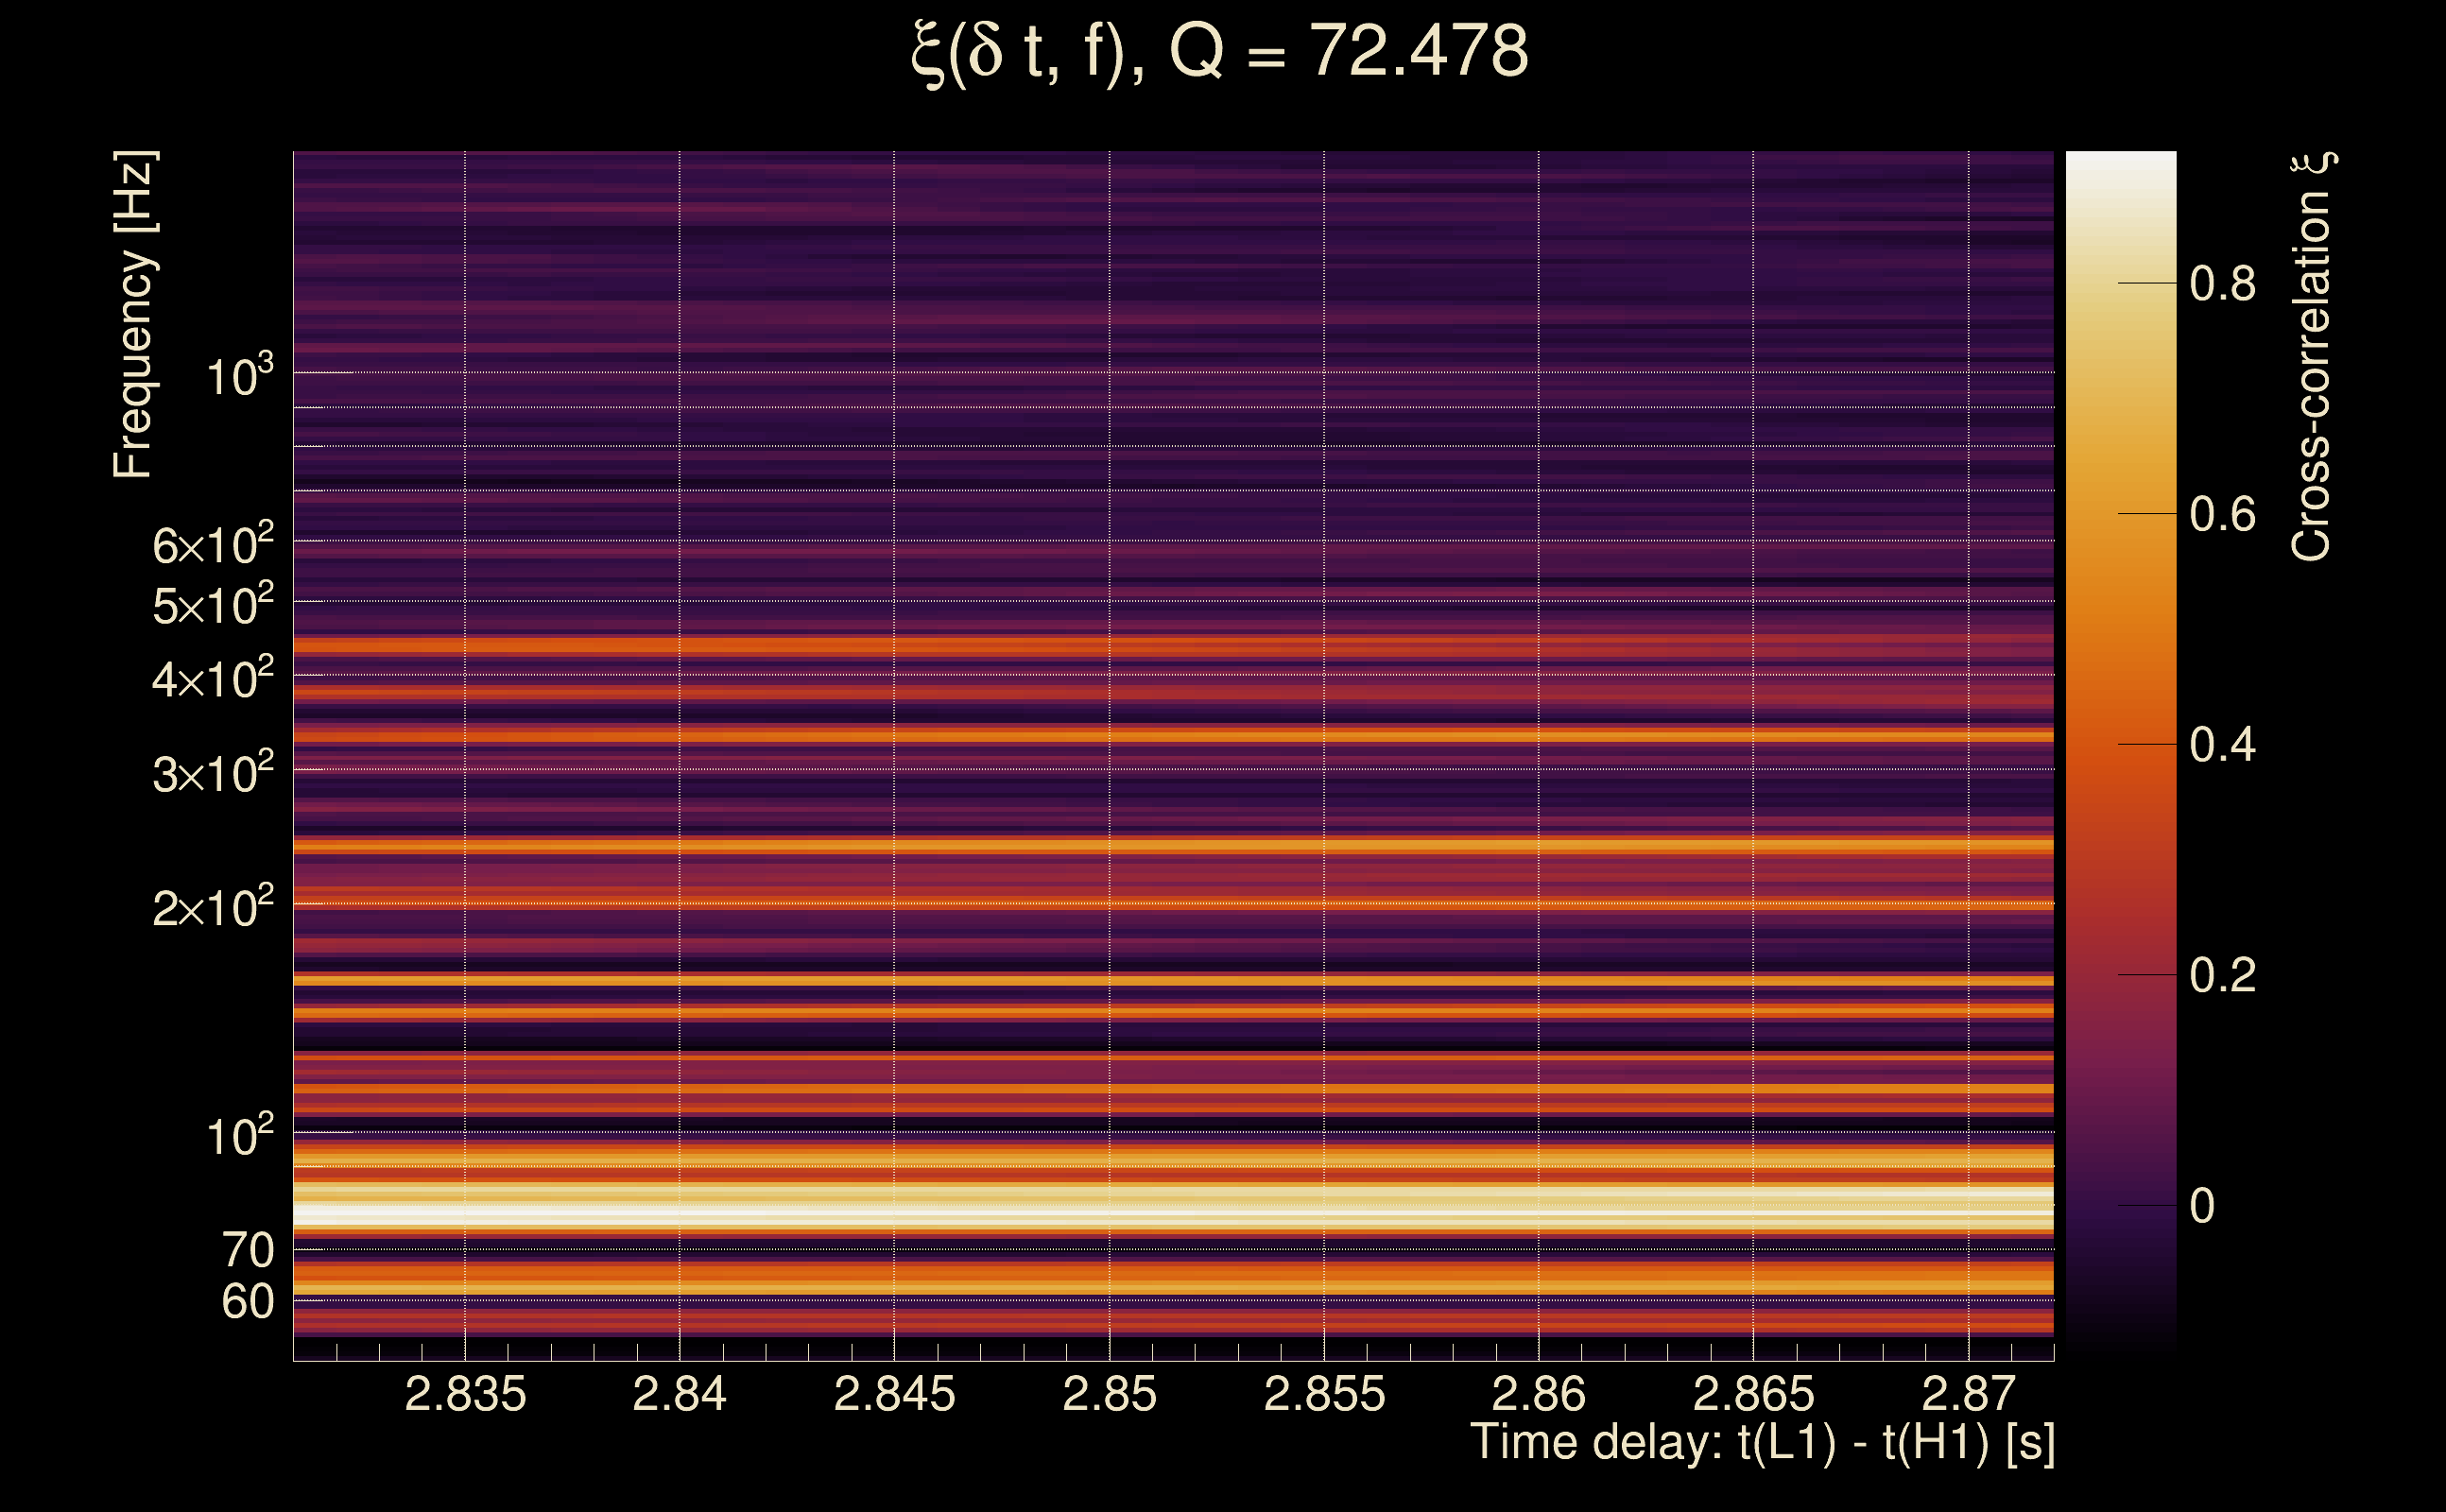
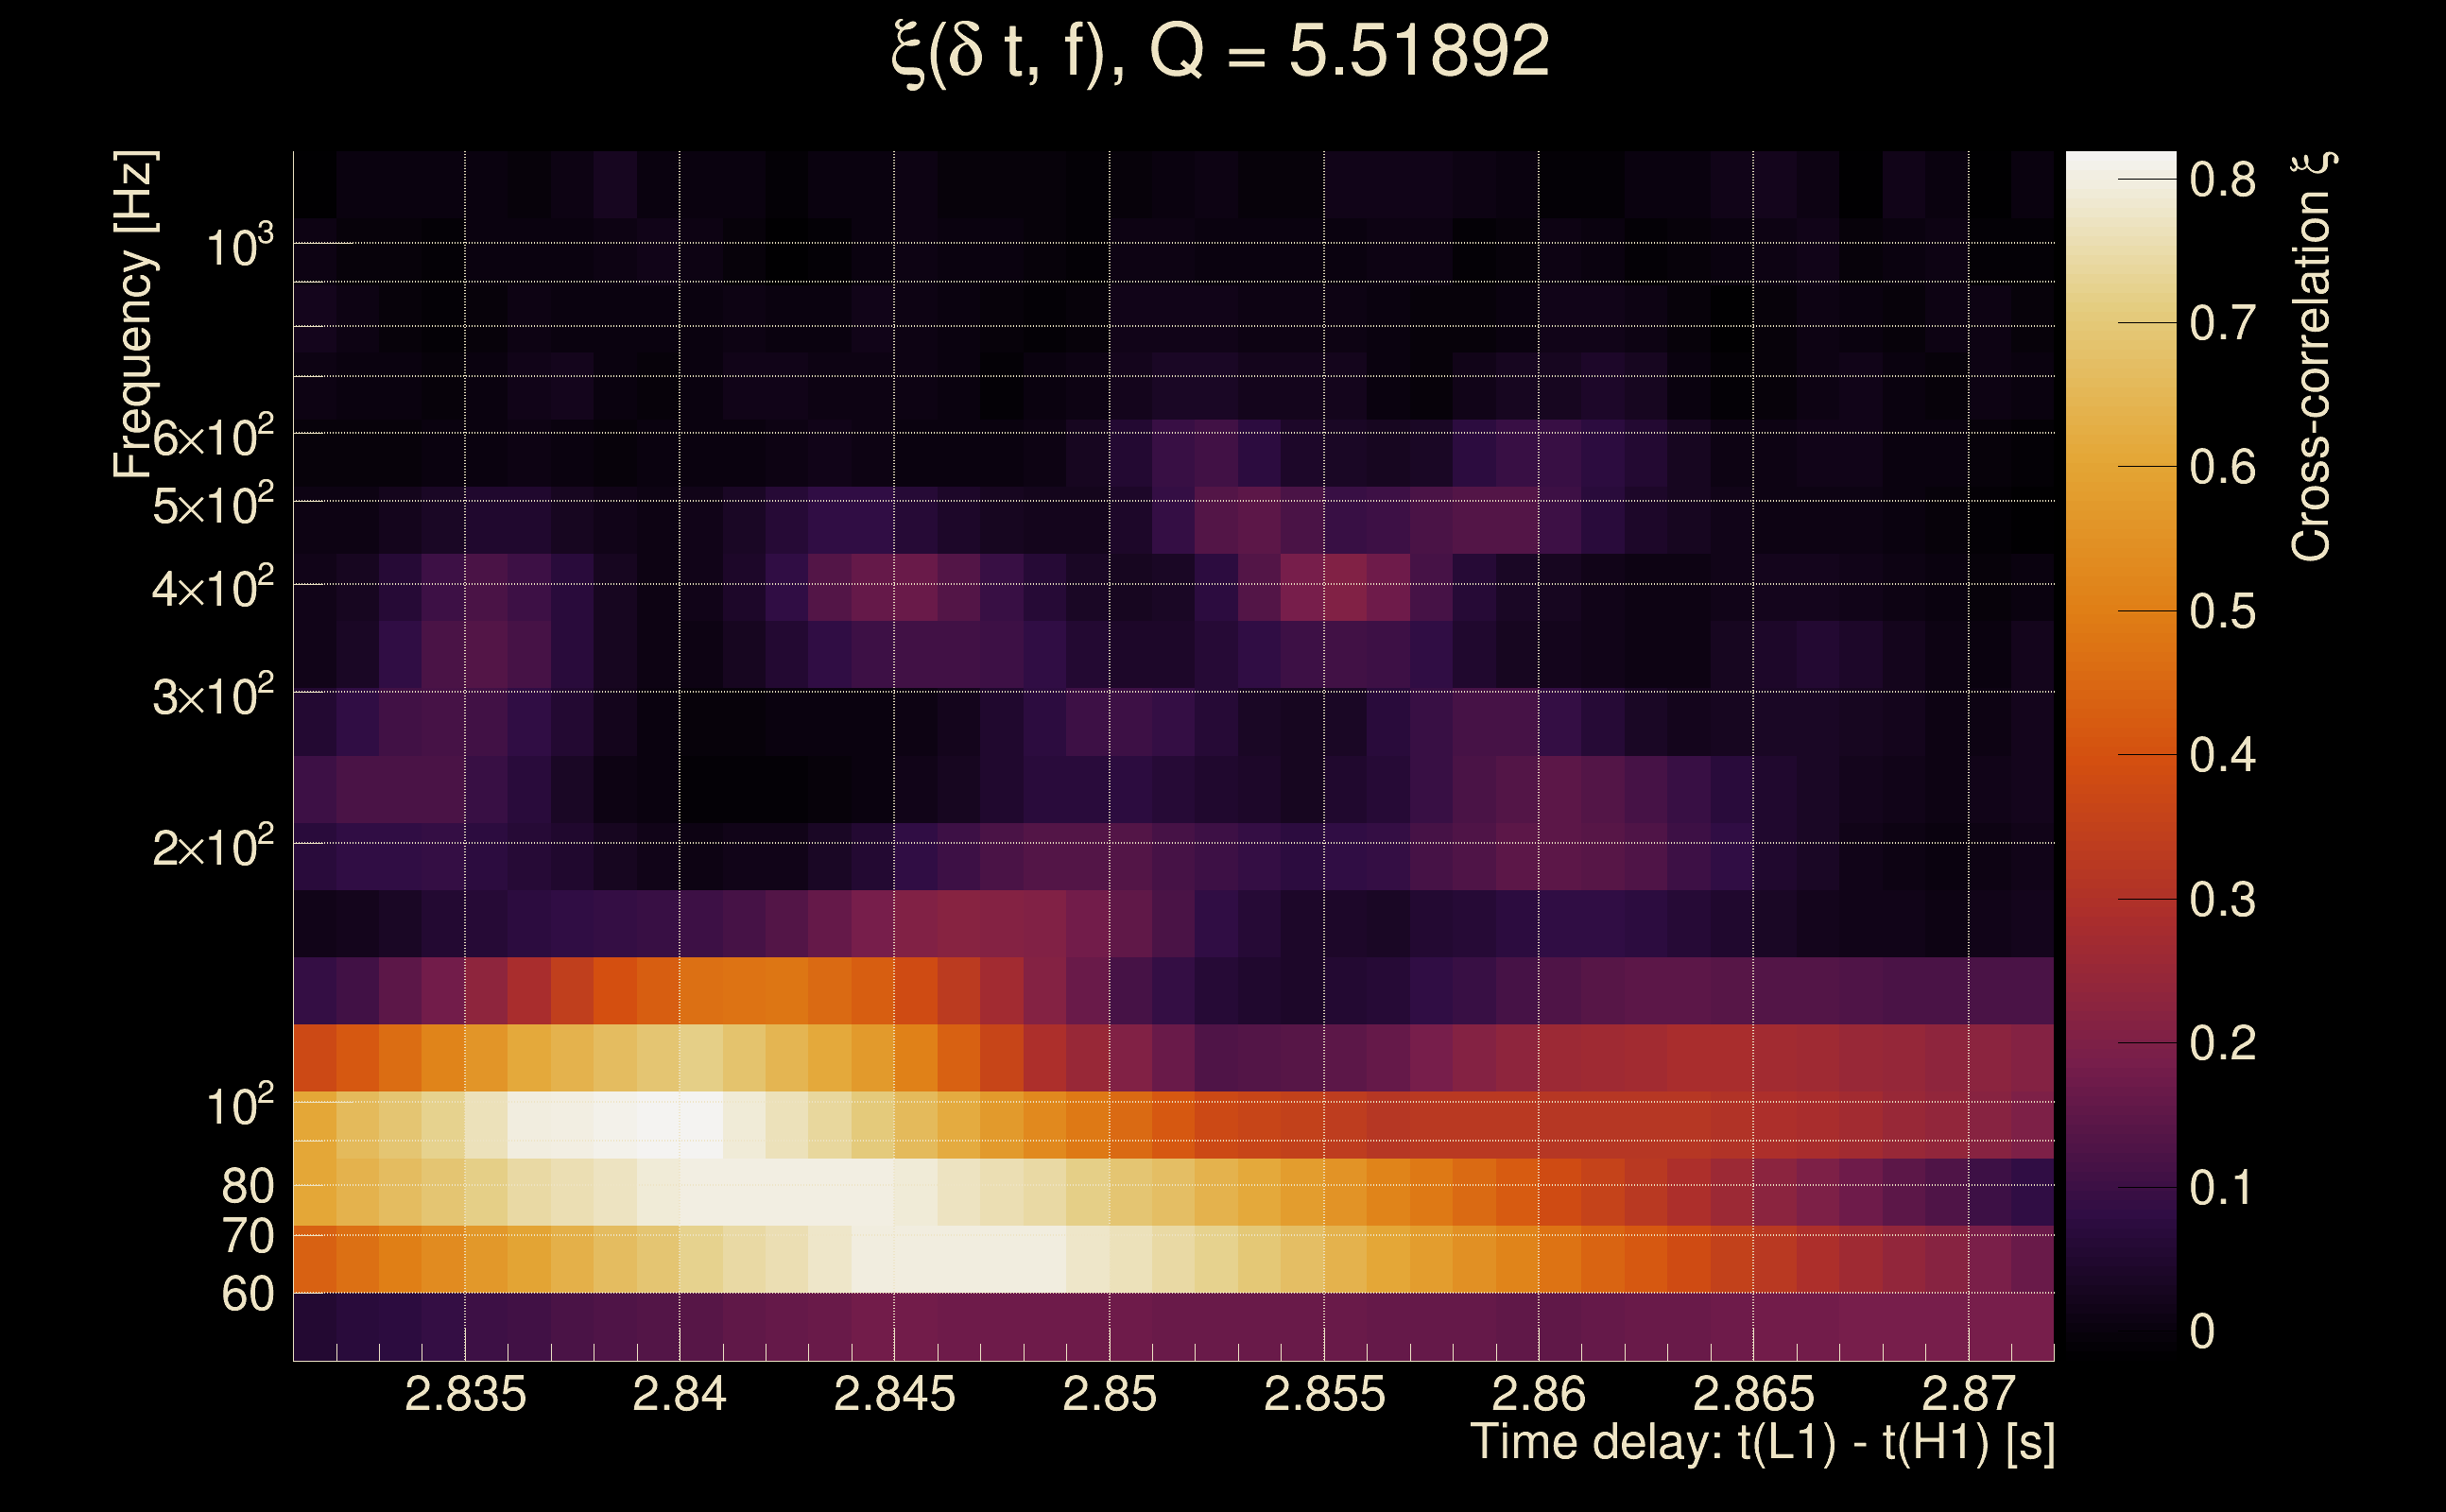
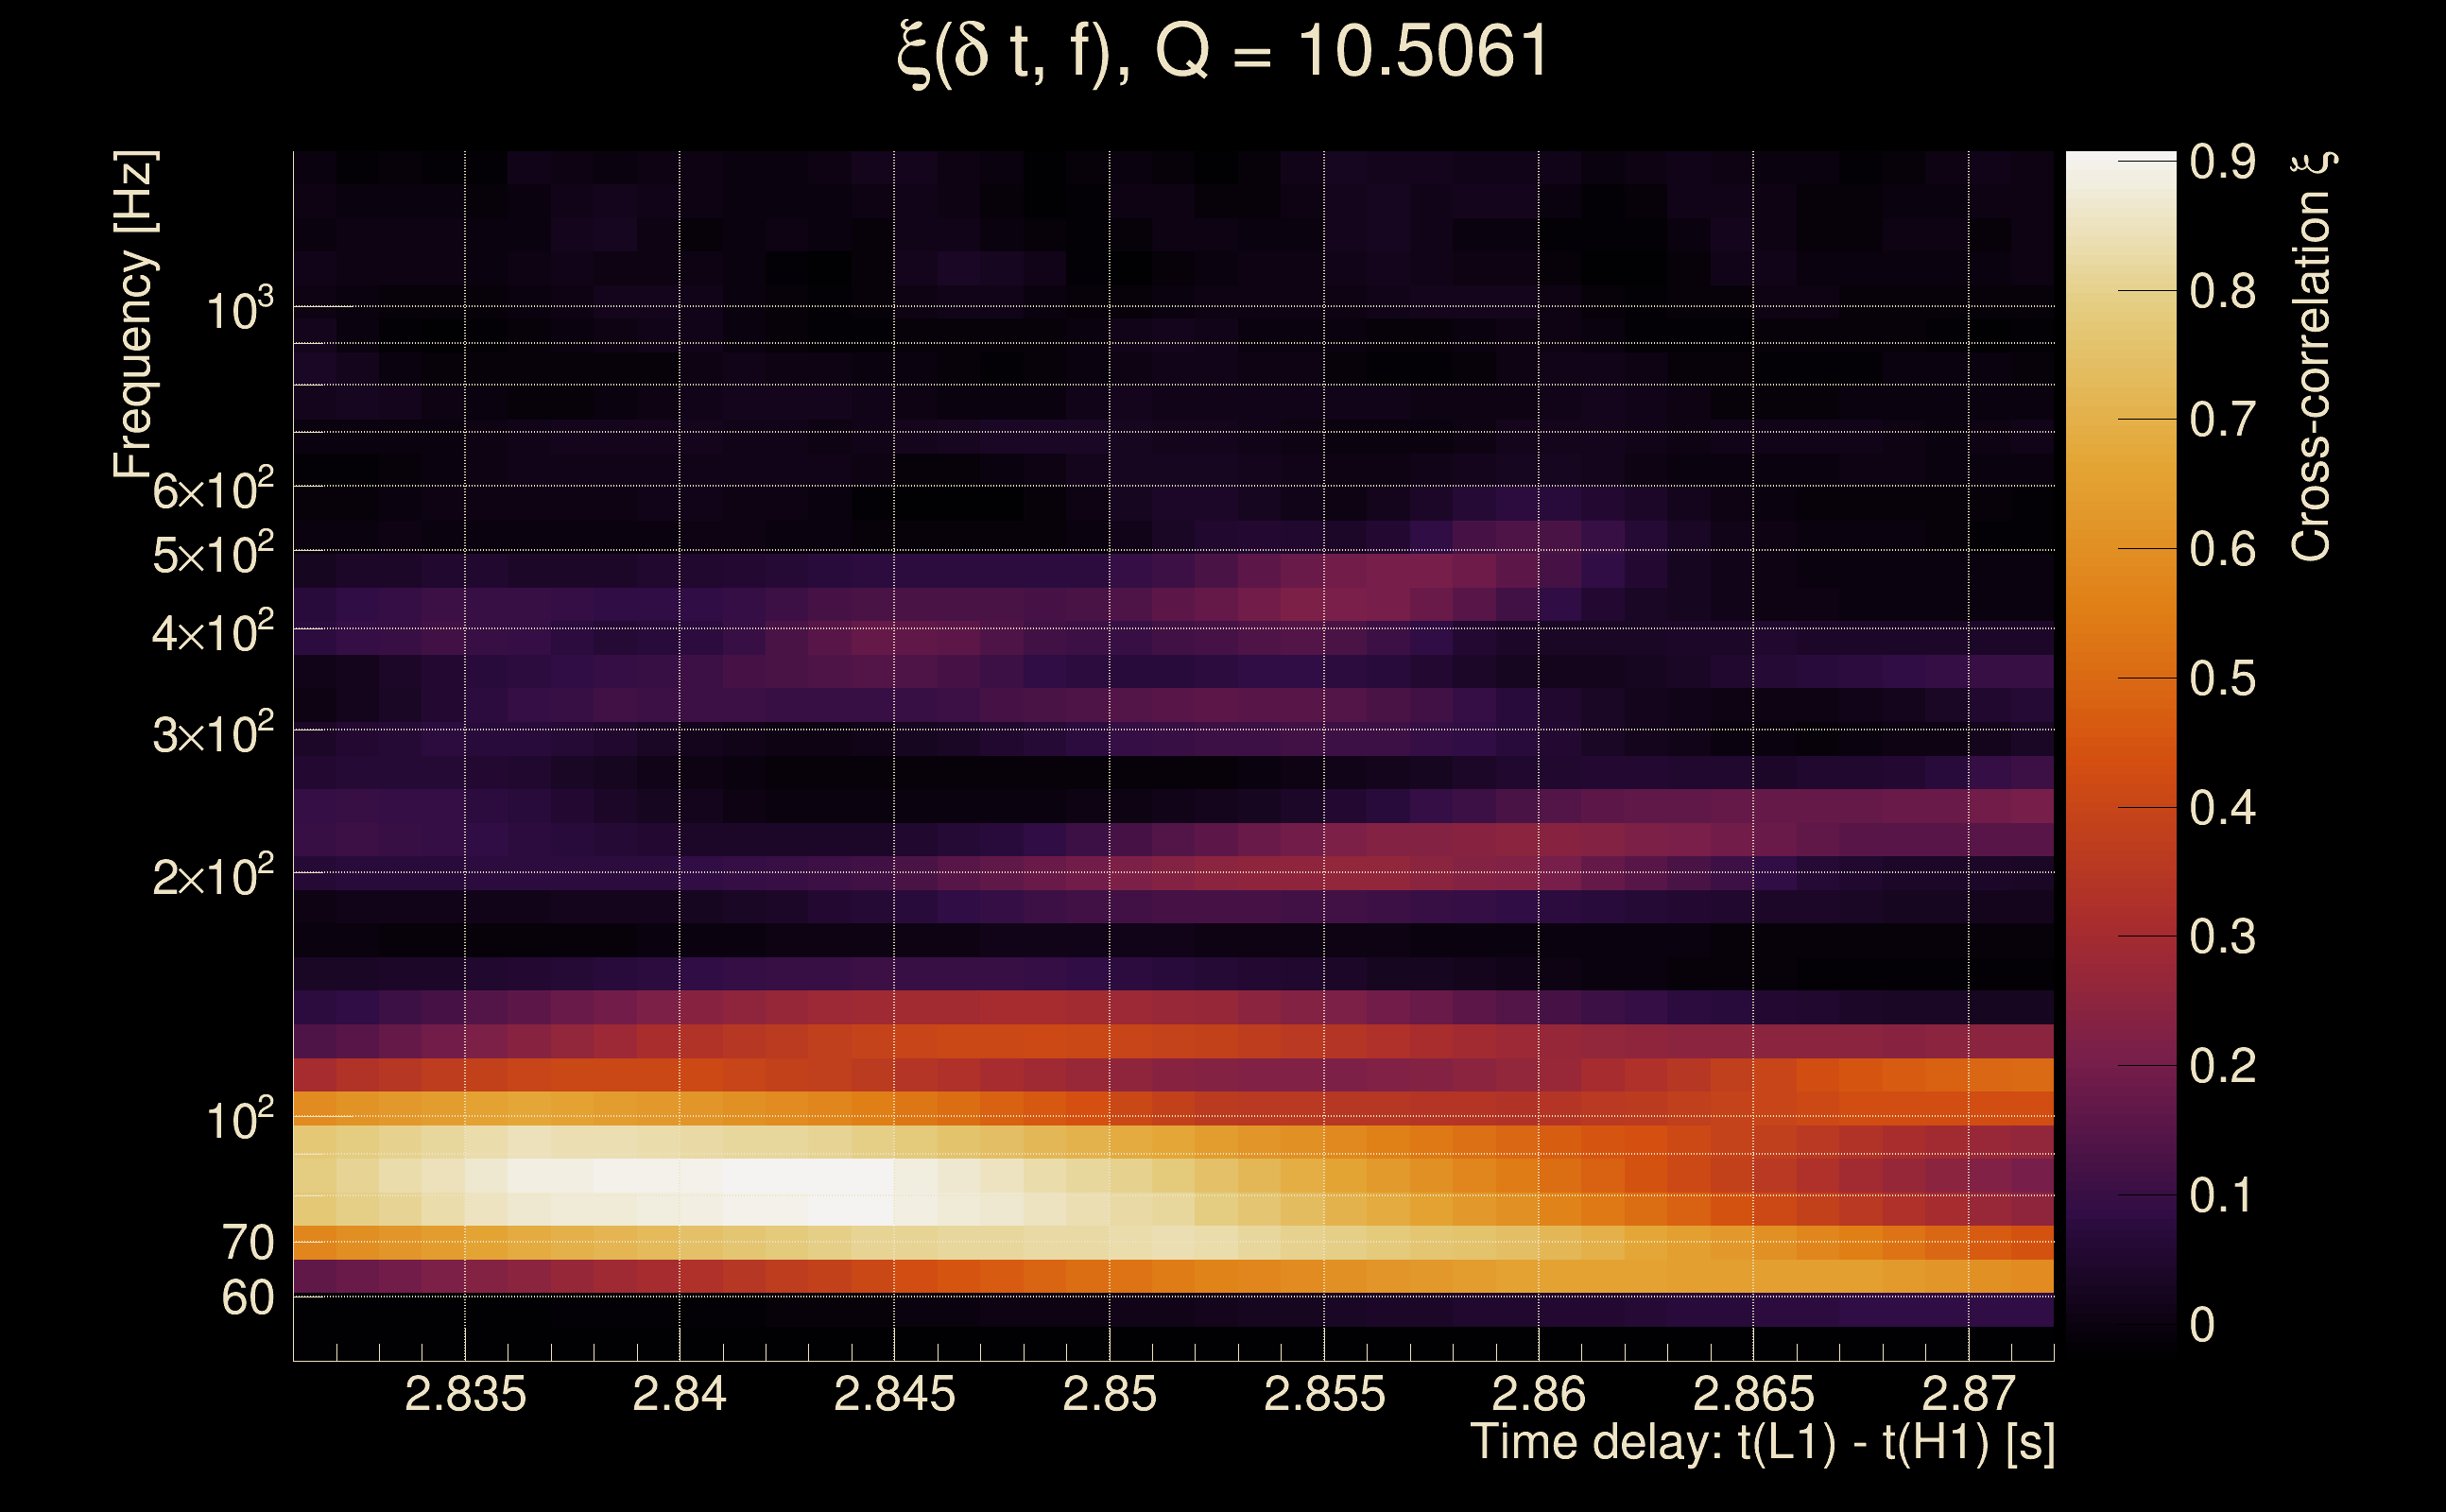
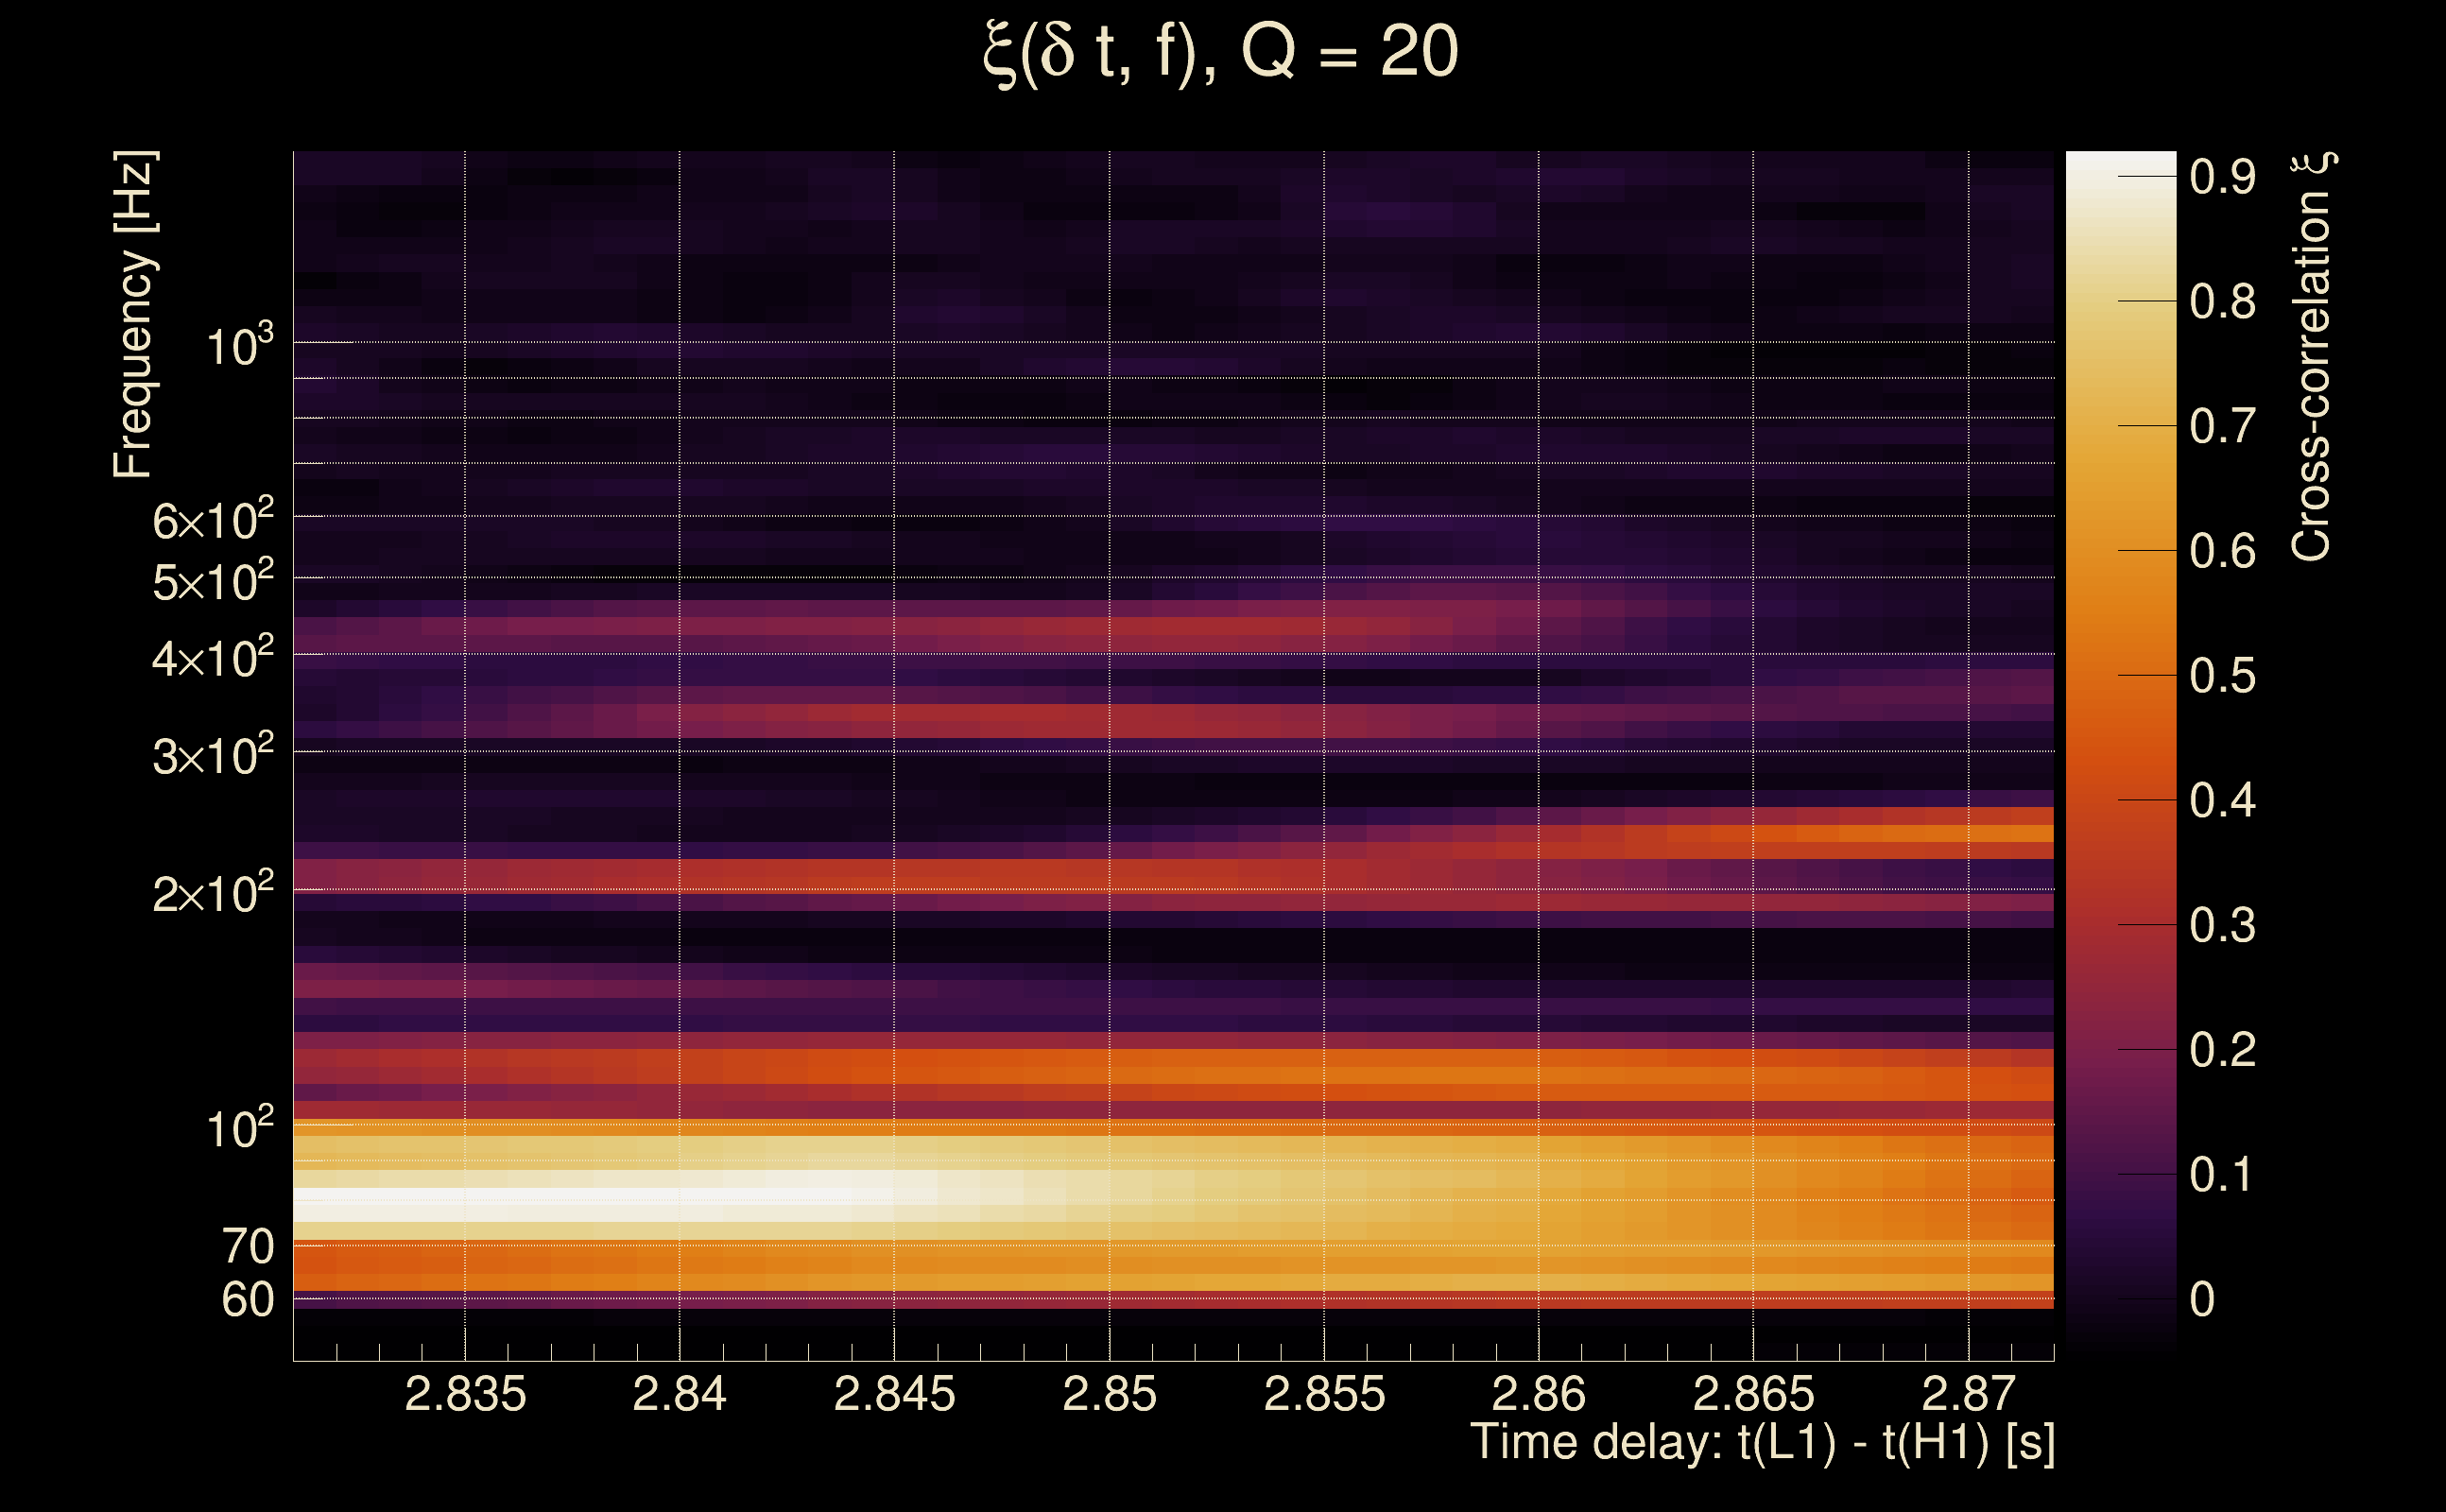
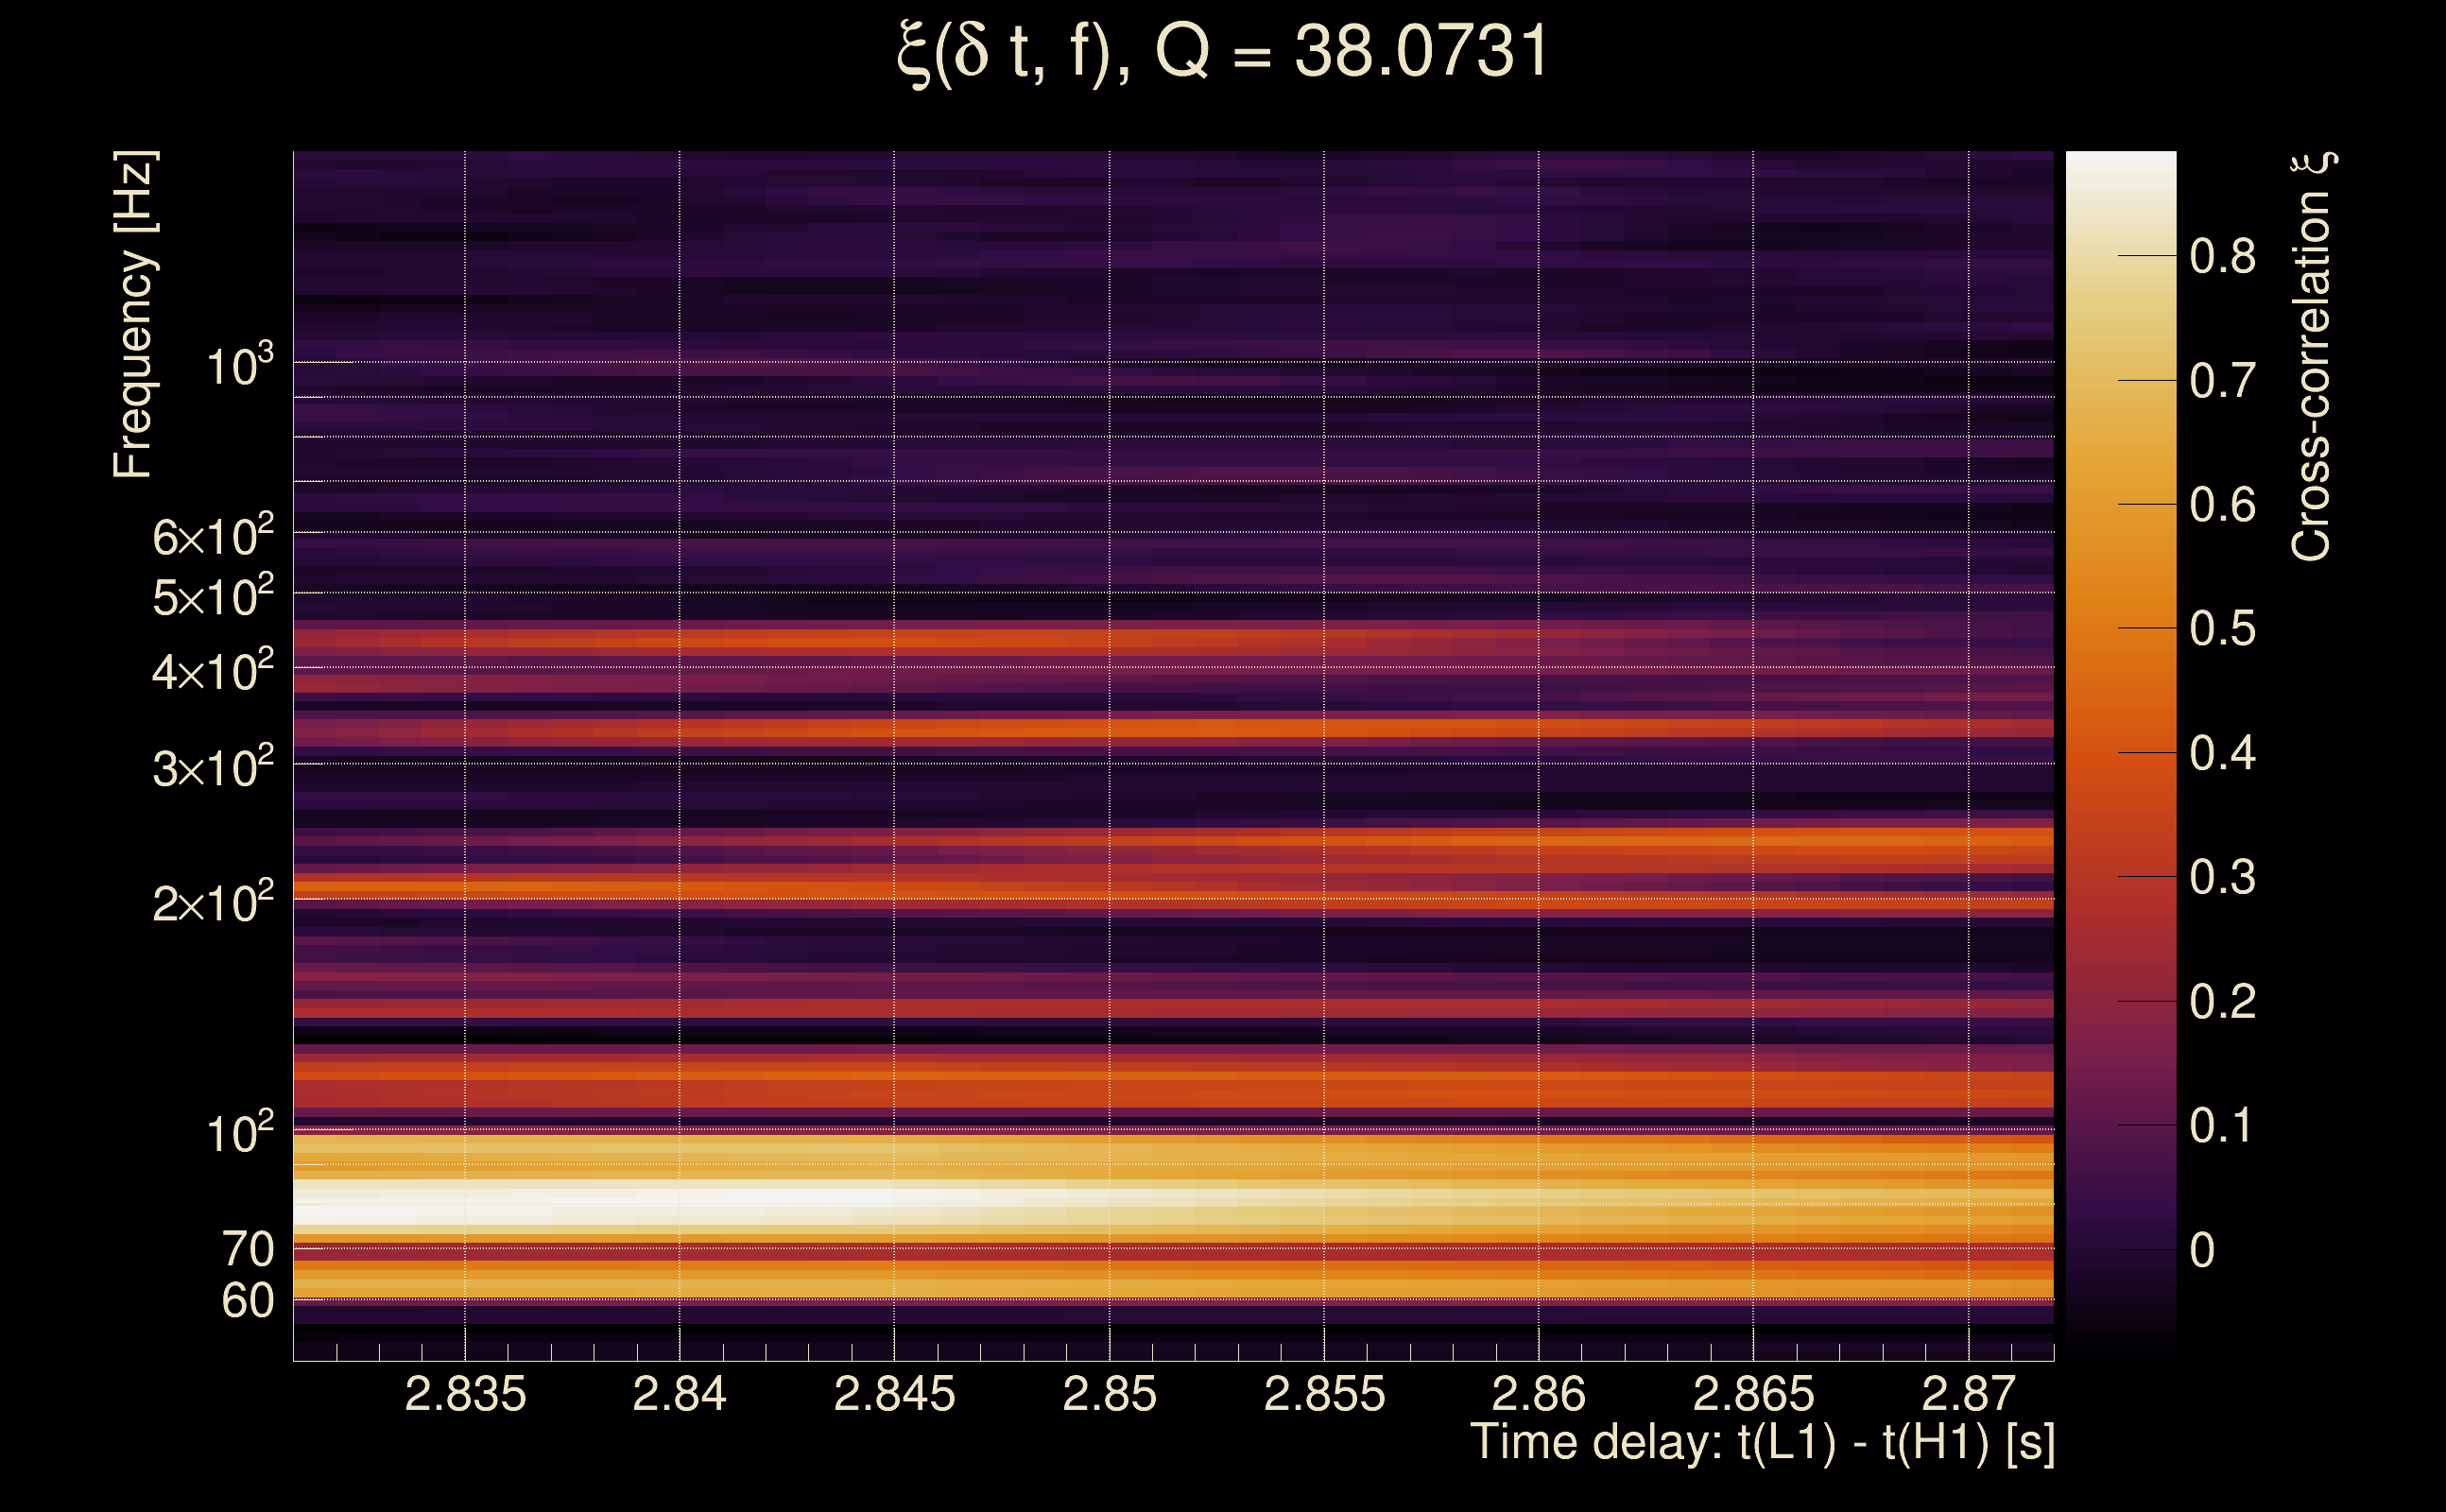
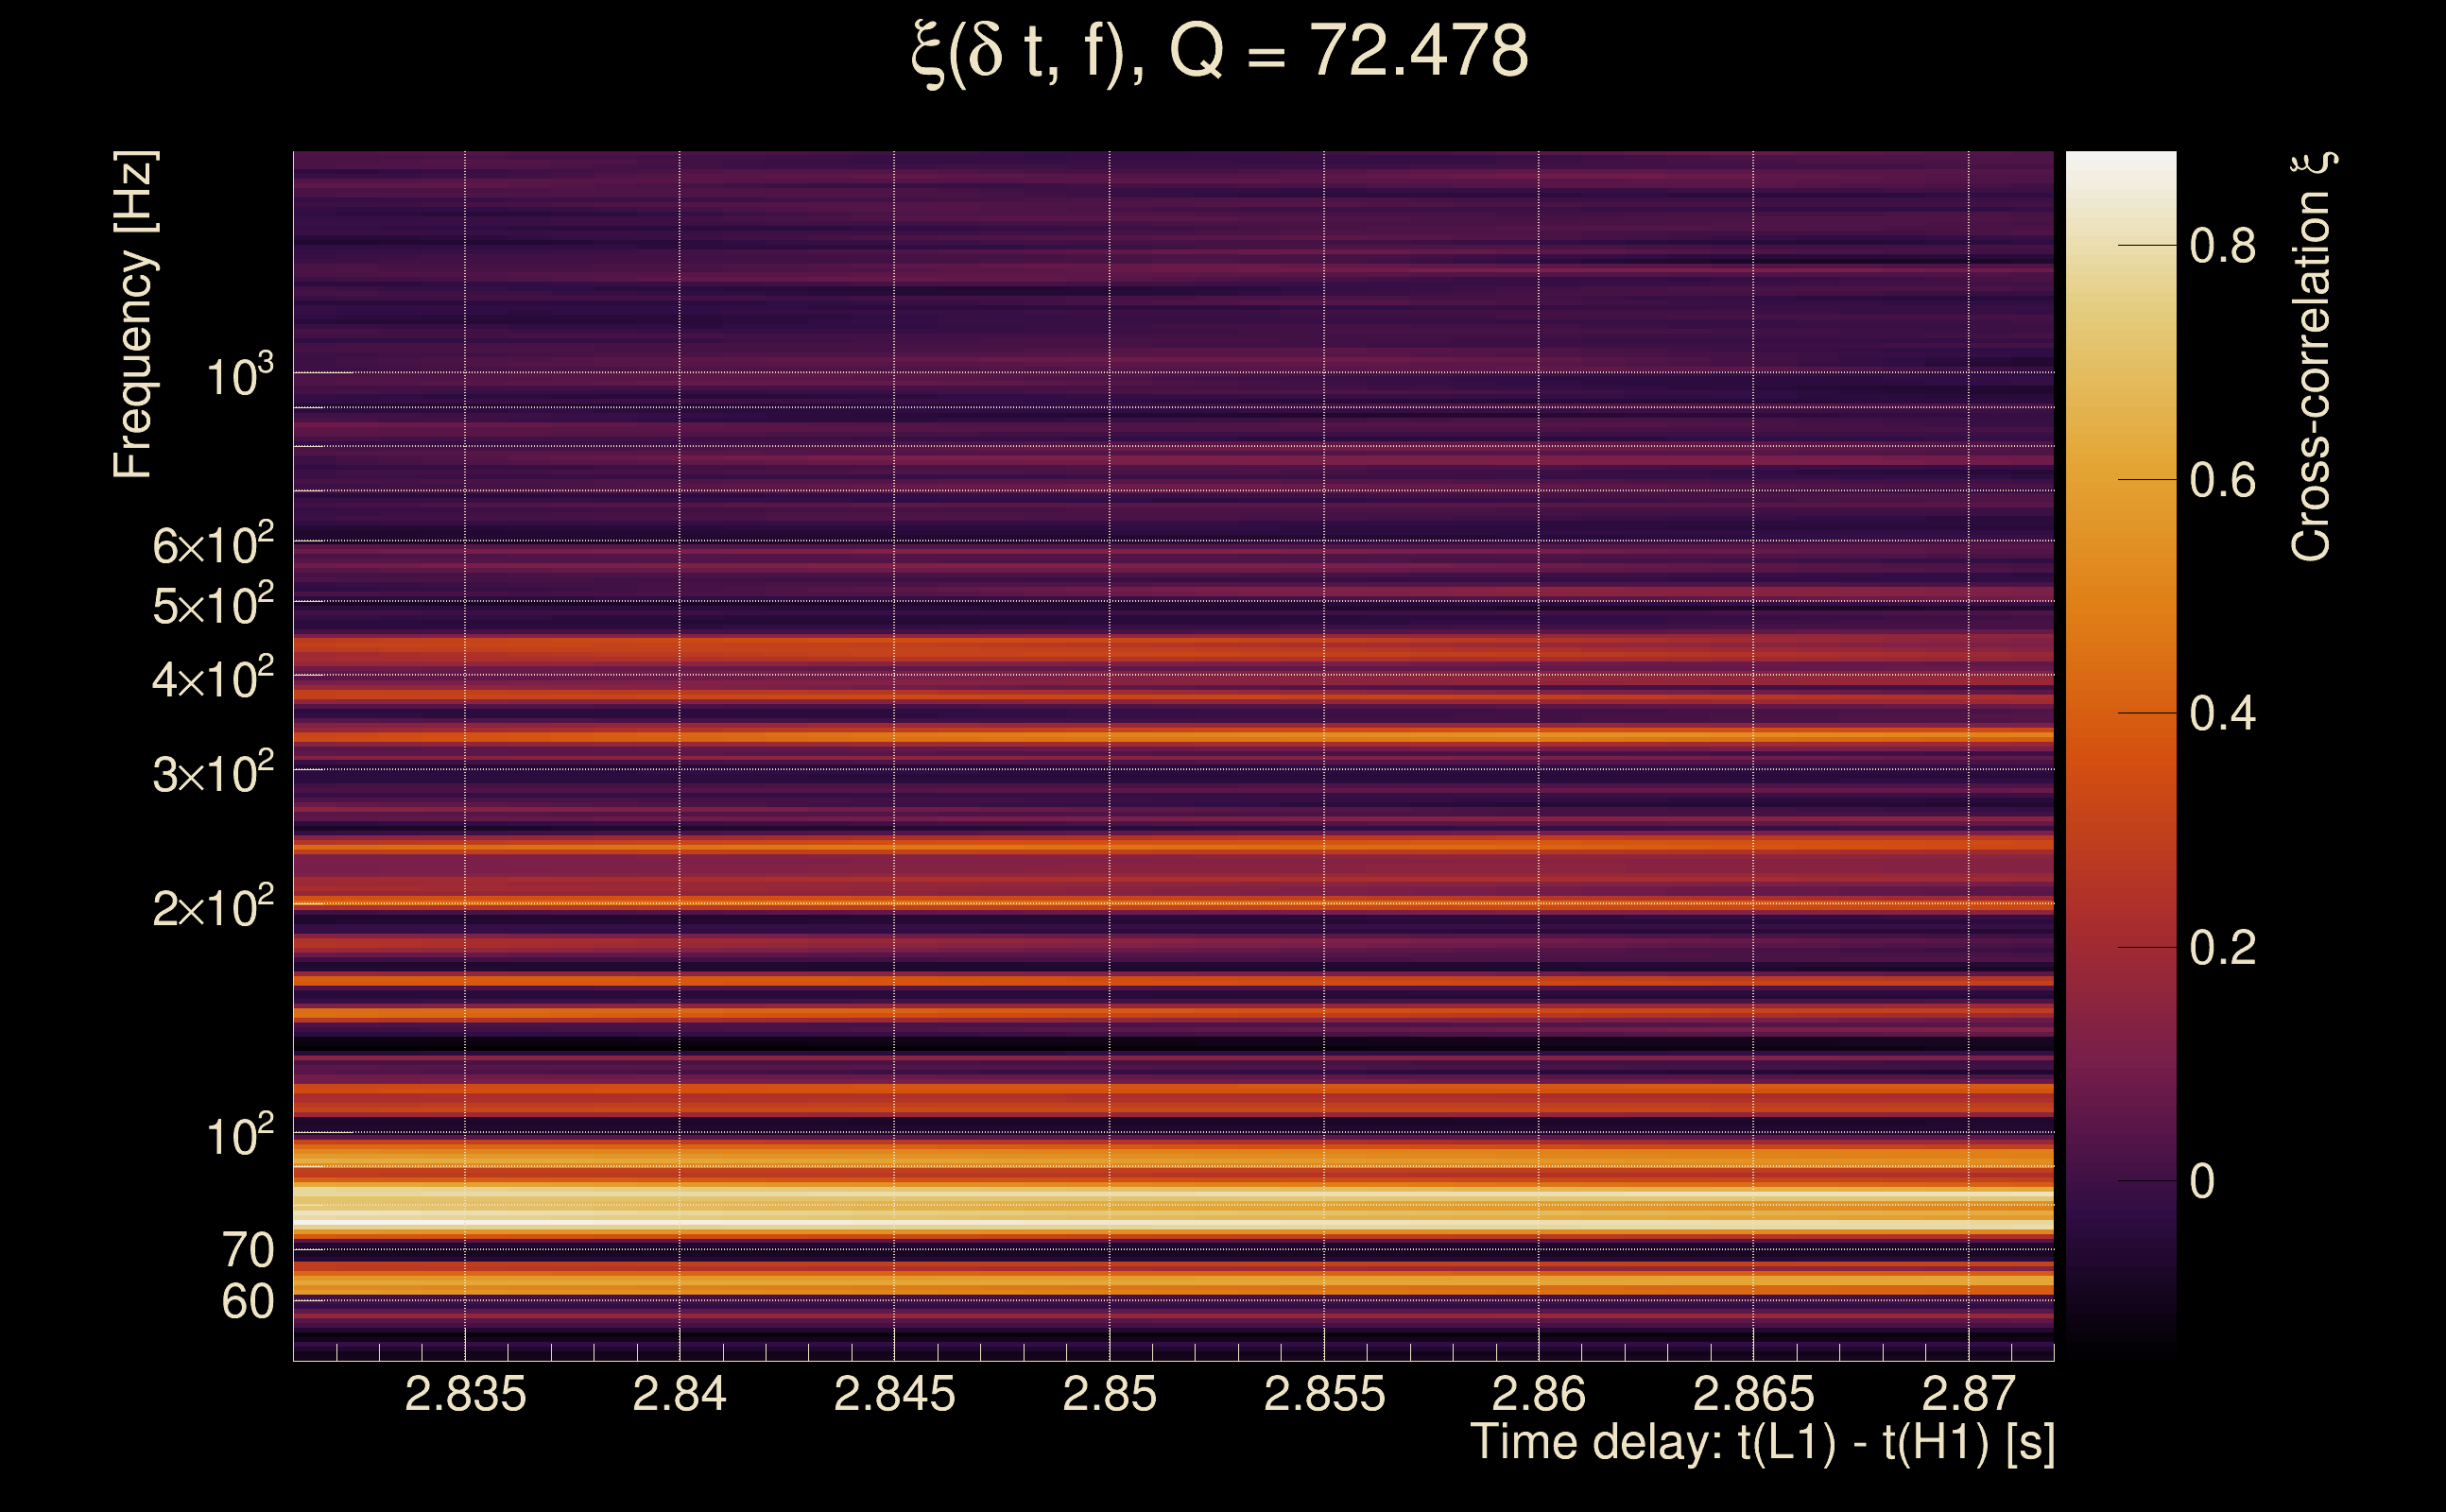
| Event time t(H1): | GPS = 1378654038 (Wed Sep 13 15:27:00 2023 ) → GPS = 1378654048 (Wed Sep 13 15:27:10 2023 ) |
| Event time t(L1): | GPS = 1378654038 (Wed Sep 13 15:27:10 2023 ) → GPS = 1378654048 (Wed Sep 13 15:27:10 2023 ) |
| Omicron analysis time window (H1): | GPS = 1378654035 → GPS = 1378654051 |
| Omicron analysis time window (L1): | GPS = 1378654035 → GPS = 1378654051 |
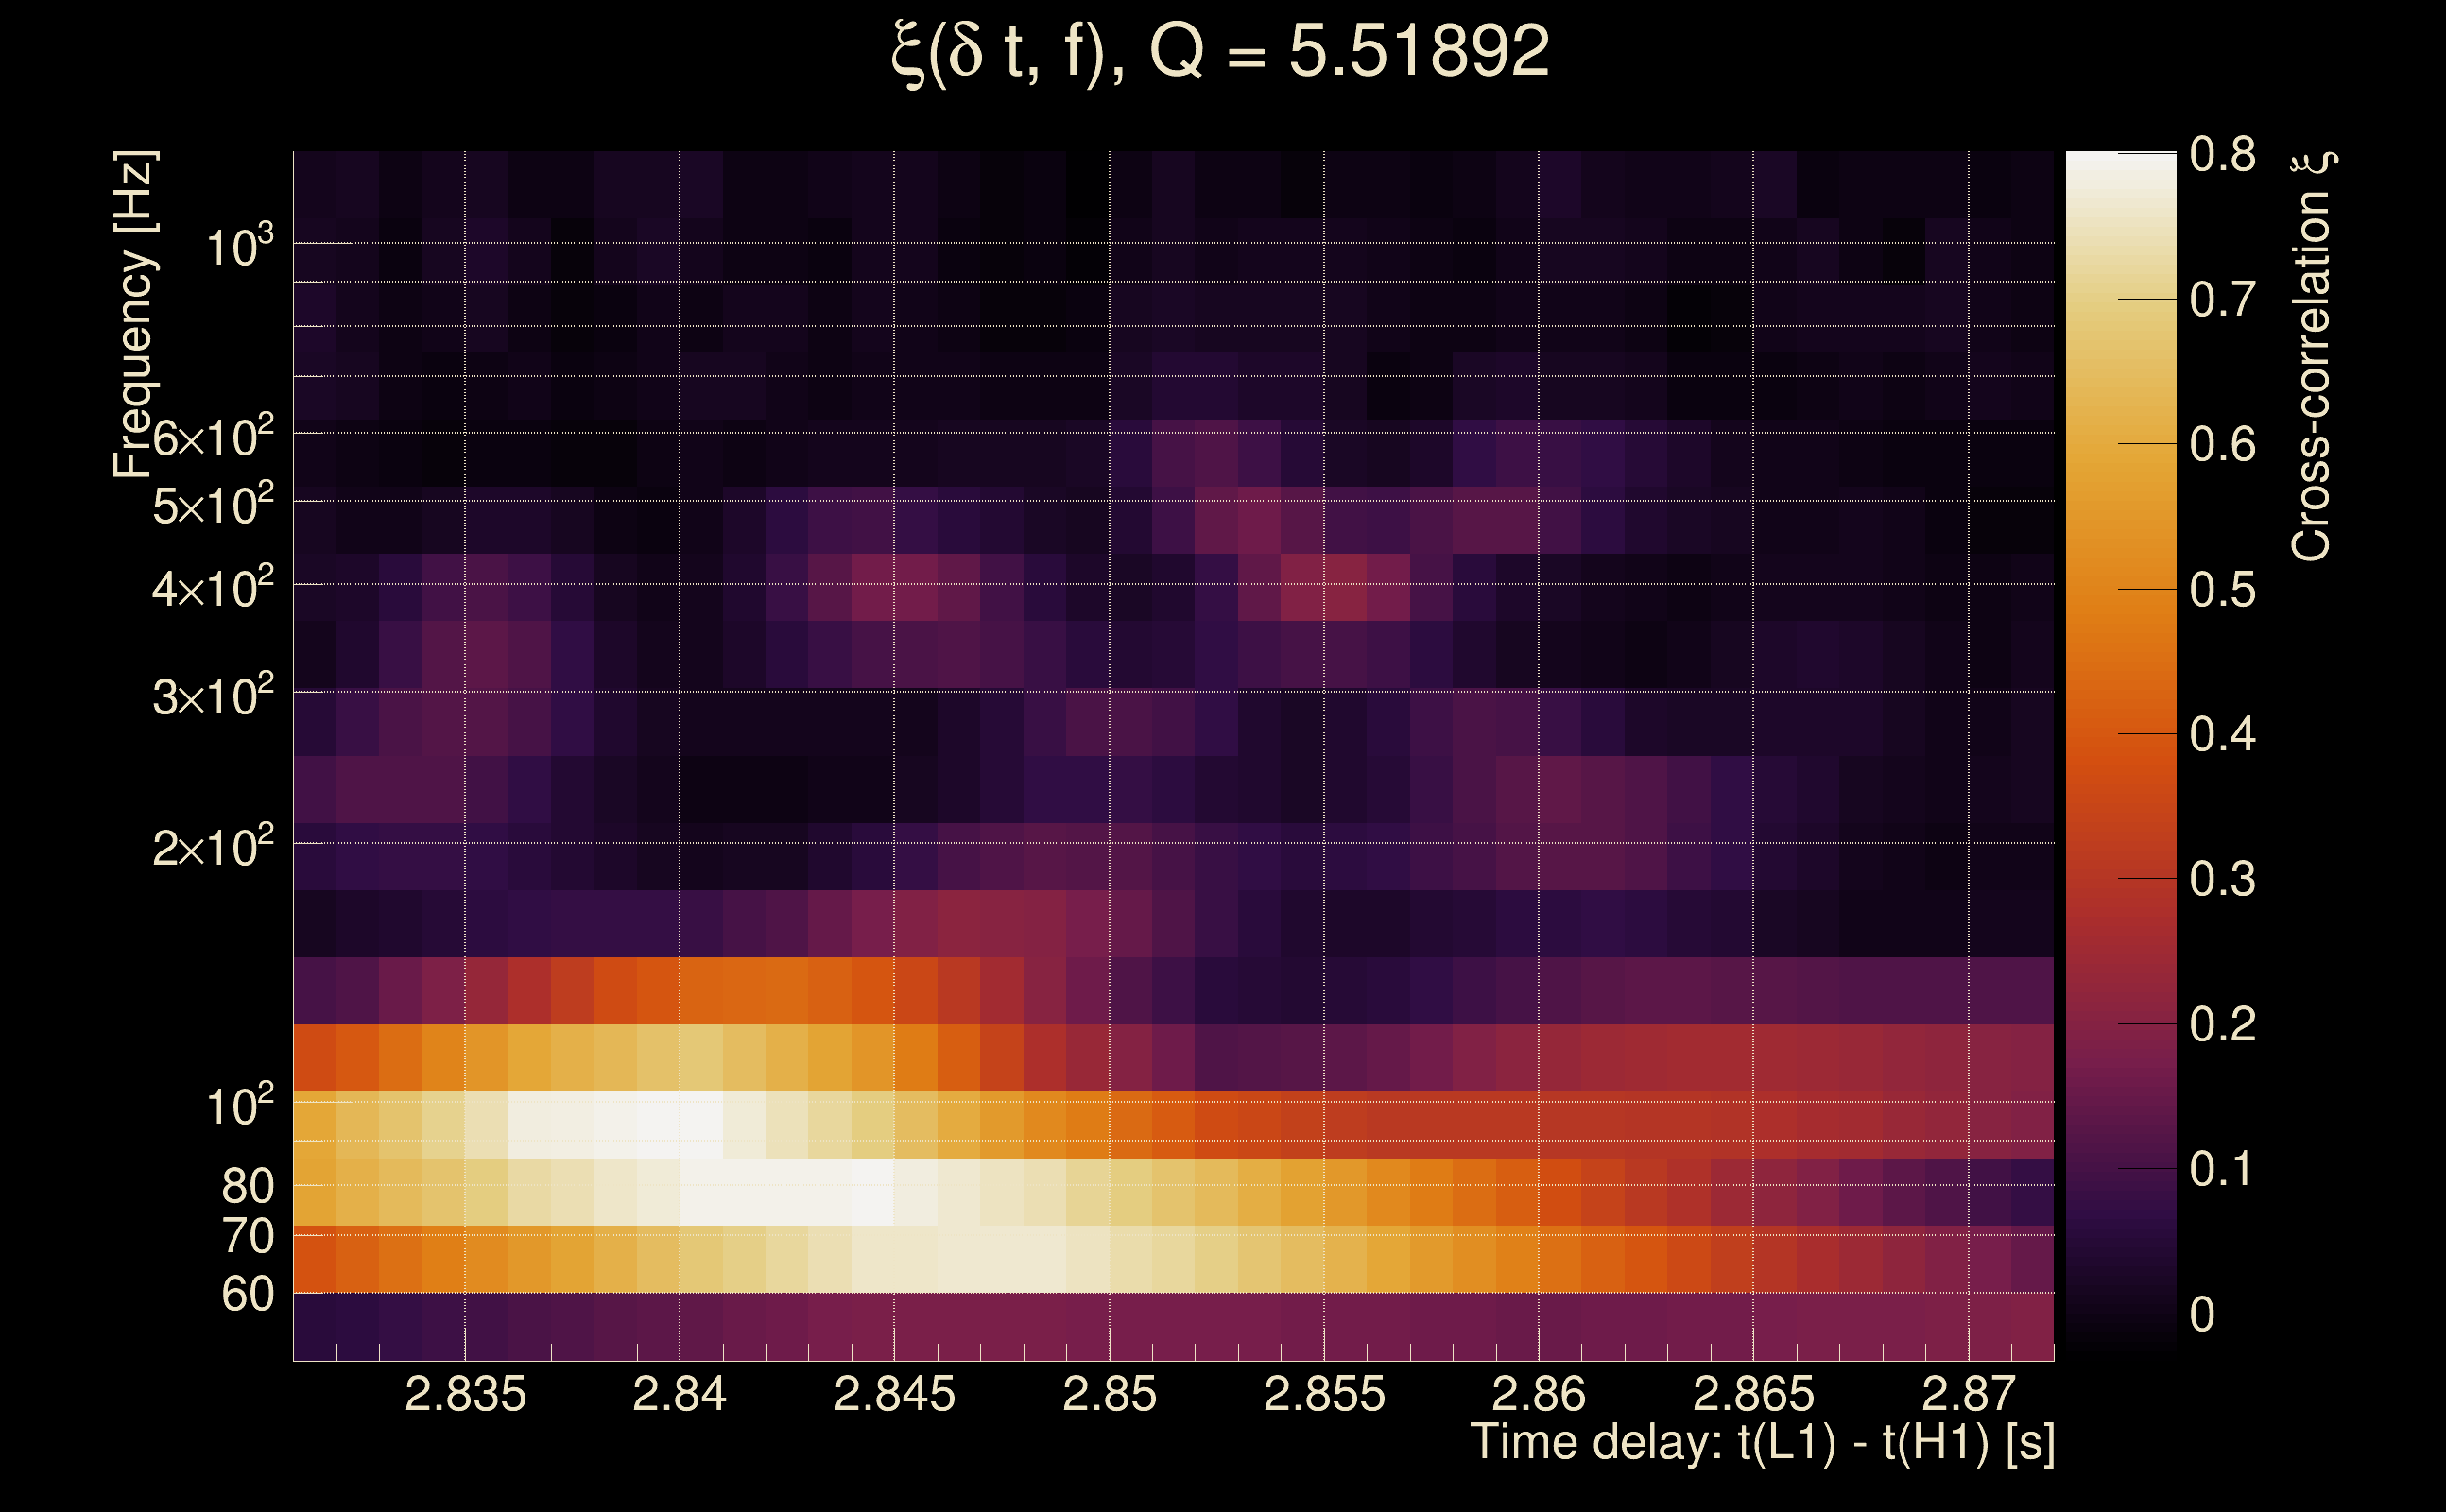
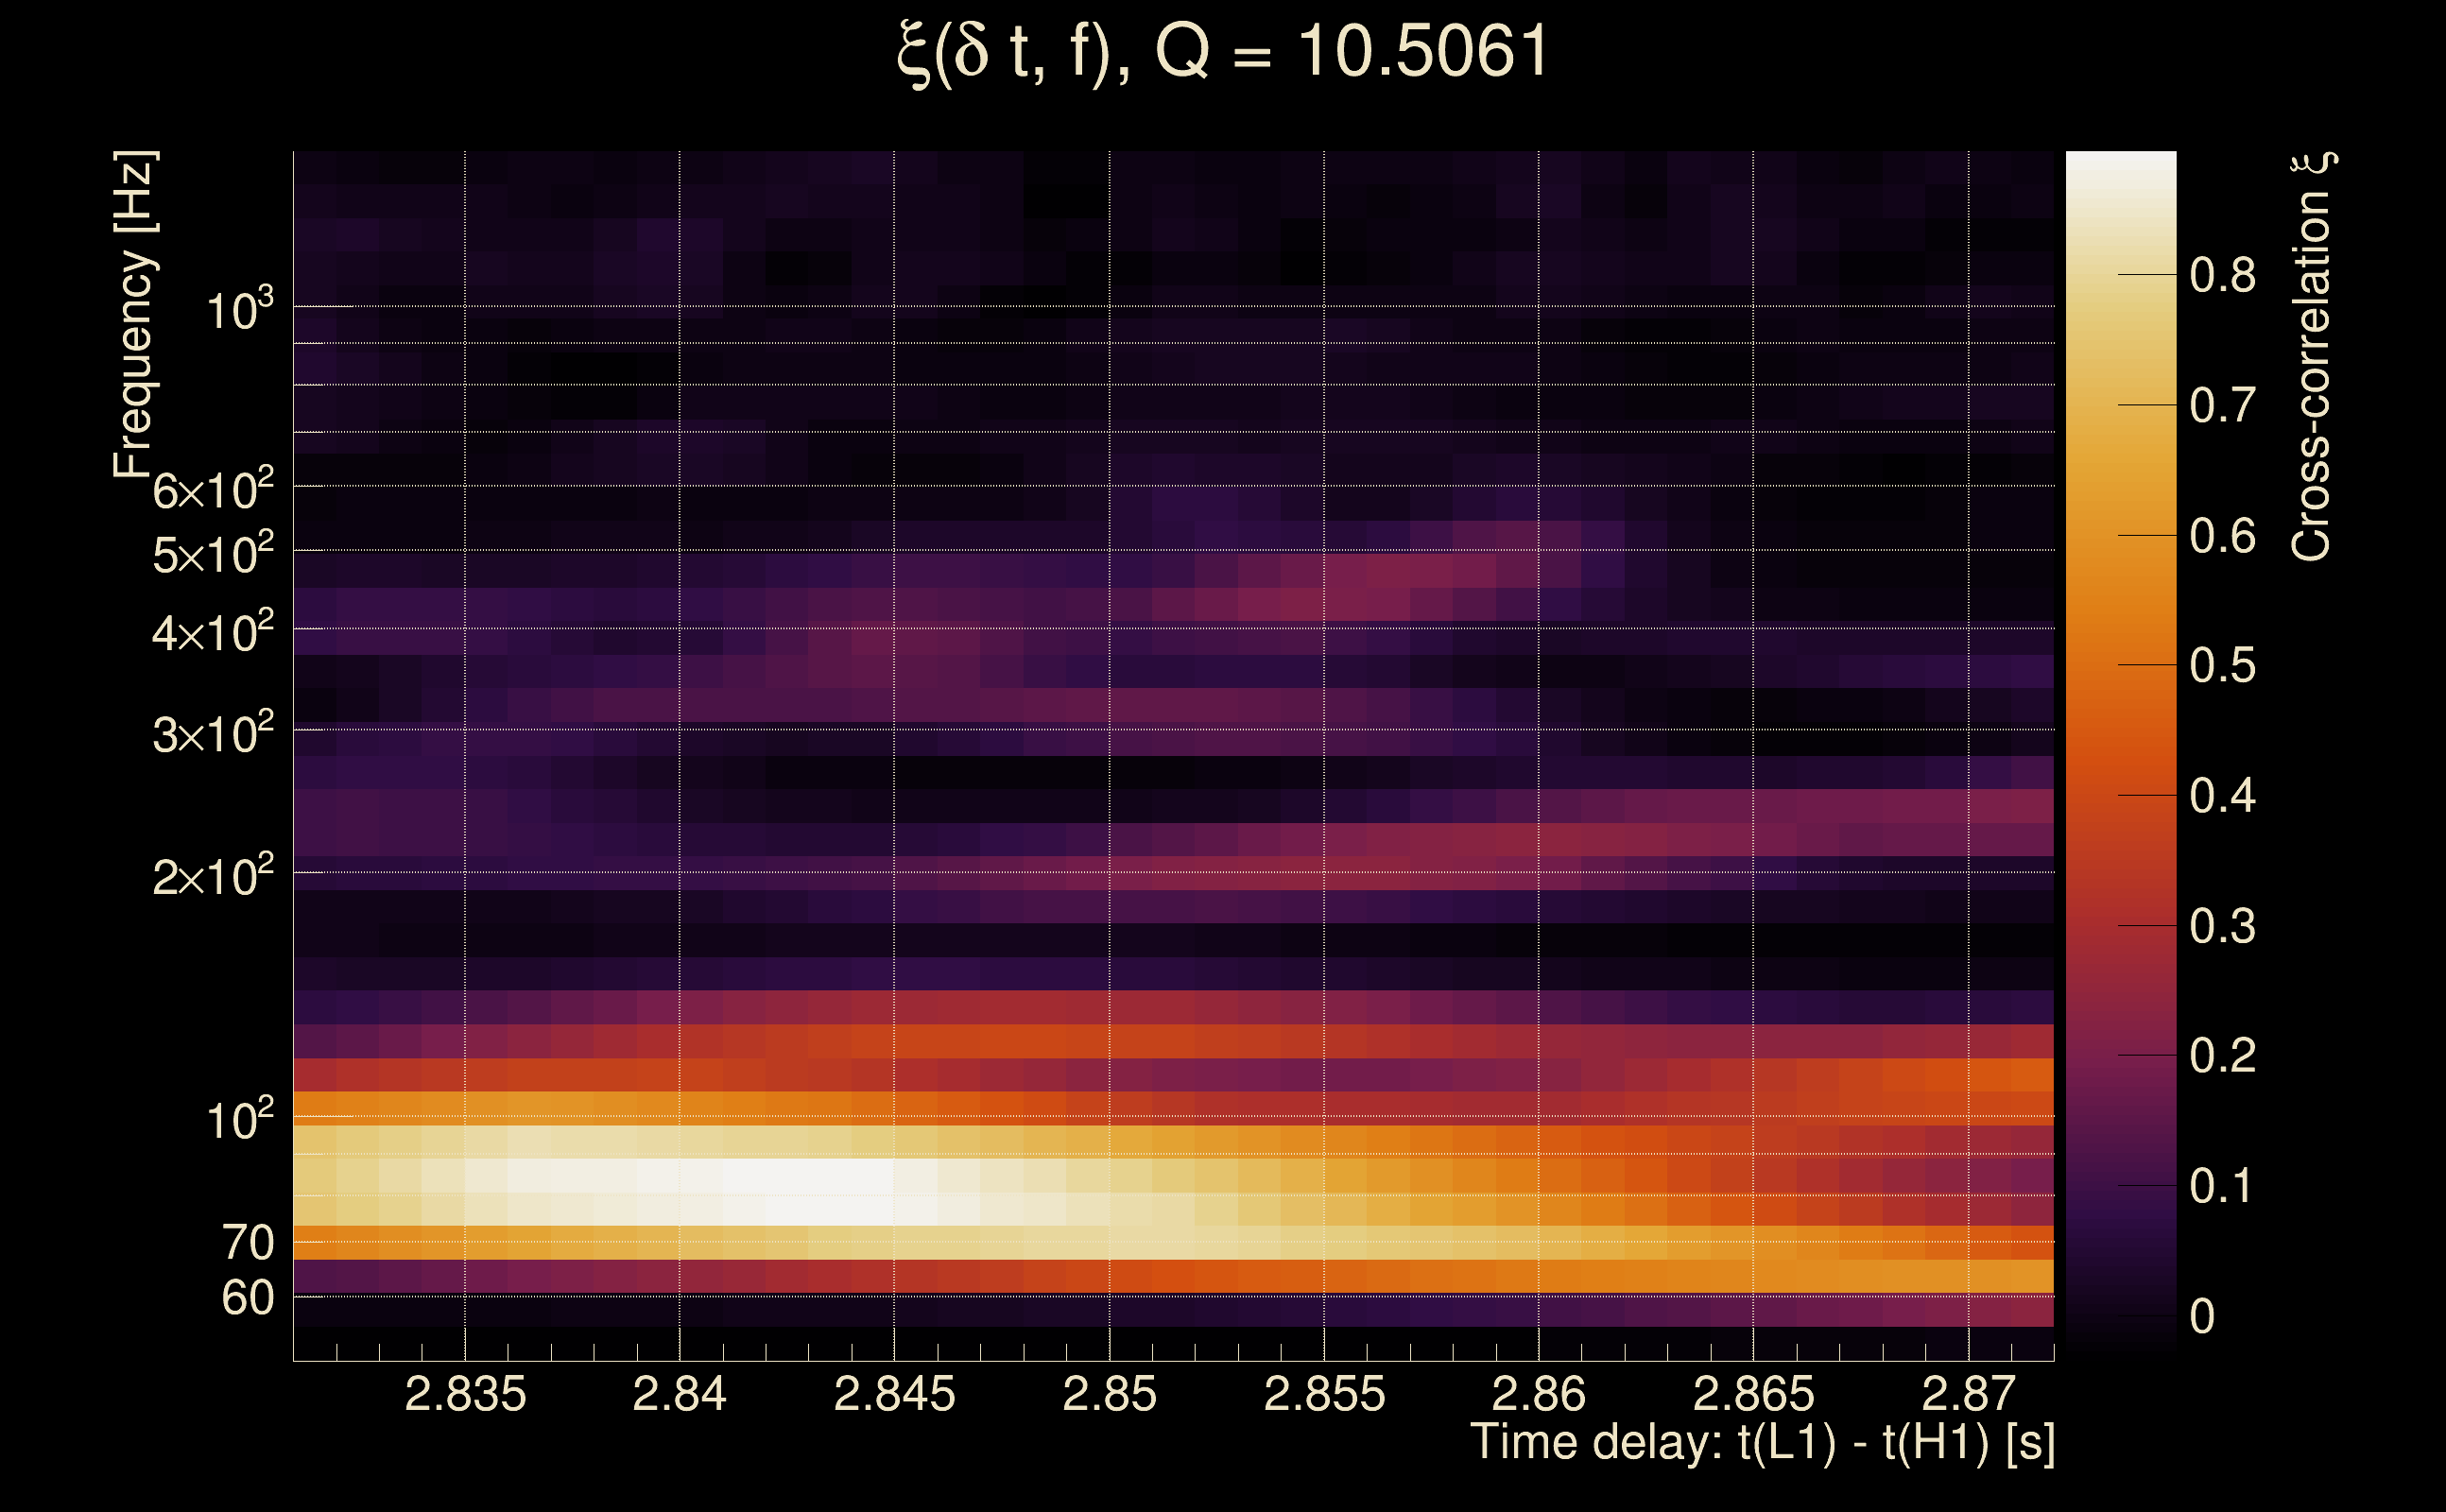
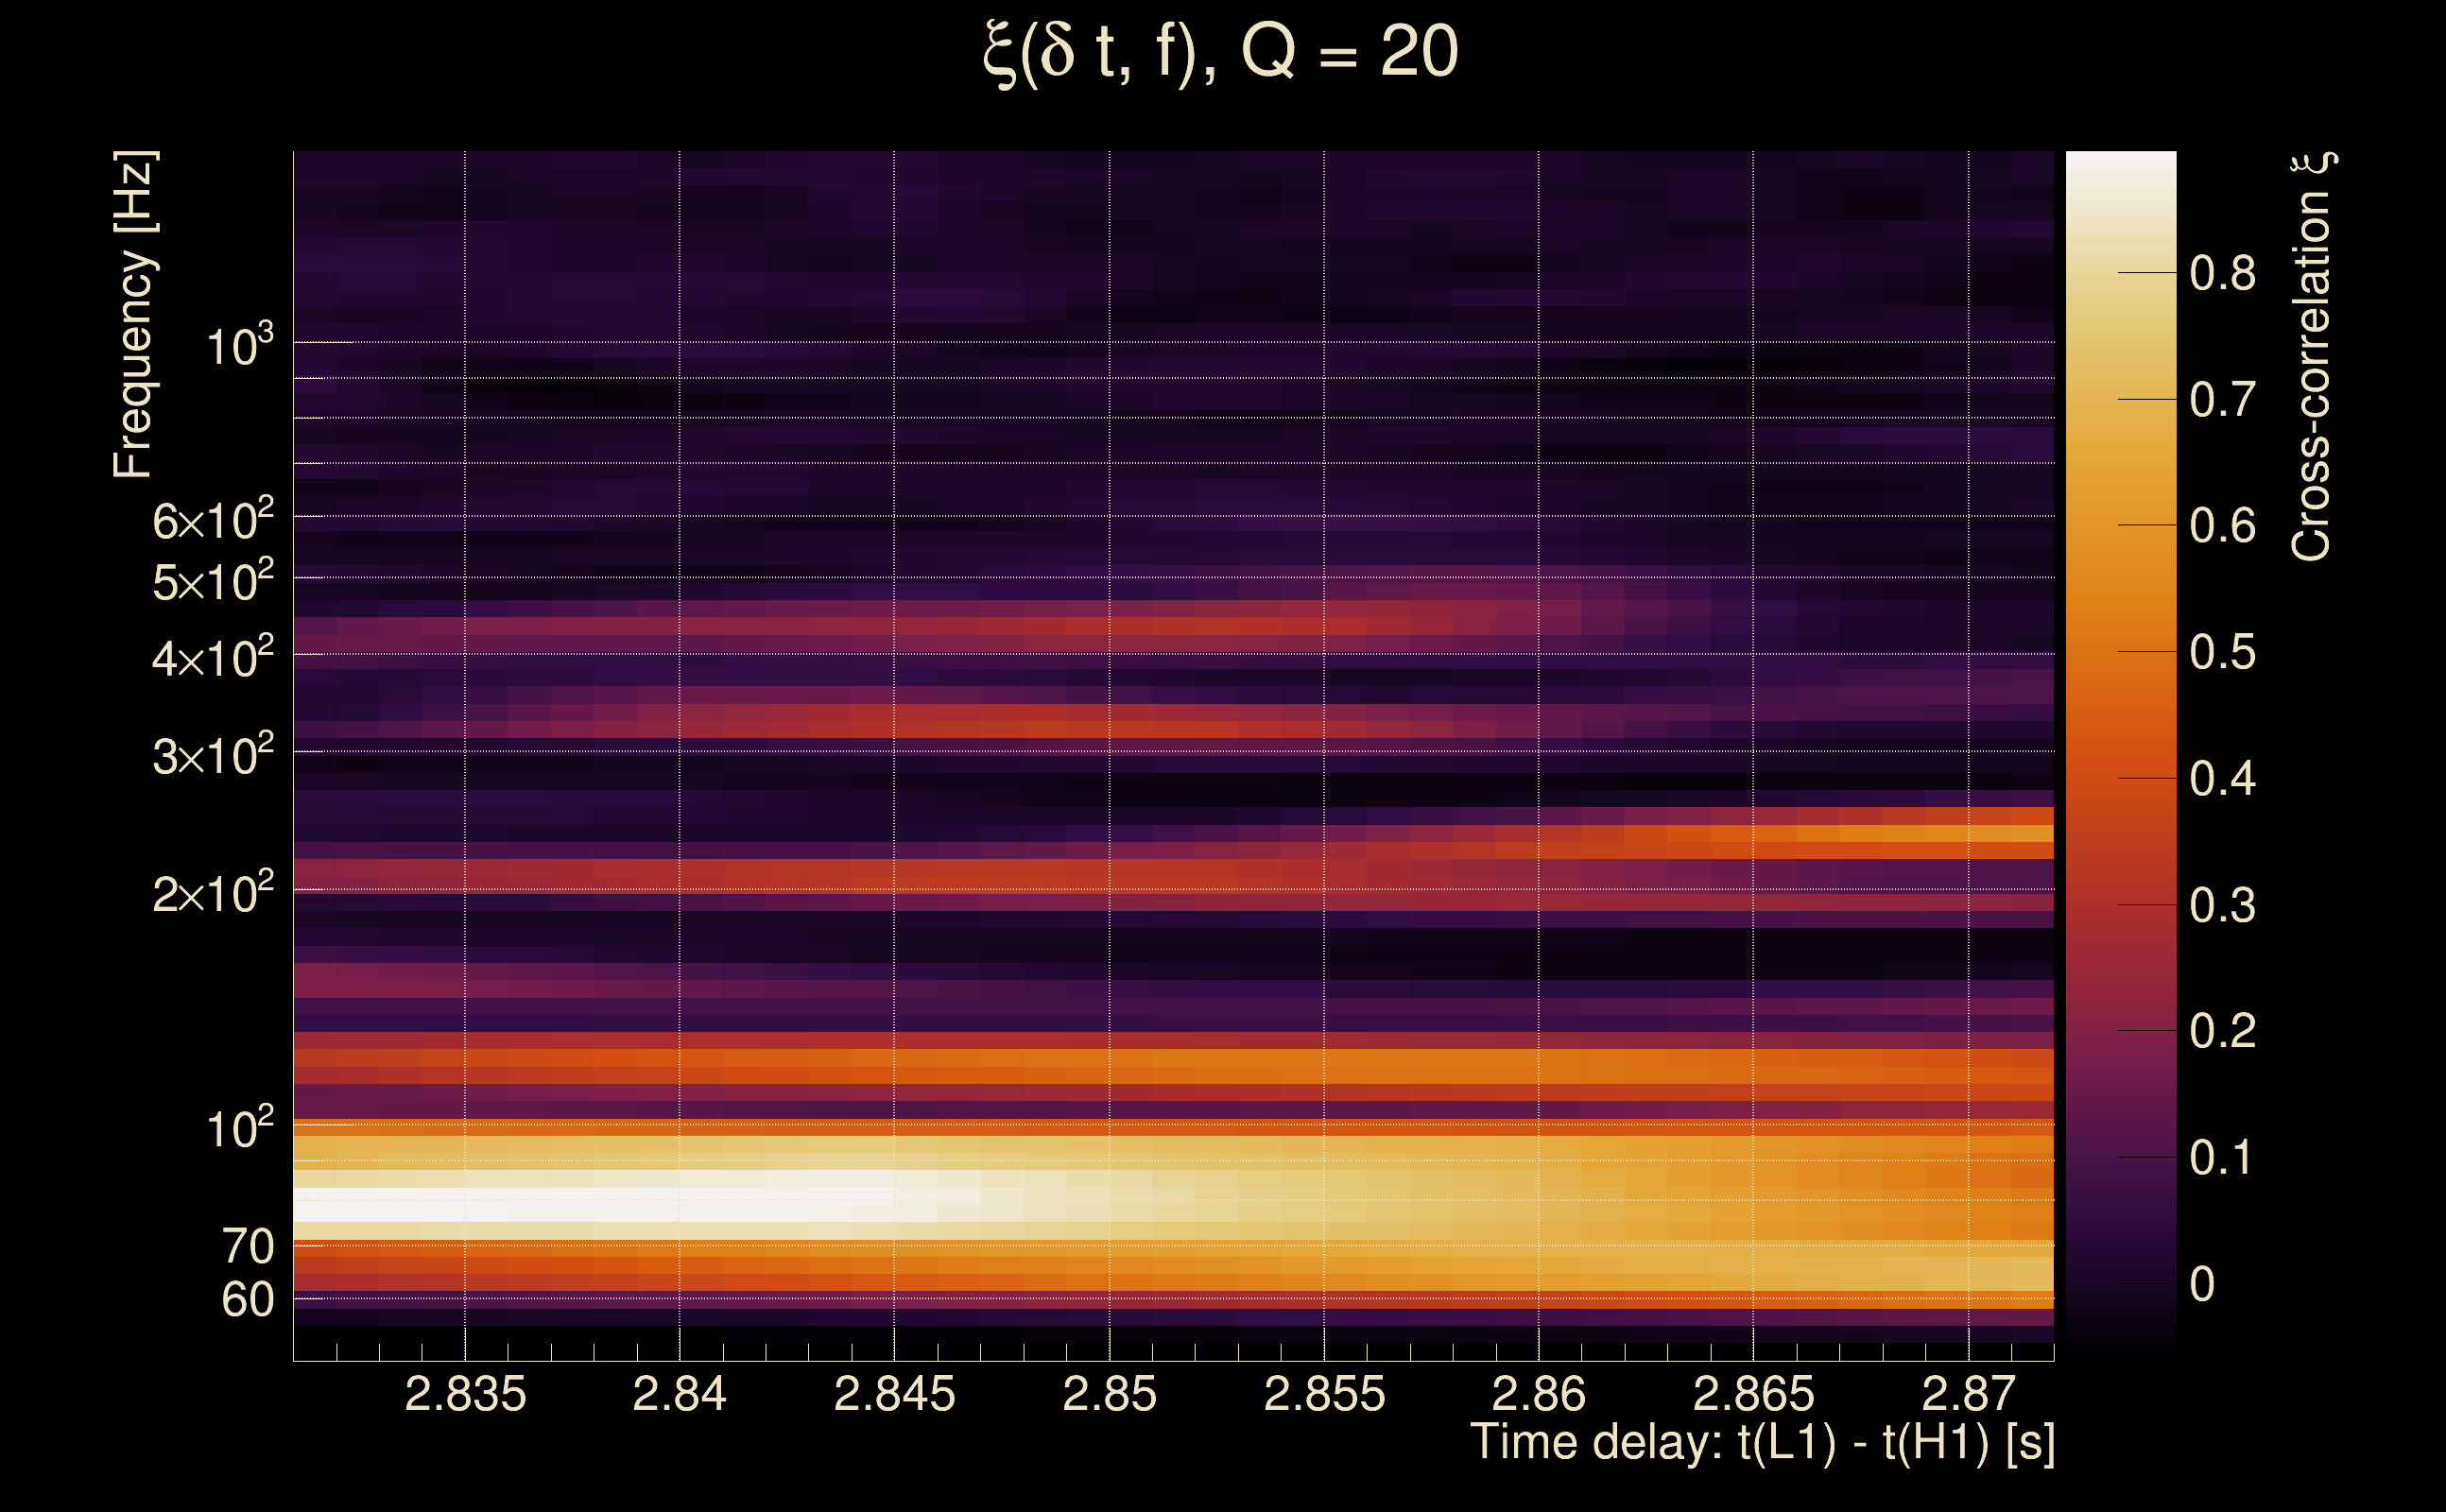
| Time delay between detectors t(L1) - t(H1): | 2.85113 s (slice index = 46 / 217), δt_gw = -0.000872734 s |
| Time delay uncertainty: | 0.00590145 s |
| [targeted mode] Time delay probability: | 0.987671 (0.0154526 sigmas), δt_target = 0.0011785 s |
| Frequency: | 137.979 Hz |
| Ξ: | 0.316928 ± 0.084445 (variance = 0.00713096): Q0: 0.562503, Q1: 0.529276, Q2: 0.574738, Q3: 0.542567, Q4: 0.344839 |
| Rank: | R_A = 0.31302 |
| Log of amplitude ratio (L1/H1): | -1.18375, variance = 0.393731 (L1/H1: -1.42281, variance = 0.54592, H1/L1: 0.000391859, variance = 0.562659) |
| Amplitude ratio (L1/H1): | 0.30613 ⋇ 1.87288 (L1/H1: 0.241036 ⋇ 2.09356, H1/L1: 1.00039 ⋇ 2.11722) |
| Amplitude ratio H1|L1 compatibility (probability): | 0.176707 |
| Antenna factor probability: | 1 |
| Number of rejected frequency rows: | Q0: 5 / 18, Q1: 16 / 36, Q2: 48 / 70, Q3: 100 / 134, Q4: 222 / 258 |
| Maximum signal-to-noise ratio: | H1: 24.5116, L1: 11.0172 |
| SNR variance: | H1: 0.915687, L1: 0.567351 |
| Click here for a zoomed plot | Click here for a zoomed plot | Click here for a zoomed plot | Click here for a zoomed plot | Click here for a zoomed plot |
 |
 |
 |
 |
 |
 |
 |
 |
 |
 |
 |
 |
 |
 |
 |
 |
 |
 |
 |
 |
 |
 |
 |
 |
 |
 |
 |
 |
 |
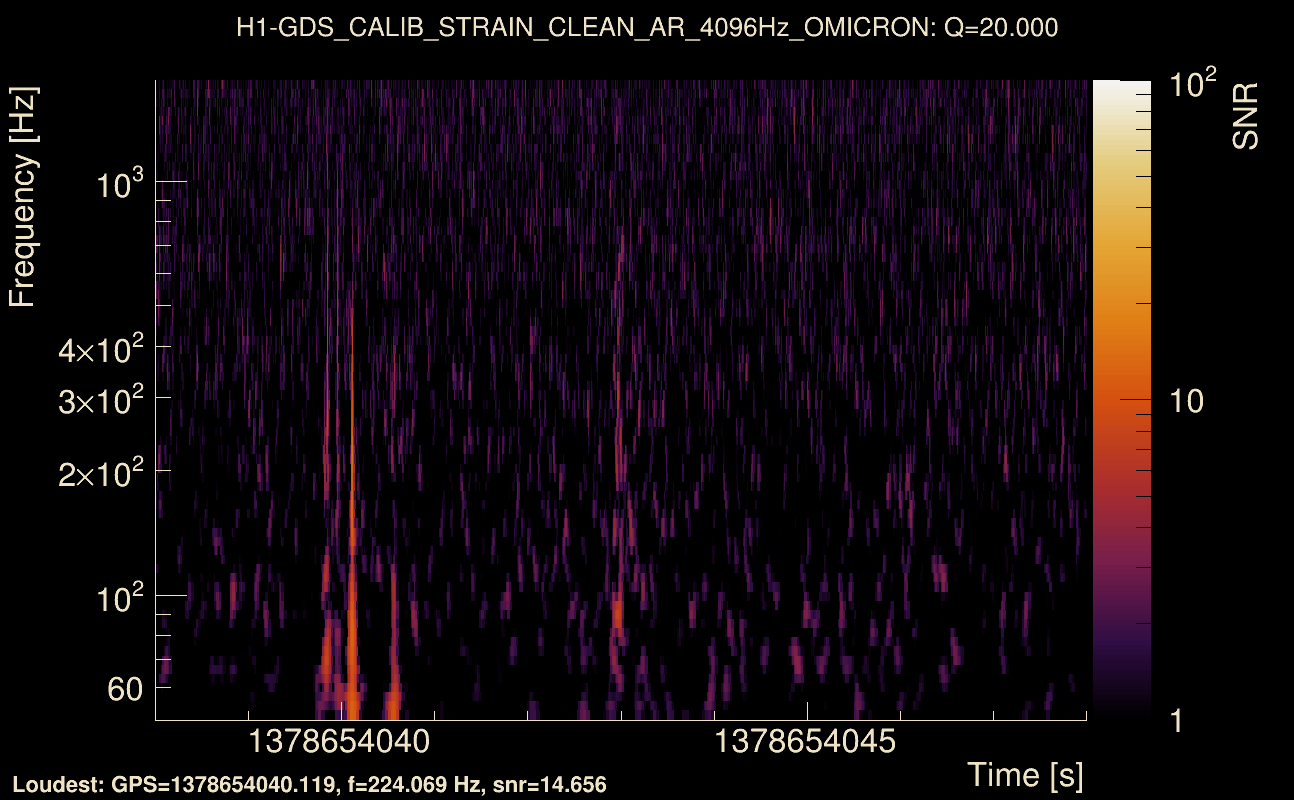
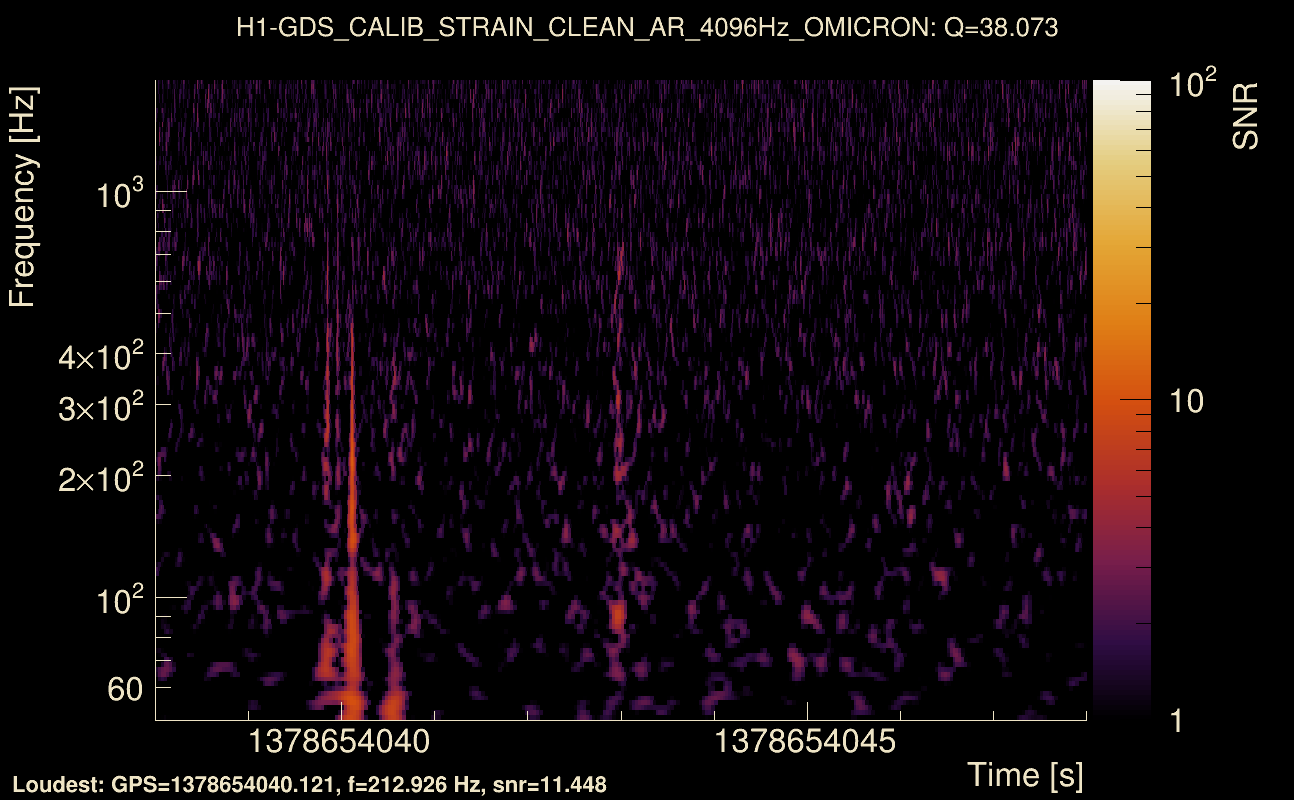
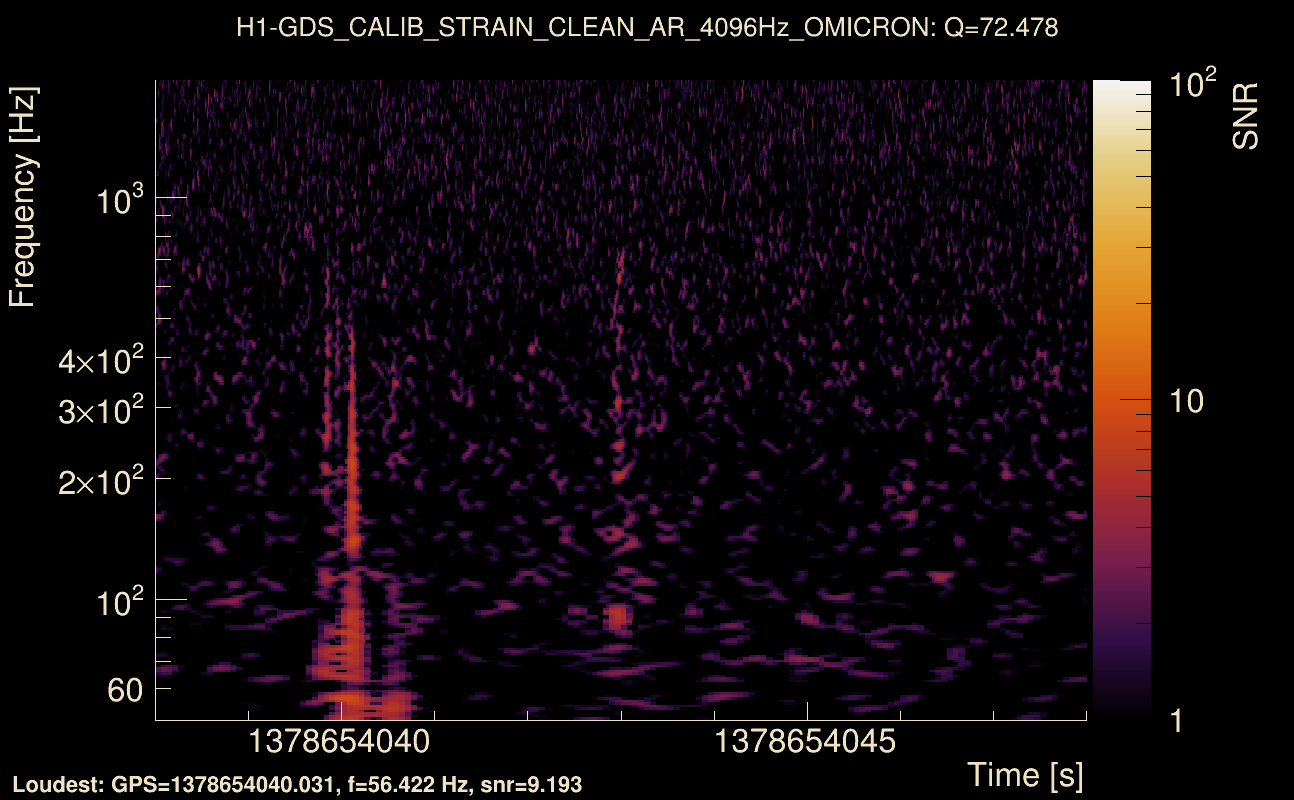
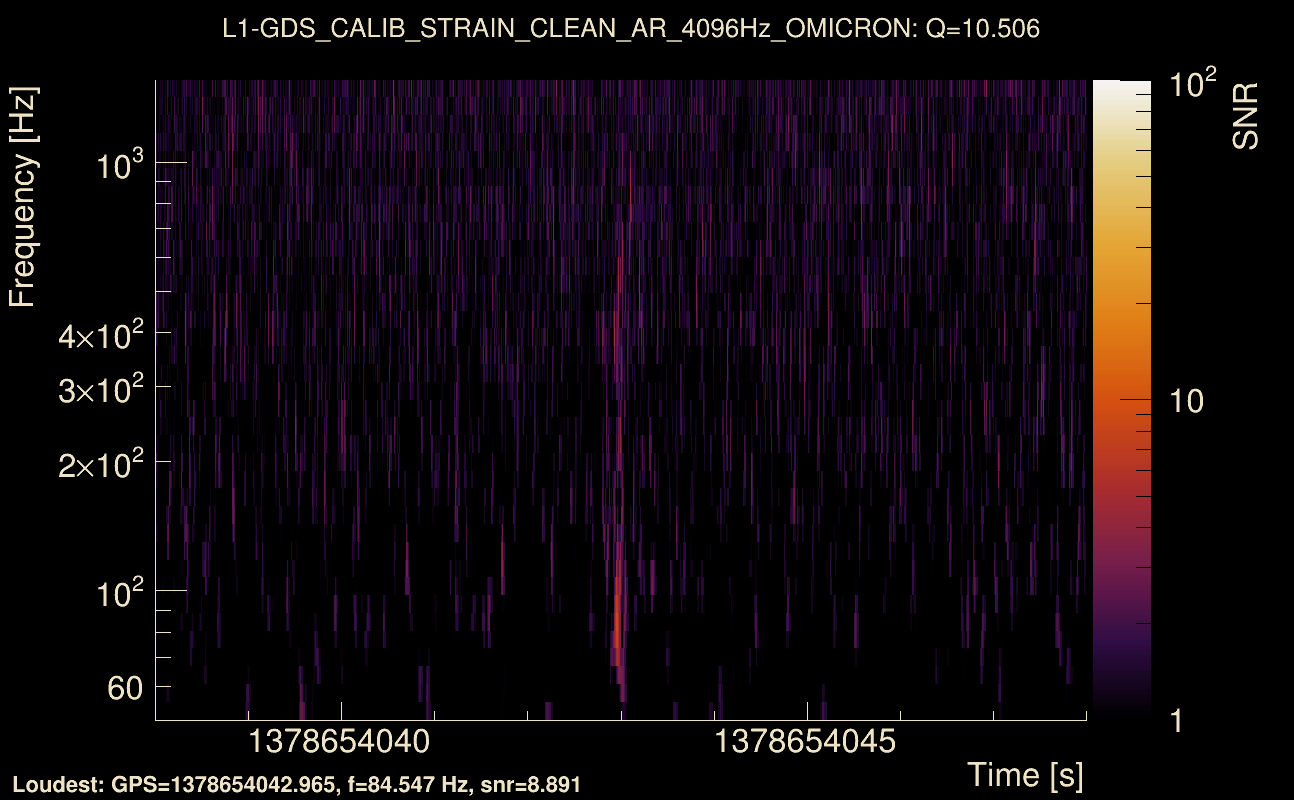
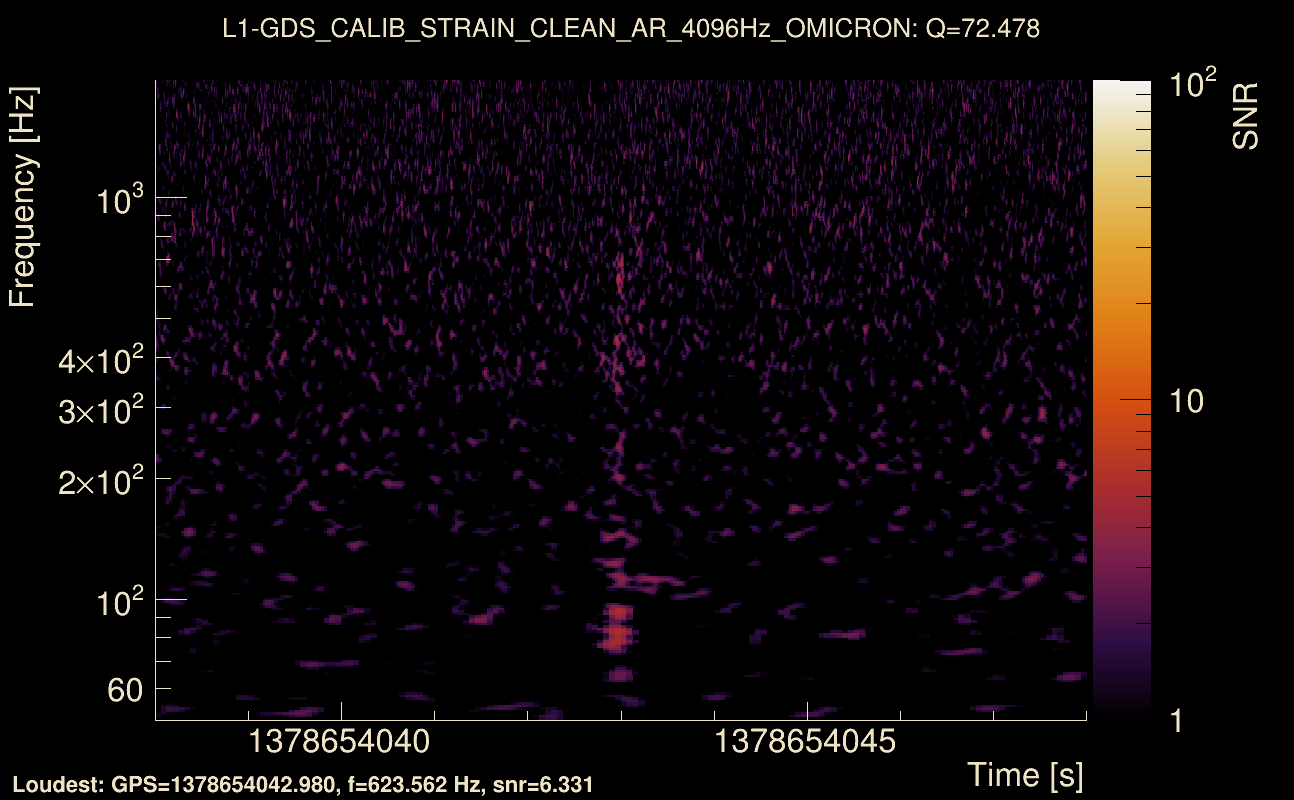
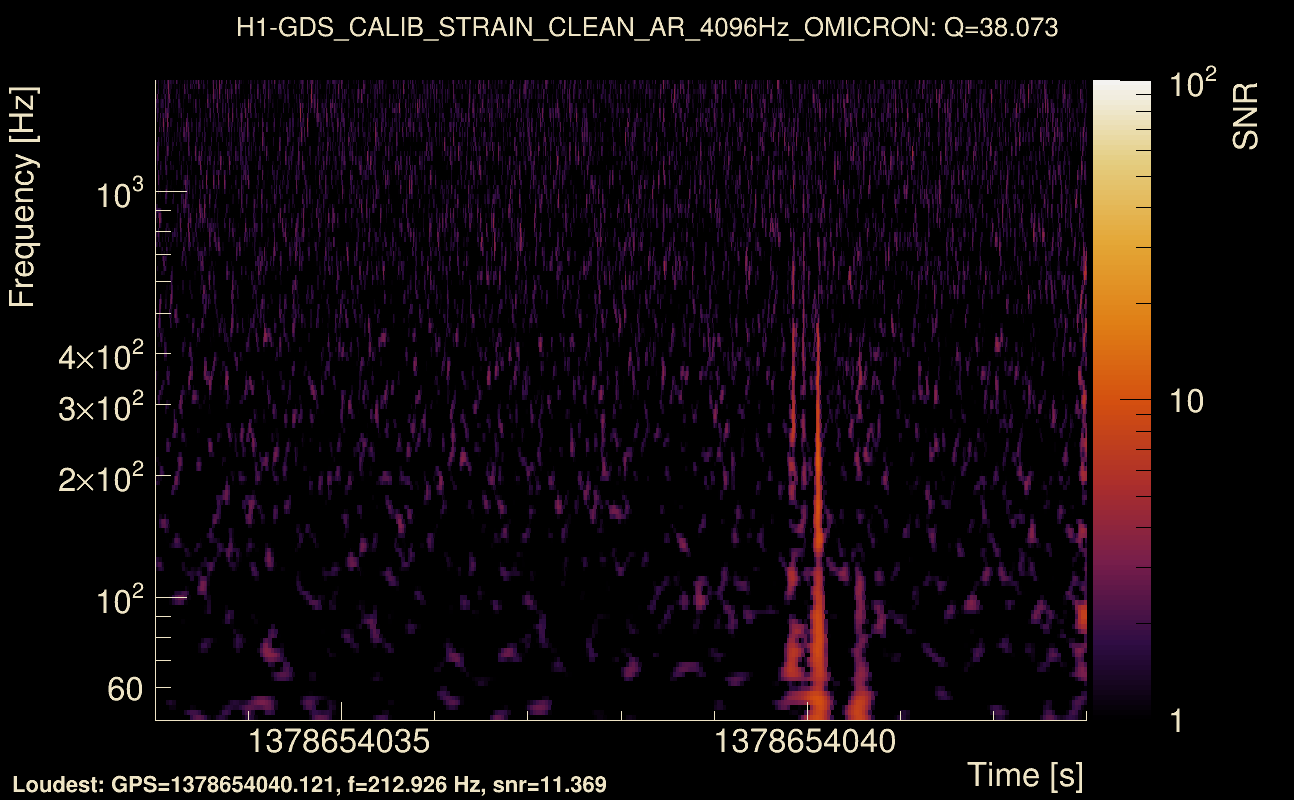
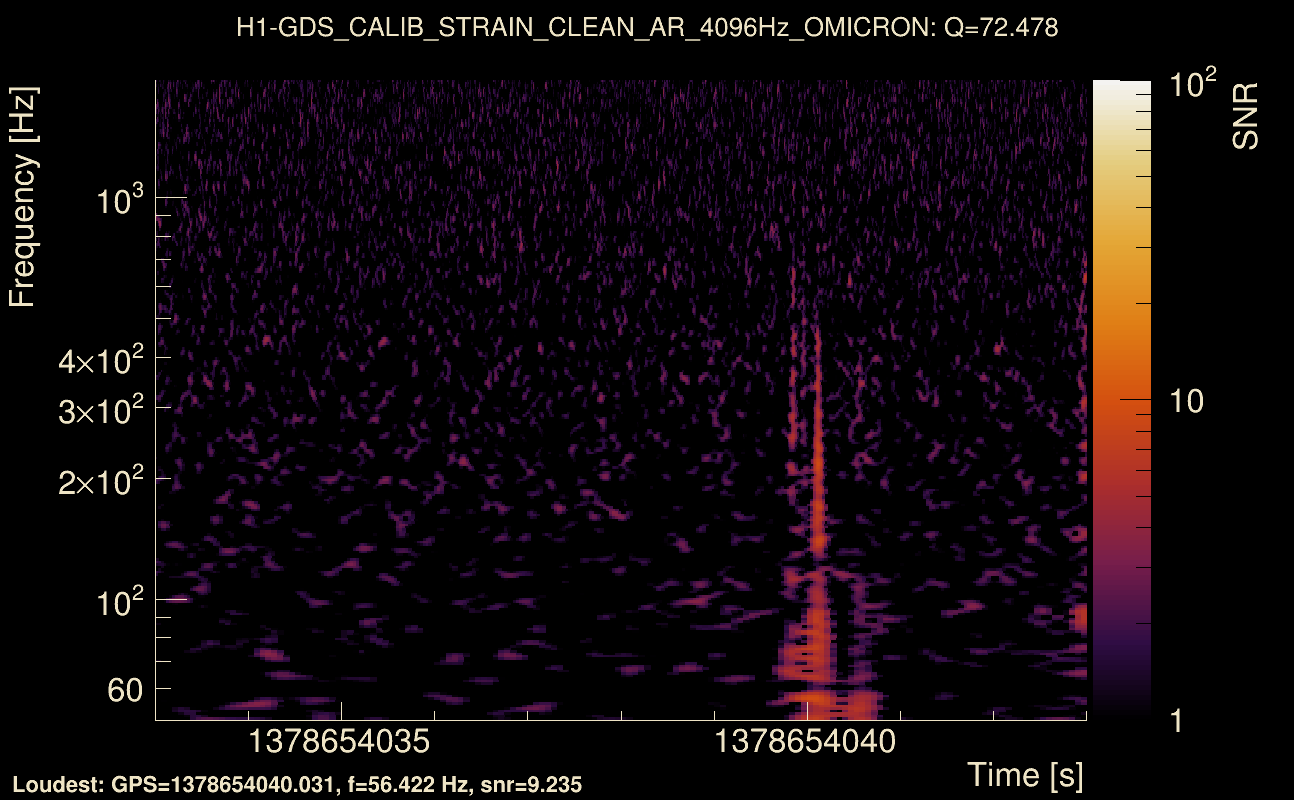
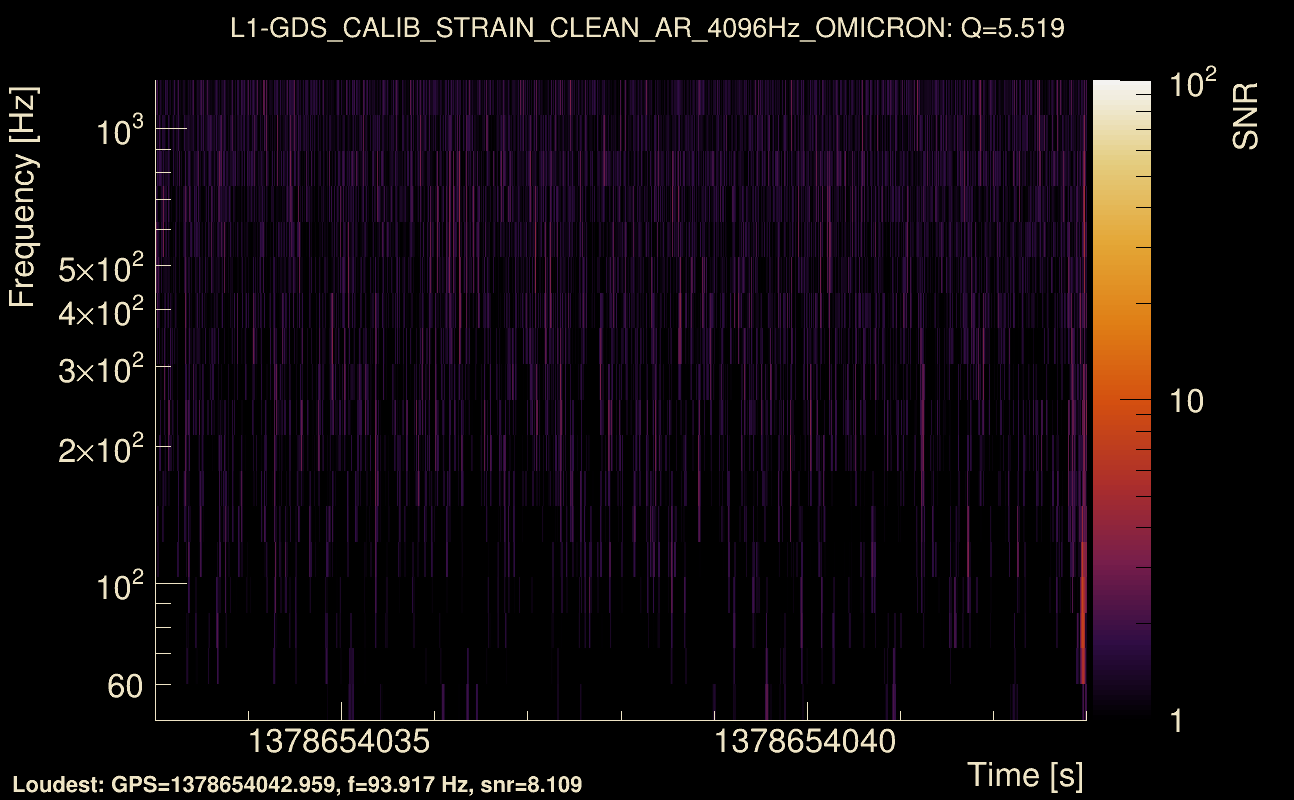
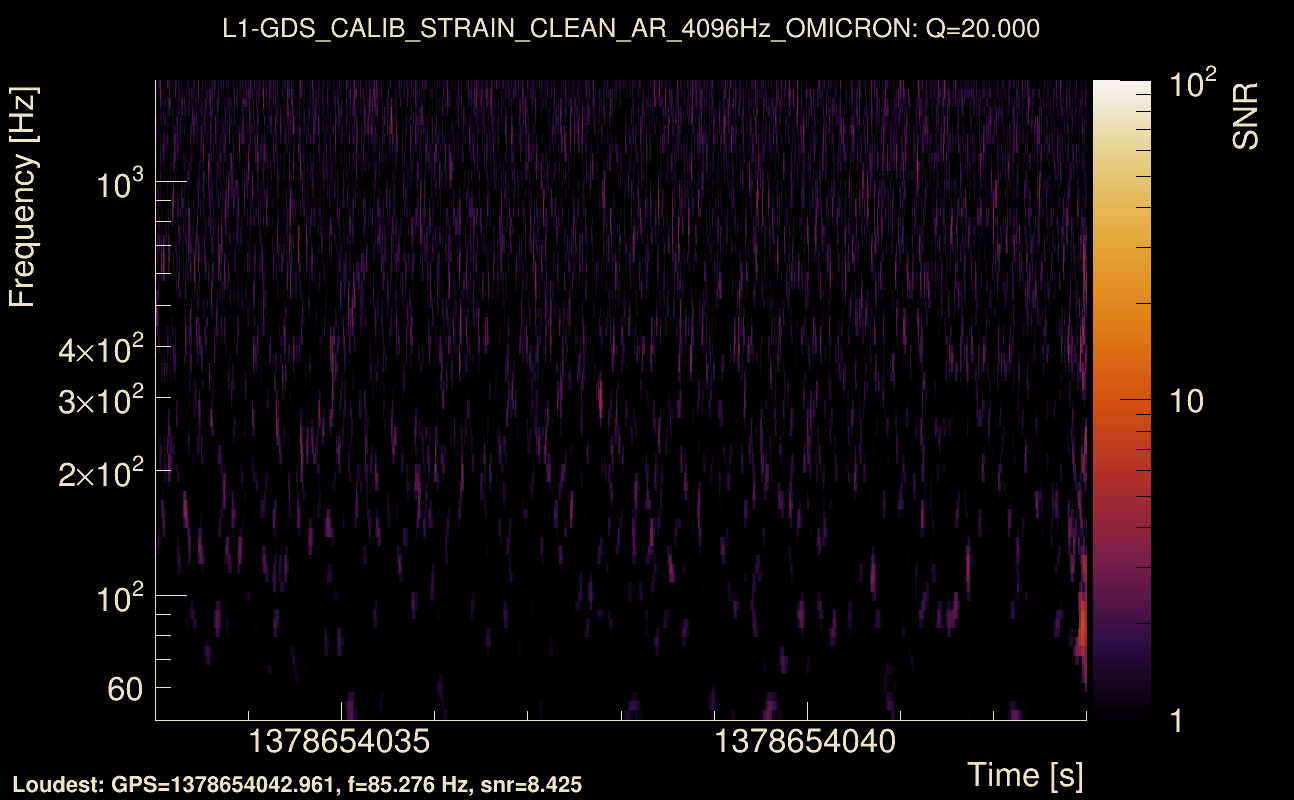
| Event time t(H1): | GPS = 1378654033 (Wed Sep 13 15:26:55 2023 ) → GPS = 1378654043 (Wed Sep 13 15:27:05 2023 ) |
| Event time t(L1): | GPS = 1378654033 (Wed Sep 13 15:27:05 2023 ) → GPS = 1378654043 (Wed Sep 13 15:27:05 2023 ) |
| Omicron analysis time window (H1): | GPS = 1378654030 → GPS = 1378654046 |
| Omicron analysis time window (L1): | GPS = 1378654030 → GPS = 1378654046 |
| Time delay between detectors t(L1) - t(H1): | 2.85144 s (slice index = 46 / 217), δt_gw = -0.000555658 s |
| Time delay uncertainty: | 0.0048064 s |
| [targeted mode] Time delay probability: | 0.932425 (0.0847939 sigmas), δt_target = -0.000963926 s |
| Frequency: | 127.043 Hz |
| Ξ: | 0.301879 ± 0.093819 (variance = 0.008802): Q0: 0.601121, Q1: 0.538459, Q2: 0.546062, Q3: 0.513222, Q4: 0.326401 |
| Rank: | R_A = 0.281479 |
| Log of amplitude ratio (L1/H1): | -1.22827, variance = 0.458968 (L1/H1: -1.44655, variance = 0.634833, H1/L1: 0.136664, variance = 0.651079) |
| Amplitude ratio (L1/H1): | 0.292797 ⋇ 1.96889 (L1/H1: 0.235382 ⋇ 2.21835, H1/L1: 1.14644 ⋇ 2.24094) |
| Amplitude ratio H1|L1 compatibility (probability): | 0.248041 |
| Antenna factor probability: | 1 |
| Number of rejected frequency rows: | Q0: 7 / 18, Q1: 16 / 36, Q2: 44 / 70, Q3: 95 / 134, Q4: 225 / 258 |
| Maximum signal-to-noise ratio: | H1: 24.5919, L1: 10.9966 |
| SNR variance: | H1: 0.50812, L1: 0.51049 |
| Click here for a zoomed plot | Click here for a zoomed plot | Click here for a zoomed plot | Click here for a zoomed plot | Click here for a zoomed plot |
 |
 |
 |
 |
 |
 |
 |
 |
 |
 |
 |
 |
 |
 |
 |
 |
 |
 |
 |
 |
 |
 |
 |
 |
 |
 |
 |
 |
 |
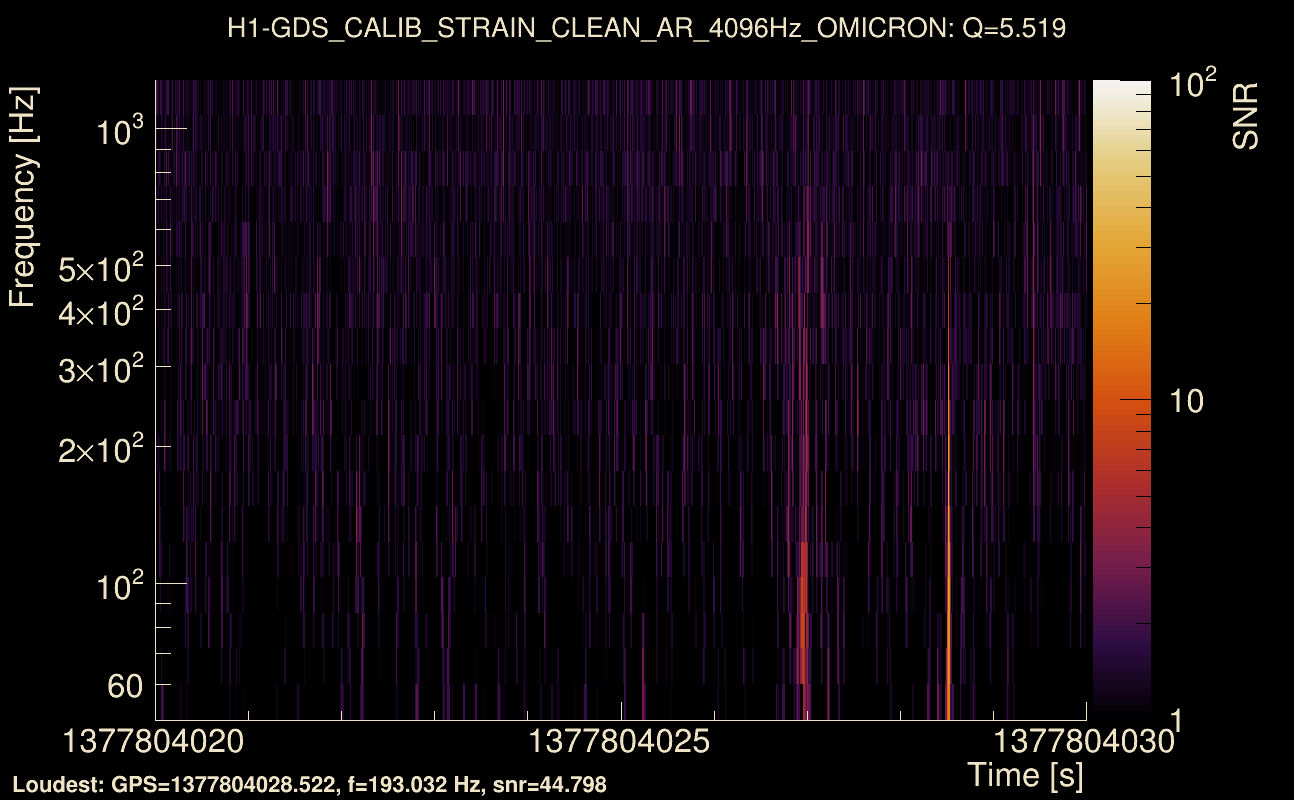
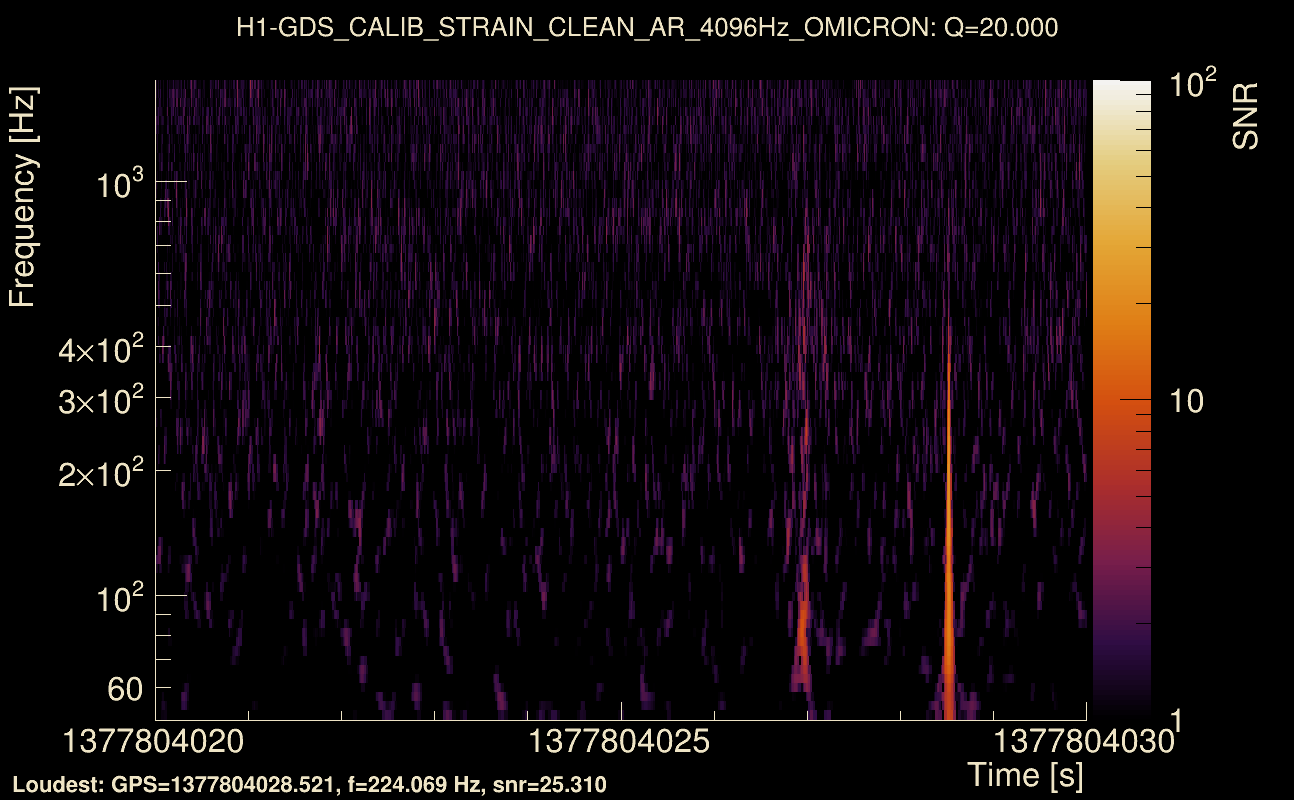
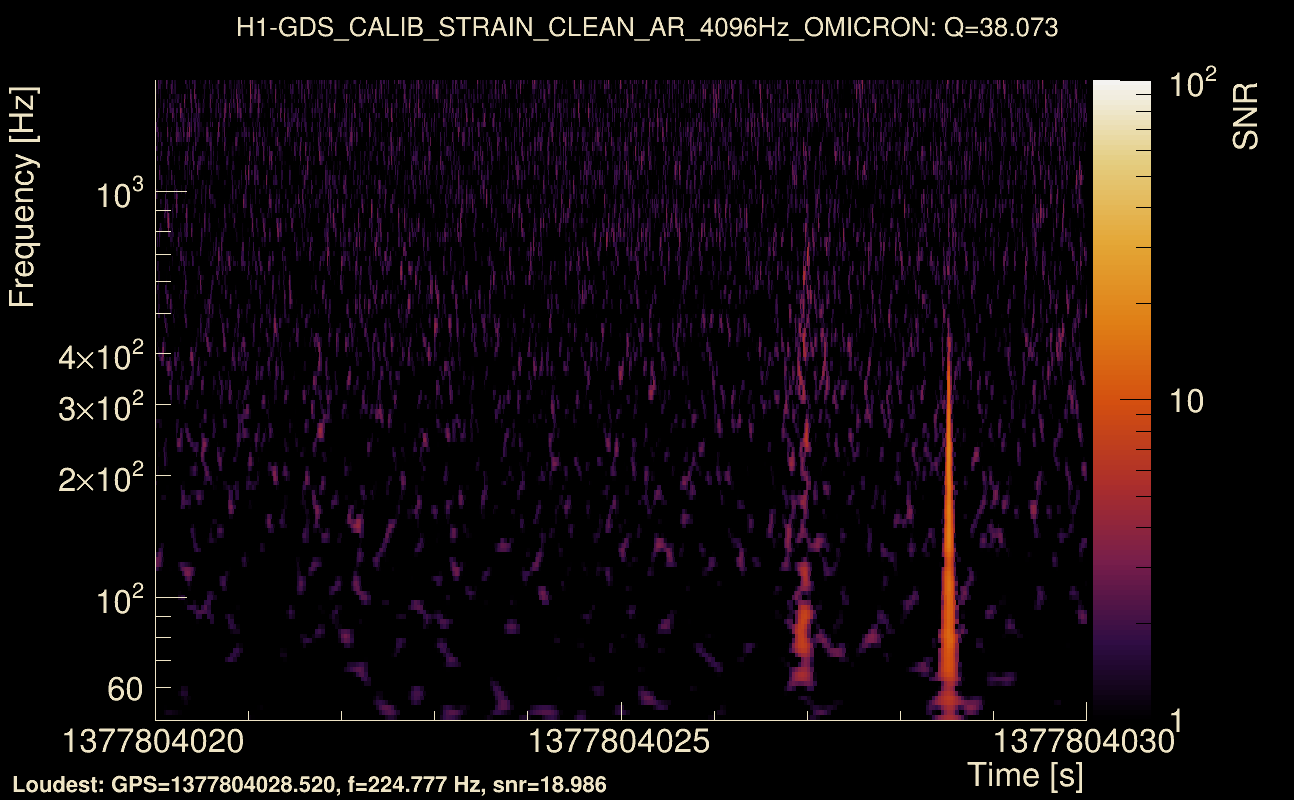
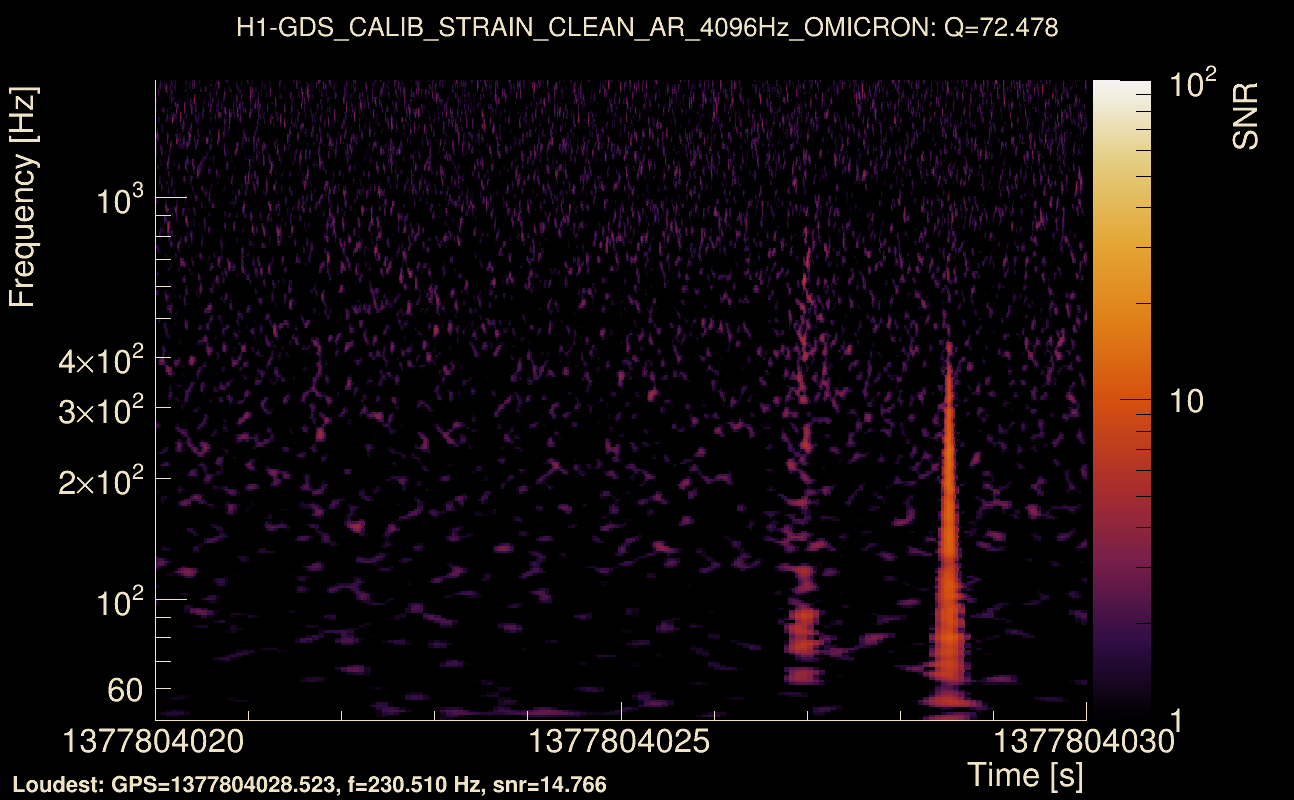
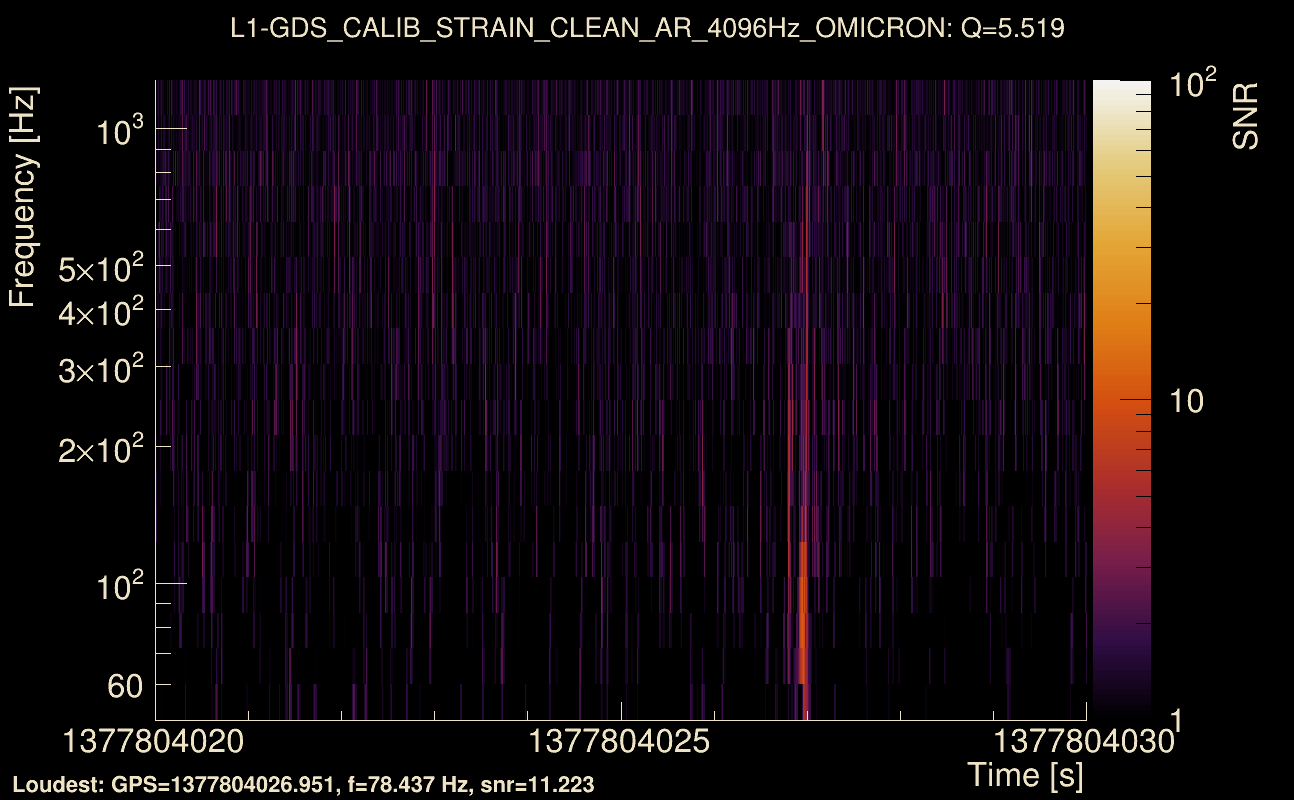
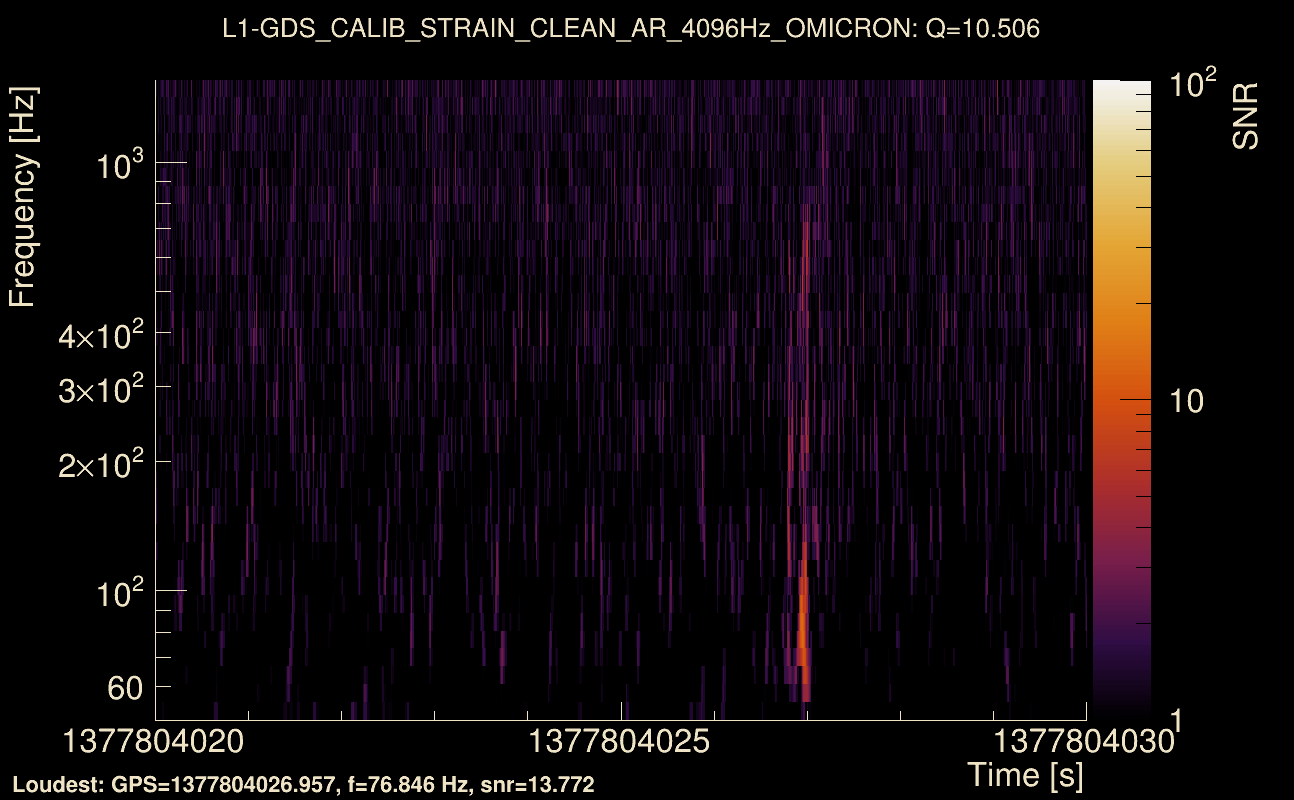
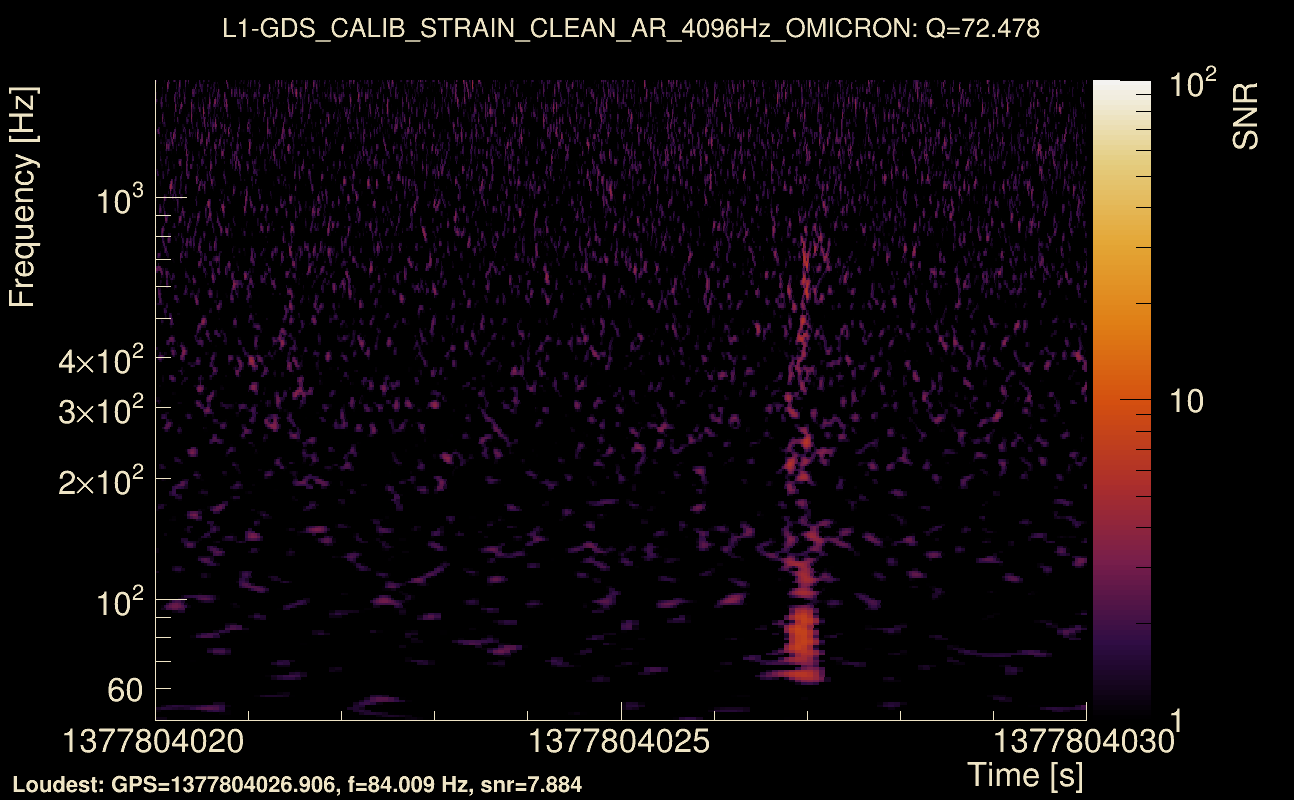
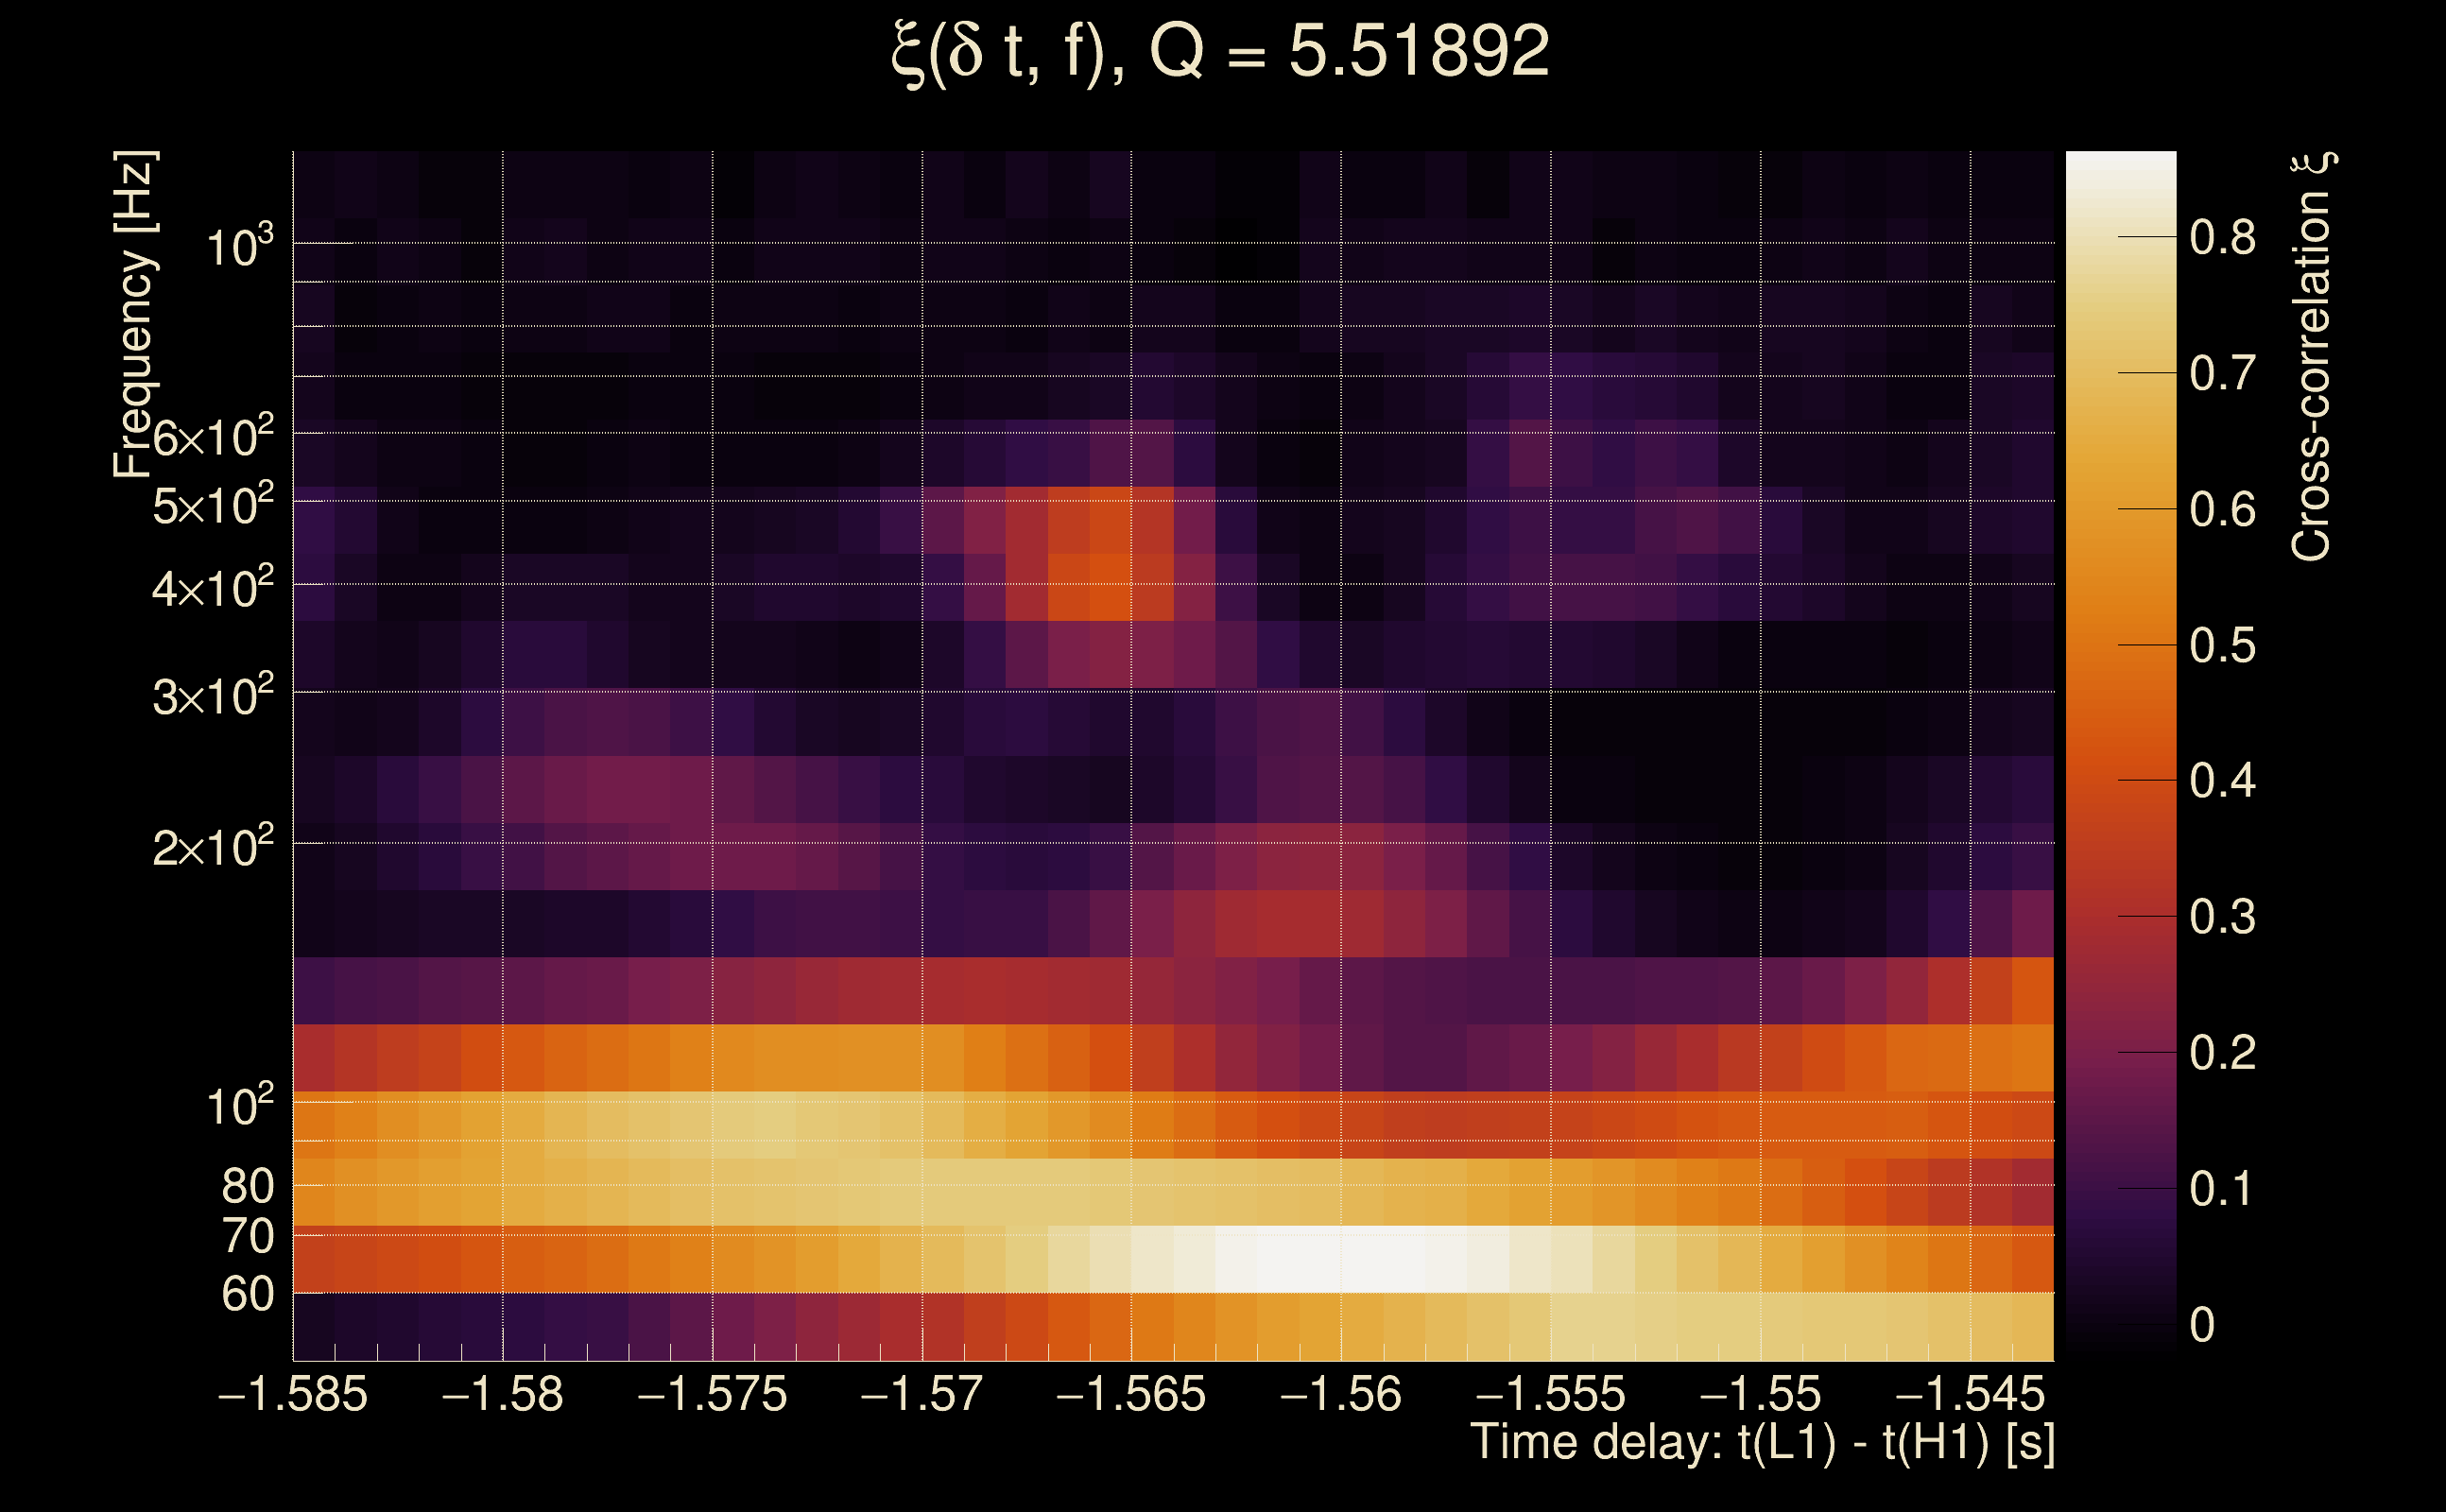
| Event time t(H1): | GPS = 1377804020 (Sun Sep 3 19:20:02 2023 ) → GPS = 1377804030 (Sun Sep 3 19:20:12 2023 ) |
| Event time t(L1): | GPS = 1377804020 (Sun Sep 3 19:20:12 2023 ) → GPS = 1377804030 (Sun Sep 3 19:20:12 2023 ) |
| Omicron analysis time window (H1): | GPS = 1377804017 → GPS = 1377804033 |
| Omicron analysis time window (L1): | GPS = 1377804017 → GPS = 1377804033 |
| Time delay between detectors t(L1) - t(H1): | -1.56401 s (slice index = 142 / 217), δt_gw = -6.37926e-06 s |
| Time delay uncertainty: | 0.00490098 s |
| [targeted mode] Time delay probability: | 0.832588 (0.211384 sigmas), δt_target = -0.000963211 s |
| Frequency: | 144.534 Hz |
| Ξ: | 0.313923 ± 0.111418 (variance = 0.012414): Q0: 0.559996, Q1: 0.573895, Q2: 0.476567, Q3: 0.695428, Q4: 0.79344 |
| Rank: | R_A = 0.261369 |
| Log of amplitude ratio (L1/H1): | -1.03027, variance = 0.585795 (L1/H1: -1.16336, variance = 0.728568, H1/L1: -0.0500769, variance = 0.688645) |
| Amplitude ratio (L1/H1): | 0.356912 ⋇ 2.1498 (L1/H1: 0.312435 ⋇ 2.348, H1/L1: 0.951156 ⋇ 2.29297) |
| Amplitude ratio H1|L1 compatibility (probability): | 0.308064 |
| Antenna factor probability: | 1 |
| Number of rejected frequency rows: | Q0: 6 / 18, Q1: 17 / 36, Q2: 42 / 70, Q3: 93 / 134, Q4: 196 / 258 |
| Maximum signal-to-noise ratio: | H1: 48.0001, L1: 16.8476 |
| SNR variance: | H1: 0.502328, L1: 0.536286 |
| Click here for a zoomed plot | Click here for a zoomed plot | Click here for a zoomed plot | Click here for a zoomed plot | Click here for a zoomed plot |
 |
 |
 |
 |
 |
 |
 |
 |
 |
 |
 |
 |
 |
 |
 |
 |
 |
 |
 |
 |
 |
 |
 |
 |
 |
 |
 |
 |
 |
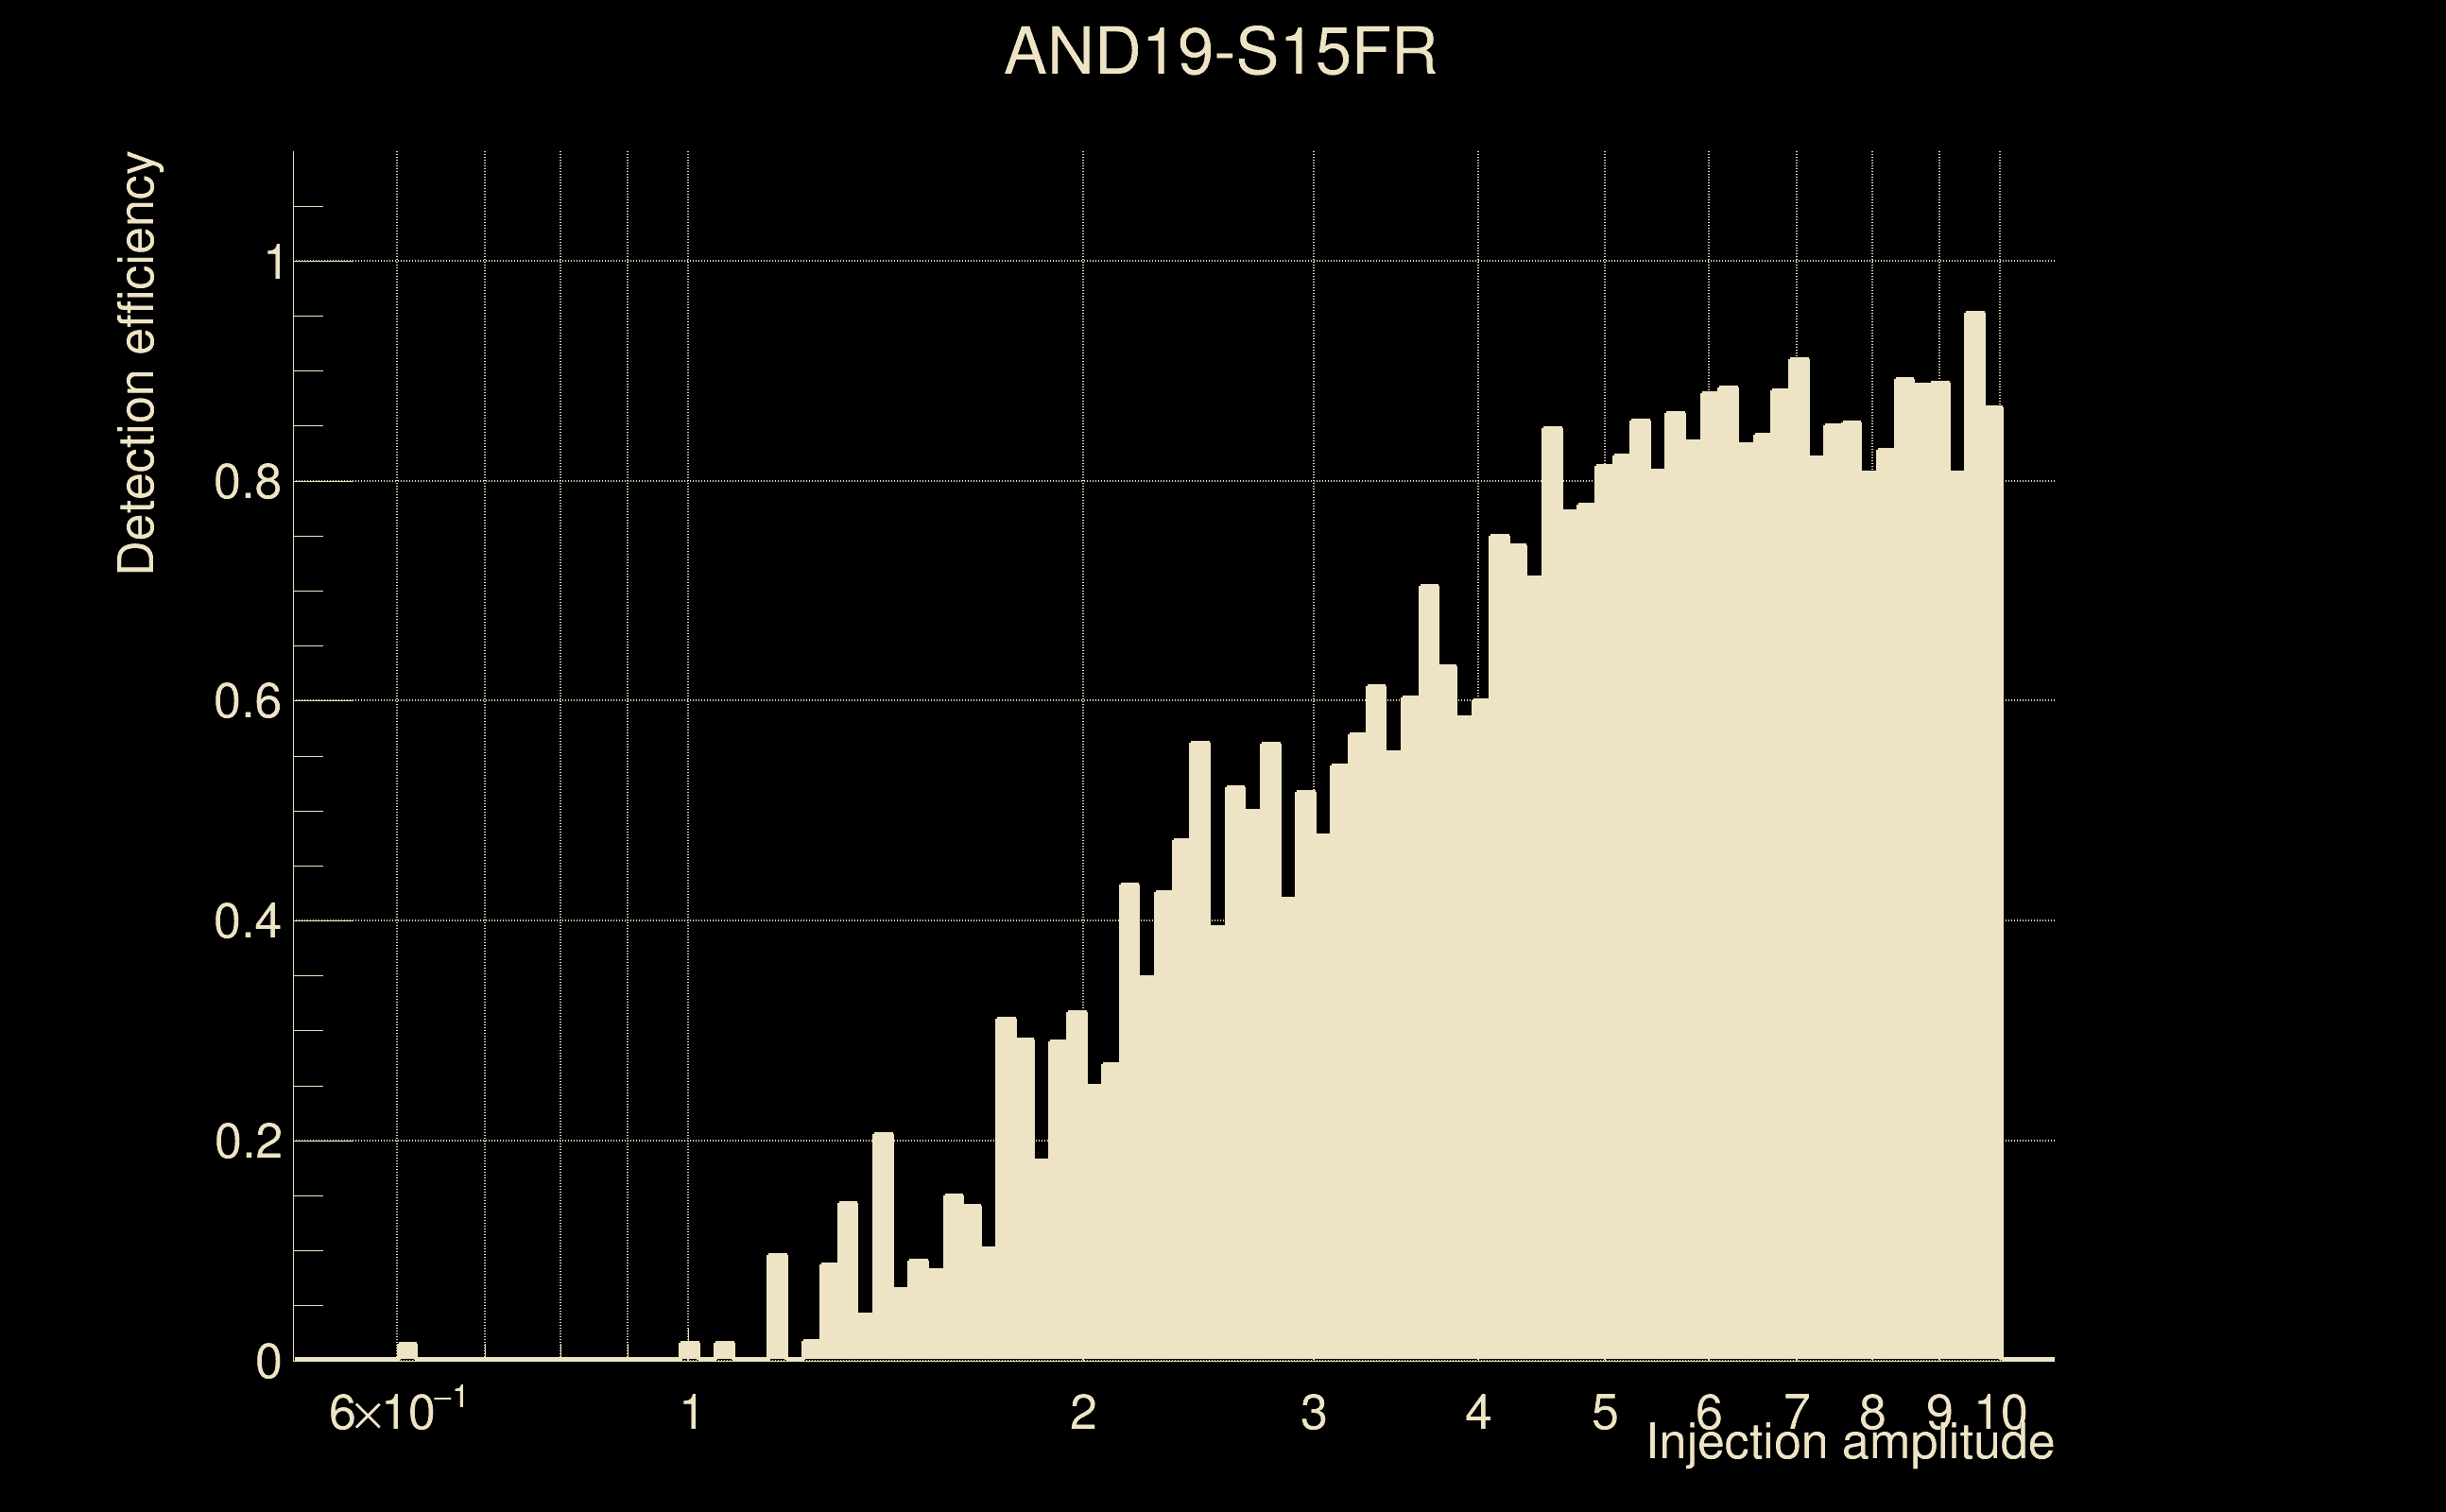
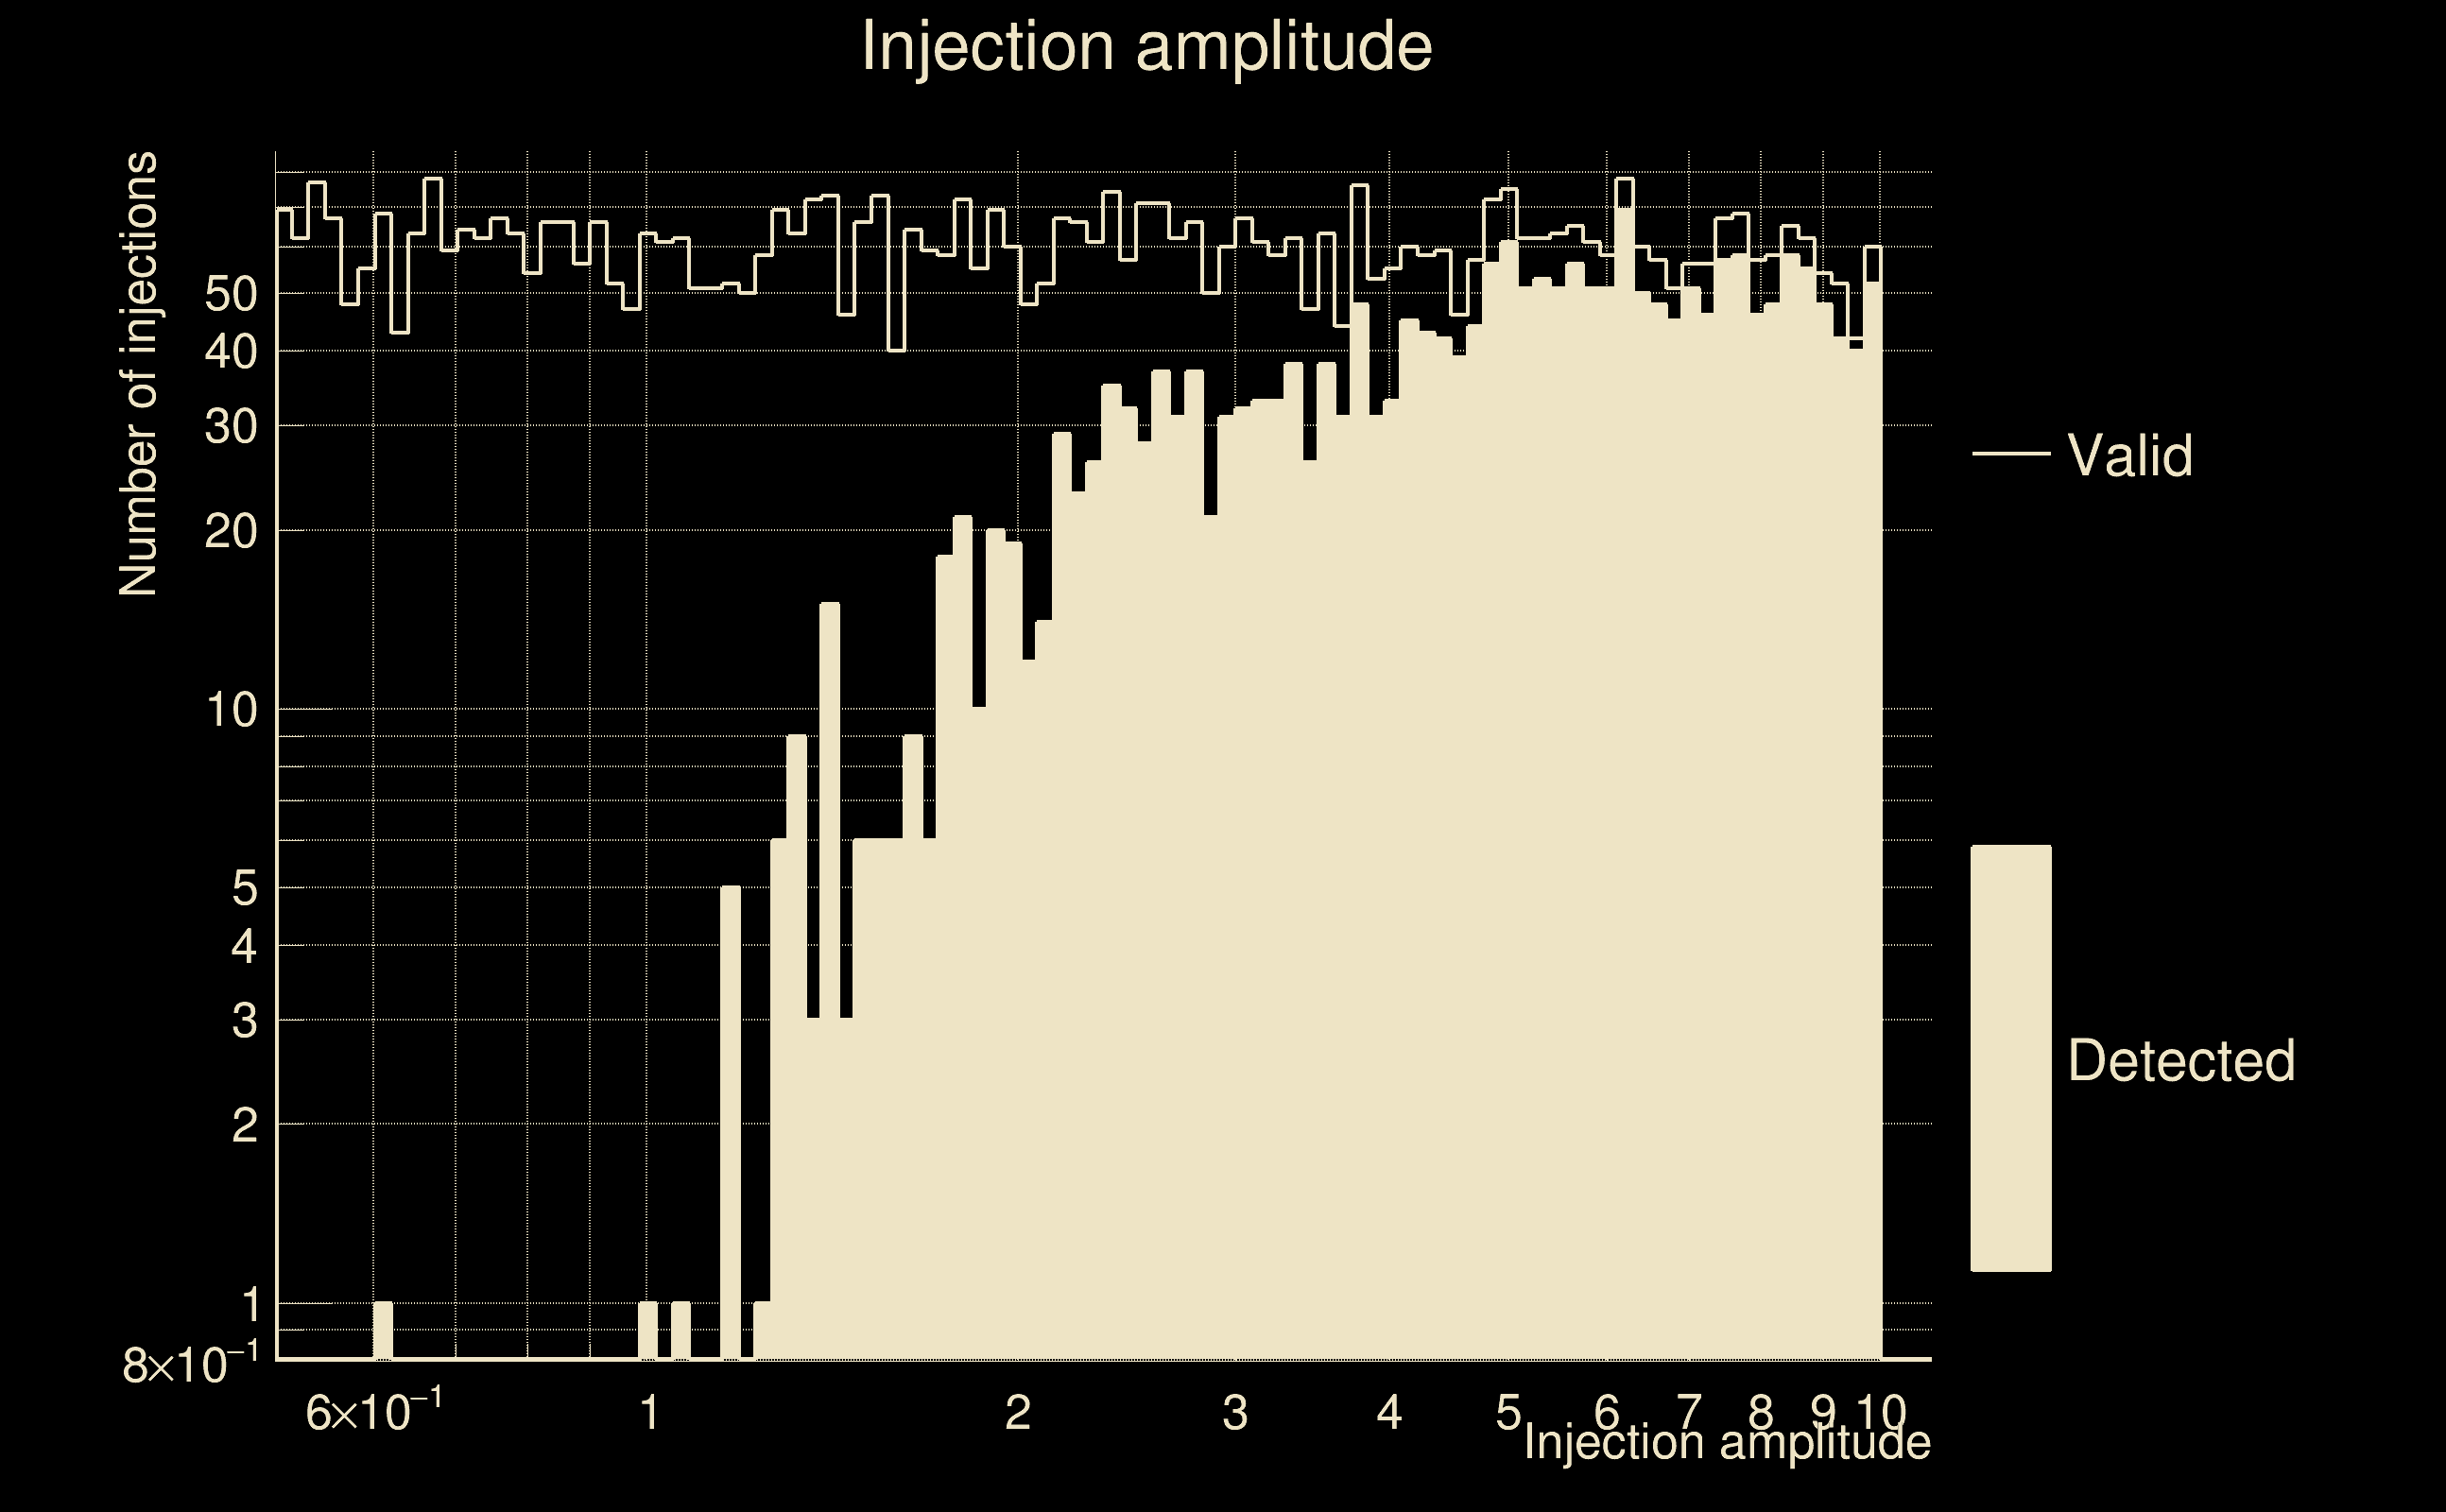
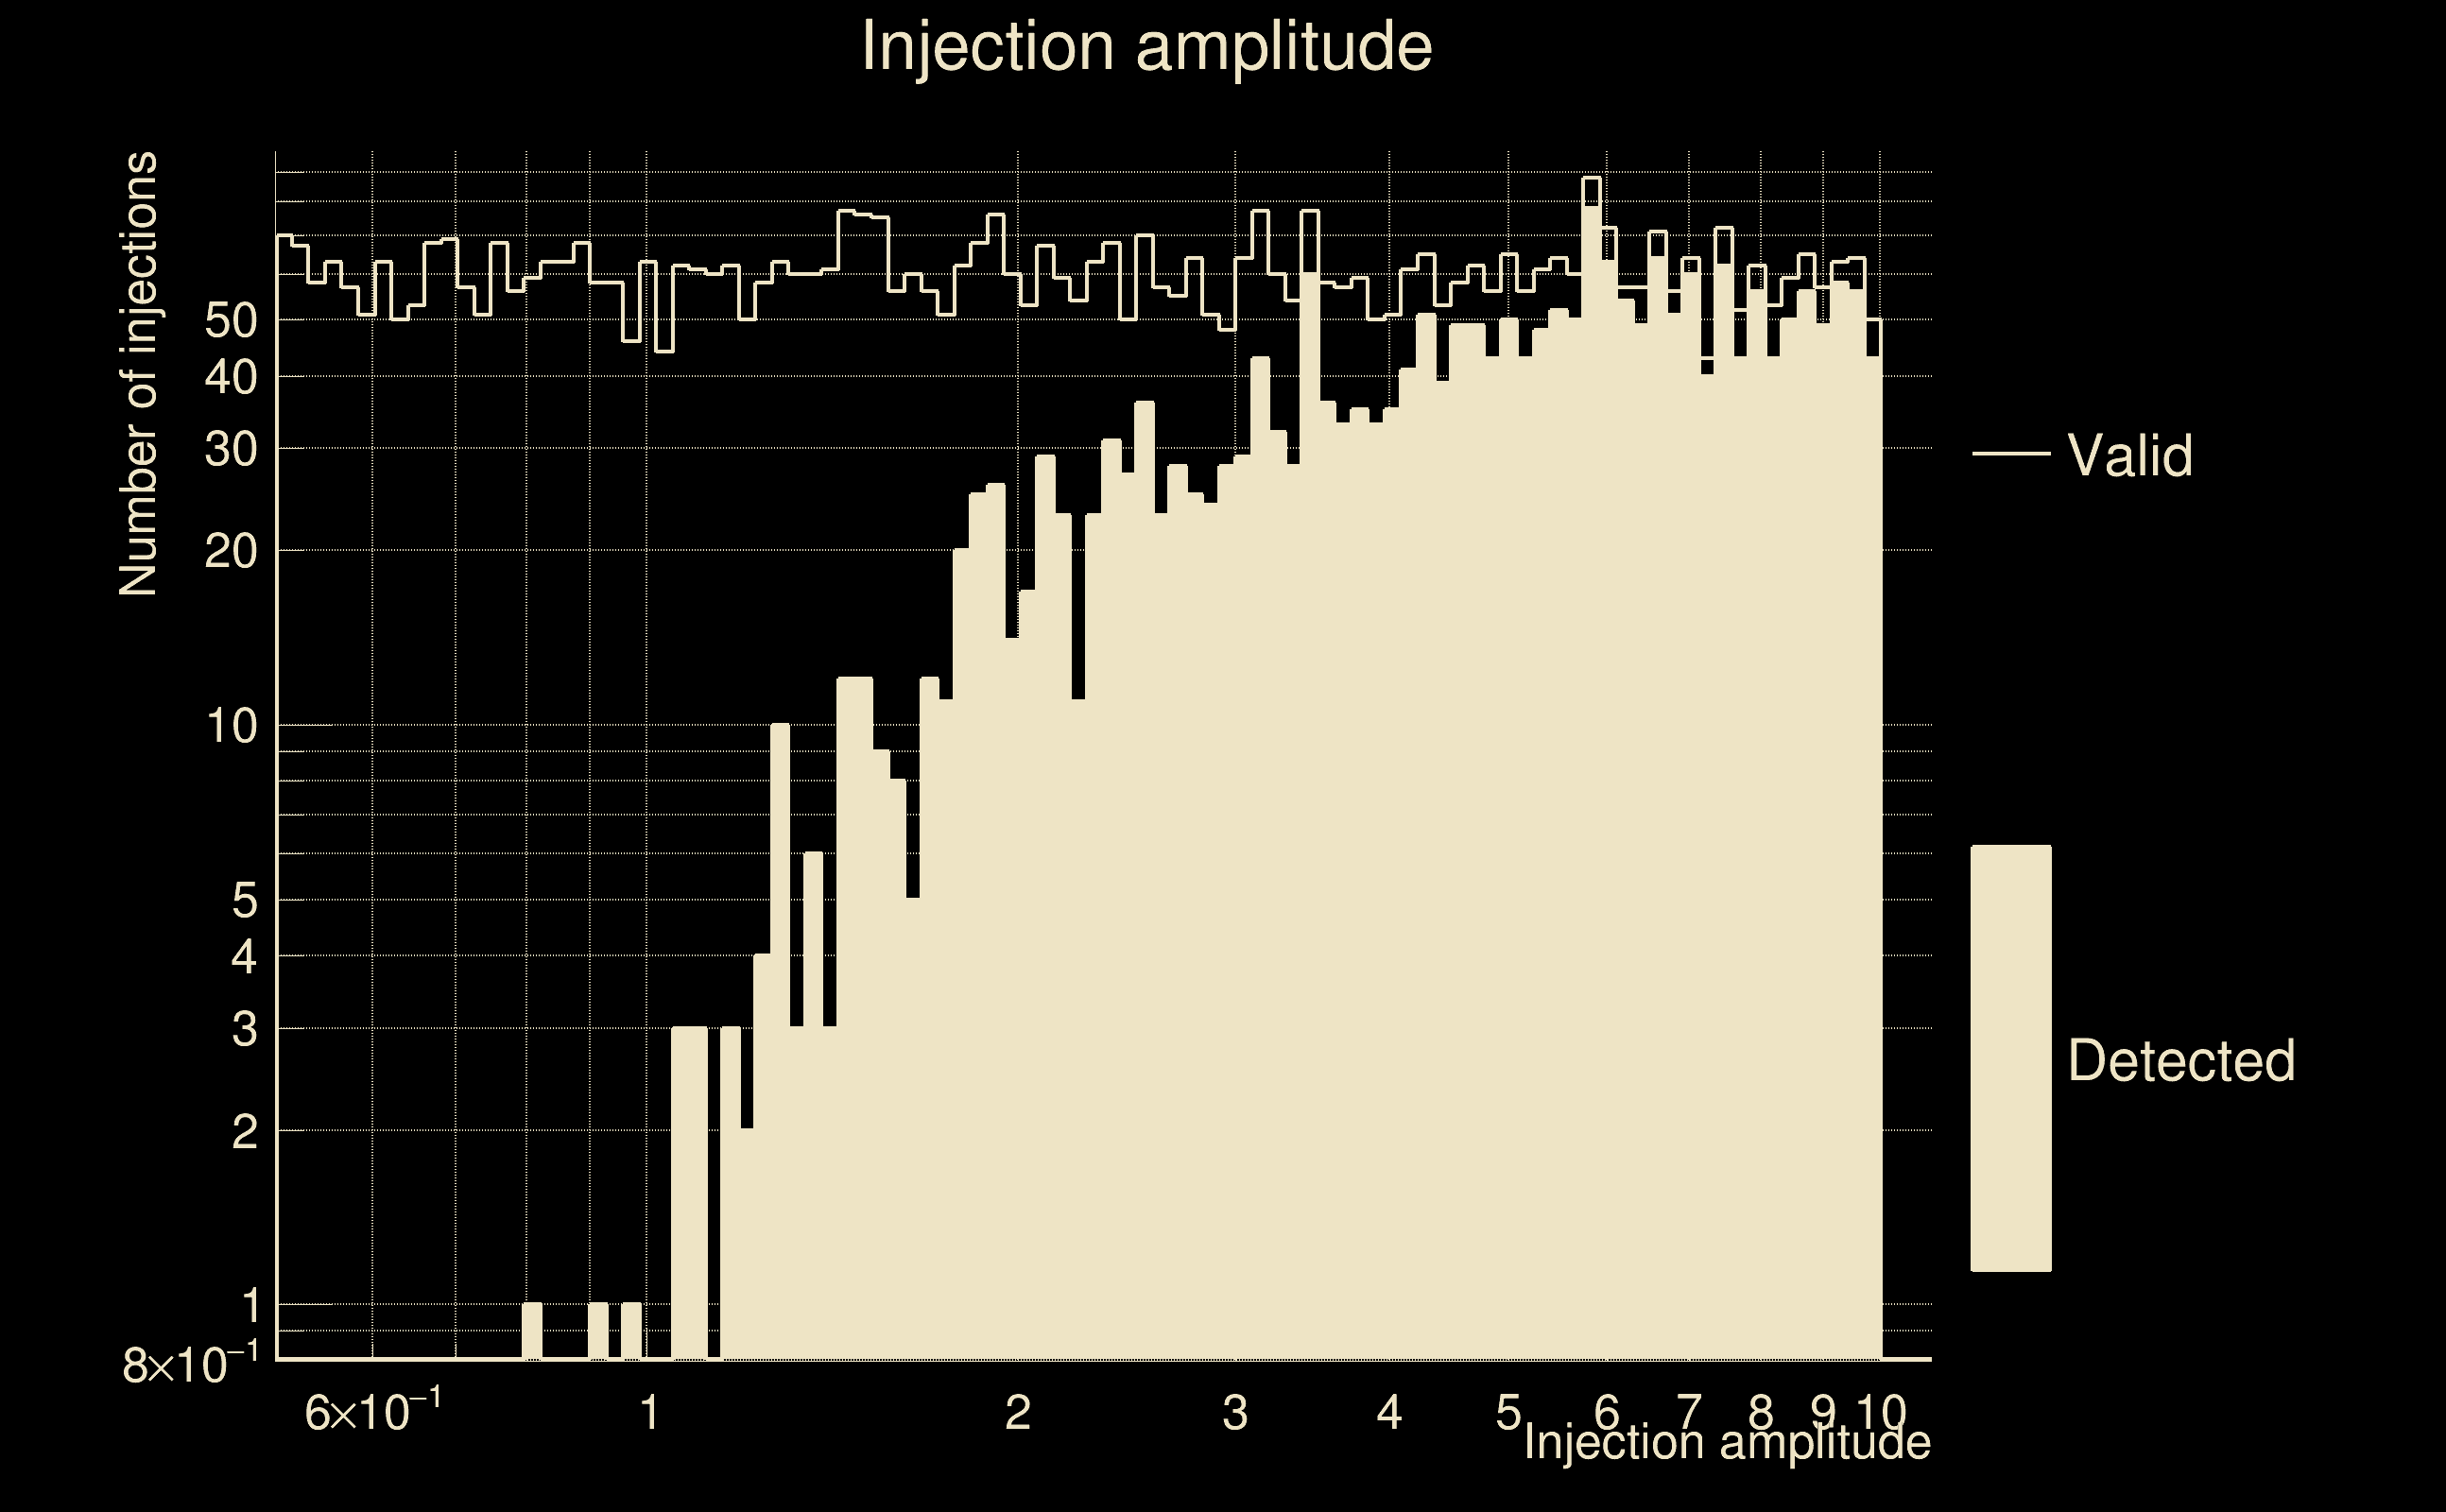
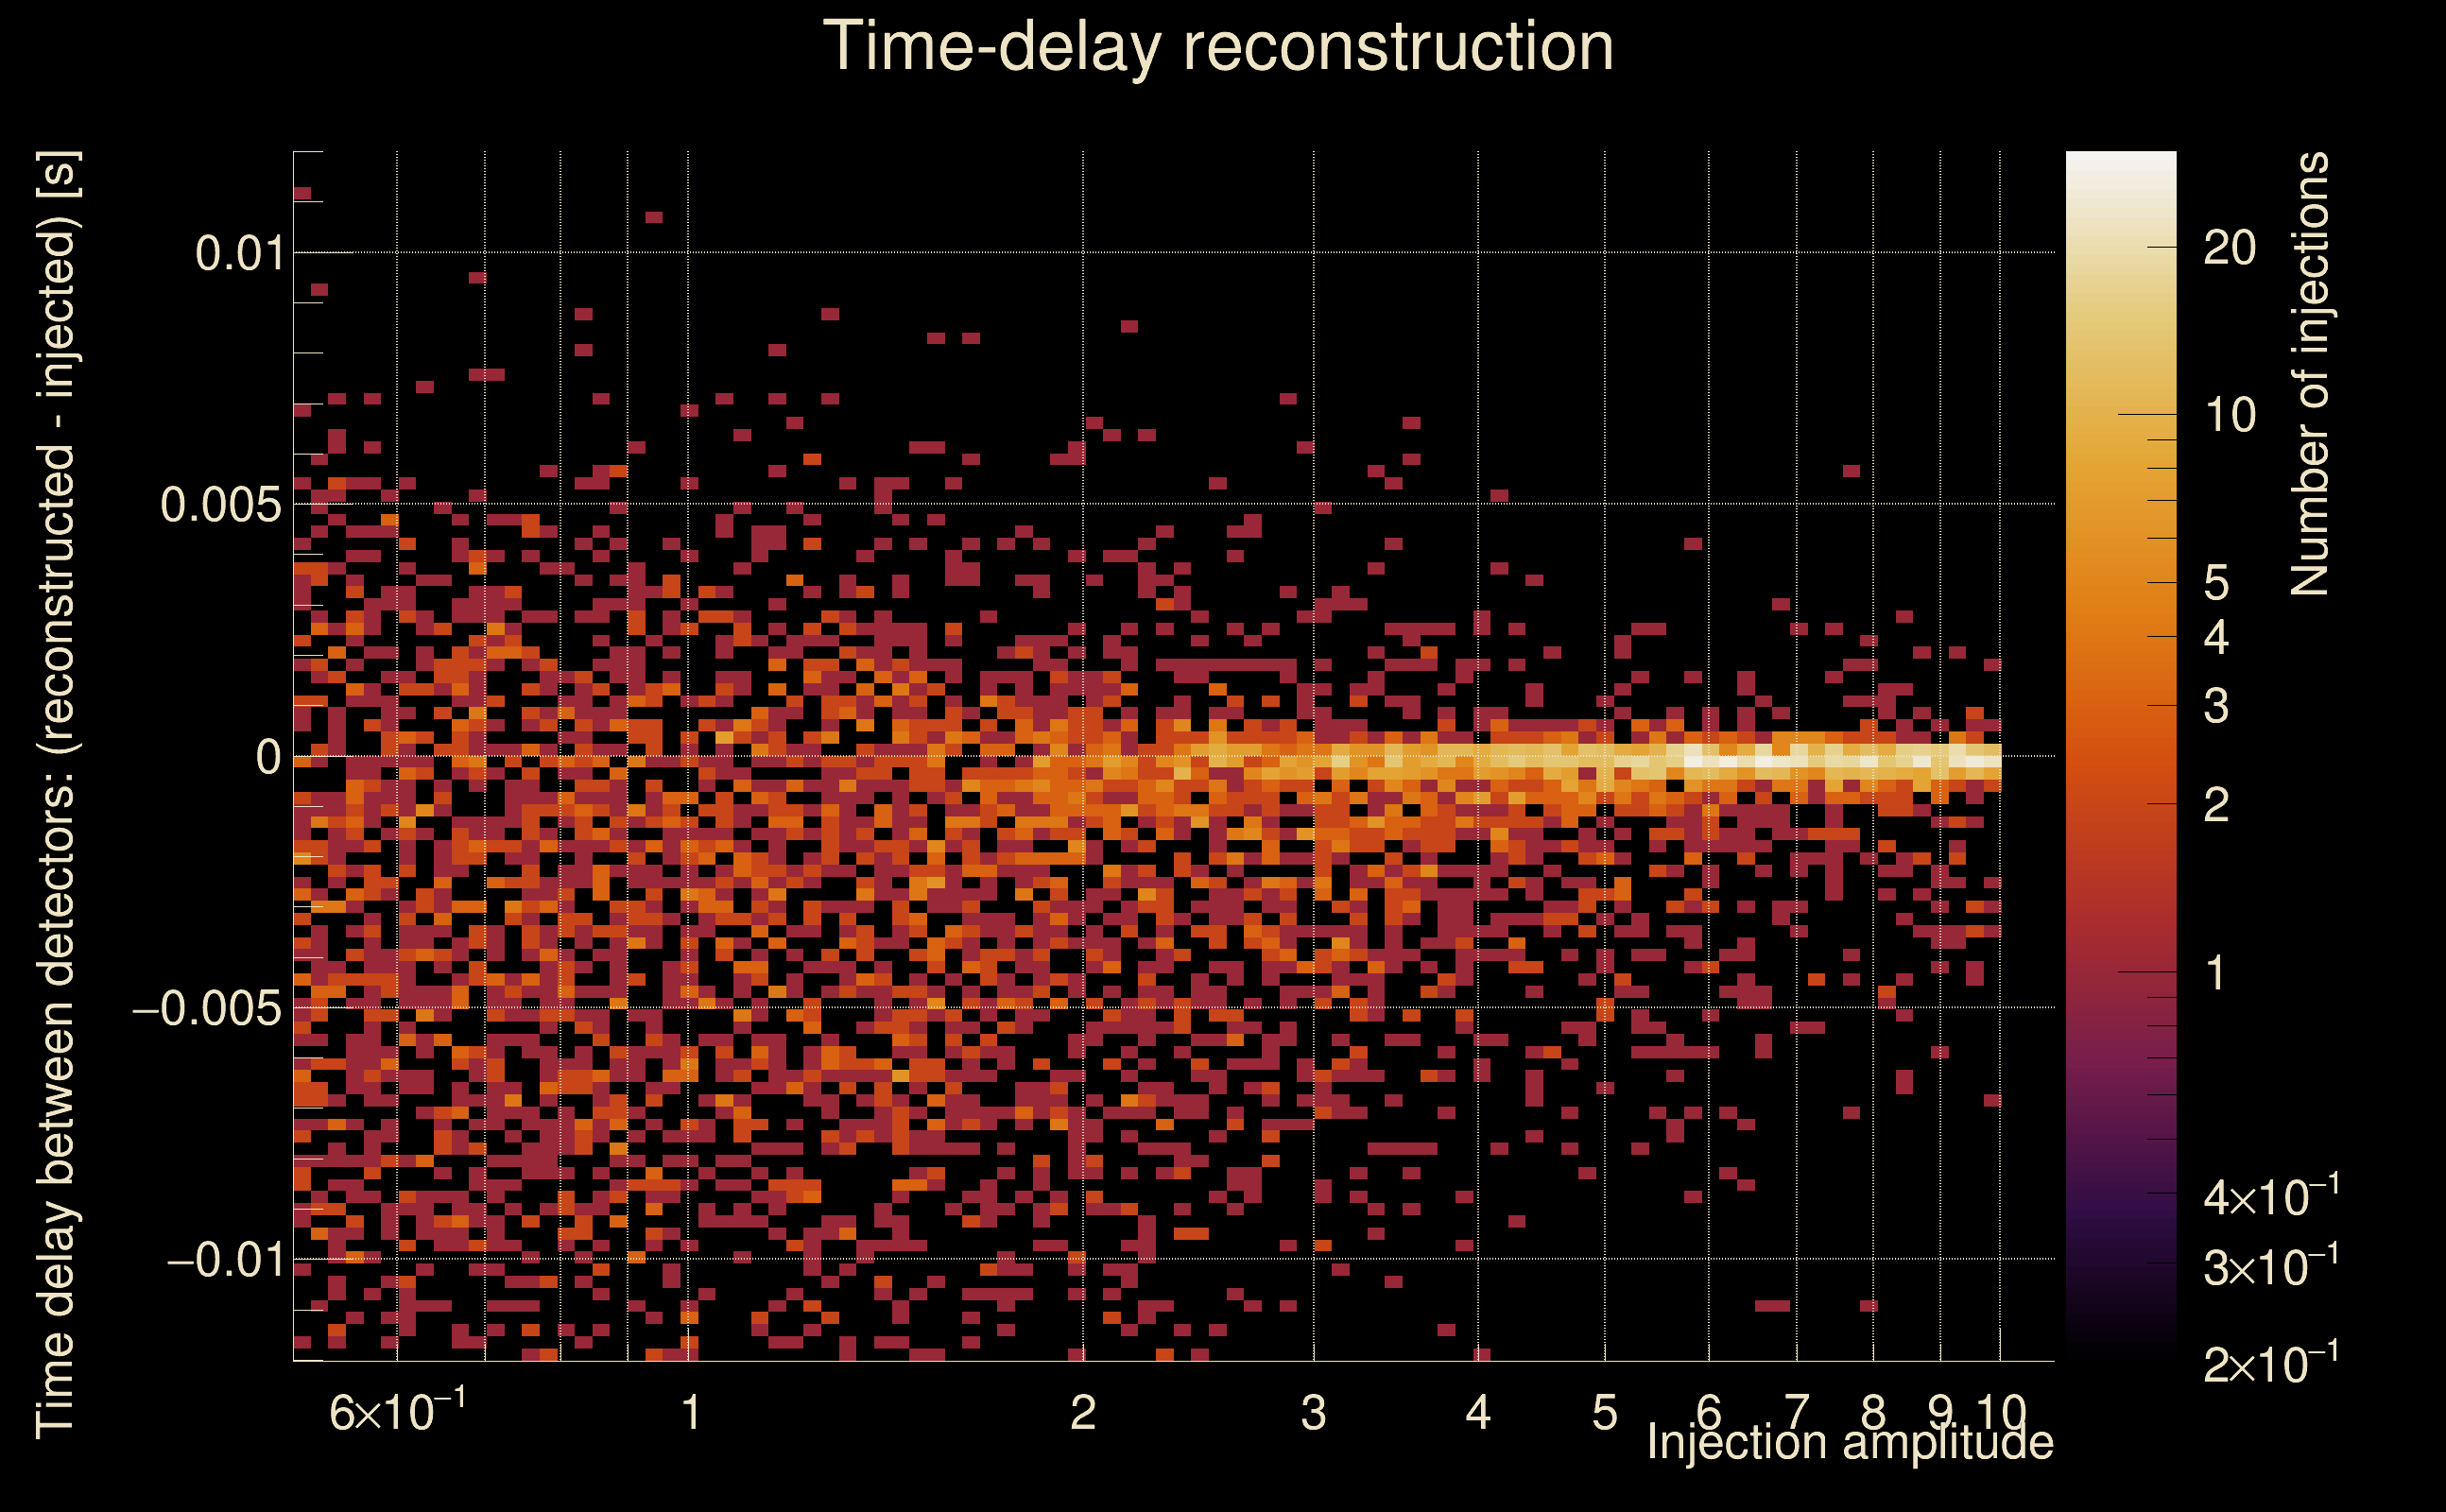
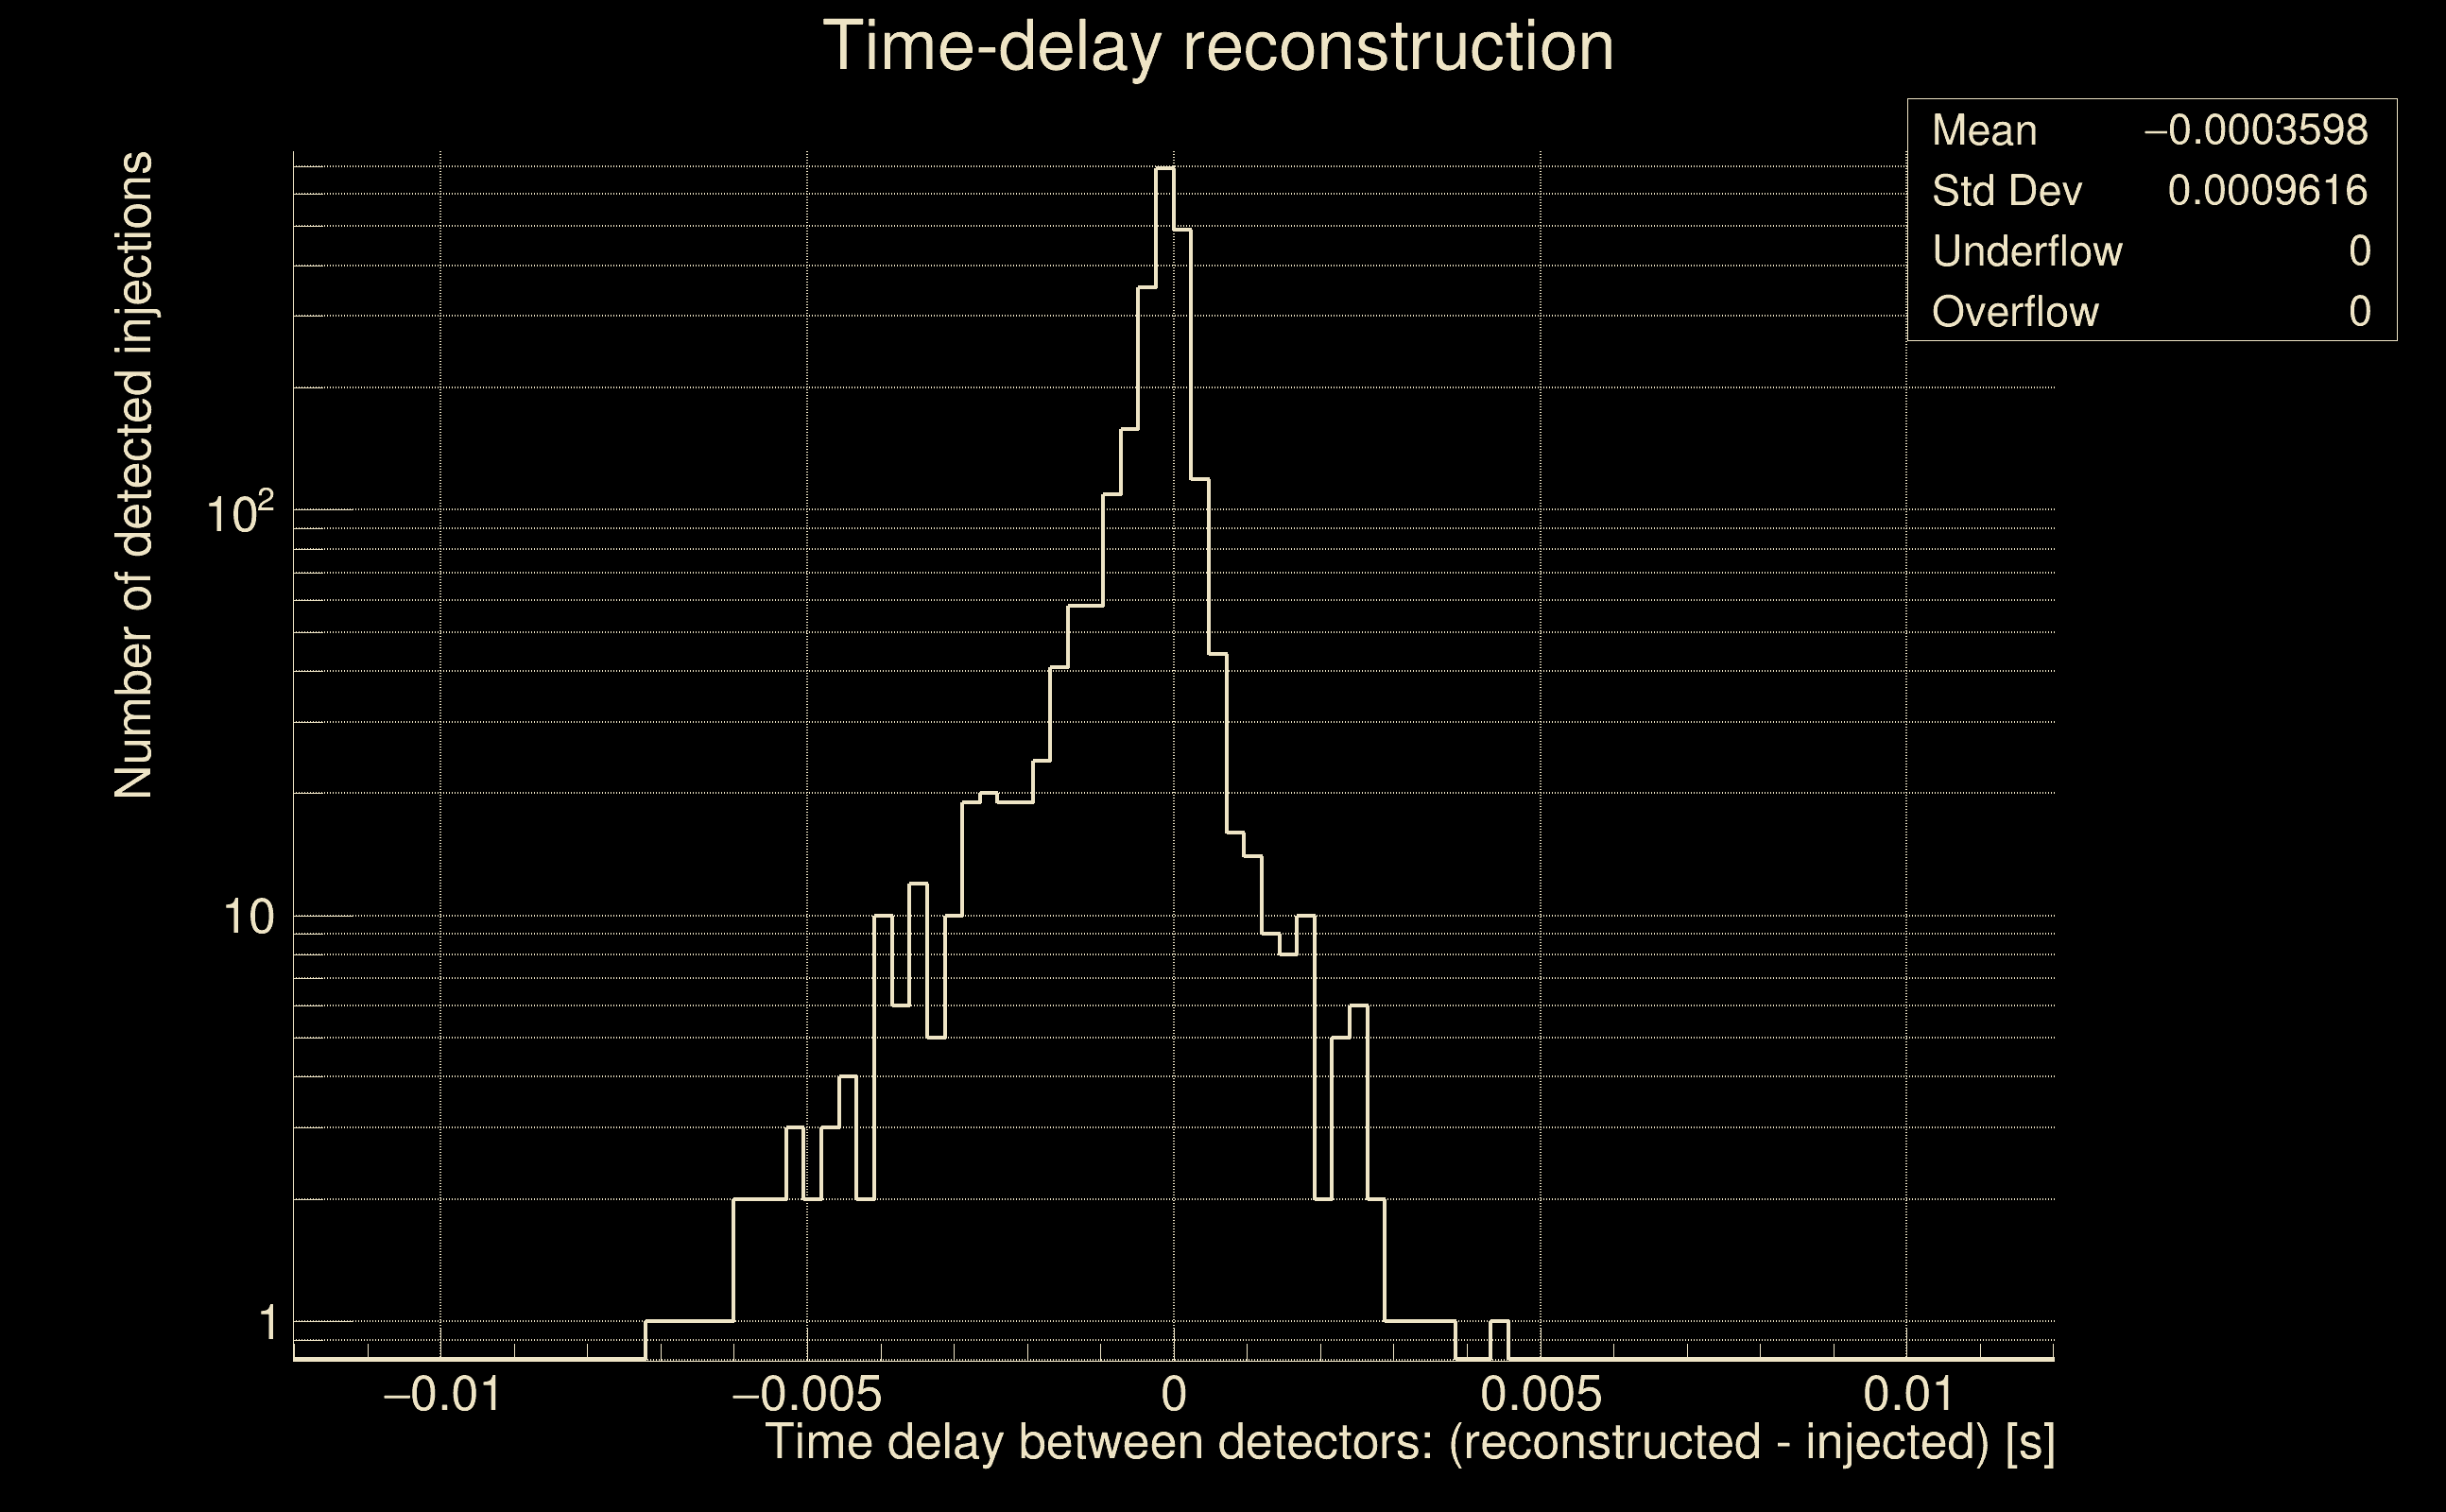
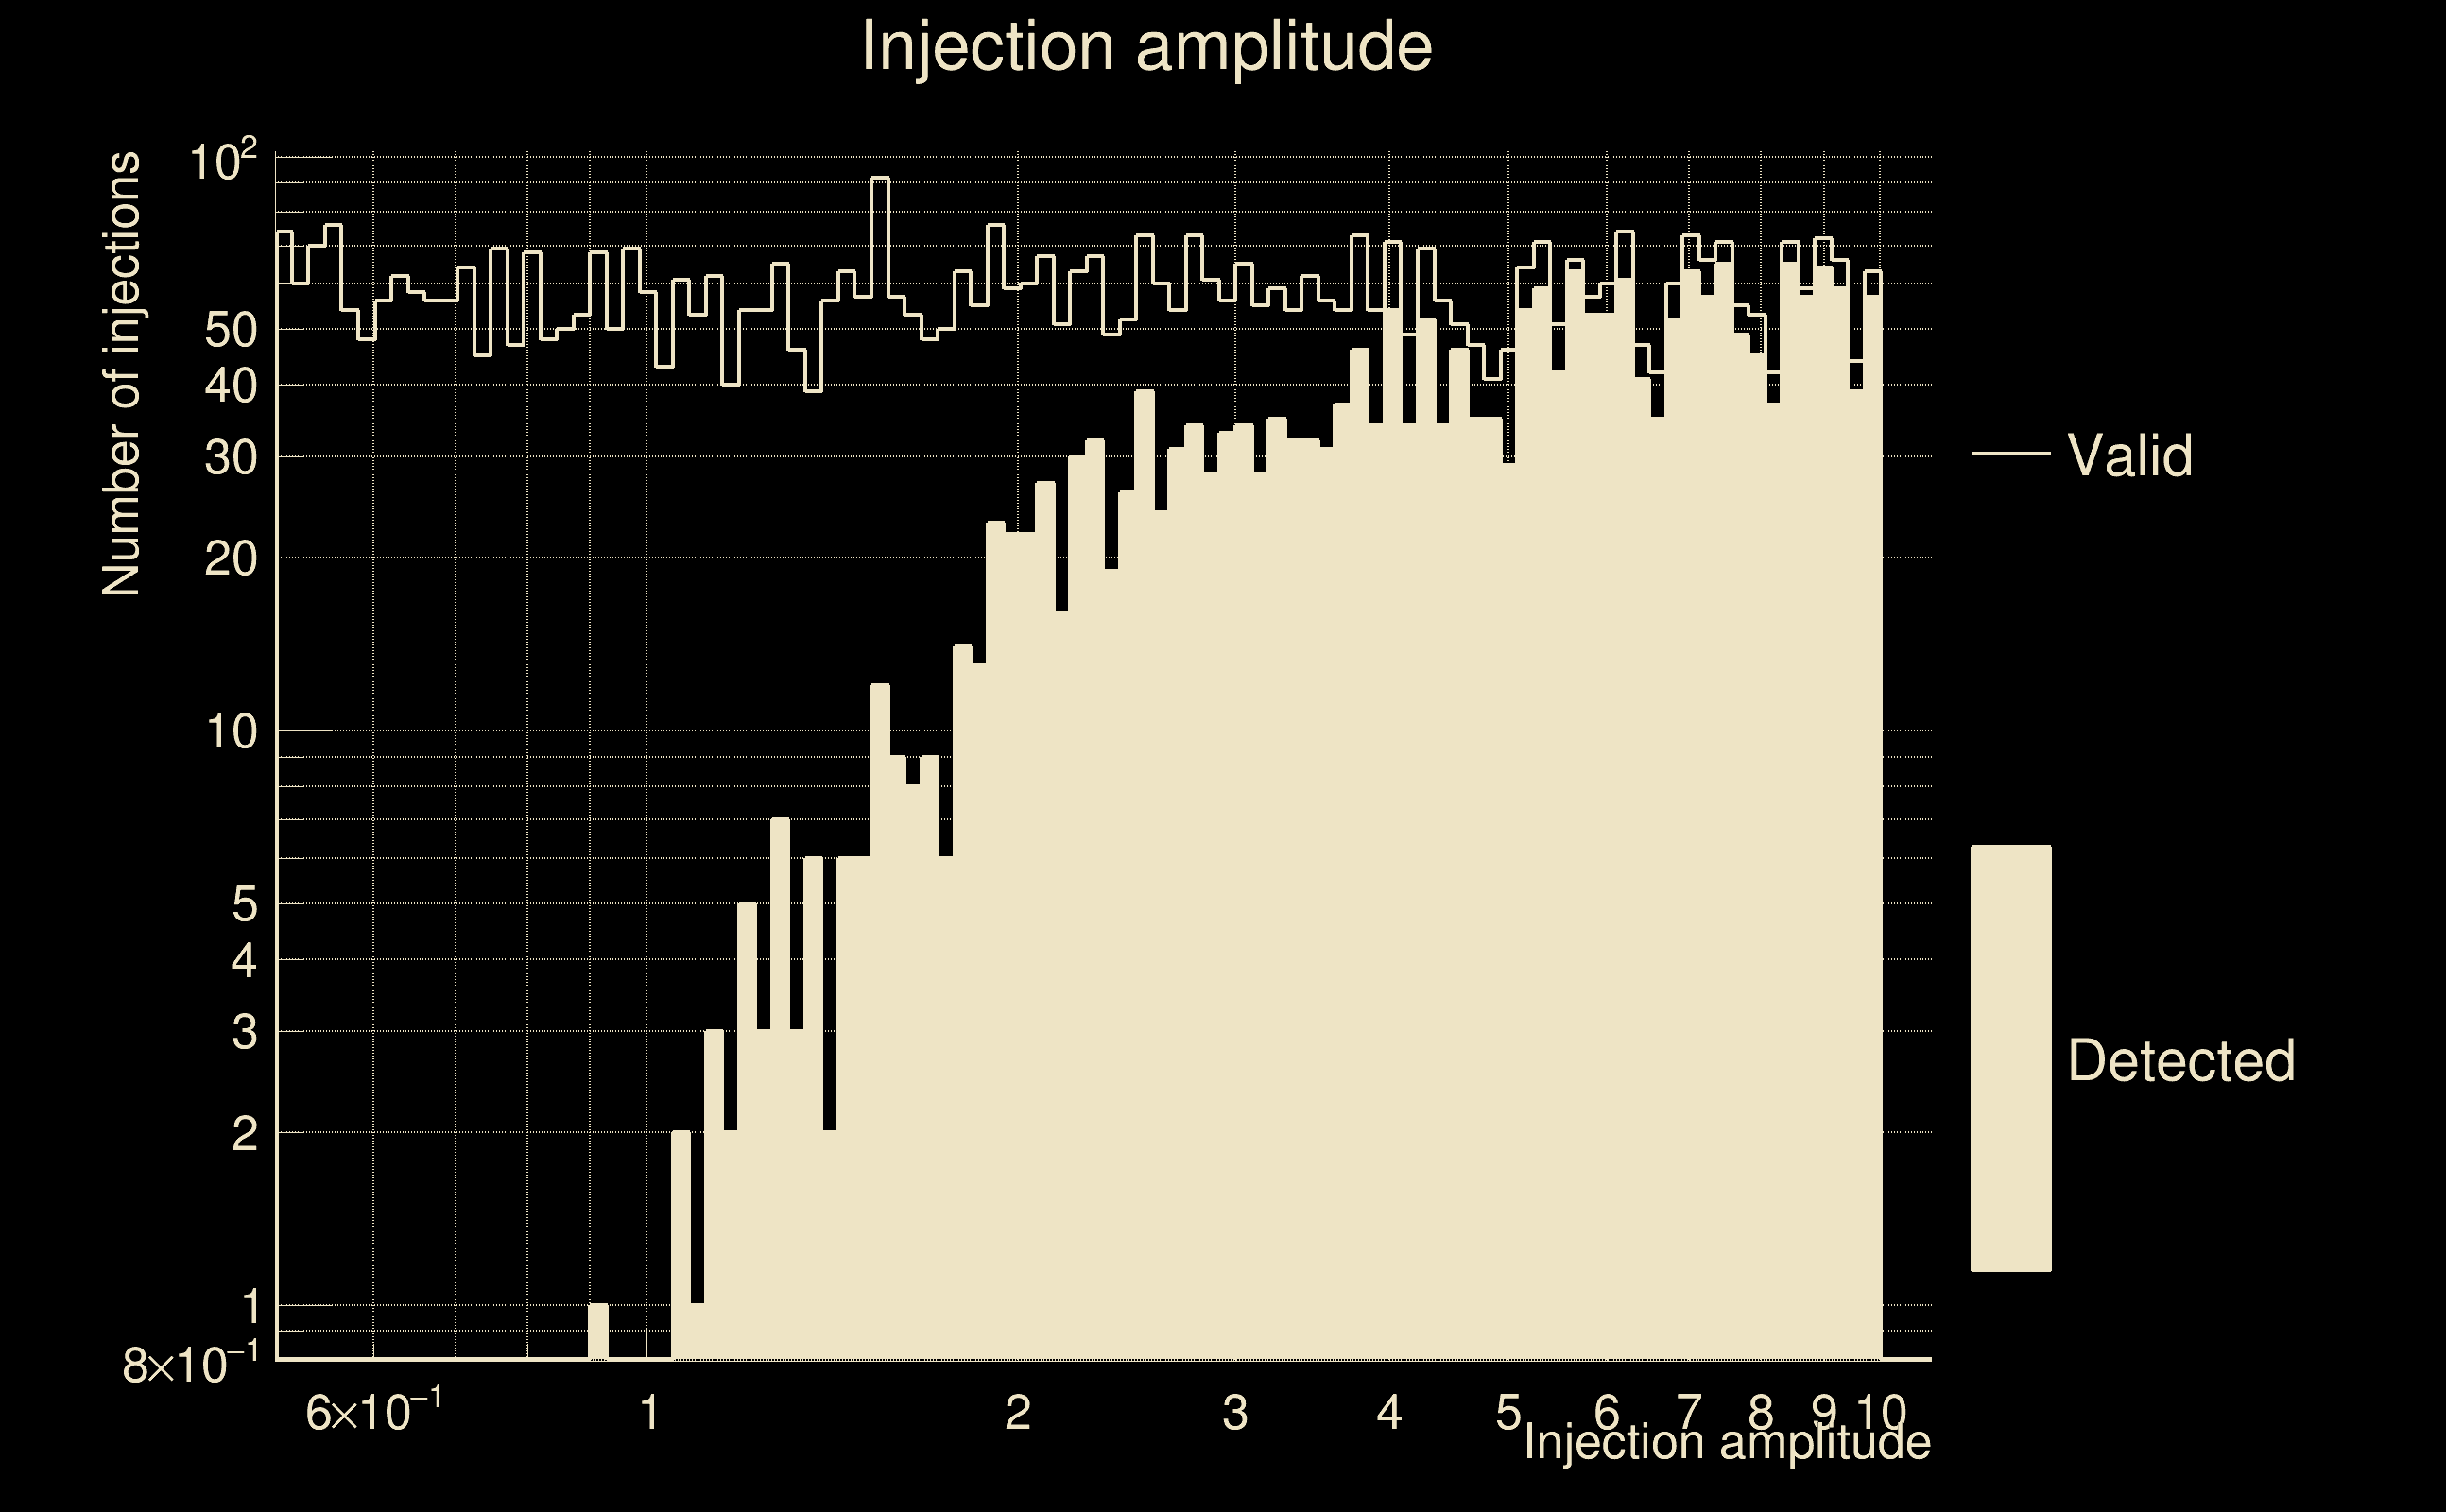
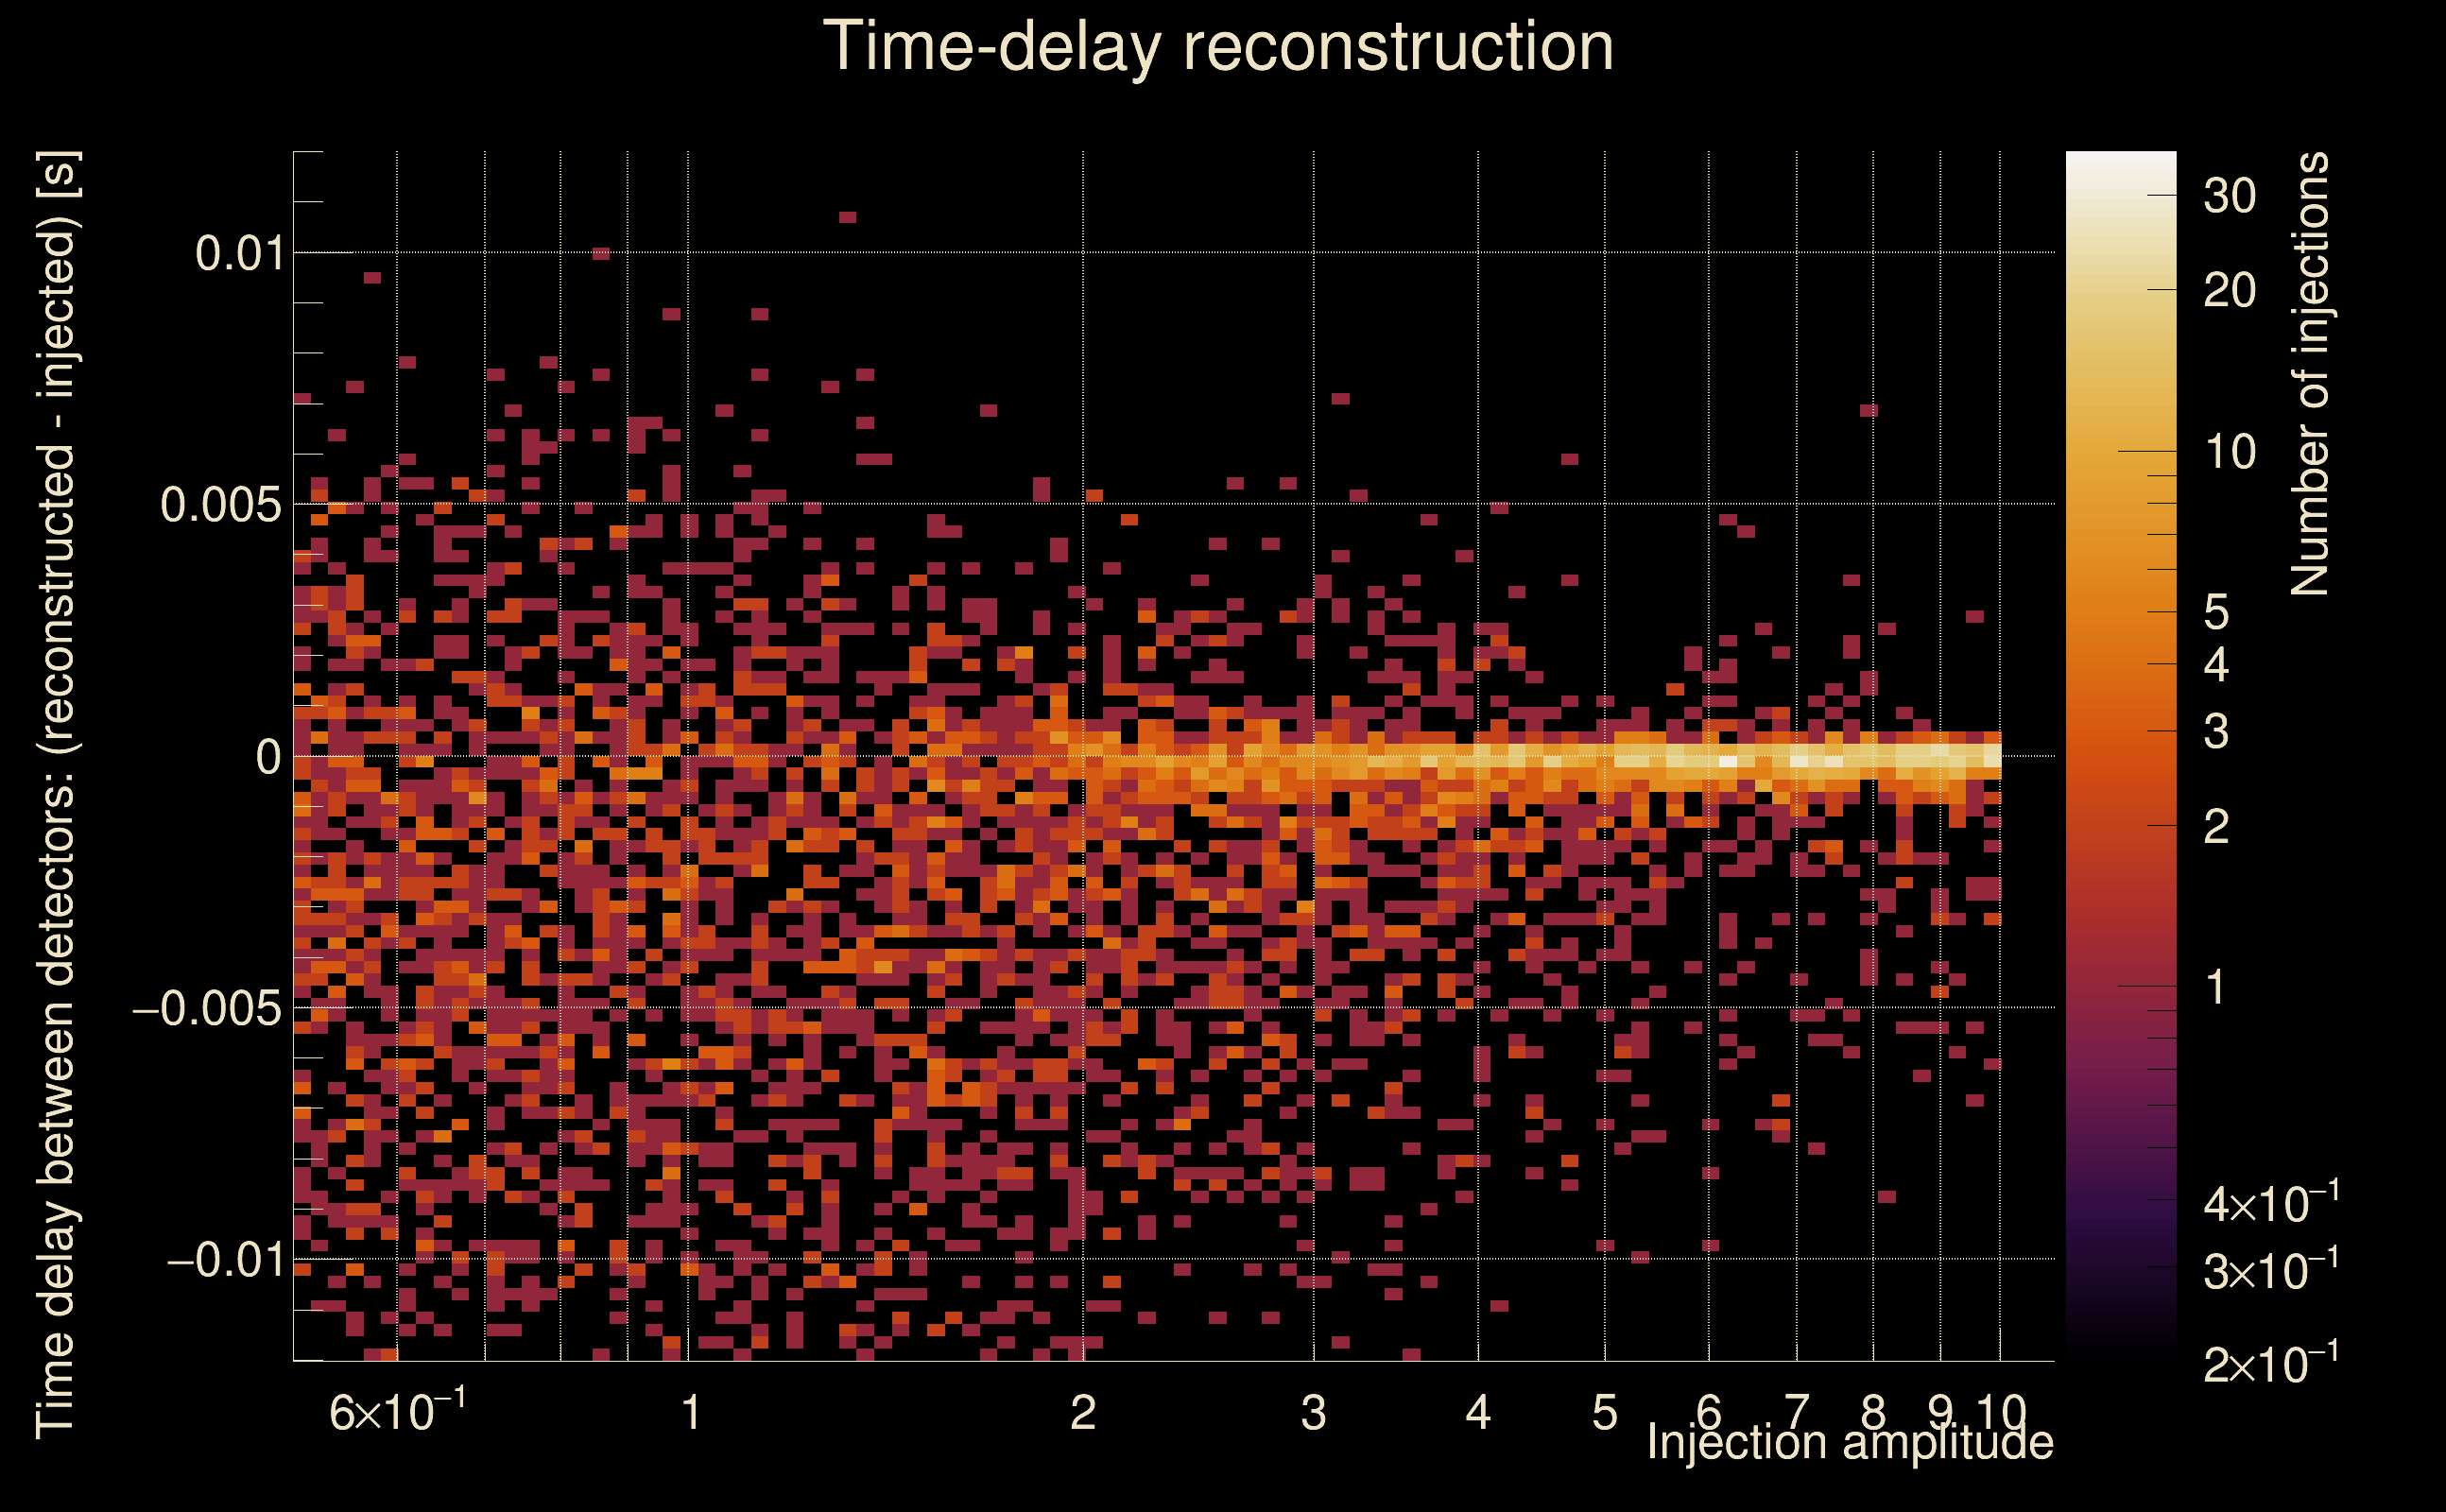
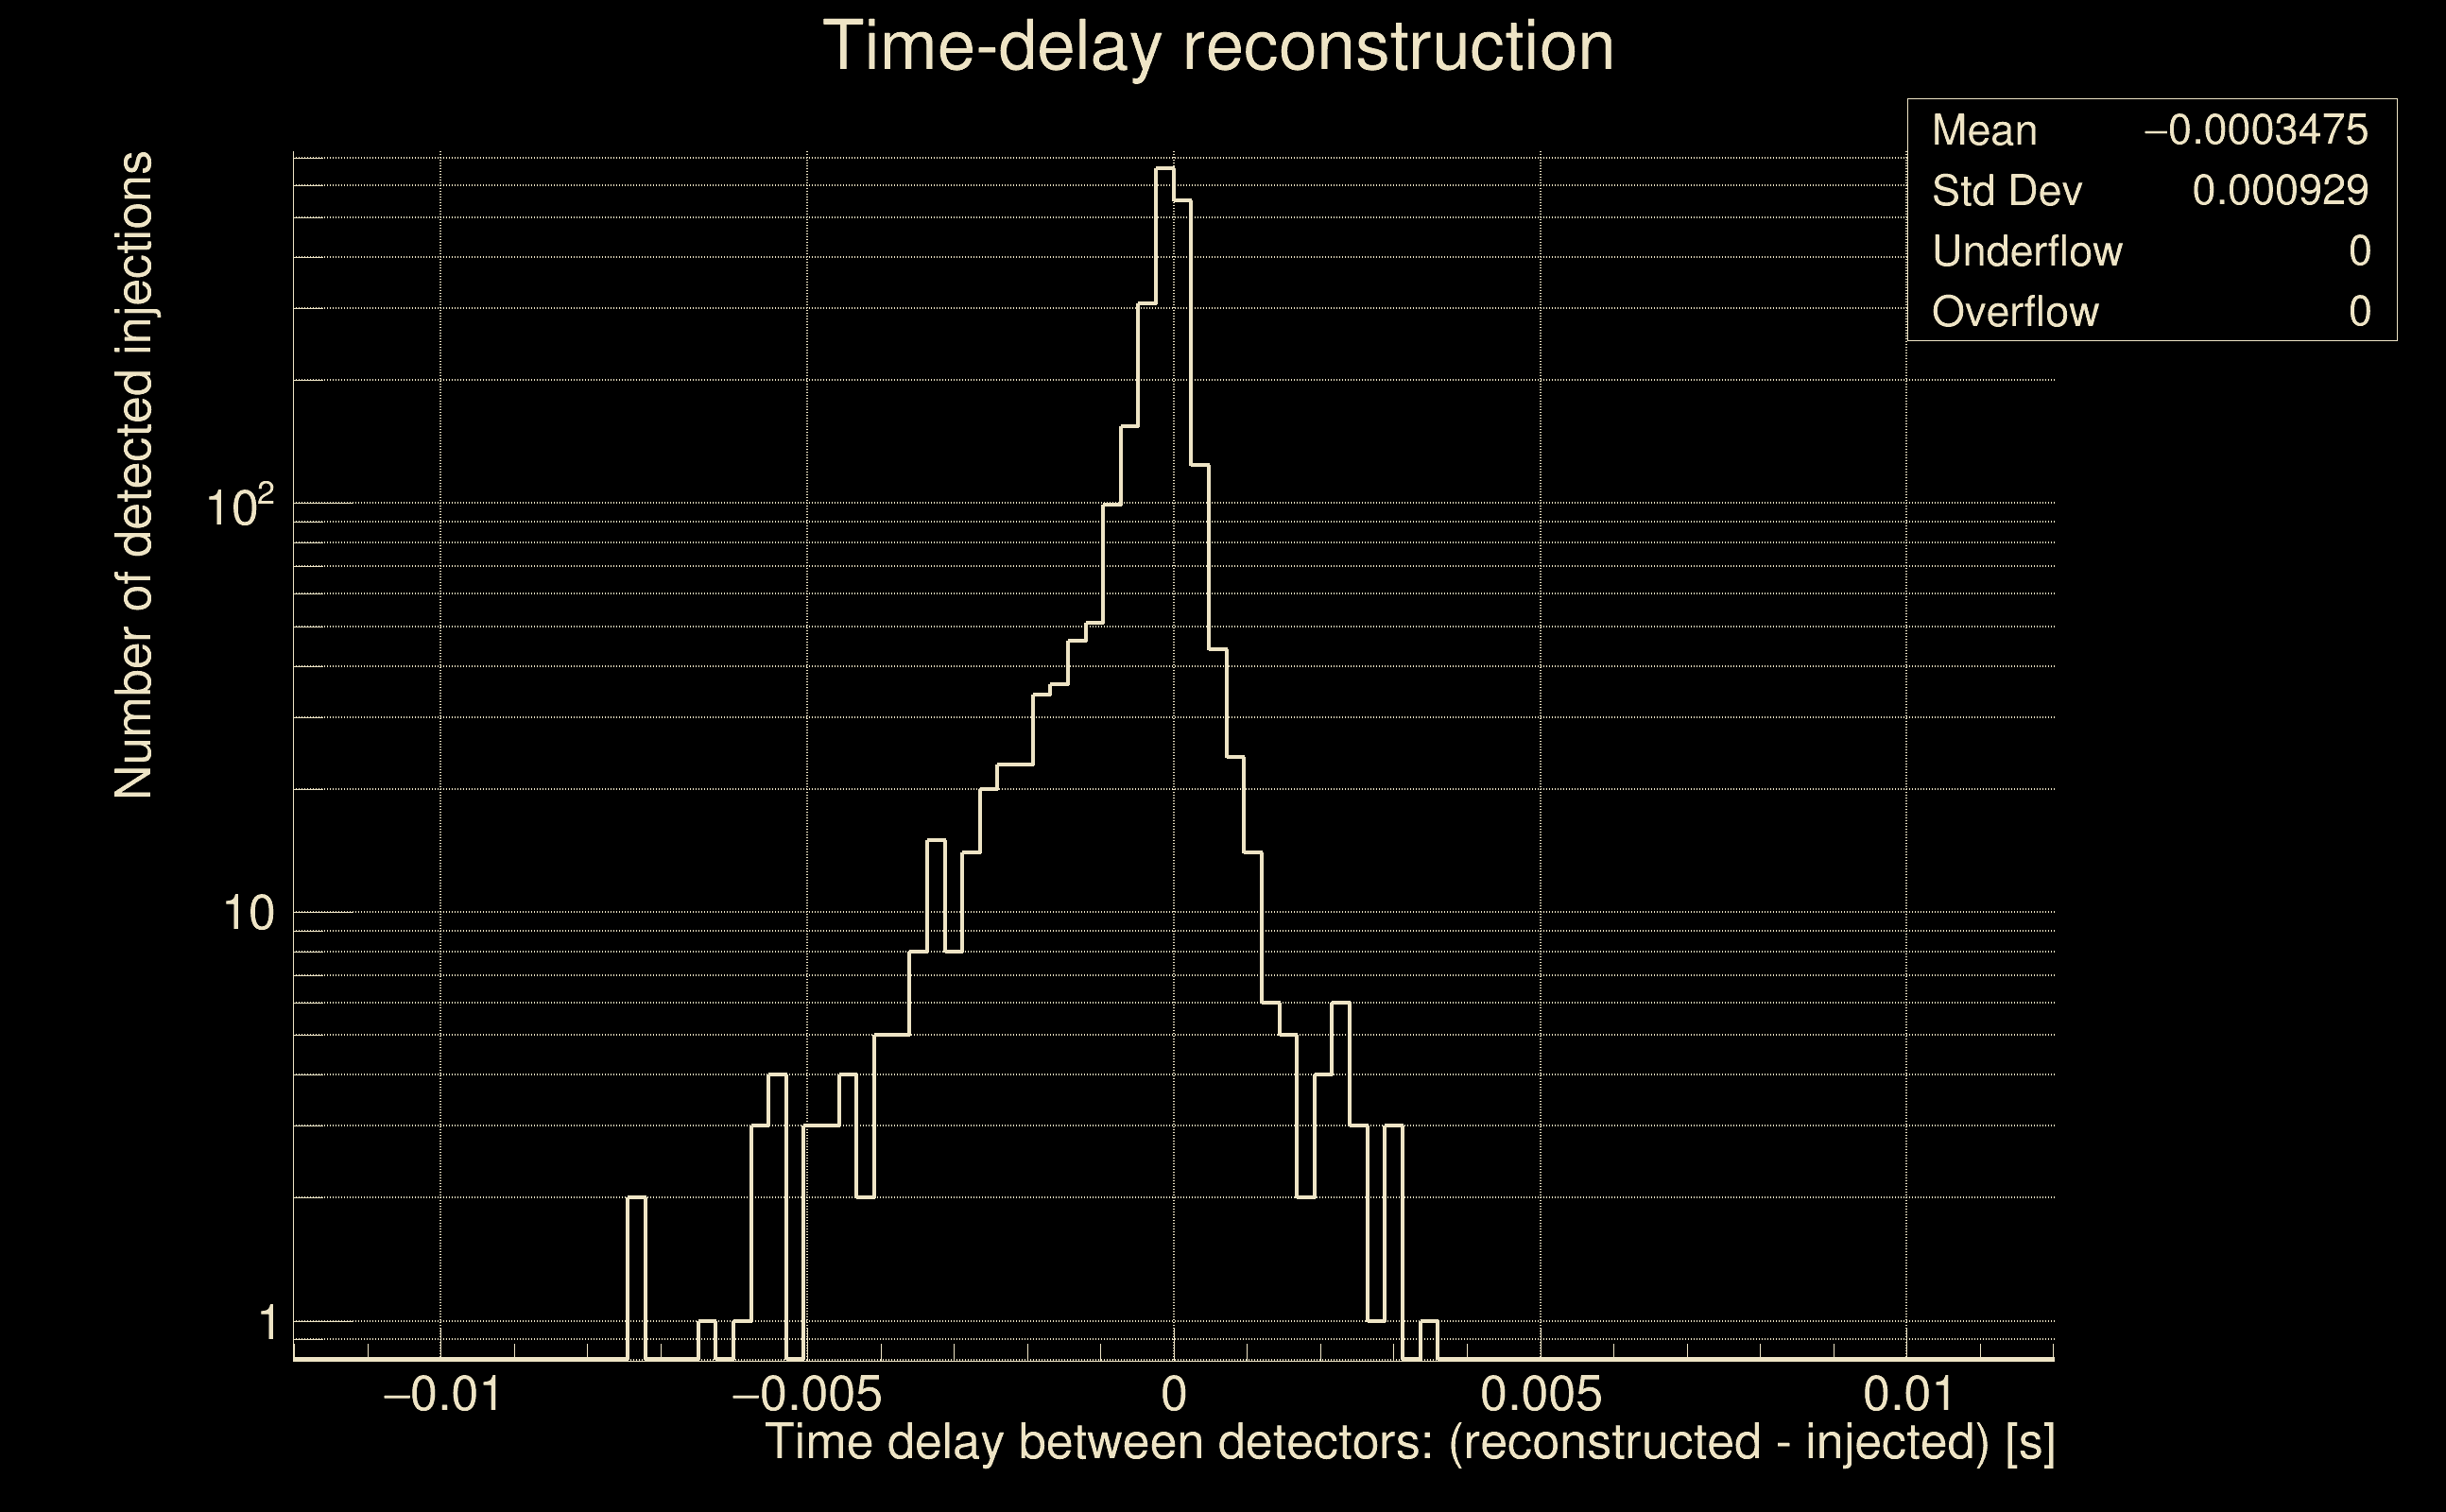
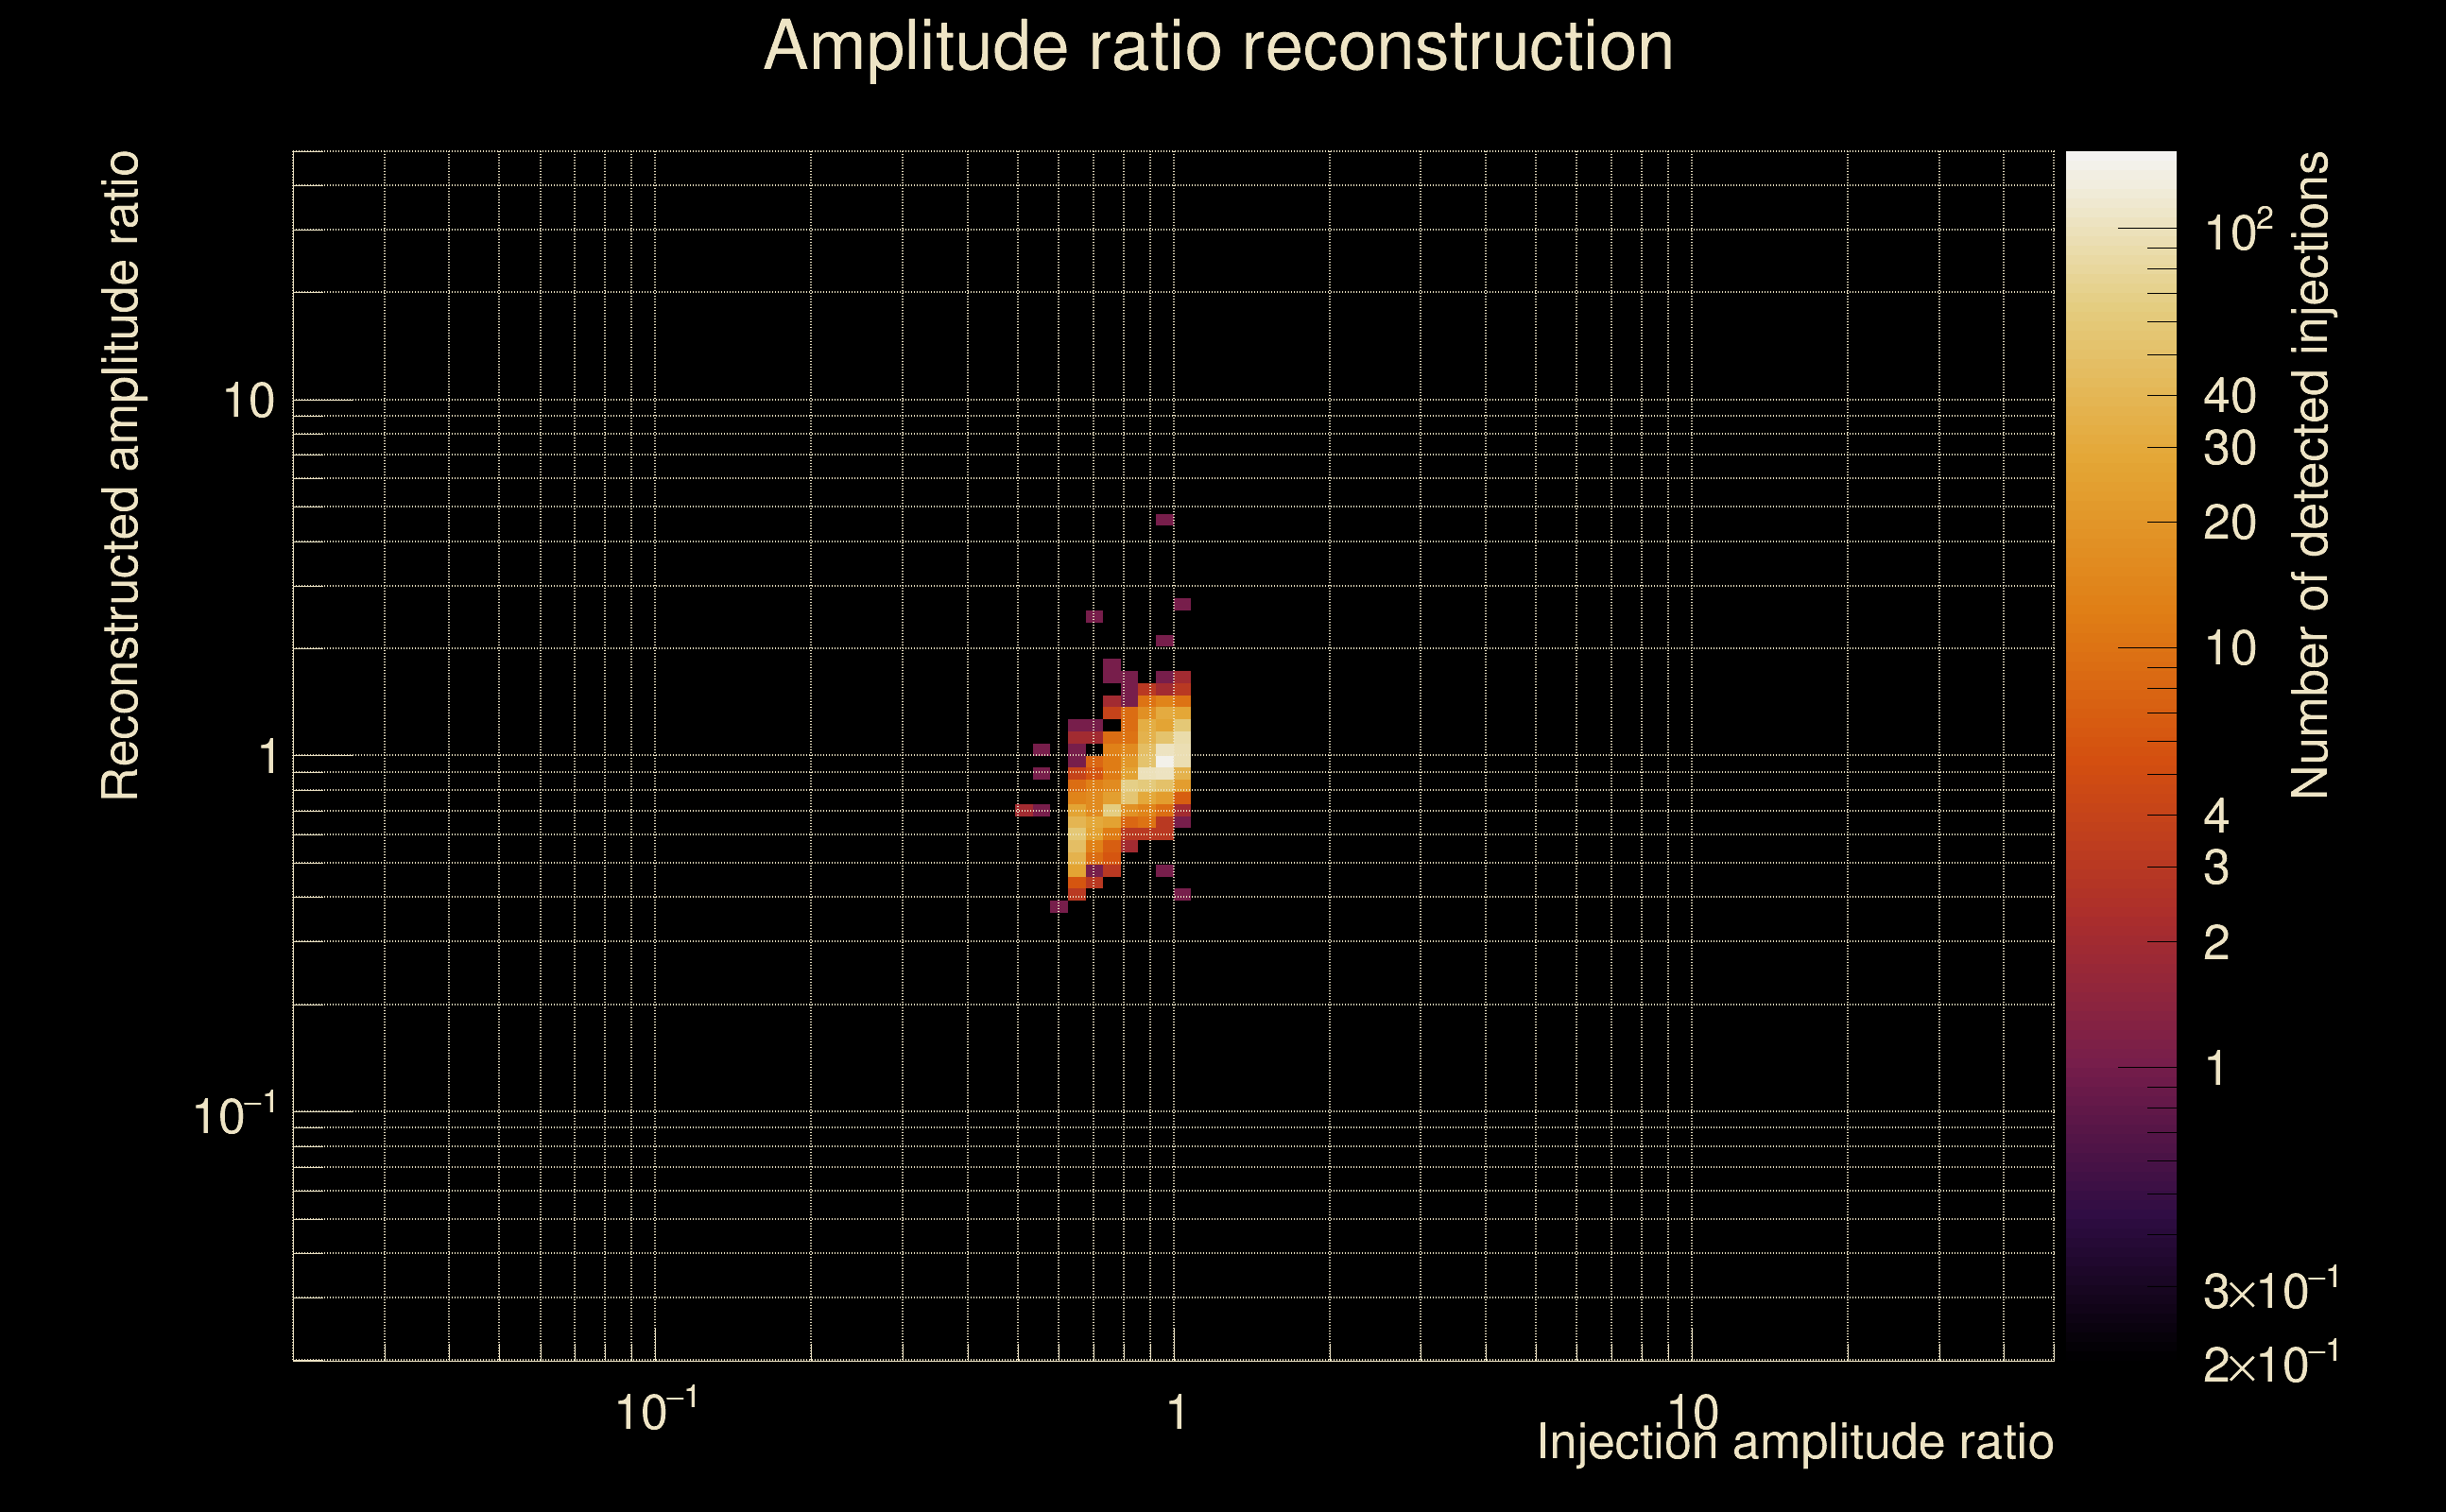
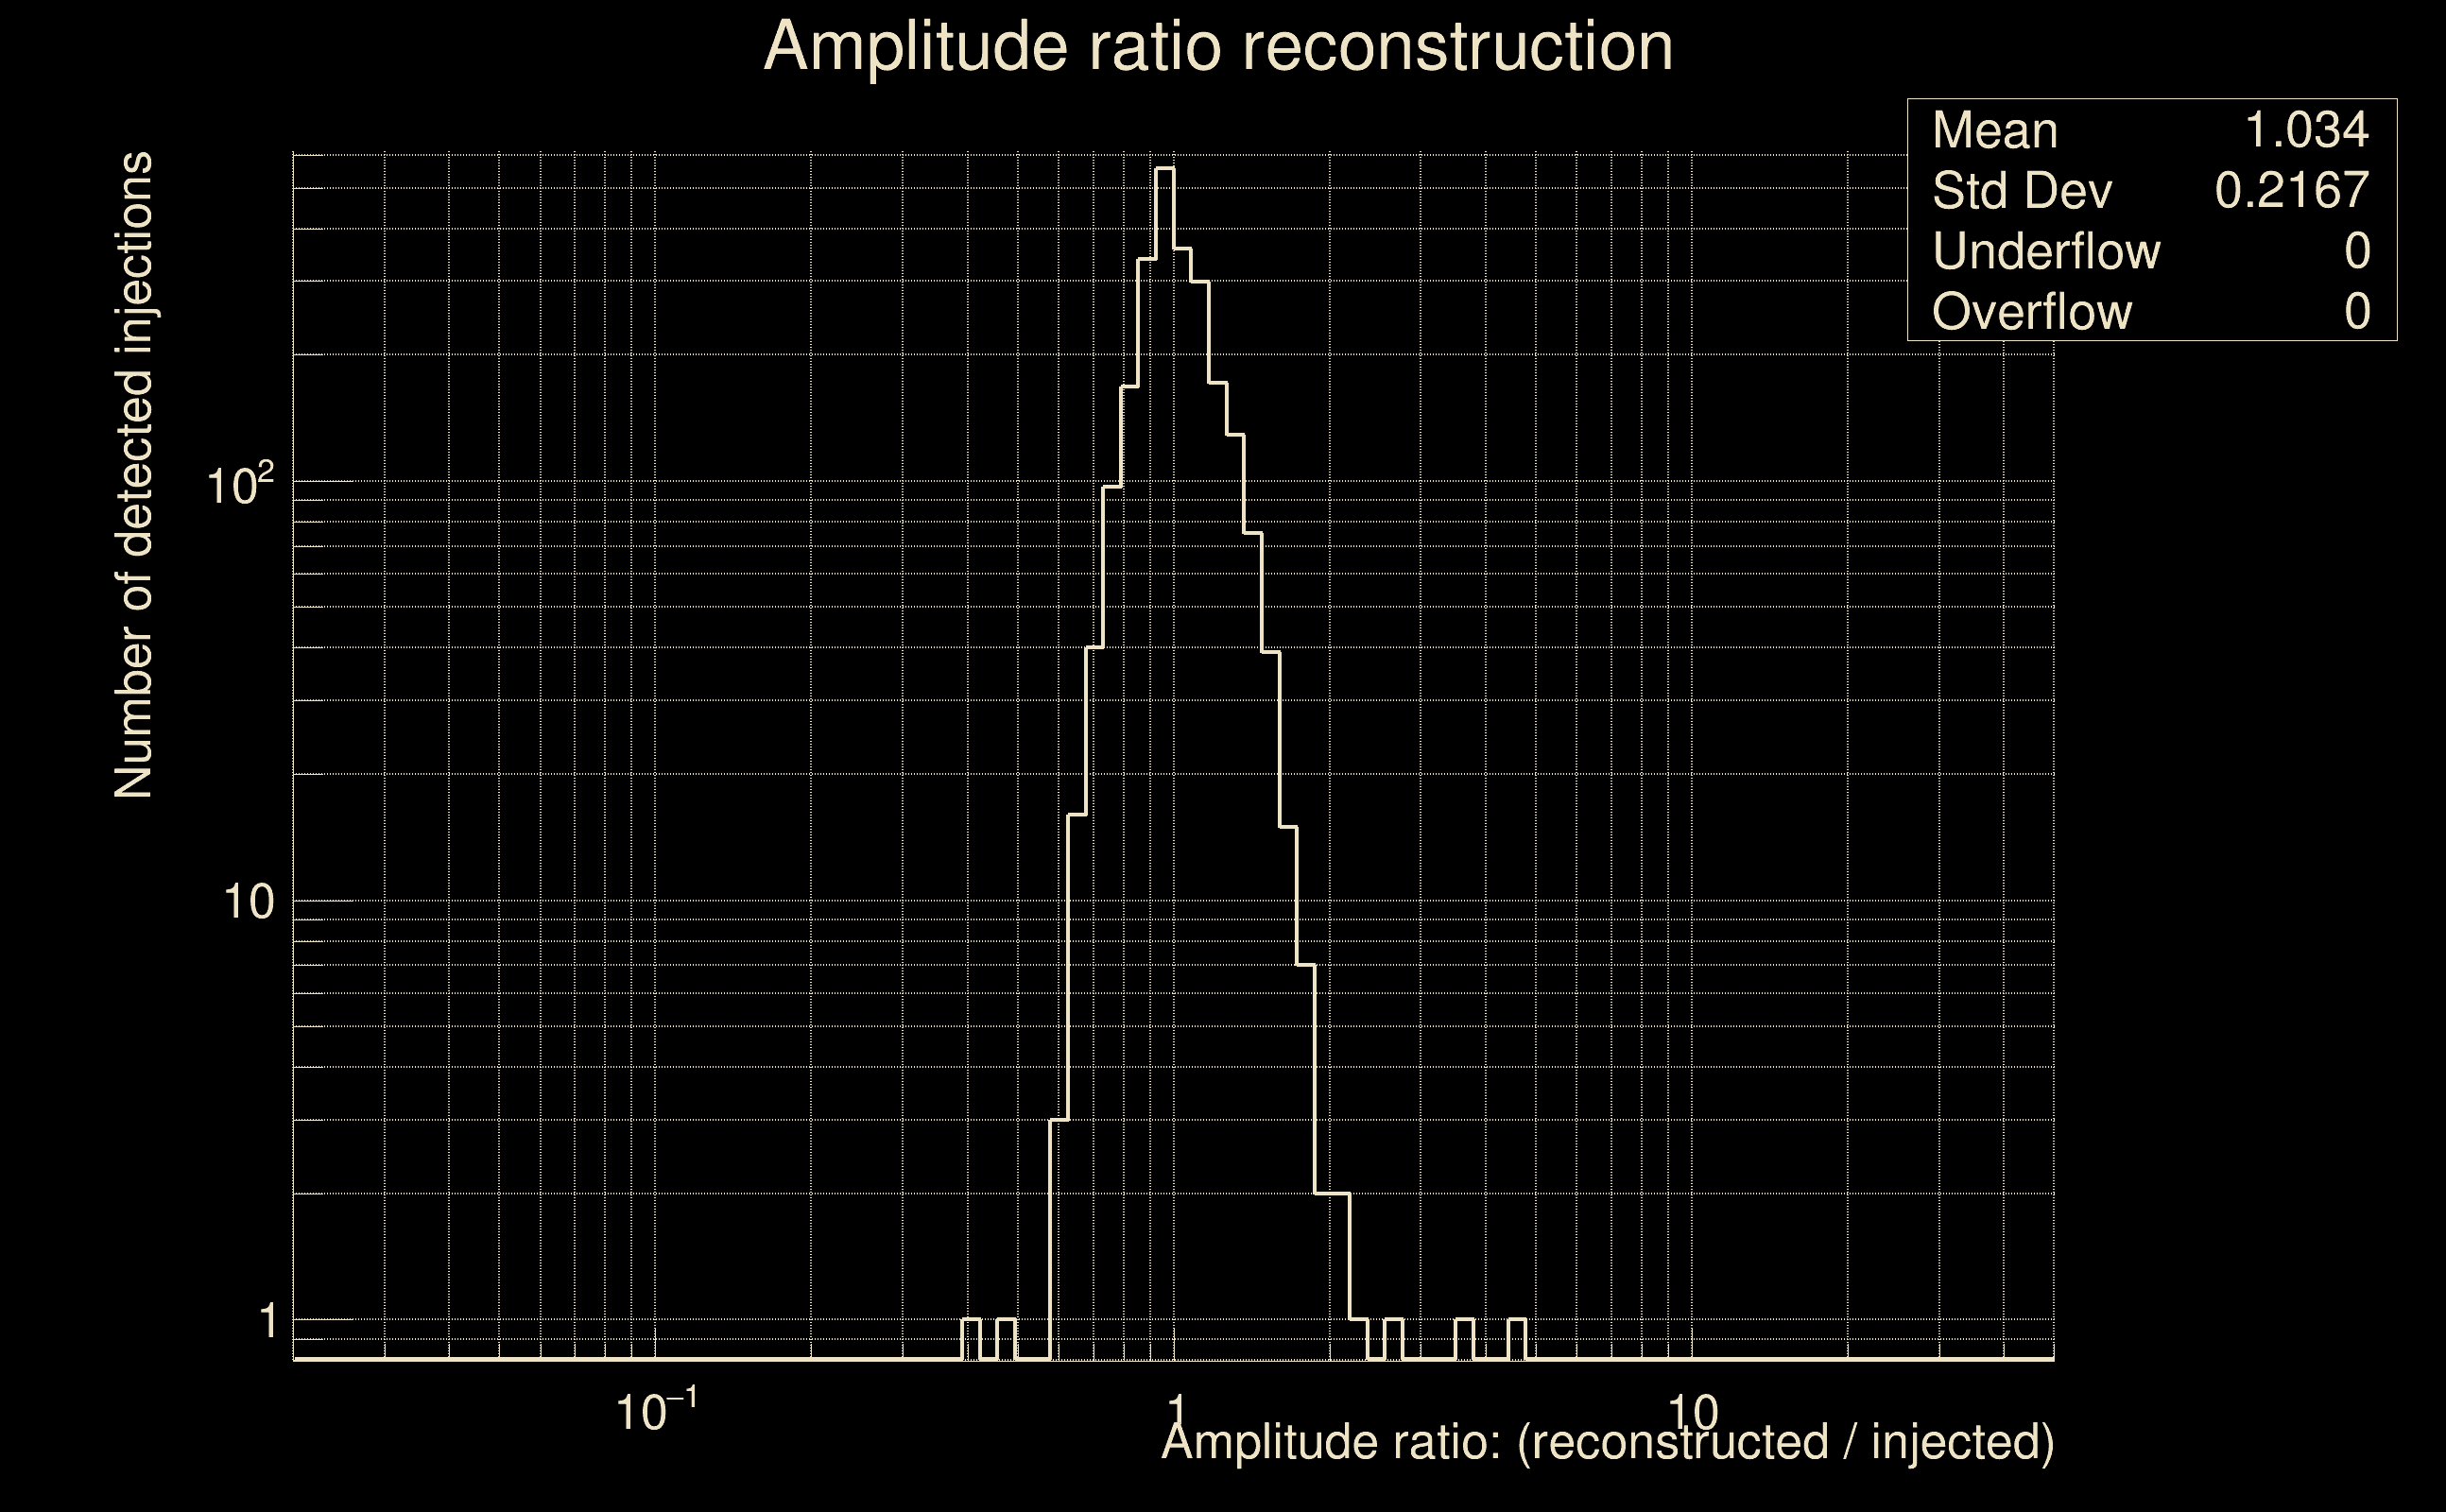
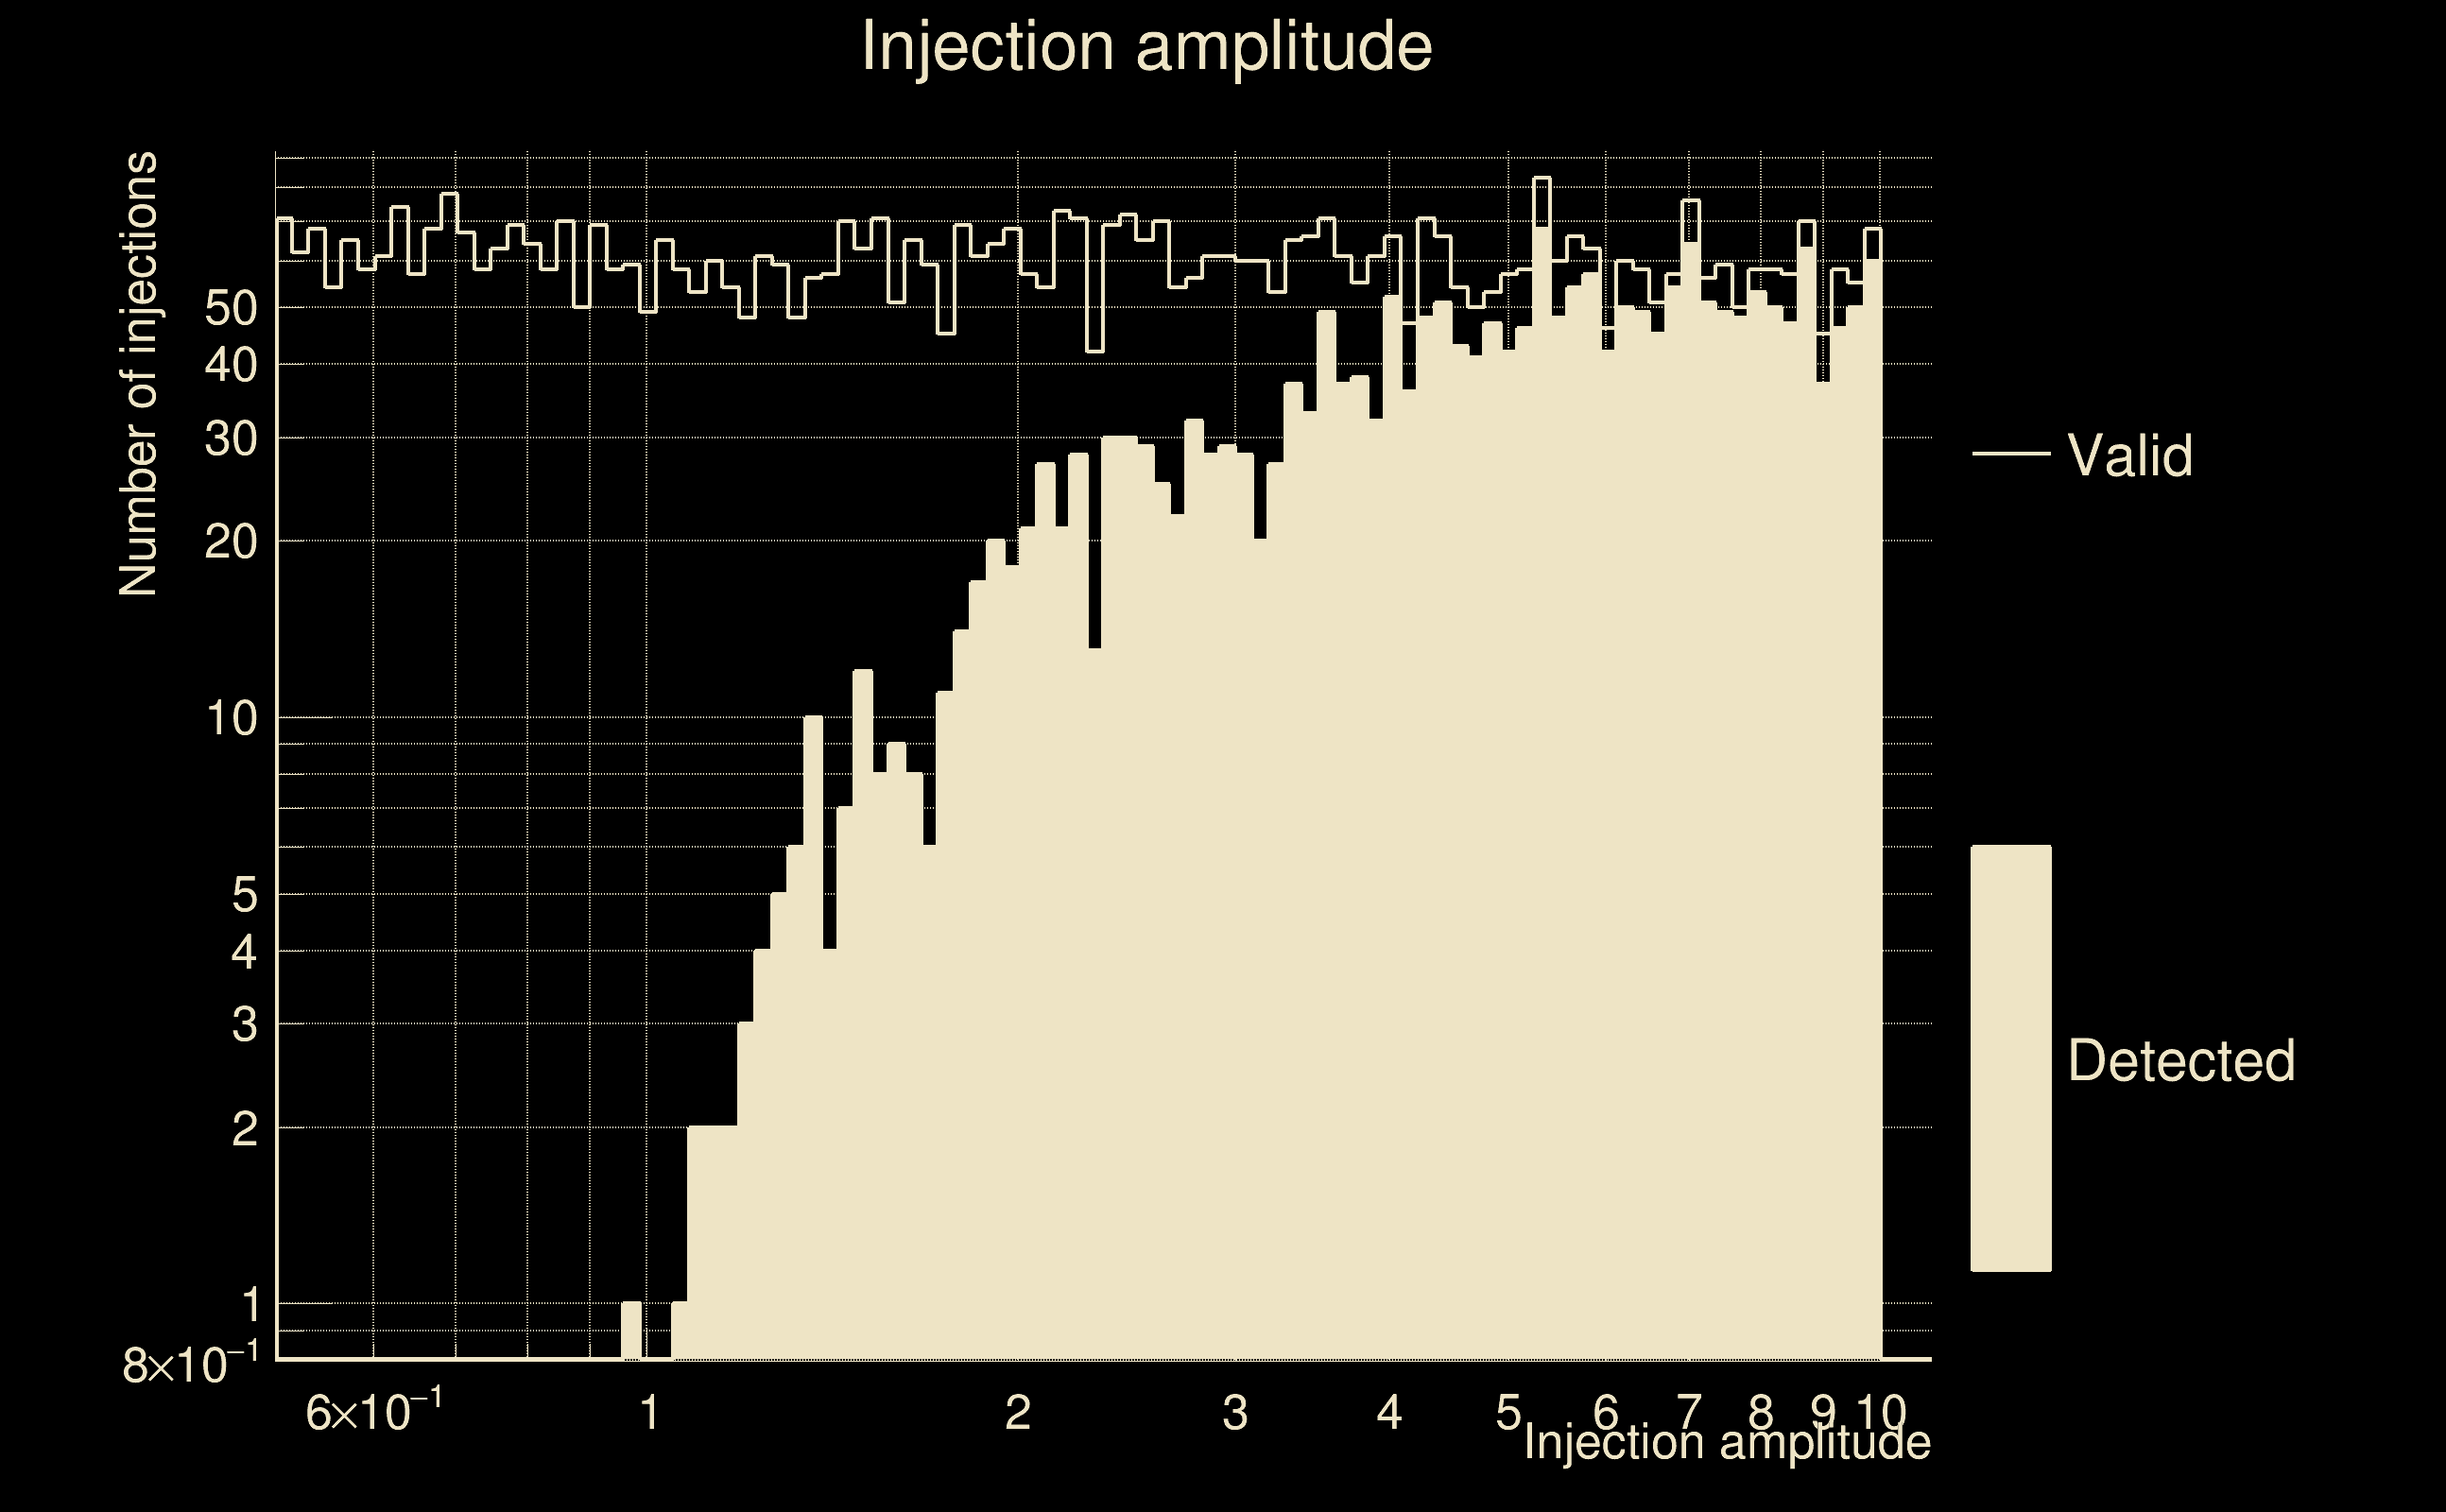
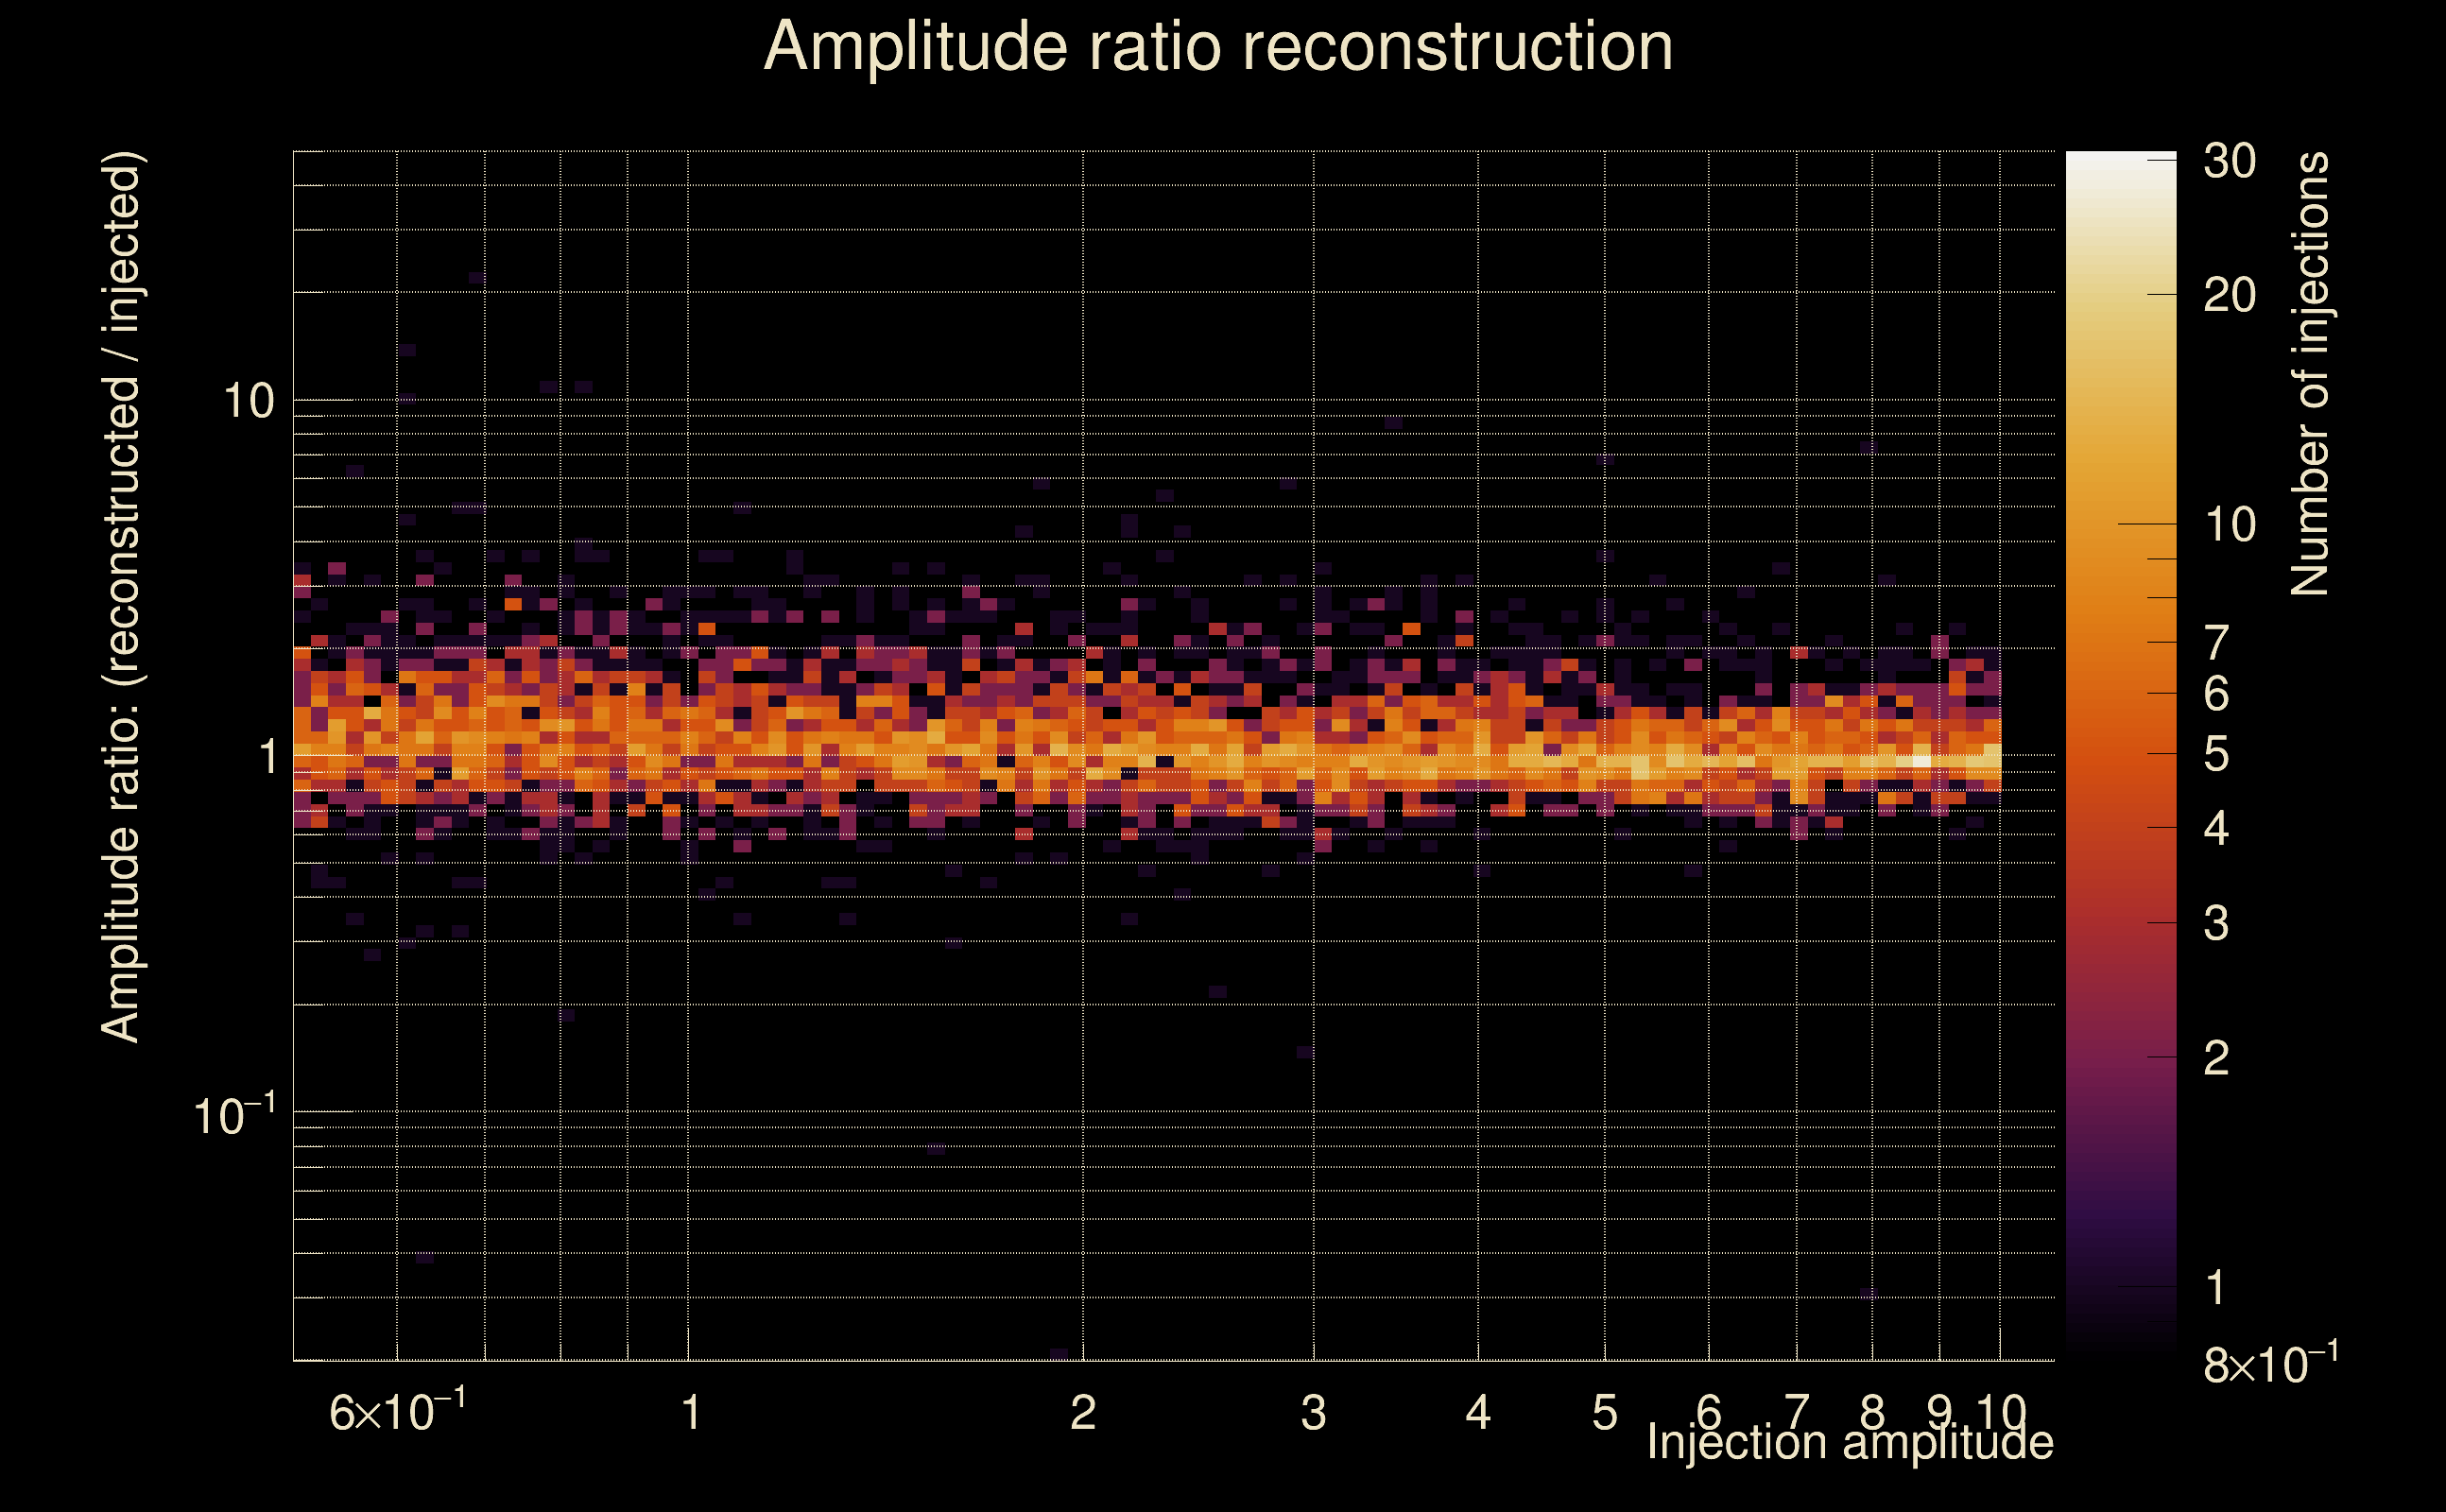
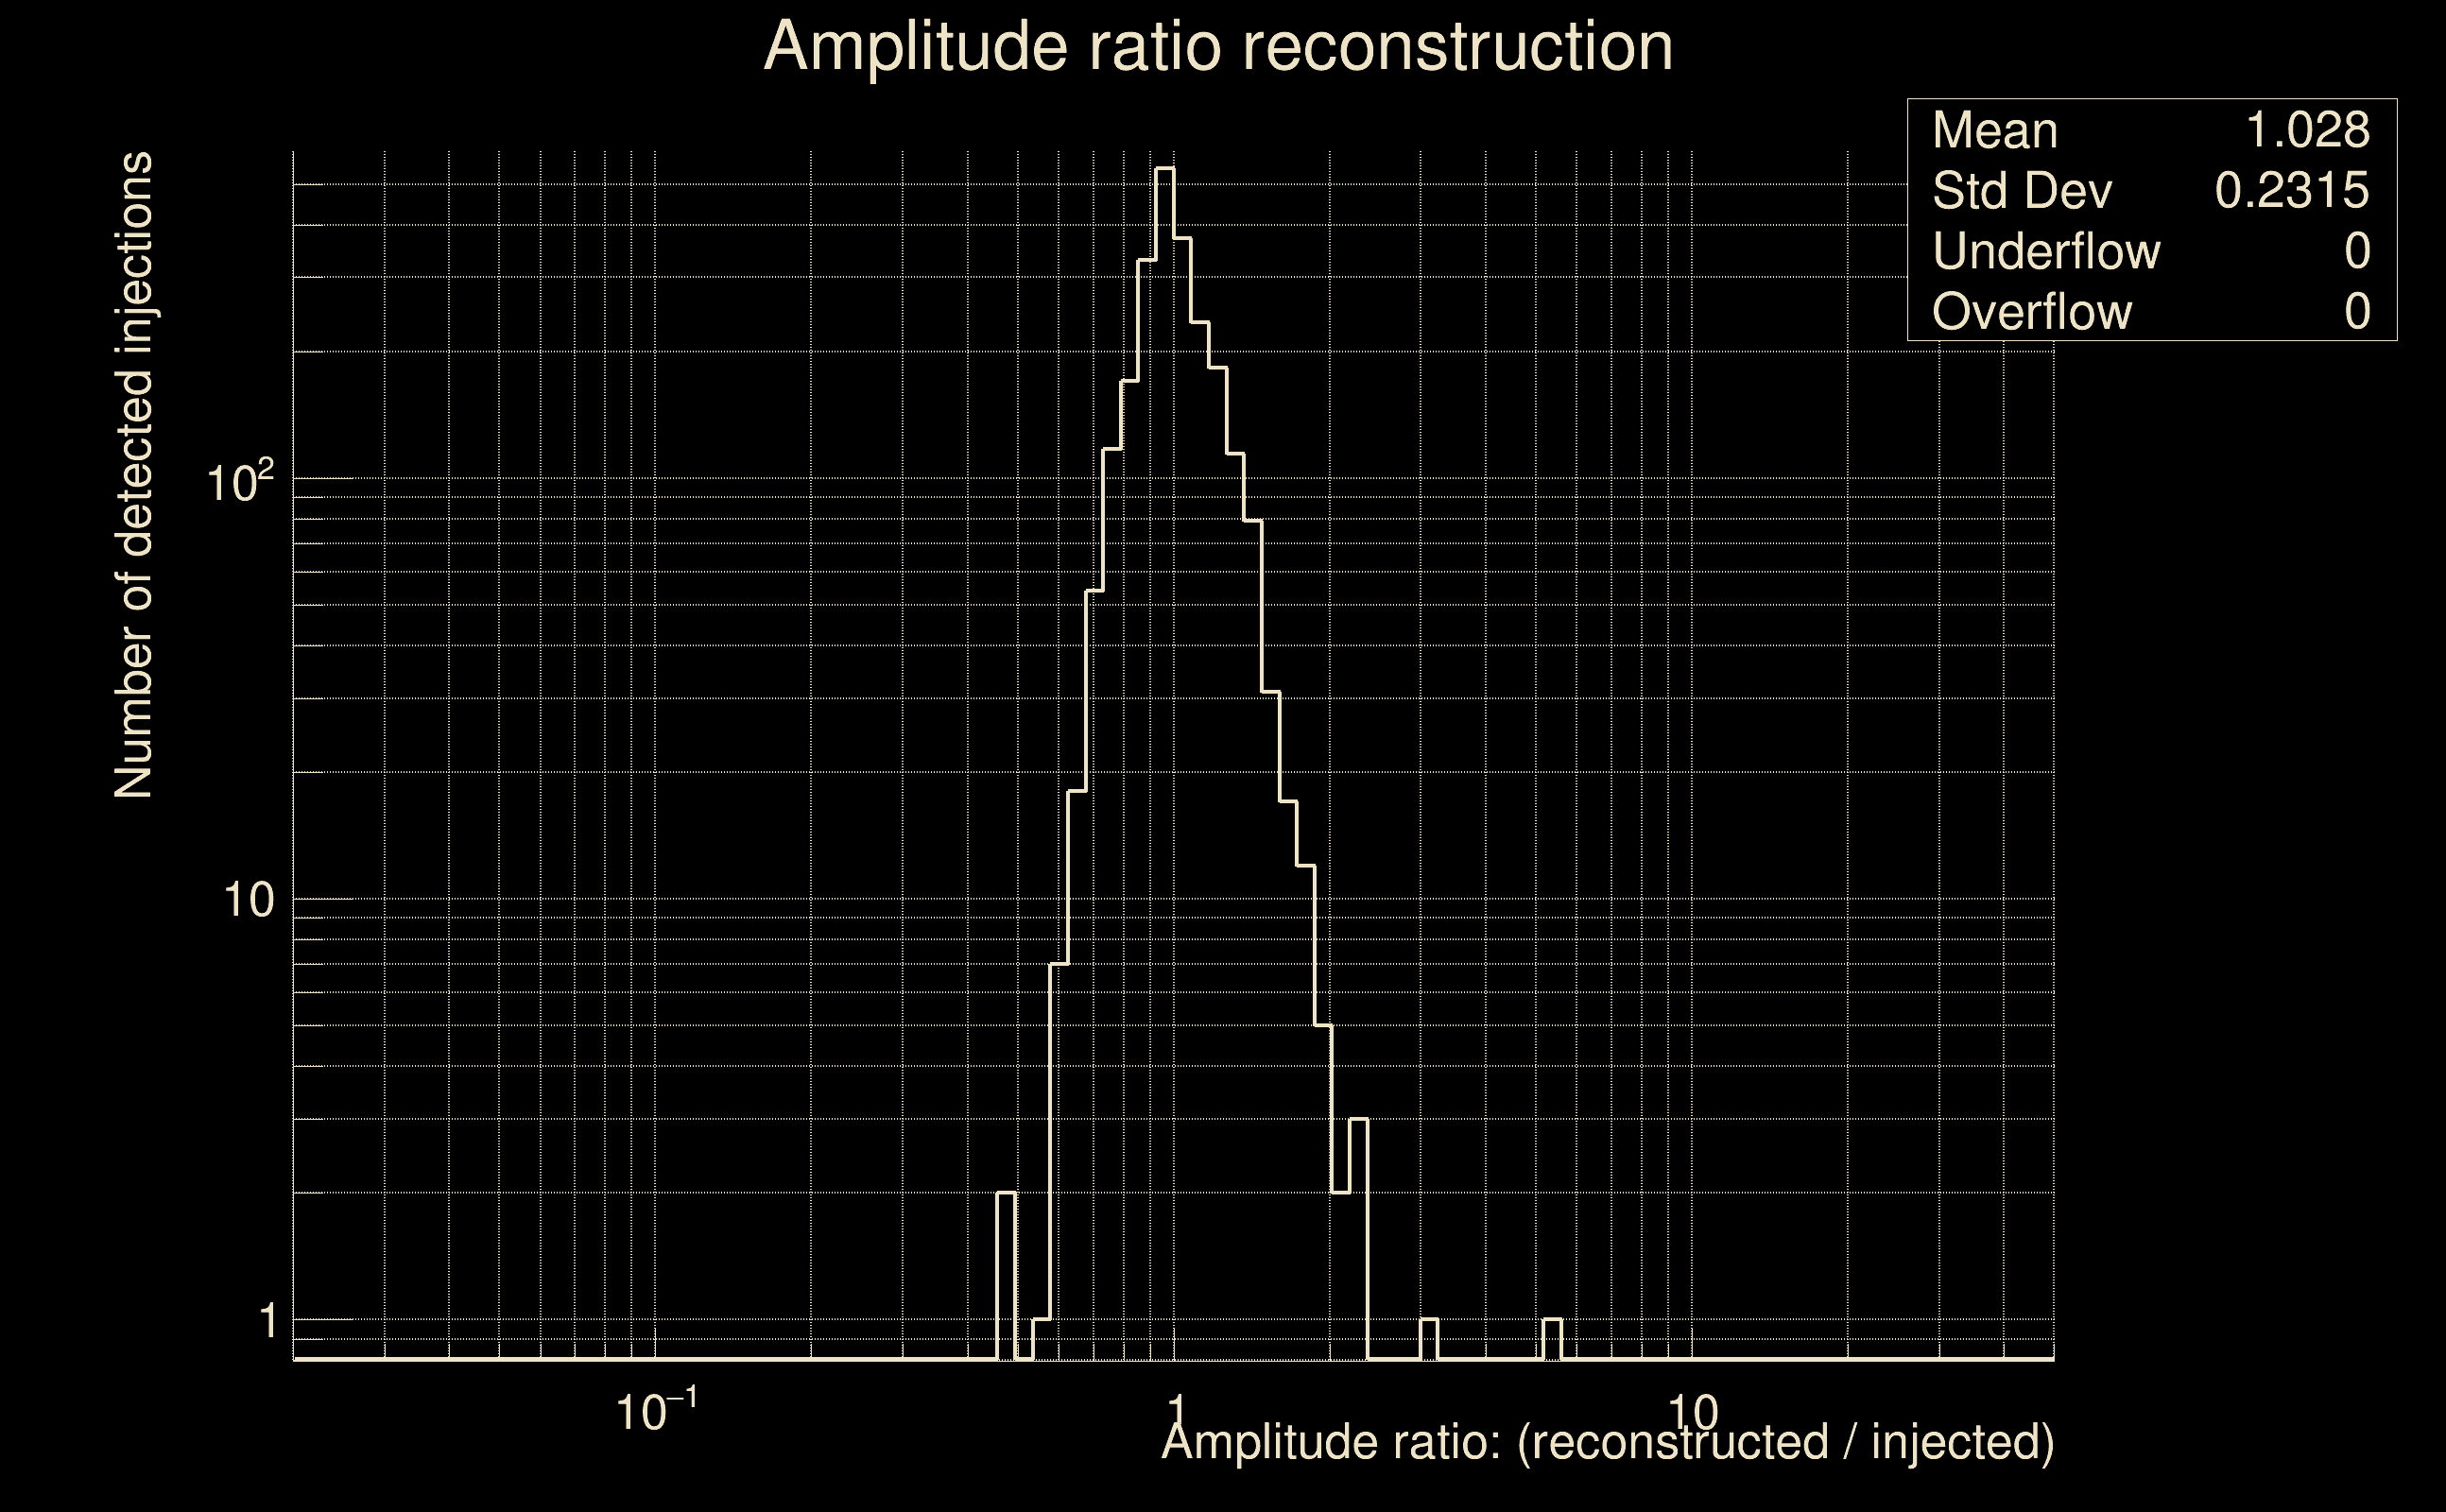
| Number of injections (total/valid/detected): | 5923 / 5871 / 2321 |
| List of missed injections: | ./AND19-S15FR_missed.txt |
| Injection amplitude at 90% detection efficiency: | 9.46589 |
| Injection amplitude at 50% detection efficiency: | 3.0839 |
| Injection amplitude at 10% detection efficiency: | 1.55798 |
 |
 |
 |
 |
 |
 |
|
 |
 |
|
 |
 |
 |
 |
 |
 |
 |
 |
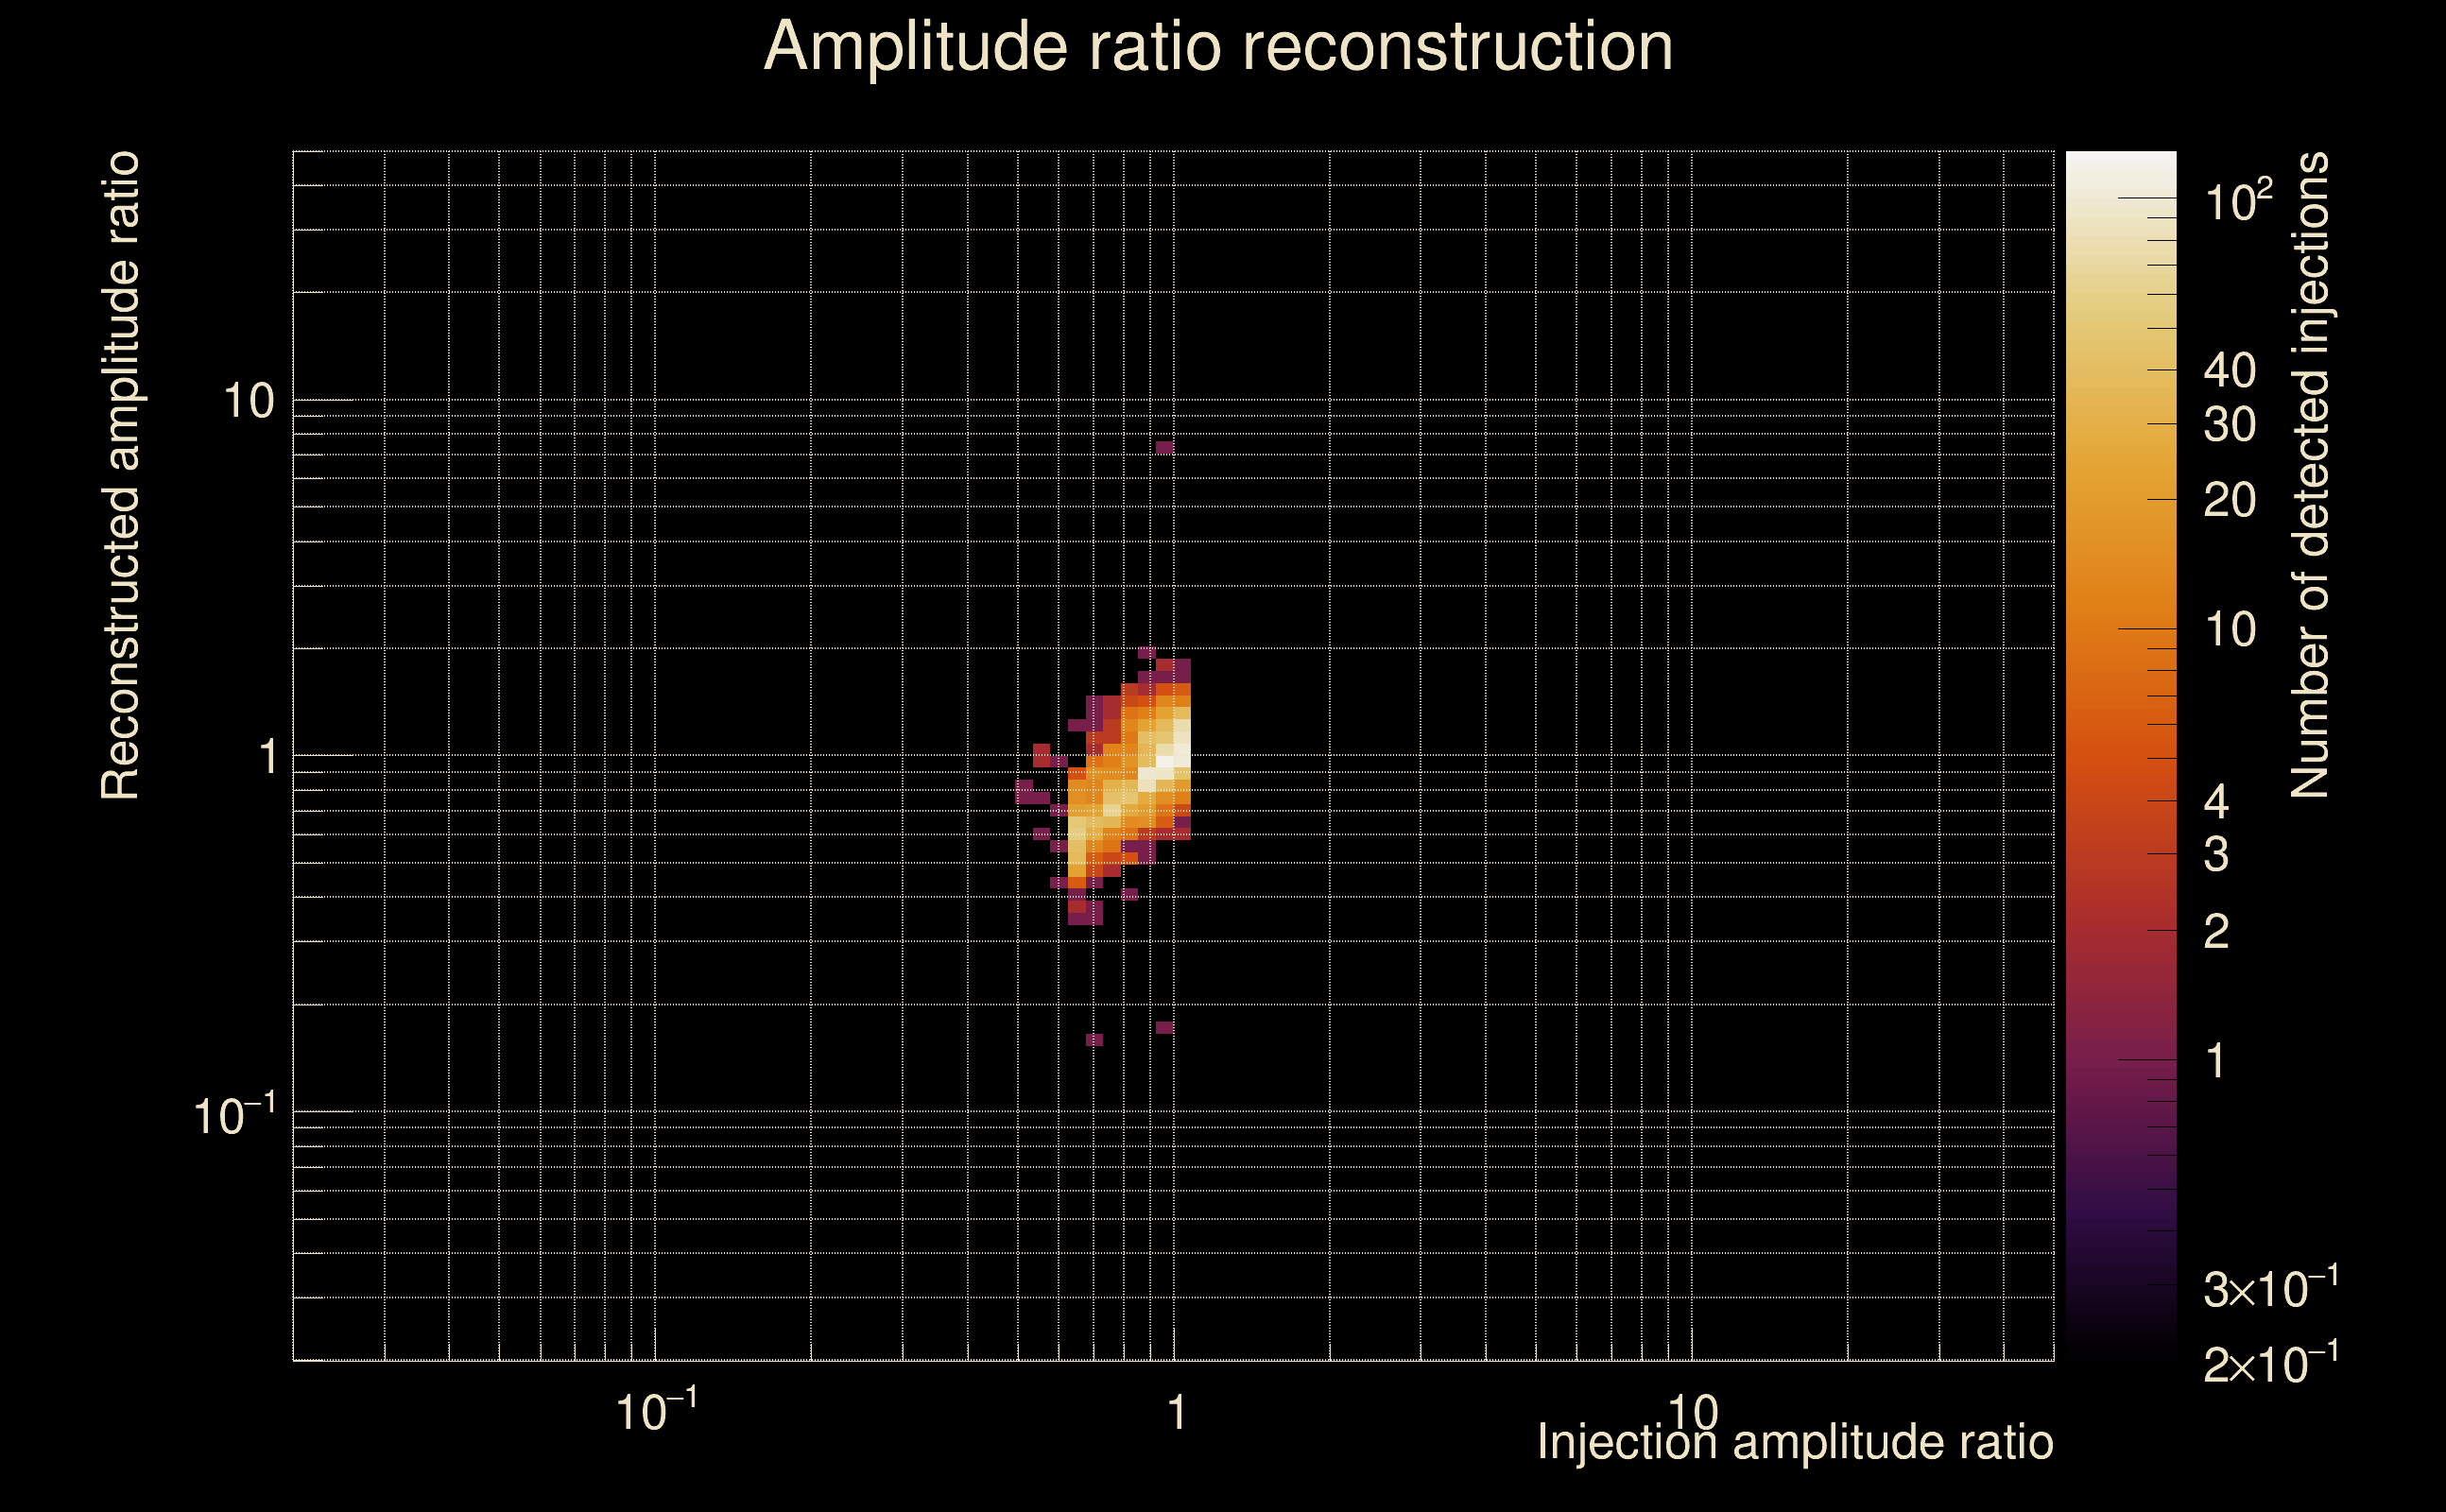
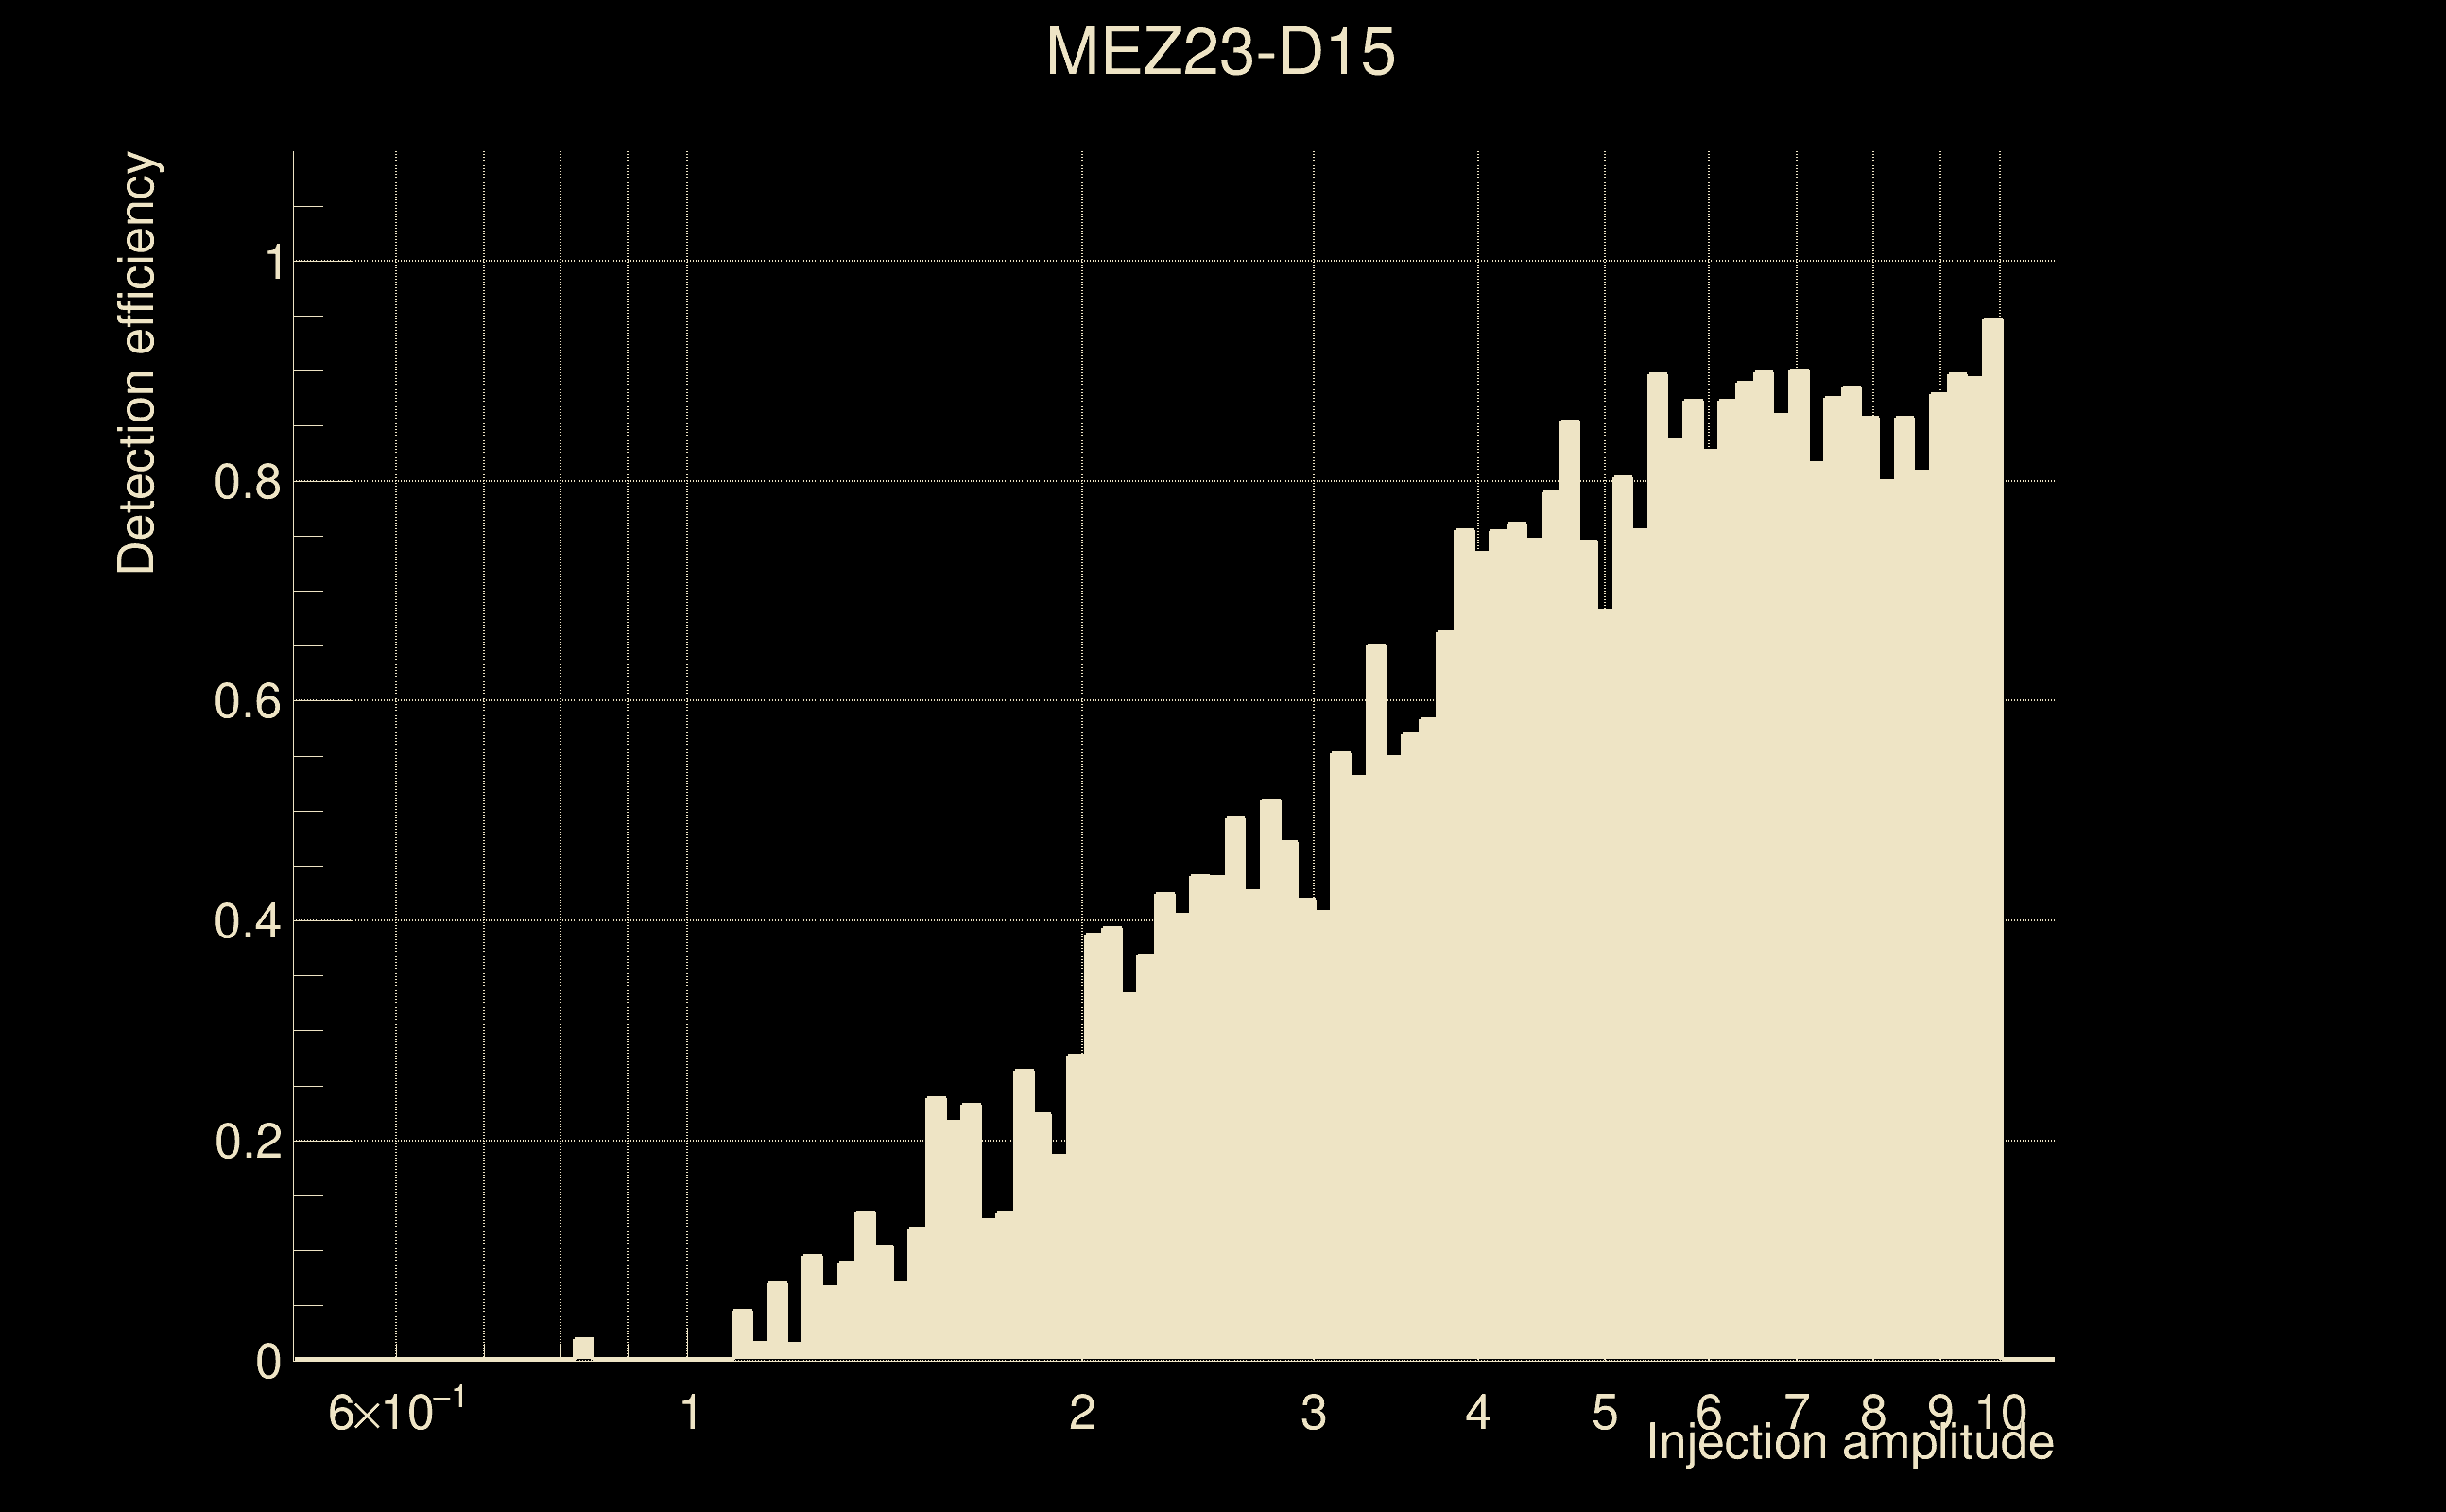
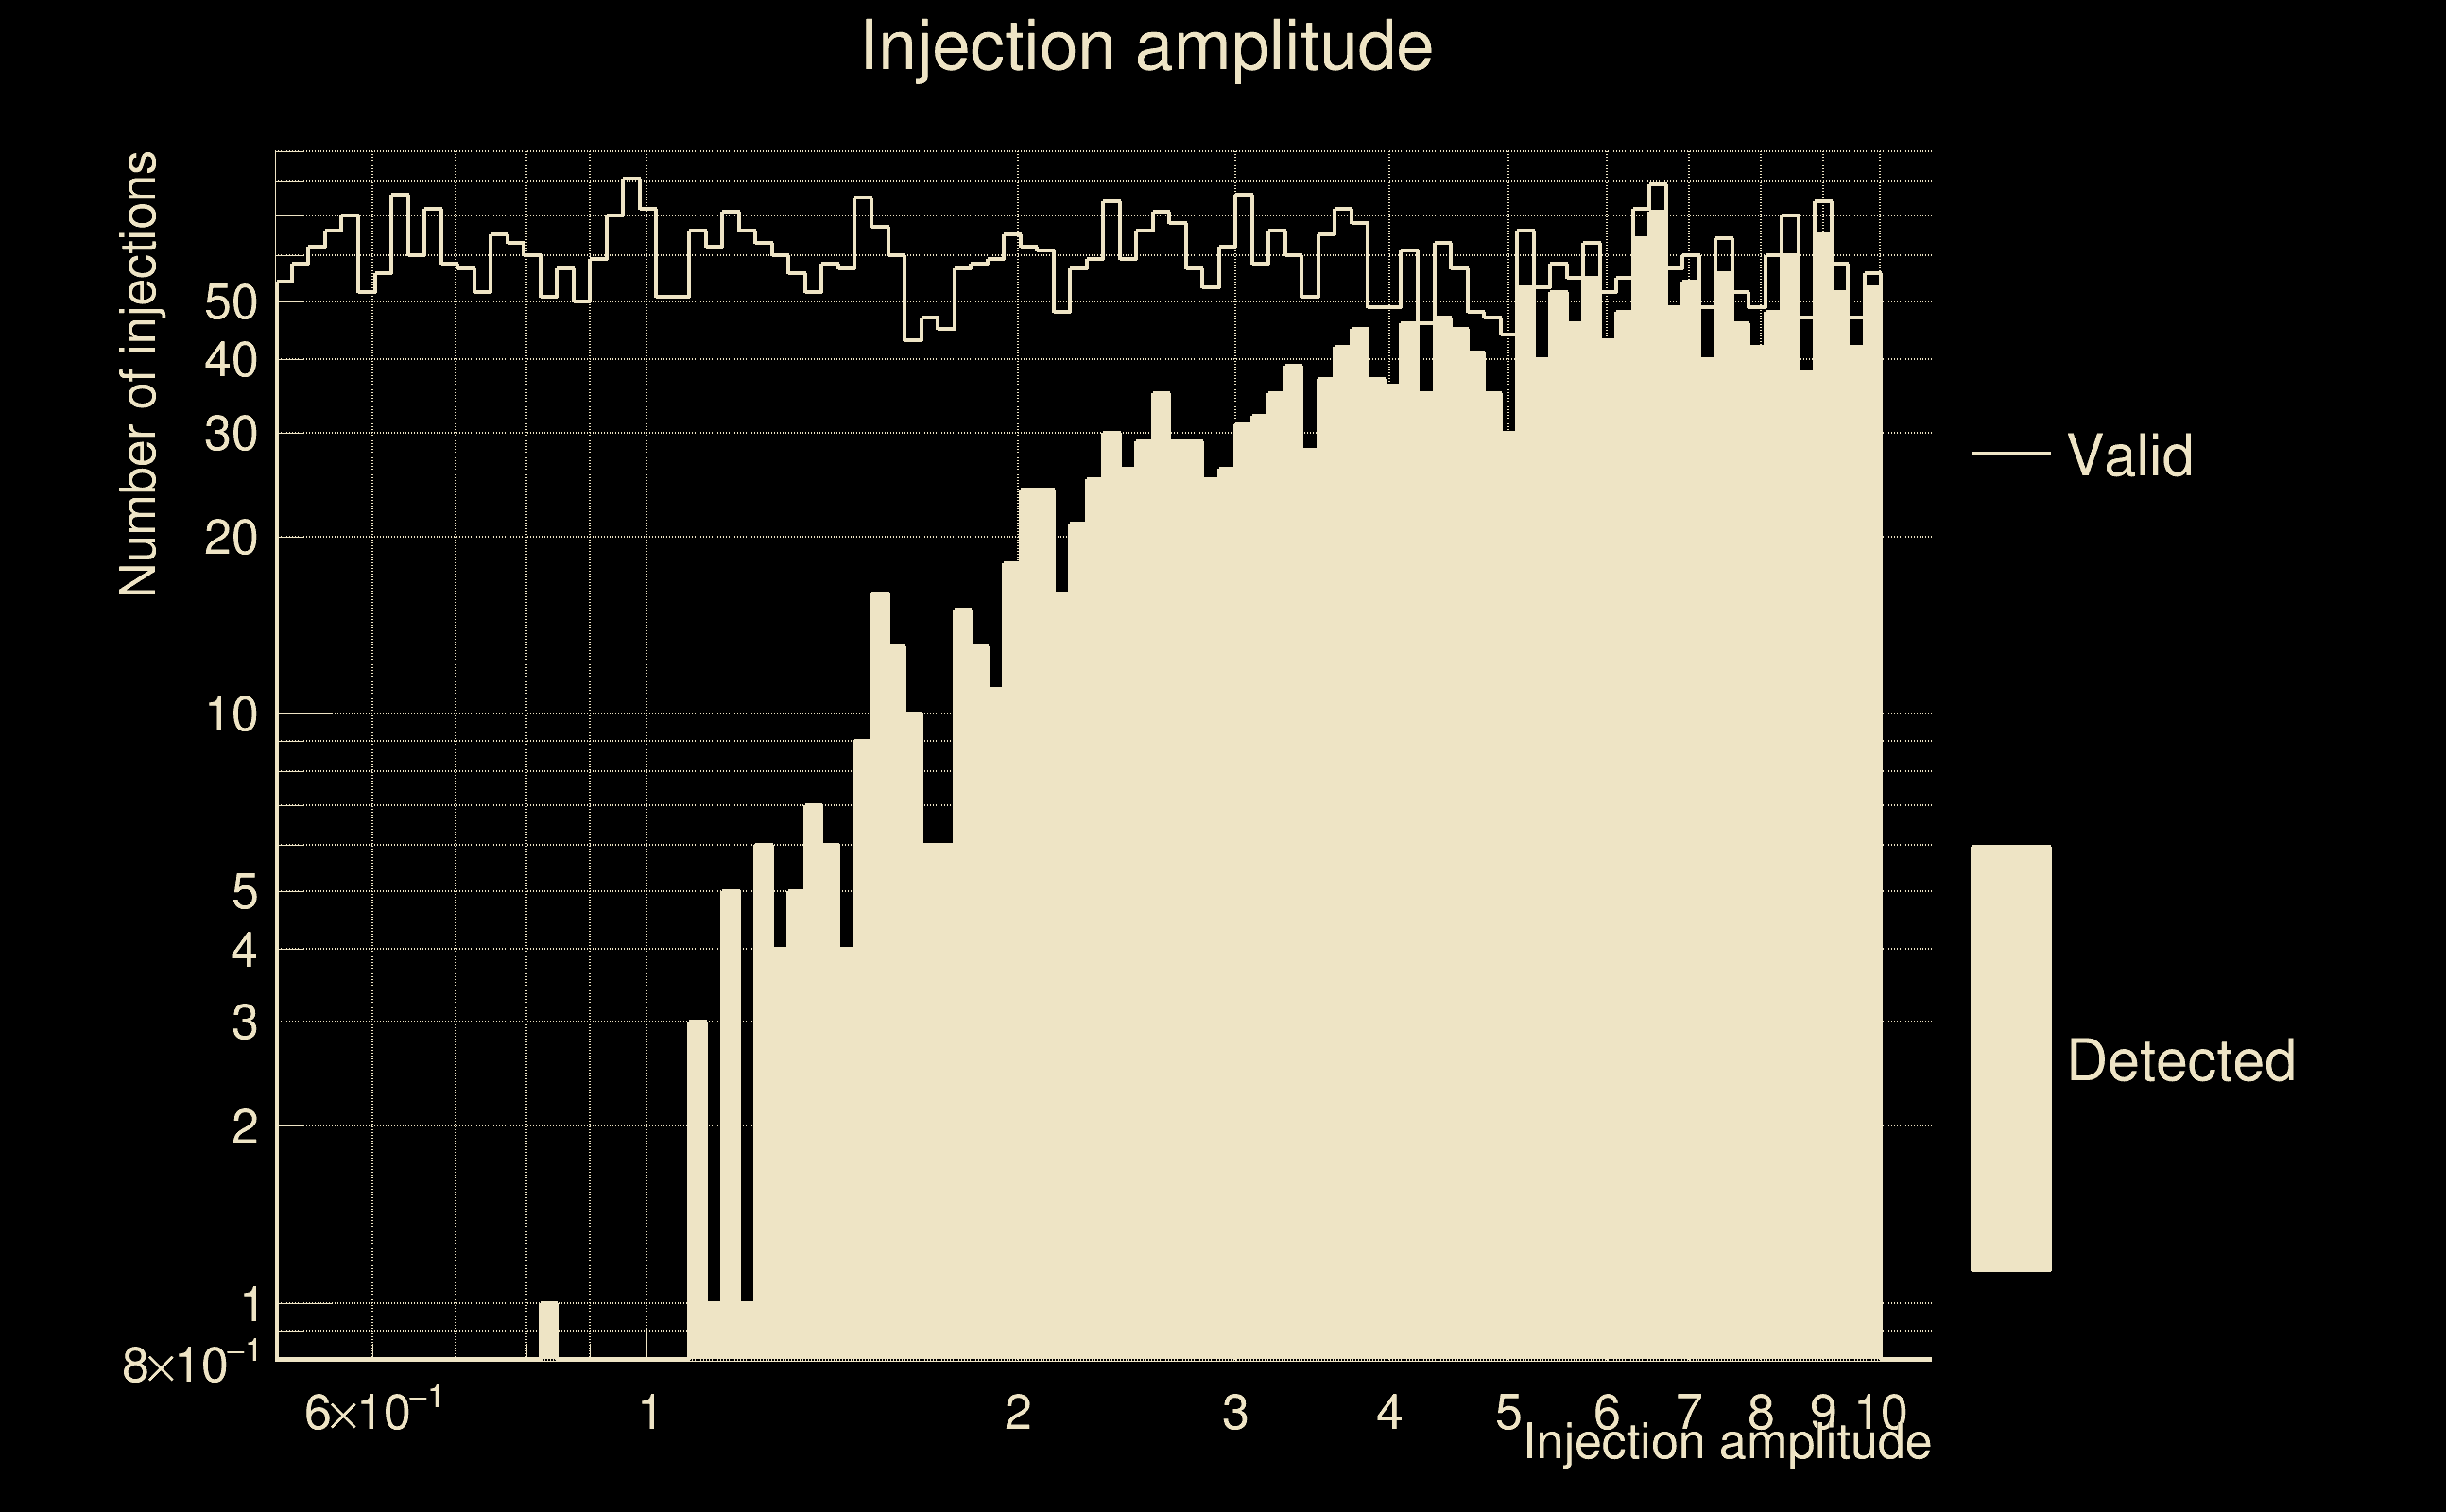
| Number of injections (total/valid/detected): | 5836 / 5783 / 2257 |
| List of missed injections: | ./MEZ23-D15_missed.txt |
| Injection amplitude at 90% detection efficiency: | 9.60498 |
| Injection amplitude at 50% detection efficiency: | 3.11201 |
| Injection amplitude at 10% detection efficiency: | 1.48067 |
 |
 |
 |
 |
 |
 |
|
 |
 |
|
 |
 |
 |
 |
 |
 |
 |
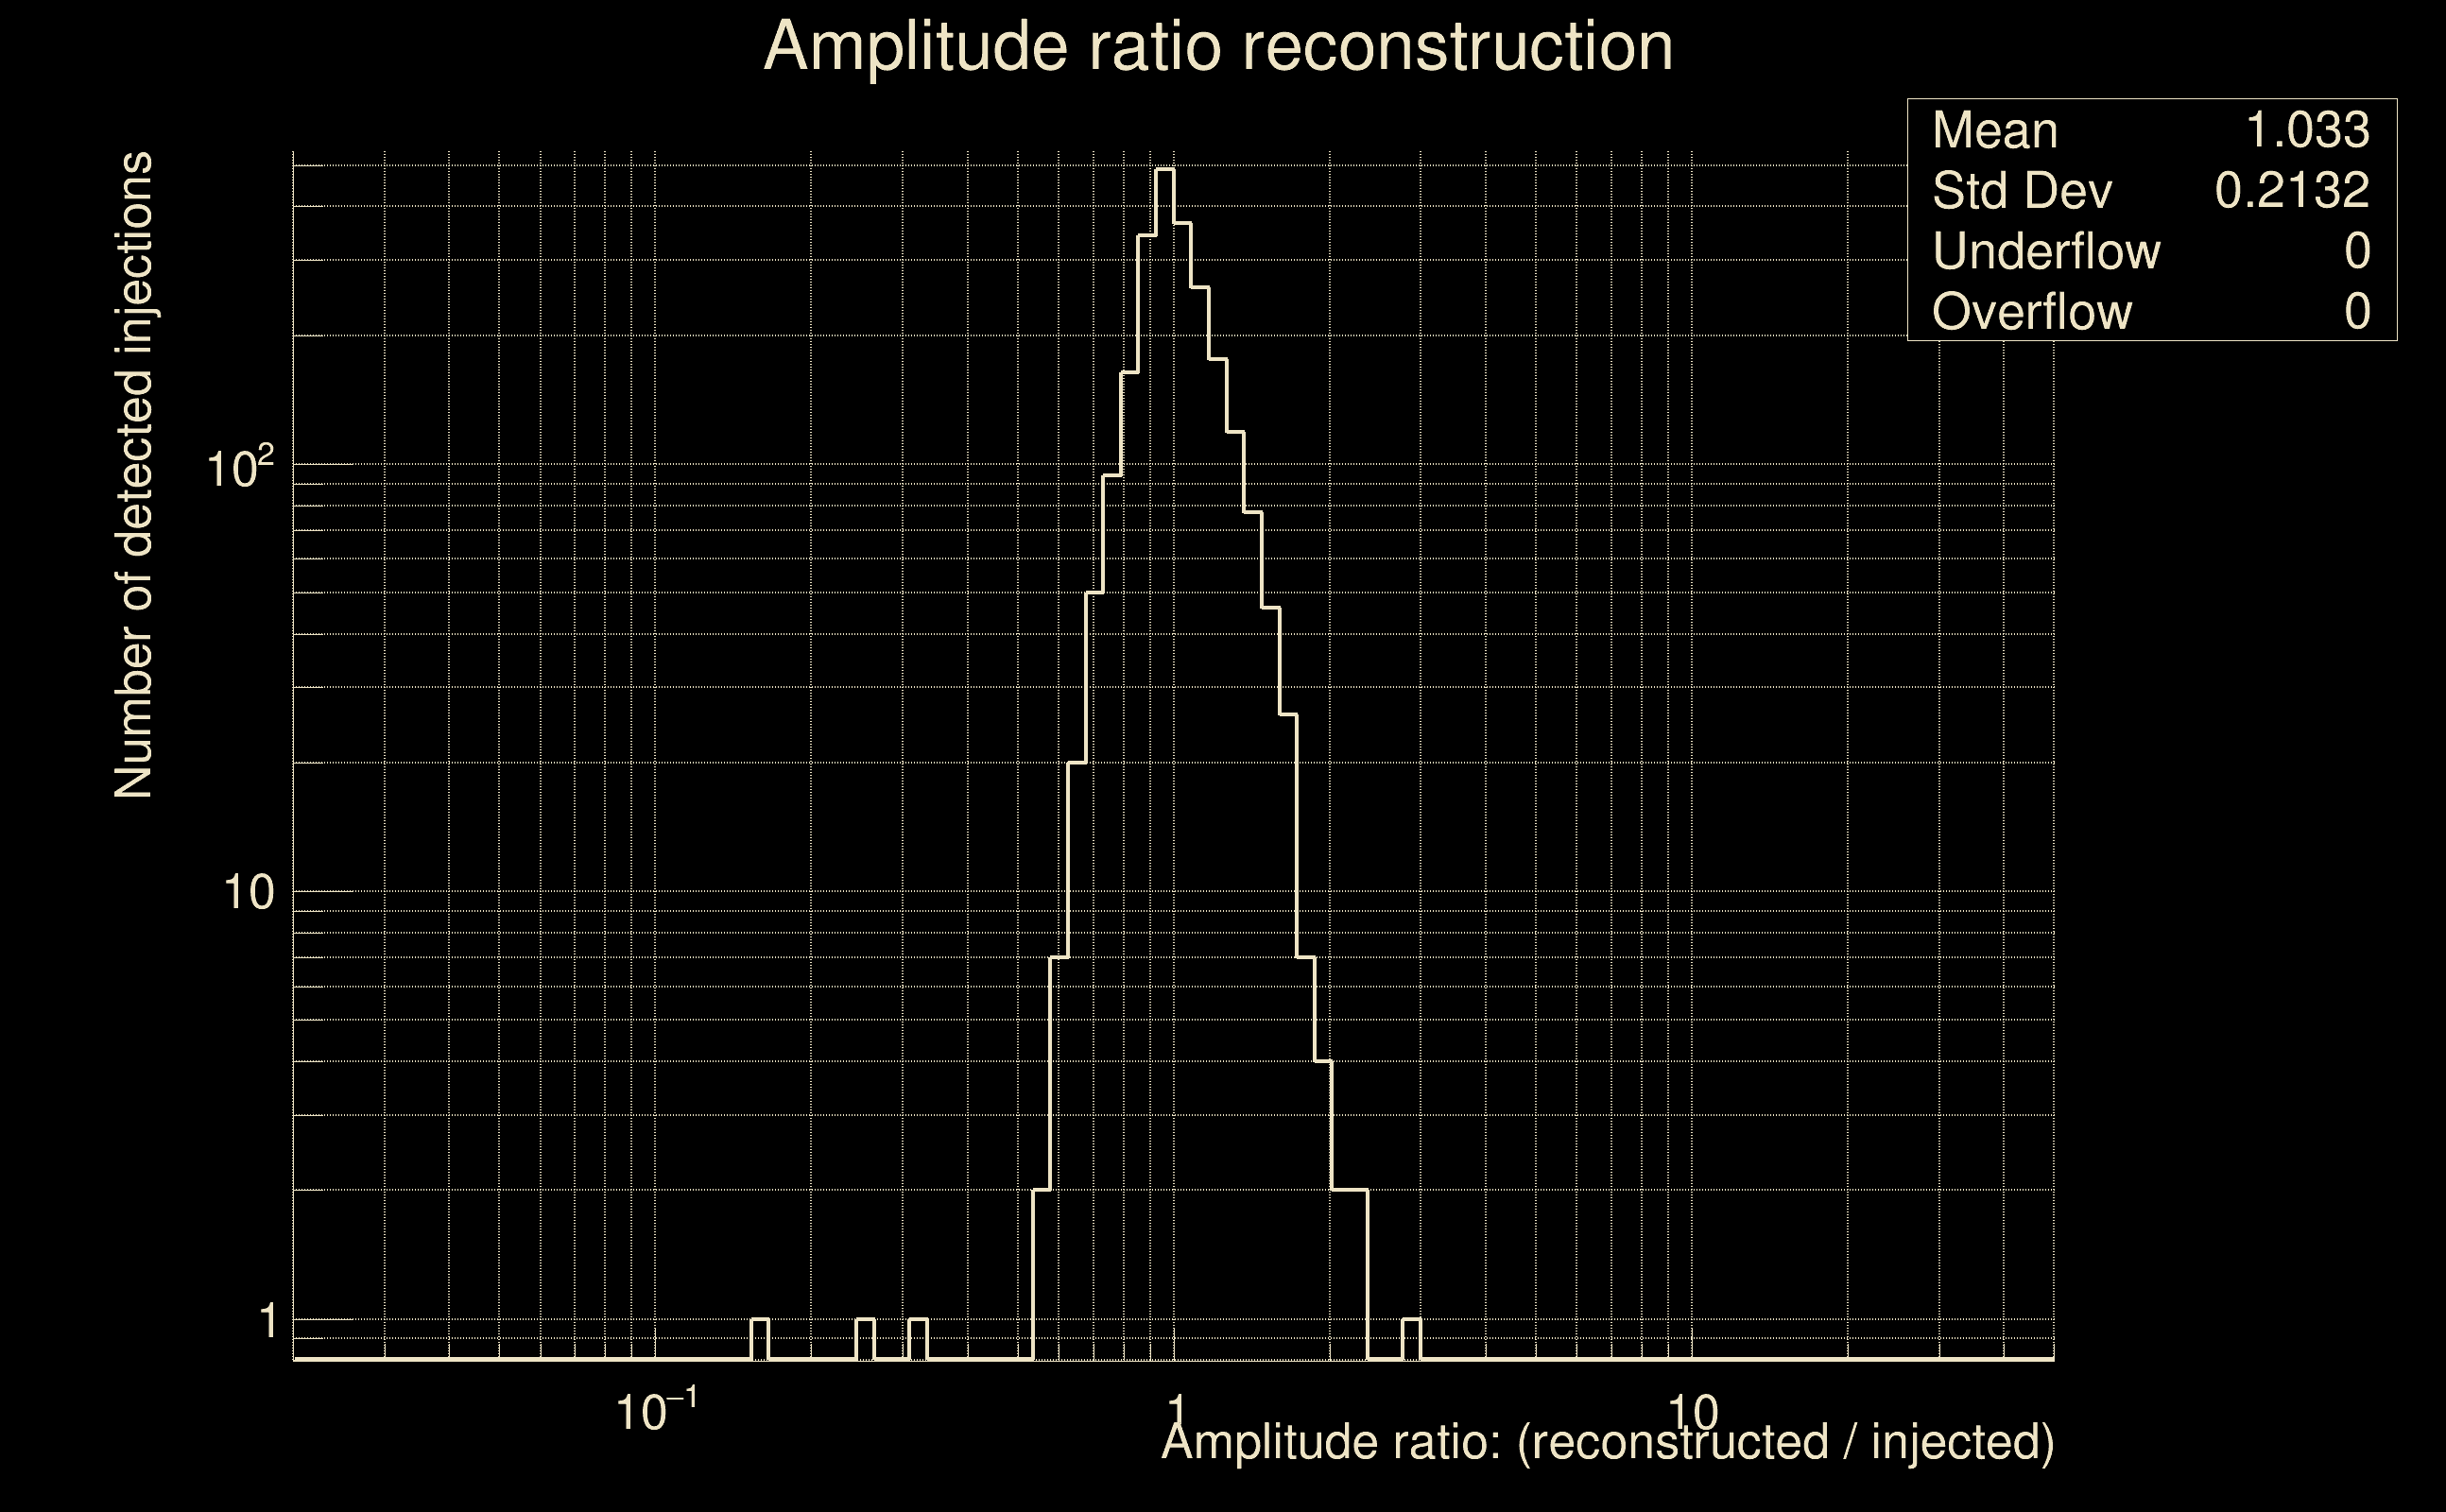 |
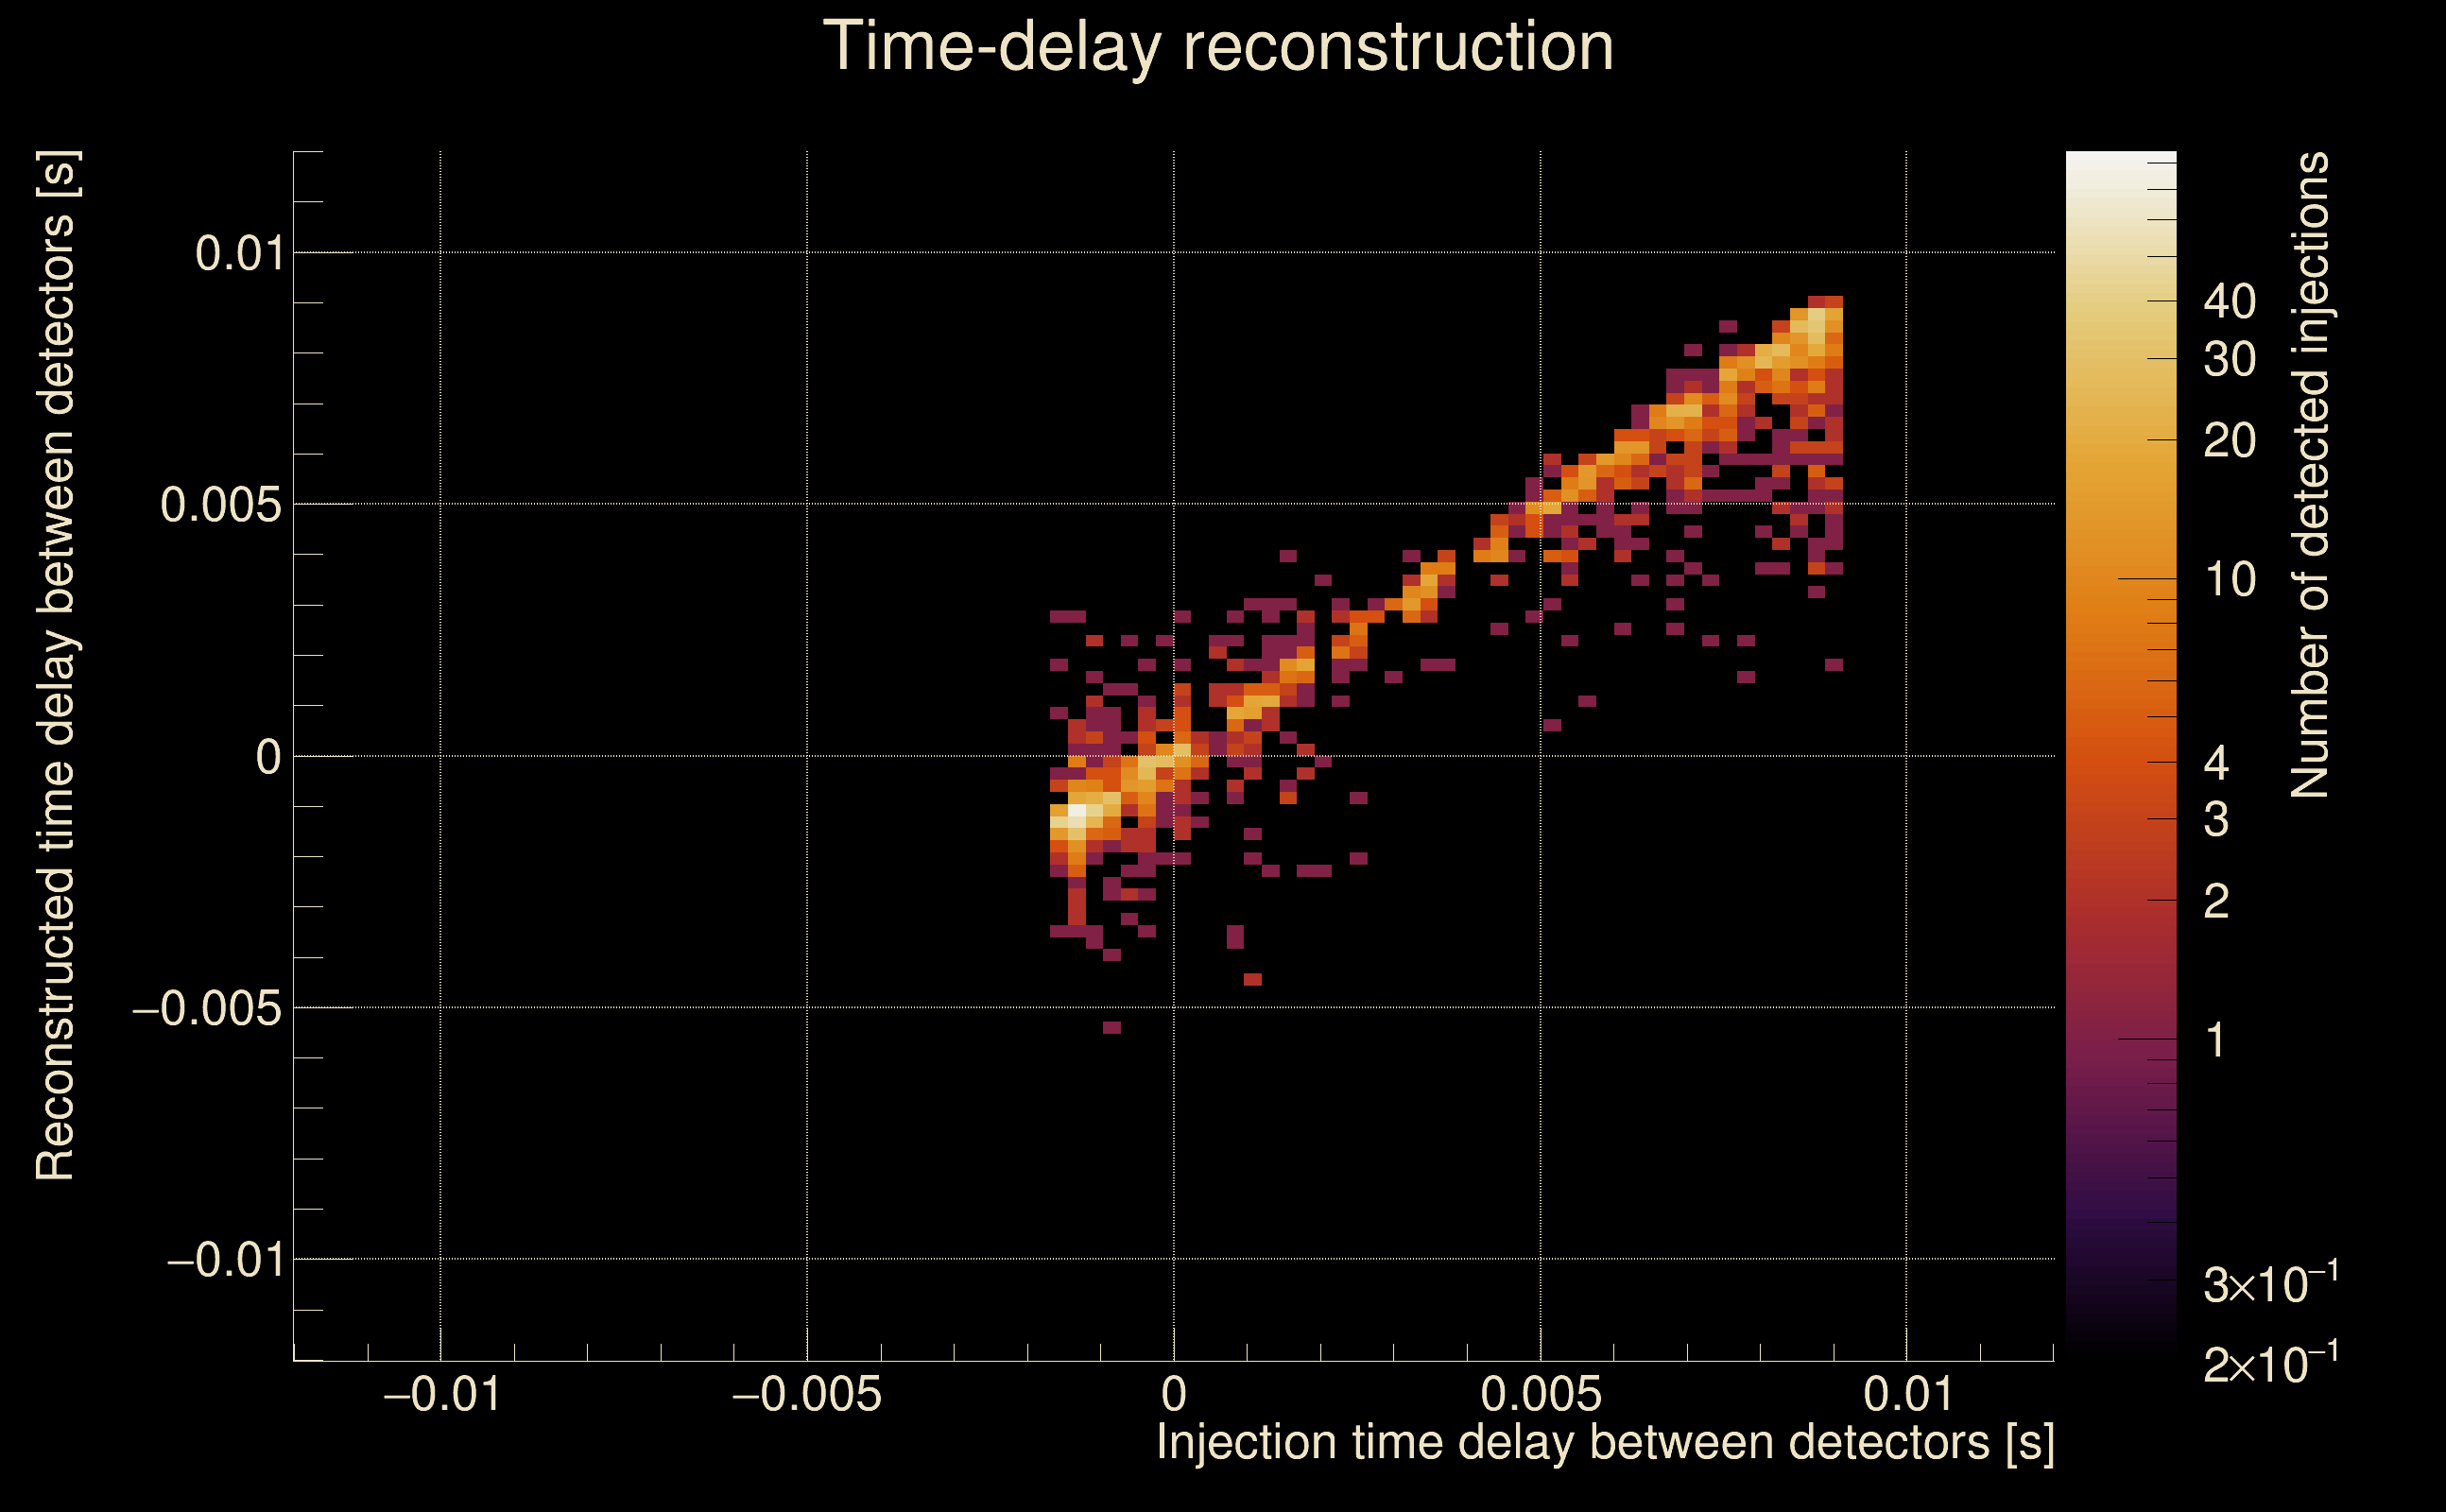
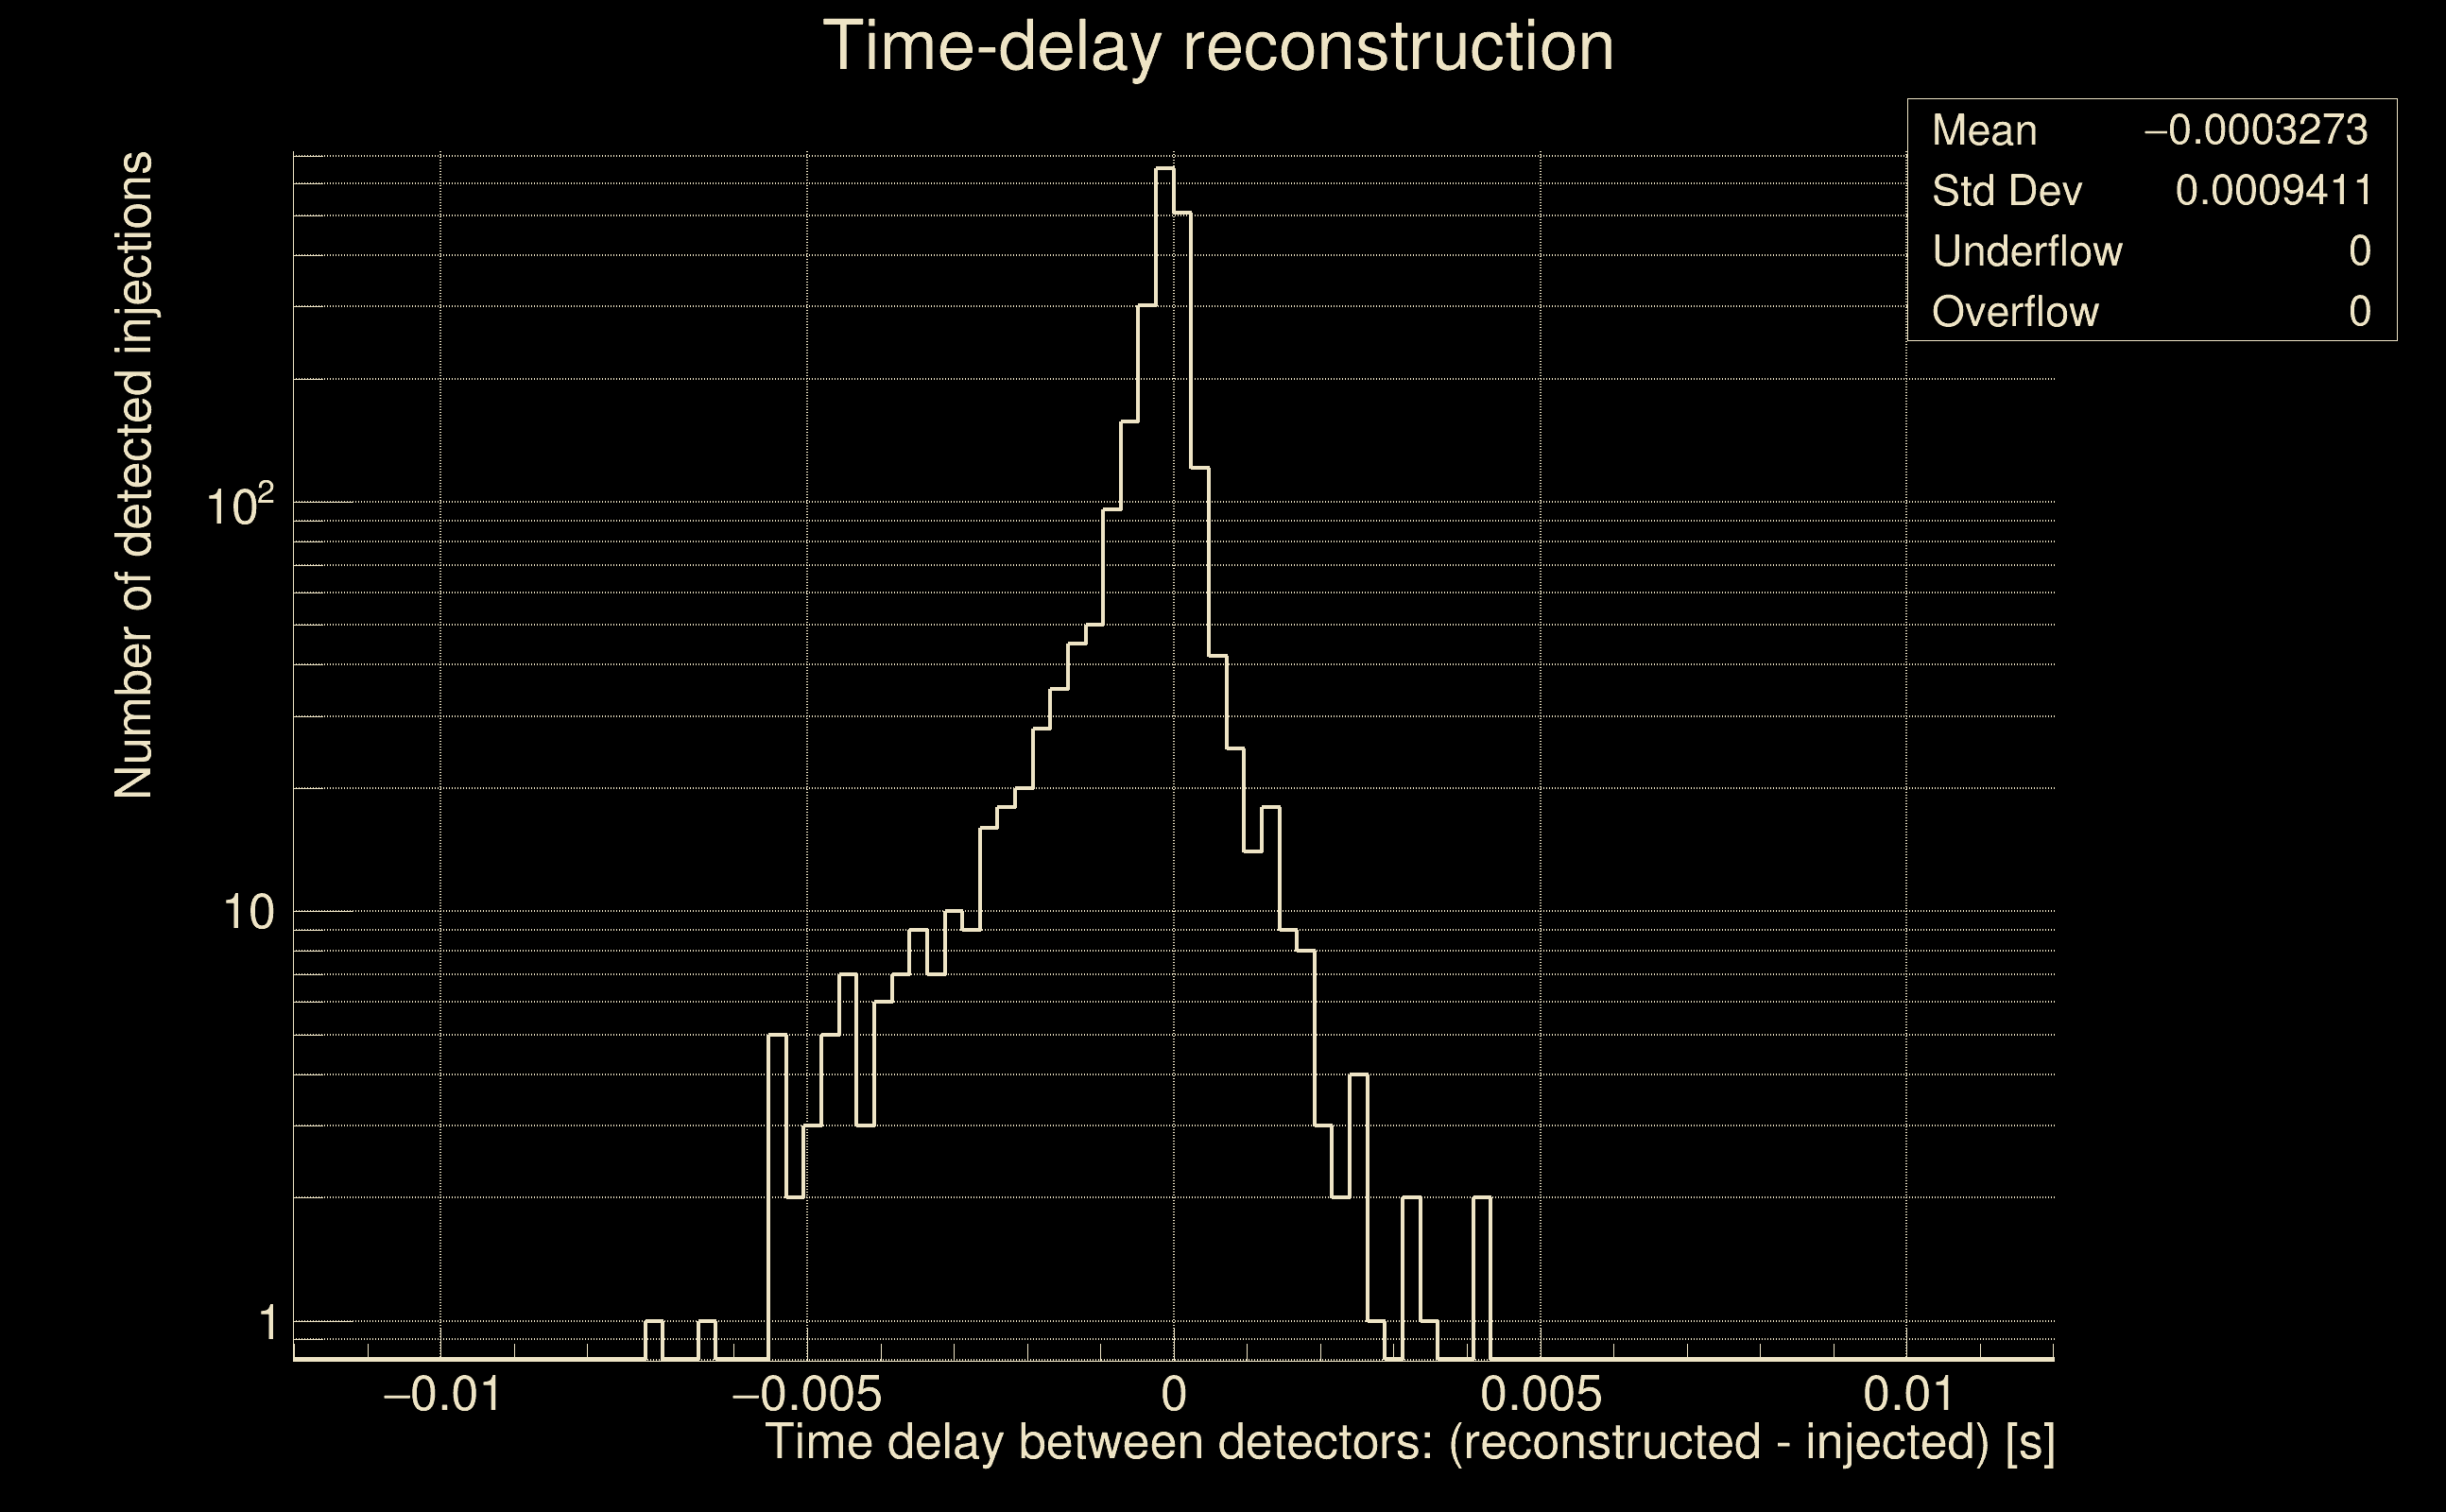
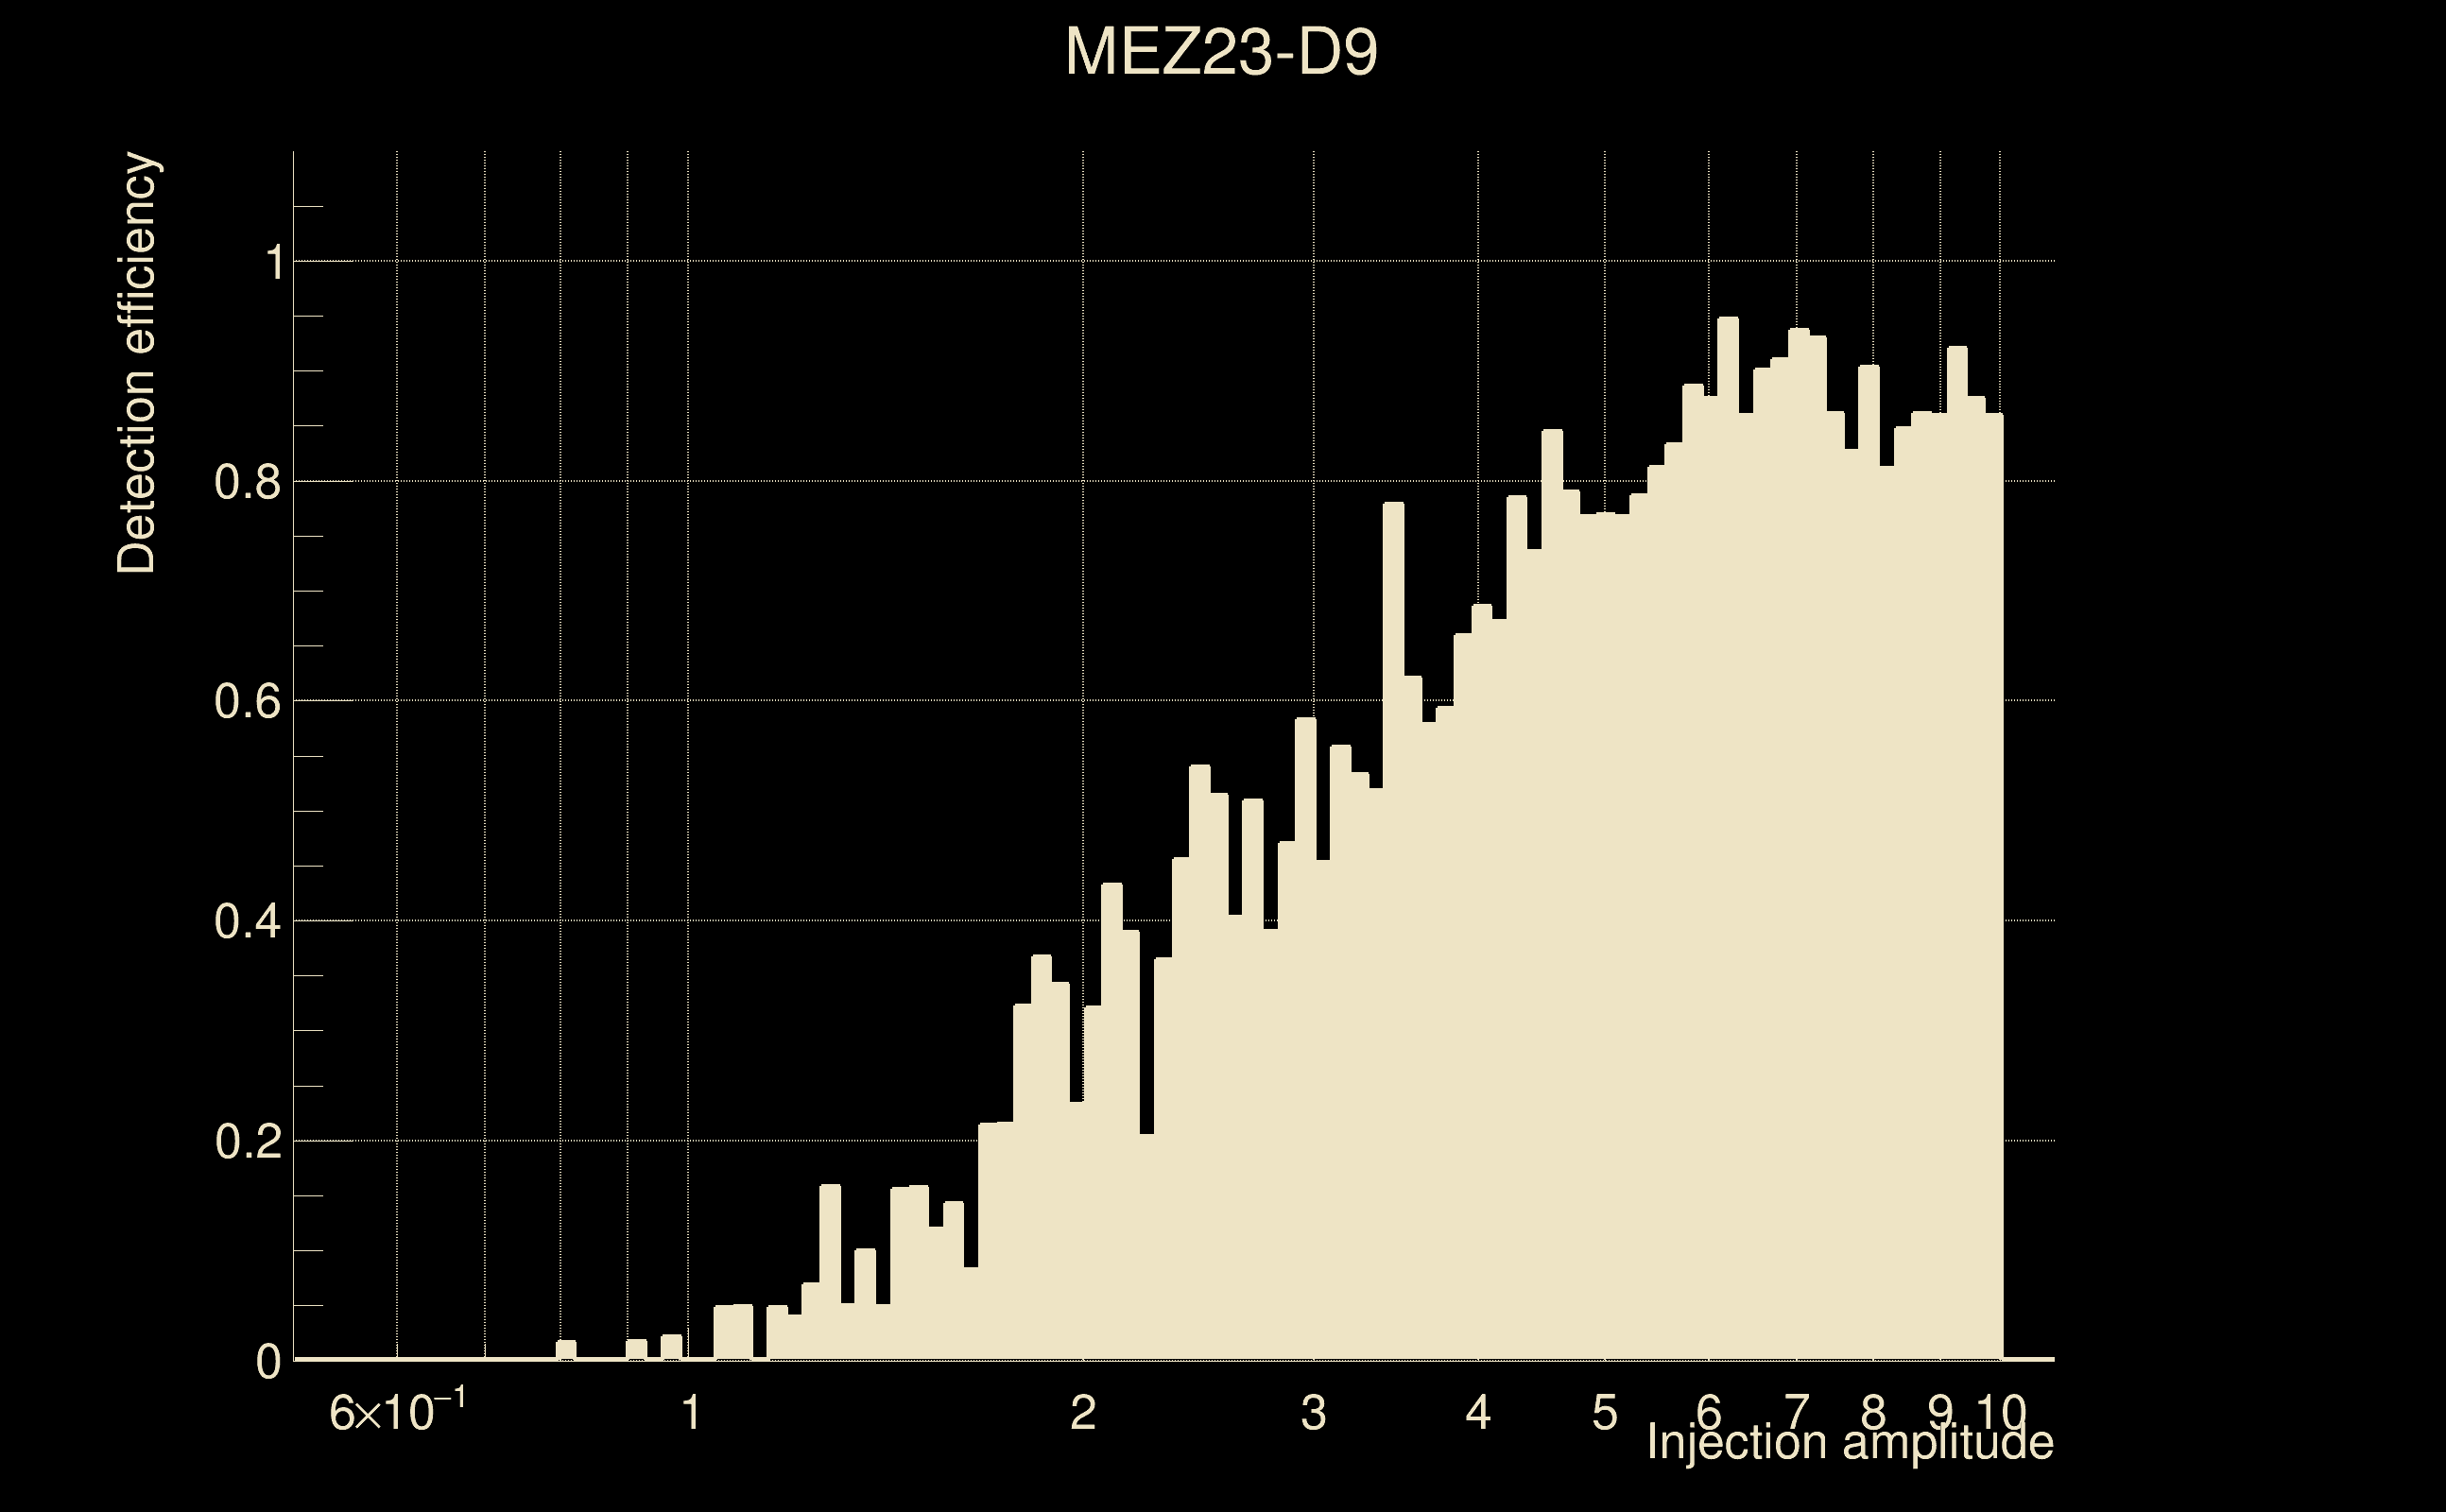
| Number of injections (total/valid/detected): | 5911 / 5869 / 2373 |
| List of missed injections: | ./MEZ23-D9_missed.txt |
| Injection amplitude at 90% detection efficiency: | 6.0843 |
| Injection amplitude at 50% detection efficiency: | 3.0927 |
| Injection amplitude at 10% detection efficiency: | 1.6507 |
 |
 |
 |
 |
 |
 |
|
 |
 |
|
 |
 |
 |
 |
 |
 |
 |
 |
| Number of injections (total/valid/detected): | 5730 / 5680 / 2322 |
| List of missed injections: | ./OCO18-MESA20PERTLR_missed.txt |
| Injection amplitude at 90% detection efficiency: | 8.33937 |
| Injection amplitude at 50% detection efficiency: | 2.89482 |
| Injection amplitude at 10% detection efficiency: | 1.47404 |
 |
 |
 |
 |
 |
 |
|
 |
 |
|
 |
 |
 |
 |
 |
 |
 |
 |
| Number of injections (total/valid/detected): | 5932 / 5888 / 2297 |
| List of missed injections: | ./POW18-S18_missed.txt |
| Injection amplitude at 90% detection efficiency: | 7.60069 |
| Injection amplitude at 50% detection efficiency: | 3.23956 |
| Injection amplitude at 10% detection efficiency: | 1.45282 |
 |
 |
 |
 |
 |
 |
|
 |
 |
|
 |
 |
 |
 |
 |
 |
 |
 |
| florent.robinet@ijclab.in2p3.fr |