| Omicron version: | 4.2.0: documentation gitlab repository |
| Omicron run by: | unknown |
| Report produced on: | Fri Oct 31 09:11:26 2025 UTC |
| Ox option file: | Targ_FirstTest_O4bw_14days_options.txt |
| Omicron option files: | detector 0, detector 1 |
| Detector channel names: | H1:GDS-CALIB_STRAIN_CLEAN_AR_4096Hz, L1:GDS-CALIB_STRAIN_CLEAN_AR_4096Hz |
| Omicron analysis time window and overlap: | 16 s, 6 s |
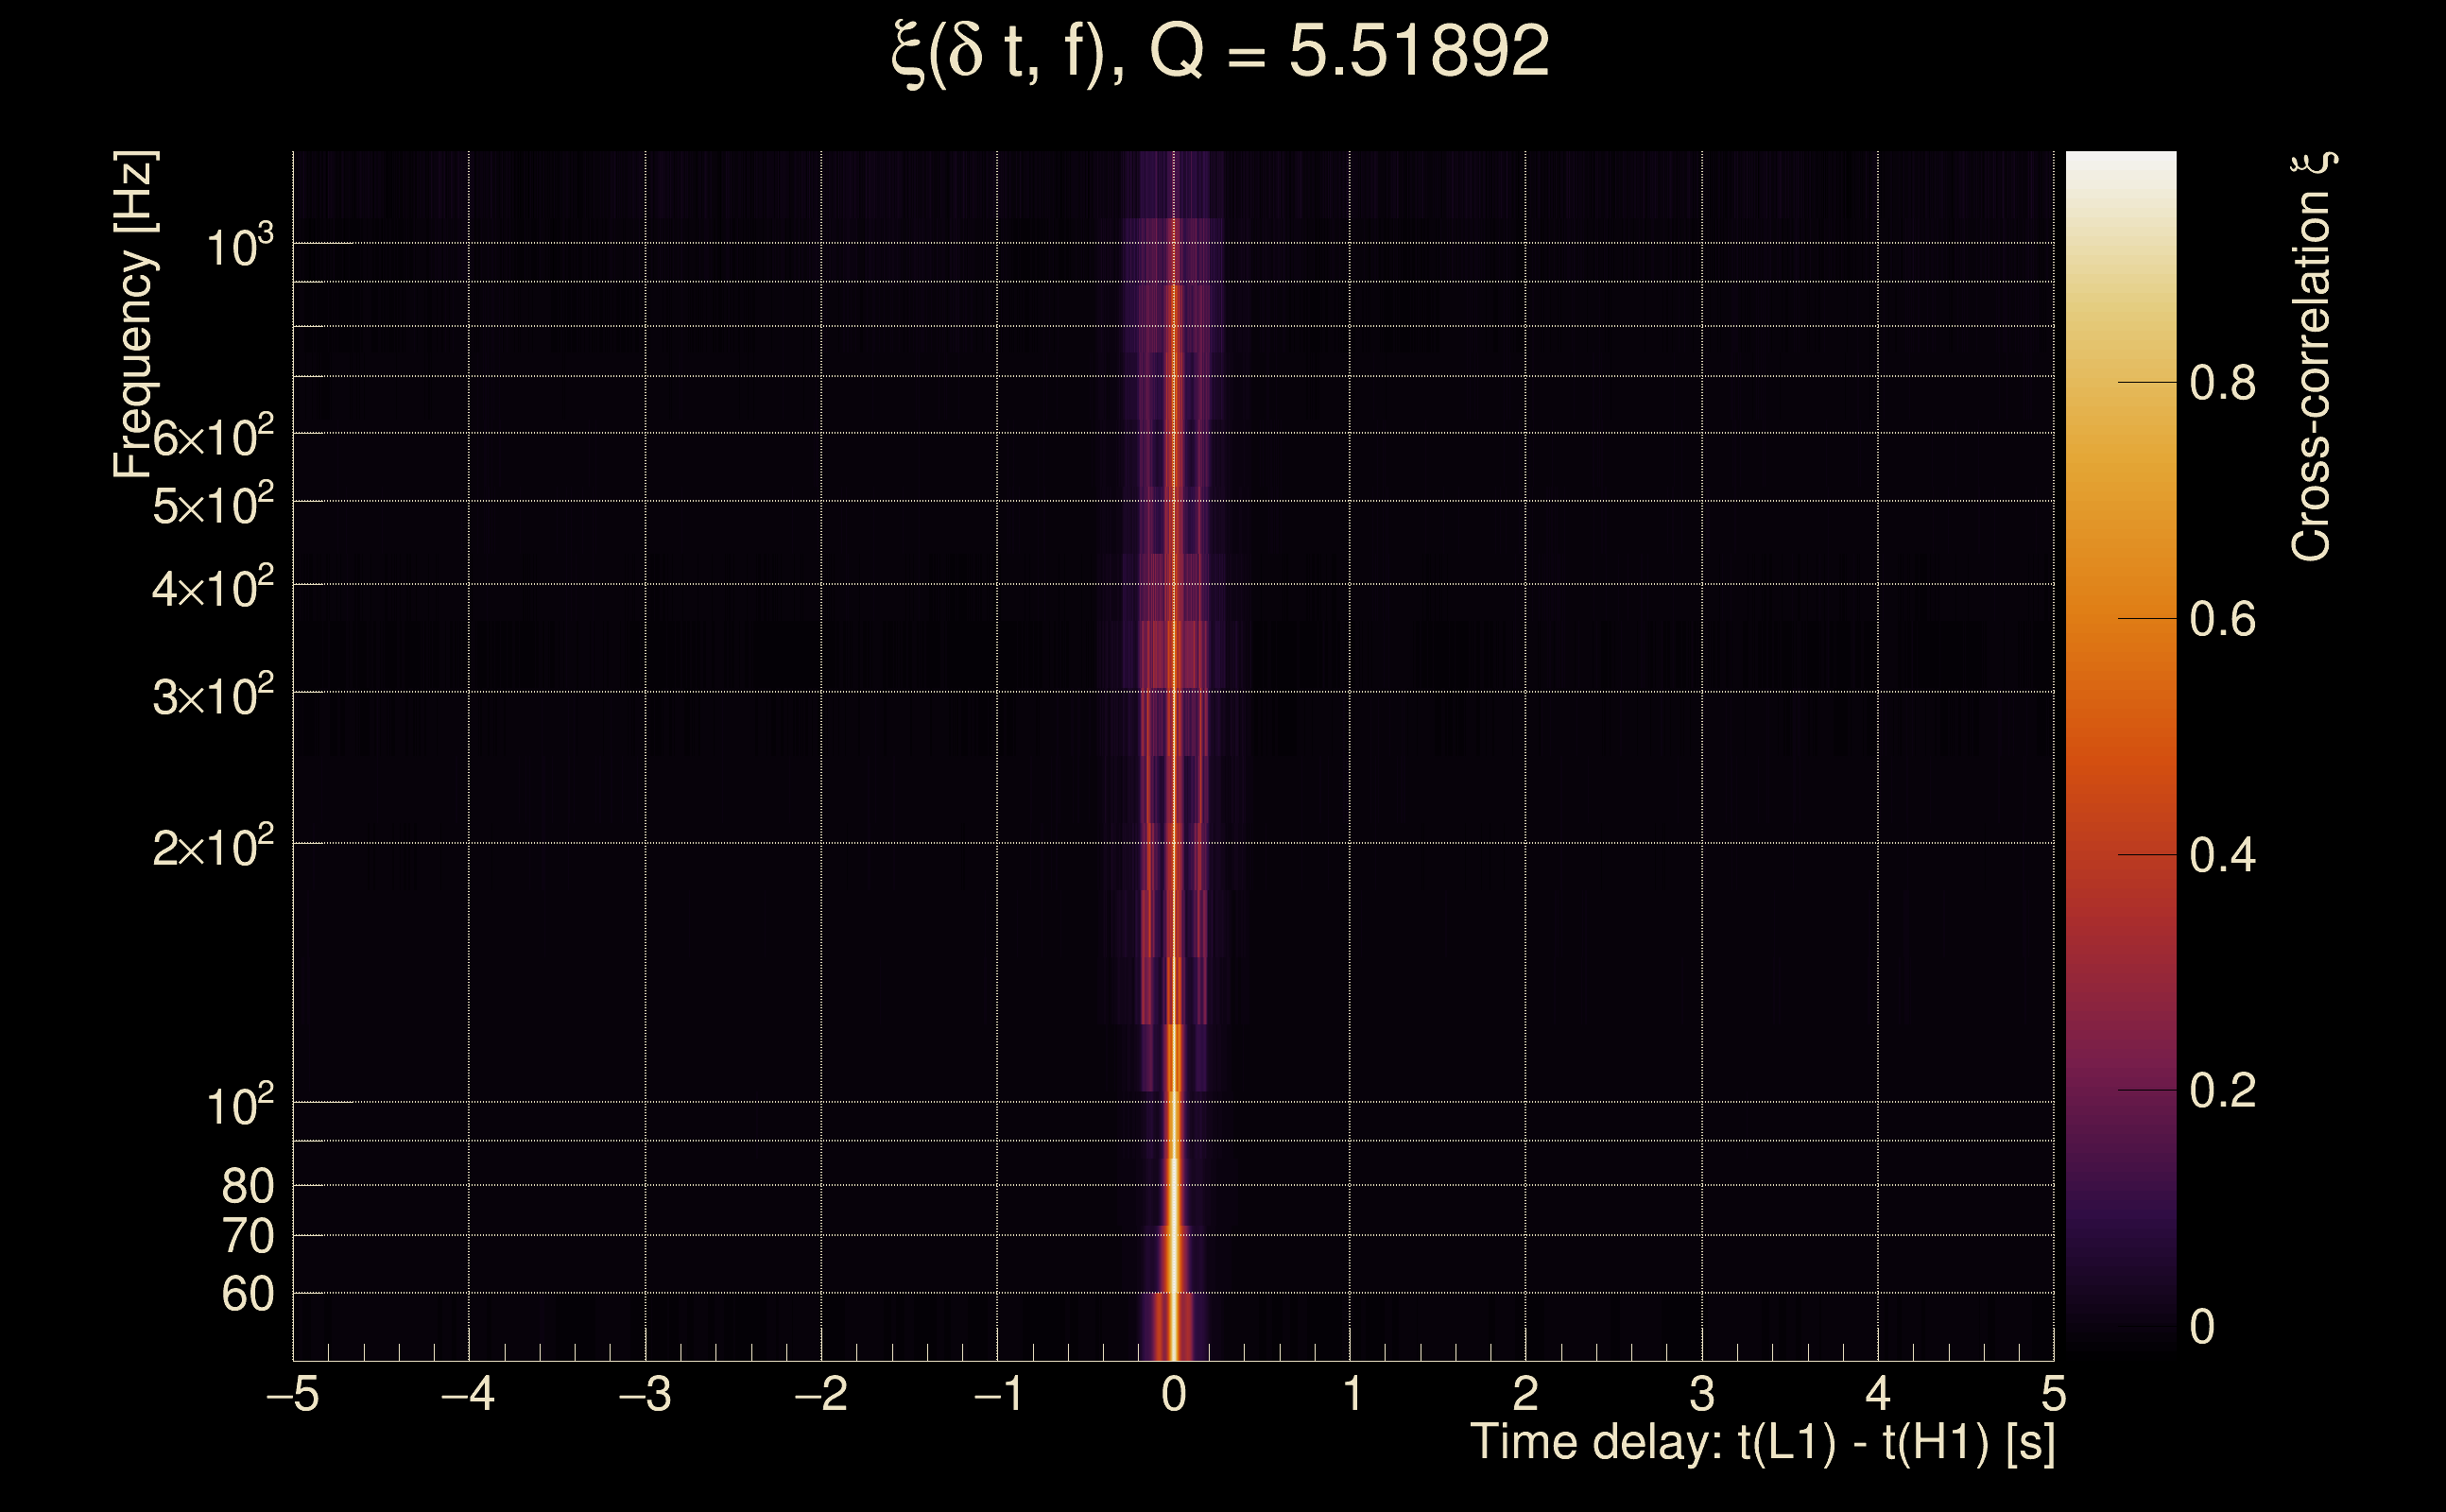
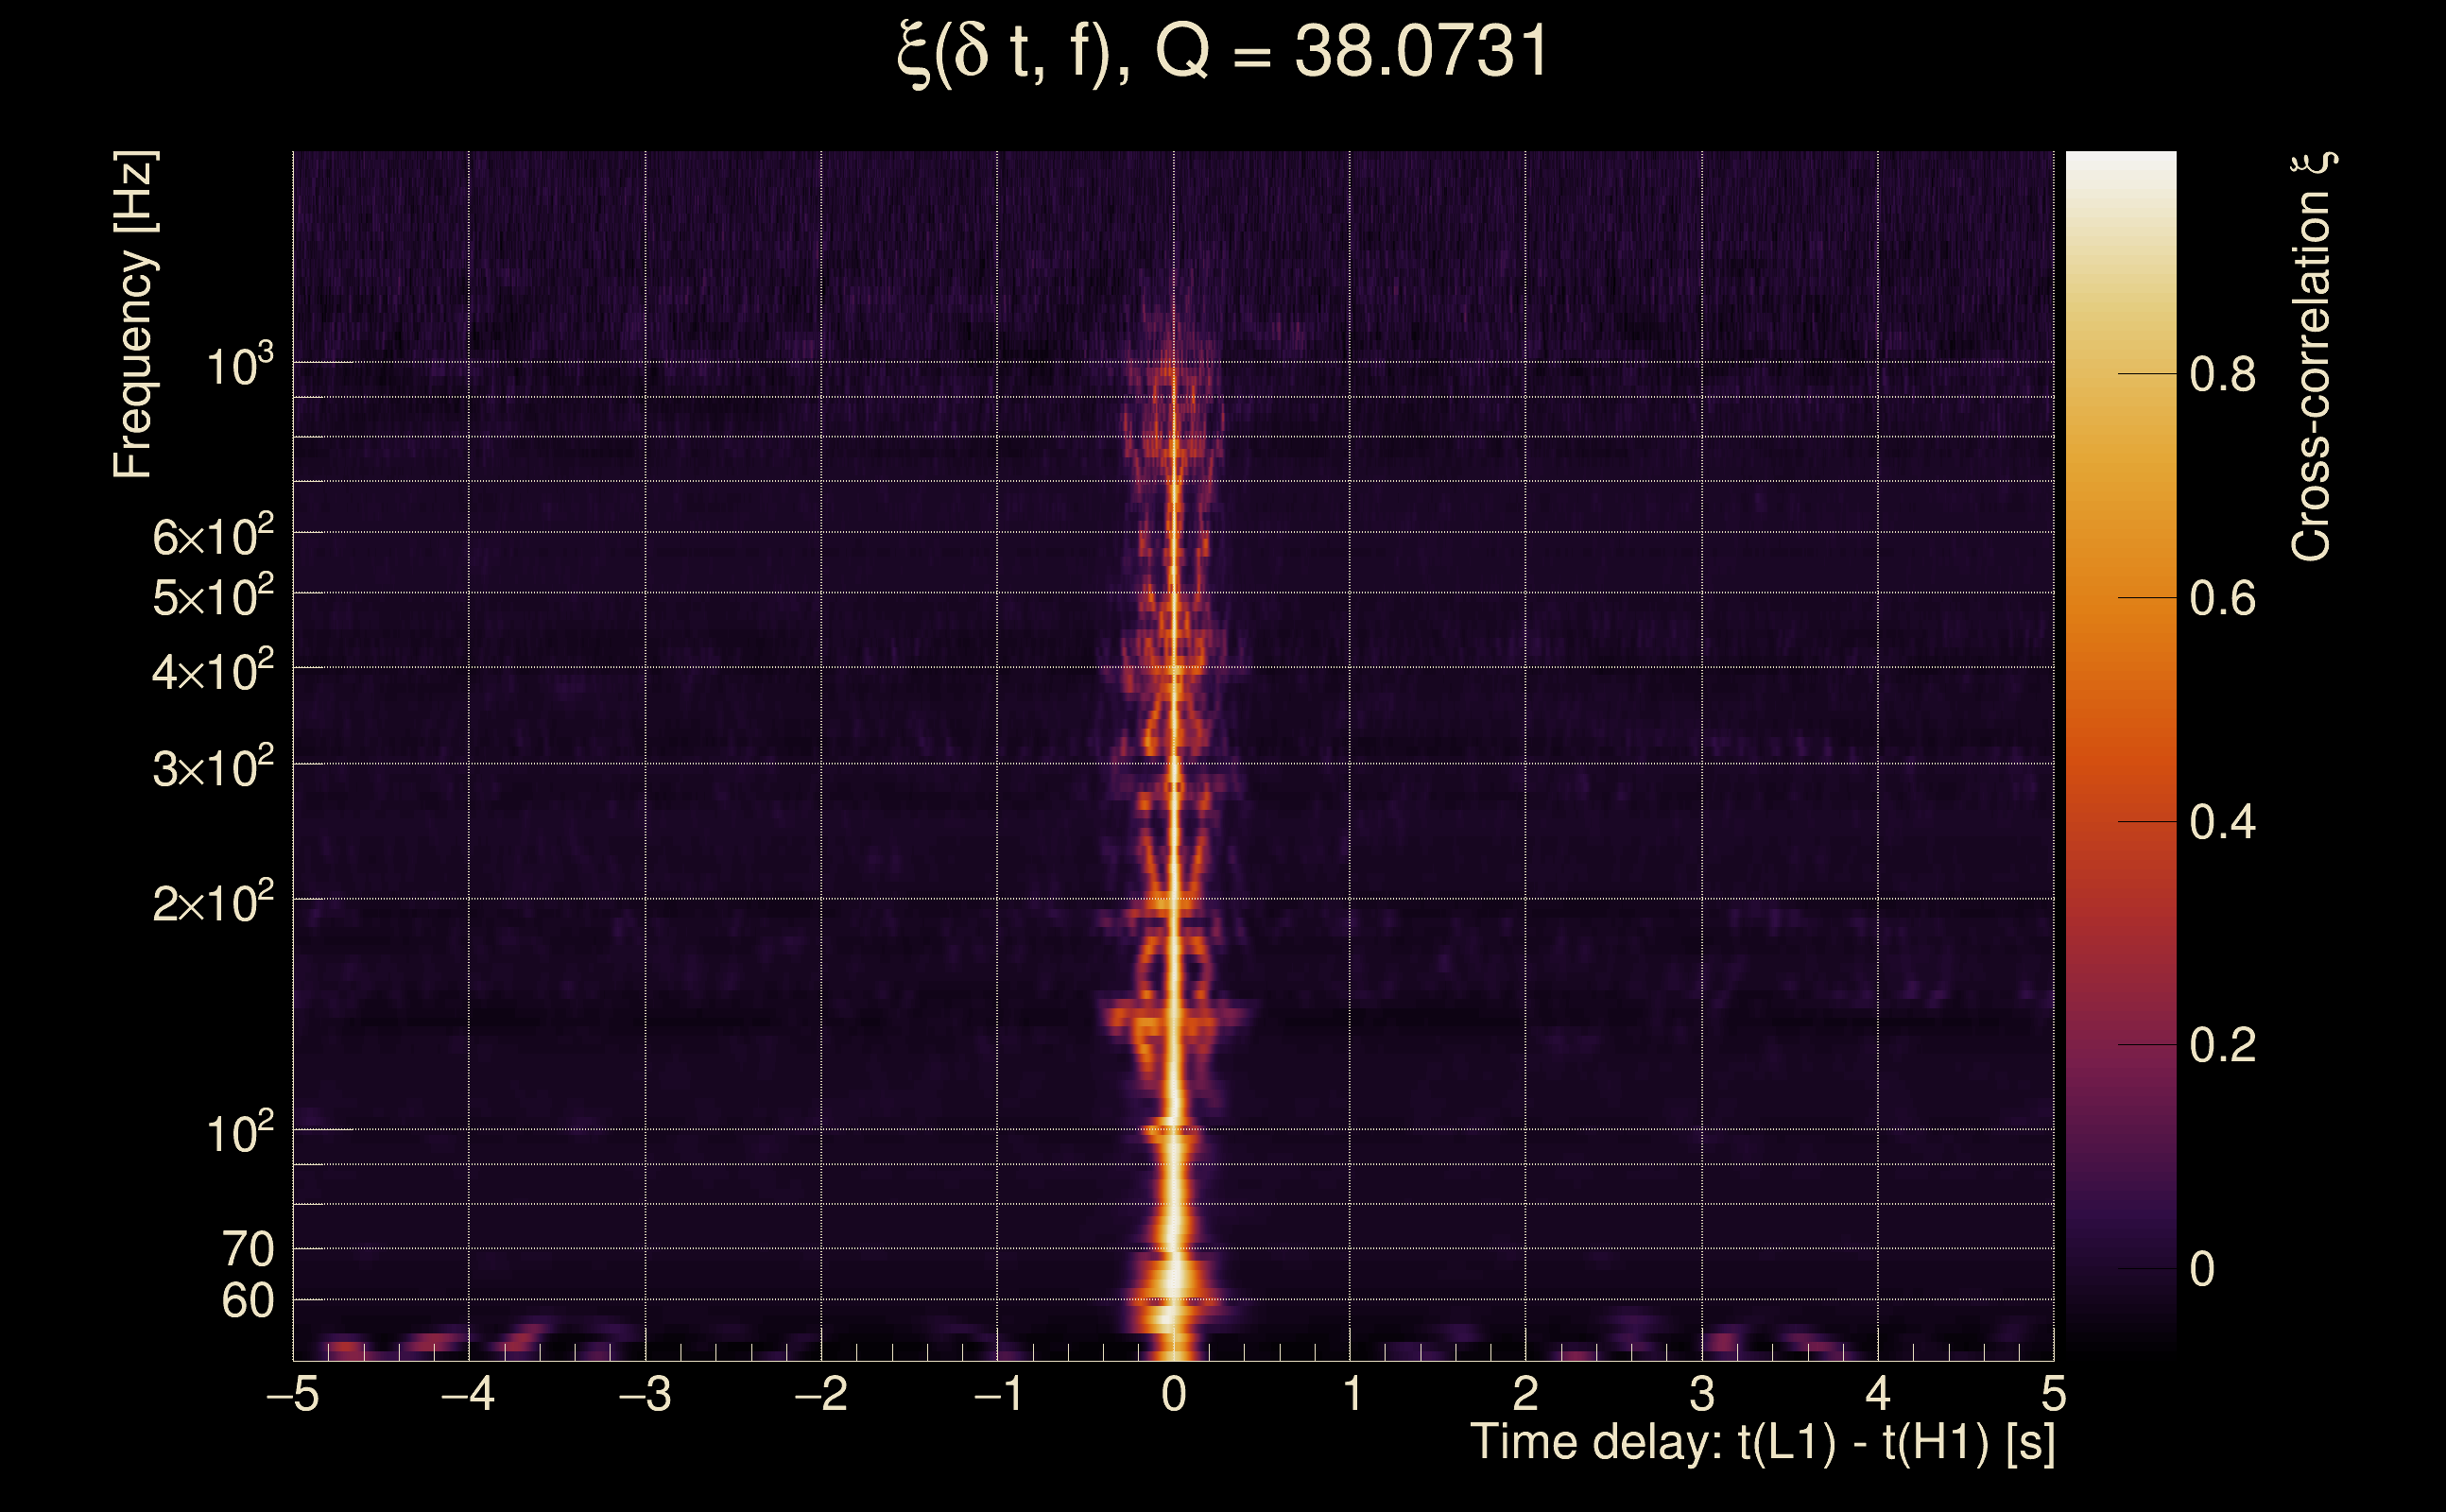
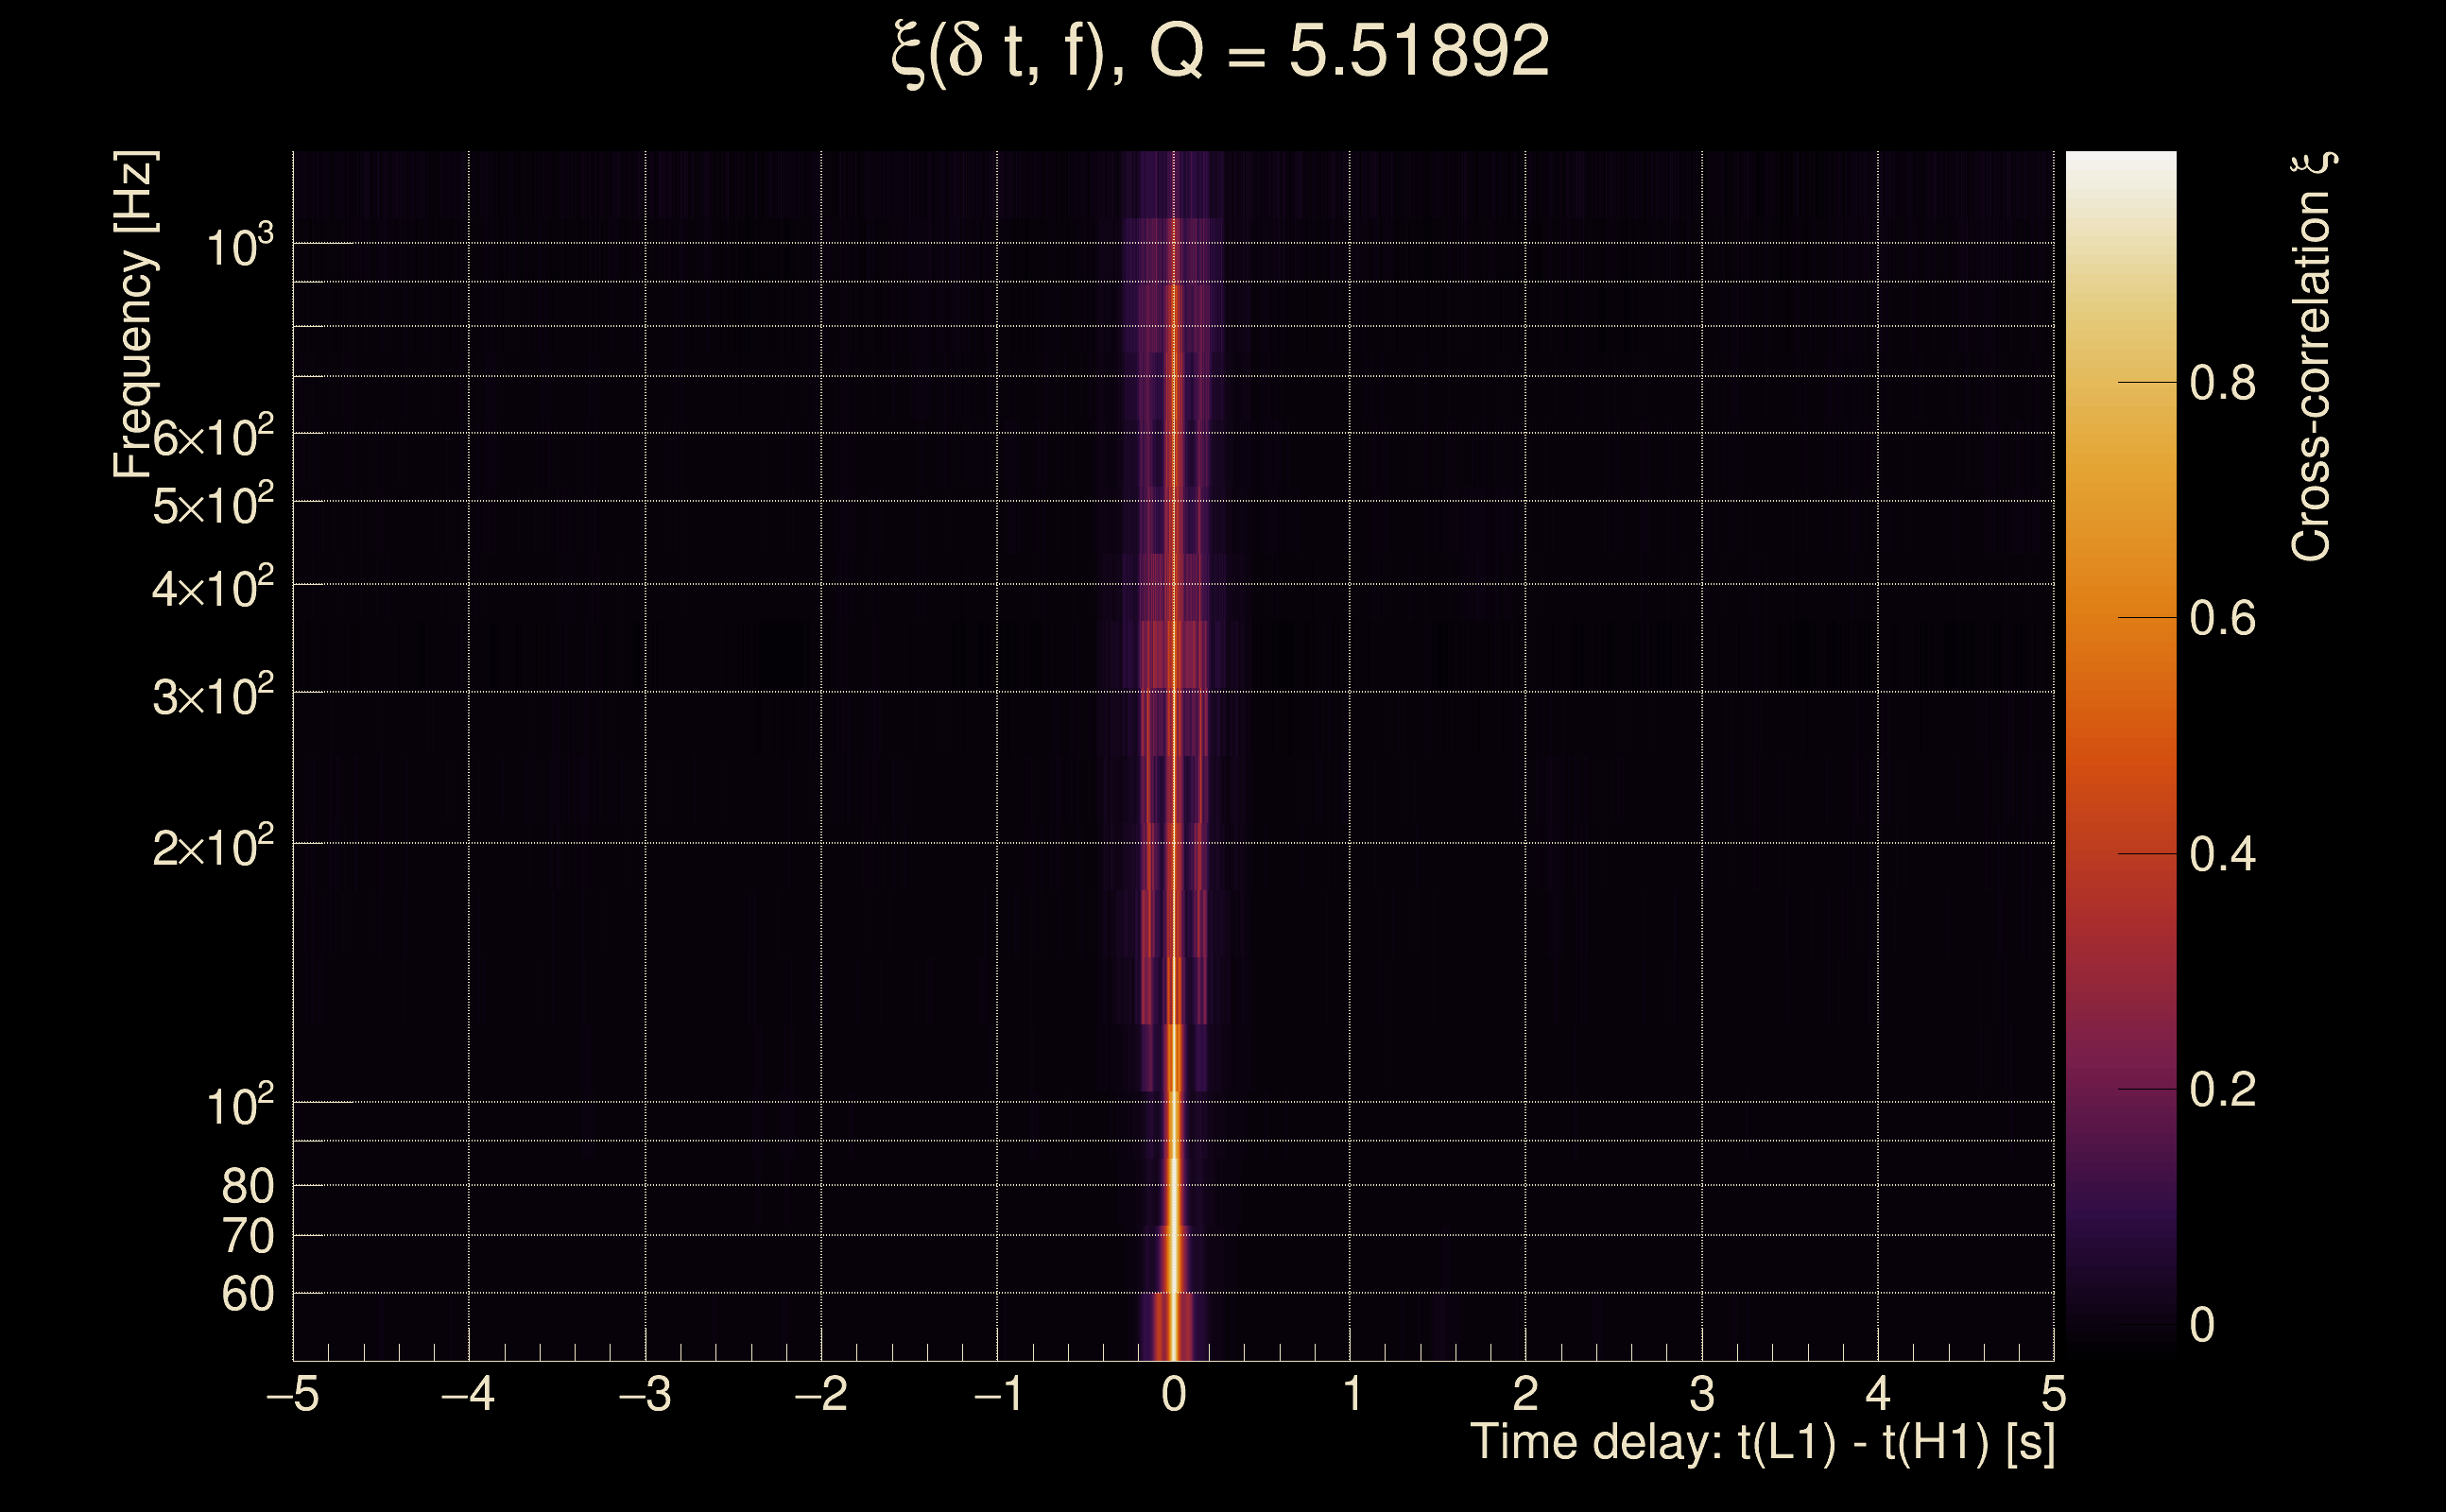
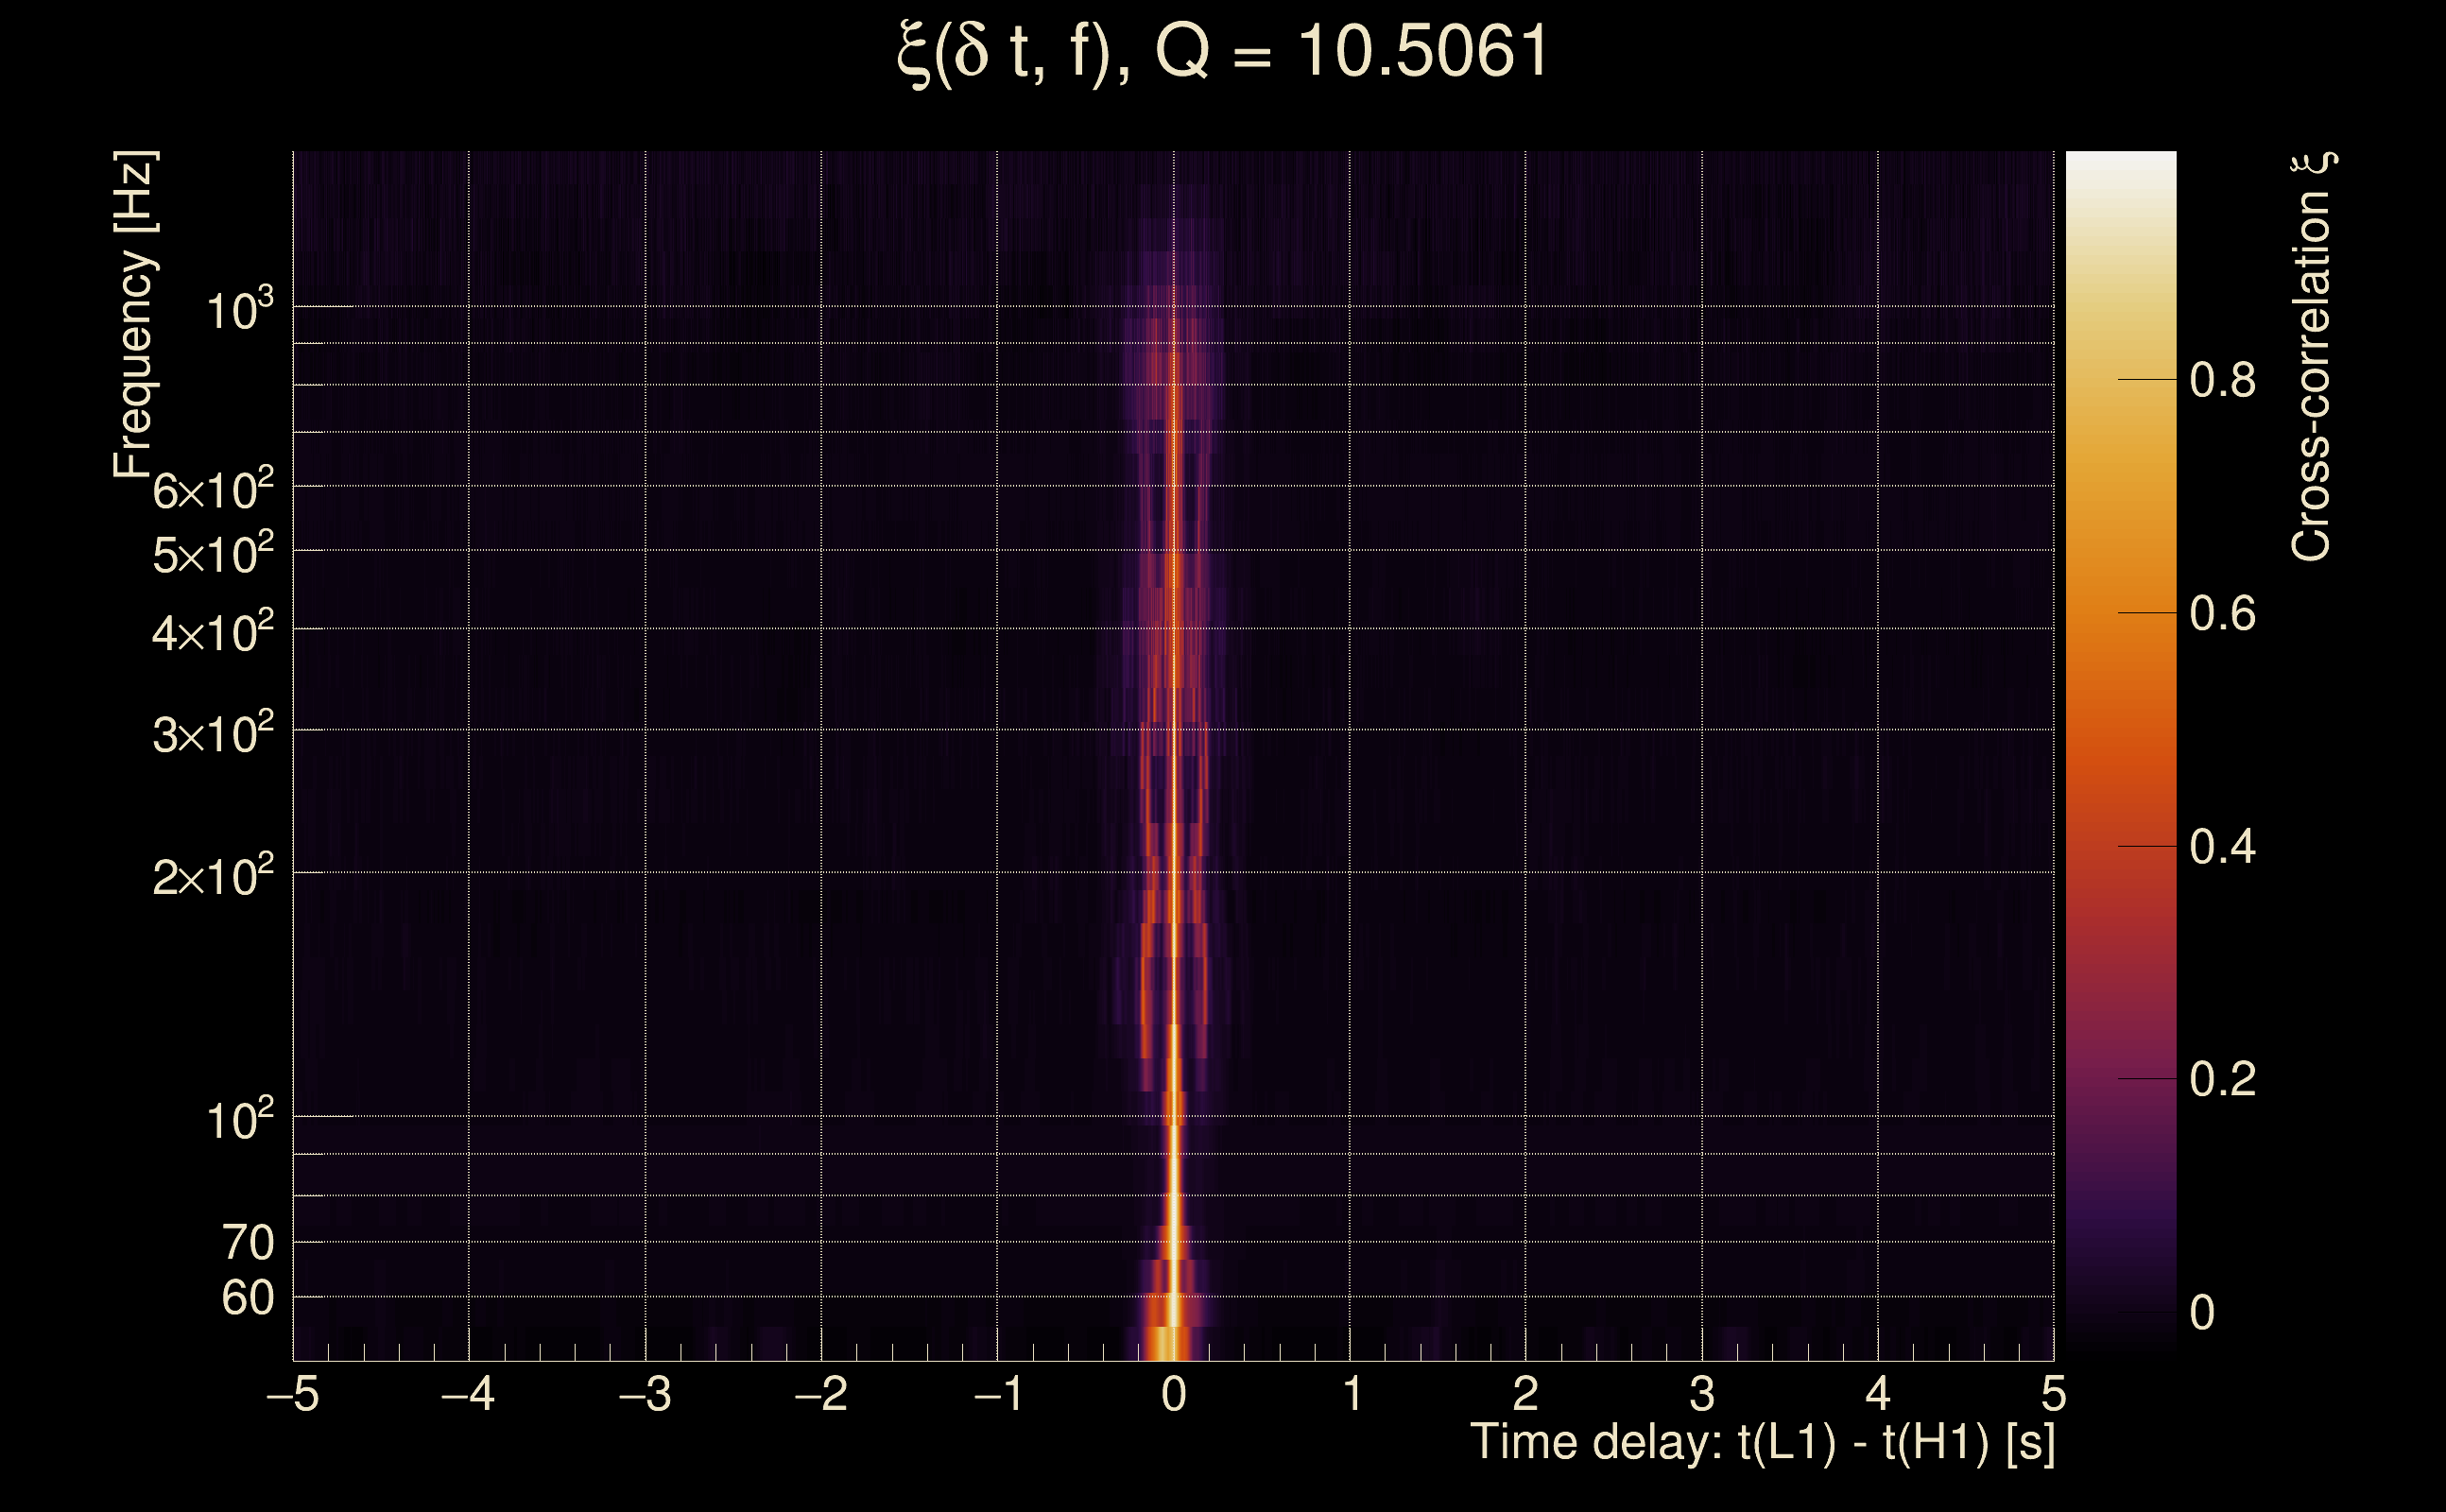
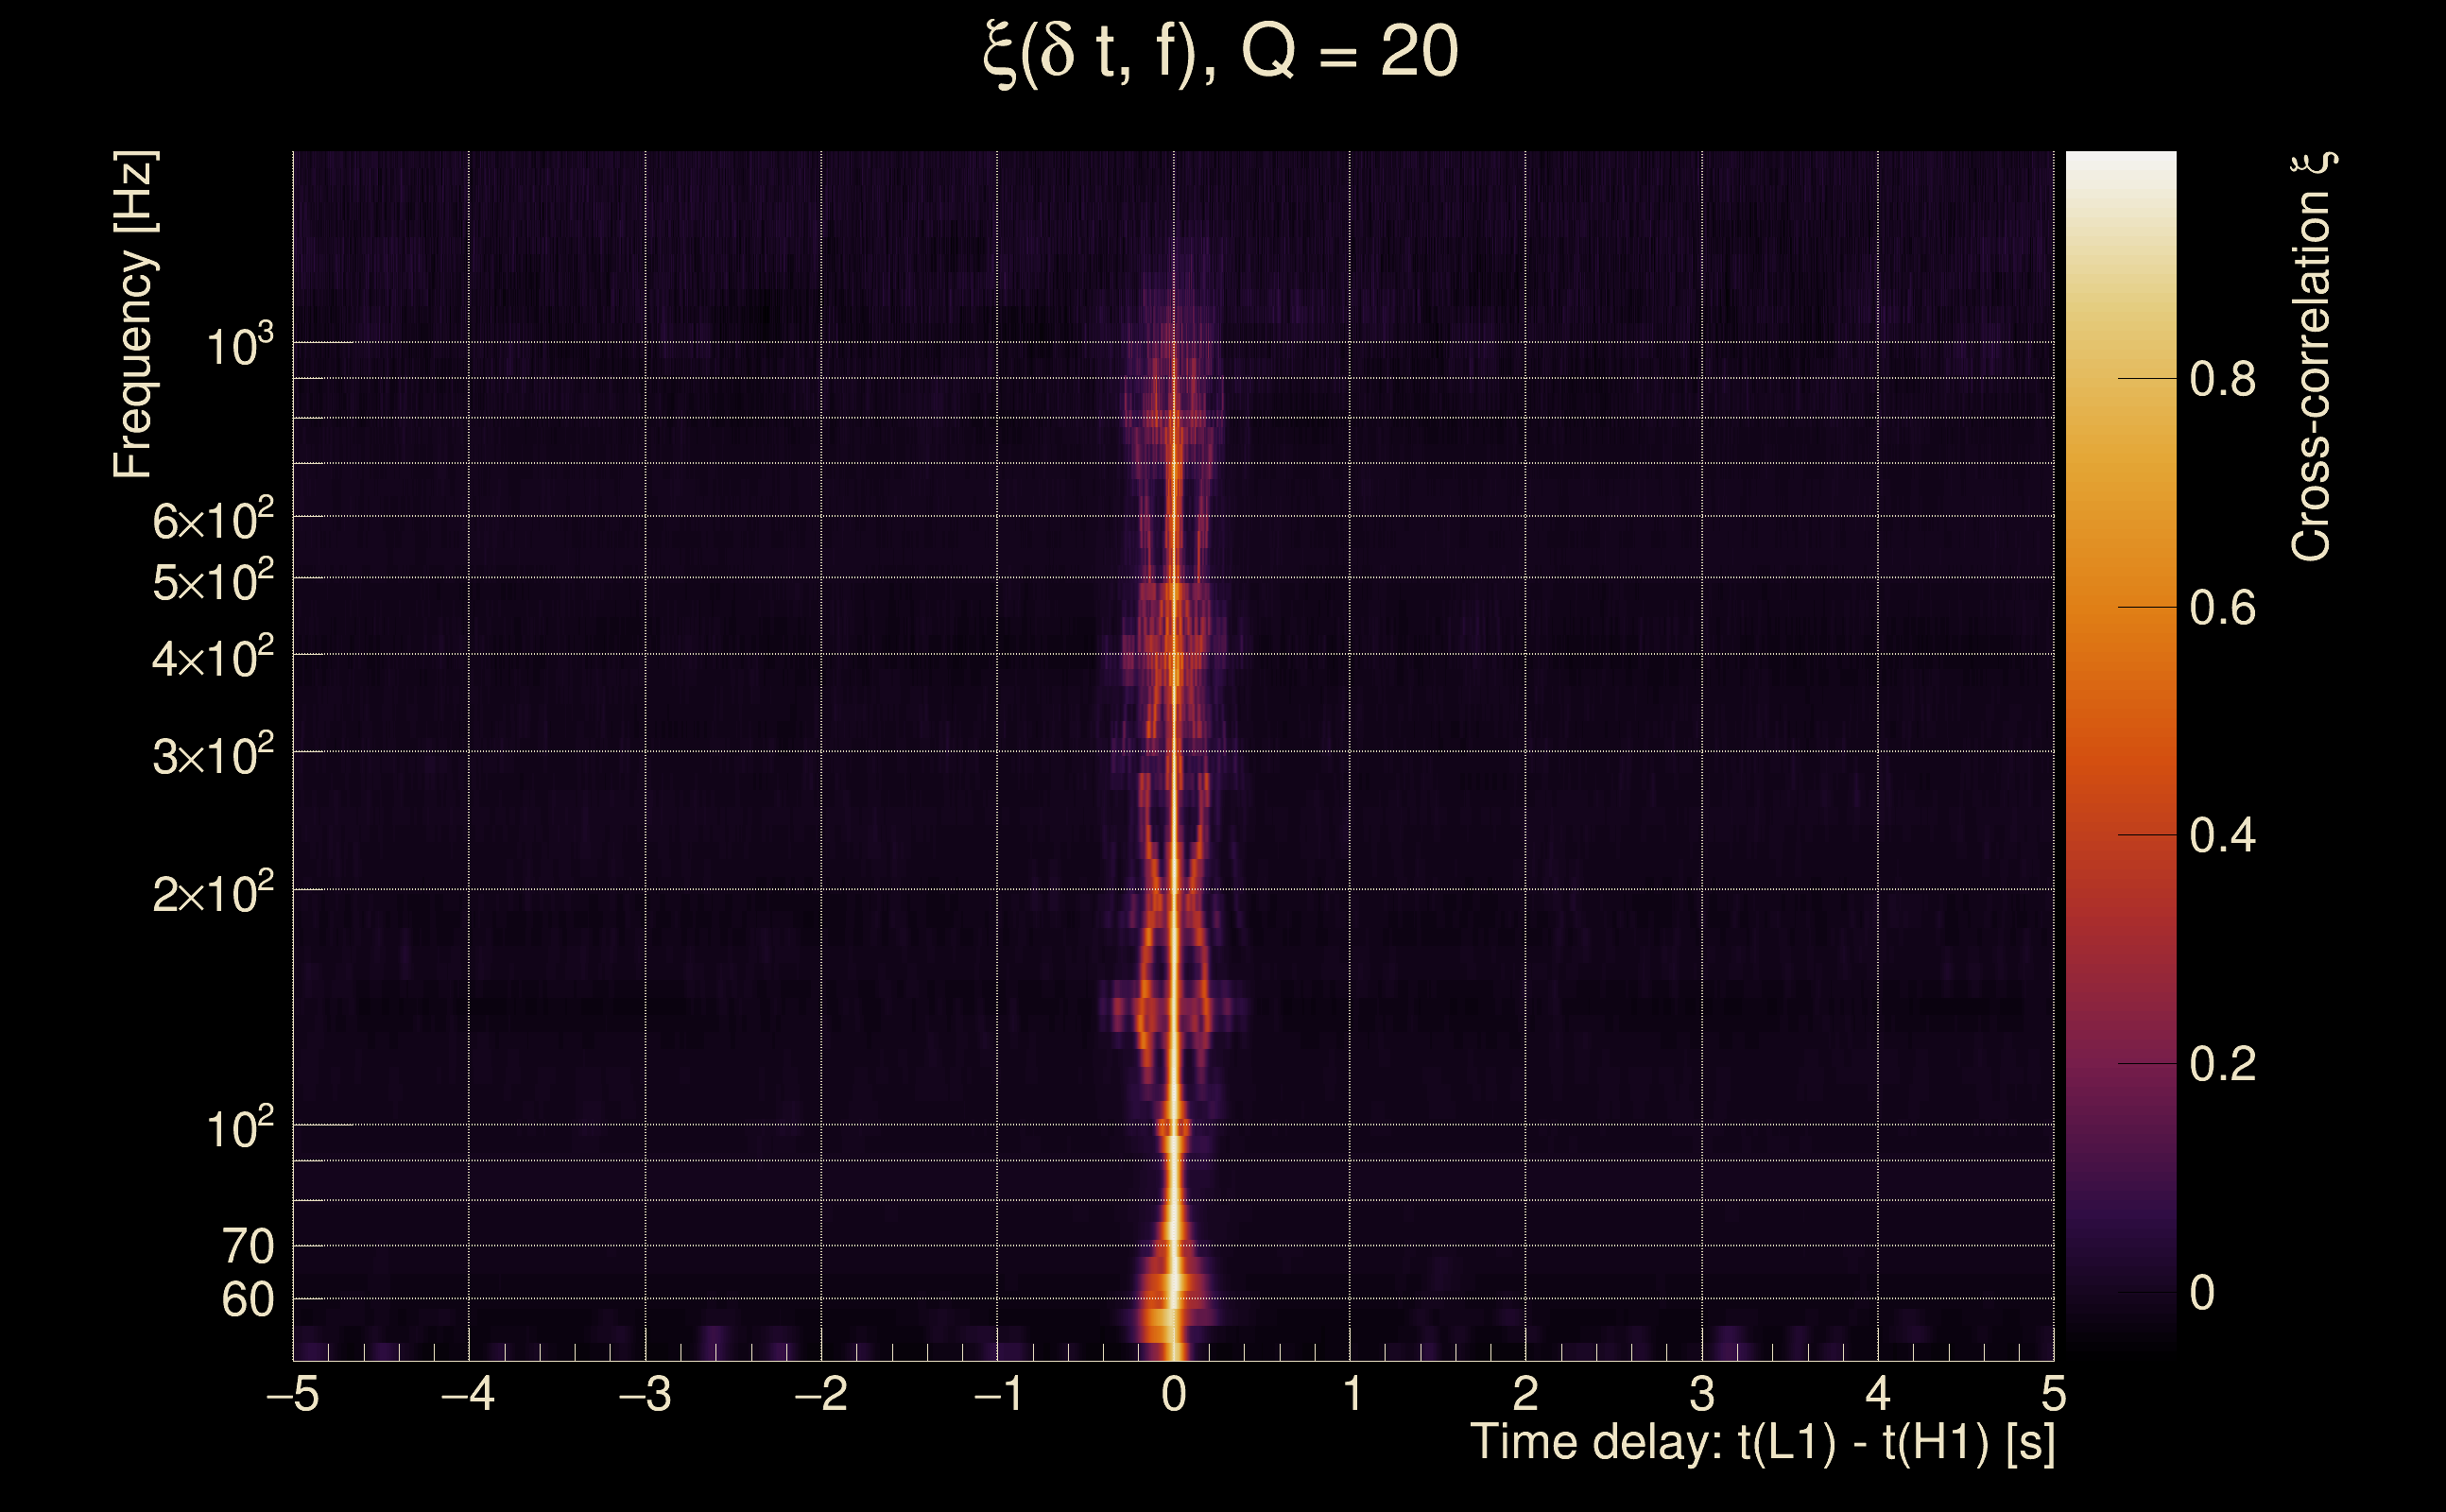
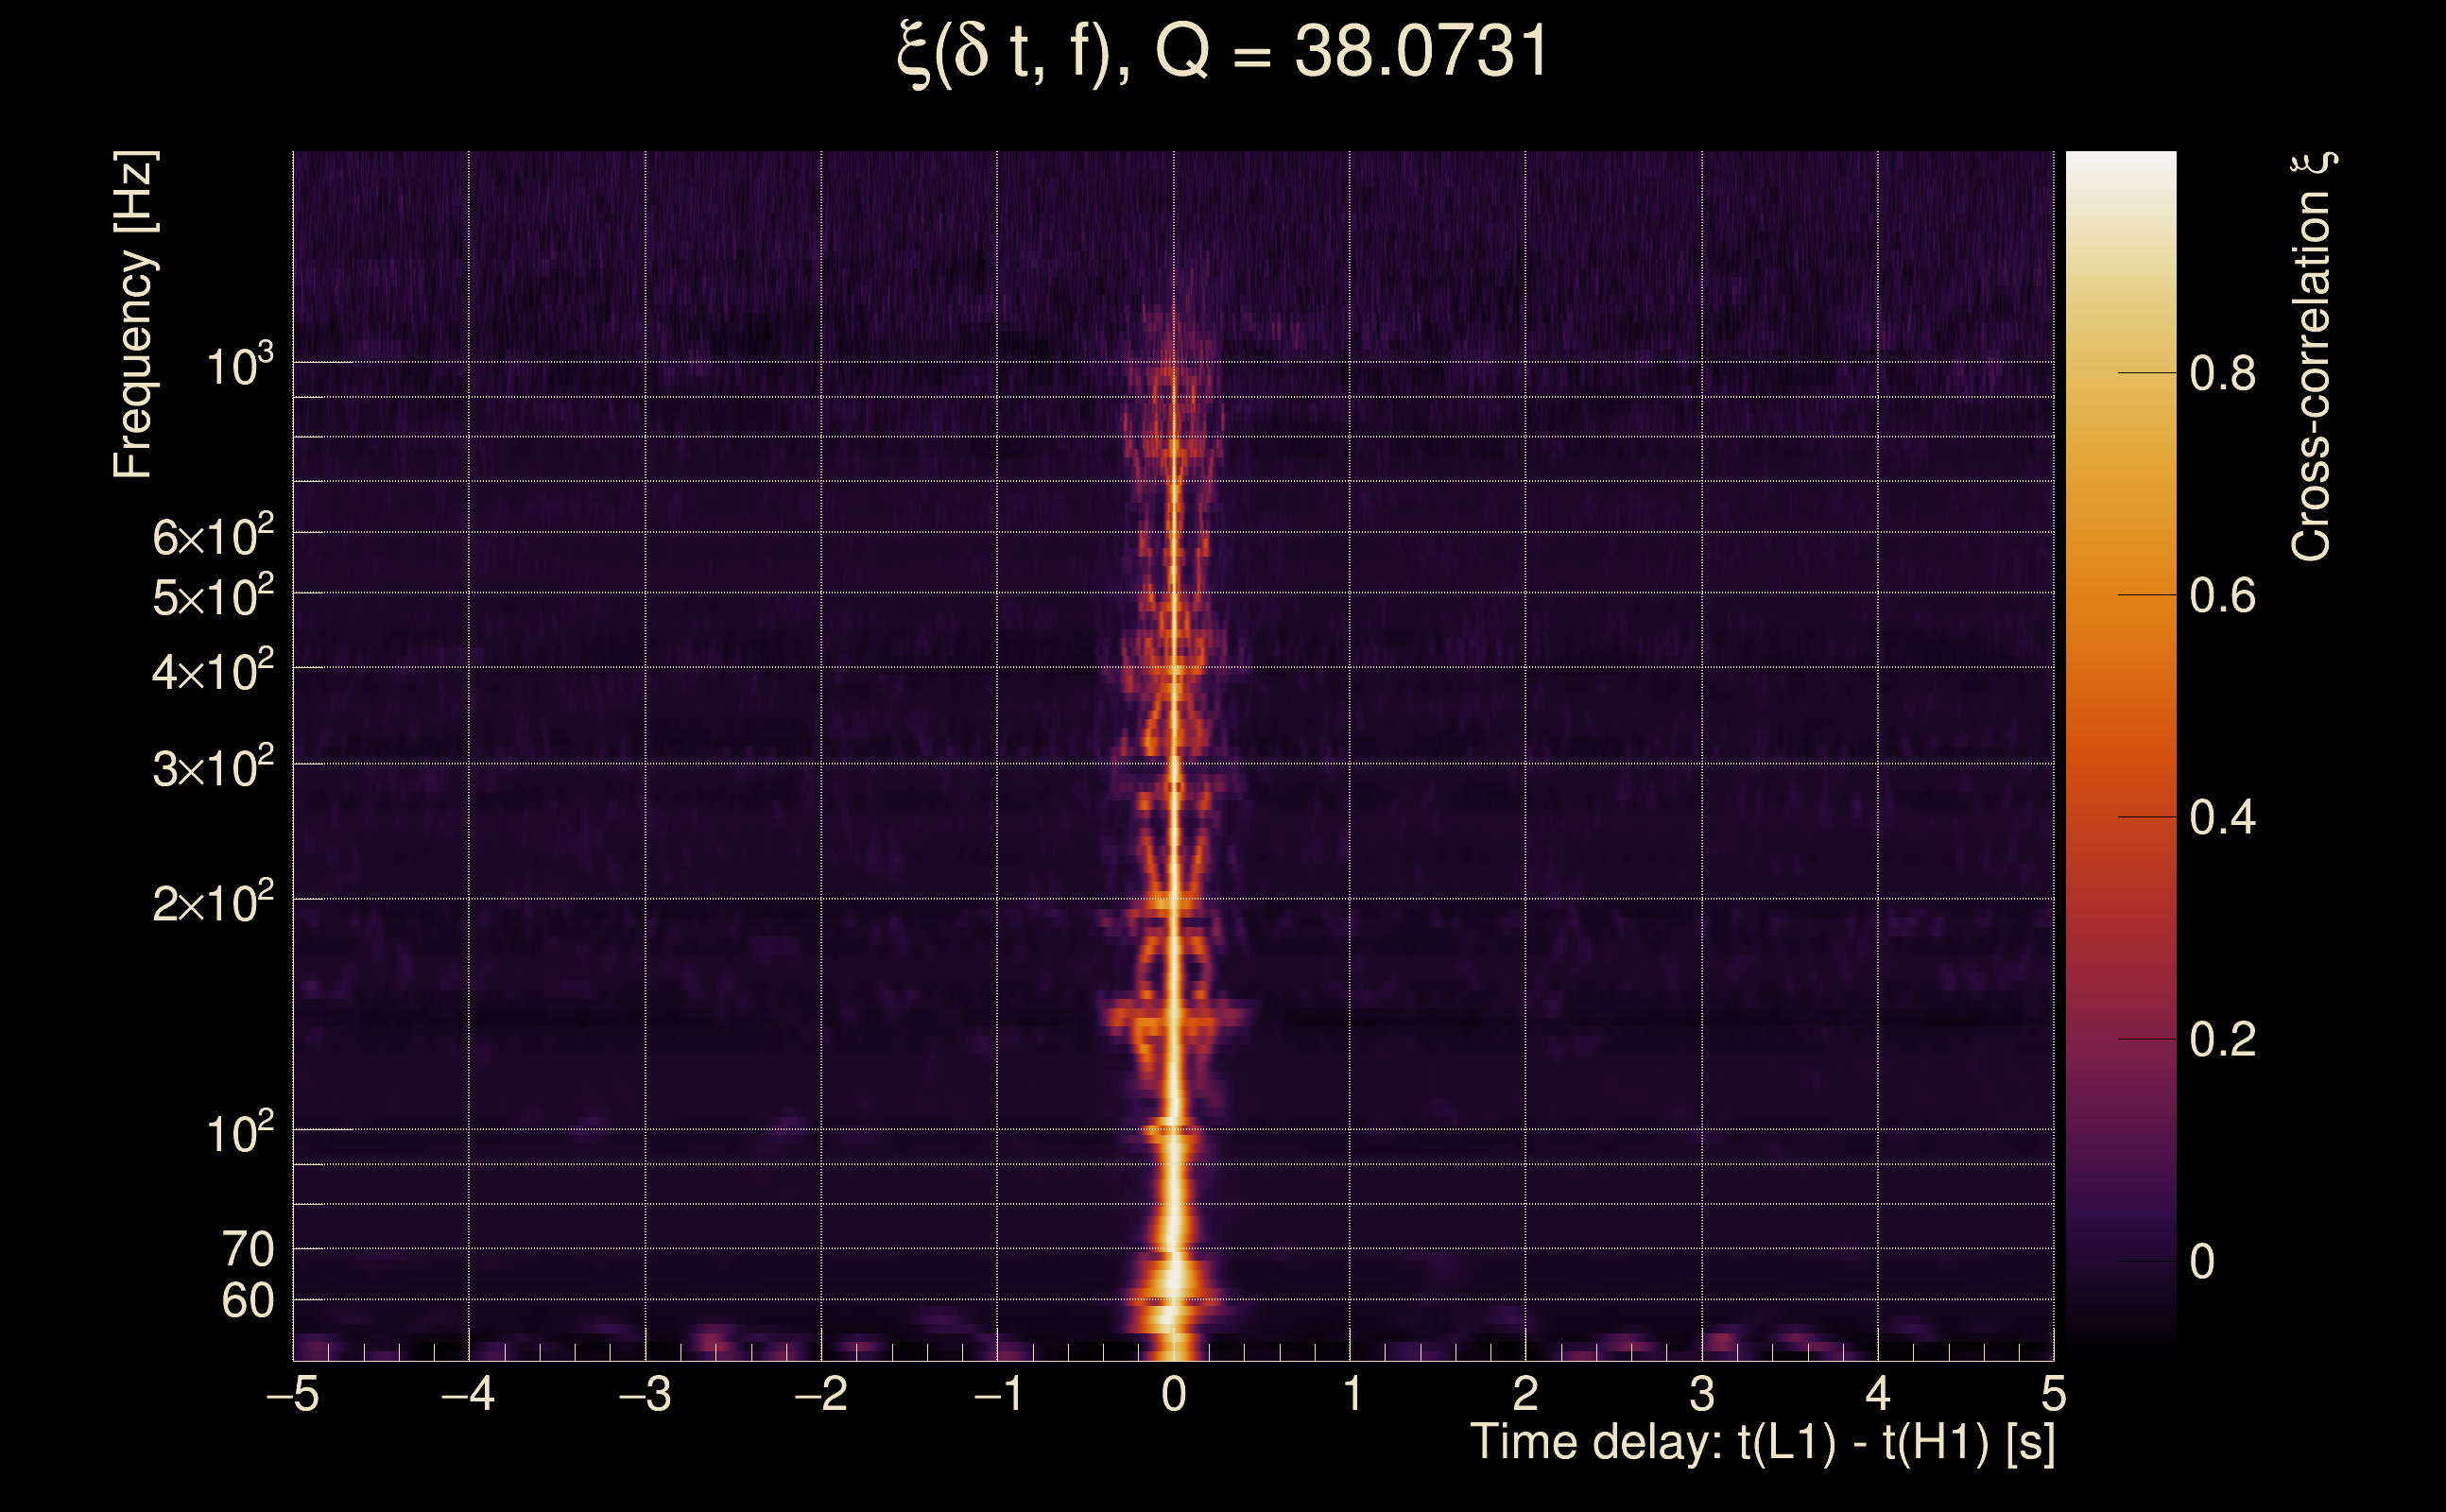
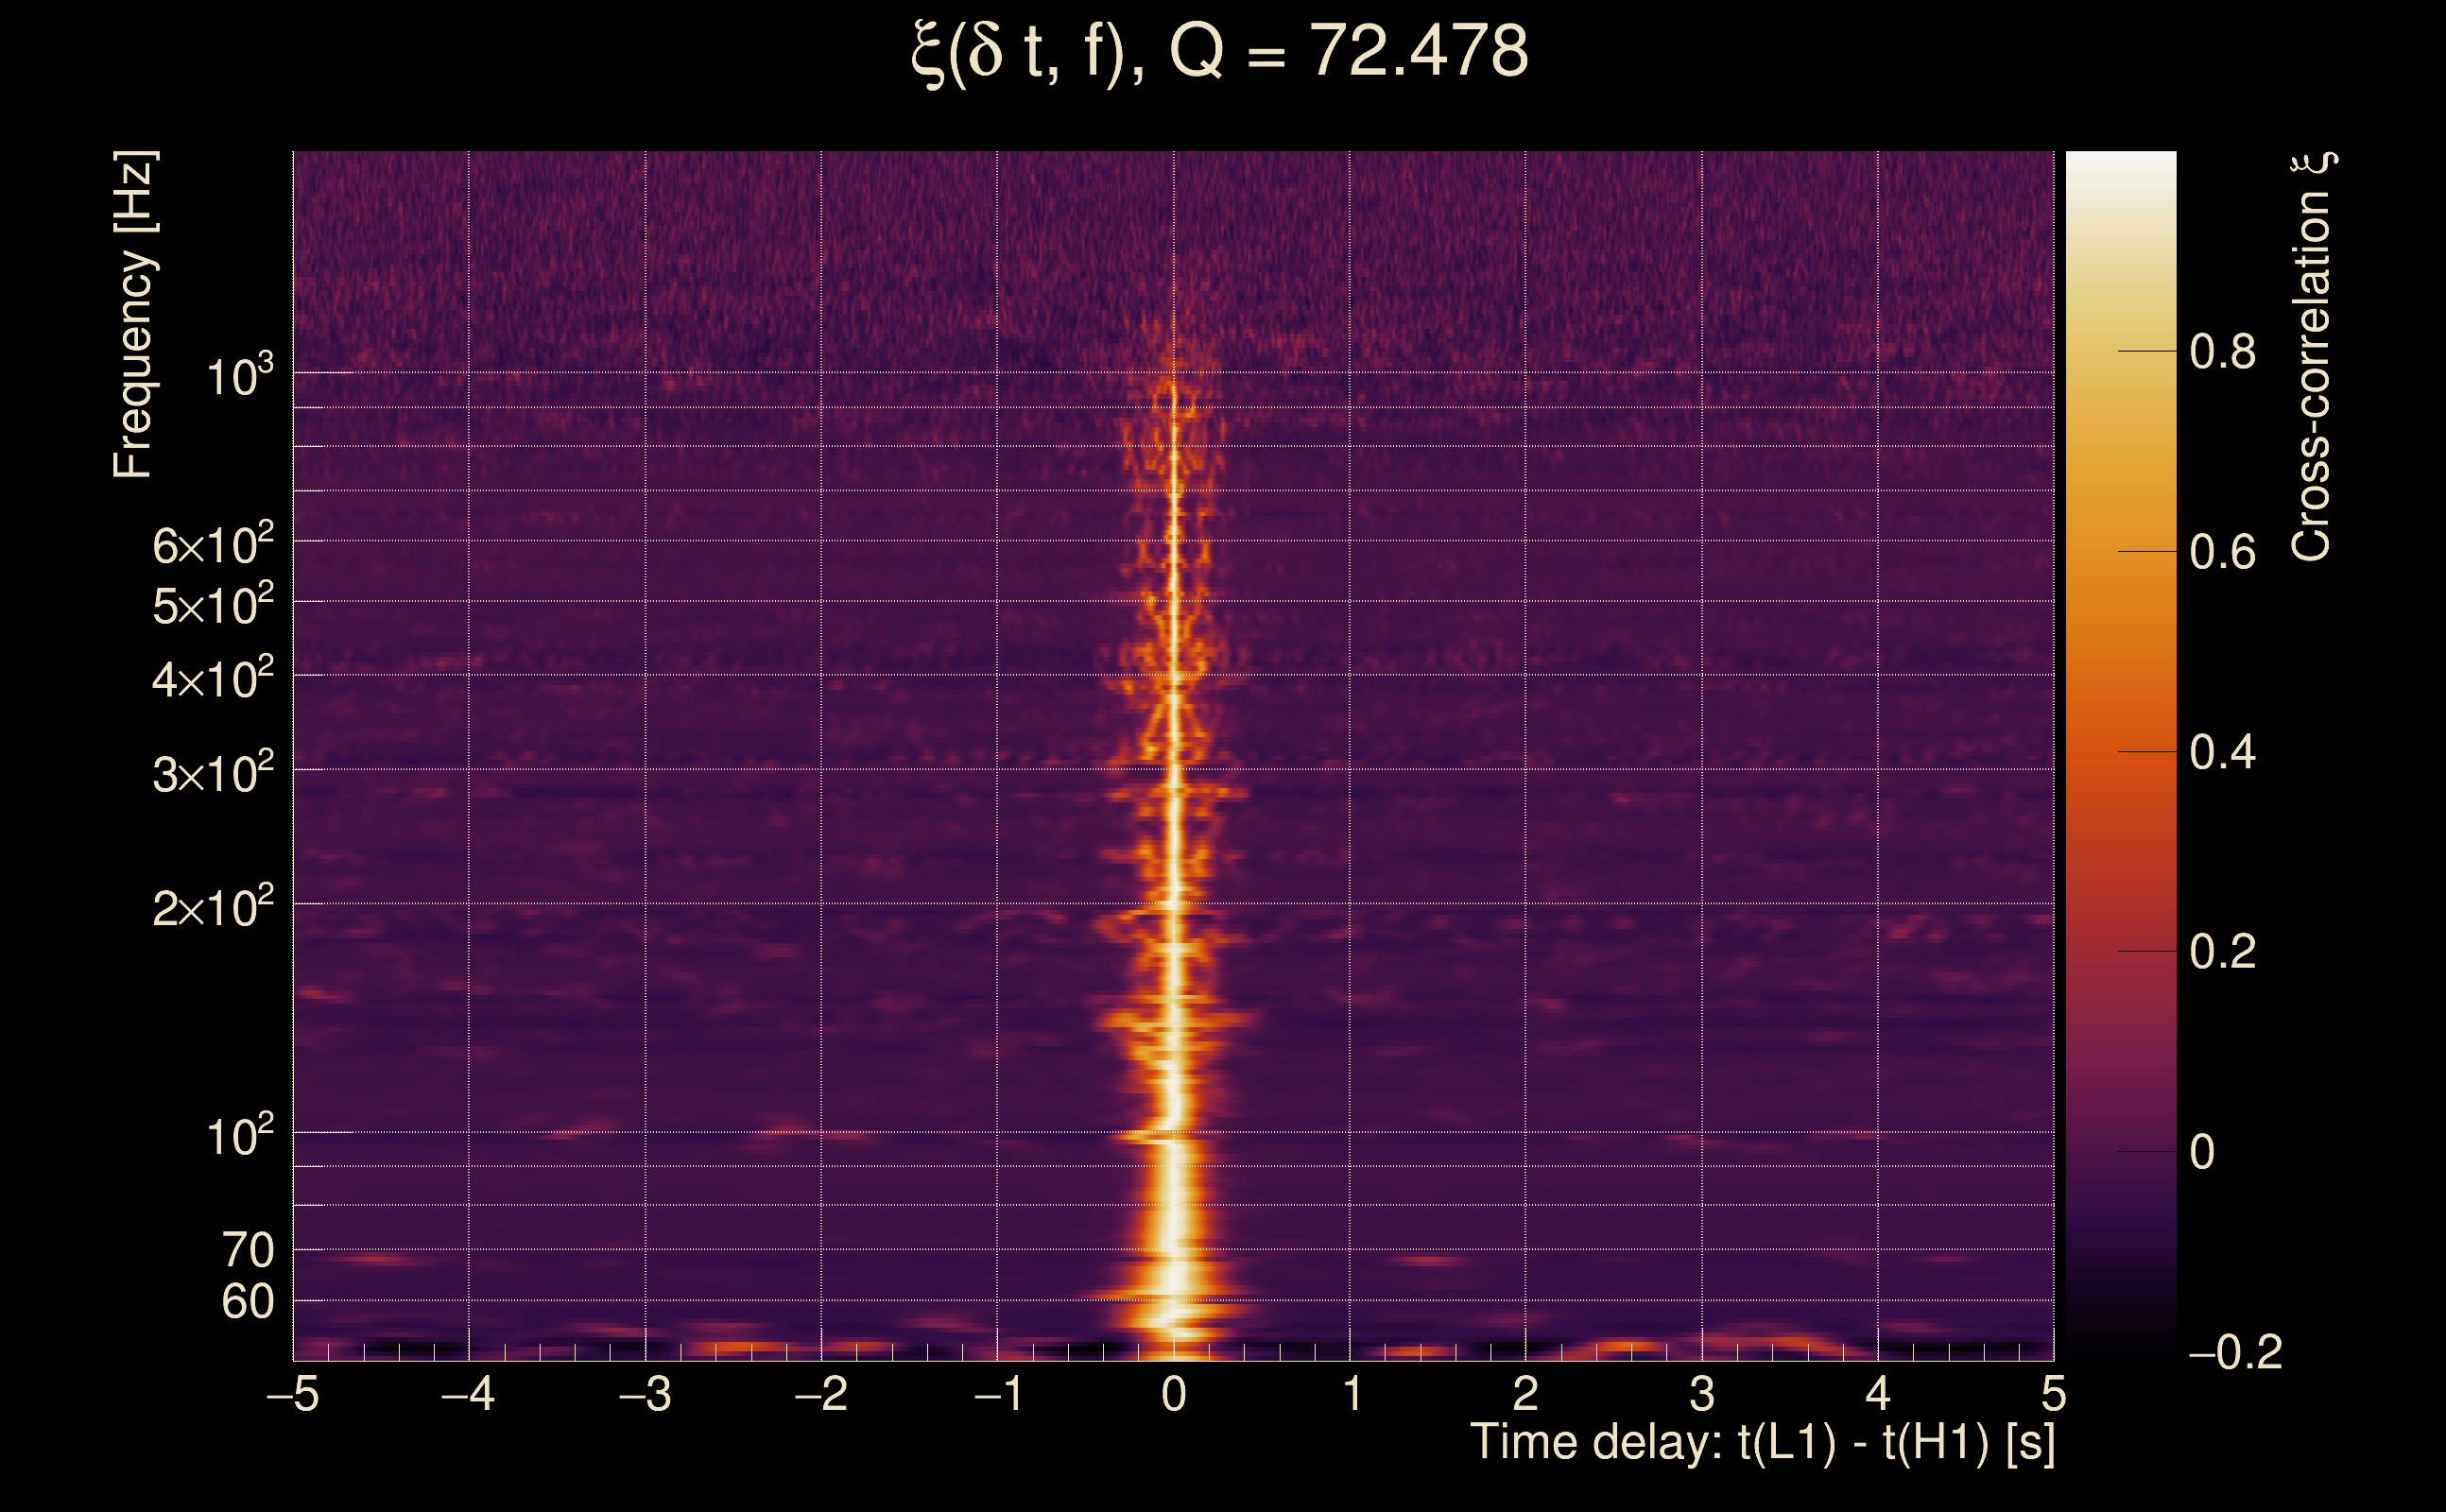
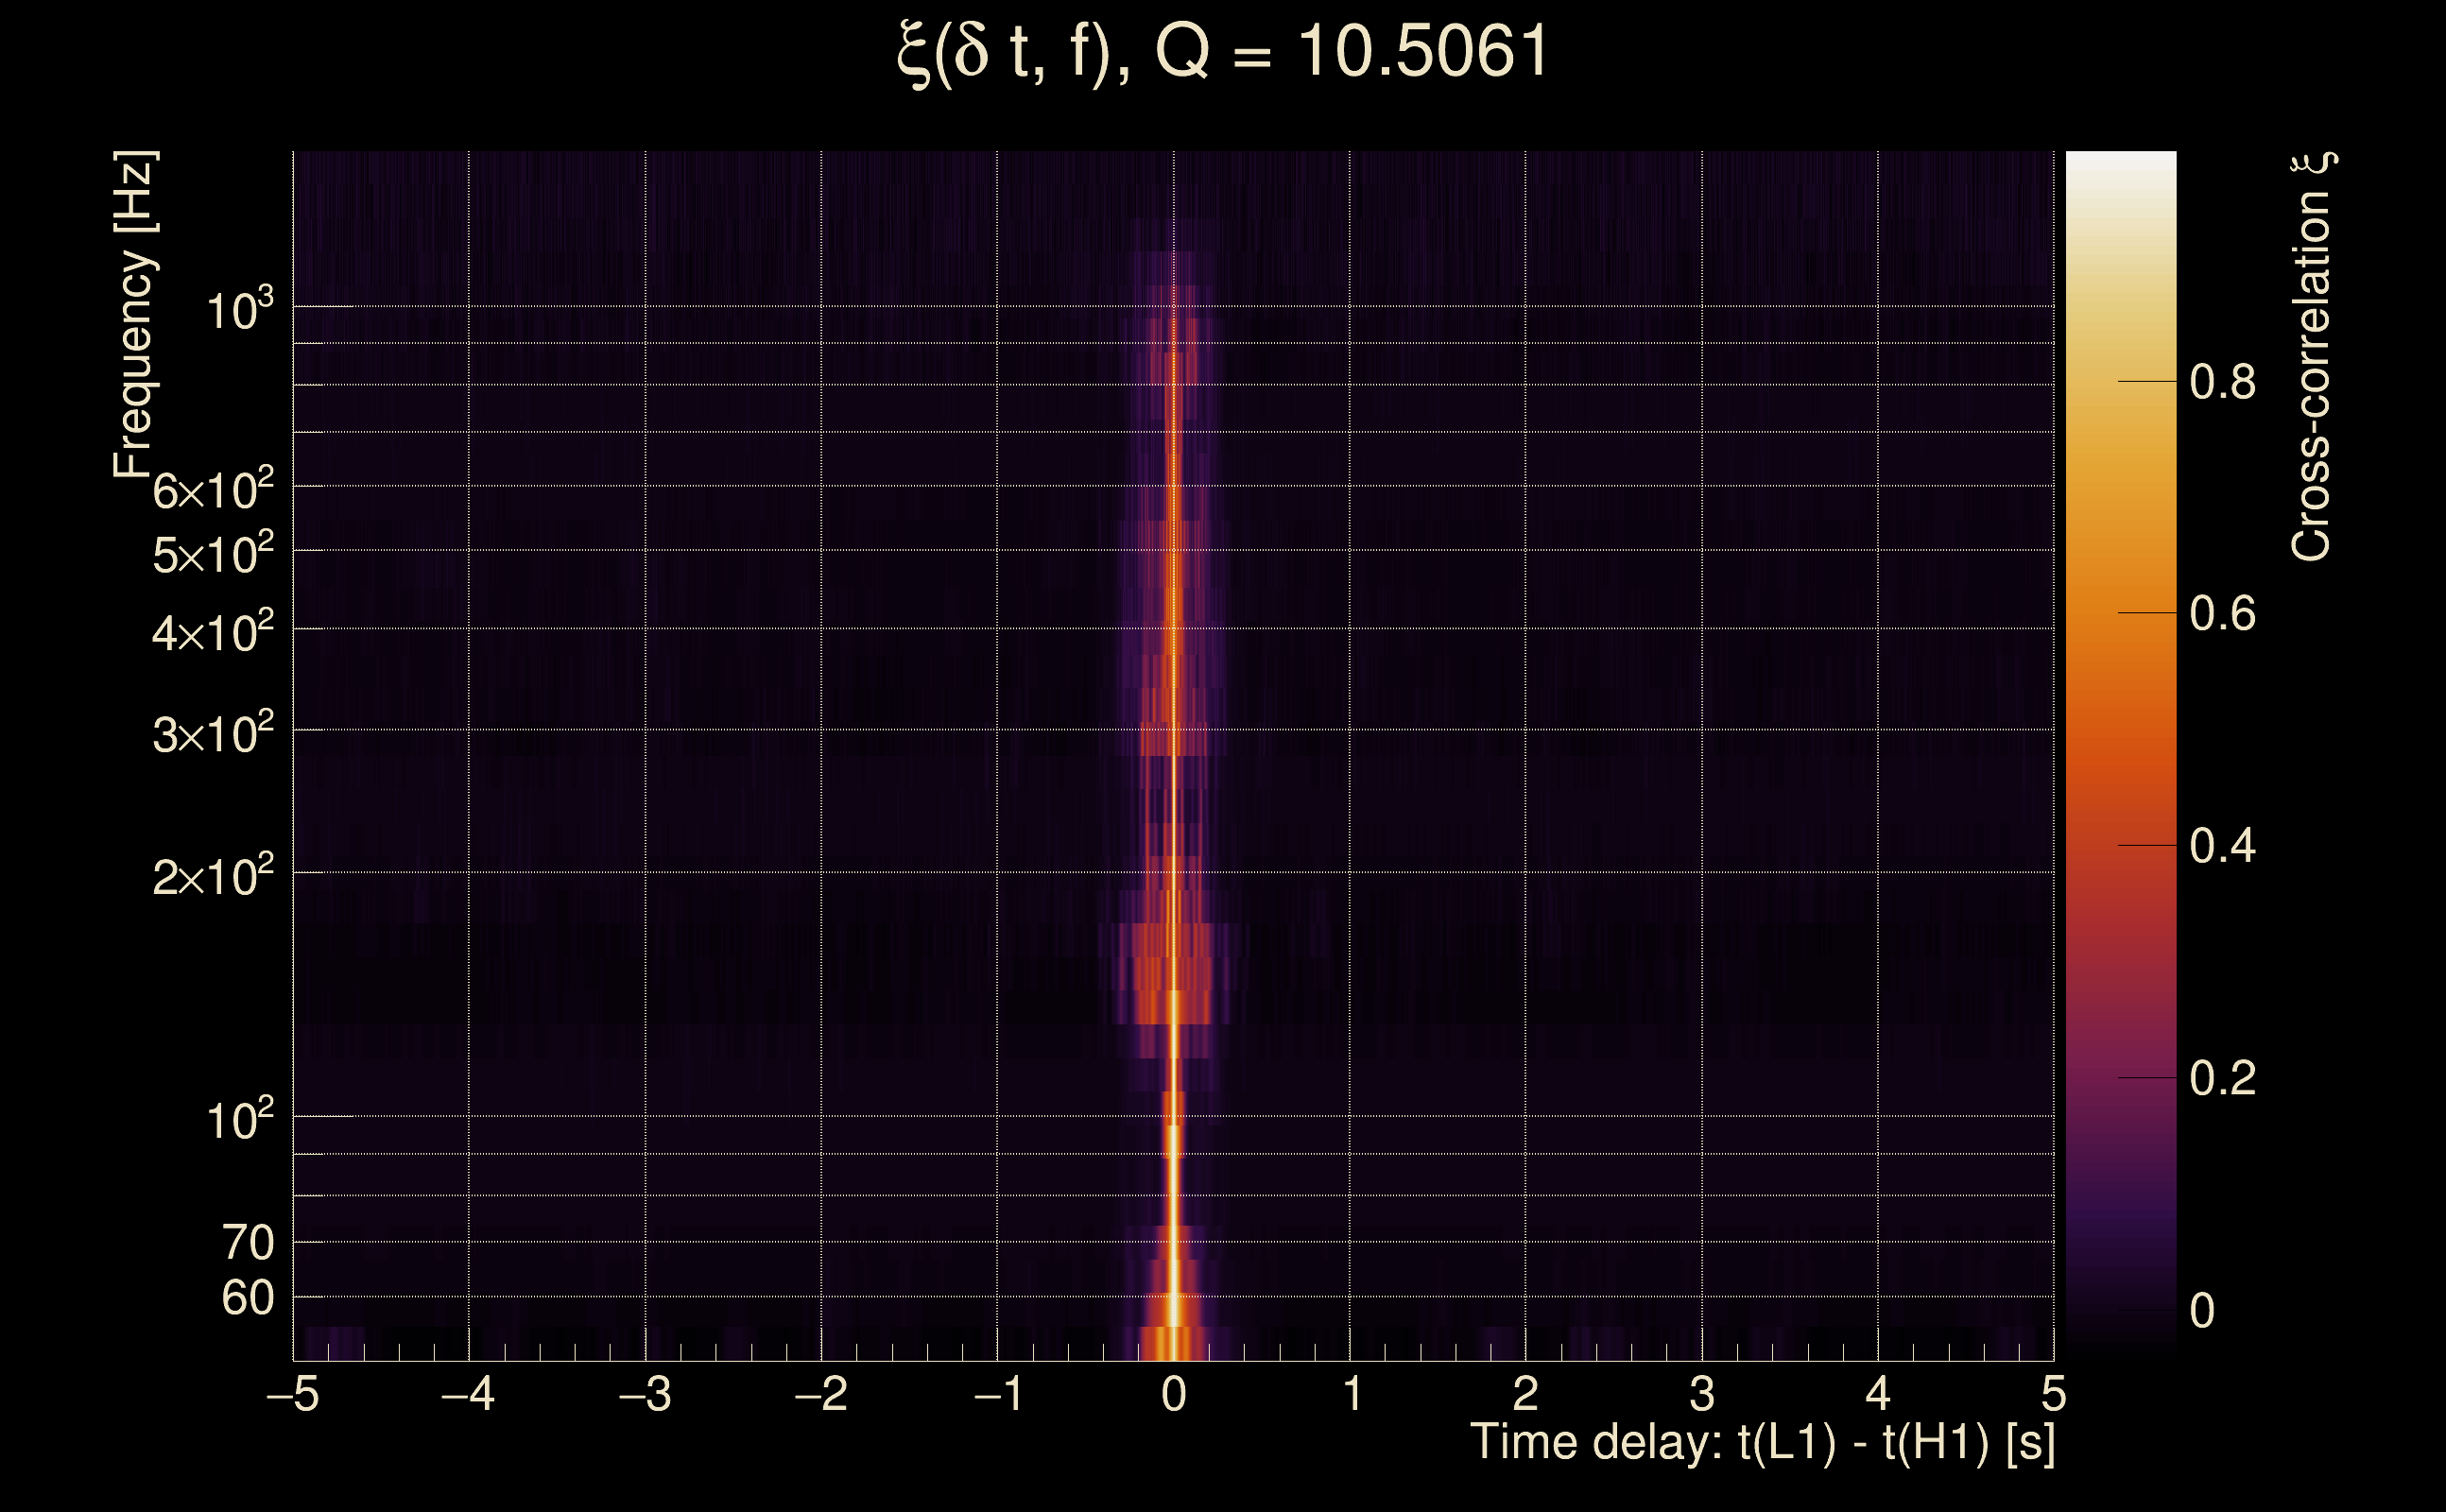
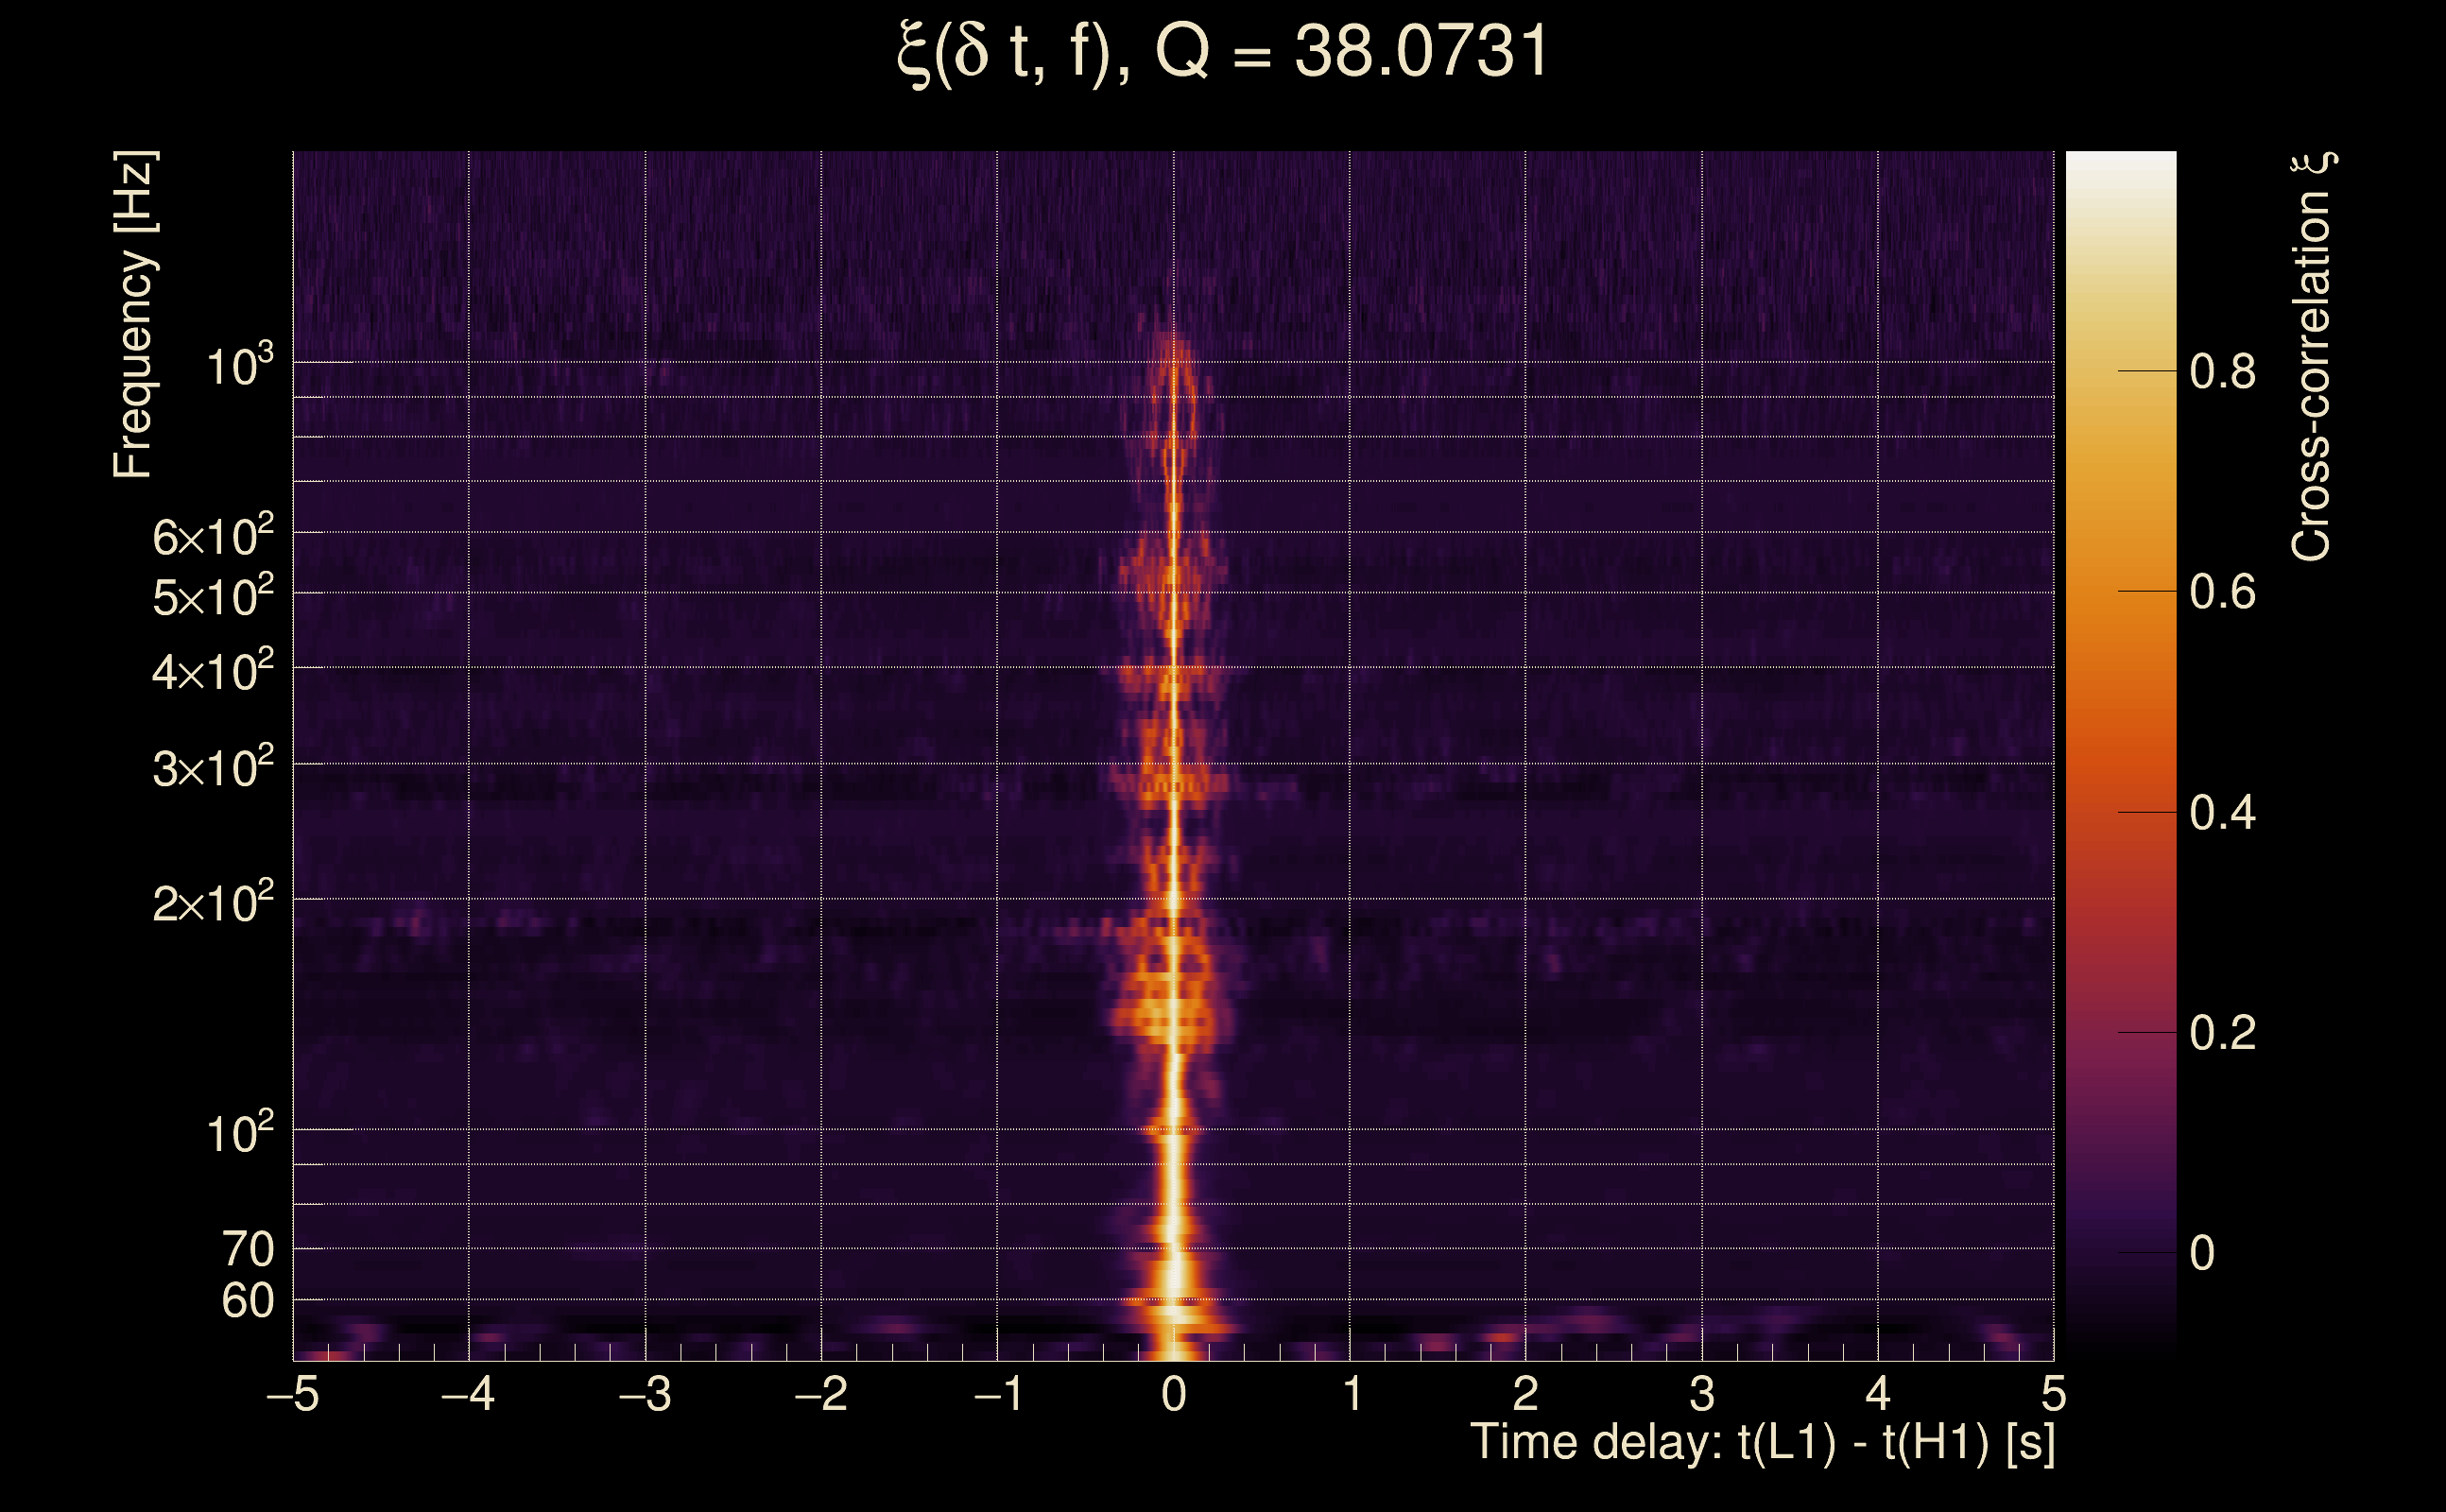
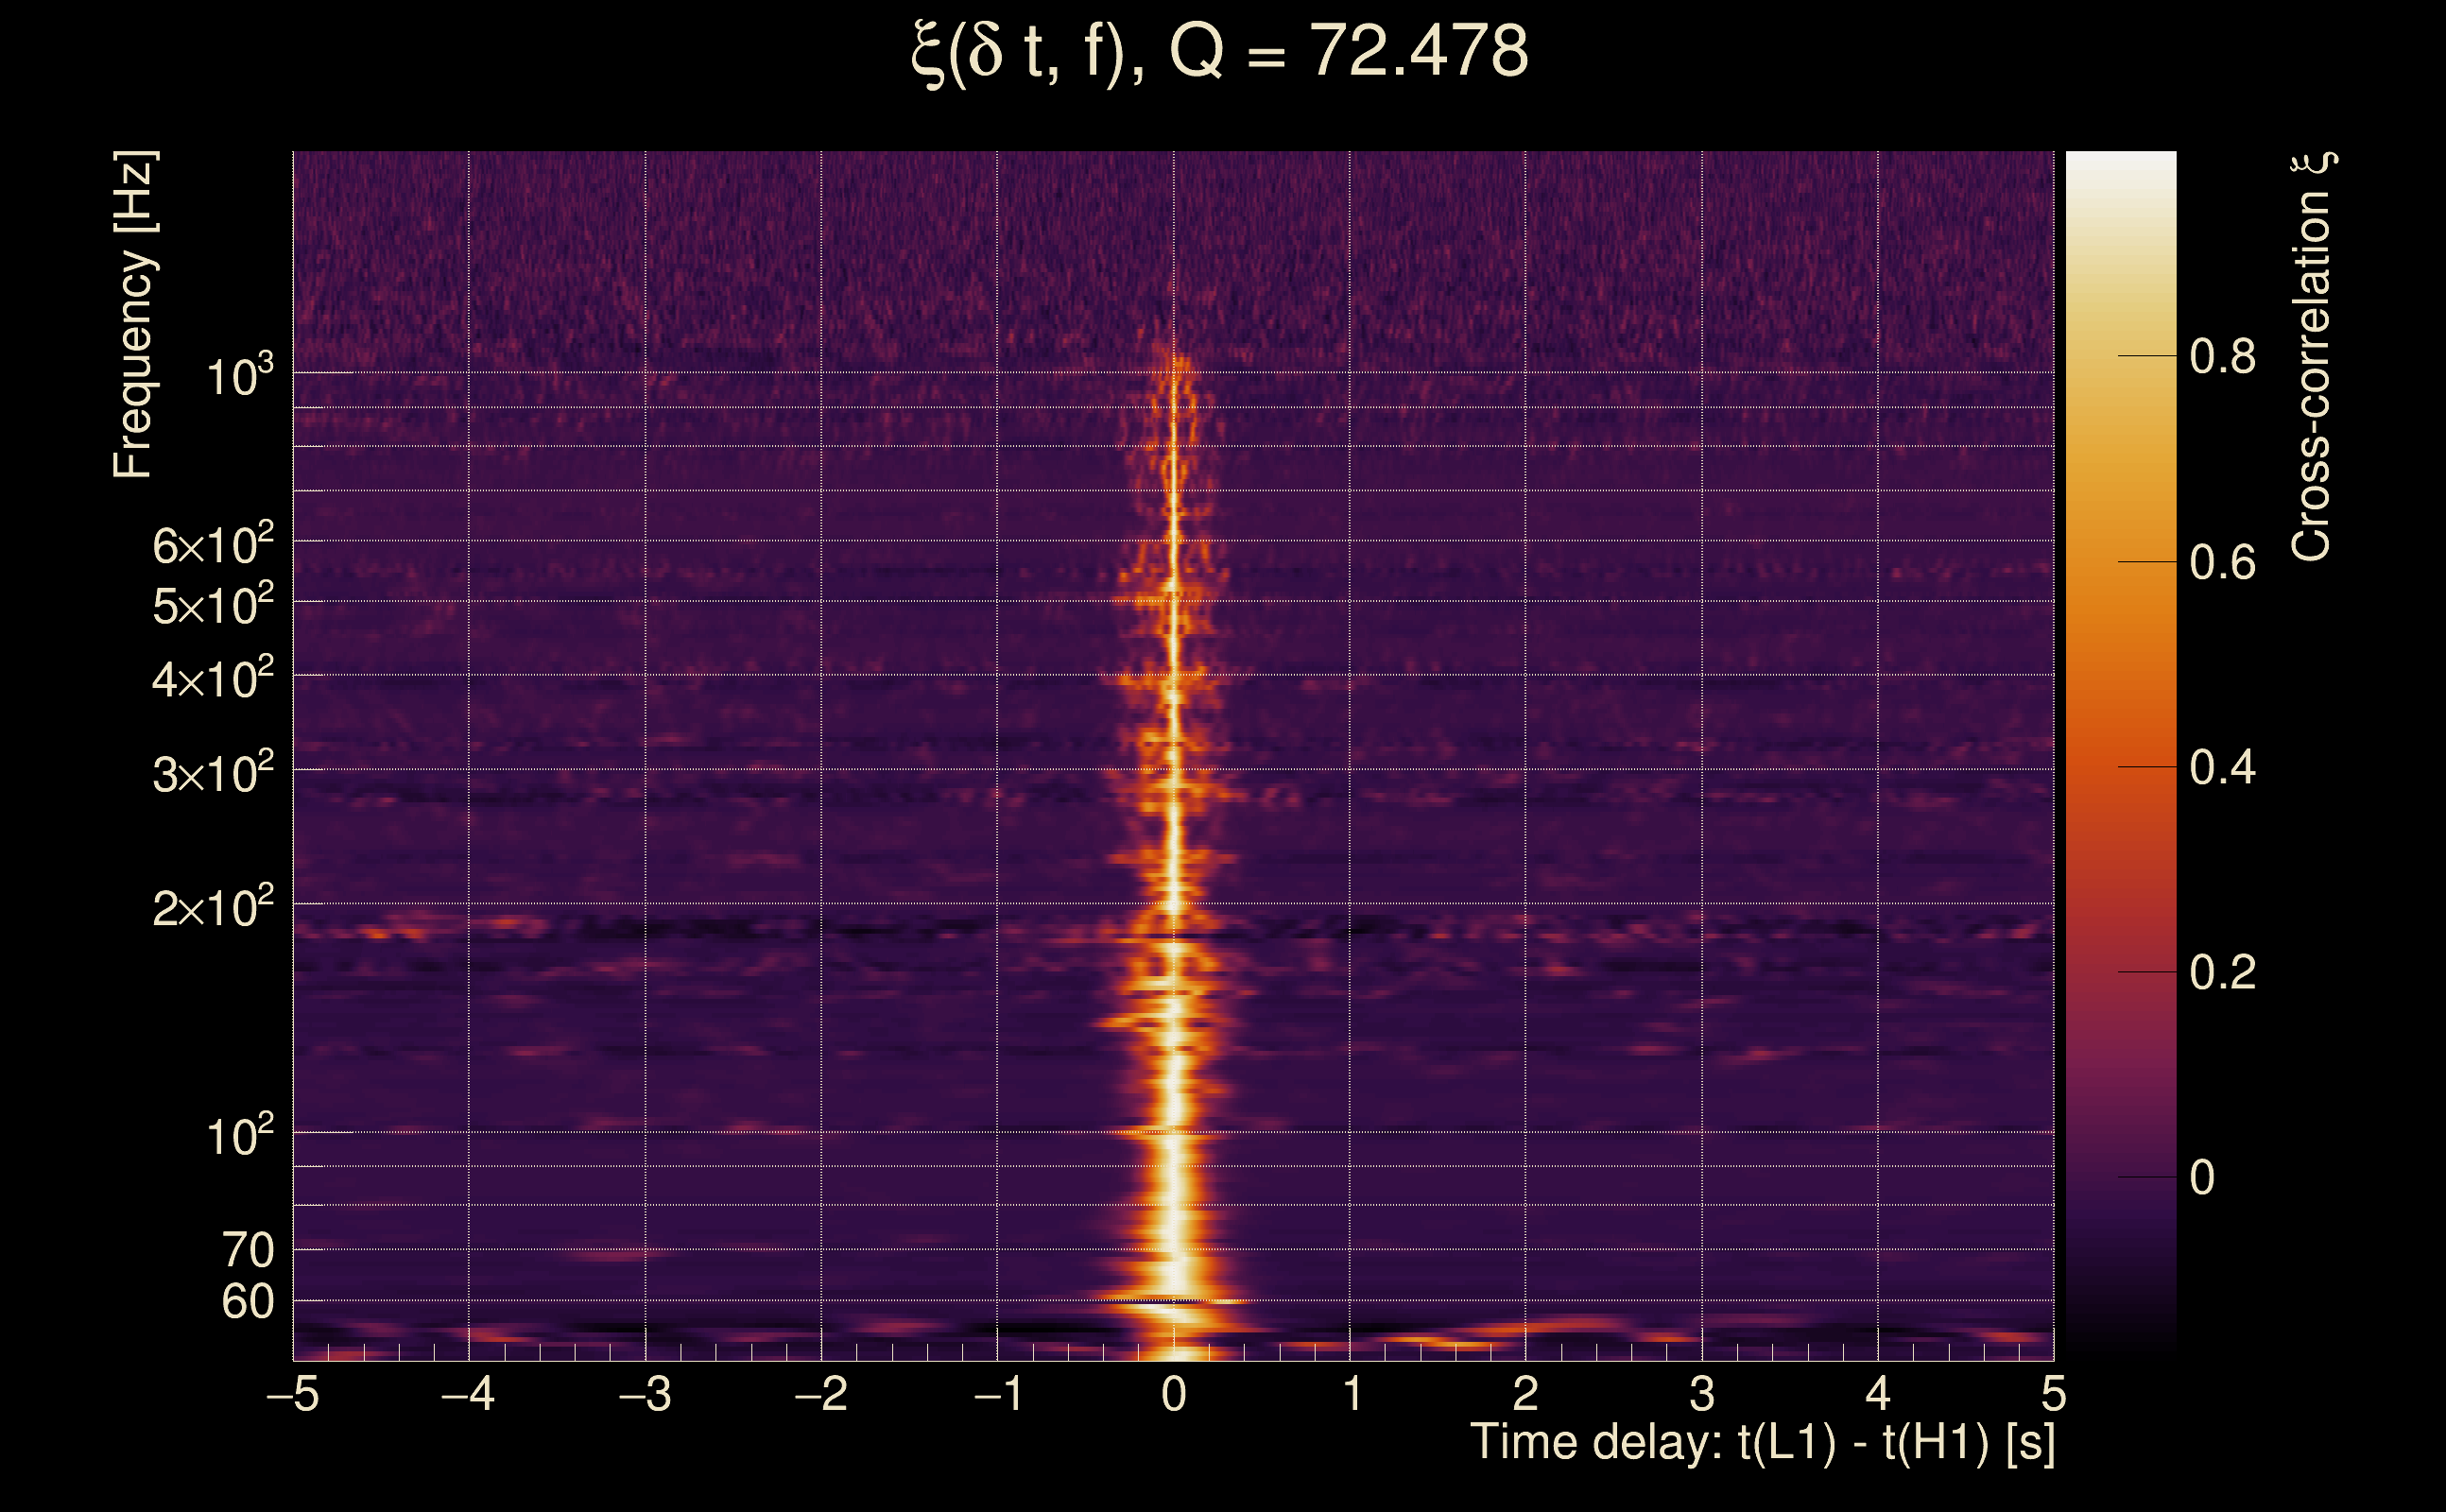
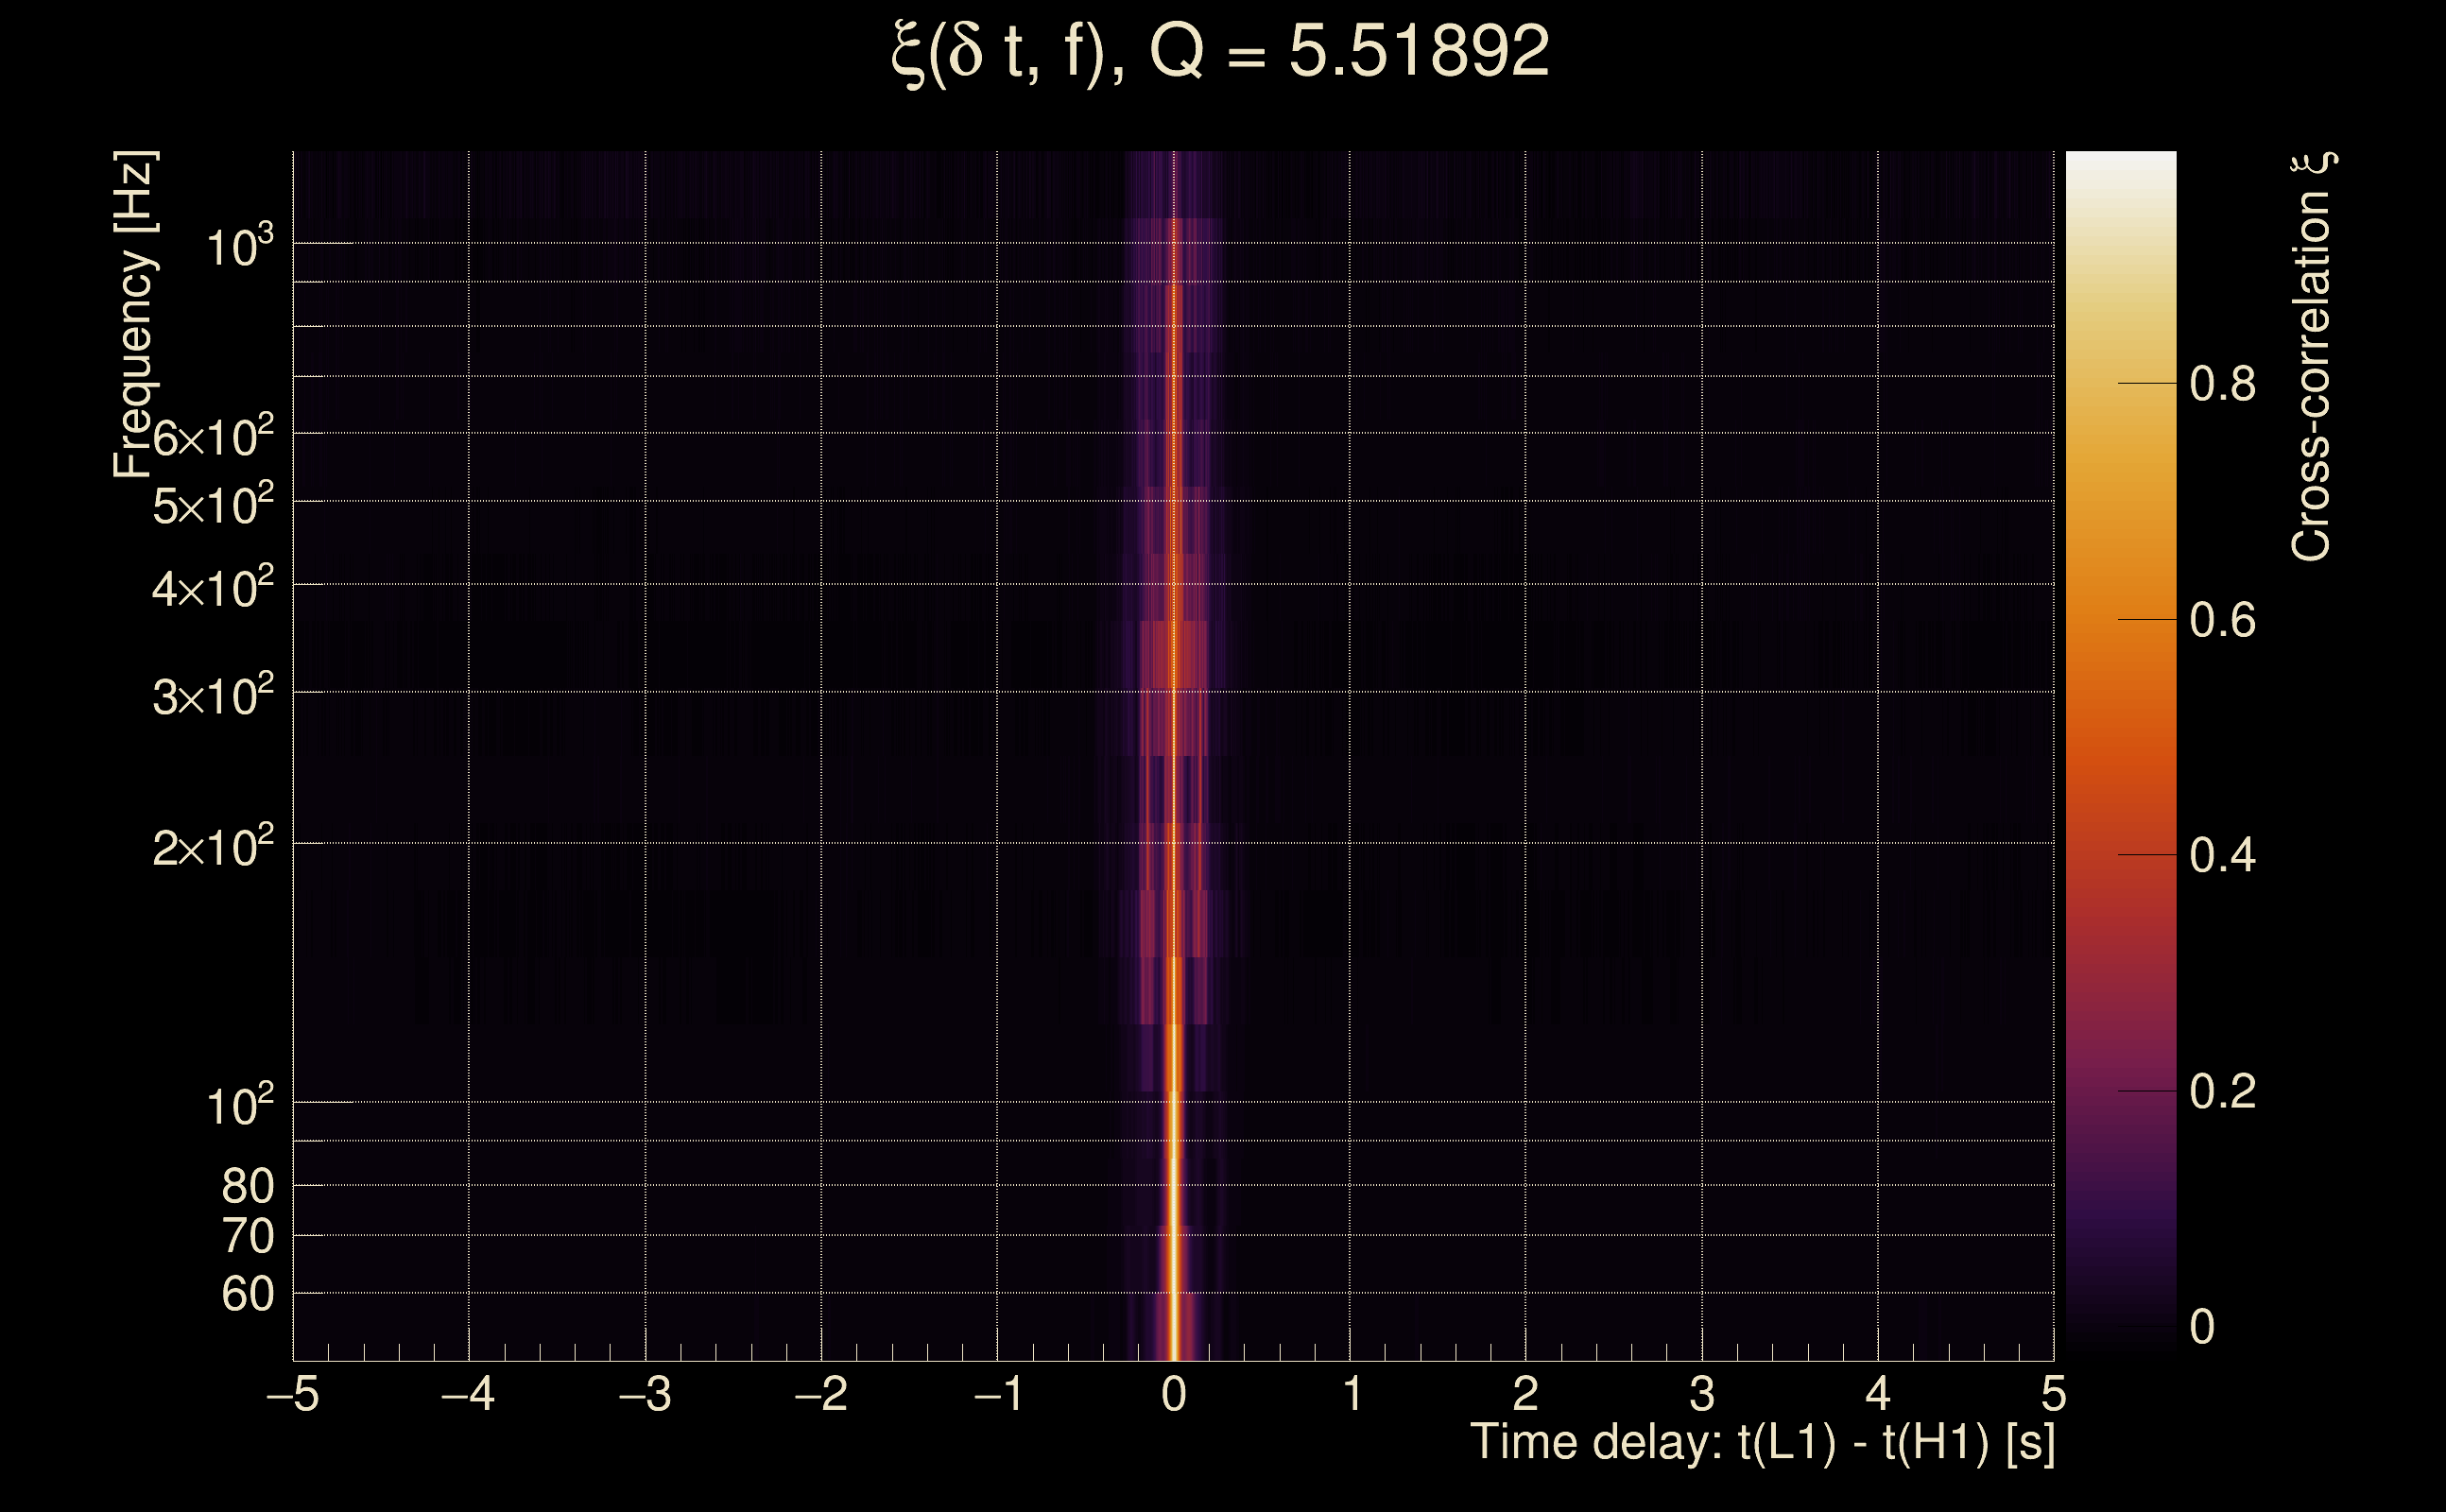
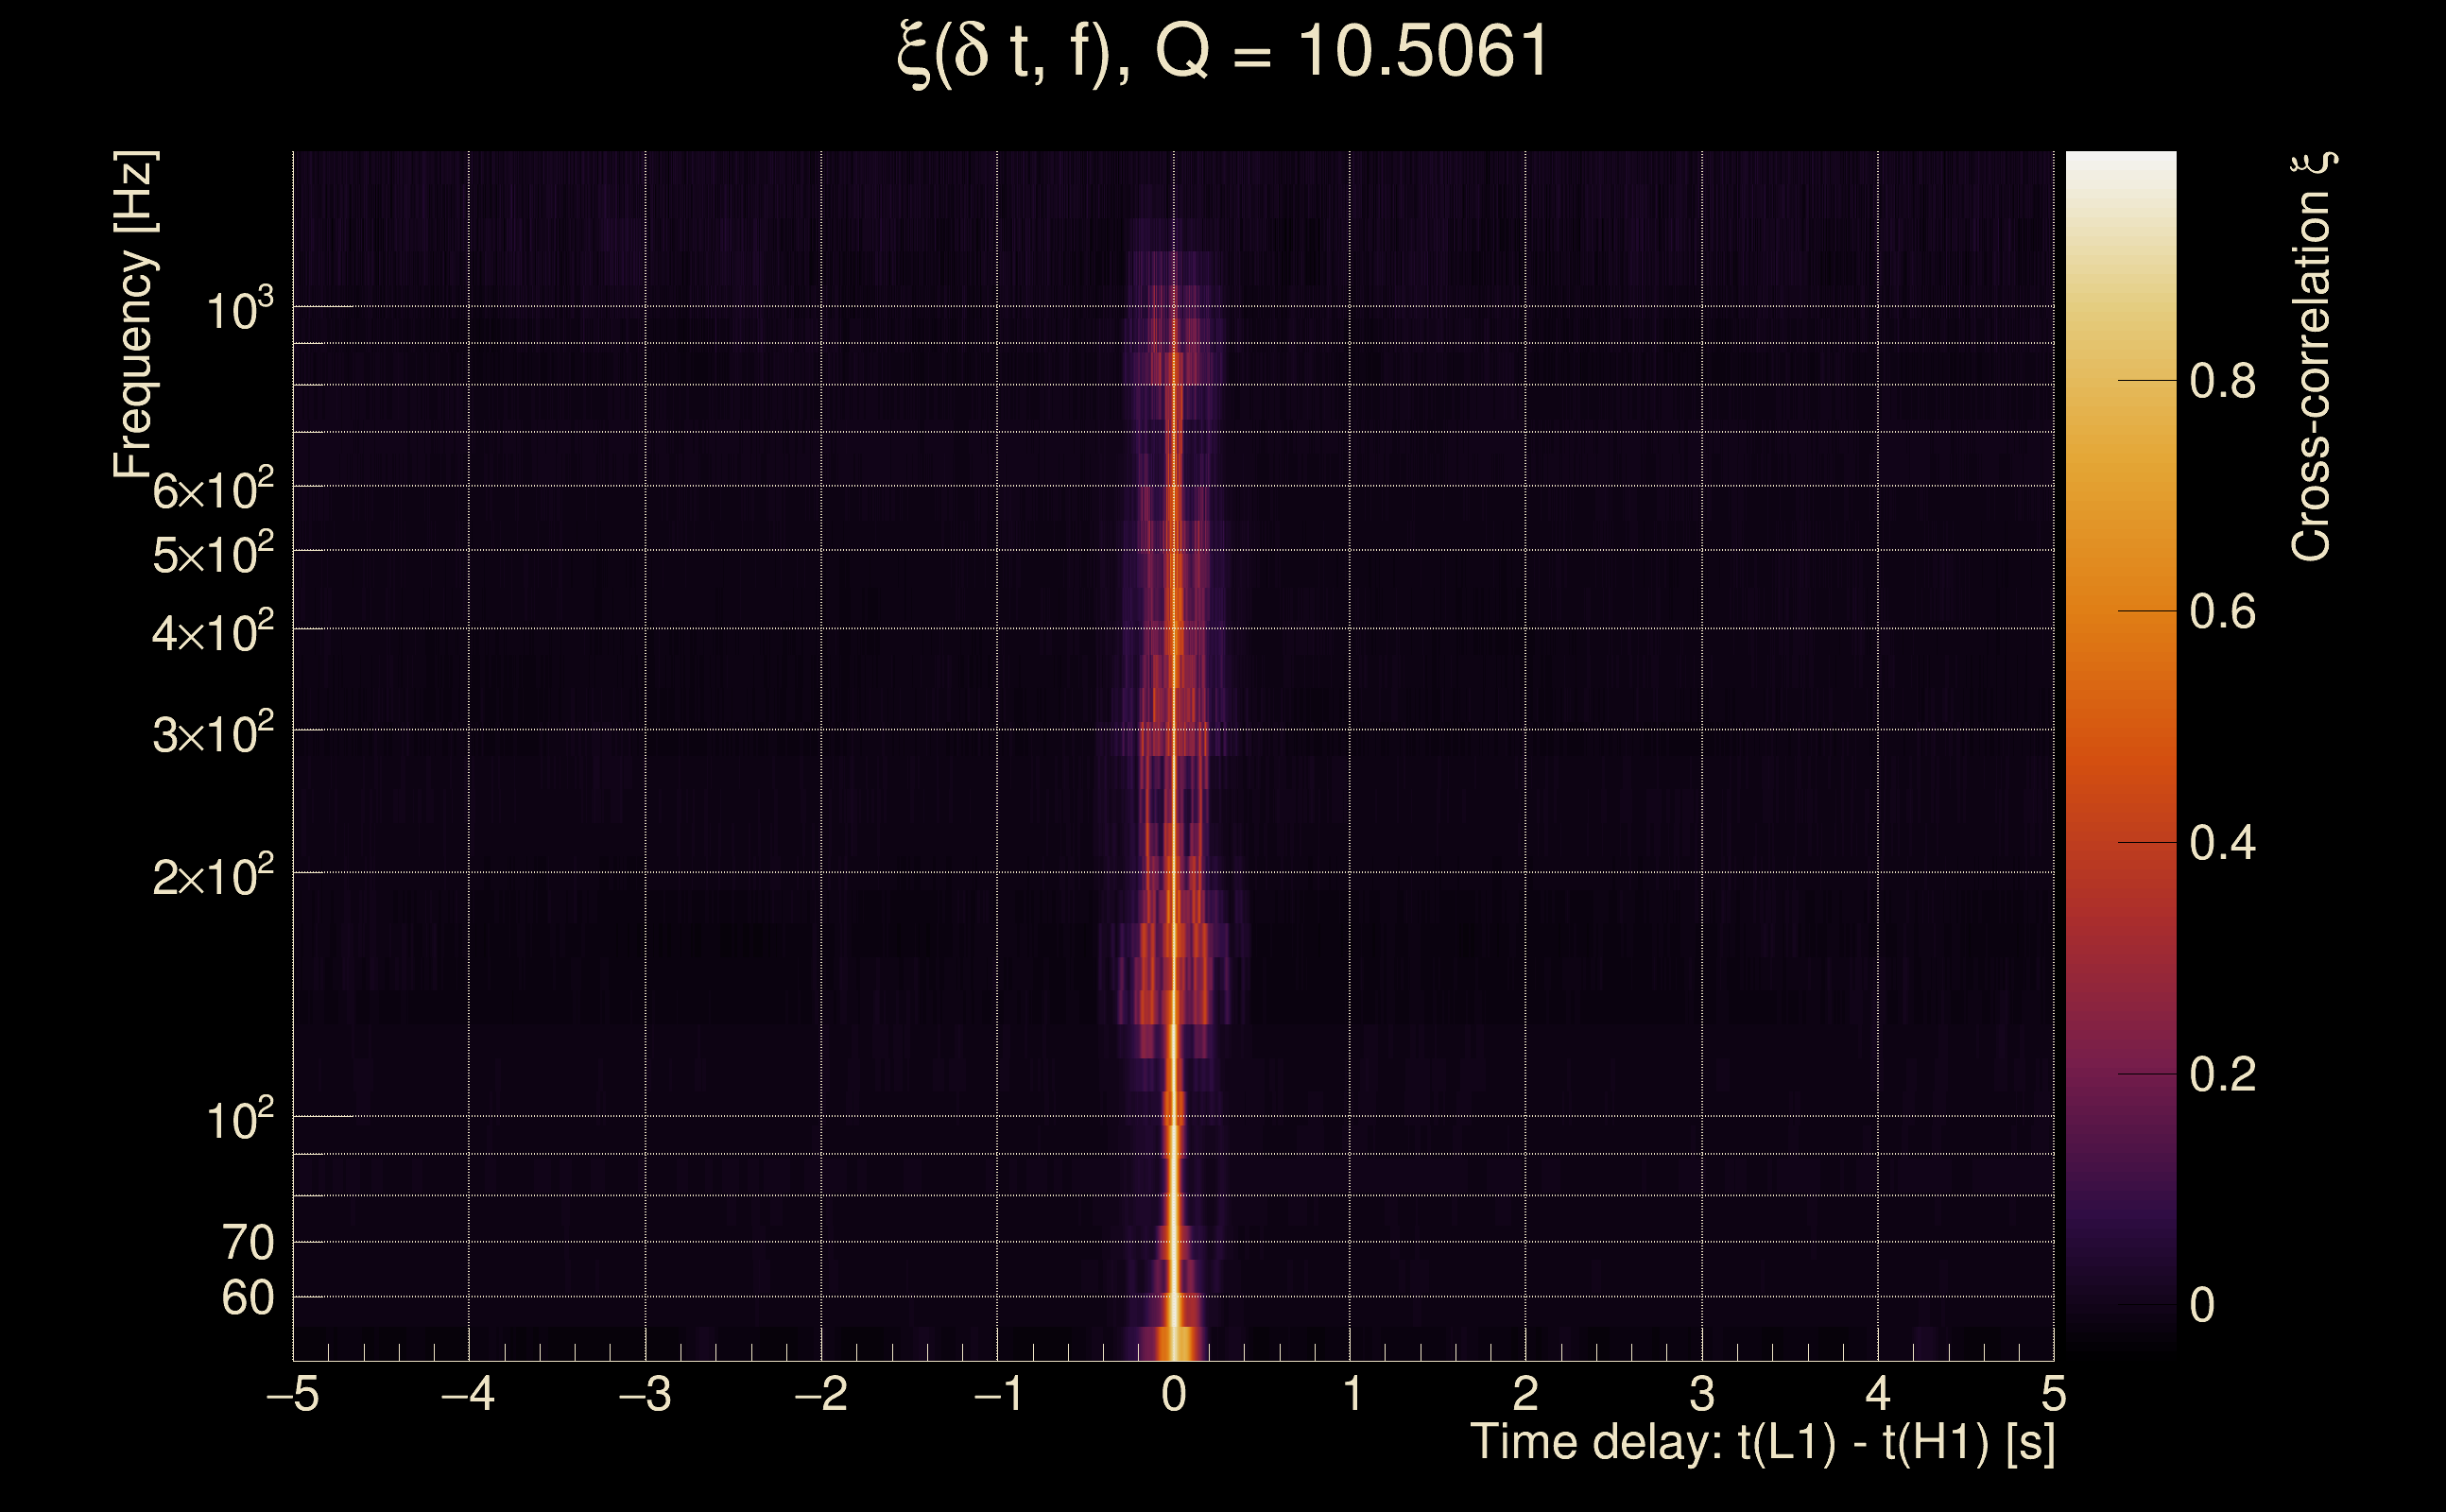
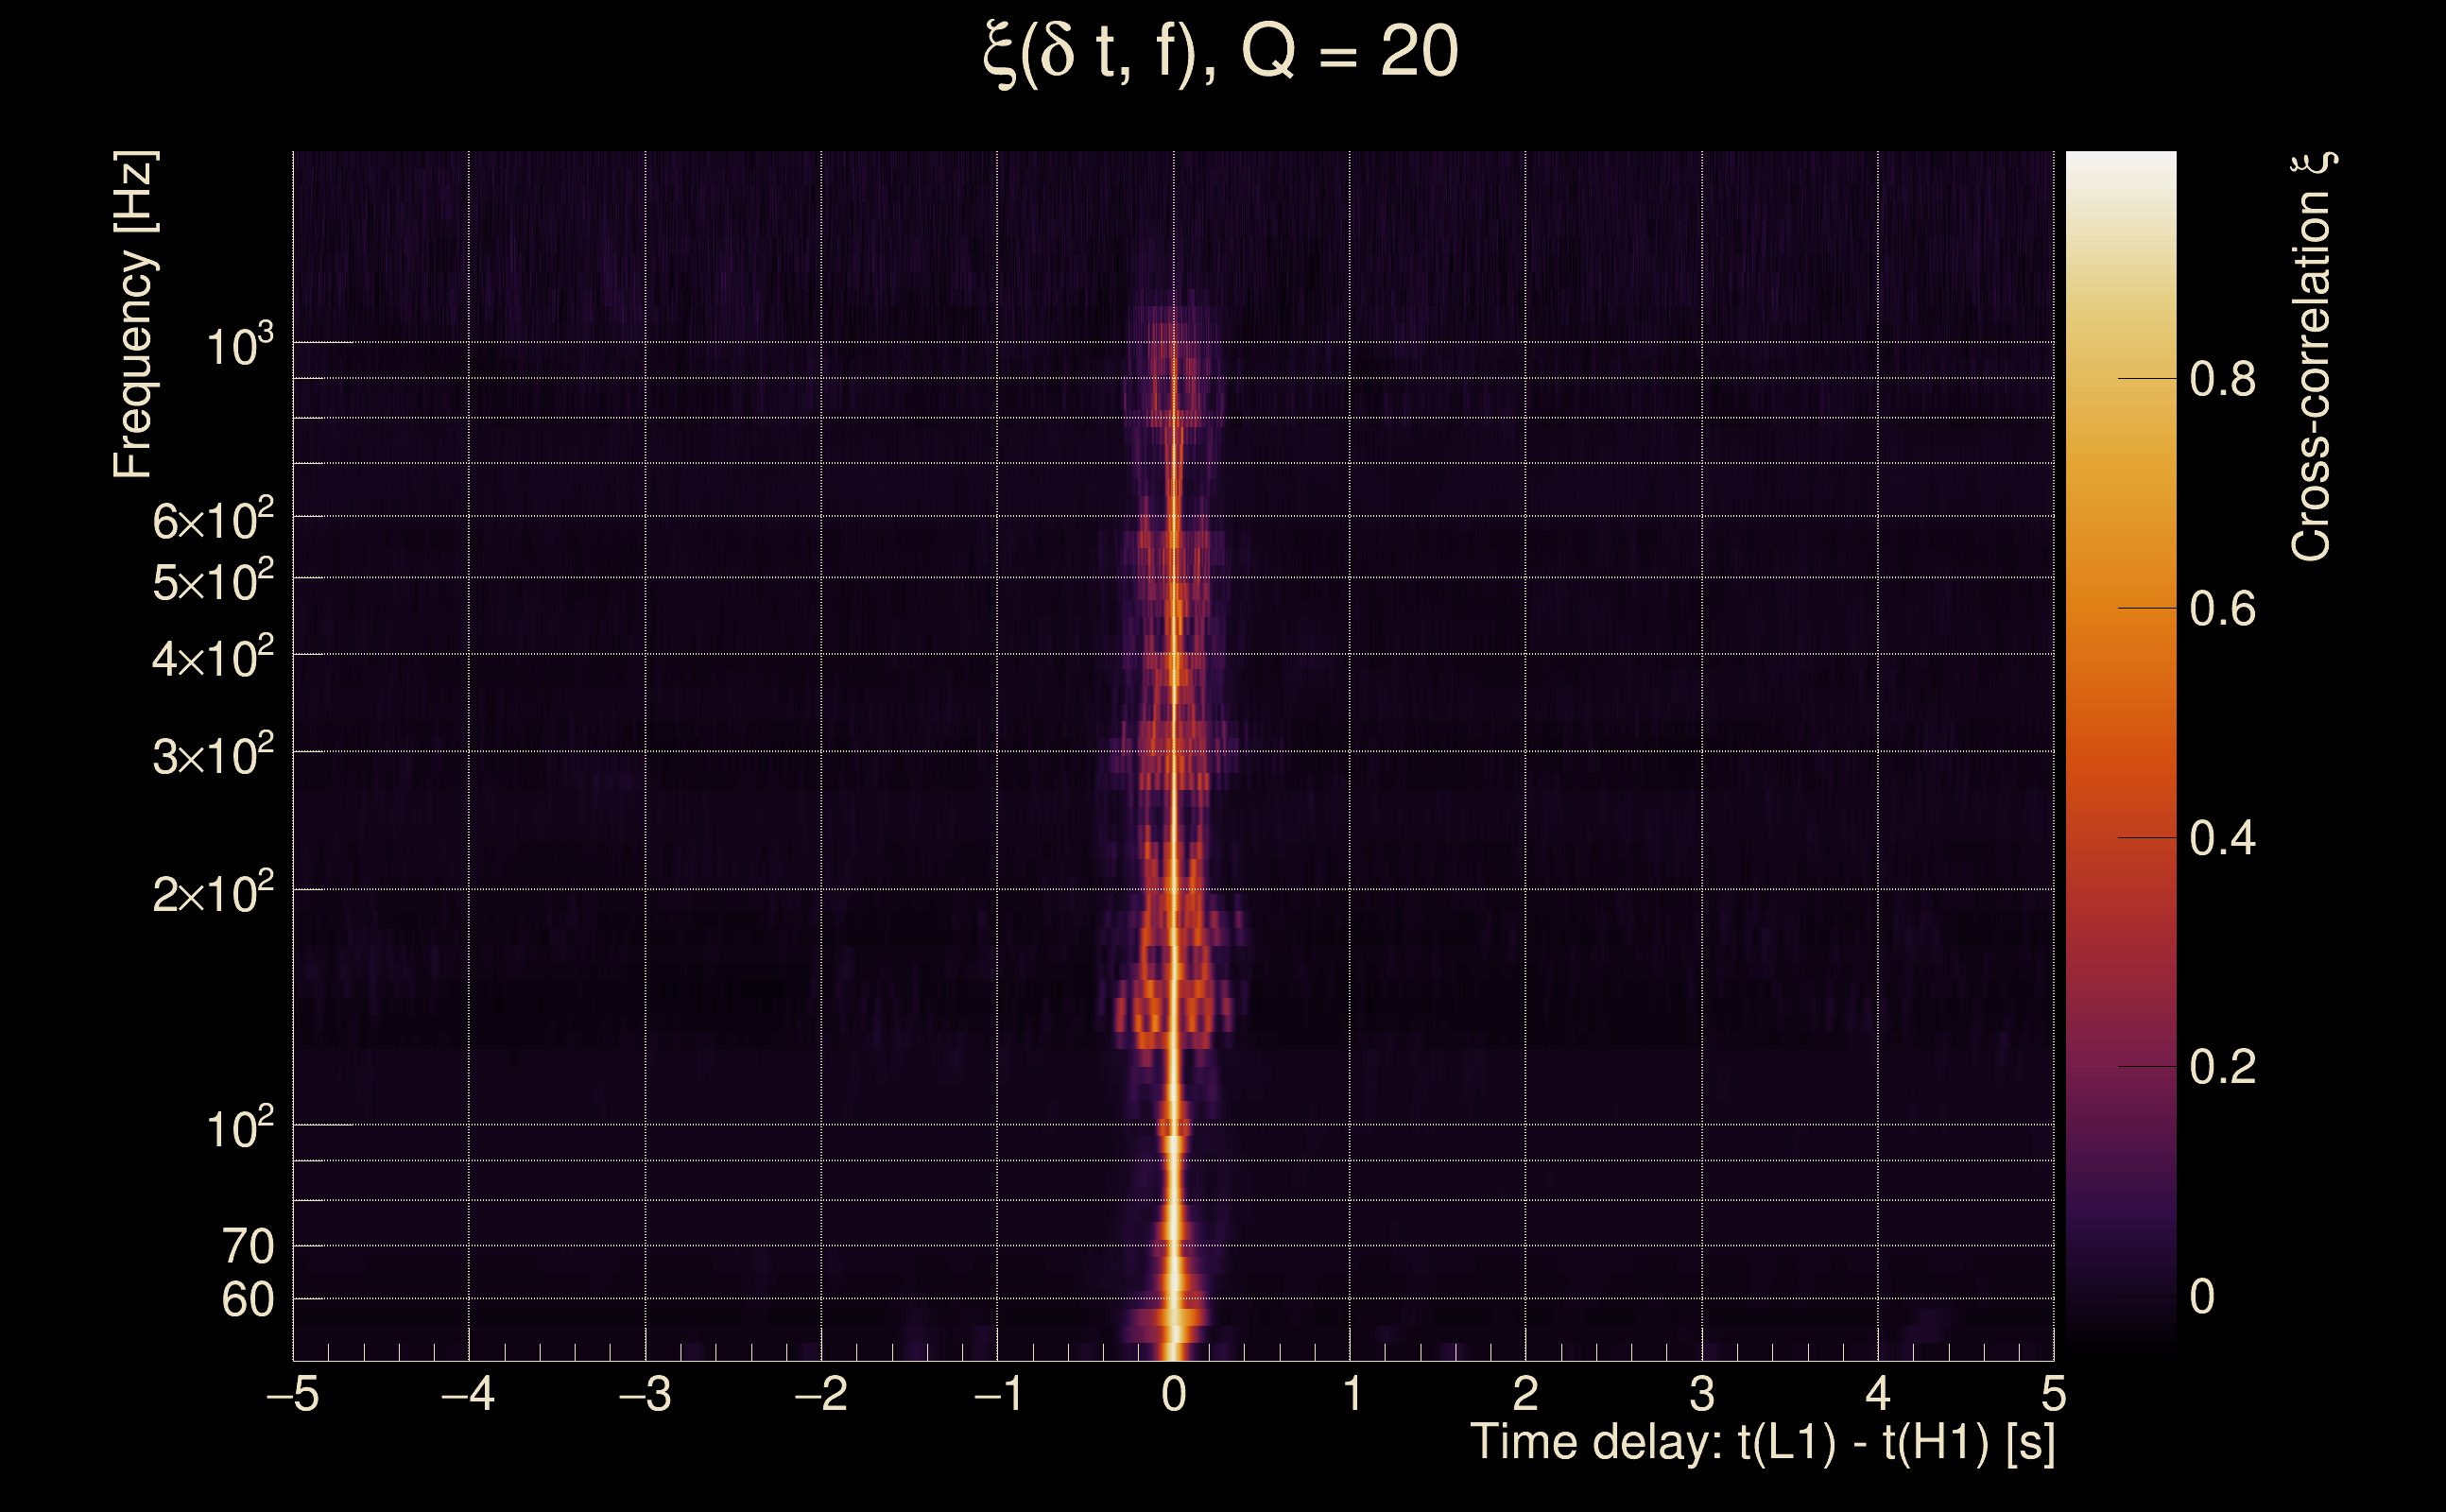
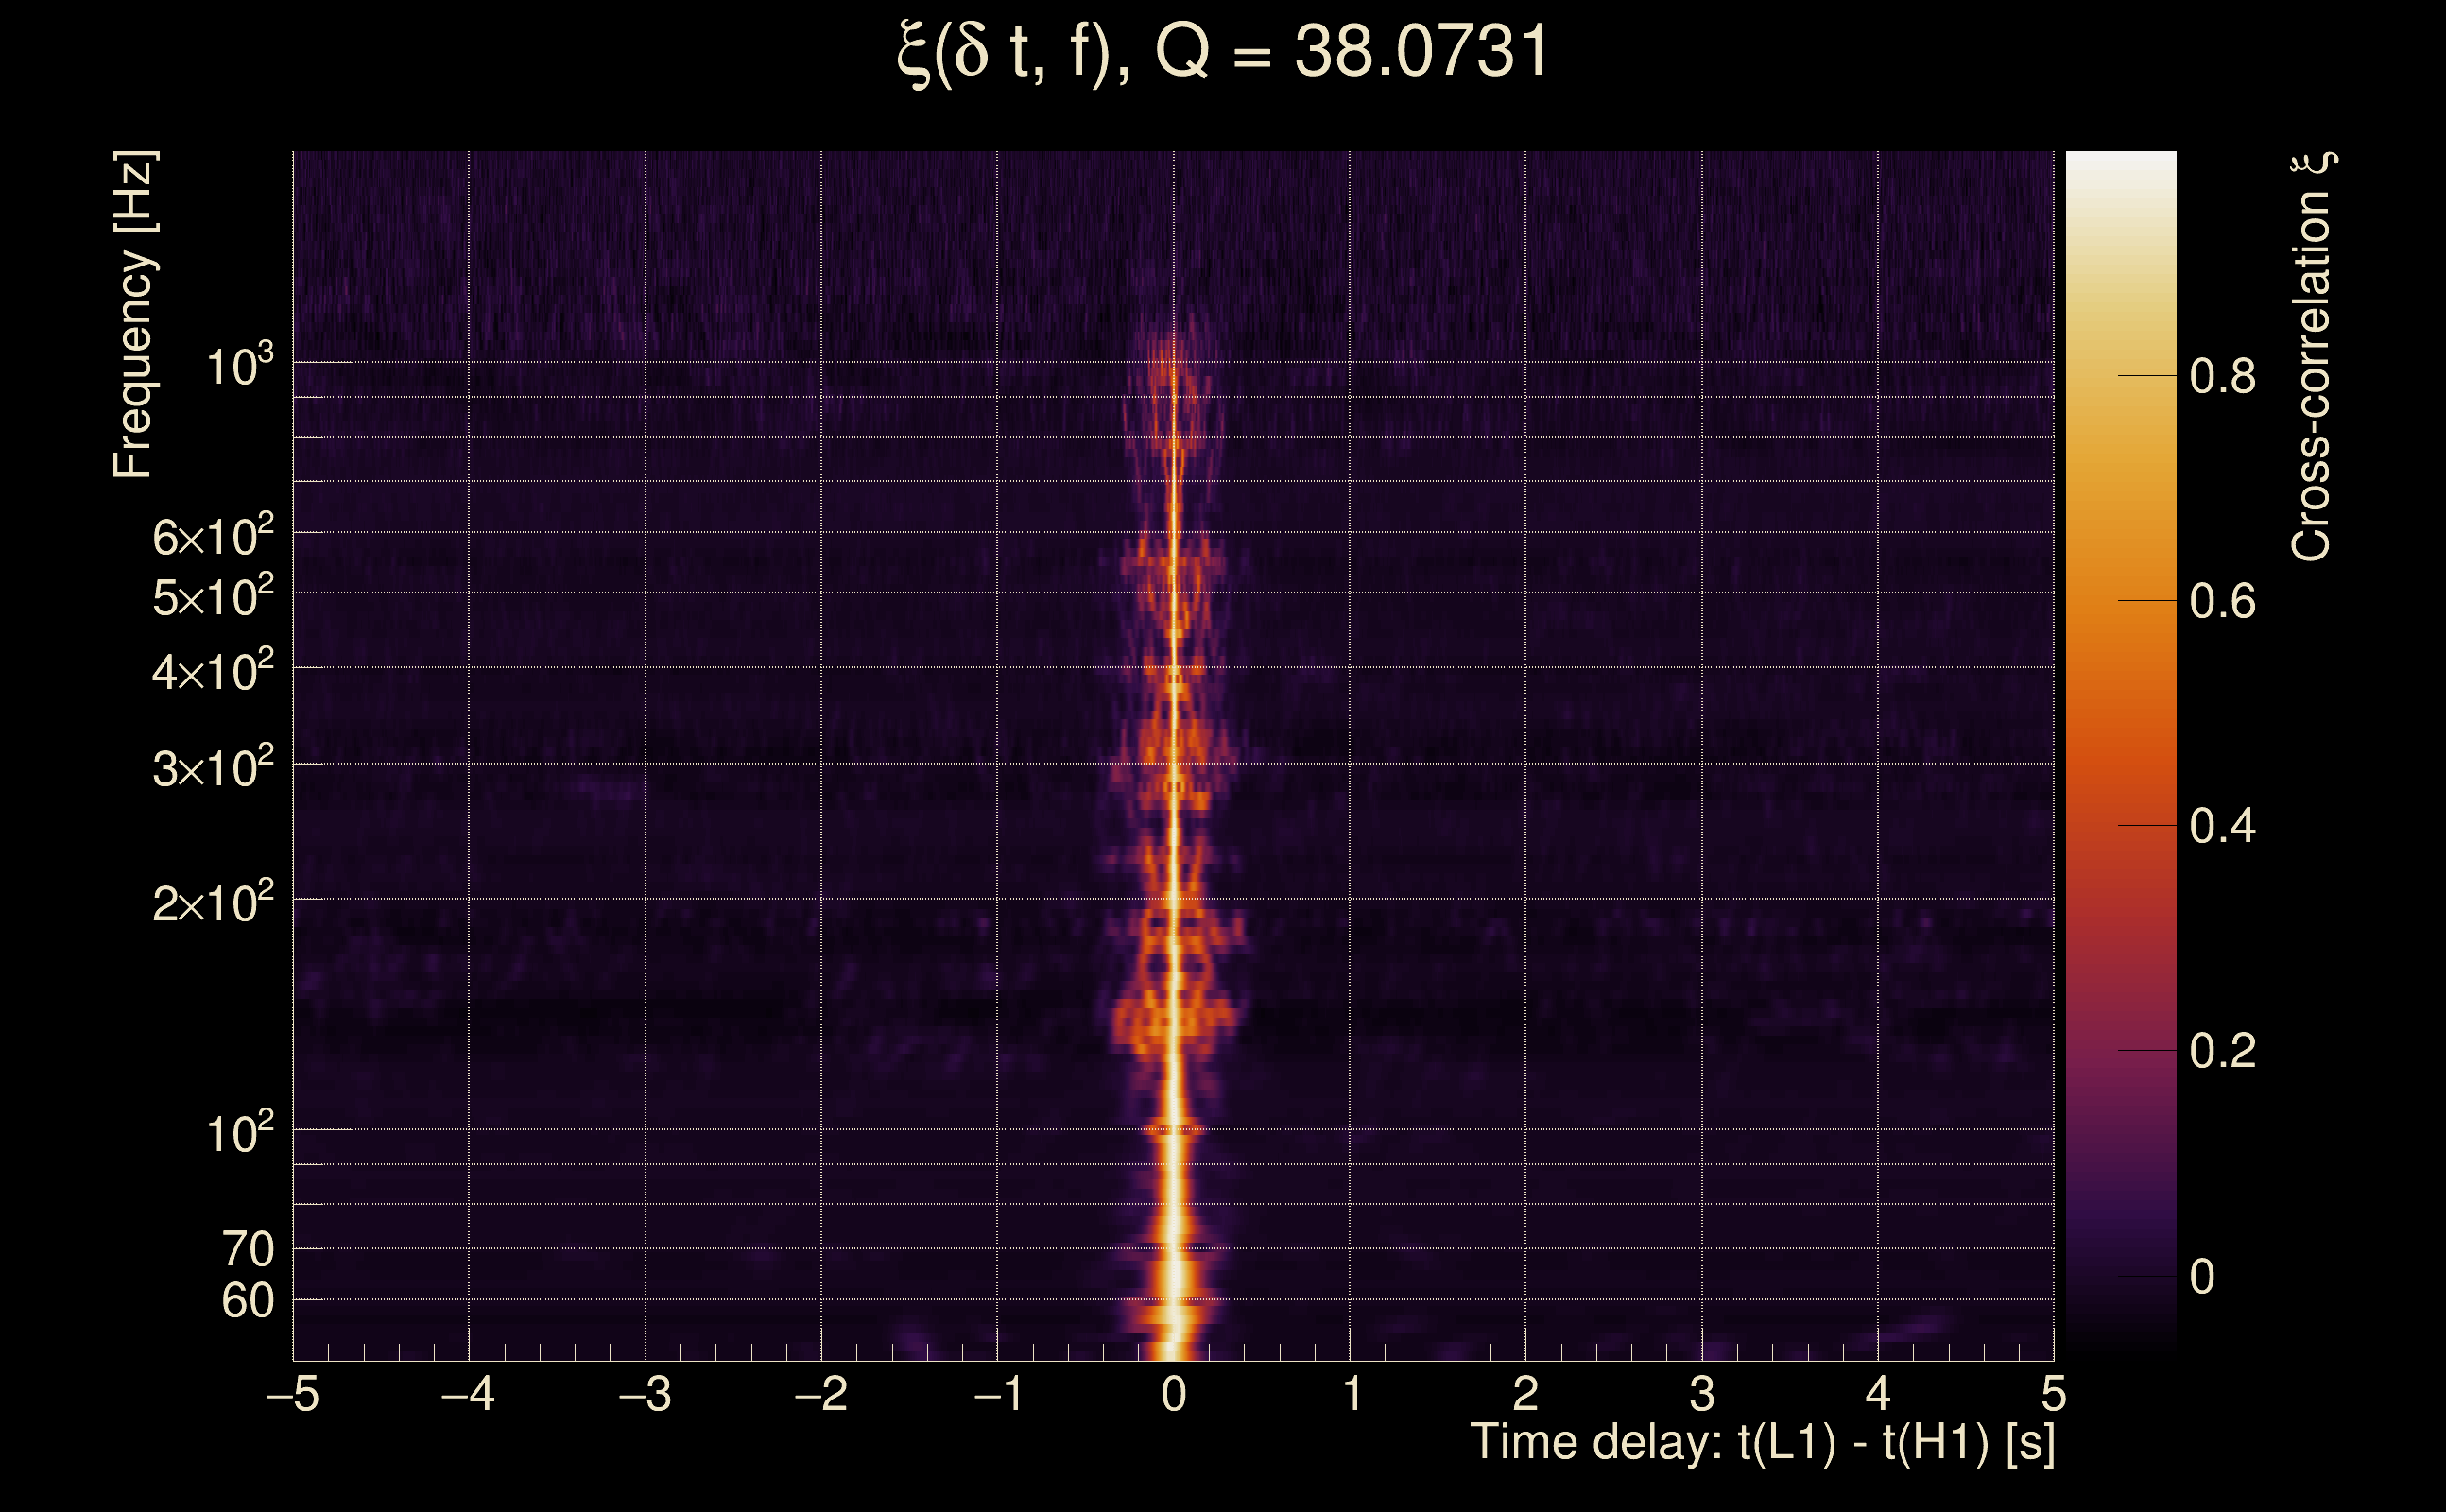
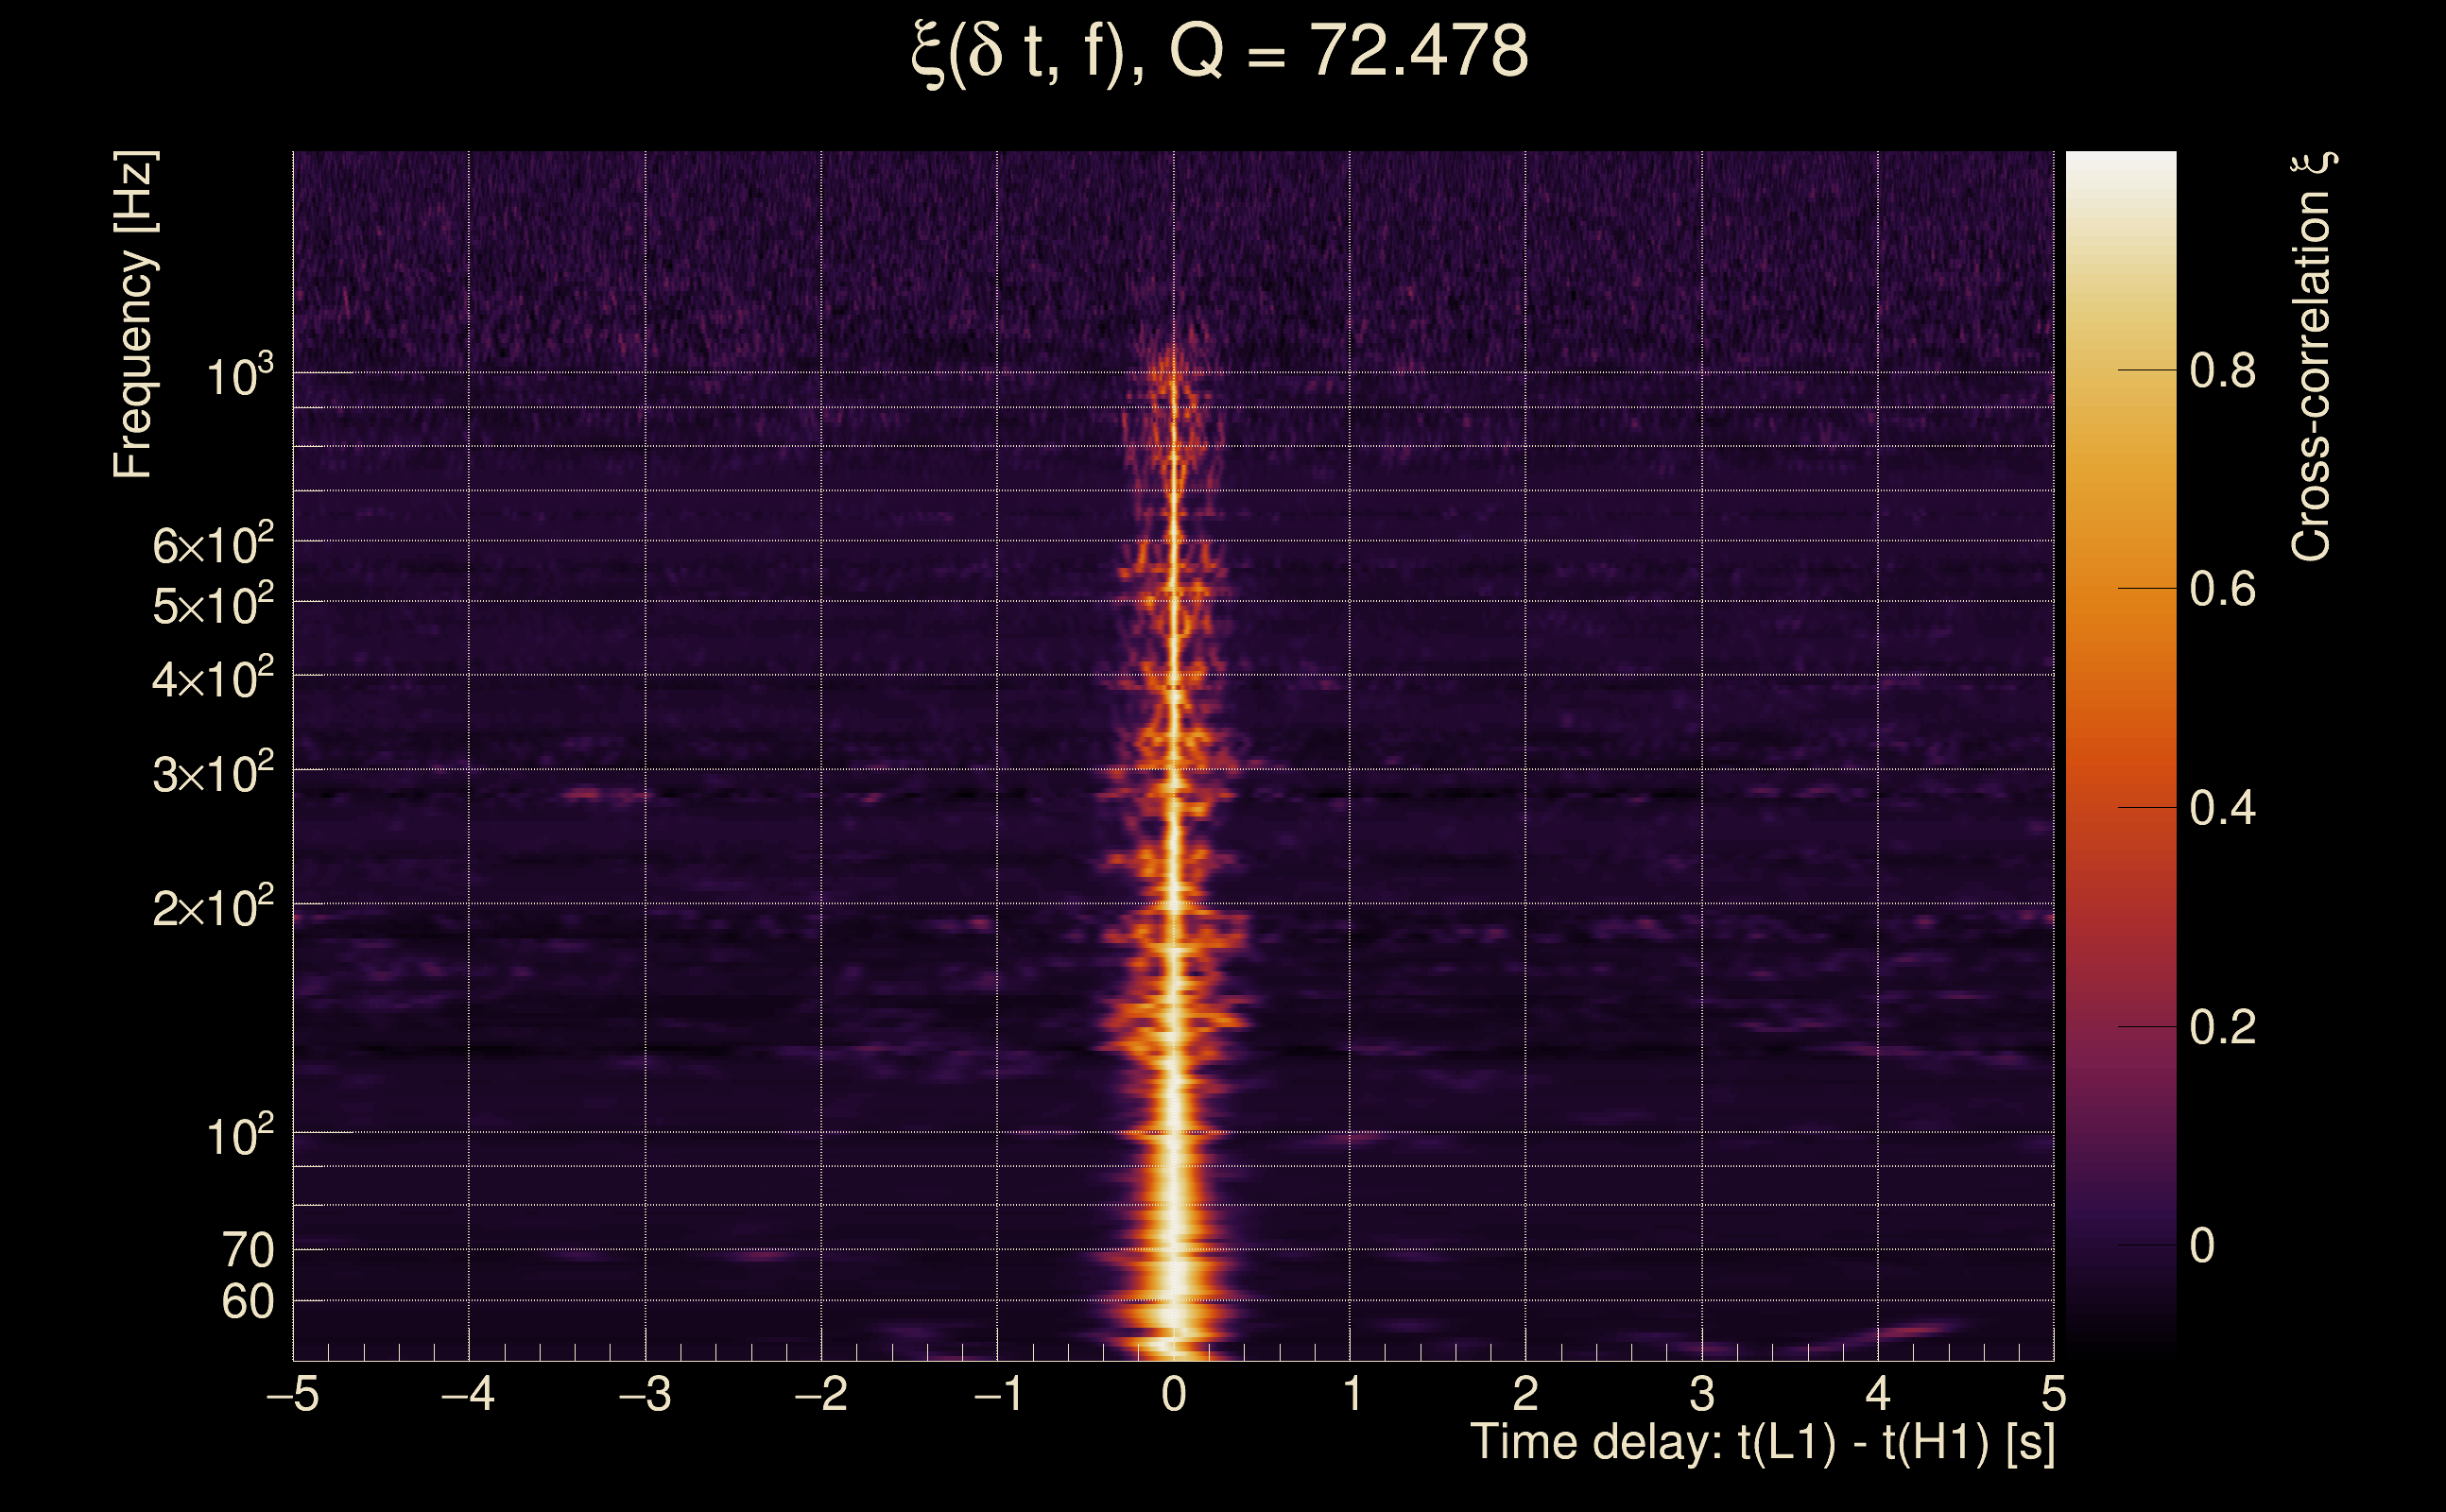
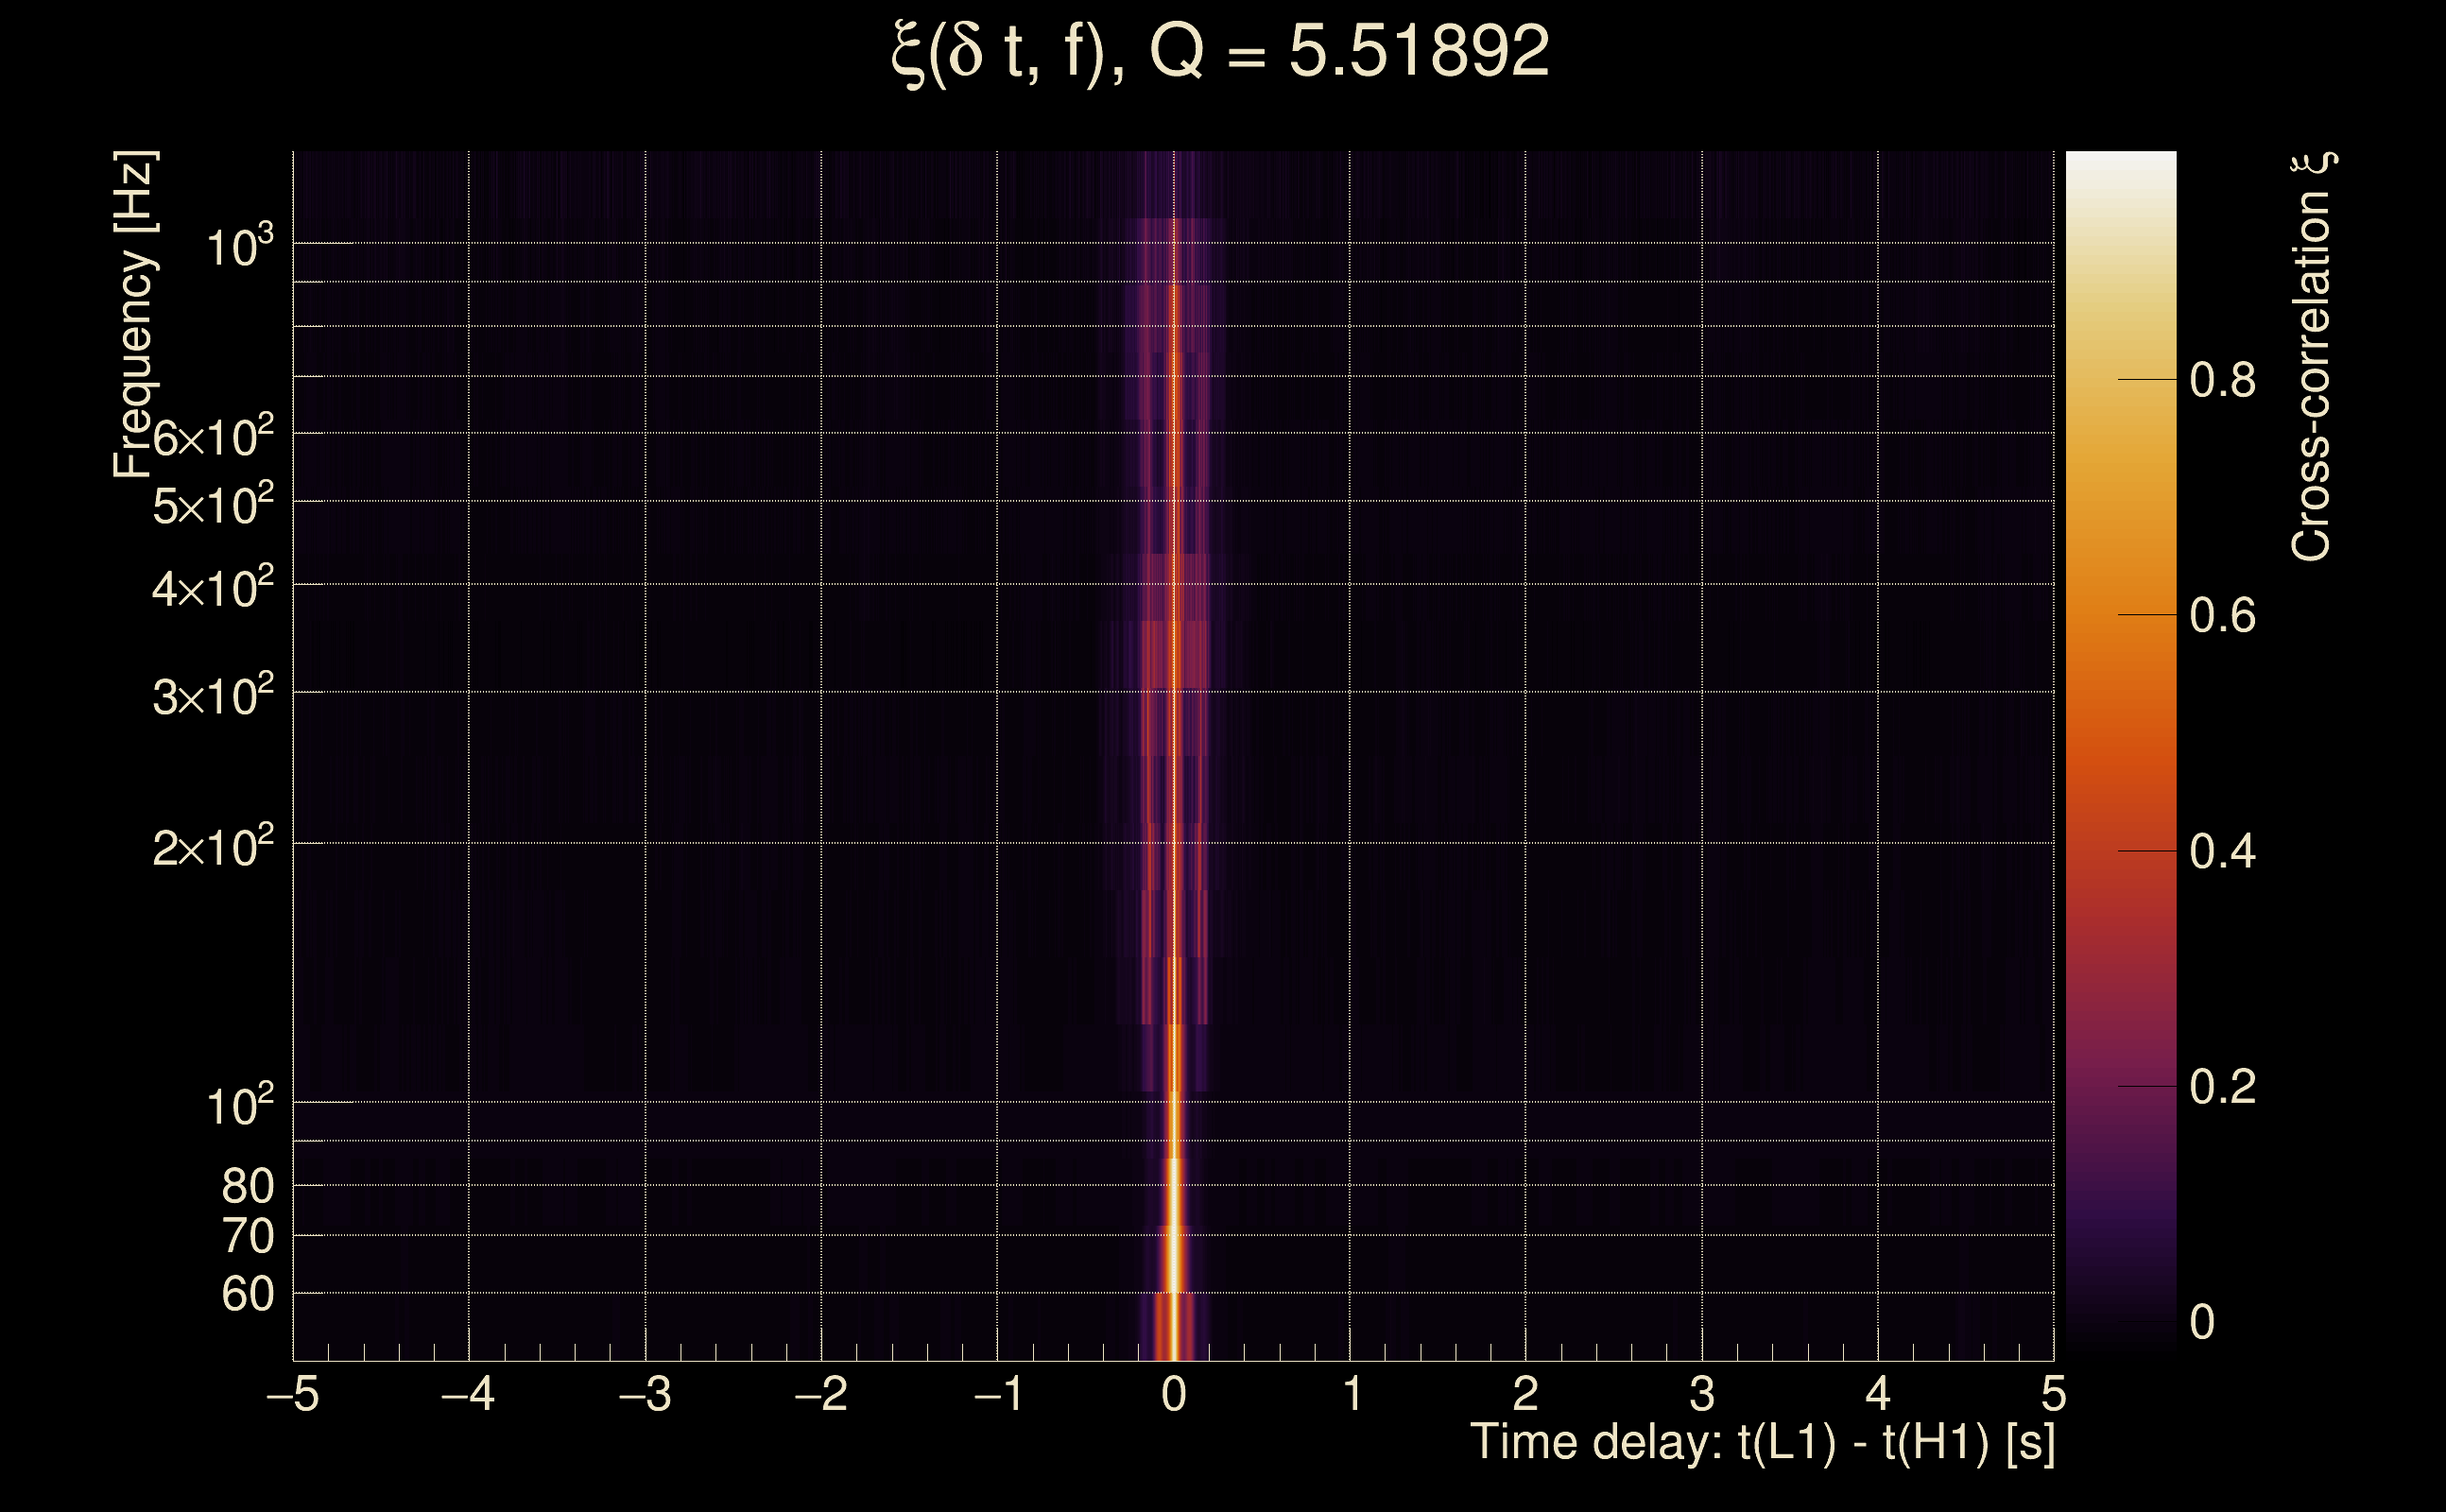
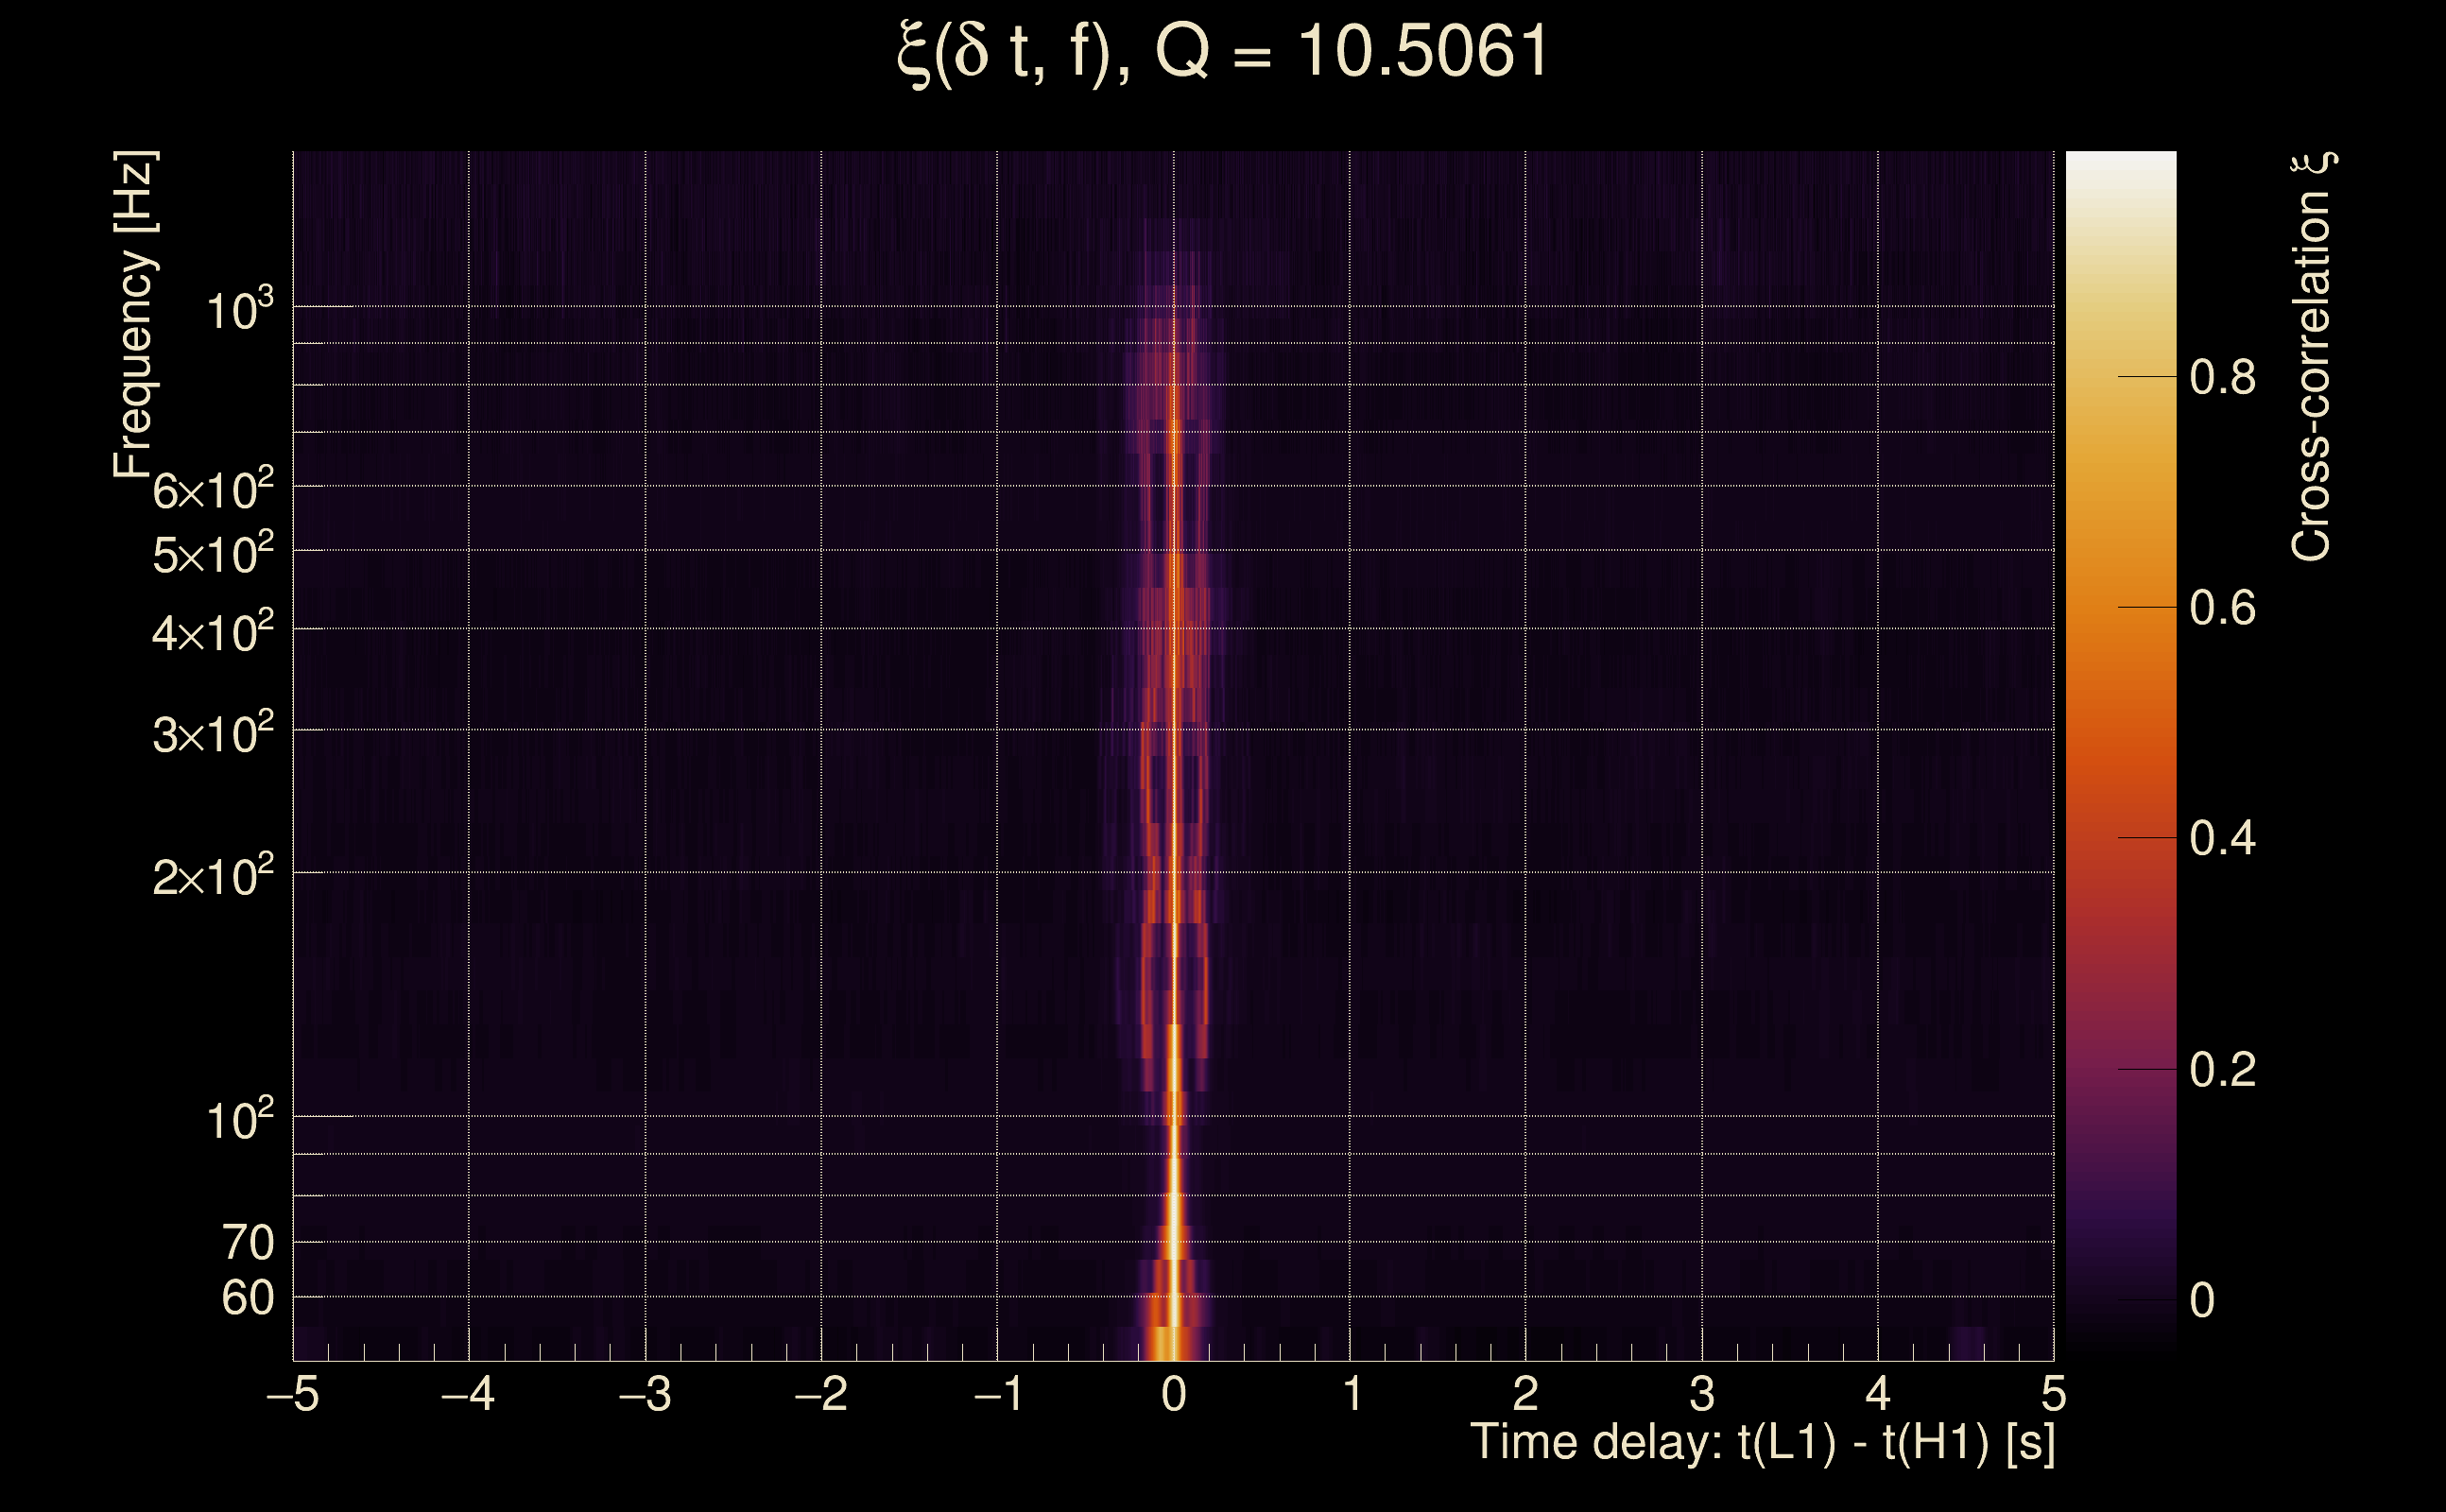
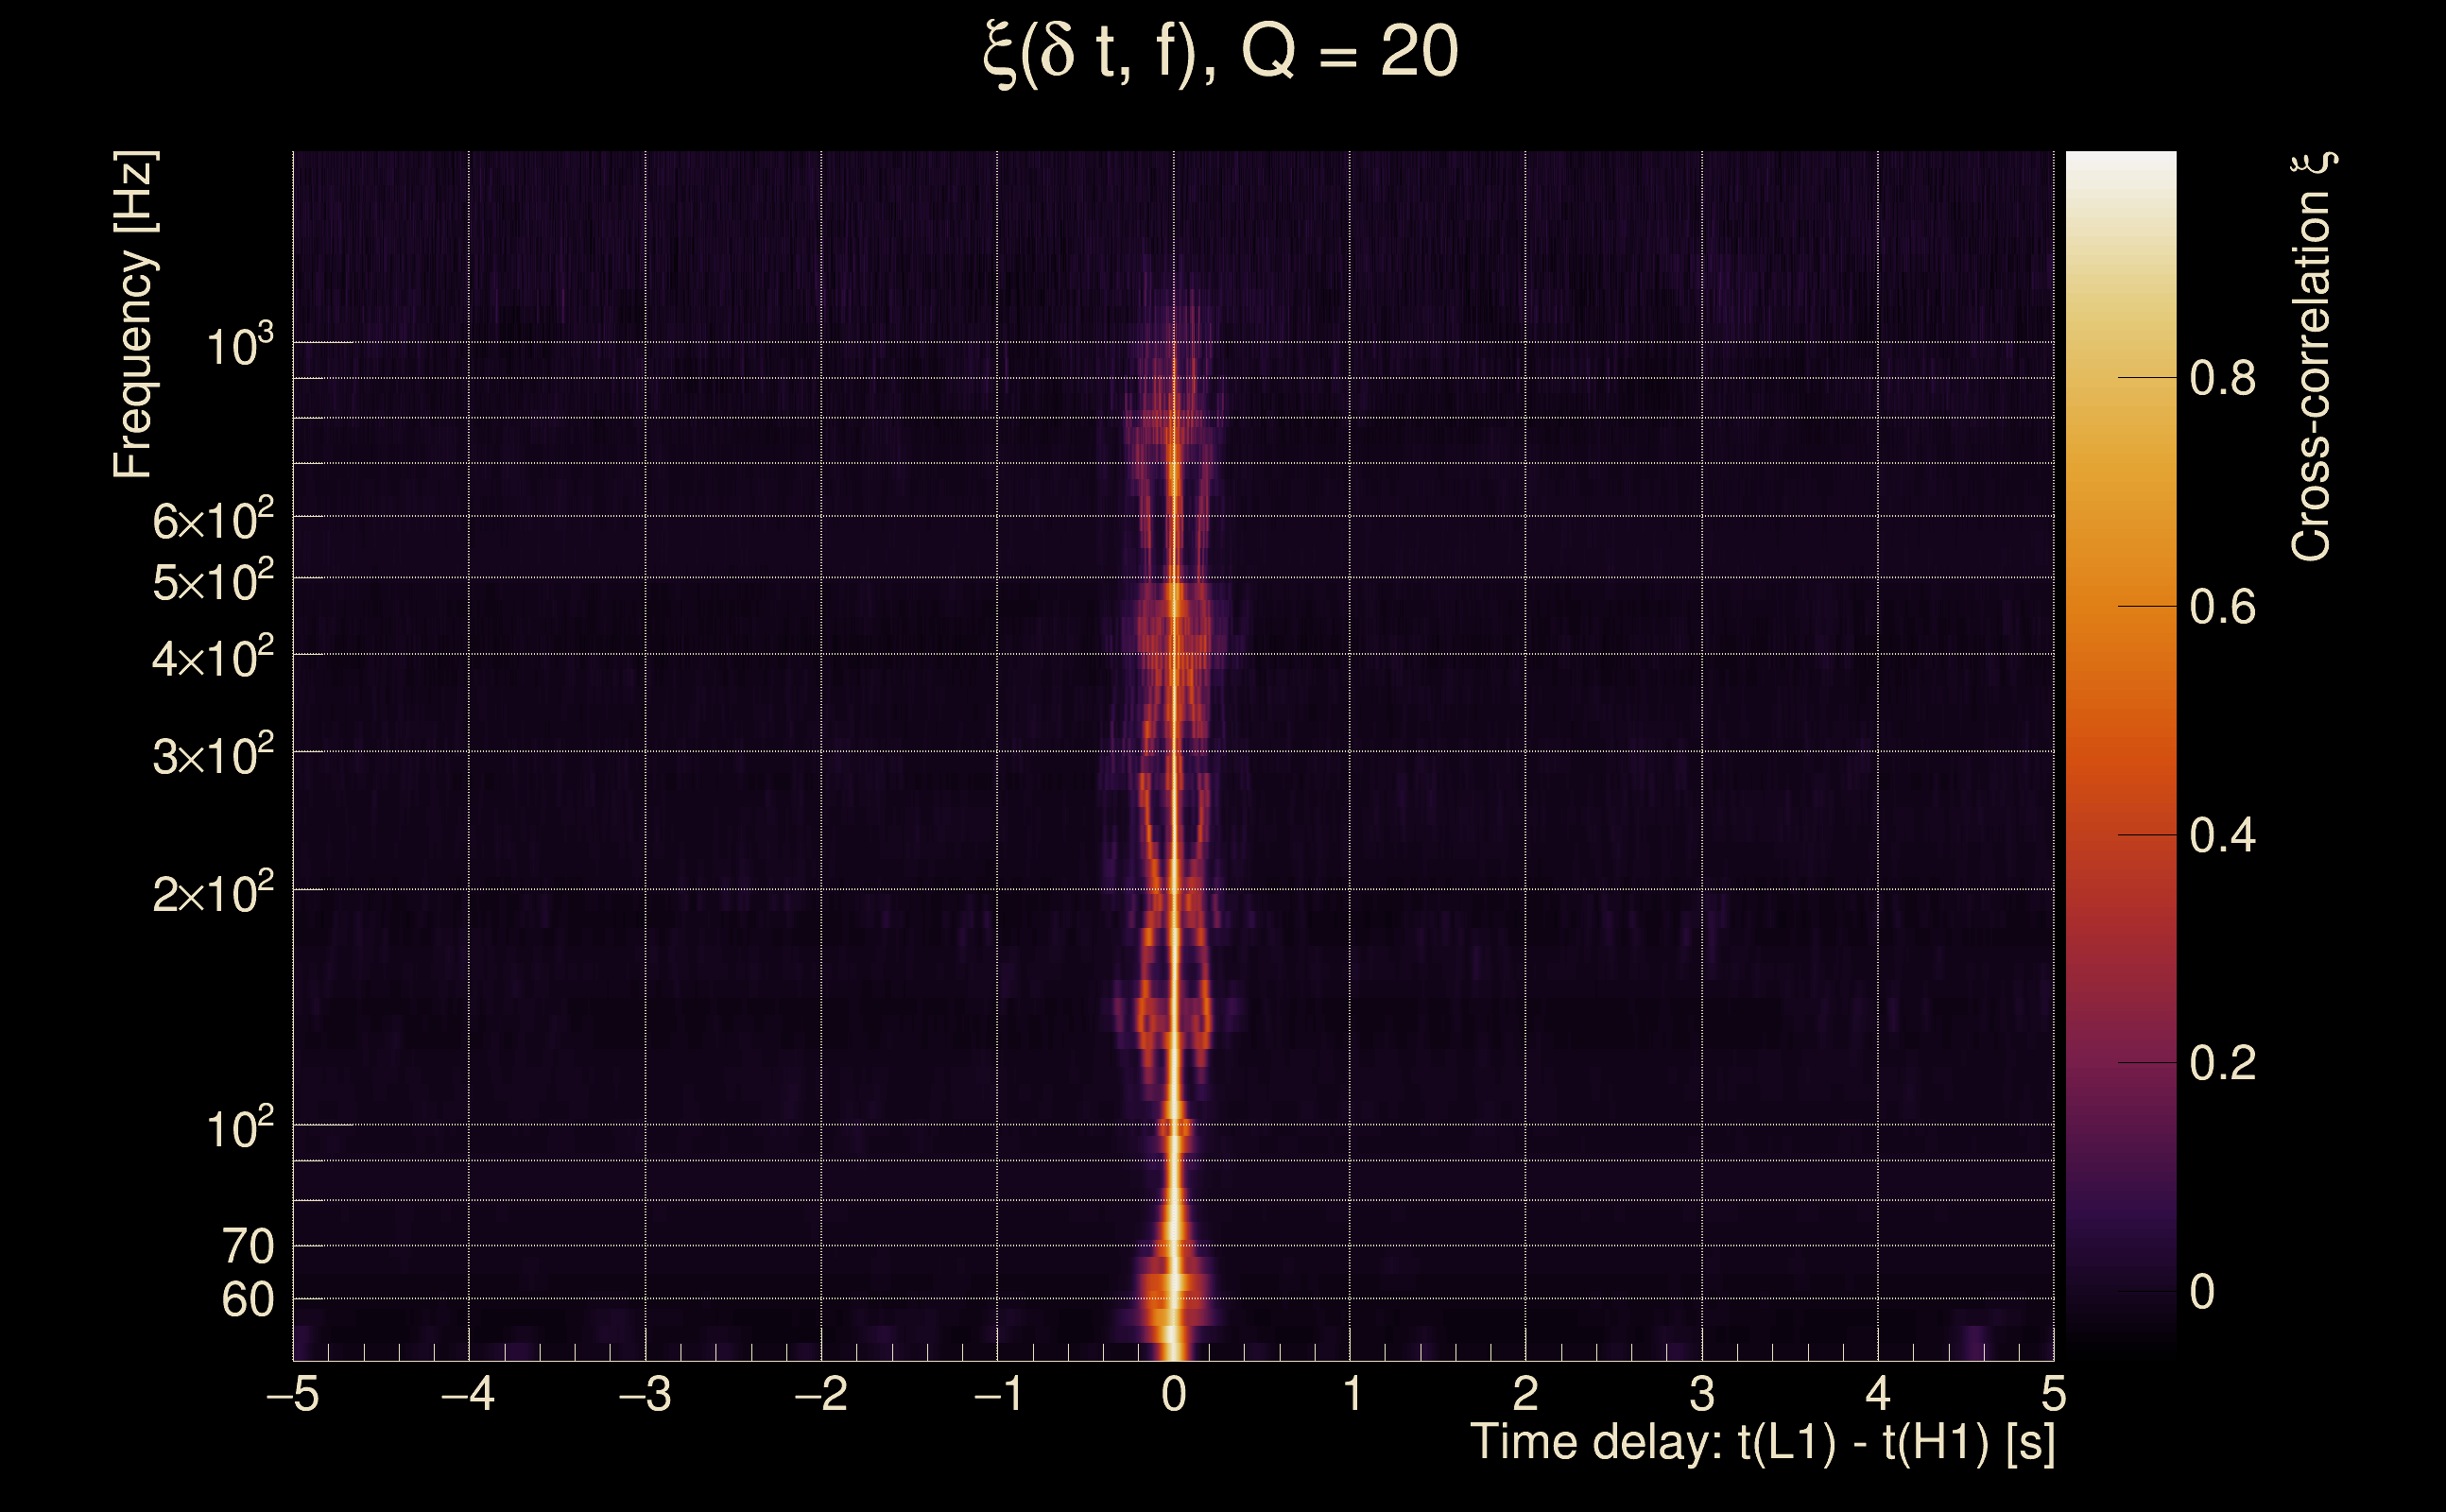
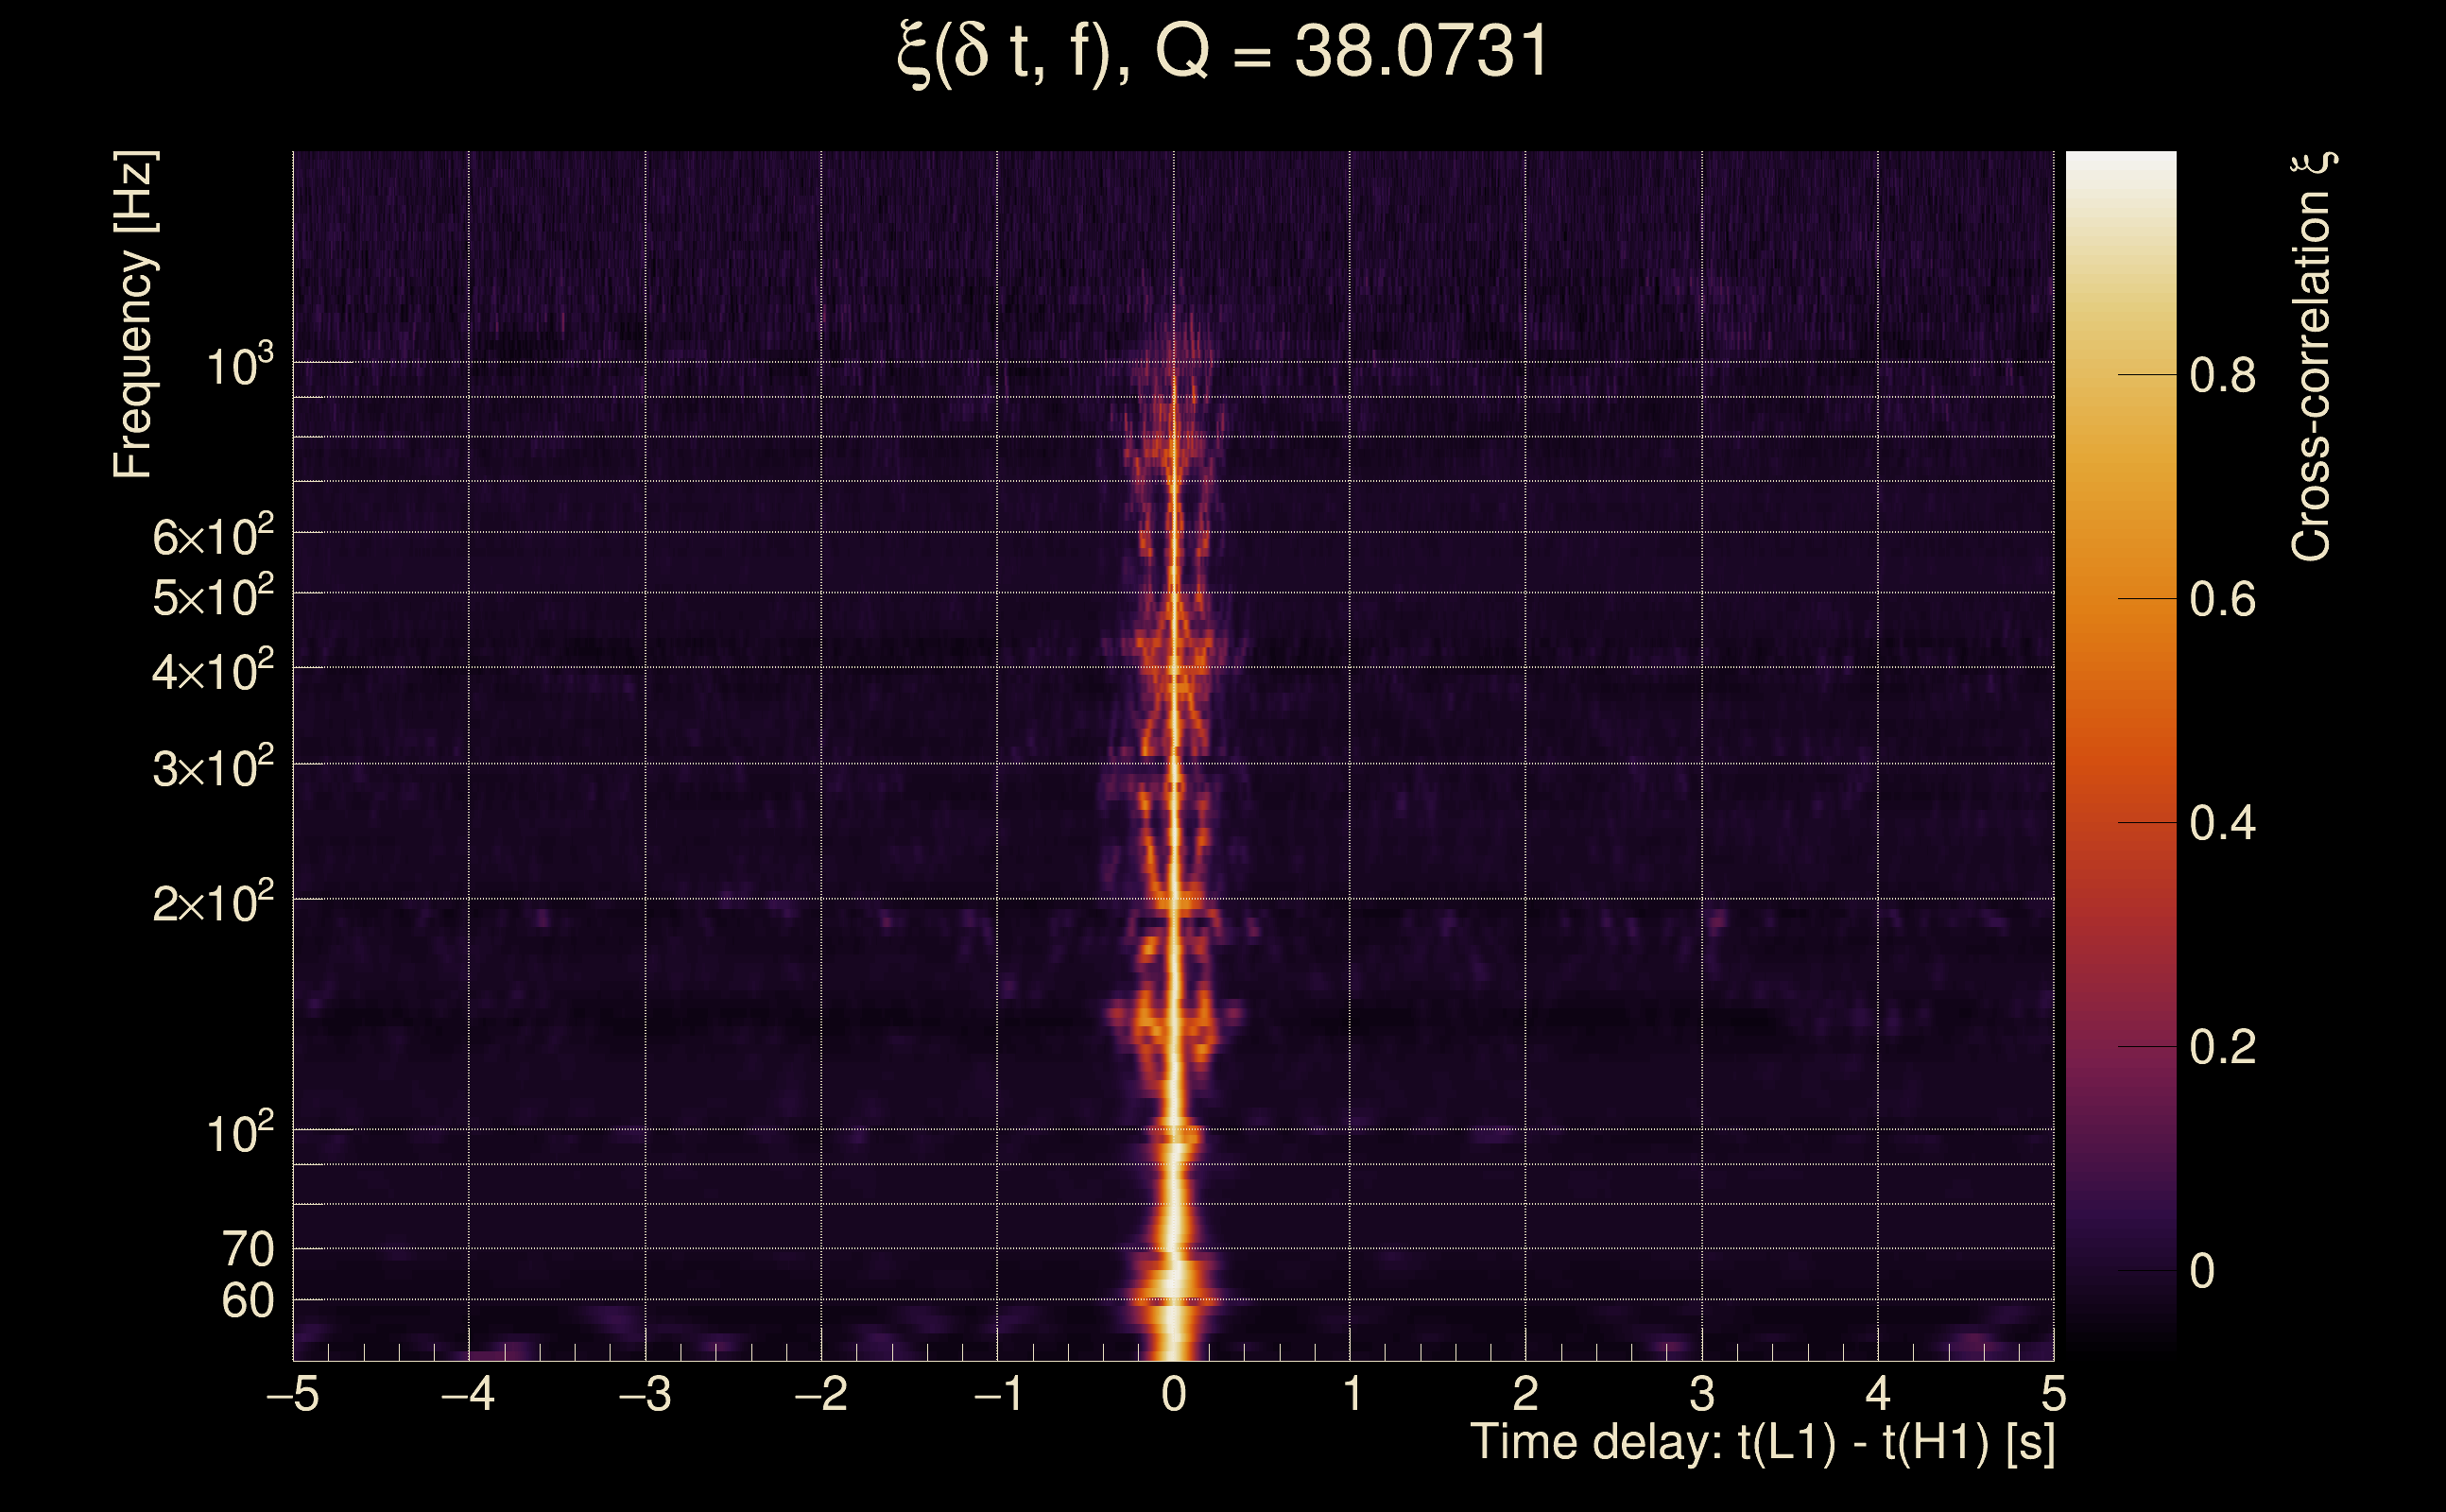
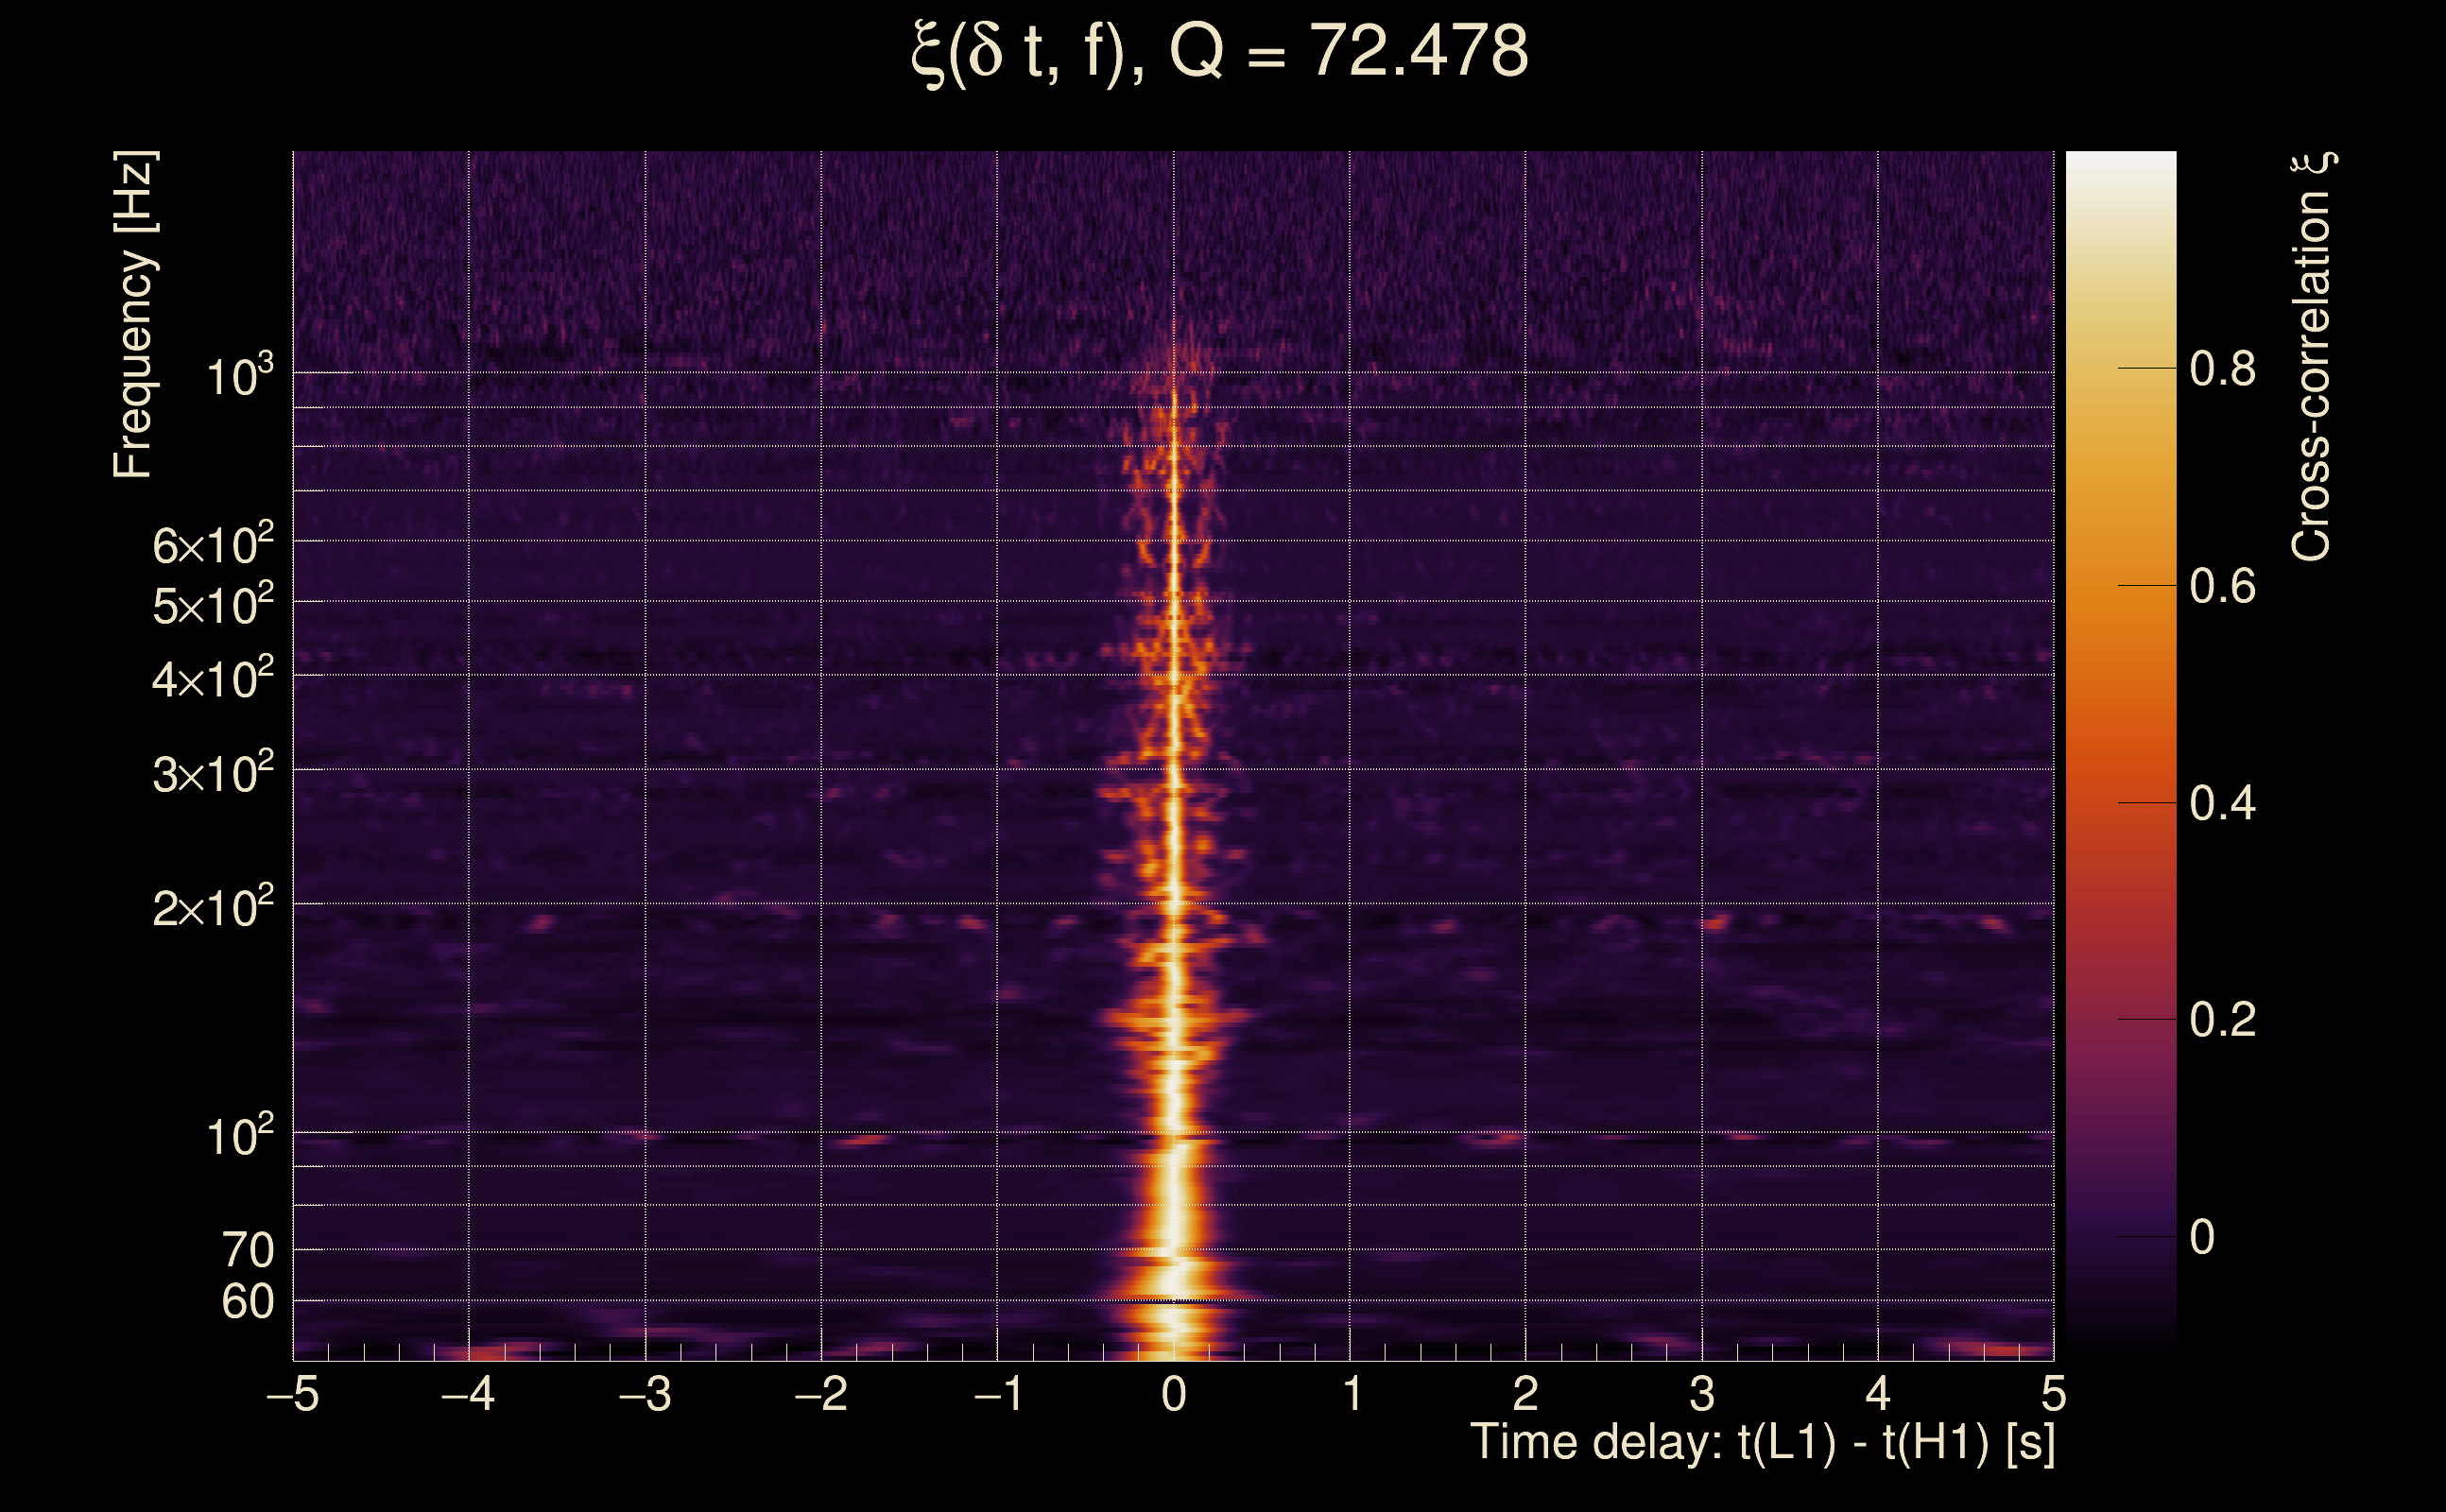
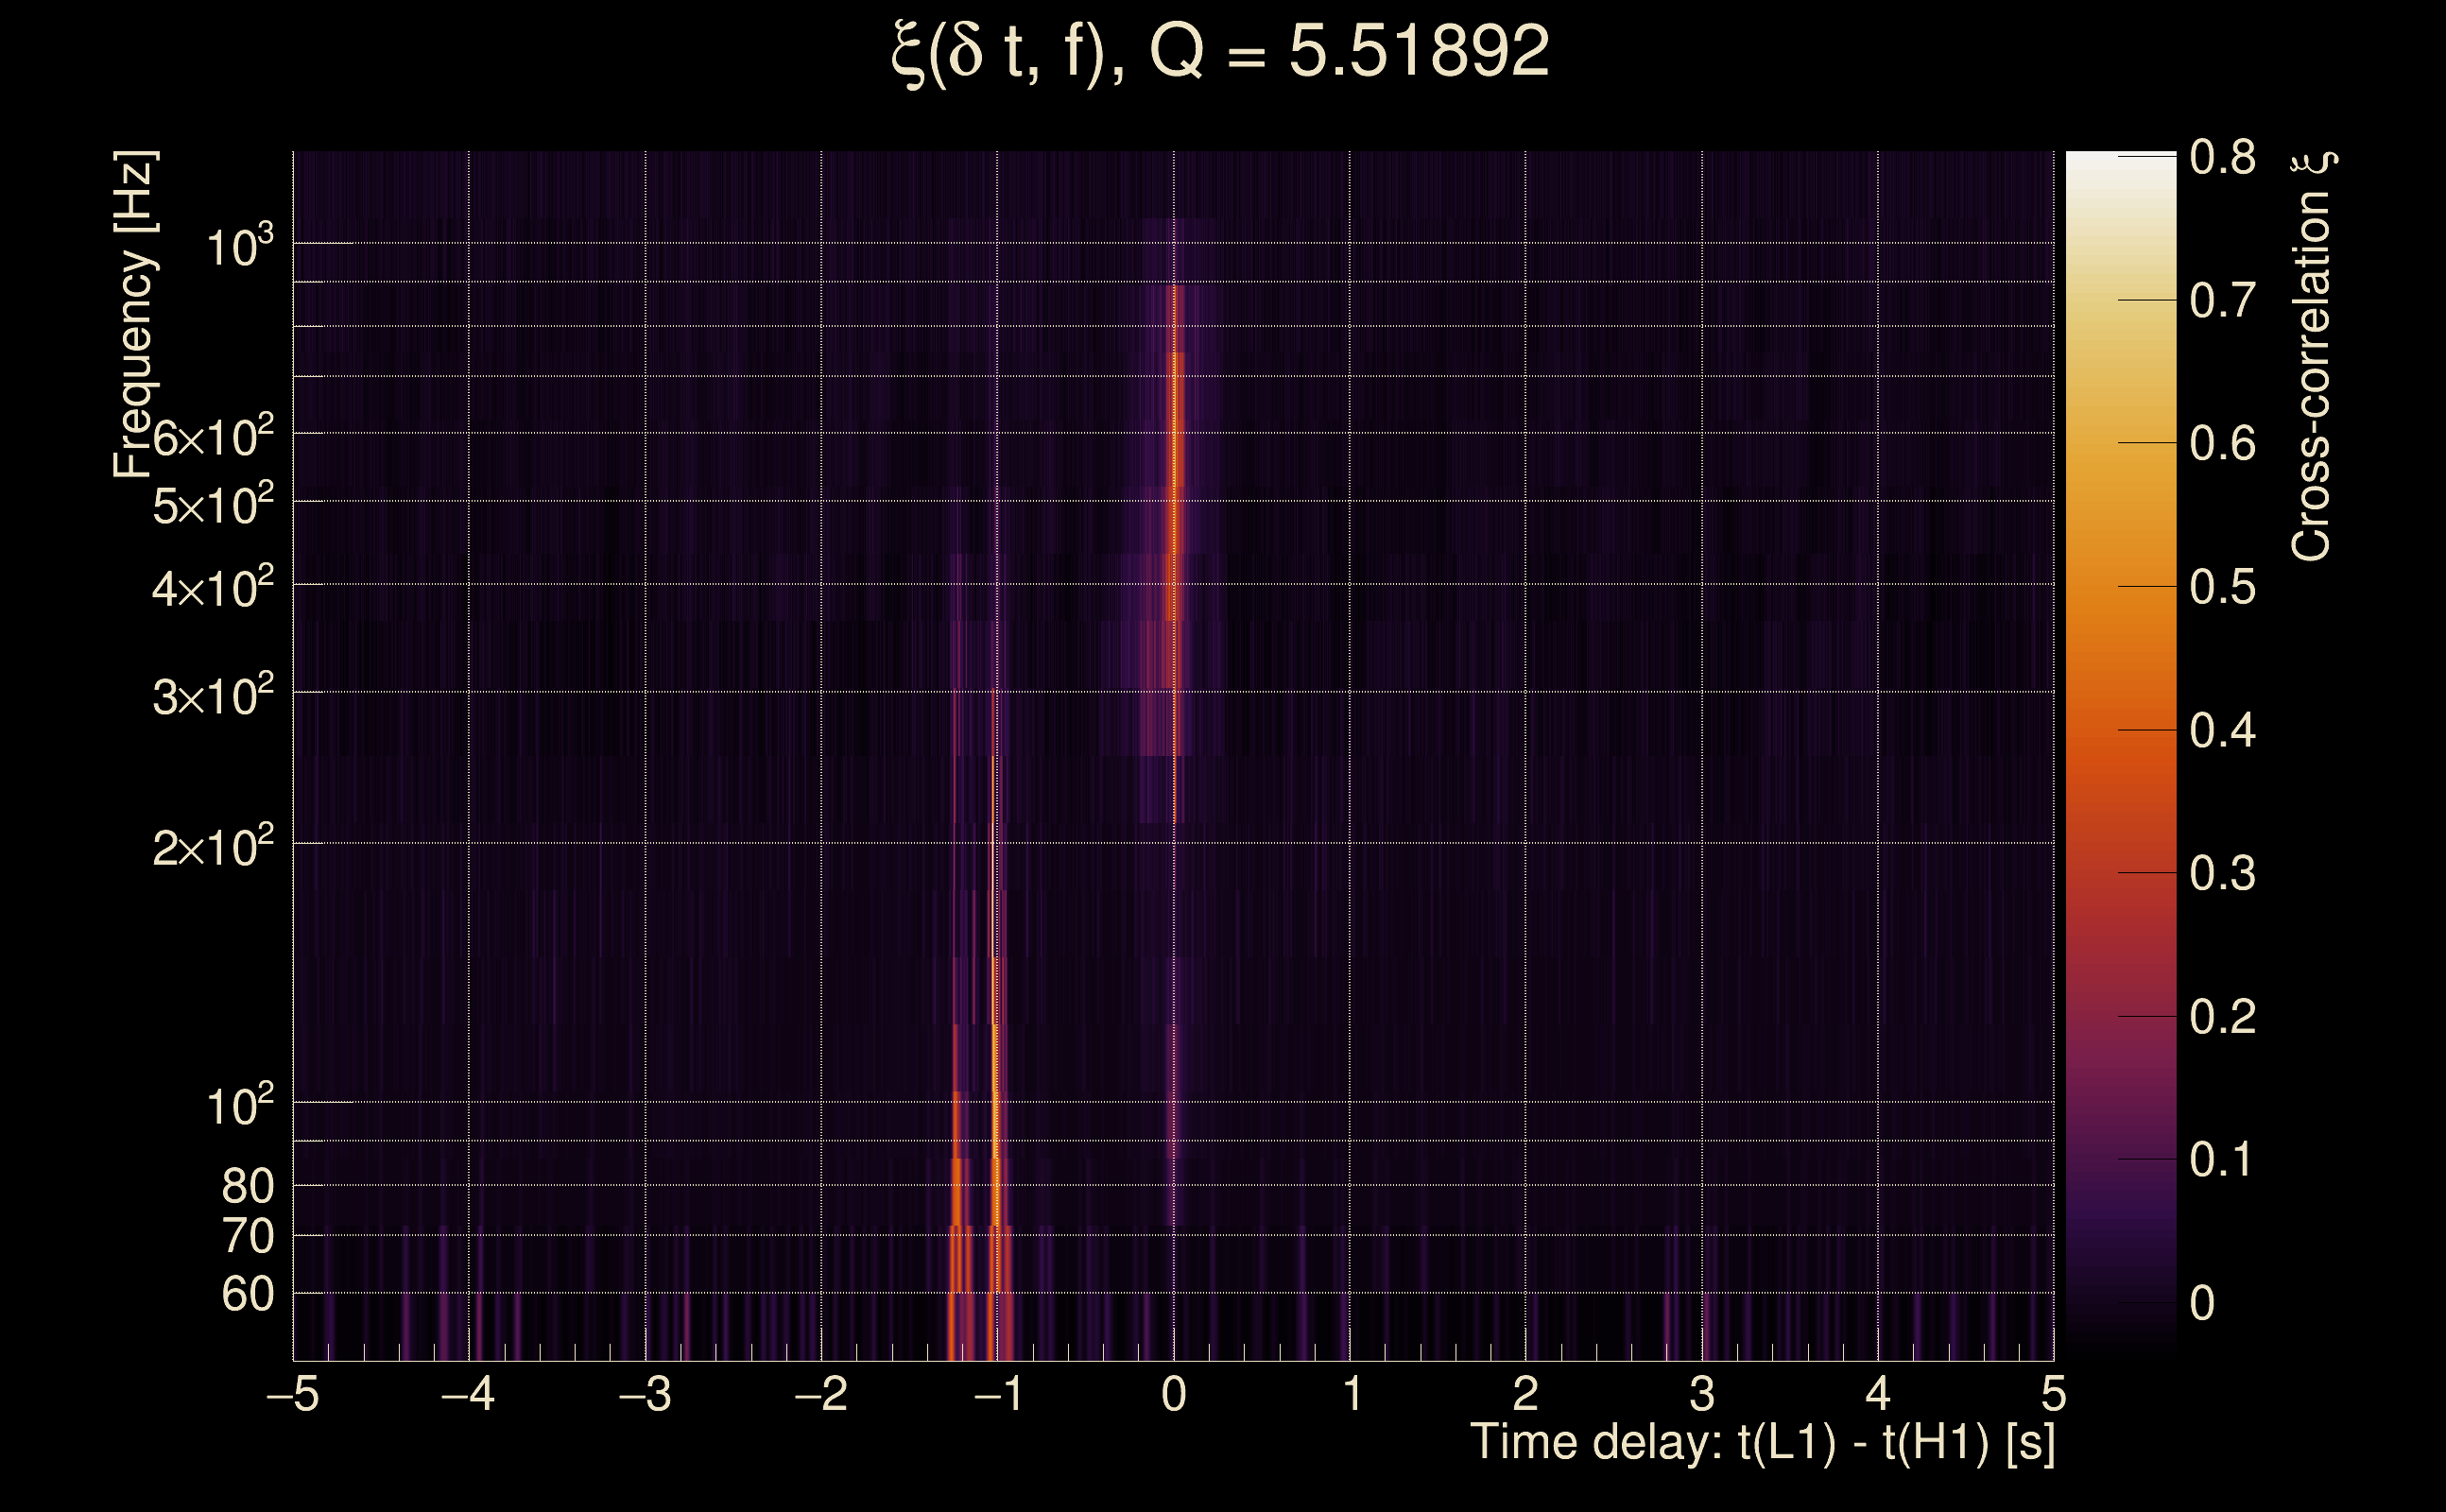
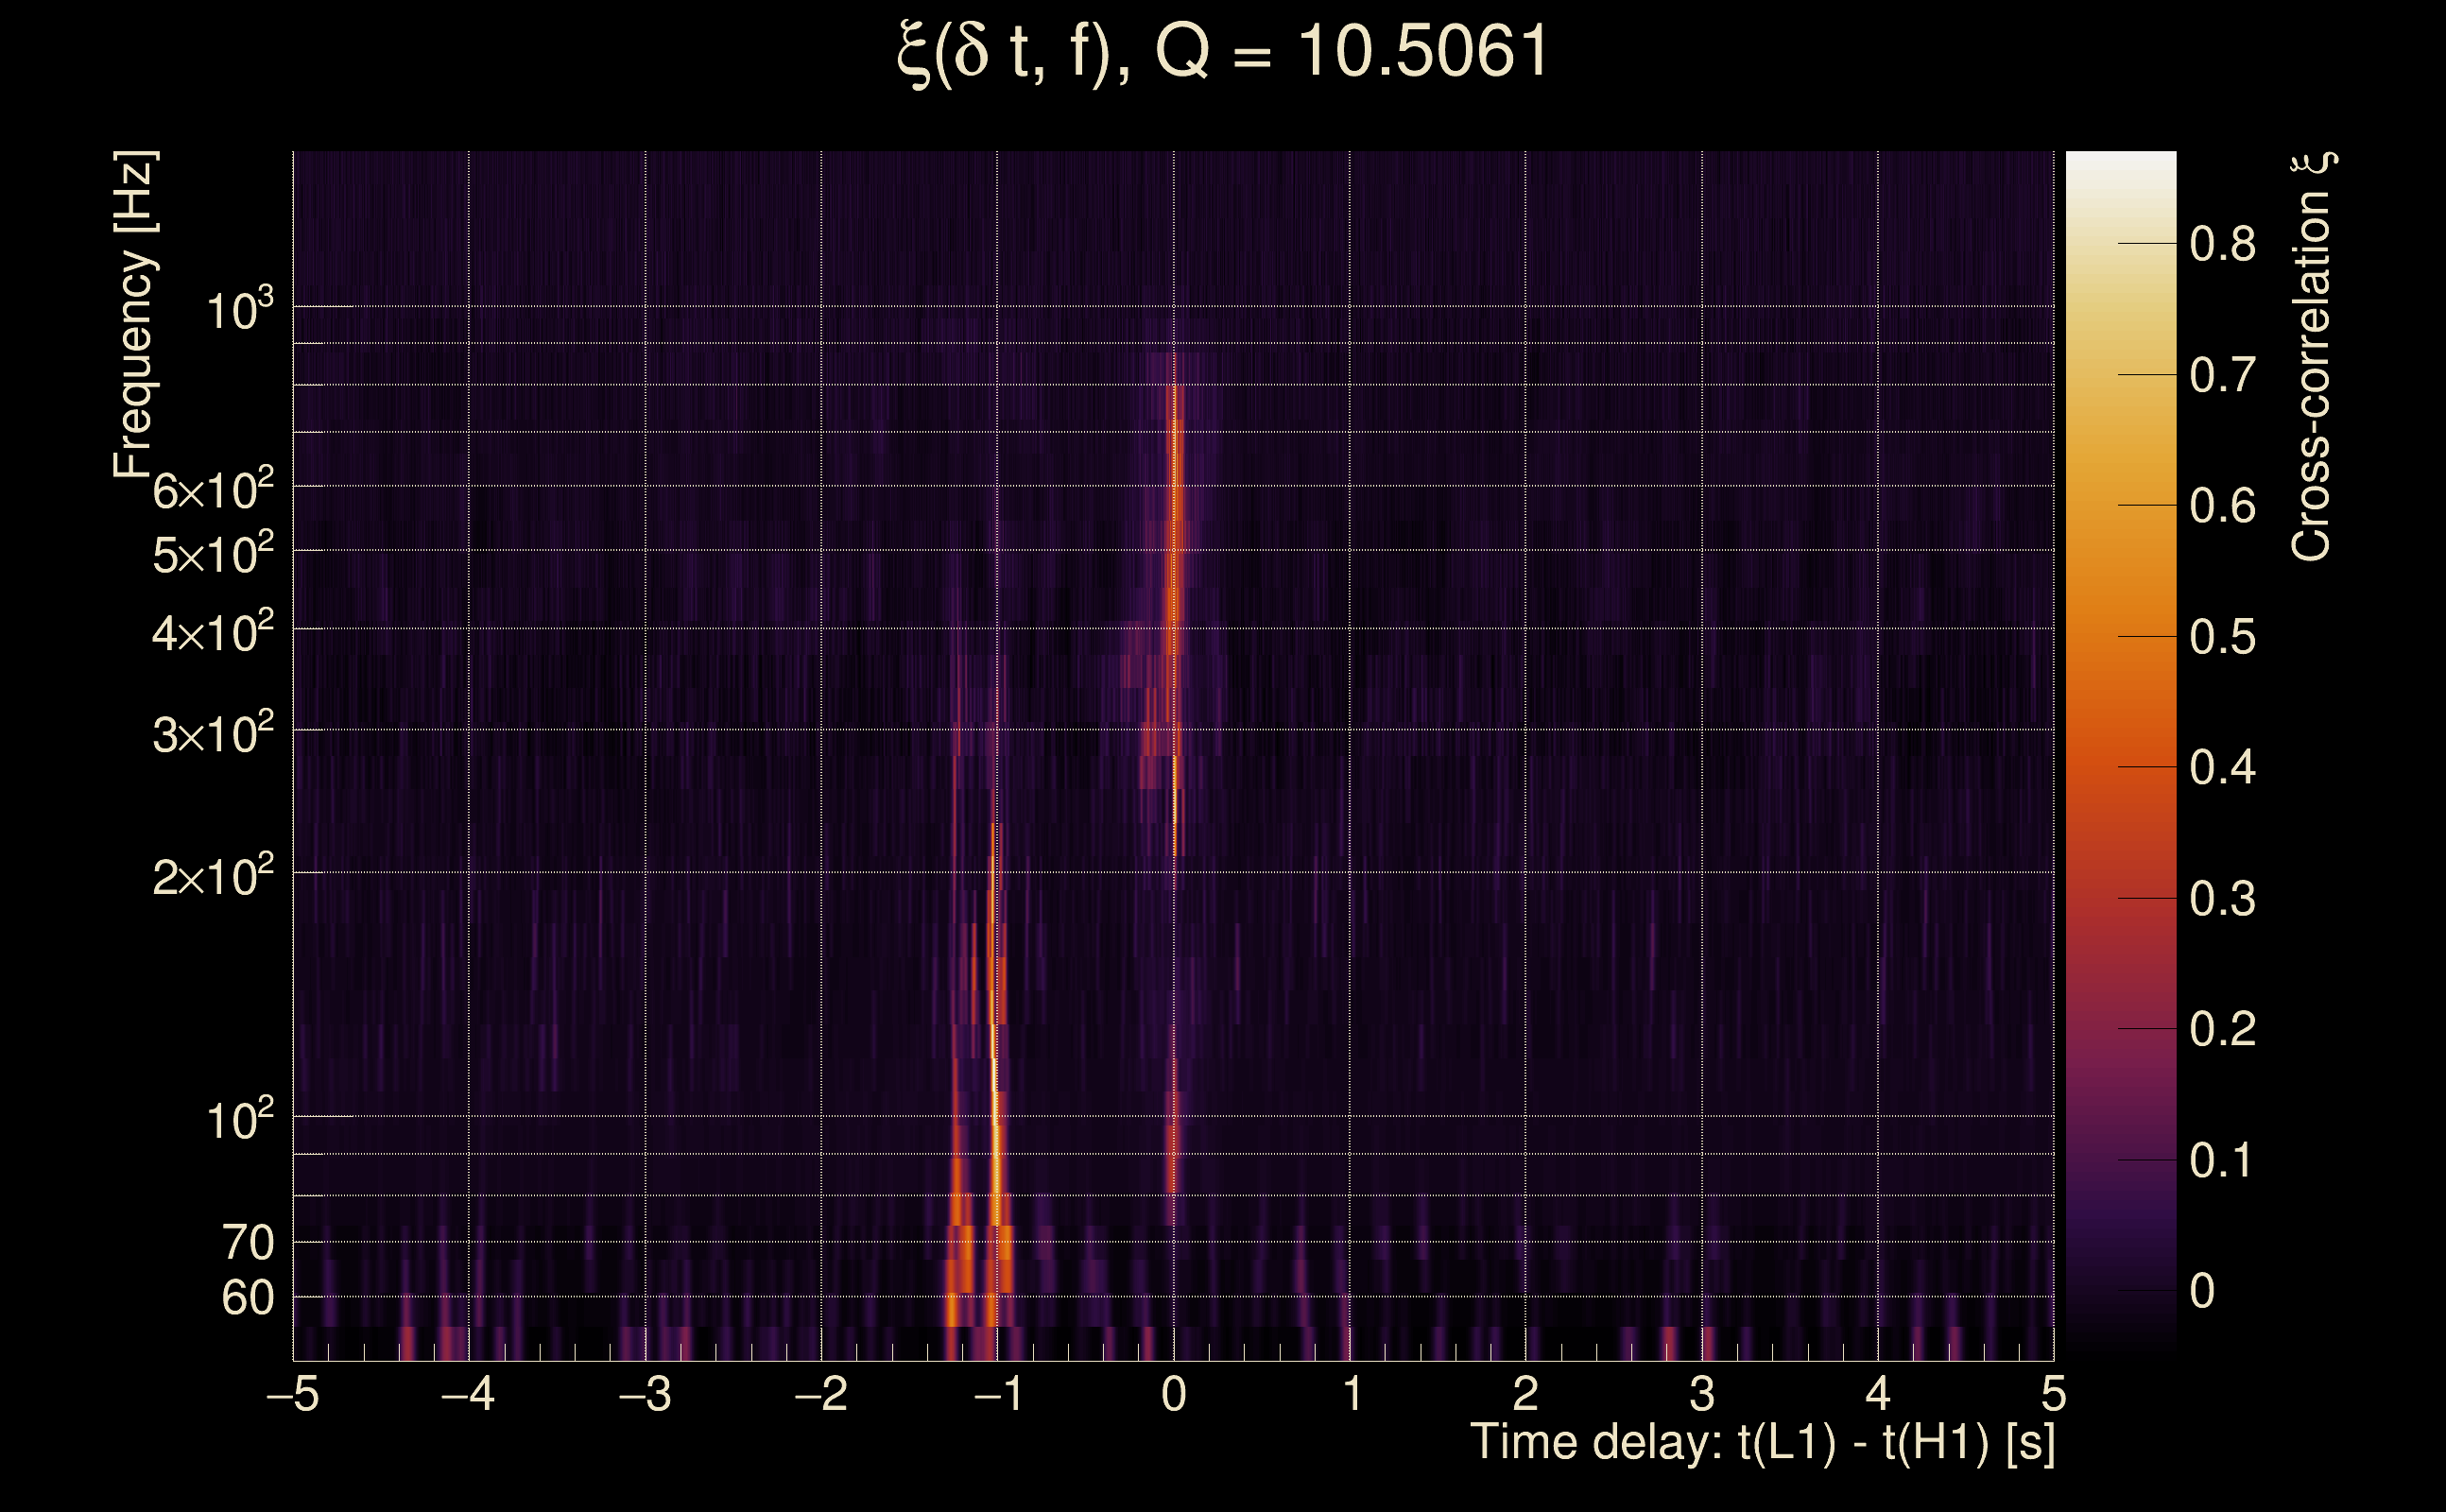
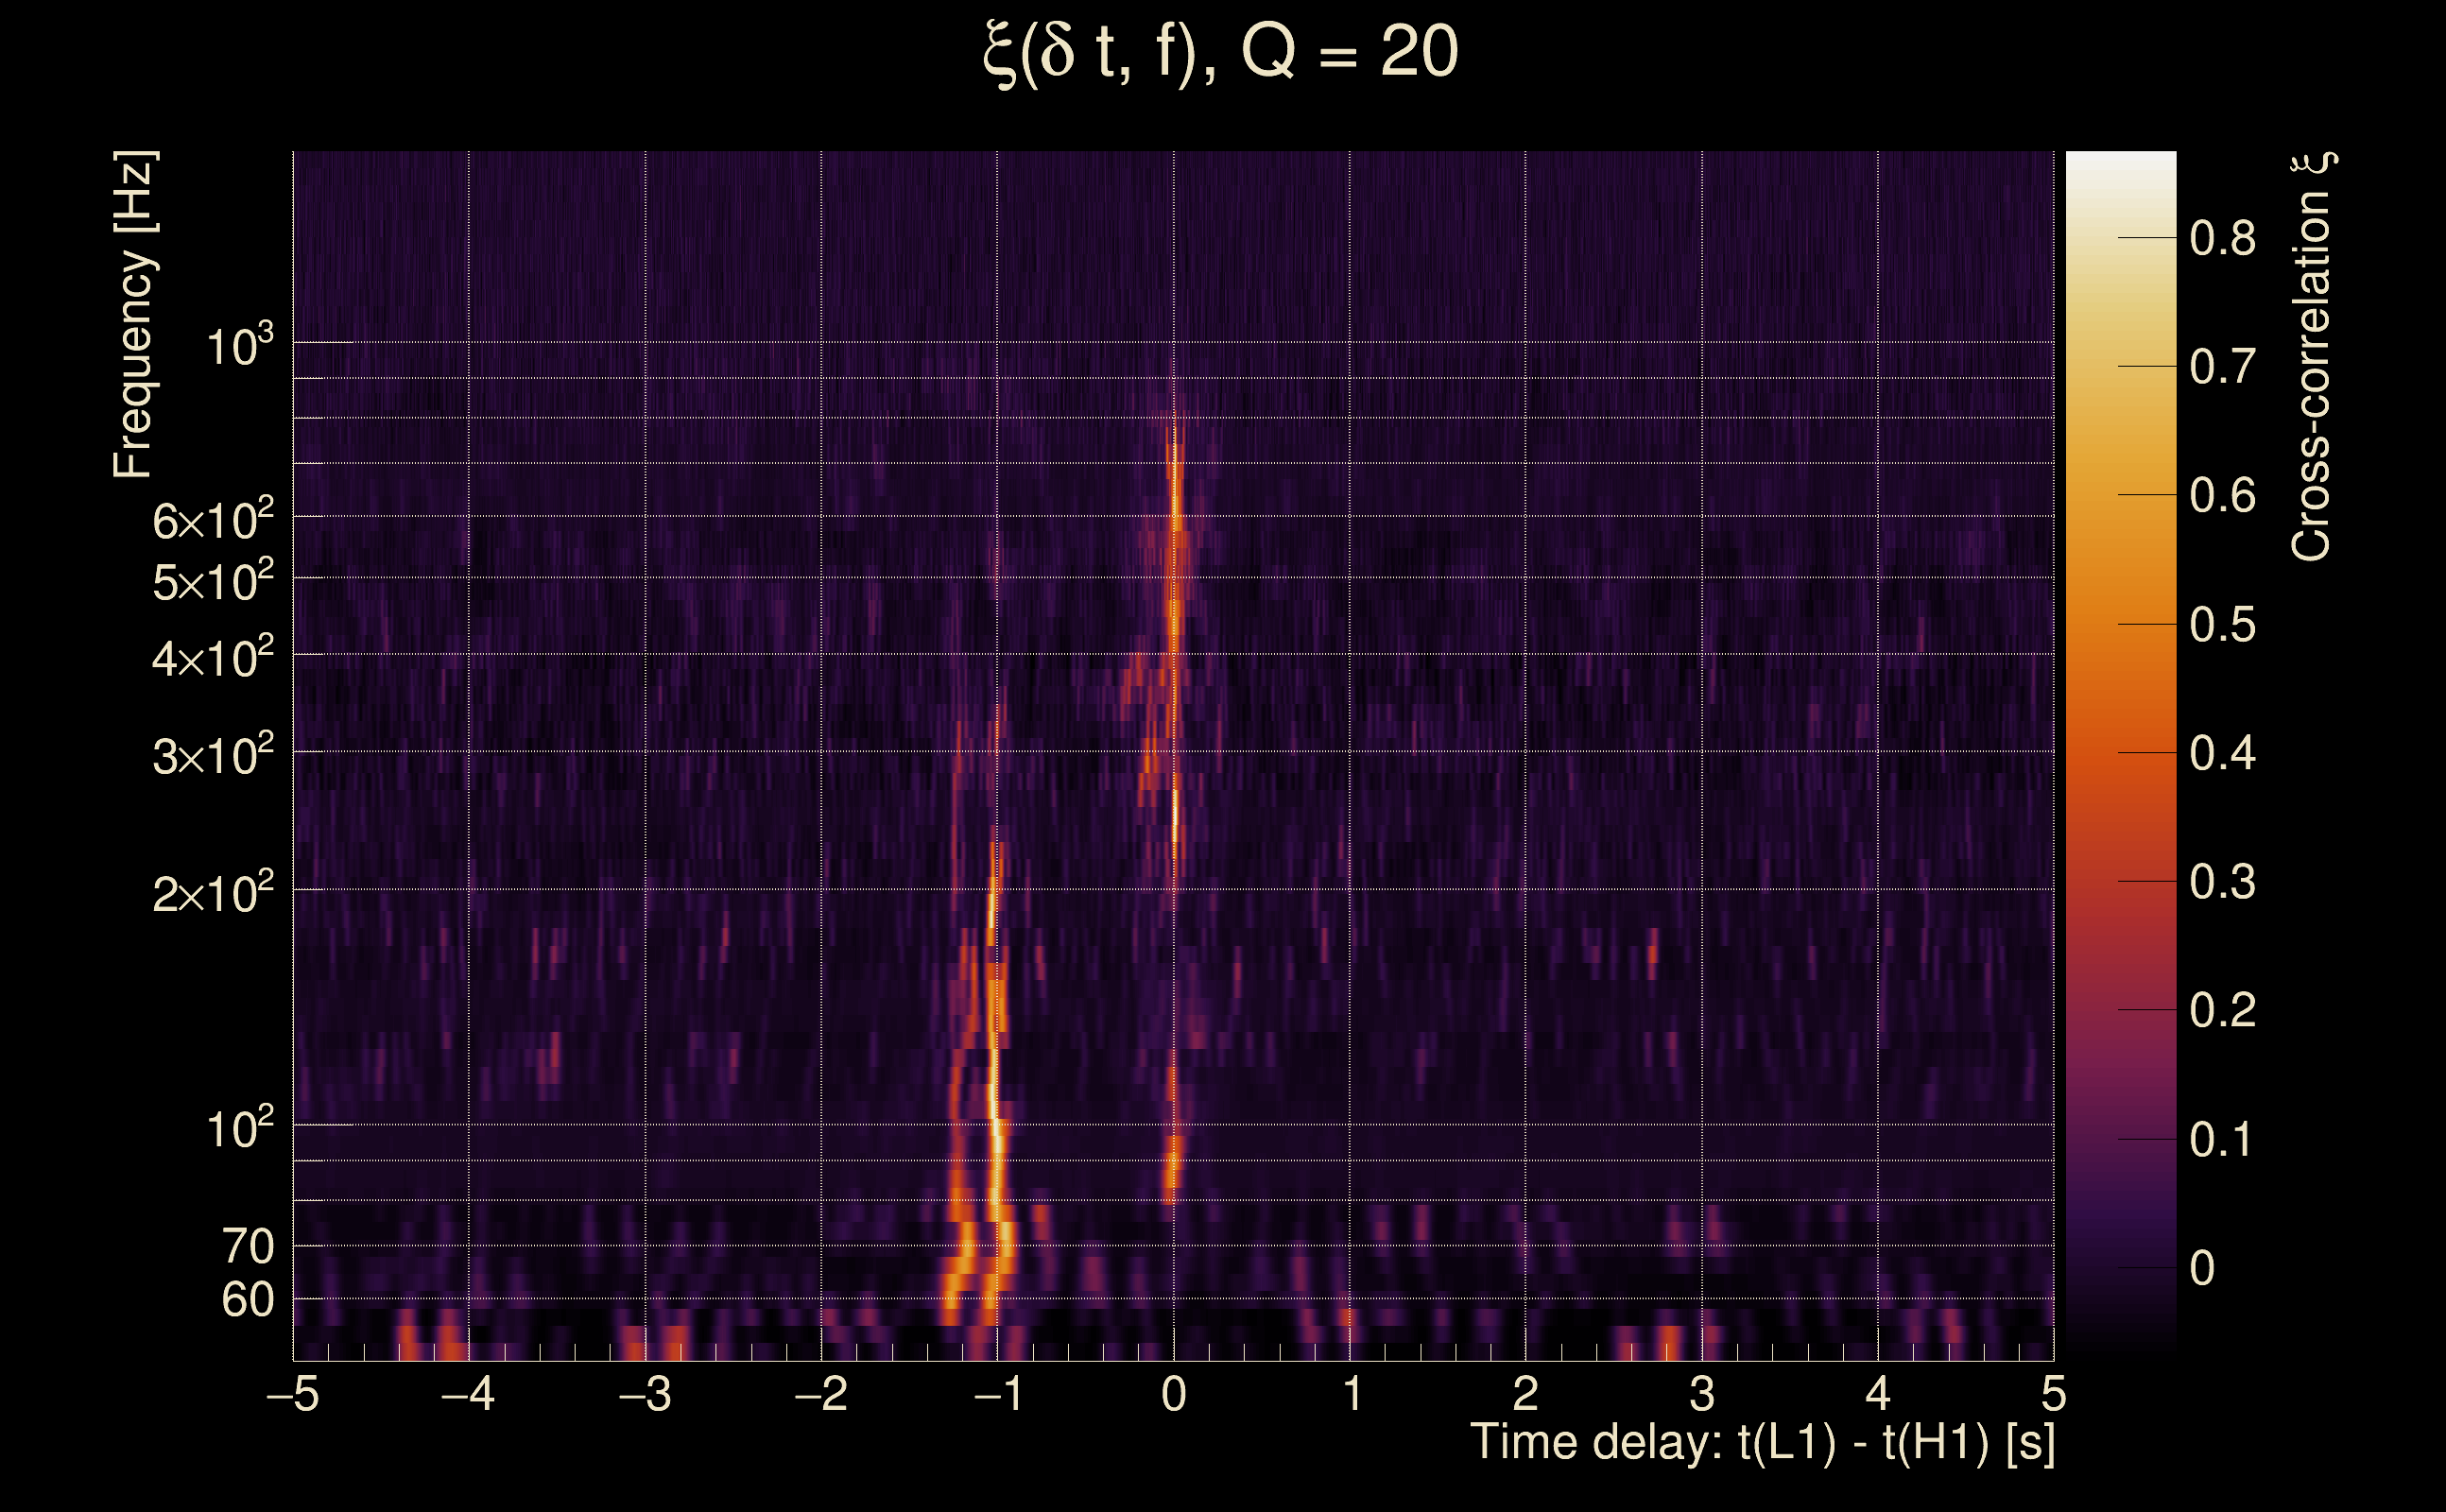
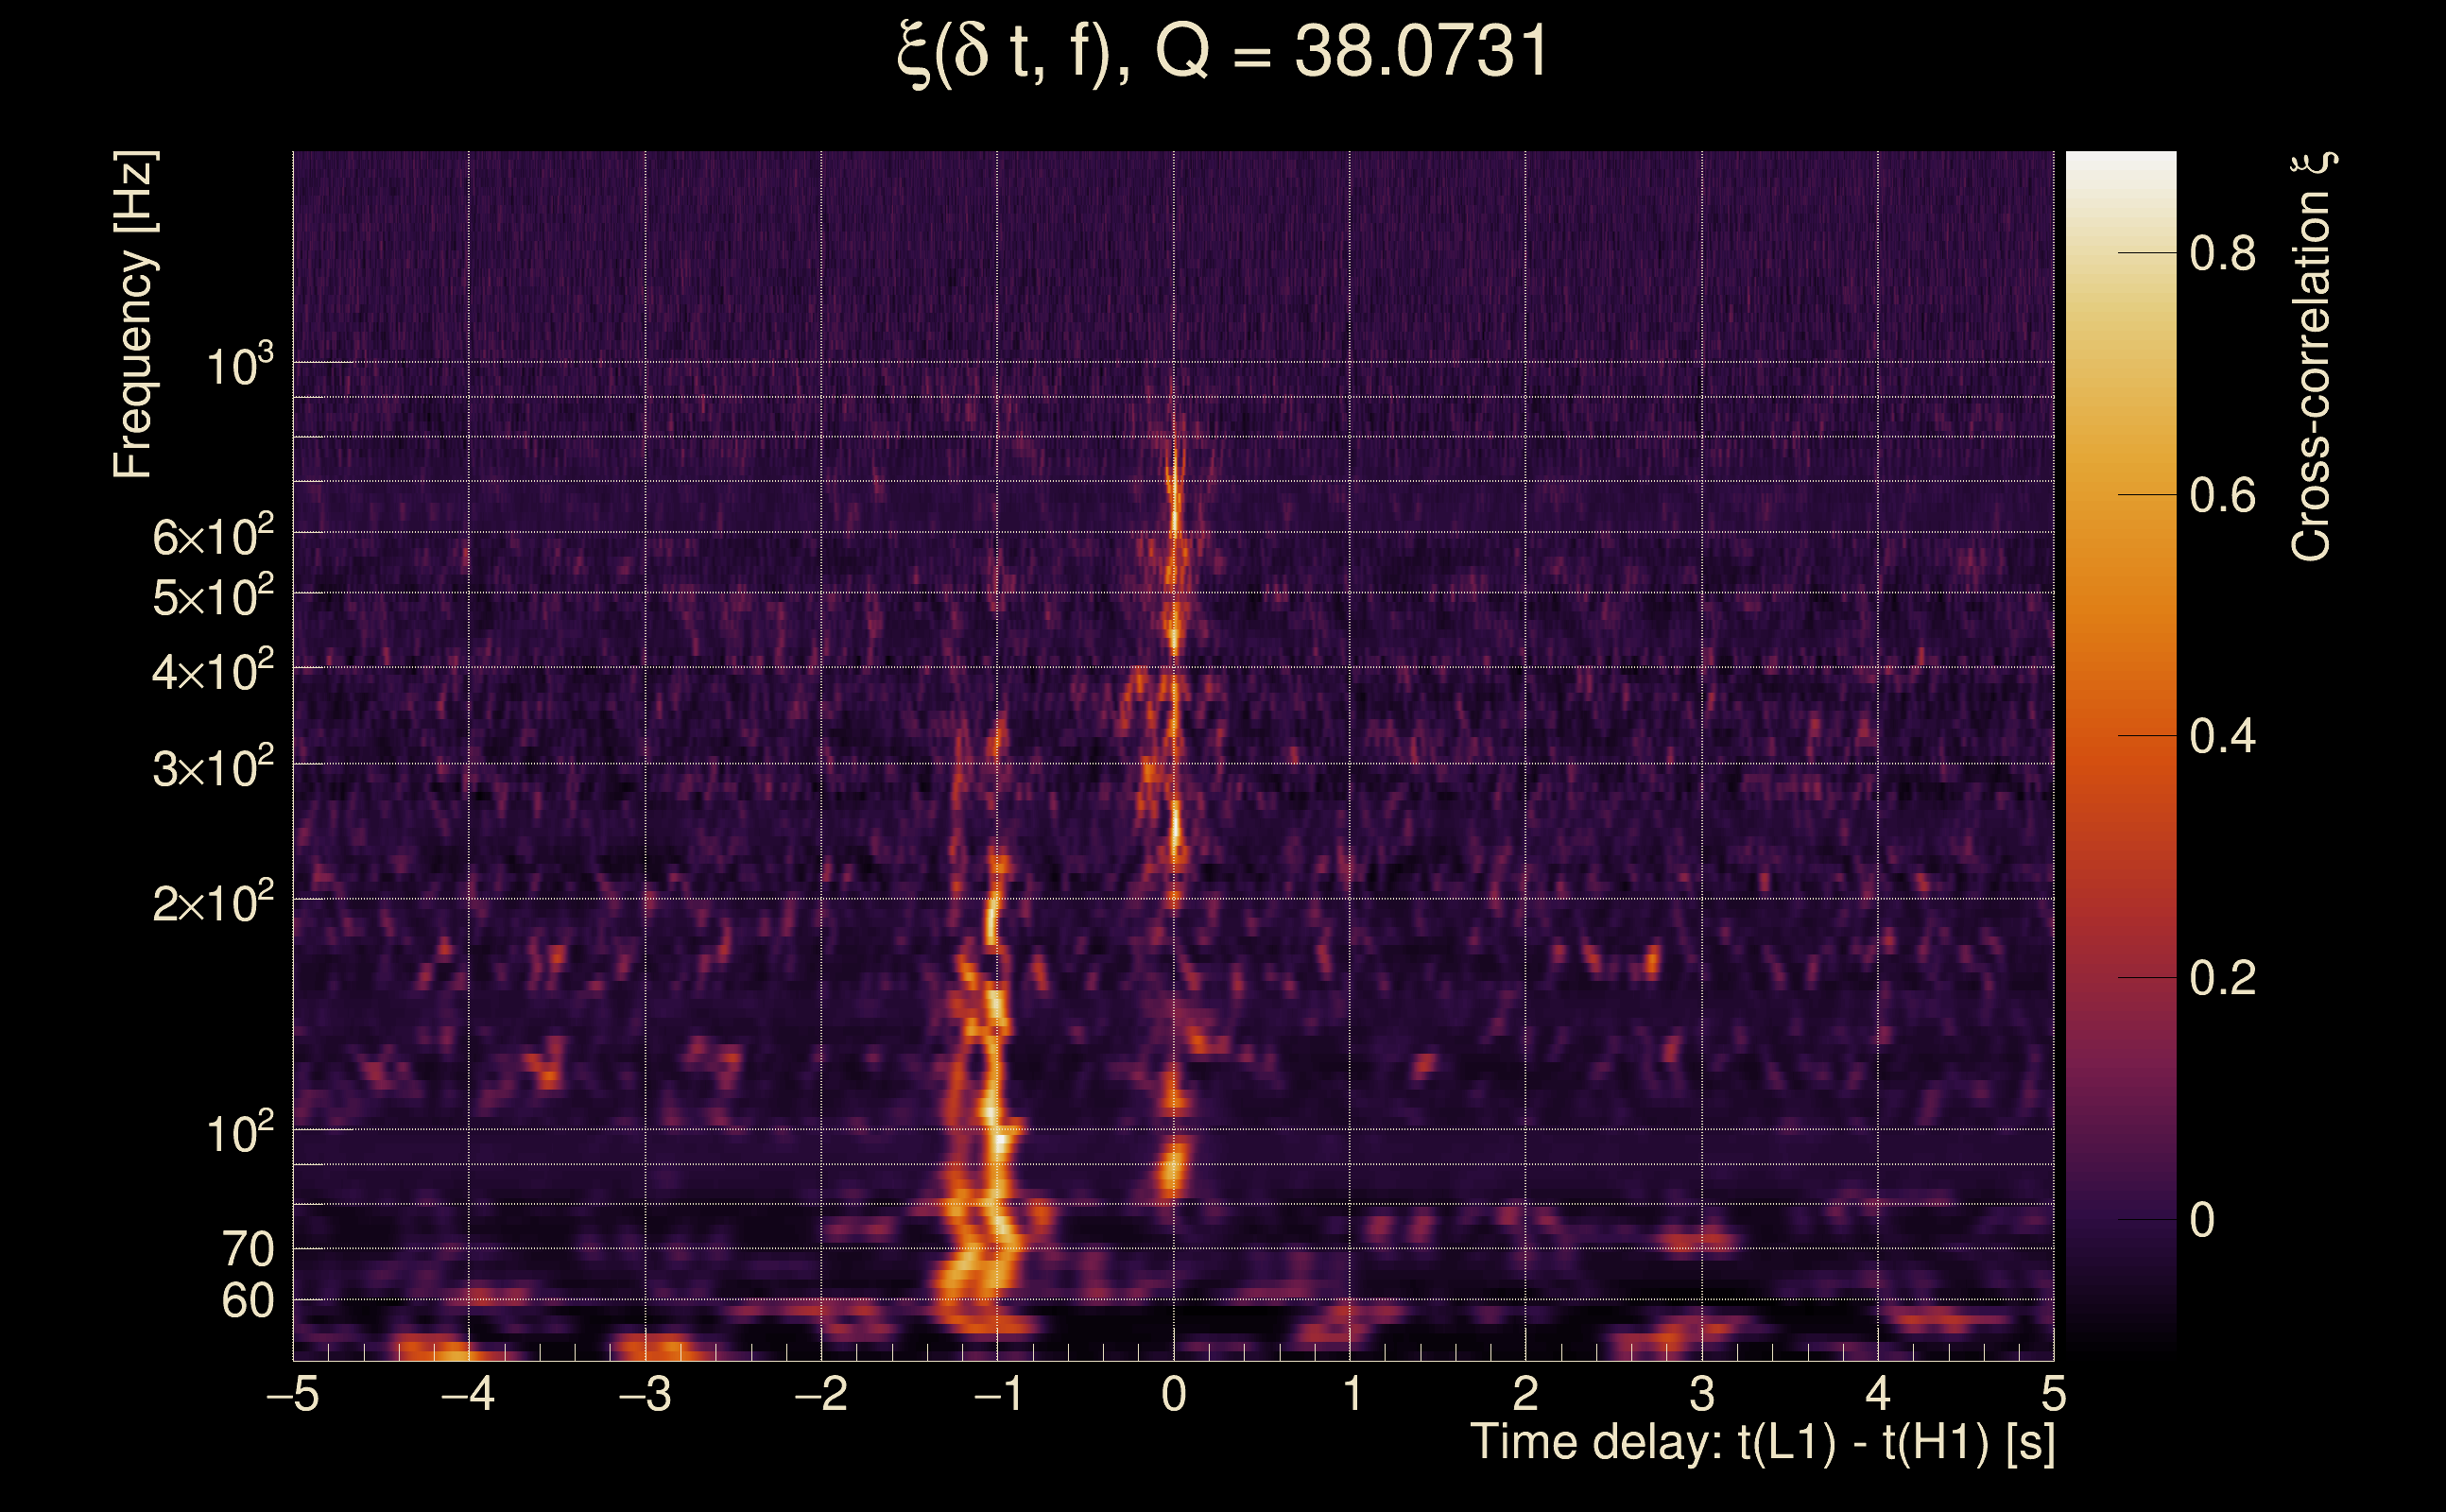
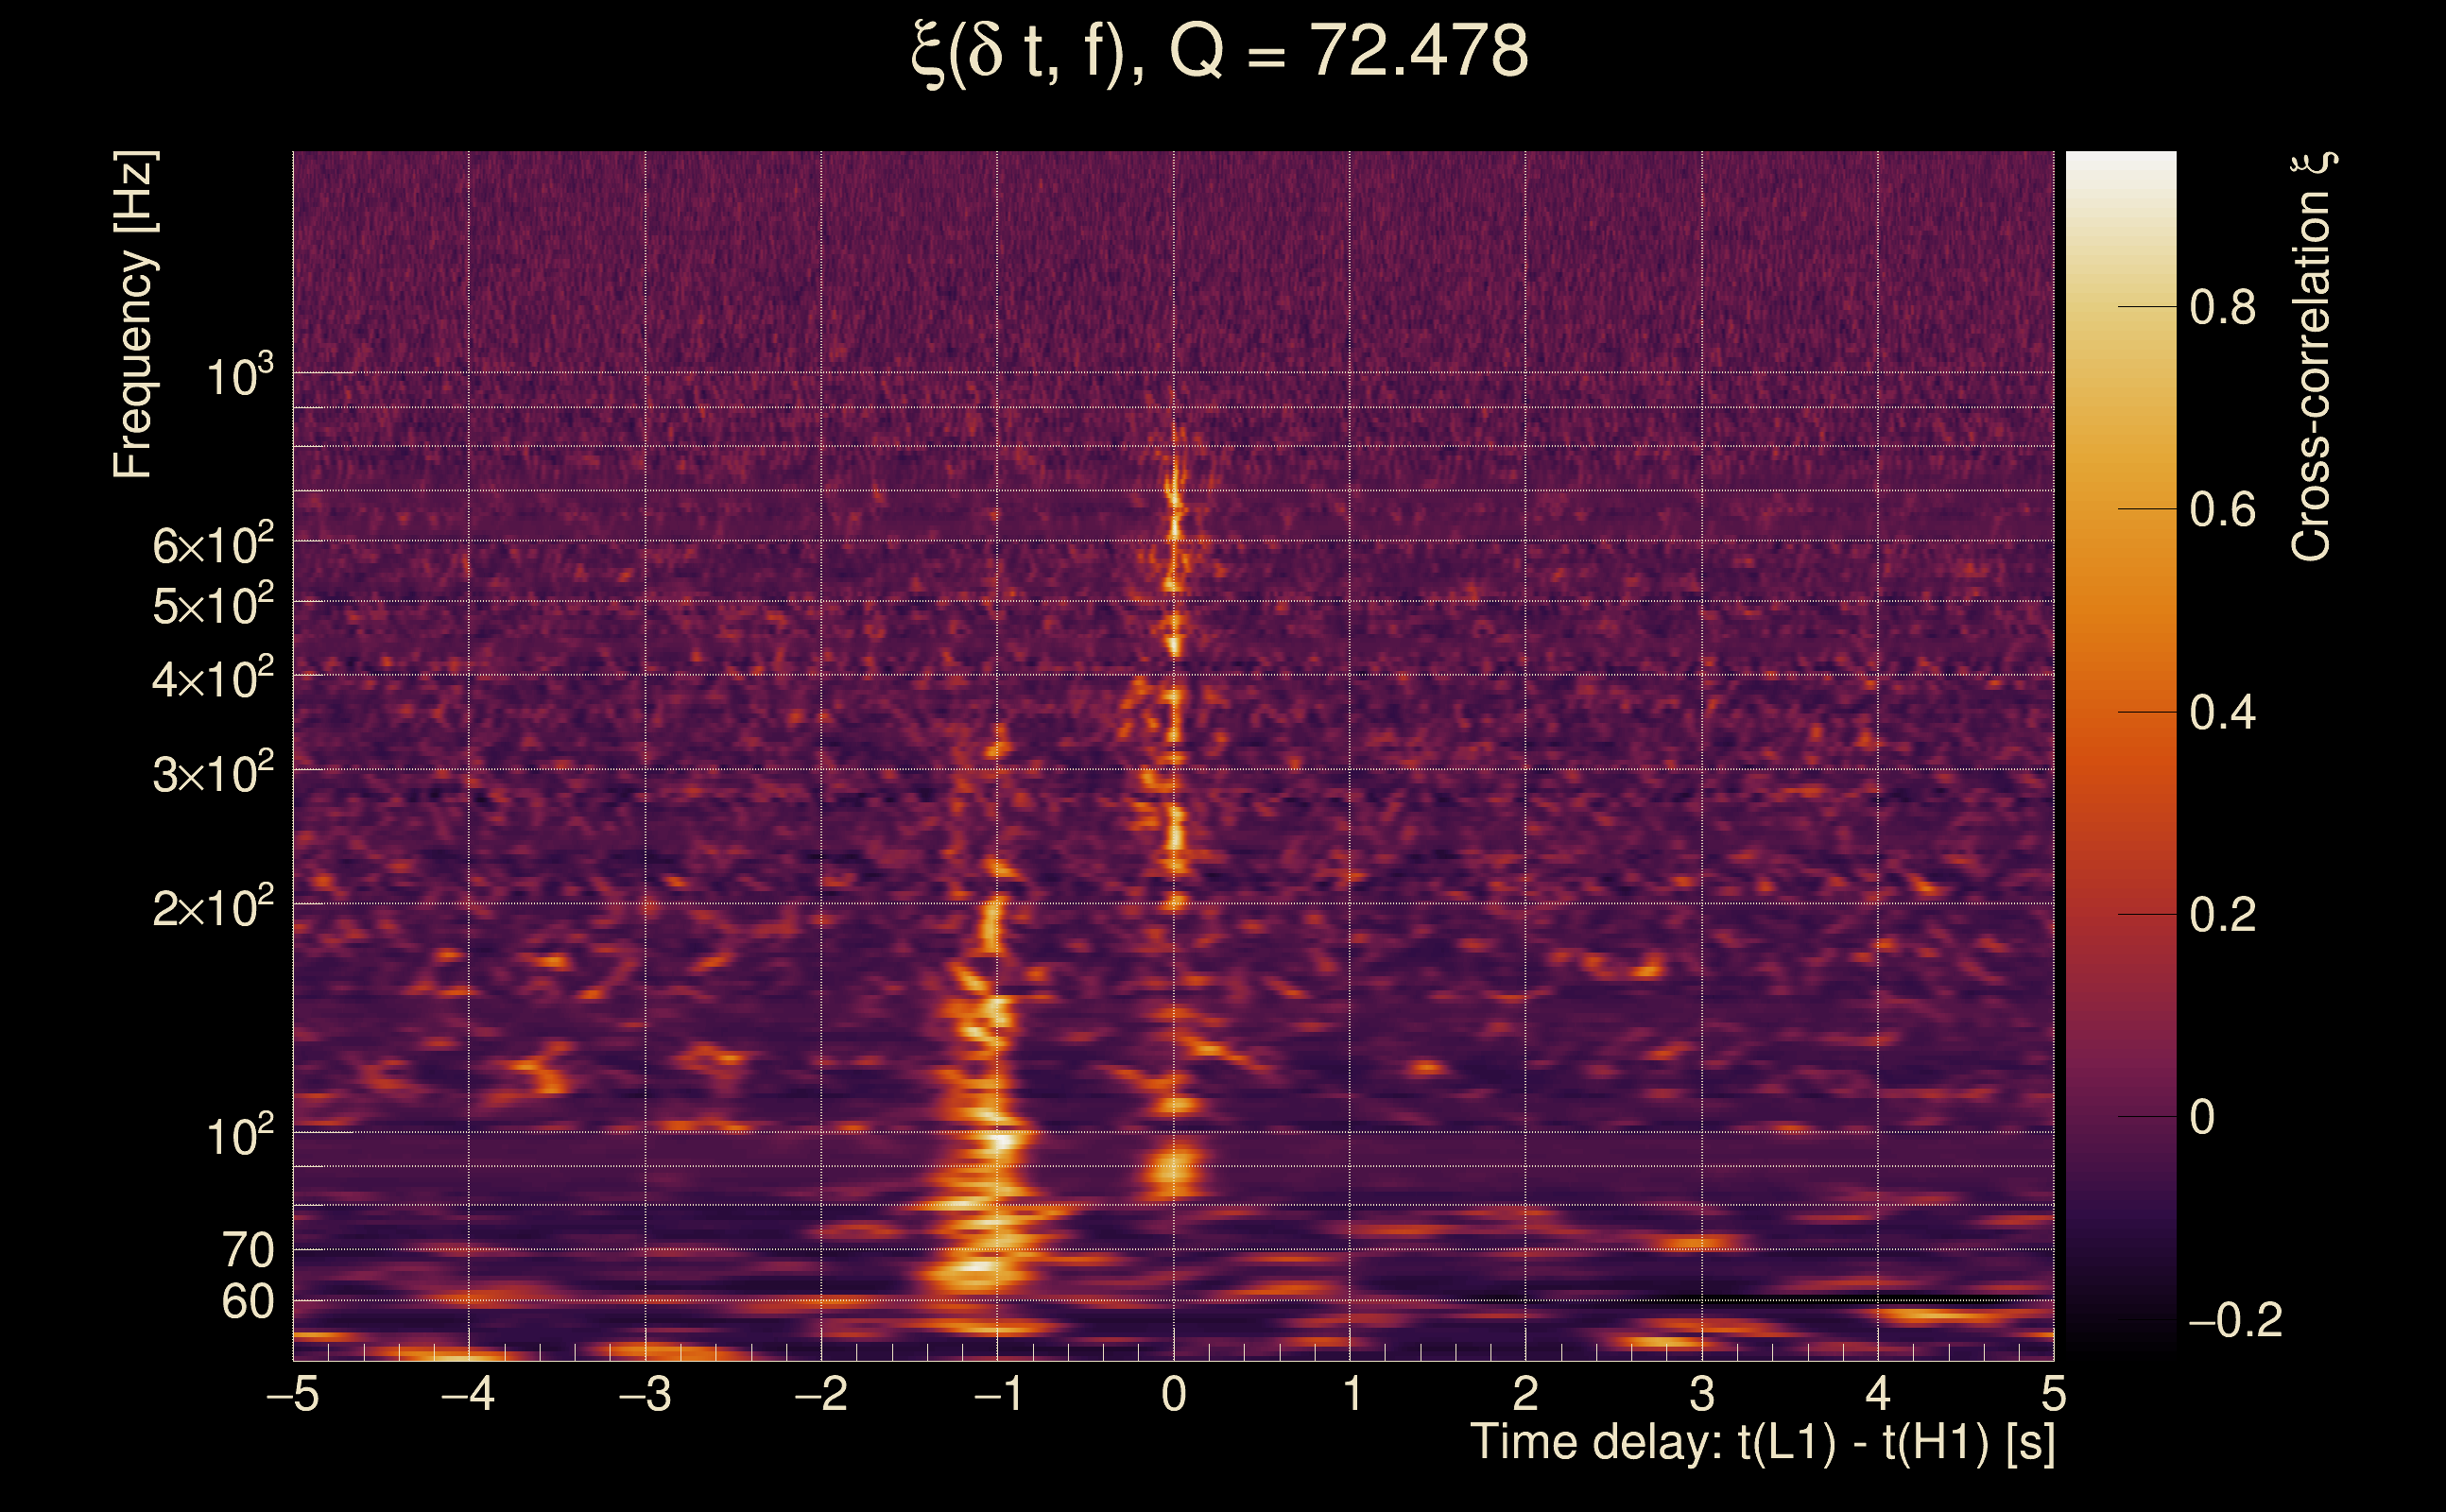
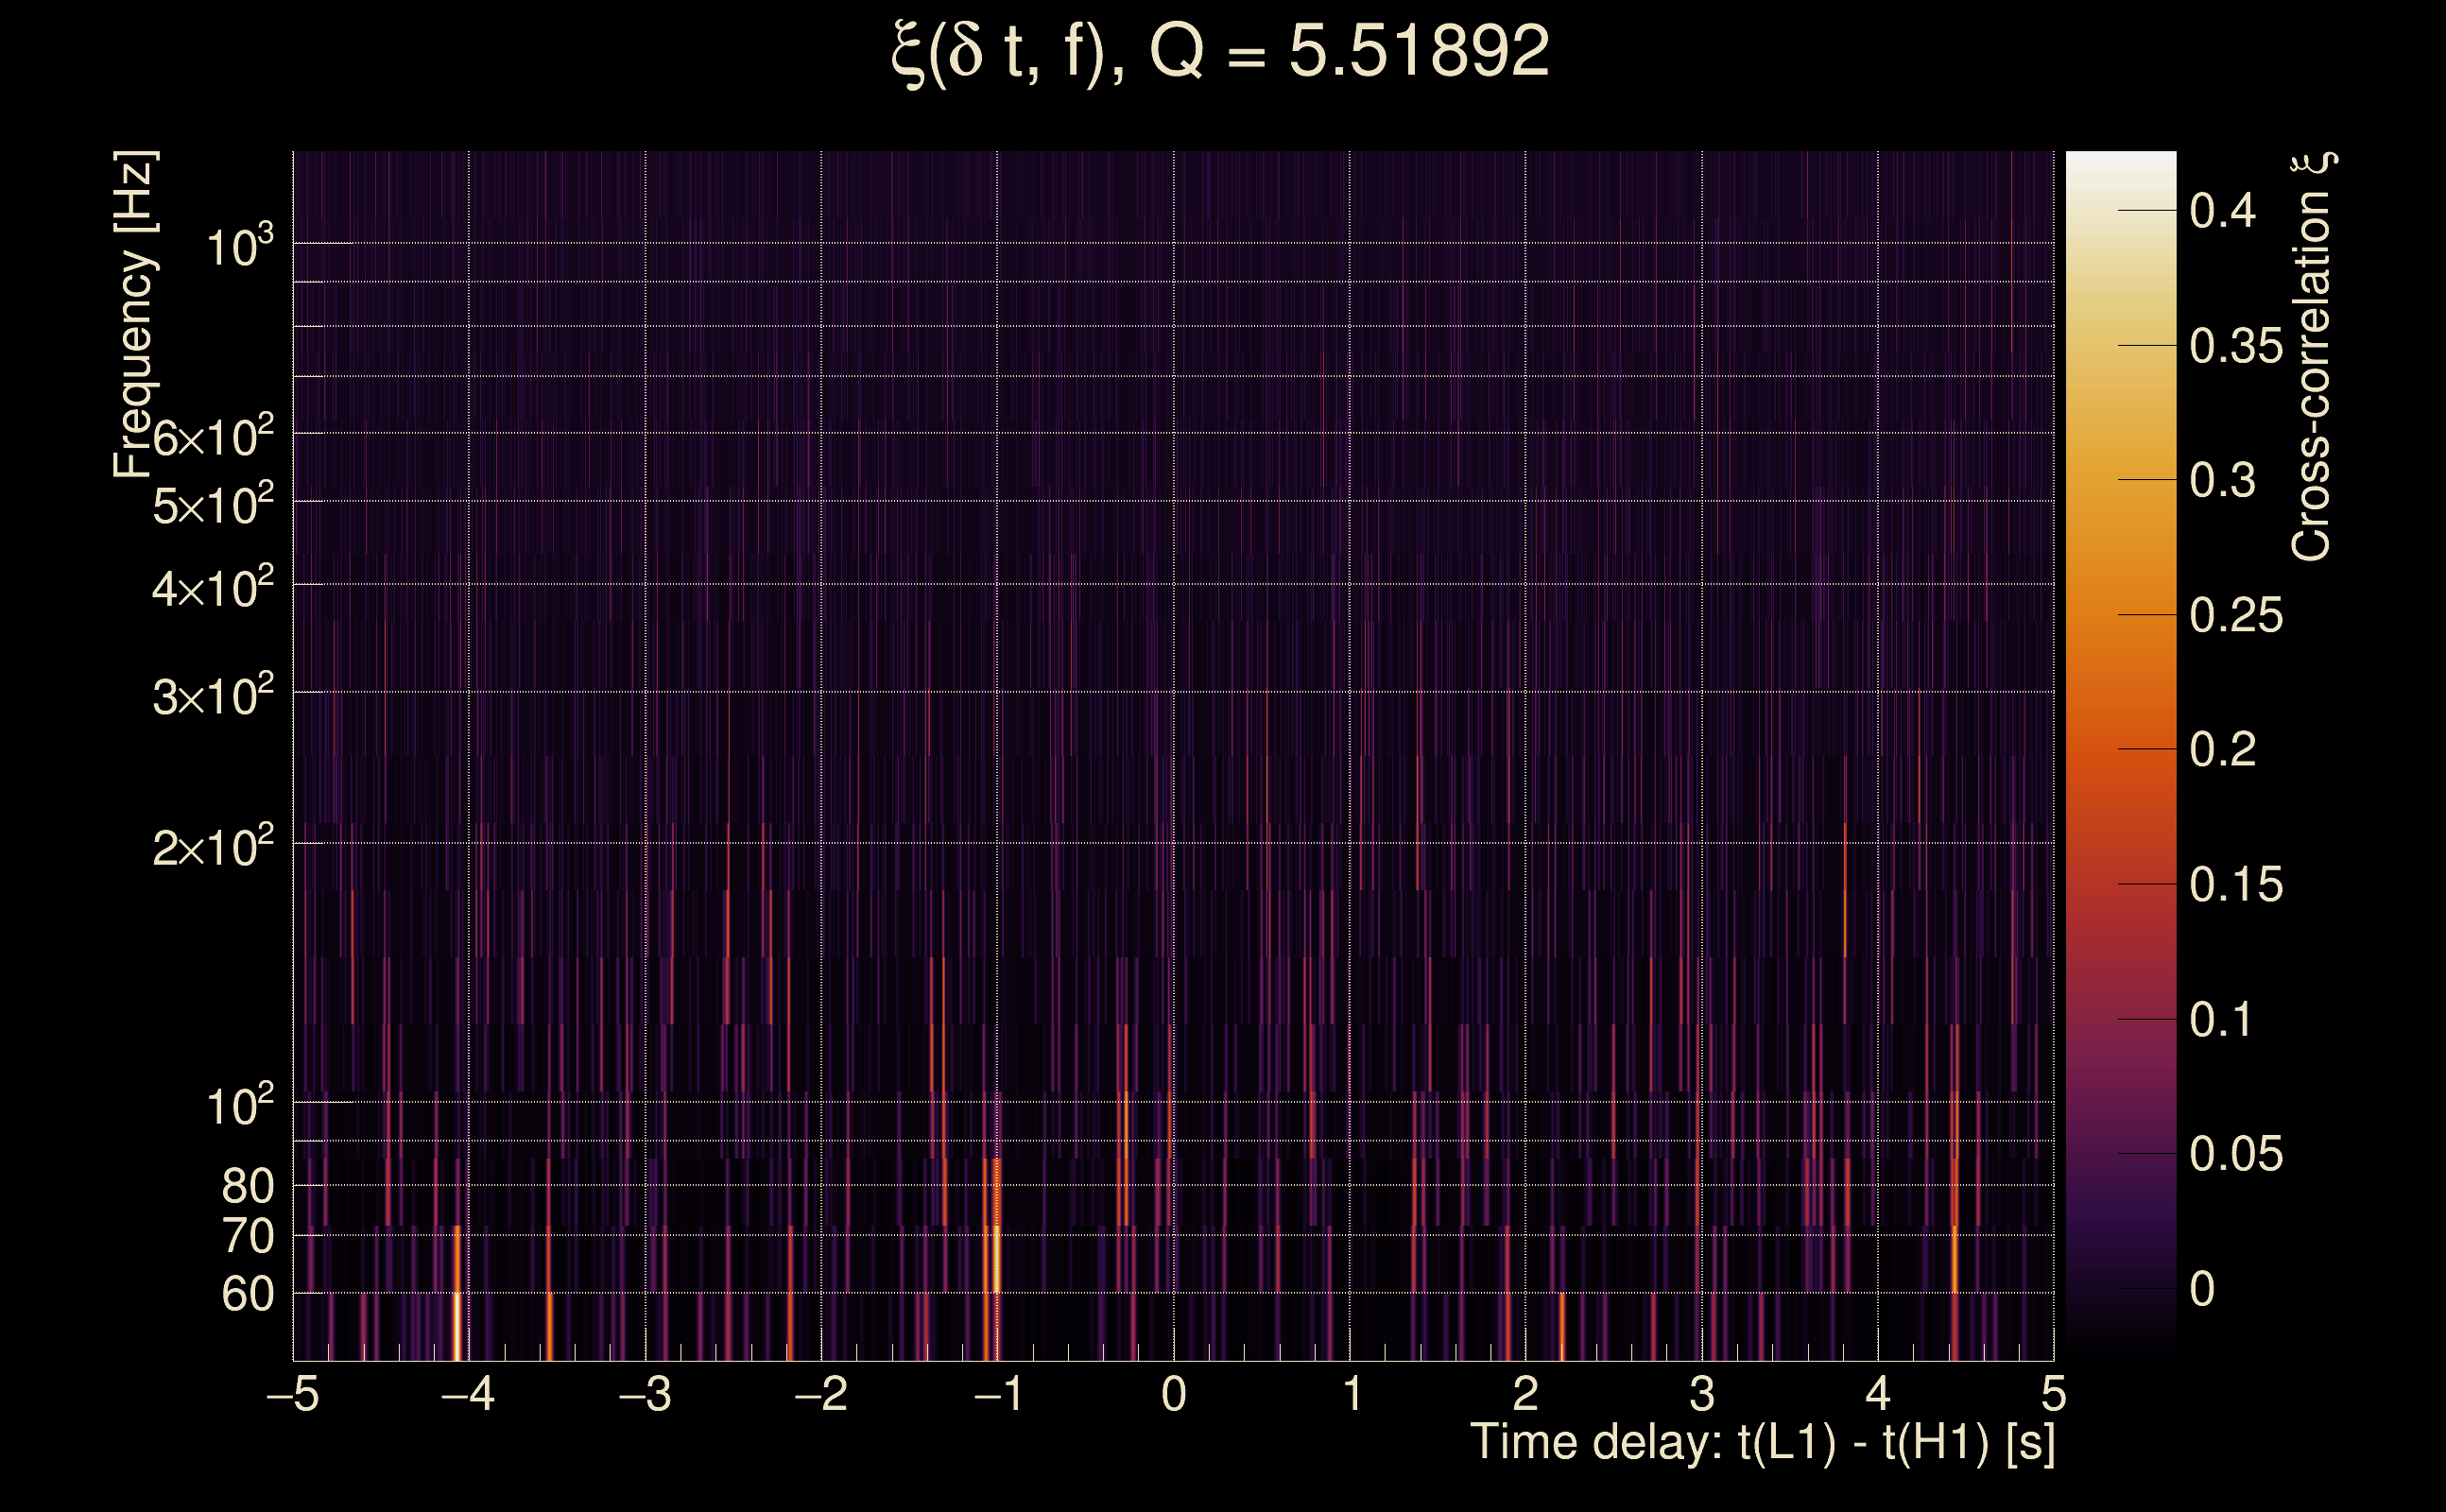
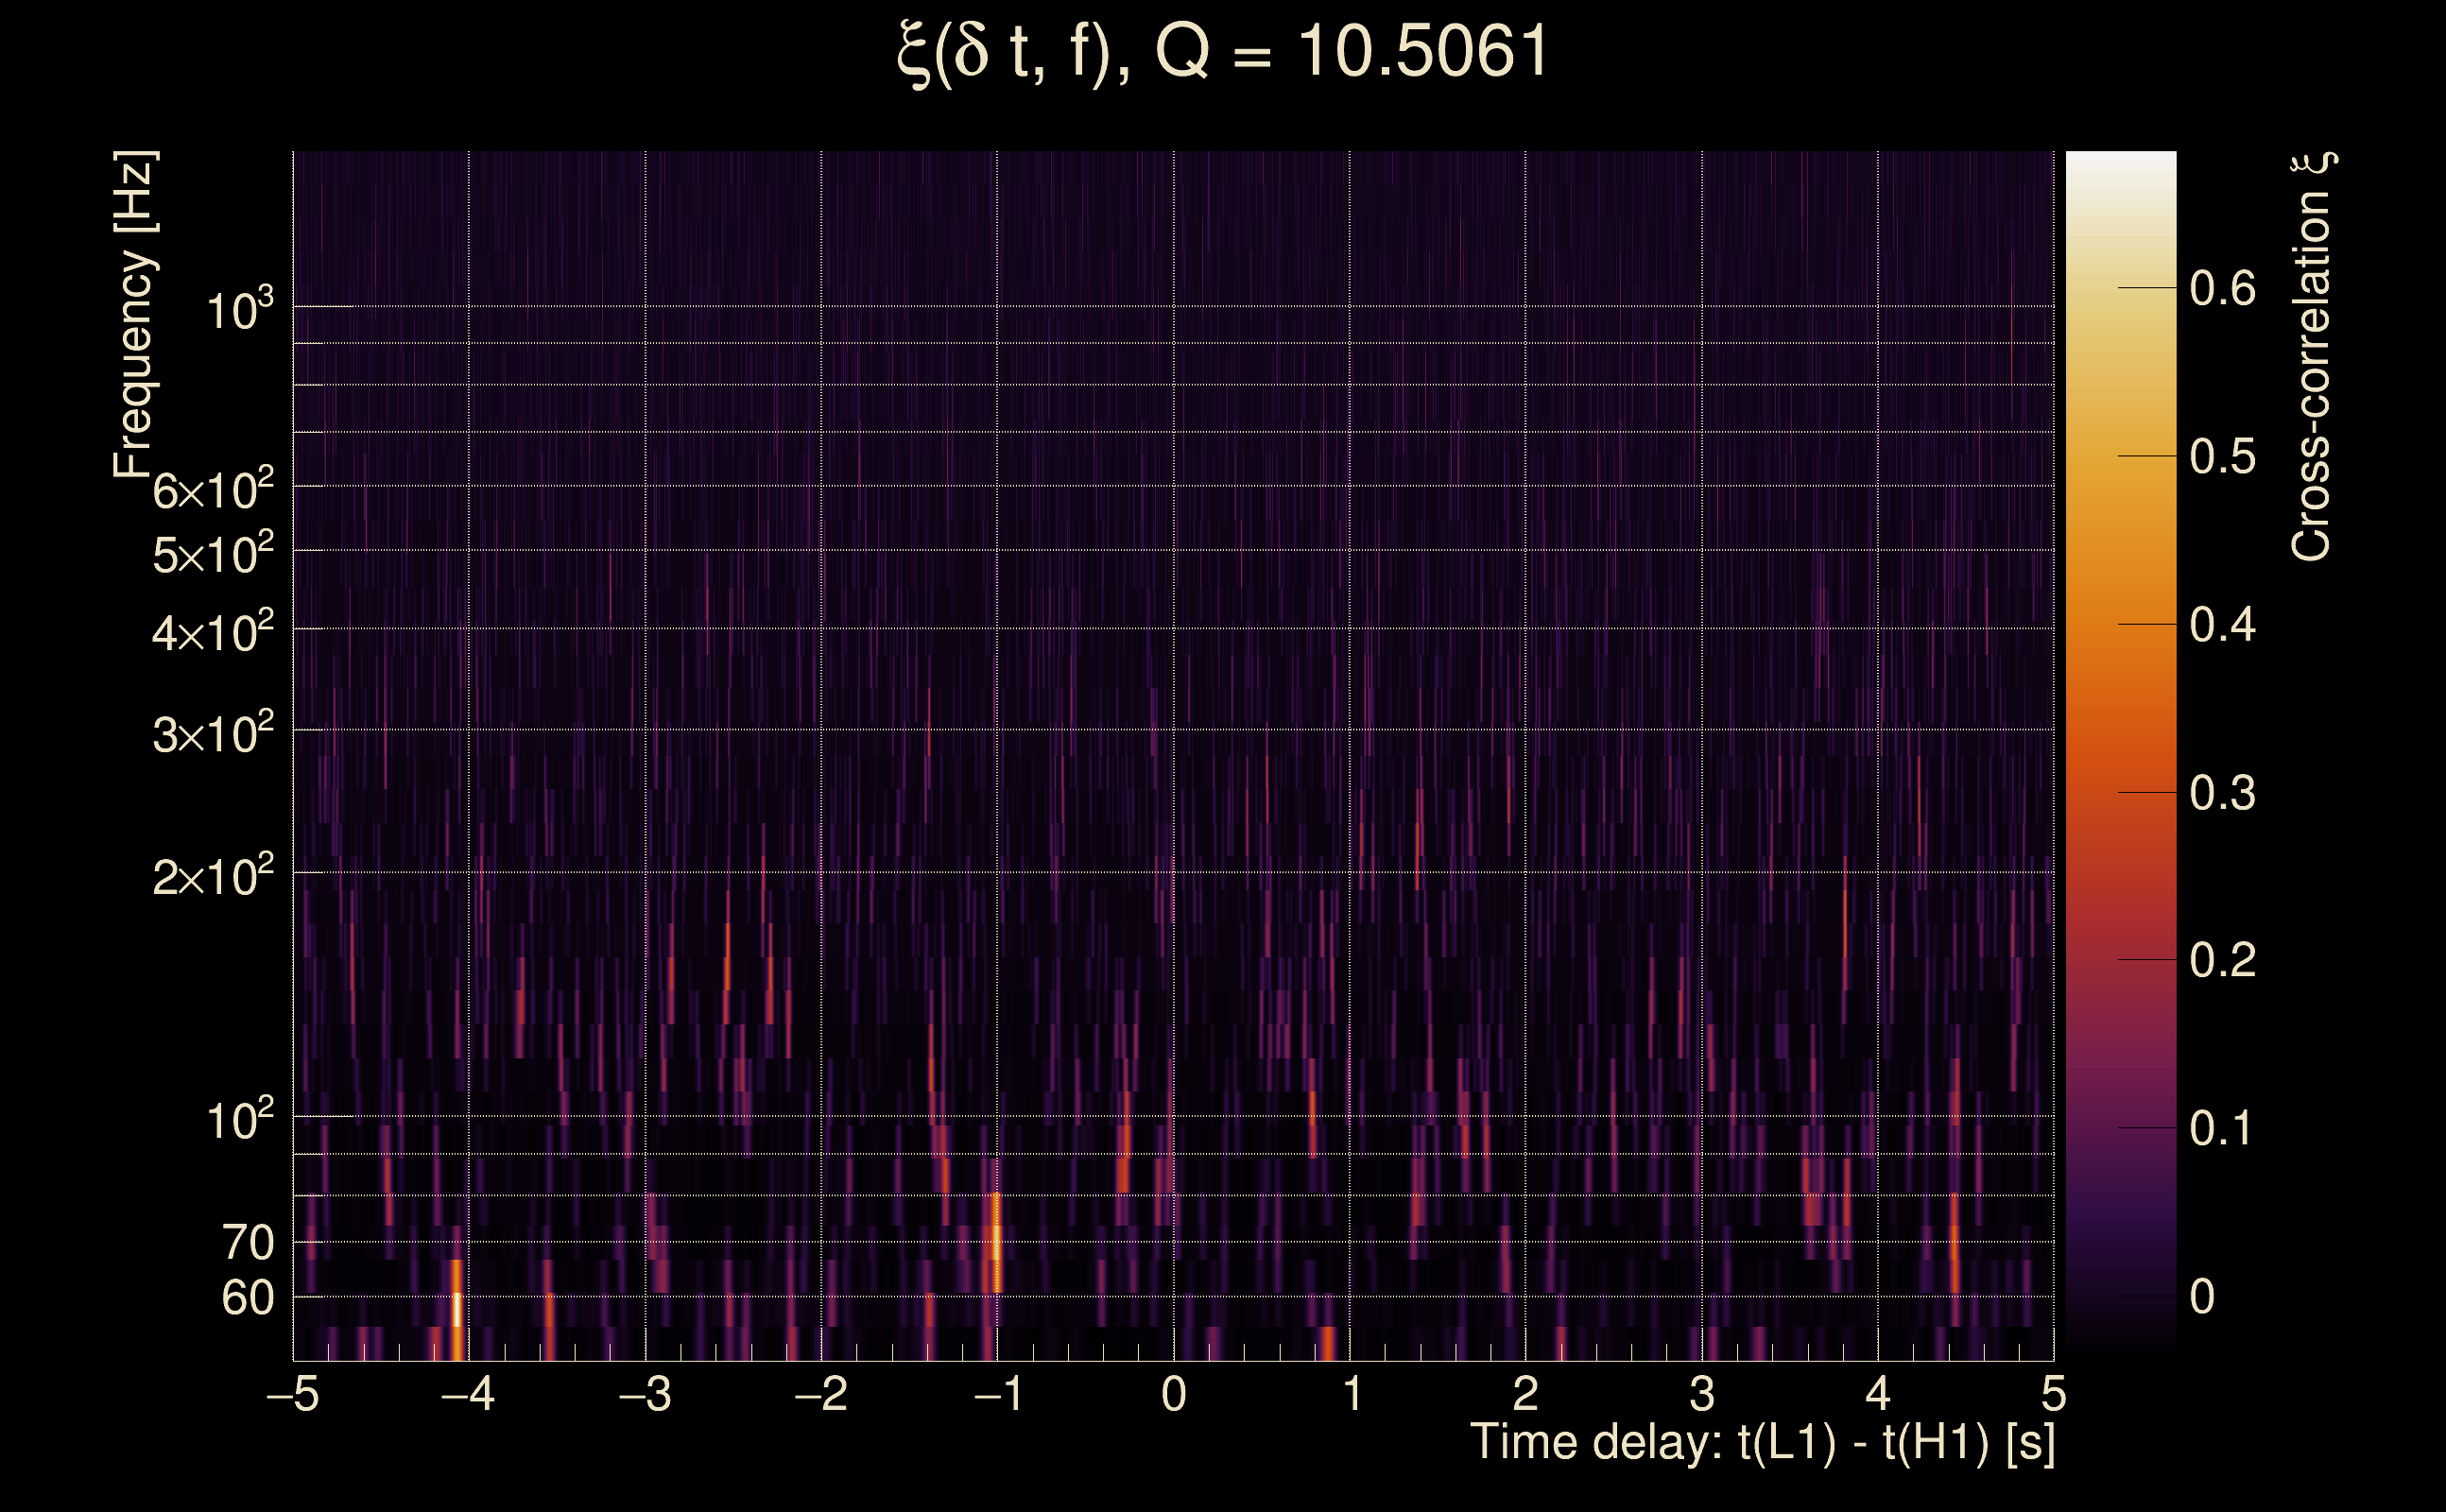
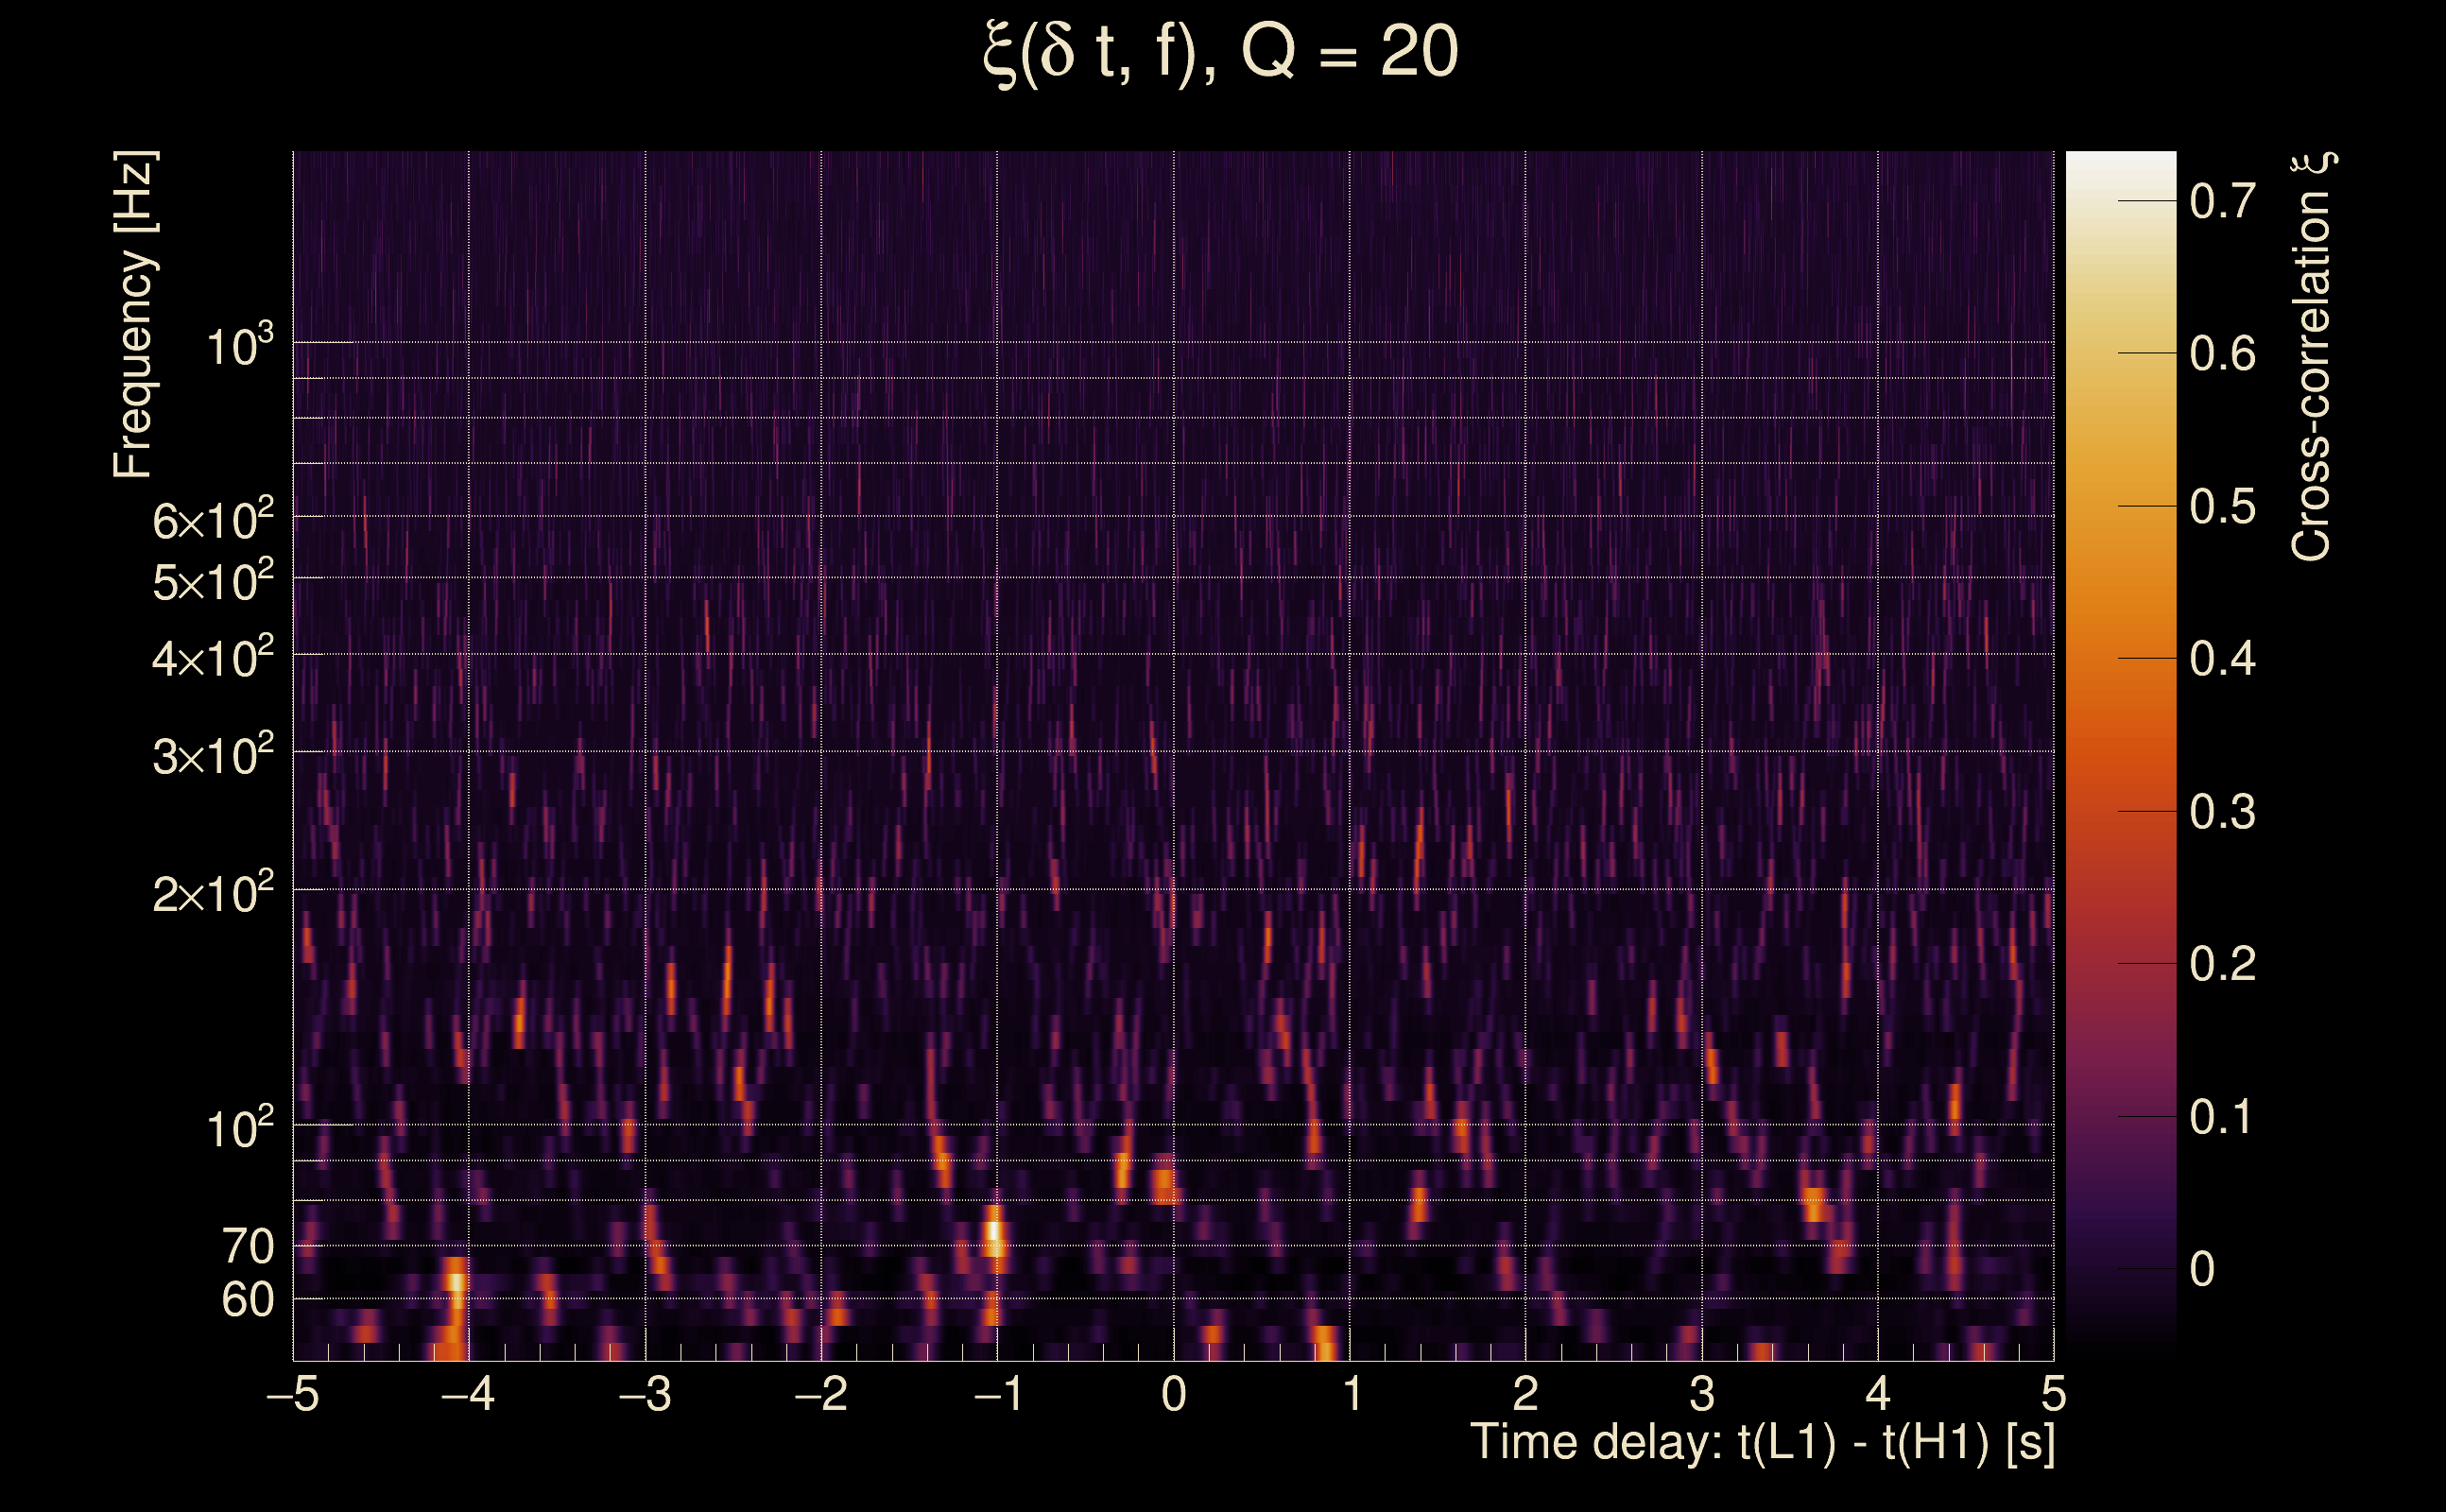
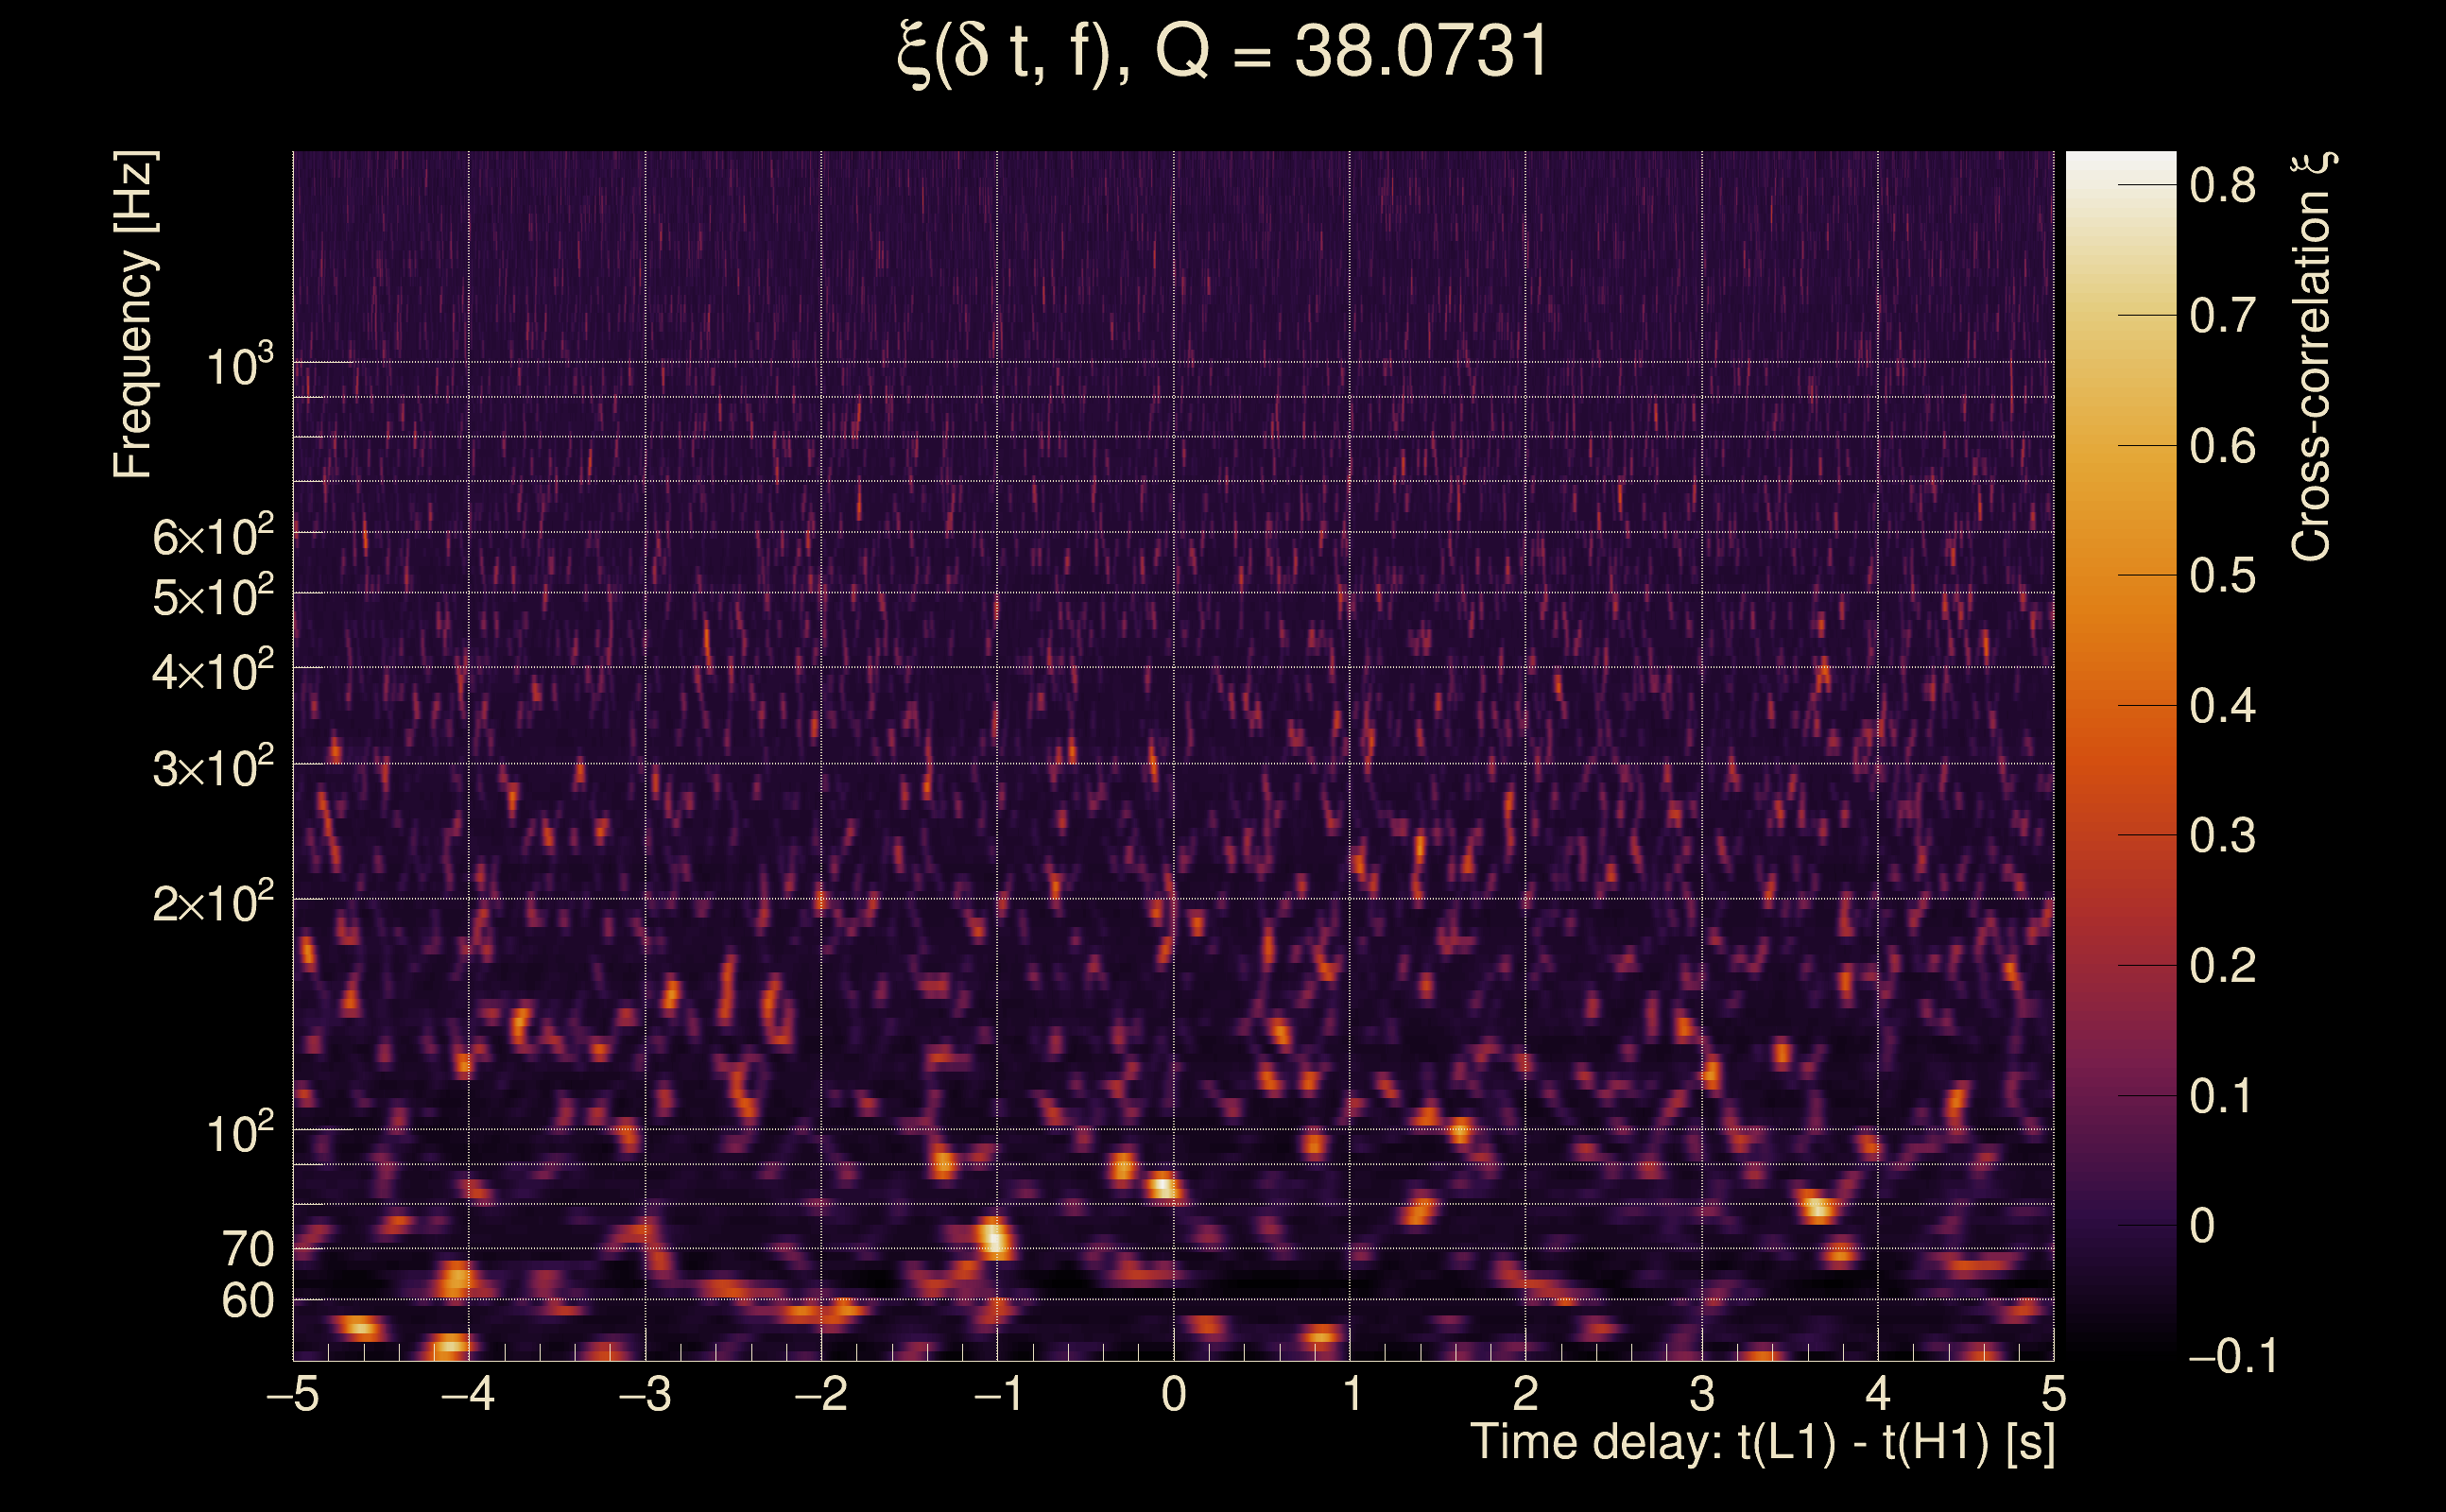
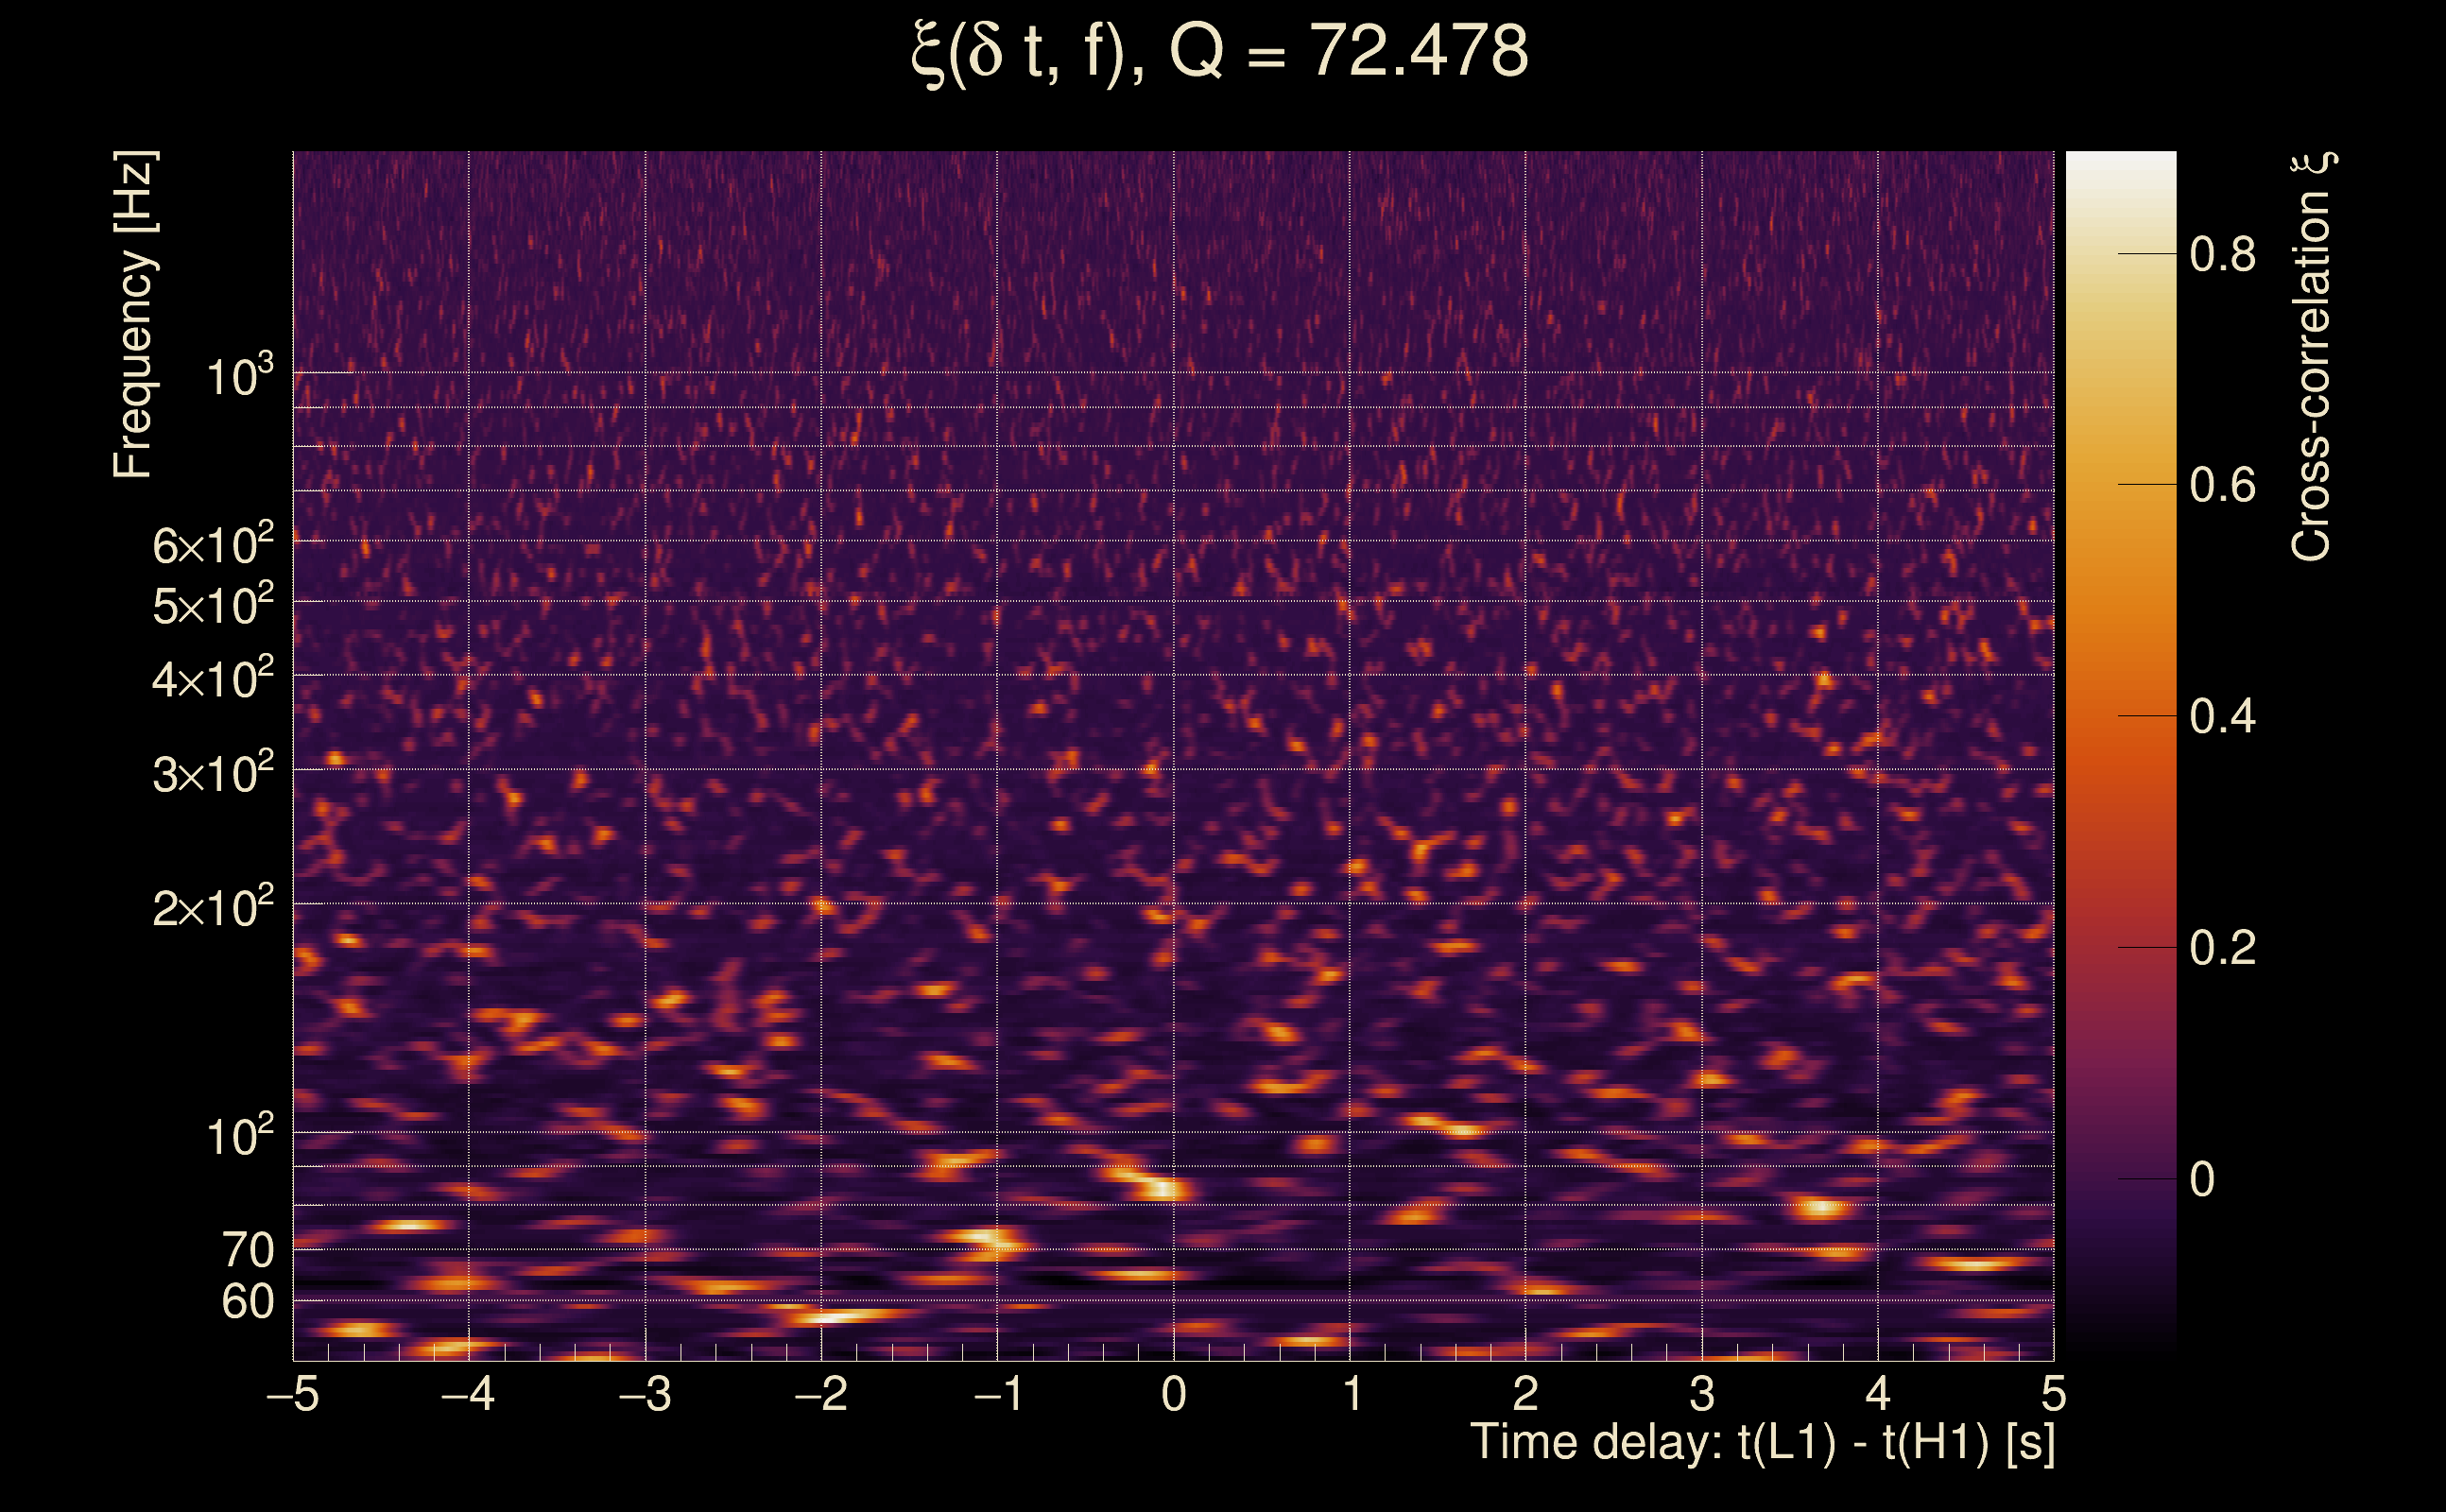
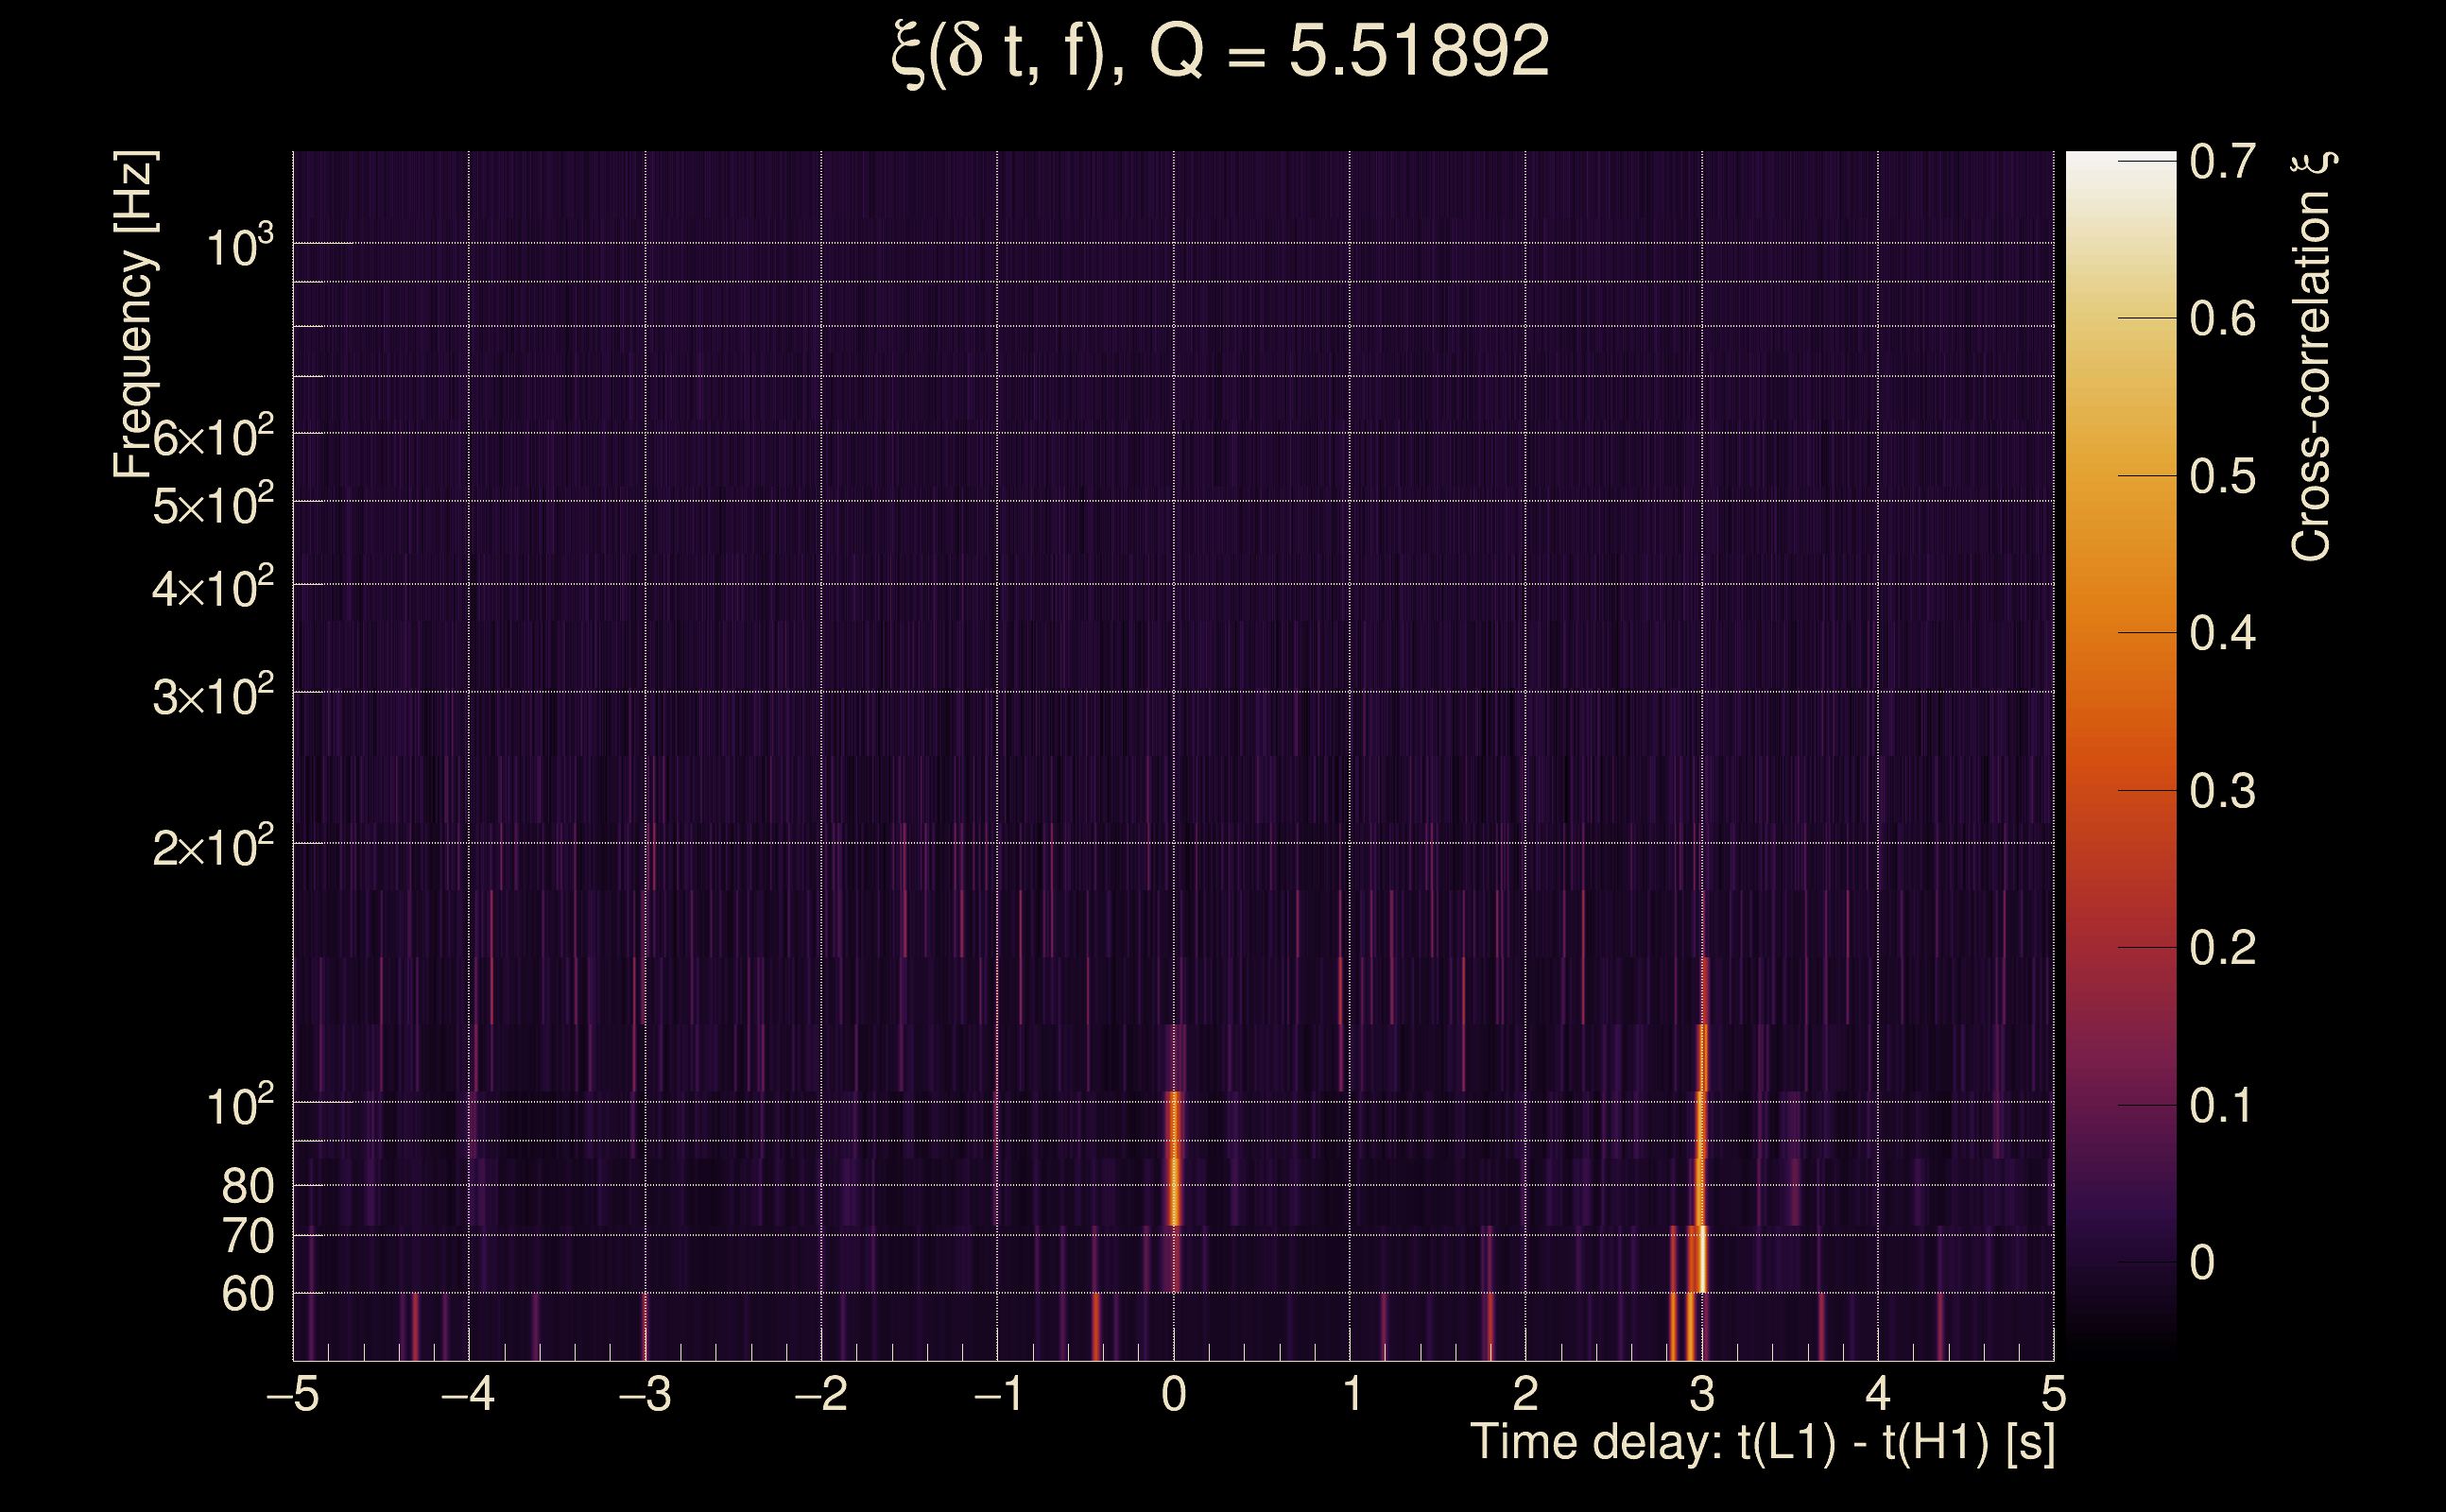
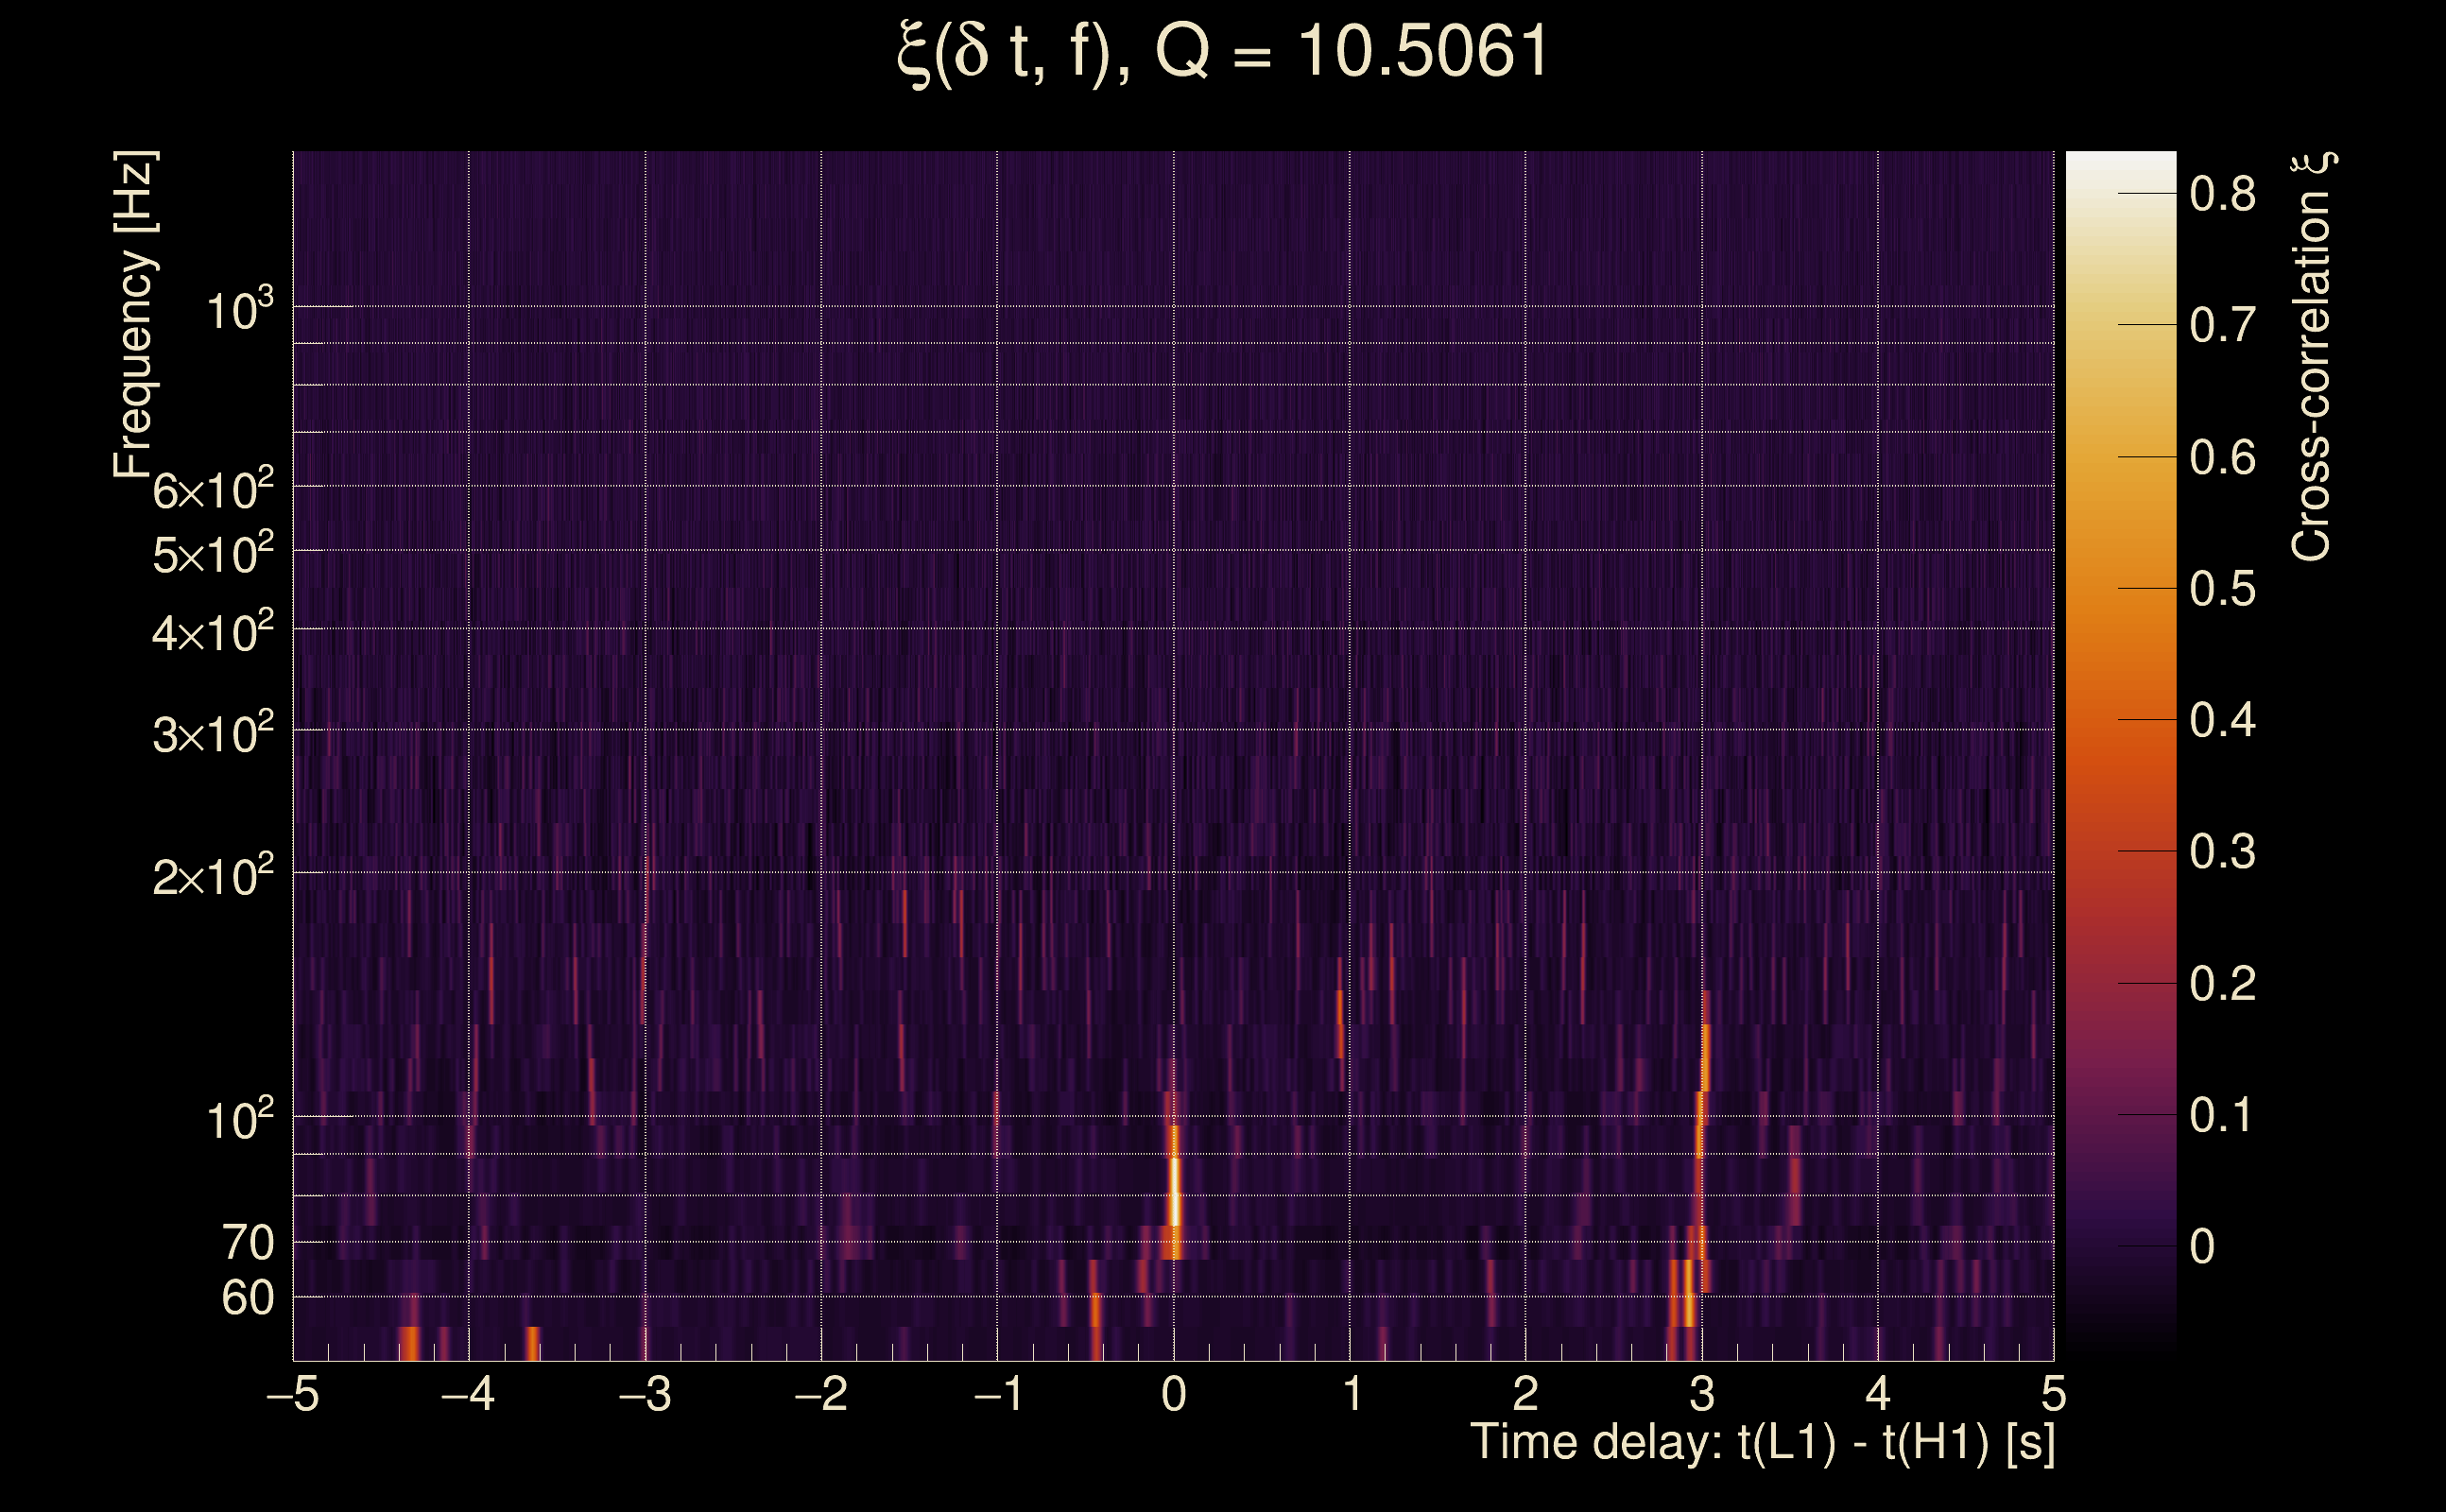
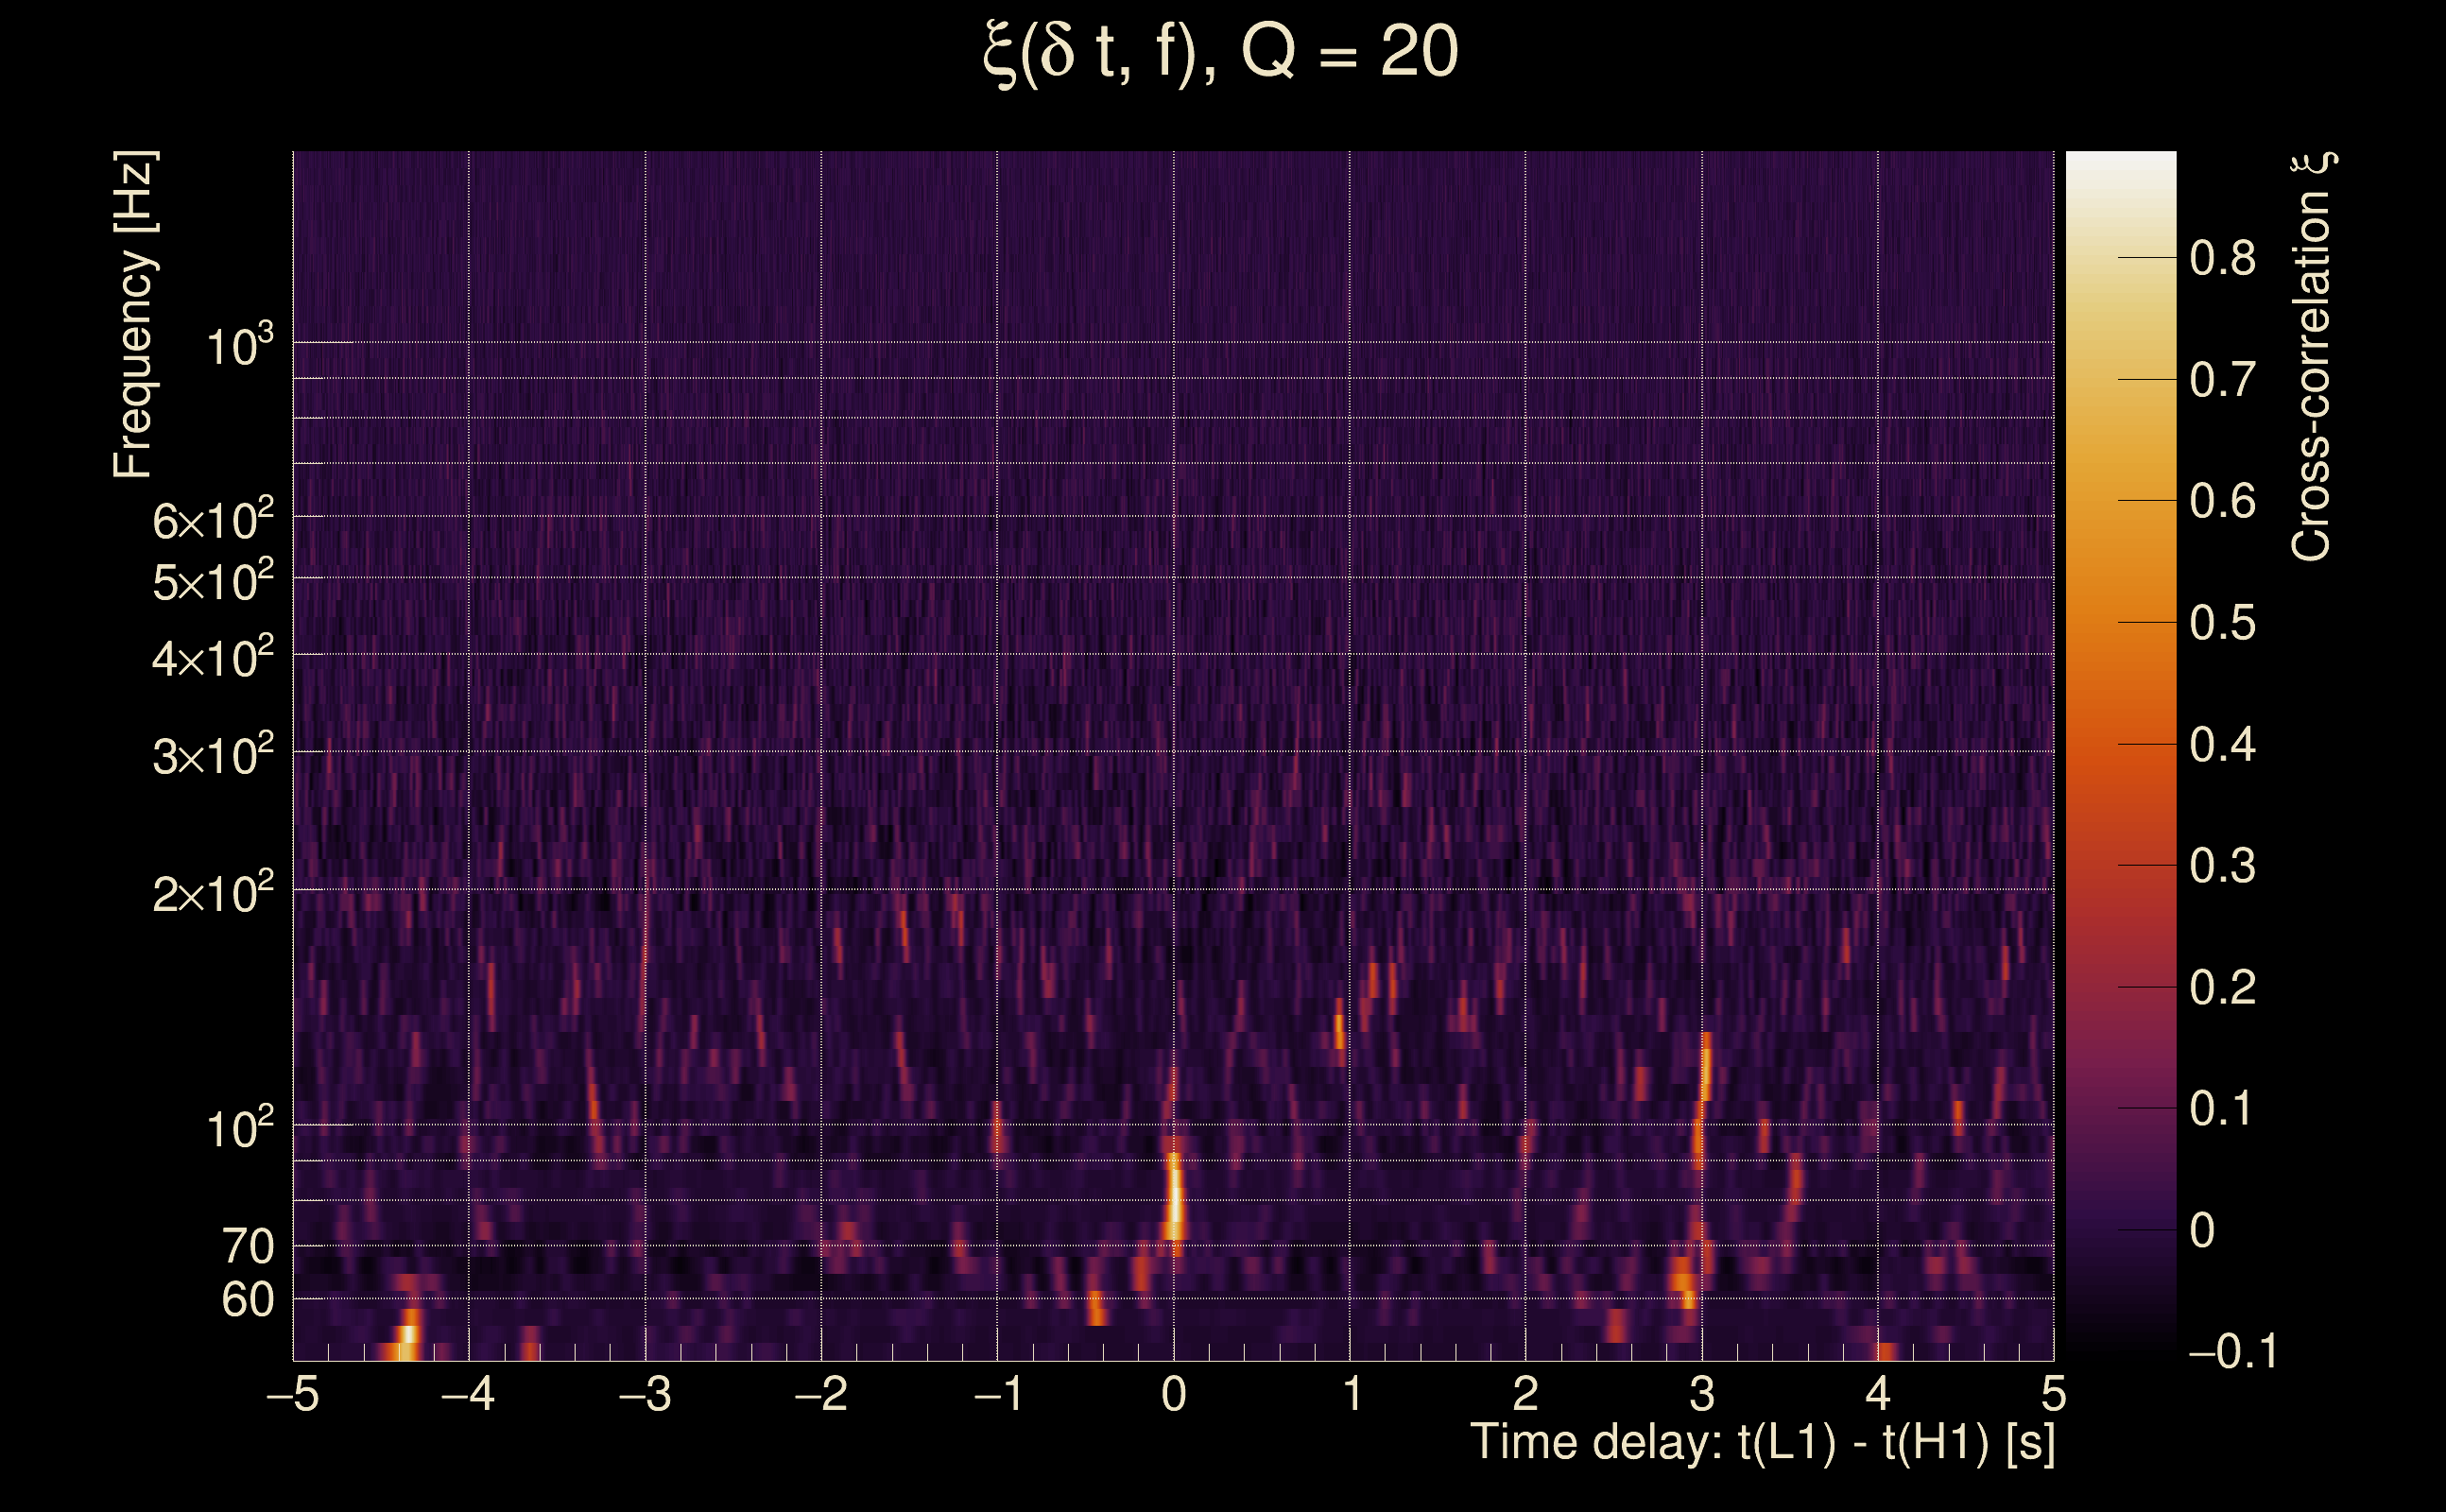
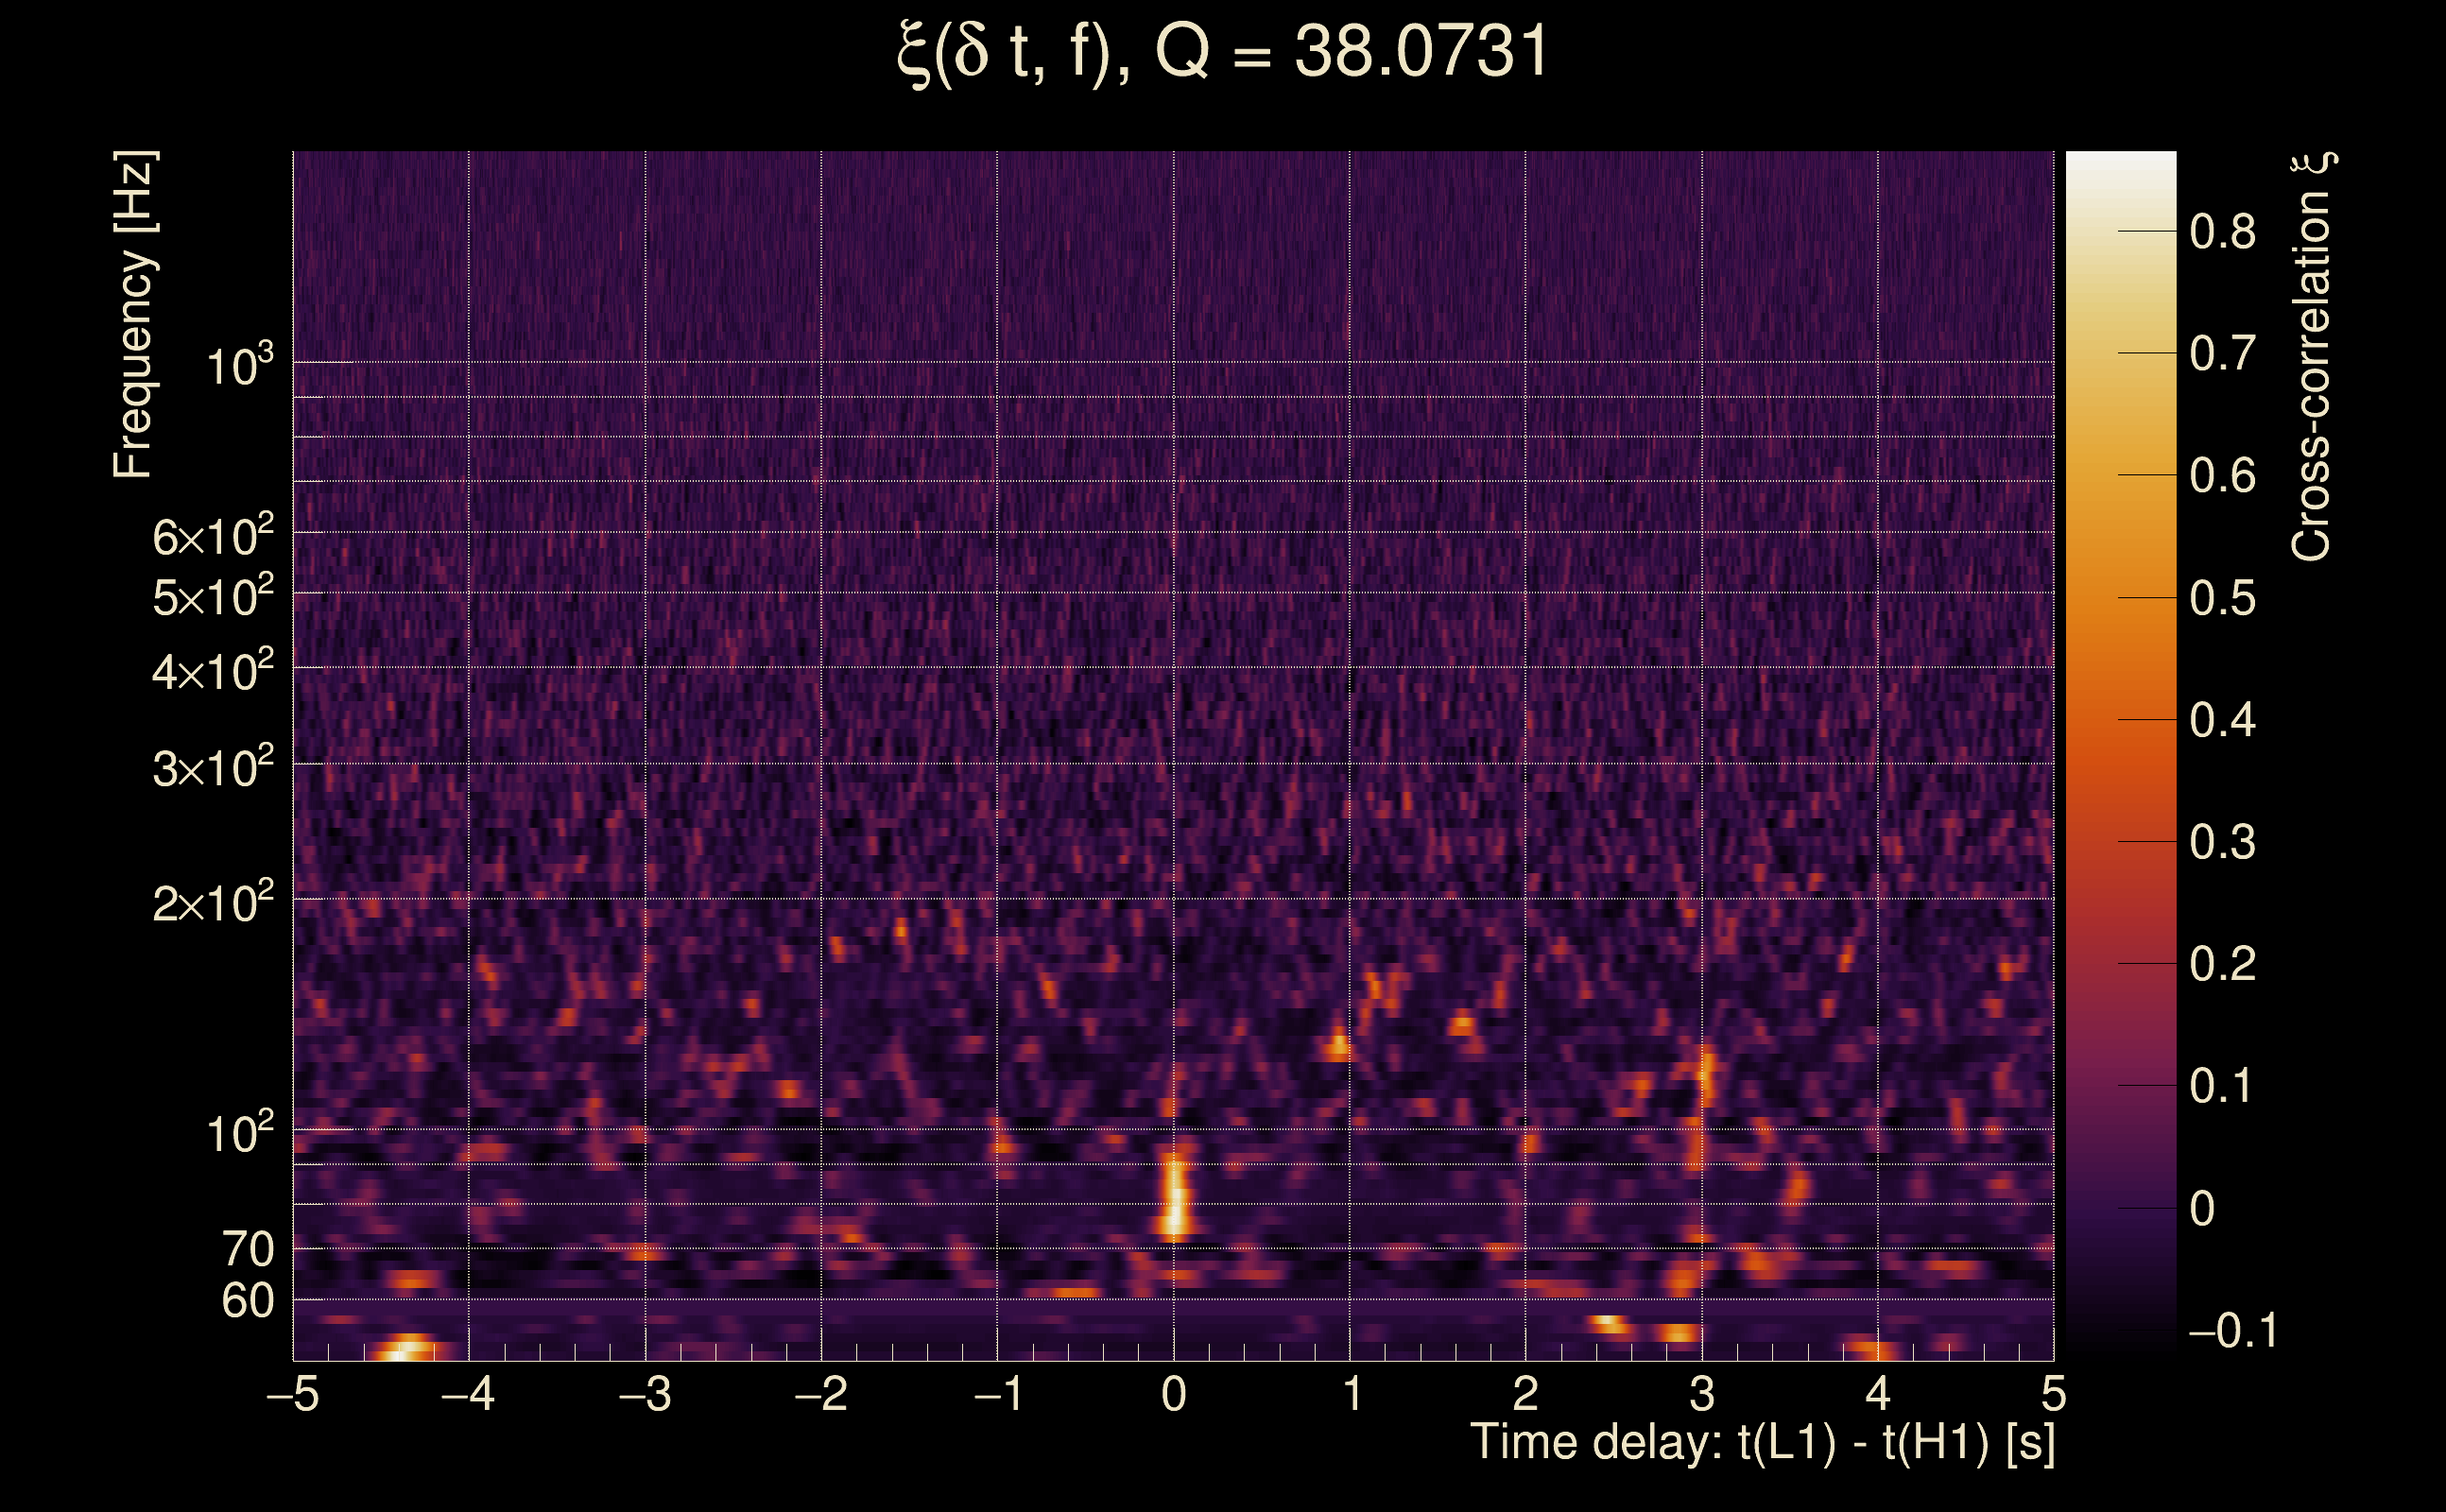
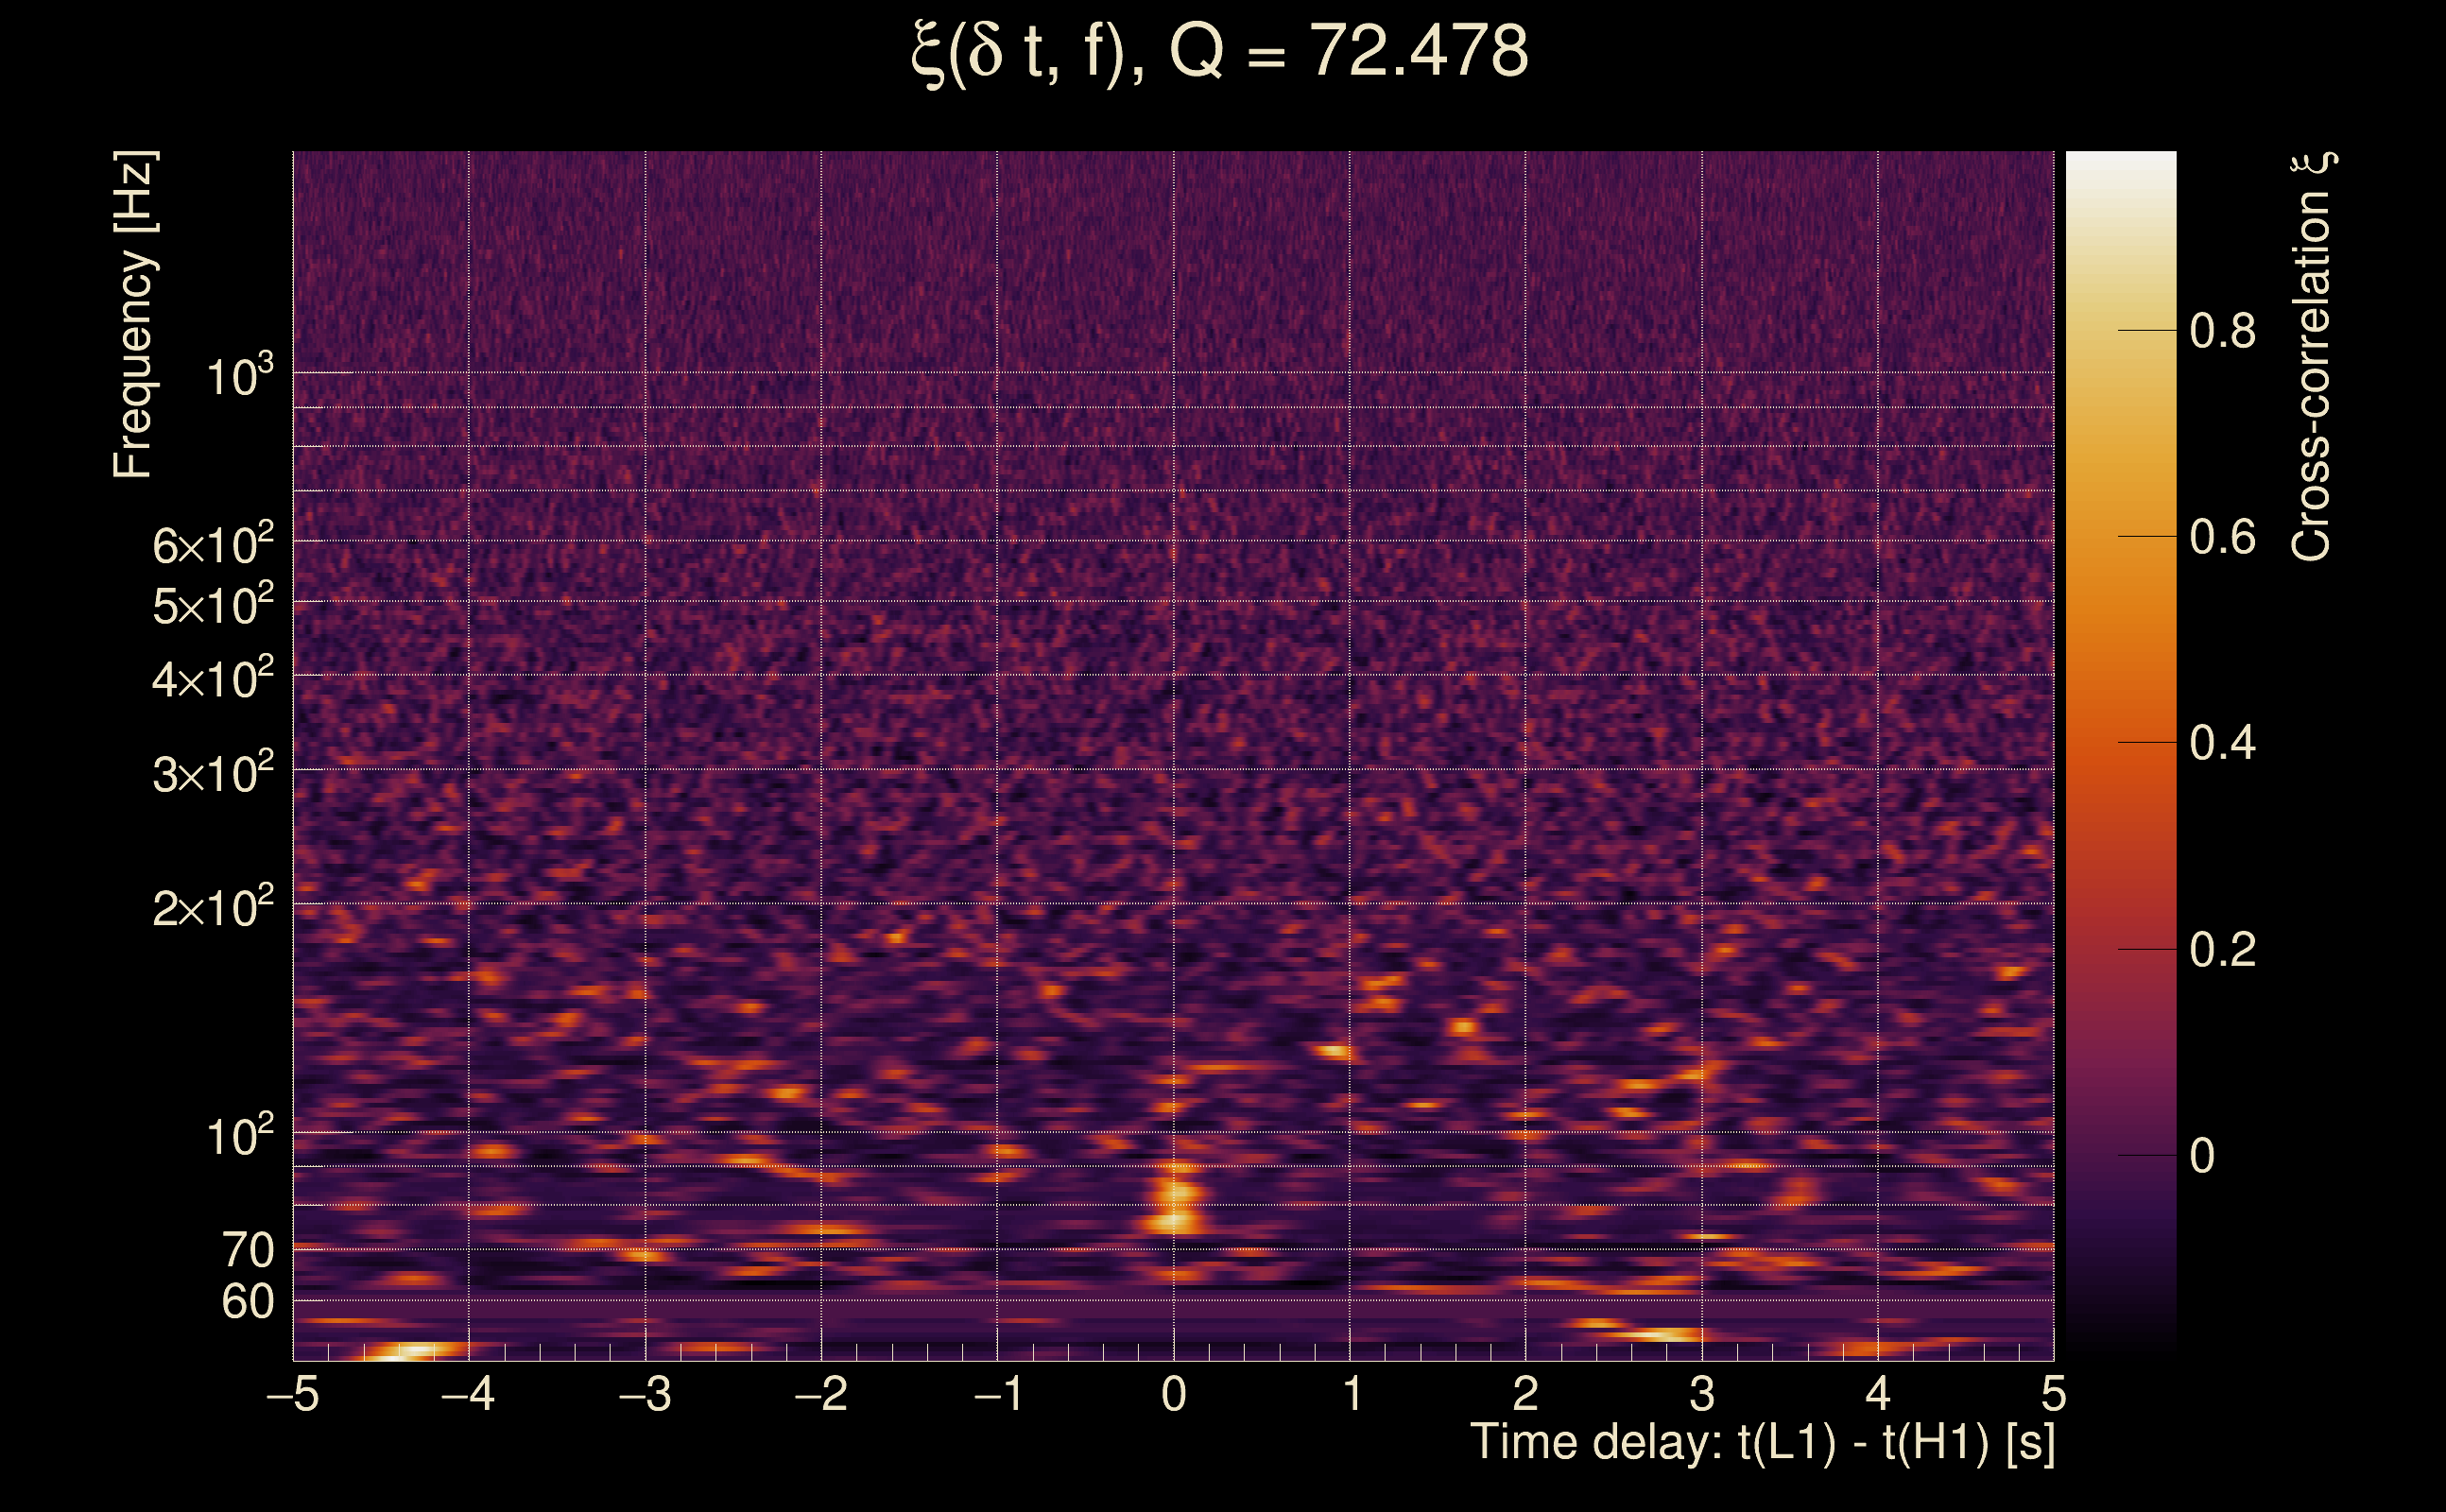
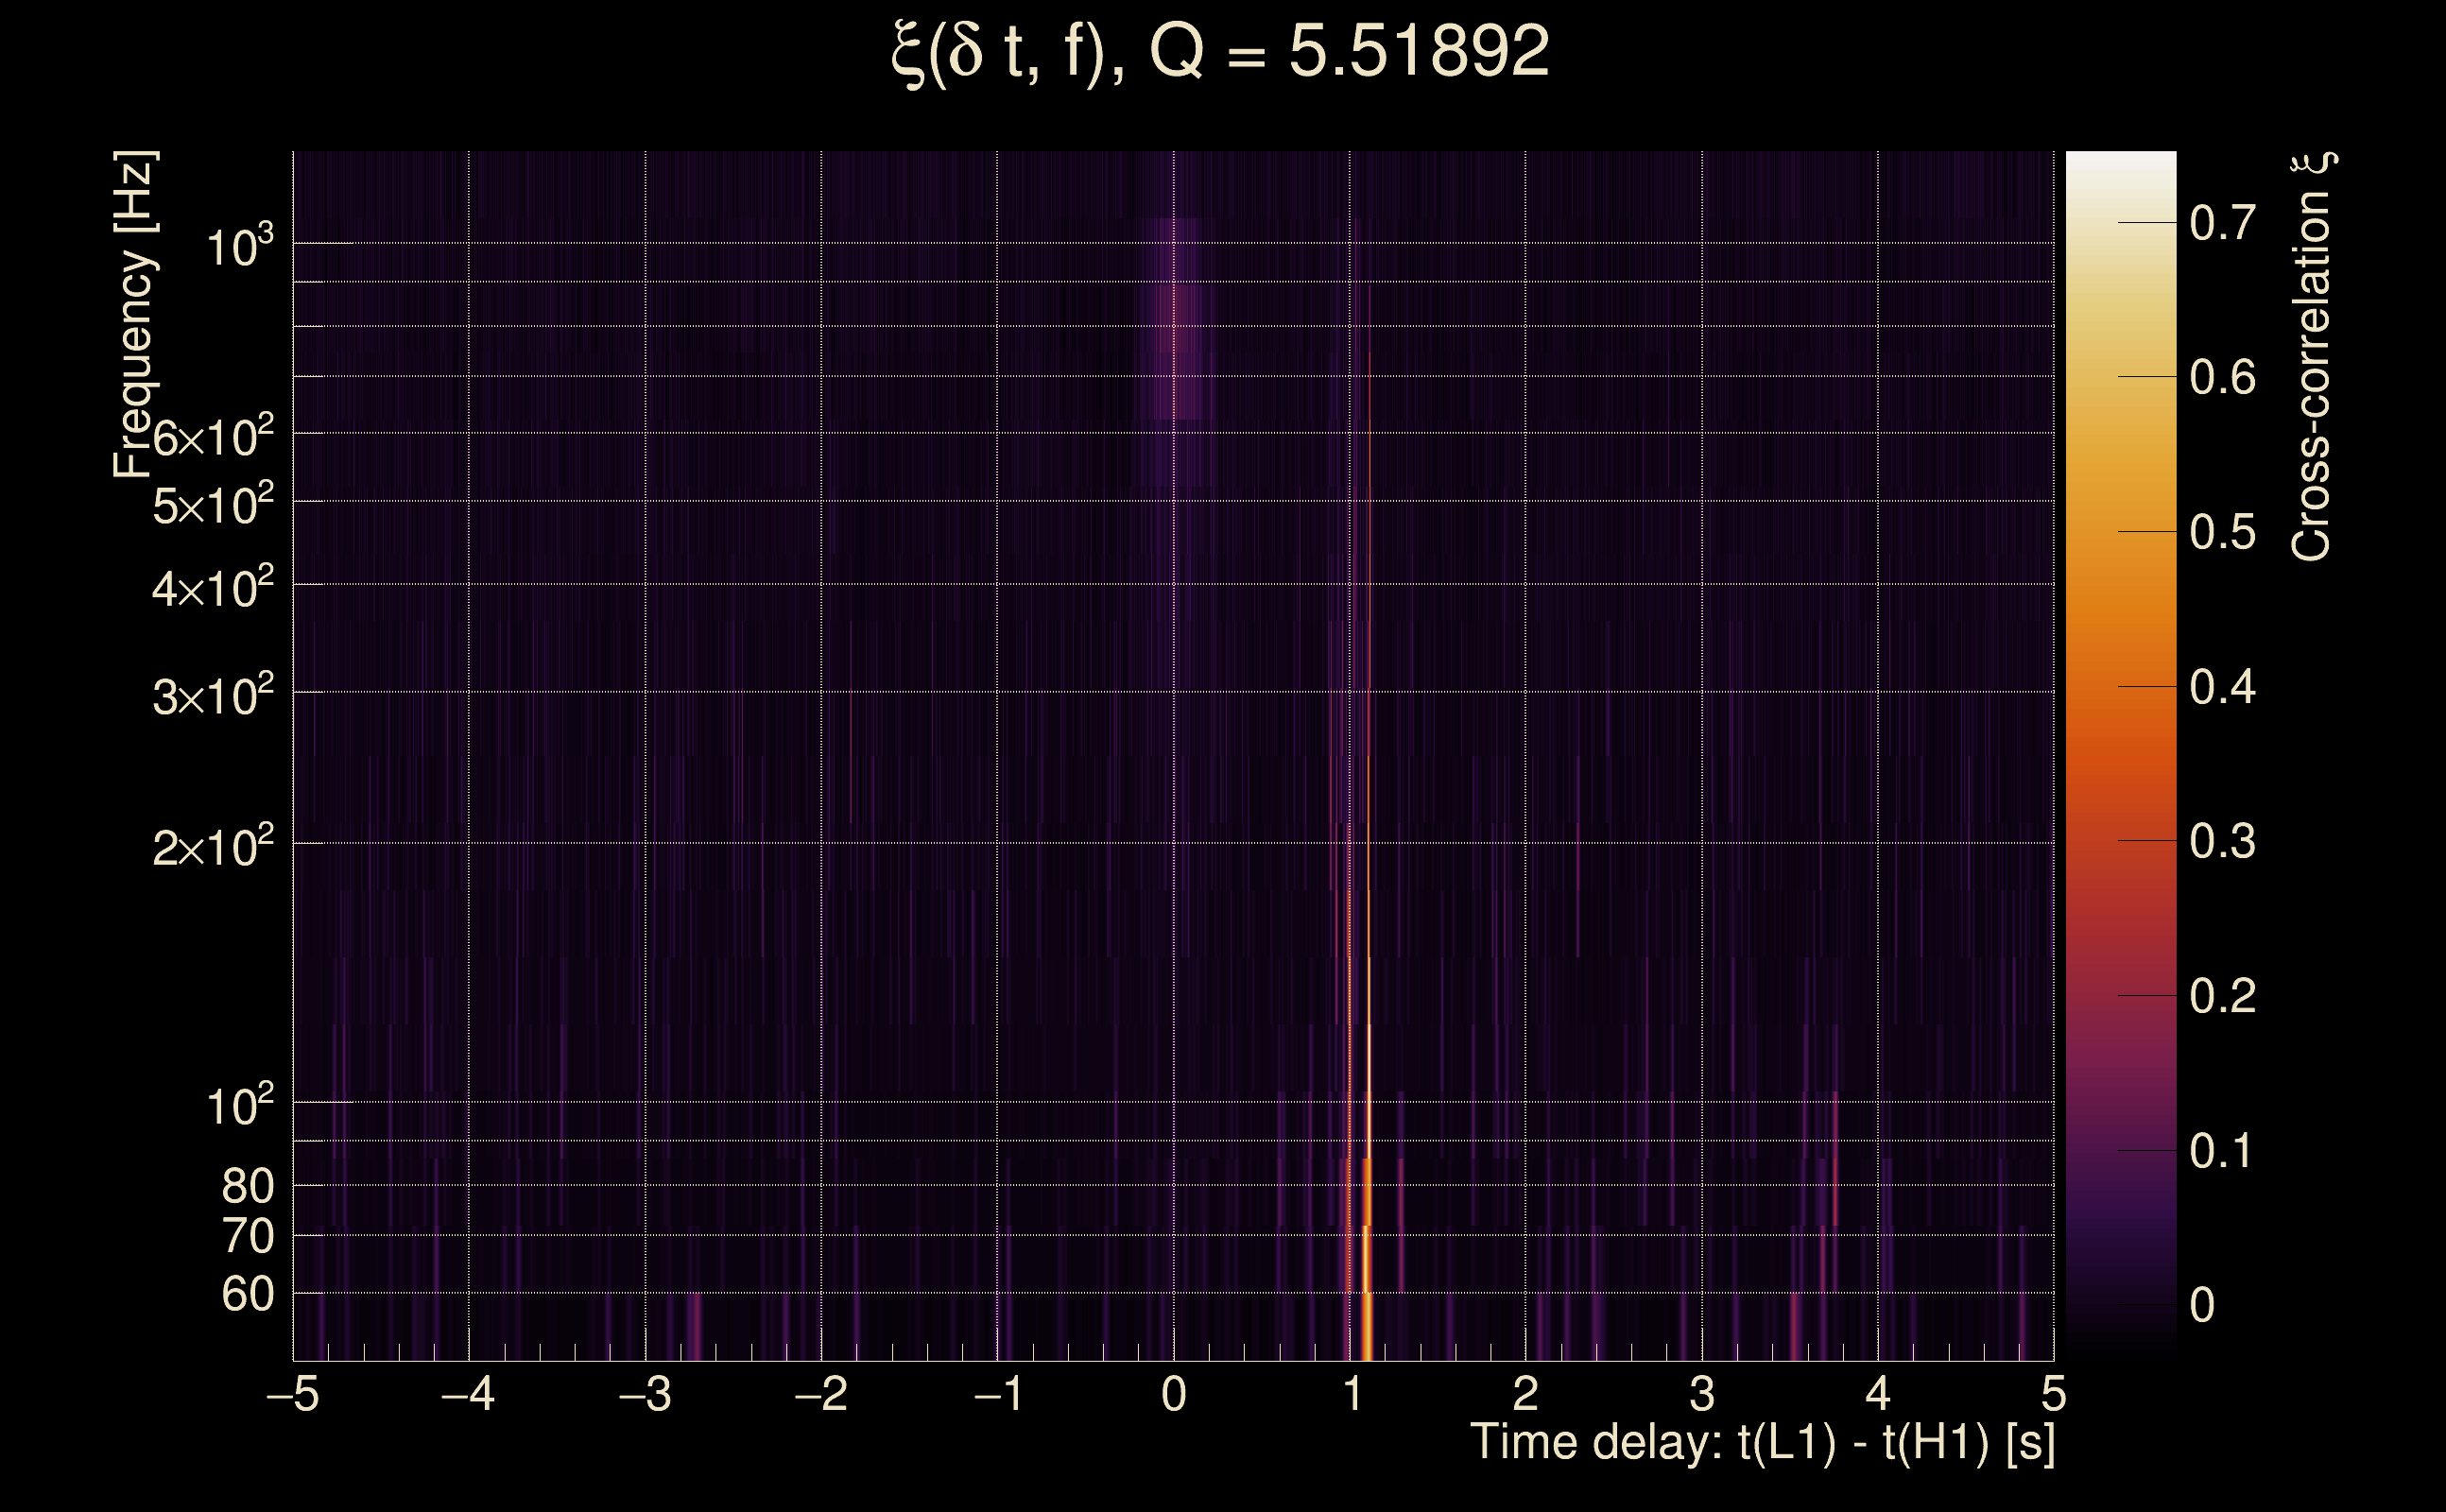
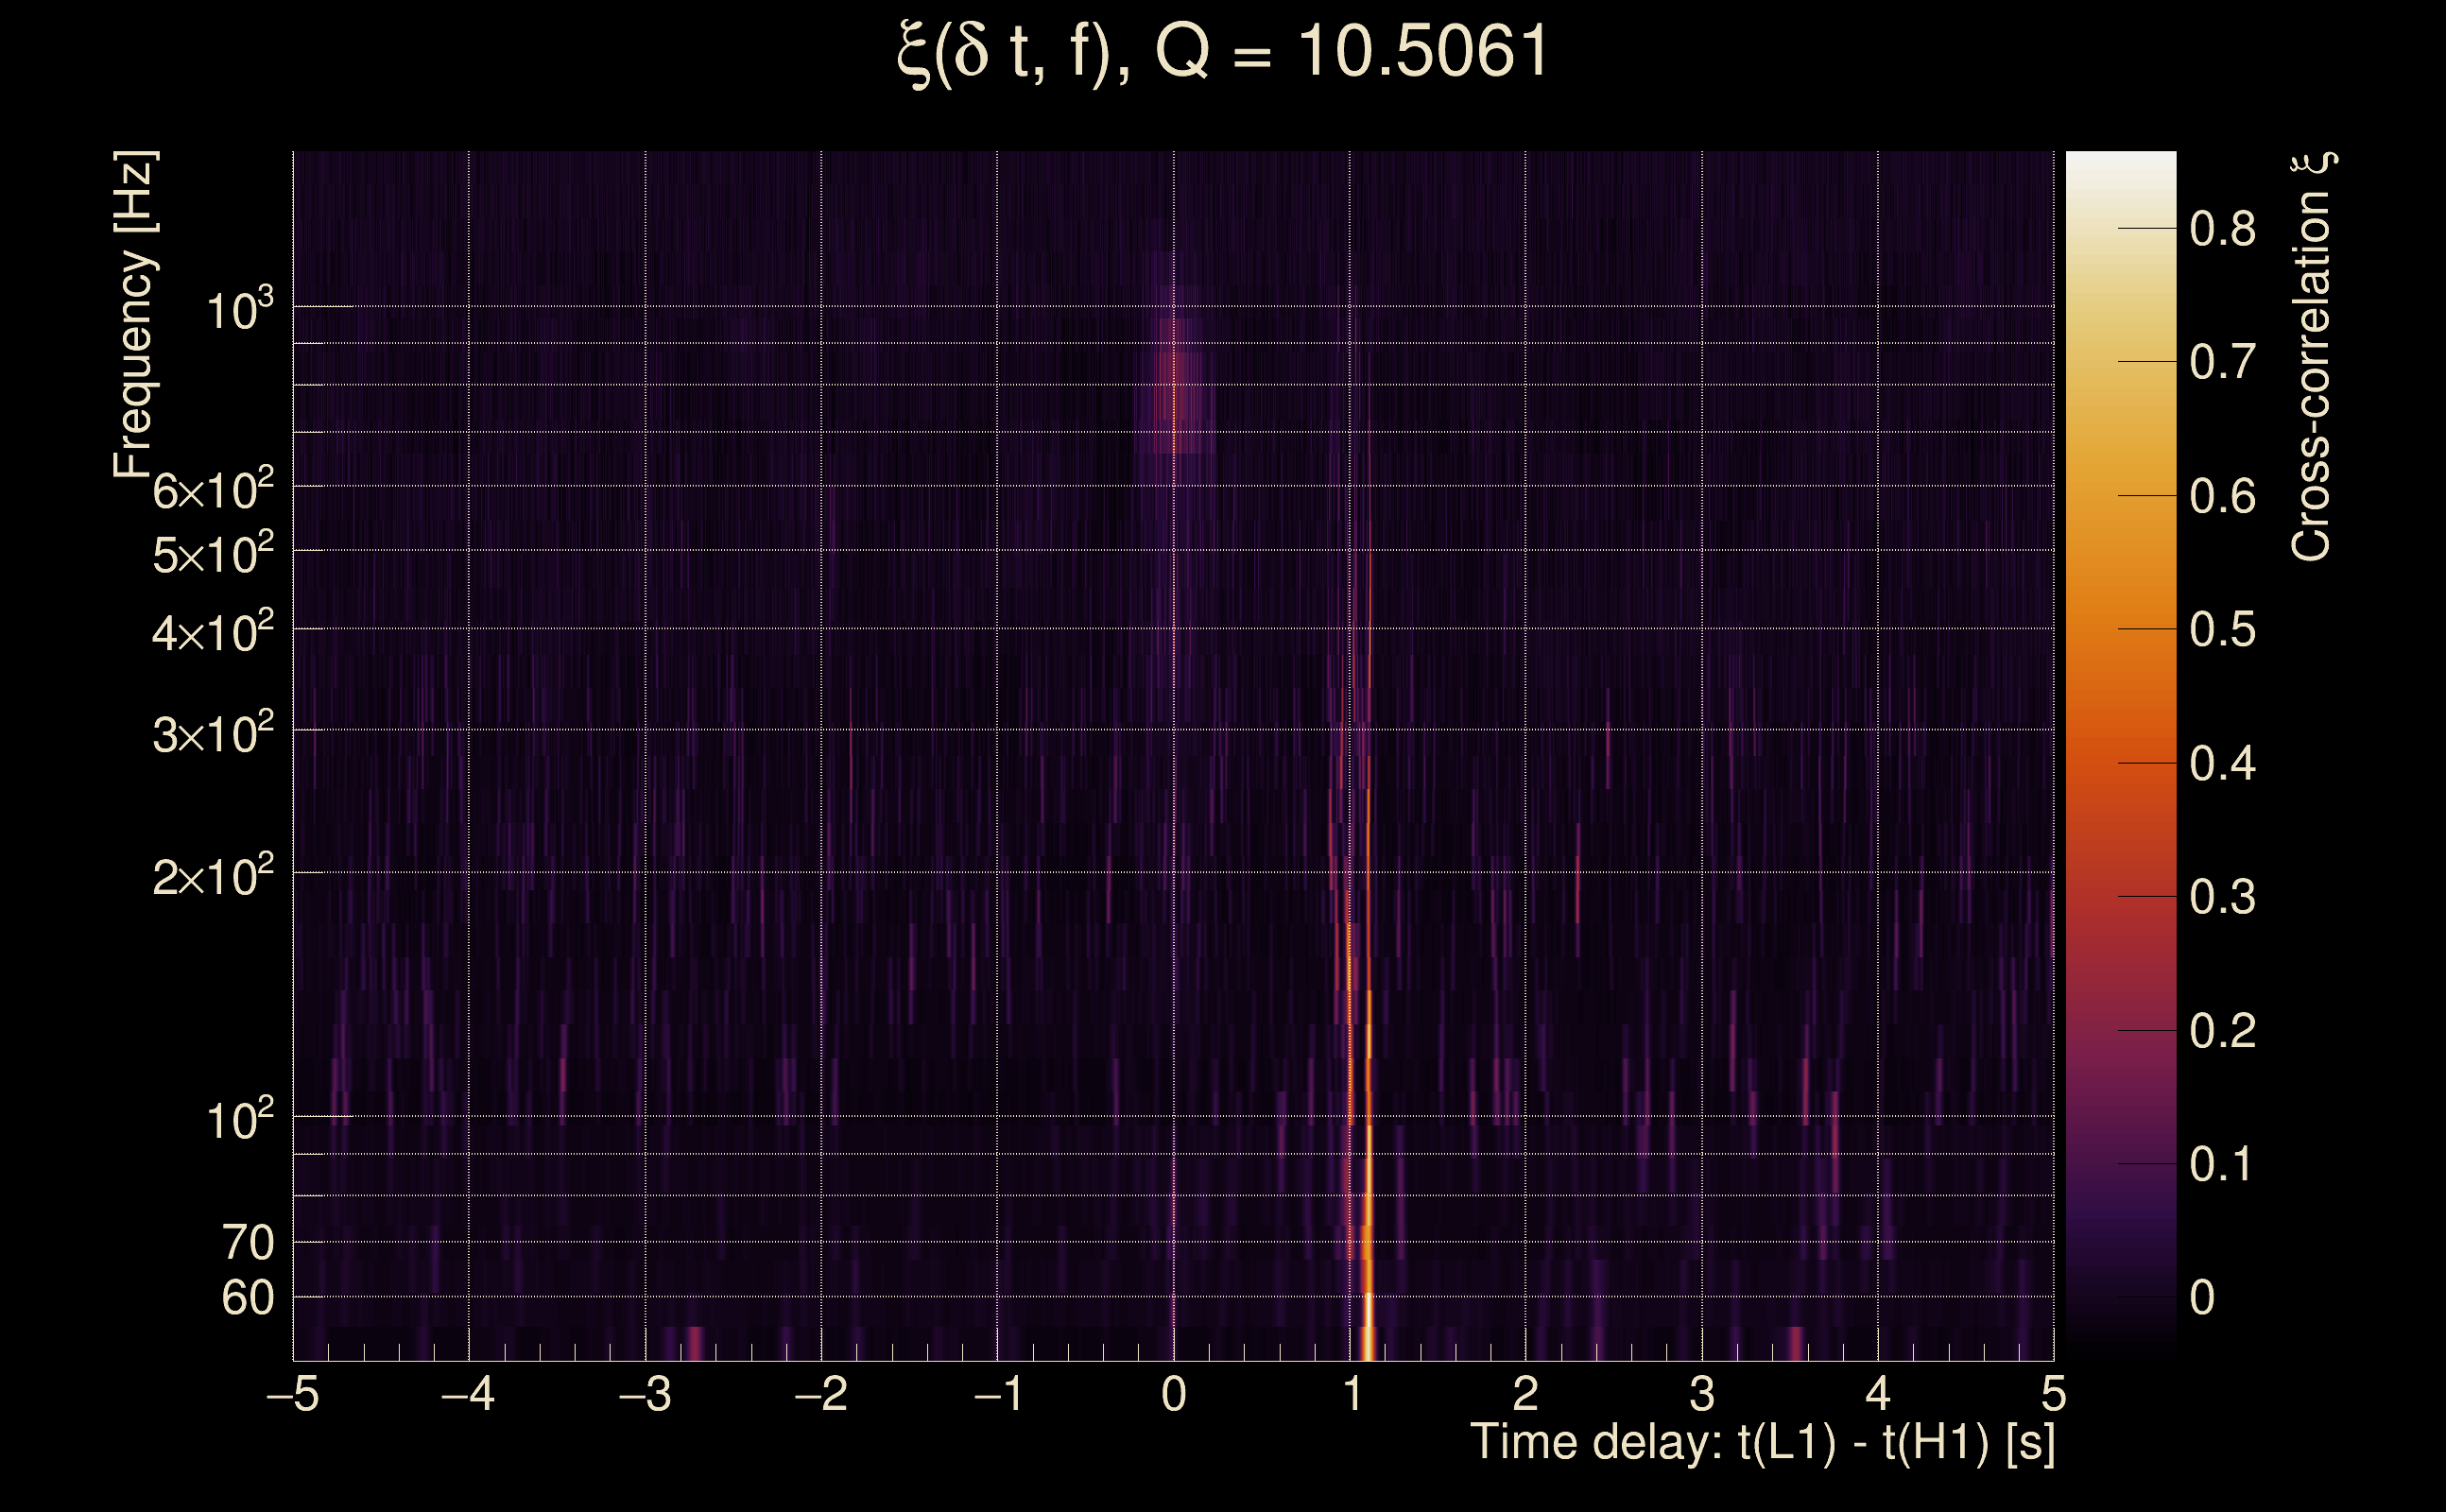
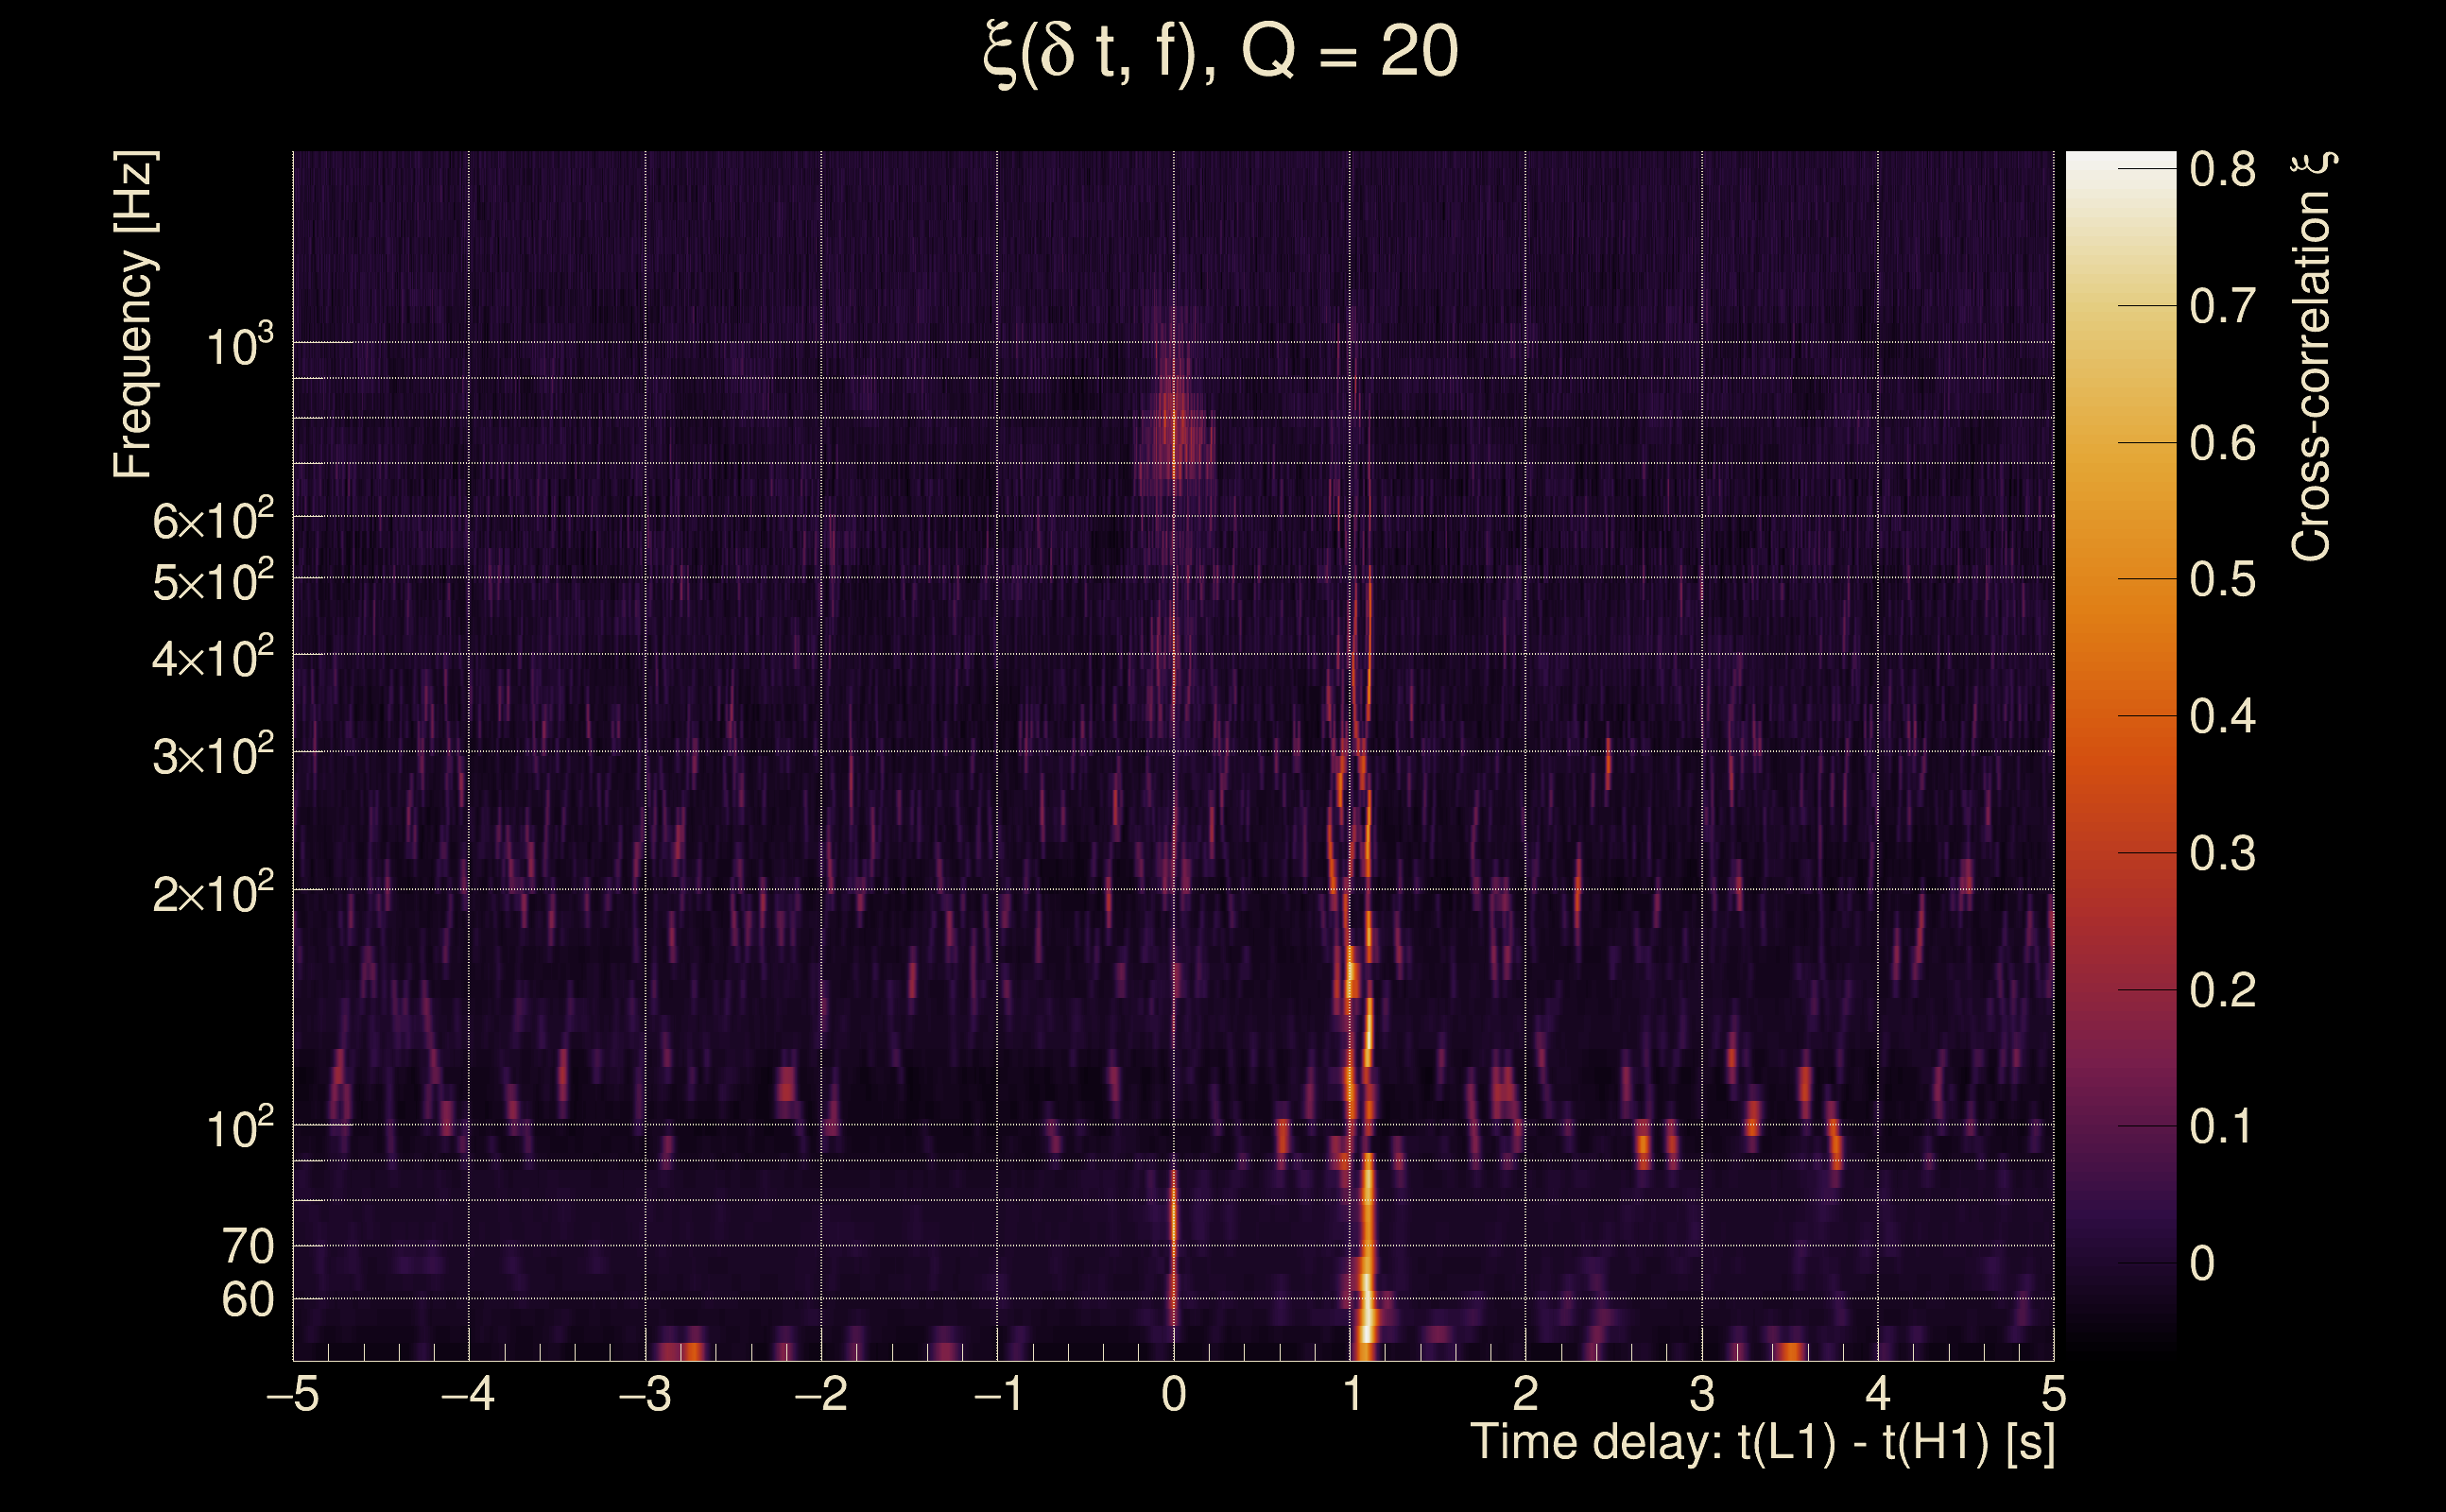
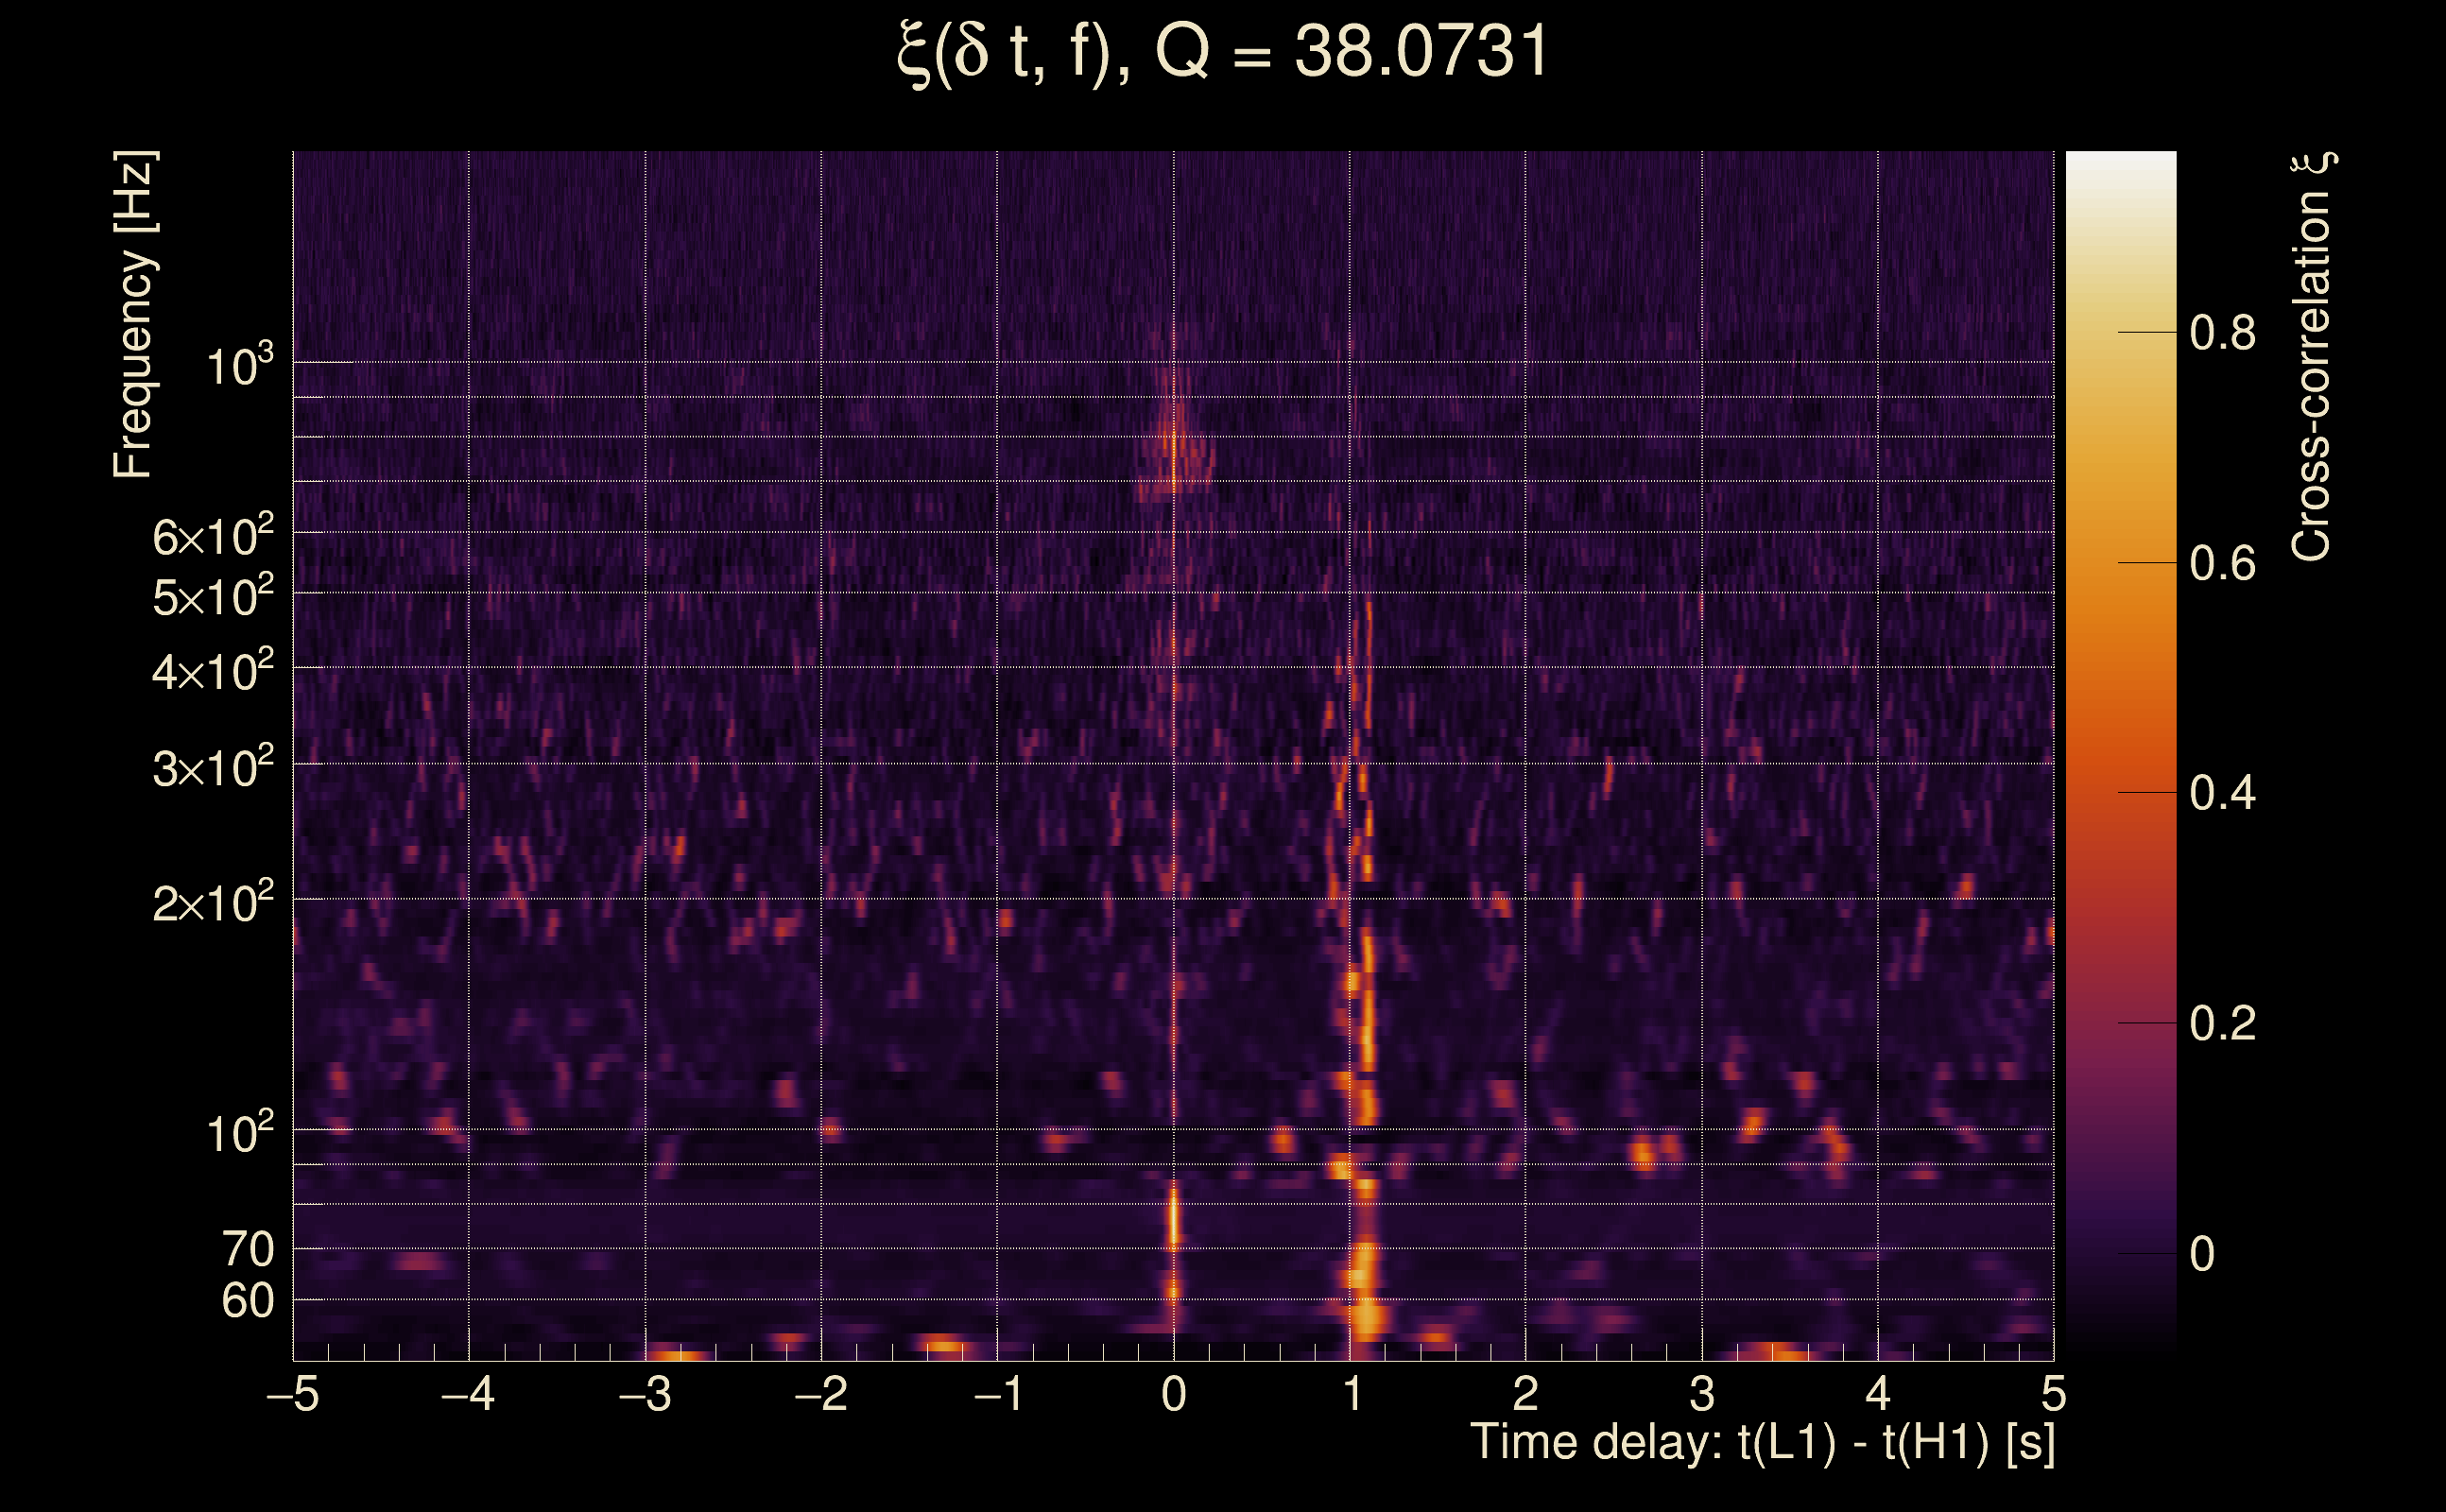
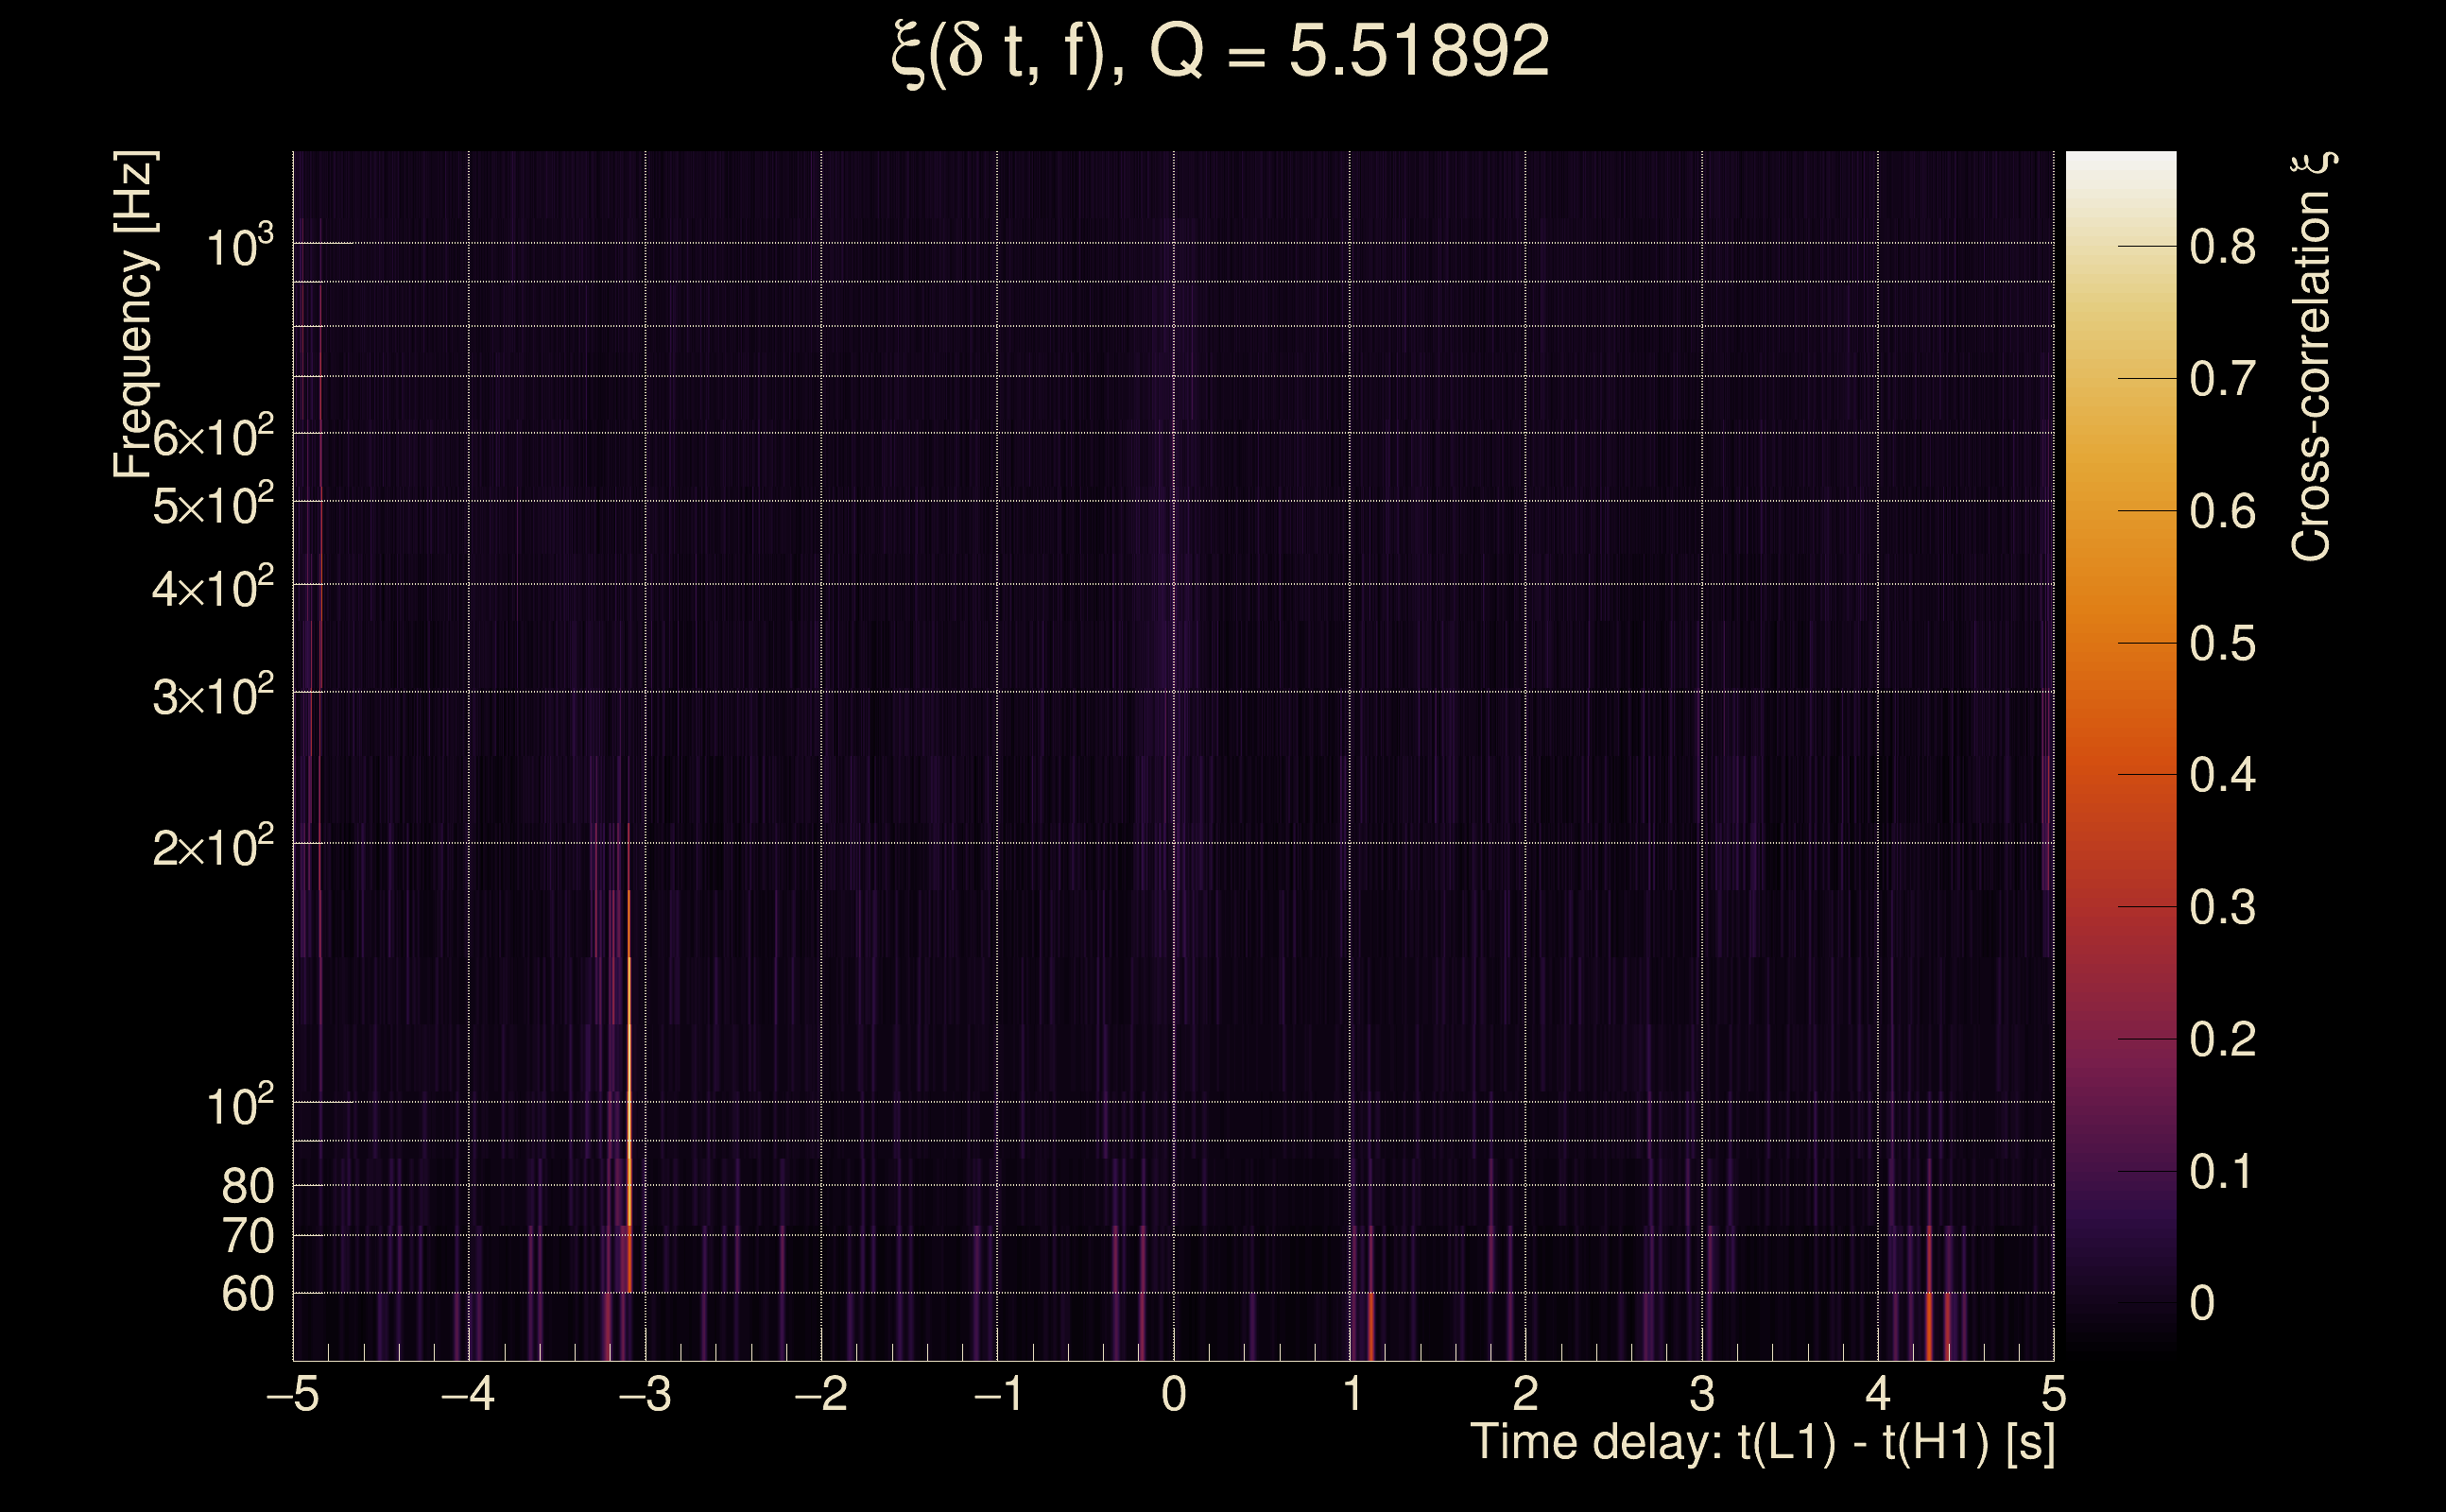
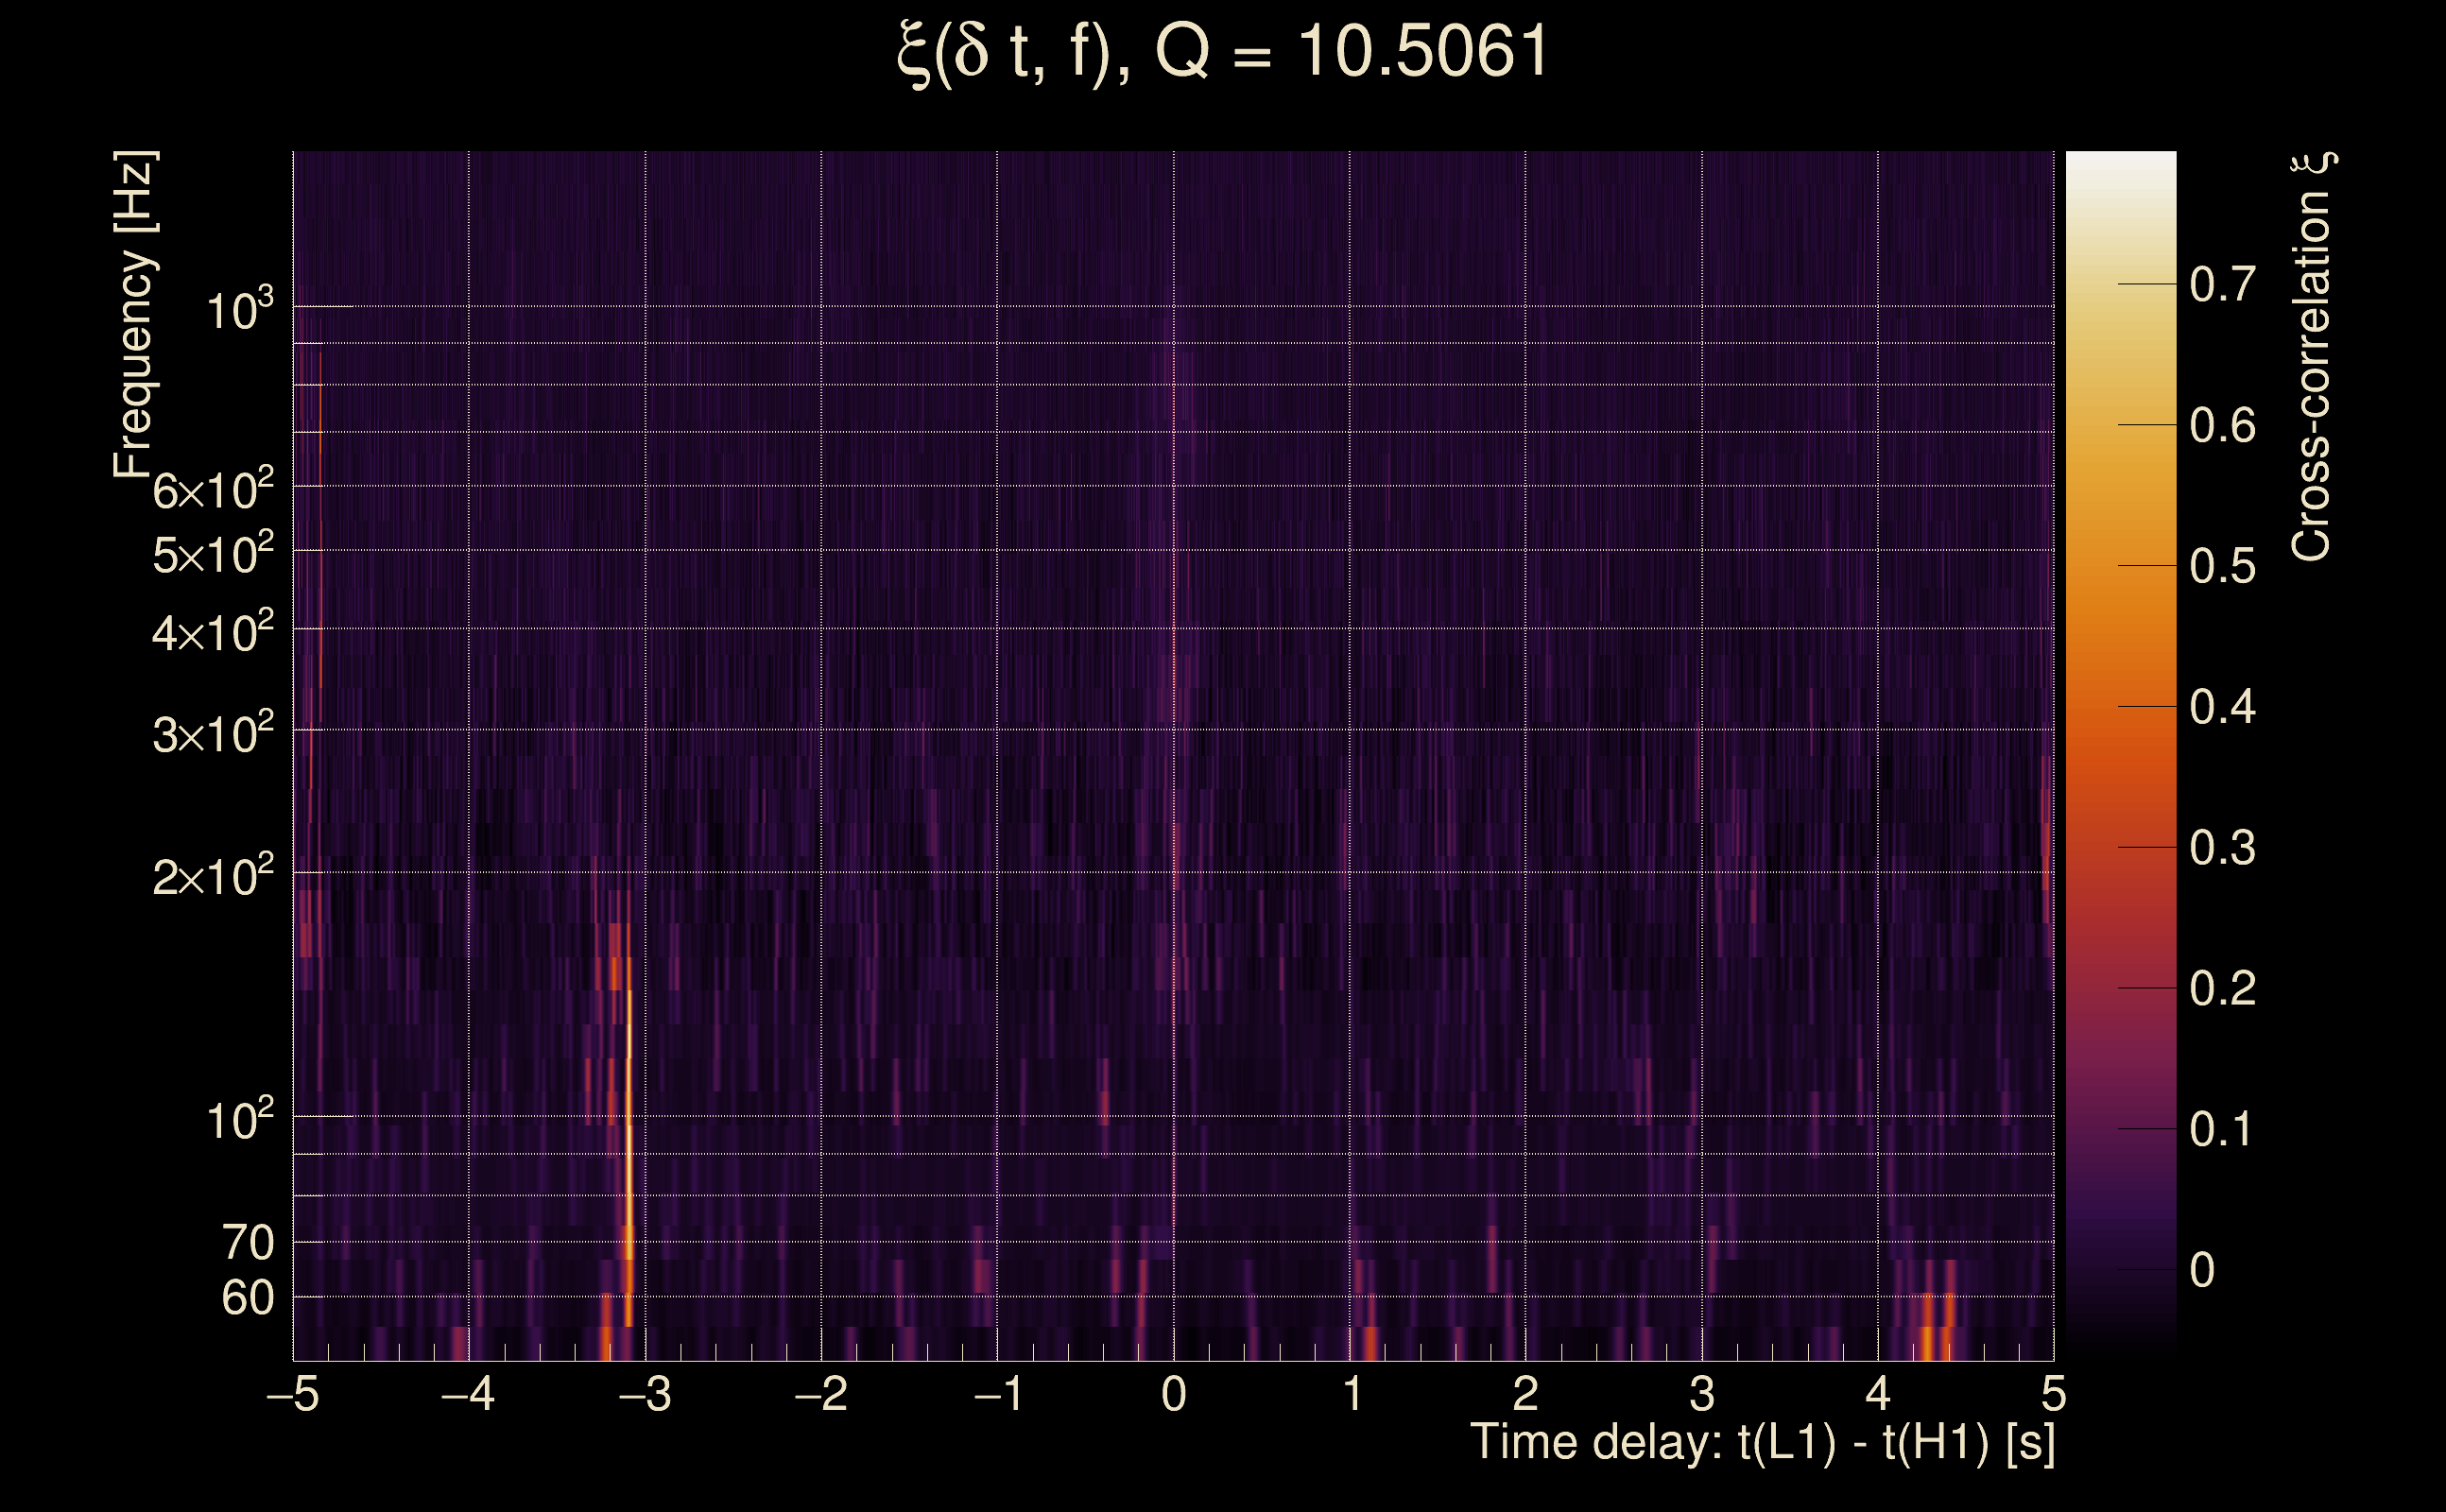
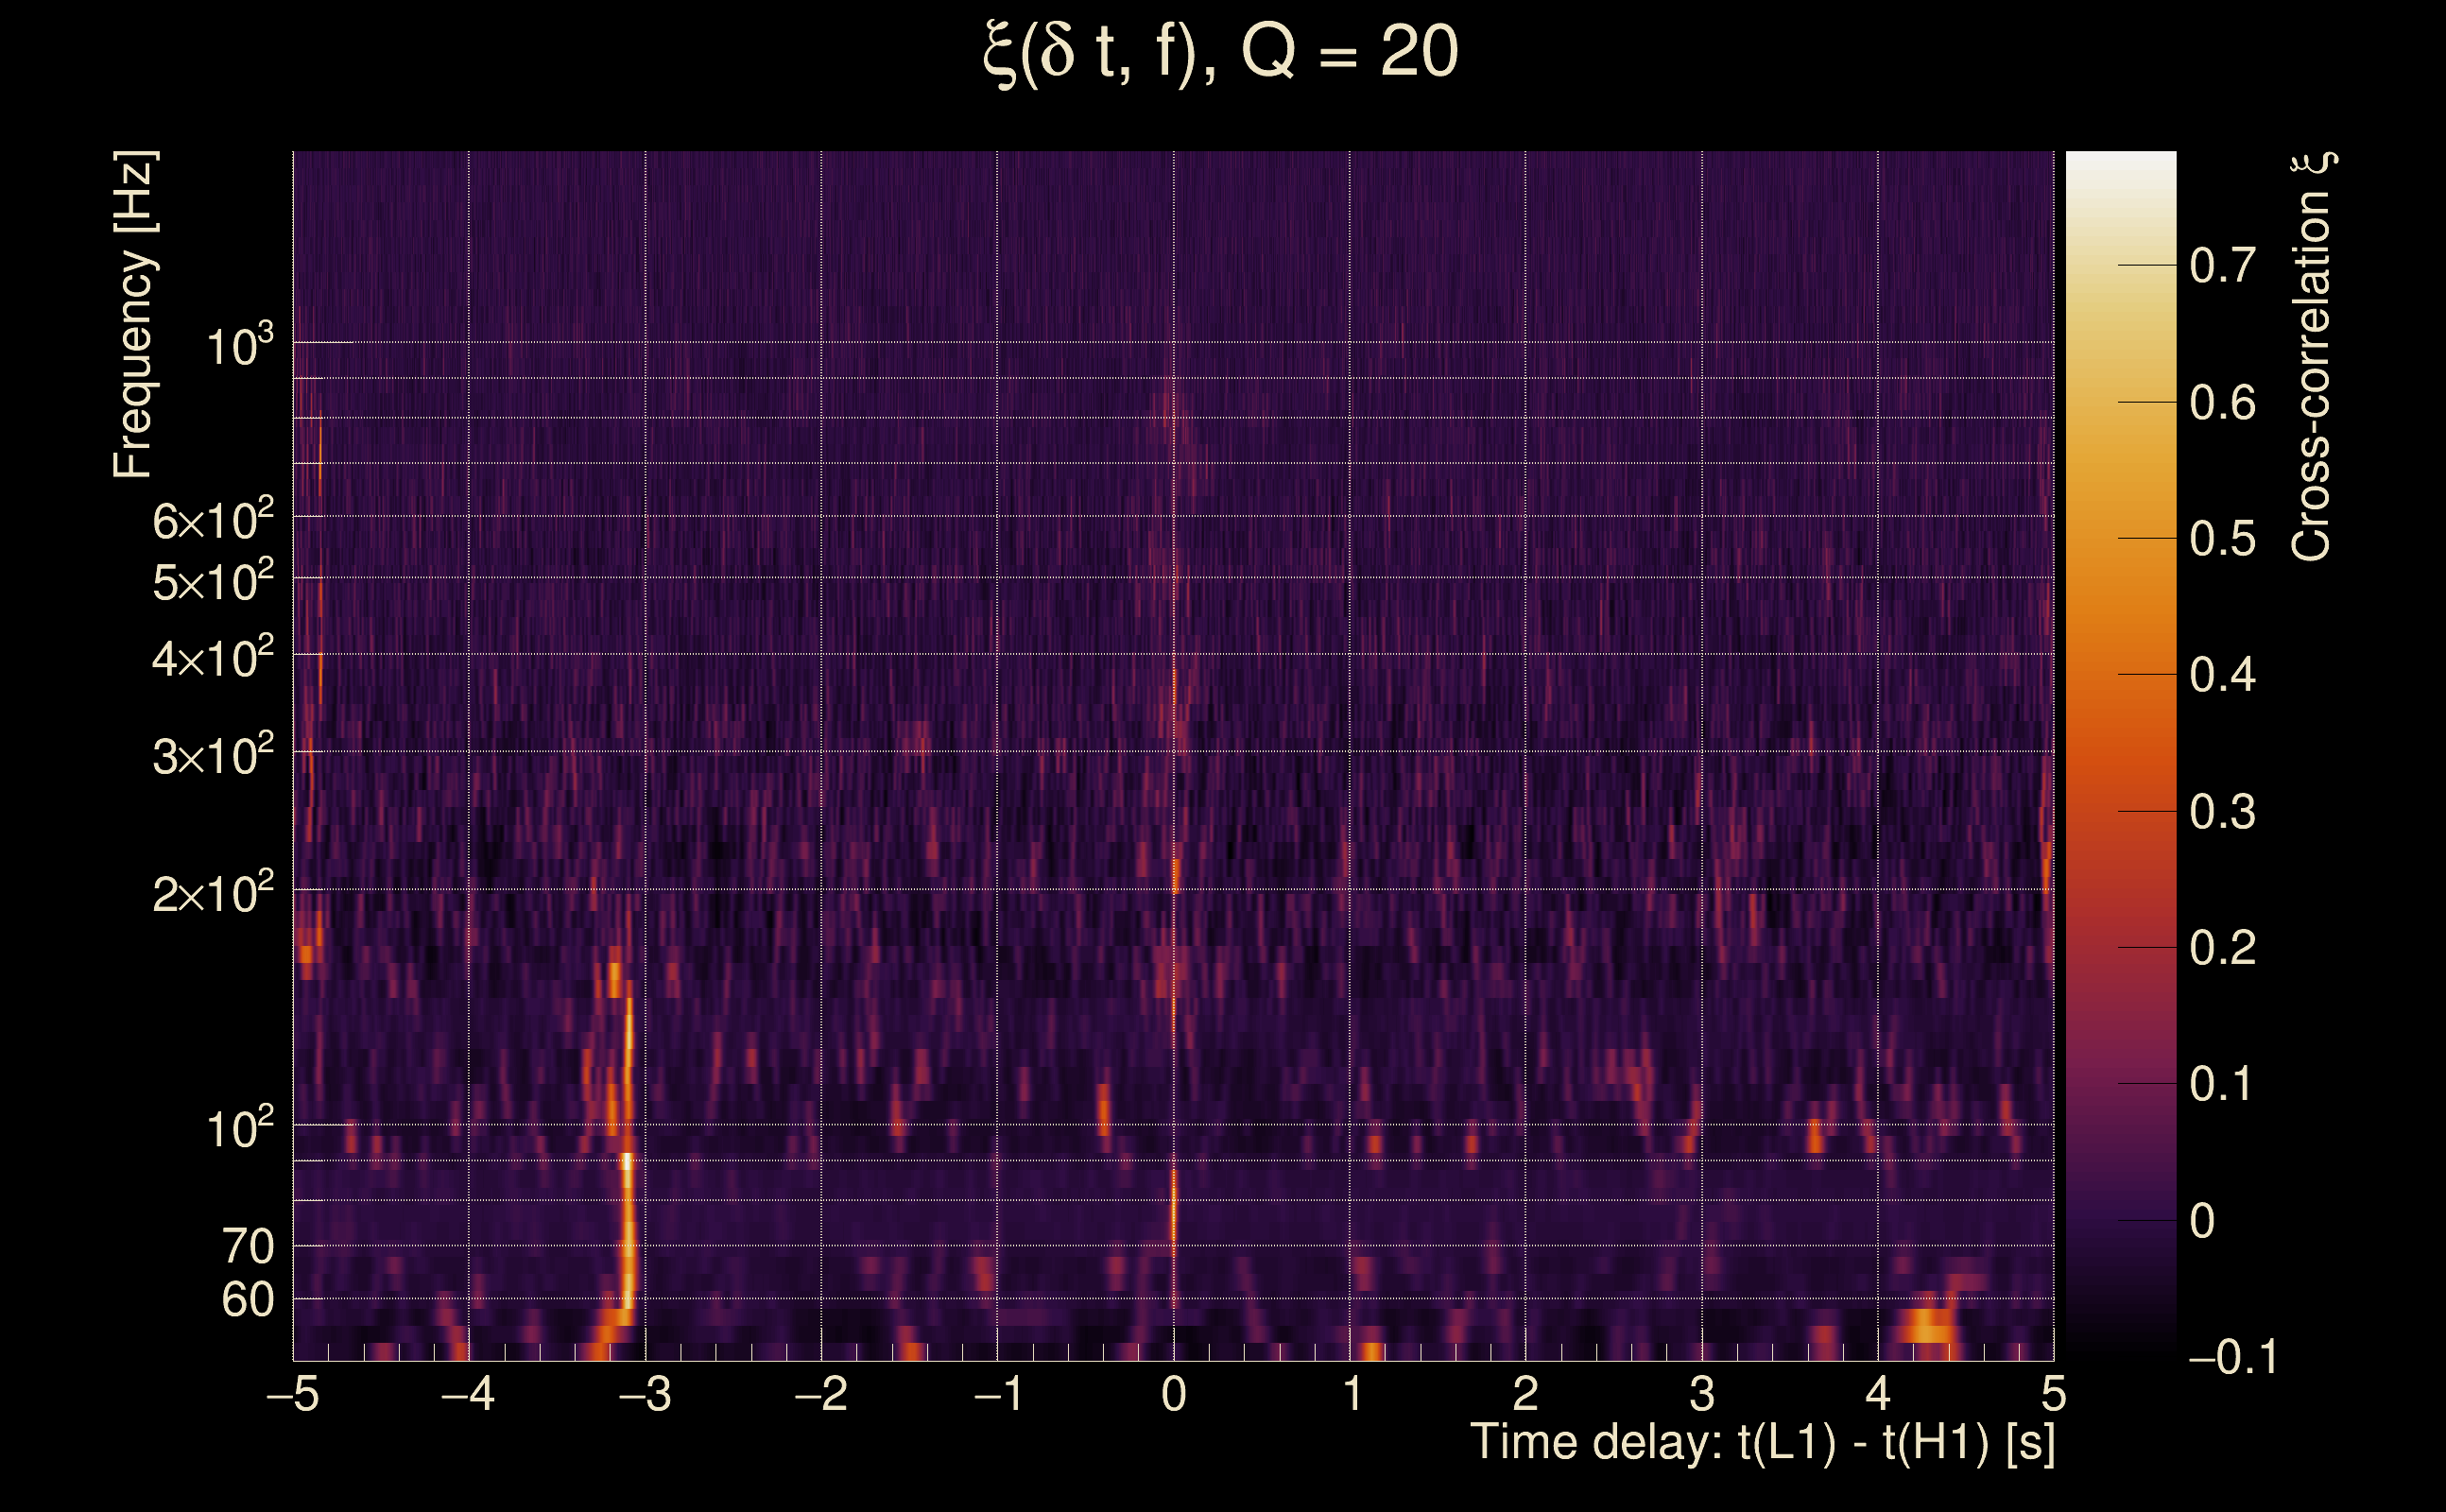
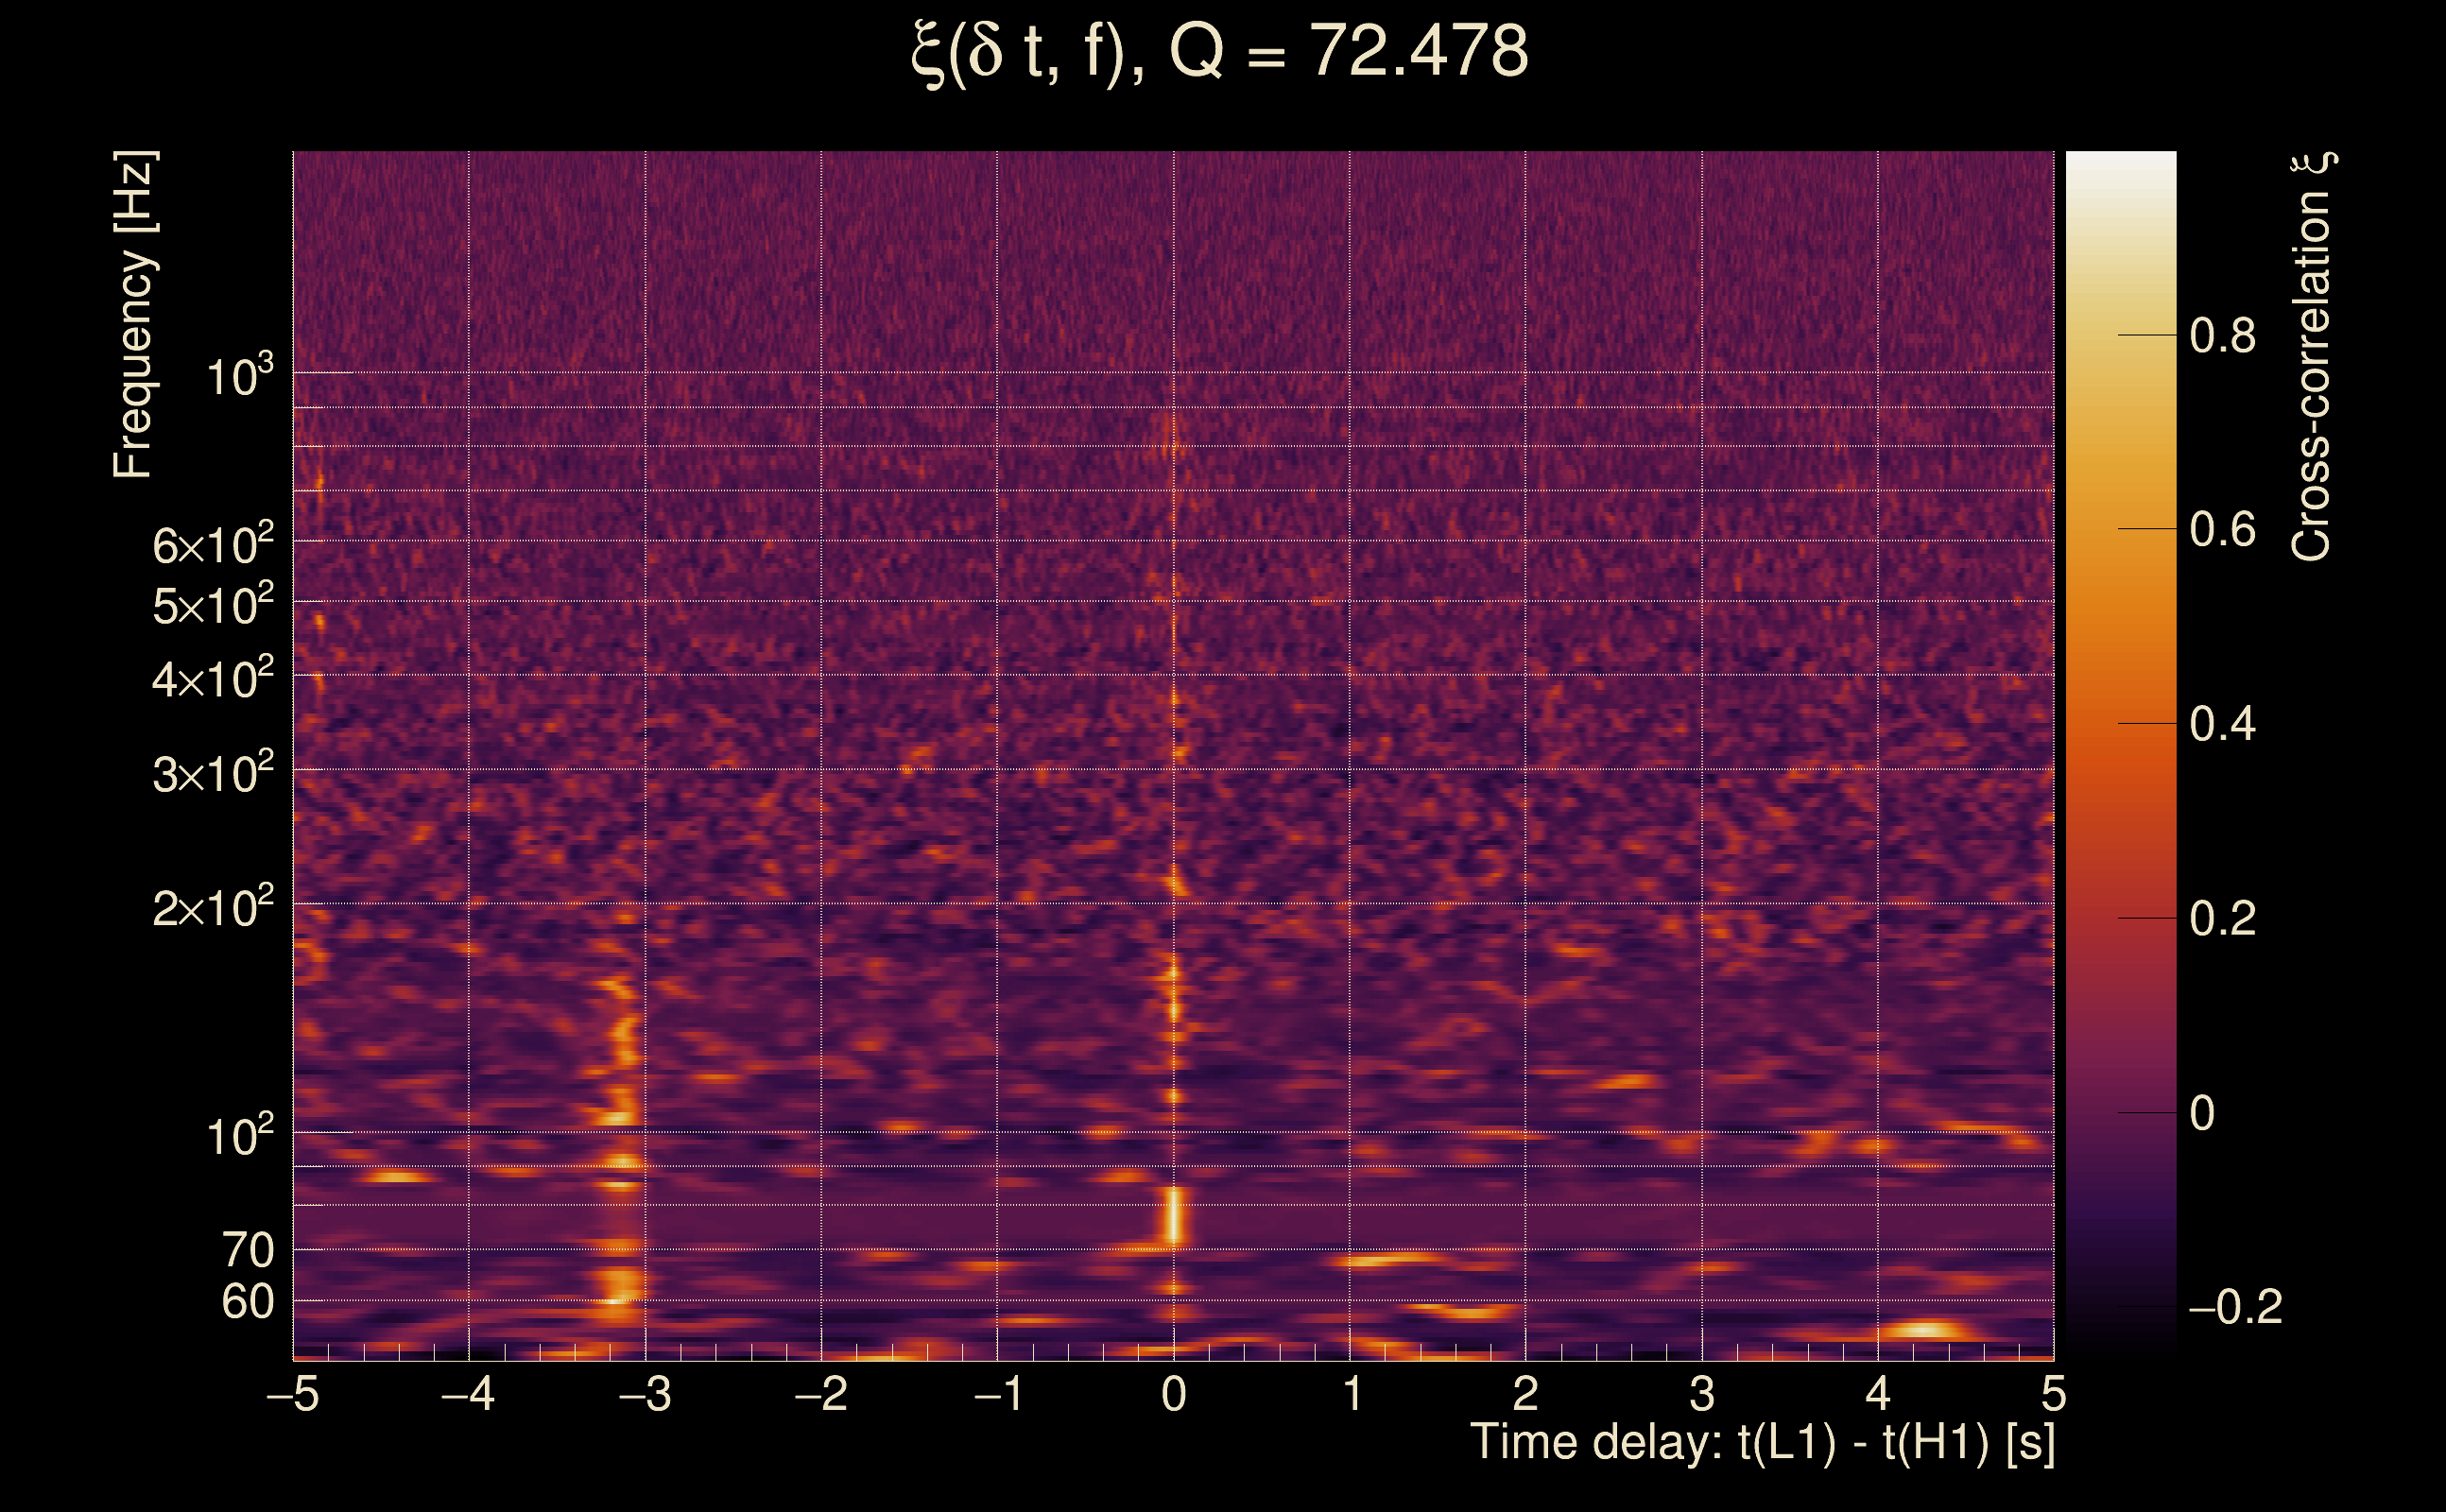
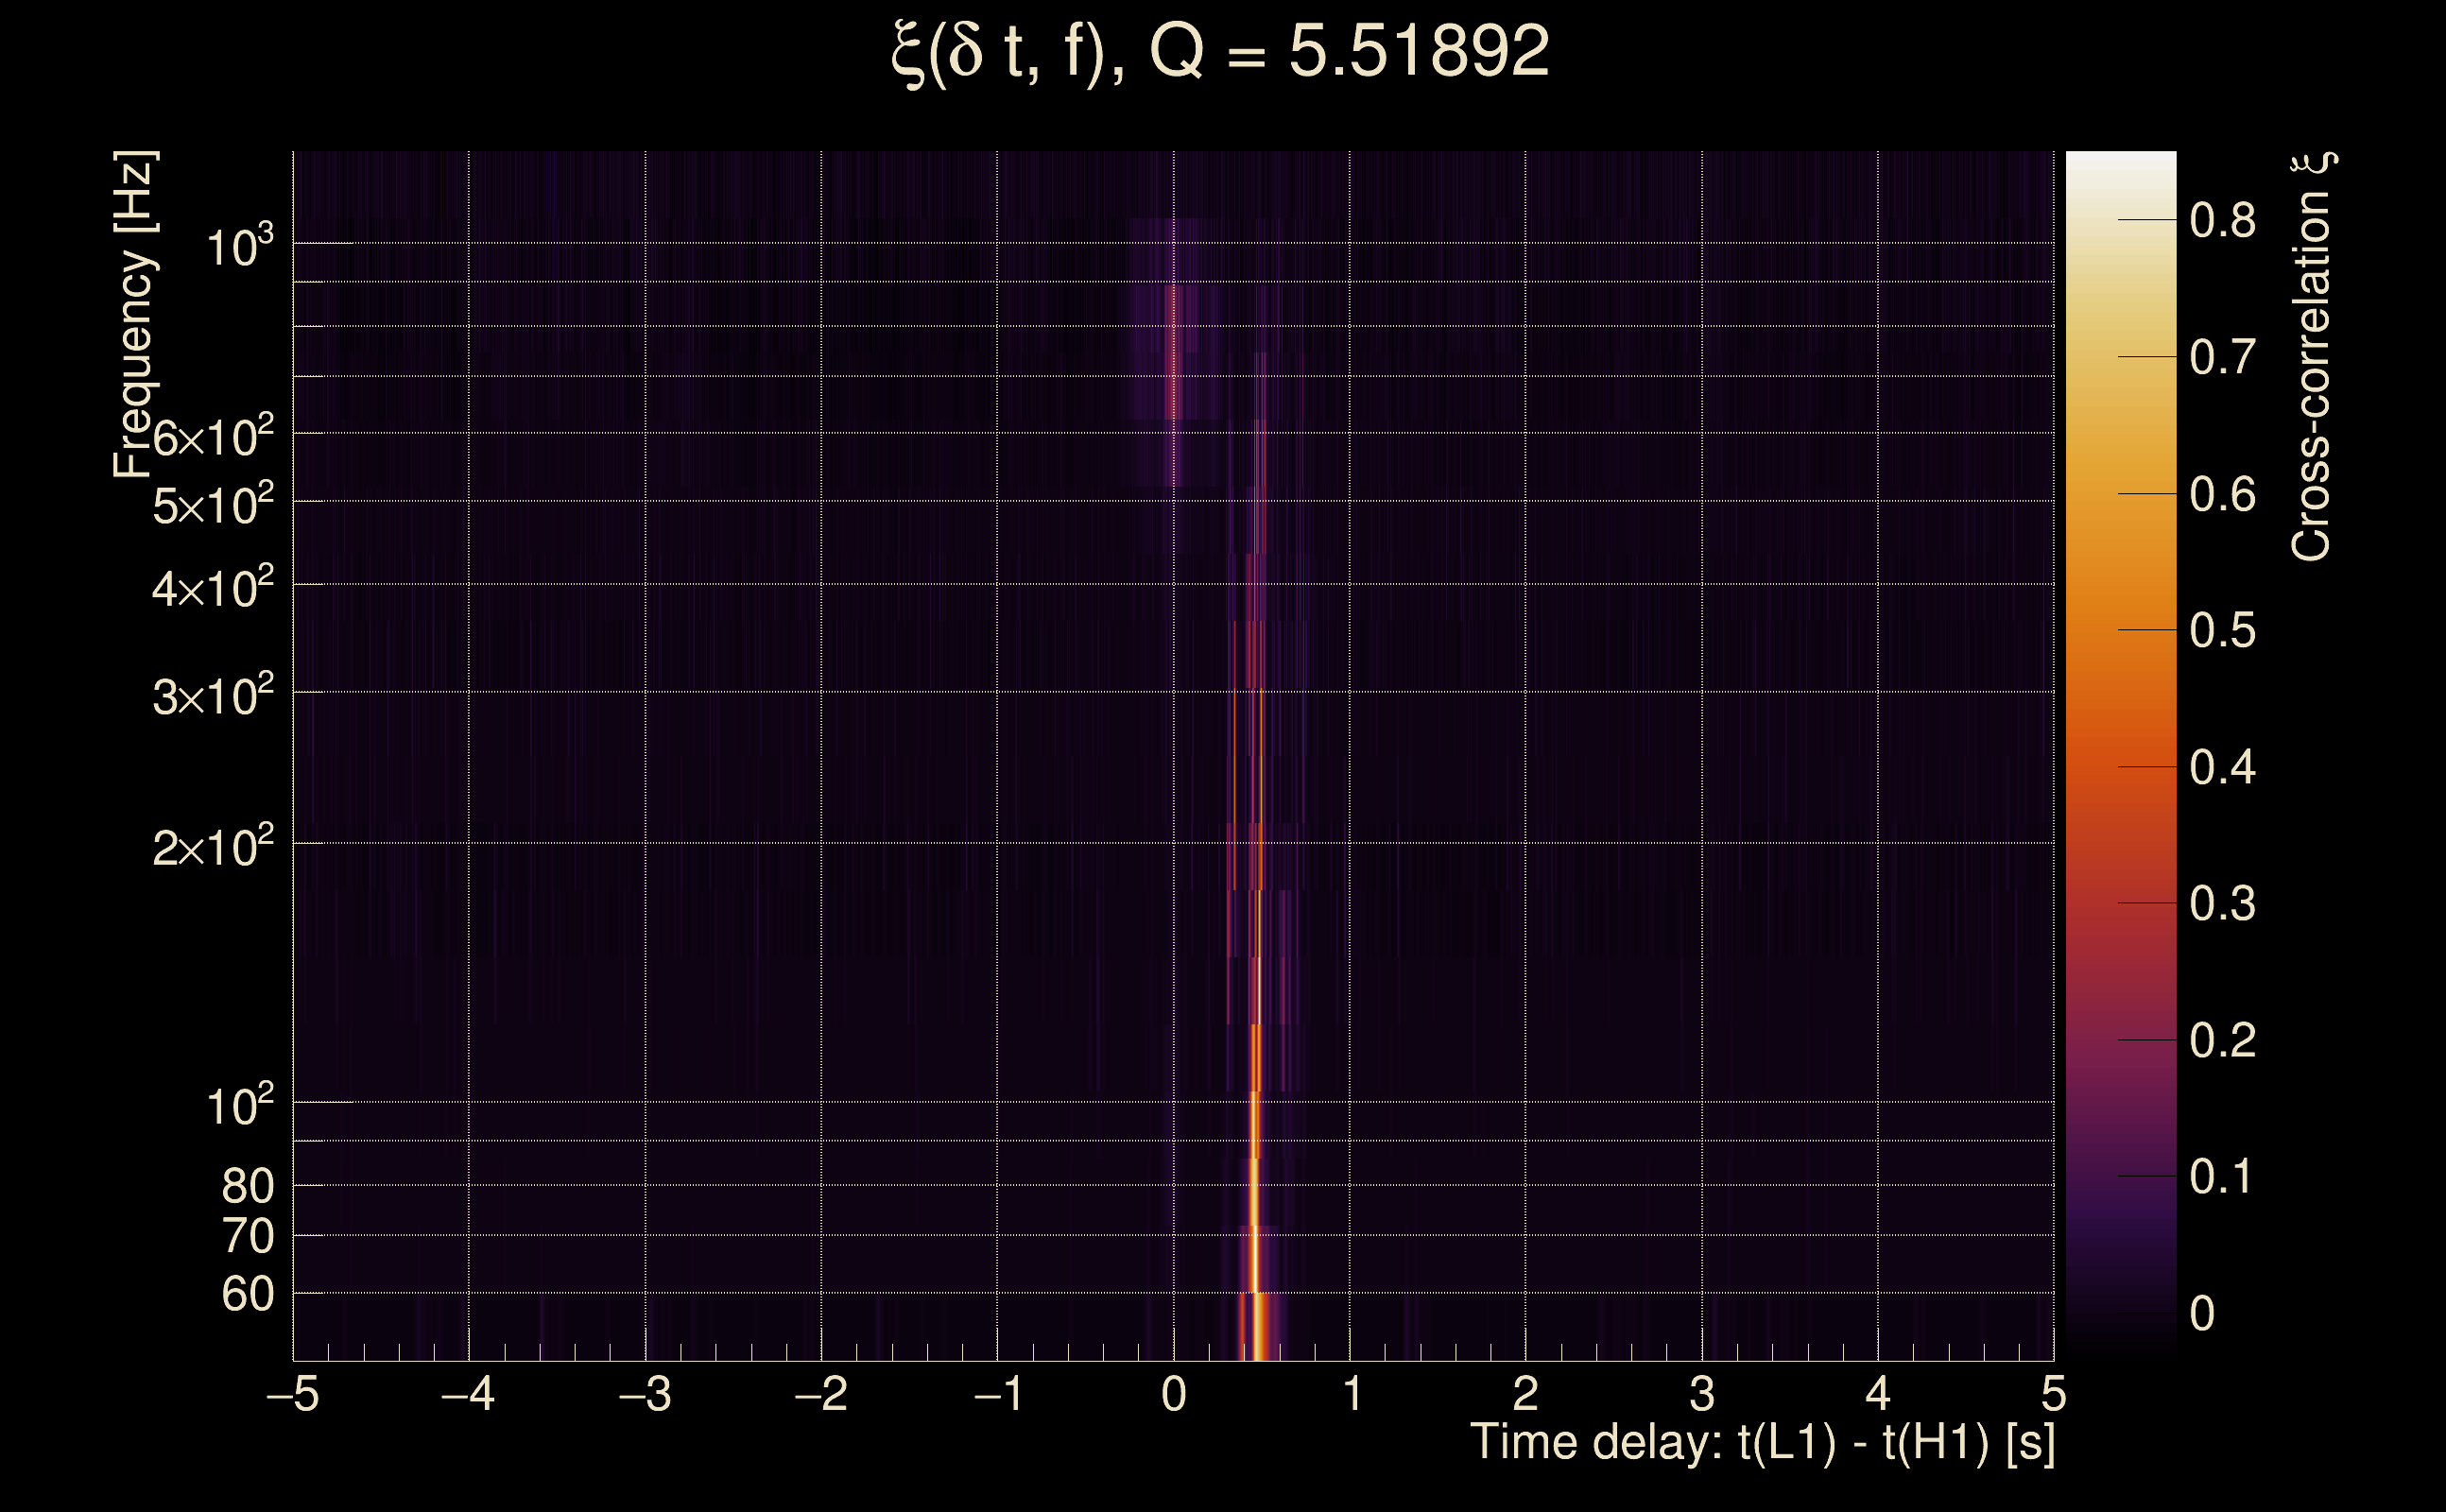
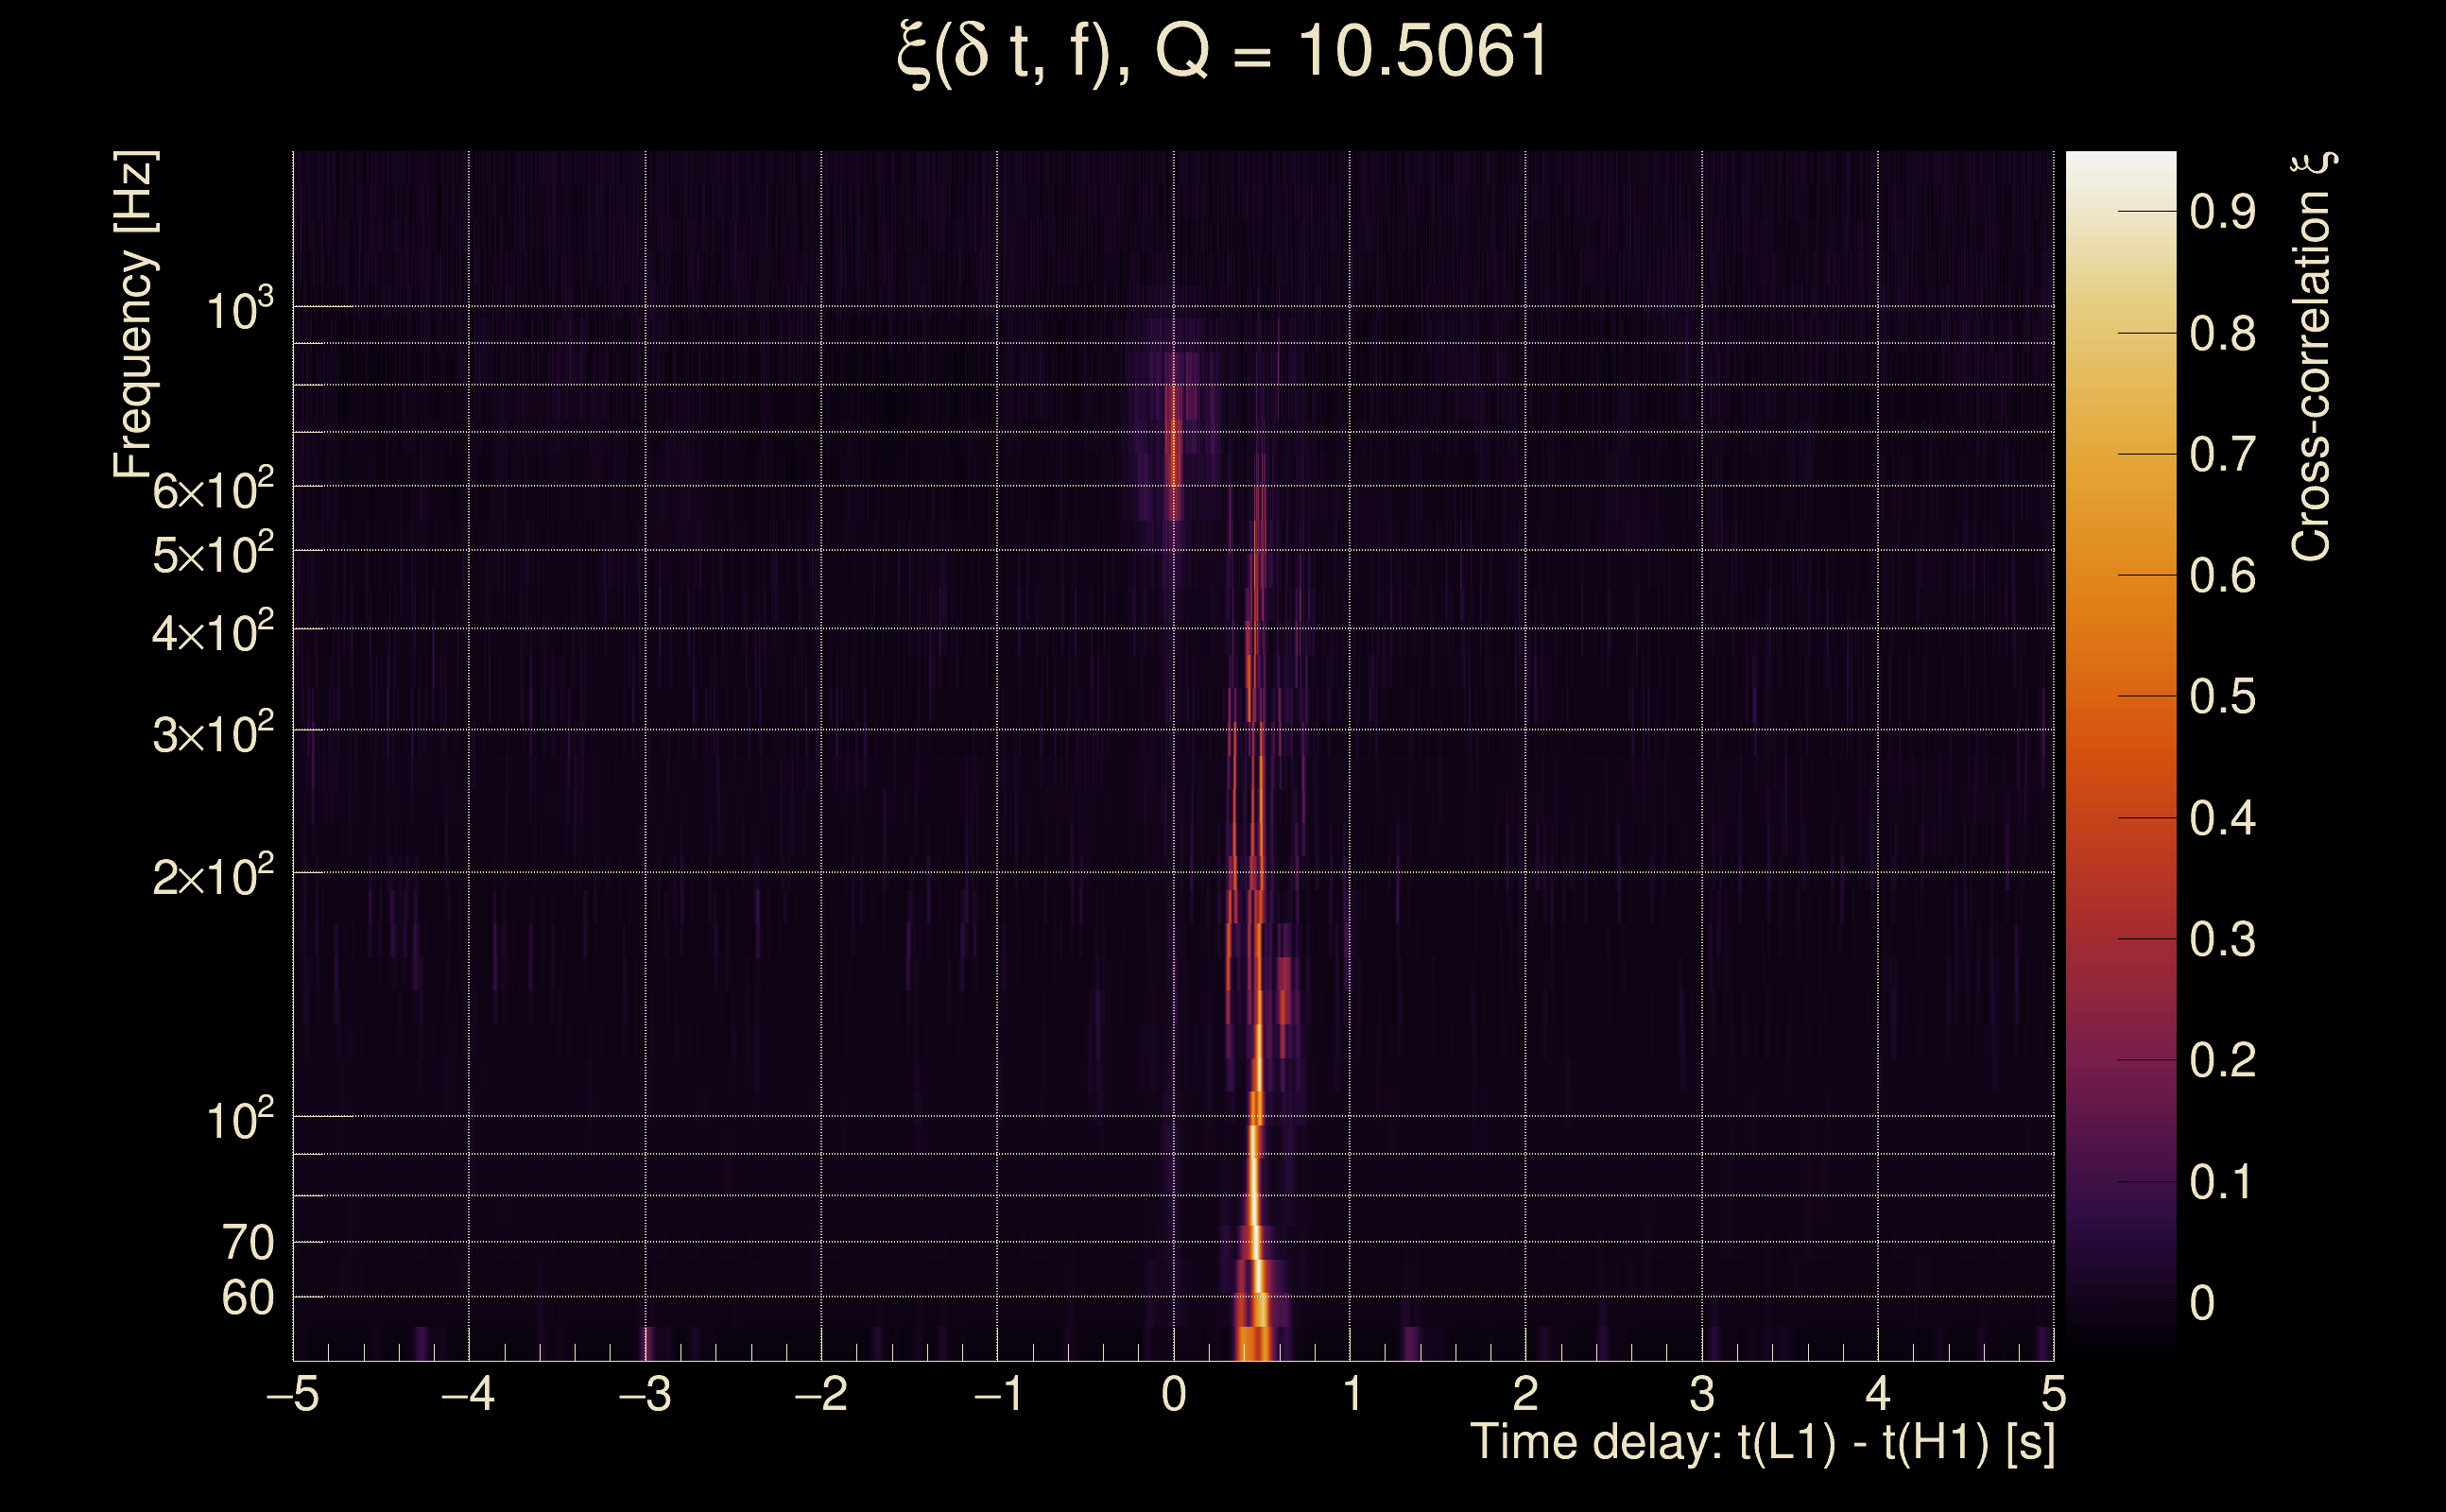
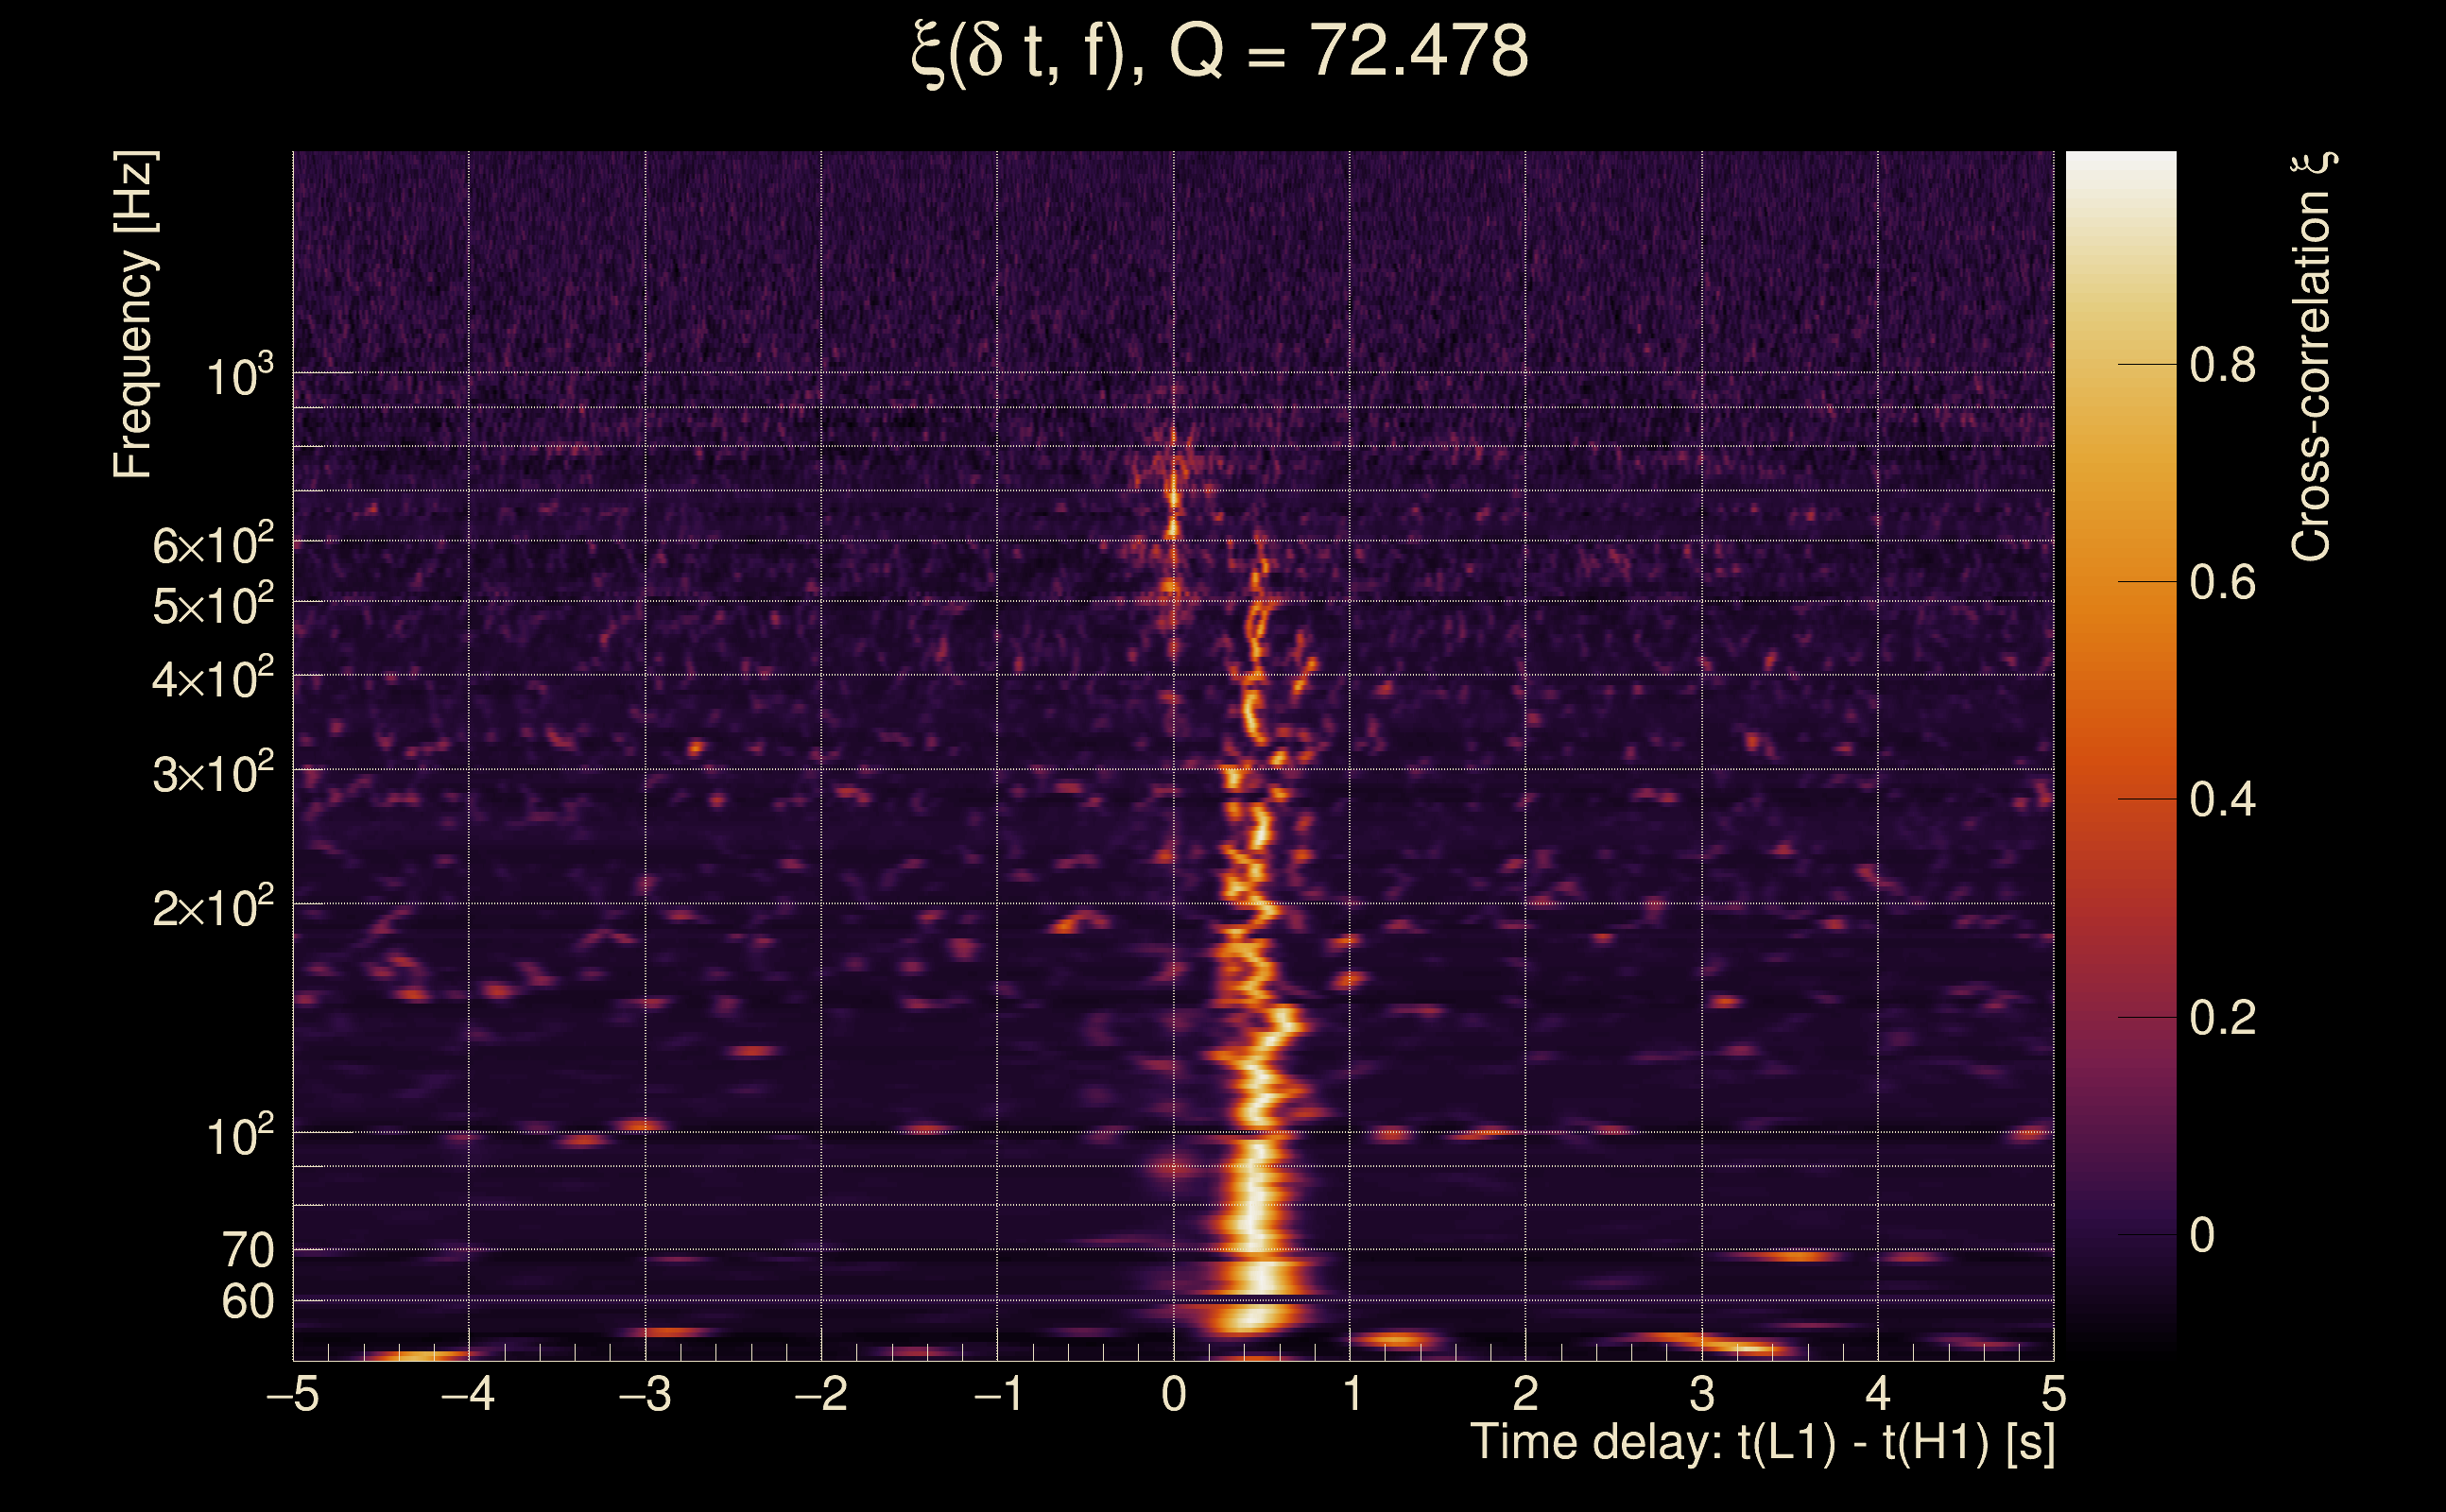
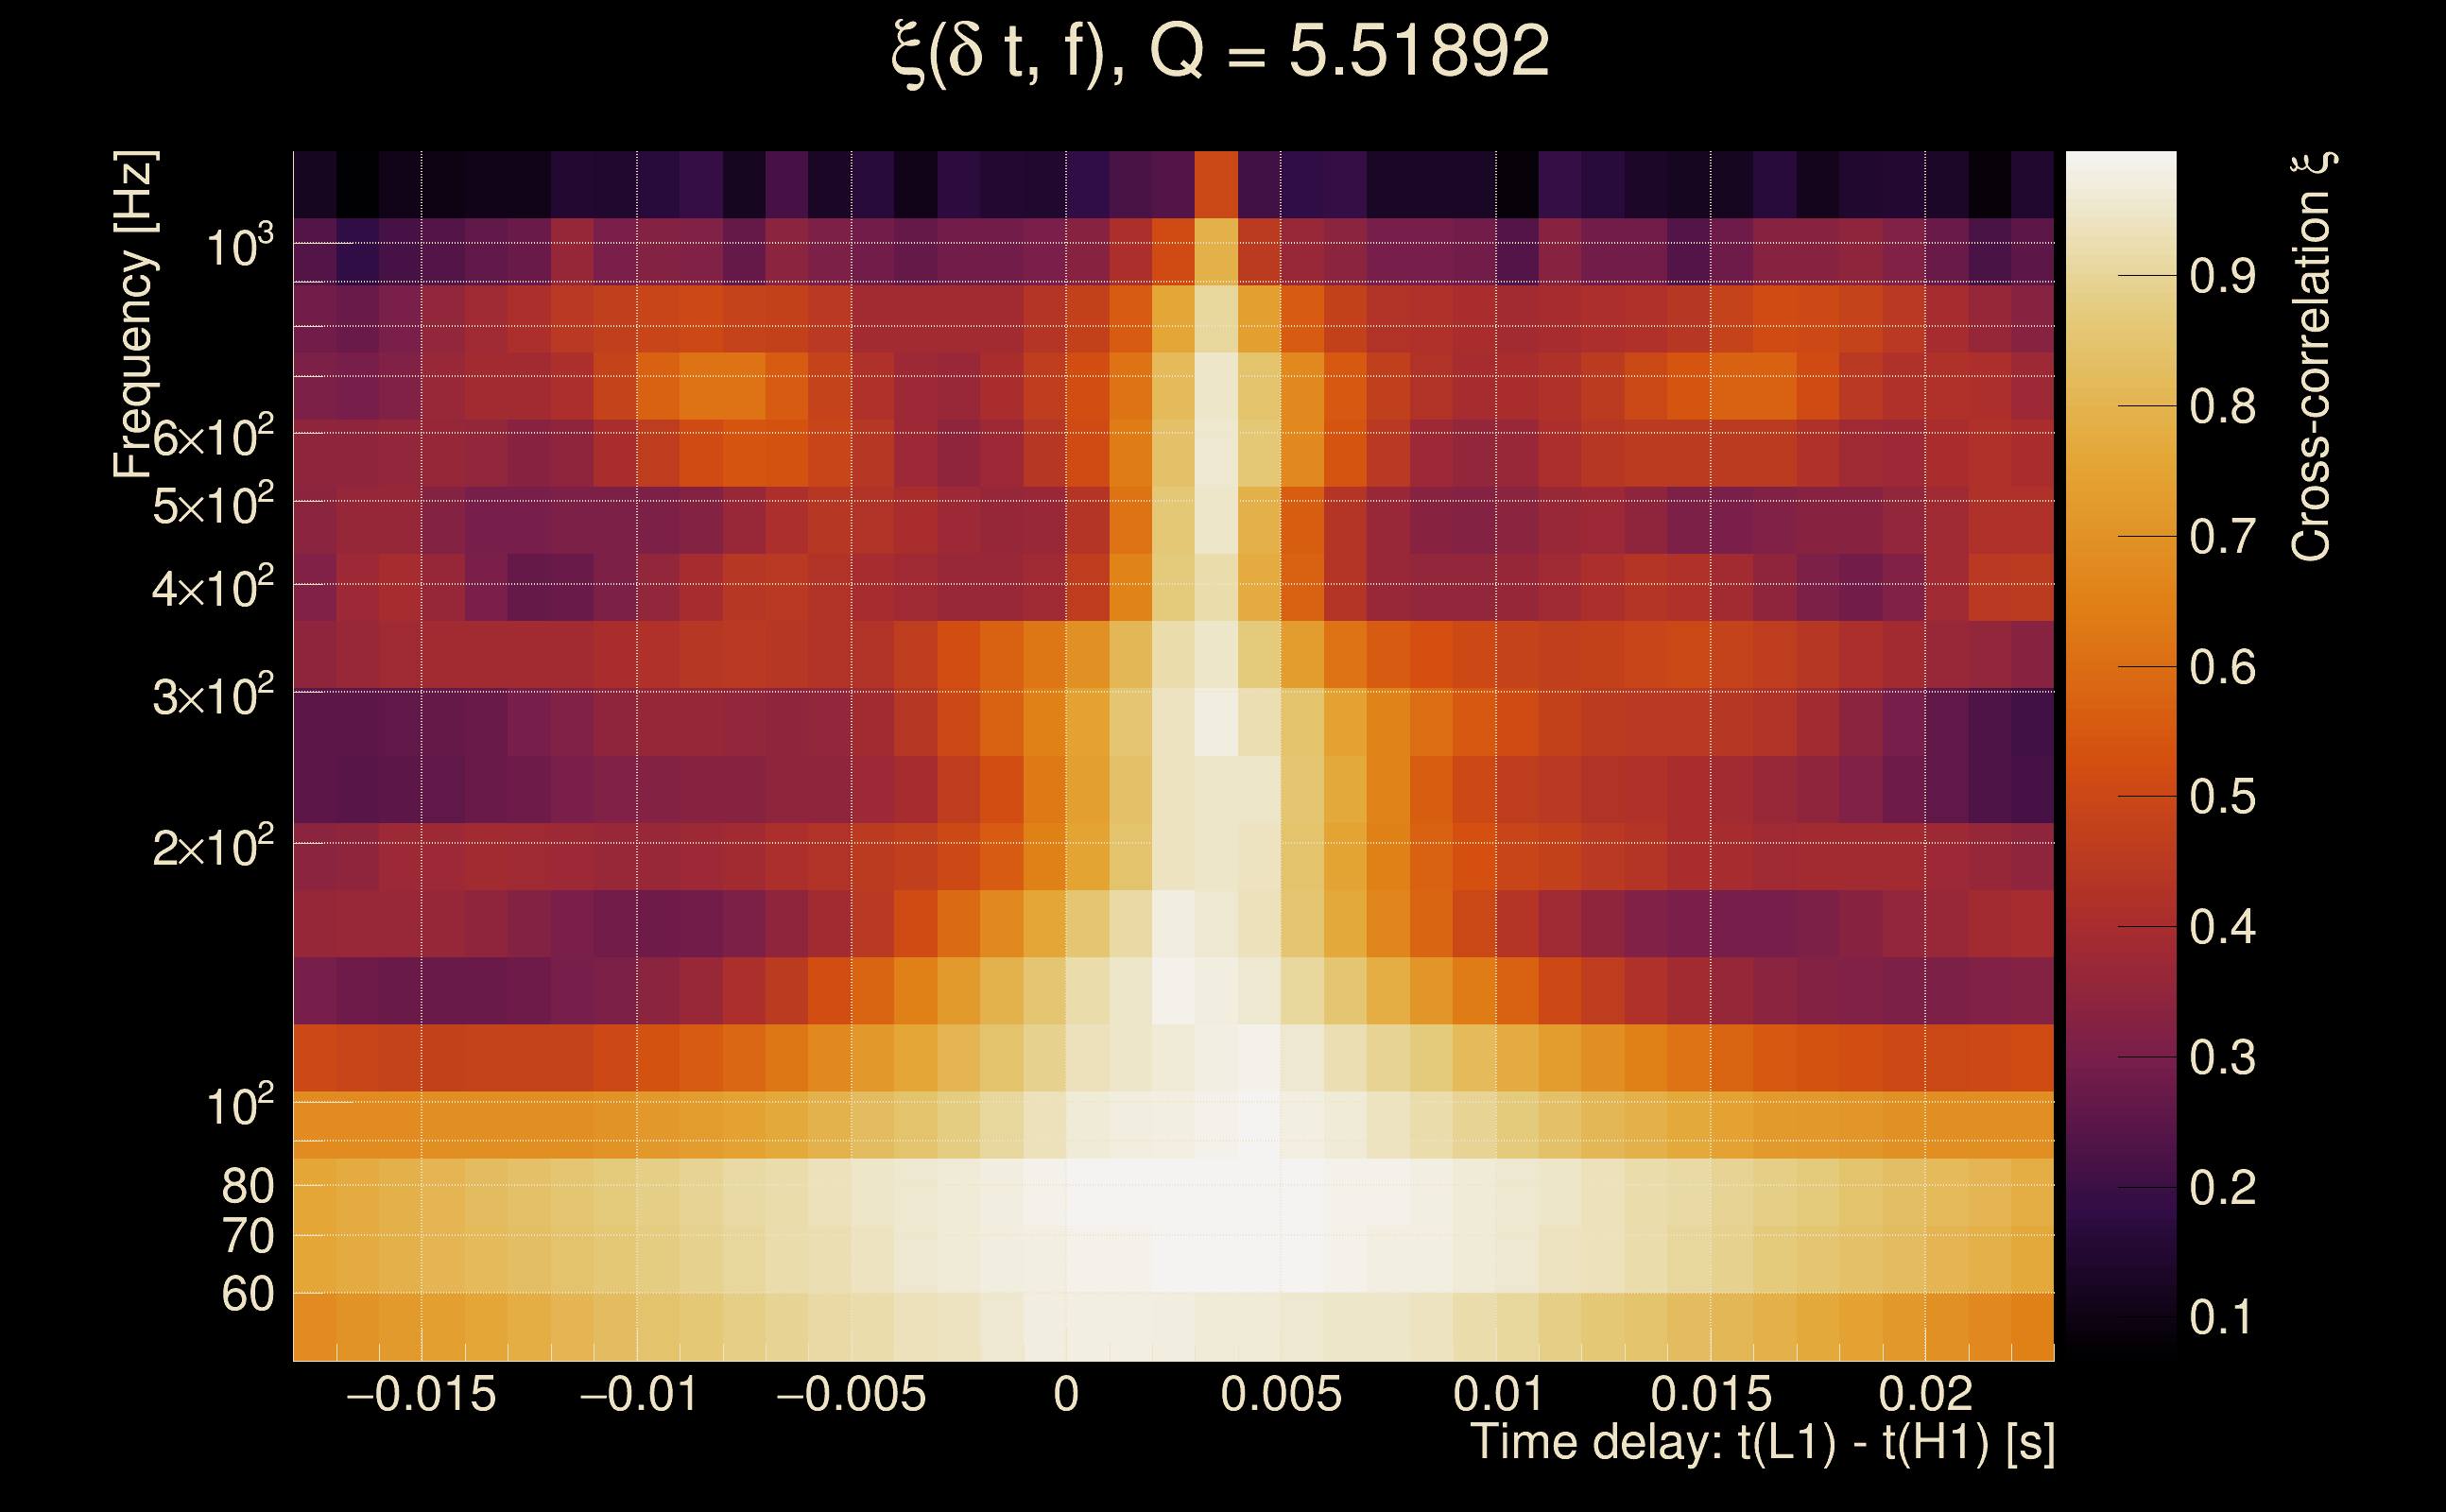
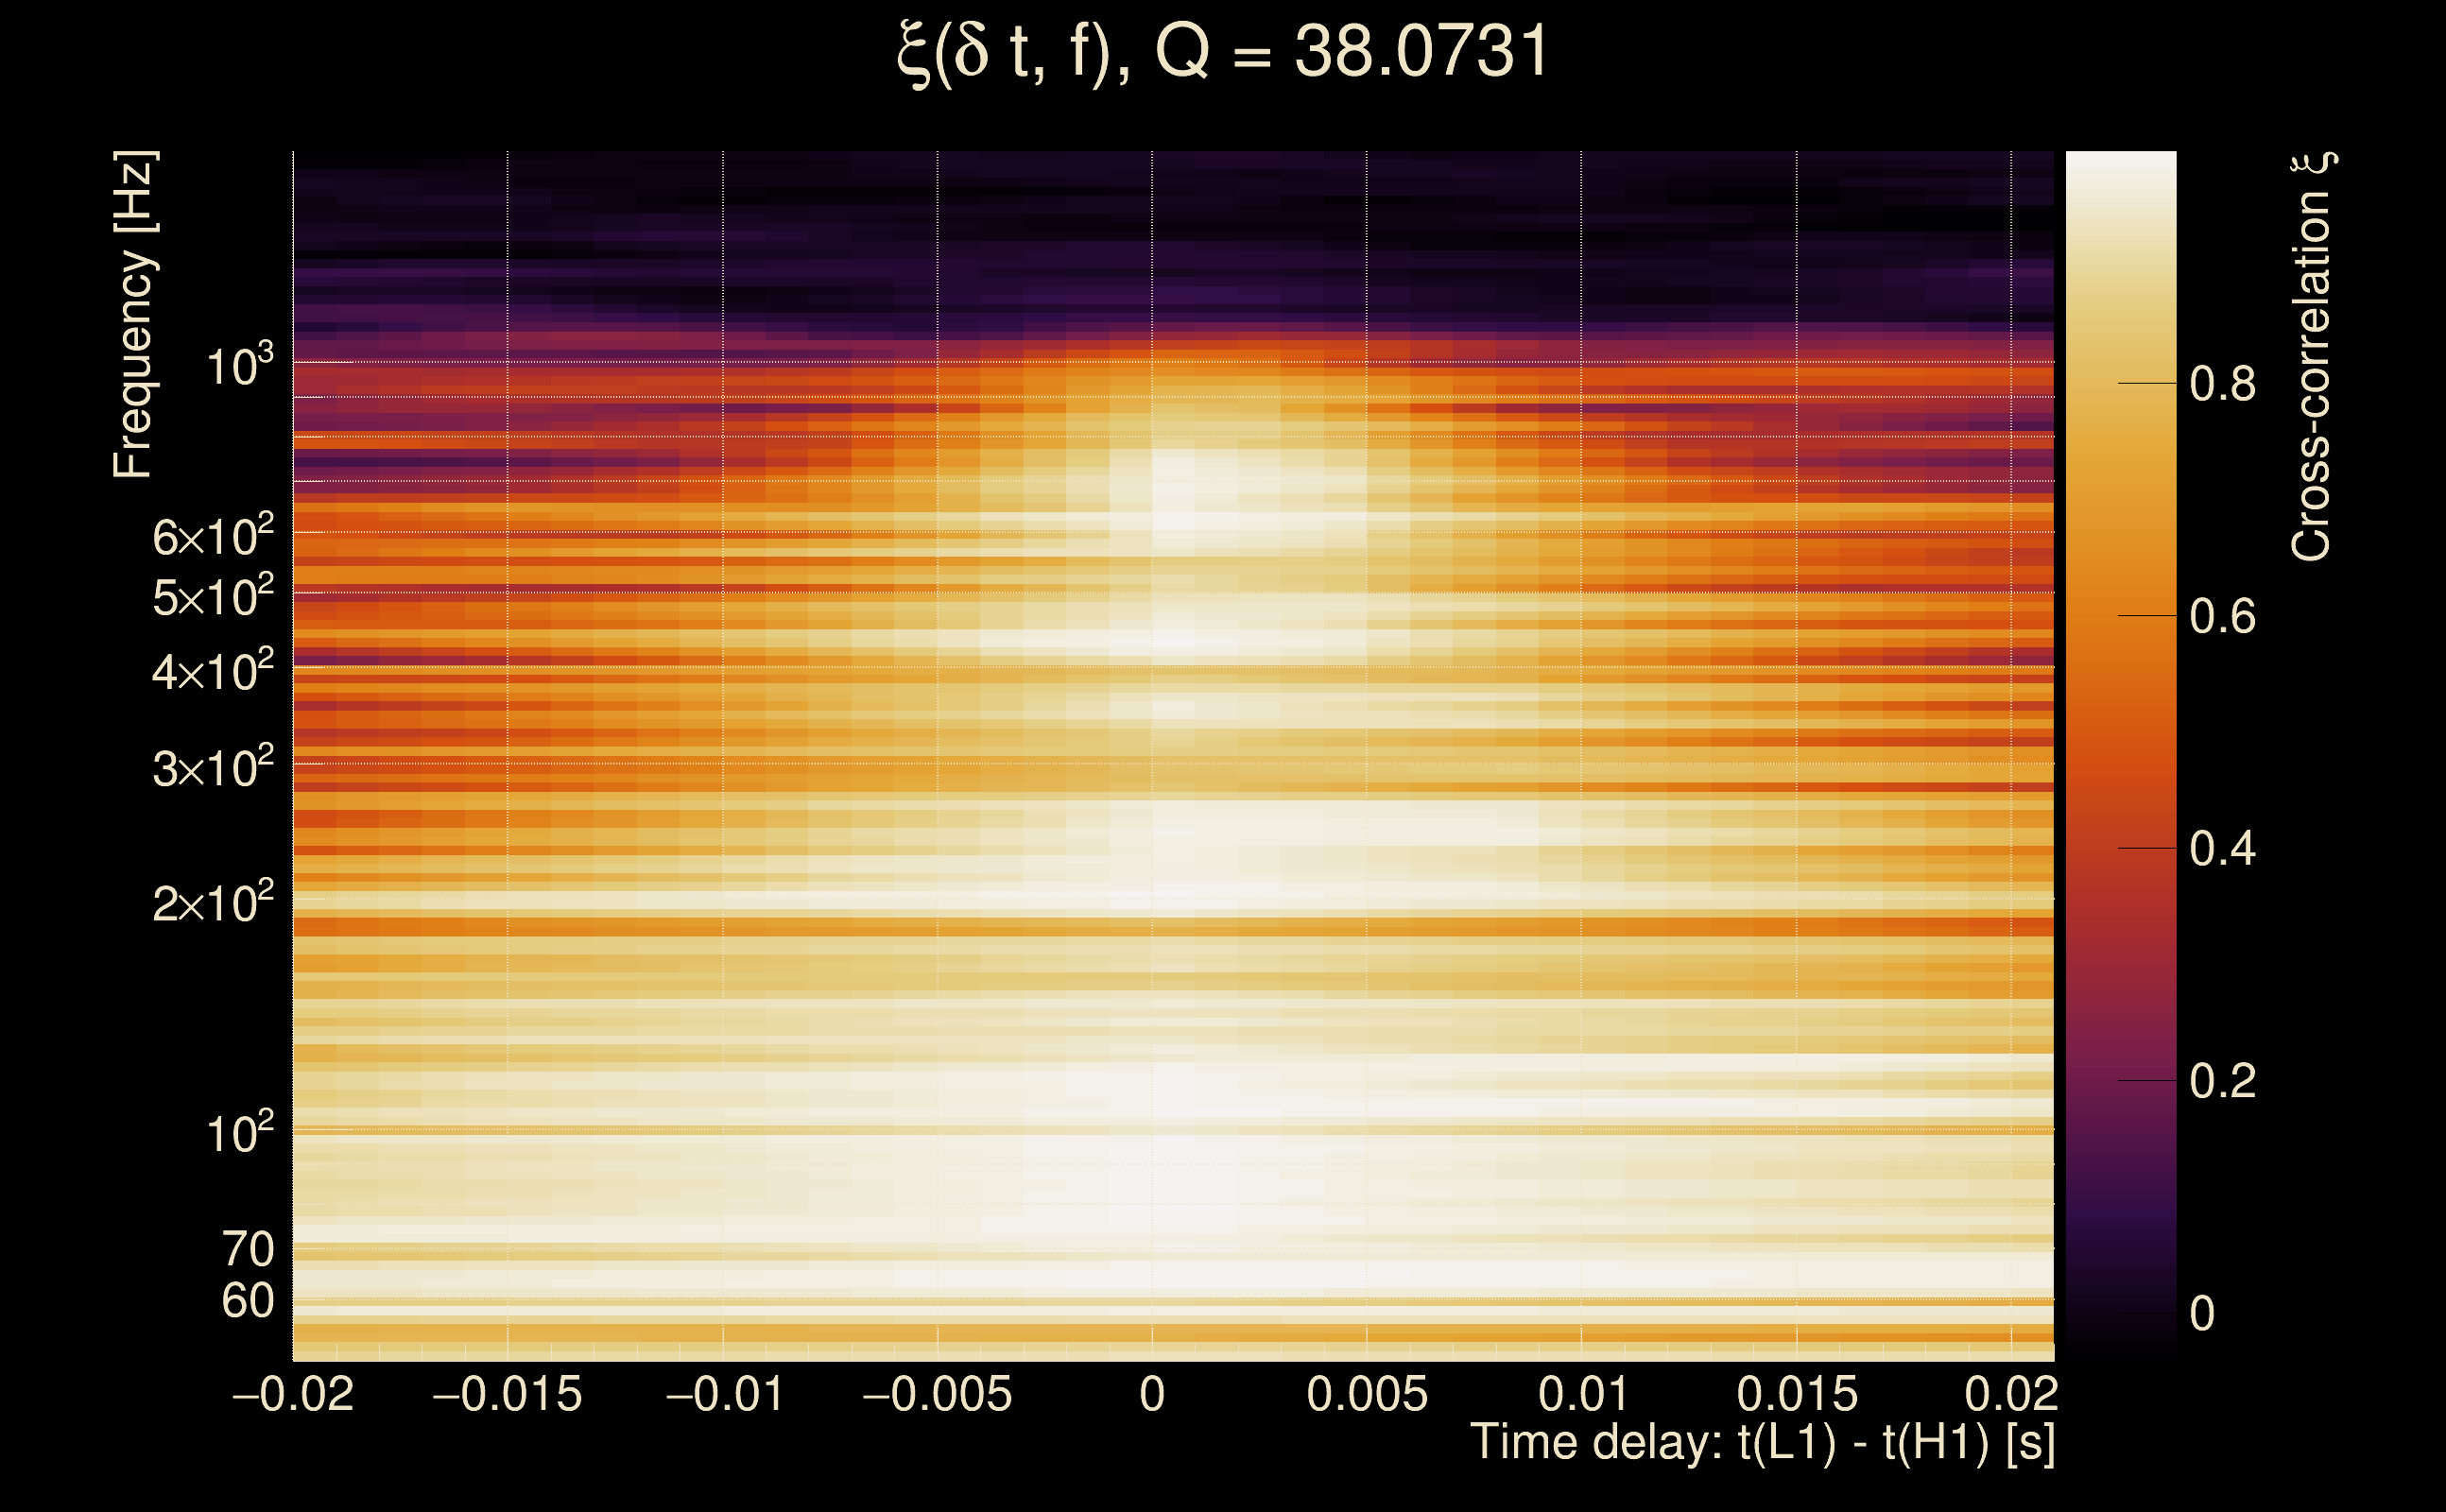
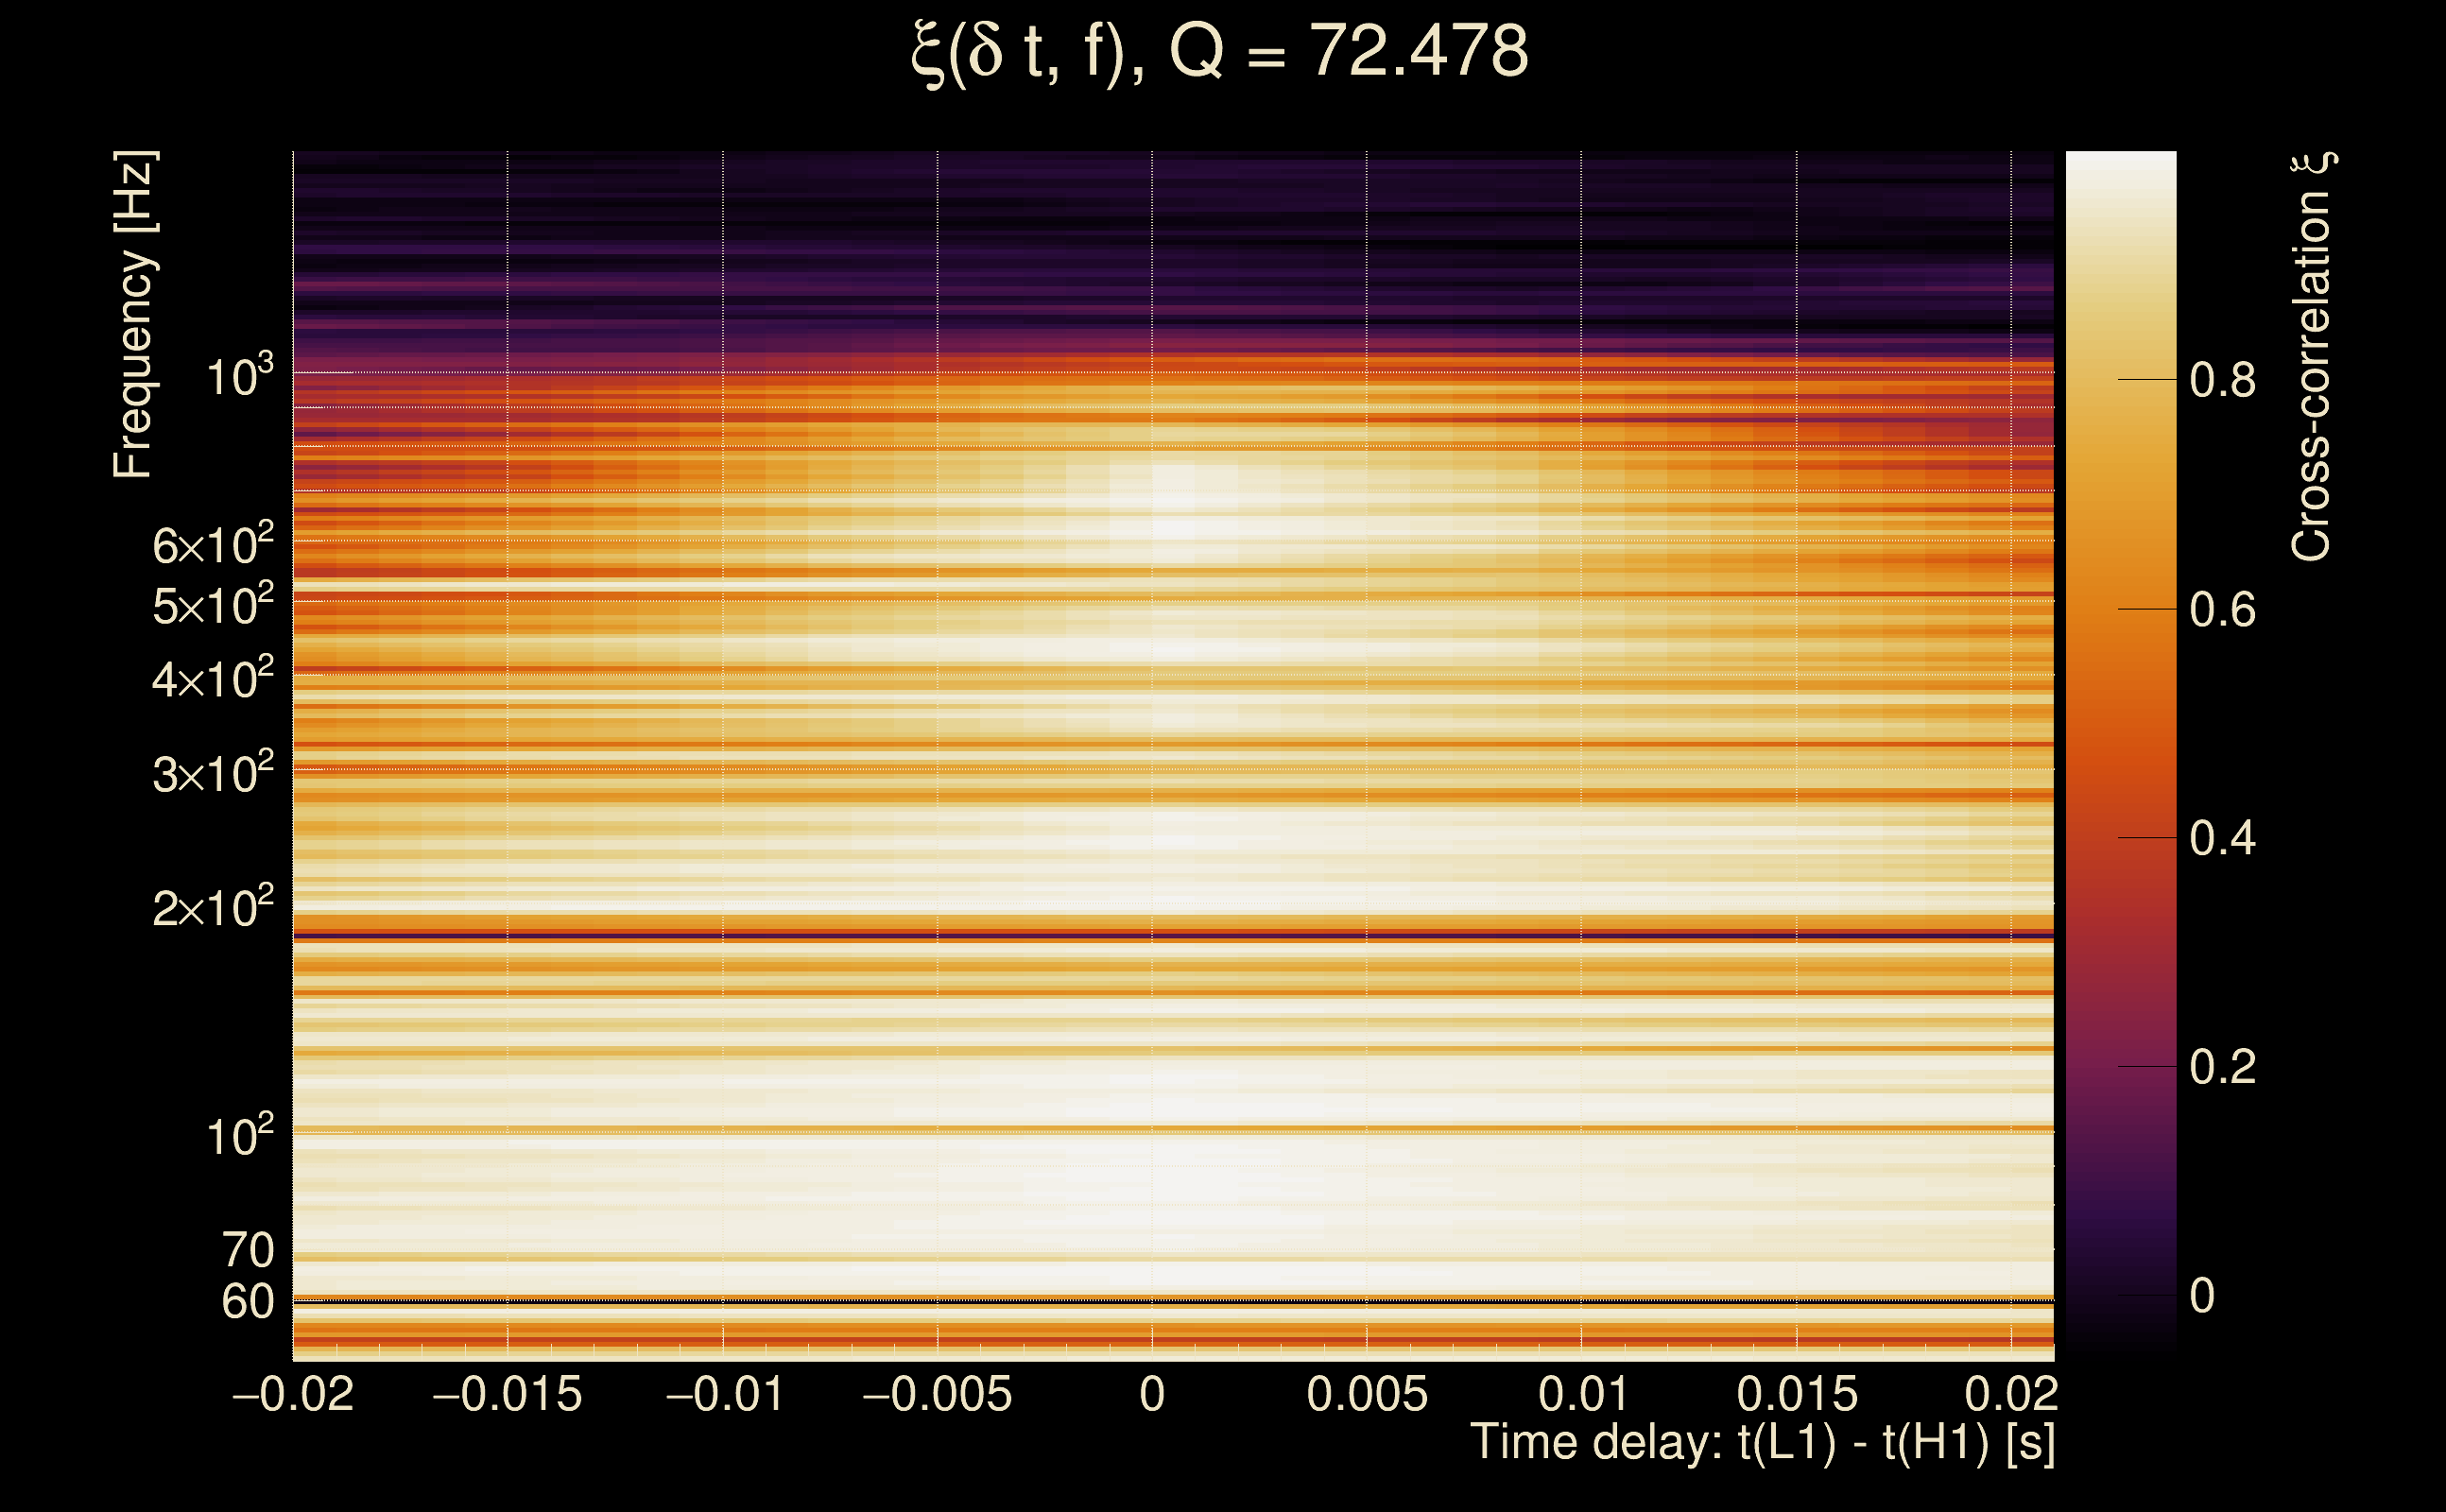
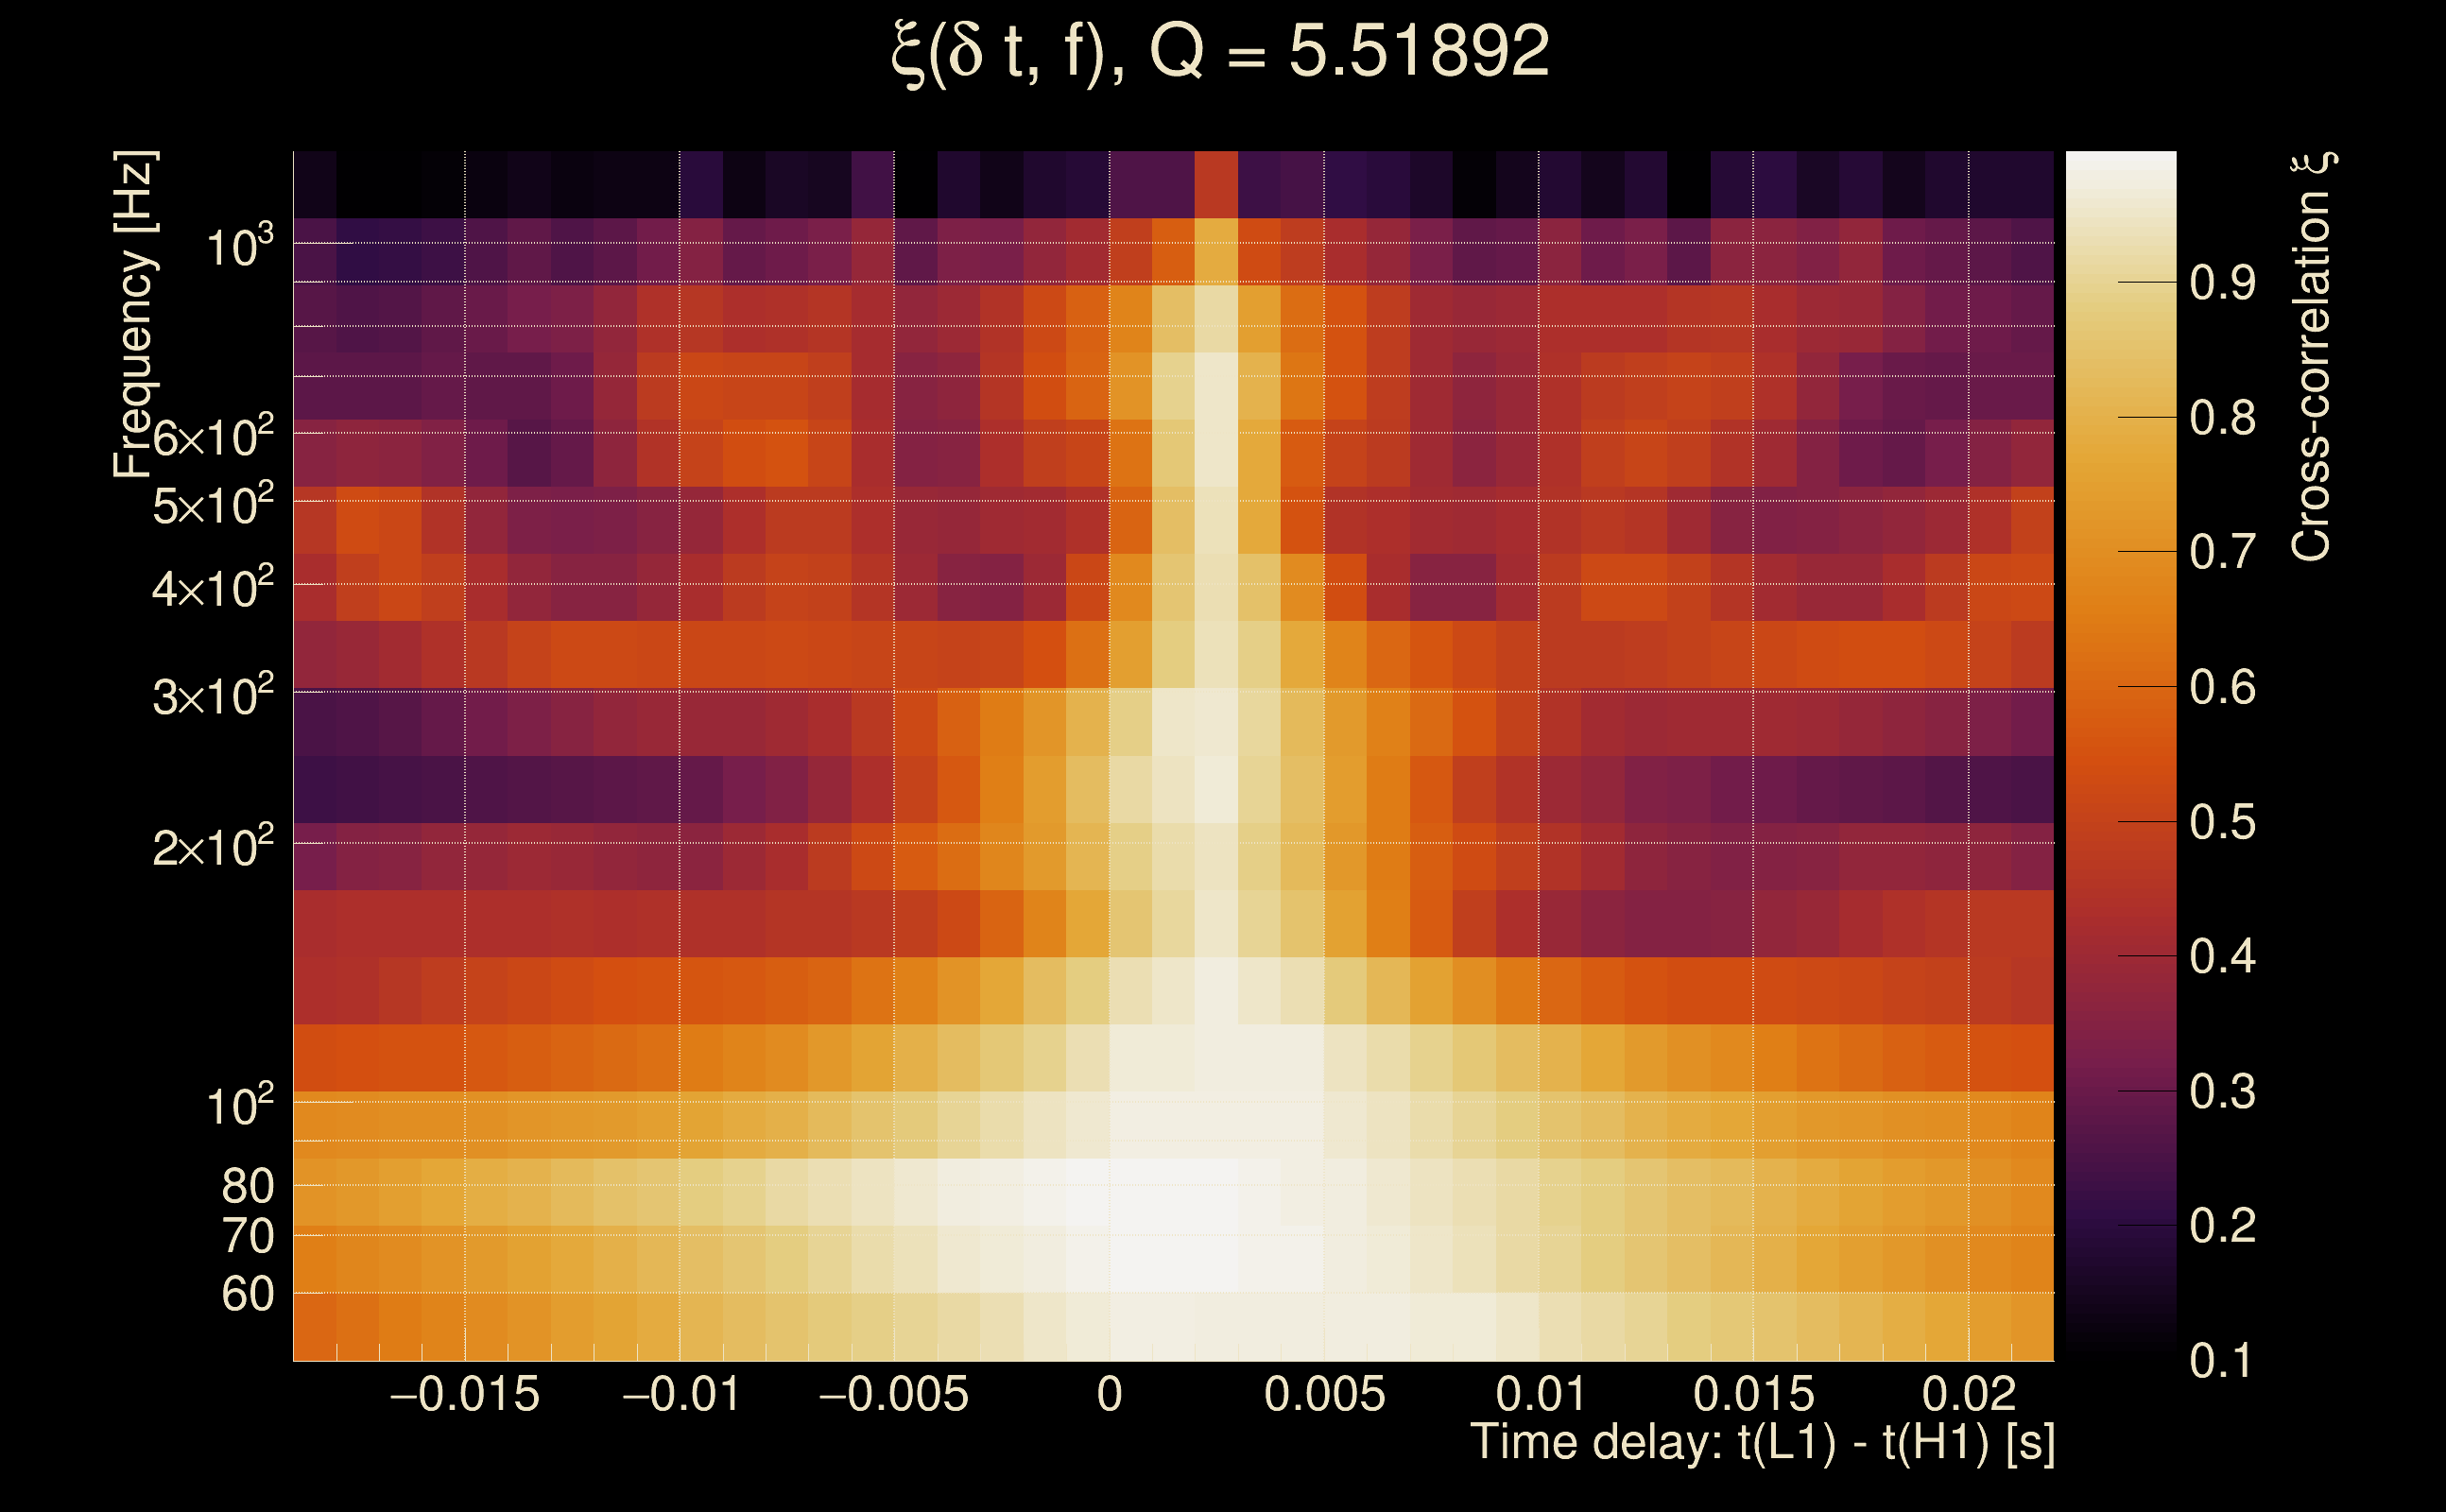
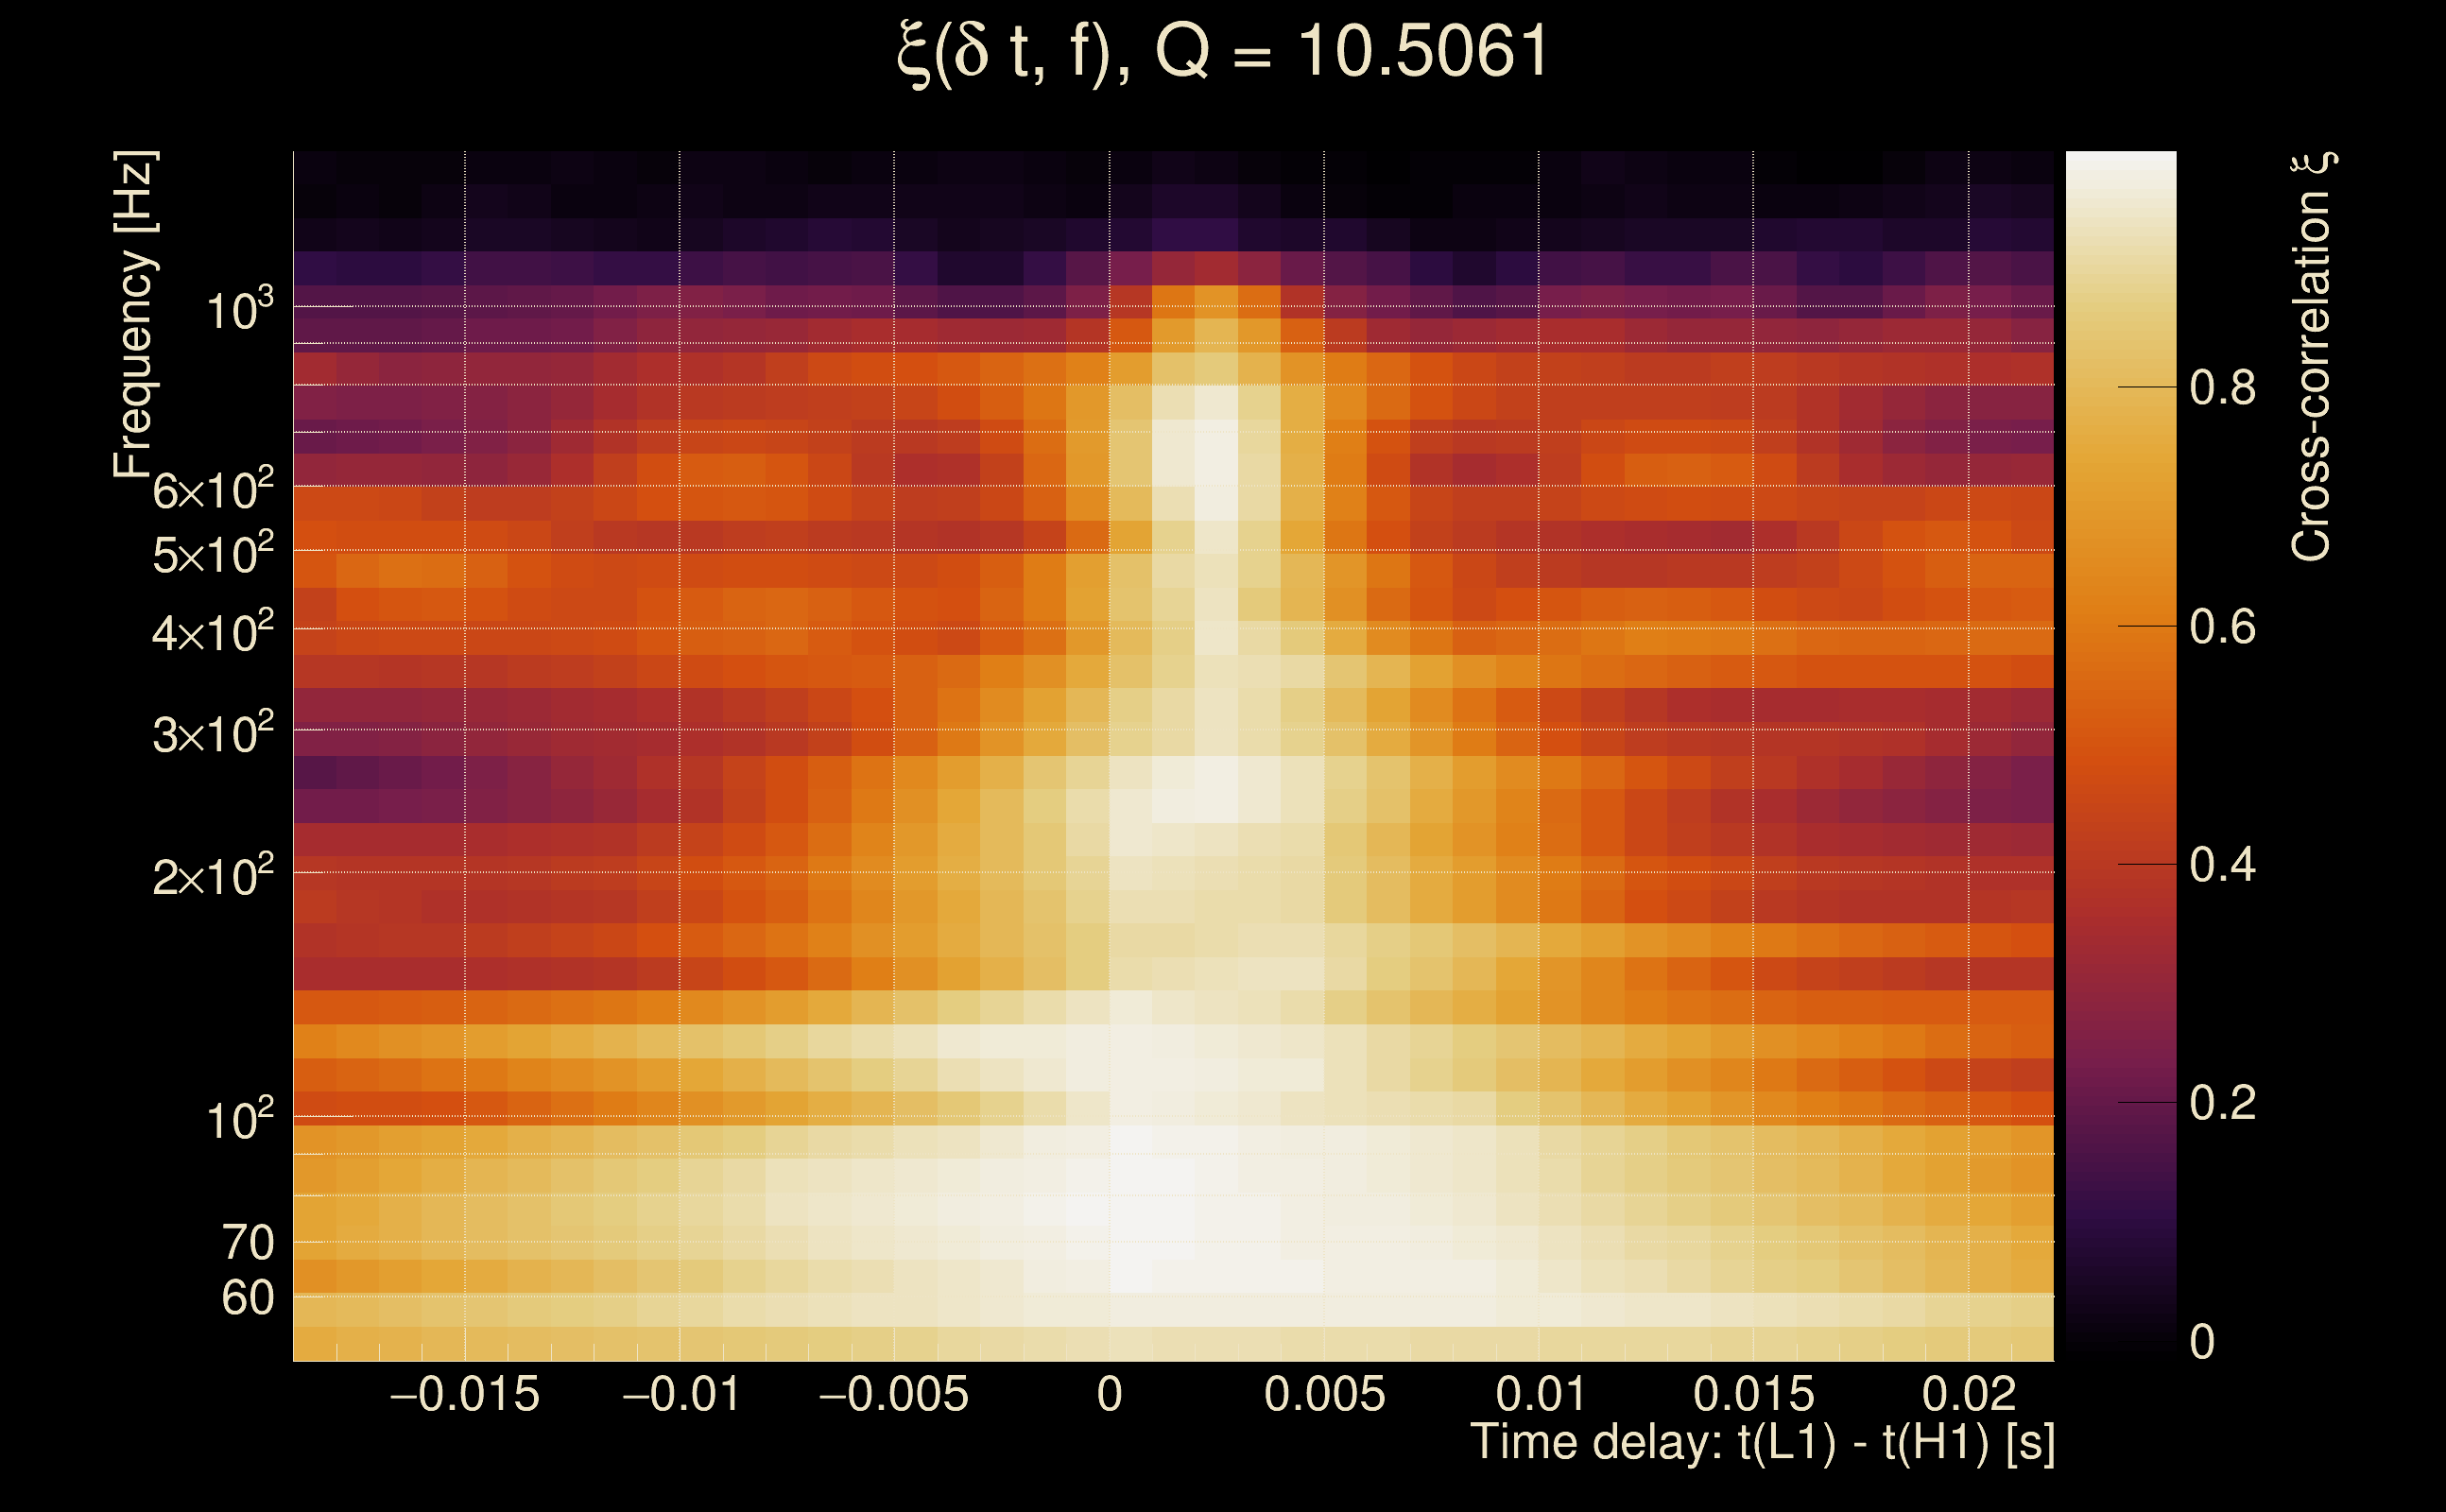
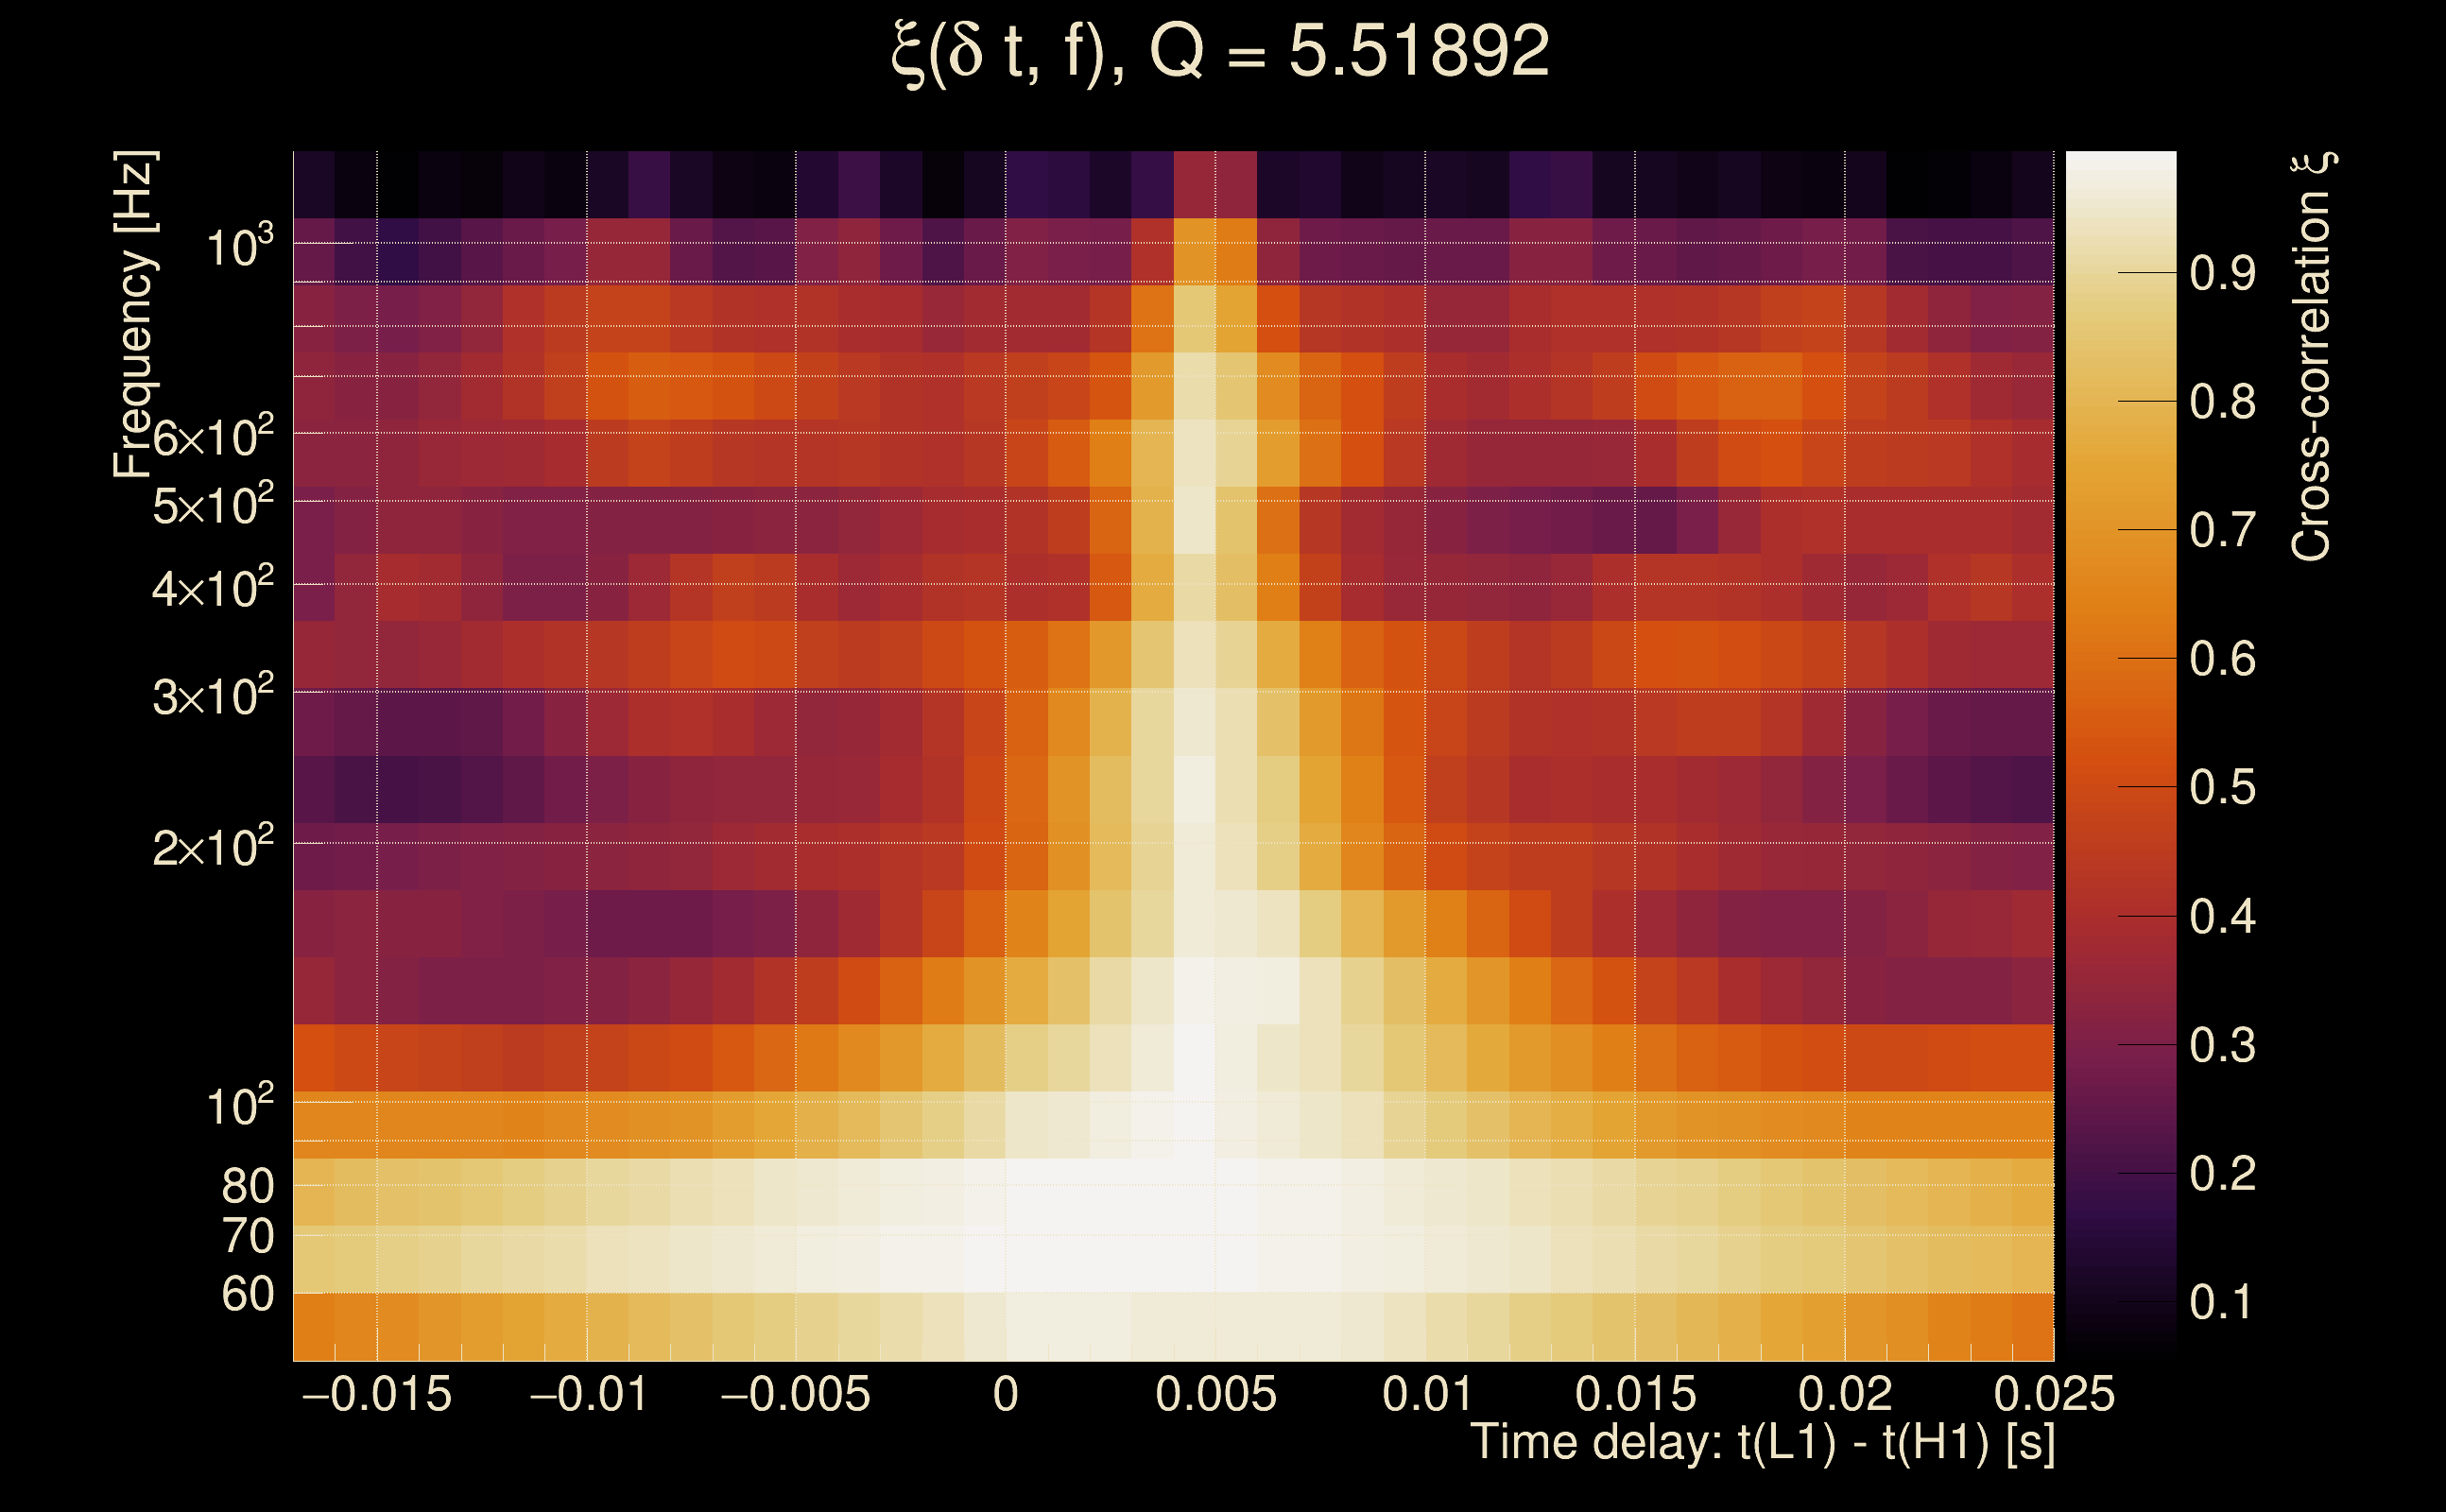
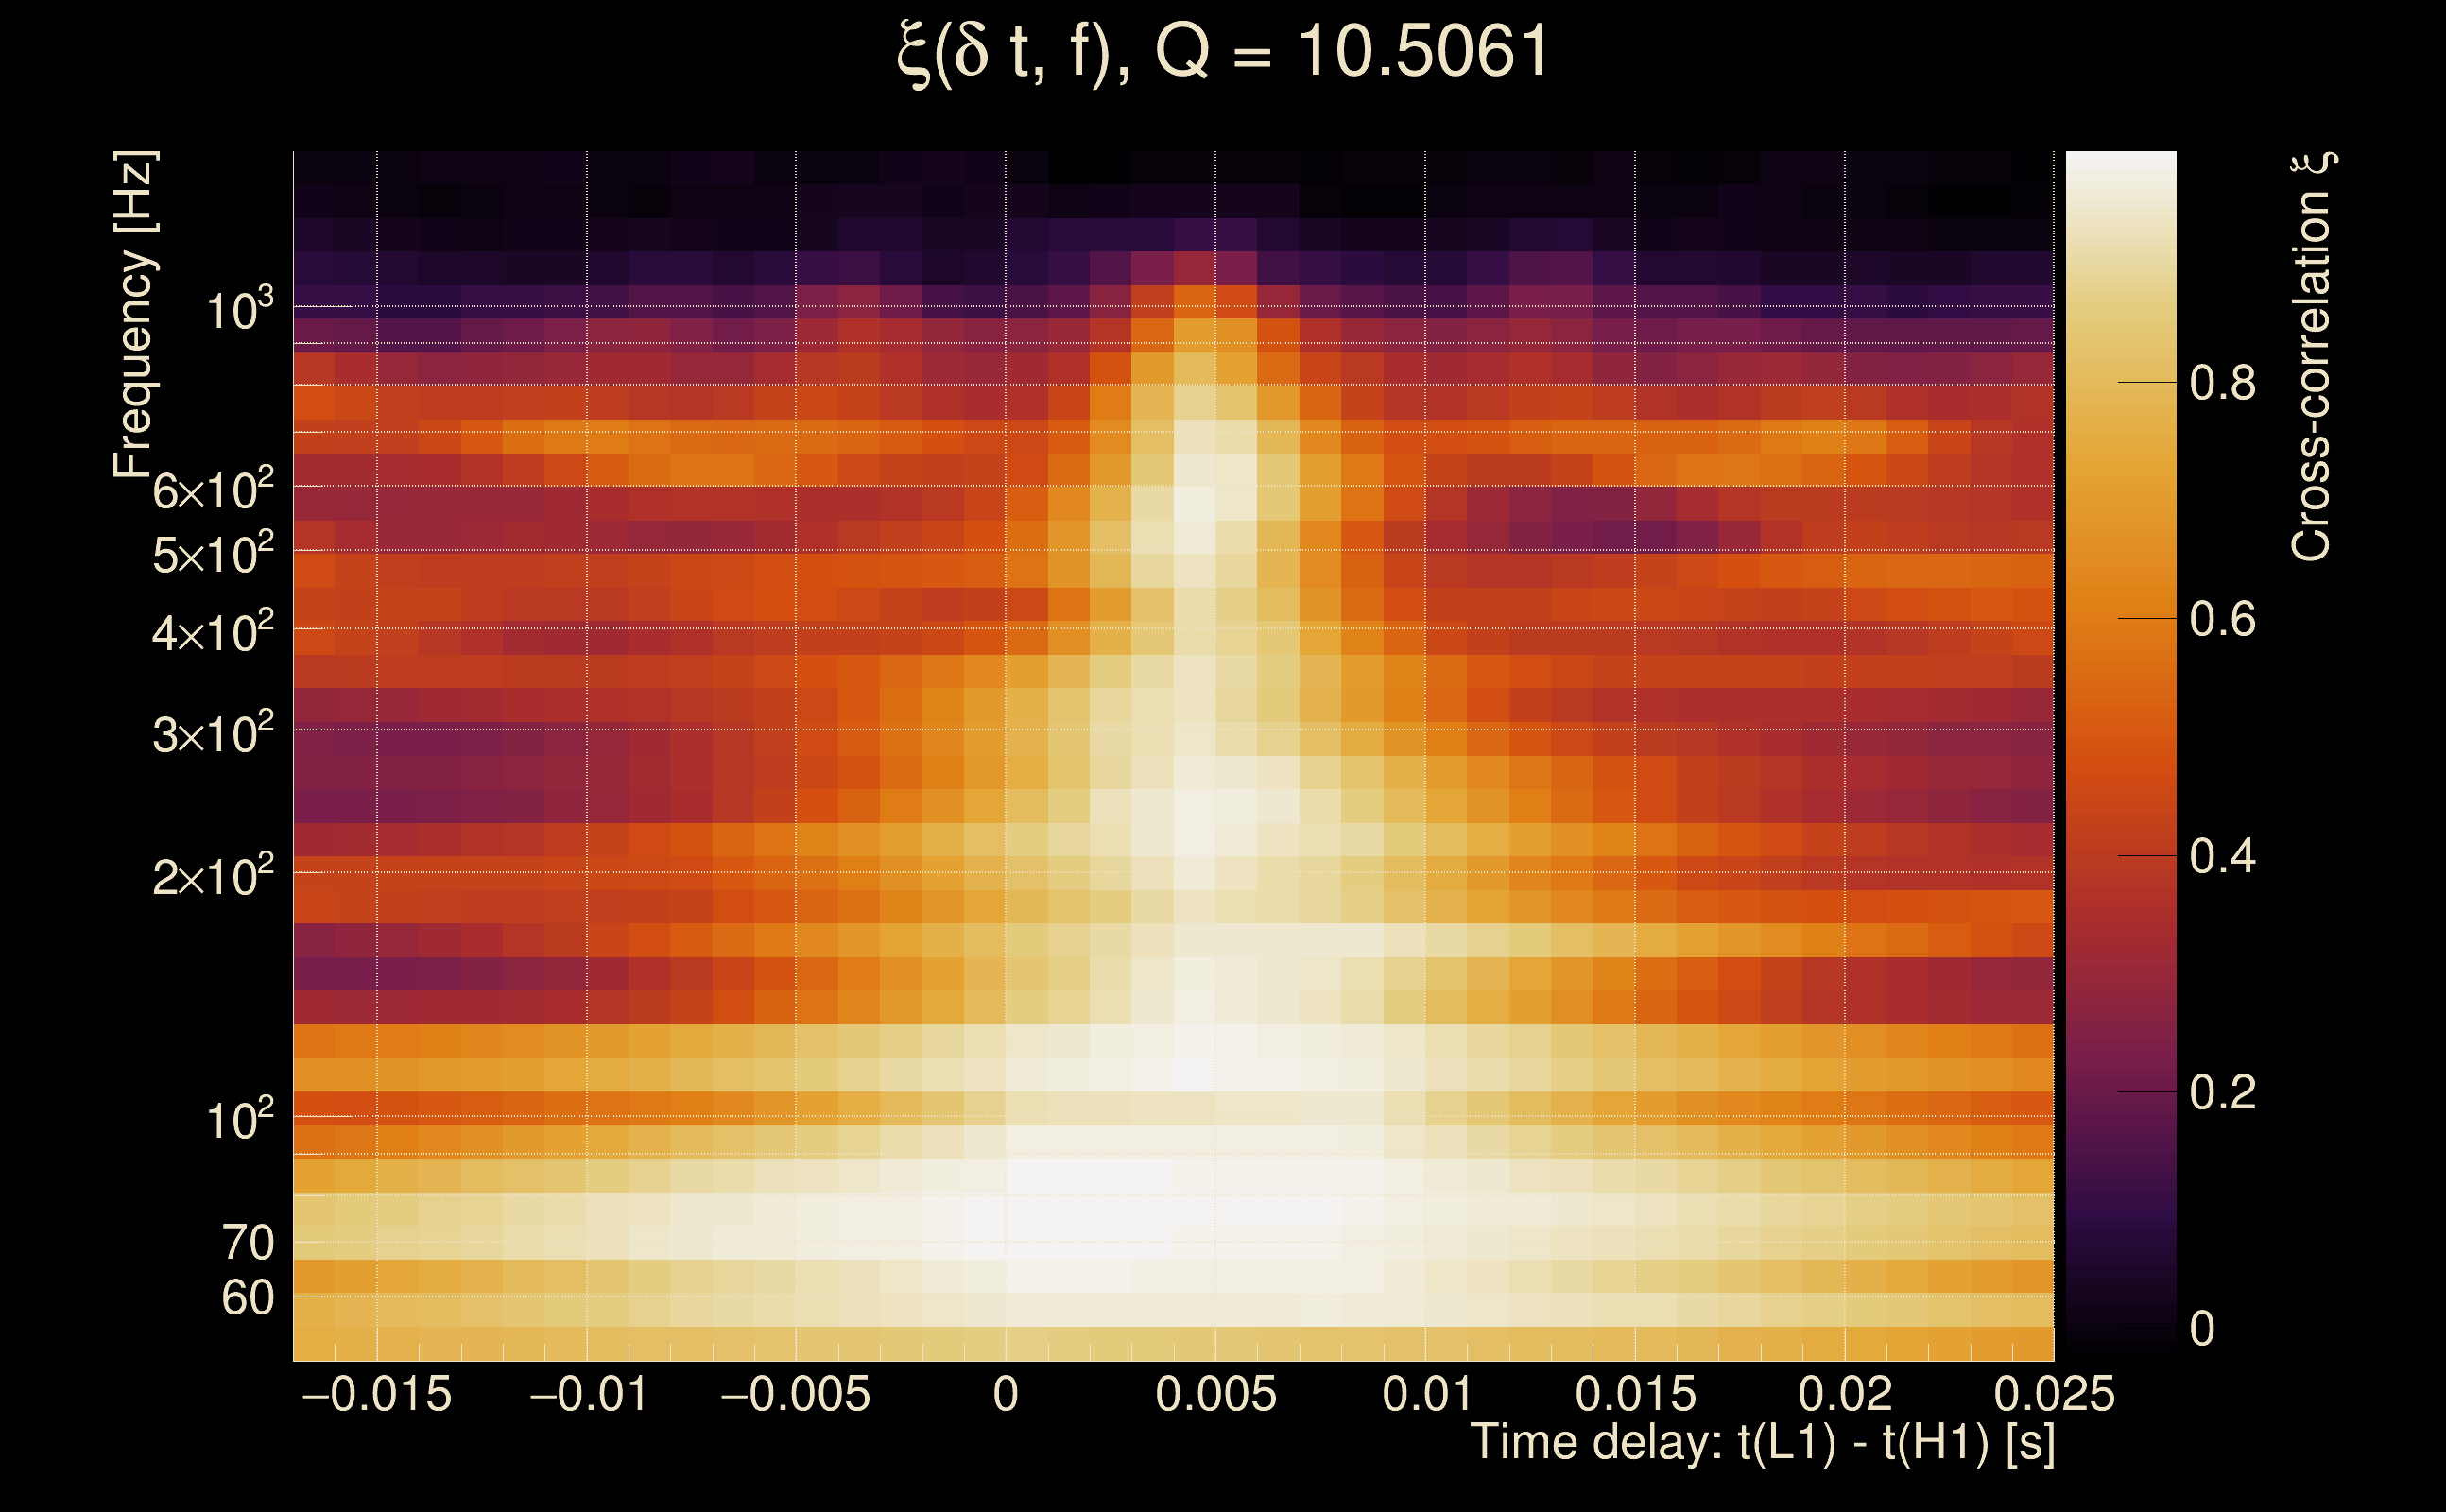
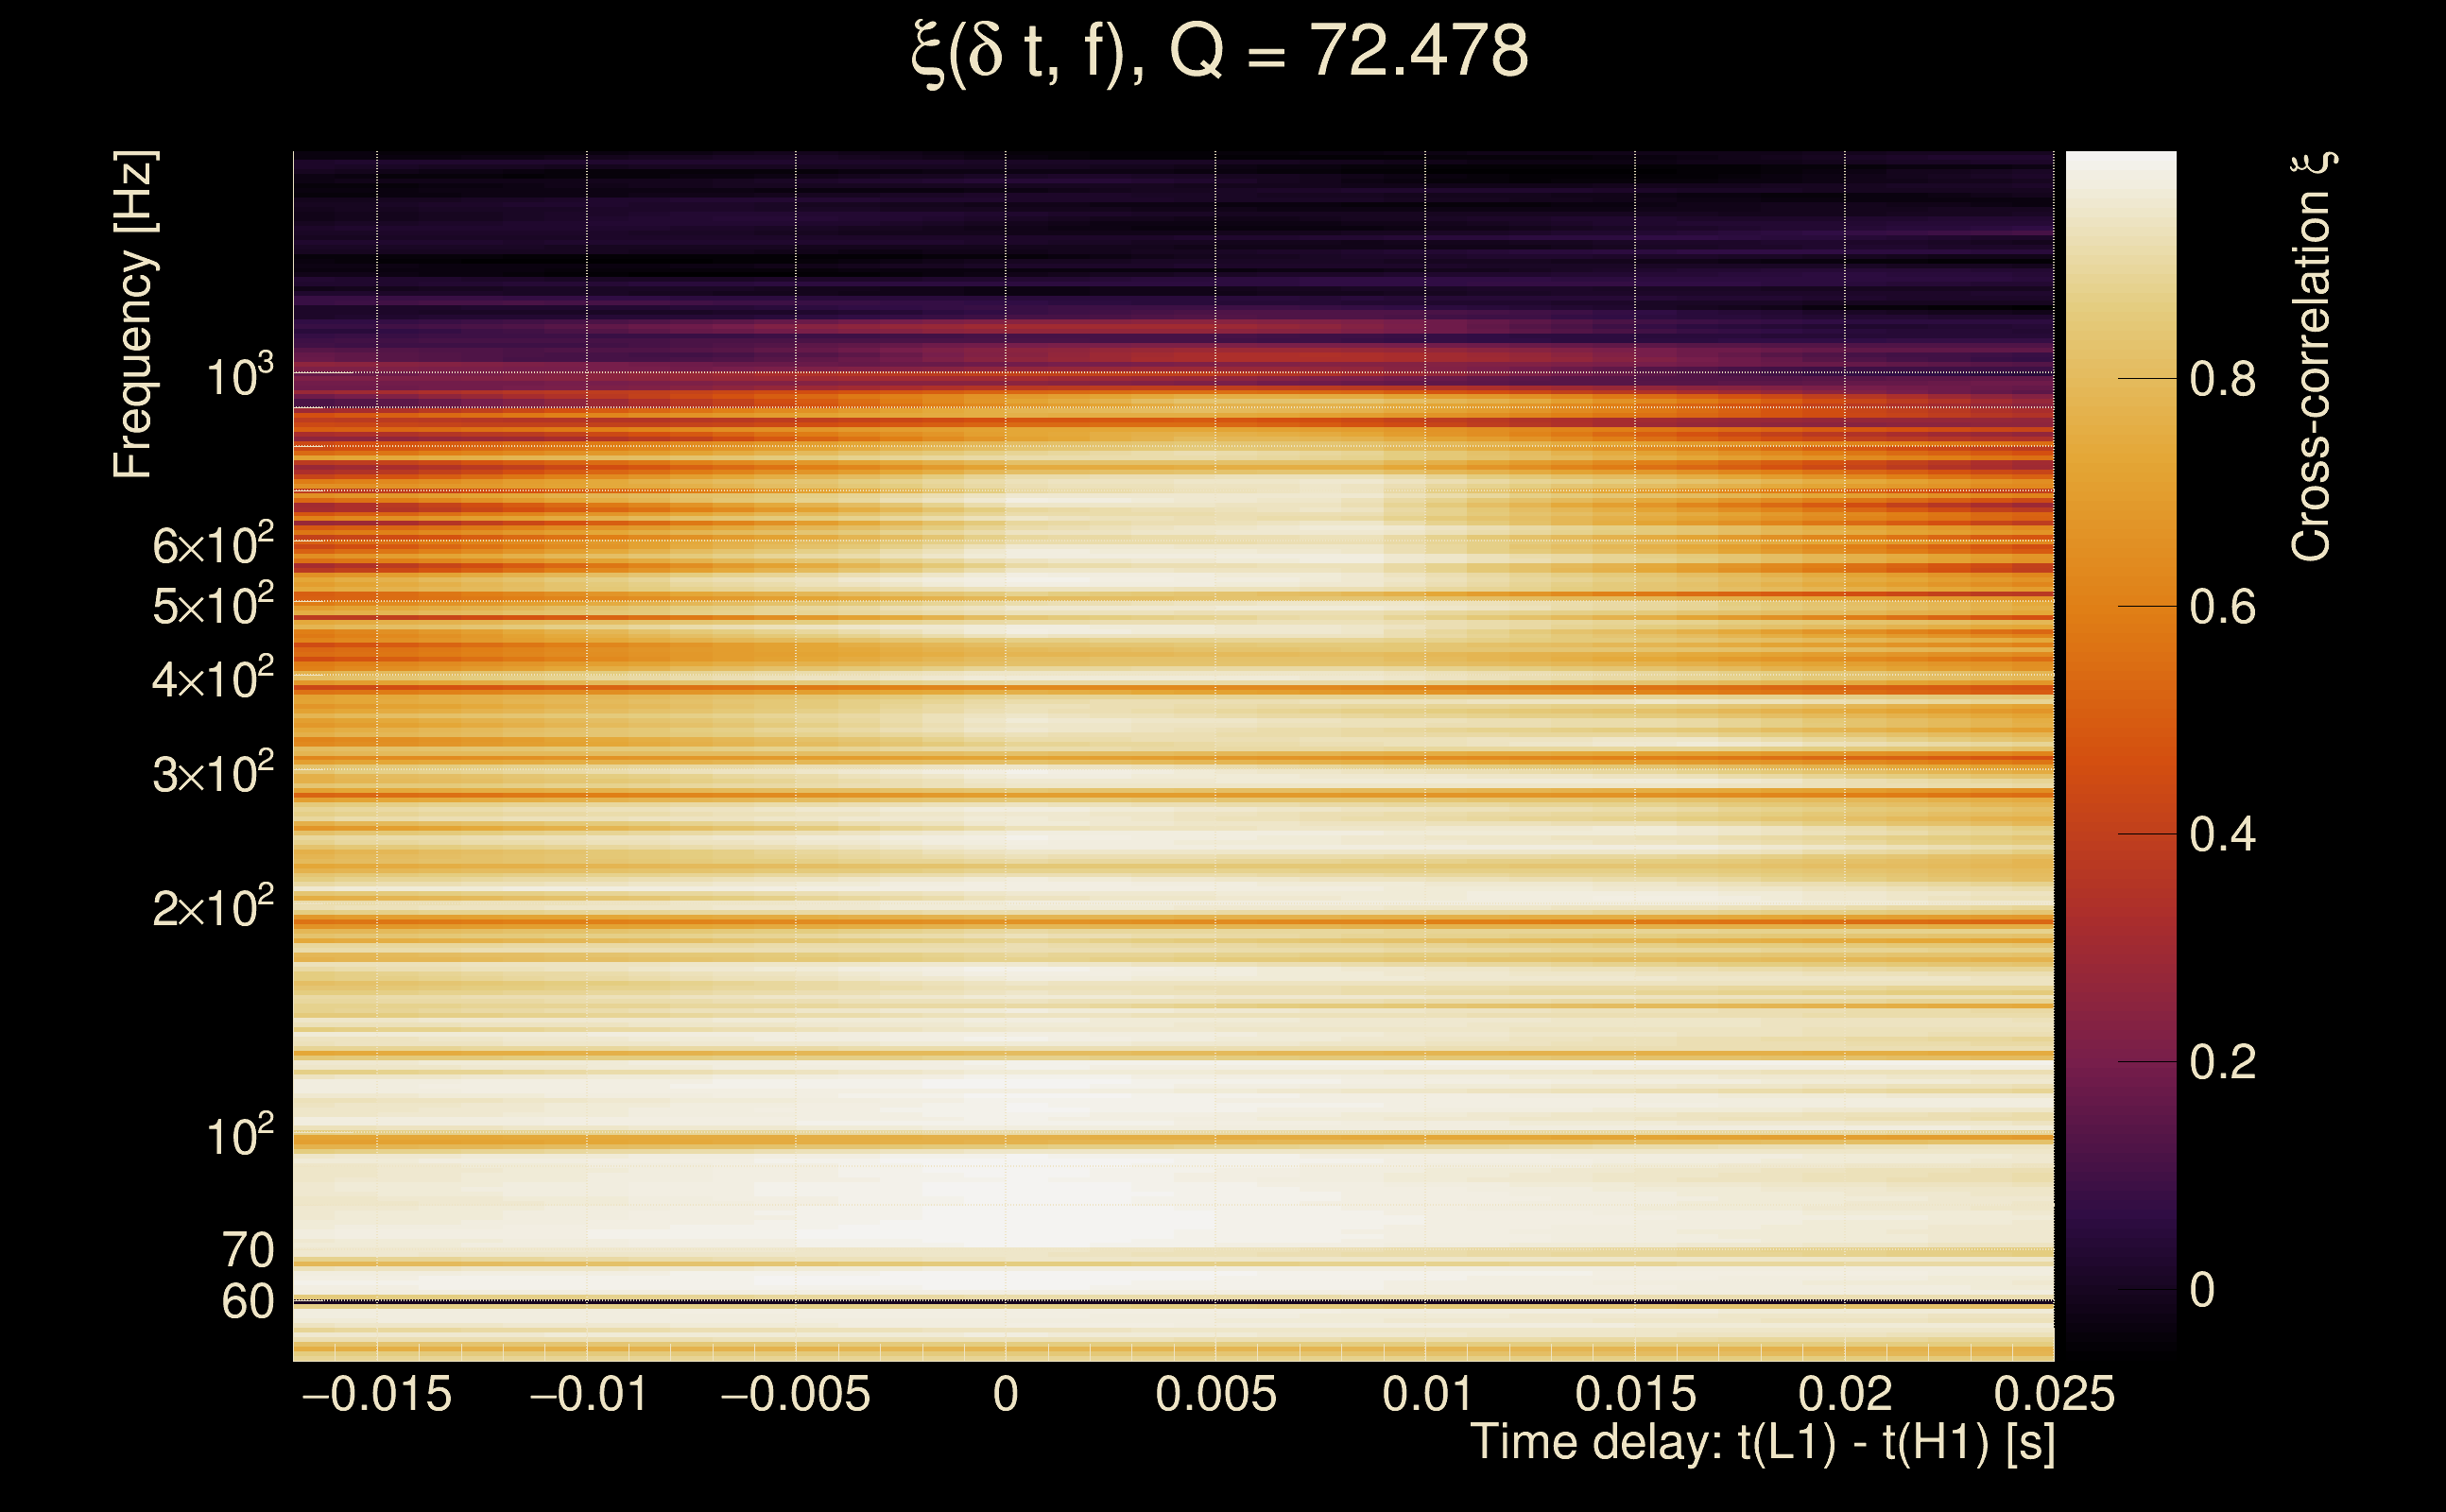
| Number of Q planes: | 5 (Q = 5.51892 → Q = 72.478) |
| Omicron frequency range: | 50 Hz → 1958.38 Hz |
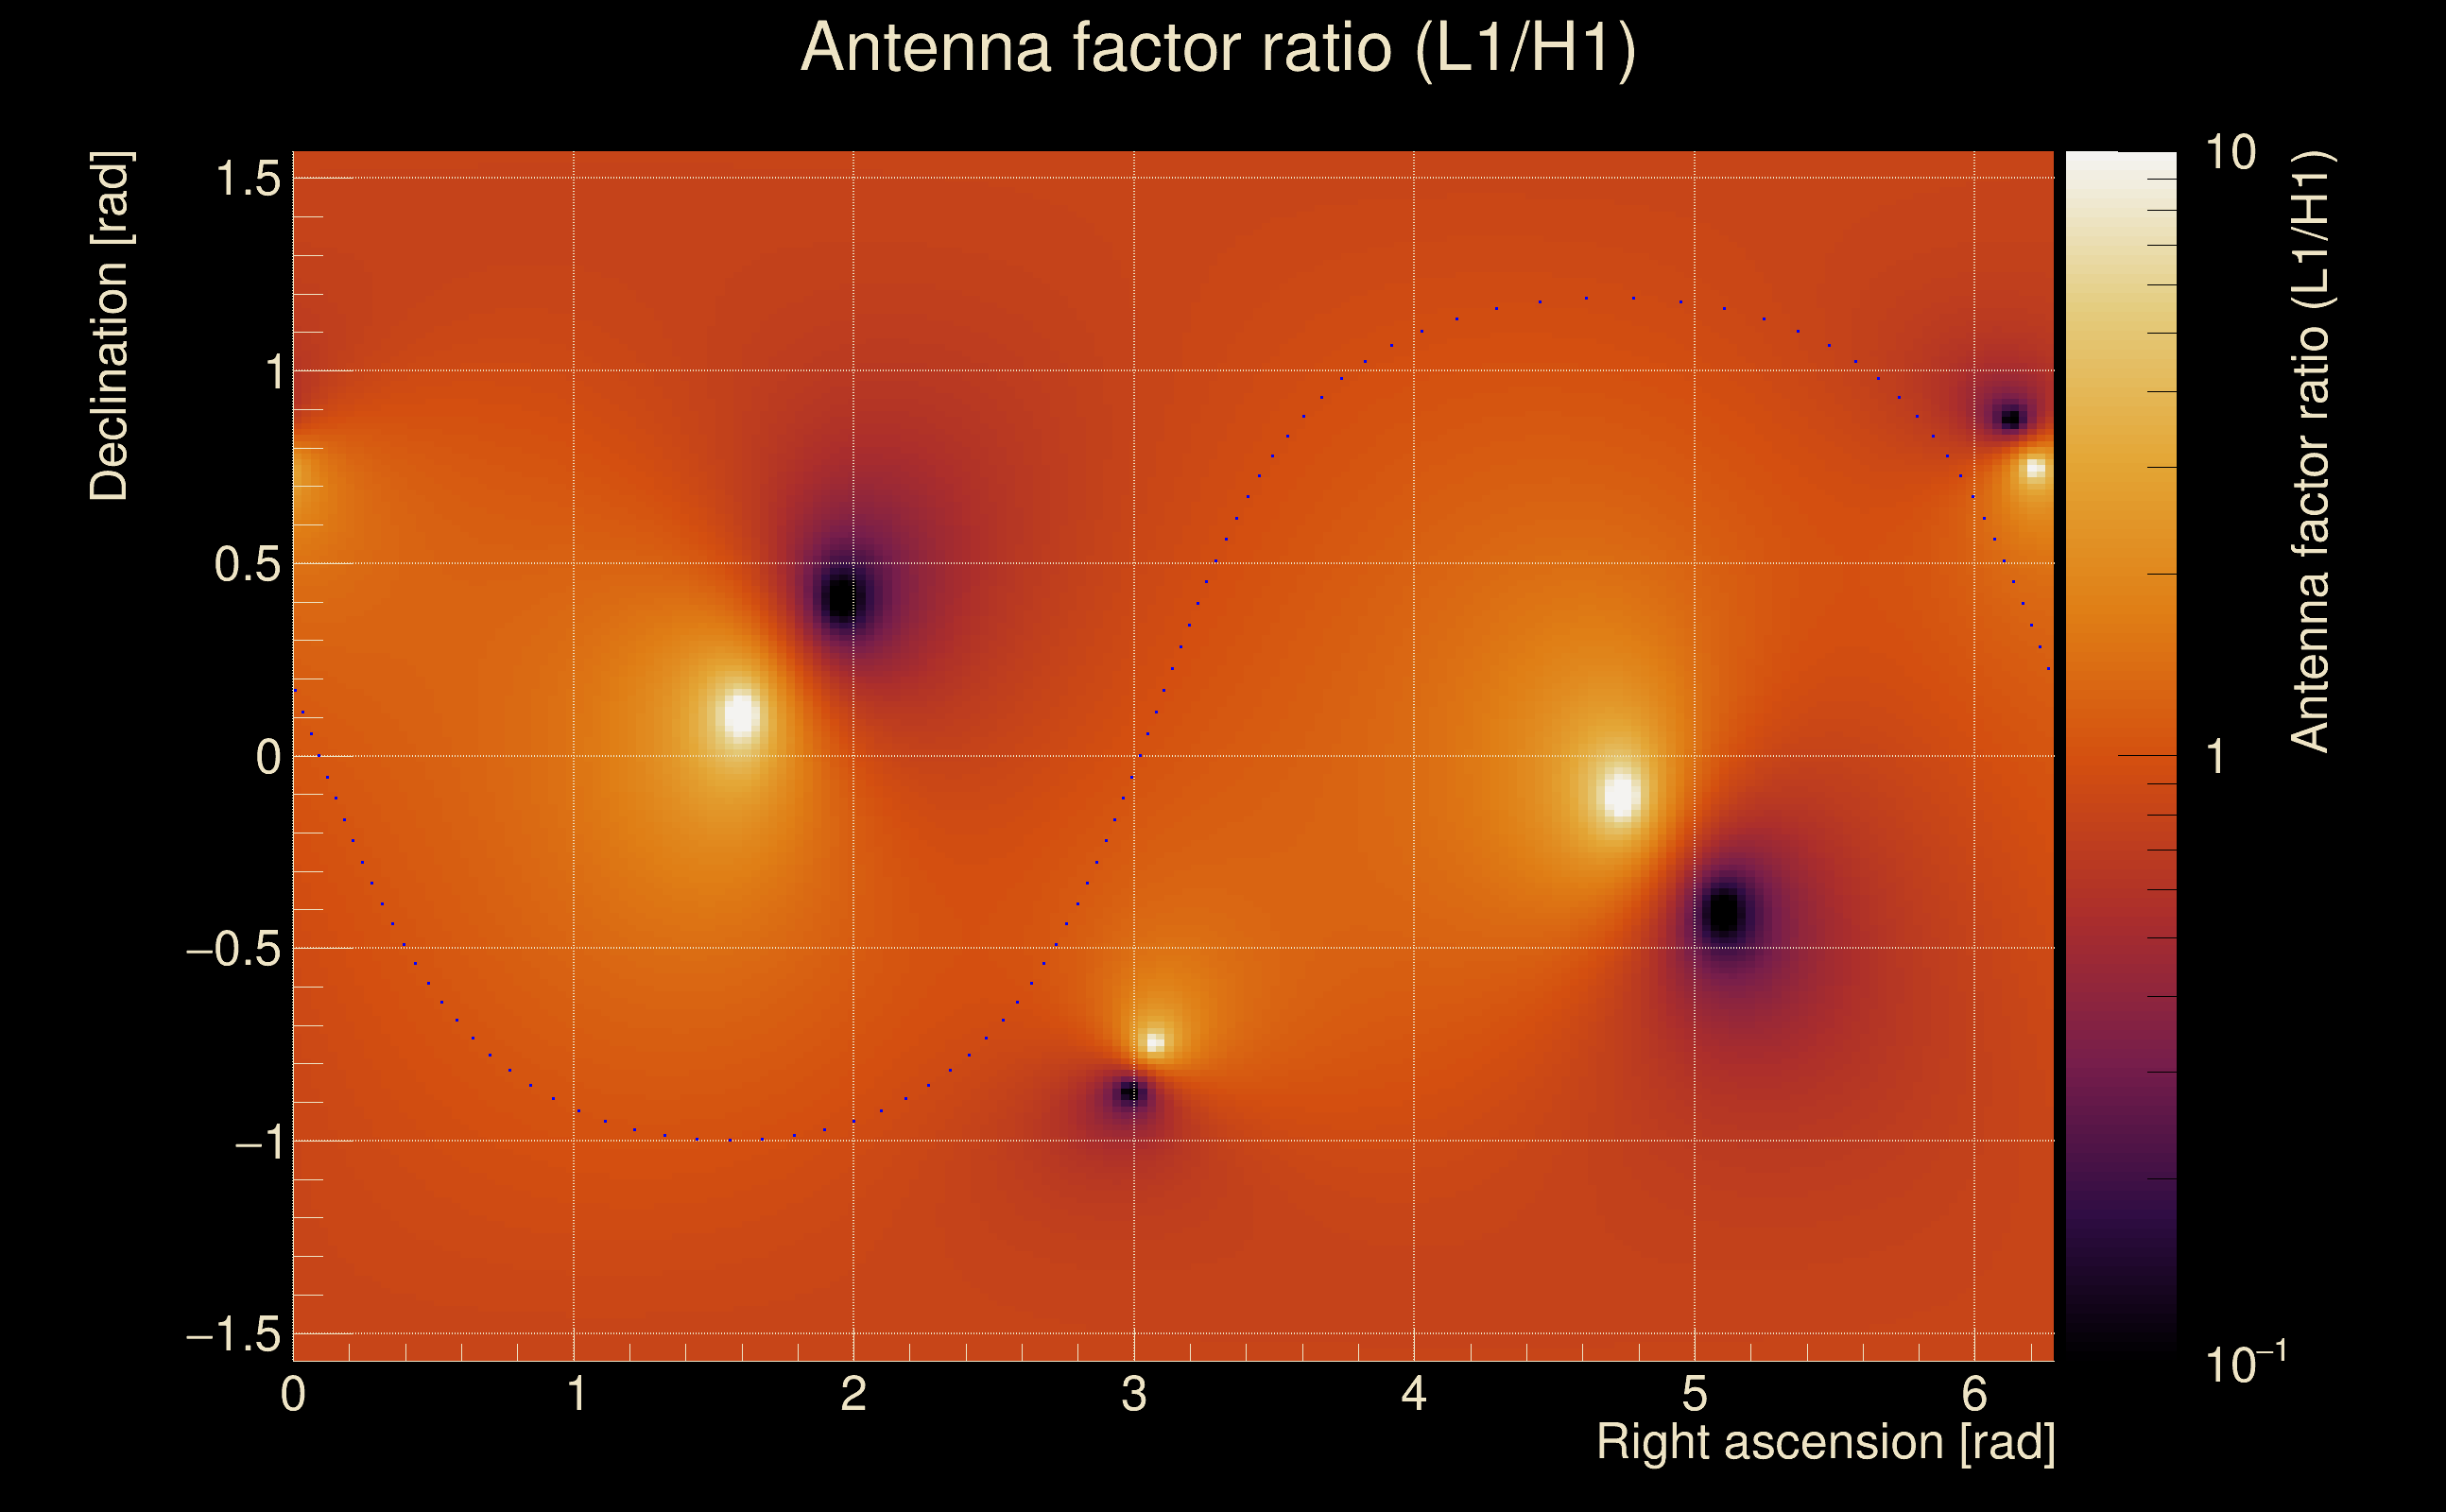
| Light travel time between detectors: | 0.0100128 s |
| Slice extra-time (calibration uncertainty + slice veto): | 0.0129872 s |
| Number of time-delay bins in a cross-correlation map: | 10000 |
| Number of slices in a cross-correlation map: | 217 |
| Number of time-delay bins in a slice: | 46 |
| SNR gating: | < 100 (detector 0), < 100 (detector 1) |
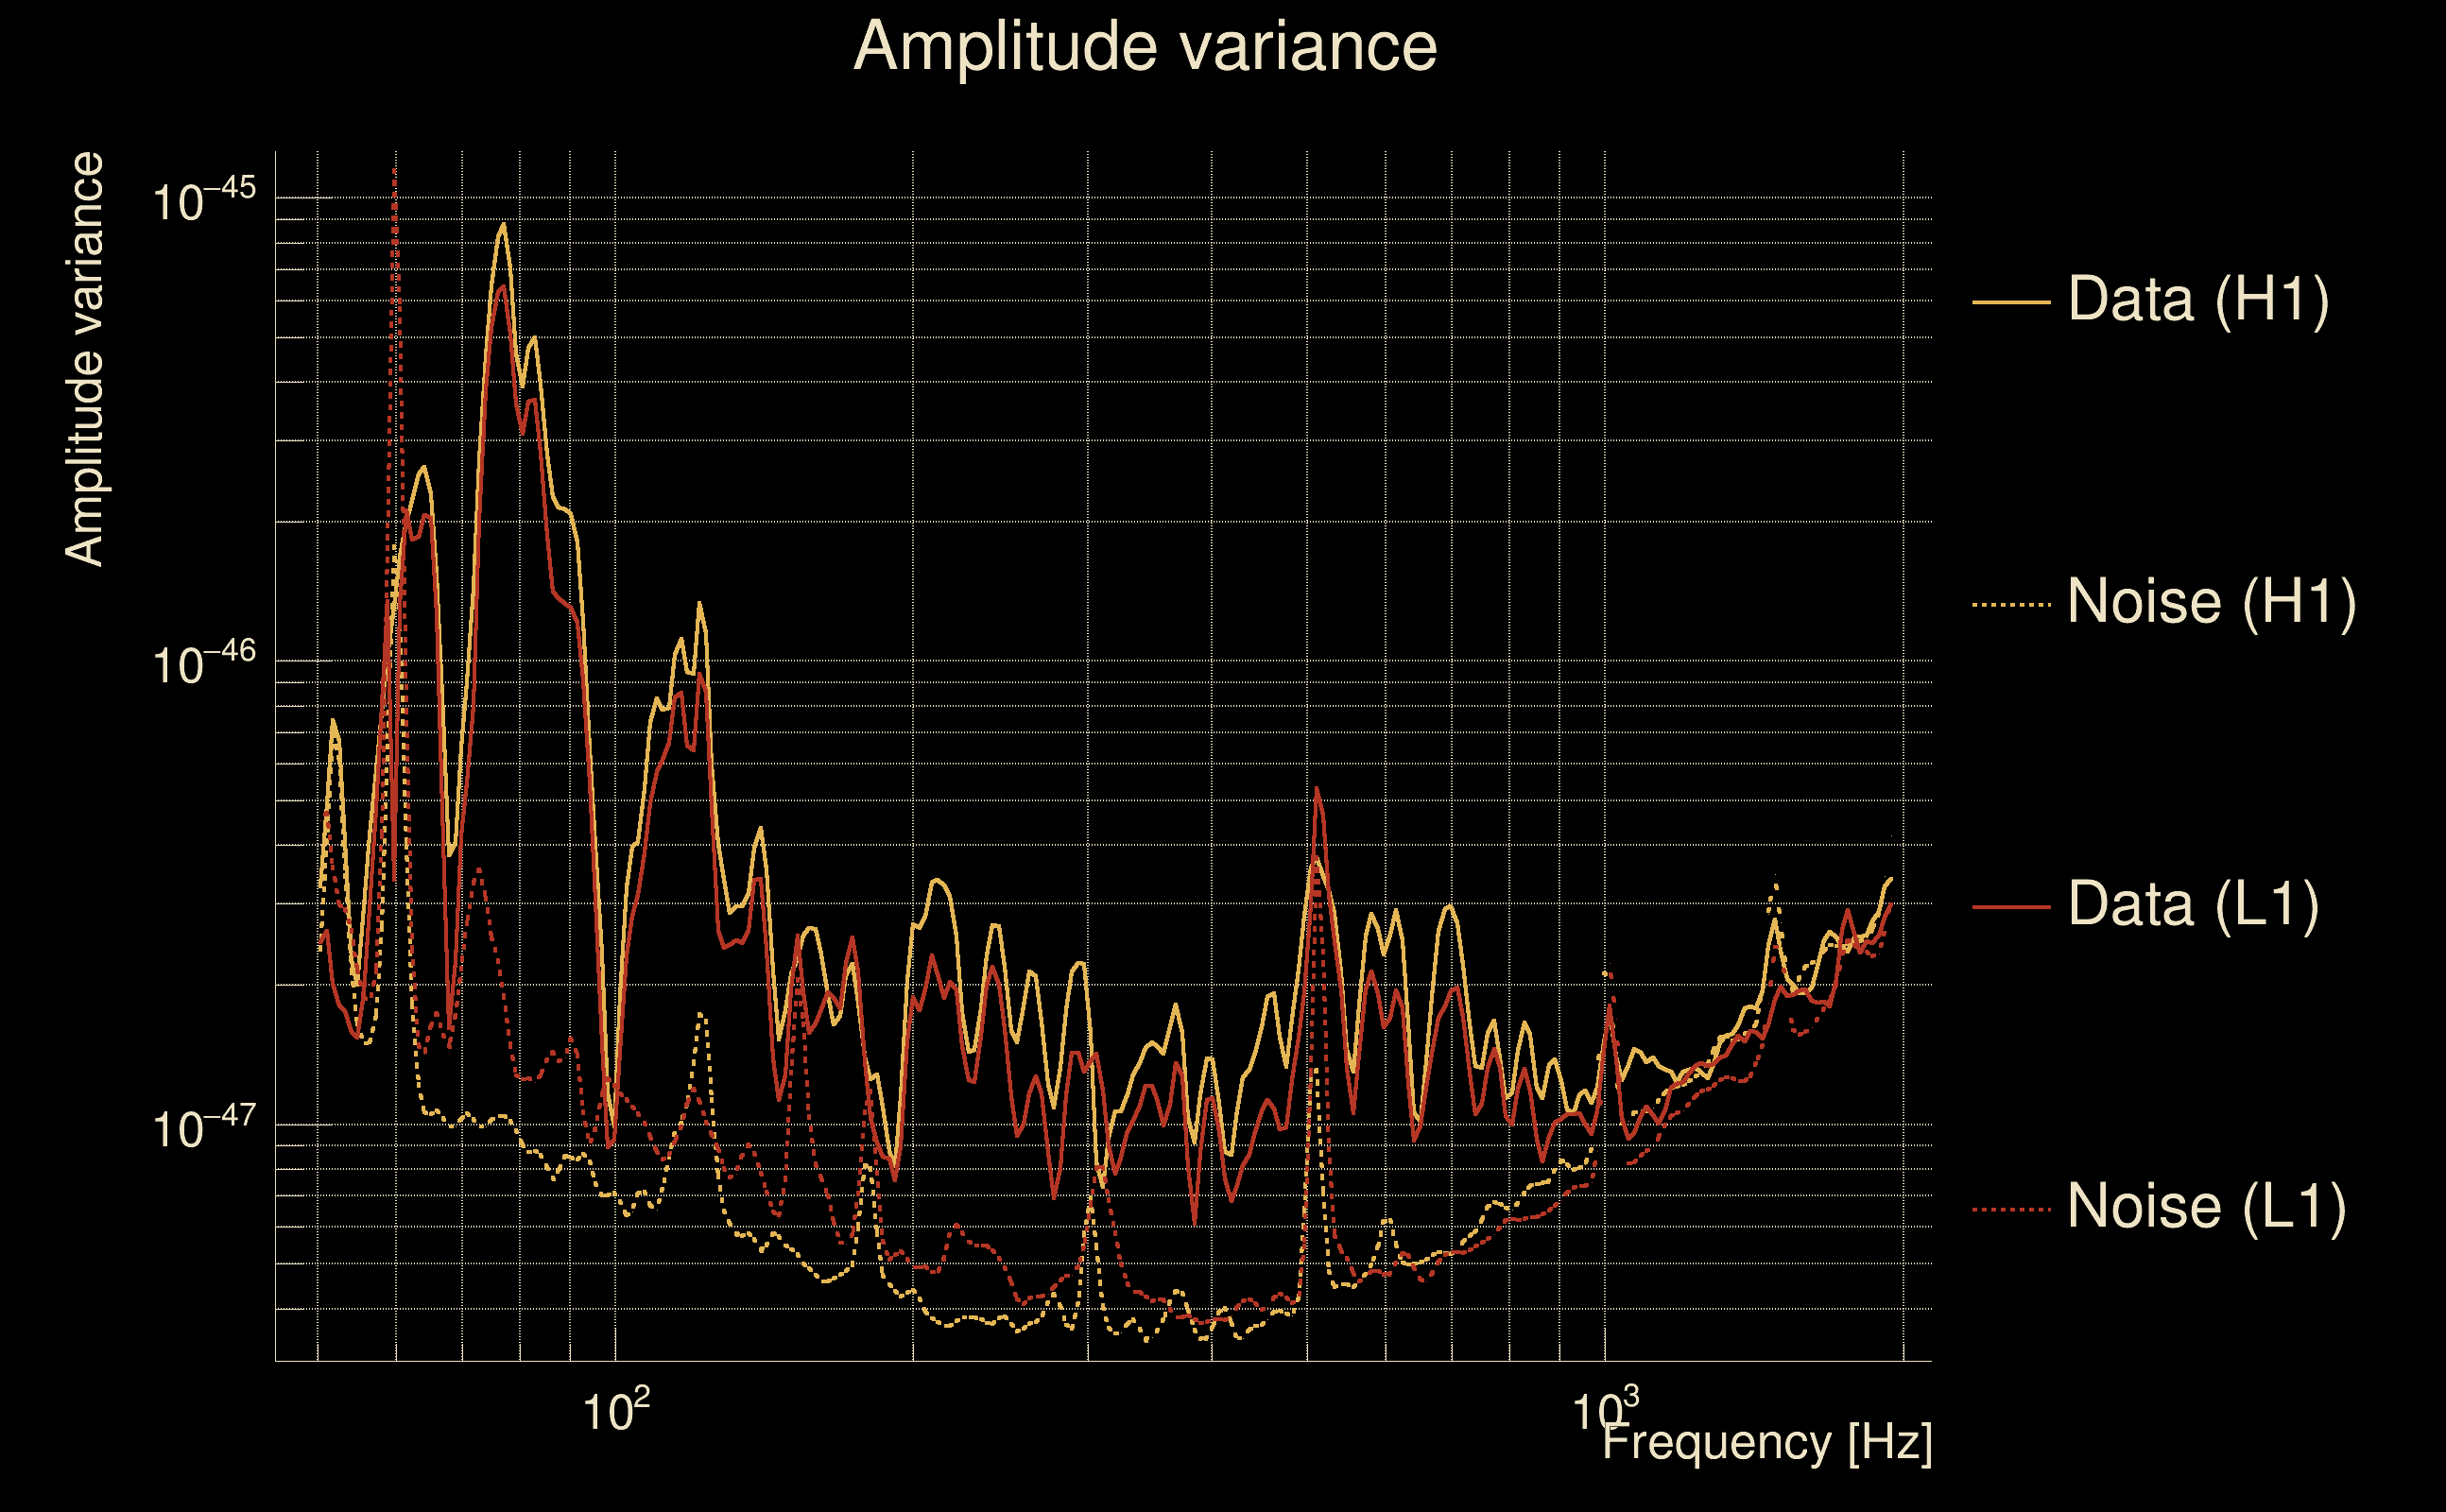
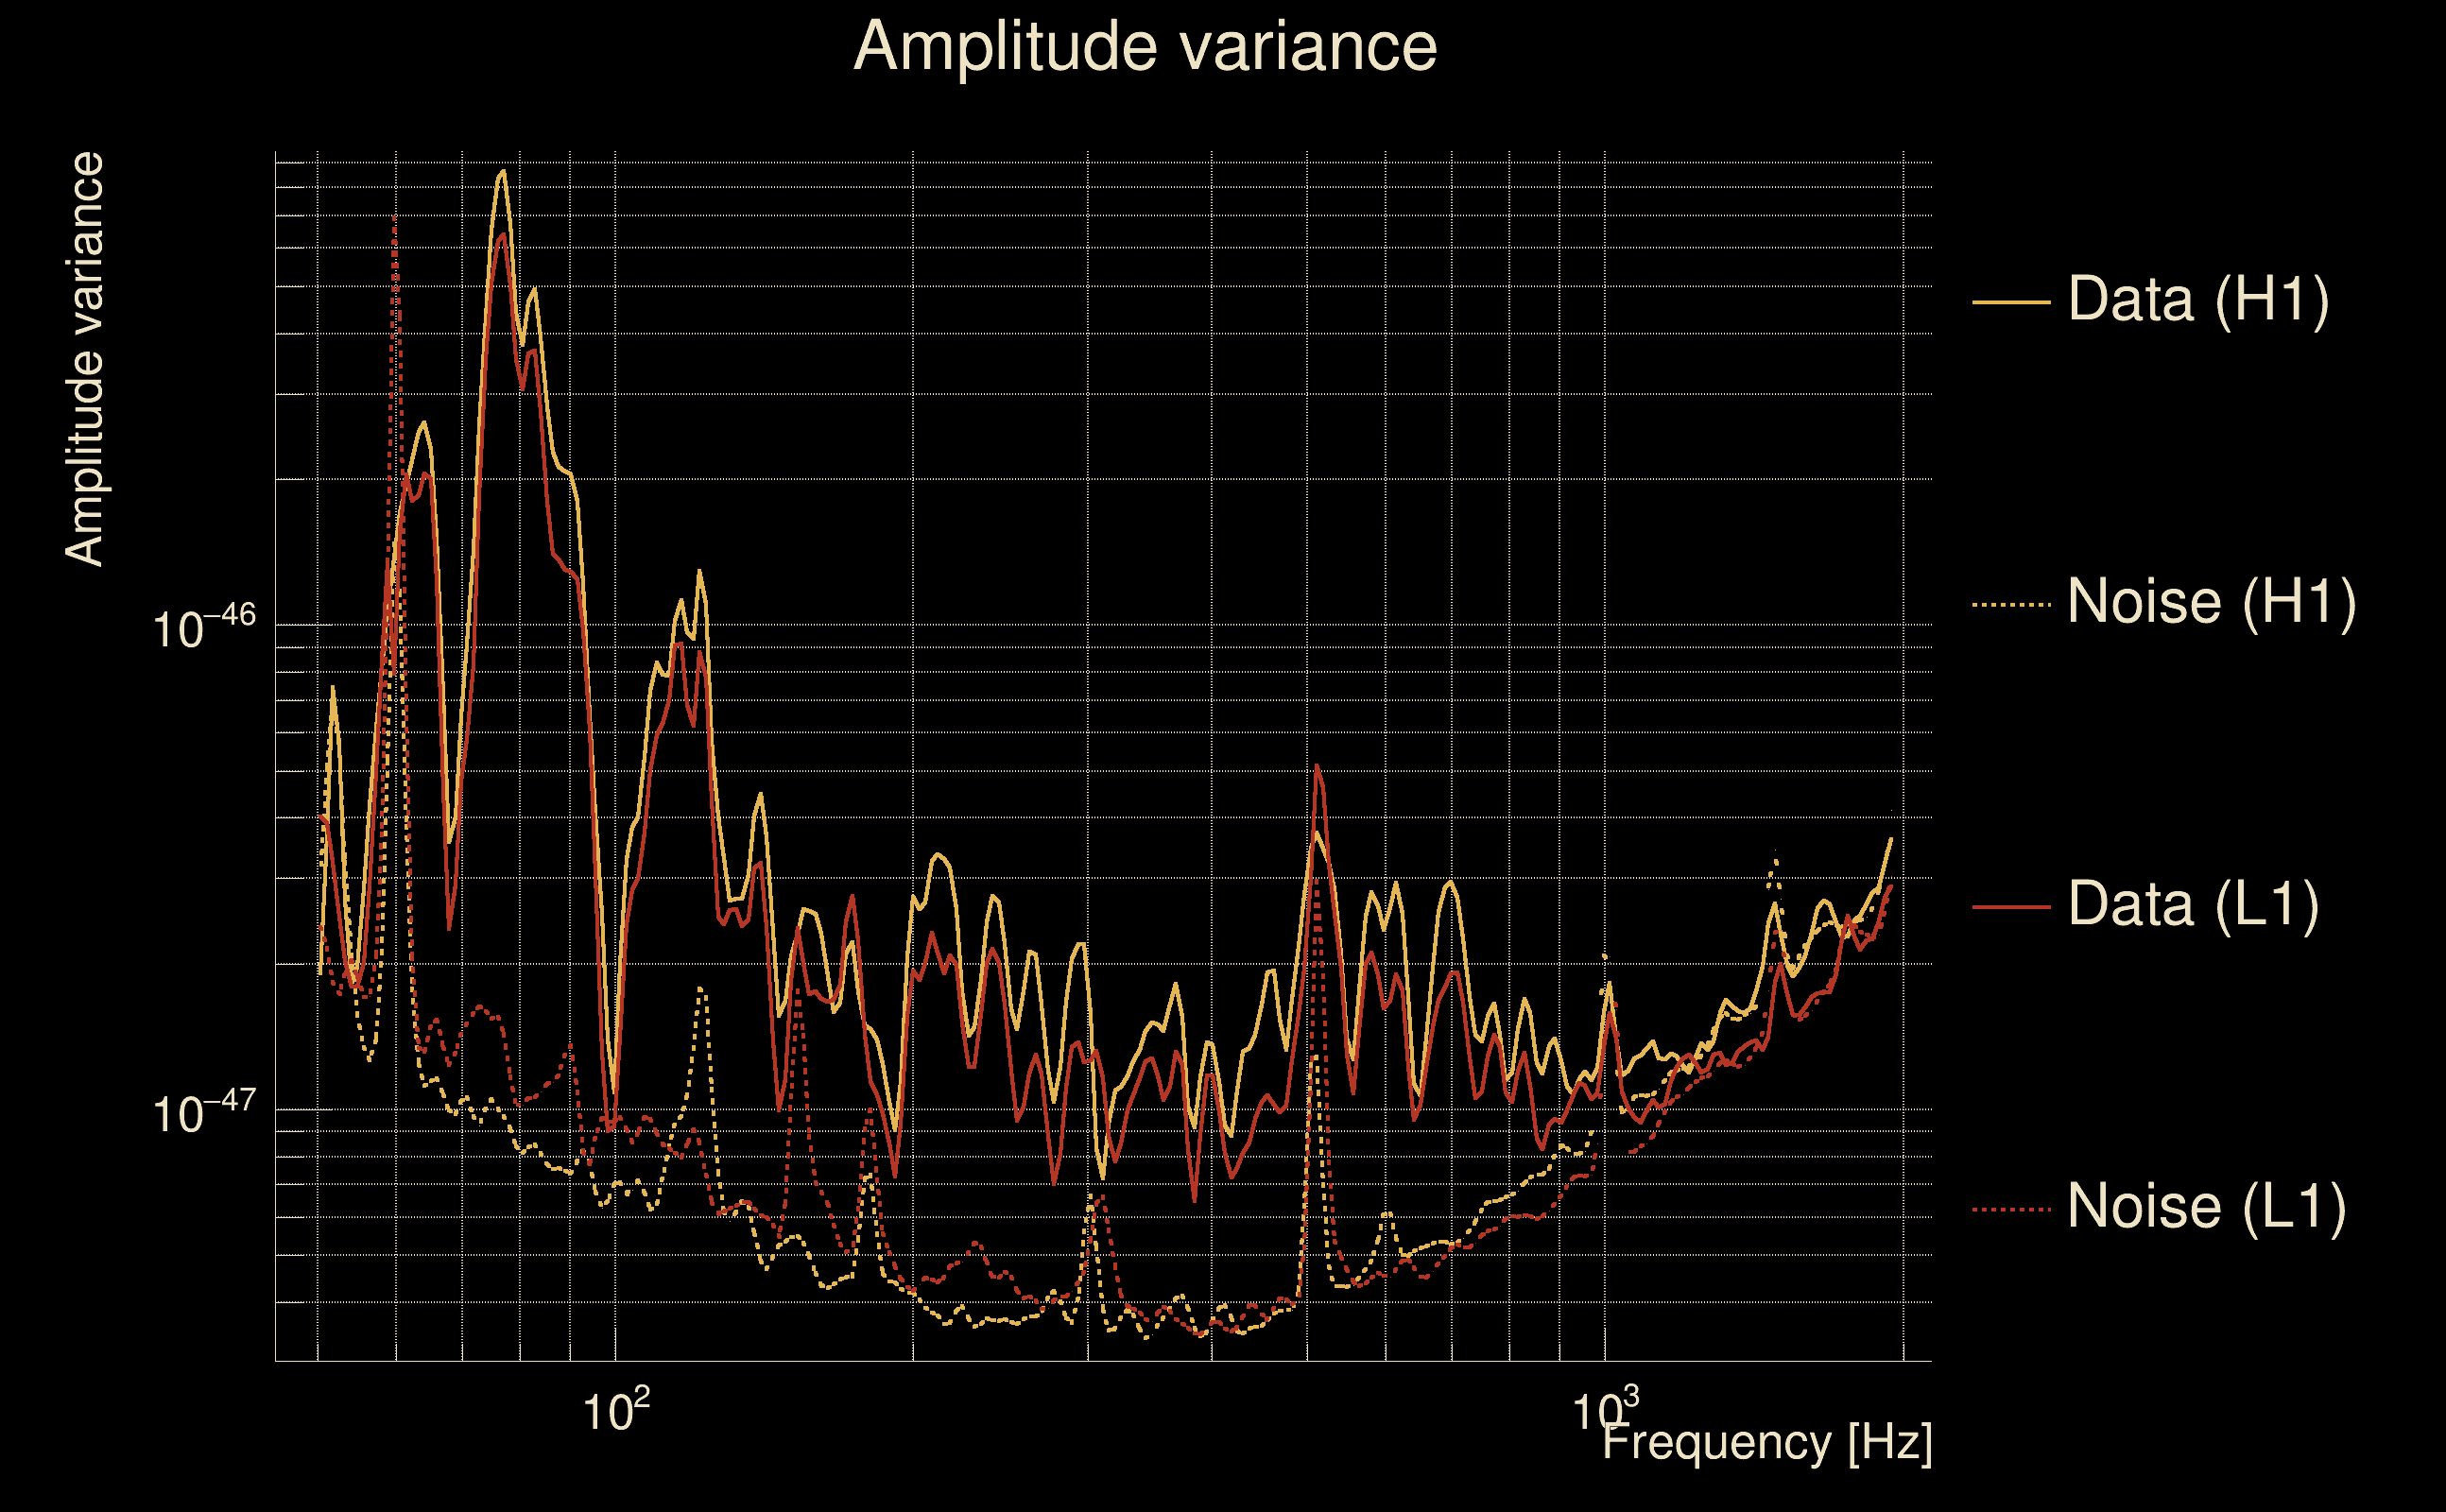
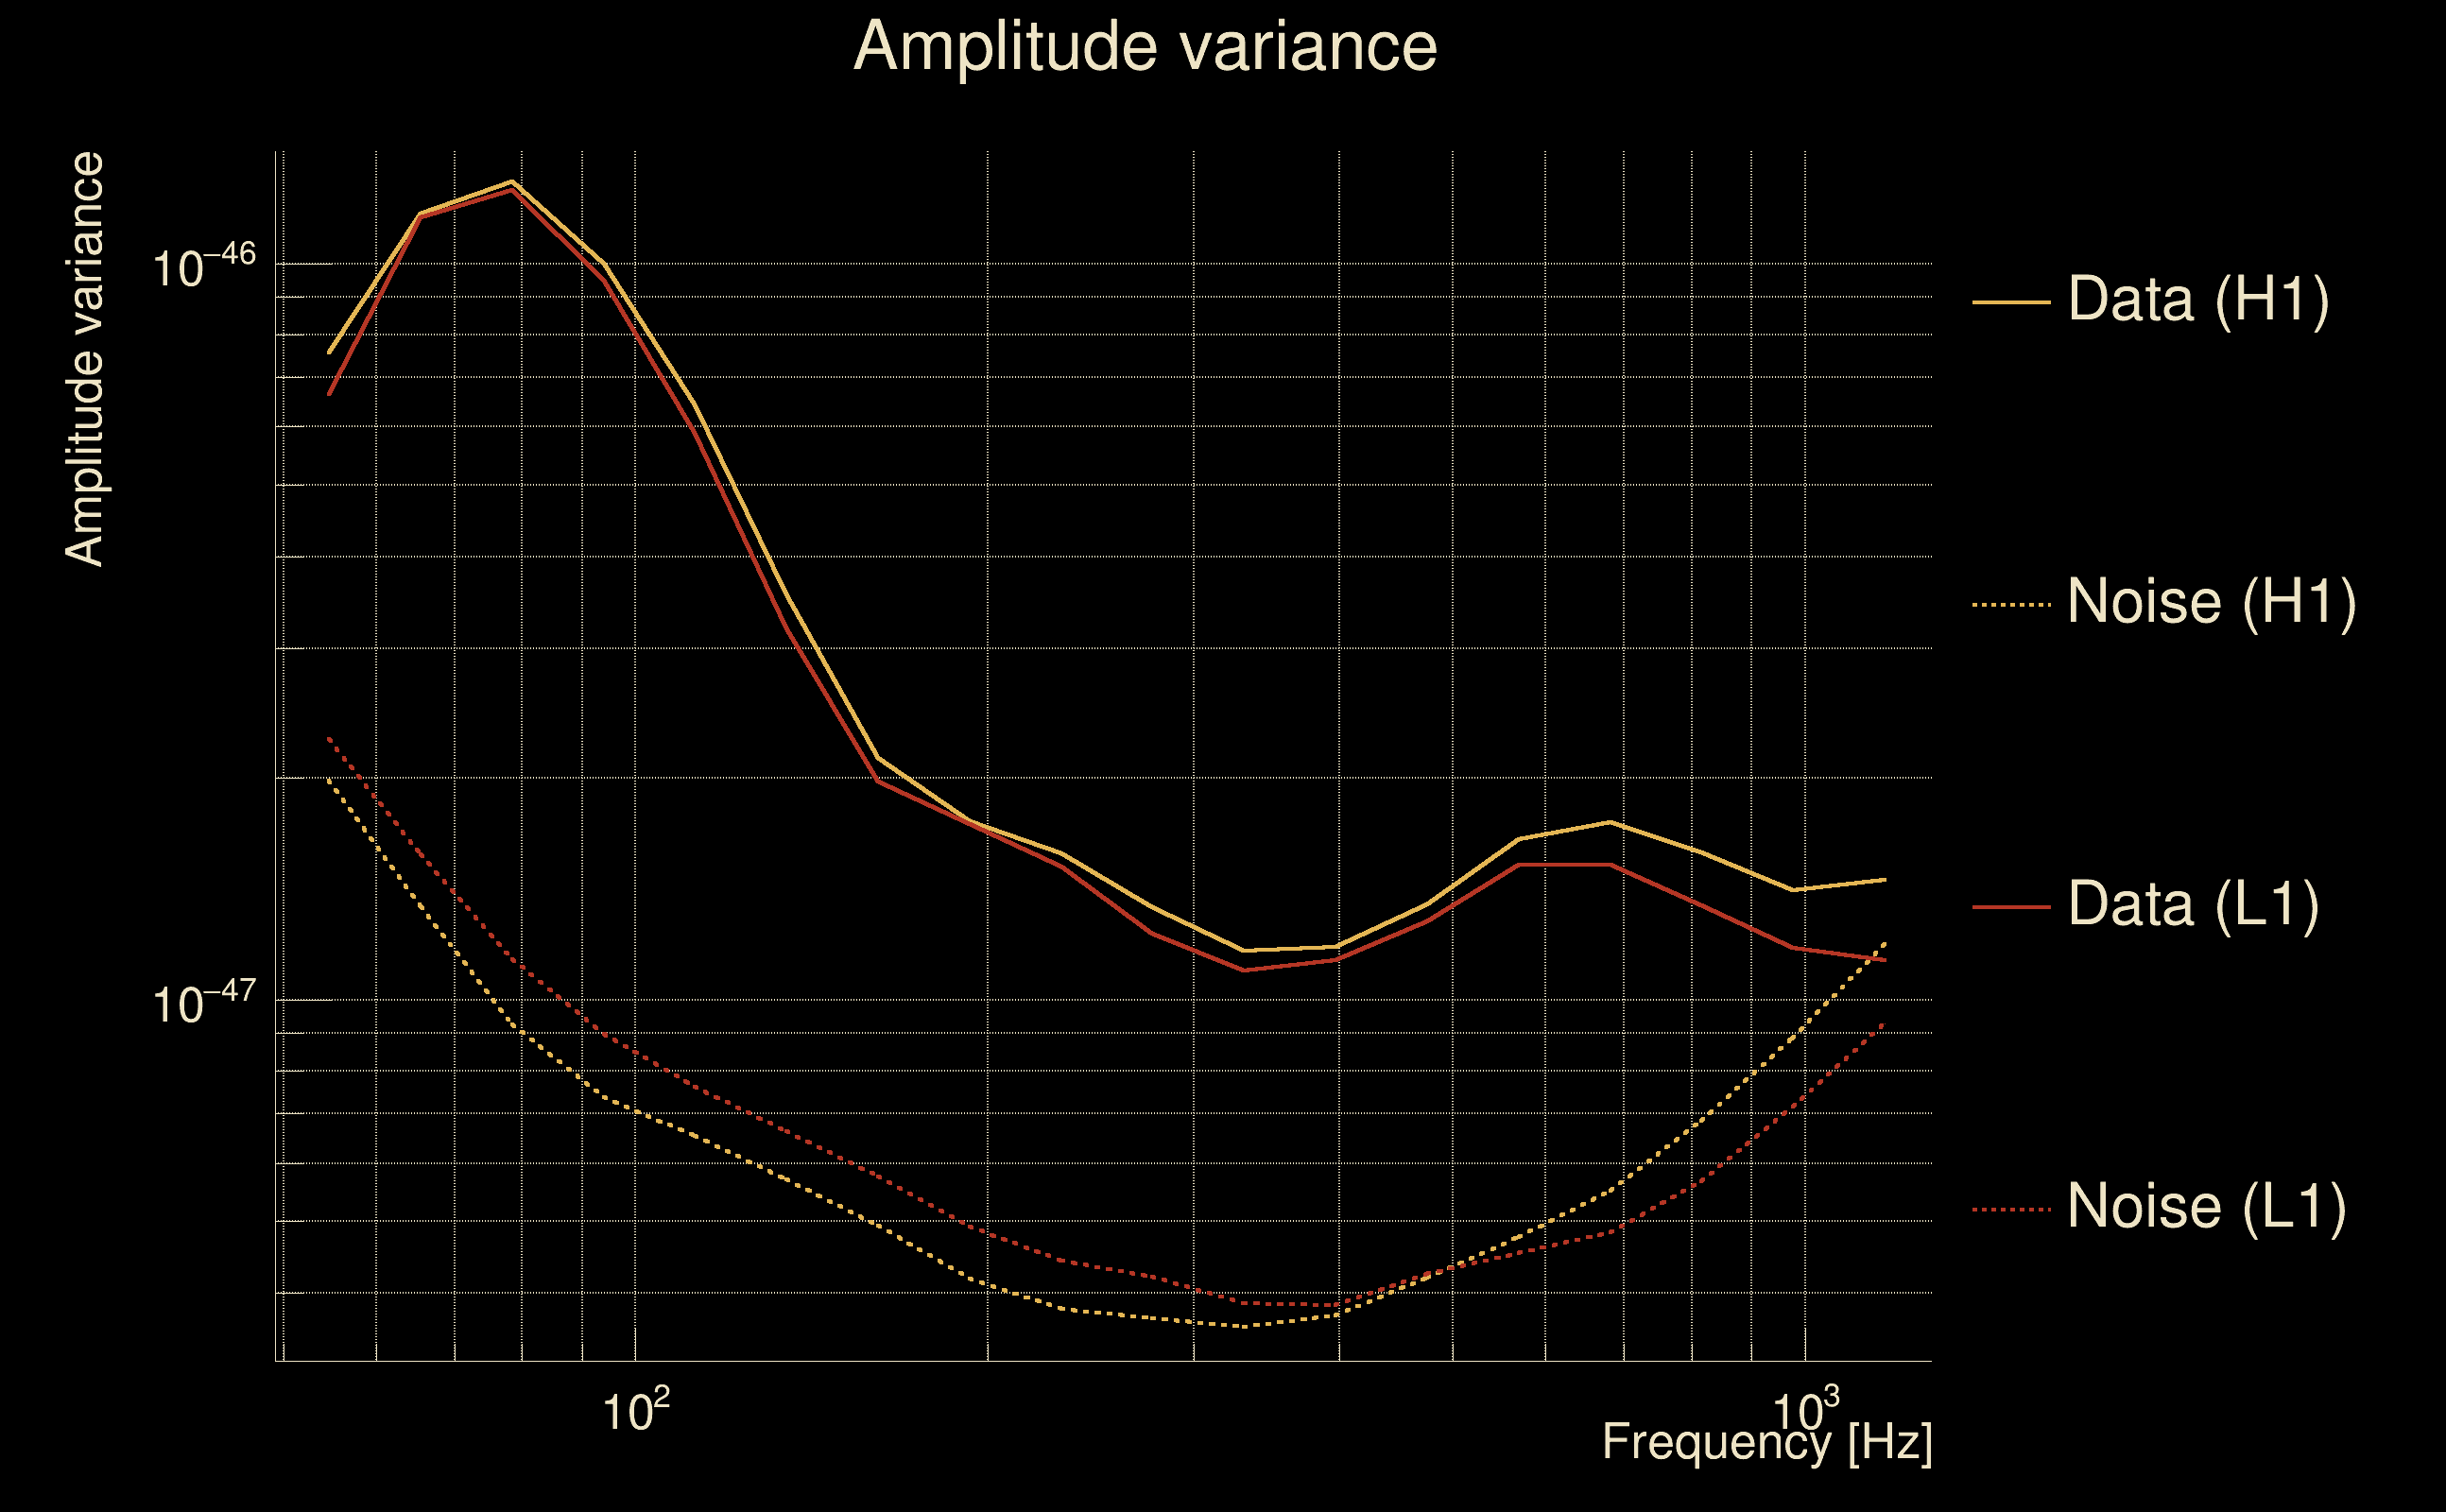
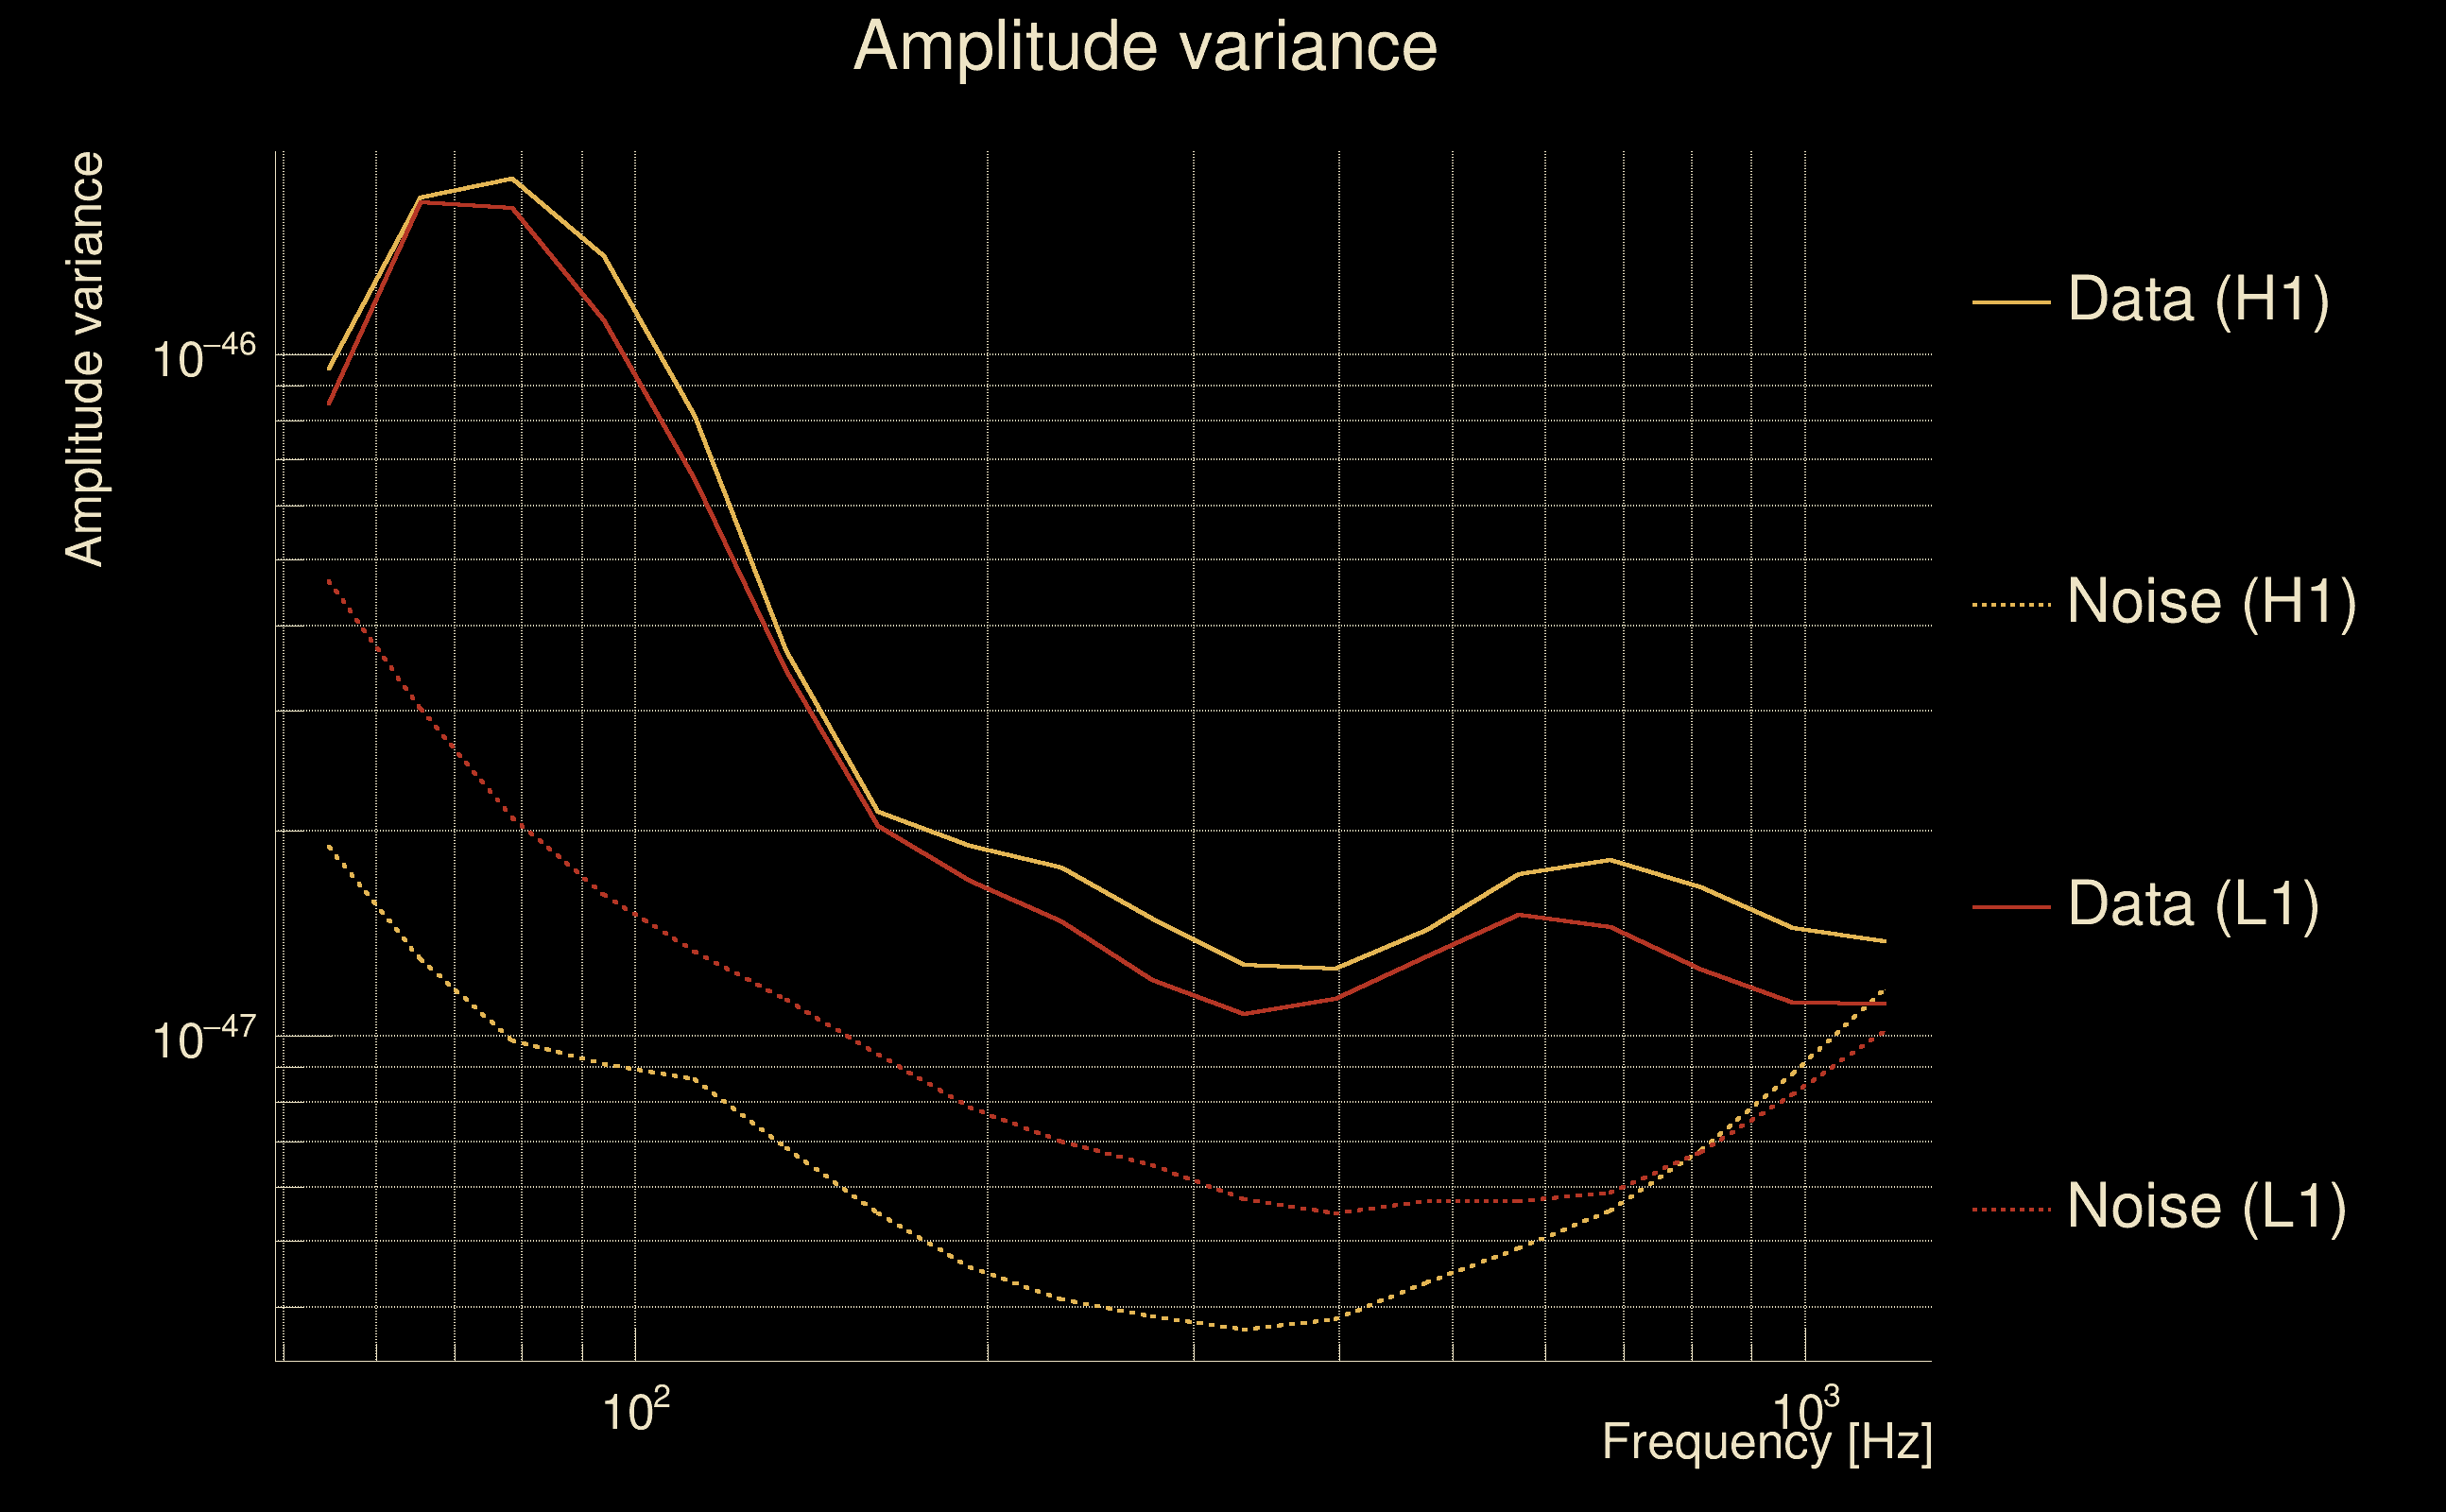
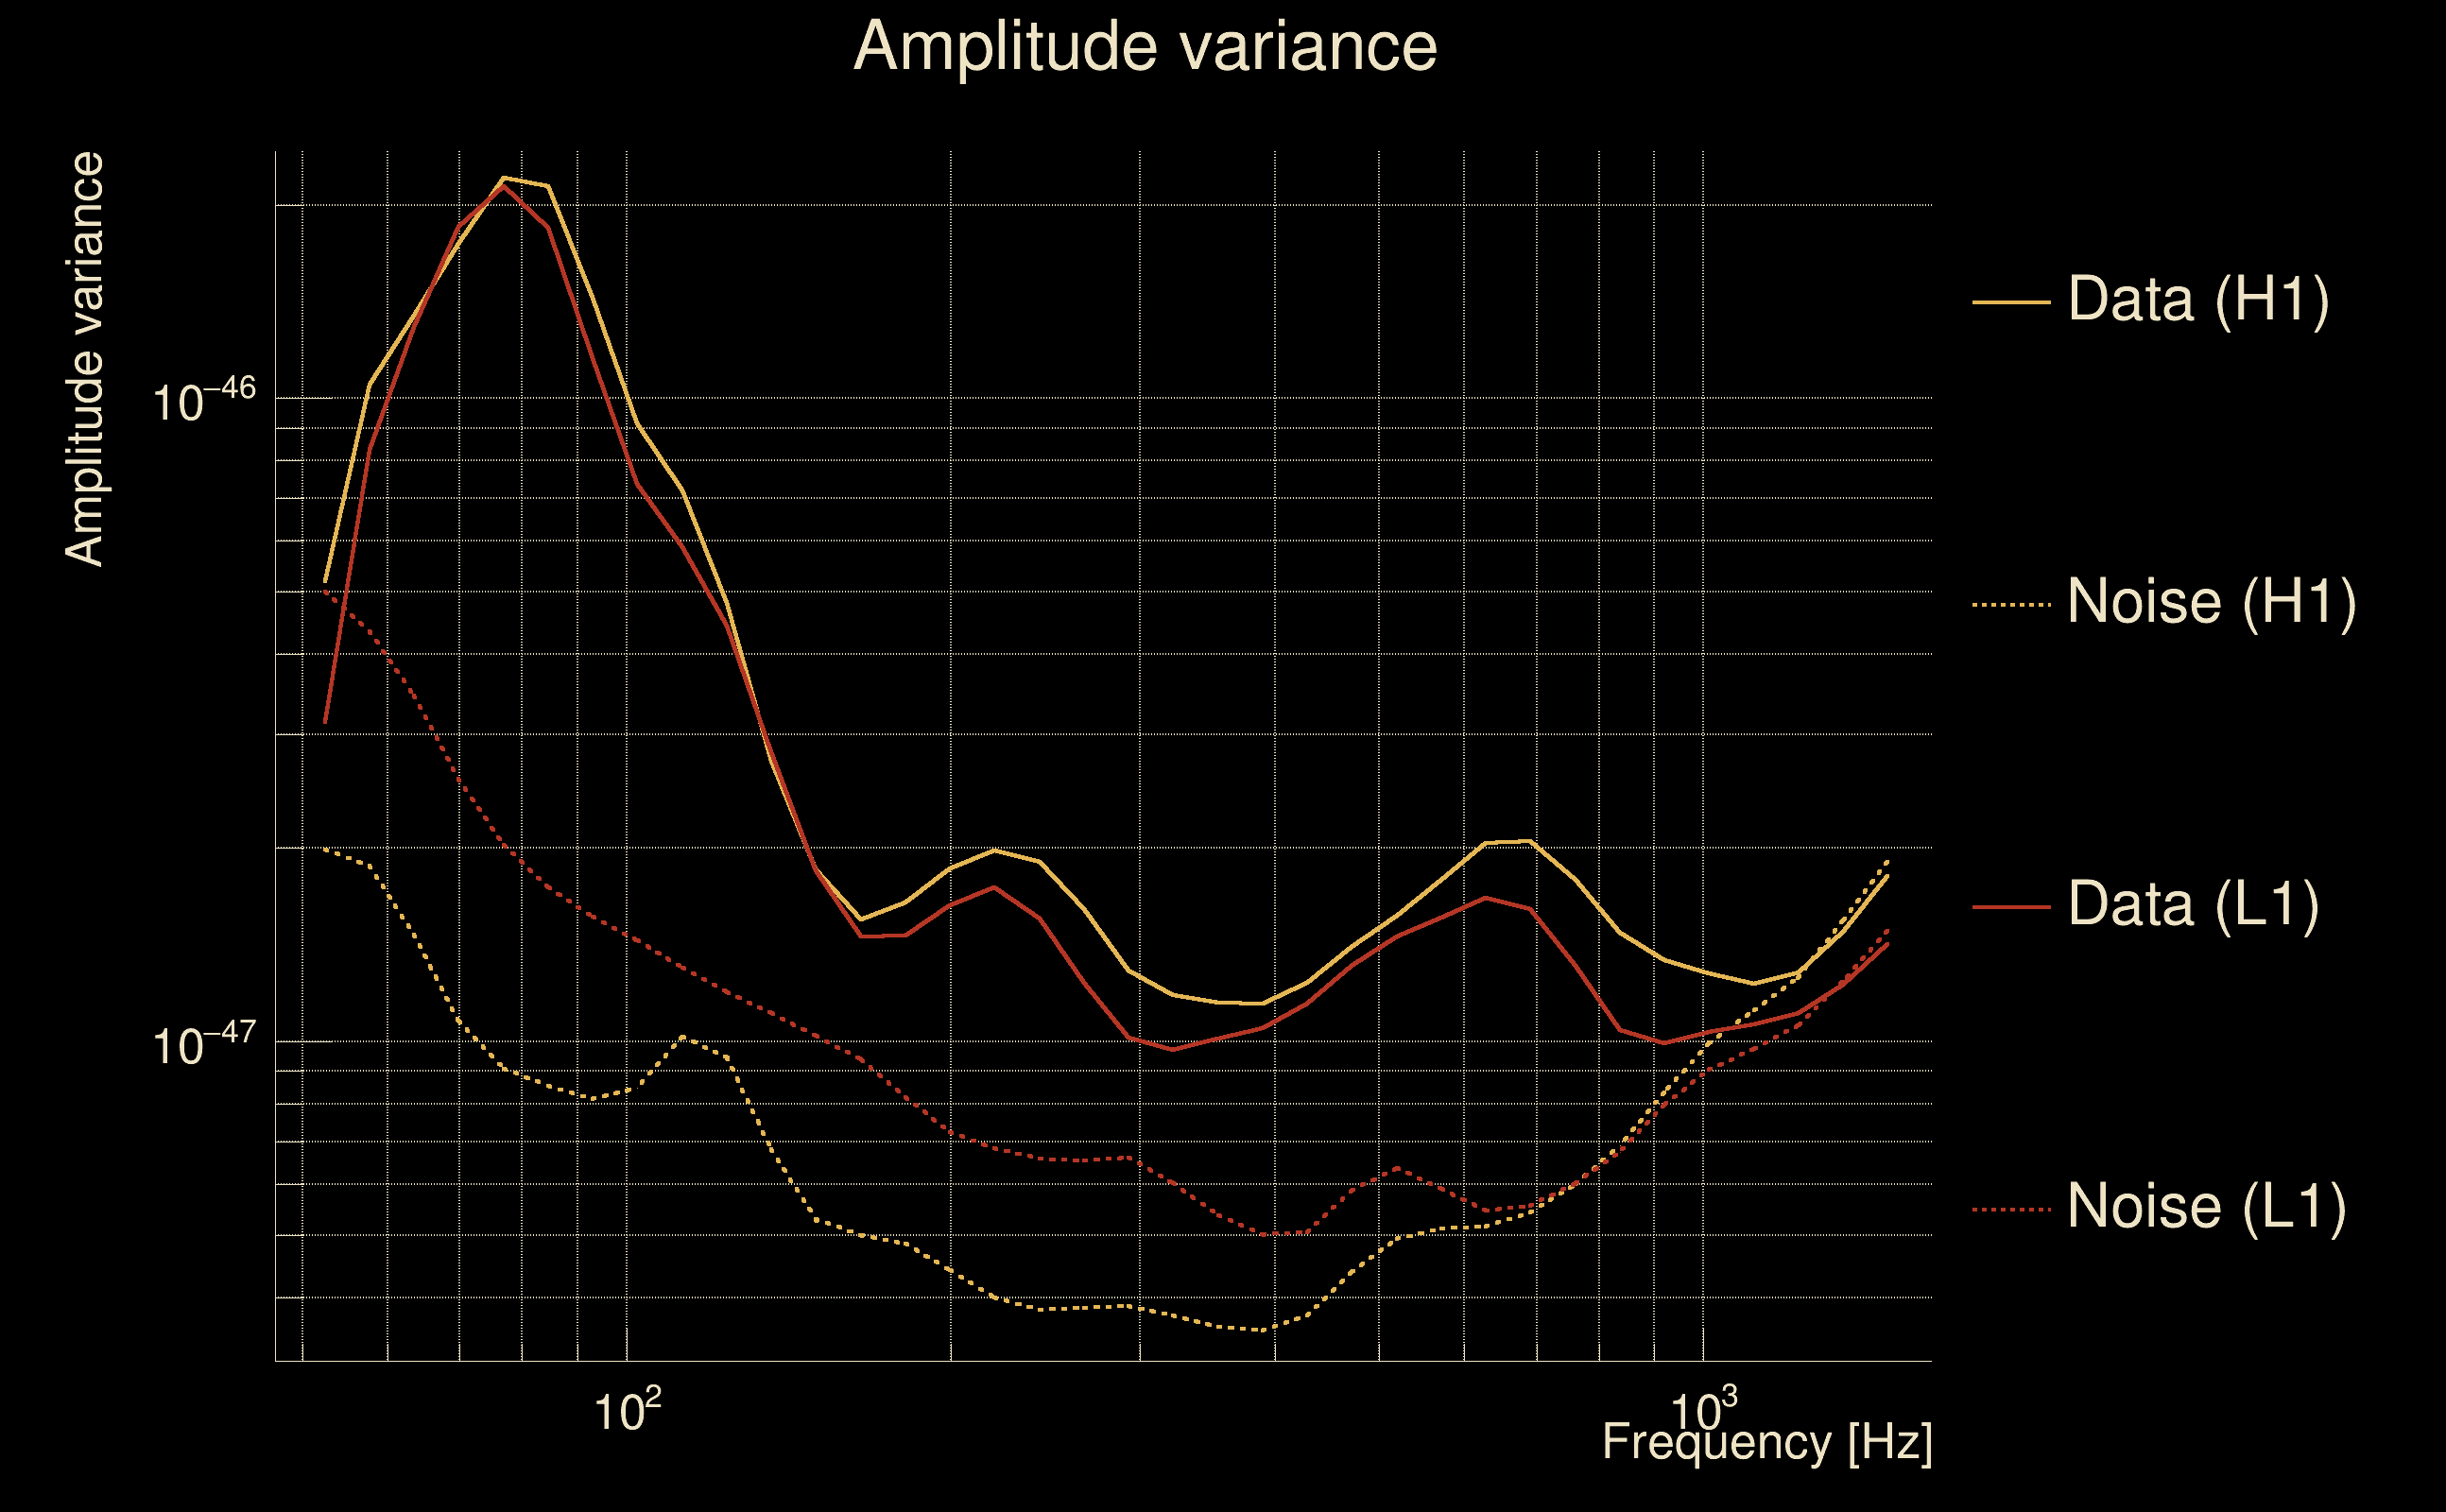
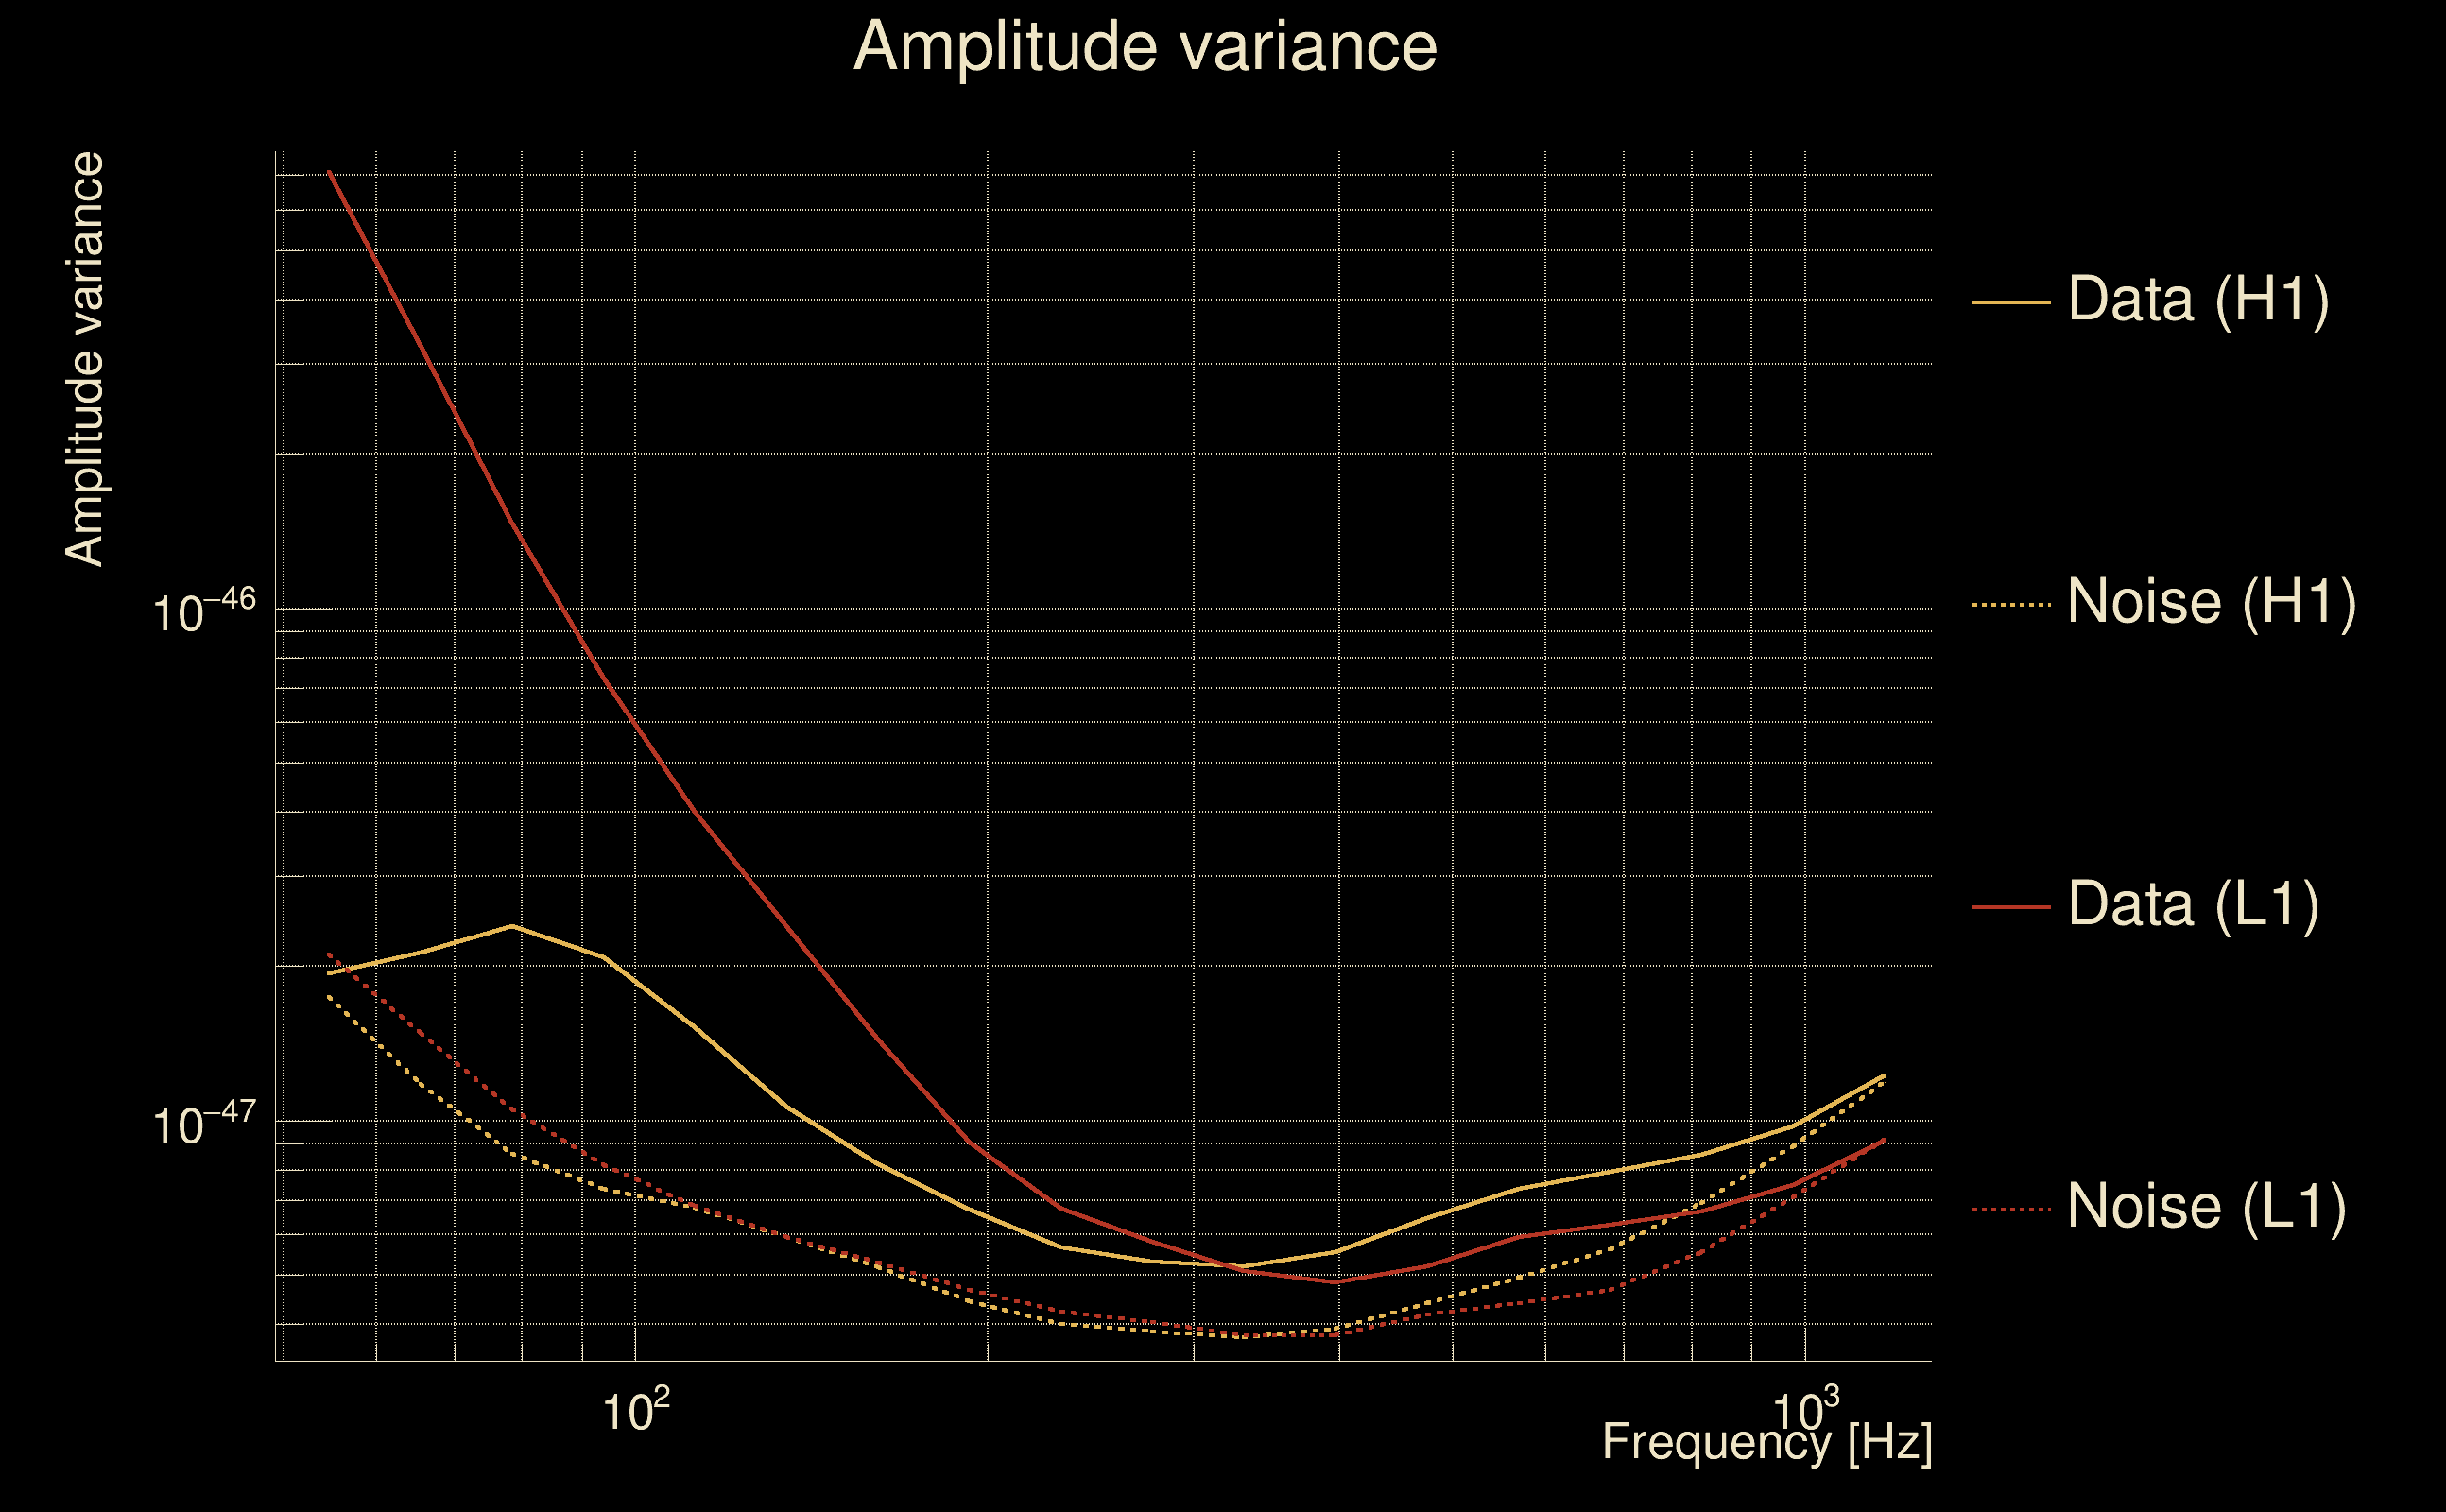
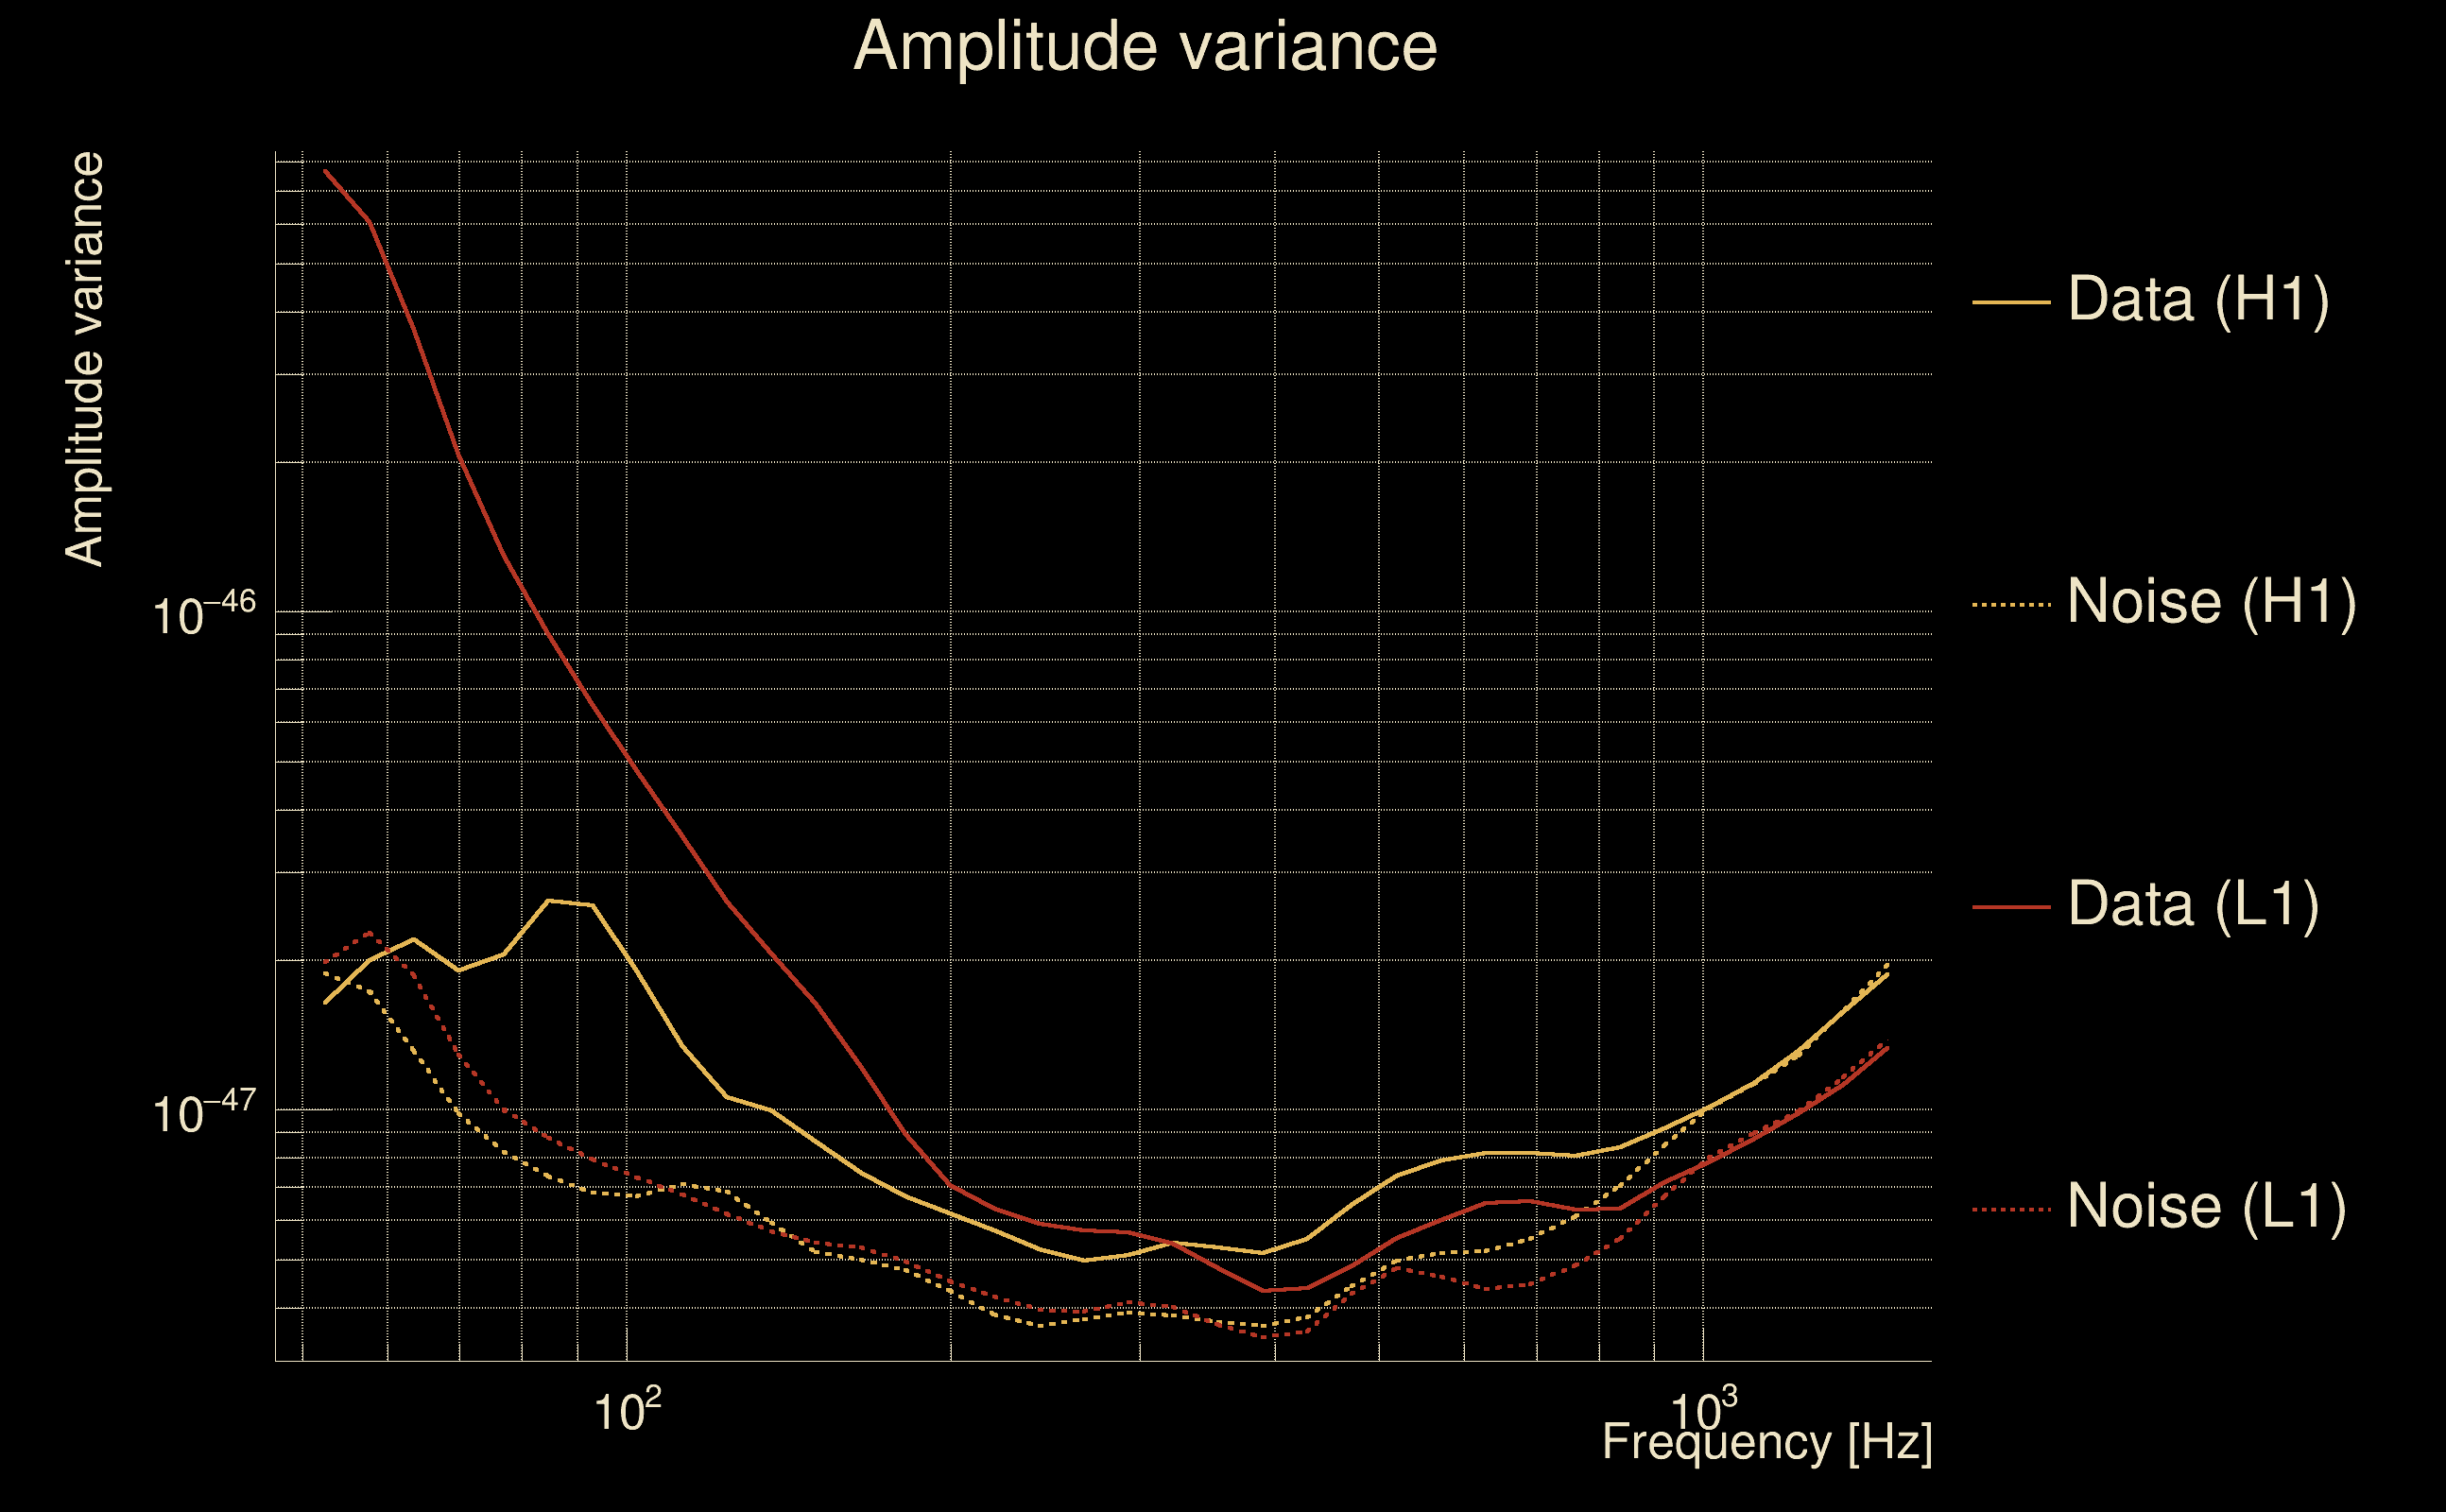
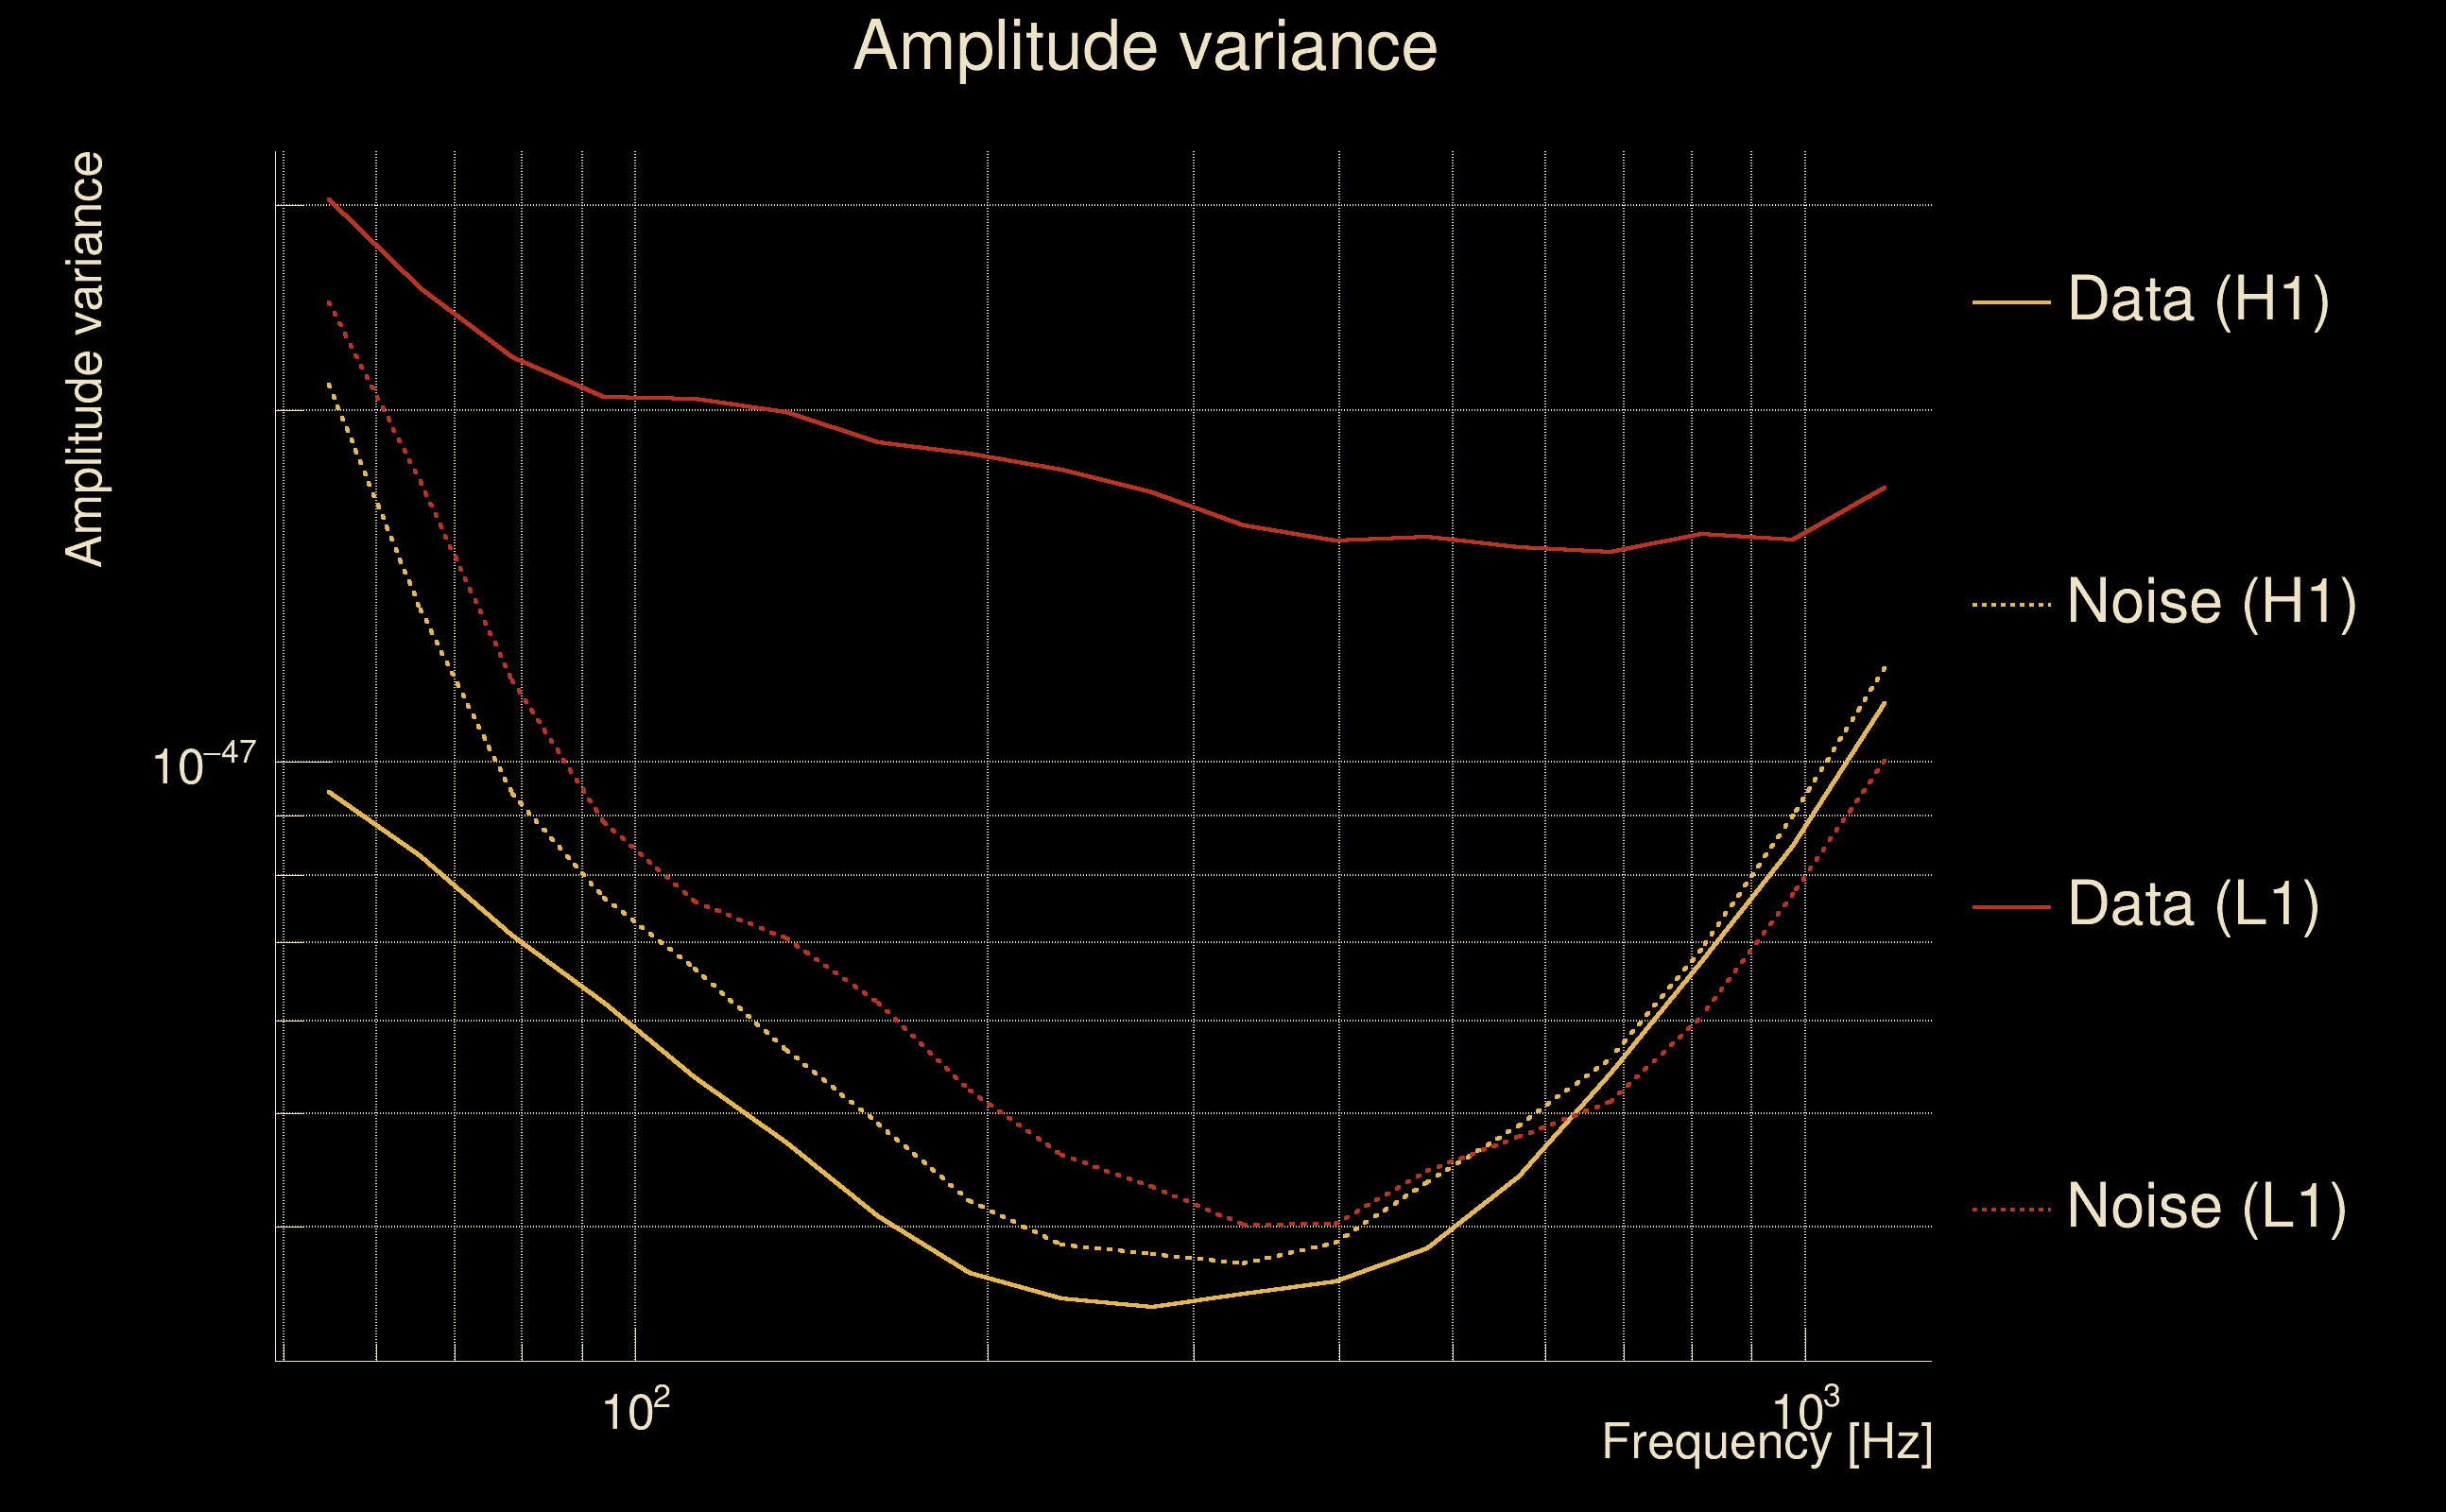
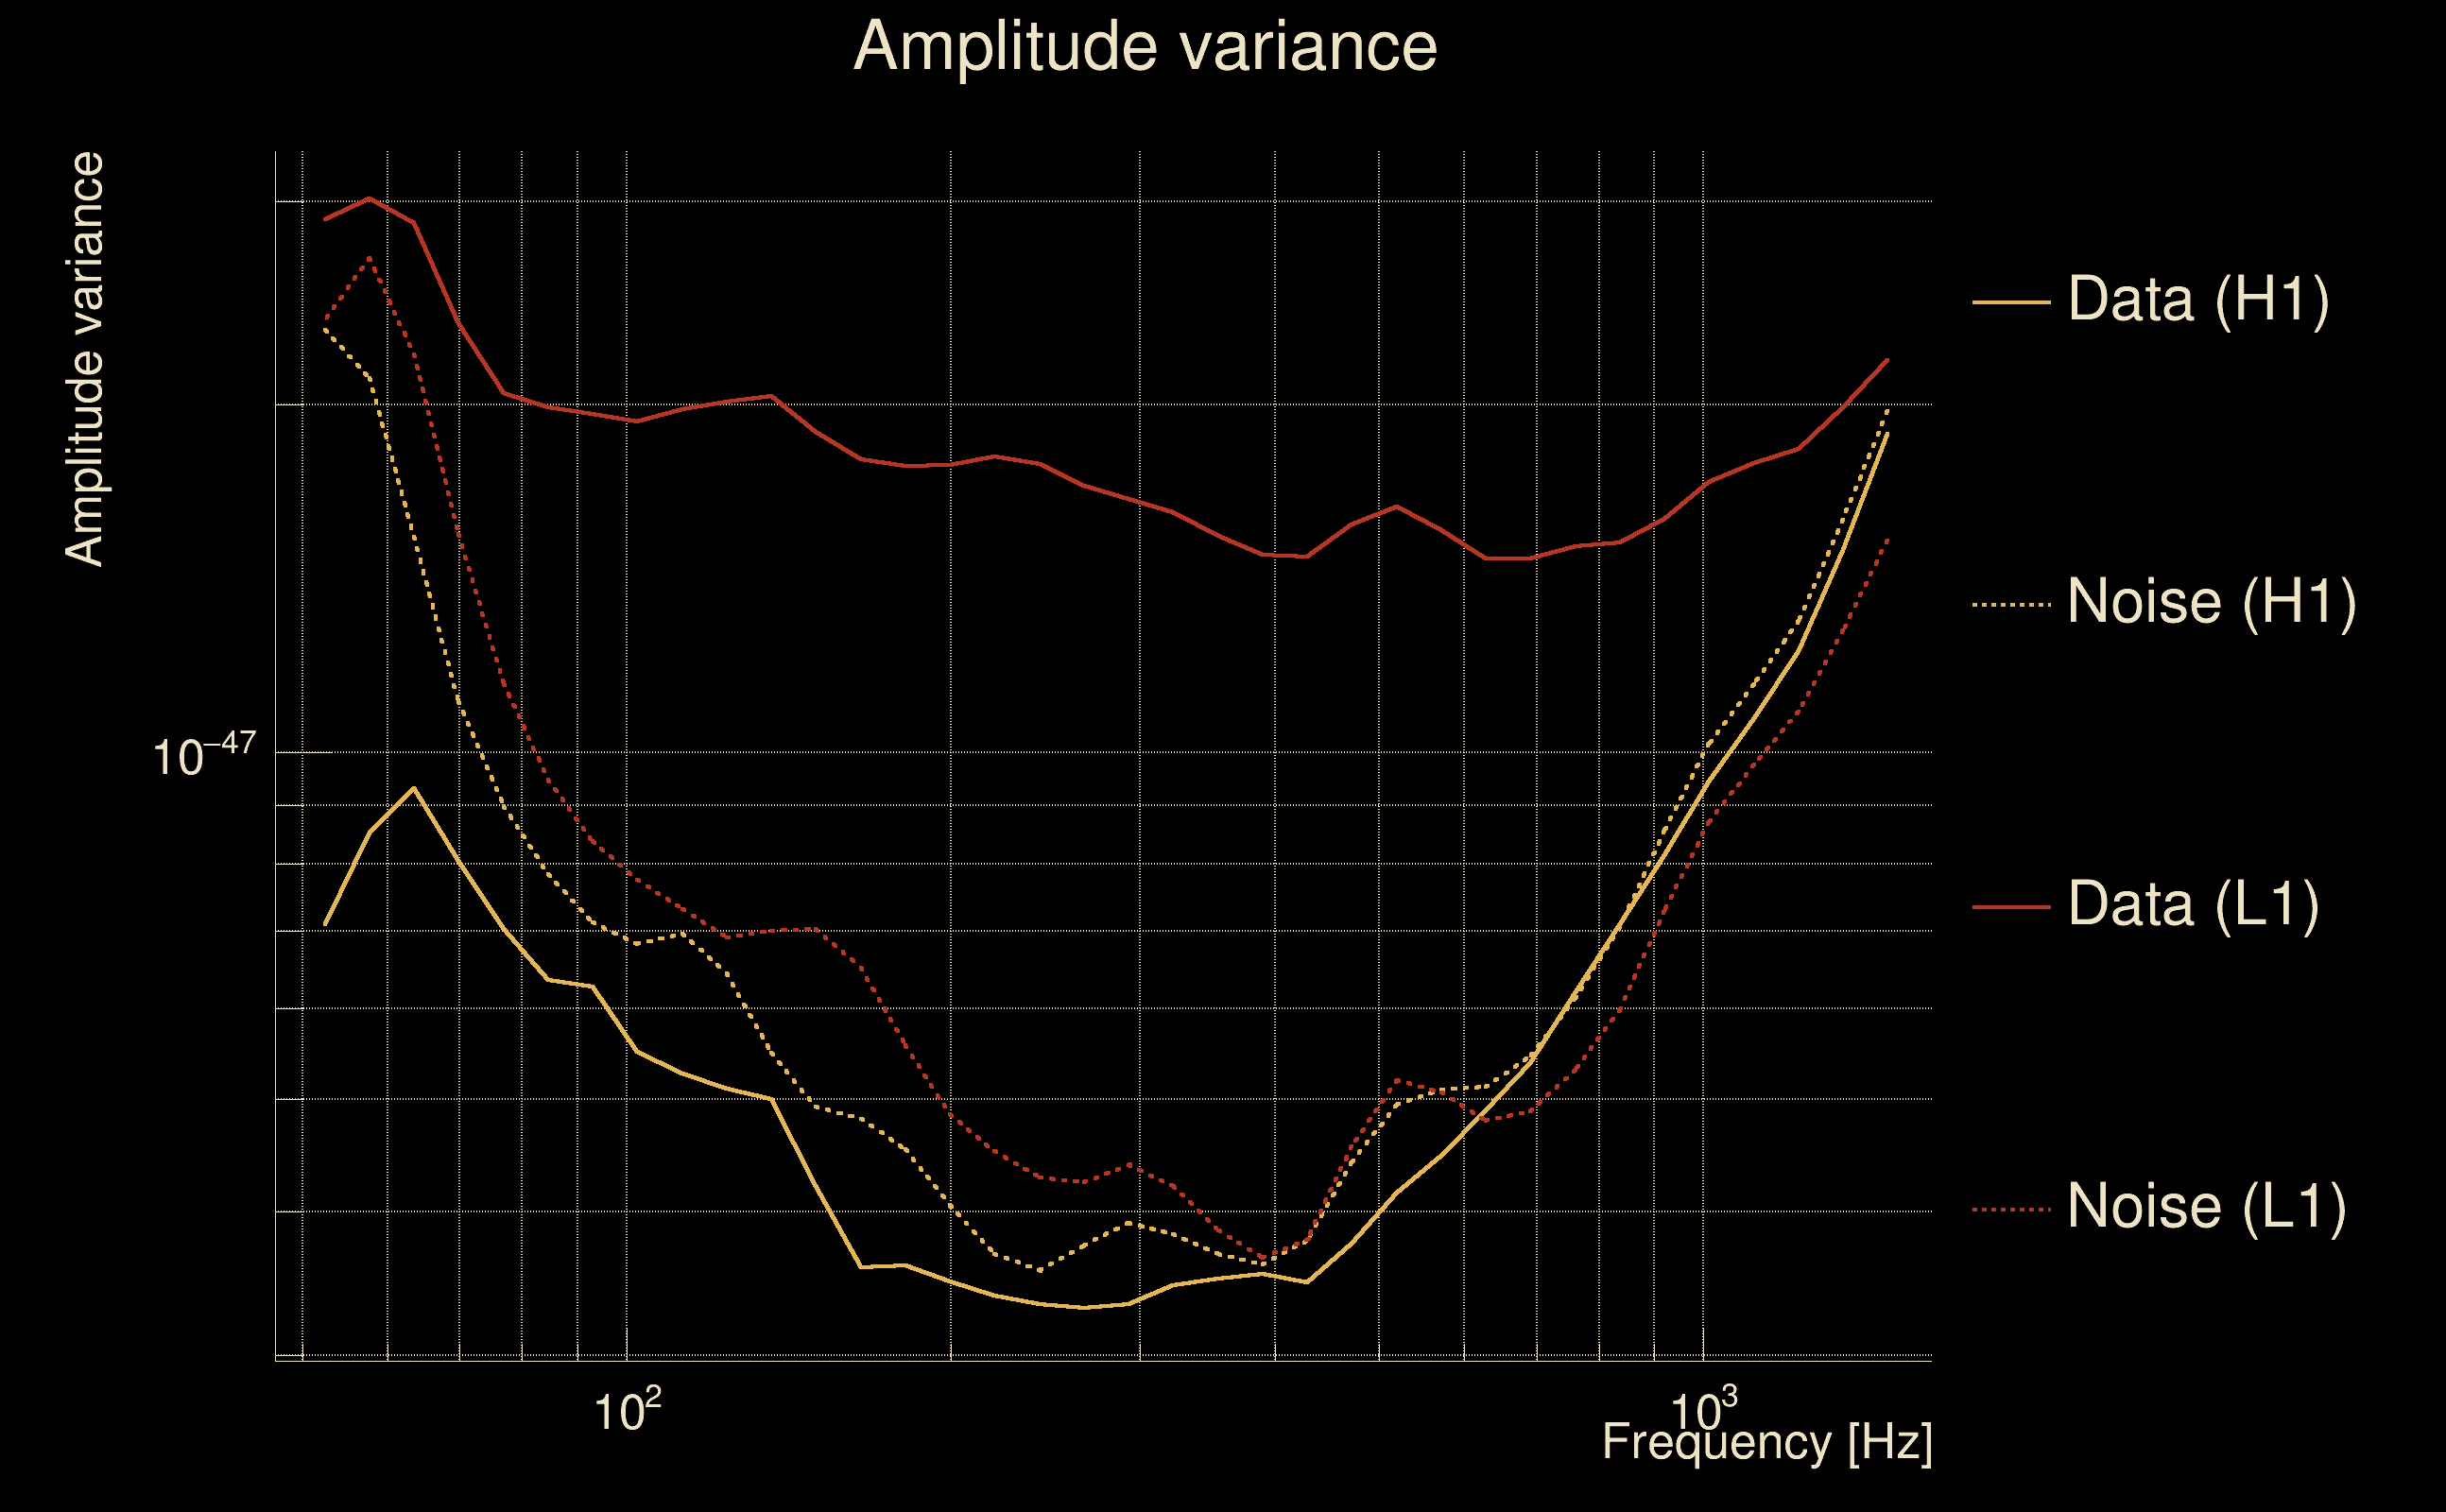
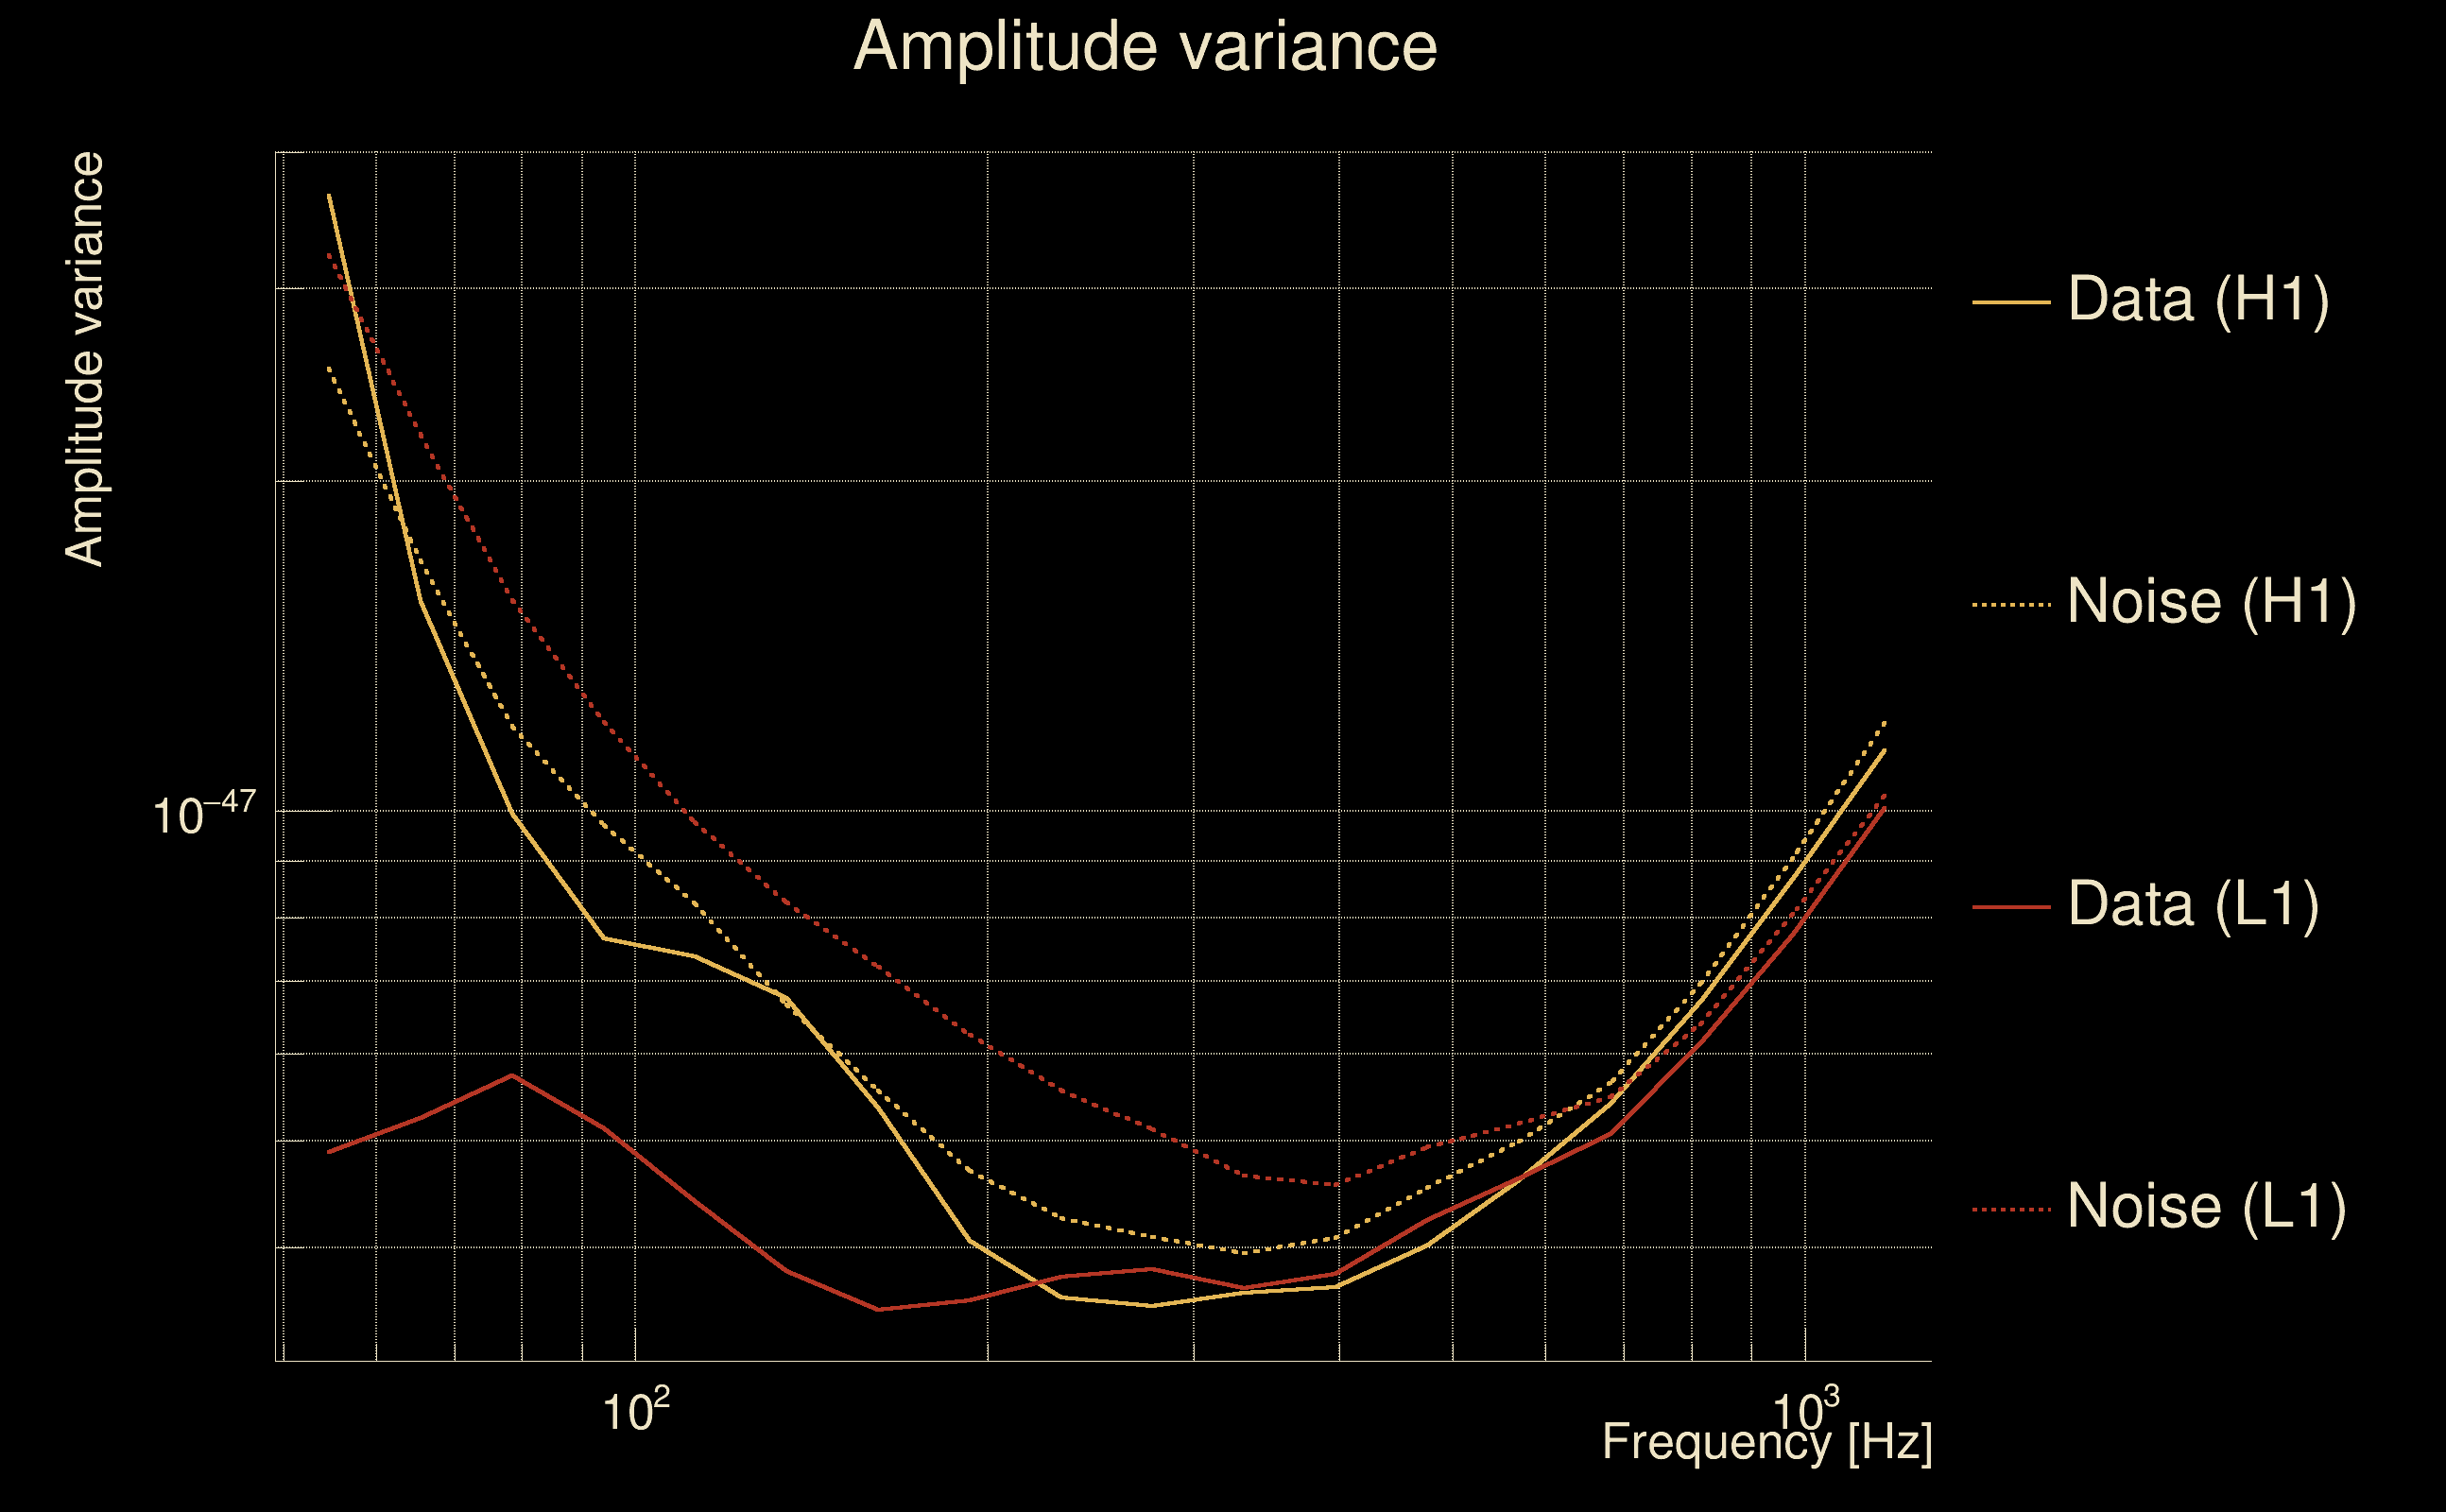
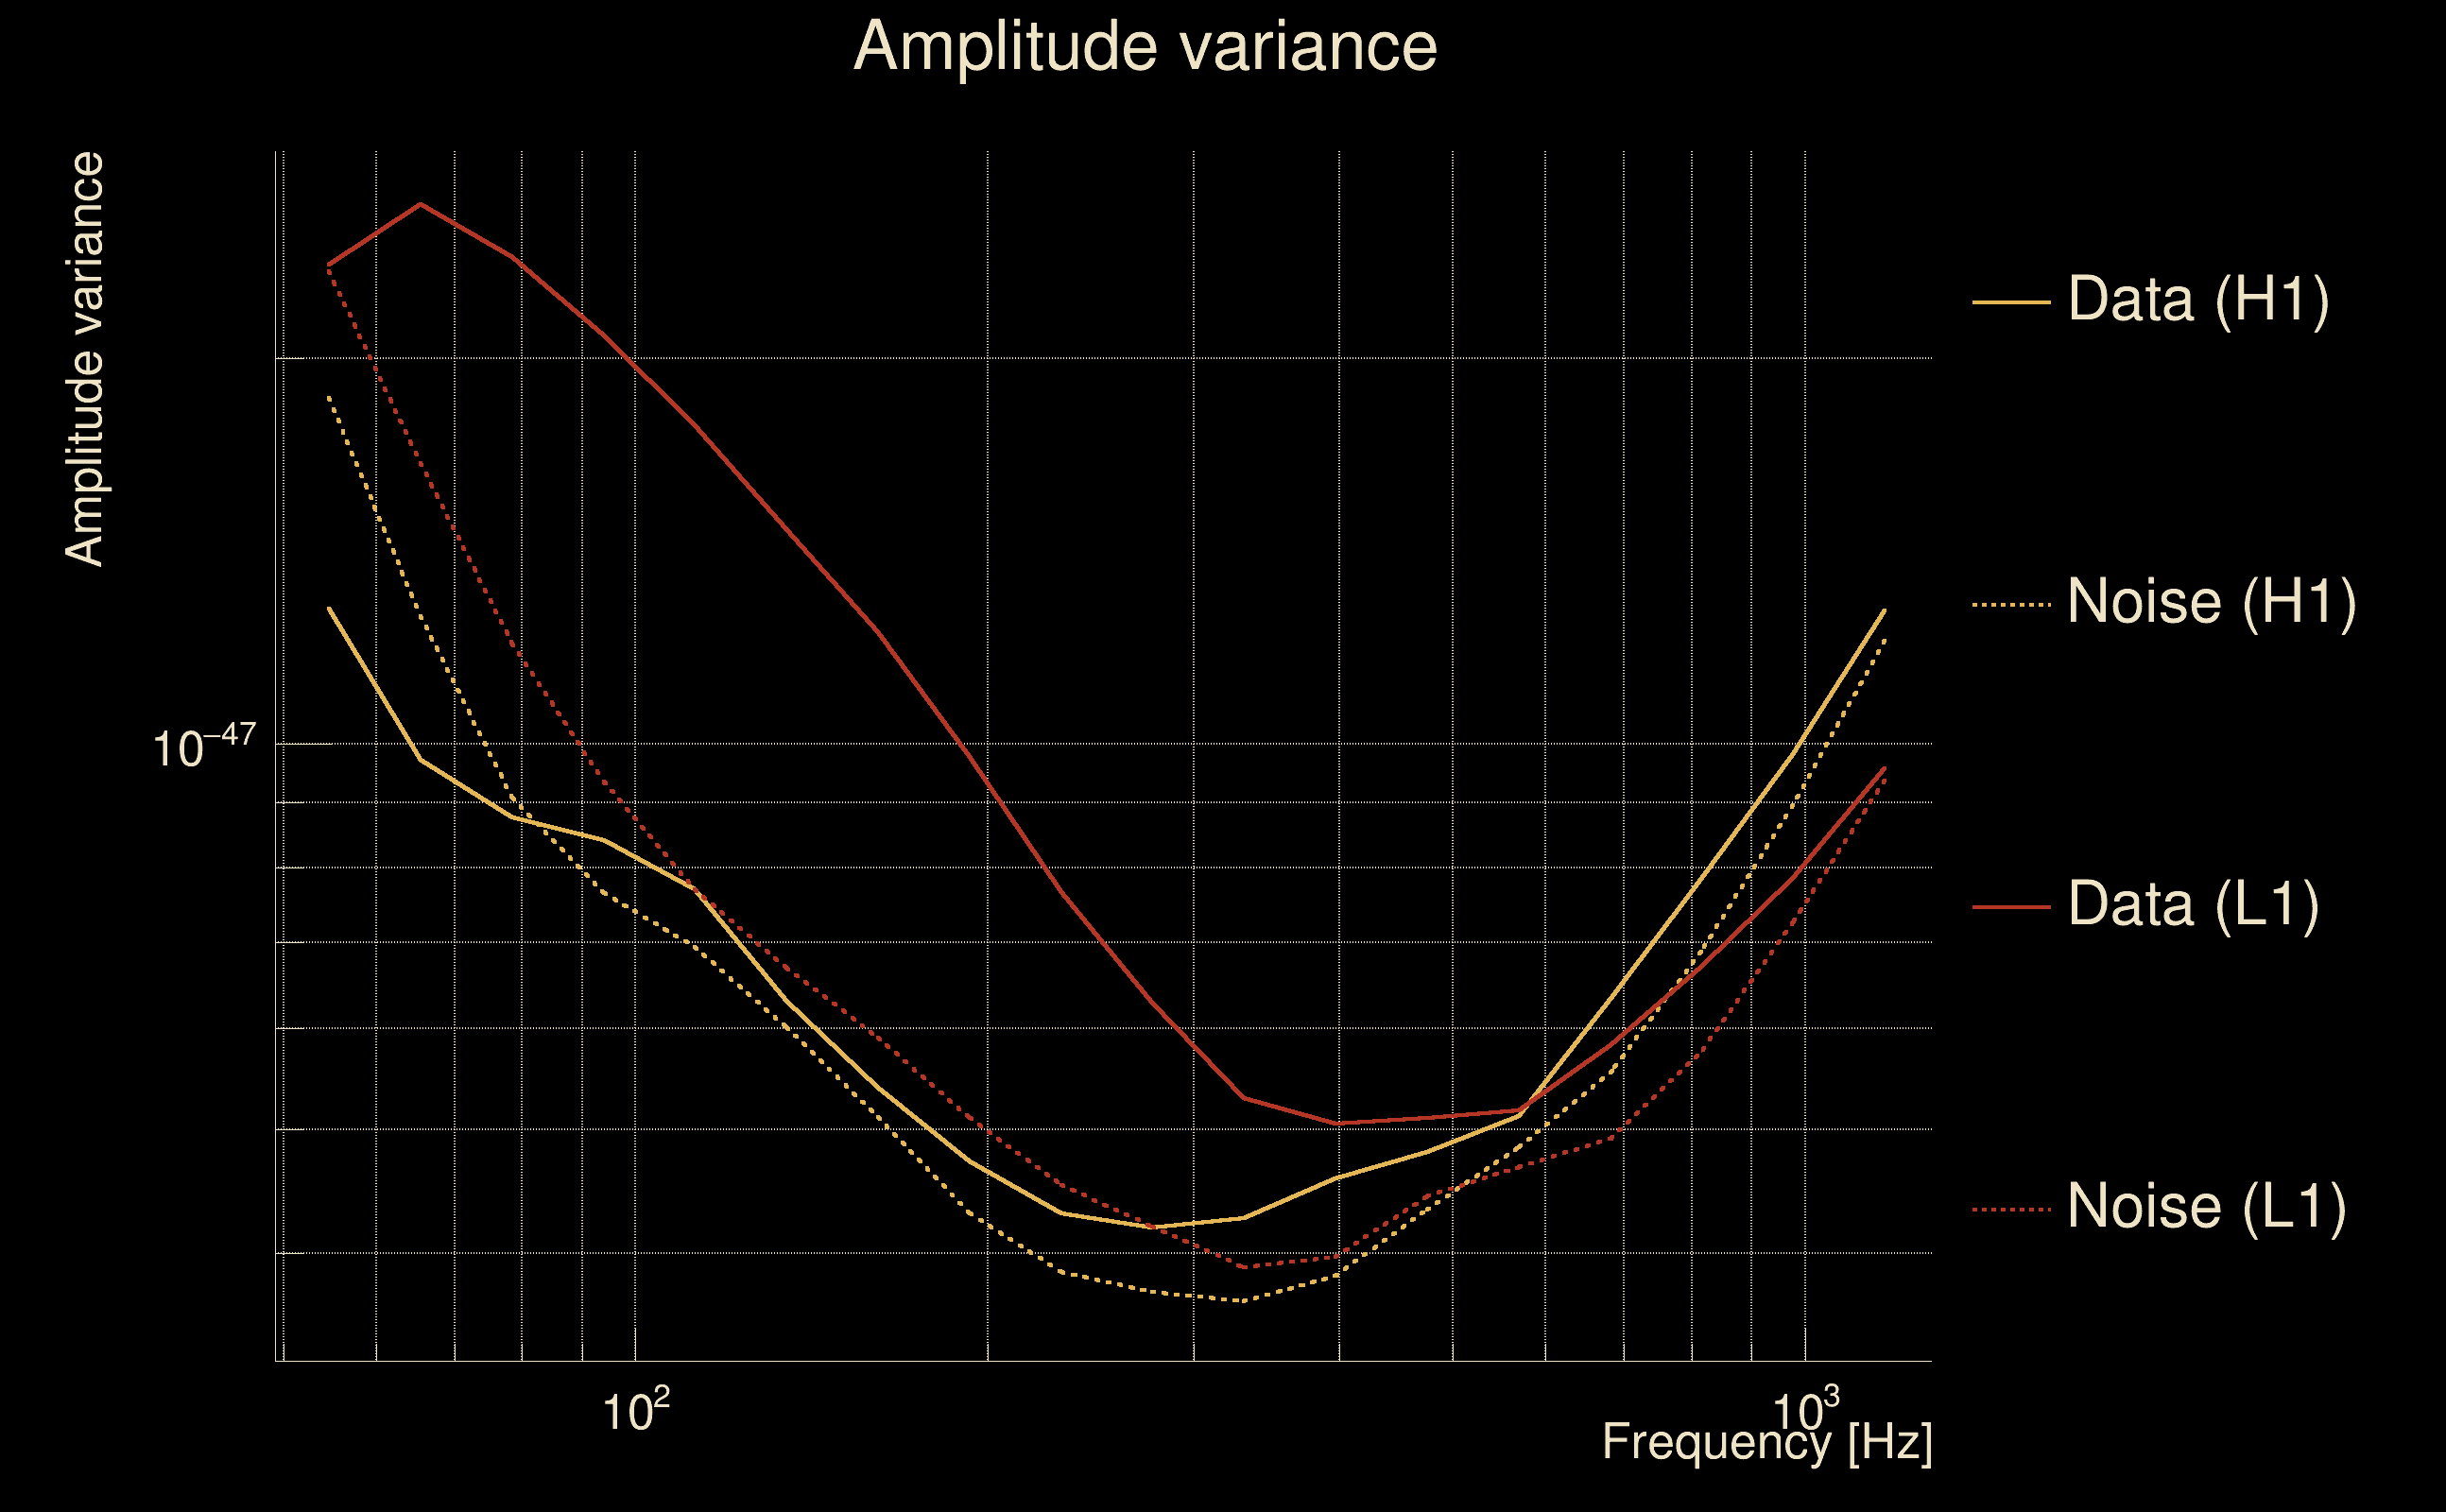
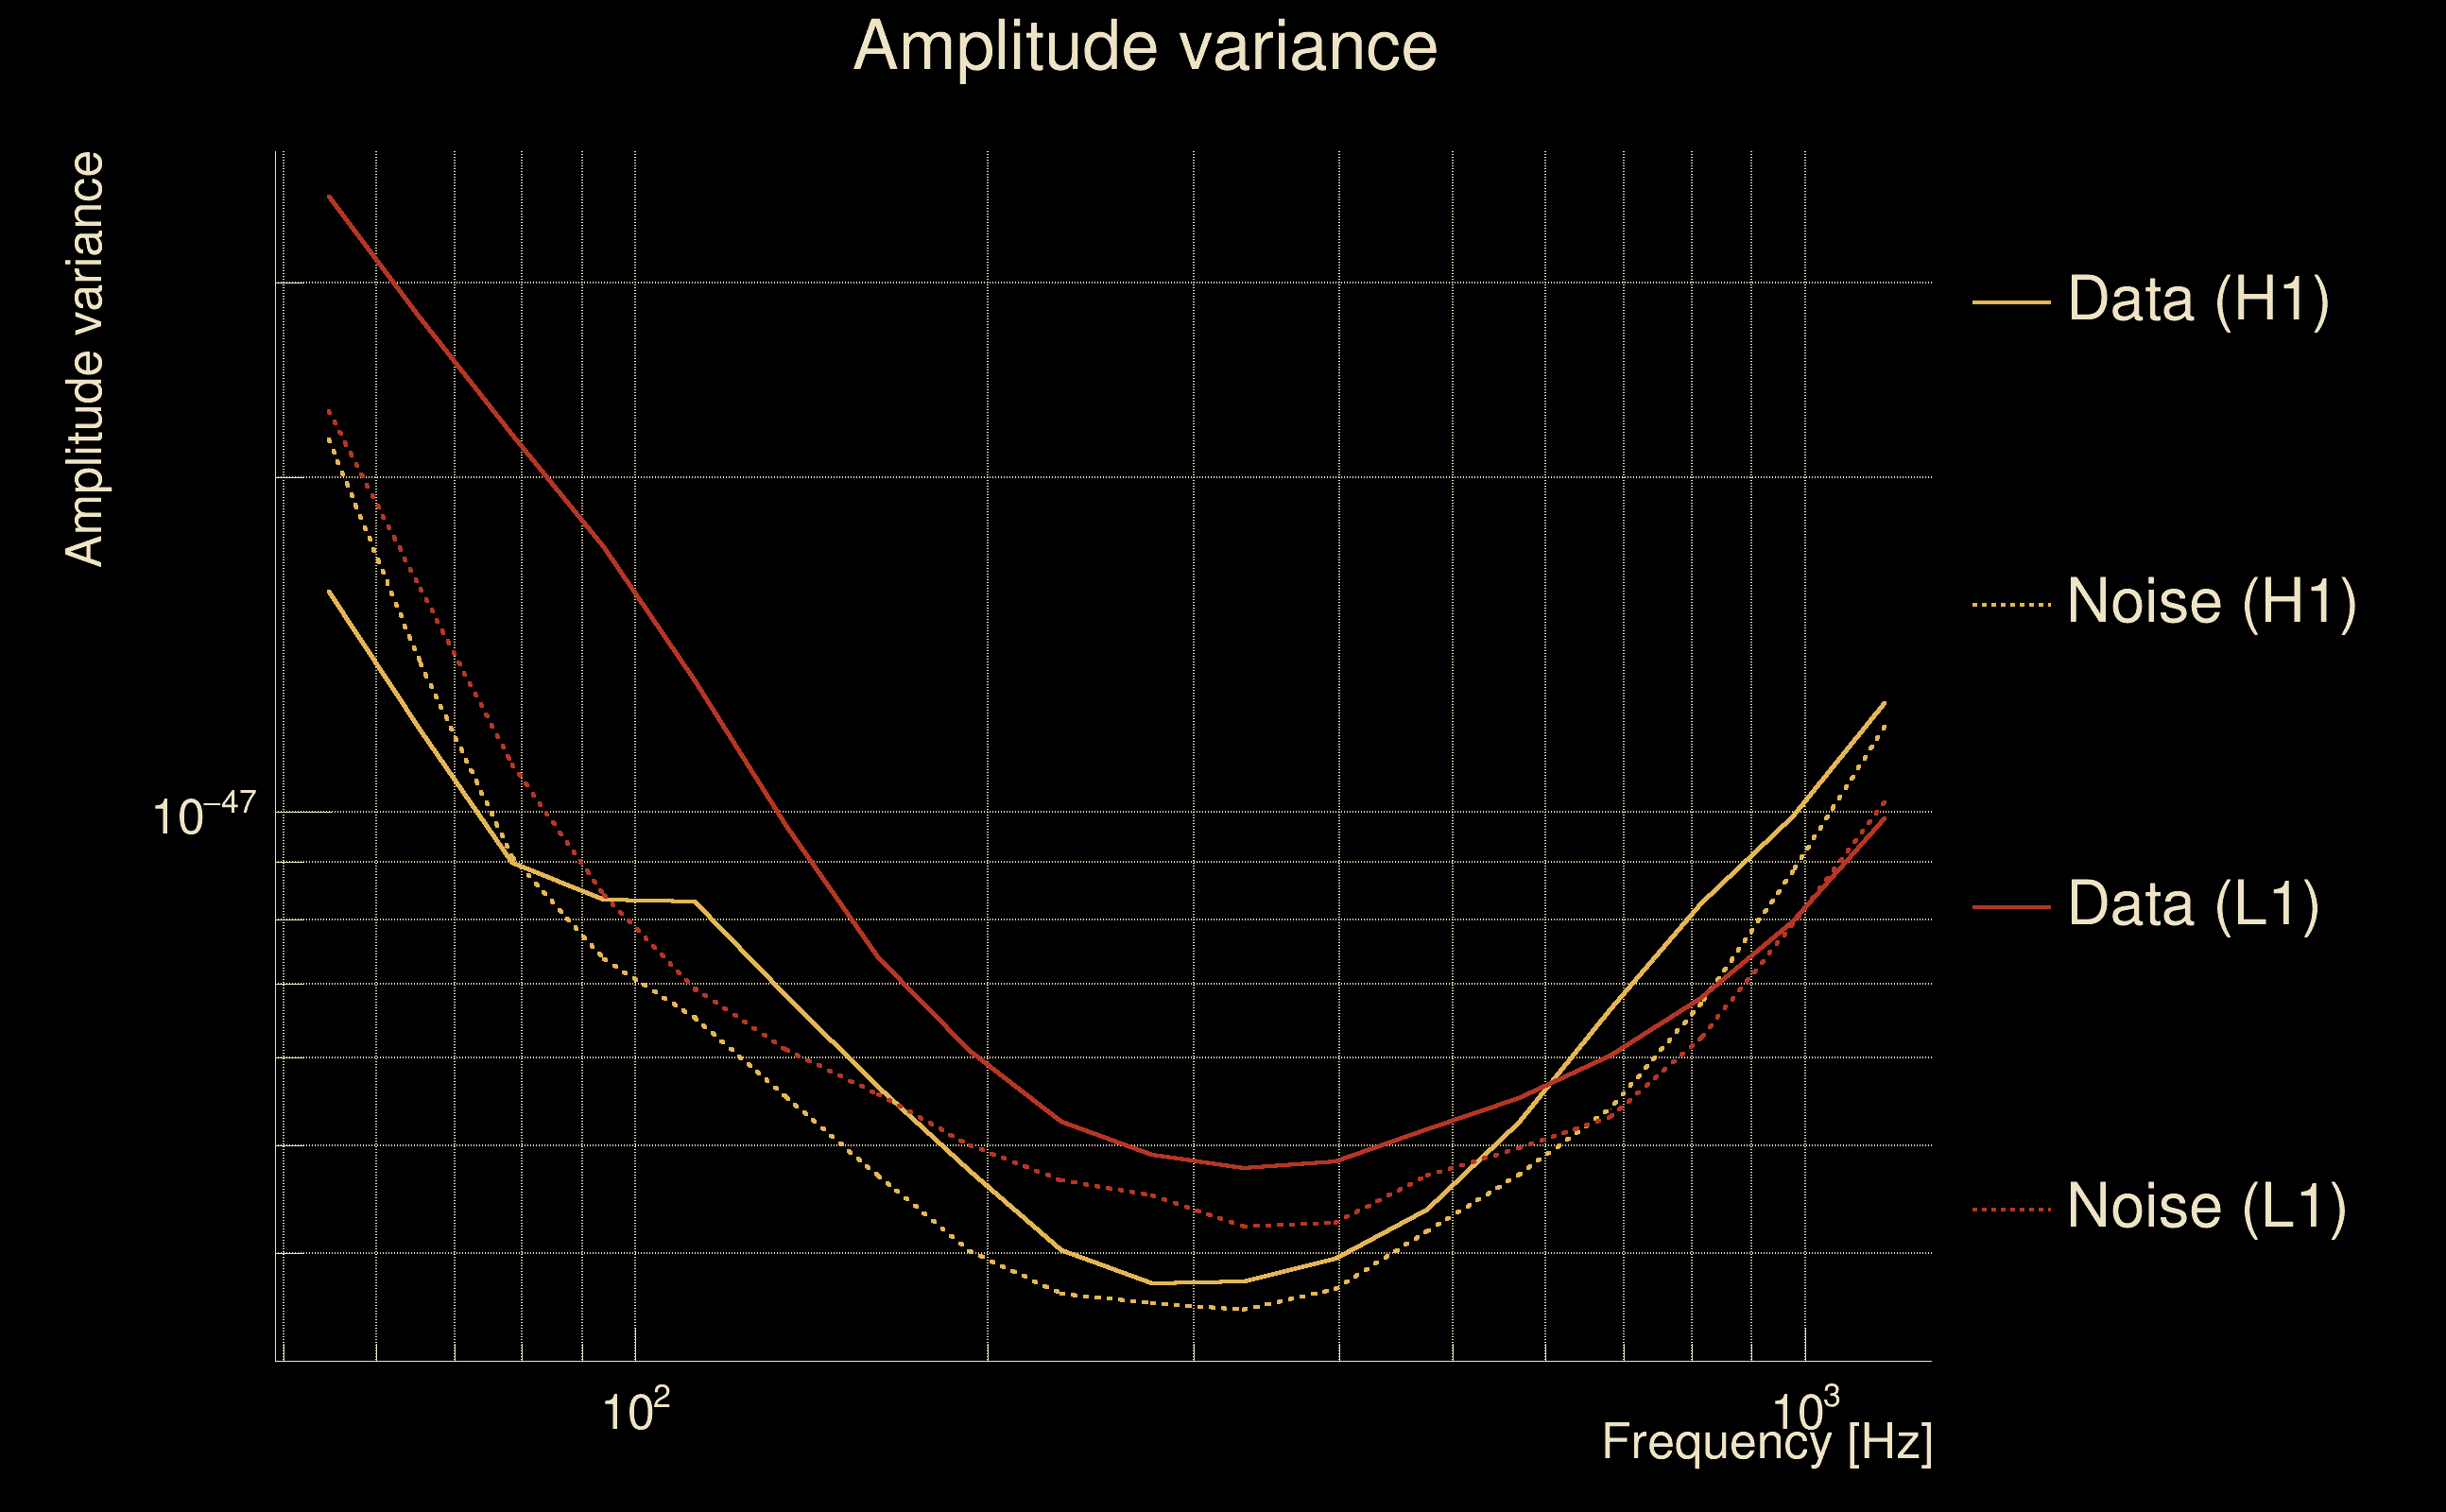
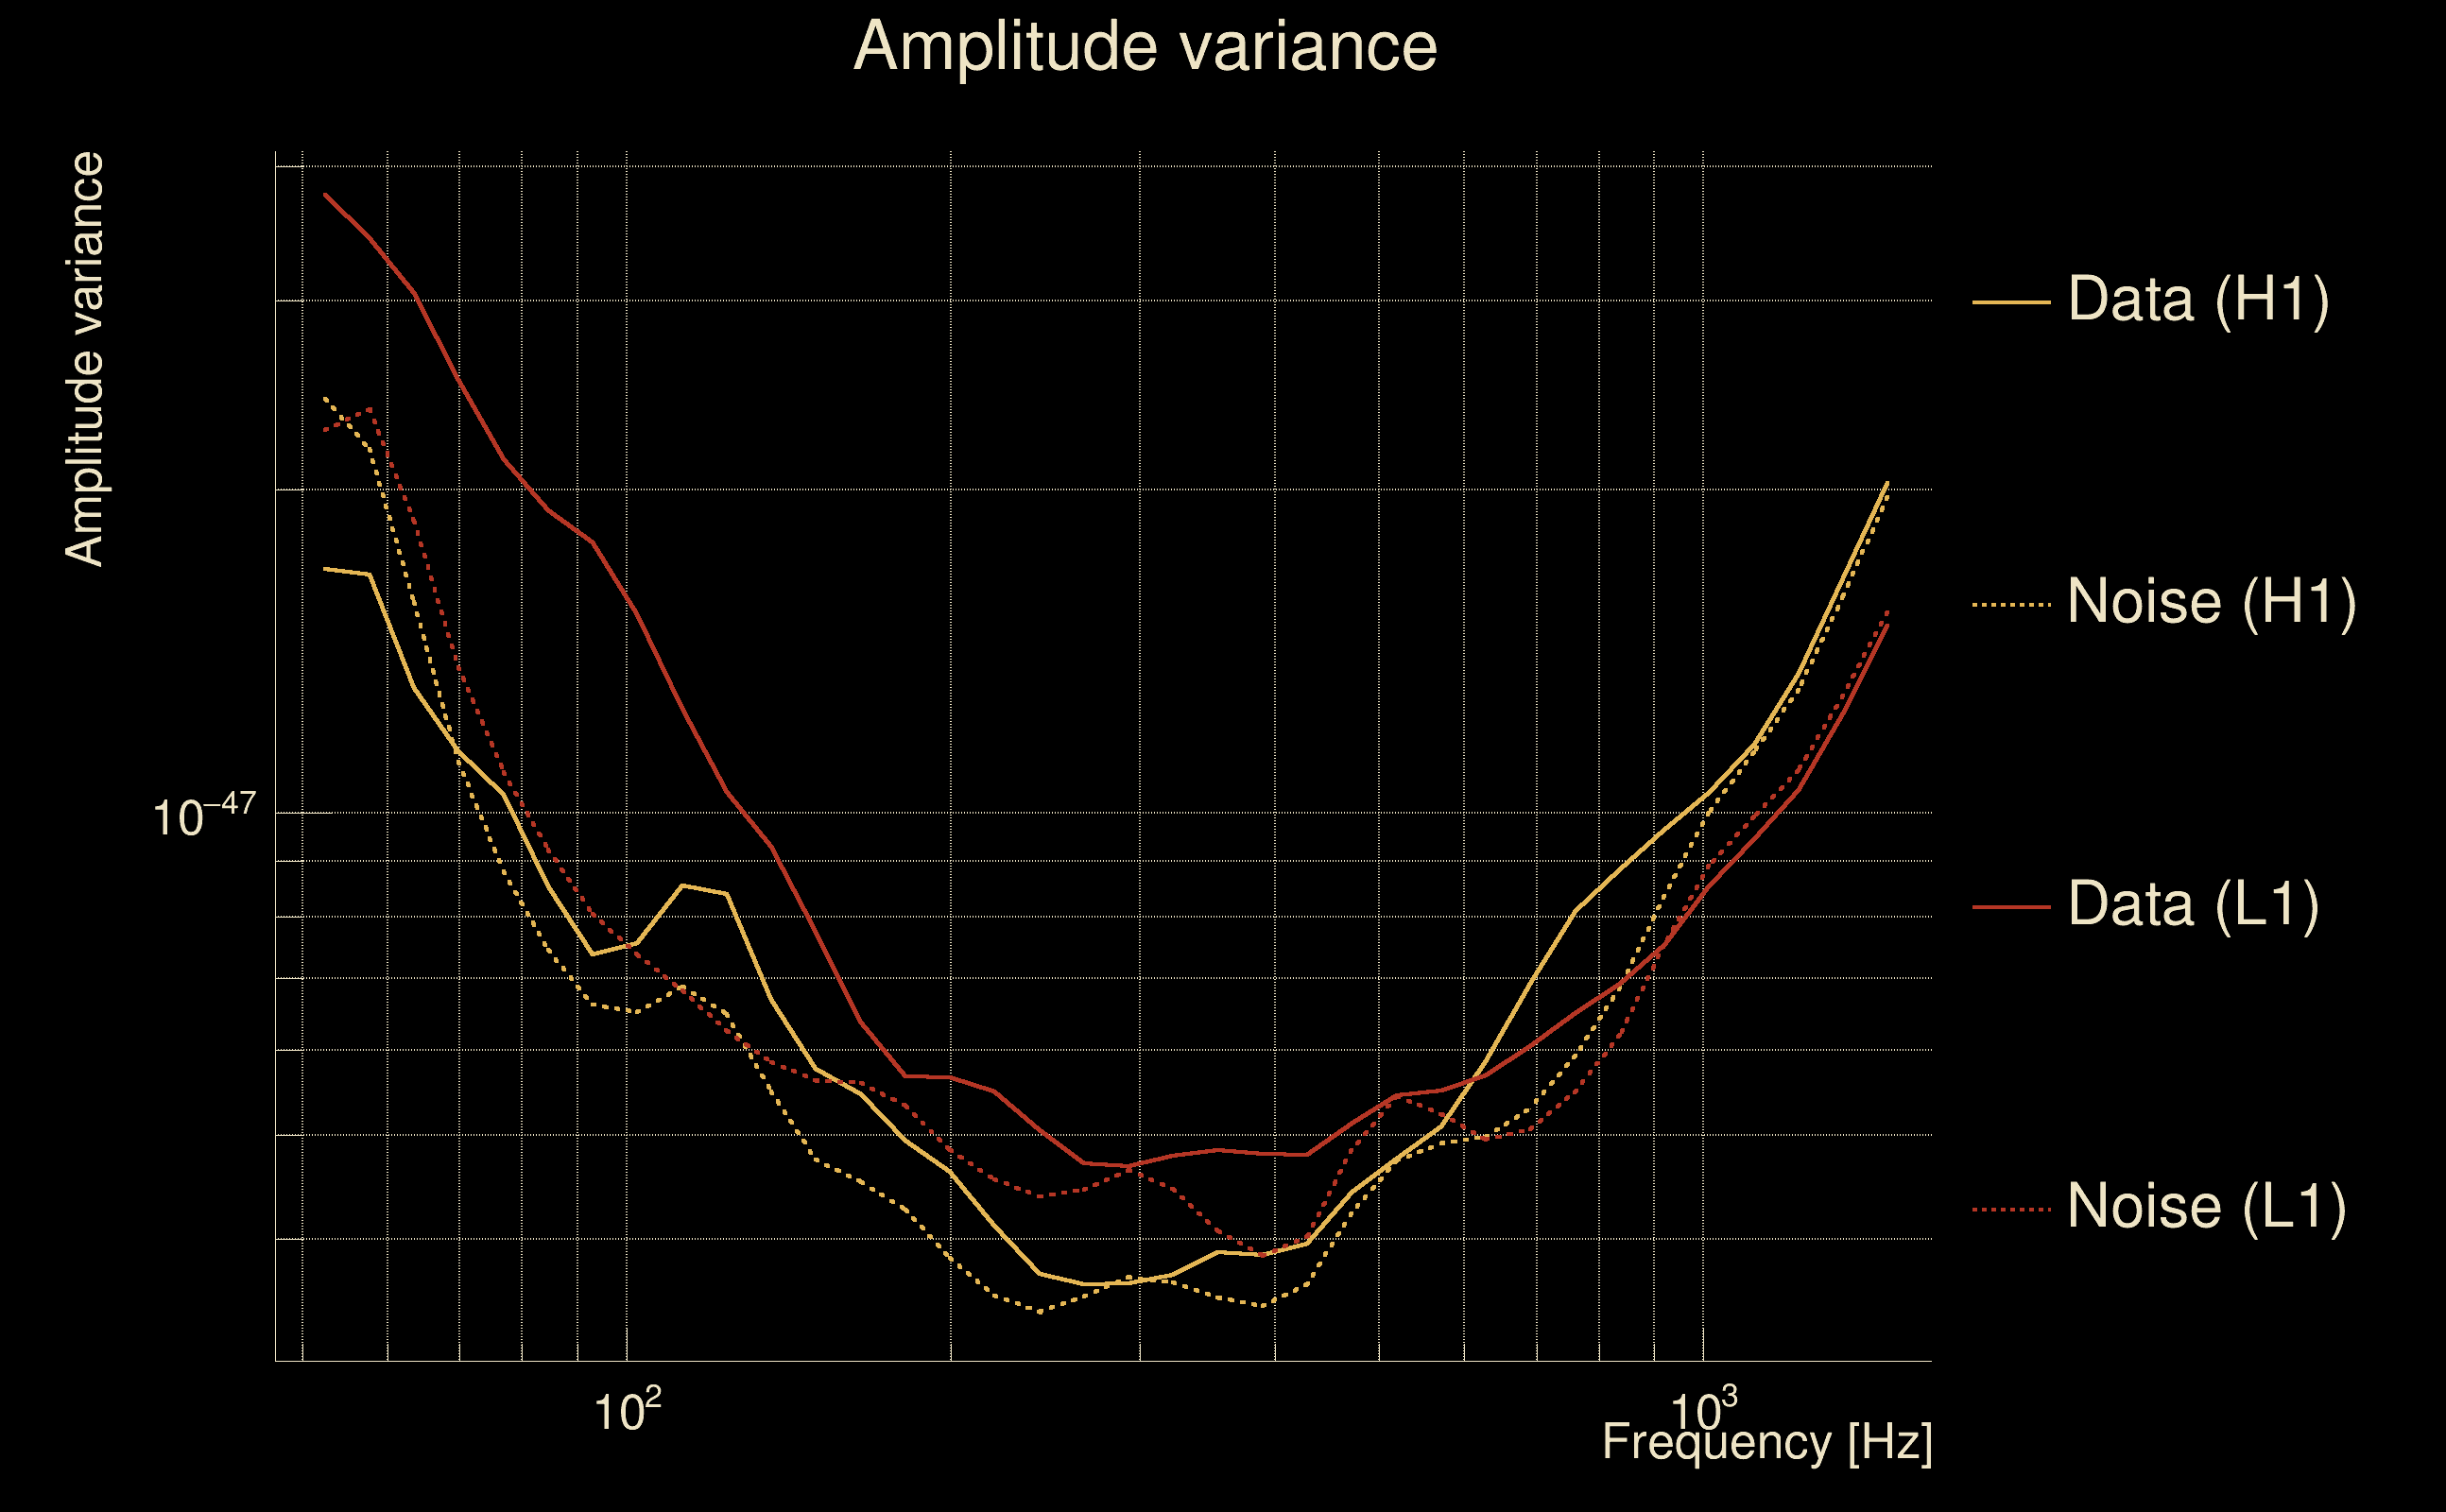
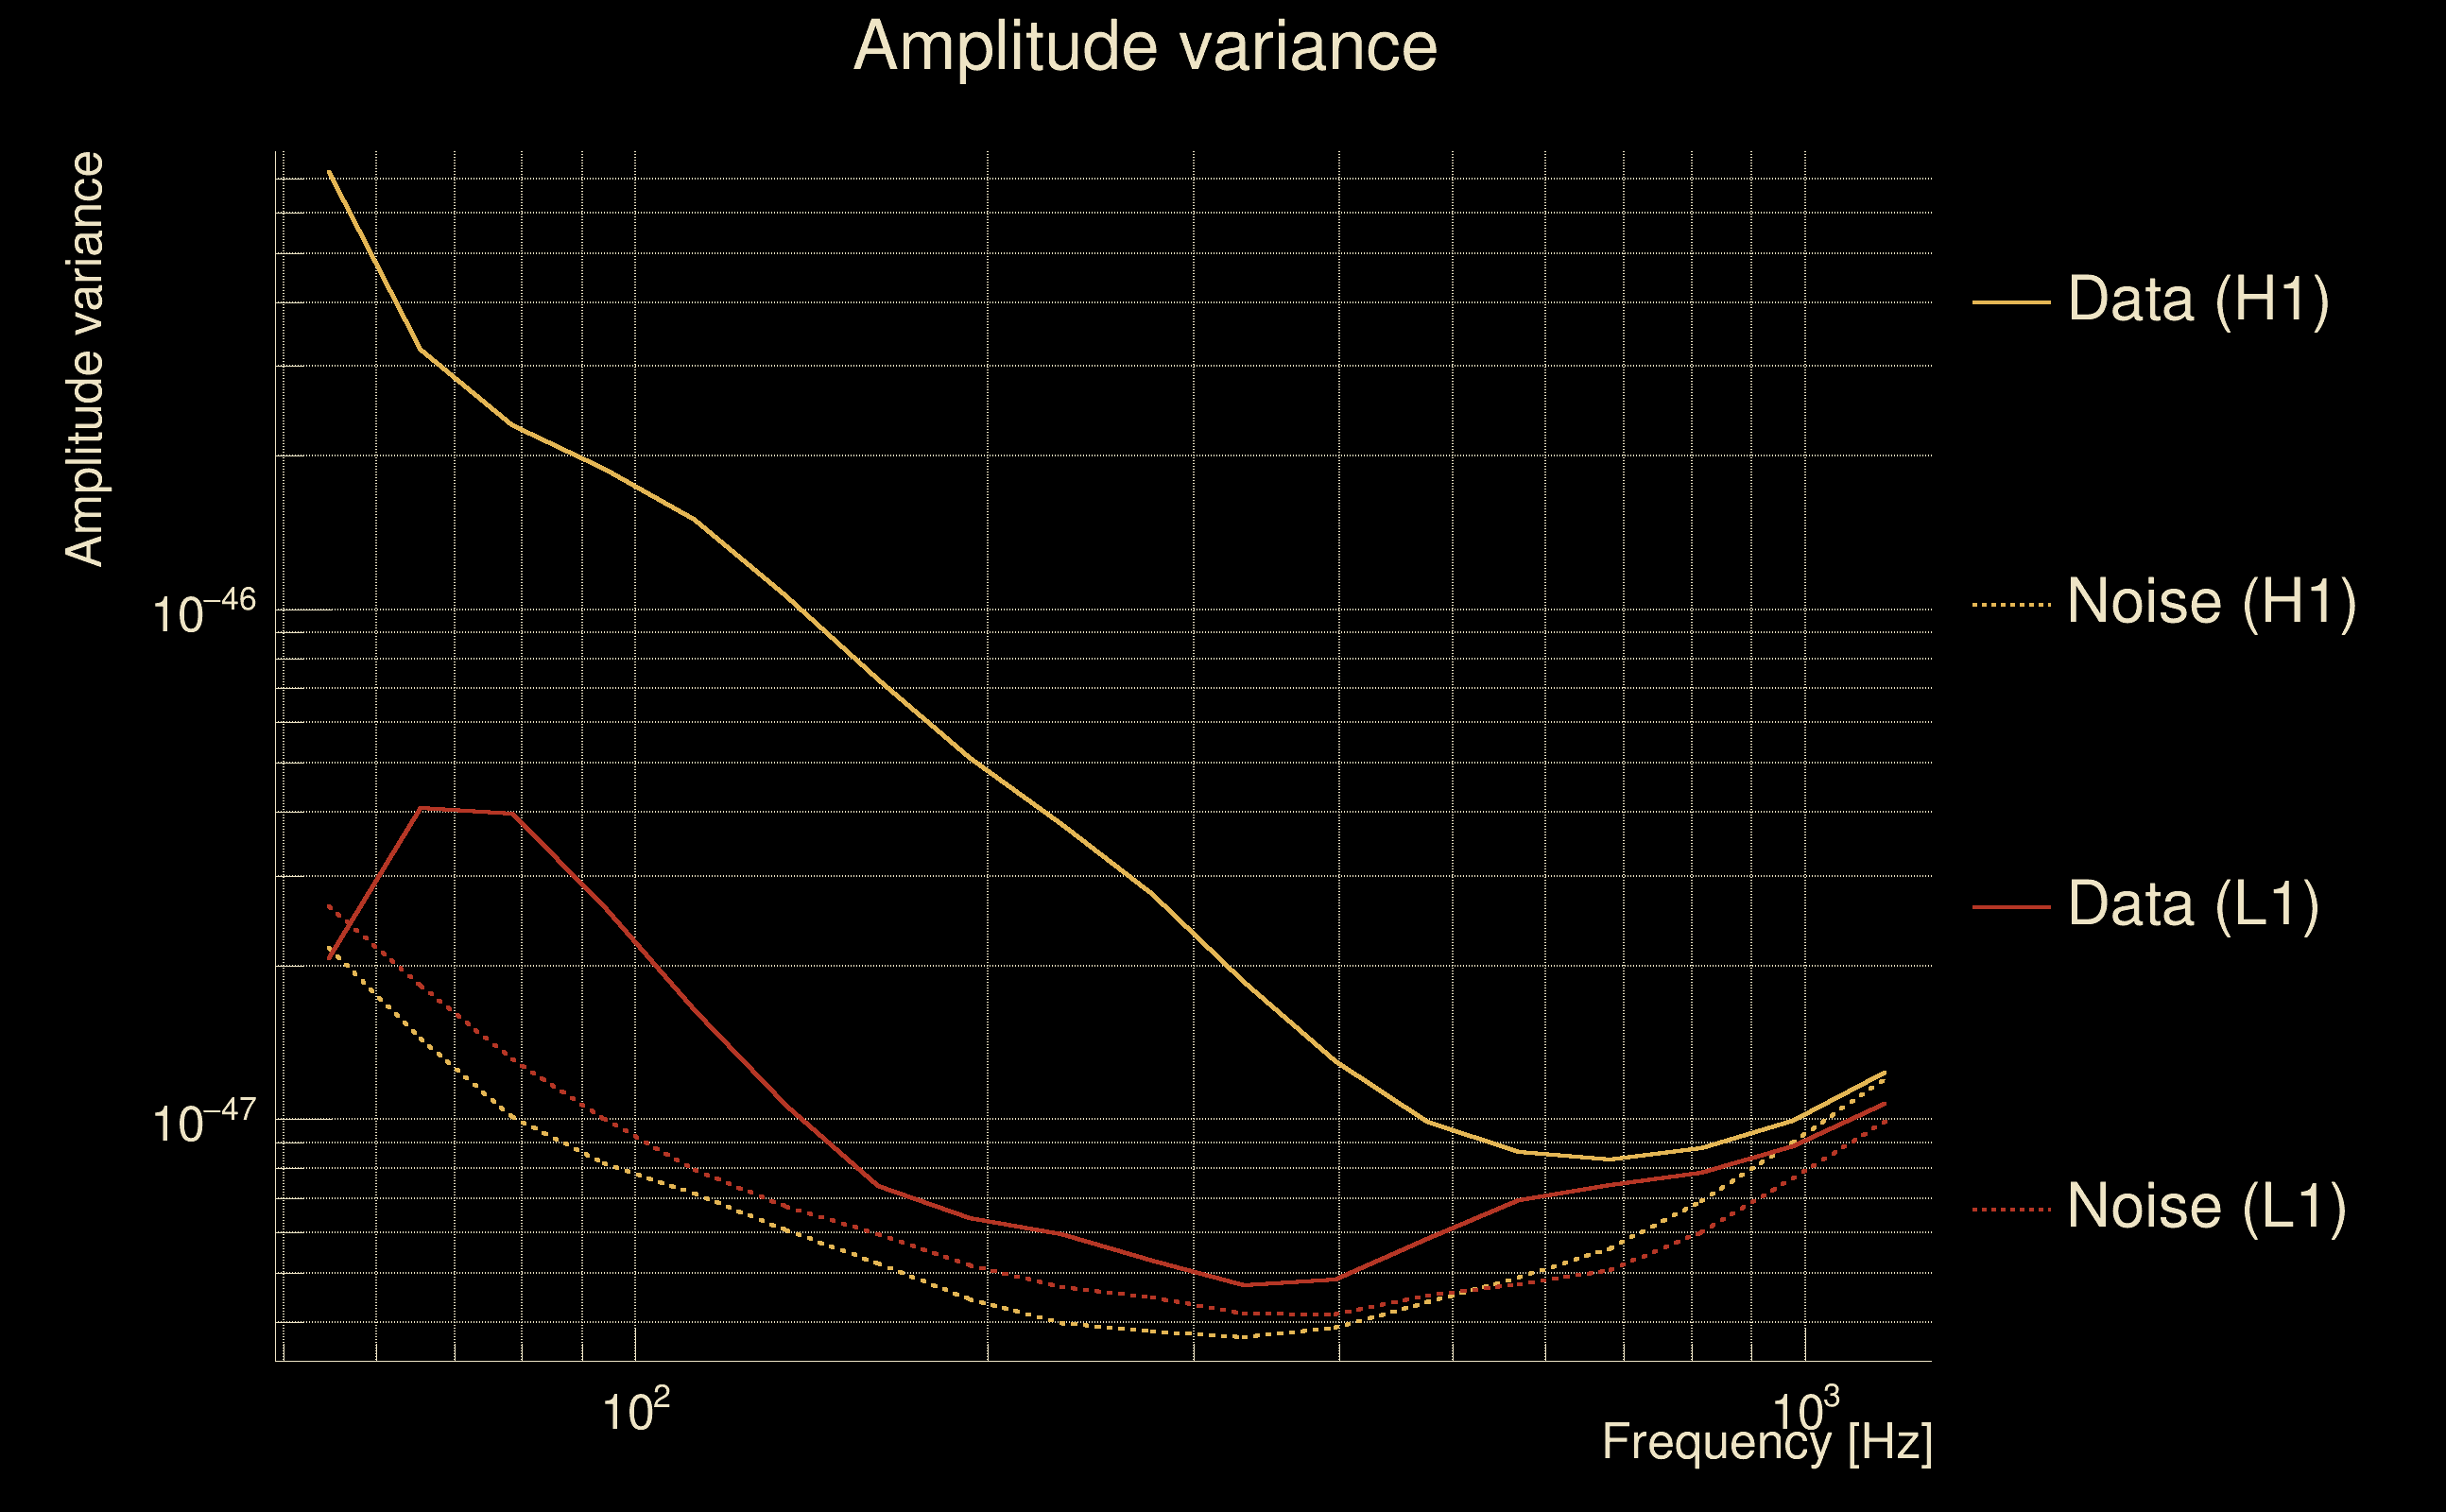
| Amplitude spectrograms: | normalization = 1e-22, power index = 2 |
| White noise SNR variance: | 0.523175 (after applying a correction factor = 1) |
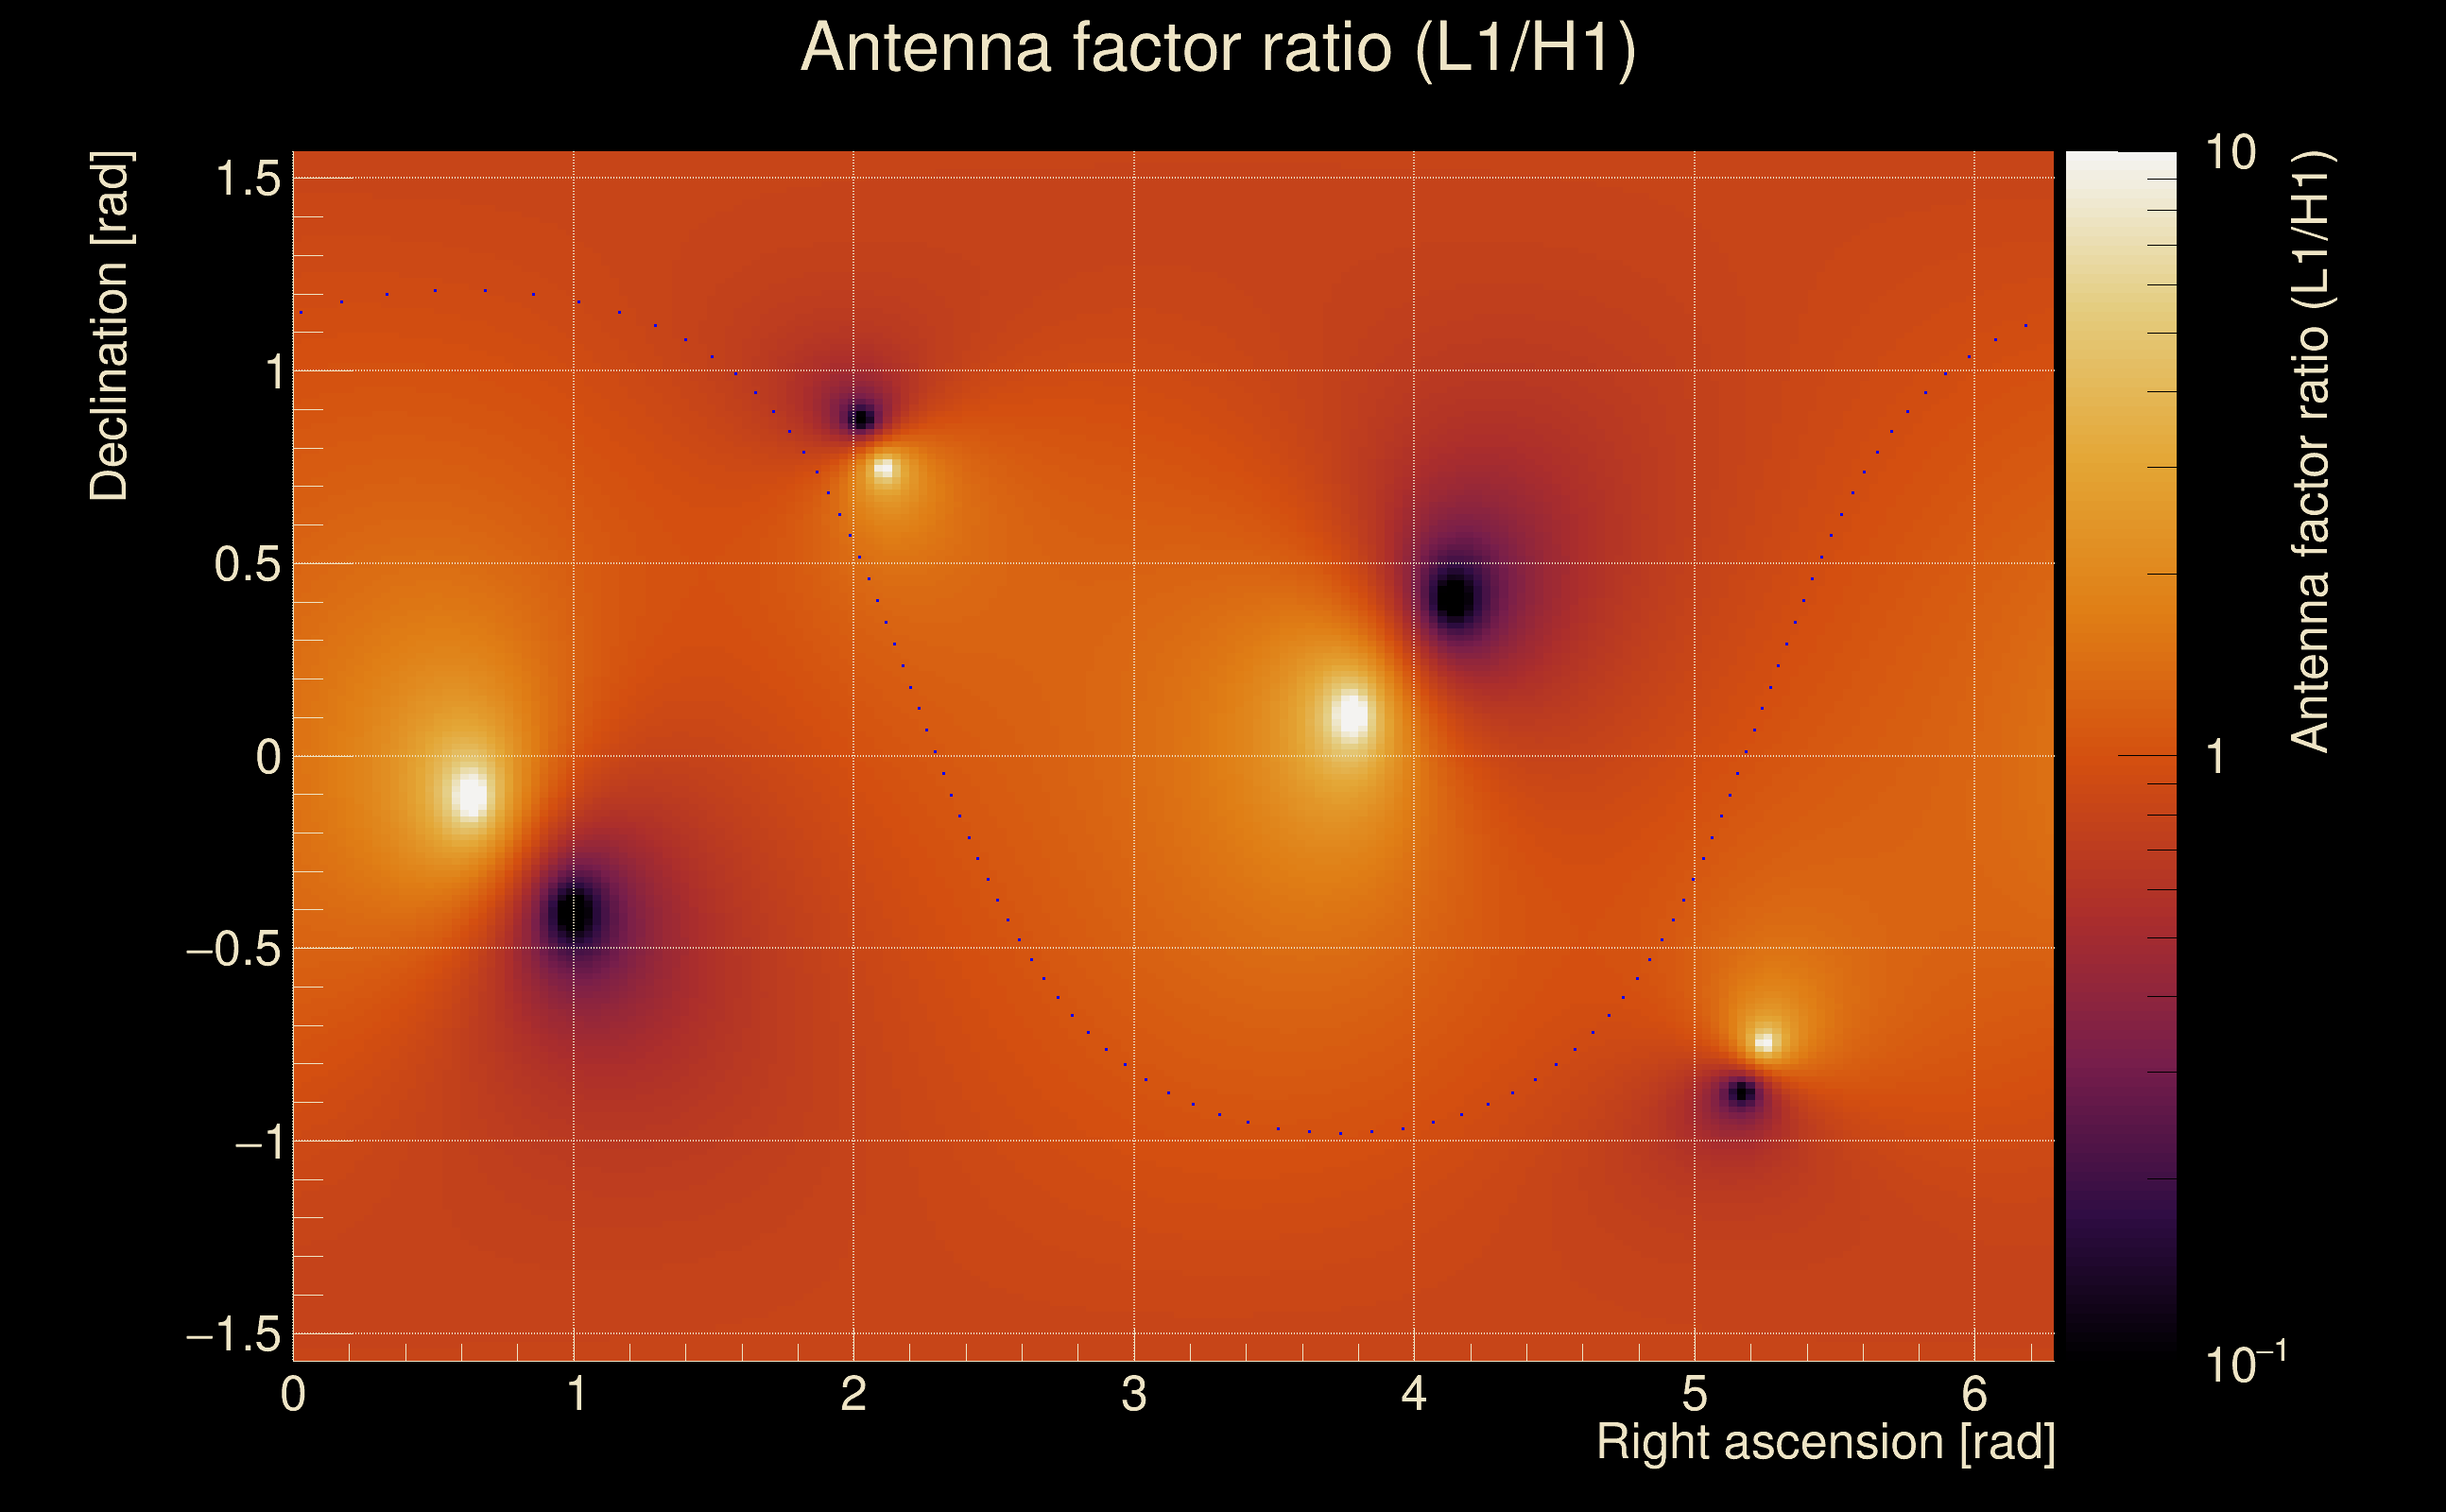
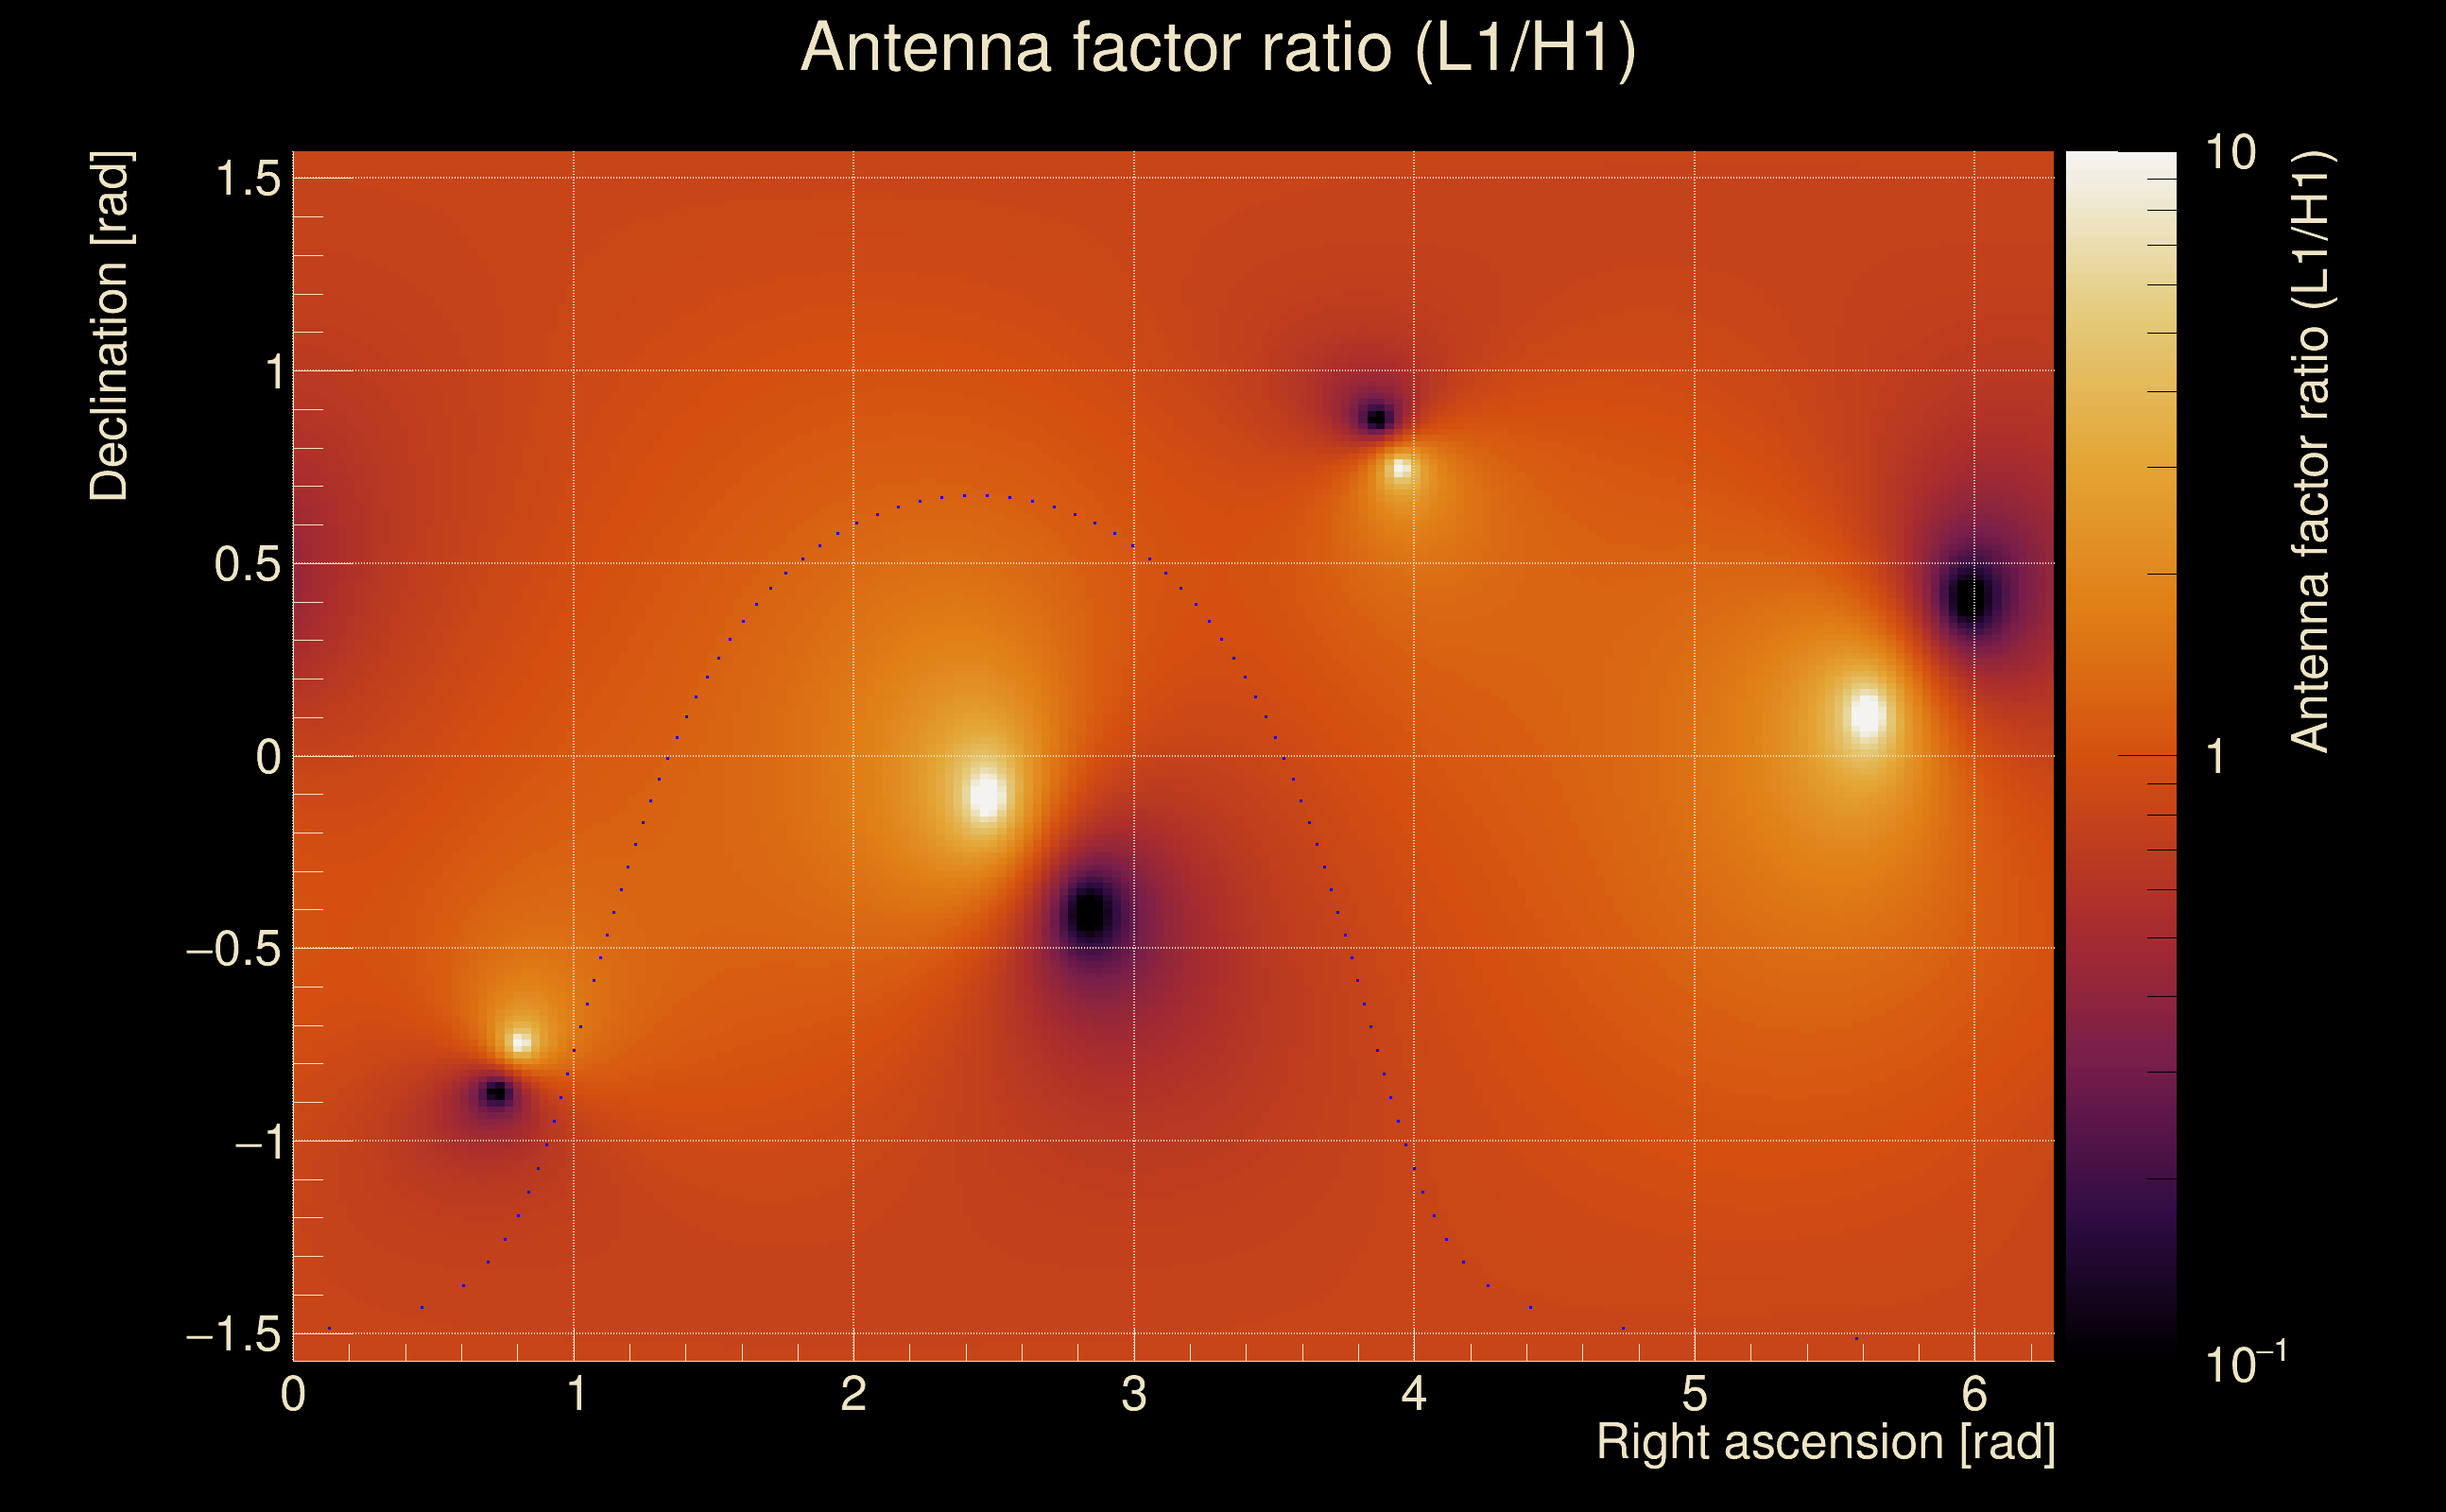
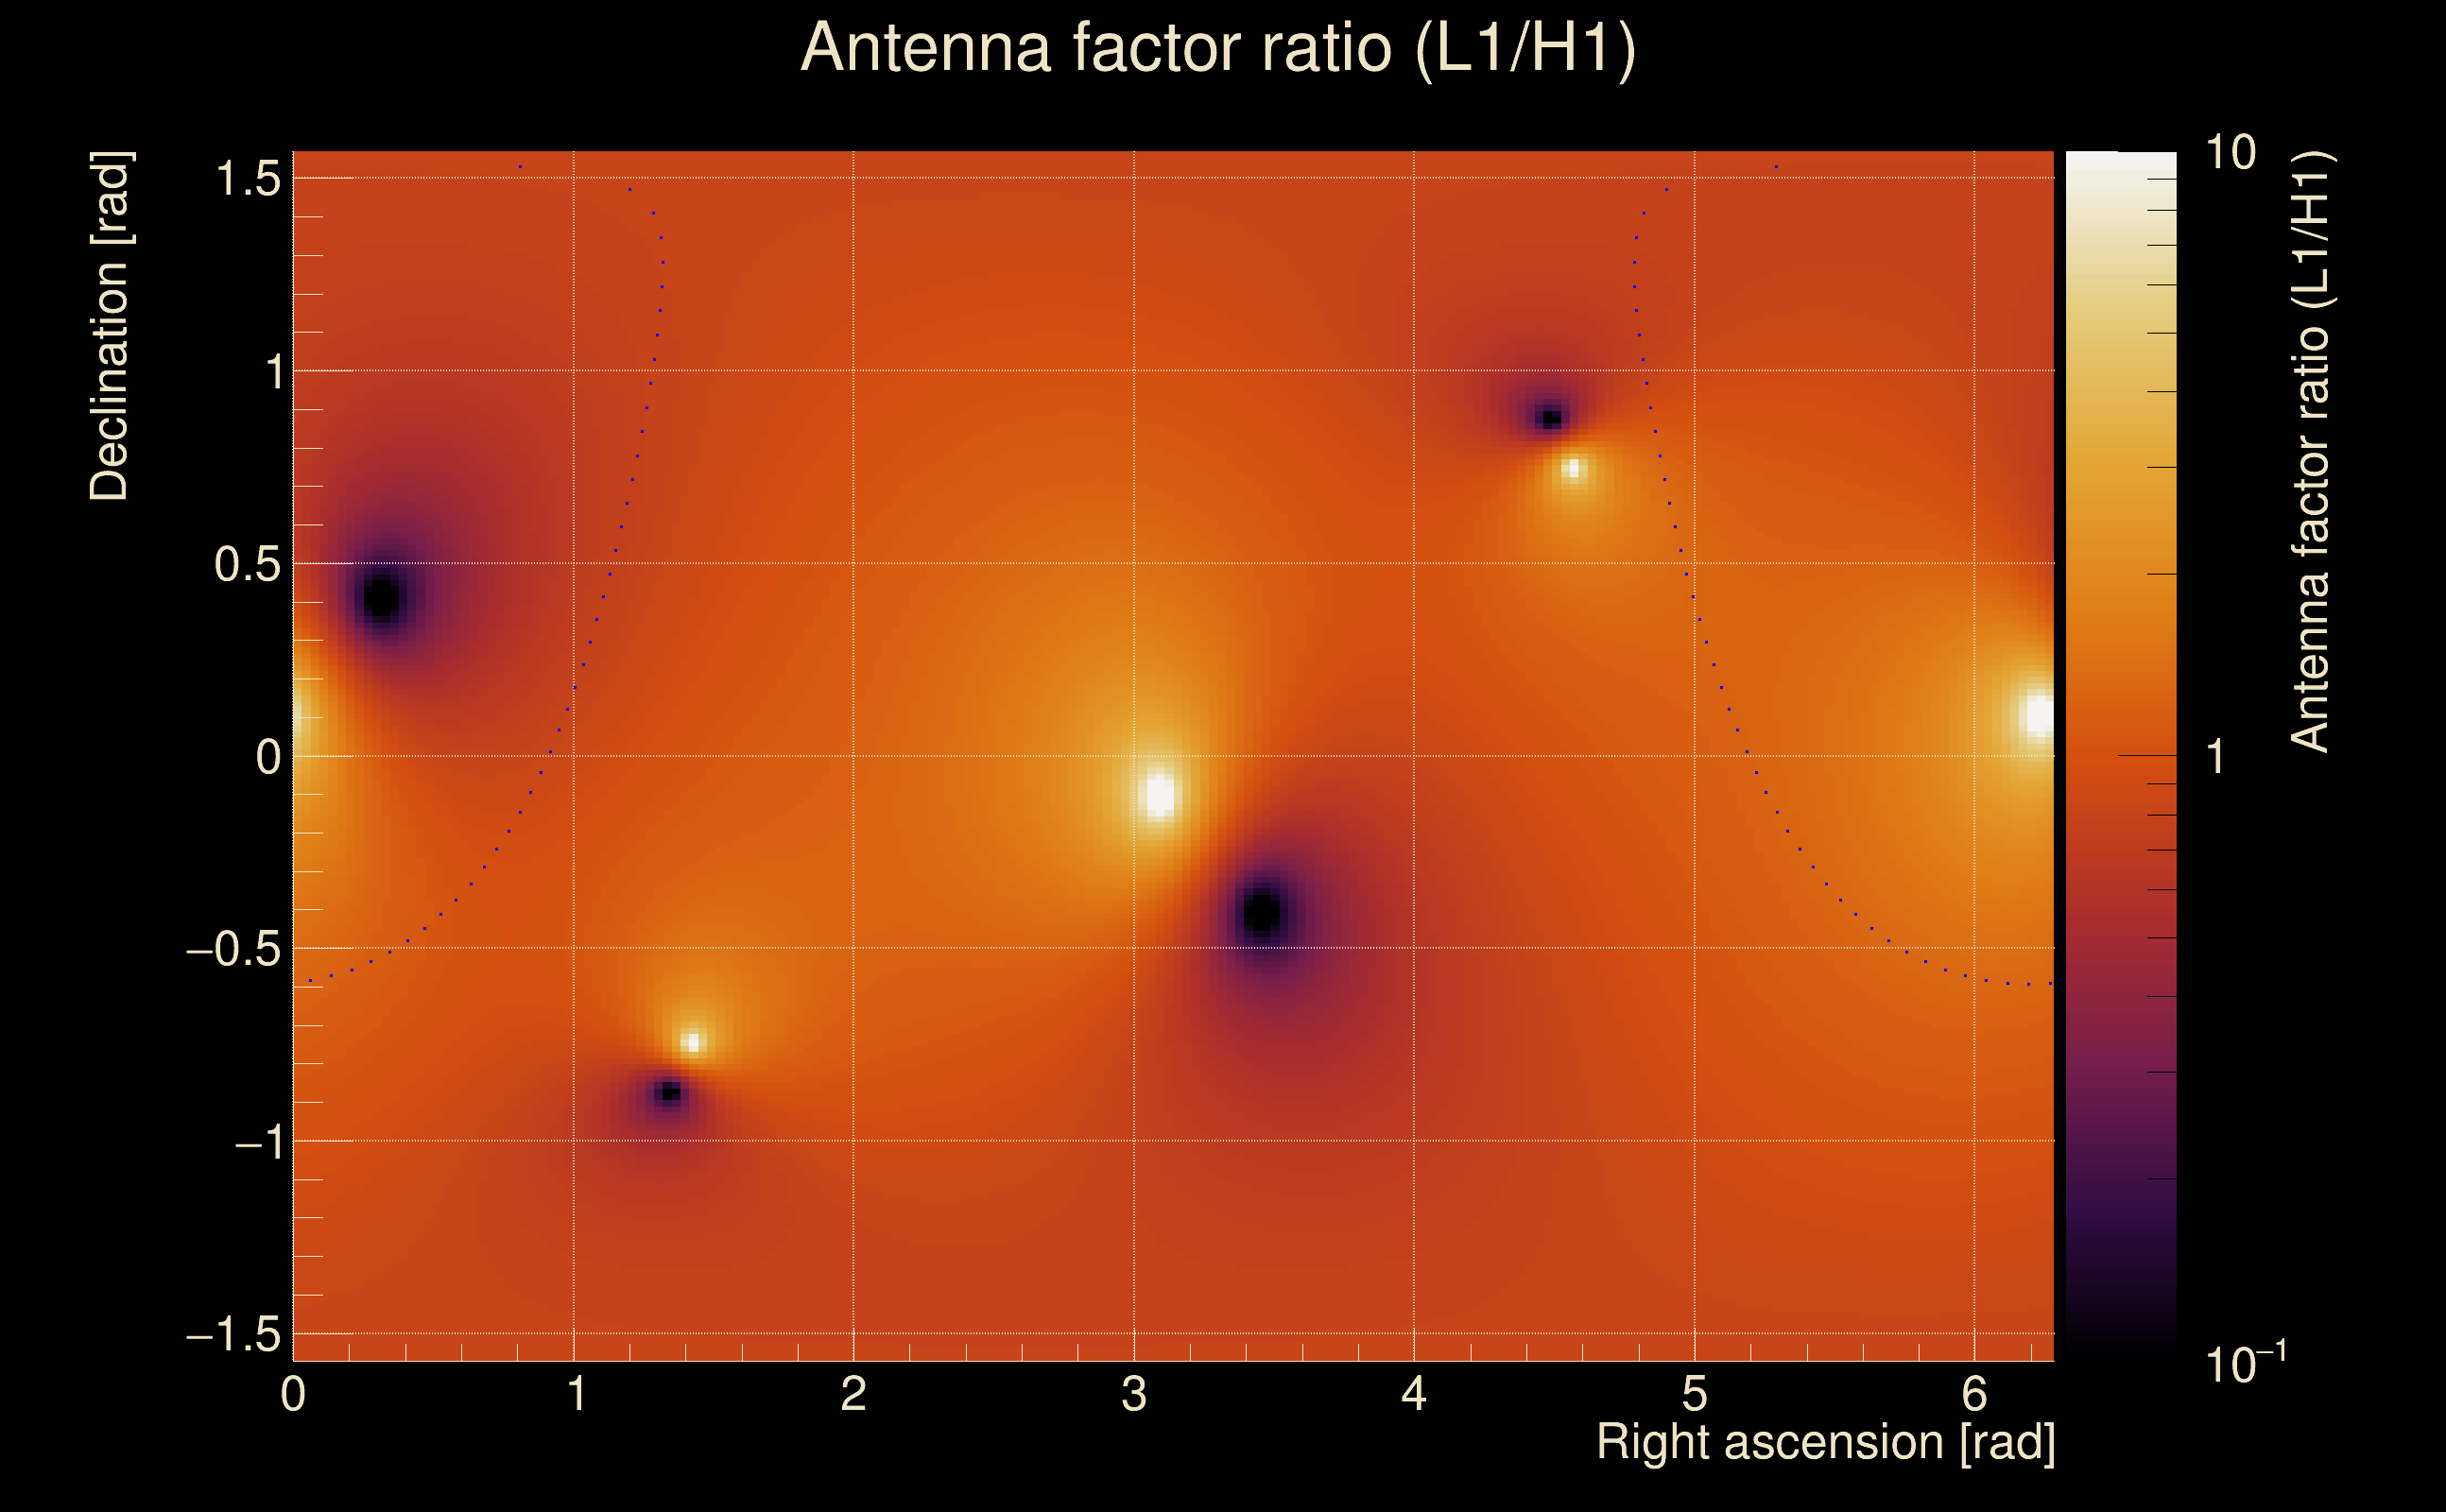
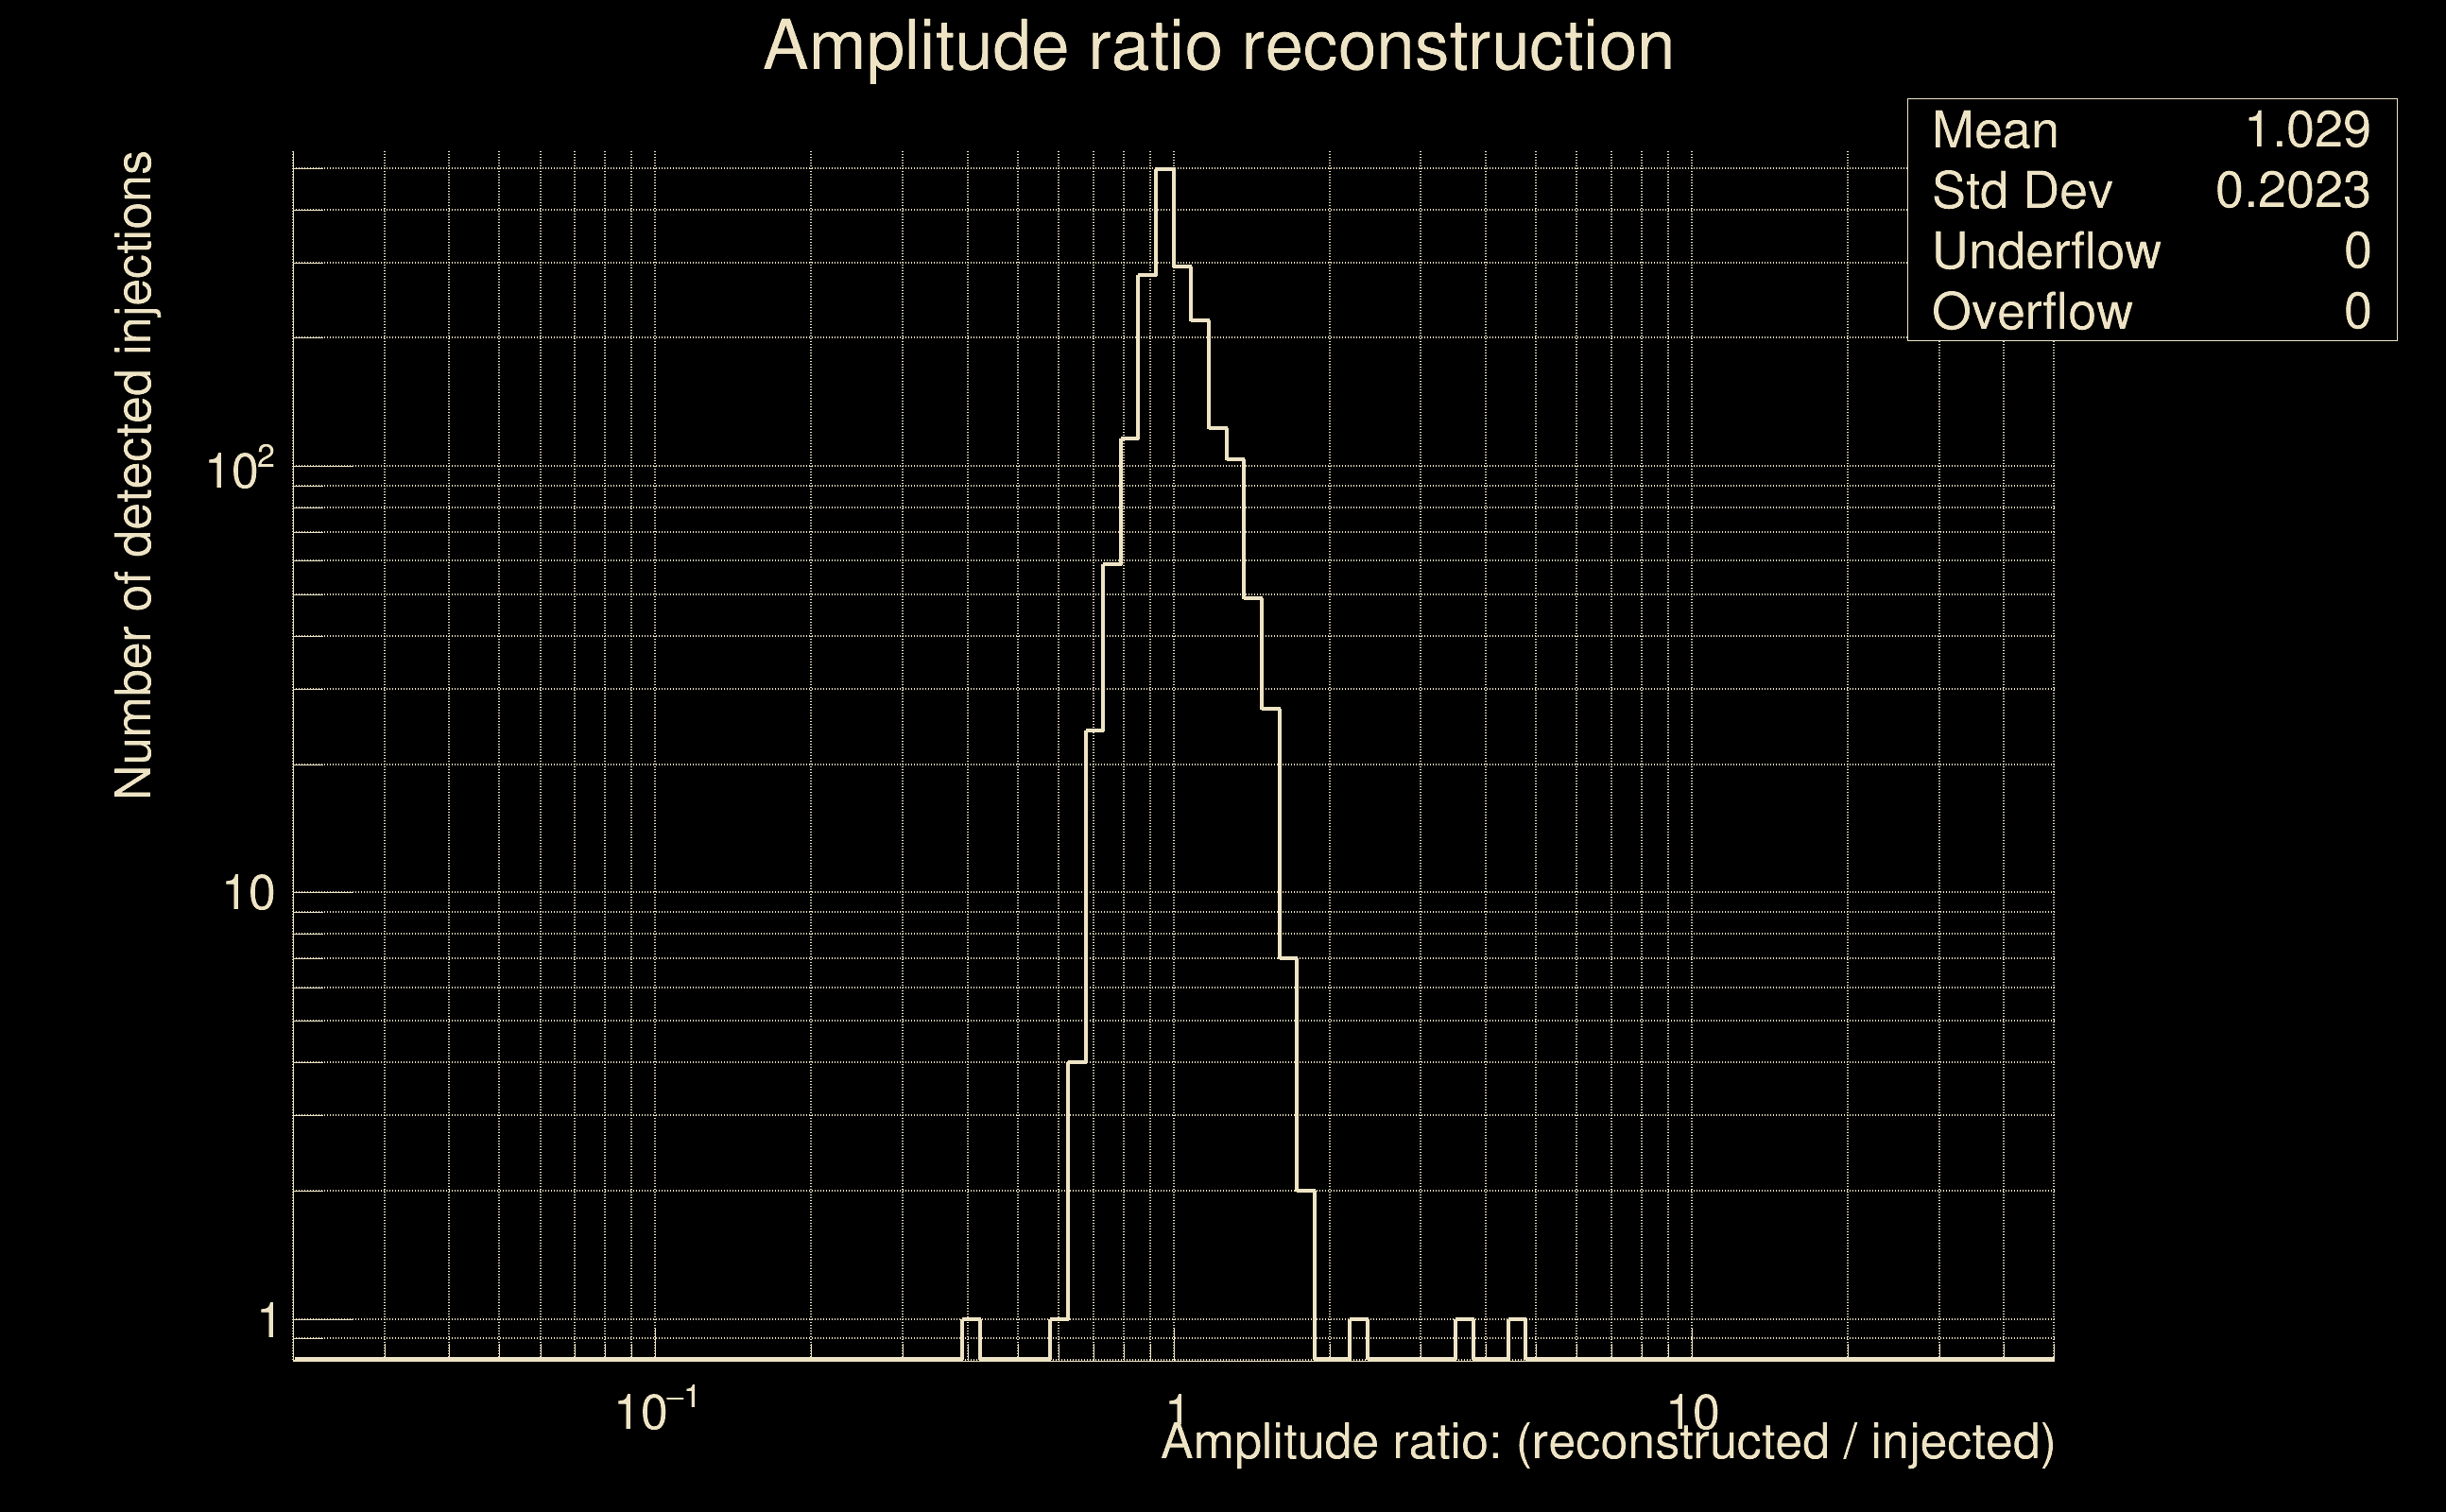
| Amplitude ratio confidence level: | 3 sigma |
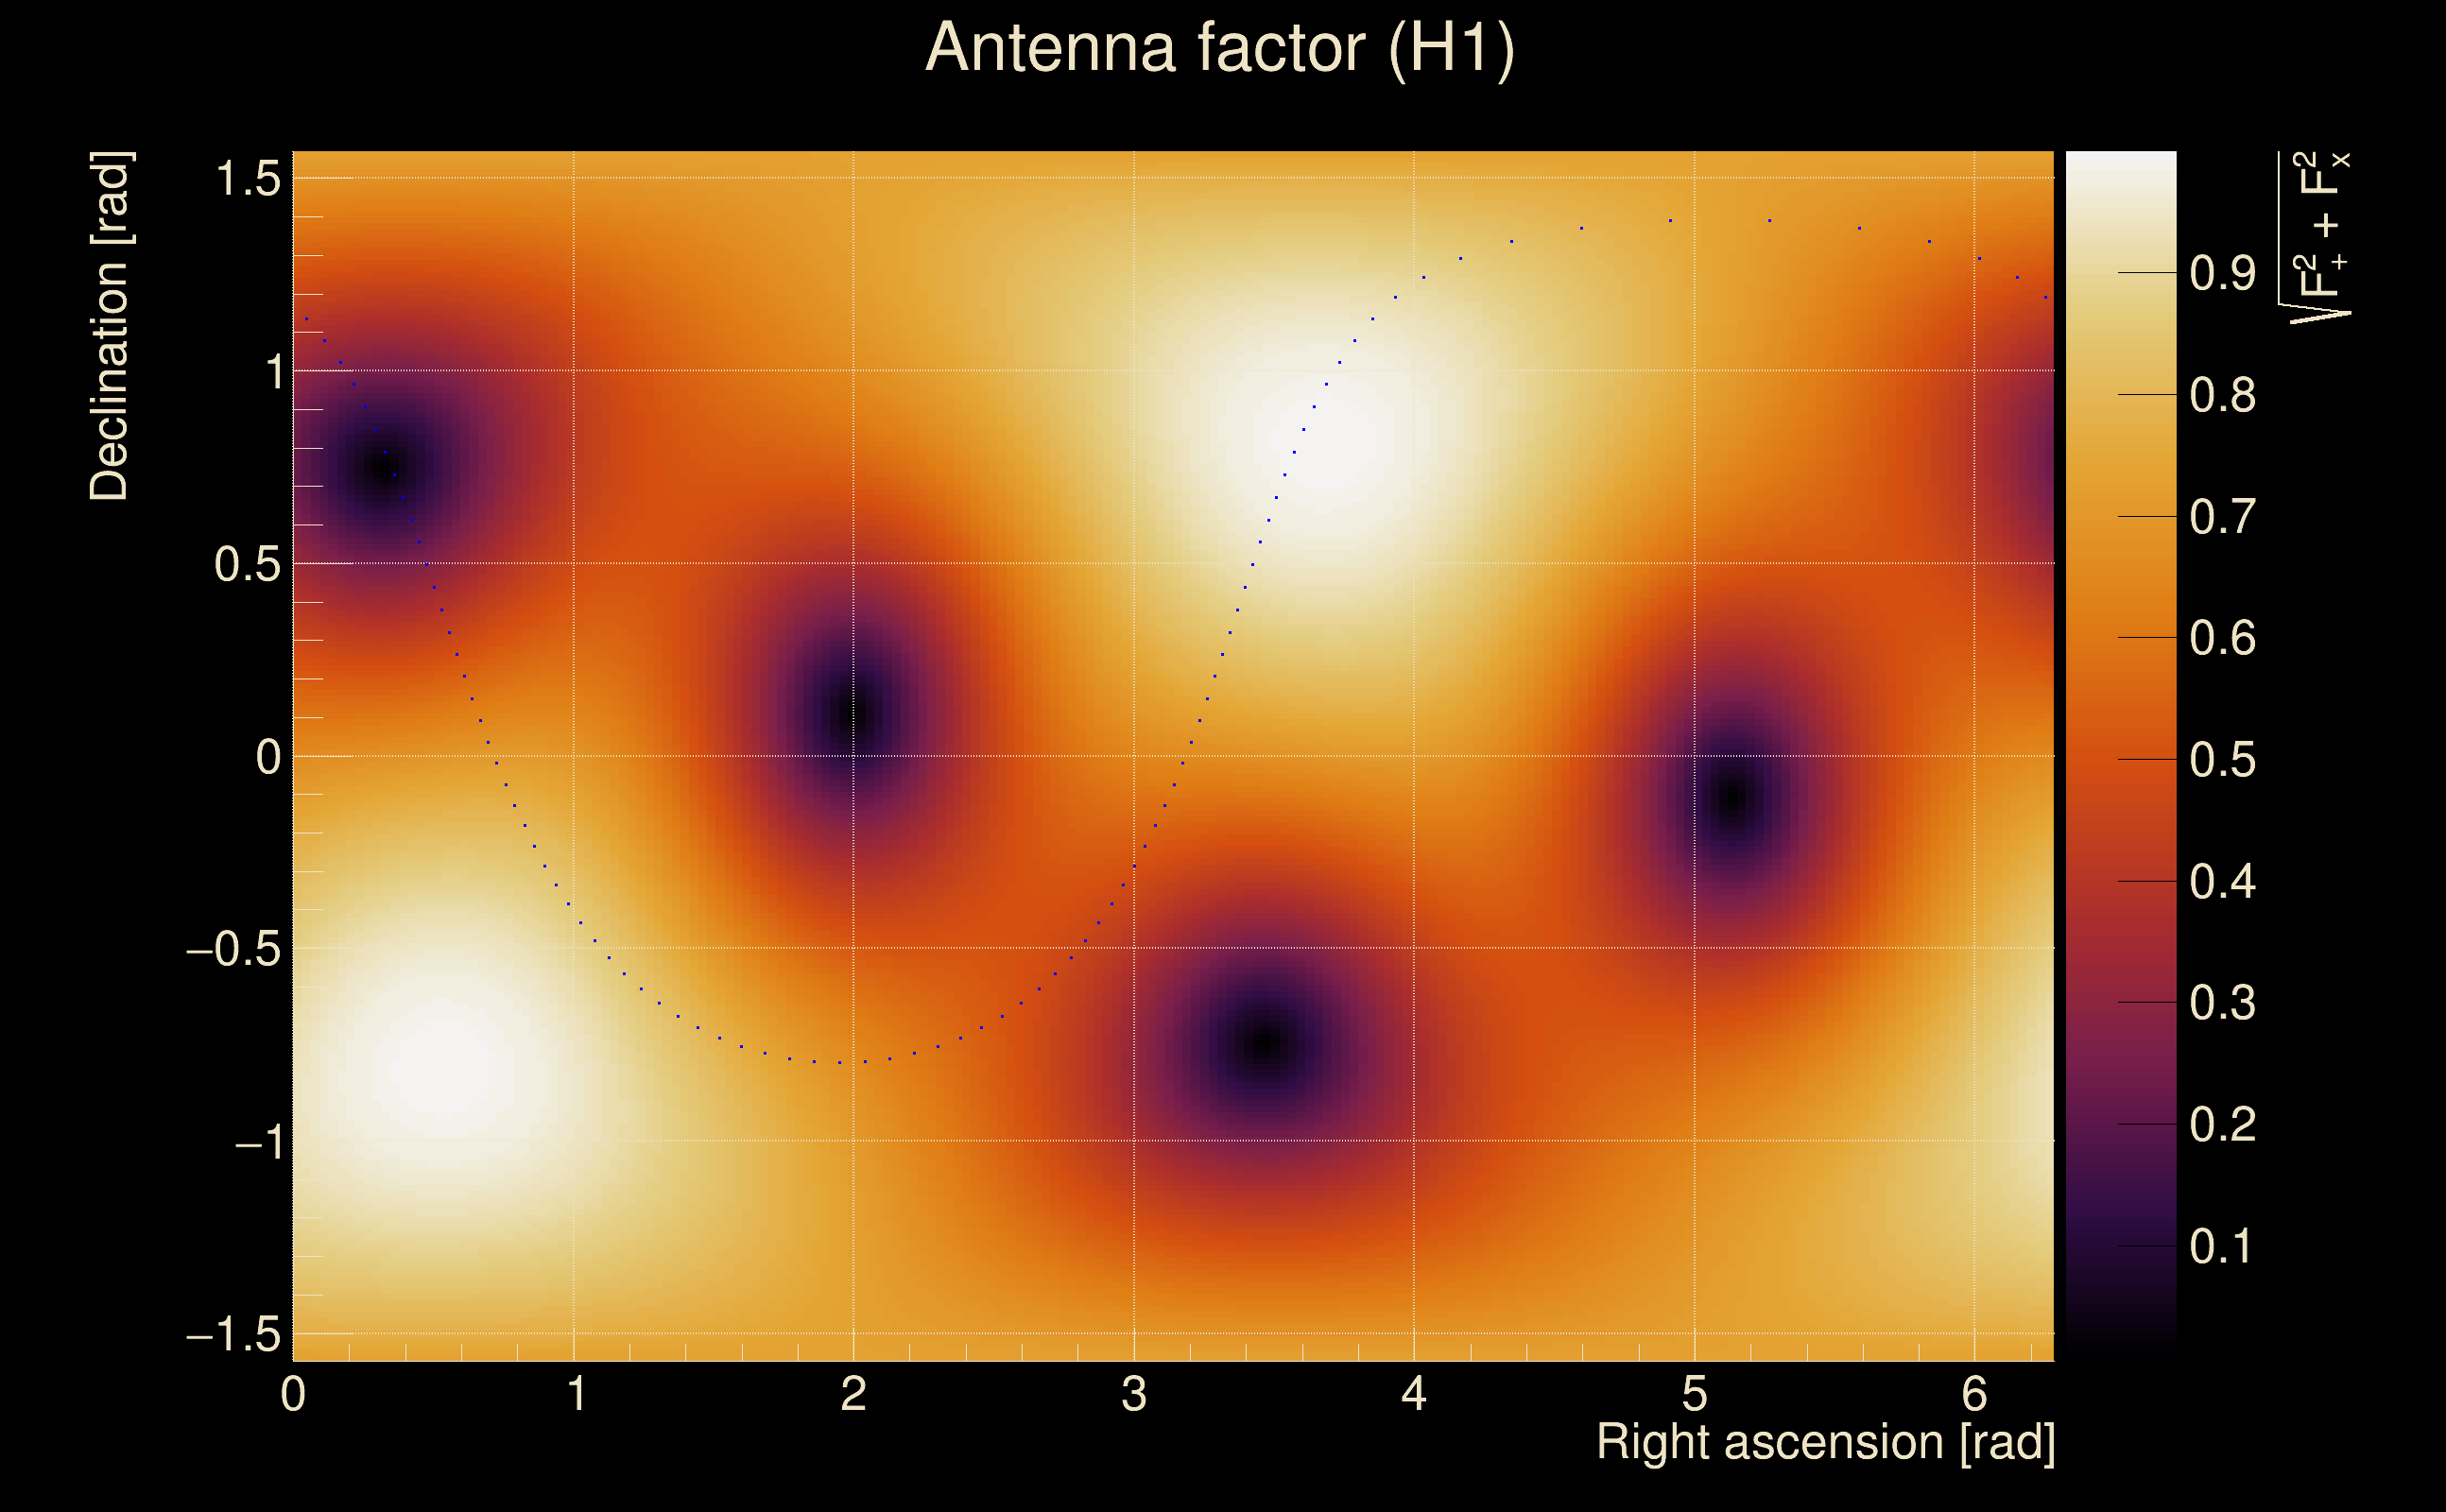
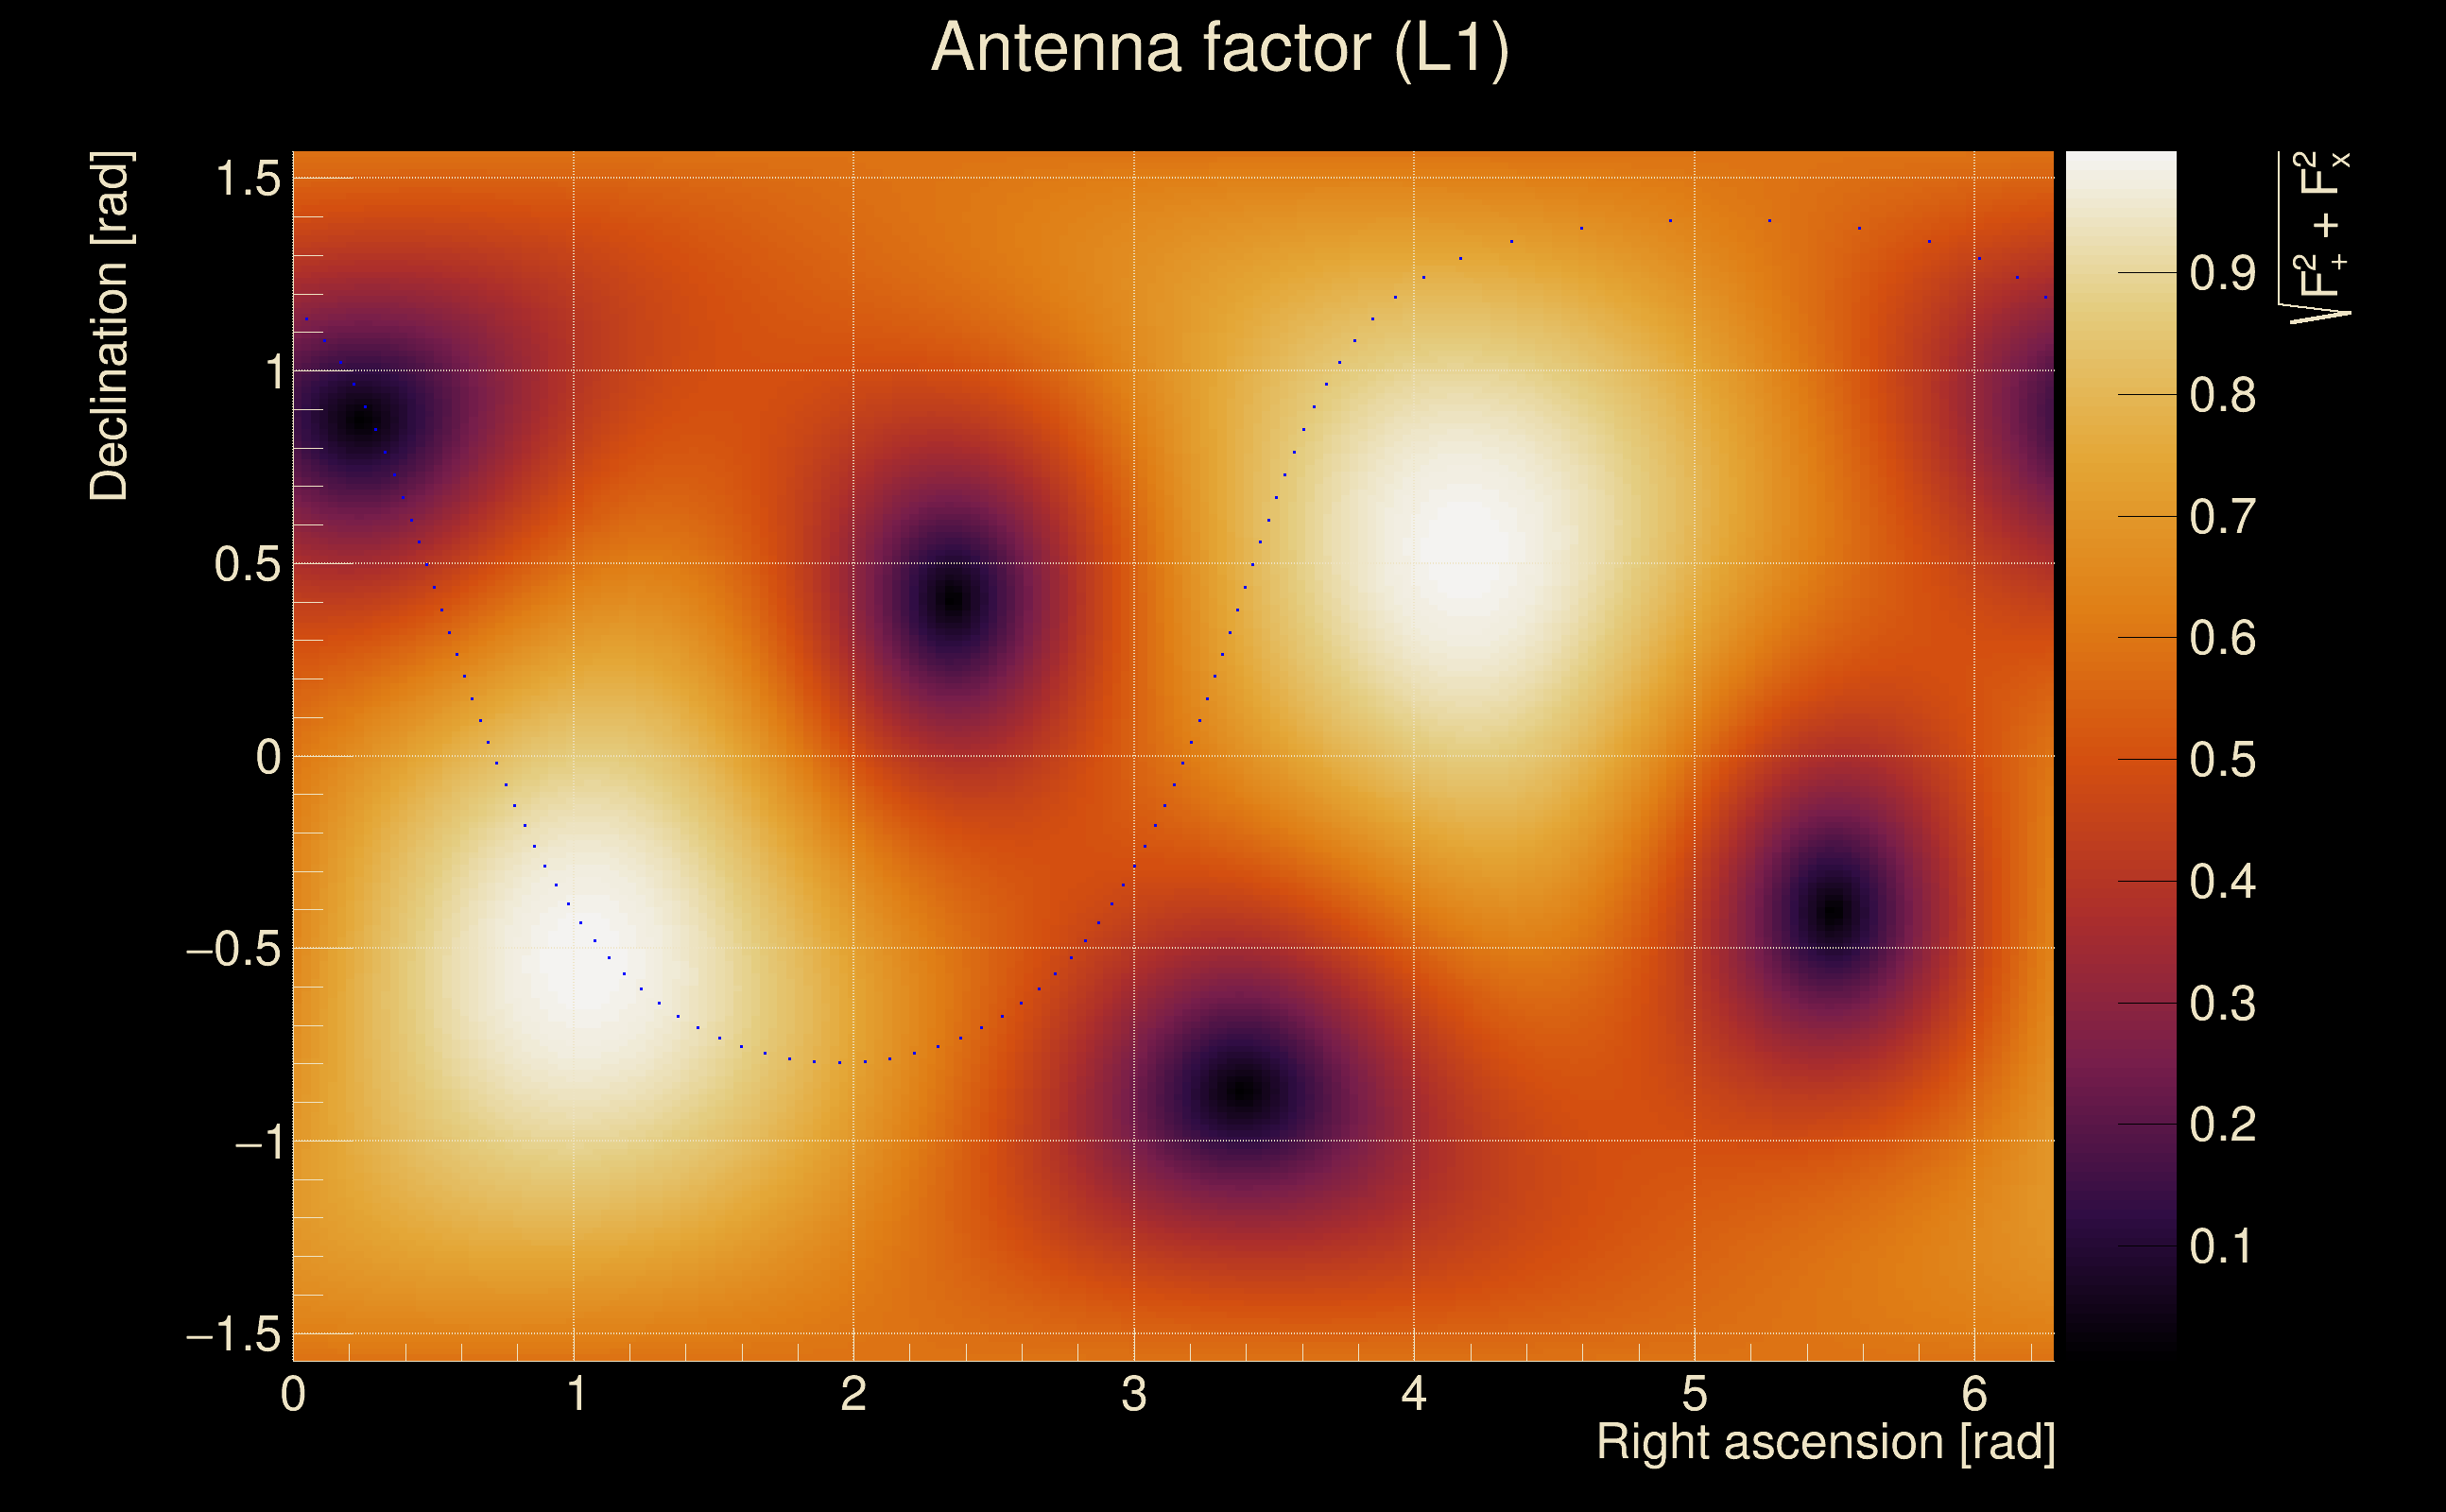
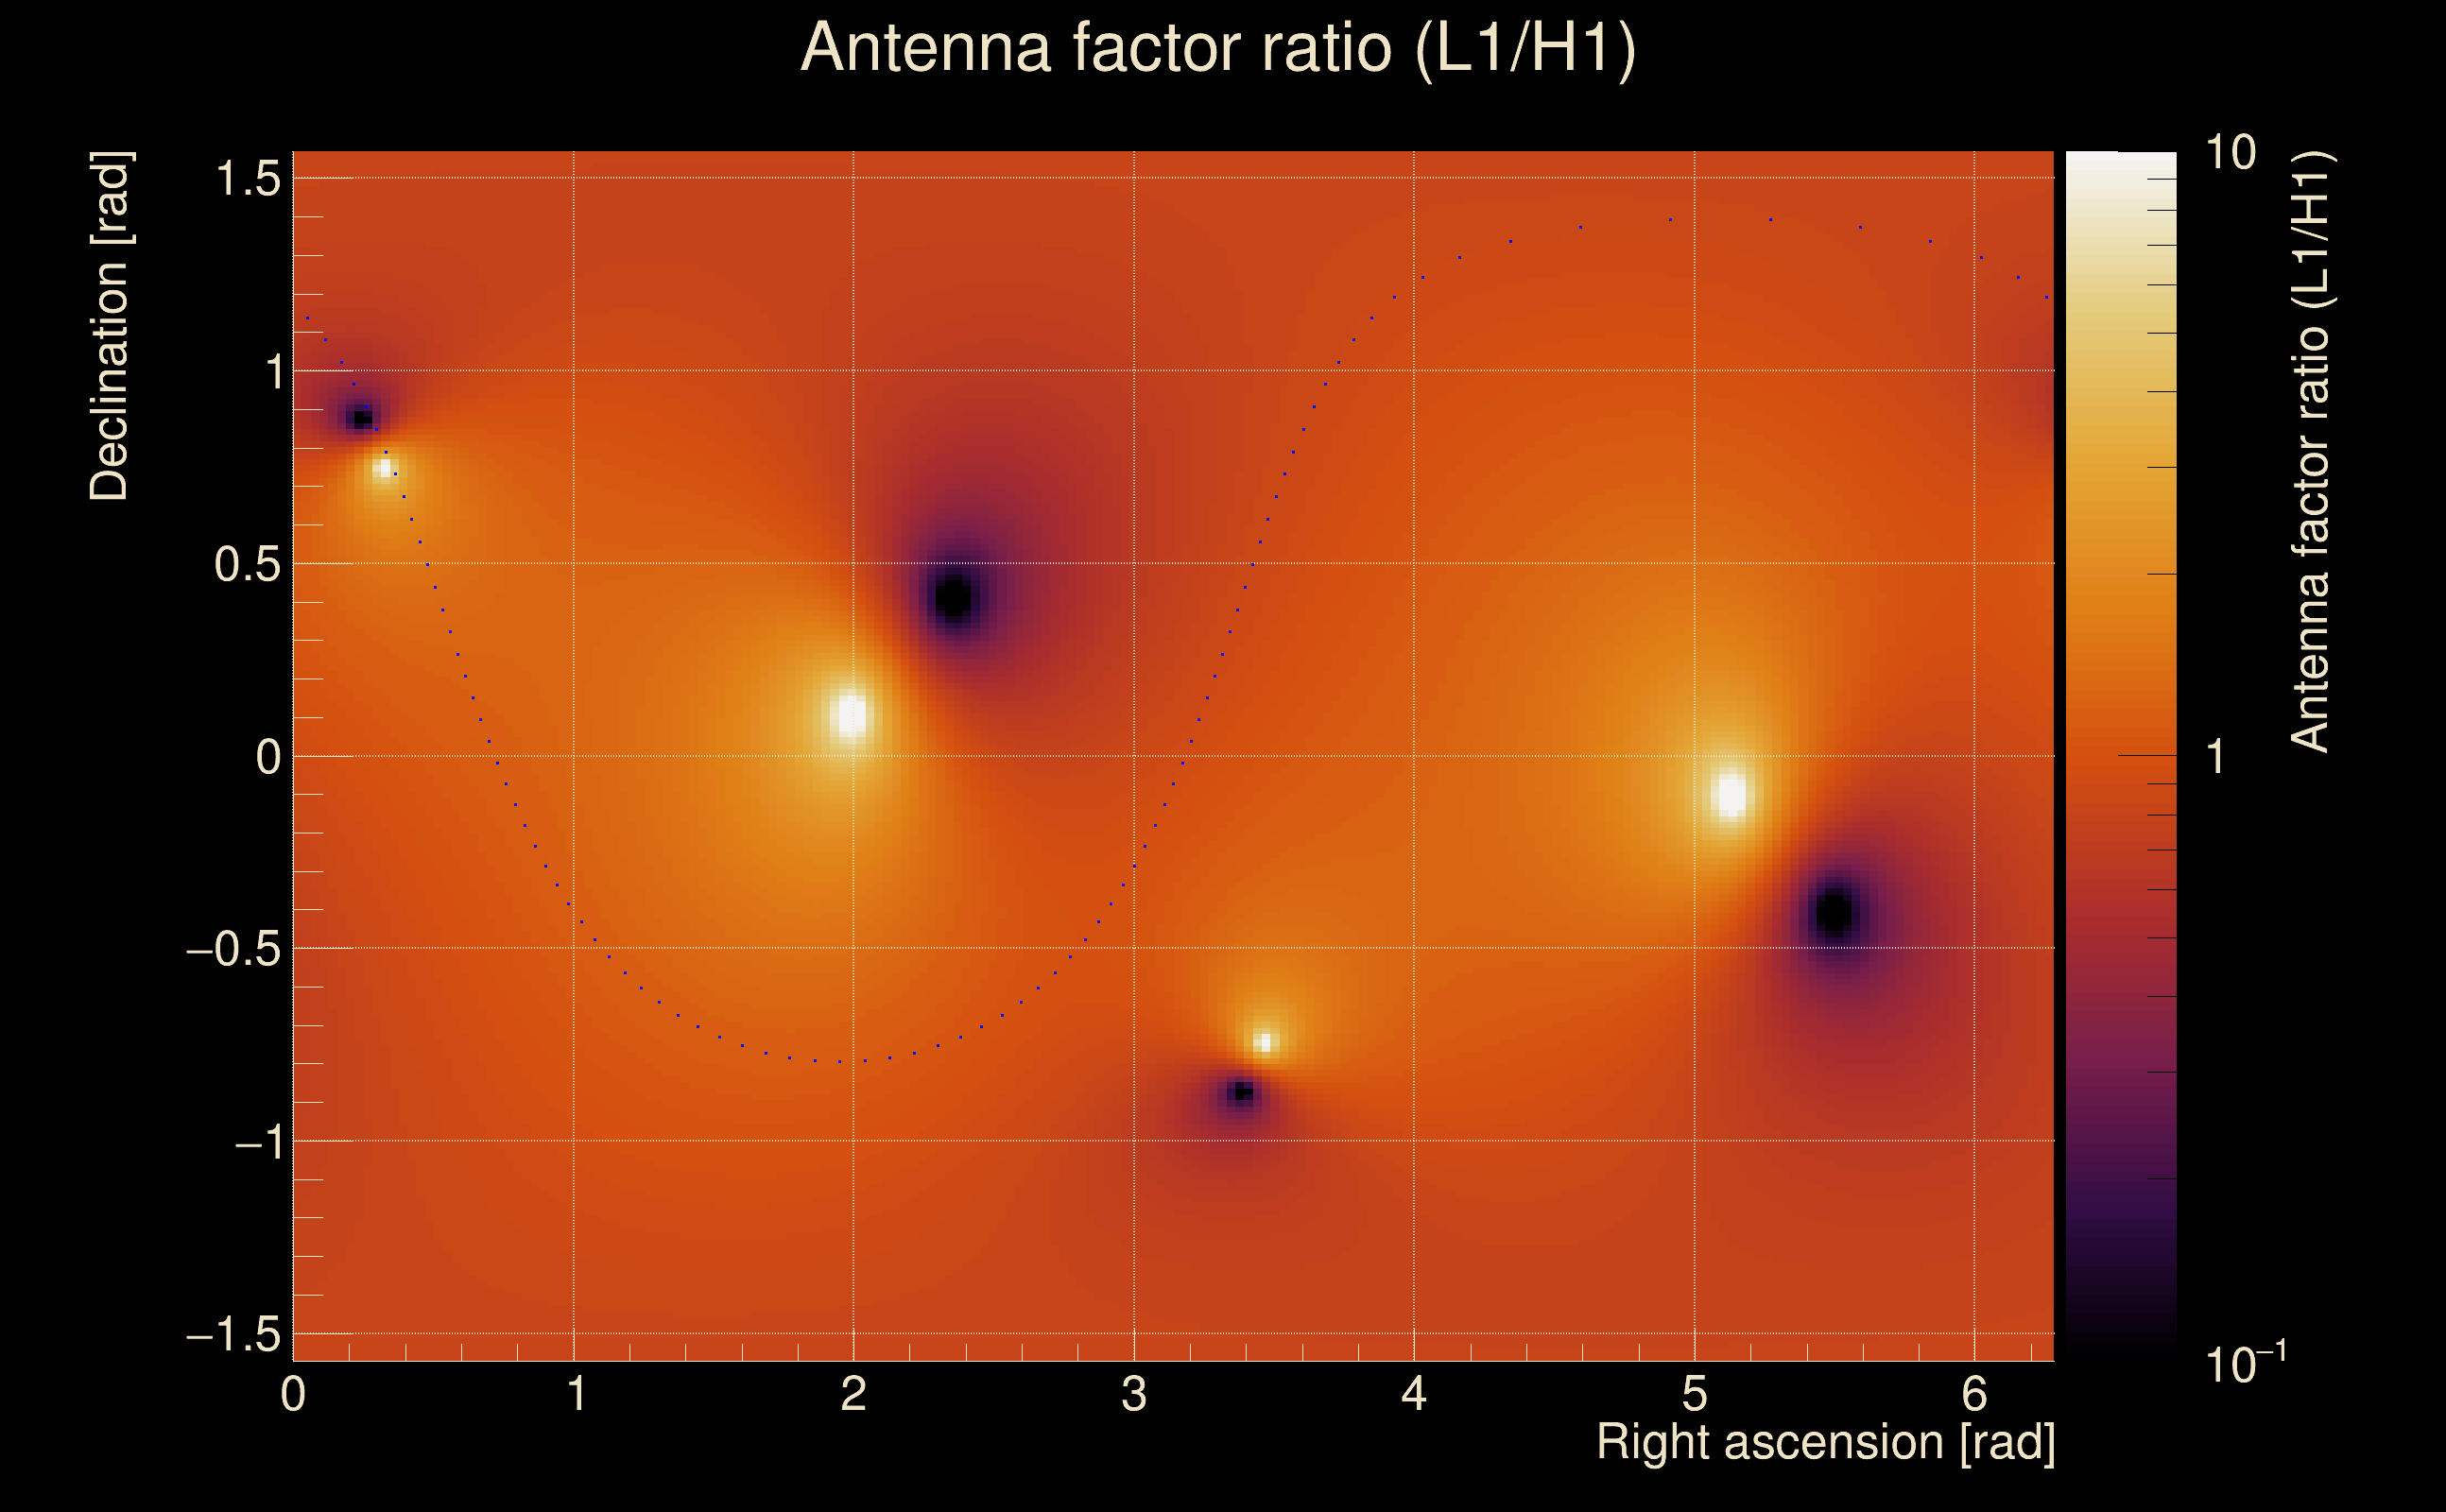
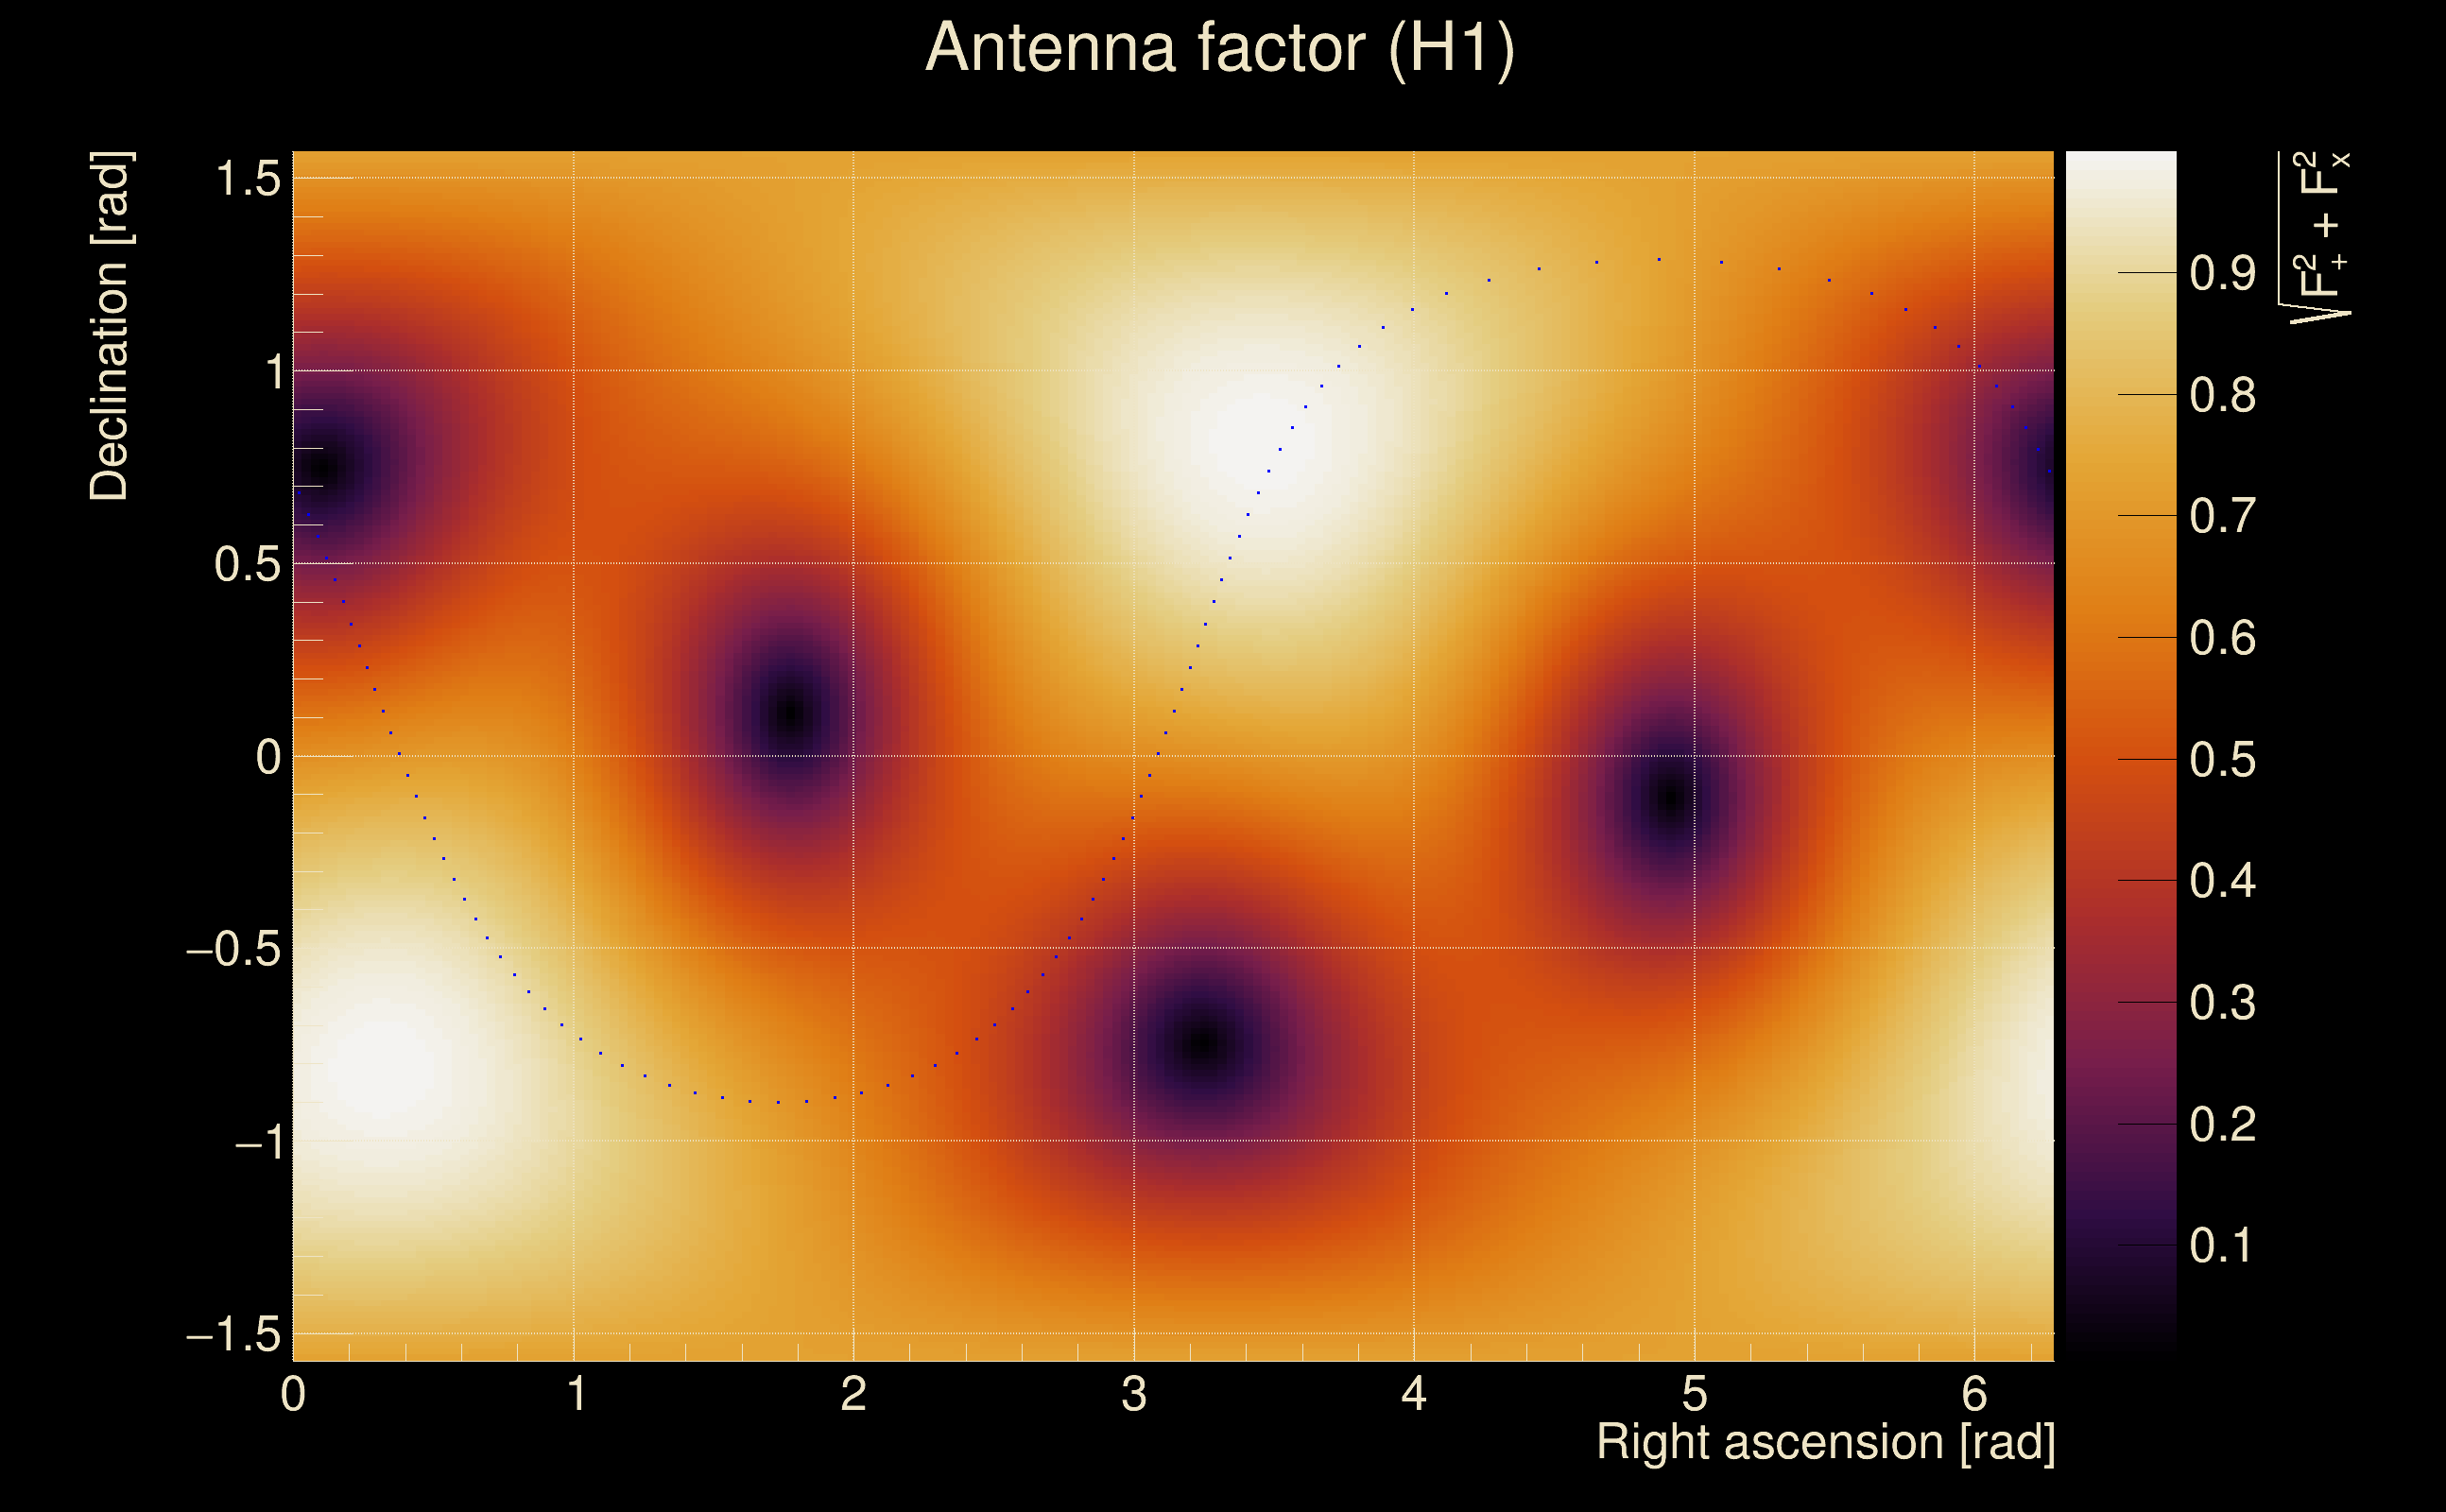
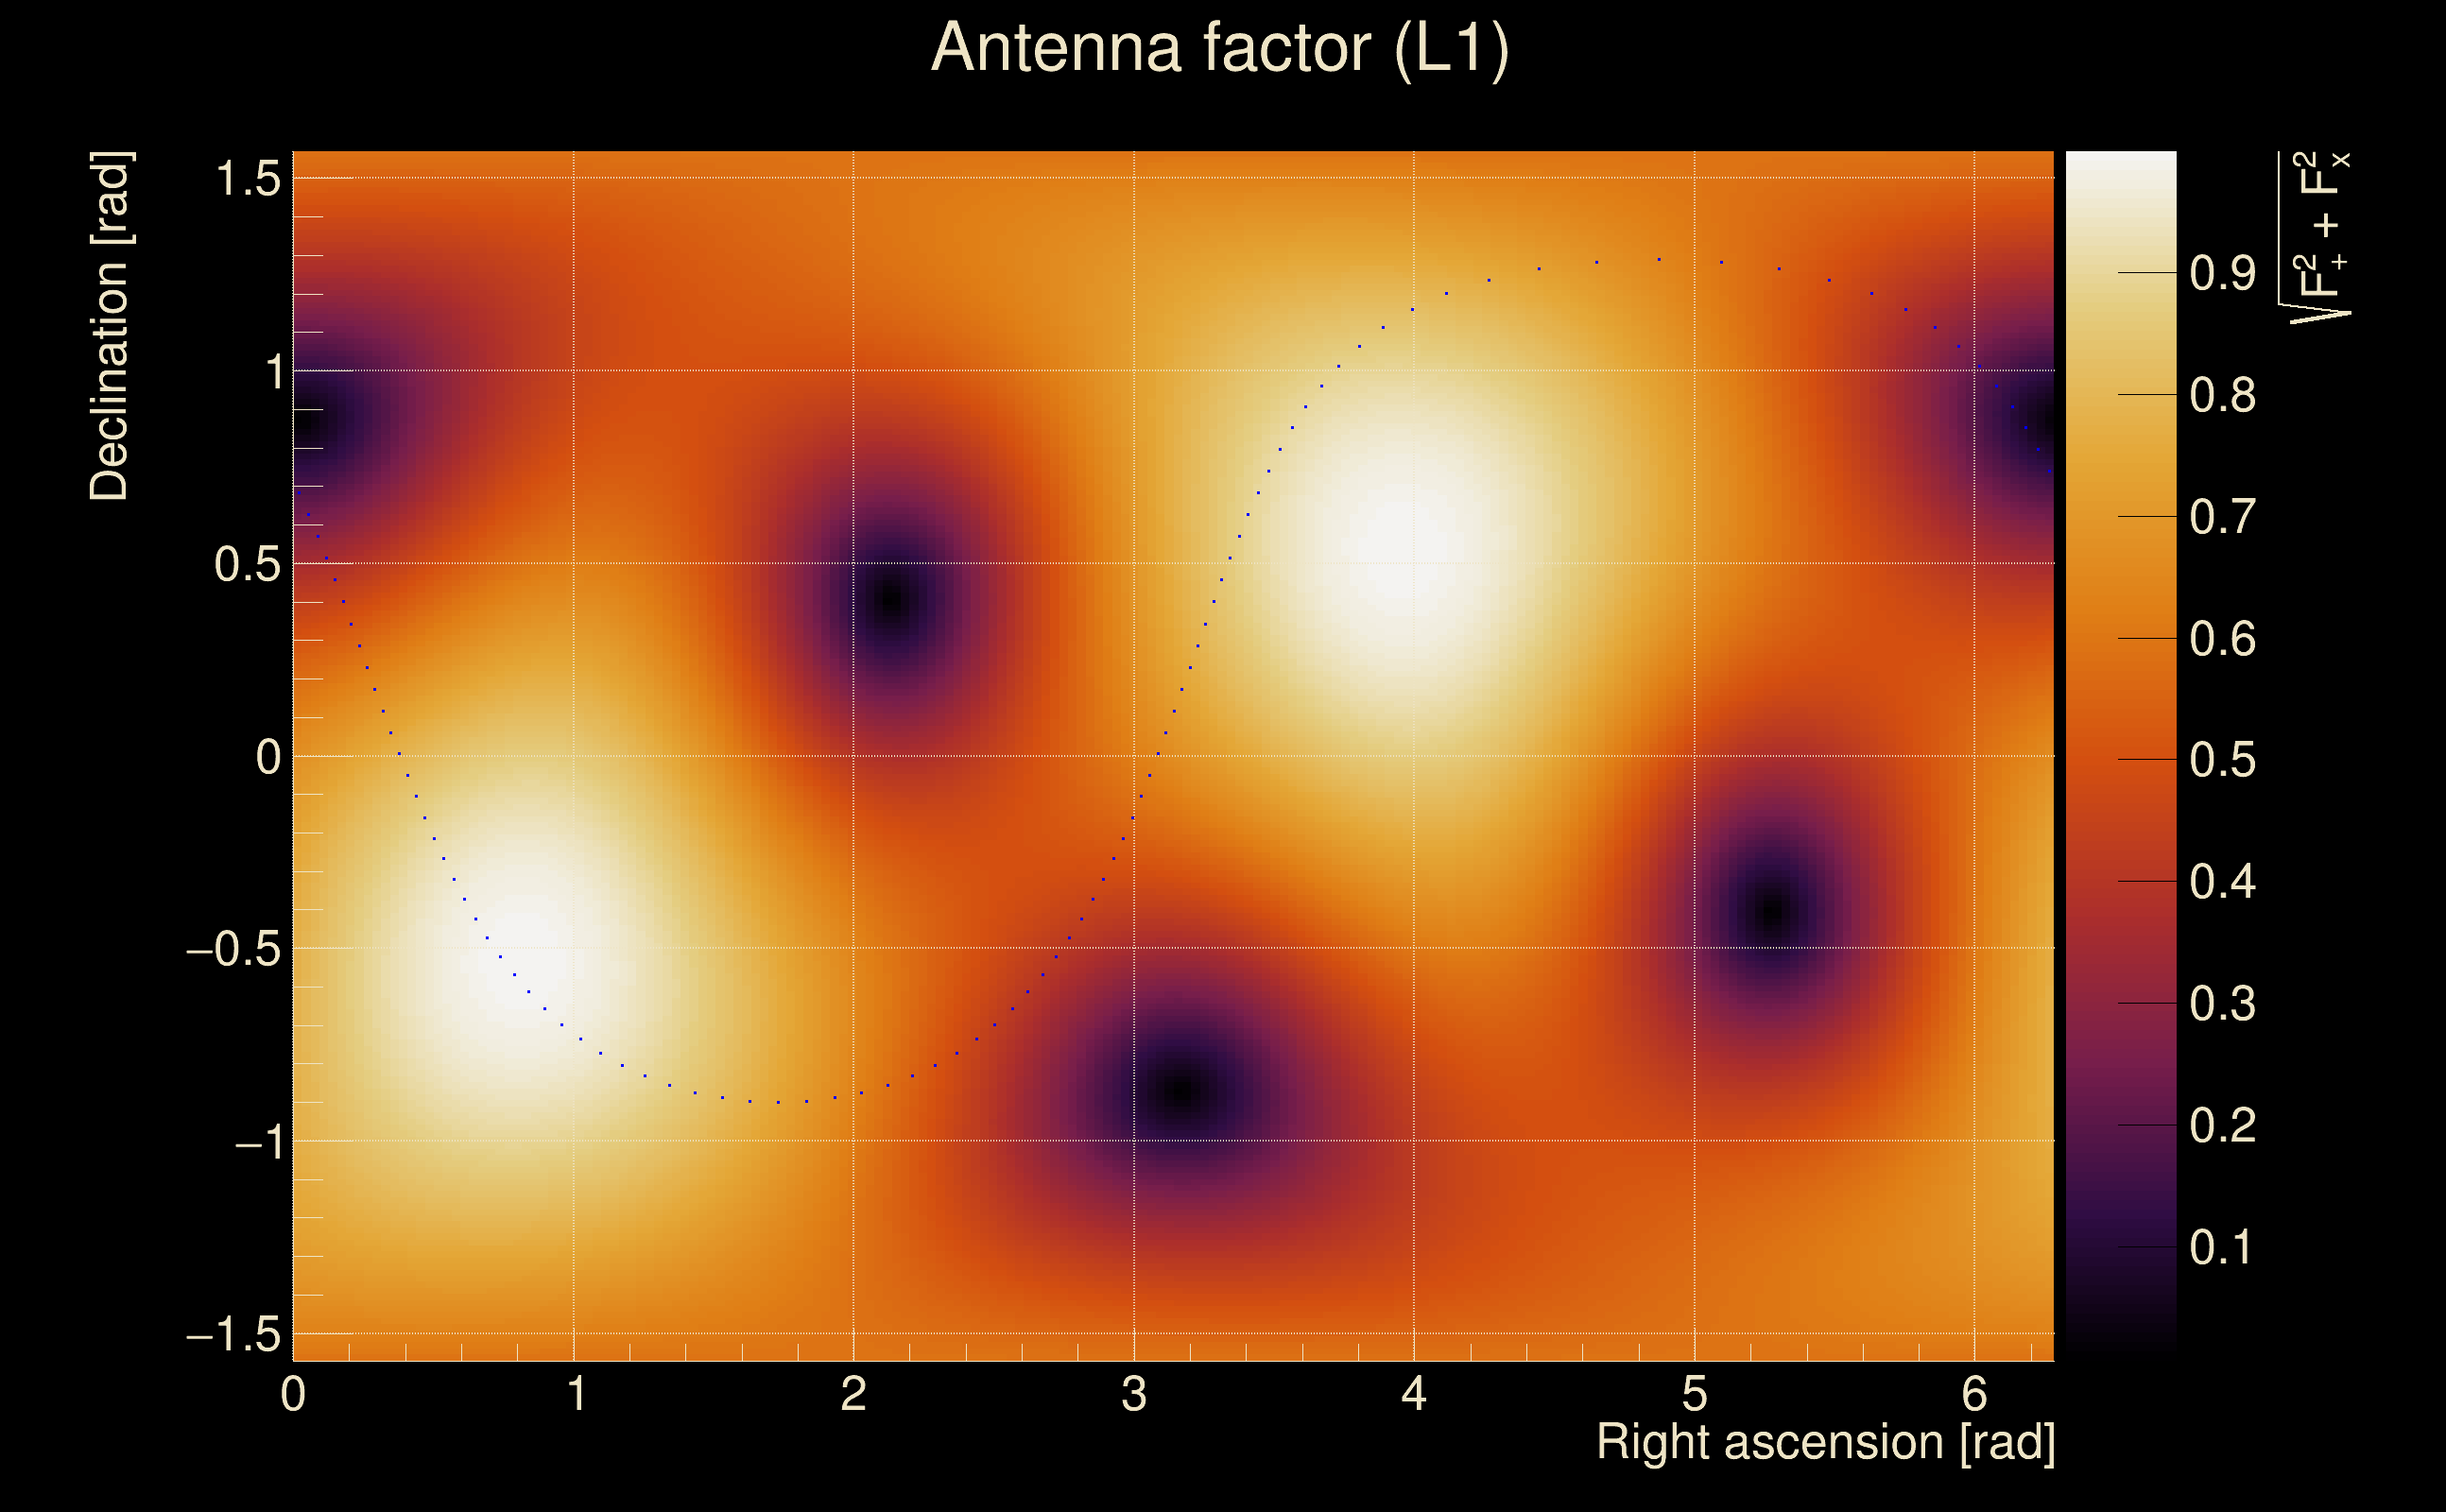
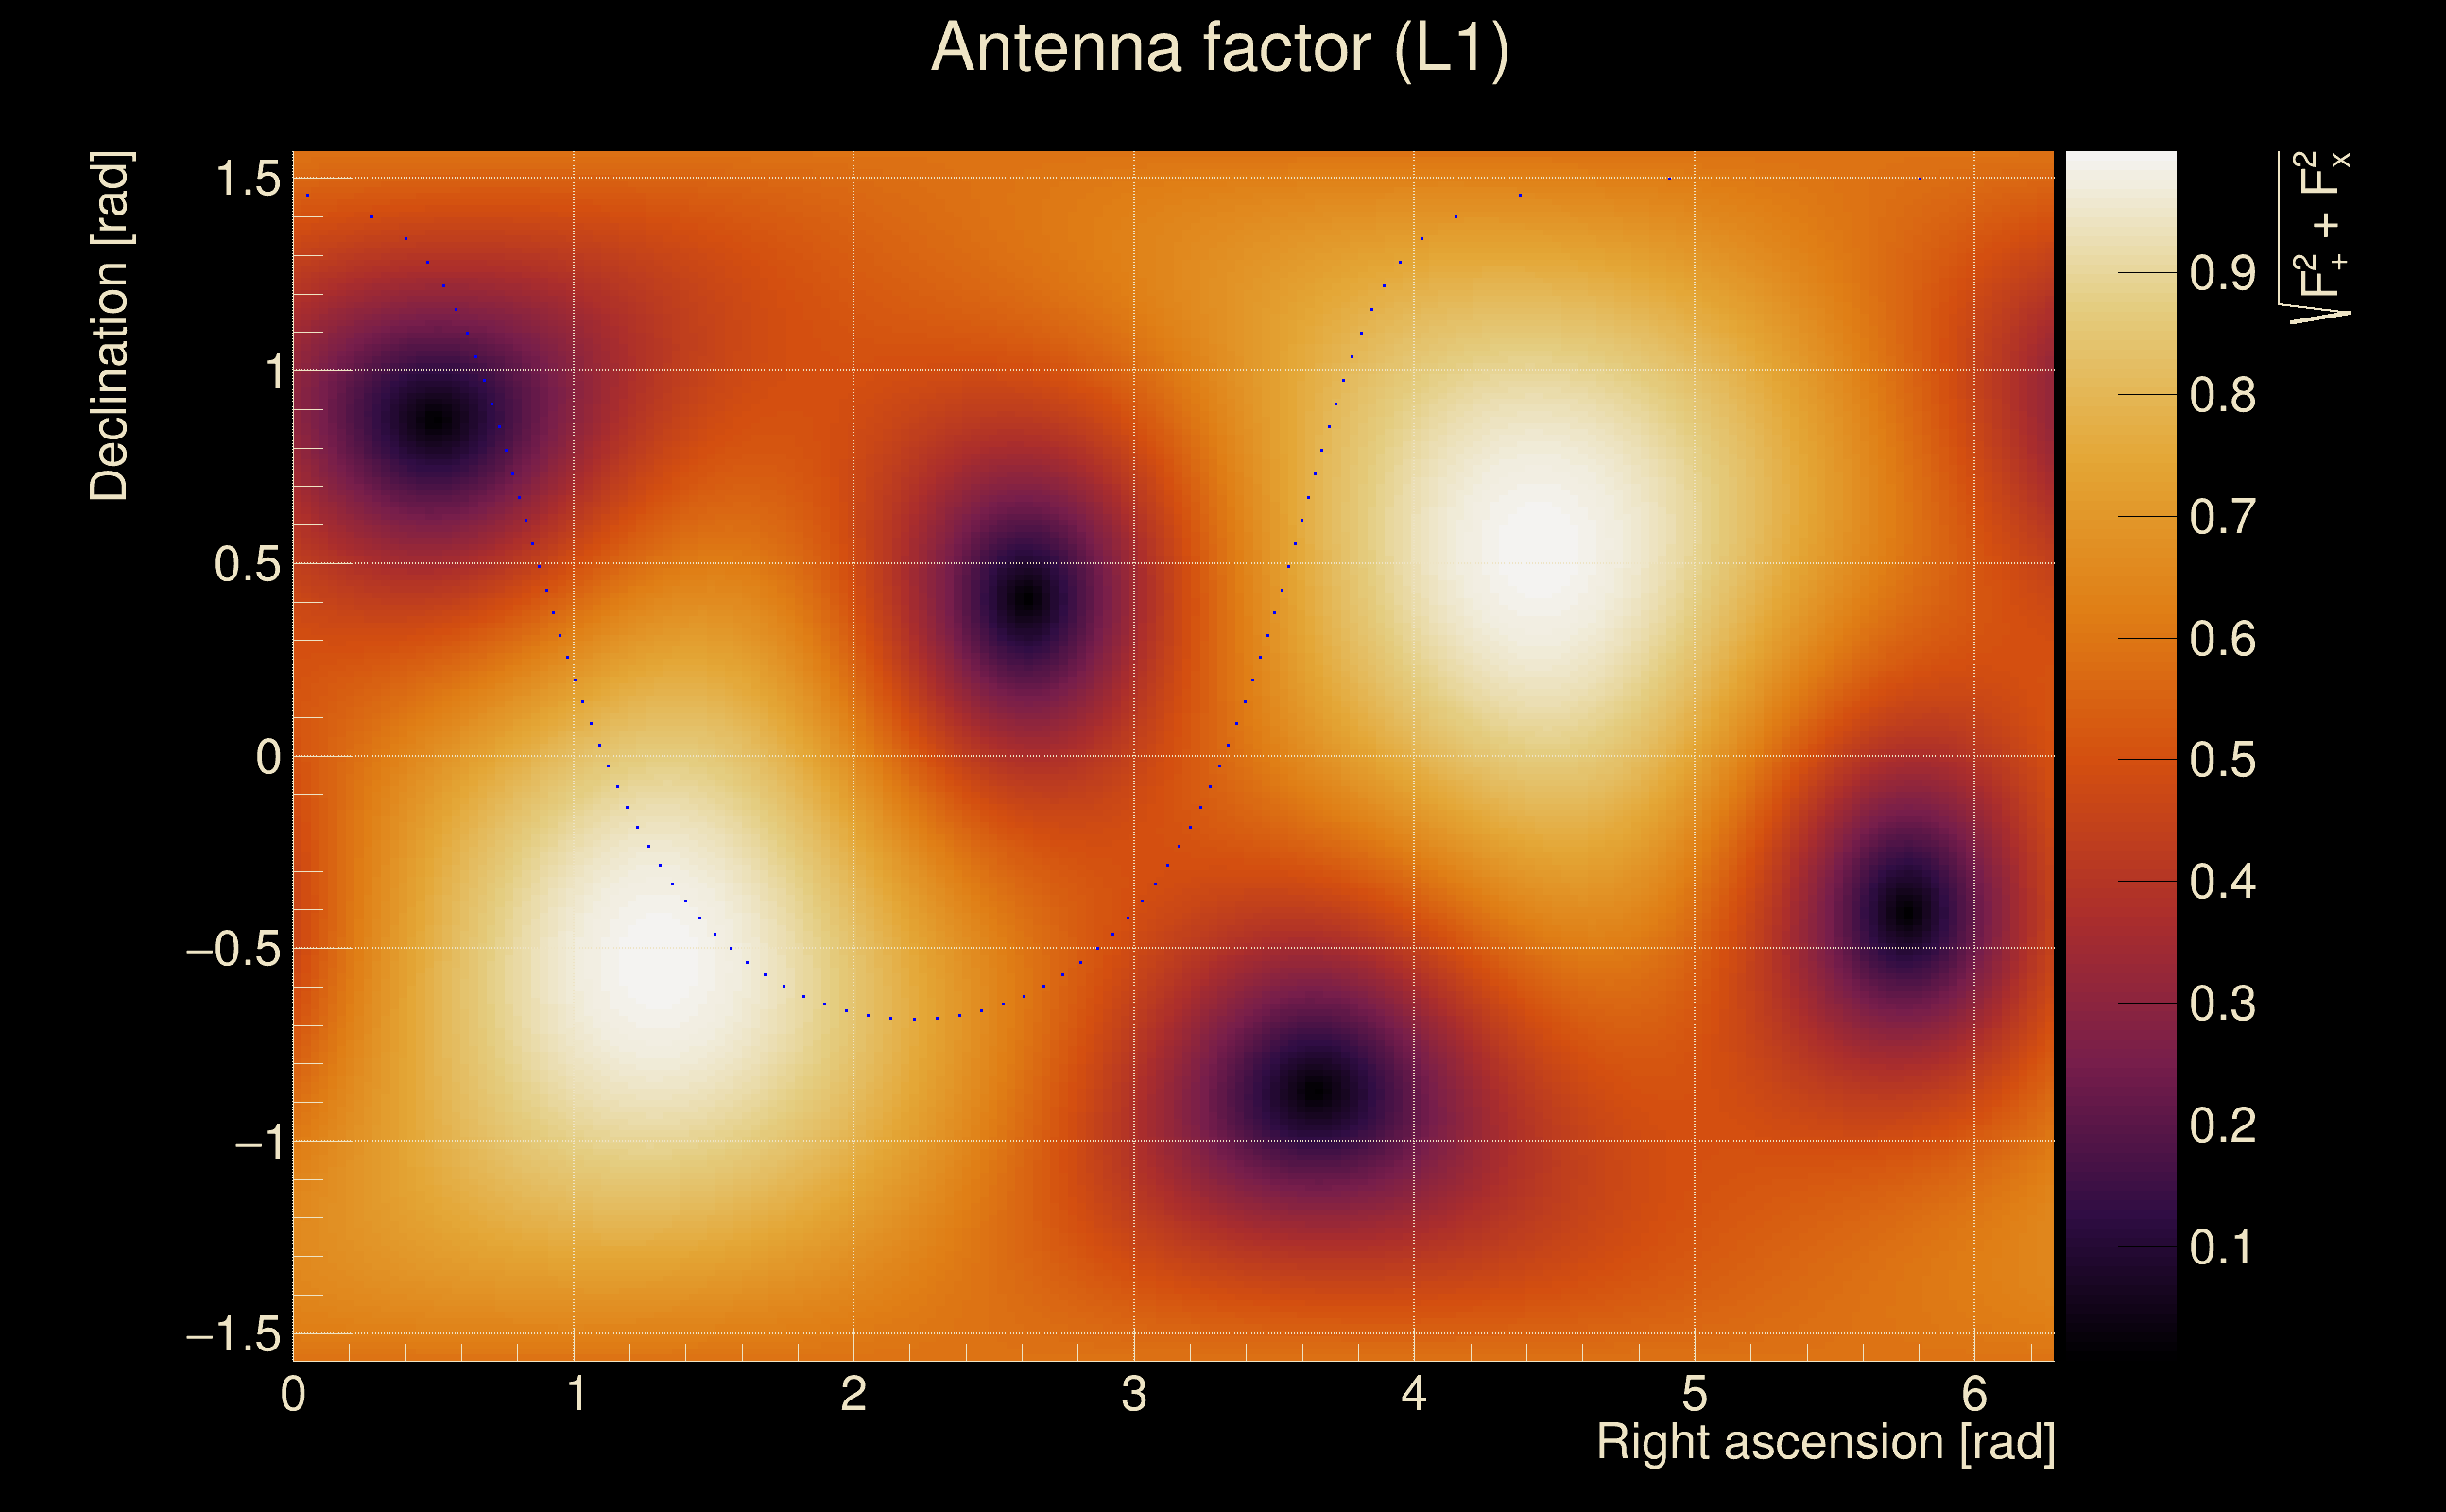
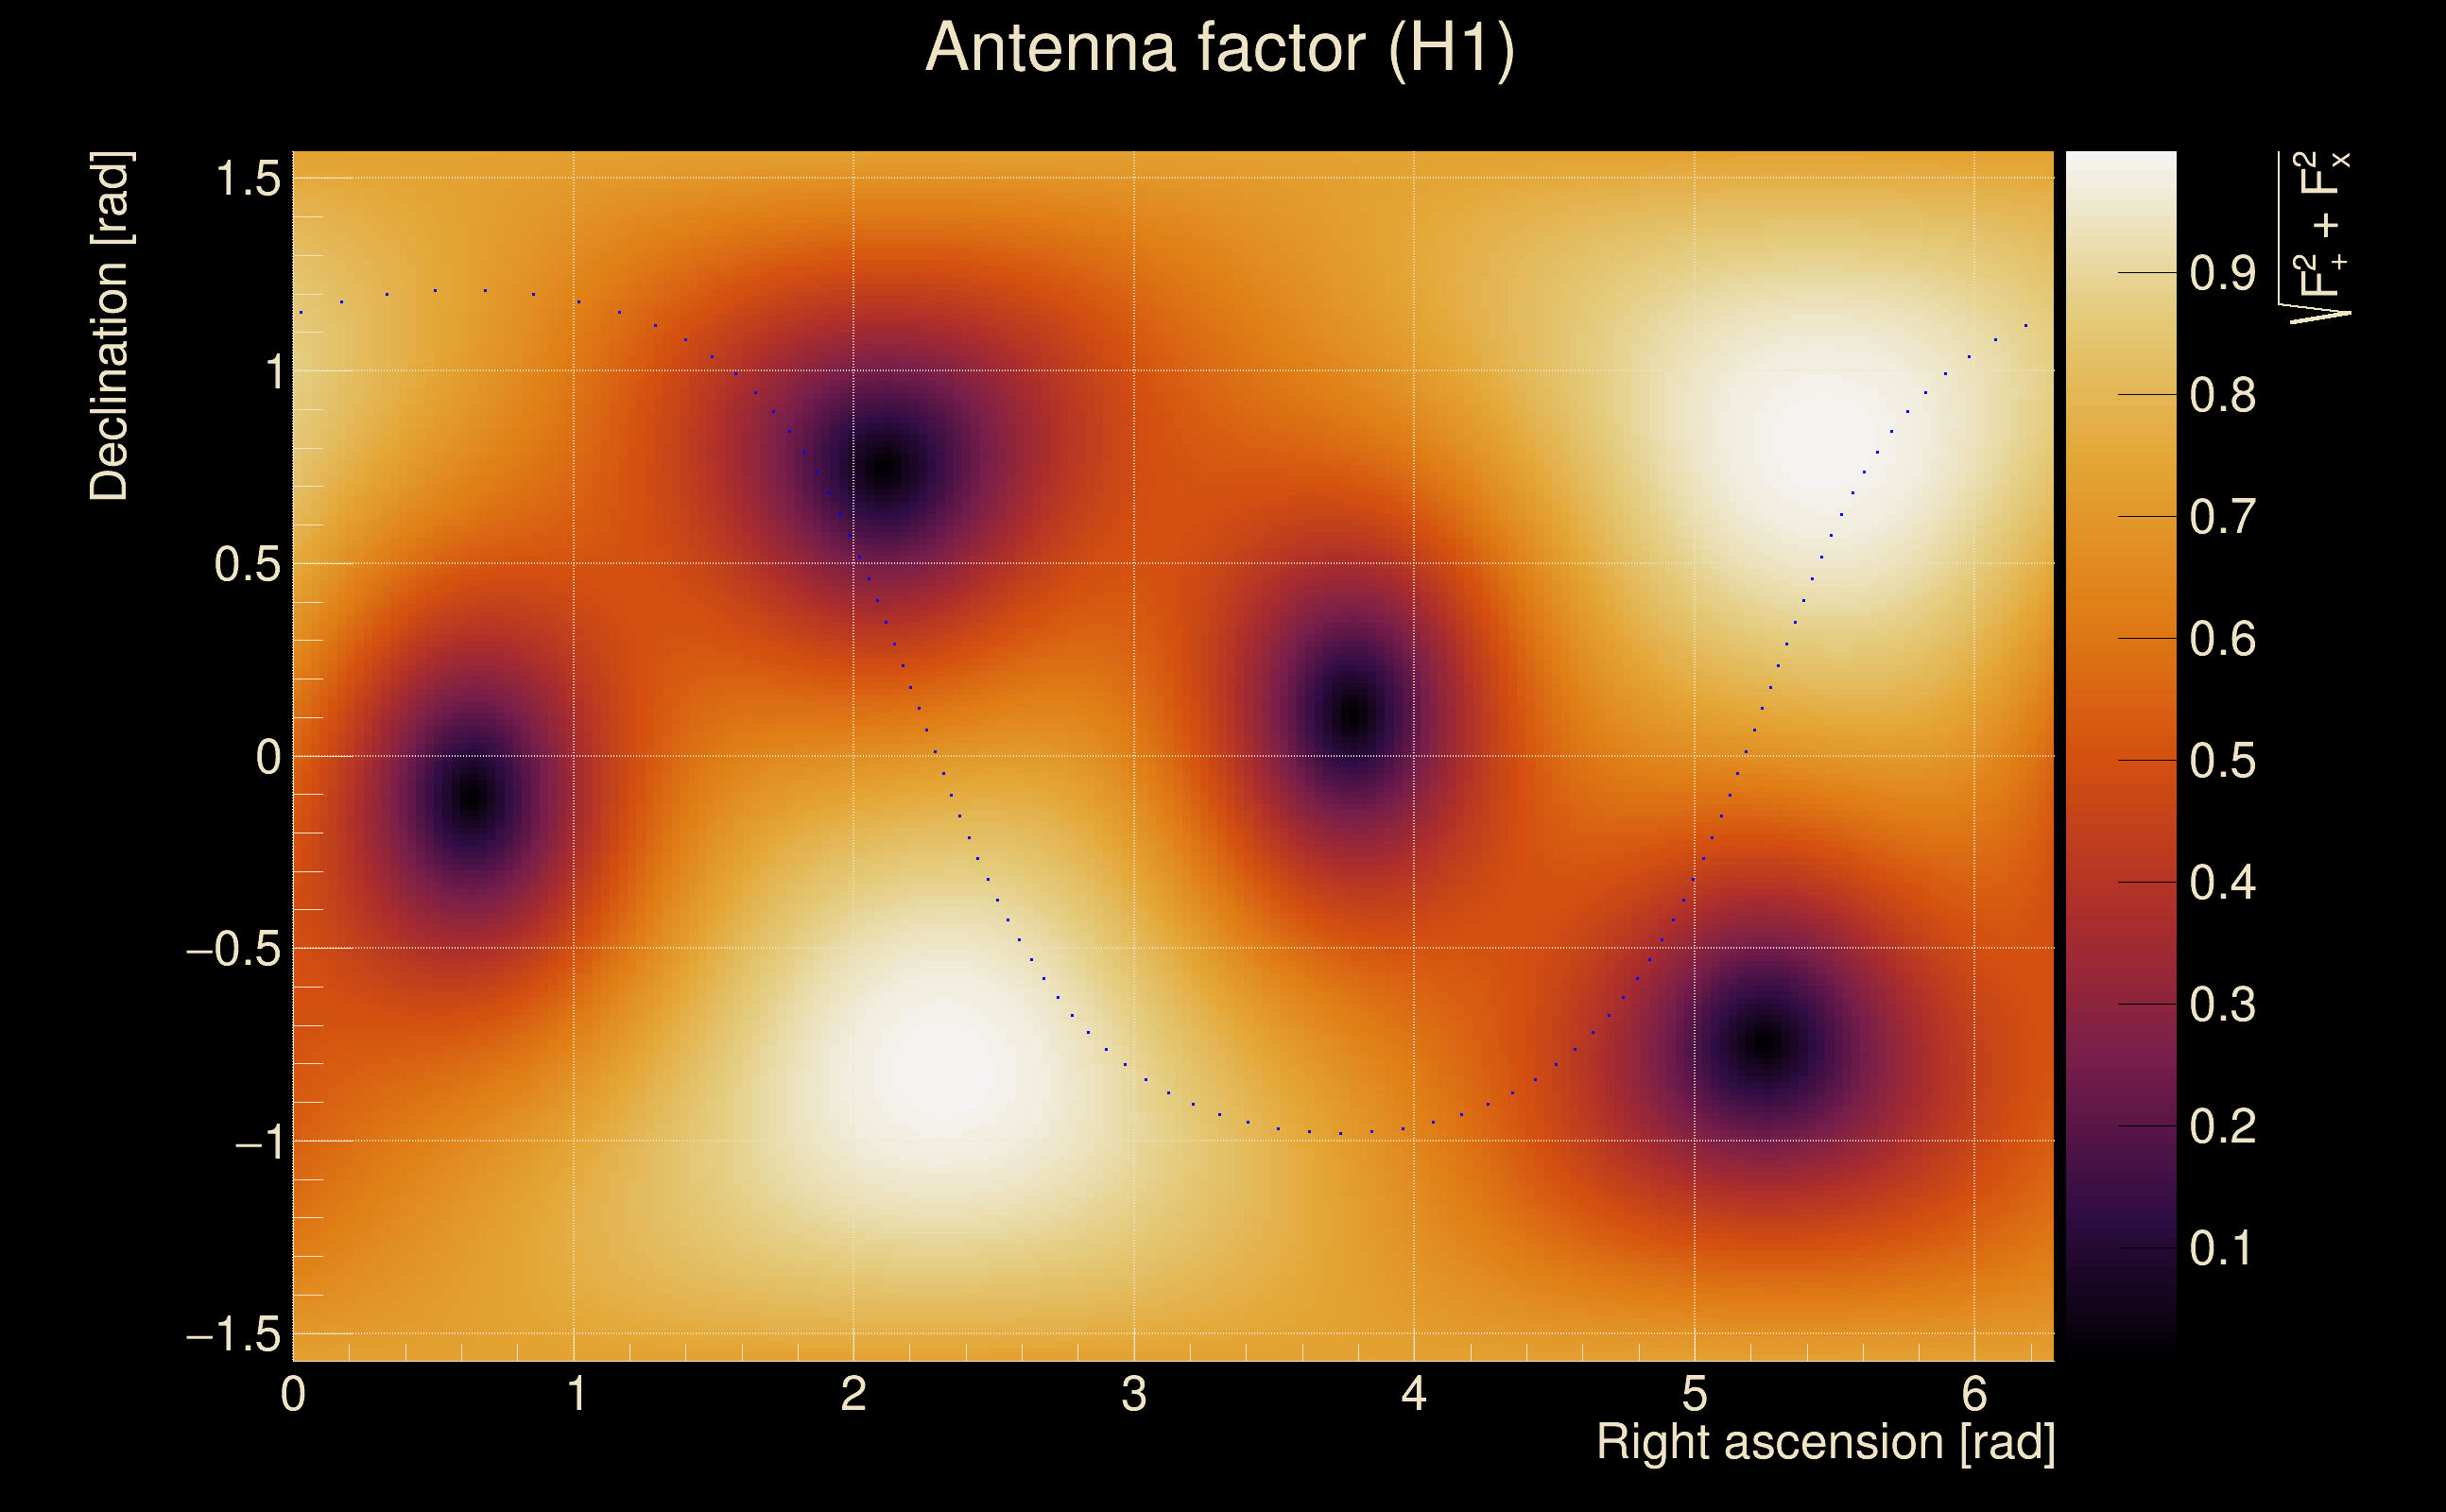
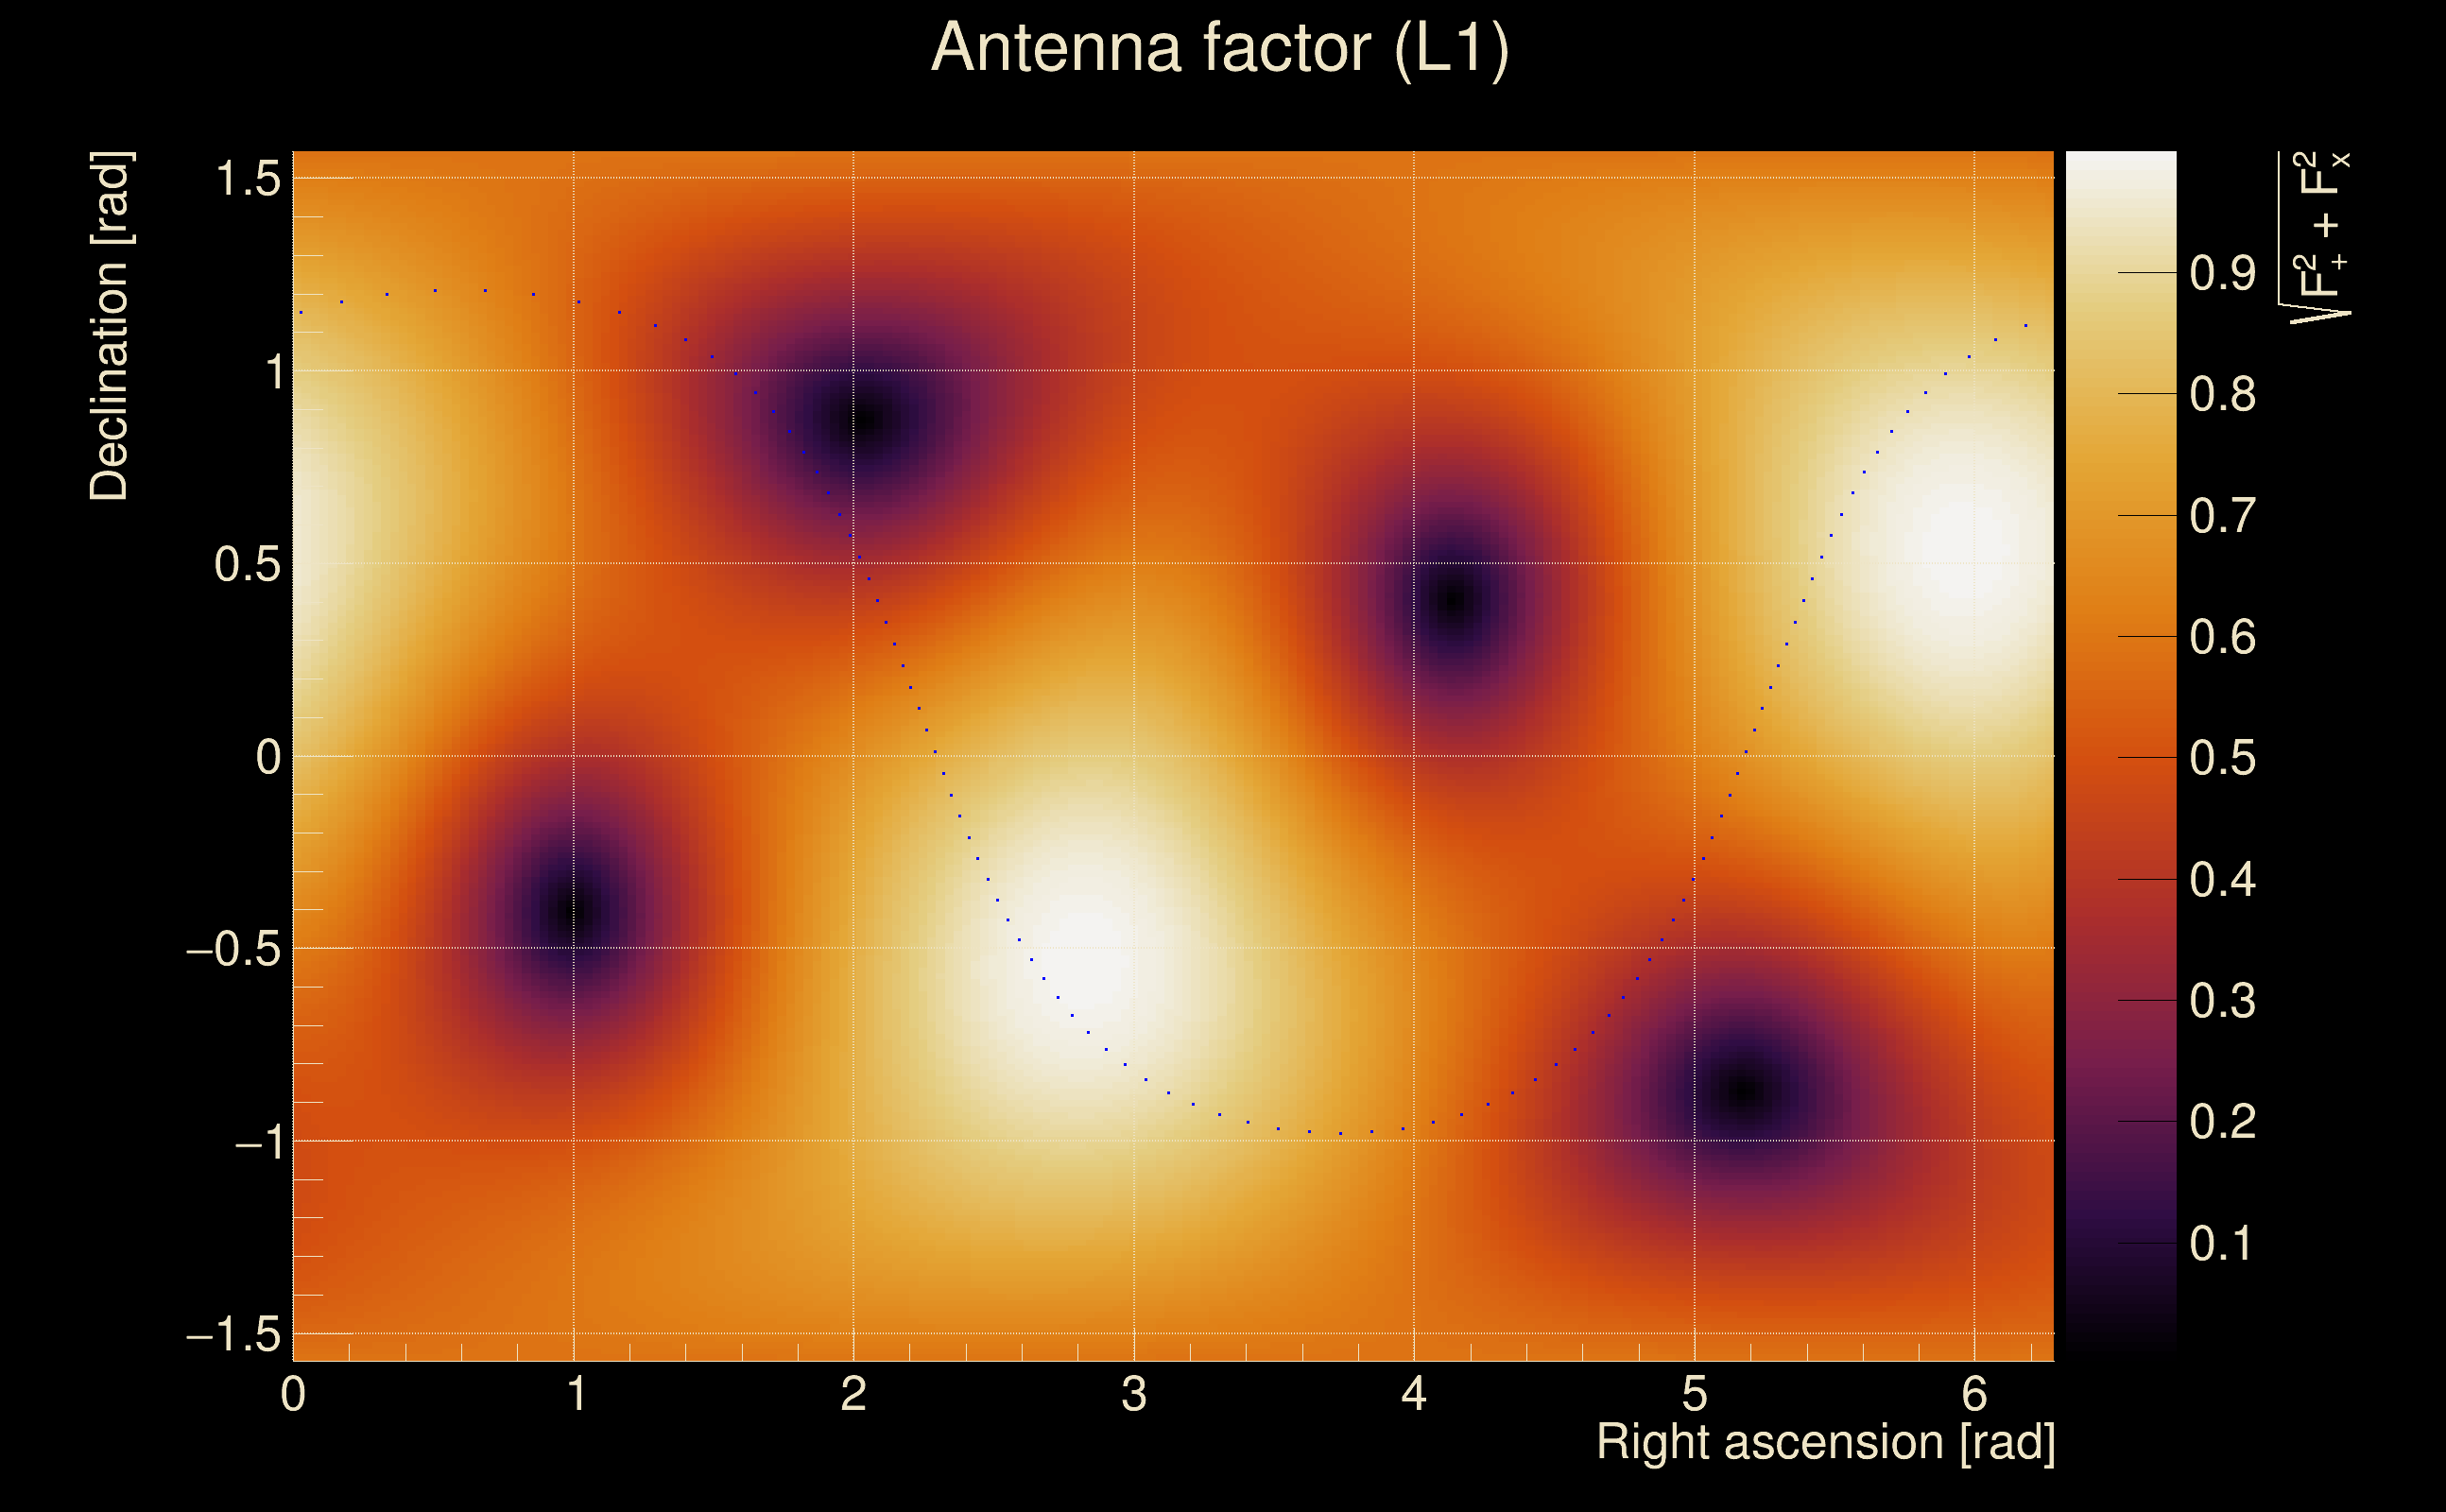
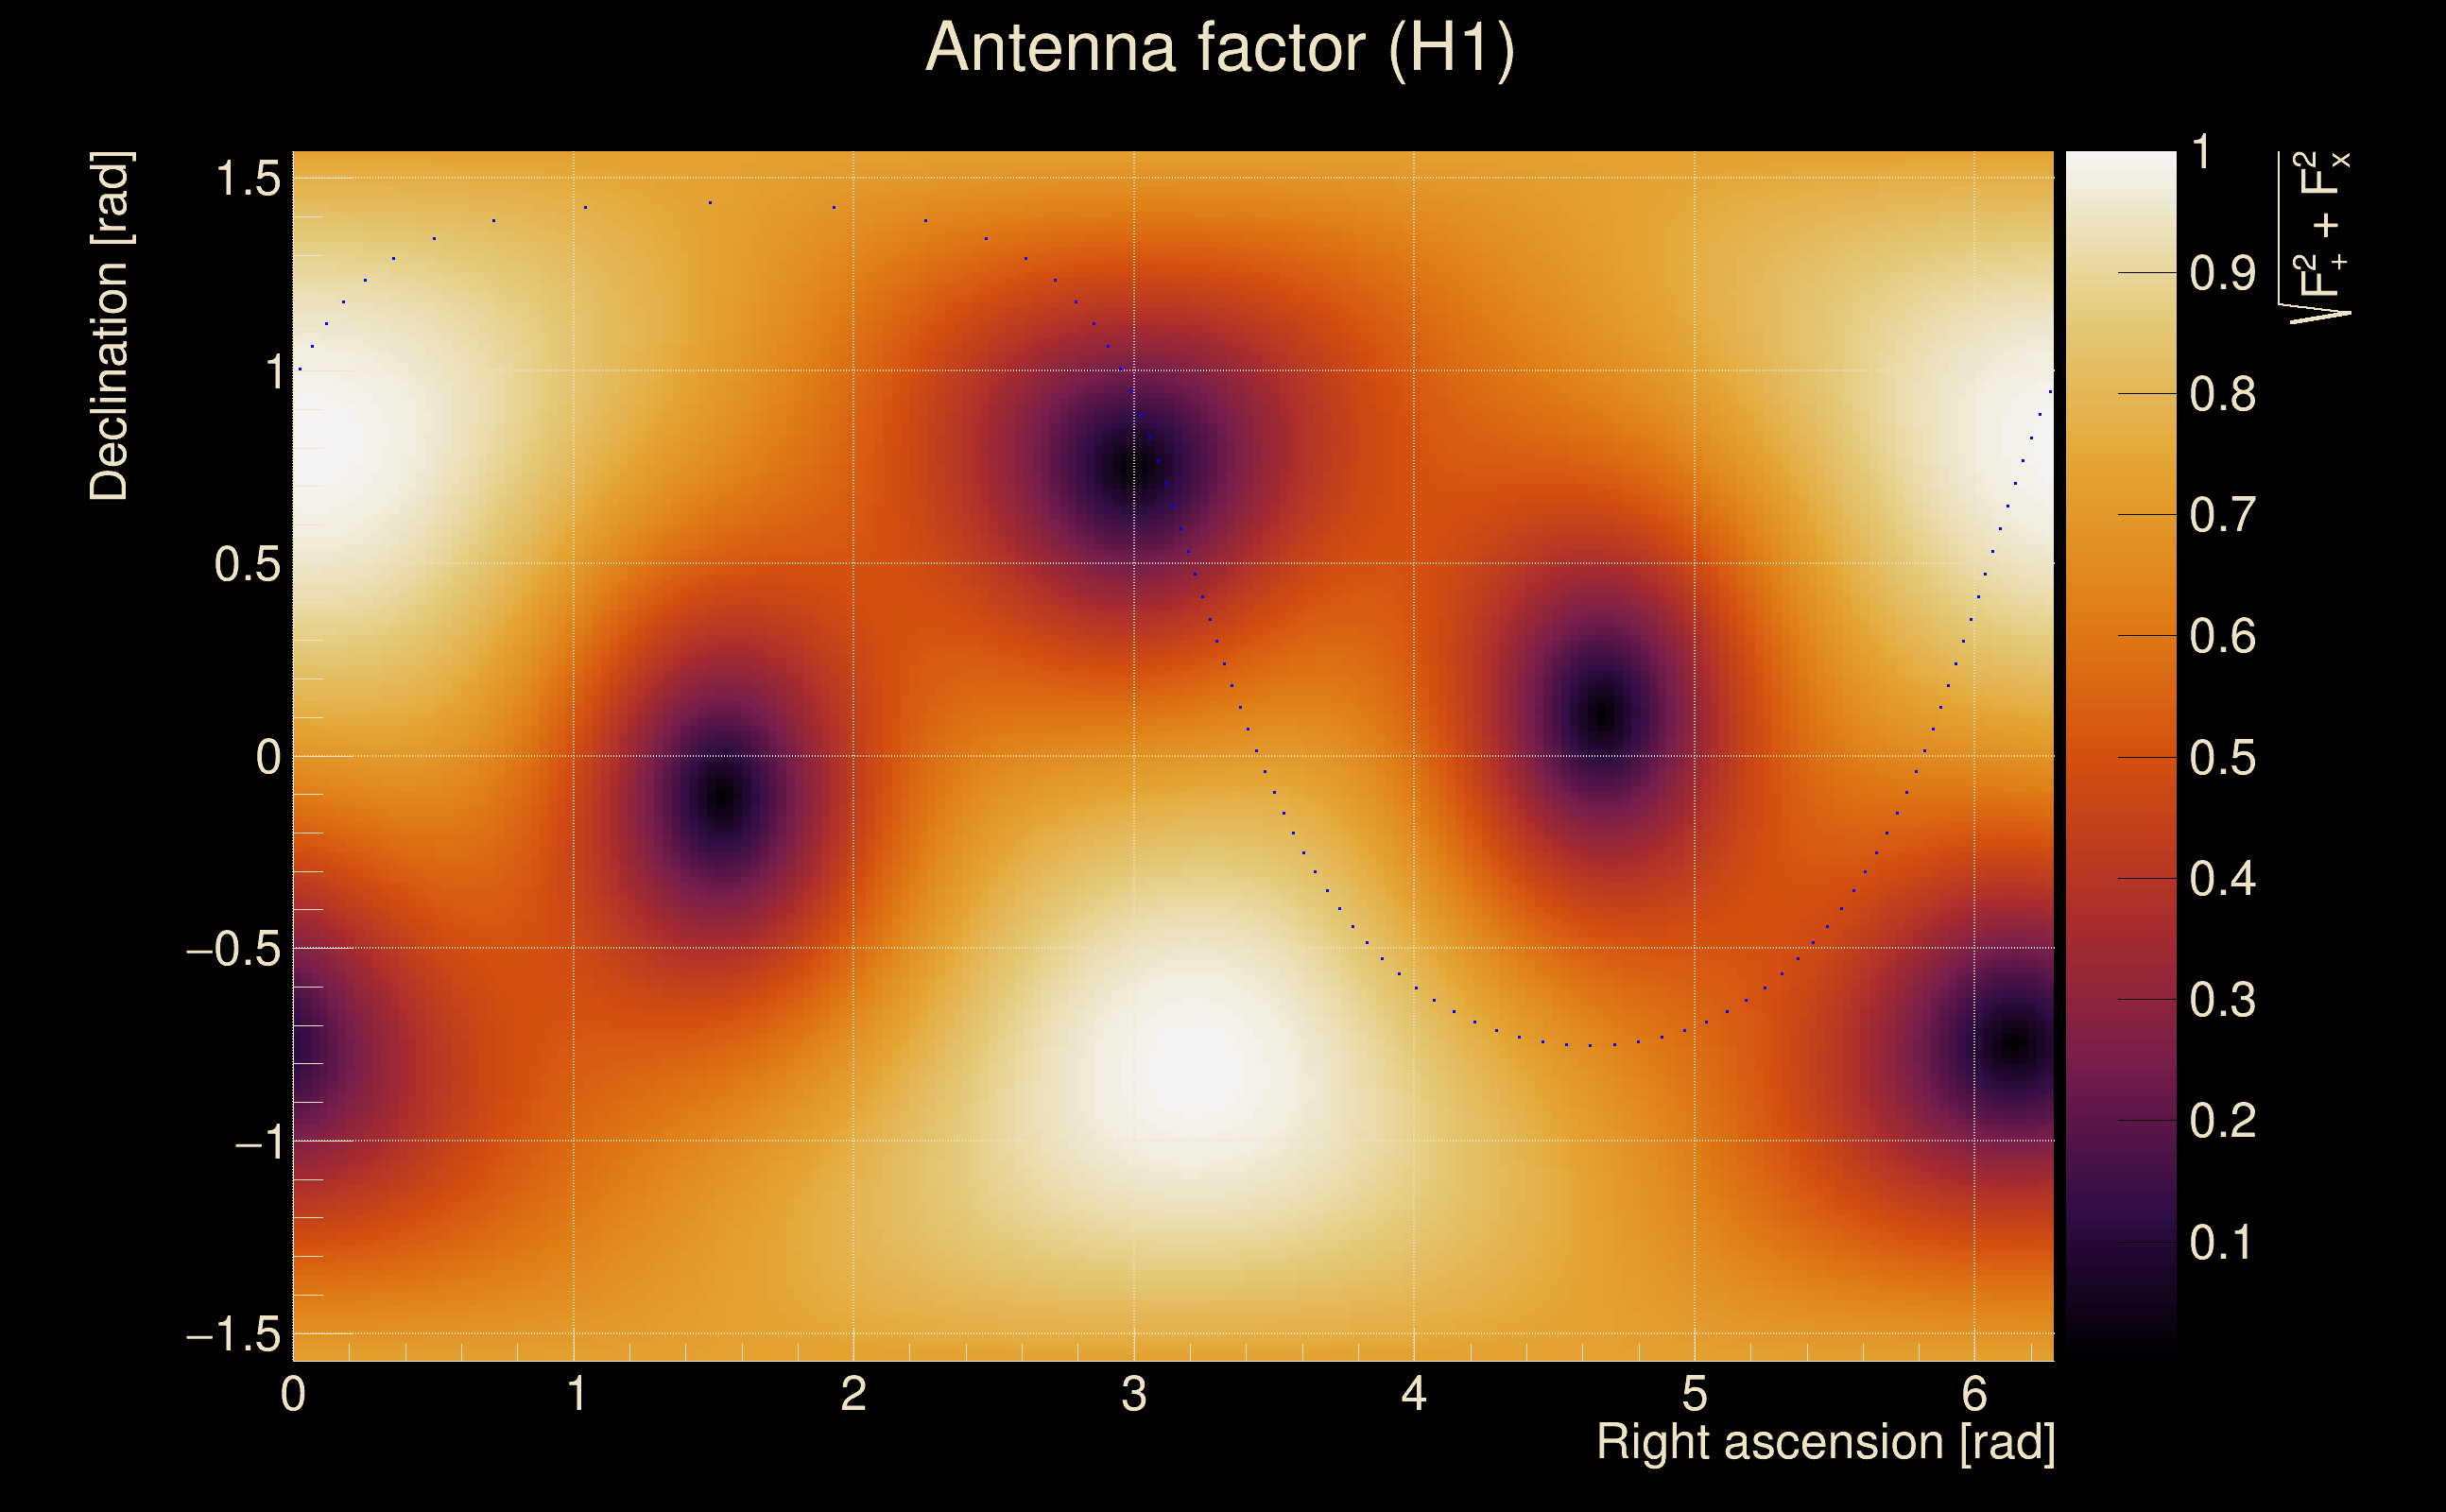
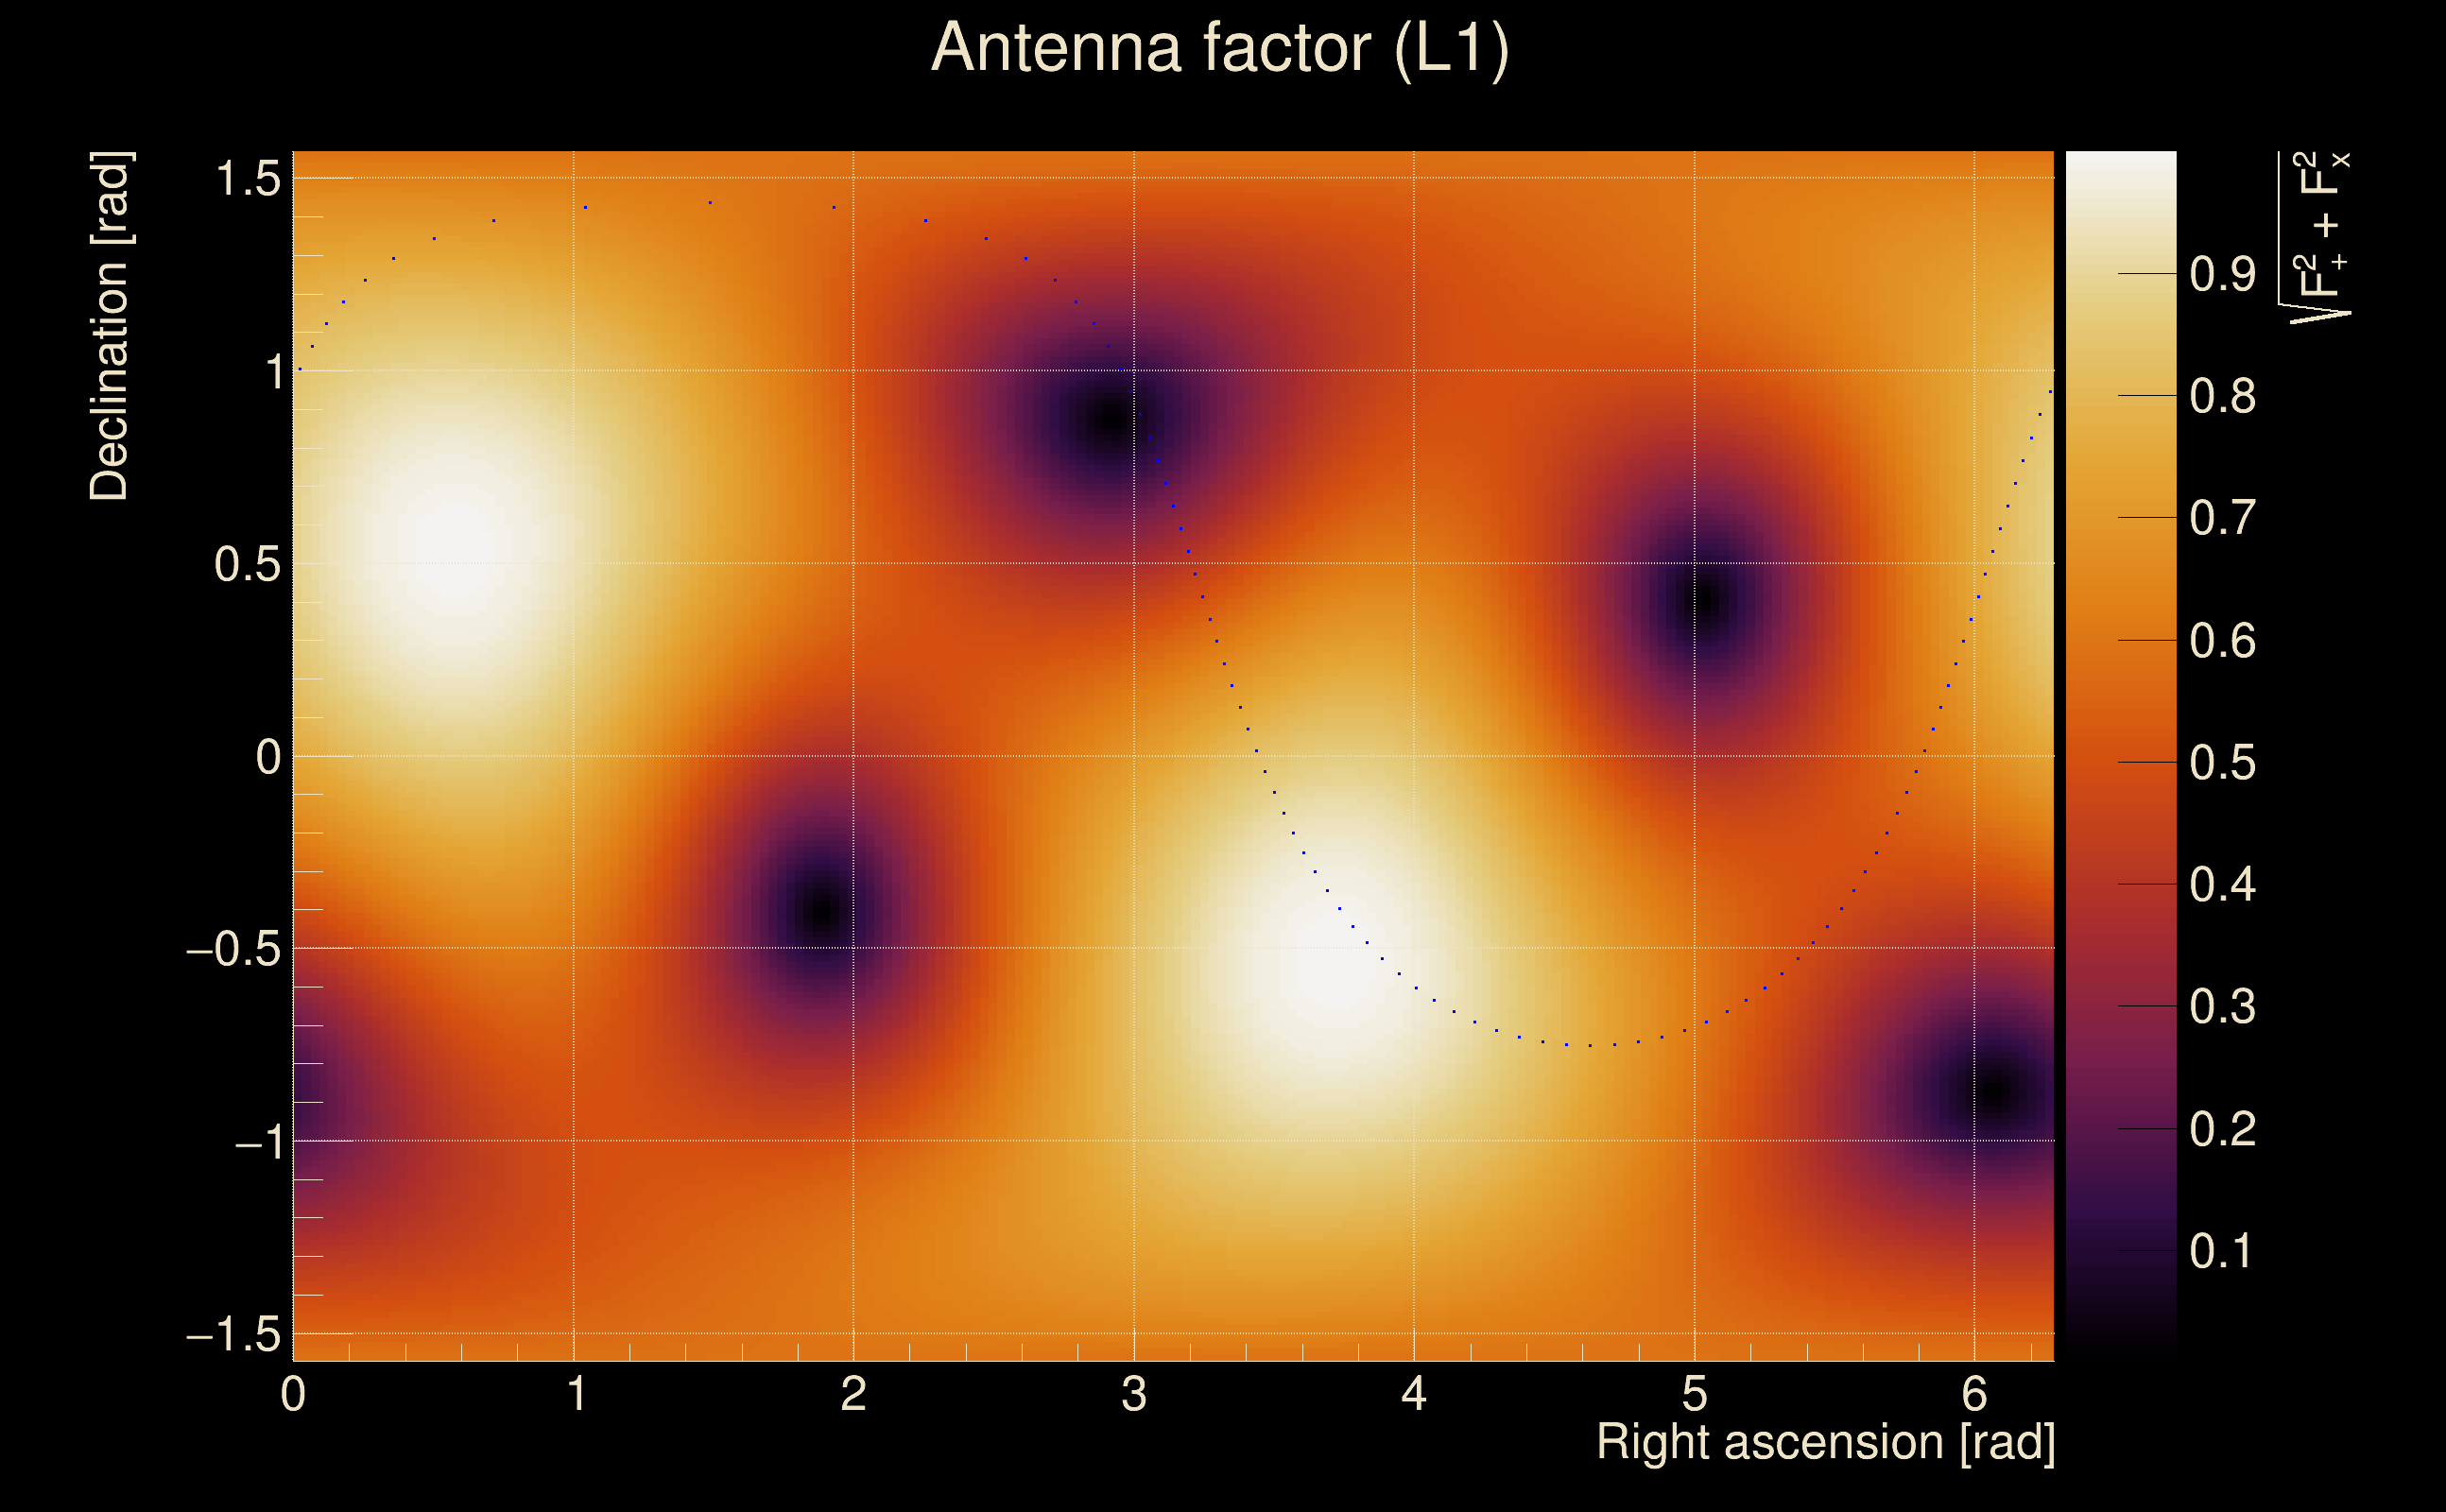
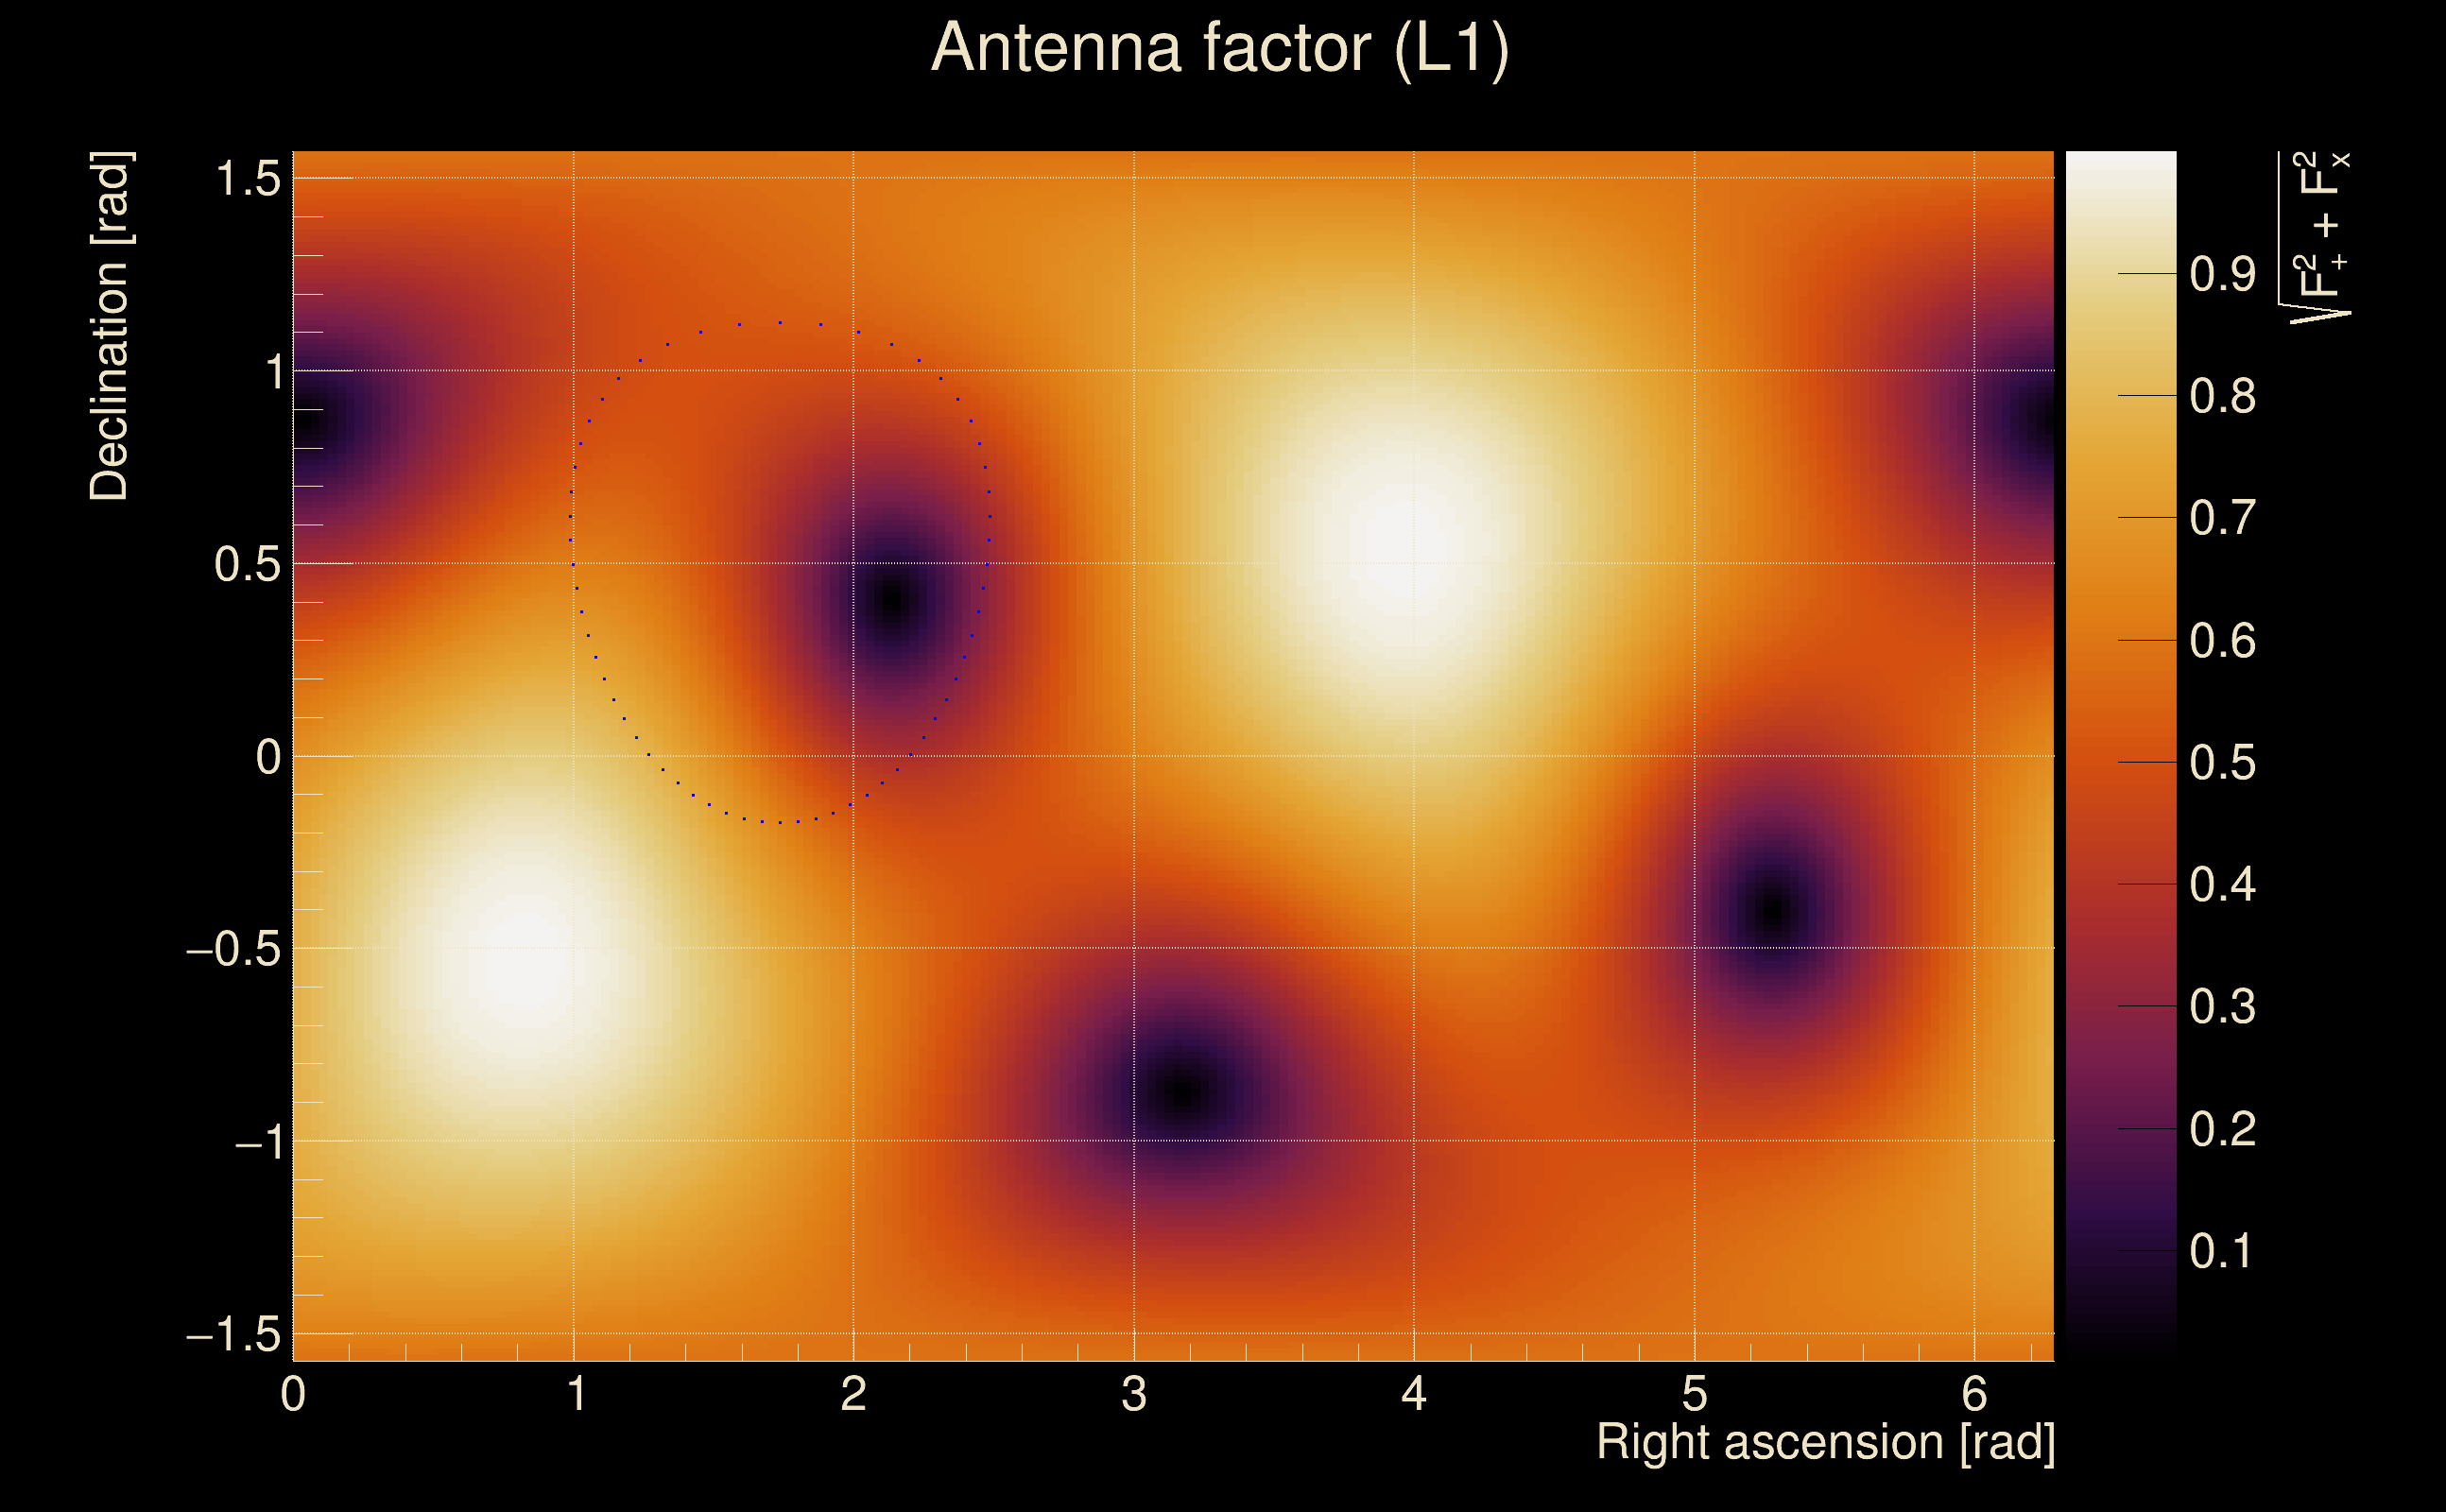
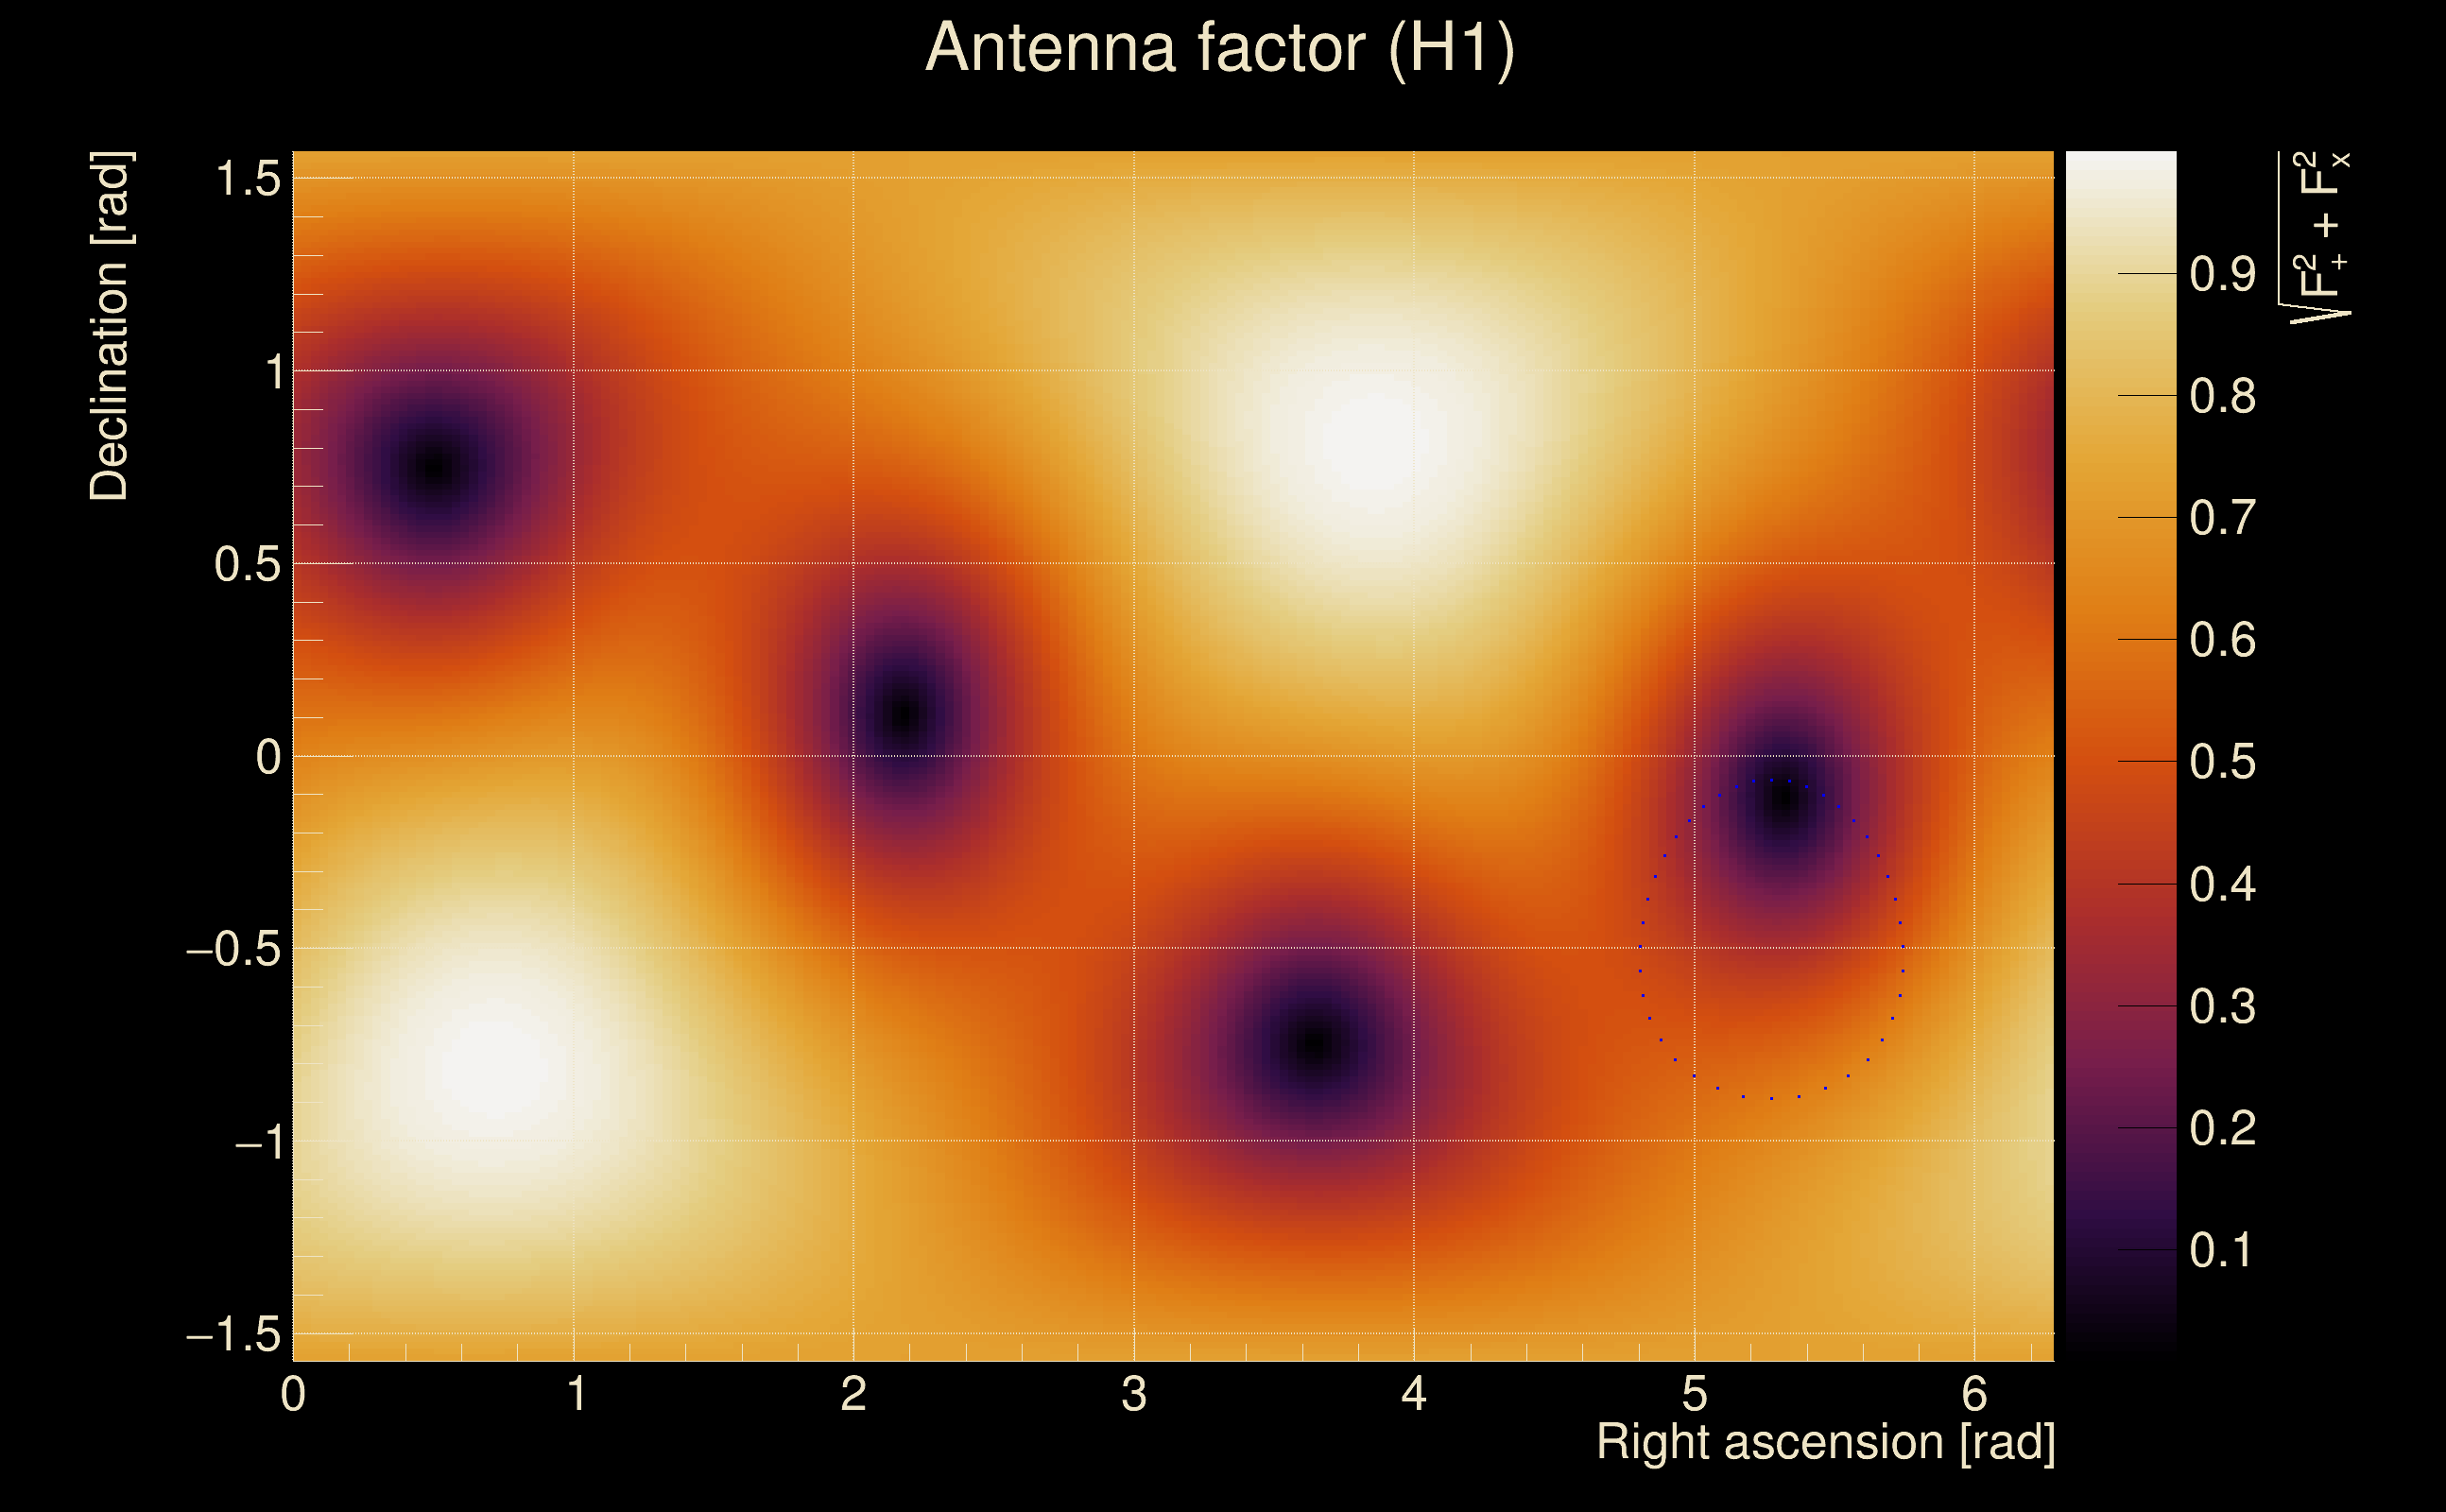
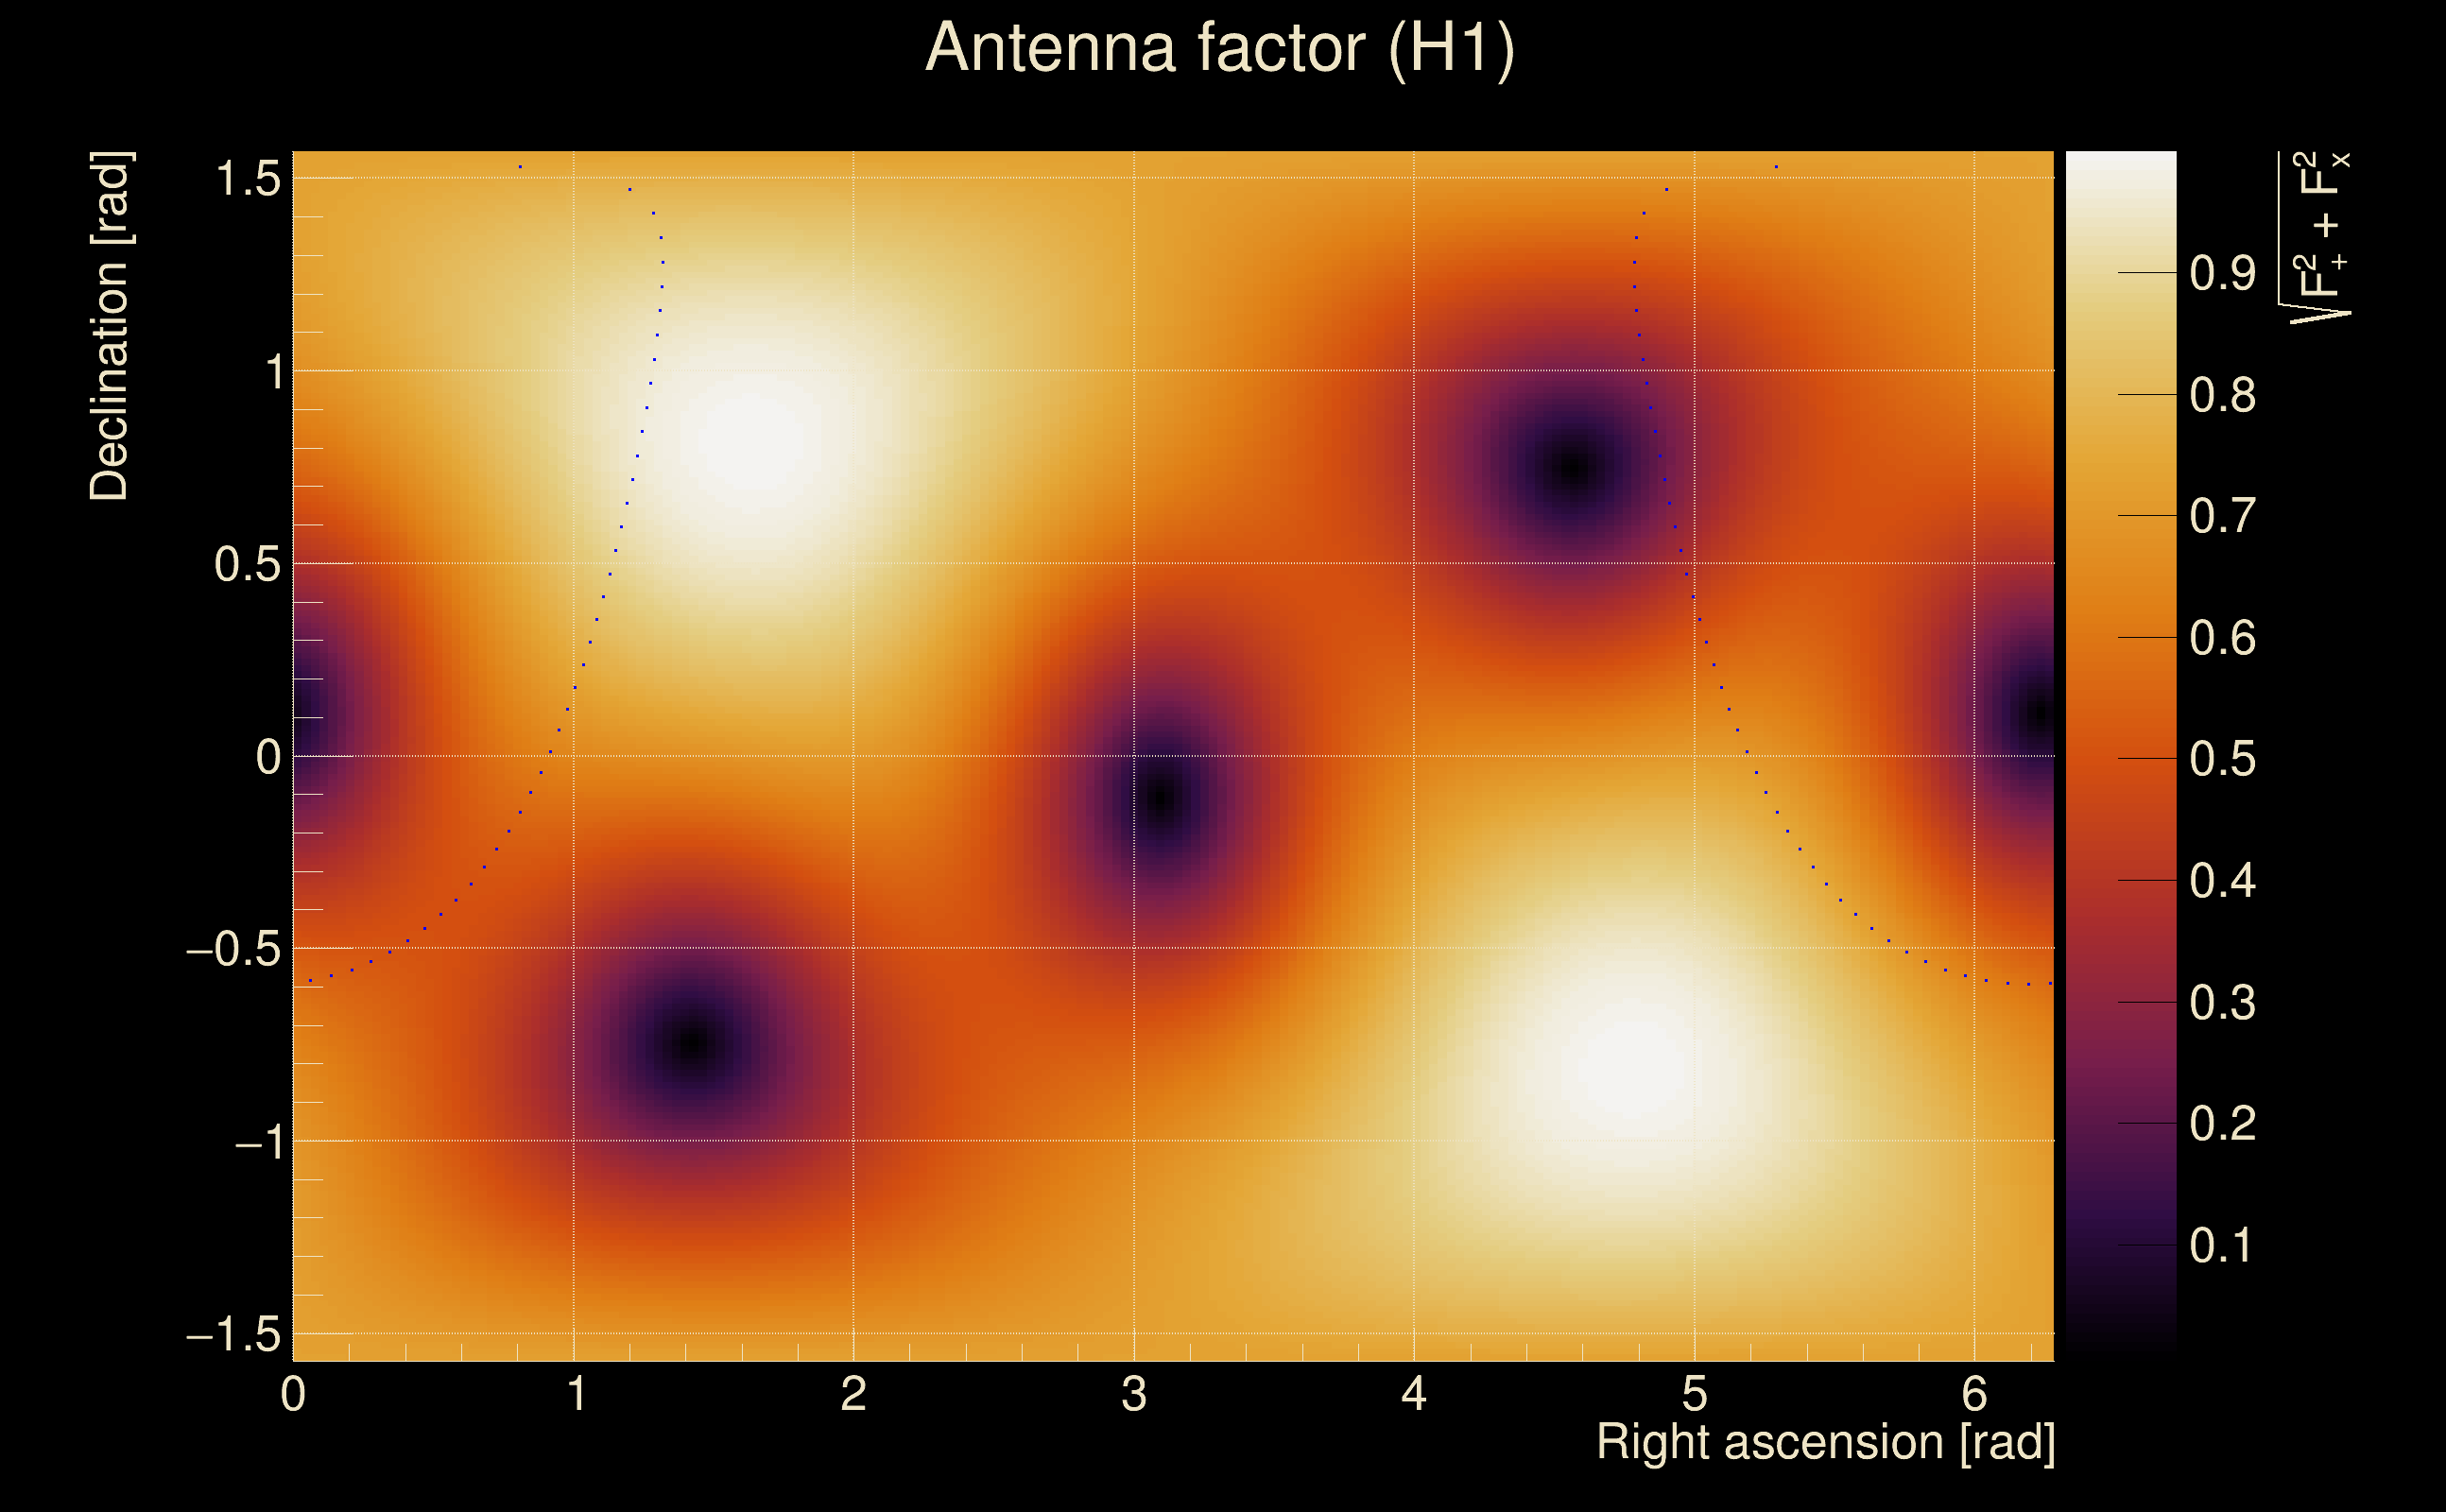
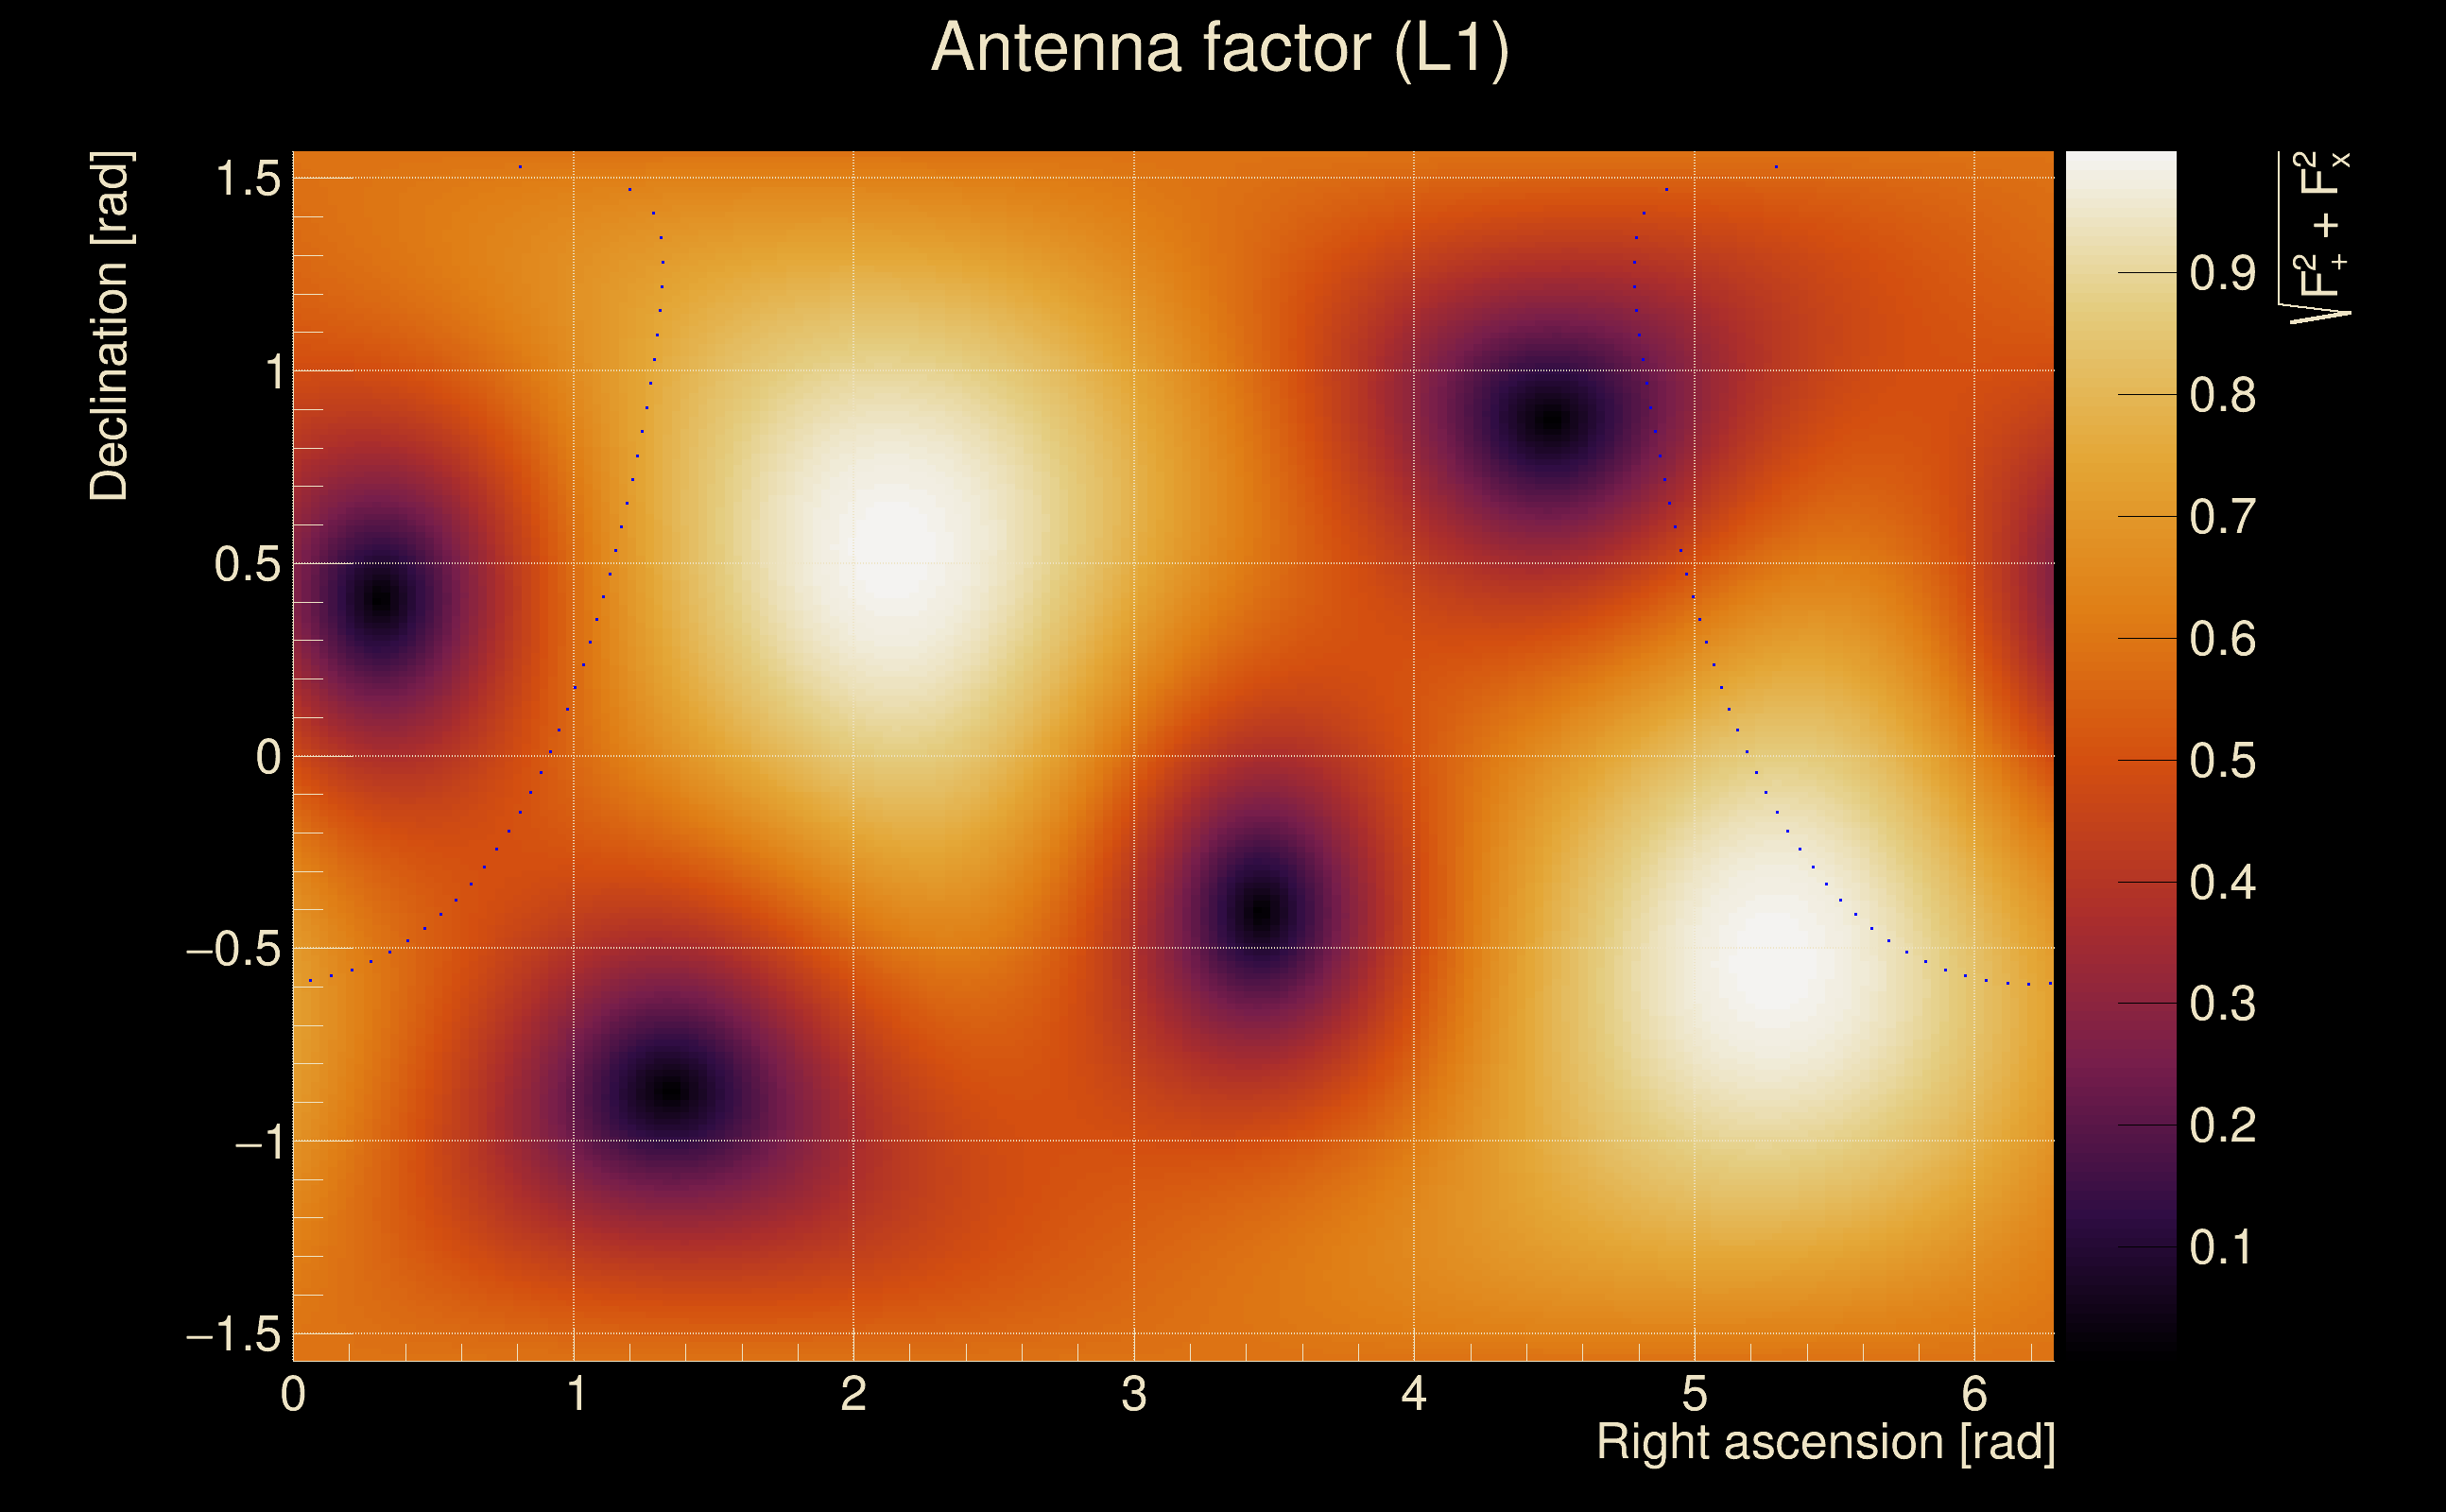
| Target sky positon: | Ra: 10, Dec: 10 [rad] |
| List of input Ox files: | Targ_FirstTest_O4bw_14days_file_list.txt (930 files) |
| Analysis result file: | Targ_FirstTest_O4bw_14days_results-0.root |
| Slice selected for the the fakeground: | slice index=130 (-1.012 s), time lag = 0 s |
| Foreground | Fakeground | Background | ||
|---|---|---|---|---|
| Number of processed ox events | 175167 | 175167 | 37660905 | |
| Start Date (detector 0) | Sat Sep 2 04:54:54 2023 UTC | Sat Sep 2 04:54:54 2023 UTC | Sat Sep 2 04:54:54 2023 UTC | |
| End Date (detector 0) | Sun Sep 17 00:01:47 2023 UTC | Sun Sep 17 00:01:47 2023 UTC | Sun Sep 17 00:01:47 2023 UTC | |
| Start GPS (detector 0) | 1377665712 | 1377665712 | 1377665712 | |
| End GPS (detector 0) | 1378944125 | 1378944125 | 1378944125 | |
| Used livetime (detector 0) | 880485 s | 880485 s | 880485 s | |
| Start Date (detector 1) | Sat Sep 2 04:54:54 2023 UTC | Sat Sep 2 04:54:54 2023 UTC | Sat Sep 2 04:54:54 2023 UTC | |
| End Date (detector 1) | Sun Sep 17 00:01:47 2023 UTC | Sun Sep 17 00:01:47 2023 UTC | Sun Sep 17 00:01:47 2023 UTC | |
| Start GPS (detector 1) | 1377665712 | 1377665712 | 1377665712 | |
| End GPS (detector 1) | 1378944125 | 1378944125 | 1378944125 | |
| Used livetime (detector 1) | 880485 s | 880485 s | 880485 s | |
| Cumulative livetime | 1751670 s | 1751670 s | 376609050 s | |
| 0 years, 20 days, 6 hours, 34 min, 30 s | 0 years, 20 days, 6 hours, 34 min, 30 s | 11 years, 341 days, 21 hours, 37 min, 30 s |
|
|
| Event time t(H1): | GPS = 1377731628 (Sat Sep 2 23:13:30 2023 ) → GPS = 1377731638 (Sat Sep 2 23:13:40 2023 ) |
| Event time t(L1): | GPS = 1377731628 (Sat Sep 2 23:13:40 2023 ) → GPS = 1377731638 (Sat Sep 2 23:13:40 2023 ) |
| Omicron analysis time window (H1): | GPS = 1377731625 → GPS = 1377731641 |
| Omicron analysis time window (L1): | GPS = 1377731625 → GPS = 1377731641 |
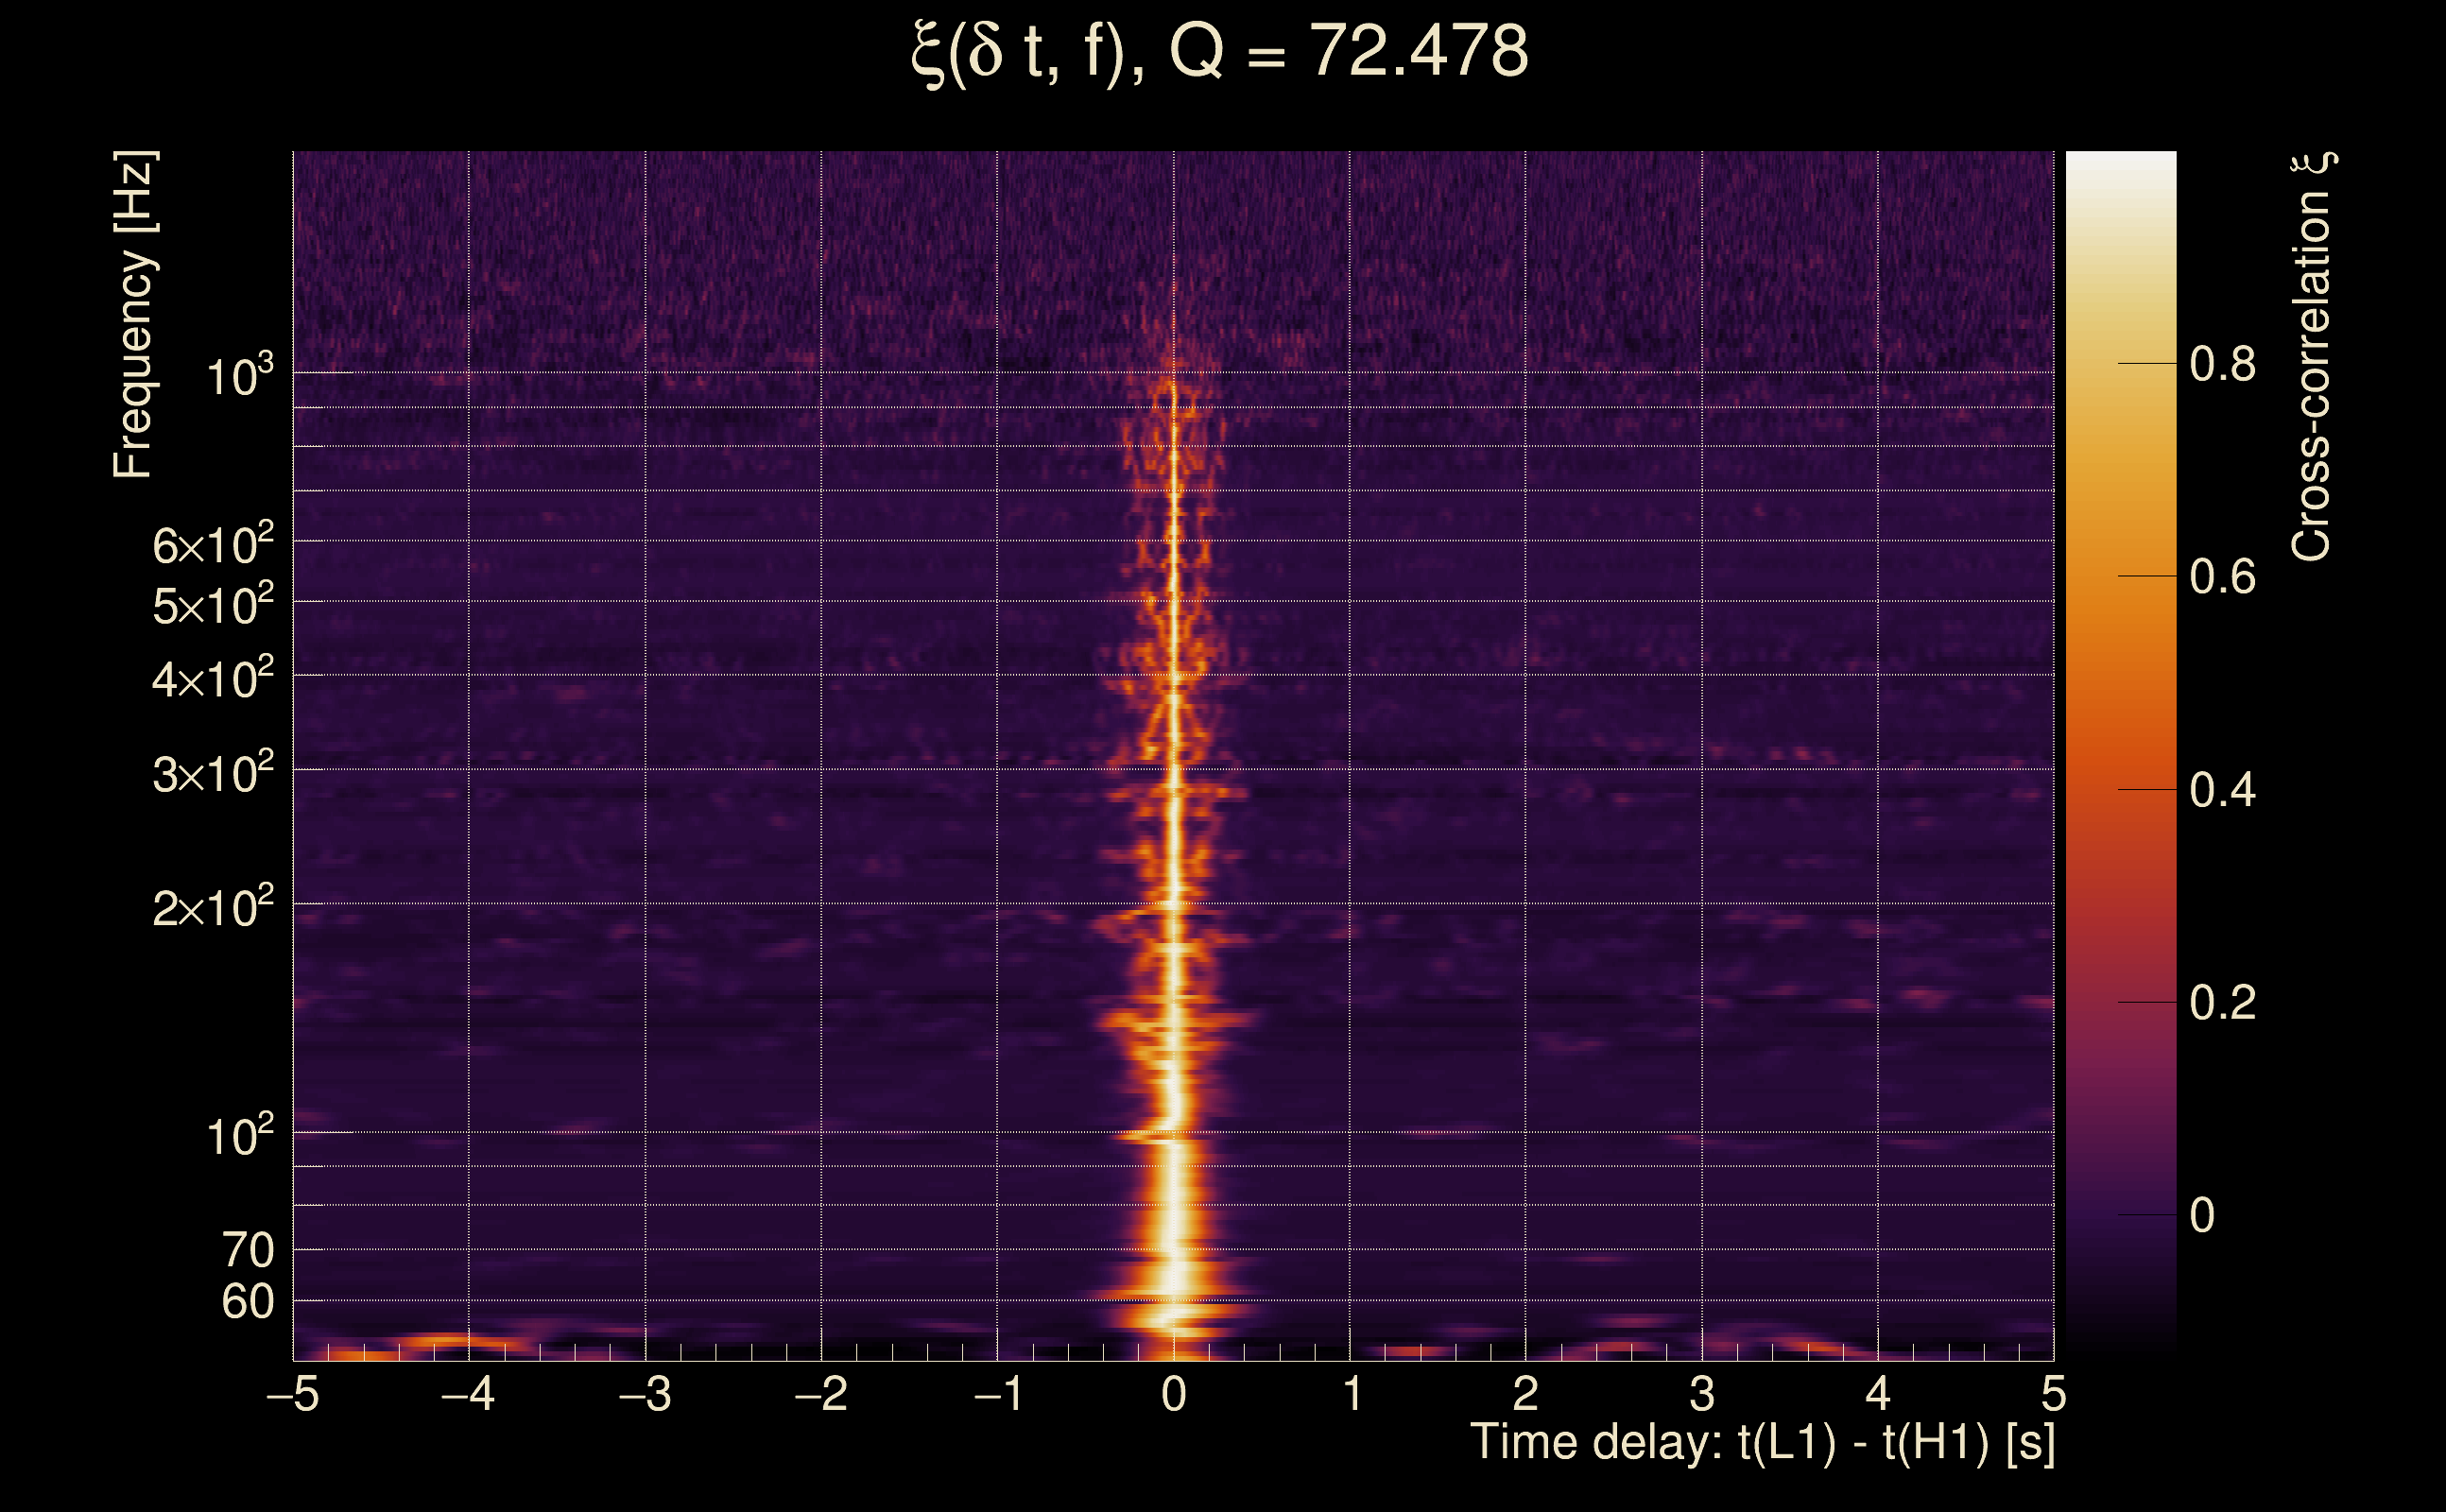
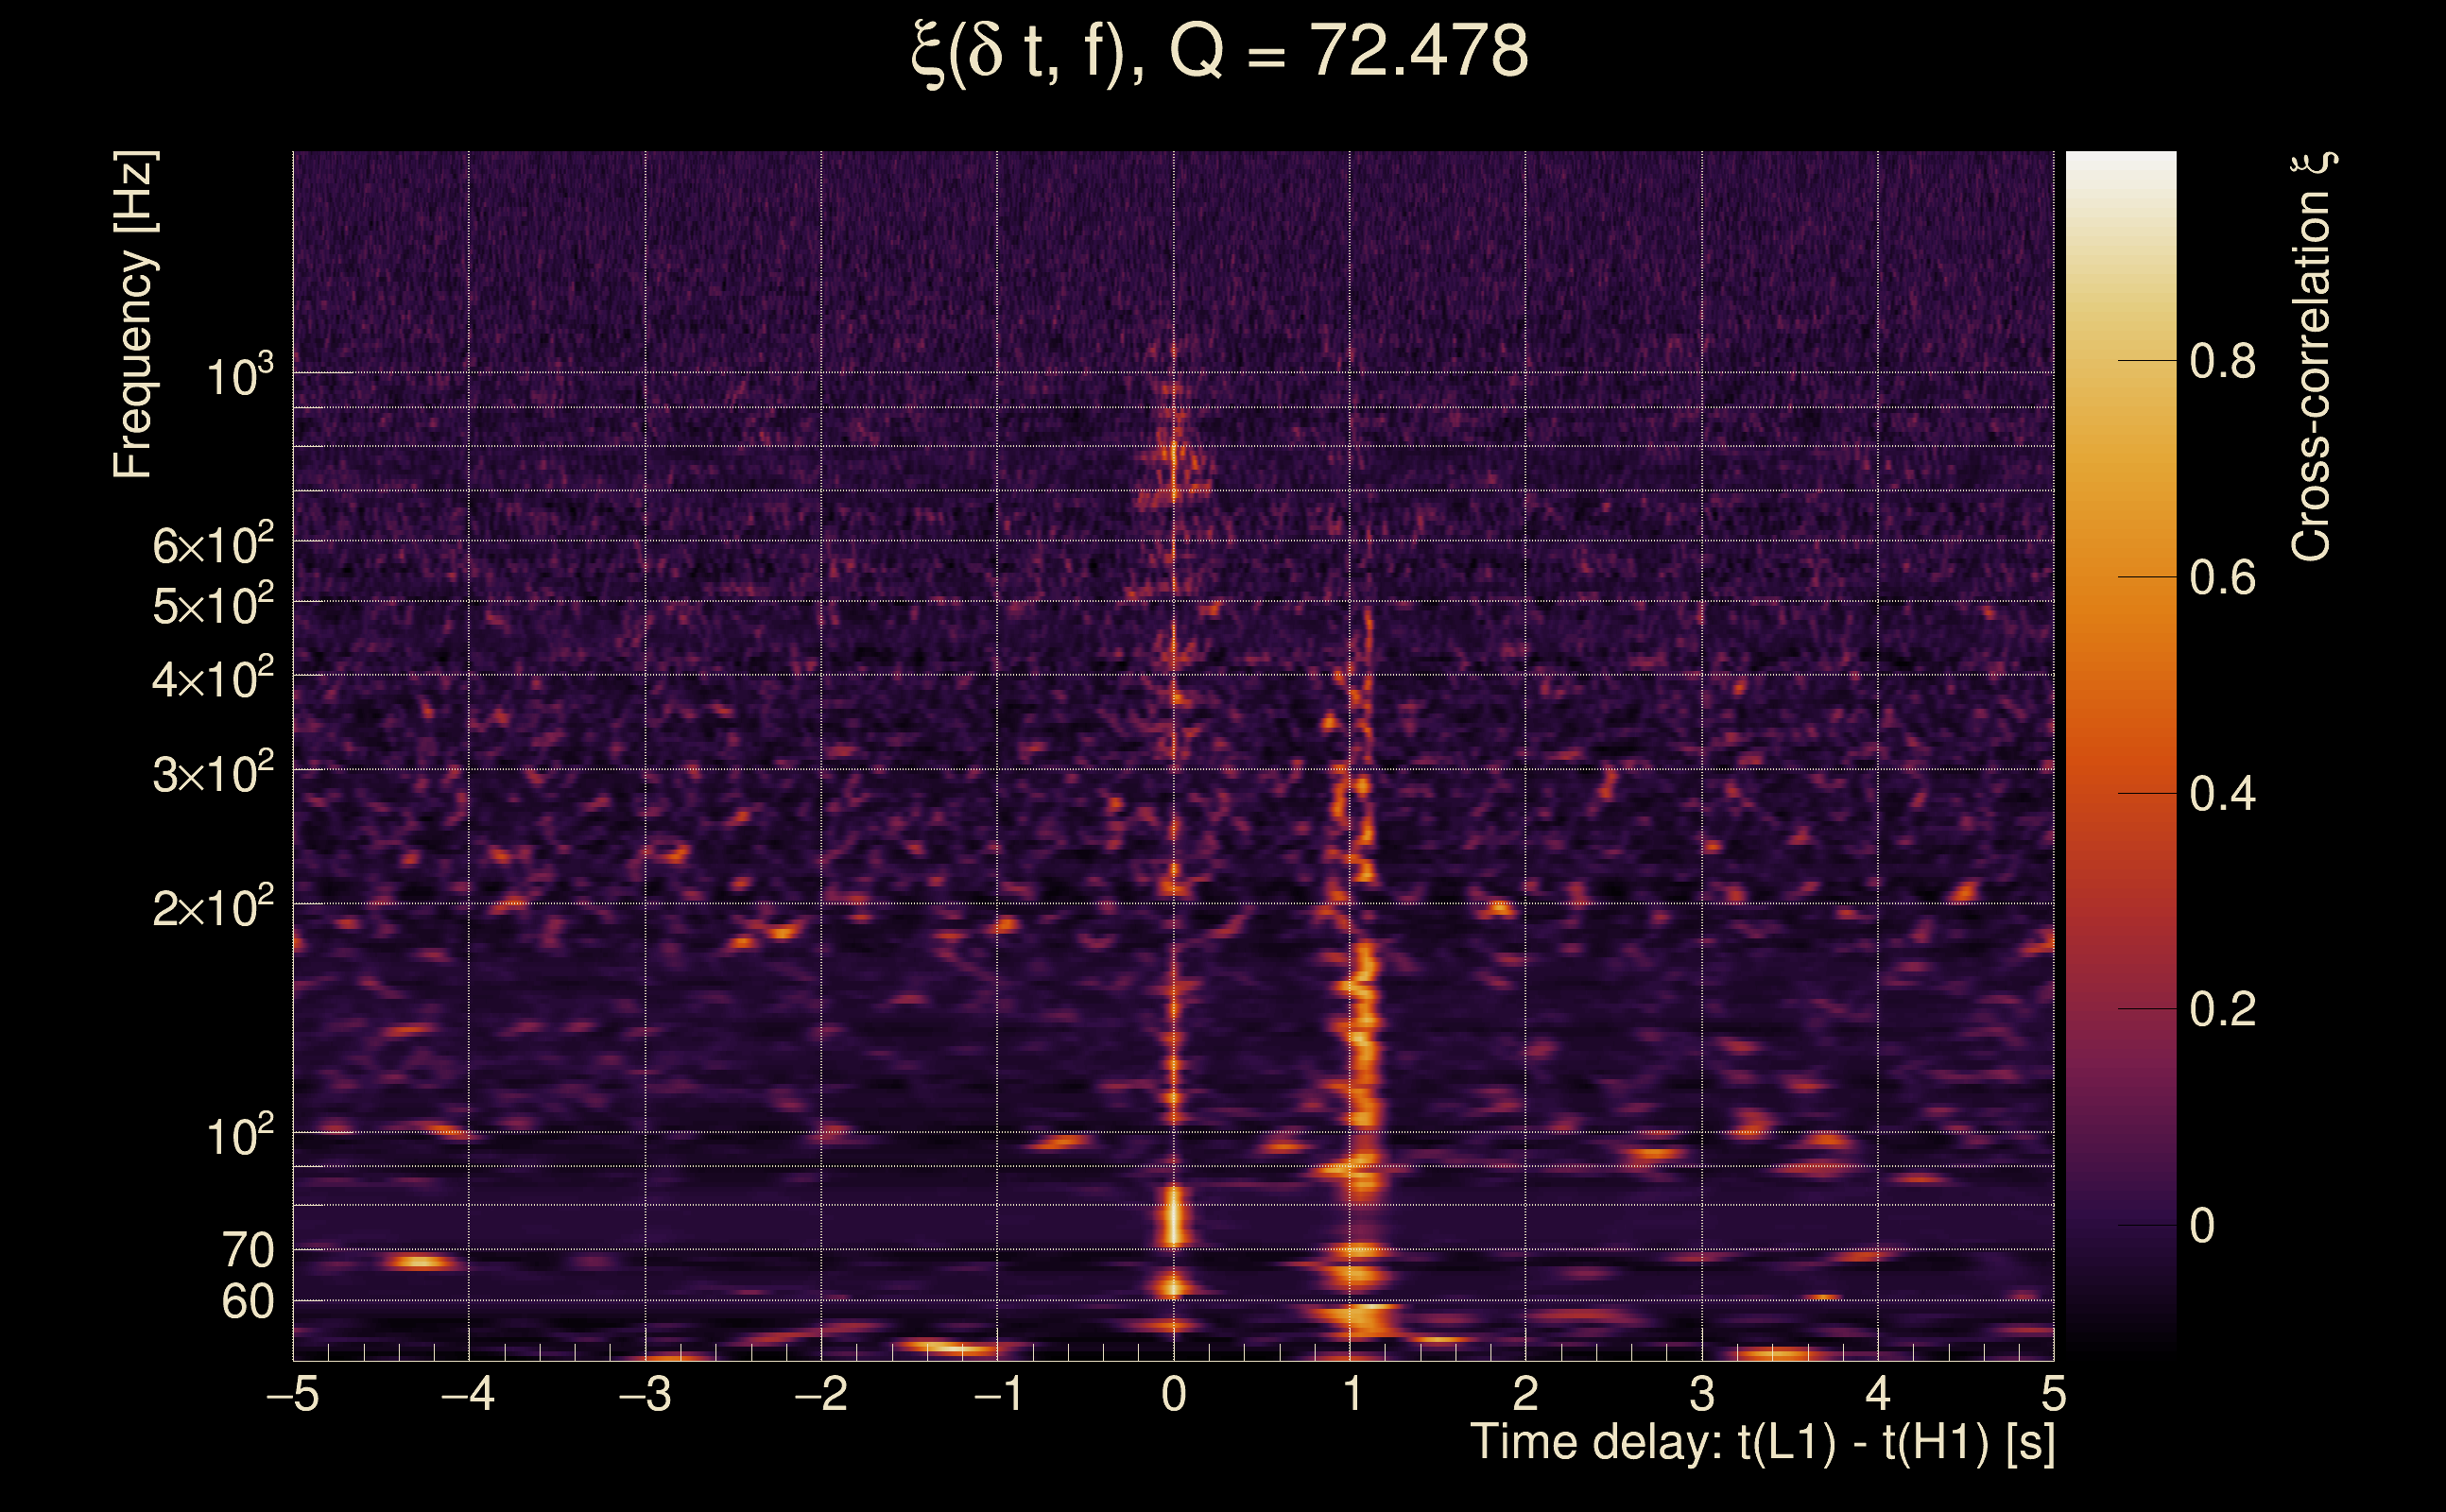
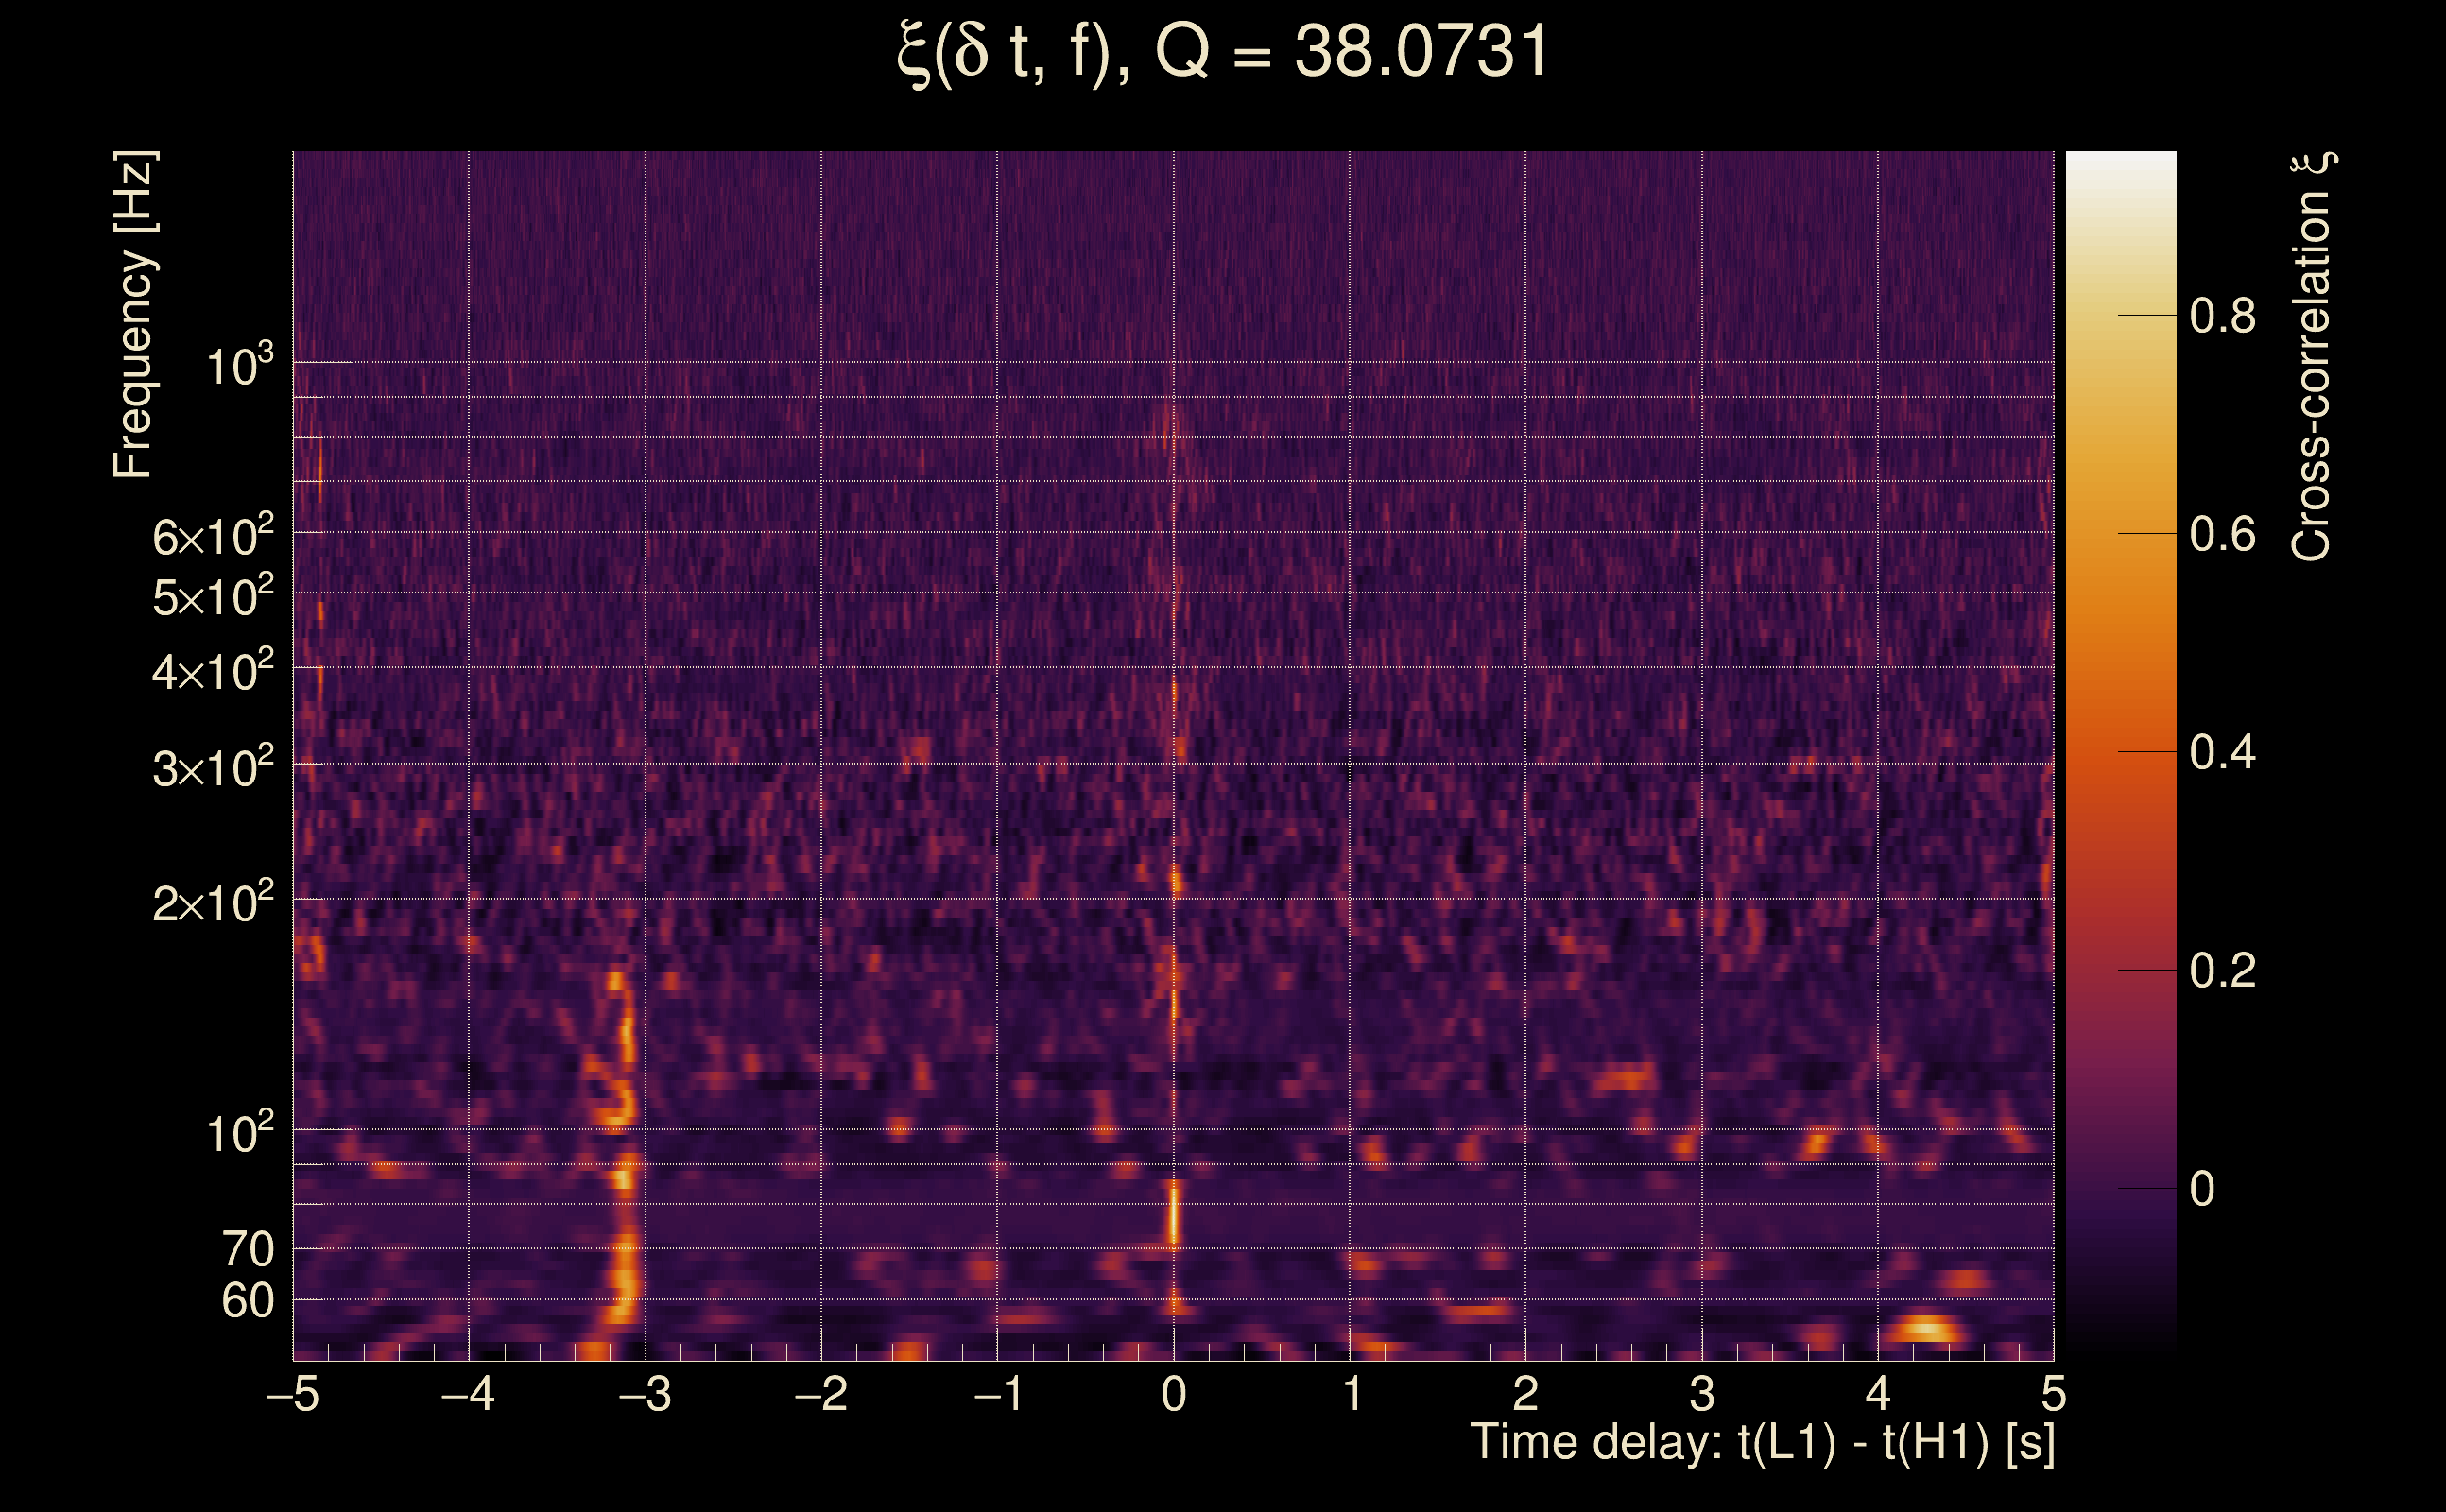
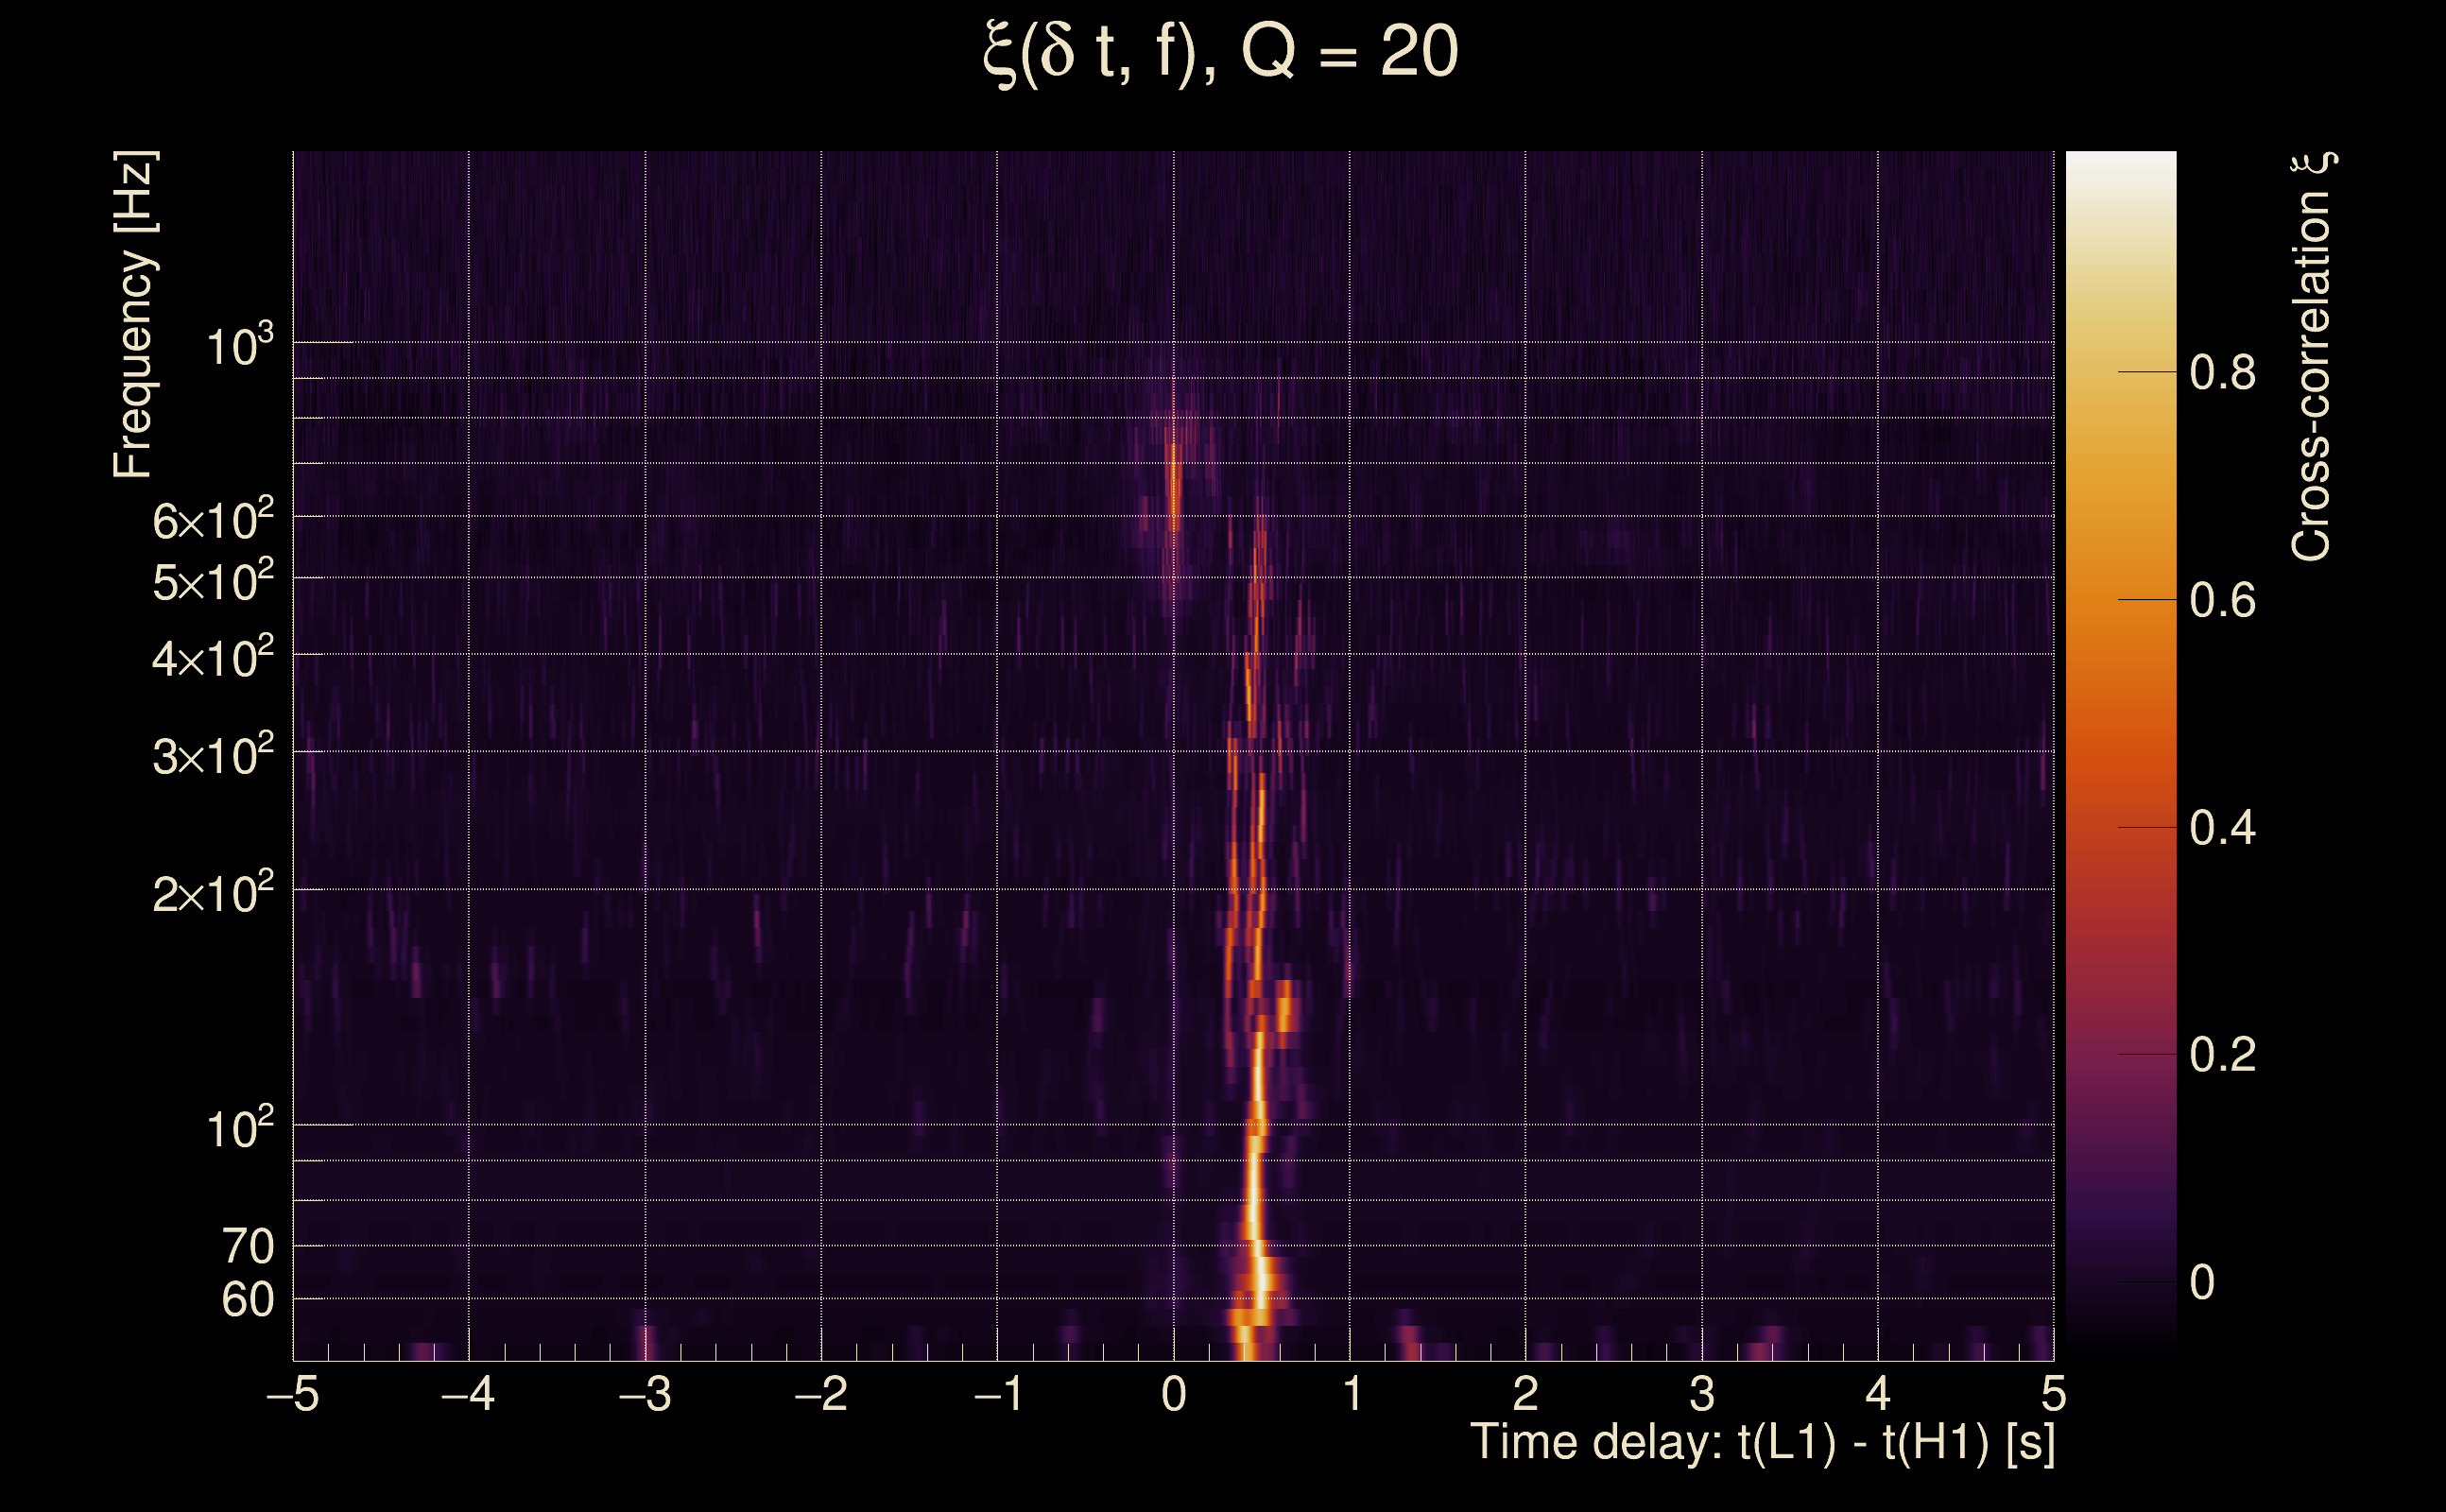
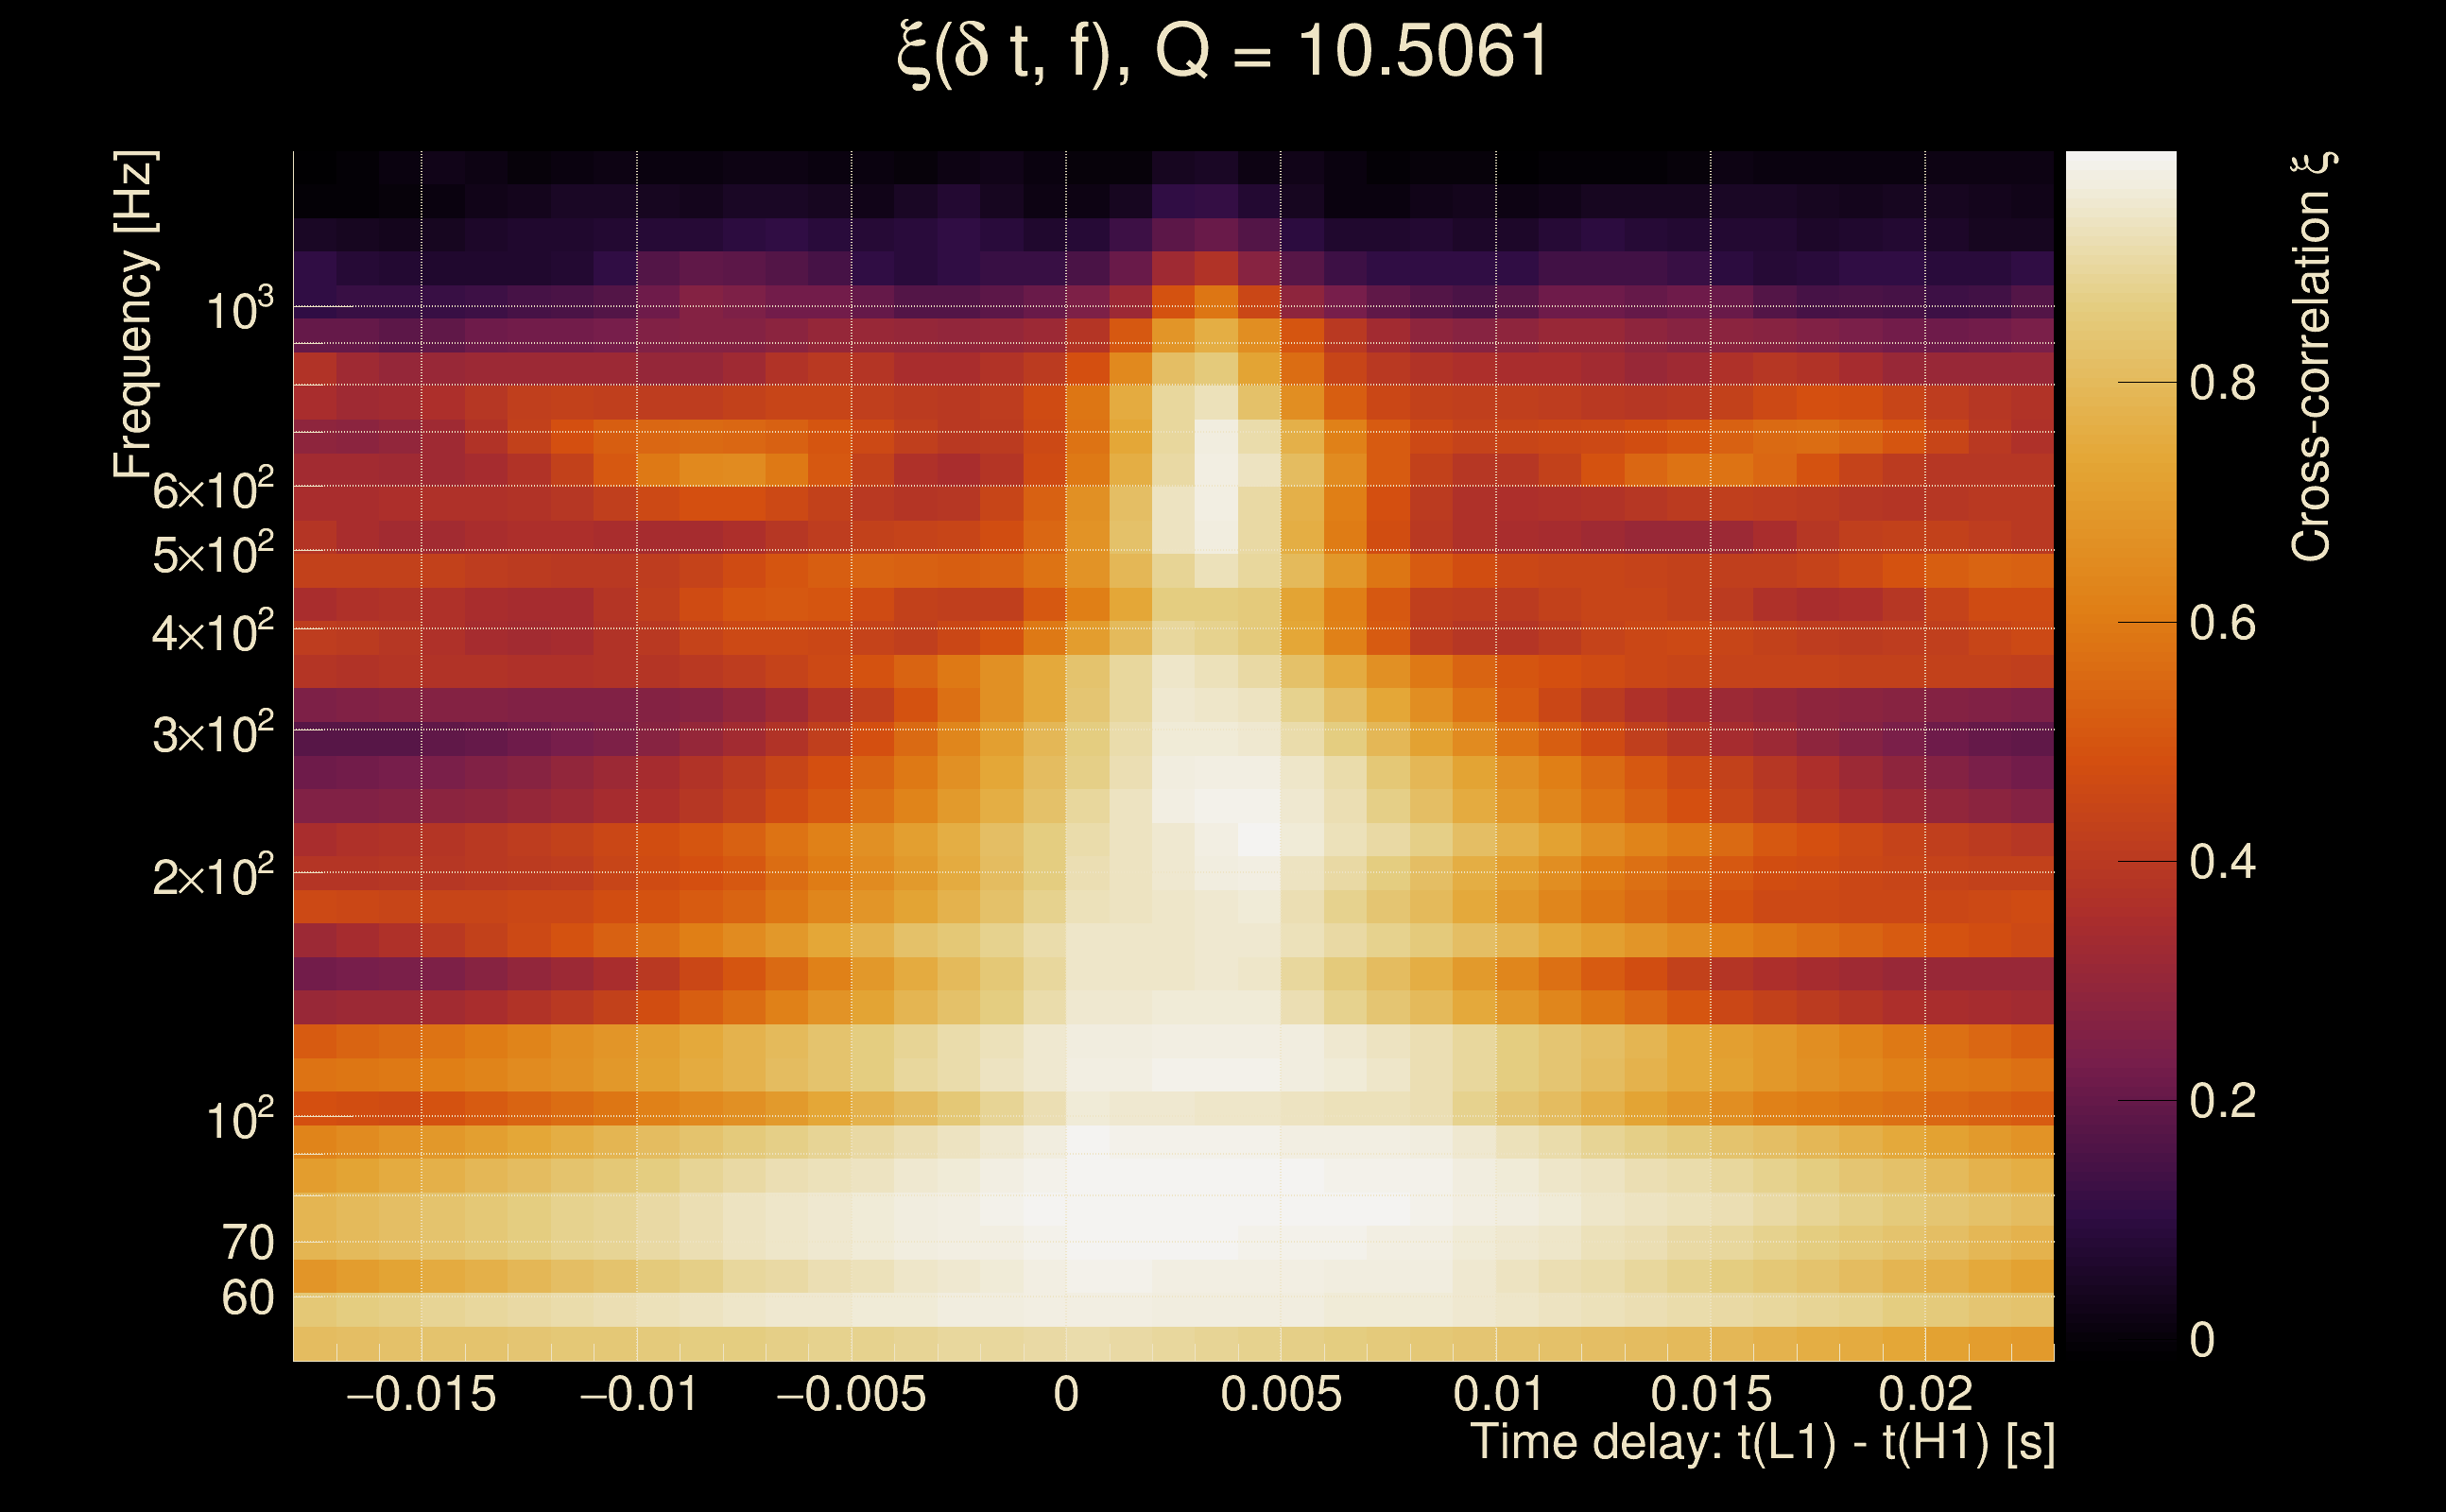
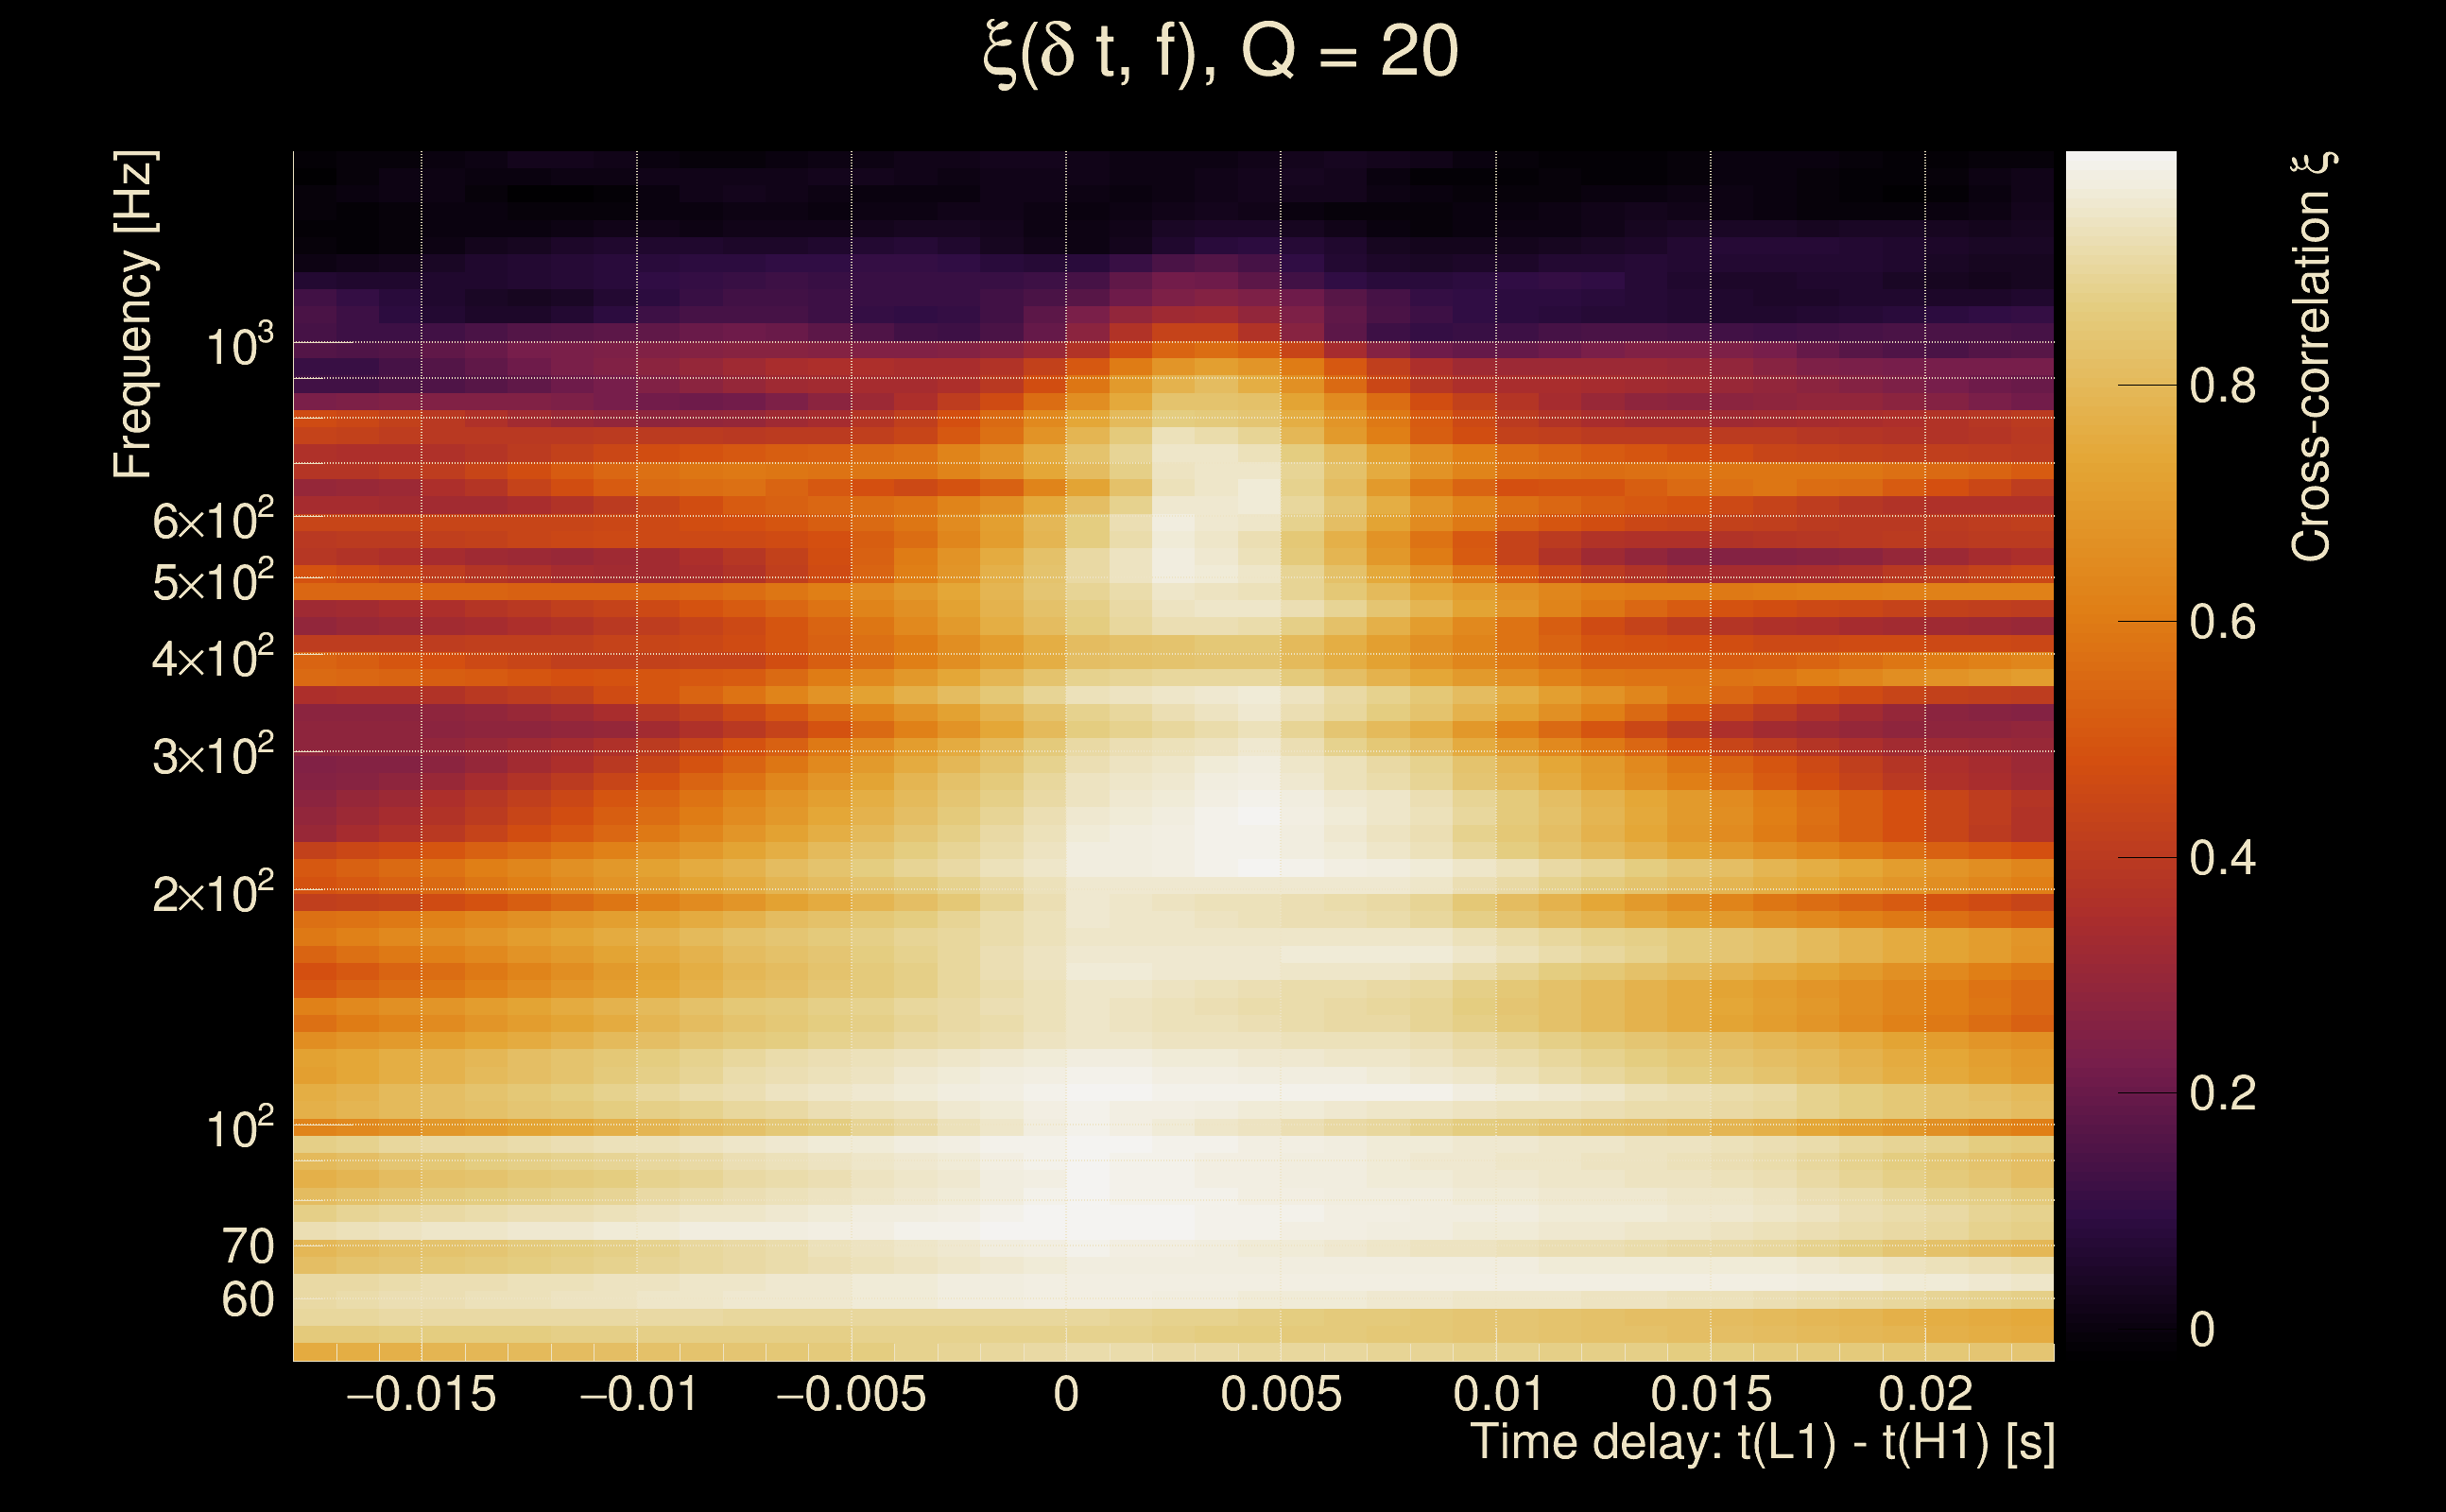
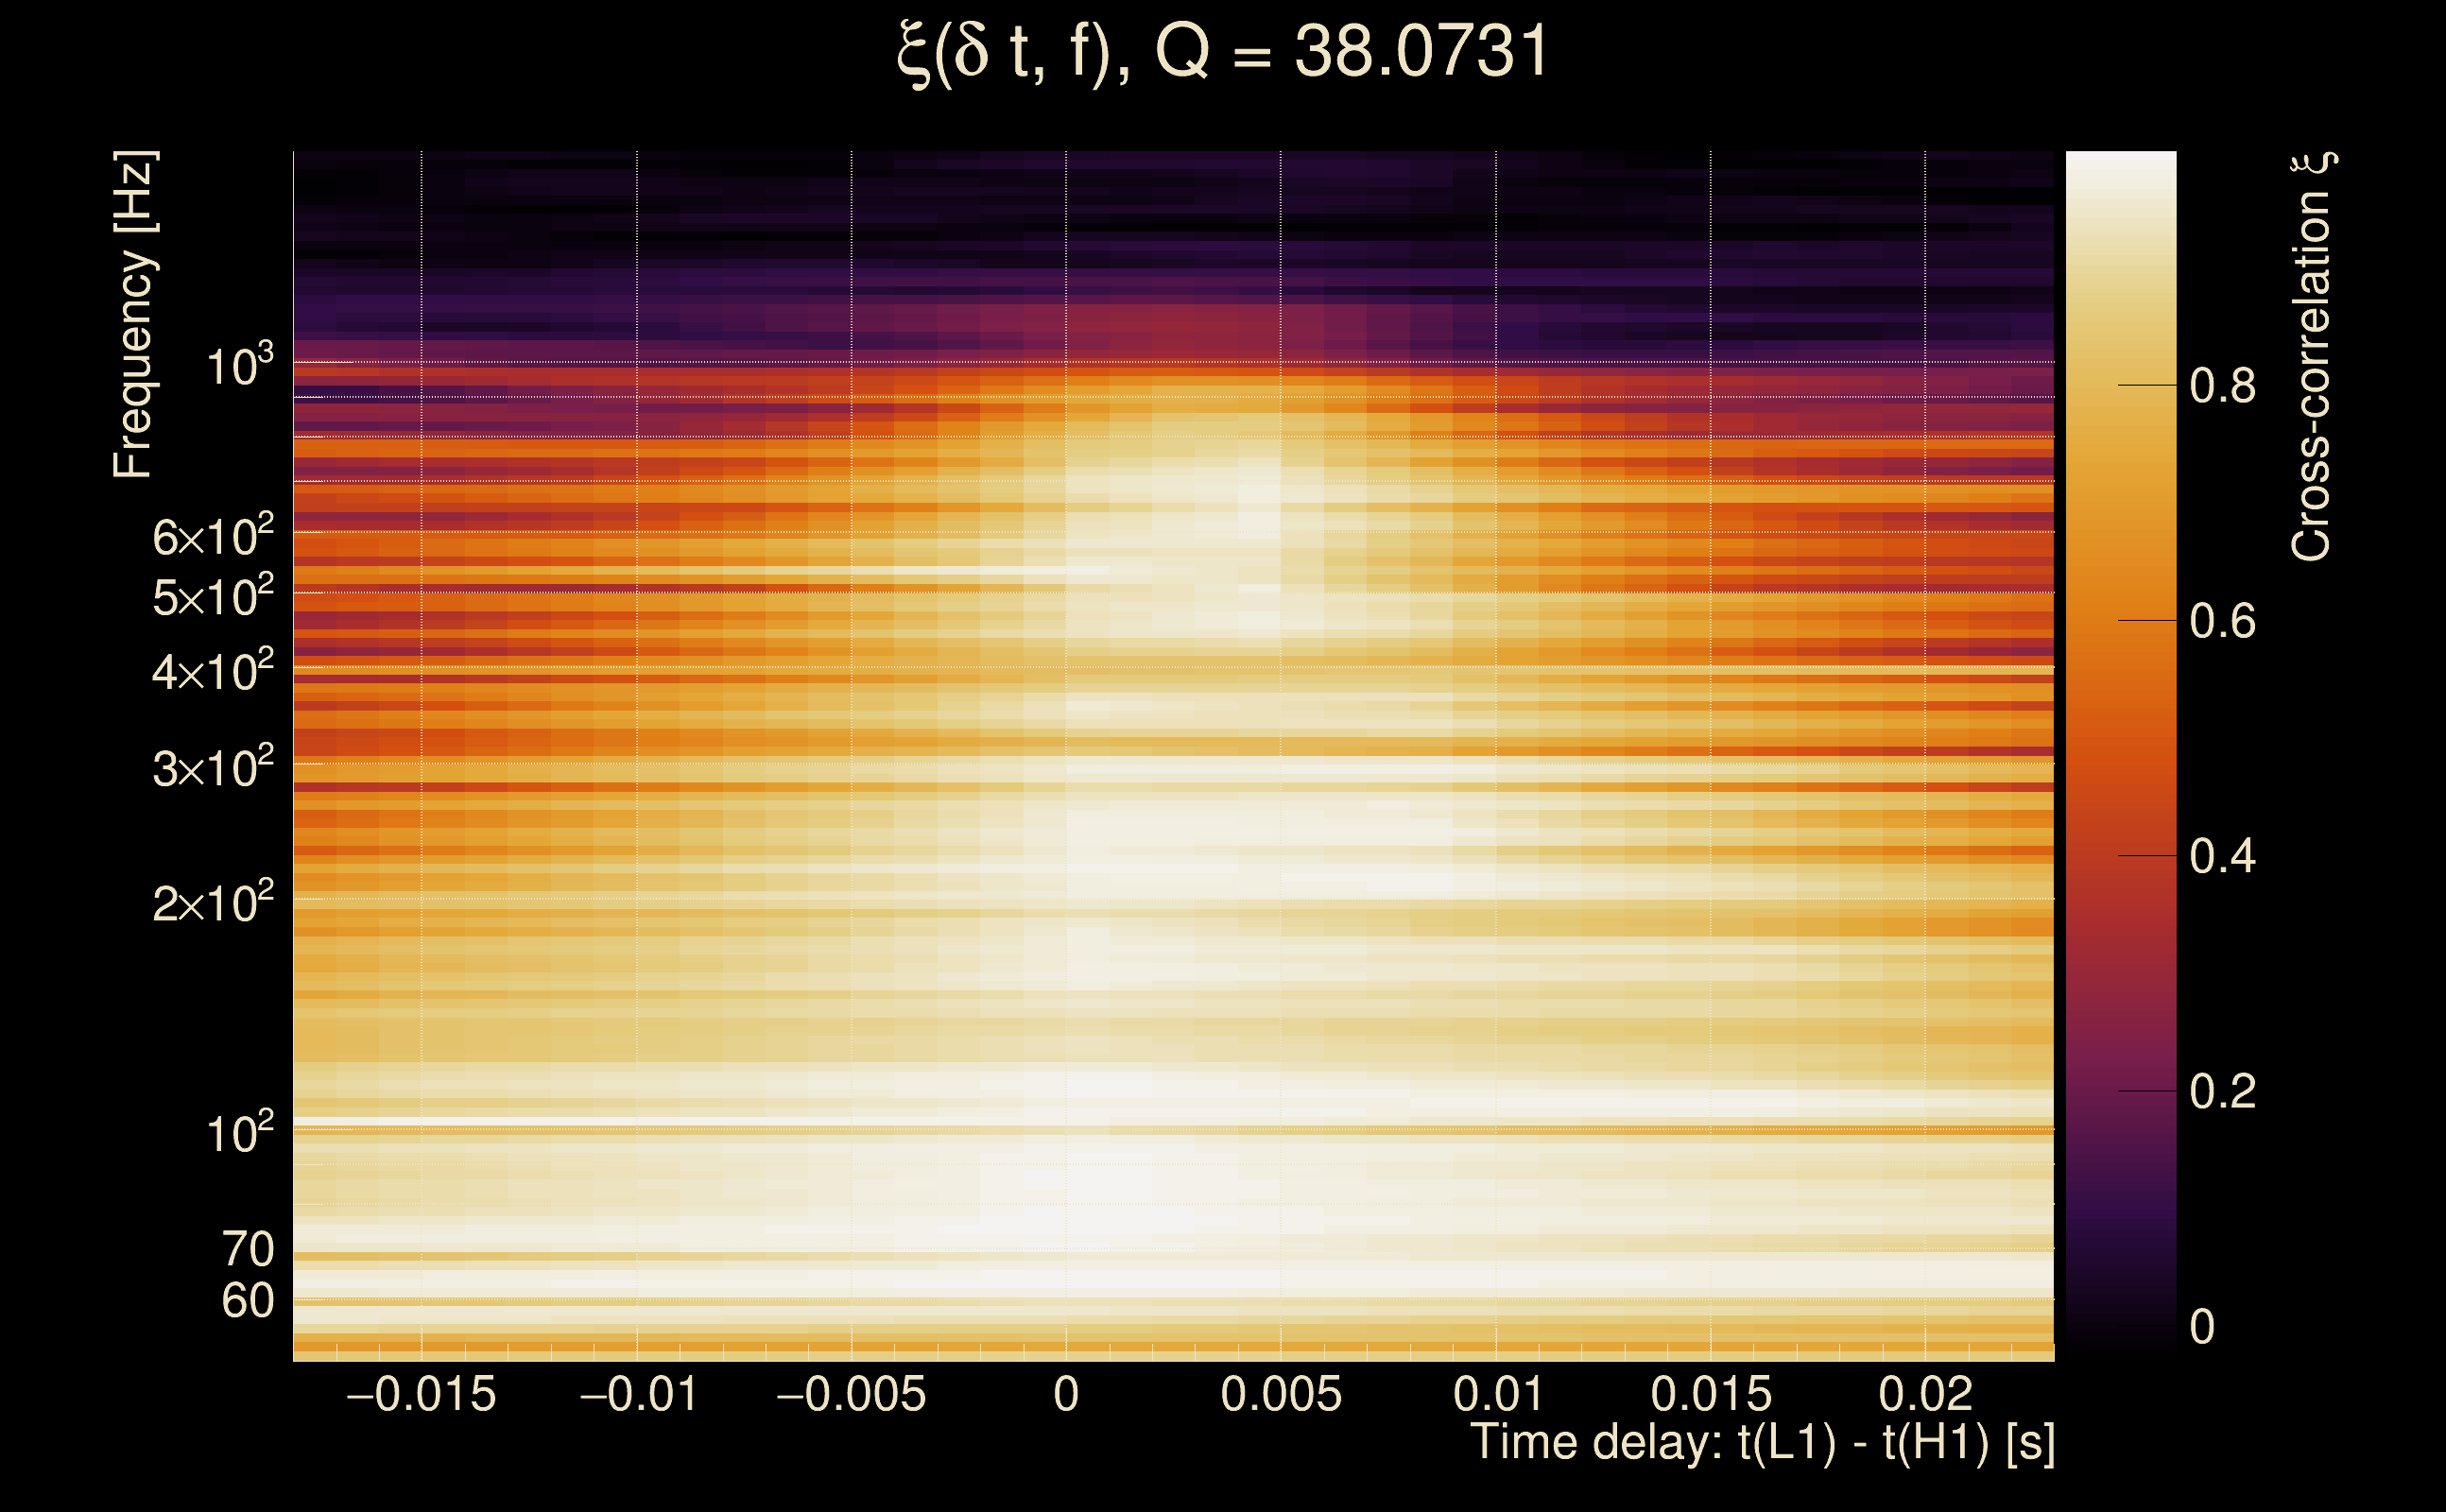
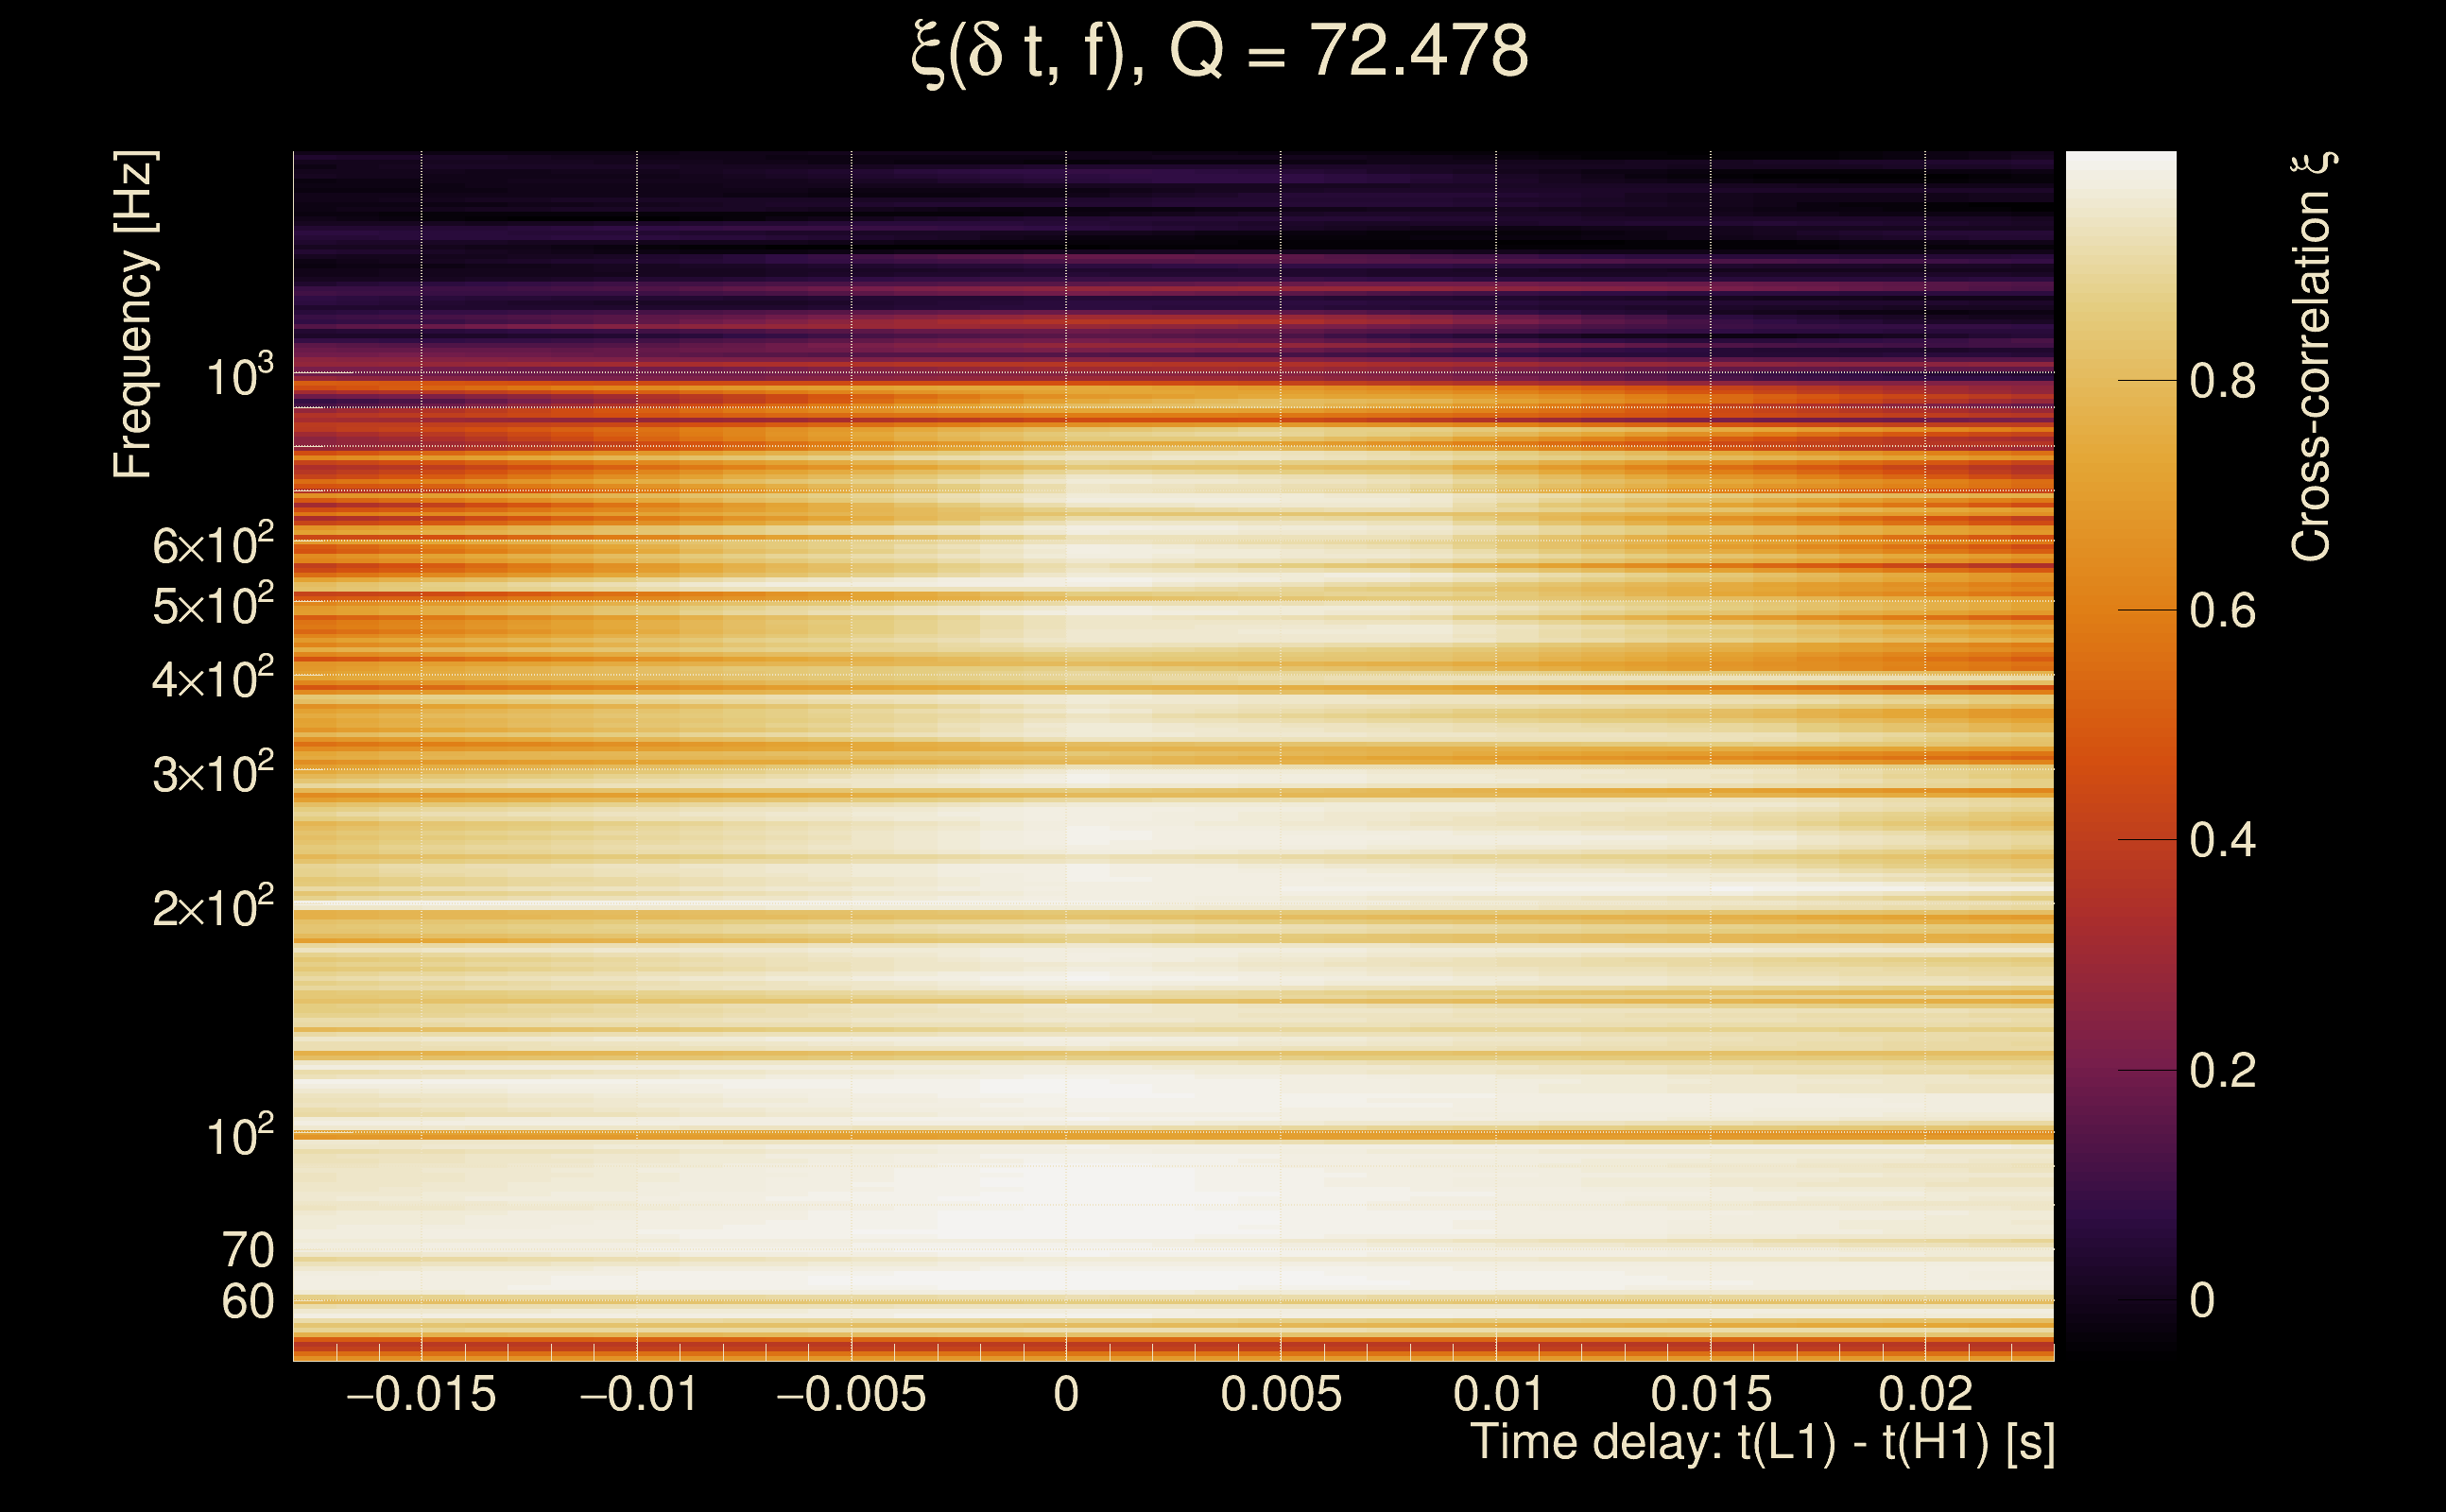
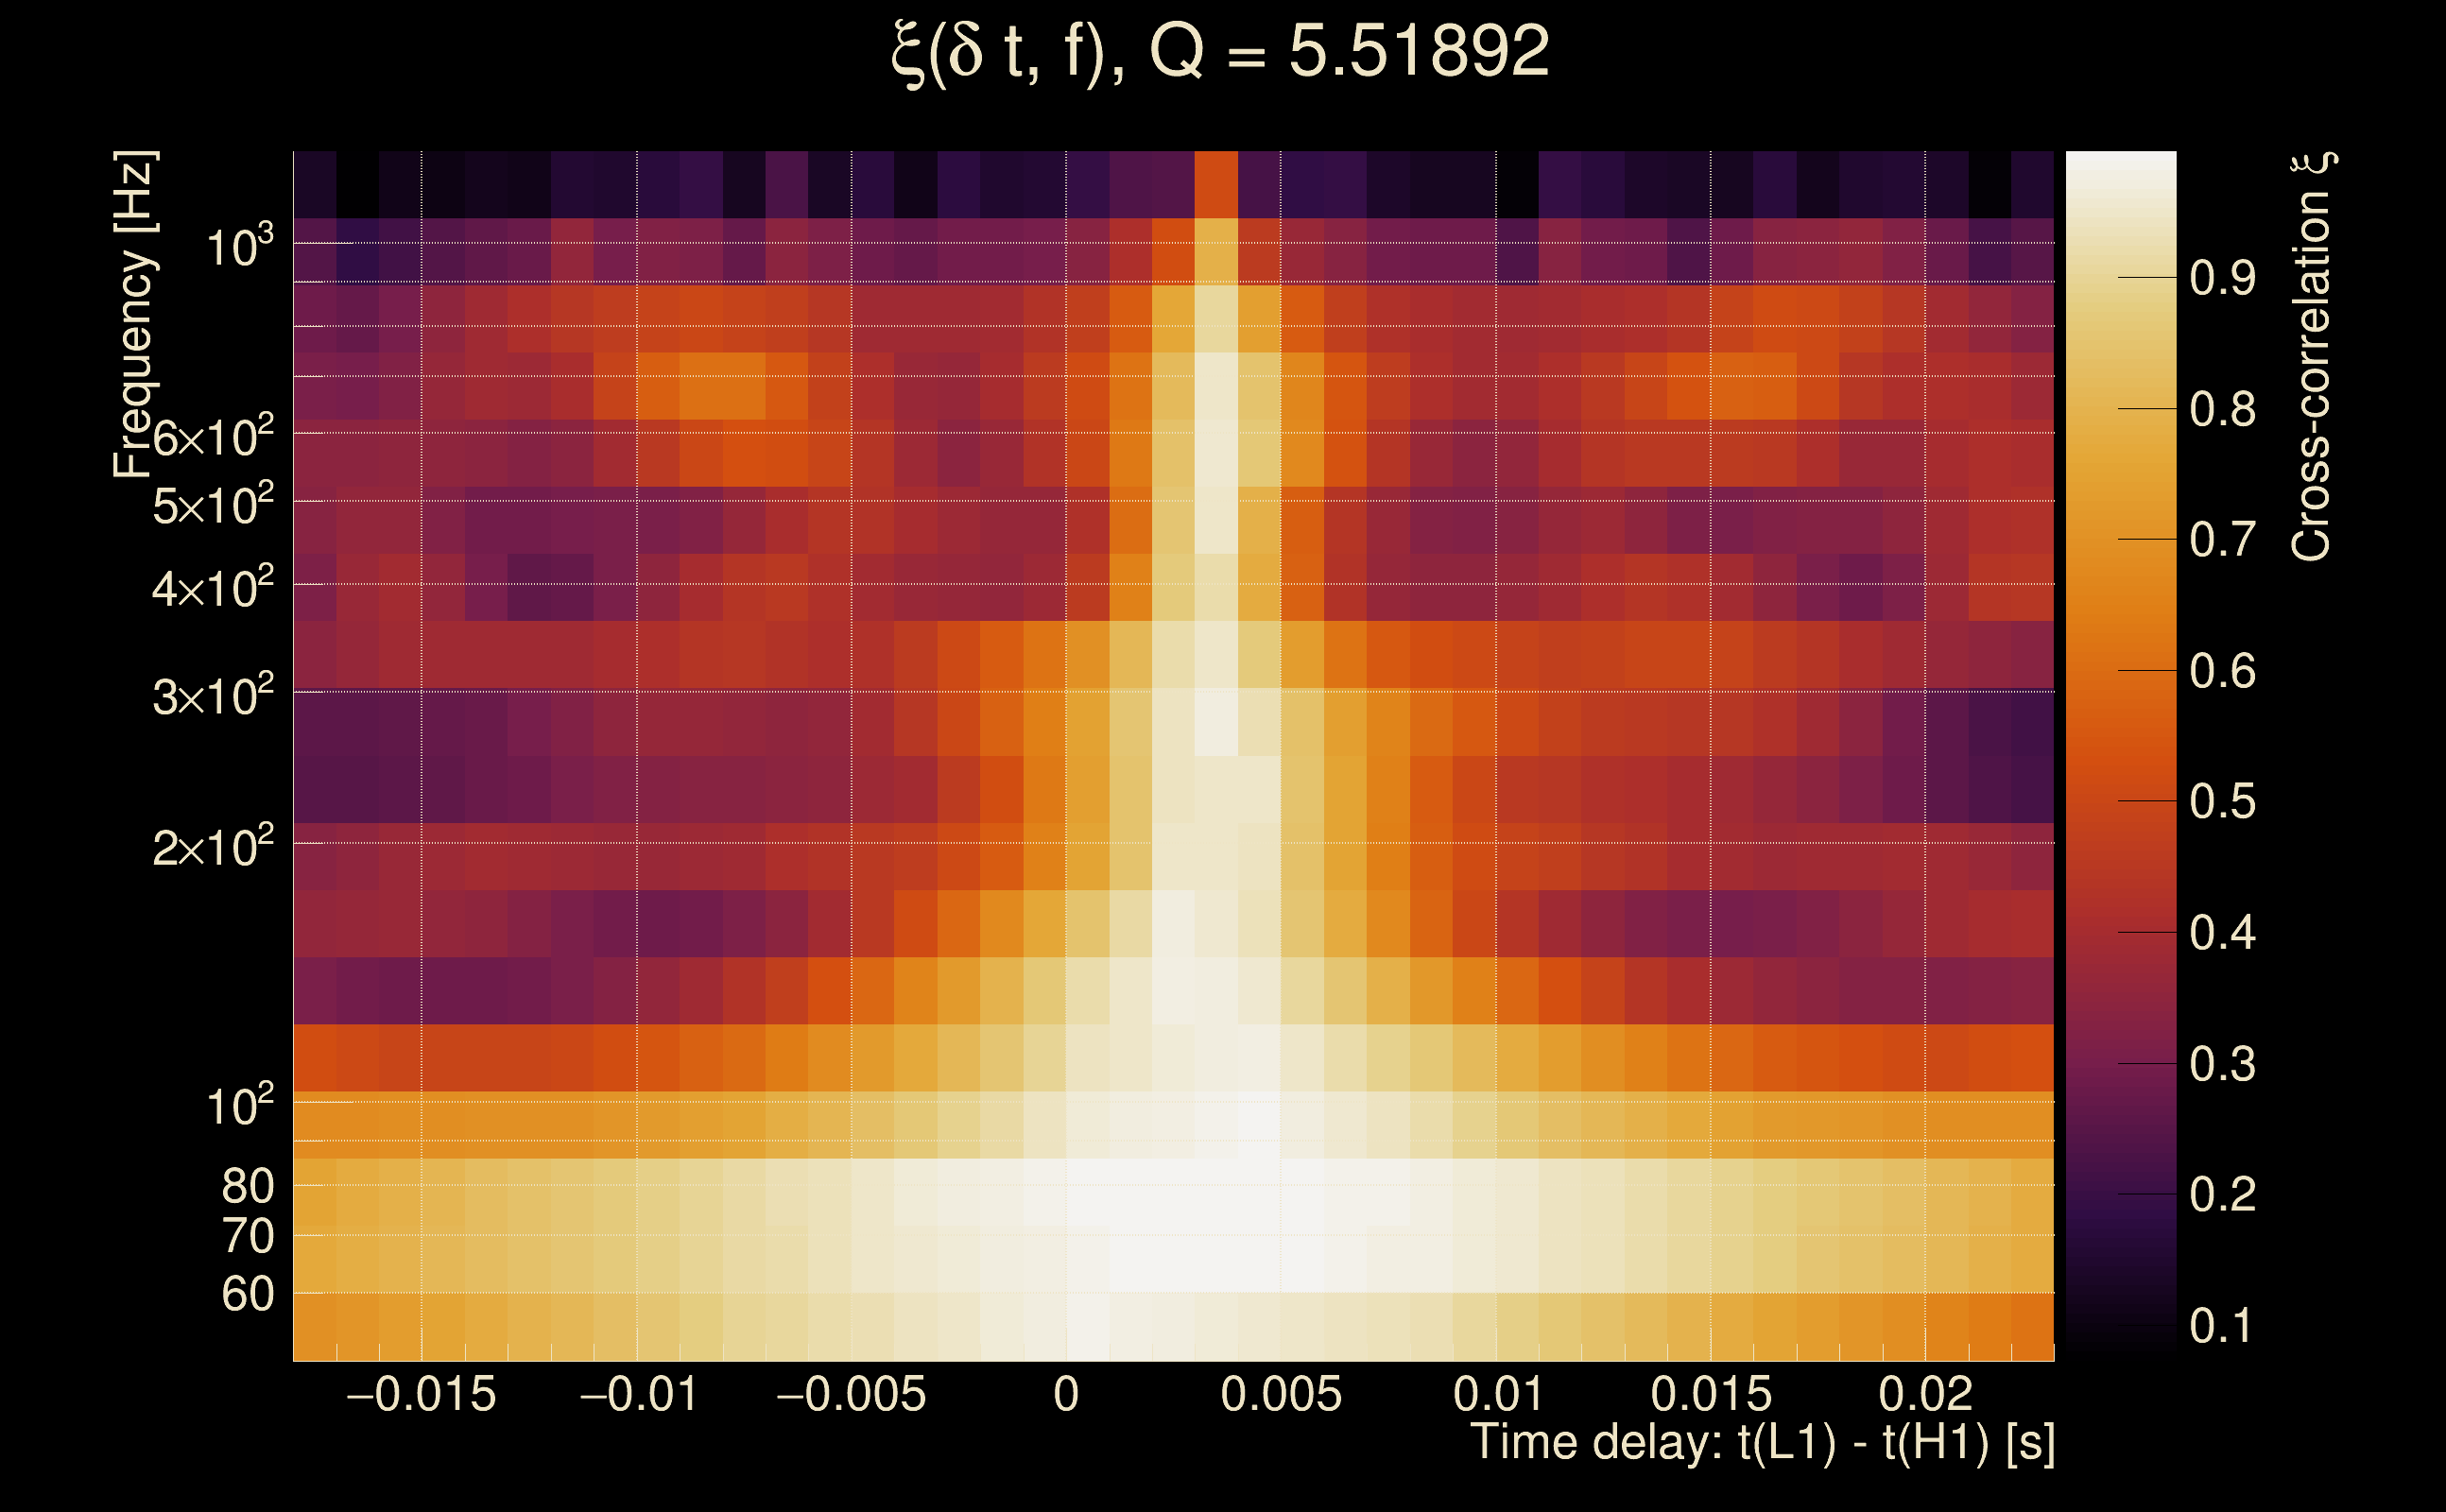
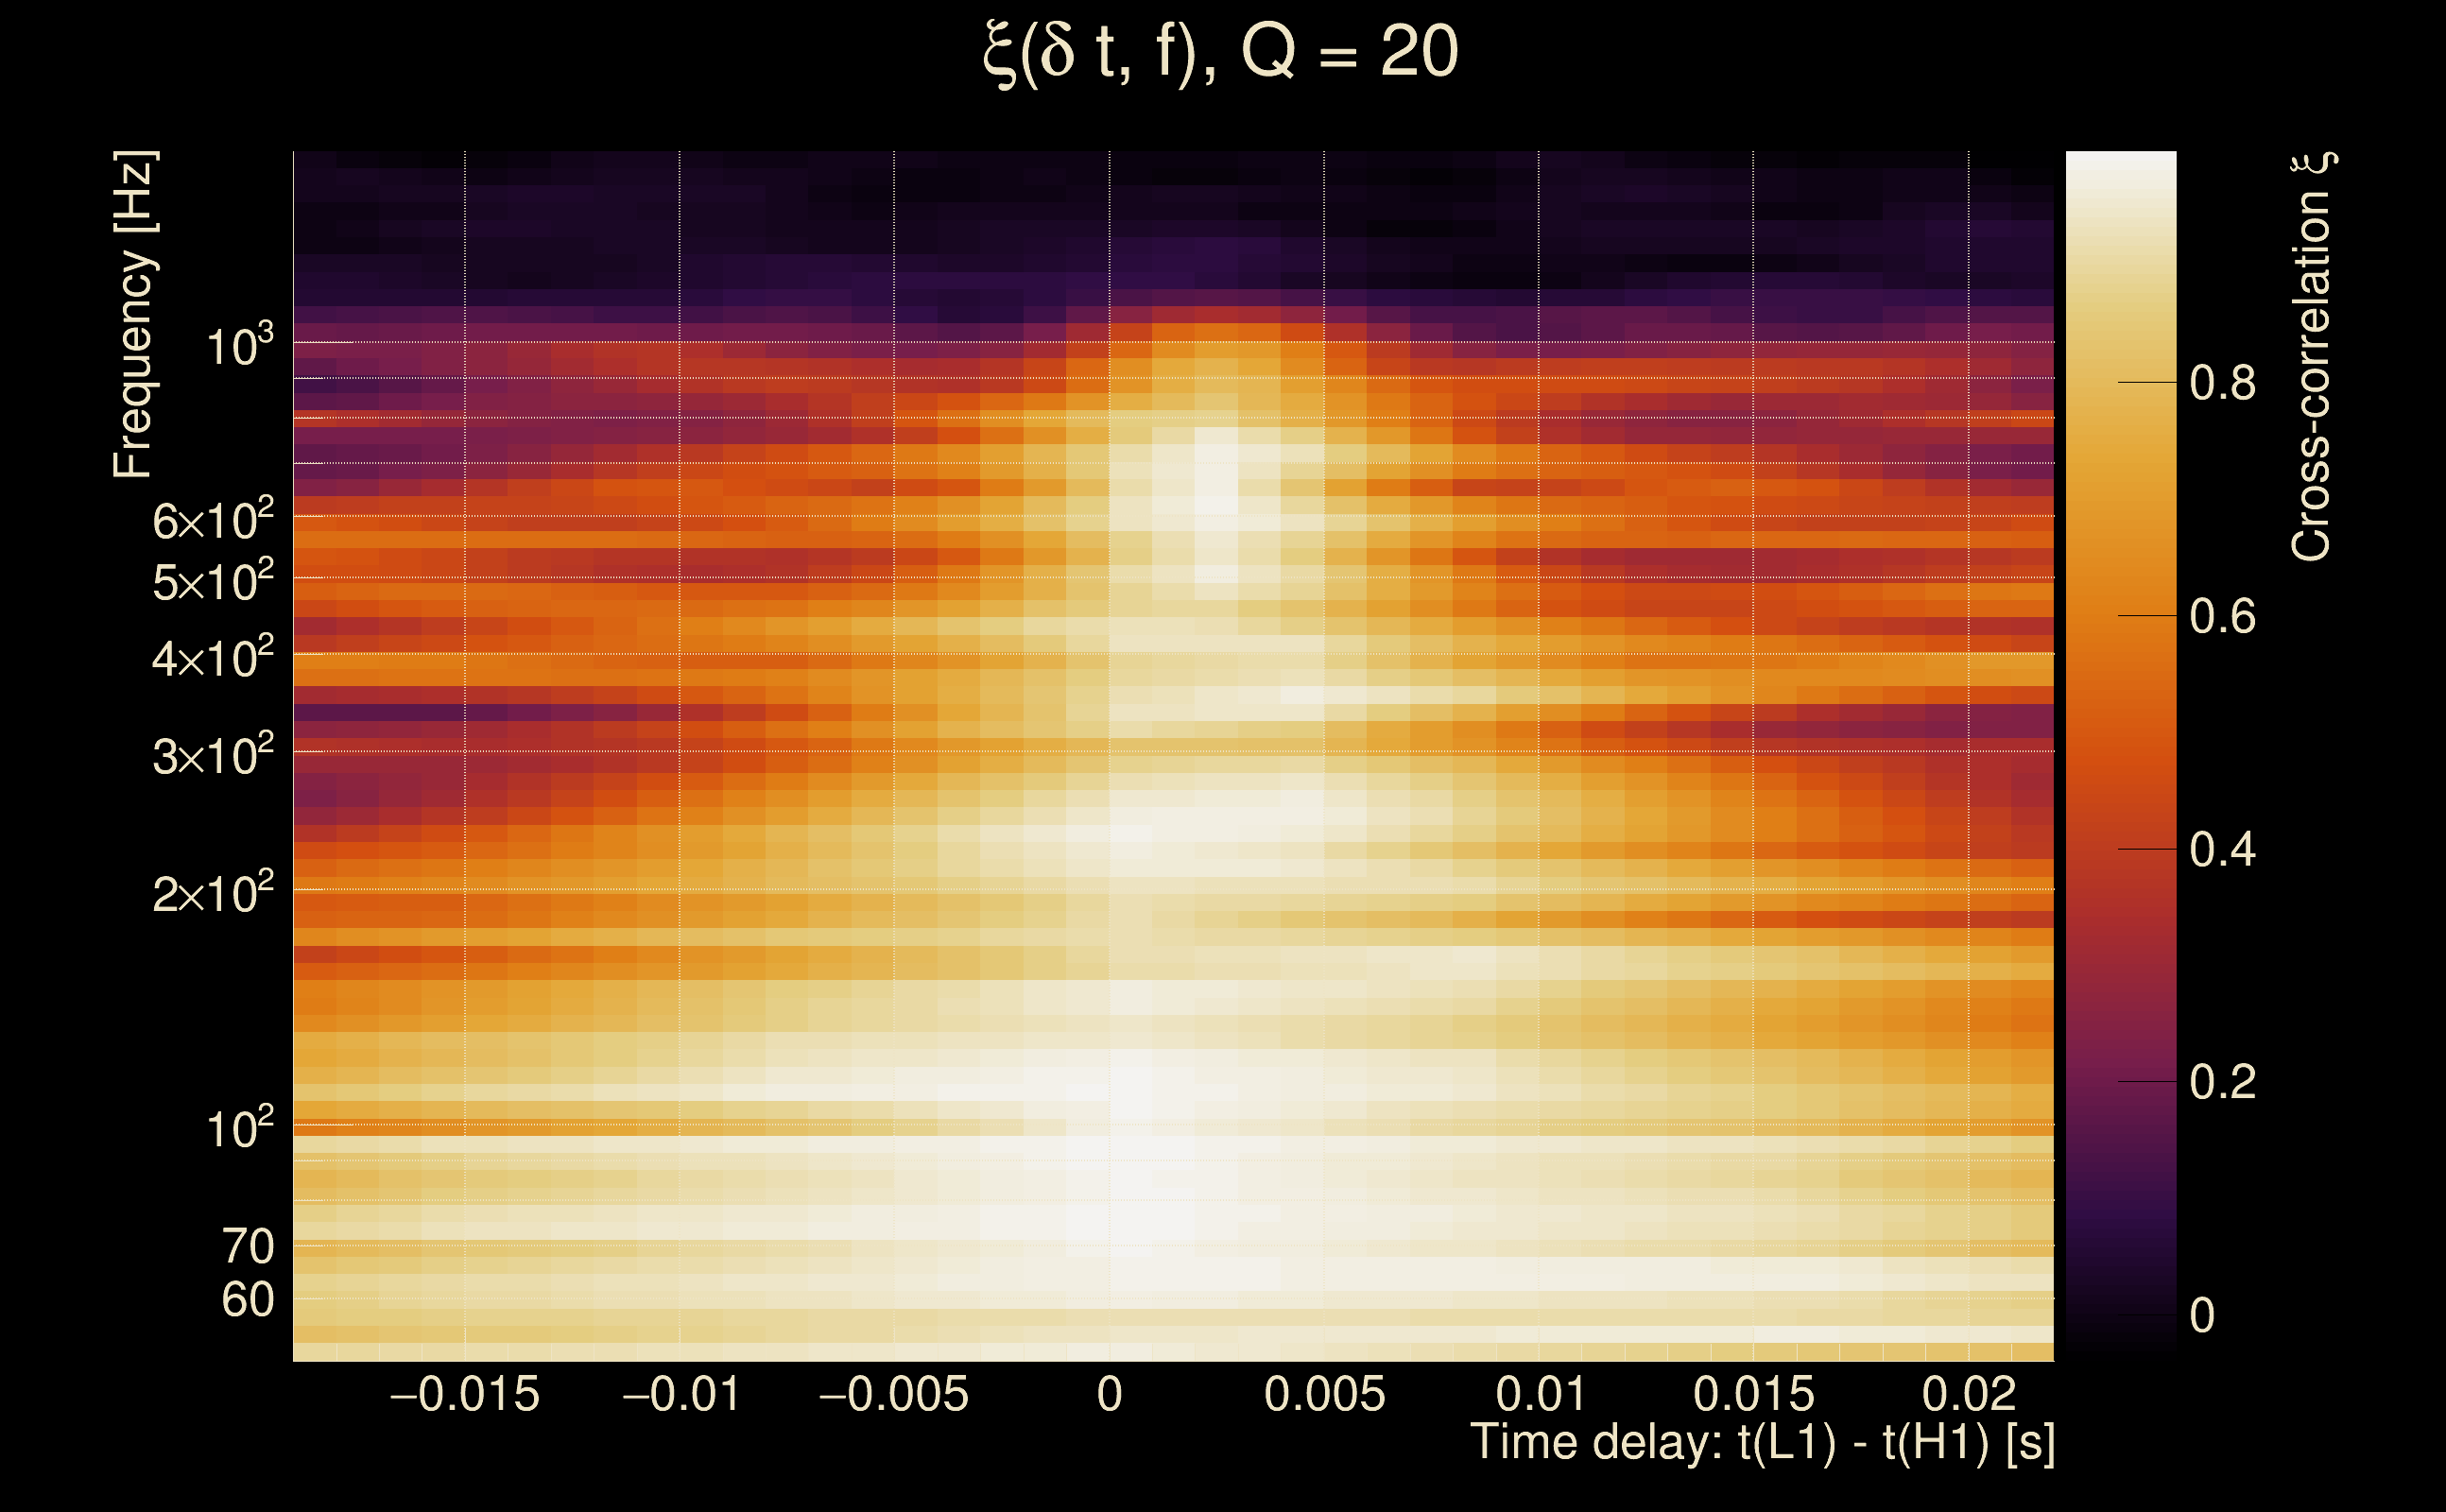
| Time delay between detectors t(L1) - t(H1): | 0.00295124 s (slice index = 108 / 217), δt_gw = 0.00295124 s |
| Time delay uncertainty: | 0.000616164 s |
| [targeted mode] Time delay probability: | 0.927737 (0.0906924 sigmas), δt_target = 1.72247e+45 s |
| Frequency: | 234.823 Hz |
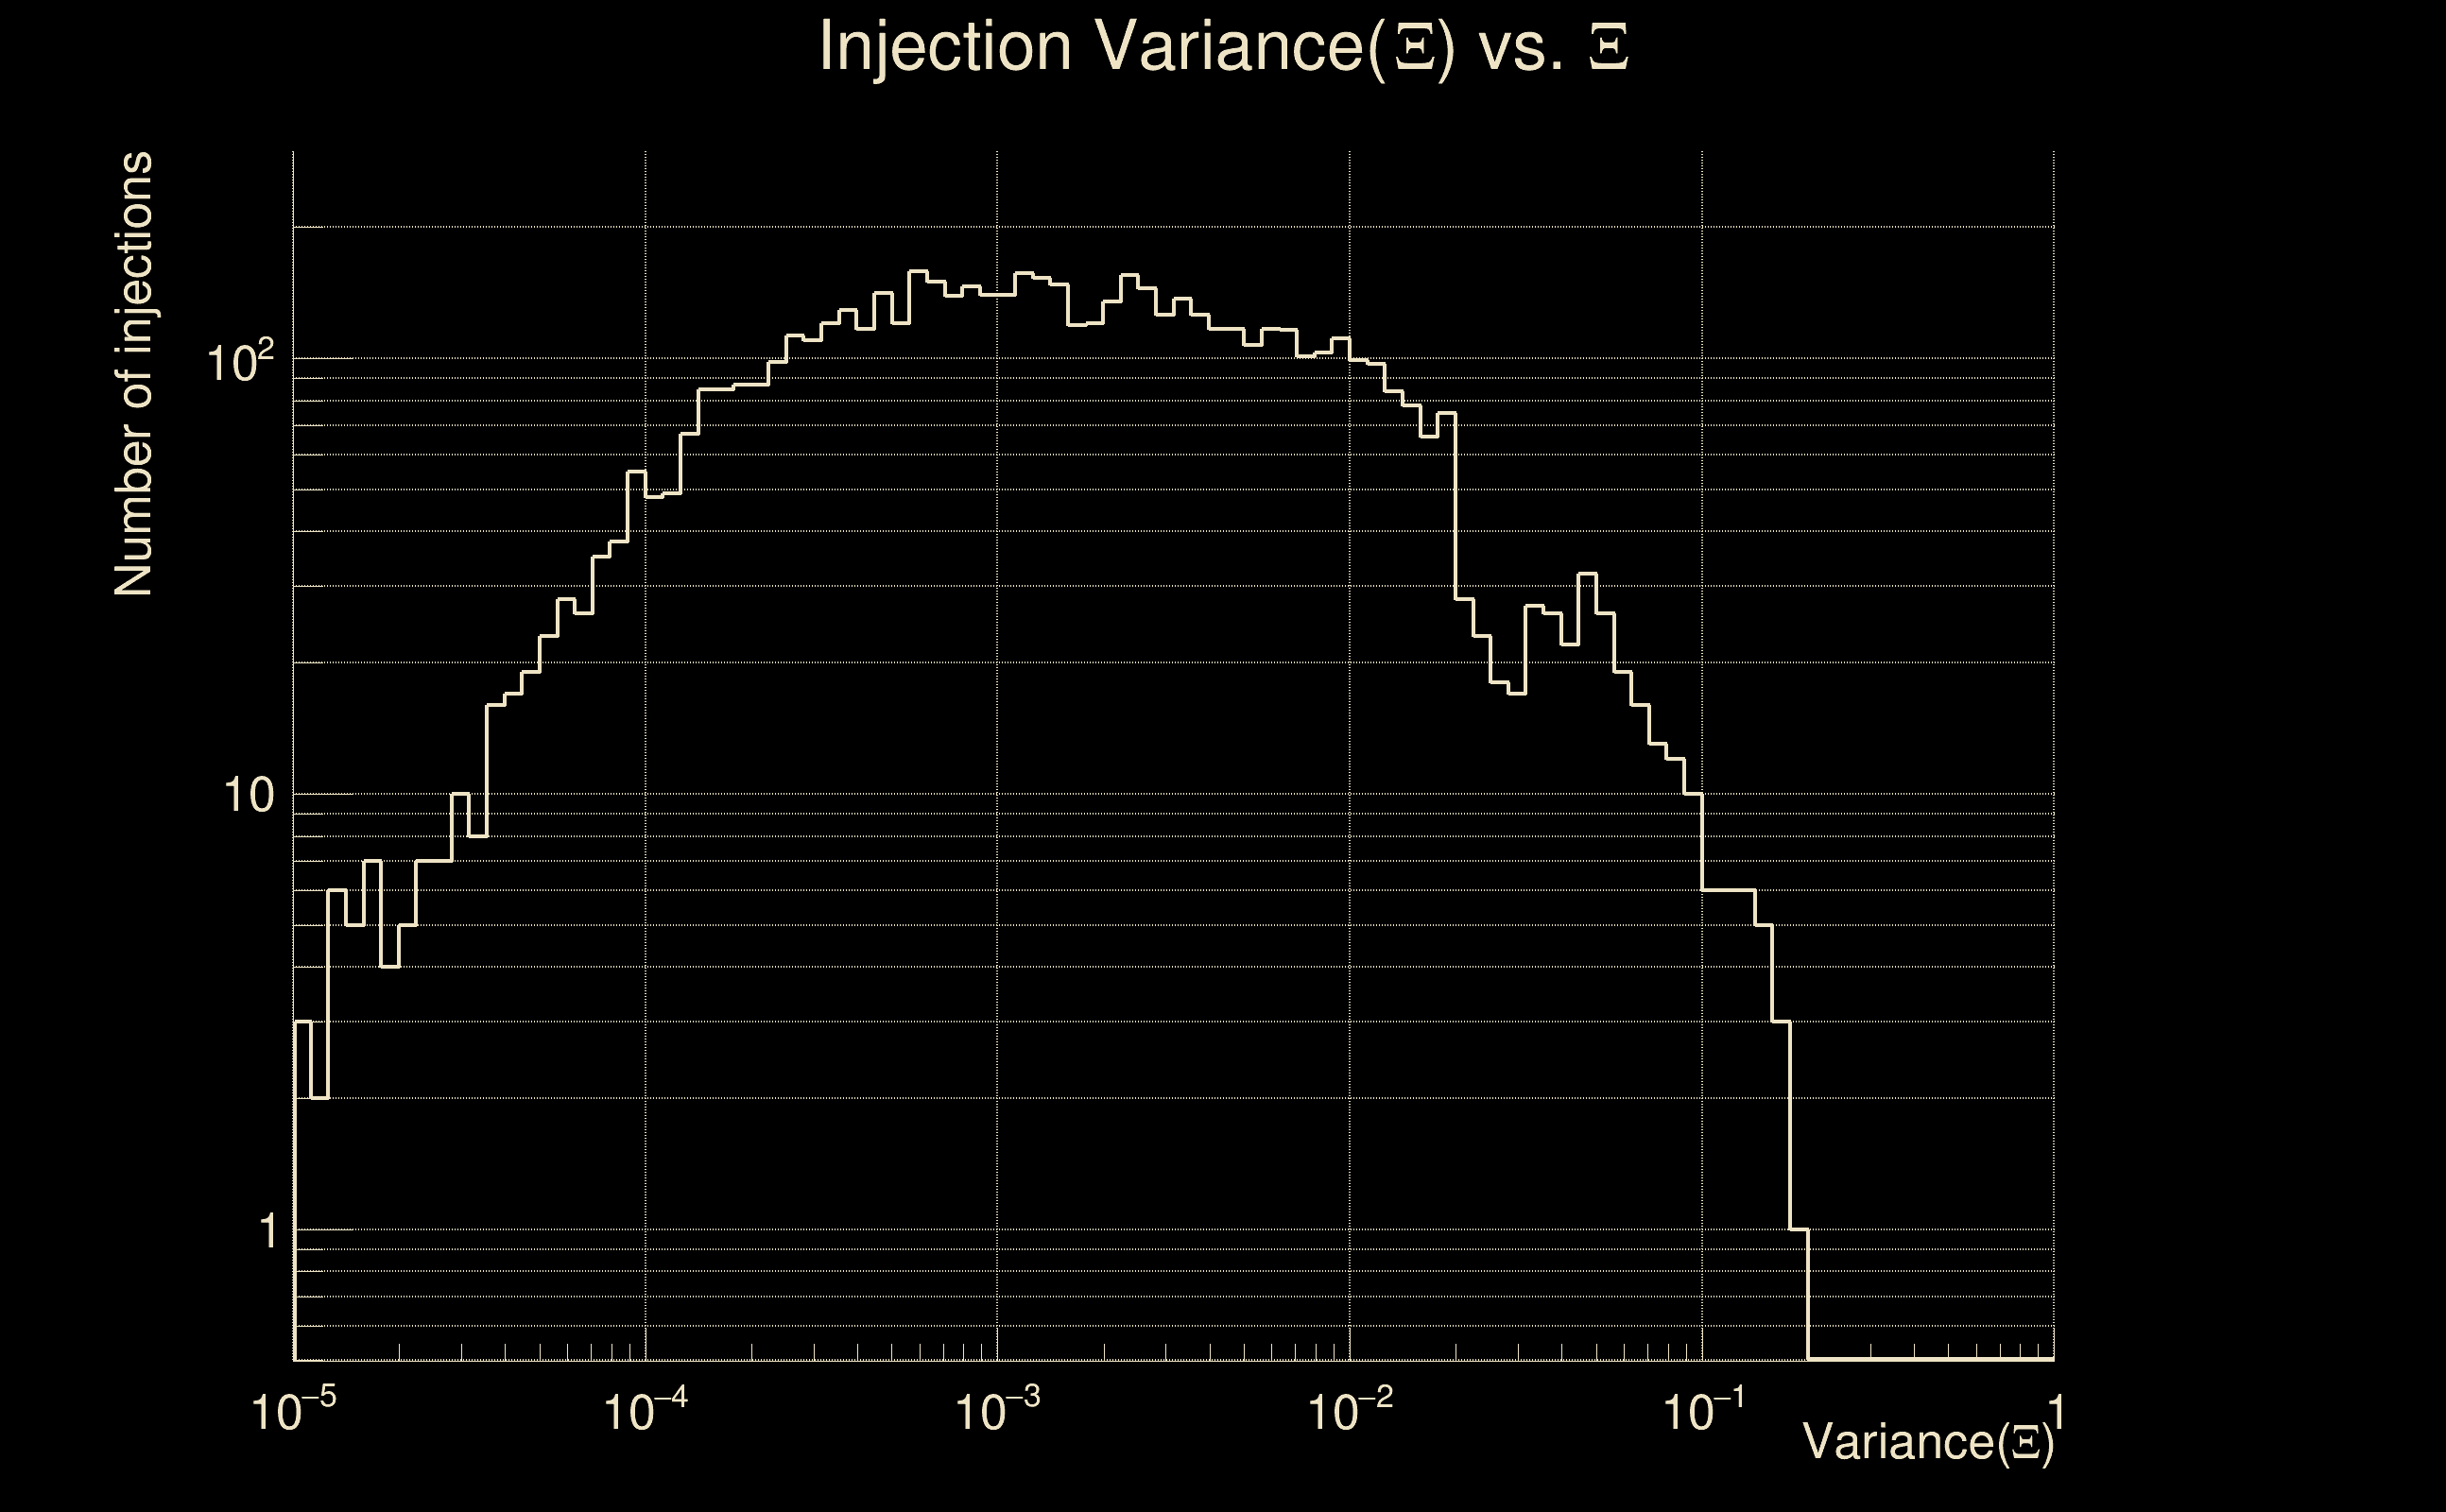
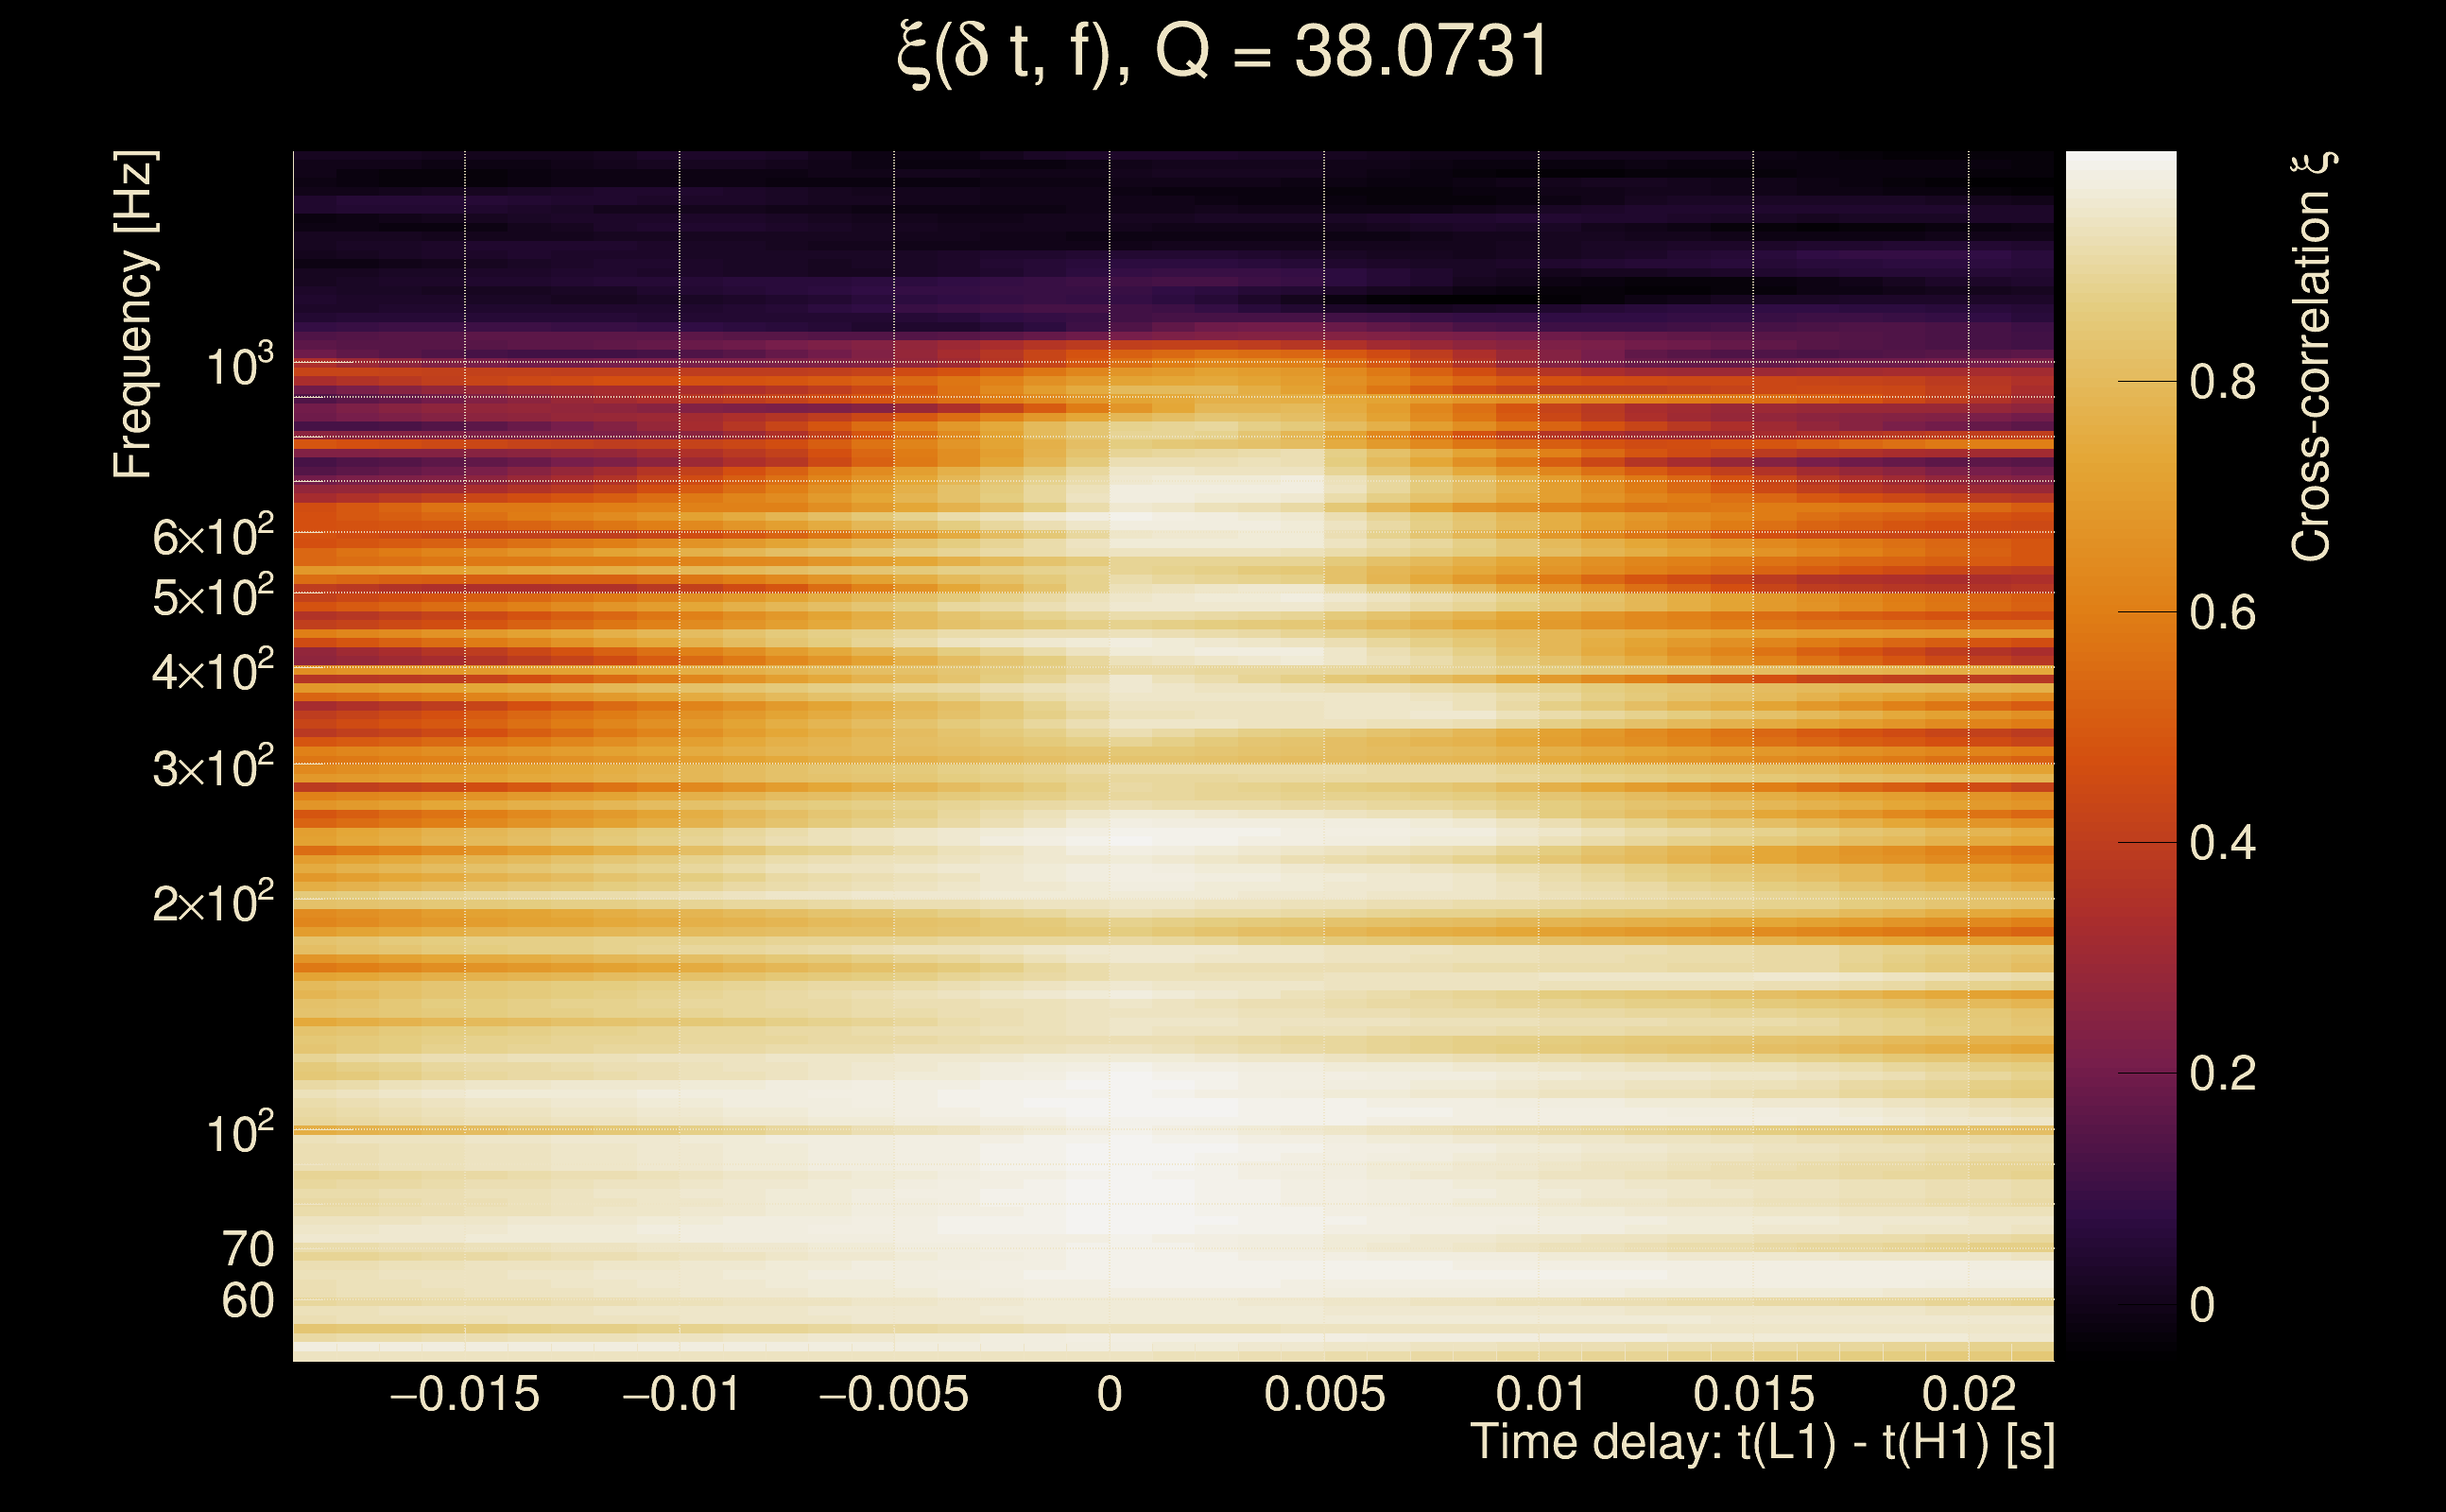
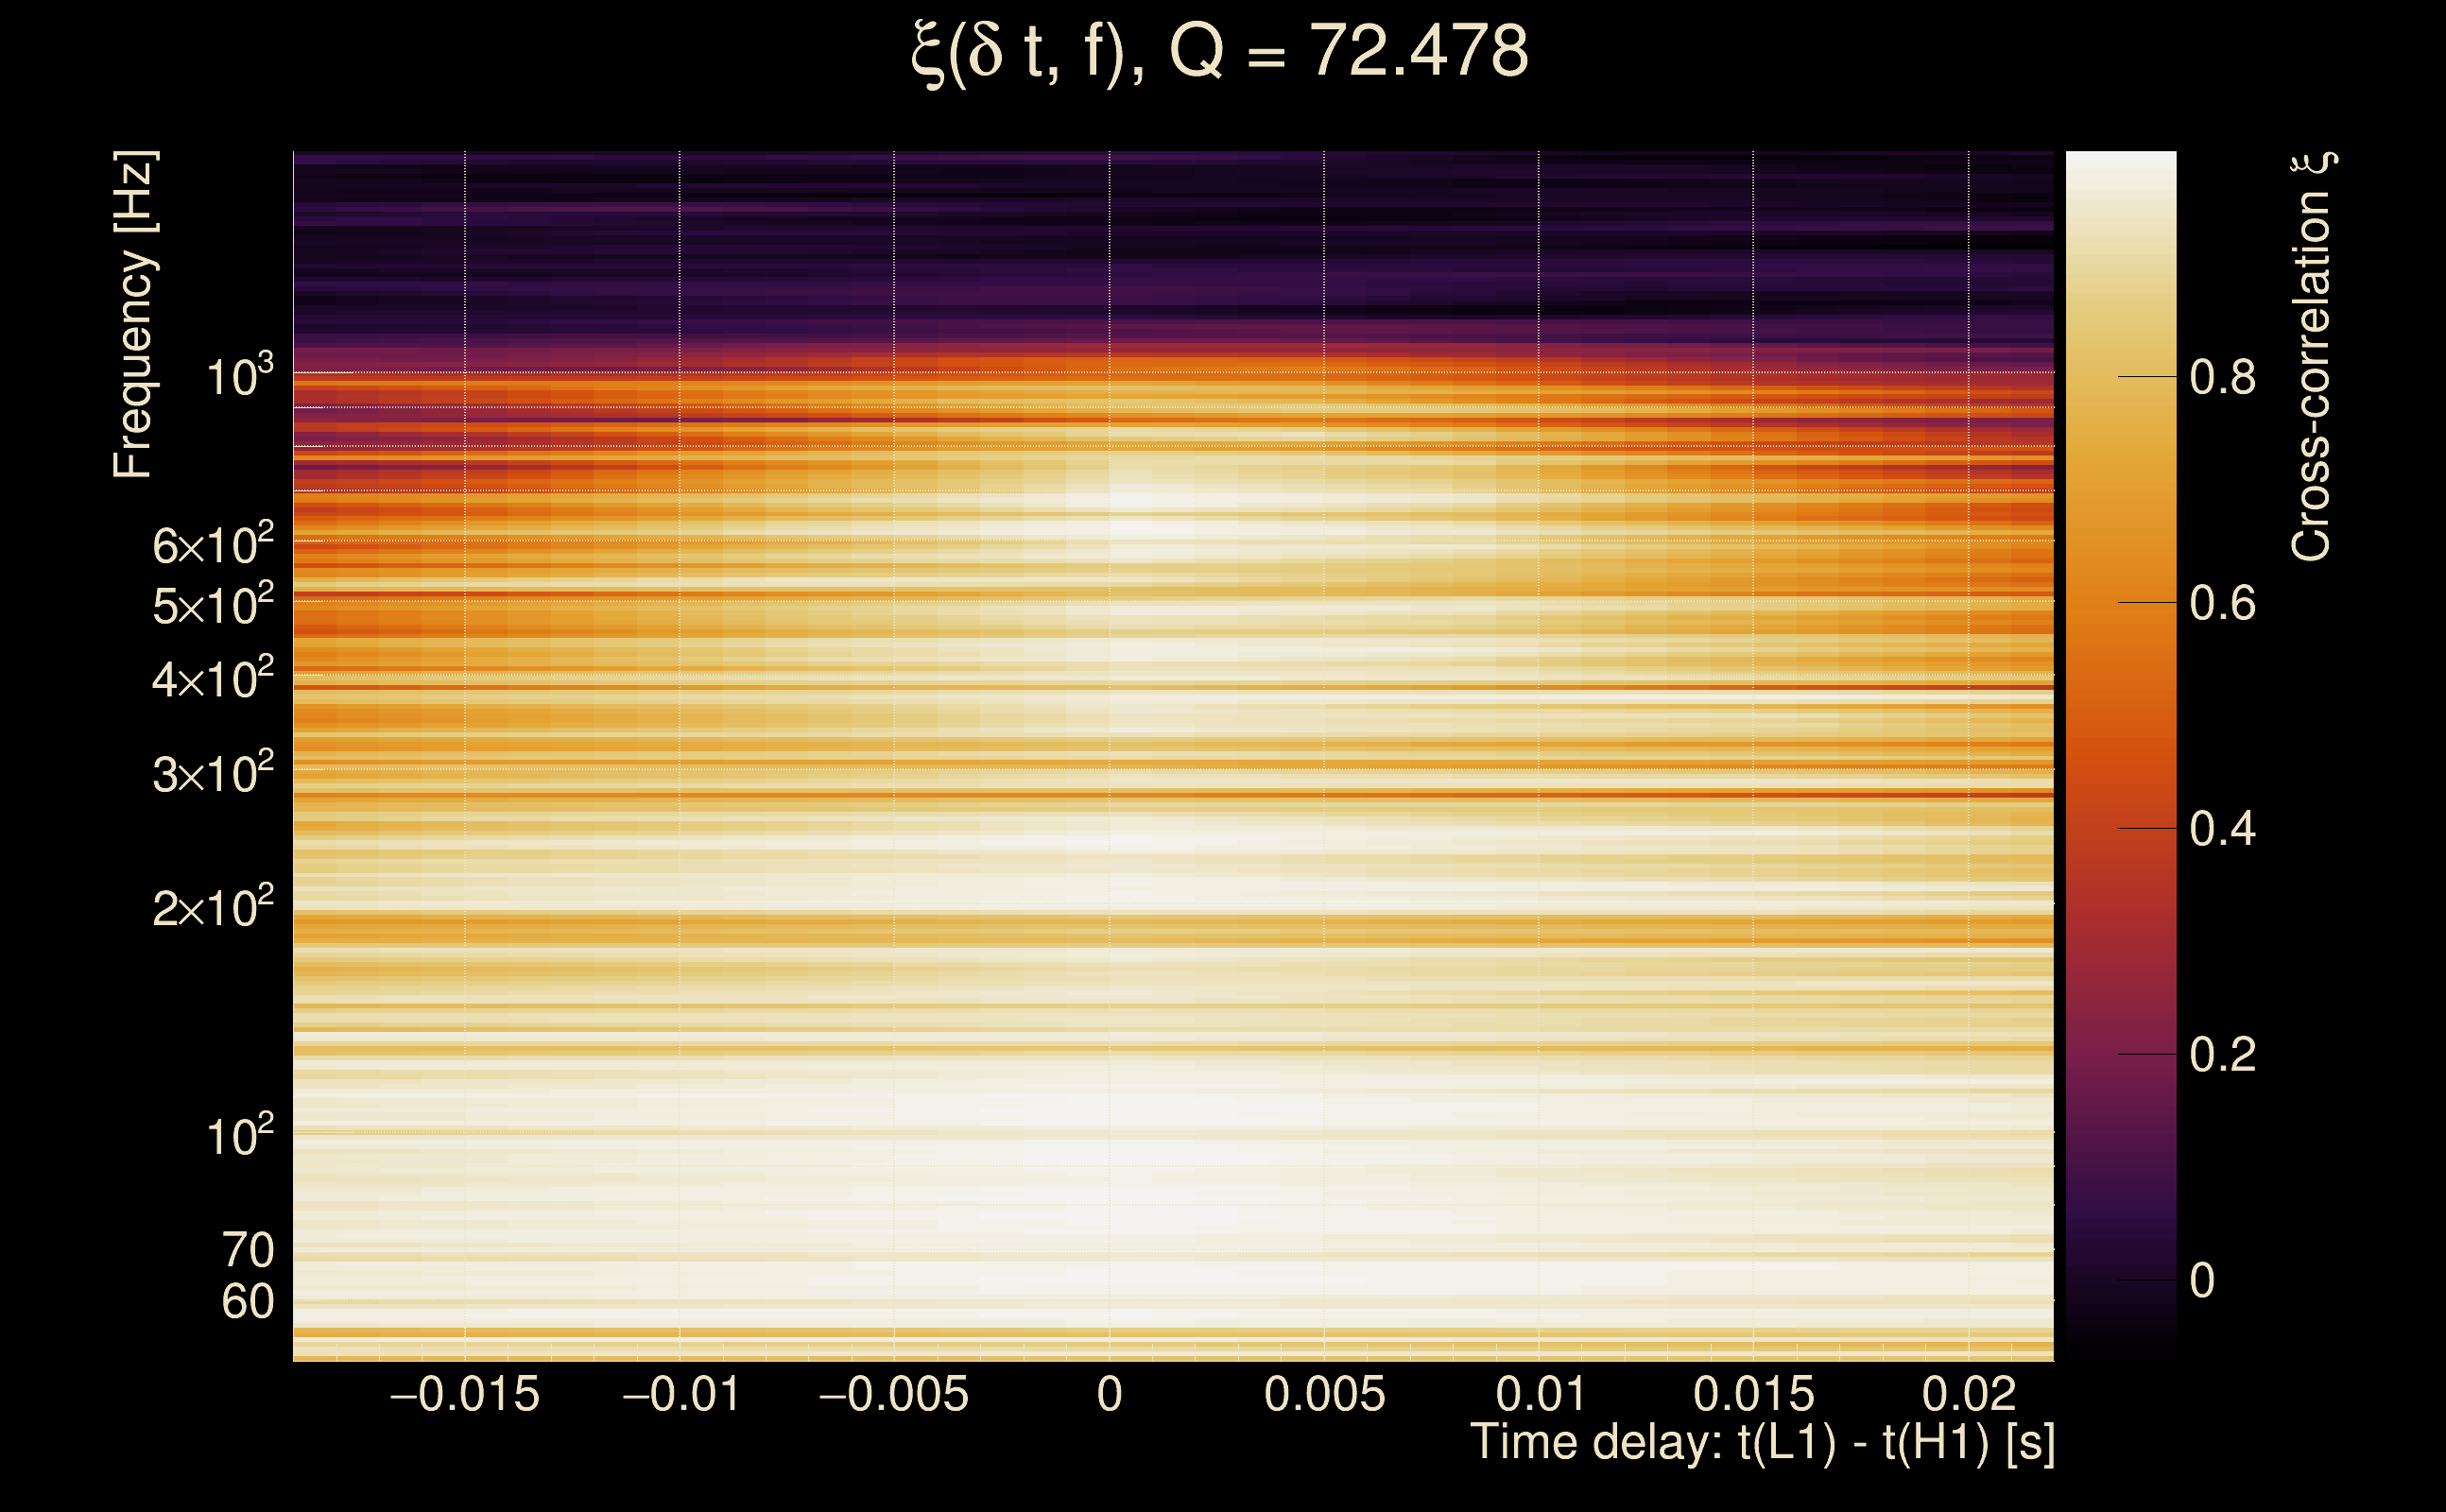
| Ξ: | 0.916233 ± 0.00707533 (variance = 5.00603e-05): Q0: 0.94085, Q1: 0.928355, Q2: 0.930098, Q3: 0.922017, Q4: 0.921207 |
| Rank: | R_A = 0.916233 |
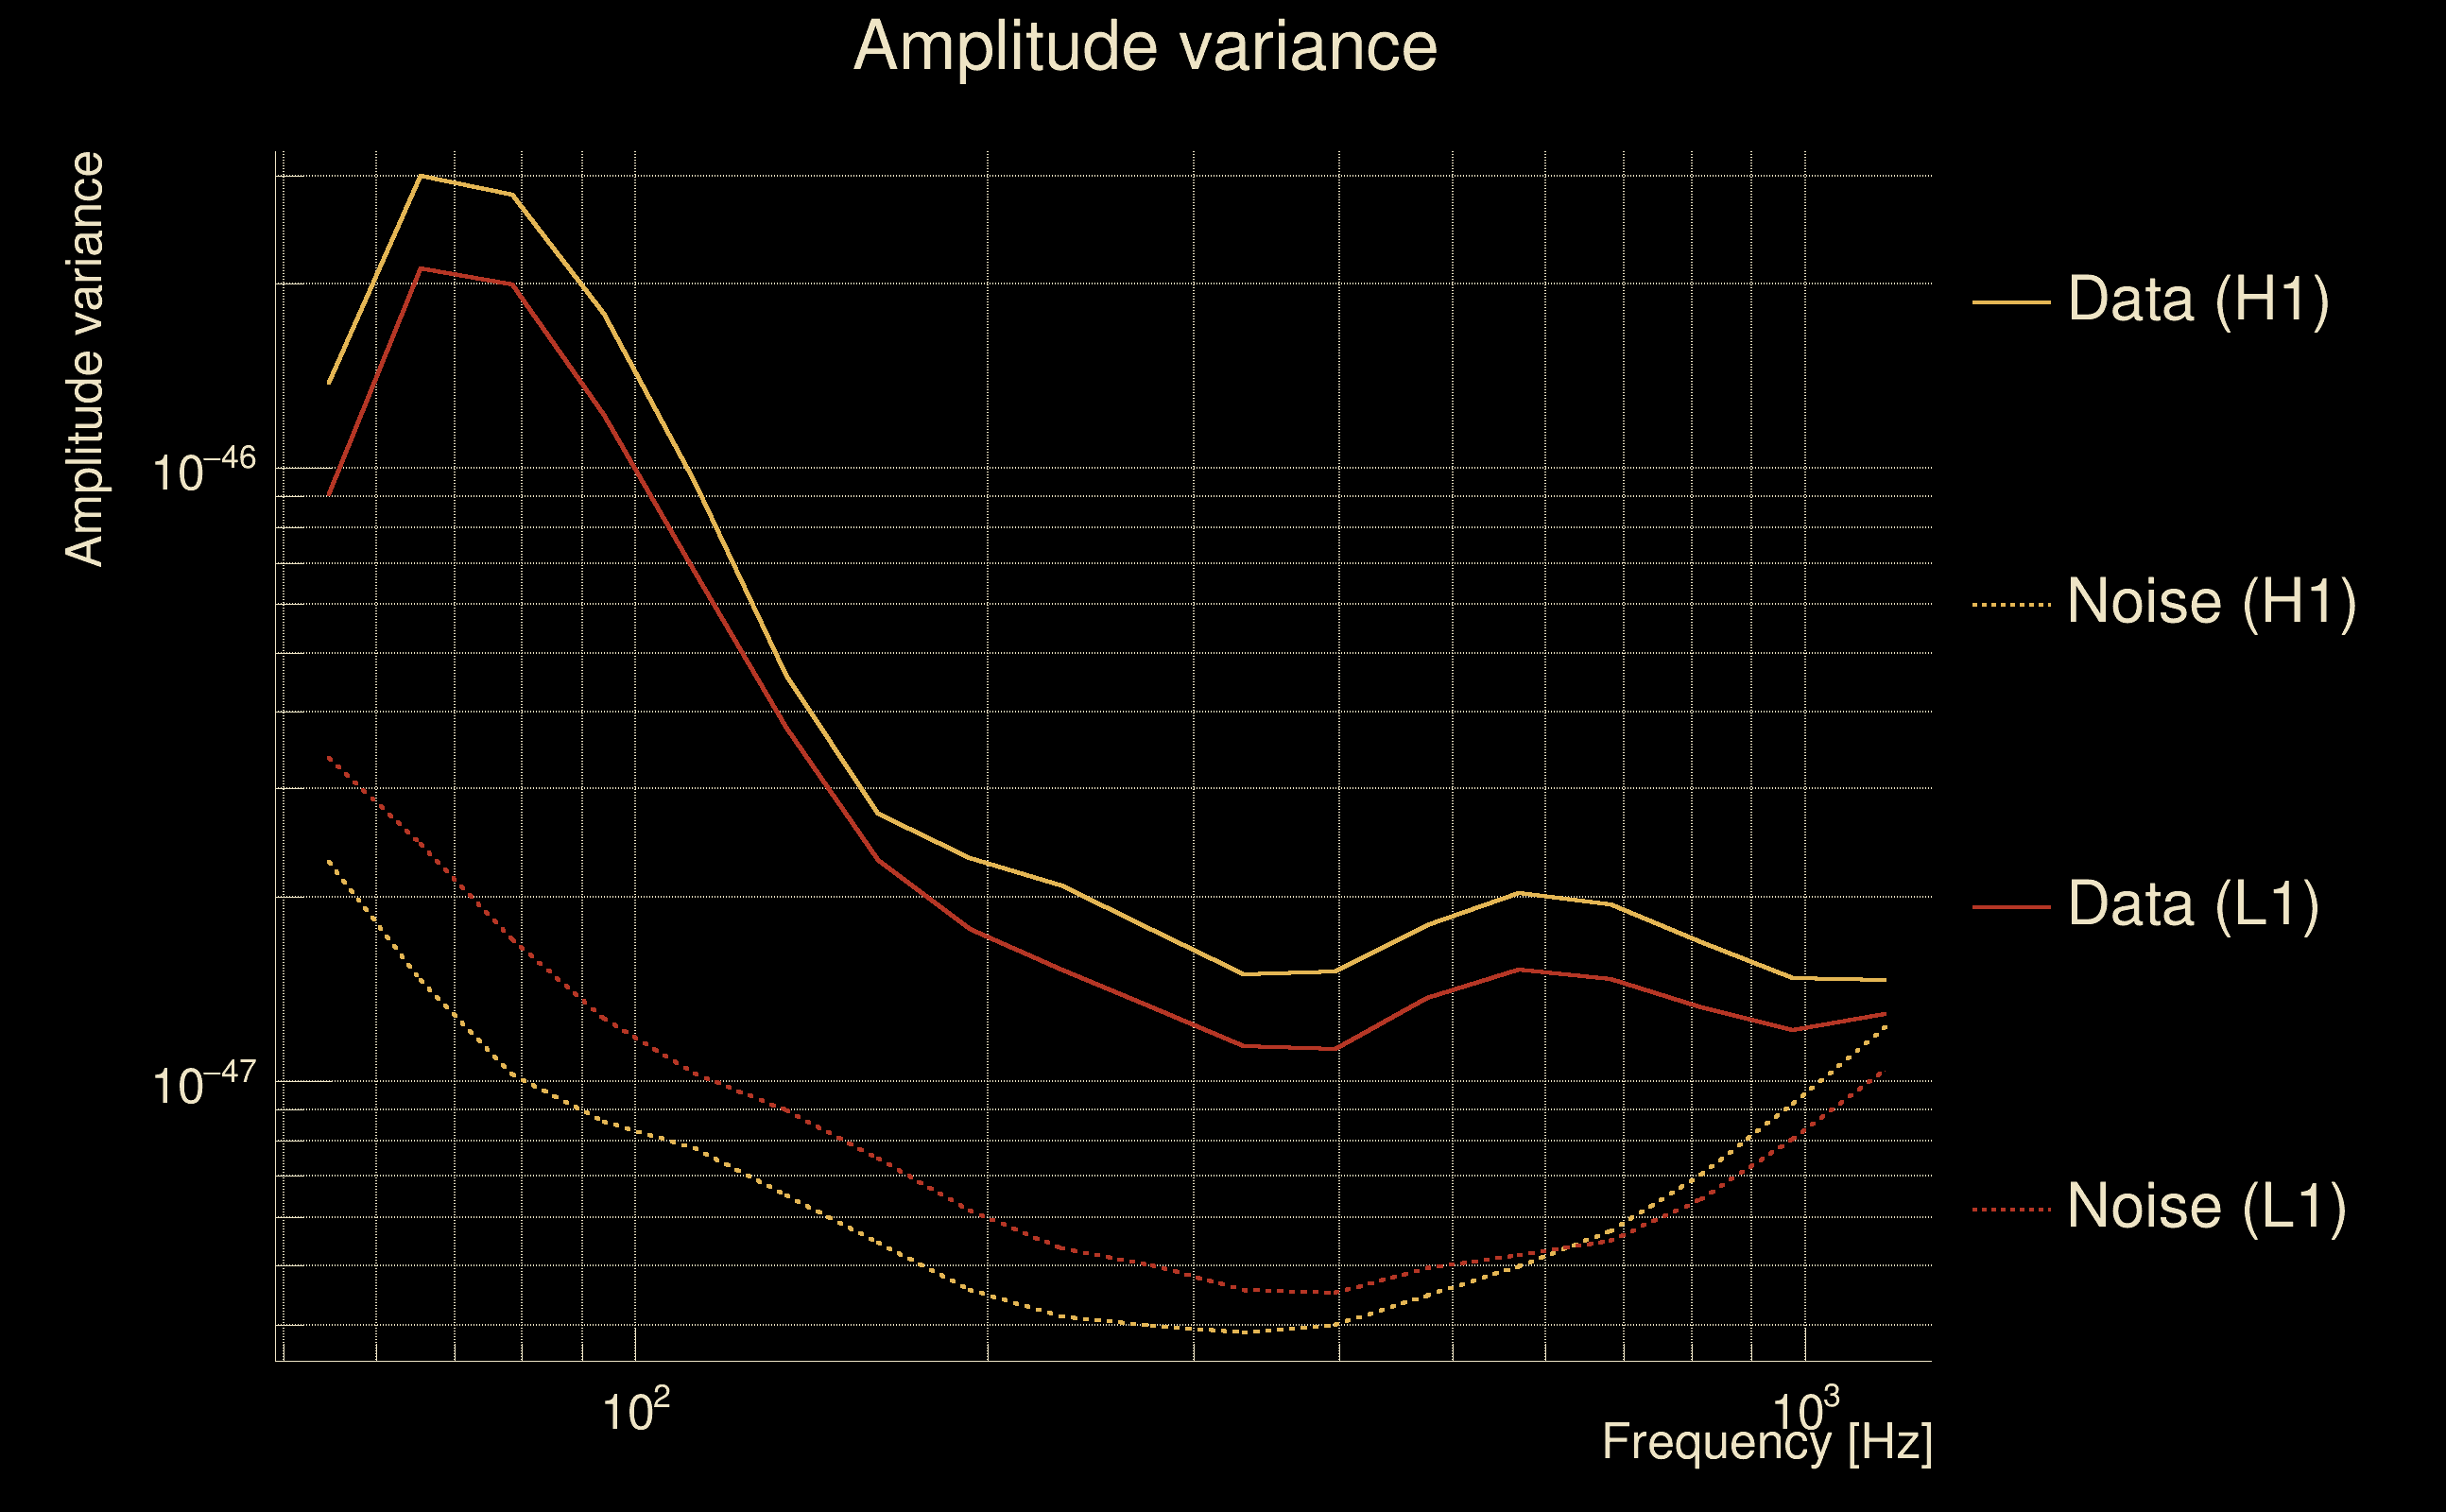
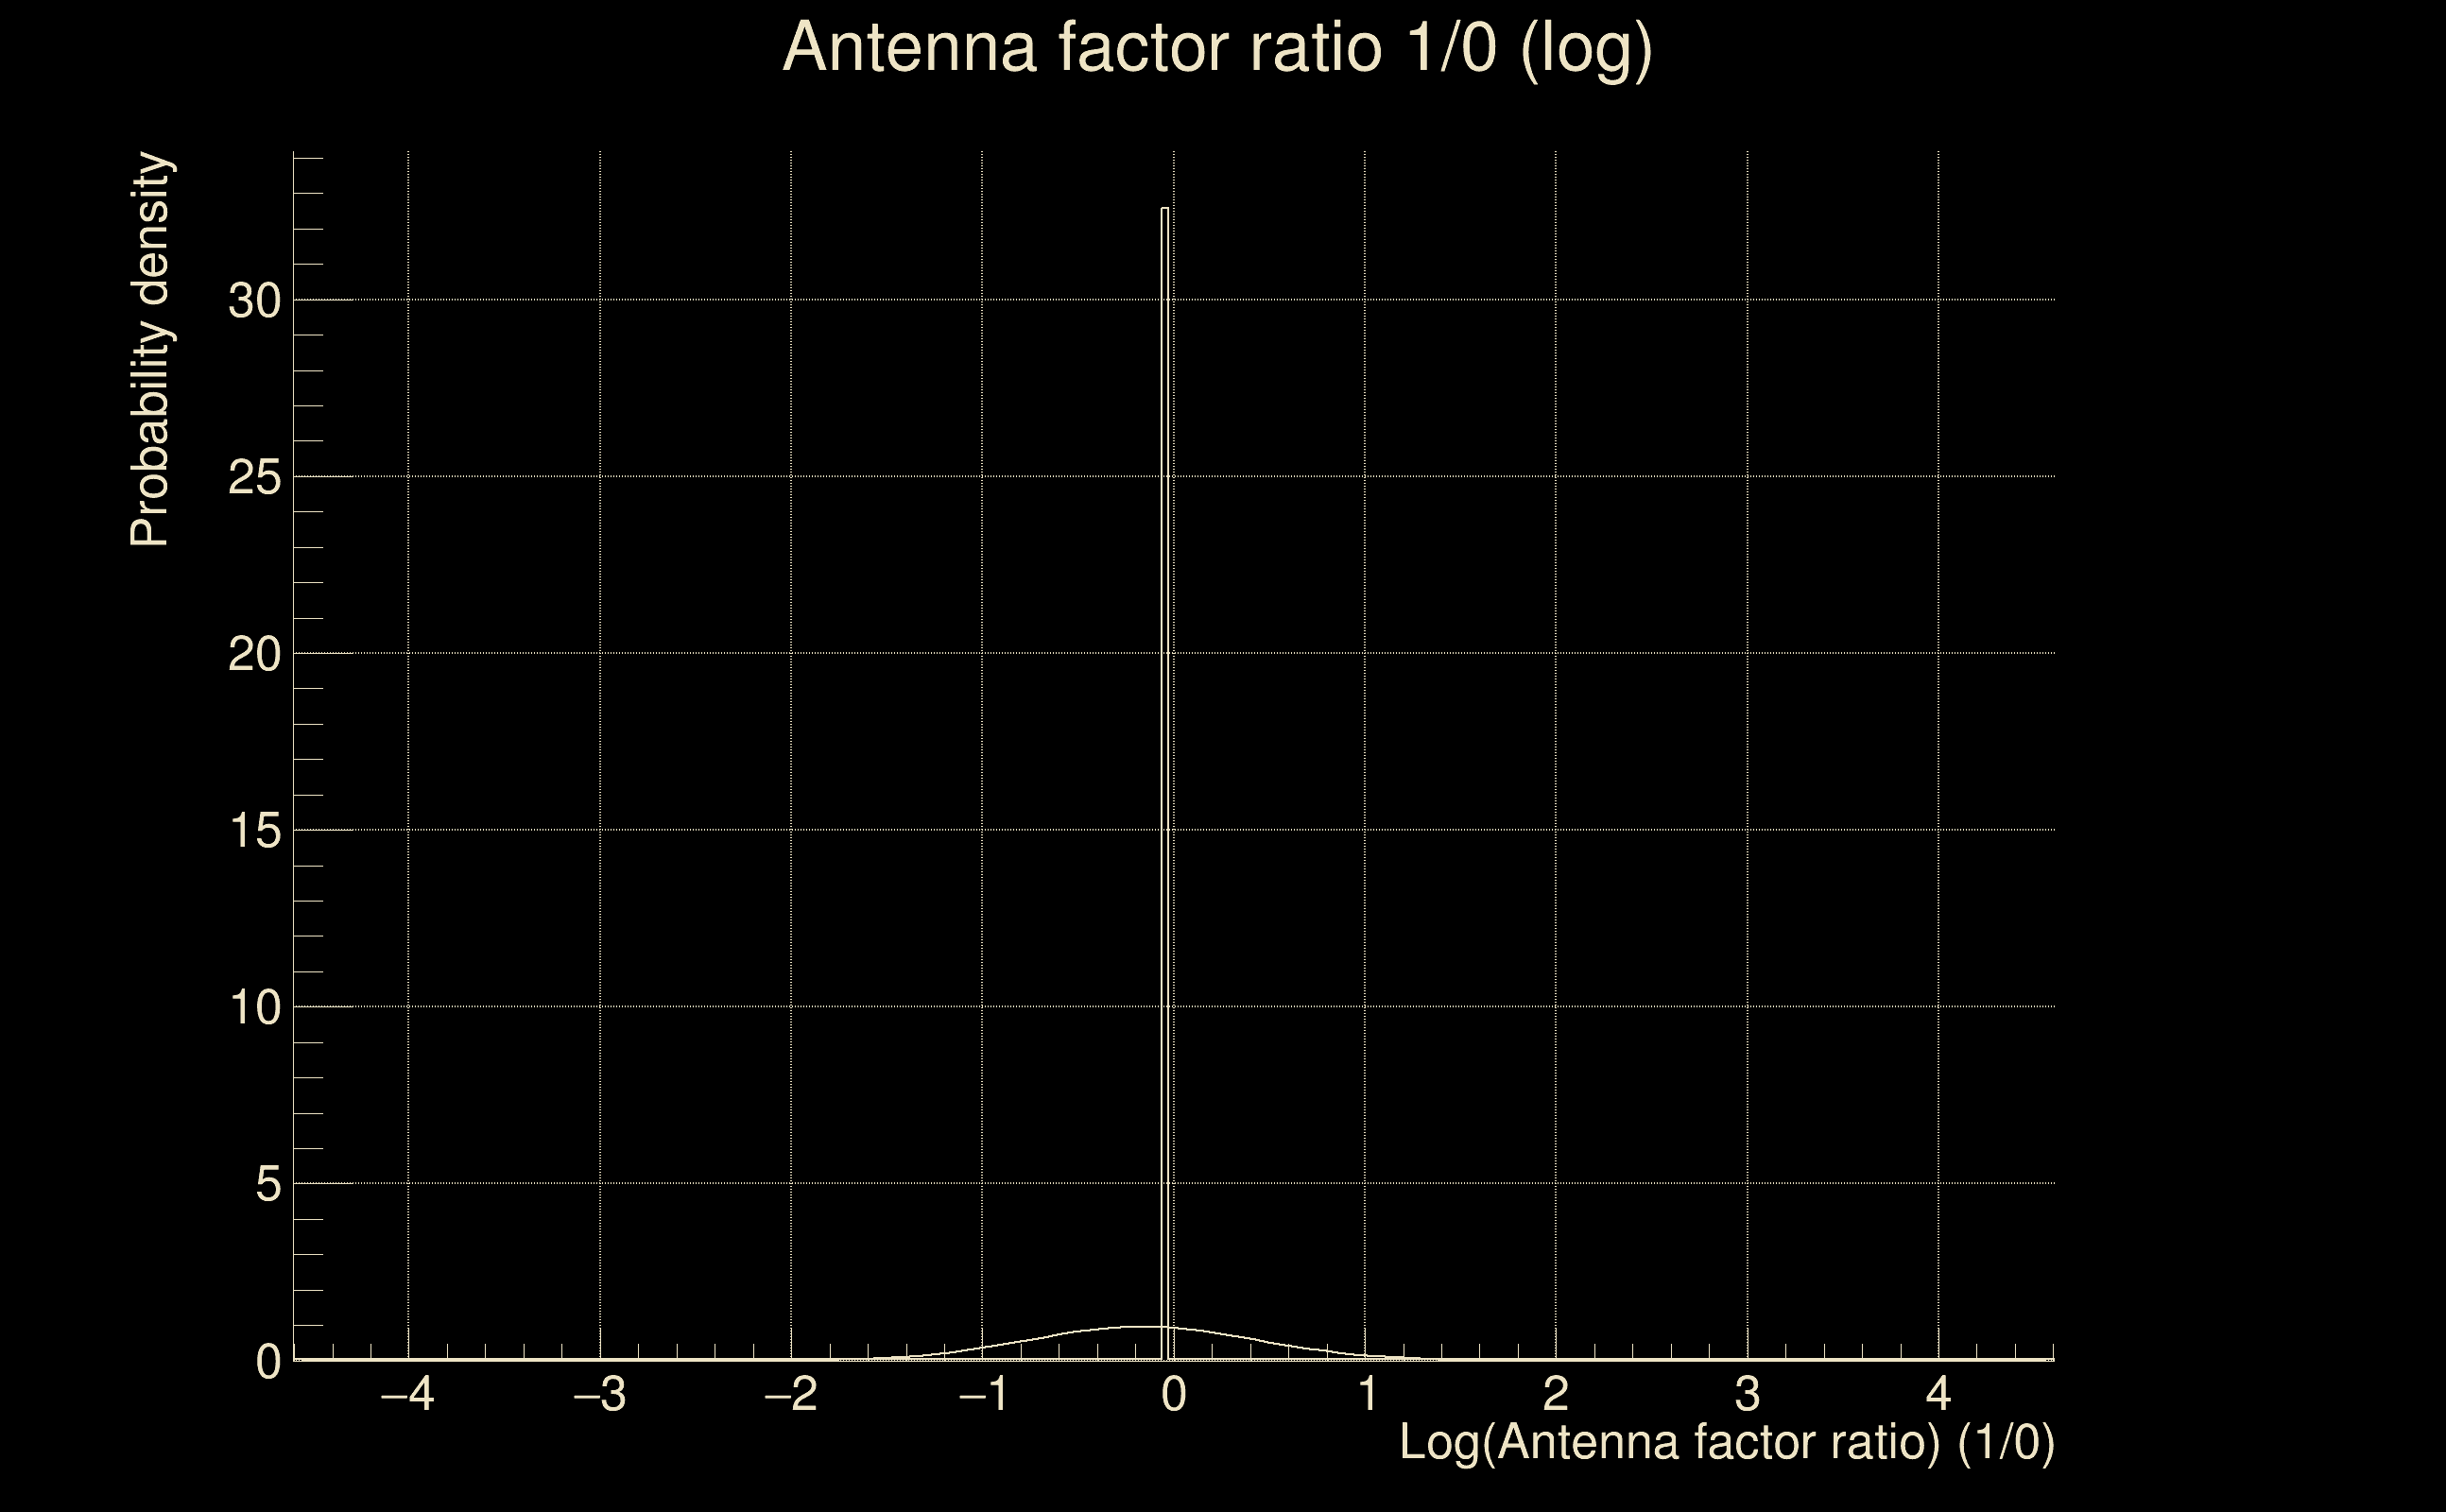
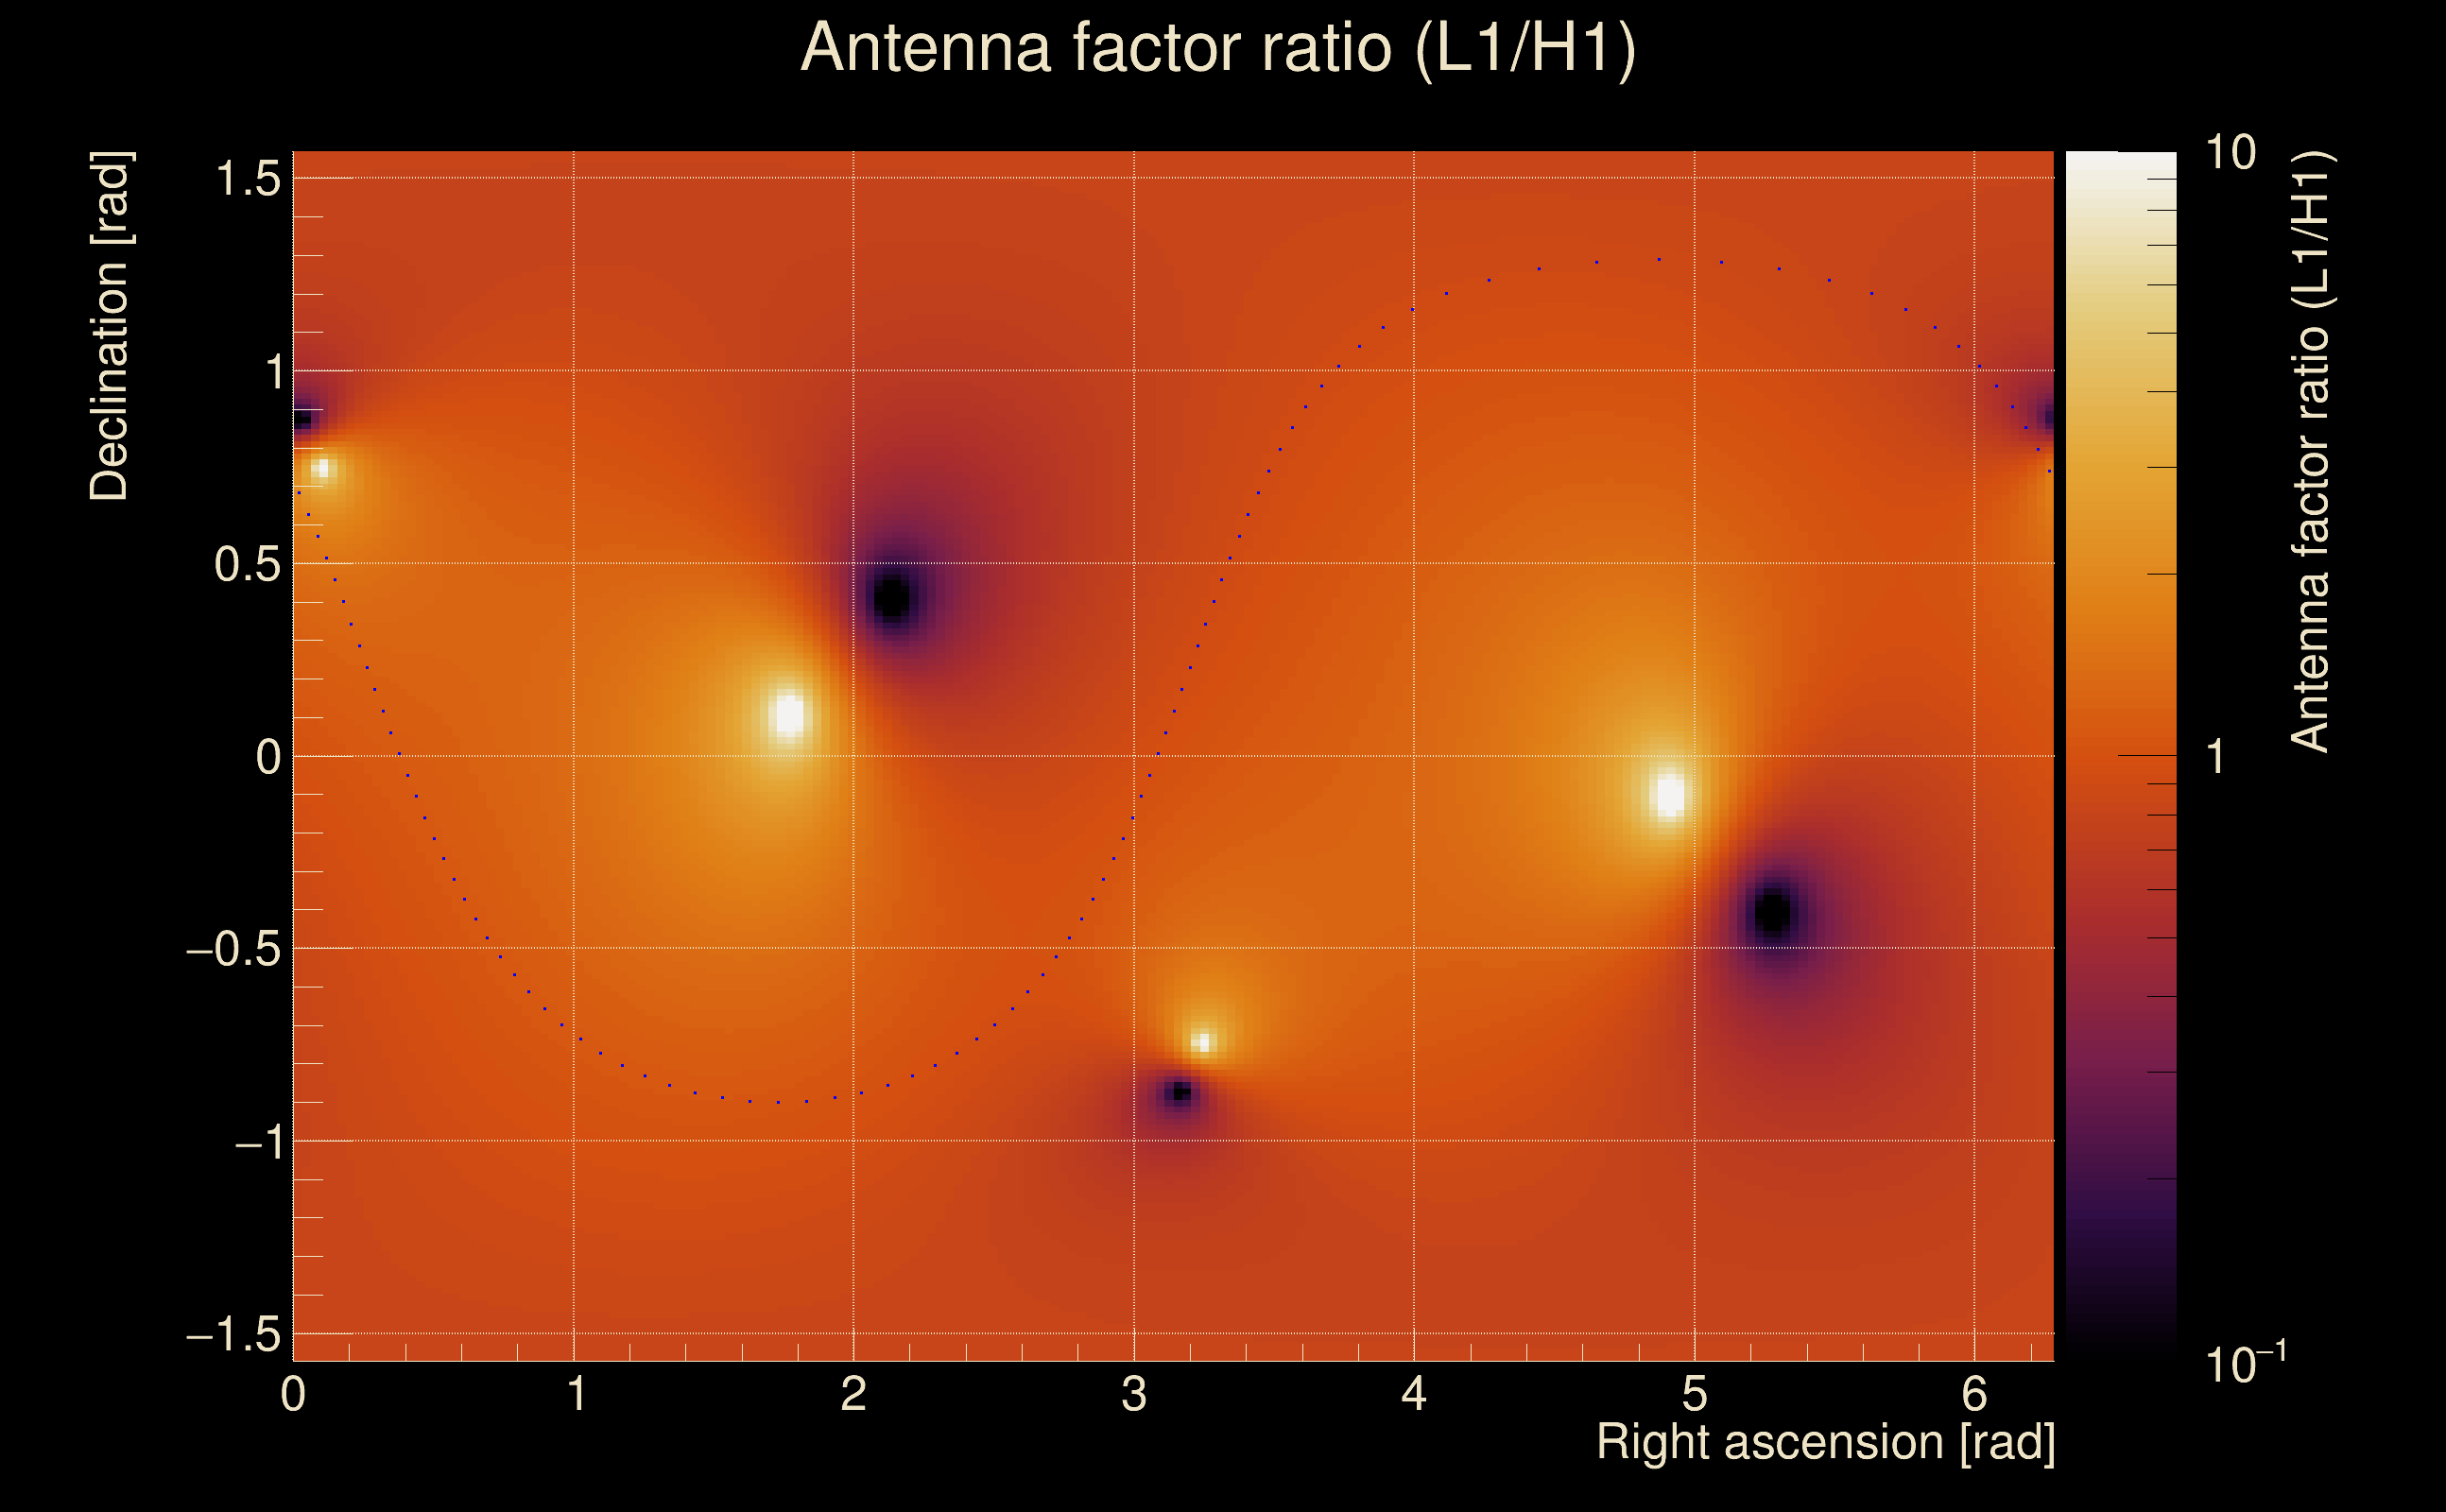
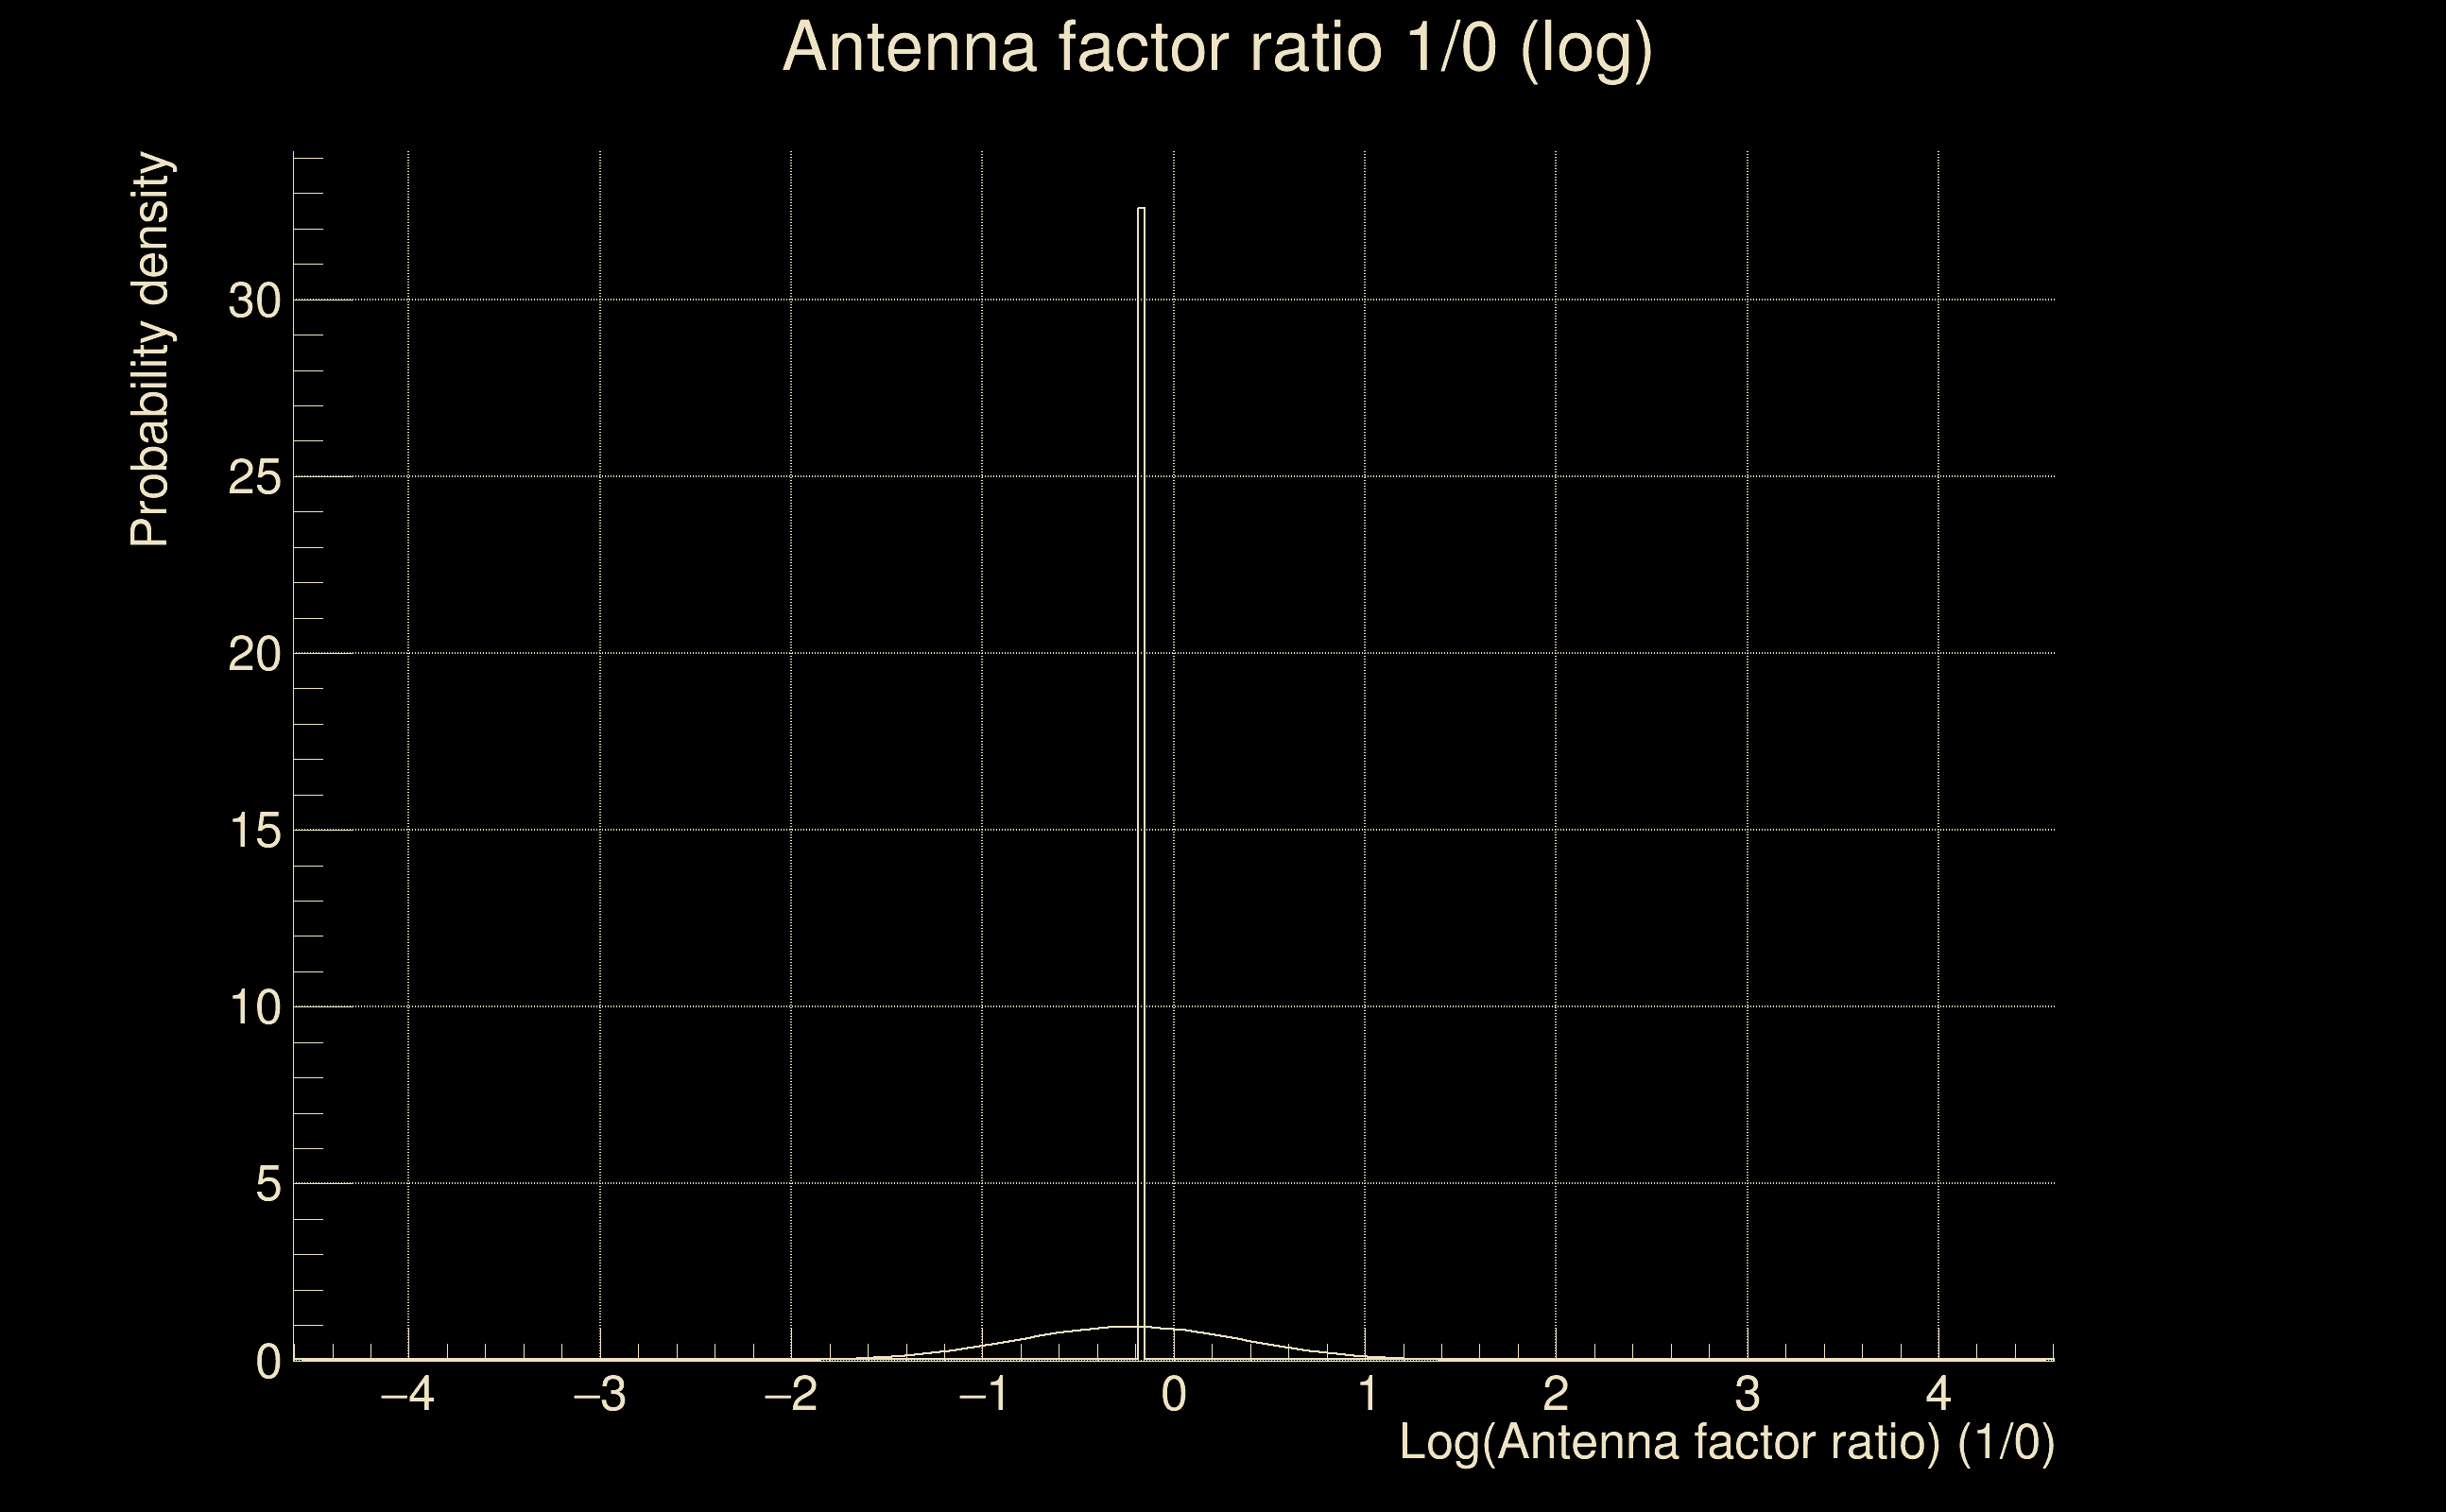
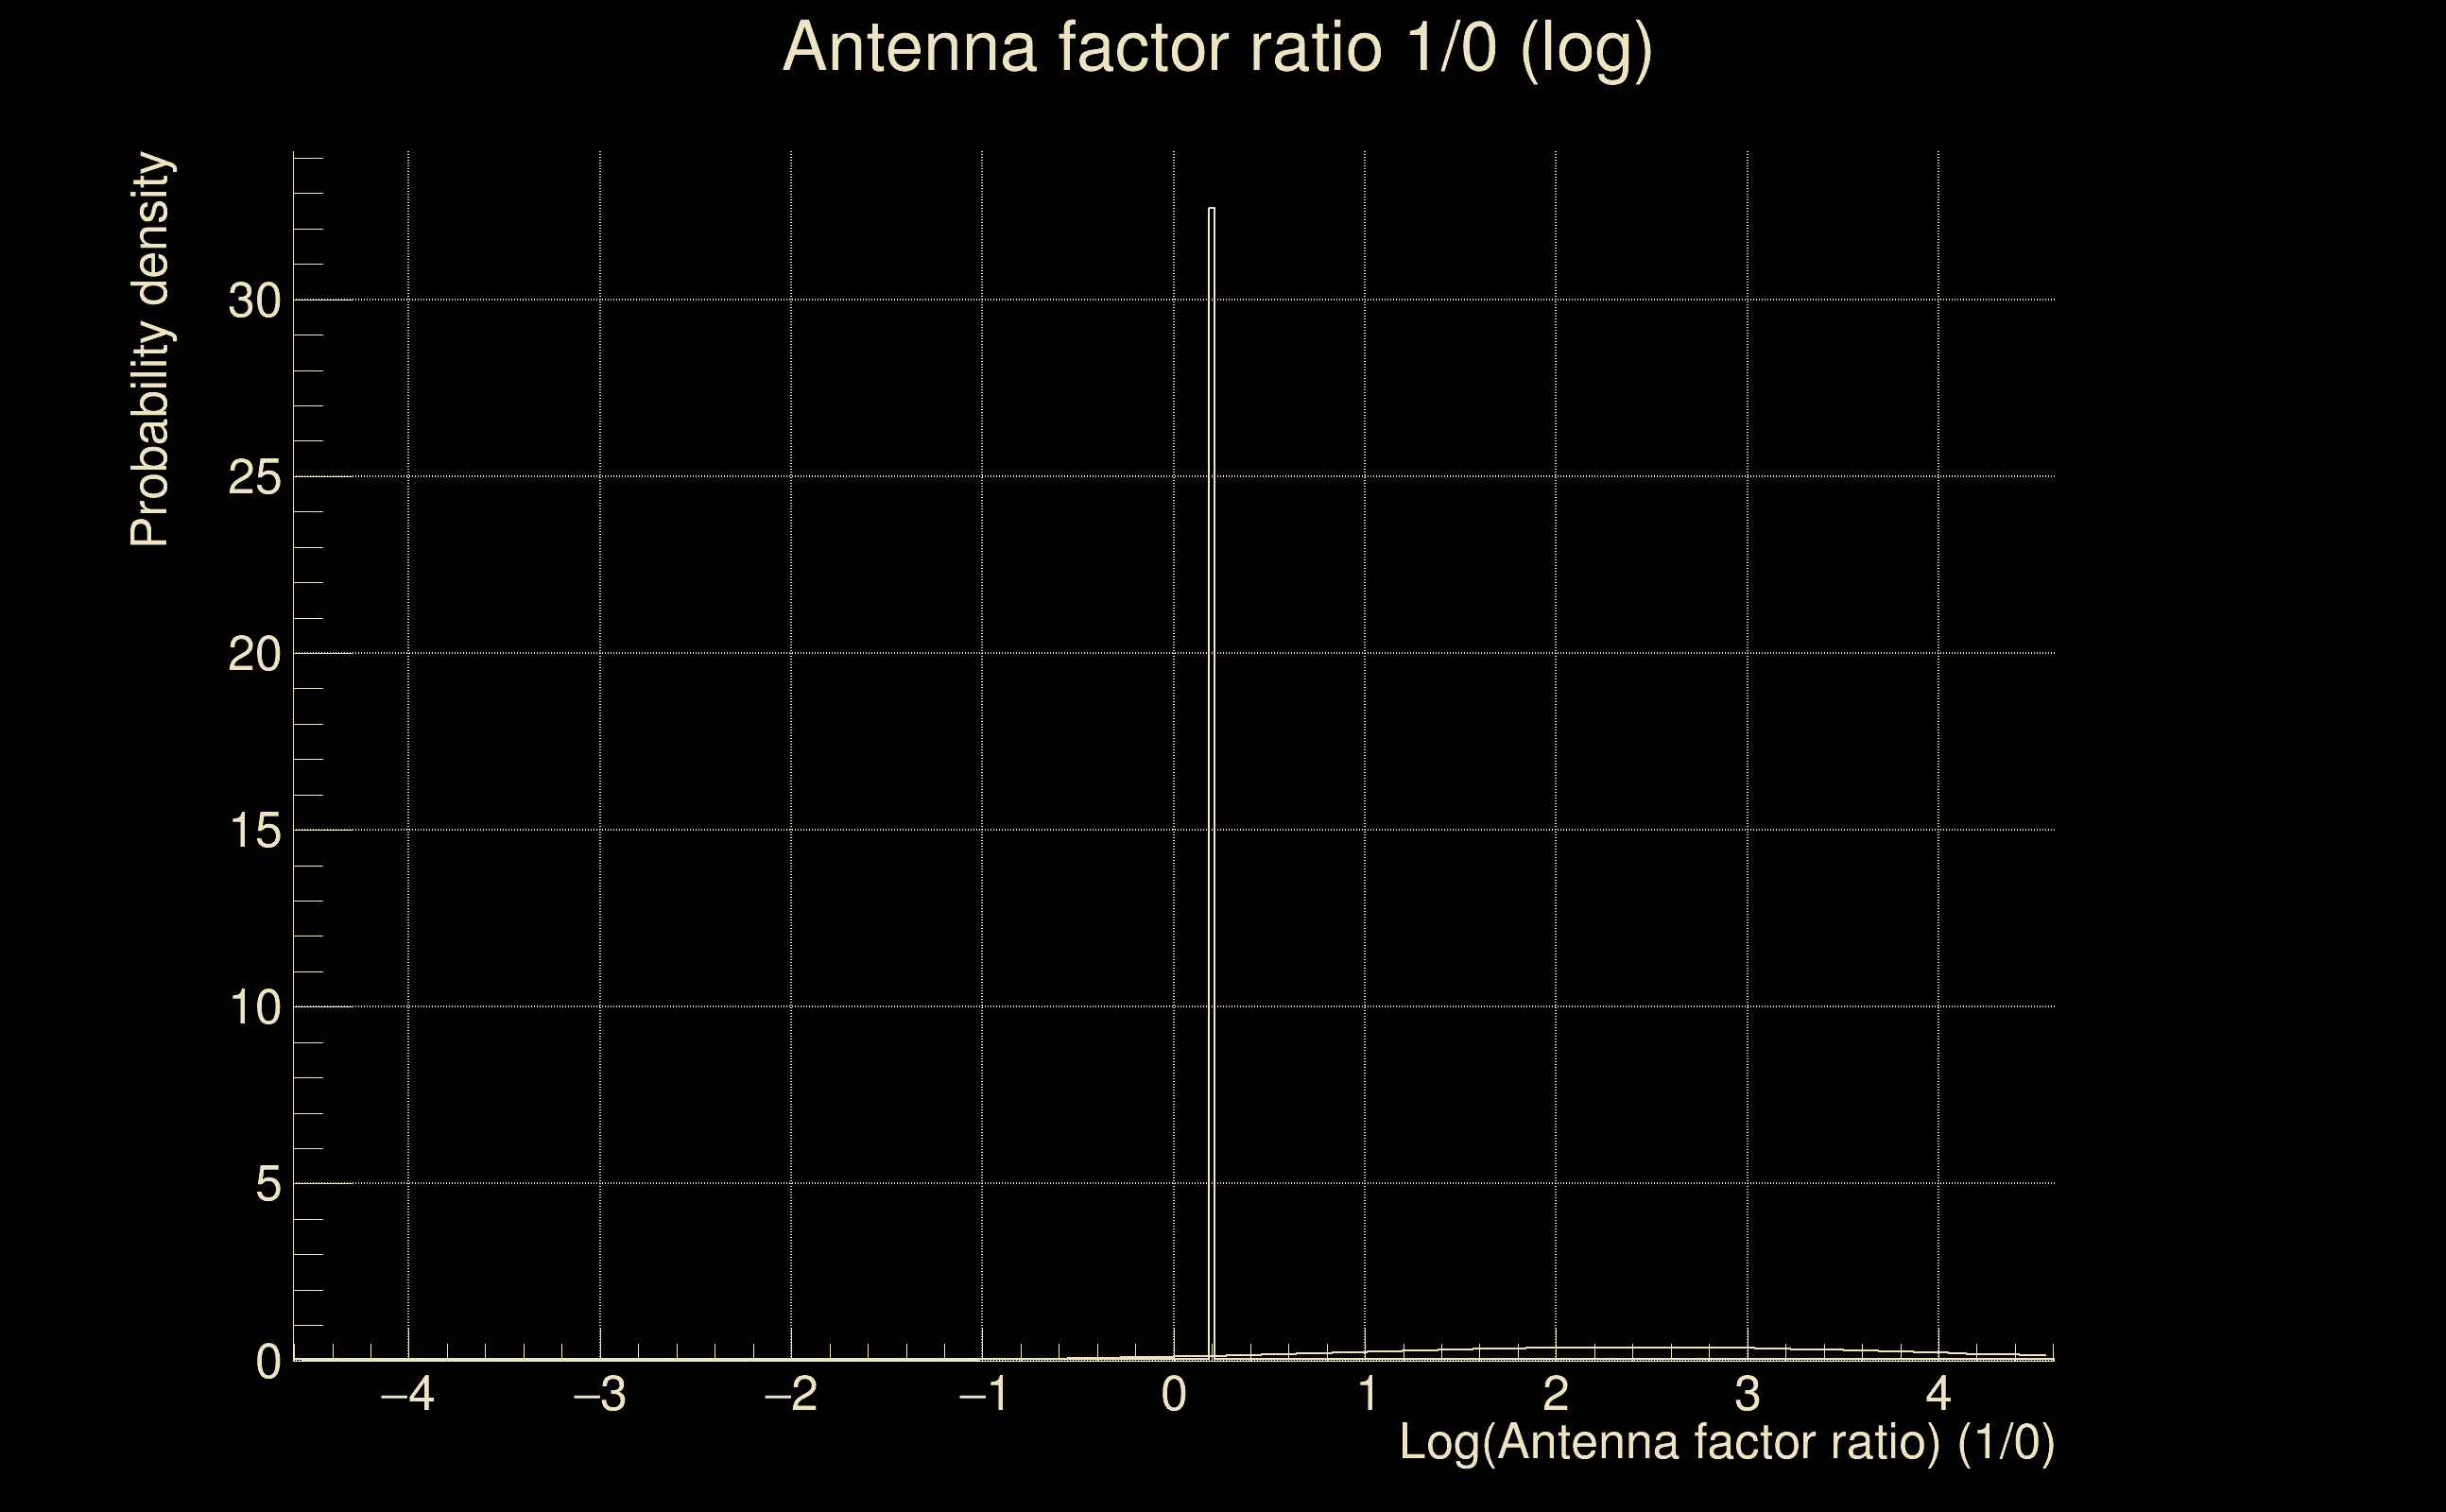
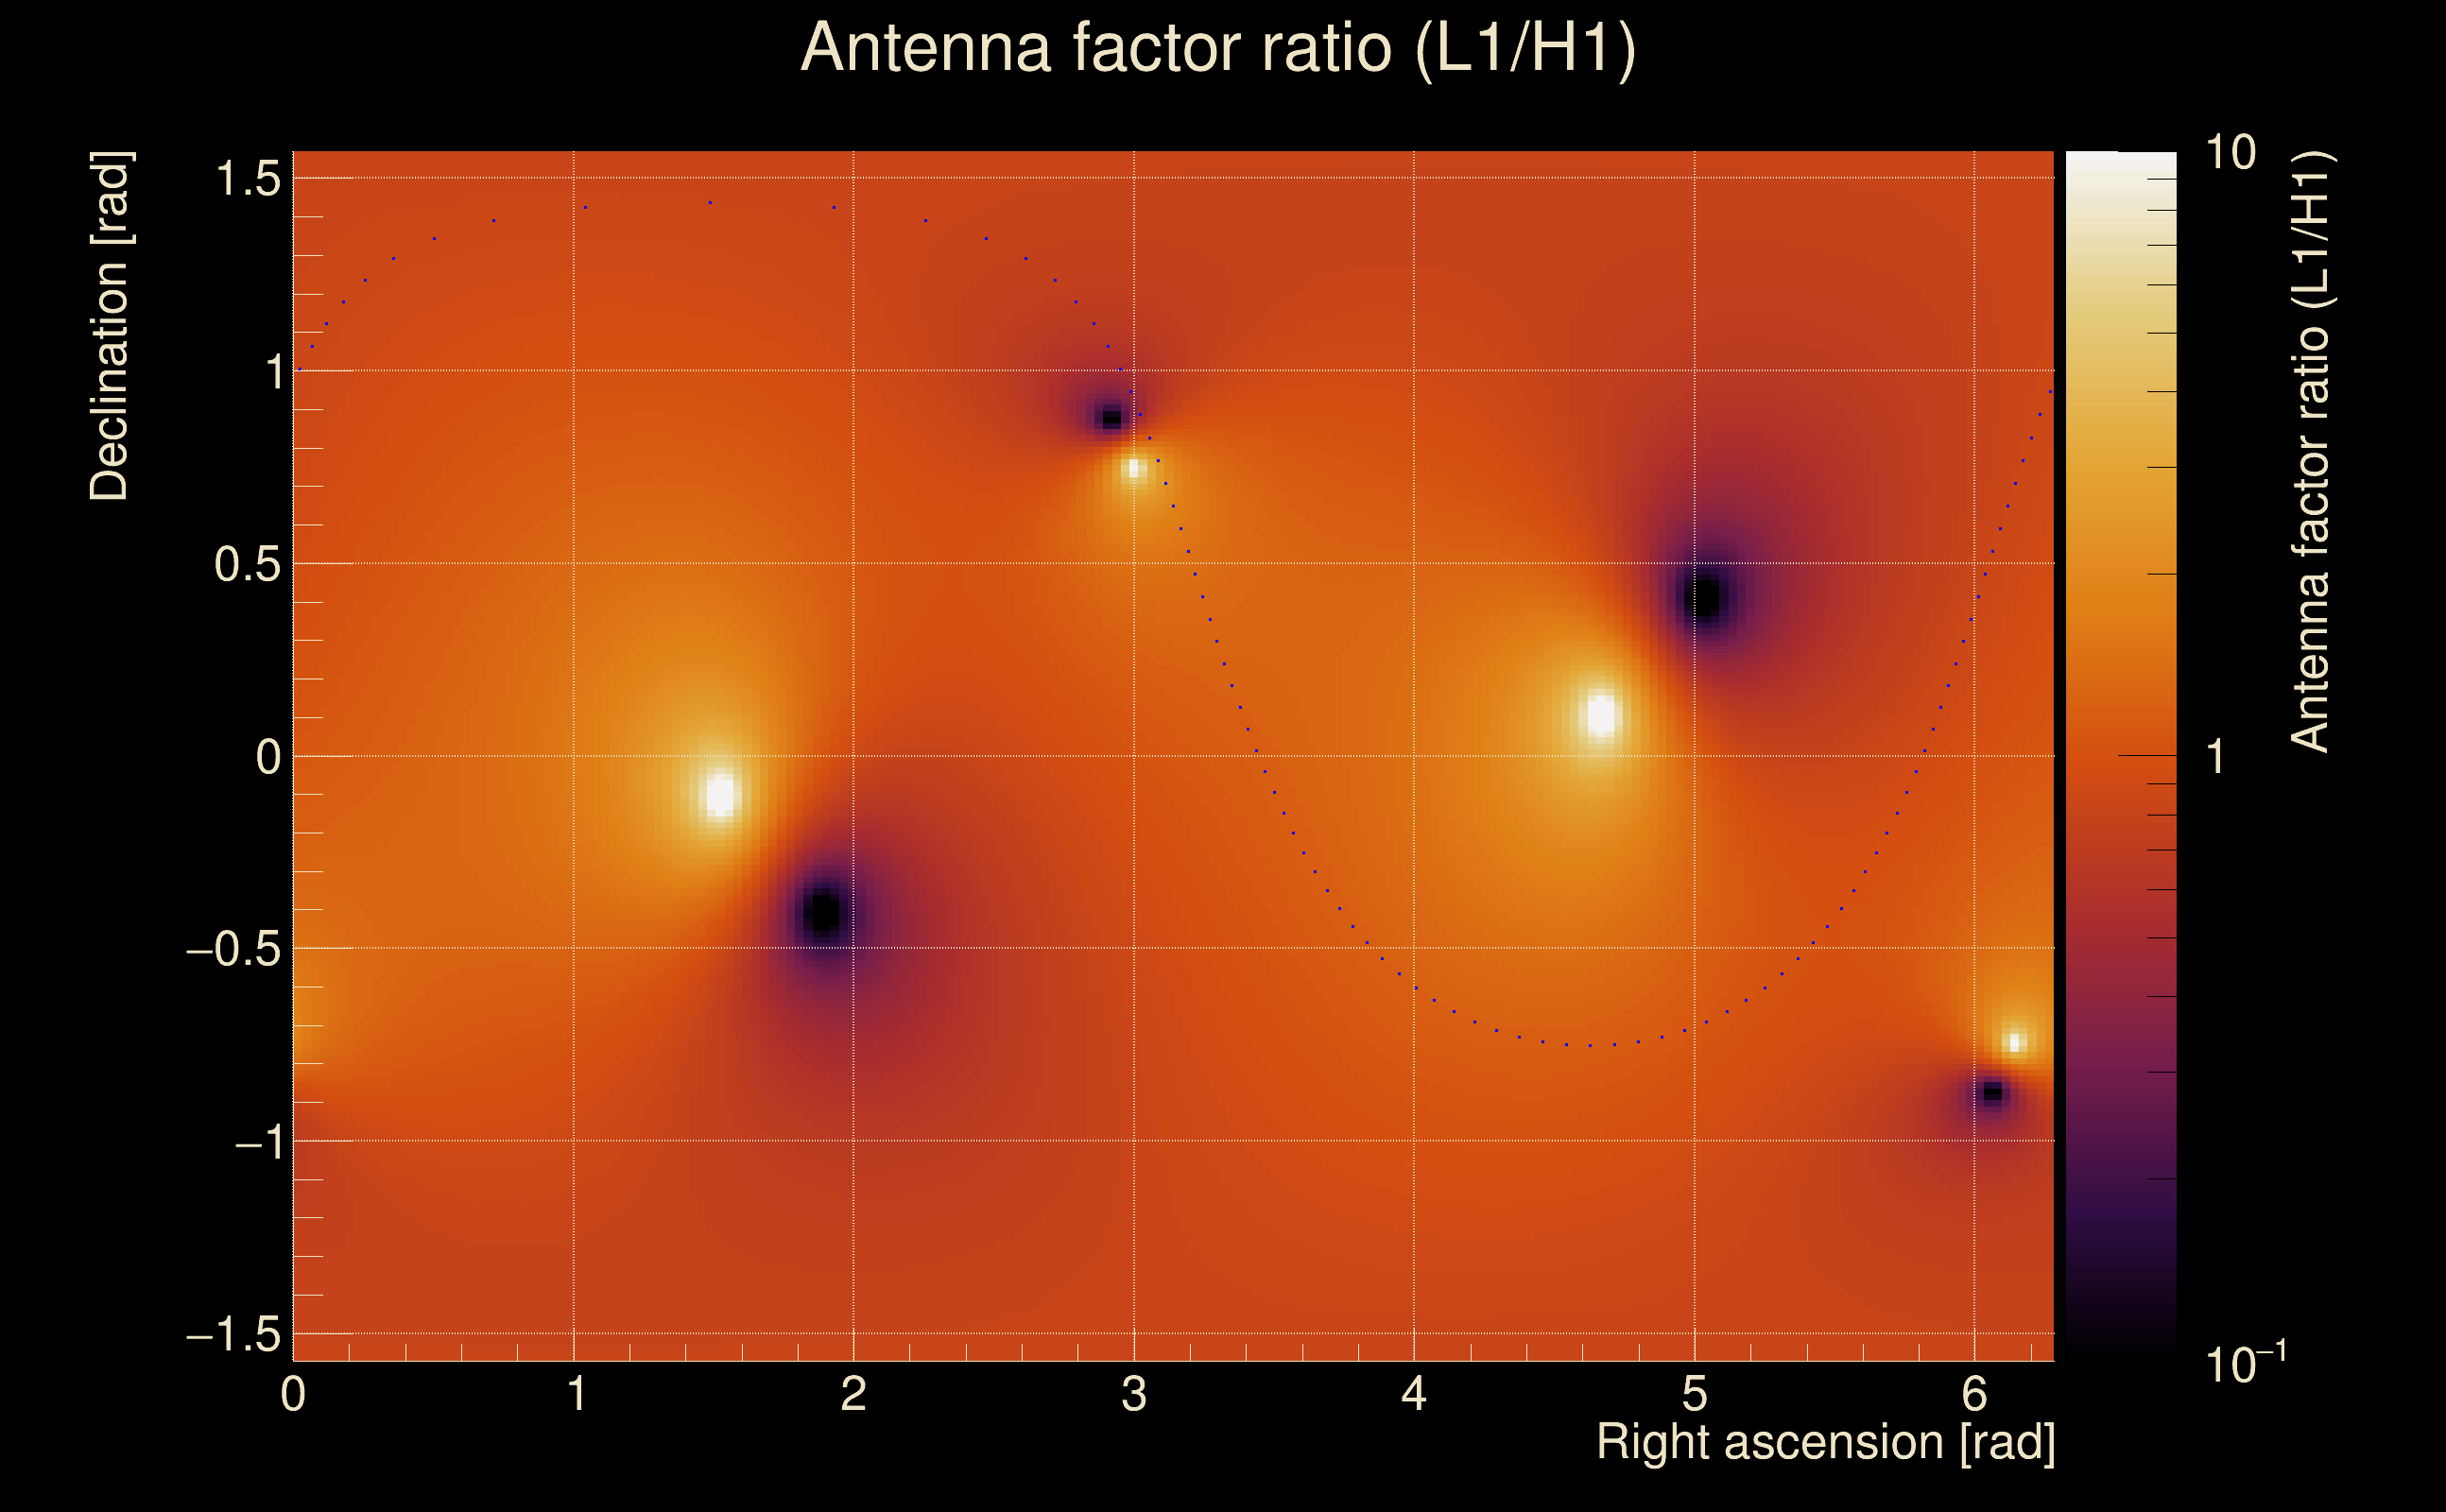
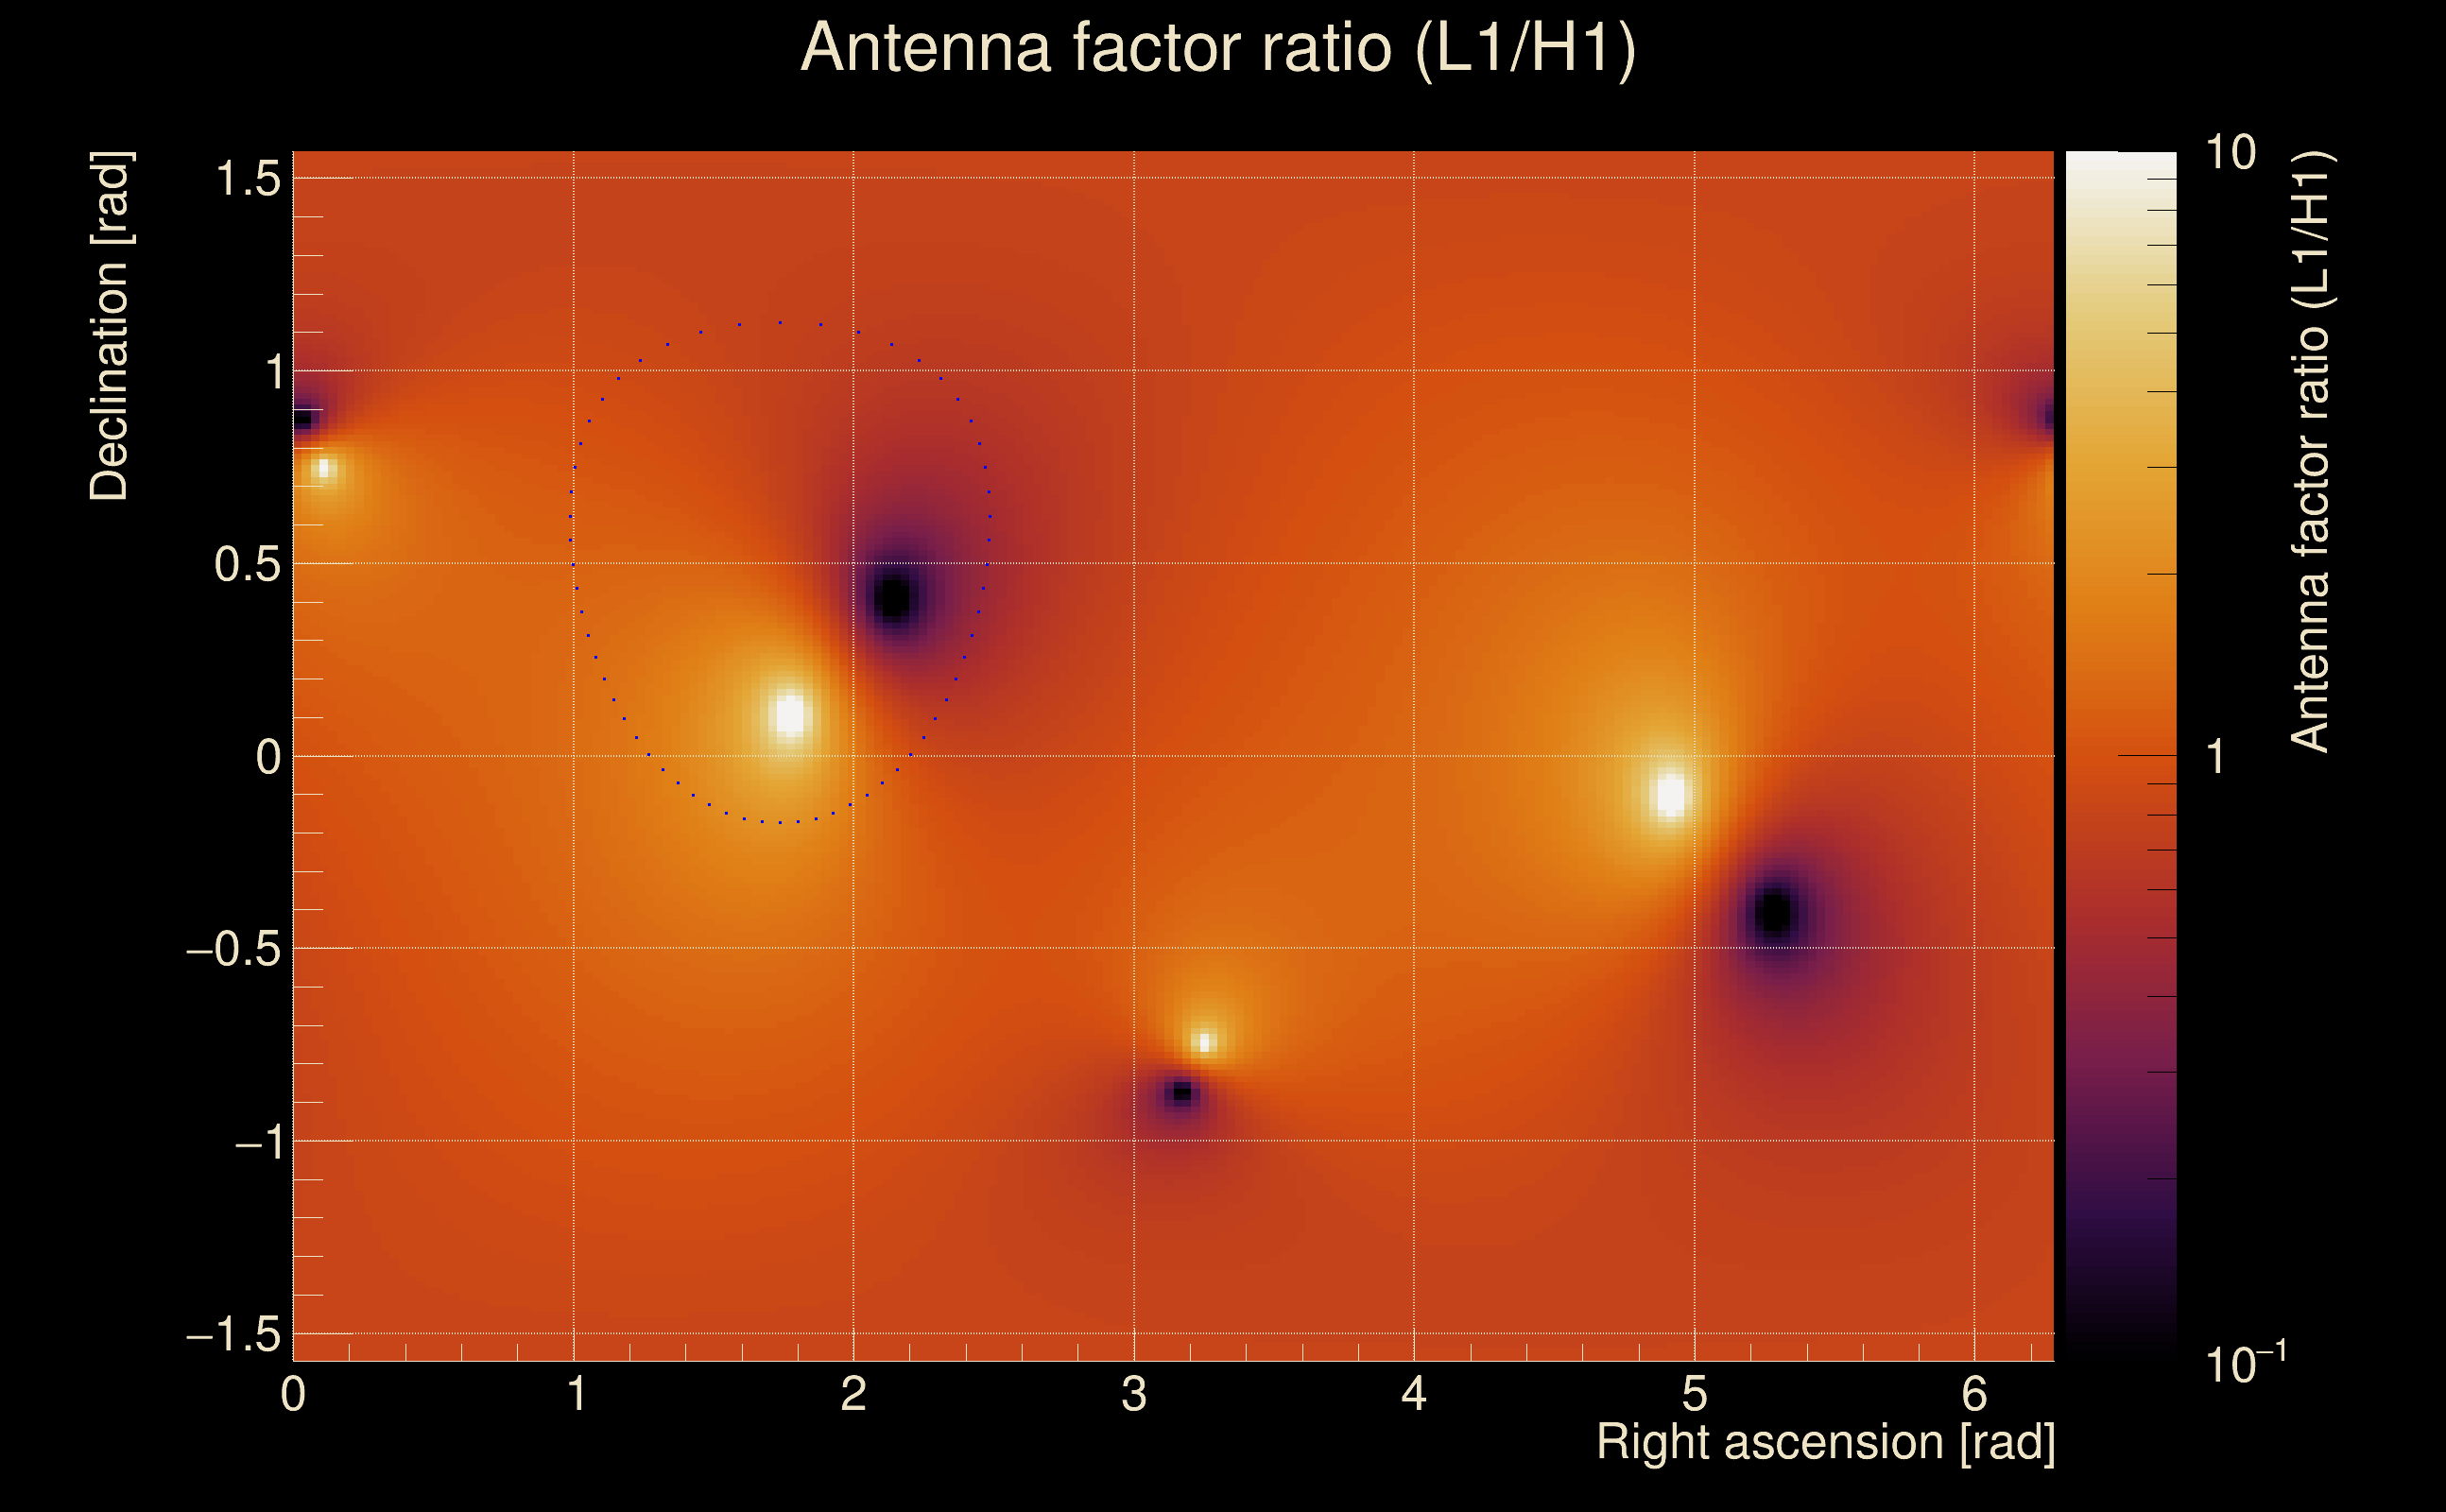
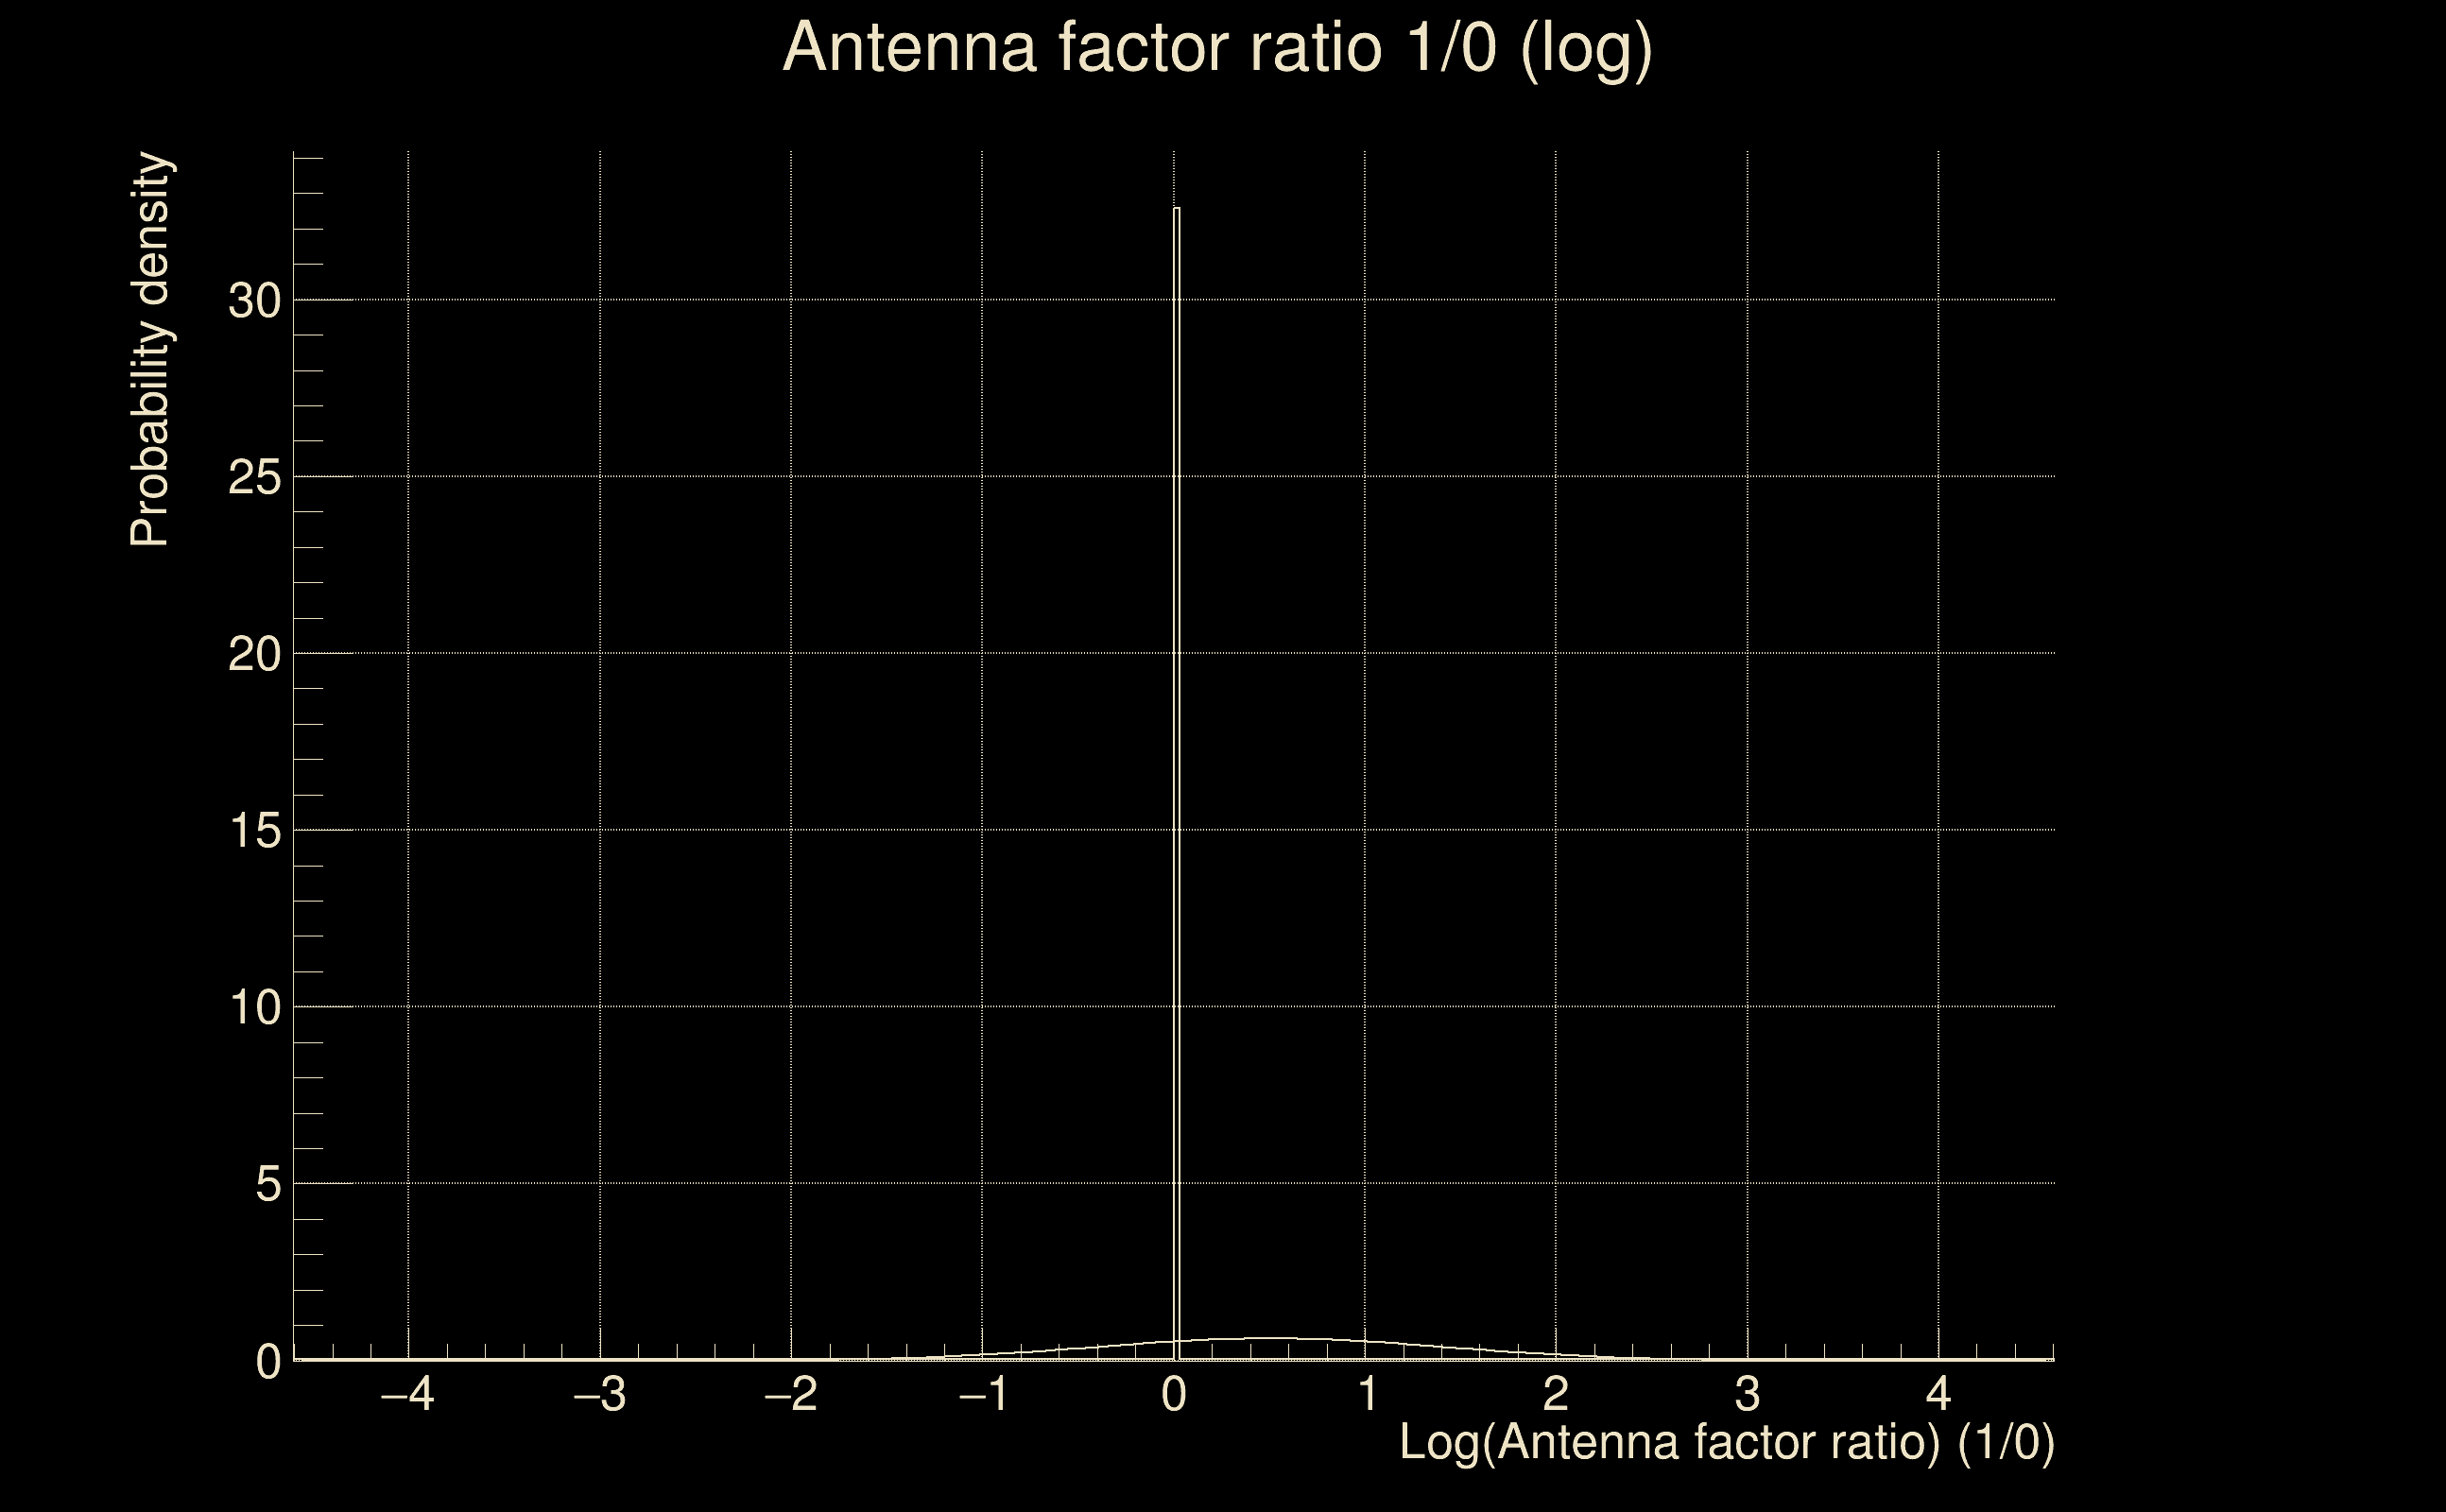
| Log of amplitude ratio (L1/H1): | -0.155453, variance = 0.156231 (L1/H1: -0.169225, variance = 0.303091, H1/L1: 0.136512, variance = 0.308181) |
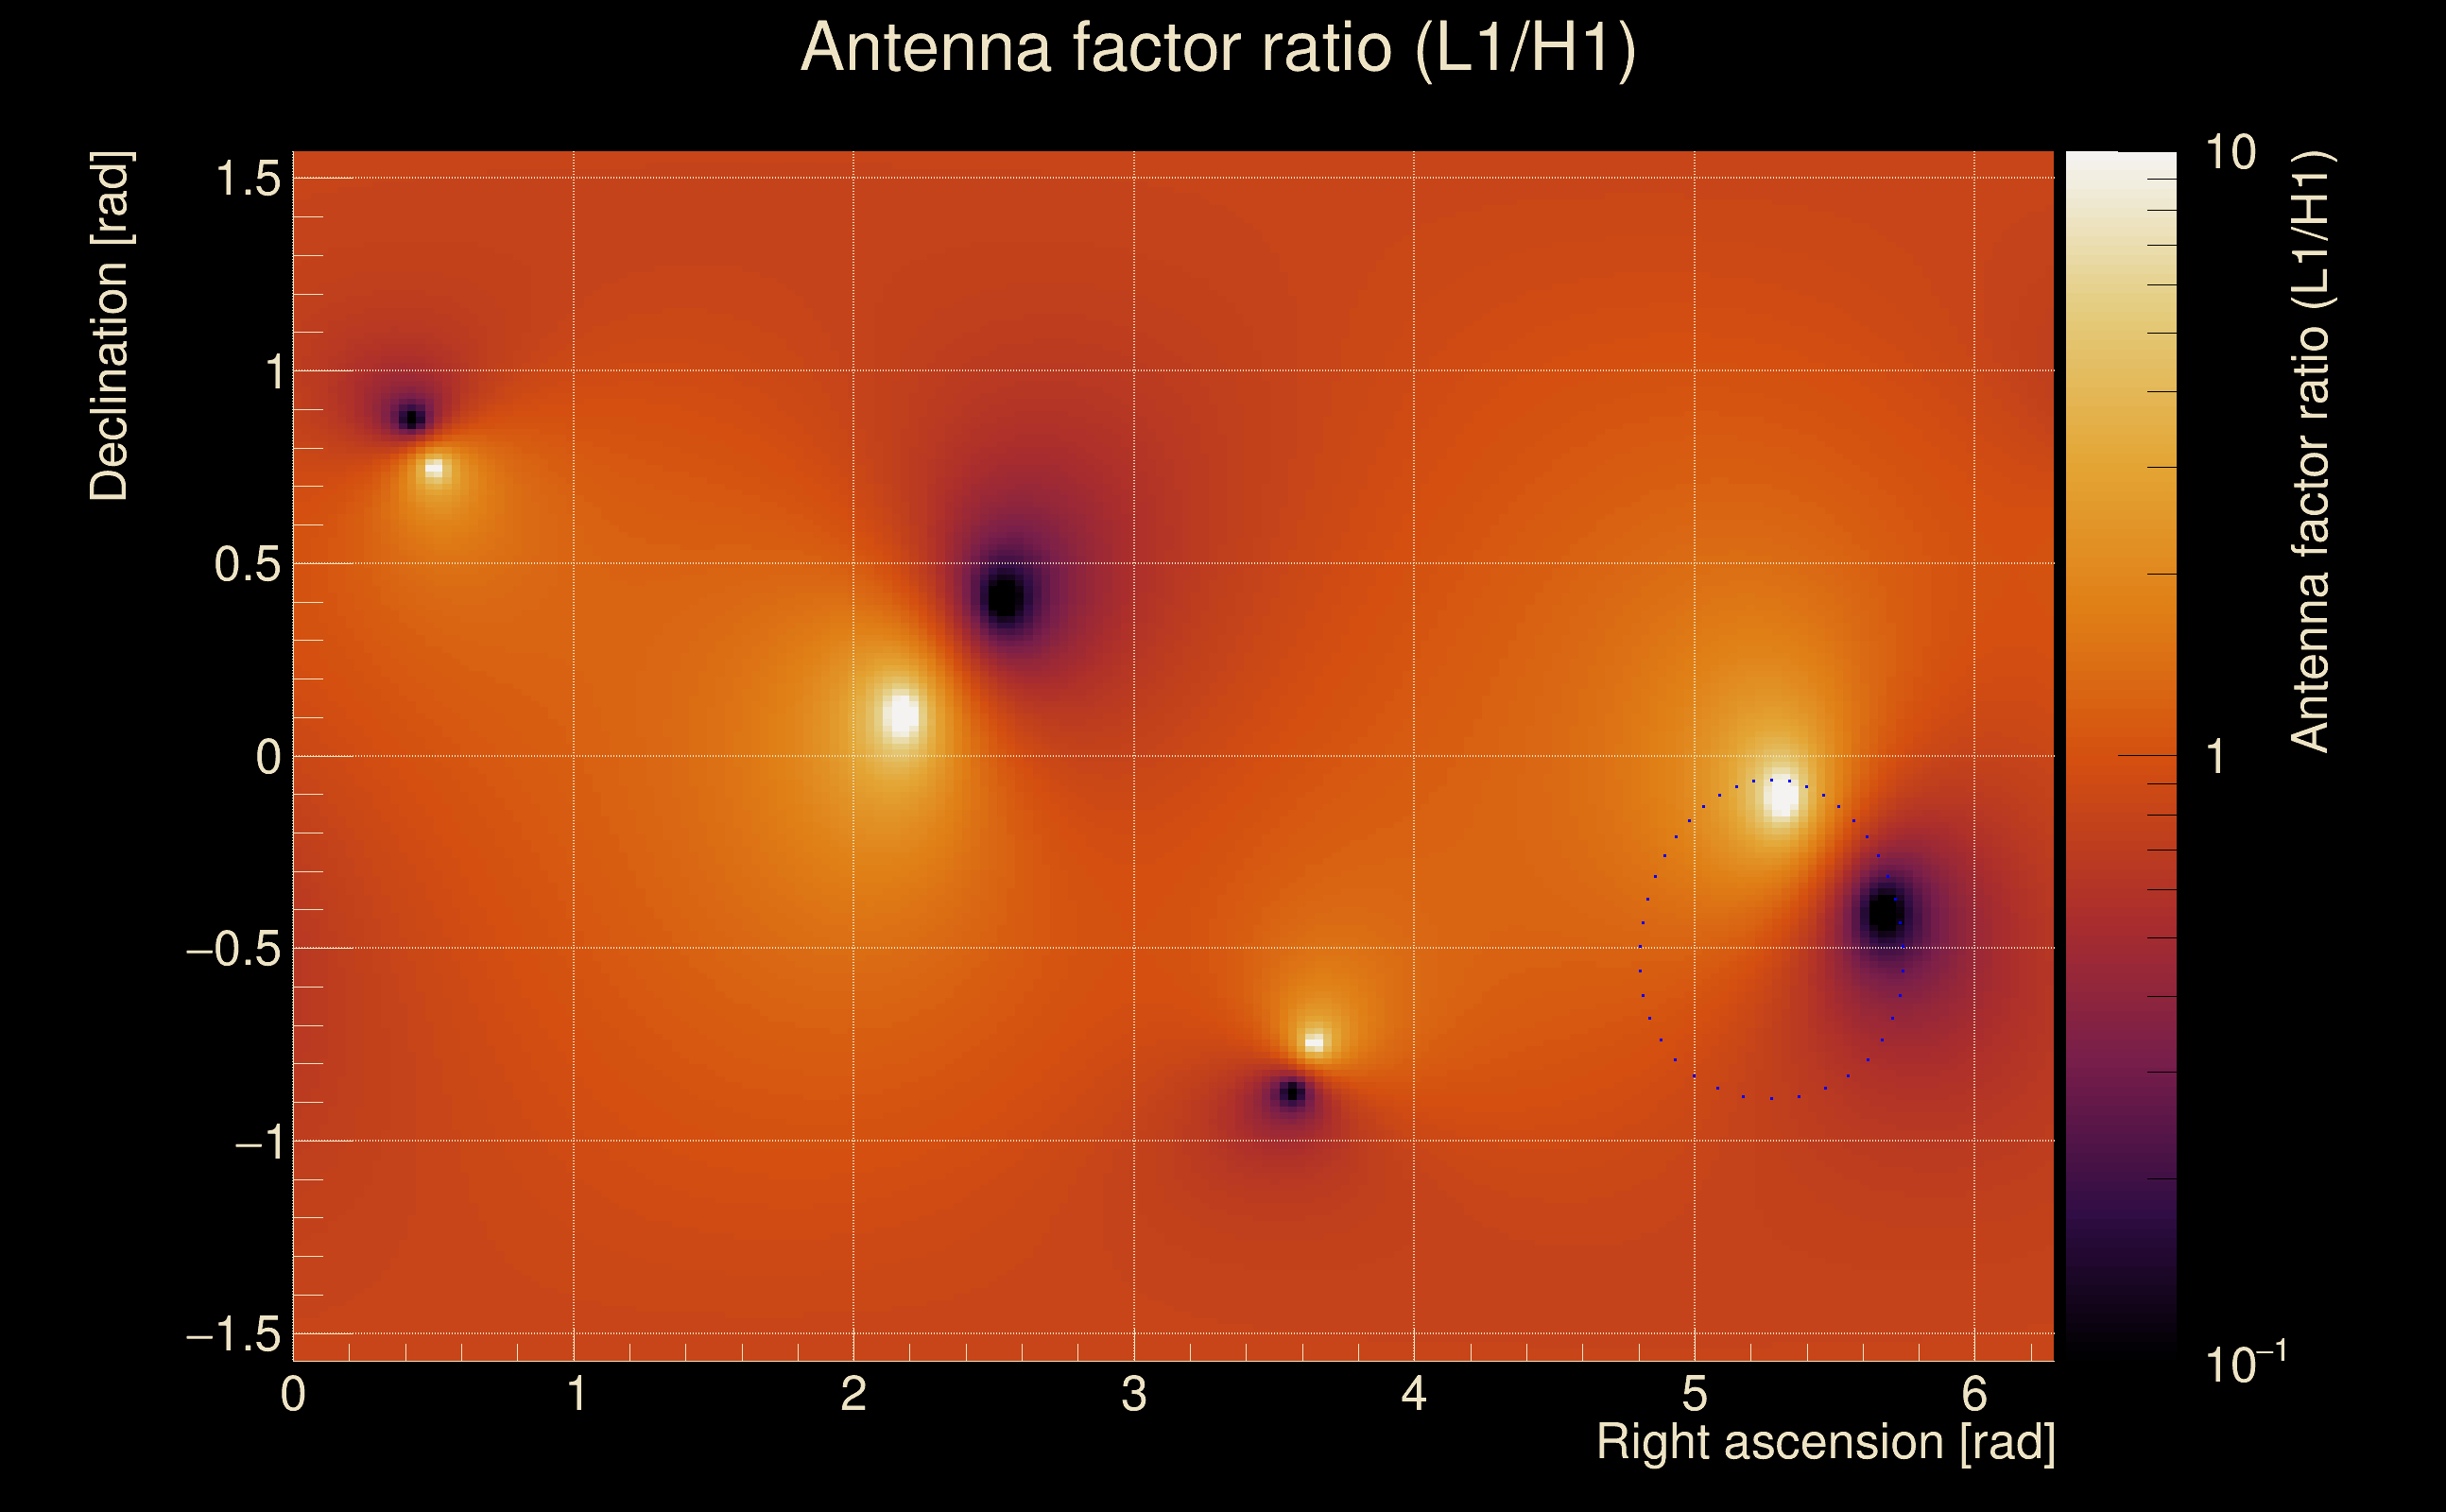
| Amplitude ratio (L1/H1): | 0.856028 ⋇ 1.48477 (L1/H1: 0.844319 ⋇ 1.73418, H1/L1: 1.14627 ⋇ 1.74219) |
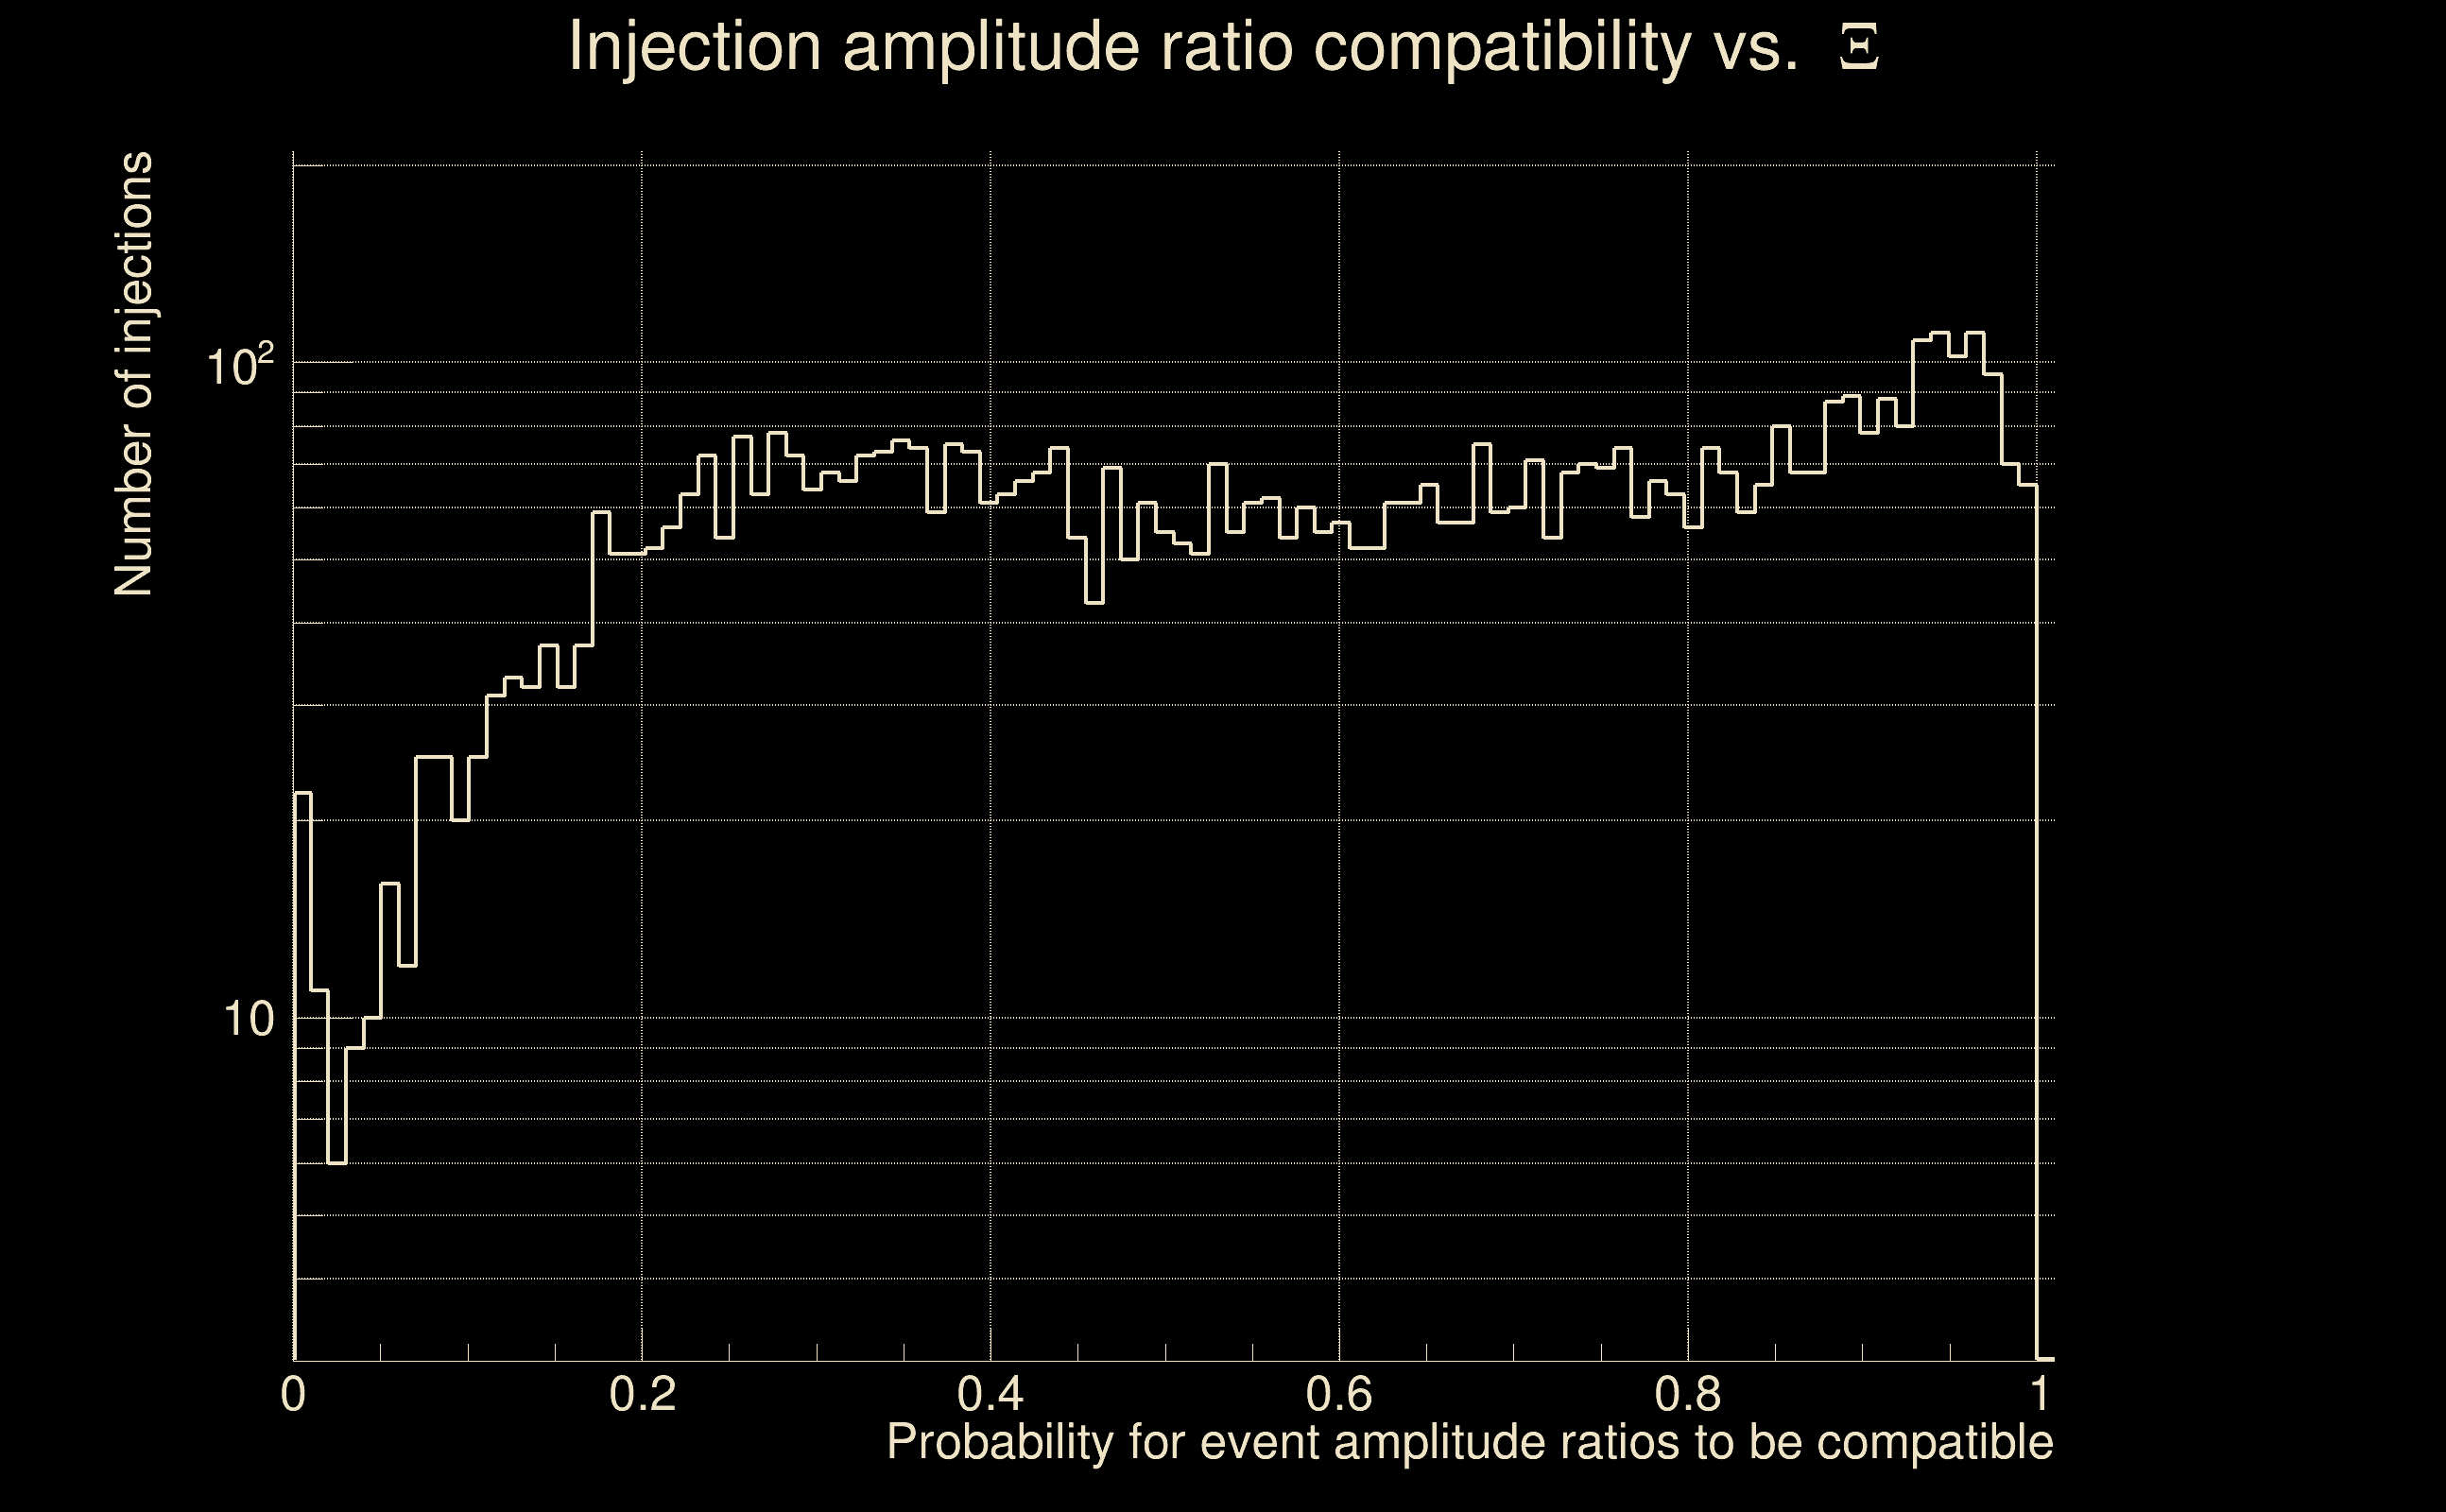
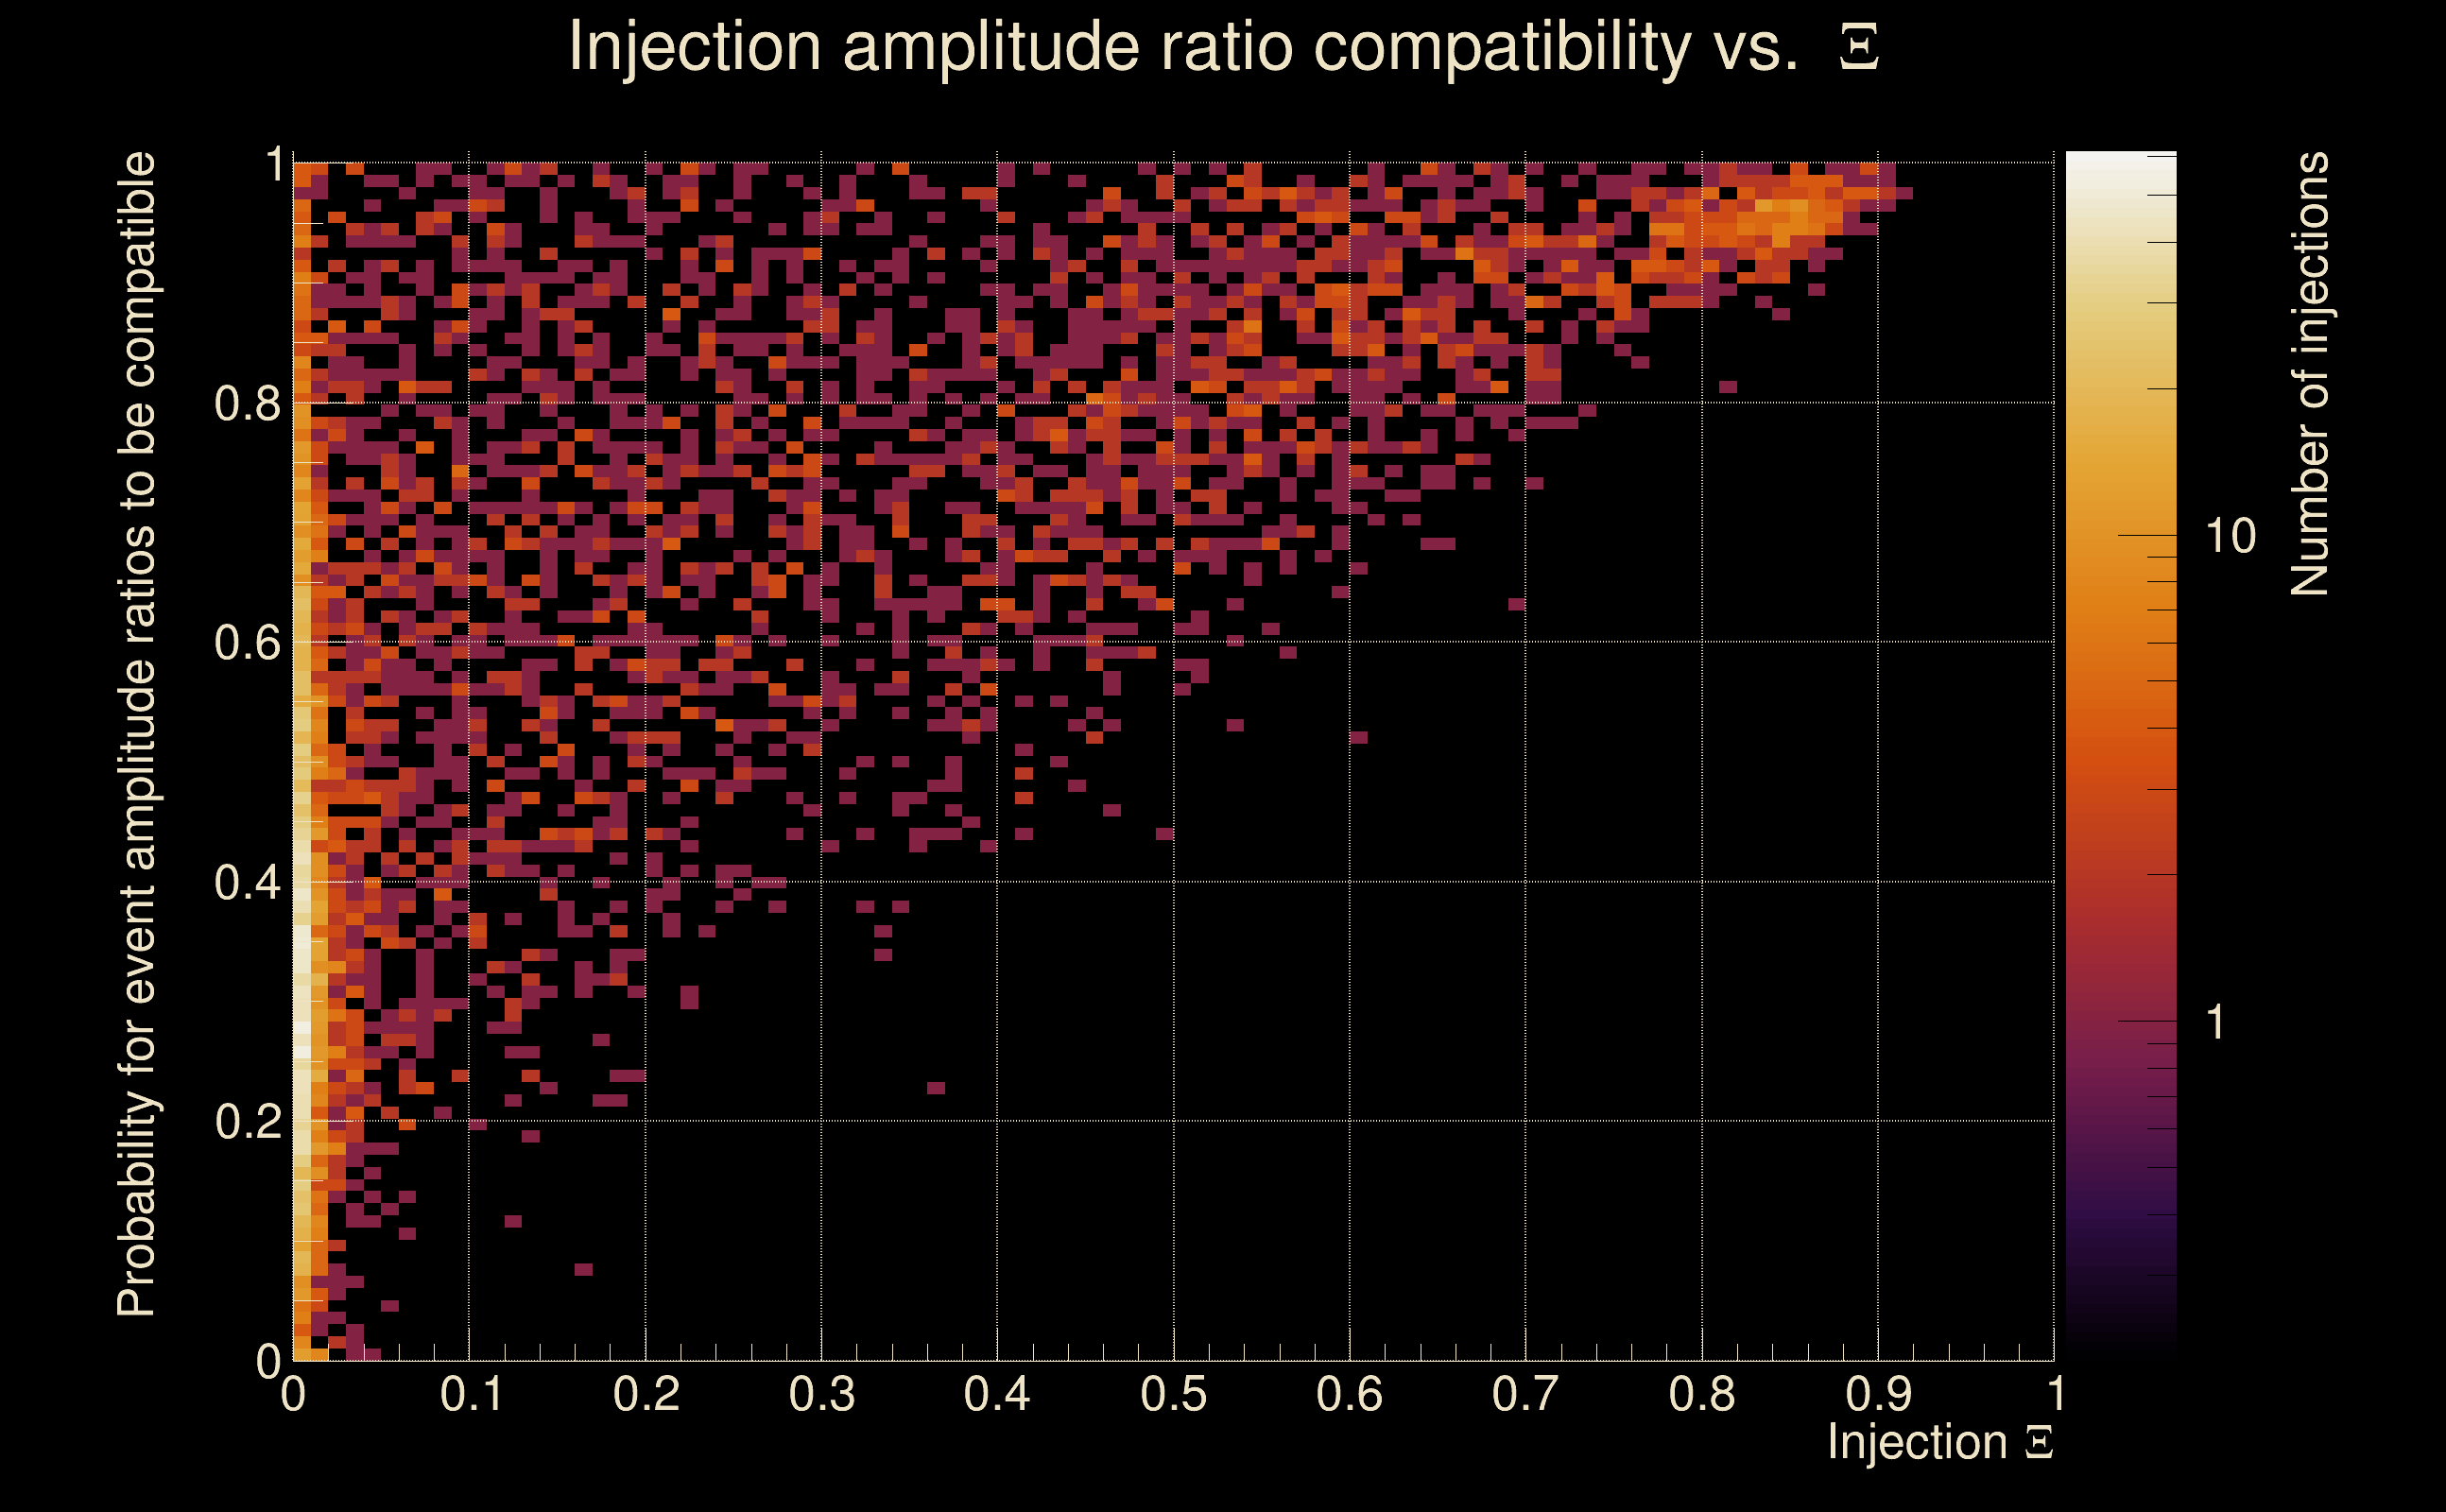
| Amplitude ratio H1|L1 compatibility (probability): | 0.966626 |
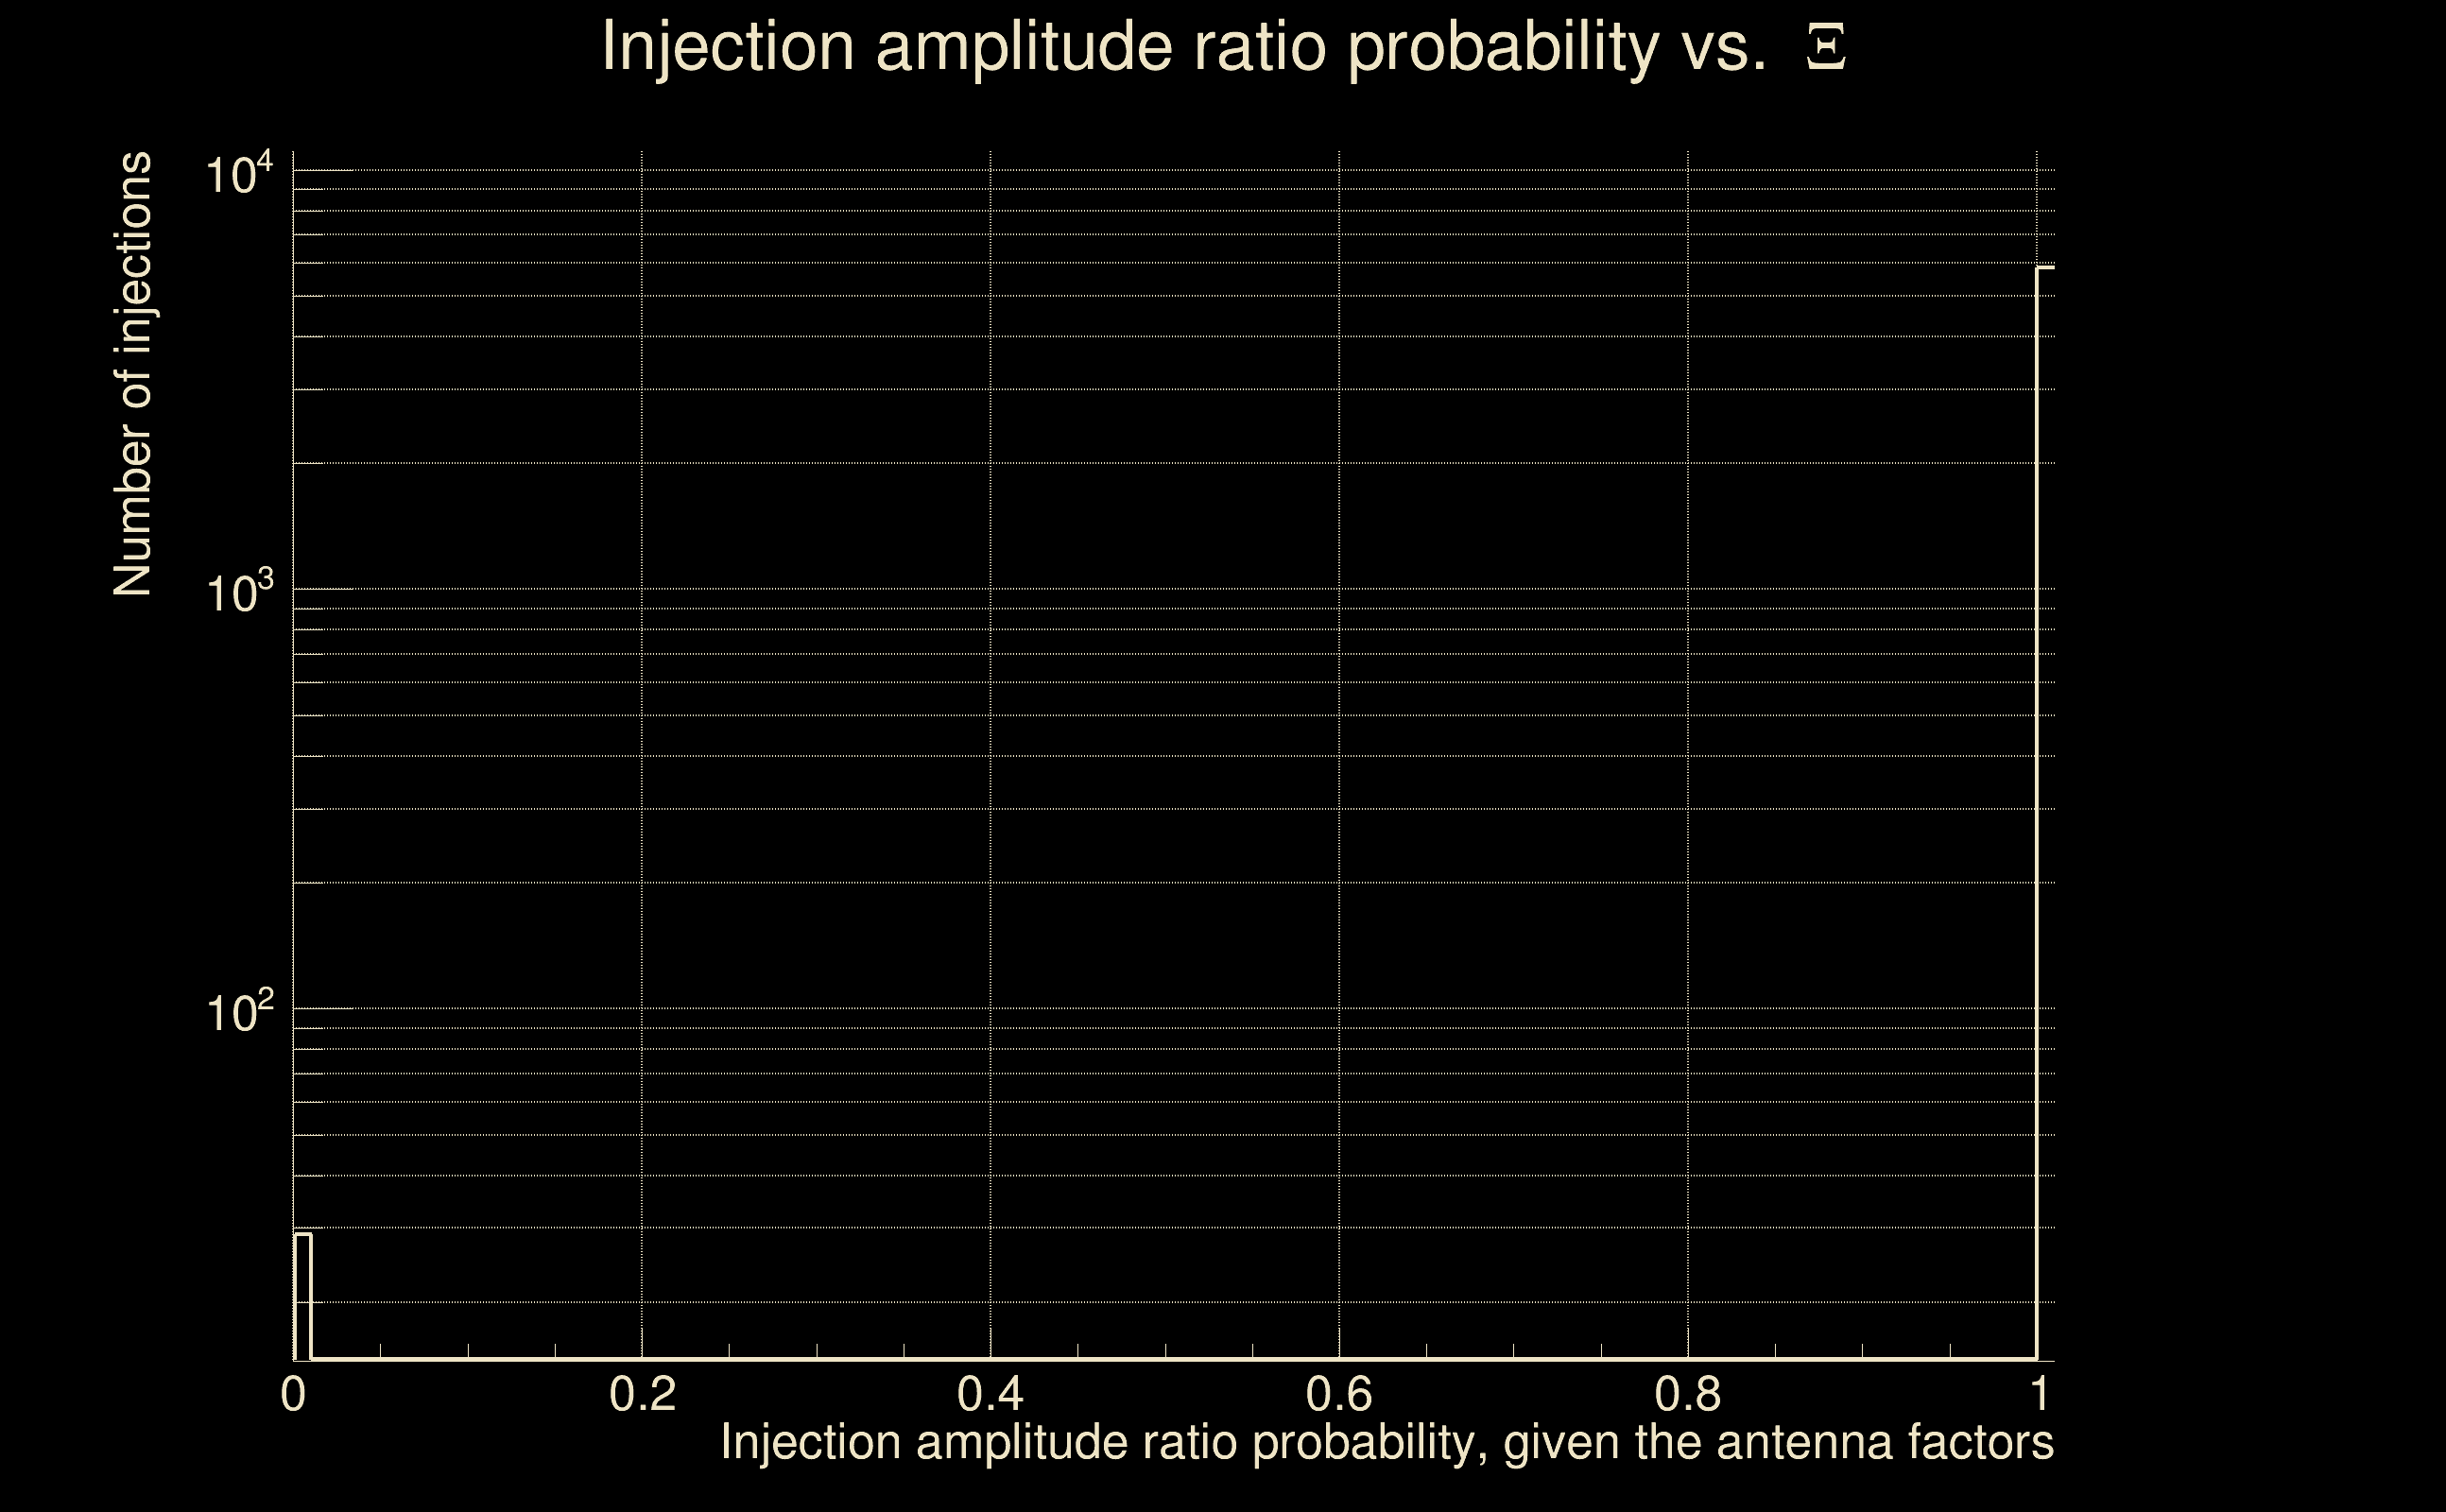
| Antenna factor probability: | 1 |
| Number of rejected frequency rows: | Q0: 0 / 18, Q1: 0 / 36, Q2: 5 / 70, Q3: 9 / 134, Q4: 40 / 258 |
| Maximum signal-to-noise ratio: | H1: 76.6601, L1: 65.3693 |
| SNR variance: | H1: 0.509637, L1: 0.521962 |
| Click here for a zoomed plot | Click here for a zoomed plot | Click here for a zoomed plot | Click here for a zoomed plot | Click here for a zoomed plot |
 |
 |
 |
 |
 |
 |
 |
 |
 |
 |
 |
 |
 |
 |
 |
 |
 |
 |
 |
 |
 |
 |
 |
 |
 |
 |
 |
 |
 |
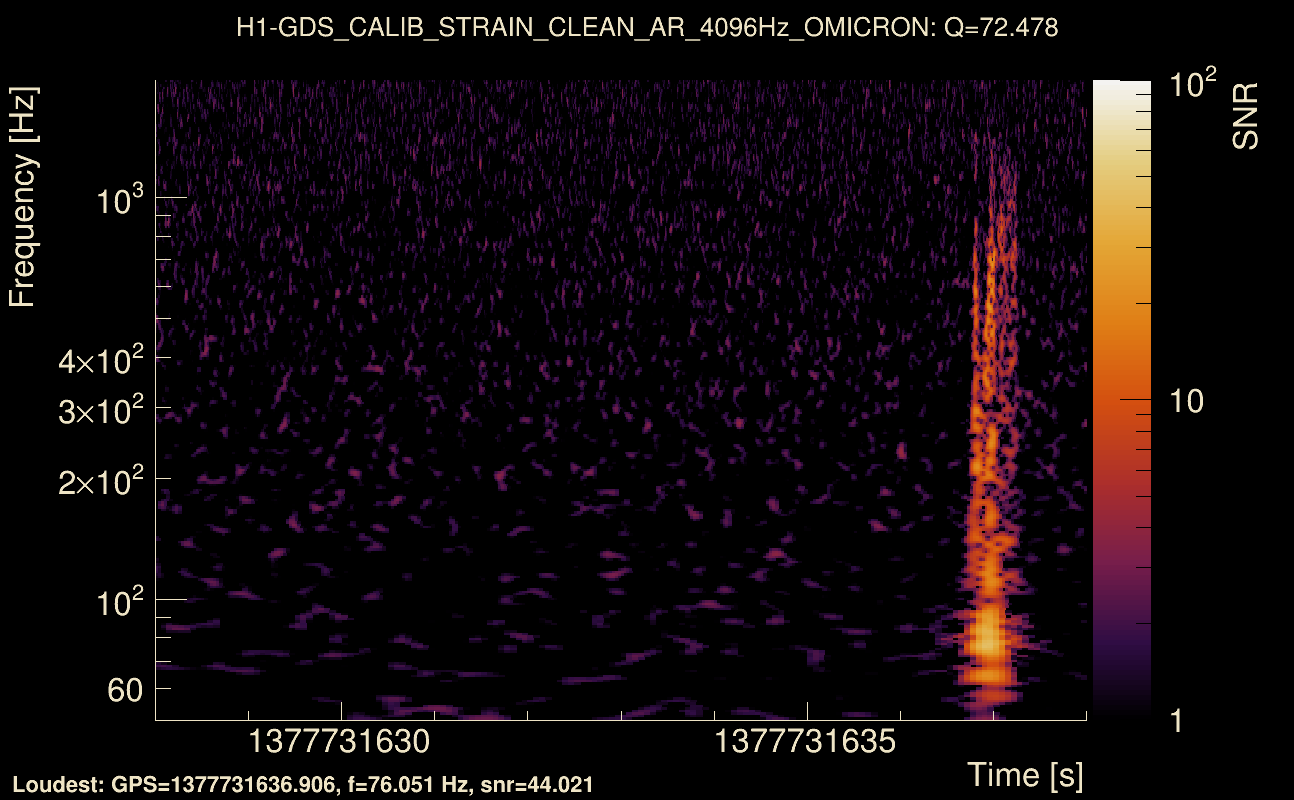
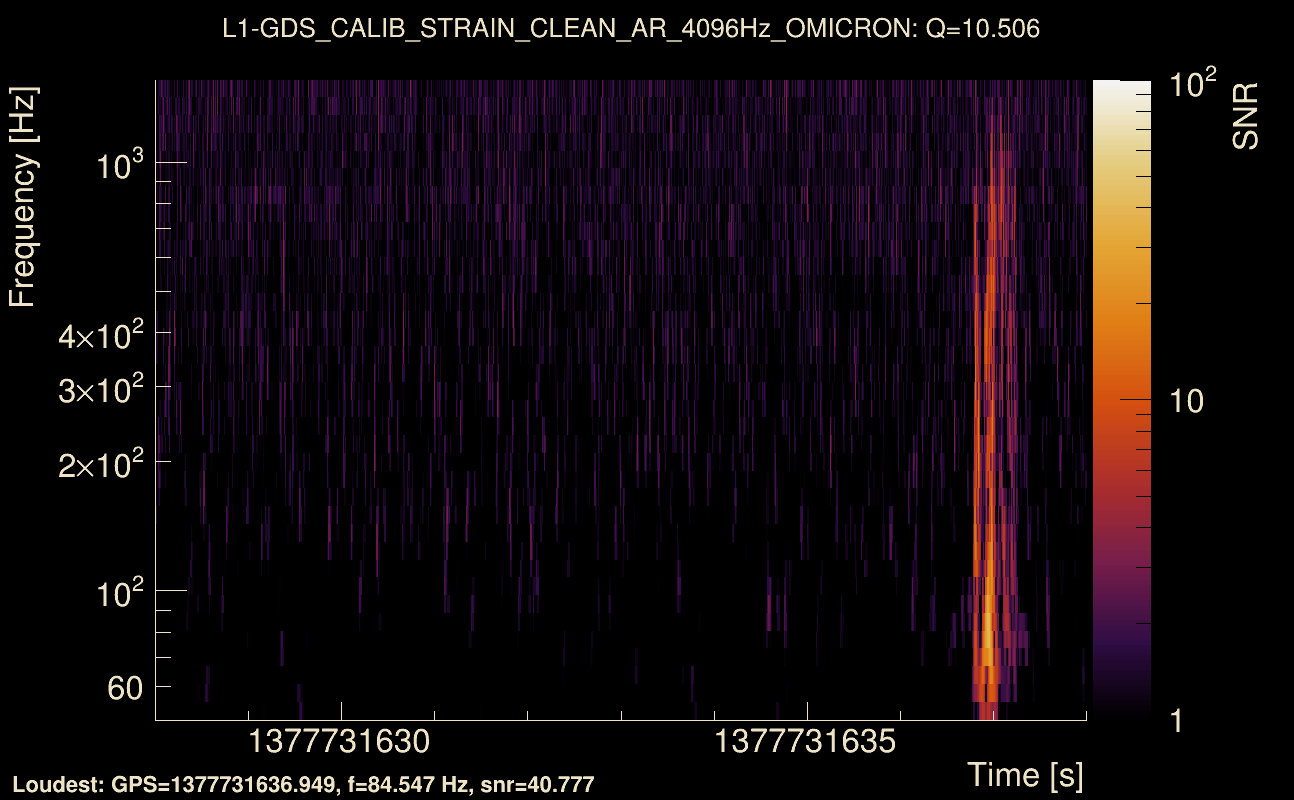
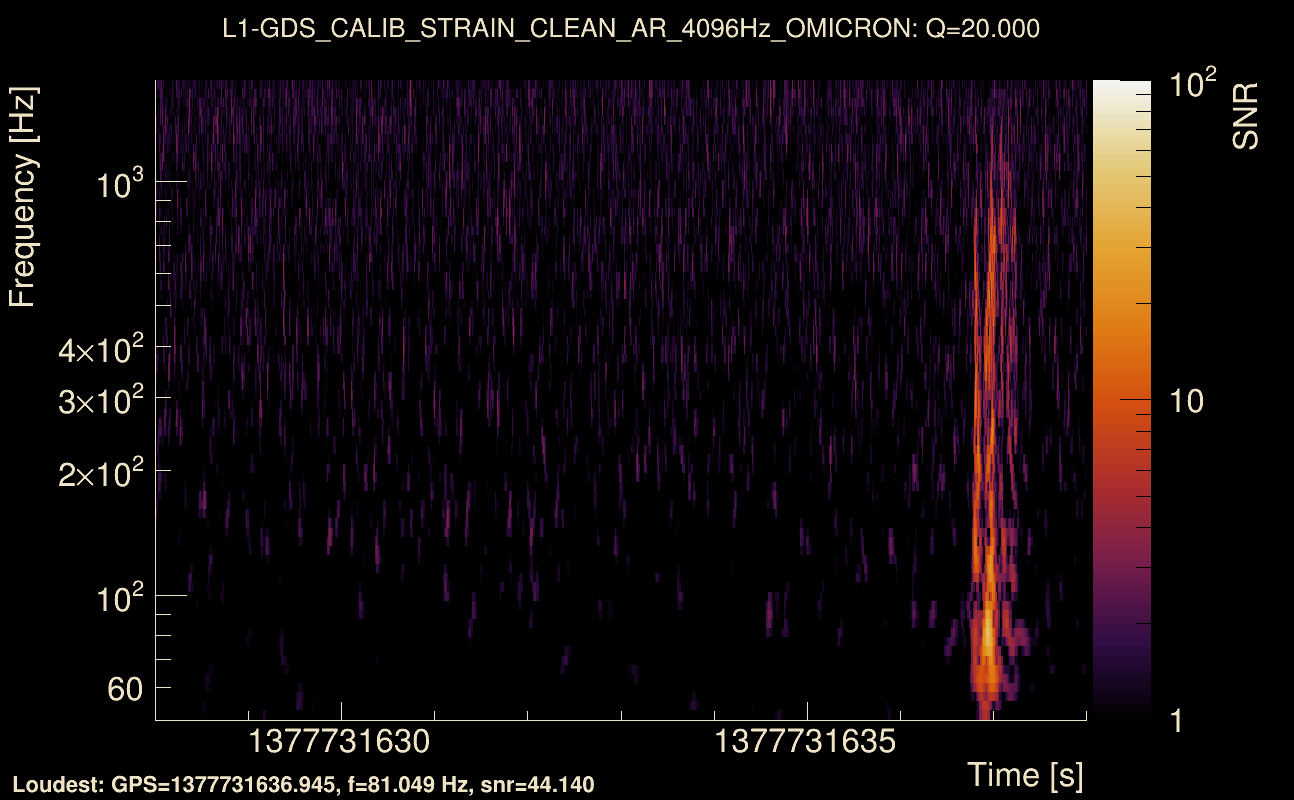
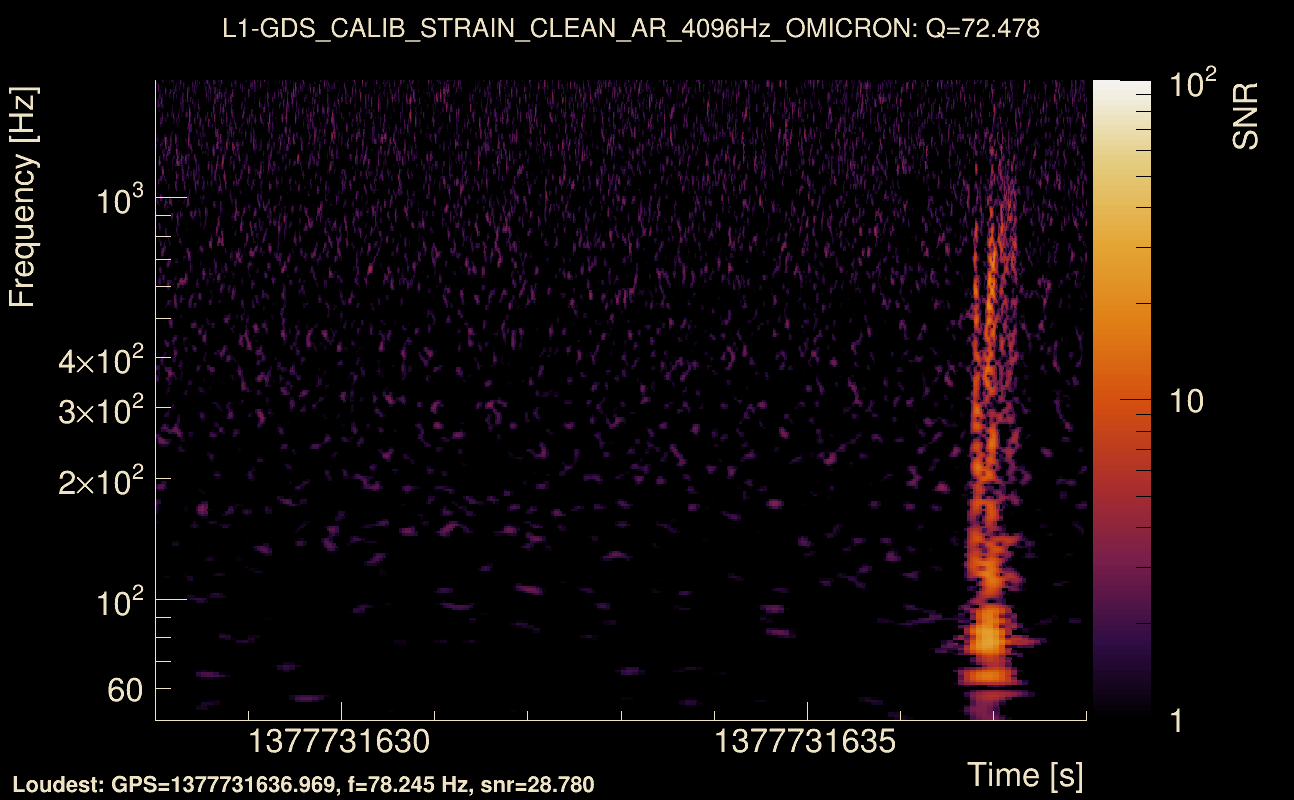
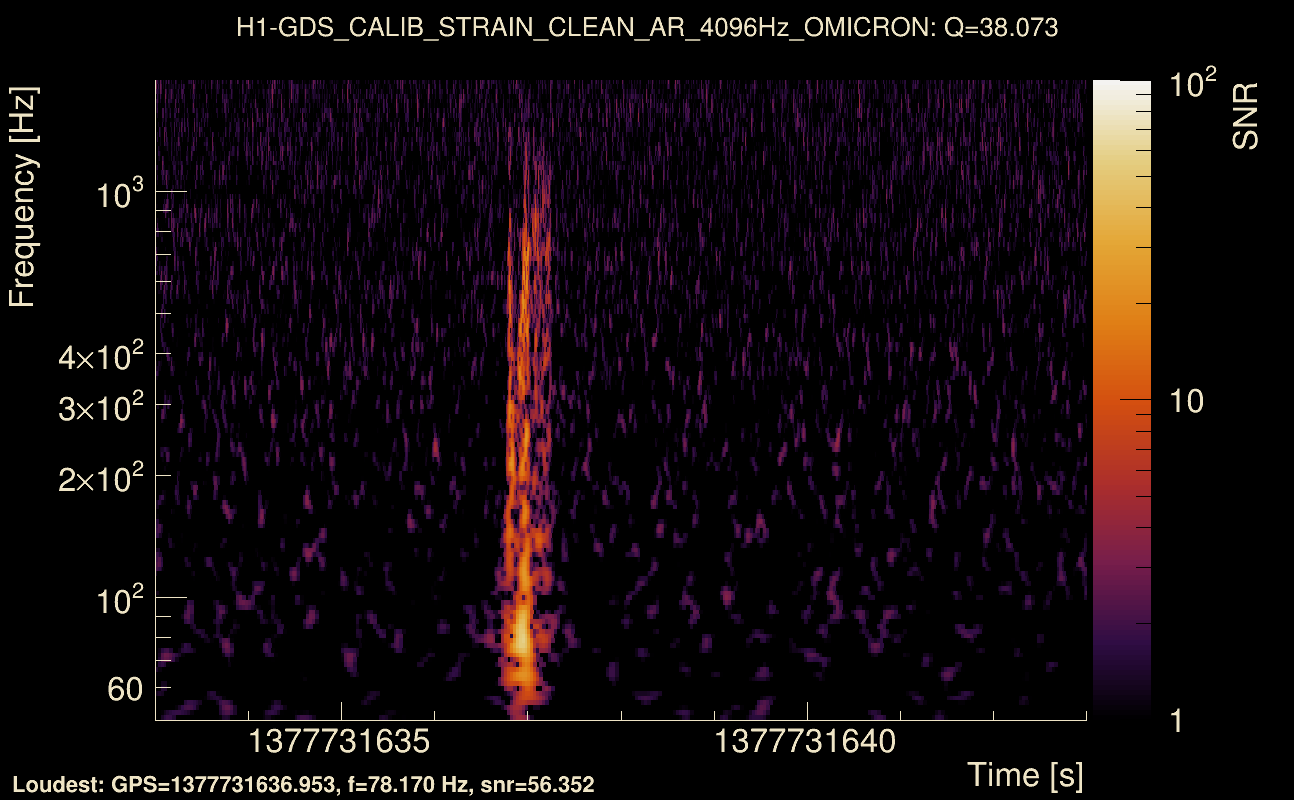
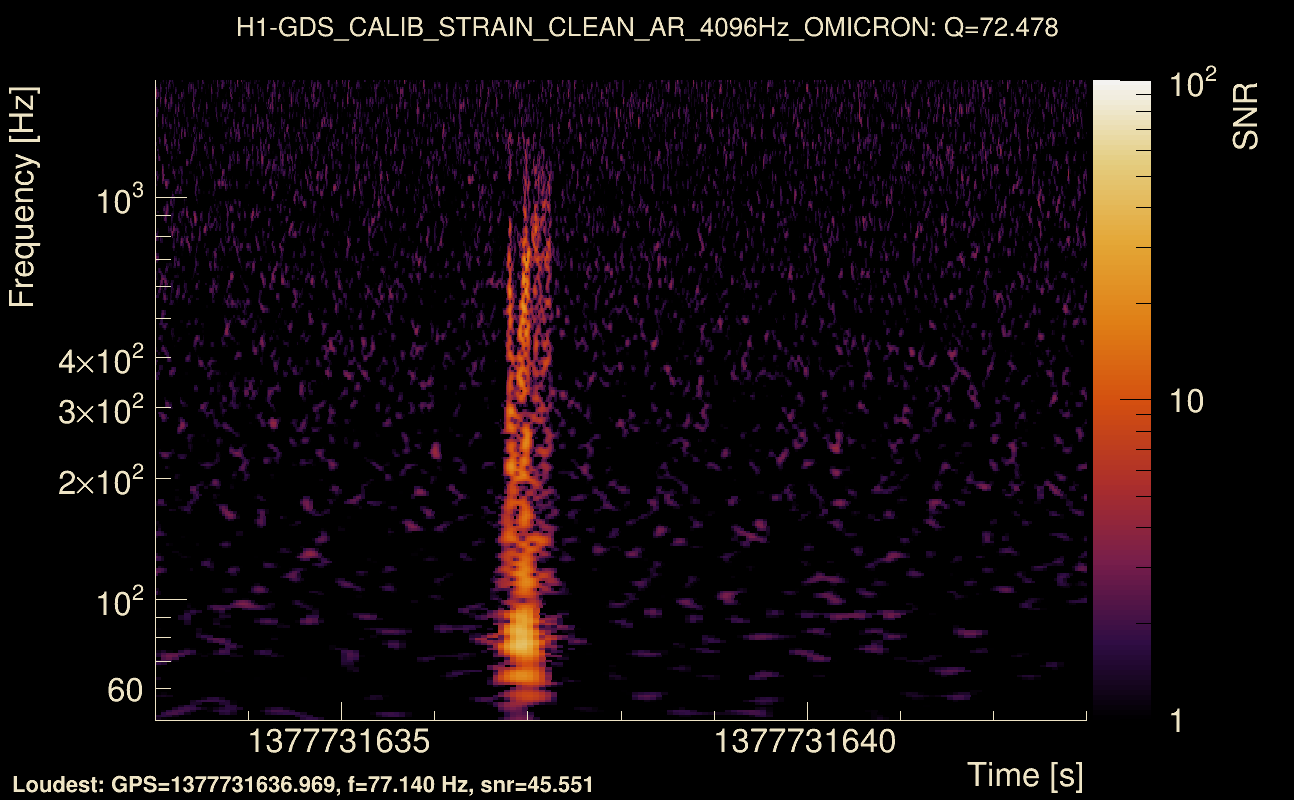
| Event time t(H1): | GPS = 1377731633 (Sat Sep 2 23:13:35 2023 ) → GPS = 1377731643 (Sat Sep 2 23:13:45 2023 ) |
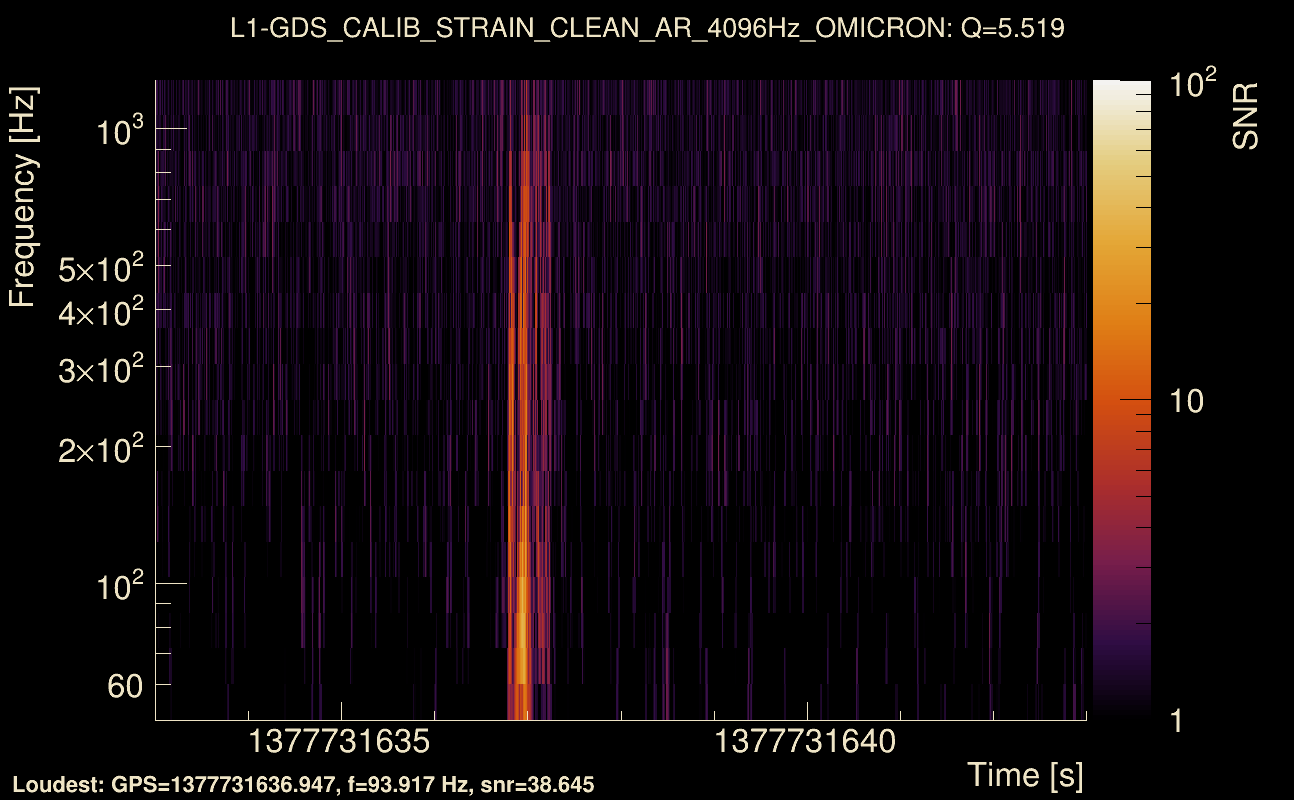
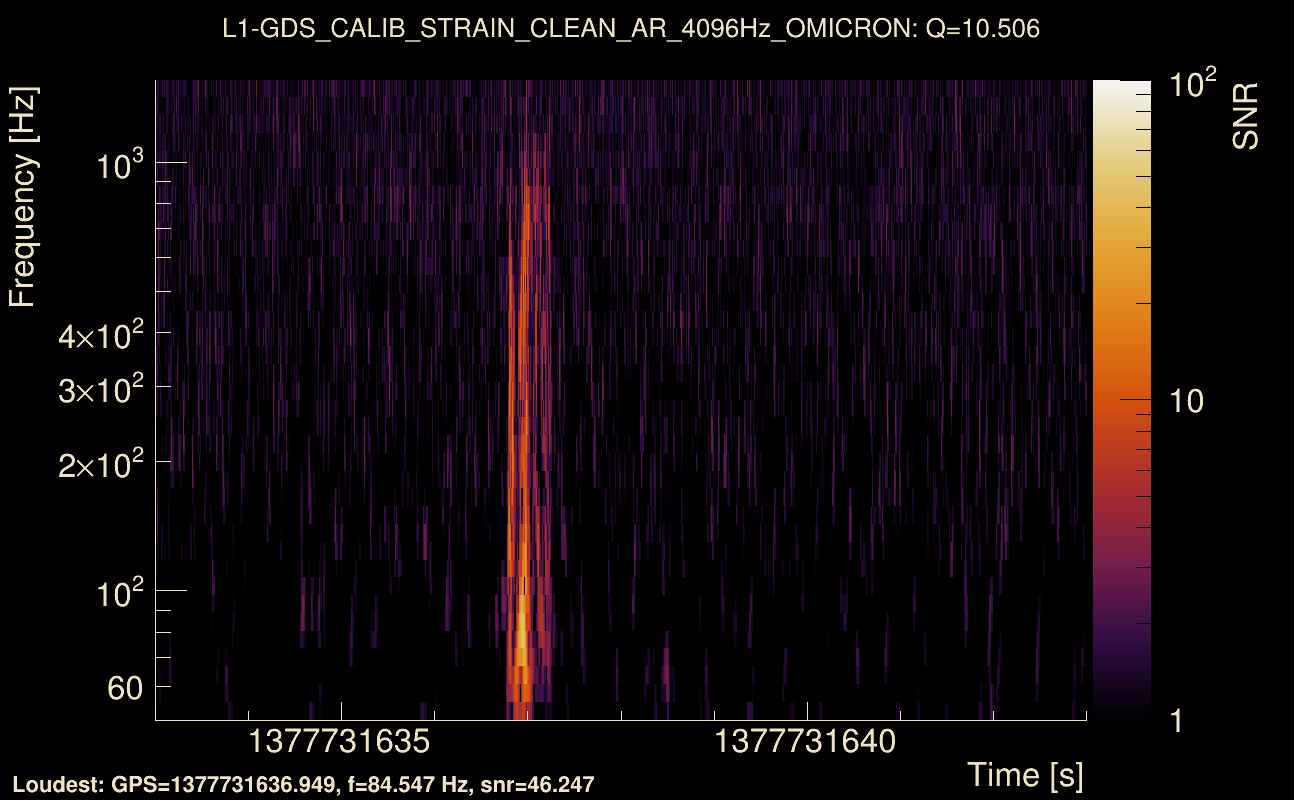
| Event time t(L1): | GPS = 1377731633 (Sat Sep 2 23:13:45 2023 ) → GPS = 1377731643 (Sat Sep 2 23:13:45 2023 ) |
| Omicron analysis time window (H1): | GPS = 1377731630 → GPS = 1377731646 |
| Omicron analysis time window (L1): | GPS = 1377731630 → GPS = 1377731646 |
| Time delay between detectors t(L1) - t(H1): | 0.00296274 s (slice index = 108 / 217), δt_gw = 0.00296274 s |
| Time delay uncertainty: | 0.000644684 s |
| [targeted mode] Time delay probability: | 0.9191 (0.101568 sigmas), δt_target = -0.00103712 s |
| Frequency: | 235.163 Hz |
| Ξ: | 0.915375 ± 0.00724143 (variance = 5.24384e-05): Q0: 0.941141, Q1: 0.928004, Q2: 0.929394, Q3: 0.922827, Q4: 0.920172 |
| Rank: | R_A = 0.915375 |
| Log of amplitude ratio (L1/H1): | -0.154006, variance = 0.155253 (L1/H1: -0.166077, variance = 0.303047, H1/L1: 0.137767, variance = 0.305492) |
| Amplitude ratio (L1/H1): | 0.857267 ⋇ 1.48293 (L1/H1: 0.846981 ⋇ 1.73411, H1/L1: 1.14771 ⋇ 1.73796) |
| Amplitude ratio H1|L1 compatibility (probability): | 0.97105 |
| Antenna factor probability: | 1 |
| Number of rejected frequency rows: | Q0: 0 / 18, Q1: 0 / 36, Q2: 5 / 70, Q3: 10 / 134, Q4: 43 / 258 |
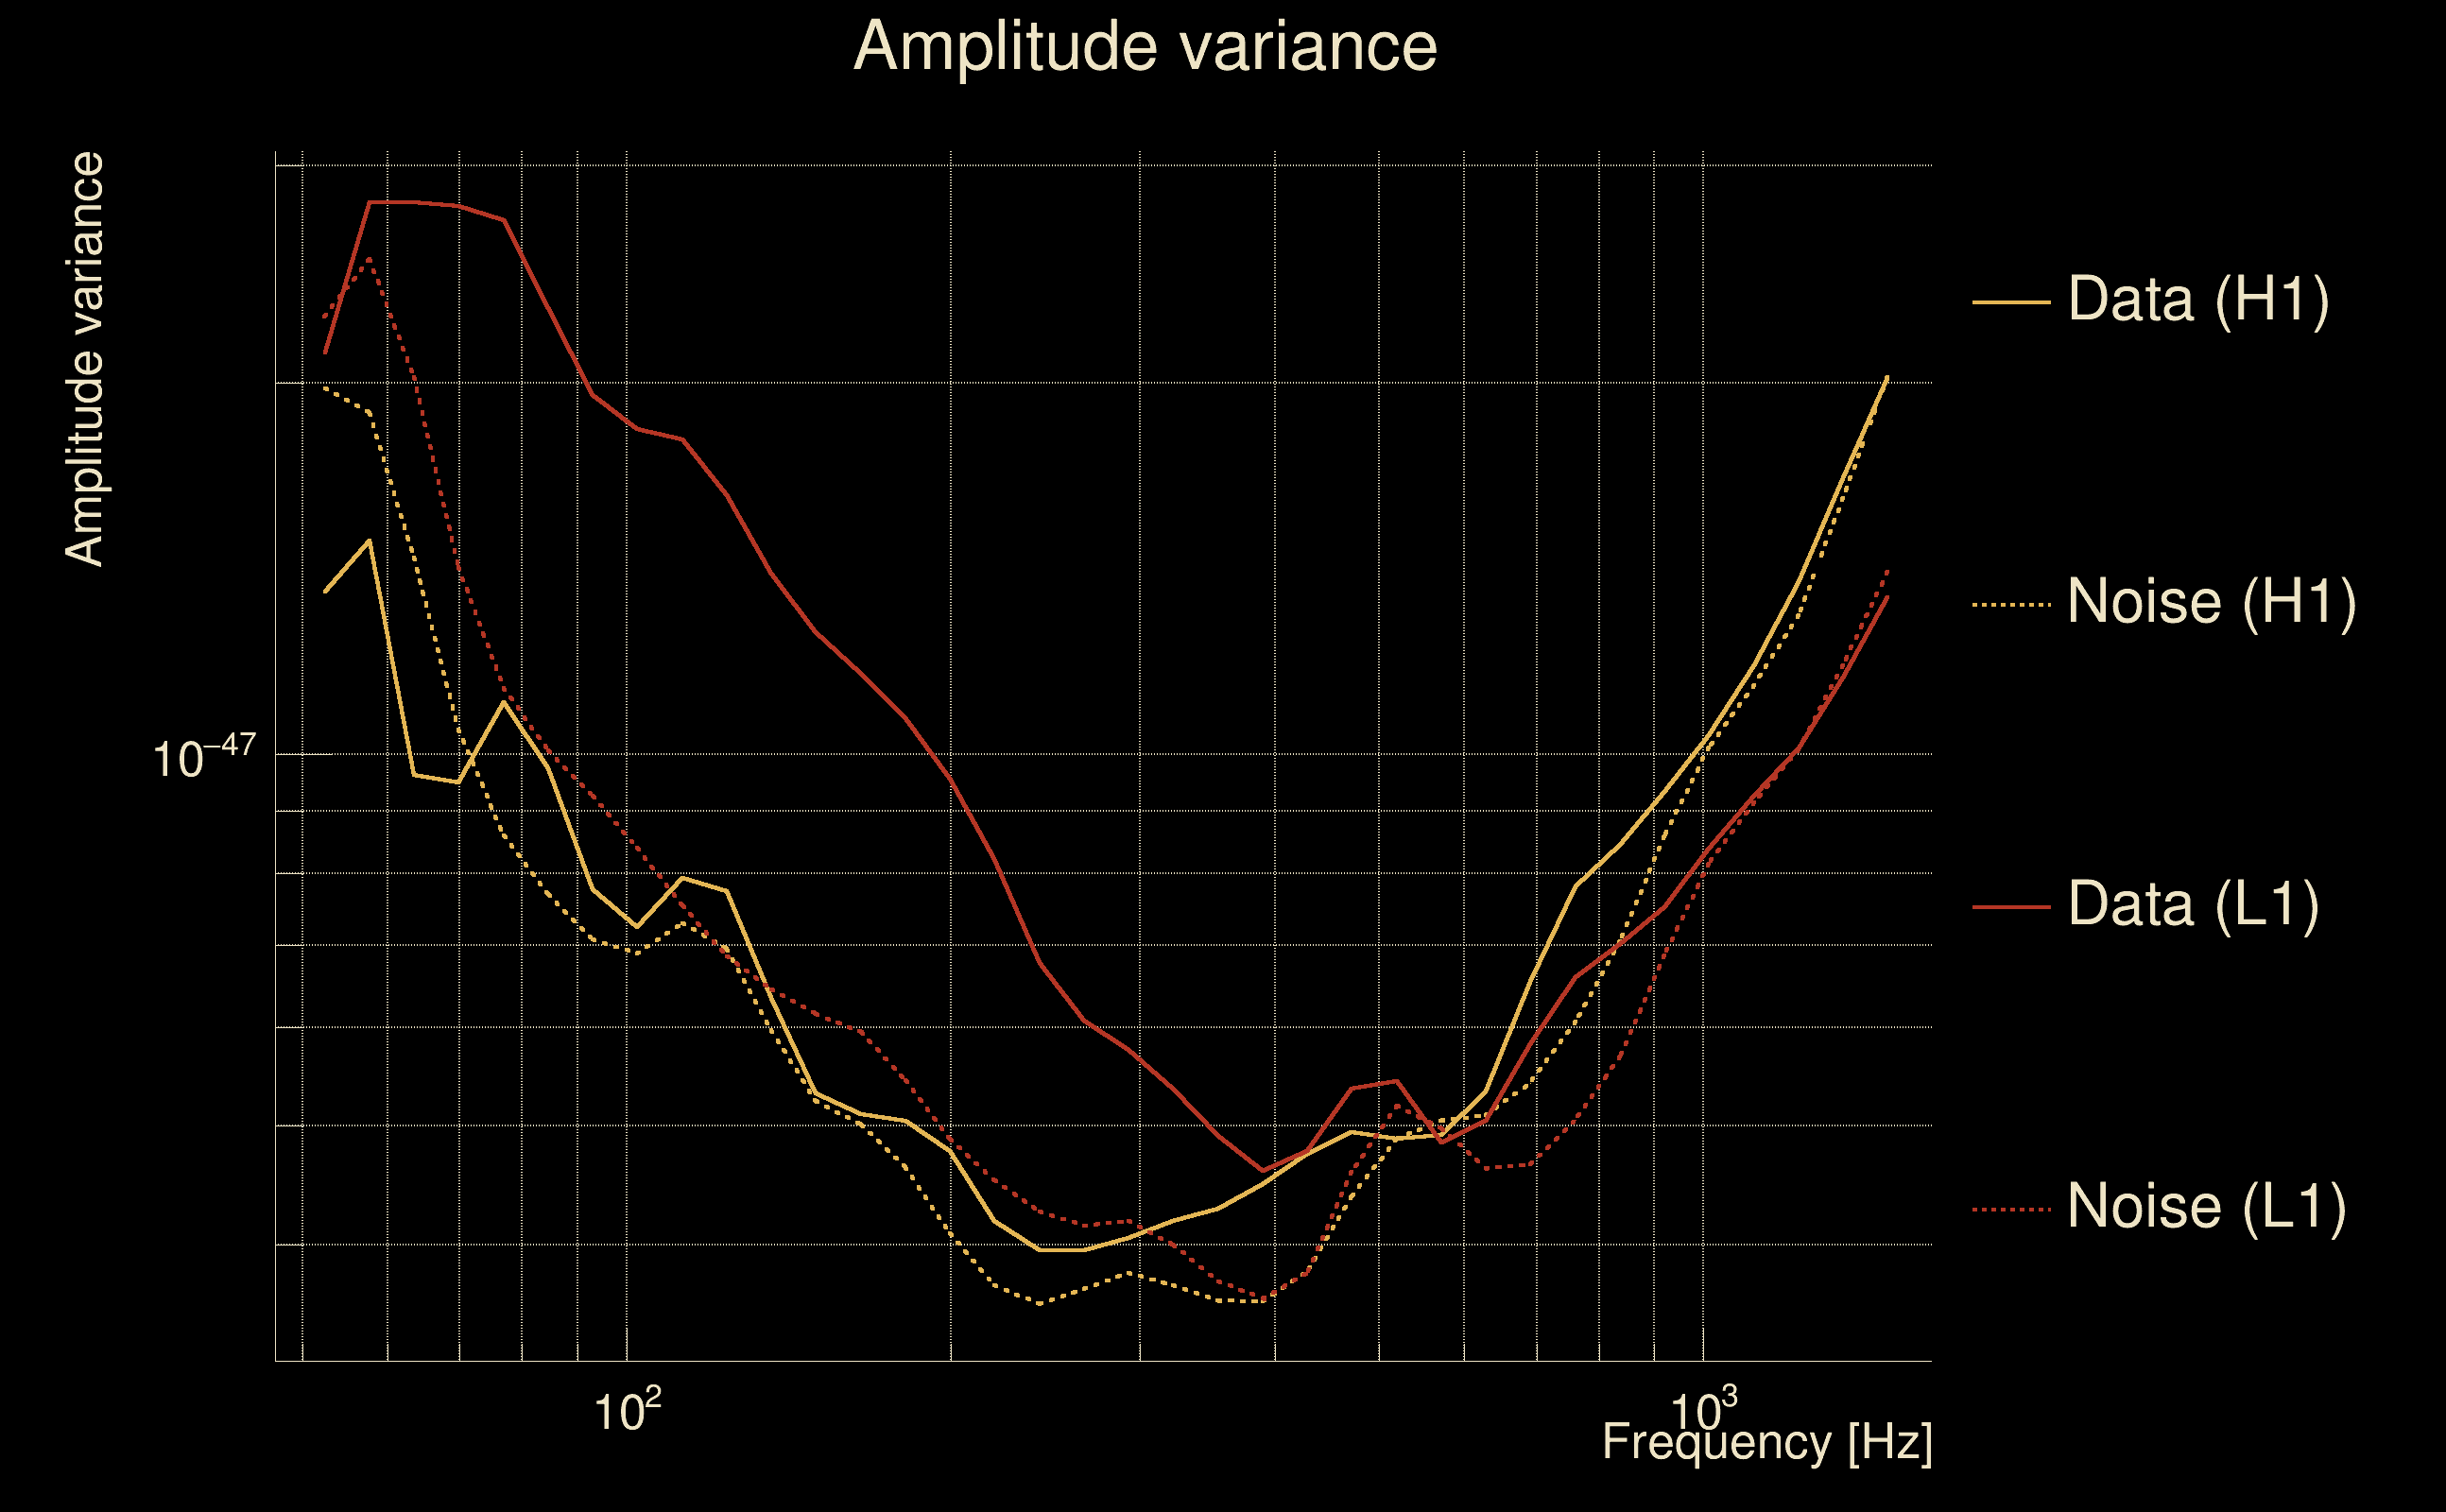
| Maximum signal-to-noise ratio: | H1: 75.6116, L1: 65.1896 |
| SNR variance: | H1: 4.5306, L1: 3.54565 |
| Click here for a zoomed plot | Click here for a zoomed plot | Click here for a zoomed plot | Click here for a zoomed plot | Click here for a zoomed plot |
 |
 |
 |
 |
 |
 |
 |
 |
 |
 |
 |
 |
 |
 |
 |
 |
 |
 |
 |
 |
 |
 |
 |
 |
 |
 |
 |
 |
 |
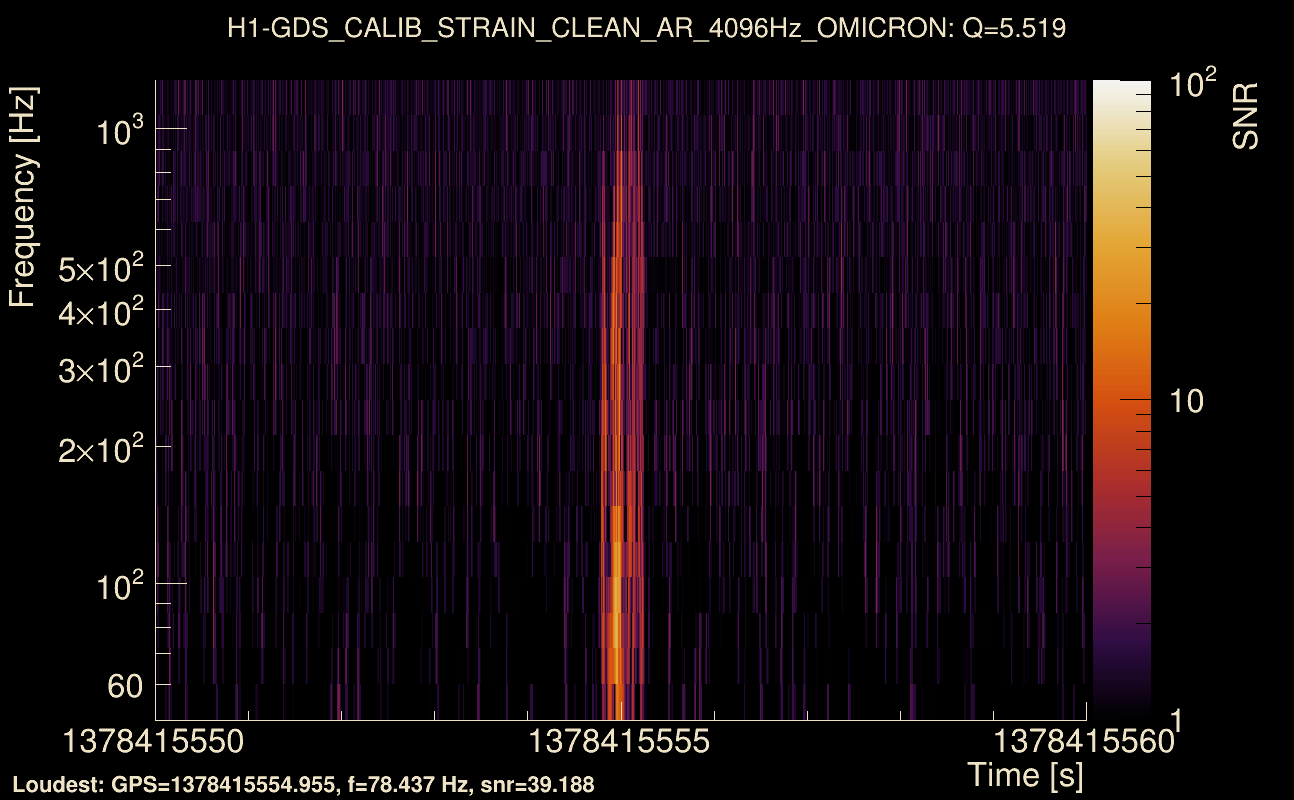
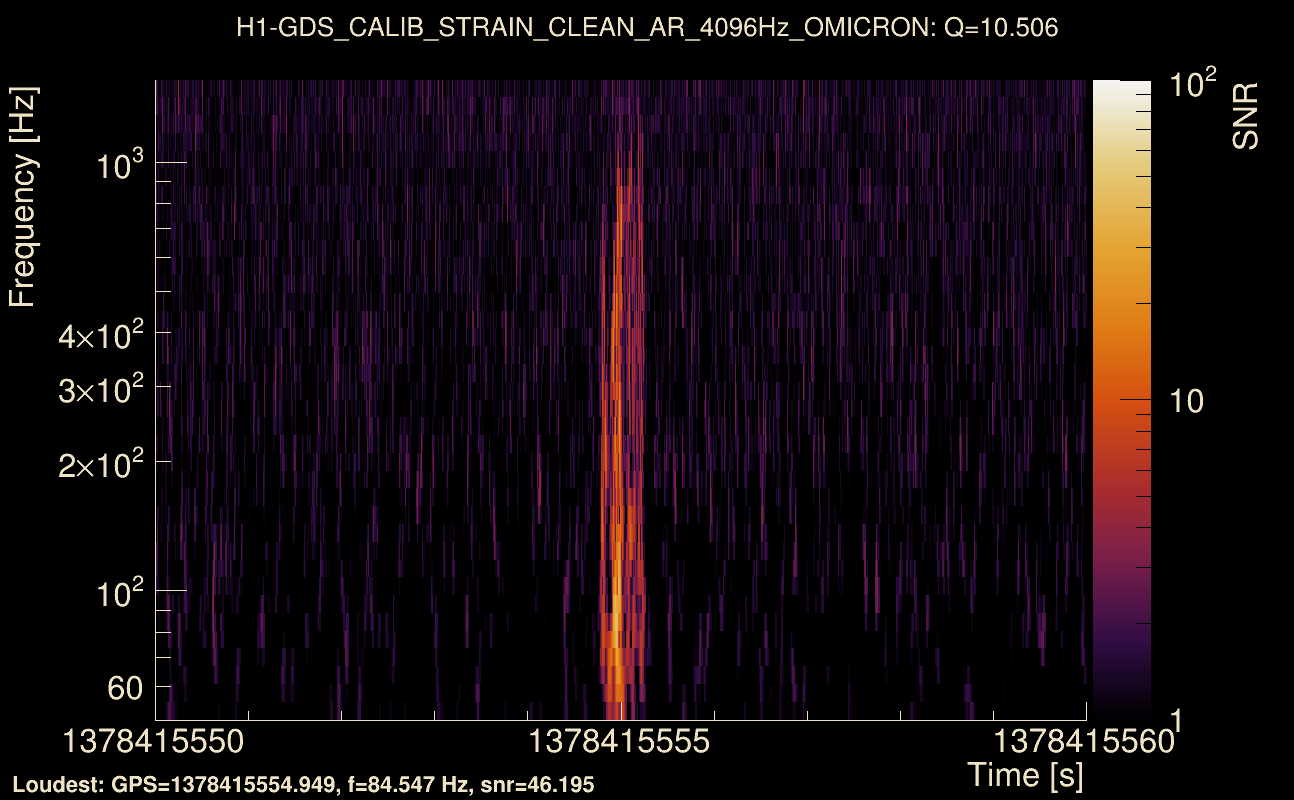
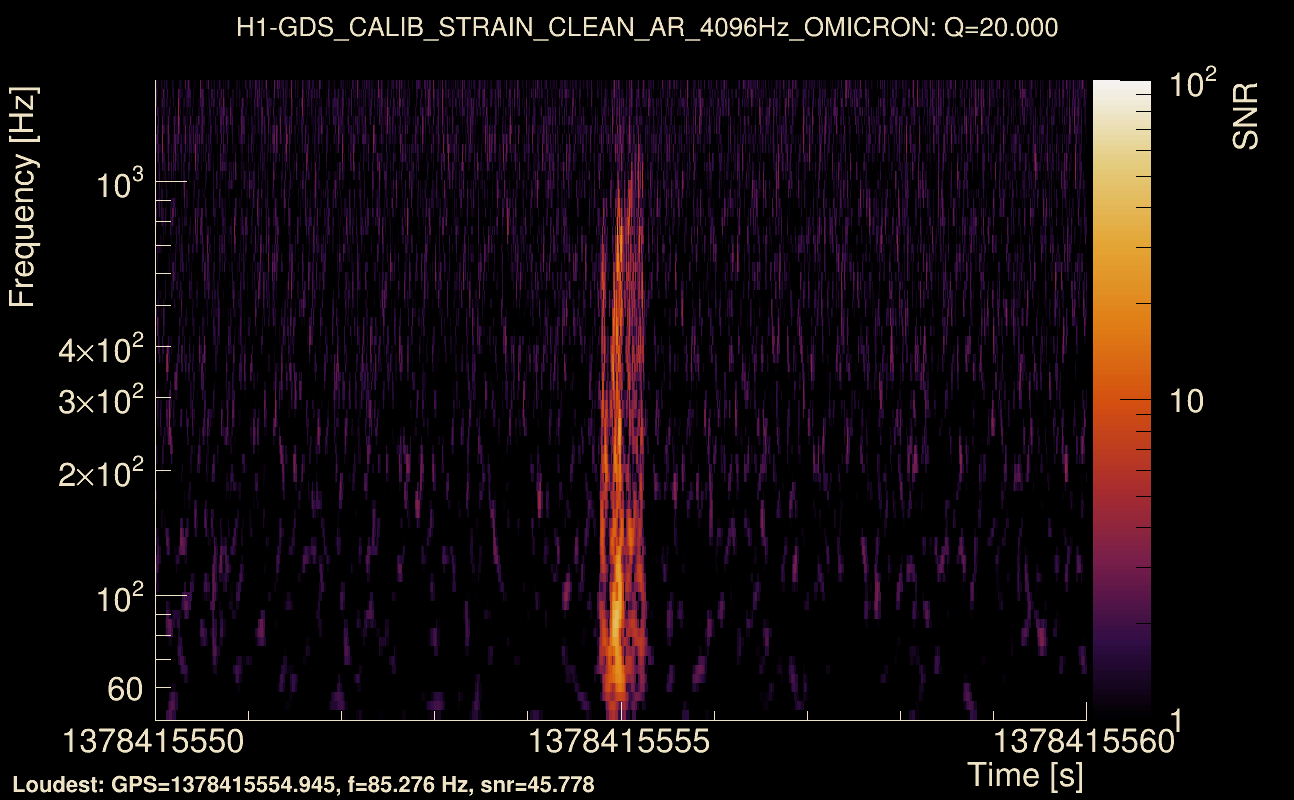
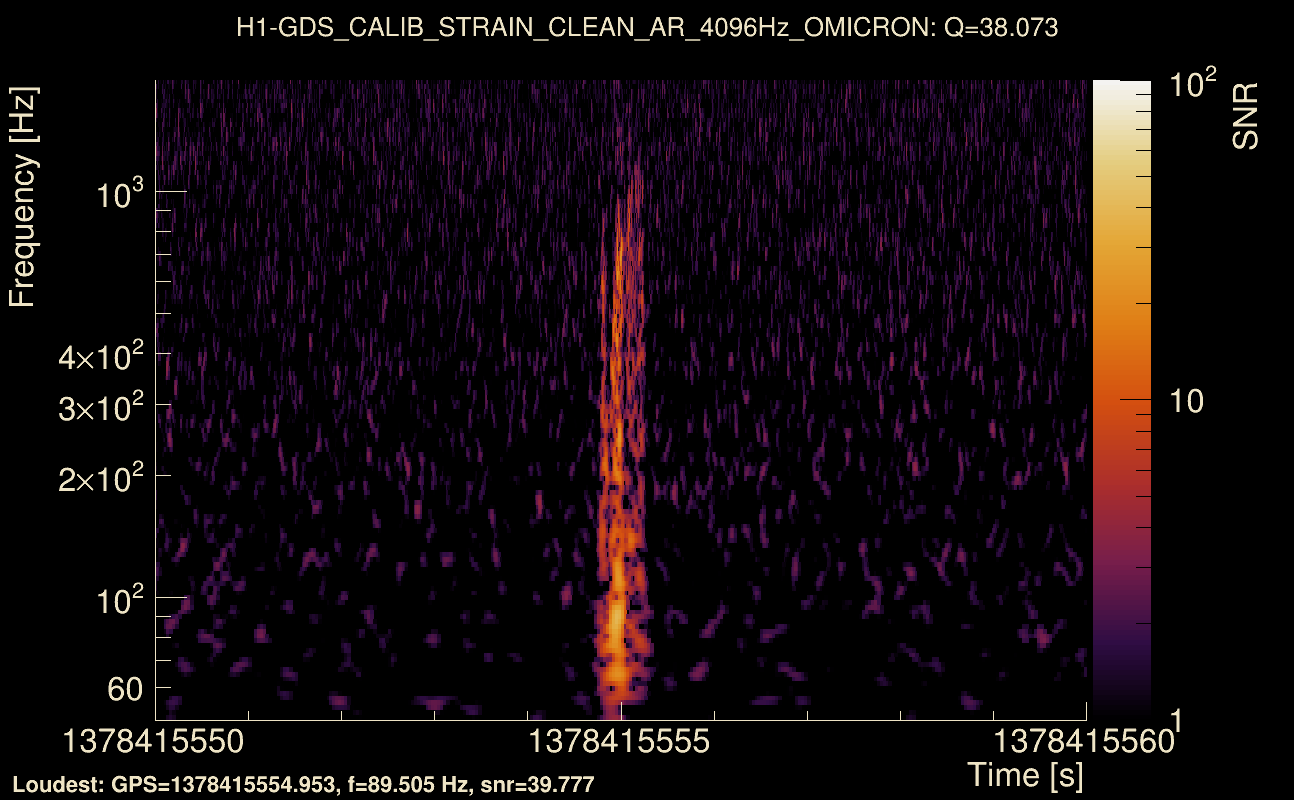
| Event time t(H1): | GPS = 1378415550 (Sun Sep 10 21:12:12 2023 ) → GPS = 1378415560 (Sun Sep 10 21:12:22 2023 ) |
| Event time t(L1): | GPS = 1378415550 (Sun Sep 10 21:12:22 2023 ) → GPS = 1378415560 (Sun Sep 10 21:12:22 2023 ) |
| Omicron analysis time window (H1): | GPS = 1378415547 → GPS = 1378415563 |
| Omicron analysis time window (L1): | GPS = 1378415547 → GPS = 1378415563 |
| Time delay between detectors t(L1) - t(H1): | 0.000965298 s (slice index = 108 / 217), δt_gw = 0.000965298 s |
| Time delay uncertainty: | 0.000453237 s |
| [targeted mode] Time delay probability: | 0.945377 (0.0685139 sigmas), δt_target = -0.00103974 s |
| Frequency: | 235.297 Hz |
| Ξ: | 0.915235 ± 0.00787906 (variance = 6.20796e-05): Q0: 0.945423, Q1: 0.938296, Q2: 0.935233, Q3: 0.932196, Q4: 0.92143 |
| Rank: | R_A = 0.915235 |
| Log of amplitude ratio (L1/H1): | -0.0179829, variance = 0.153512 (L1/H1: -0.0324009, variance = 0.306945, H1/L1: 0.00425248, variance = 0.306745) |
| Amplitude ratio (L1/H1): | 0.982178 ⋇ 1.47965 (L1/H1: 0.968118 ⋇ 1.74024, H1/L1: 1.00426 ⋇ 1.73993) |
| Amplitude ratio H1|L1 compatibility (probability): | 0.971337 |
| Antenna factor probability: | 1 |
| Number of rejected frequency rows: | Q0: 0 / 18, Q1: 0 / 36, Q2: 5 / 70, Q3: 20 / 134, Q4: 55 / 258 |
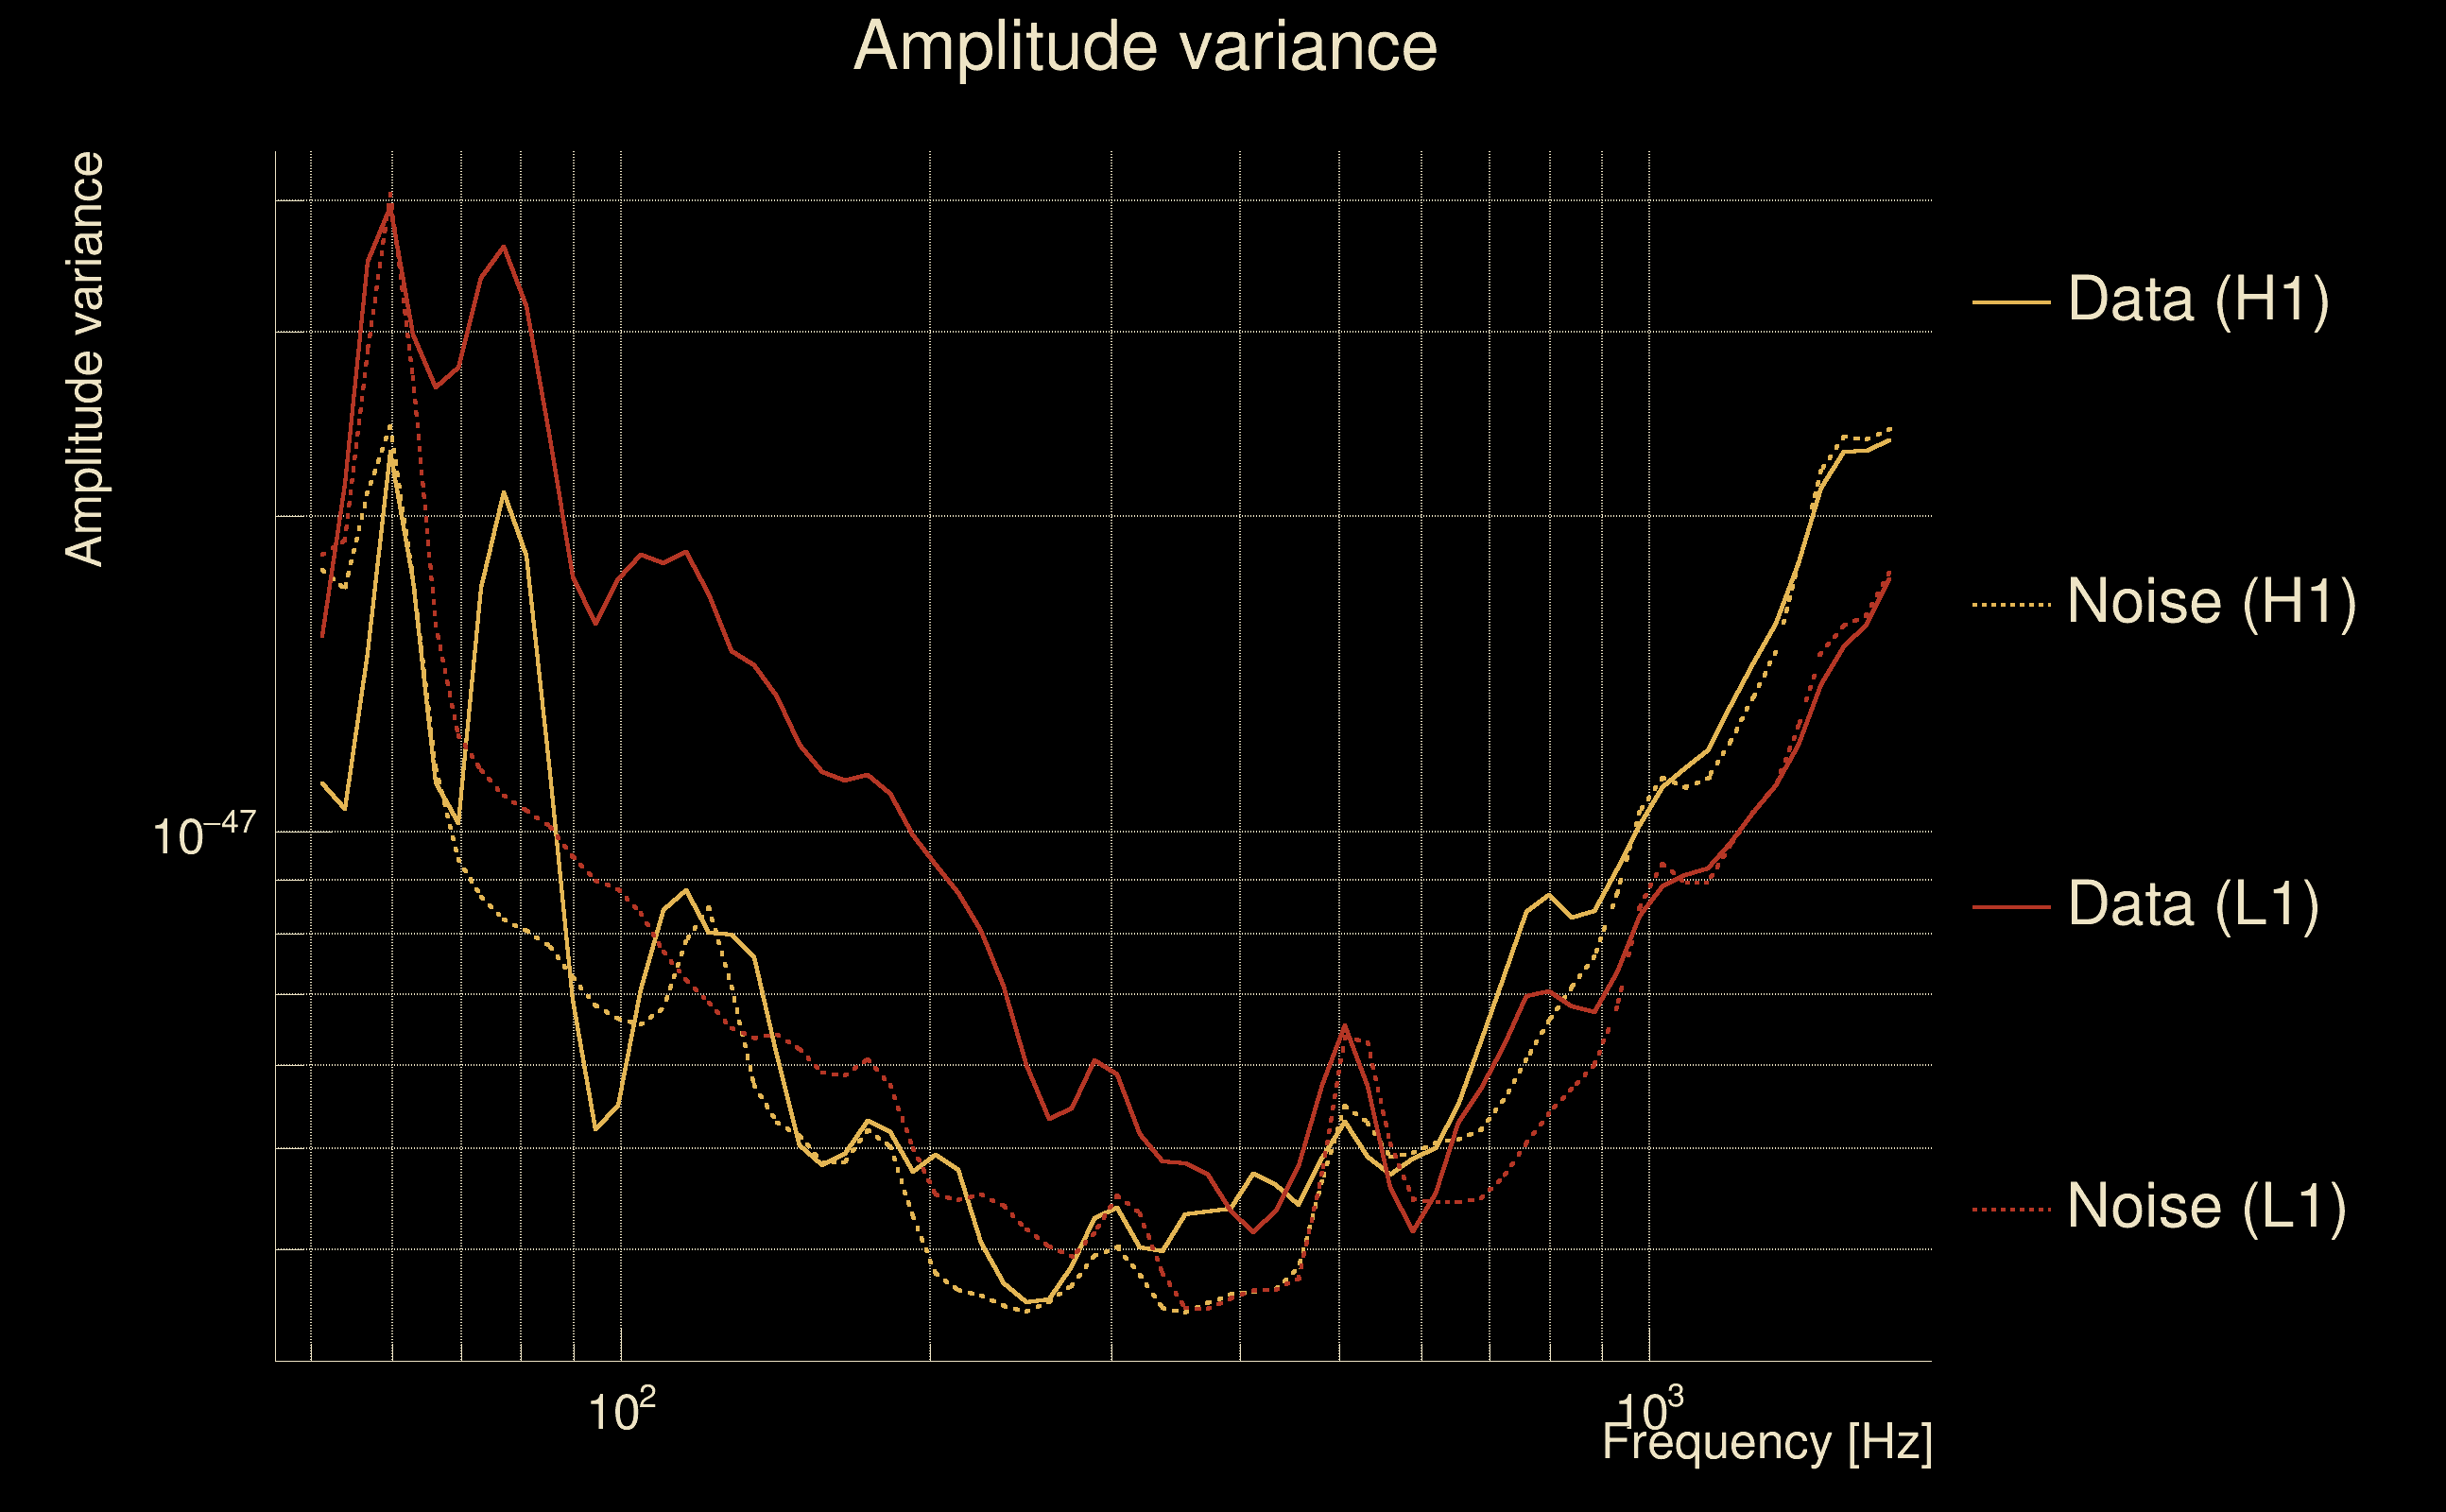
| Maximum signal-to-noise ratio: | H1: 49.3612, L1: 50.582 |
| SNR variance: | H1: 2.17021, L1: 2.28197 |
| Click here for a zoomed plot | Click here for a zoomed plot | Click here for a zoomed plot | Click here for a zoomed plot | Click here for a zoomed plot |
 |
 |
 |
 |
 |
 |
 |
 |
 |
 |
 |
 |
 |
 |
 |
 |
 |
 |
 |
 |
 |
 |
 |
 |
 |
 |
 |
 |
 |
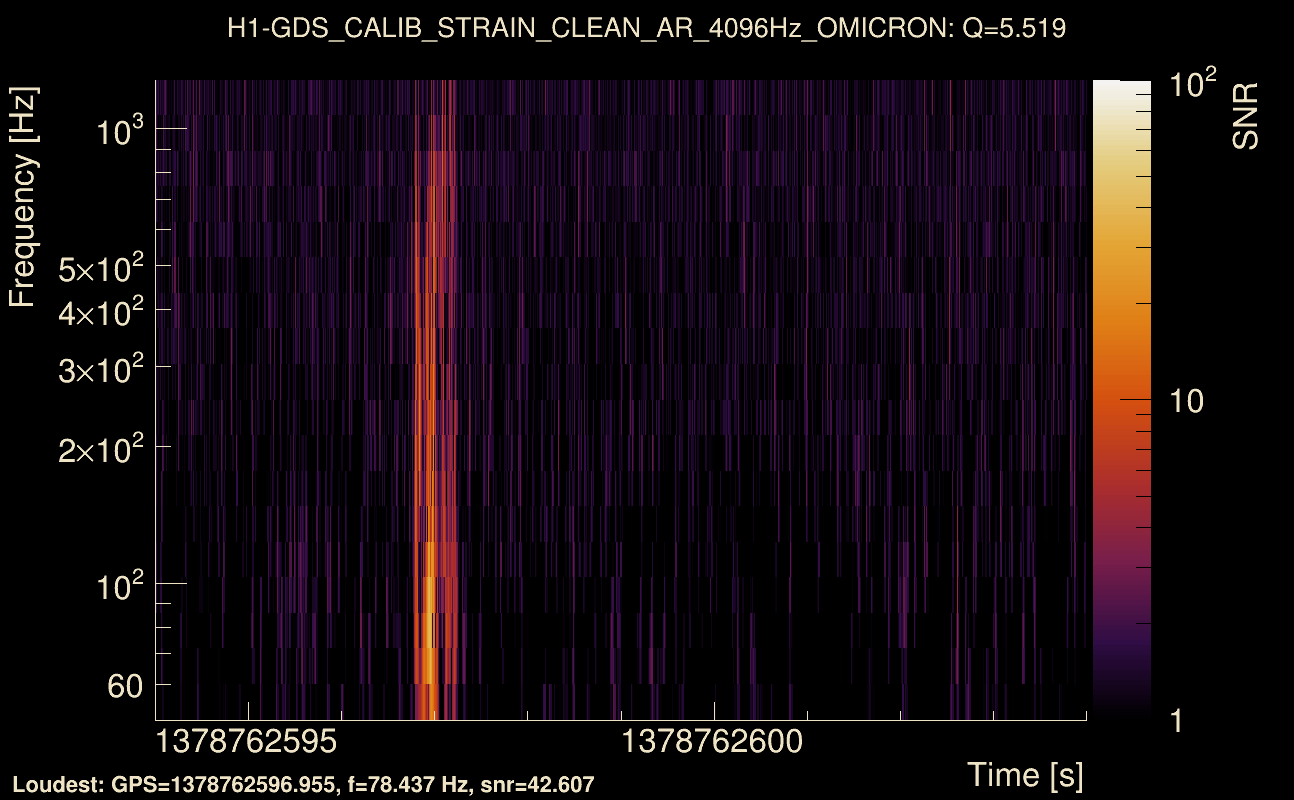
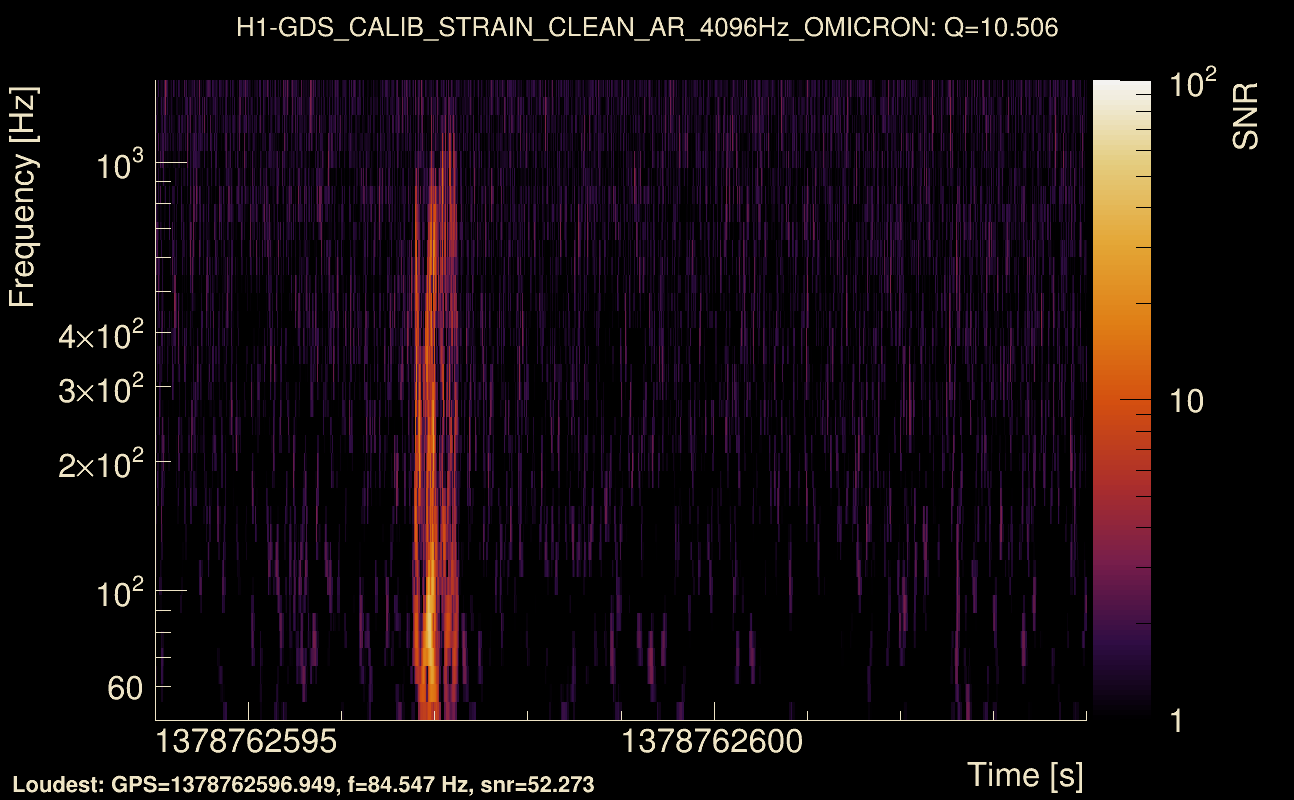
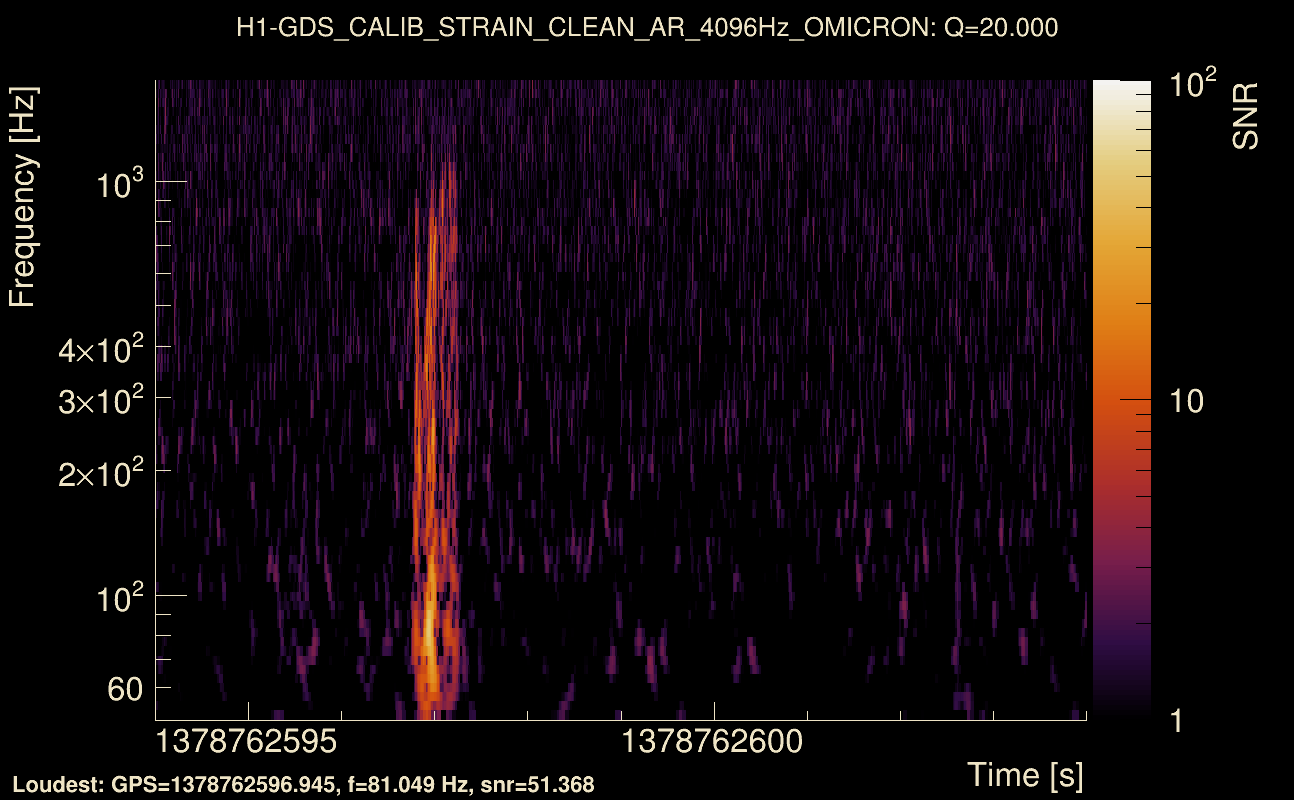
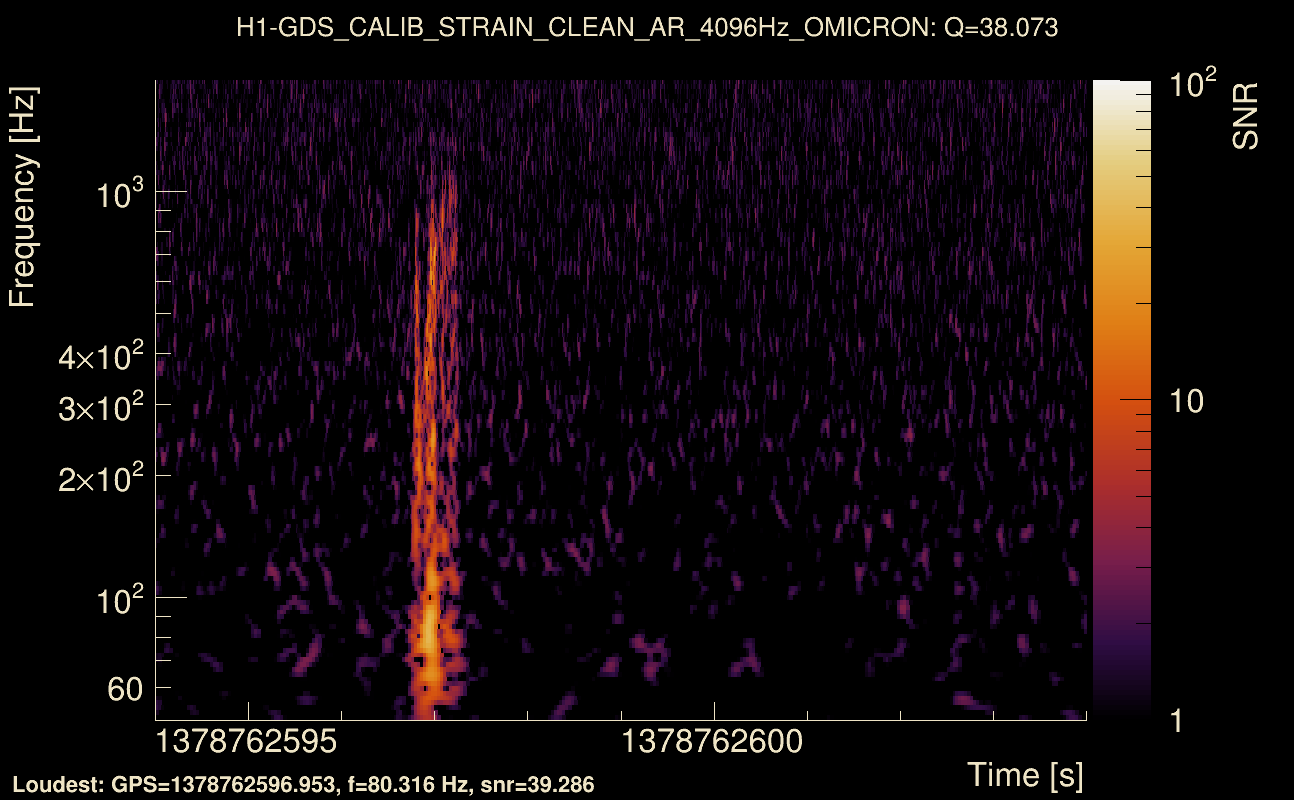
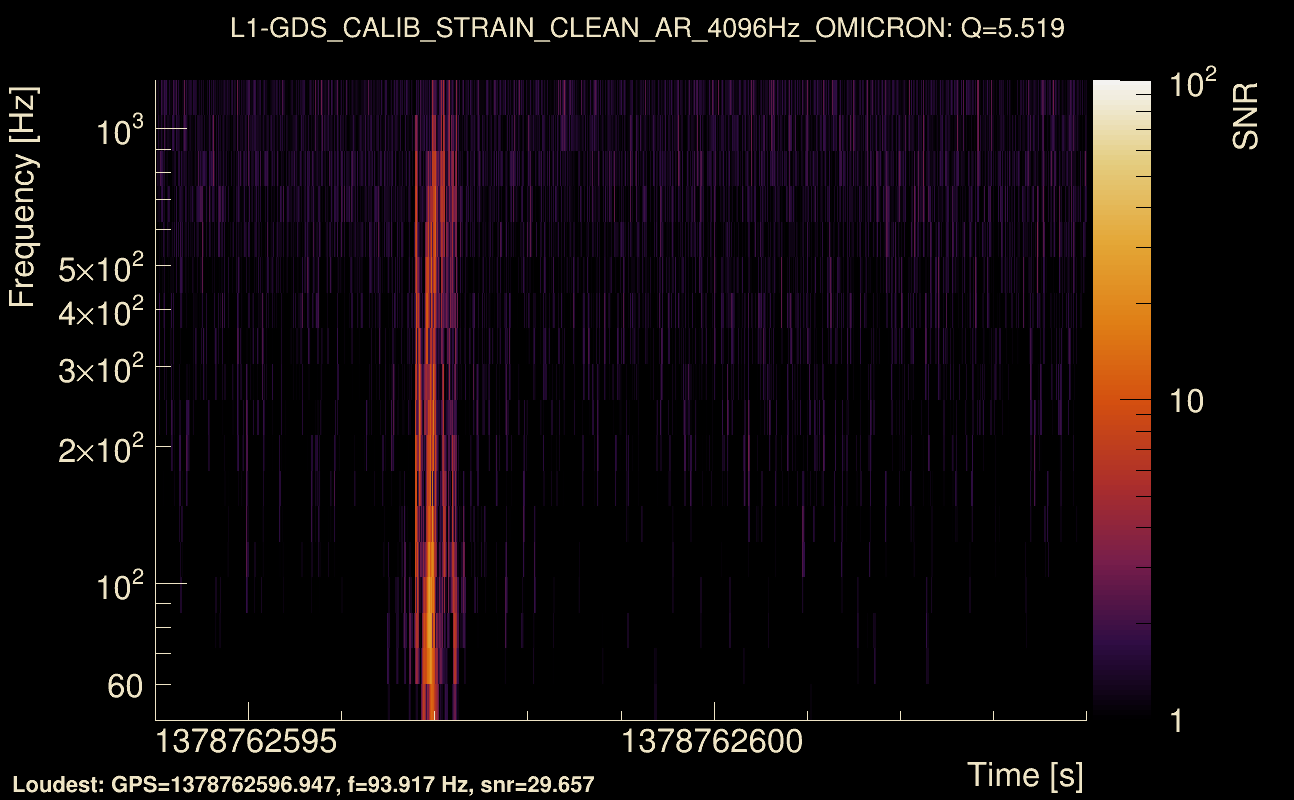
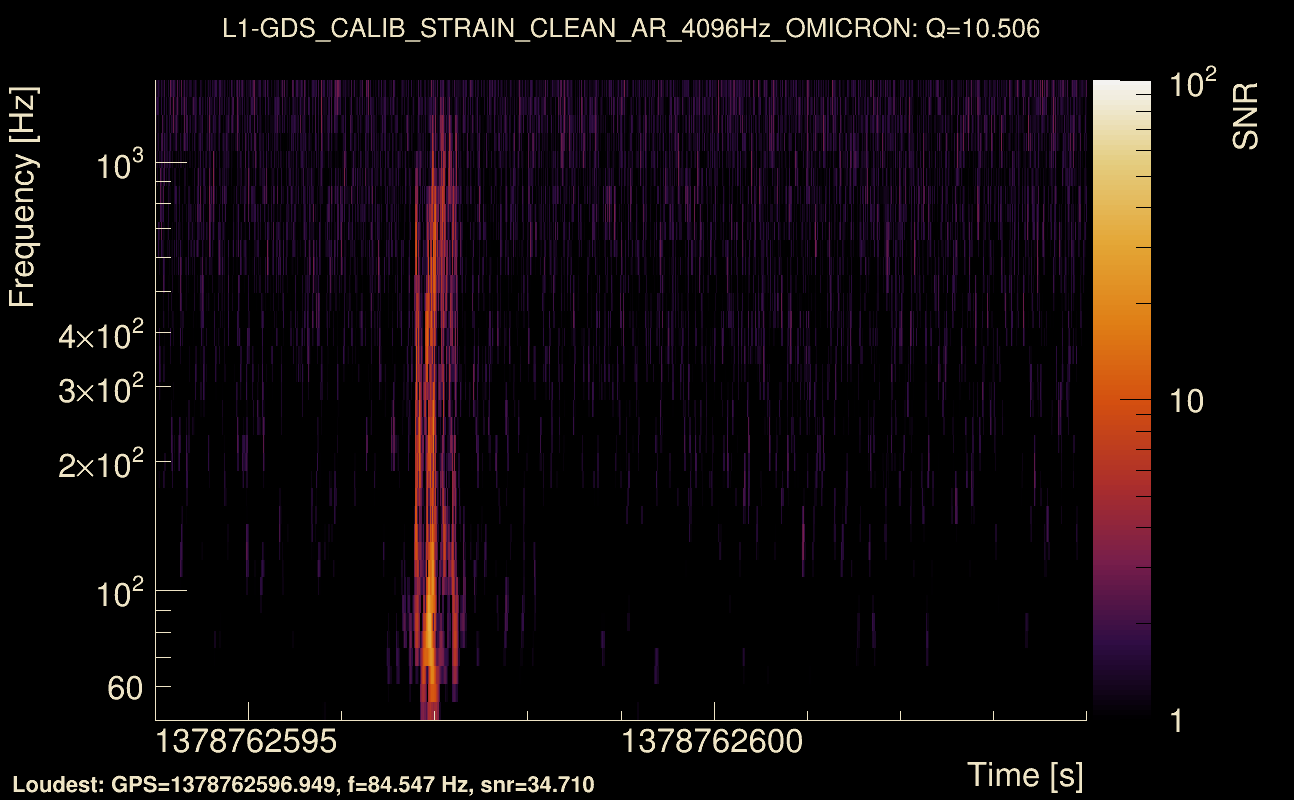
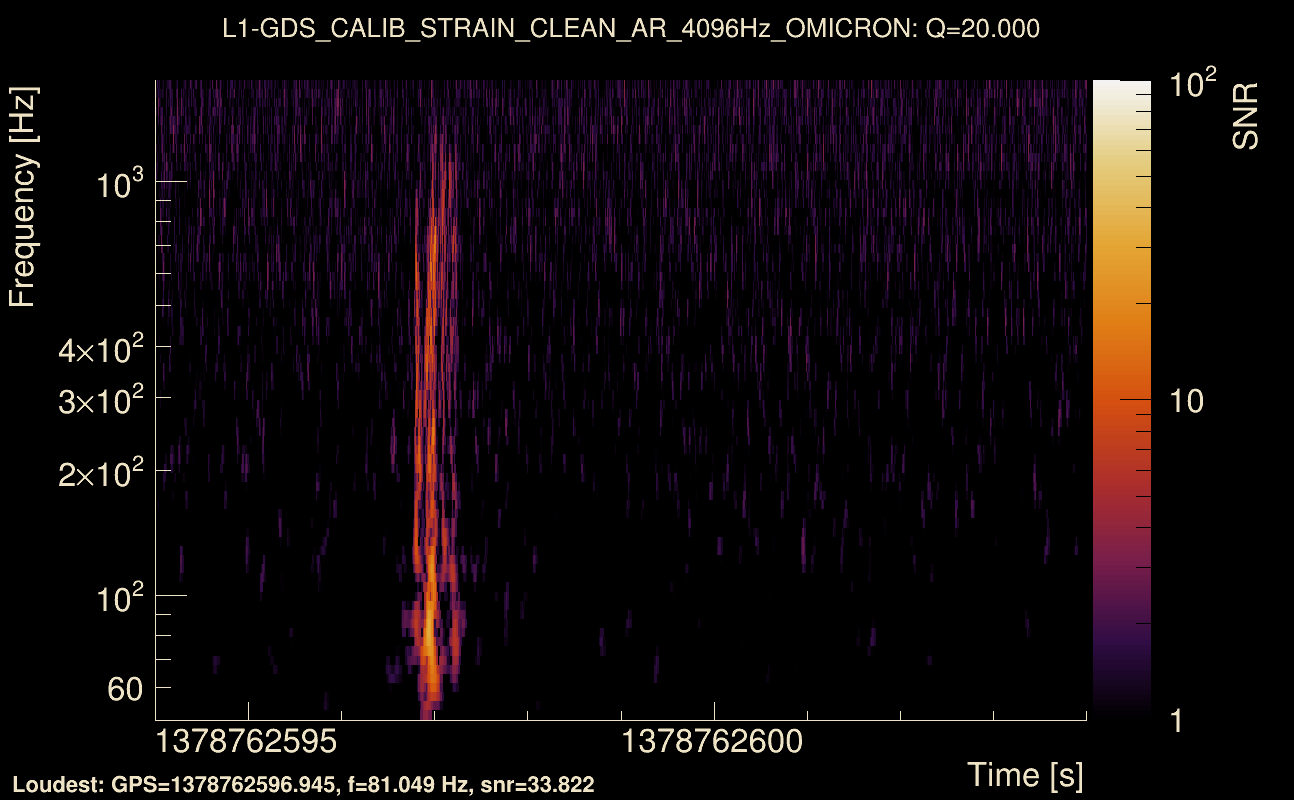
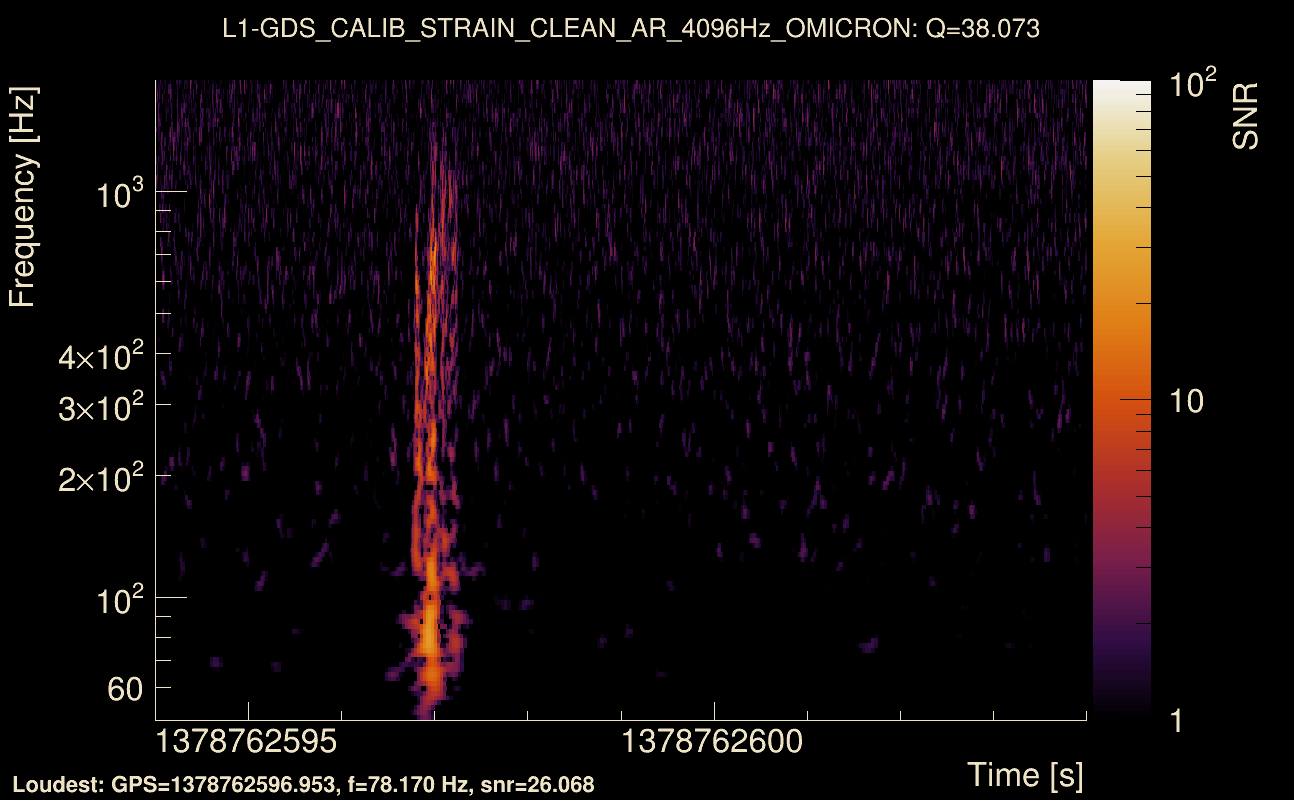
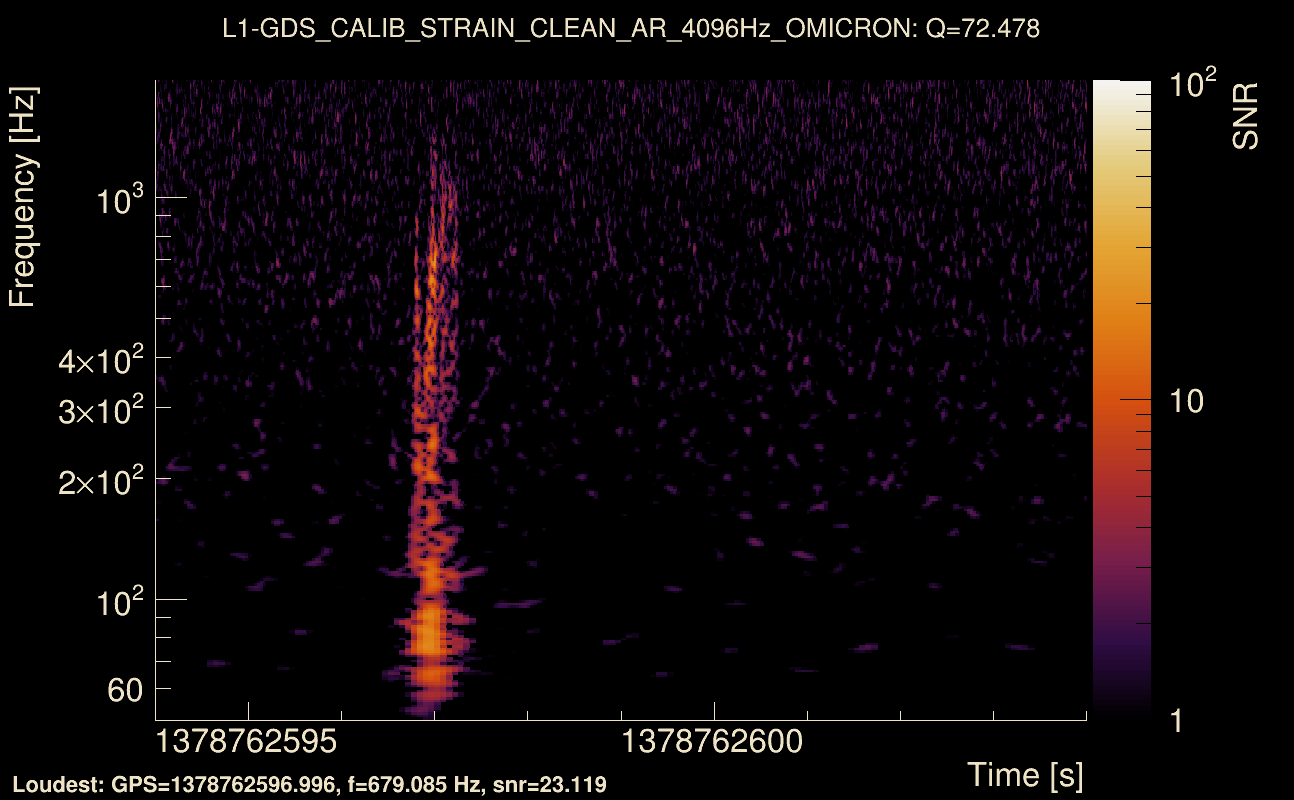
| Event time t(H1): | GPS = 1378762594 (Thu Sep 14 21:36:16 2023 ) → GPS = 1378762604 (Thu Sep 14 21:36:26 2023 ) |
| Event time t(L1): | GPS = 1378762594 (Thu Sep 14 21:36:26 2023 ) → GPS = 1378762604 (Thu Sep 14 21:36:26 2023 ) |
| Omicron analysis time window (H1): | GPS = 1378762591 → GPS = 1378762607 |
| Omicron analysis time window (L1): | GPS = 1378762591 → GPS = 1378762607 |
| Time delay between detectors t(L1) - t(H1): | 0.00193118 s (slice index = 108 / 217), δt_gw = 0.00193118 s |
| Time delay uncertainty: | 0.000723384 s |
| [targeted mode] Time delay probability: | 0.858488 (0.178299 sigmas), δt_target = 0.00165629 s |
| Frequency: | 231.303 Hz |
| Ξ: | 0.915059 ± 0.00613572 (variance = 3.76471e-05): Q0: 0.939028, Q1: 0.937998, Q2: 0.936032, Q3: 0.929021, Q4: 0.922906 |
| Rank: | R_A = 0.915059 |
| Log of amplitude ratio (L1/H1): | -0.0892849, variance = 0.154096 (L1/H1: -0.100971, variance = 0.306423, H1/L1: 0.0774899, variance = 0.30998) |
| Amplitude ratio (L1/H1): | 0.914585 ⋇ 1.48075 (L1/H1: 0.903959 ⋇ 1.73943, H1/L1: 1.08057 ⋇ 1.74501) |
| Amplitude ratio H1|L1 compatibility (probability): | 0.976141 |
| Antenna factor probability: | 1 |
| Number of rejected frequency rows: | Q0: 0 / 18, Q1: 1 / 36, Q2: 3 / 70, Q3: 12 / 134, Q4: 35 / 258 |
| Maximum signal-to-noise ratio: | H1: 53.4293, L1: 53.1818 |
| SNR variance: | H1: 3.00762, L1: 2.91477 |
| Click here for a zoomed plot | Click here for a zoomed plot | Click here for a zoomed plot | Click here for a zoomed plot | Click here for a zoomed plot |
 |
 |
 |
 |
 |
 |
 |
 |
 |
 |
 |
 |
 |
 |
 |
 |
 |
 |
 |
 |
 |
 |
 |
 |
 |
 |
 |
 |
 |
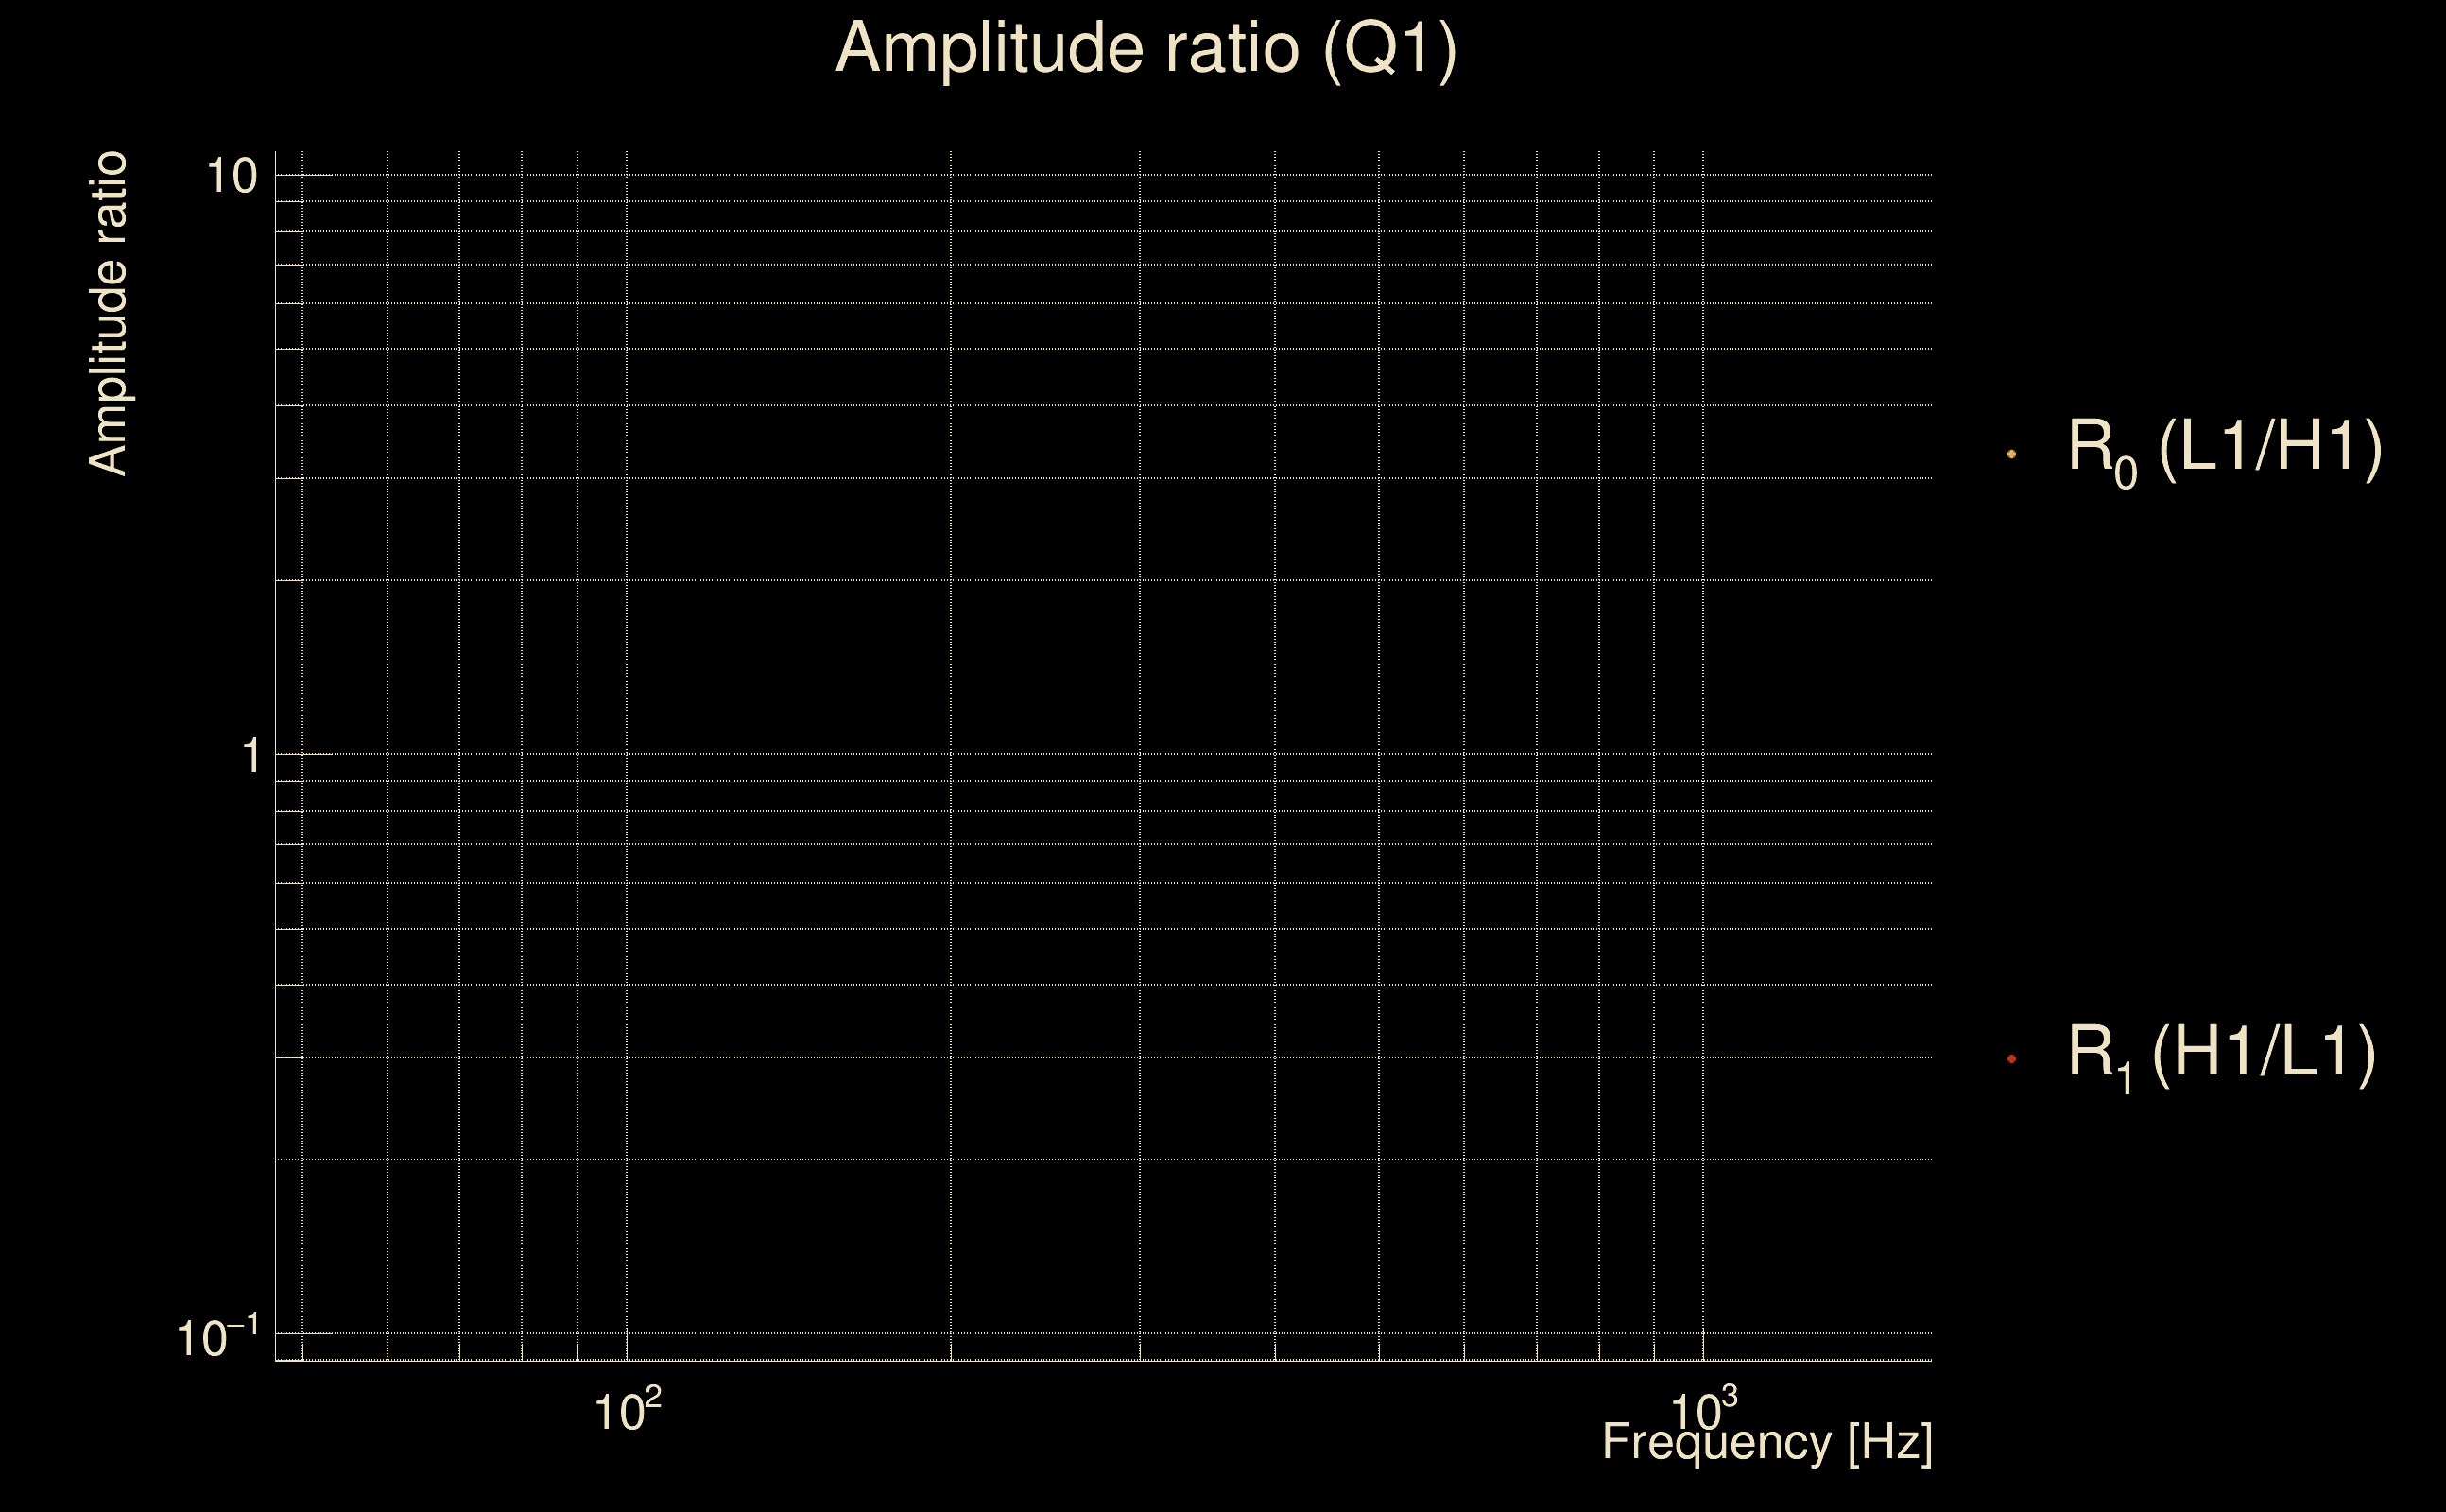
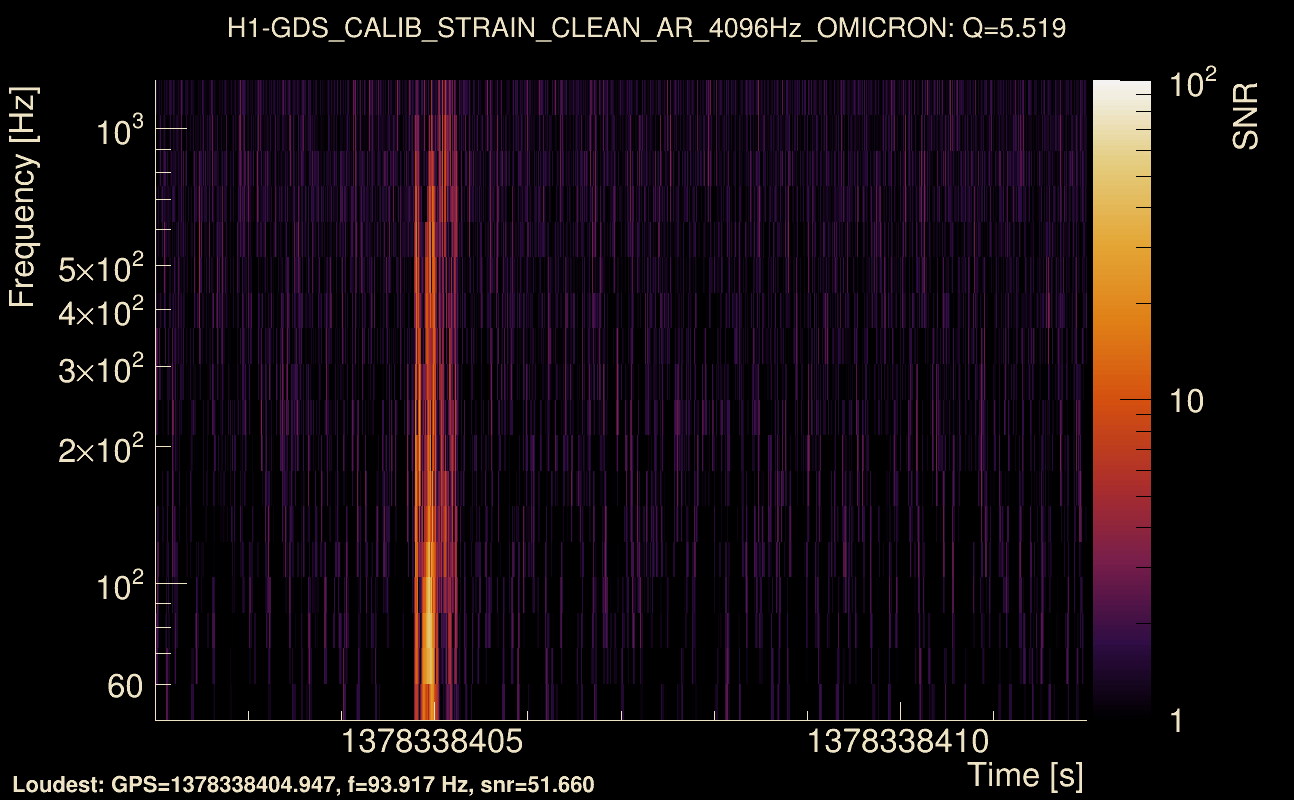
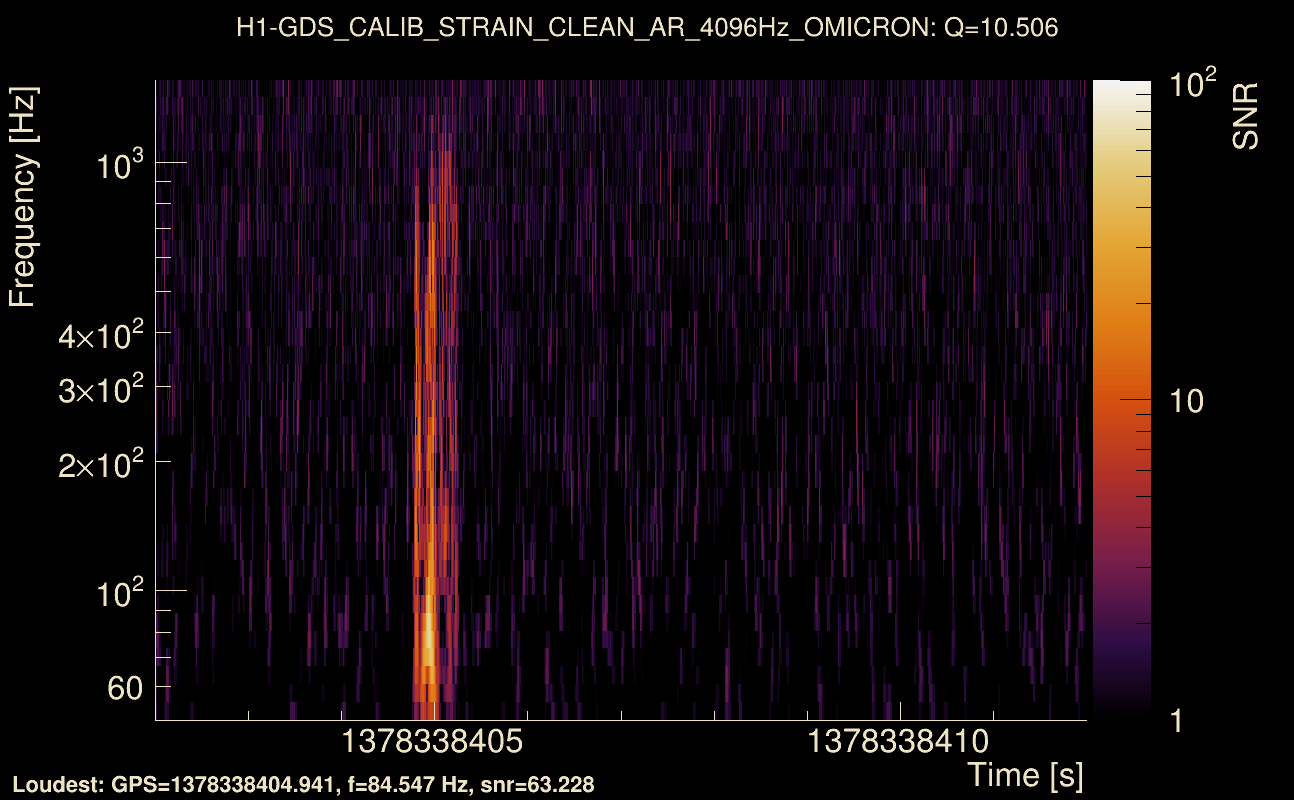
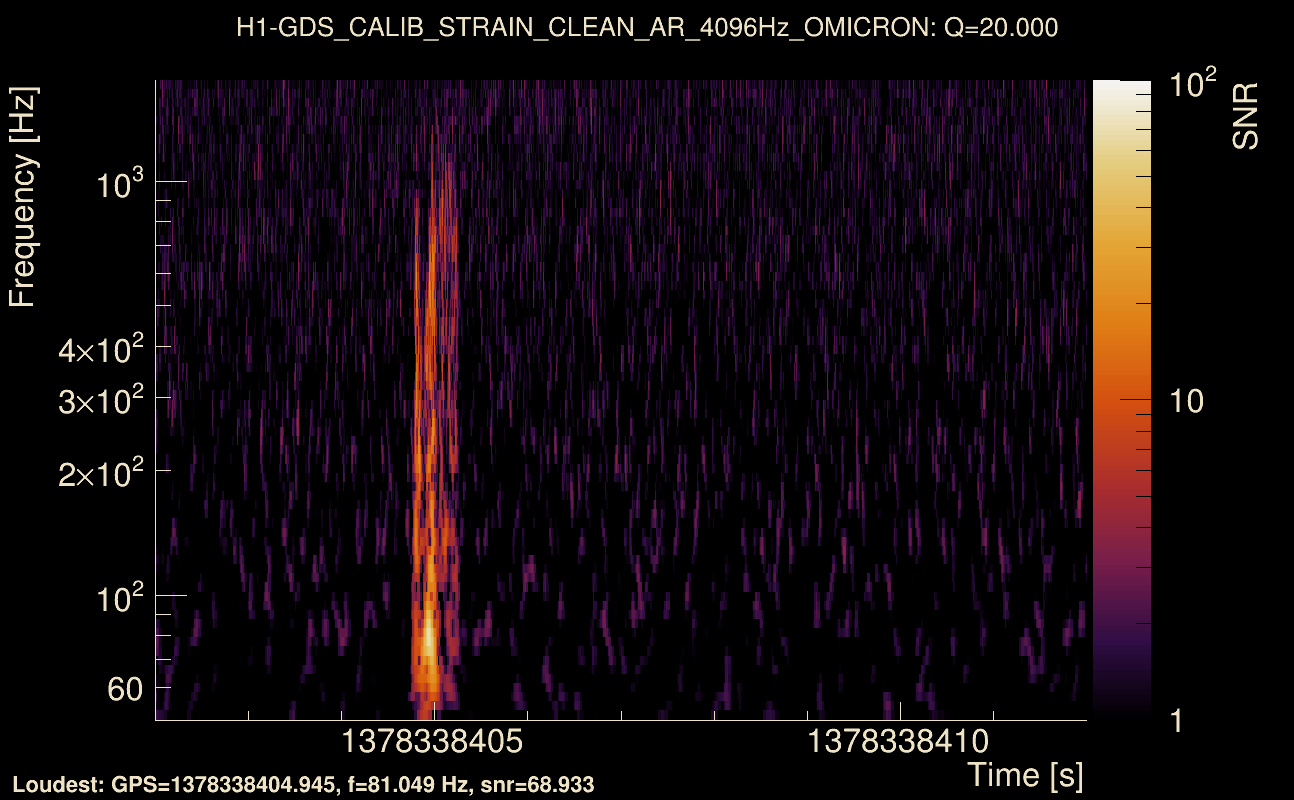
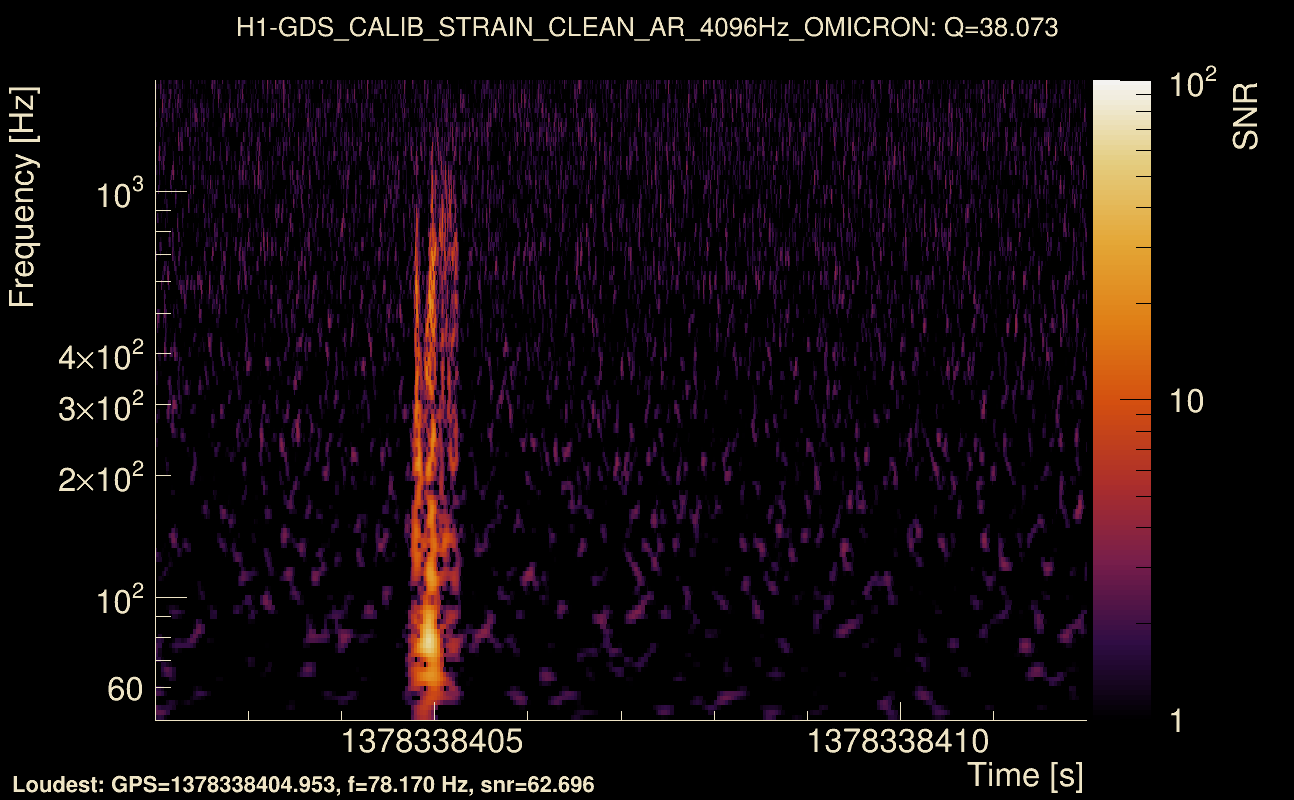
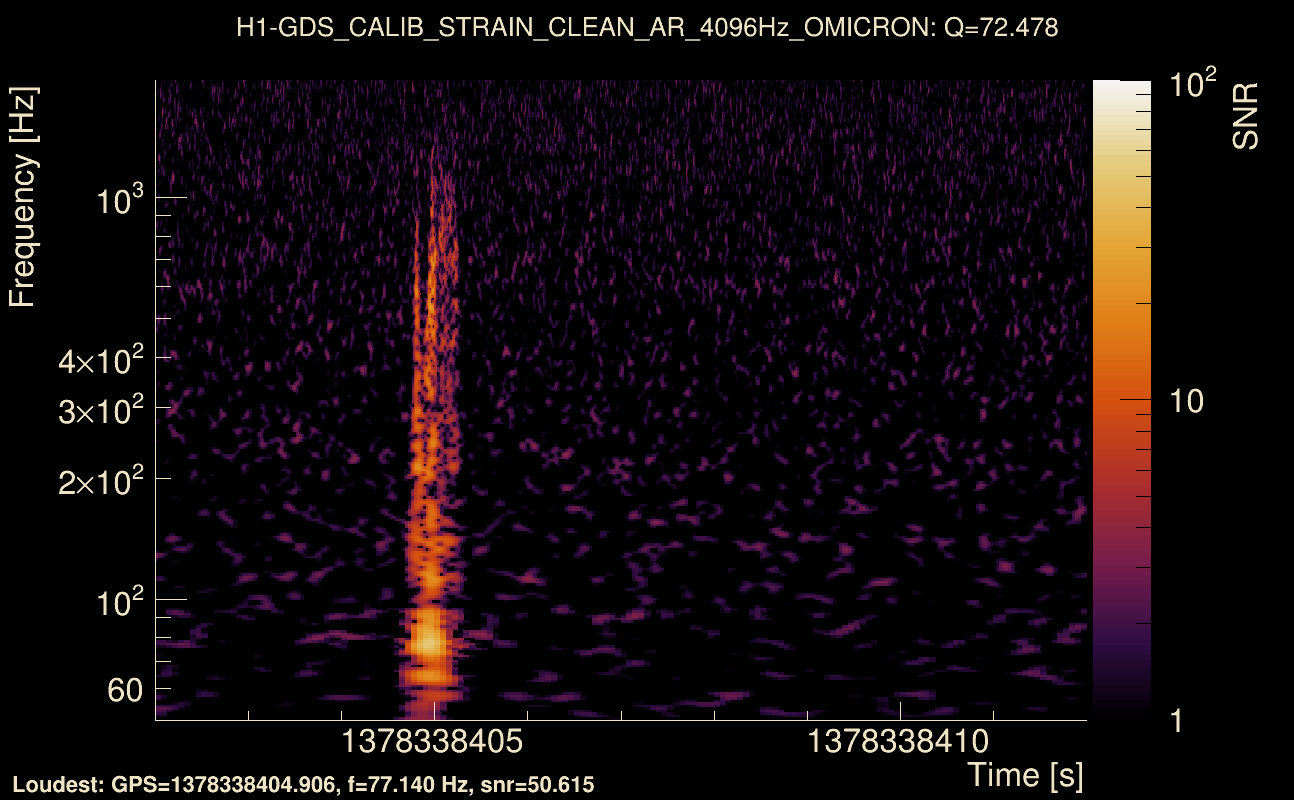
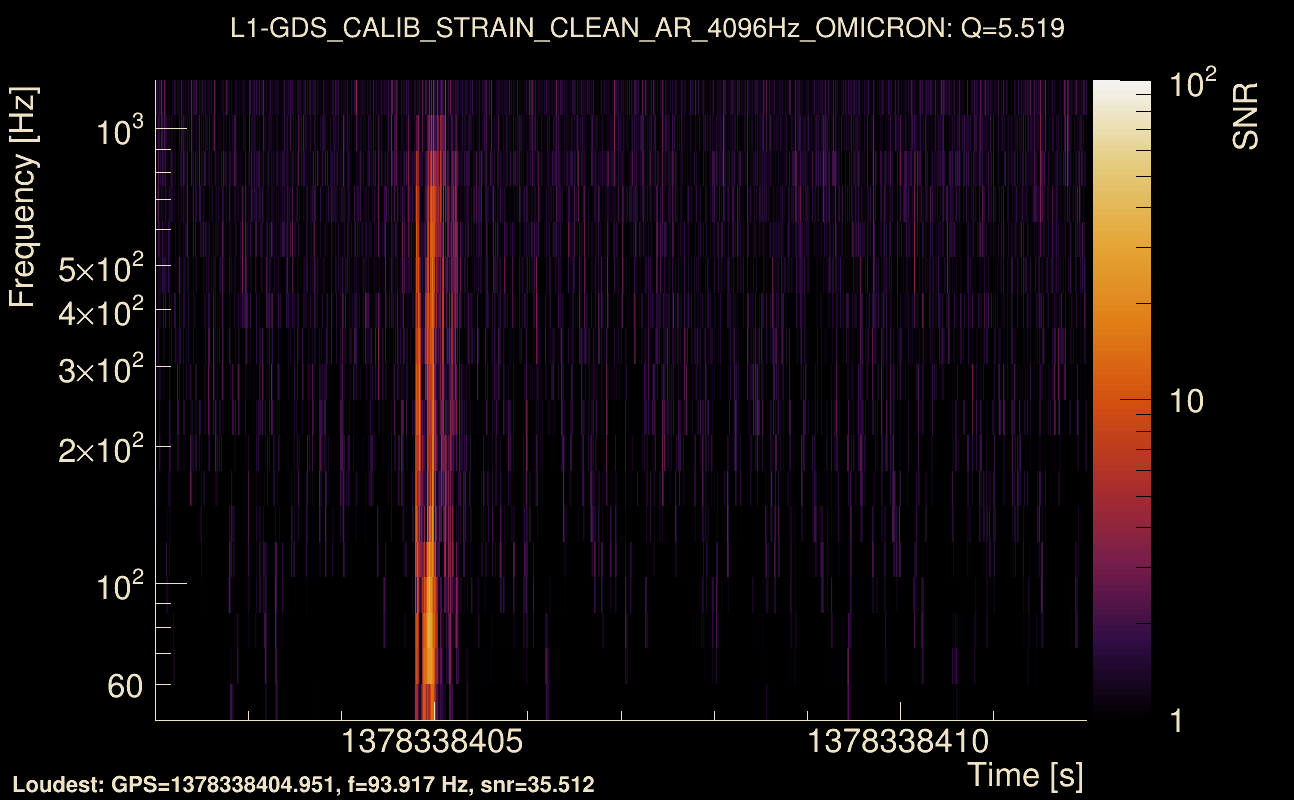
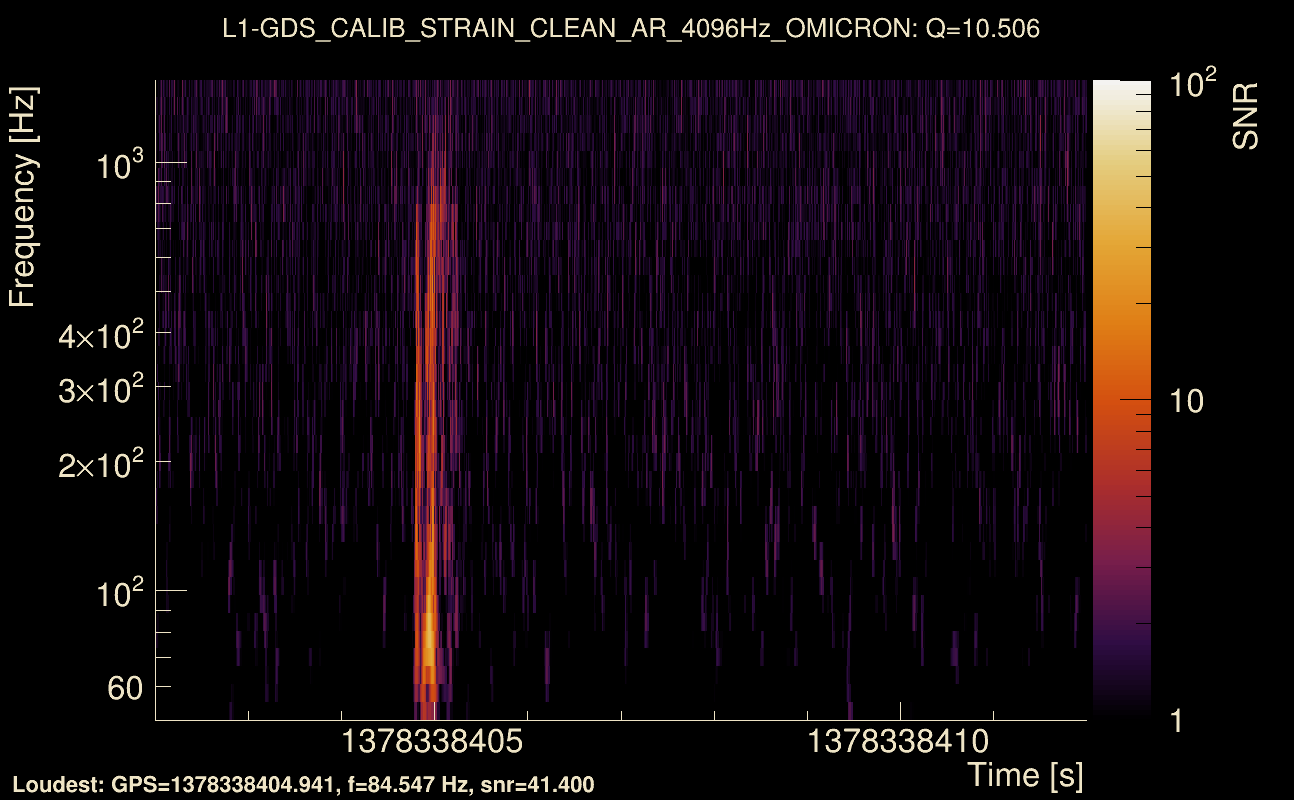
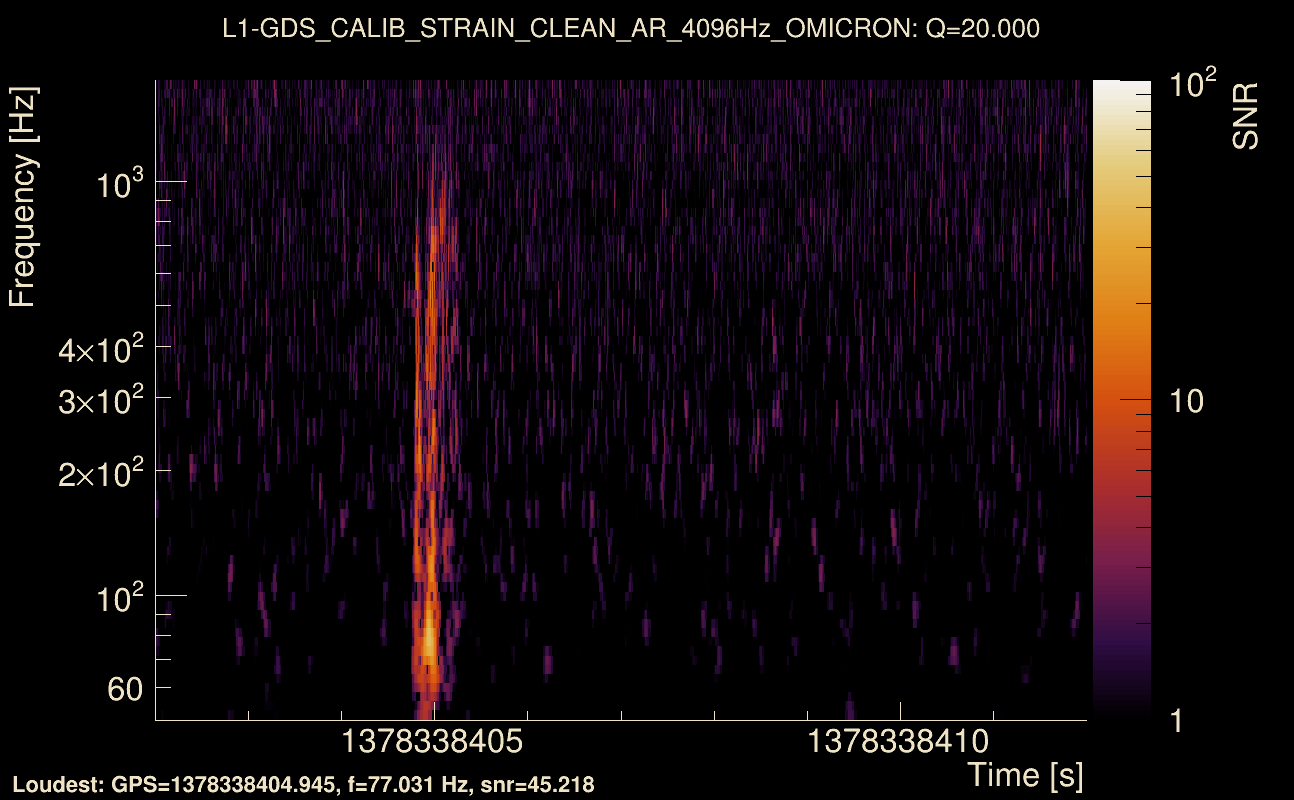
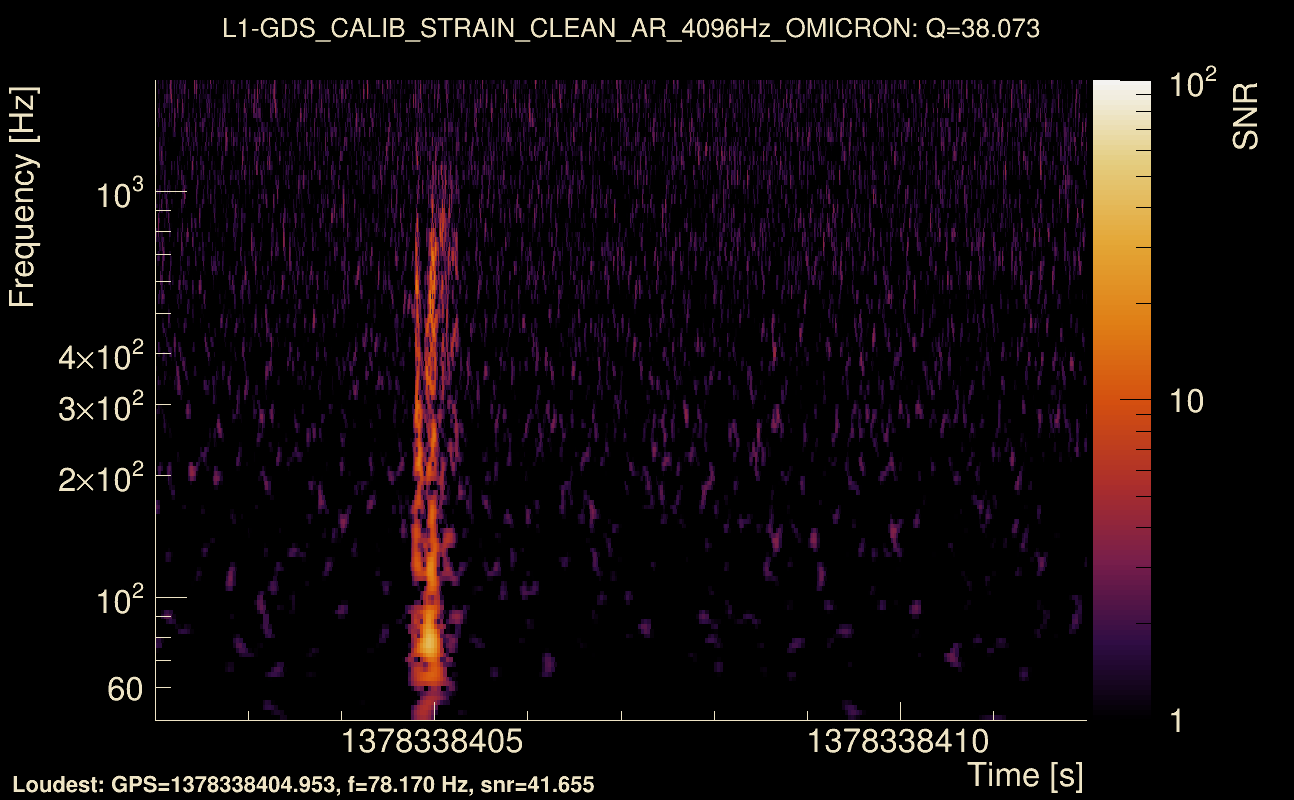
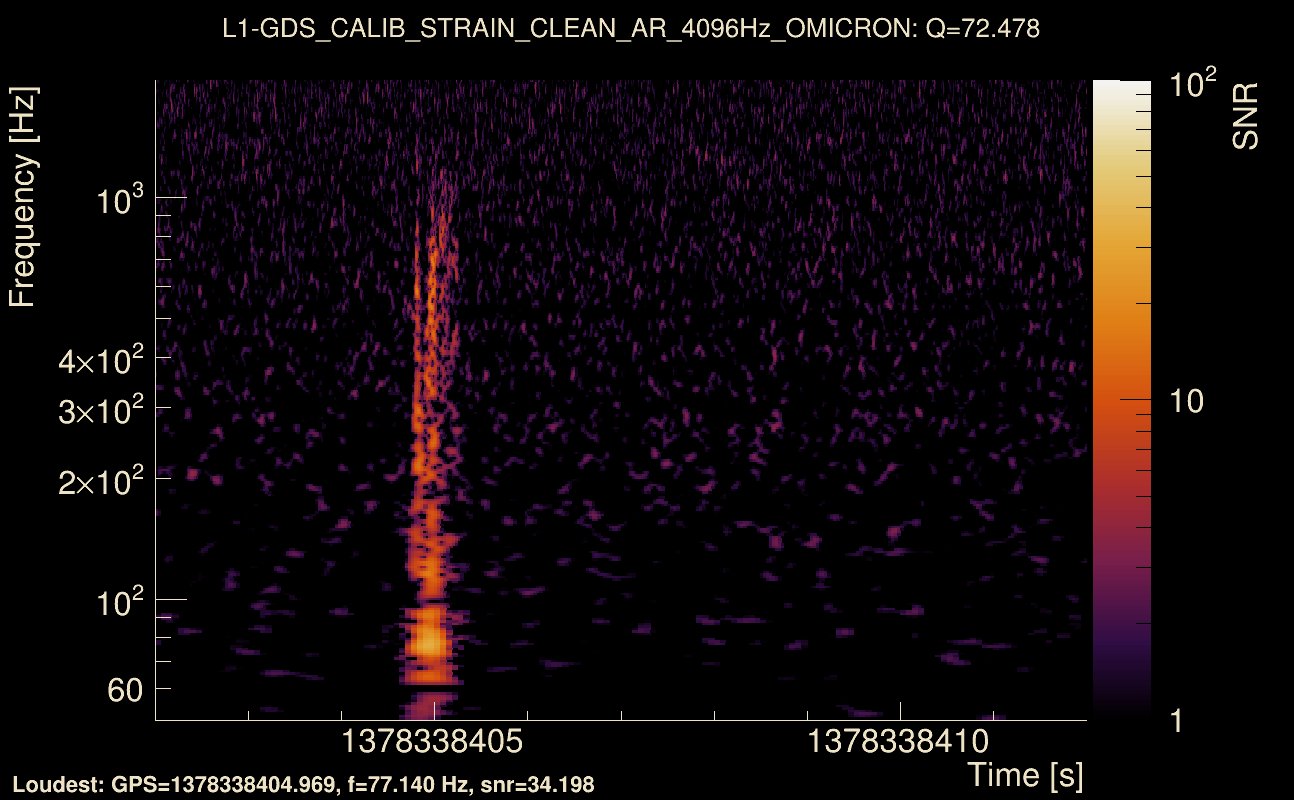
| Event time t(H1): | GPS = 1378338402 (Sat Sep 9 23:46:24 2023 ) → GPS = 1378338412 (Sat Sep 9 23:46:34 2023 ) |
| Event time t(L1): | GPS = 1378338402 (Sat Sep 9 23:46:34 2023 ) → GPS = 1378338412 (Sat Sep 9 23:46:34 2023 ) |
| Omicron analysis time window (H1): | GPS = 1378338399 → GPS = 1378338415 |
| Omicron analysis time window (L1): | GPS = 1378338399 → GPS = 1378338415 |
| Time delay between detectors t(L1) - t(H1): | 0.00399286 s (slice index = 108 / 217), δt_gw = 0.00399286 s |
| Time delay uncertainty: | 0.0007515 s |
| [targeted mode] Time delay probability: | 0.718847 (0.36 sigmas), δt_target = 0.000518799 s |
| Frequency: | 227.227 Hz |
| Ξ: | 0.912683 ± 0.00721346 (variance = 5.2034e-05): Q0: 0.932773, Q1: 0.929938, Q2: 0.930955, Q3: 0.927157, Q4: 0.912754 |
| Rank: | R_A = 0.912683 |
| Log of amplitude ratio (L1/H1): | -0.223347, variance = 0.161331 (L1/H1: -0.235944, variance = 0.304553, H1/L1: 0.202687, variance = 0.305256) |
| Amplitude ratio (L1/H1): | 0.799837 ⋇ 1.4943 (L1/H1: 0.789825 ⋇ 1.73649, H1/L1: 1.22469 ⋇ 1.73759) |
| Amplitude ratio H1|L1 compatibility (probability): | 0.96603 |
| Antenna factor probability: | 1 |
| Number of rejected frequency rows: | Q0: 0 / 18, Q1: 0 / 36, Q2: 3 / 70, Q3: 14 / 134, Q4: 49 / 258 |
| Maximum signal-to-noise ratio: | H1: 72.5146, L1: 56.6205 |
| SNR variance: | H1: 4.18774, L1: 2.84983 |
| Click here for a zoomed plot | Click here for a zoomed plot | Click here for a zoomed plot | Click here for a zoomed plot | Click here for a zoomed plot |
 |
 |
 |
 |
 |
 |
 |
 |
 |
 |
 |
 |
 |
 |
 |
 |
 |
 |
 |
 |
 |
 |
 |
 |
 |
 |
 |
 |
 |
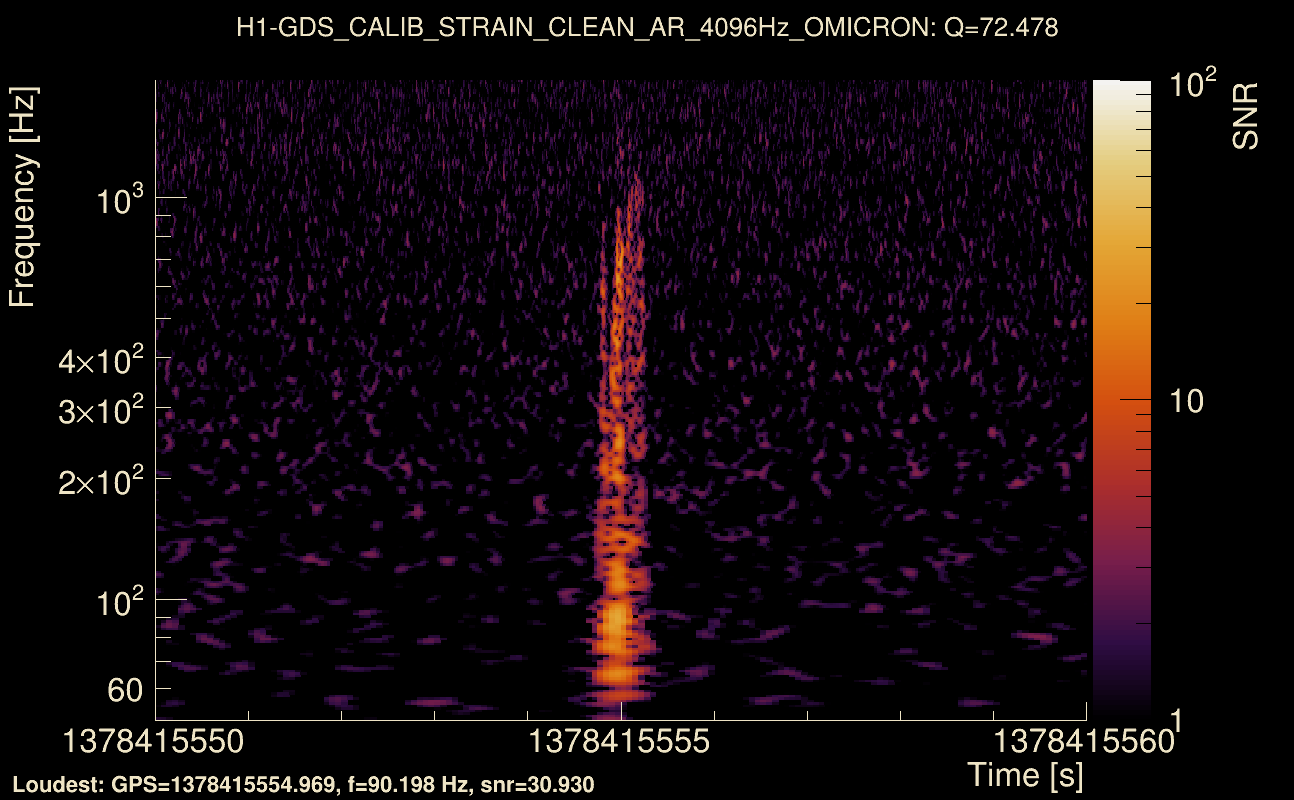
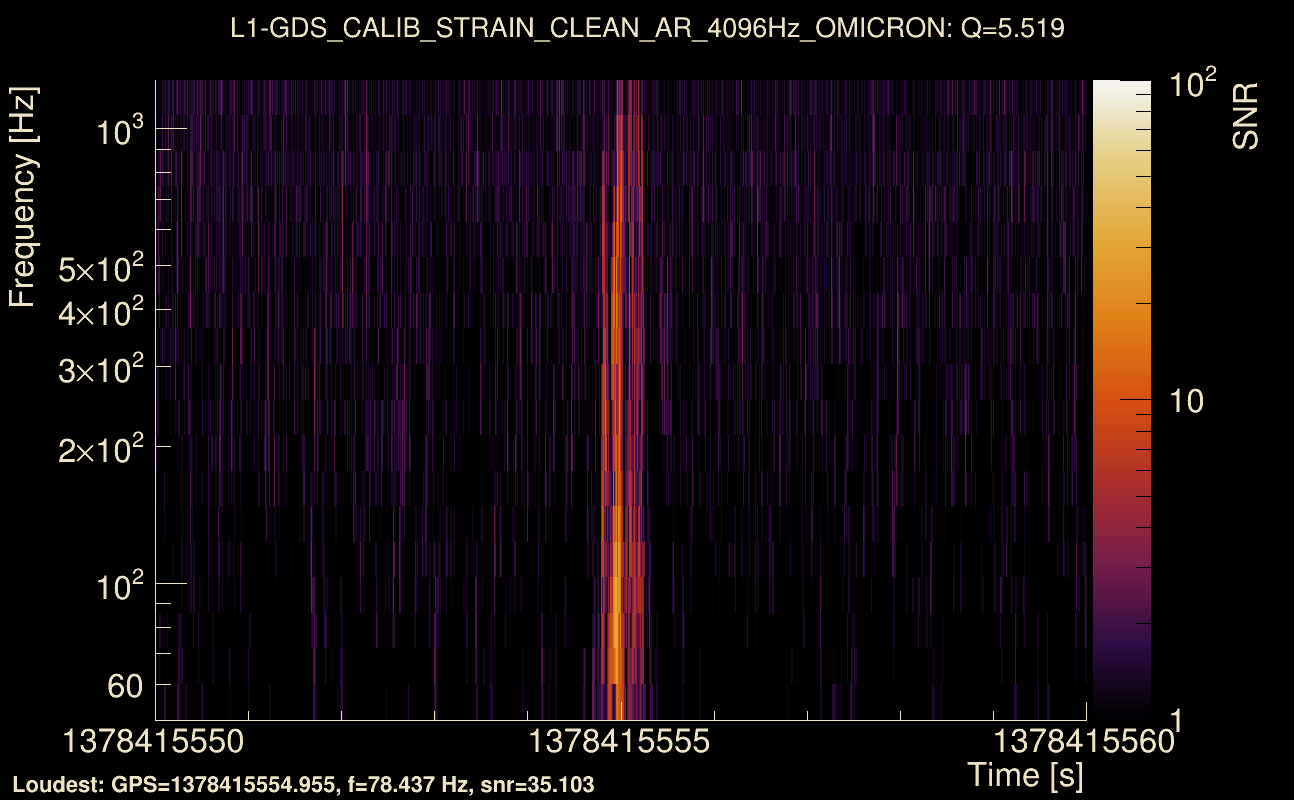
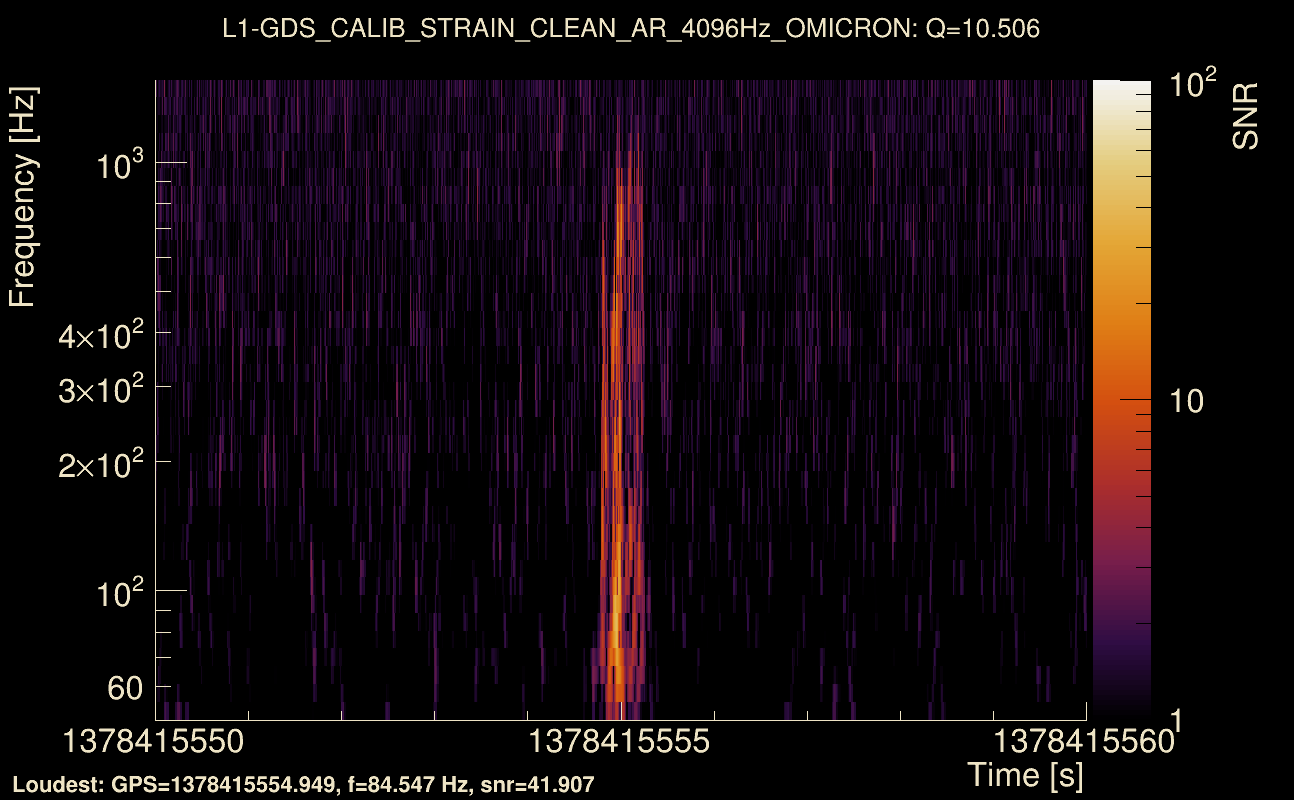
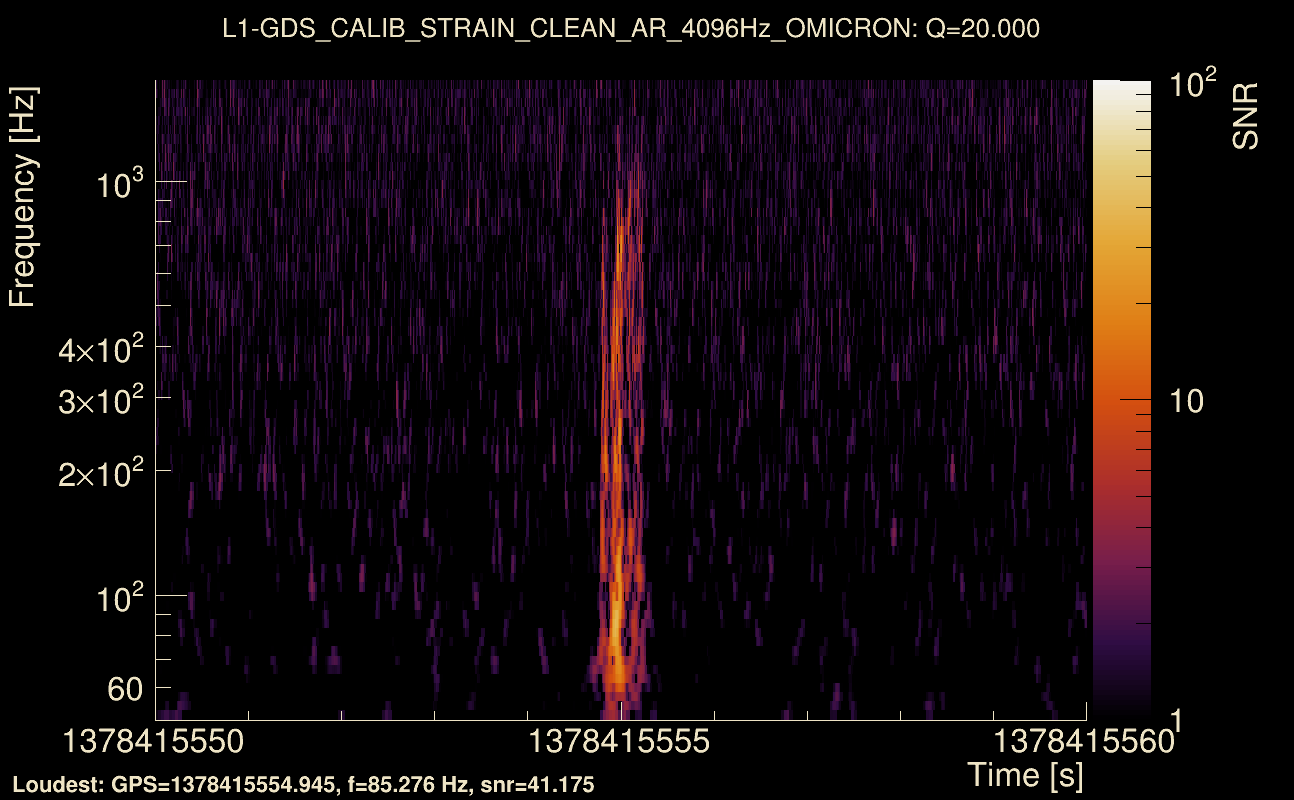
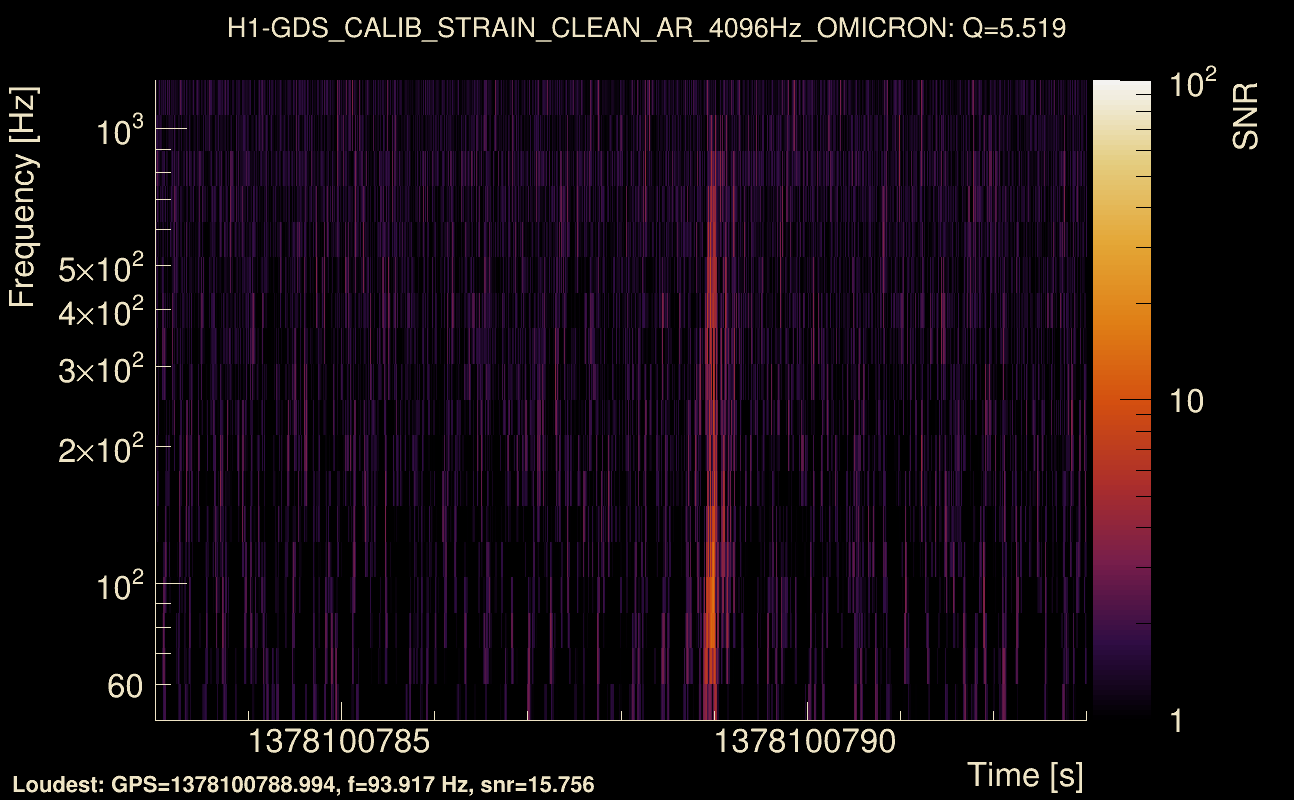
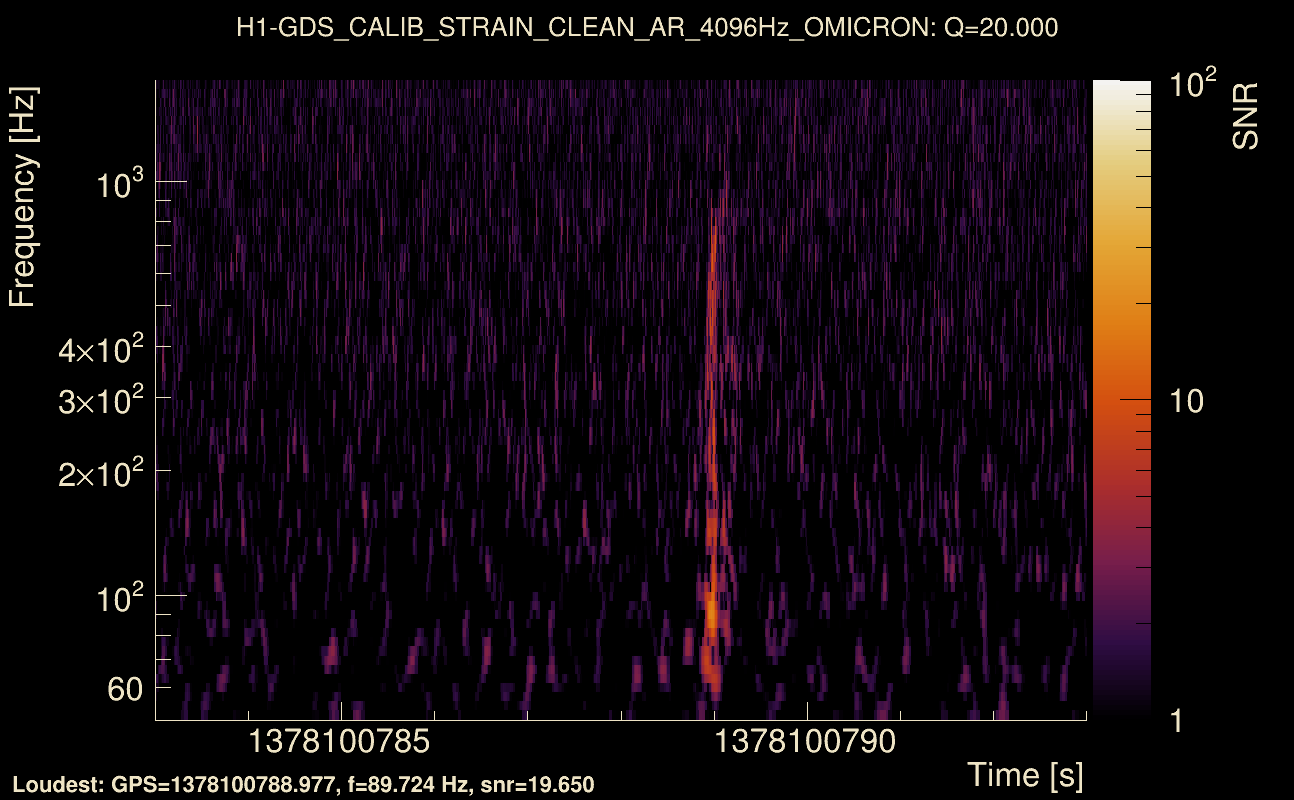
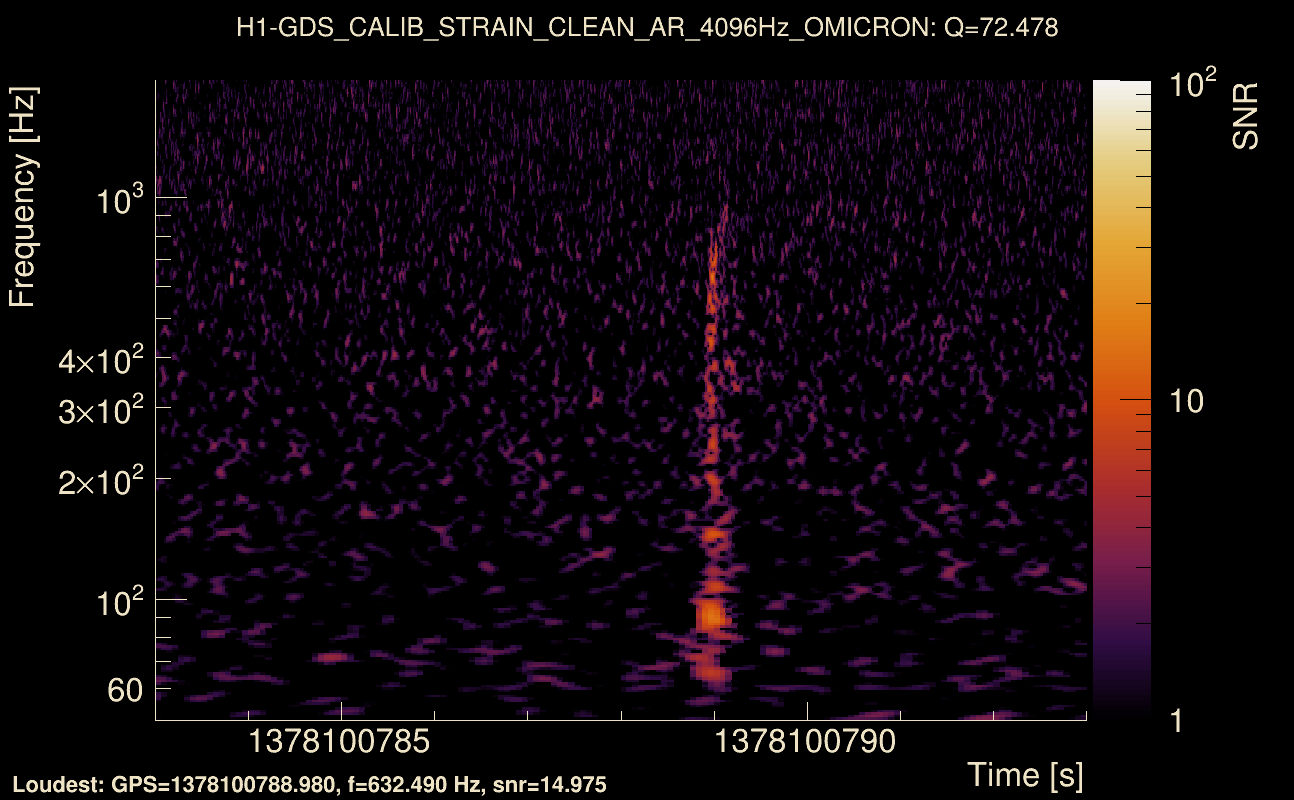
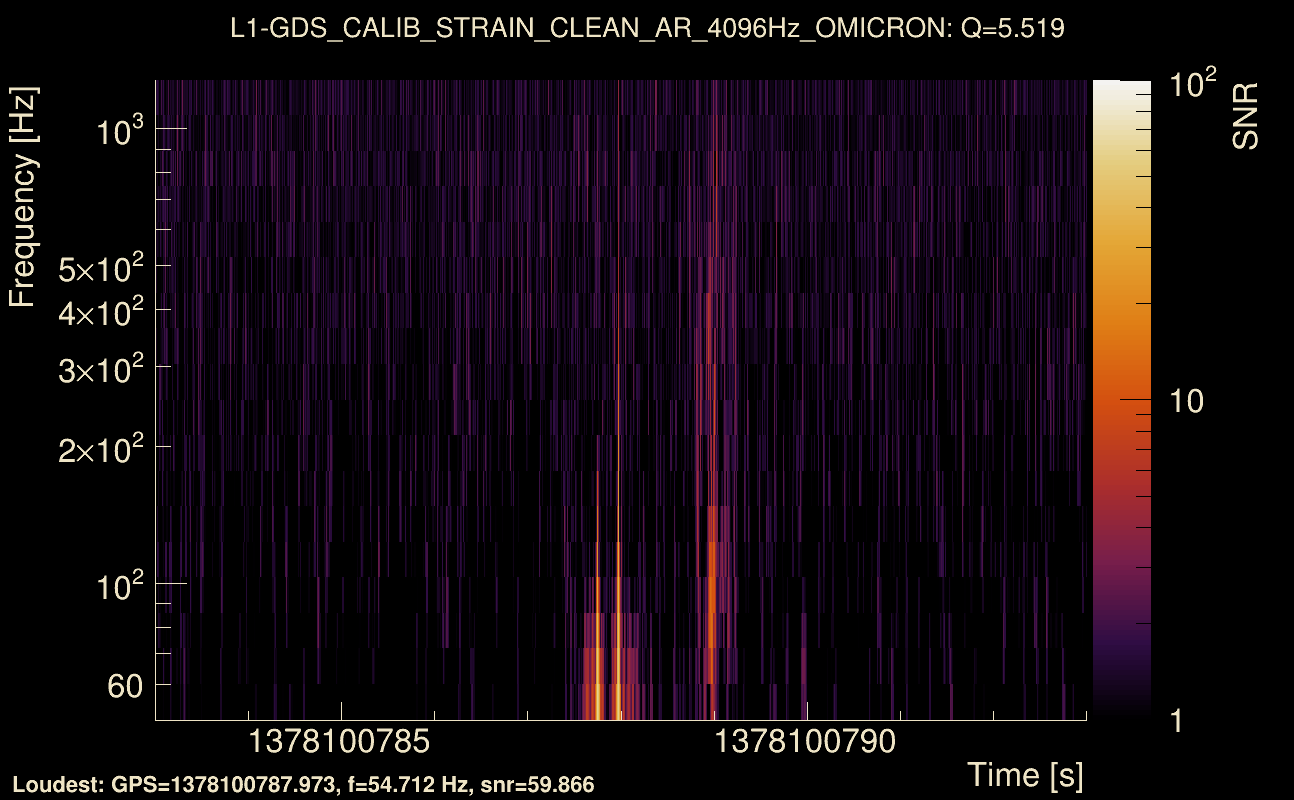
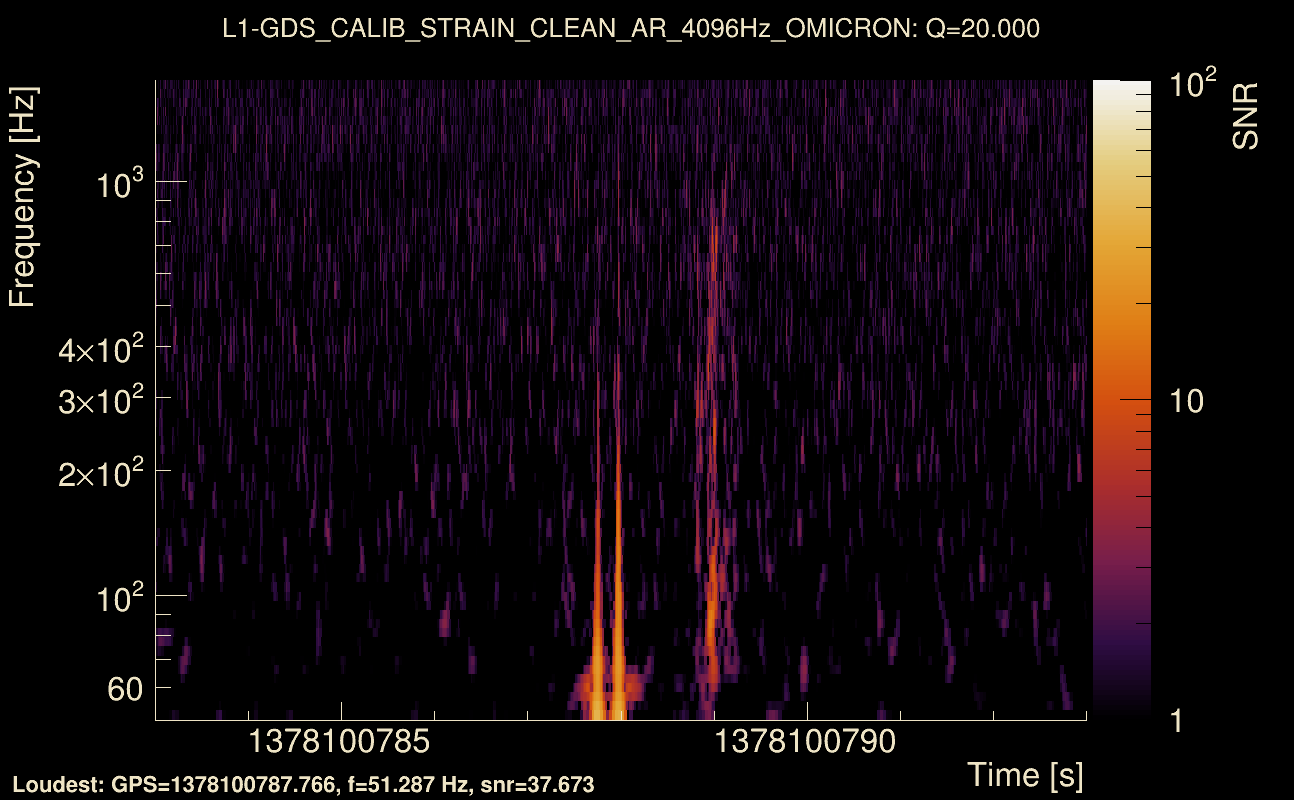
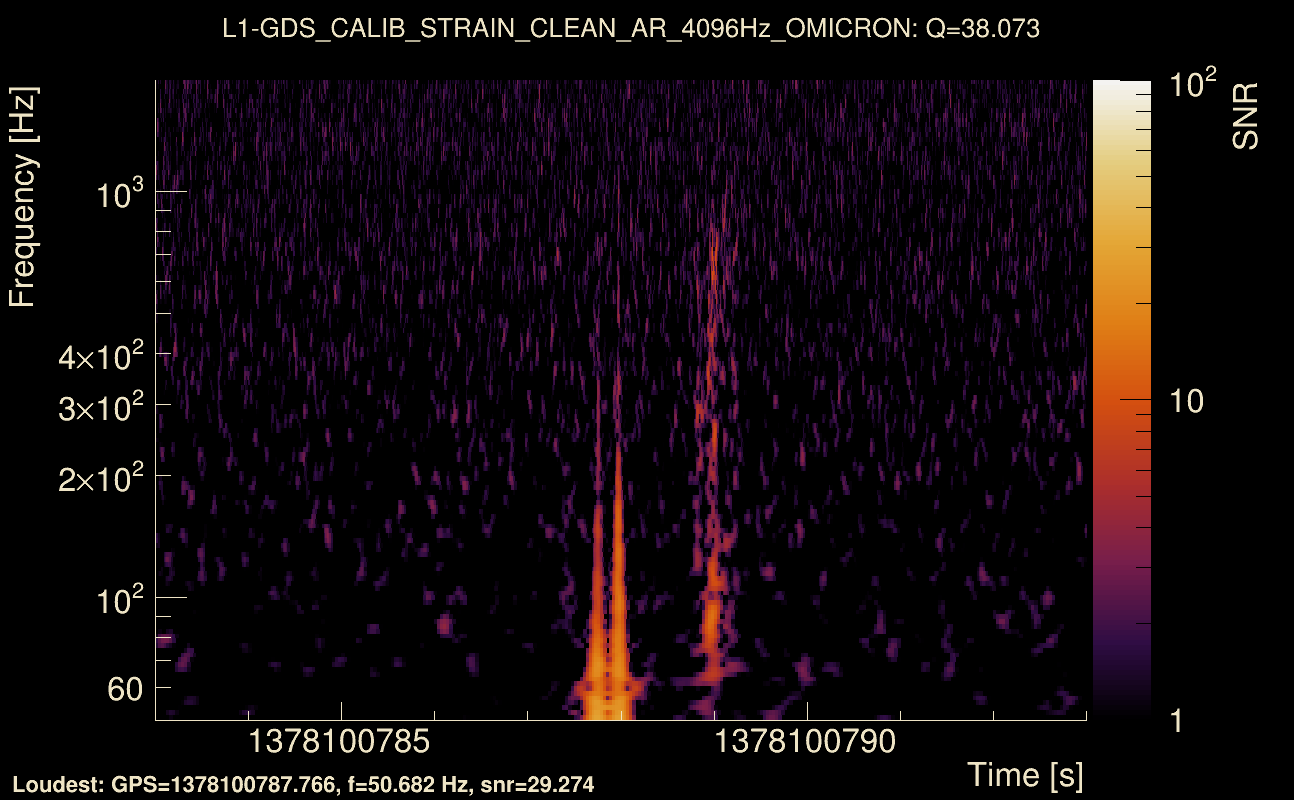
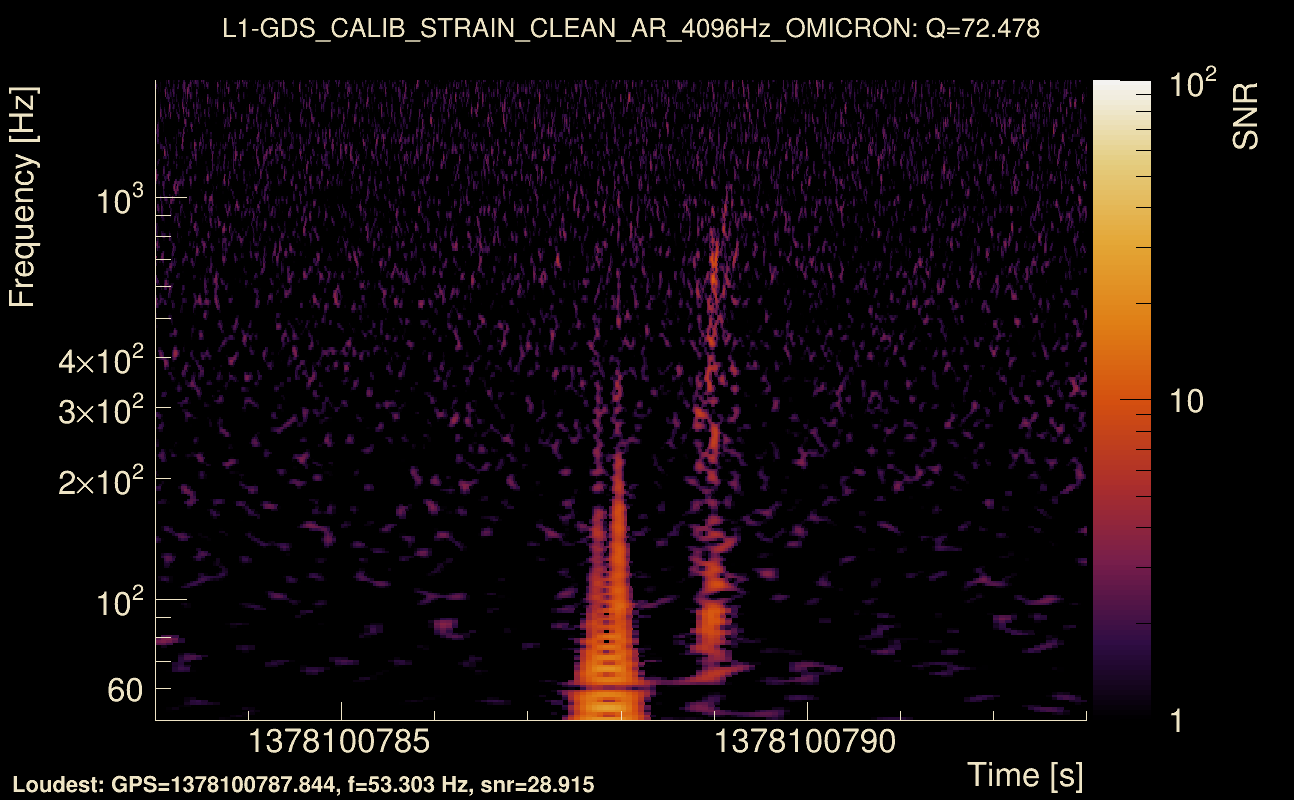
| Event time t(H1): | GPS = 1378100783 (Thu Sep 7 05:46:05 2023 ) → GPS = 1378100793 (Thu Sep 7 05:46:15 2023 ) |
| Event time t(L1): | GPS = 1378100783 (Thu Sep 7 05:46:15 2023 ) → GPS = 1378100793 (Thu Sep 7 05:46:15 2023 ) |
| Omicron analysis time window (H1): | GPS = 1378100780 → GPS = 1378100796 |
| Omicron analysis time window (L1): | GPS = 1378100780 → GPS = 1378100796 |
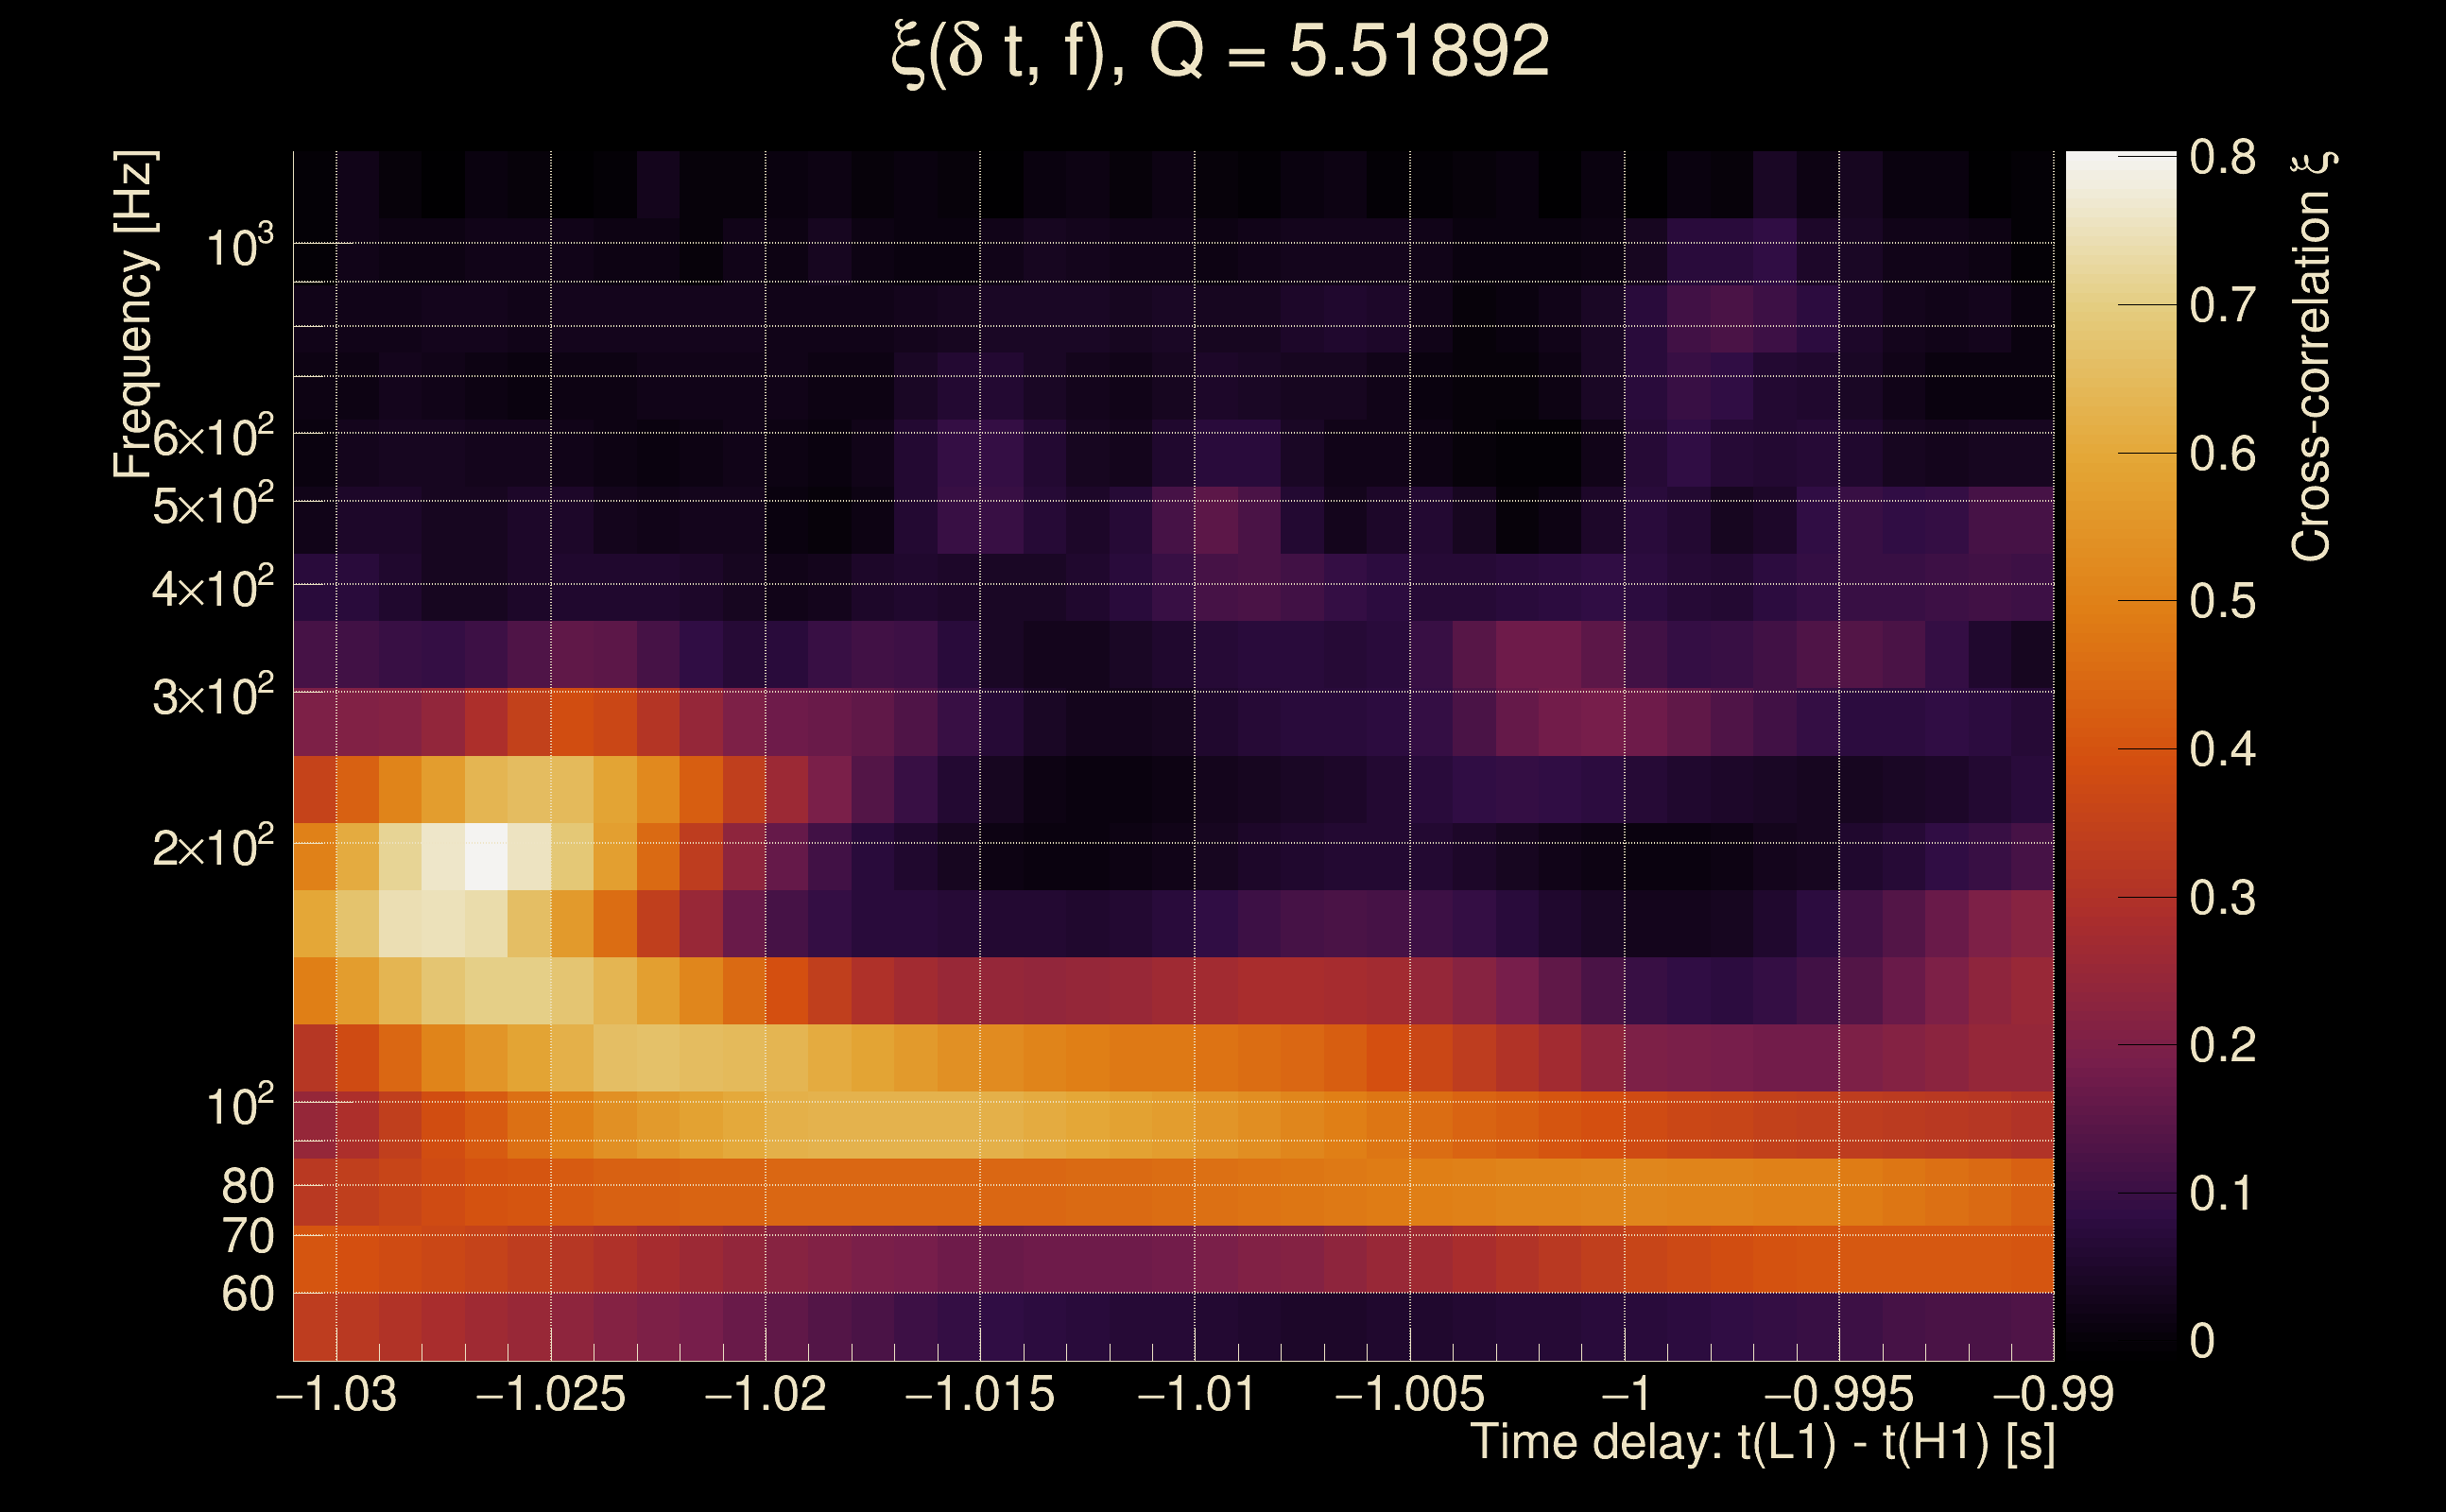
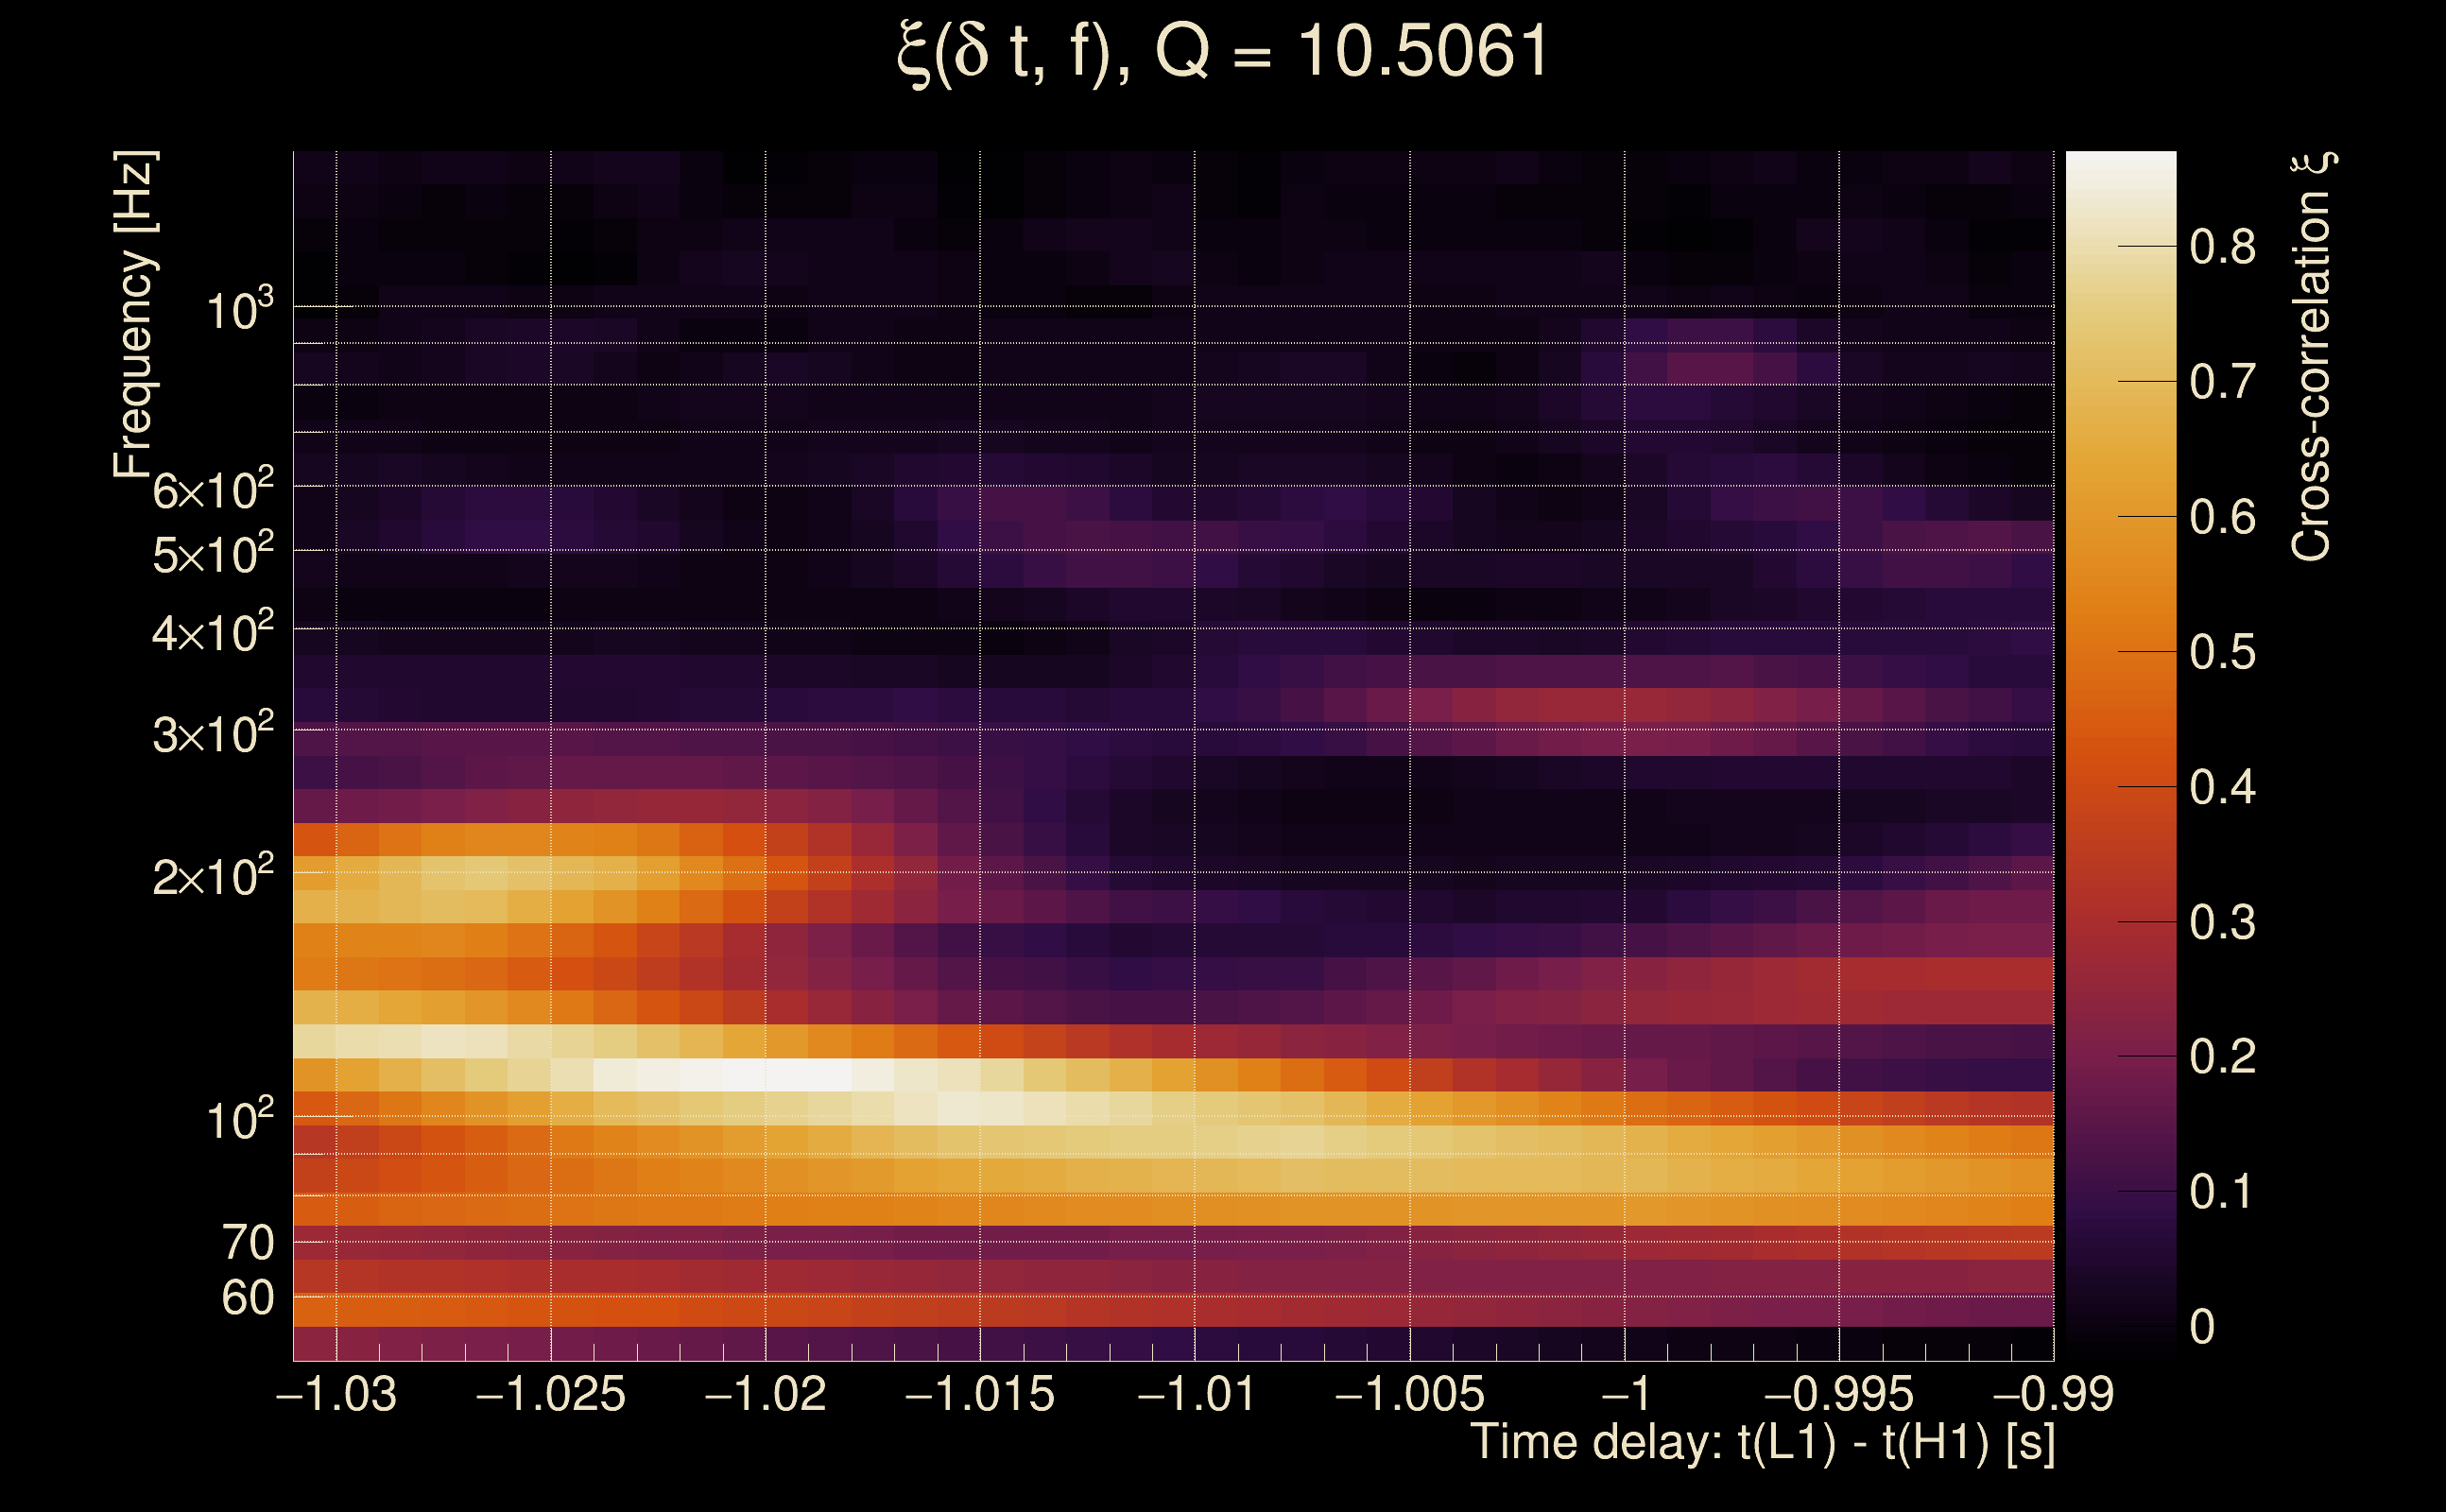
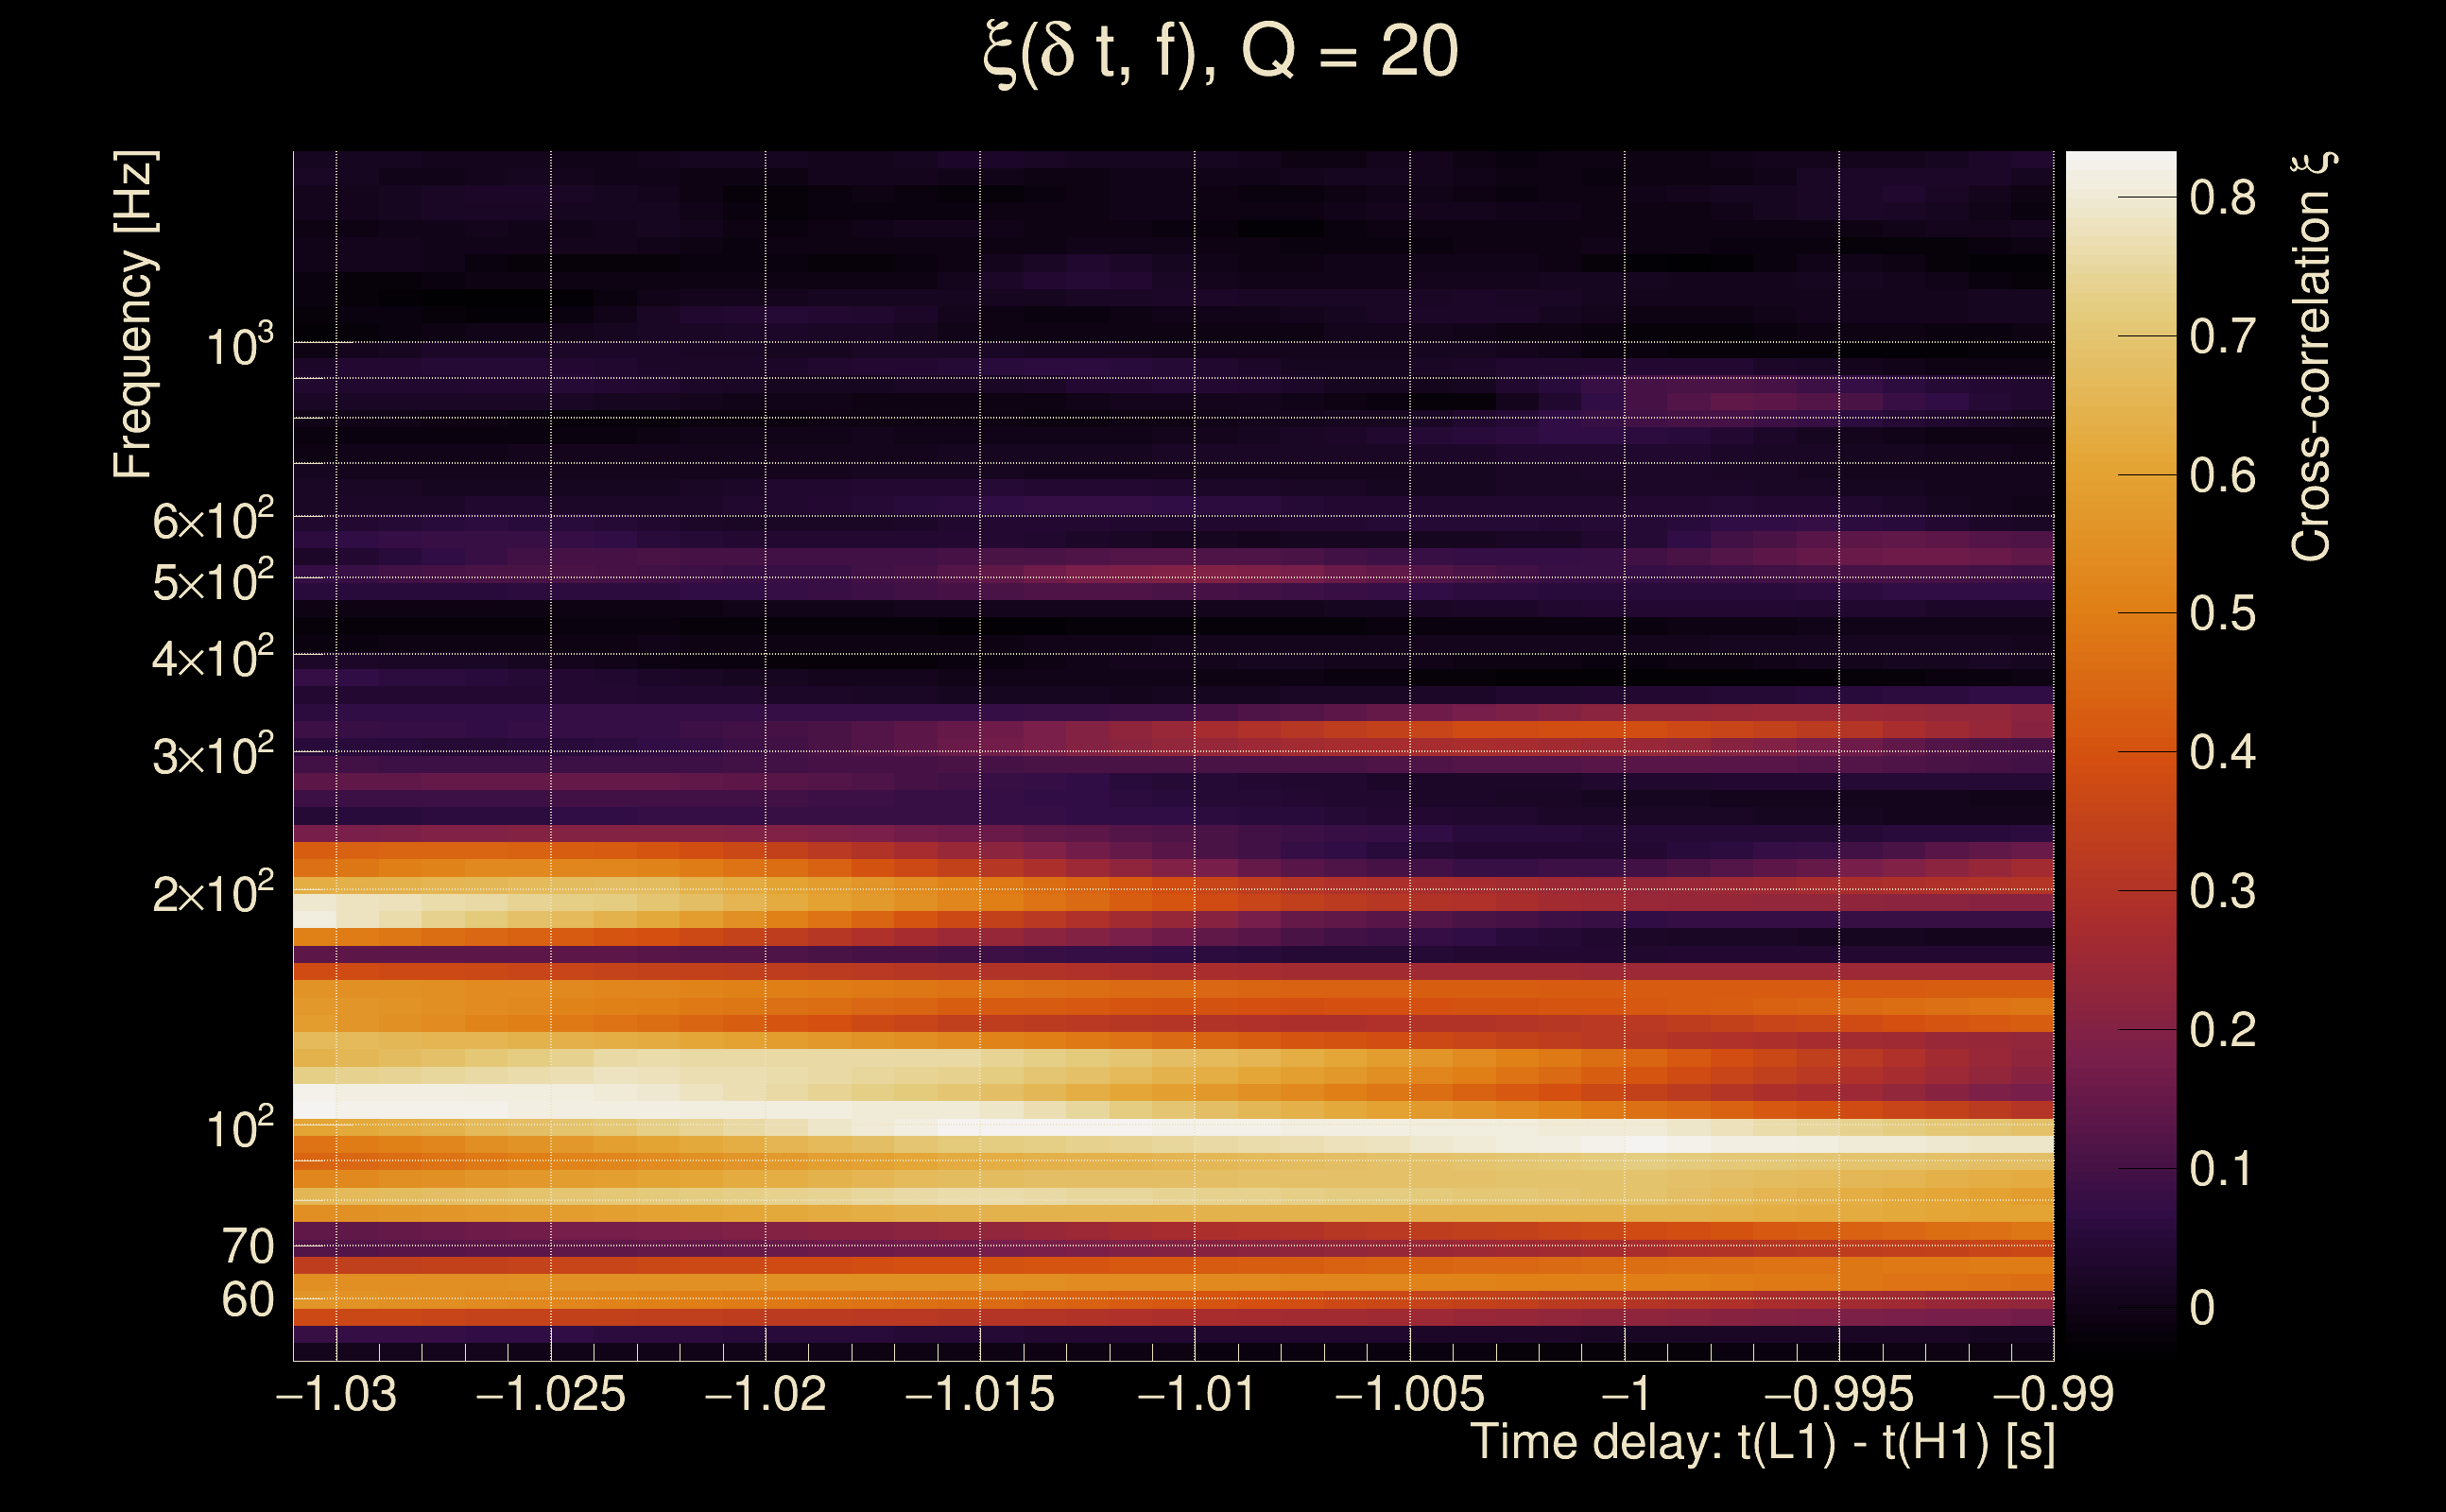
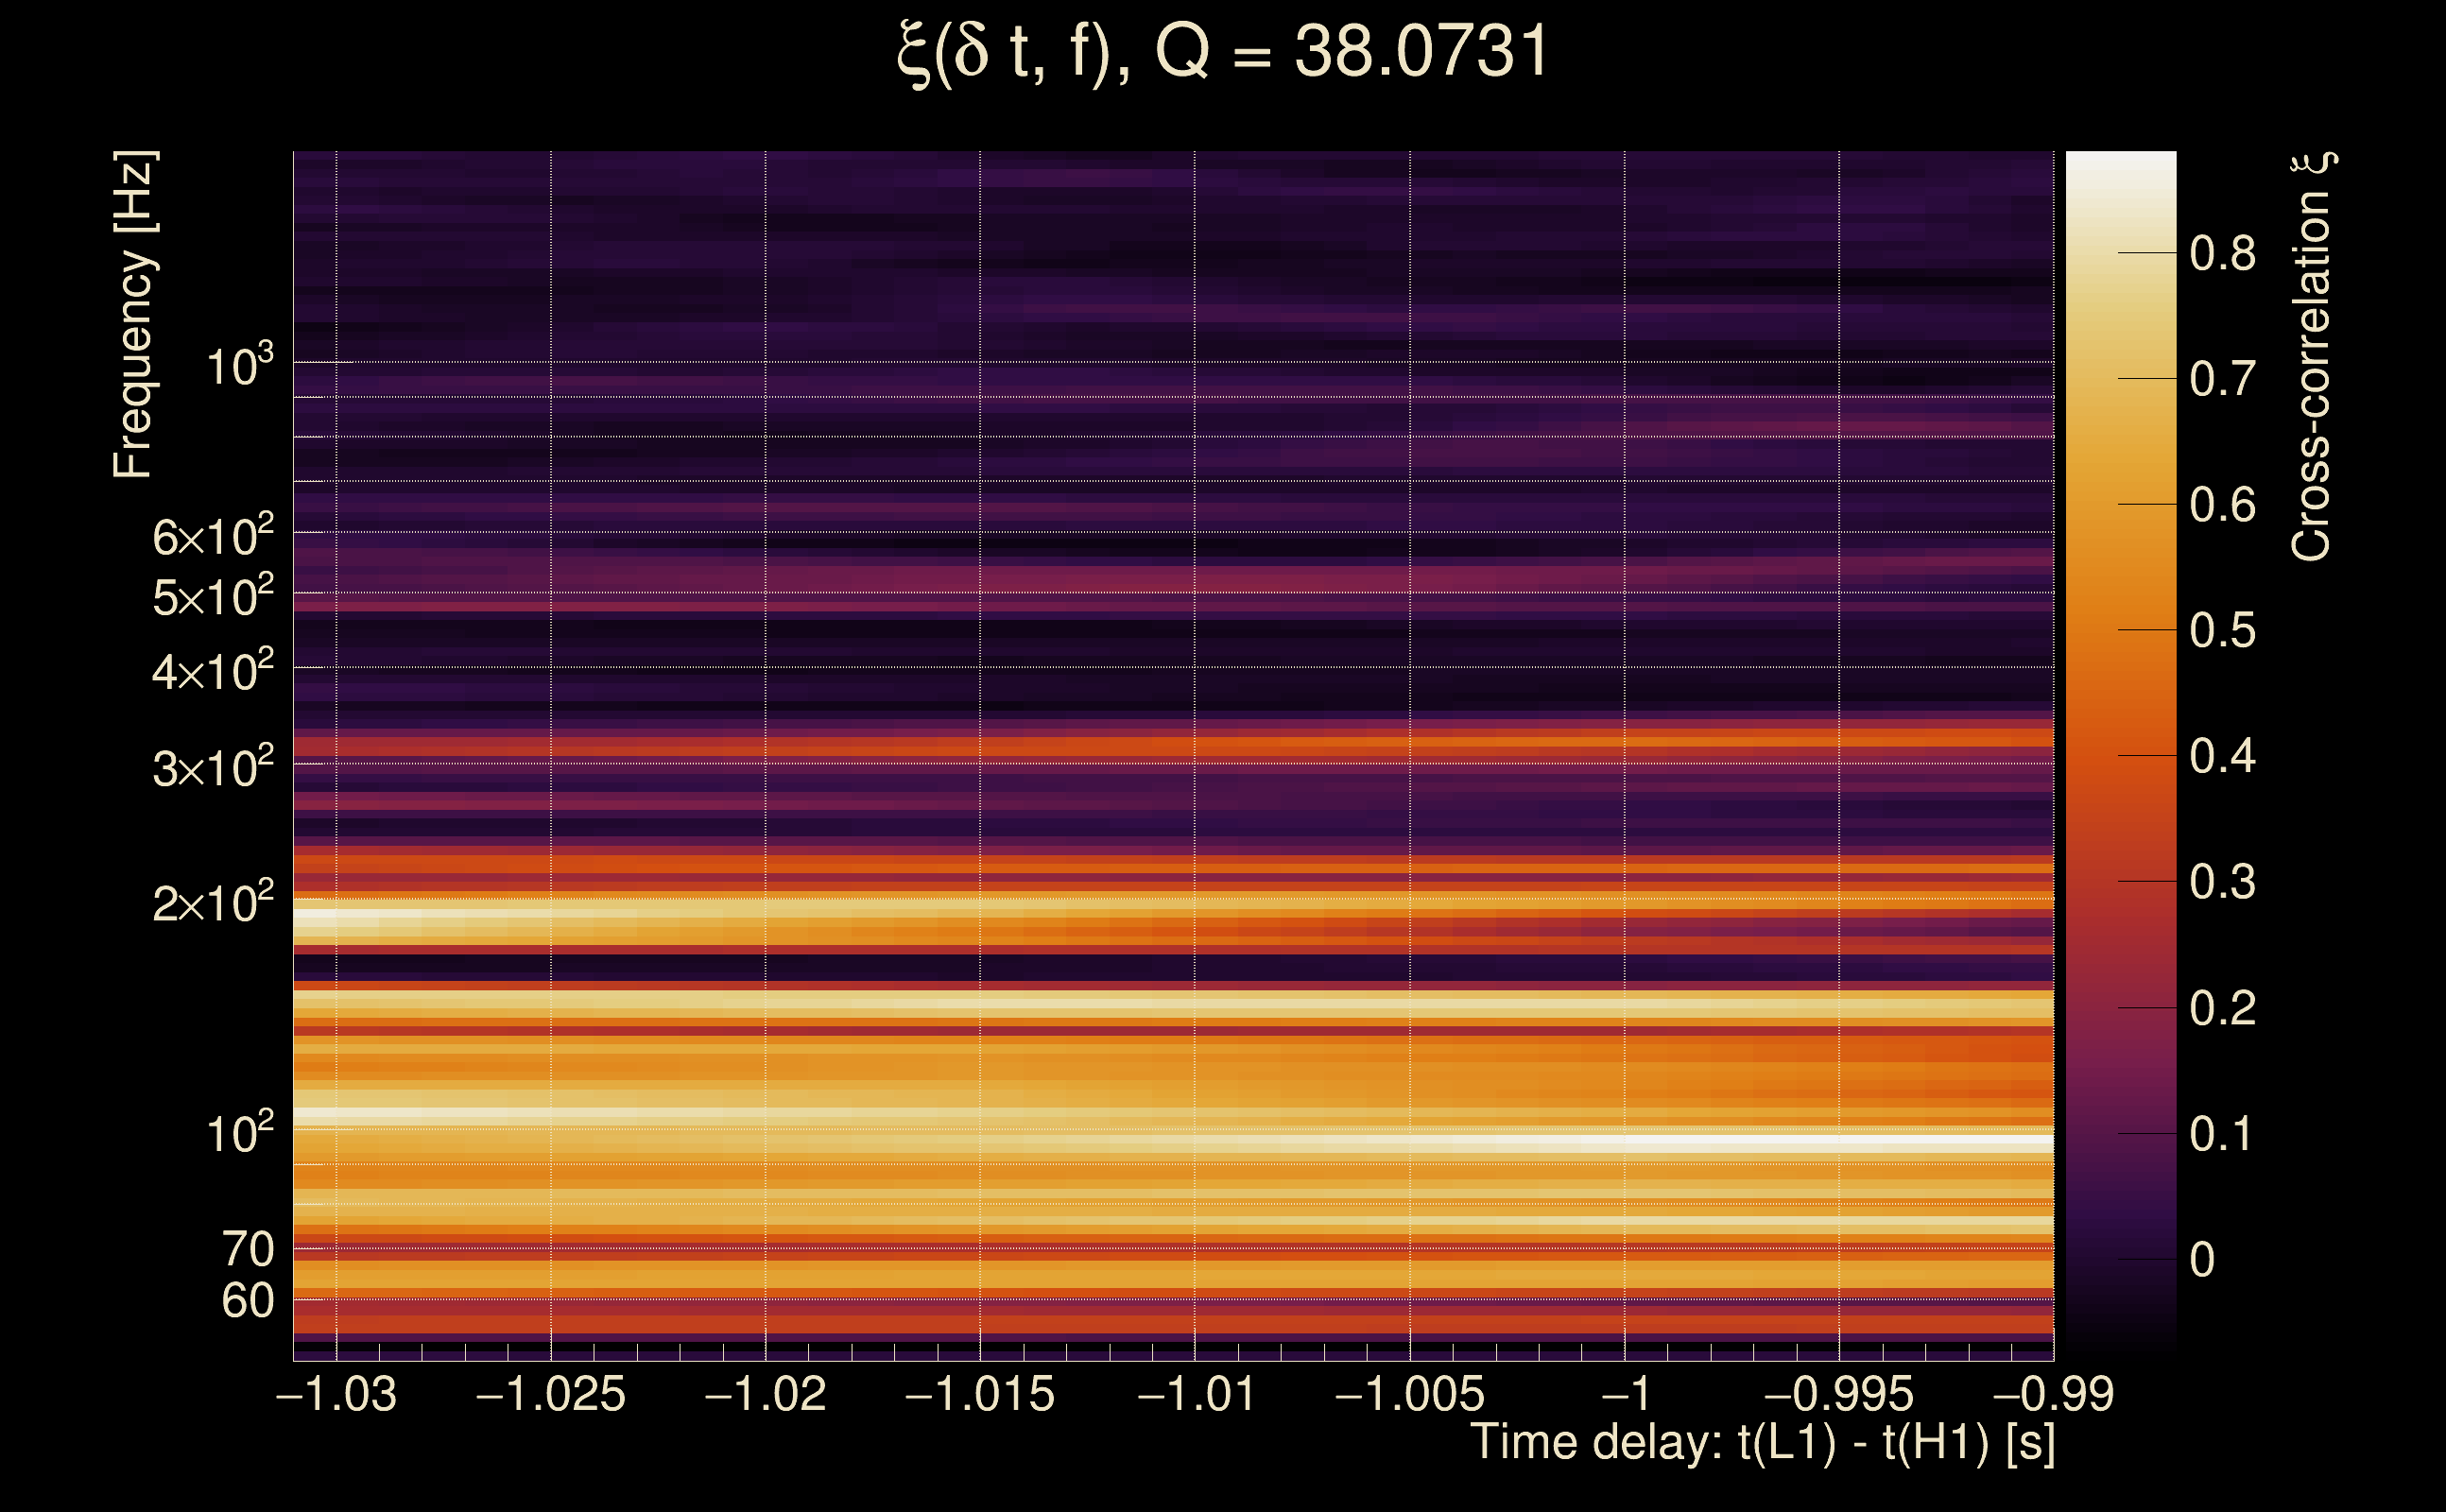
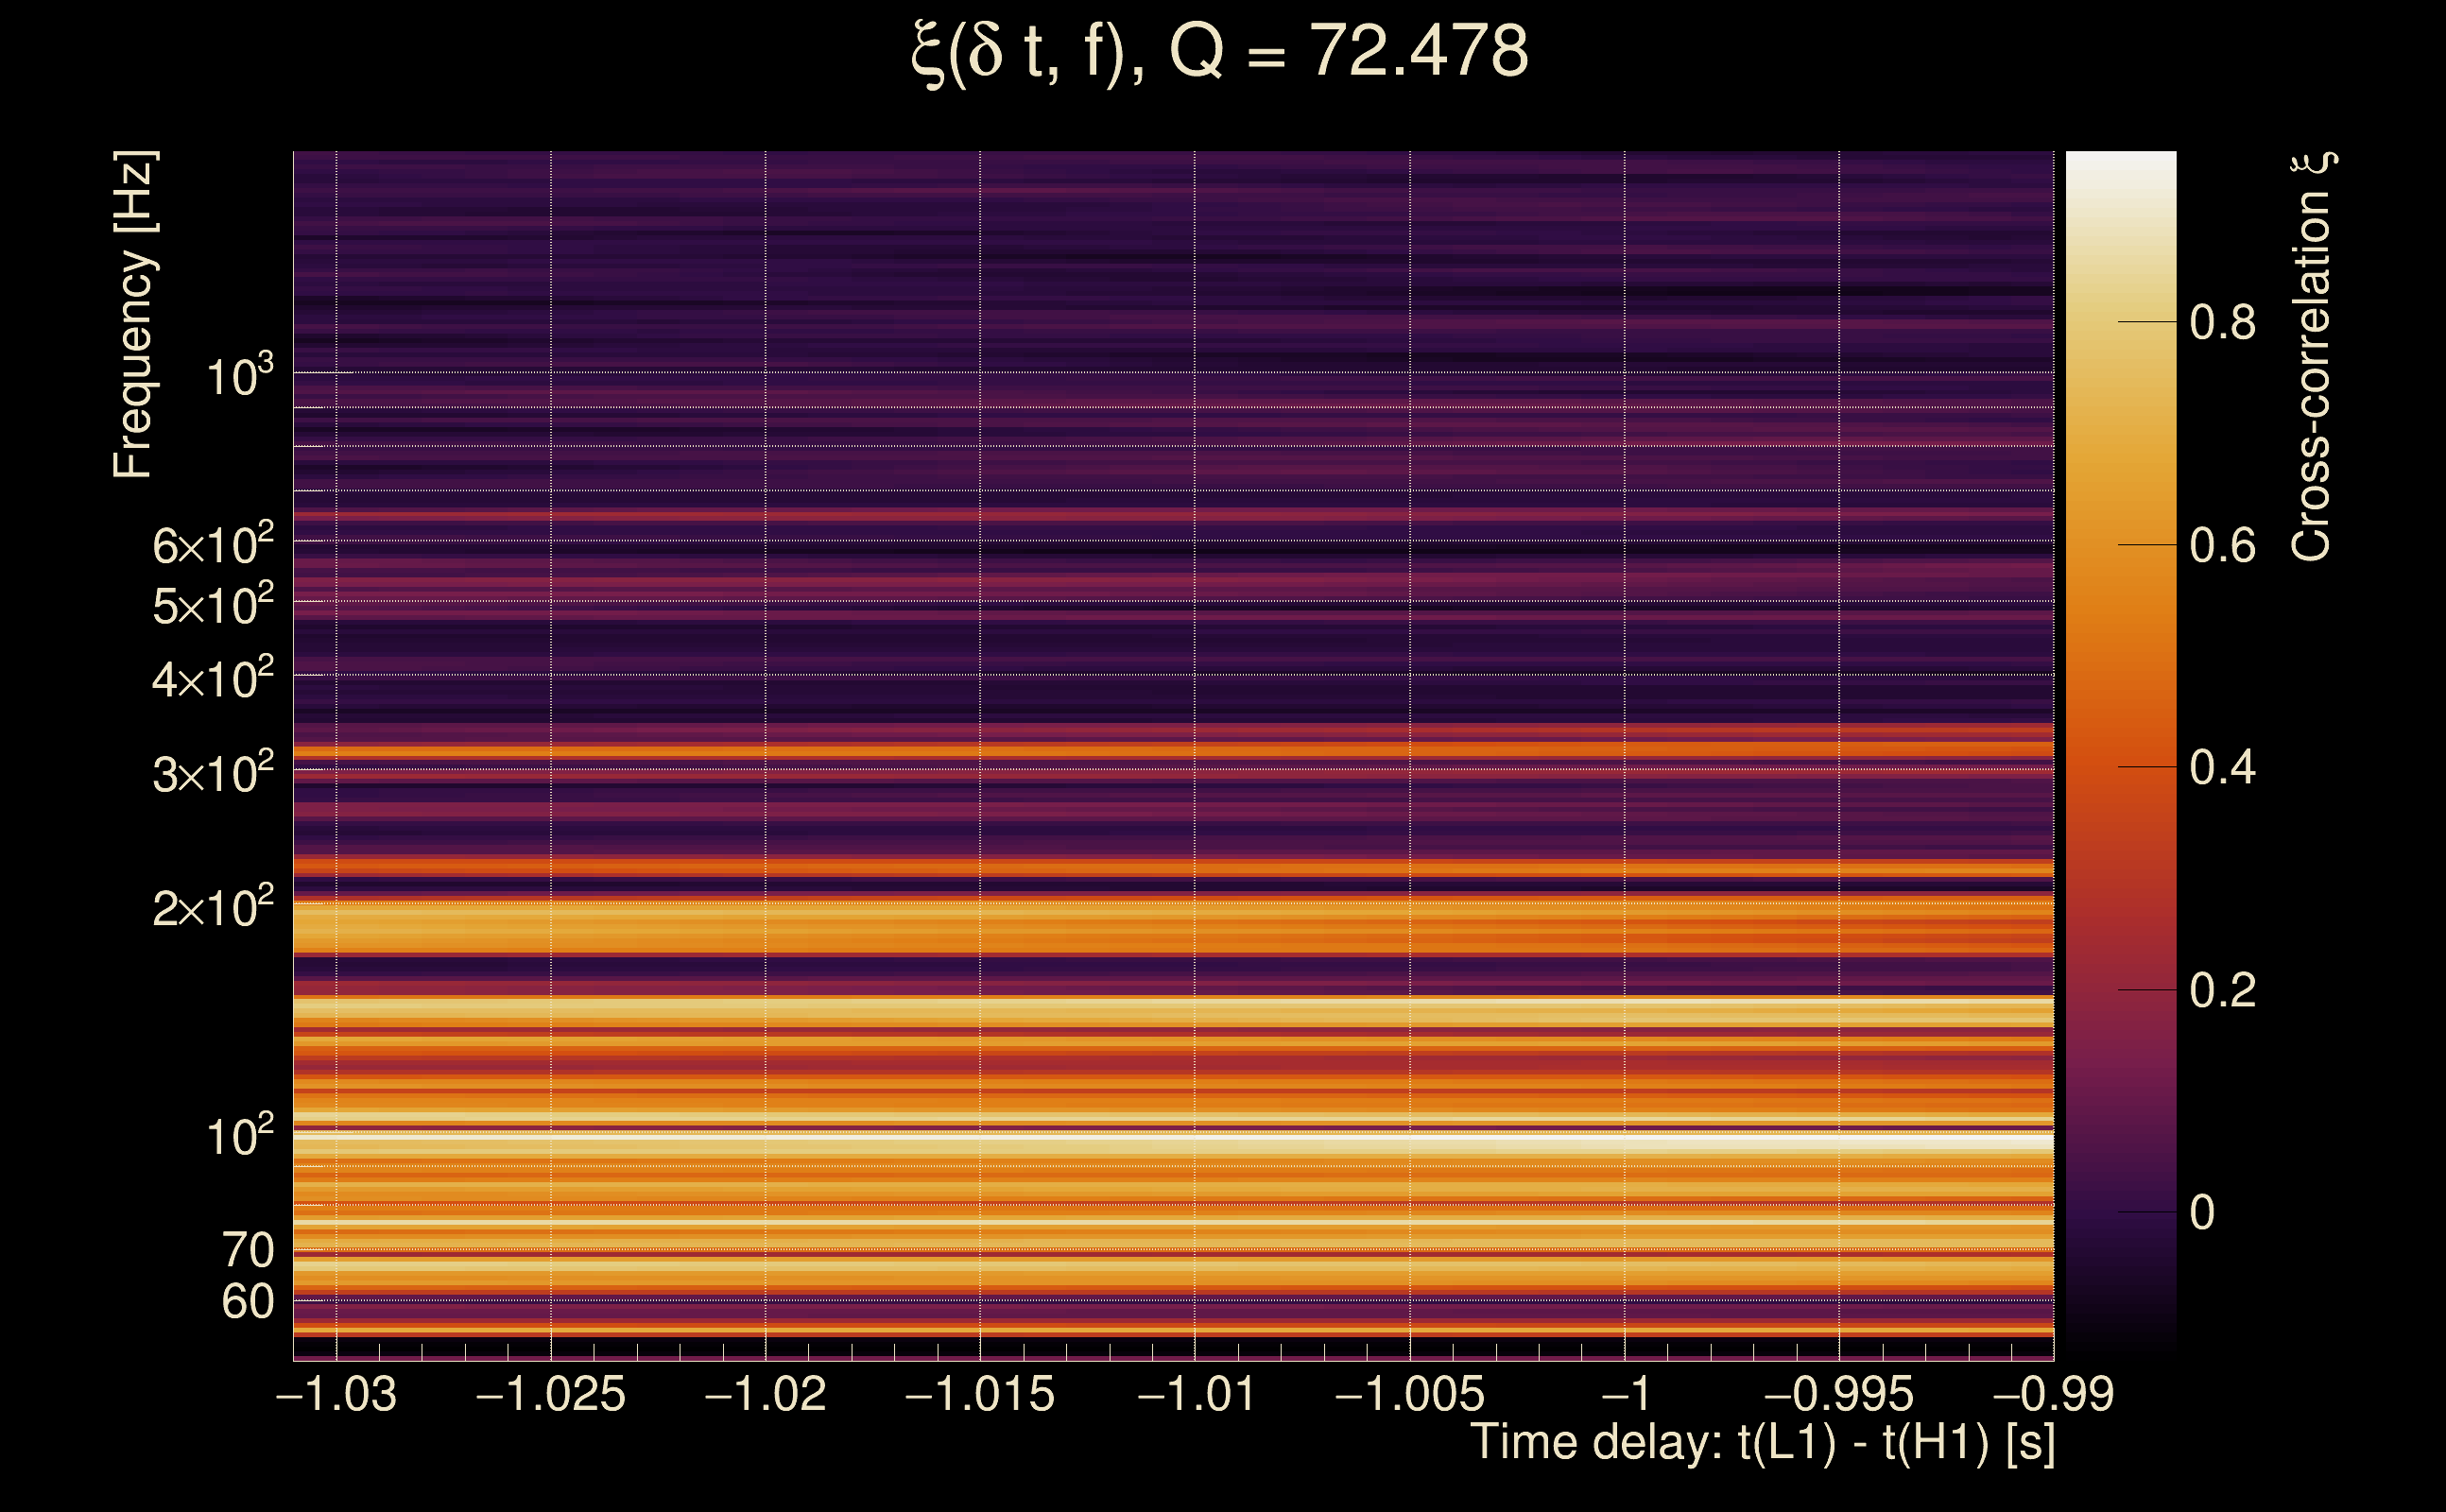
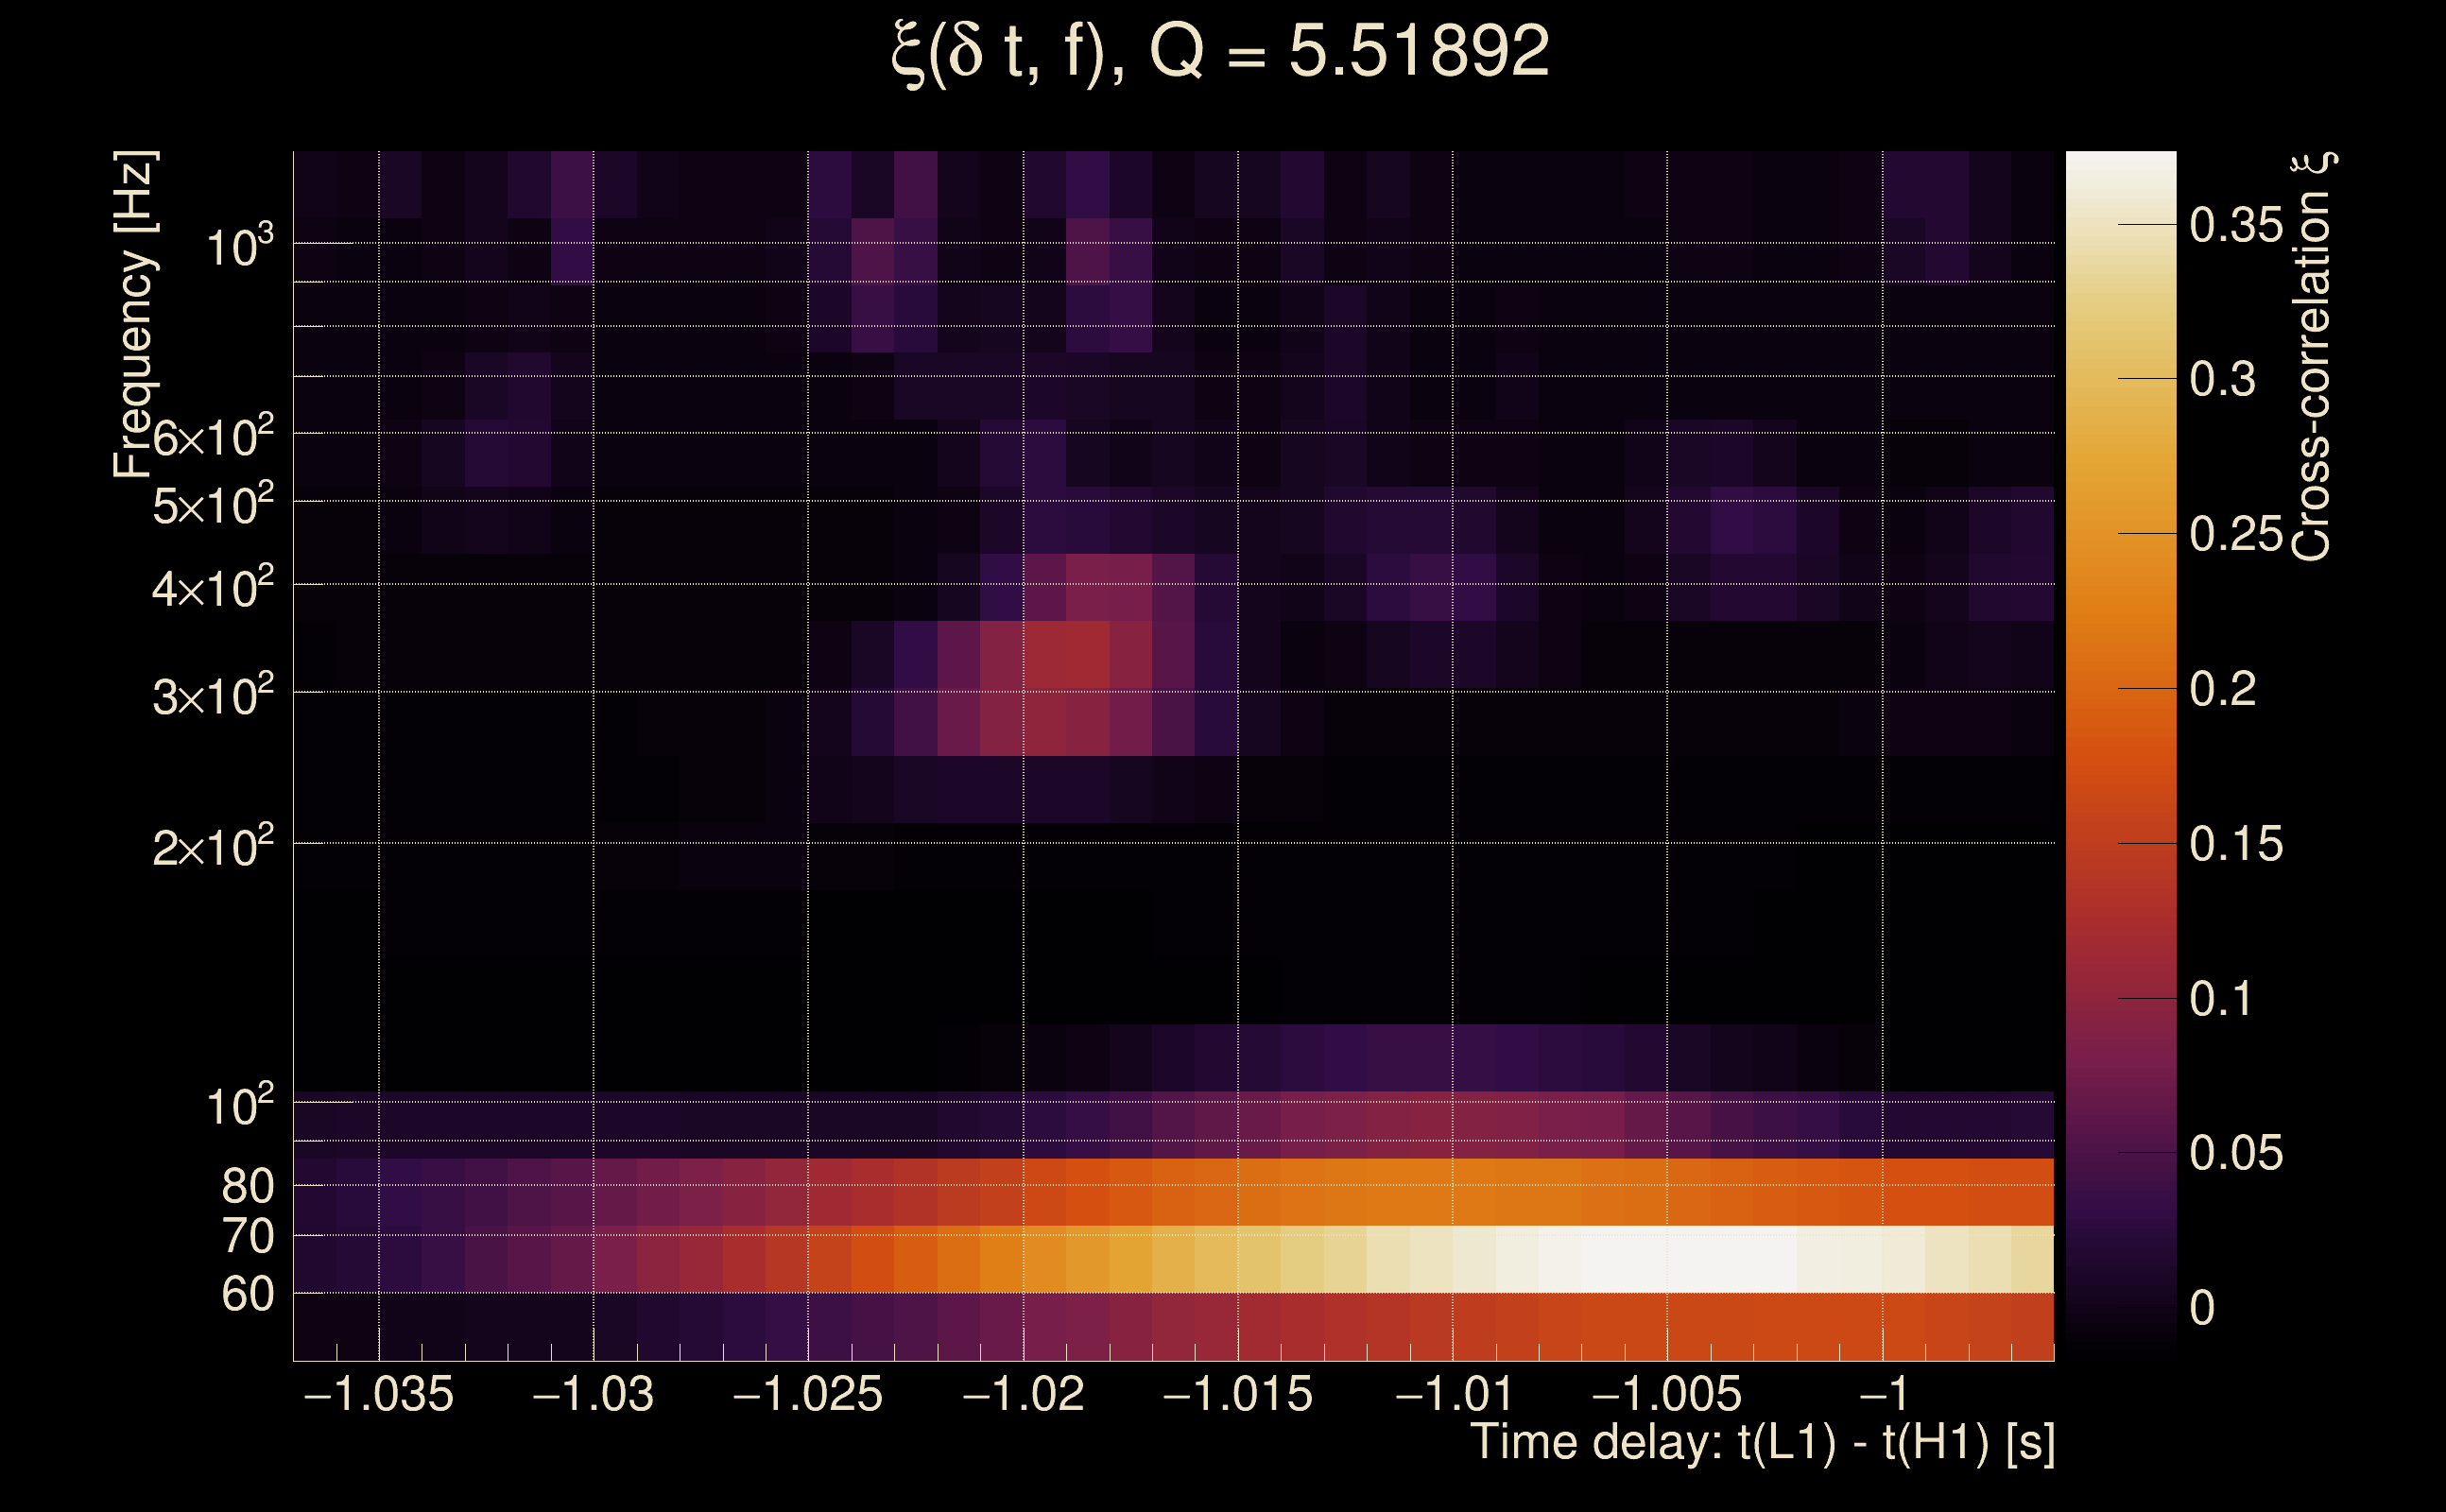
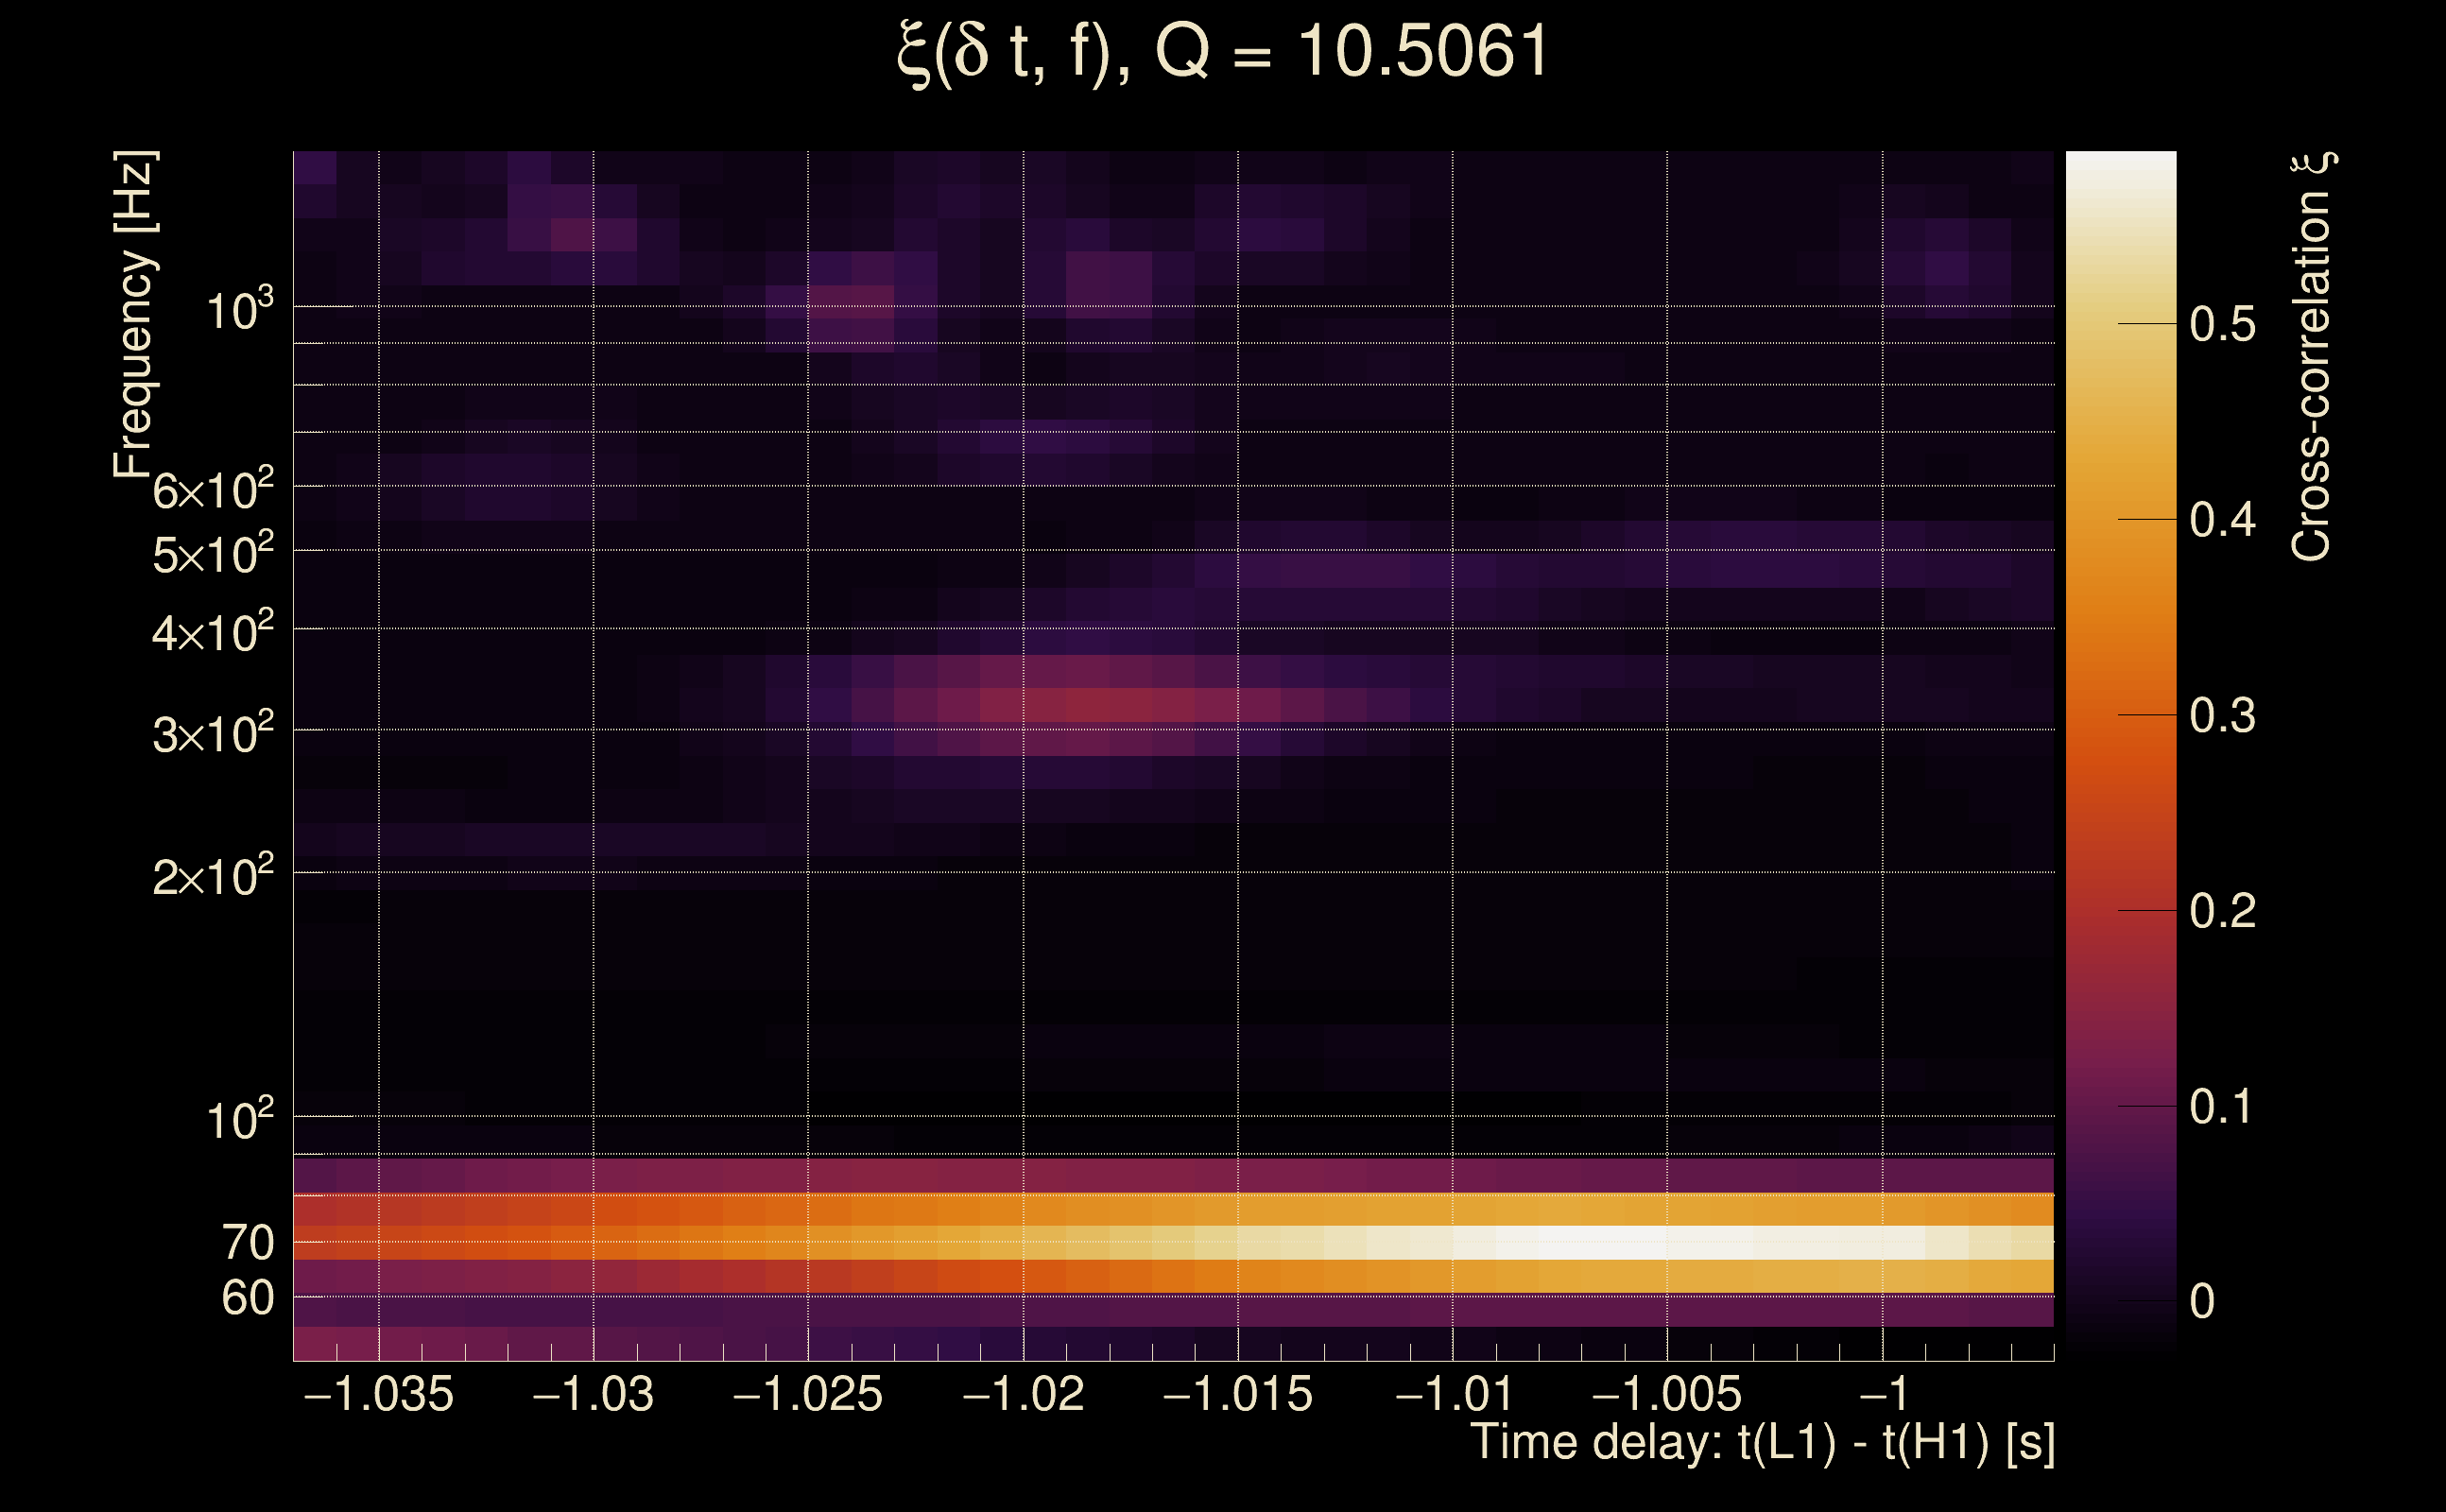
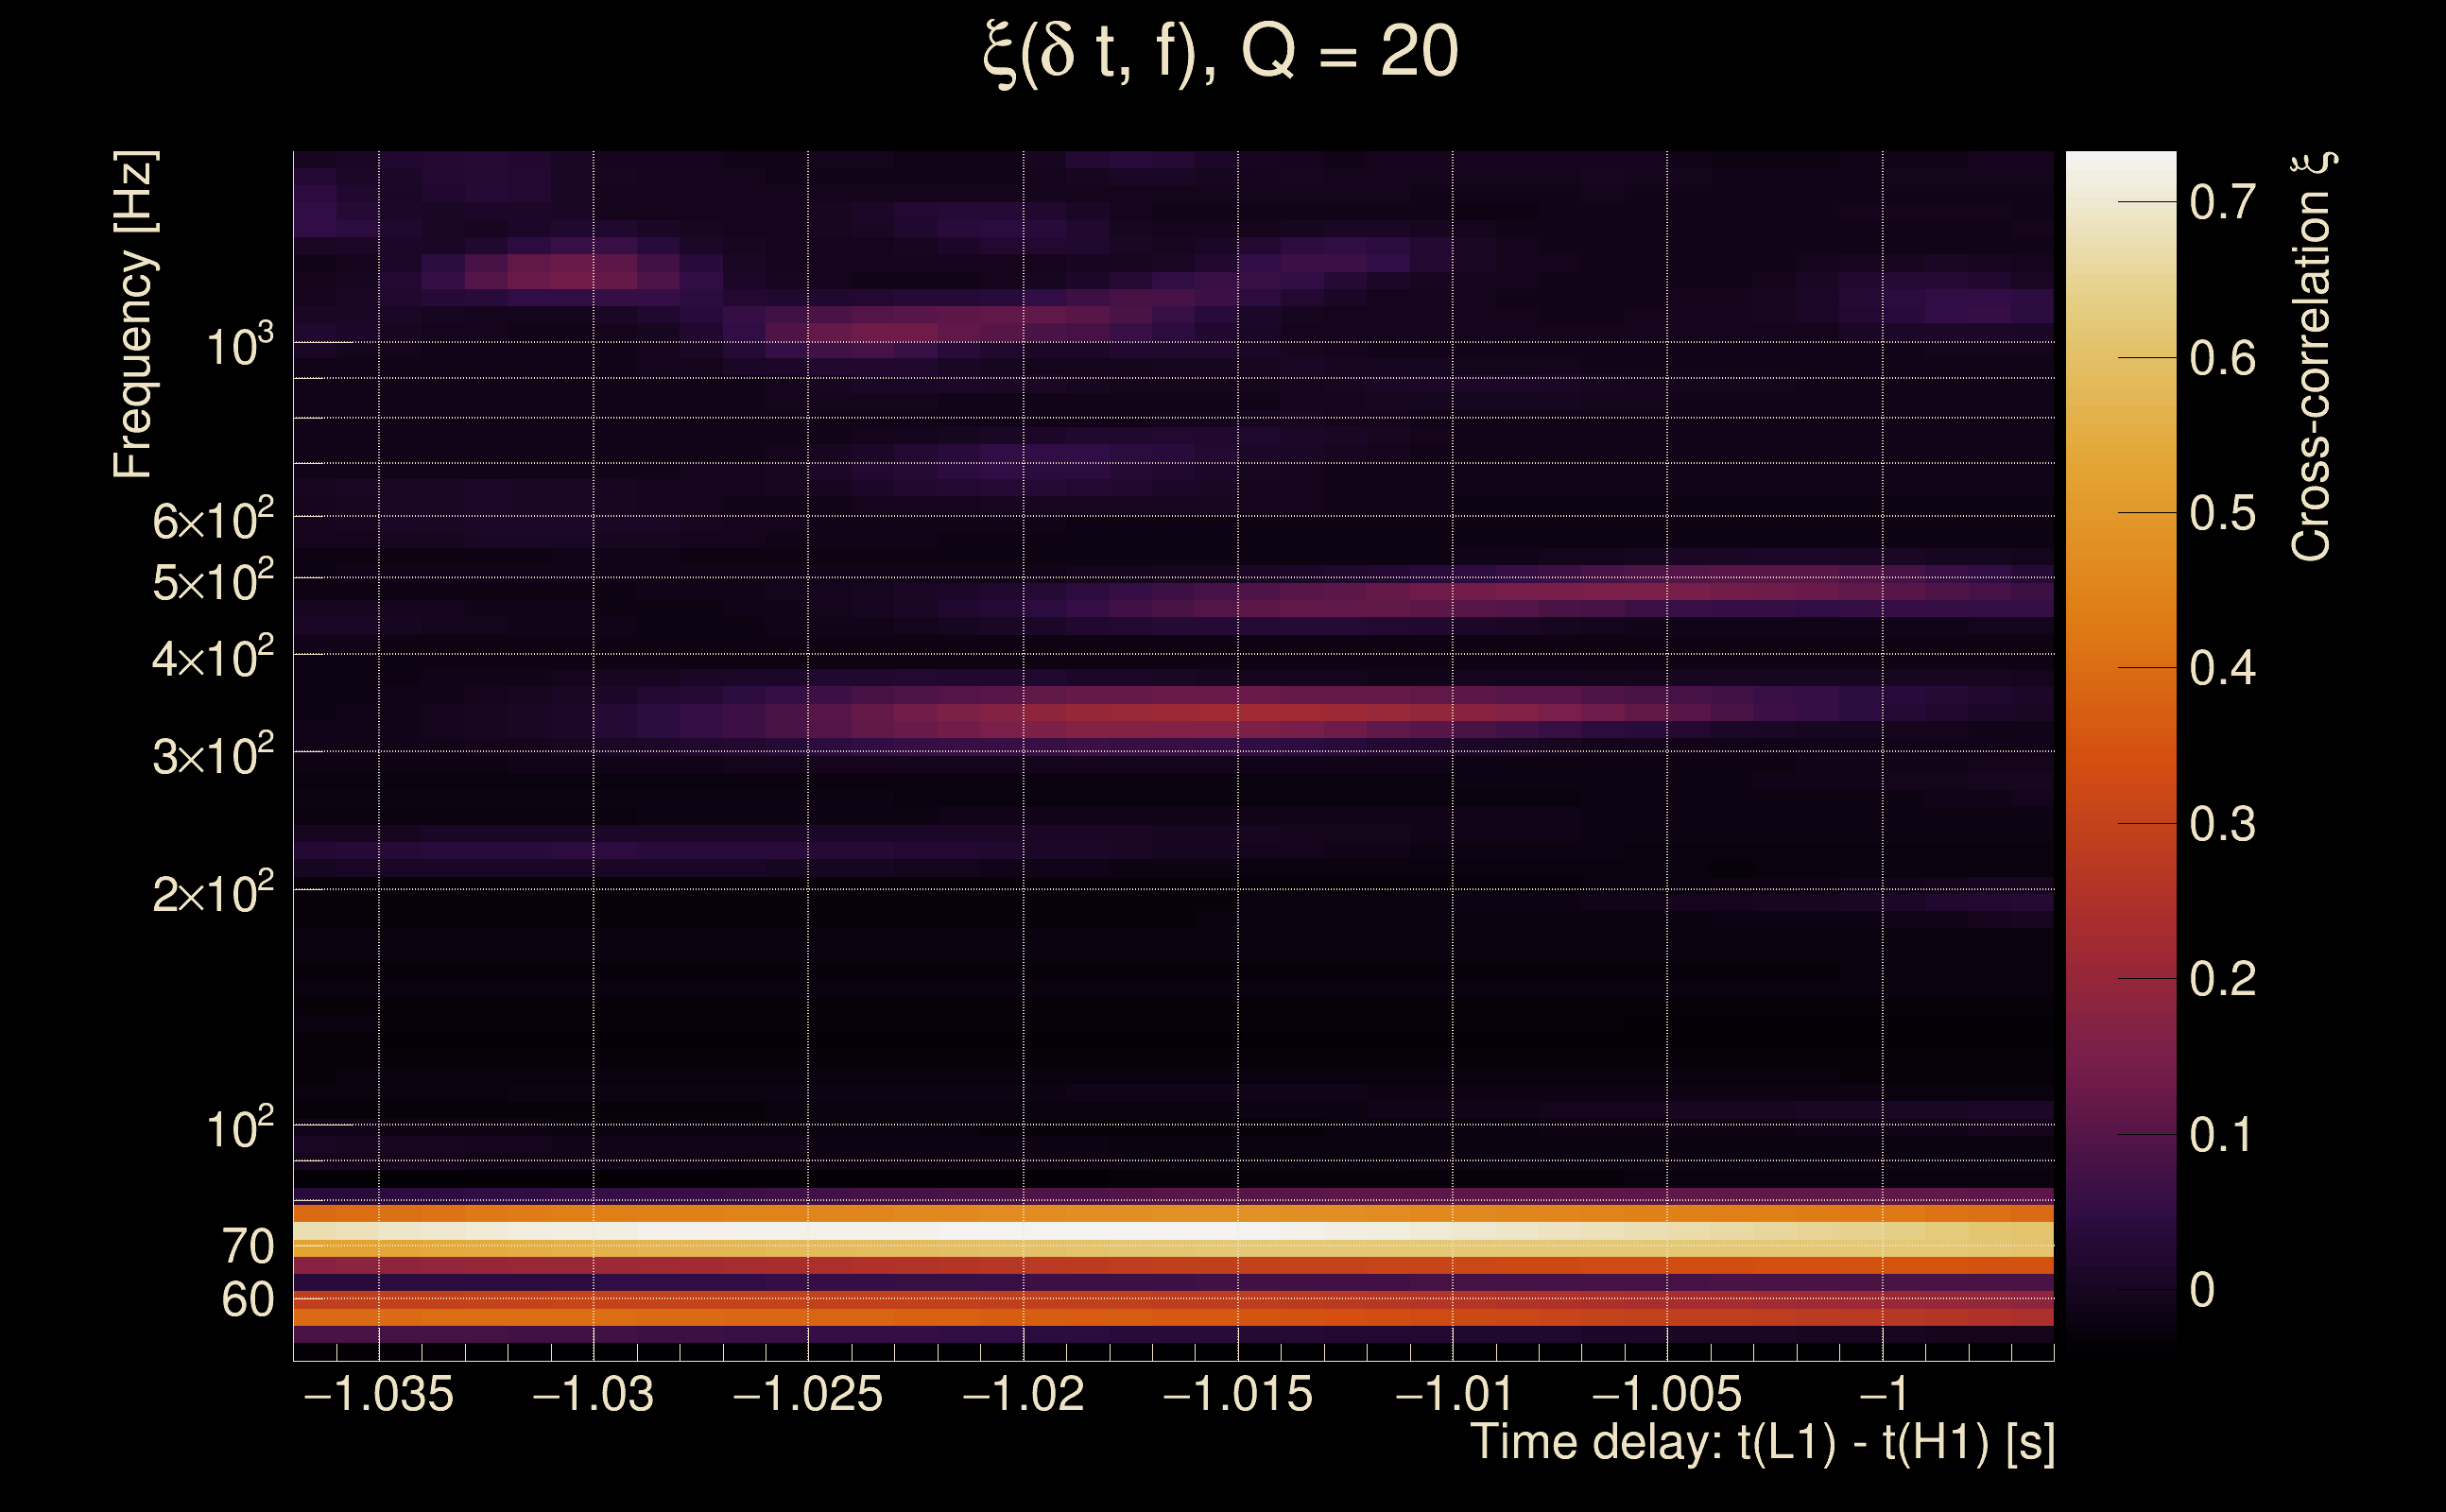
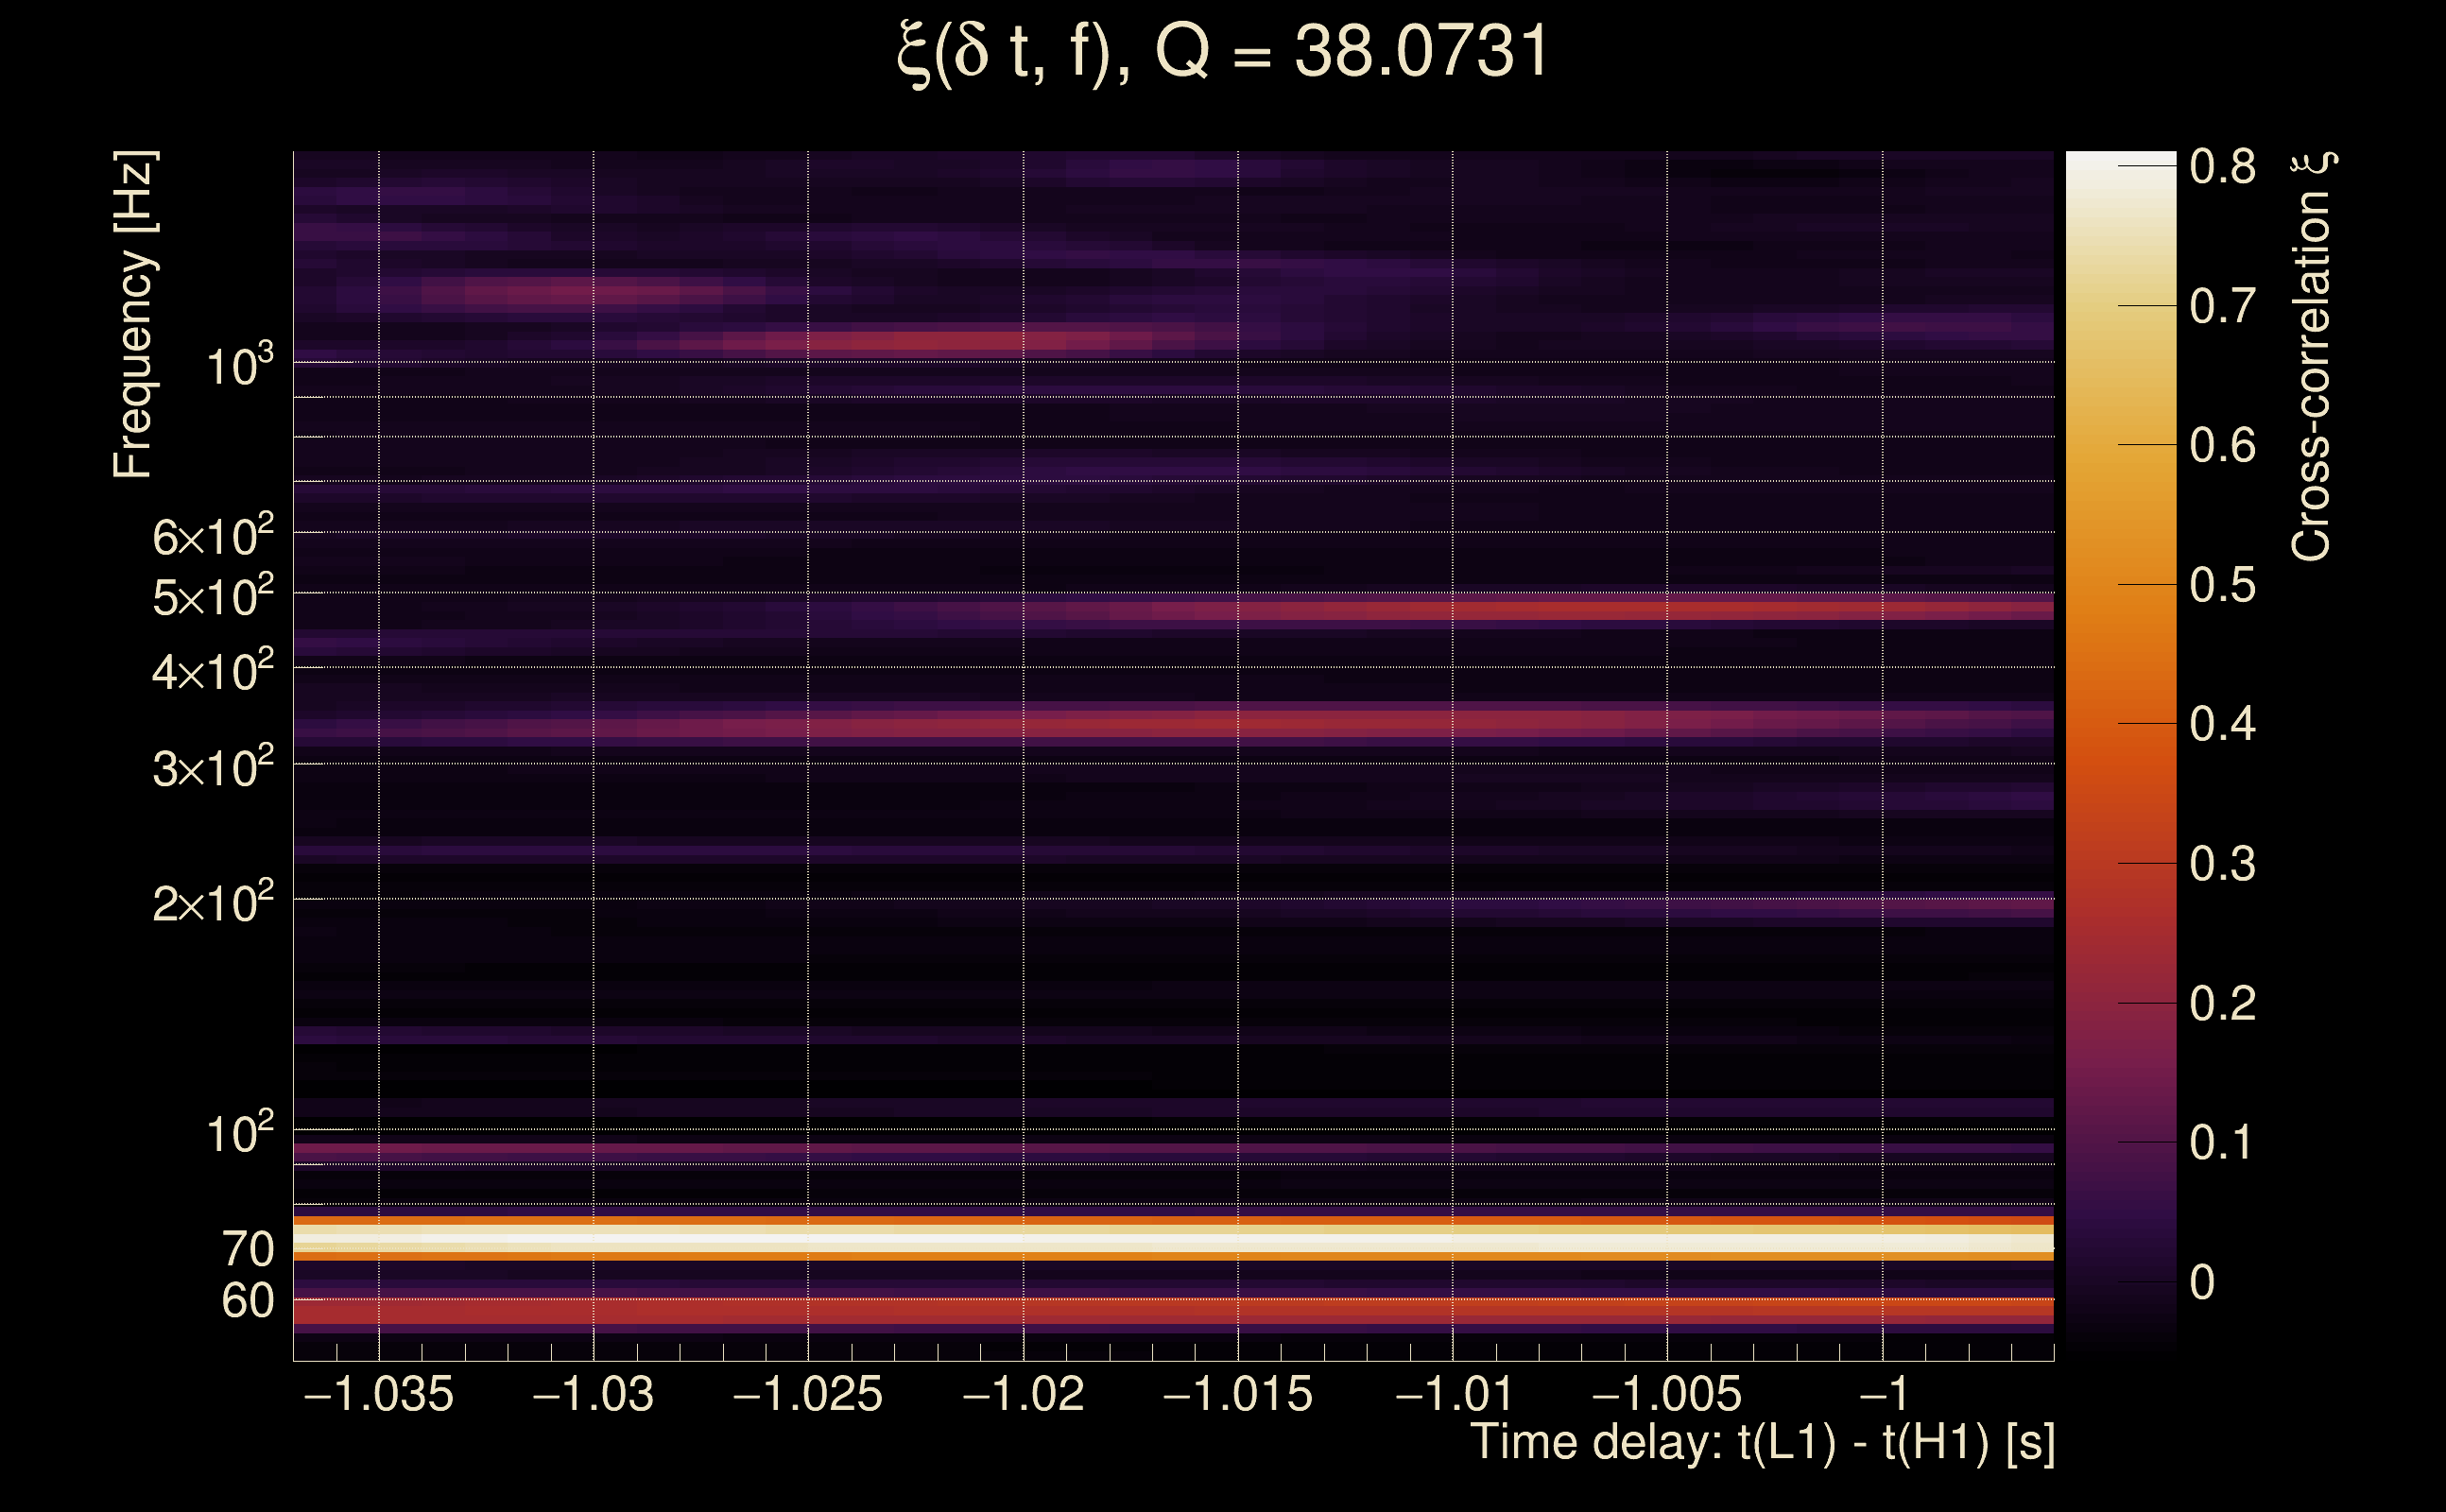
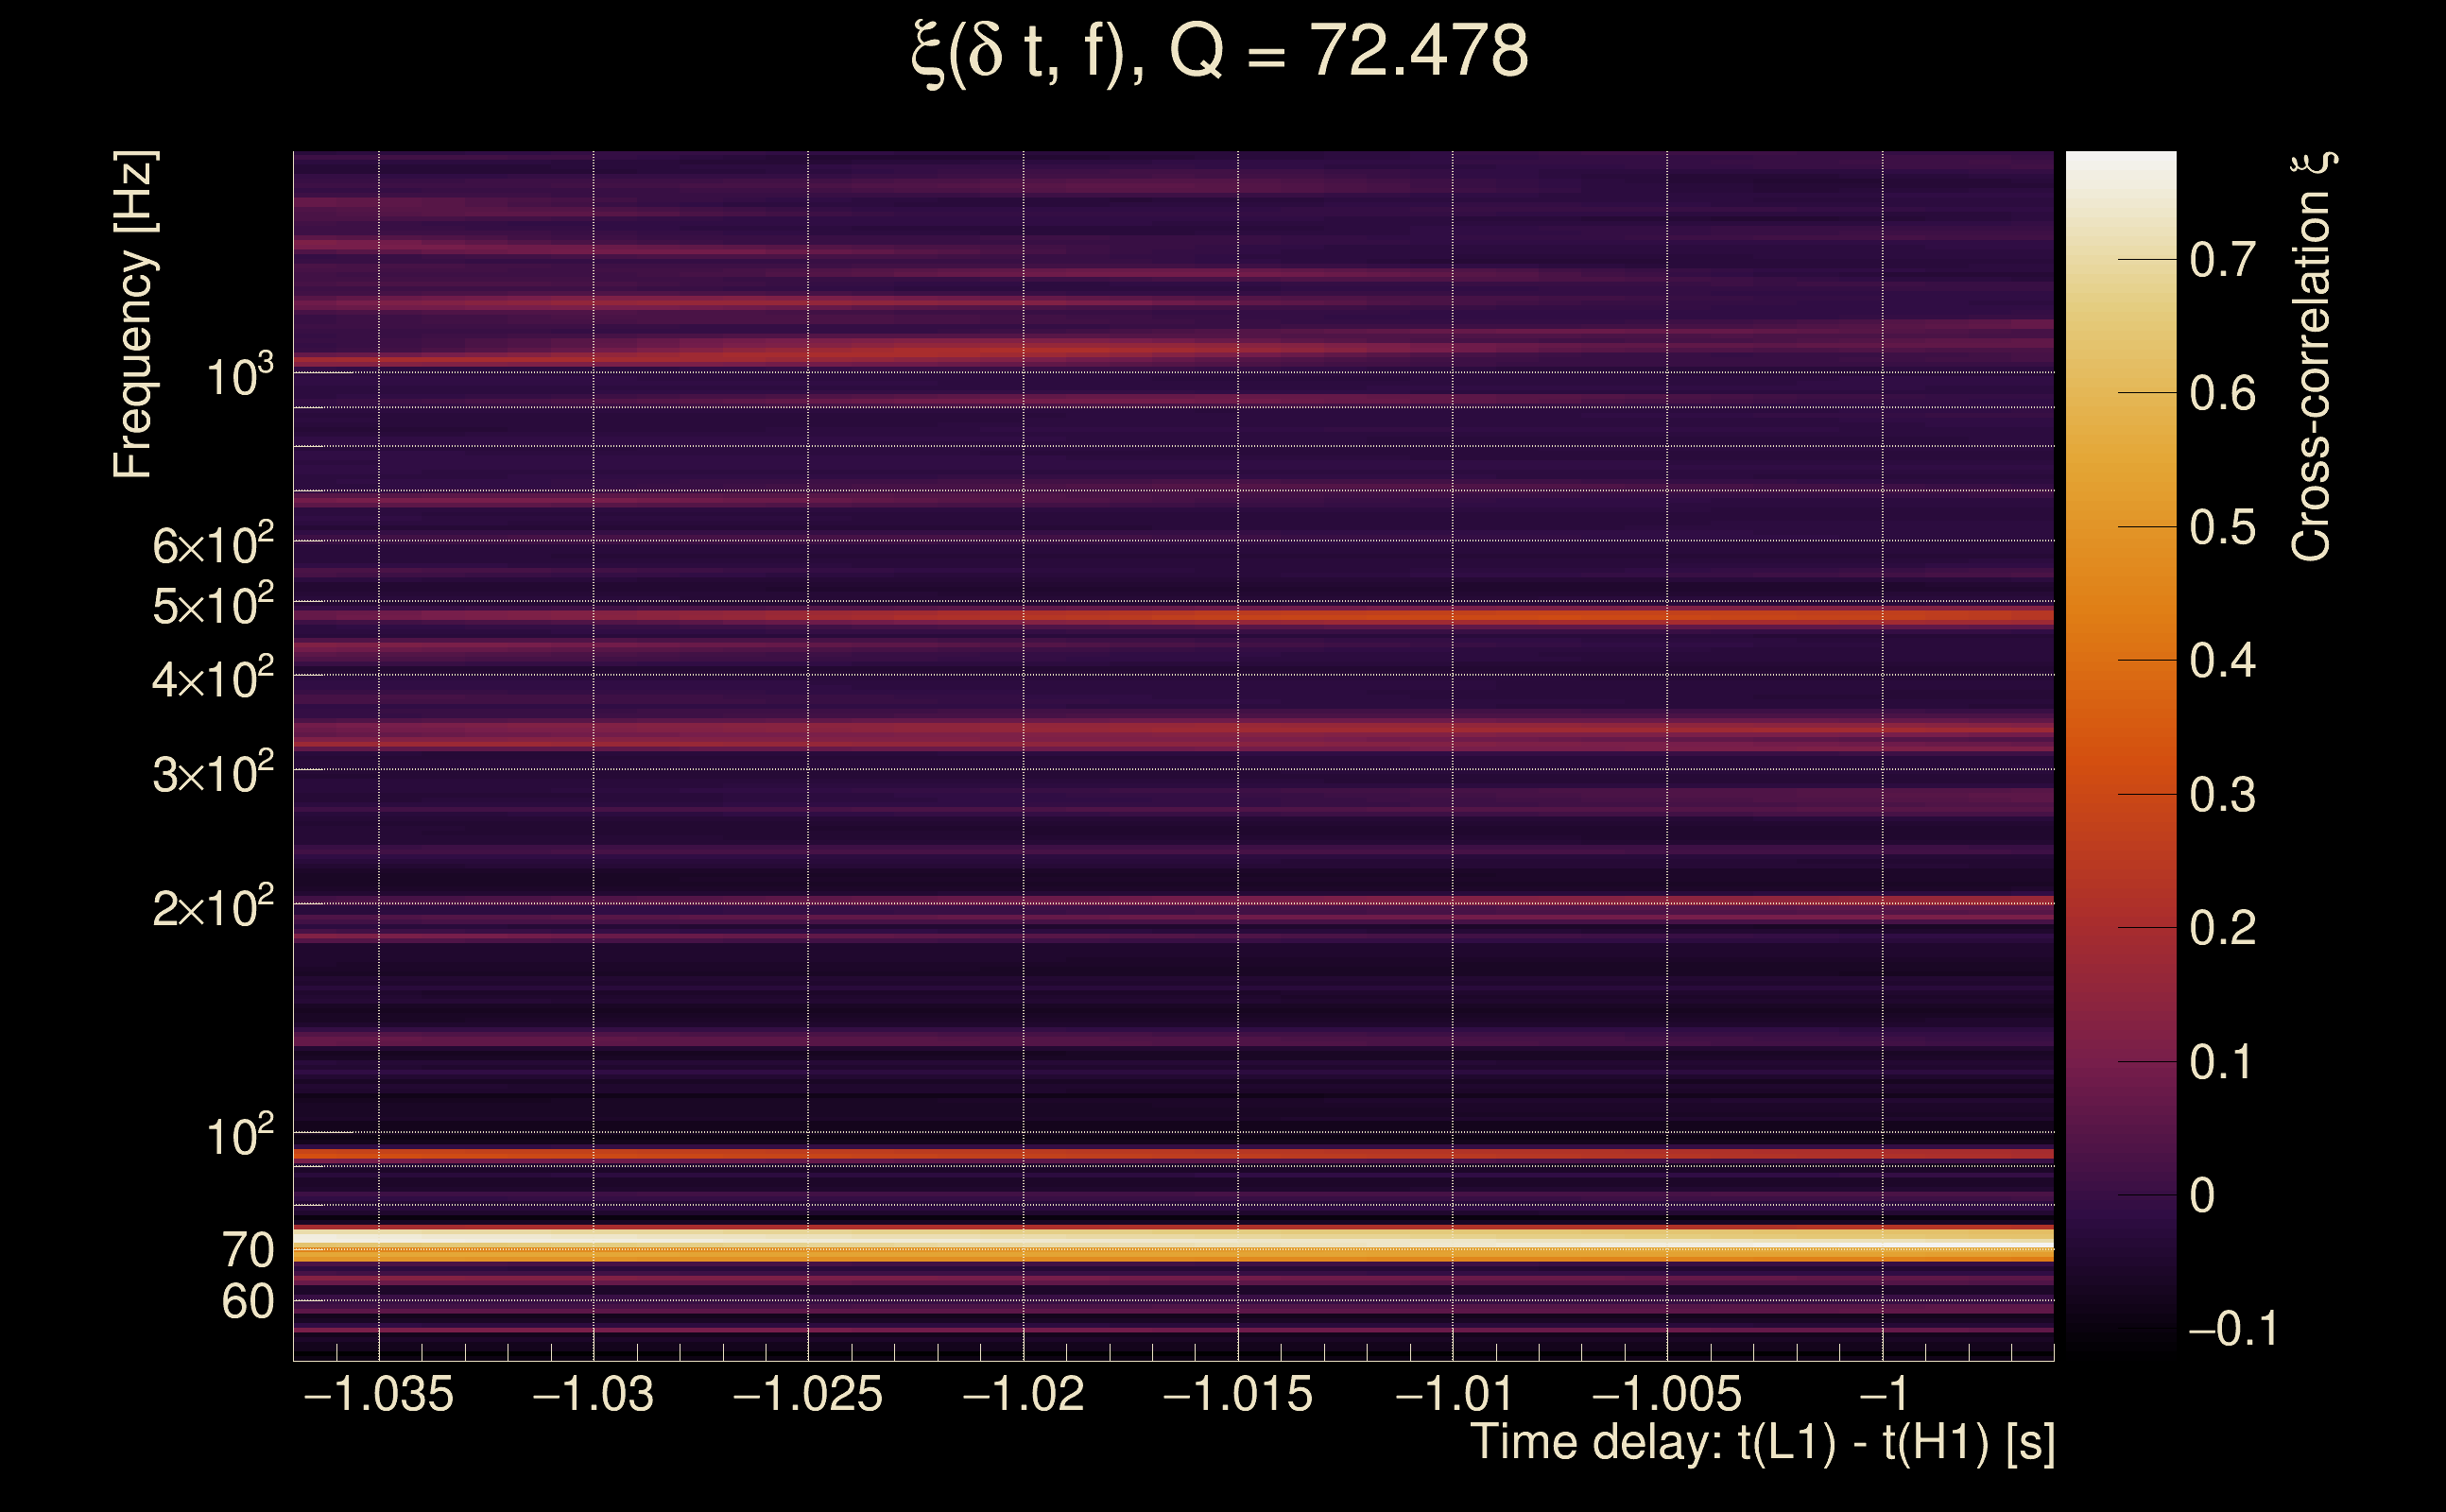
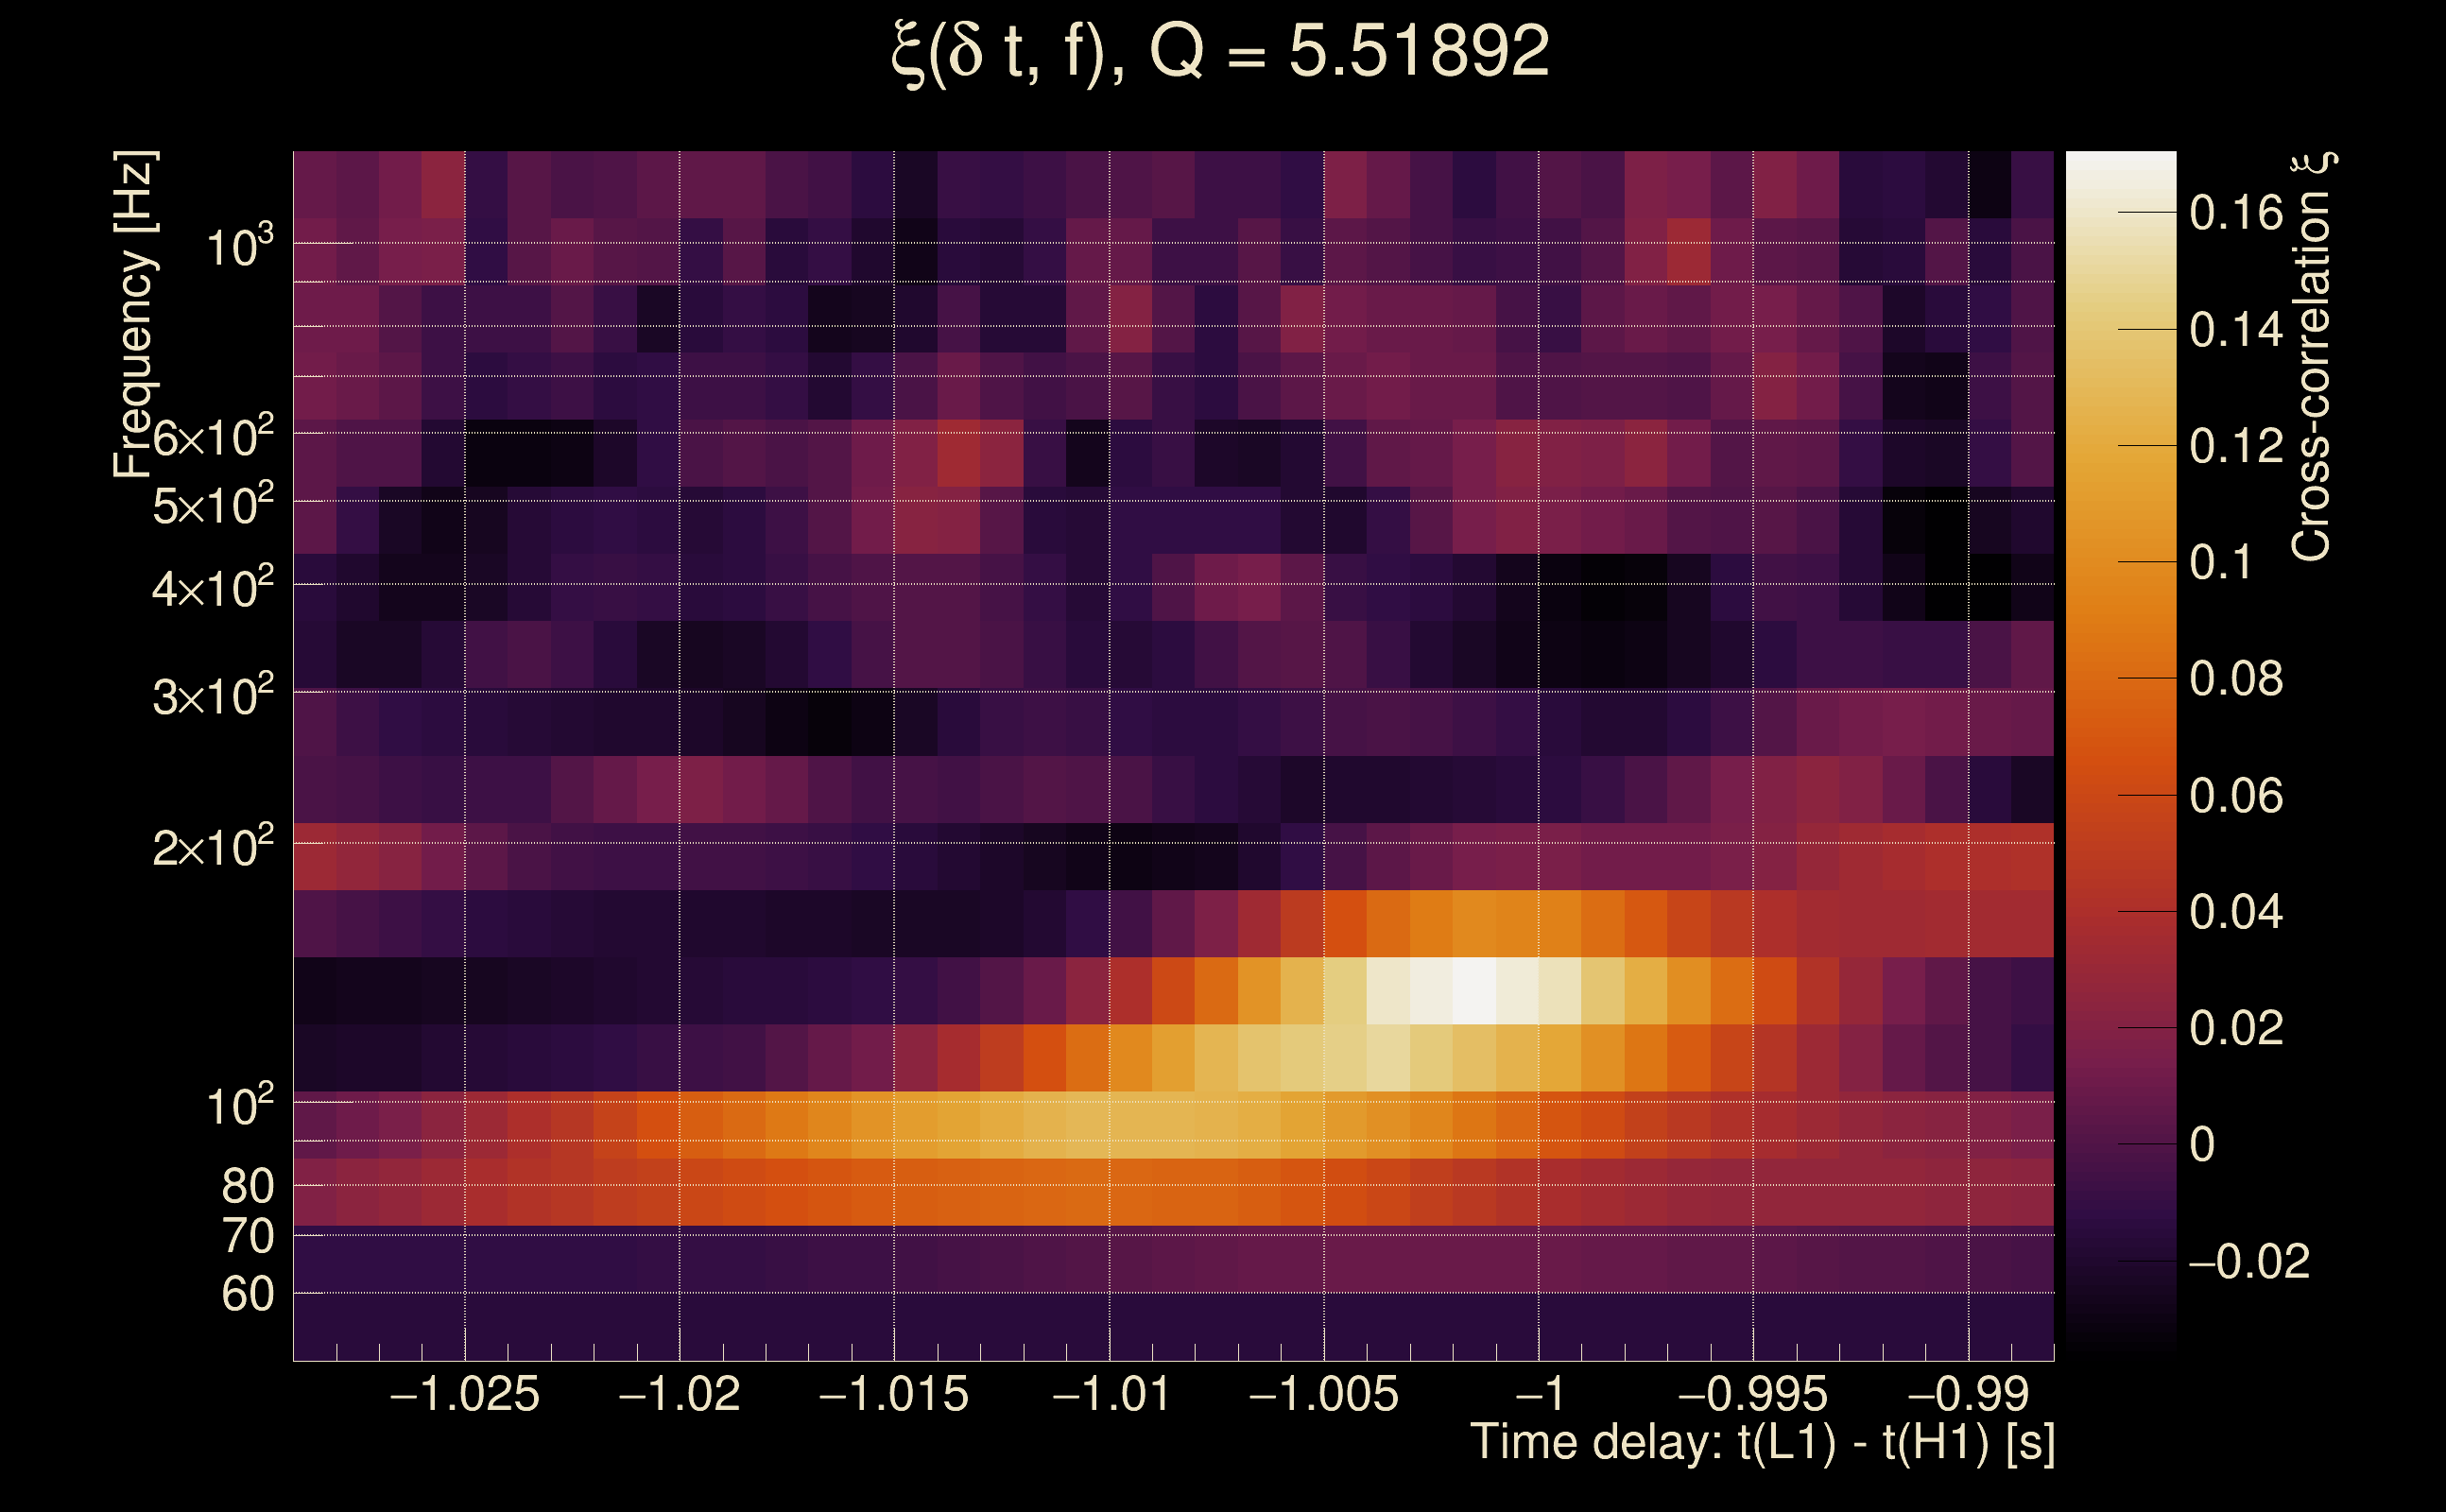
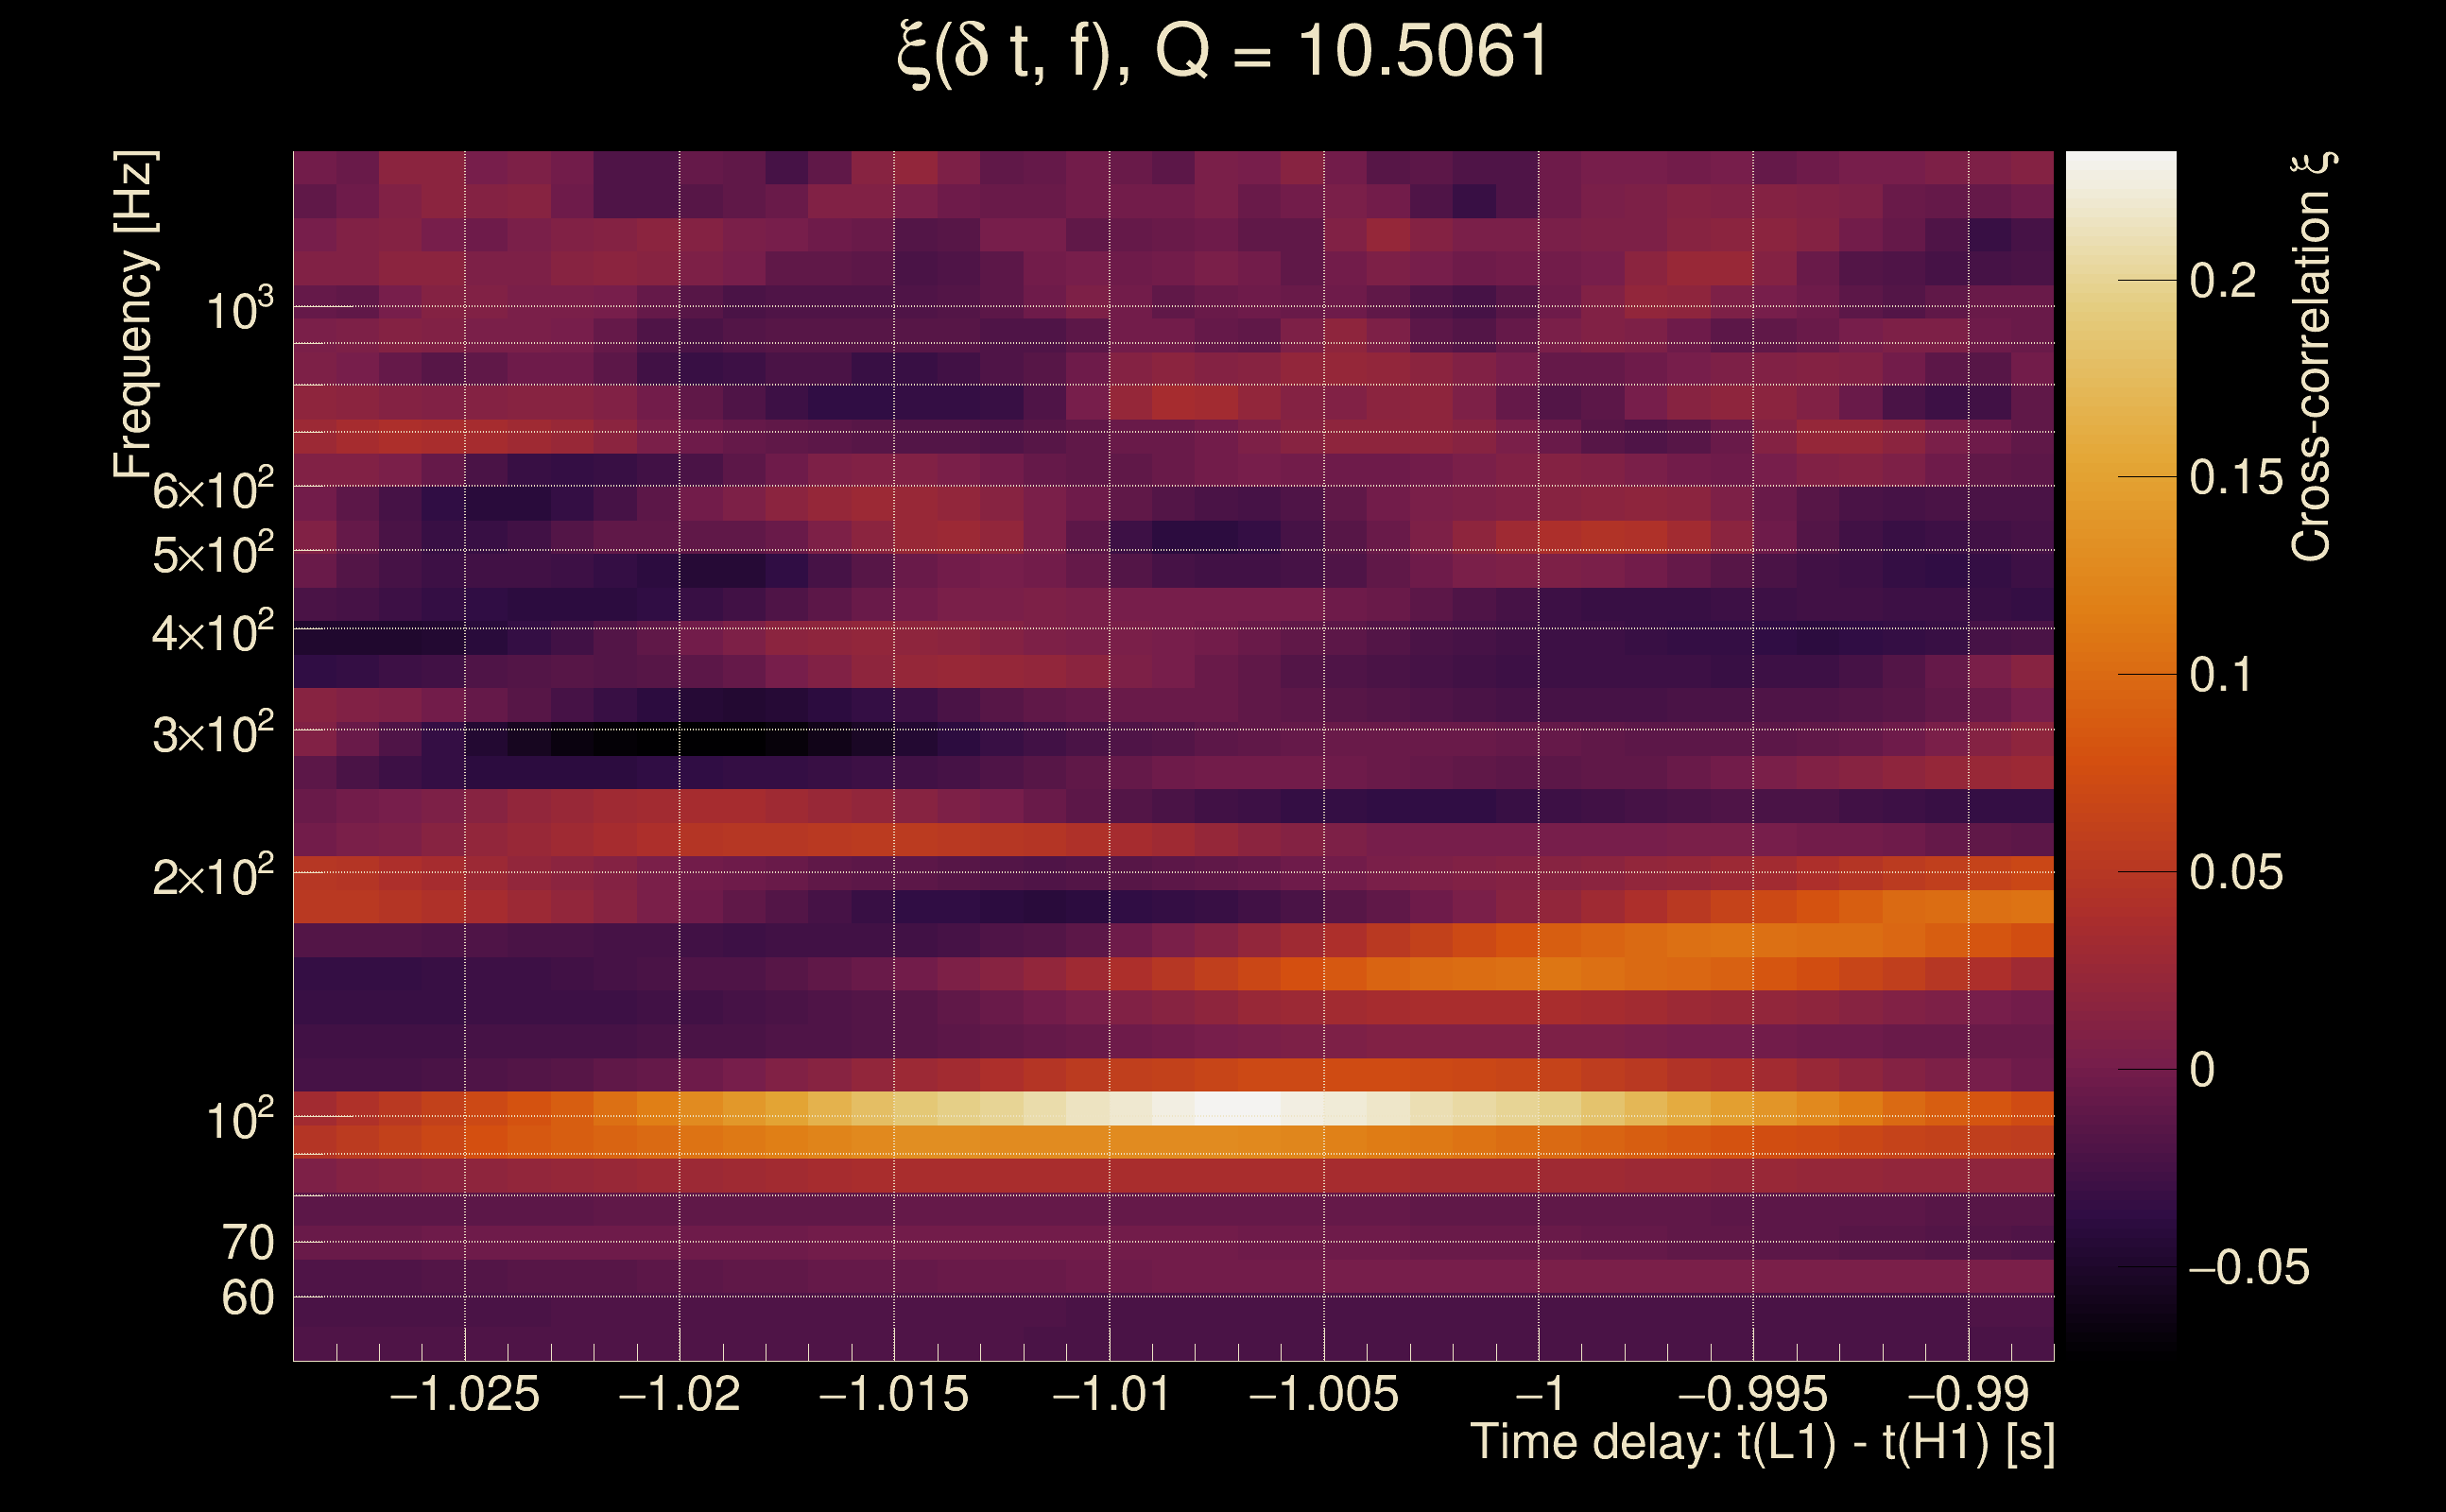
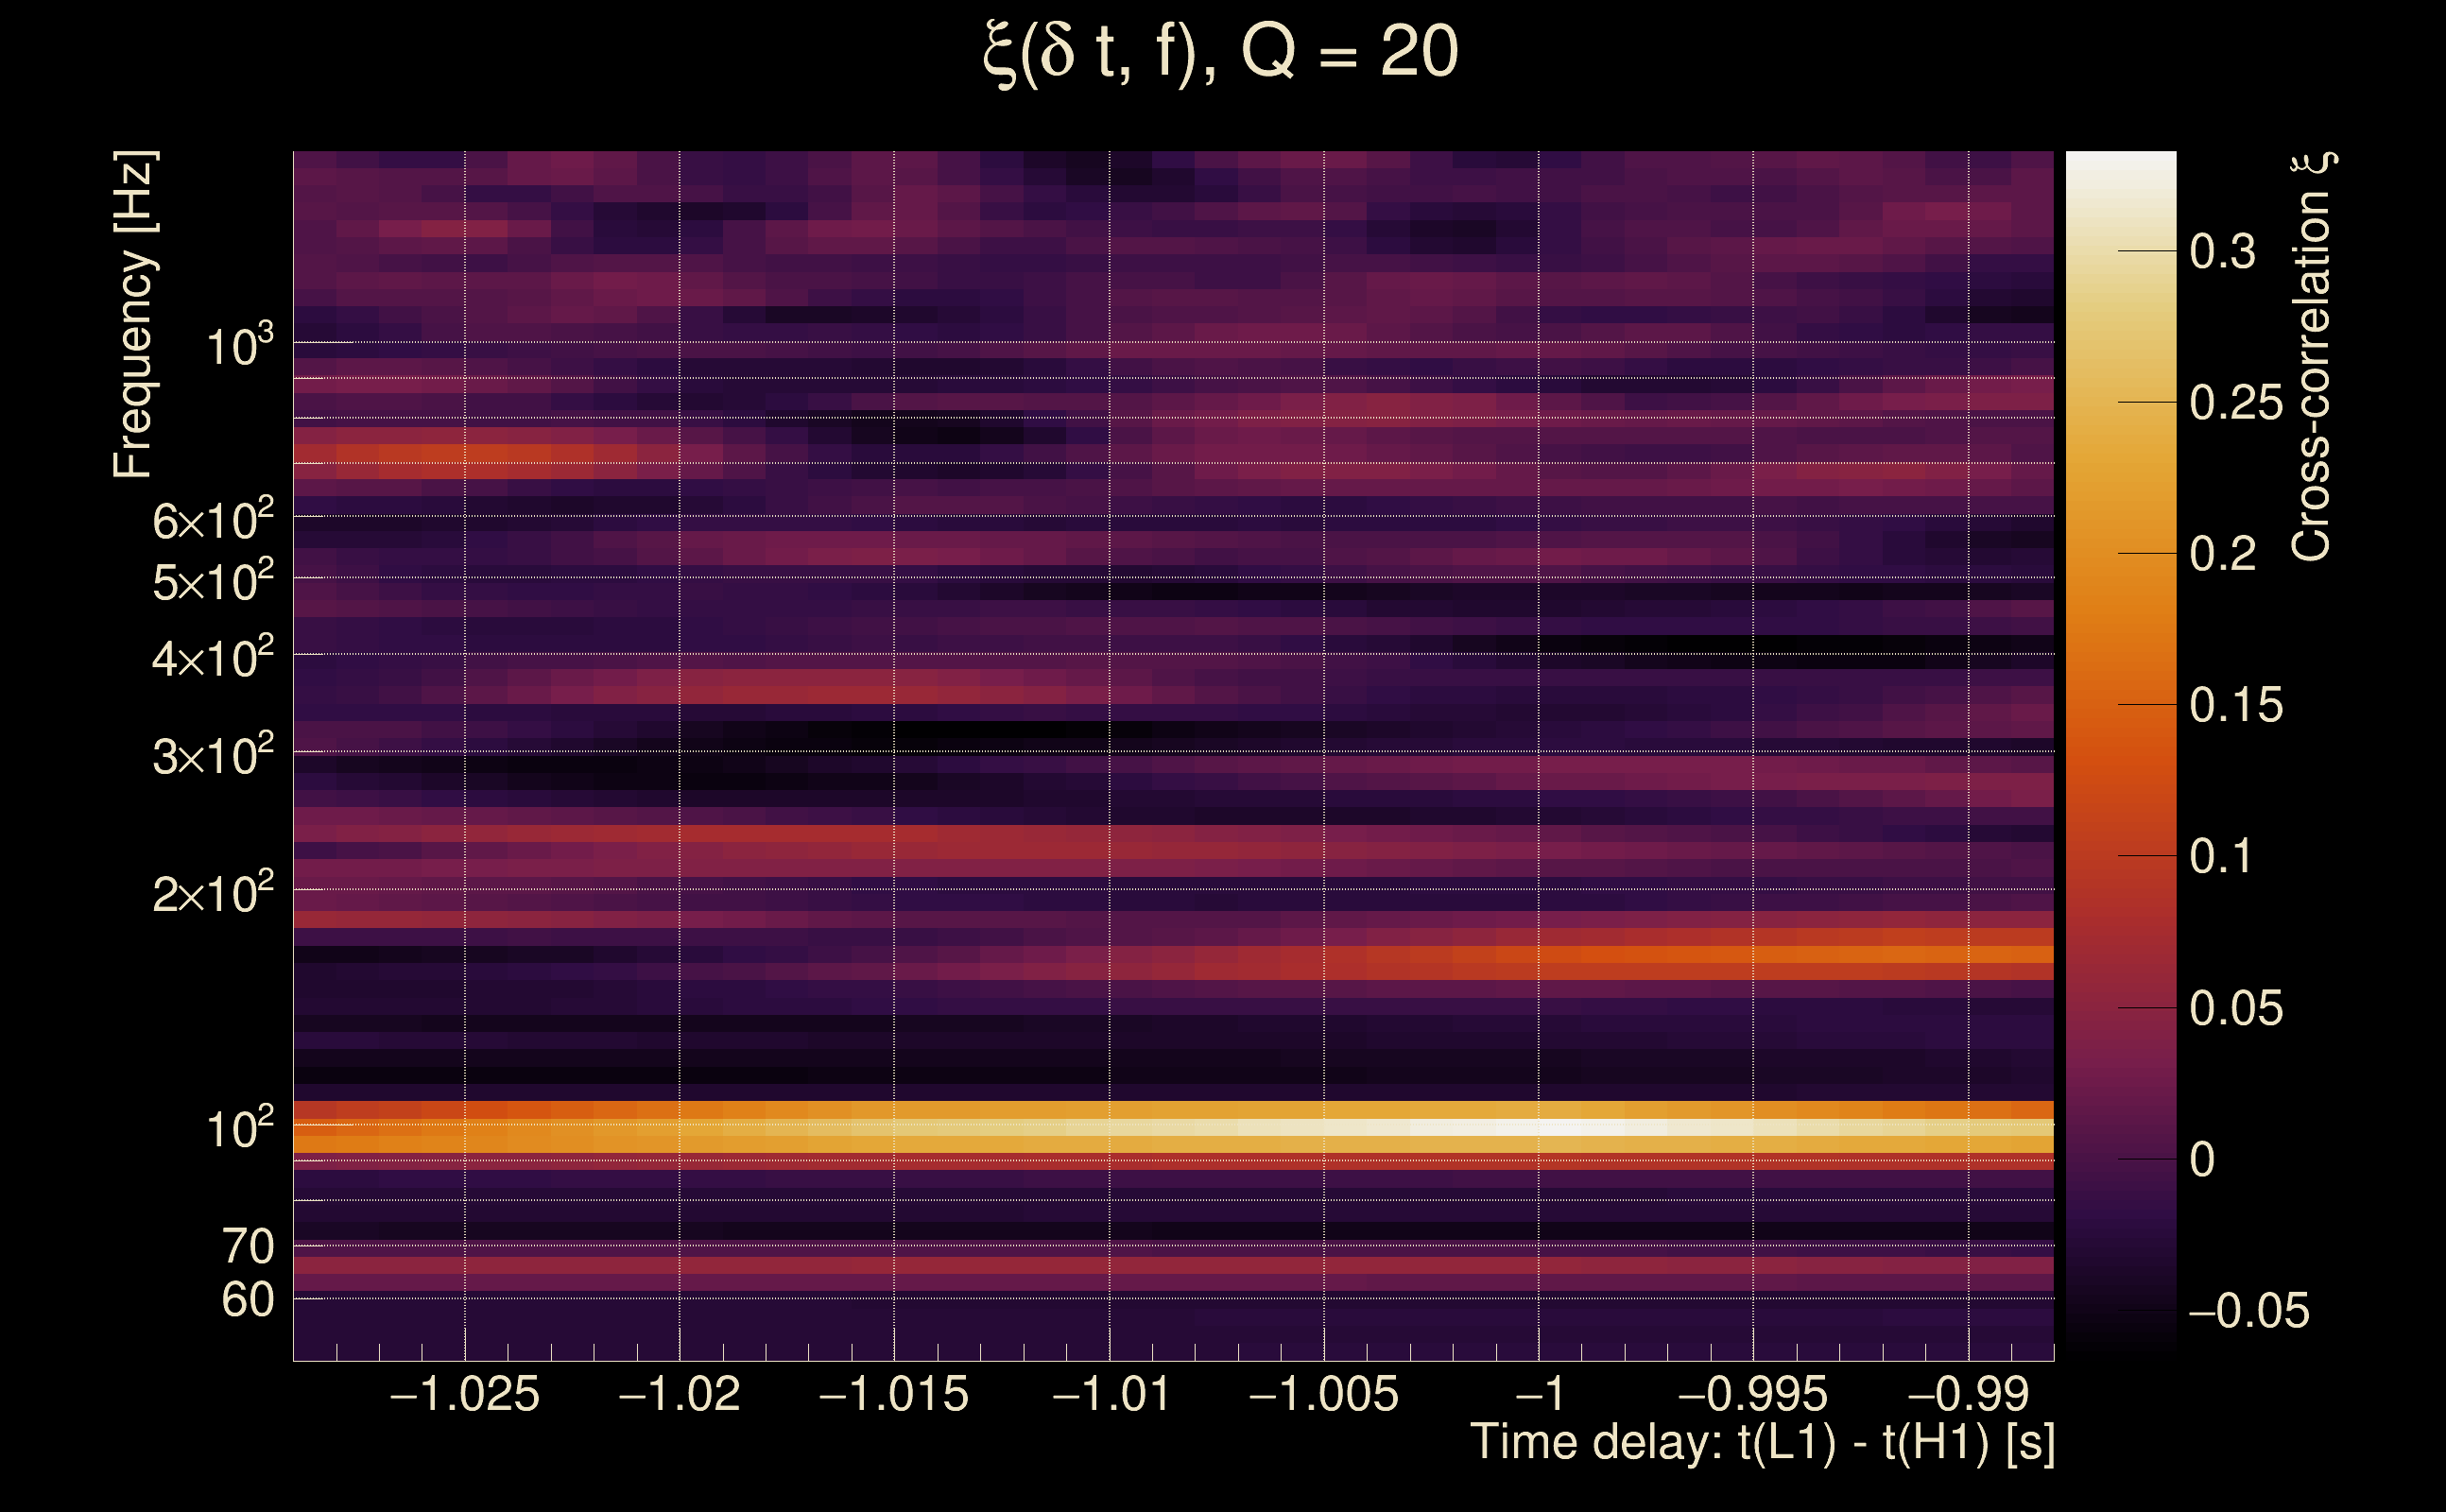
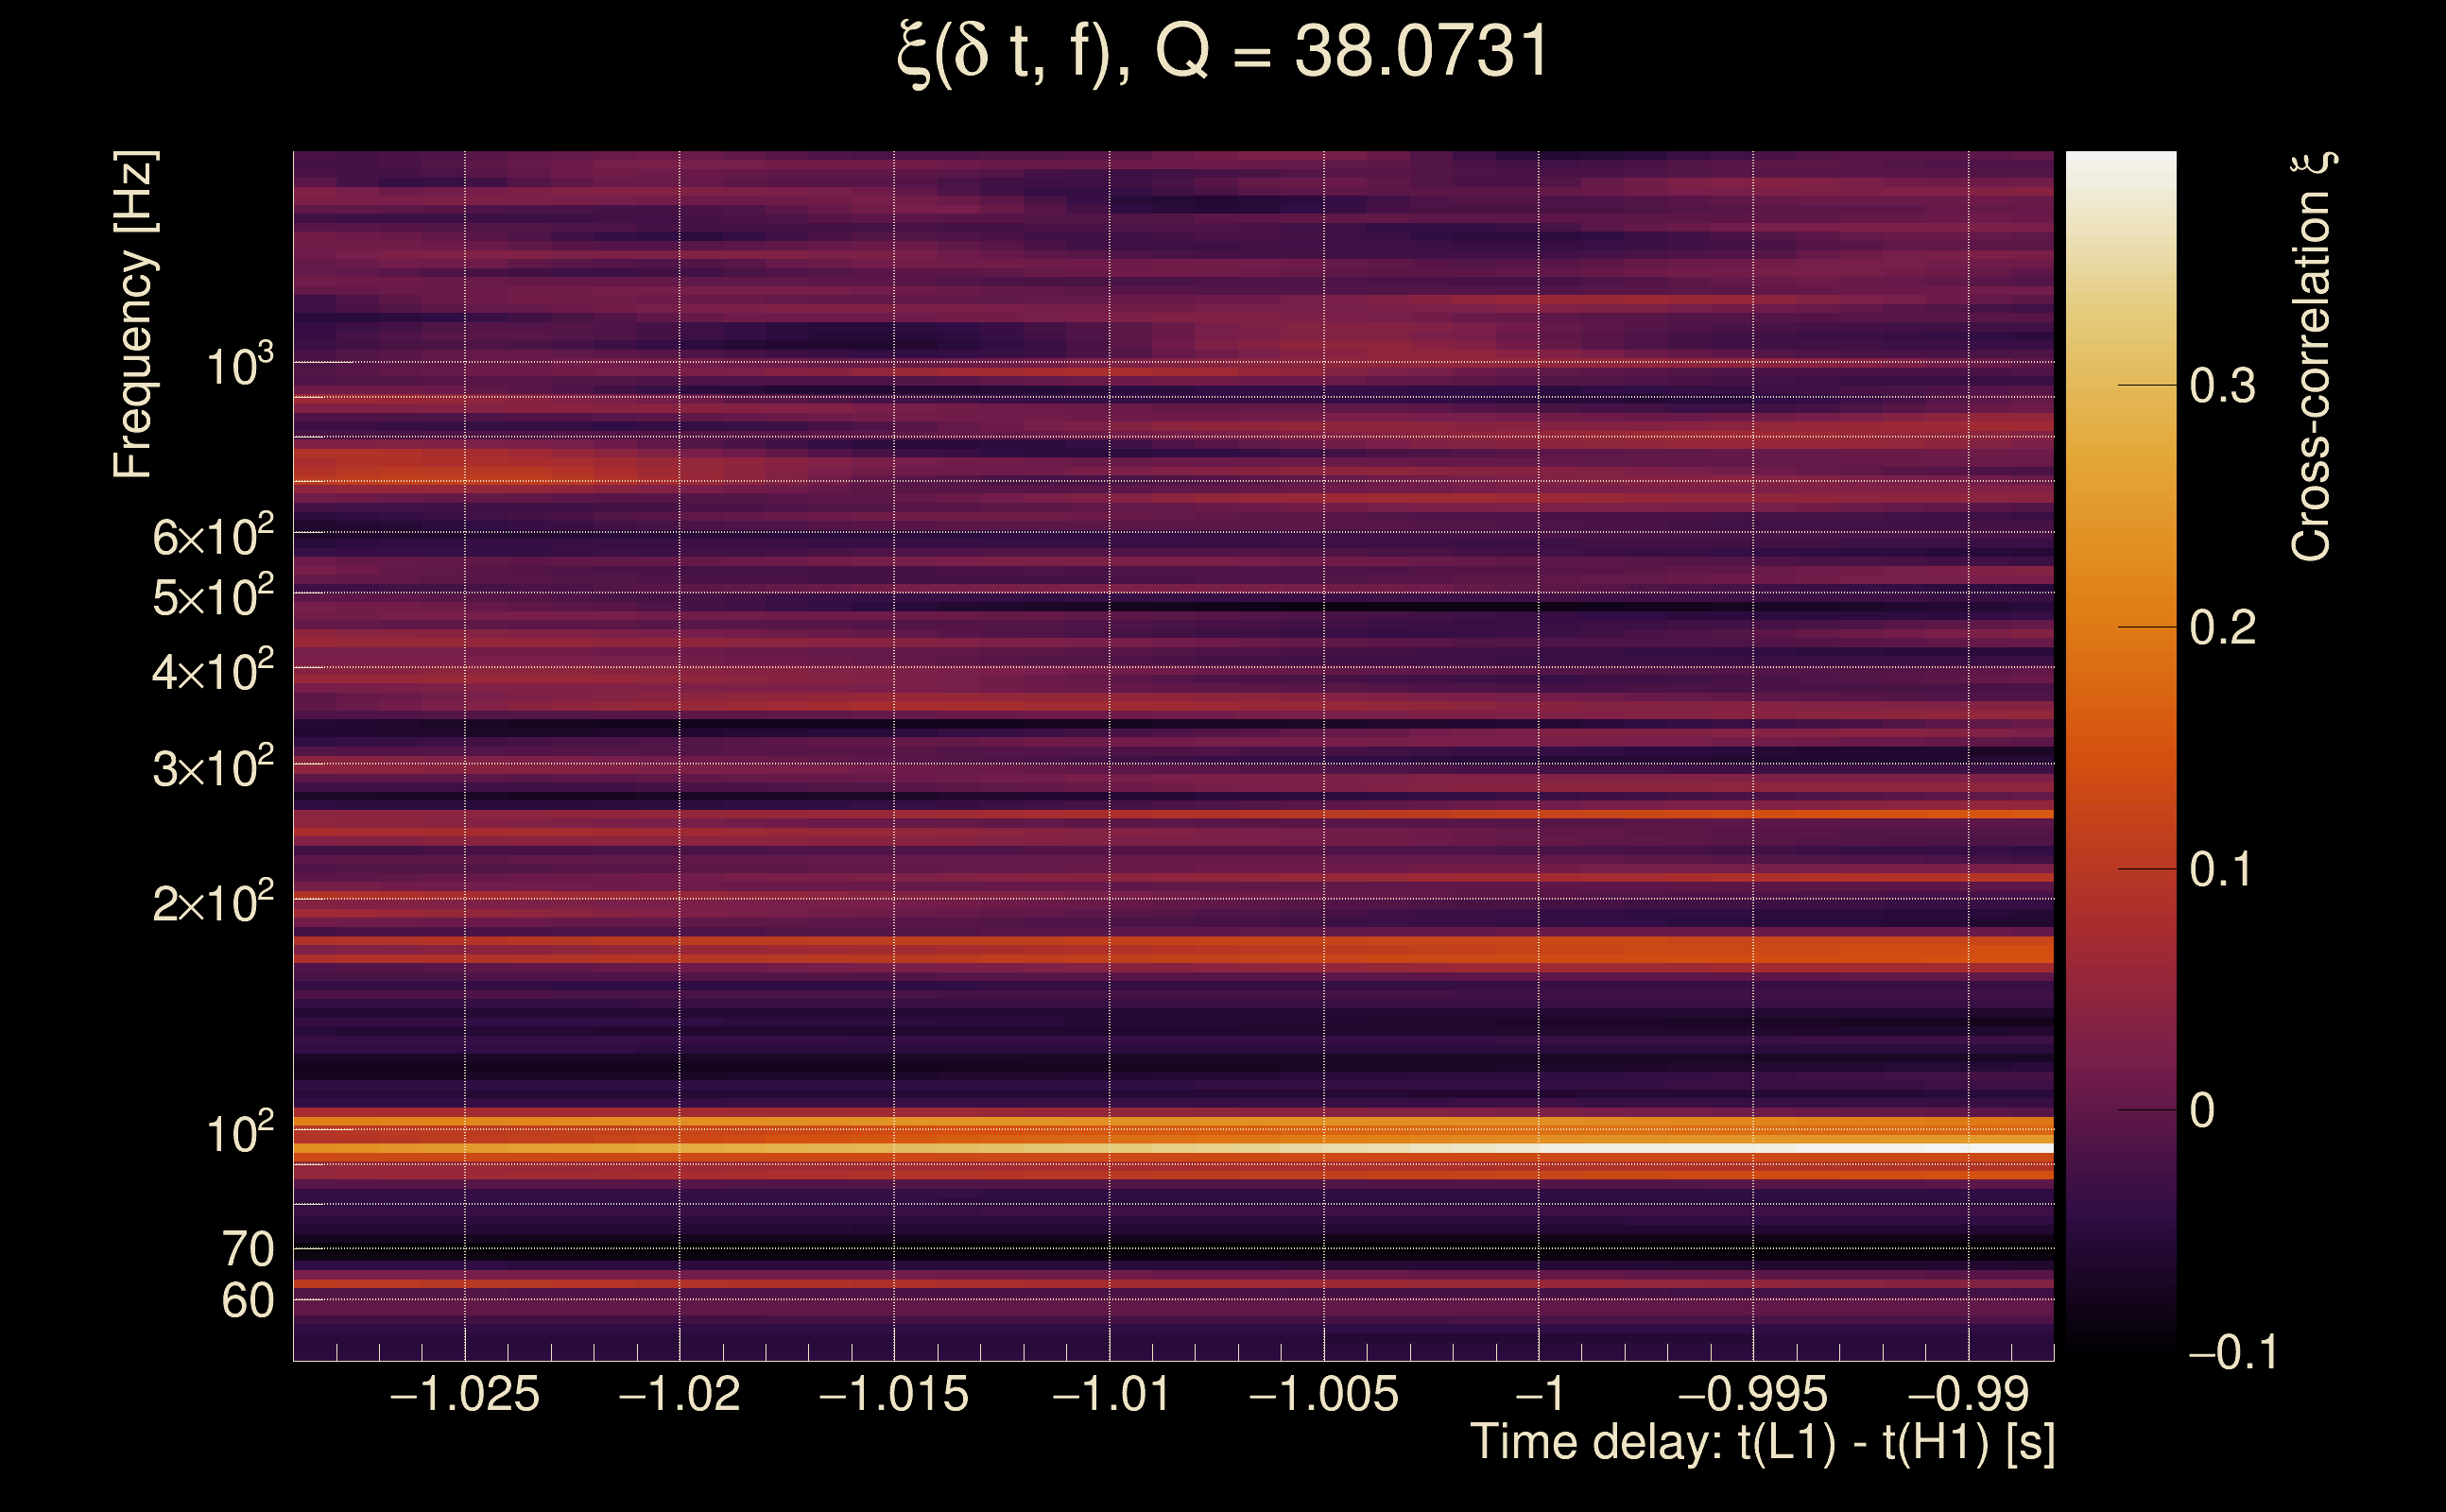
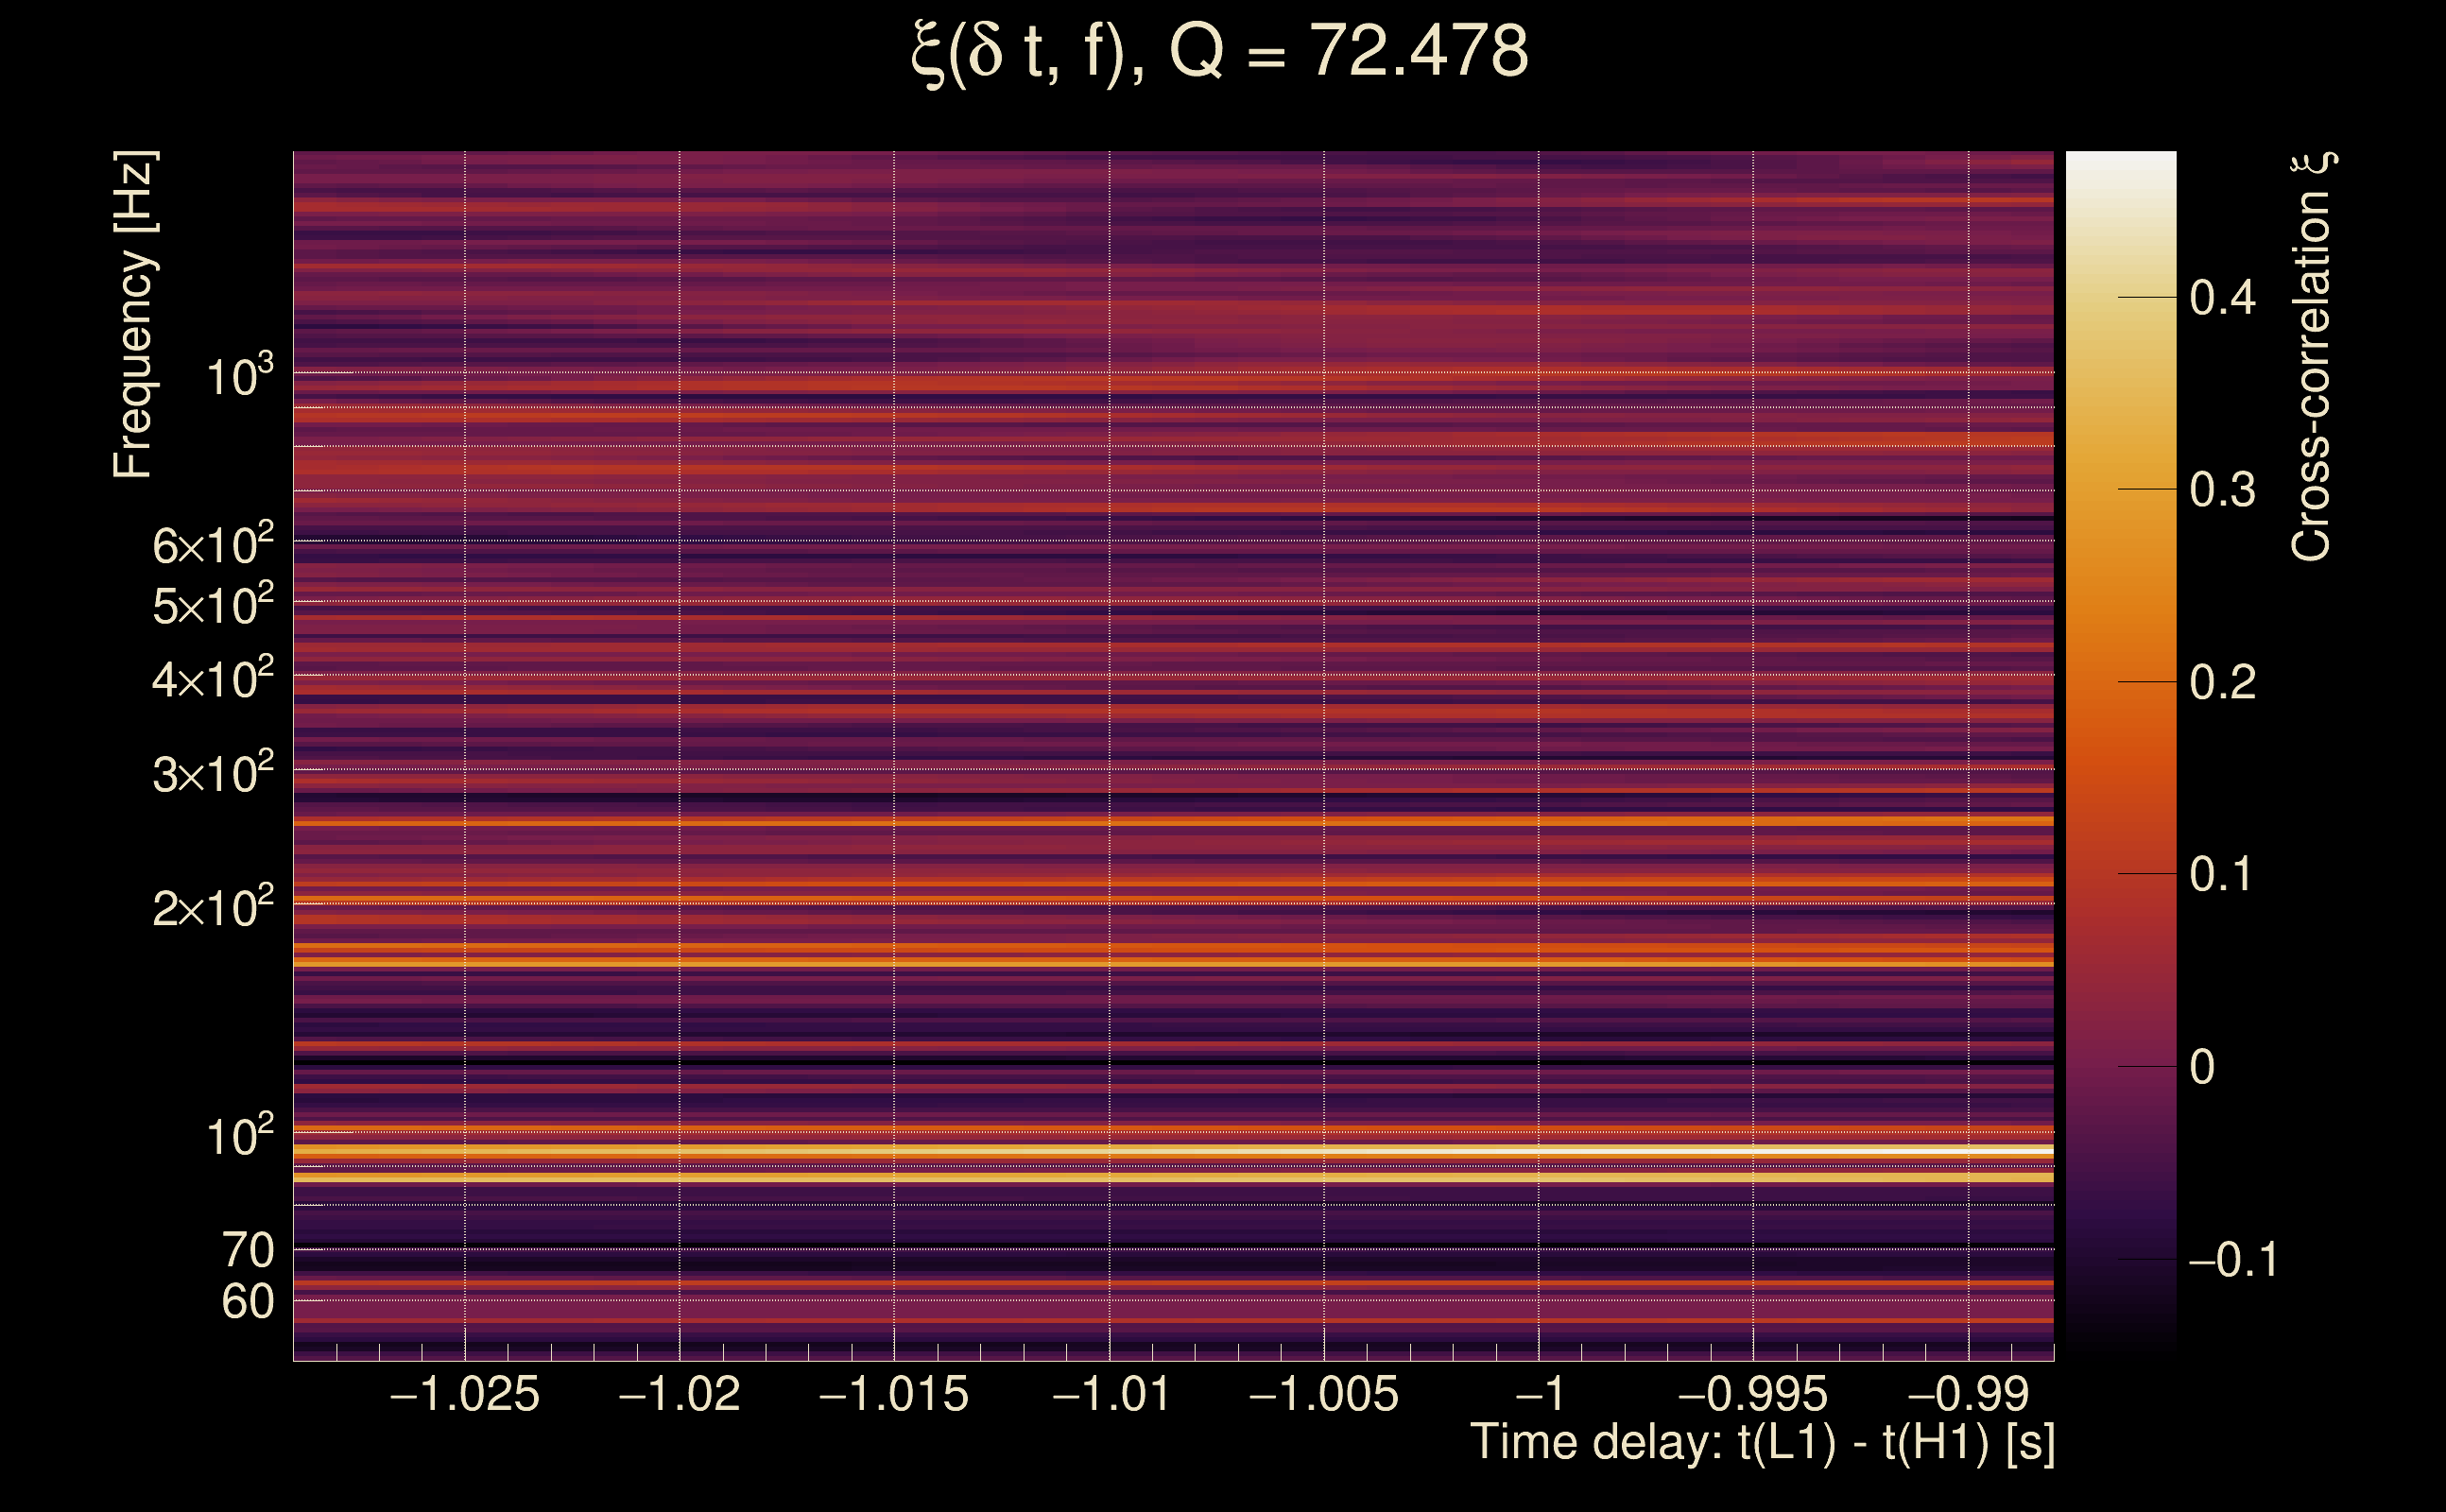
| Time delay between detectors t(L1) - t(H1): | -1.01086 s (slice index = 130 / 217), δt_gw = 0.00113997 s |
| Time delay uncertainty: | 0.00708476 s |
| [targeted mode] Time delay probability: | 0.272648 (1.09699 sigmas), δt_target = -0.00300121 s |
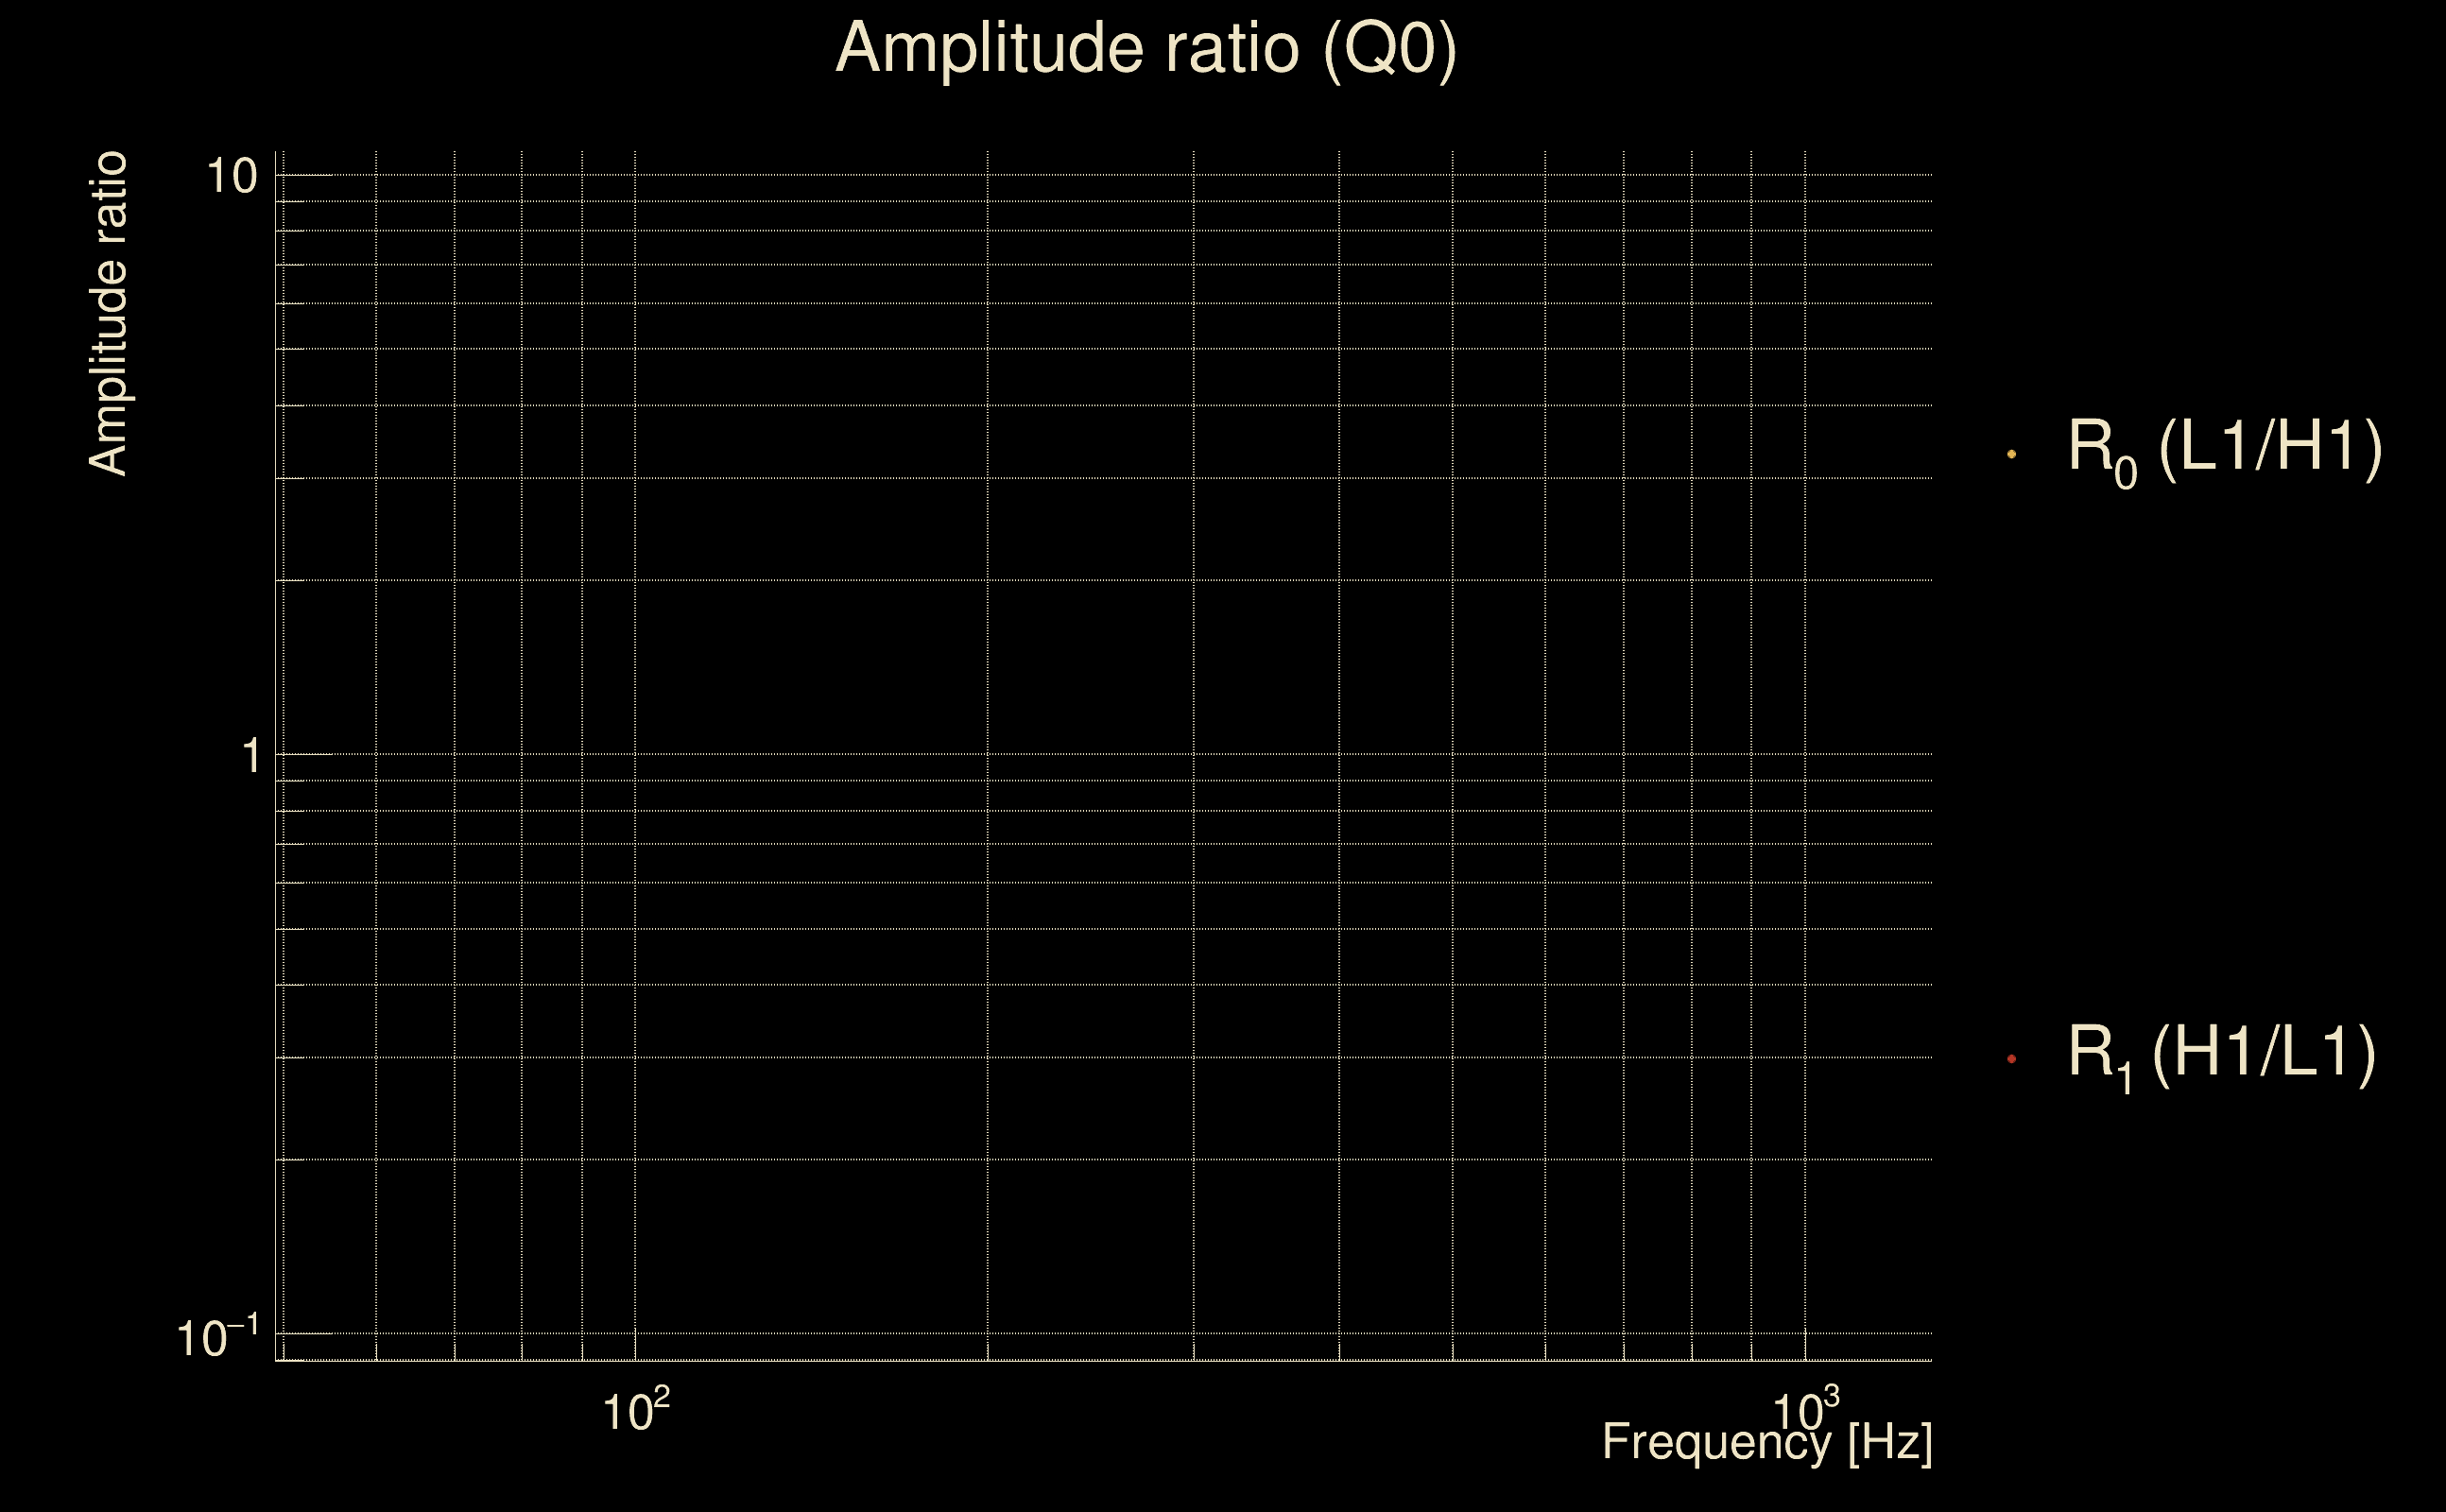
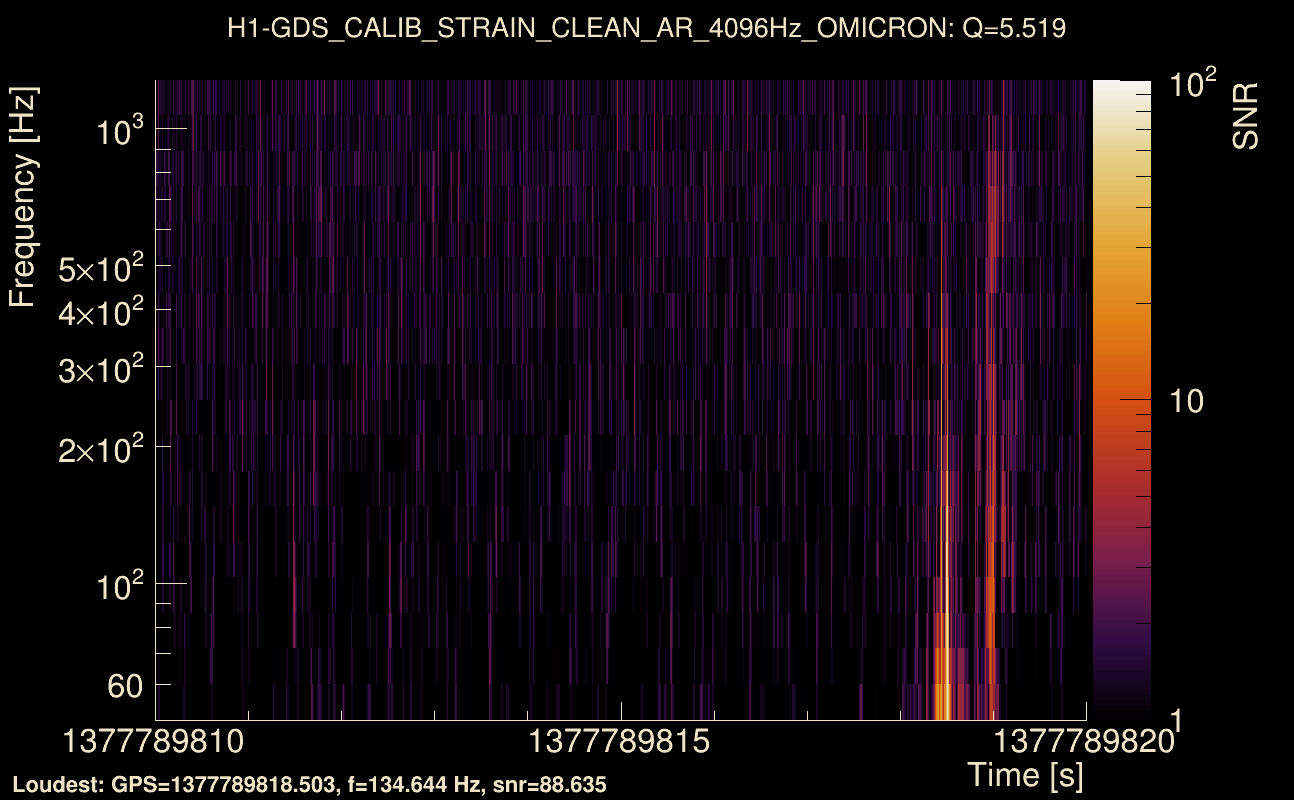
| Frequency: | 131.688 Hz |
| Ξ: | 0.191958 ± 0.0364939 (variance = 0.0013318): Q0: 0.525252, Q1: 0.621415, Q2: 0.620209, Q3: 0.610583, Q4: 0.577792 |
| Rank: | R_A = 0.191958 |
| Log of amplitude ratio (L1/H1): | 1.44308, variance = 0.565815 (L1/H1: -0.302761, variance = 1.15836, H1/L1: -1.57305, variance = 0.646771) |
| Amplitude ratio (L1/H1): | 4.23373 ⋇ 2.12168 (L1/H1: 0.738775 ⋇ 2.93373, H1/L1: 0.207413 ⋇ 2.23495) |
| Amplitude ratio H1|L1 compatibility (probability): | 0.162668 |
| Antenna factor probability: | 1 |
| Number of rejected frequency rows: | Q0: 12 / 18, Q1: 24 / 36, Q2: 44 / 70, Q3: 85 / 134, Q4: 203 / 258 |
| Maximum signal-to-noise ratio: | H1: 20.3167, L1: 74.4638 |
| SNR variance: | H1: 0.539454, L1: 2.65526 |
| Click here for a zoomed plot | Click here for a zoomed plot | Click here for a zoomed plot | Click here for a zoomed plot | Click here for a zoomed plot |
 |
 |
 |
 |
 |
 |
 |
 |
 |
 |
 |
 |
 |
 |
 |
 |
 |
 |
 |
 |
 |
 |
 |
 |
 |
 |
 |
 |
 |
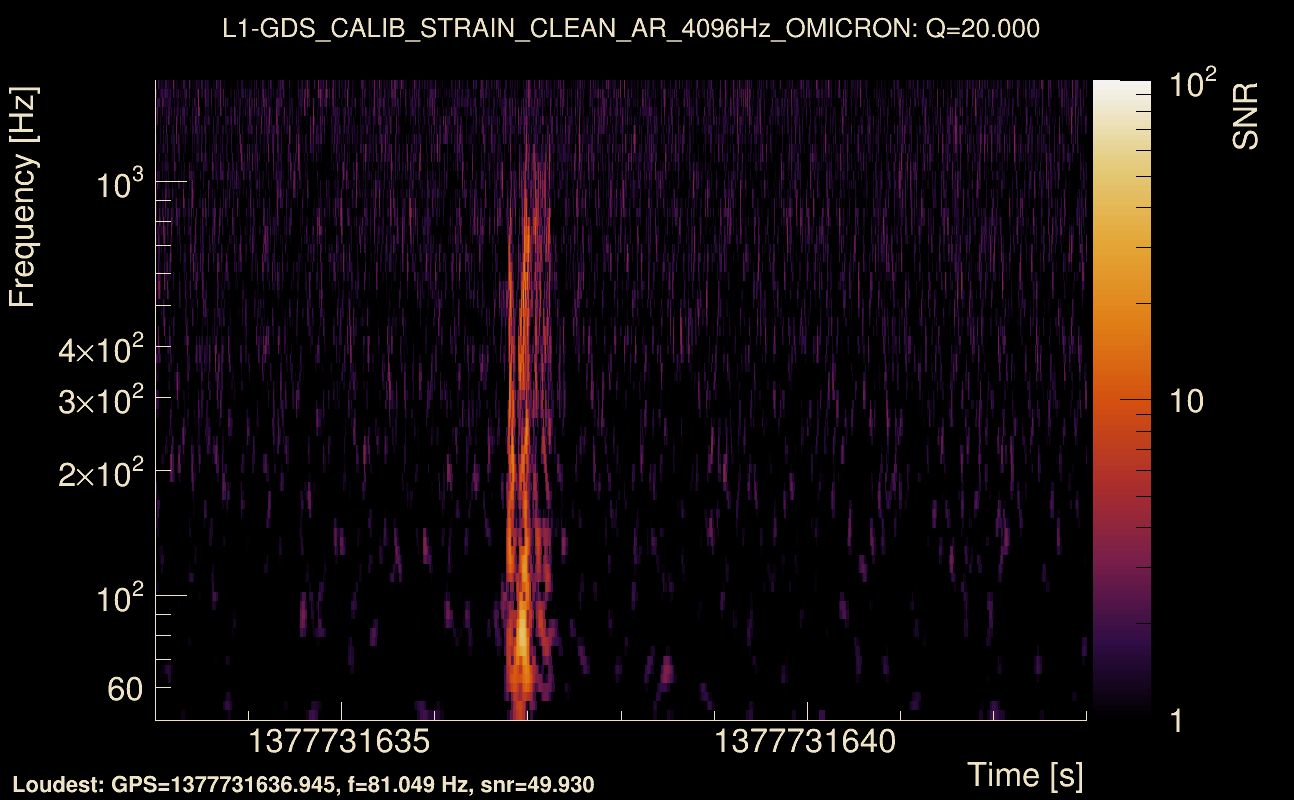
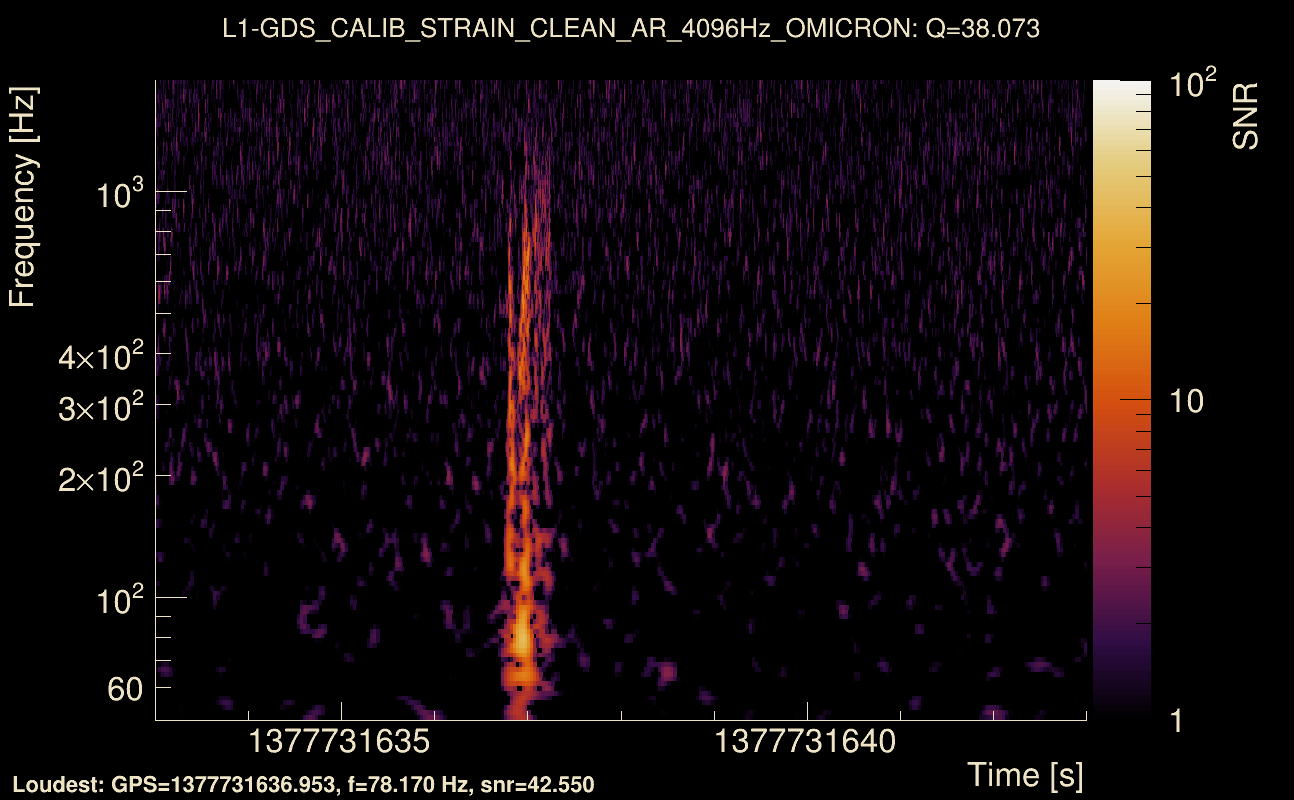
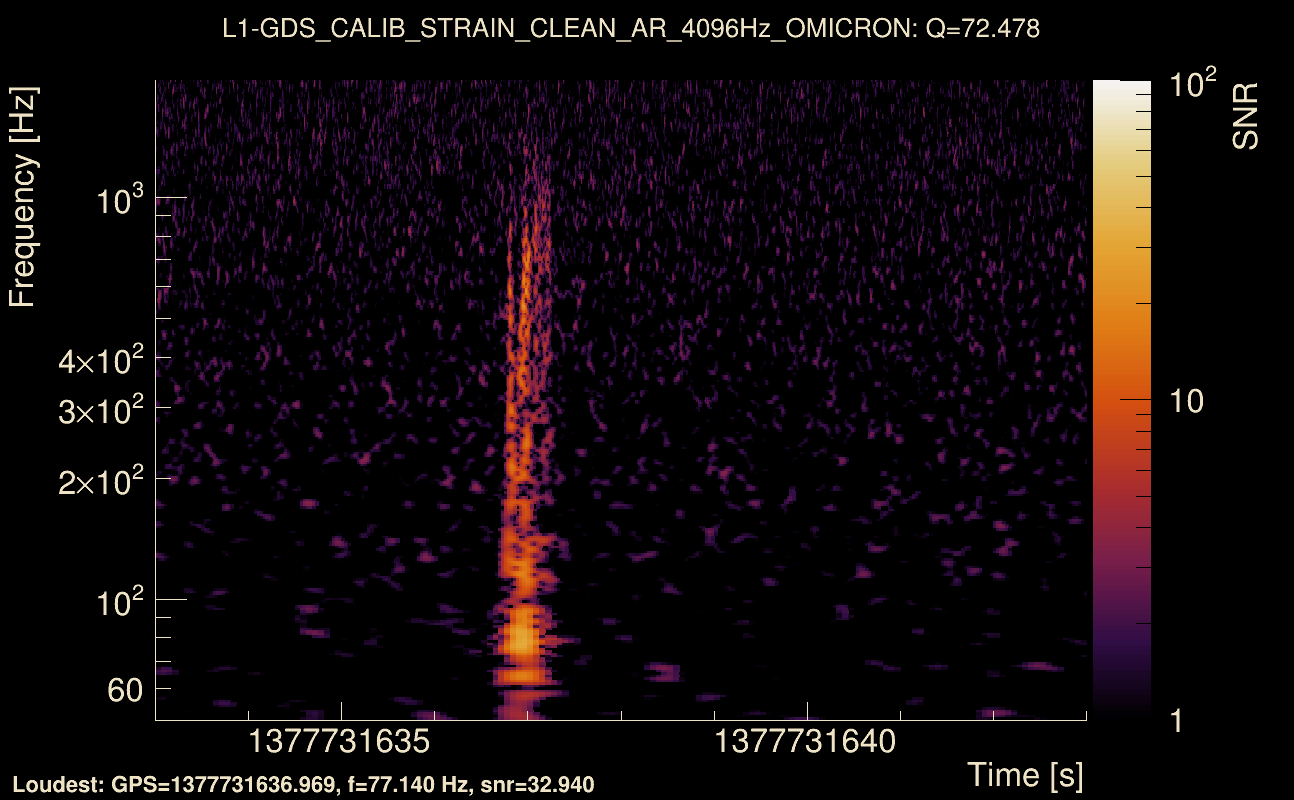
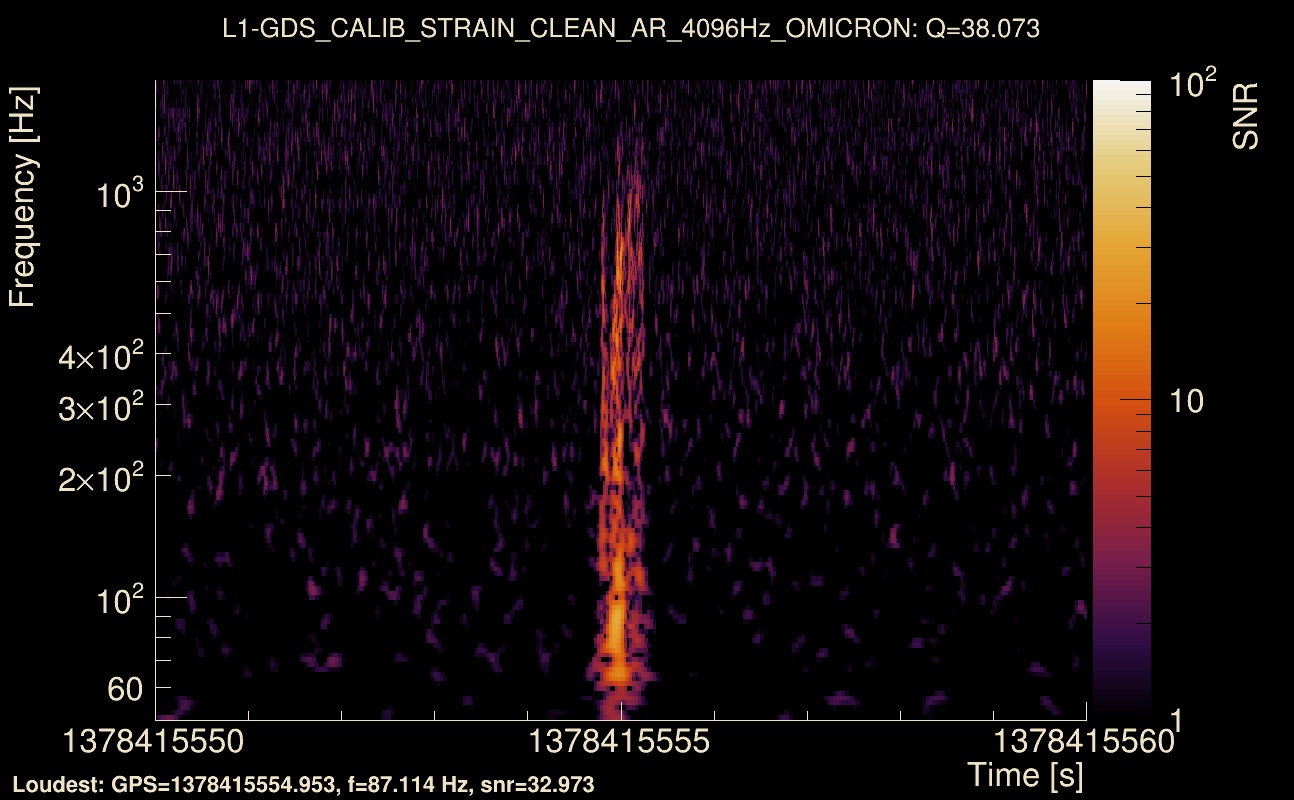
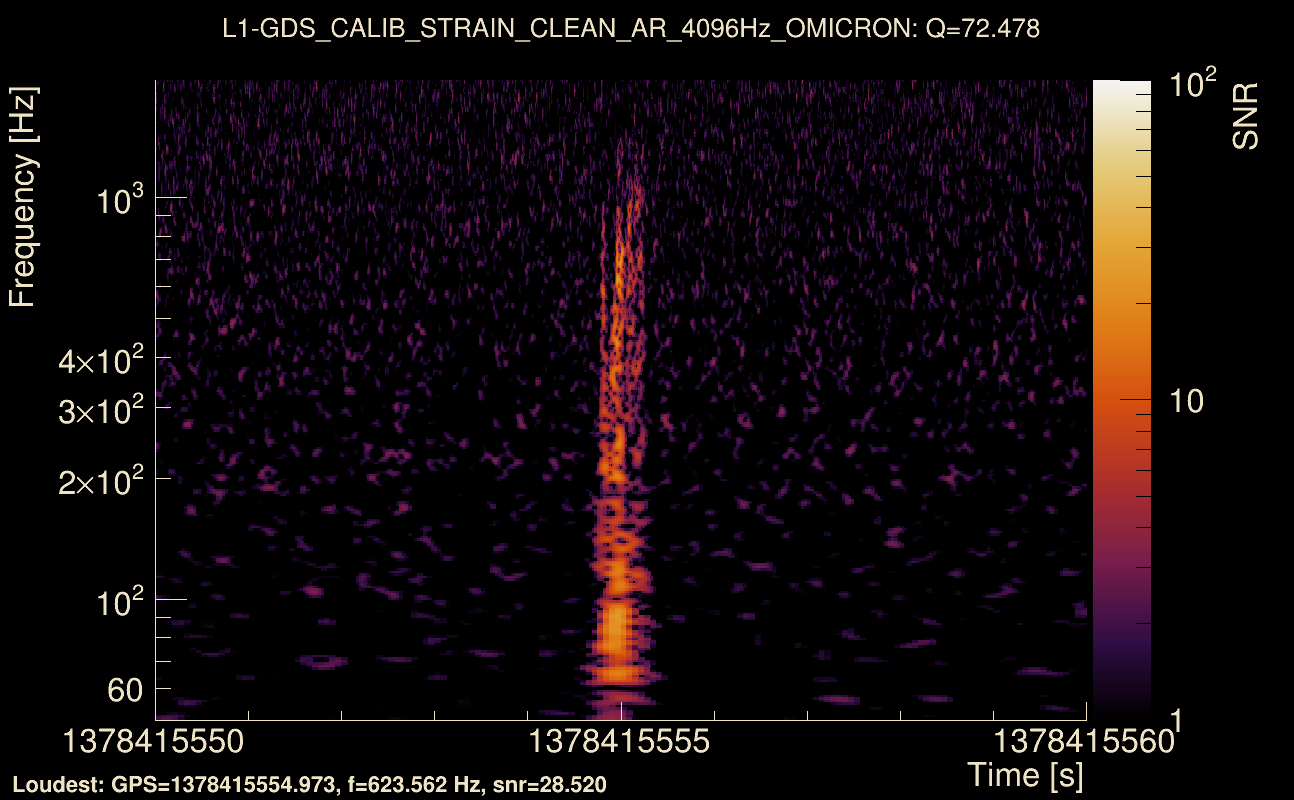
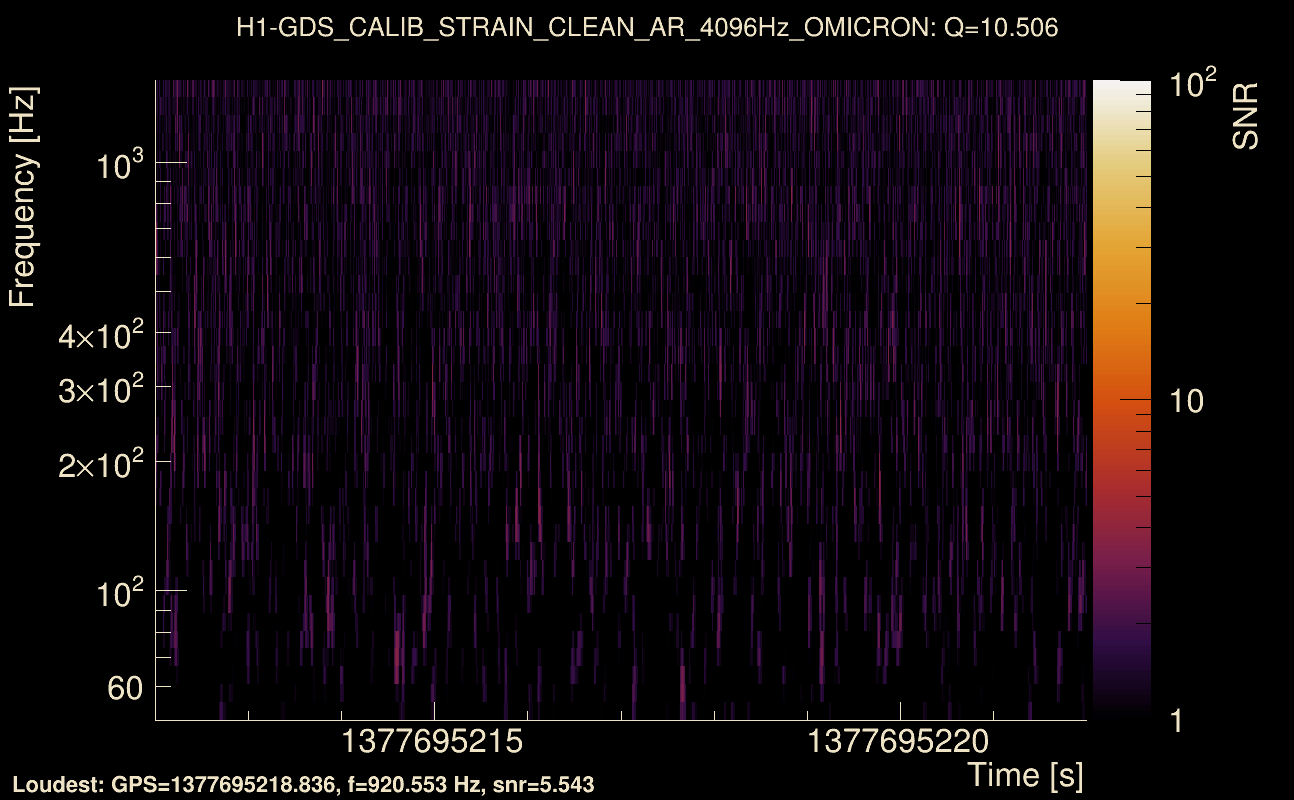
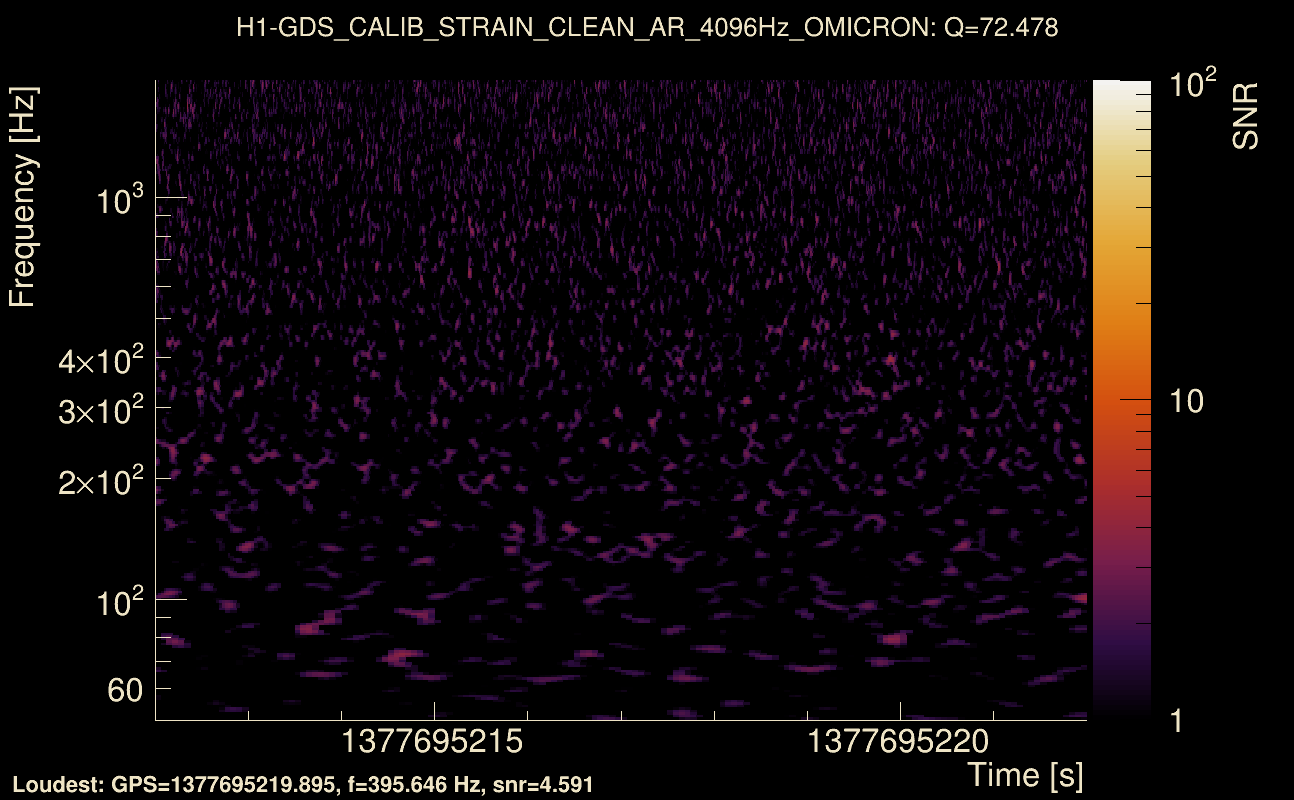
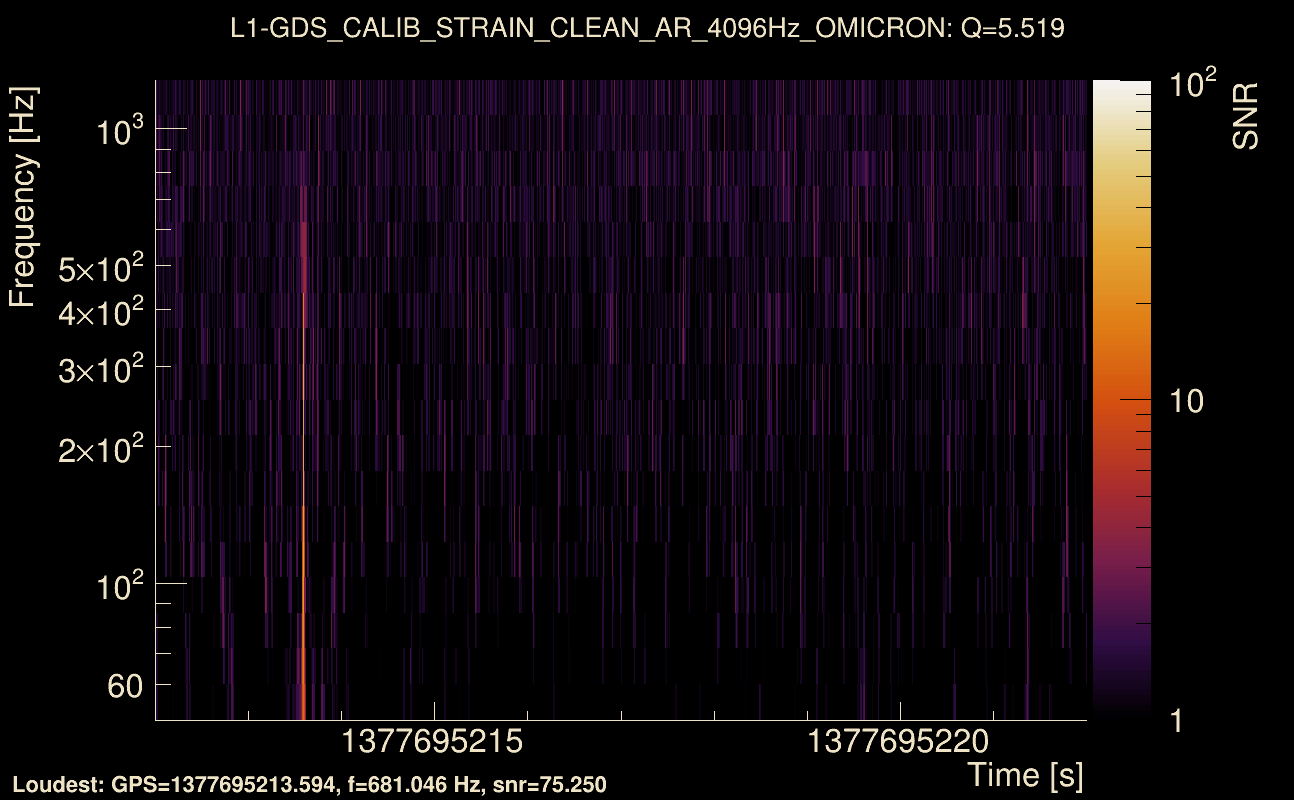
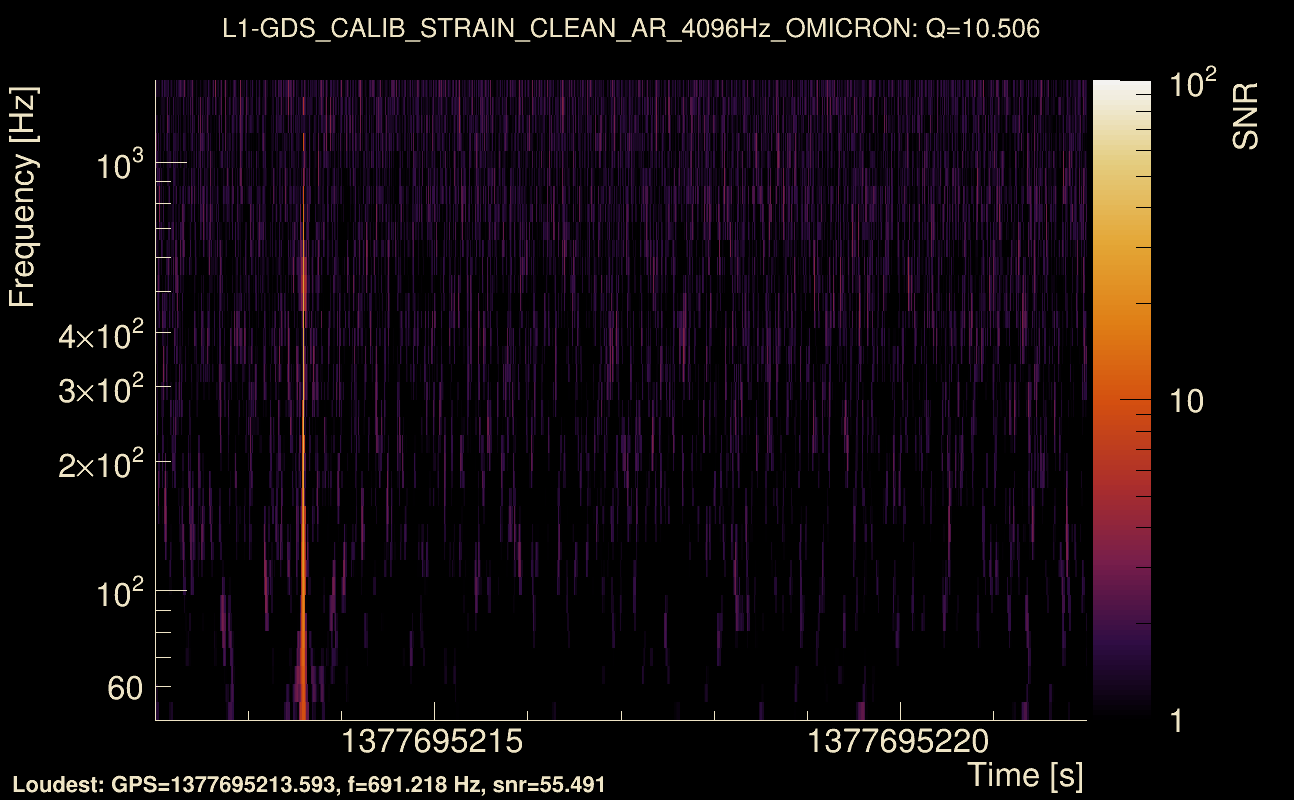
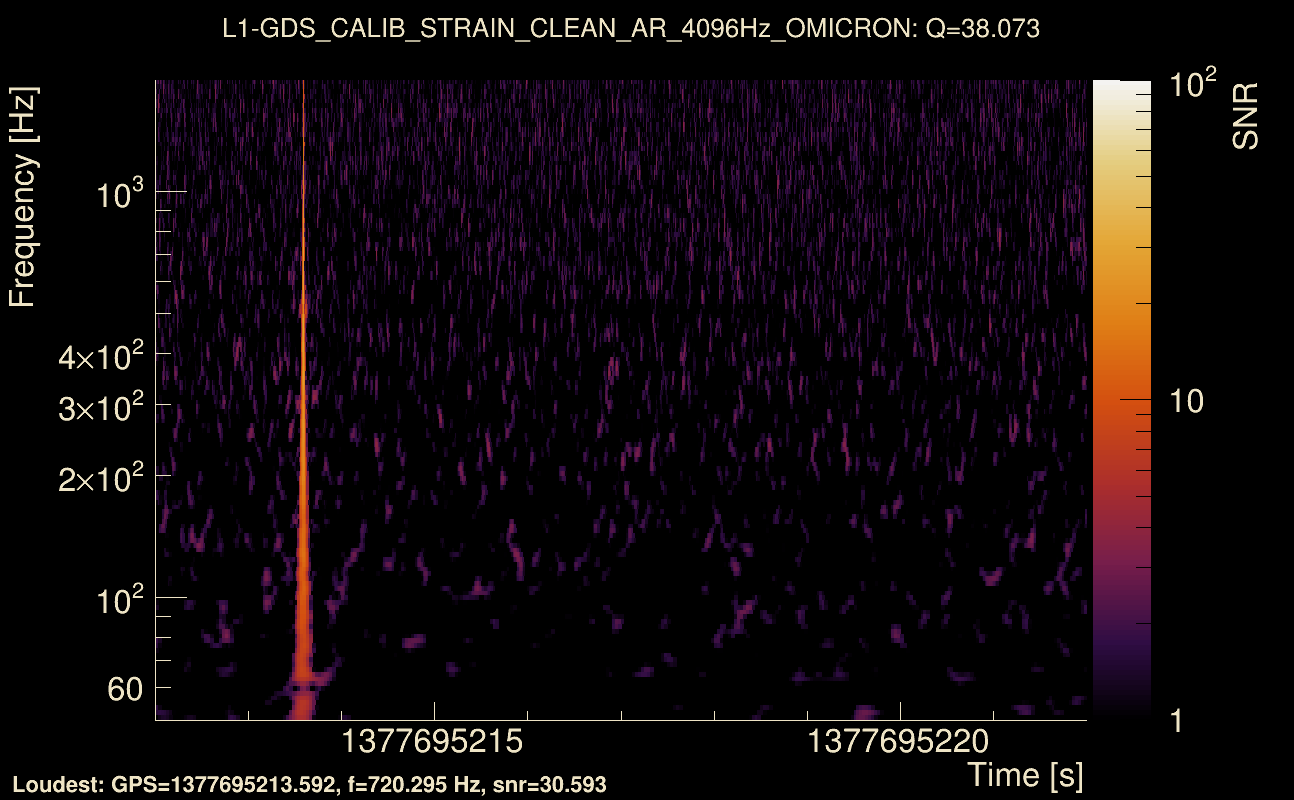
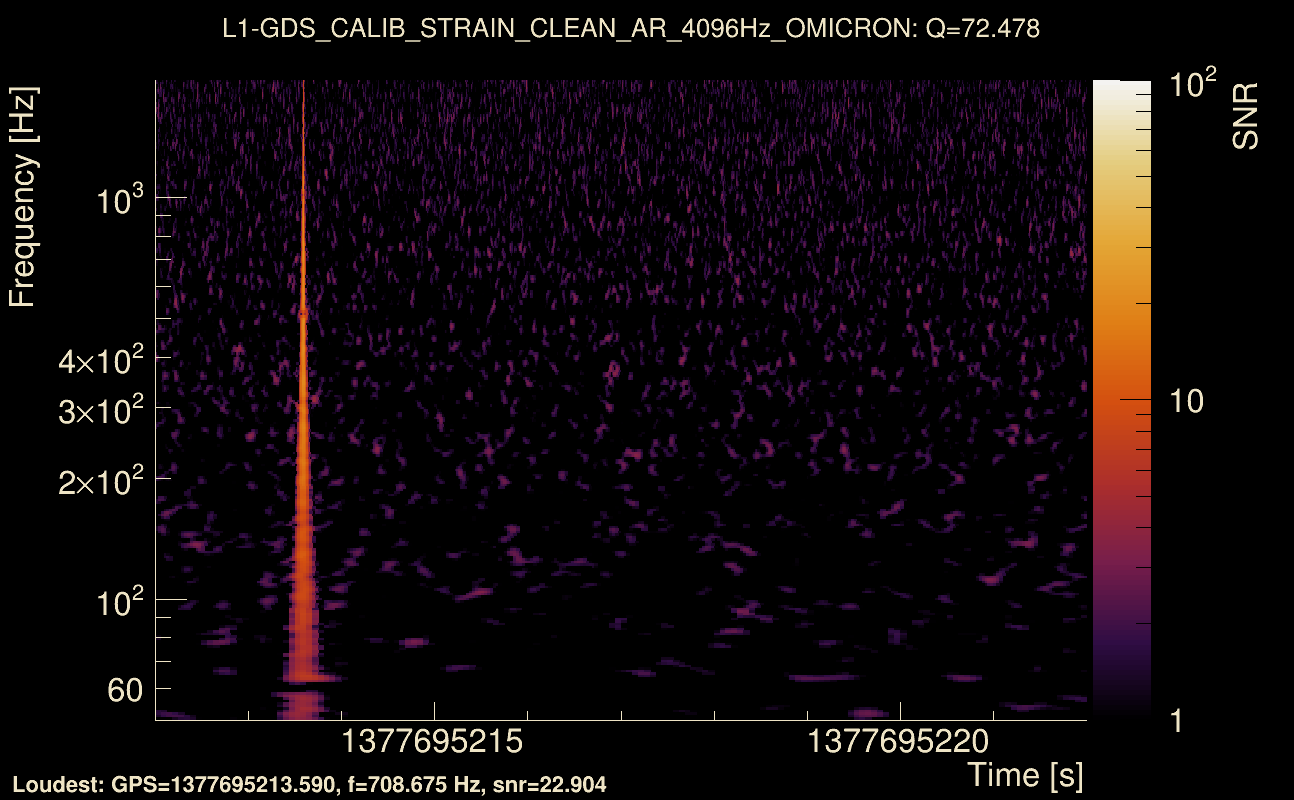
| Event time t(H1): | GPS = 1377695212 (Sat Sep 2 13:06:34 2023 ) → GPS = 1377695222 (Sat Sep 2 13:06:44 2023 ) |
| Event time t(L1): | GPS = 1377695212 (Sat Sep 2 13:06:44 2023 ) → GPS = 1377695222 (Sat Sep 2 13:06:44 2023 ) |
| Omicron analysis time window (H1): | GPS = 1377695209 → GPS = 1377695225 |
| Omicron analysis time window (L1): | GPS = 1377695209 → GPS = 1377695225 |
| Time delay between detectors t(L1) - t(H1): | -1.01606 s (slice index = 130 / 217), δt_gw = -0.00405836 s |
| Time delay uncertainty: | 0.00527502 s |
| [targeted mode] Time delay probability: | 0.245315 (1.16181 sigmas), δt_target = -0.00996256 s |
| Frequency: | 87.8977 Hz |
| Ξ: | 0.0663826 ± 0.135953 (variance = 0.0184832): Q0: 0.261461, Q1: 0.430166, Q2: 0.465006, Q3: 0.47463, Q4: 0.127721 |
| Rank: | R_A = 0.0663826 |
| Log of amplitude ratio (L1/H1): | 2.41557, variance = 1.13918 (L1/H1: 0.366592, variance = 1.05656, H1/L1: -2.4255, variance = 1.15022) |
| Amplitude ratio (L1/H1): | 11.1962 ⋇ 2.90758 (L1/H1: 1.44281 ⋇ 2.79517, H1/L1: 0.0884337 ⋇ 2.92263) |
| Amplitude ratio H1|L1 compatibility (probability): | 0.165752 |
| Antenna factor probability: | 1 |
| Number of rejected frequency rows: | Q0: 14 / 18, Q1: 29 / 36, Q2: 57 / 70, Q3: 118 / 134, Q4: 245 / 258 |
| Maximum signal-to-noise ratio: | H1: 5.30638, L1: 76.2288 |
| SNR variance: | H1: 0.509928, L1: 1.65448 |
| Click here for a zoomed plot | Click here for a zoomed plot | Click here for a zoomed plot | Click here for a zoomed plot | Click here for a zoomed plot |
 |
 |
 |
 |
 |
 |
 |
 |
 |
 |
 |
 |
 |
 |
 |
 |
 |
 |
 |
 |
 |
 |
 |
 |
 |
 |
 |
 |
 |
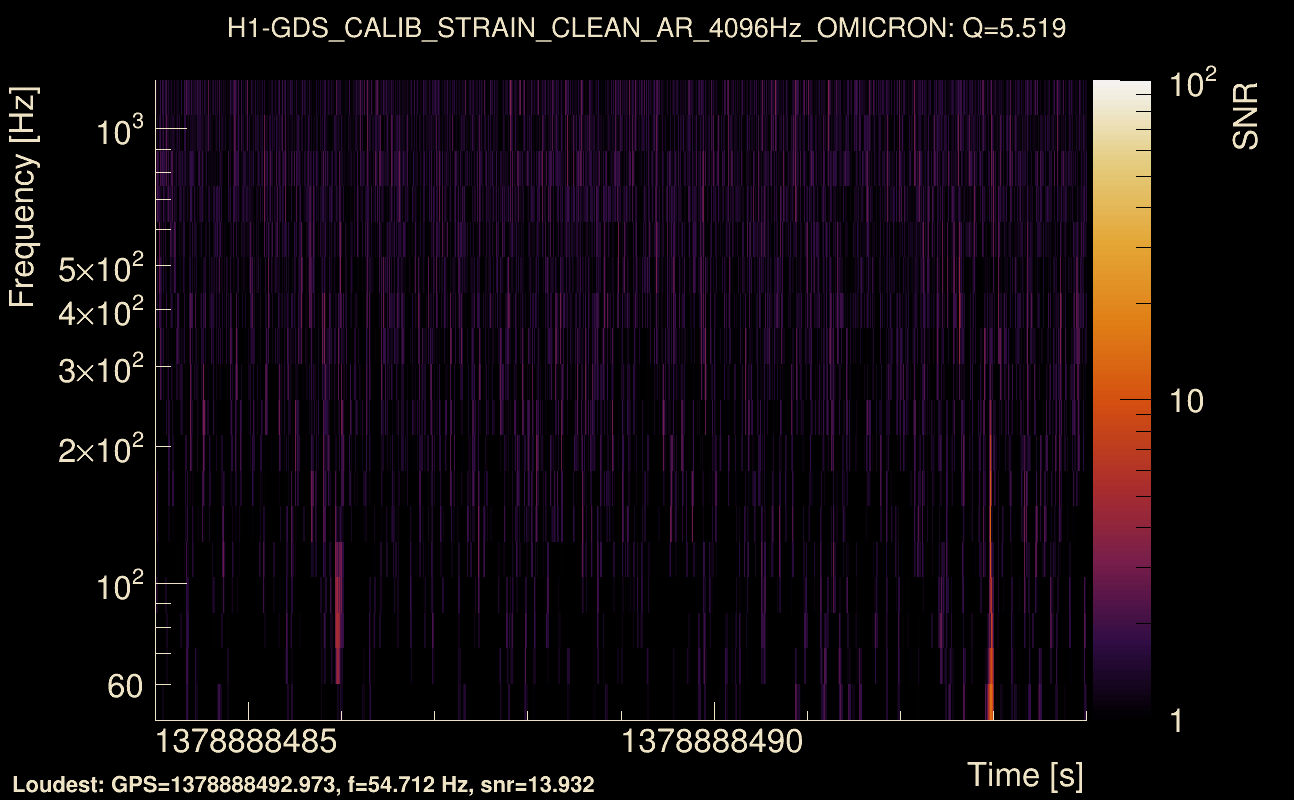
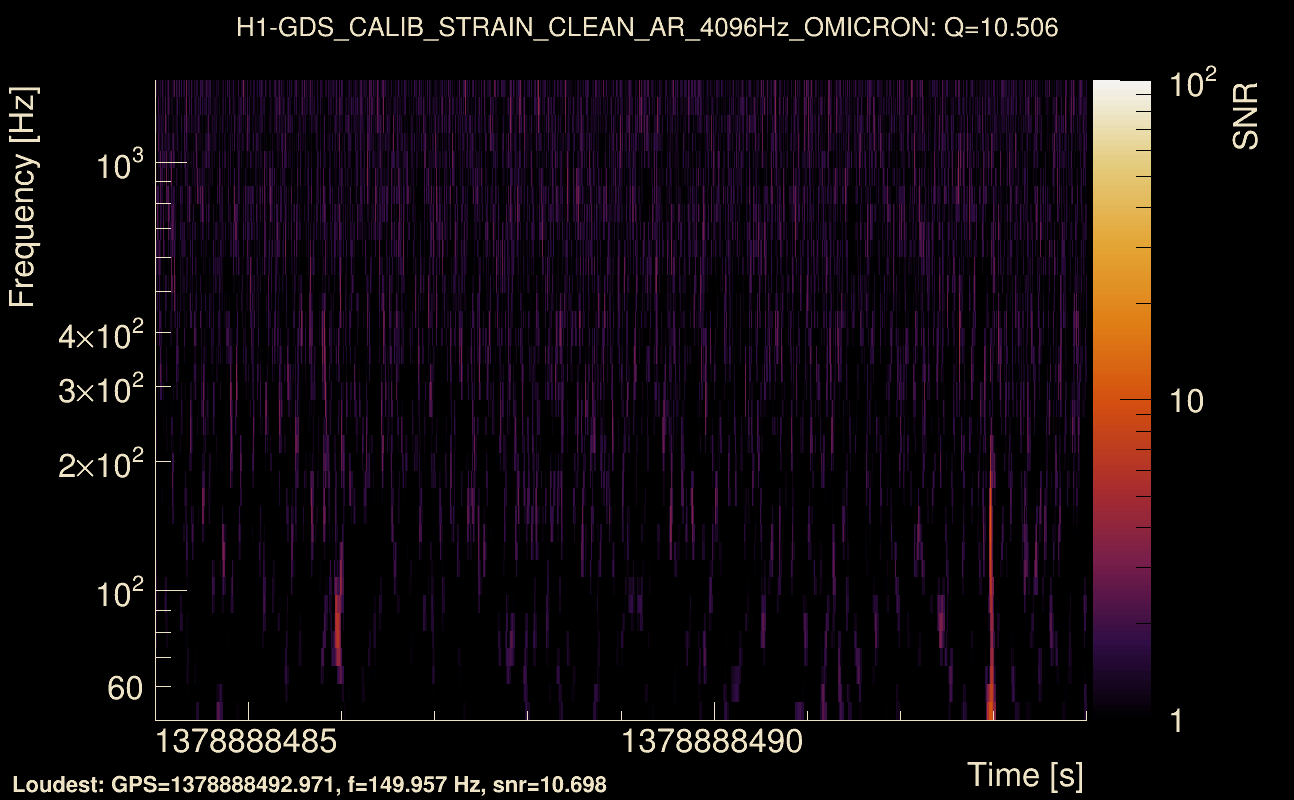
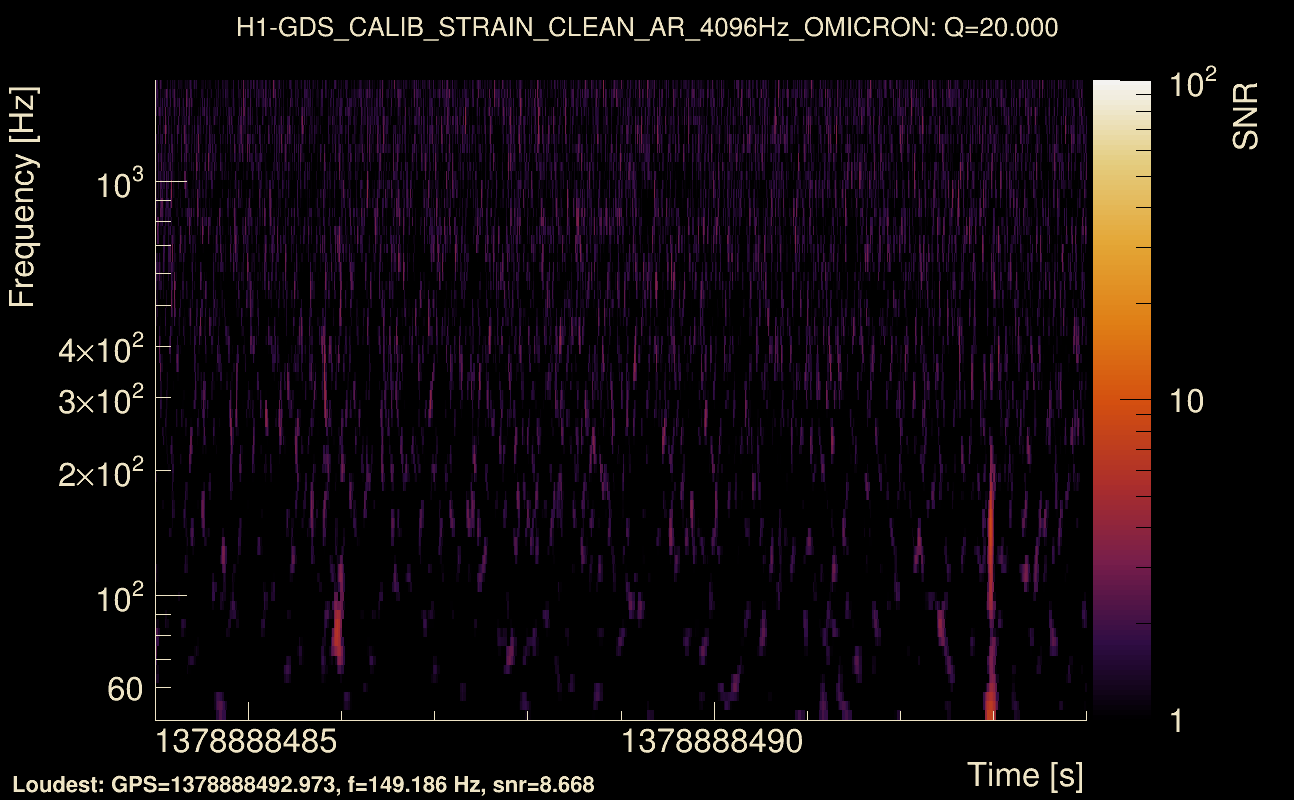
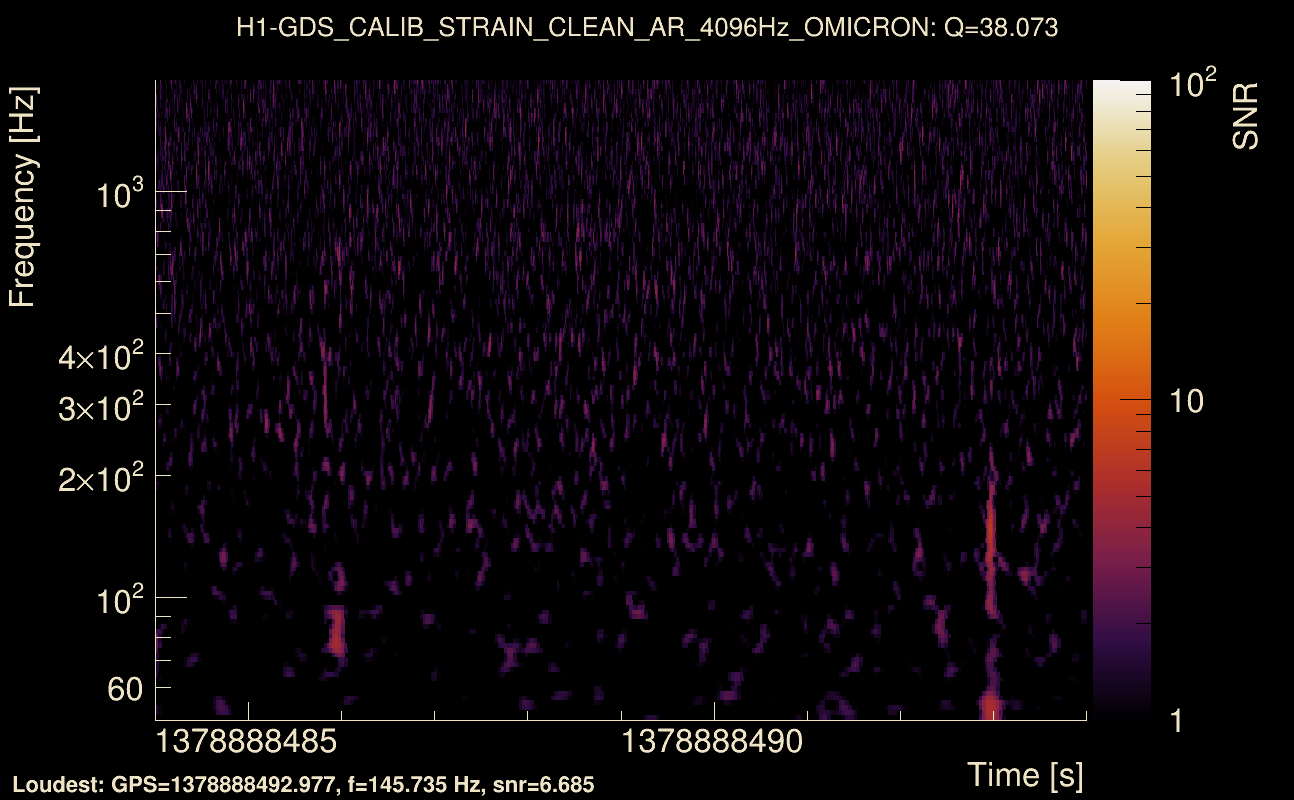
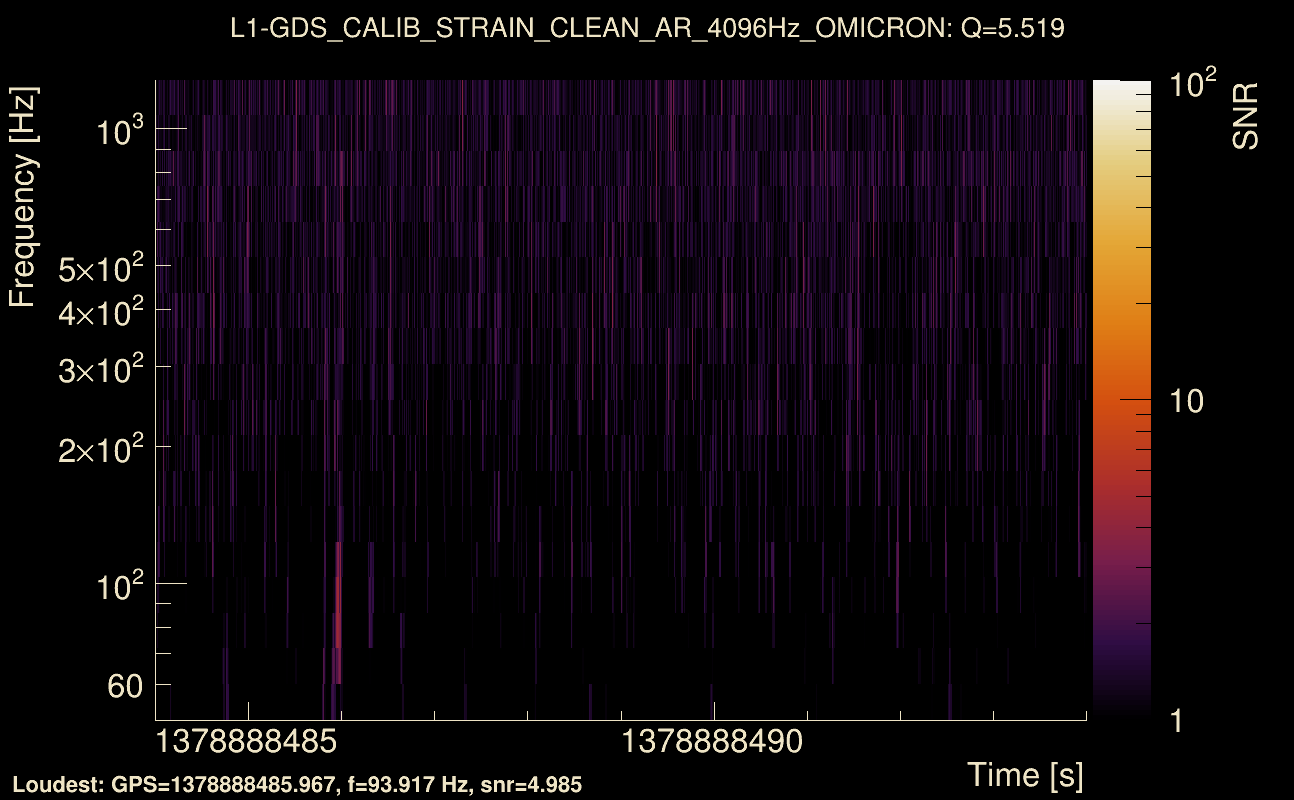
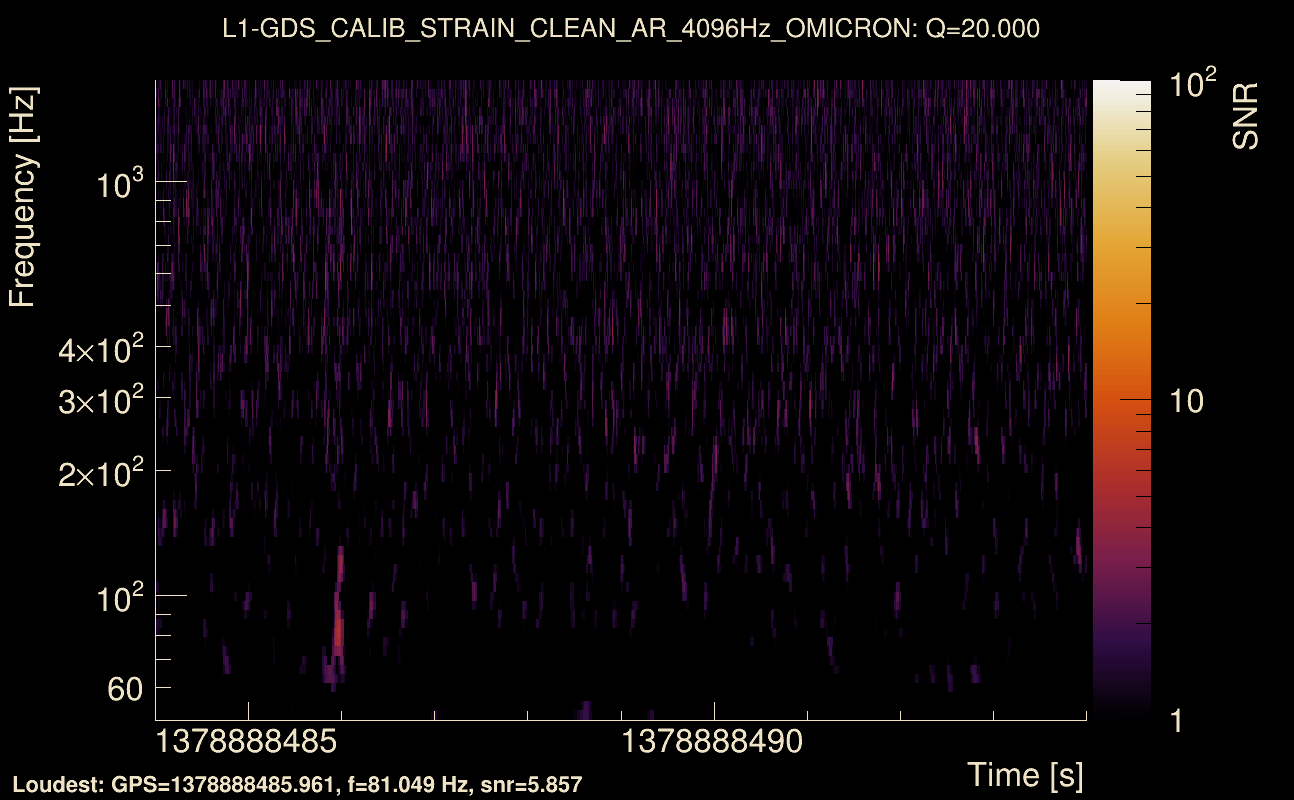
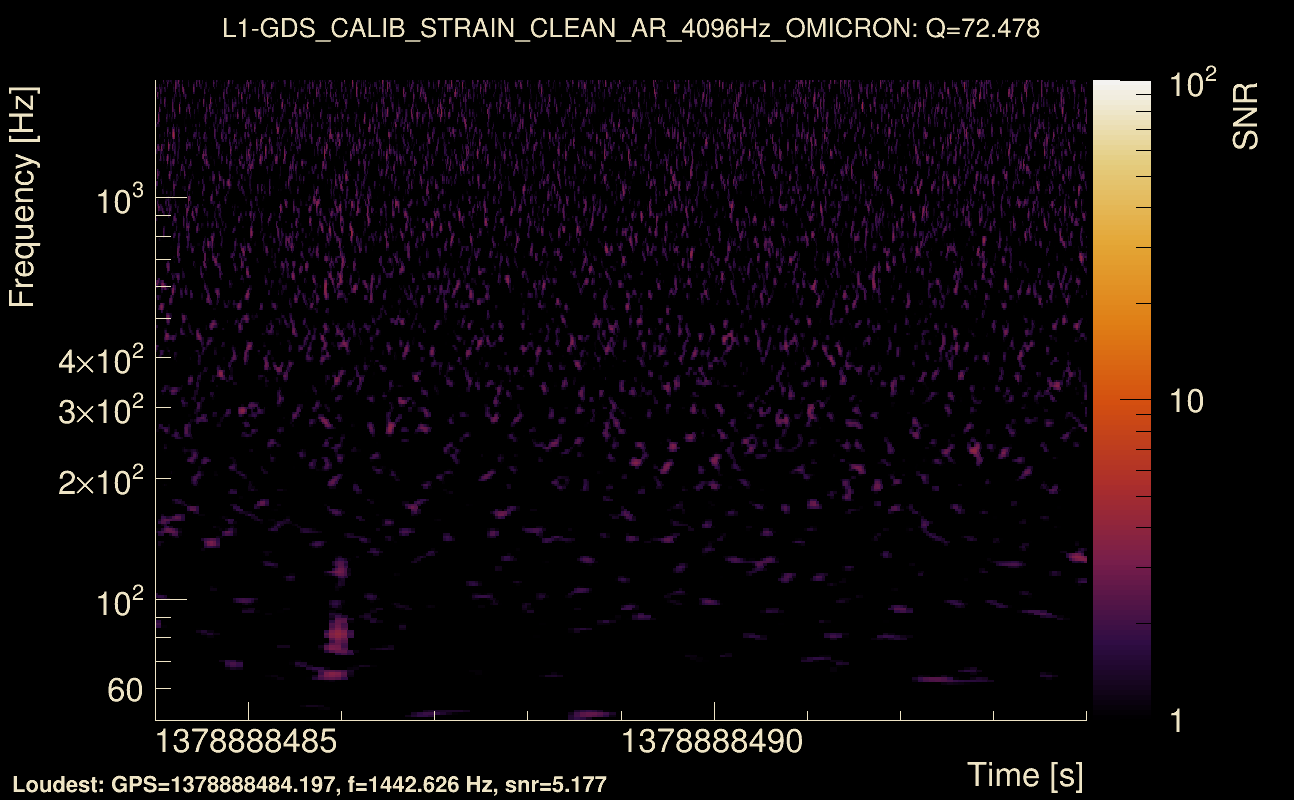
| Event time t(H1): | GPS = 1378888484 (Sat Sep 16 08:34:26 2023 ) → GPS = 1378888494 (Sat Sep 16 08:34:36 2023 ) |
| Event time t(L1): | GPS = 1378888484 (Sat Sep 16 08:34:36 2023 ) → GPS = 1378888494 (Sat Sep 16 08:34:36 2023 ) |
| Omicron analysis time window (H1): | GPS = 1378888481 → GPS = 1378888497 |
| Omicron analysis time window (L1): | GPS = 1378888481 → GPS = 1378888497 |
| Time delay between detectors t(L1) - t(H1): | -1.00864 s (slice index = 130 / 217), δt_gw = 0.00336301 s |
| Time delay uncertainty: | 0.00591496 s |
| [targeted mode] Time delay probability: | 0.56523 (0.575091 sigmas), δt_target = -0.000366926 s |
| Frequency: | 137.115 Hz |
| Ξ: | 0.0638065 ± 0.0294943 (variance = 0.000869913): Q0: 0.128989, Q1: 0.116305, Q2: 0.177202, Q3: 0.087255, Q4: 0.114588 |
| Rank: | R_A = 0.0638065 |
| Log of amplitude ratio (L1/H1): | -1.52762, variance = 0.942987 (L1/H1: -2.18334, variance = 1.34117, H1/L1: -1.24401, variance = 1.80084) |
| Amplitude ratio (L1/H1): | 0.217053 ⋇ 2.64078 (L1/H1: 0.112664 ⋇ 3.18384, H1/L1: 0.288227 ⋇ 3.82651) |
| Amplitude ratio H1|L1 compatibility (probability): | 0.0531686 |
| Antenna factor probability: | 1 |
| Number of rejected frequency rows: | Q0: 7 / 18, Q1: 16 / 36, Q2: 51 / 70, Q3: 122 / 134, Q4: 239 / 258 |
| Maximum signal-to-noise ratio: | H1: 17.3193, L1: 8.4241 |
| SNR variance: | H1: 0.540988, L1: 0.556096 |
| Click here for a zoomed plot | Click here for a zoomed plot | Click here for a zoomed plot | Click here for a zoomed plot | Click here for a zoomed plot |
 |
 |
 |
 |
 |
 |
 |
 |
 |
 |
 |
 |
 |
 |
 |
 |
 |
 |
 |
 |
 |
 |
 |
 |
 |
 |
 |
 |
 |
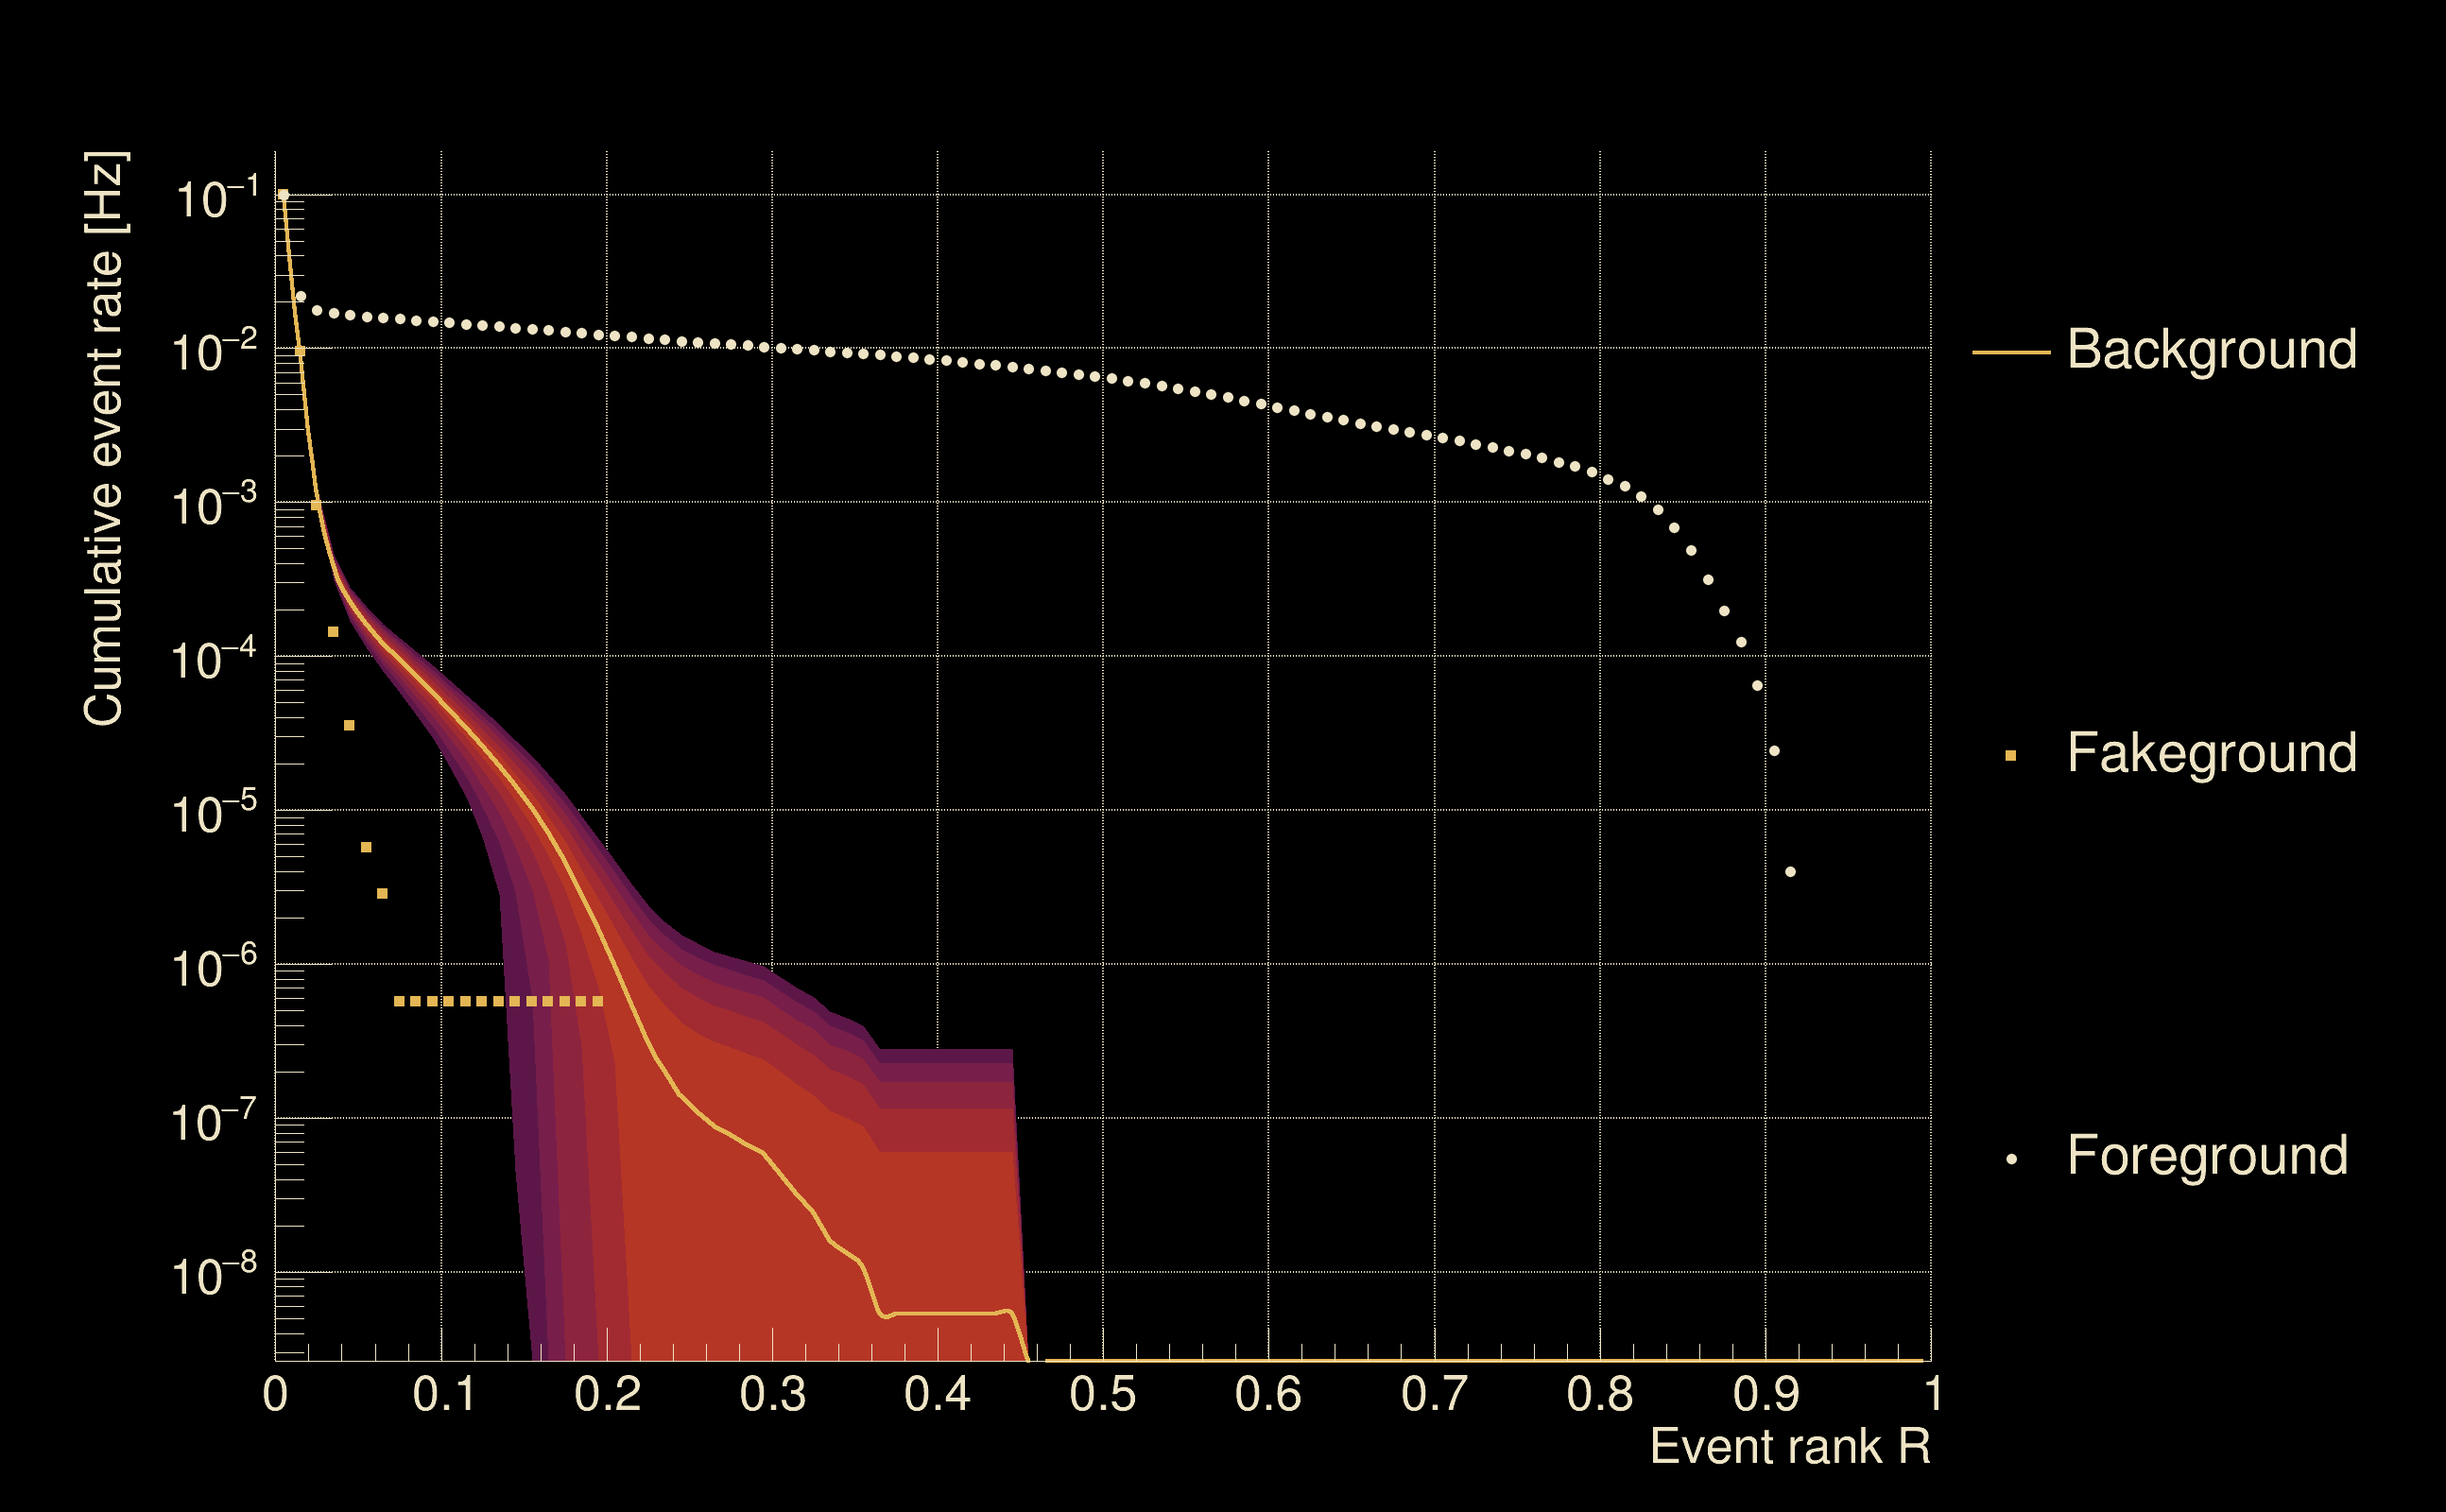
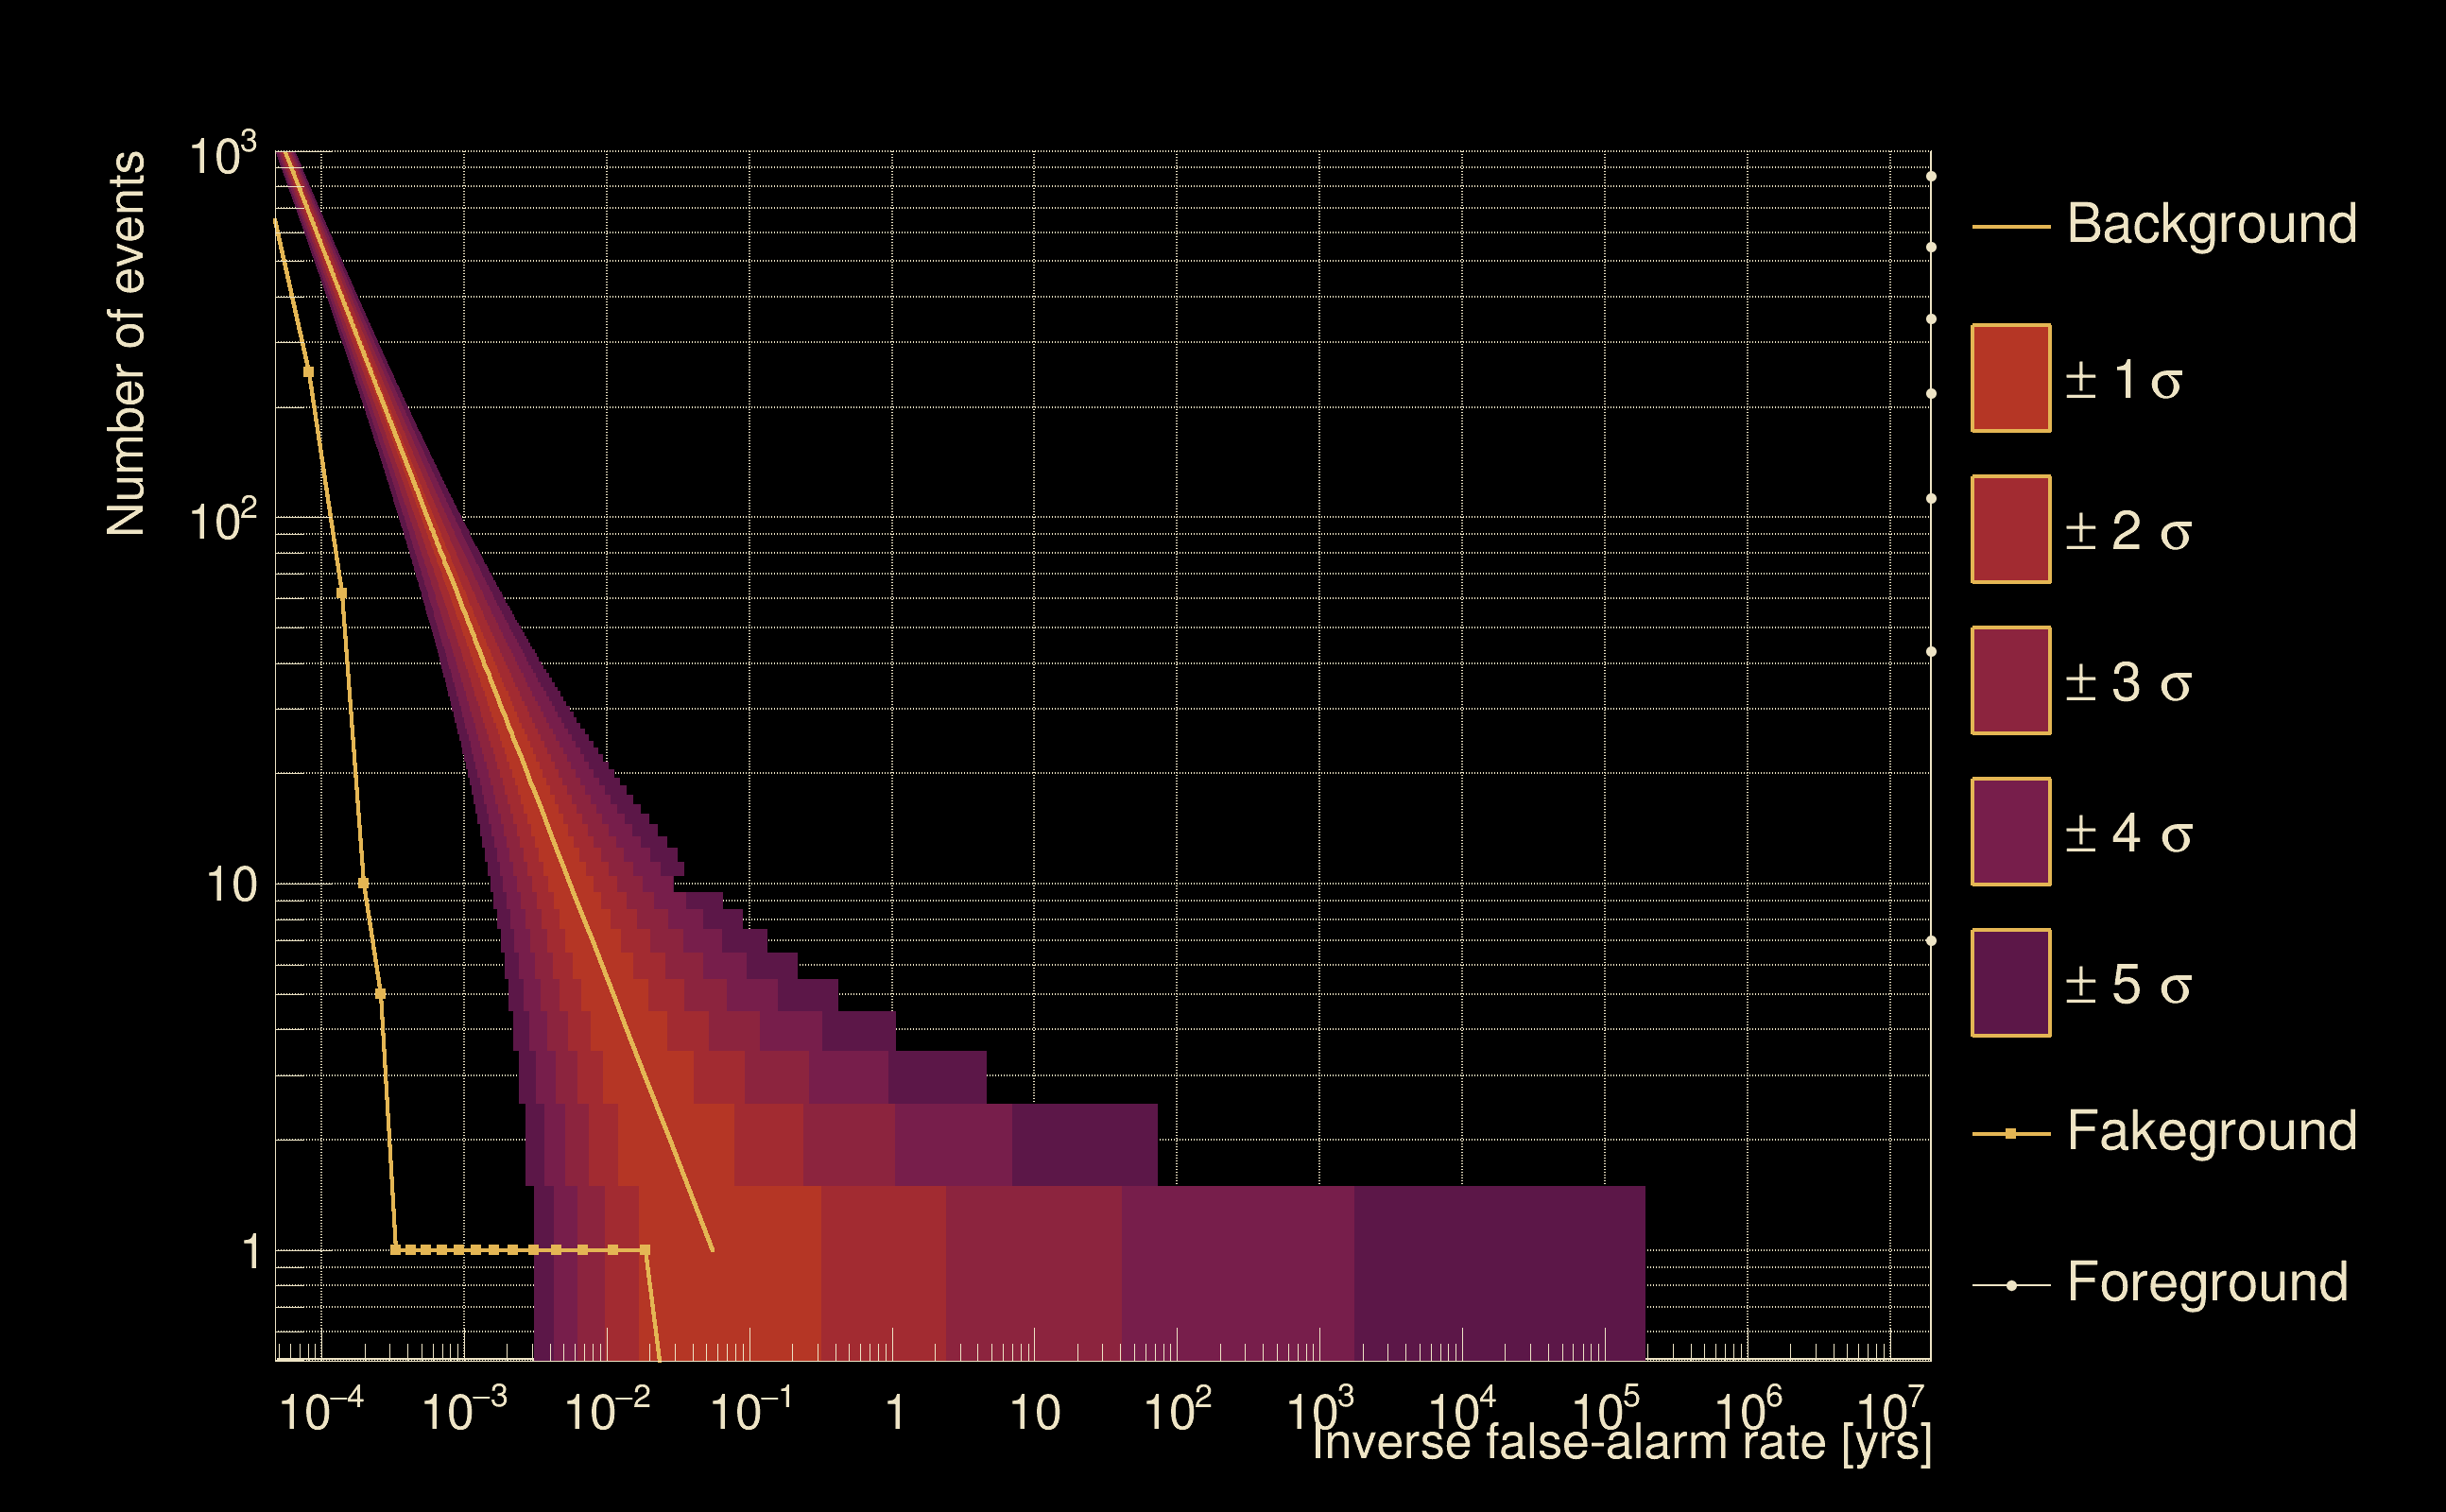
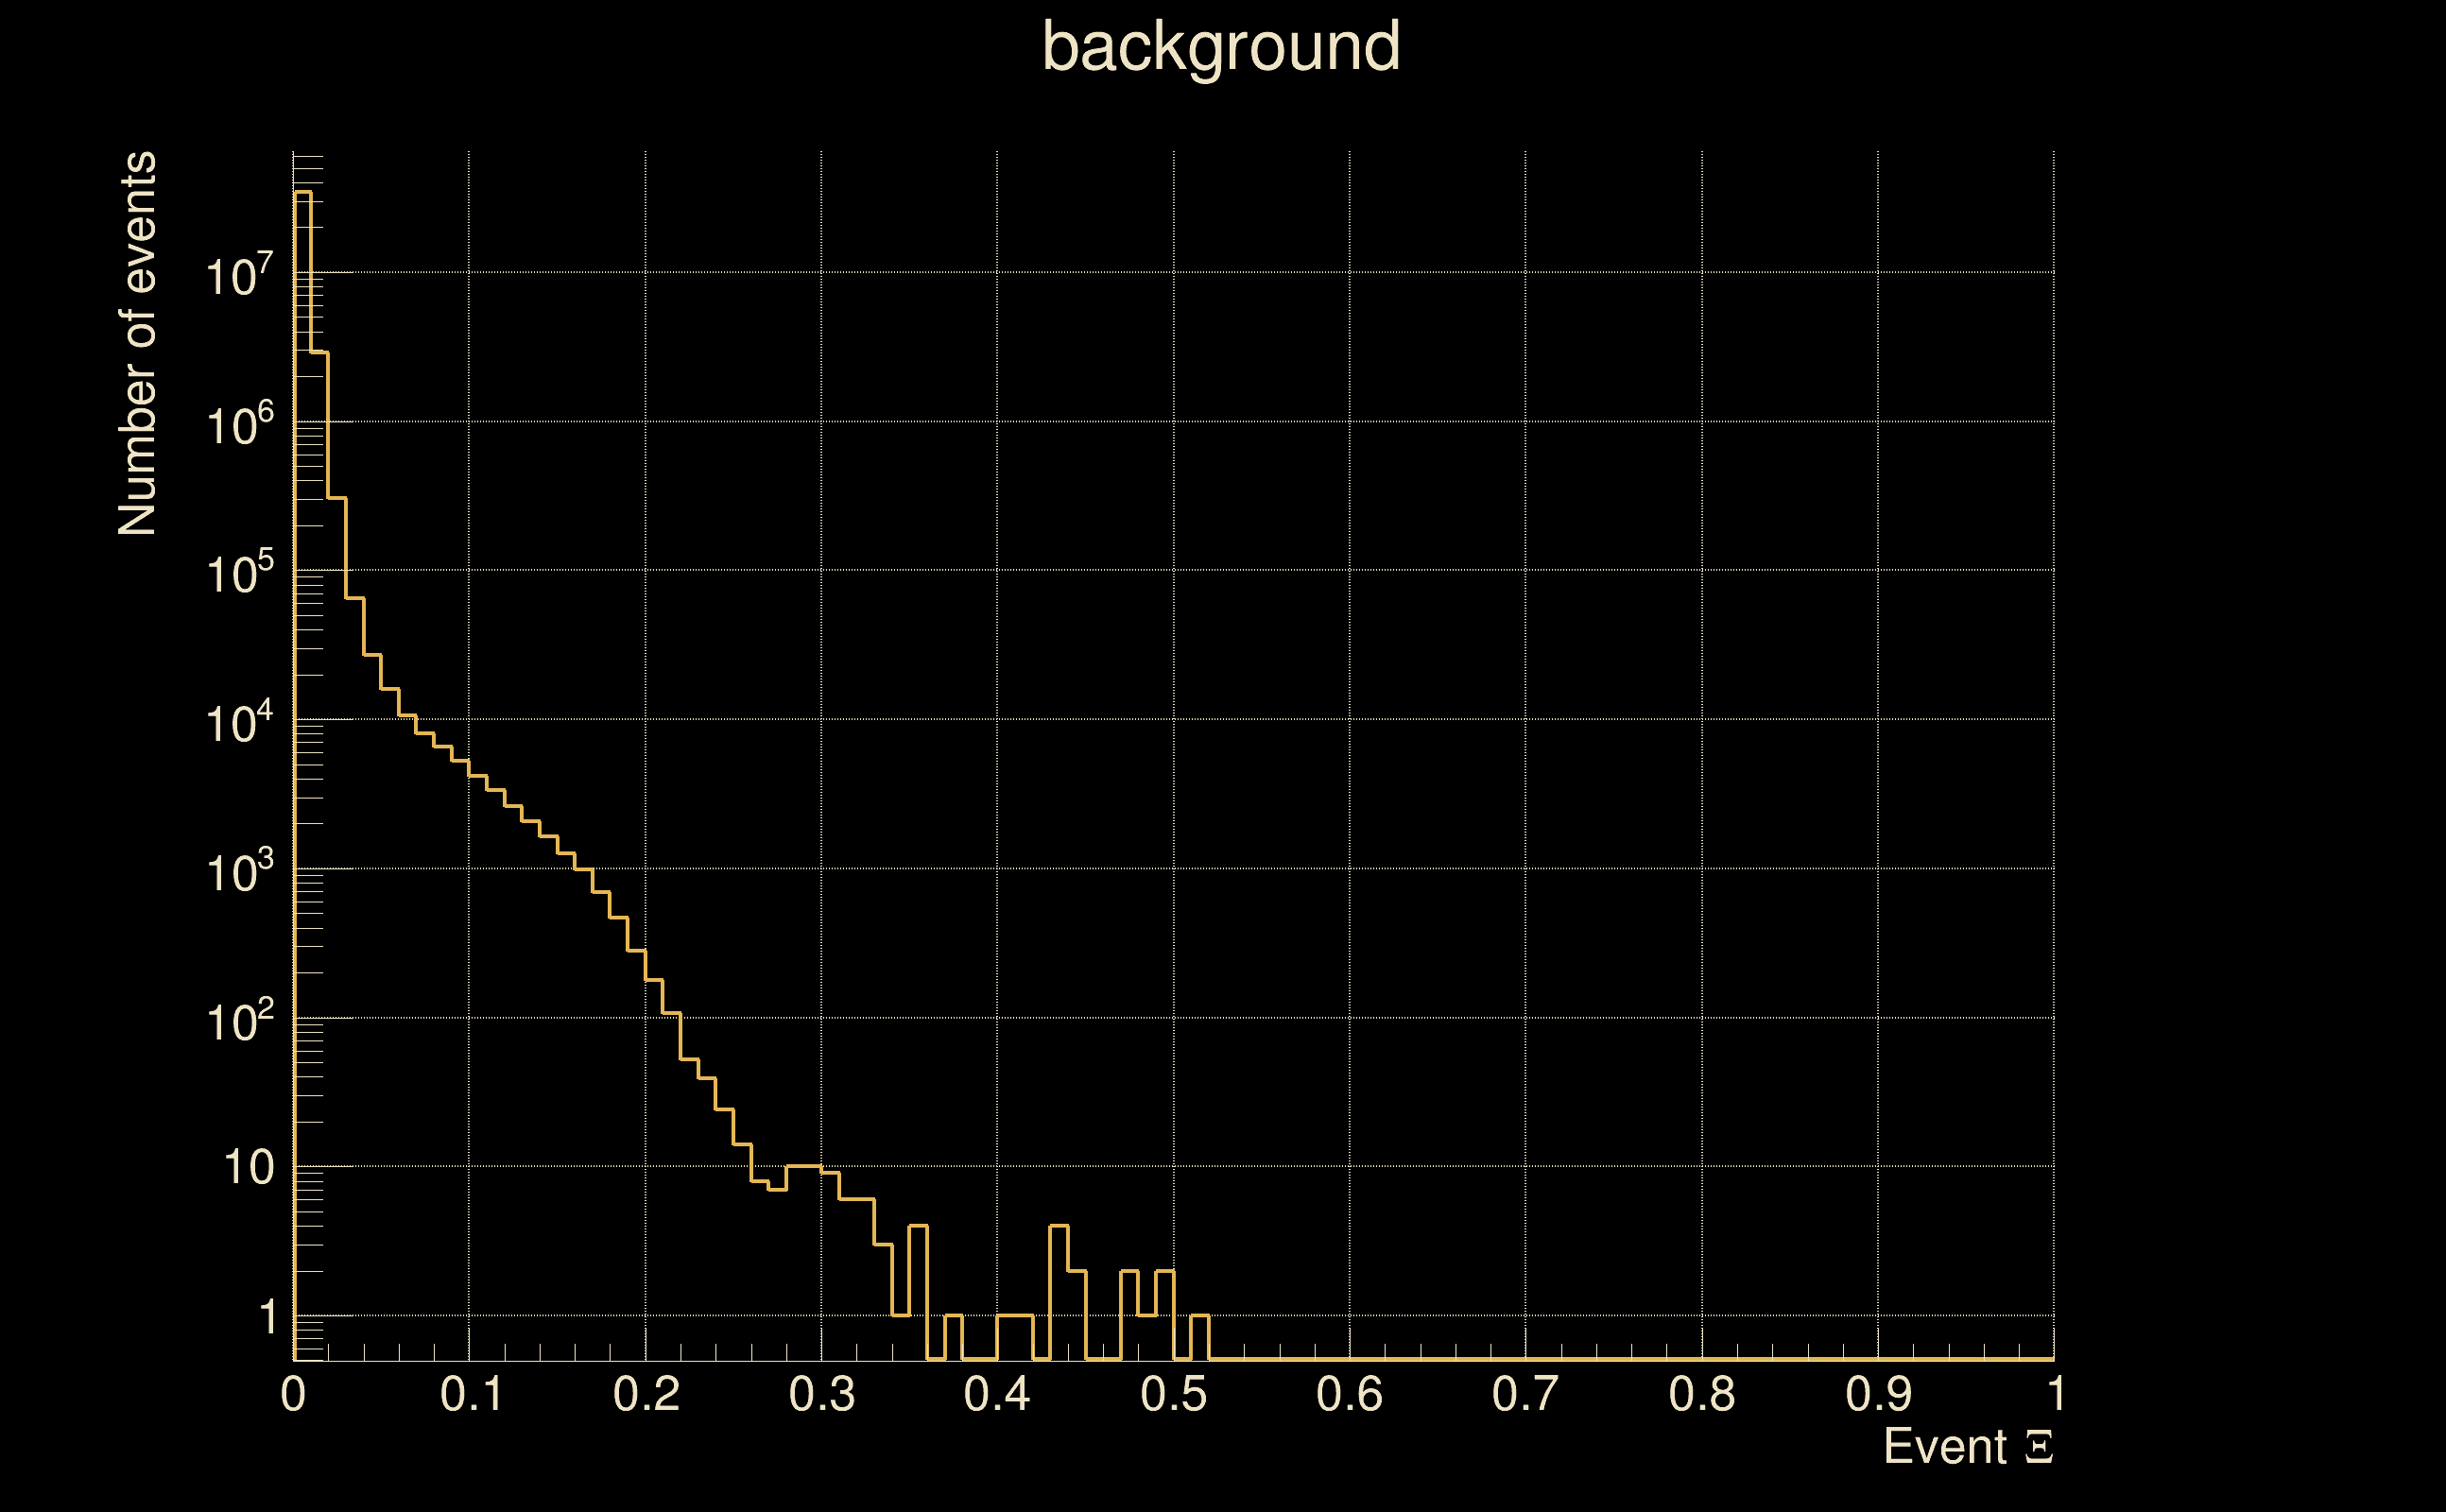
| Detection threshold: | R > 0.29 |
| False-alarm rate above that detection threshold: | 5.8416e-08 |
| Alternative threshold at 1/1000 yrs: | R > 0.445 |
| Alternative threshold at 1/100 yrs: | R > 0.445 |
| Alternative threshold at 1/10 yrs: | R > 0.445 |
| Alternative threshold at 1/1 yr: | R > 0.31505 |
| Alternative threshold at 1/1 d: | R > 0.145294 |
 |
|
 |
 |
 |
 |
 |
 |
 |
 |
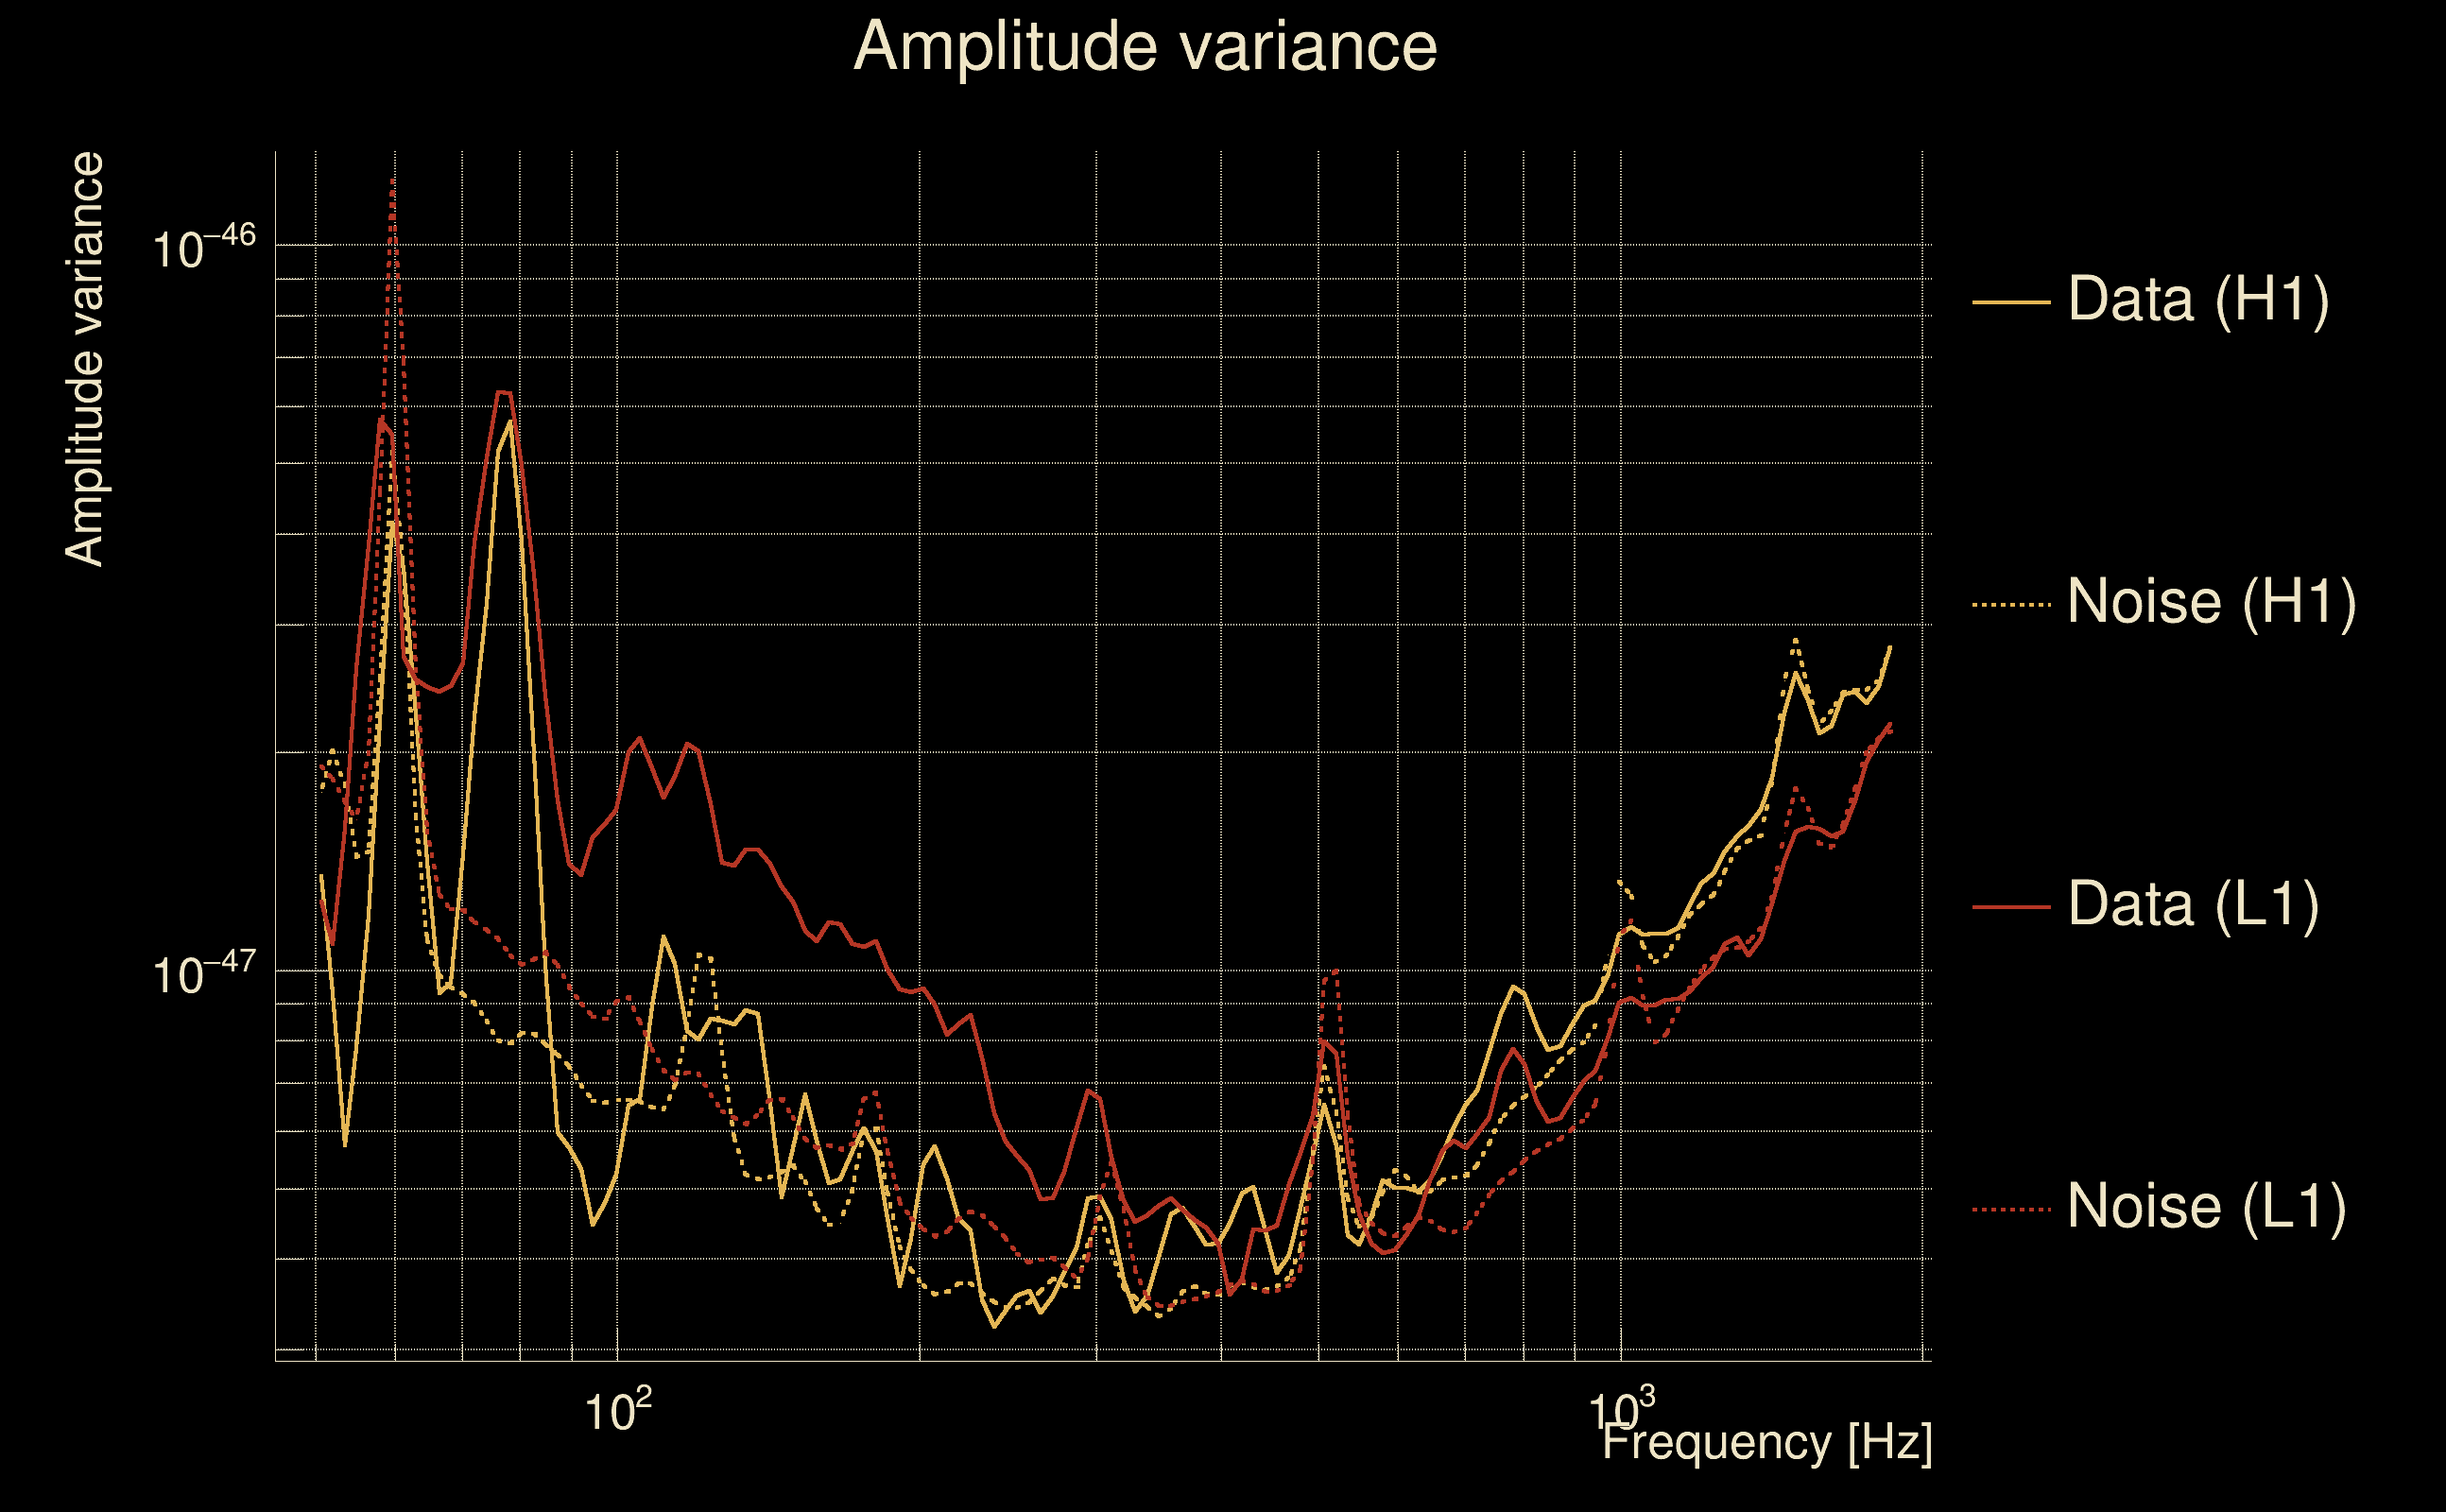
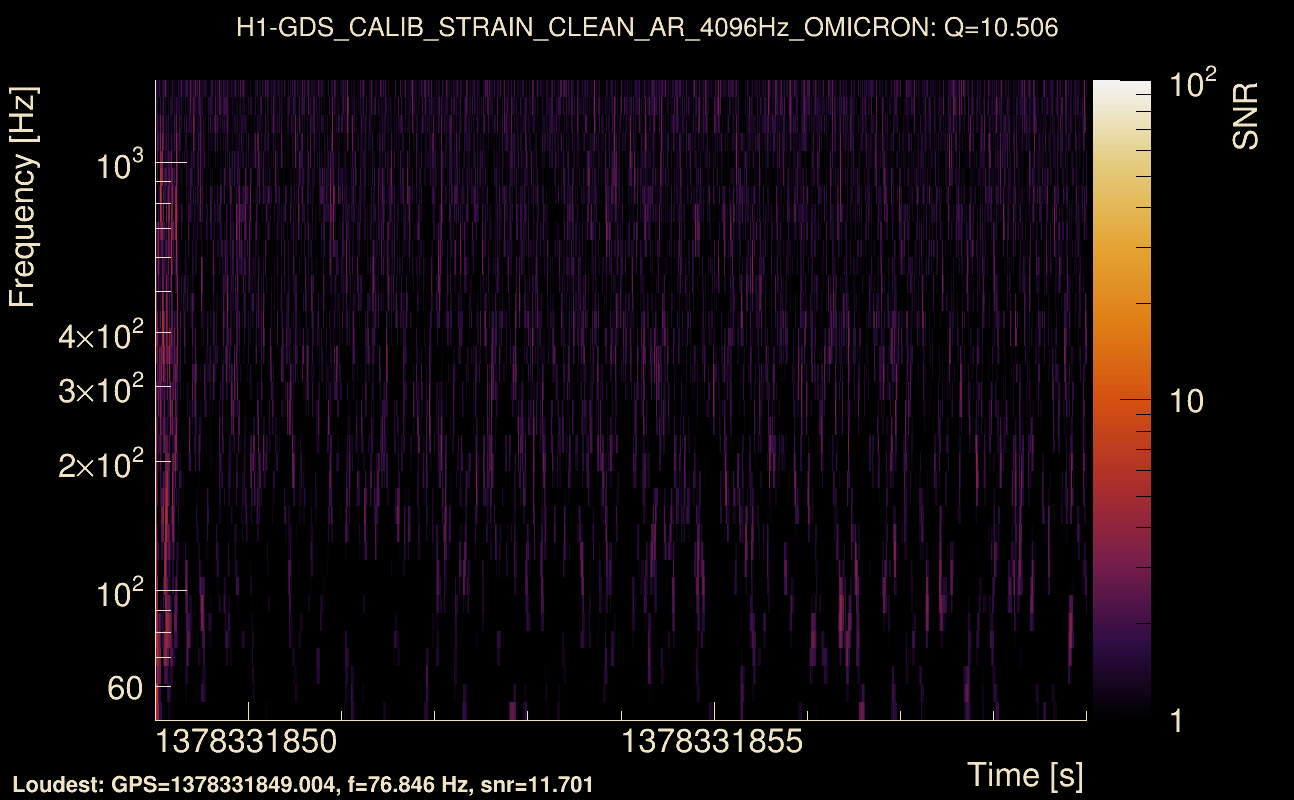
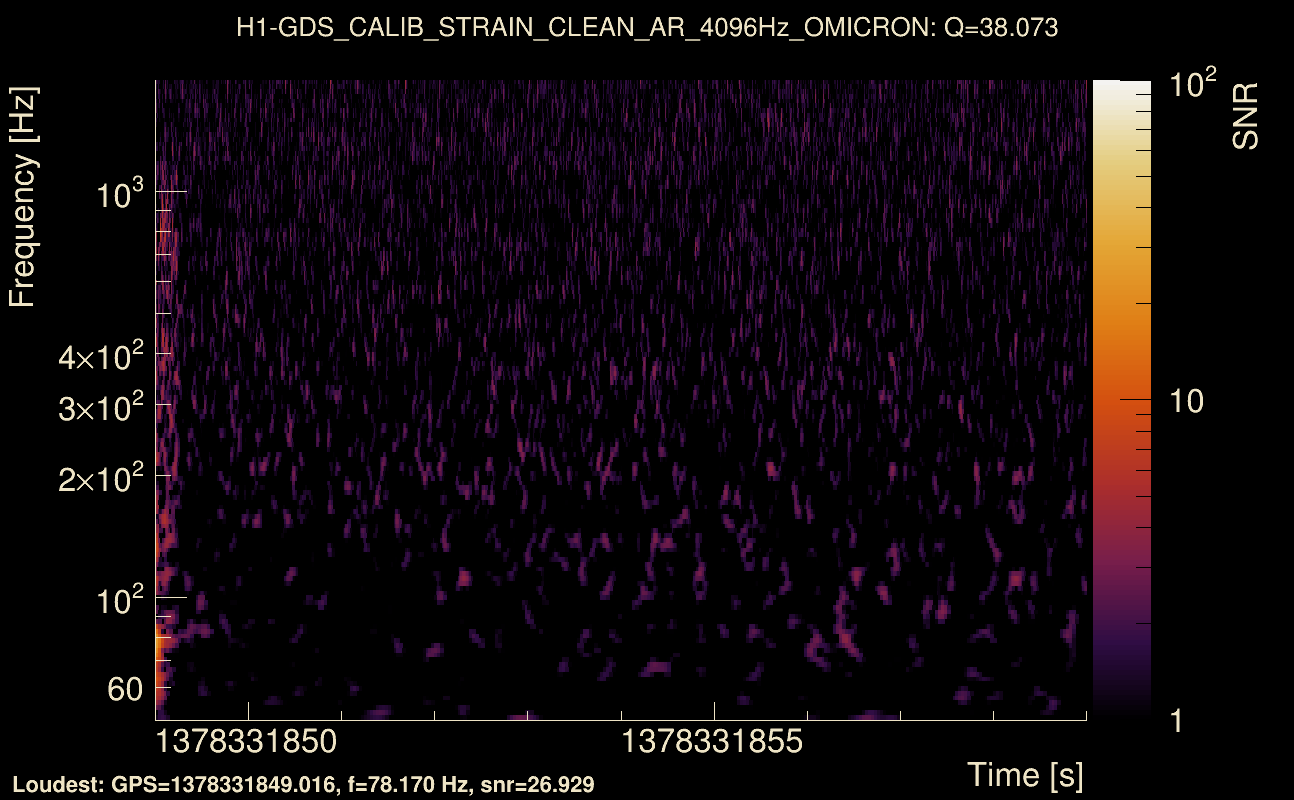
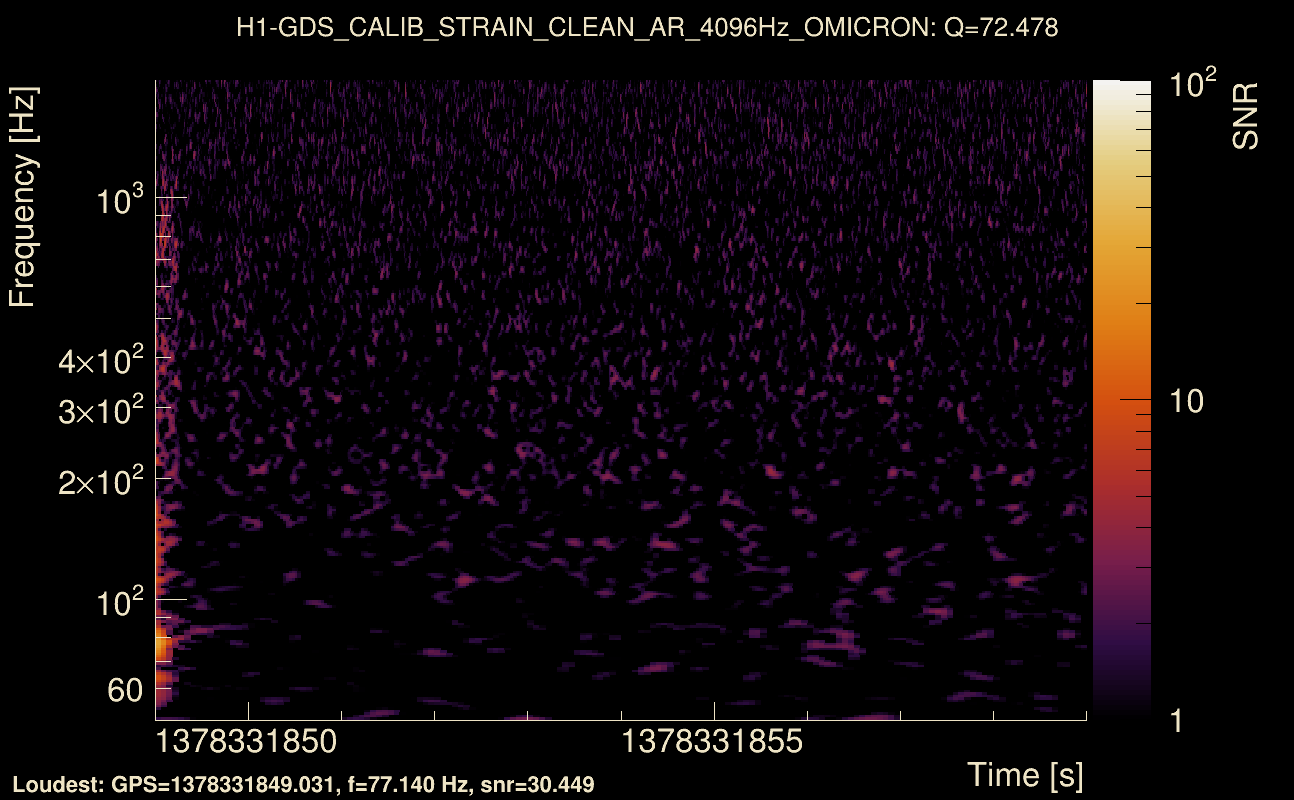
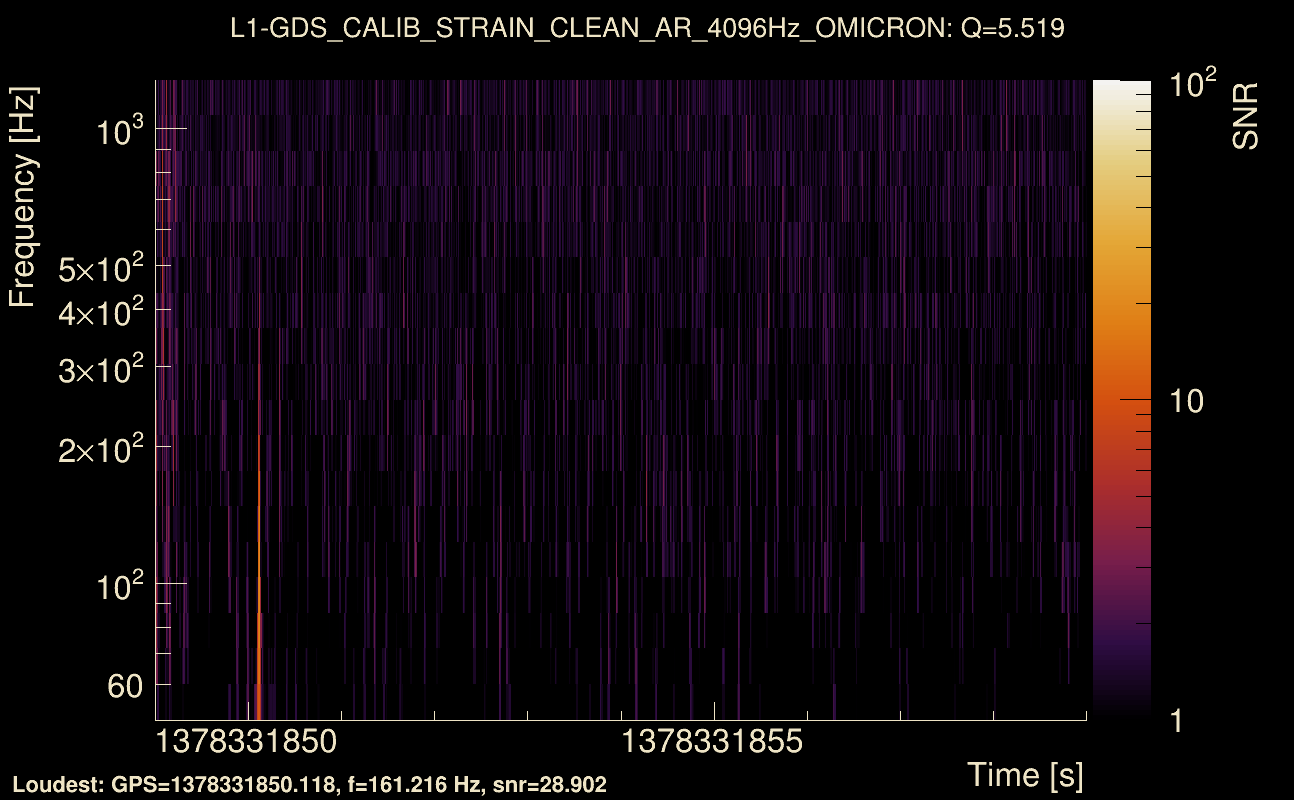
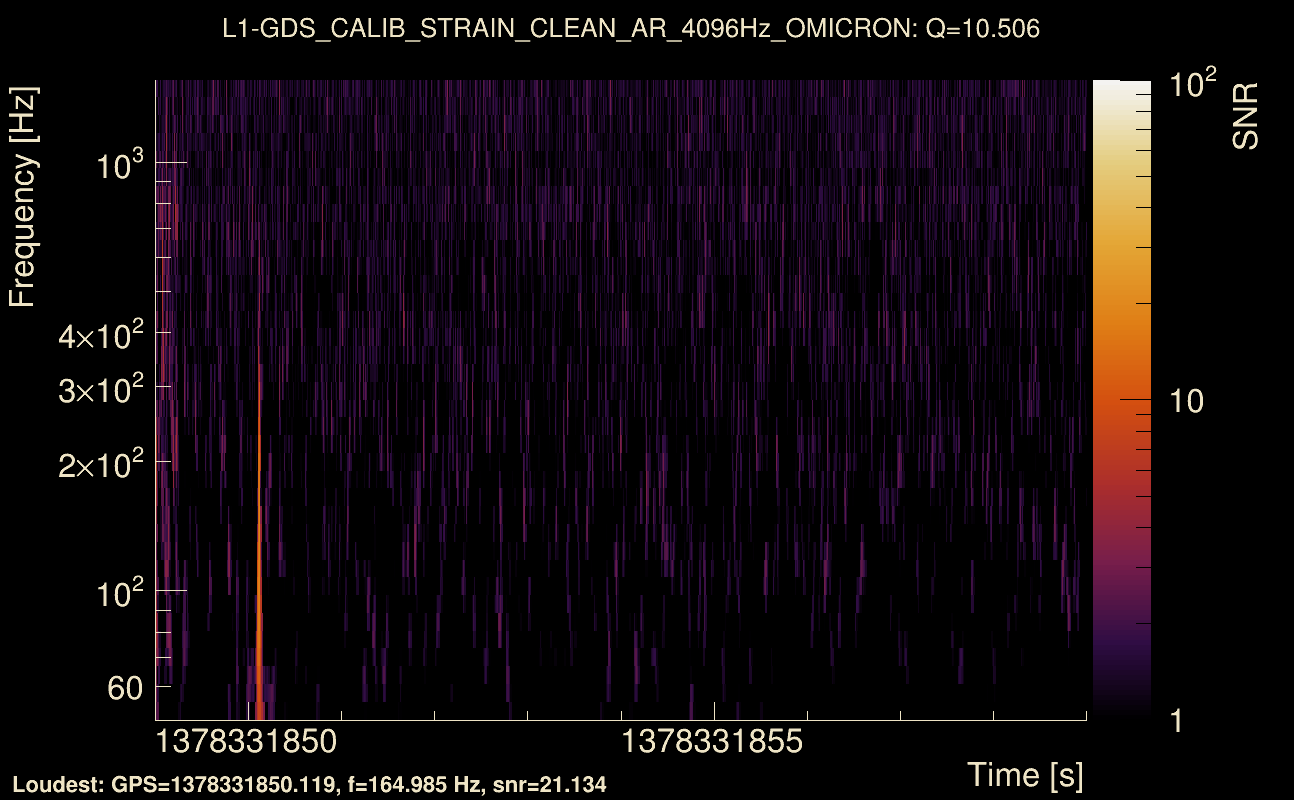
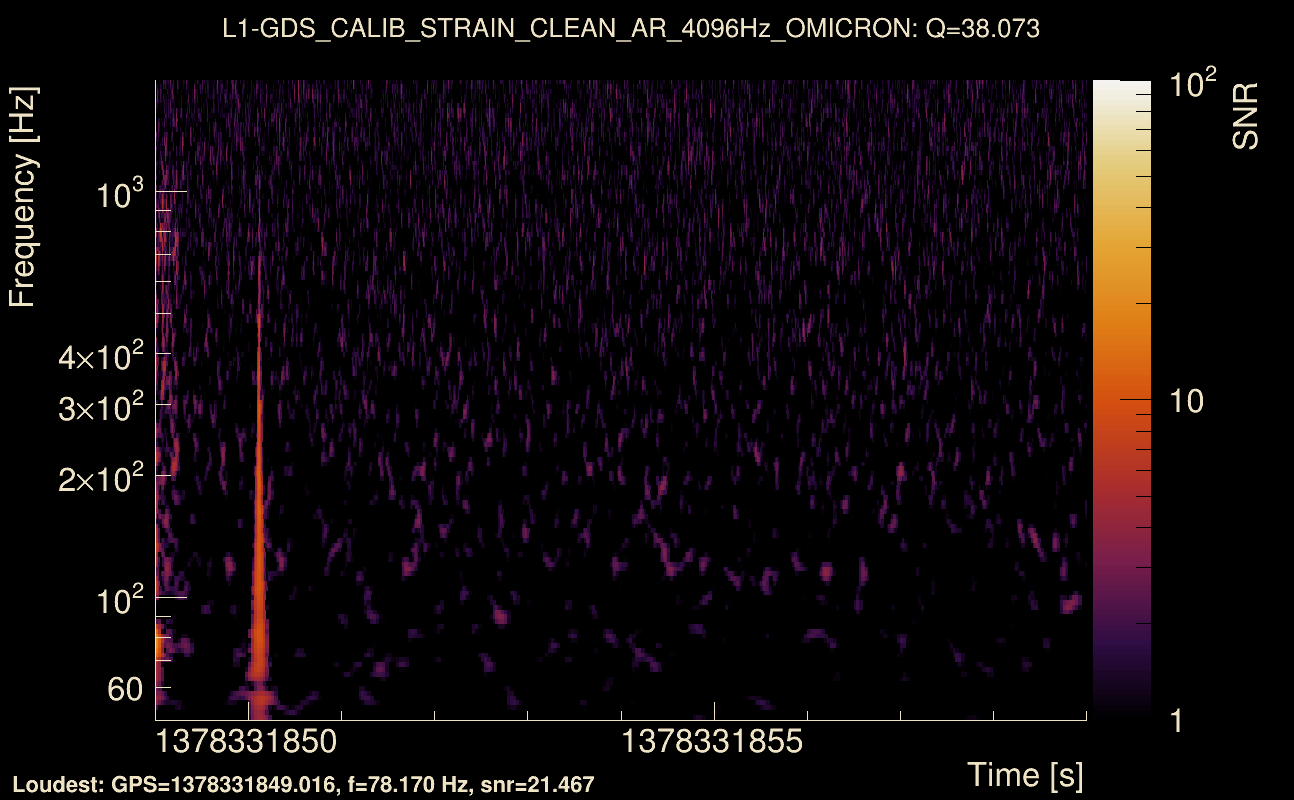
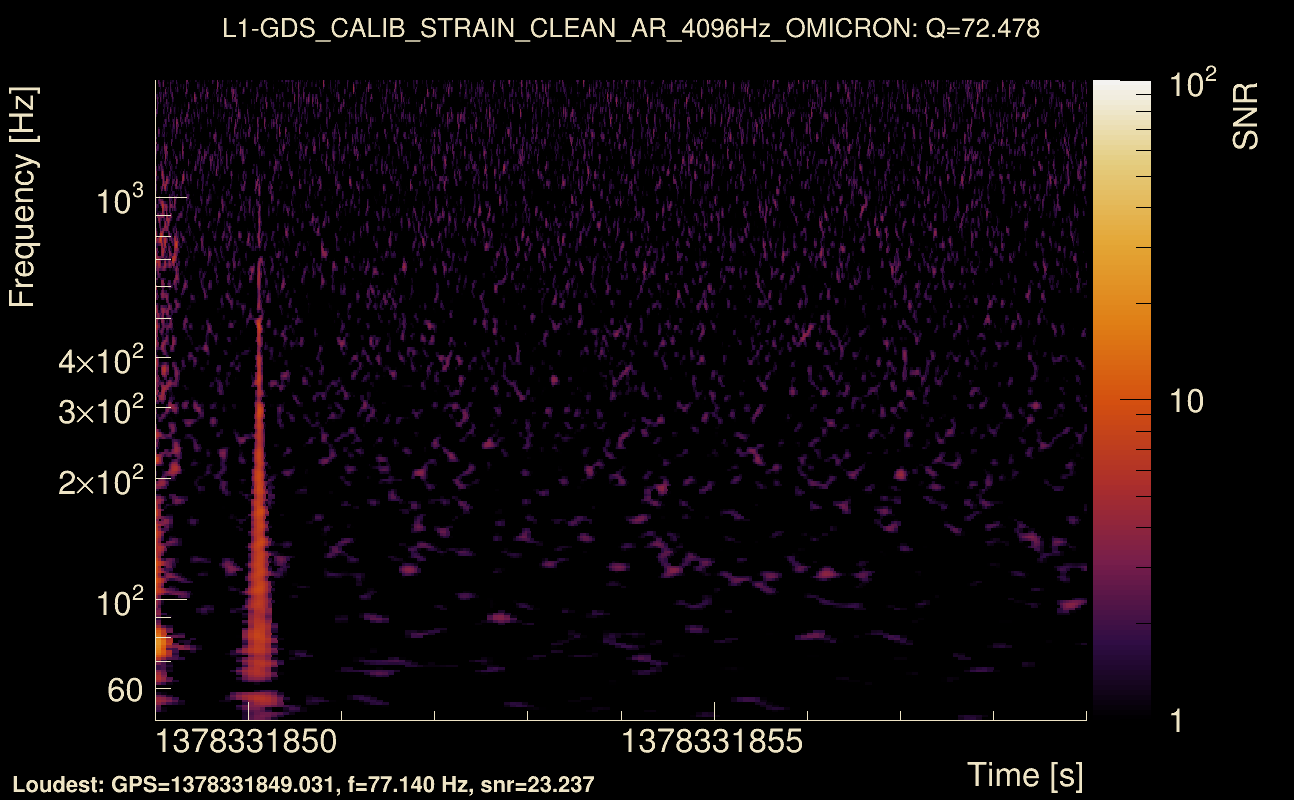
| Event time t(H1): | GPS = 1378331849 (Sat Sep 9 21:57:11 2023 ) → GPS = 1378331859 (Sat Sep 9 21:57:21 2023 ) |
| Event time t(L1): | GPS = 1378331849 (Sat Sep 9 21:57:21 2023 ) → GPS = 1378331859 (Sat Sep 9 21:57:21 2023 ) |
| Omicron analysis time window (H1): | GPS = 1378331846 → GPS = 1378331862 |
| Omicron analysis time window (L1): | GPS = 1378331846 → GPS = 1378331862 |
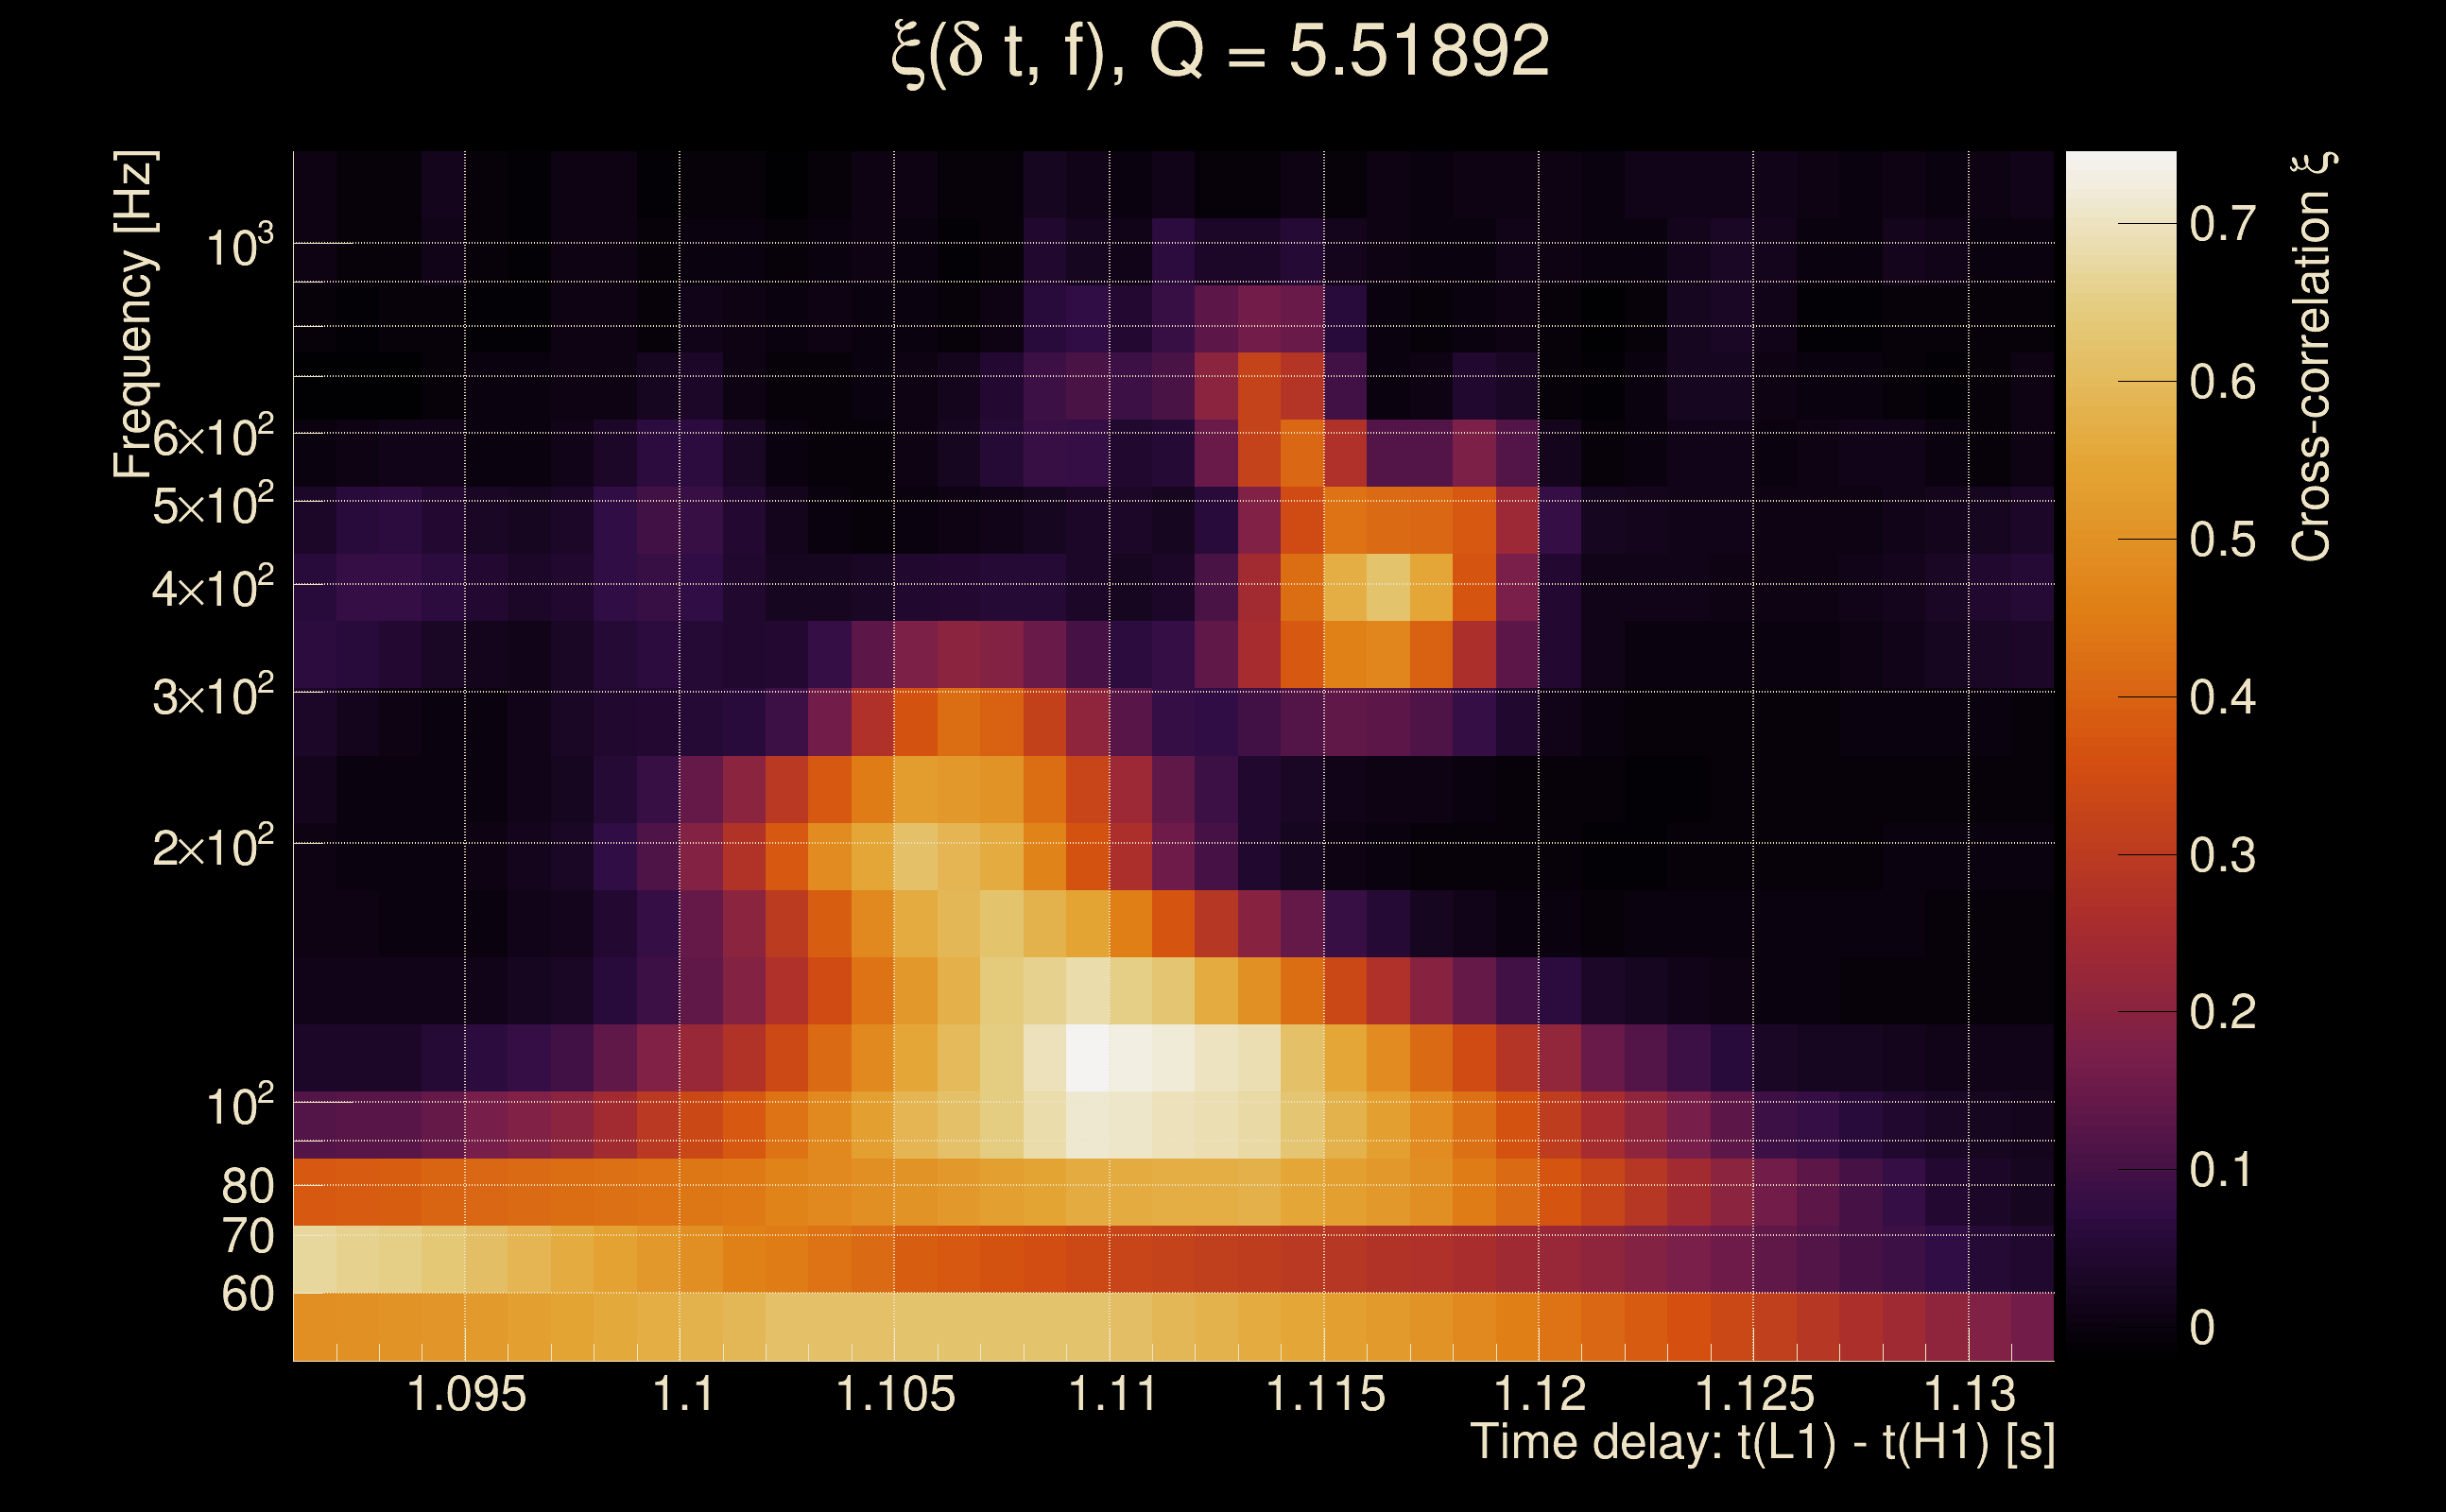
| Time delay between detectors t(L1) - t(H1): | 1.11197 s (slice index = 84 / 217), δt_gw = 0.0079675 s |
| Time delay uncertainty: | 0.00432852 s |
| [targeted mode] Time delay probability: | 0.15614 (1.41817 sigmas), δt_target = -0.00707817 s |
| Frequency: | 169.759 Hz |
| Ξ: | 0.449221 ± 0.0266418 (variance = 0.000709785): Q0: 0.554399, Q1: 0.569983, Q2: 0.516546, Q3: 0.517235, Q4: 0.498082 |
| Rank: | R_A = 0.449221 |
| Log of amplitude ratio (L1/H1): | 0.574716, variance = 0.394197 (L1/H1: -0.287489, variance = 1.039, H1/L1: -1.38701, variance = 0.564645) |
| Amplitude ratio (L1/H1): | 1.77663 ⋇ 1.87358 (L1/H1: 0.750145 ⋇ 2.77129, H1/L1: 0.249821 ⋇ 2.12003) |
| Amplitude ratio H1|L1 compatibility (probability): | 0.186067 |
| Antenna factor probability: | 1 |
| Number of rejected frequency rows: | Q0: 1 / 18, Q1: 9 / 36, Q2: 23 / 70, Q3: 52 / 134, Q4: 169 / 258 |
| Maximum signal-to-noise ratio: | H1: 30.925, L1: 31.8609 |
| SNR variance: | H1: 1.87937, L1: 1.92623 |
| Click here for a zoomed plot | Click here for a zoomed plot | Click here for a zoomed plot | Click here for a zoomed plot | Click here for a zoomed plot |
 |
 |
 |
 |
 |
 |
 |
 |
 |
 |
 |
 |
 |
 |
 |
 |
 |
 |
 |
 |
 |
 |
 |
 |
 |
 |
 |
 |
 |
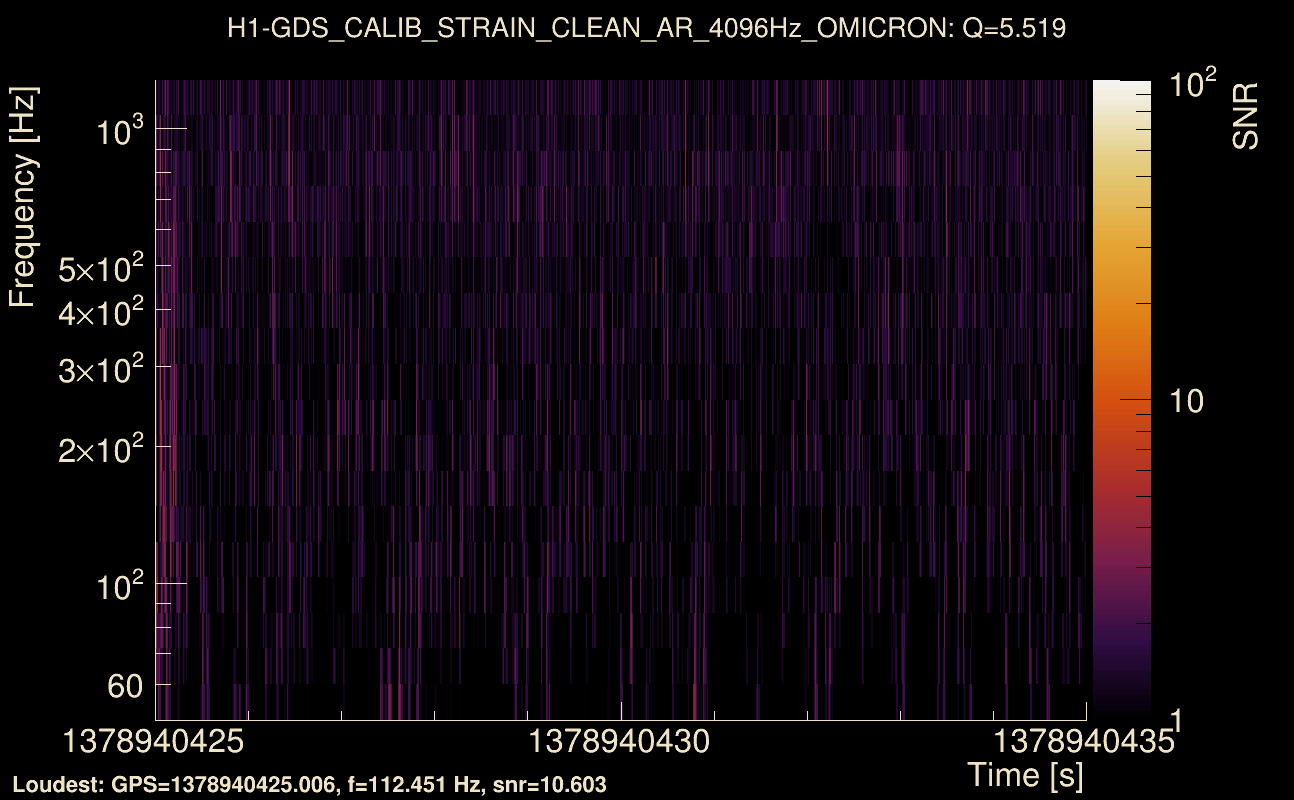
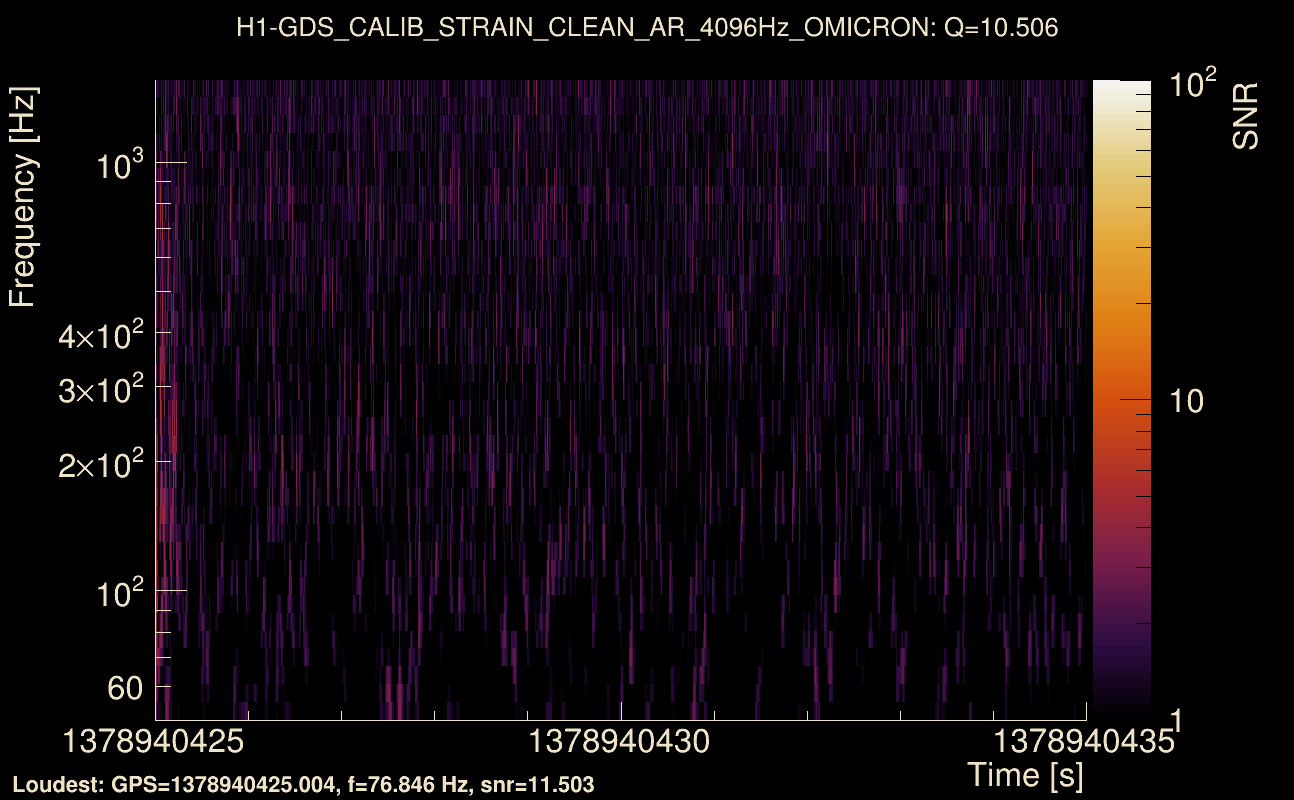
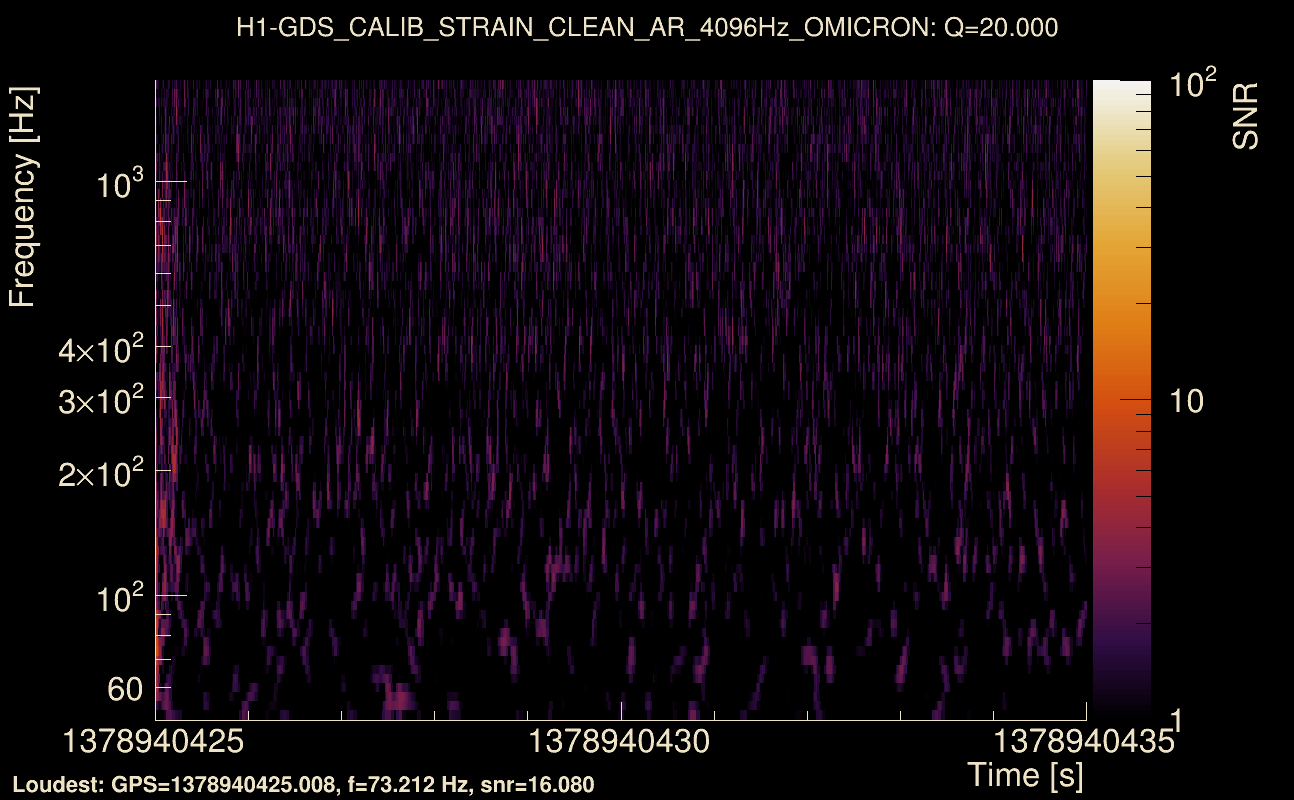
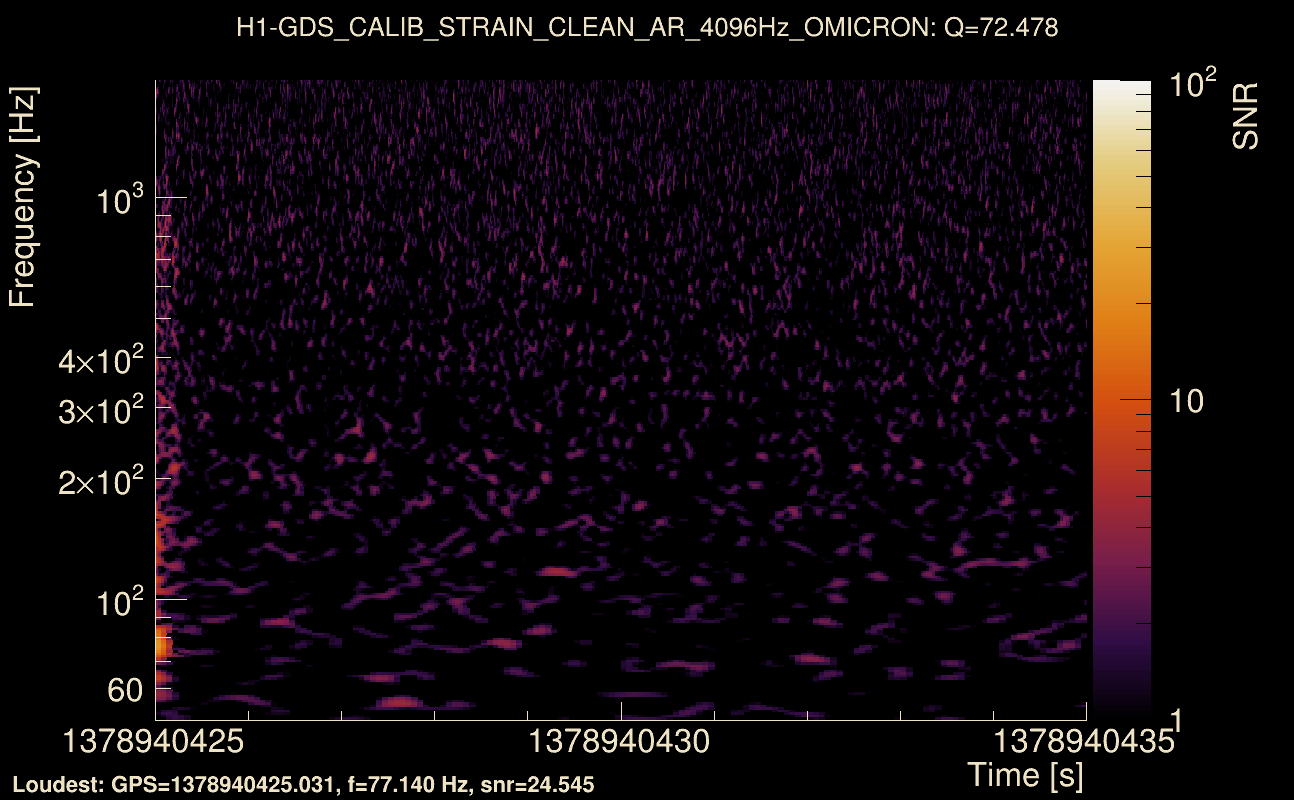
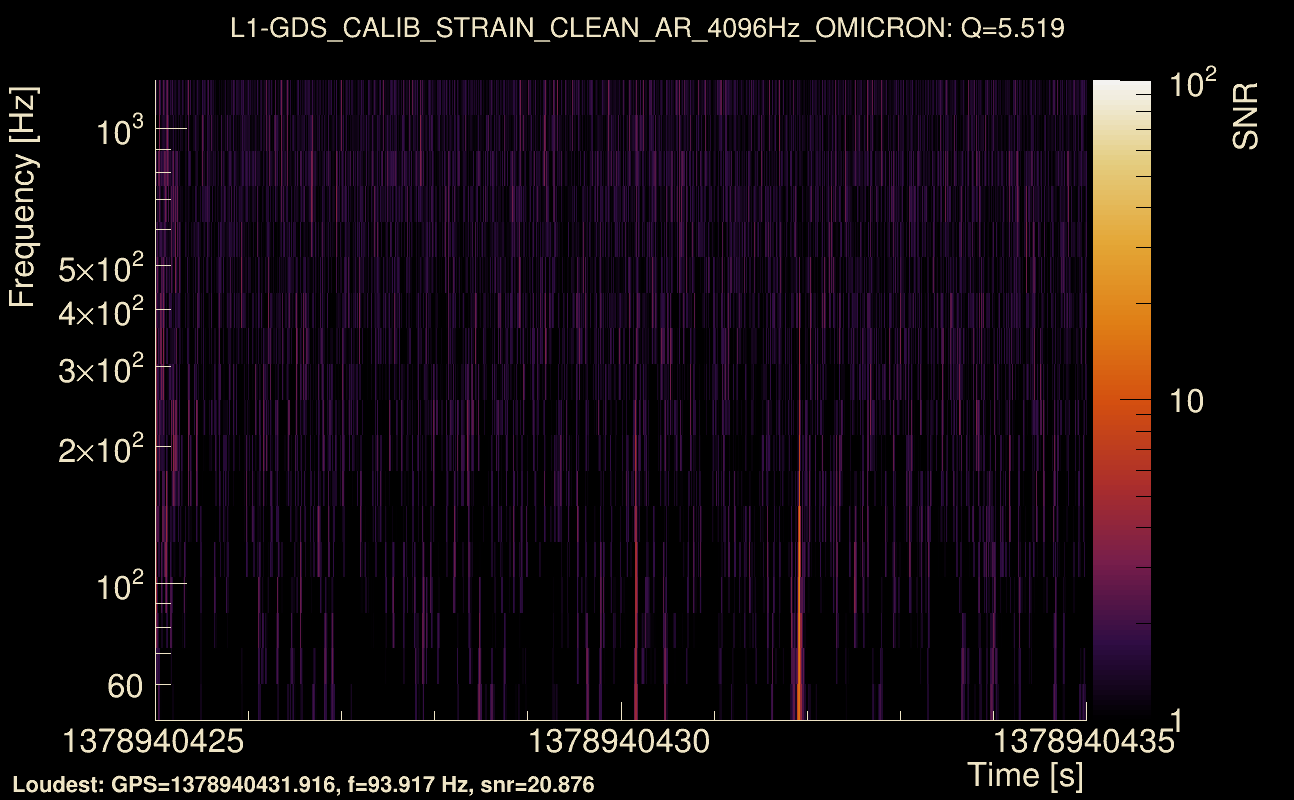
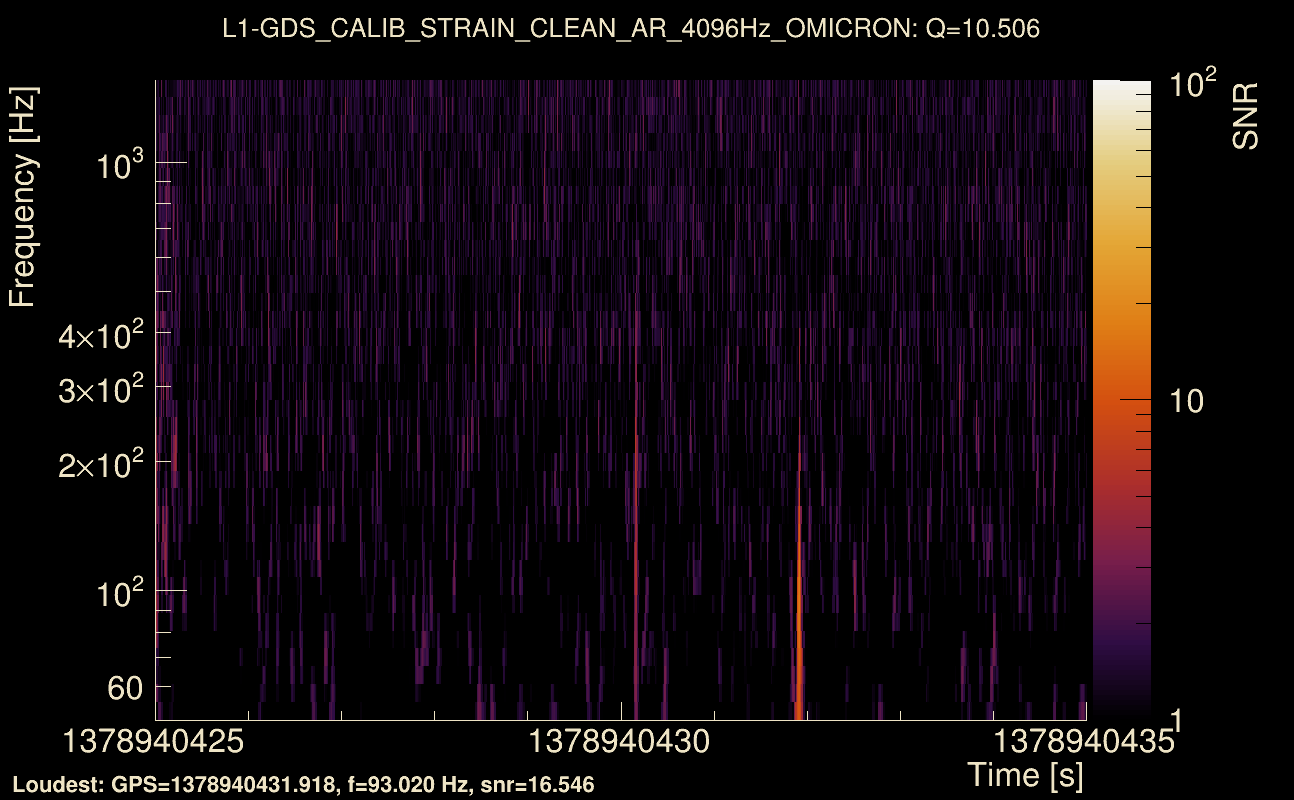
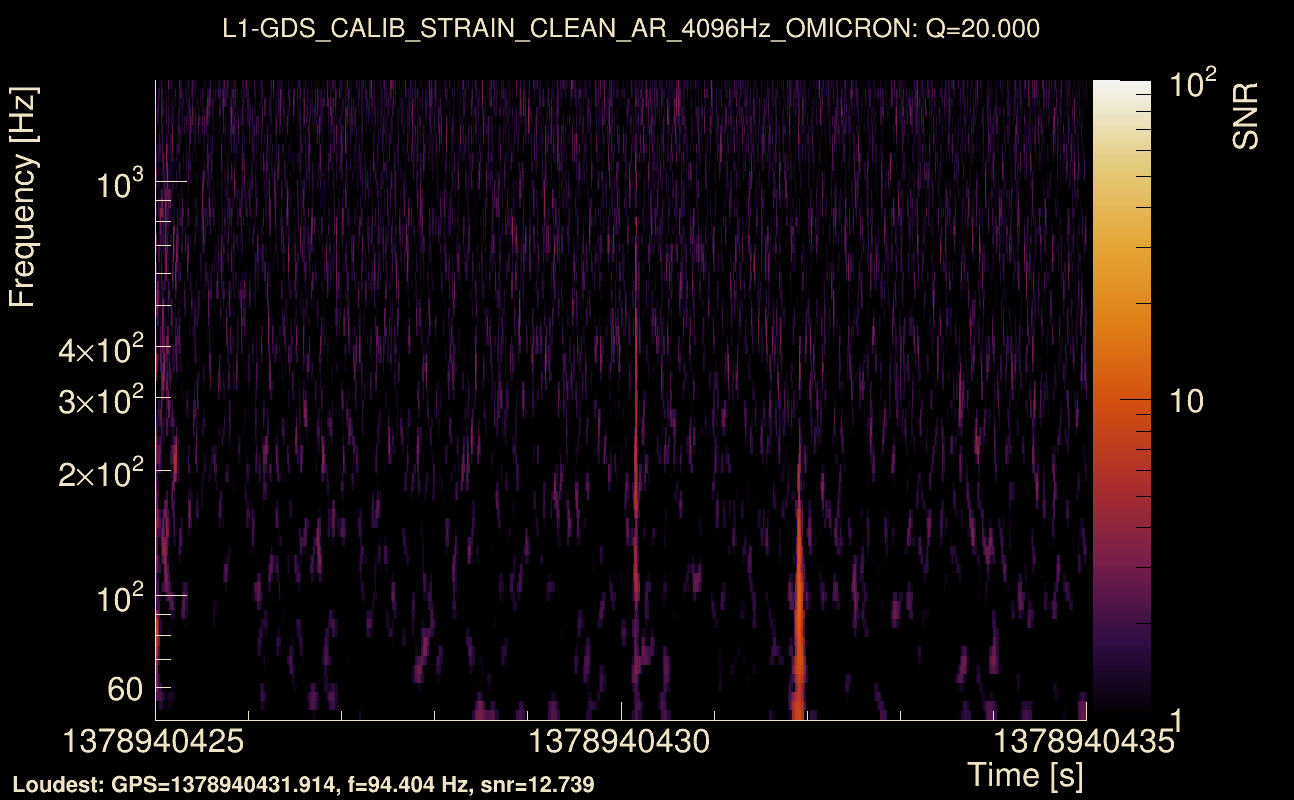
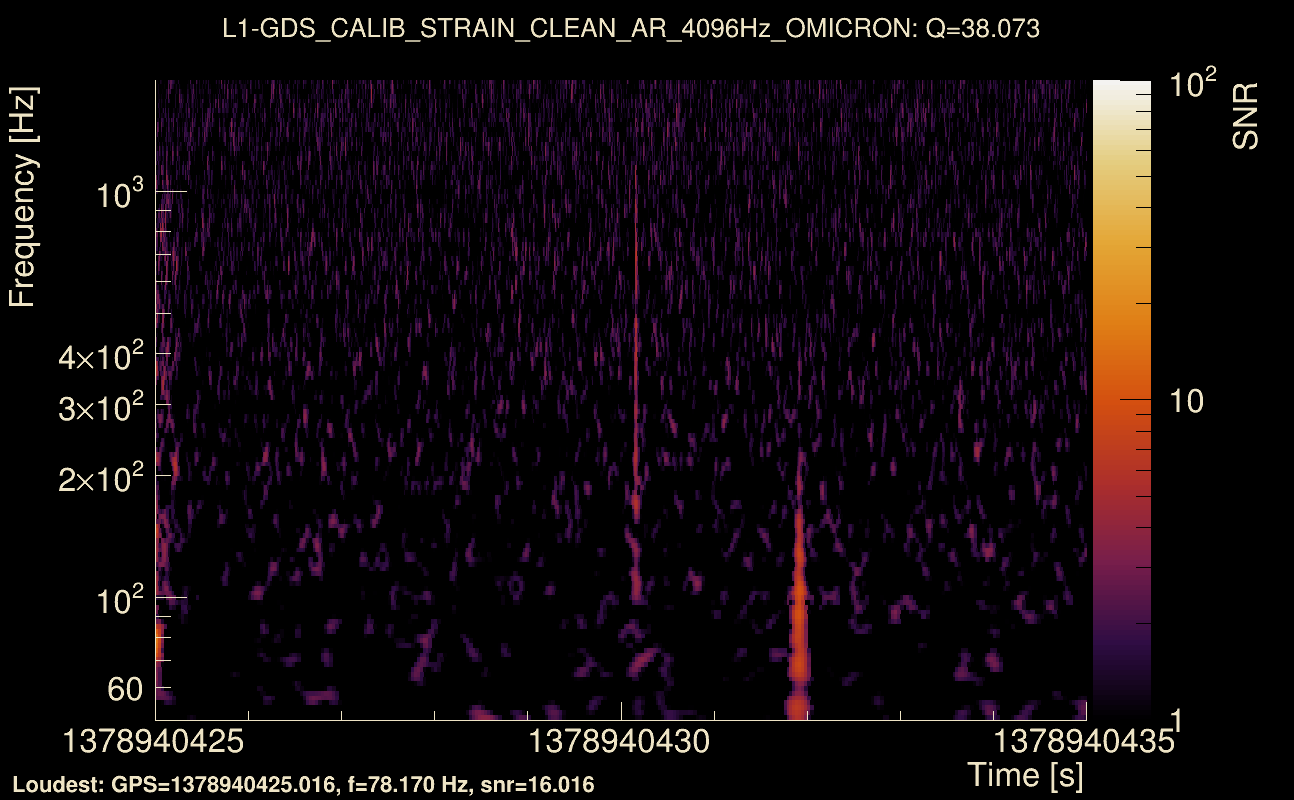
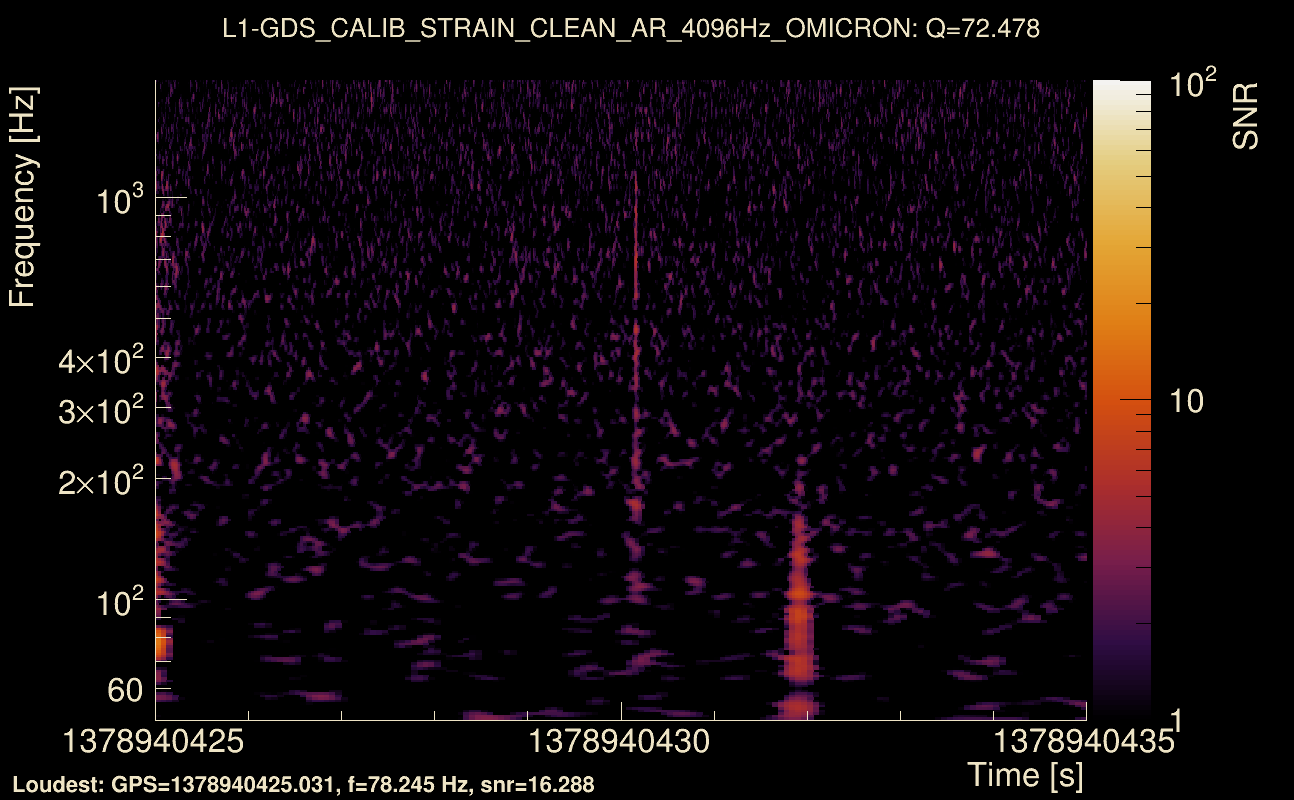
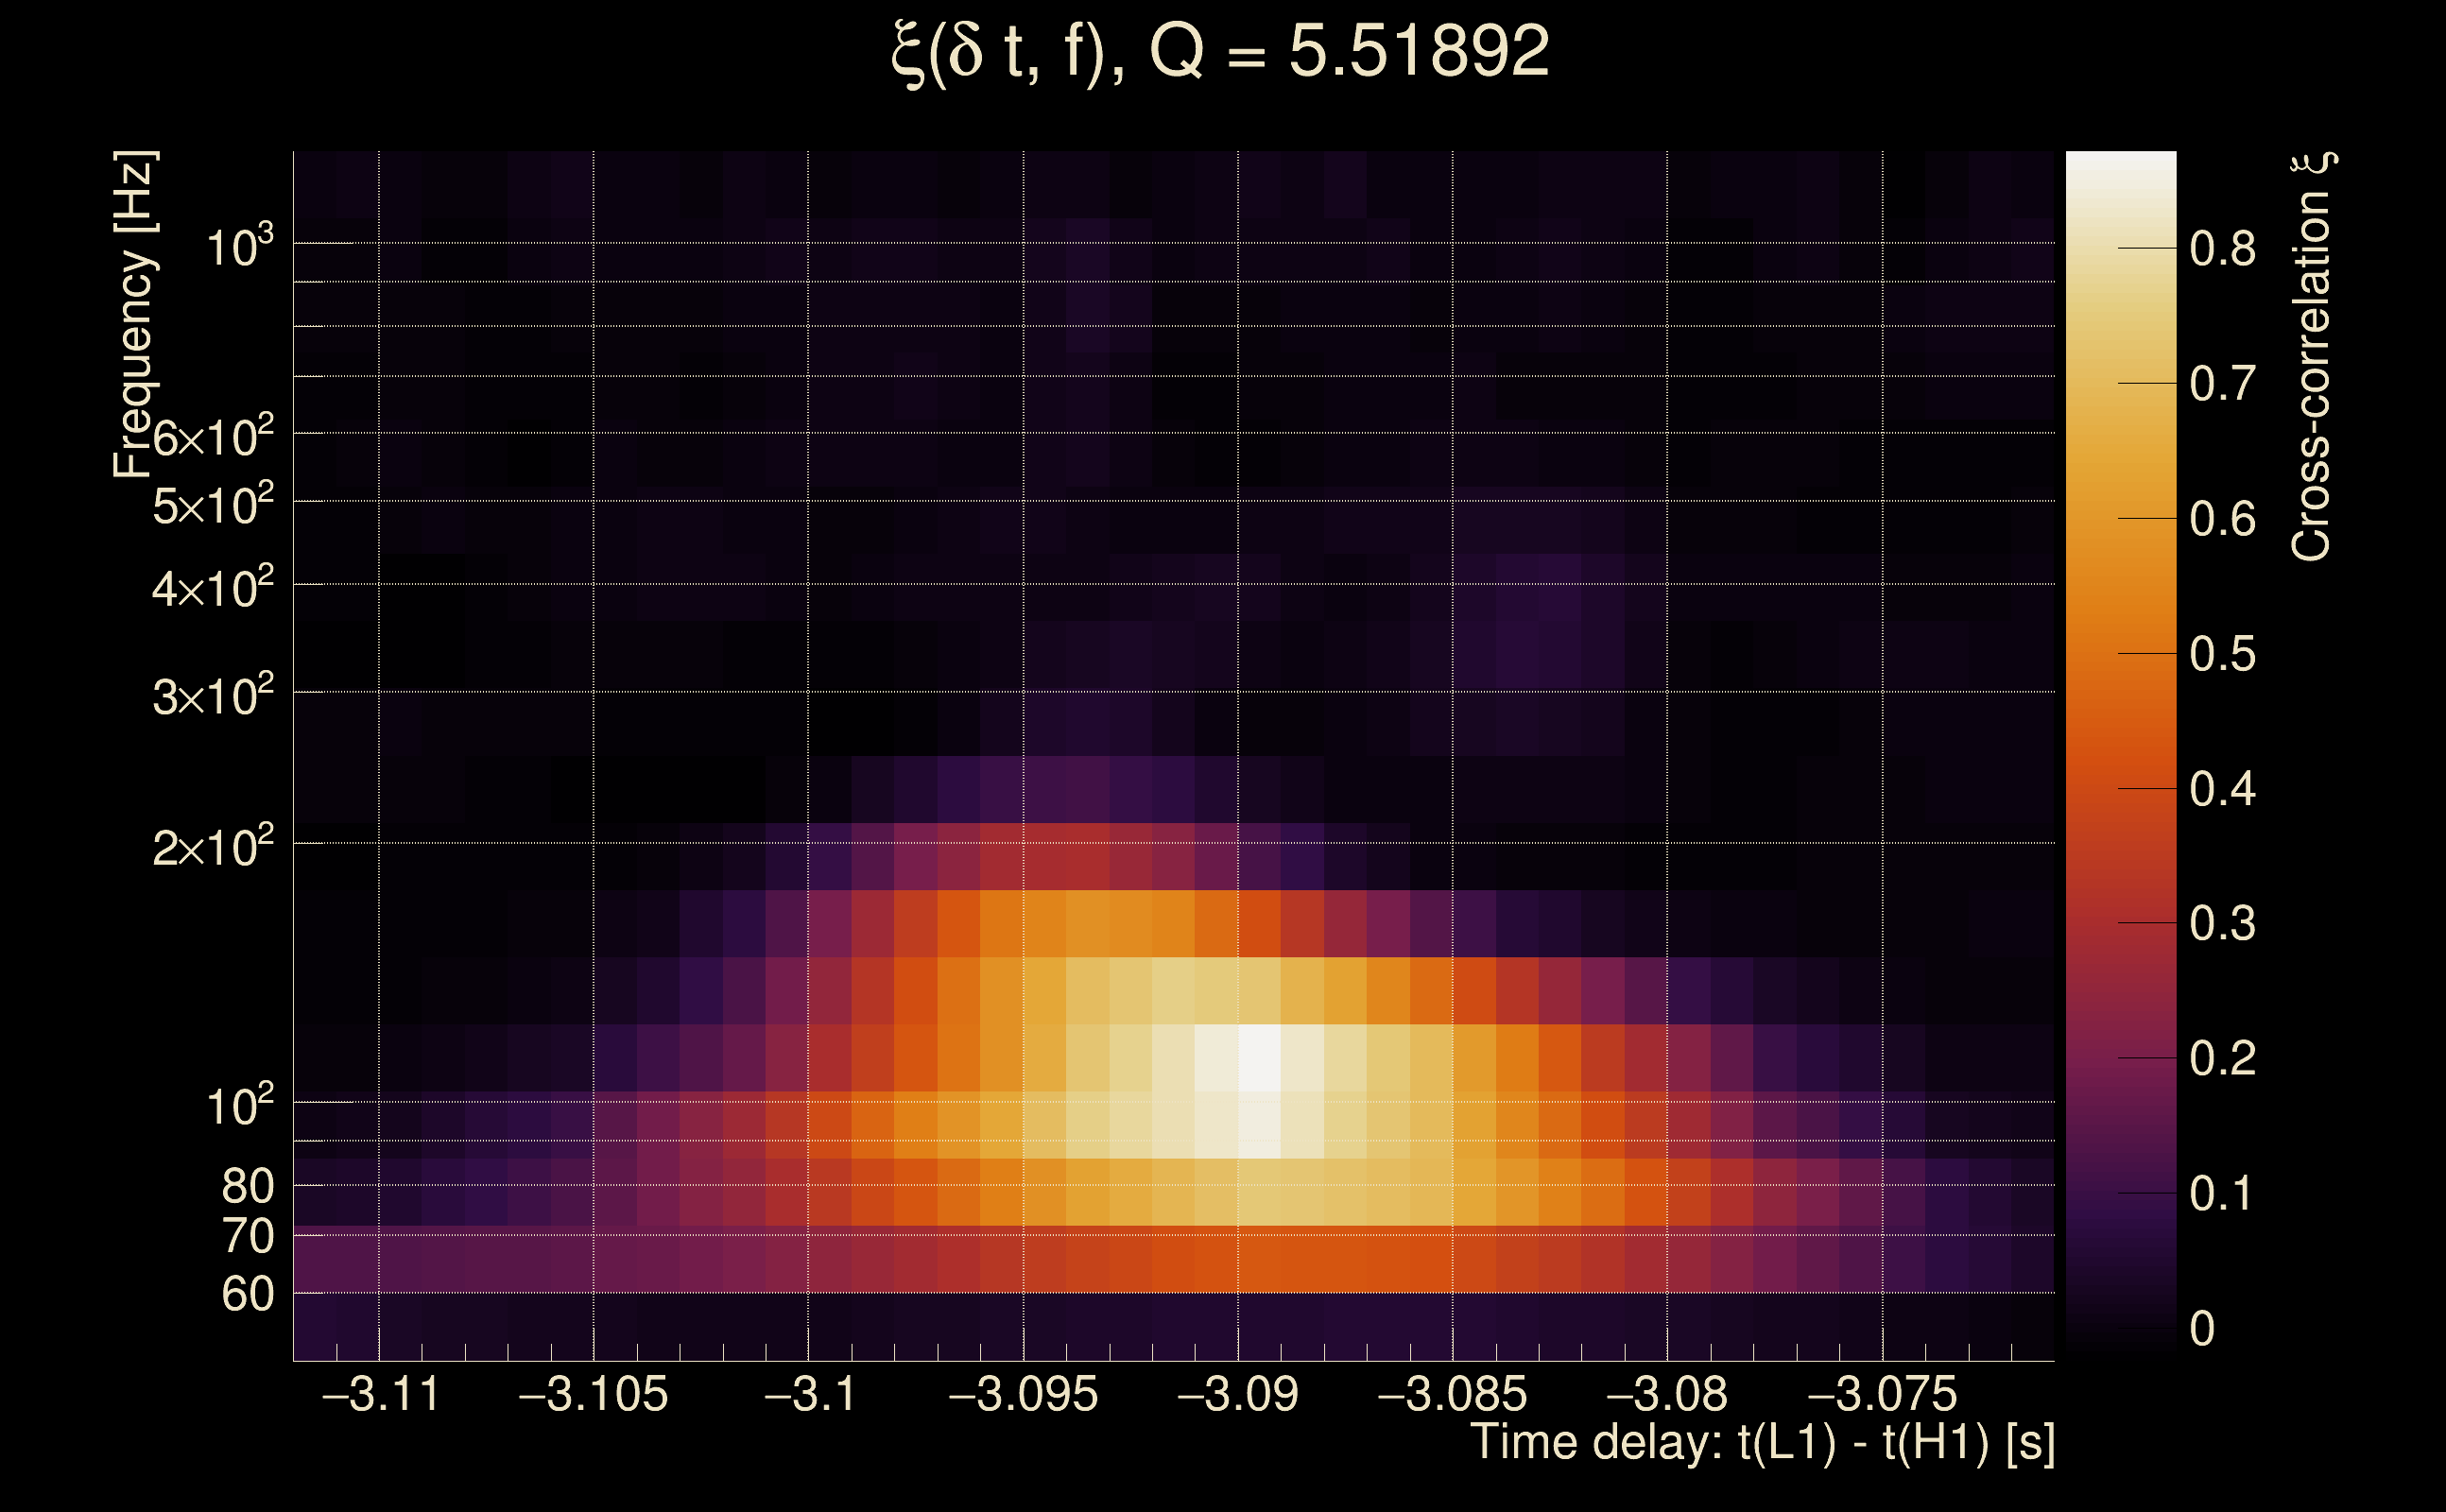
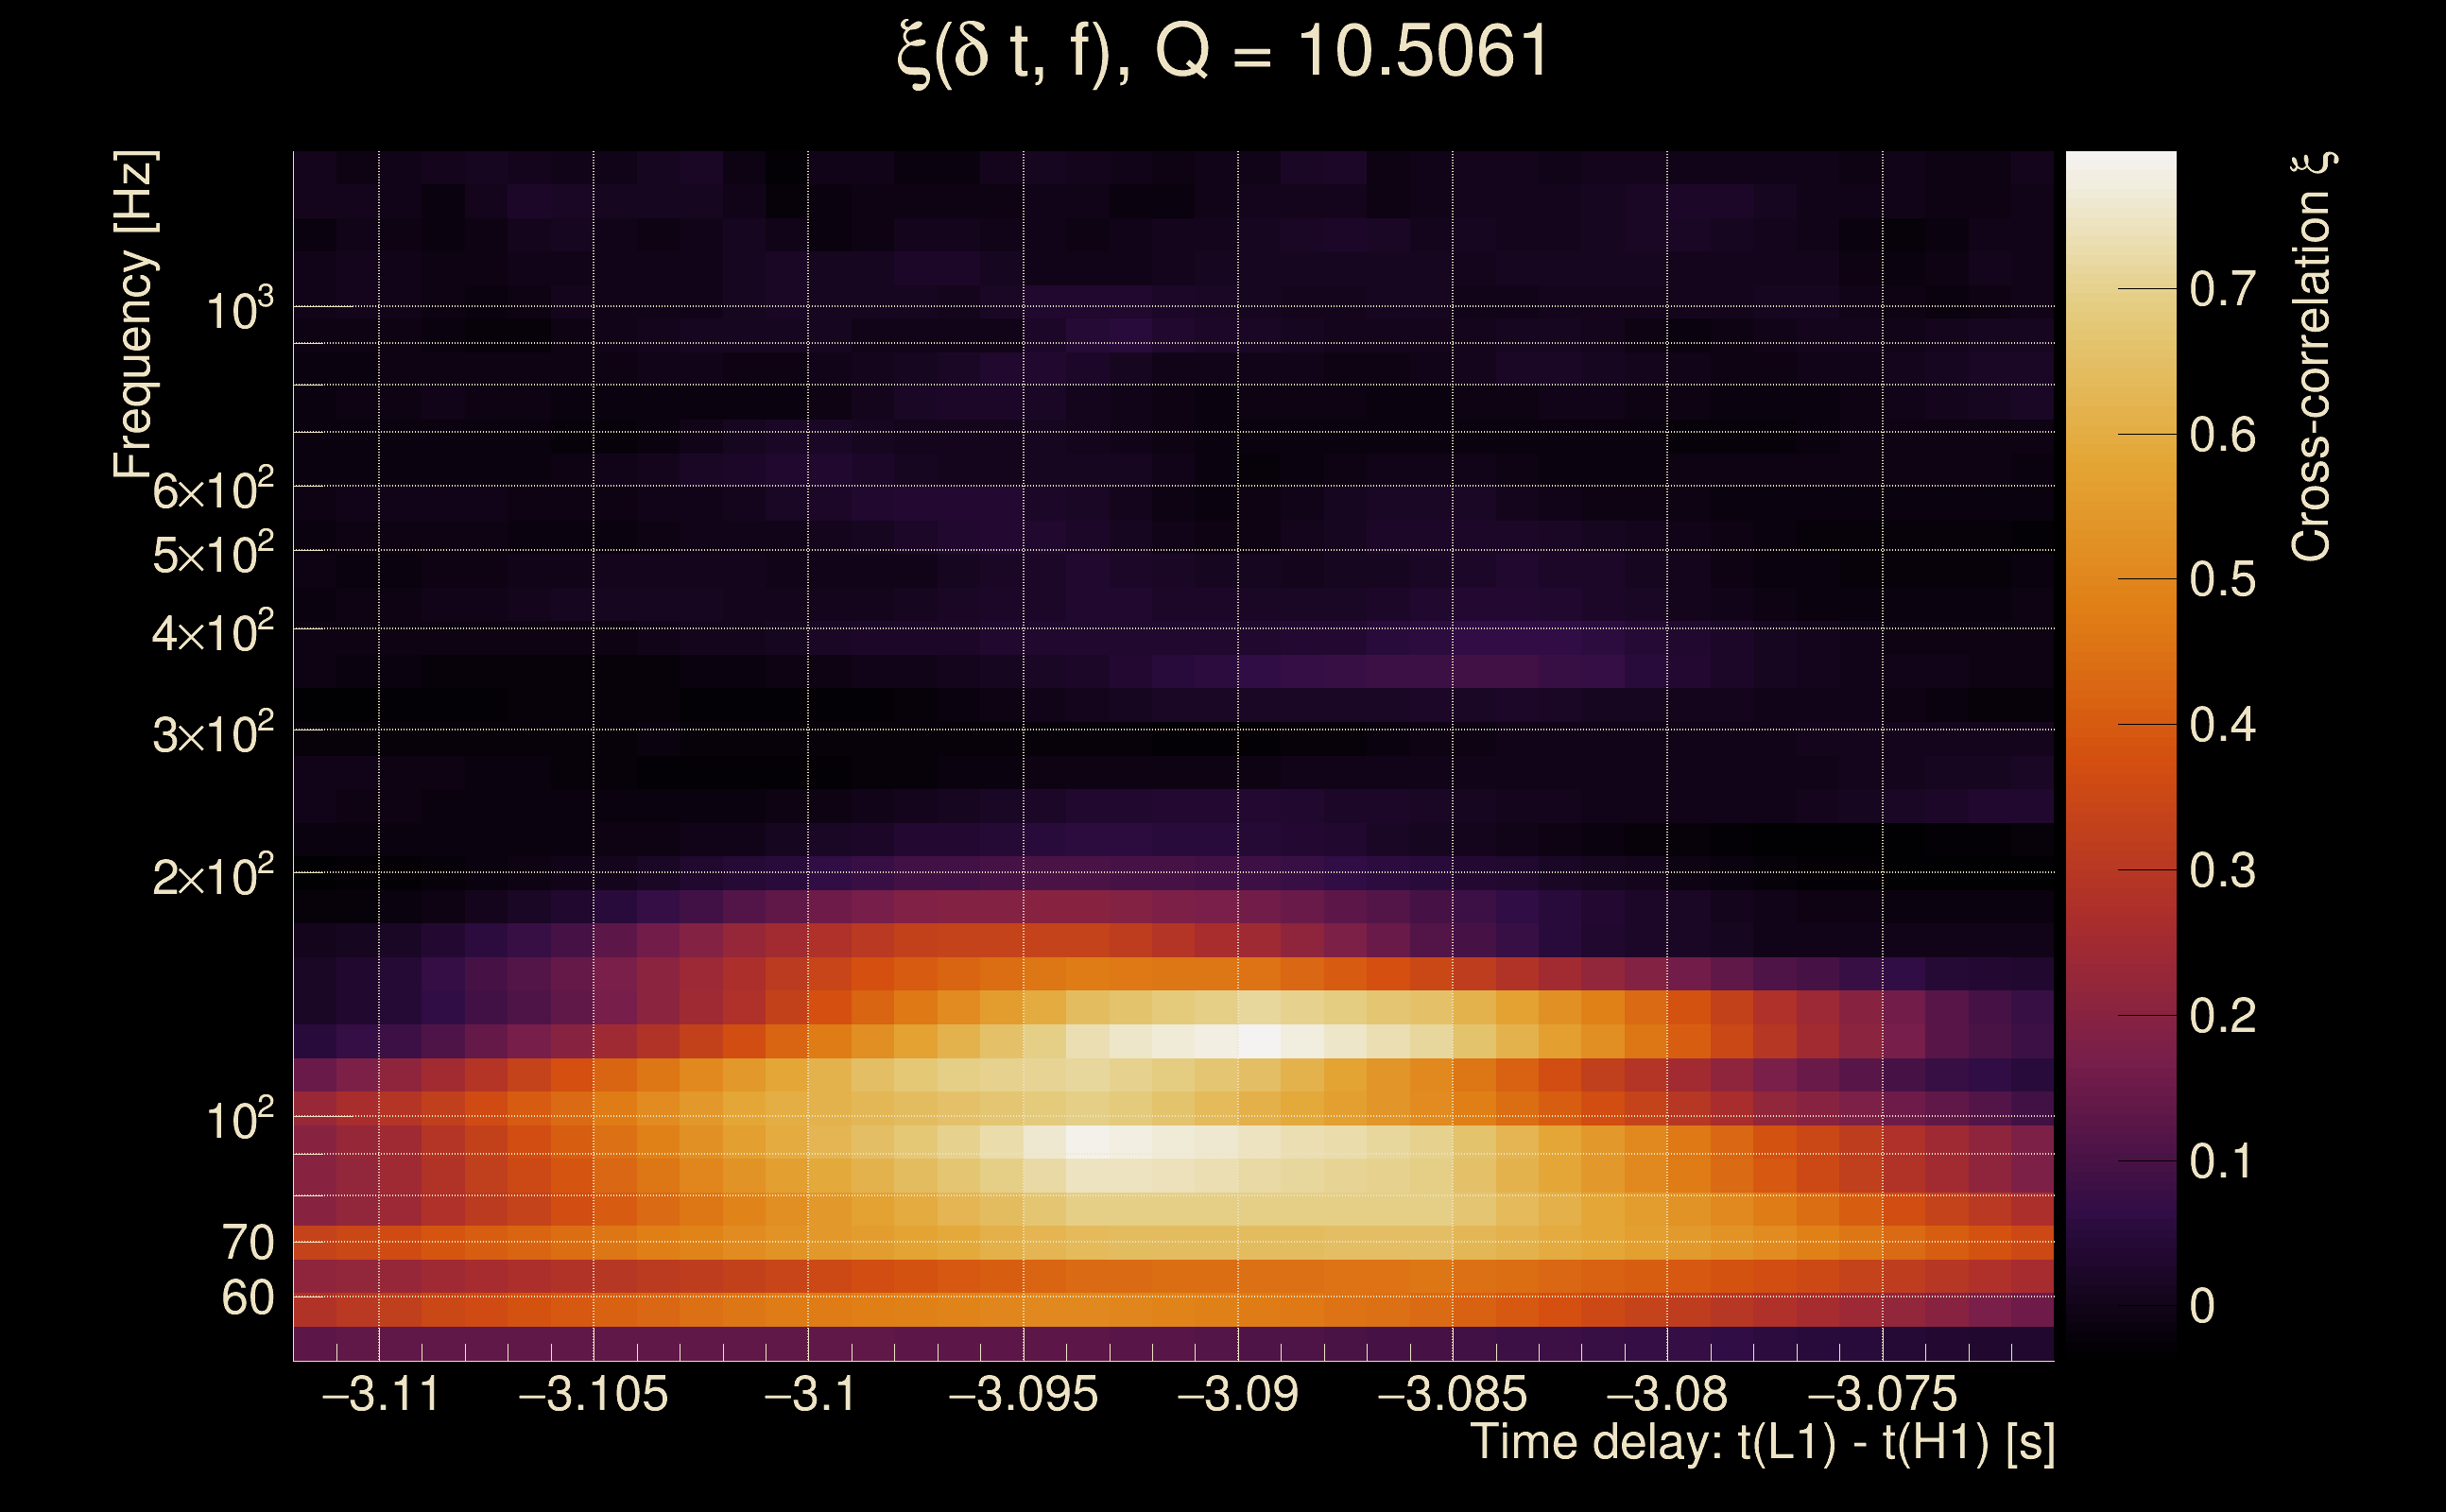
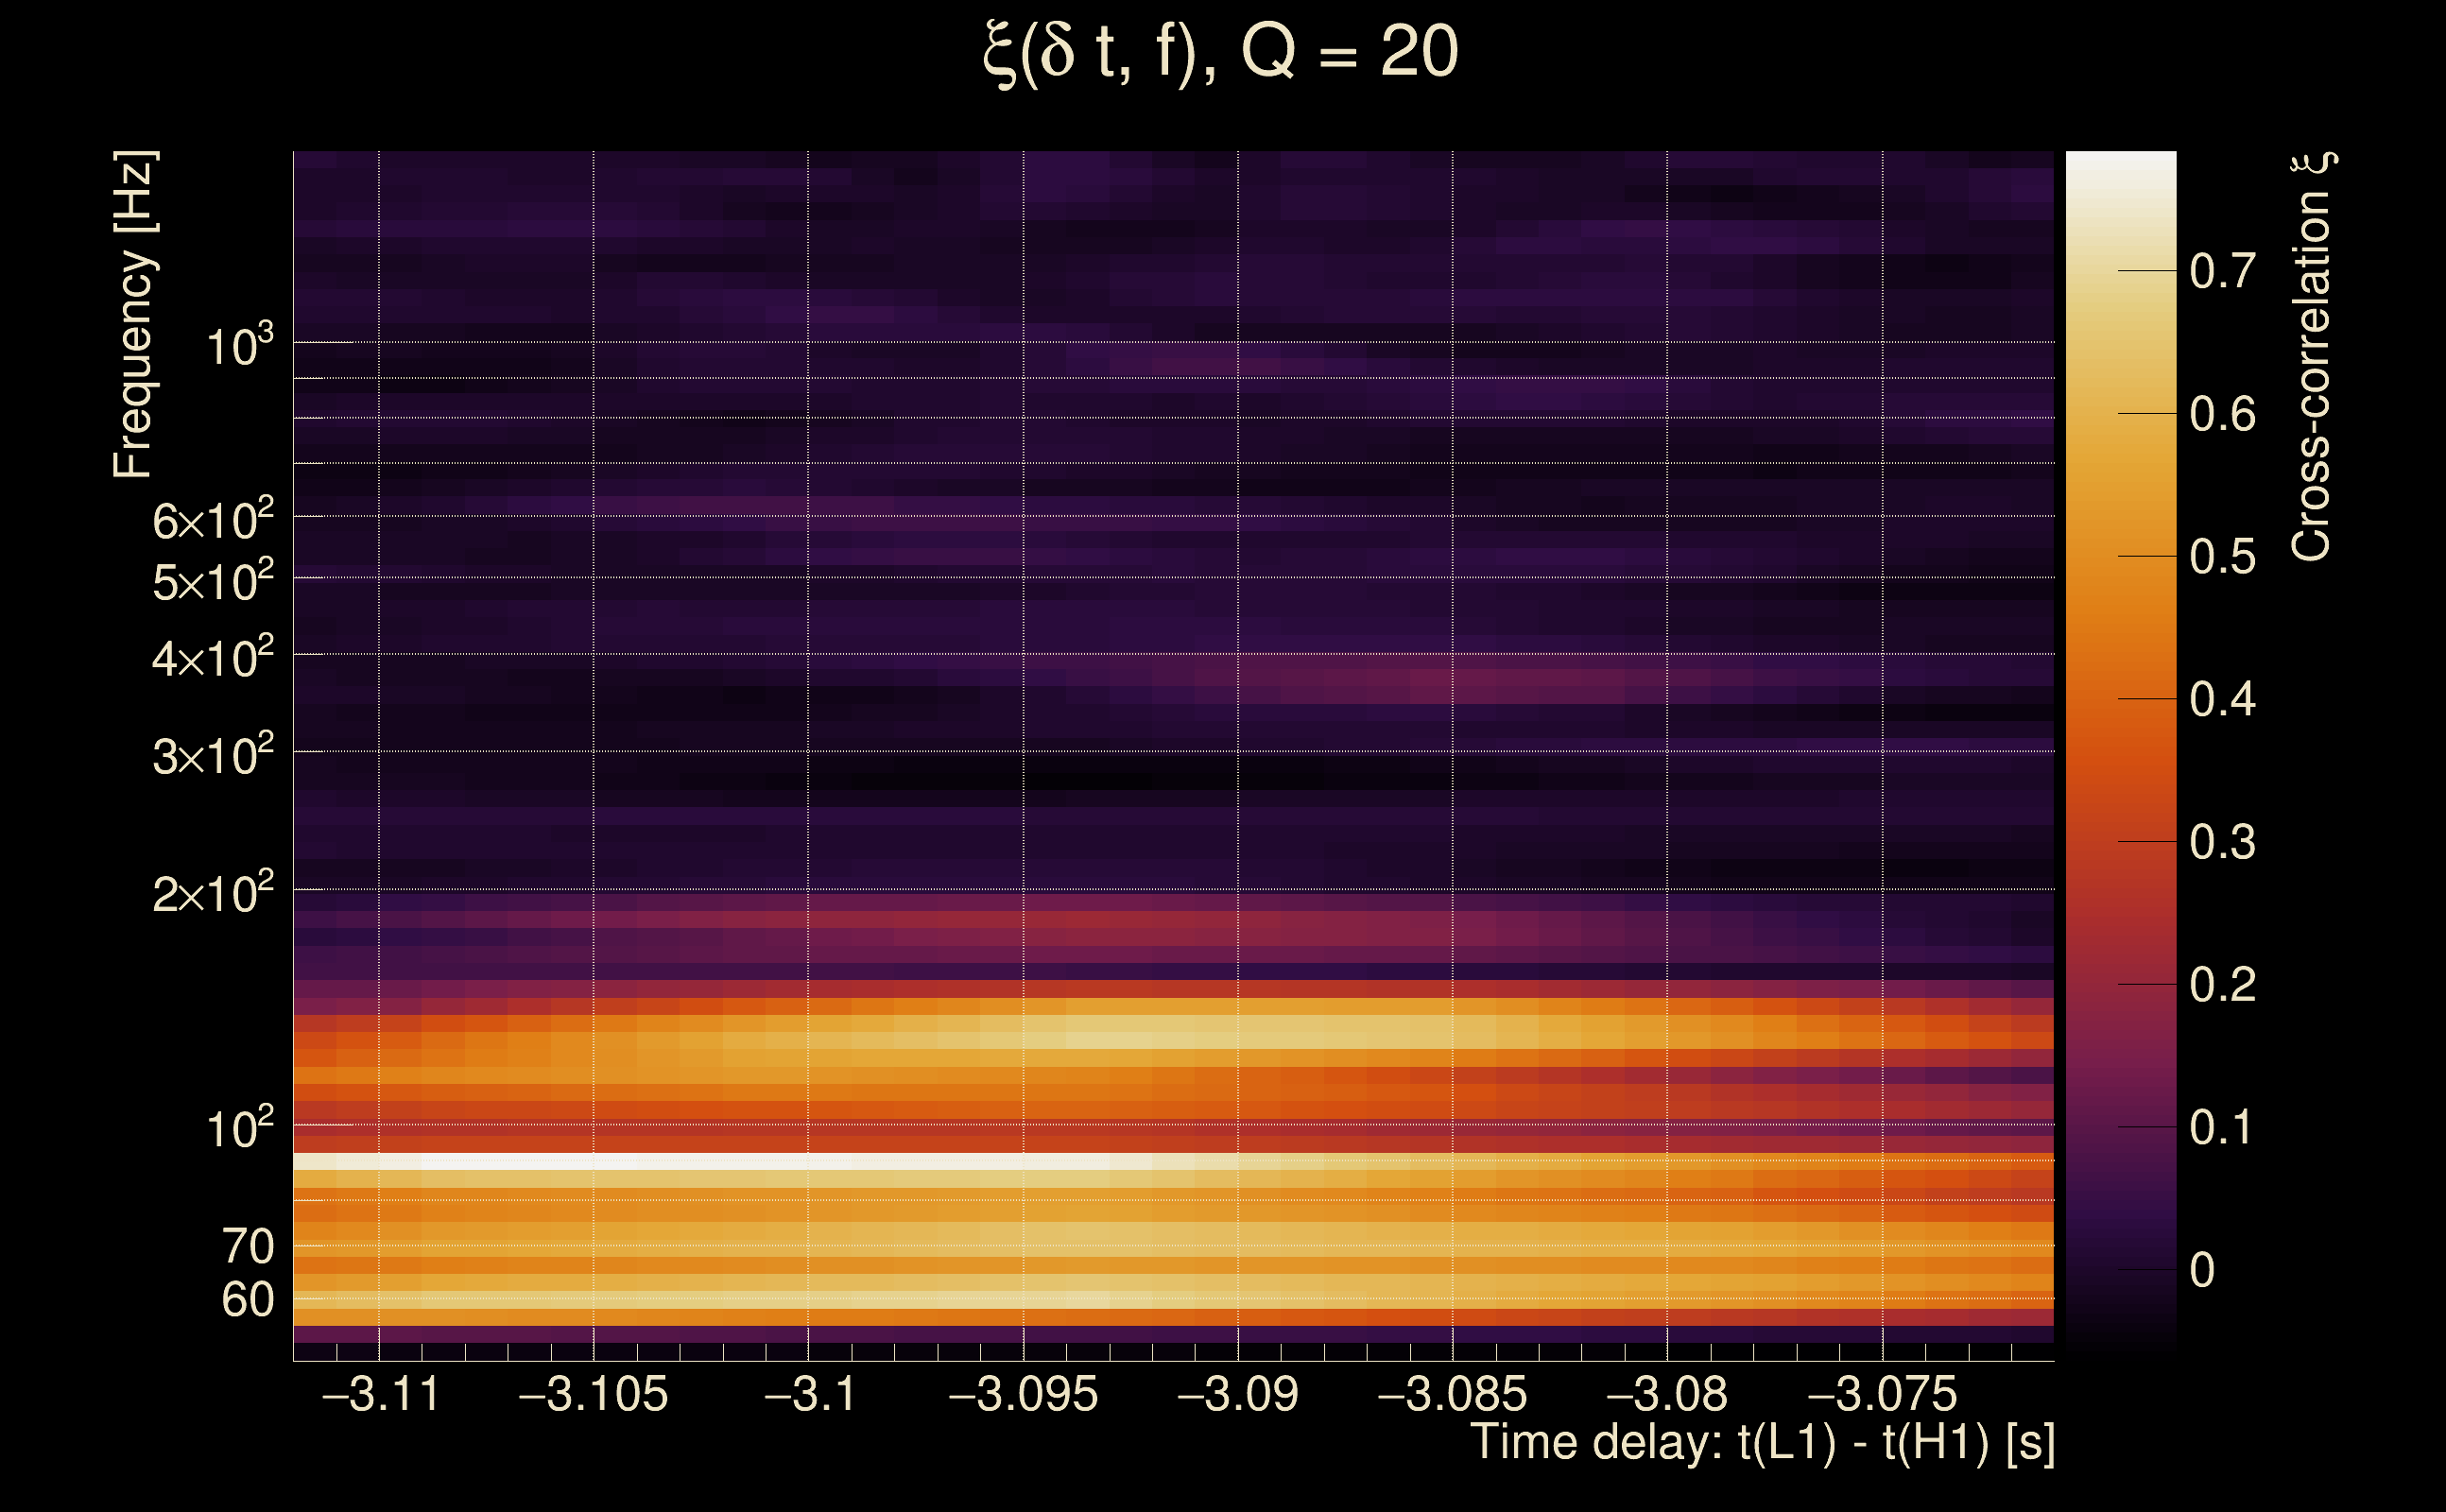
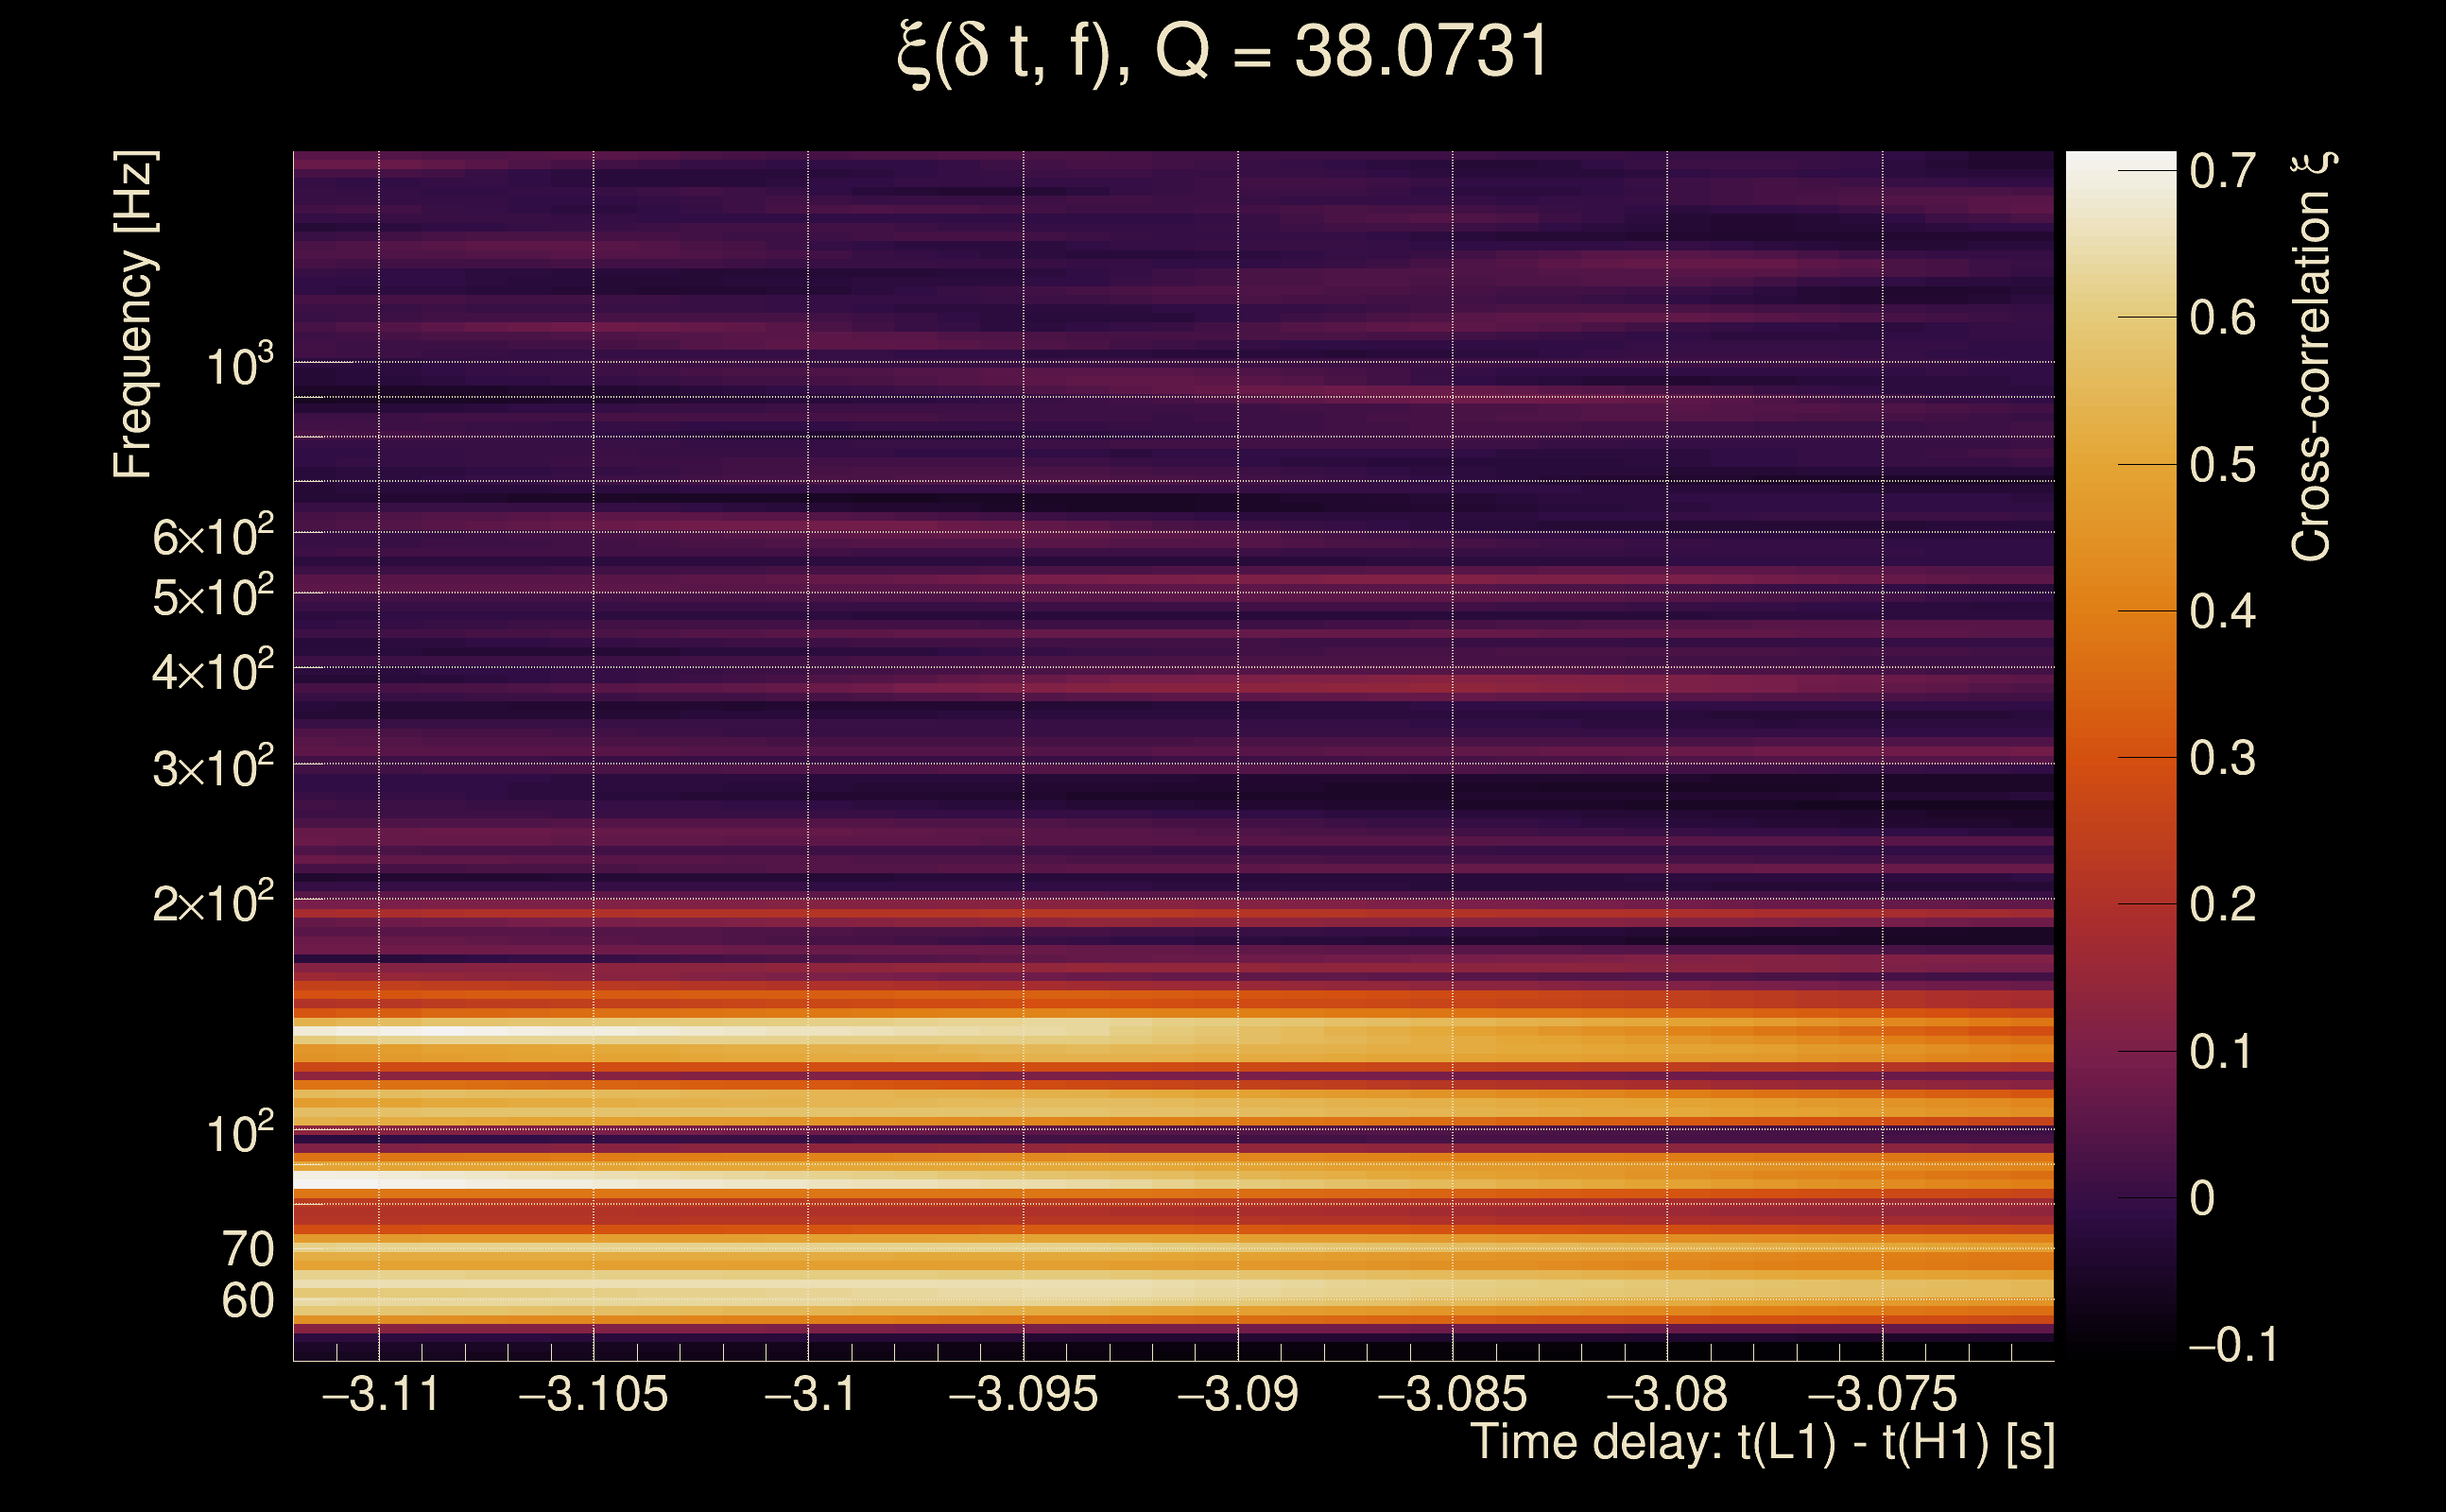
| Event time t(H1): | GPS = 1378940425 (Sat Sep 16 23:00:07 2023 ) → GPS = 1378940435 (Sat Sep 16 23:00:17 2023 ) |
| Event time t(L1): | GPS = 1378940425 (Sat Sep 16 23:00:17 2023 ) → GPS = 1378940435 (Sat Sep 16 23:00:17 2023 ) |
| Omicron analysis time window (H1): | GPS = 1378940422 → GPS = 1378940438 |
| Omicron analysis time window (L1): | GPS = 1378940422 → GPS = 1378940438 |
| Time delay between detectors t(L1) - t(H1): | -3.09116 s (slice index = 175 / 217), δt_gw = -0.0091629 s |
| Time delay uncertainty: | 0.00454205 s |
| [targeted mode] Time delay probability: | 0.00420438 (2.86241 sigmas), δt_target = 0.000481129 s |
| Frequency: | 113.144 Hz |
| Ξ: | 0.44789 ± 0.111735 (variance = 0.0124847): Q0: 0.667151, Q1: 0.625065, Q2: 0.501478, Q3: 0.445914, Q4: 0.36539 |
| Rank: | R_A = 0.44789 |
| Log of amplitude ratio (L1/H1): | 0.405149, variance = 0.515712 (L1/H1: -0.488059, variance = 1.20545, H1/L1: -1.52611, variance = 0.72381) |
| Amplitude ratio (L1/H1): | 1.49953 ⋇ 2.0506 (L1/H1: 0.613817 ⋇ 2.99795, H1/L1: 0.217379 ⋇ 2.34145) |
| Amplitude ratio H1|L1 compatibility (probability): | 0.147027 |
| Antenna factor probability: | 1 |
| Number of rejected frequency rows: | Q0: 2 / 18, Q1: 13 / 36, Q2: 34 / 70, Q3: 97 / 134, Q4: 229 / 258 |
| Maximum signal-to-noise ratio: | H1: 26.058, L1: 23.2606 |
| SNR variance: | H1: 1.48879, L1: 1.05547 |
| Click here for a zoomed plot | Click here for a zoomed plot | Click here for a zoomed plot | Click here for a zoomed plot | Click here for a zoomed plot |
 |
 |
 |
 |
 |
 |
 |
 |
 |
 |
 |
 |
 |
 |
 |
 |
 |
 |
 |
 |
 |
 |
 |
 |
 |
 |
 |
 |
 |
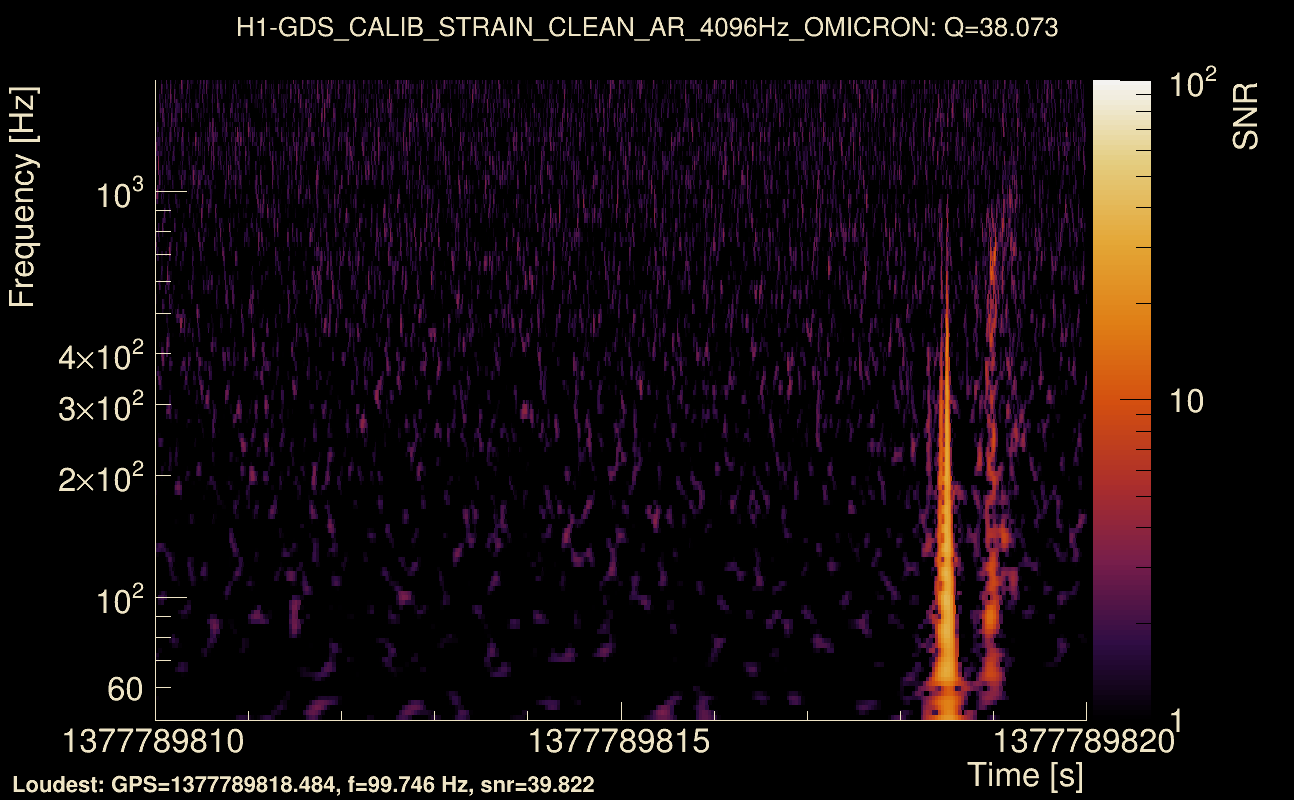
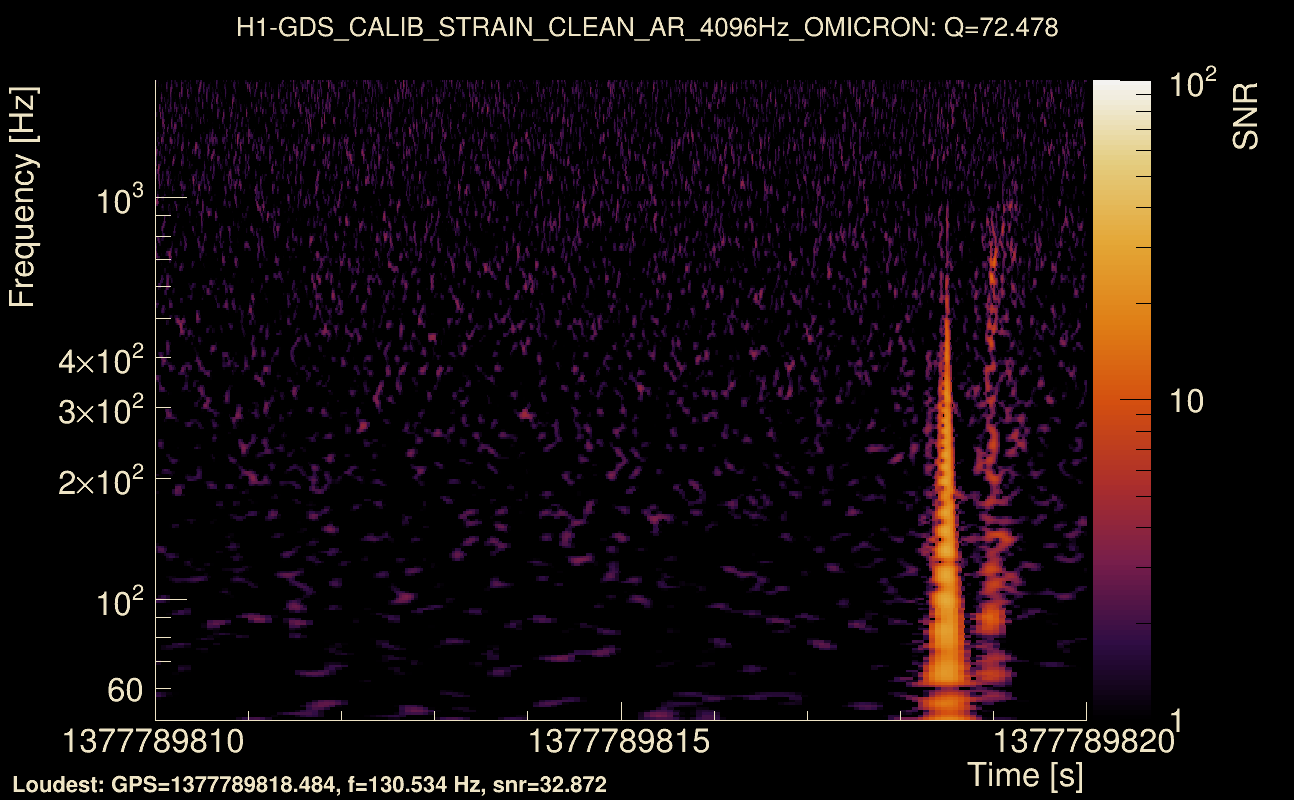
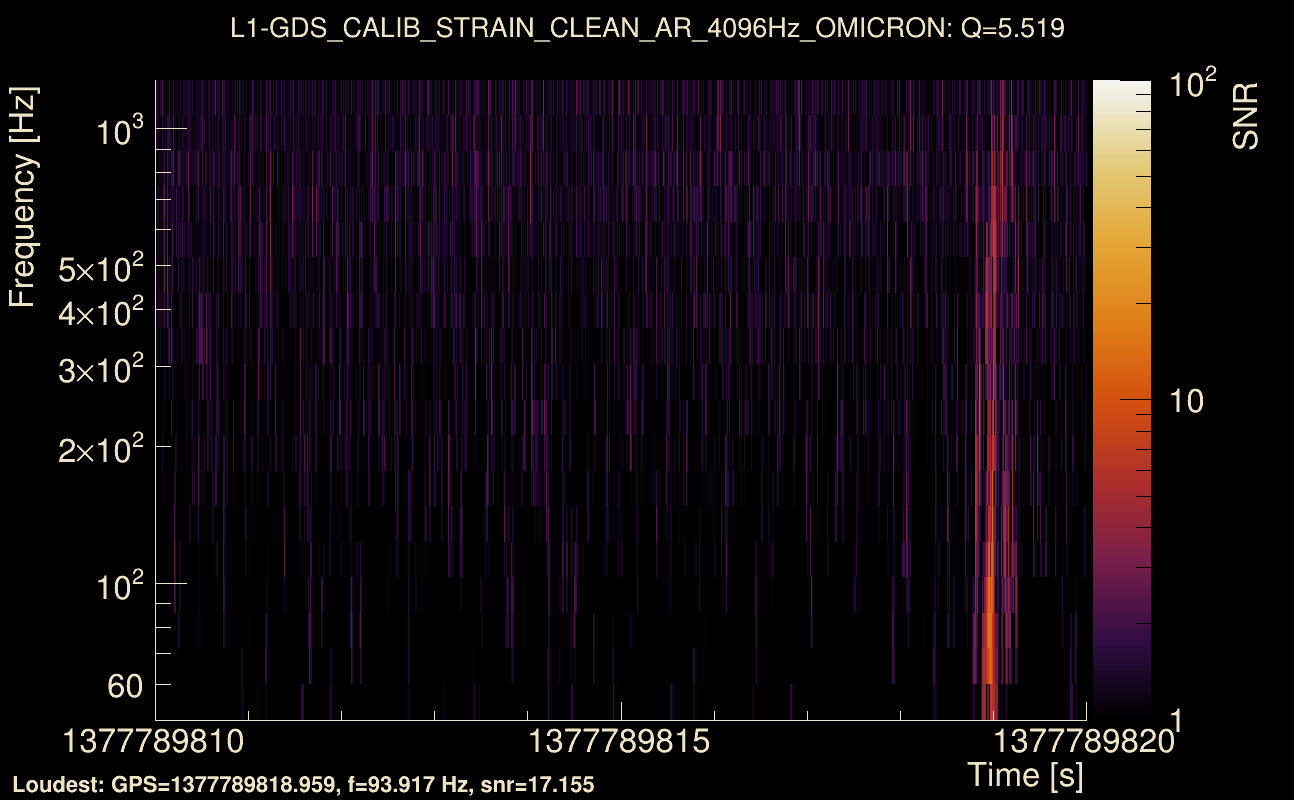
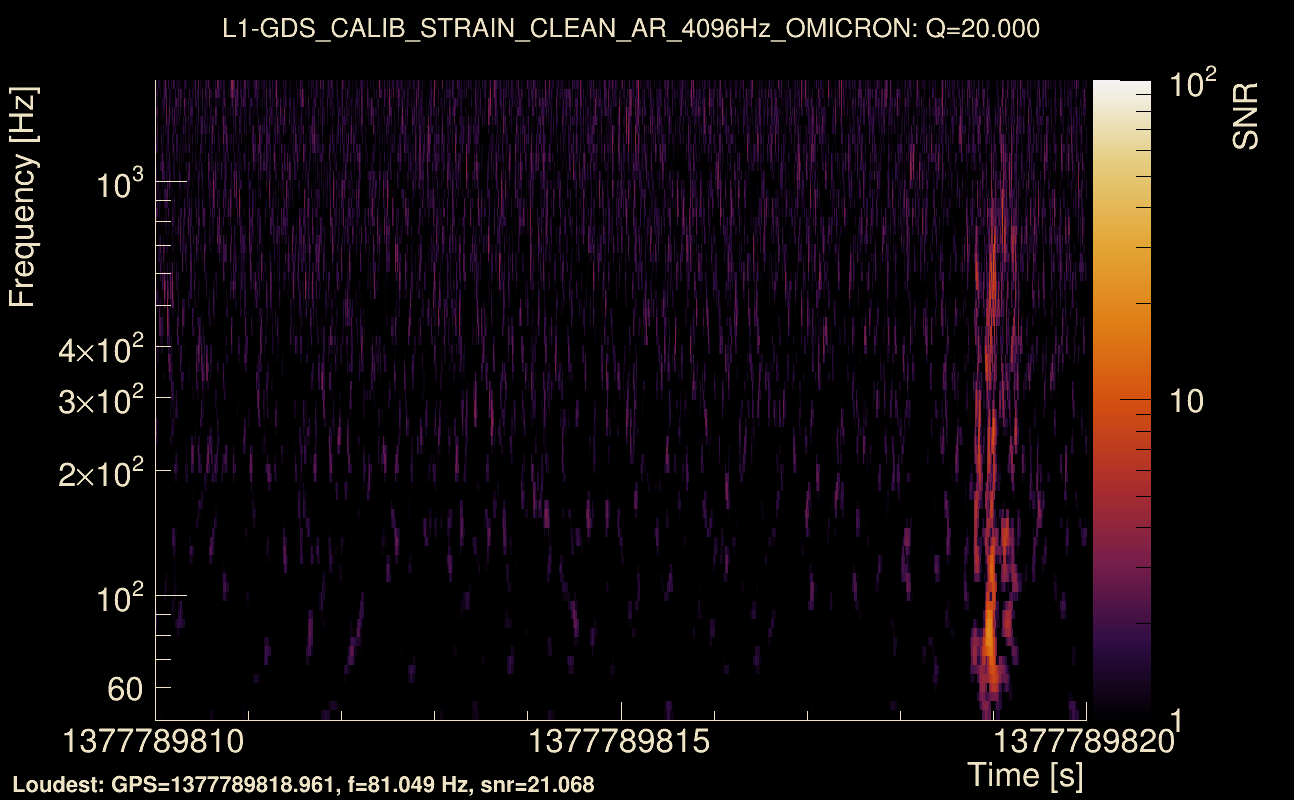
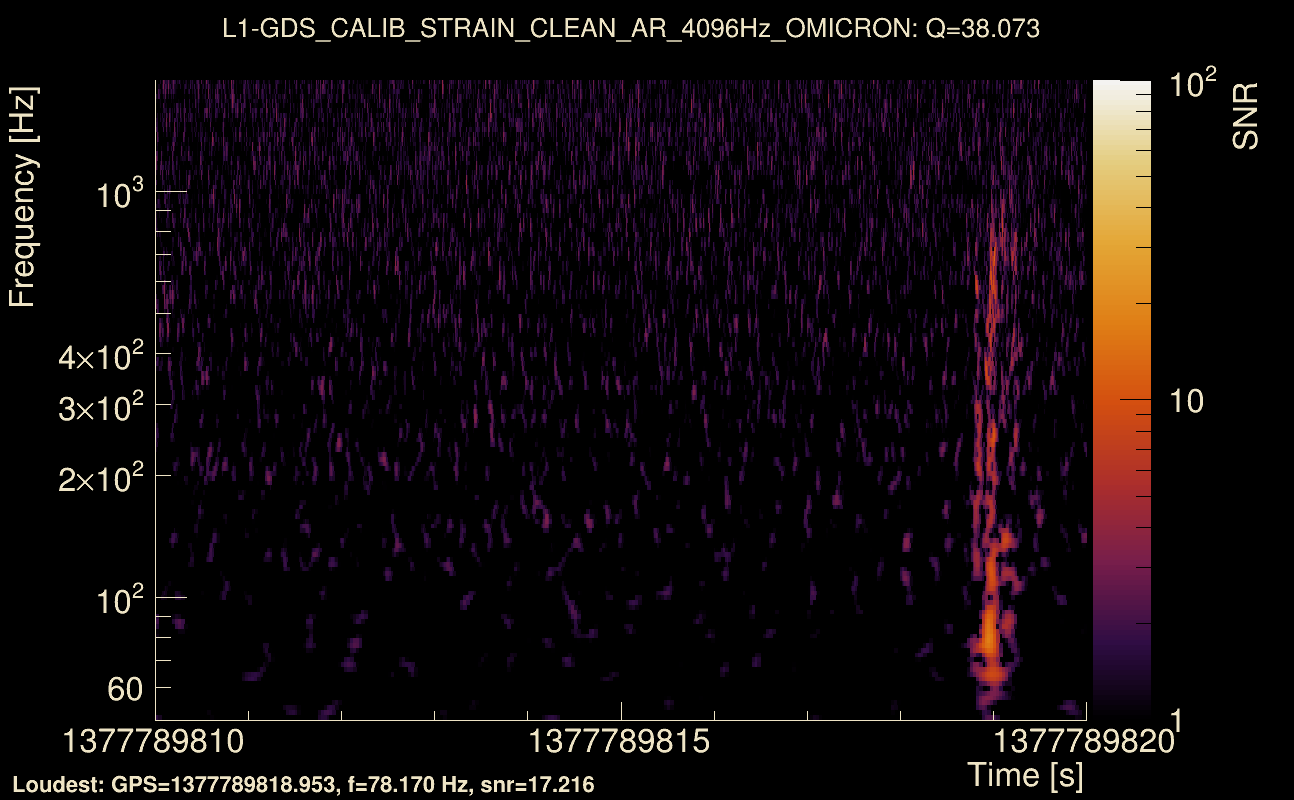
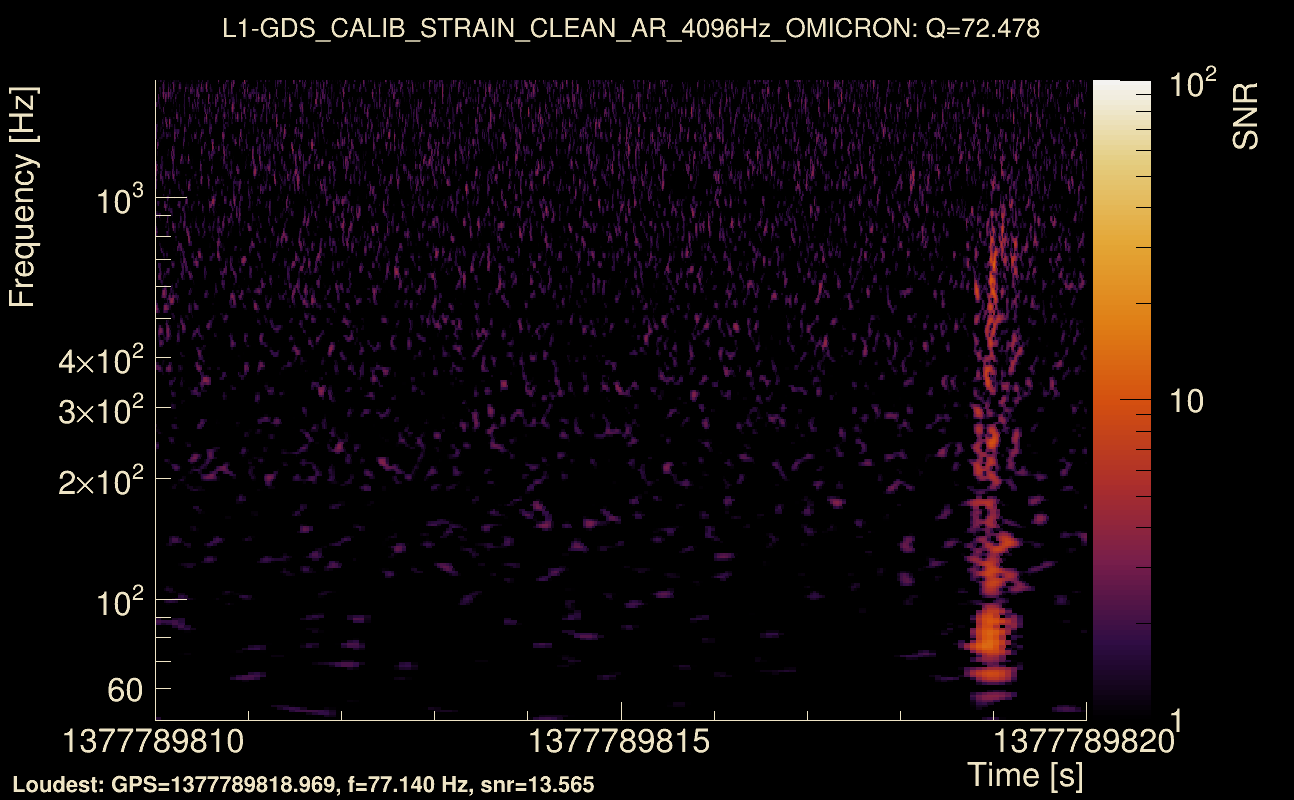
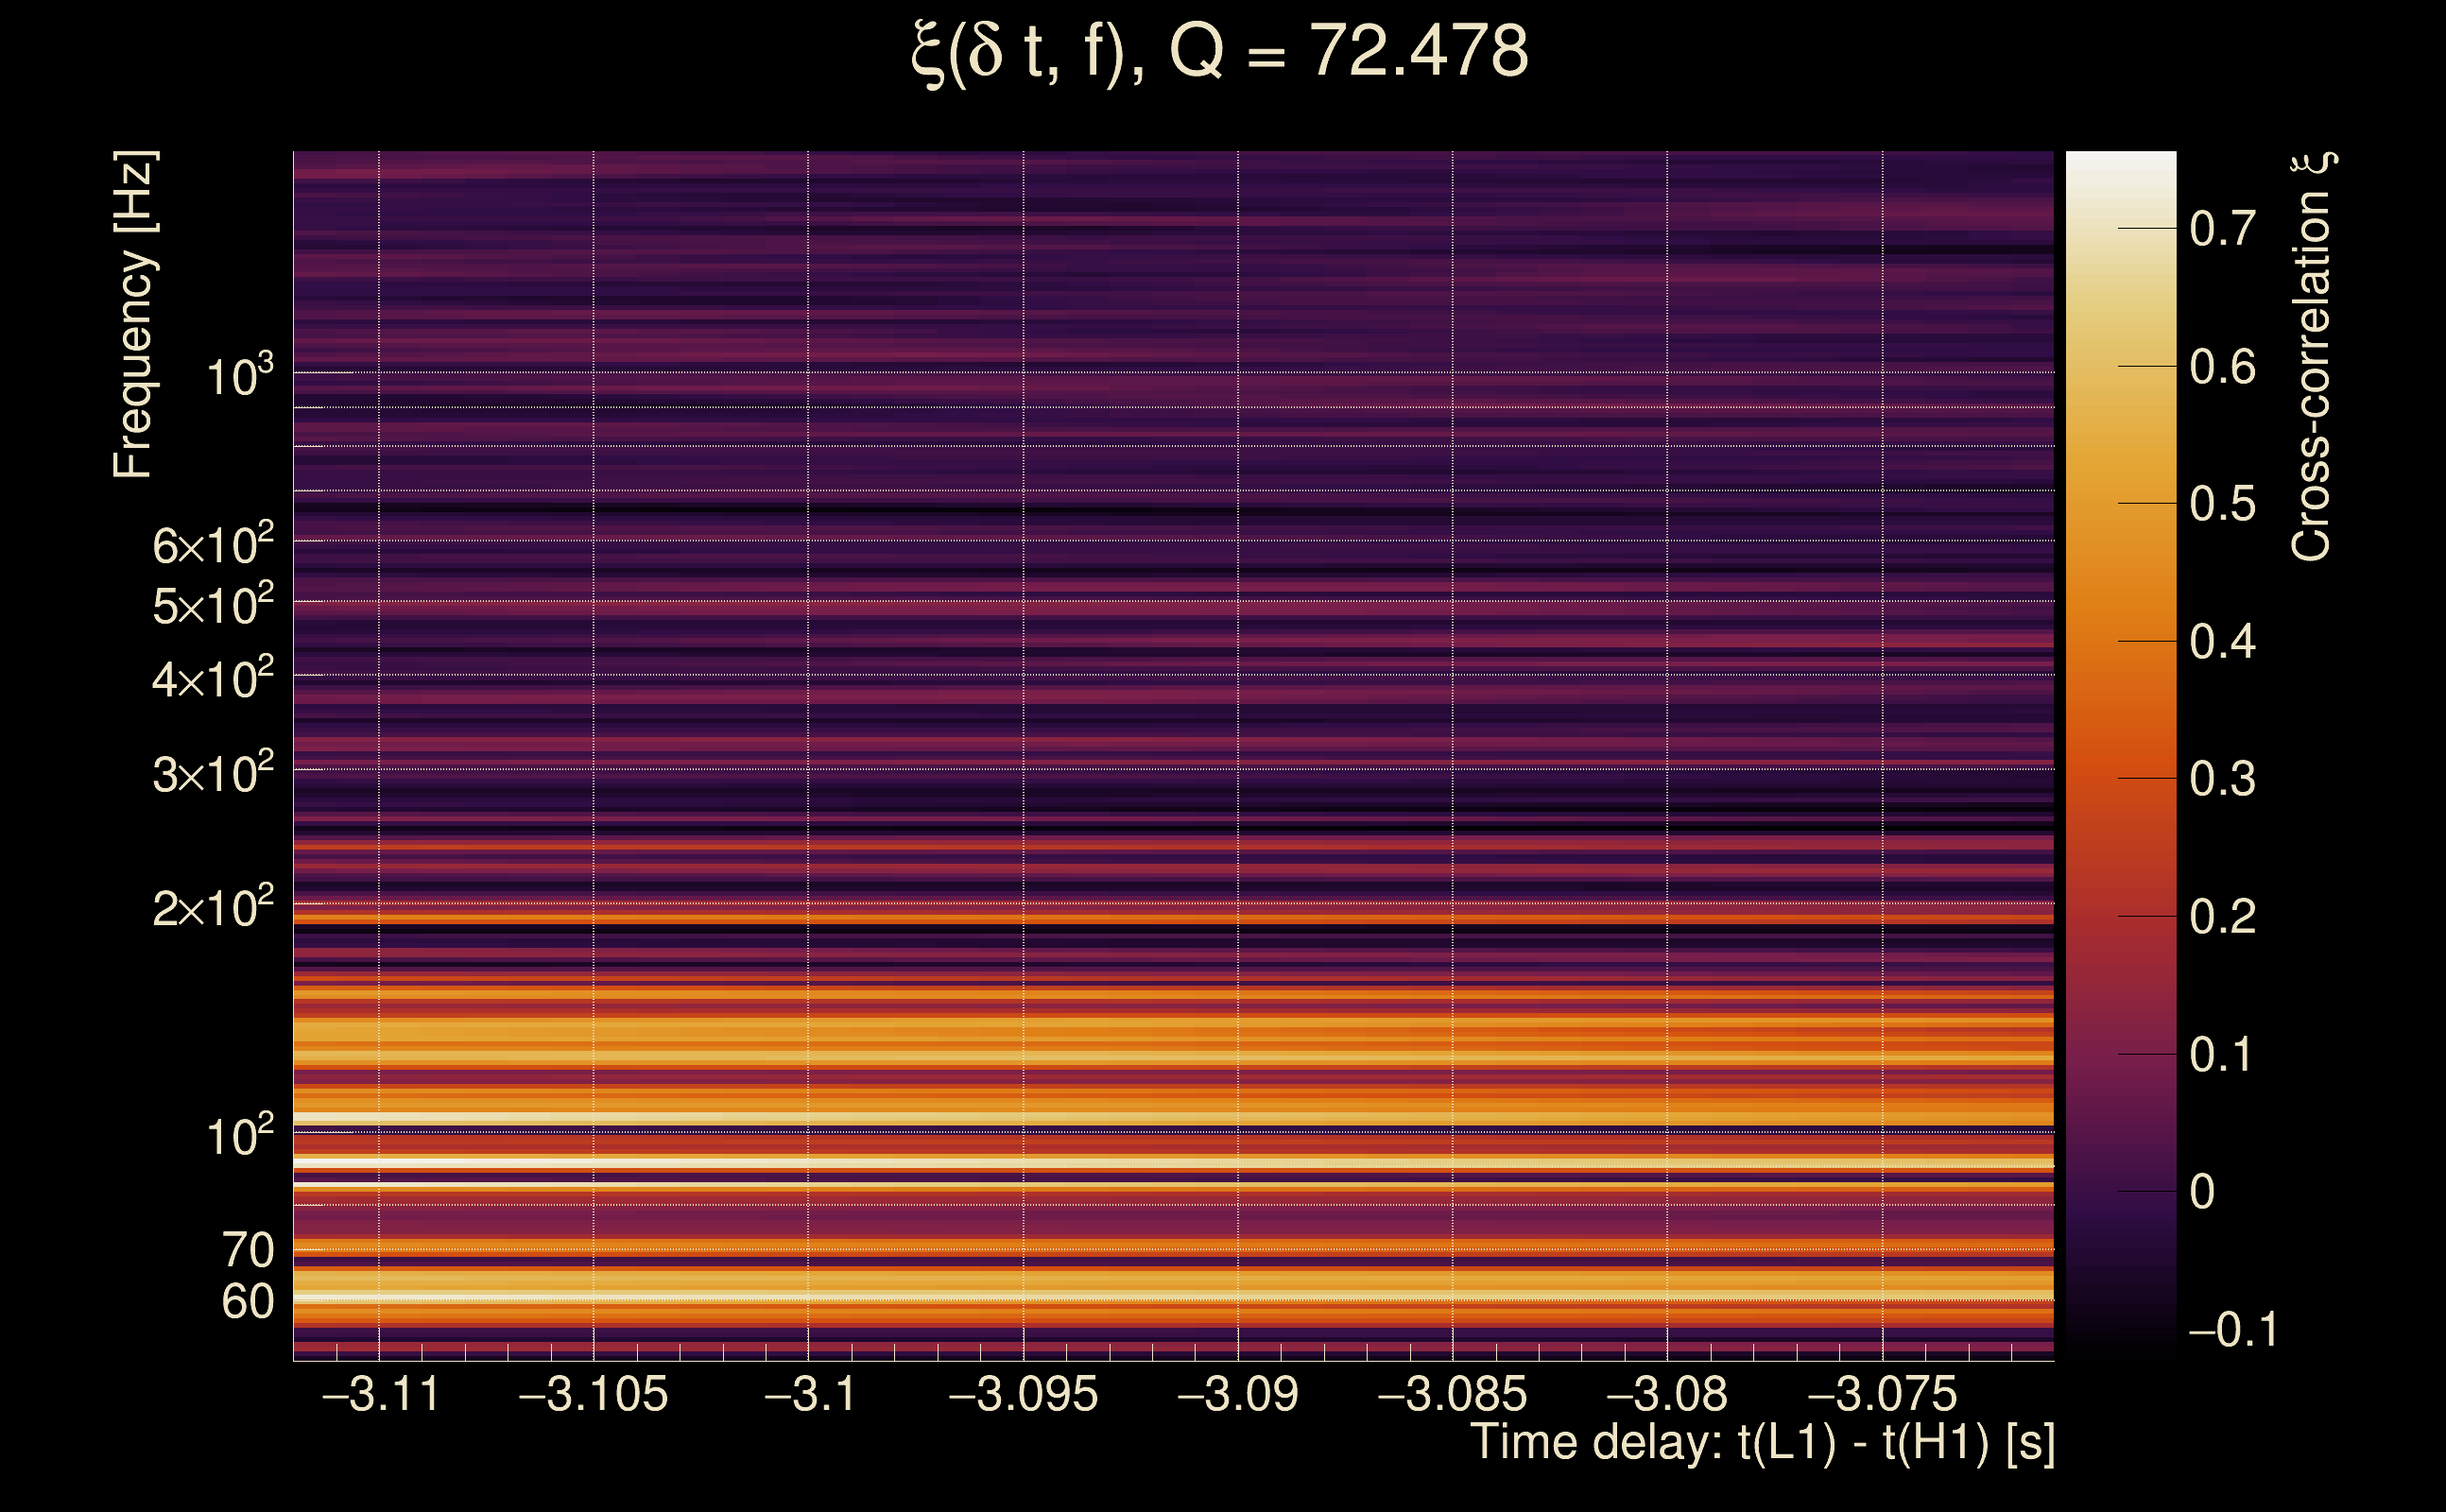
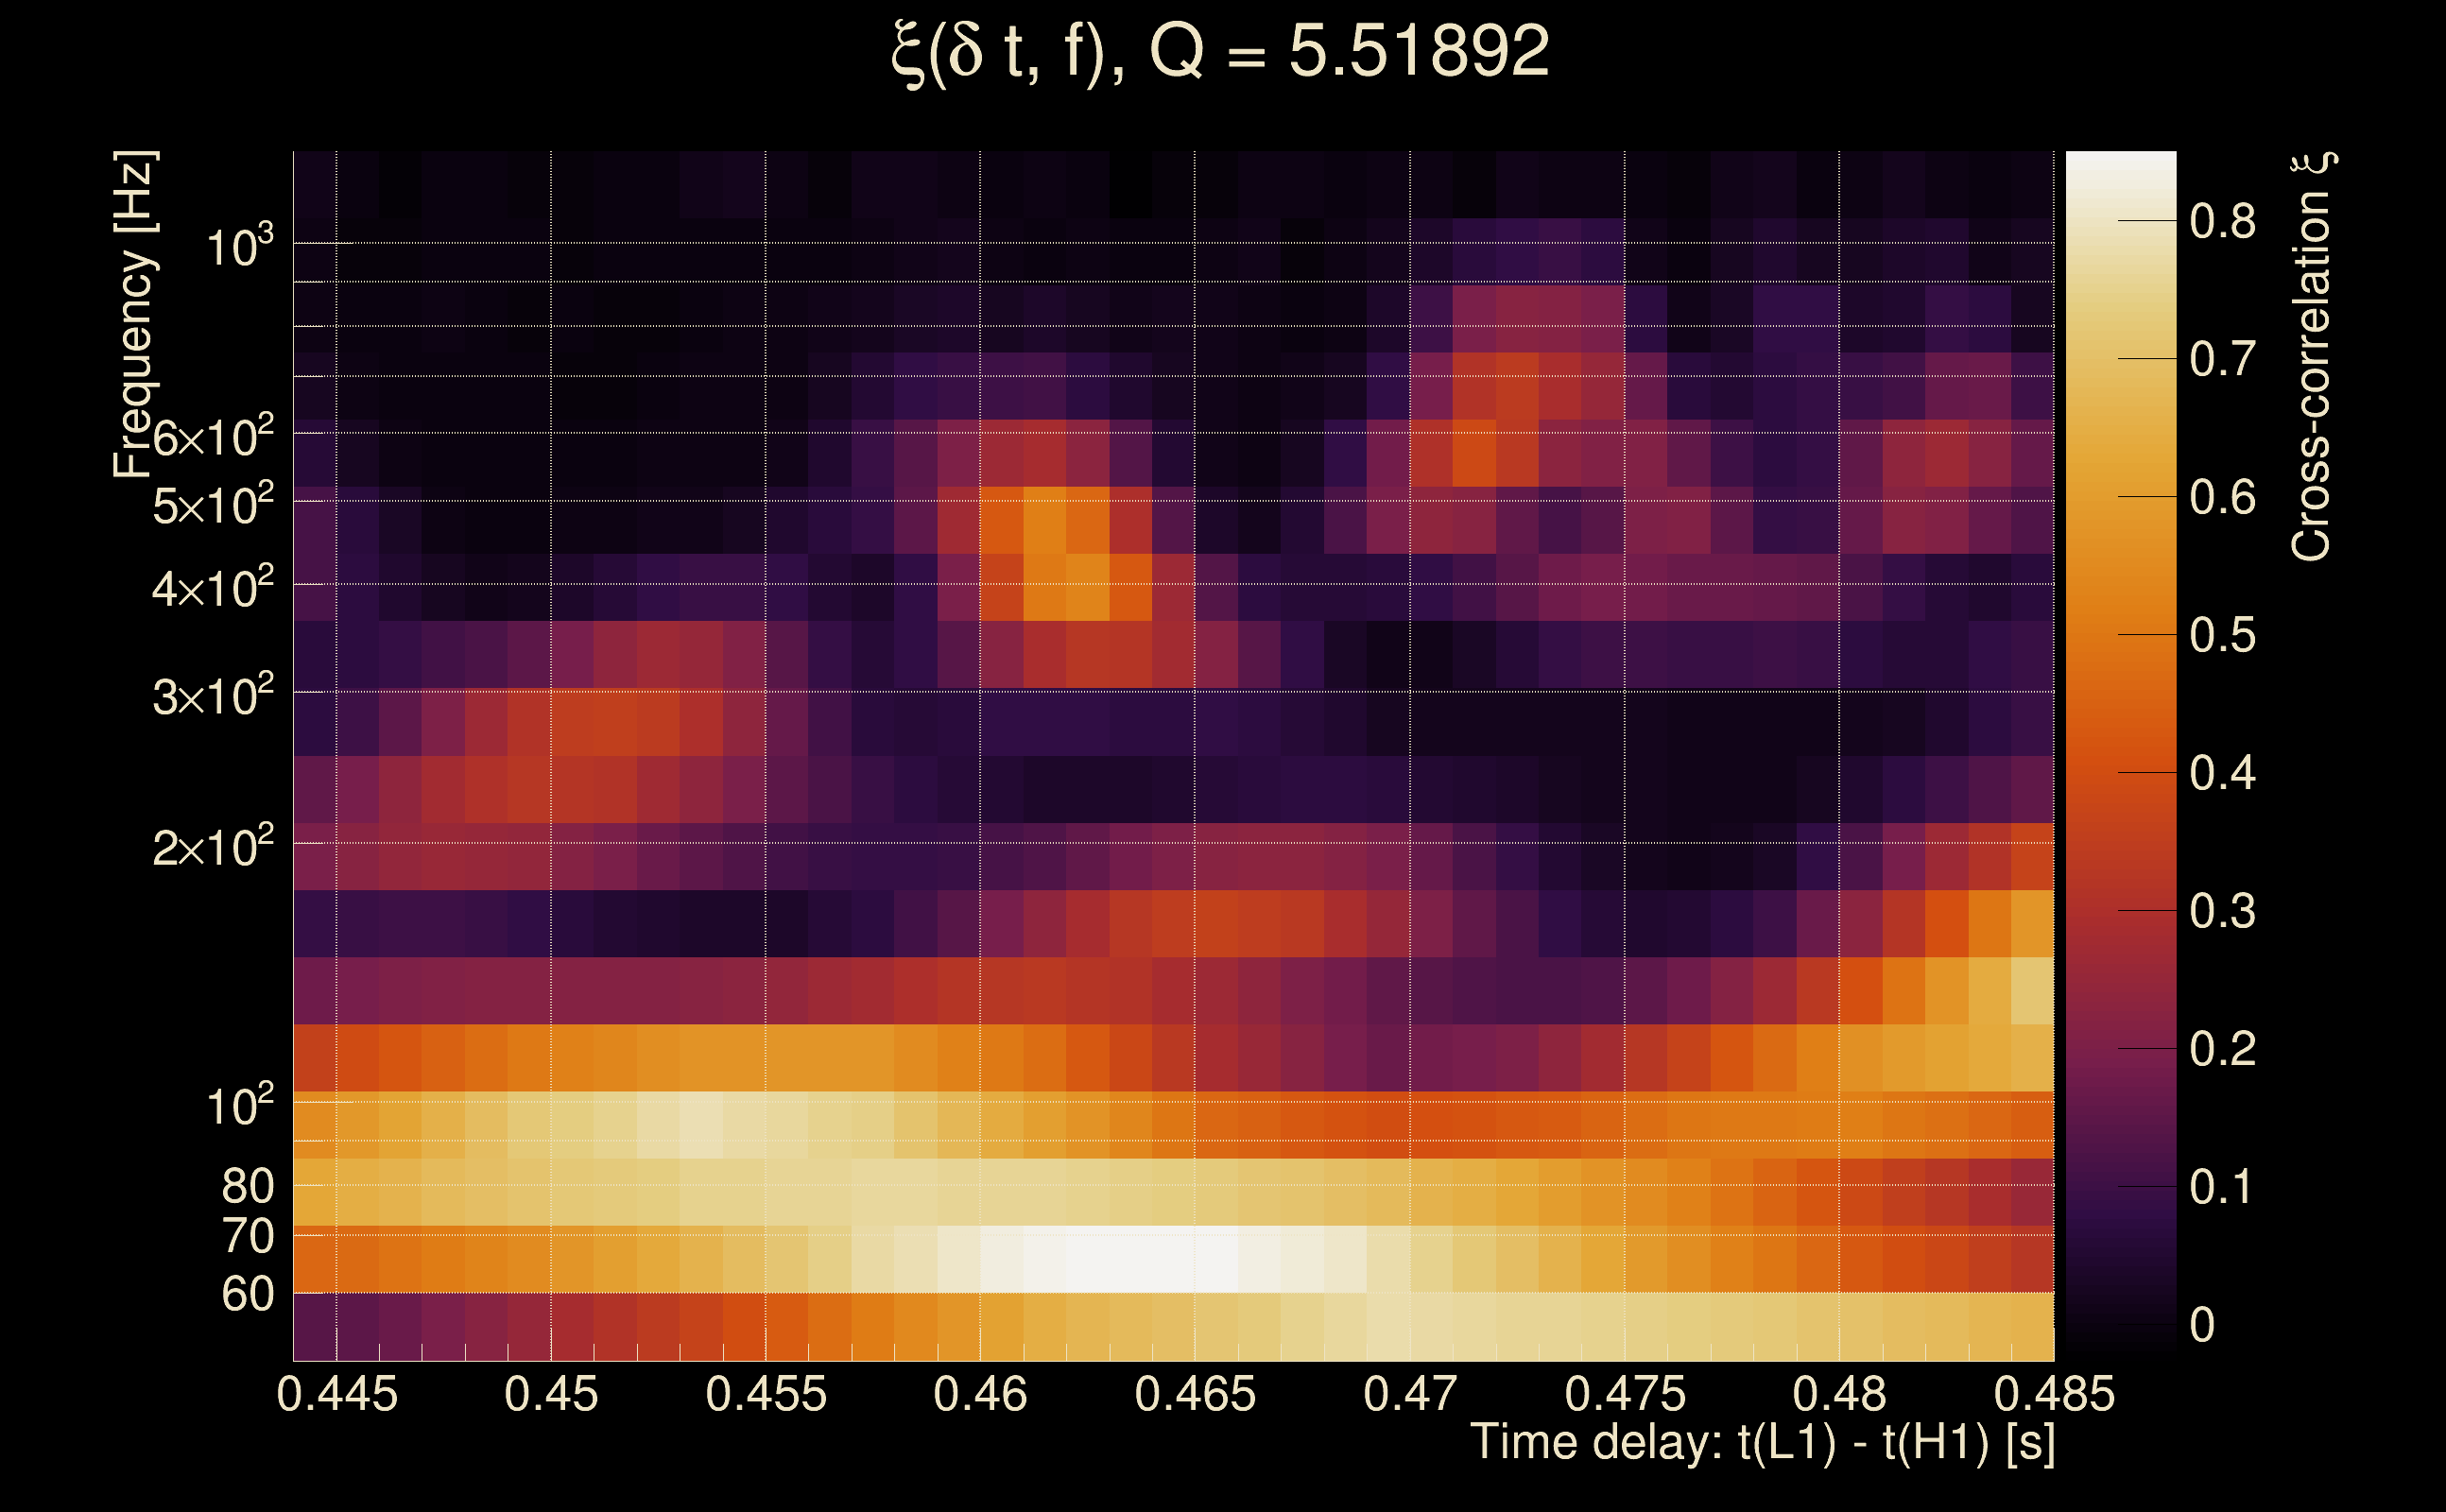
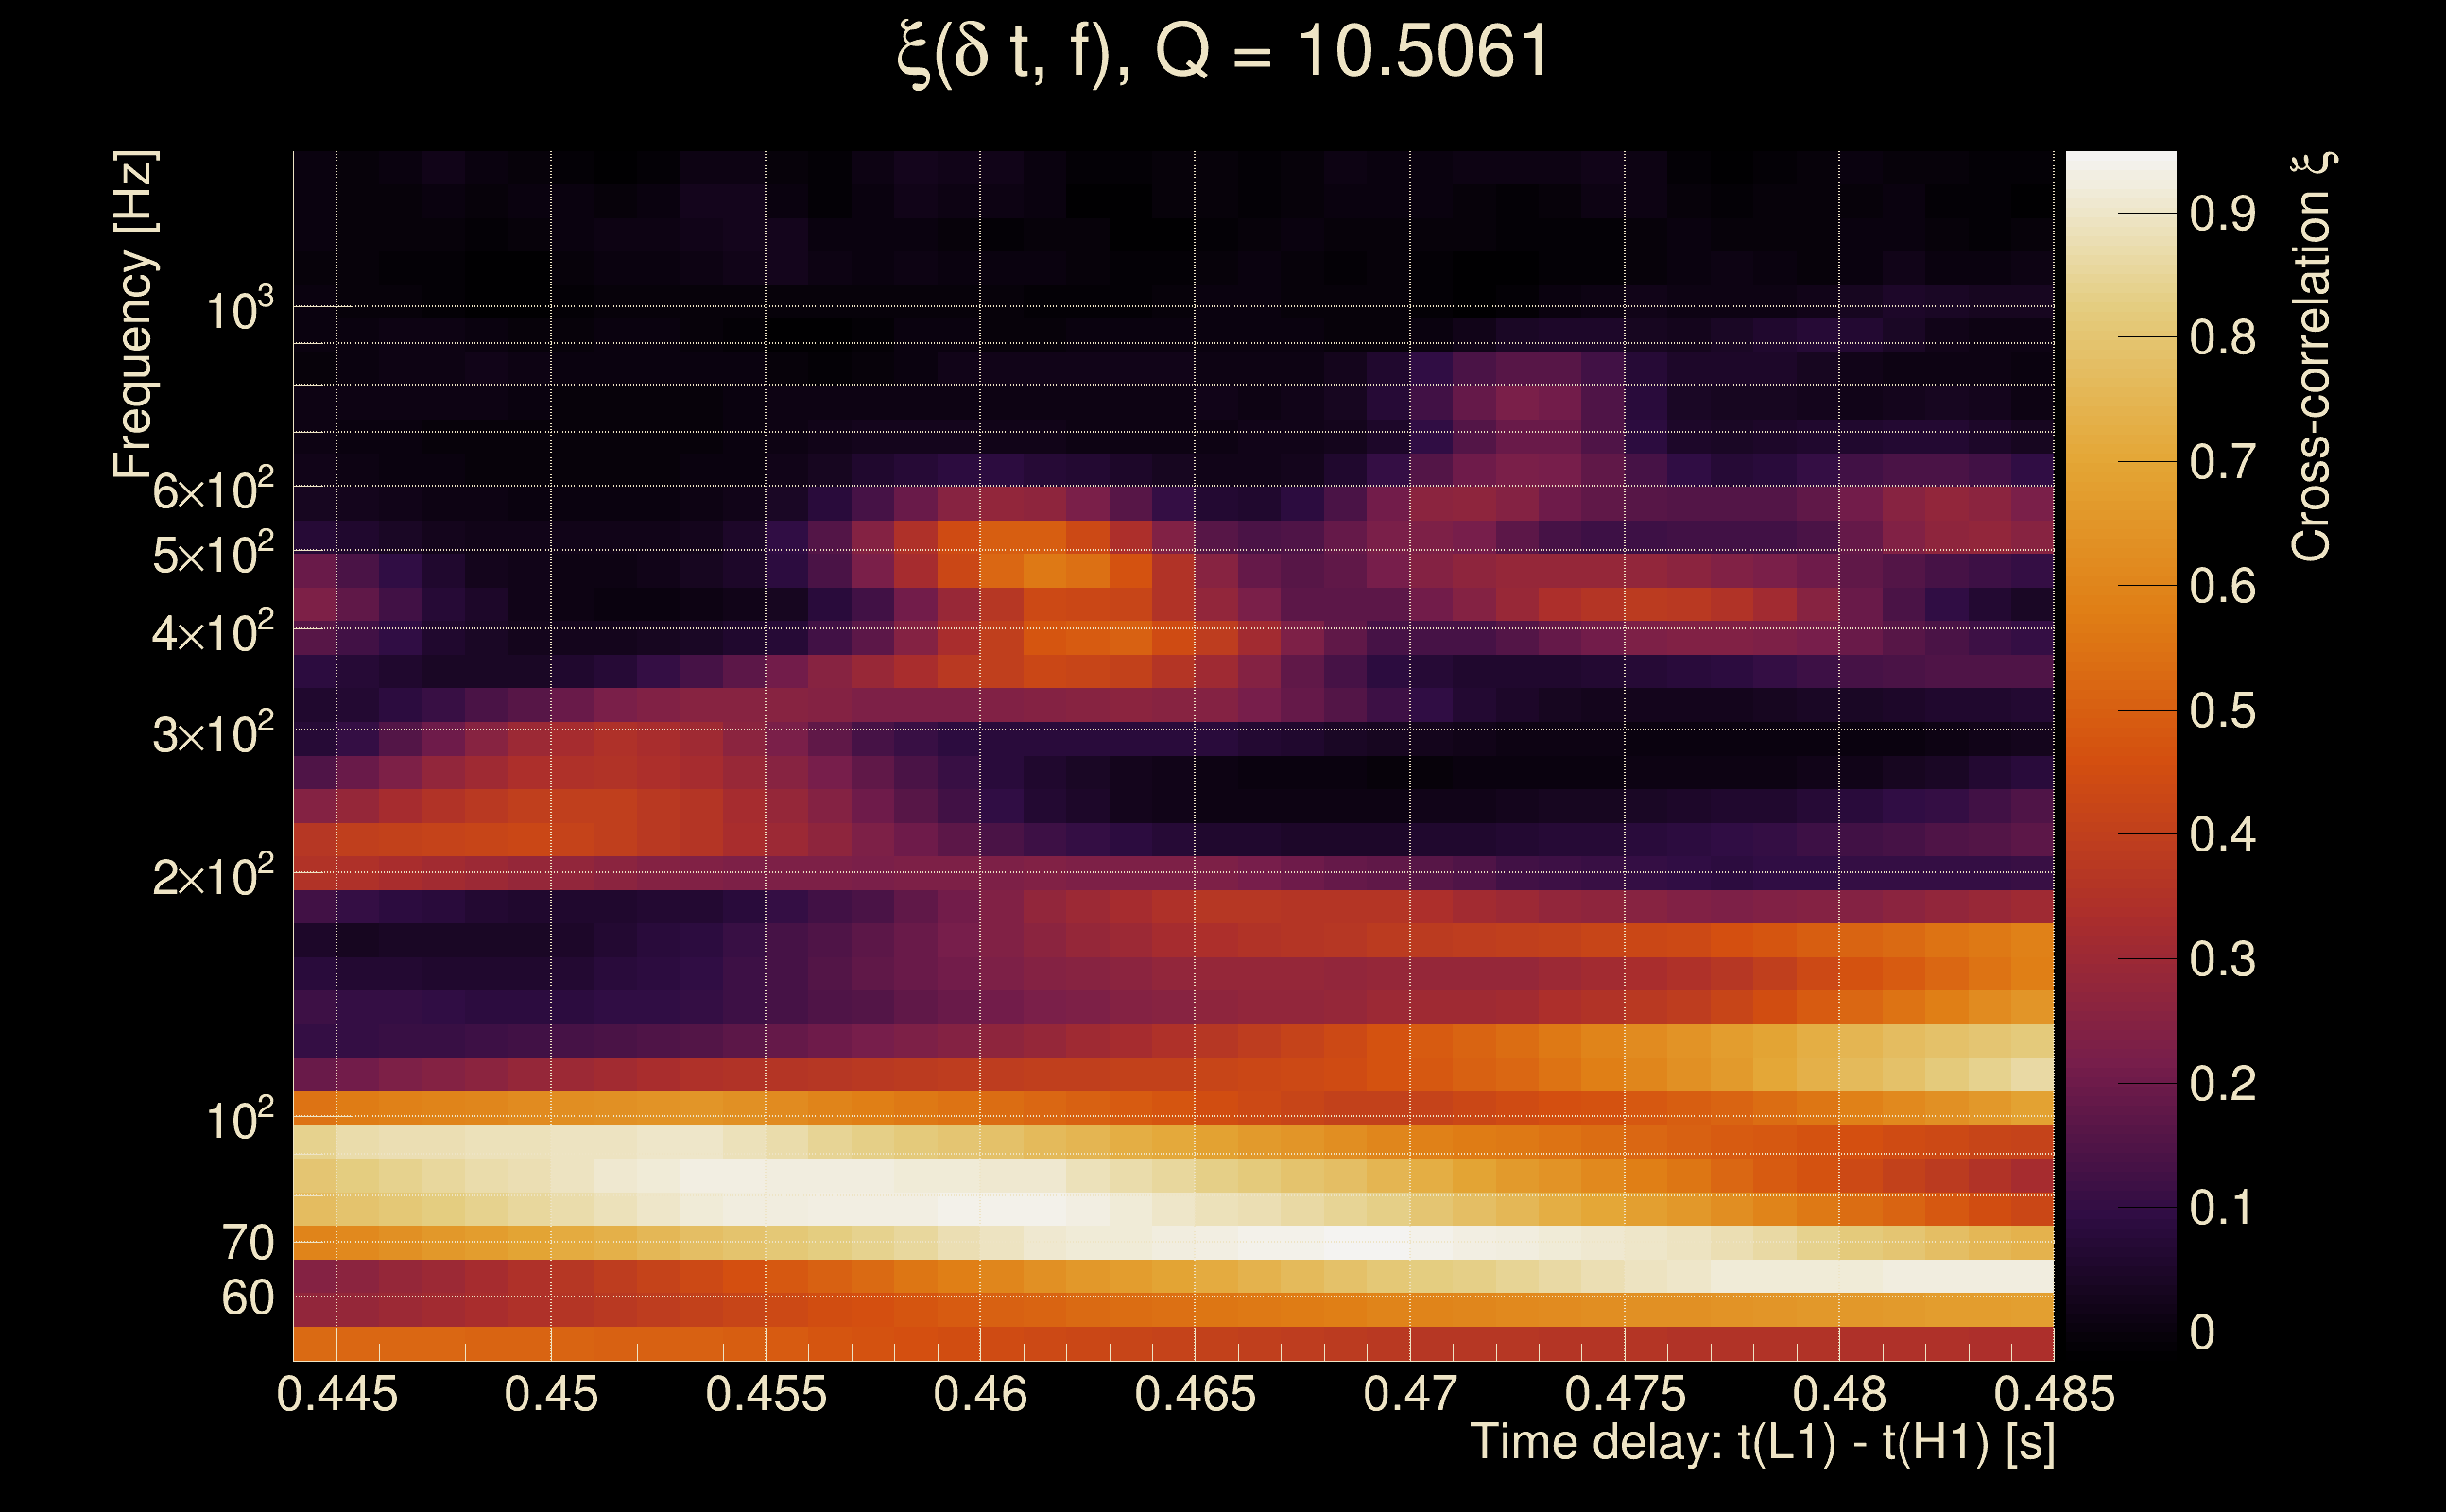
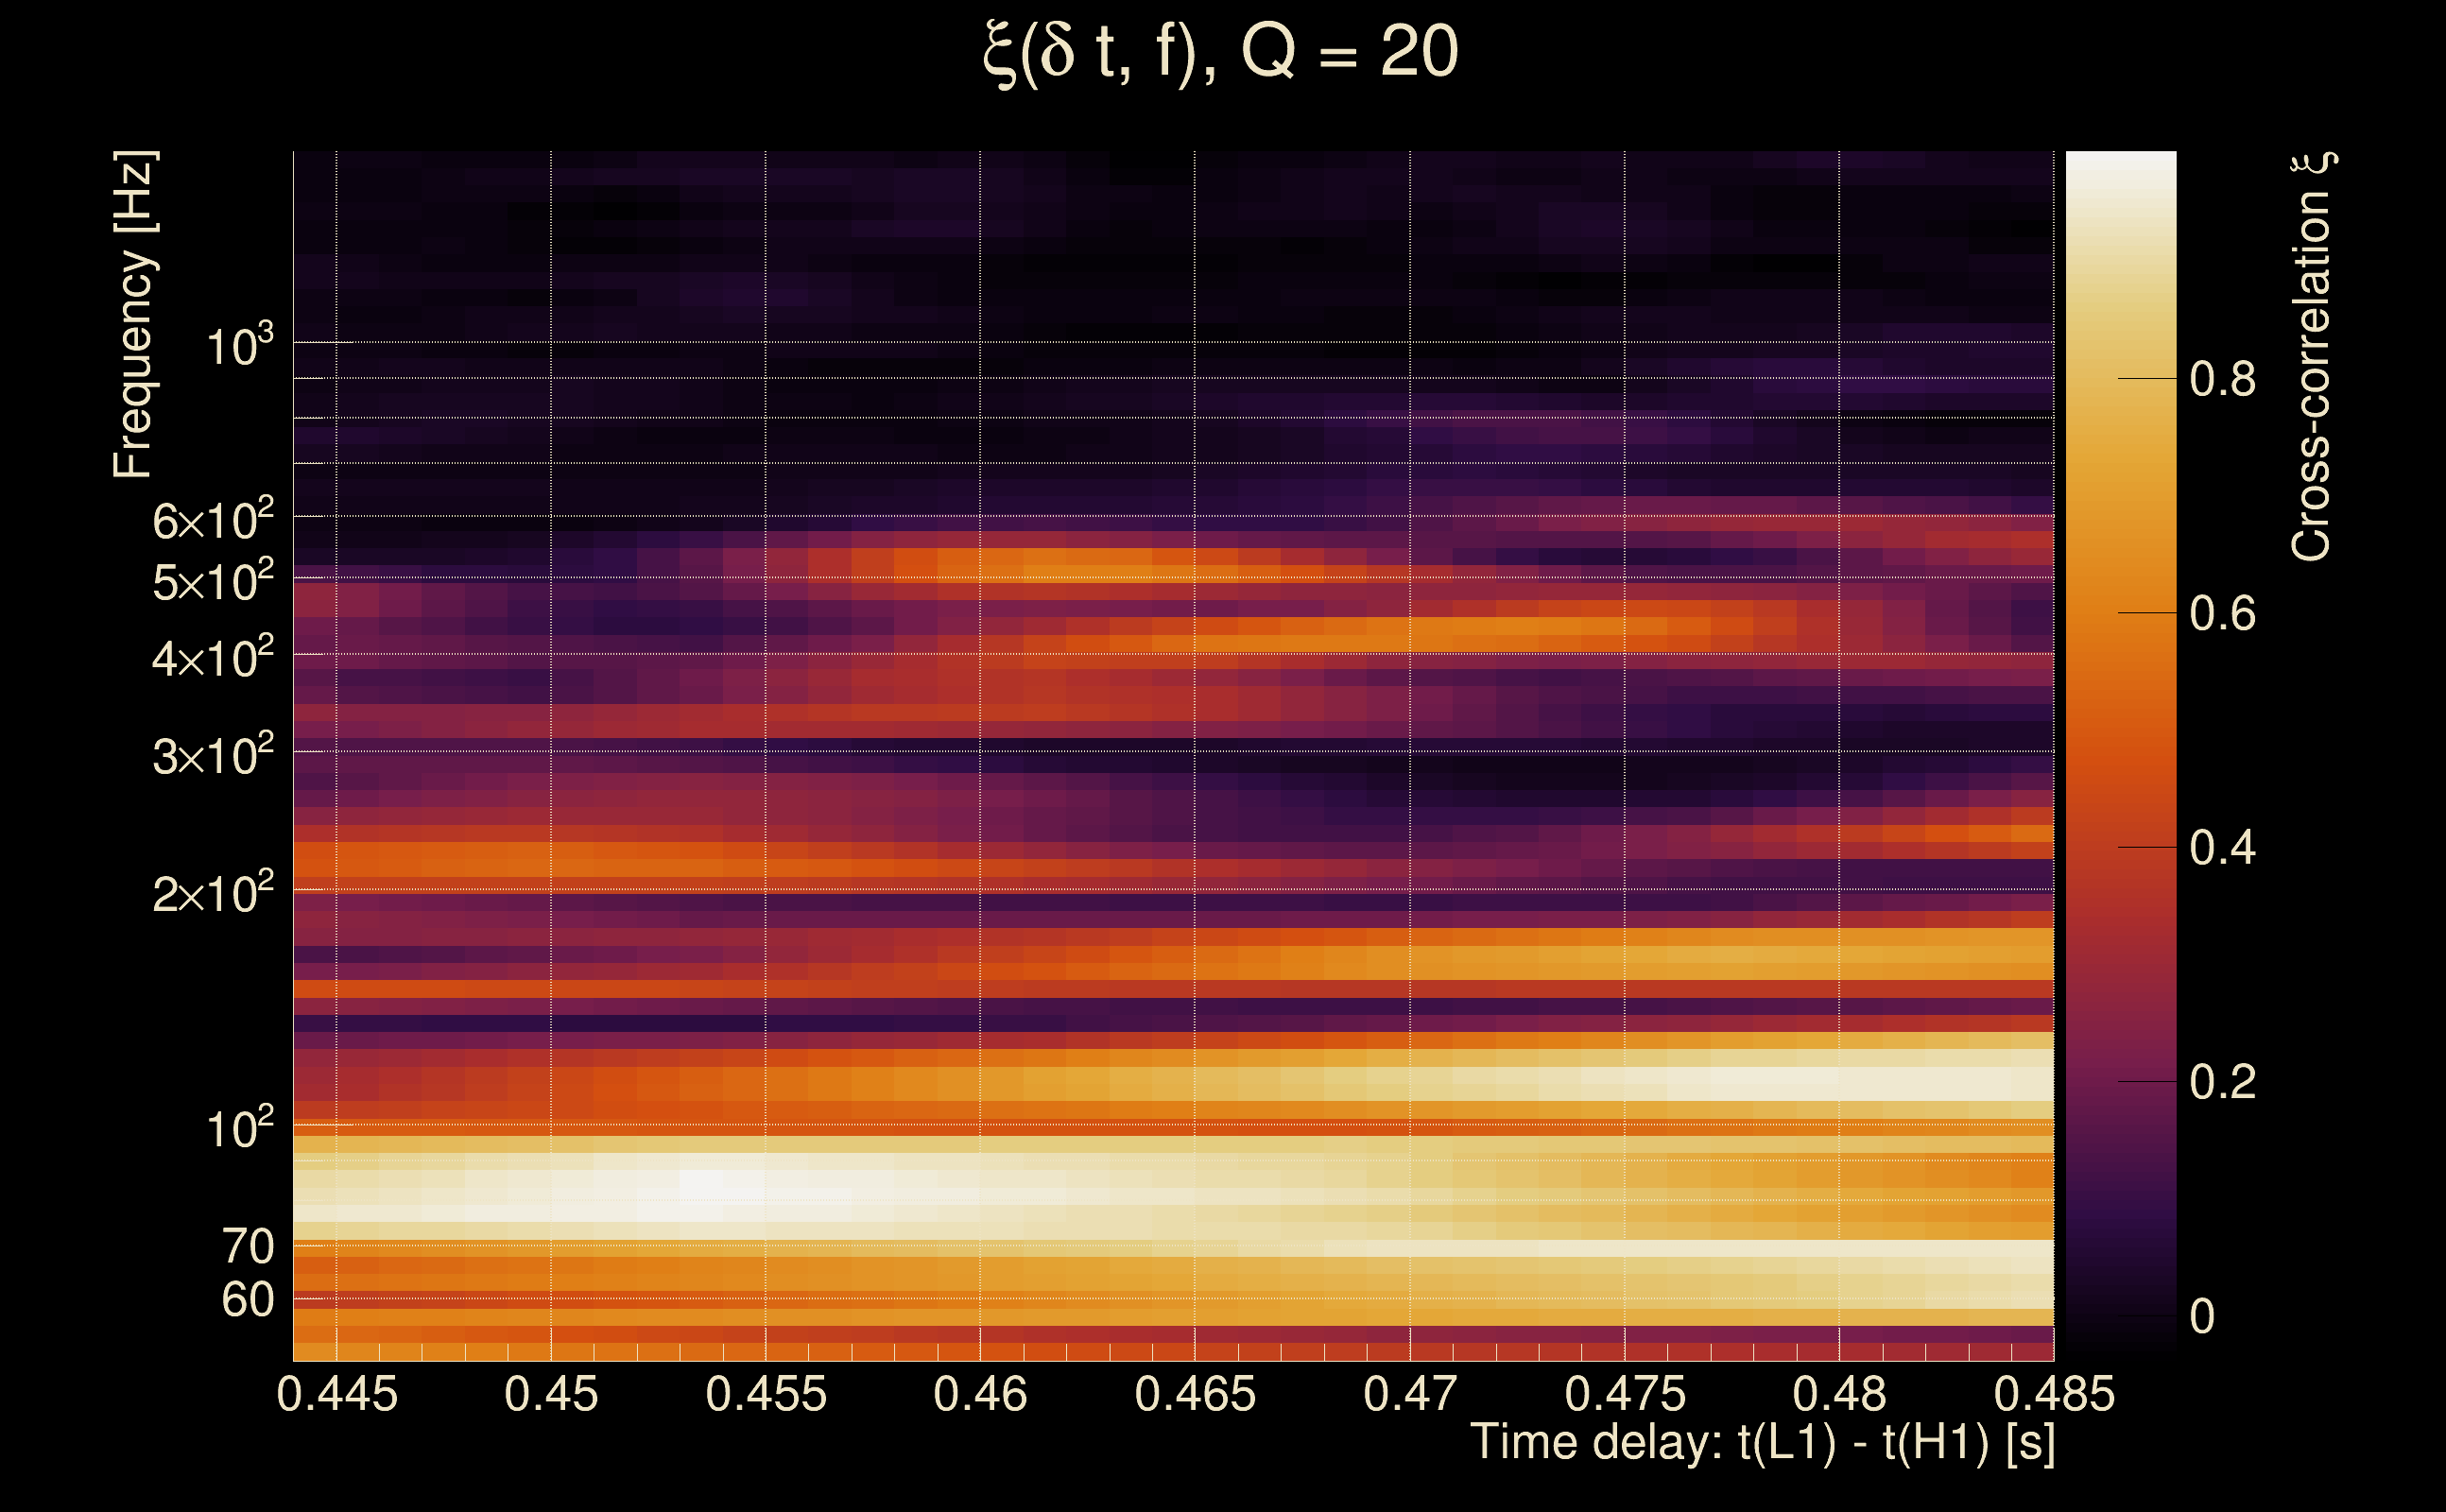
| Event time t(H1): | GPS = 1377789810 (Sun Sep 3 15:23:12 2023 ) → GPS = 1377789820 (Sun Sep 3 15:23:22 2023 ) |
| Event time t(L1): | GPS = 1377789810 (Sun Sep 3 15:23:22 2023 ) → GPS = 1377789820 (Sun Sep 3 15:23:22 2023 ) |
| Omicron analysis time window (H1): | GPS = 1377789807 → GPS = 1377789823 |
| Omicron analysis time window (L1): | GPS = 1377789807 → GPS = 1377789823 |
| Time delay between detectors t(L1) - t(H1): | 0.464813 s (slice index = 98 / 217), δt_gw = 0.00481251 s |
| Time delay uncertainty: | 0.00691271 s |
| [targeted mode] Time delay probability: | 0.445264 (0.763335 sigmas), δt_target = -0.00238872 s |
| Frequency: | 191.718 Hz |
| Ξ: | 0.353598 ± 0.0664978 (variance = 0.00442195): Q0: 0.568824, Q1: 0.601408, Q2: 0.699721, Q3: 0.752656, Q4: 0.674244 |
| Rank: | R_A = 0.353598 |
| Log of amplitude ratio (L1/H1): | -1.41402, variance = 0.50544 (L1/H1: -1.48984, variance = 0.585753, H1/L1: 0.482947, variance = 0.80821) |
| Amplitude ratio (L1/H1): | 0.243164 ⋇ 2.03591 (L1/H1: 0.225408 ⋇ 2.14974, H1/L1: 1.62084 ⋇ 2.45716) |
| Amplitude ratio H1|L1 compatibility (probability): | 0.393758 |
| Antenna factor probability: | 1 |
| Number of rejected frequency rows: | Q0: 6 / 18, Q1: 12 / 36, Q2: 44 / 70, Q3: 86 / 134, Q4: 199 / 258 |
| Maximum signal-to-noise ratio: | H1: 93.0124, L1: 26.5428 |
| SNR variance: | H1: 0.515996, L1: 0.501822 |
| Click here for a zoomed plot | Click here for a zoomed plot | Click here for a zoomed plot | Click here for a zoomed plot | Click here for a zoomed plot |
 |
 |
 |
 |
 |
 |
 |
 |
 |
 |
 |
 |
 |
 |
 |
 |
 |
 |
 |
 |
 |
 |
 |
 |
 |
 |
 |
 |
 |
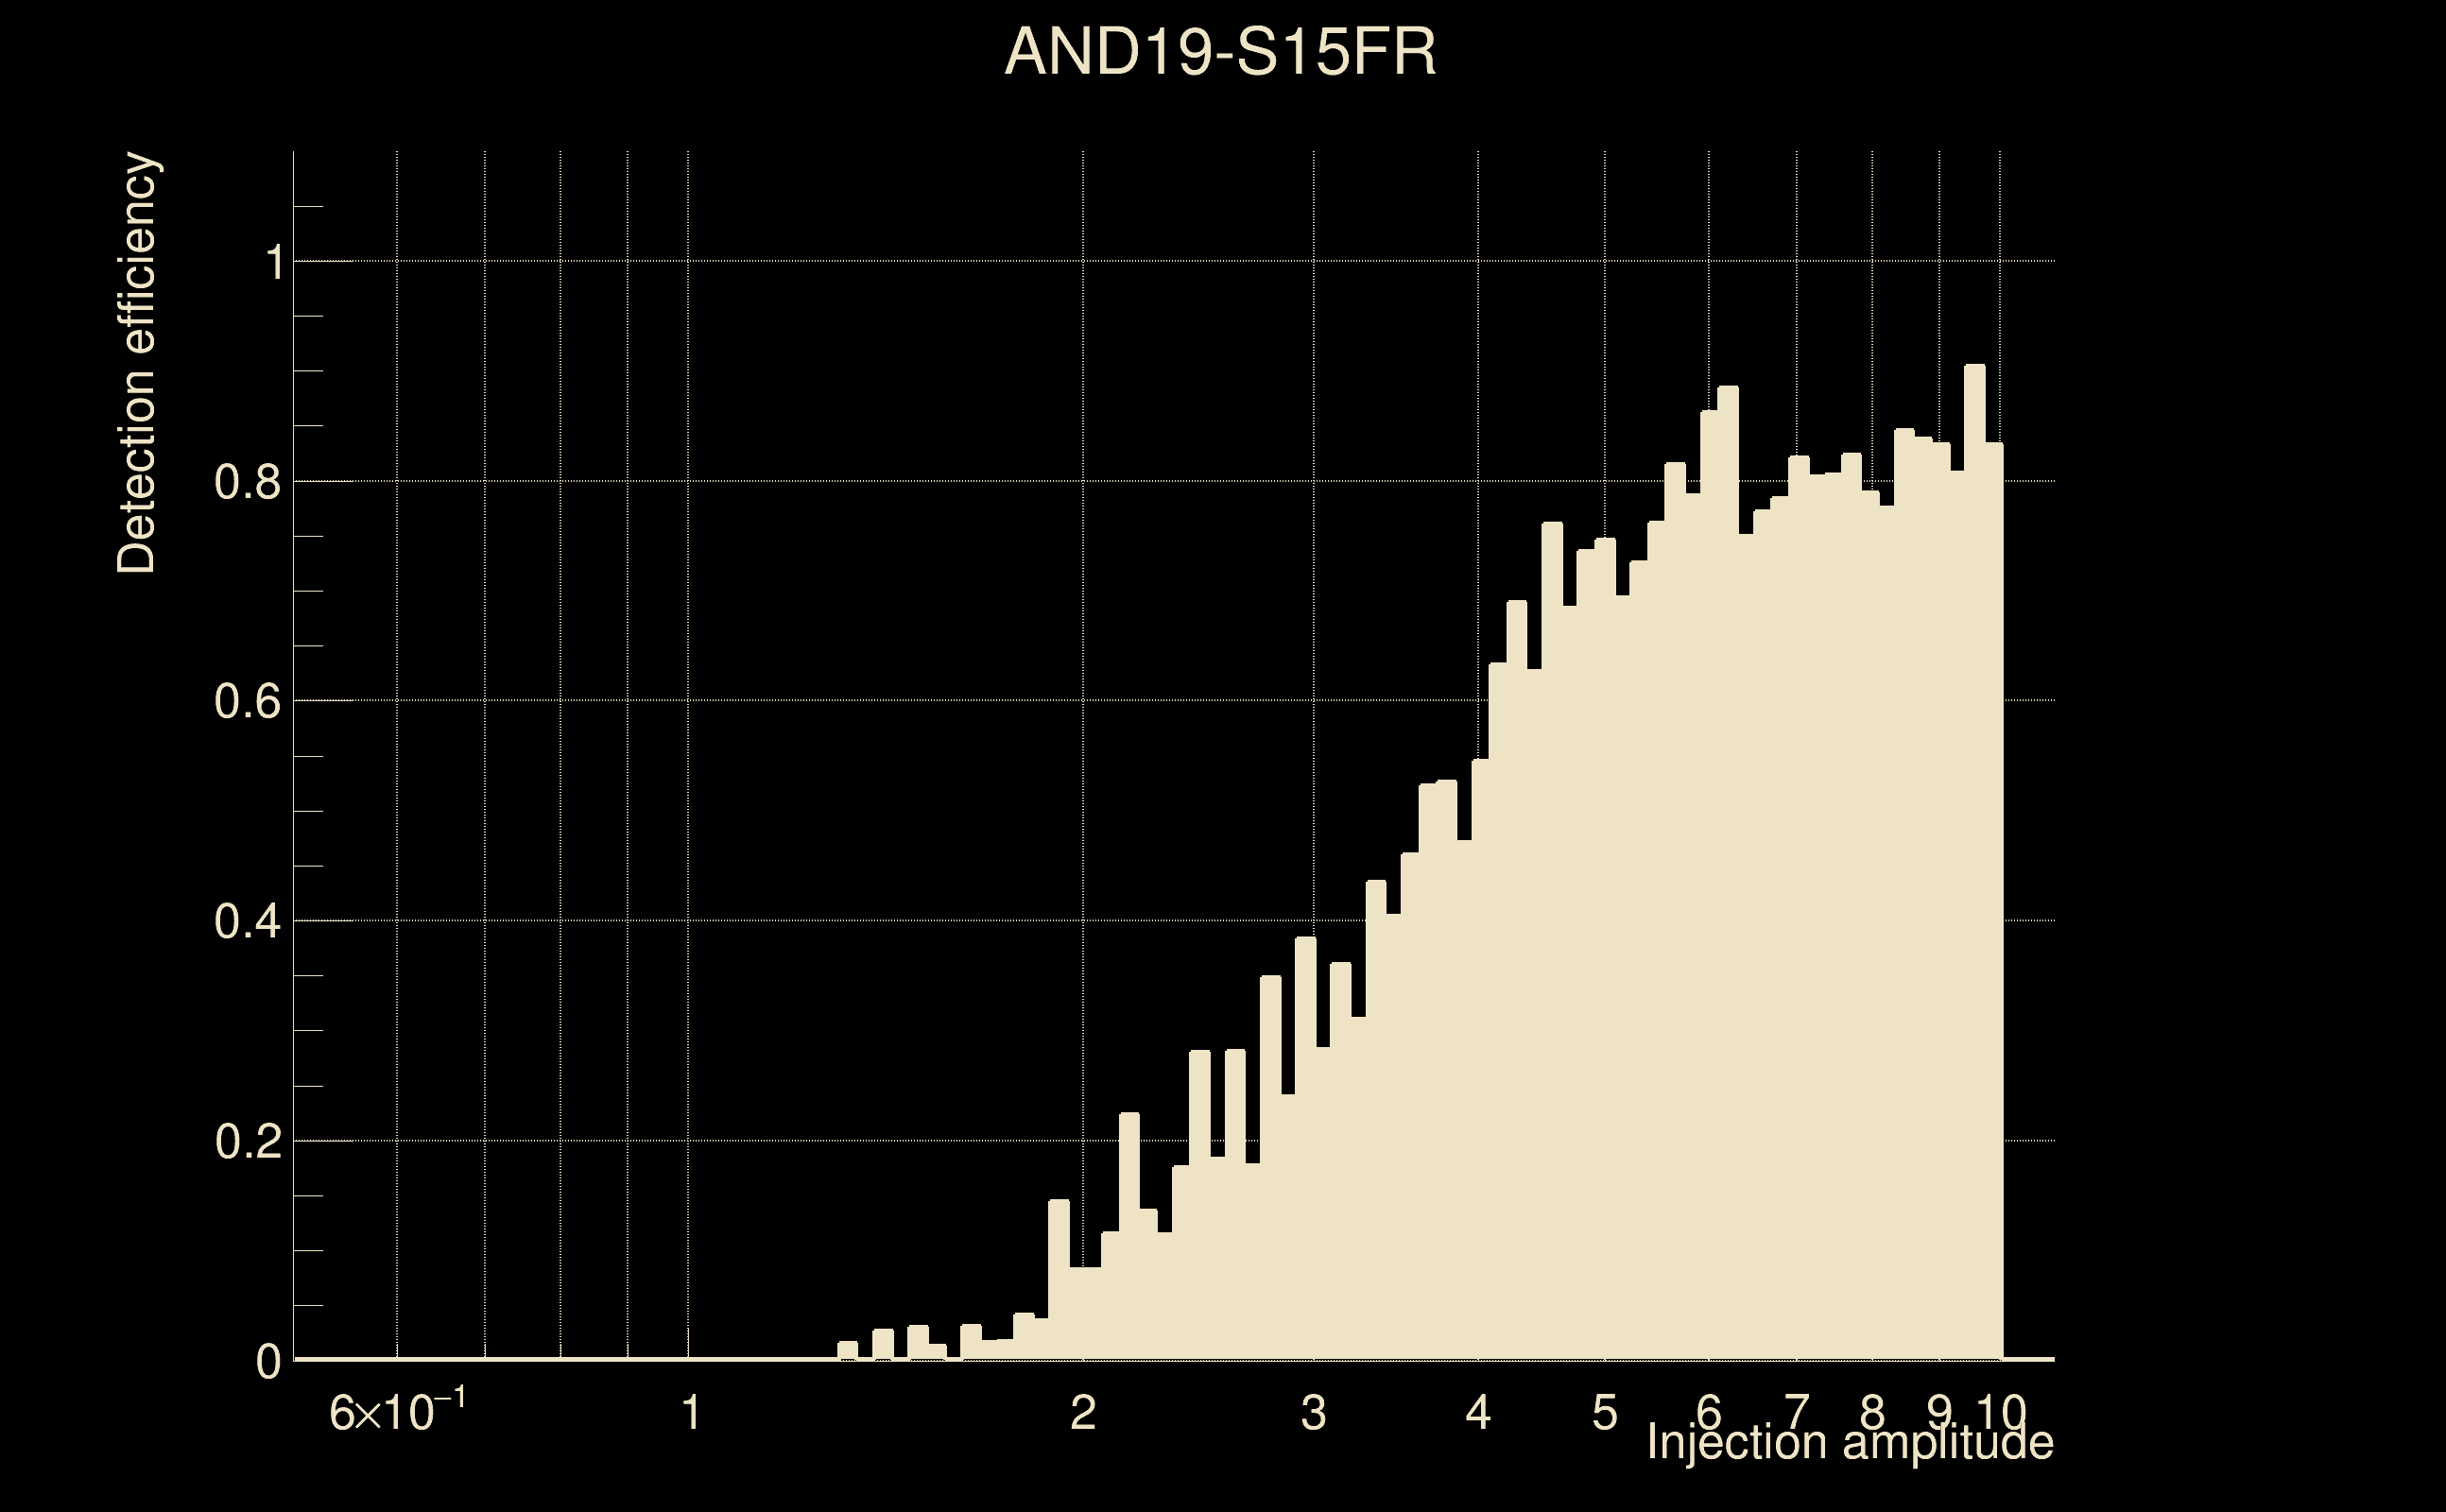
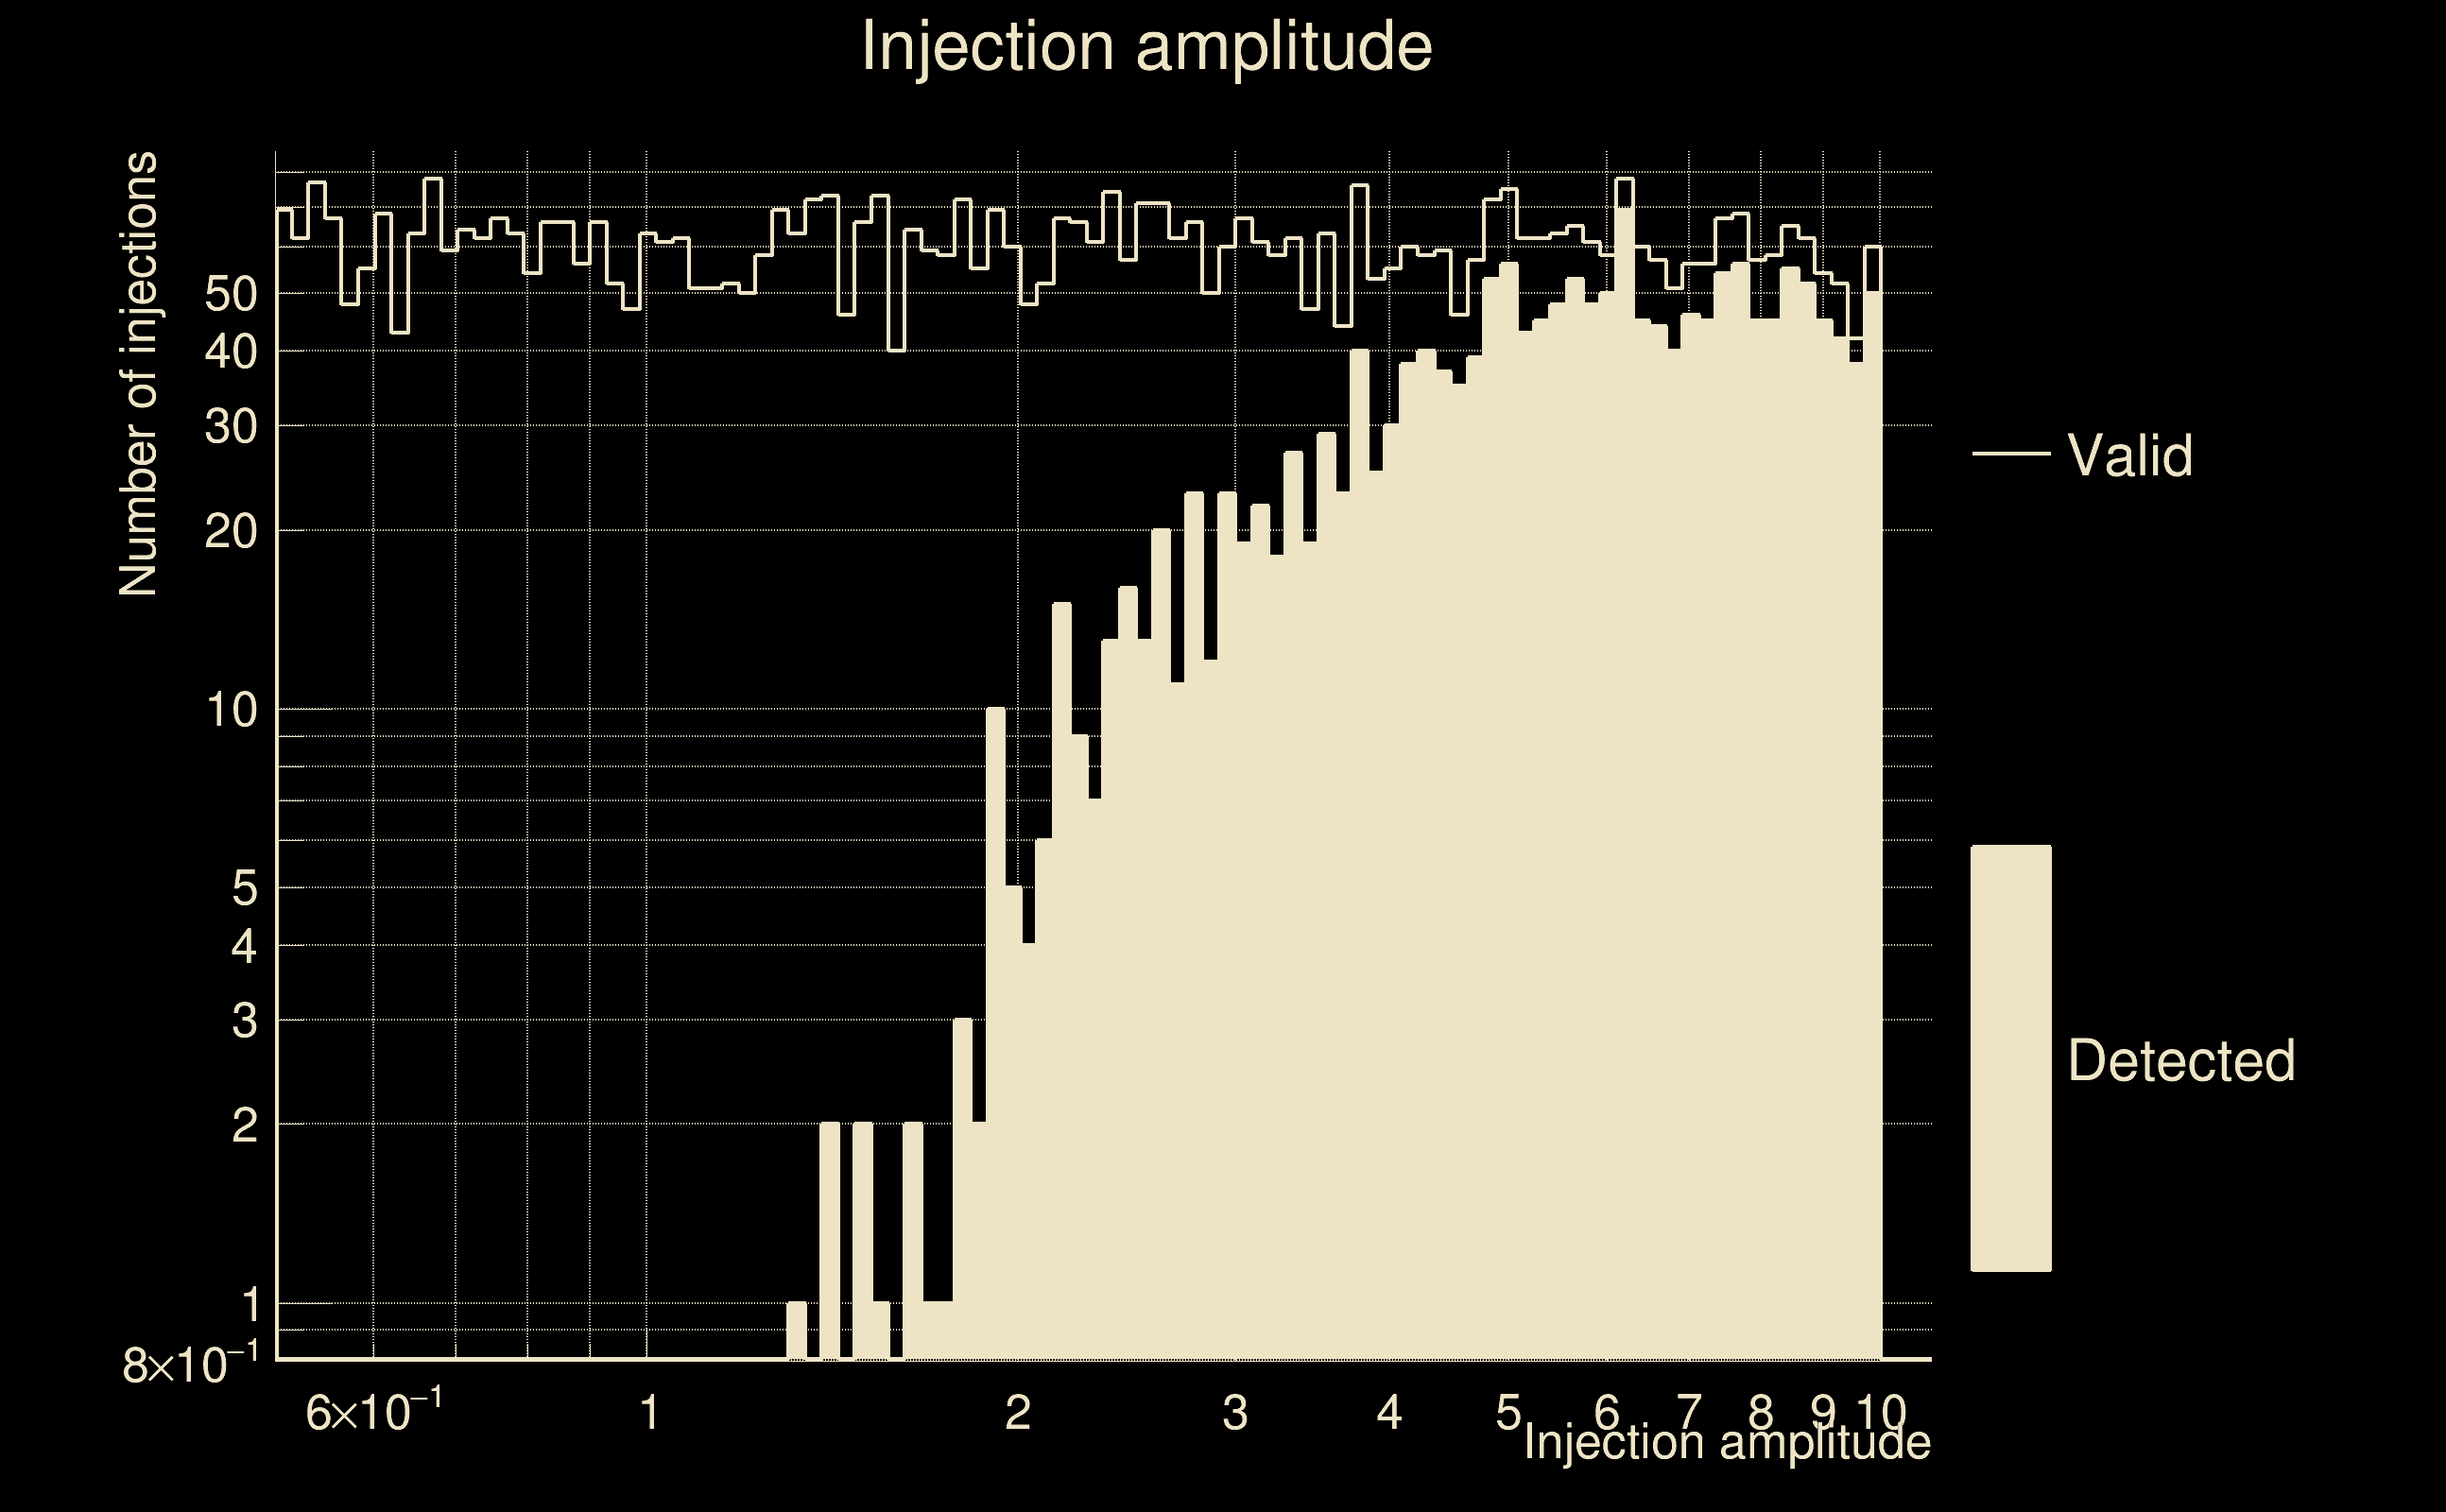
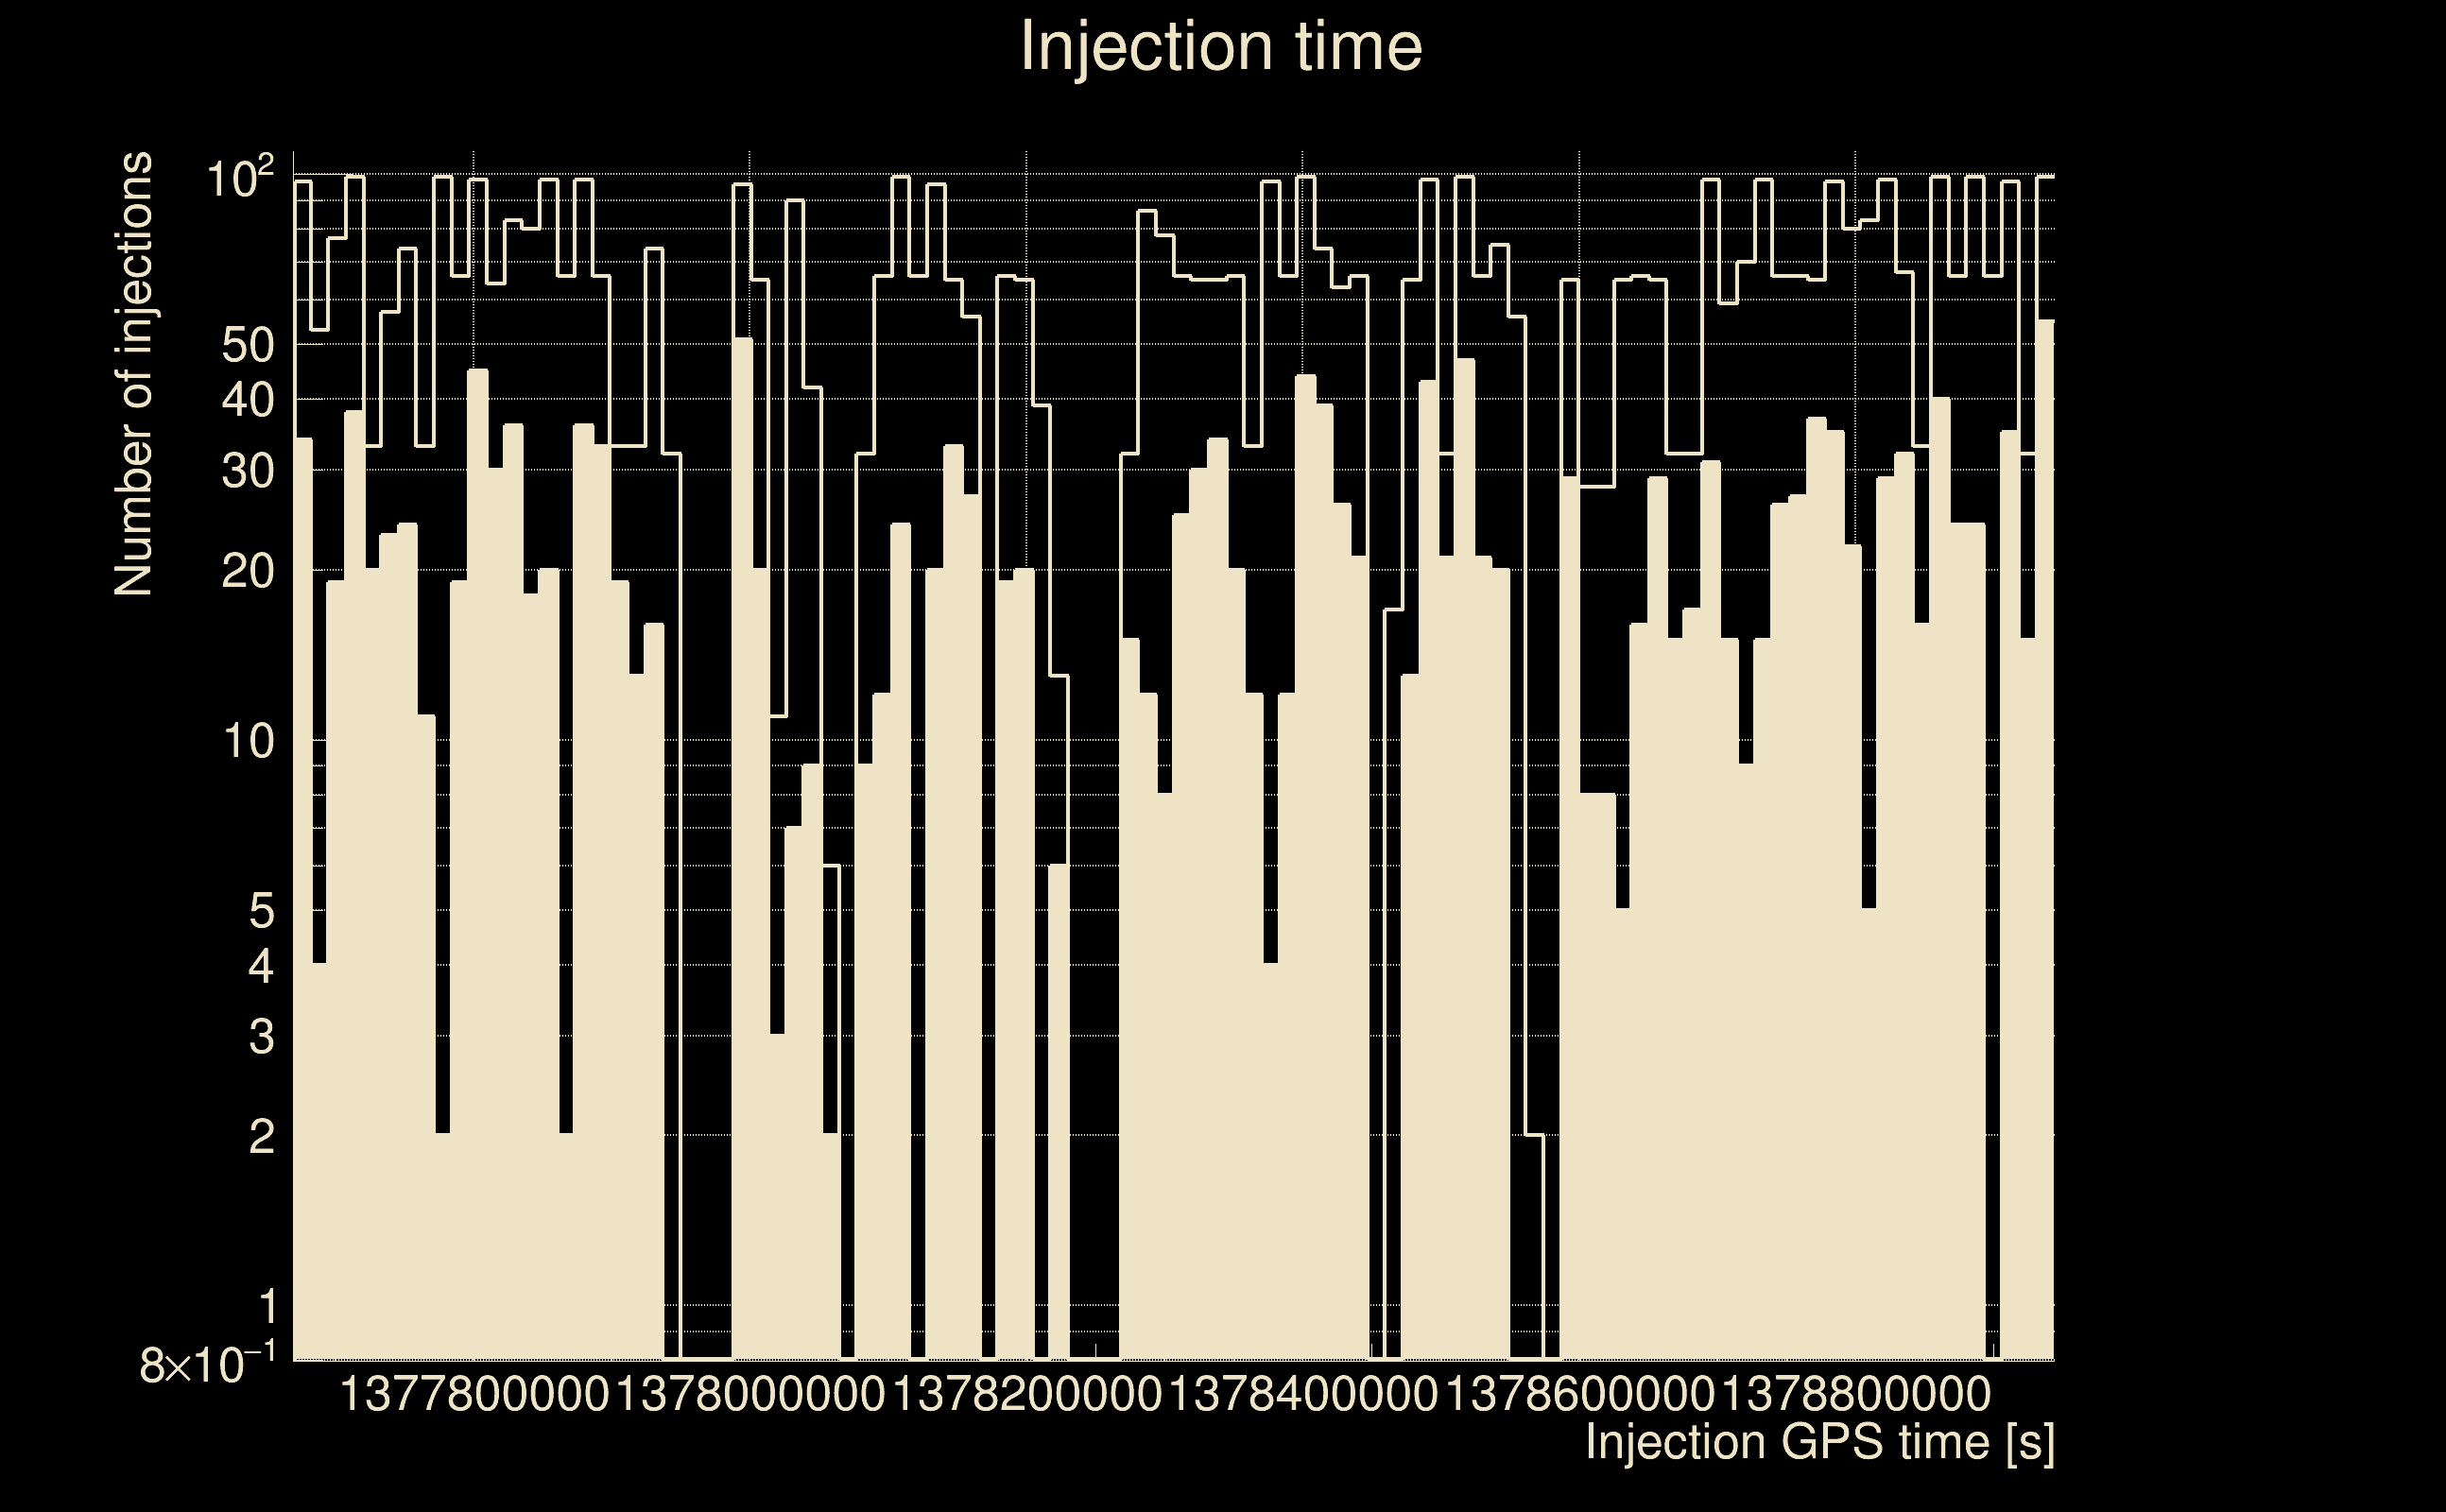
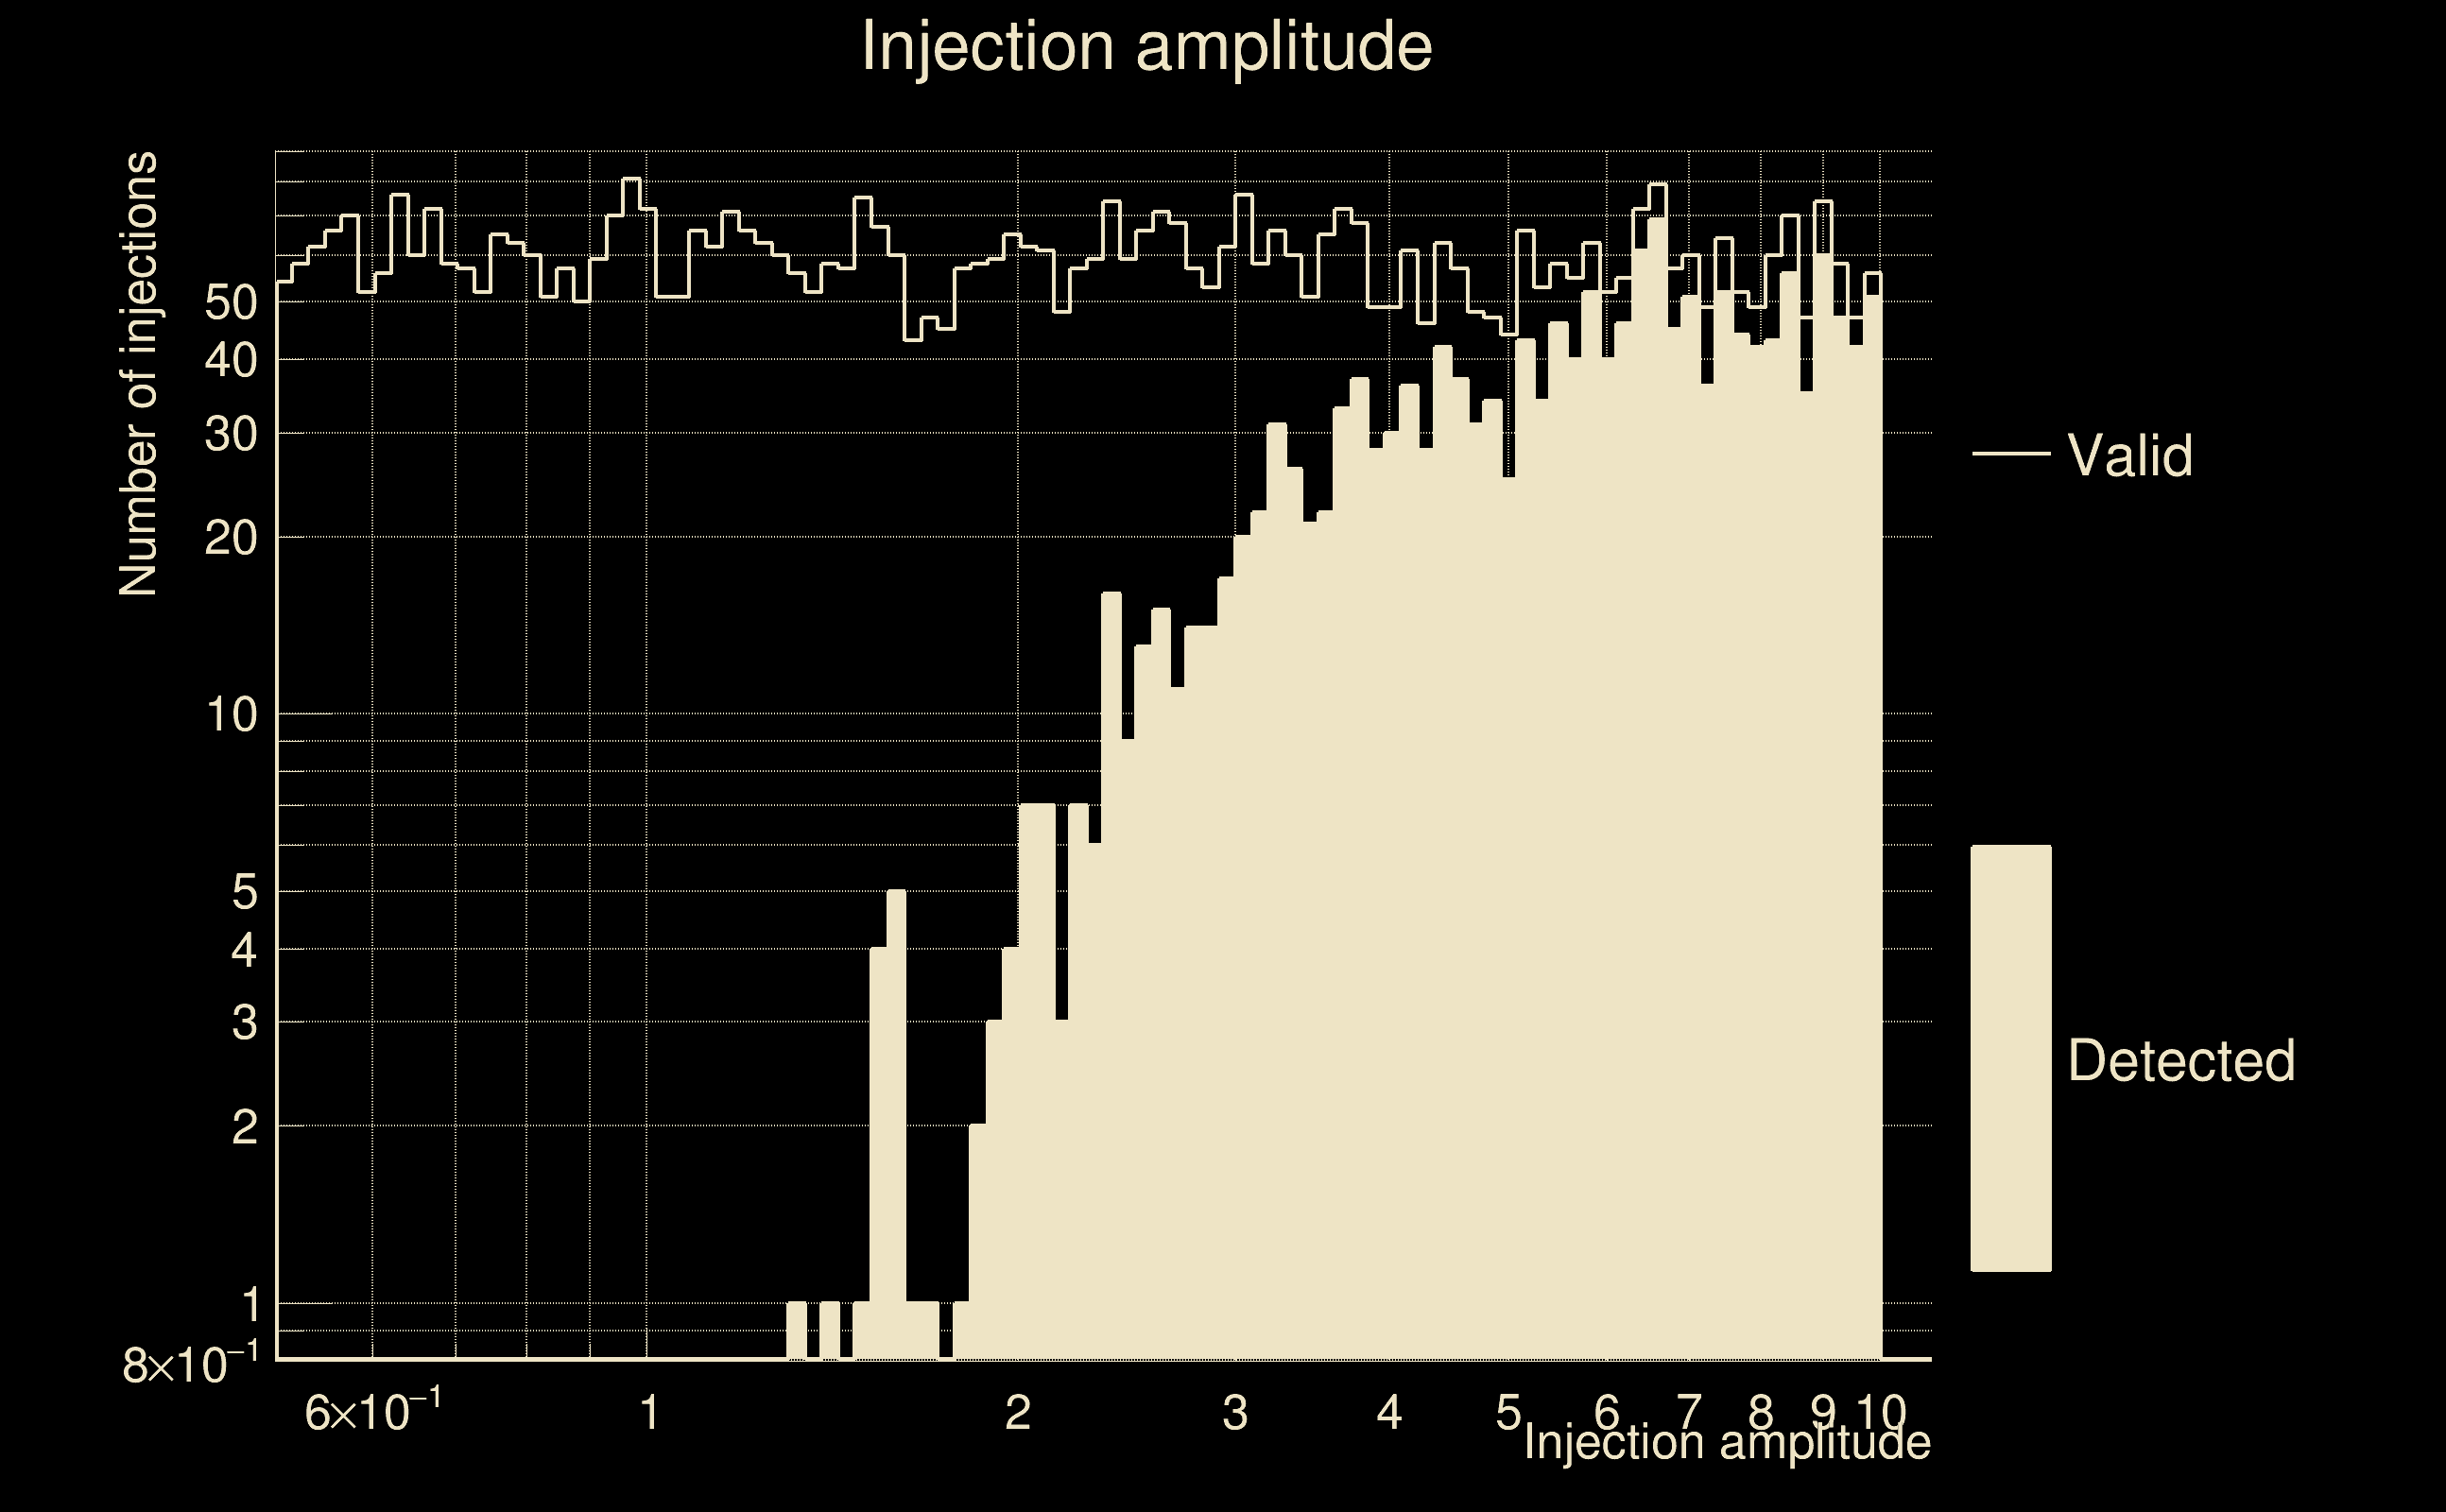
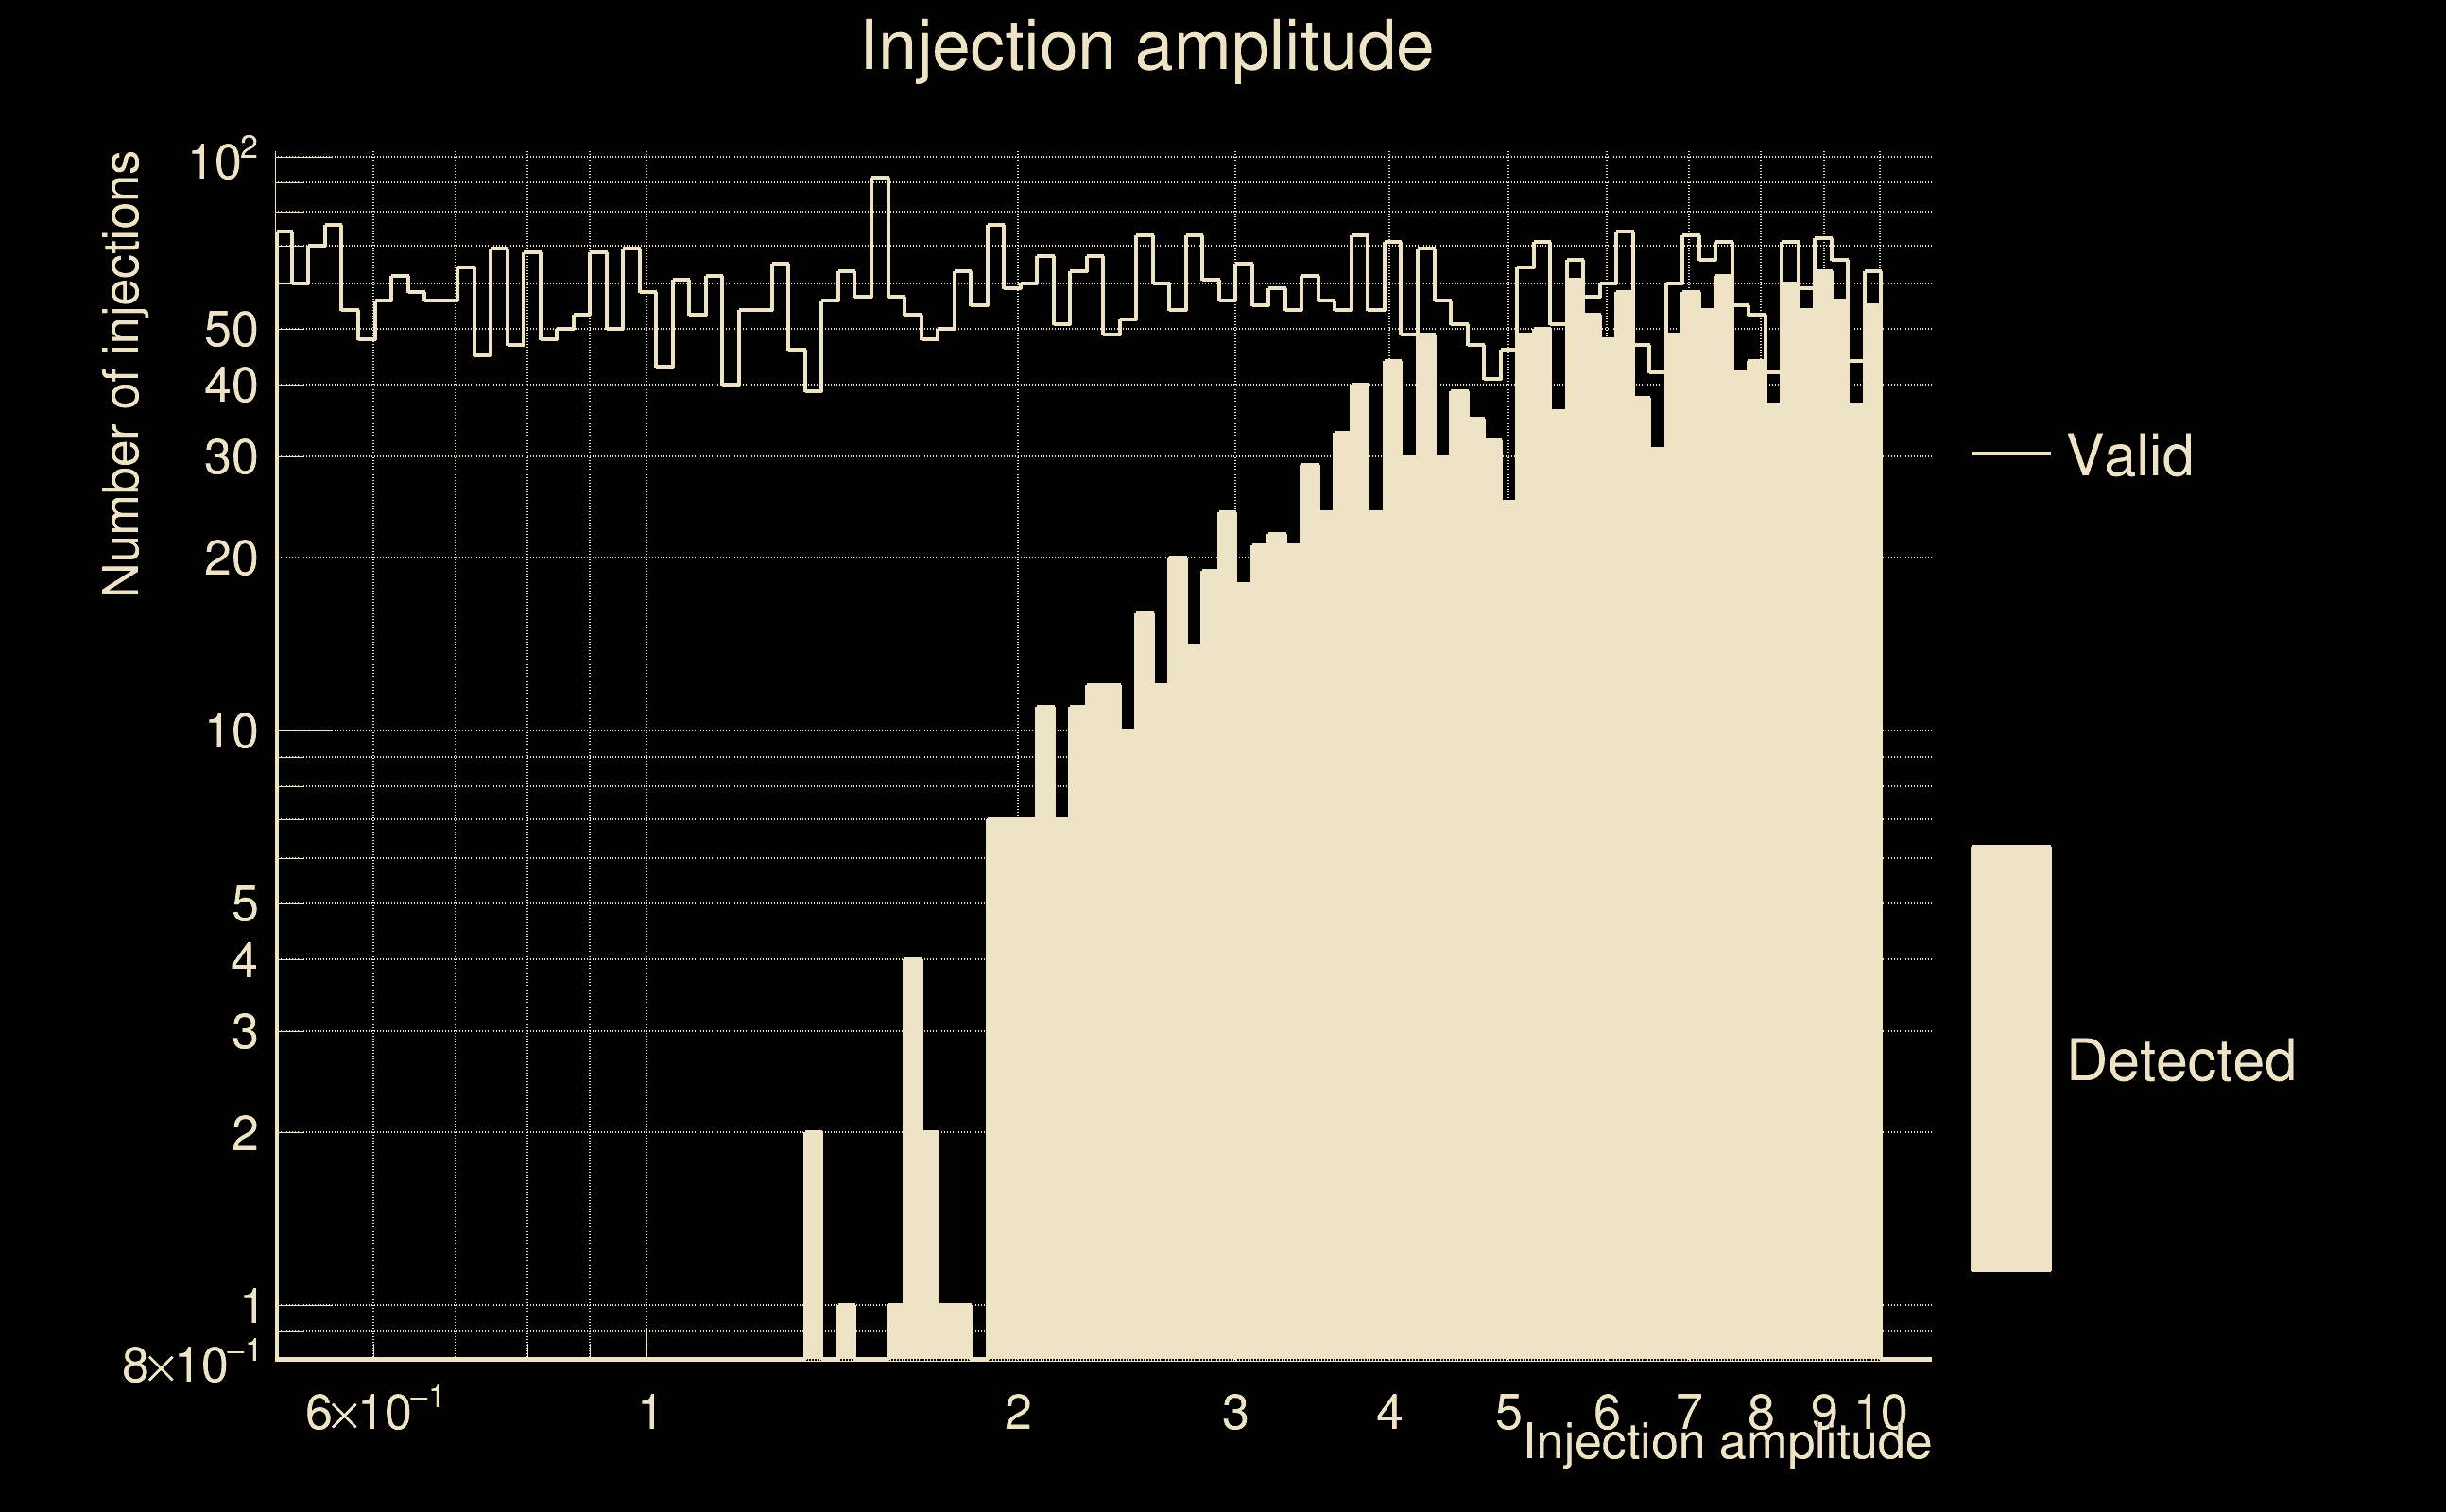
| Number of injections (total/valid/detected): | 5923 / 5871 / 1810 |
| List of missed injections: | ./AND19-S15FR_missed.txt |
| Injection amplitude at 90% detection efficiency: | 9.55707 |
| Injection amplitude at 50% detection efficiency: | 3.95273 |
| Injection amplitude at 10% detection efficiency: | 2.07415 |
 |
 |
 |
 |
 |
 |
|
 |
 |
|
 |
 |
 |
 |
 |
 |
 |
 |
| Number of injections (total/valid/detected): | 5836 / 5783 / 1701 |
| List of missed injections: | ./MEZ23-D15_missed.txt |
| Injection amplitude at 90% detection efficiency: | 9.68078 |
| Injection amplitude at 50% detection efficiency: | 3.72799 |
| Injection amplitude at 10% detection efficiency: | 2.21411 |
 |
 |
 |
 |
 |
 |
|
 |
 |
|
 |
 |
 |
 |
 |
 |
 |
 |
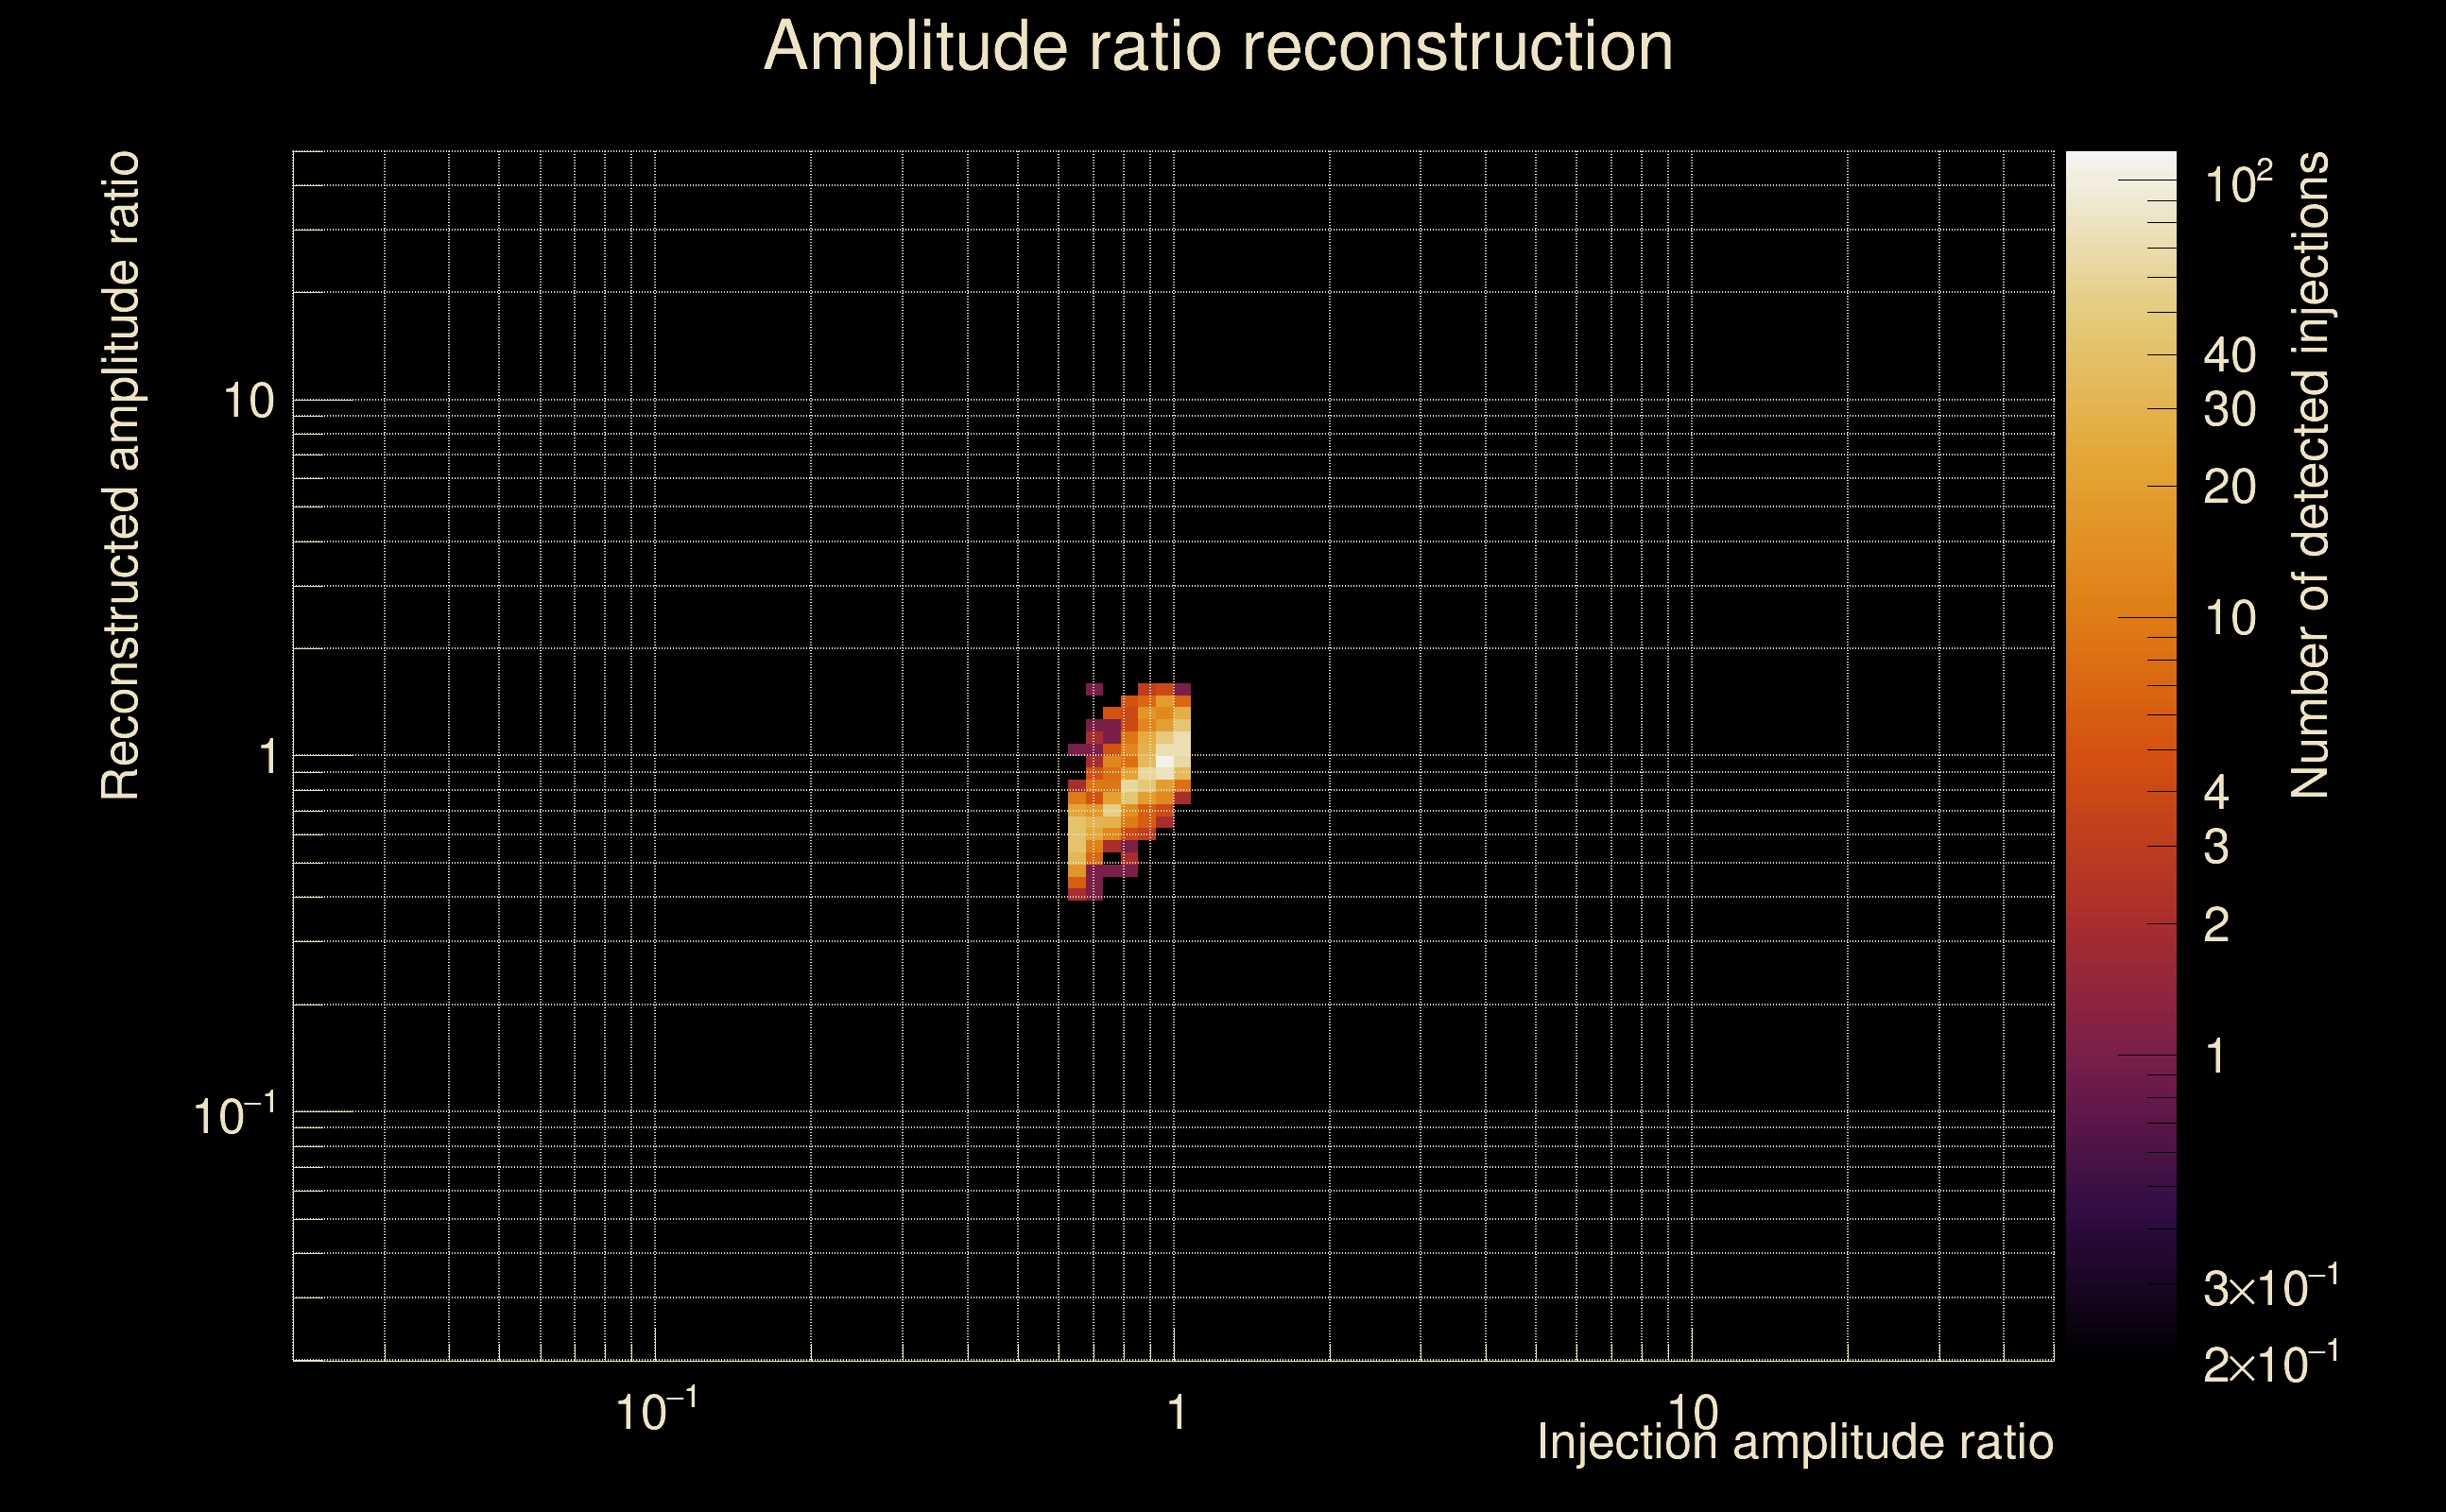
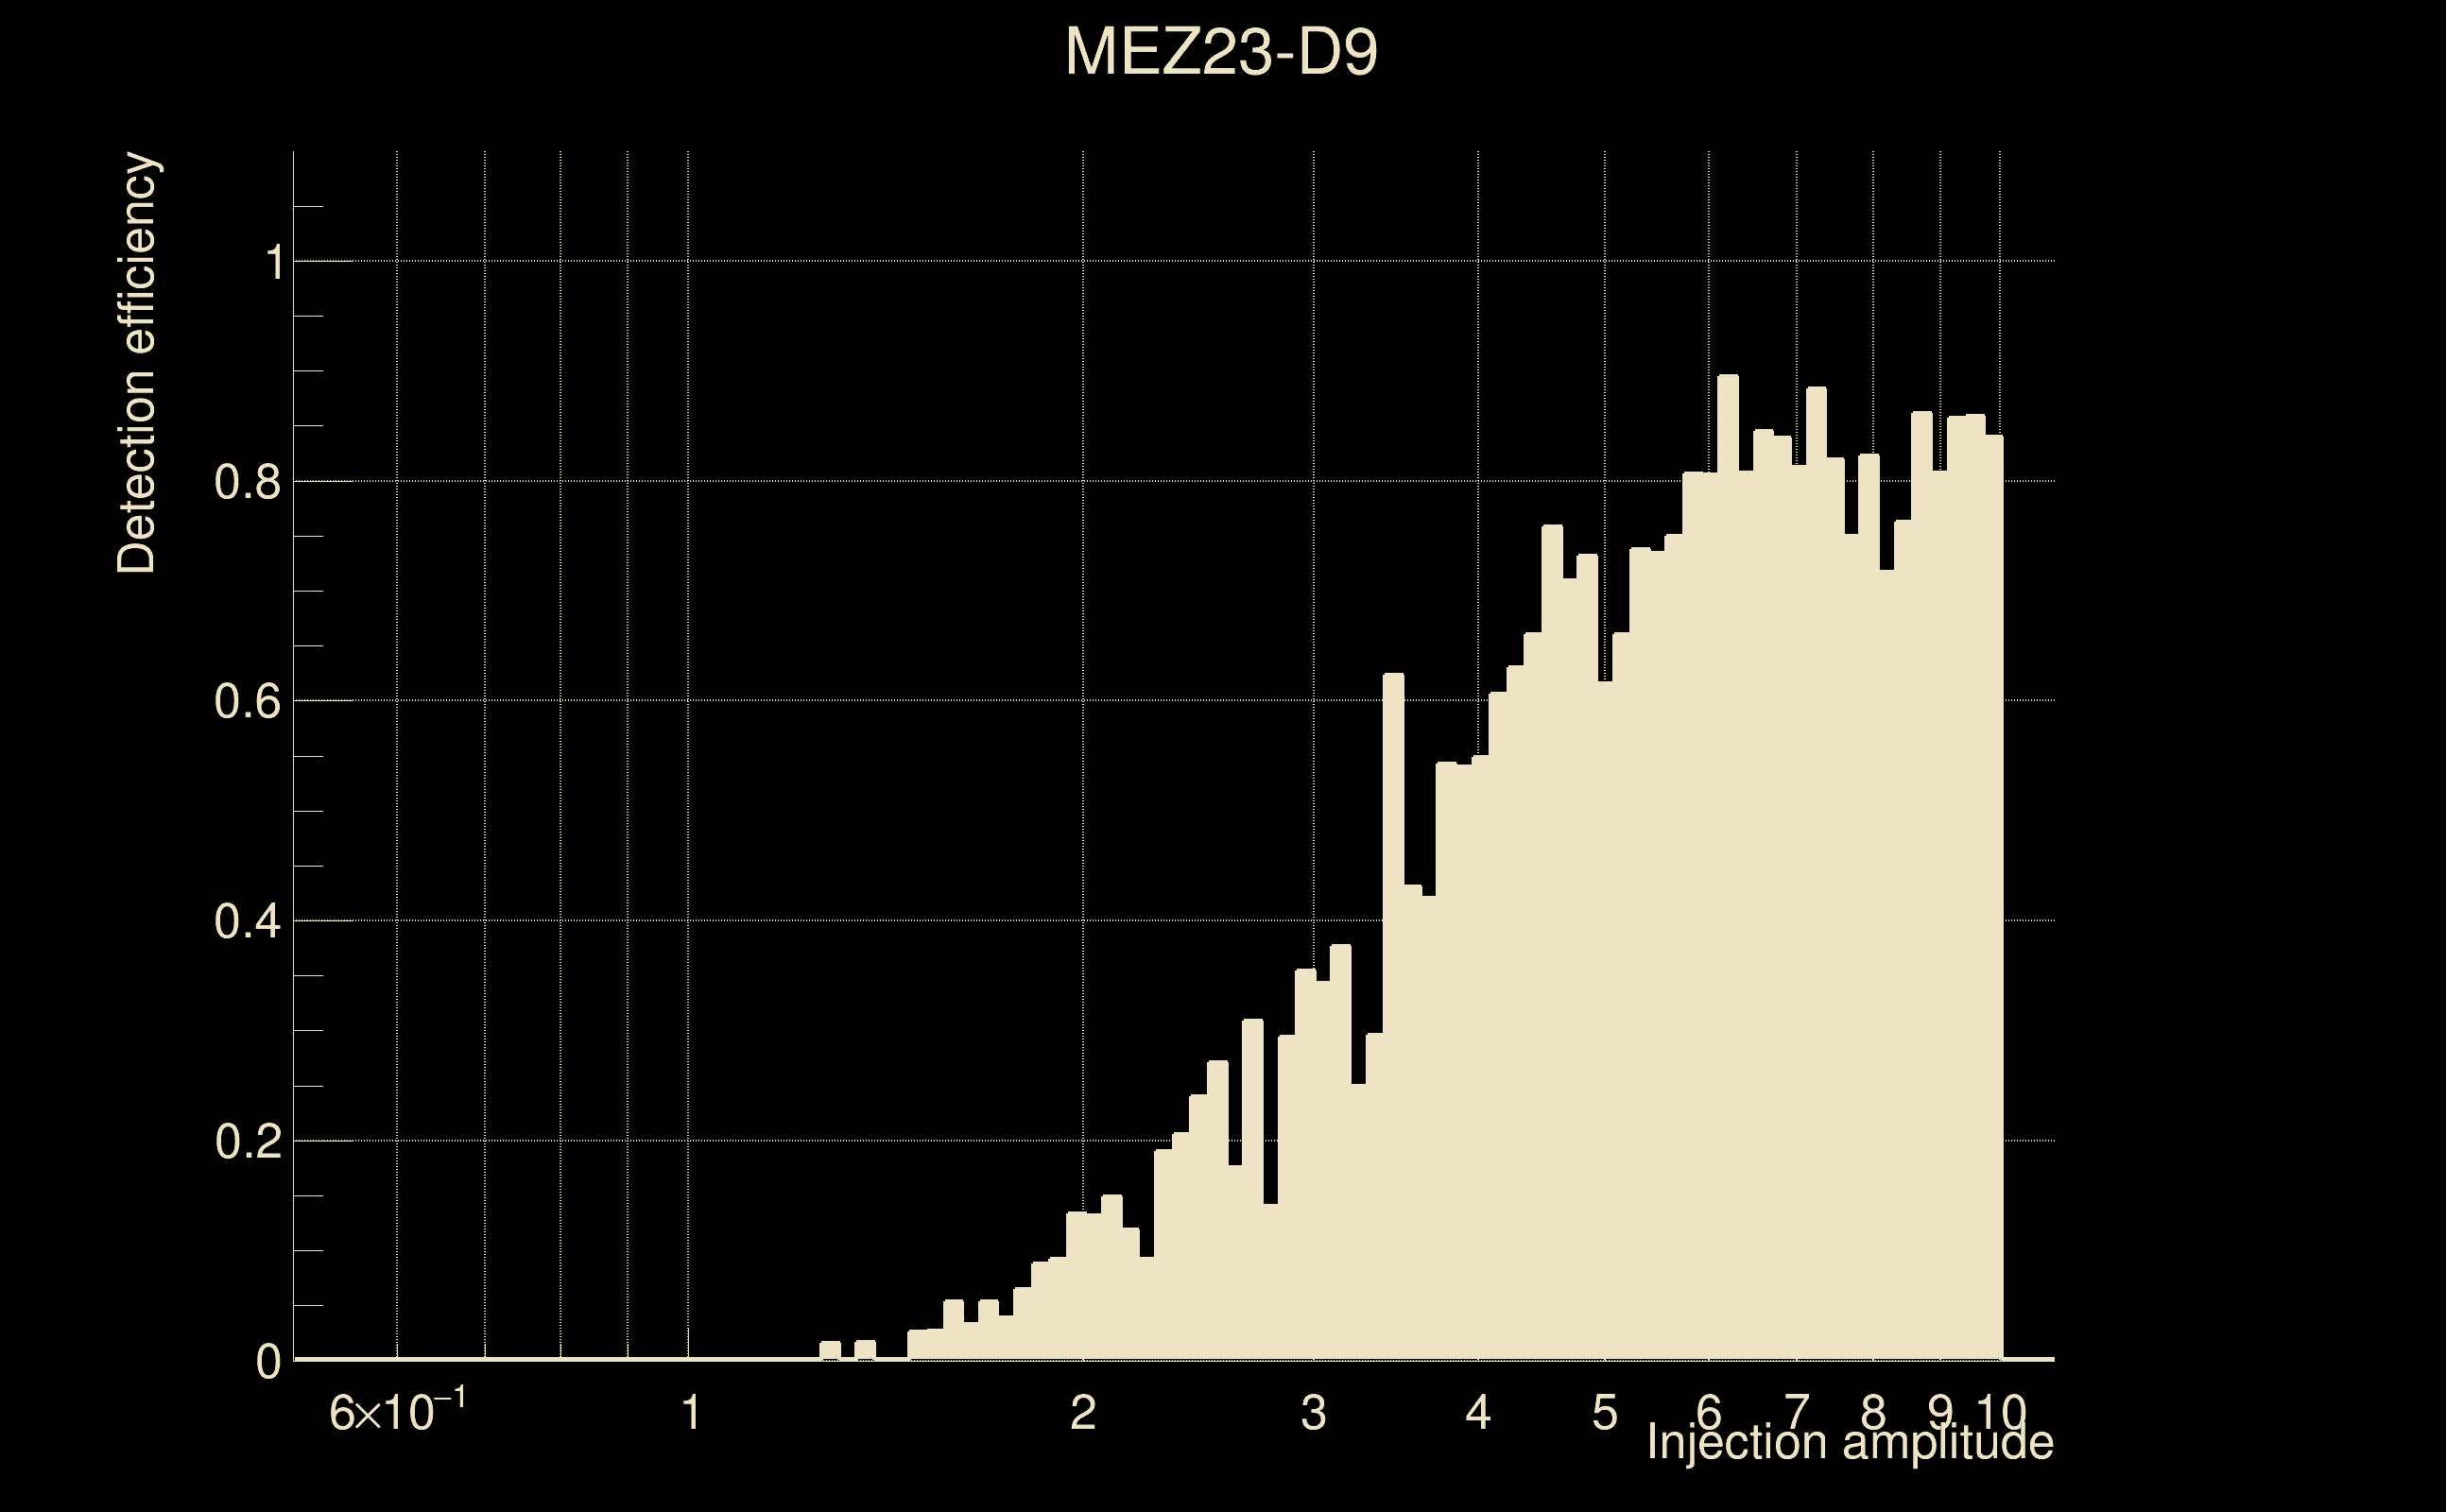
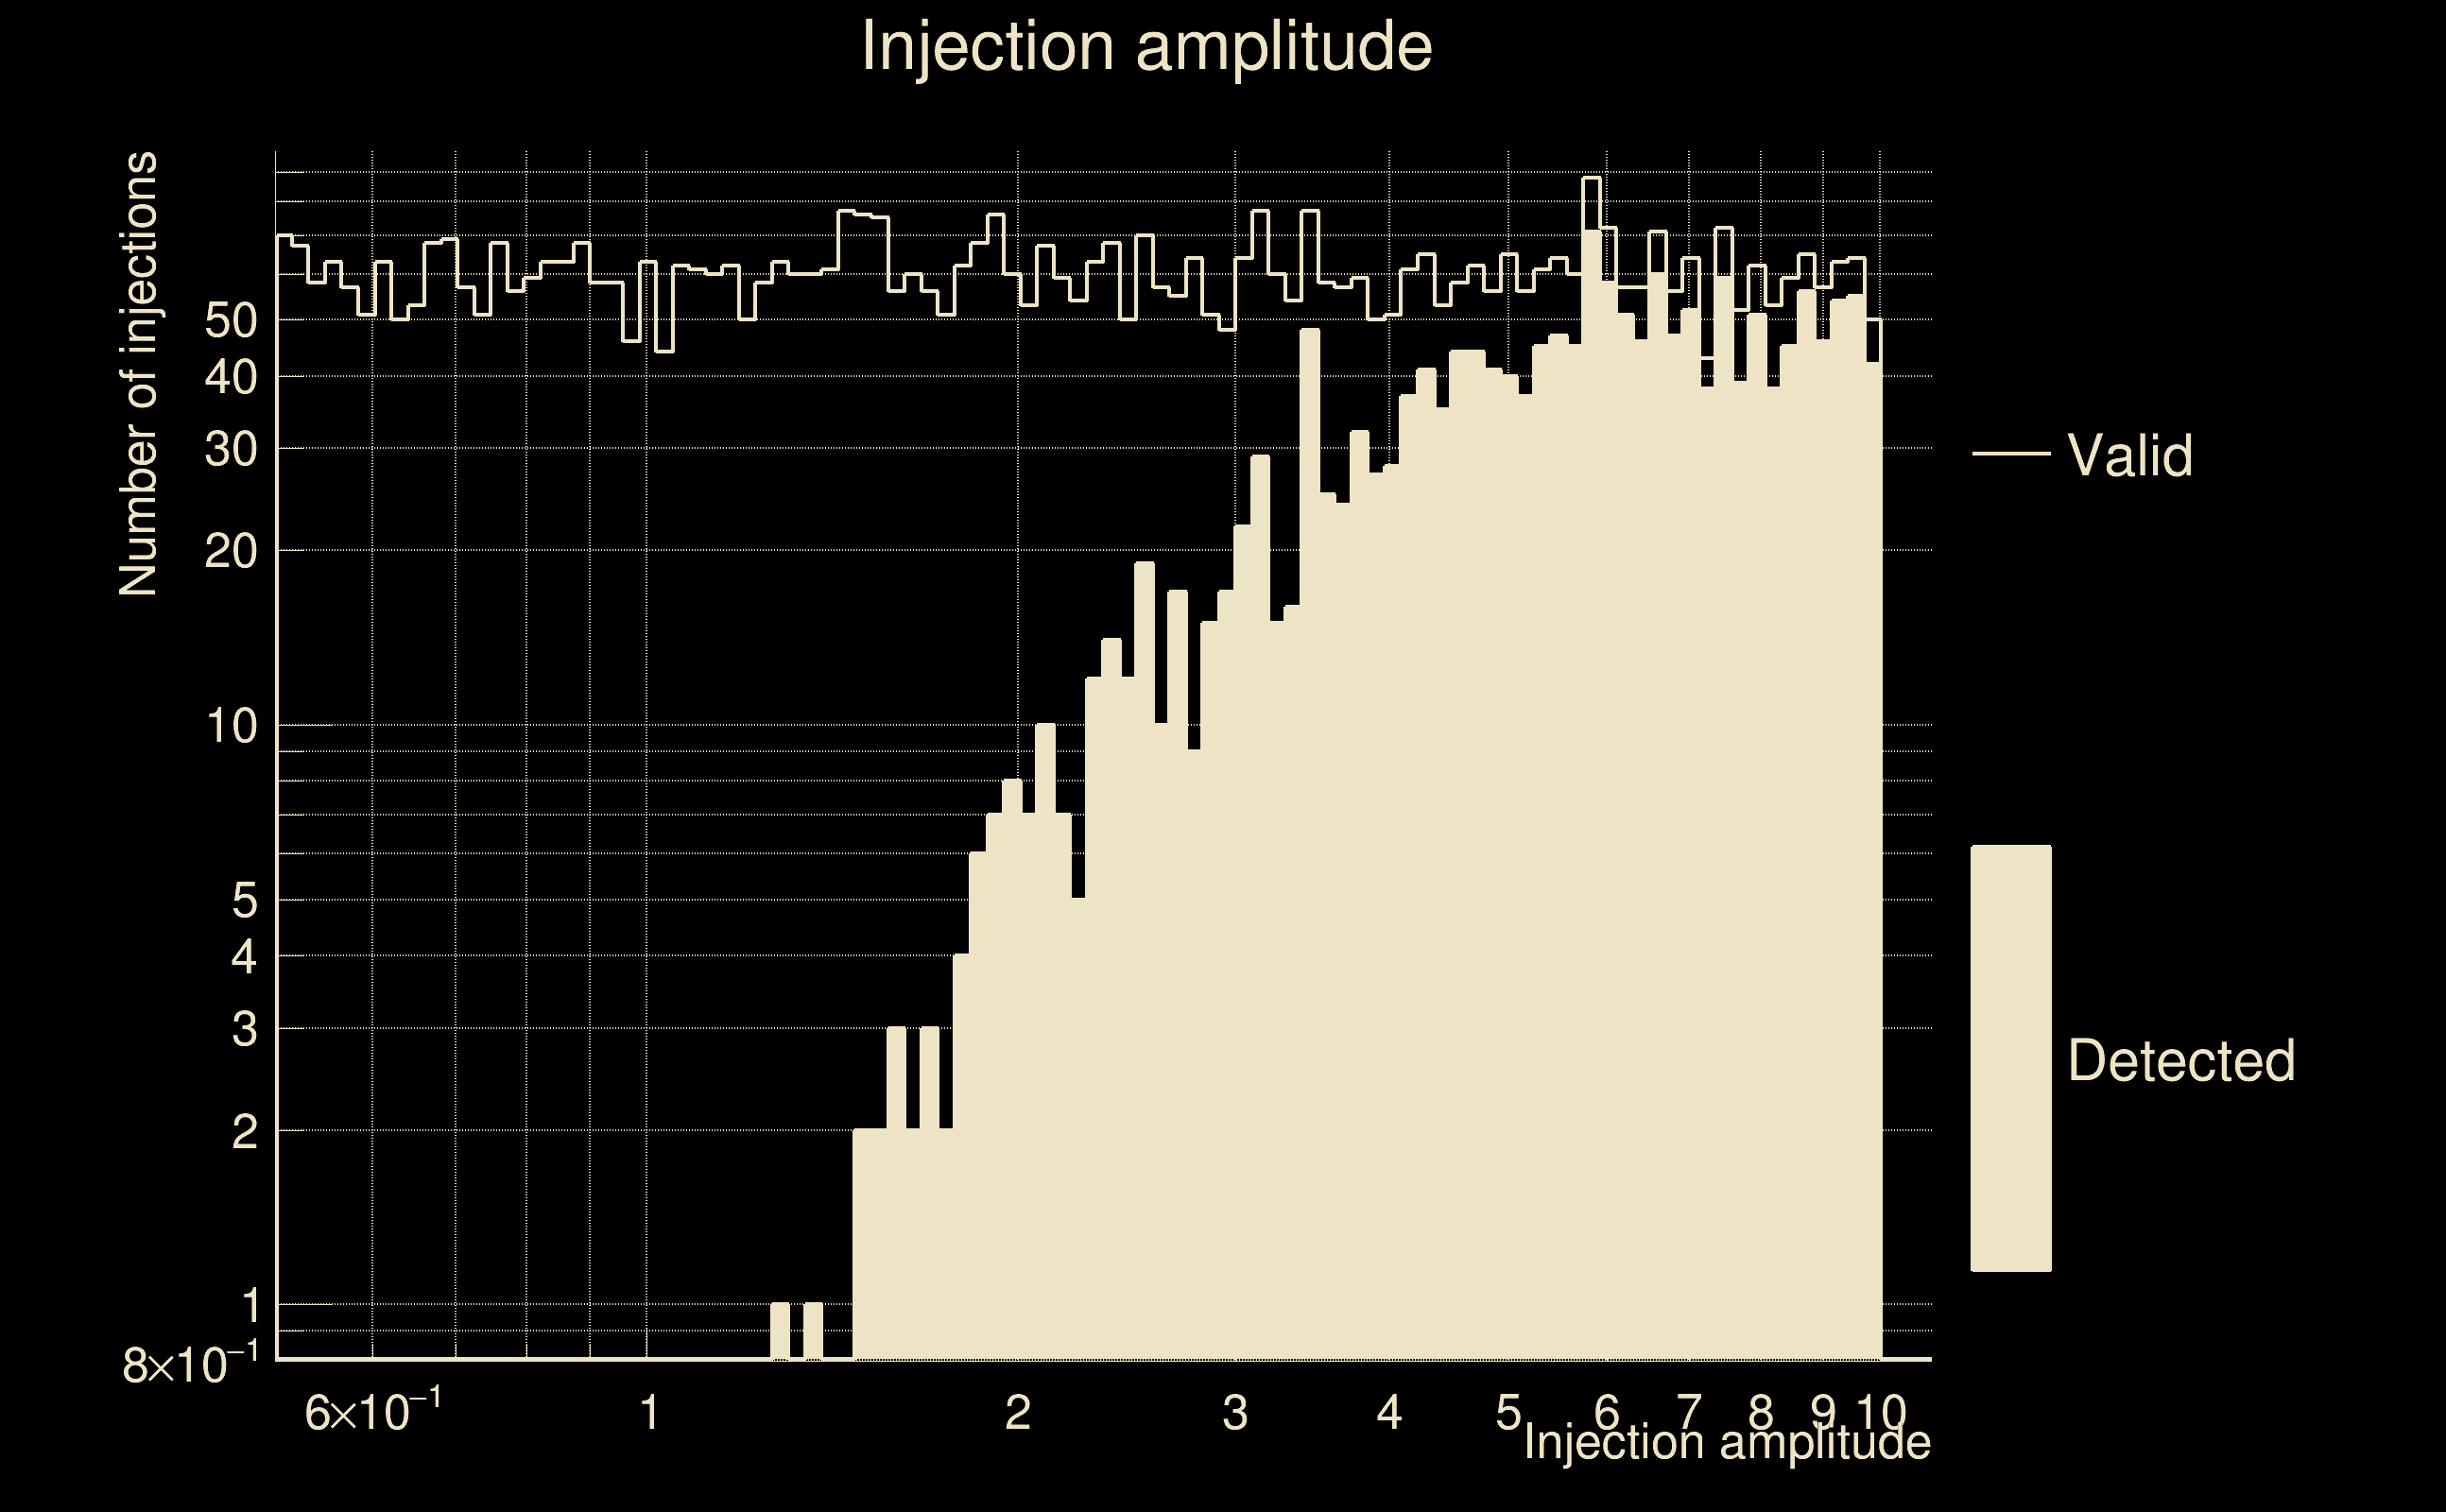
| Number of injections (total/valid/detected): | 5911 / 5869 / 1825 |
| List of missed injections: | ./MEZ23-D9_missed.txt |
| Injection amplitude at 90% detection efficiency: | -1 |
| Injection amplitude at 50% detection efficiency: | 3.74633 |
| Injection amplitude at 10% detection efficiency: | 2.24468 |
 |
 |
 |
 |
 |
 |
|
 |
 |
|
 |
 |
 |
 |
 |
 |
 |
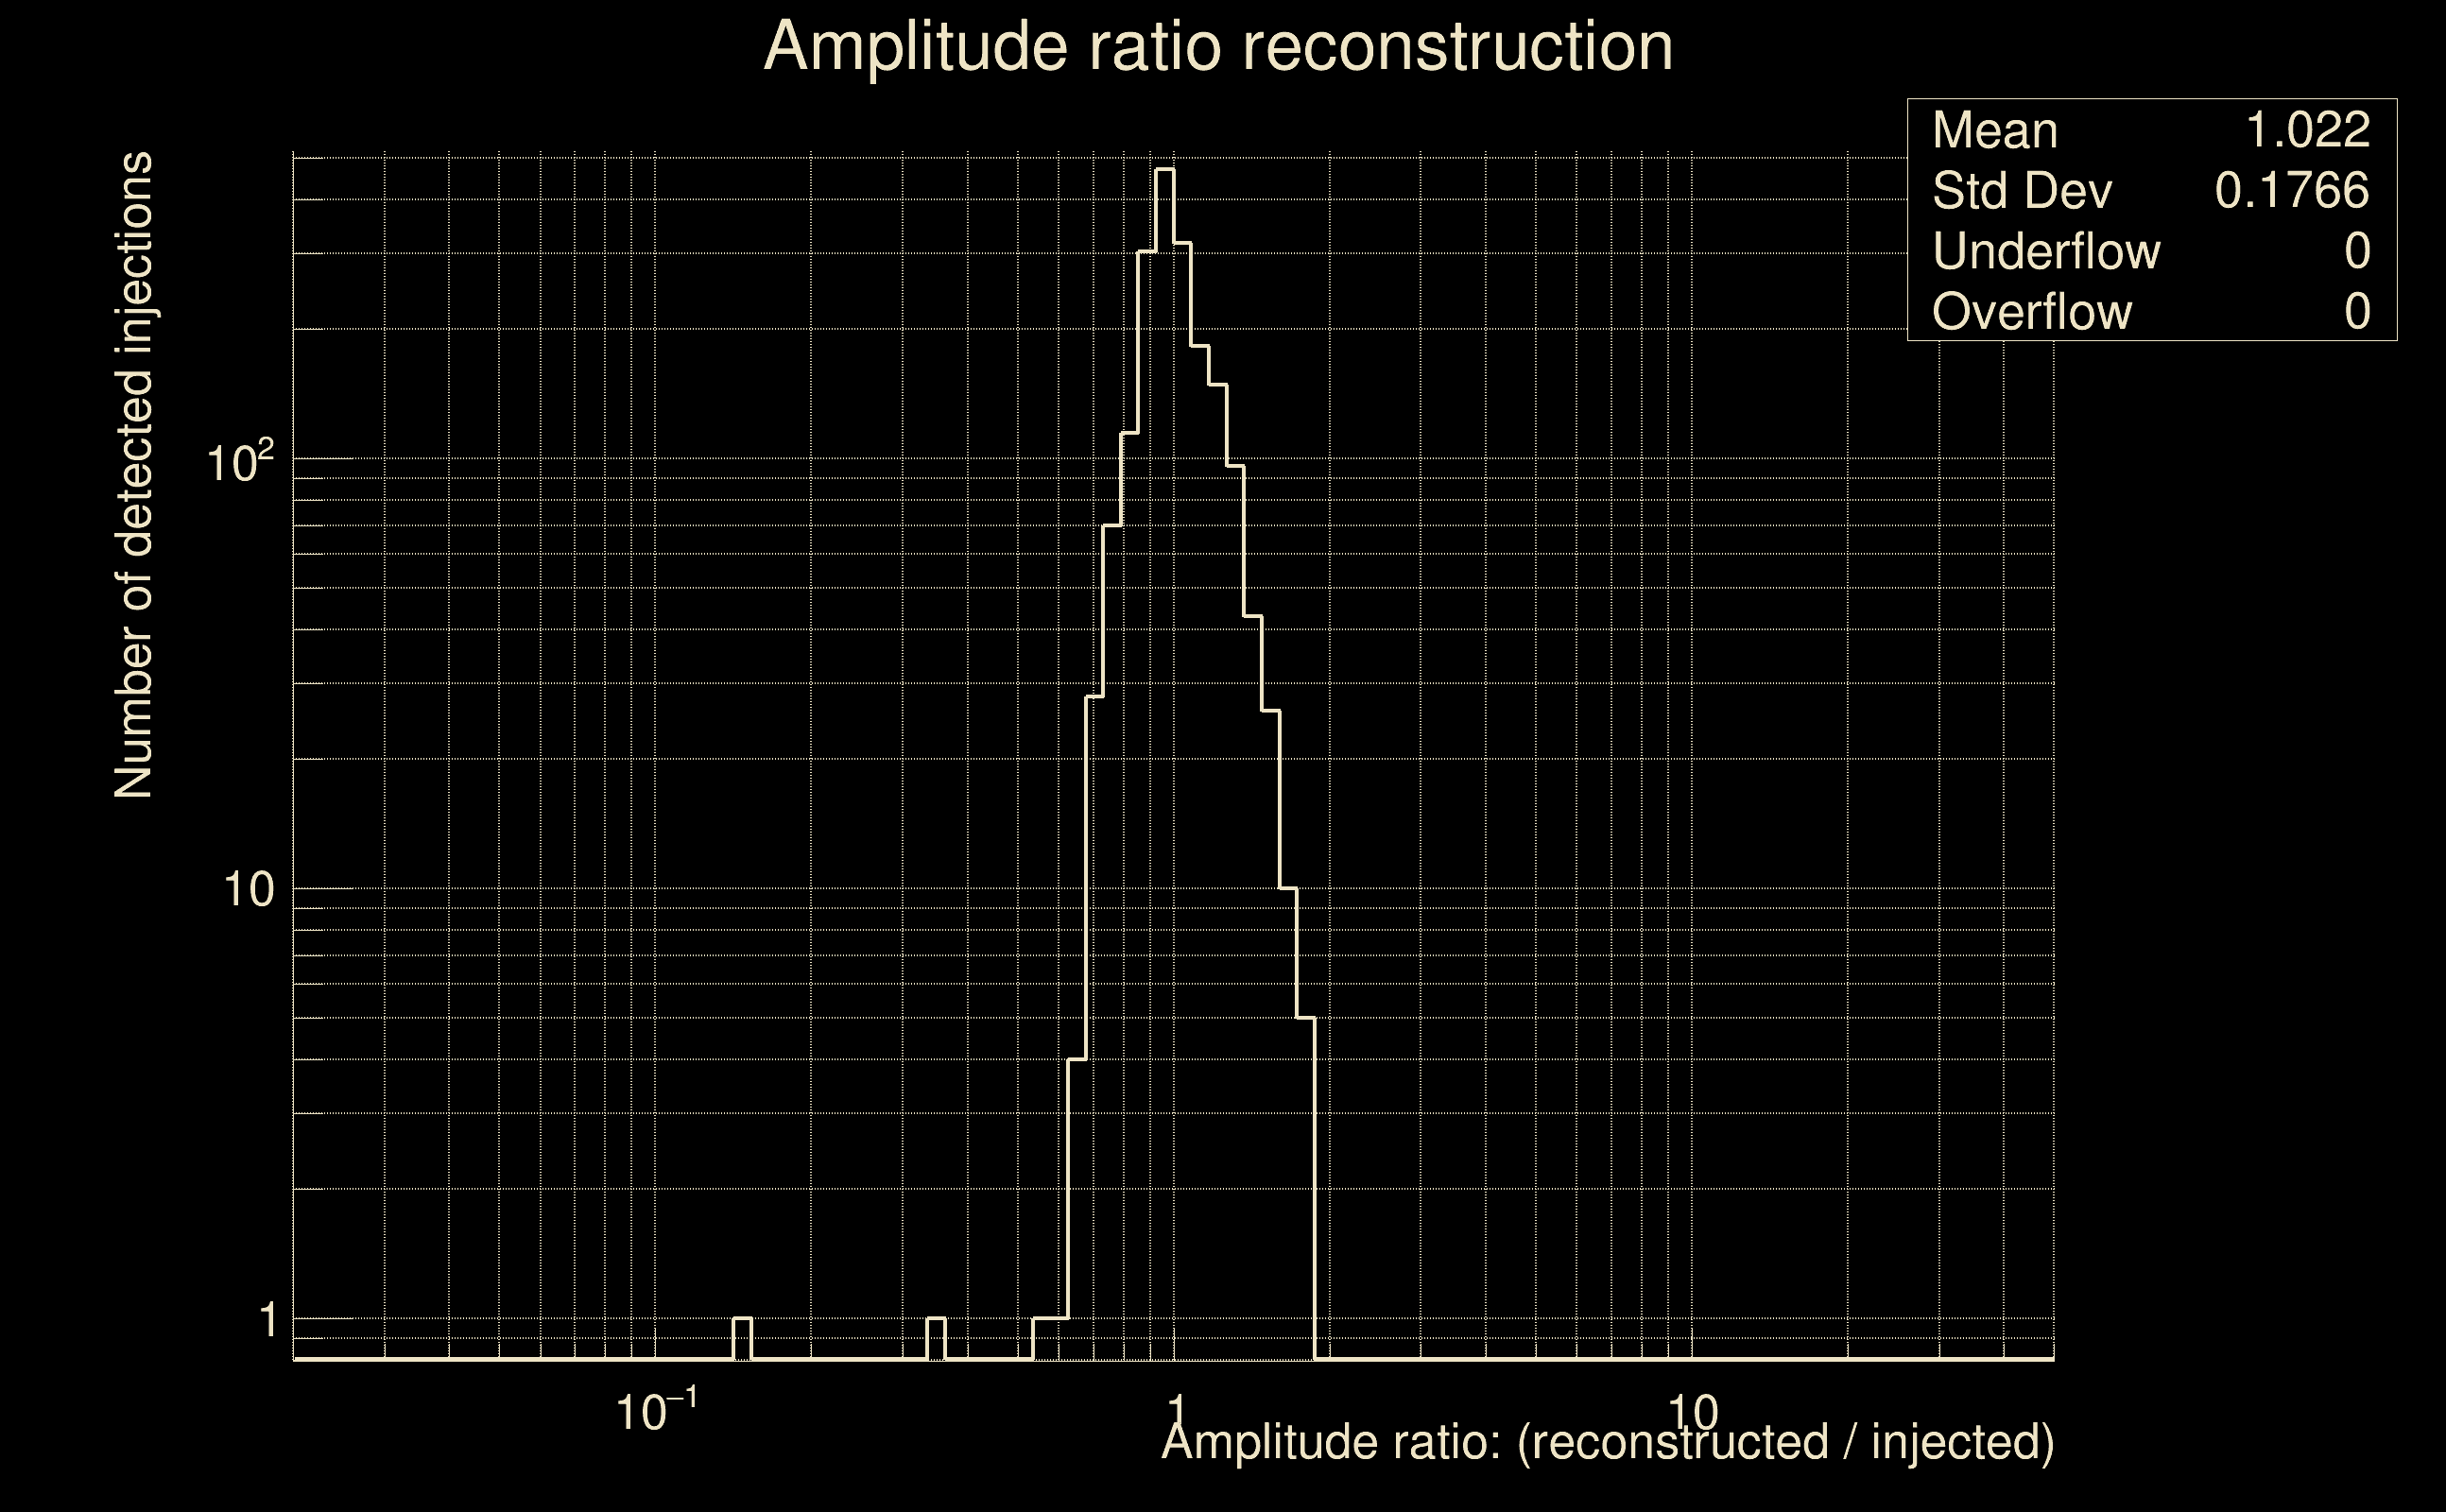 |
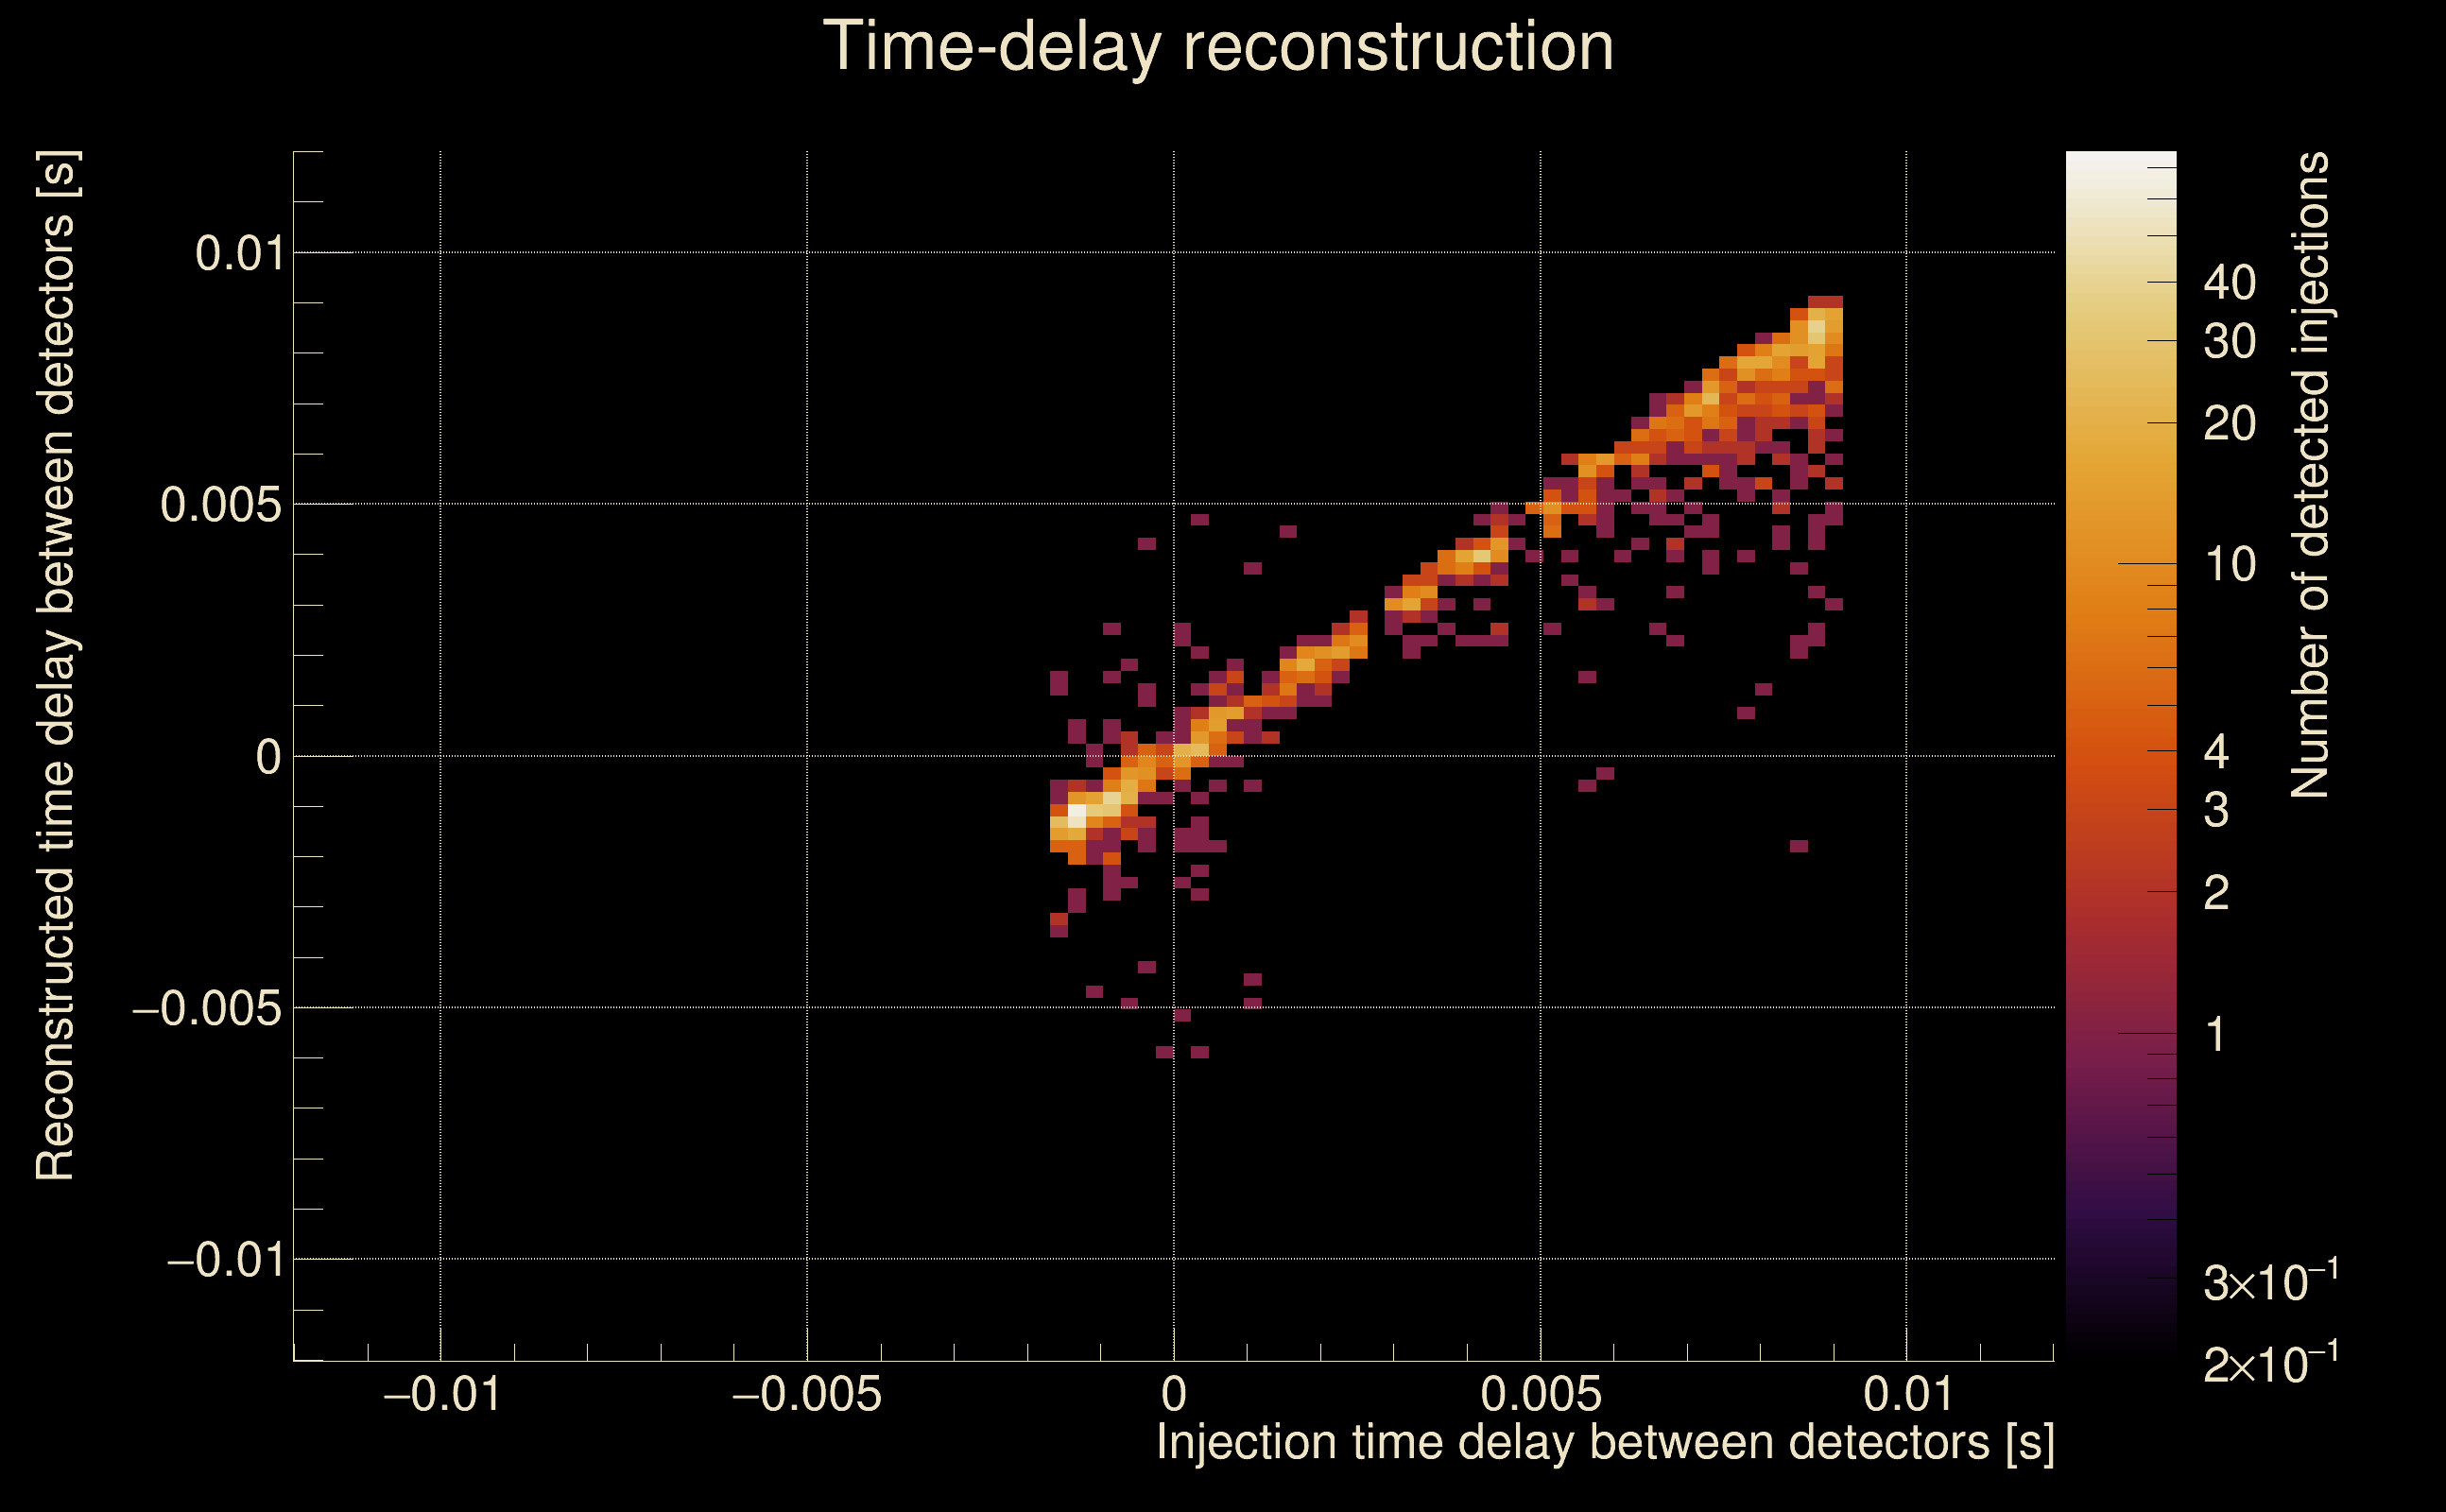
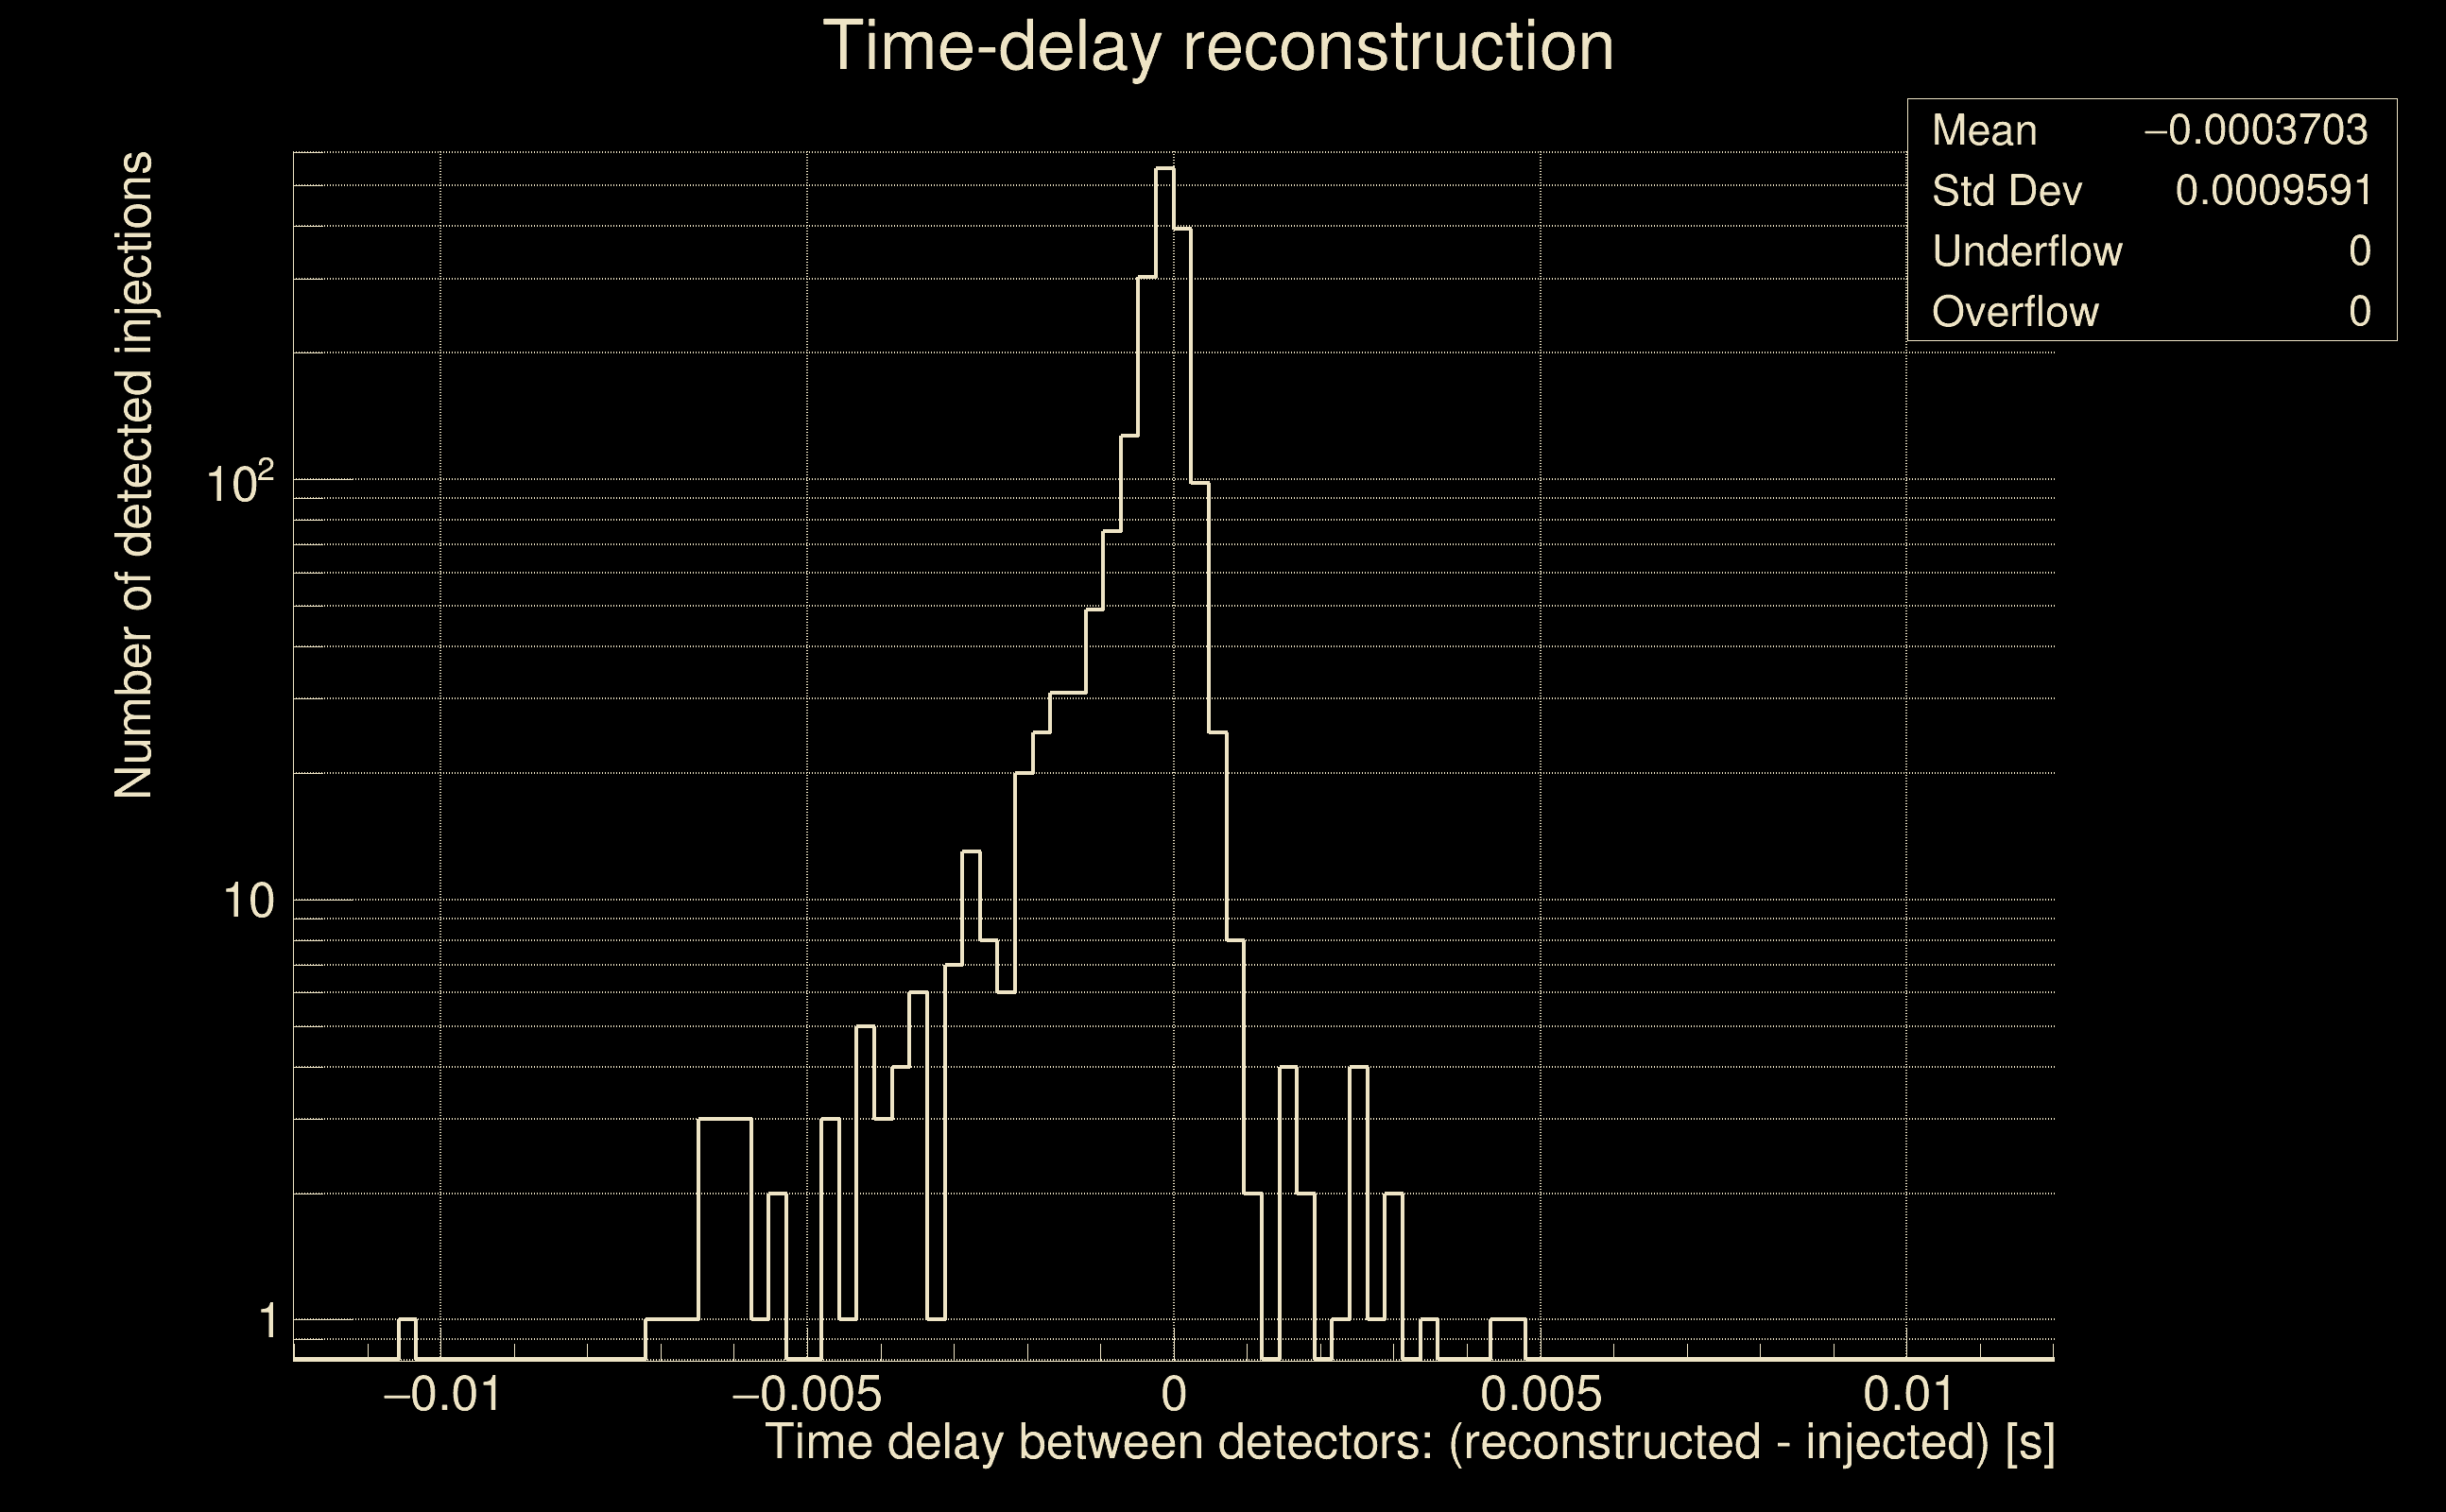
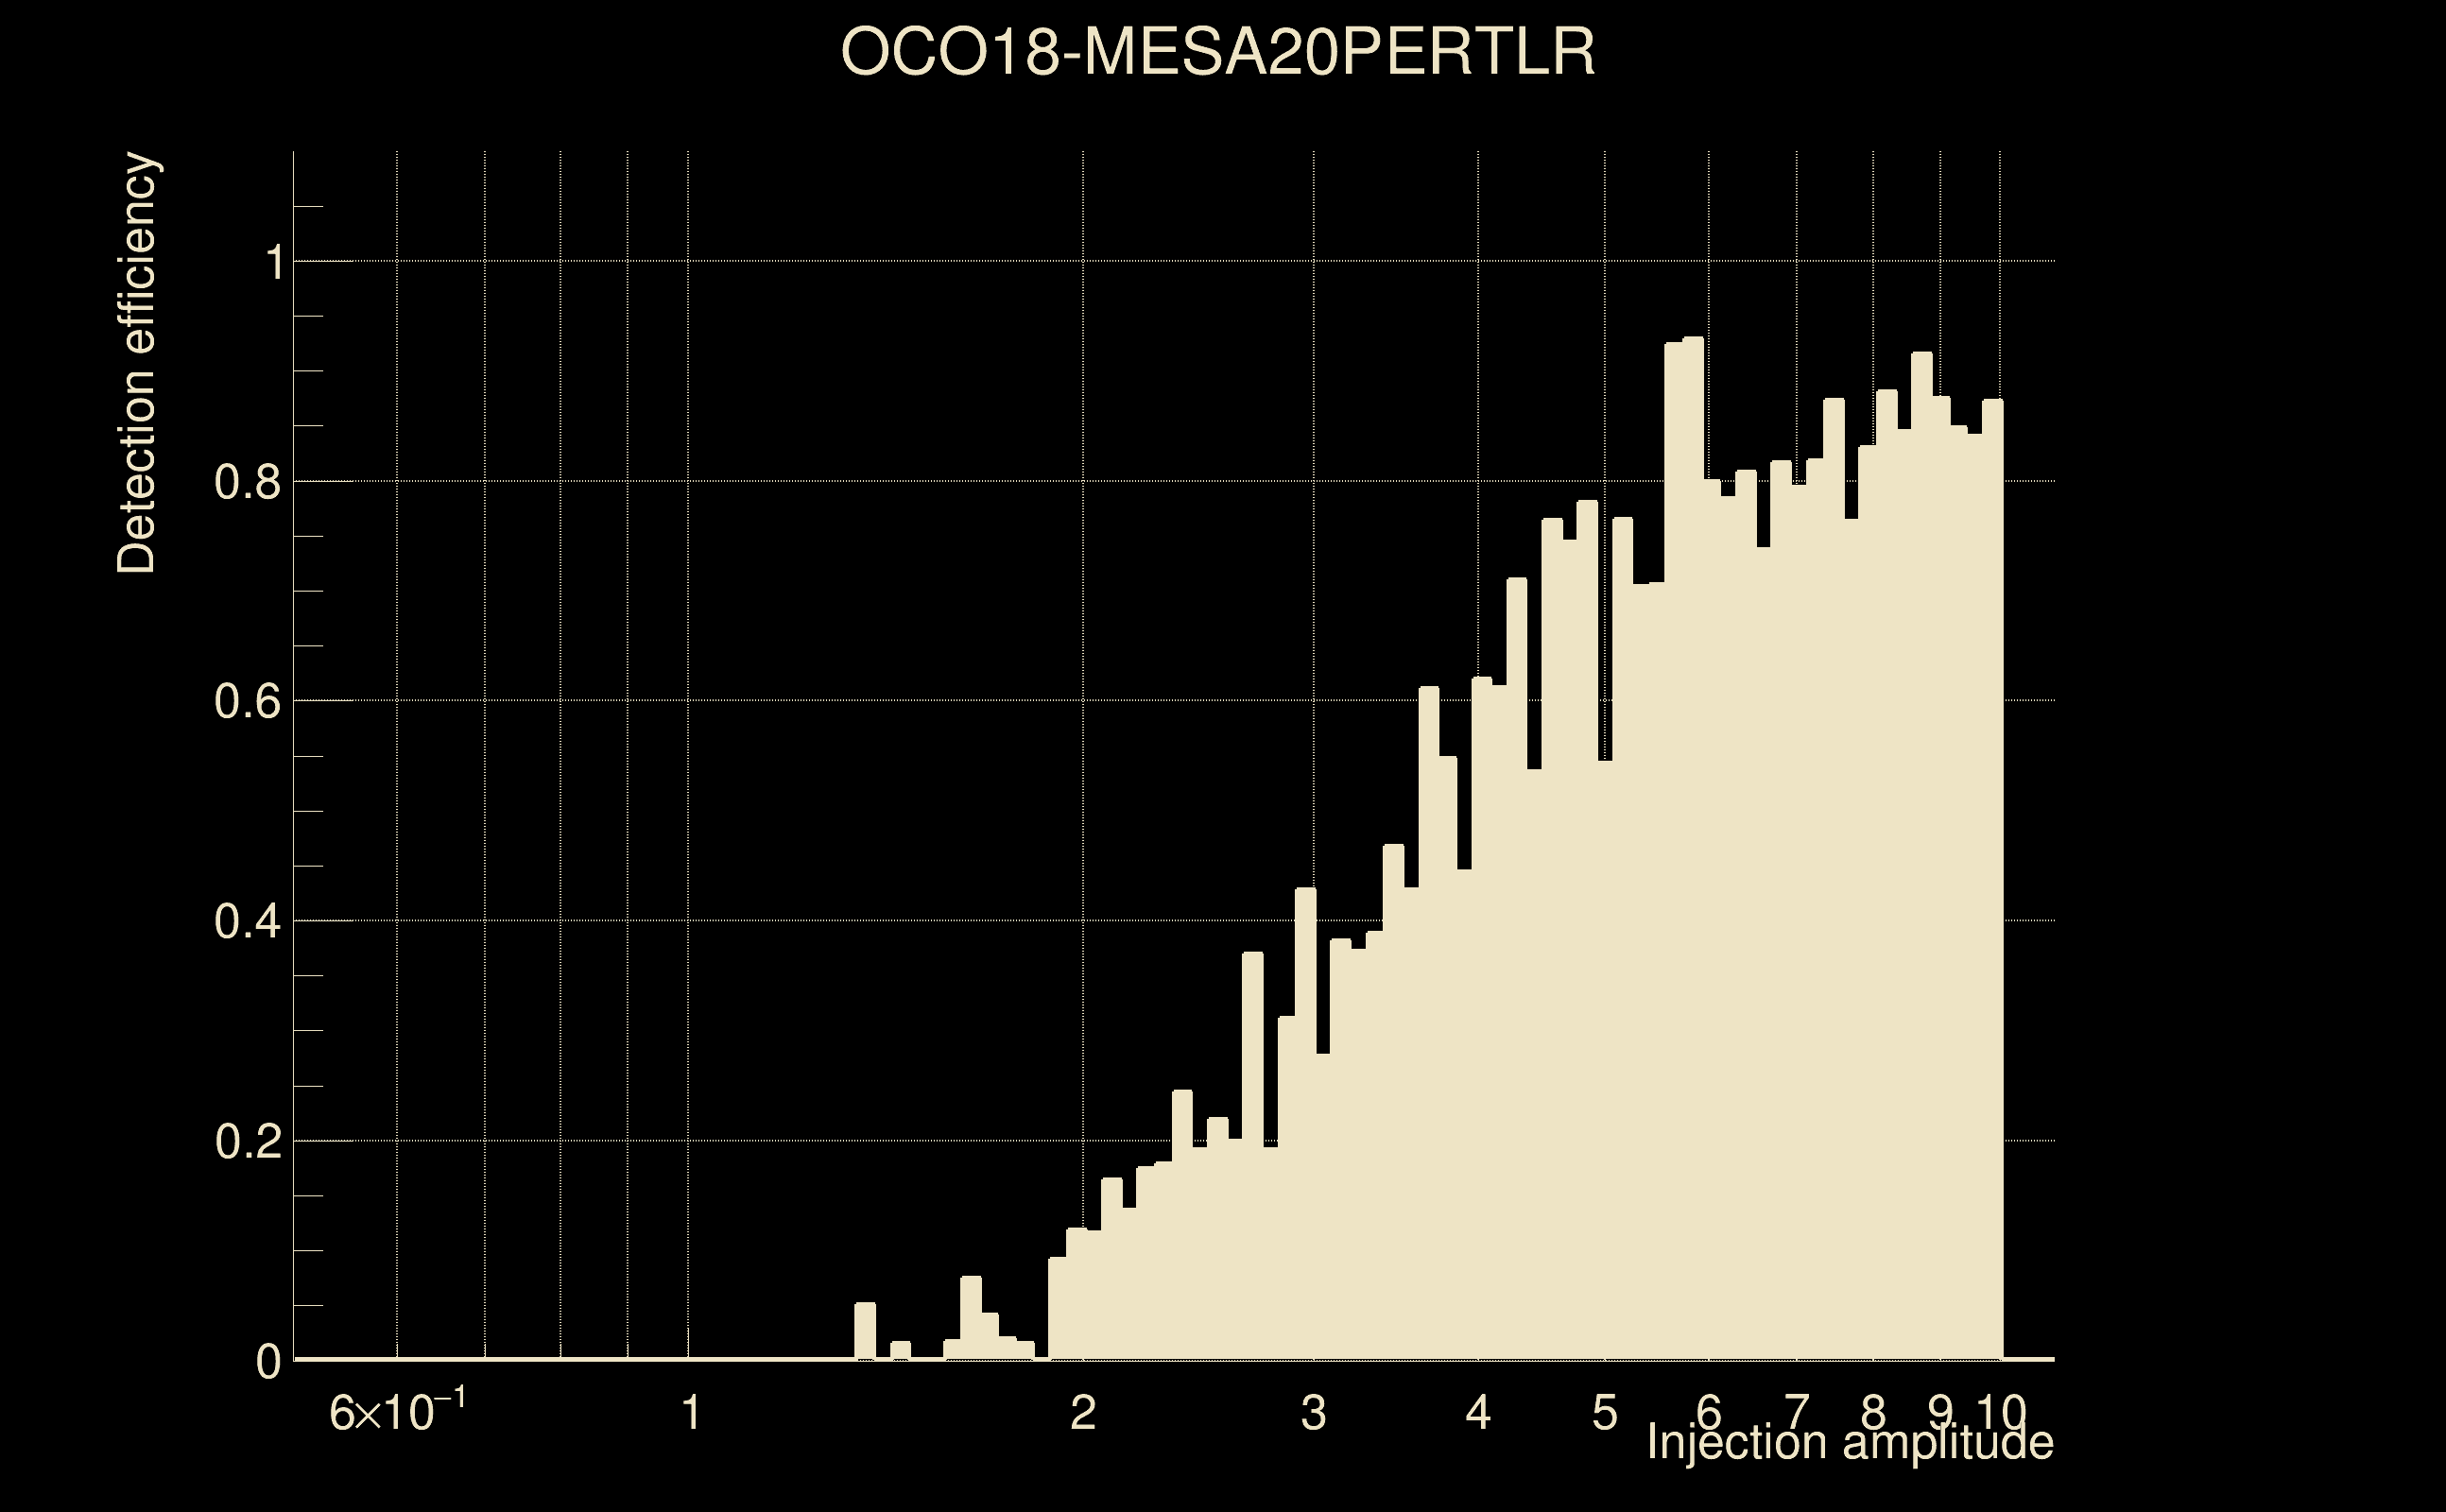
| Number of injections (total/valid/detected): | 5730 / 5680 / 1812 |
| List of missed injections: | ./OCO18-MESA20PERTLR_missed.txt |
| Injection amplitude at 90% detection efficiency: | 5.63838 |
| Injection amplitude at 50% detection efficiency: | 3.94336 |
| Injection amplitude at 10% detection efficiency: | 1.93603 |
 |
 |
 |
 |
 |
 |
|
 |
 |
|
 |
 |
 |
 |
 |
 |
 |
 |
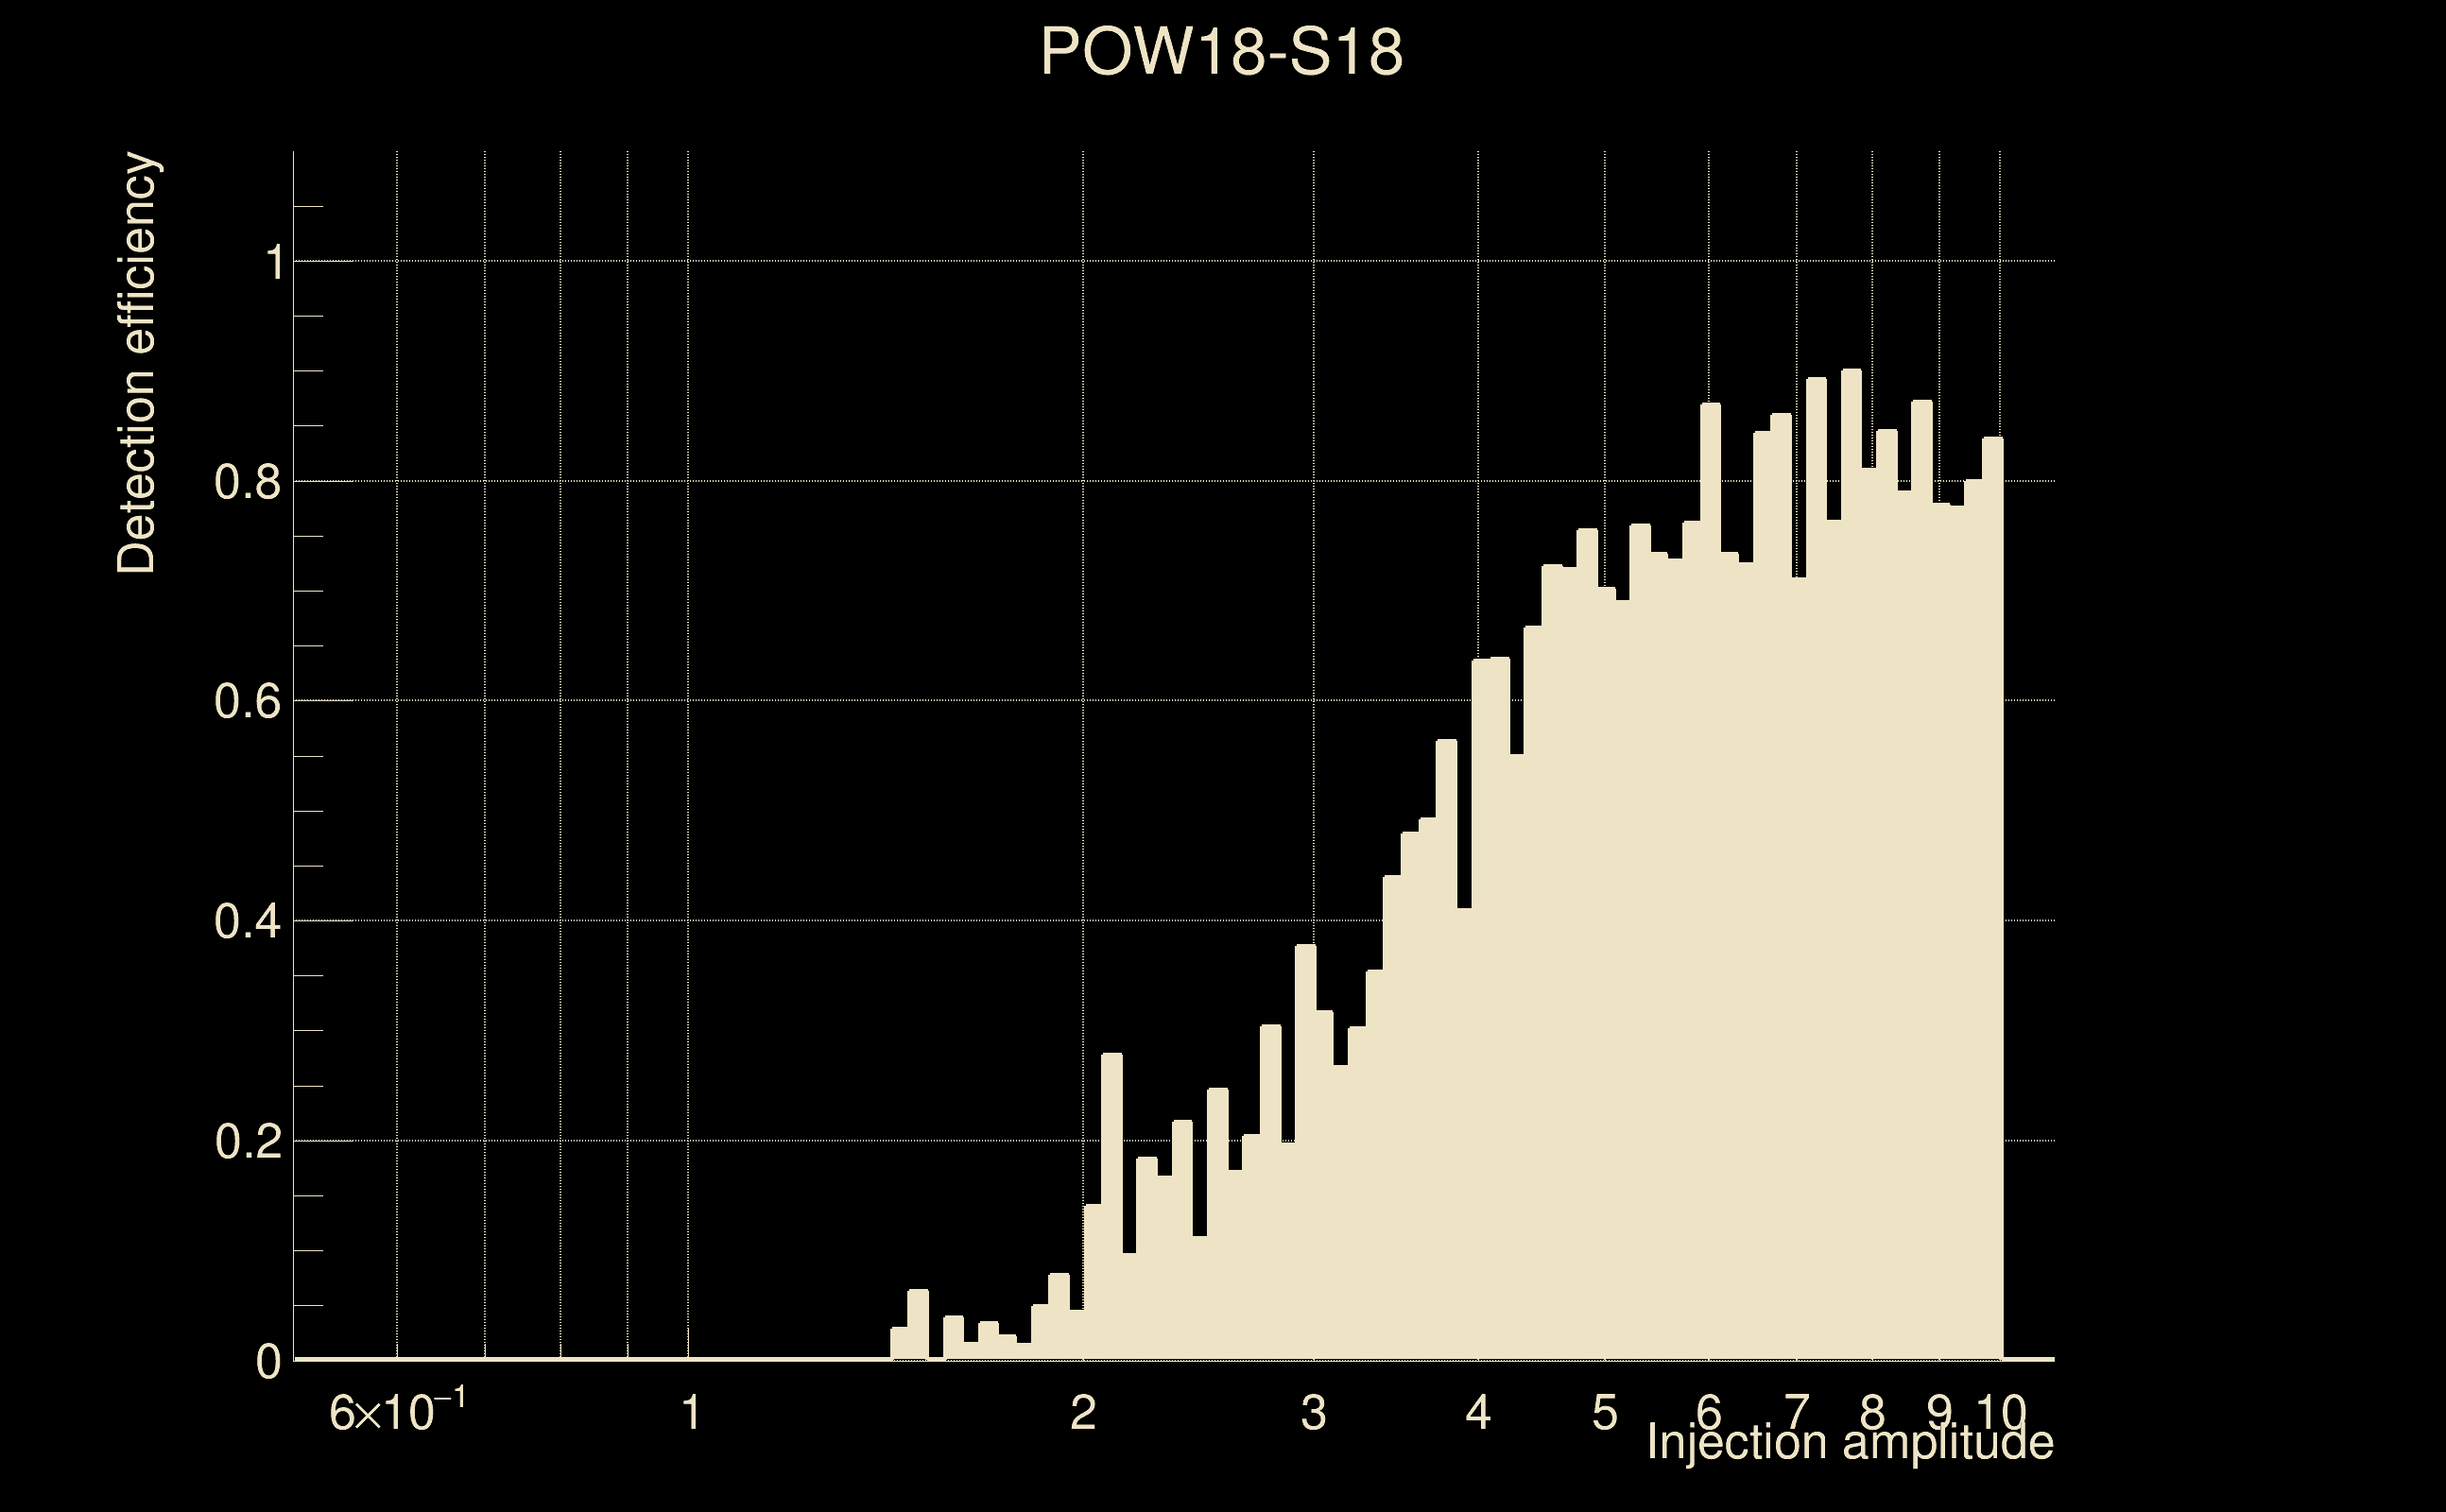
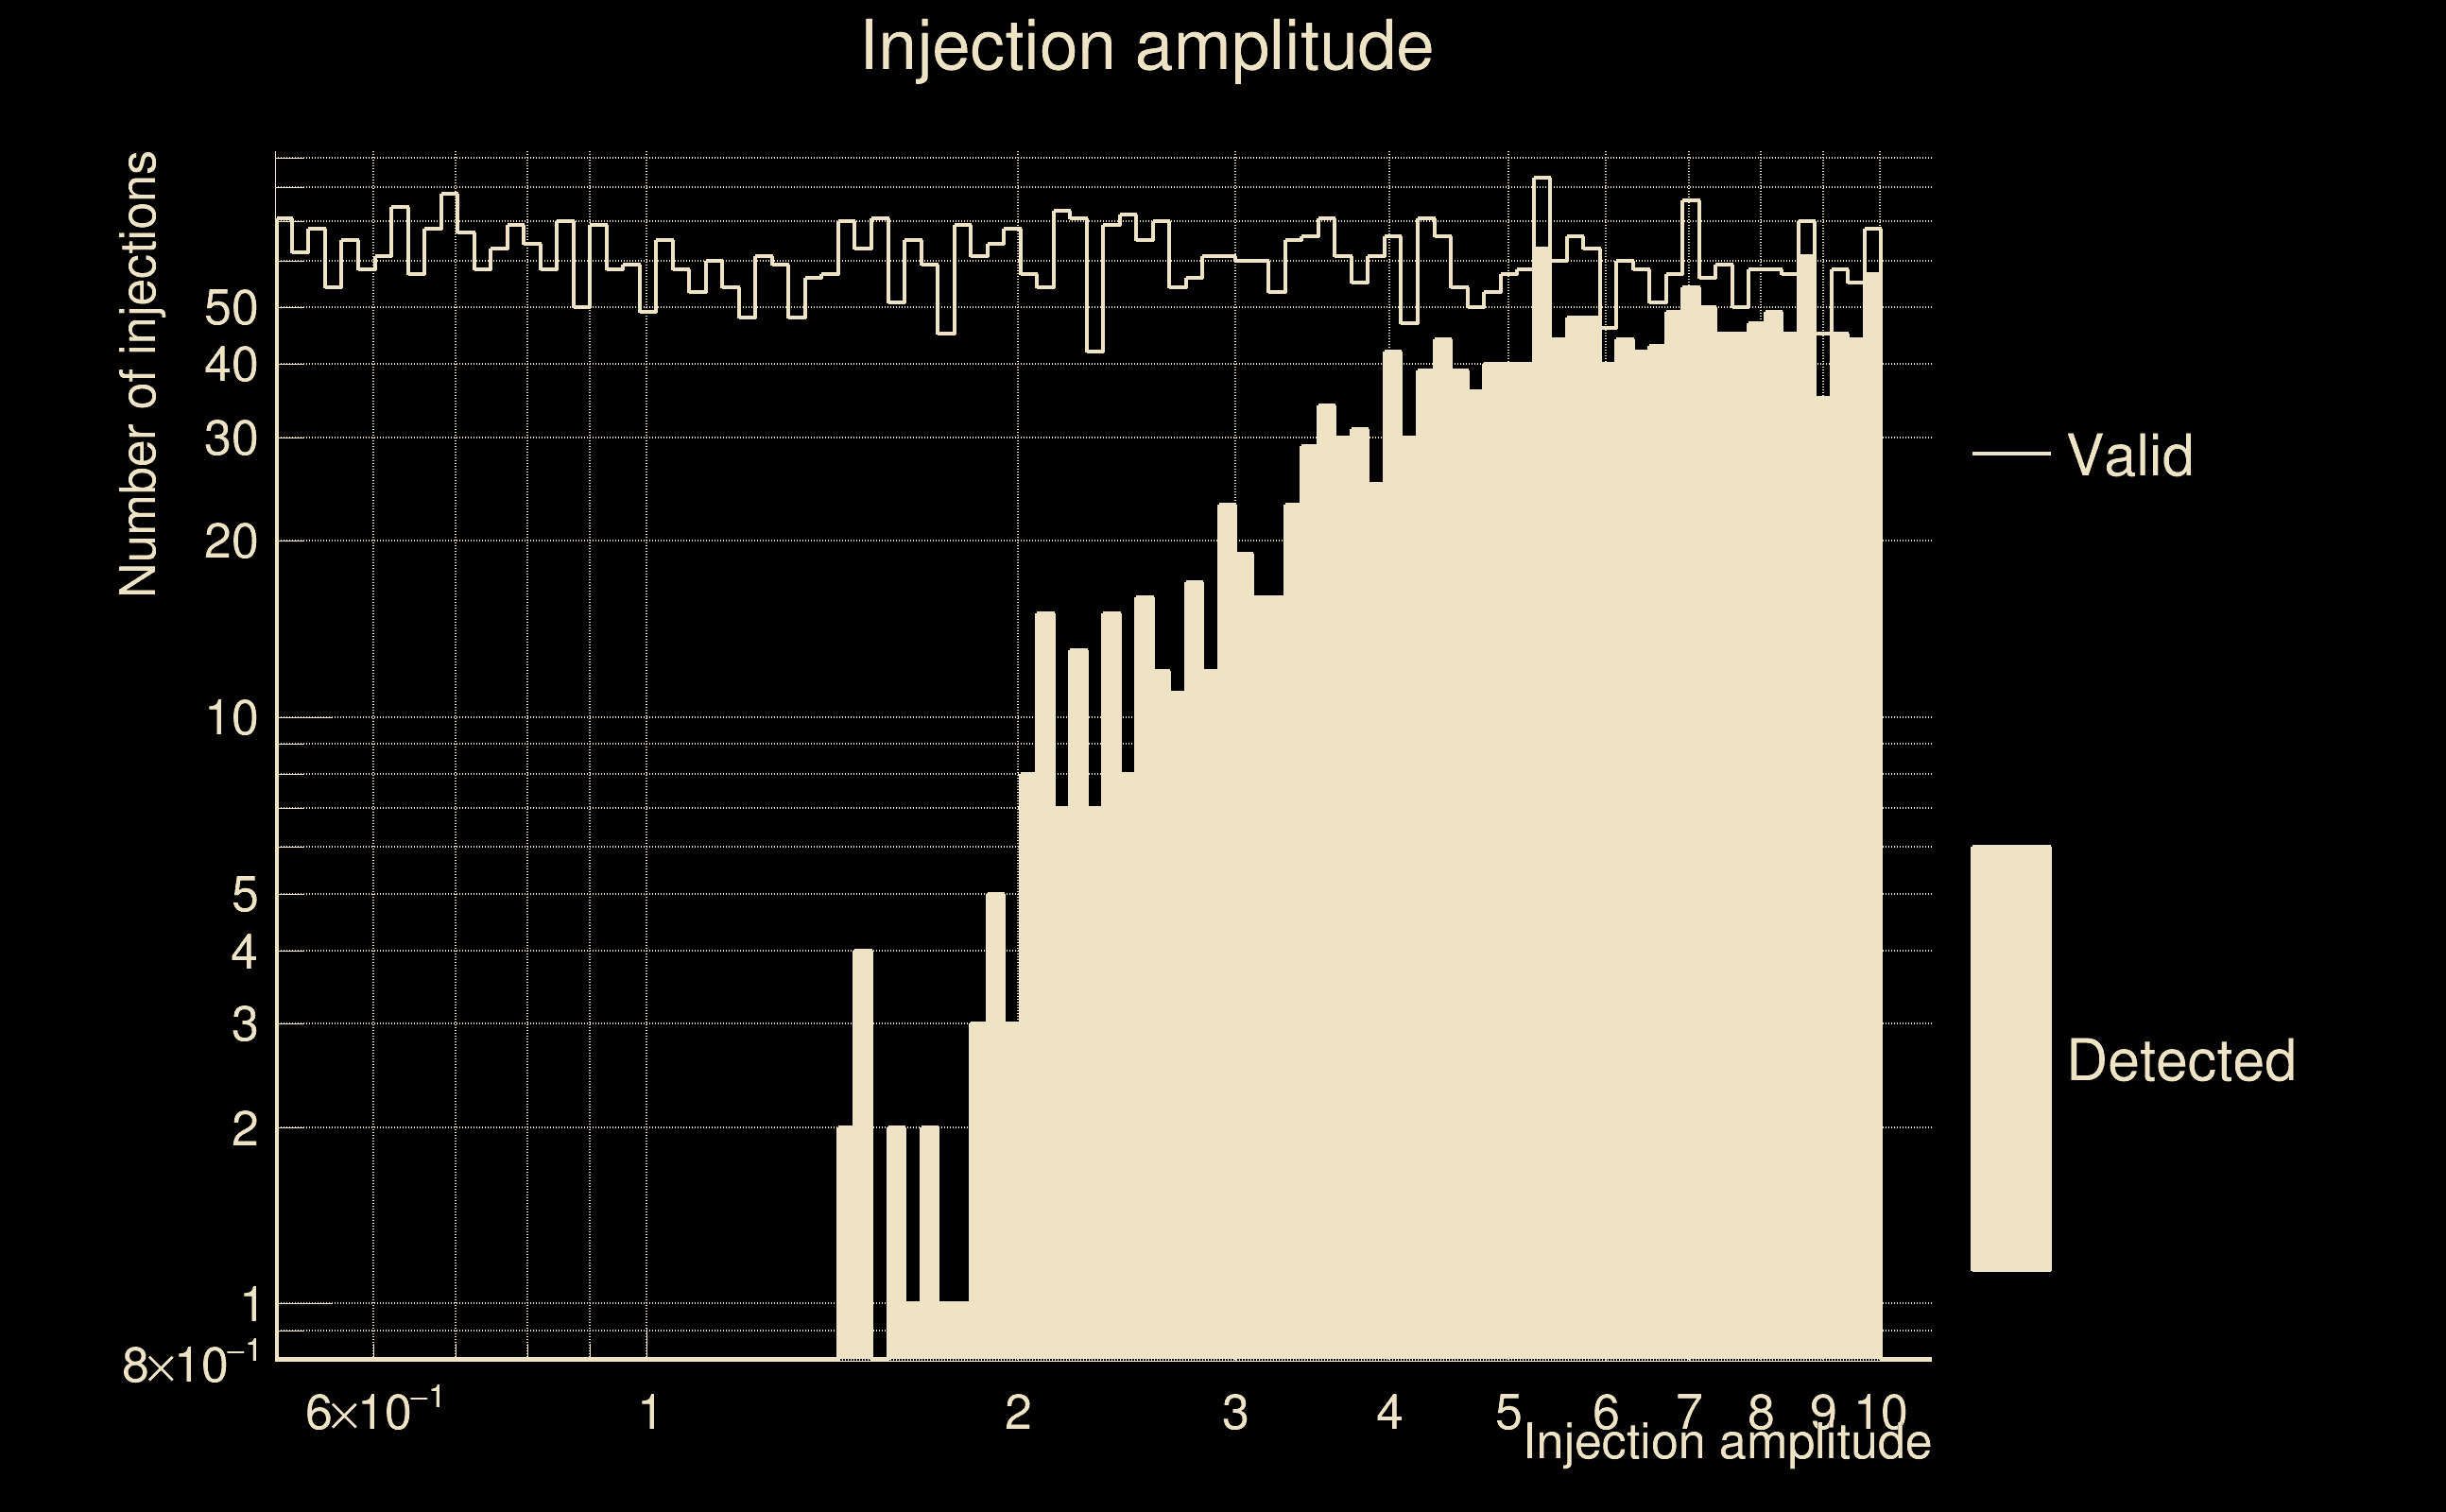
| Number of injections (total/valid/detected): | 5932 / 5888 / 1759 |
| List of missed injections: | ./POW18-S18_missed.txt |
| Injection amplitude at 90% detection efficiency: | 7.70941 |
| Injection amplitude at 50% detection efficiency: | 3.95477 |
| Injection amplitude at 10% detection efficiency: | 2.17443 |
 |
 |
 |
 |
 |
 |
|
 |
 |
|
 |
 |
 |
 |
 |
 |
 |
 |
| florent.robinet@ijclab.in2p3.fr |