| Omicron version: | 4.2.0: documentation gitlab repository |
| Omicron run by: | unknown |
| Report produced on: | Wed Dec 17 15:25:03 2025 UTC |
| Ox option file: | TargIxfw_injpt3_options.txt |
| Omicron option files: | detector 0, detector 1 |
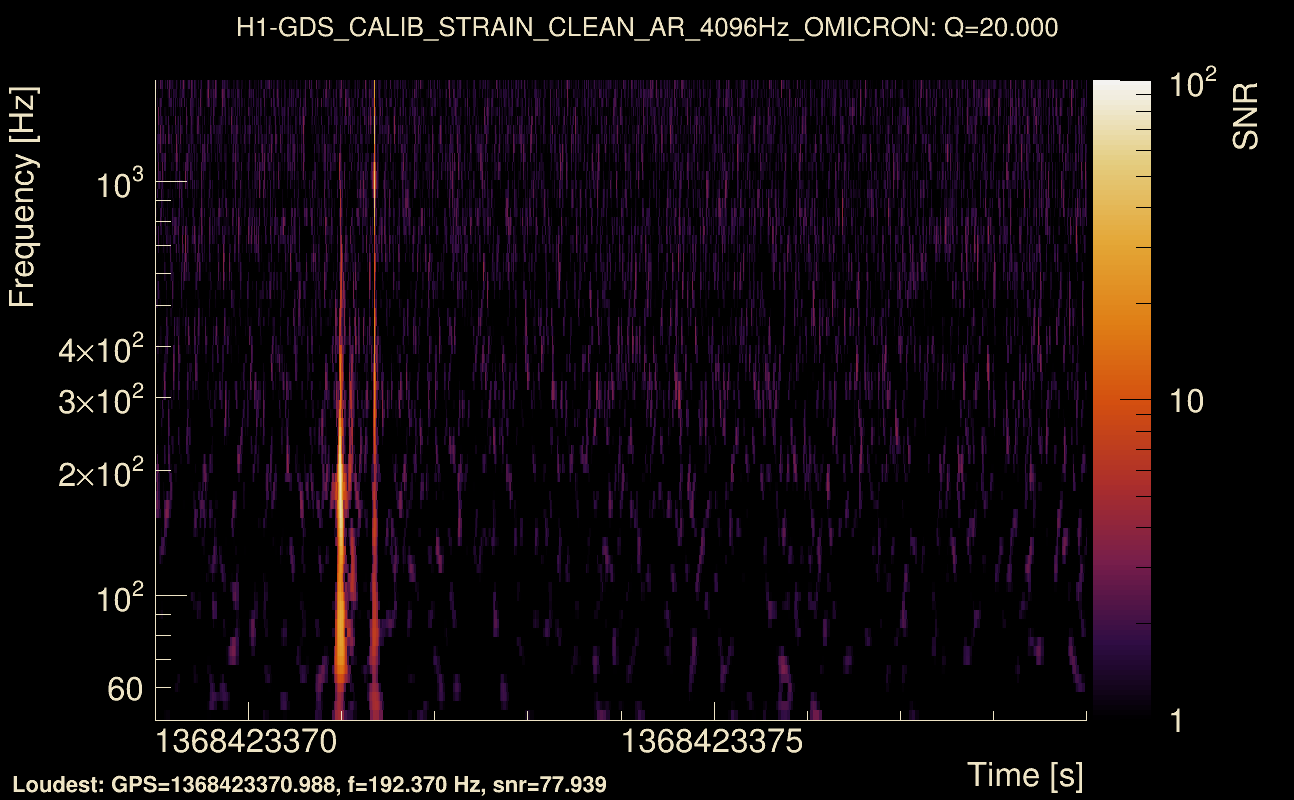
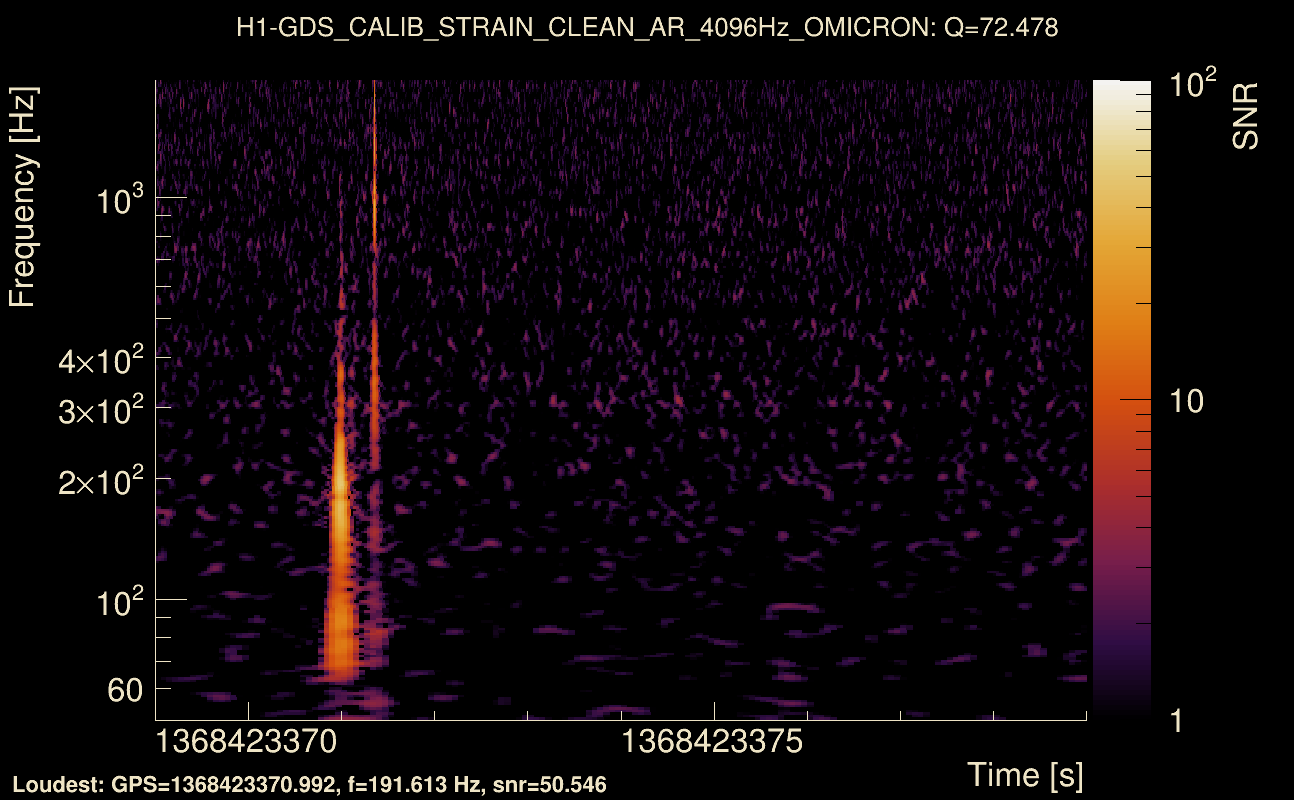
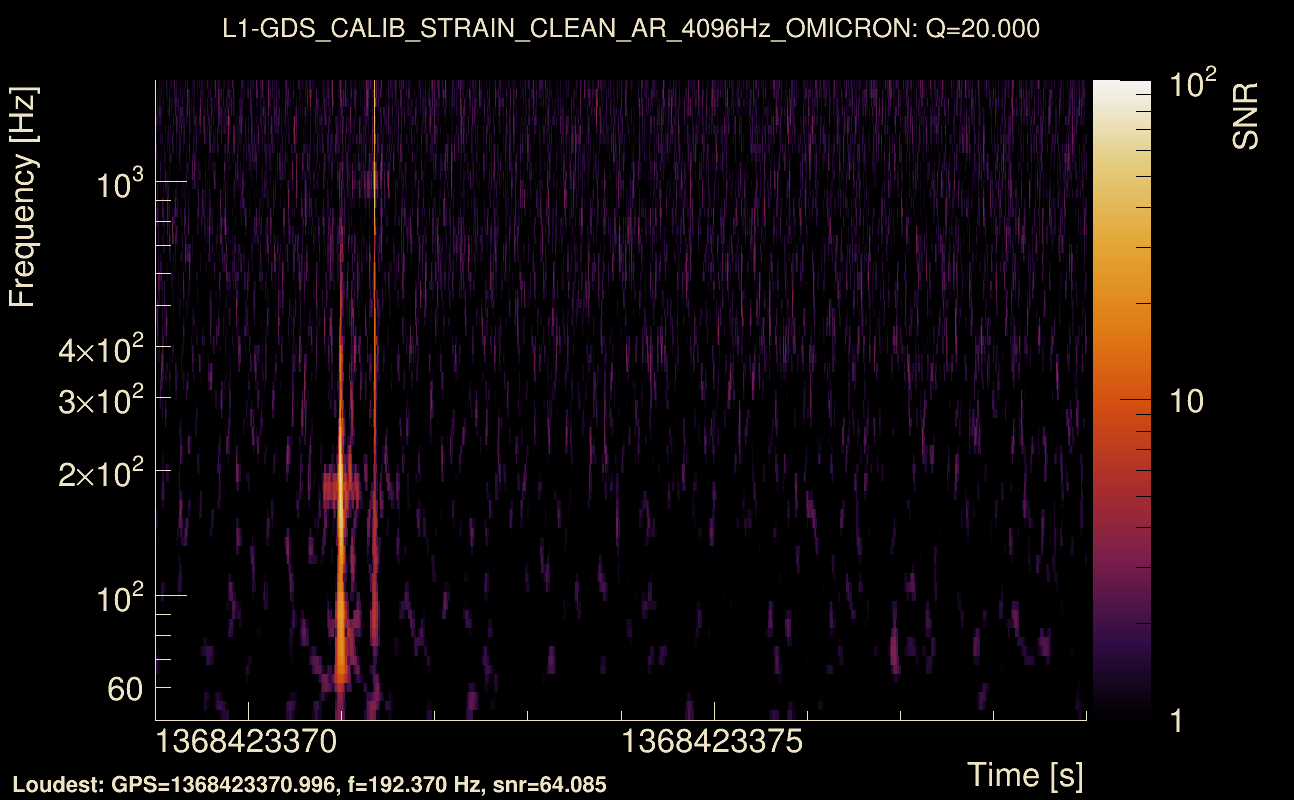
| Detector channel names: | H1:GDS-CALIB_STRAIN_CLEAN_AR_4096Hz, L1:GDS-CALIB_STRAIN_CLEAN_AR_4096Hz |
| Omicron analysis time window and overlap: | 16 s, 6 s |
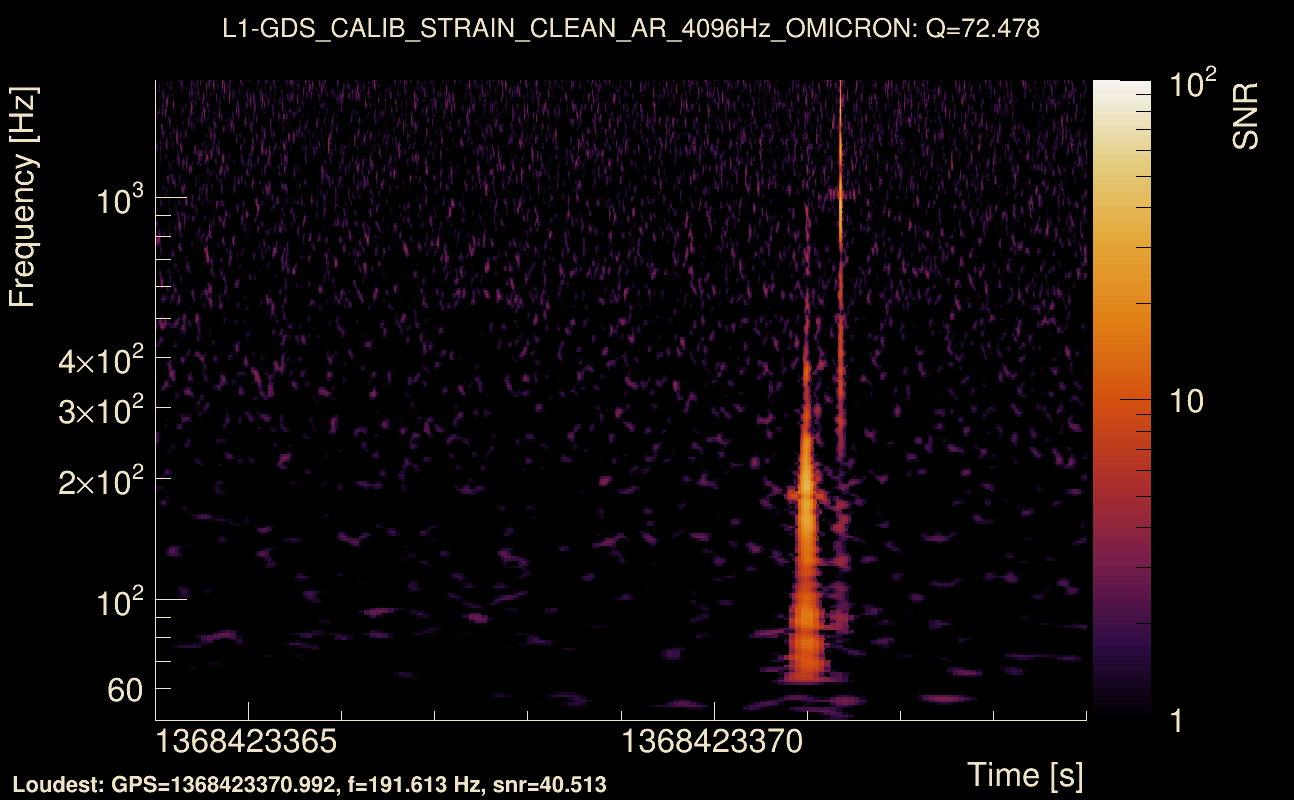
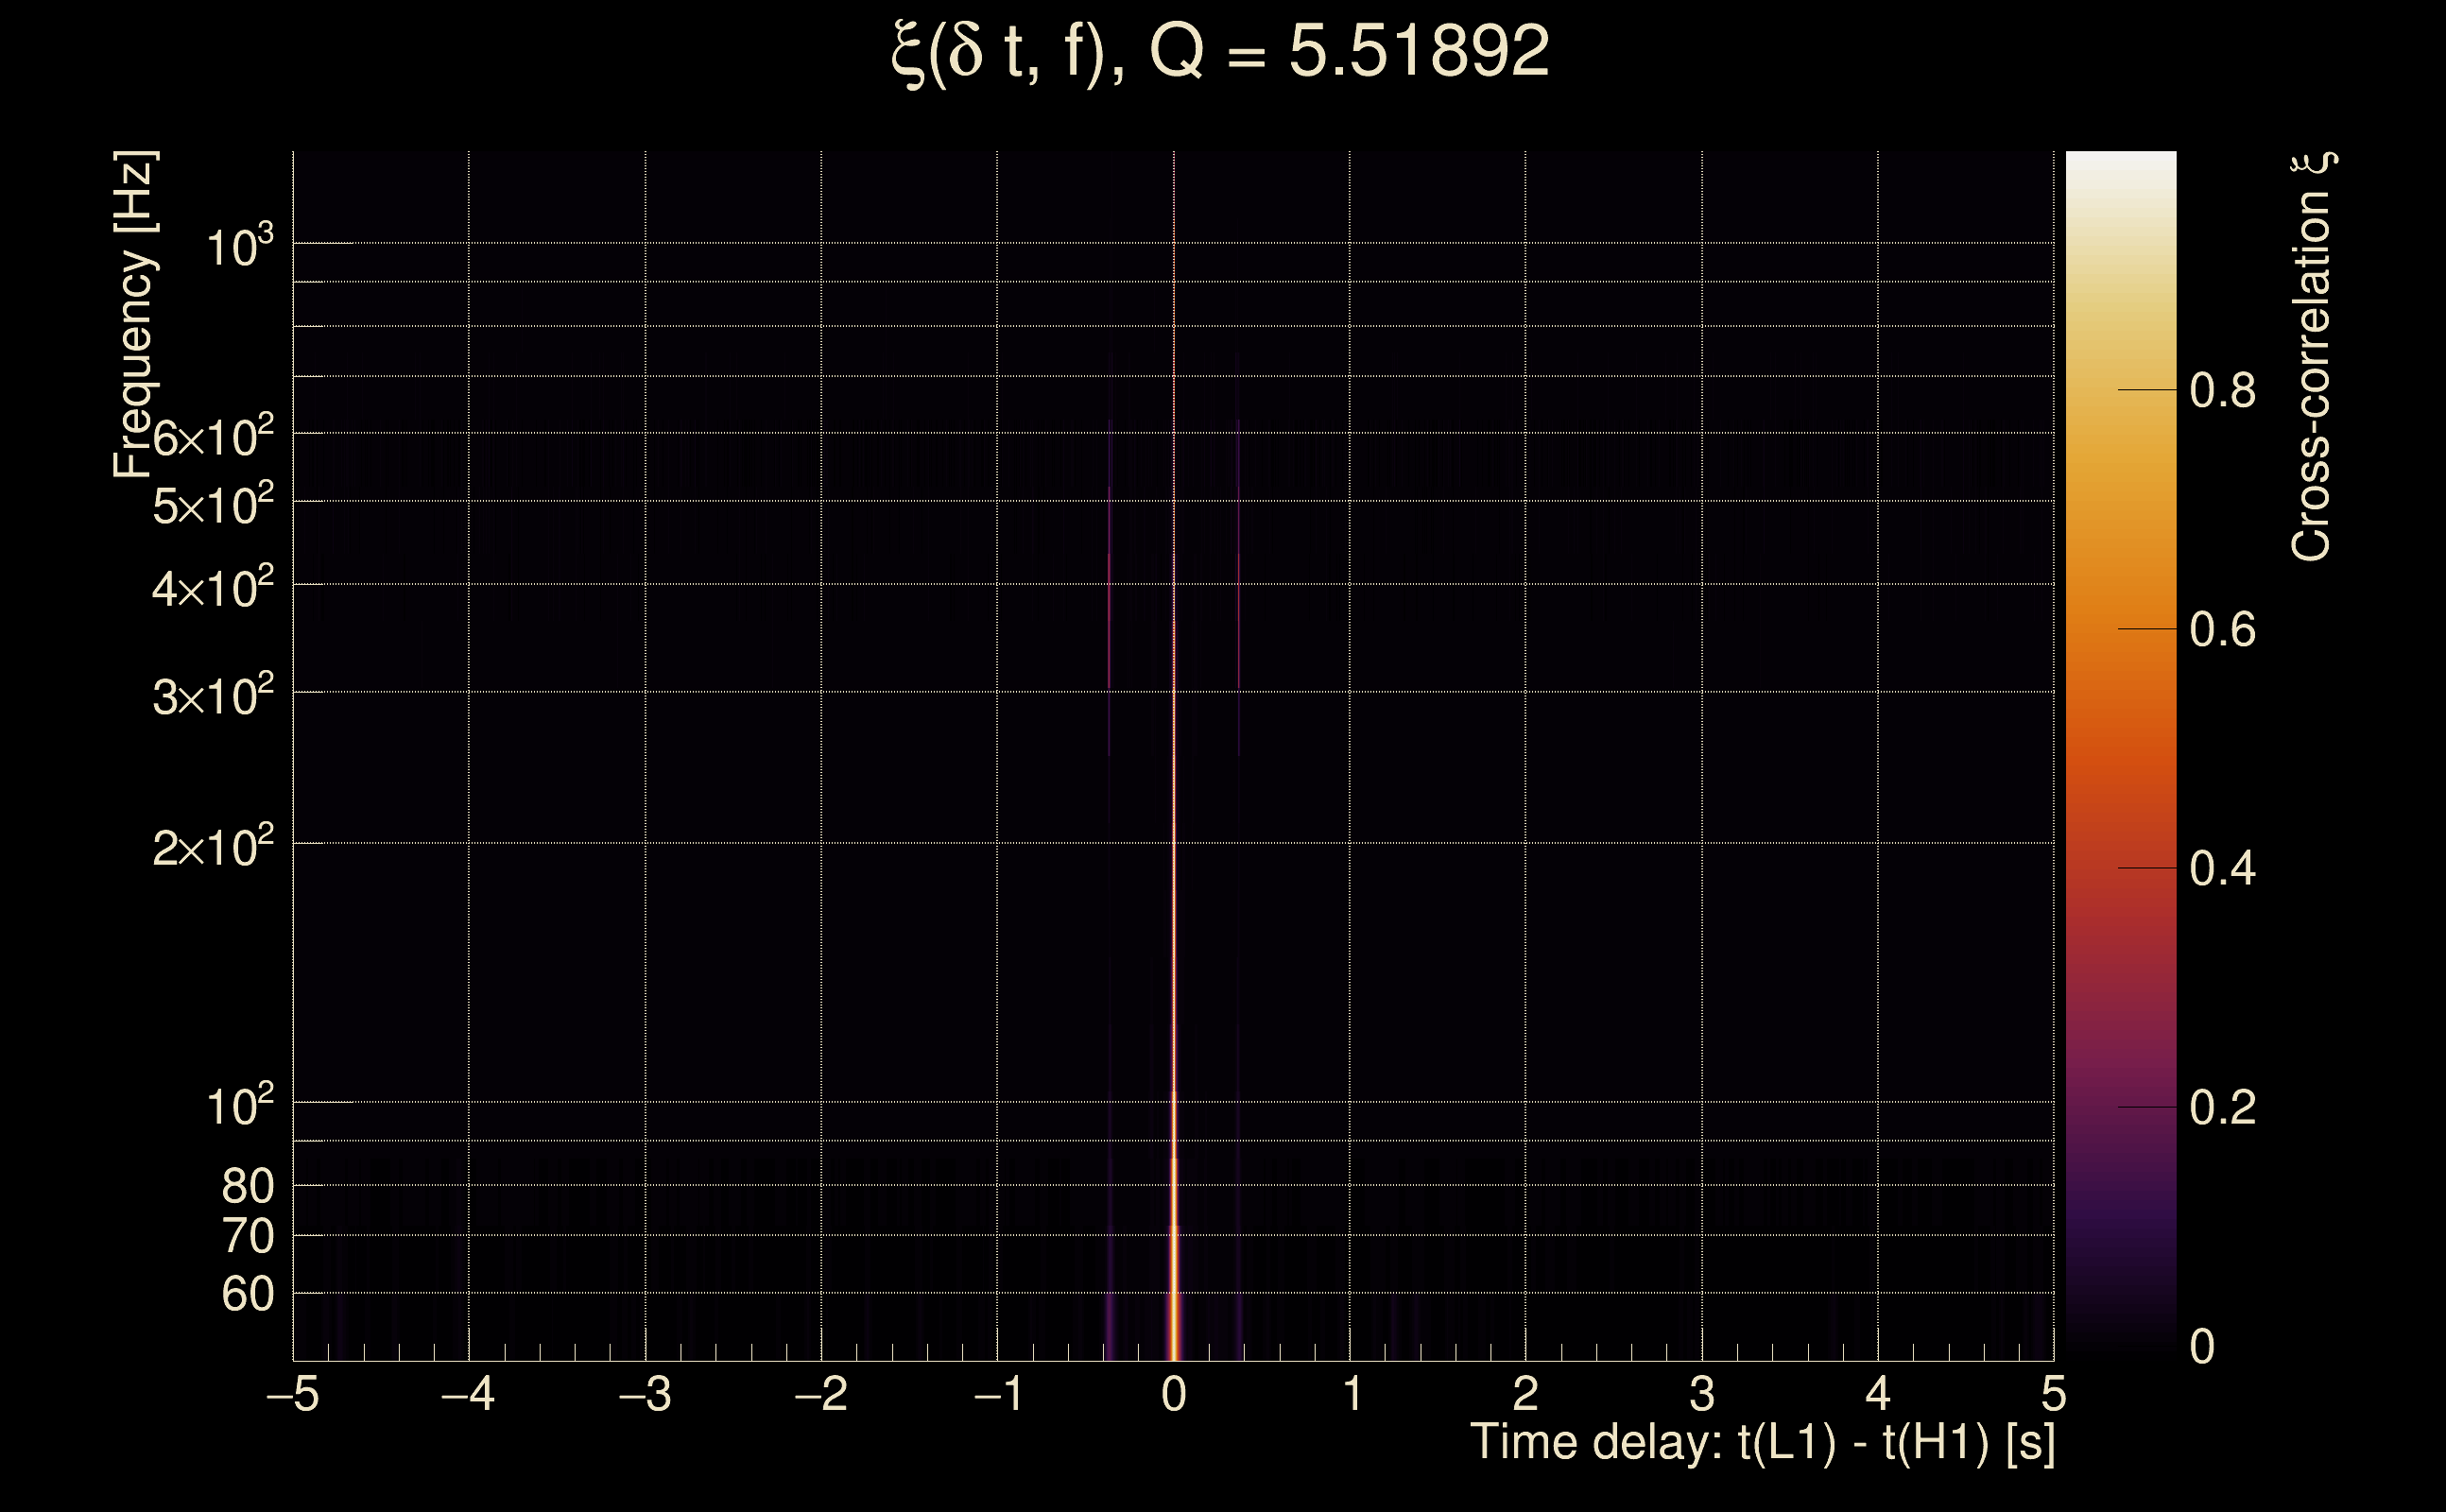
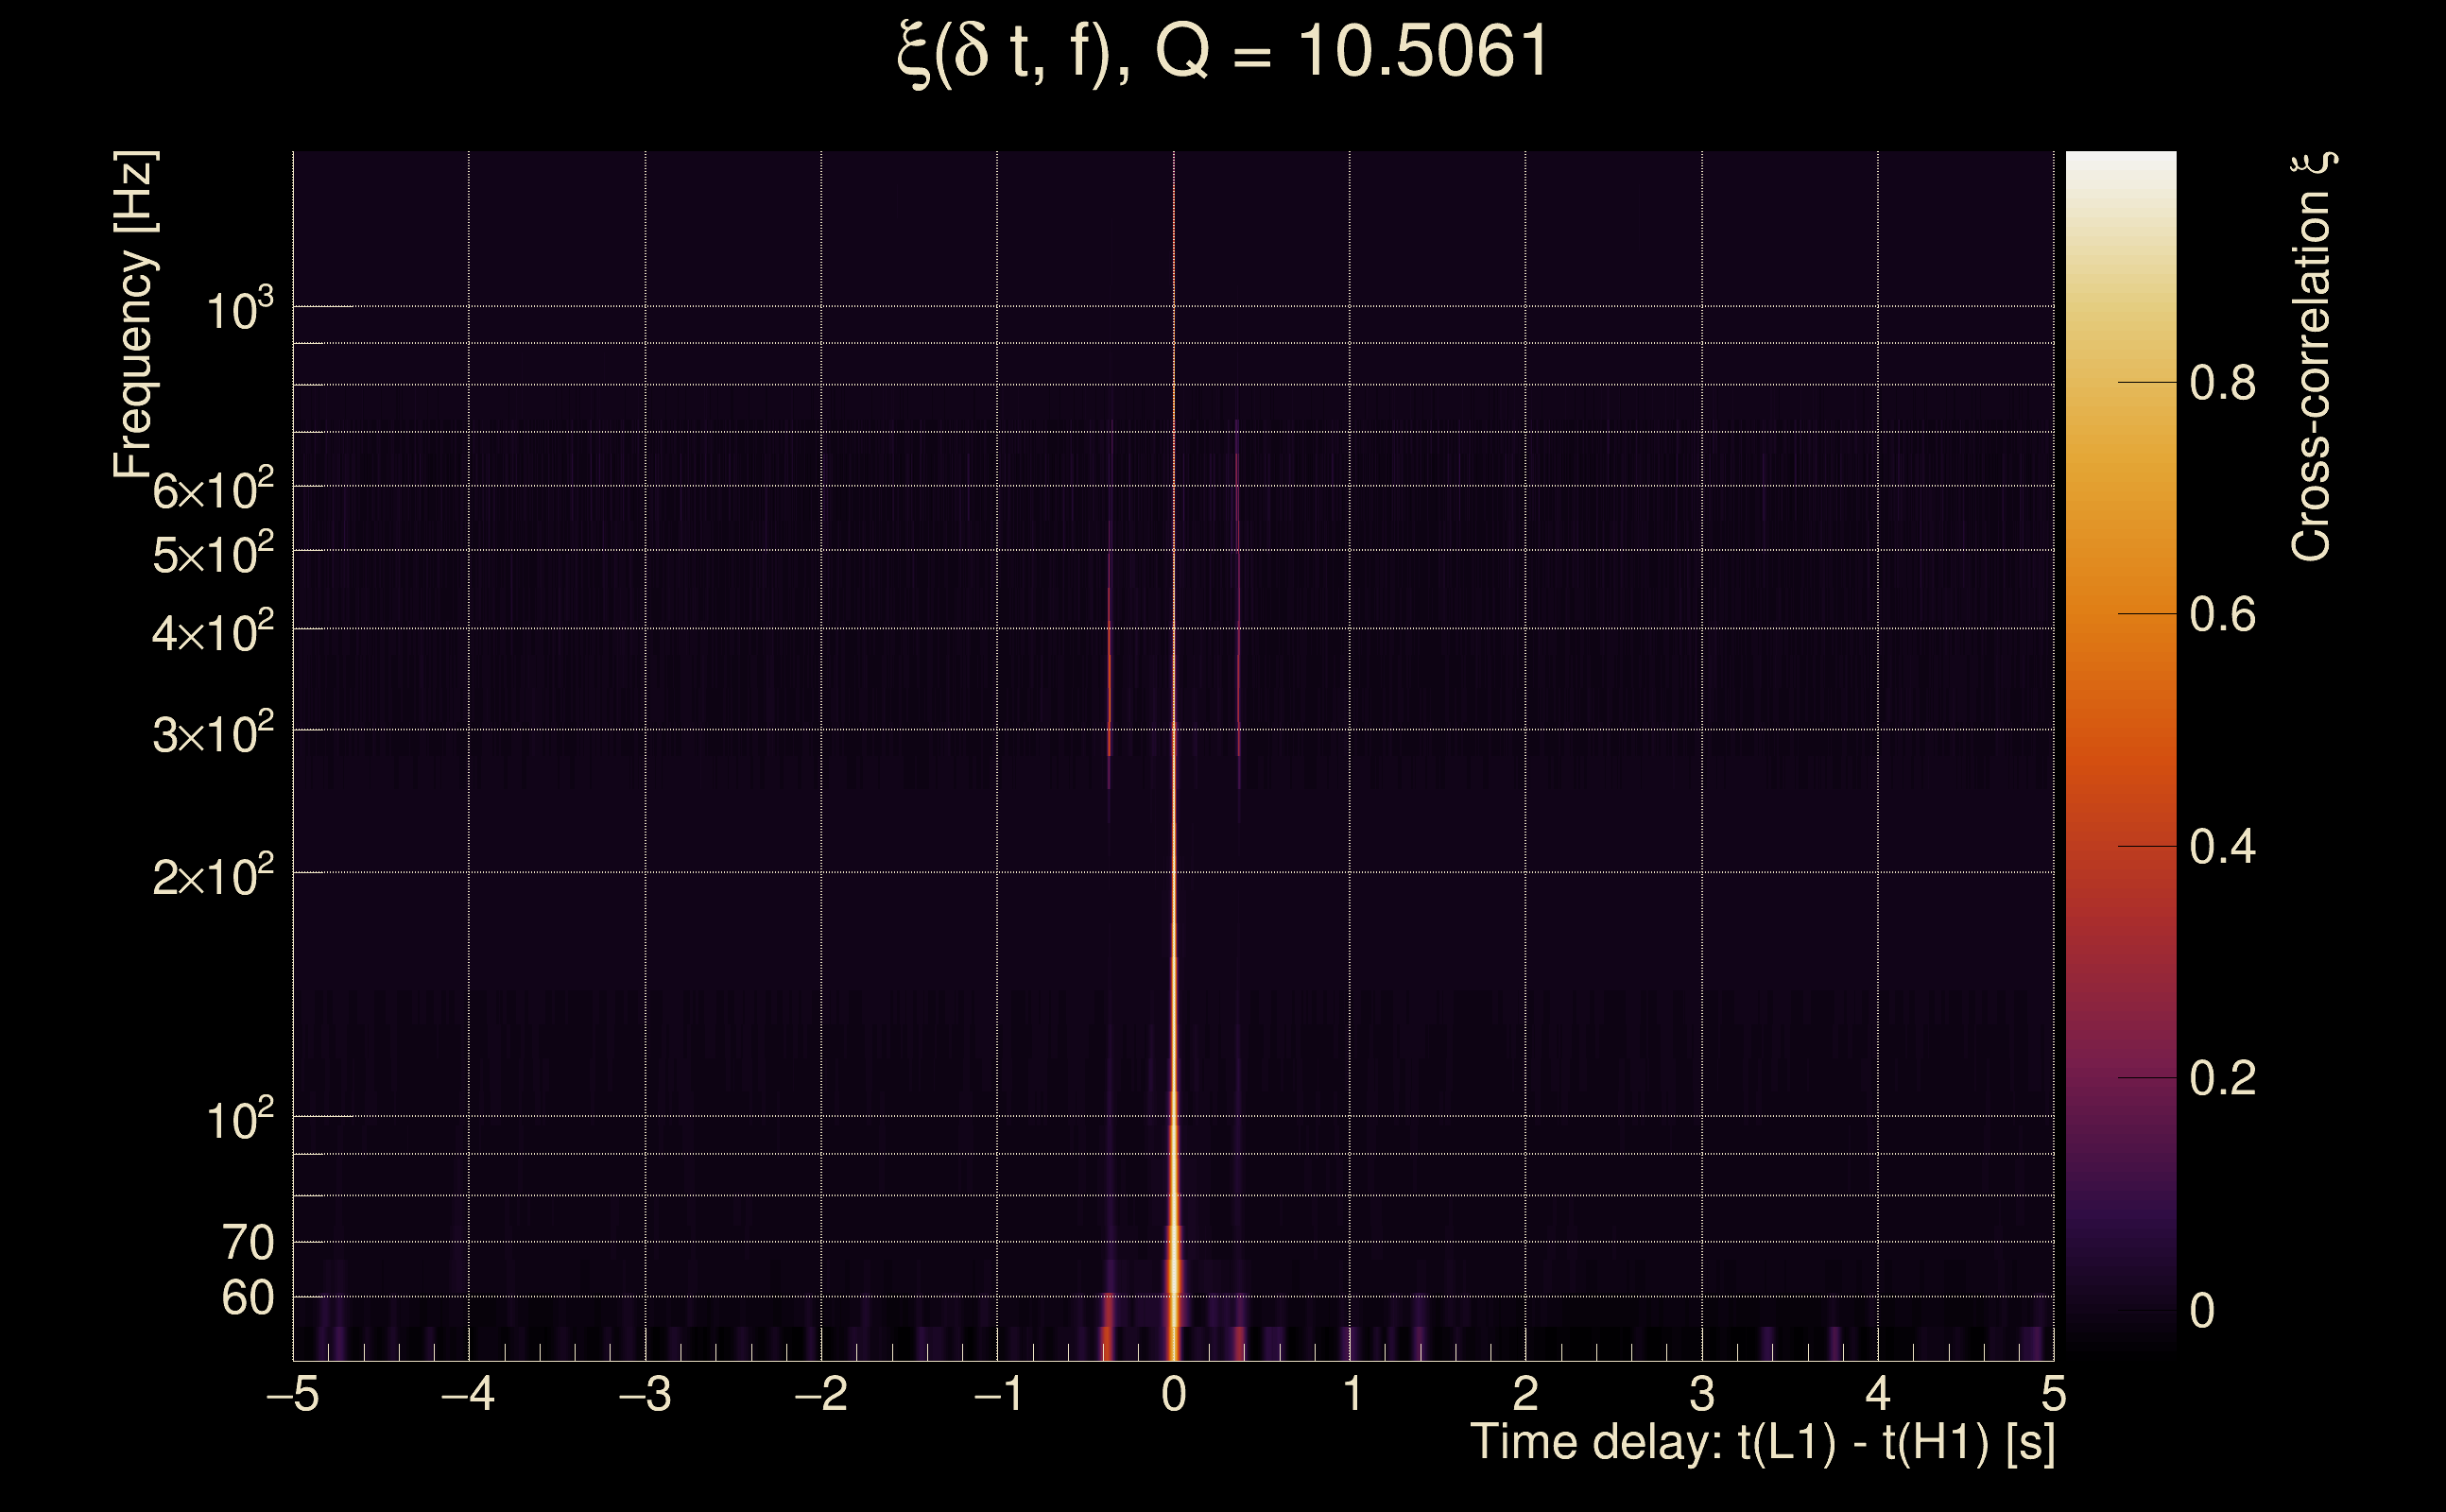
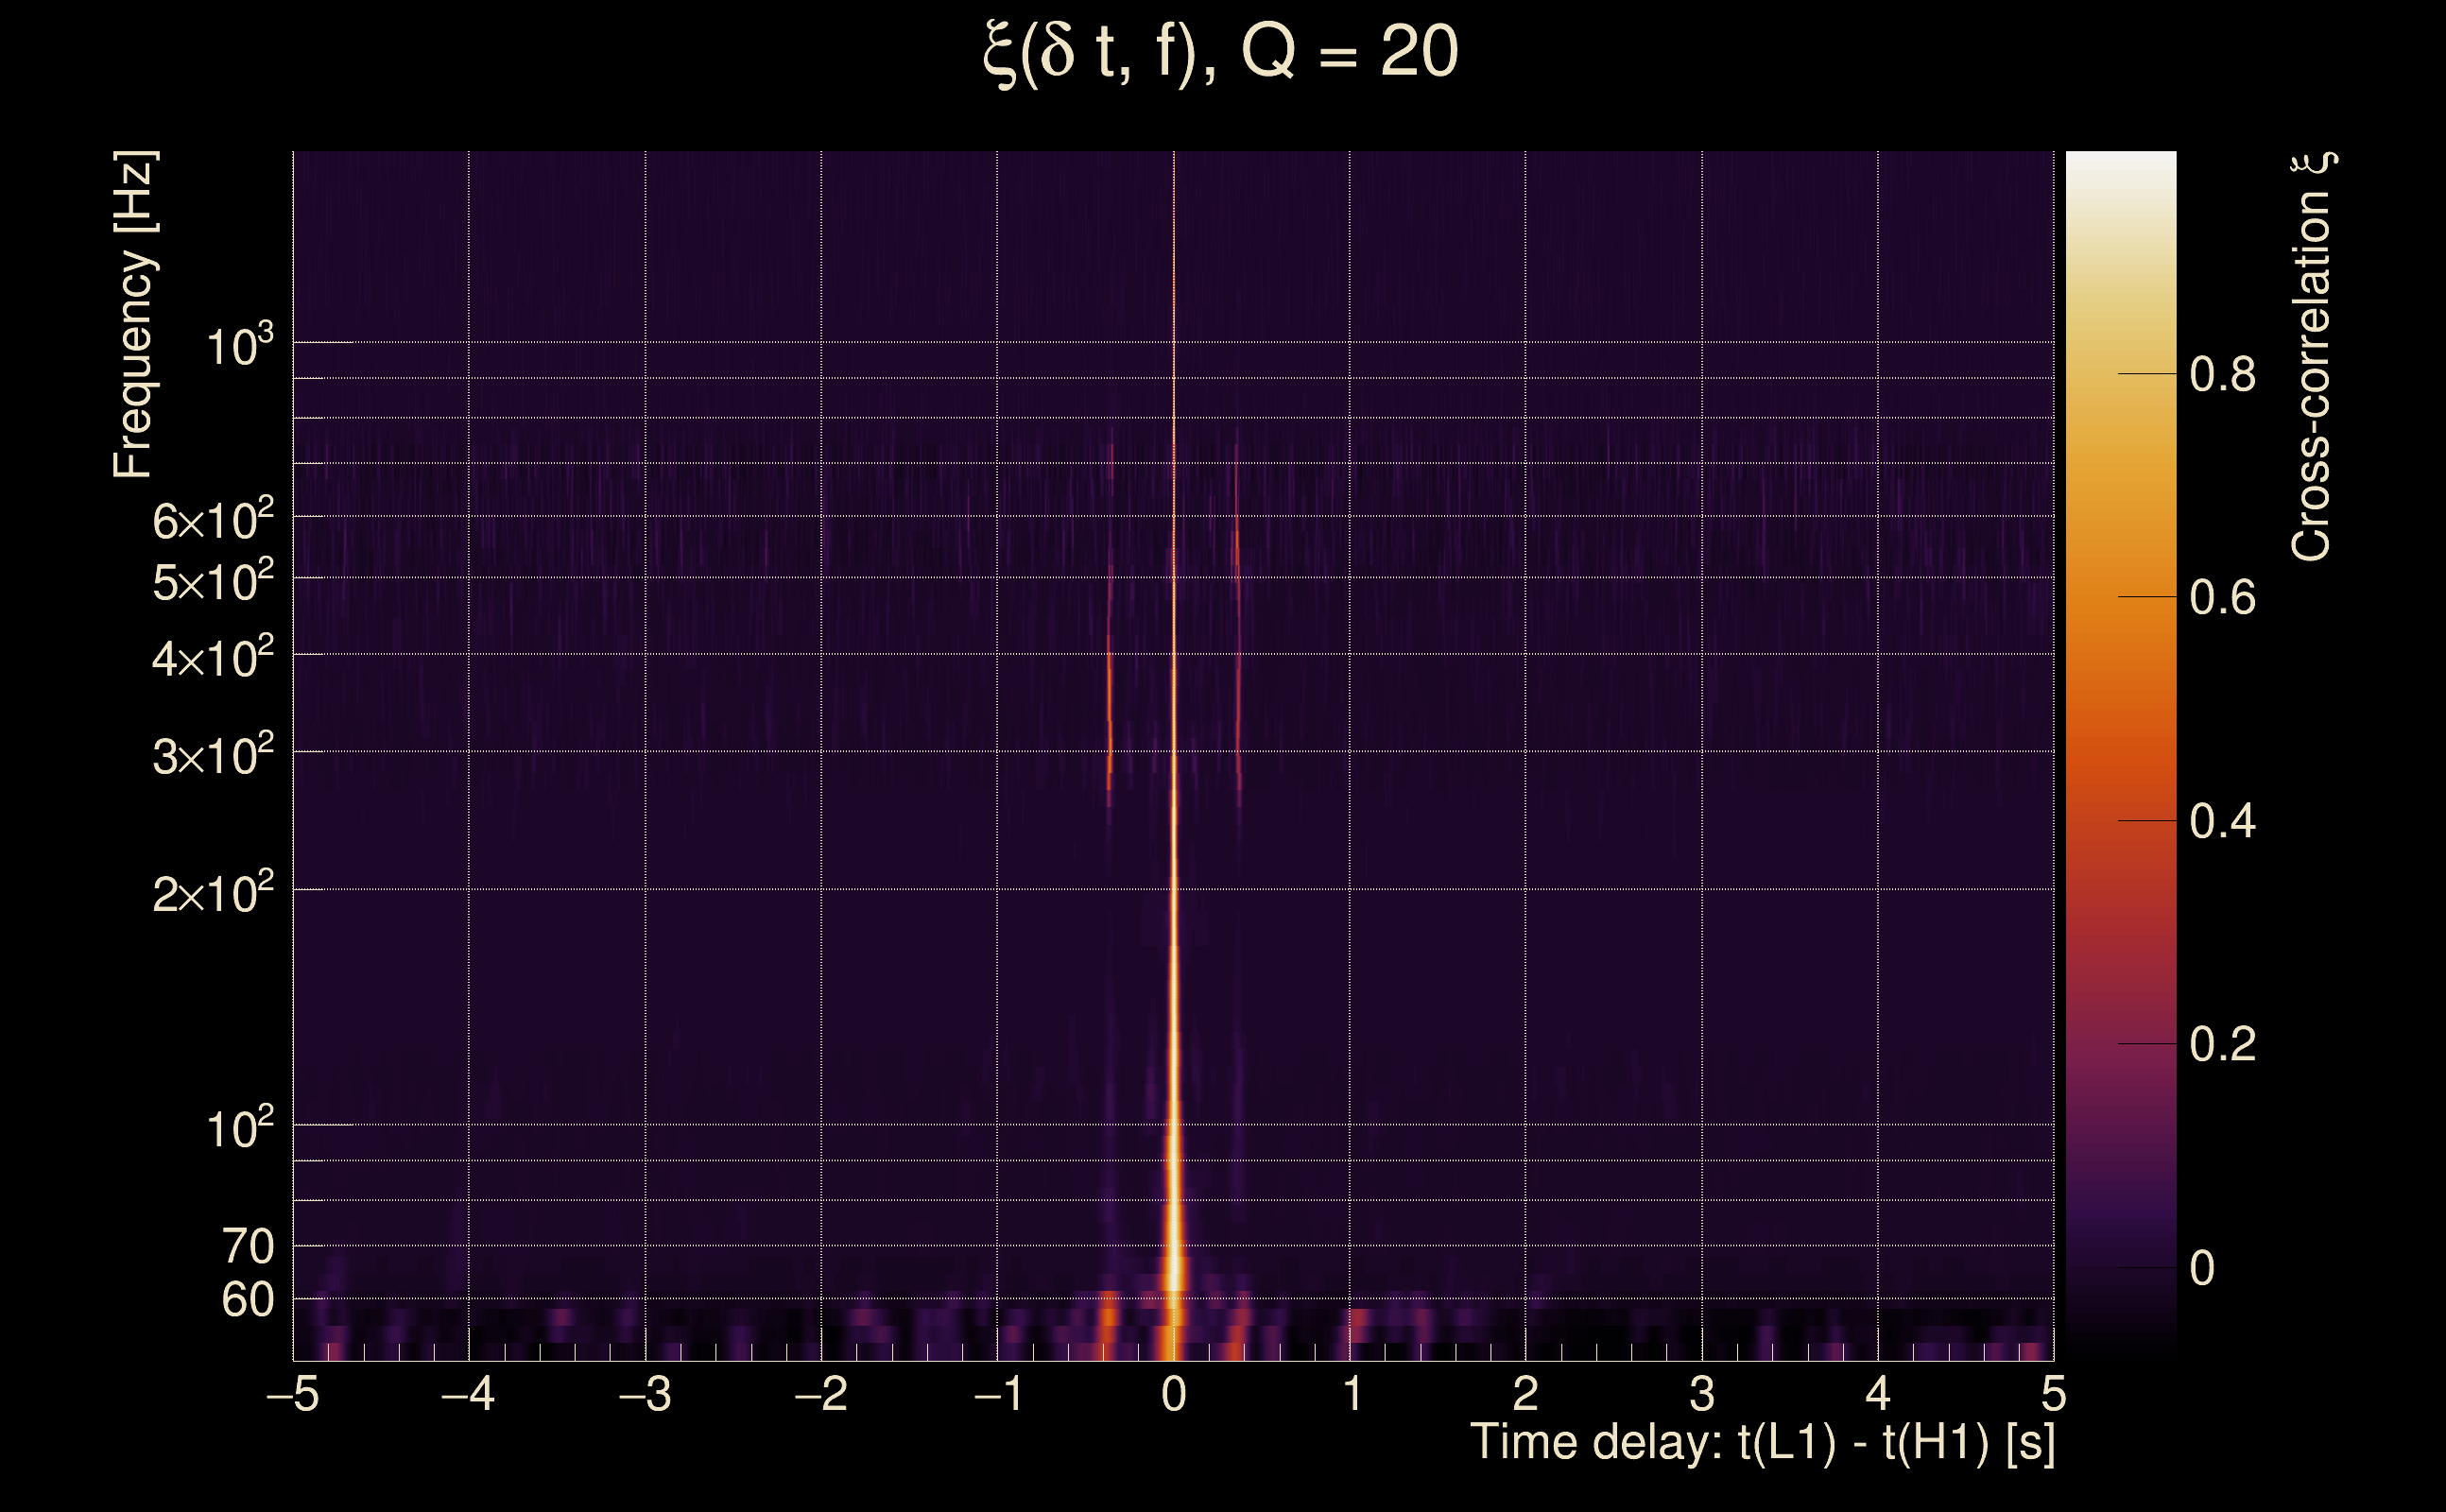
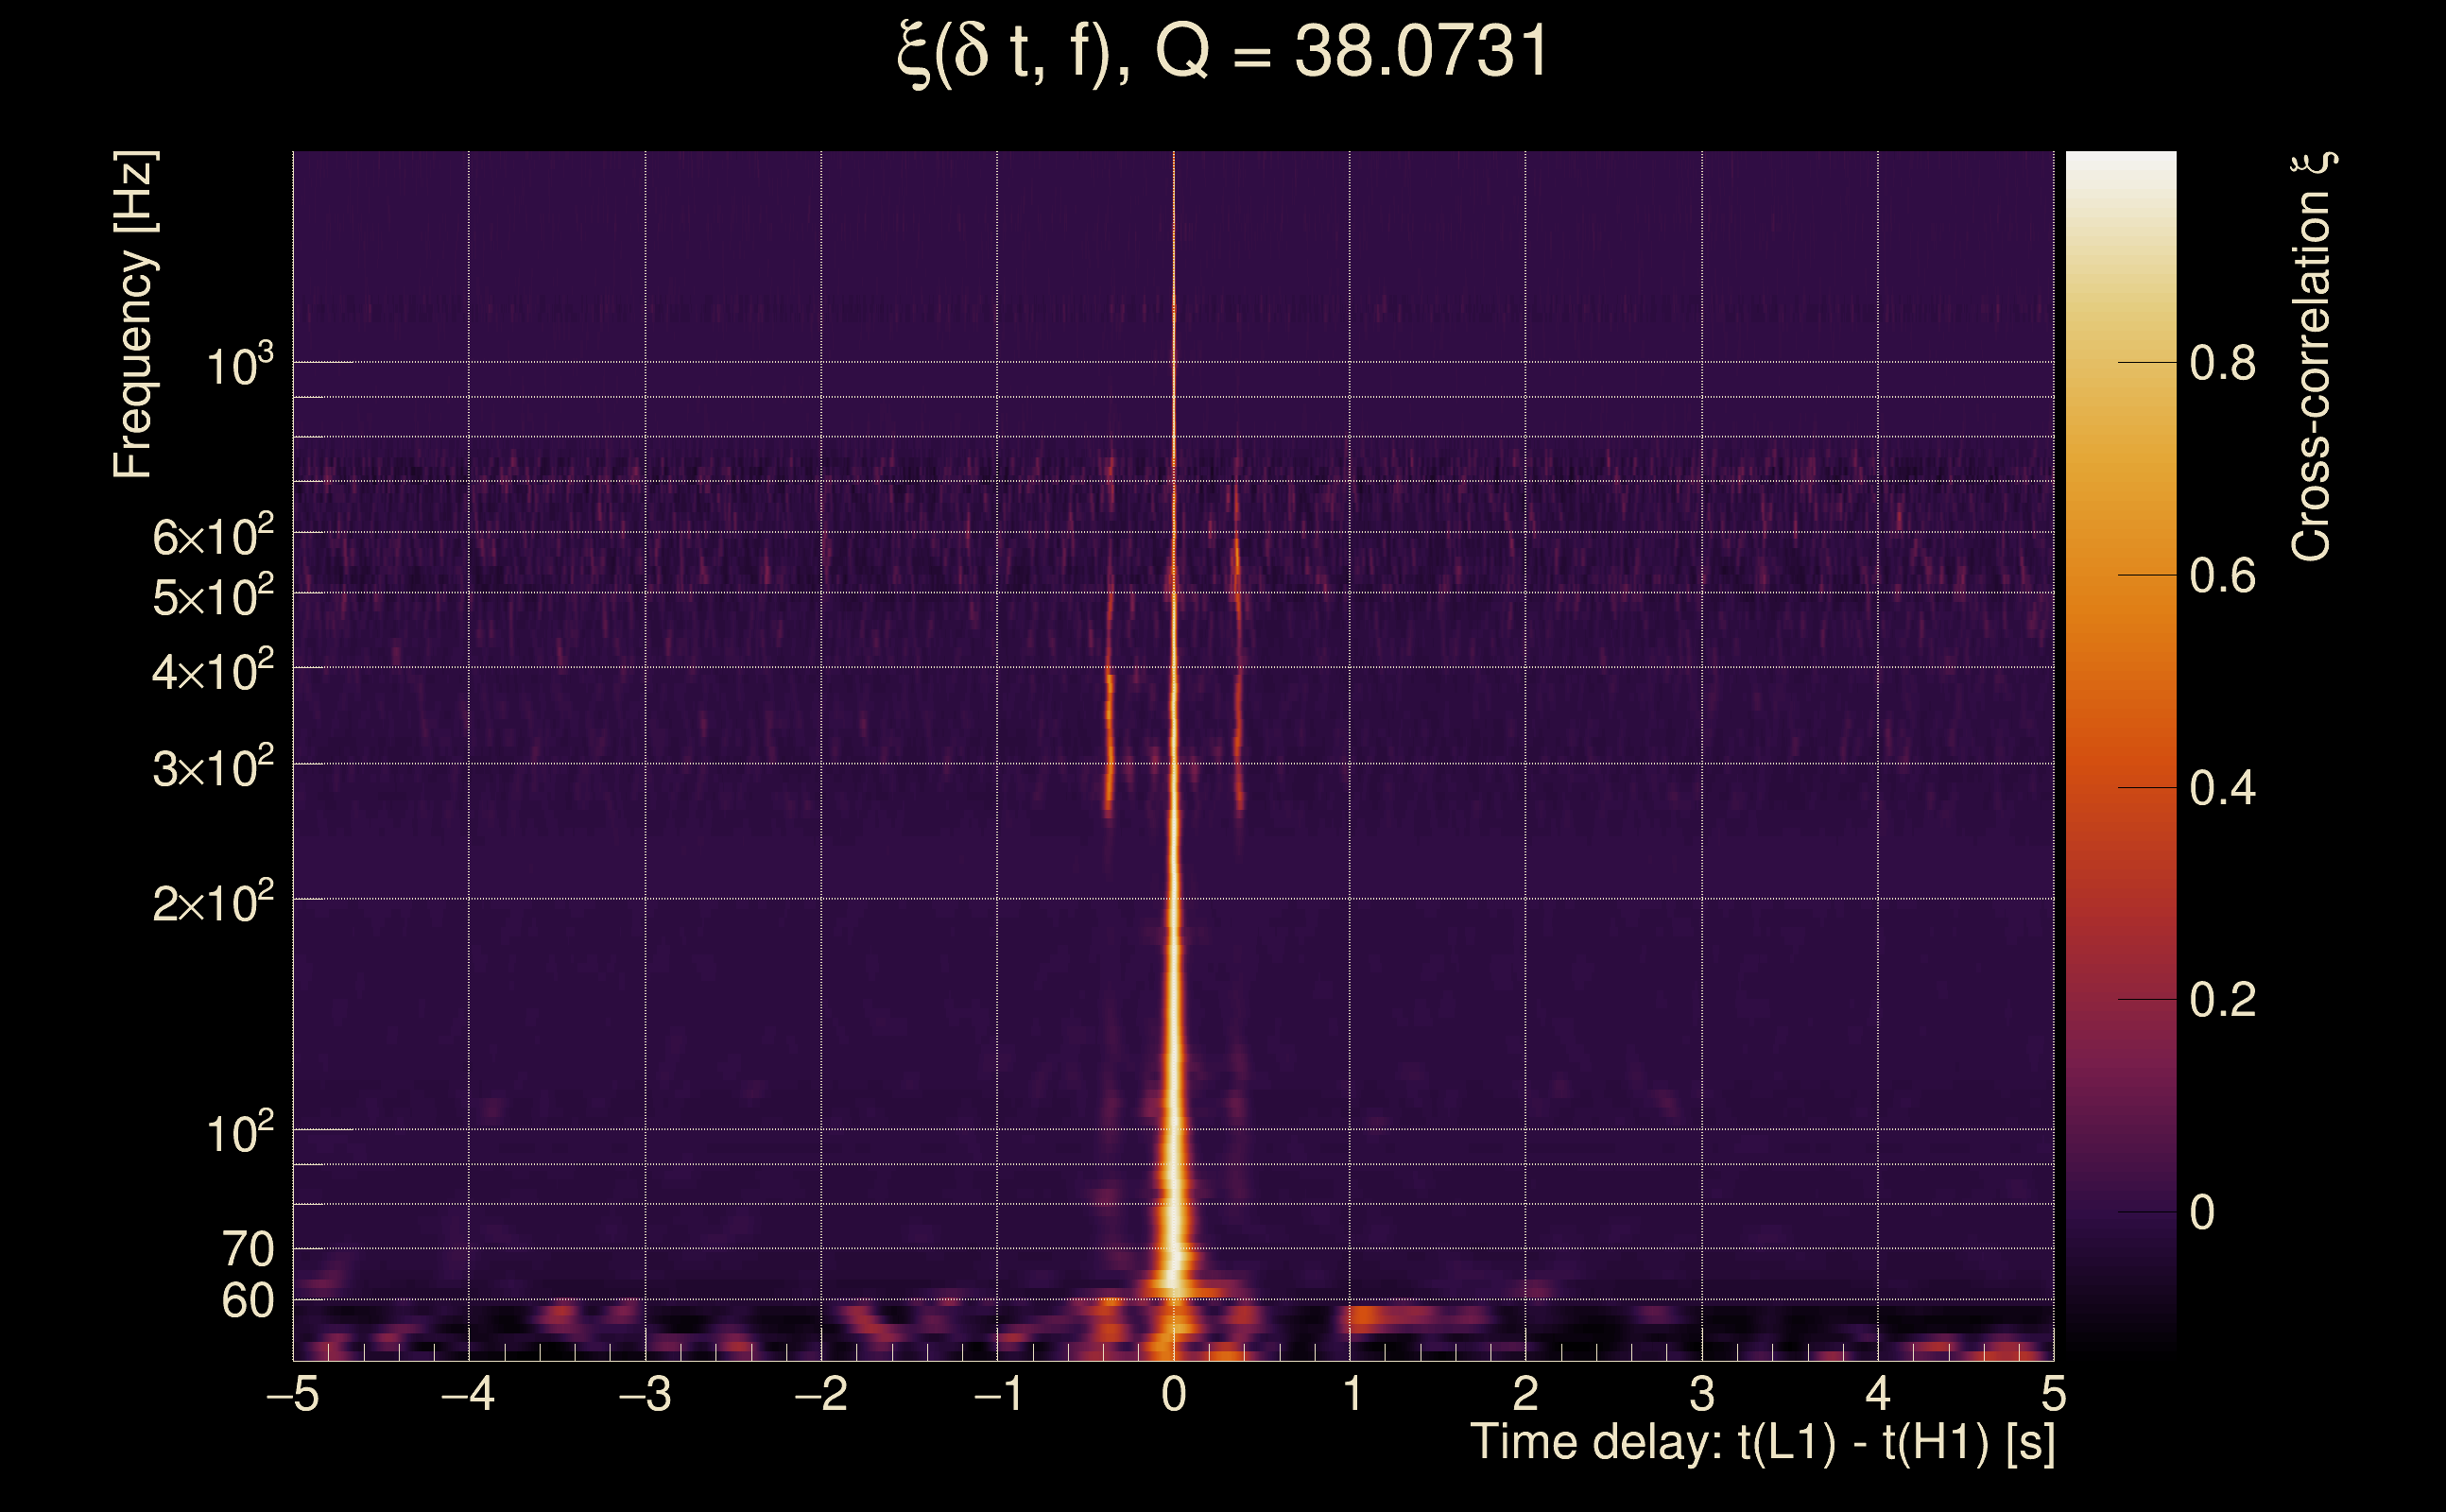
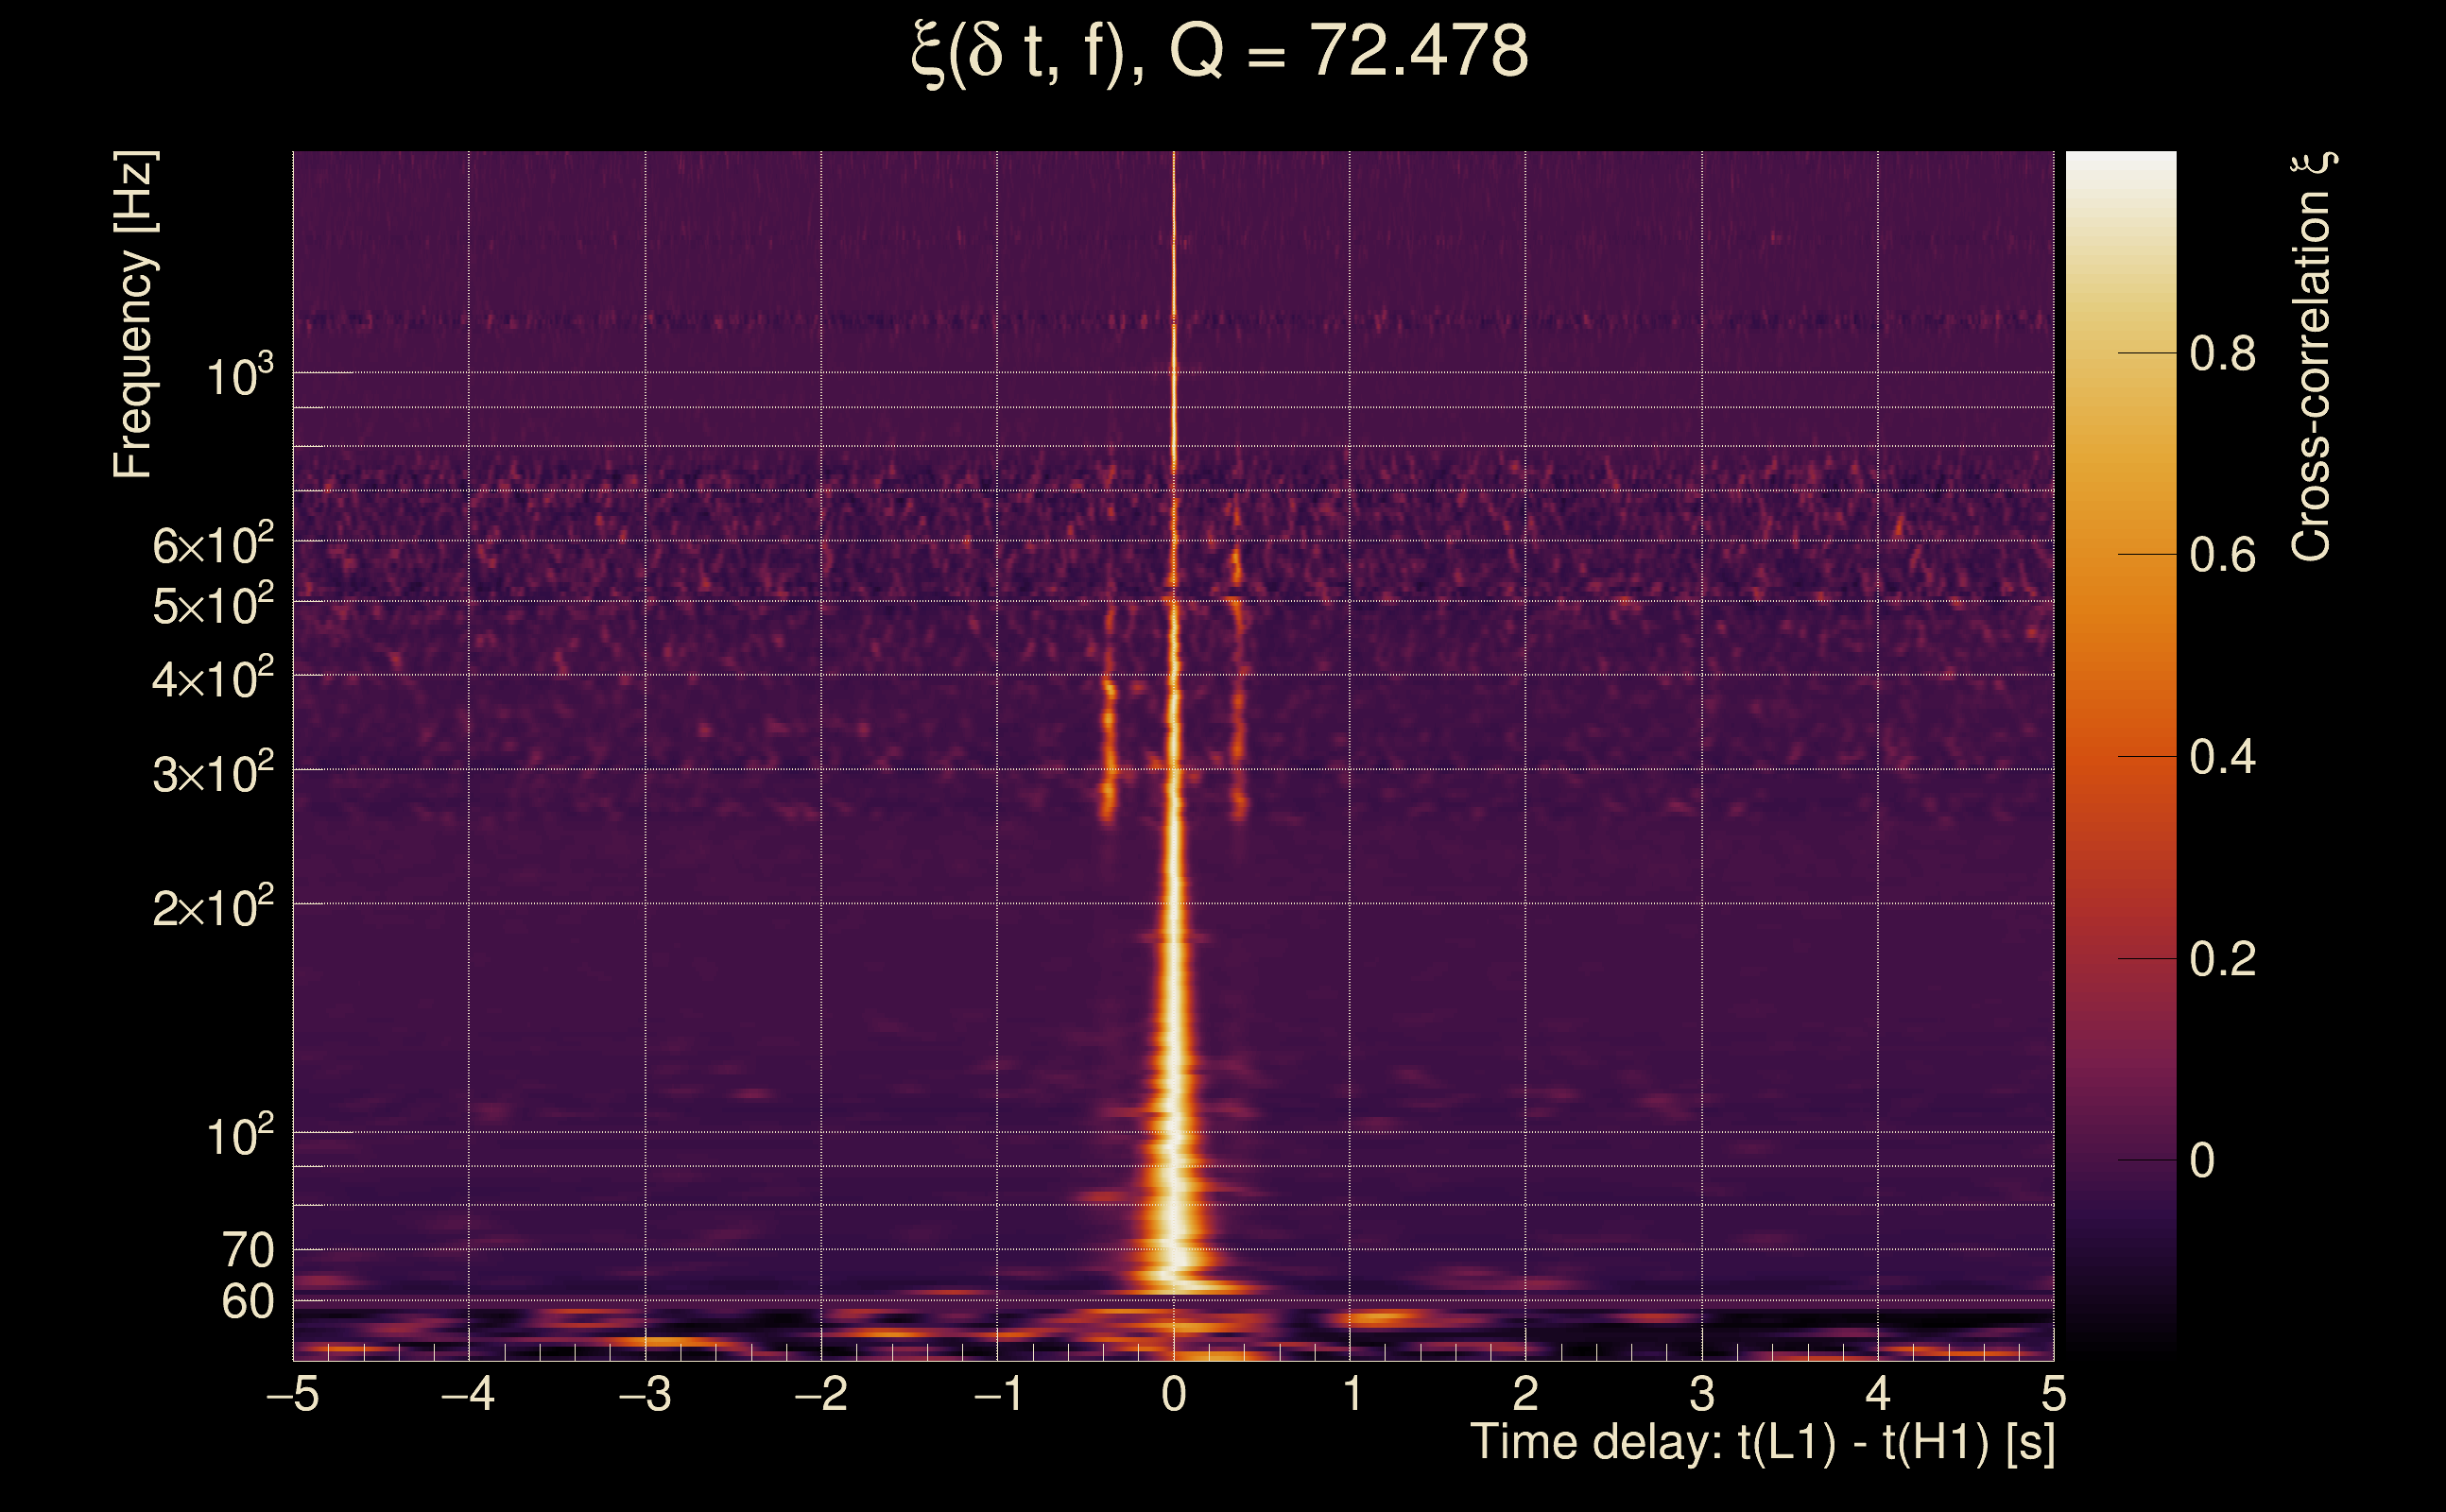
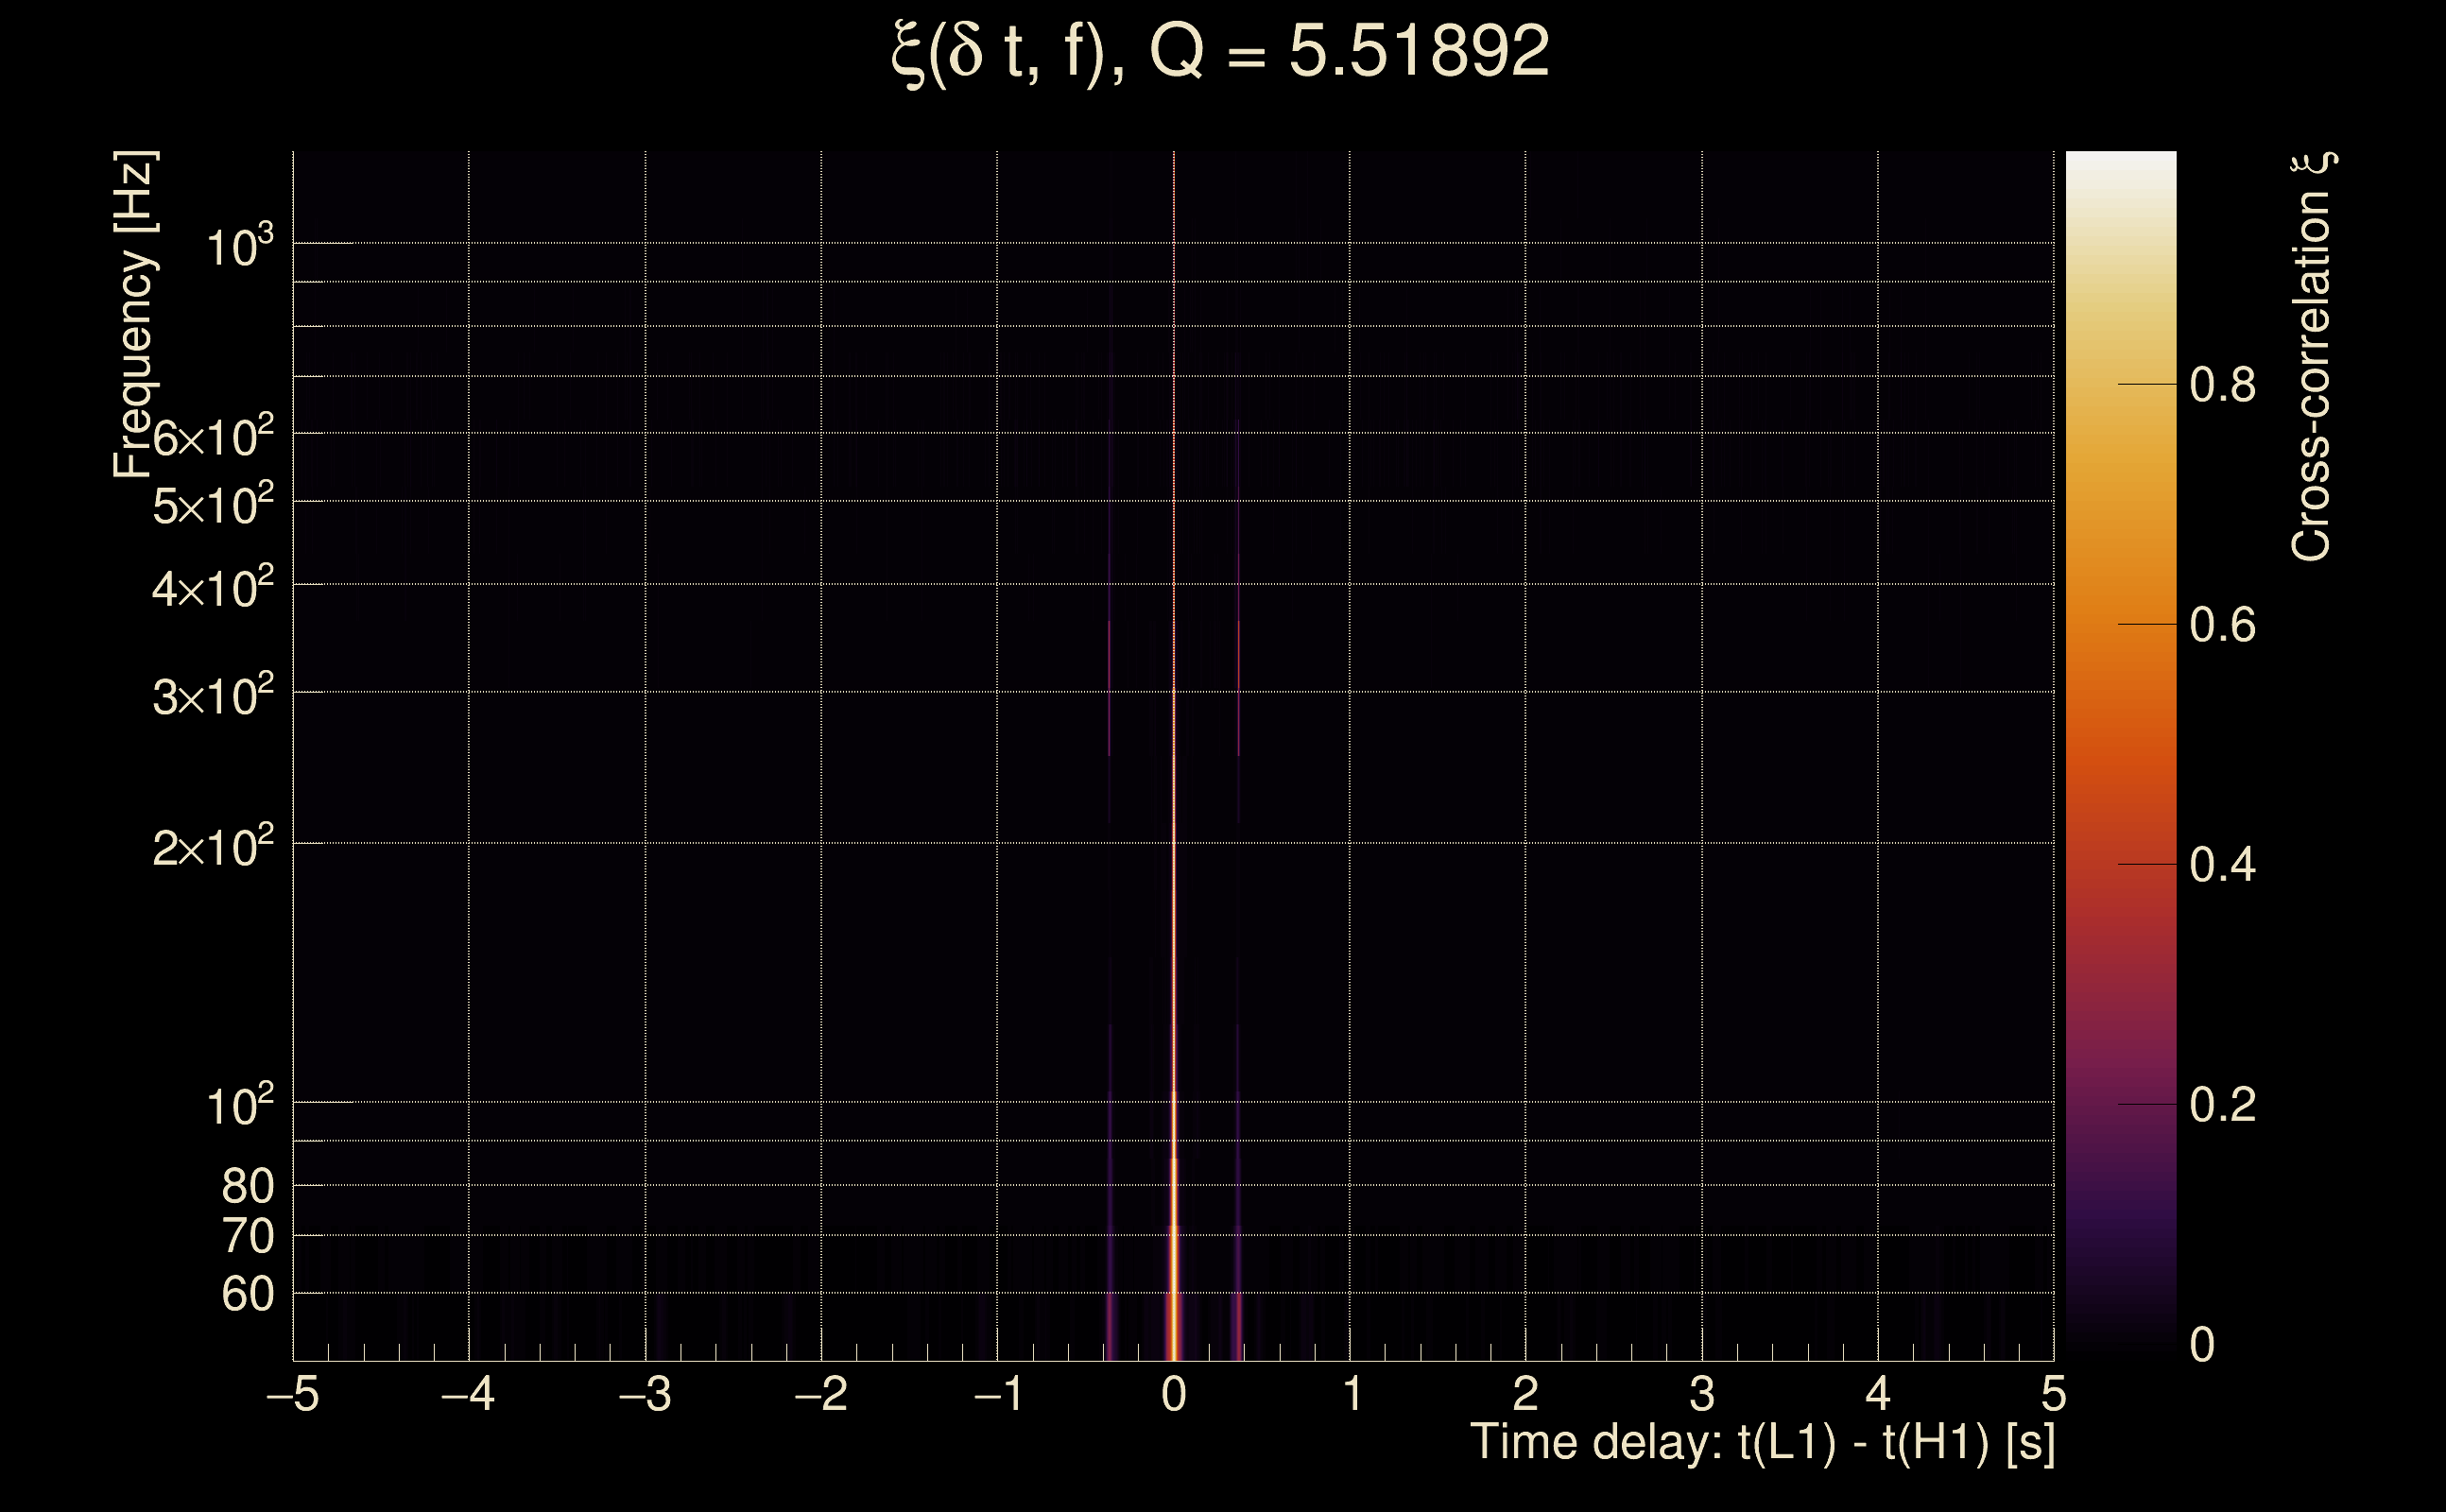
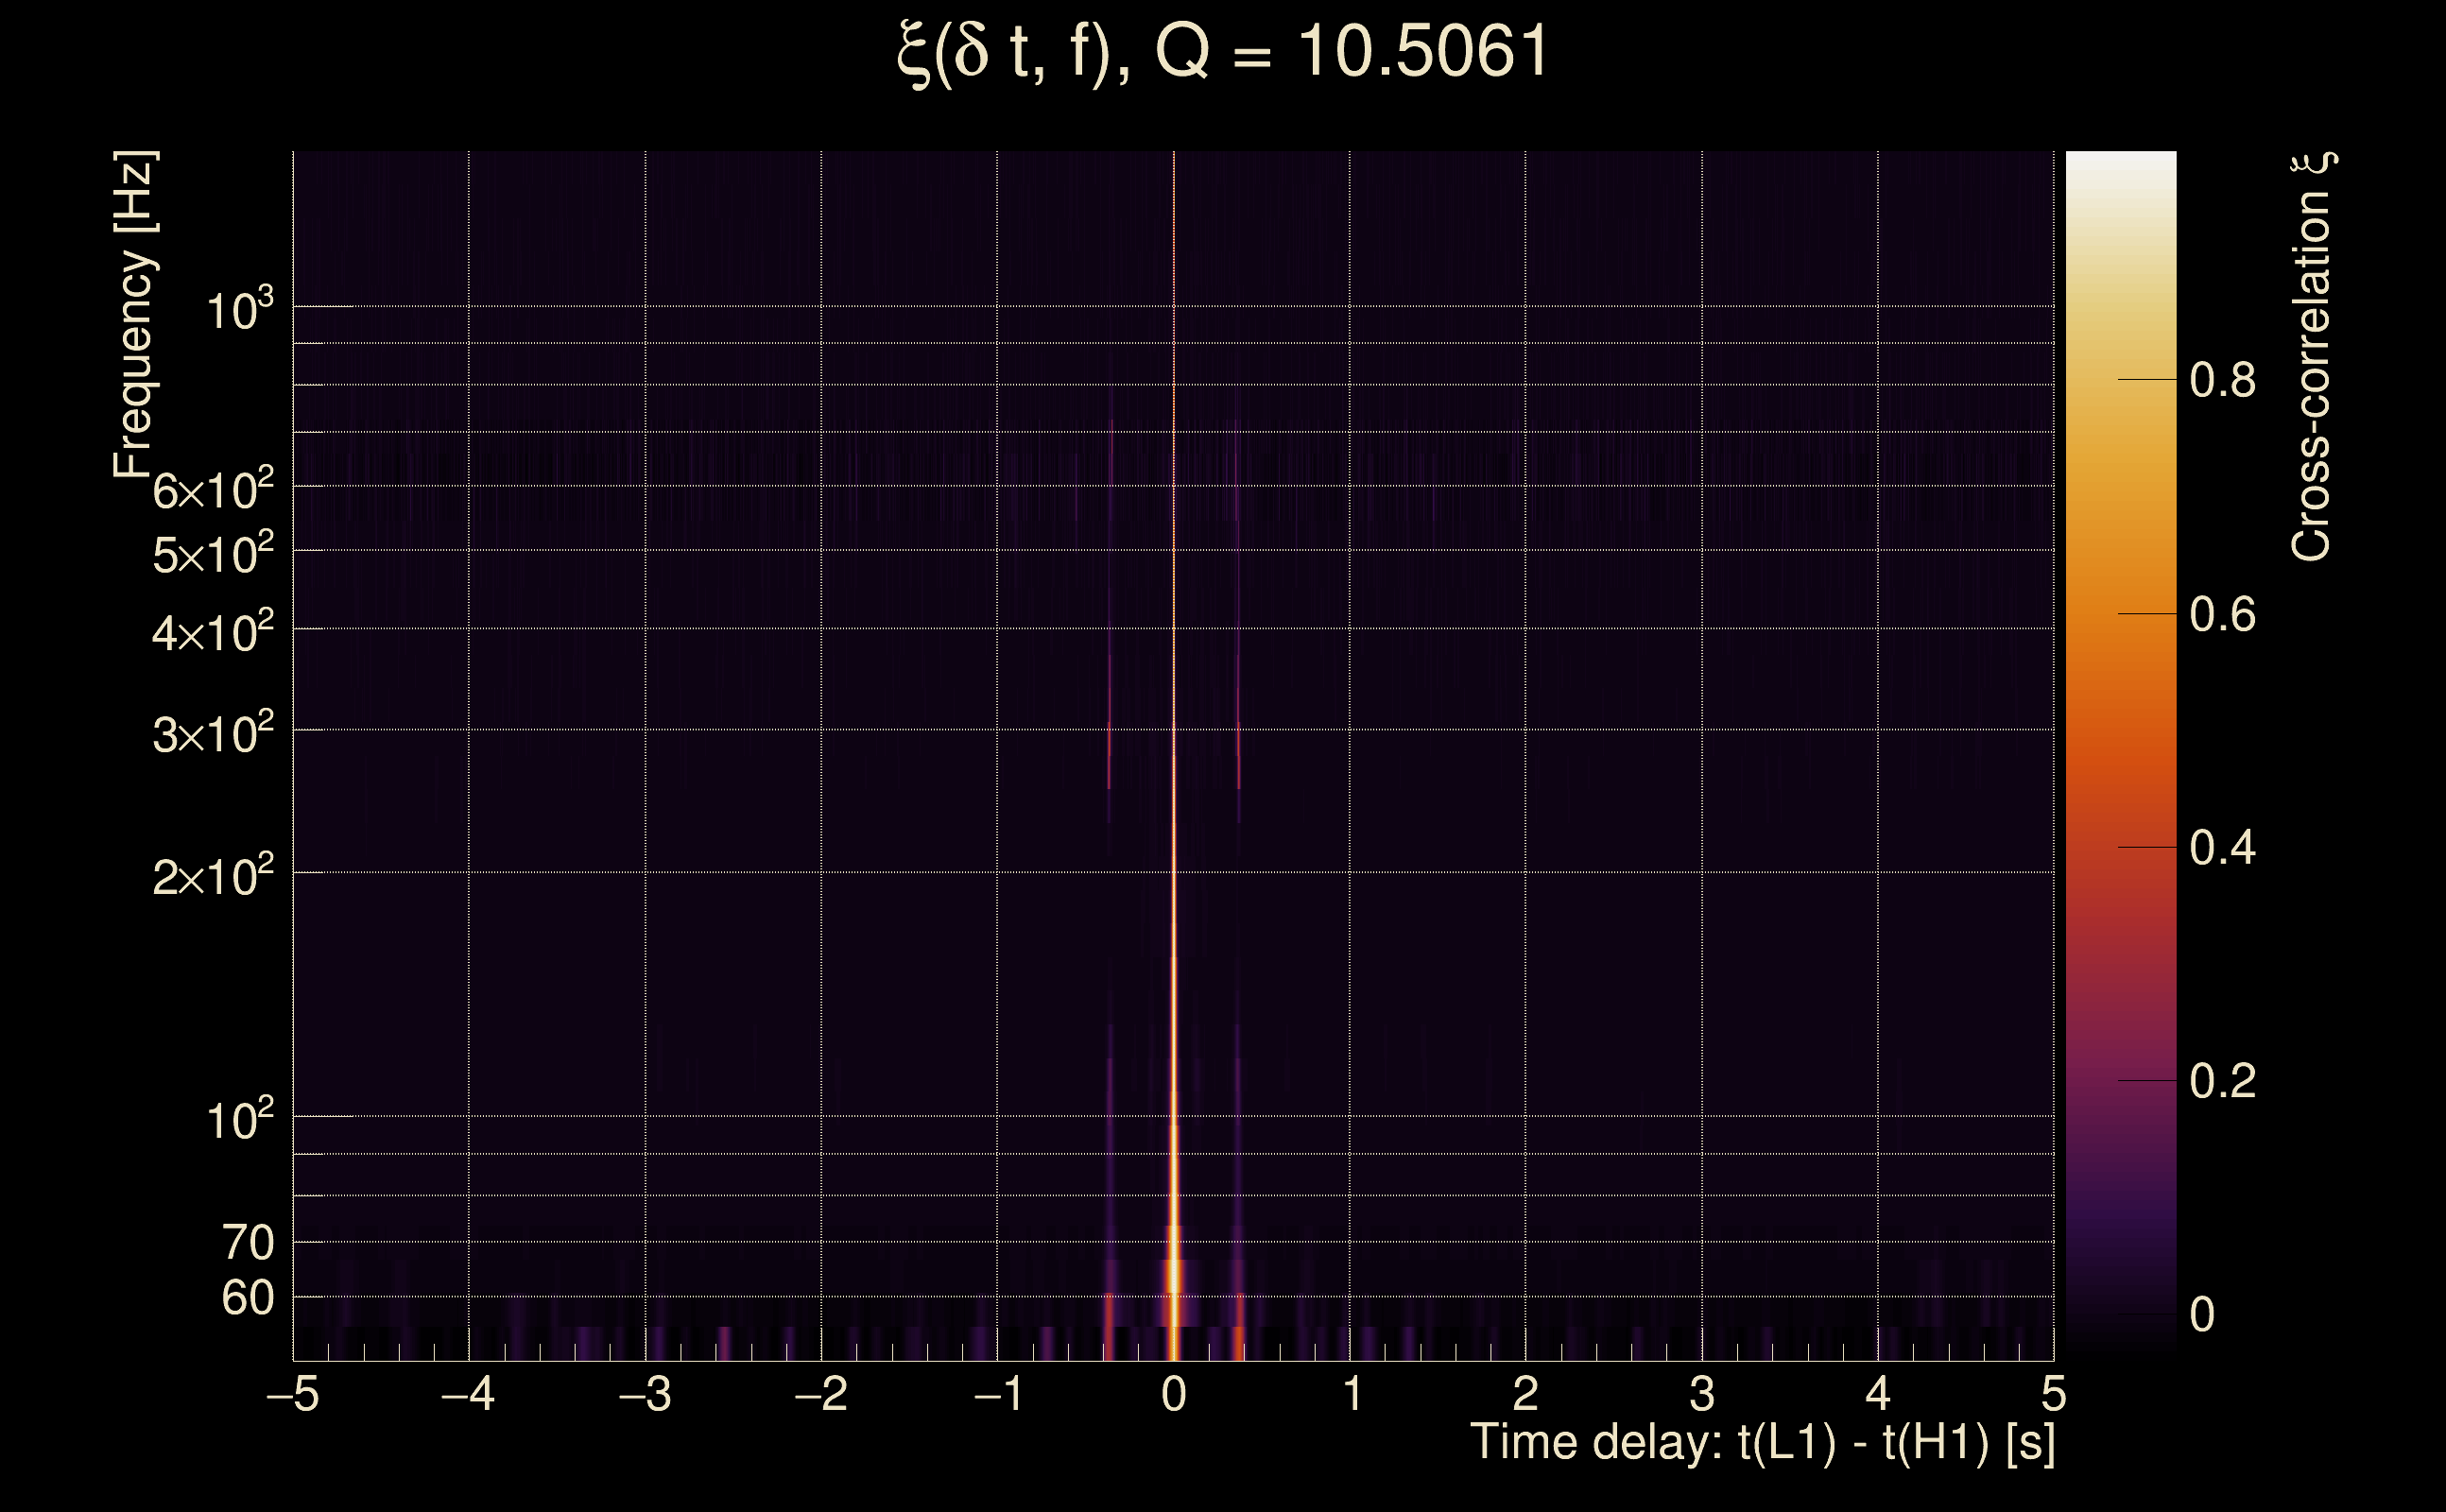
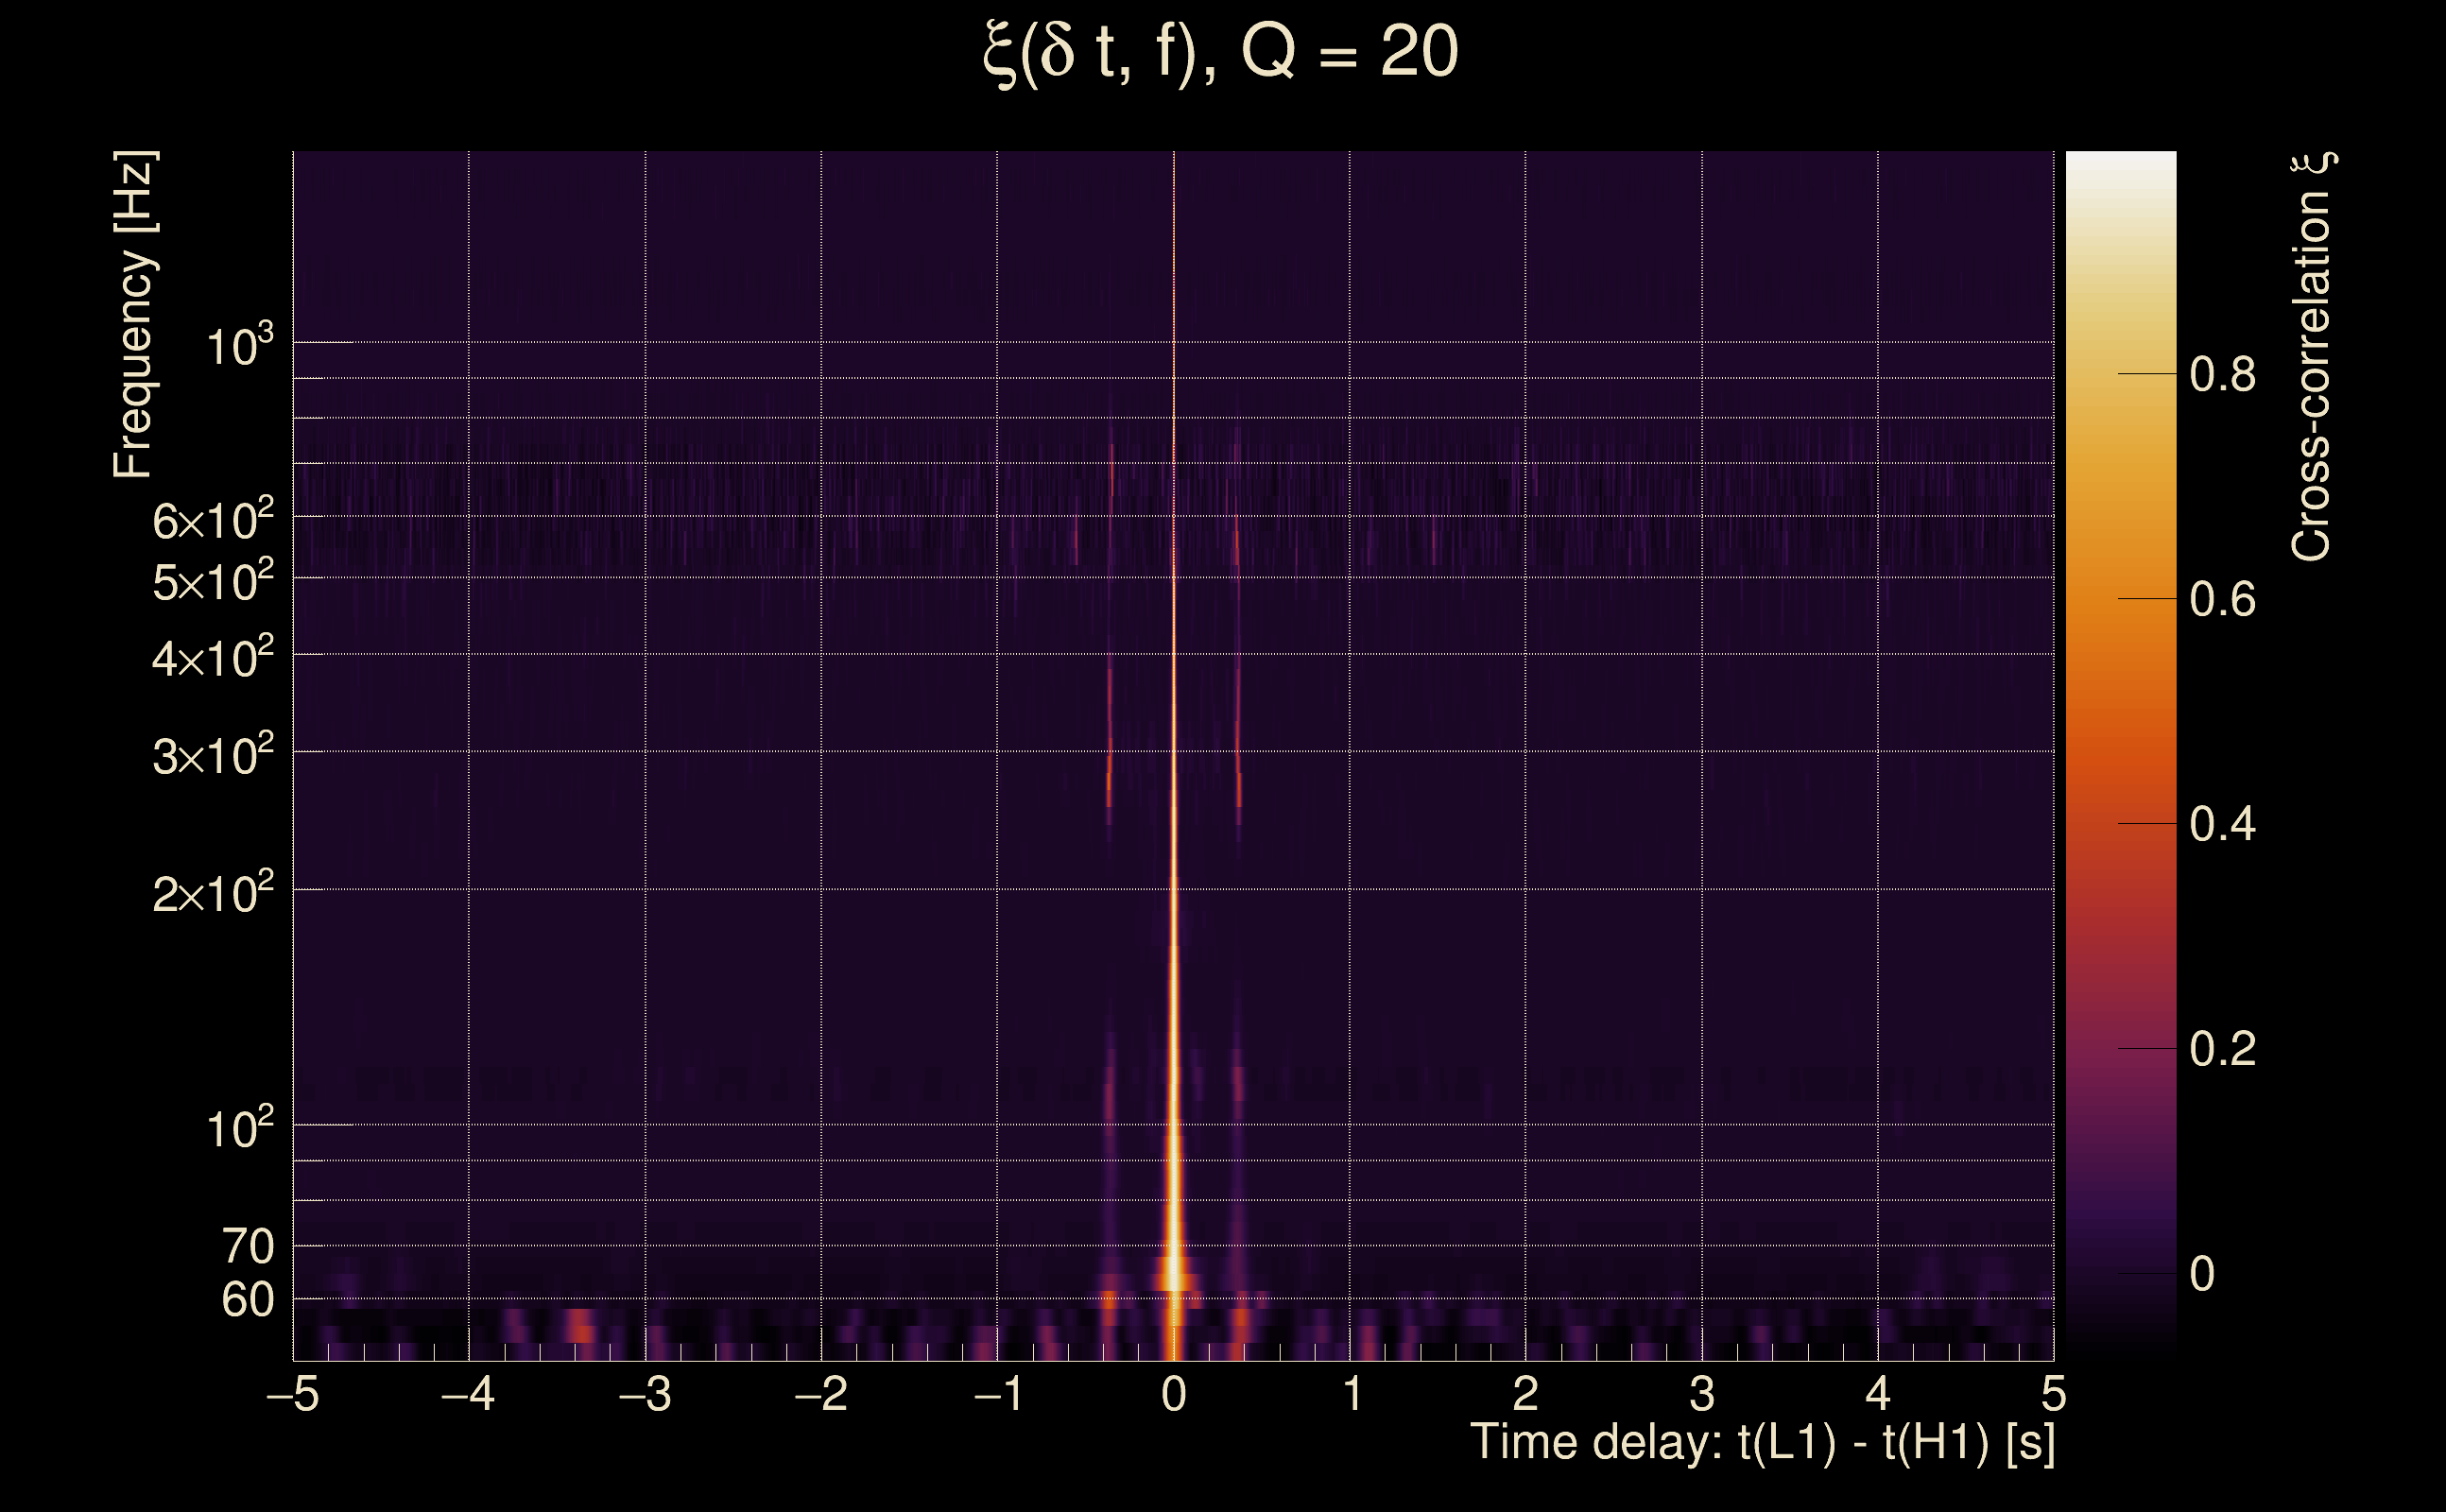
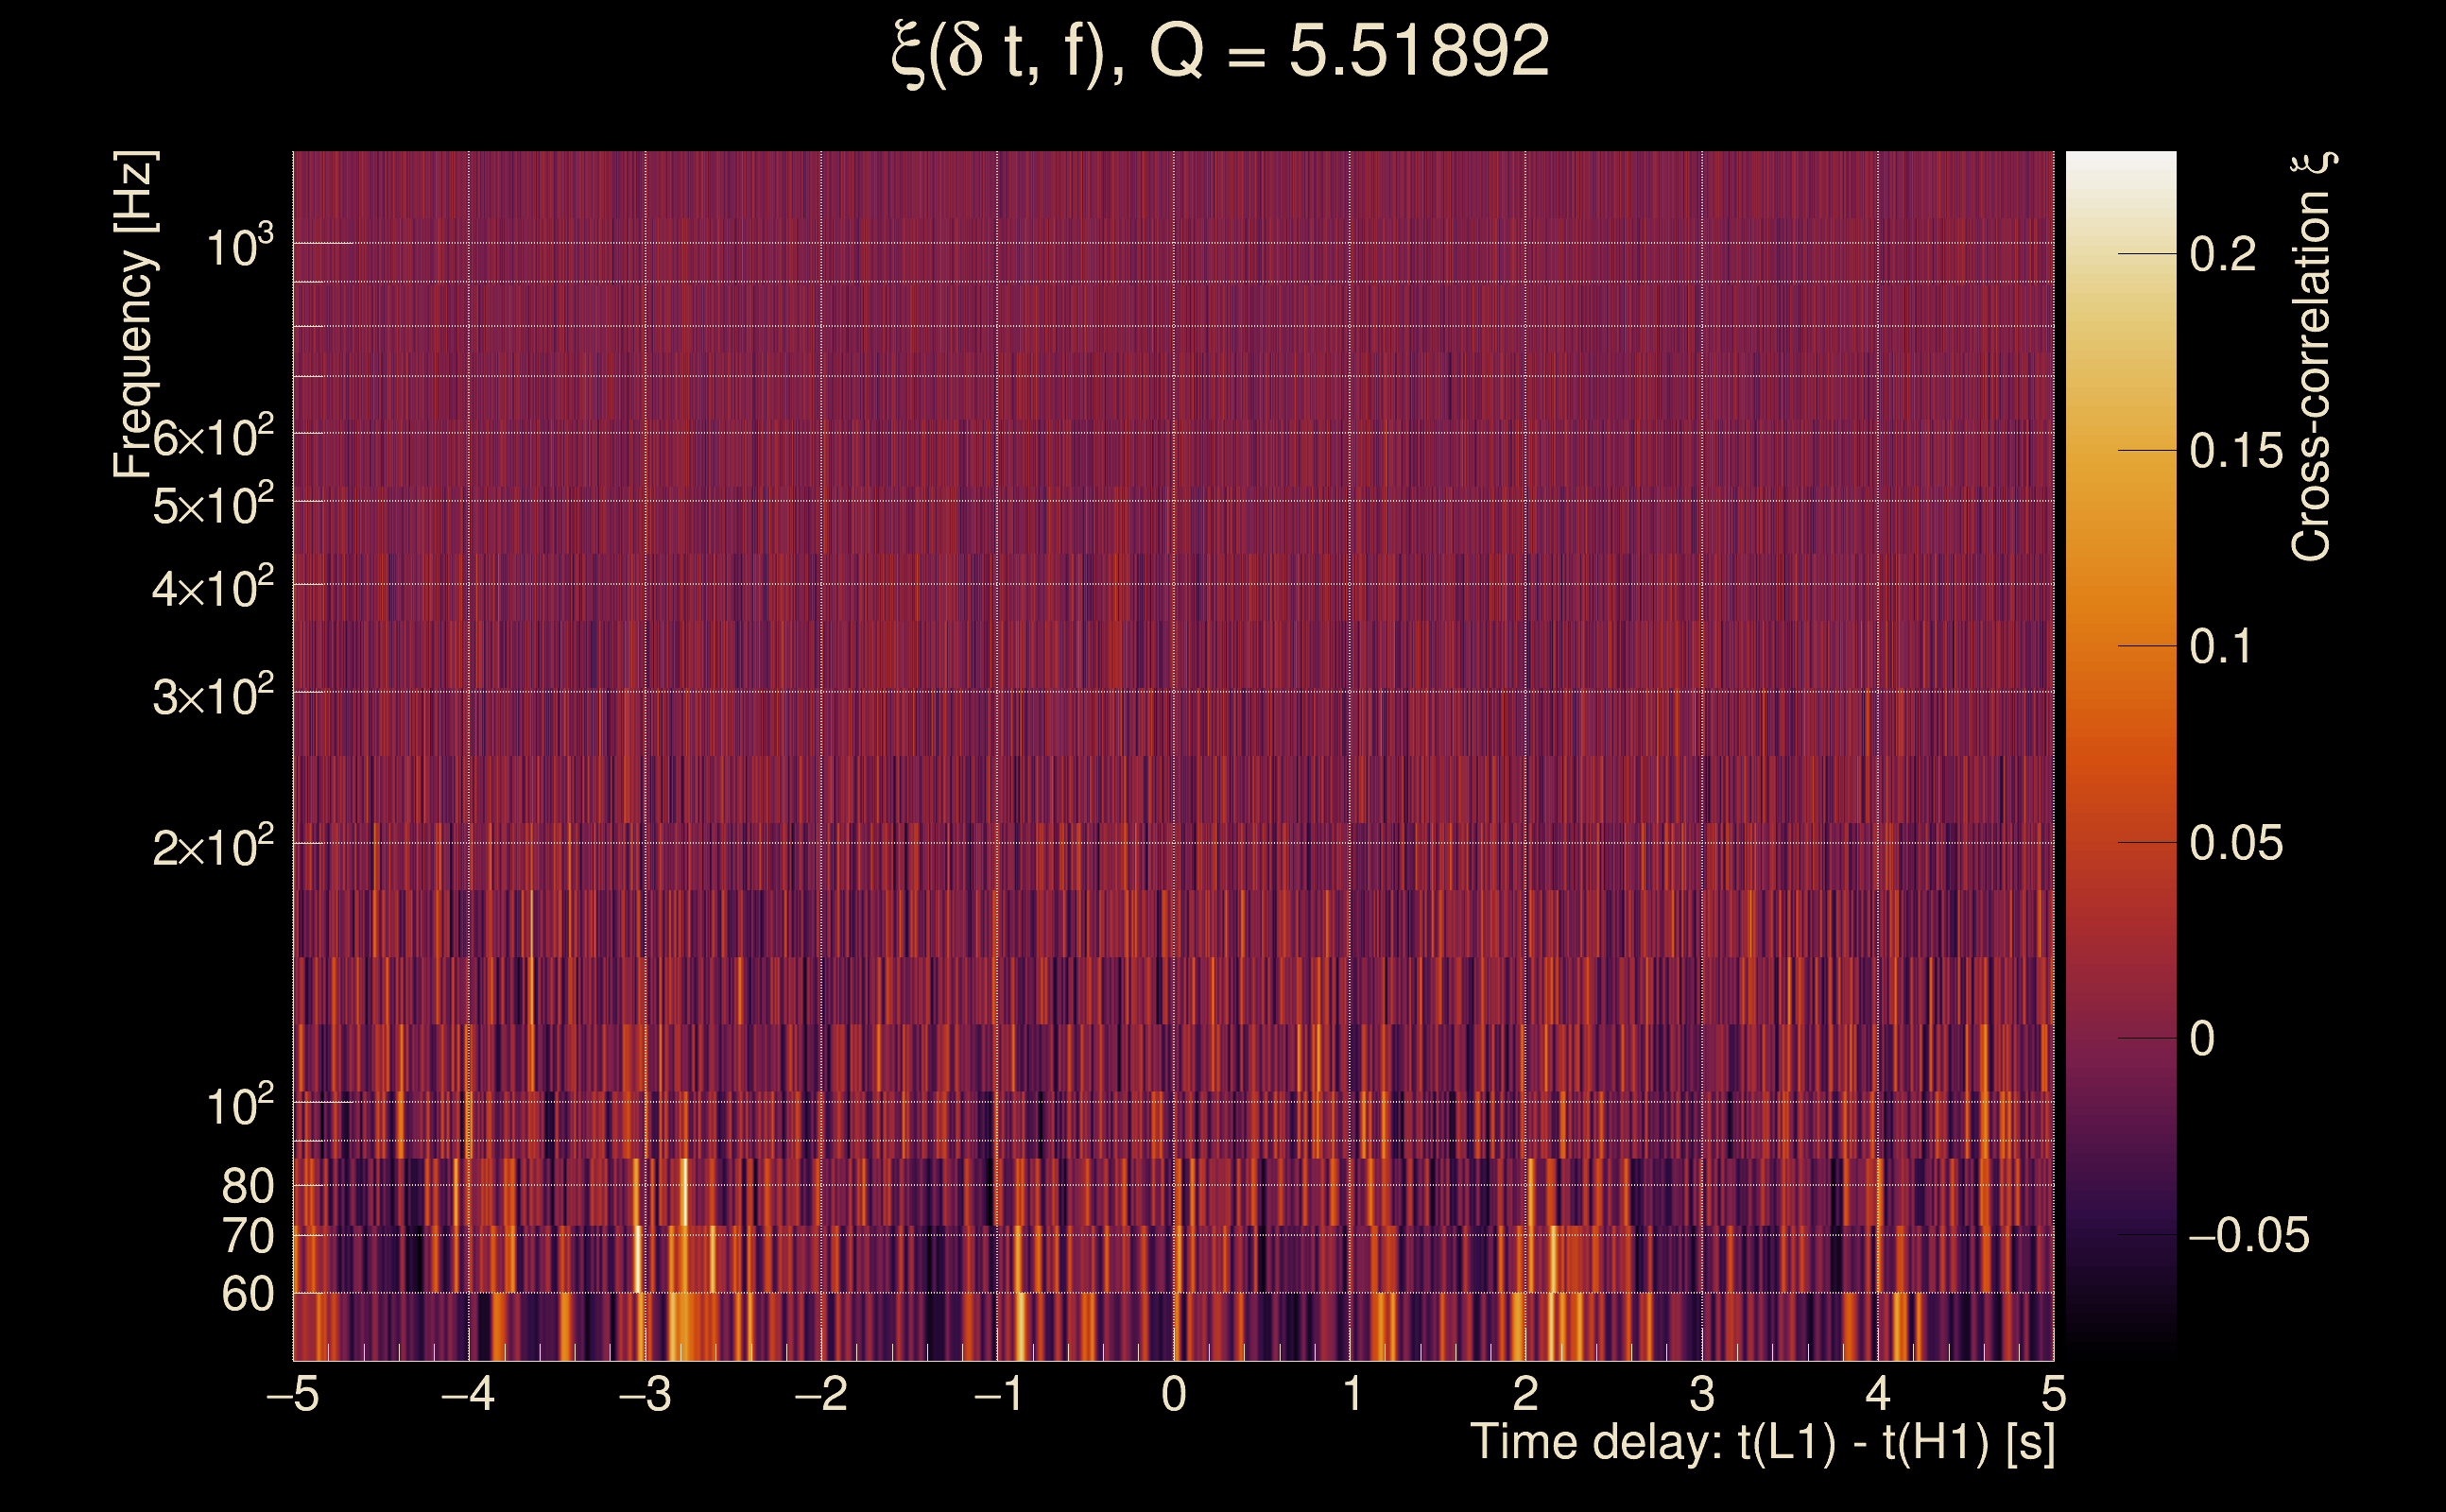
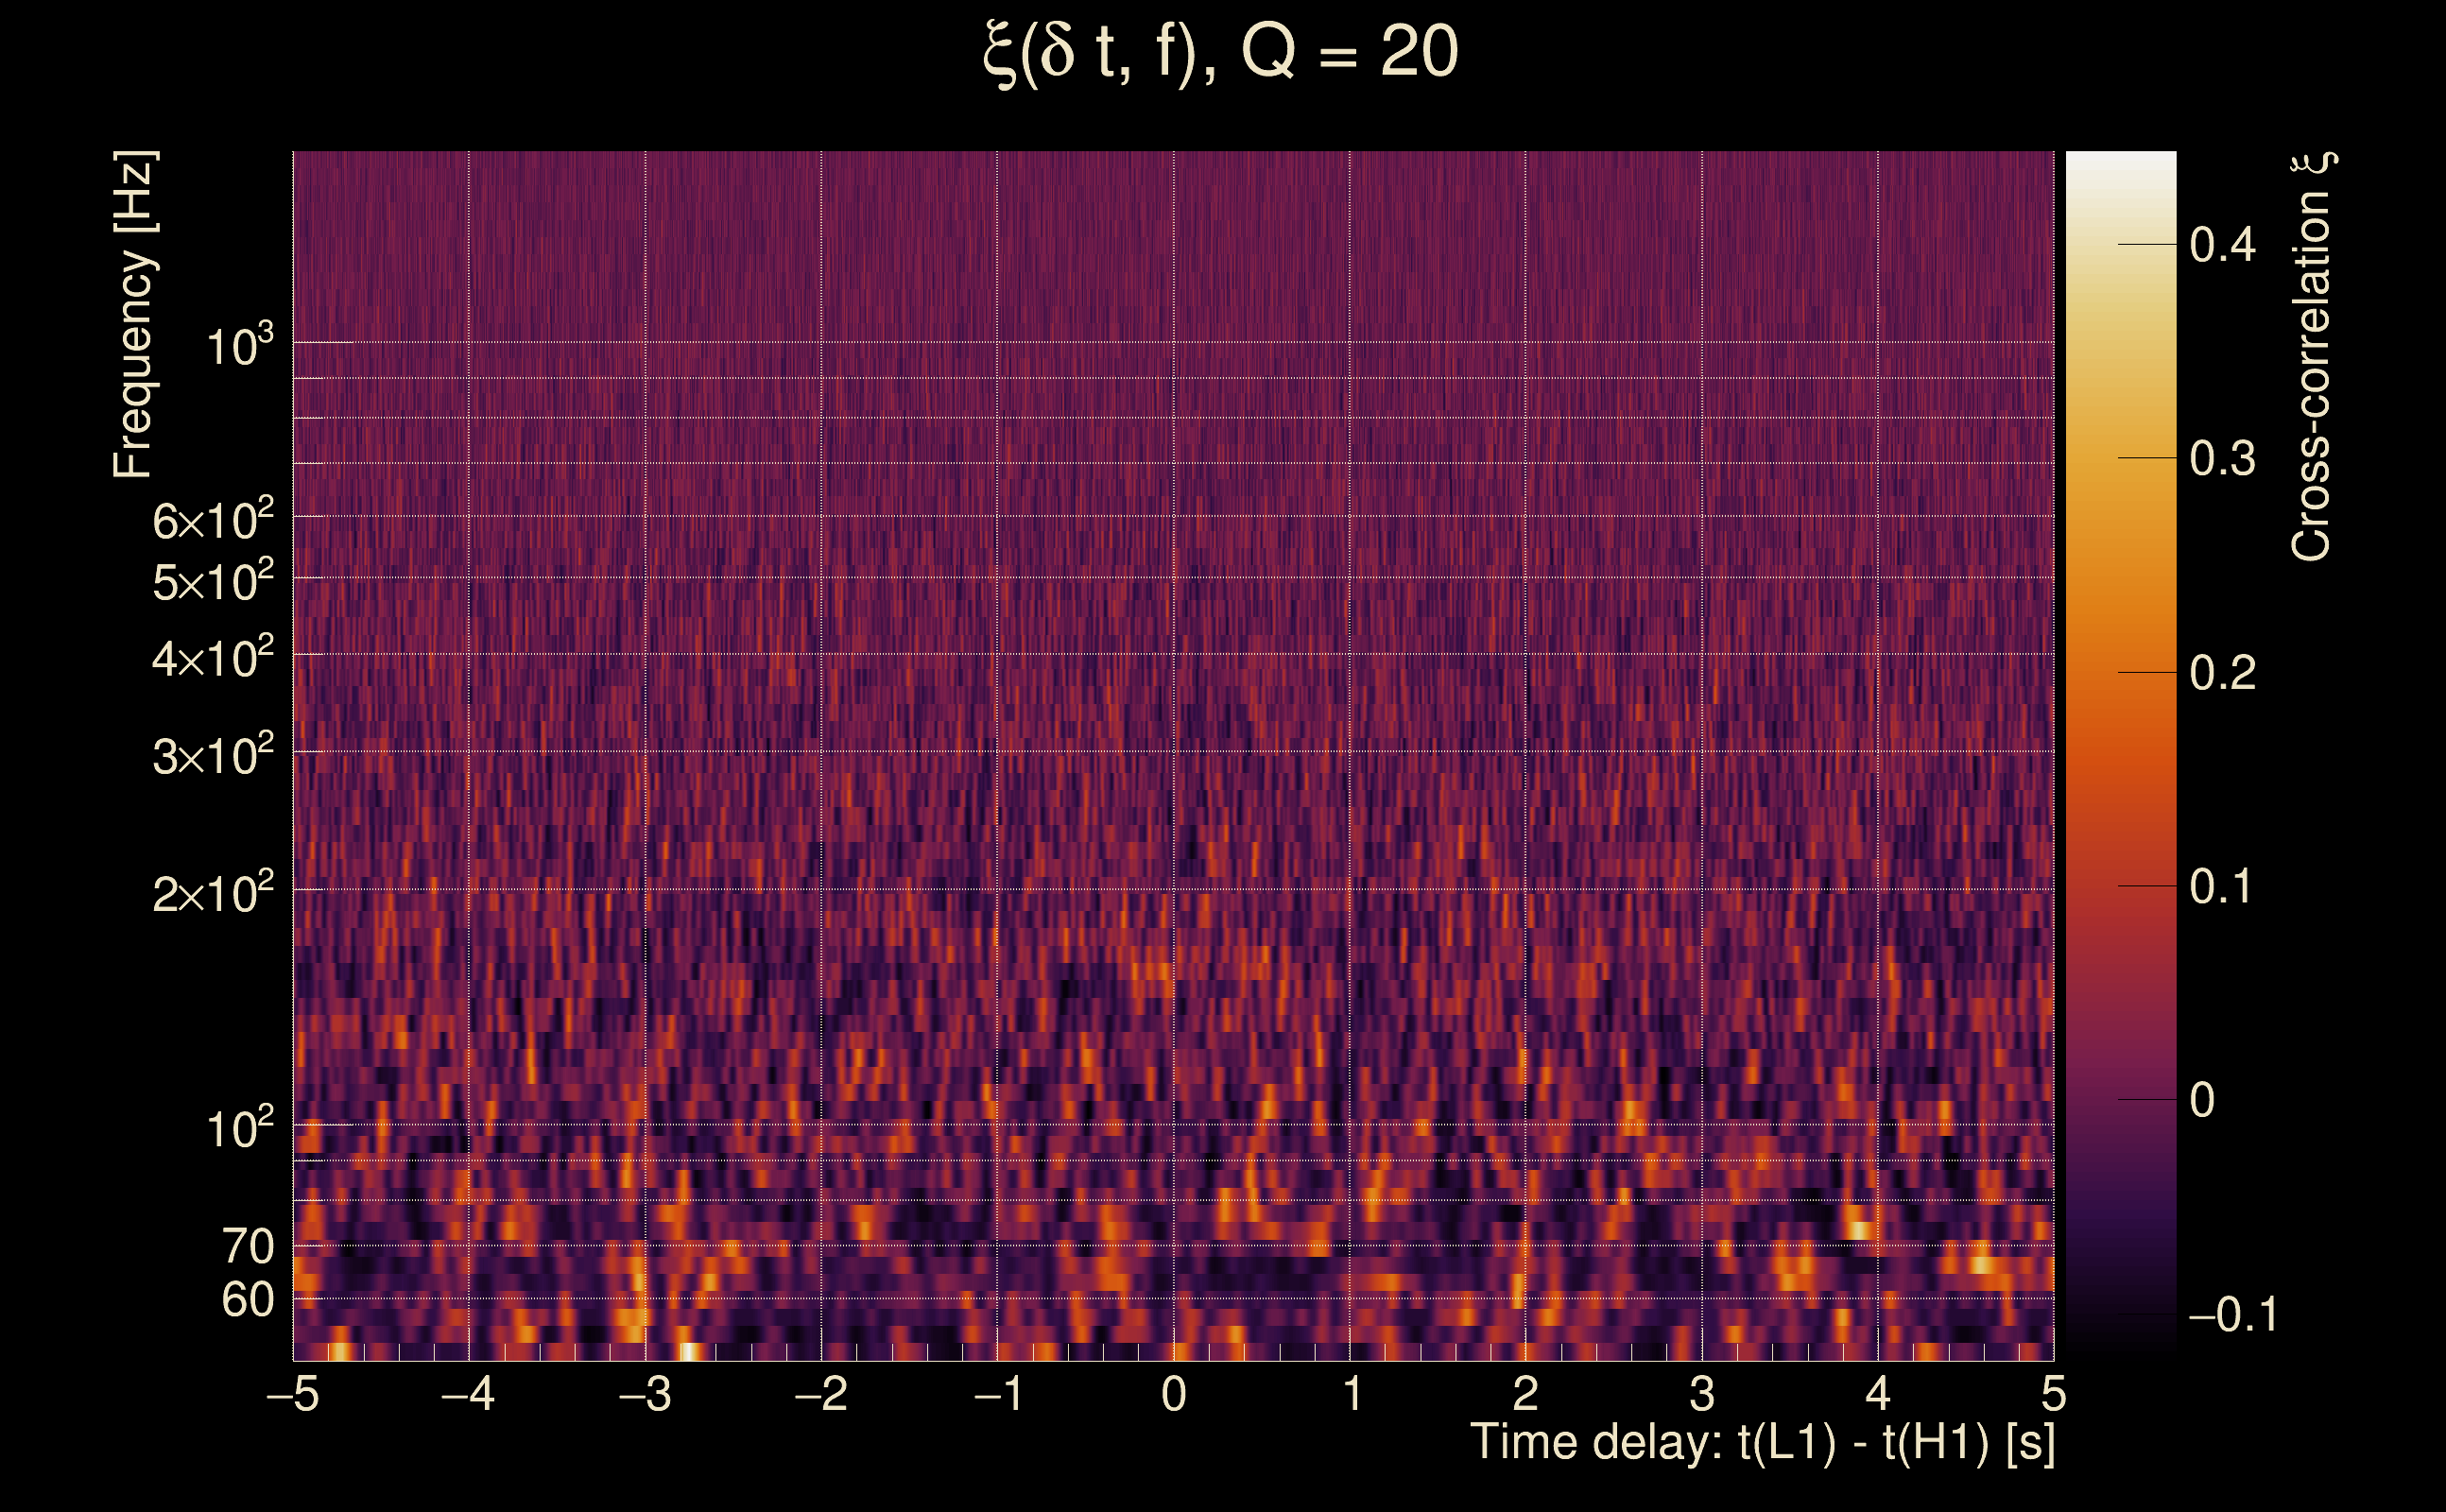
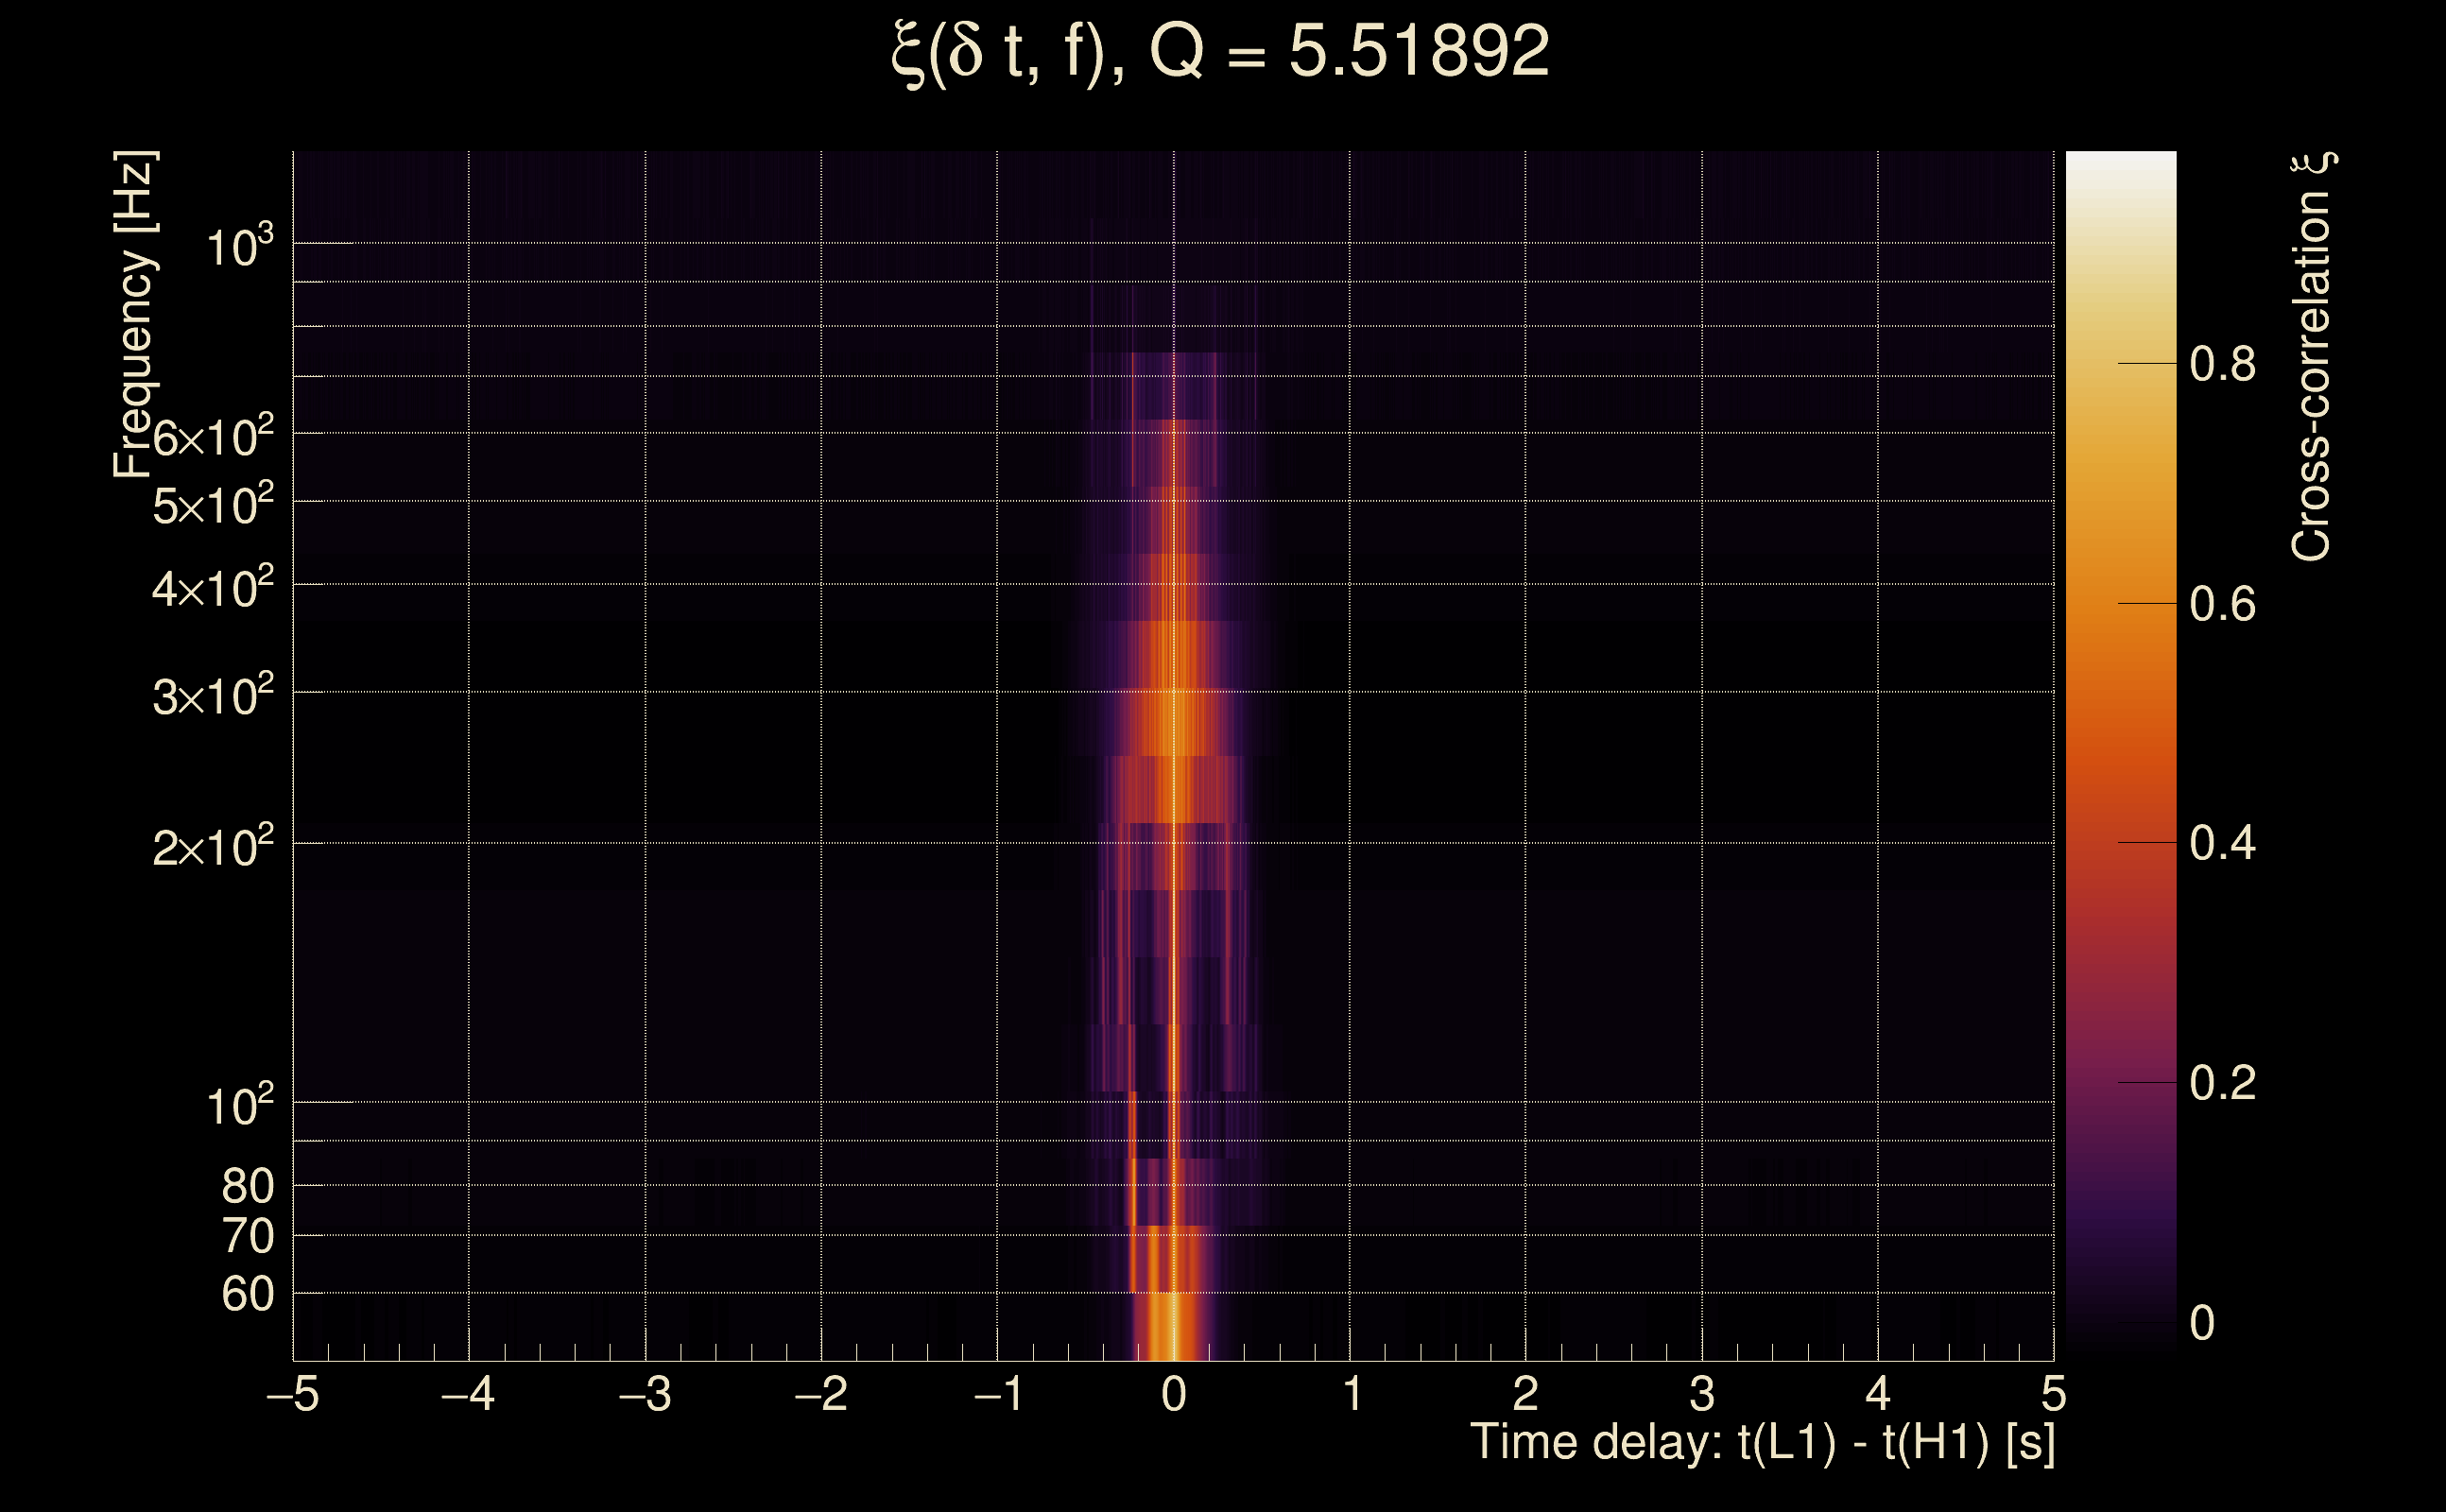
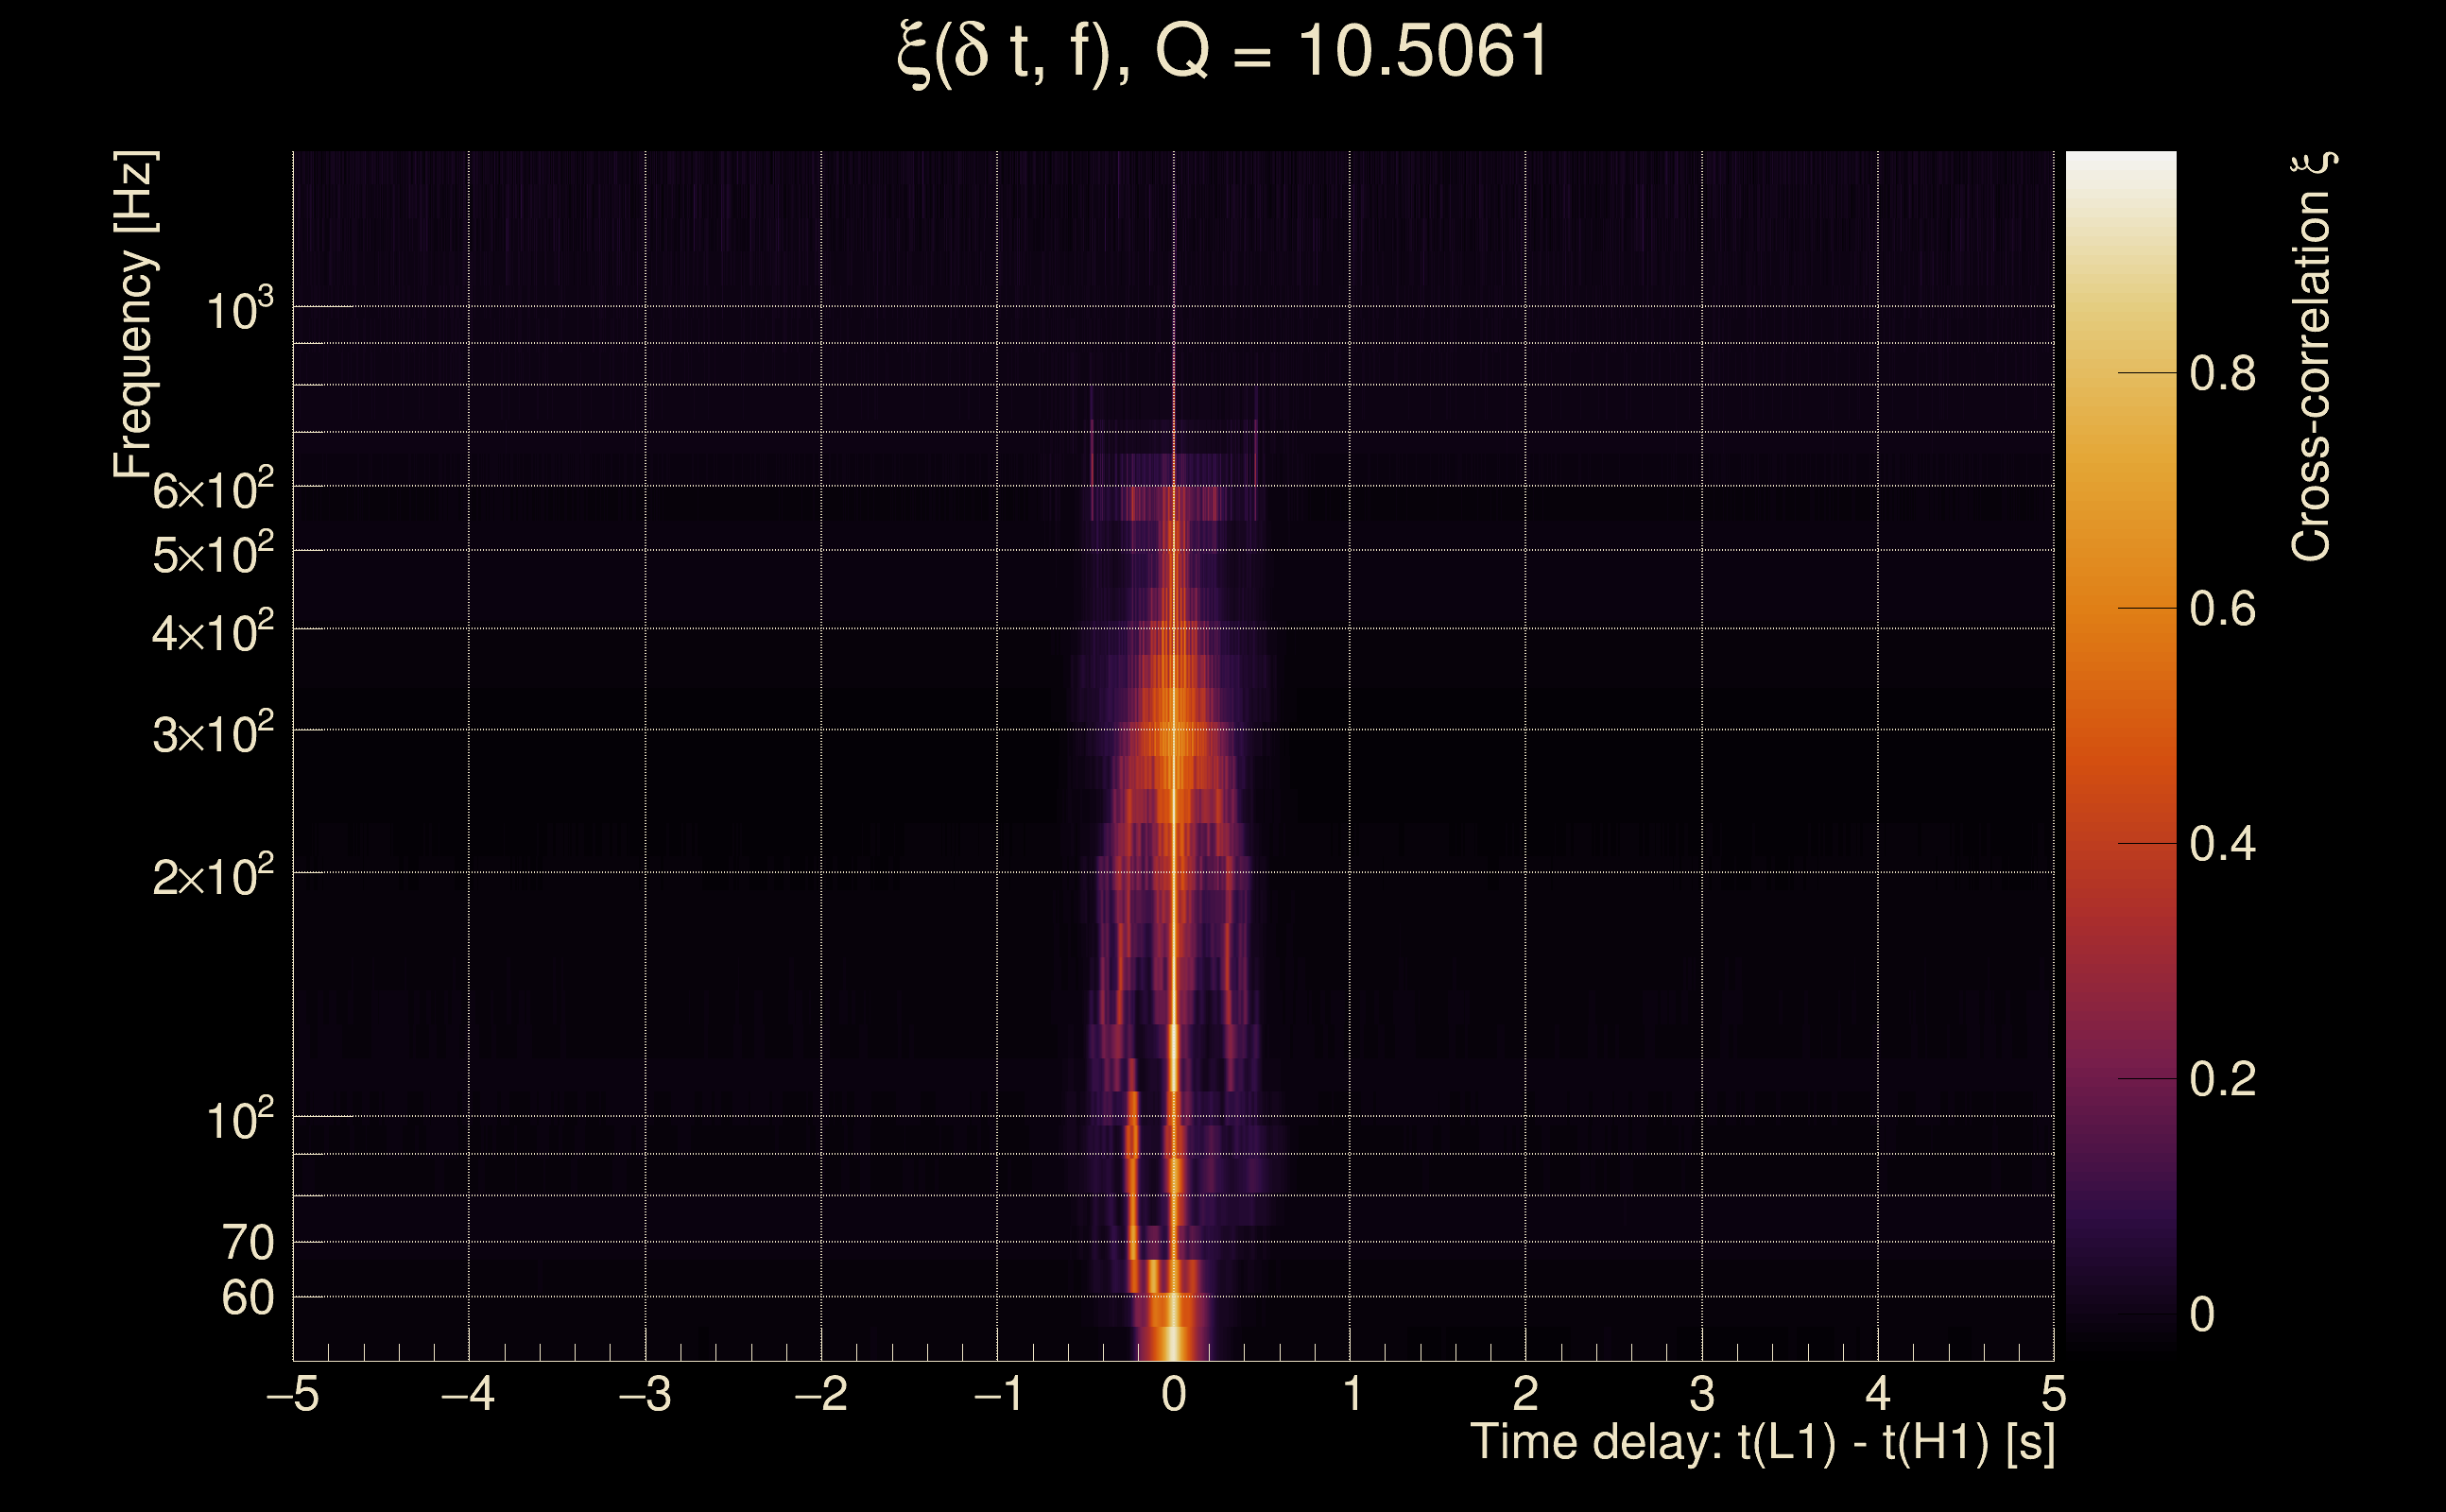
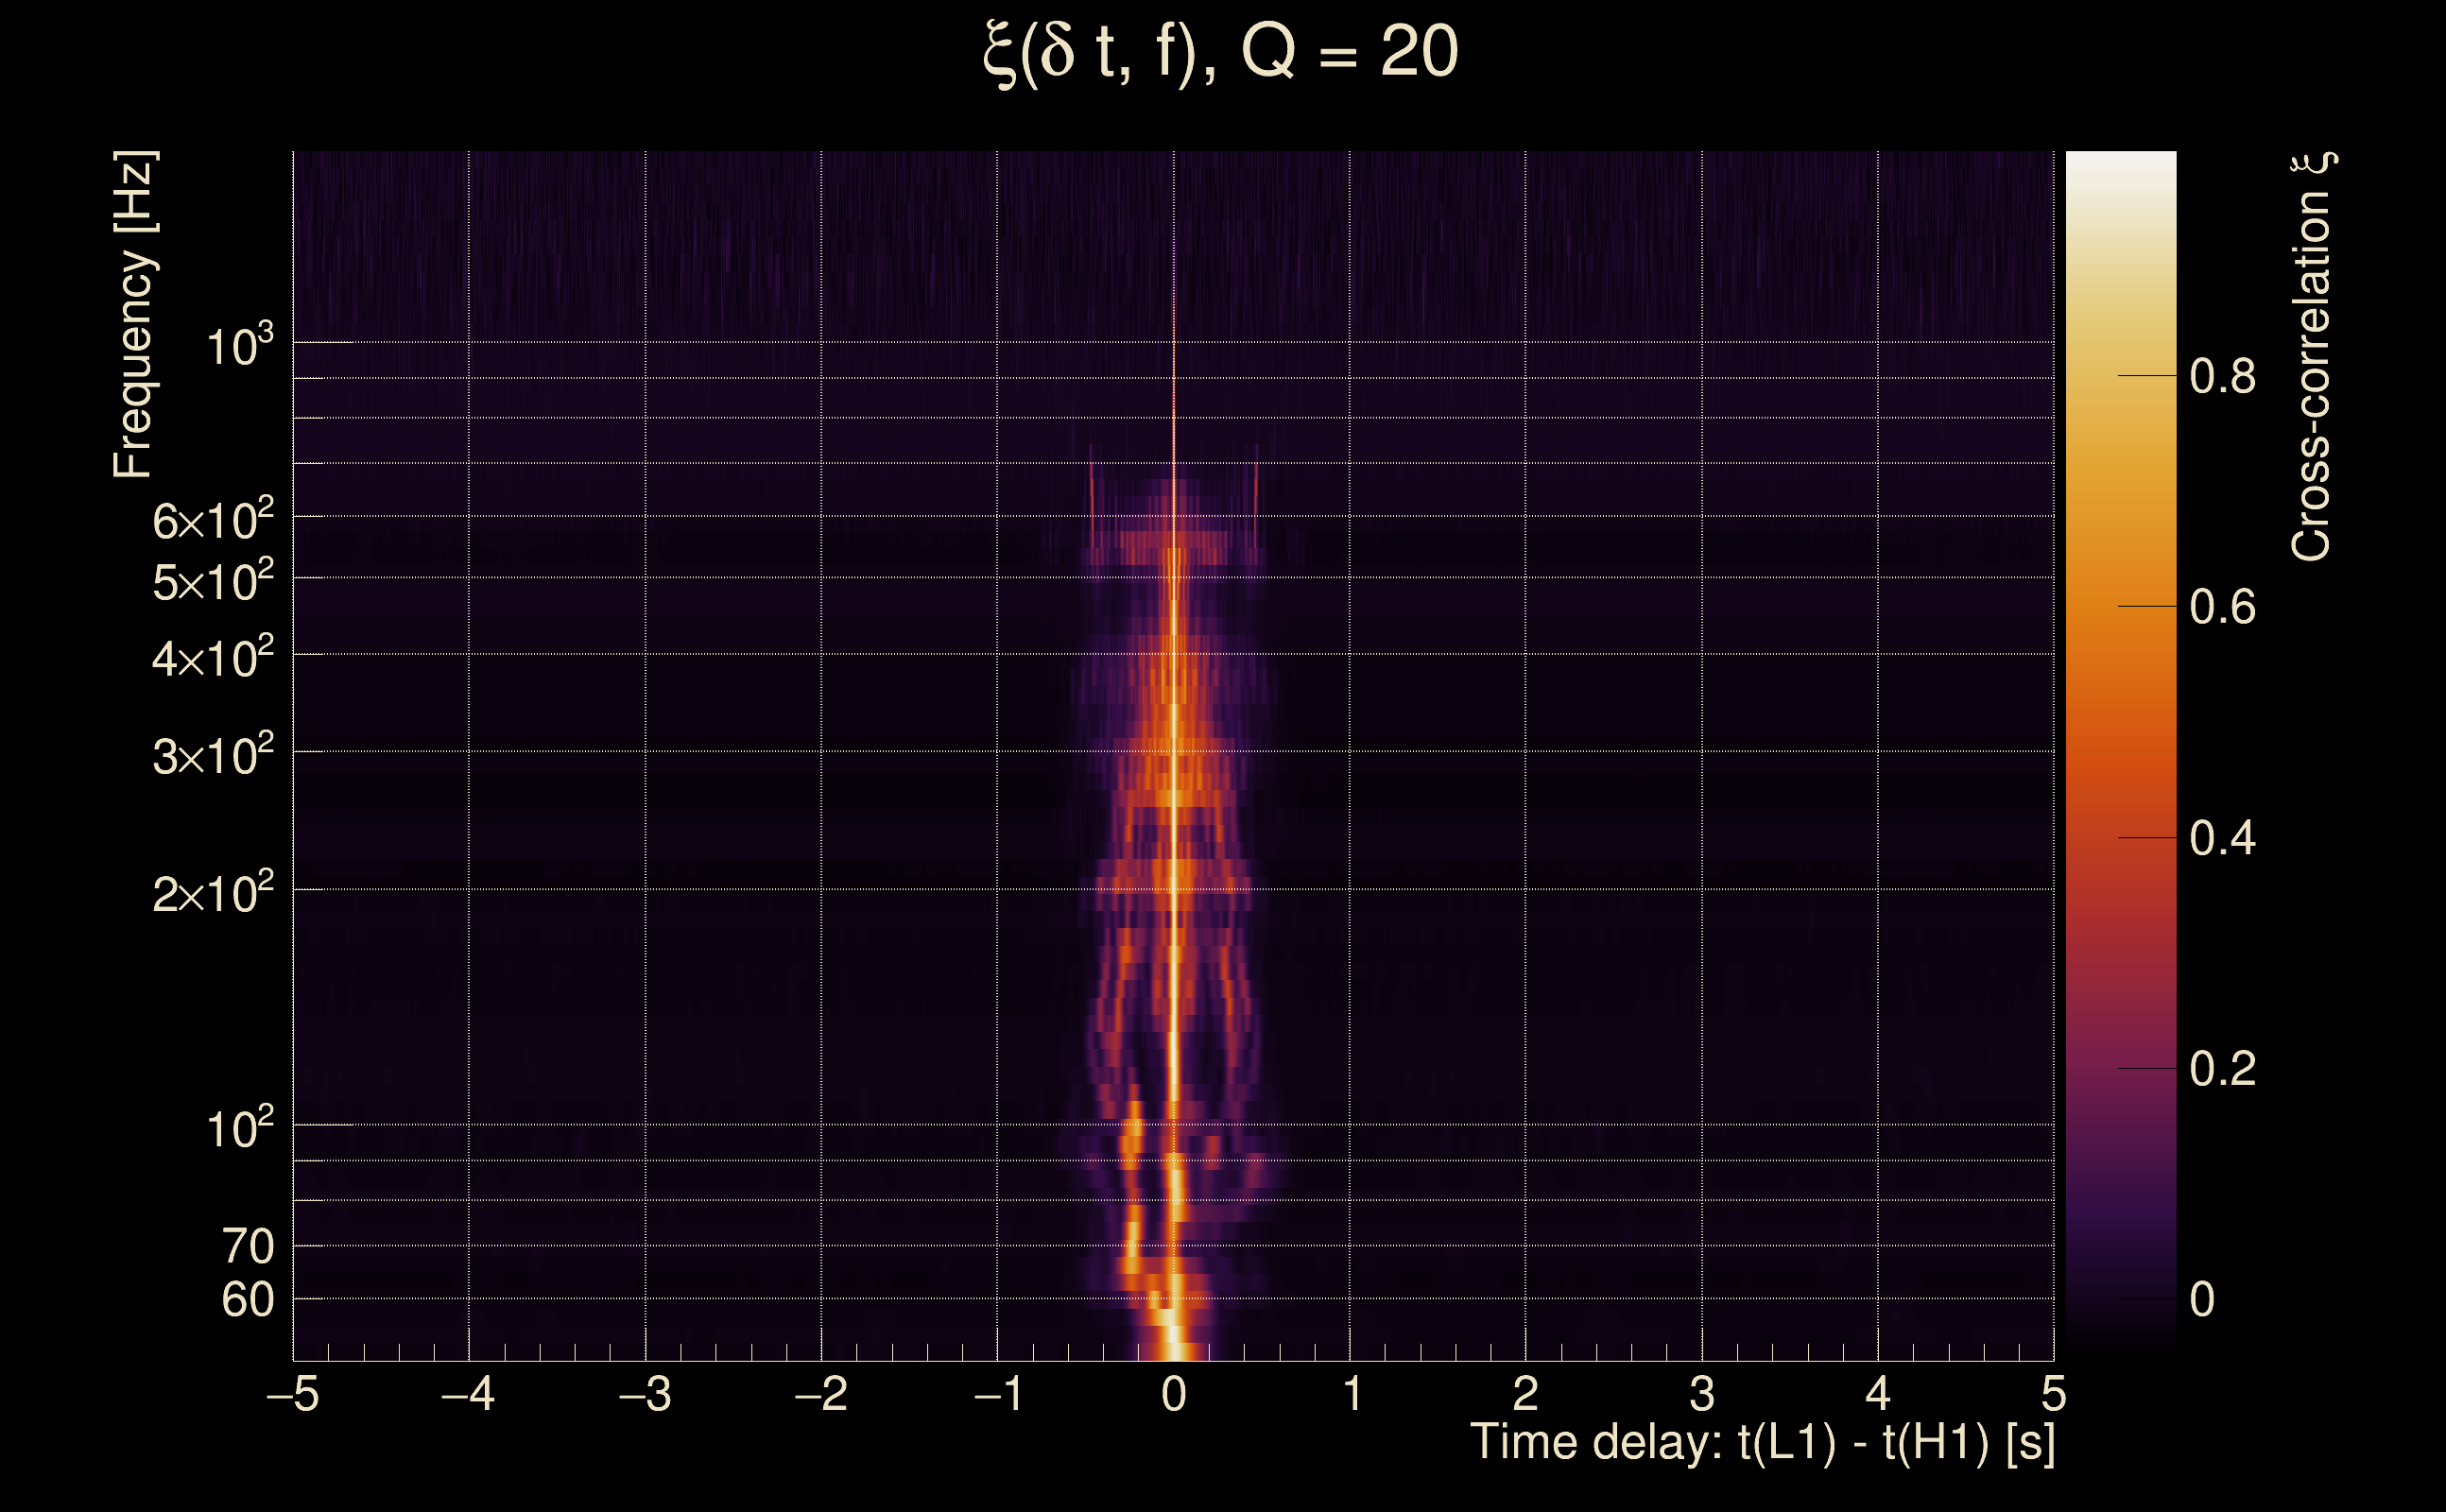
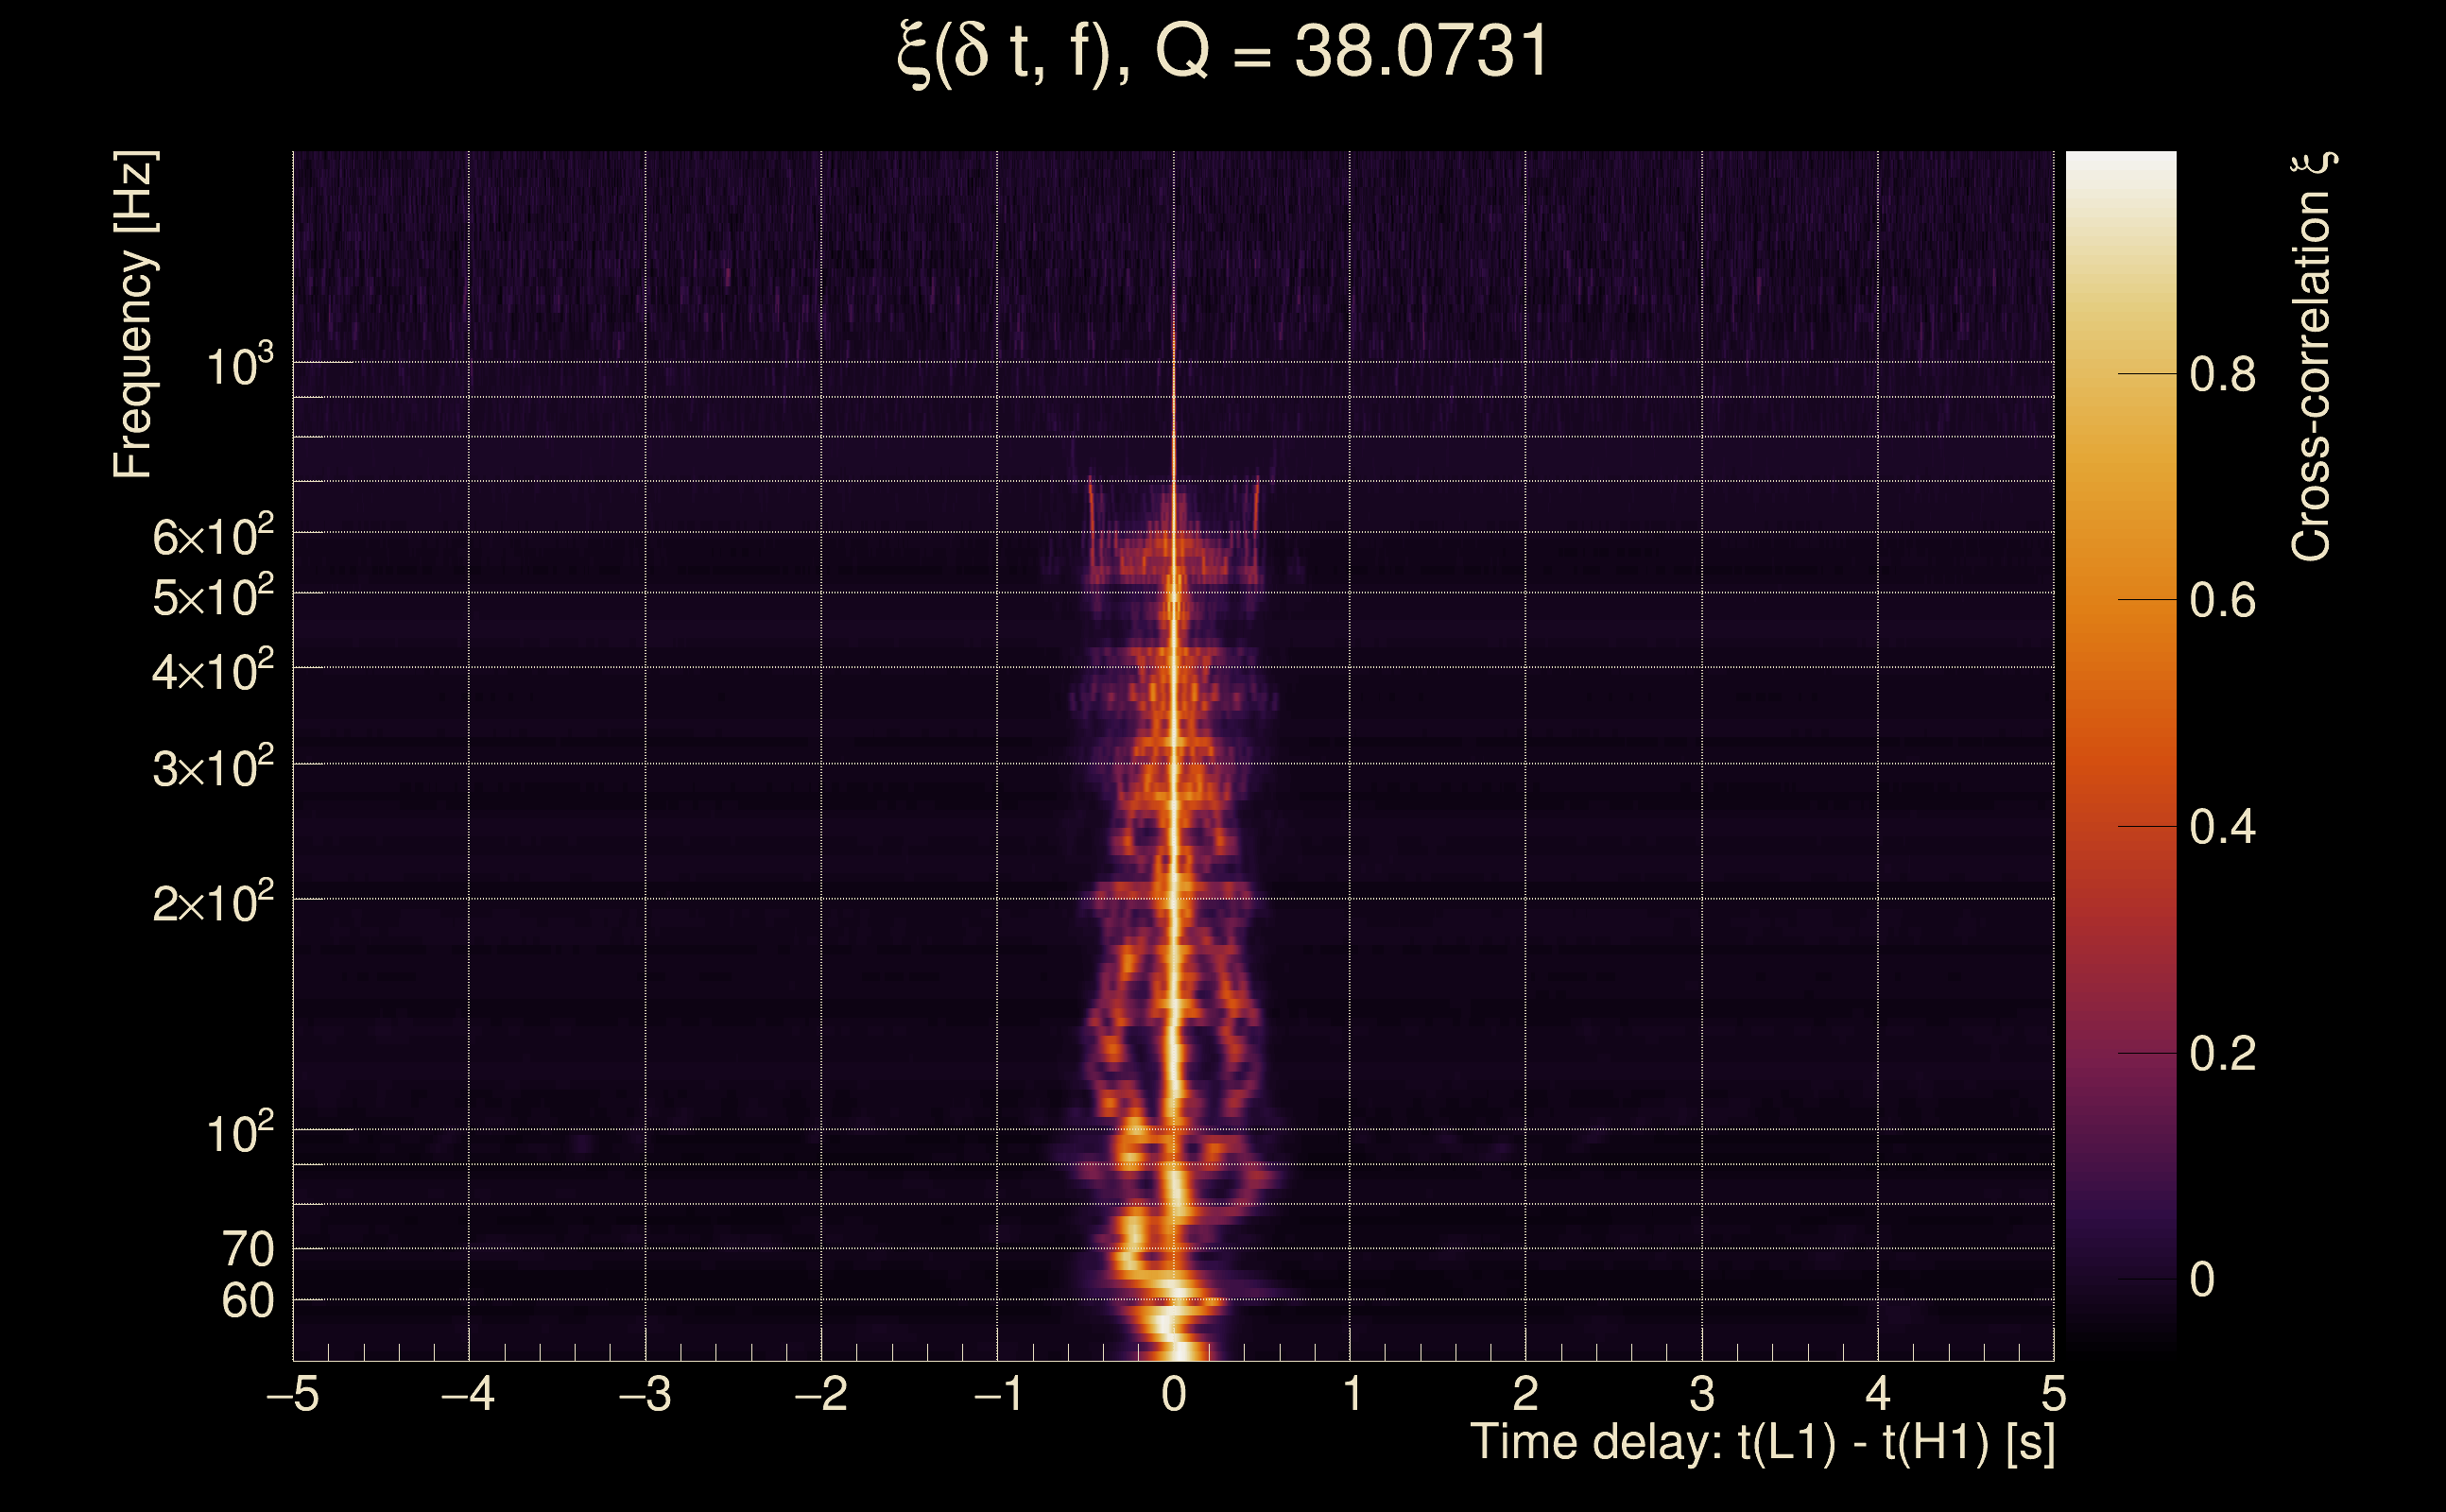
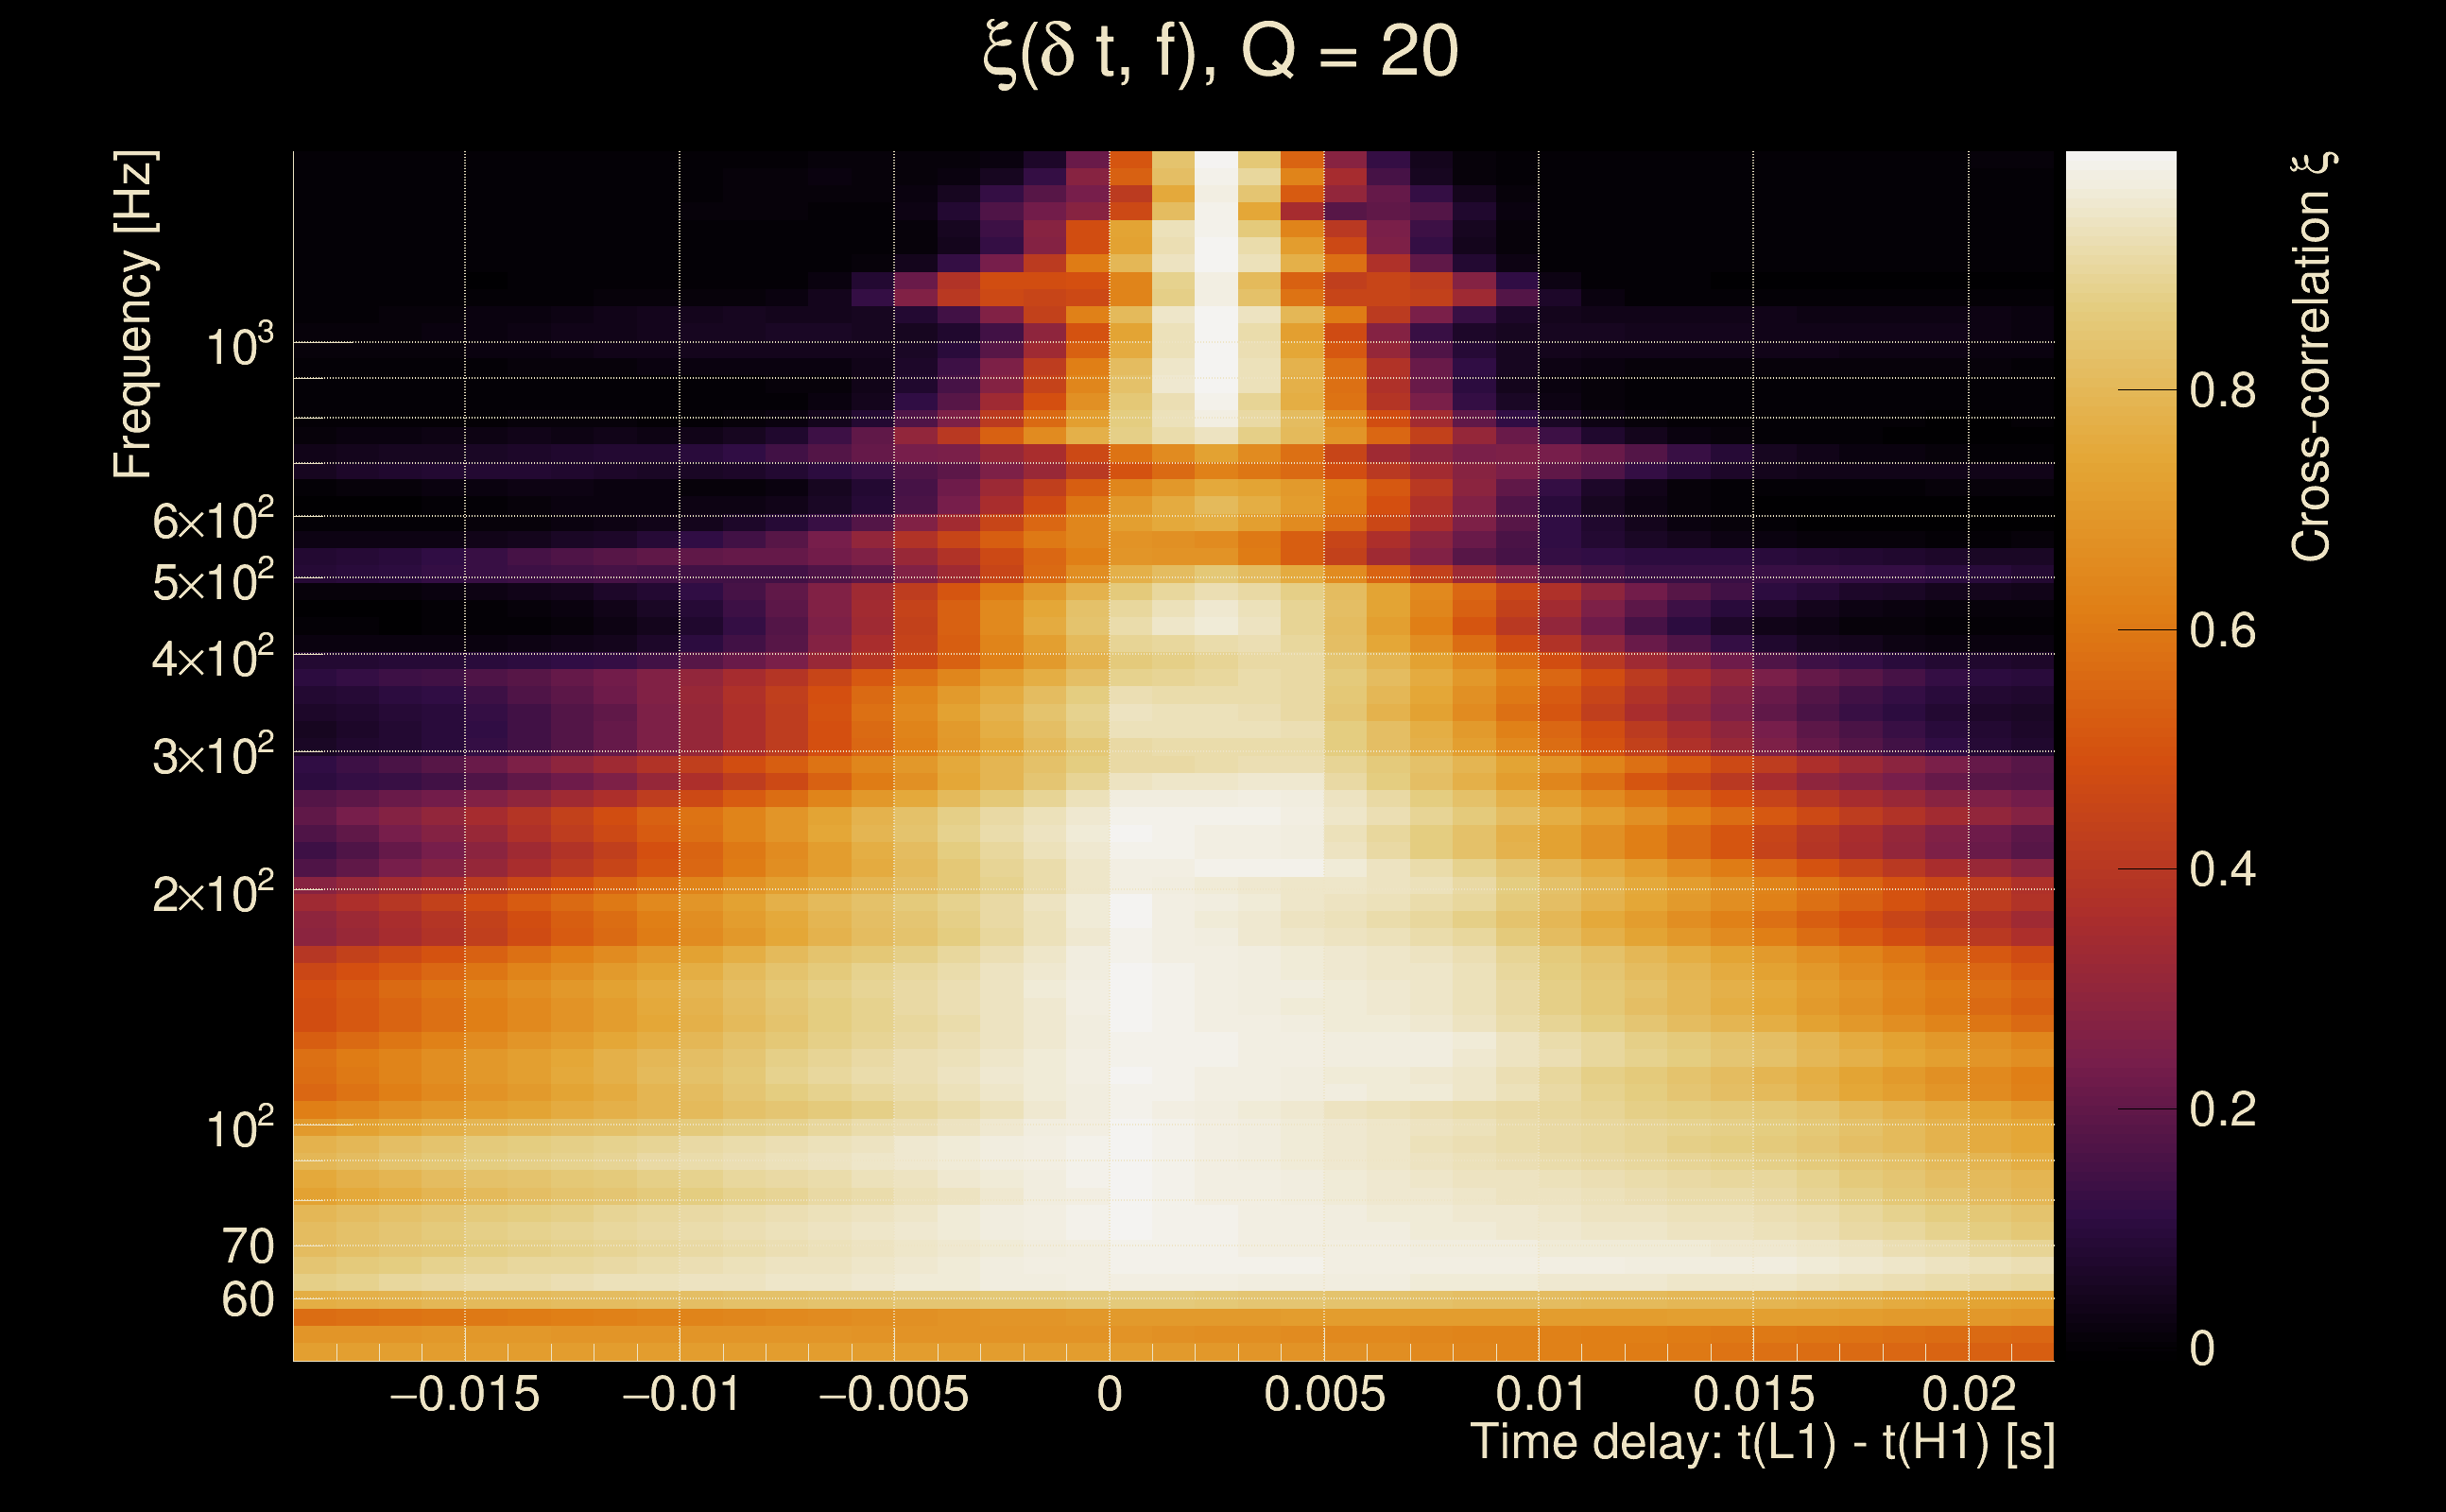
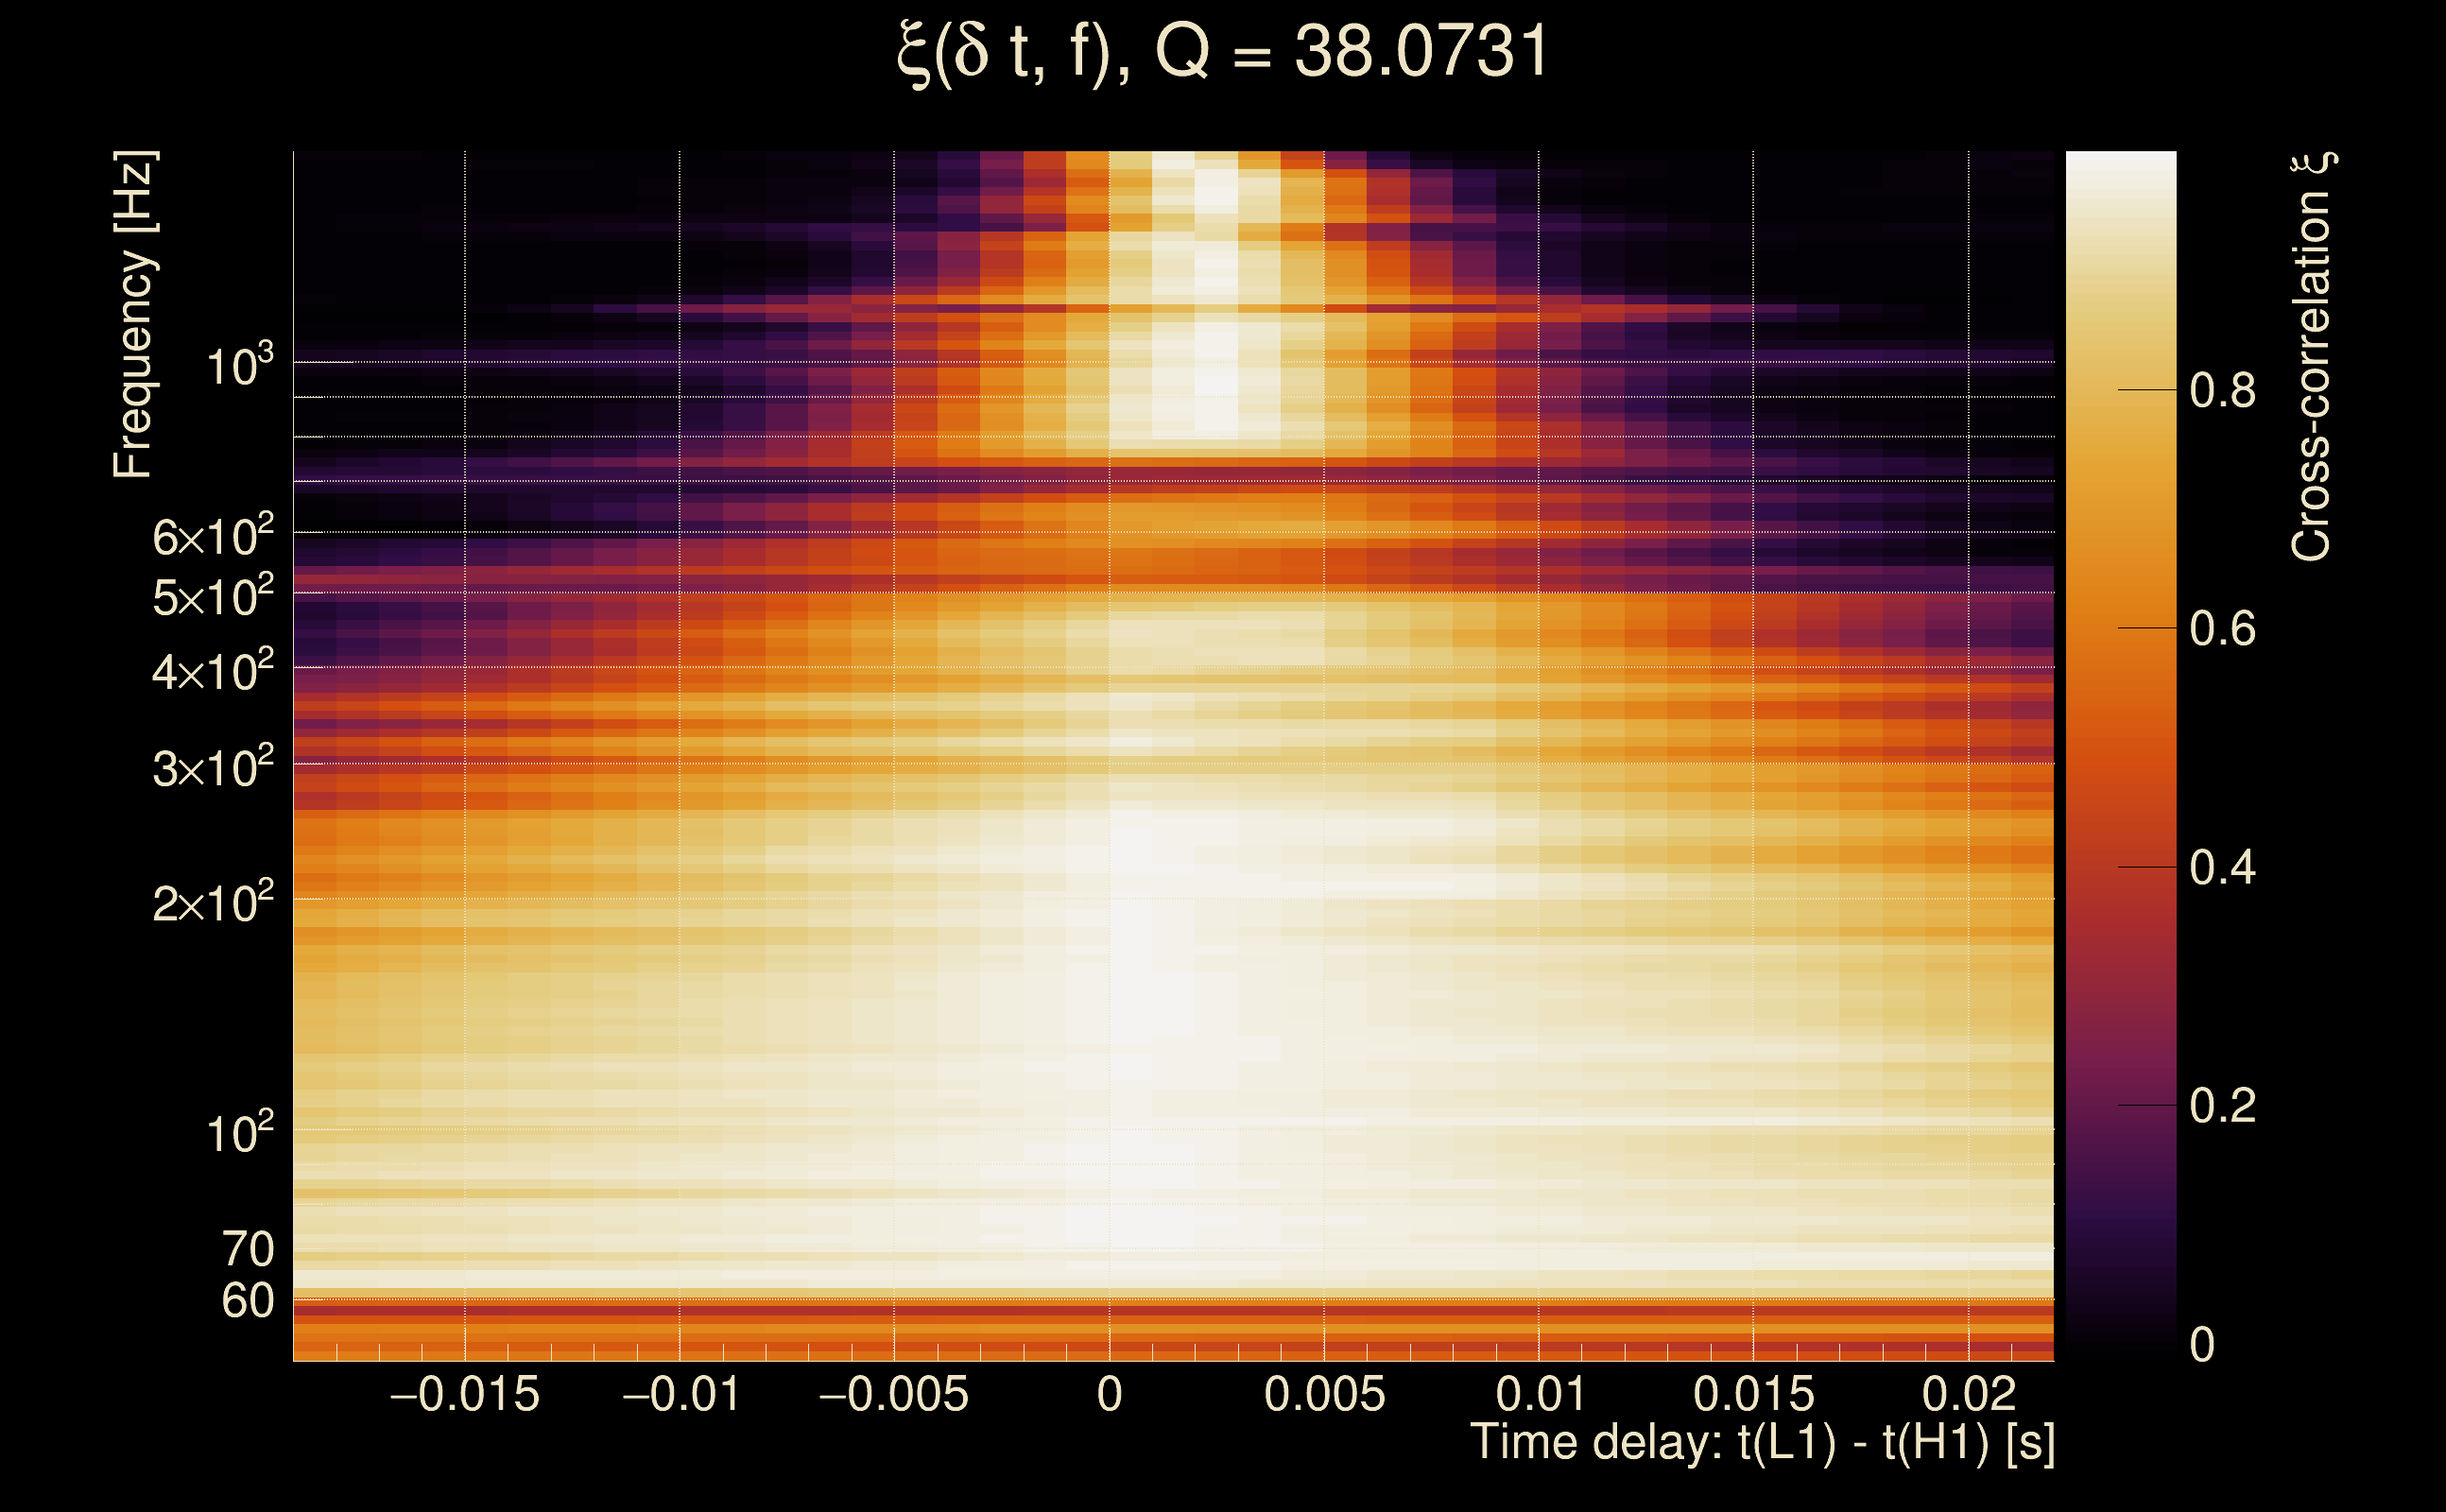
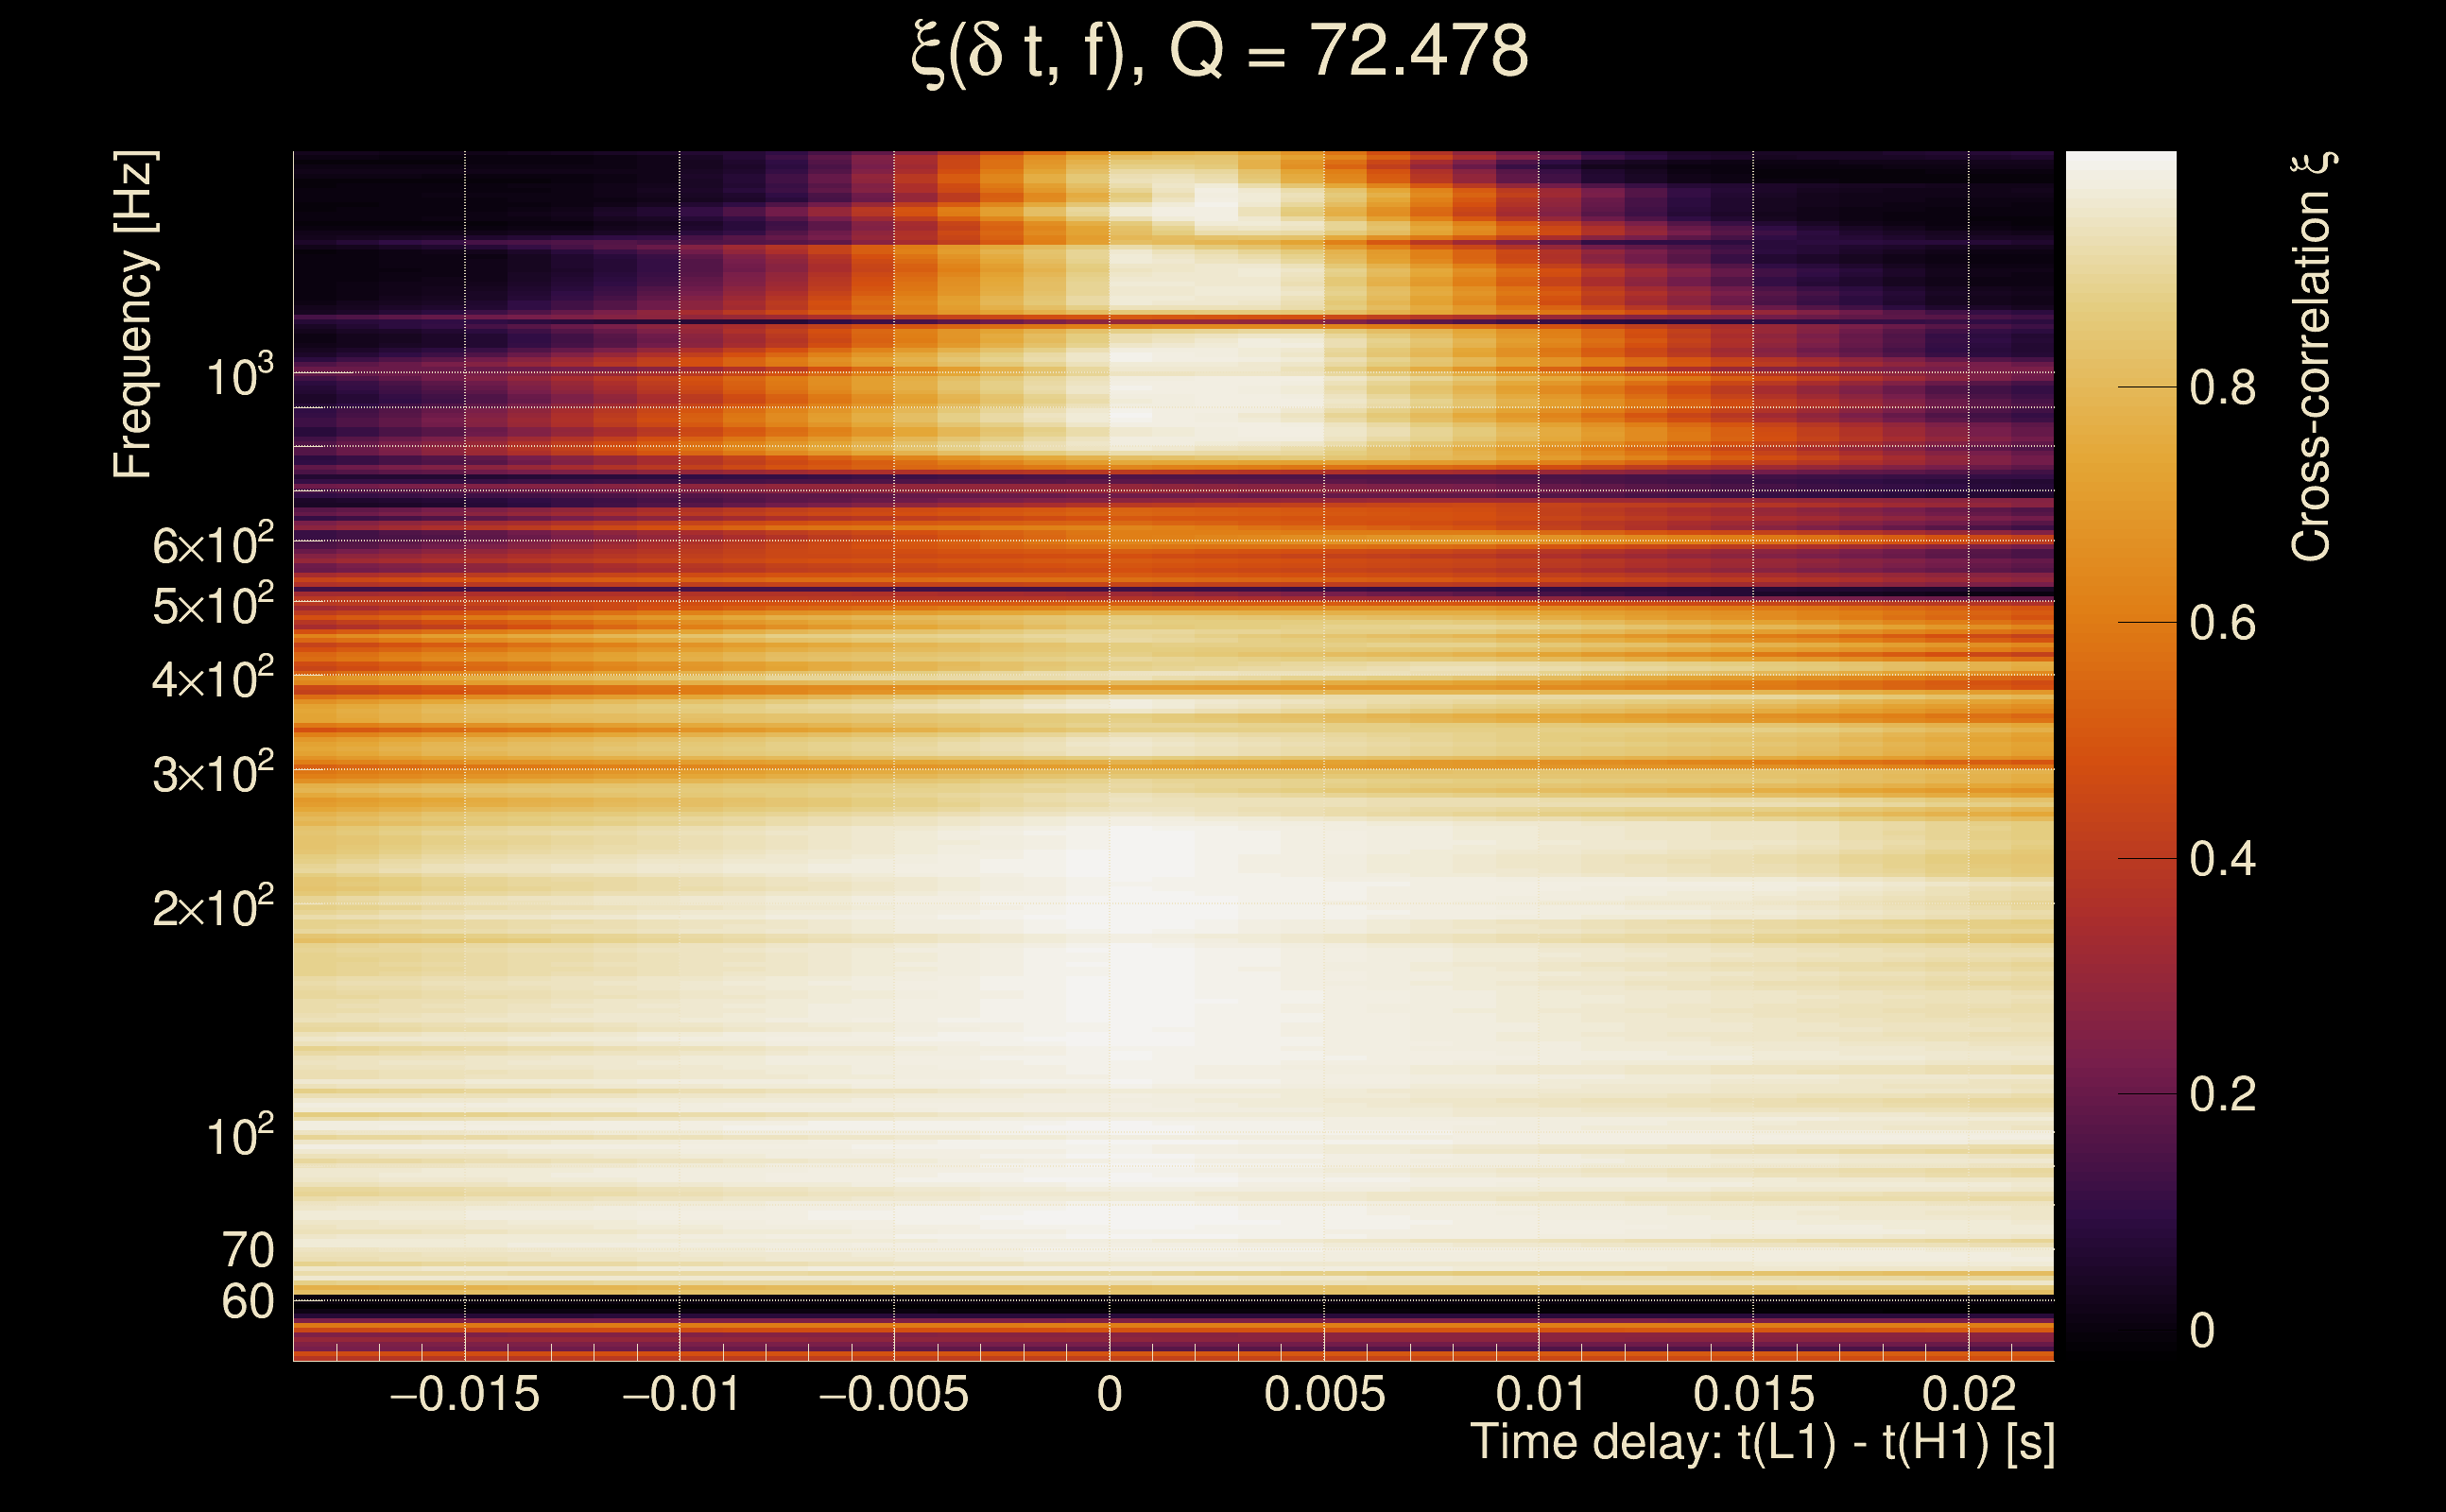
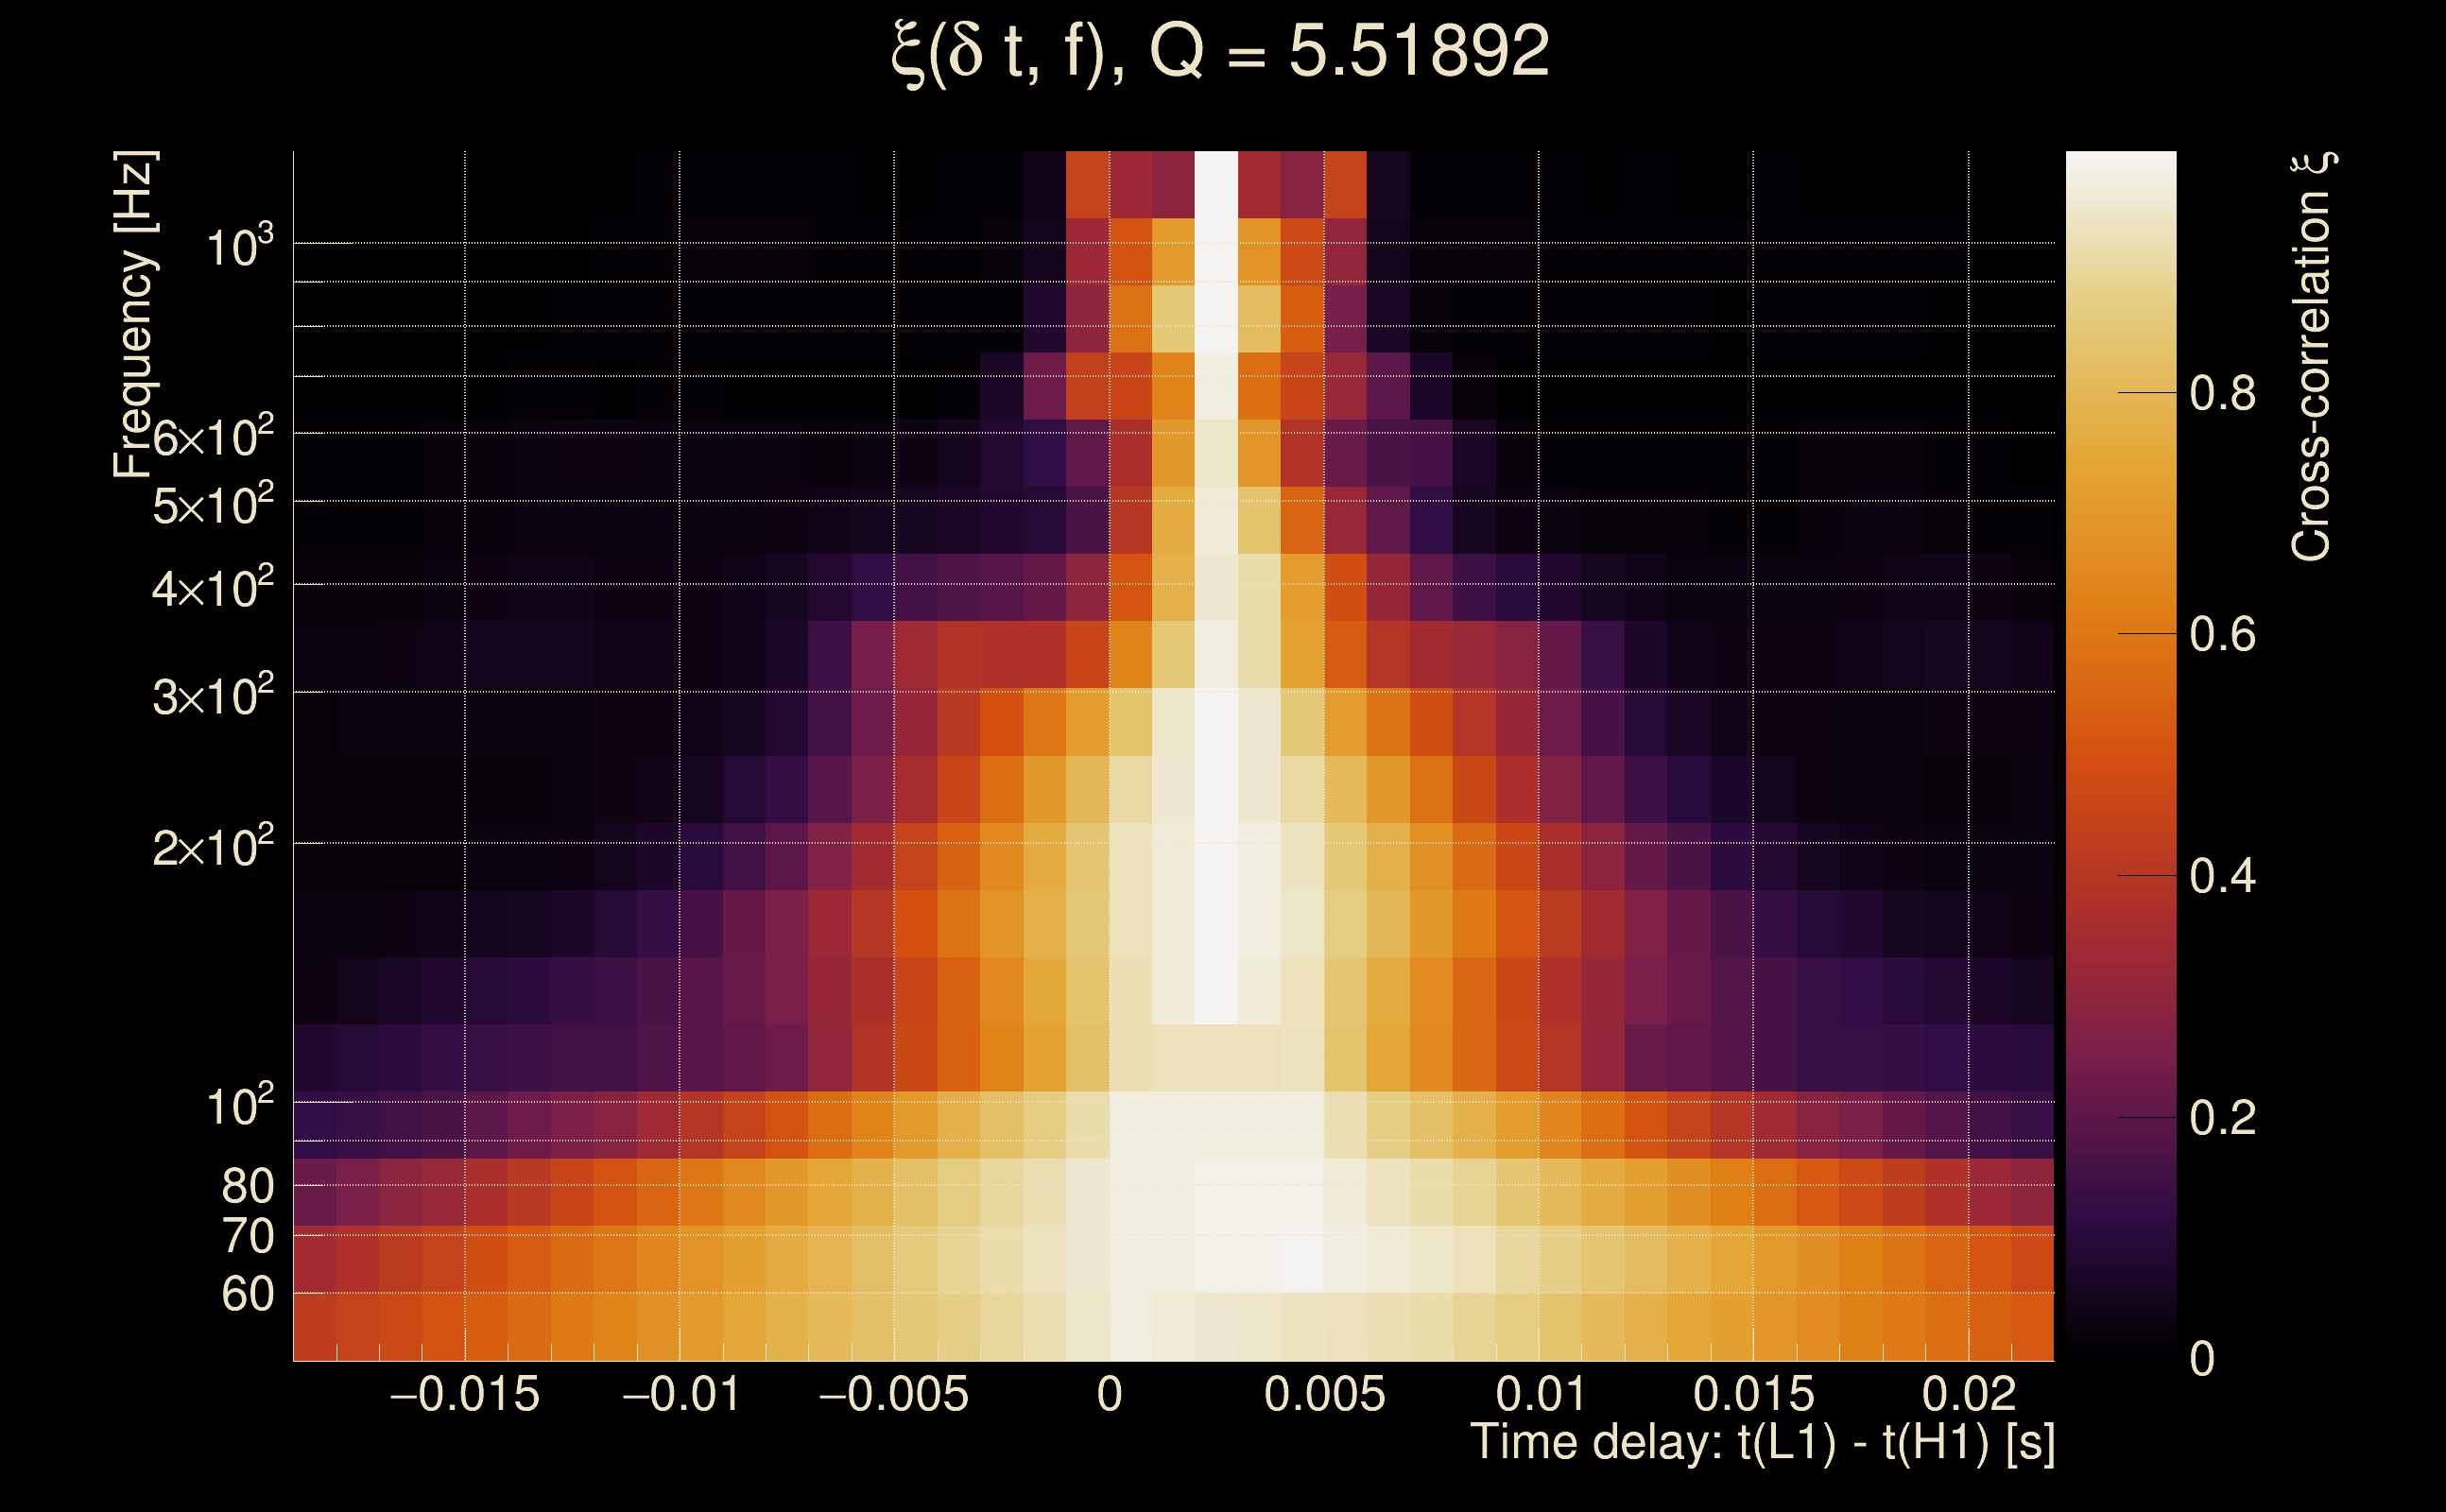
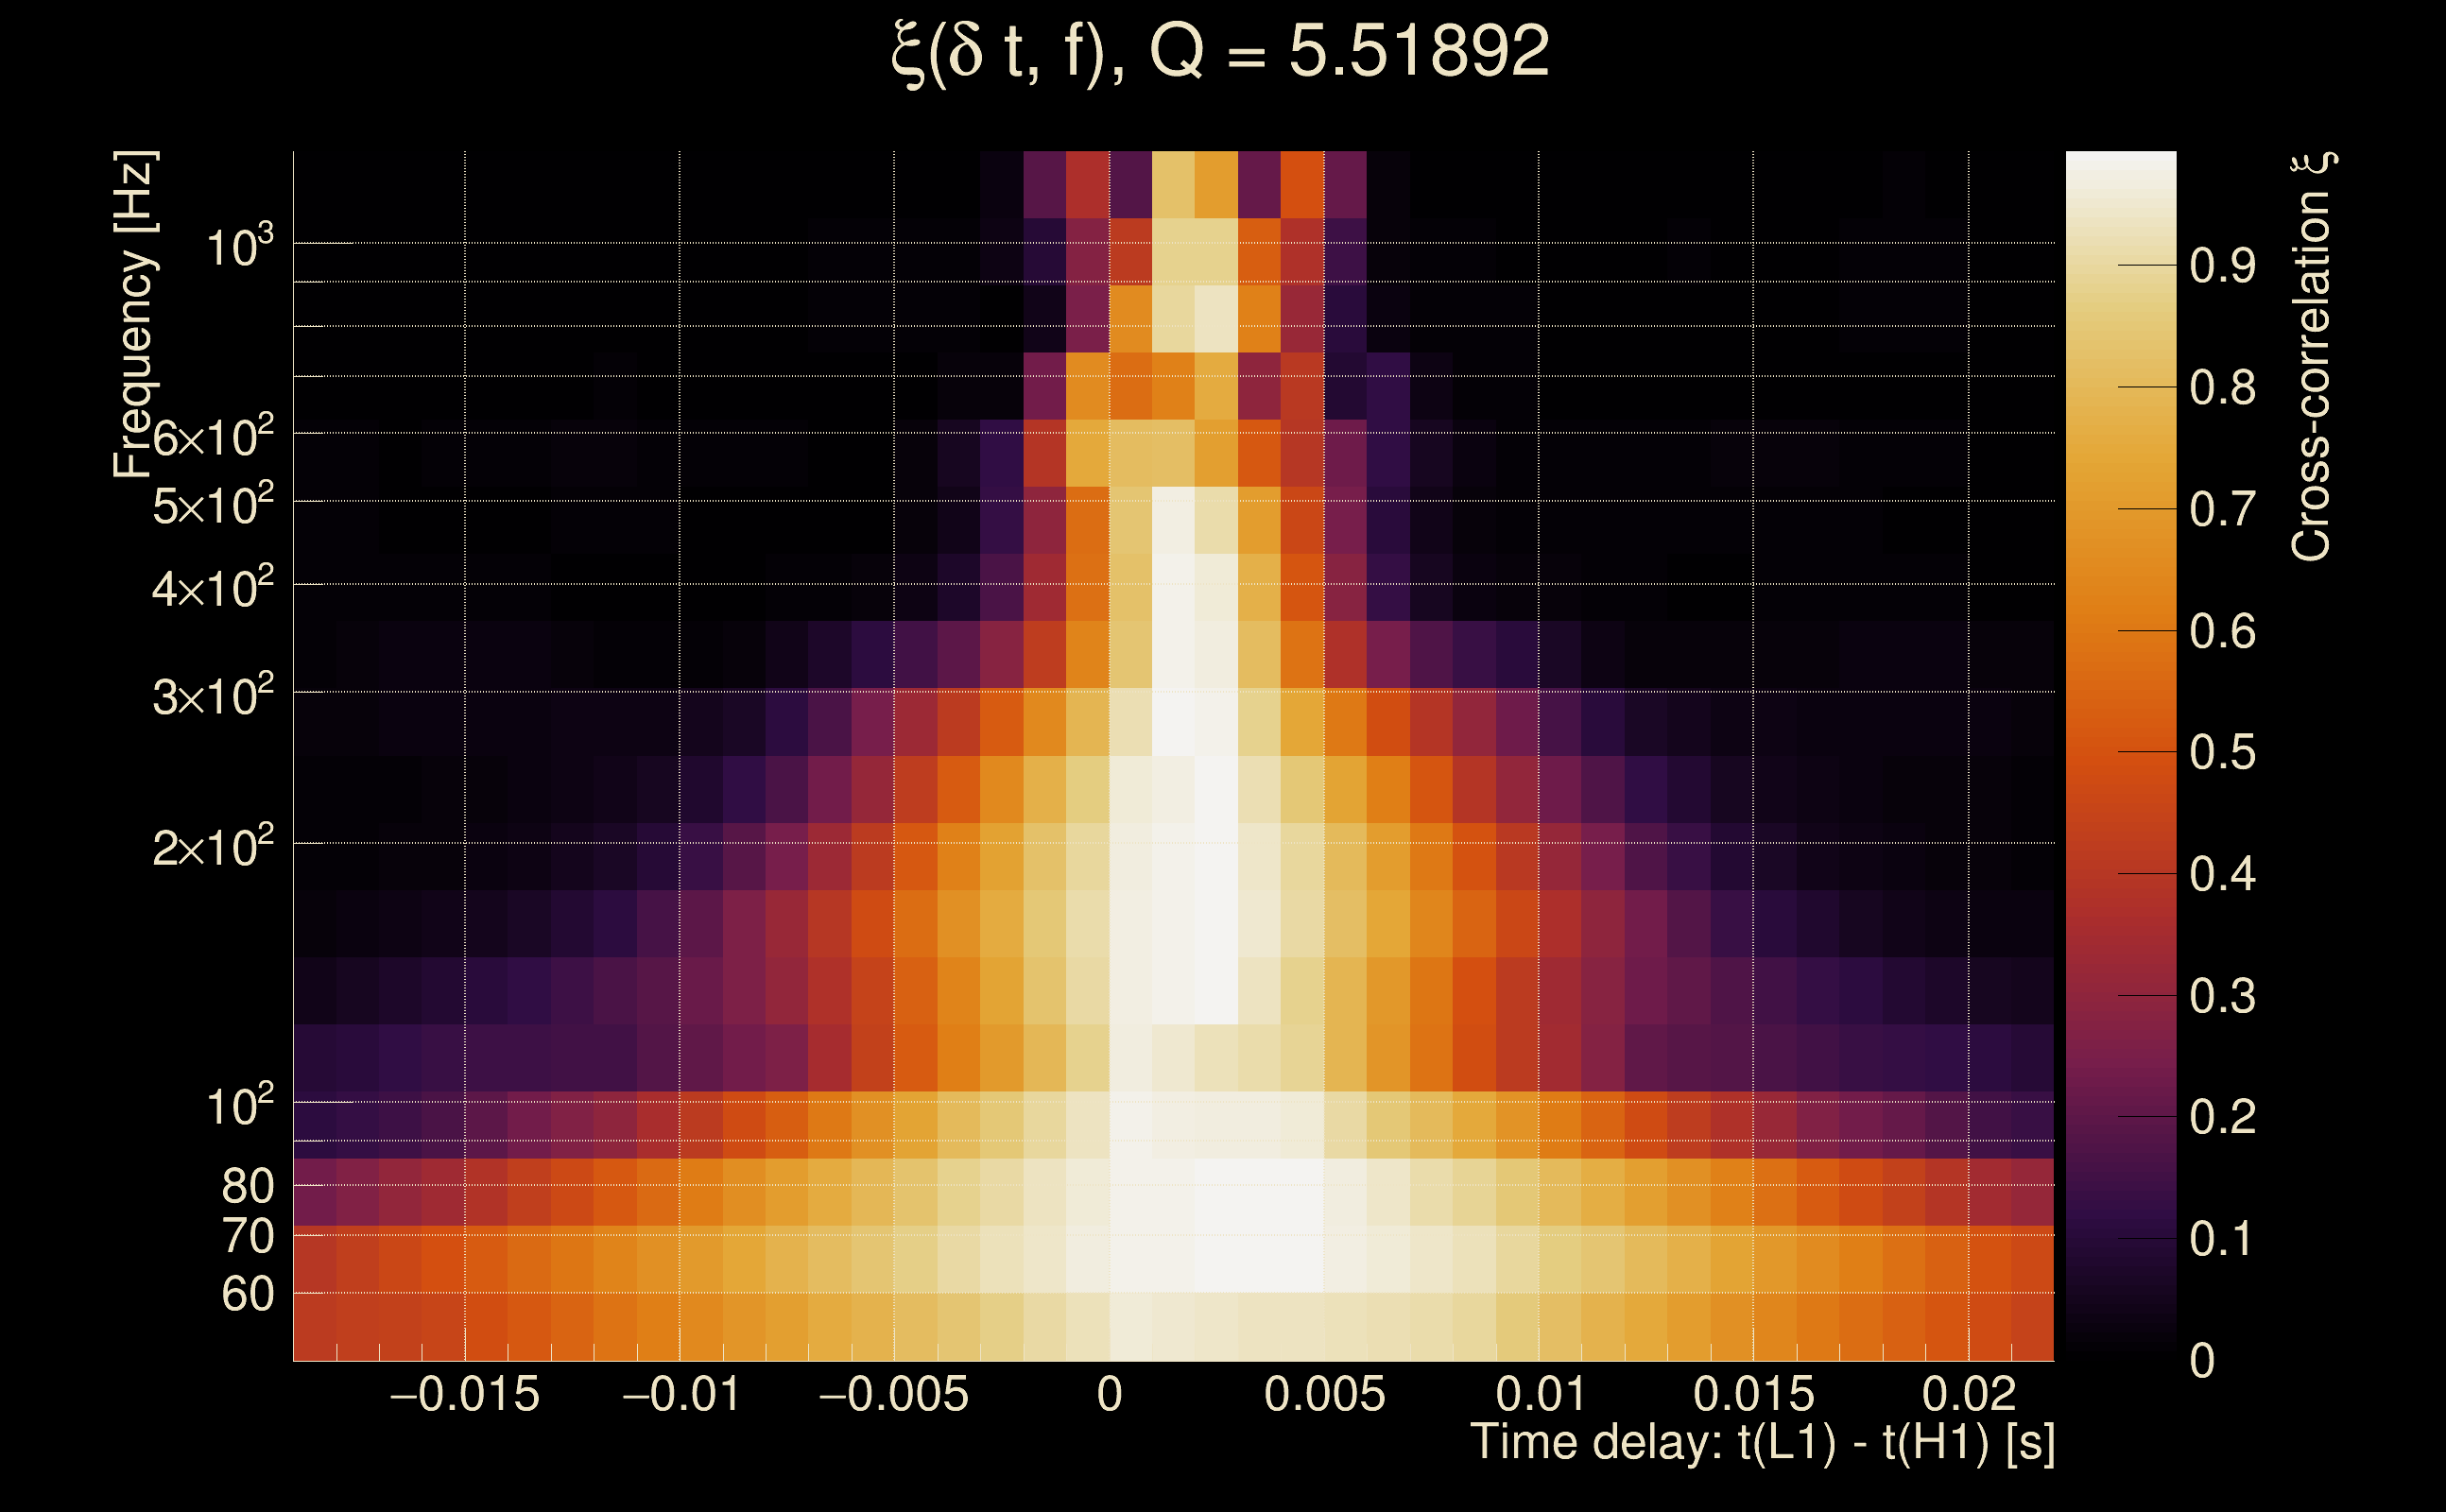
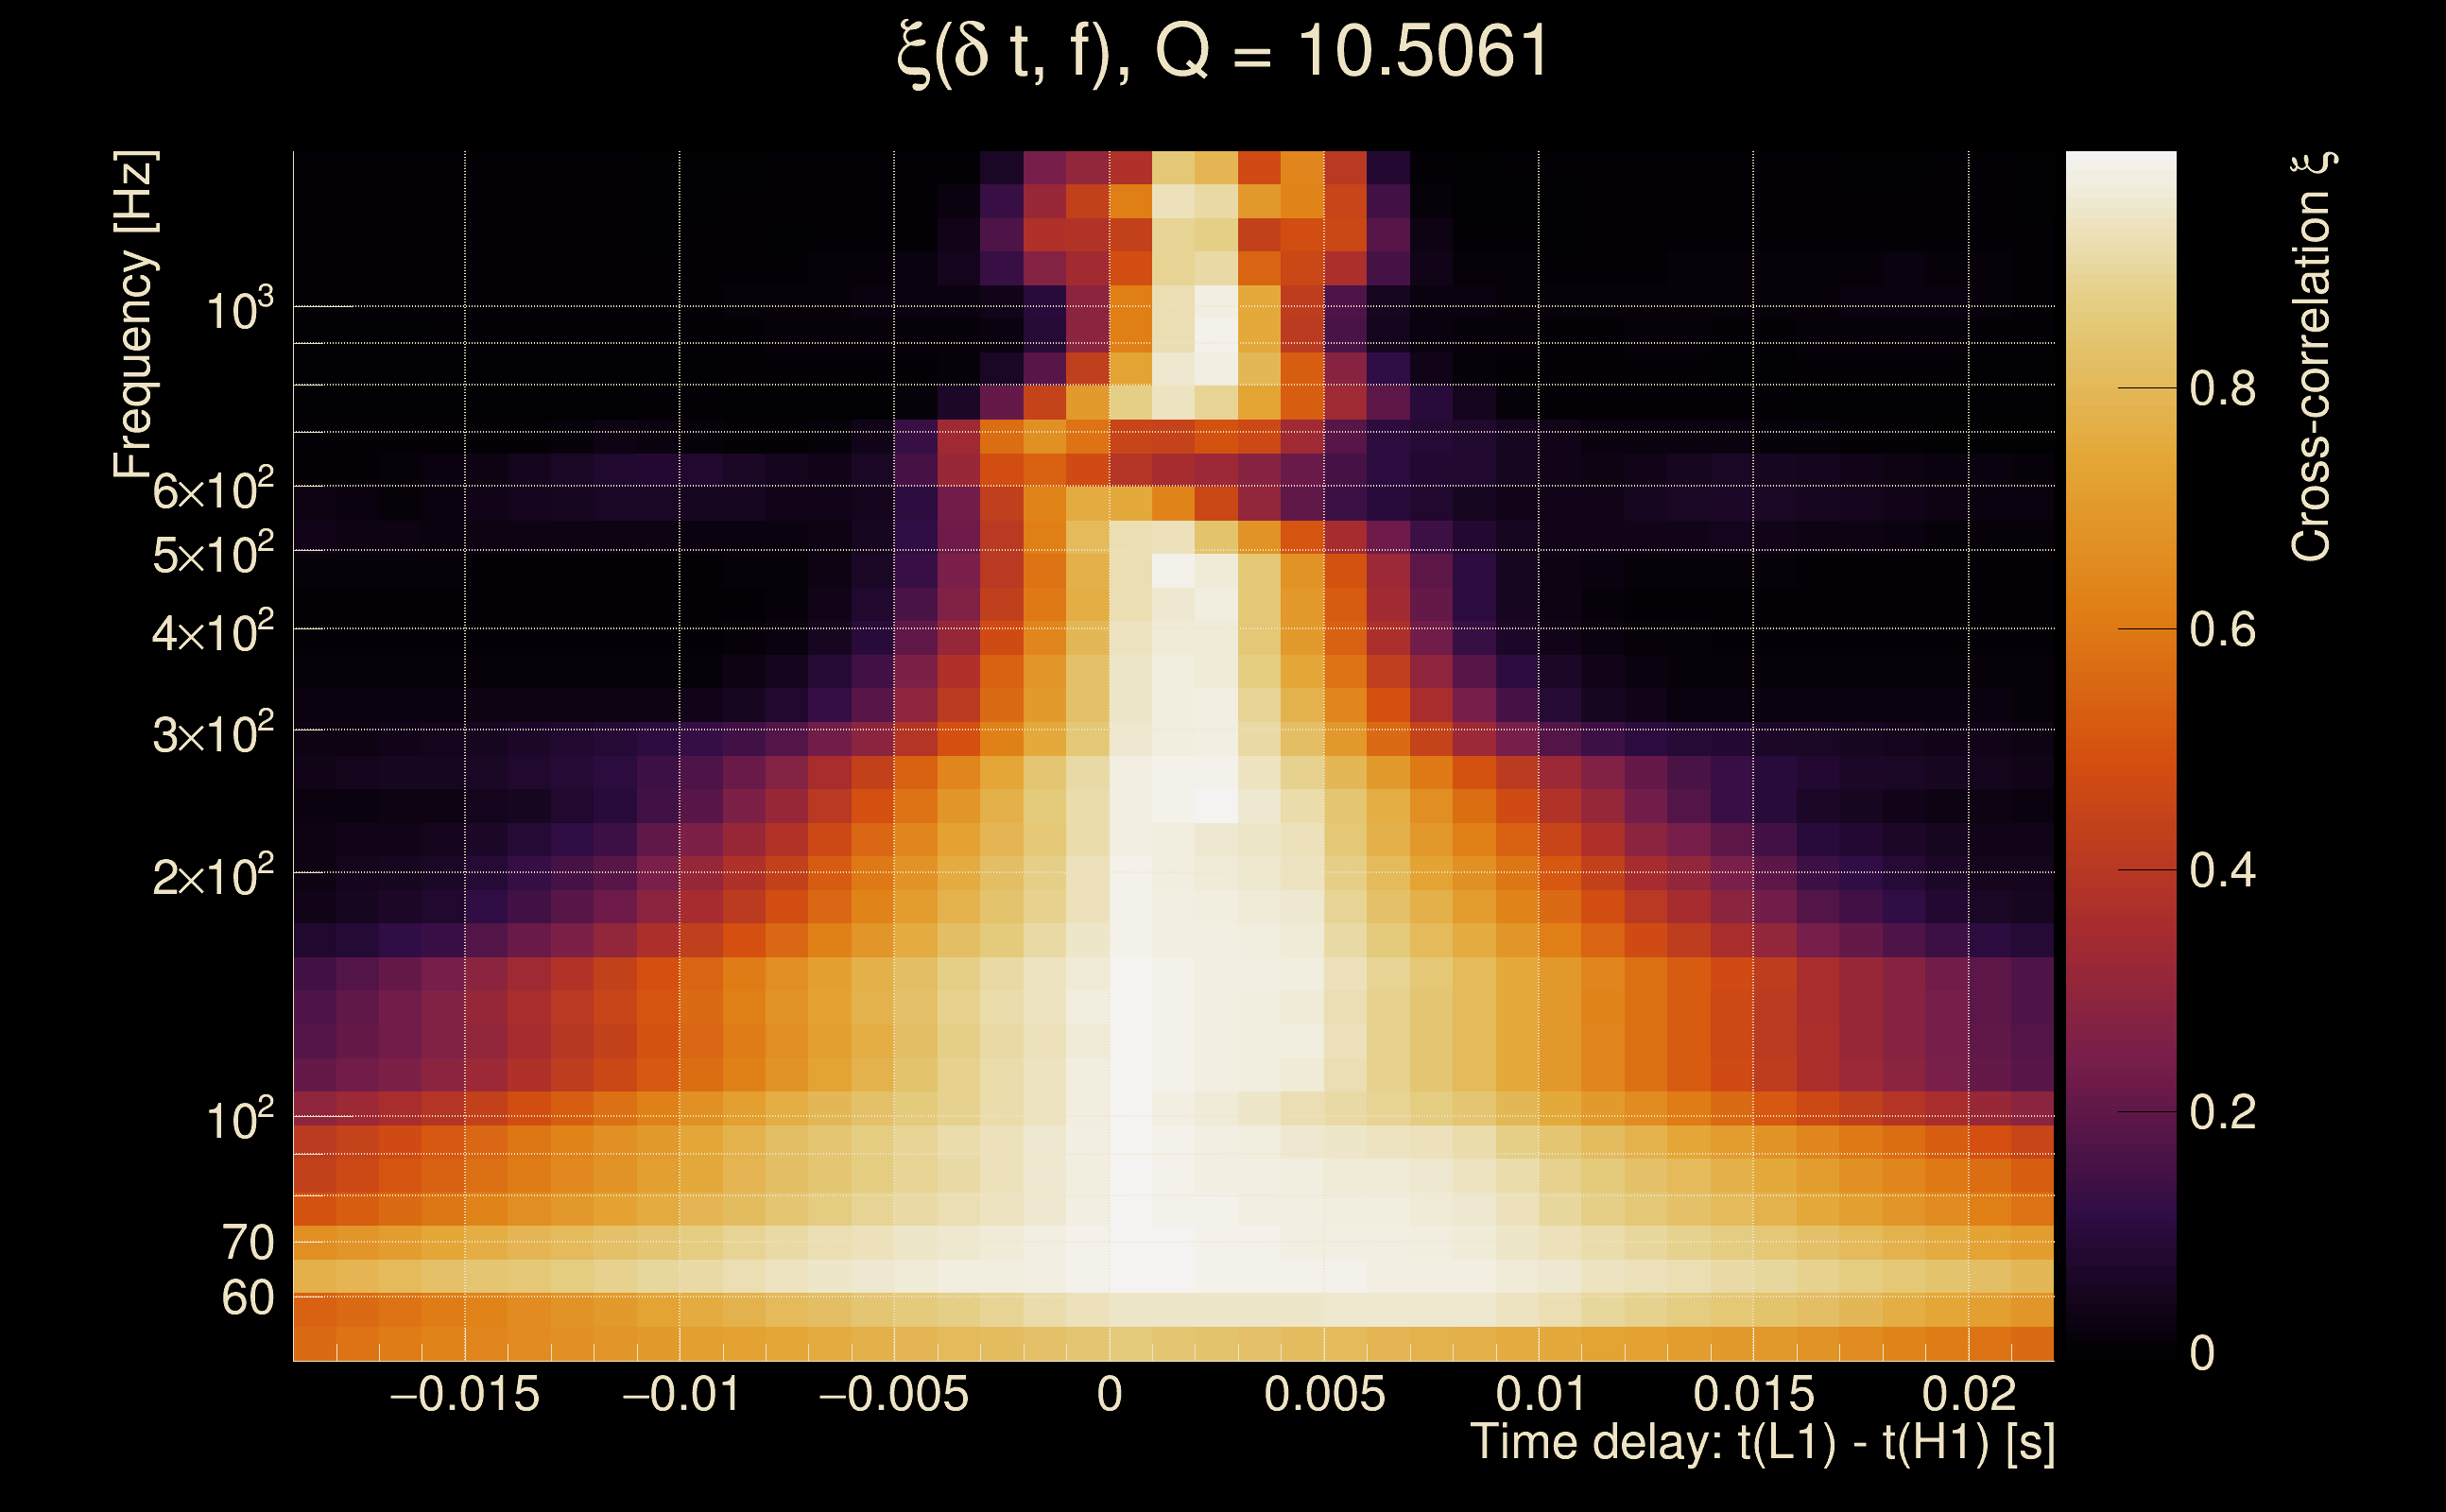
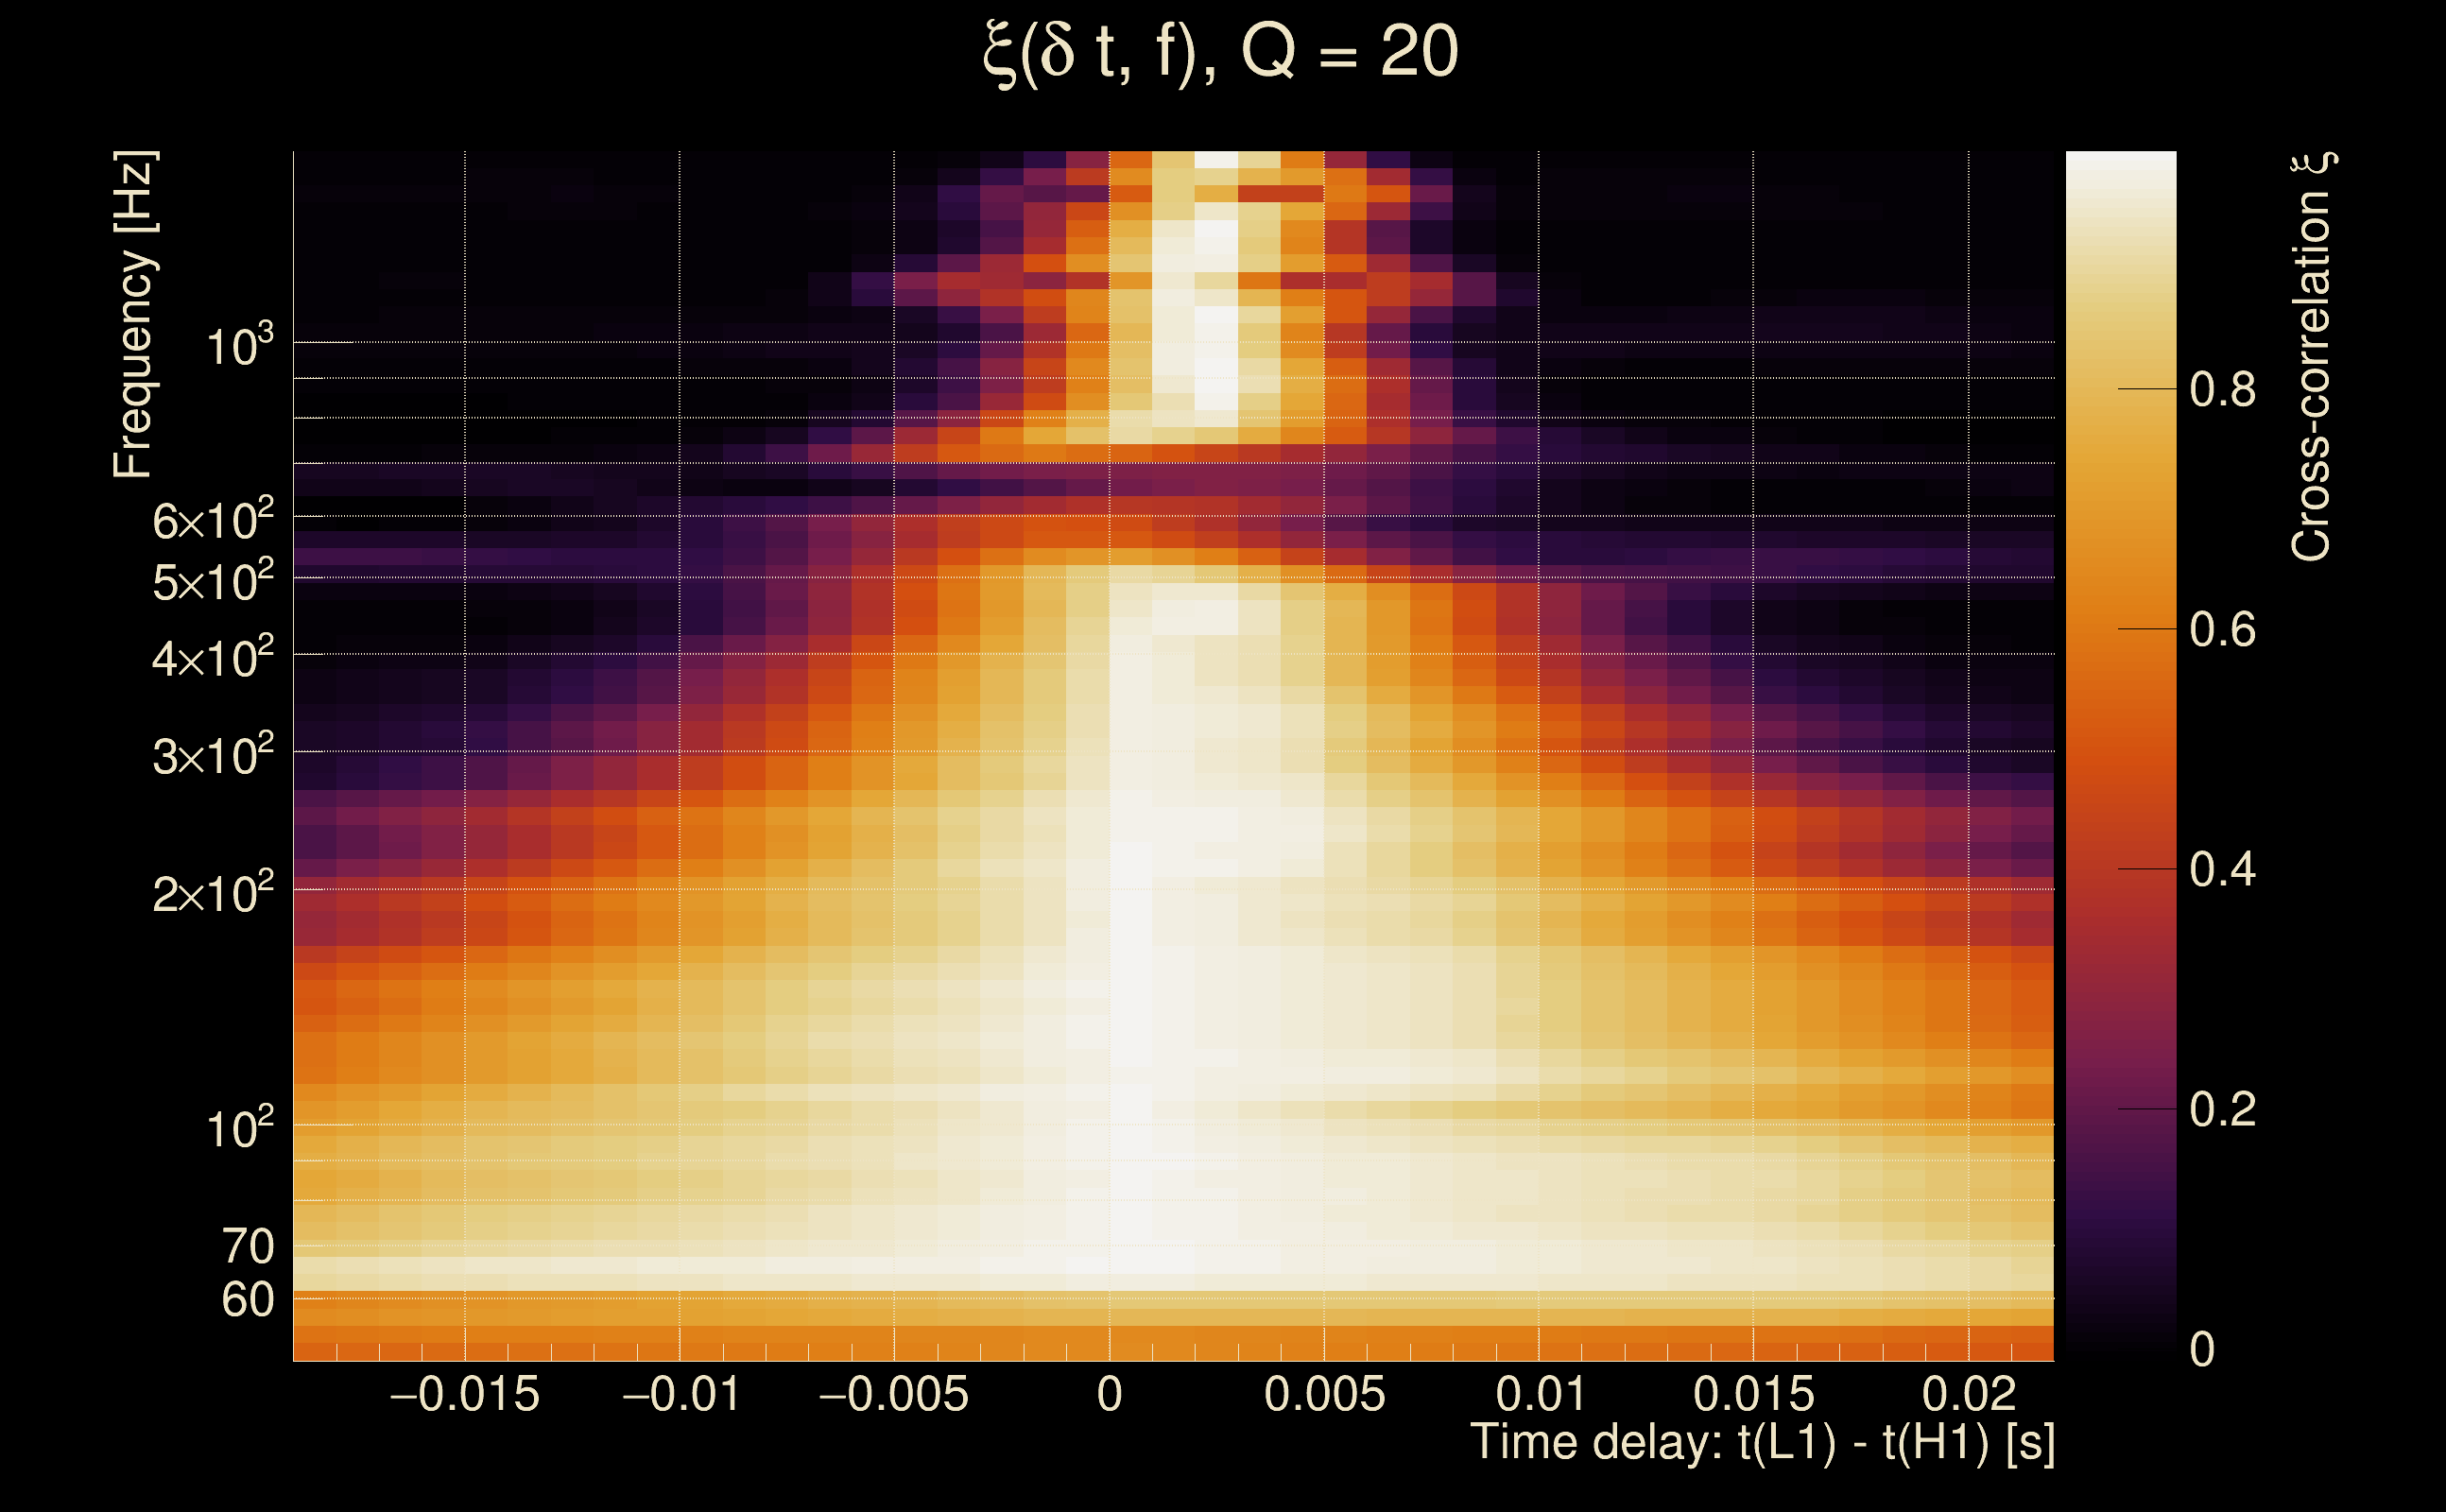
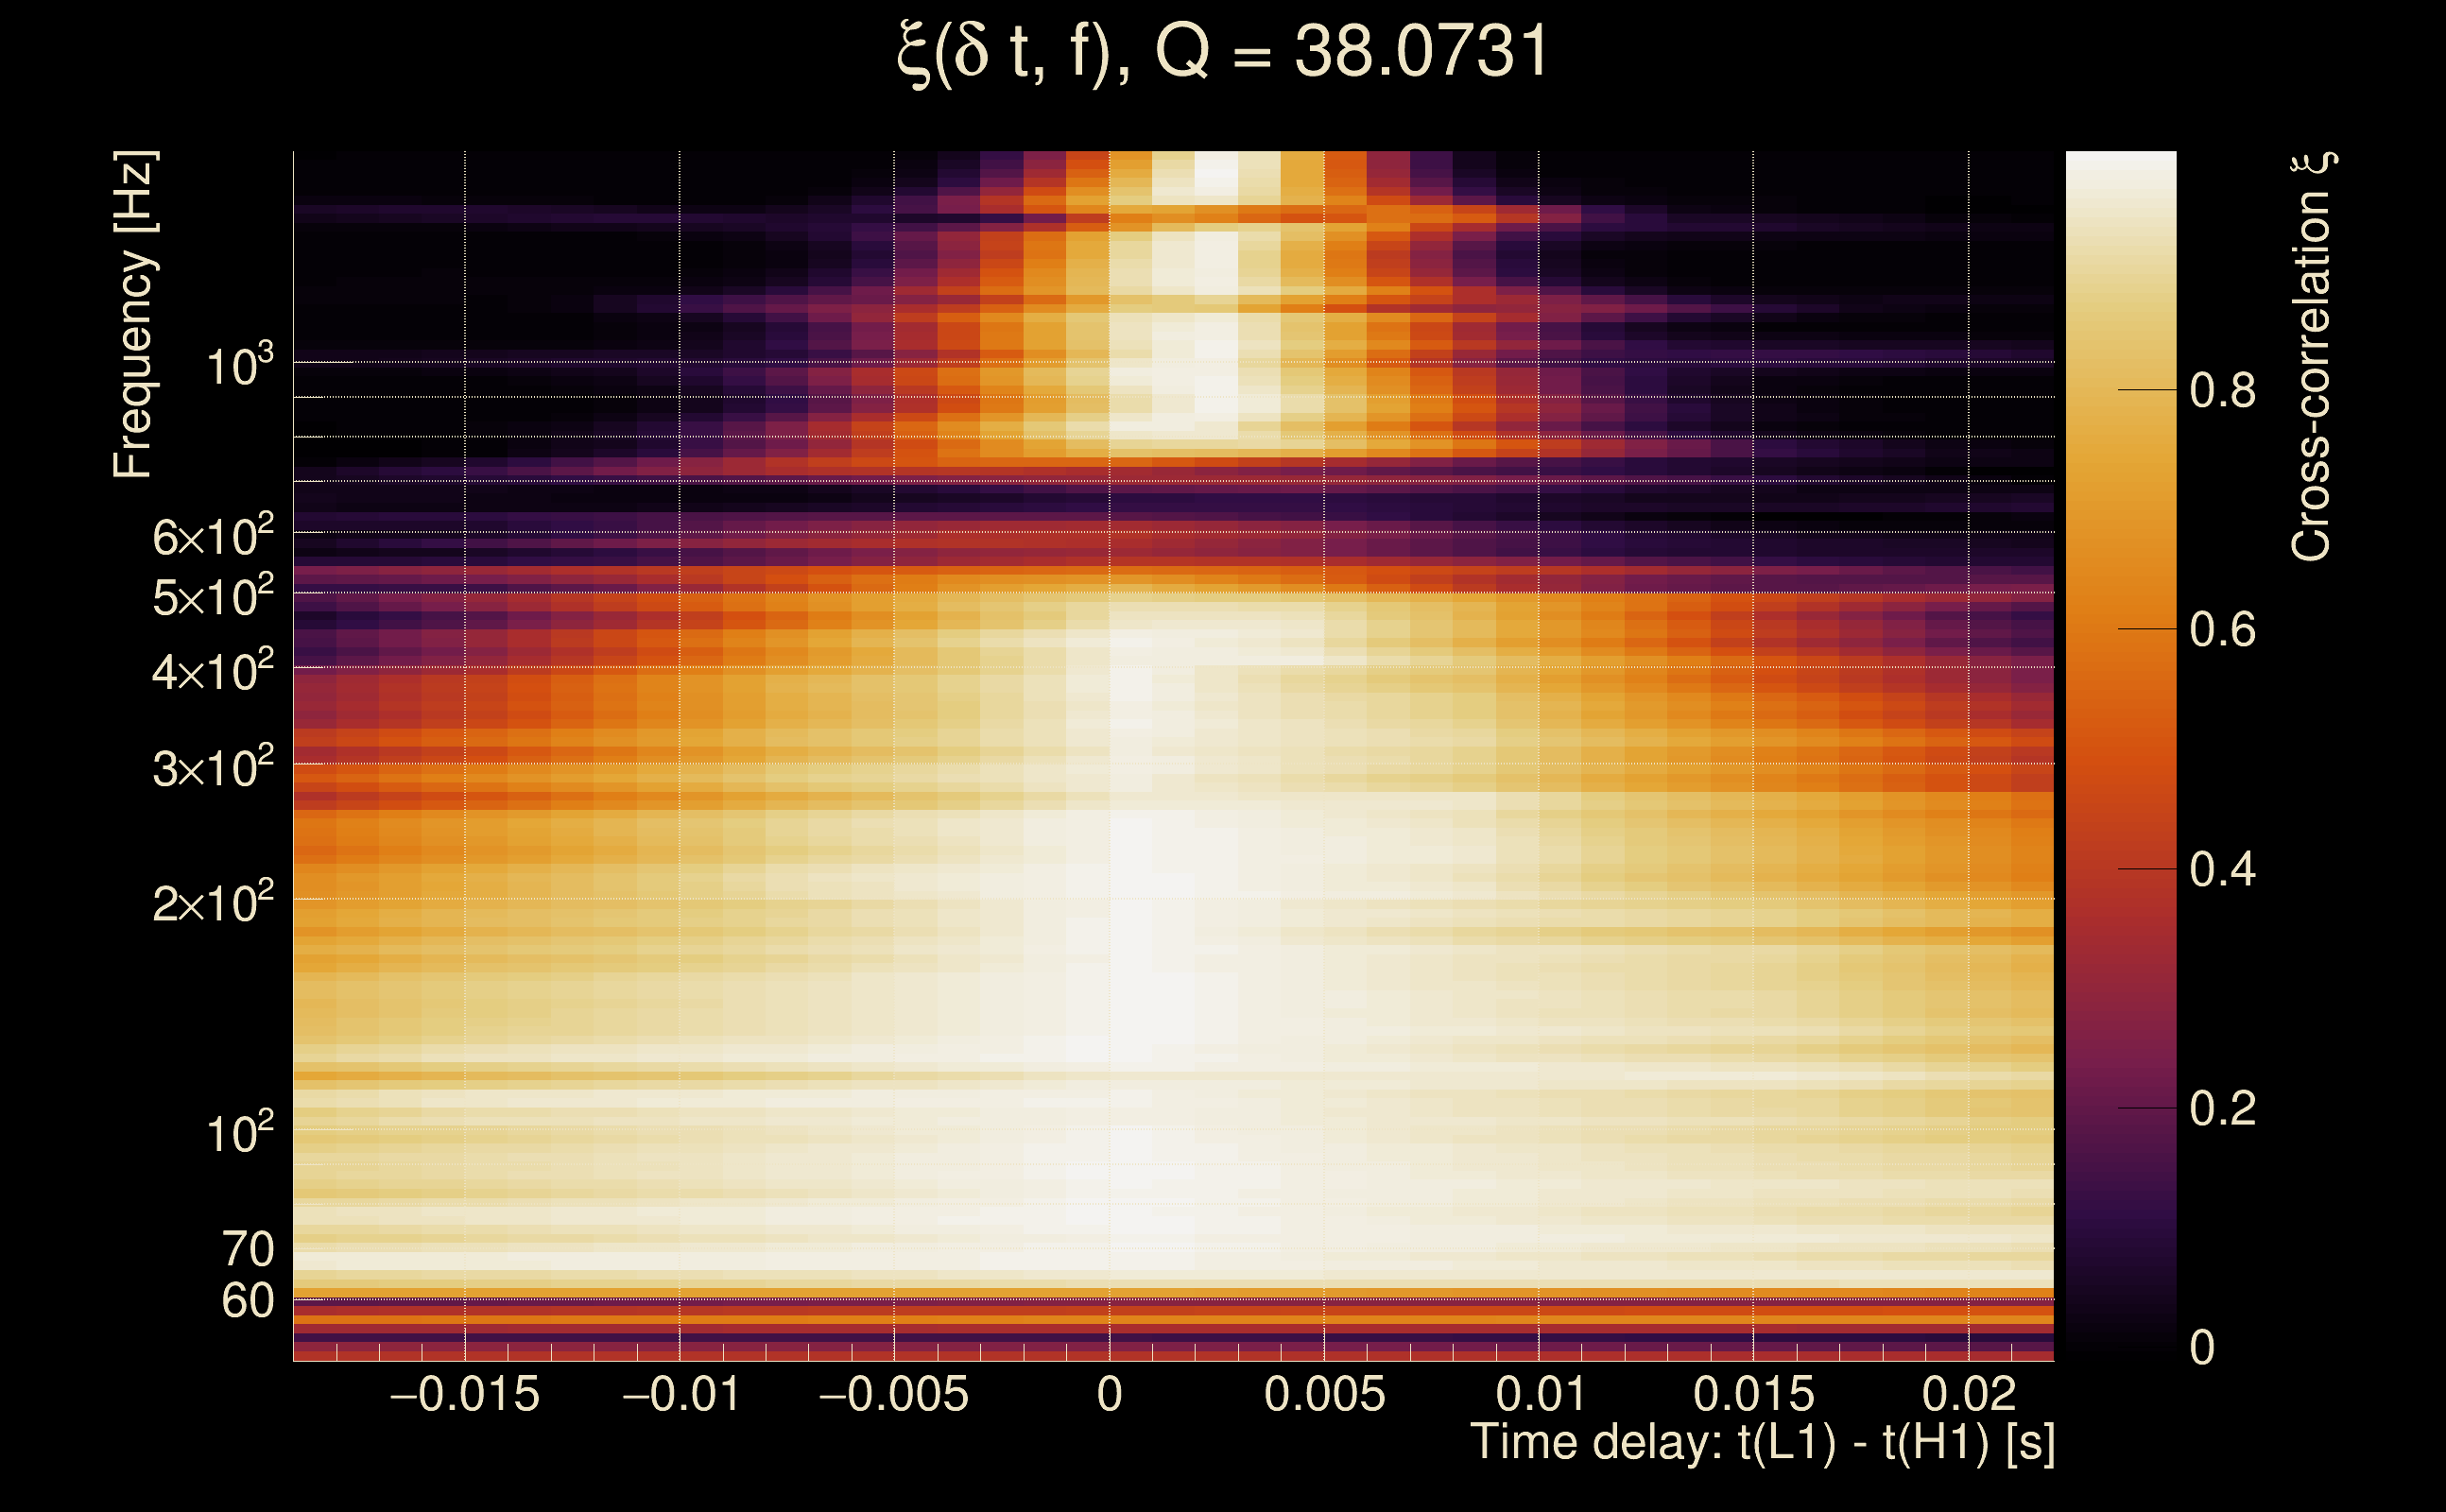
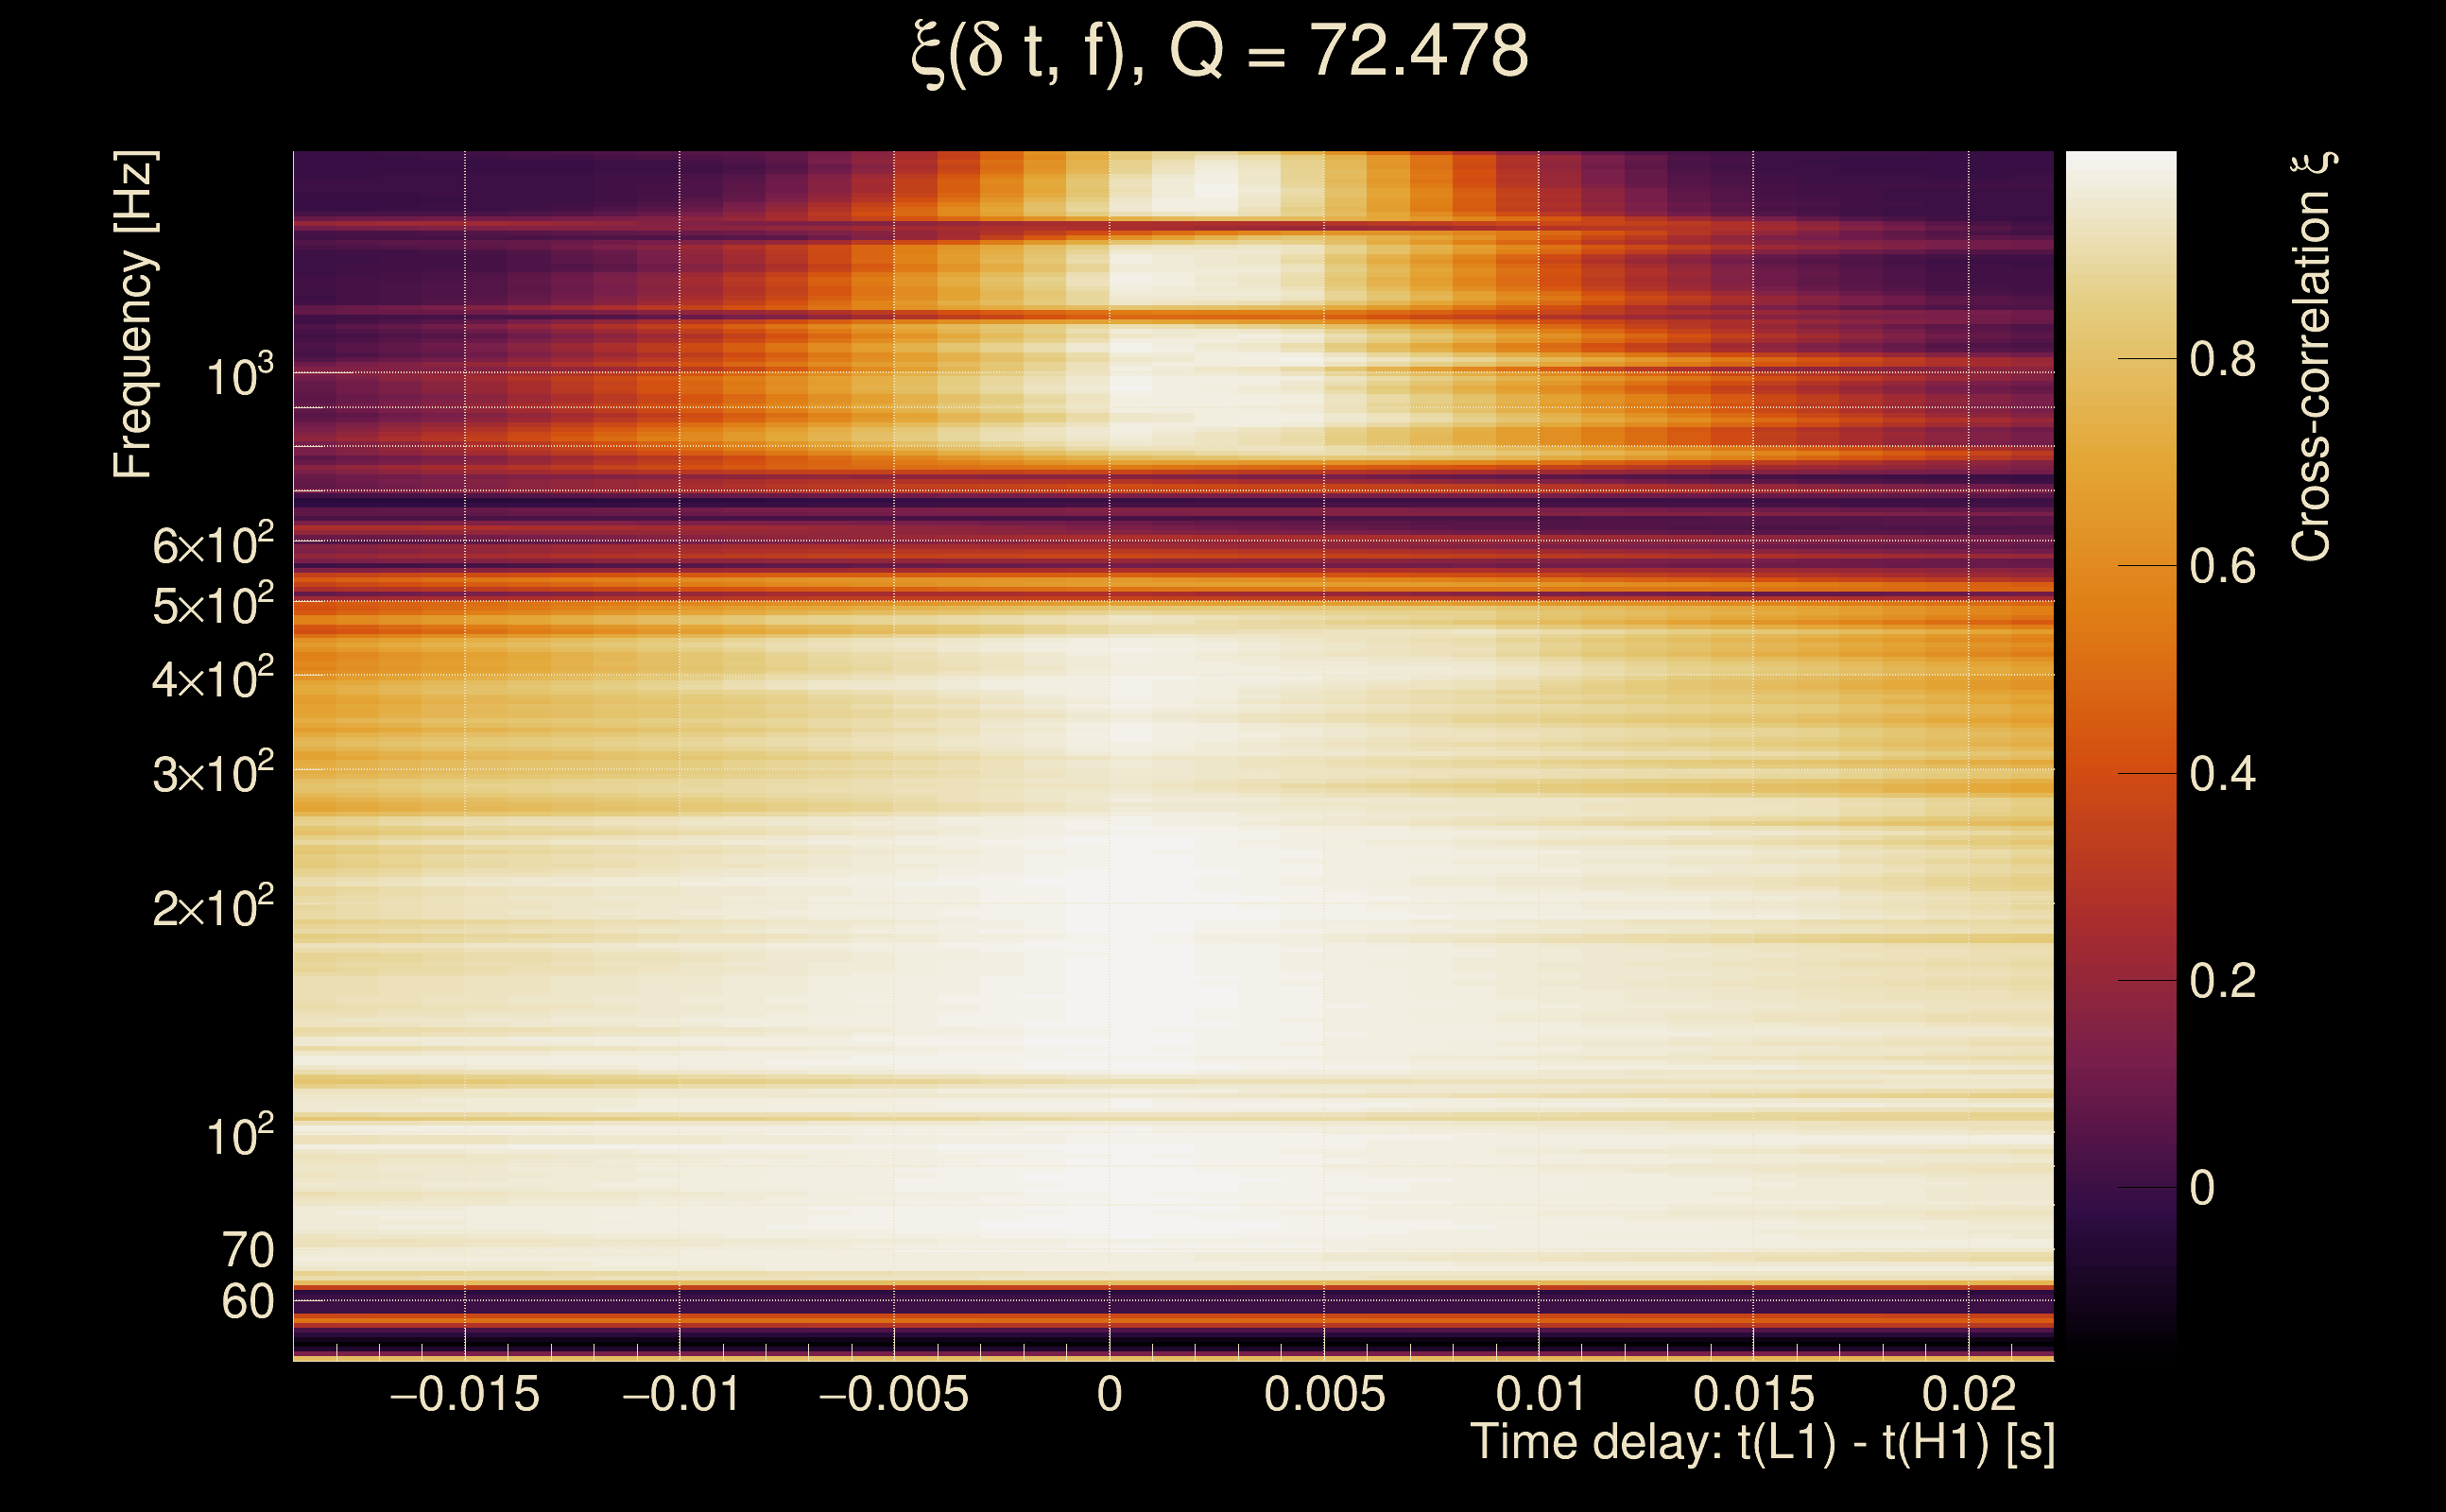
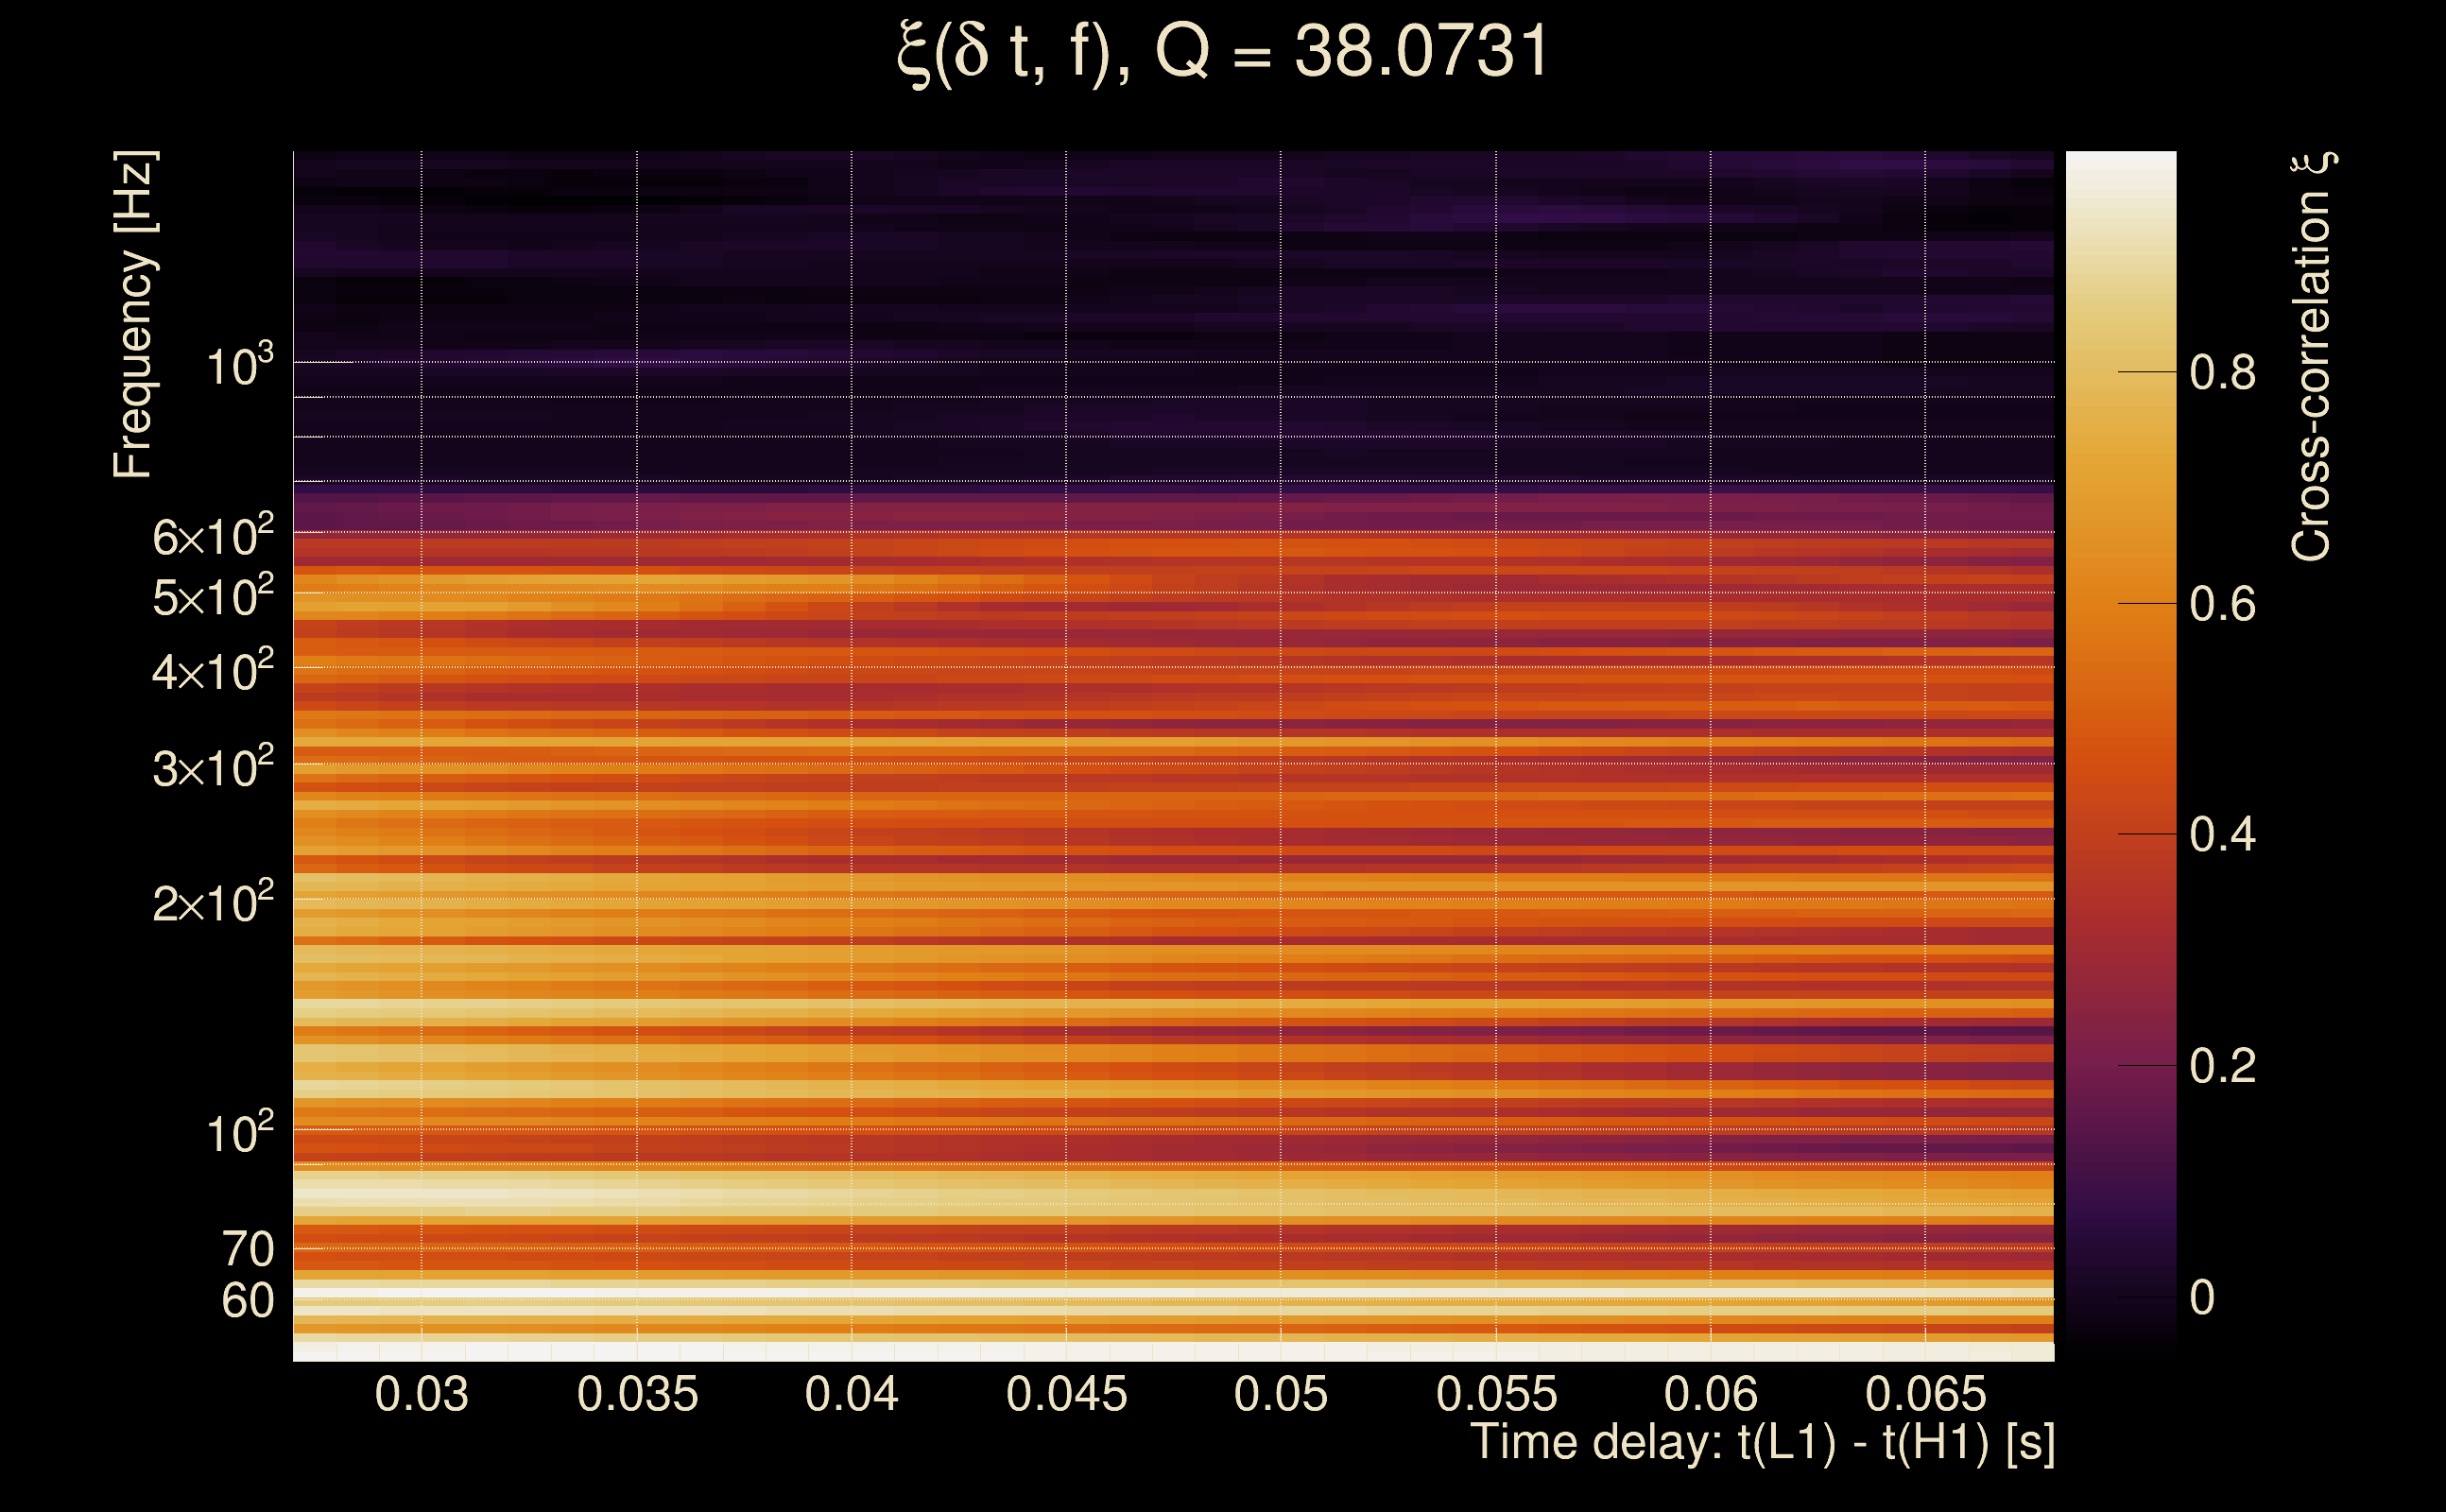
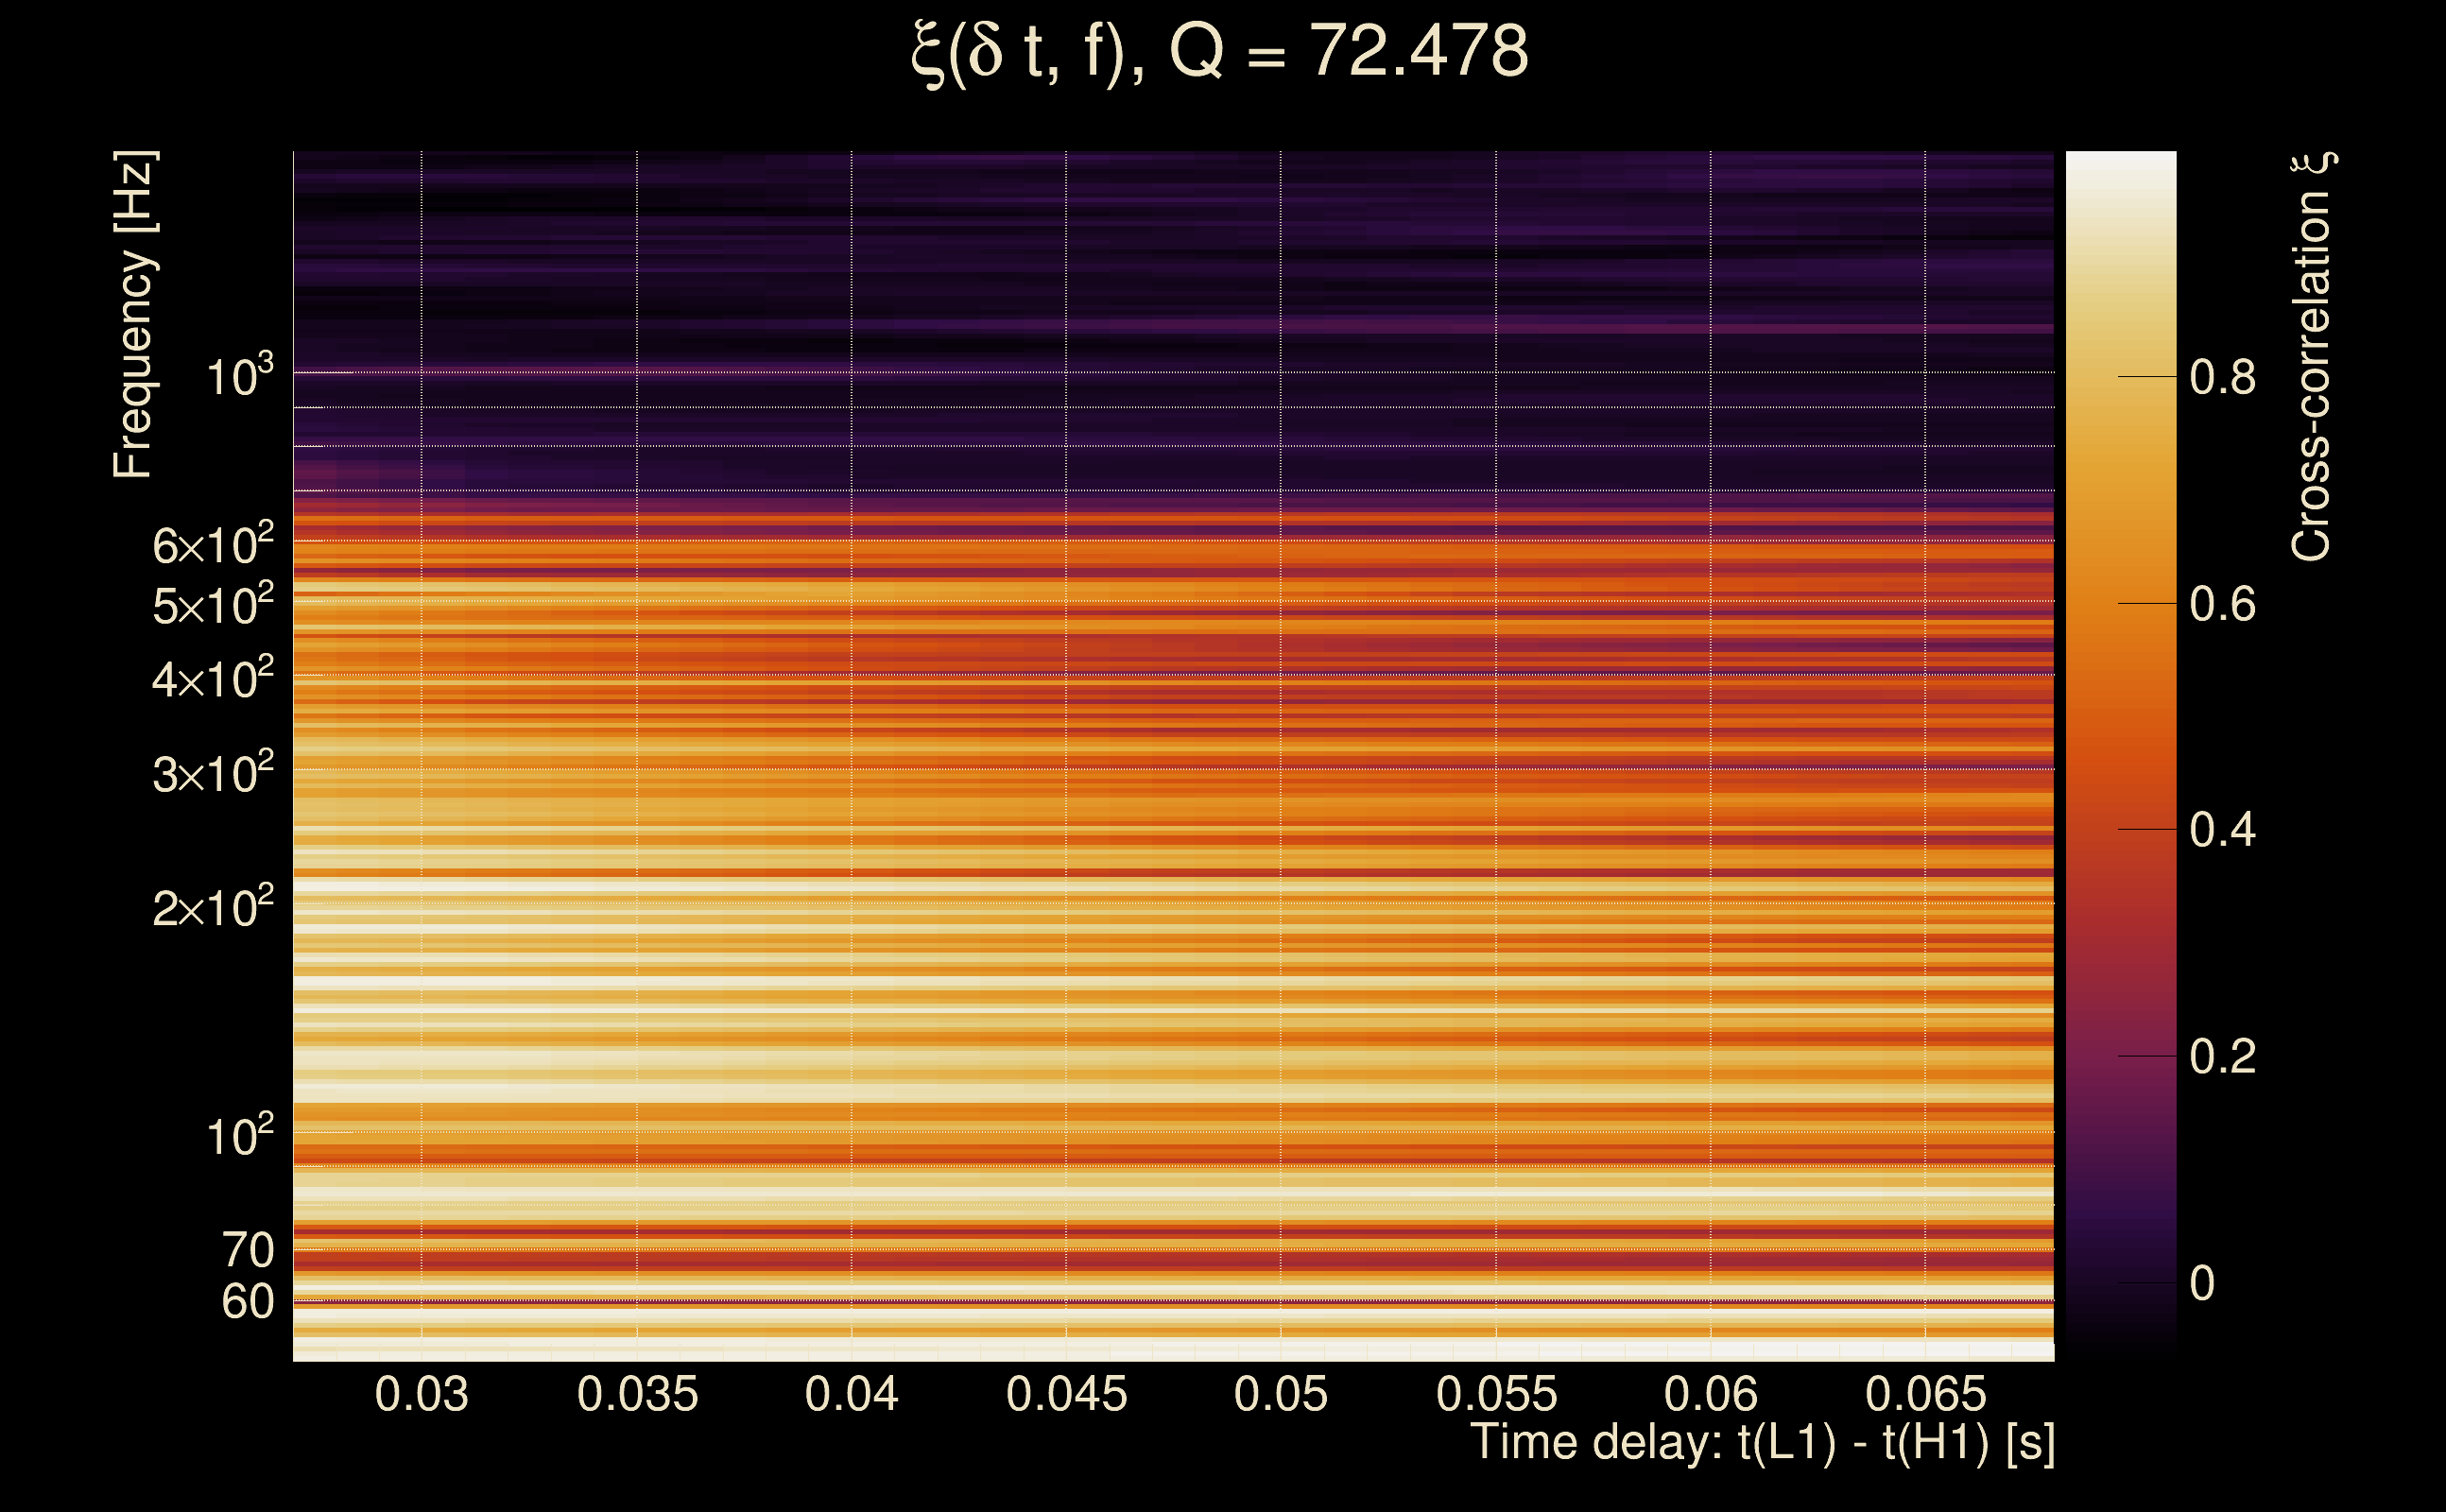
| Number of Q planes: | 5 (Q = 5.51892 → Q = 72.478) |
| Omicron frequency range: | 50 Hz → 1958.38 Hz |
| Light travel time between detectors: | 0.0100128 s |
| Slice extra-time (calibration uncertainty + slice veto): | 0.0129872 s |
| Number of time-delay bins in a cross-correlation map: | 10000 |
| Number of slices in a cross-correlation map: | 217 |
| Number of time-delay bins in a slice: | 46 |
| SNR gating: | < 100000 (detector 0), < 100000 (detector 1) |
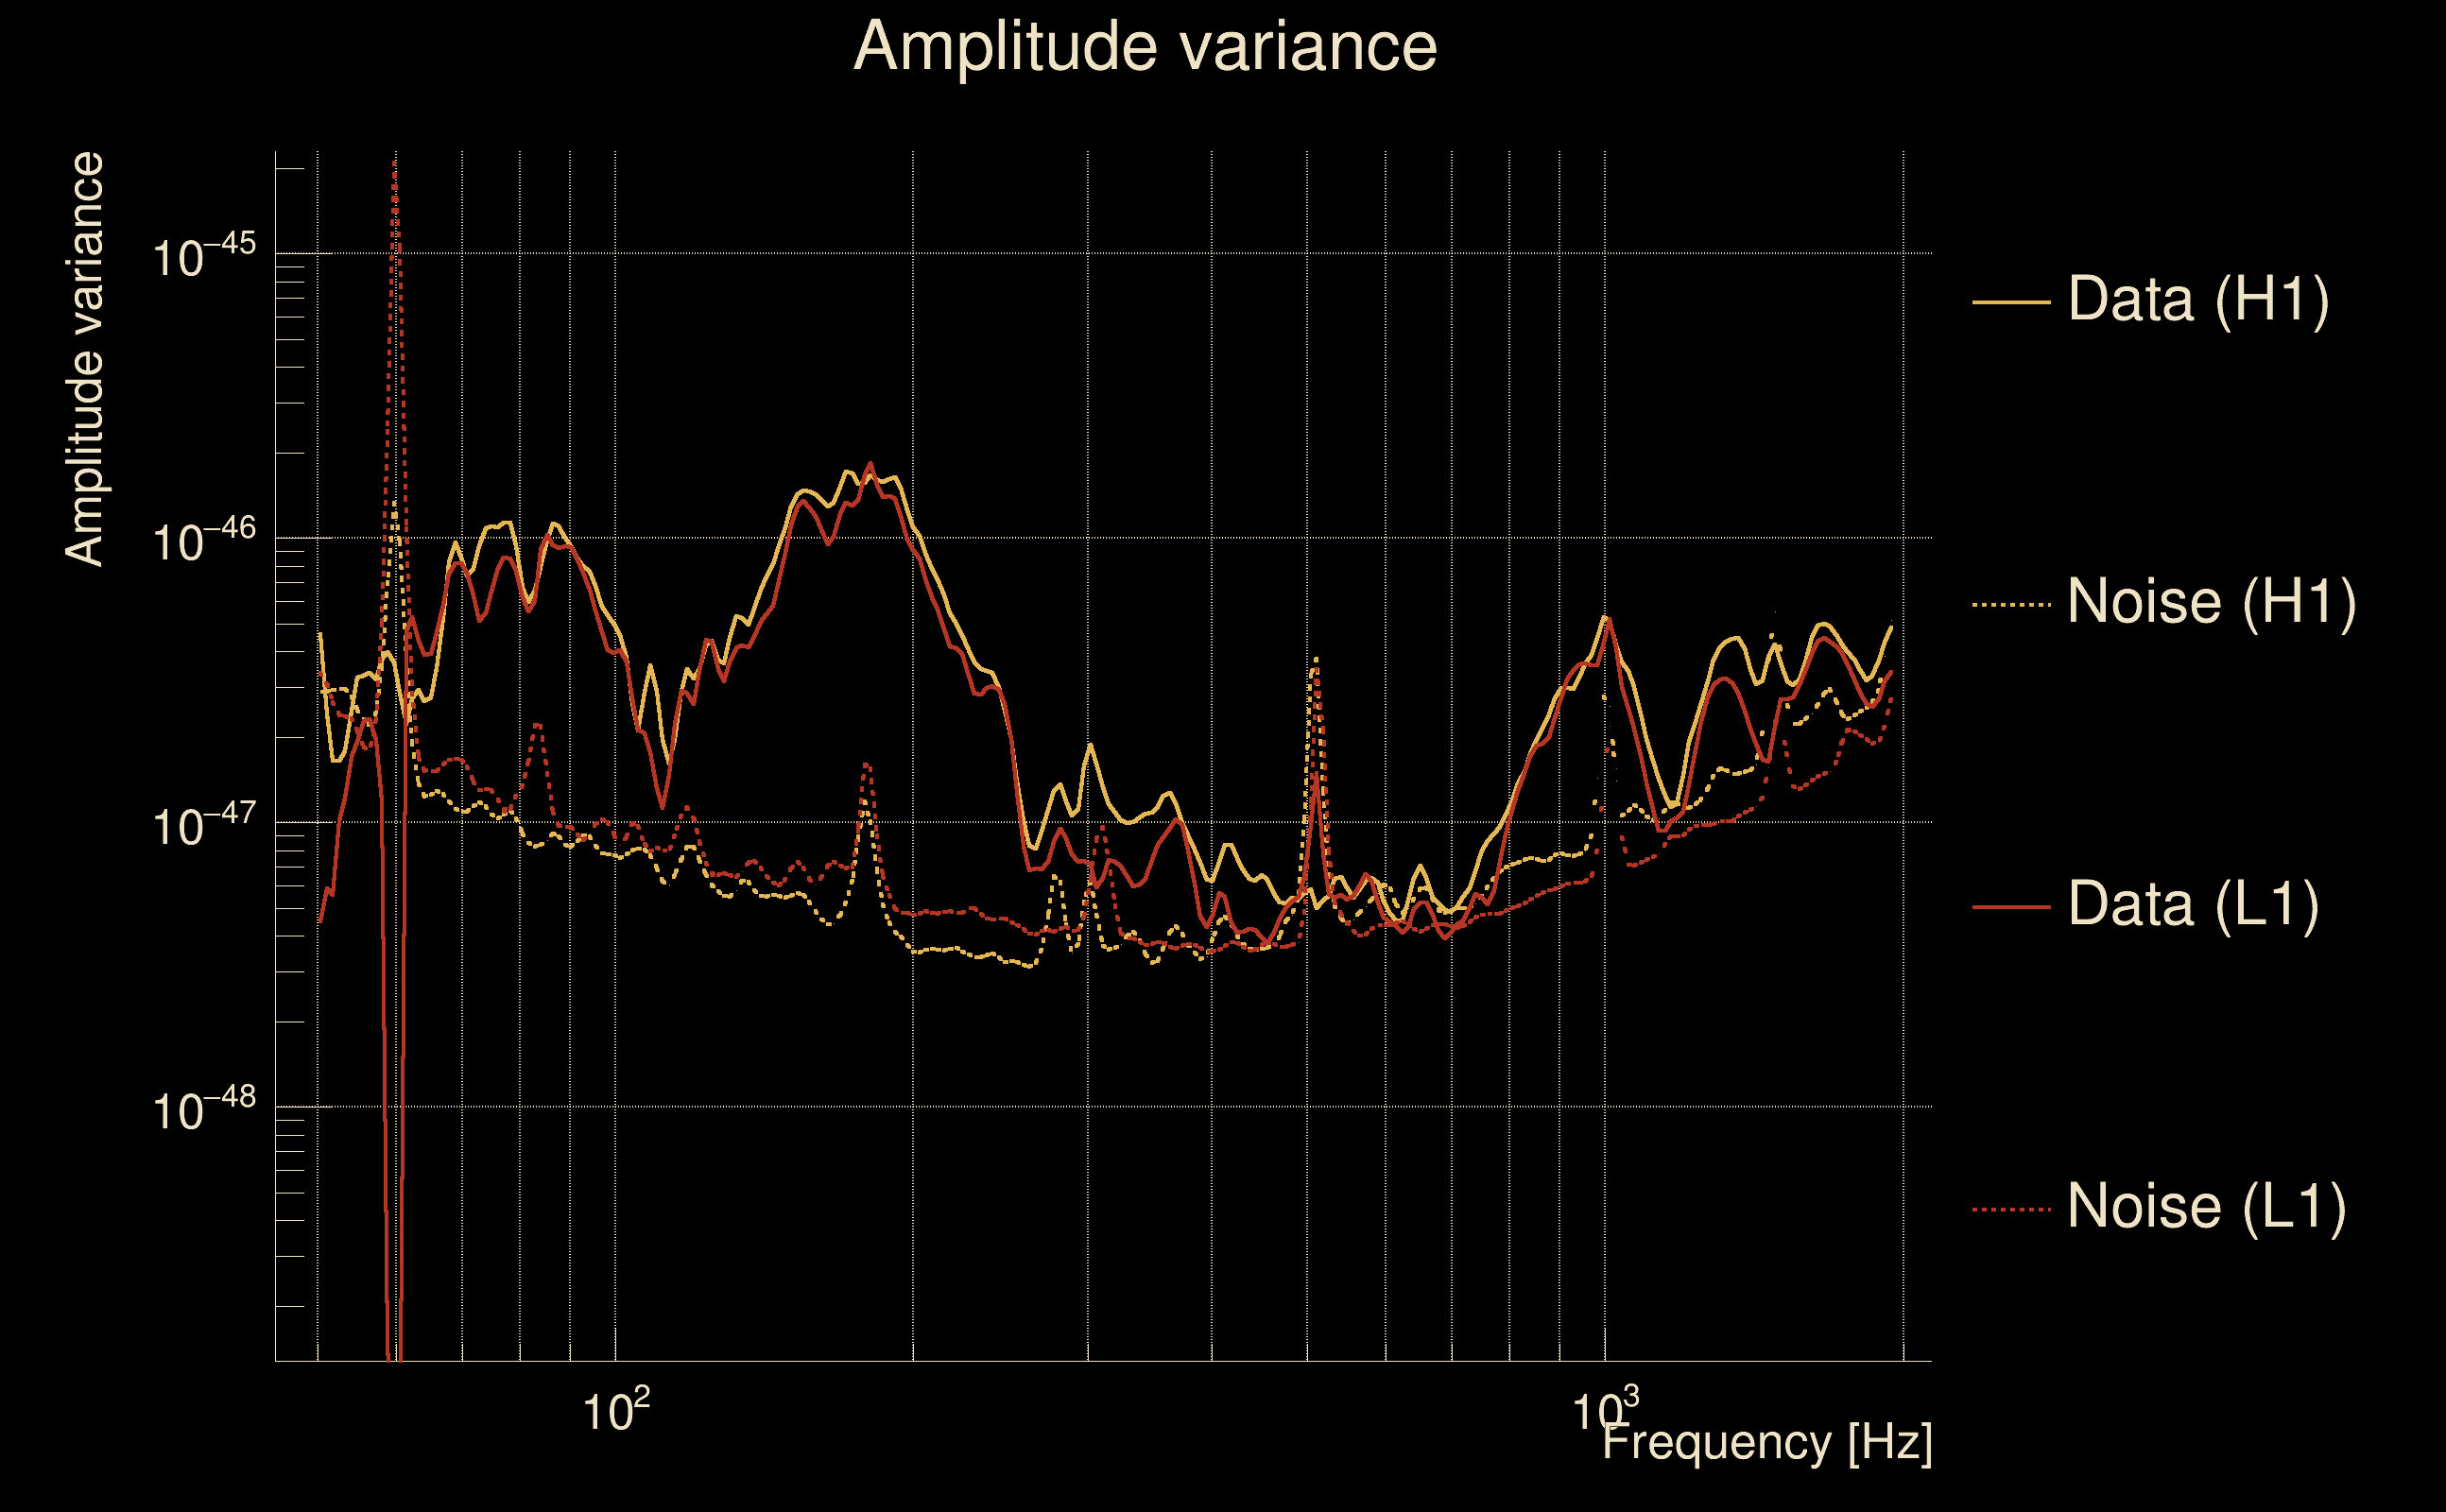
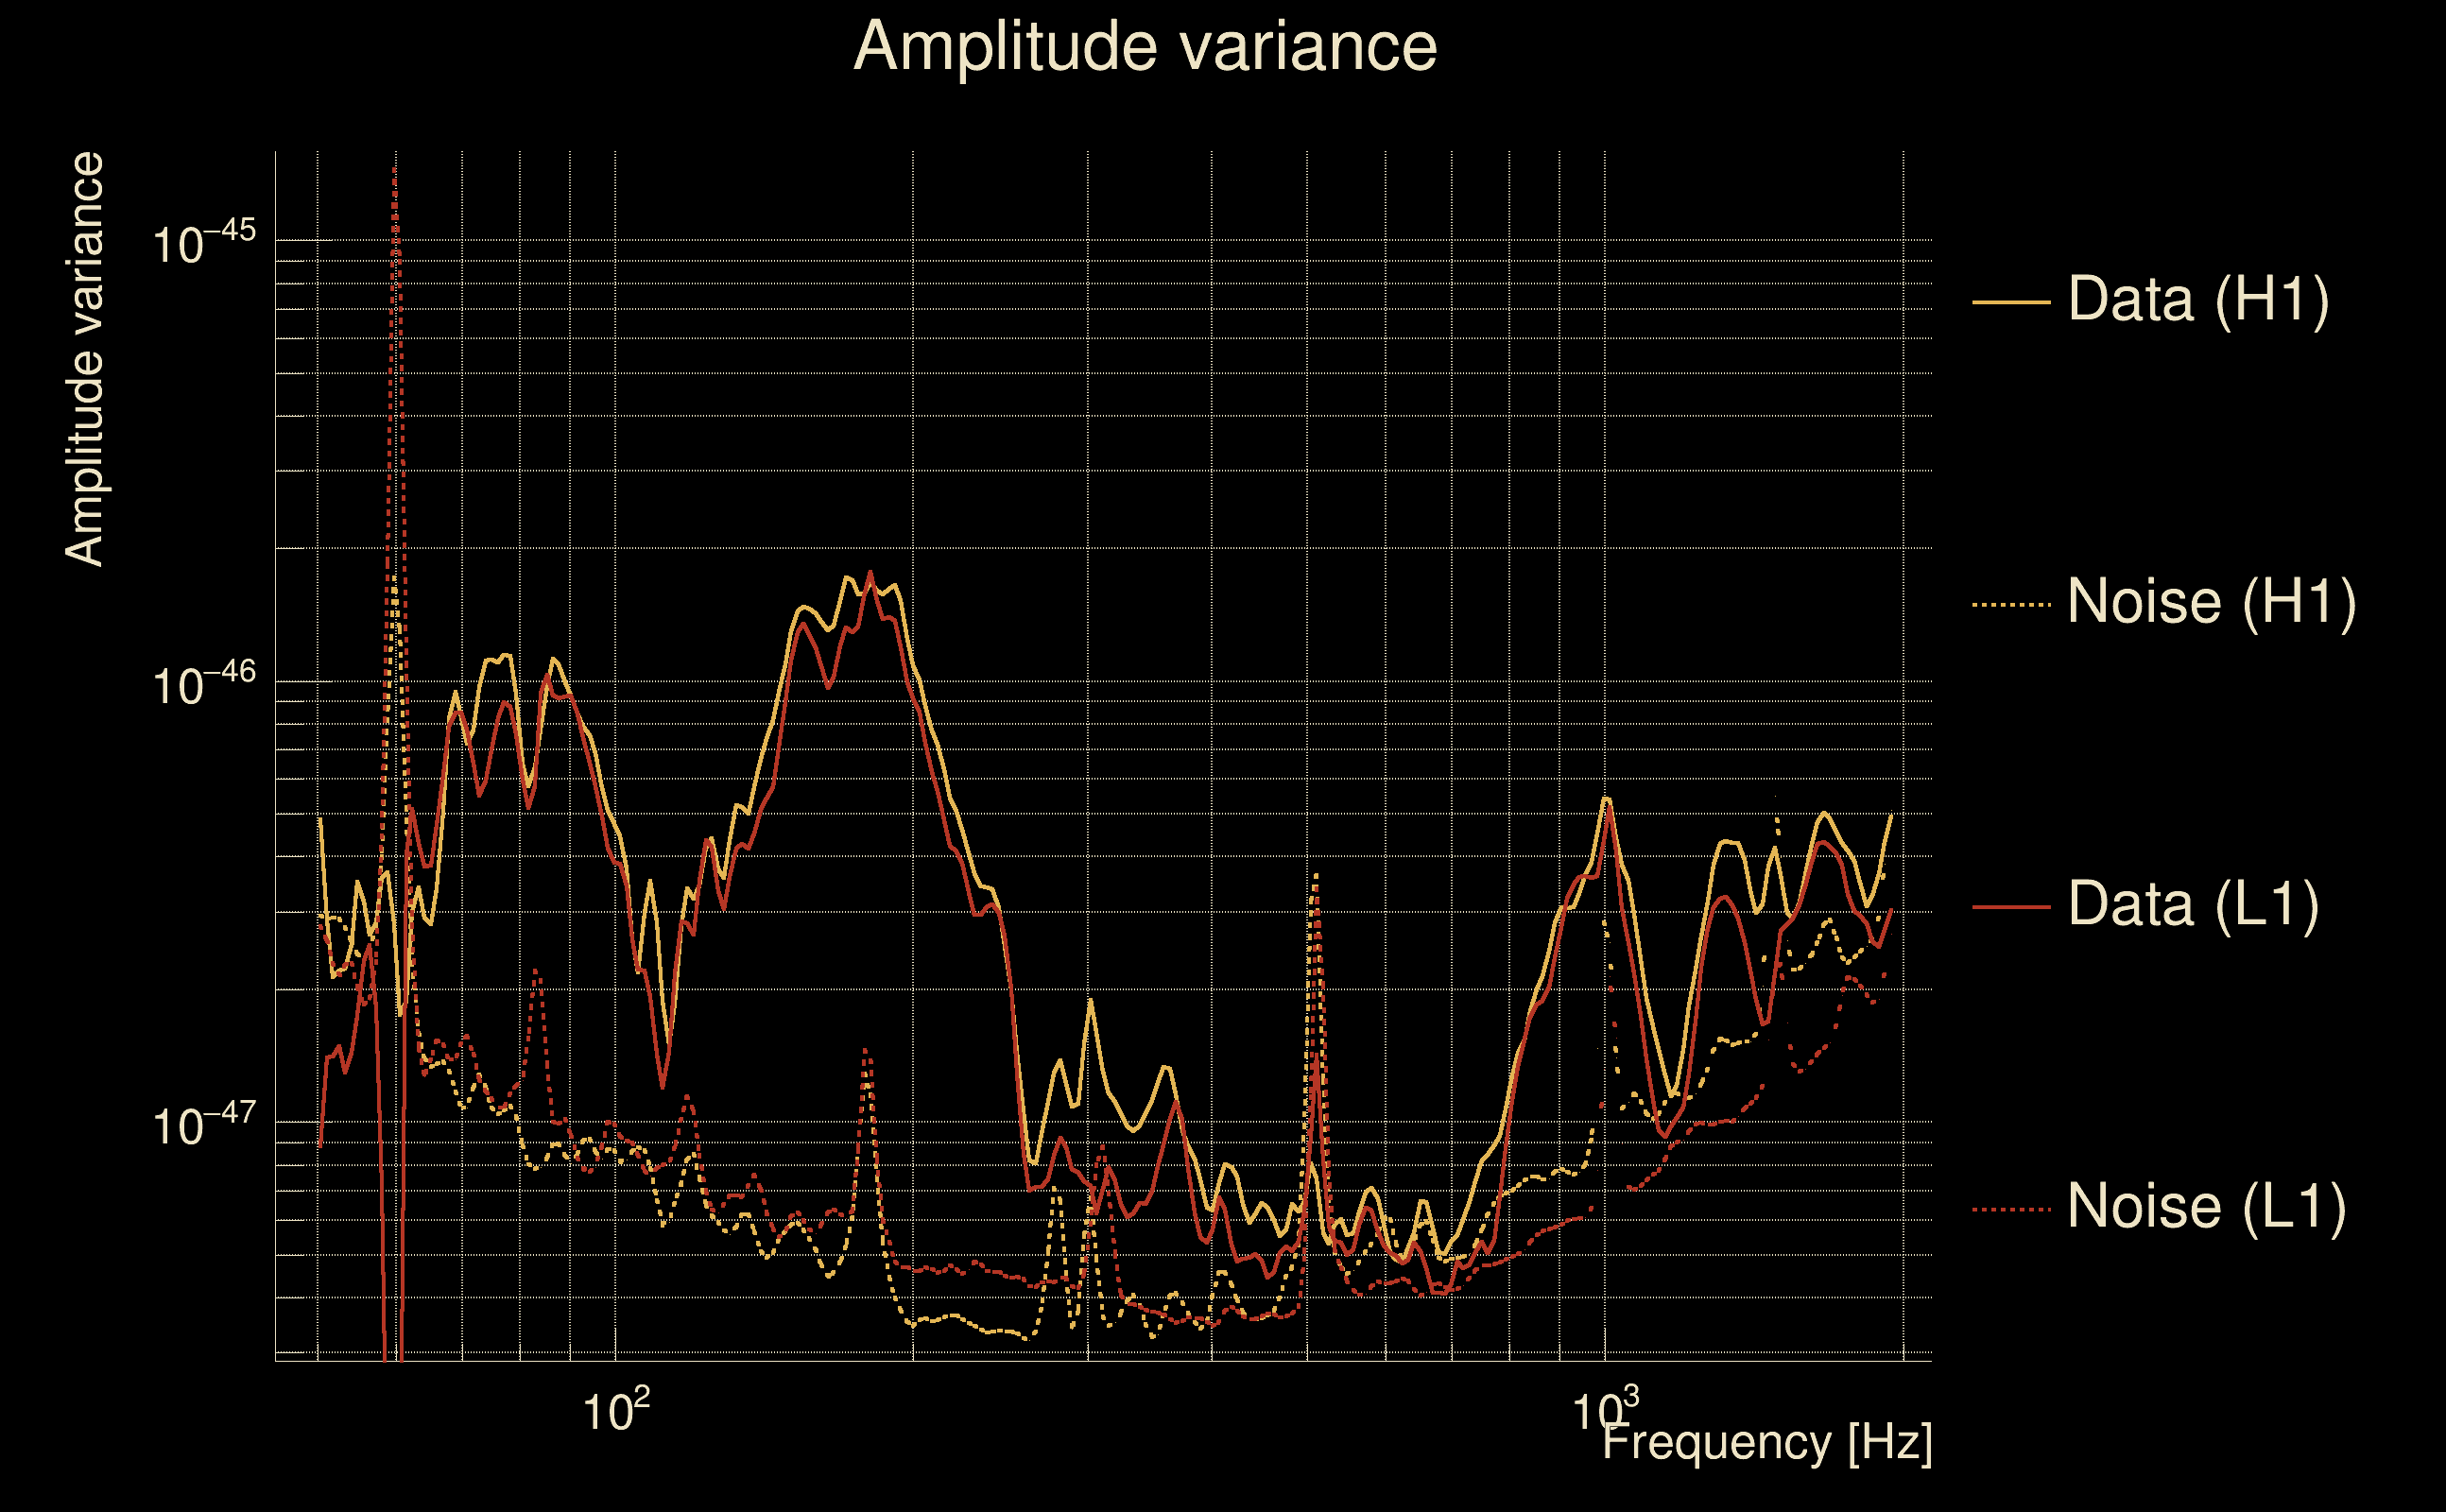
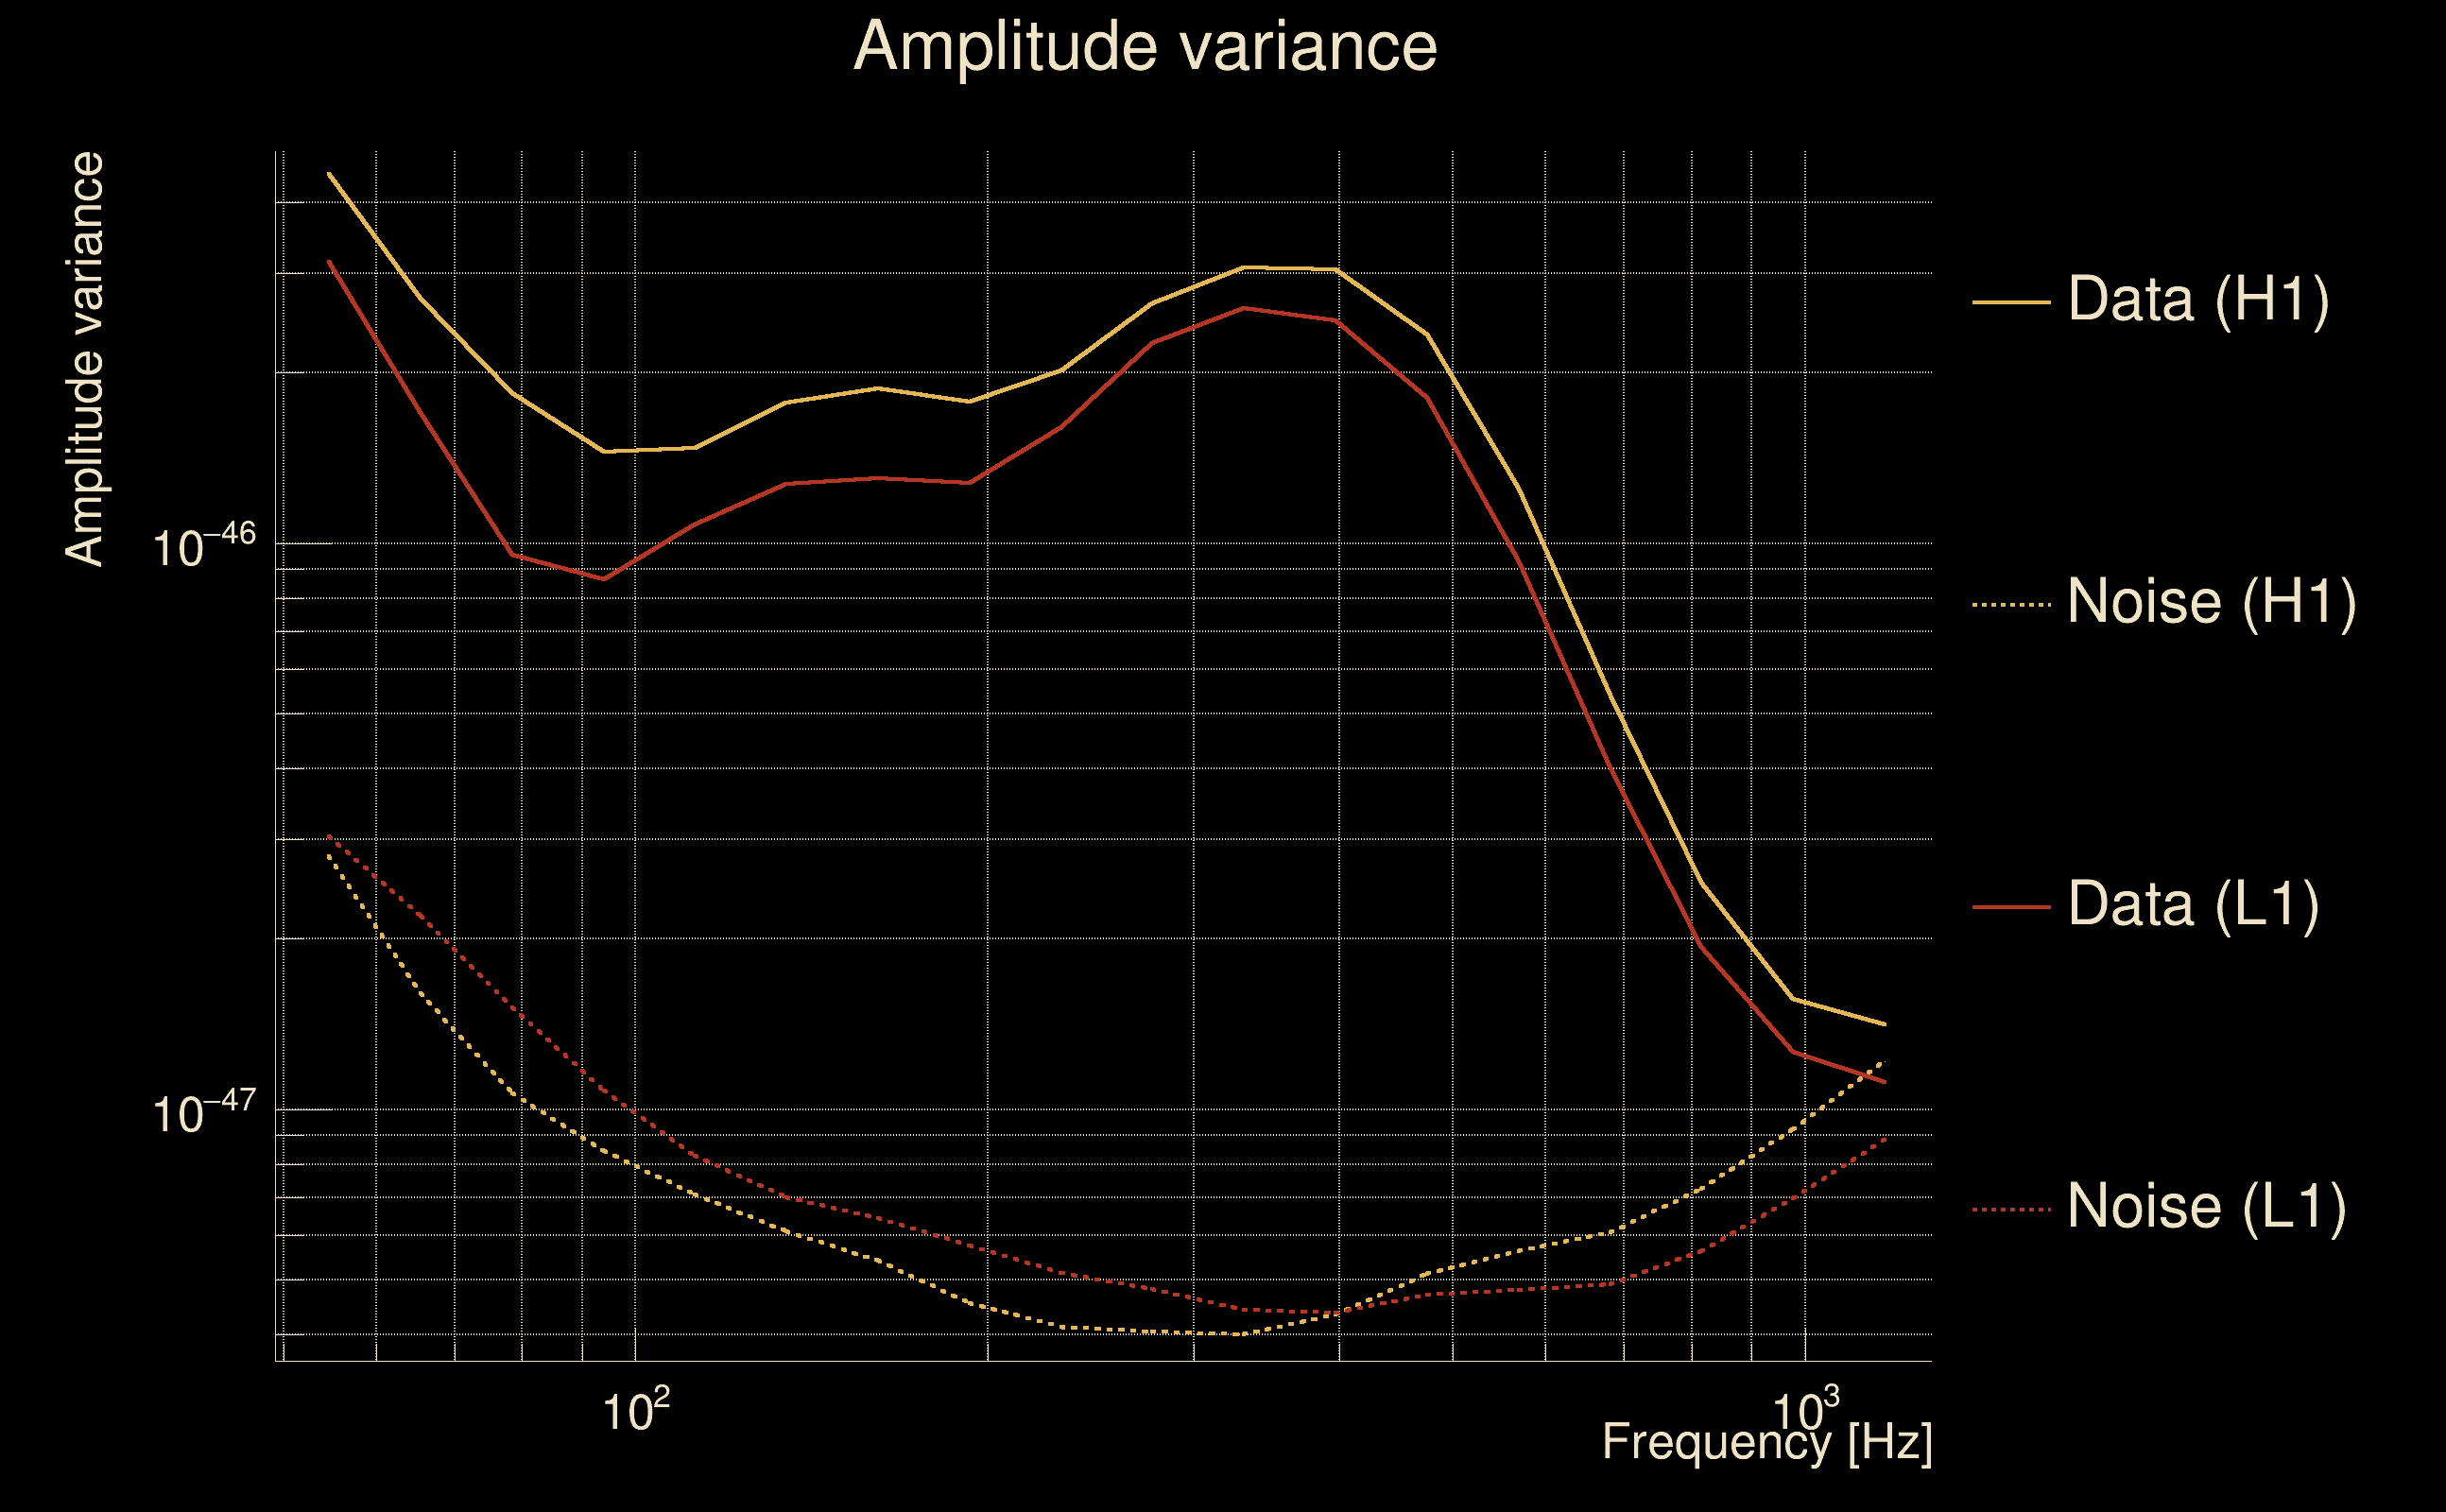
| Amplitude spectrograms: | normalization = 1e-22, power index = 2 |
| White noise SNR variance: | 0.523175 (after applying a correction factor = 1) |
| Amplitude ratio confidence level: | 3 sigma |
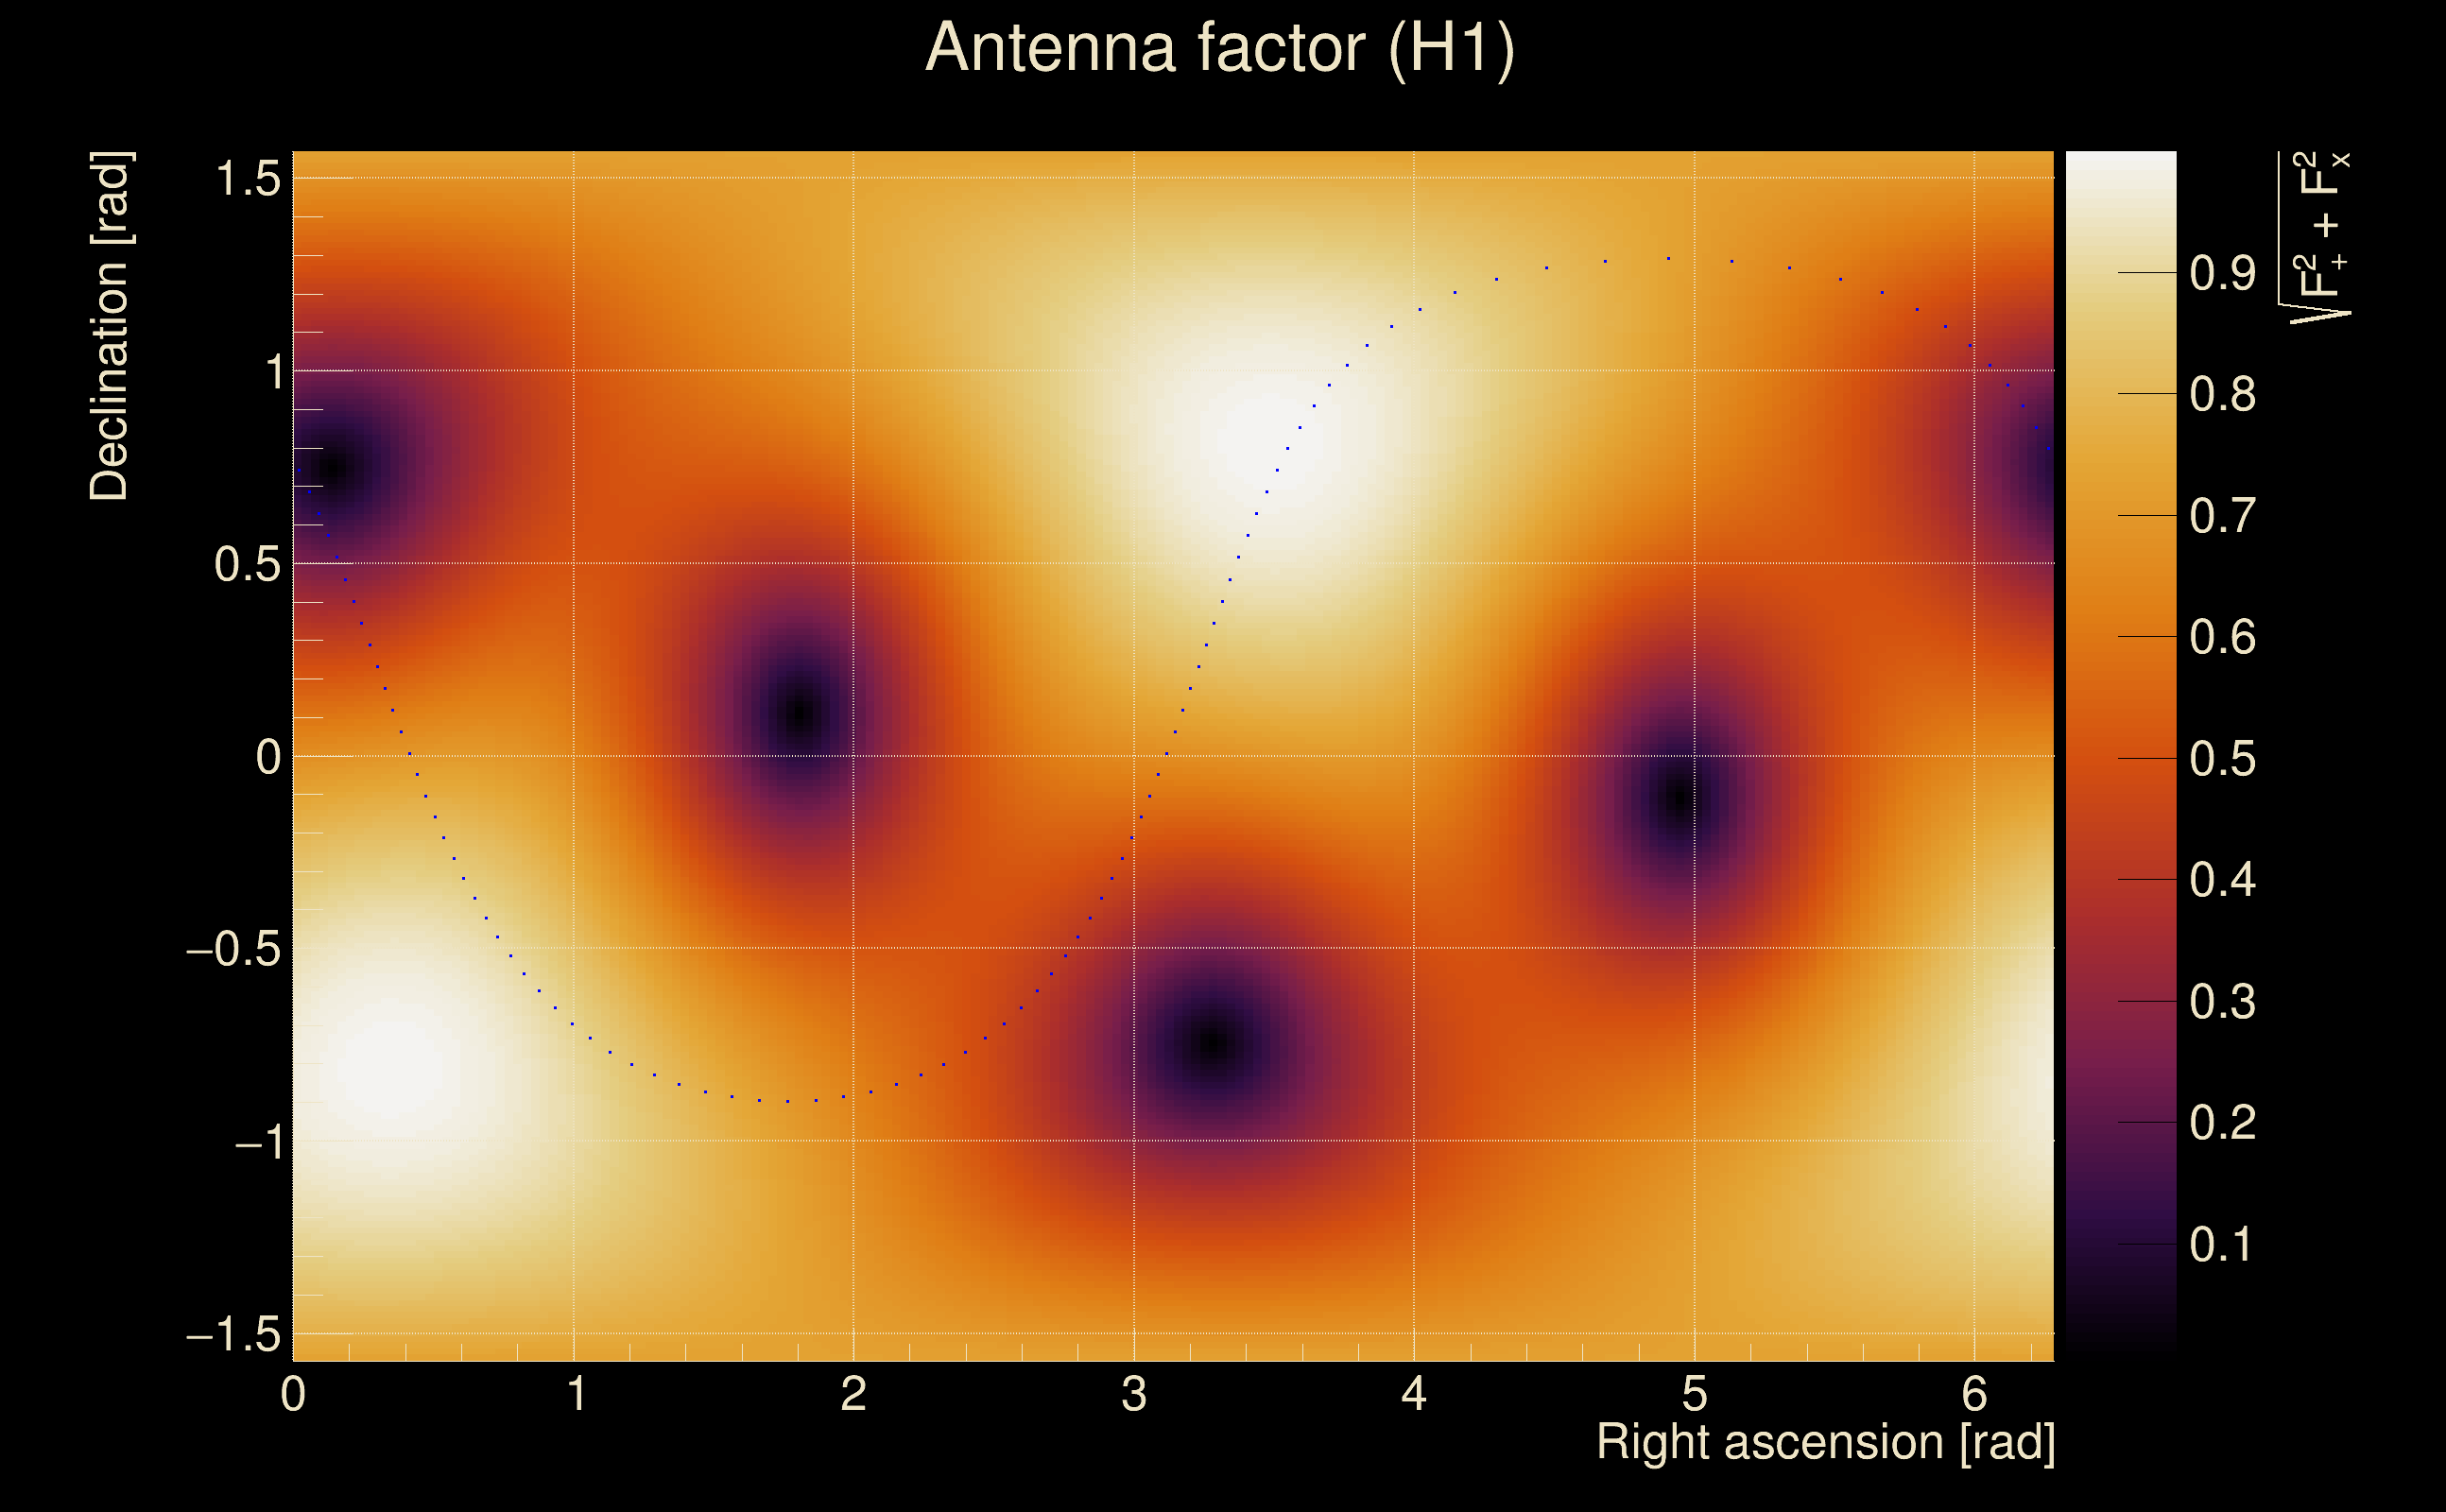
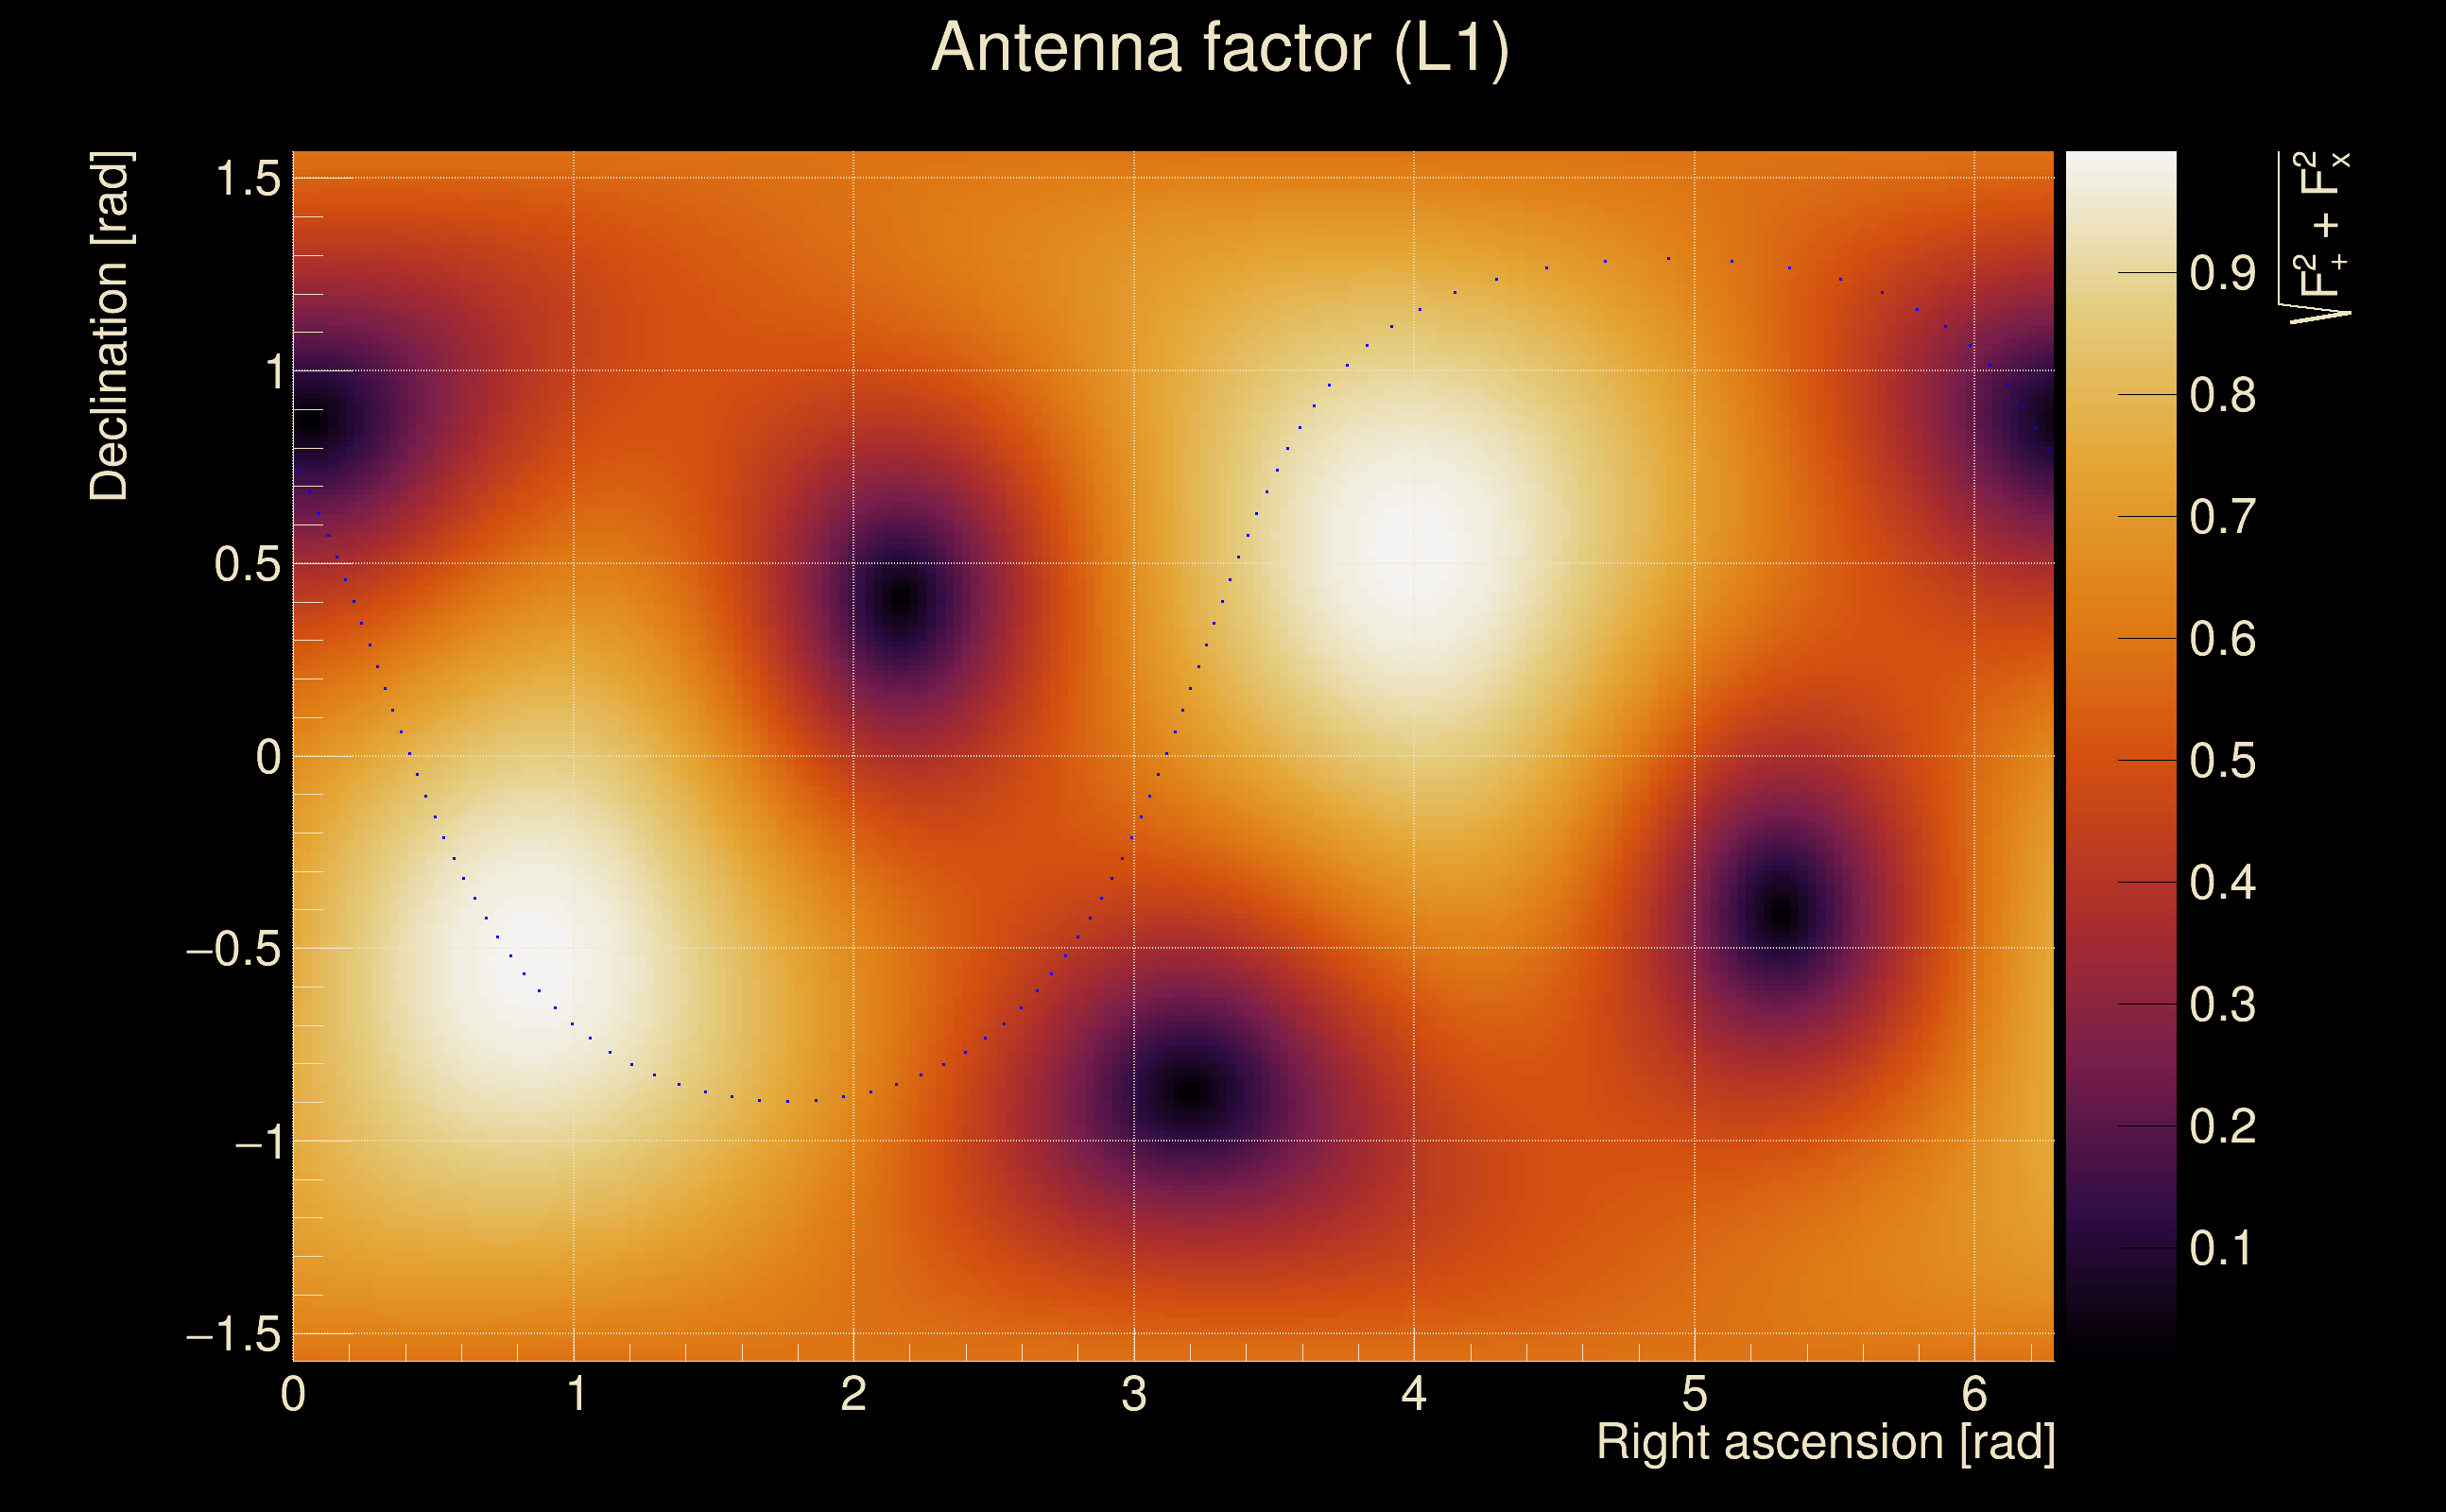
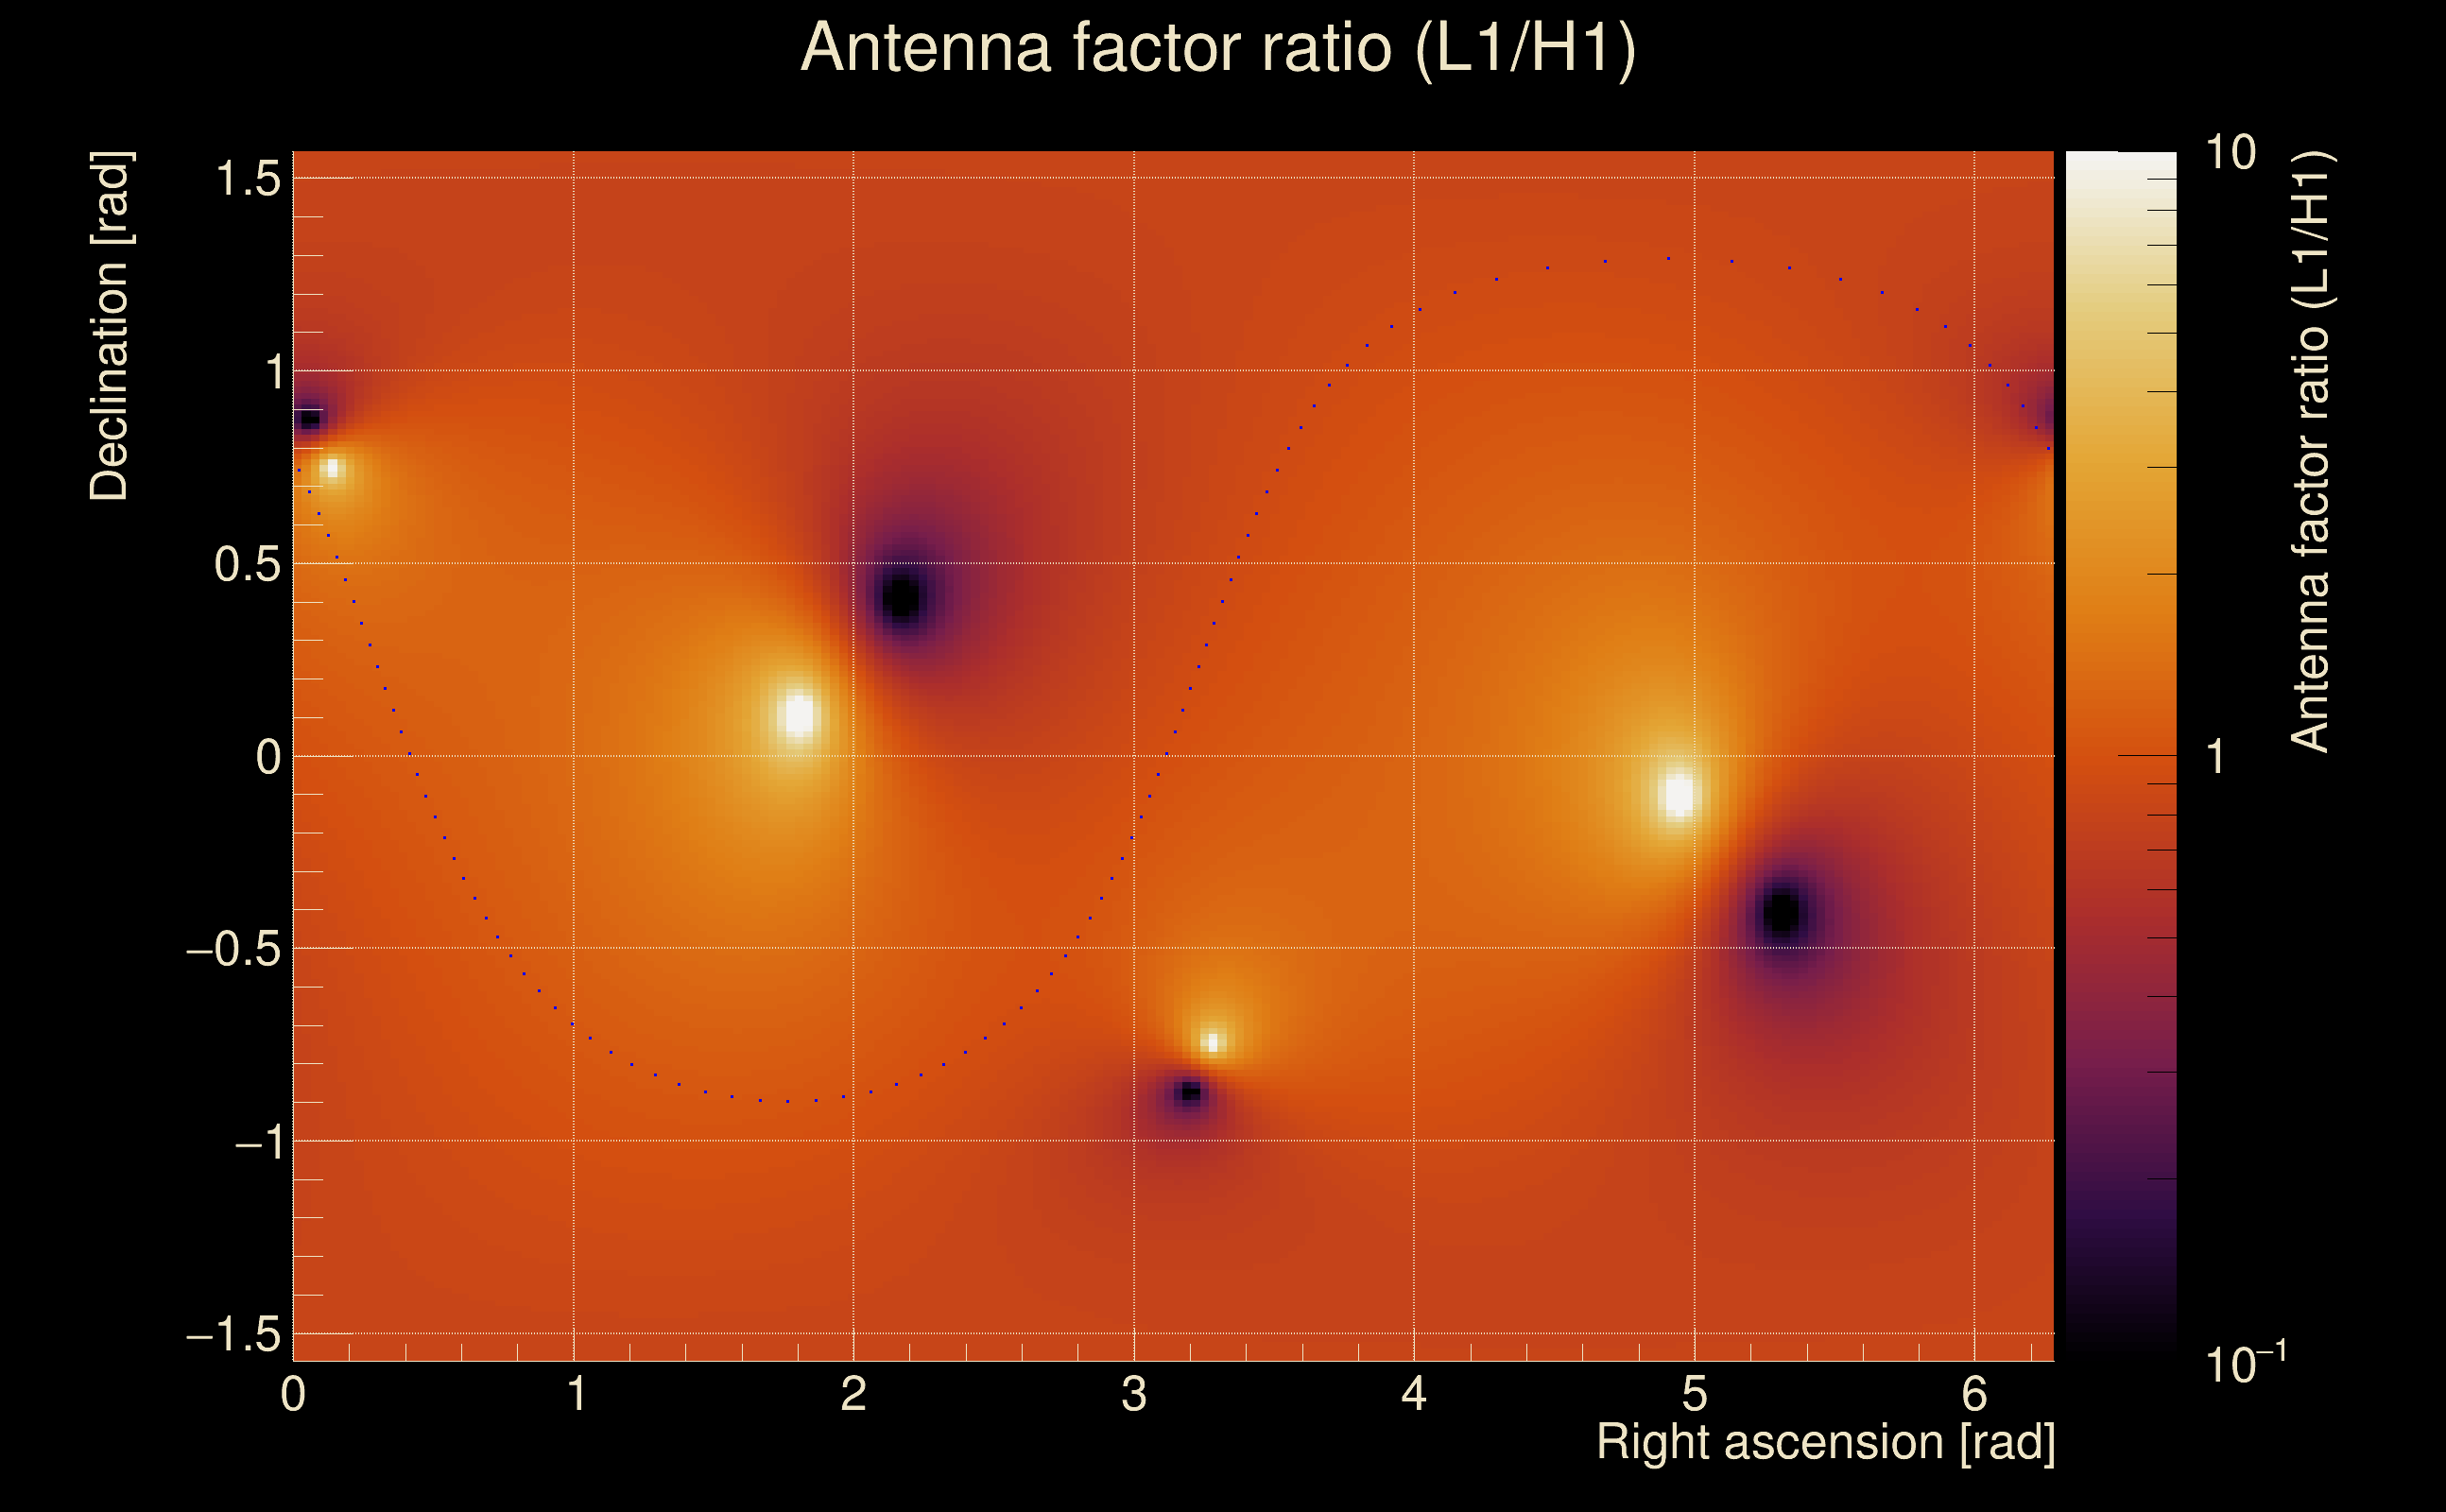
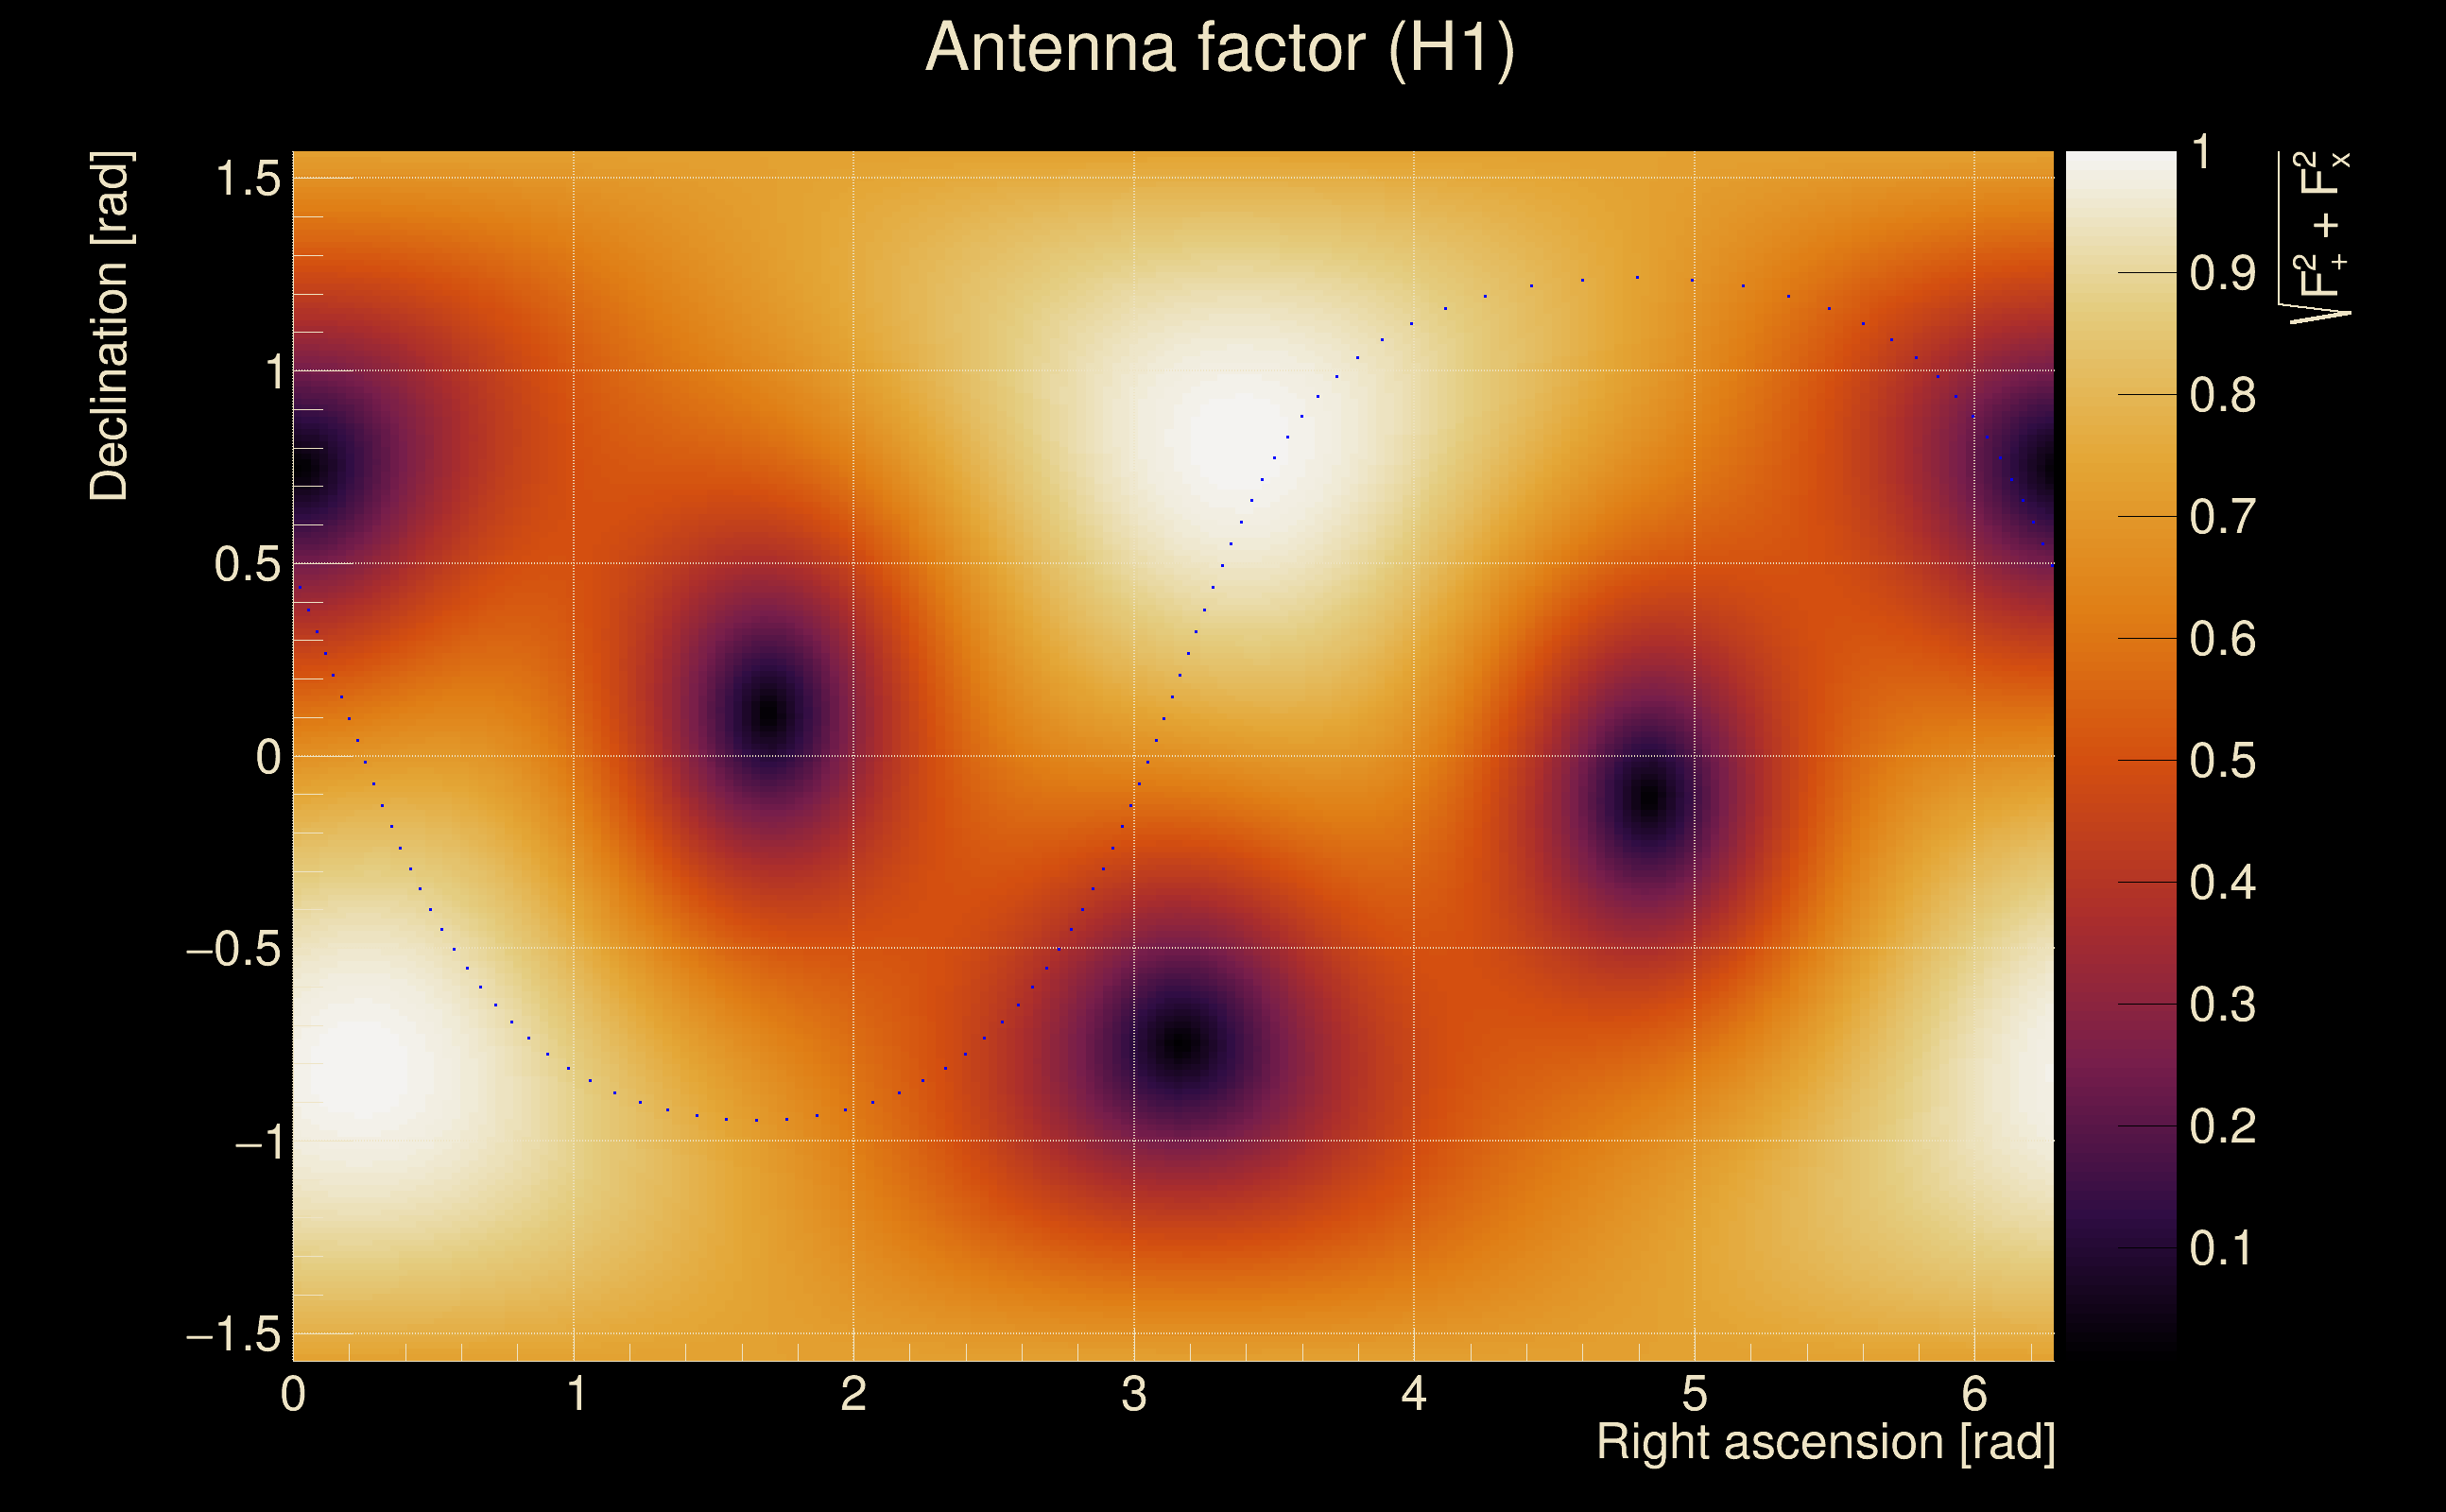
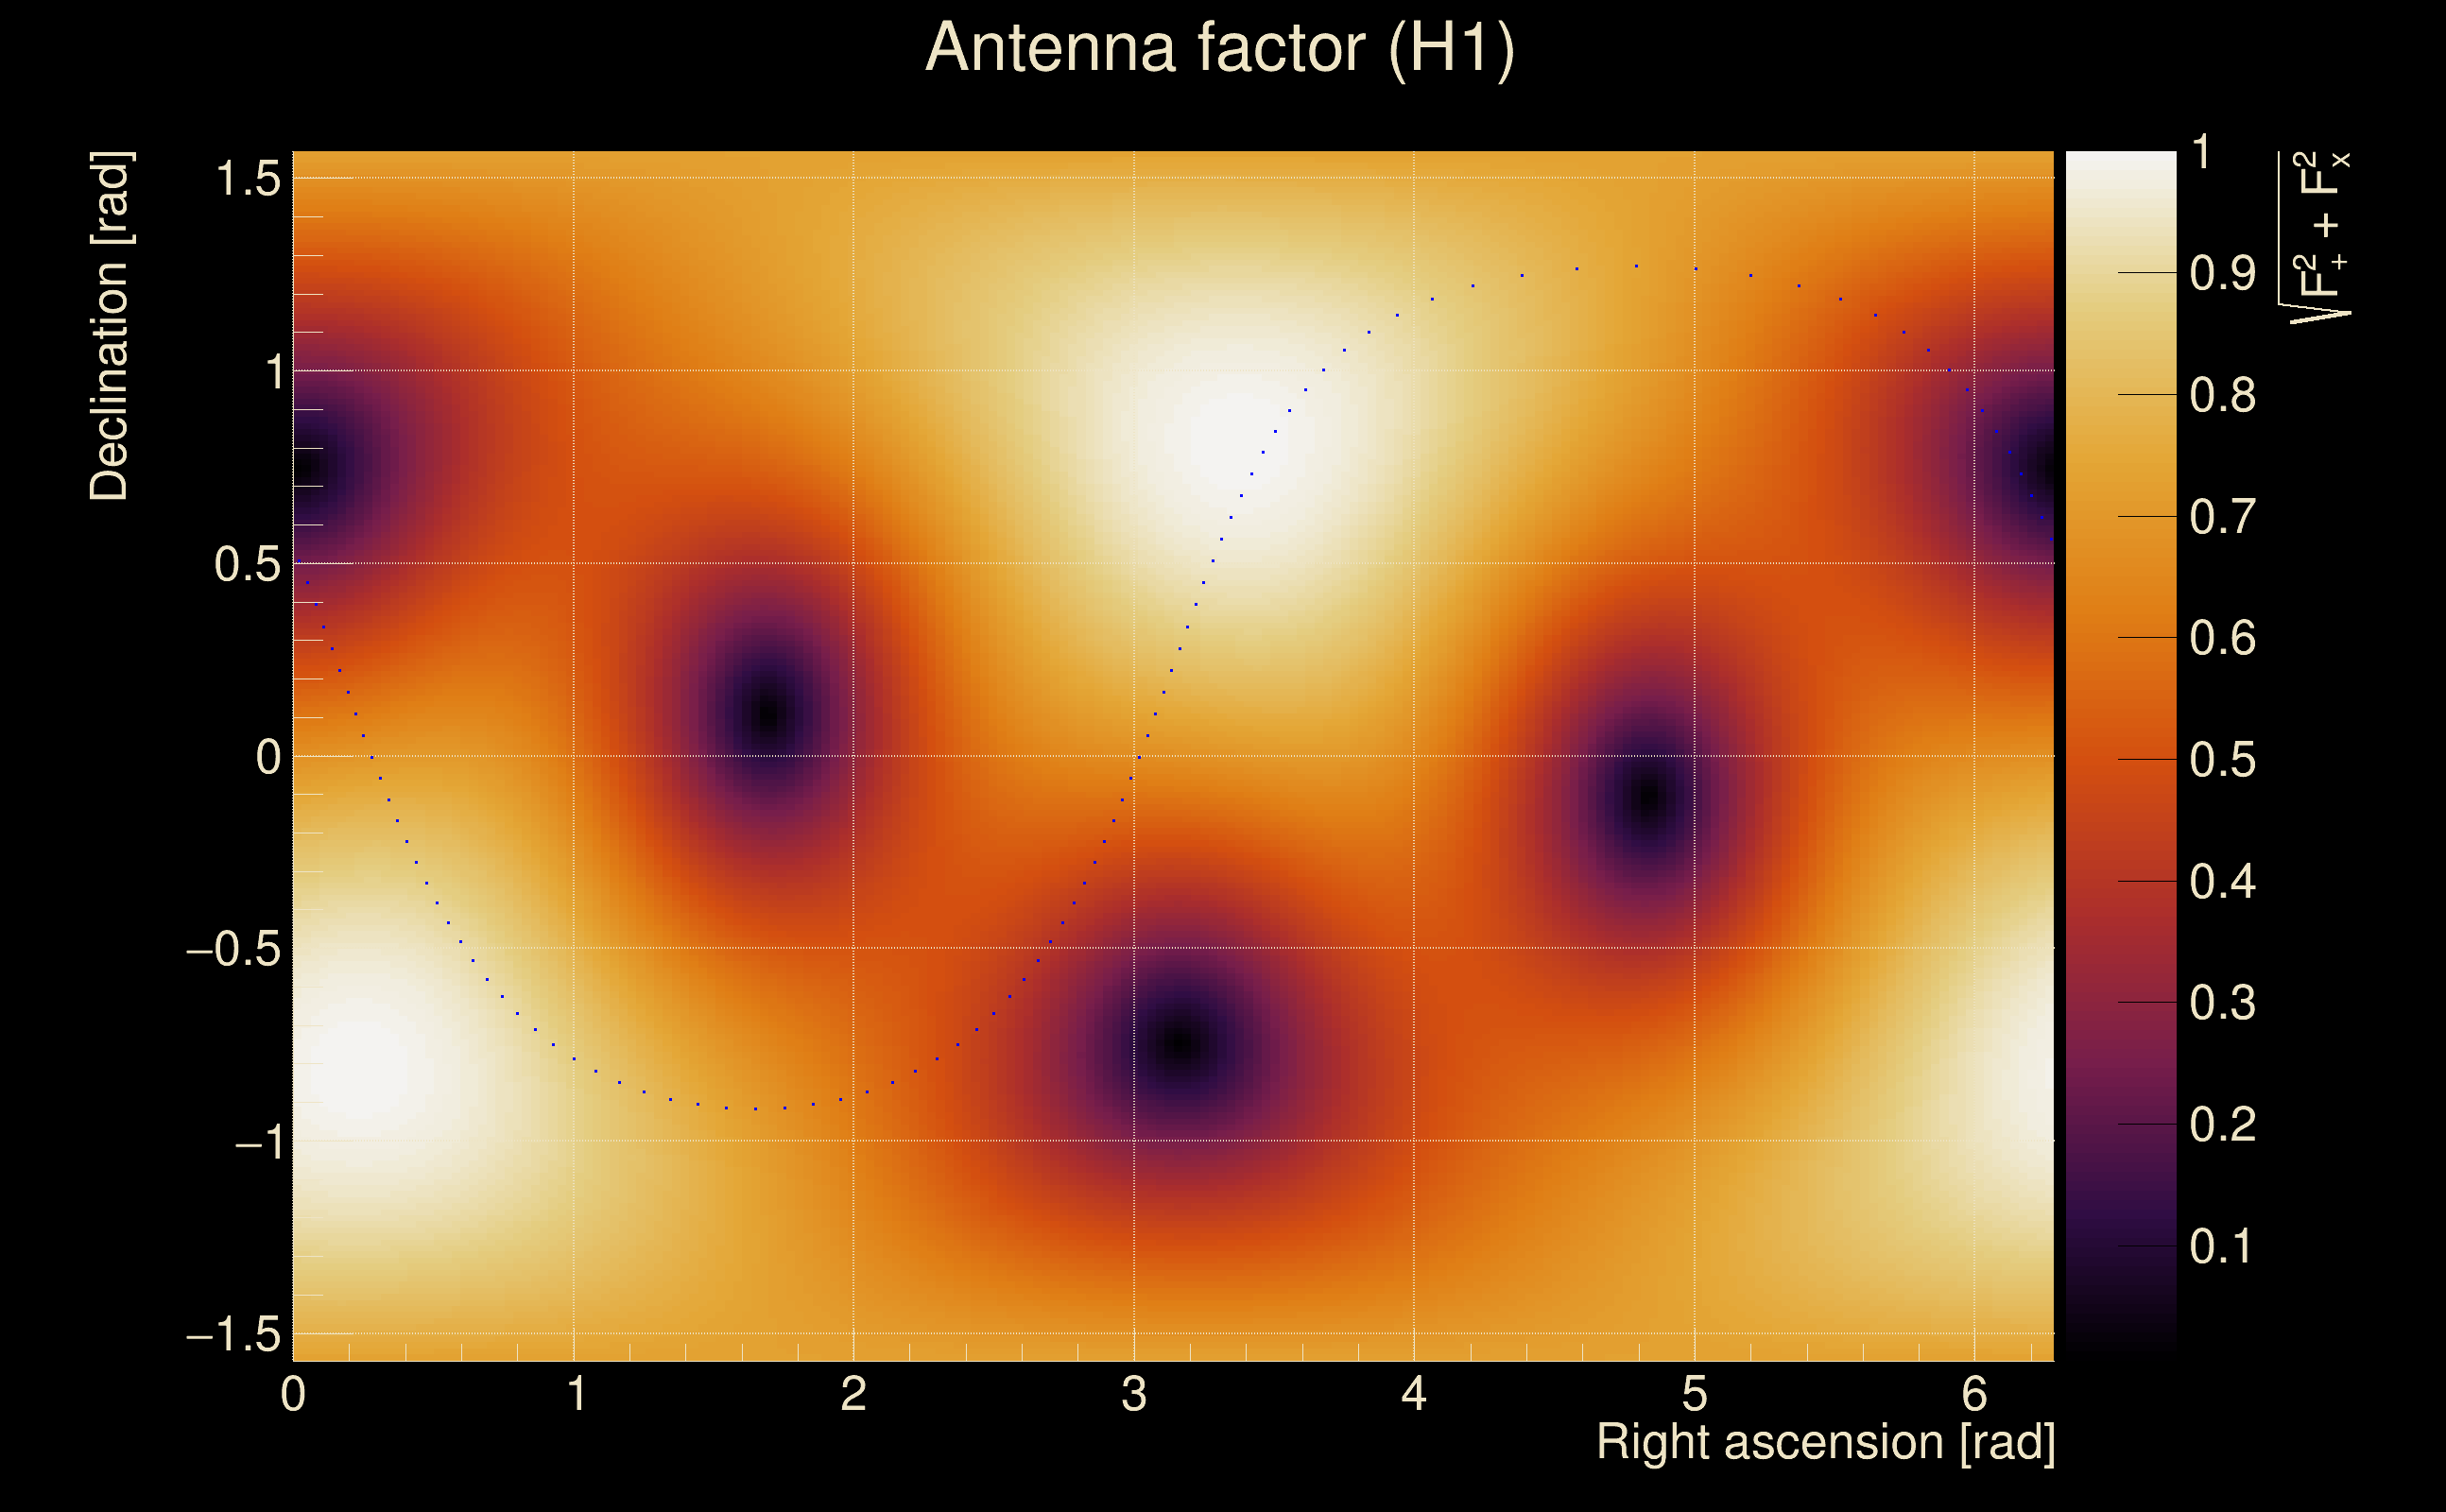
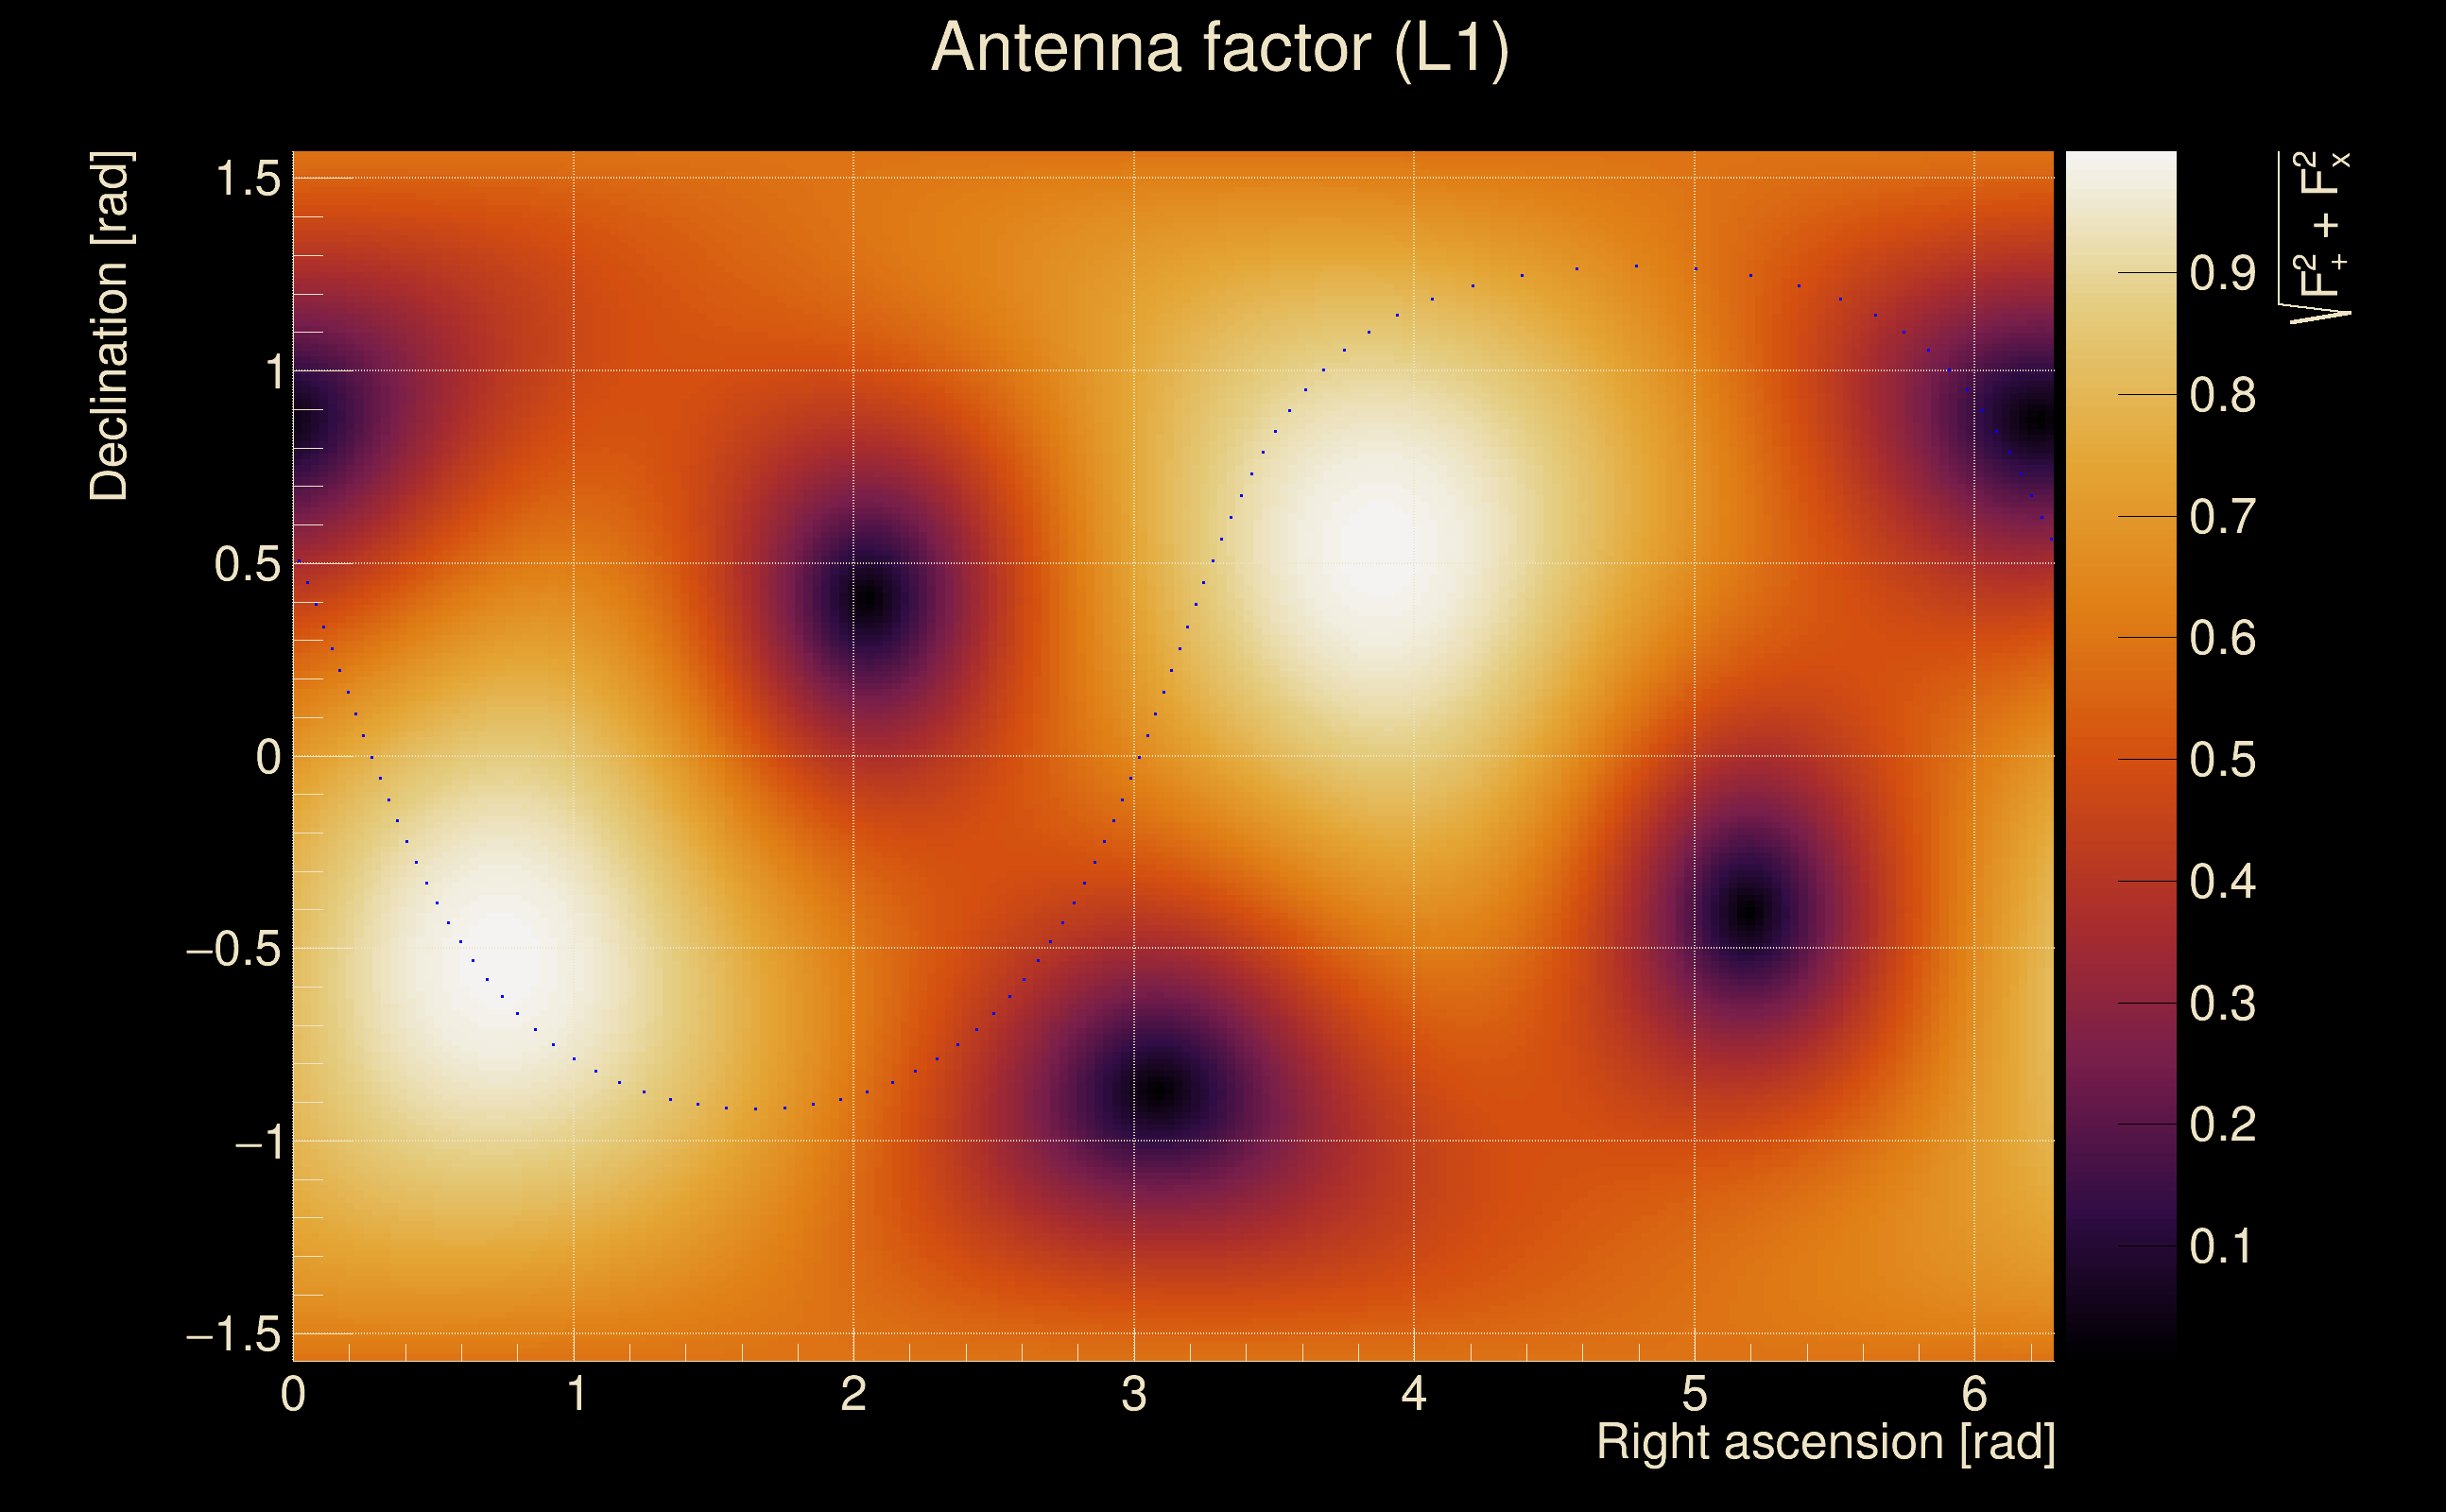
| Target sky positon: | Ra: 3.68109, Dec: 0.94792 [rad] |
| List of input Ox files: | TargIxfw_injpt3_file_list.txt (71 files) |
| Analysis result file: | TargIxfw_injpt3_results-1.root |
| Slice selected for the the fakeground: | slice index=8 (4.6 s), time lag = 0 s |
| Foreground | Fakeground | Background | ||
|---|---|---|---|---|
| Number of processed ox events | 12111 | 12111 | 2603865 | |
| Start Date (detector 0) | Mon May 15 14:13:25 2023 UTC | Mon May 15 14:13:25 2023 UTC | Mon May 15 14:13:25 2023 UTC | |
| End Date (detector 0) | Thu May 18 15:54:40 2023 UTC | Thu May 18 15:54:40 2023 UTC | Thu May 18 15:54:40 2023 UTC | |
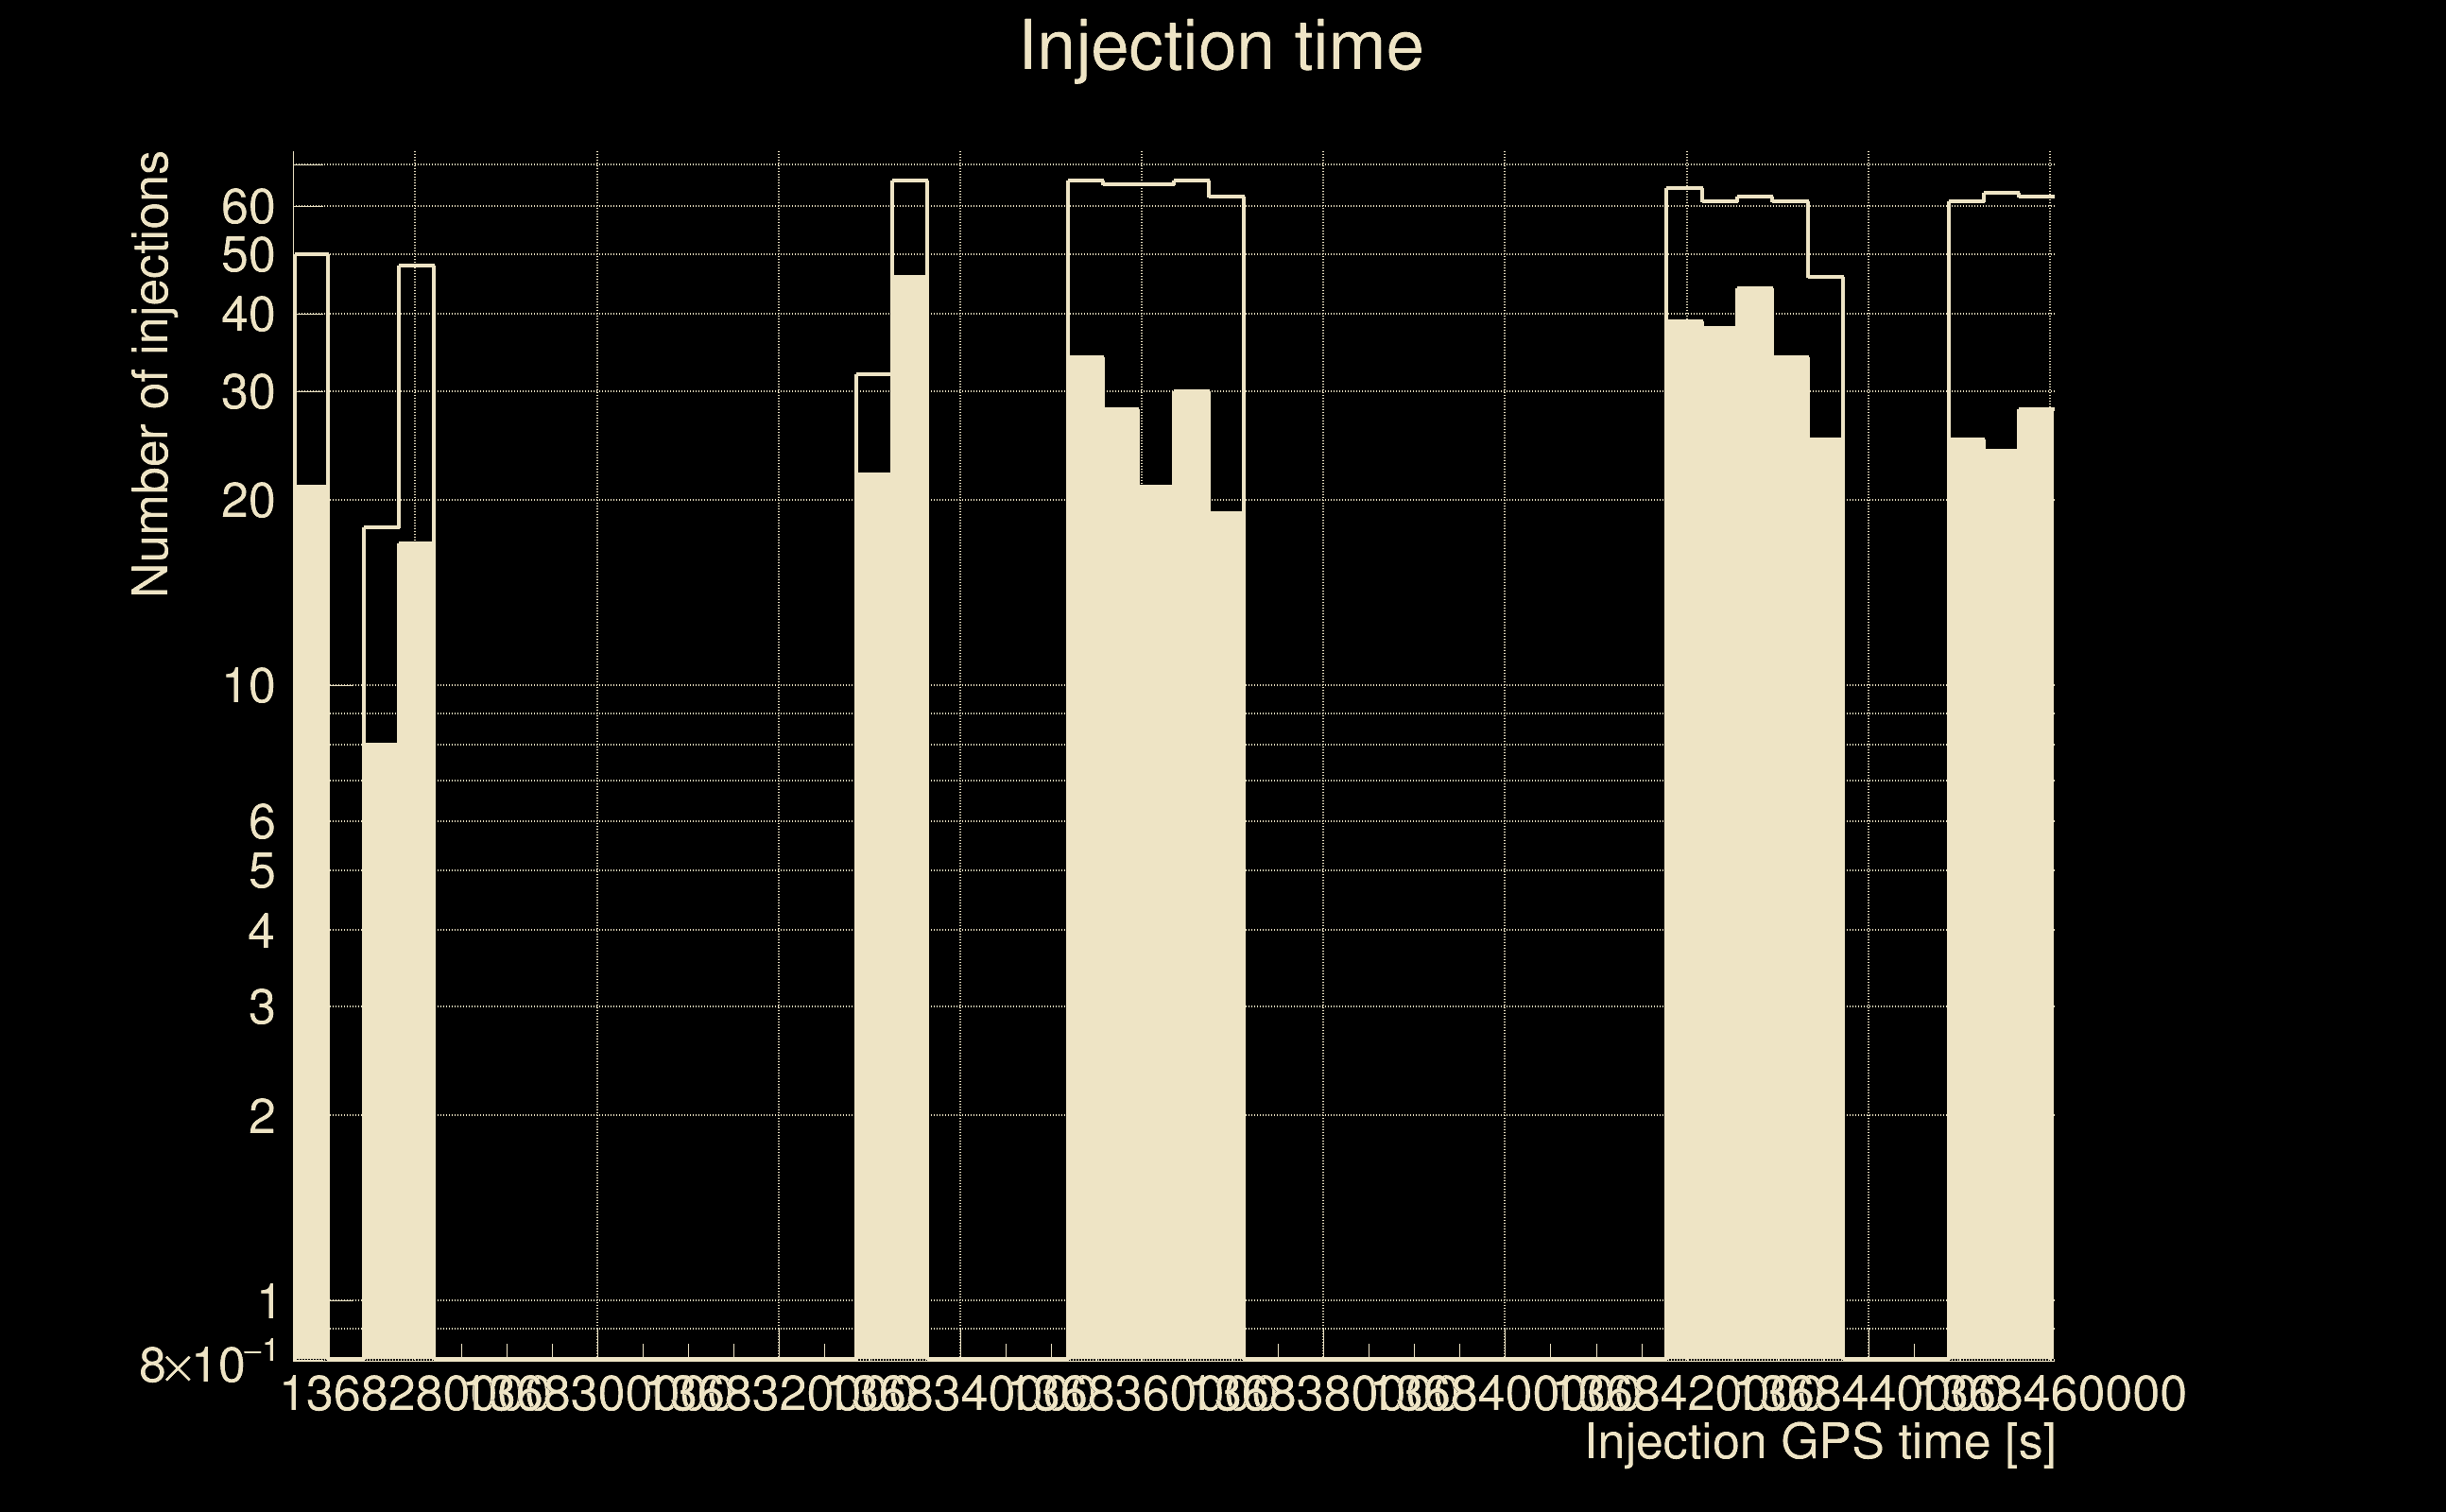
| Start GPS (detector 0) | 1368195223 | 1368195223 | 1368195223 | |
| End GPS (detector 0) | 1368460498 | 1368460498 | 1368460498 | |
| Used livetime (detector 0) | 60875 s | 60875 s | 60875 s | |
| Start Date (detector 1) | Mon May 15 14:13:25 2023 UTC | Mon May 15 14:13:25 2023 UTC | Mon May 15 14:13:25 2023 UTC | |
| End Date (detector 1) | Thu May 18 15:54:40 2023 UTC | Thu May 18 15:54:40 2023 UTC | Thu May 18 15:54:40 2023 UTC | |
| Start GPS (detector 1) | 1368195223 | 1368195223 | 1368195223 | |
| End GPS (detector 1) | 1368460498 | 1368460498 | 1368460498 | |
| Used livetime (detector 1) | 60875 s | 60875 s | 60875 s | |
| Cumulative livetime | 121110 s | 121110 s | 26038650 s | |
| 0 years, 1 days, 9 hours, 38 min, 30 s | 0 years, 1 days, 9 hours, 38 min, 30 s | 0 years, 301 days, 8 hours, 57 min, 30 s |
|
|
| Event time t(H1): | GPS = 1368423364 (Thu May 18 05:35:46 2023 ) → GPS = 1368423374 (Thu May 18 05:35:56 2023 ) |
| Event time t(L1): | GPS = 1368423364 (Thu May 18 05:35:56 2023 ) → GPS = 1368423374 (Thu May 18 05:35:56 2023 ) |
| Omicron analysis time window (H1): | GPS = 1368423361 → GPS = 1368423377 |
| Omicron analysis time window (L1): | GPS = 1368423361 → GPS = 1368423377 |
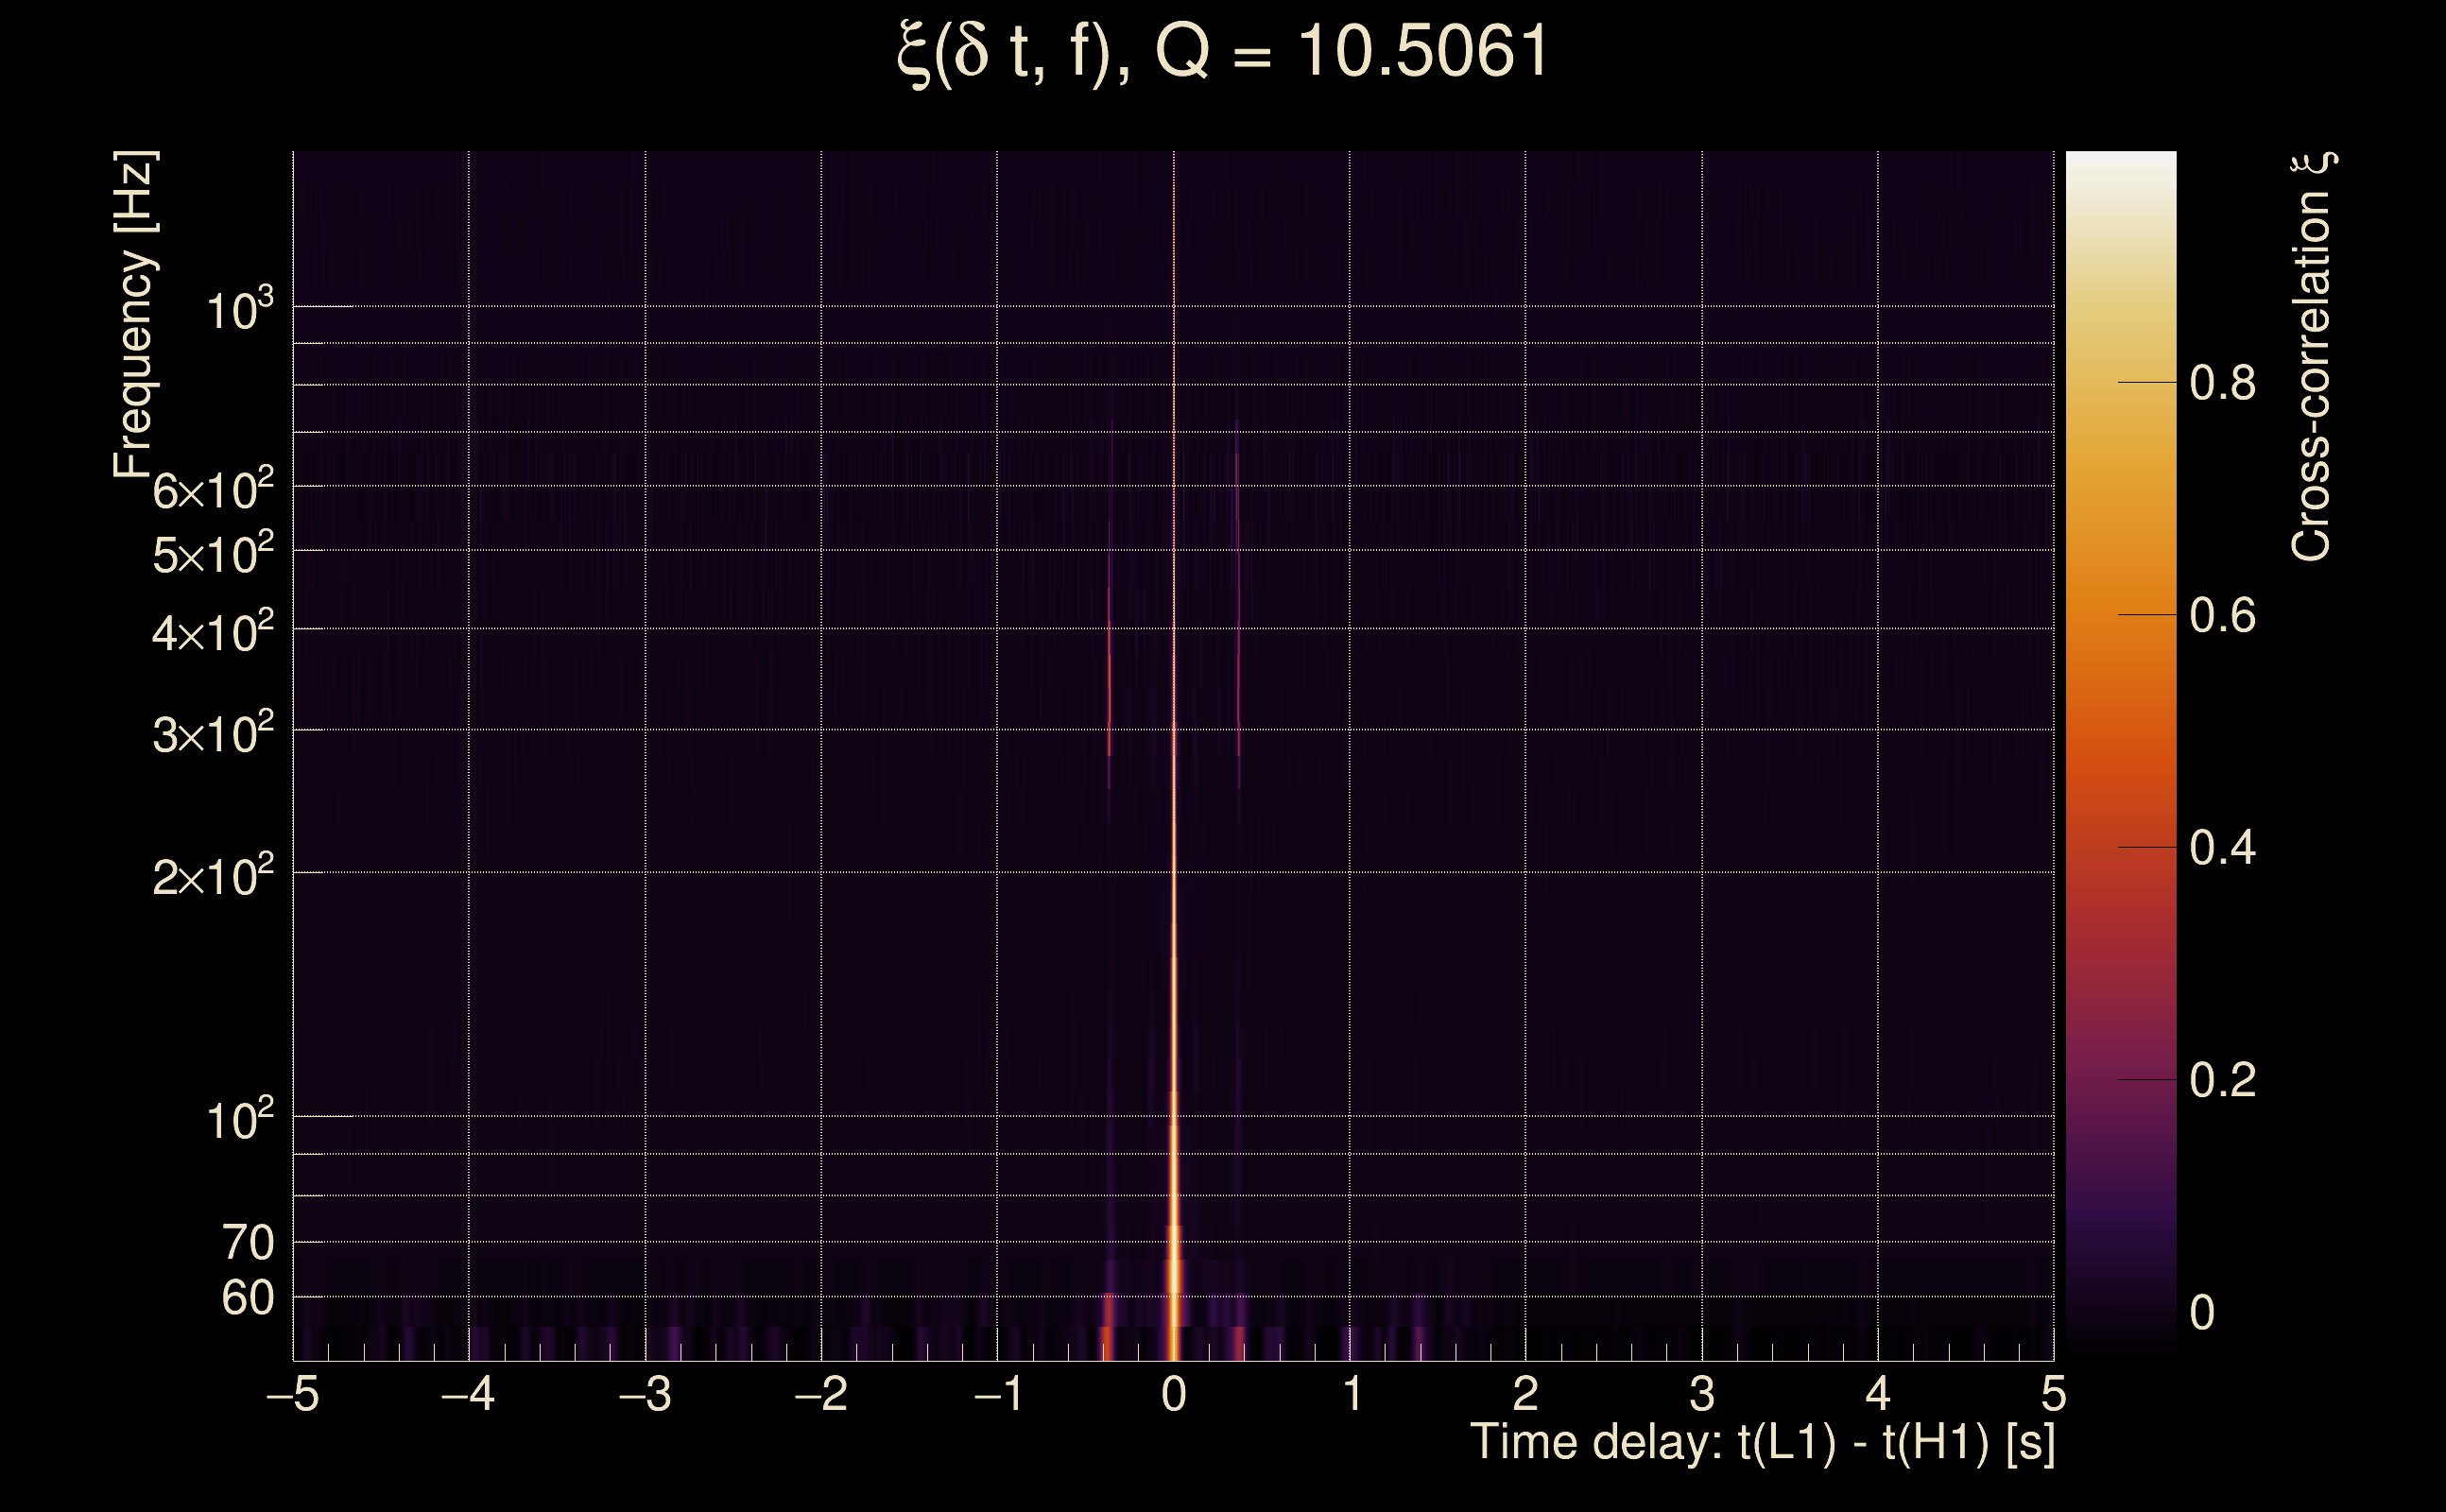
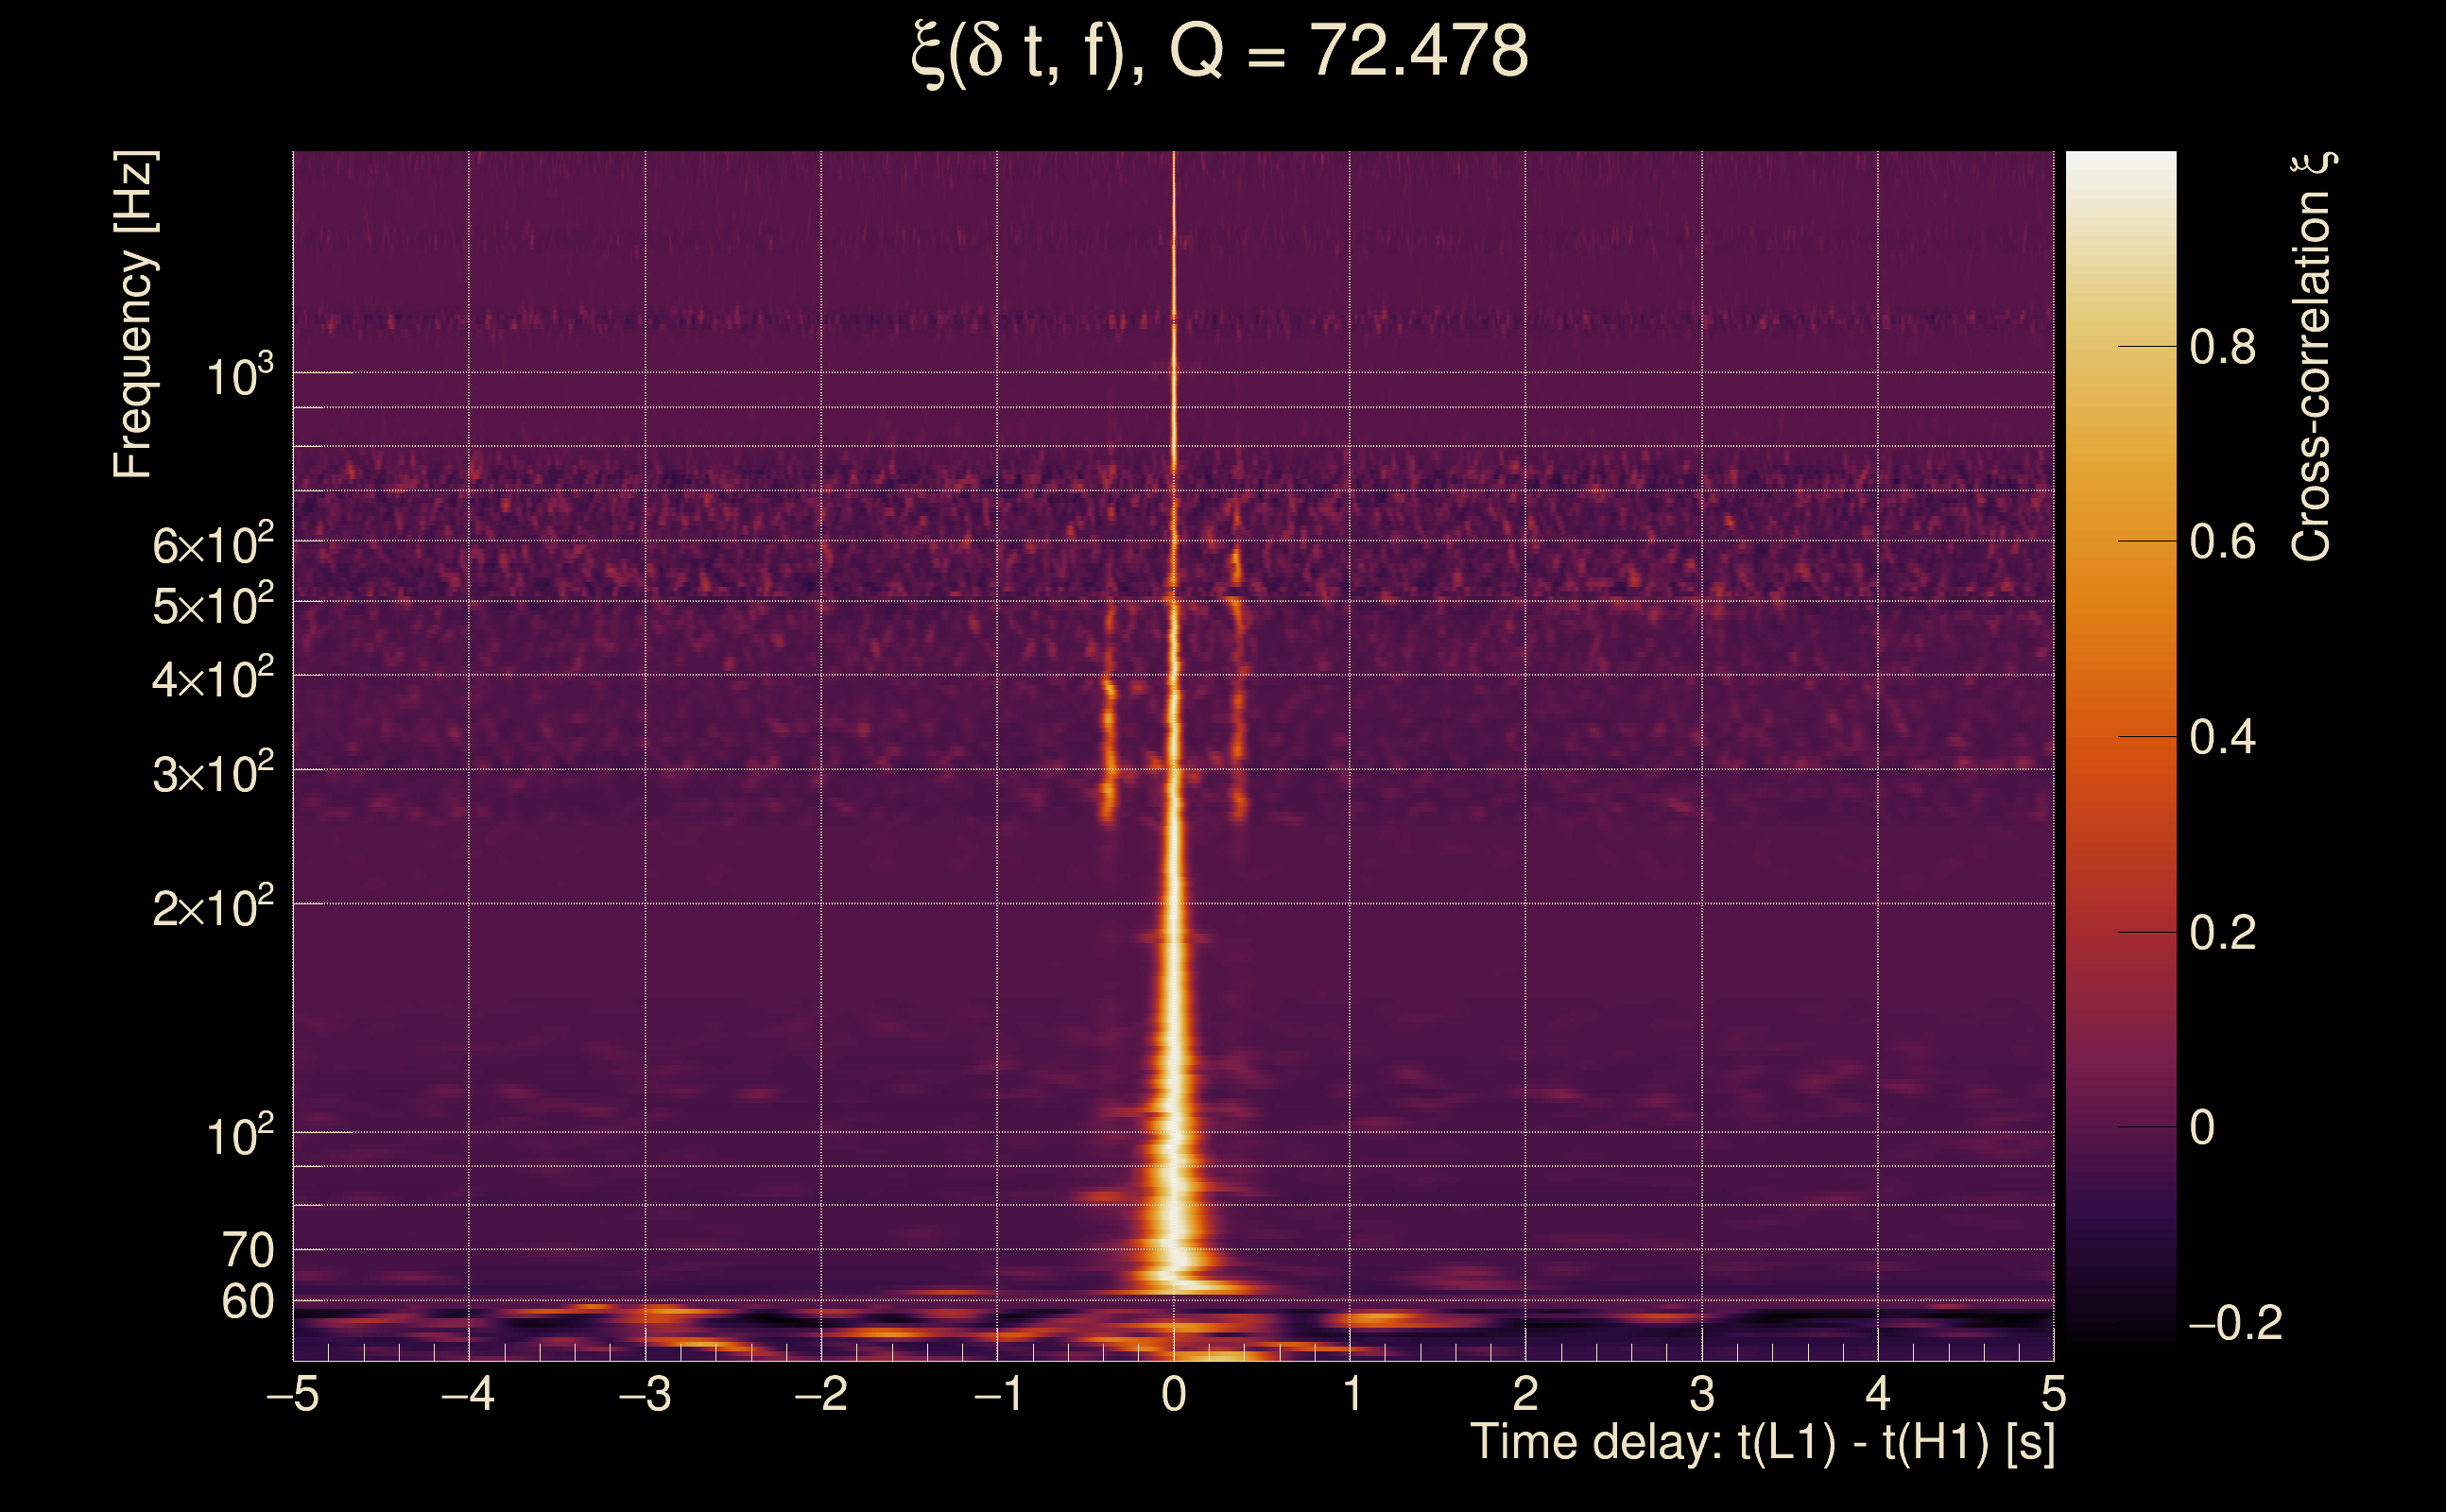
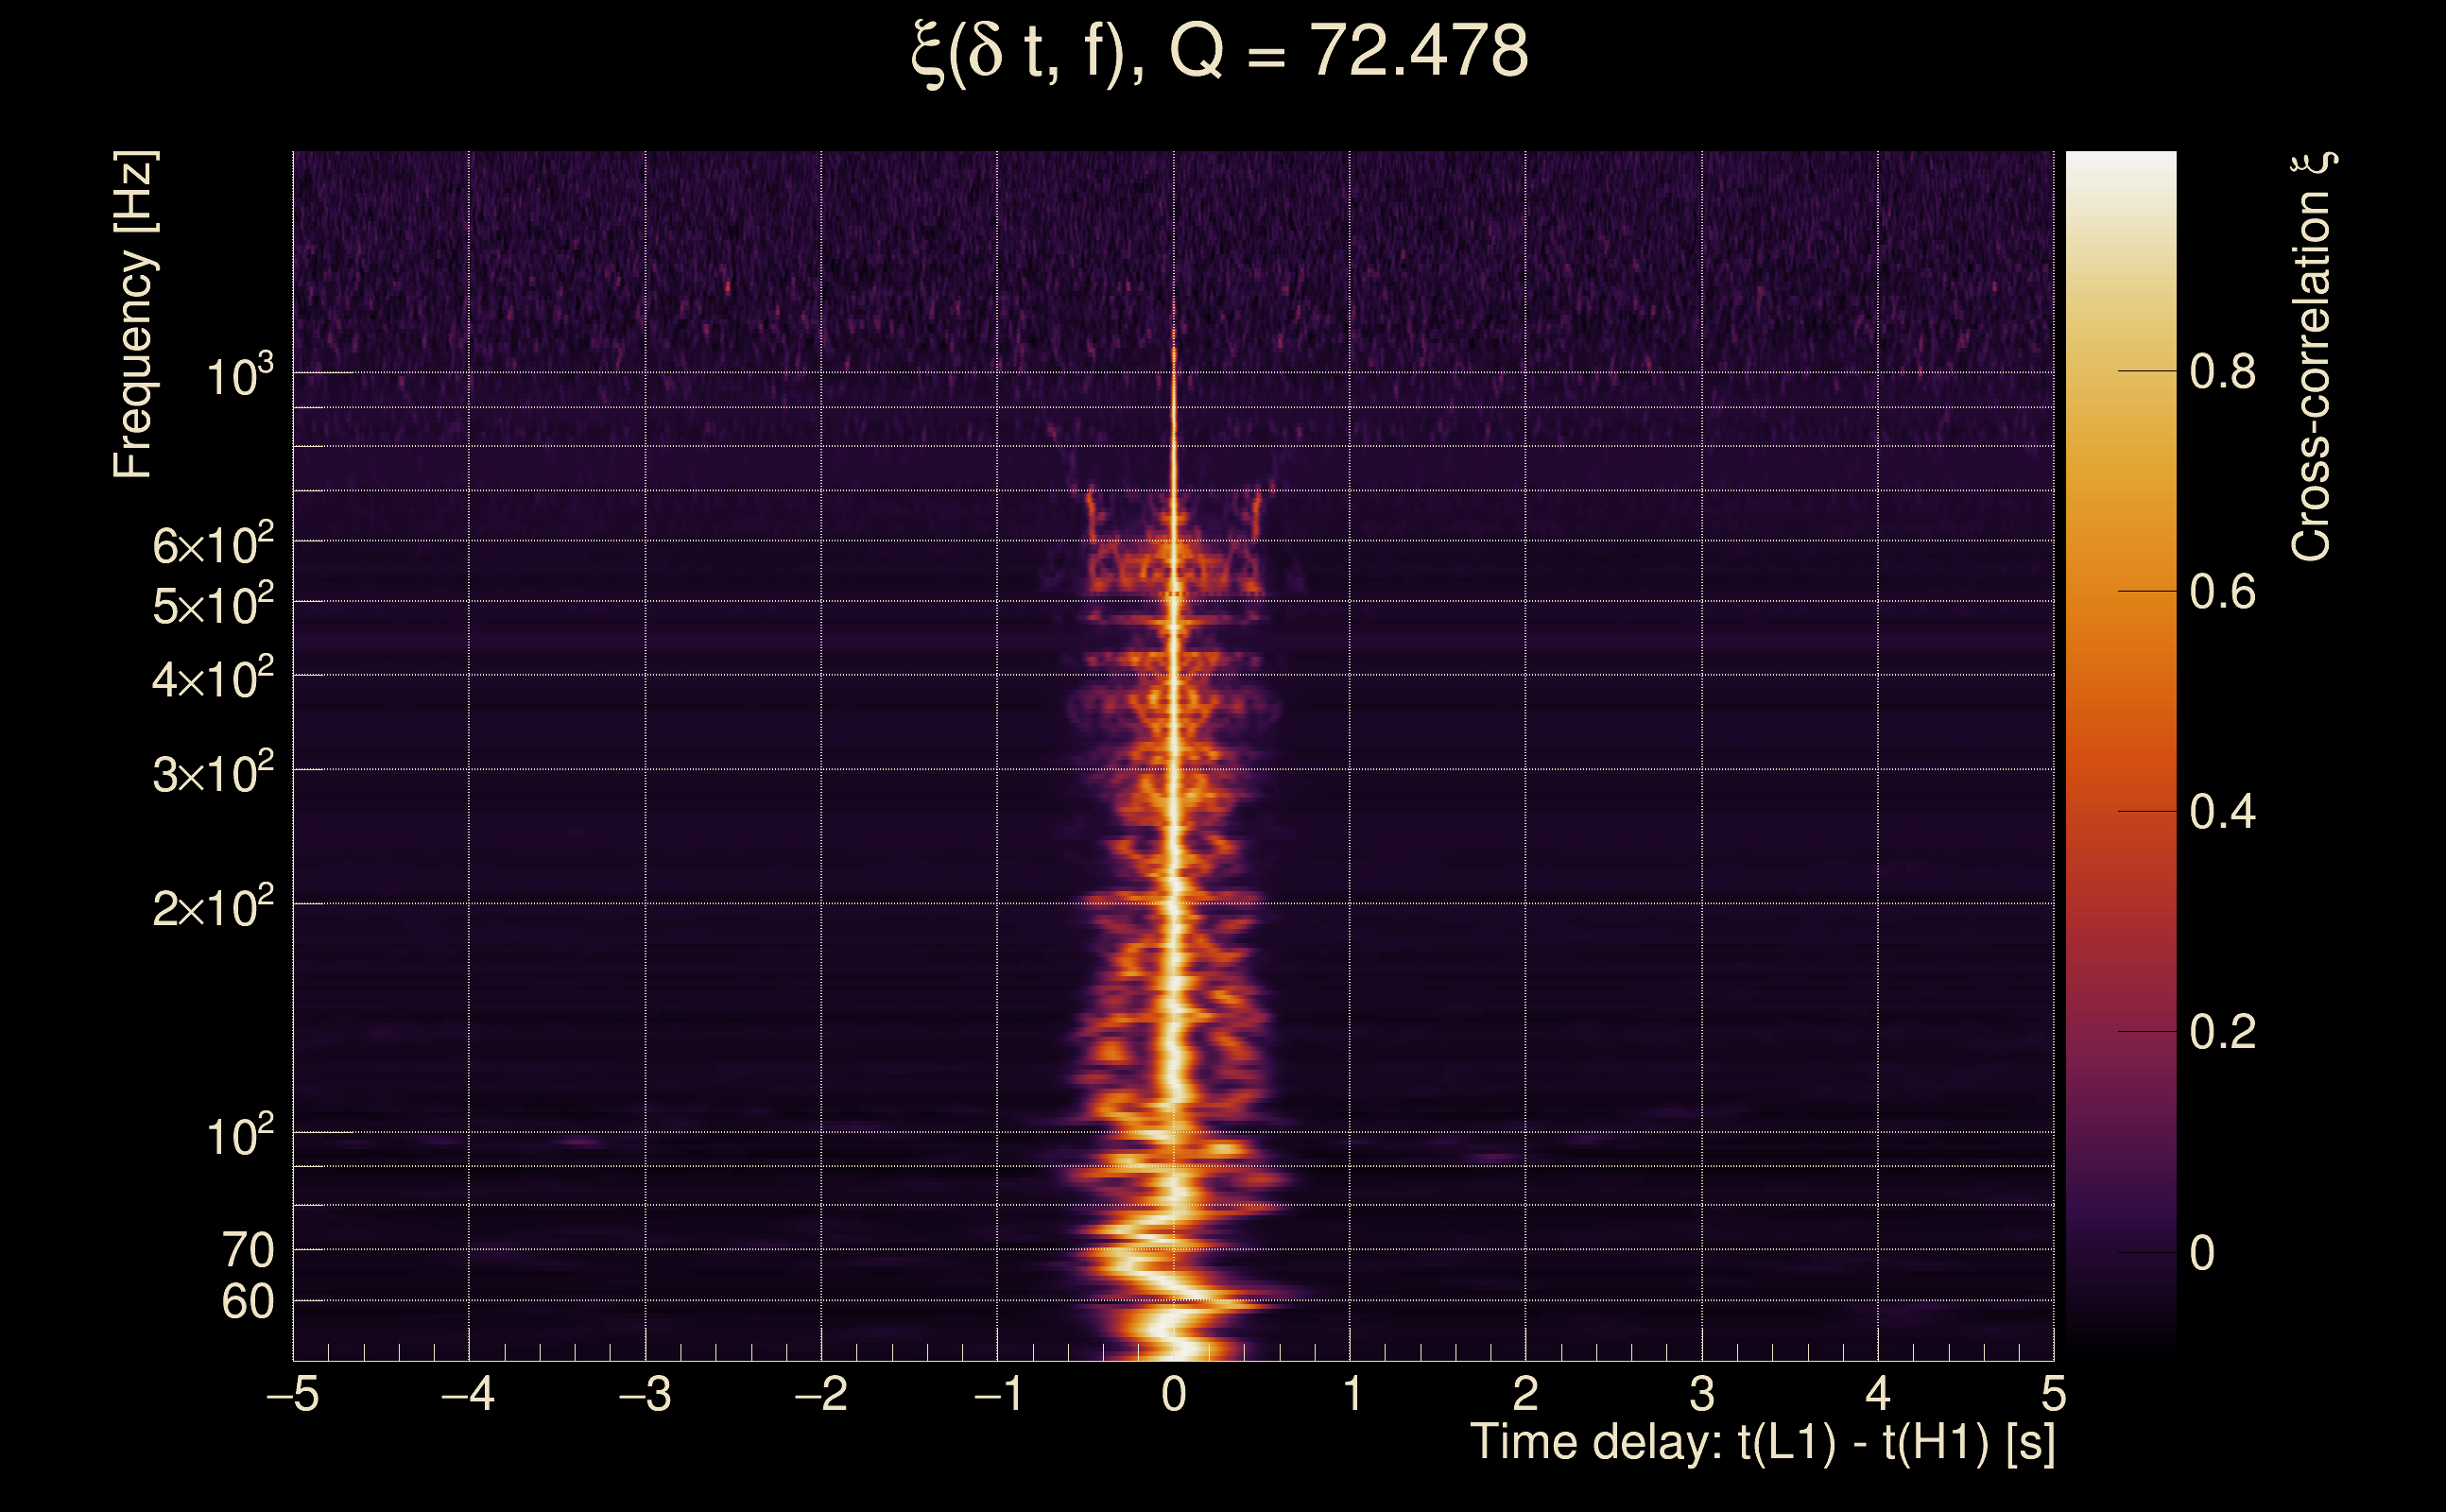
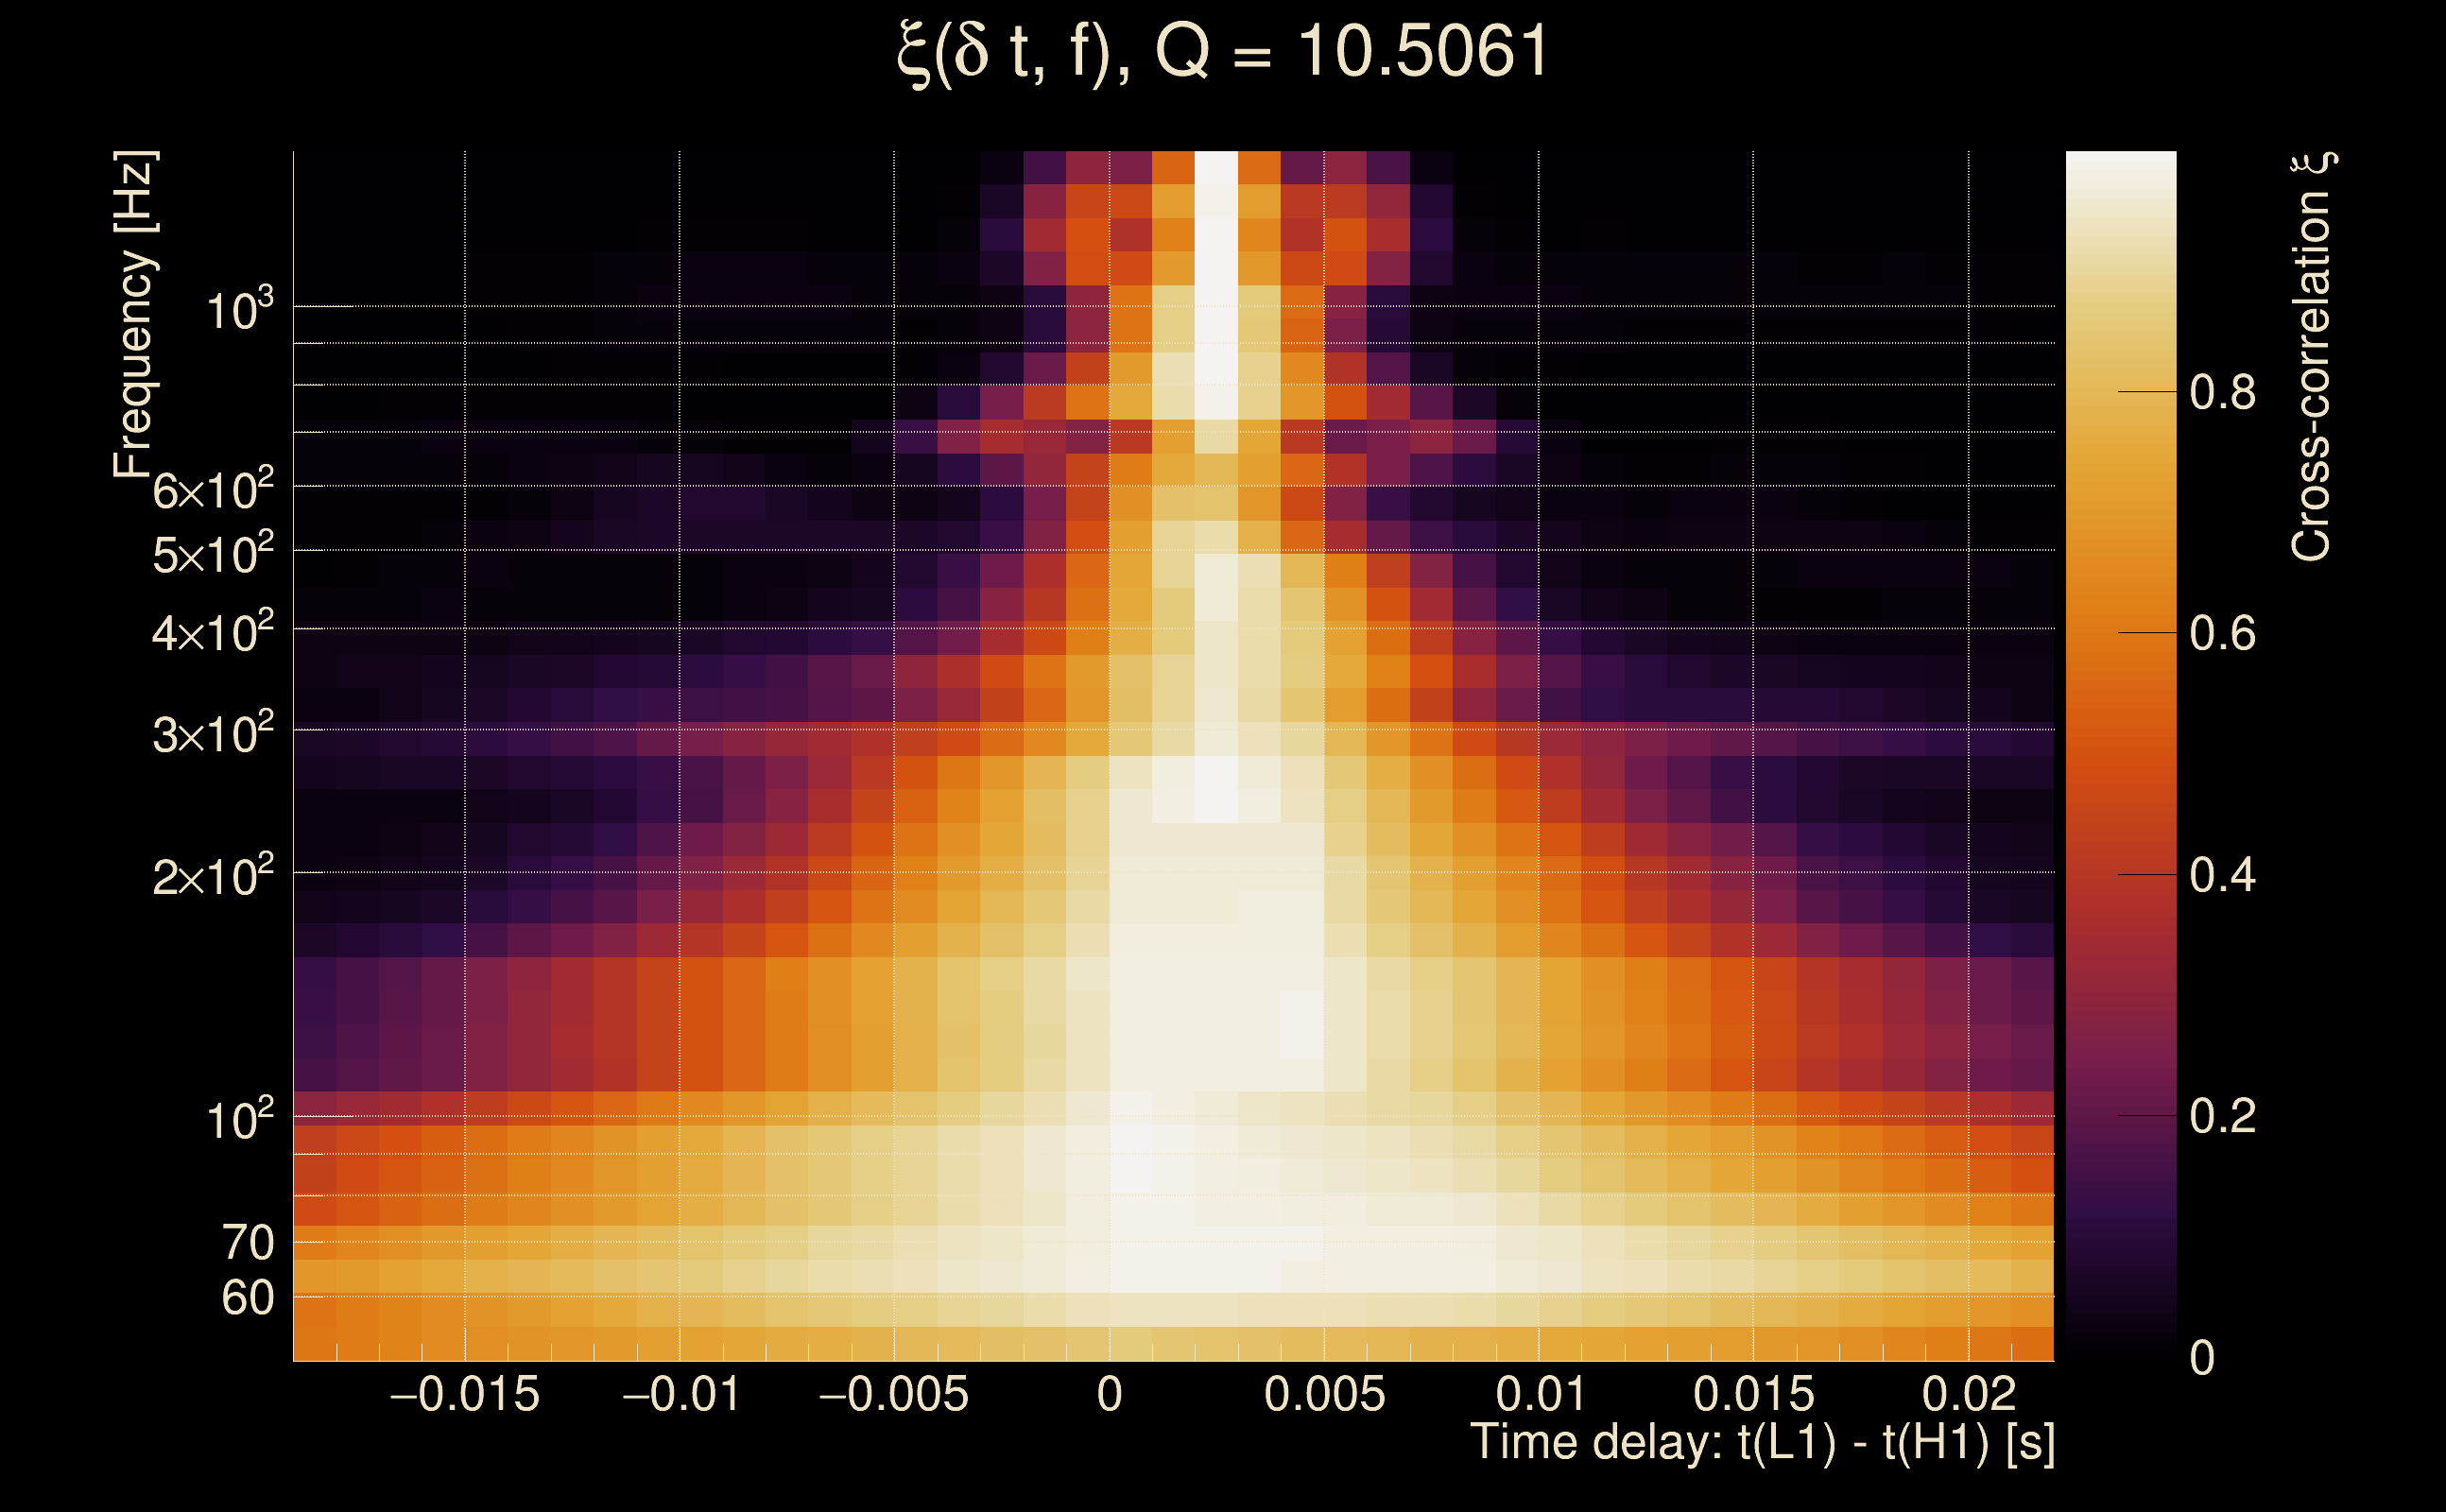
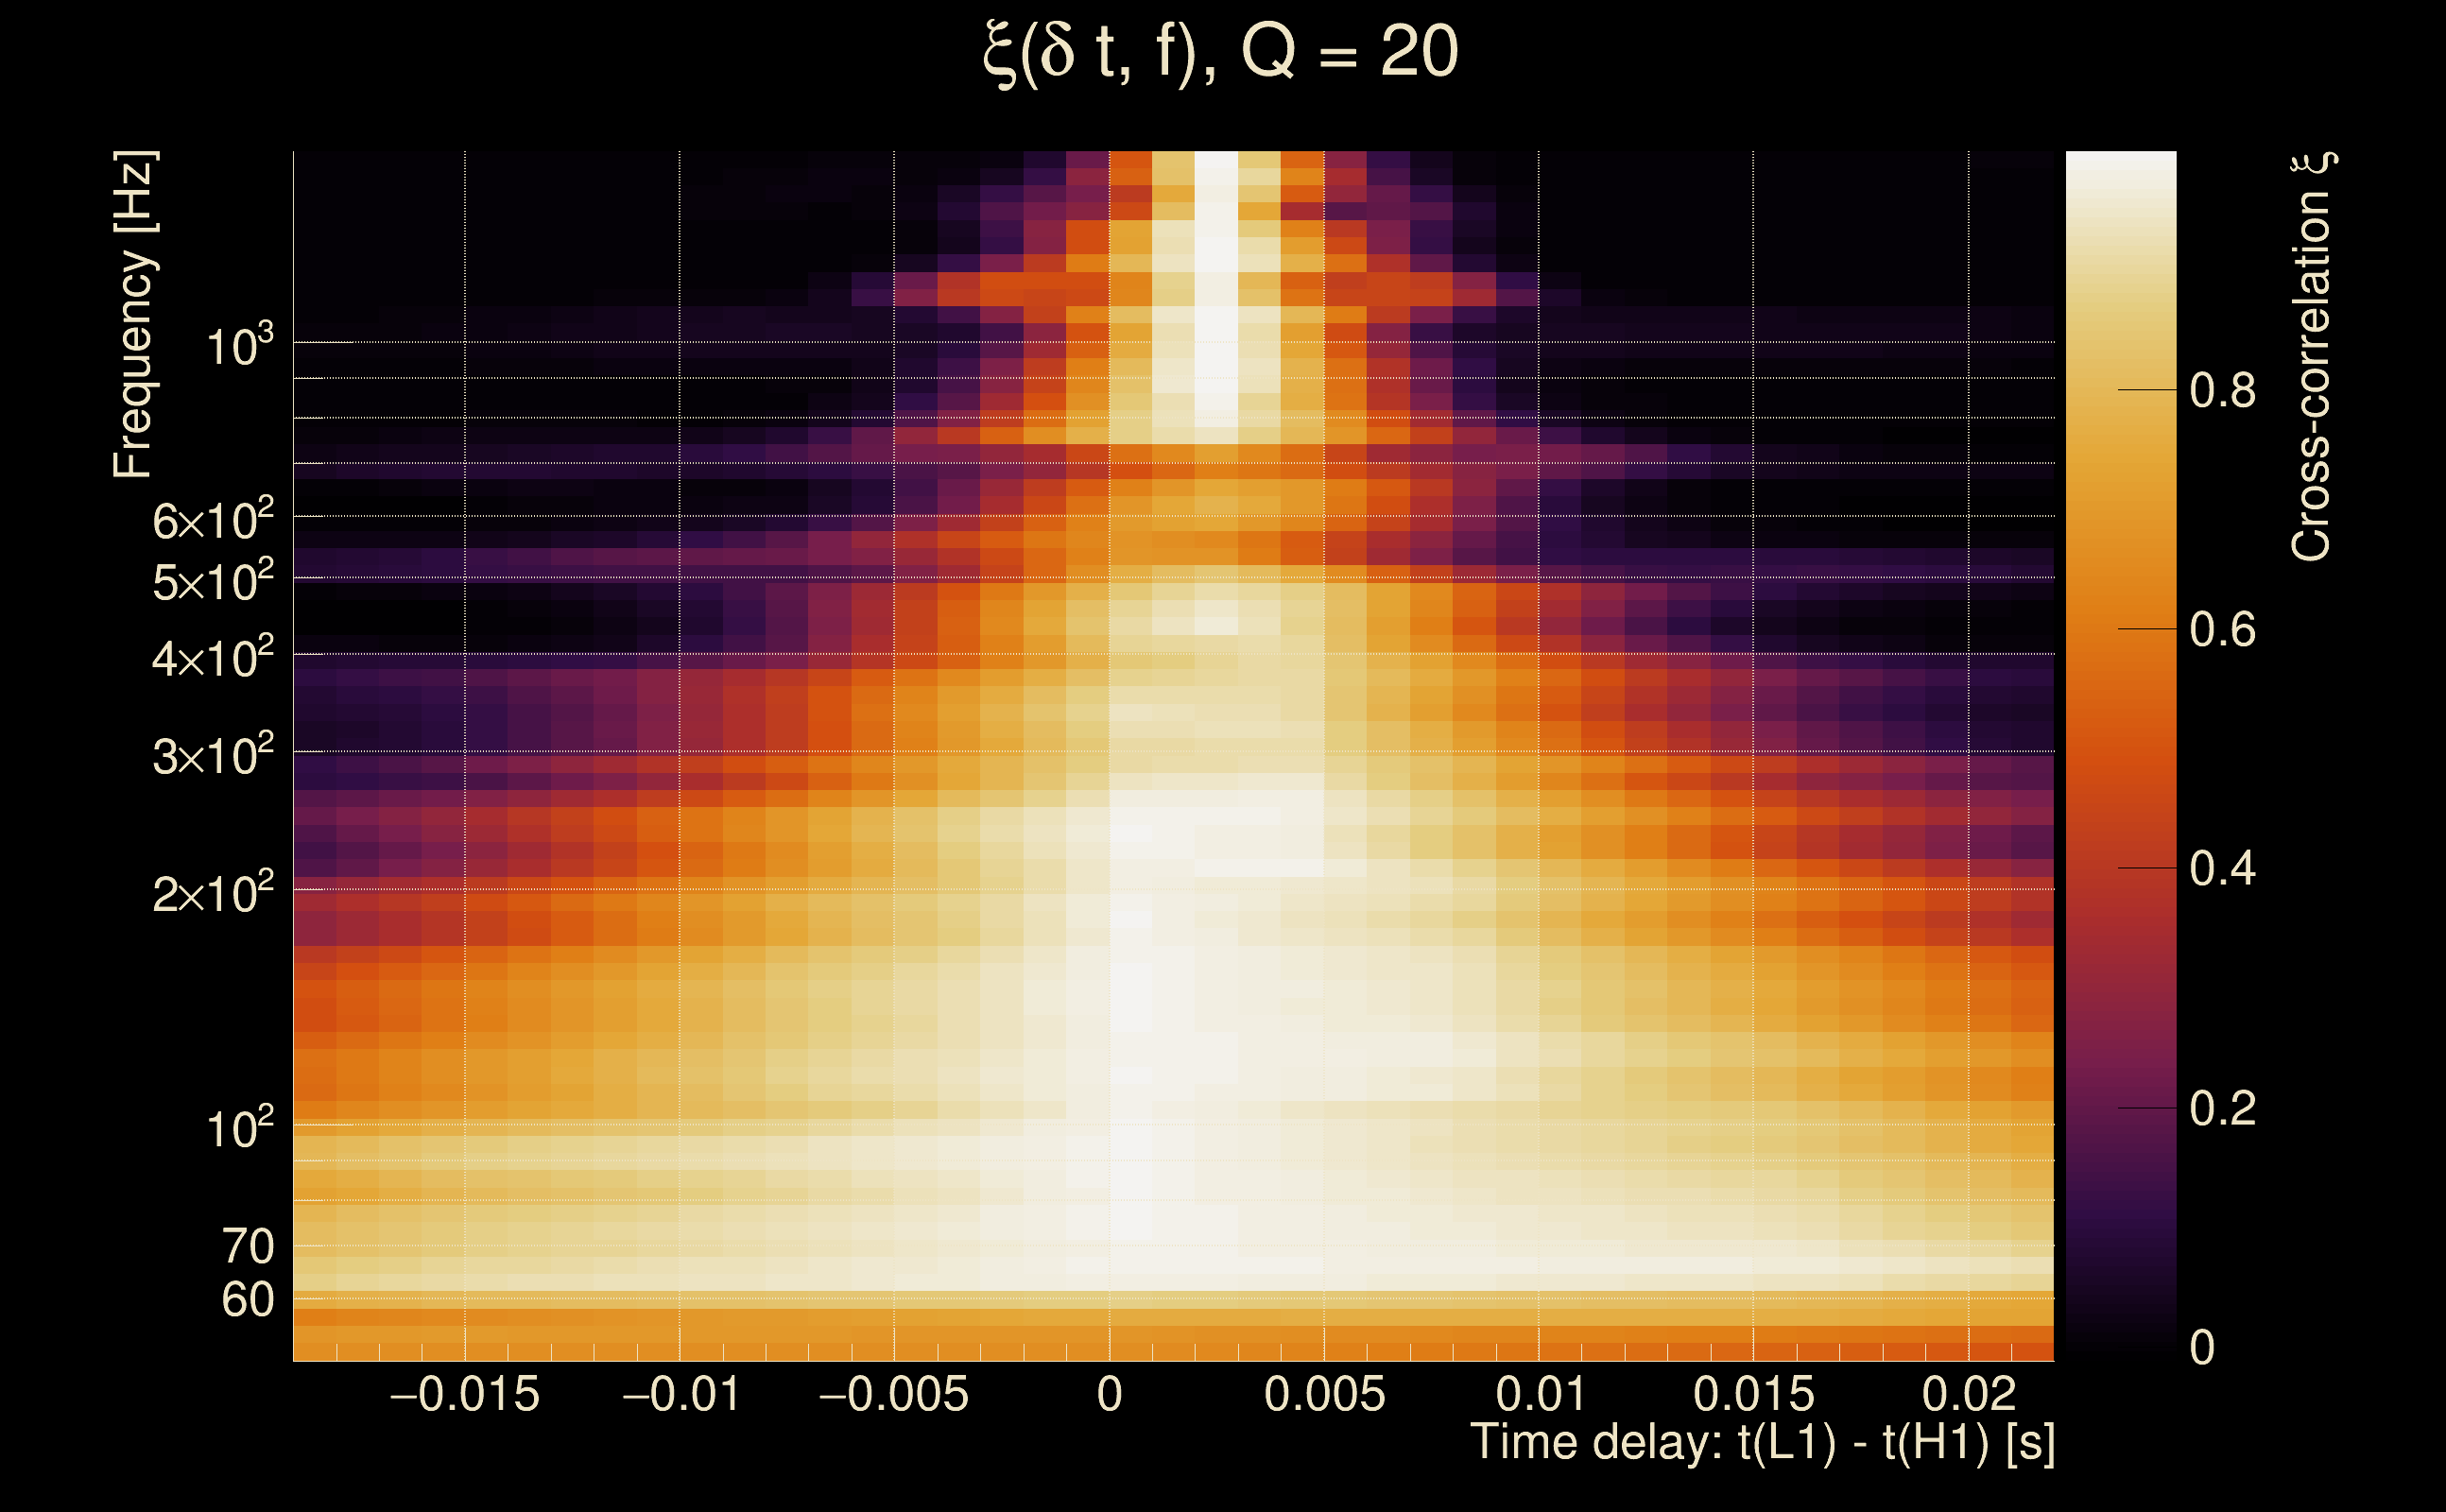
| Time delay between detectors t(L1) - t(H1): | 0.00196678 s (slice index = 108 / 217), δt_gw = 0.00196678 s |
| Time delay standard deviation: | 0.018901 s |
| [targeted mode] Time delay probability: | 0.997193 (0.00351761 sigmas), δt_target = 1.72247e+45 s |
| Frequency: | 293.626 Hz |
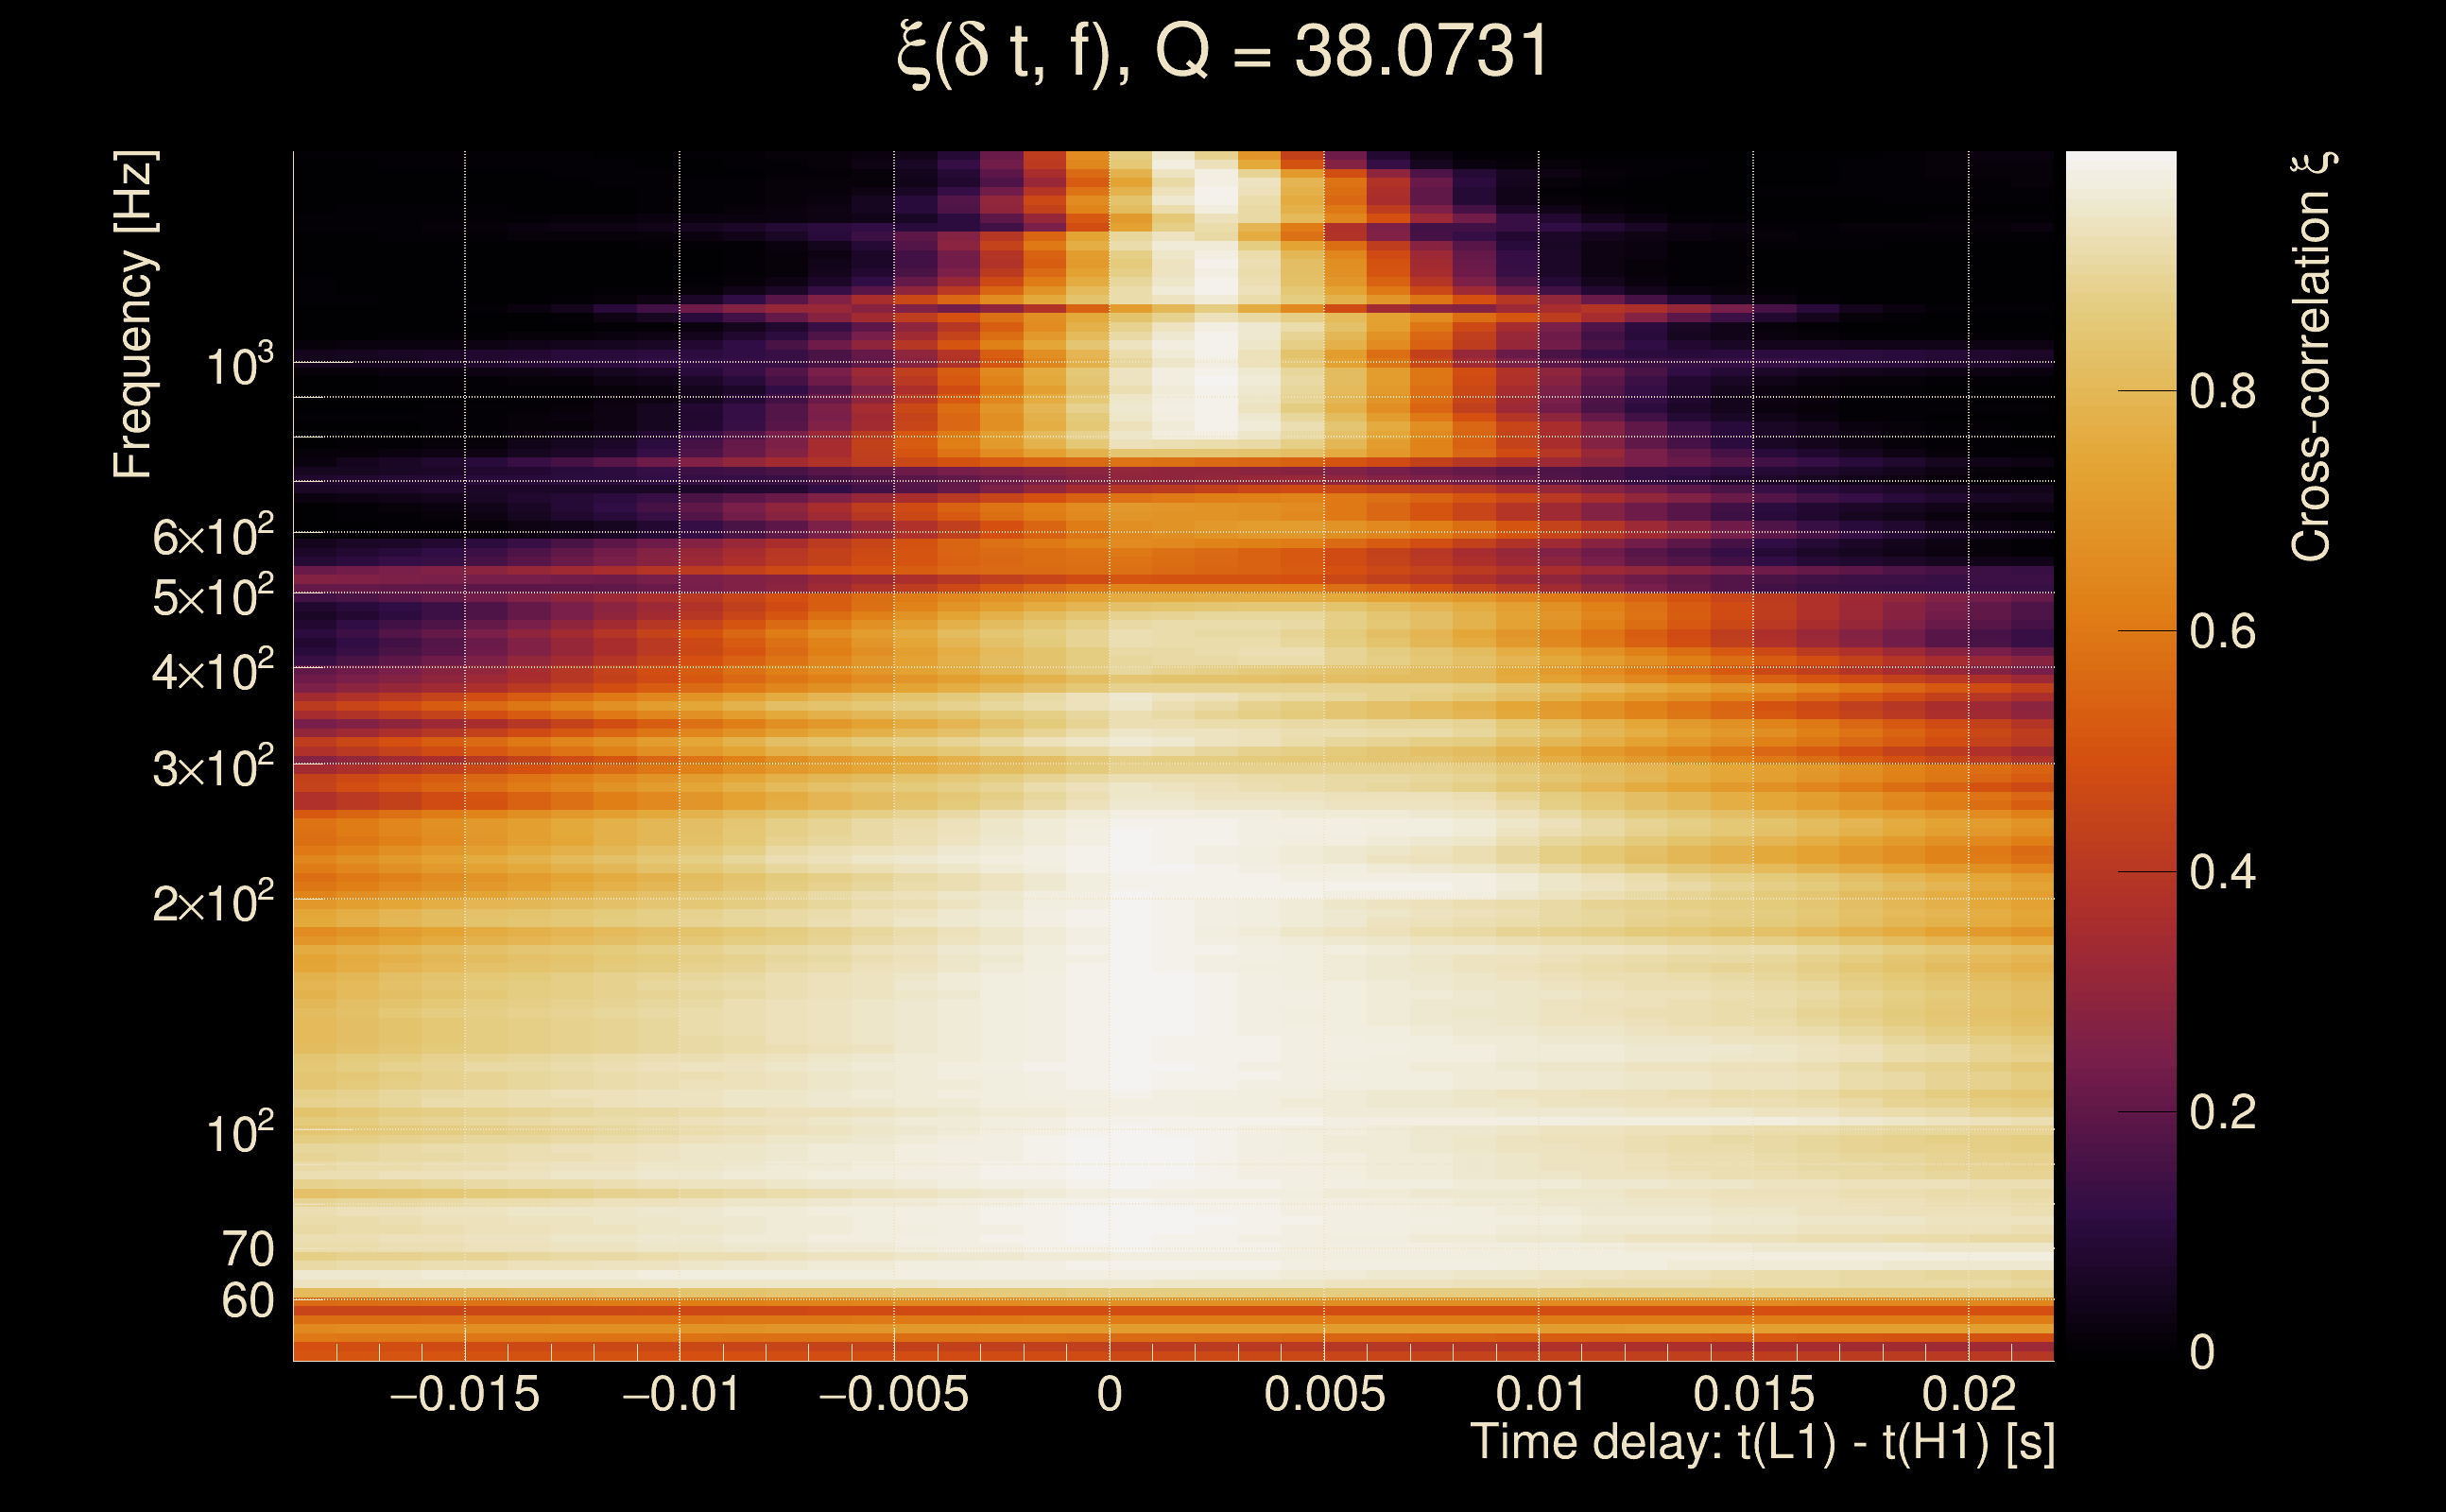
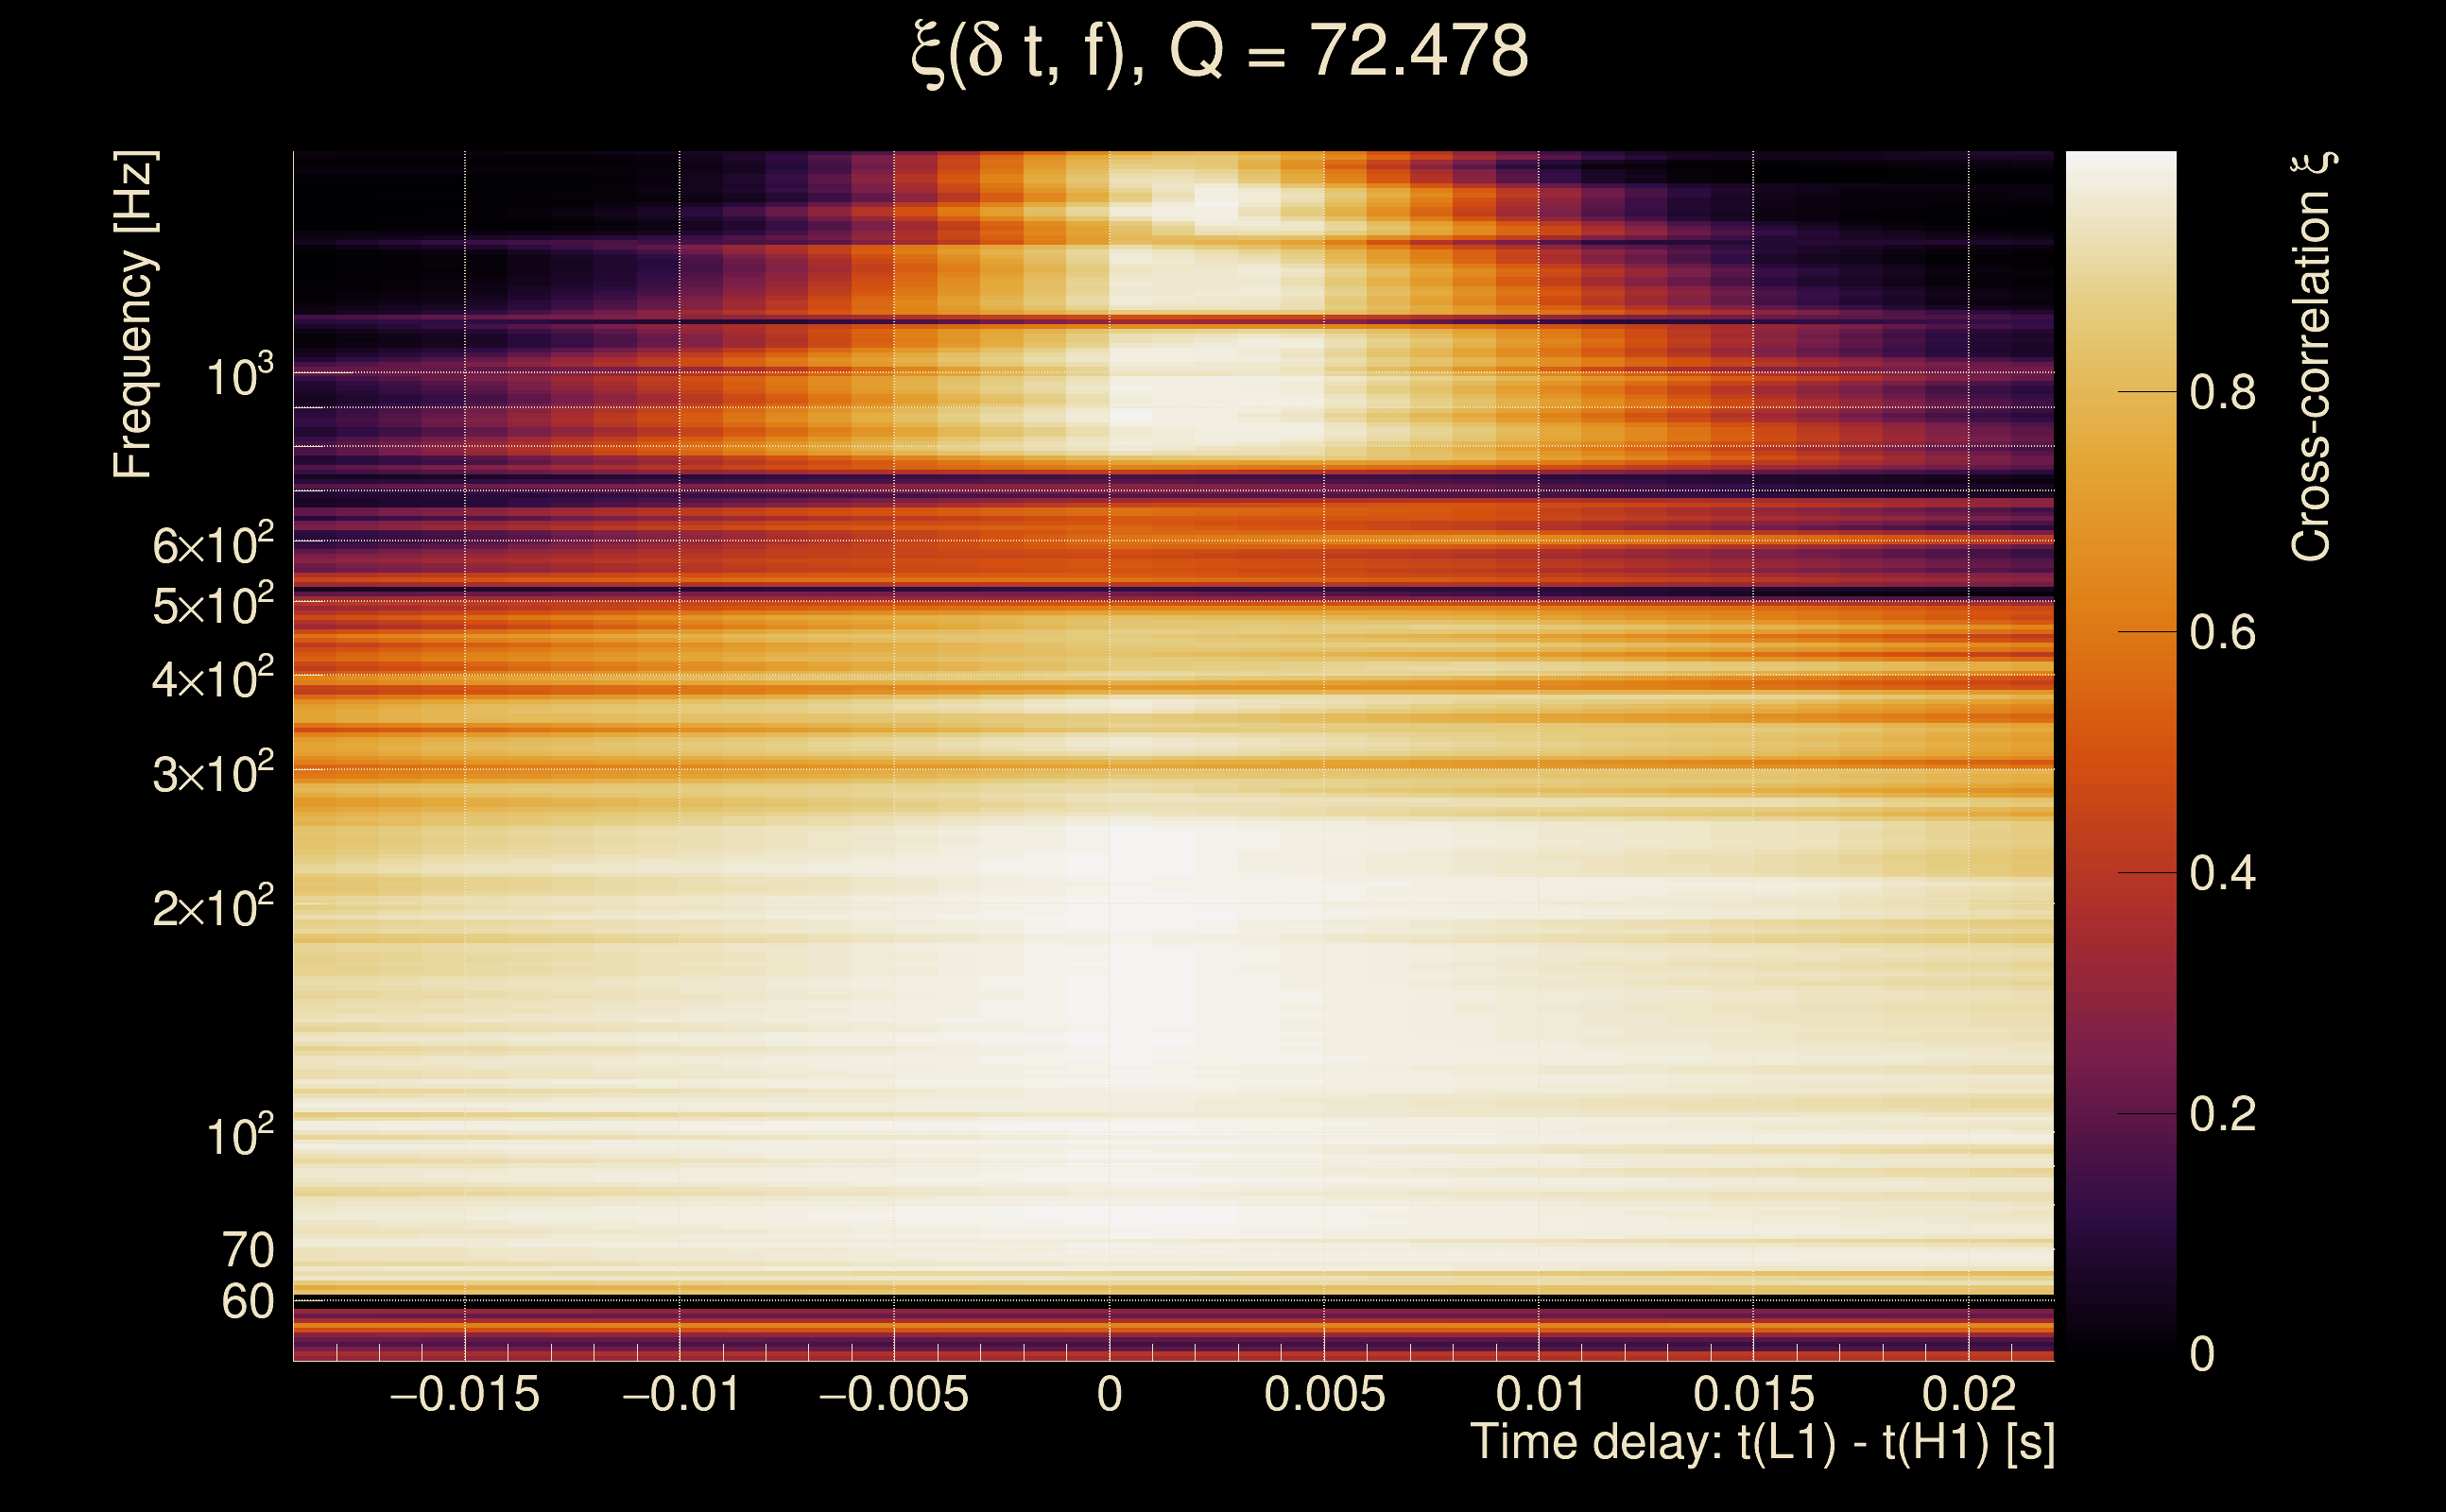
| Ξ: | 0.957564 ± 0.0174654 (variance = 0.000305041): Q0: 0.982277, Q1: 0.965233, Q2: 0.950403, Q3: 0.939466, Q4: 0.934607 |
| Rank: | R_A = 0.927715 |
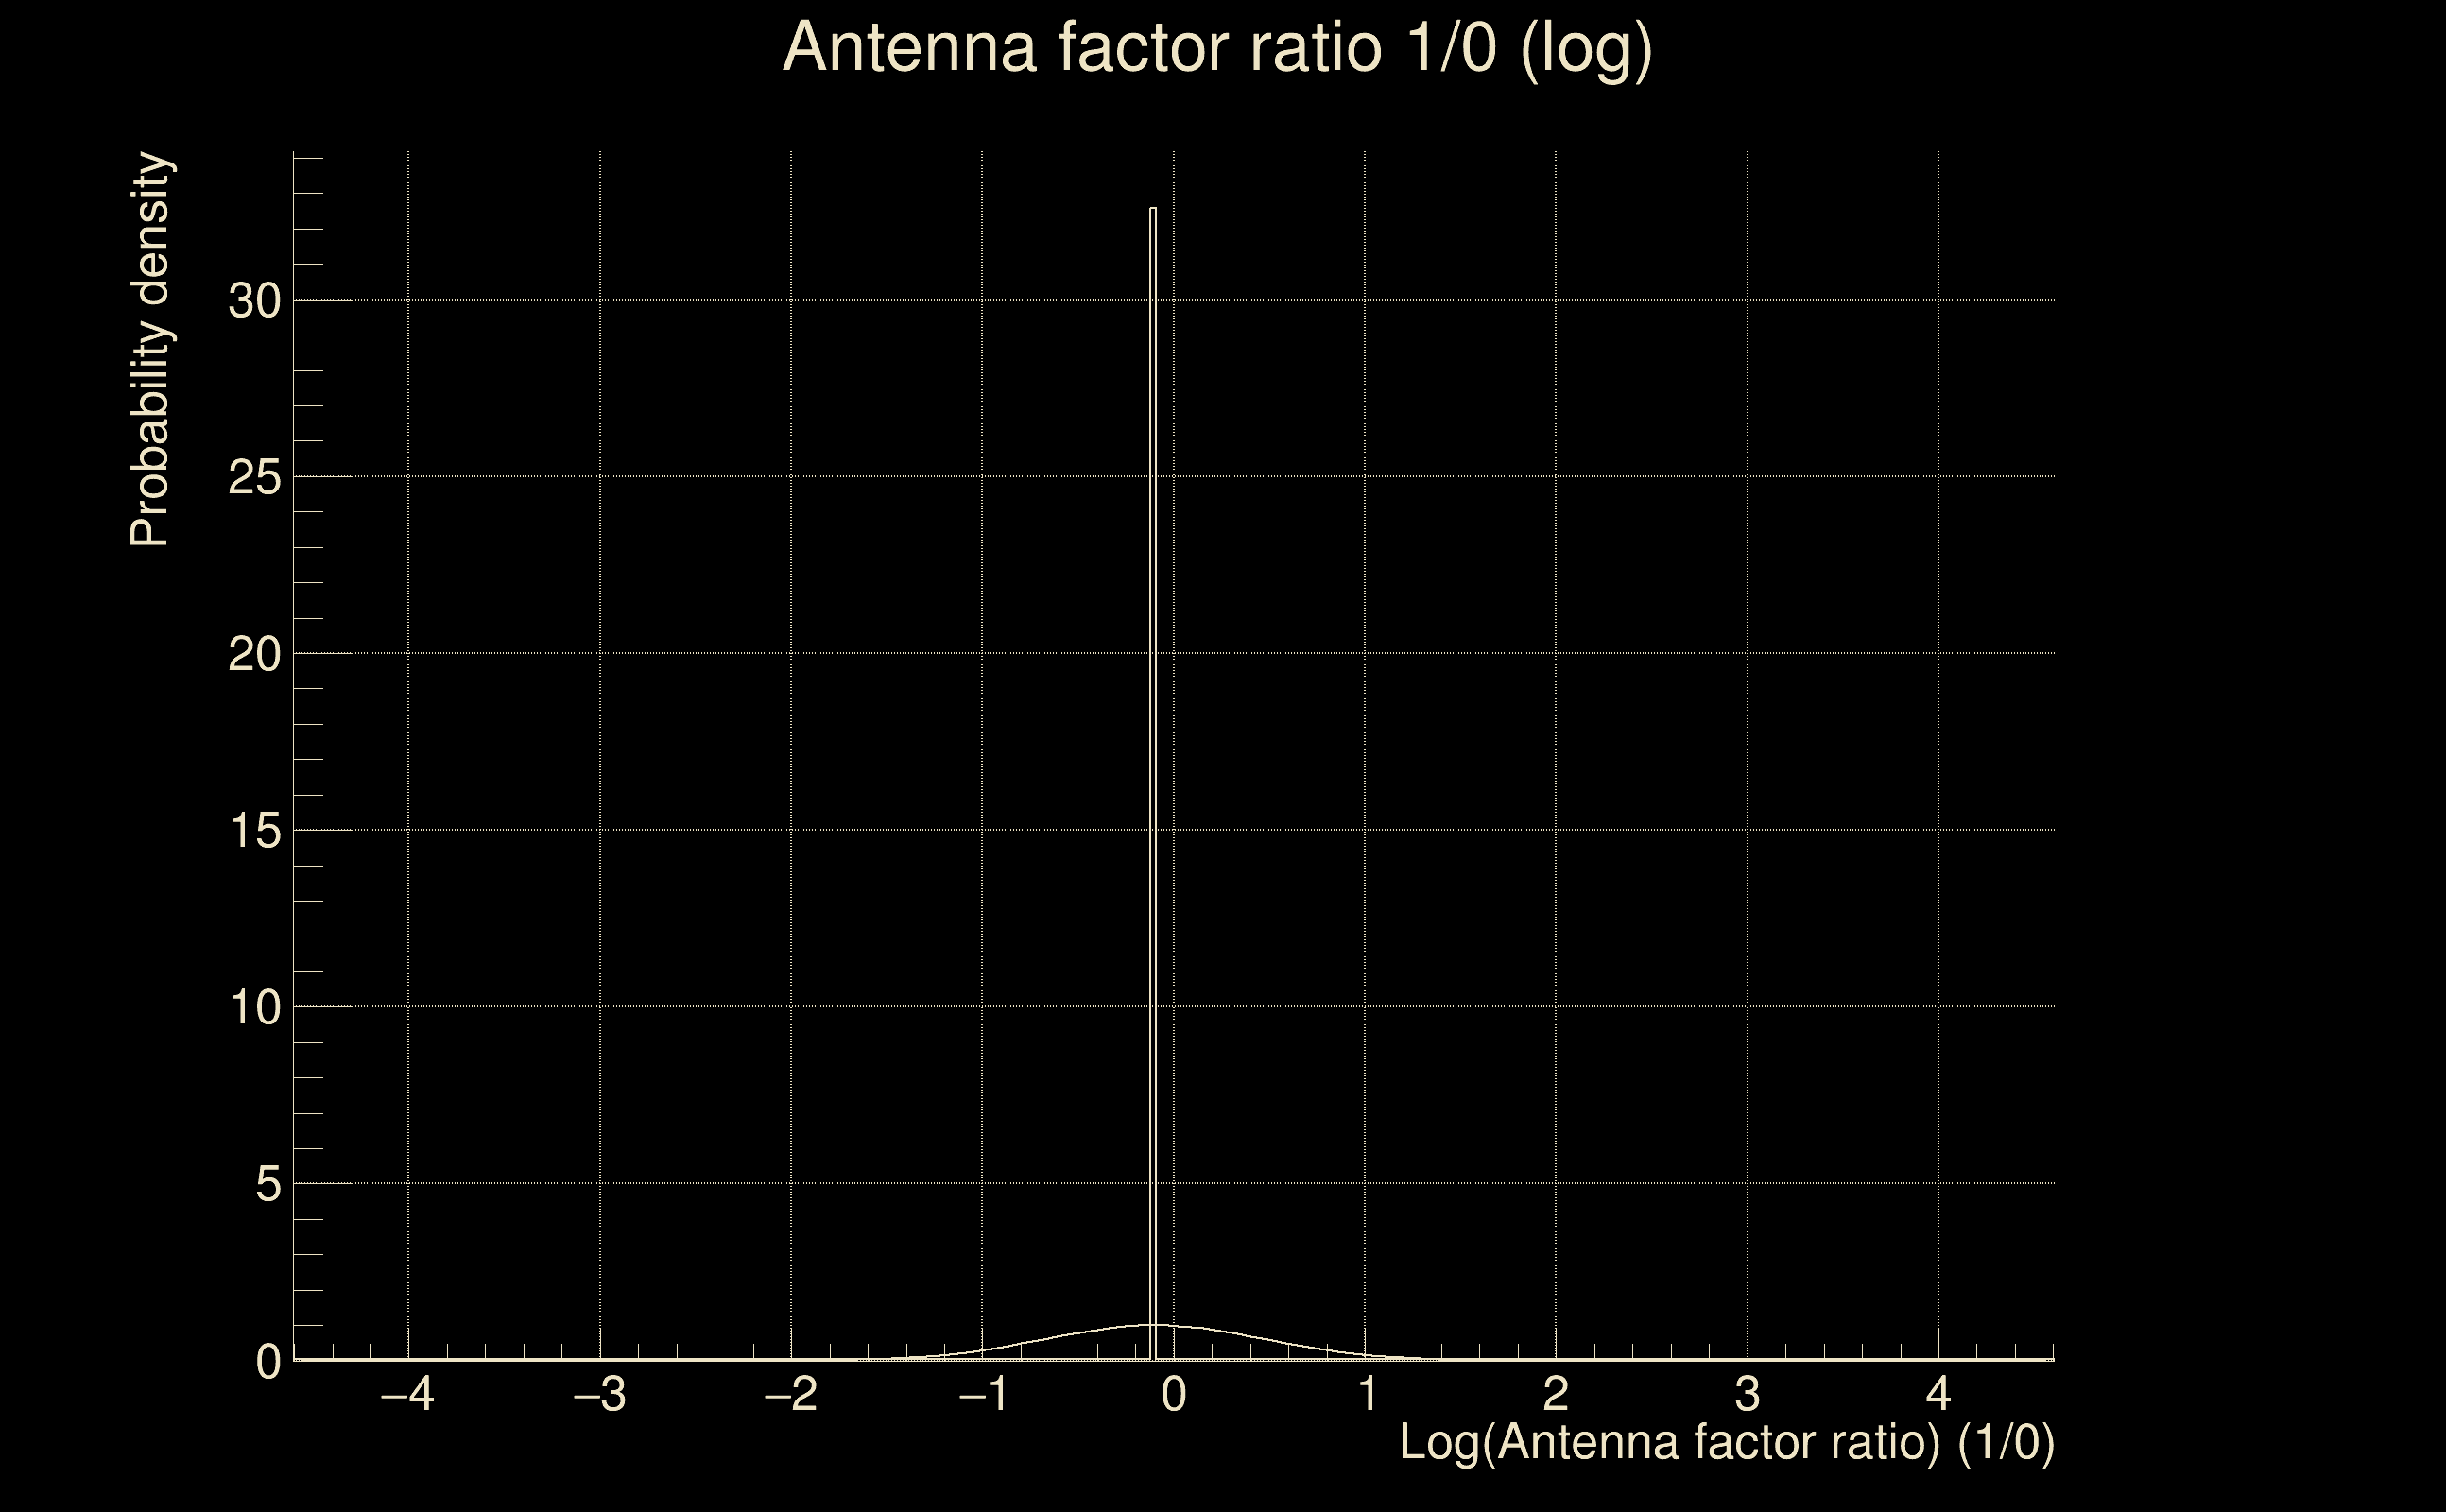
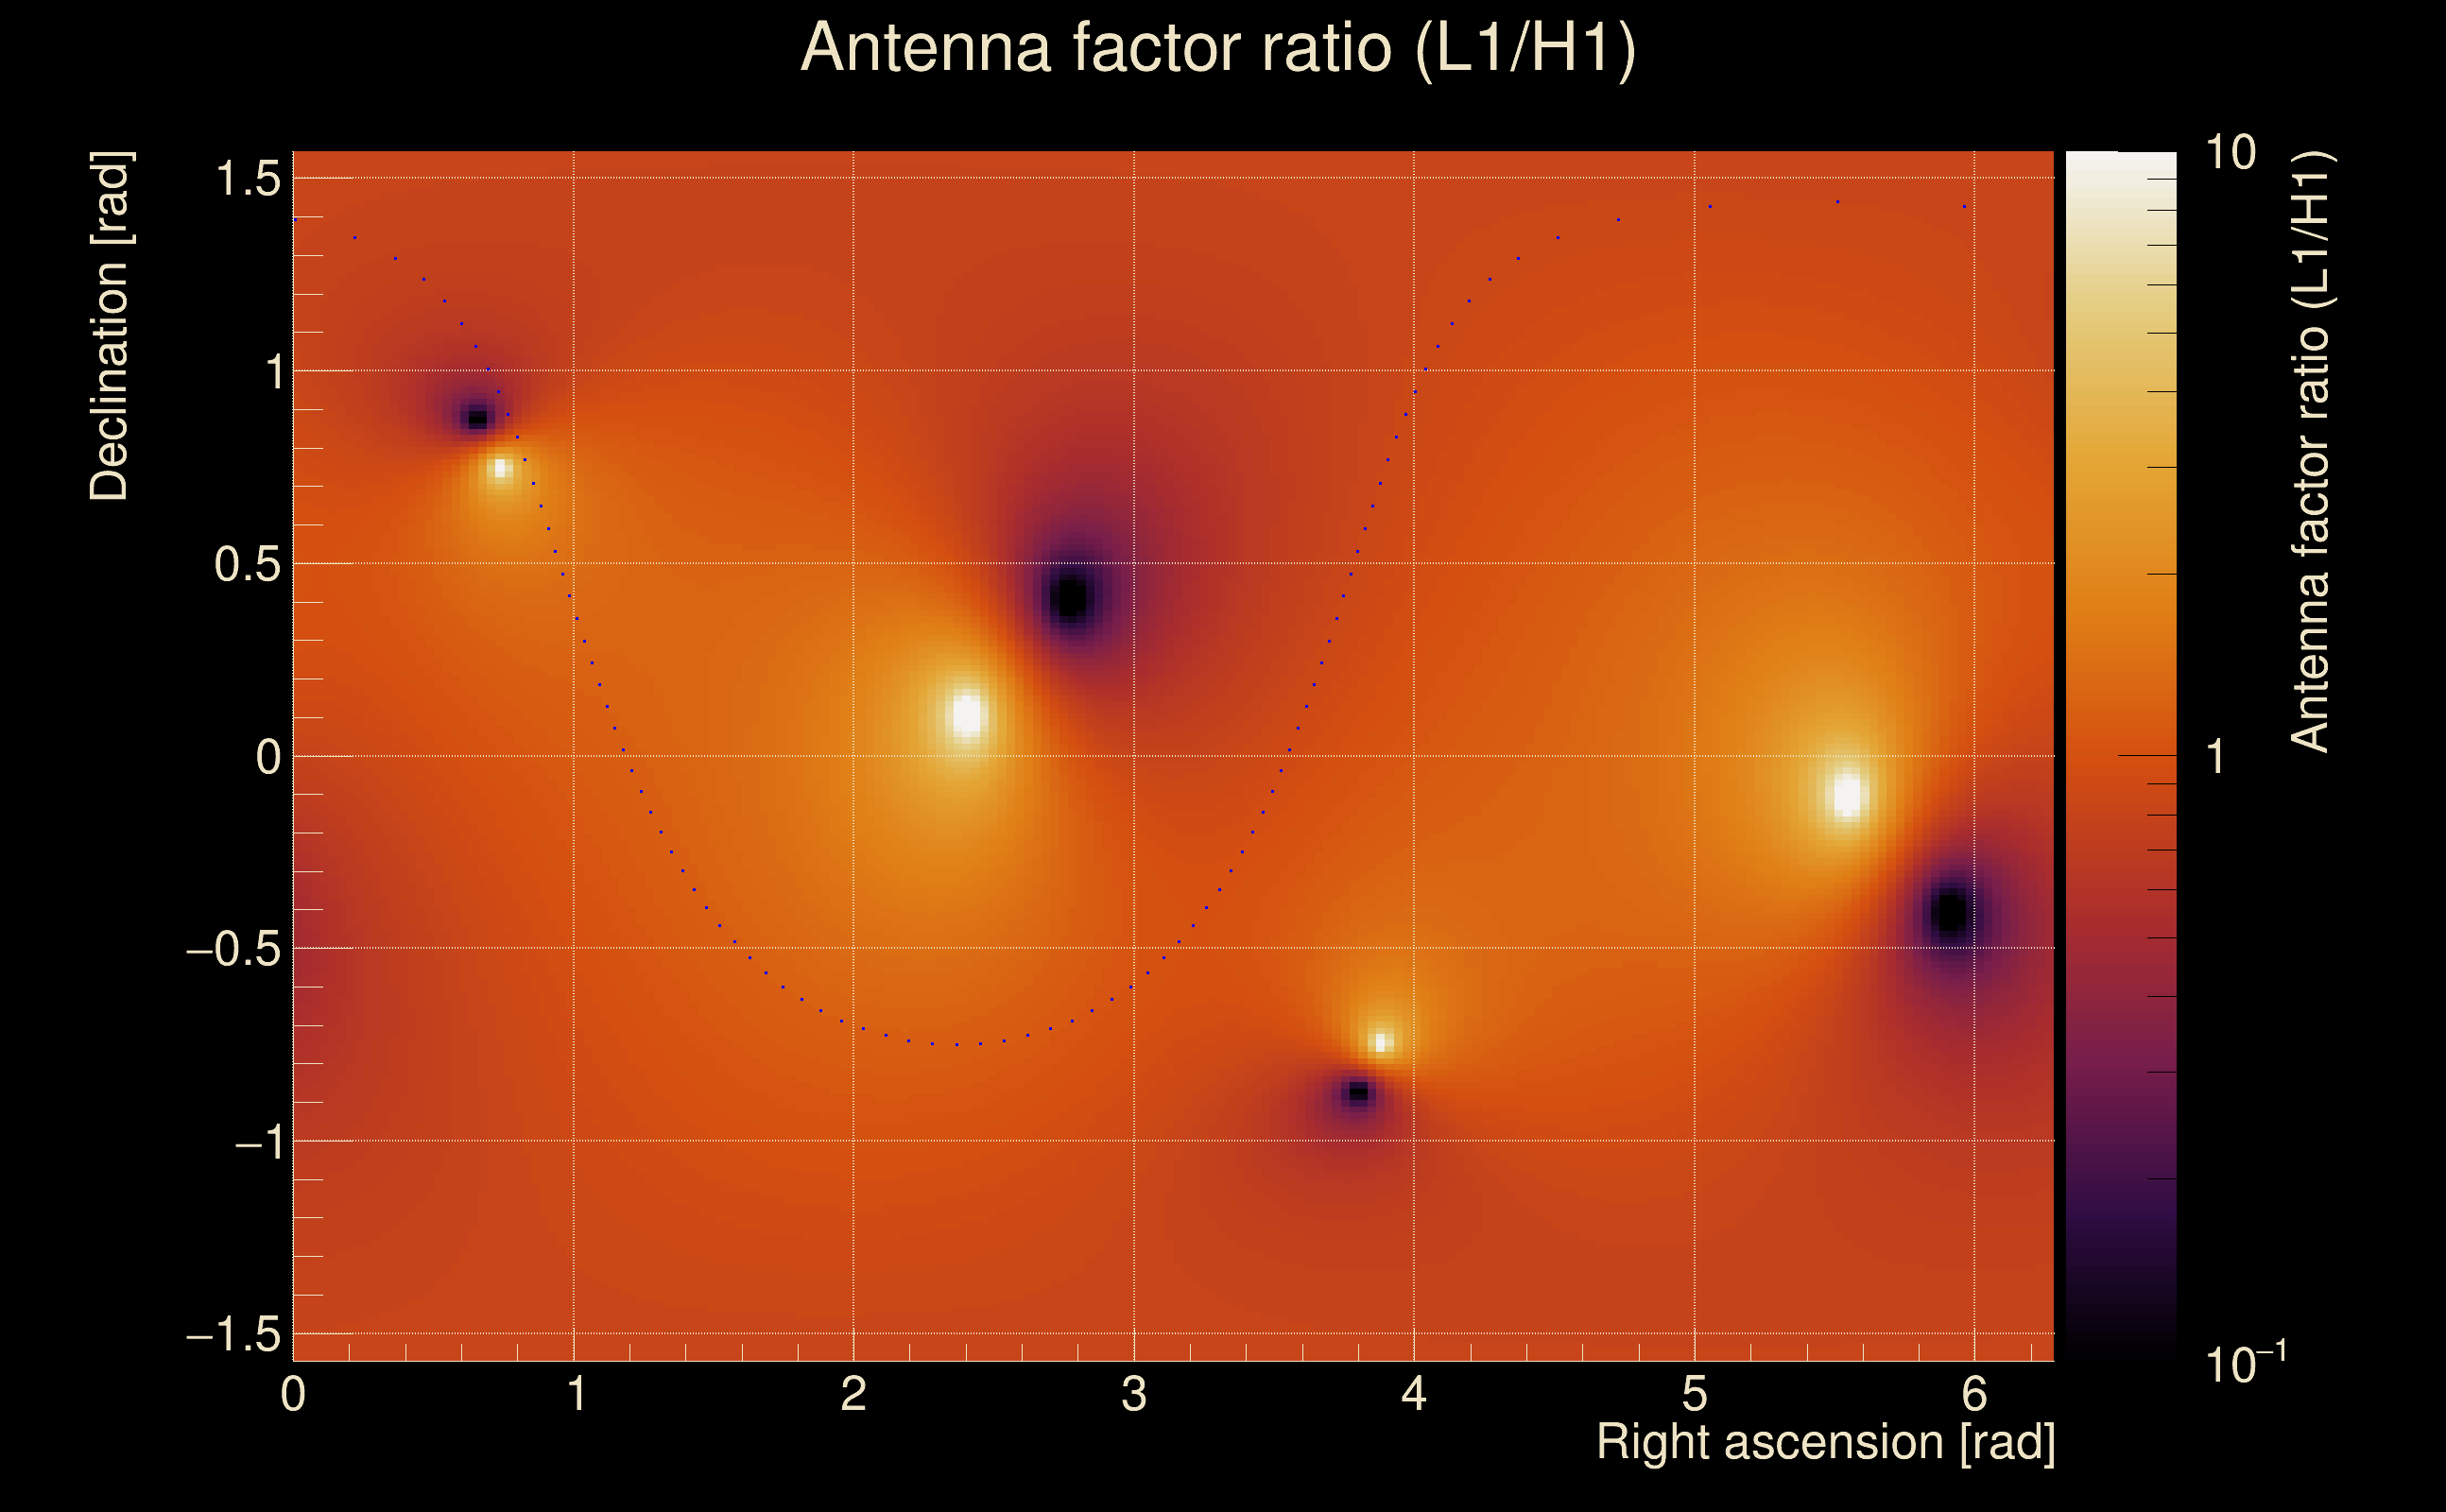
| Log of amplitude ratio (L1/H1): | -0.098395, variance = 0.154518 (L1/H1: -0.106074, variance = 0.306024, H1/L1: 0.0889613, variance = 0.305517) |
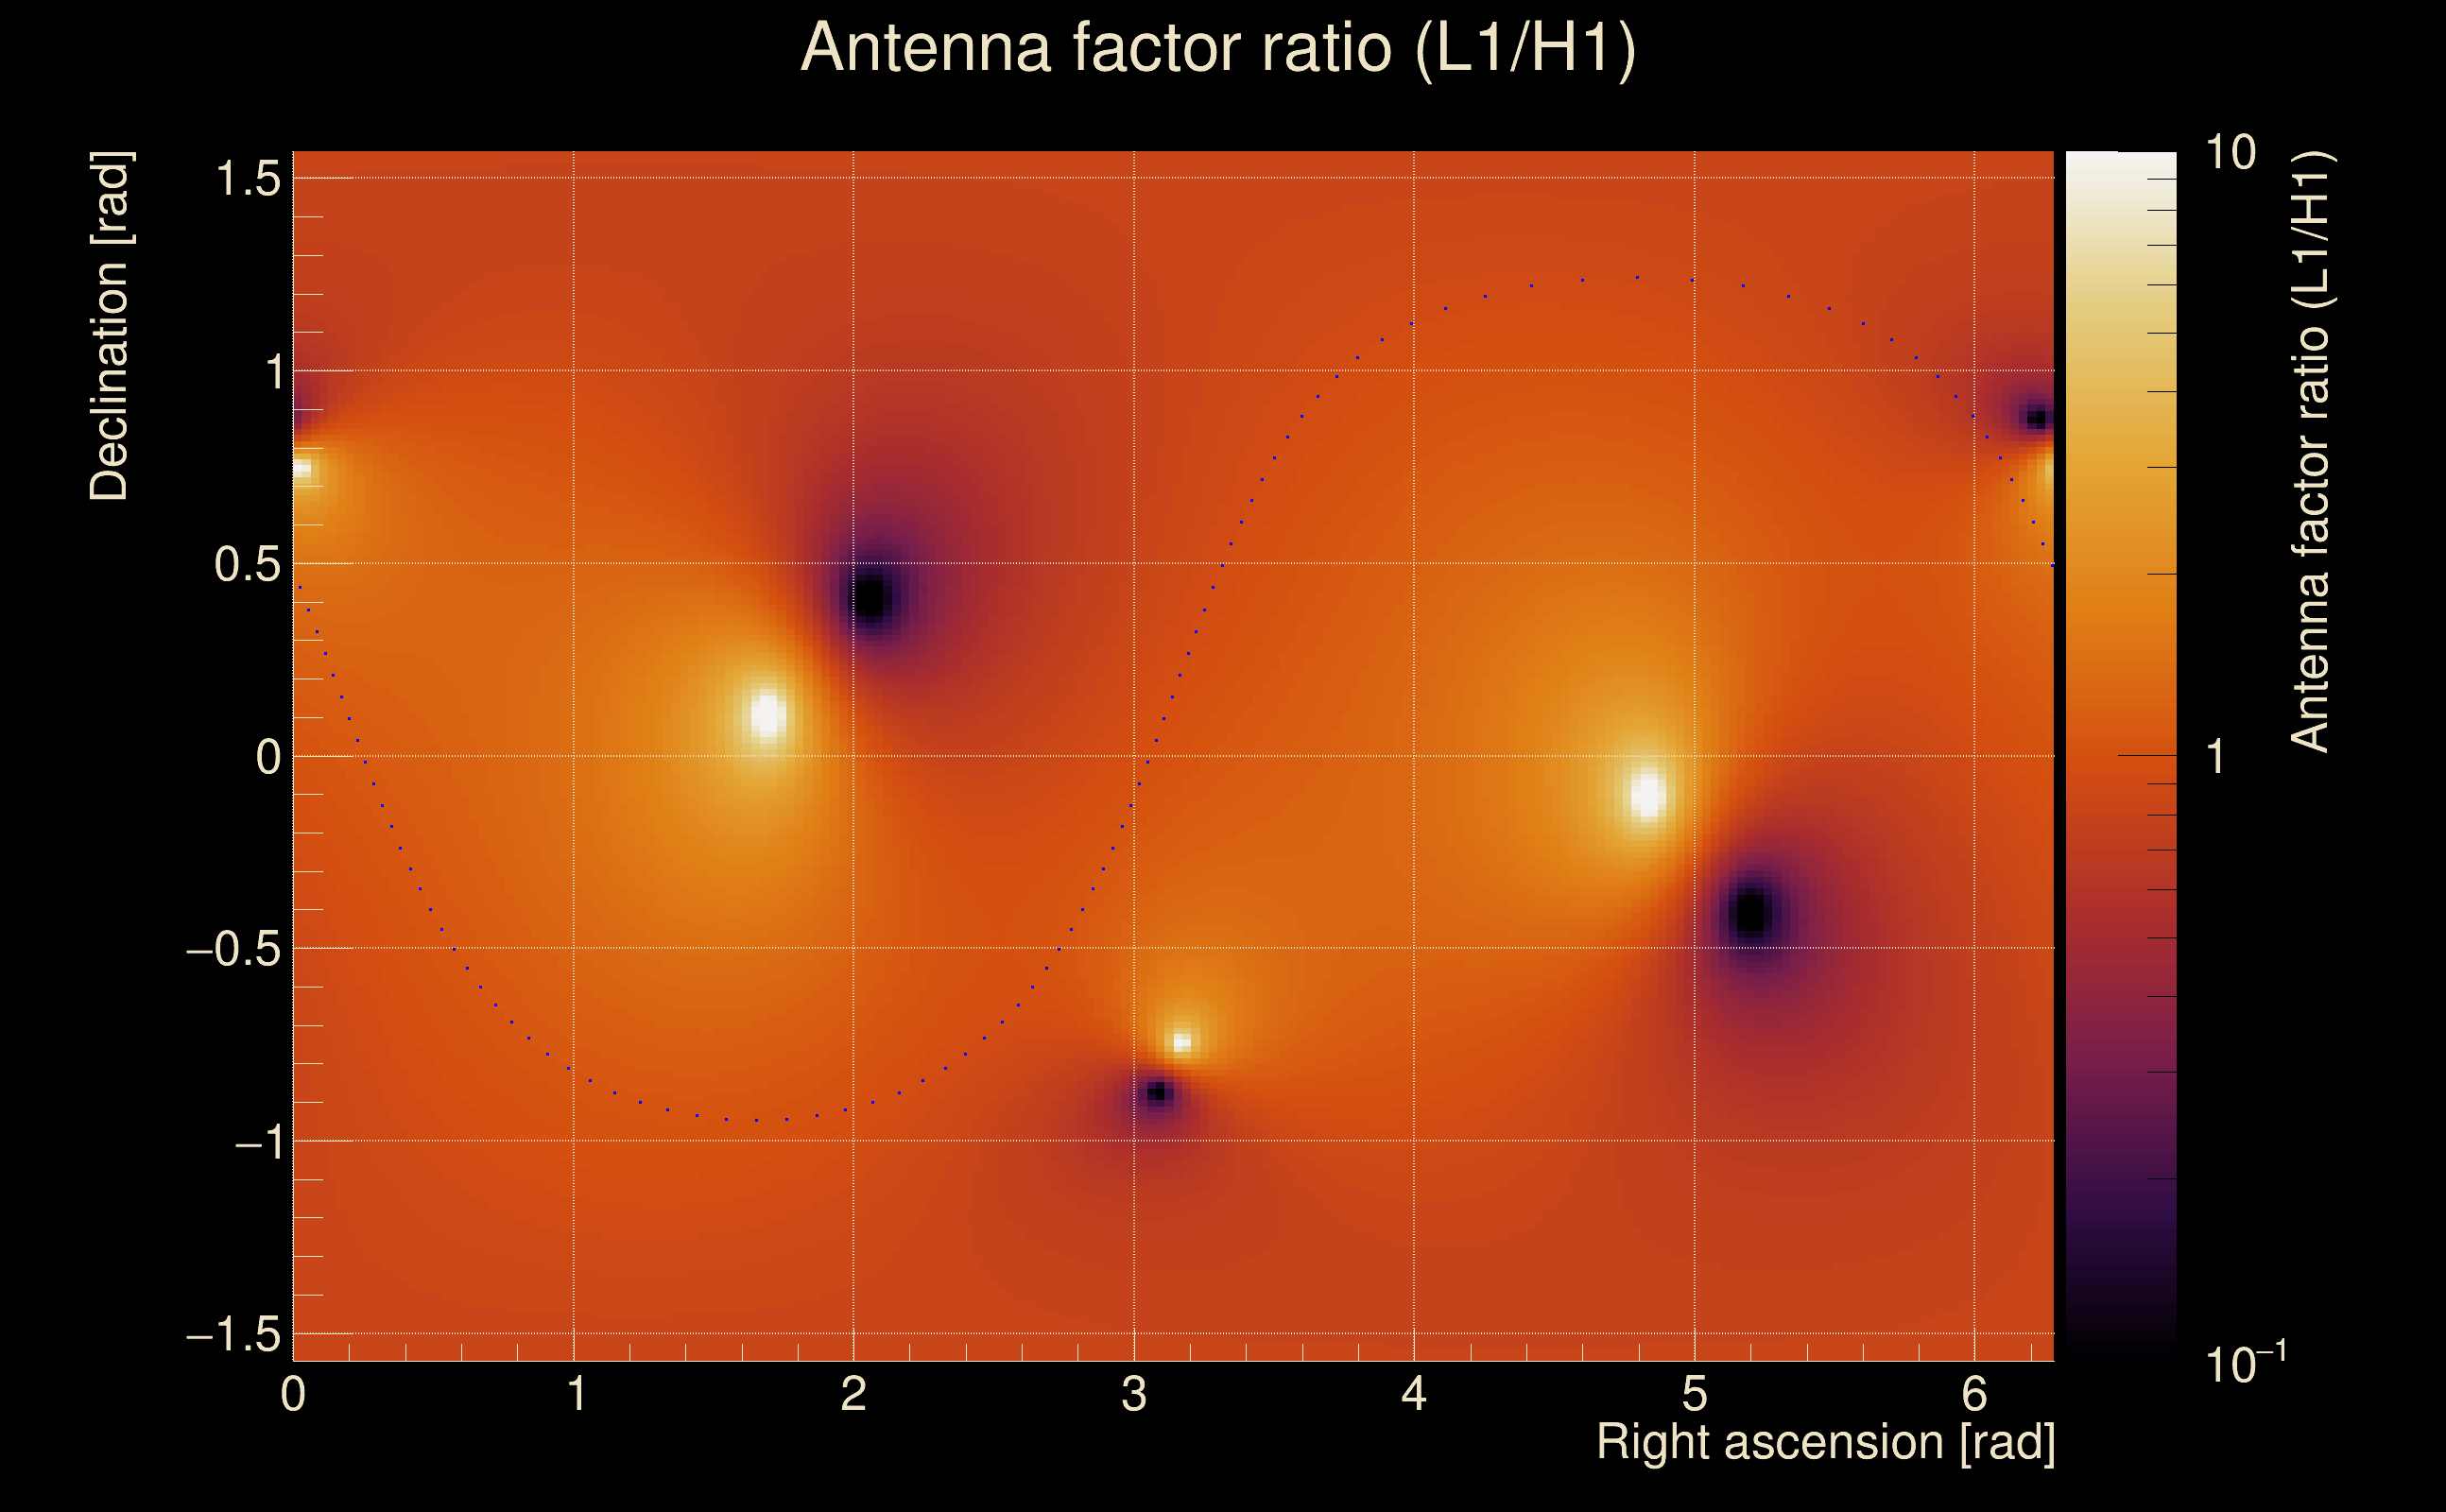
| Amplitude ratio (L1/H1): | 0.906291 ⋇ 1.48155 (L1/H1: 0.899358 ⋇ 1.7388, H1/L1: 1.09304 ⋇ 1.738) |
| Amplitude ratio H1|L1 compatibility (probability): | 0.982541 |
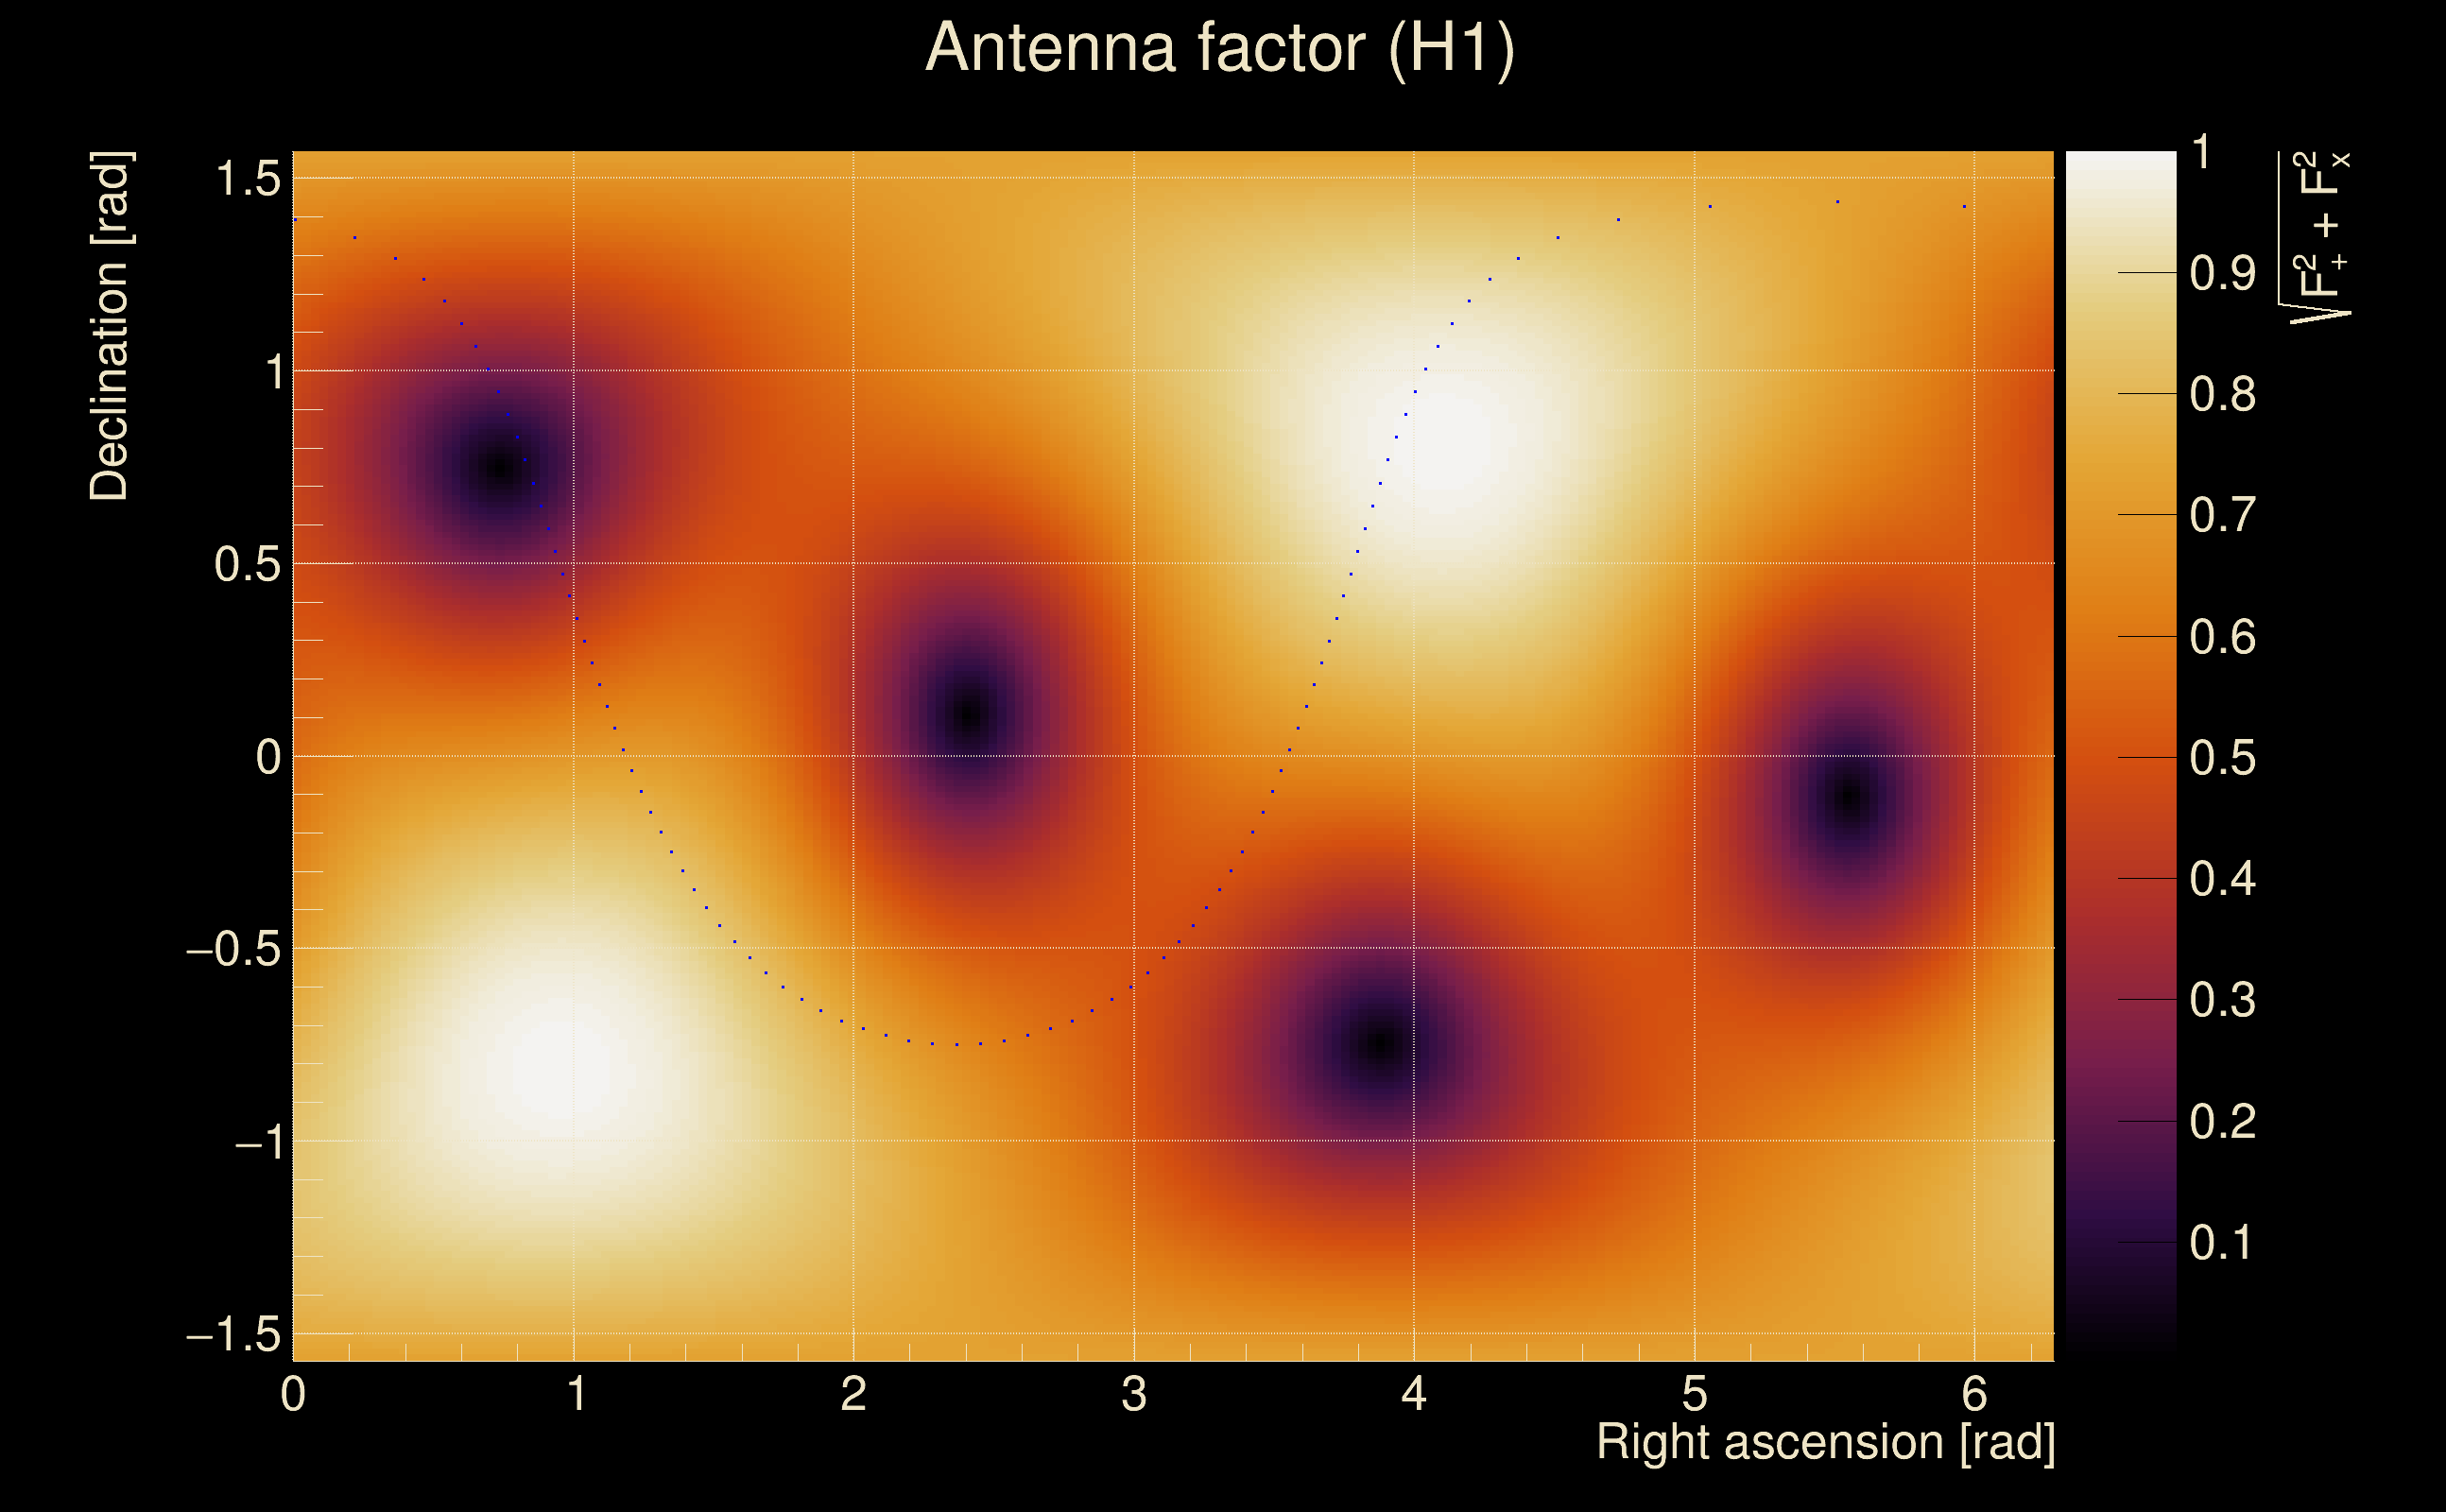
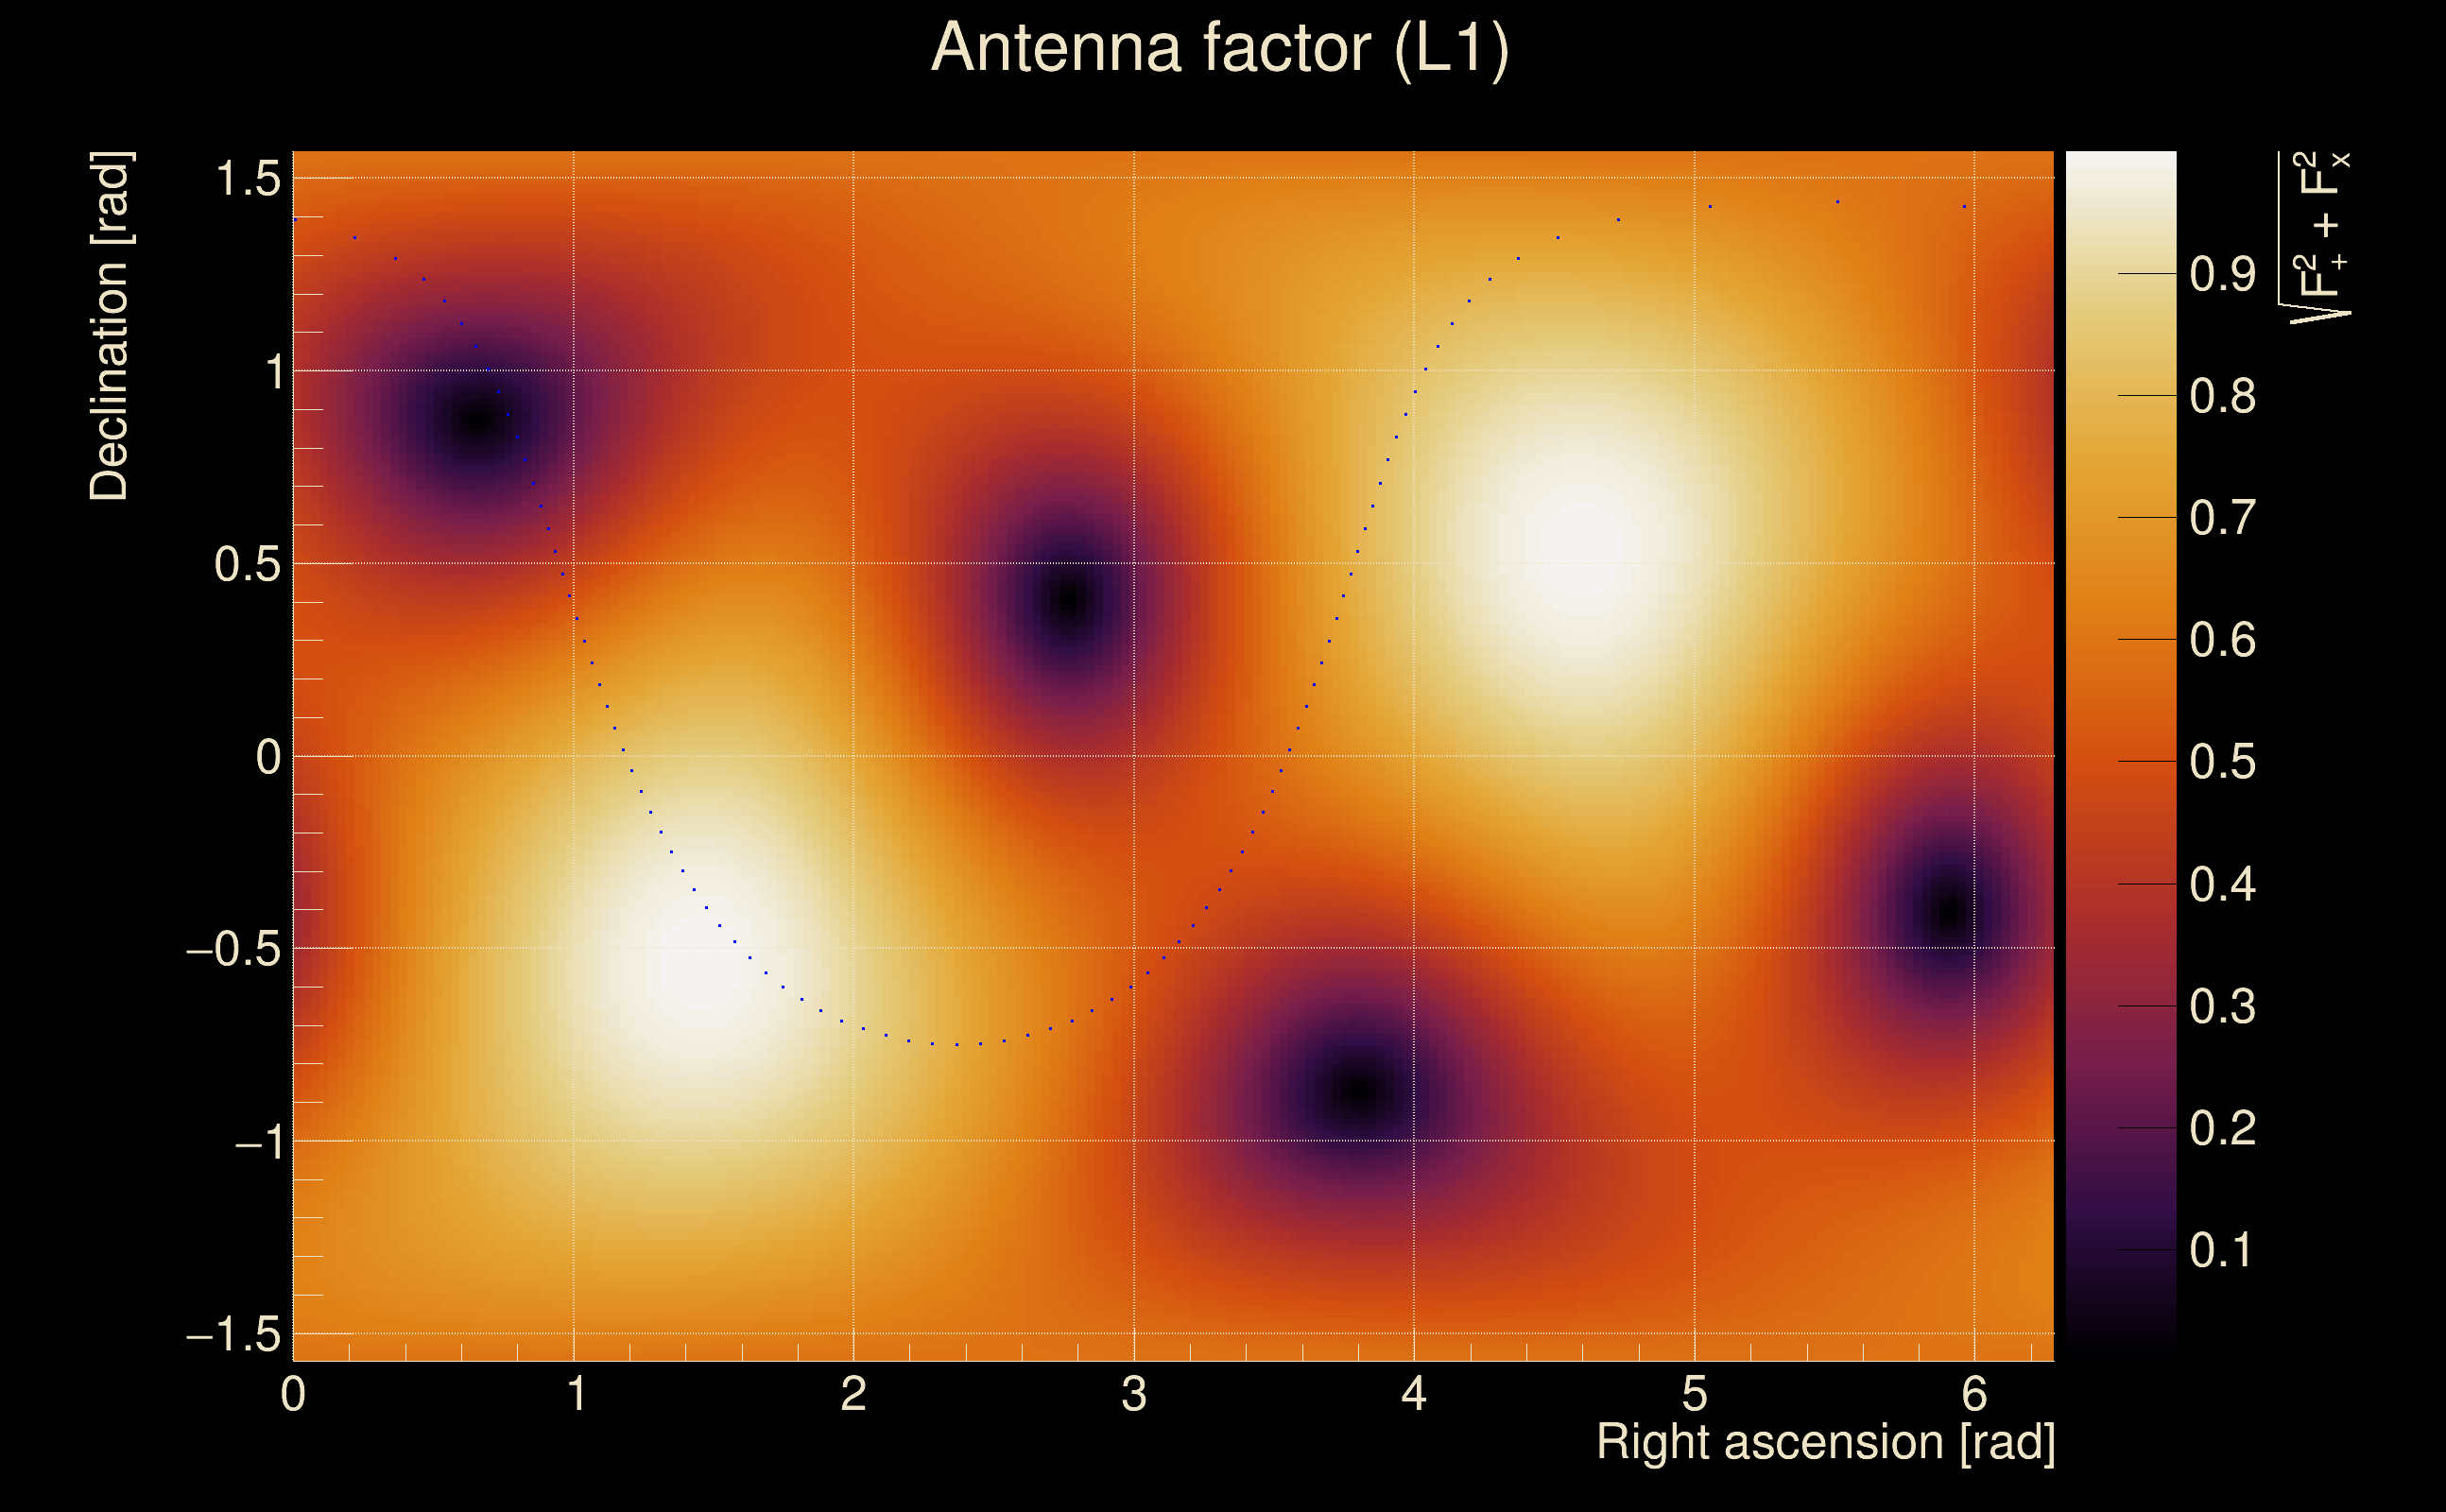
| Antenna factor probability: | 0.988819 |
| Number of rejected frequency rows: | Q0: 0 / 18, Q1: 0 / 36, Q2: 2 / 70, Q3: 7 / 134, Q4: 36 / 258 |
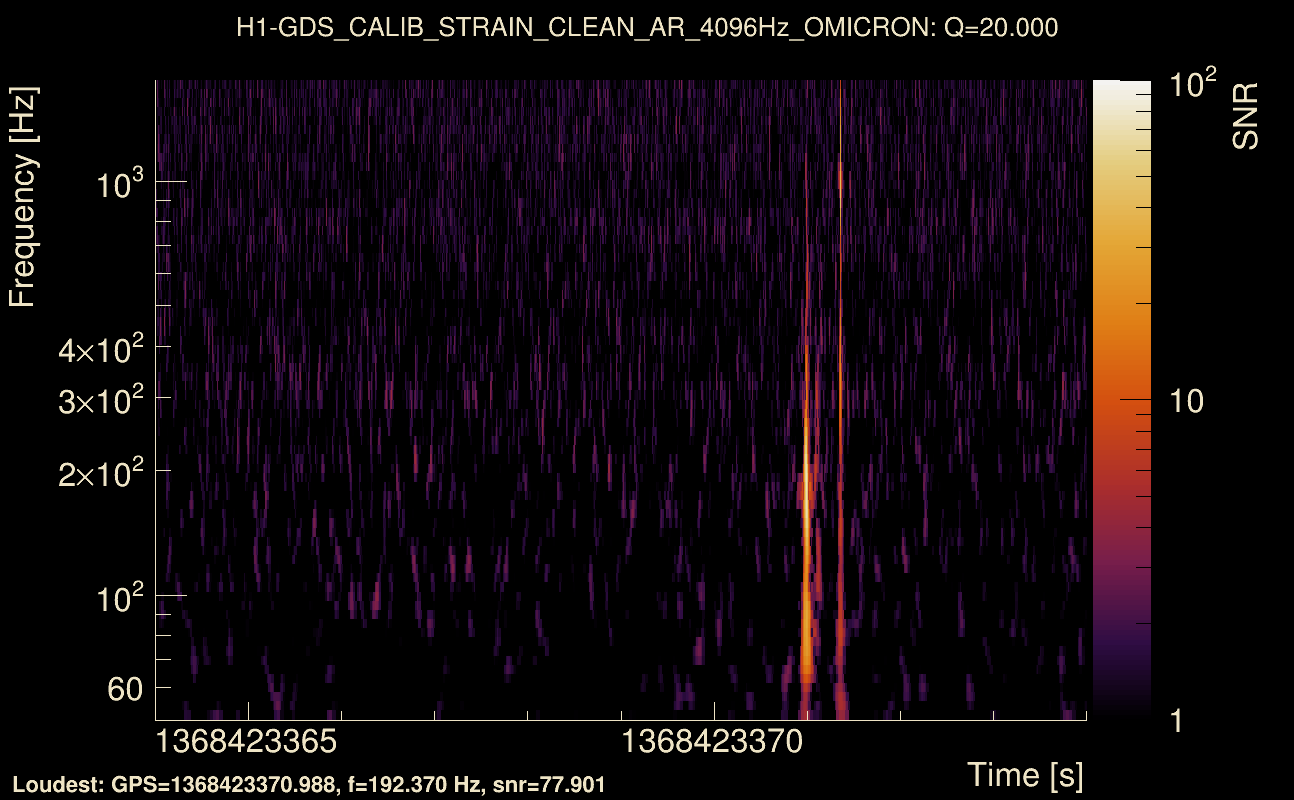
| Maximum signal-to-noise ratio: | H1: 109.369, L1: 98.6758 |
| SNR variance: | H1: 0.512168, L1: 0.486222 |
| Click here for a zoomed plot | Click here for a zoomed plot | Click here for a zoomed plot | Click here for a zoomed plot | Click here for a zoomed plot |
 |
 |
 |
 |
 |
 |
 |
 |
 |
 |
 |
 |
 |
 |
 |
 |
 |
 |
 |
 |
 |
 |
 |
 |
 |
 |
 |
 |
 |
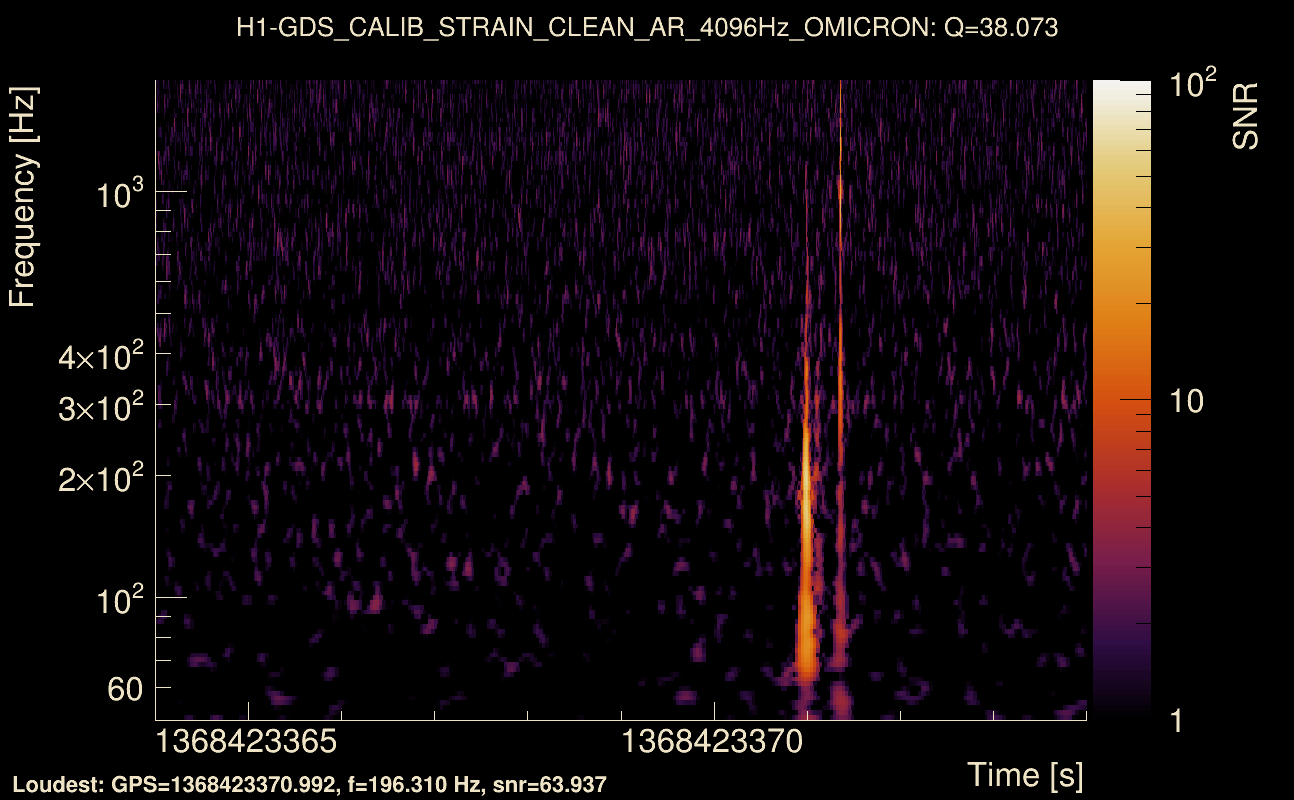
| Event time t(H1): | GPS = 1368423369 (Thu May 18 05:35:51 2023 ) → GPS = 1368423379 (Thu May 18 05:36:01 2023 ) |
| Event time t(L1): | GPS = 1368423369 (Thu May 18 05:36:01 2023 ) → GPS = 1368423379 (Thu May 18 05:36:01 2023 ) |
| Omicron analysis time window (H1): | GPS = 1368423366 → GPS = 1368423382 |
| Omicron analysis time window (L1): | GPS = 1368423366 → GPS = 1368423382 |
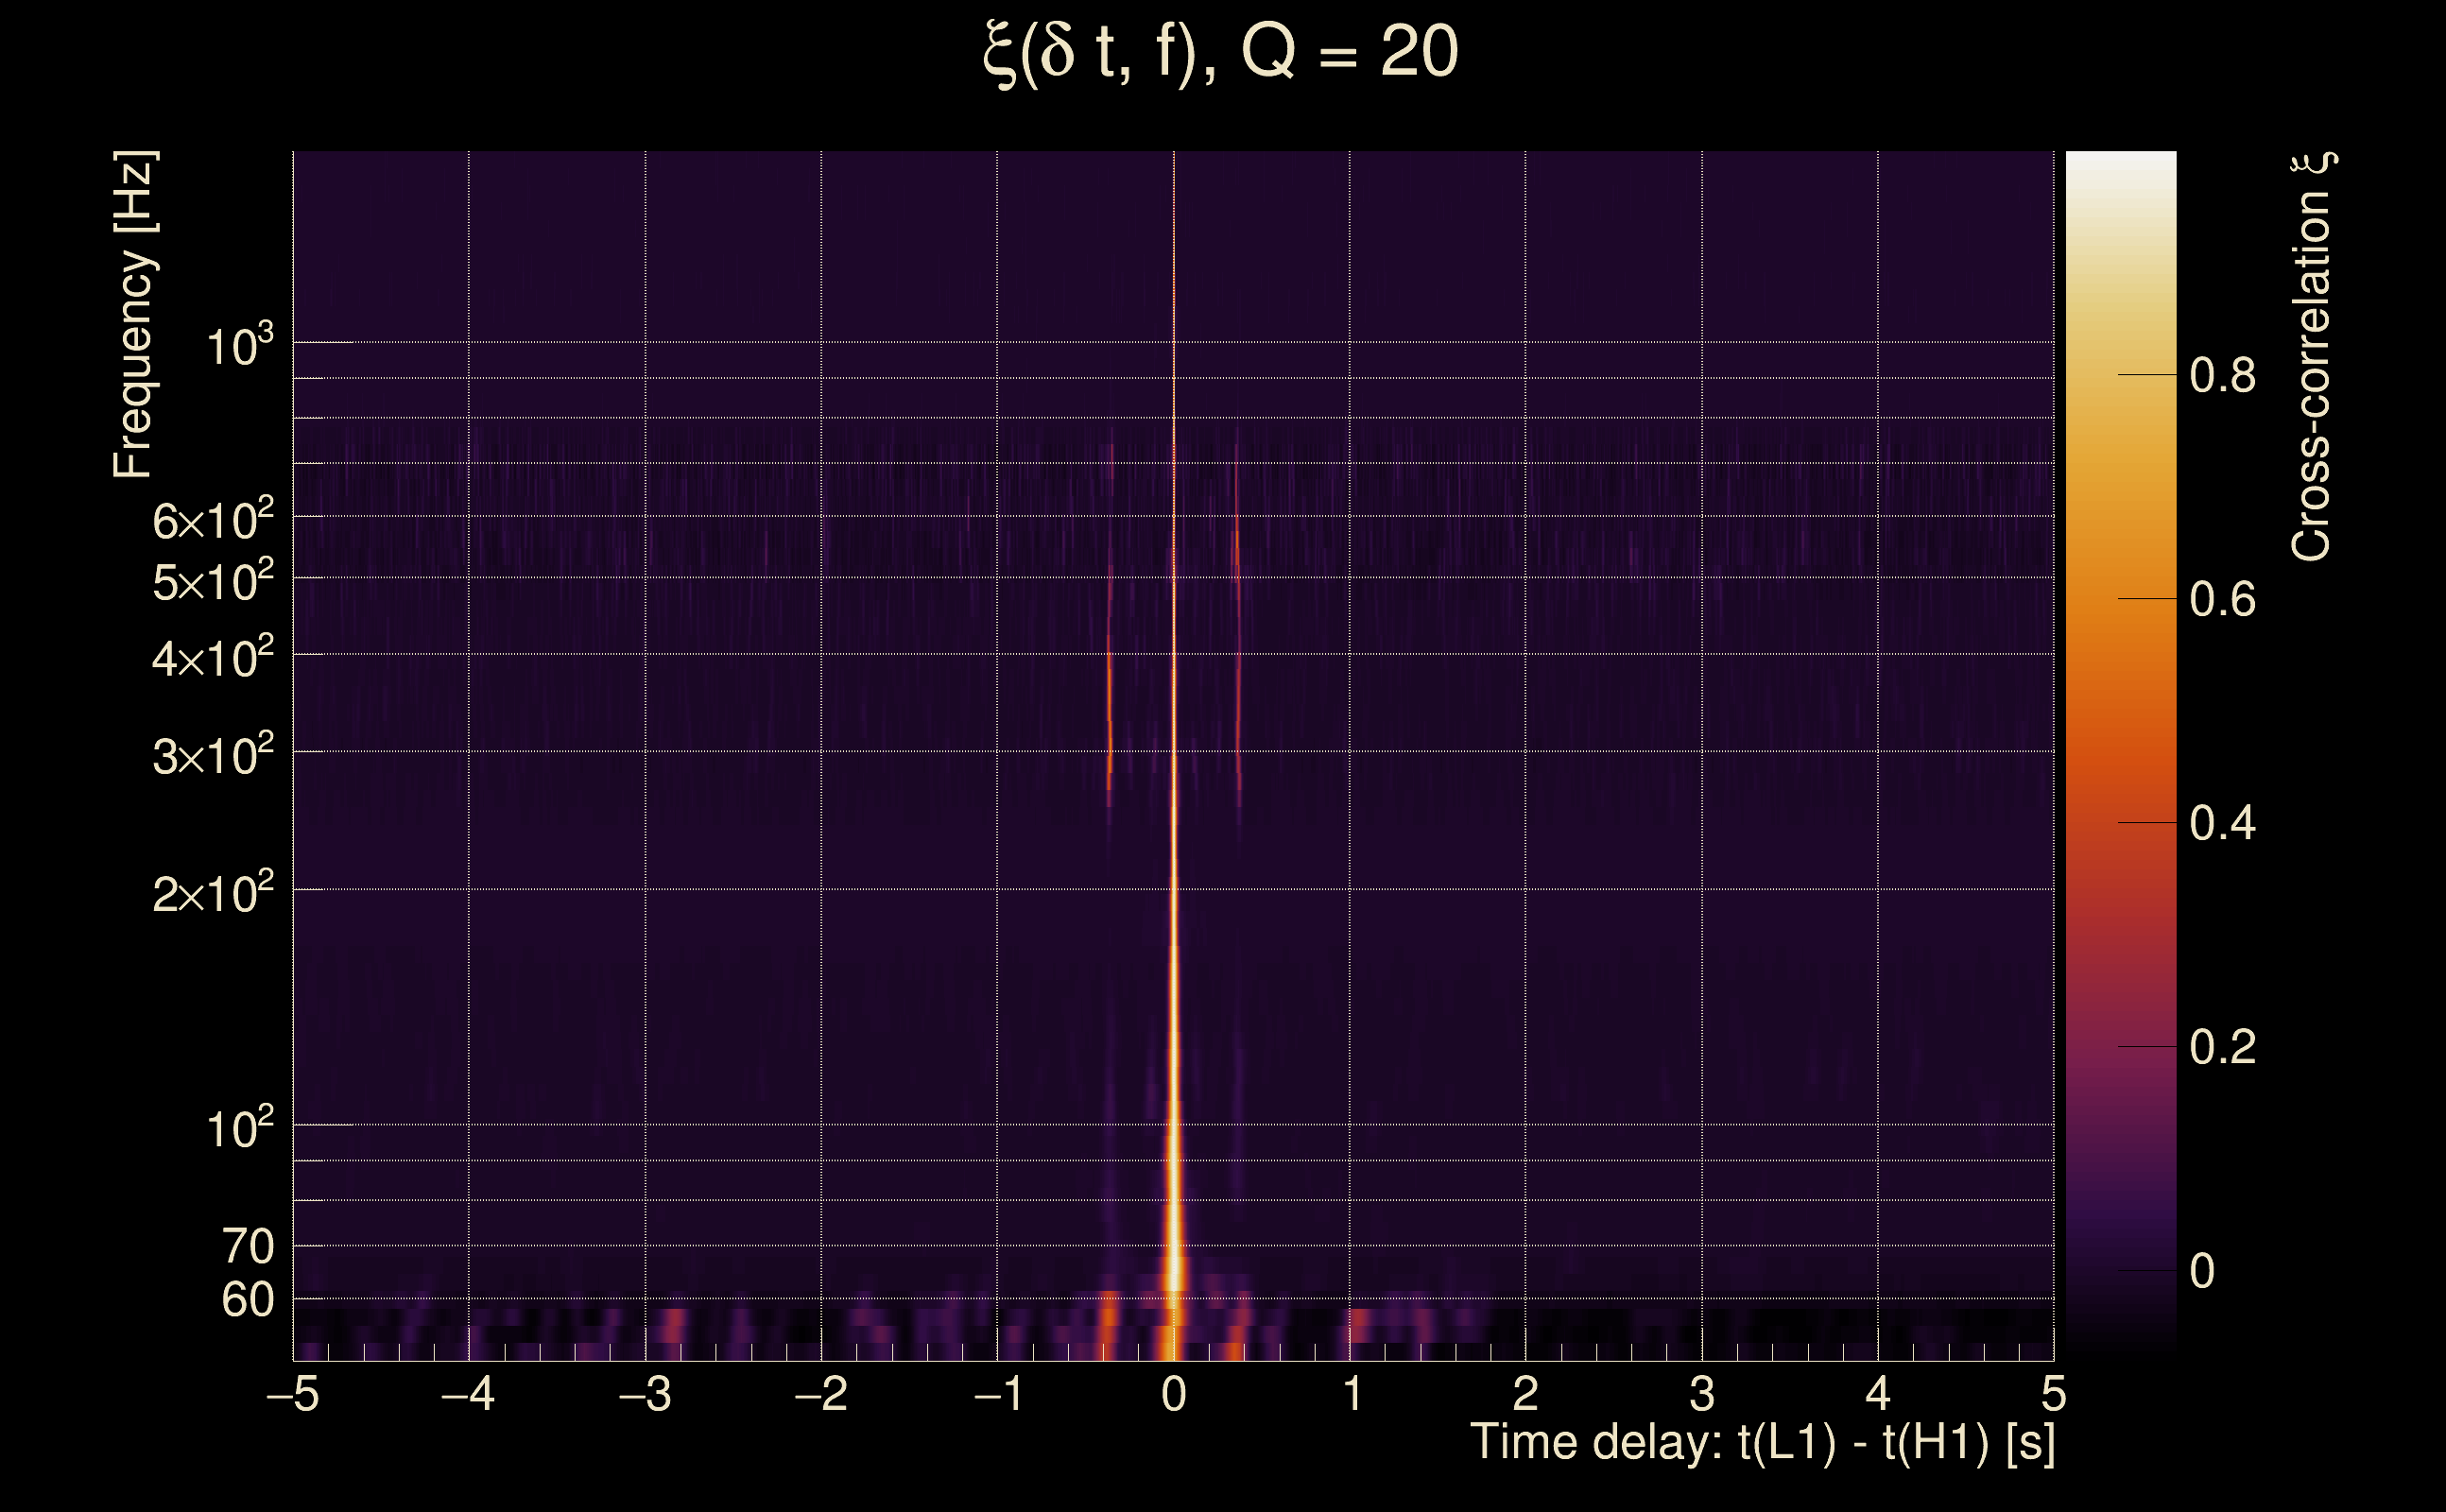
| Time delay between detectors t(L1) - t(H1): | 0.0019672 s (slice index = 108 / 217), δt_gw = 0.0019672 s |
| Time delay standard deviation: | 0.0190084 s |
| [targeted mode] Time delay probability: | 0.999991 (1.10885e-05 sigmas), δt_target = 0.00196552 s |
| Frequency: | 293.456 Hz |
| Ξ: | 0.958571 ± 0.019554 (variance = 0.000382361): Q0: 0.98159, Q1: 0.963183, Q2: 0.945164, Q3: 0.935667, Q4: 0.927351 |
| Rank: | R_A = 0.92474 |
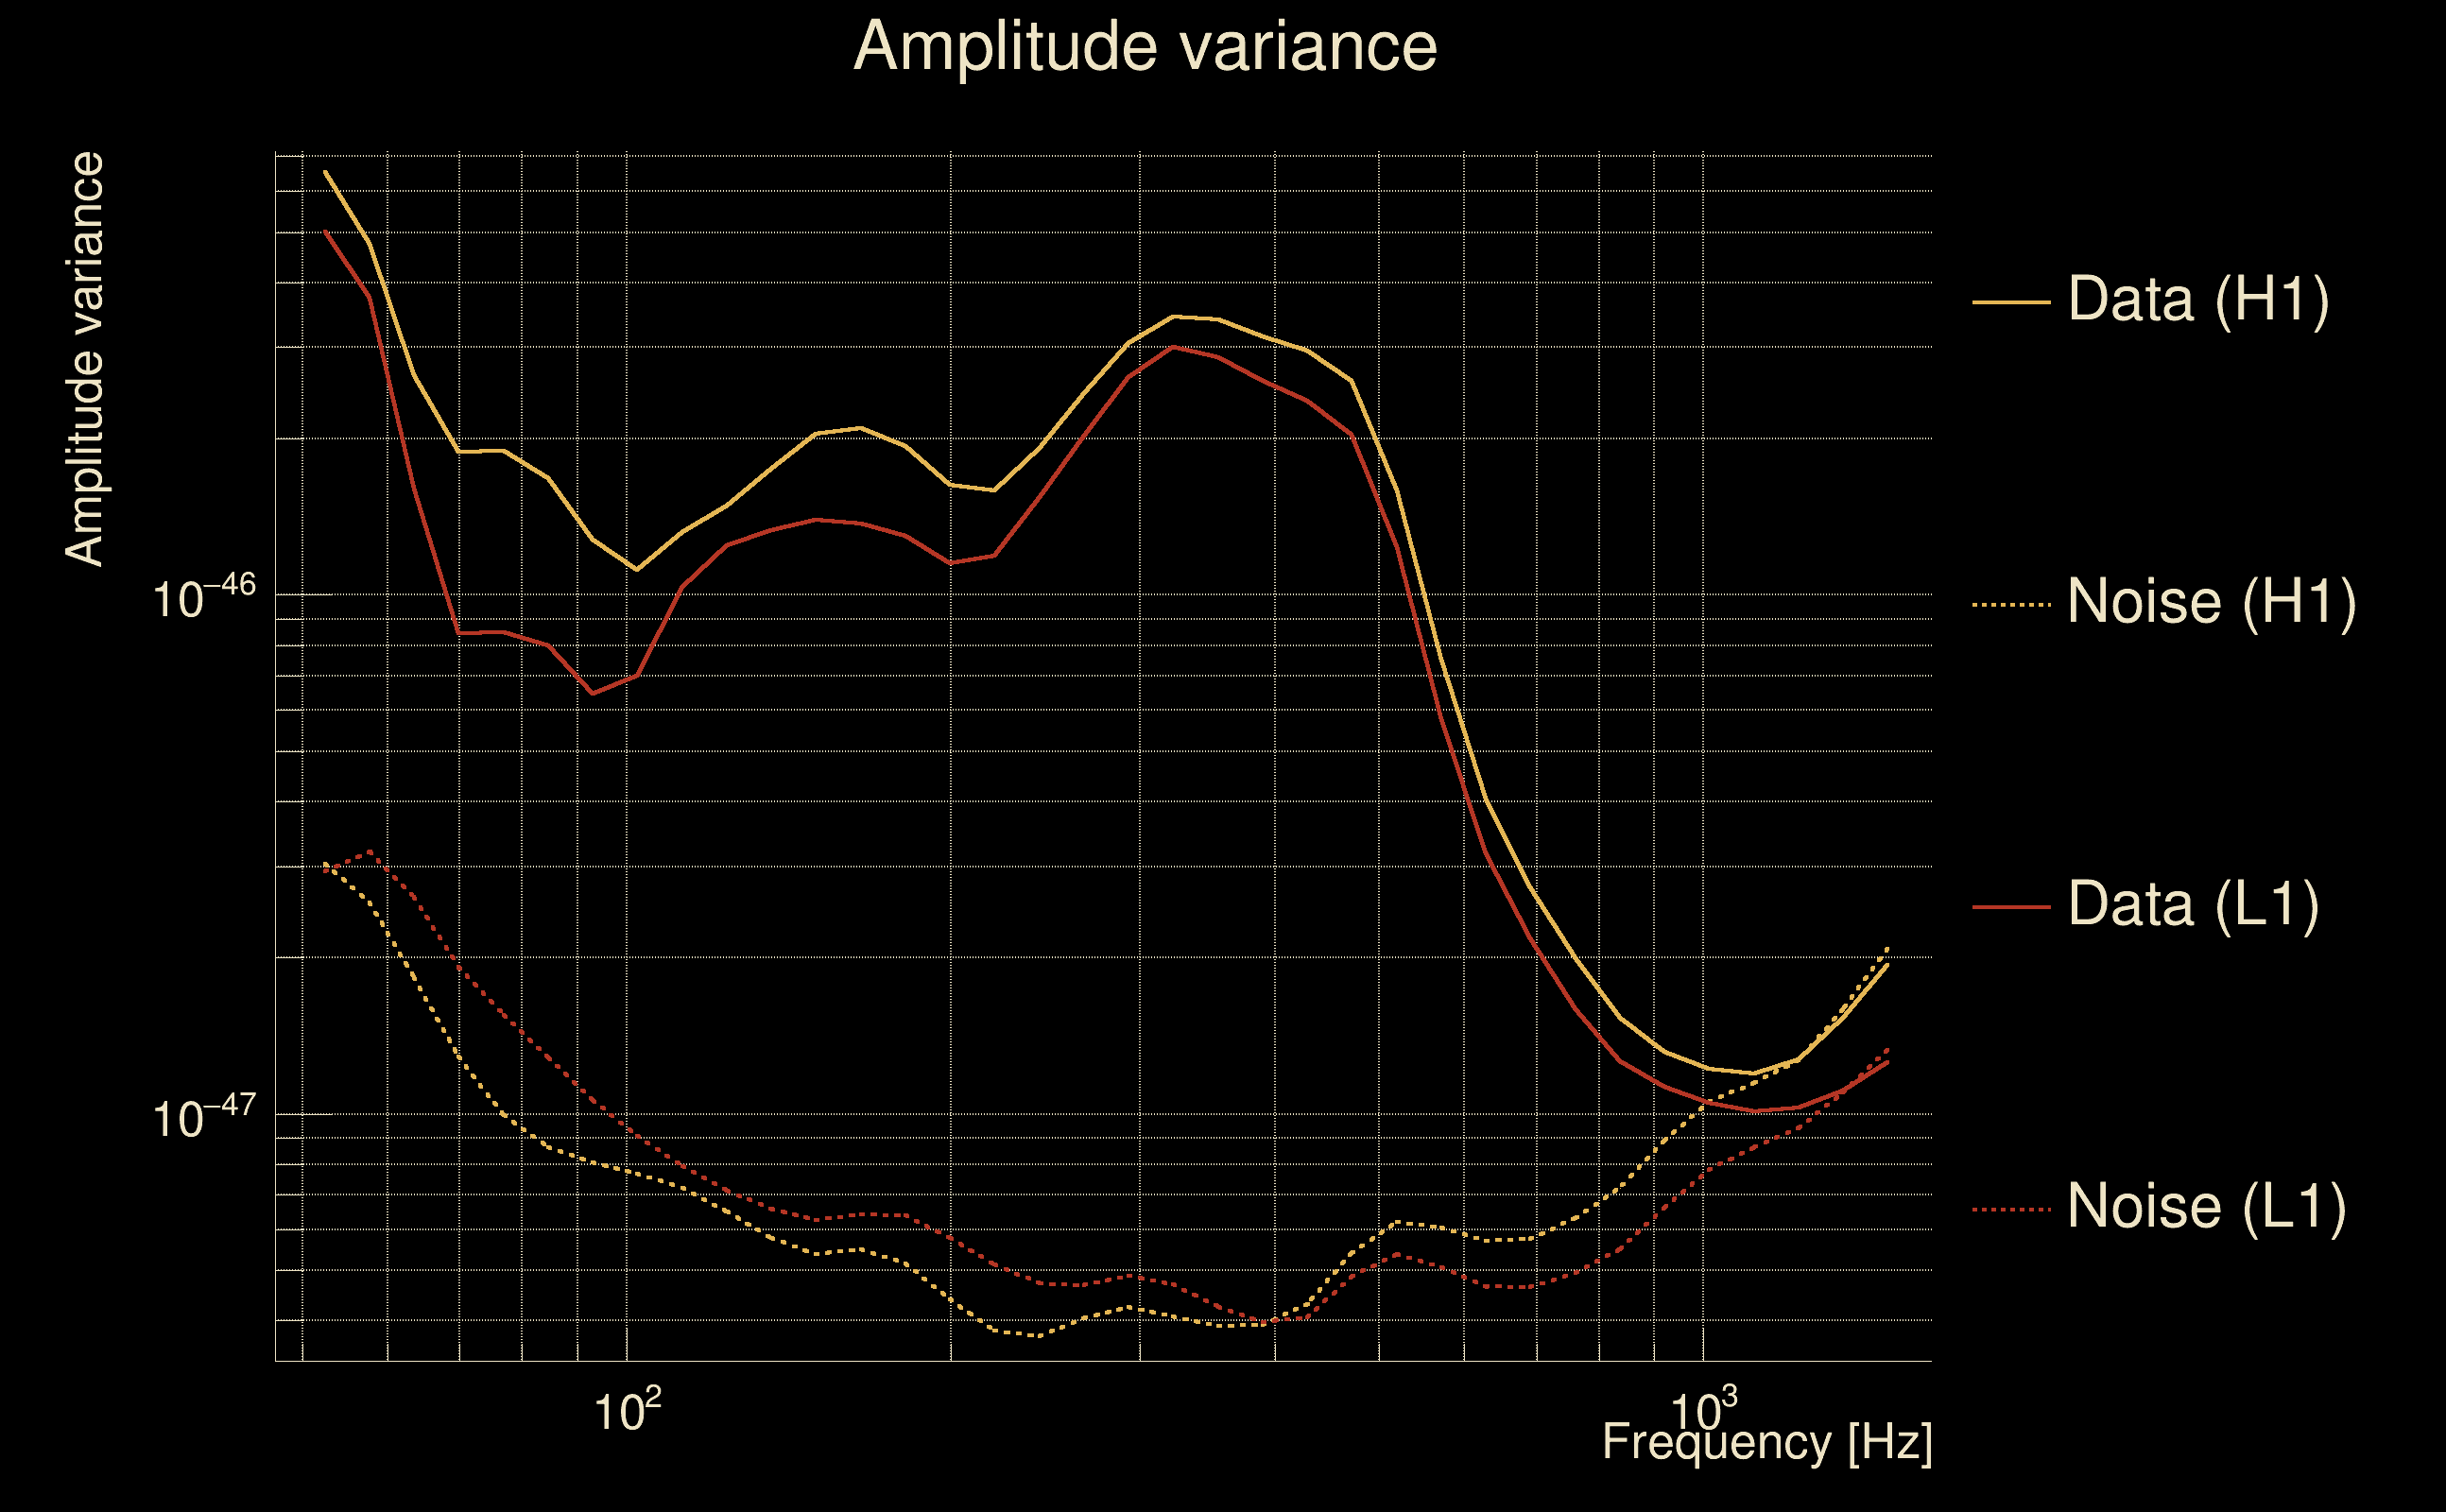
| Log of amplitude ratio (L1/H1): | -0.0980542, variance = 0.154051 (L1/H1: -0.109142, variance = 0.305078, H1/L1: 0.0844596, variance = 0.304772) |
| Amplitude ratio (L1/H1): | 0.9066 ⋇ 1.48067 (L1/H1: 0.896604 ⋇ 1.73731, H1/L1: 1.08813 ⋇ 1.73683) |
| Amplitude ratio H1|L1 compatibility (probability): | 0.974786 |
| Antenna factor probability: | 0.989669 |
| Number of rejected frequency rows: | Q0: 0 / 18, Q1: 0 / 36, Q2: 1 / 70, Q3: 6 / 134, Q4: 30 / 258 |
| Maximum signal-to-noise ratio: | H1: 108.802, L1: 98.2581 |
| SNR variance: | H1: 3.81248, L1: 3.28612 |
| Click here for a zoomed plot | Click here for a zoomed plot | Click here for a zoomed plot | Click here for a zoomed plot | Click here for a zoomed plot |
 |
 |
 |
 |
 |
 |
 |
 |
 |
 |
 |
 |
 |
 |
 |
 |
 |
 |
 |
 |
 |
 |
 |
 |
 |
 |
 |
 |
 |
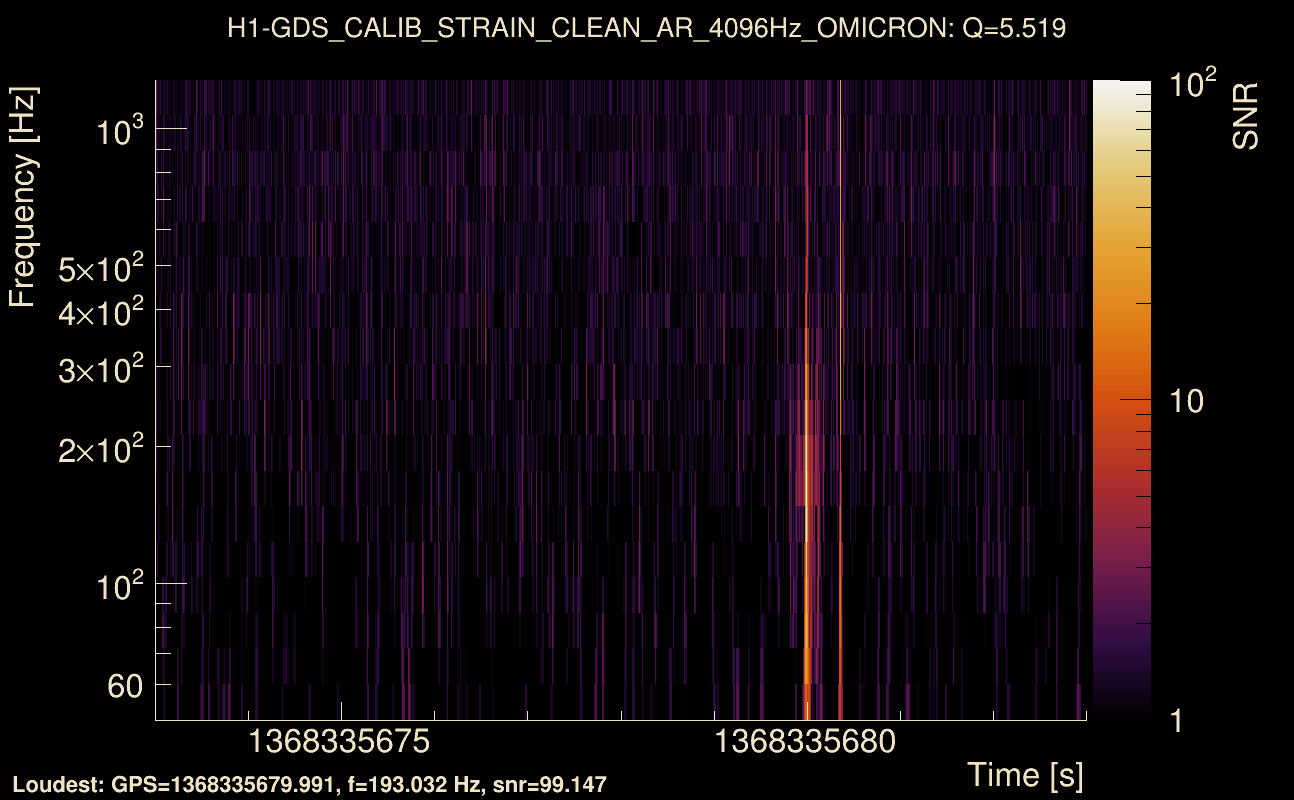
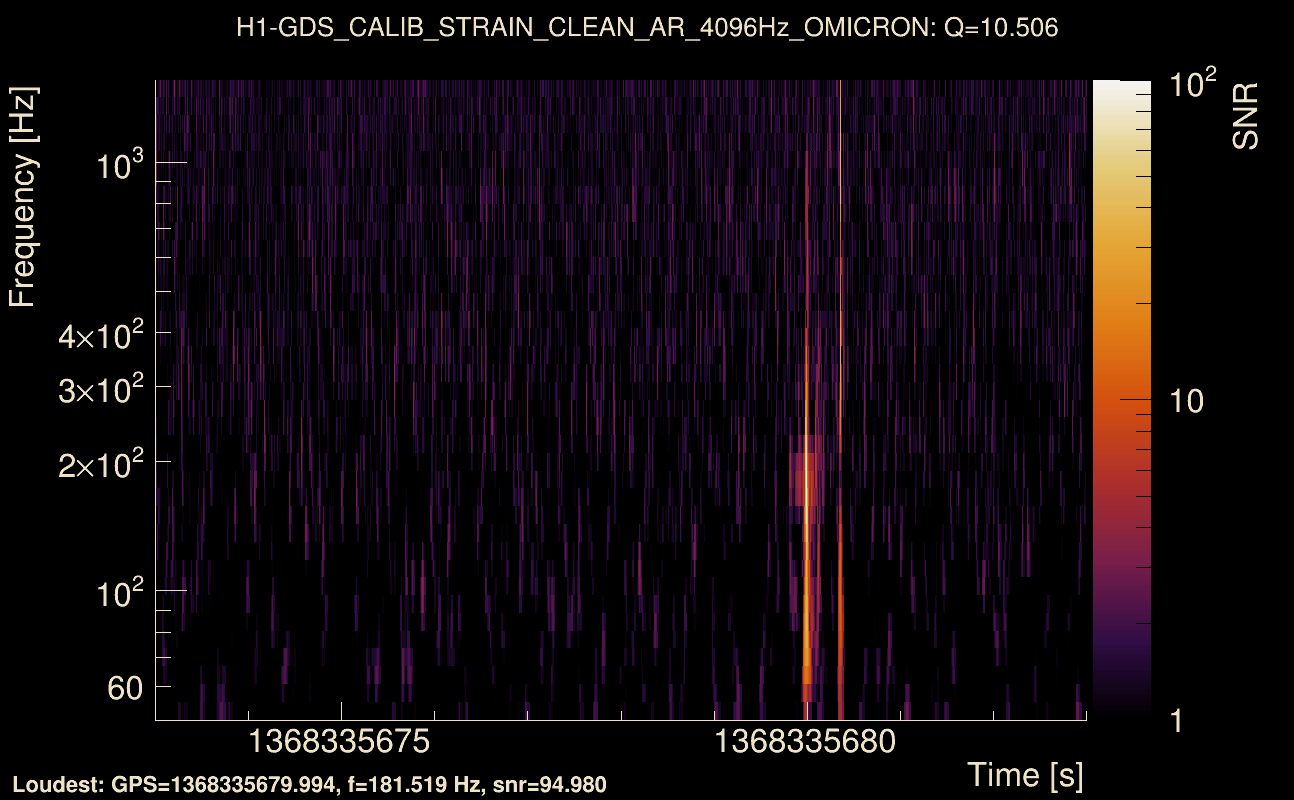
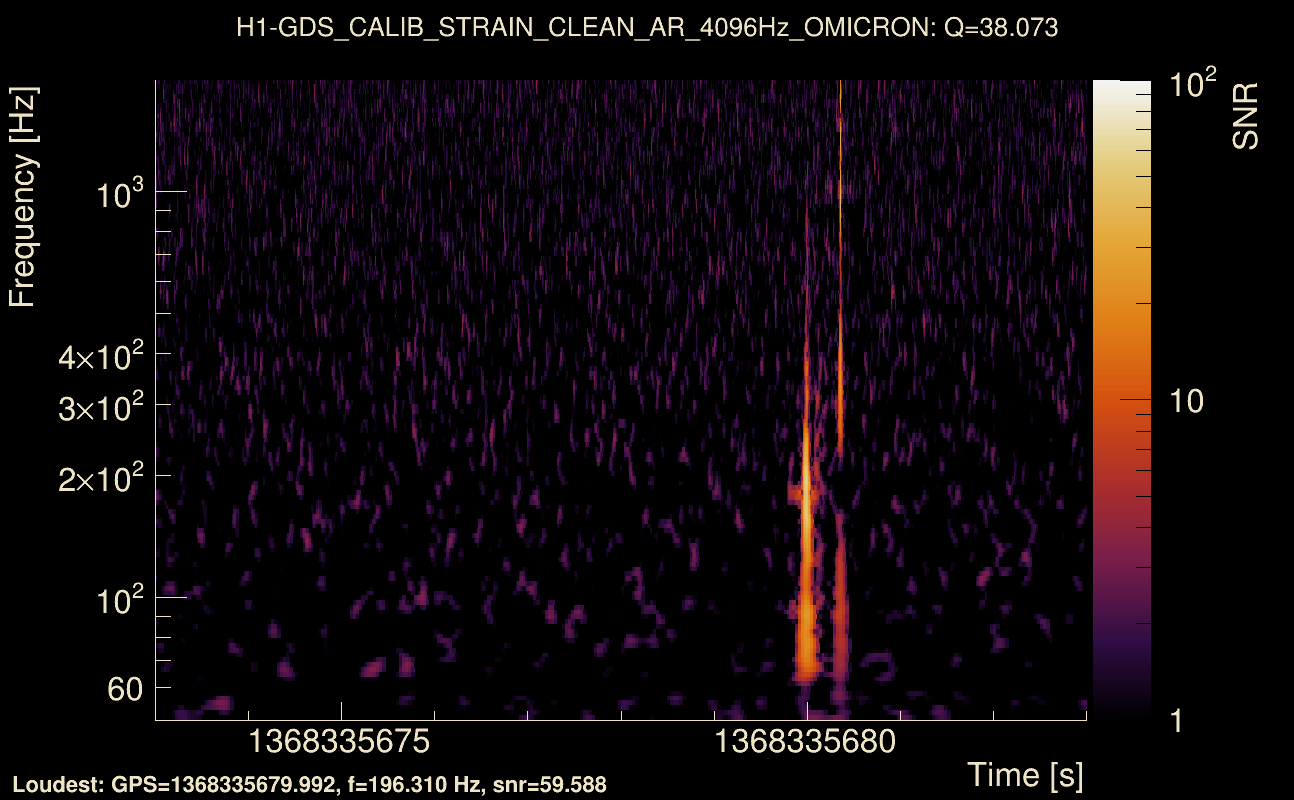
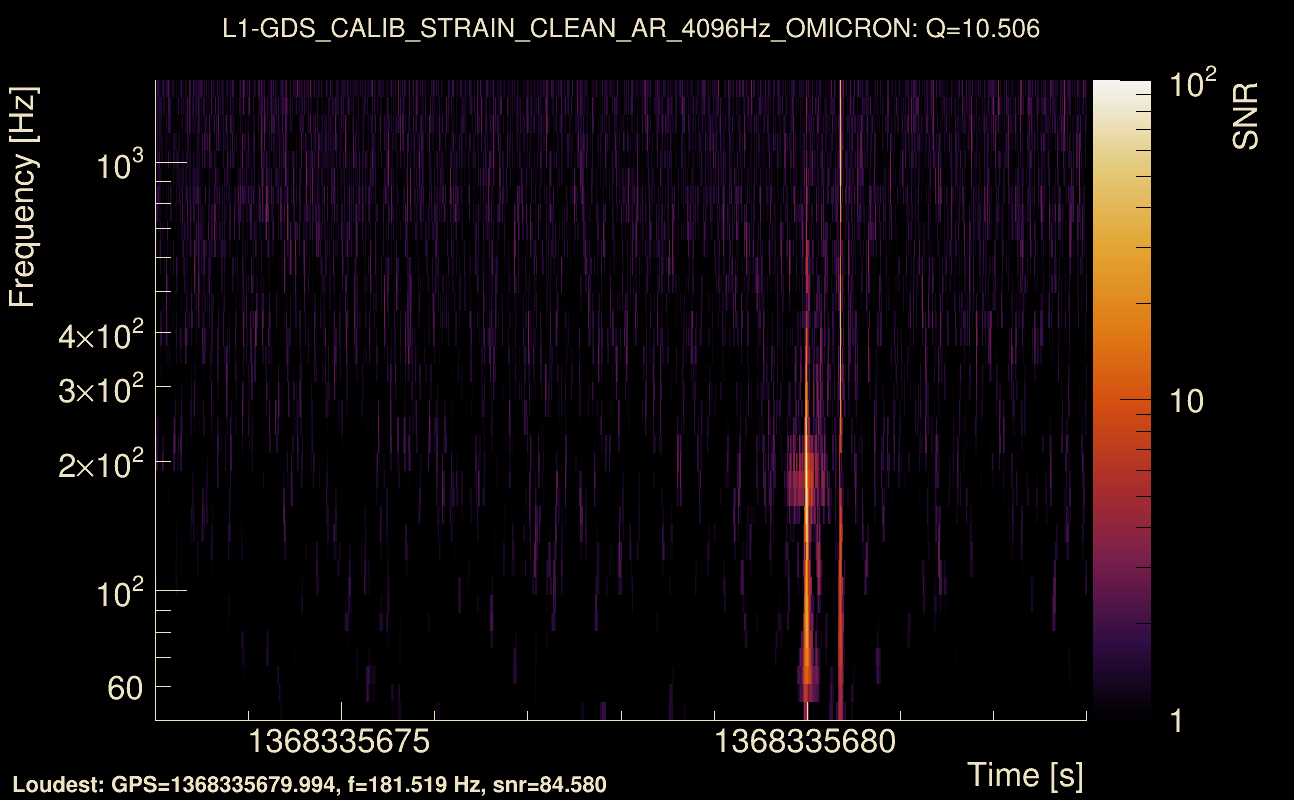
| Event time t(H1): | GPS = 1368335673 (Wed May 17 05:14:15 2023 ) → GPS = 1368335683 (Wed May 17 05:14:25 2023 ) |
| Event time t(L1): | GPS = 1368335673 (Wed May 17 05:14:25 2023 ) → GPS = 1368335683 (Wed May 17 05:14:25 2023 ) |
| Omicron analysis time window (H1): | GPS = 1368335670 → GPS = 1368335686 |
| Omicron analysis time window (L1): | GPS = 1368335670 → GPS = 1368335686 |
| Time delay between detectors t(L1) - t(H1): | 0.00147564 s (slice index = 108 / 217), δt_gw = 0.00147564 s |
| Time delay standard deviation: | 0.0275081 s |
| [targeted mode] Time delay probability: | 0.955953 (0.0552332 sigmas), δt_target = 0.00196719 s |
| Frequency: | 282.937 Hz |
| Ξ: | 0.940277 ± 0.0011007 (variance = 1.21154e-06): Q0: 0.950842, Q1: 0.948854, Q2: 0.947605, Q3: 0.949463, Q4: 0.948305 |
| Rank: | R_A = 0.876389 |
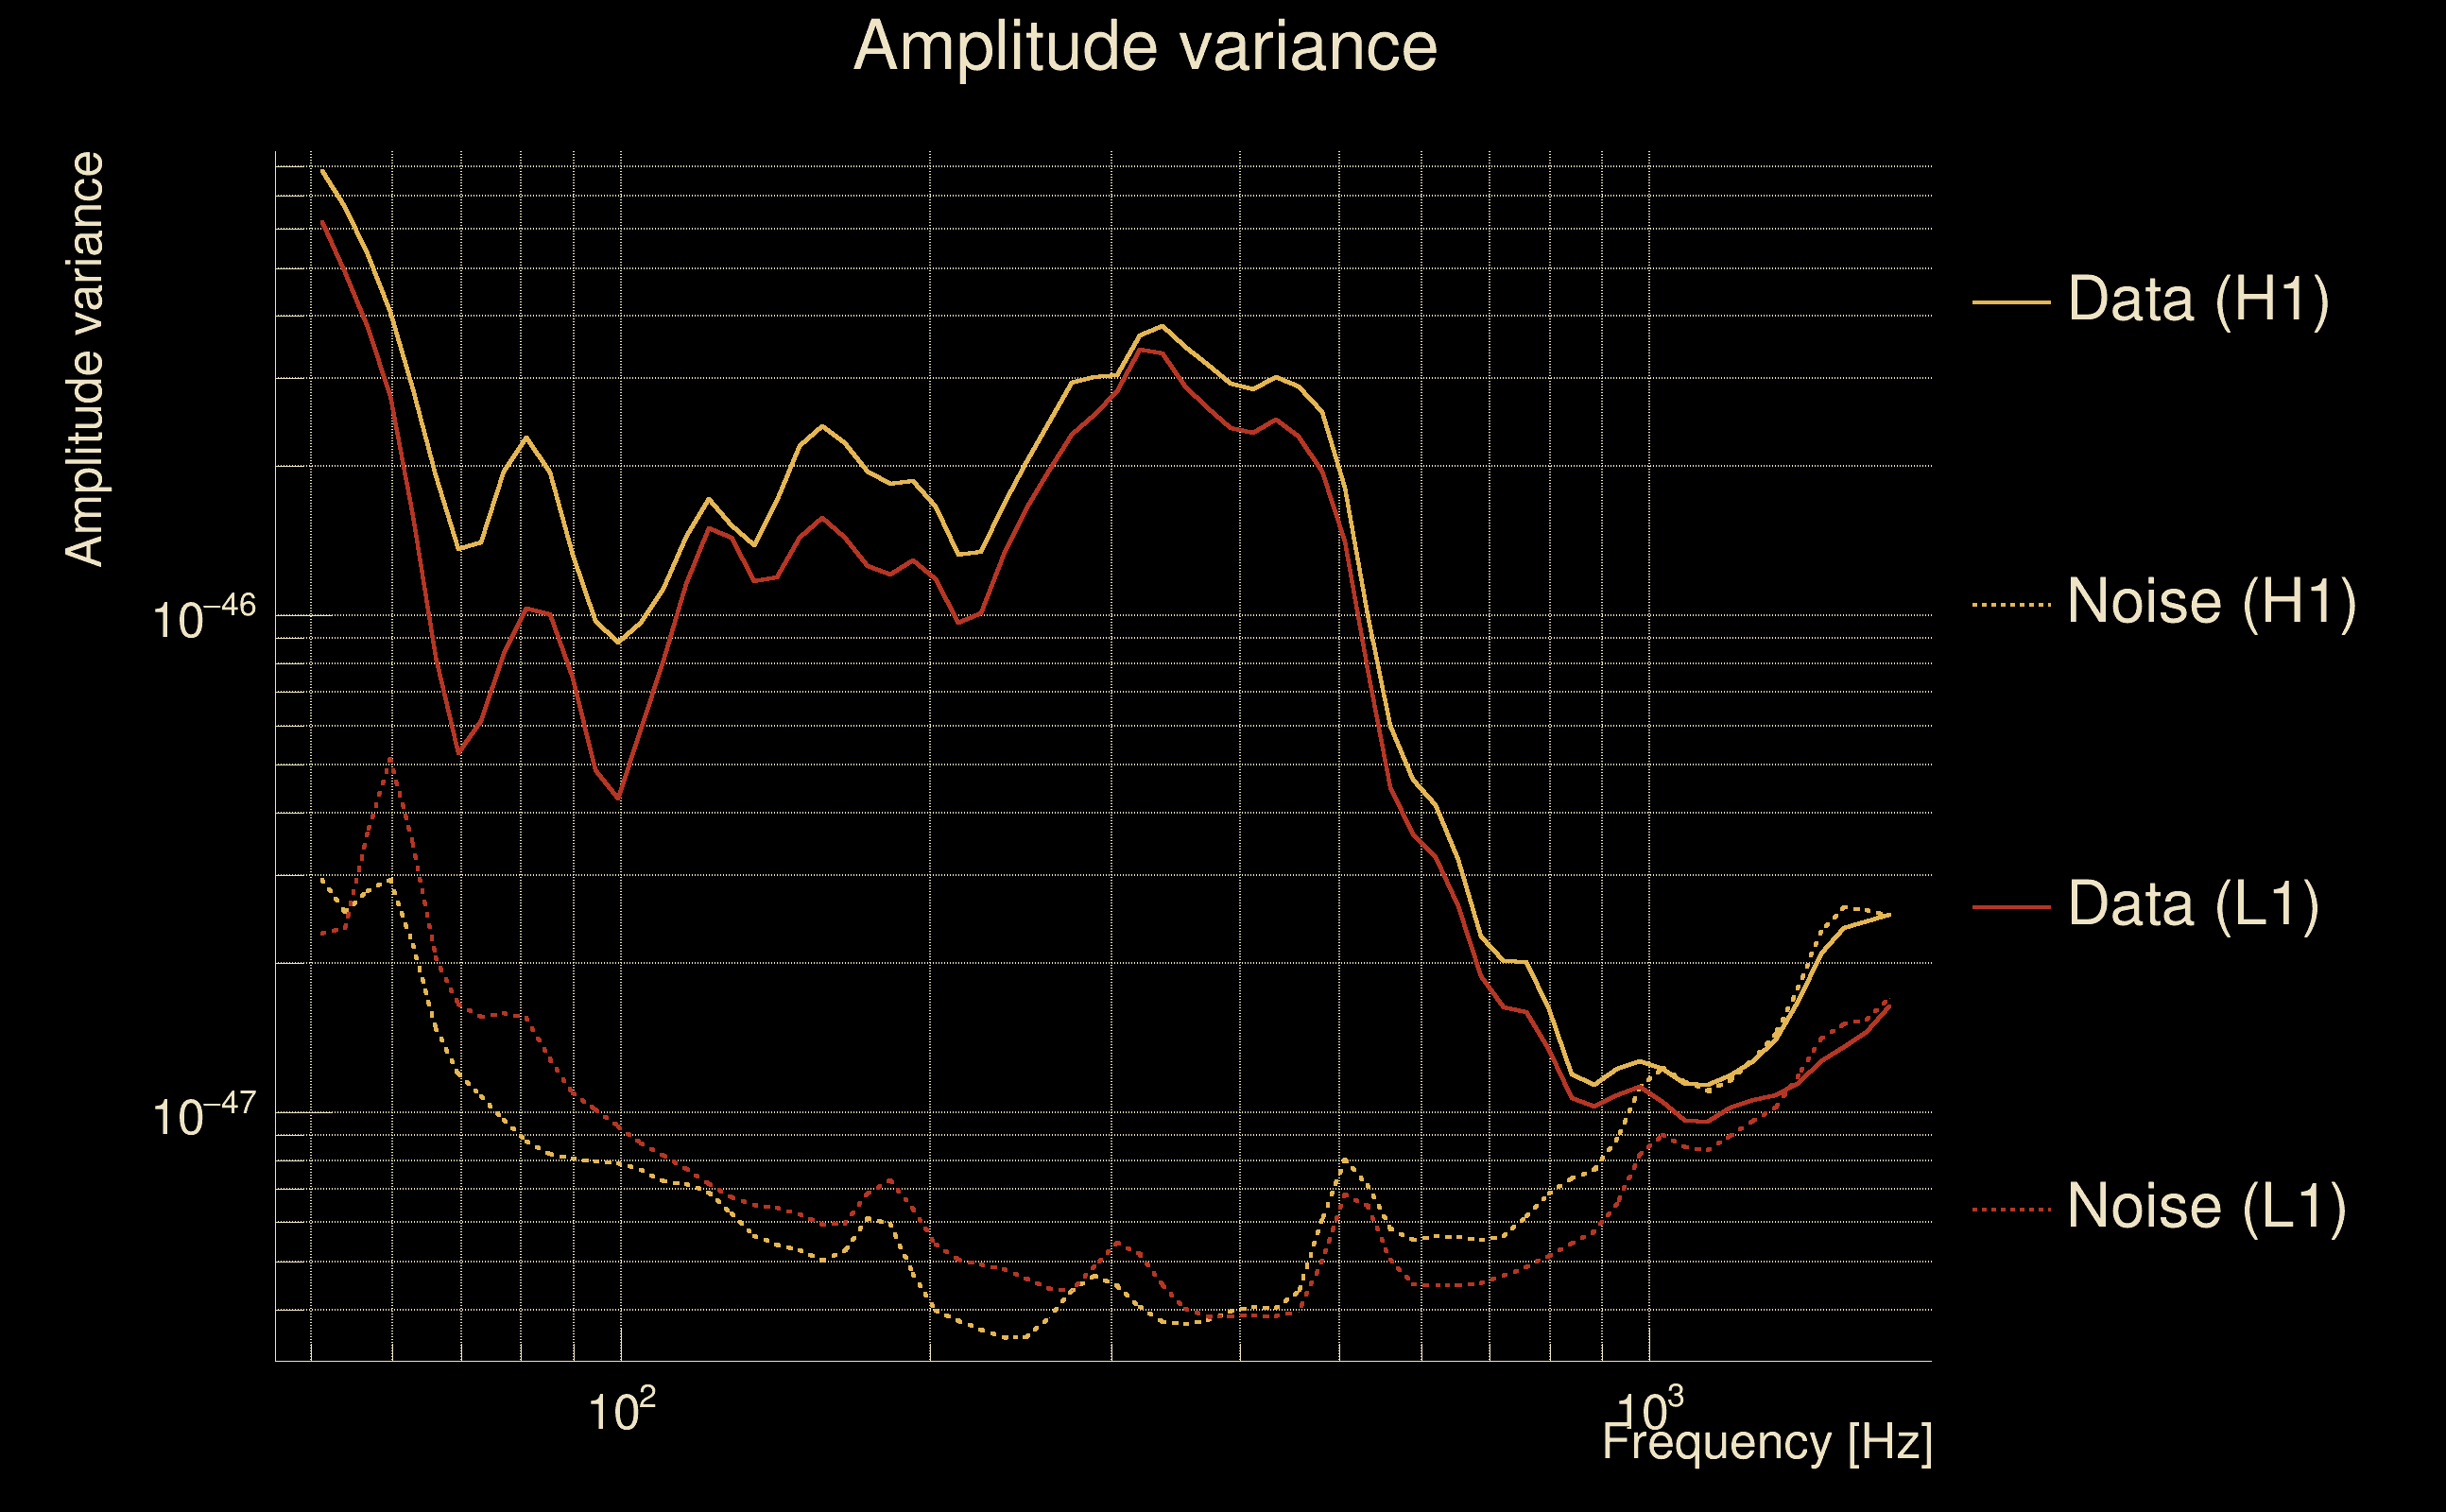
| Log of amplitude ratio (L1/H1): | -0.0654342, variance = 0.153369 (L1/H1: -0.0751072, variance = 0.306743, H1/L1: 0.0552064, variance = 0.306228) |
| Amplitude ratio (L1/H1): | 0.936661 ⋇ 1.47938 (L1/H1: 0.927644 ⋇ 1.73993, H1/L1: 1.05676 ⋇ 1.73912) |
| Amplitude ratio H1|L1 compatibility (probability): | 0.979721 |
| Antenna factor probability: | 0.995182 |
| Number of rejected frequency rows: | Q0: 0 / 18, Q1: 0 / 36, Q2: 1 / 70, Q3: 8 / 134, Q4: 29 / 258 |
| Maximum signal-to-noise ratio: | H1: 106.39, L1: 103.464 |
| SNR variance: | H1: 0.512215, L1: 0.505788 |
| Click here for a zoomed plot | Click here for a zoomed plot | Click here for a zoomed plot | Click here for a zoomed plot | Click here for a zoomed plot |
 |
 |
 |
 |
 |
 |
 |
 |
 |
 |
 |
 |
 |
 |
 |
 |
 |
 |
 |
 |
 |
 |
 |
 |
 |
 |
 |
 |
 |
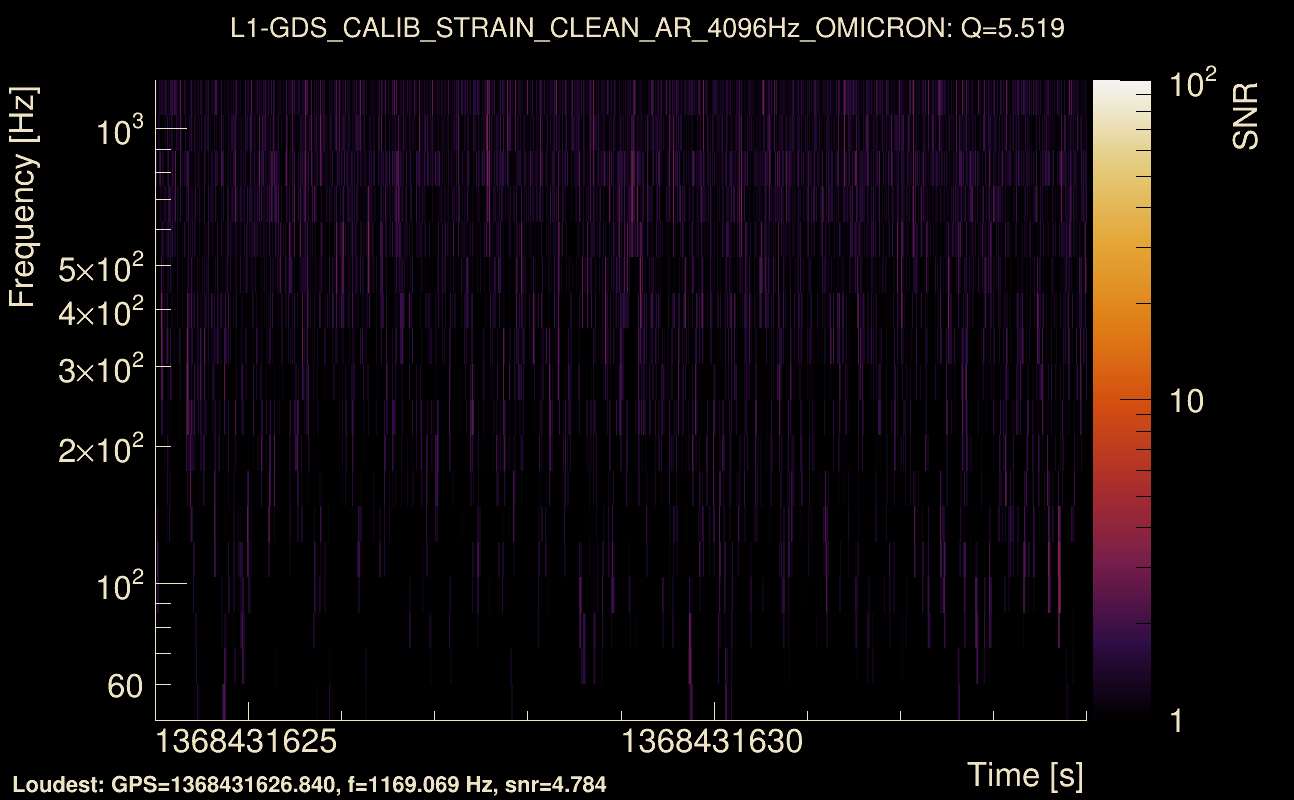
| Event time t(H1): | GPS = 1368431624 (Thu May 18 07:53:26 2023 ) → GPS = 1368431634 (Thu May 18 07:53:36 2023 ) |
| Event time t(L1): | GPS = 1368431624 (Thu May 18 07:53:36 2023 ) → GPS = 1368431634 (Thu May 18 07:53:36 2023 ) |
| Omicron analysis time window (H1): | GPS = 1368431621 → GPS = 1368431637 |
| Omicron analysis time window (L1): | GPS = 1368431621 → GPS = 1368431637 |
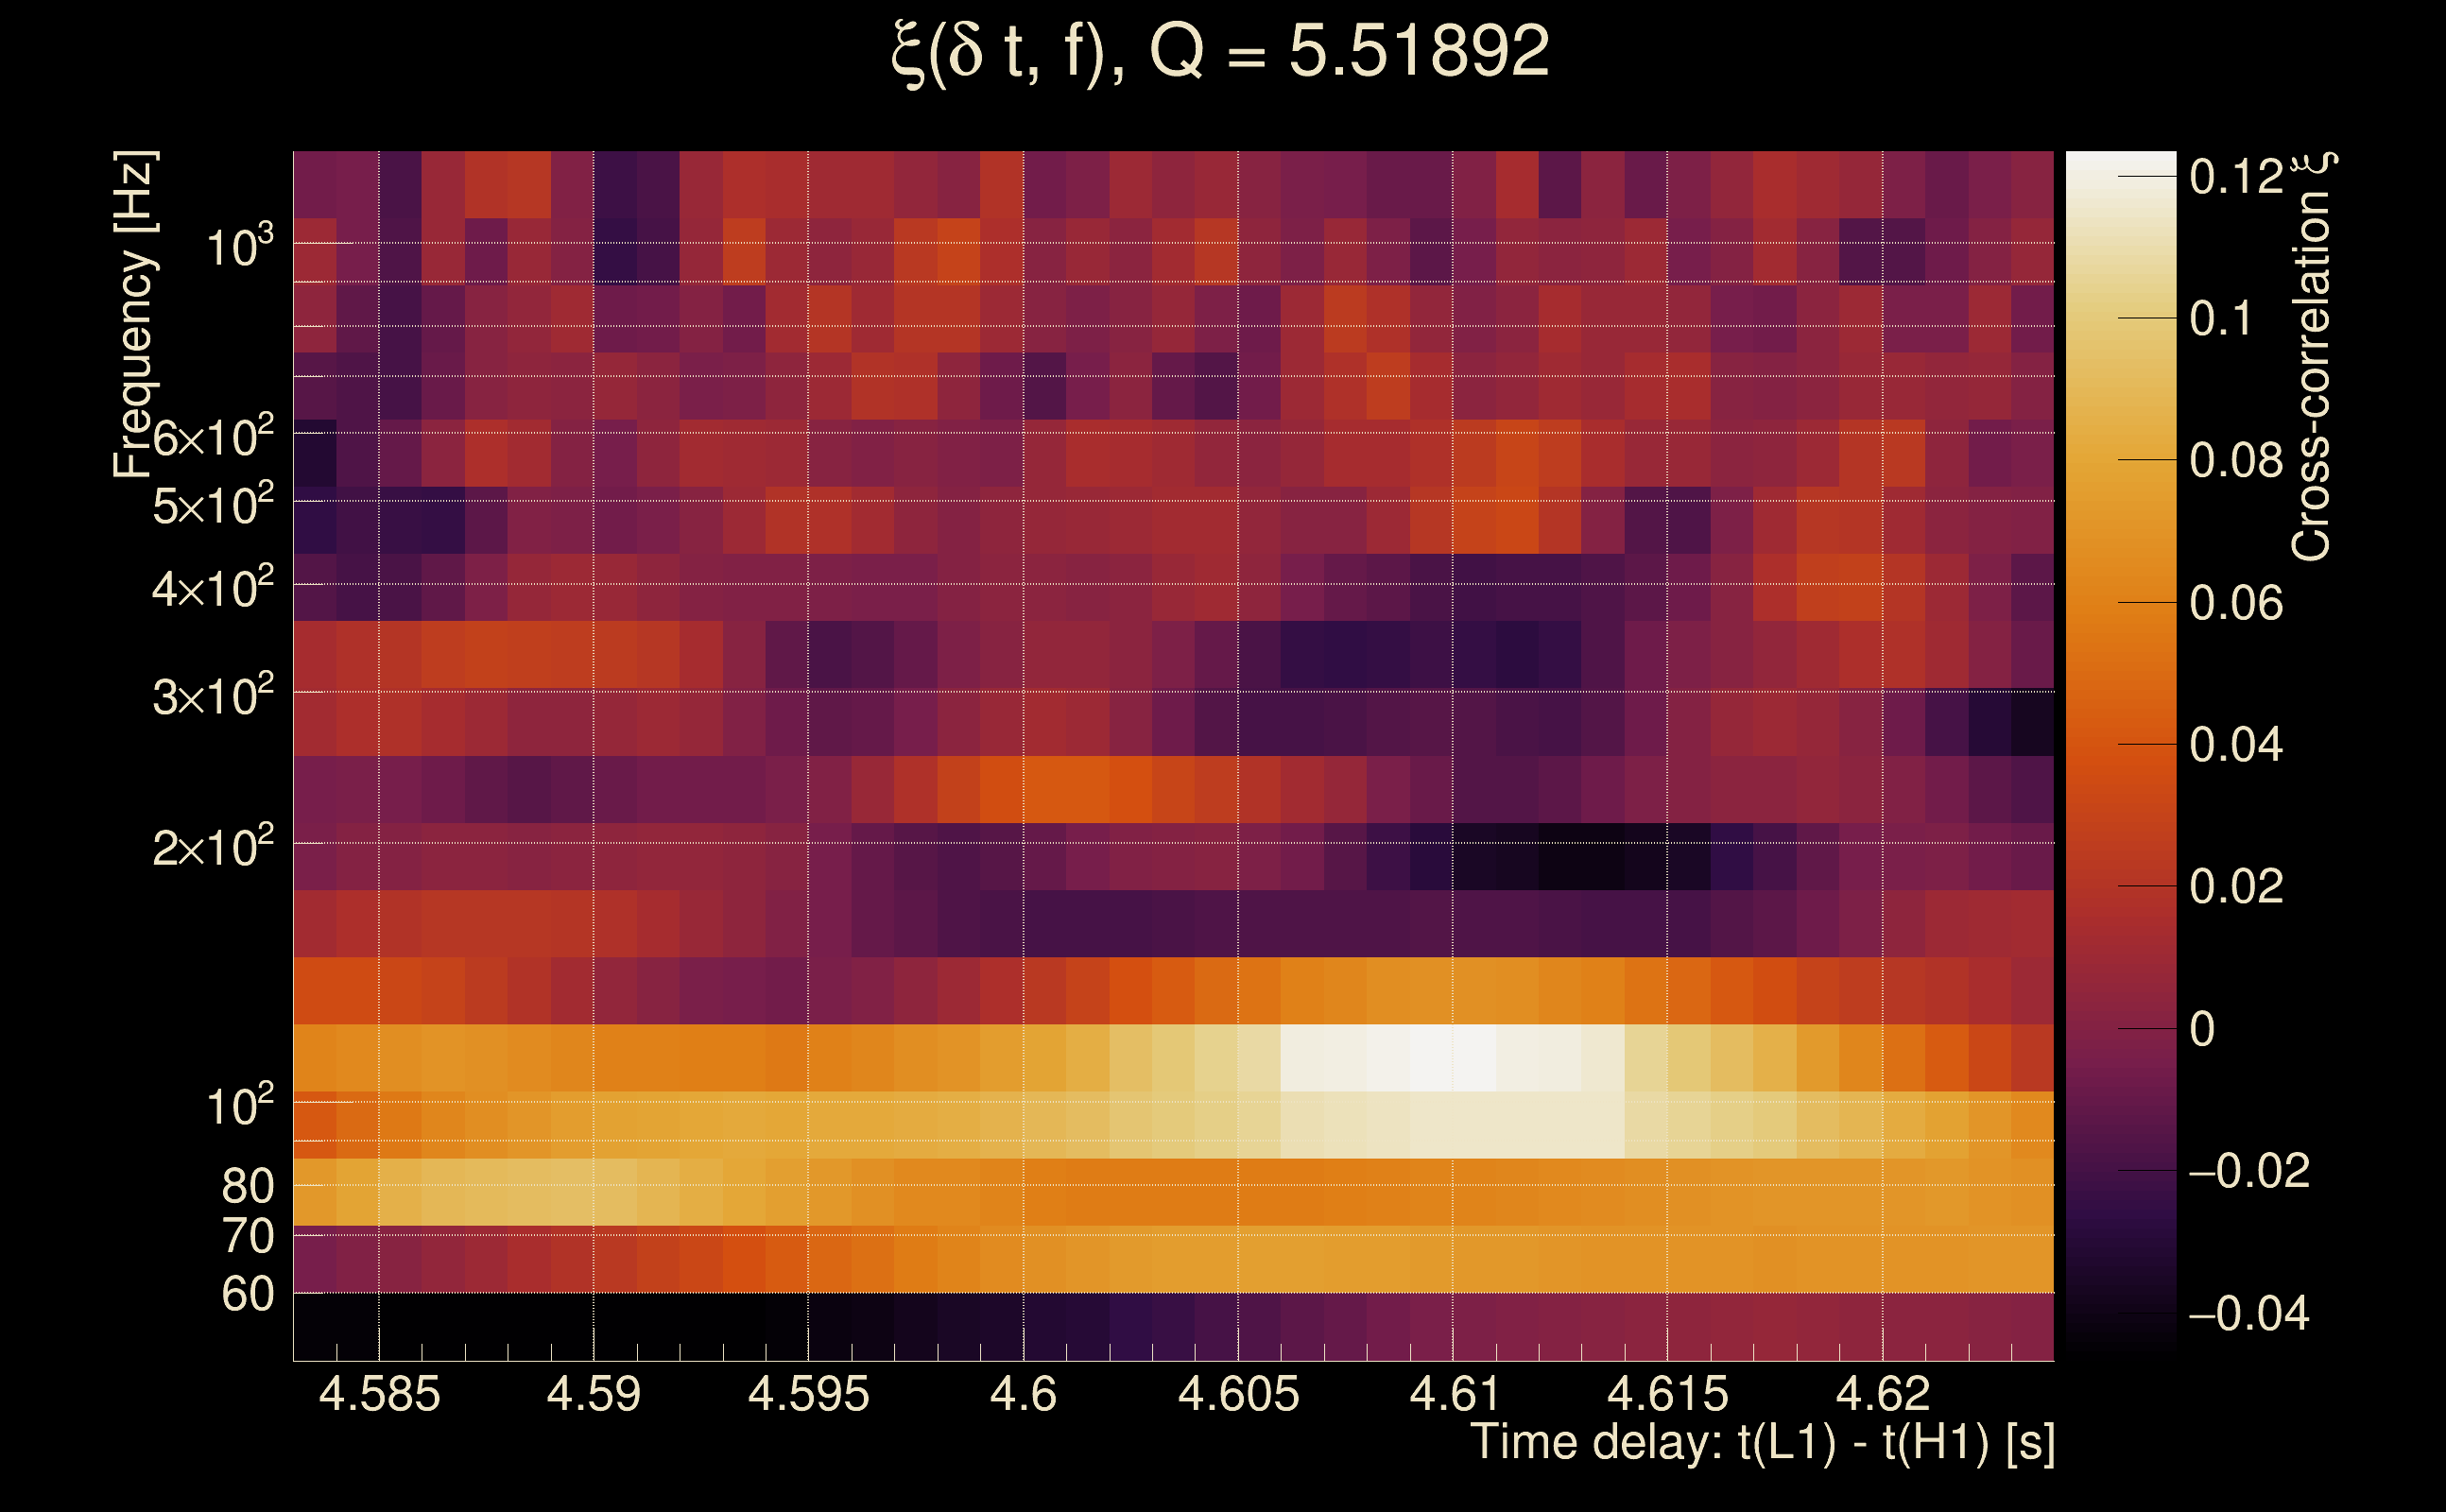
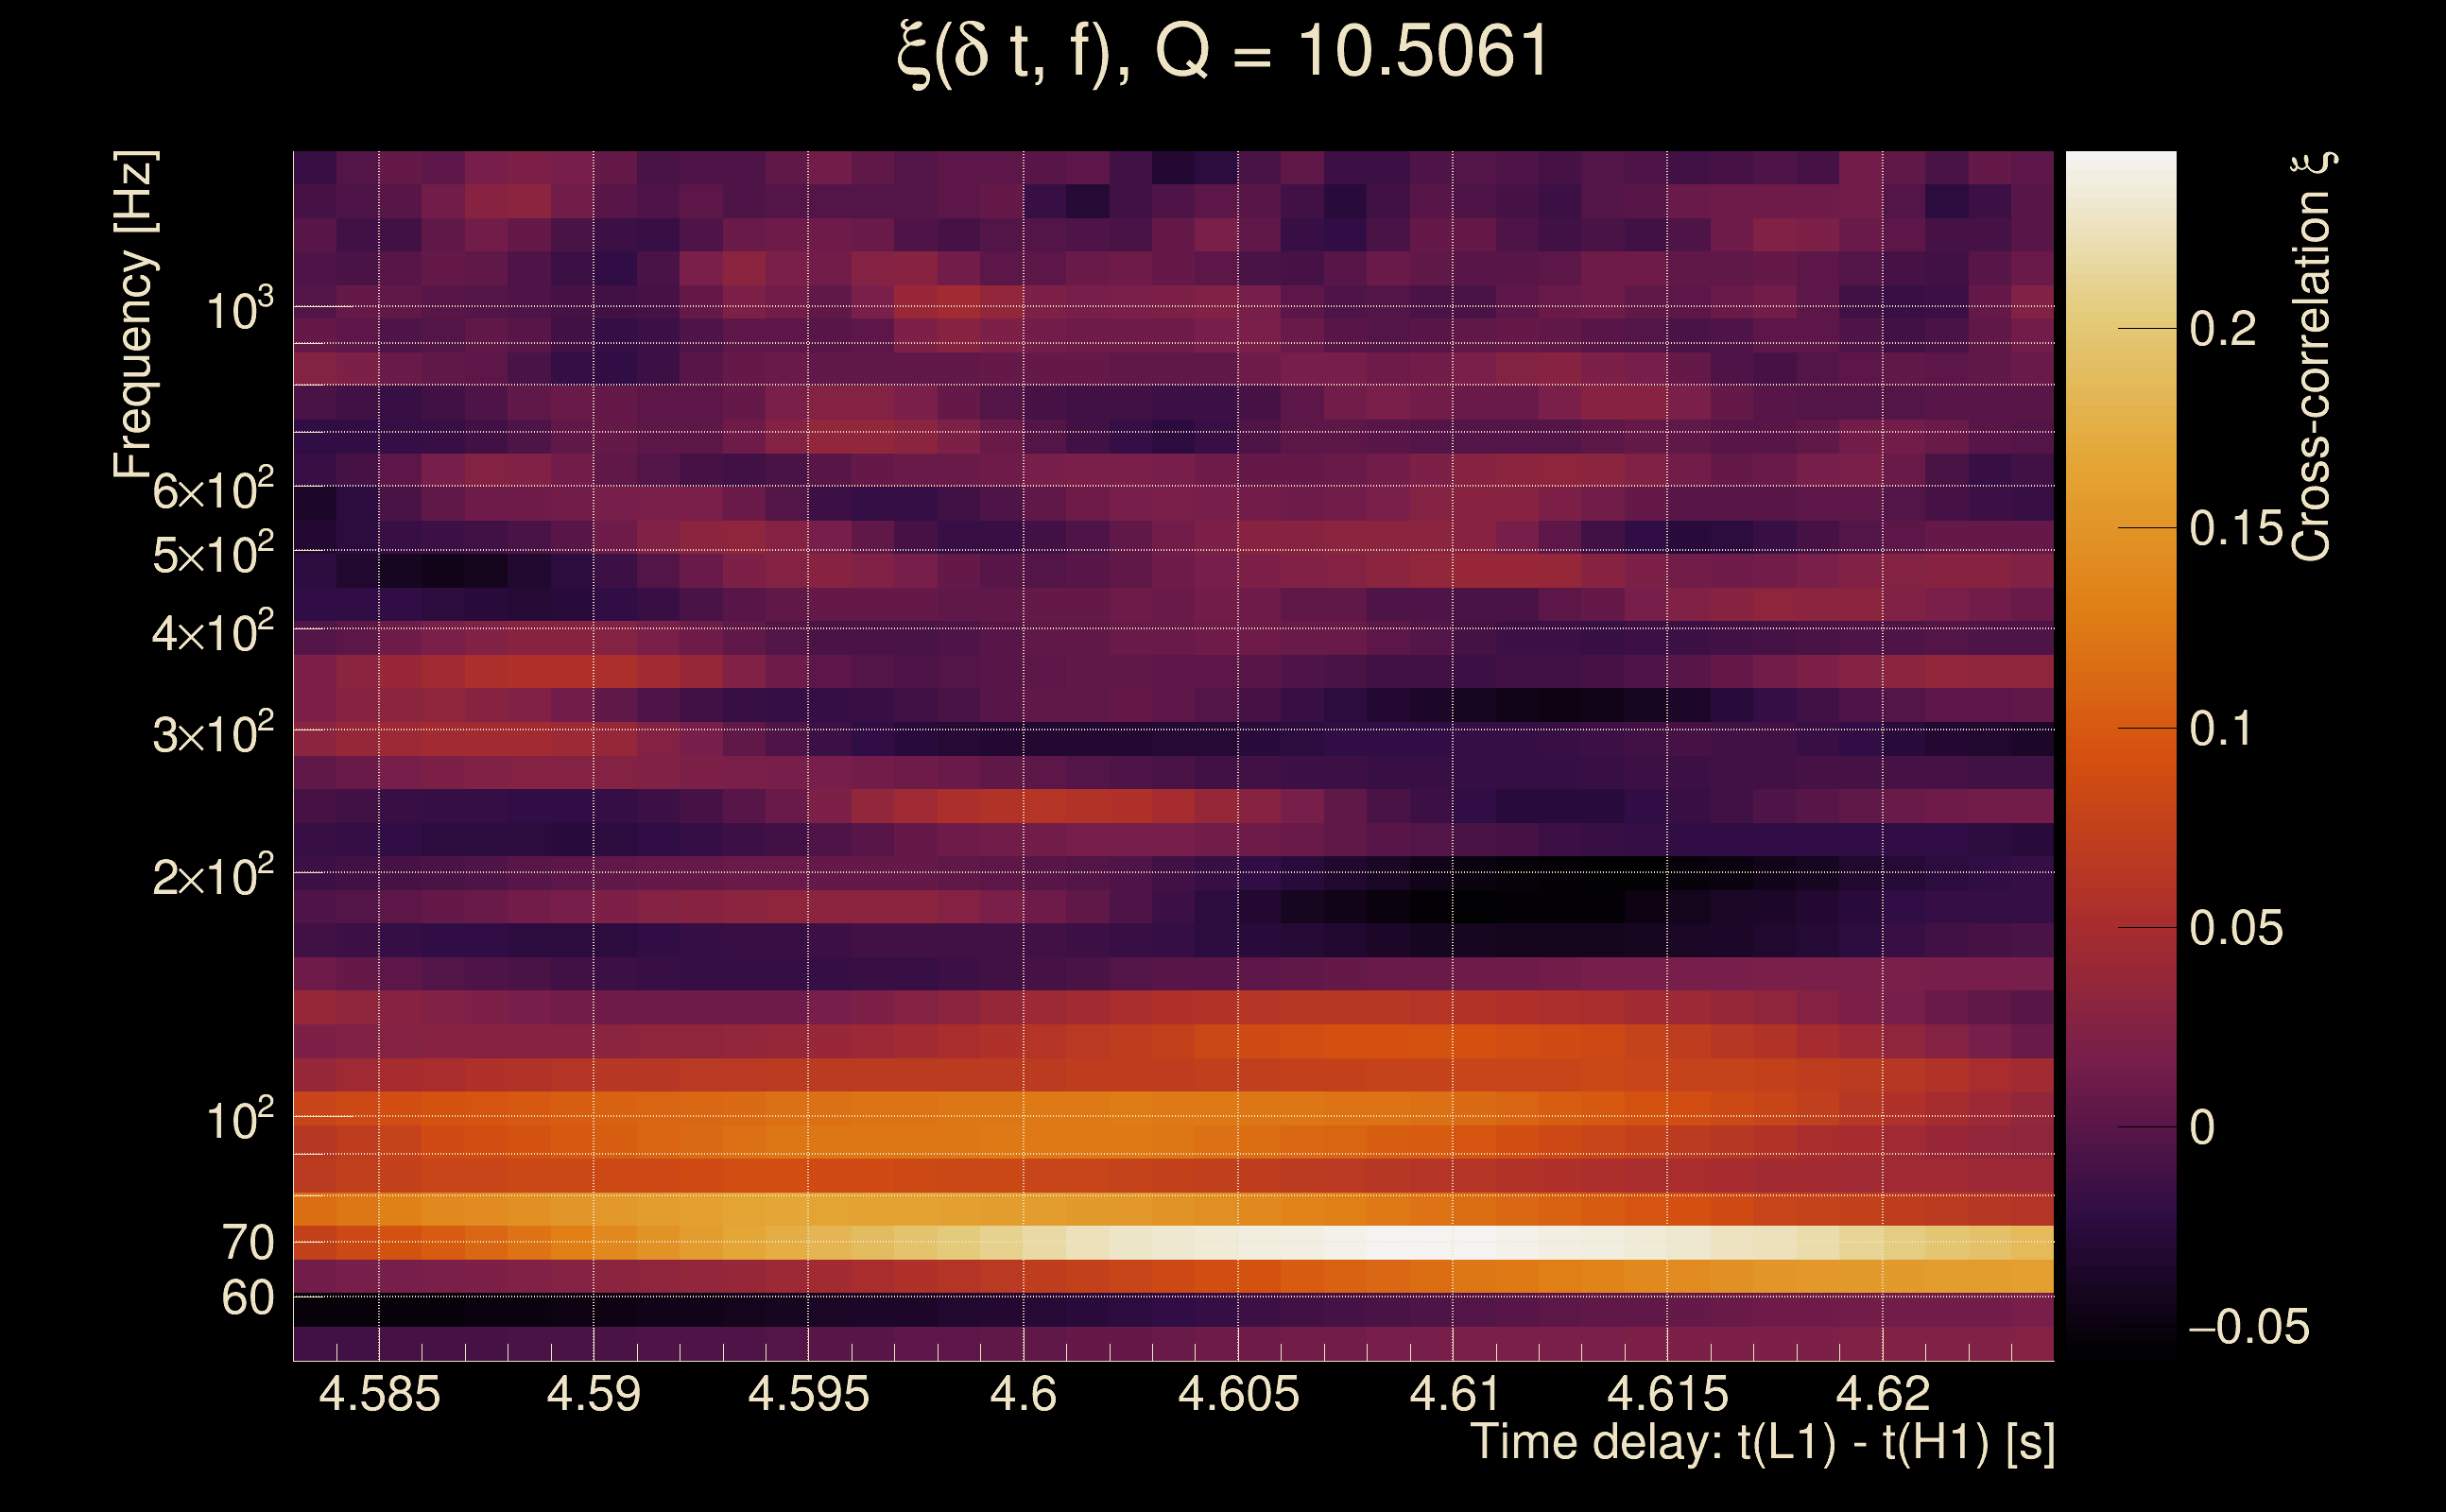
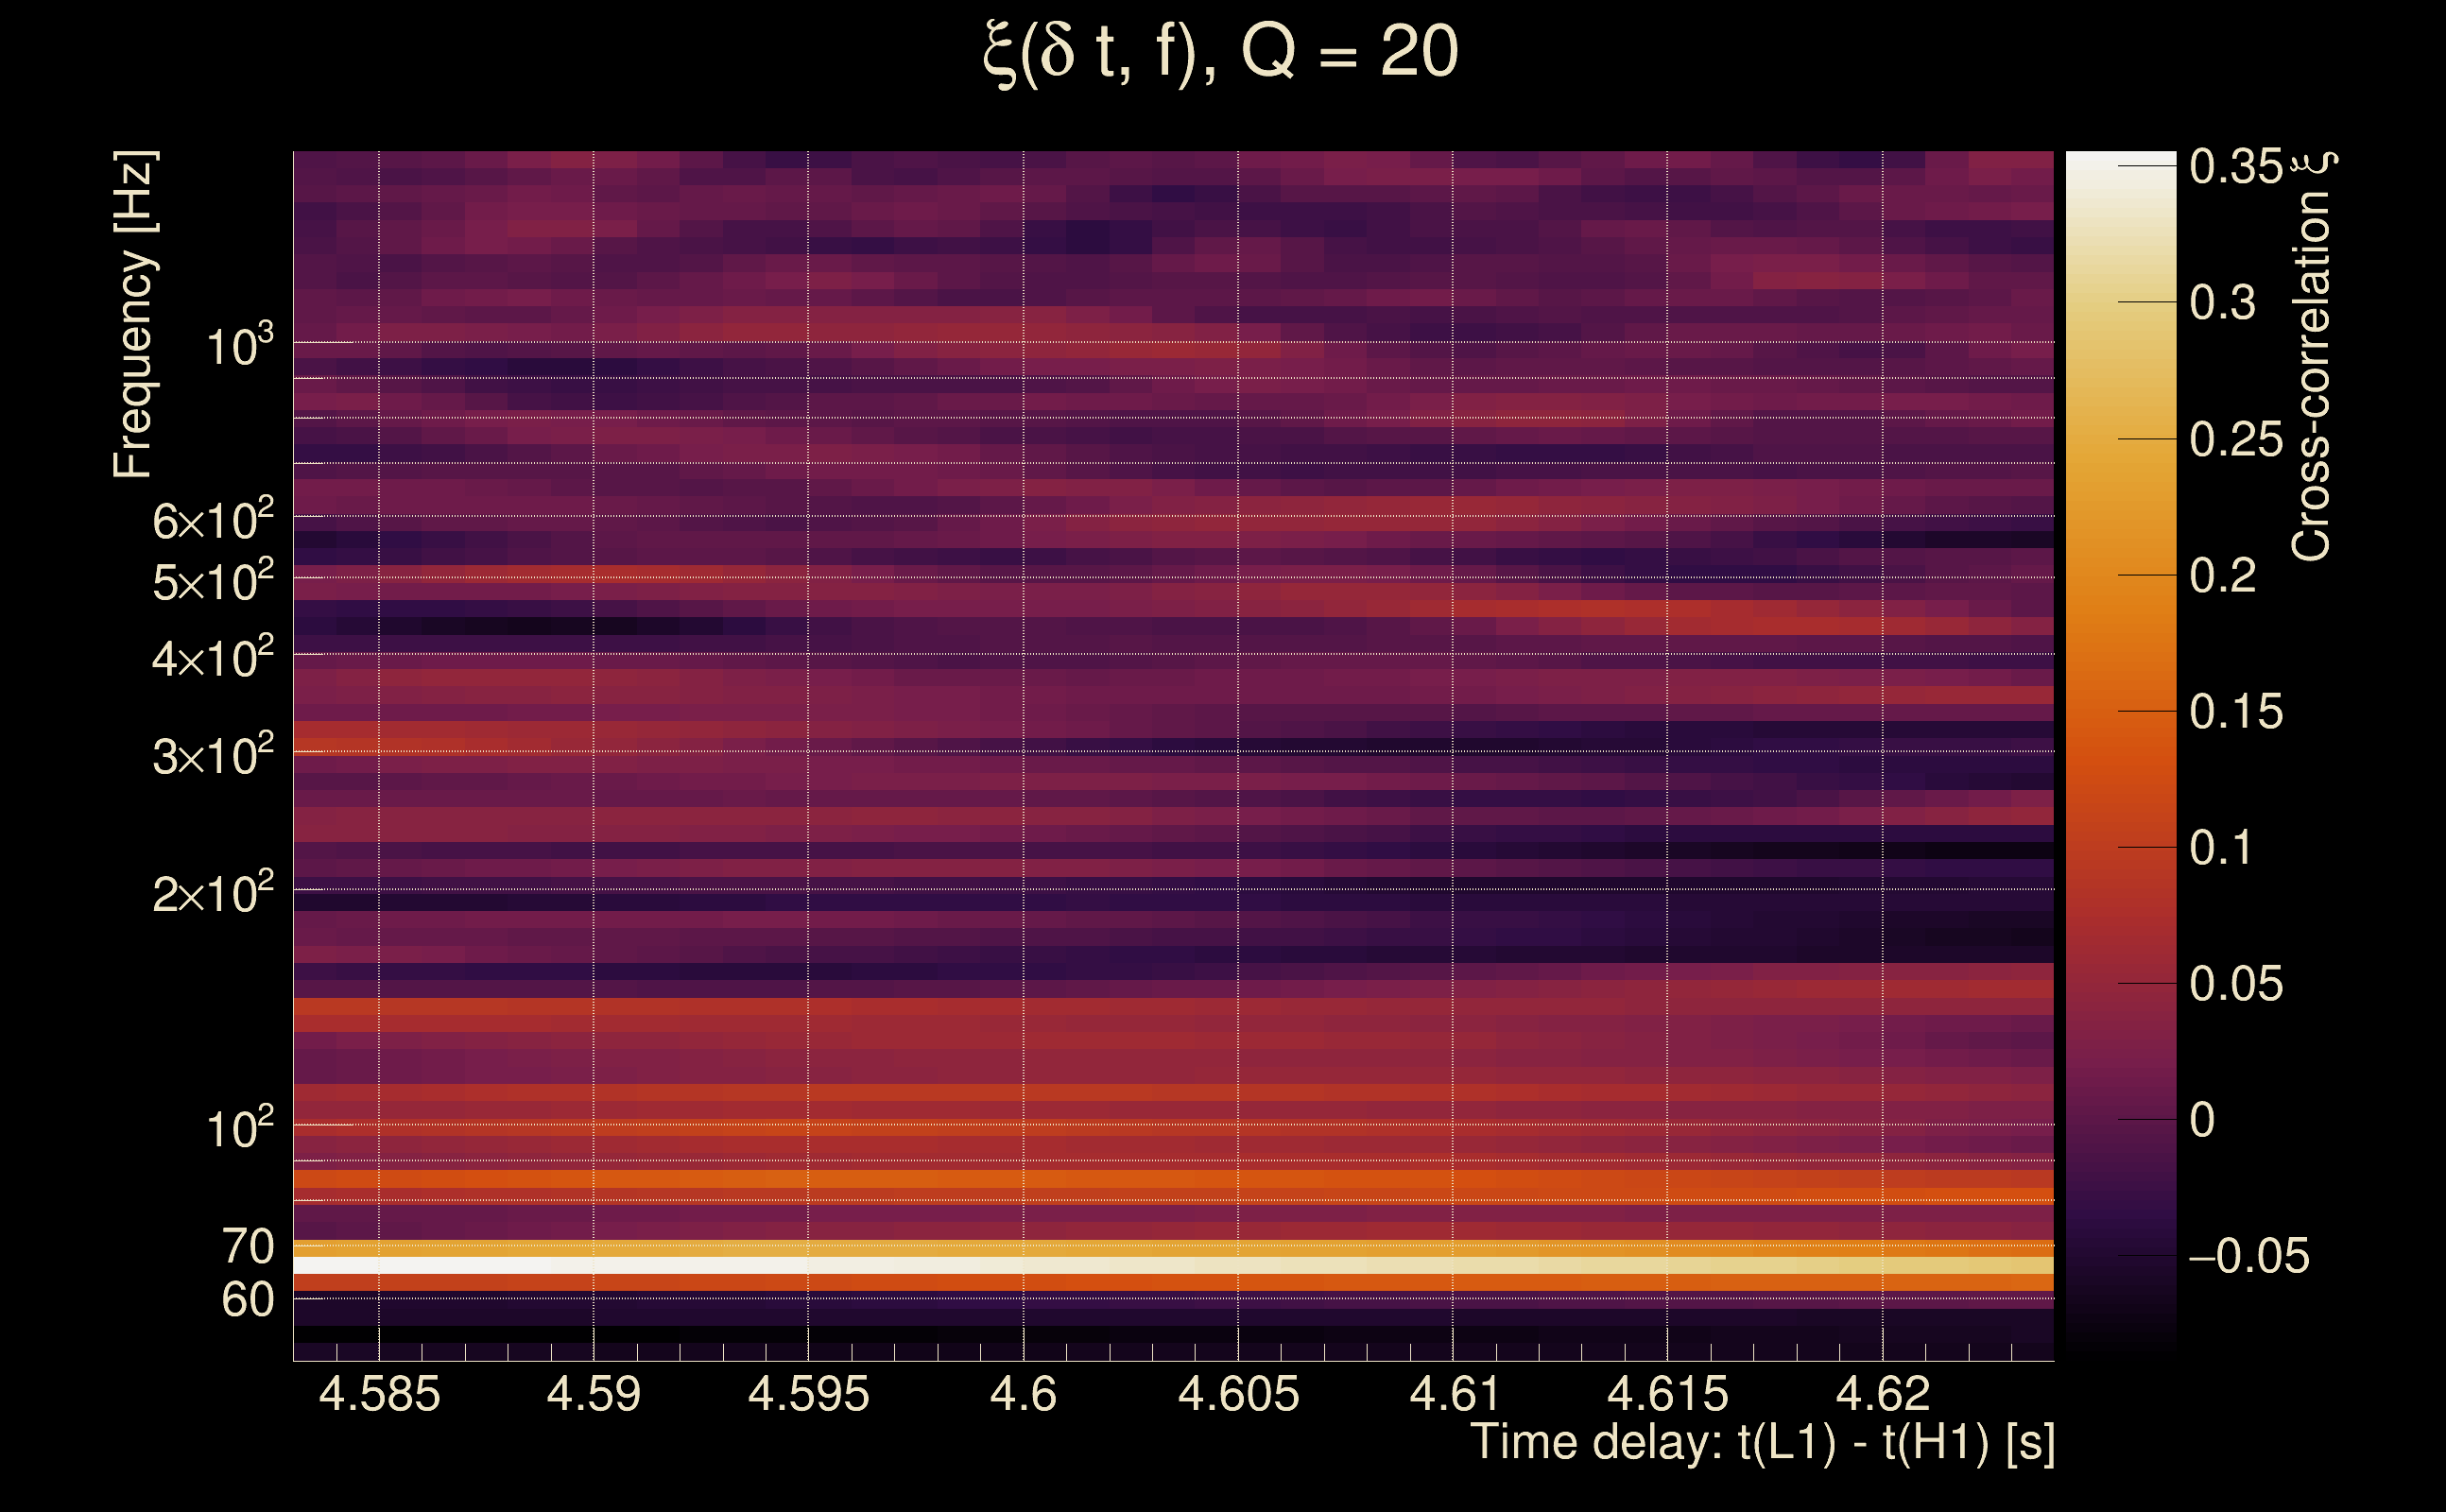
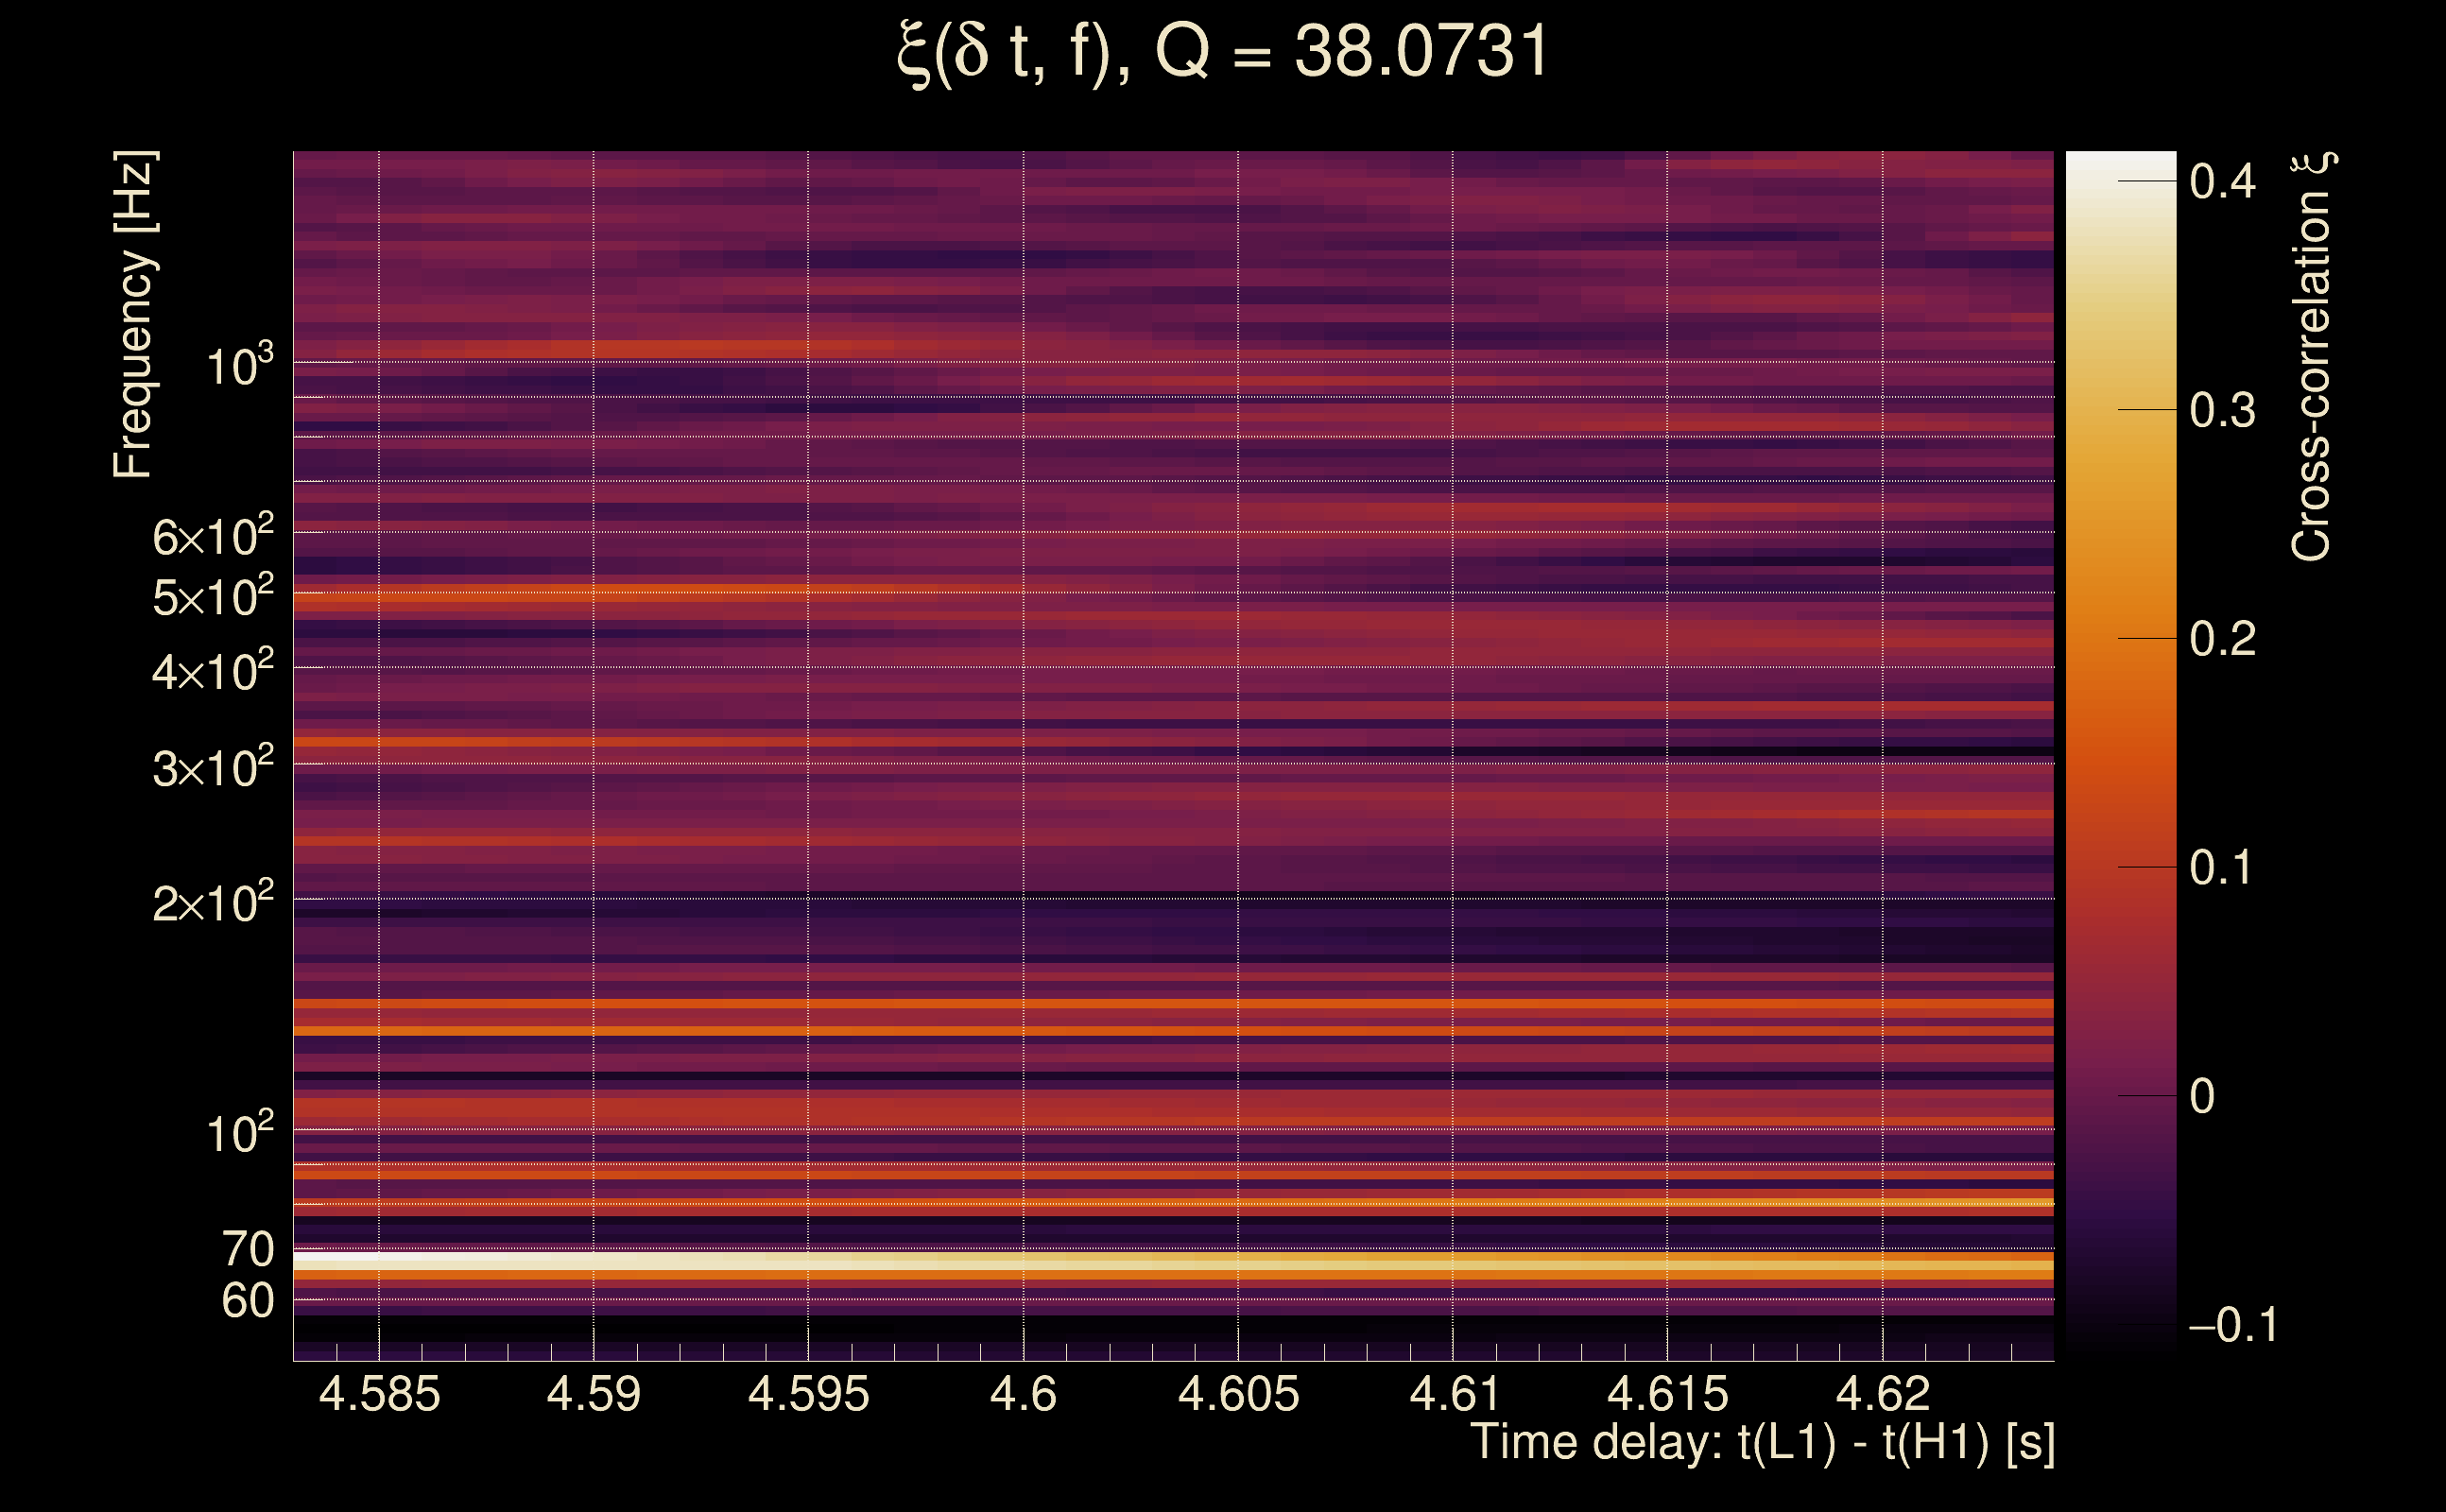
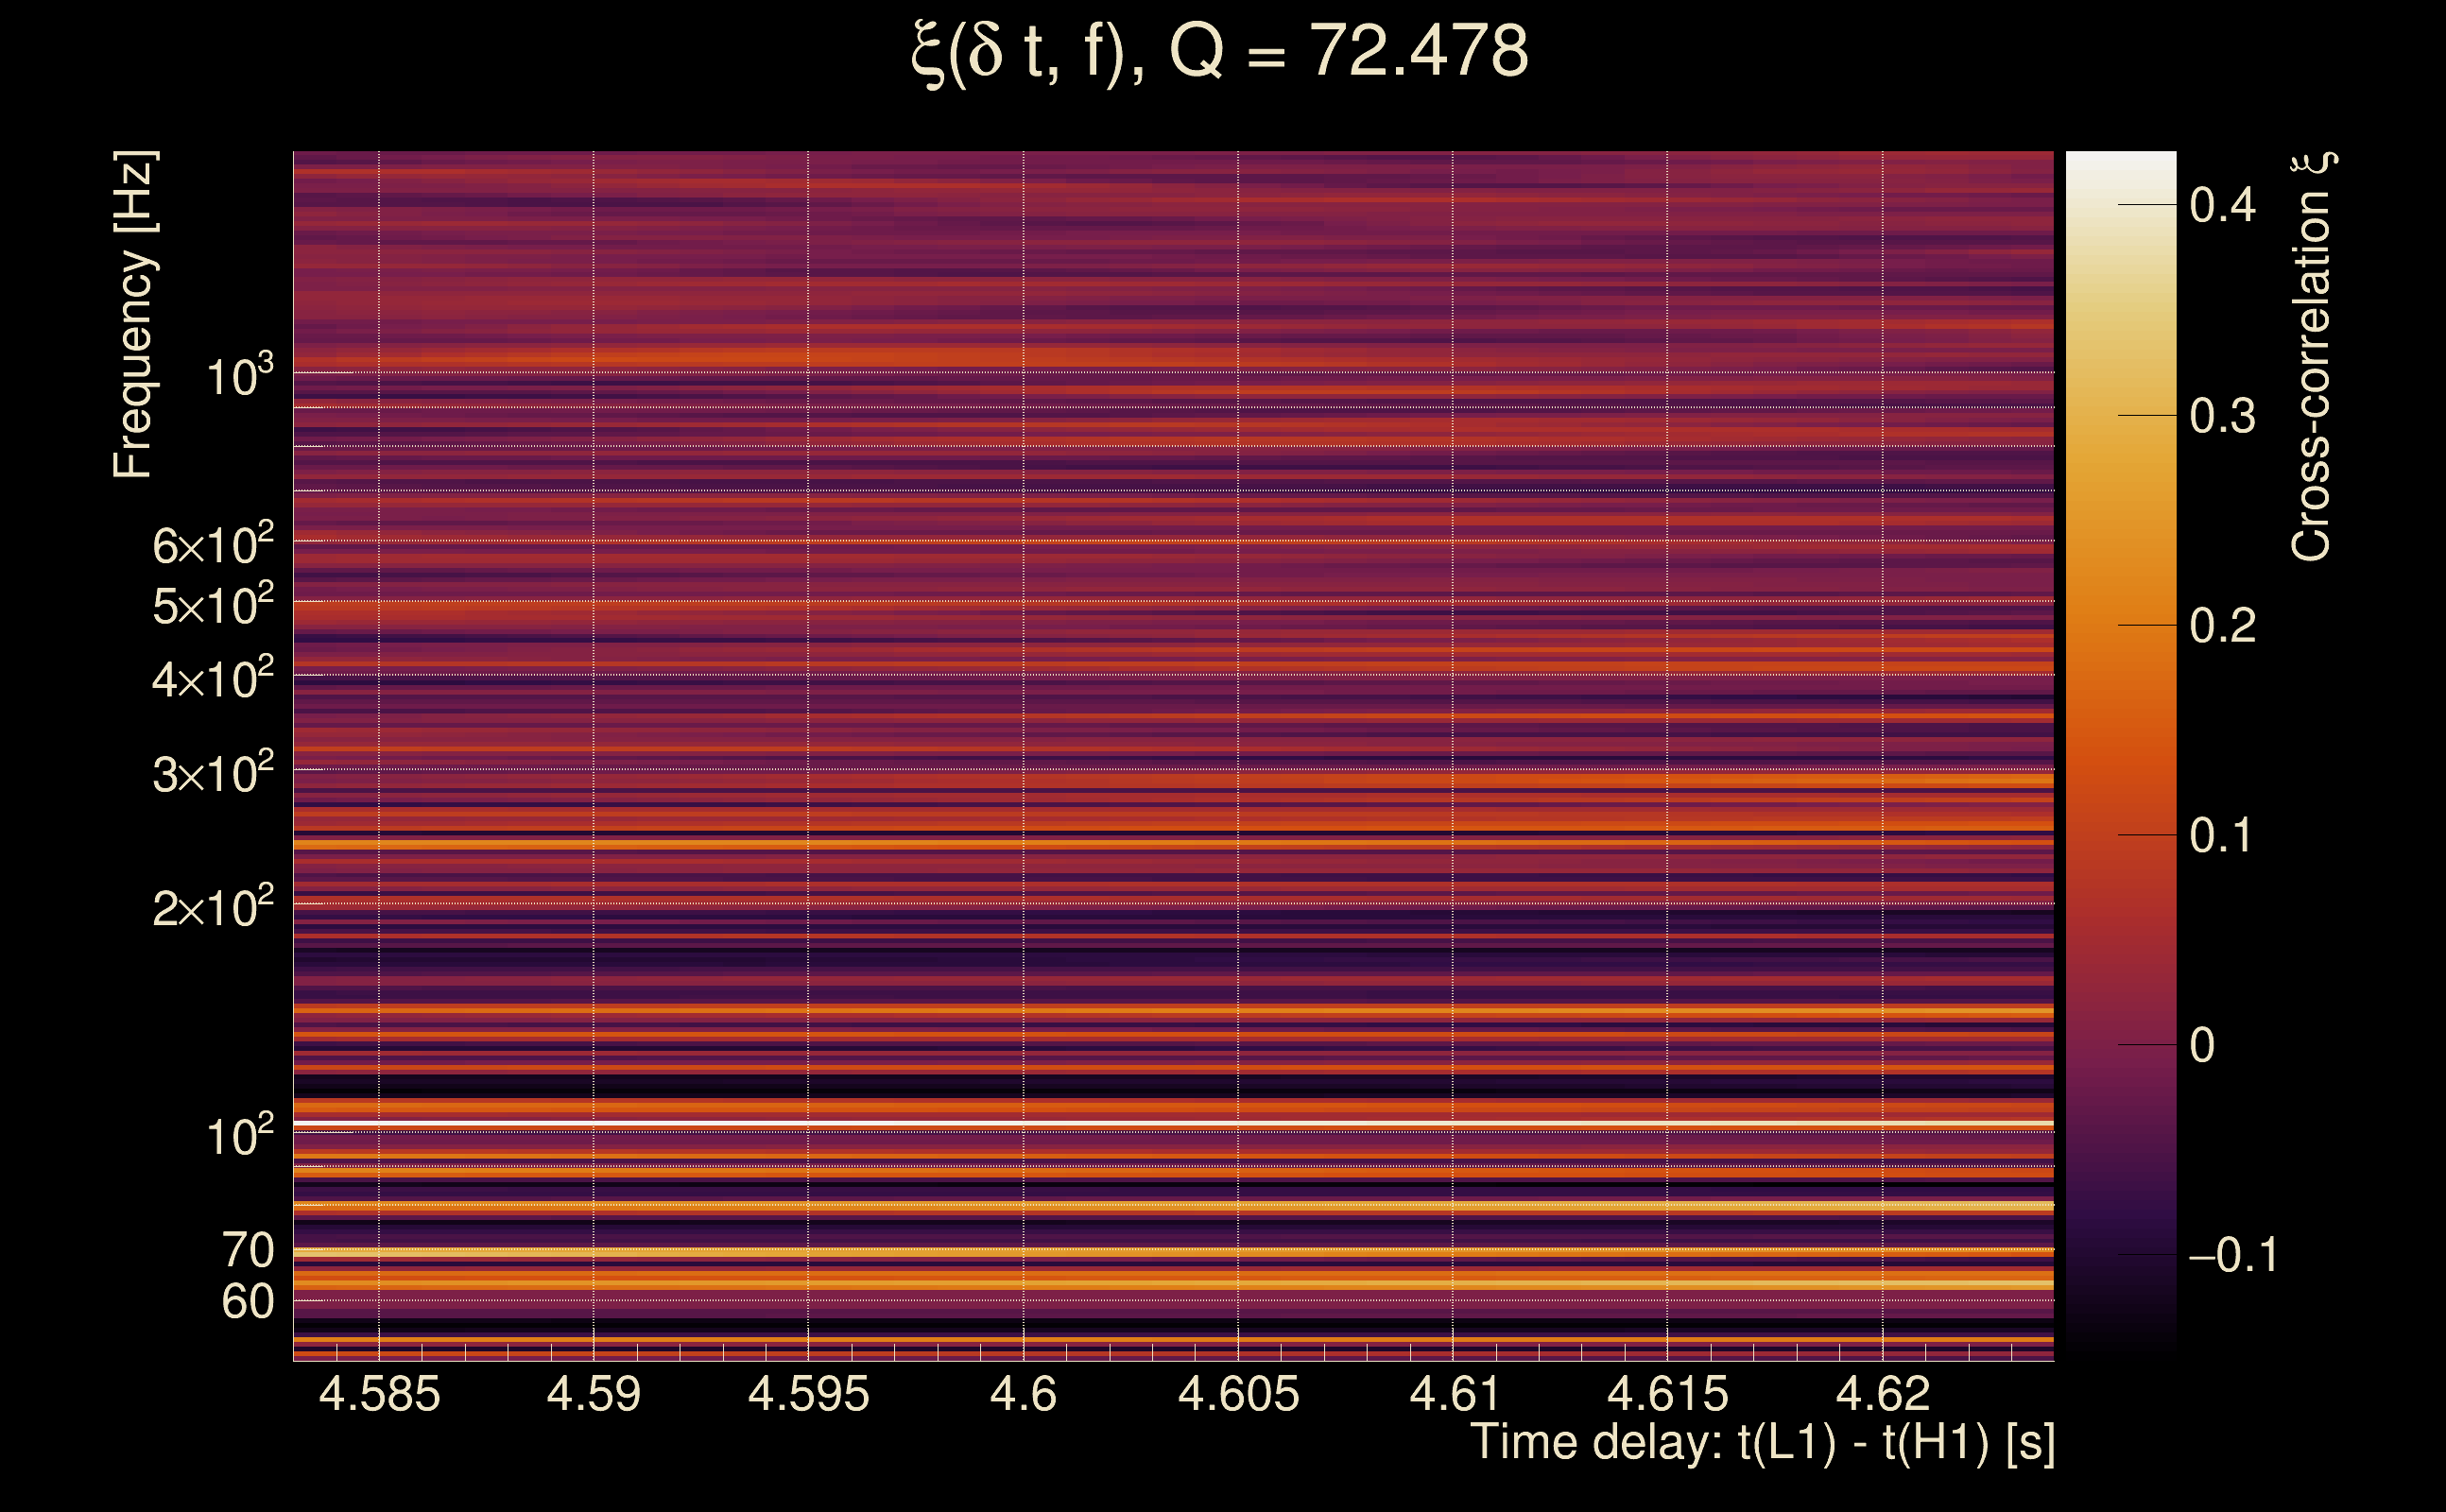
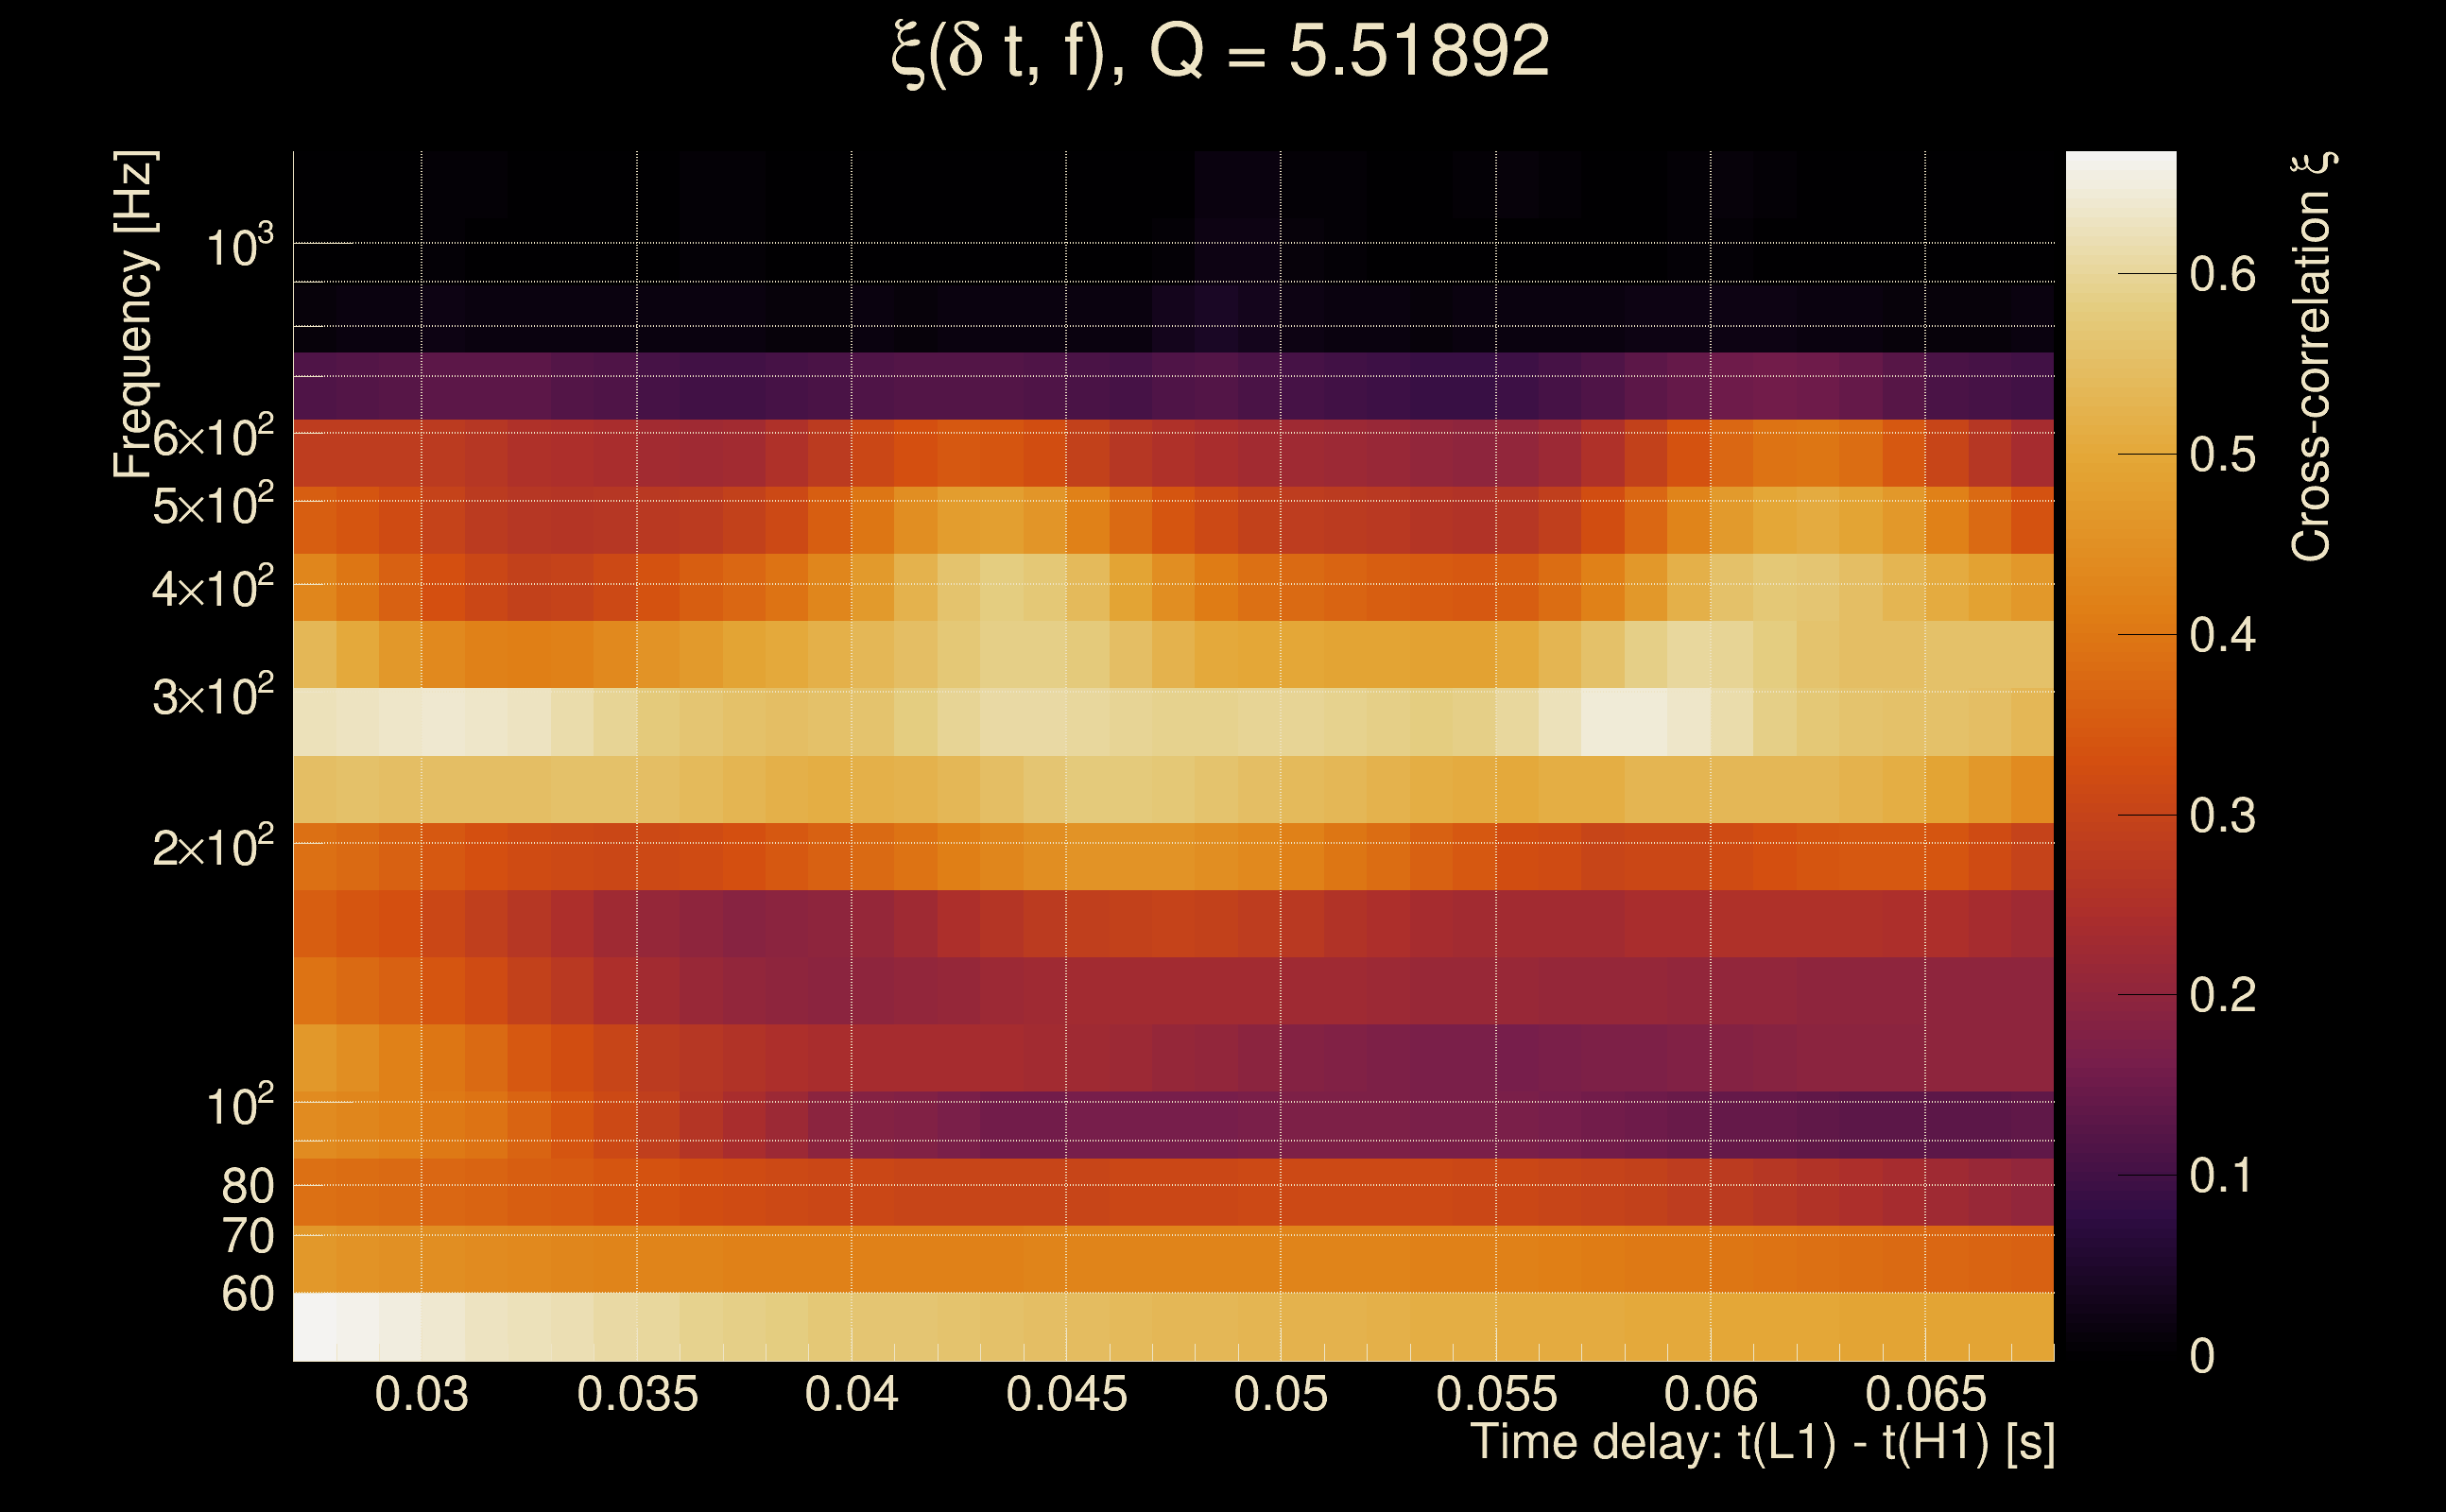
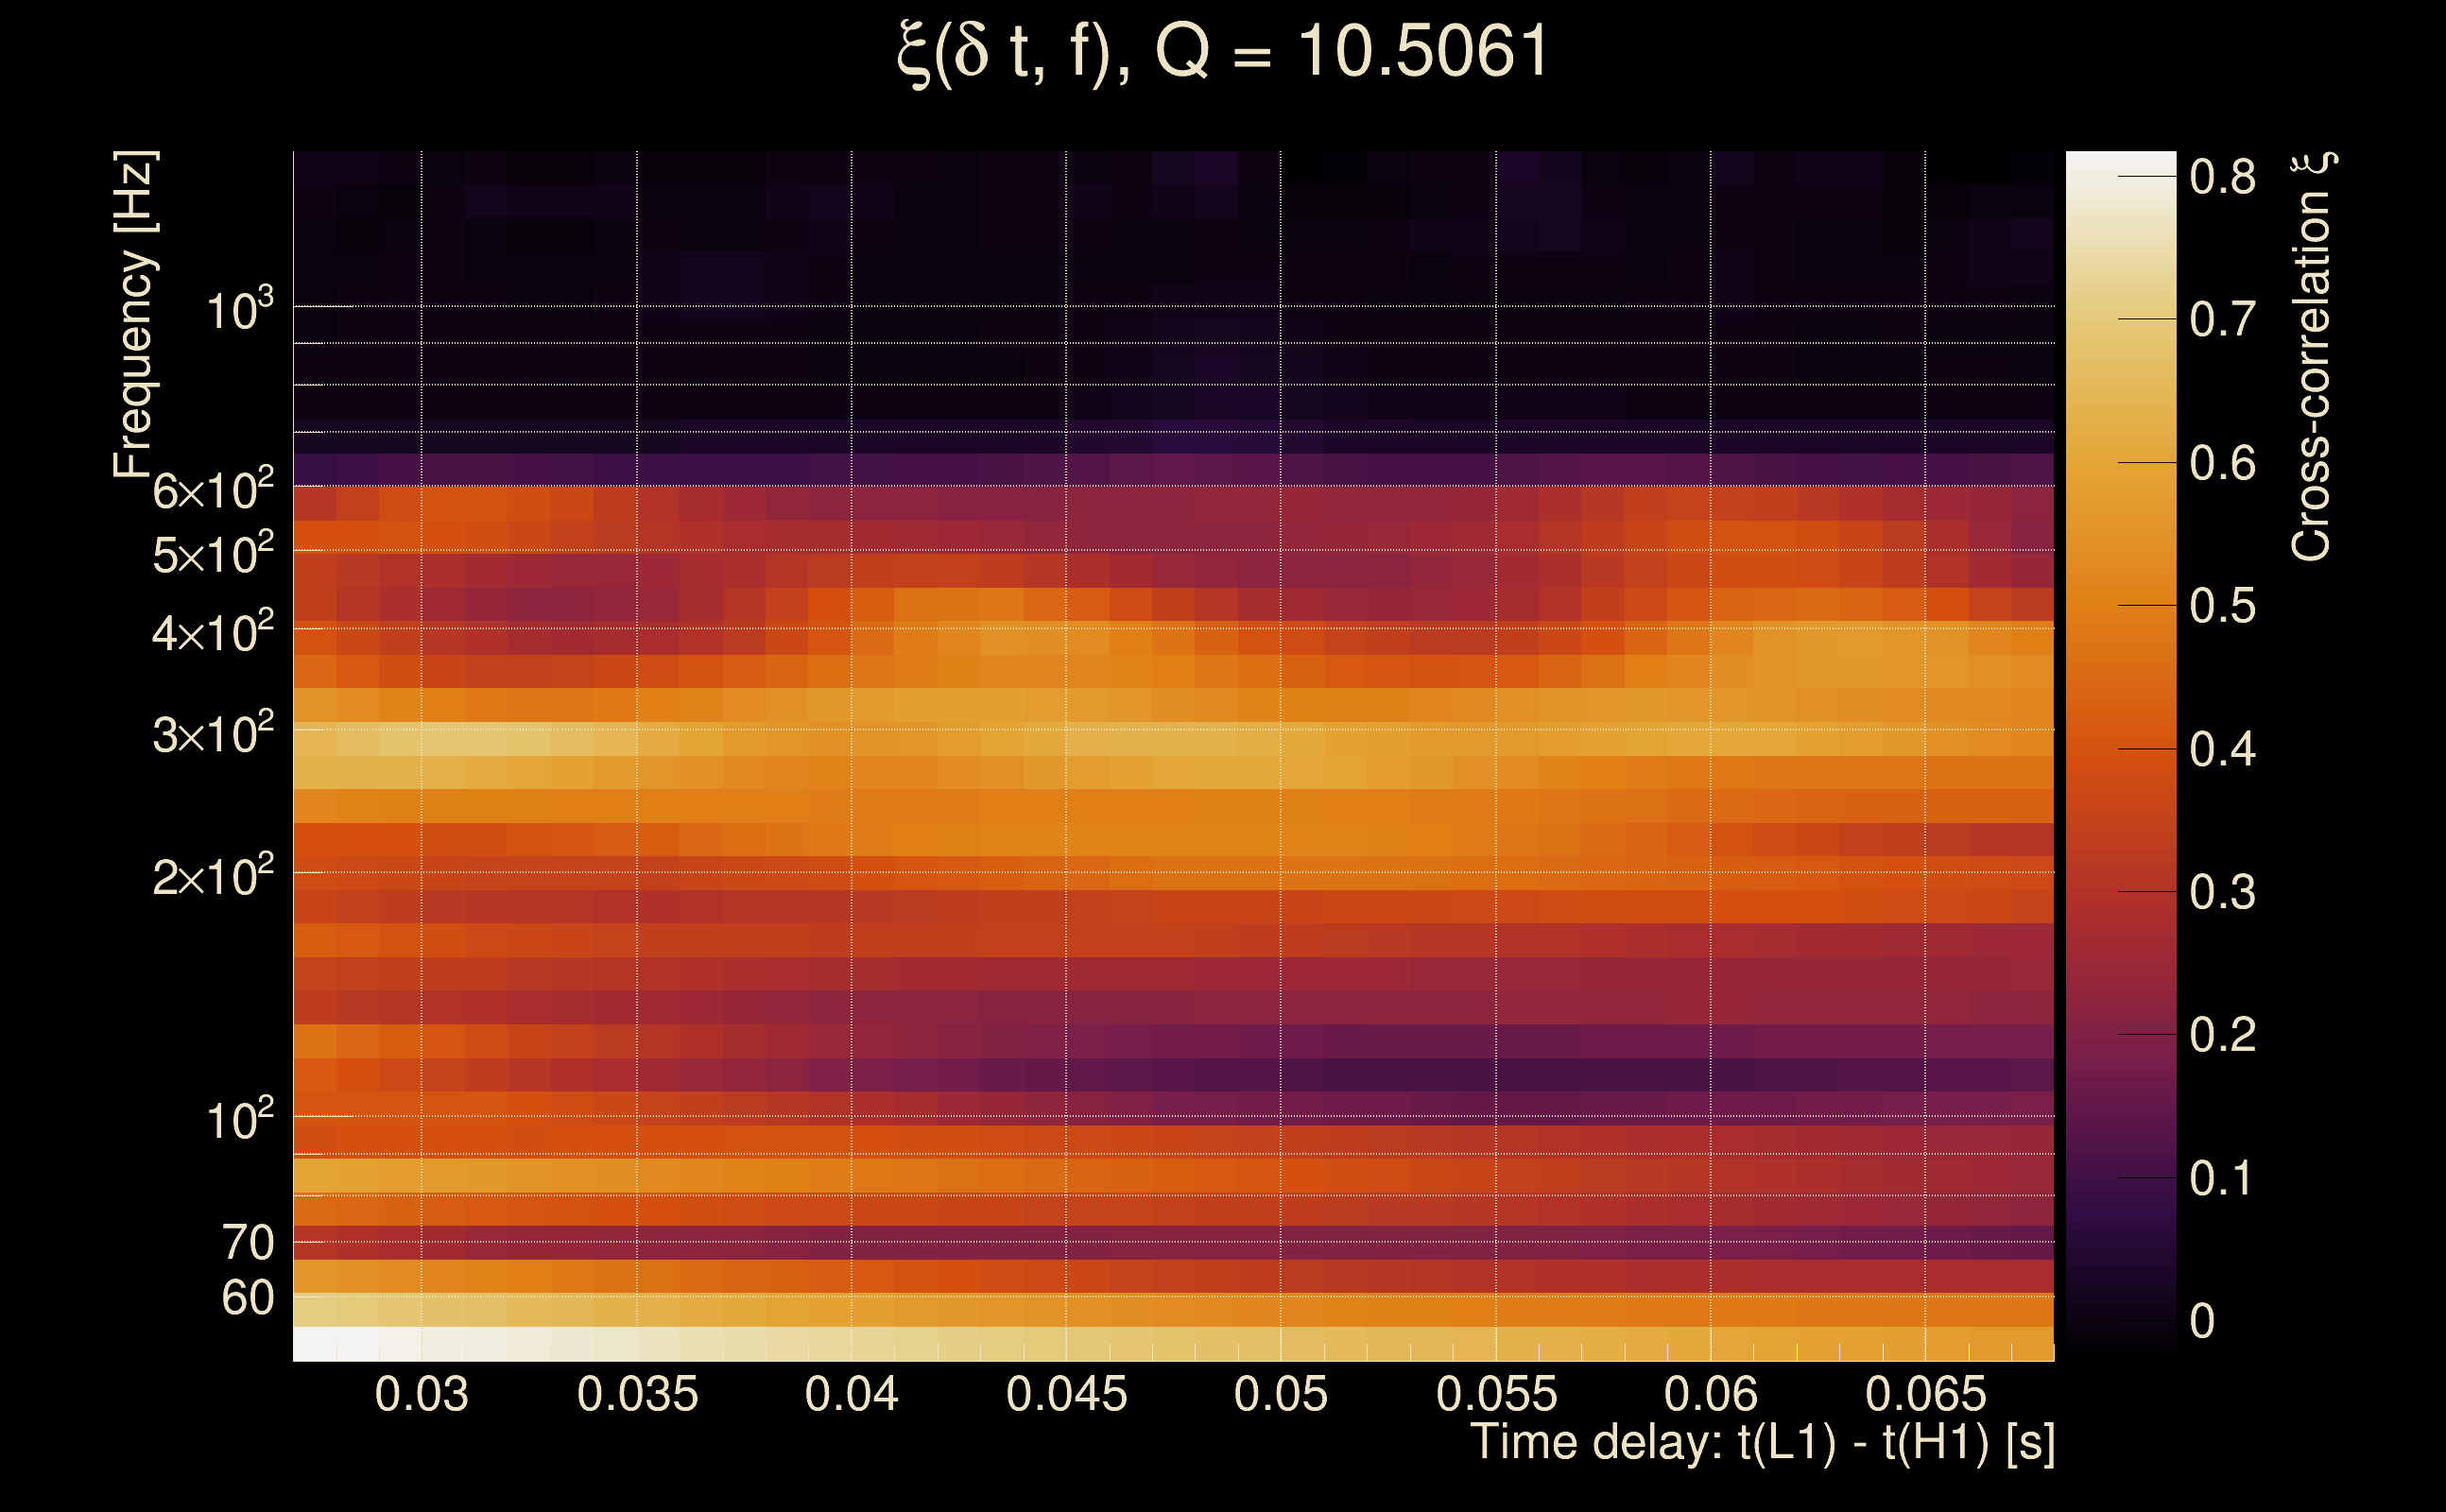
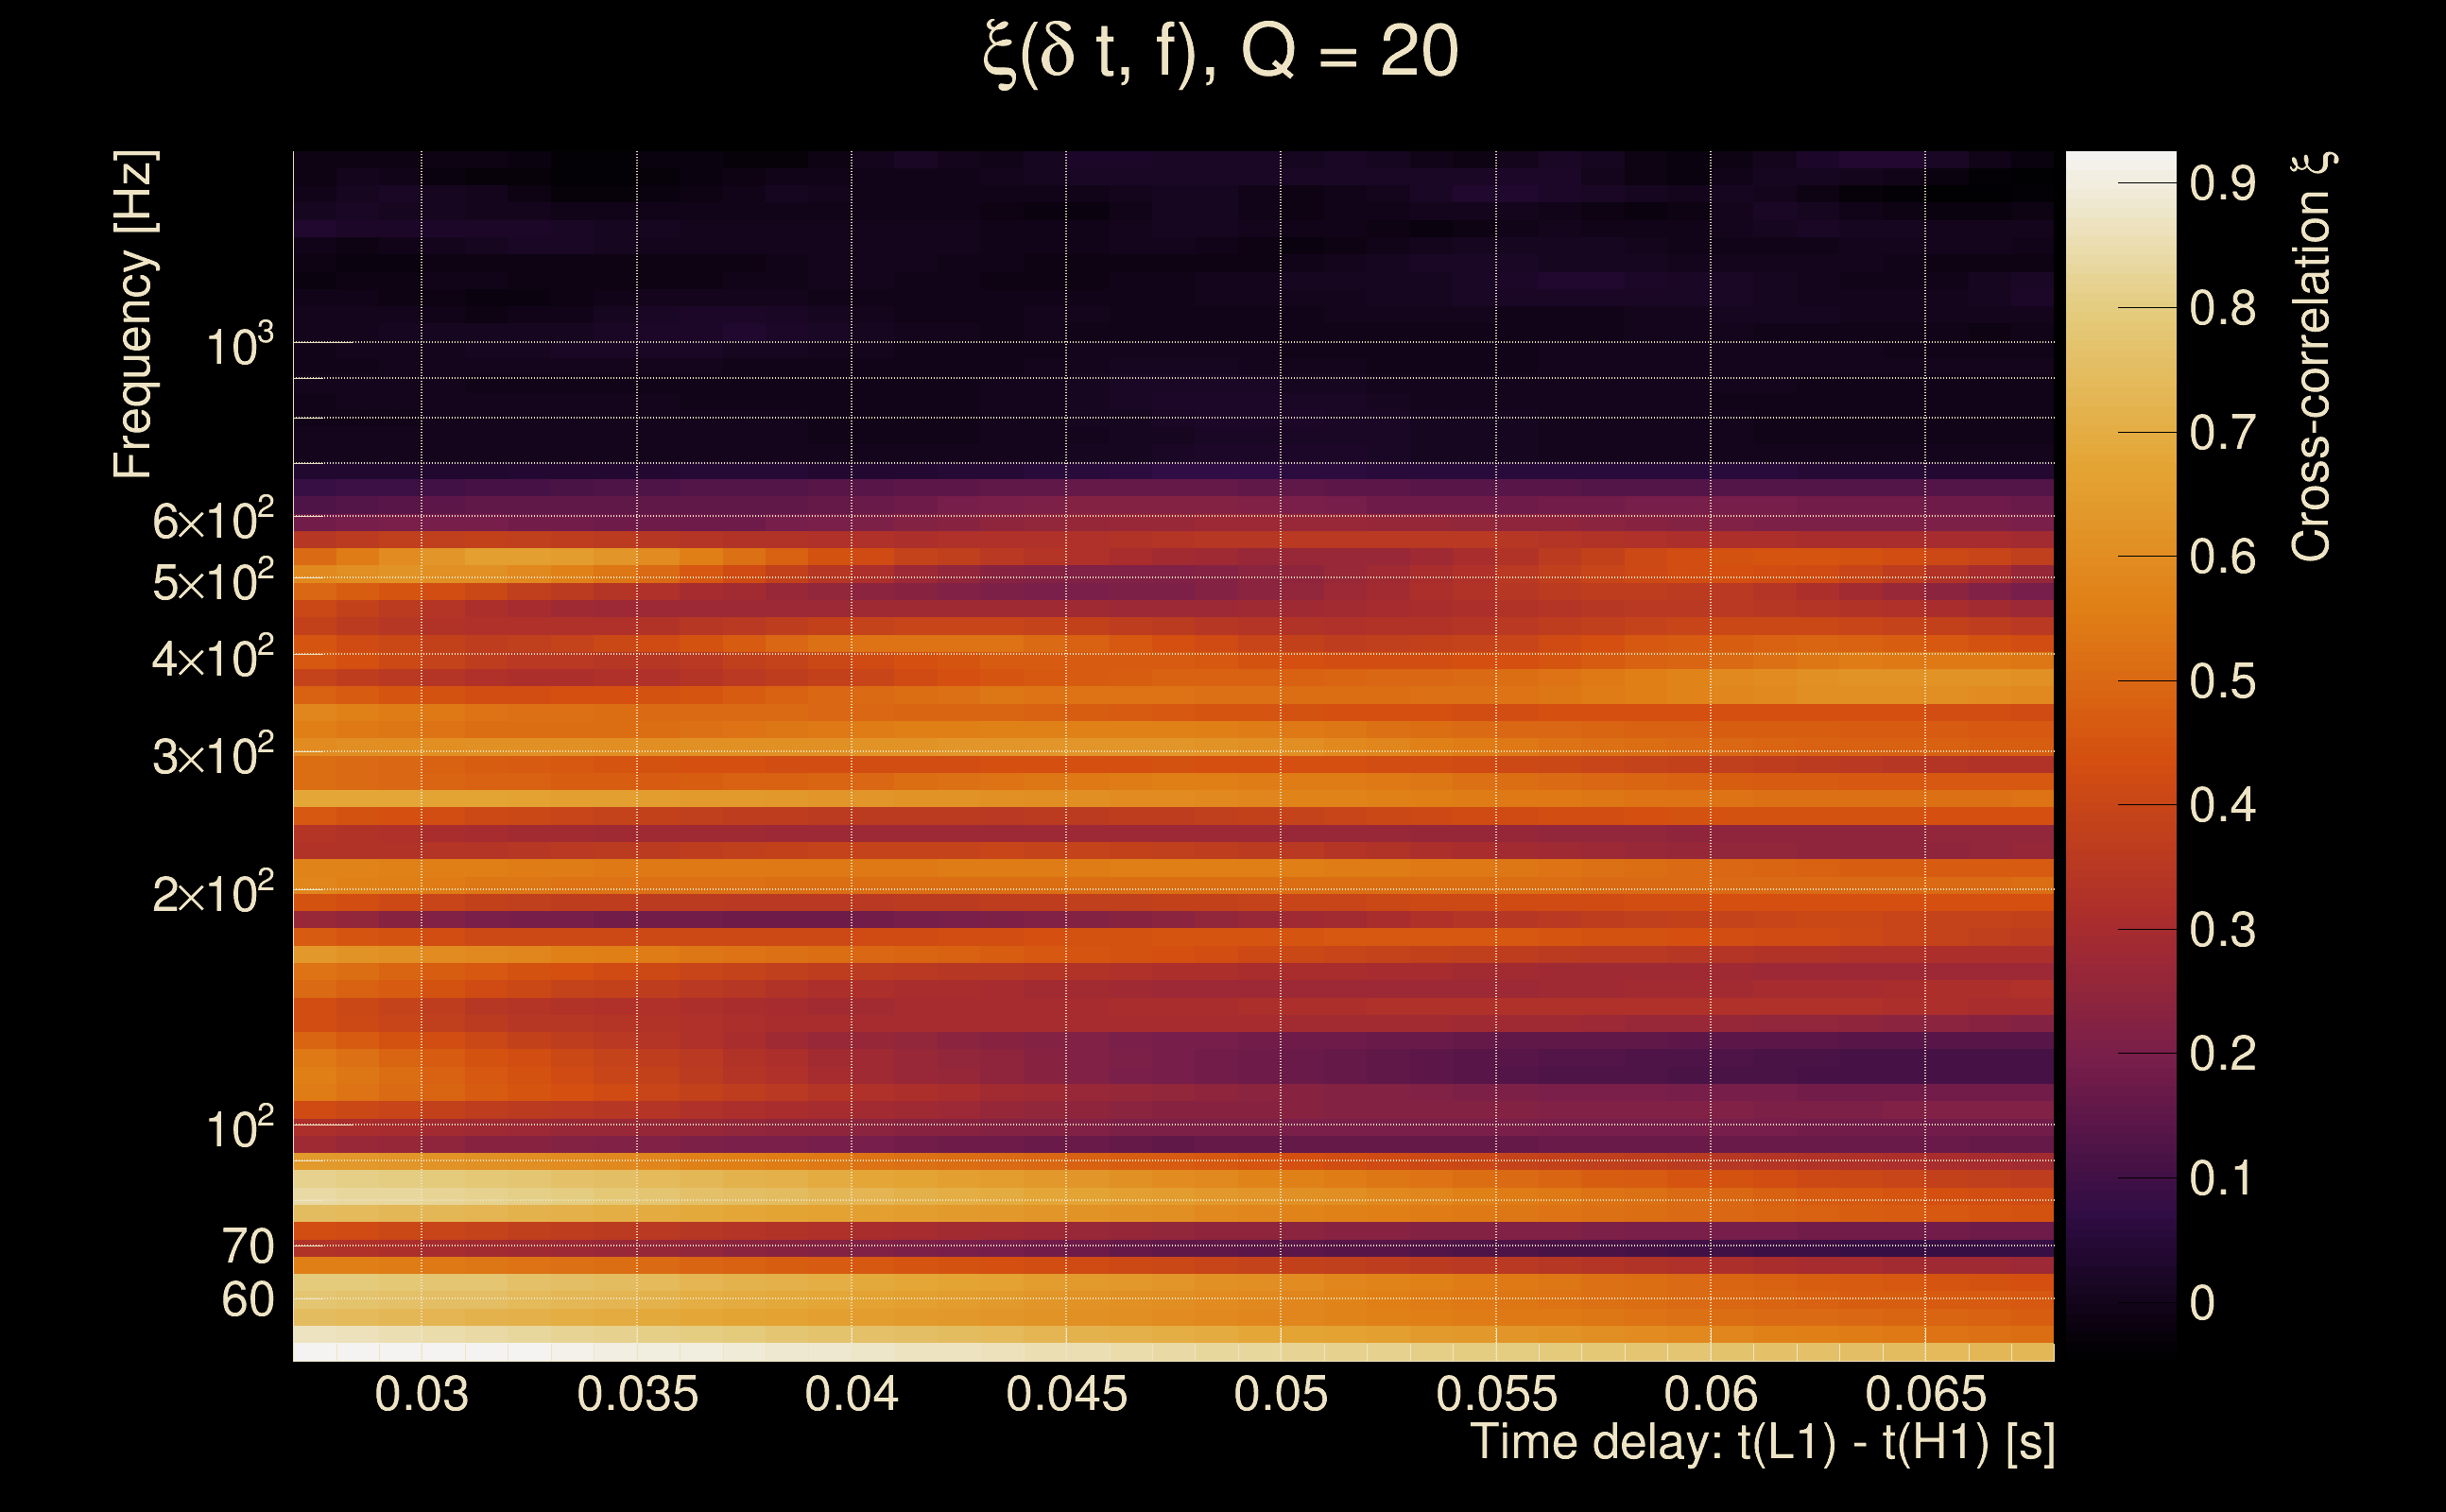
| Time delay between detectors t(L1) - t(H1): | 4.6034 s (slice index = 8 / 217), δt_gw = 0.00339755 s |
| Time delay standard deviation: | 0.0860107 s |
| [targeted mode] Time delay probability: | 0.824107 (0.222266 sigmas), δt_target = 0.00143385 s |
| Frequency: | 105.236 Hz |
| Ξ: | 0.0160395 ± 0.0505983 (variance = 0.00256019): Q0: 0.0890242, Q1: 0.0955258, Q2: 0.147402, Q3: 0.198231, Q4: 0.05348 |
| Rank: | R_A = 0.00785733 |
| Log of amplitude ratio (L1/H1): | -0.148172, variance = 0.614876 (L1/H1: -0.482906, variance = 1.79795, H1/L1: -0.183406, variance = 0.67216) |
| Amplitude ratio (L1/H1): | 0.862283 ⋇ 2.19052 (L1/H1: 0.616988 ⋇ 3.82239, H1/L1: 0.83243 ⋇ 2.27017) |
| Amplitude ratio H1|L1 compatibility (probability): | 0.671599 |
| Antenna factor probability: | 0.885094 |
| Number of rejected frequency rows: | Q0: 14 / 18, Q1: 31 / 36, Q2: 63 / 70, Q3: 128 / 134, Q4: 254 / 258 |
| Maximum signal-to-noise ratio: | H1: 5.11313, L1: 5.13741 |
| SNR variance: | H1: 0.512629, L1: 0.500759 |
| Click here for a zoomed plot | Click here for a zoomed plot | Click here for a zoomed plot | Click here for a zoomed plot | Click here for a zoomed plot |
 |
 |
 |
 |
 |
 |
 |
 |
 |
 |
 |
 |
 |
 |
 |
 |
 |
 |
 |
 |
 |
 |
 |
 |
 |
 |
 |
 |
 |
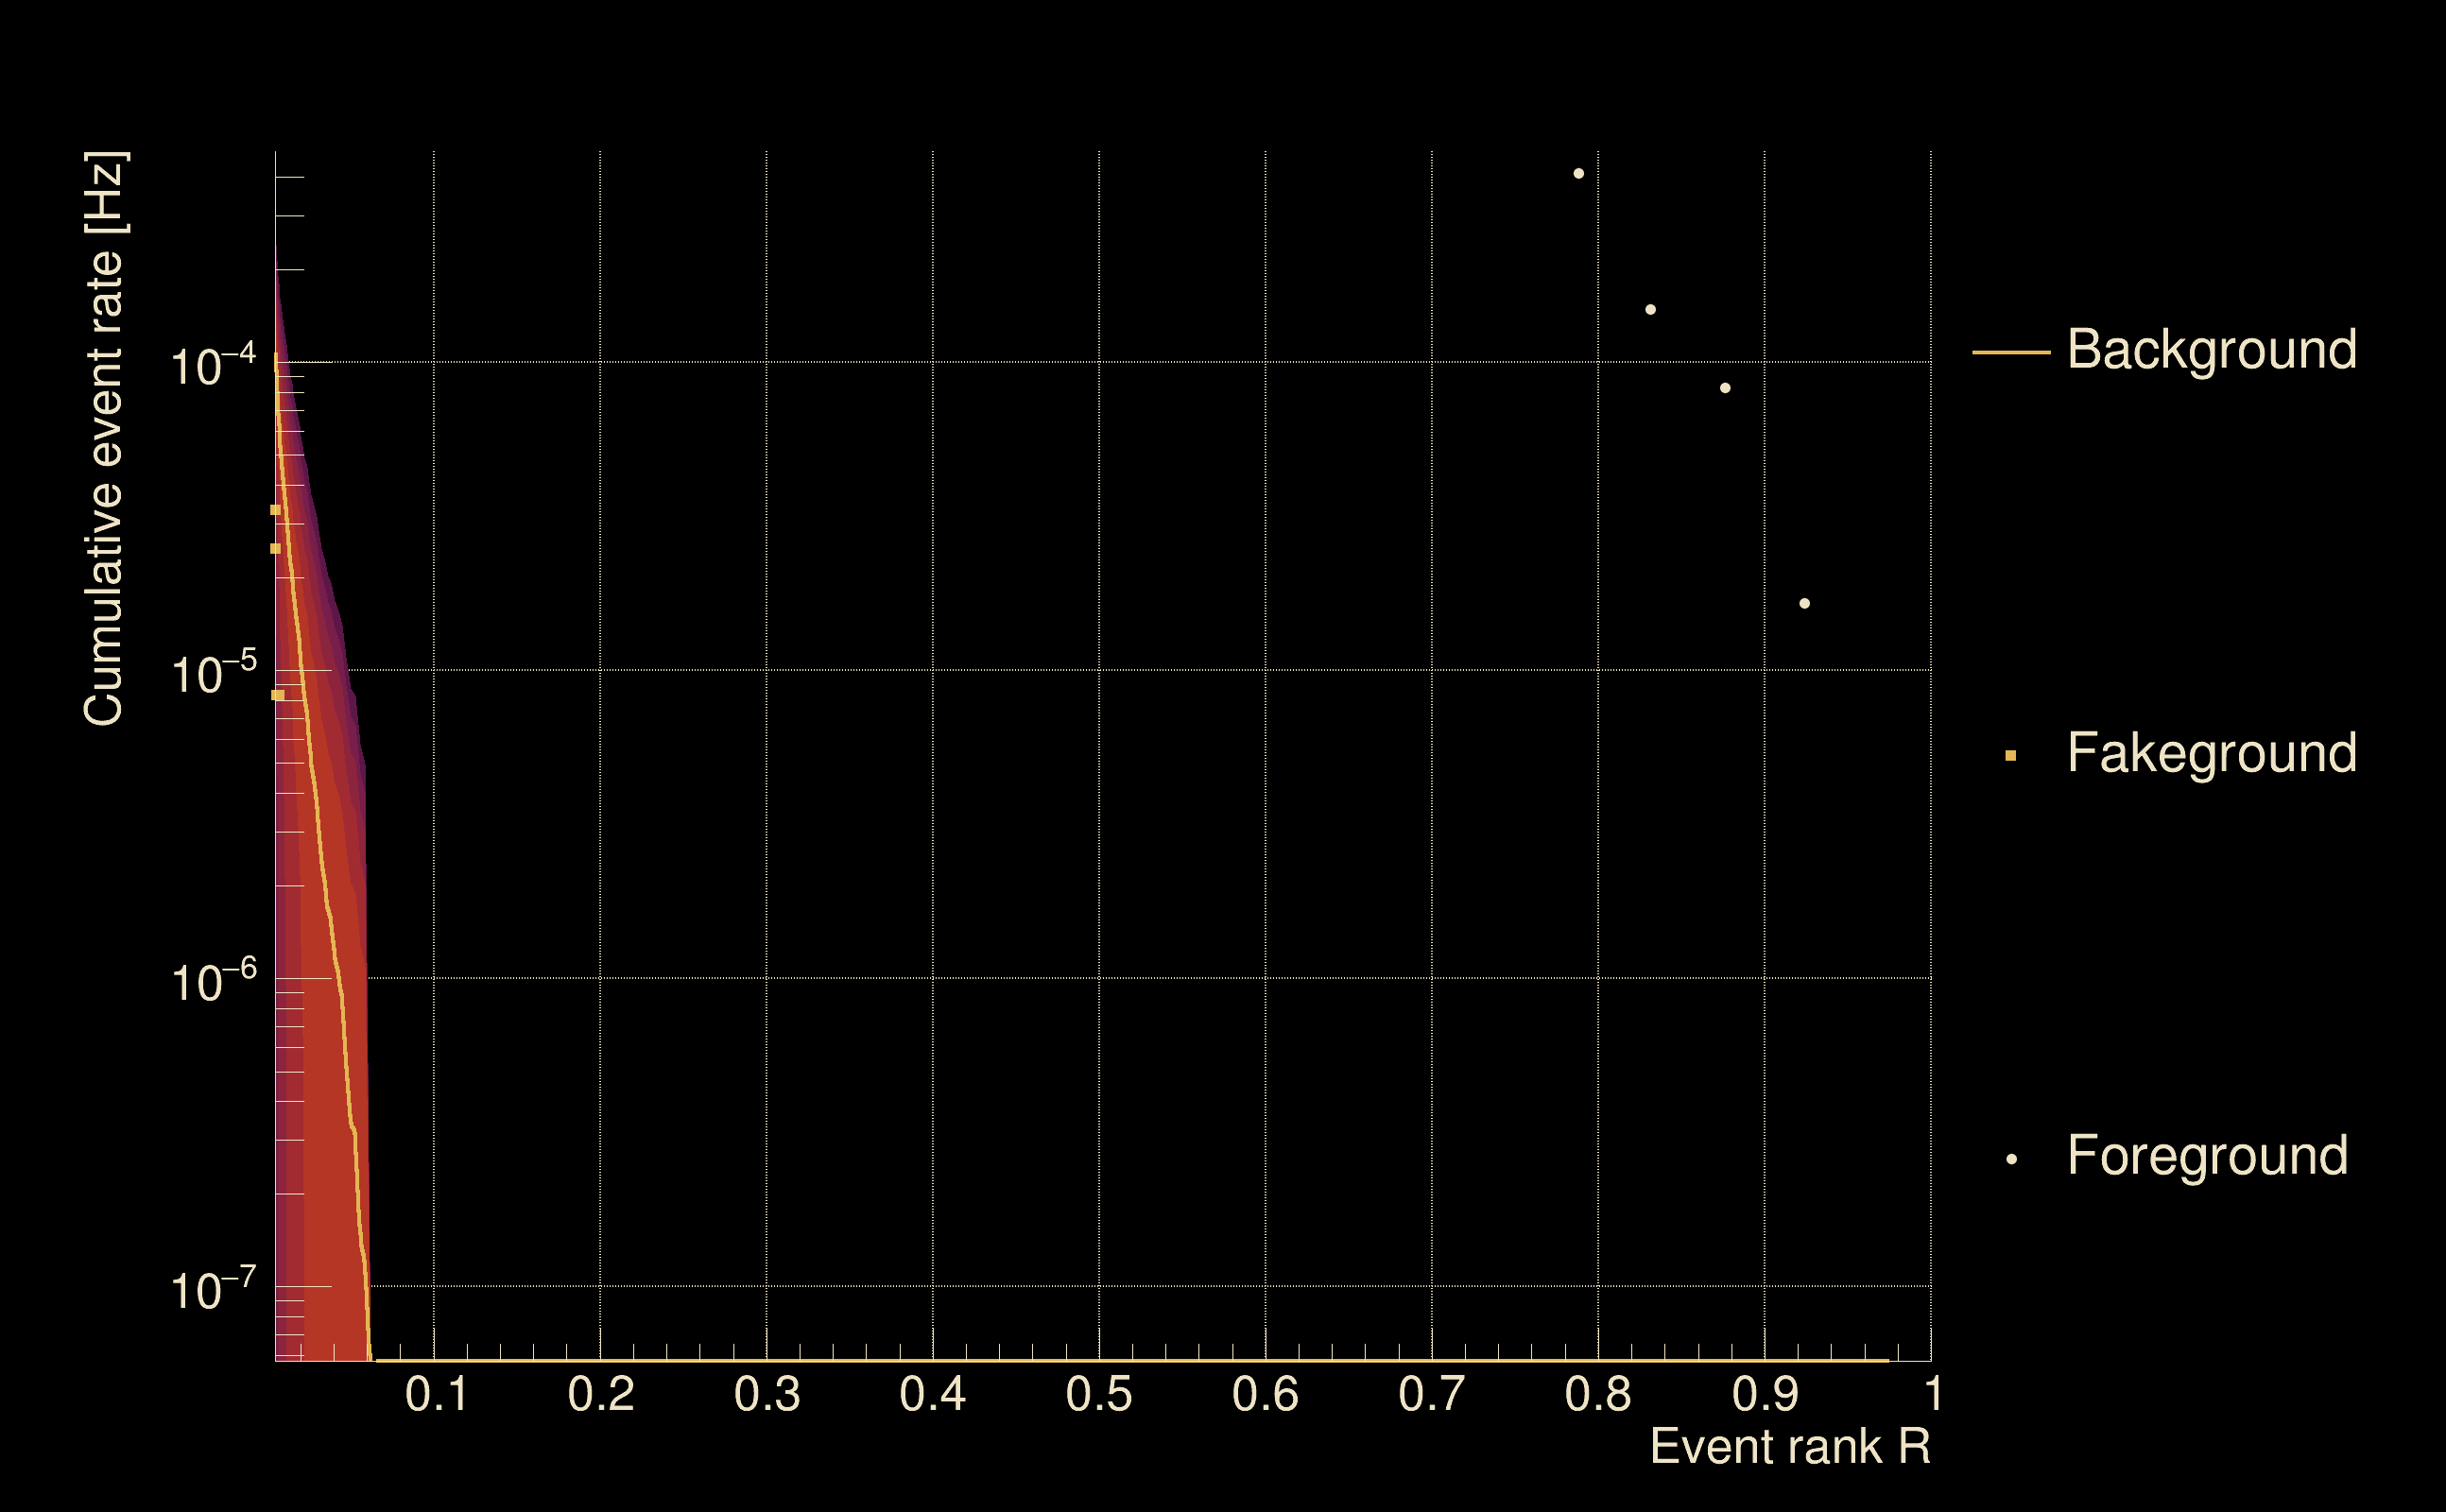
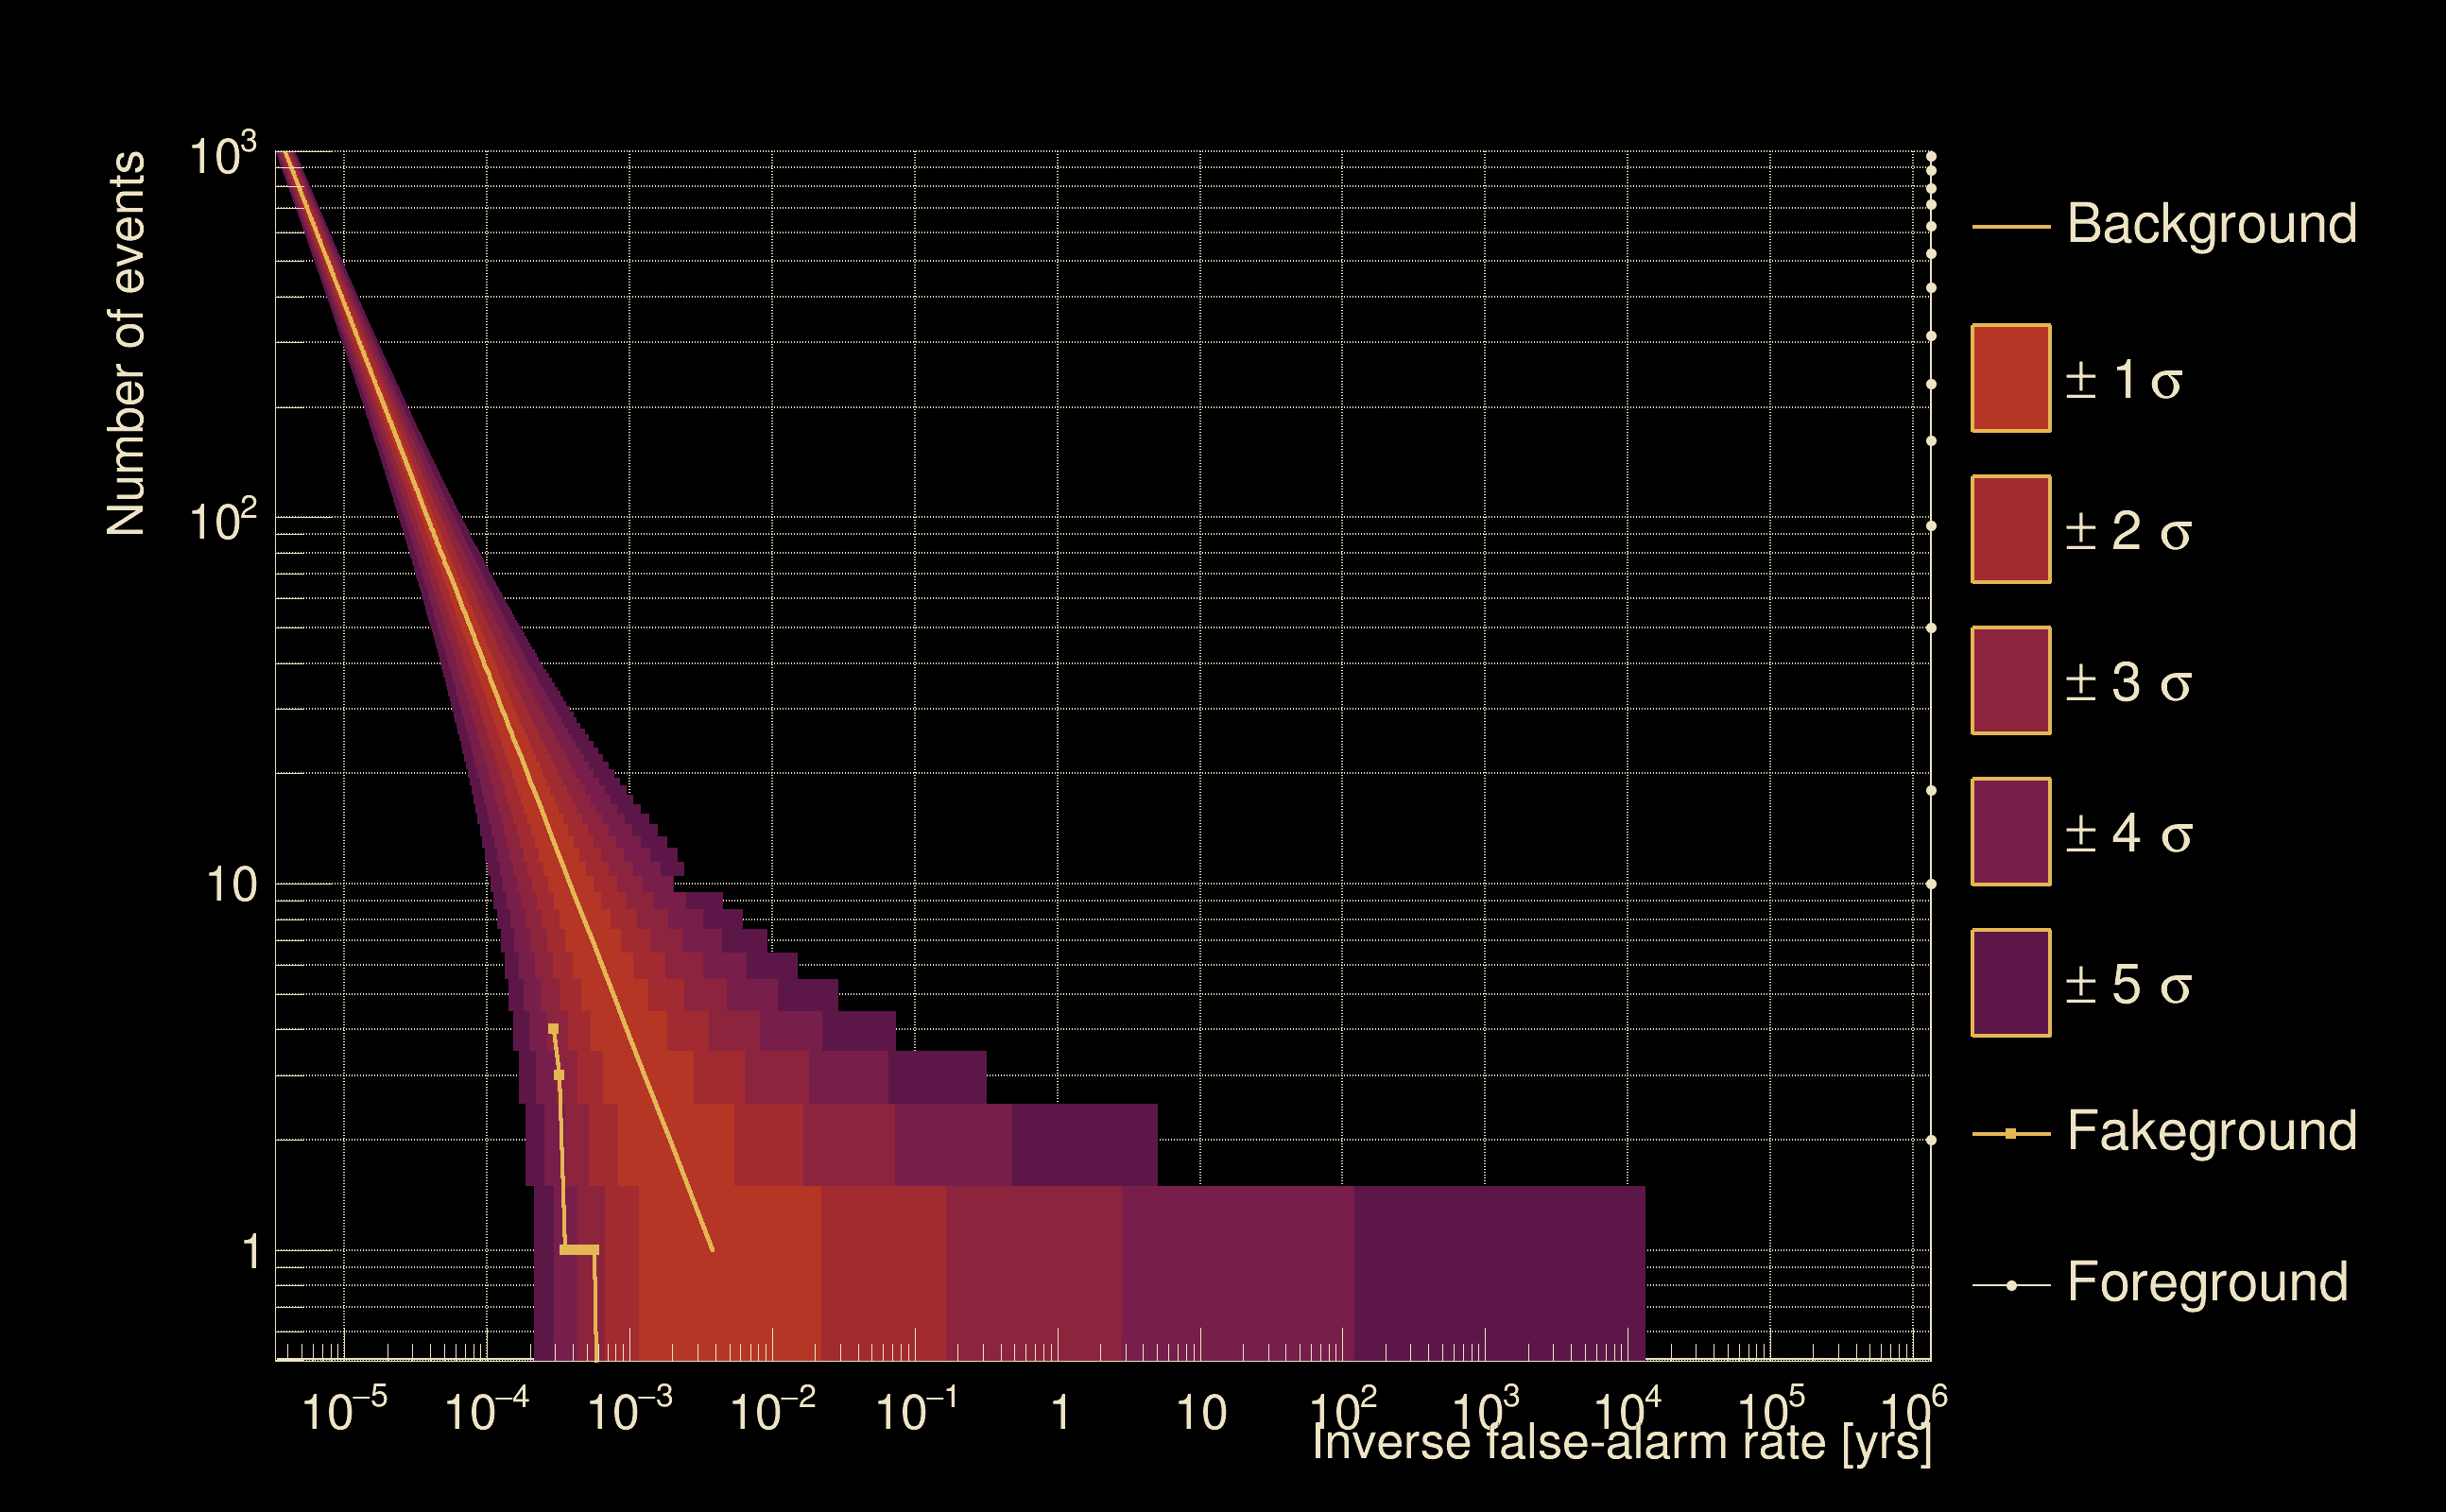
| Detection threshold: | R > 0.0314201 |
| False-alarm rate above that detection threshold: | 2.66369e-06 |
| Alternative threshold at 1/1000 yrs: | R > 0.0587626 |
| Alternative threshold at 1/100 yrs: | R > 0.0587626 |
| Alternative threshold at 1/10 yrs: | R > 0.0587626 |
| Alternative threshold at 1/1 yr: | R > 0.0587626 |
| Alternative threshold at 1/1 d: | R > 0.0193299 |
 |
|
 |
 |
 |
 |
 |
 |
 |
 |
 |
 |
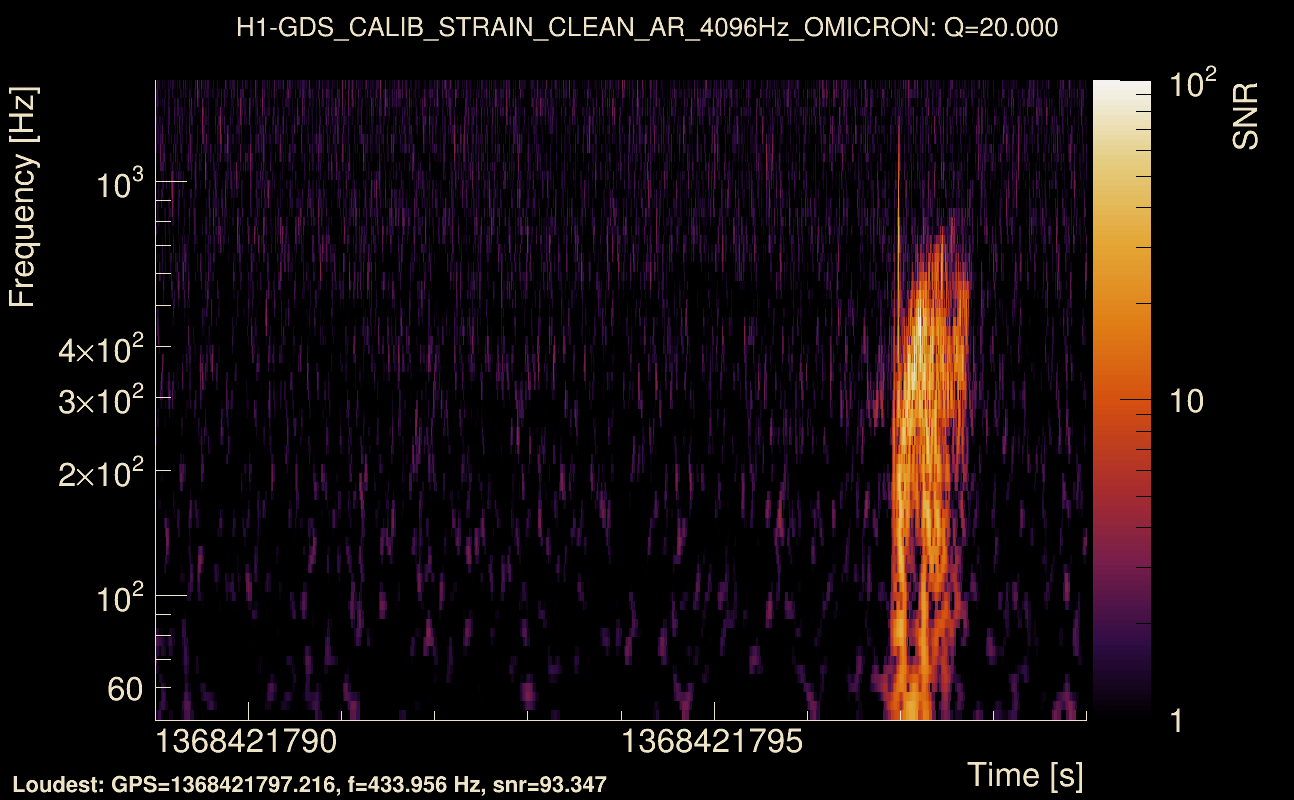
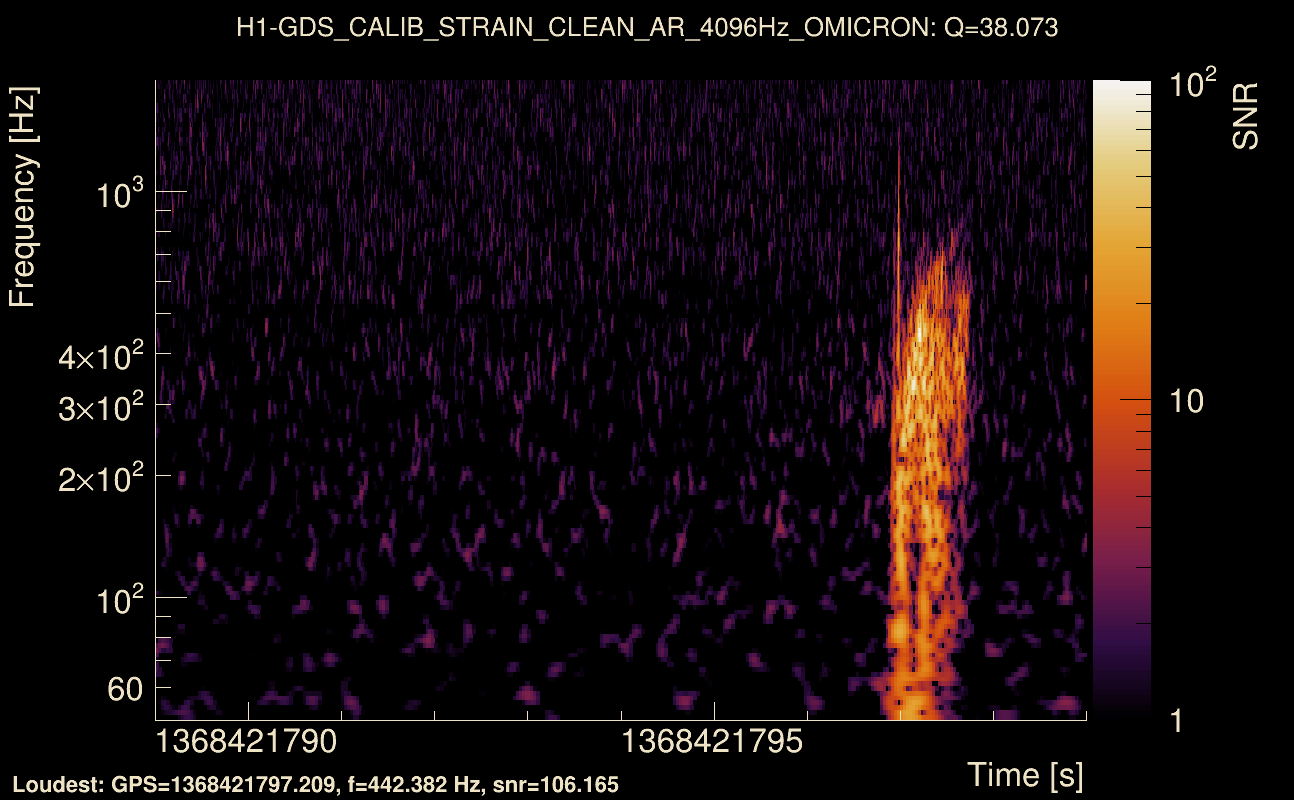
| Event time t(H1): | GPS = 1368421789 (Thu May 18 05:09:31 2023 ) → GPS = 1368421799 (Thu May 18 05:09:41 2023 ) |
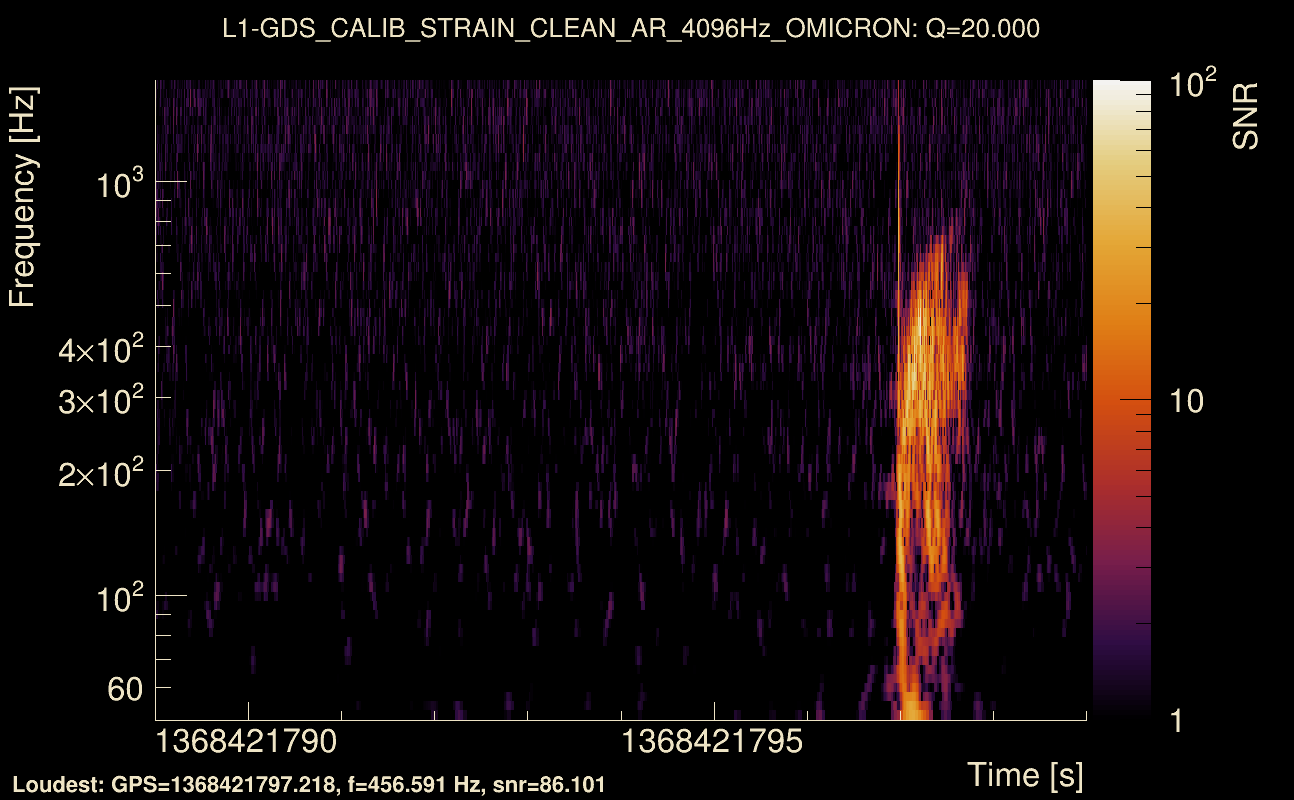
| Event time t(L1): | GPS = 1368421789 (Thu May 18 05:09:41 2023 ) → GPS = 1368421799 (Thu May 18 05:09:41 2023 ) |
| Omicron analysis time window (H1): | GPS = 1368421786 → GPS = 1368421802 |
| Omicron analysis time window (L1): | GPS = 1368421786 → GPS = 1368421802 |
| Time delay between detectors t(L1) - t(H1): | 0.0477681 s (slice index = 107 / 217), δt_gw = 0.00176812 s |
| Time delay standard deviation: | 0.0775857 s |
| [targeted mode] Time delay probability: | 0.953538 (0.0582645 sigmas), δt_target = 0.00504184 s |
| Frequency: | 316.052 Hz |
| Ξ: | 0.160806 ± 0.0717025 (variance = 0.00514125): Q0: 0.555318, Q1: 0.410707, Q2: 0.401069, Q3: 0.457403, Q4: 0.57216 |
| Rank: | R_A = 0.0588123 |
| Log of amplitude ratio (L1/H1): | -0.147286, variance = 0.195 (L1/H1: -0.4419, variance = 0.367176, H1/L1: -0.227785, variance = 0.412448) |
| Amplitude ratio (L1/H1): | 0.863047 ⋇ 1.55517 (L1/H1: 0.642814 ⋇ 1.83299, H1/L1: 0.796295 ⋇ 1.9007) |
| Amplitude ratio H1|L1 compatibility (probability): | 0.448181 |
| Antenna factor probability: | 0.855804 |
| Number of rejected frequency rows: | Q0: 11 / 18, Q1: 25 / 36, Q2: 53 / 70, Q3: 111 / 134, Q4: 251 / 258 |
| Maximum signal-to-noise ratio: | H1: 111.316, L1: 98.6568 |
| SNR variance: | H1: 0.448, L1: 0.388724 |
| Click here for a zoomed plot | Click here for a zoomed plot | Click here for a zoomed plot | Click here for a zoomed plot | Click here for a zoomed plot |
 |
 |
 |
 |
 |
 |
 |
 |
 |
 |
 |
 |
 |
 |
 |
 |
 |
 |
 |
 |
 |
 |
 |
 |
 |
 |
 |
 |
 |
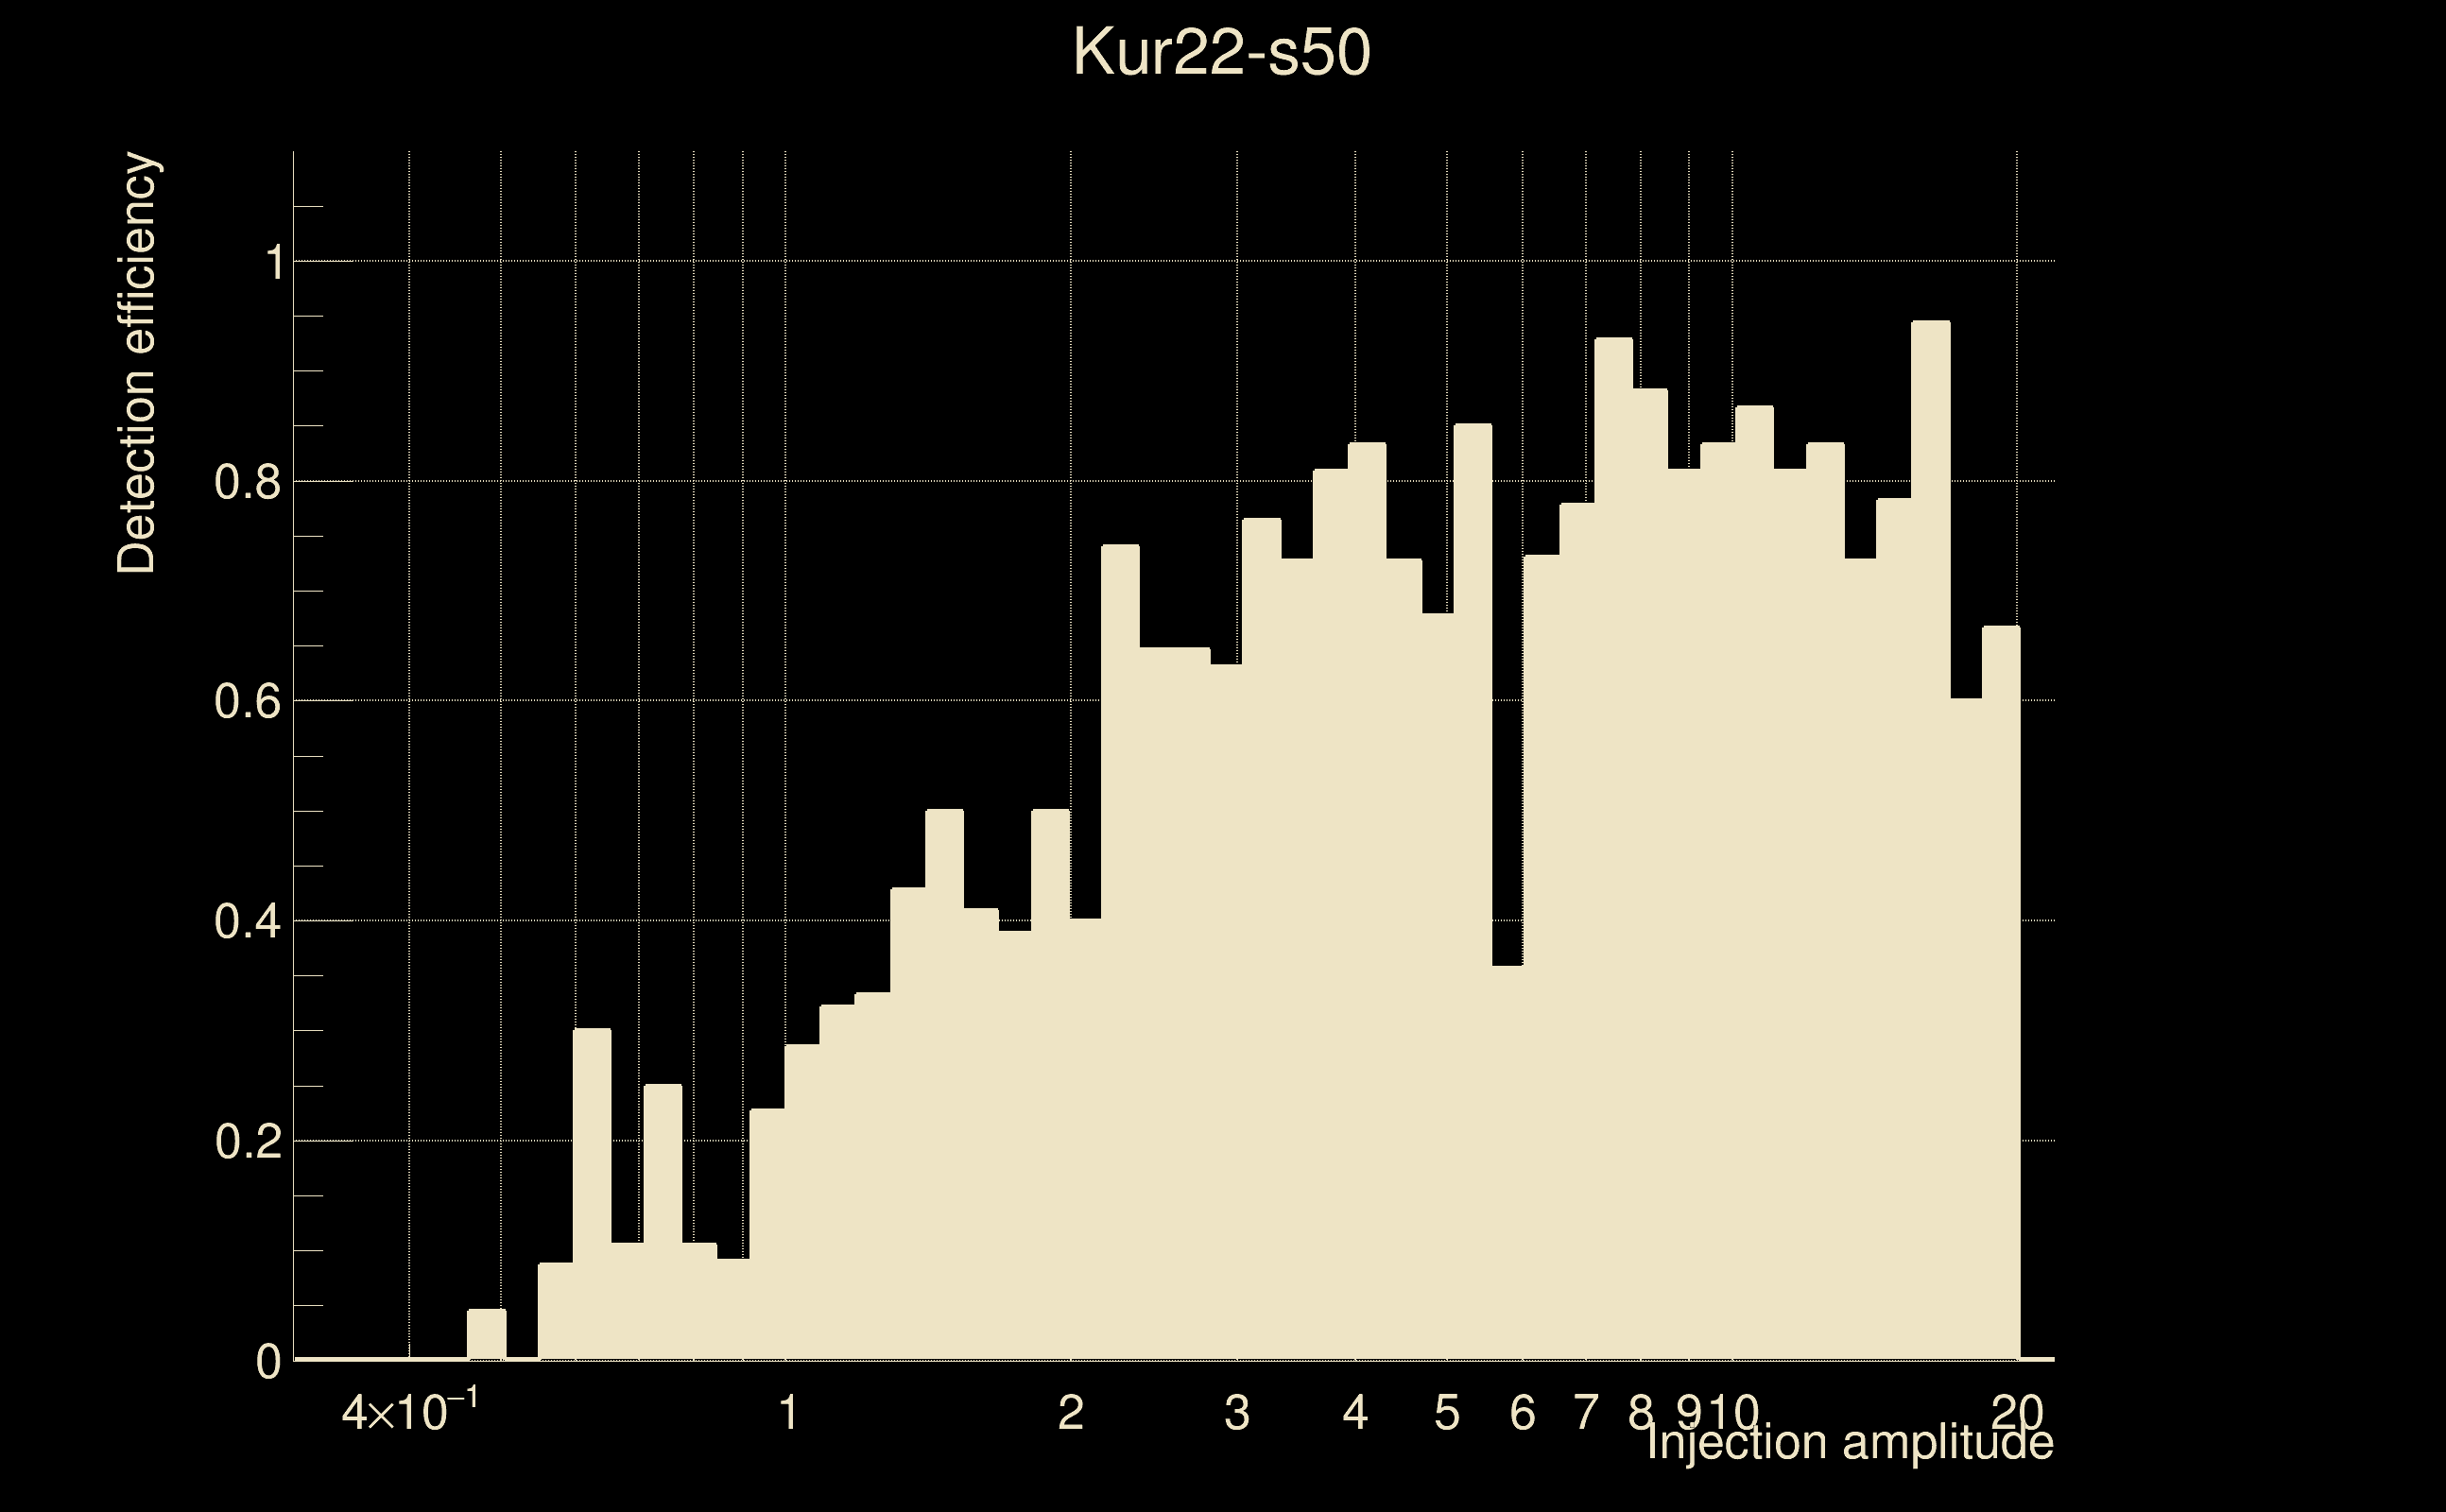
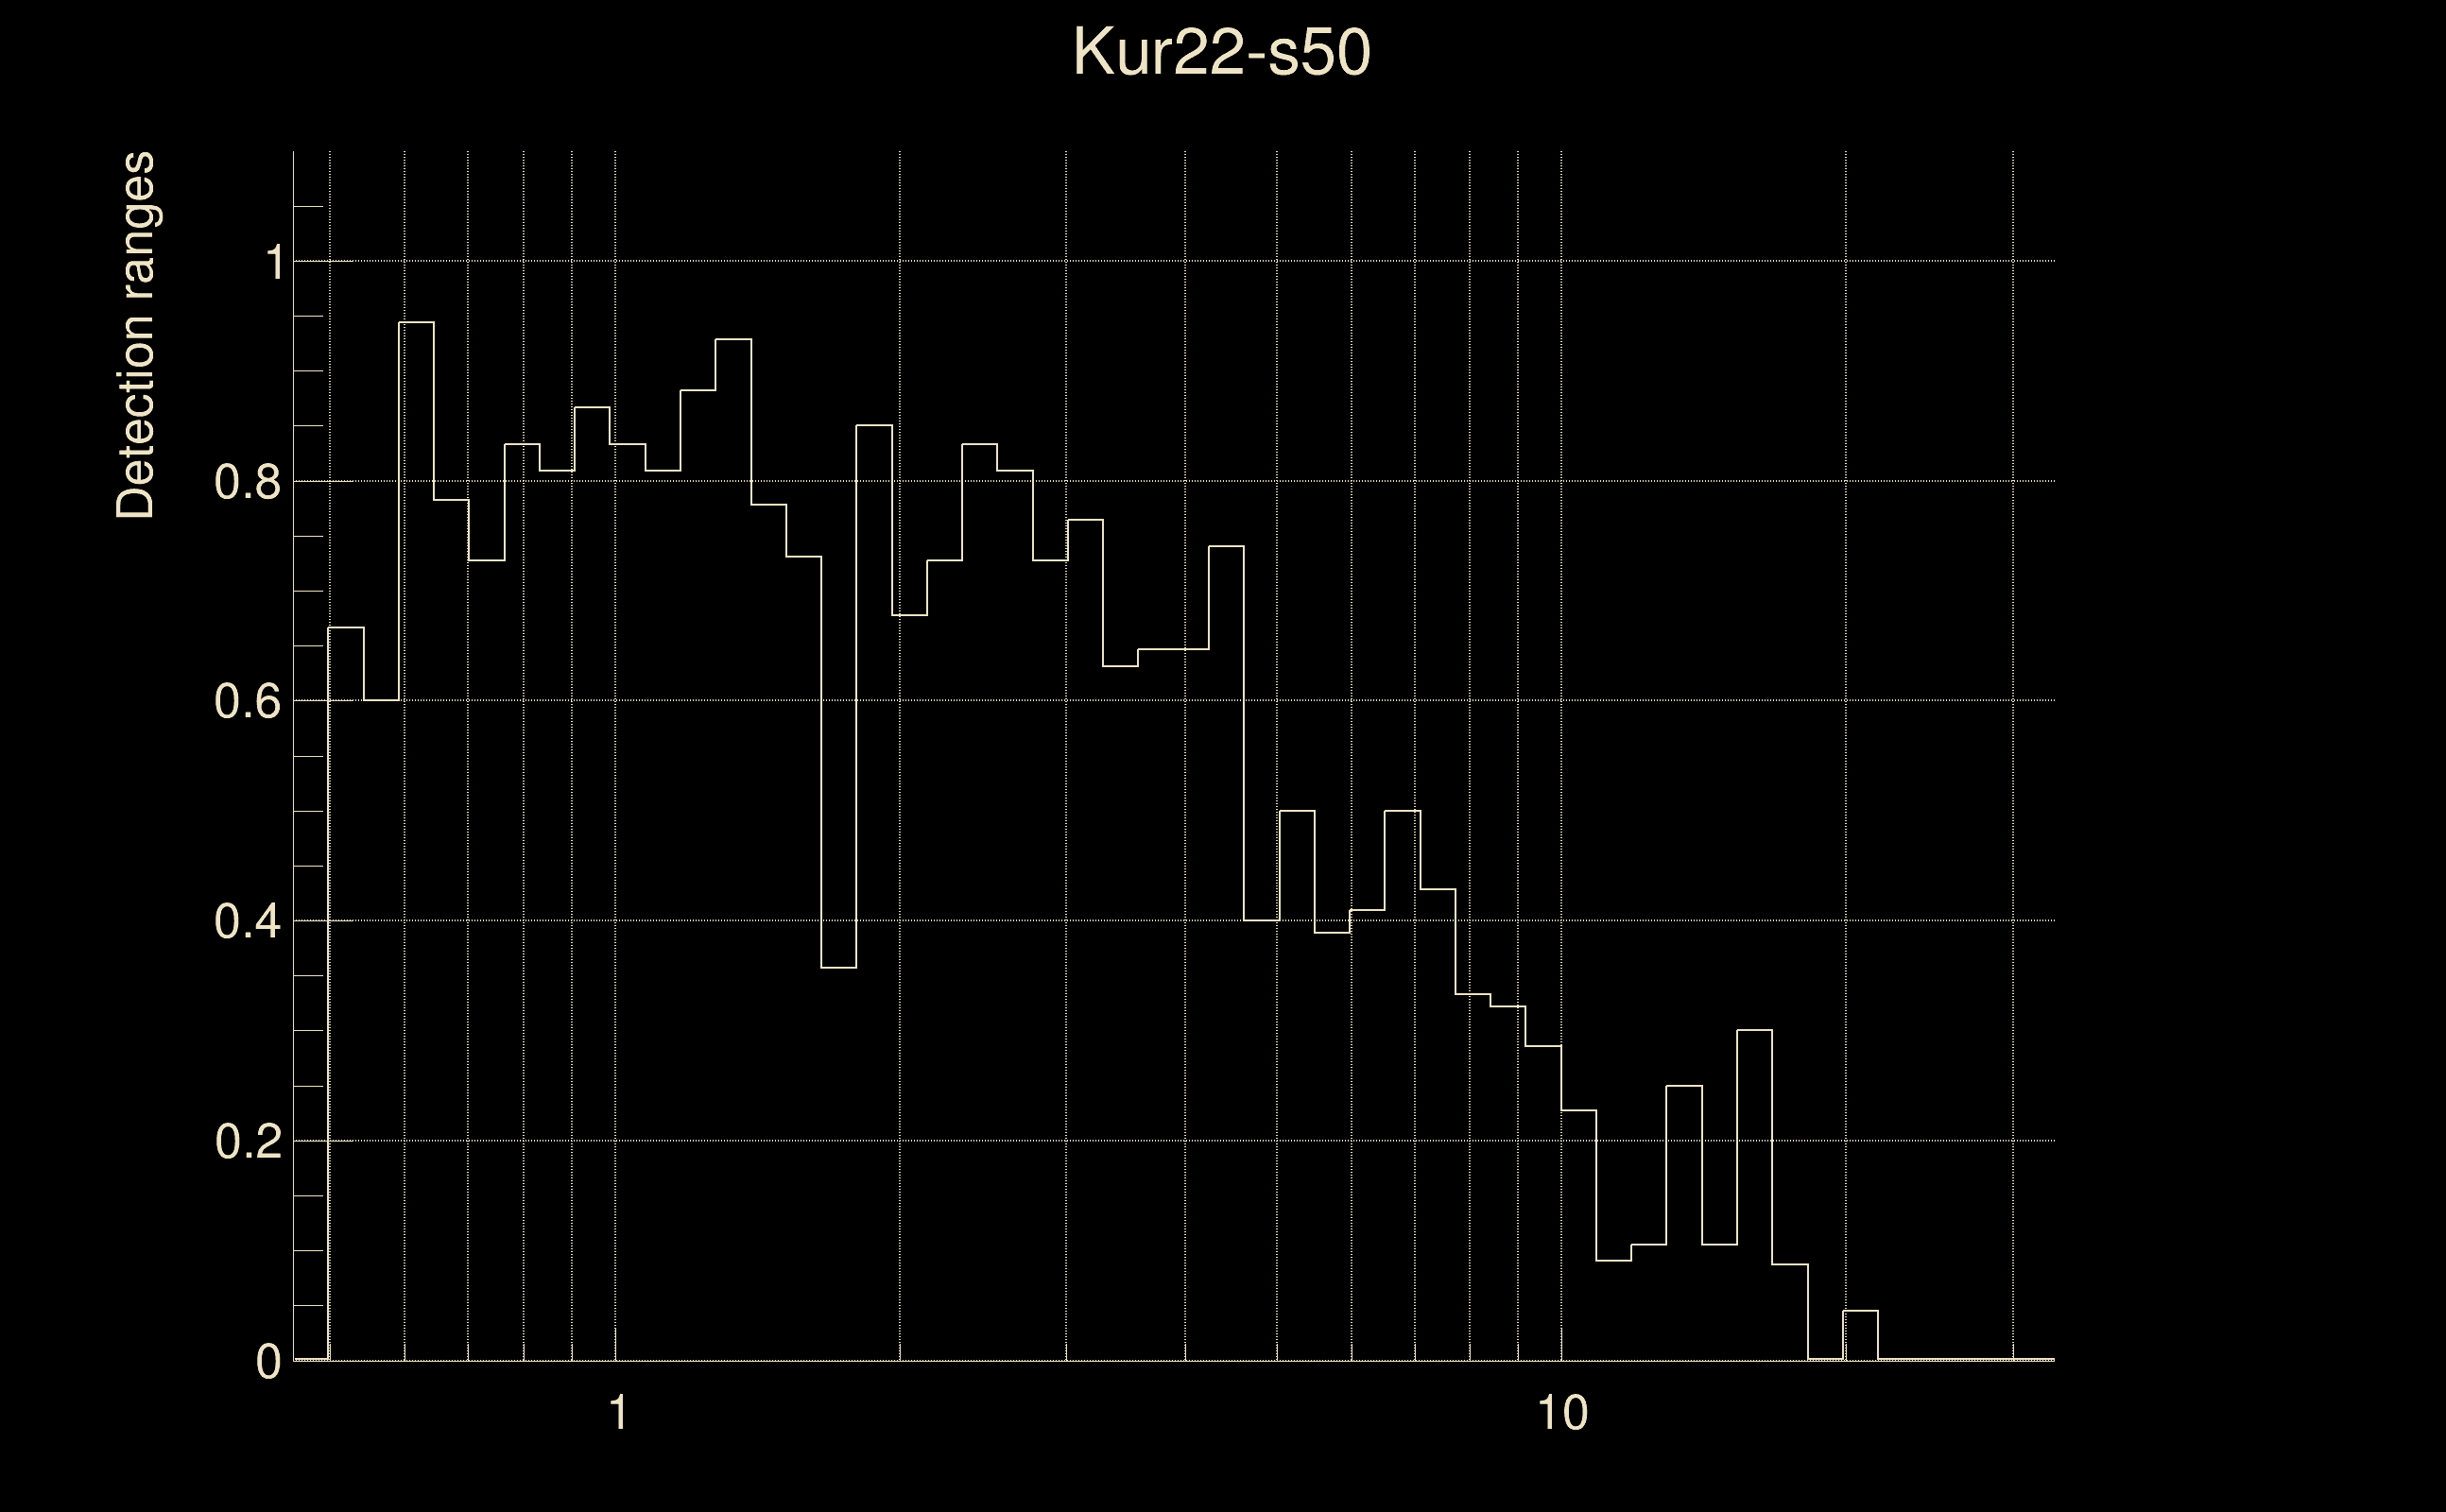
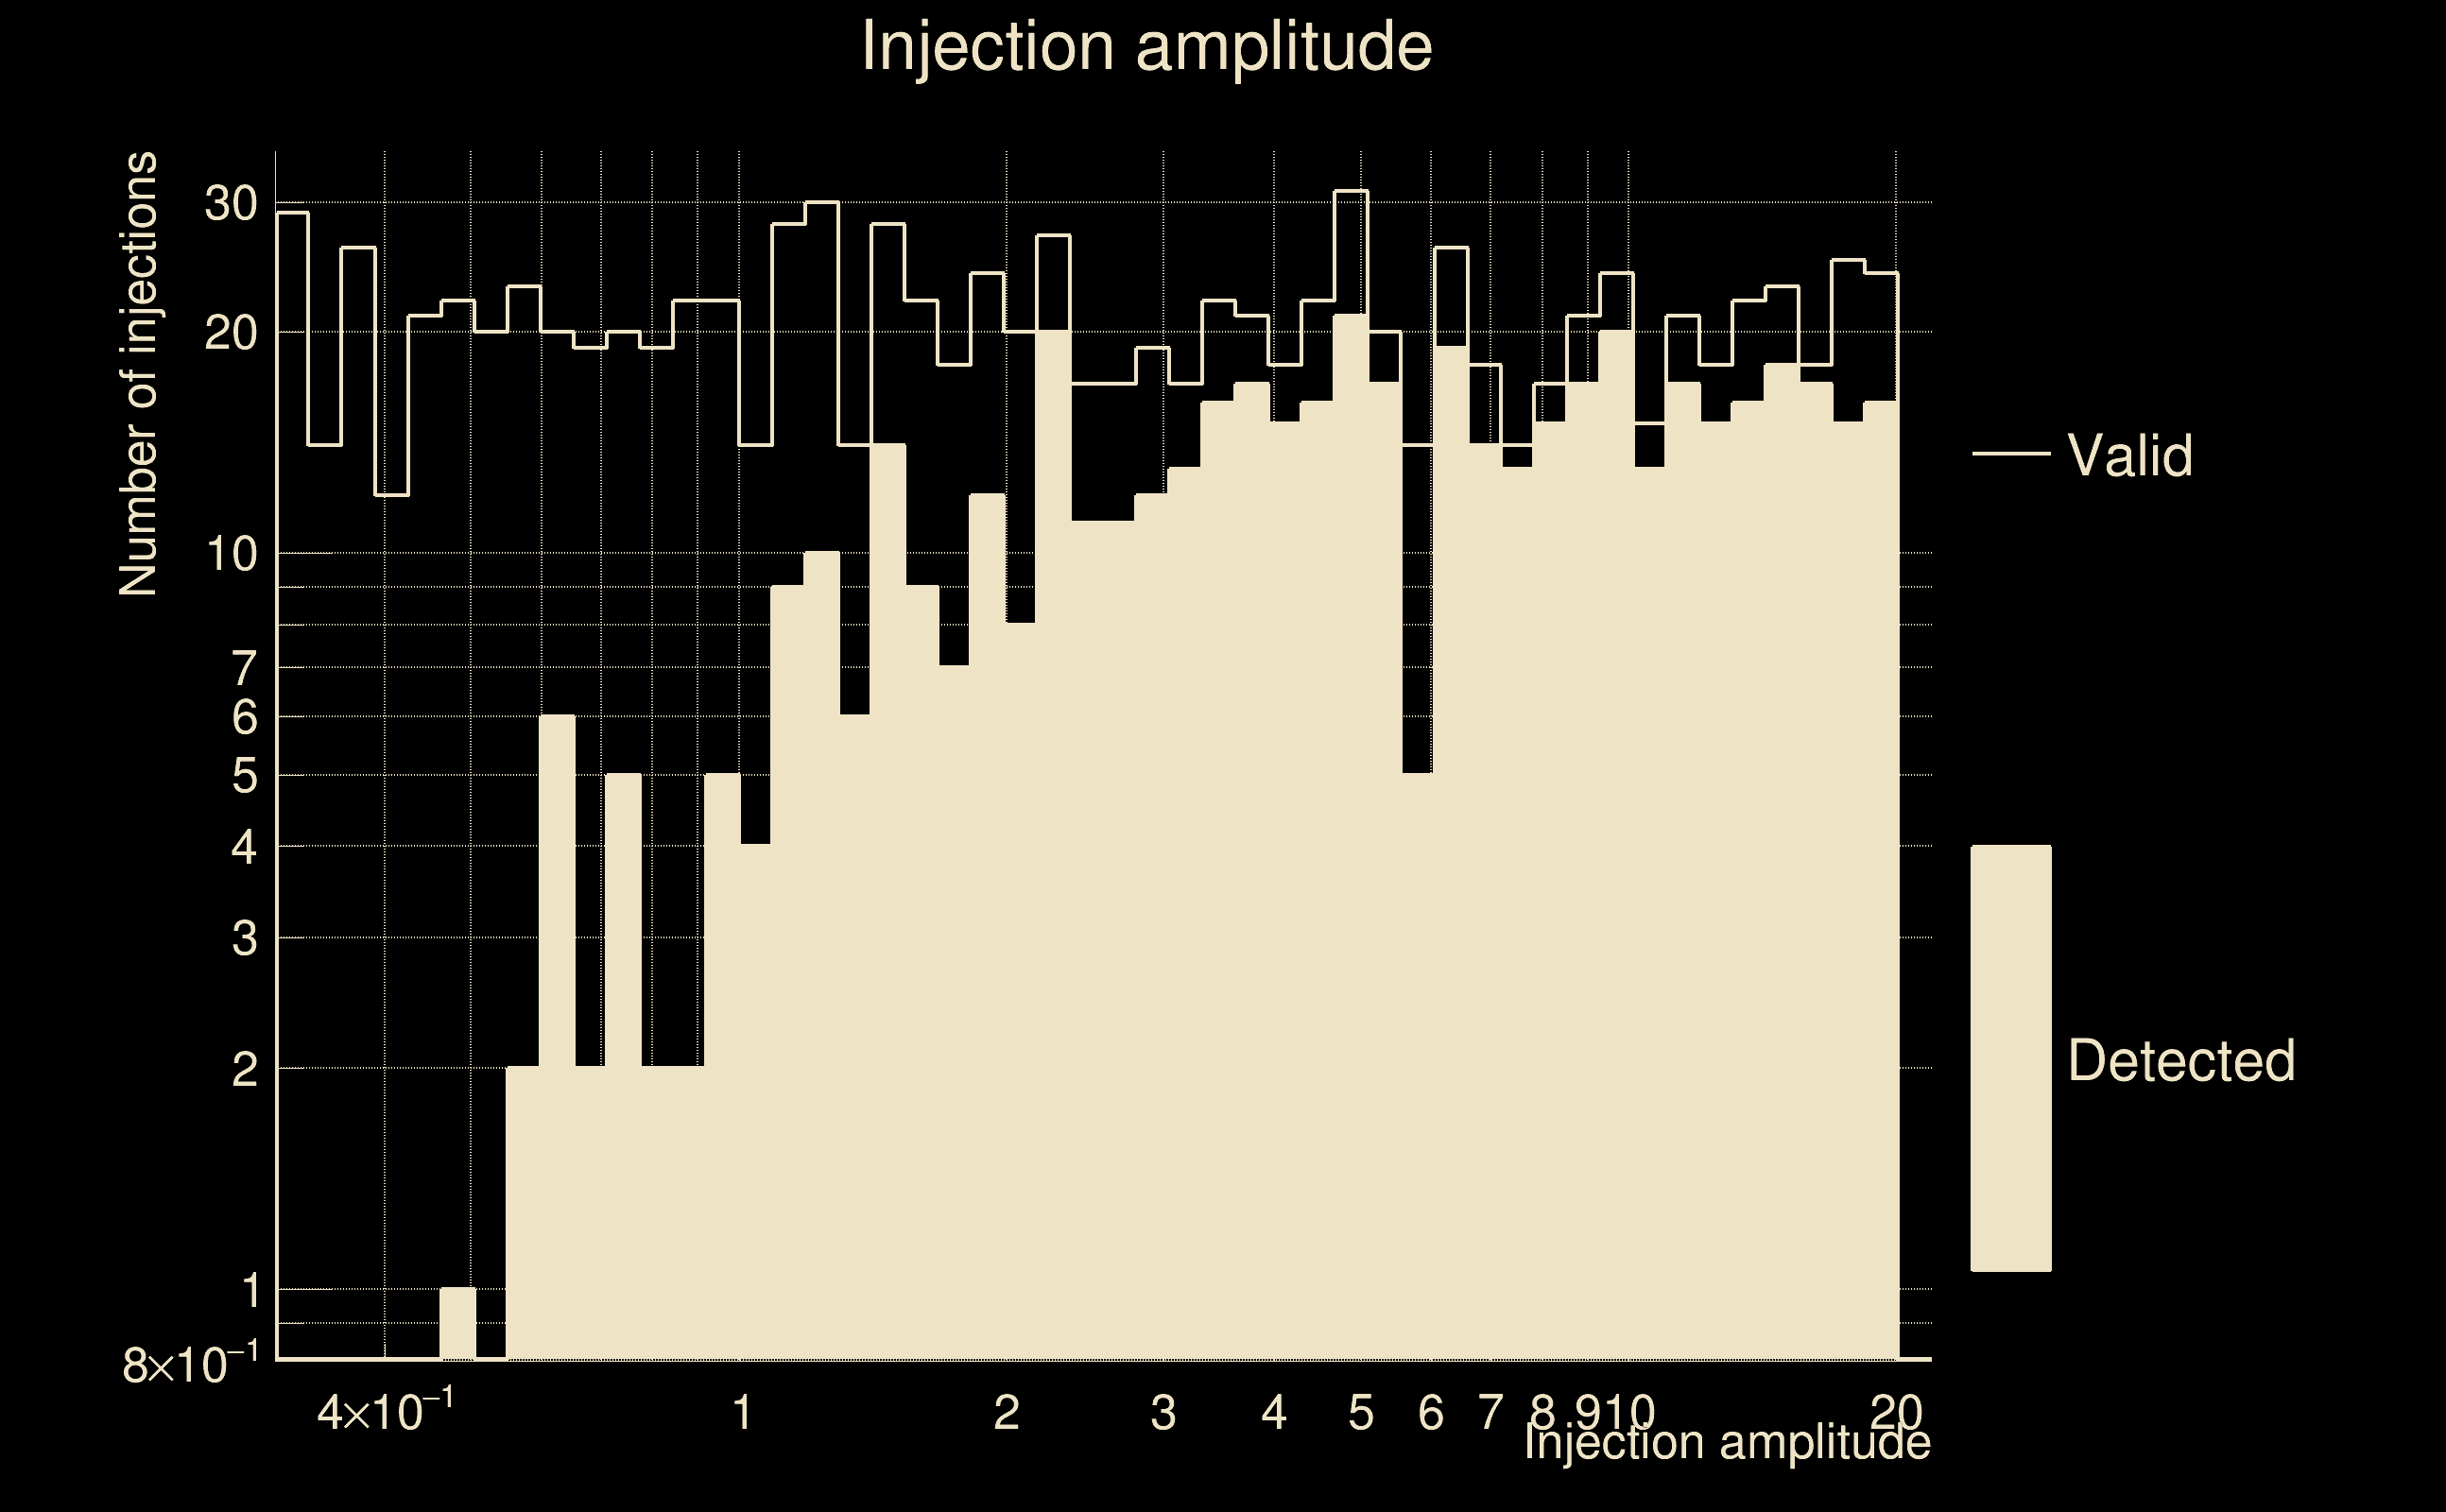
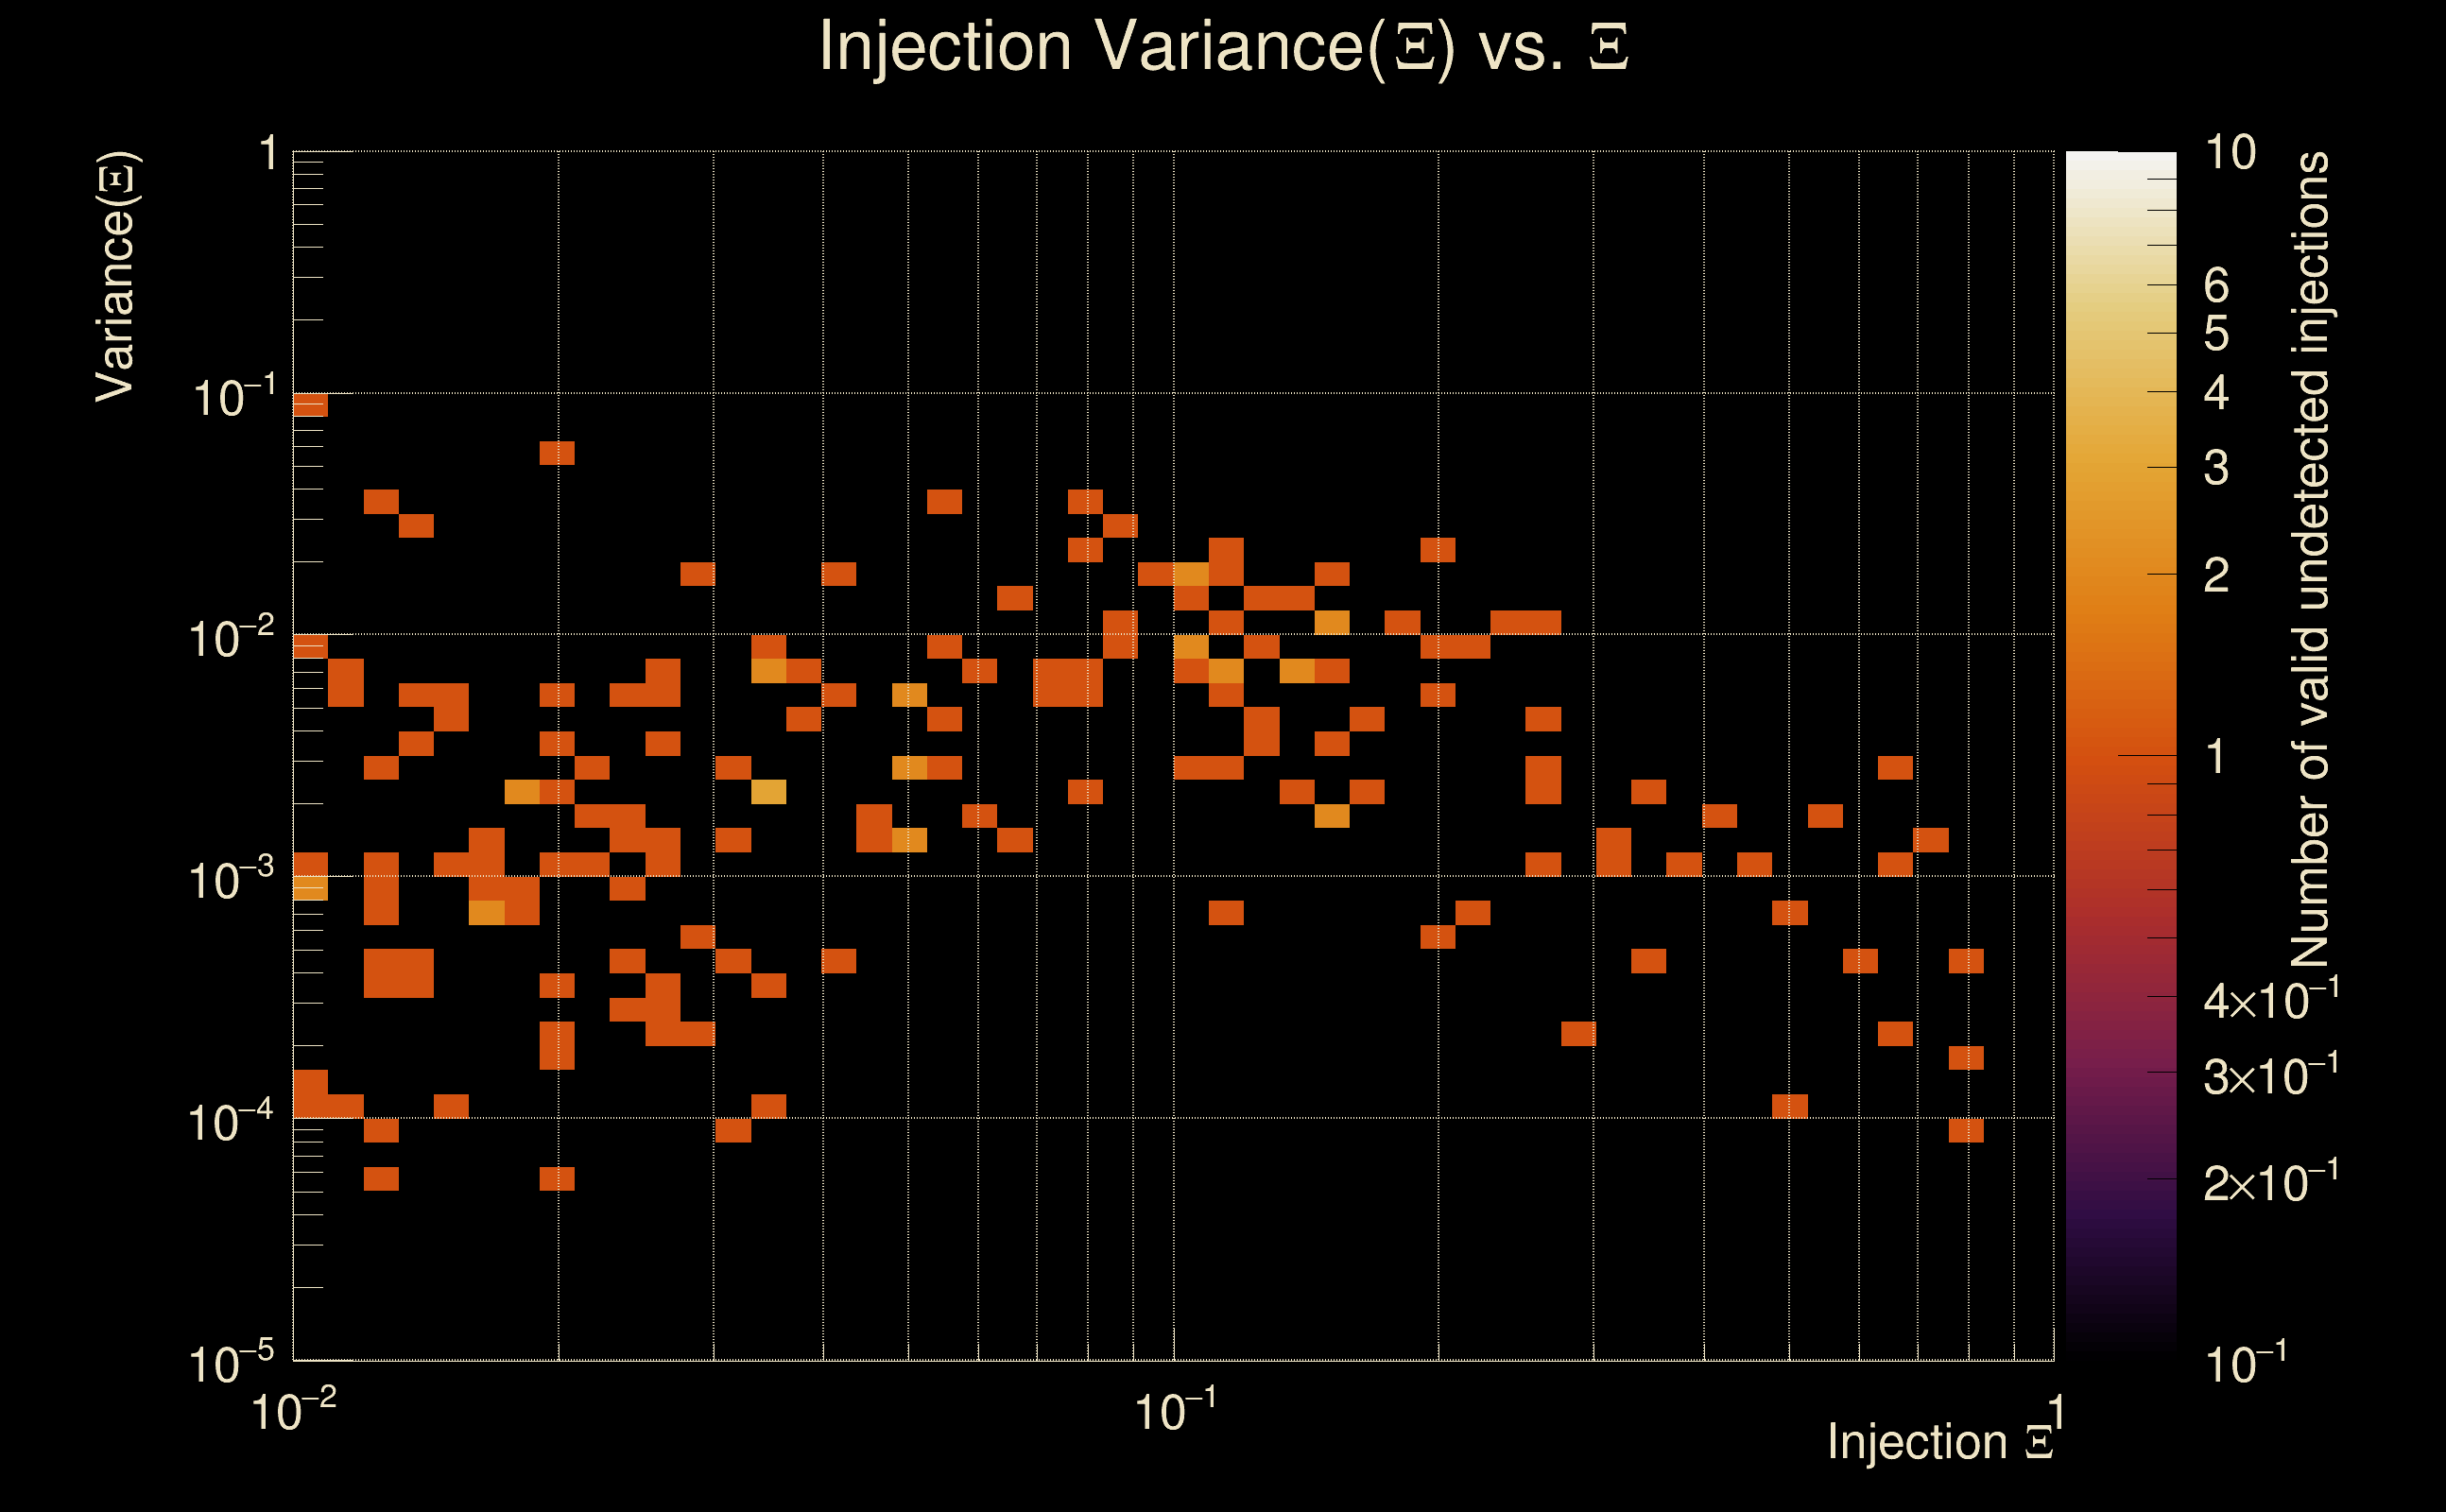
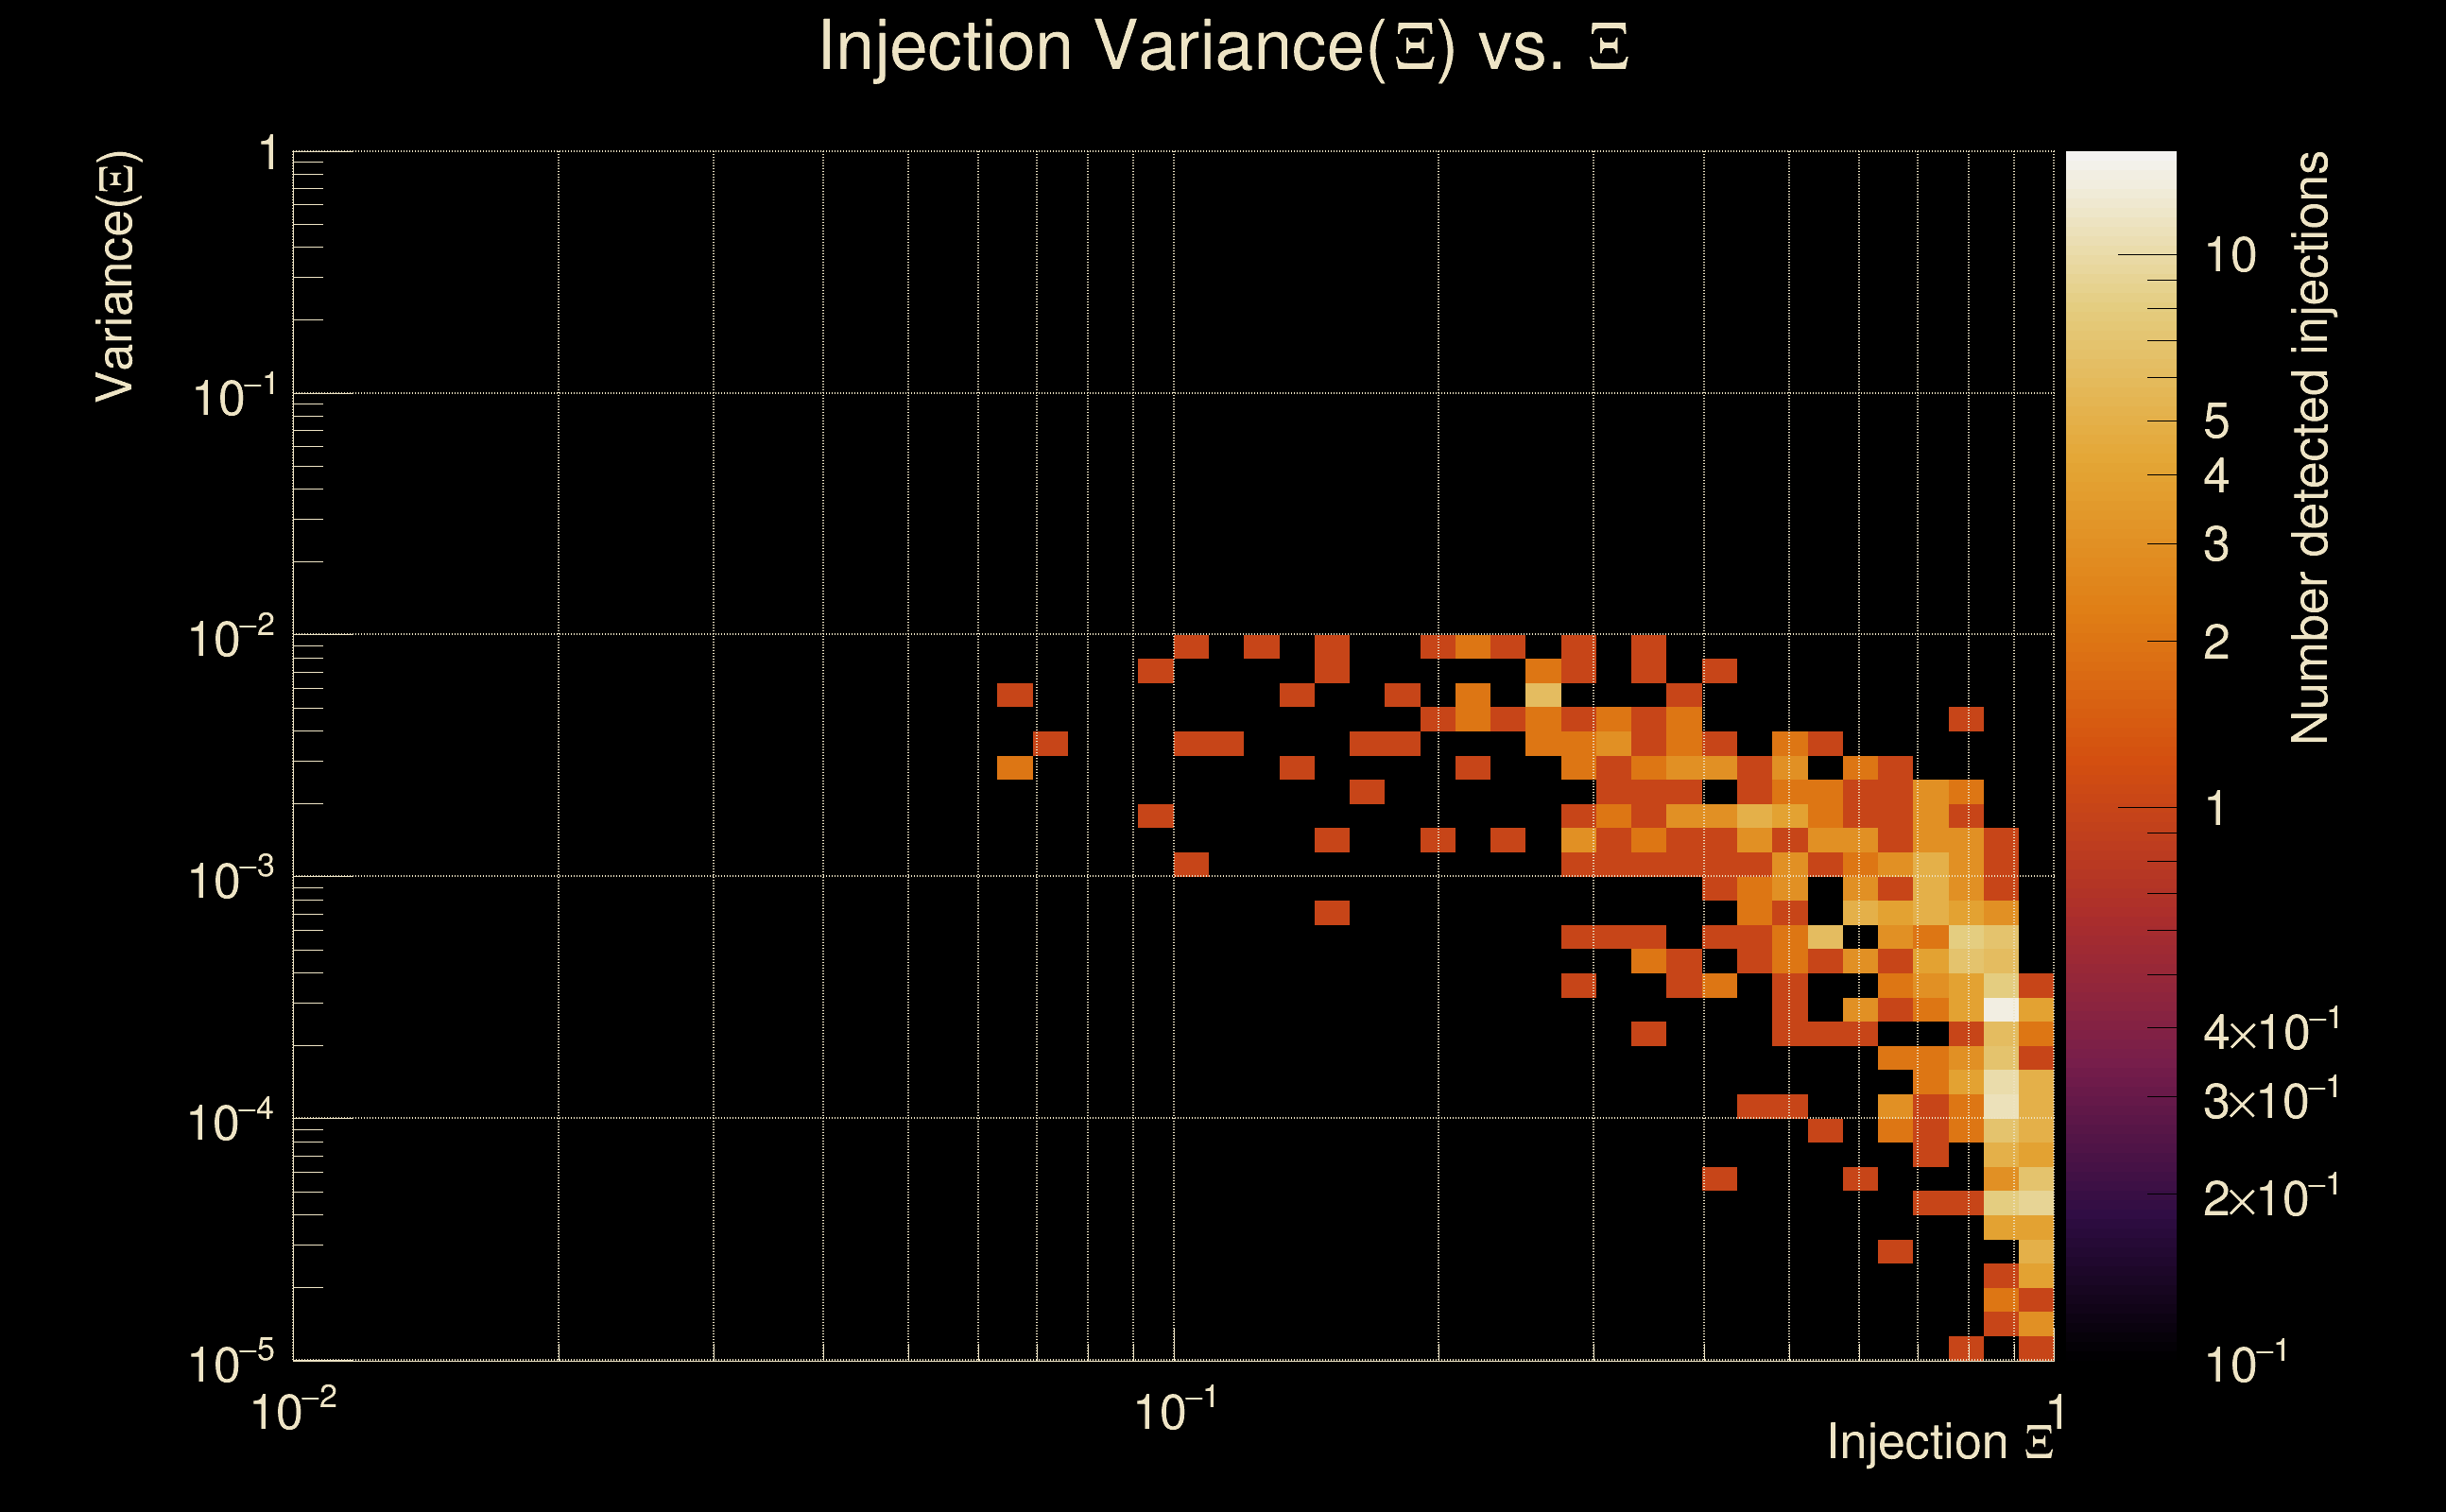
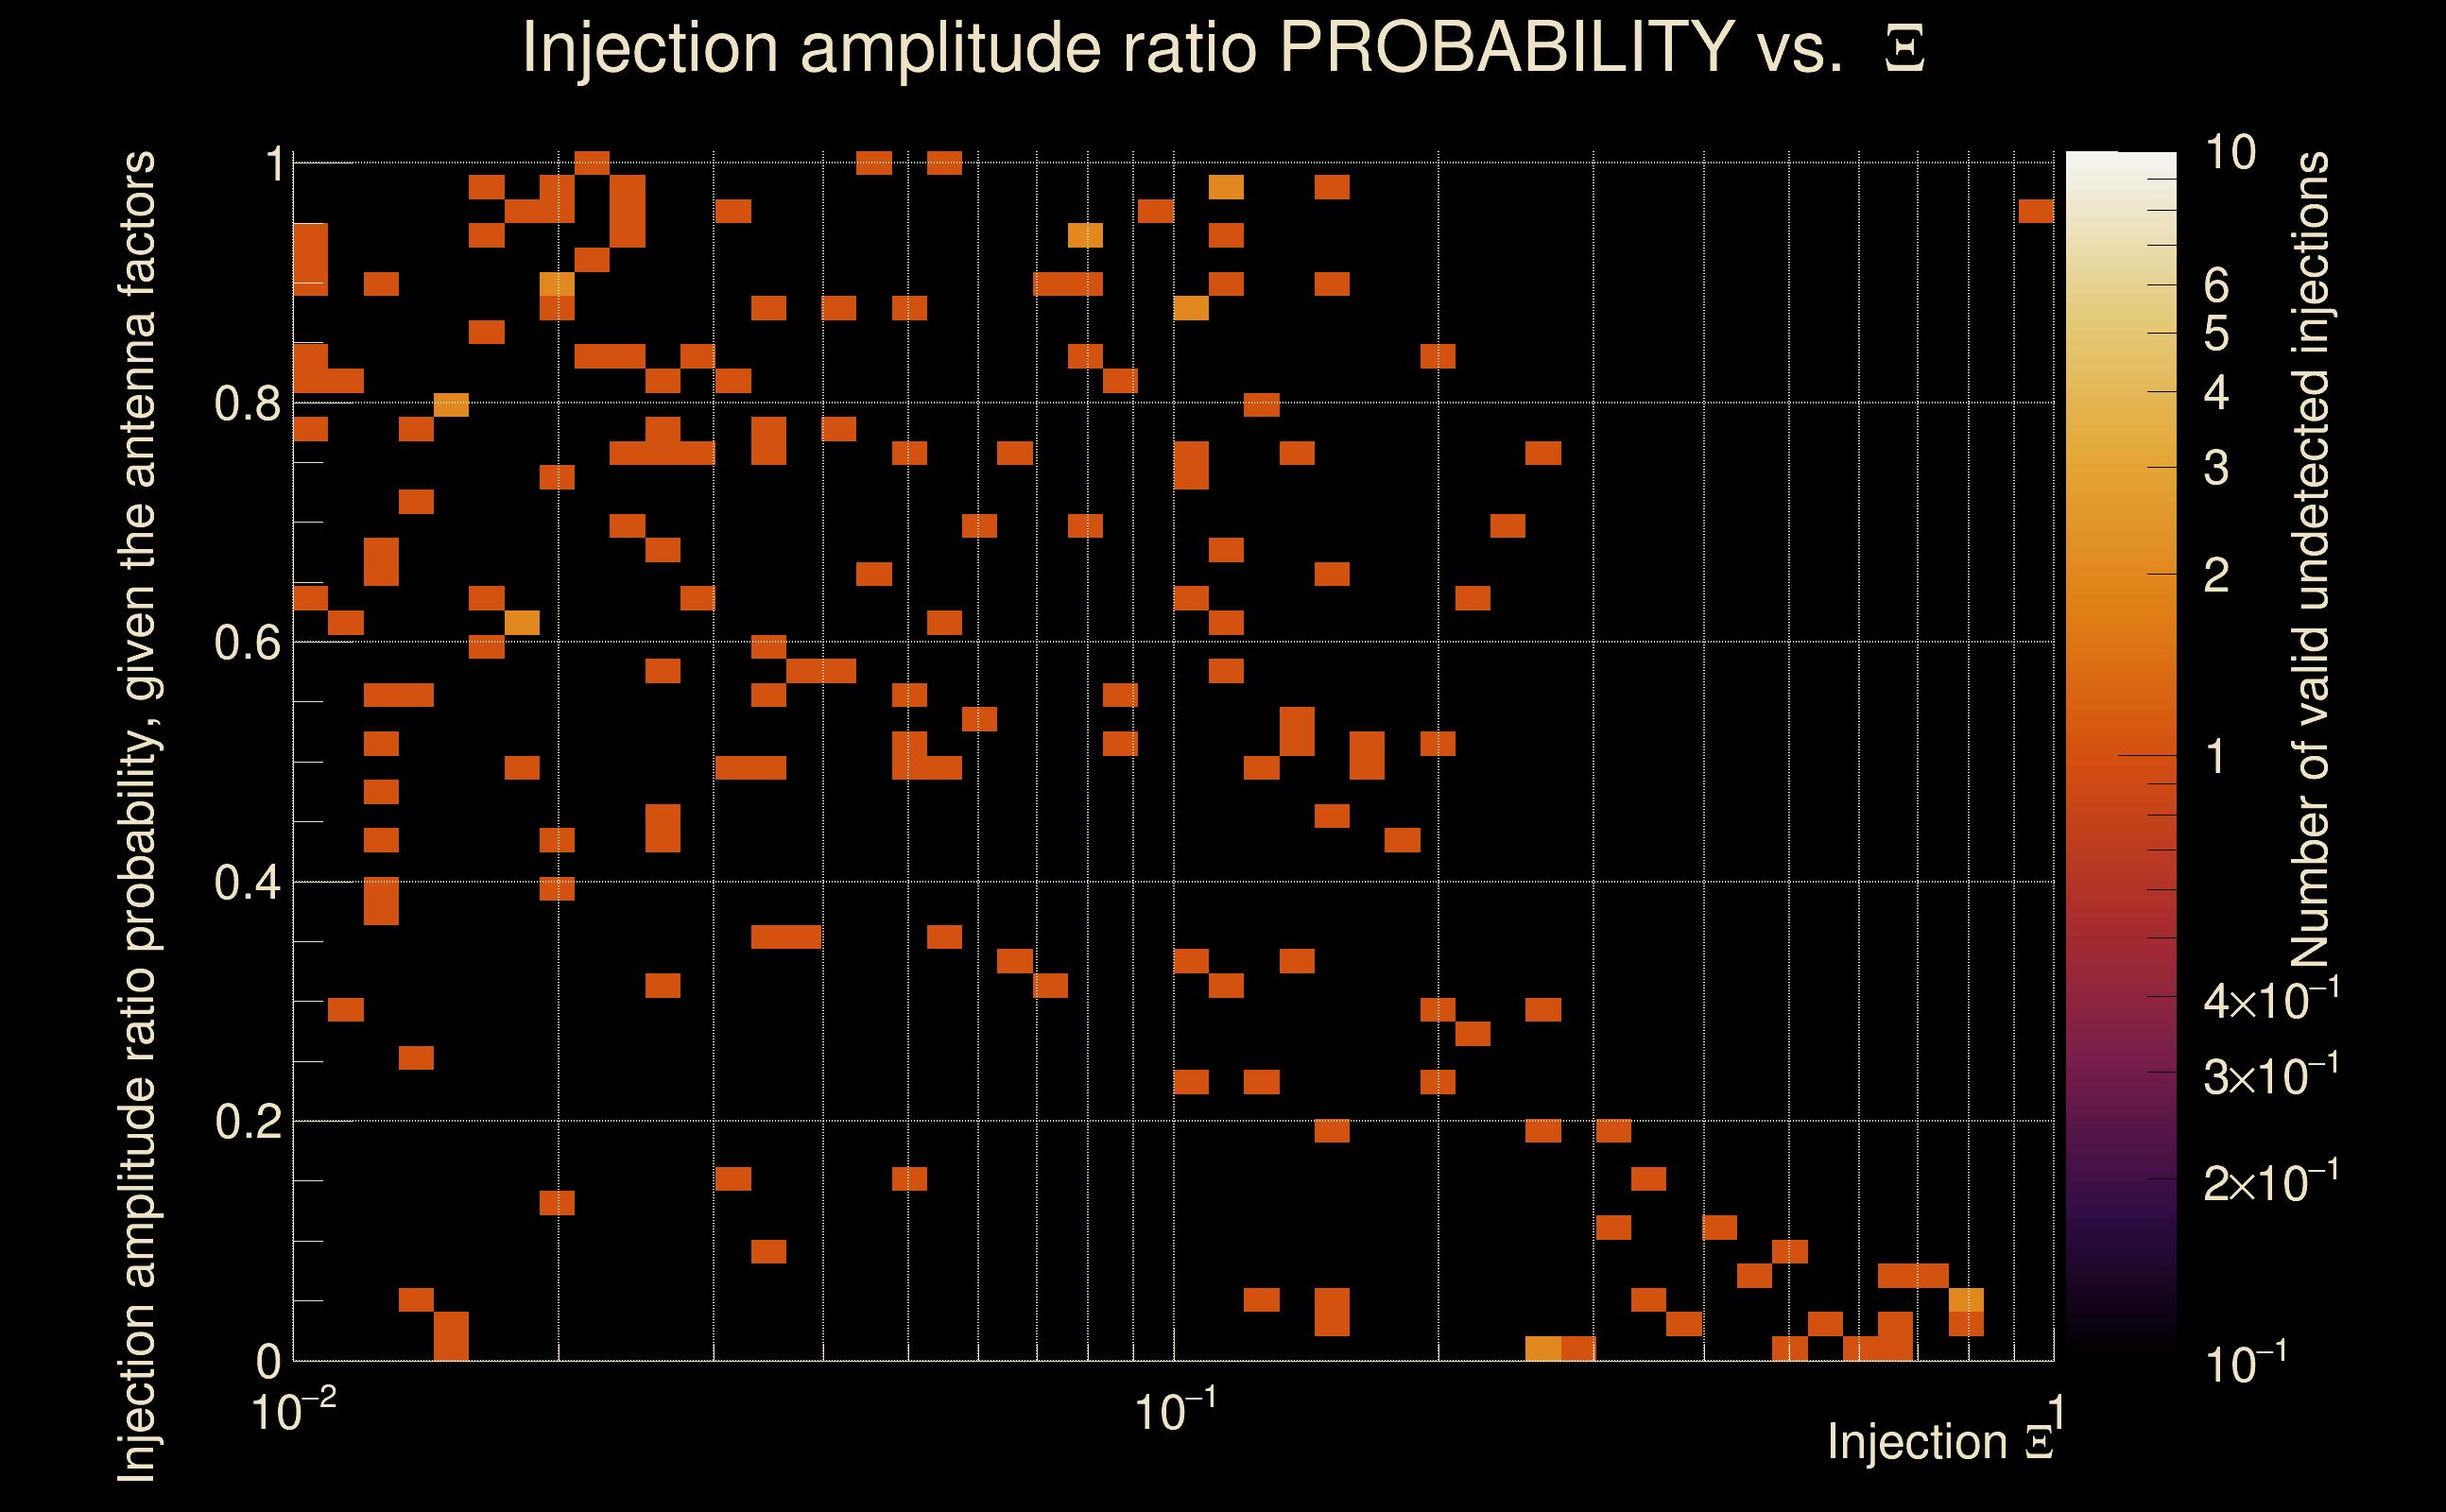
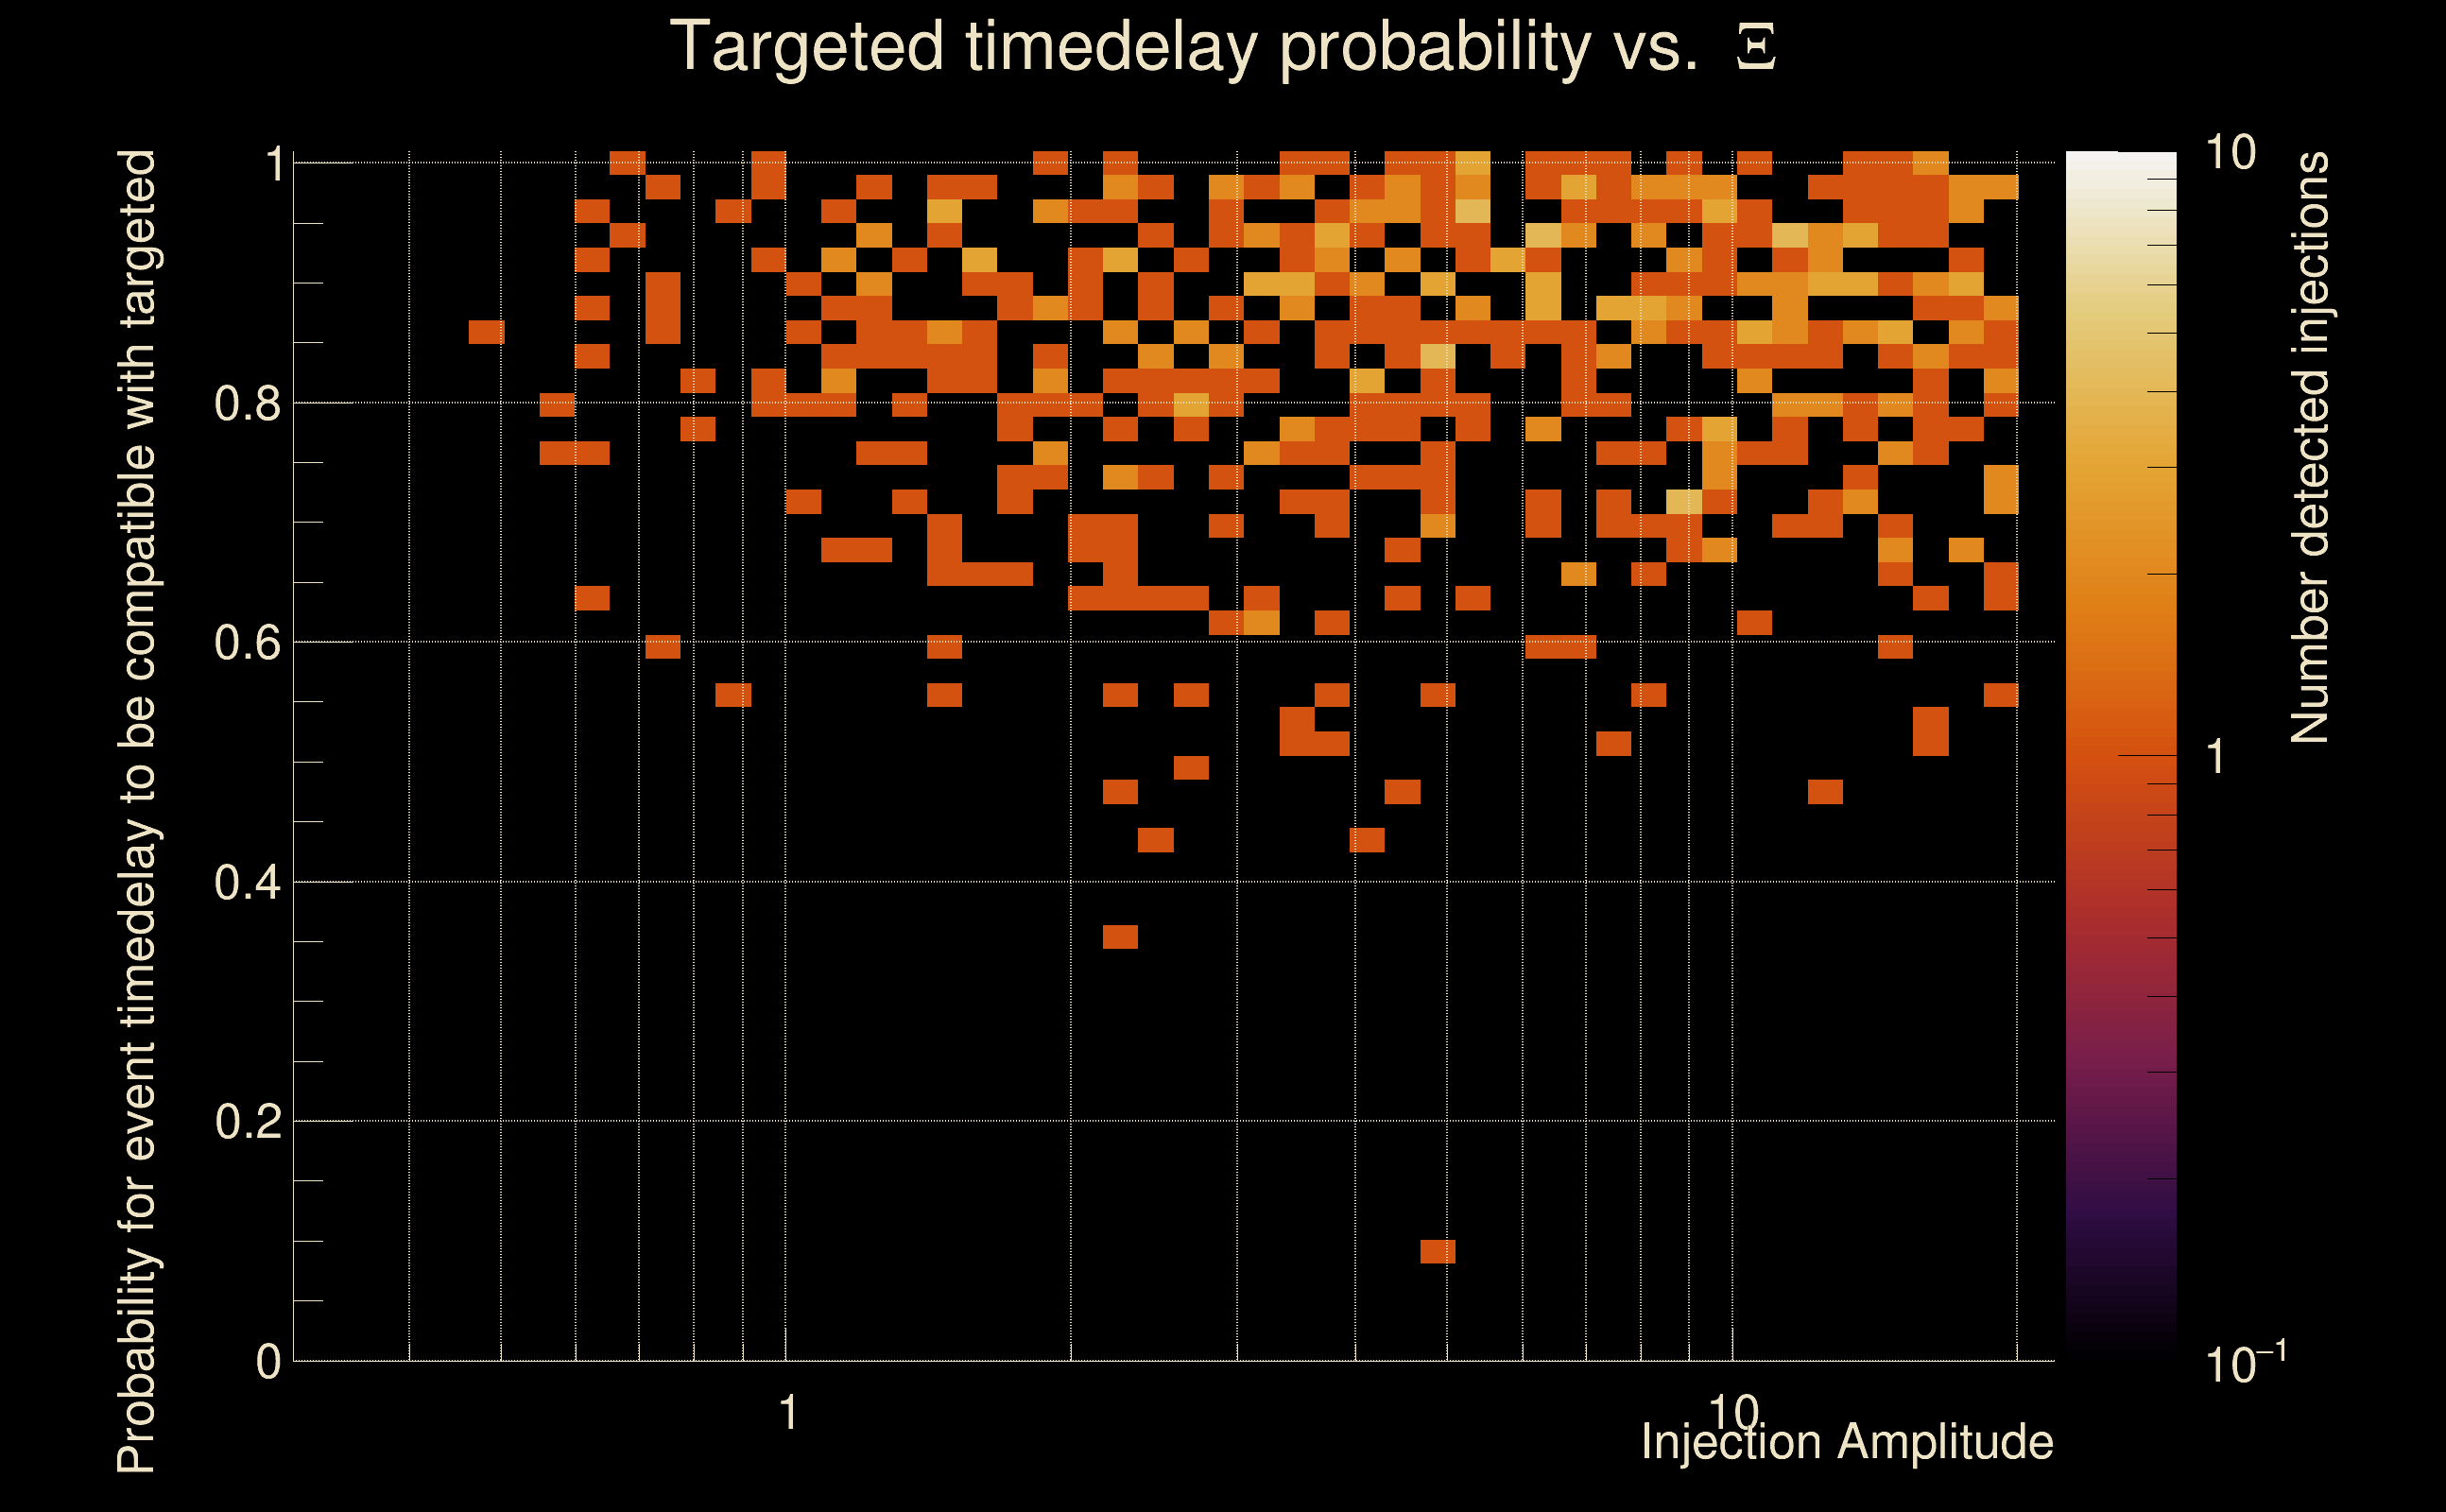
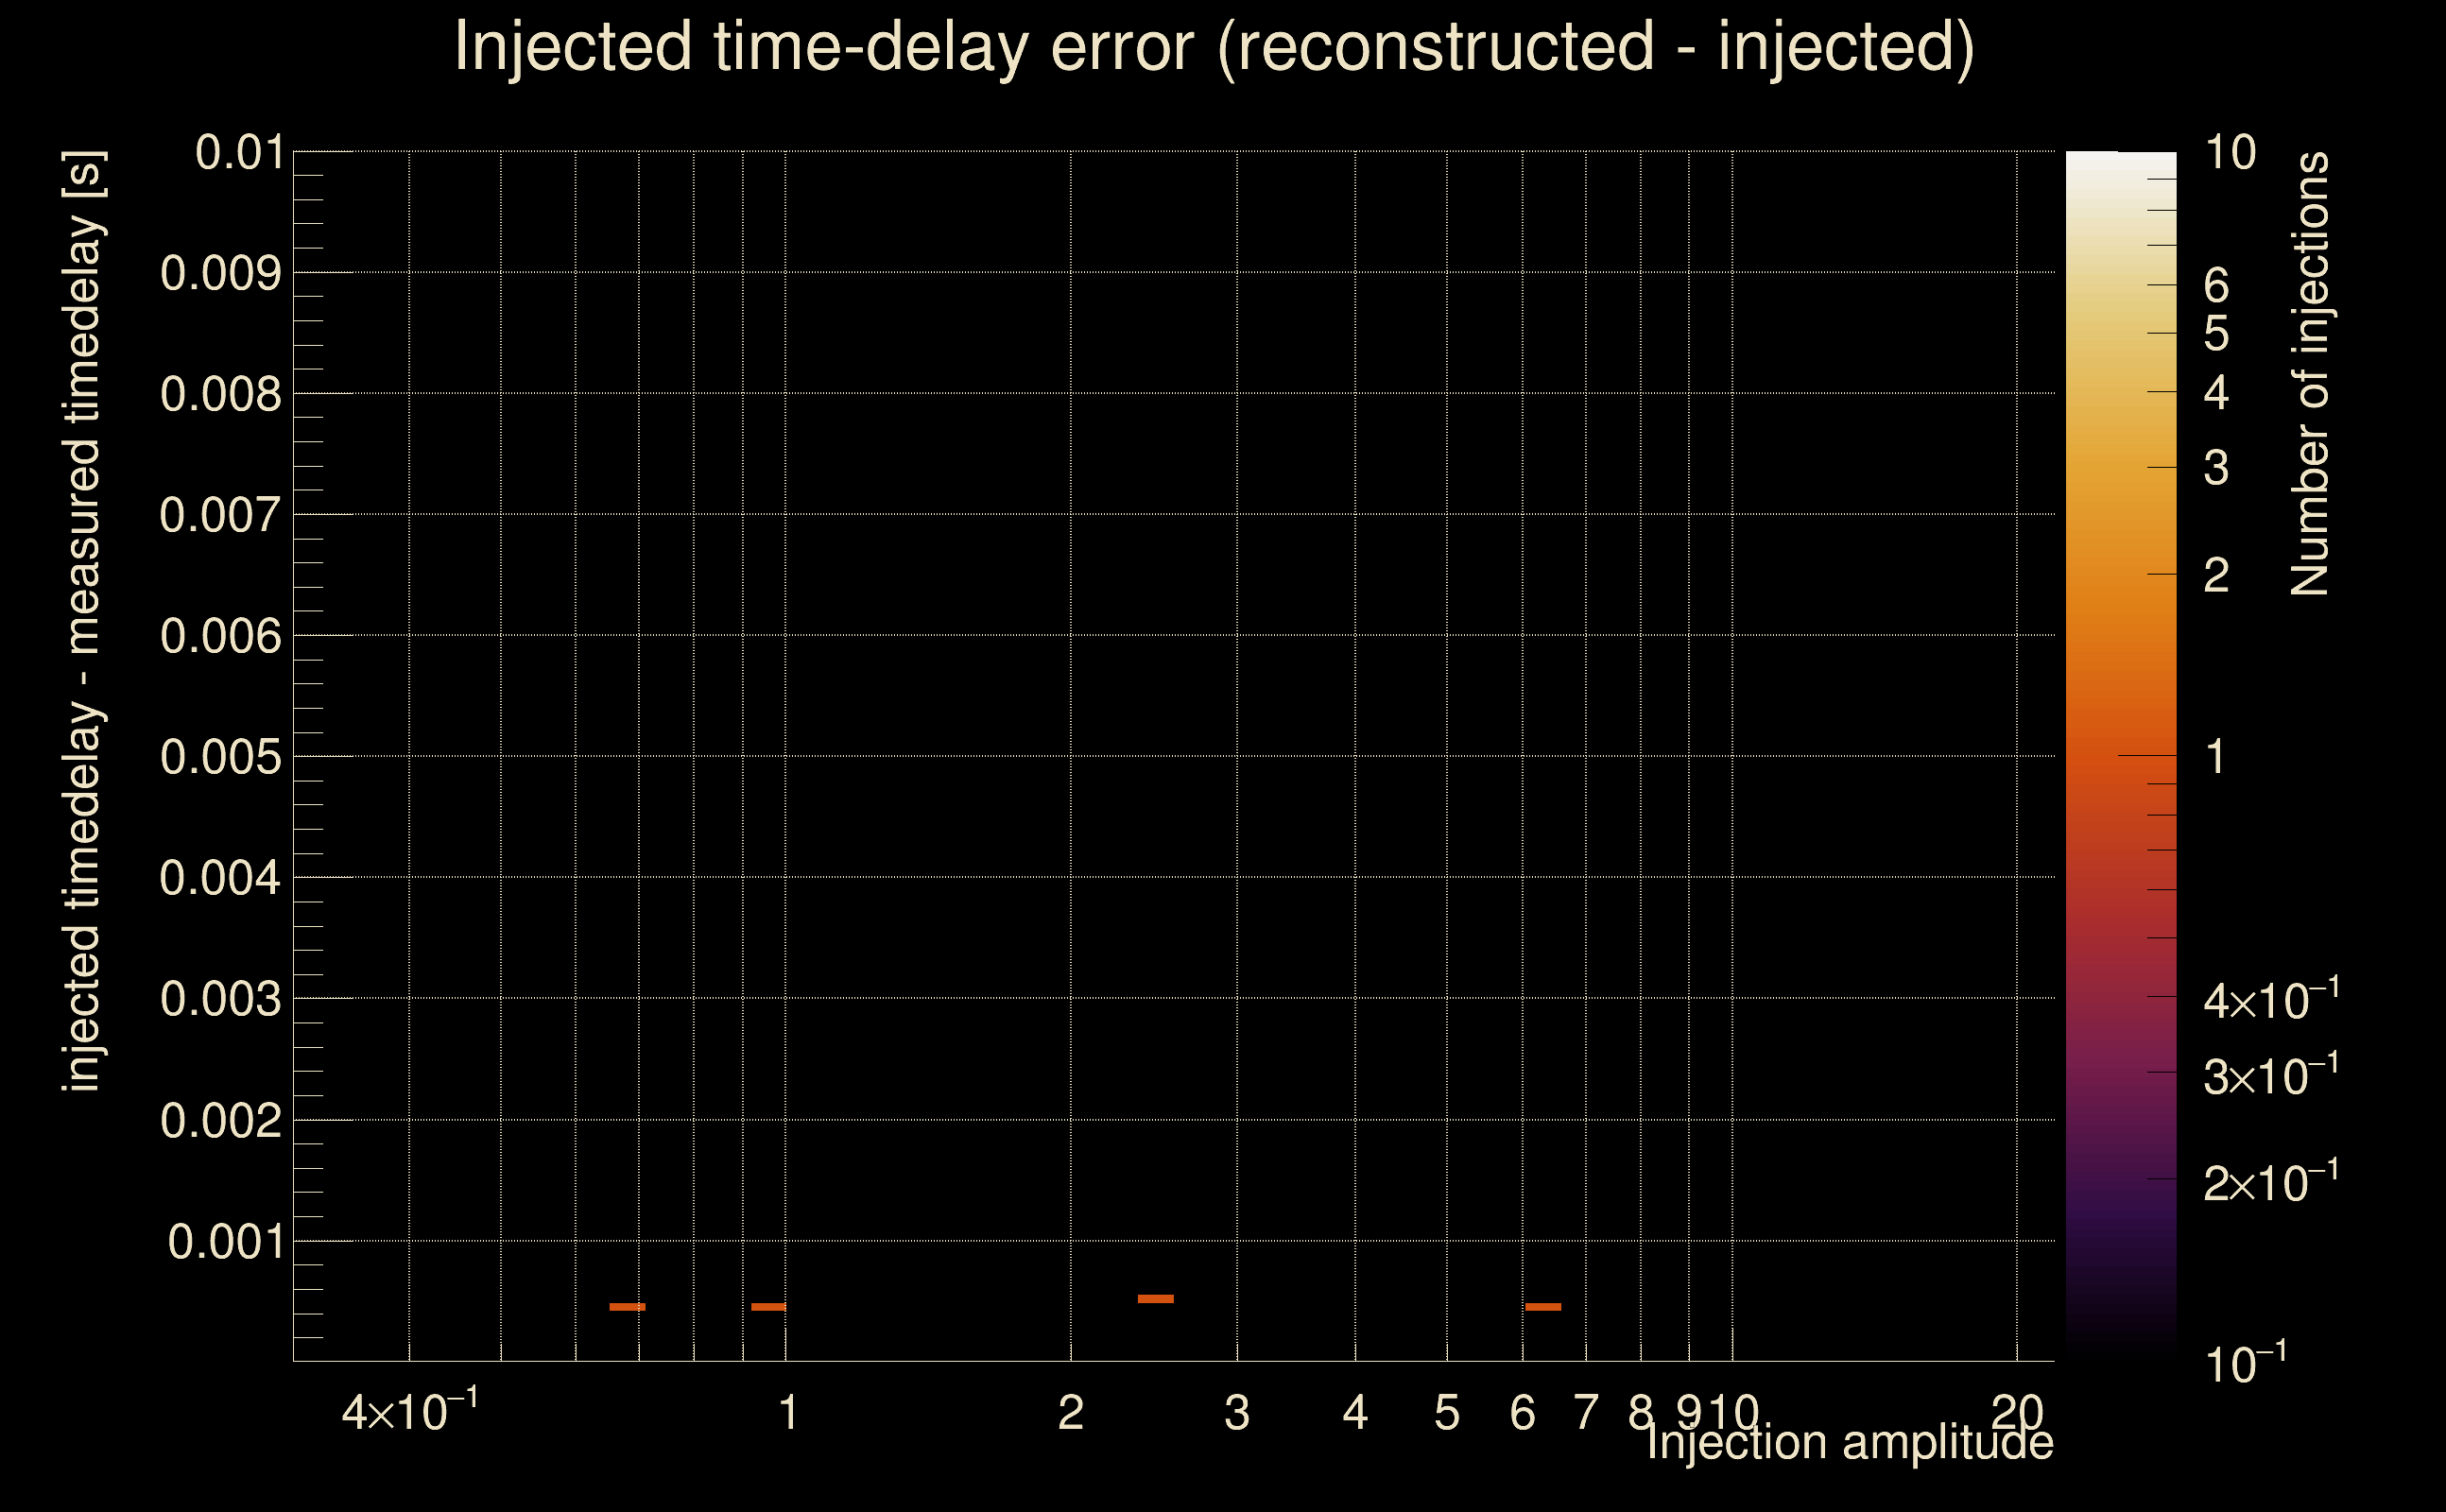
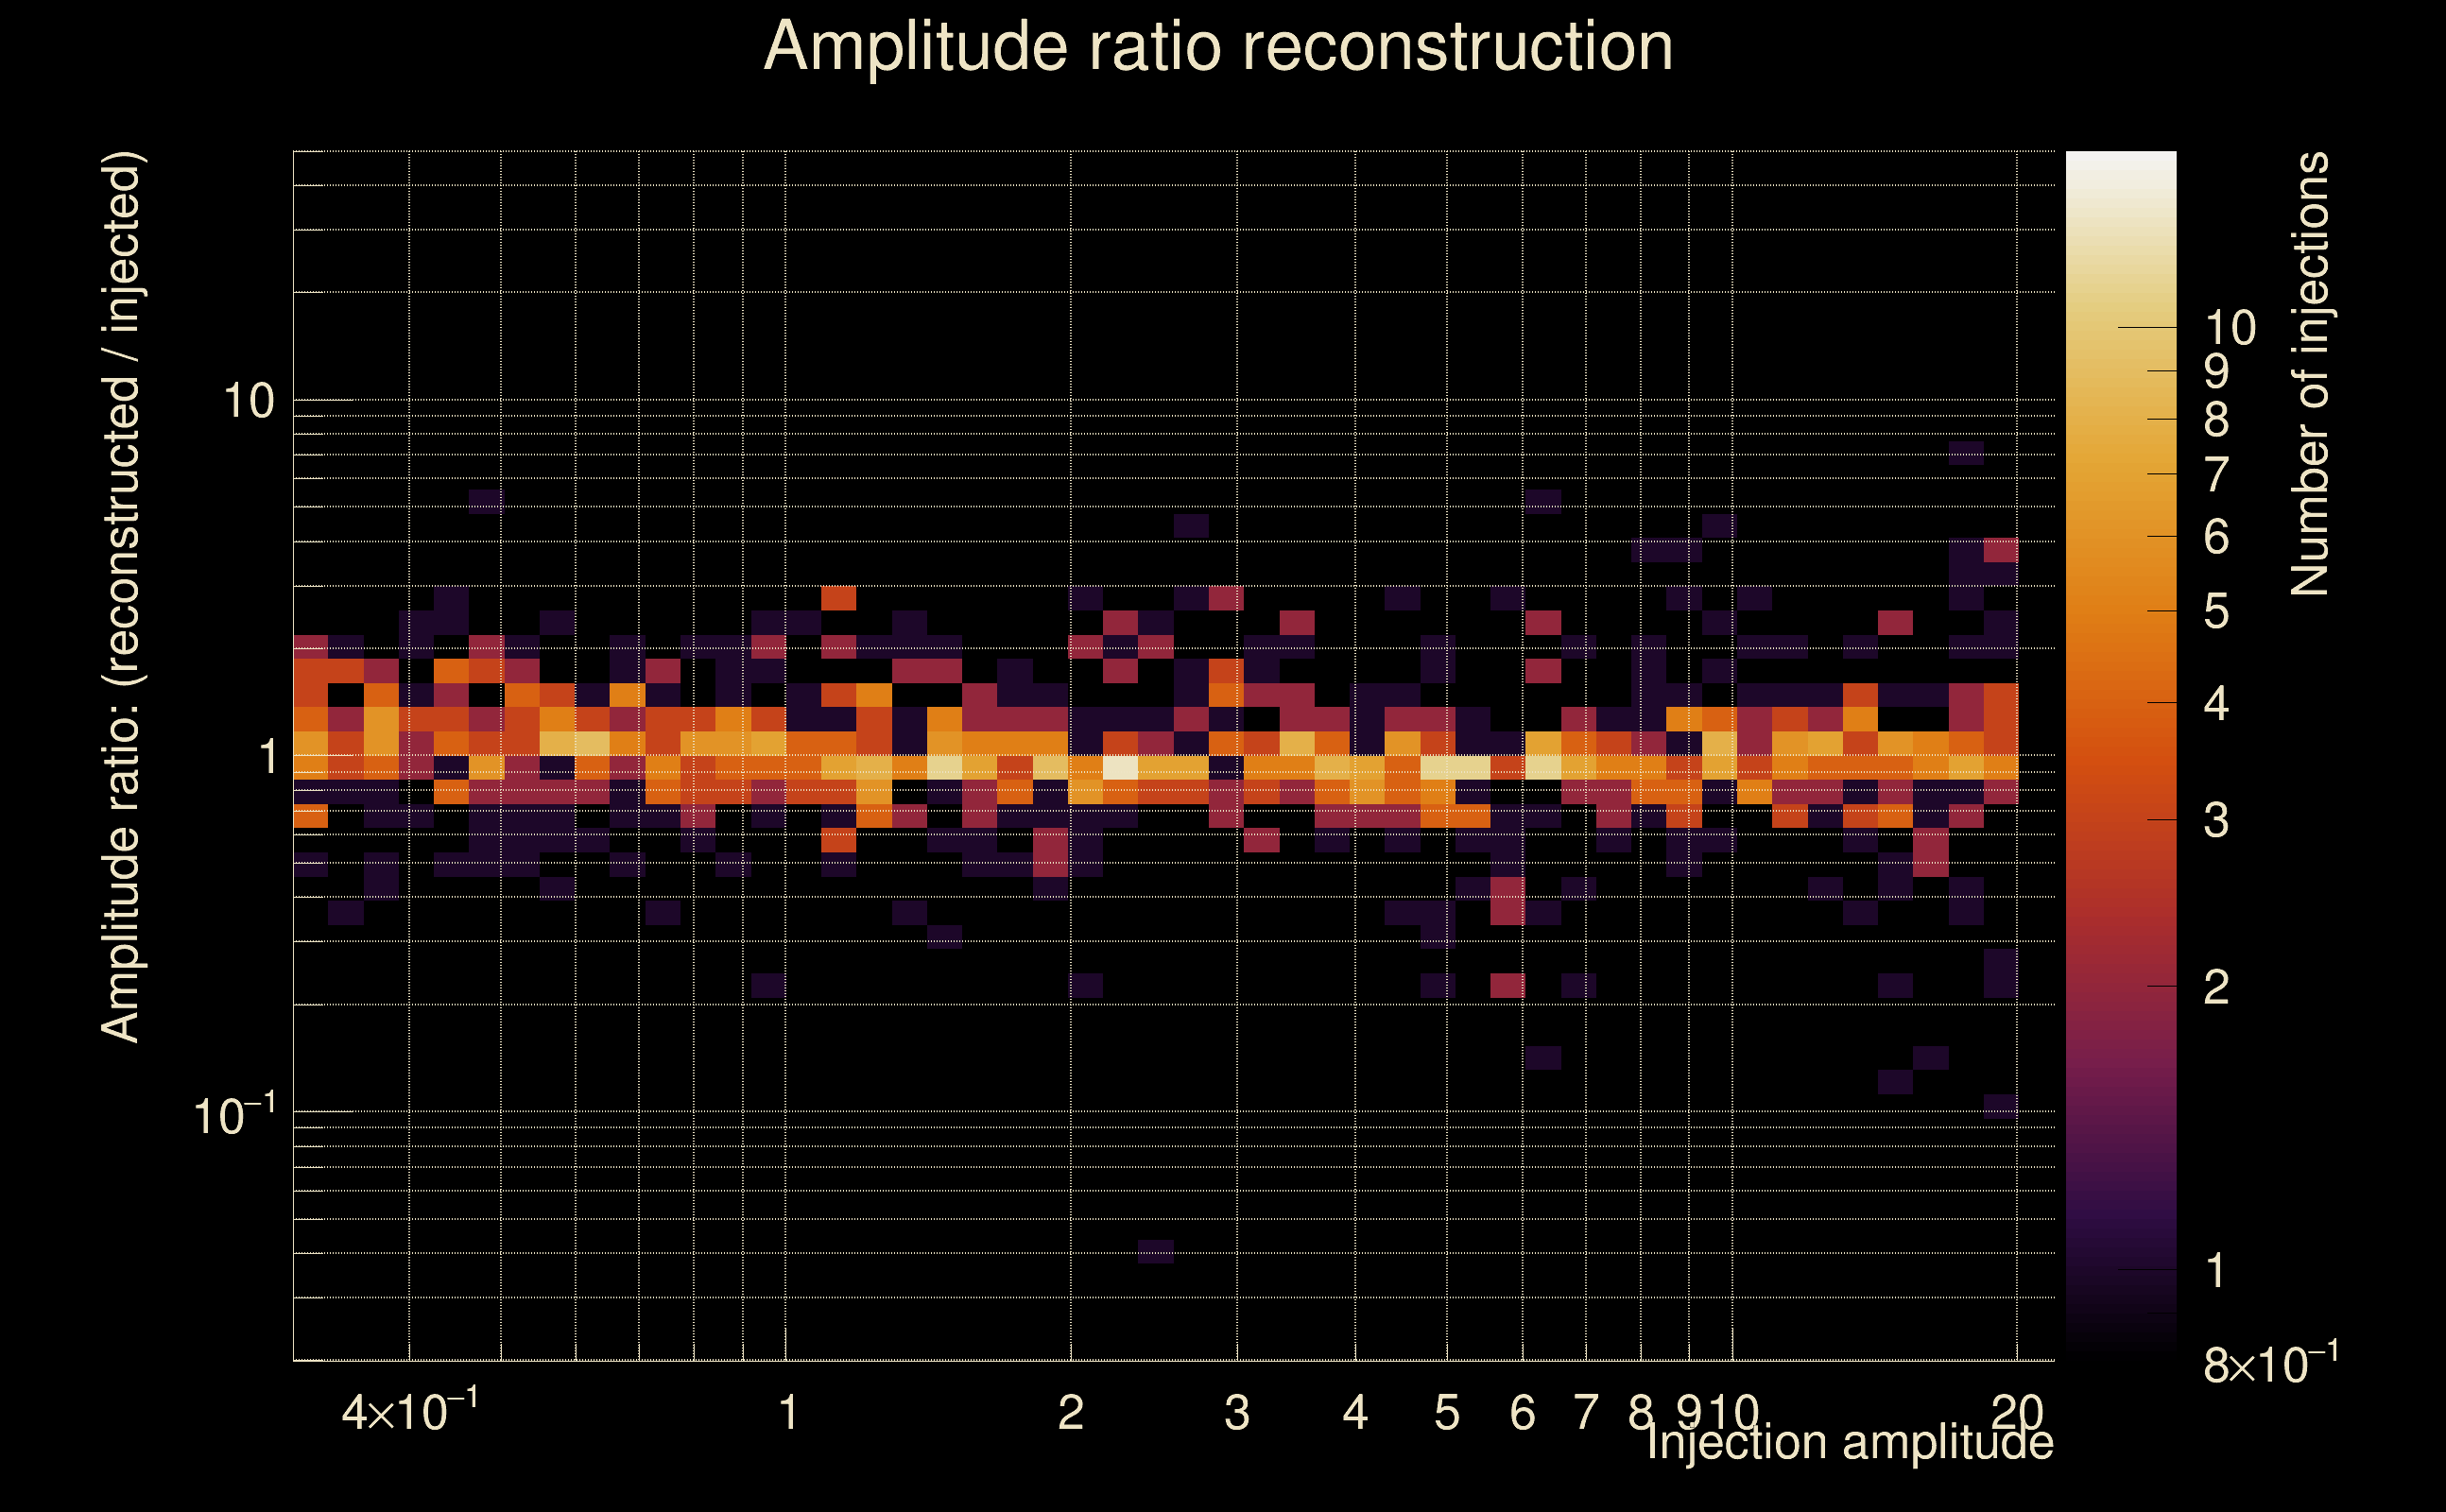
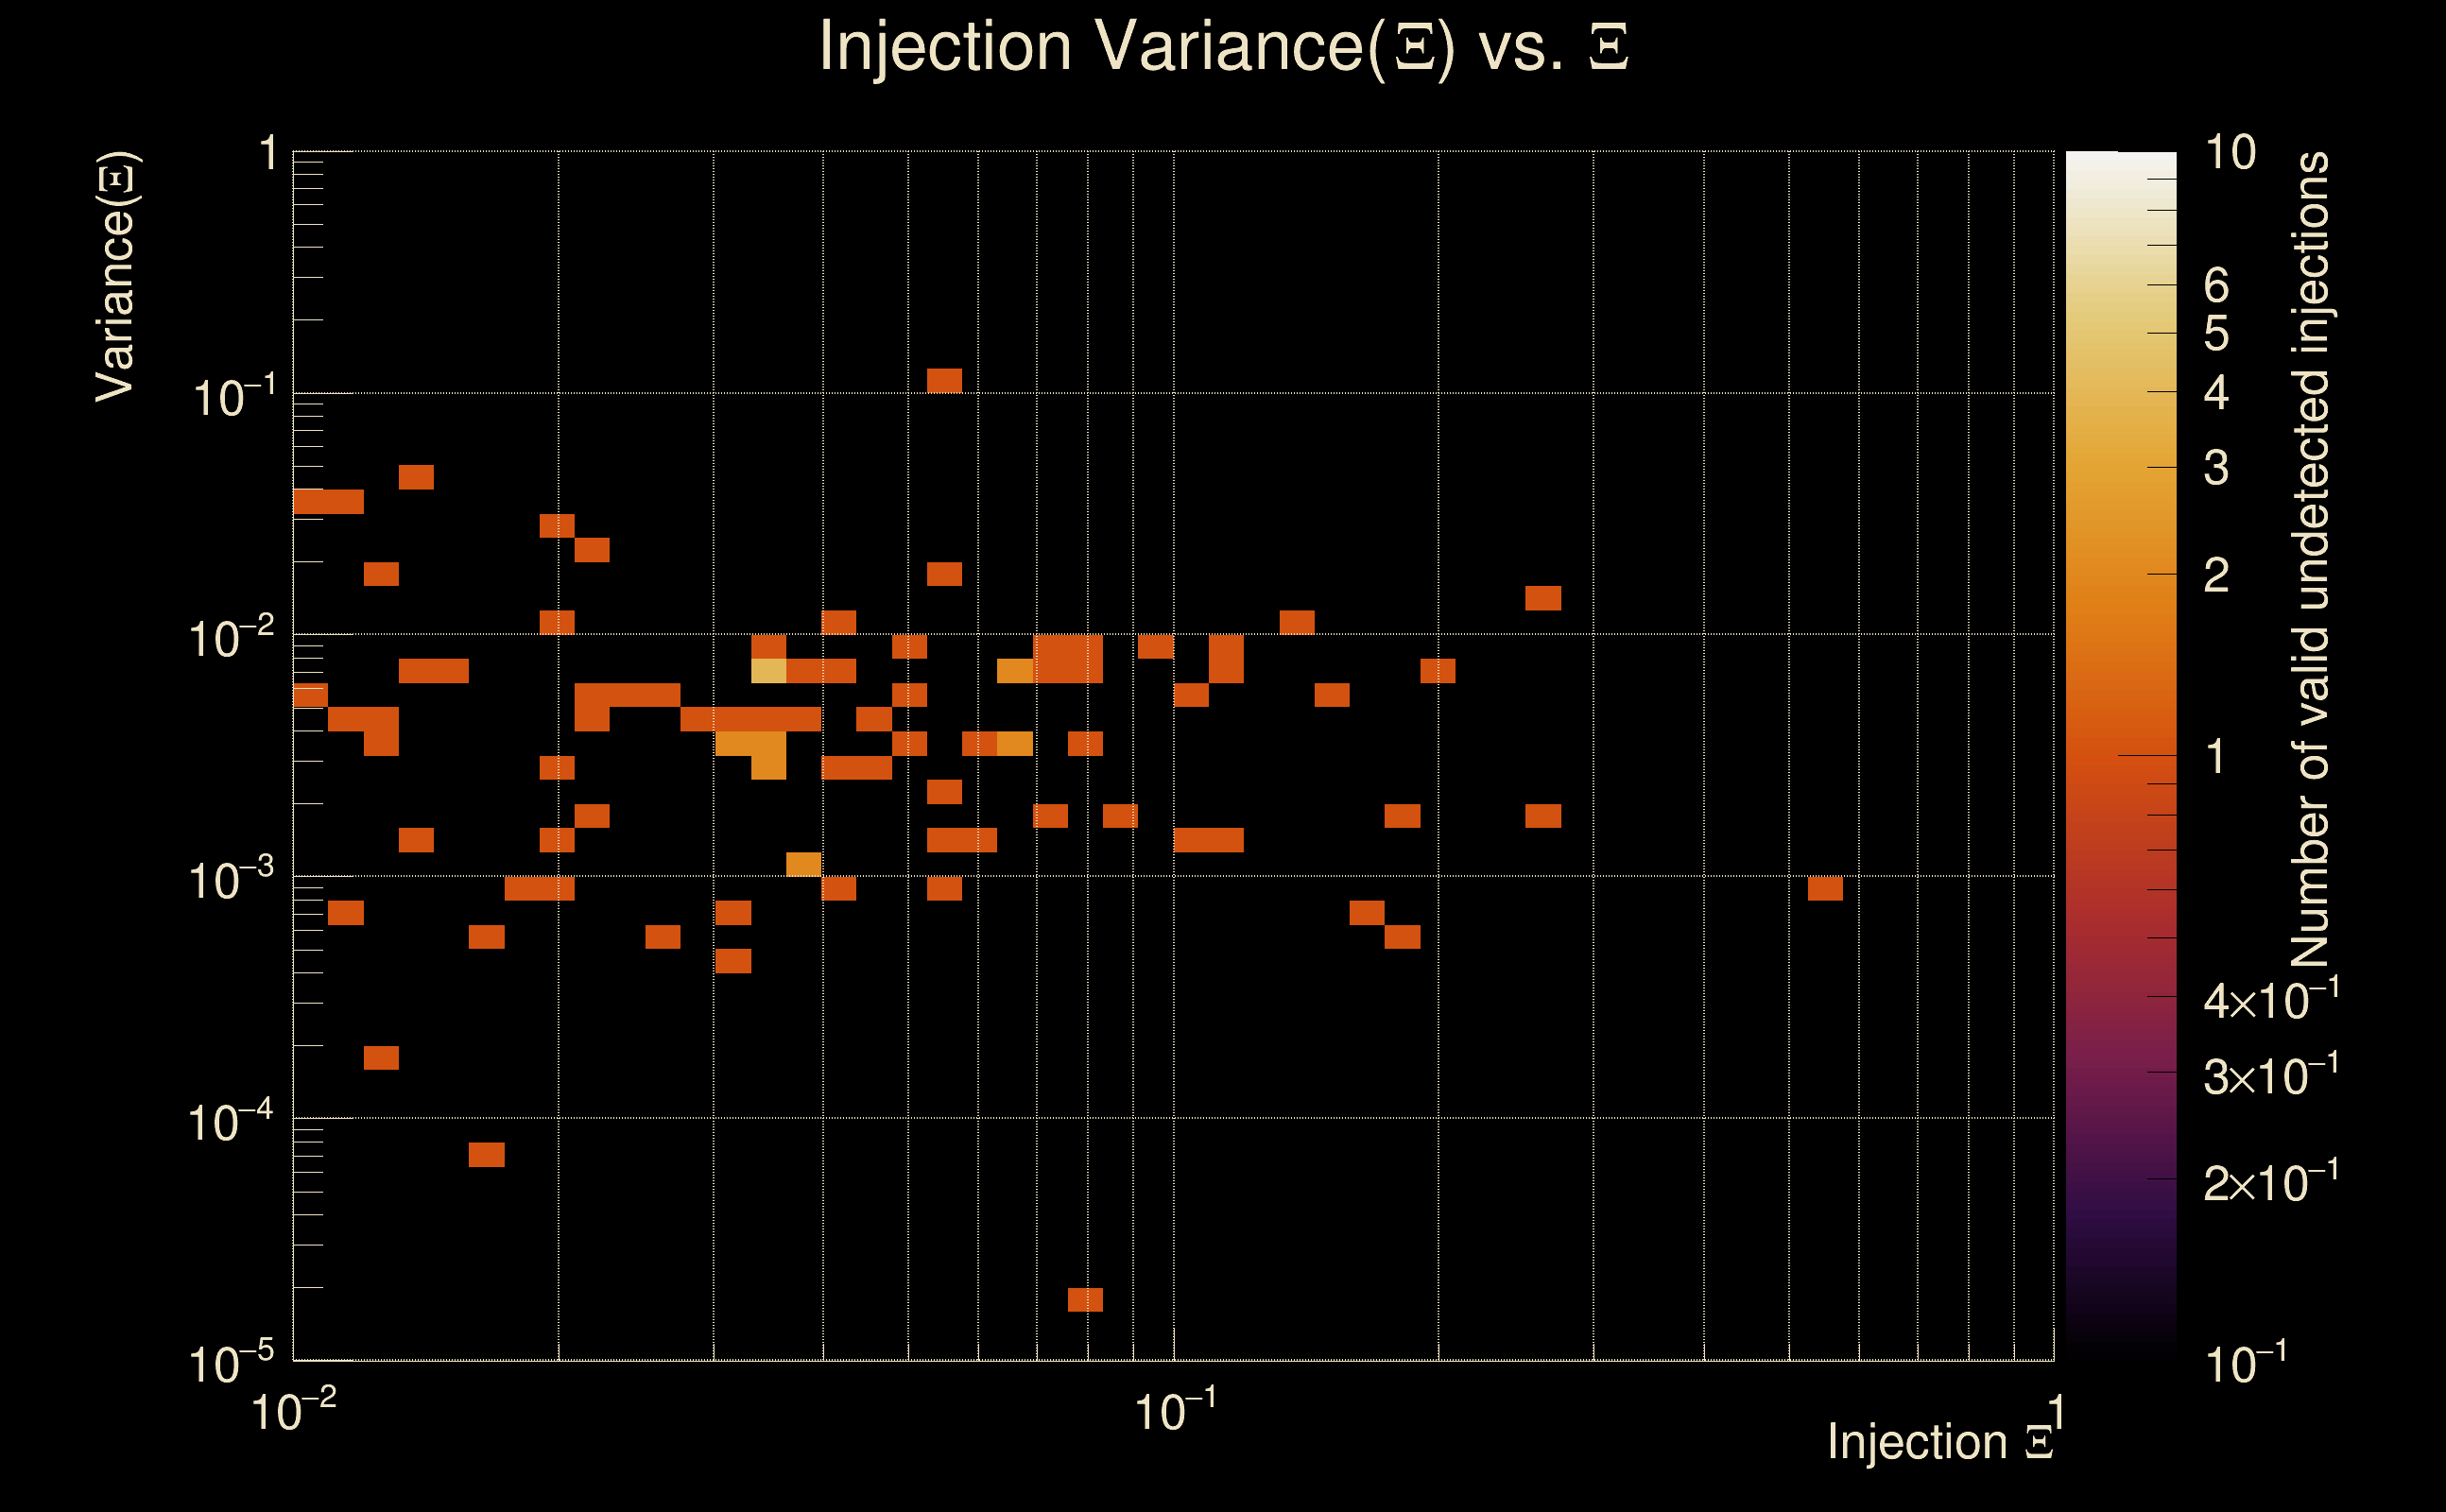
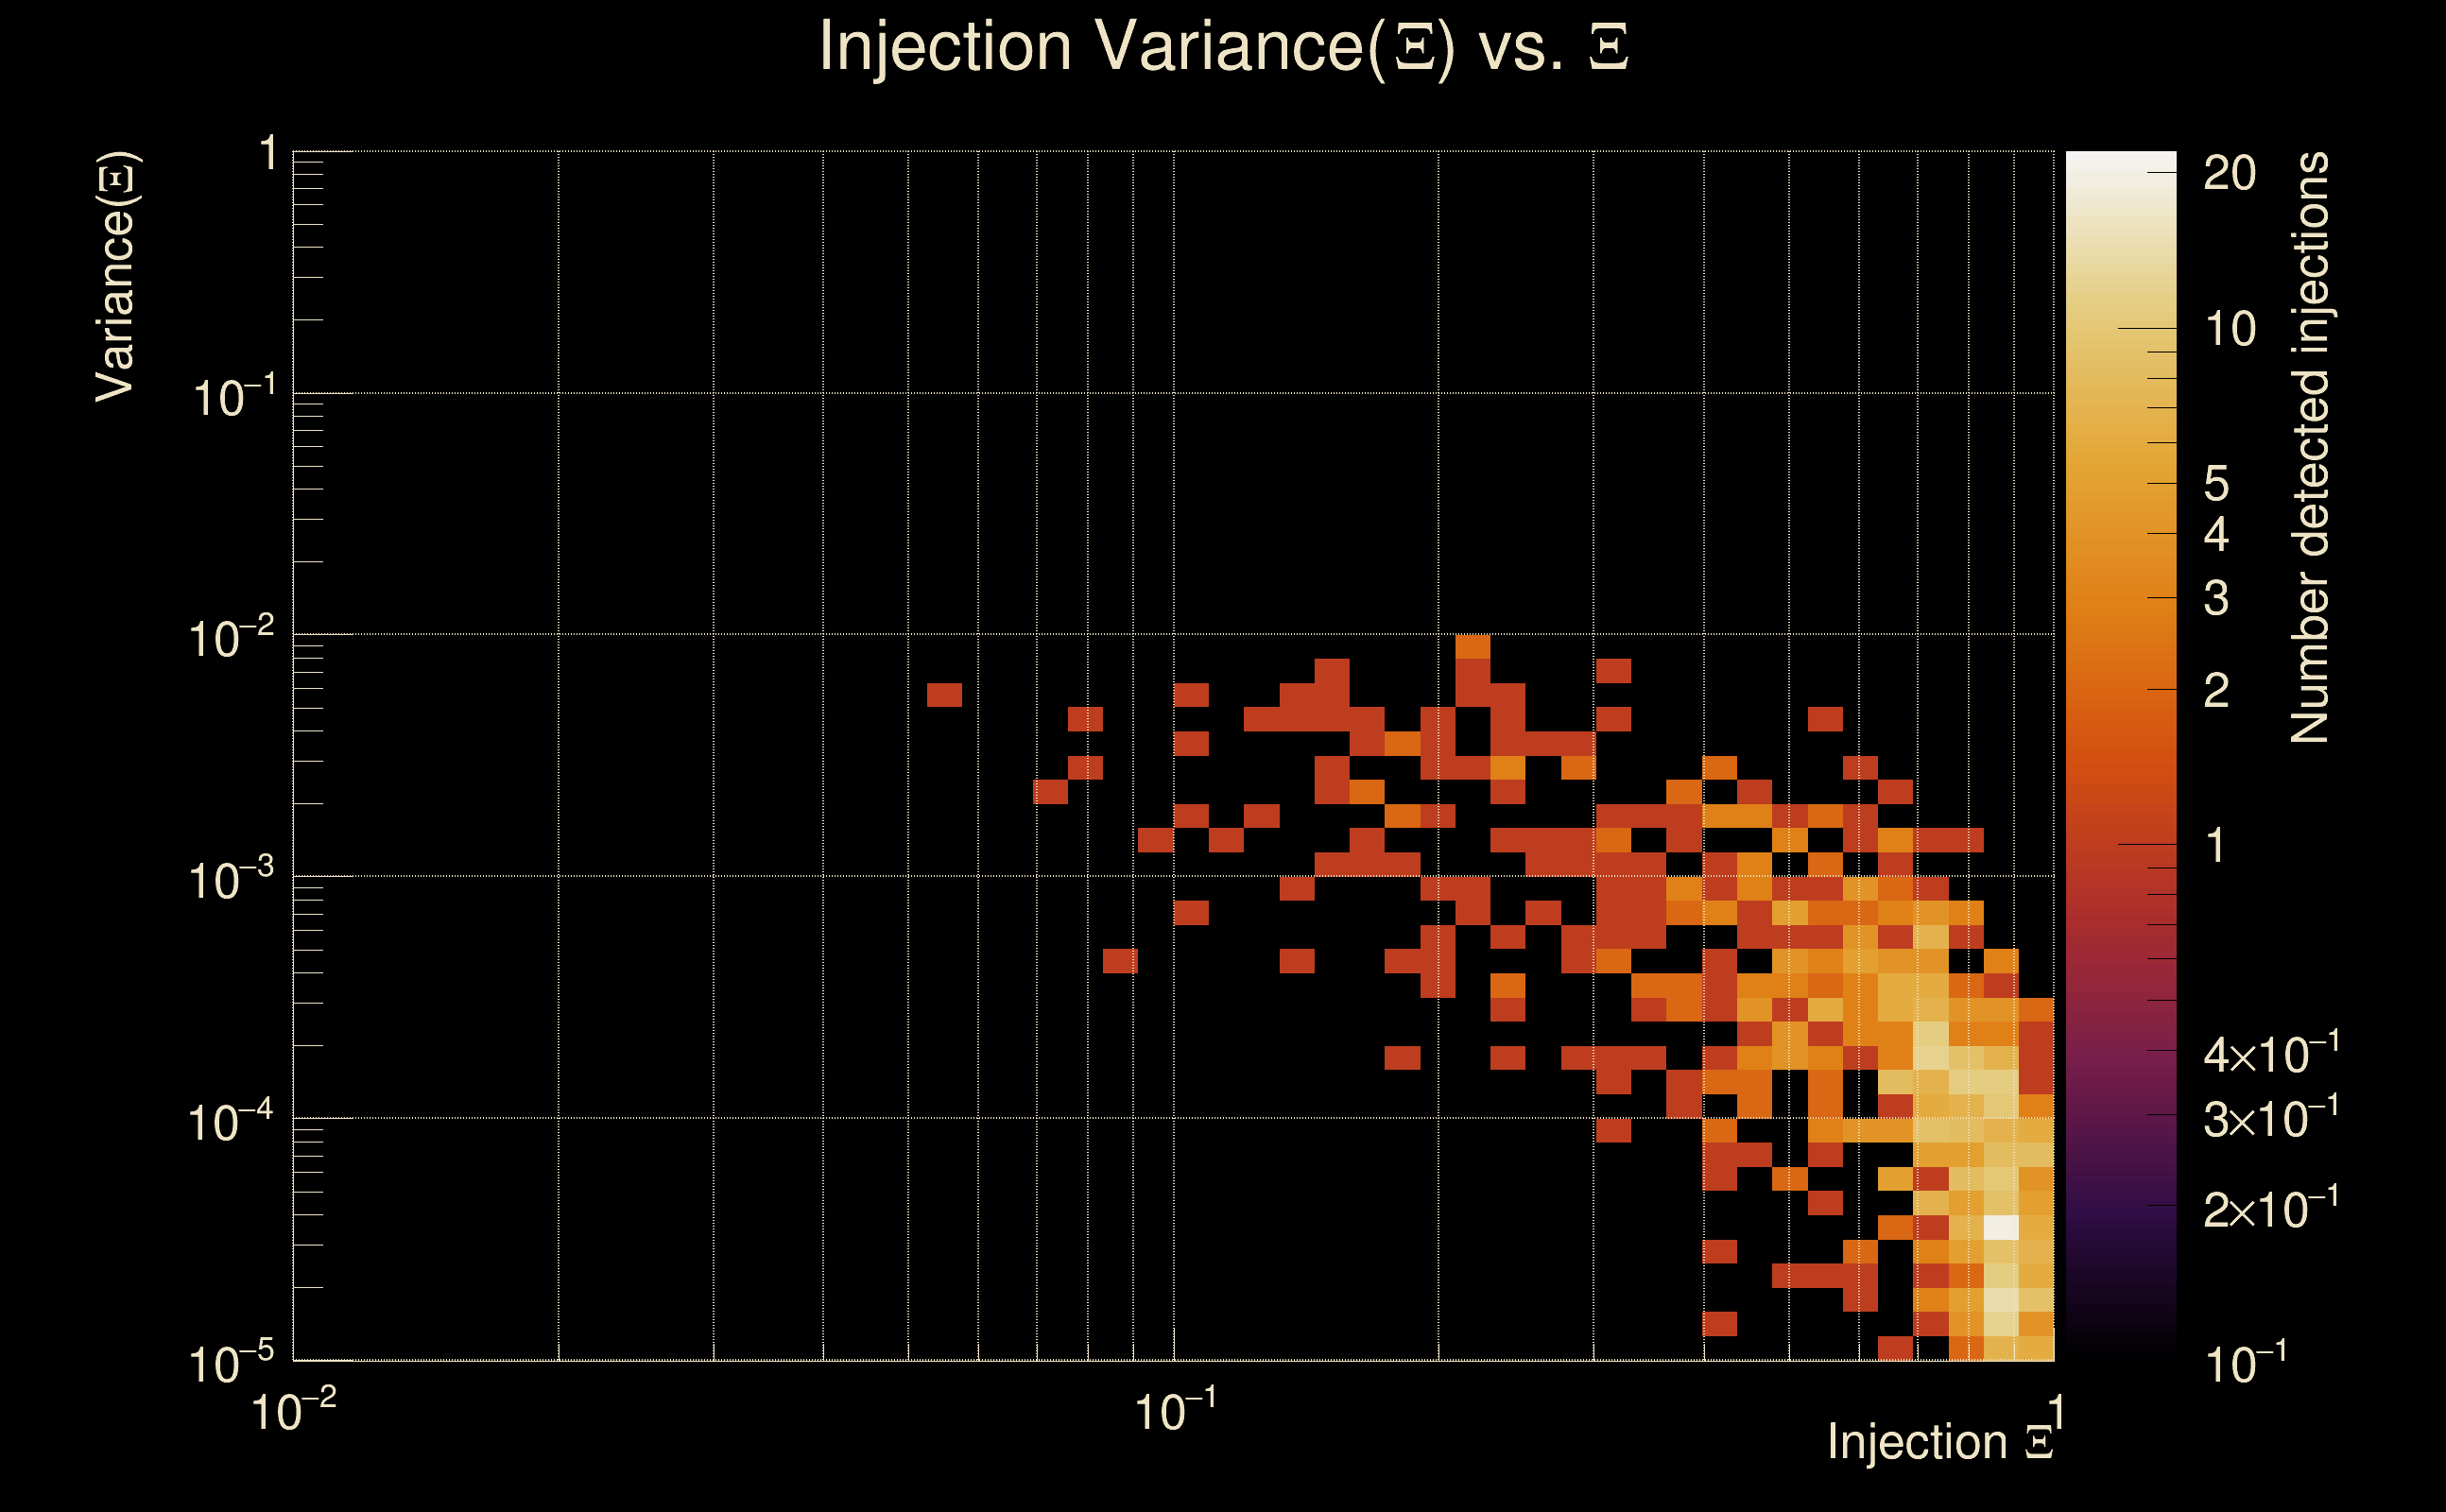
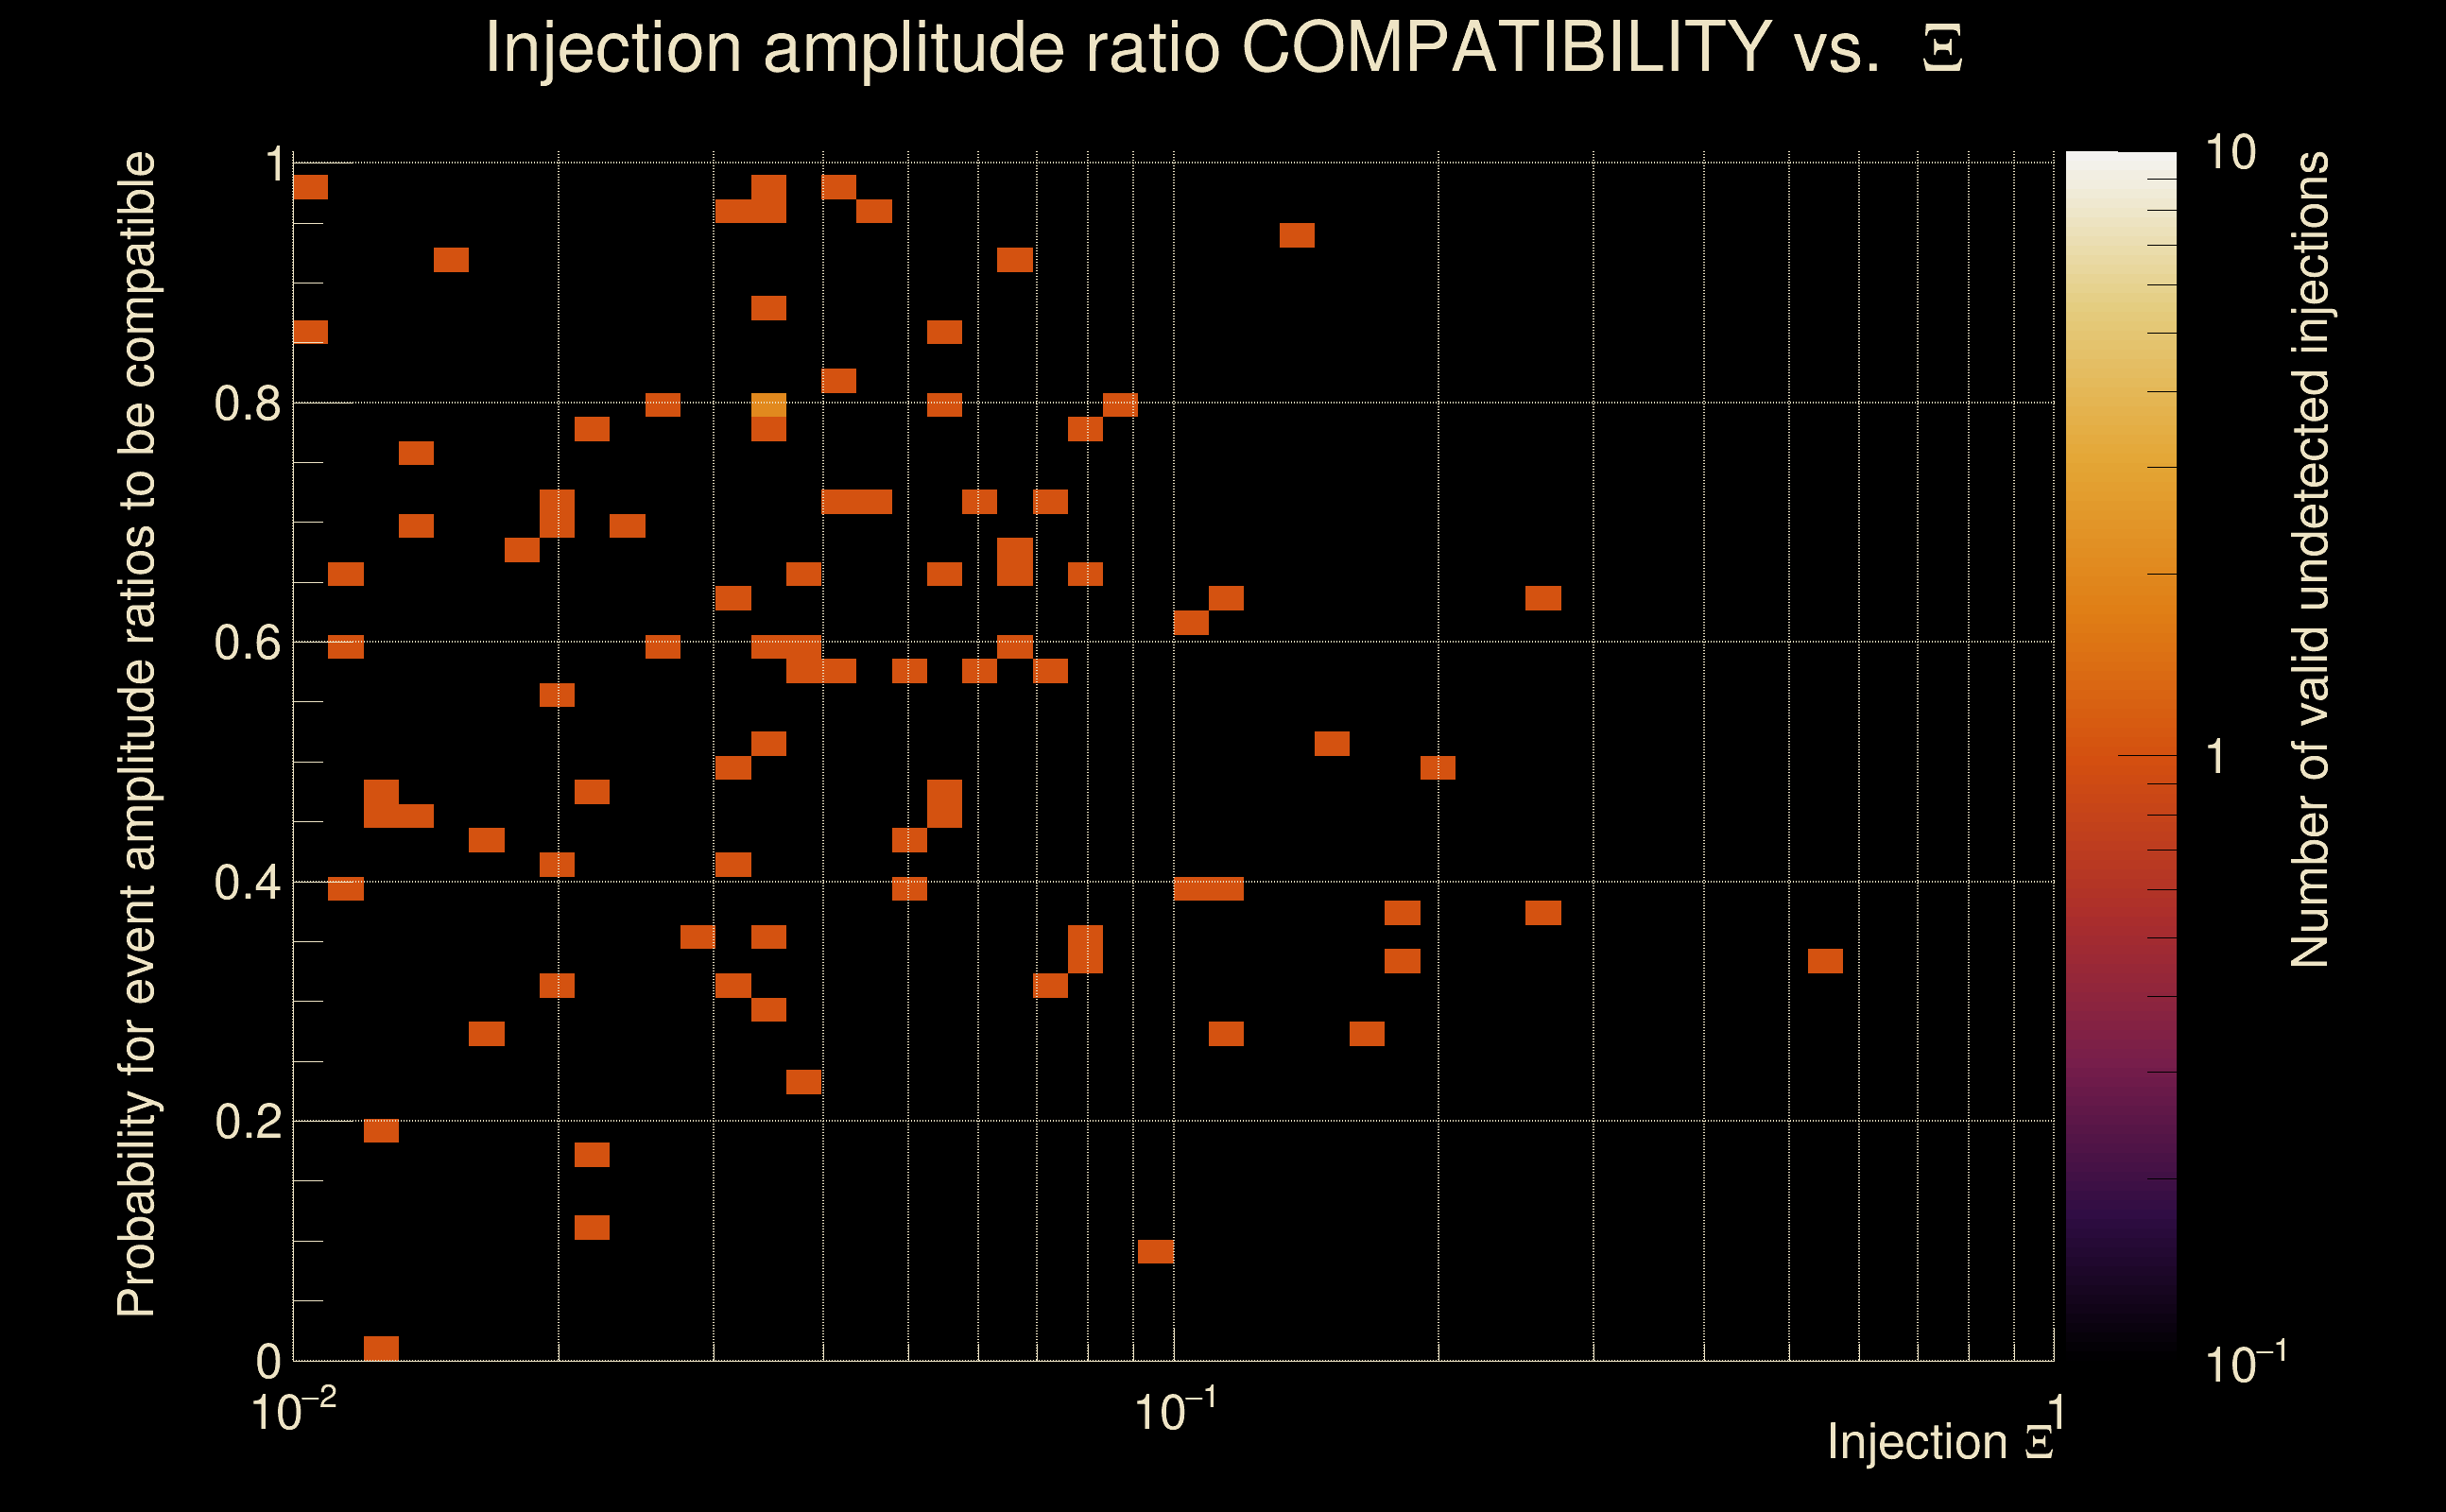
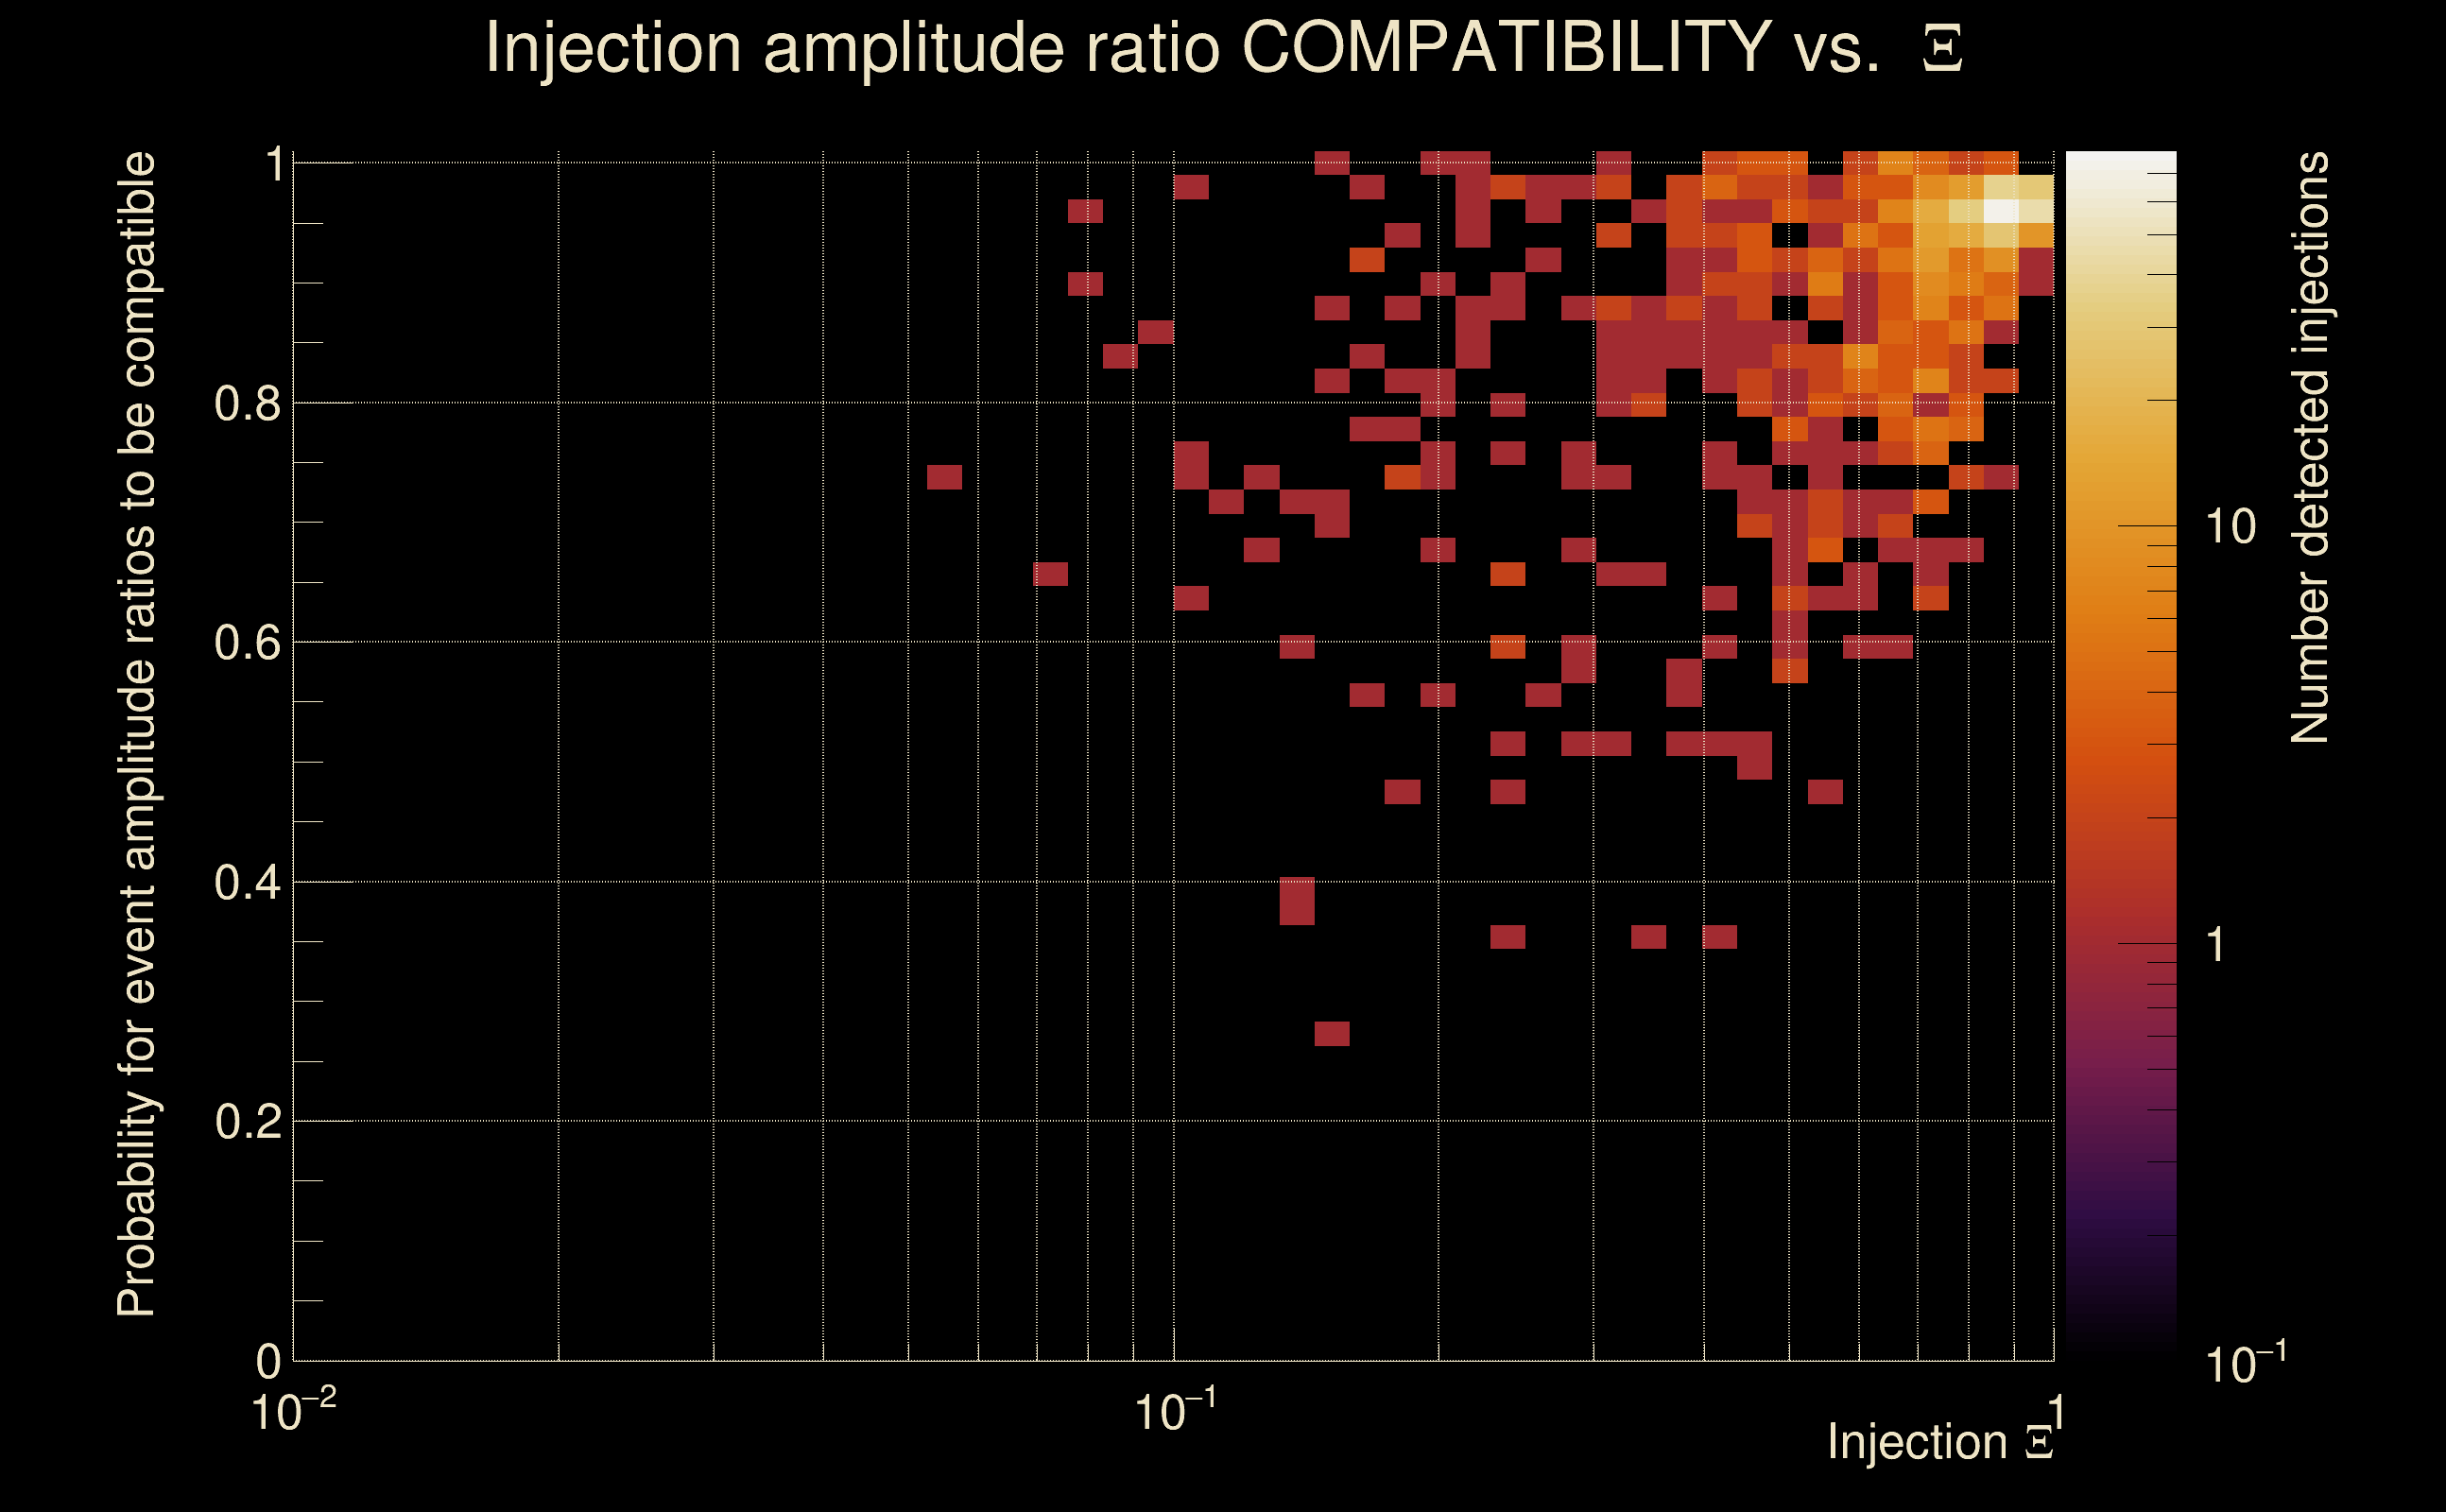
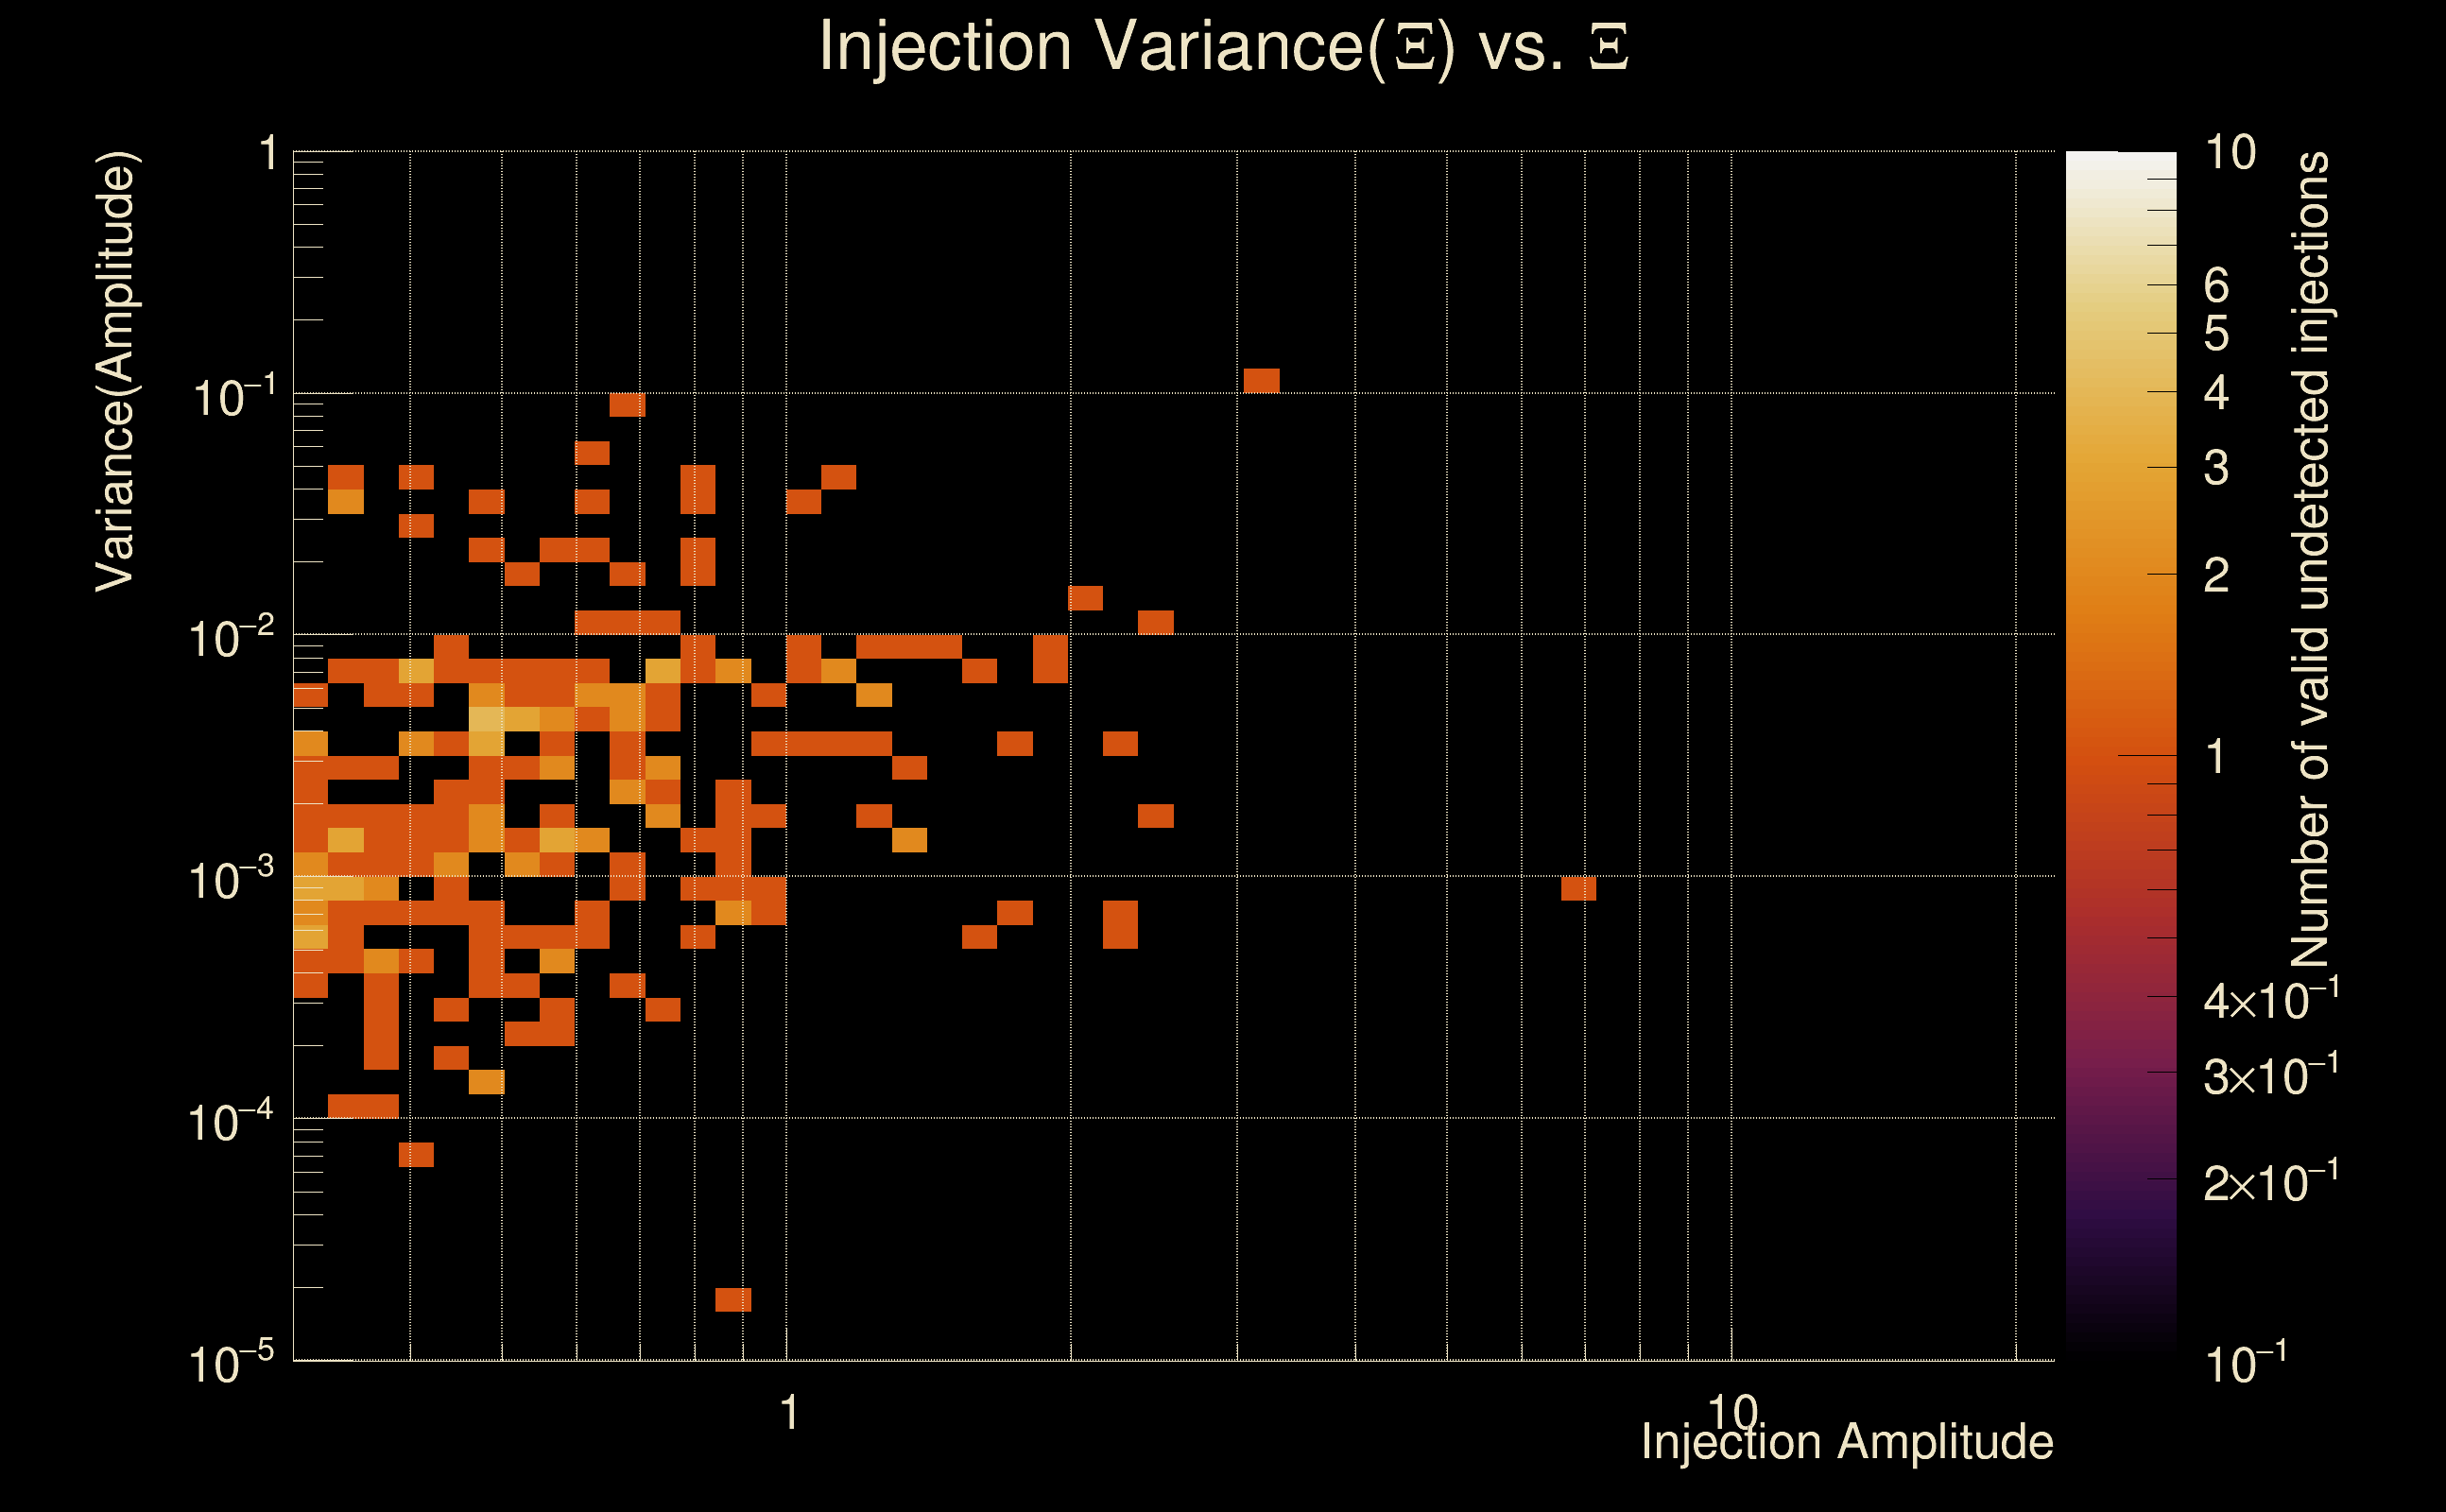
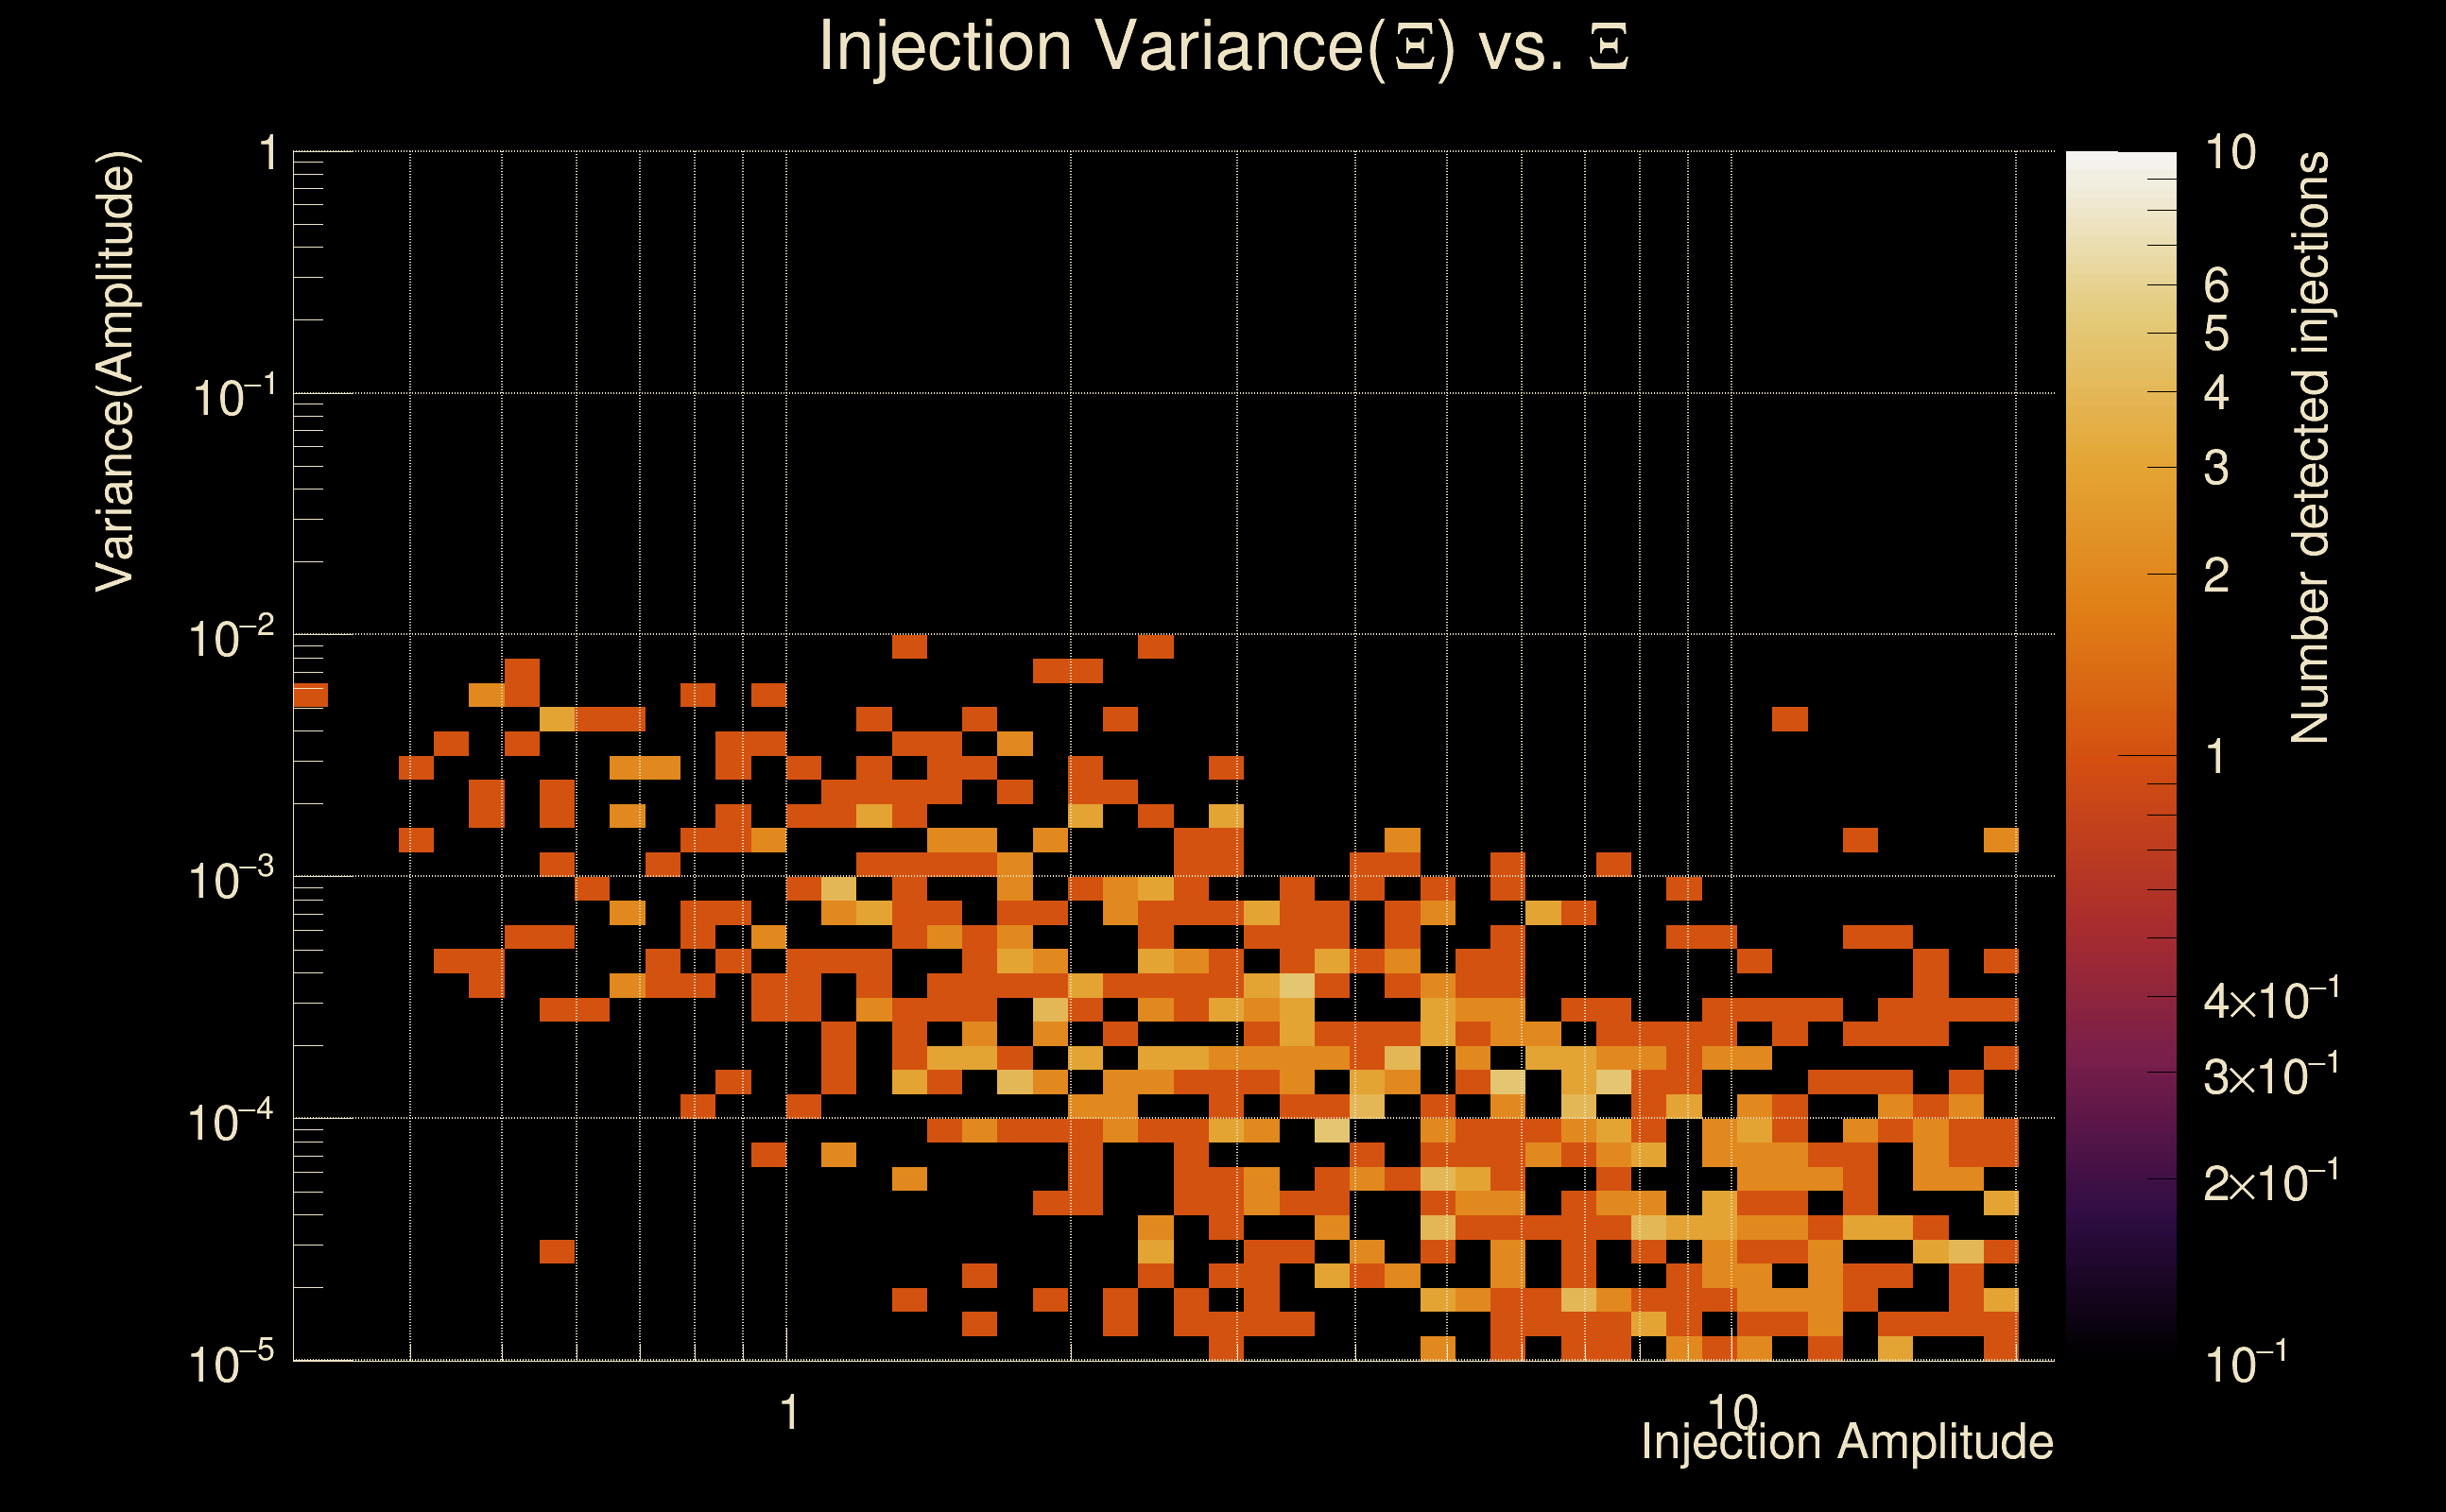
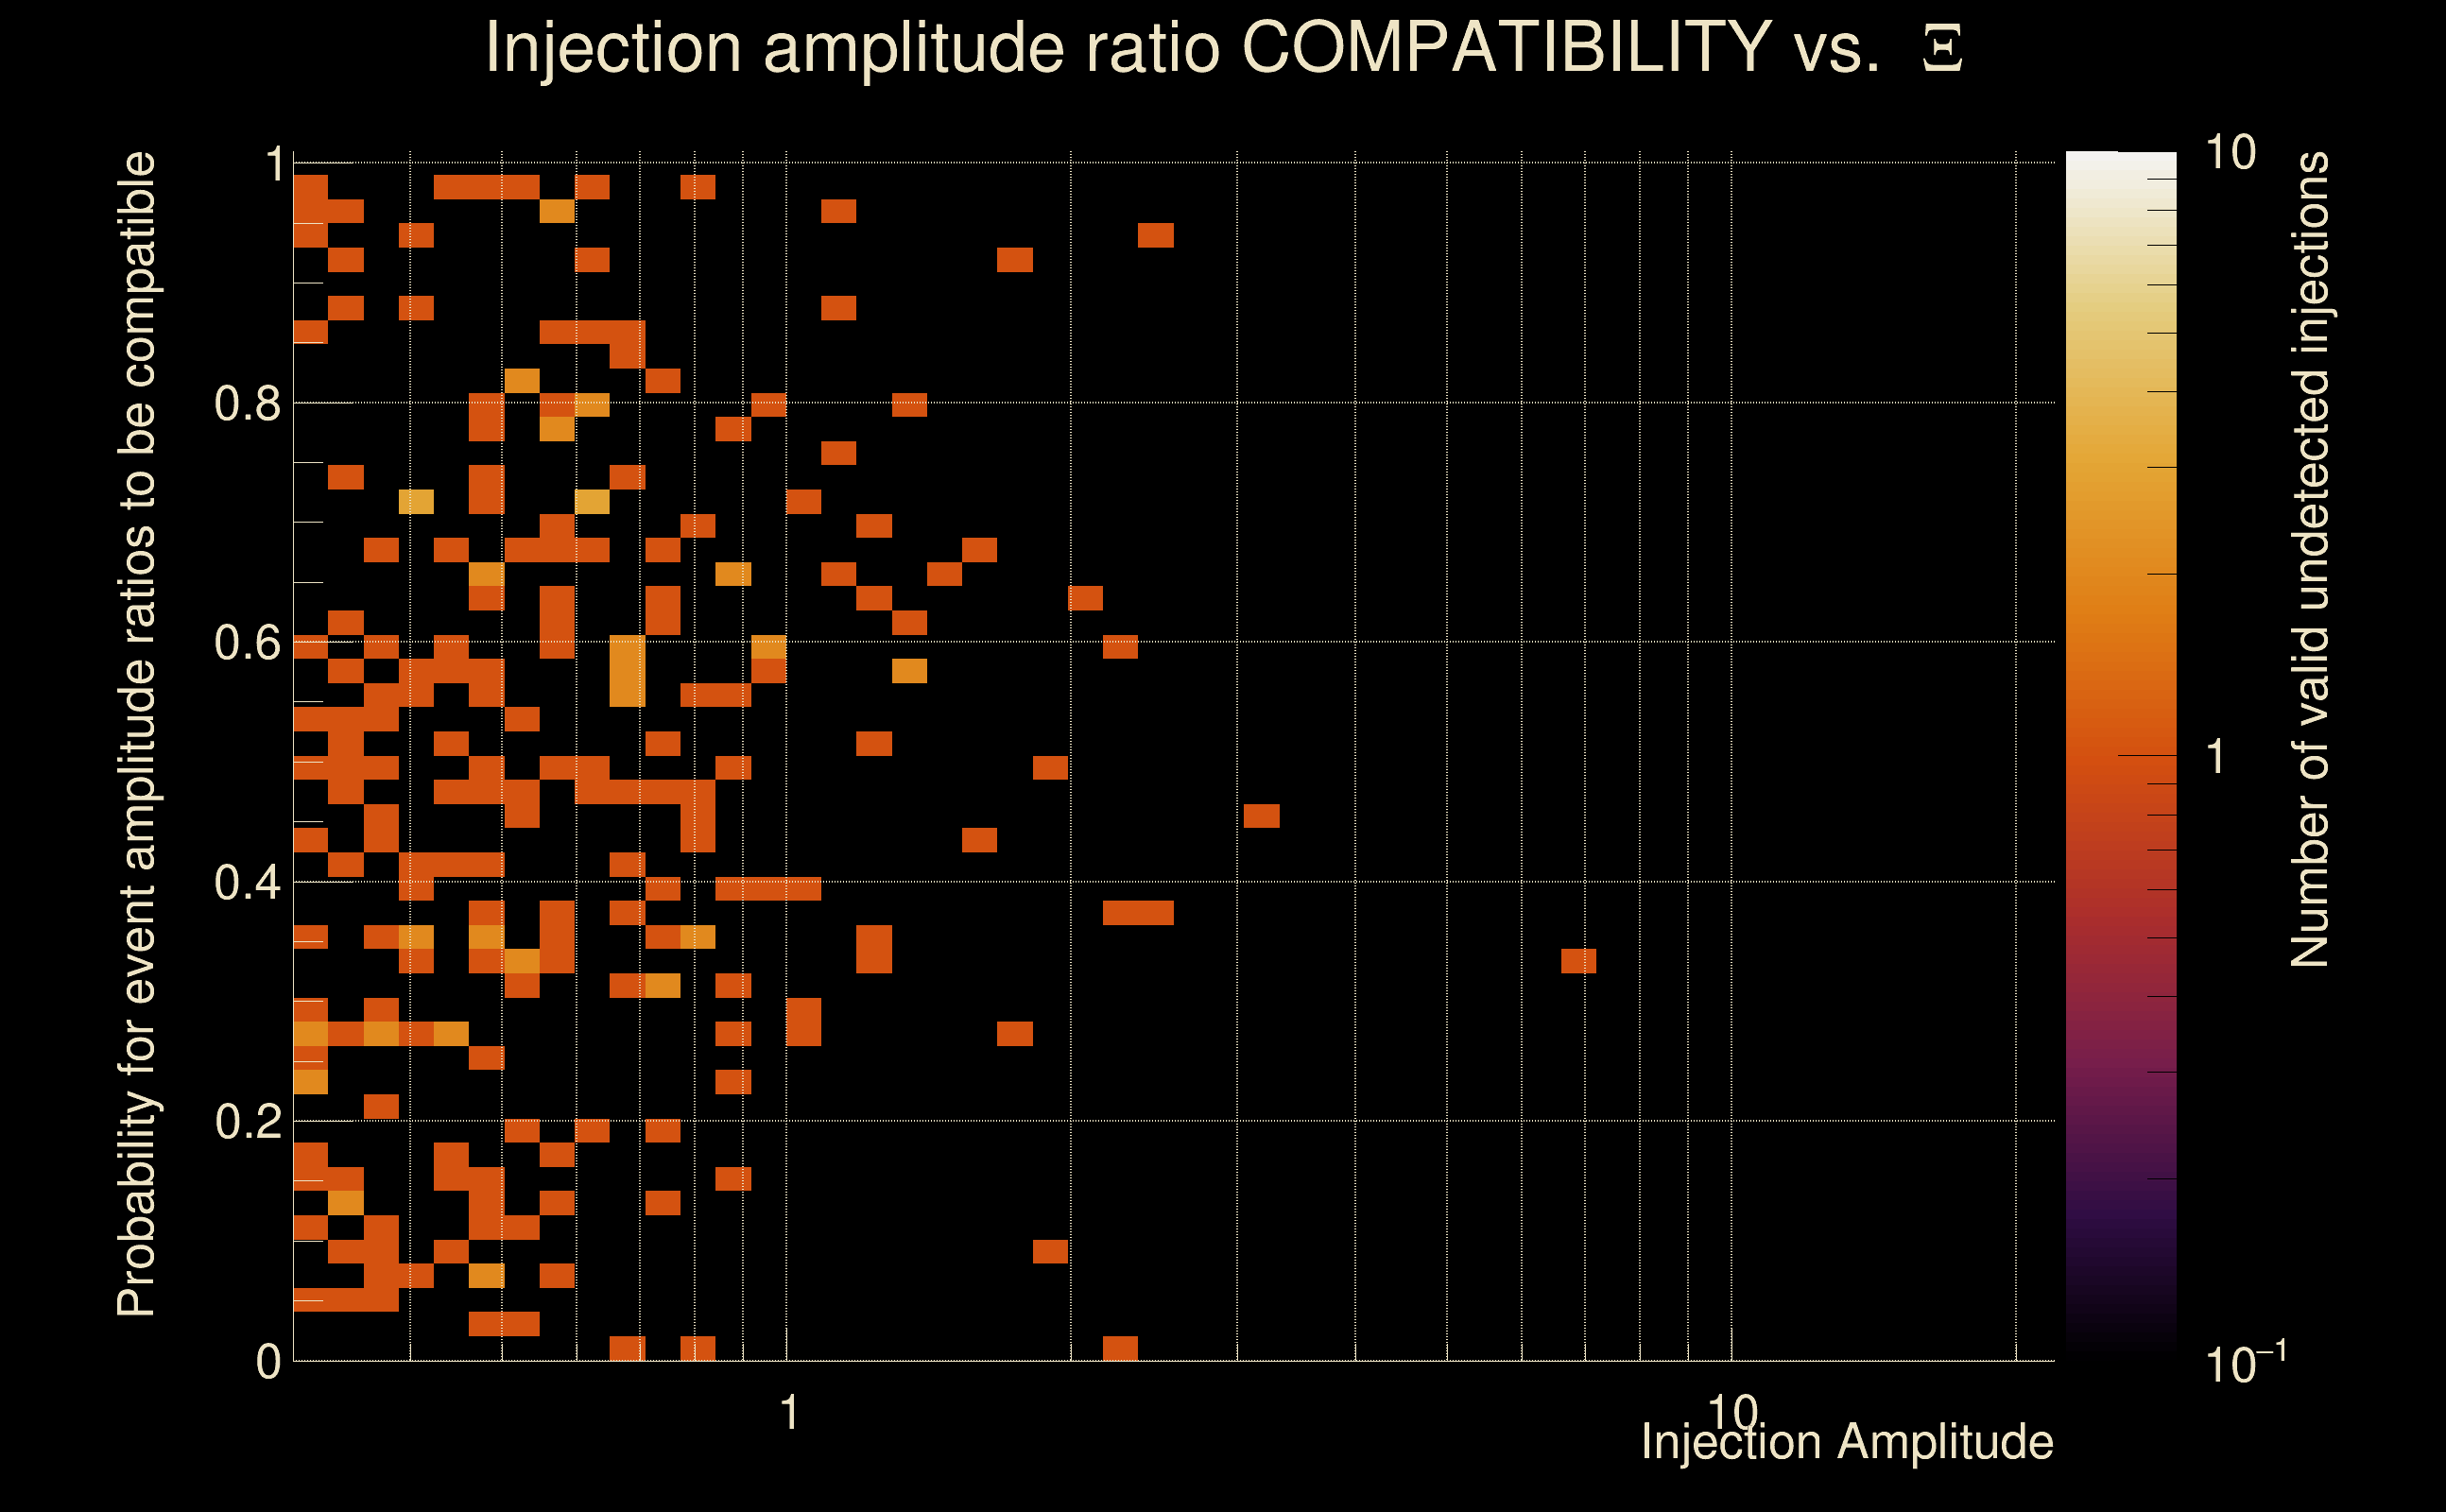
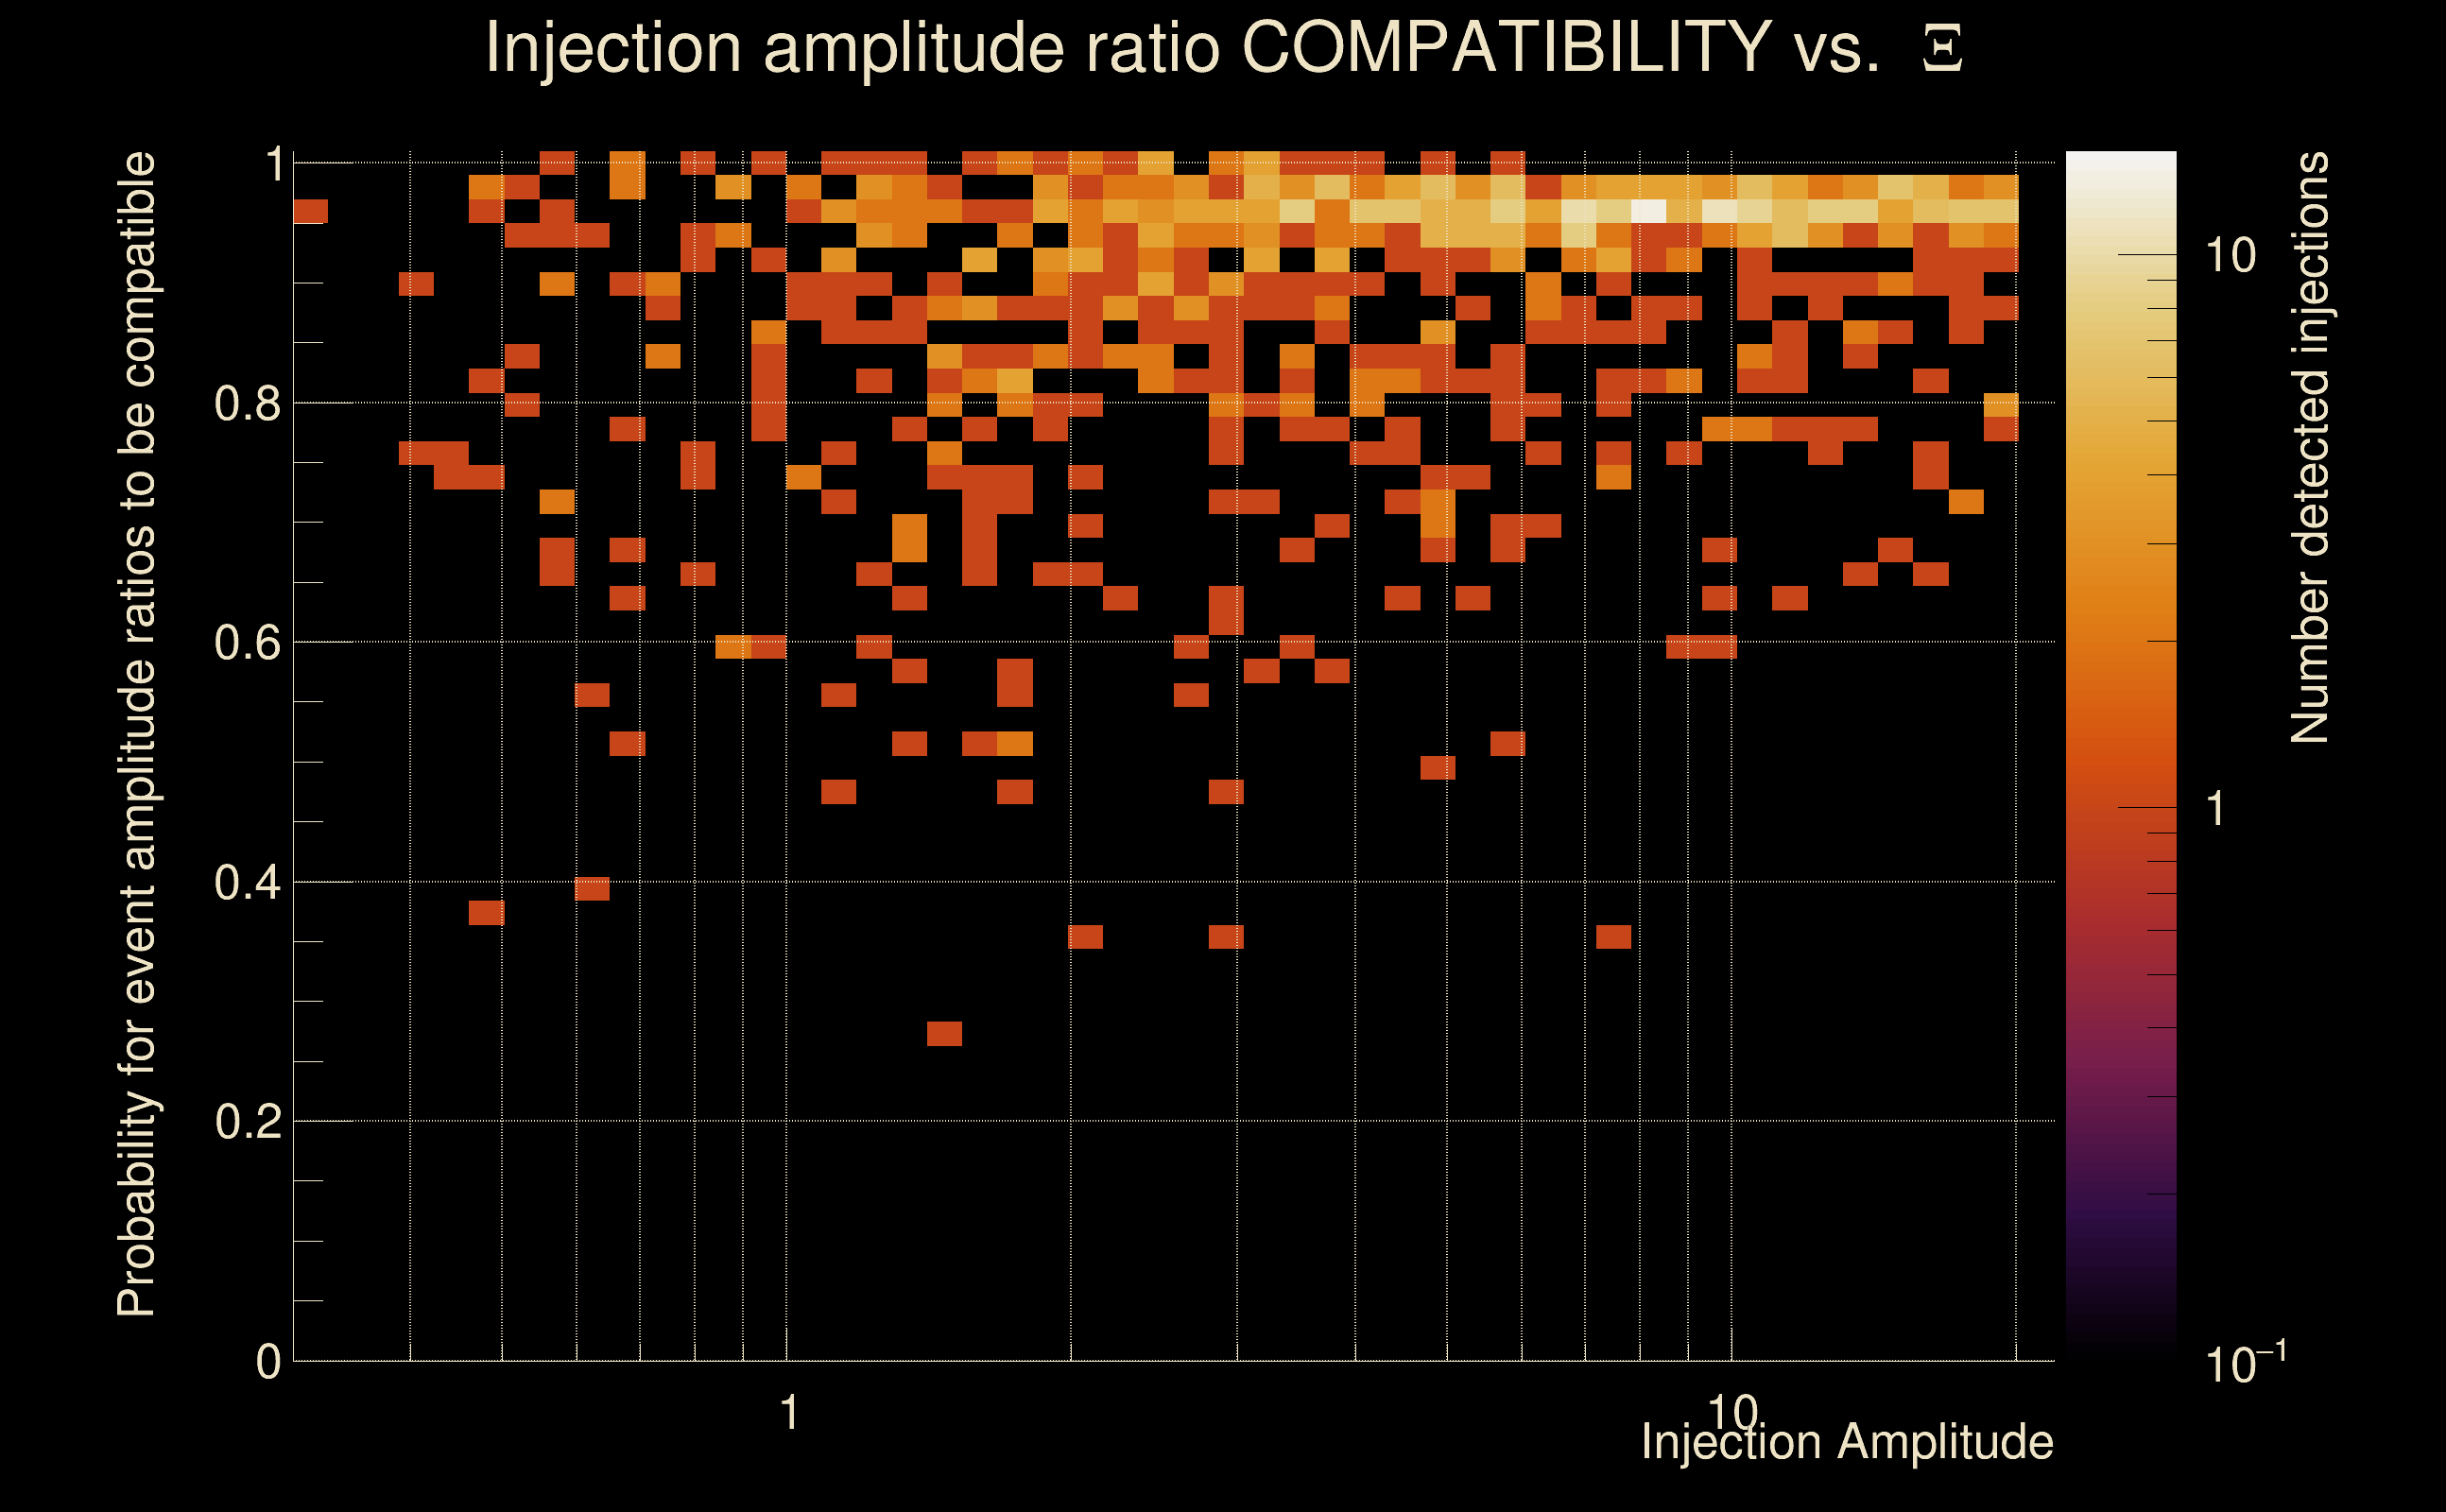
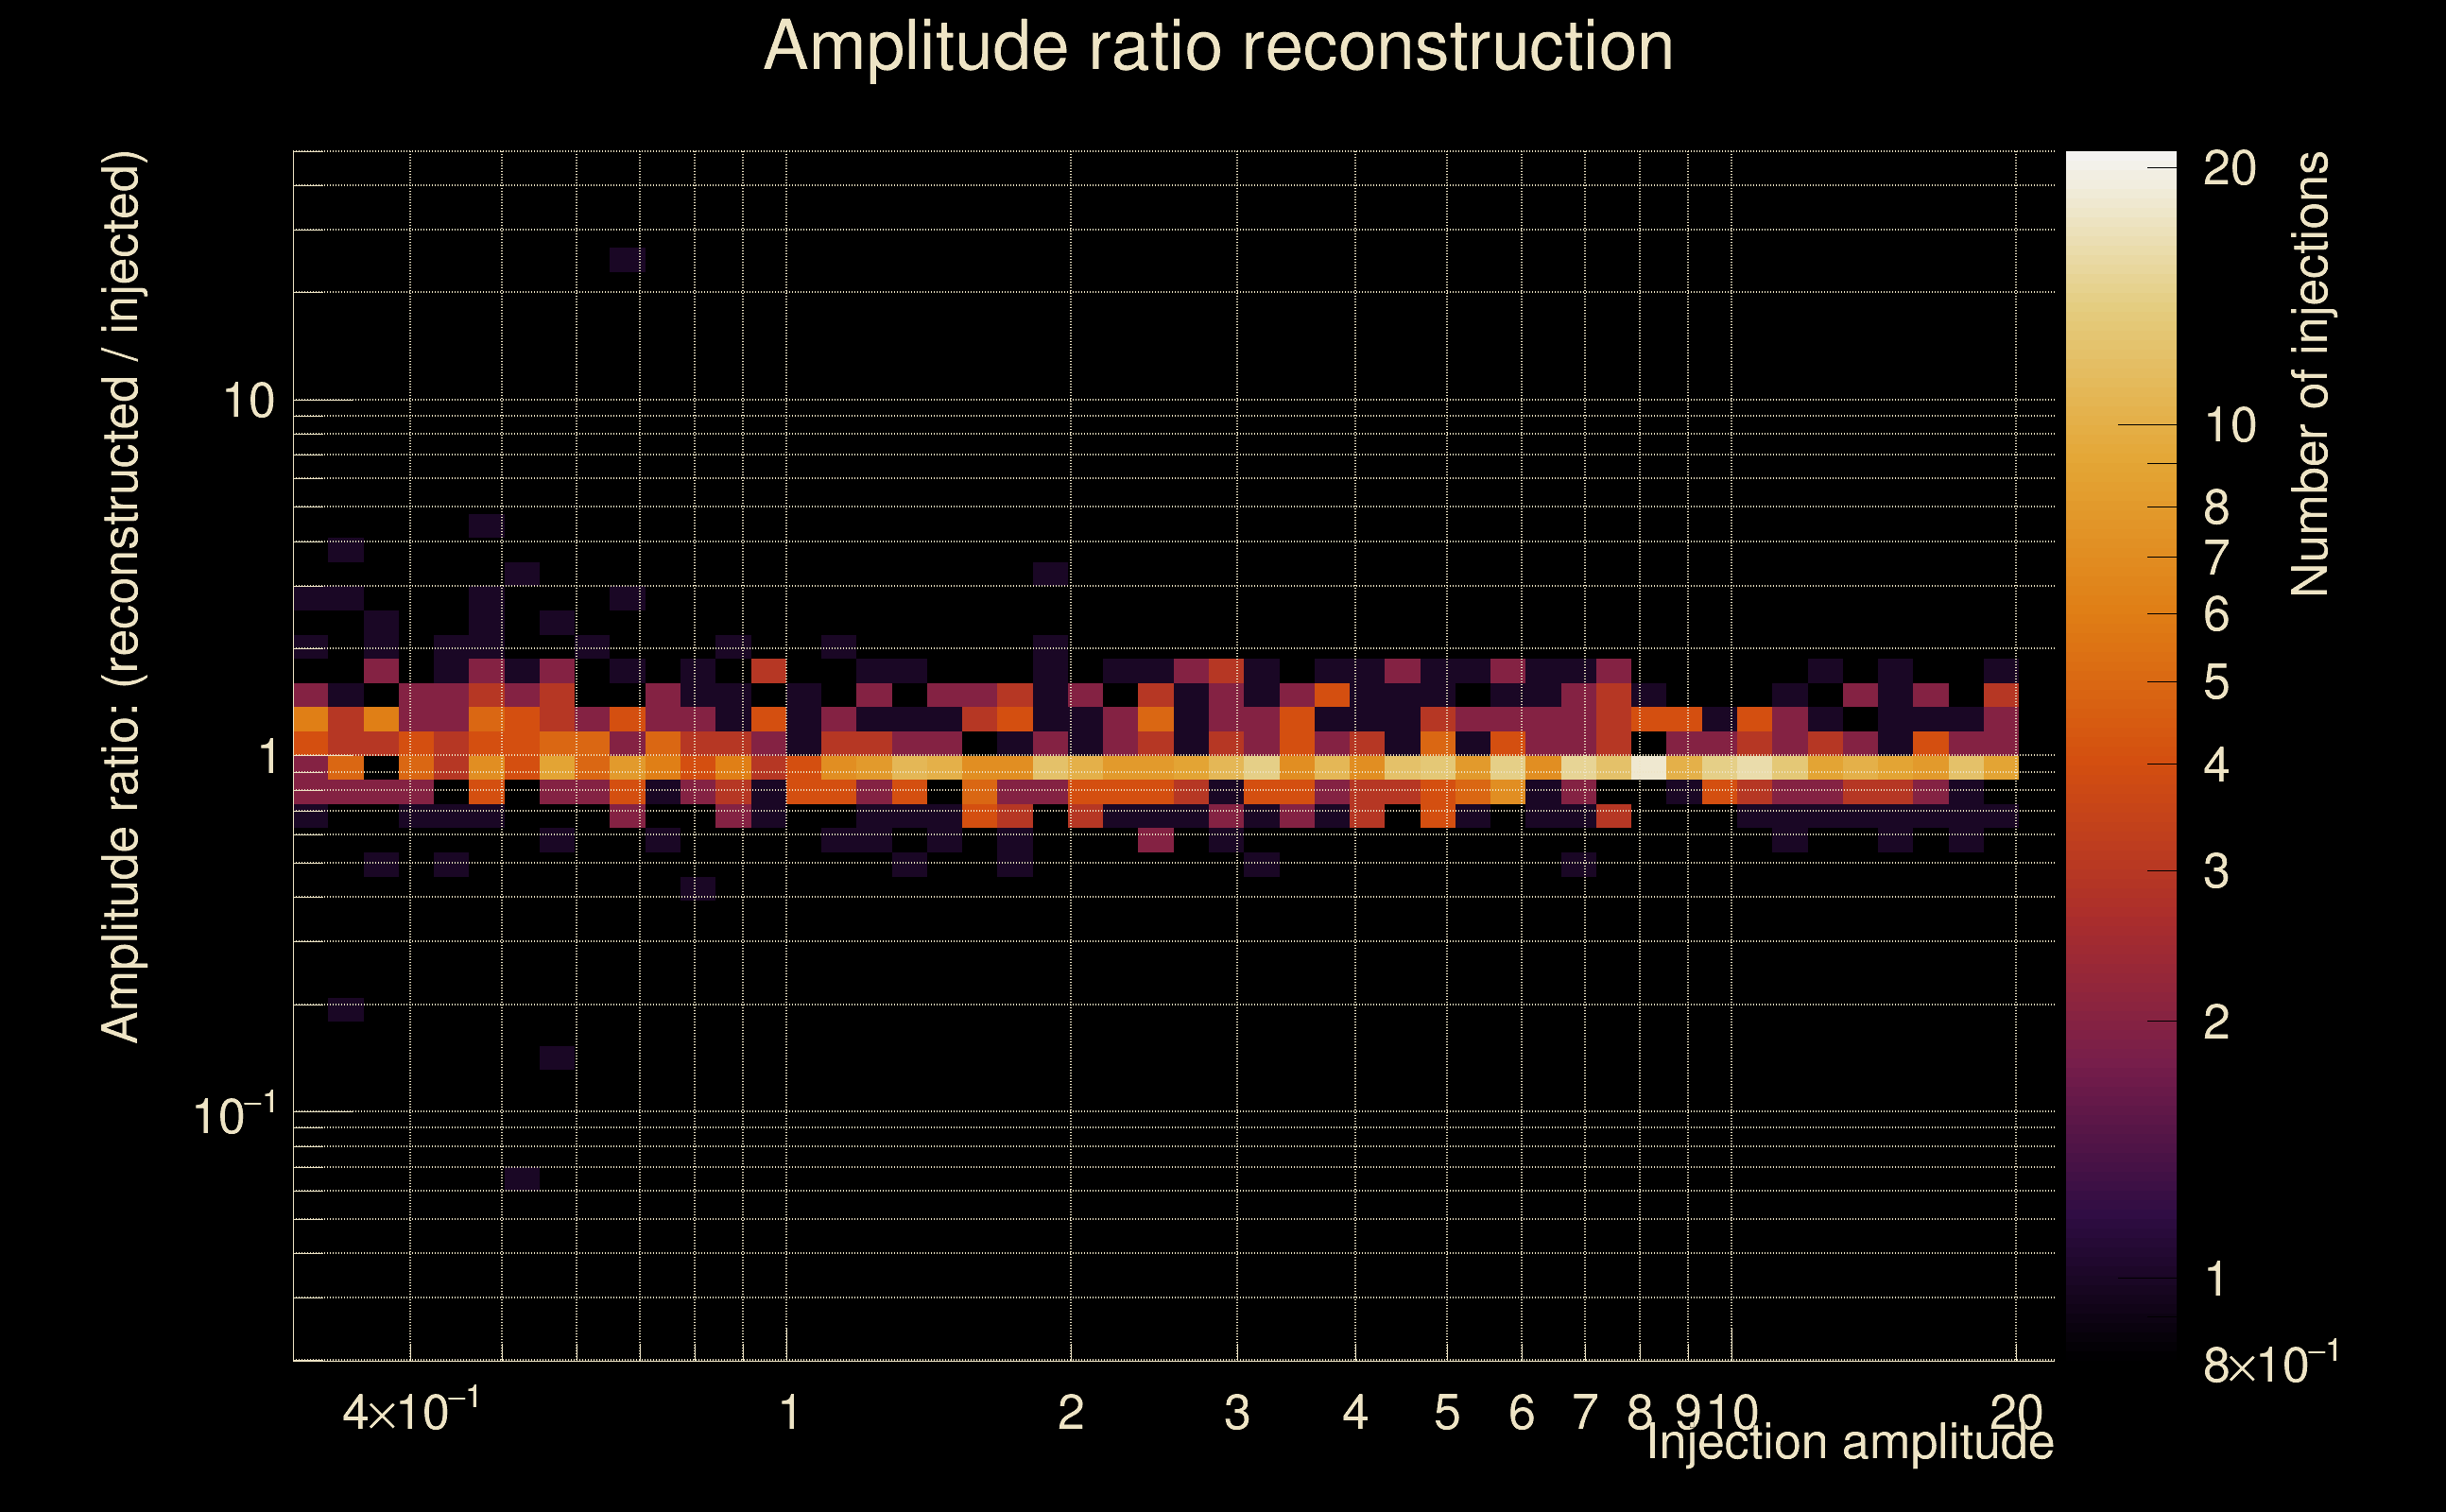
| Number of injections (total/valid/detected): | 1162 / 1018 / 503 |
| List of missed injections: | ./Kur22-s50_missed.txt |
| Injection amplitude at 90% detection efficiency: | 15.8438 |
| Injection amplitude at 50% detection efficiency: | 5.99539 |
| Injection amplitude at 10% detection efficiency: | 0.885339 |
 |
 |
 |
 |
 |
 |
 |
|
 |
 |
|
 |
 |
|
 |
 |
|
 |
 |
|
 |
 |
|
 |
 |
|
 |
 |
|
 |
 |
 |
 |
 |
 |
 |
 |
 |
 |
 |
 |
 |
 |
 |
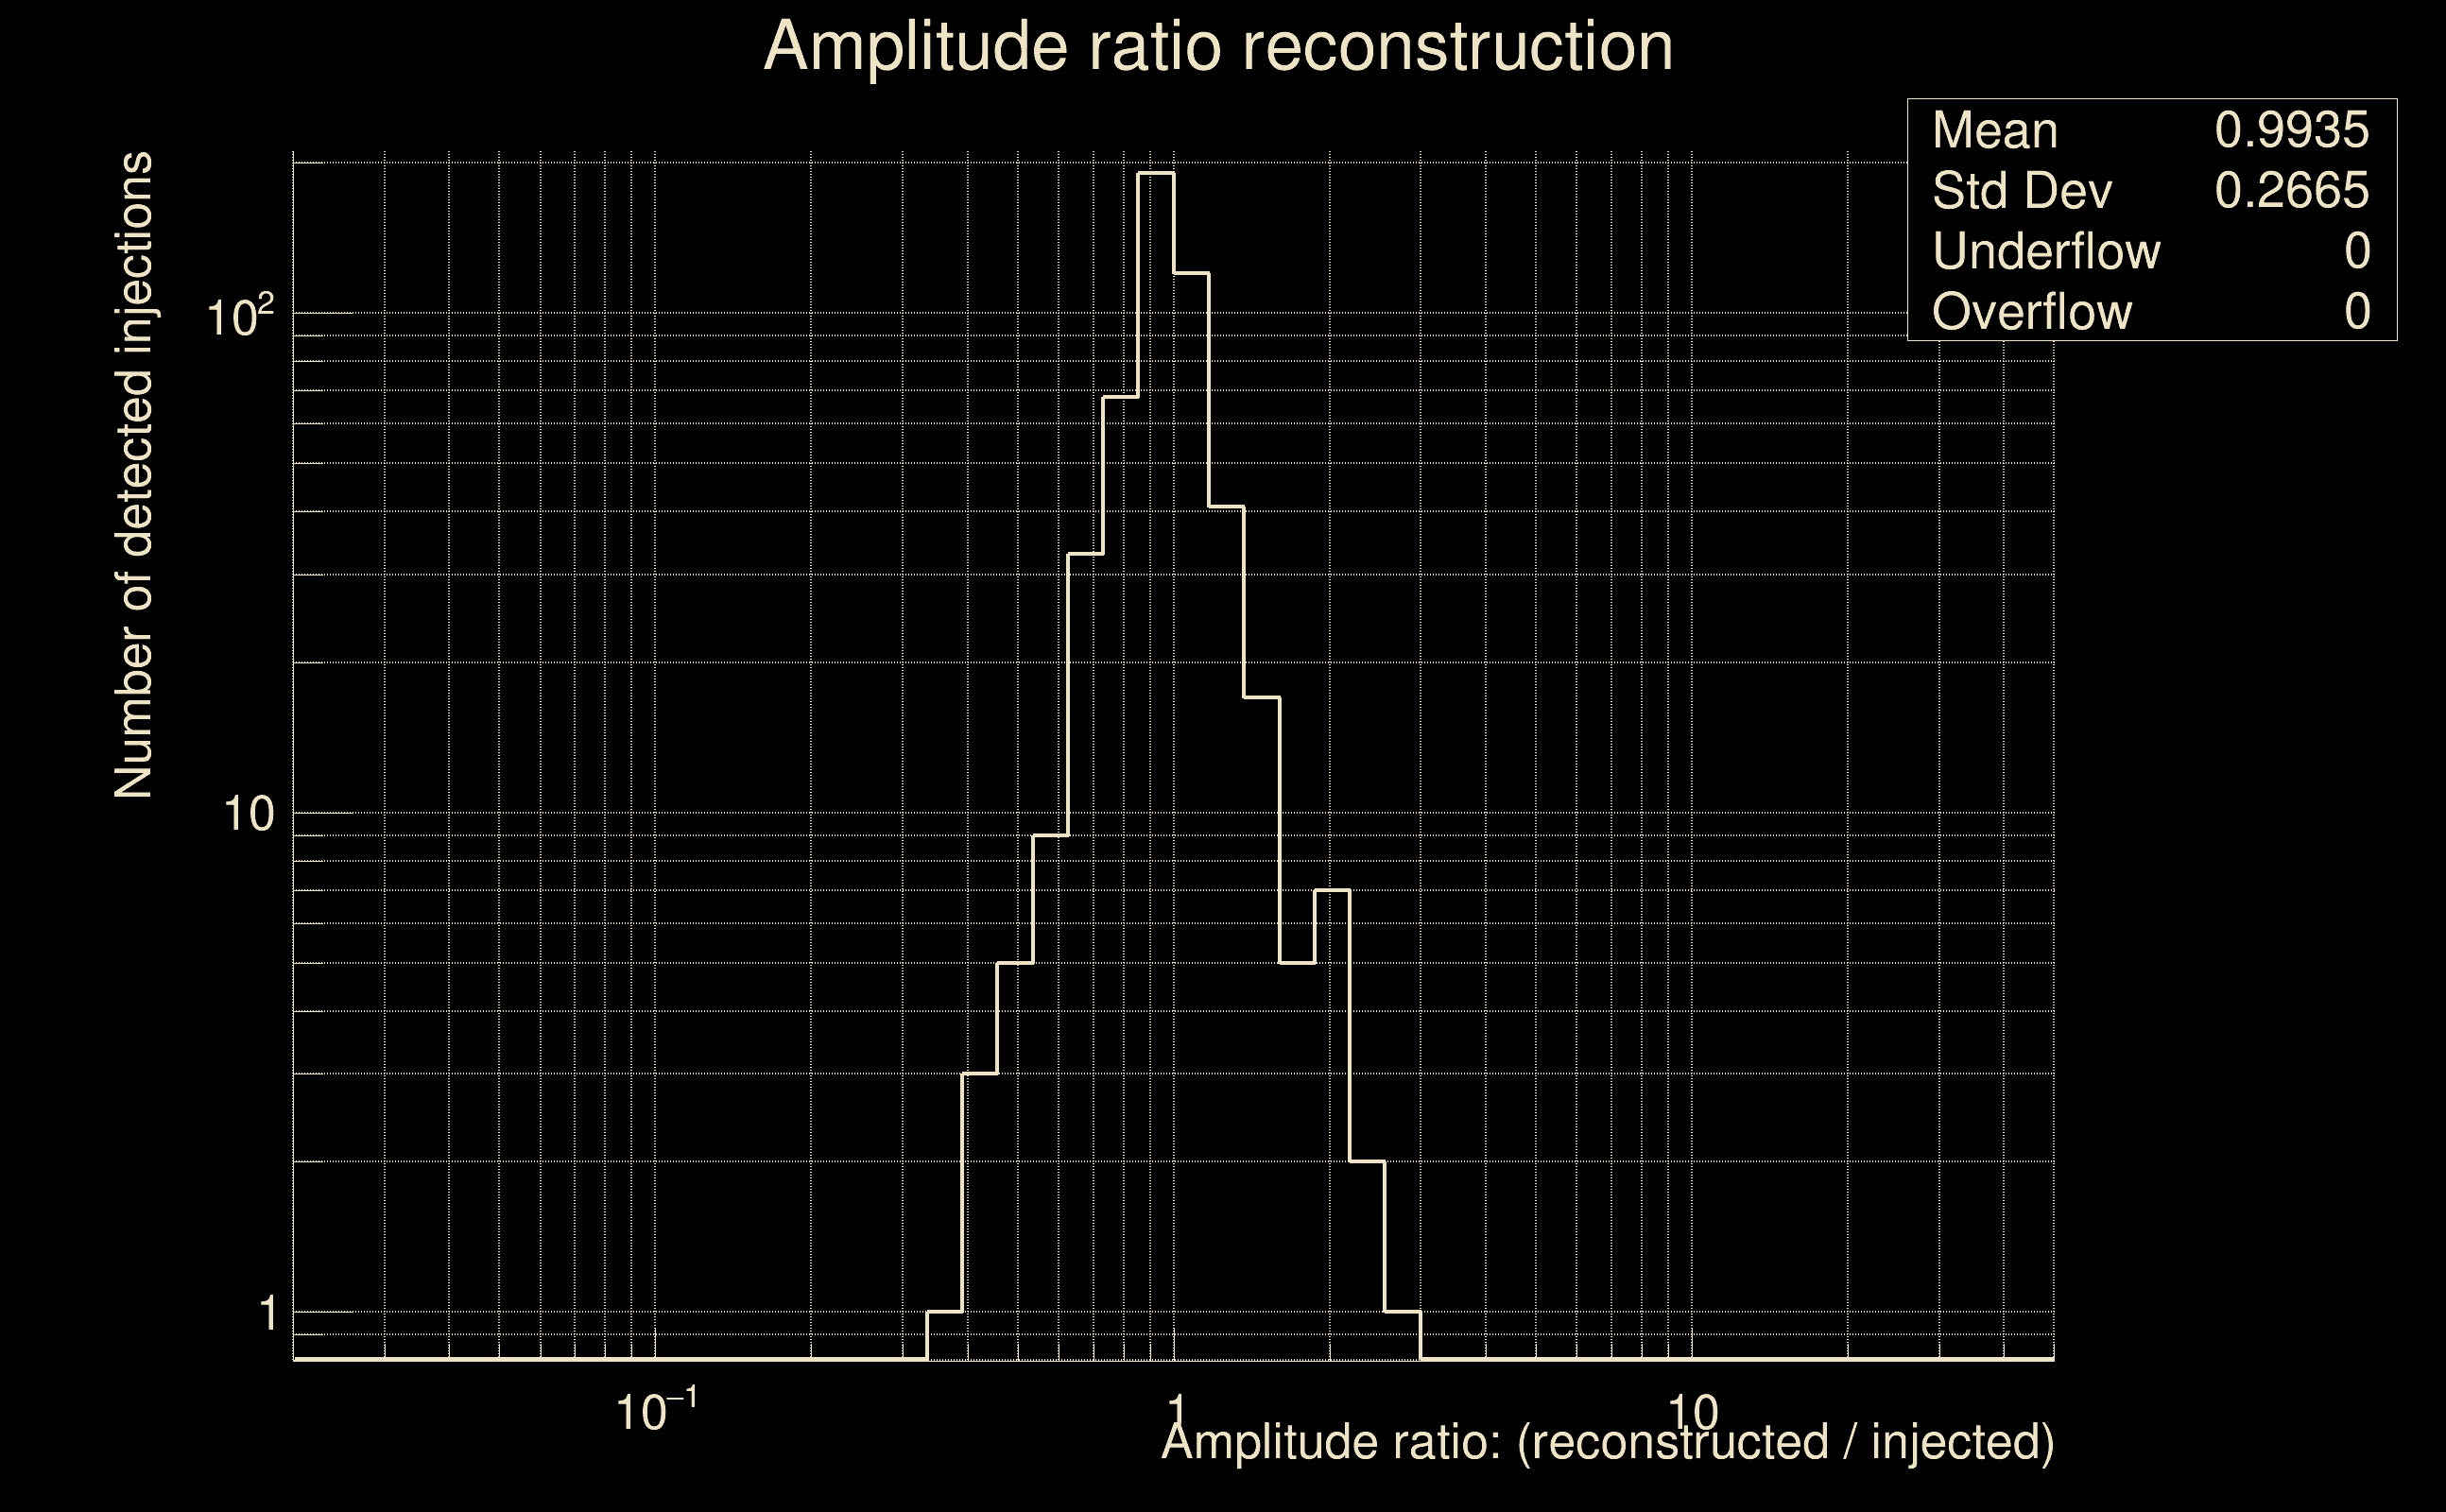
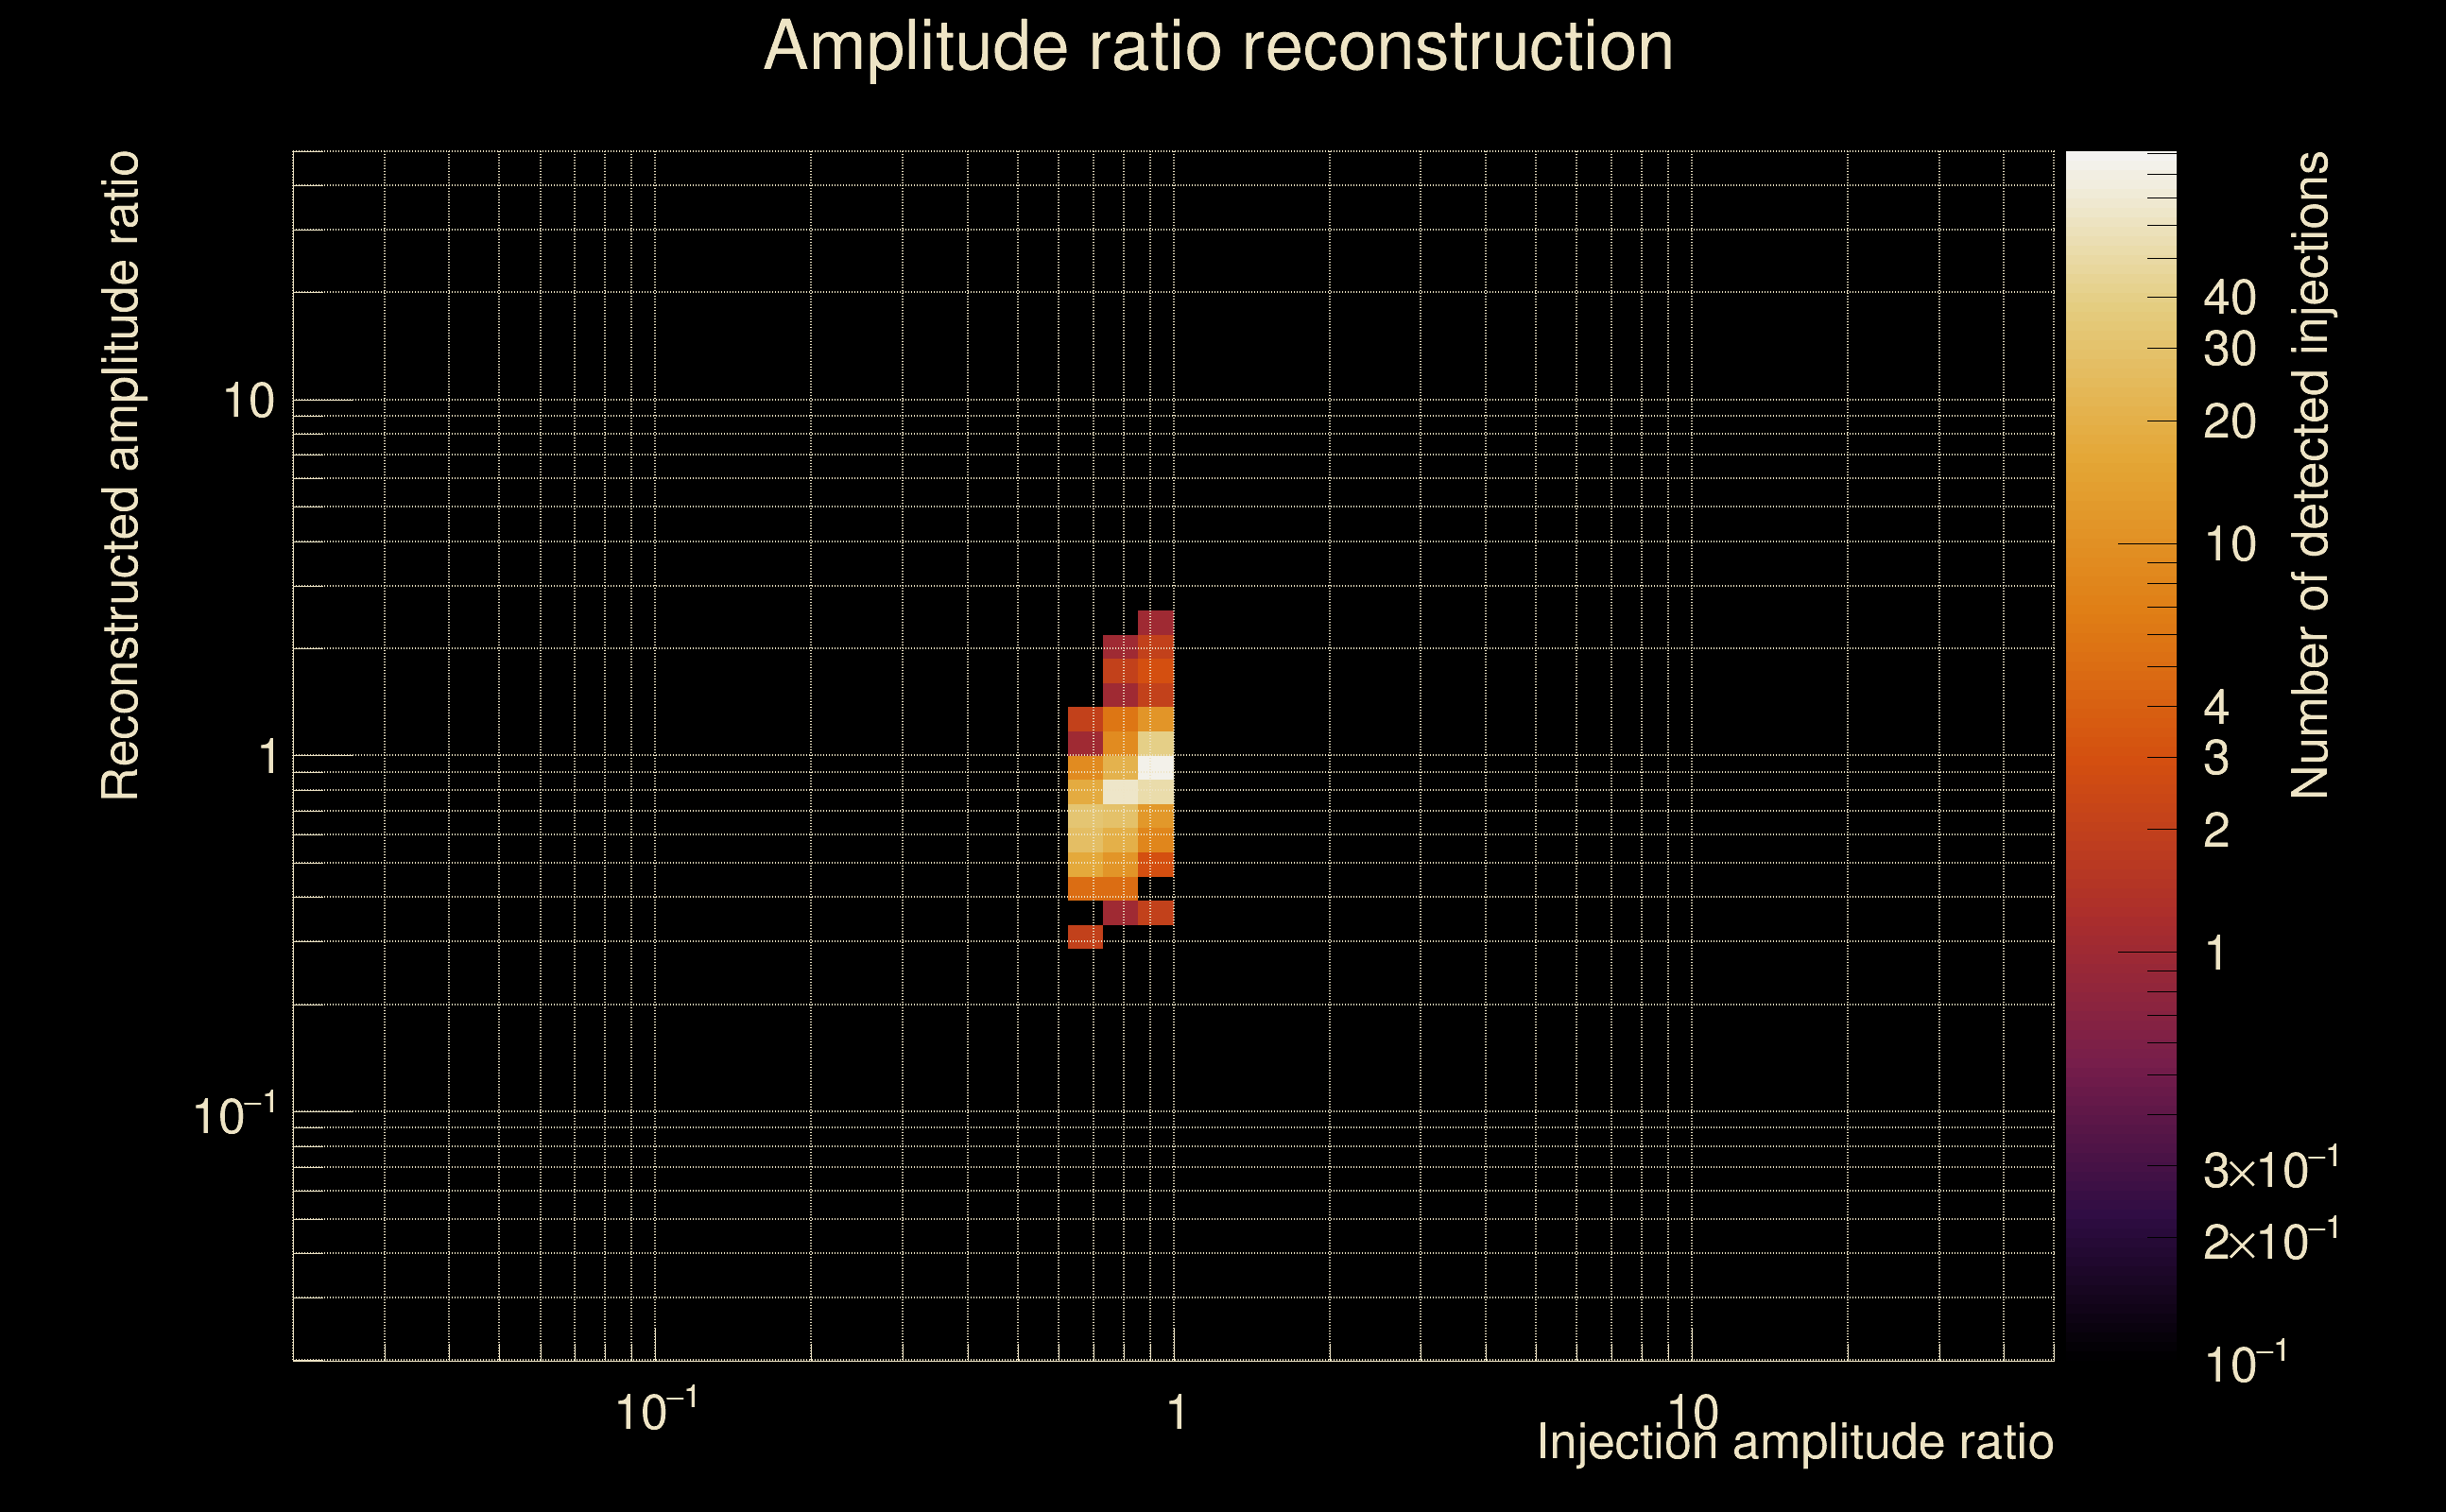
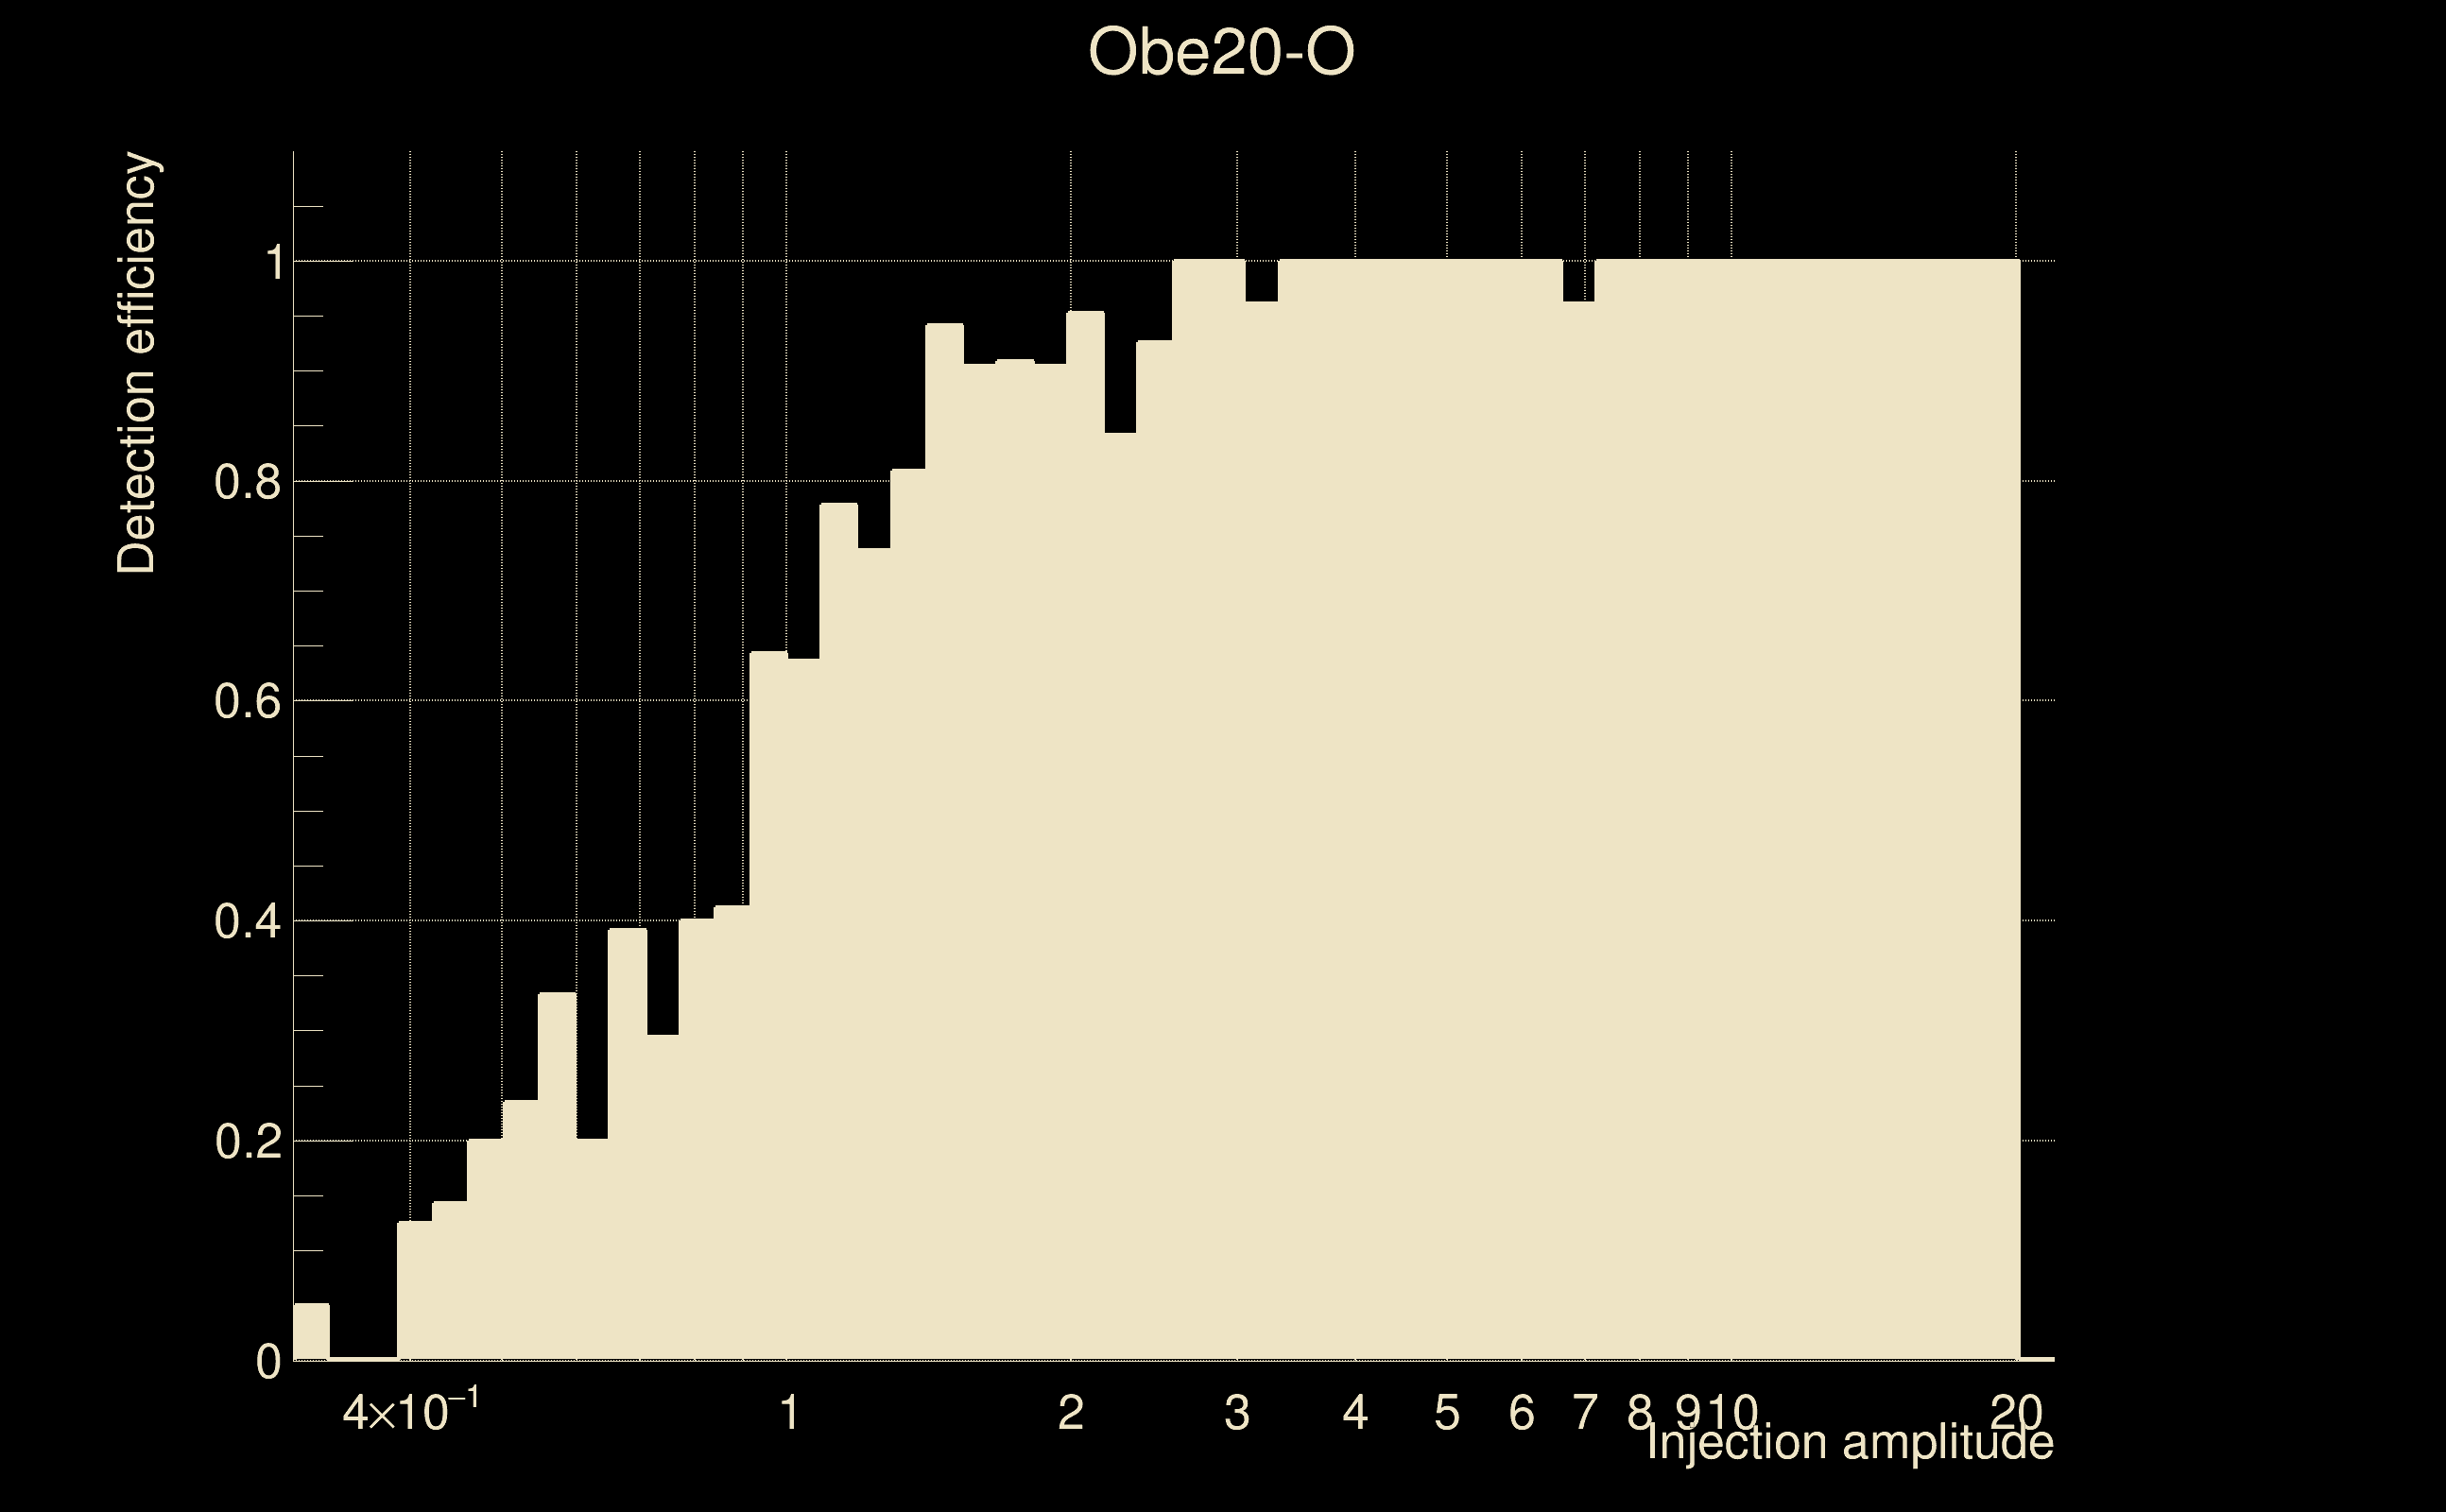
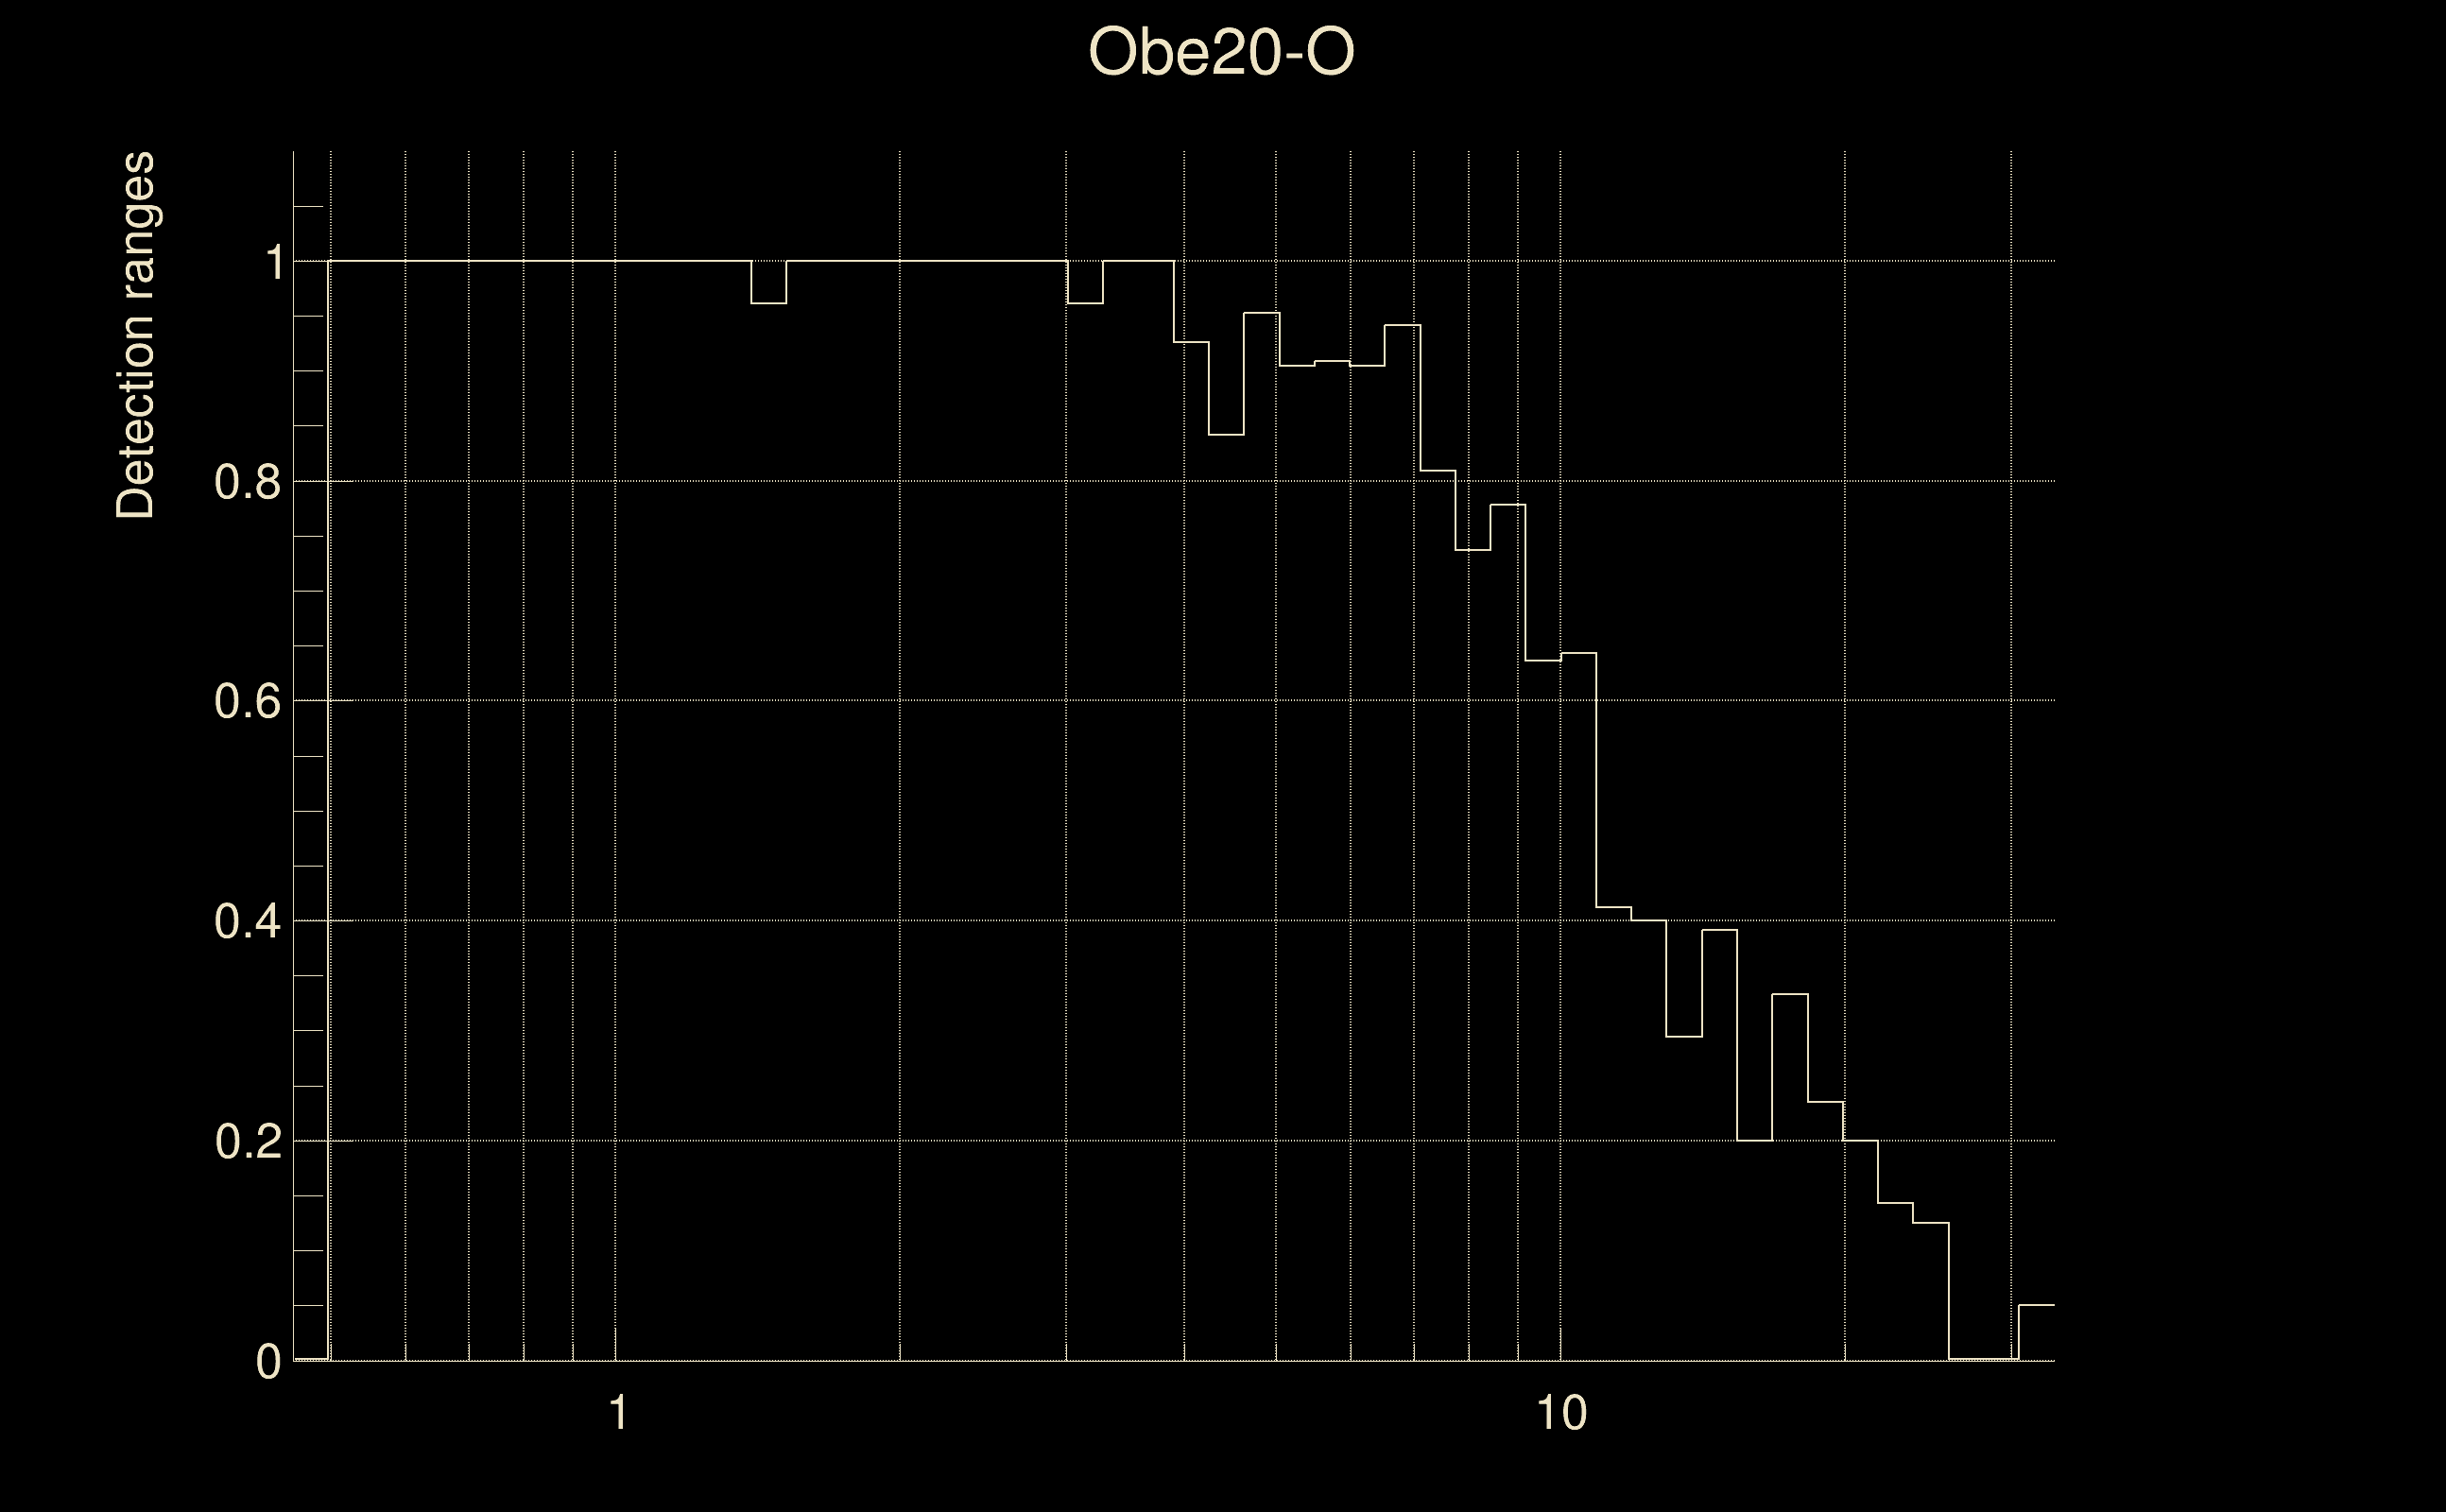
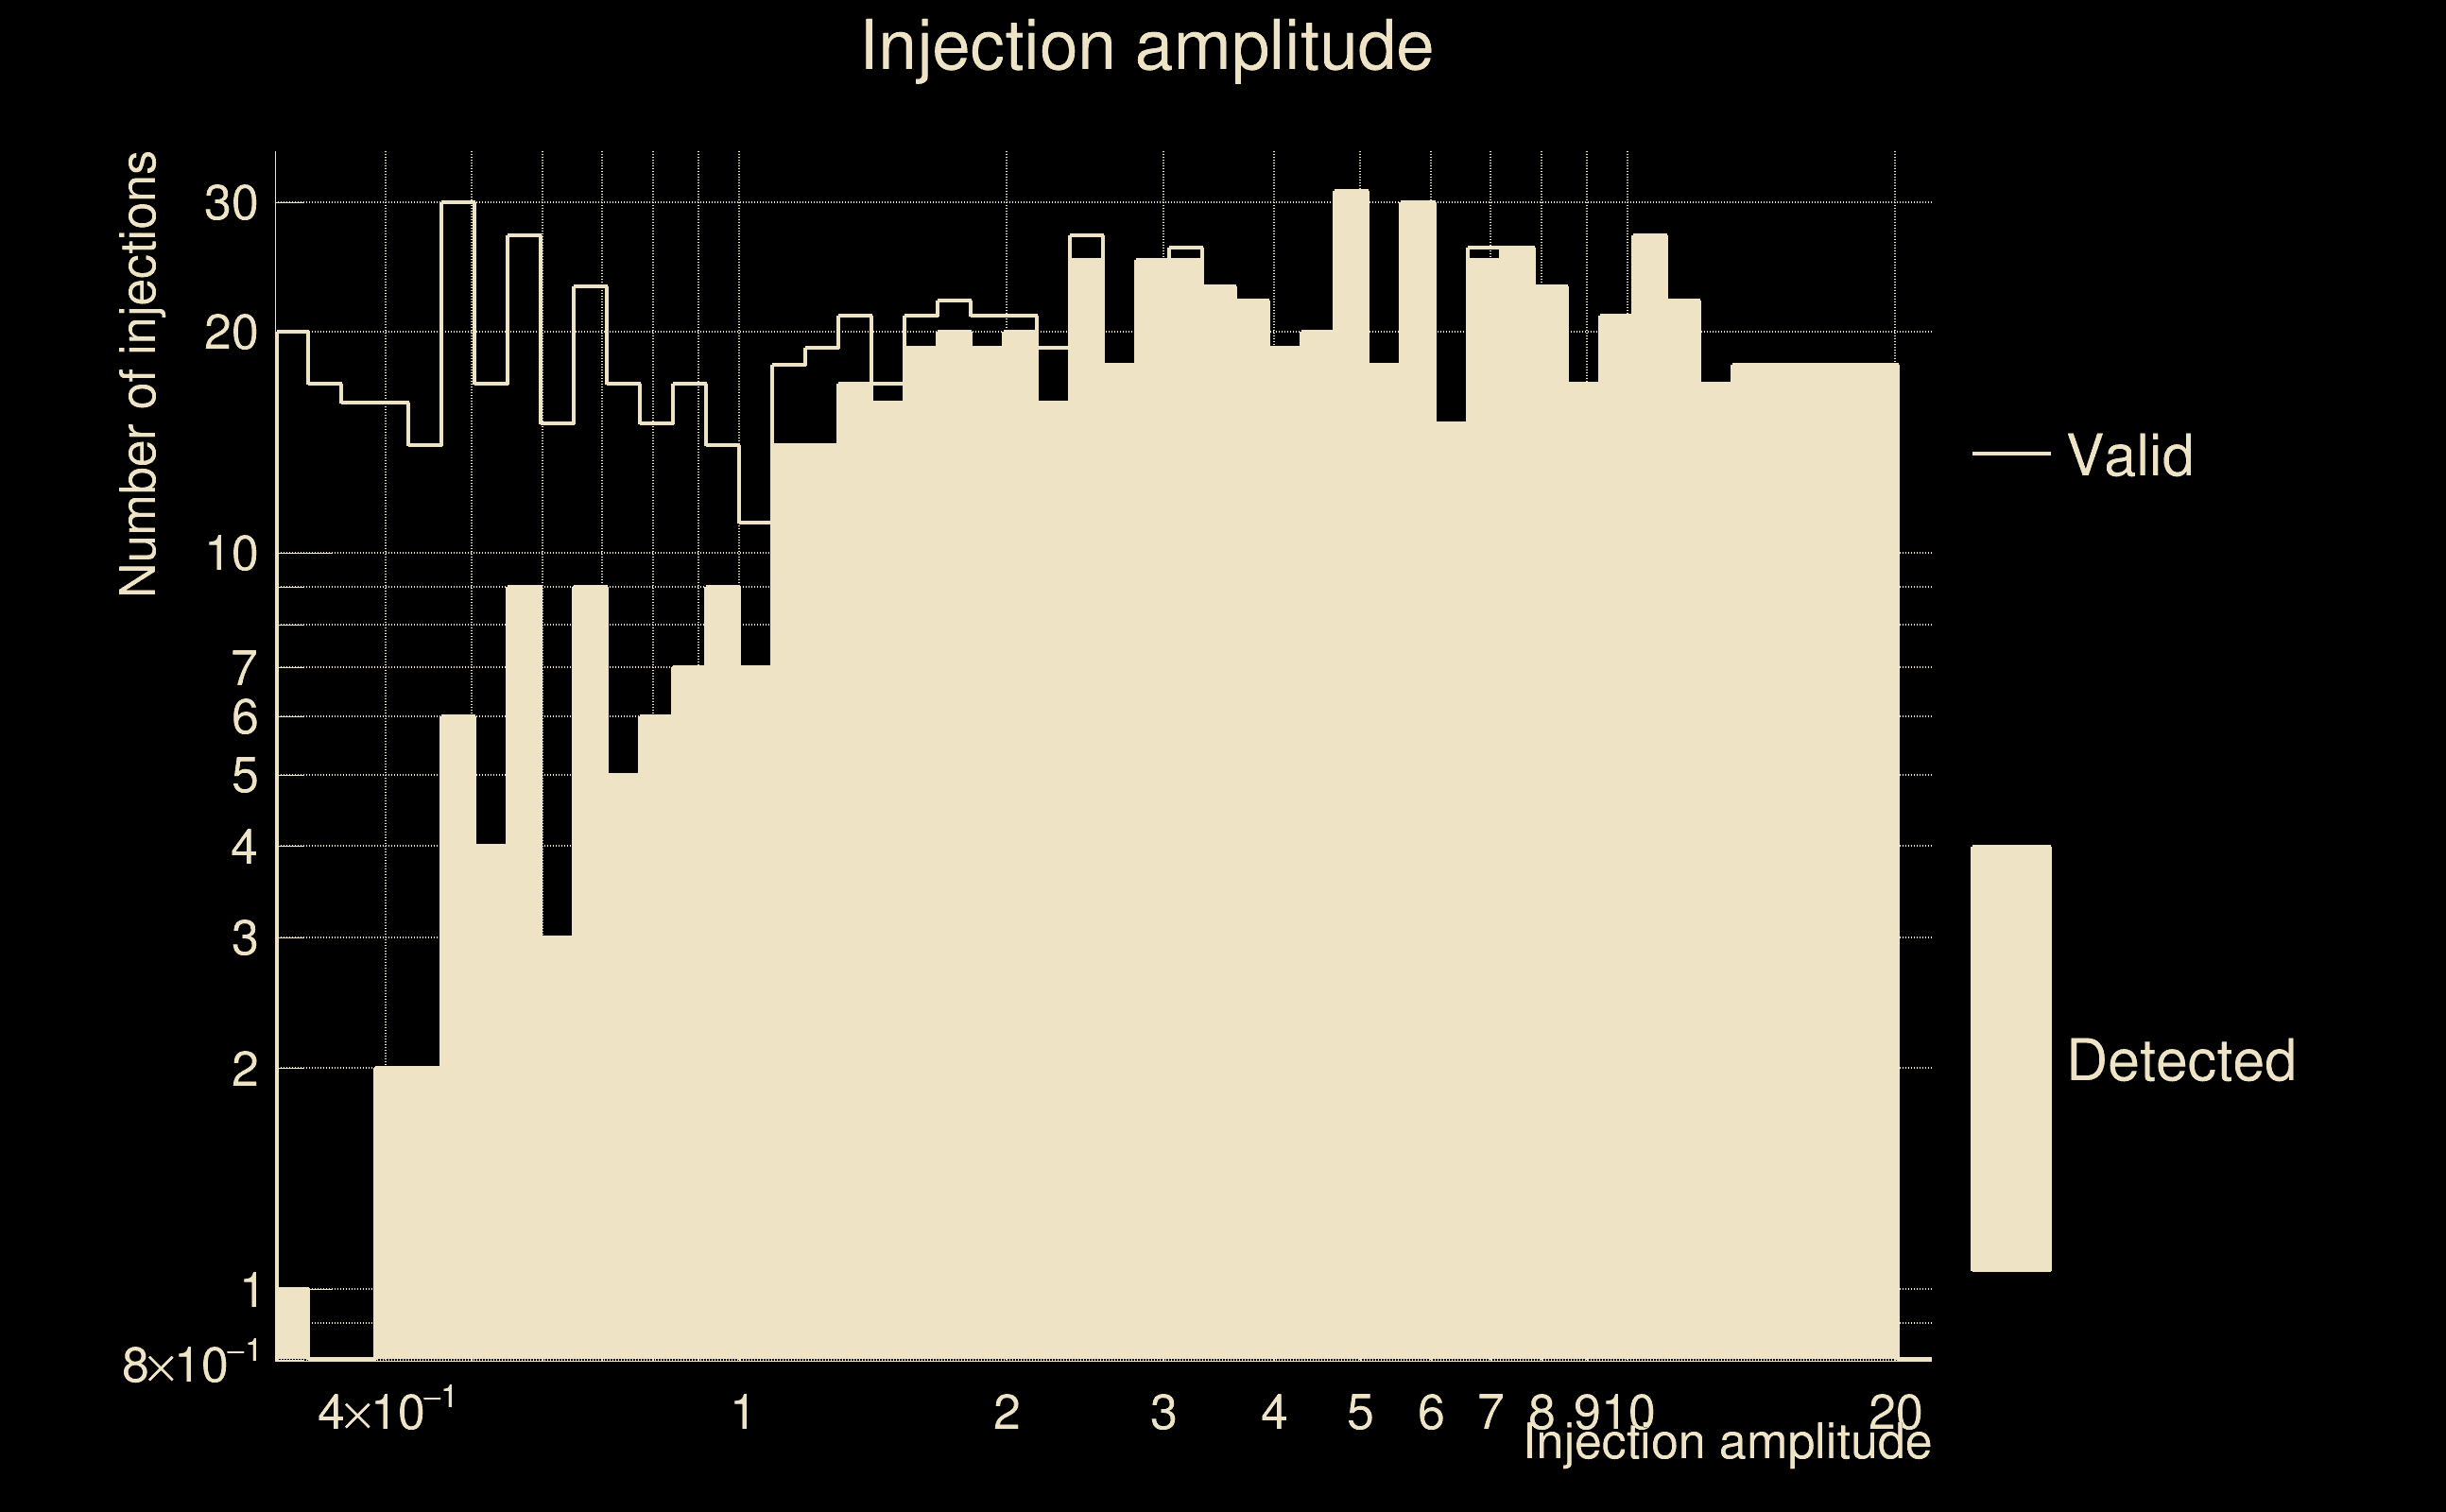
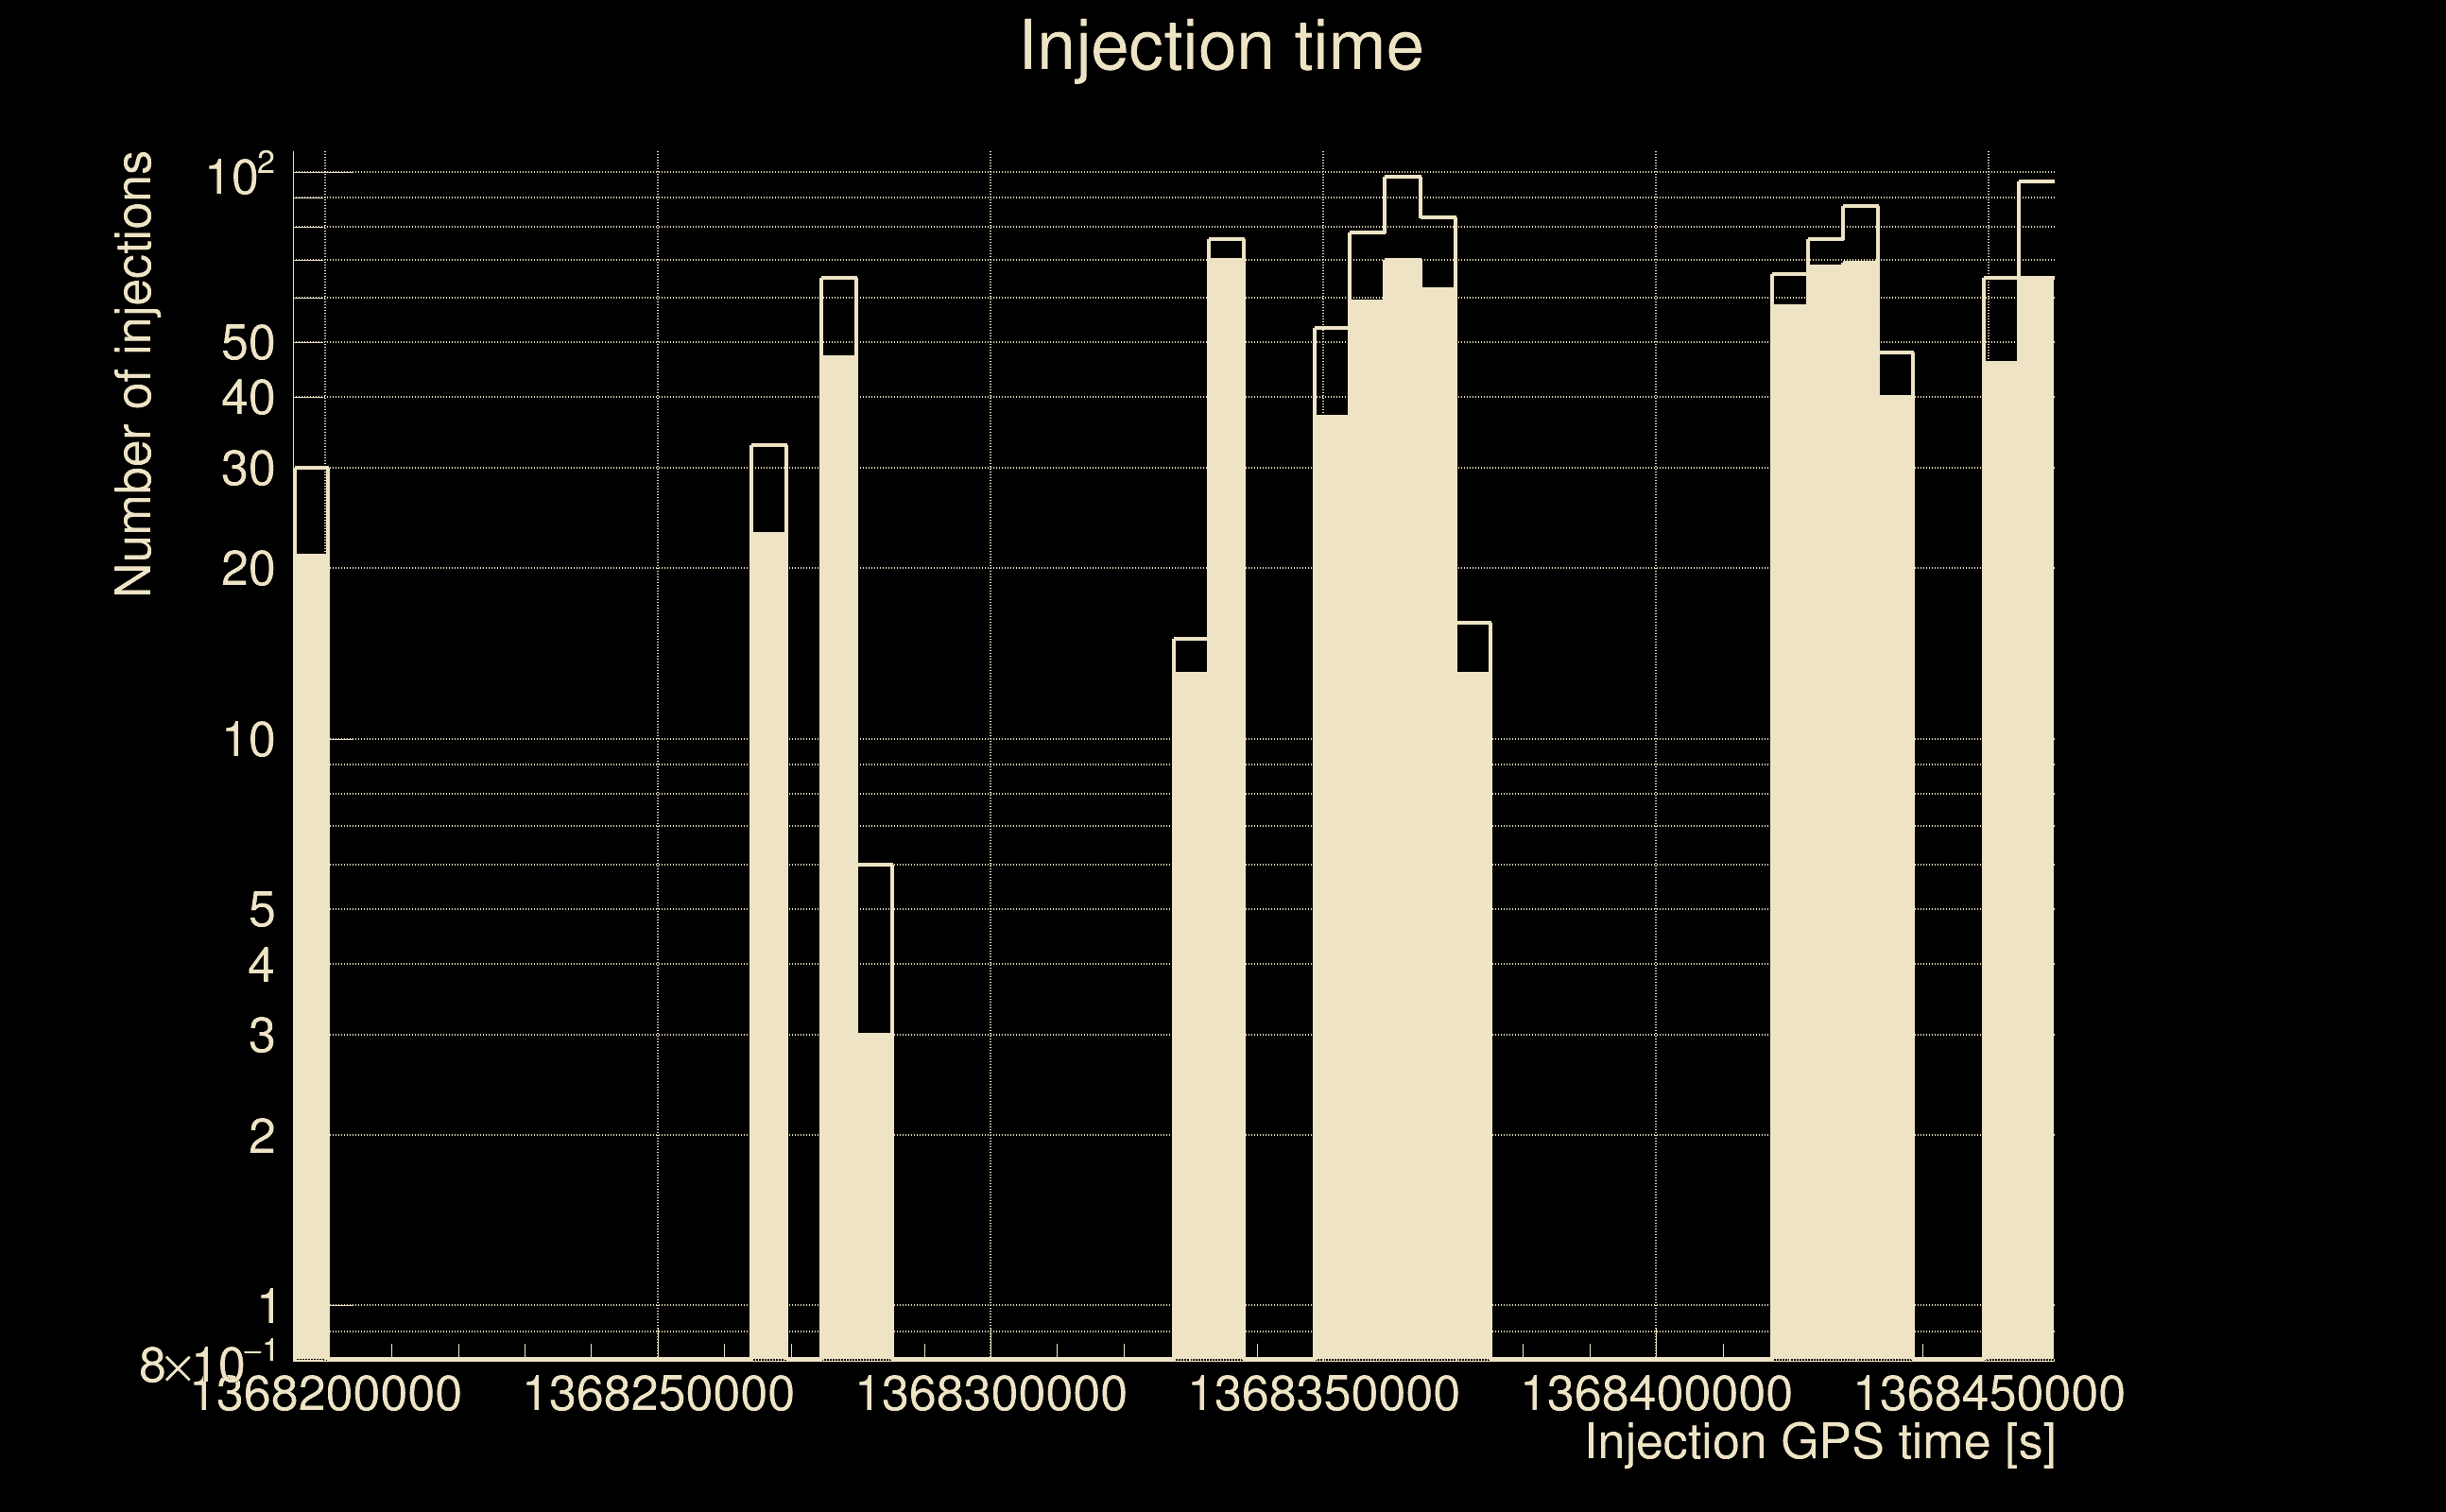
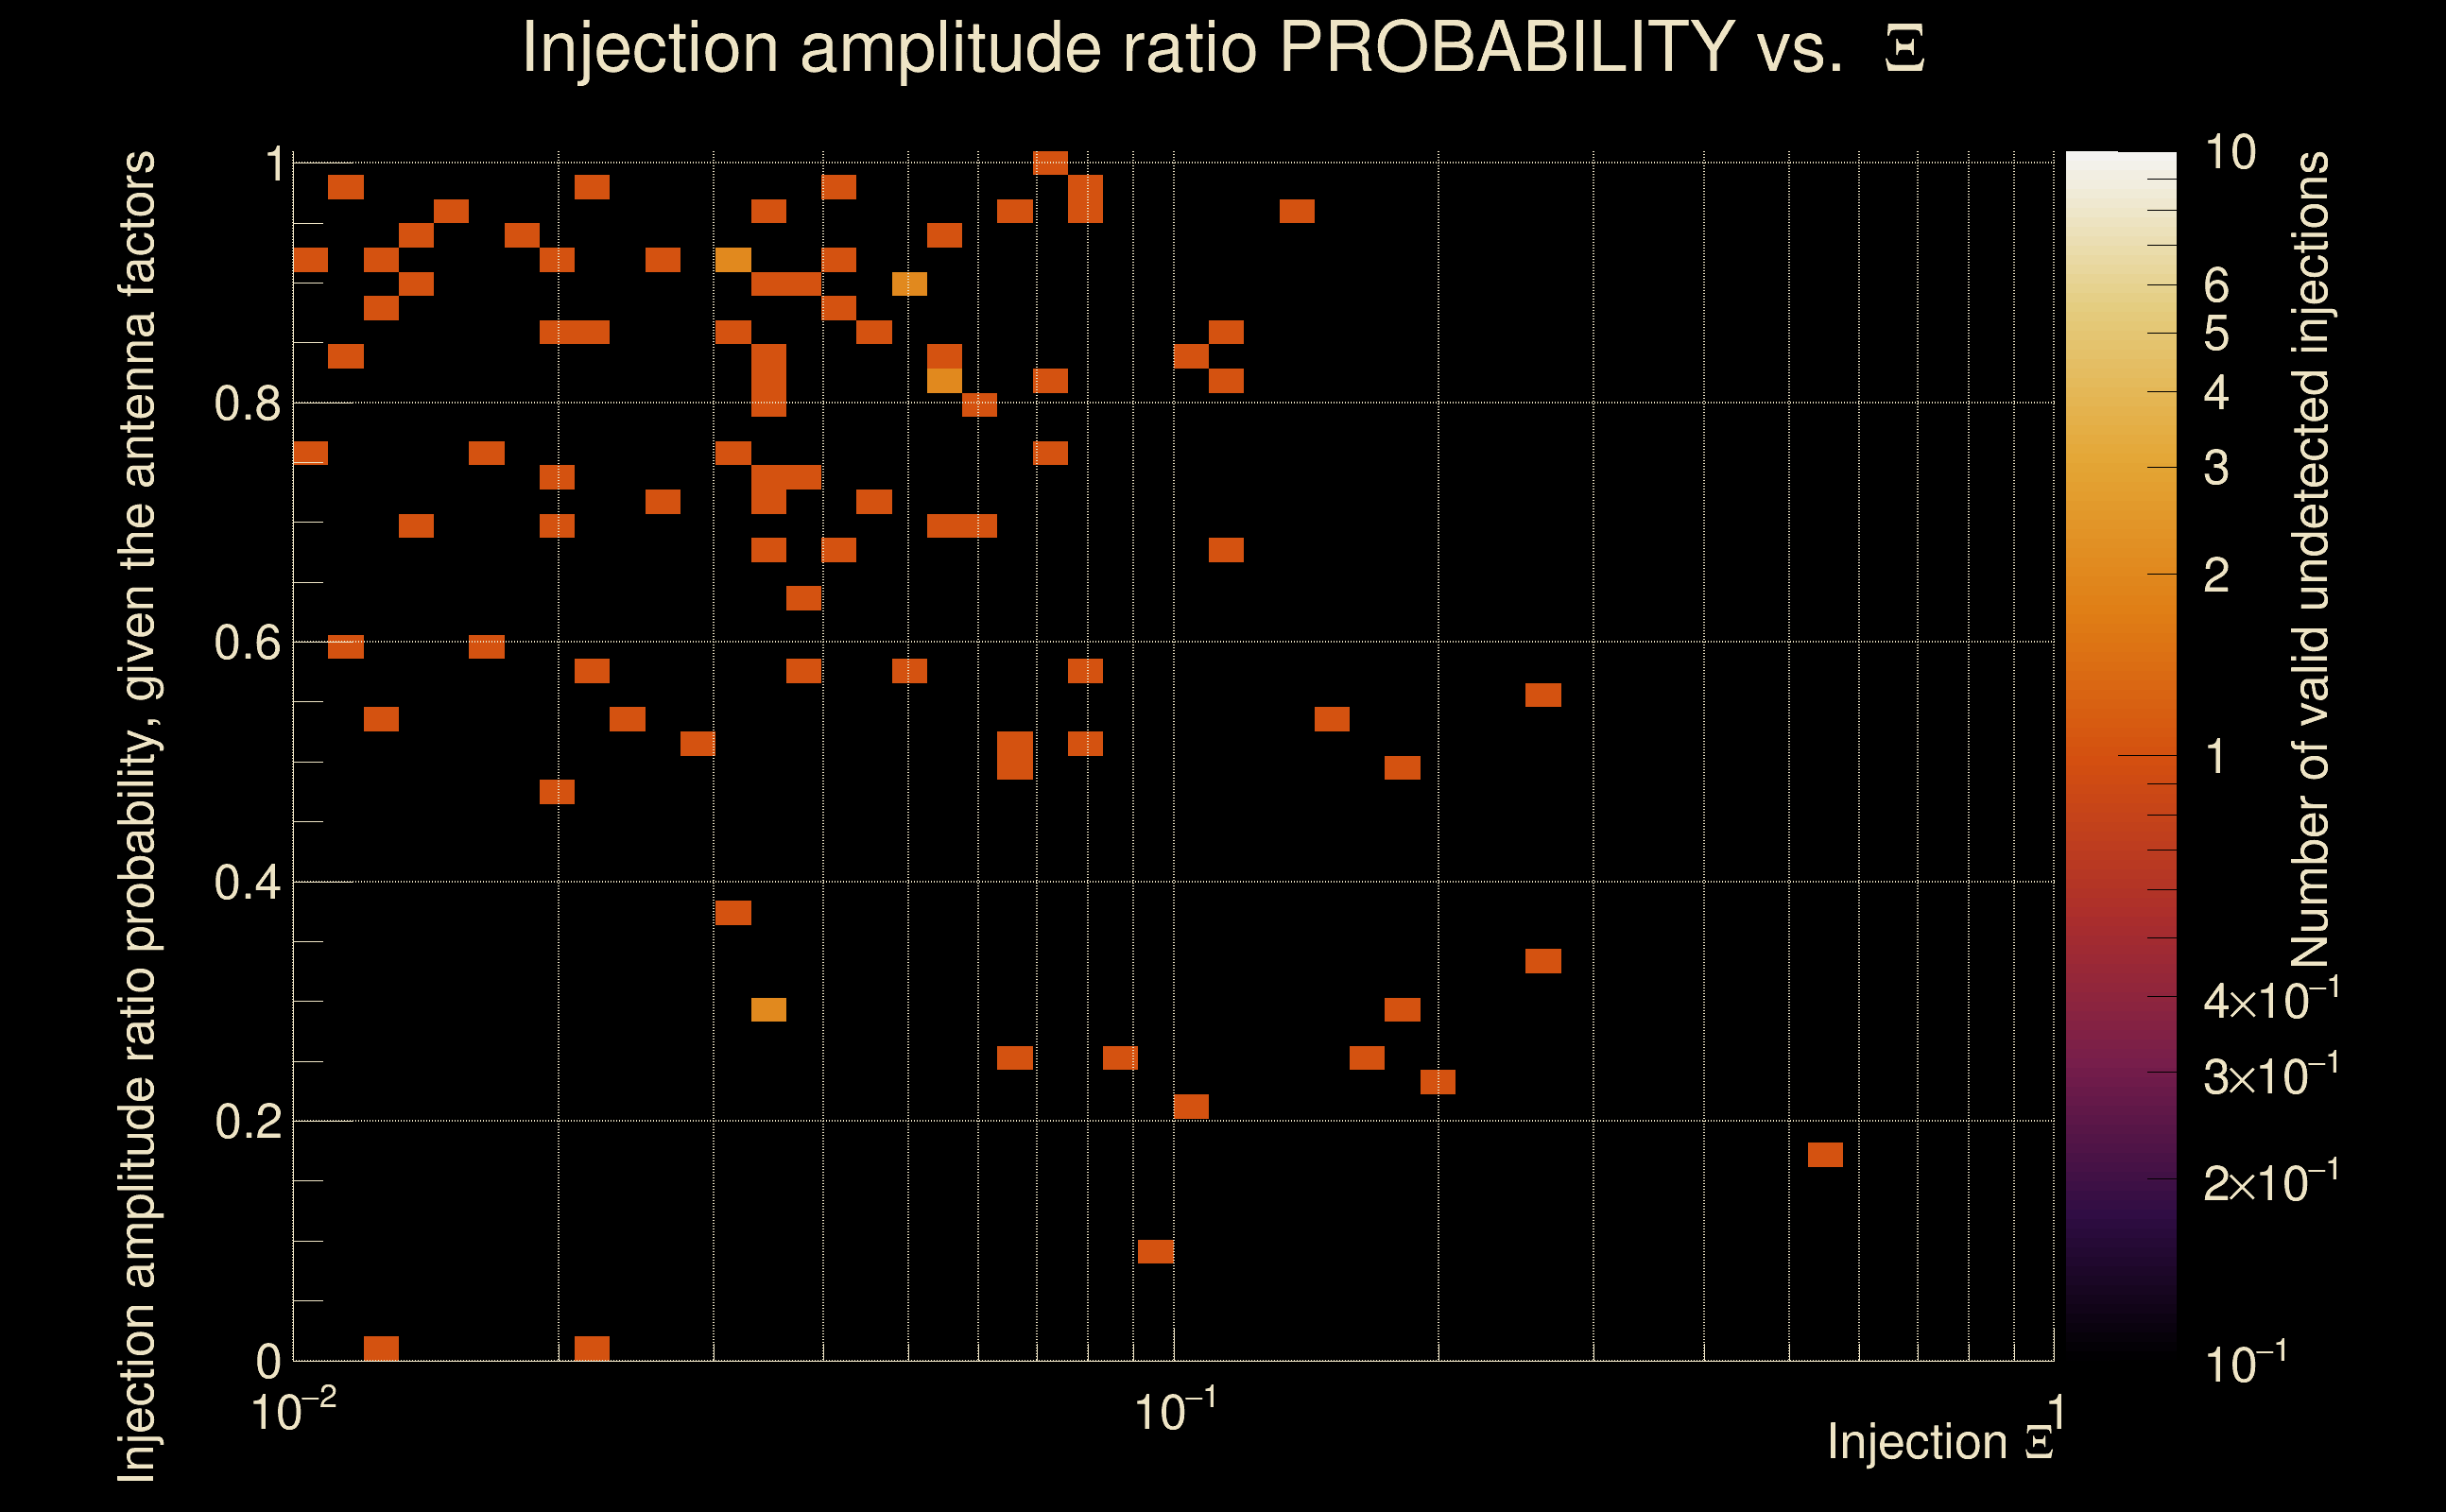
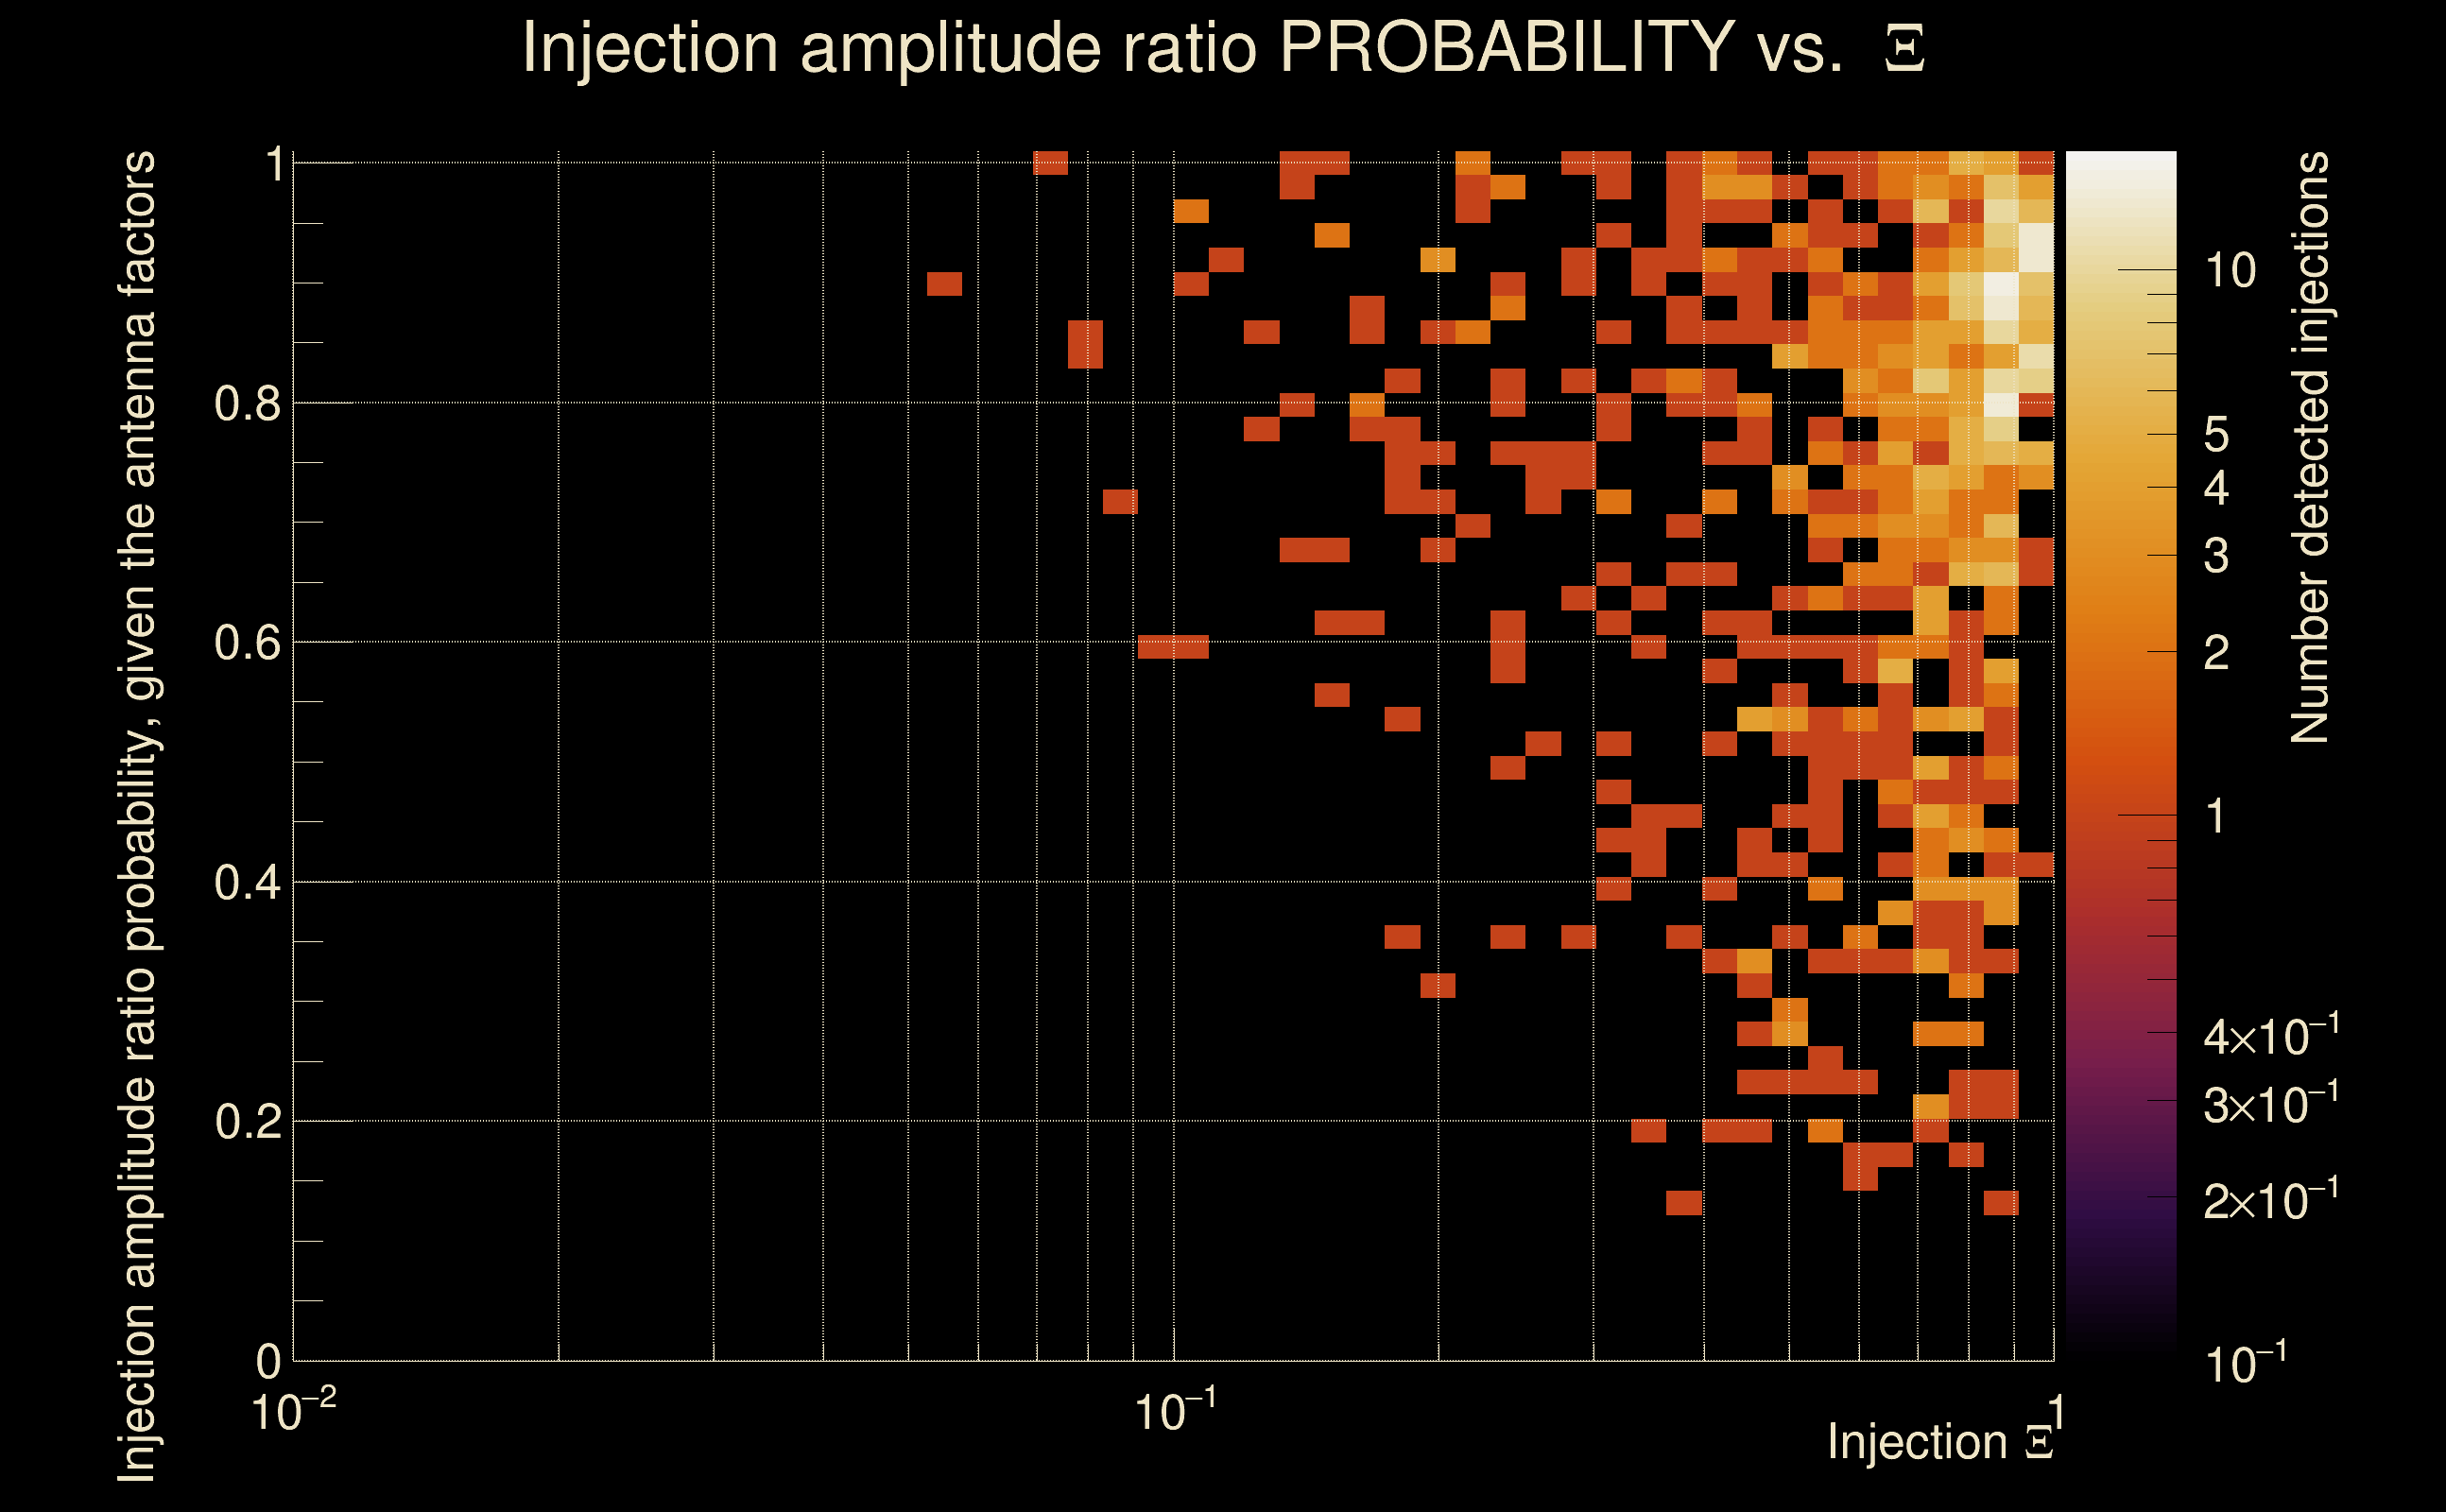
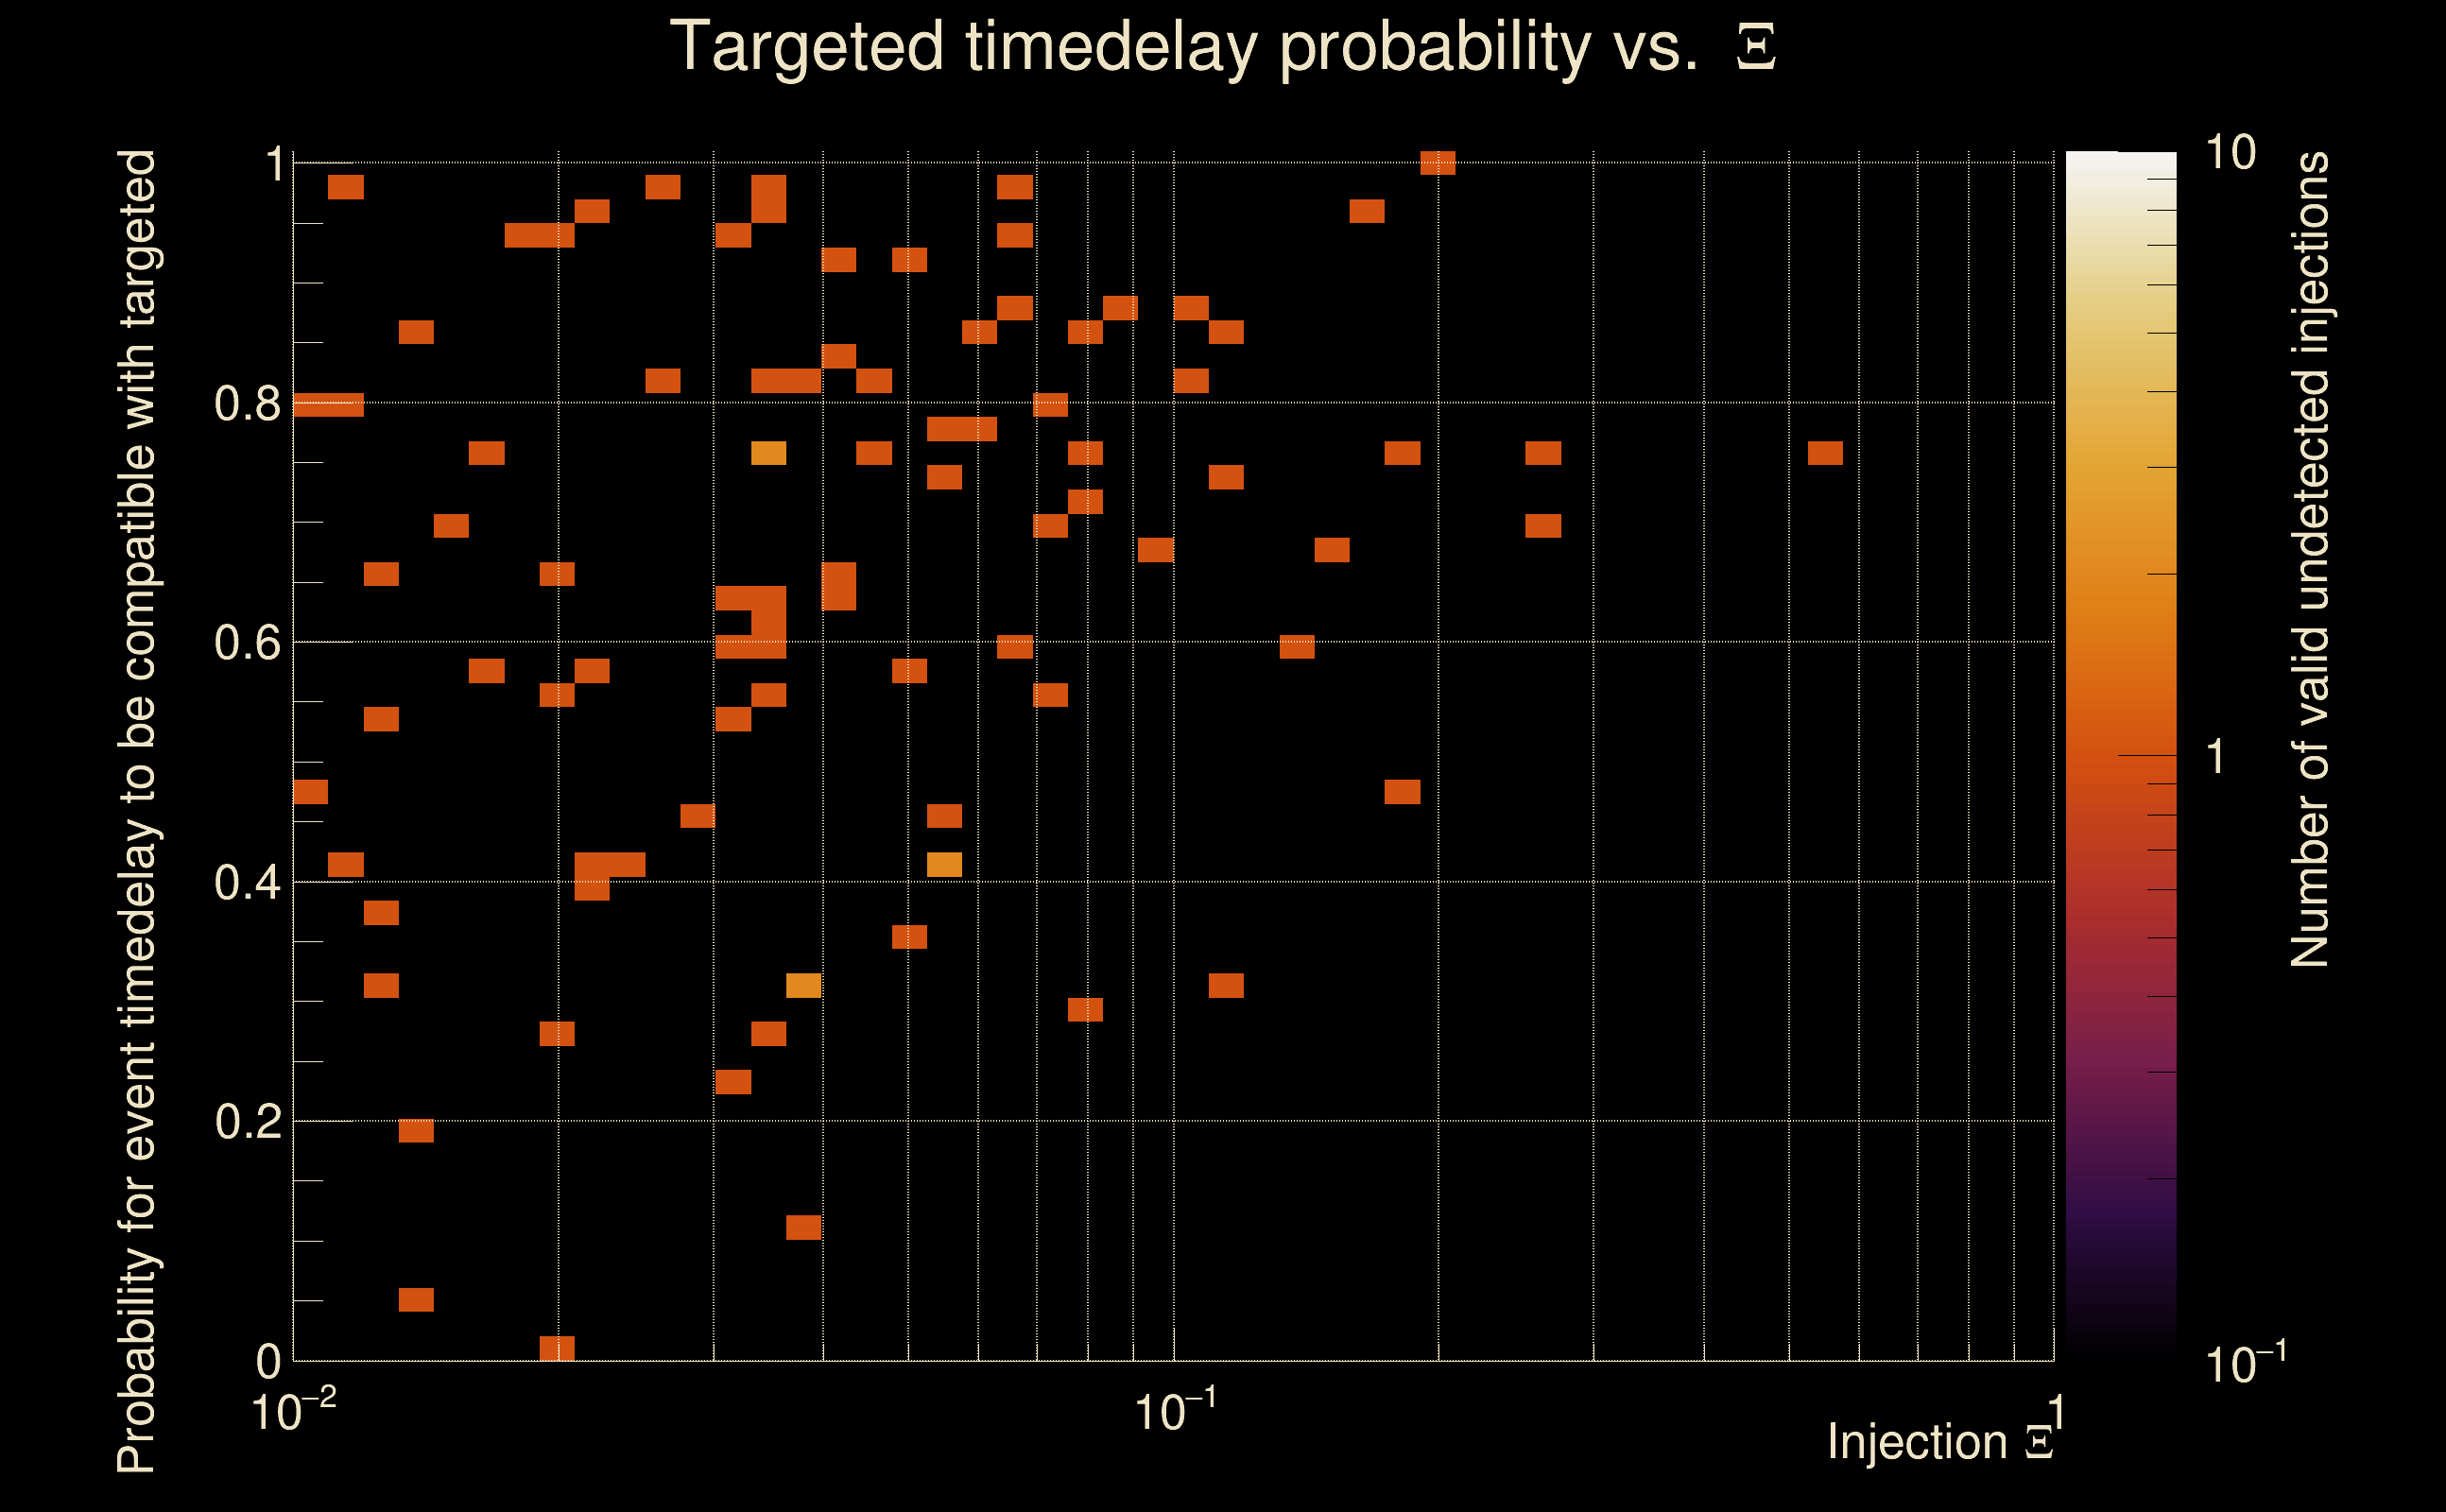
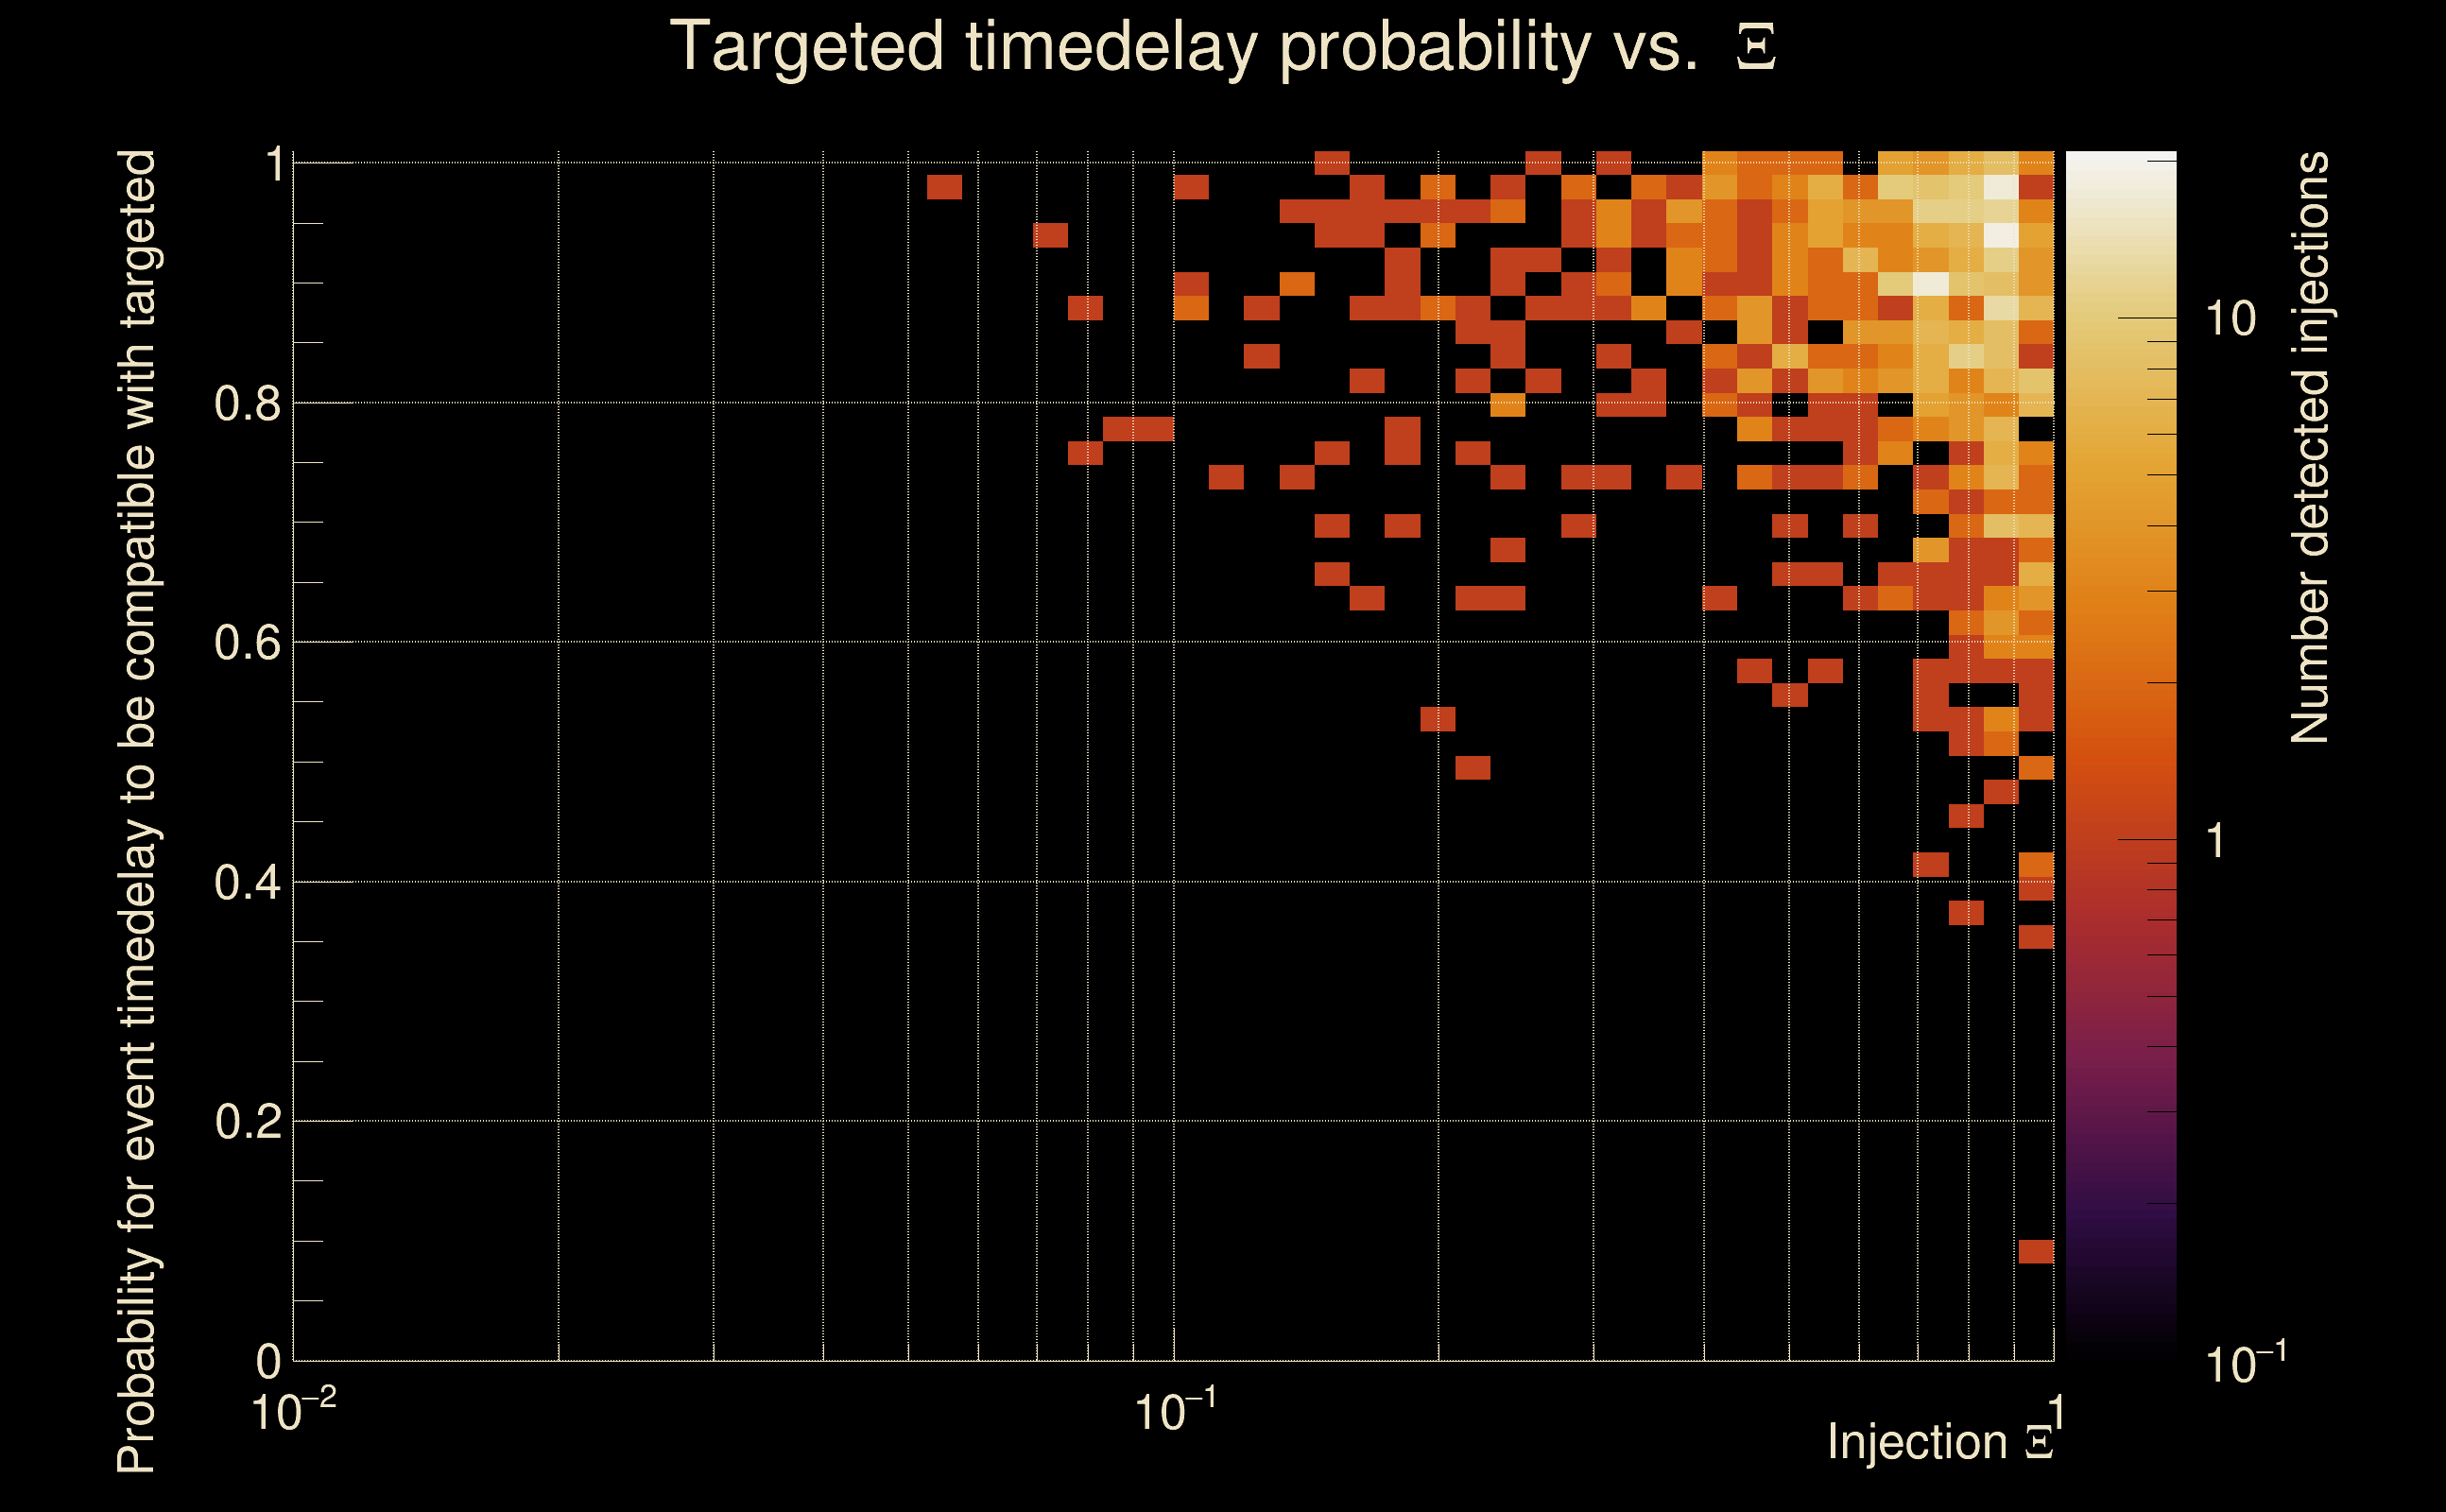
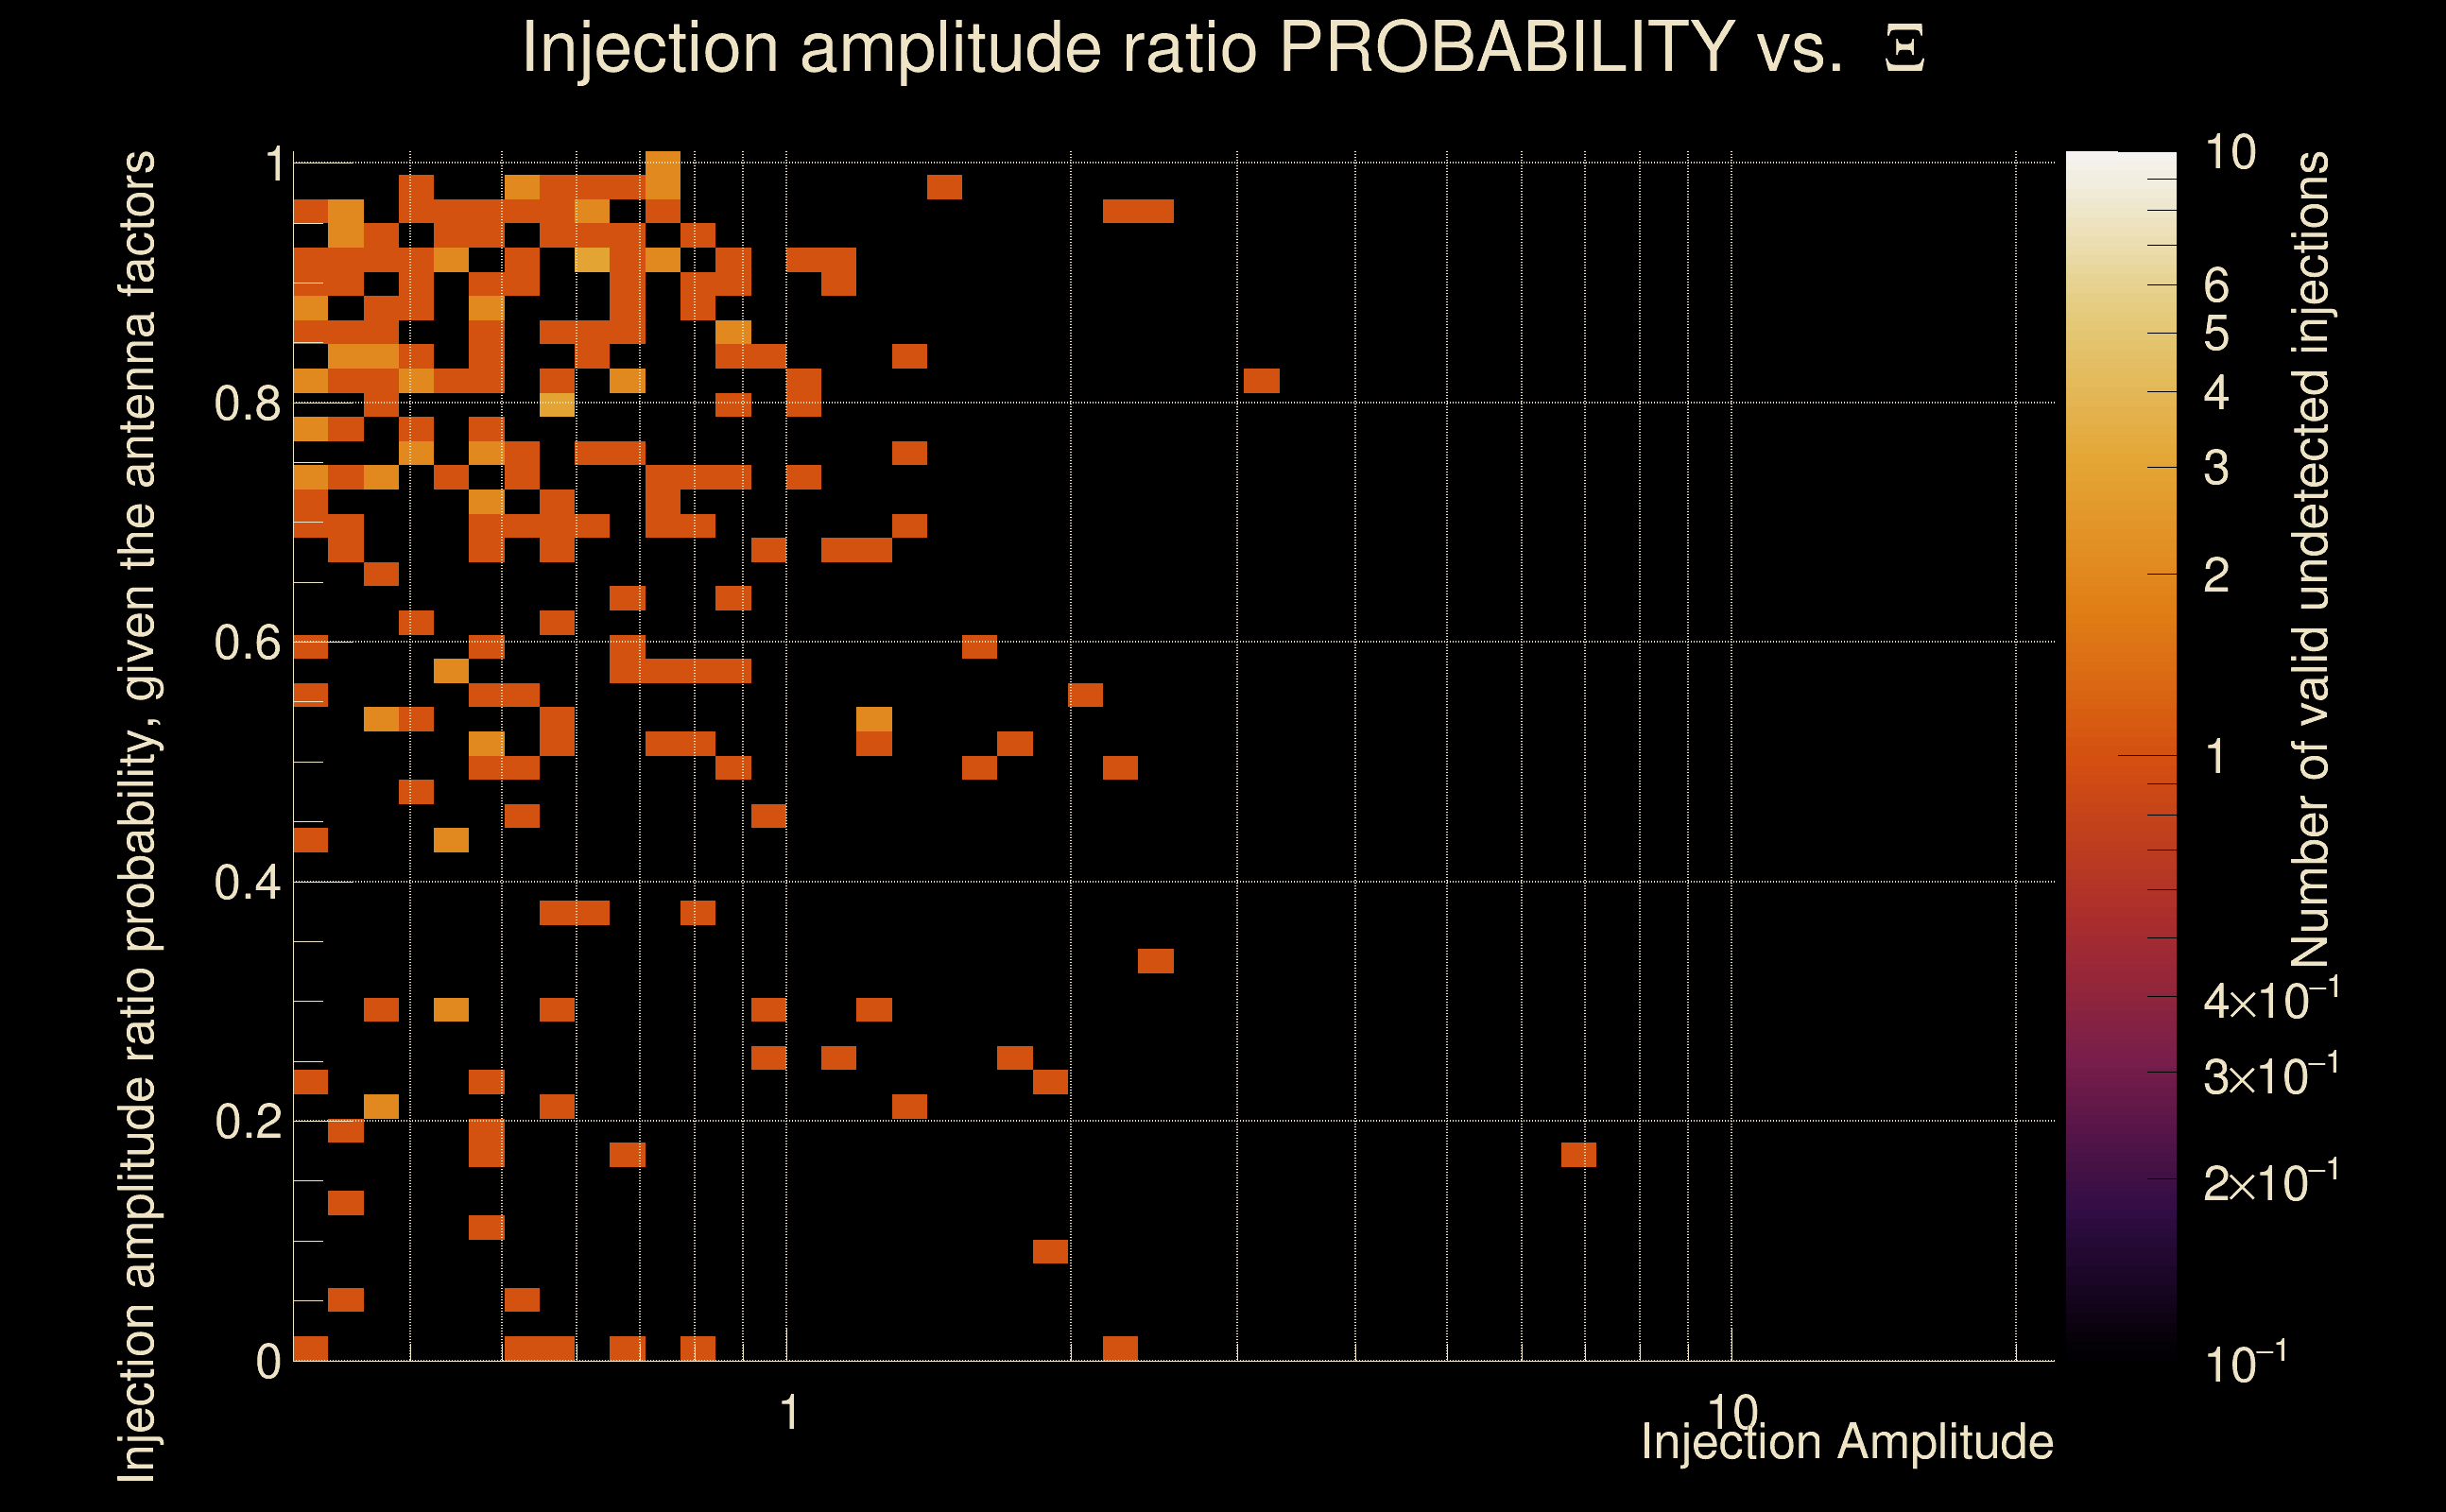
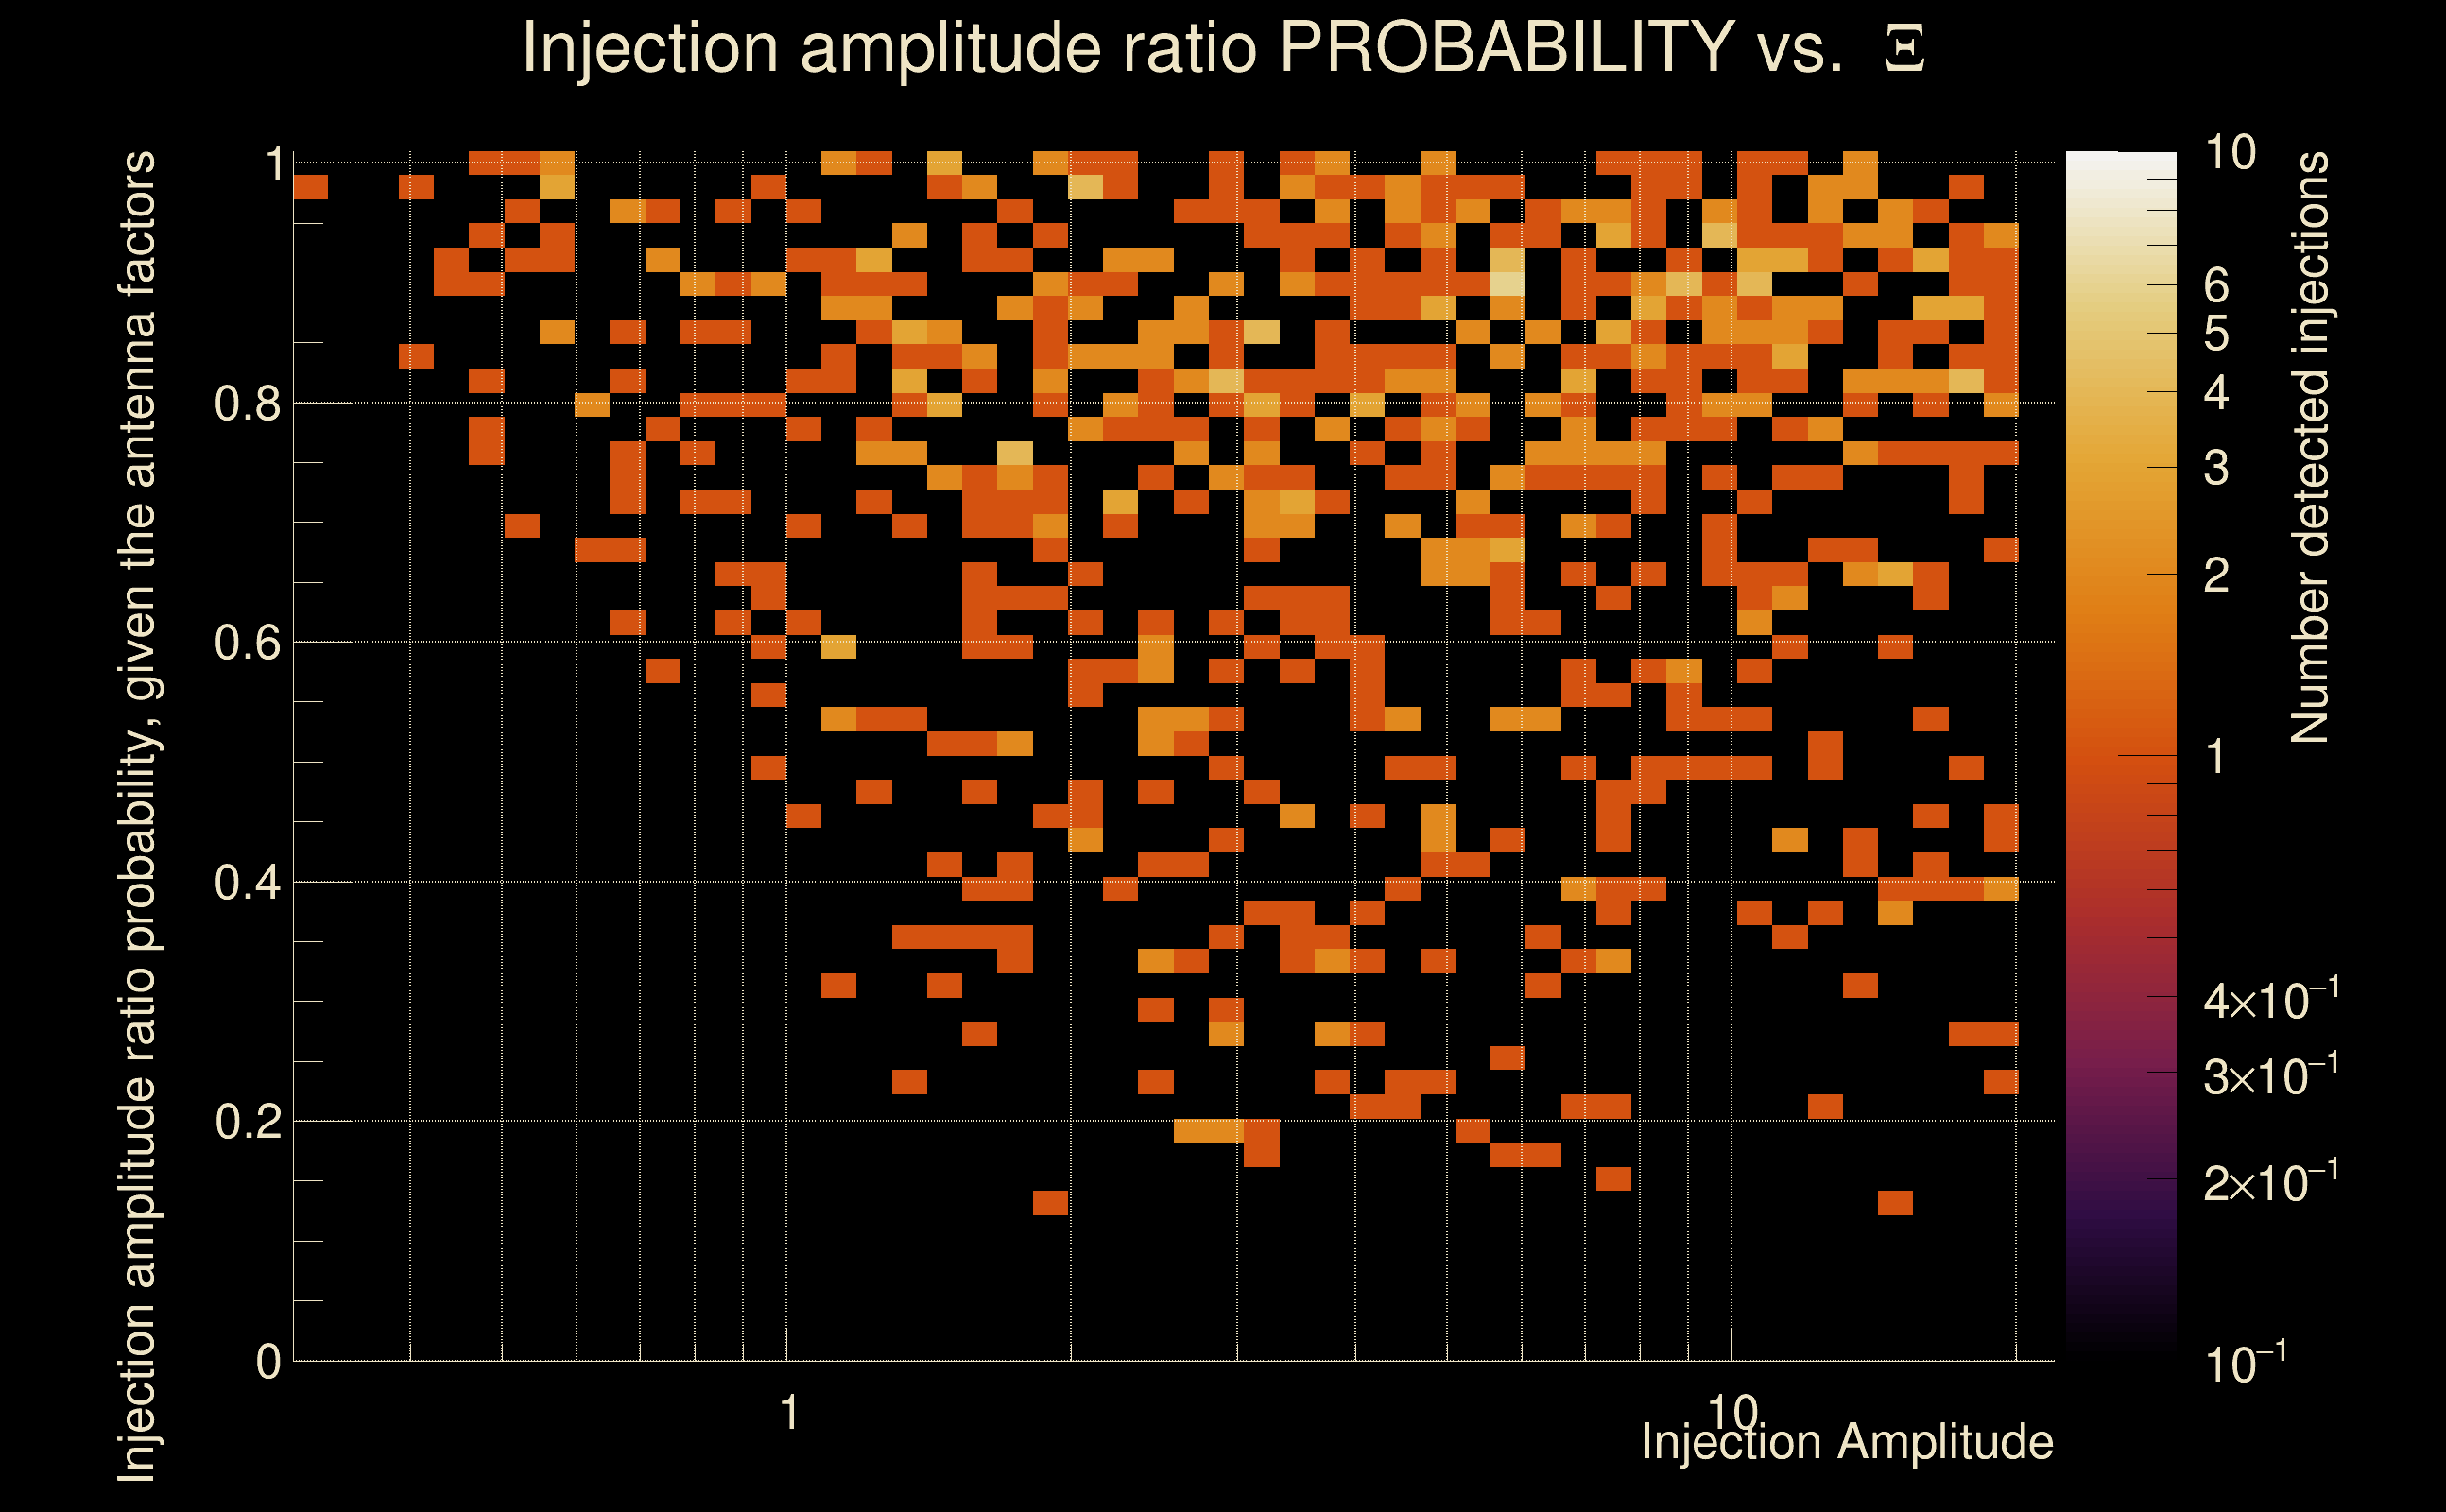
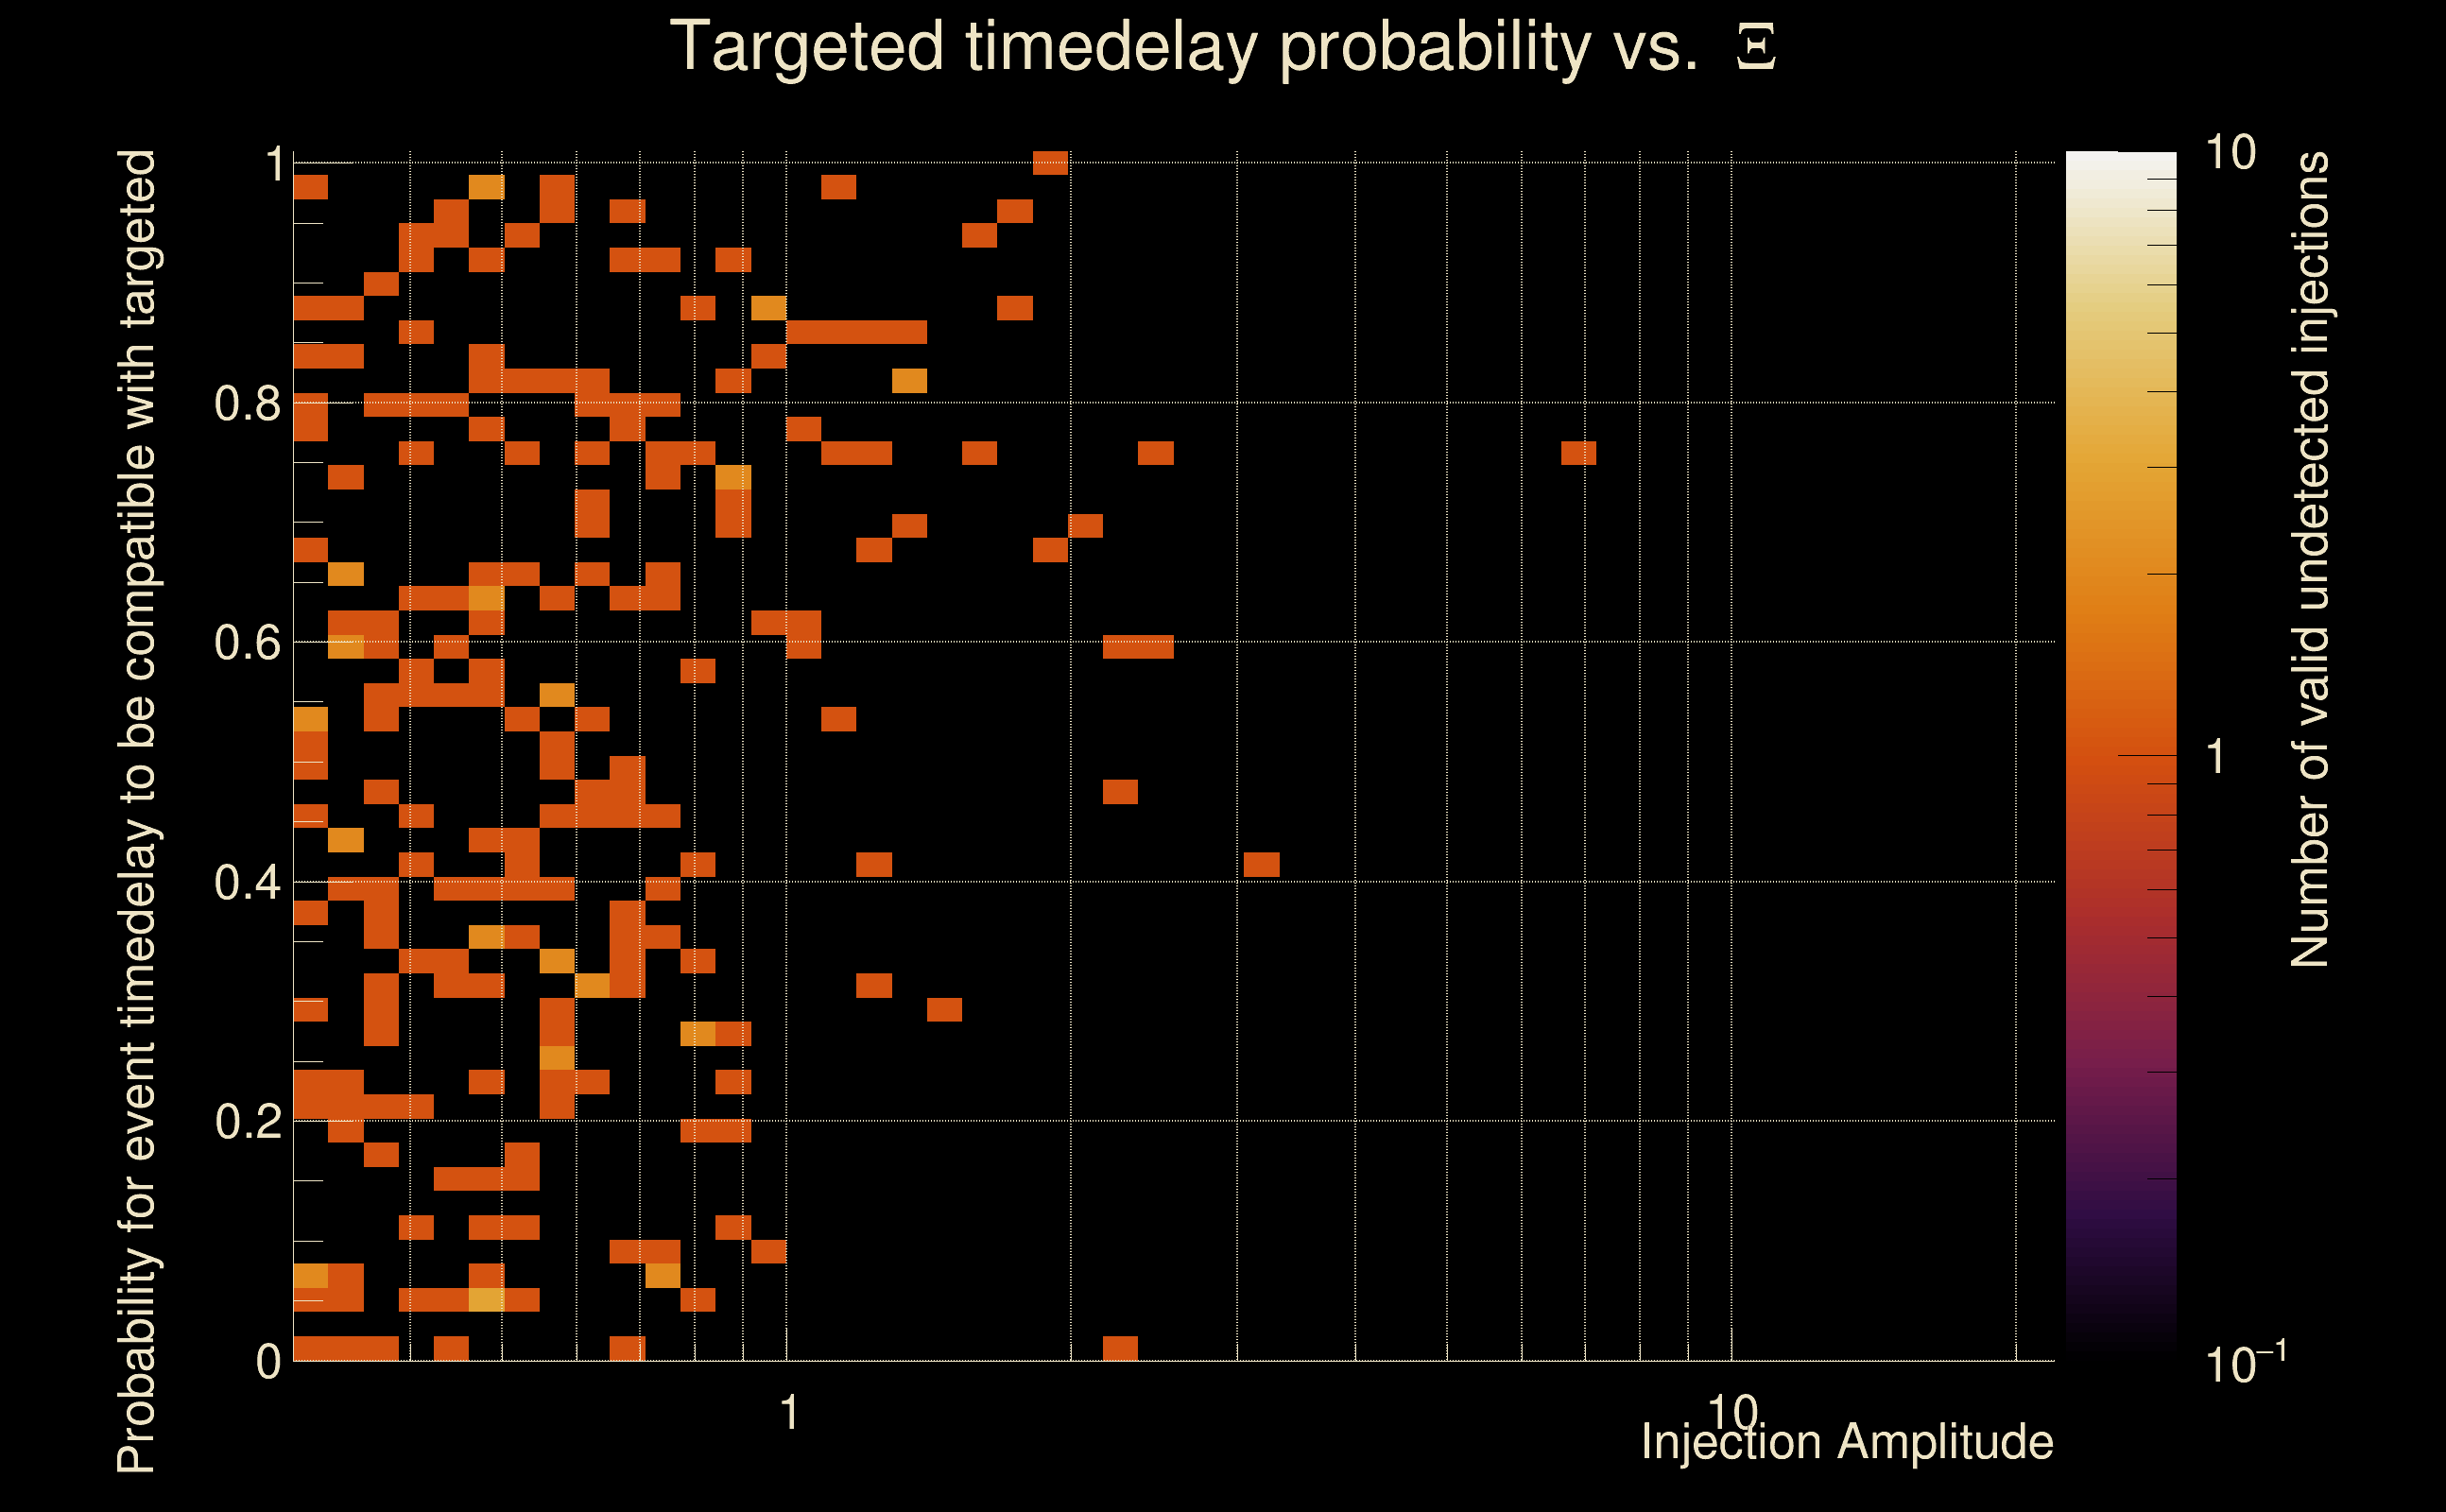
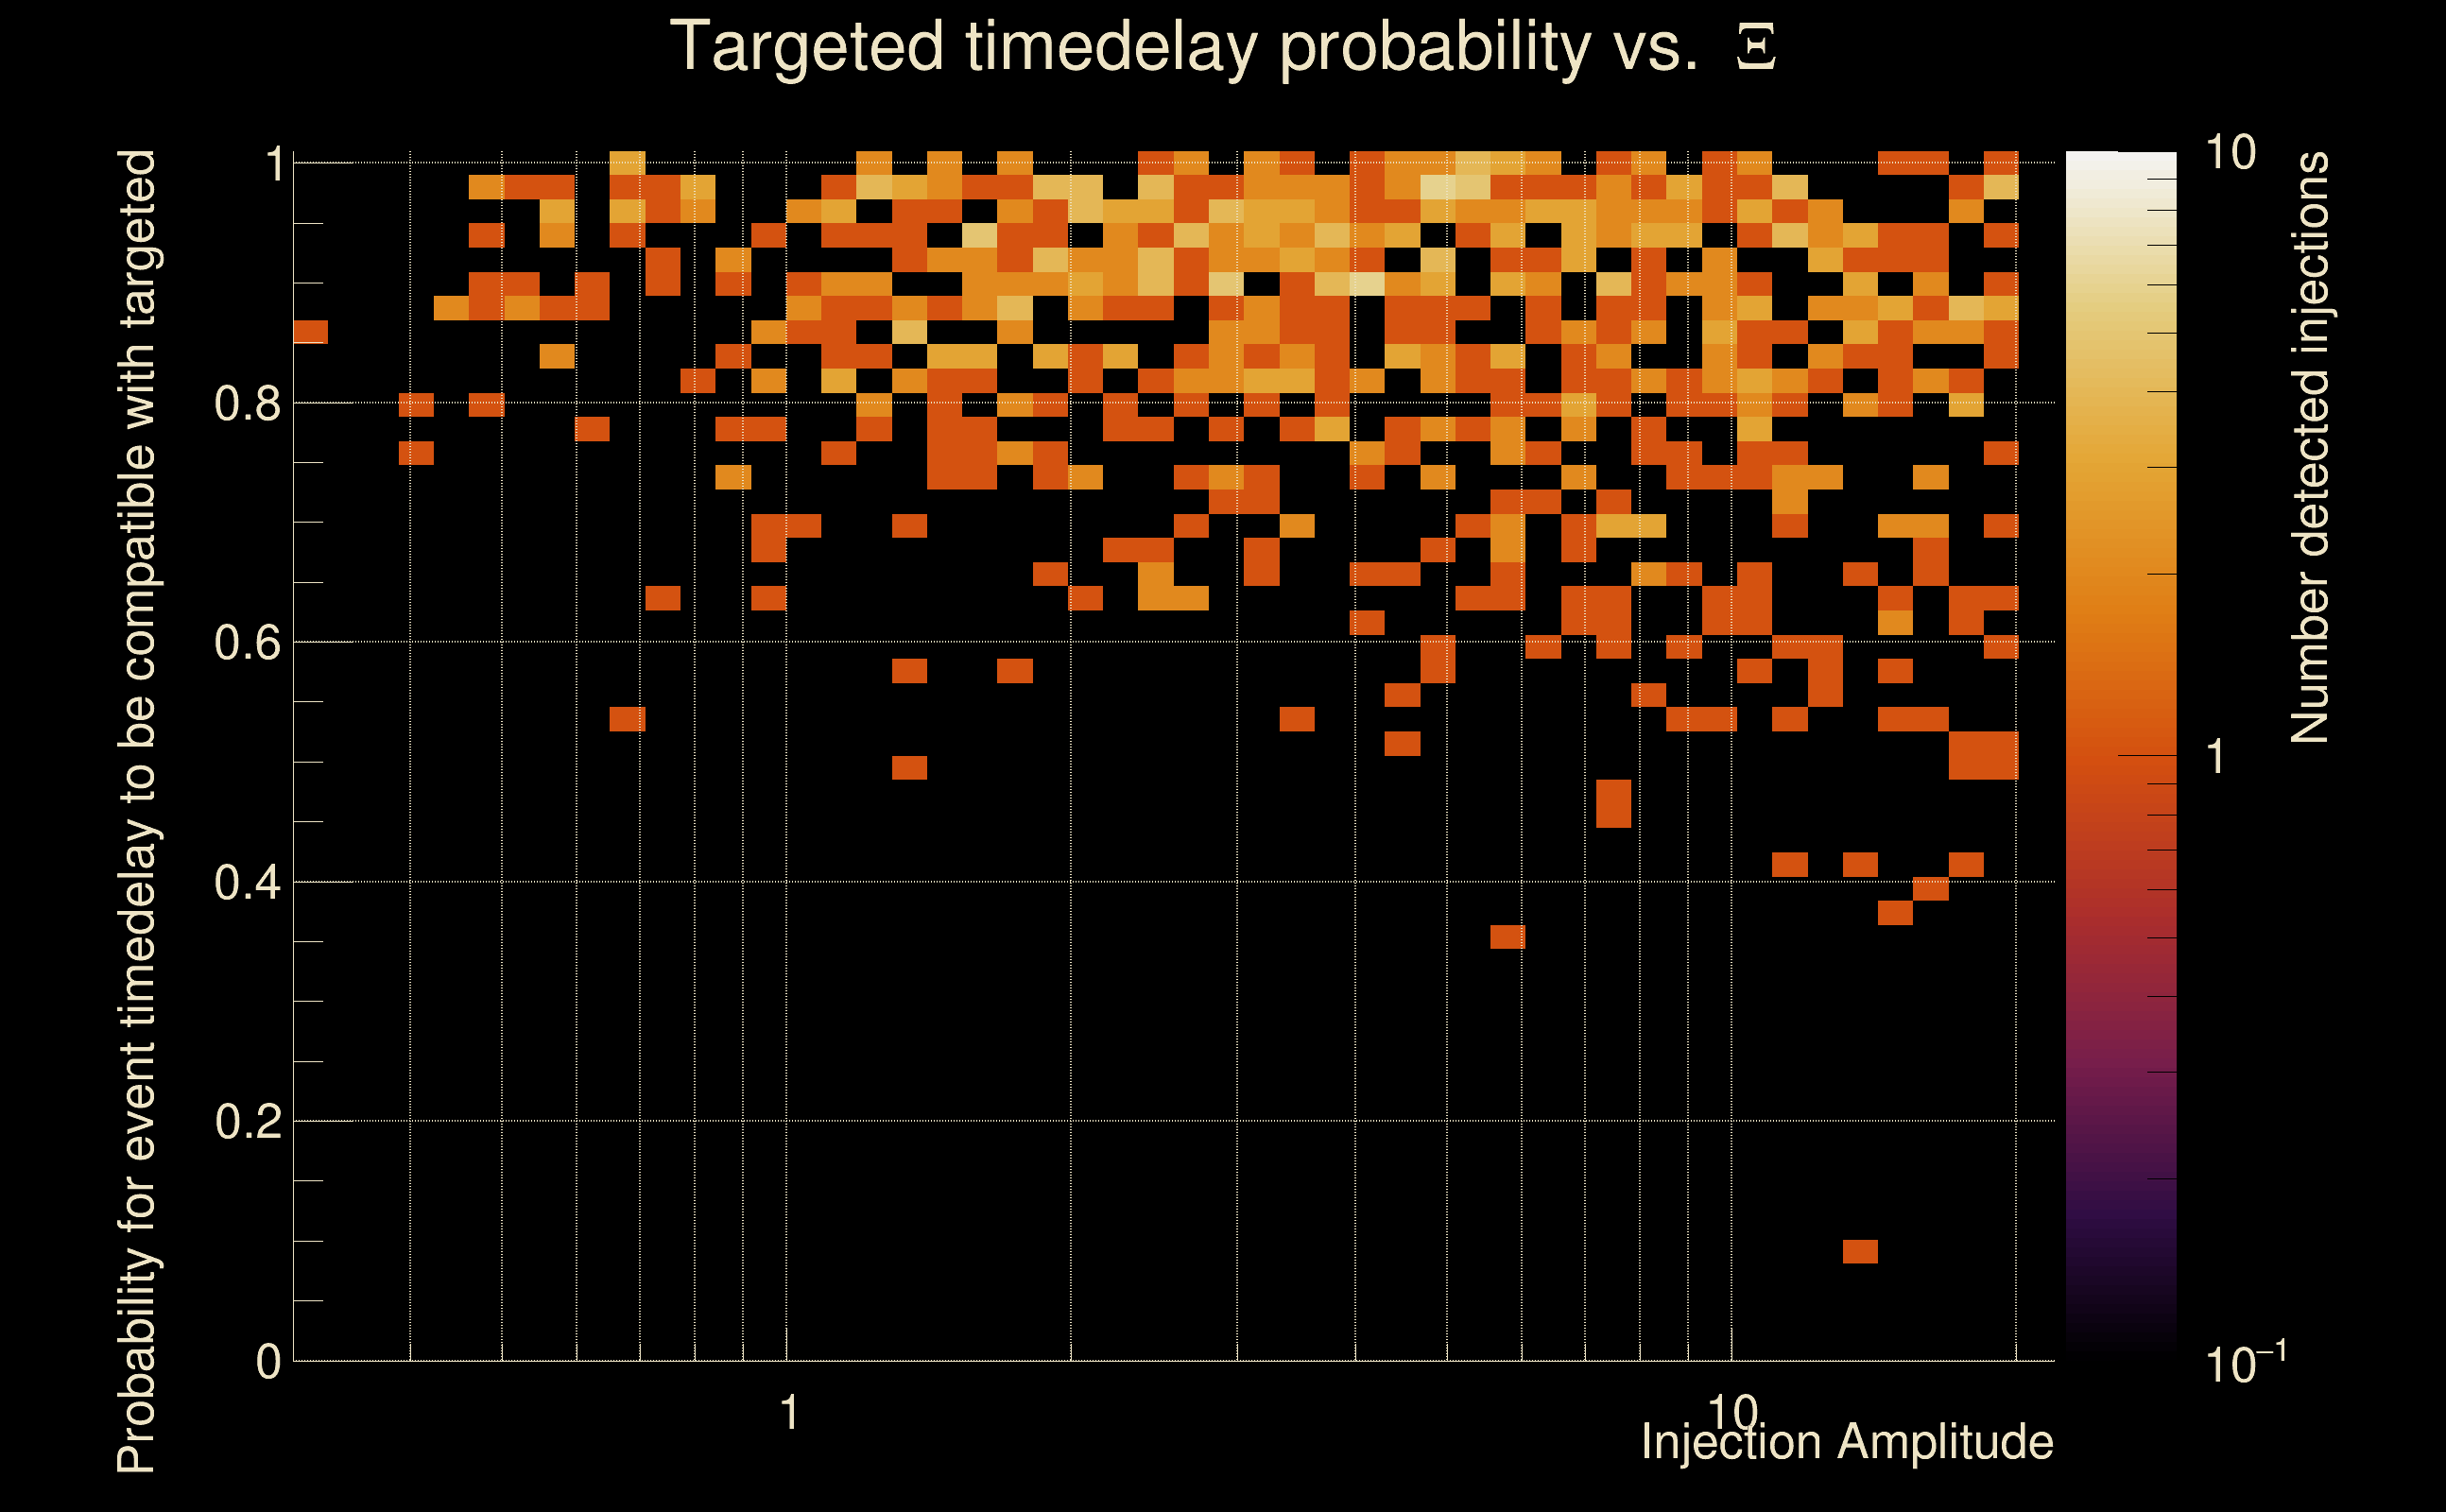
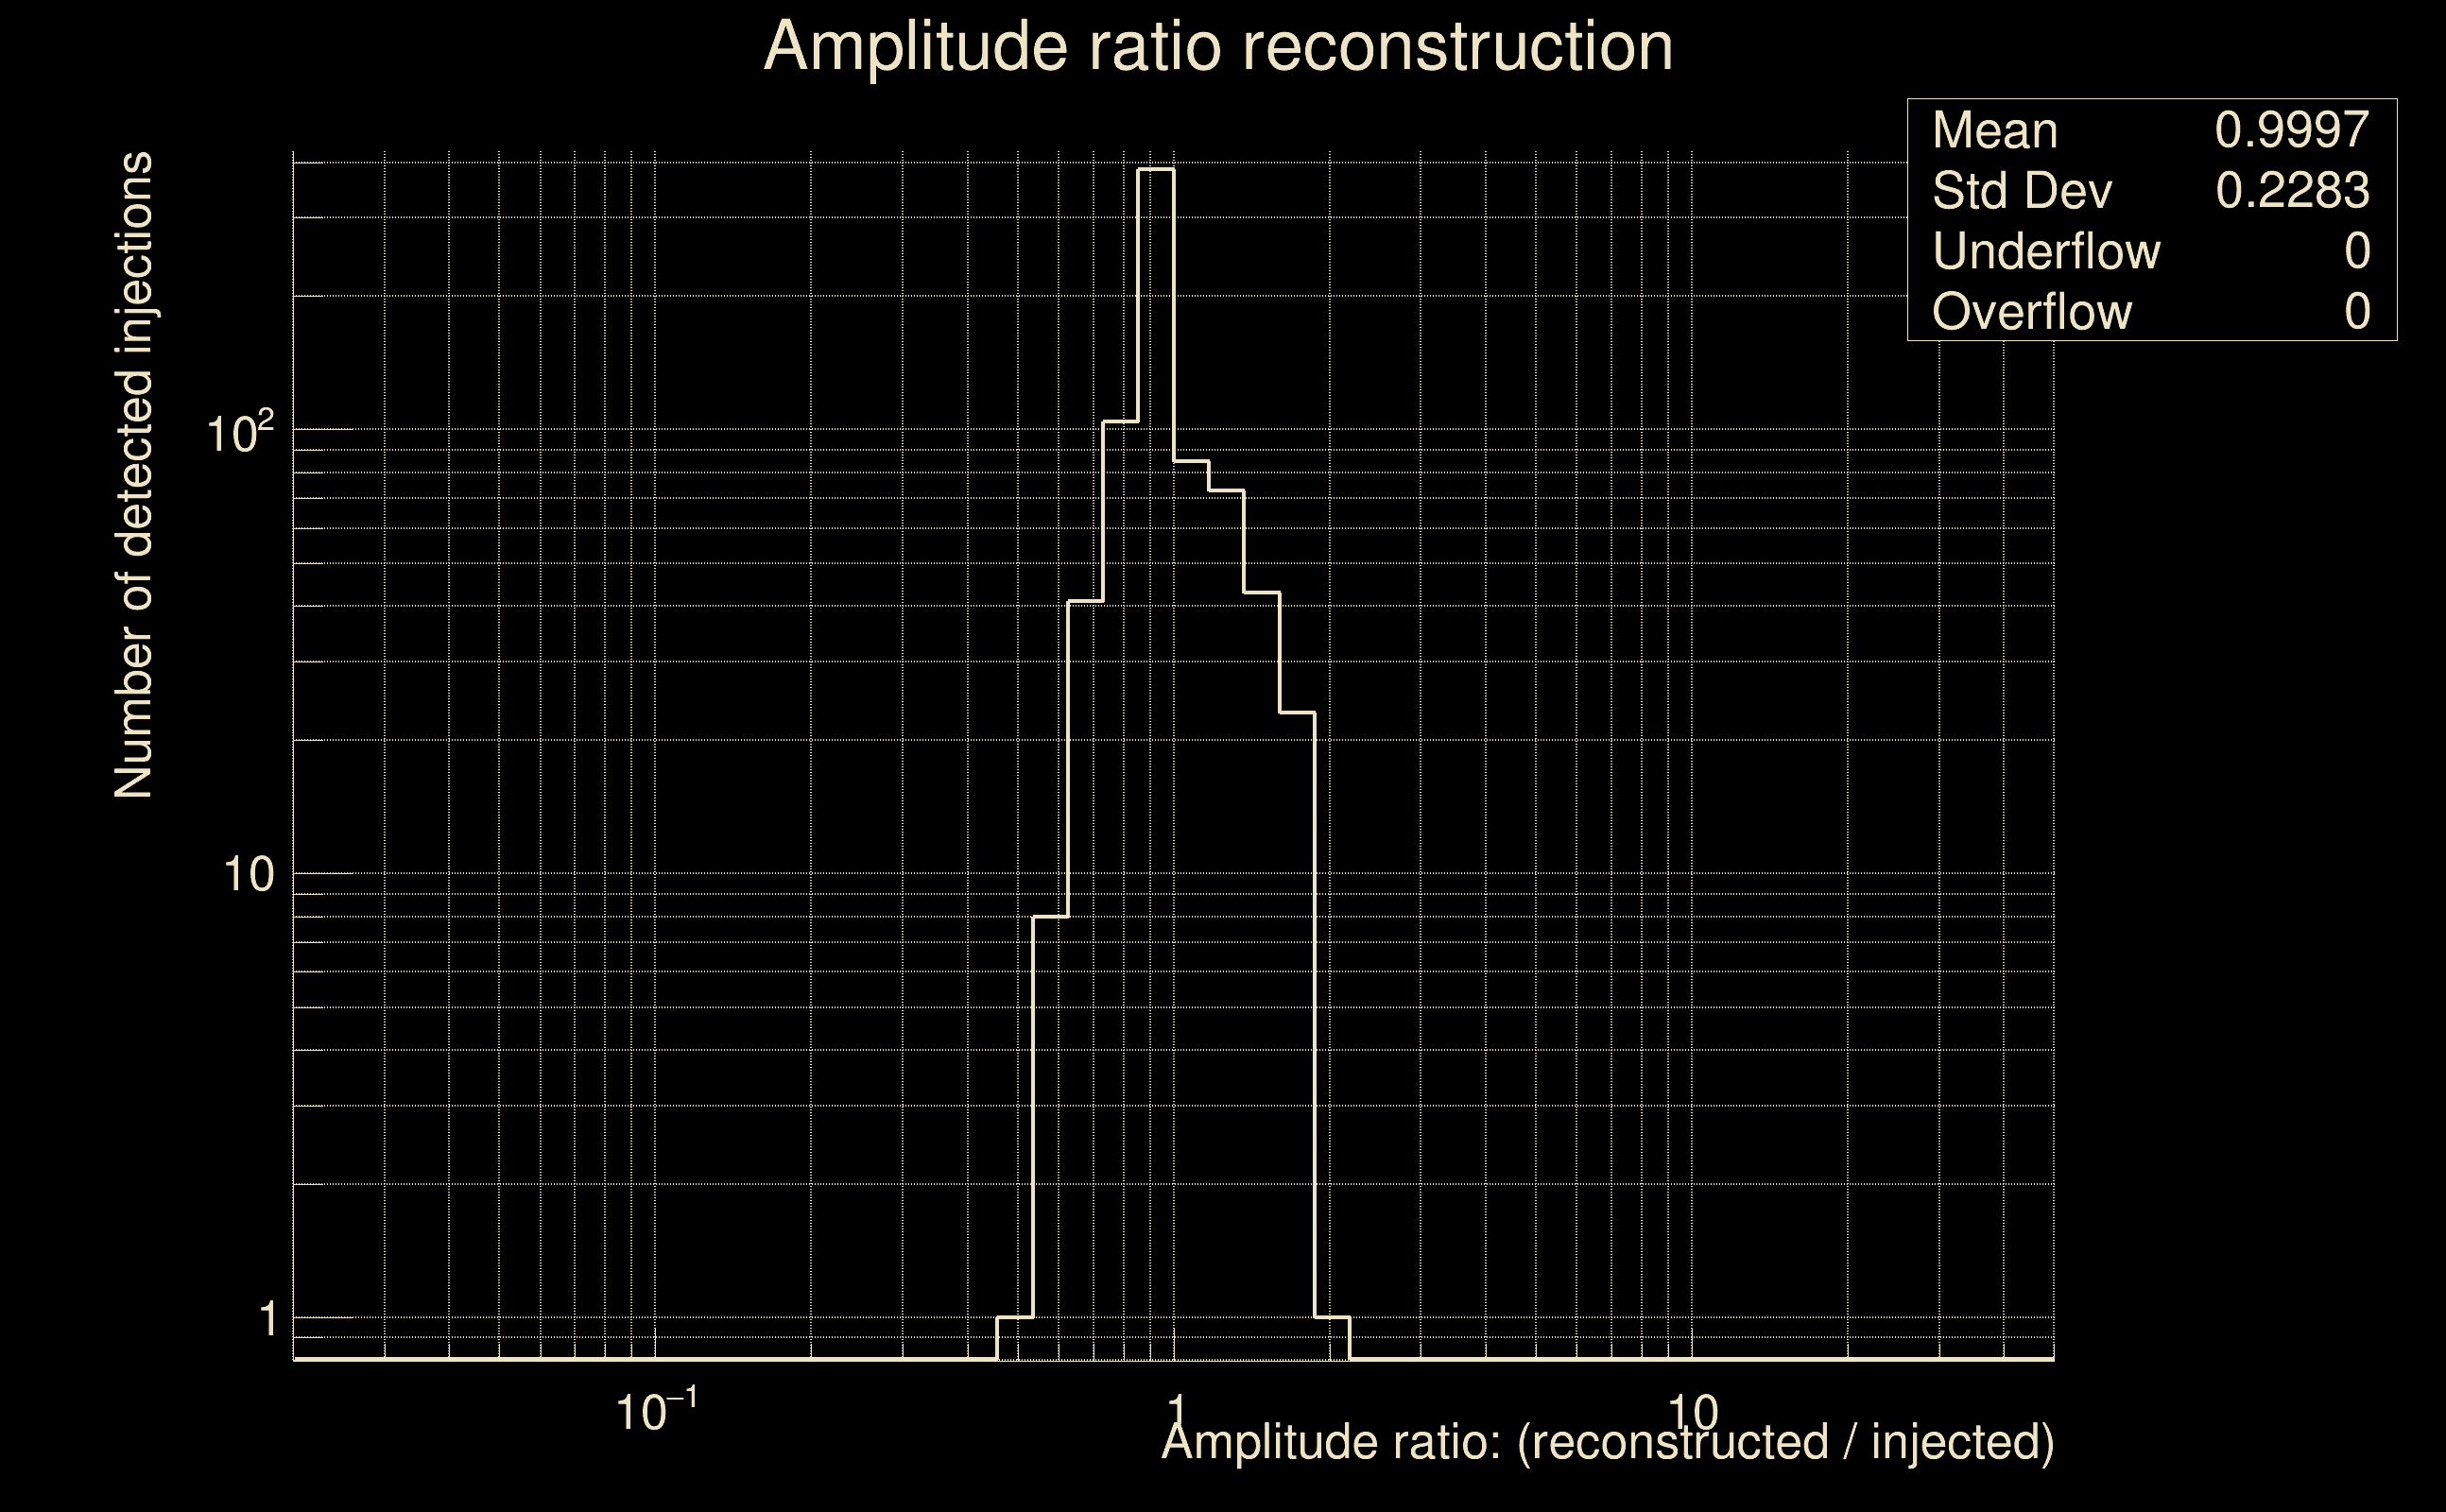
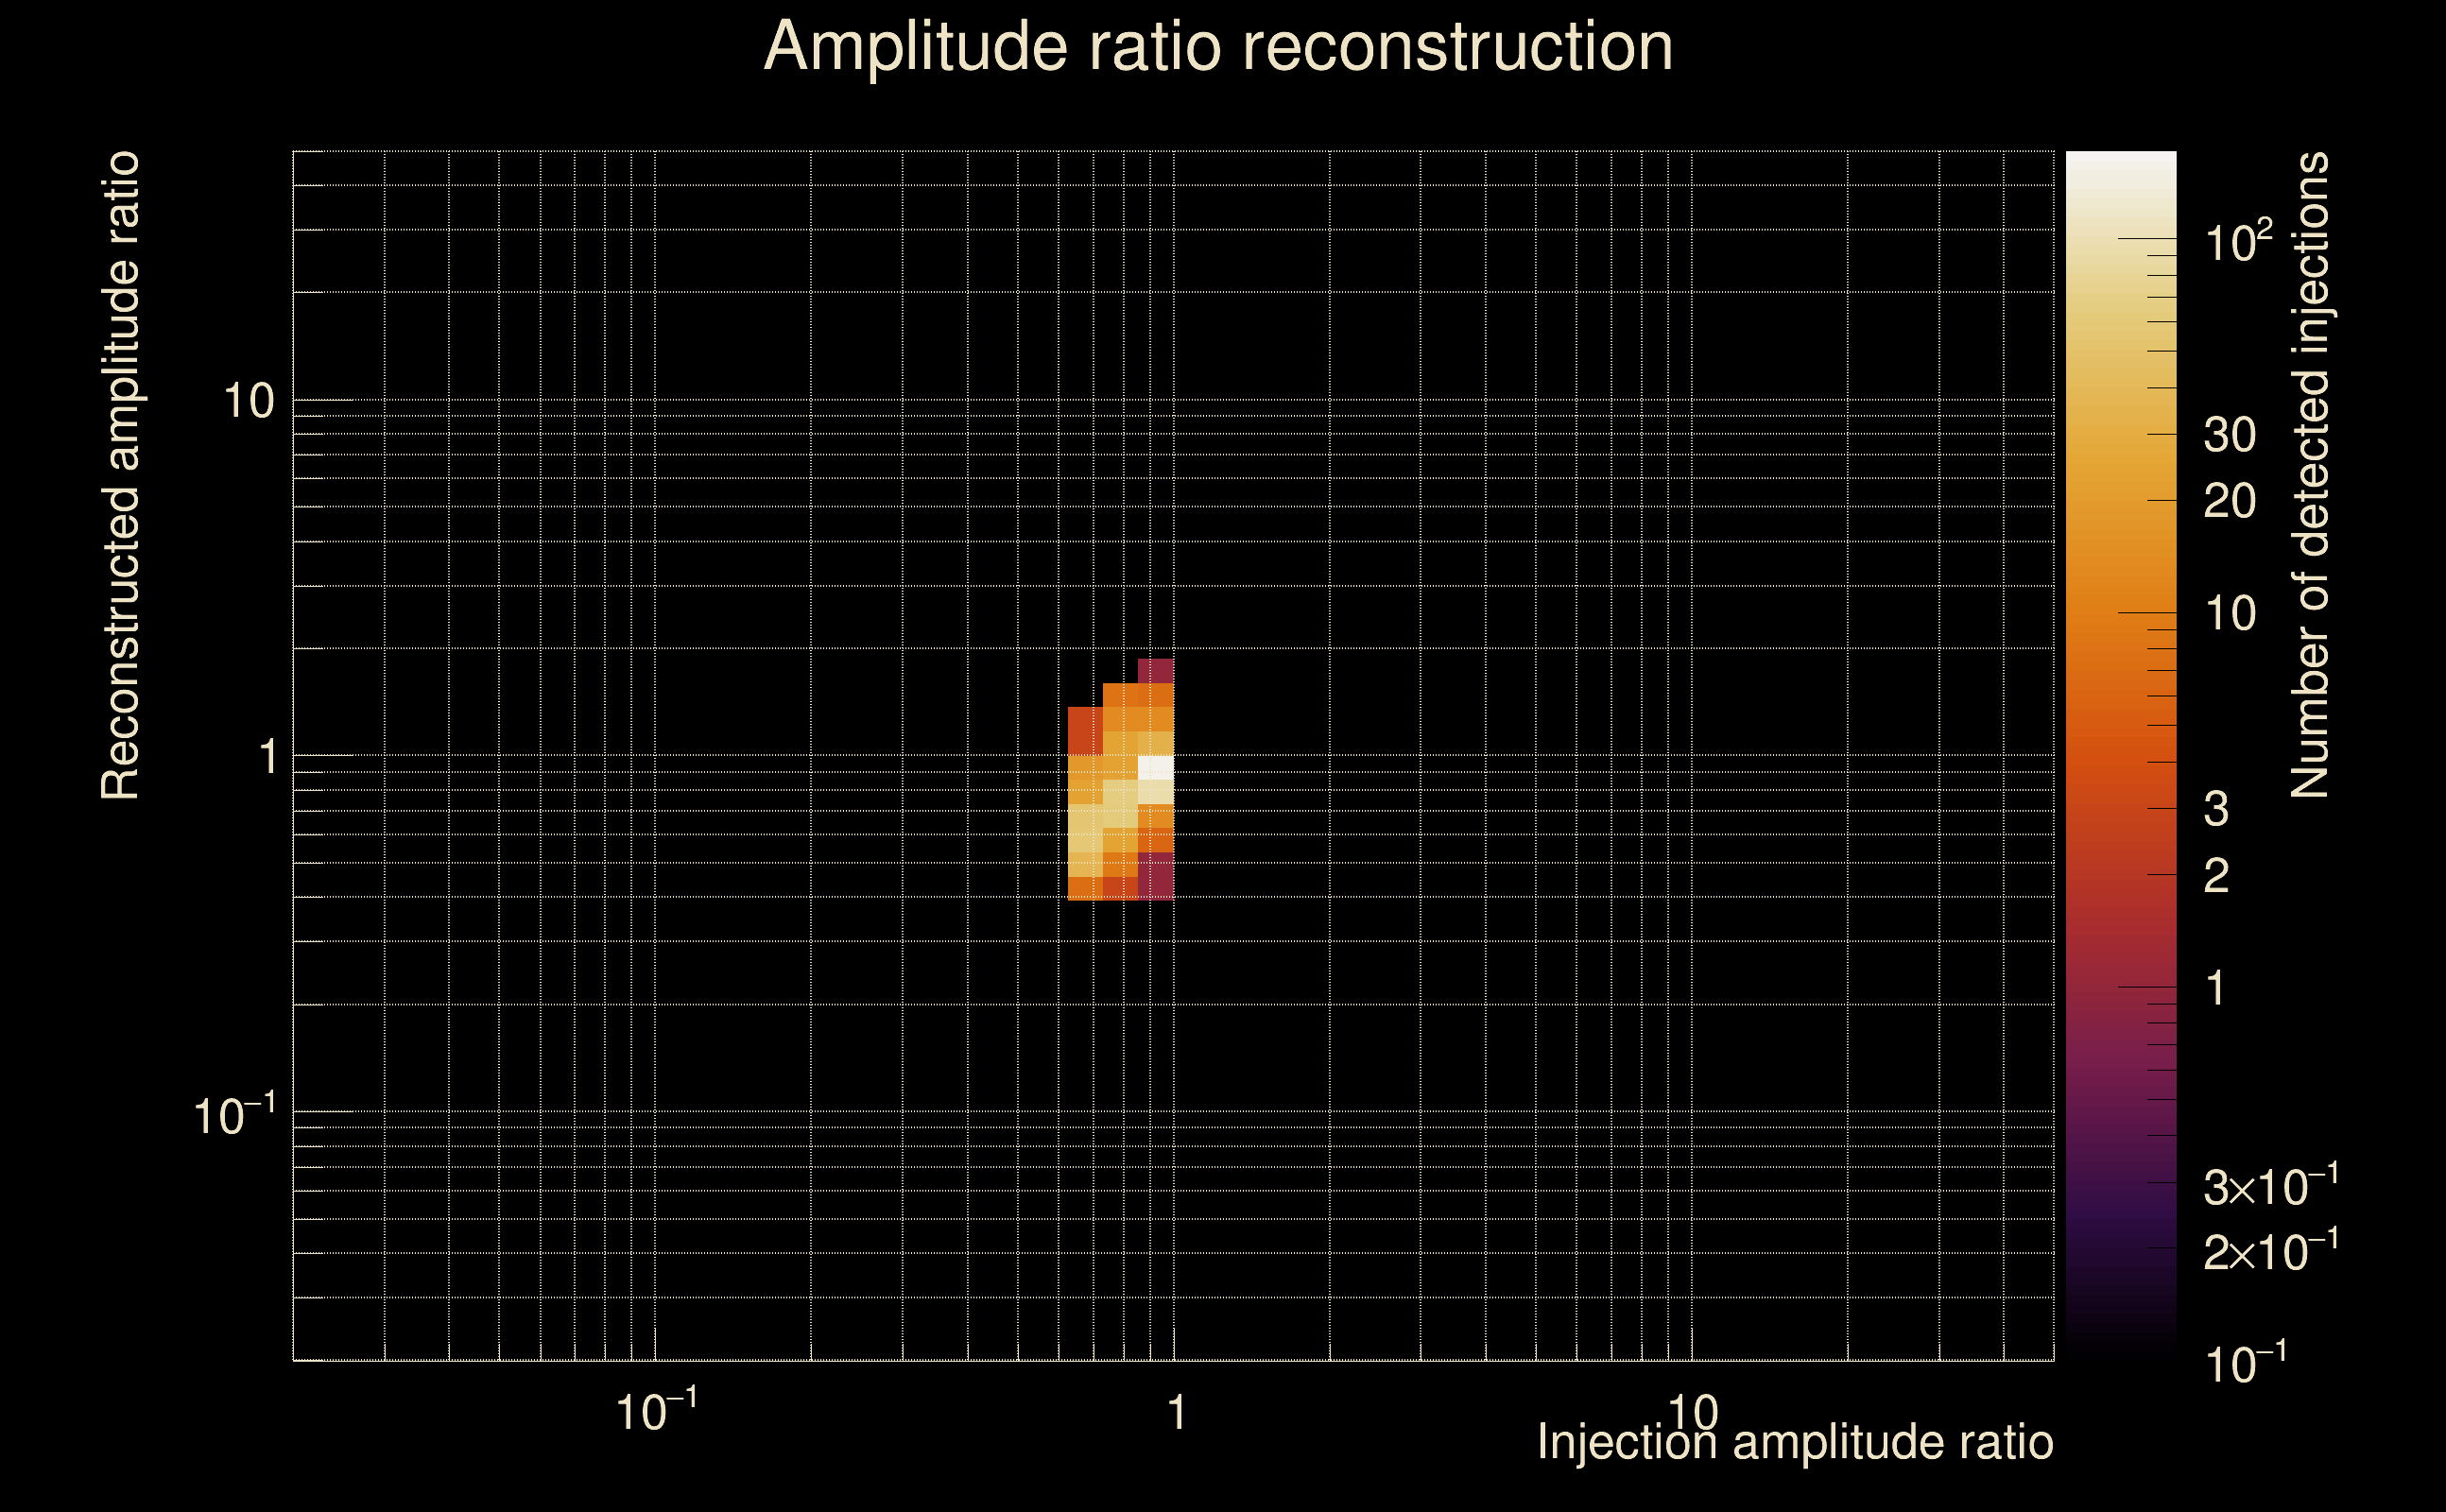
| Number of injections (total/valid/detected): | 1116 / 991 / 764 |
| List of missed injections: | ./Obe20-O_missed.txt |
| Injection amplitude at 90% detection efficiency: | 2.3975 |
| Injection amplitude at 50% detection efficiency: | 0.908541 |
| Injection amplitude at 10% detection efficiency: | 0.399139 |
 |
 |
 |
 |
 |
 |
 |
|
 |
 |
|
 |
 |
|
 |
 |
|
 |
 |
|
 |
 |
|
 |
 |
|
 |
 |
|
 |
 |
 |
 |
 |
 |
 |
 |
 |
 |
 |
 |
 |
 |
 |
| florent.robinet@ijclab.in2p3.fr |