| Omicron version: | 4.2.0: documentation gitlab repository |
| Omicron run by: | unknown |
| Report produced on: | Wed Dec 17 09:45:55 2025 UTC |
| Ox option file: | TargIxfw_injpt3_options.txt |
| Omicron option files: | detector 0, detector 1 |
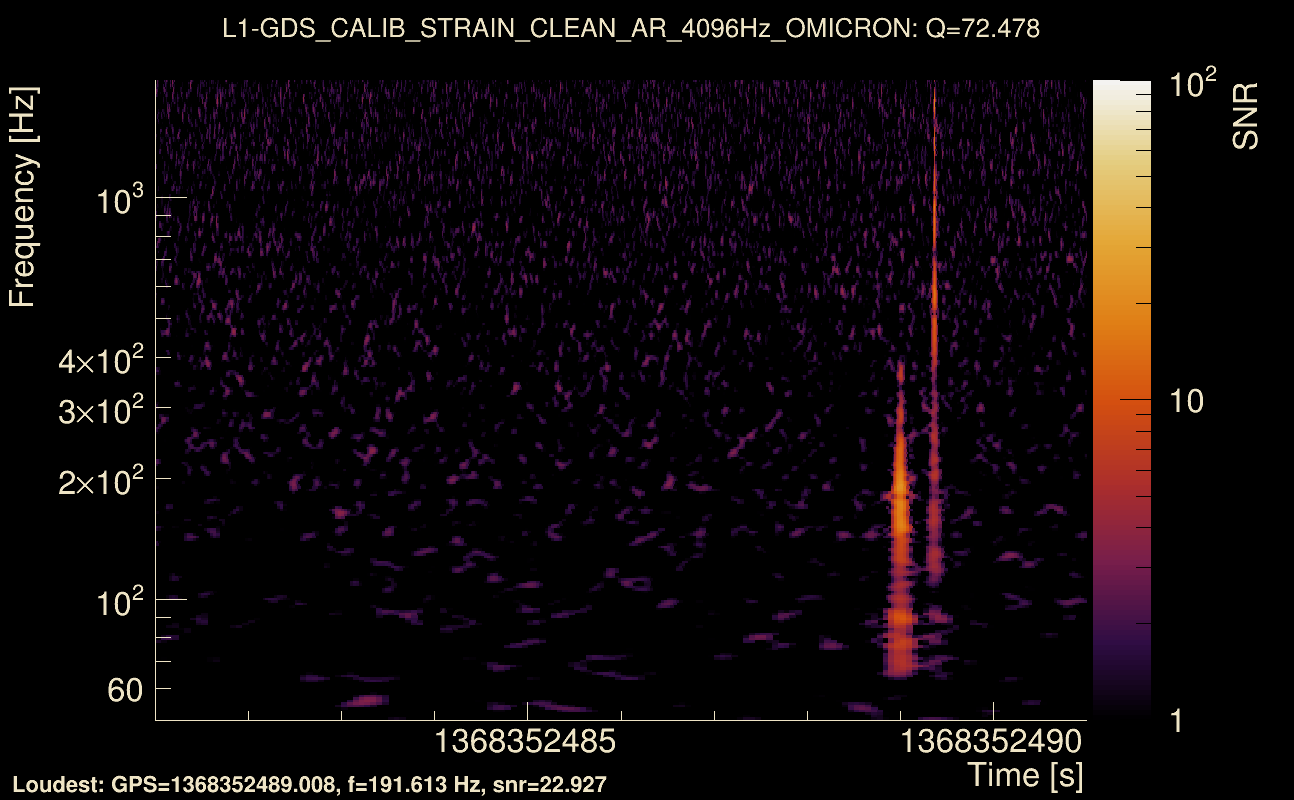
| Detector channel names: | H1:GDS-CALIB_STRAIN_CLEAN_AR_4096Hz, L1:GDS-CALIB_STRAIN_CLEAN_AR_4096Hz |
| Omicron analysis time window and overlap: | 16 s, 6 s |
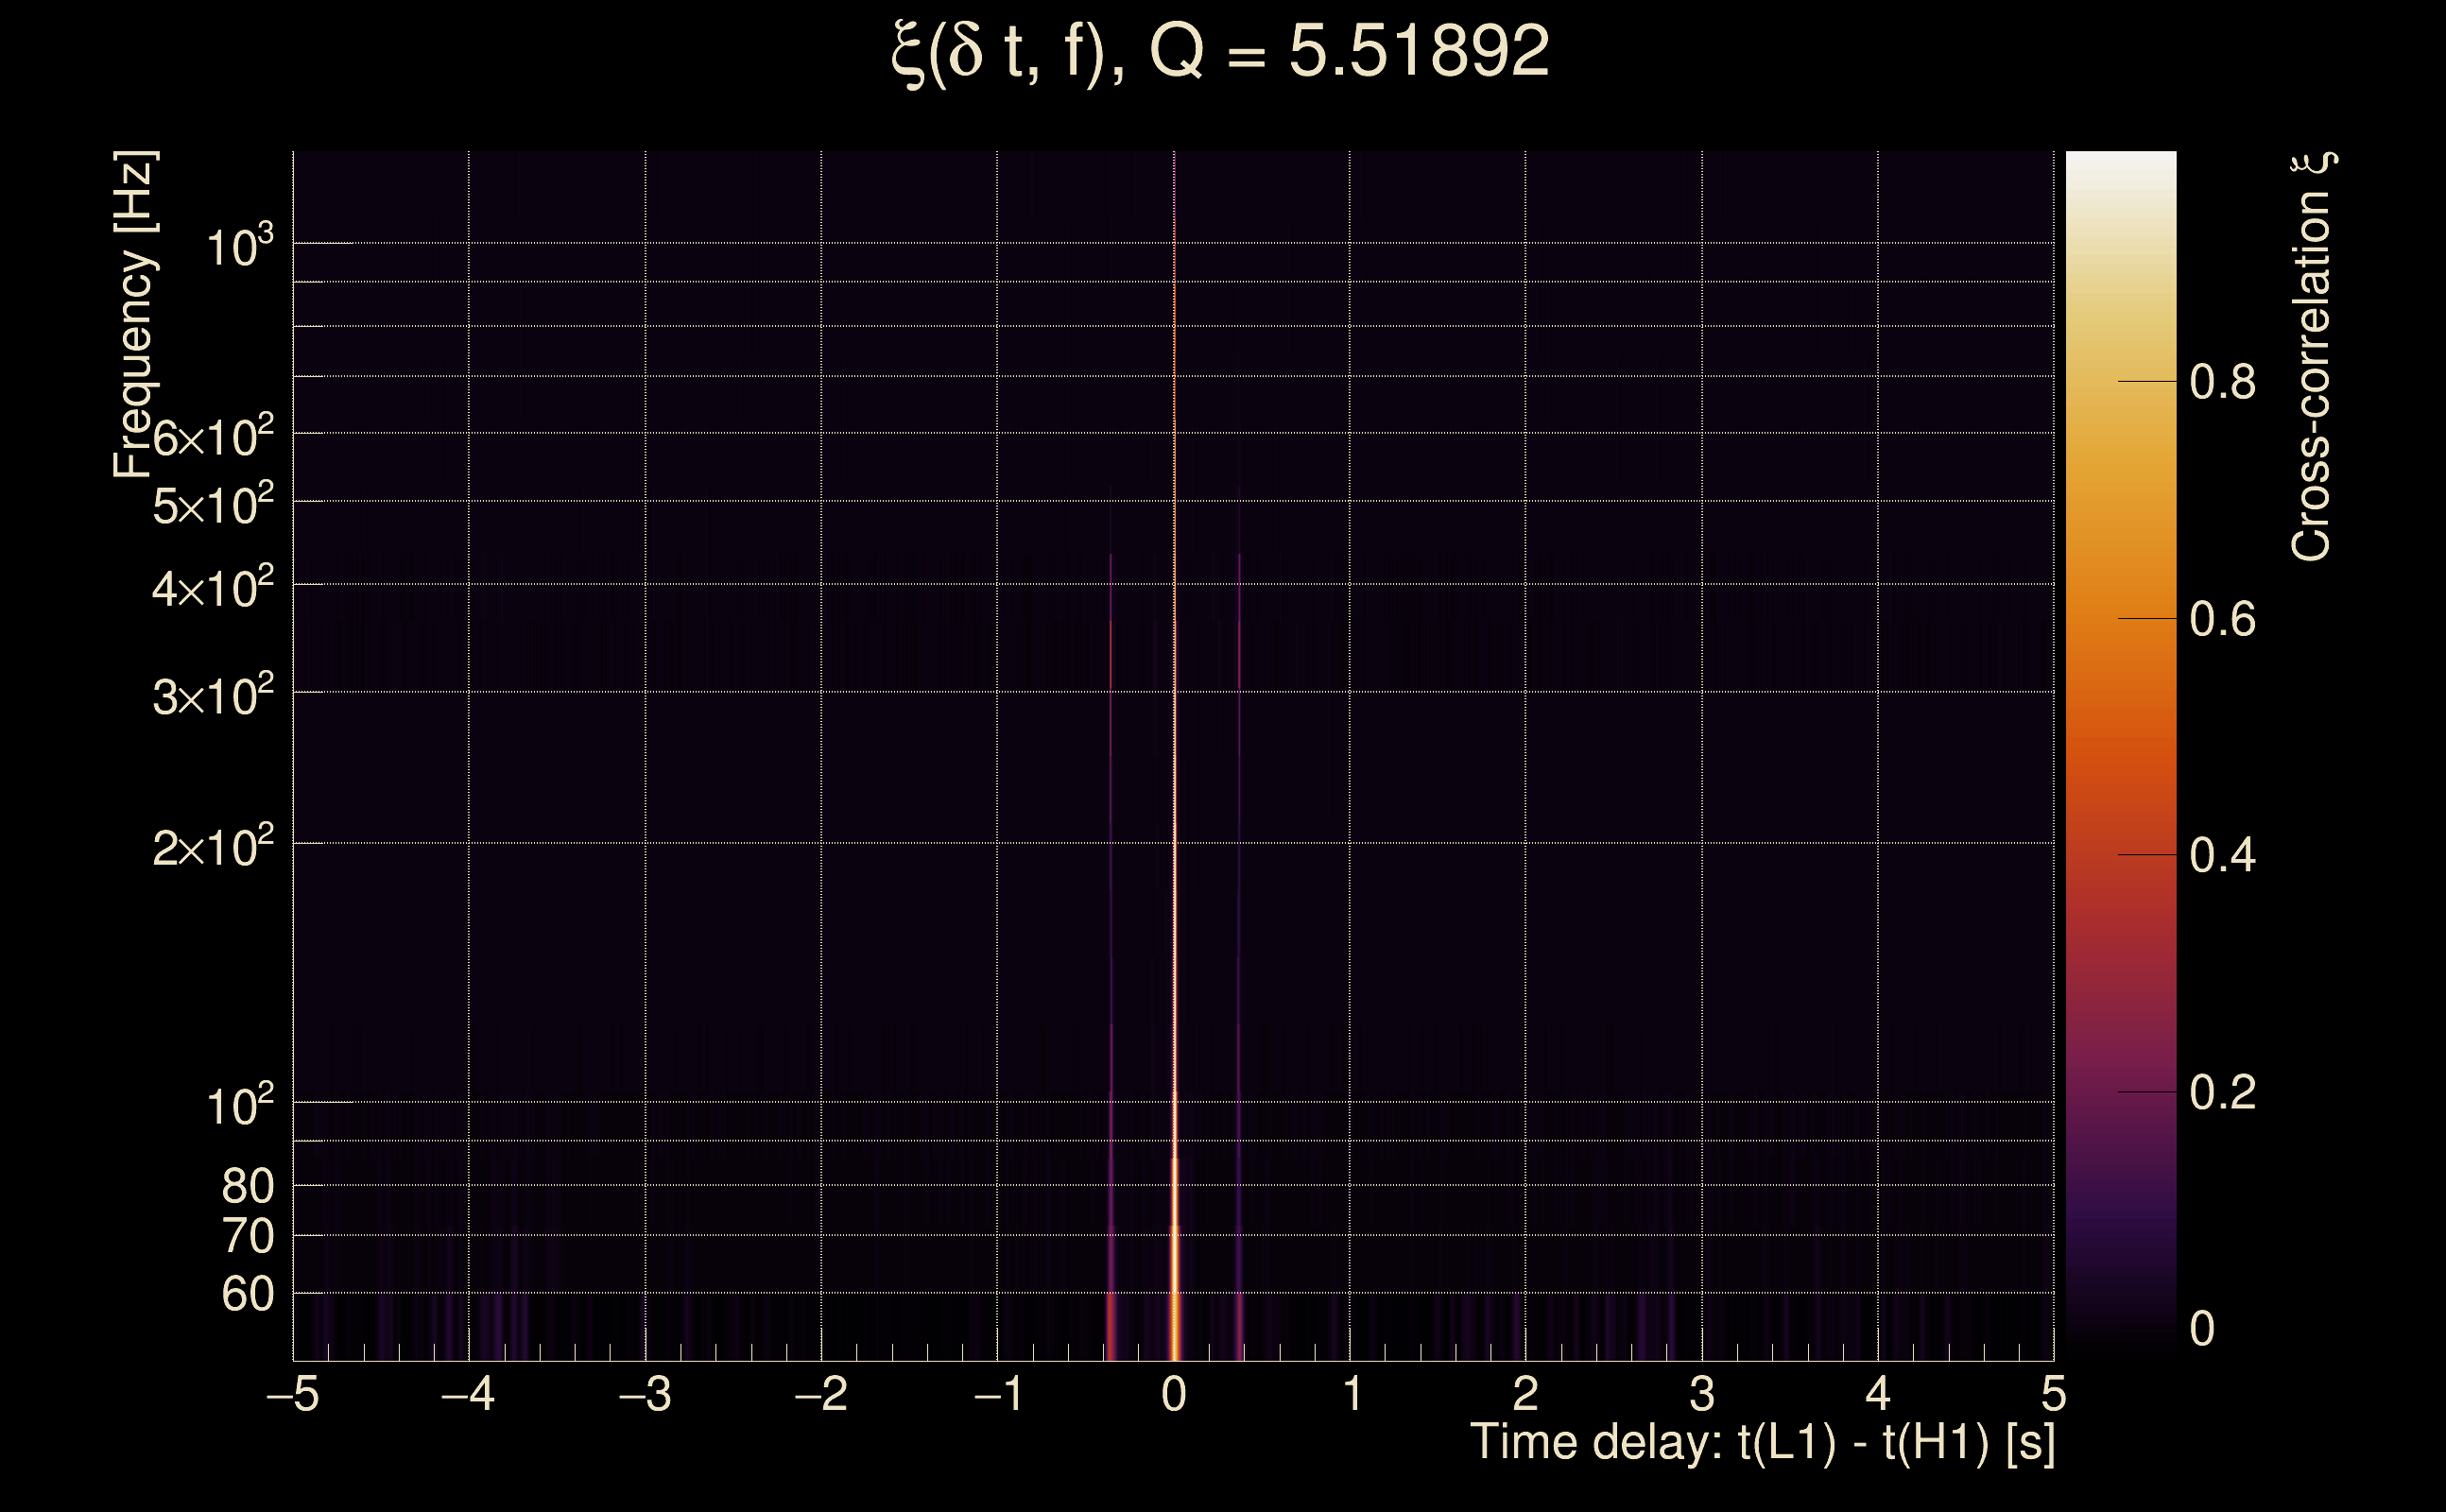
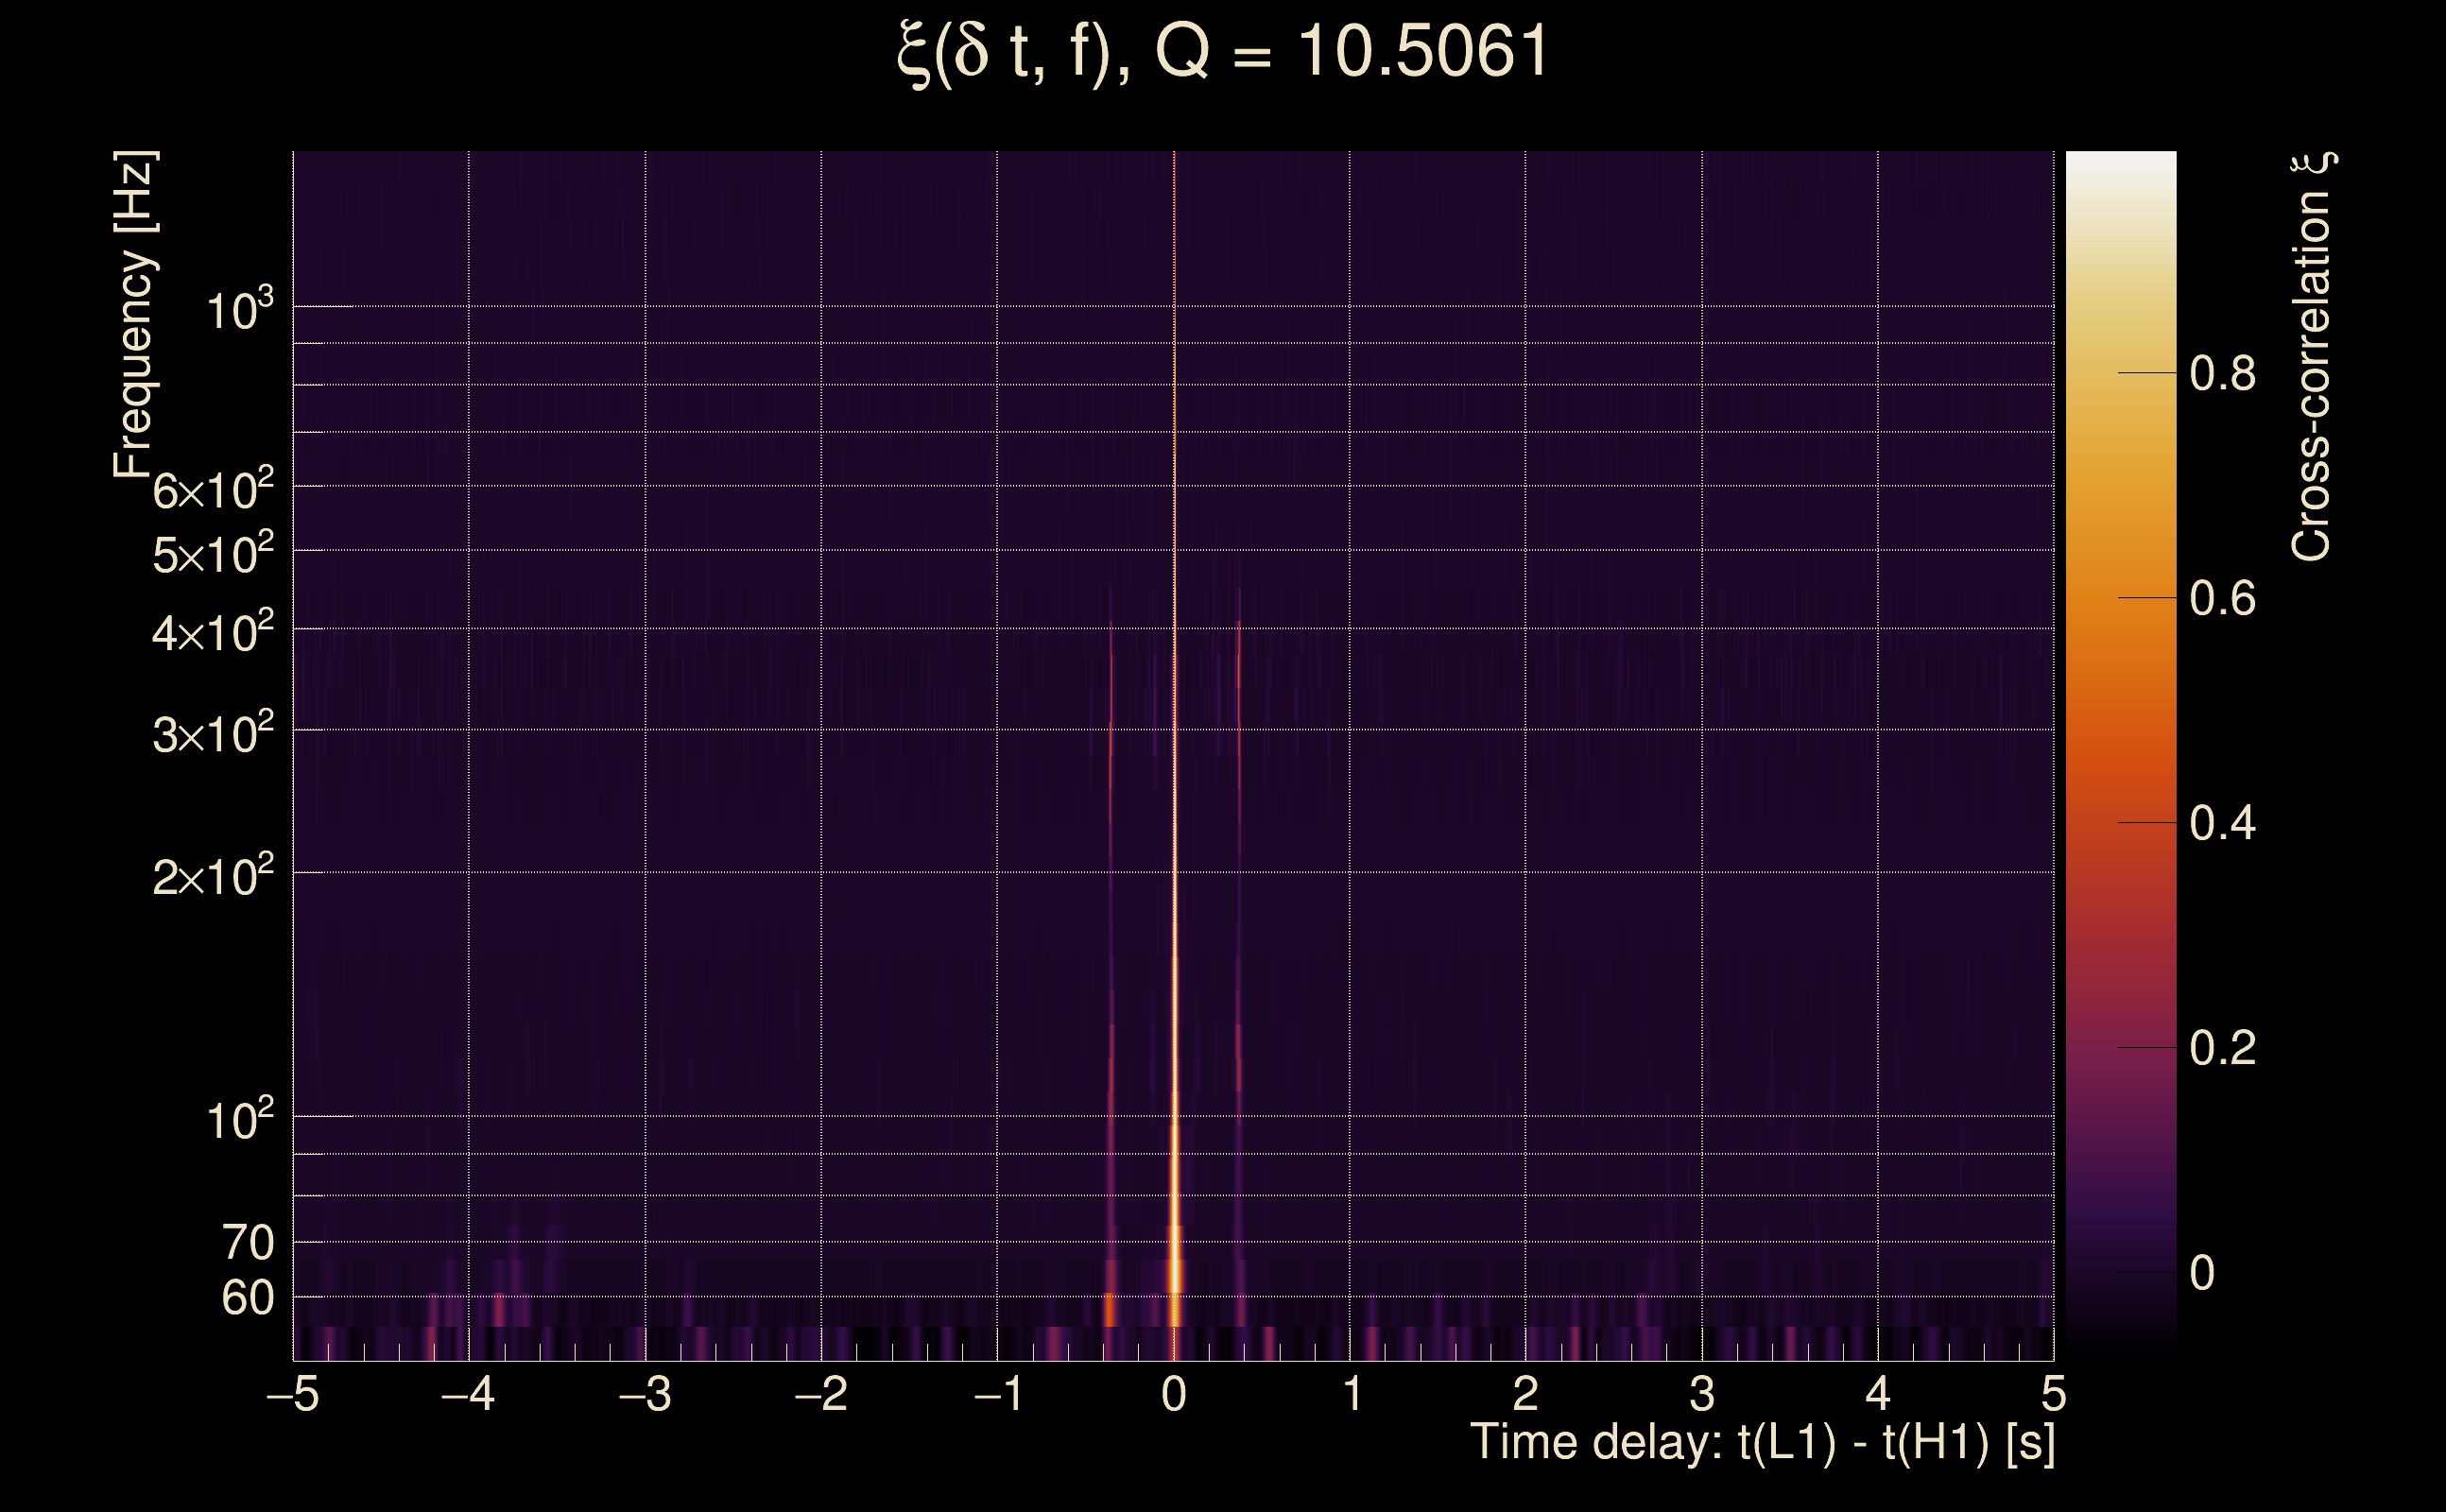
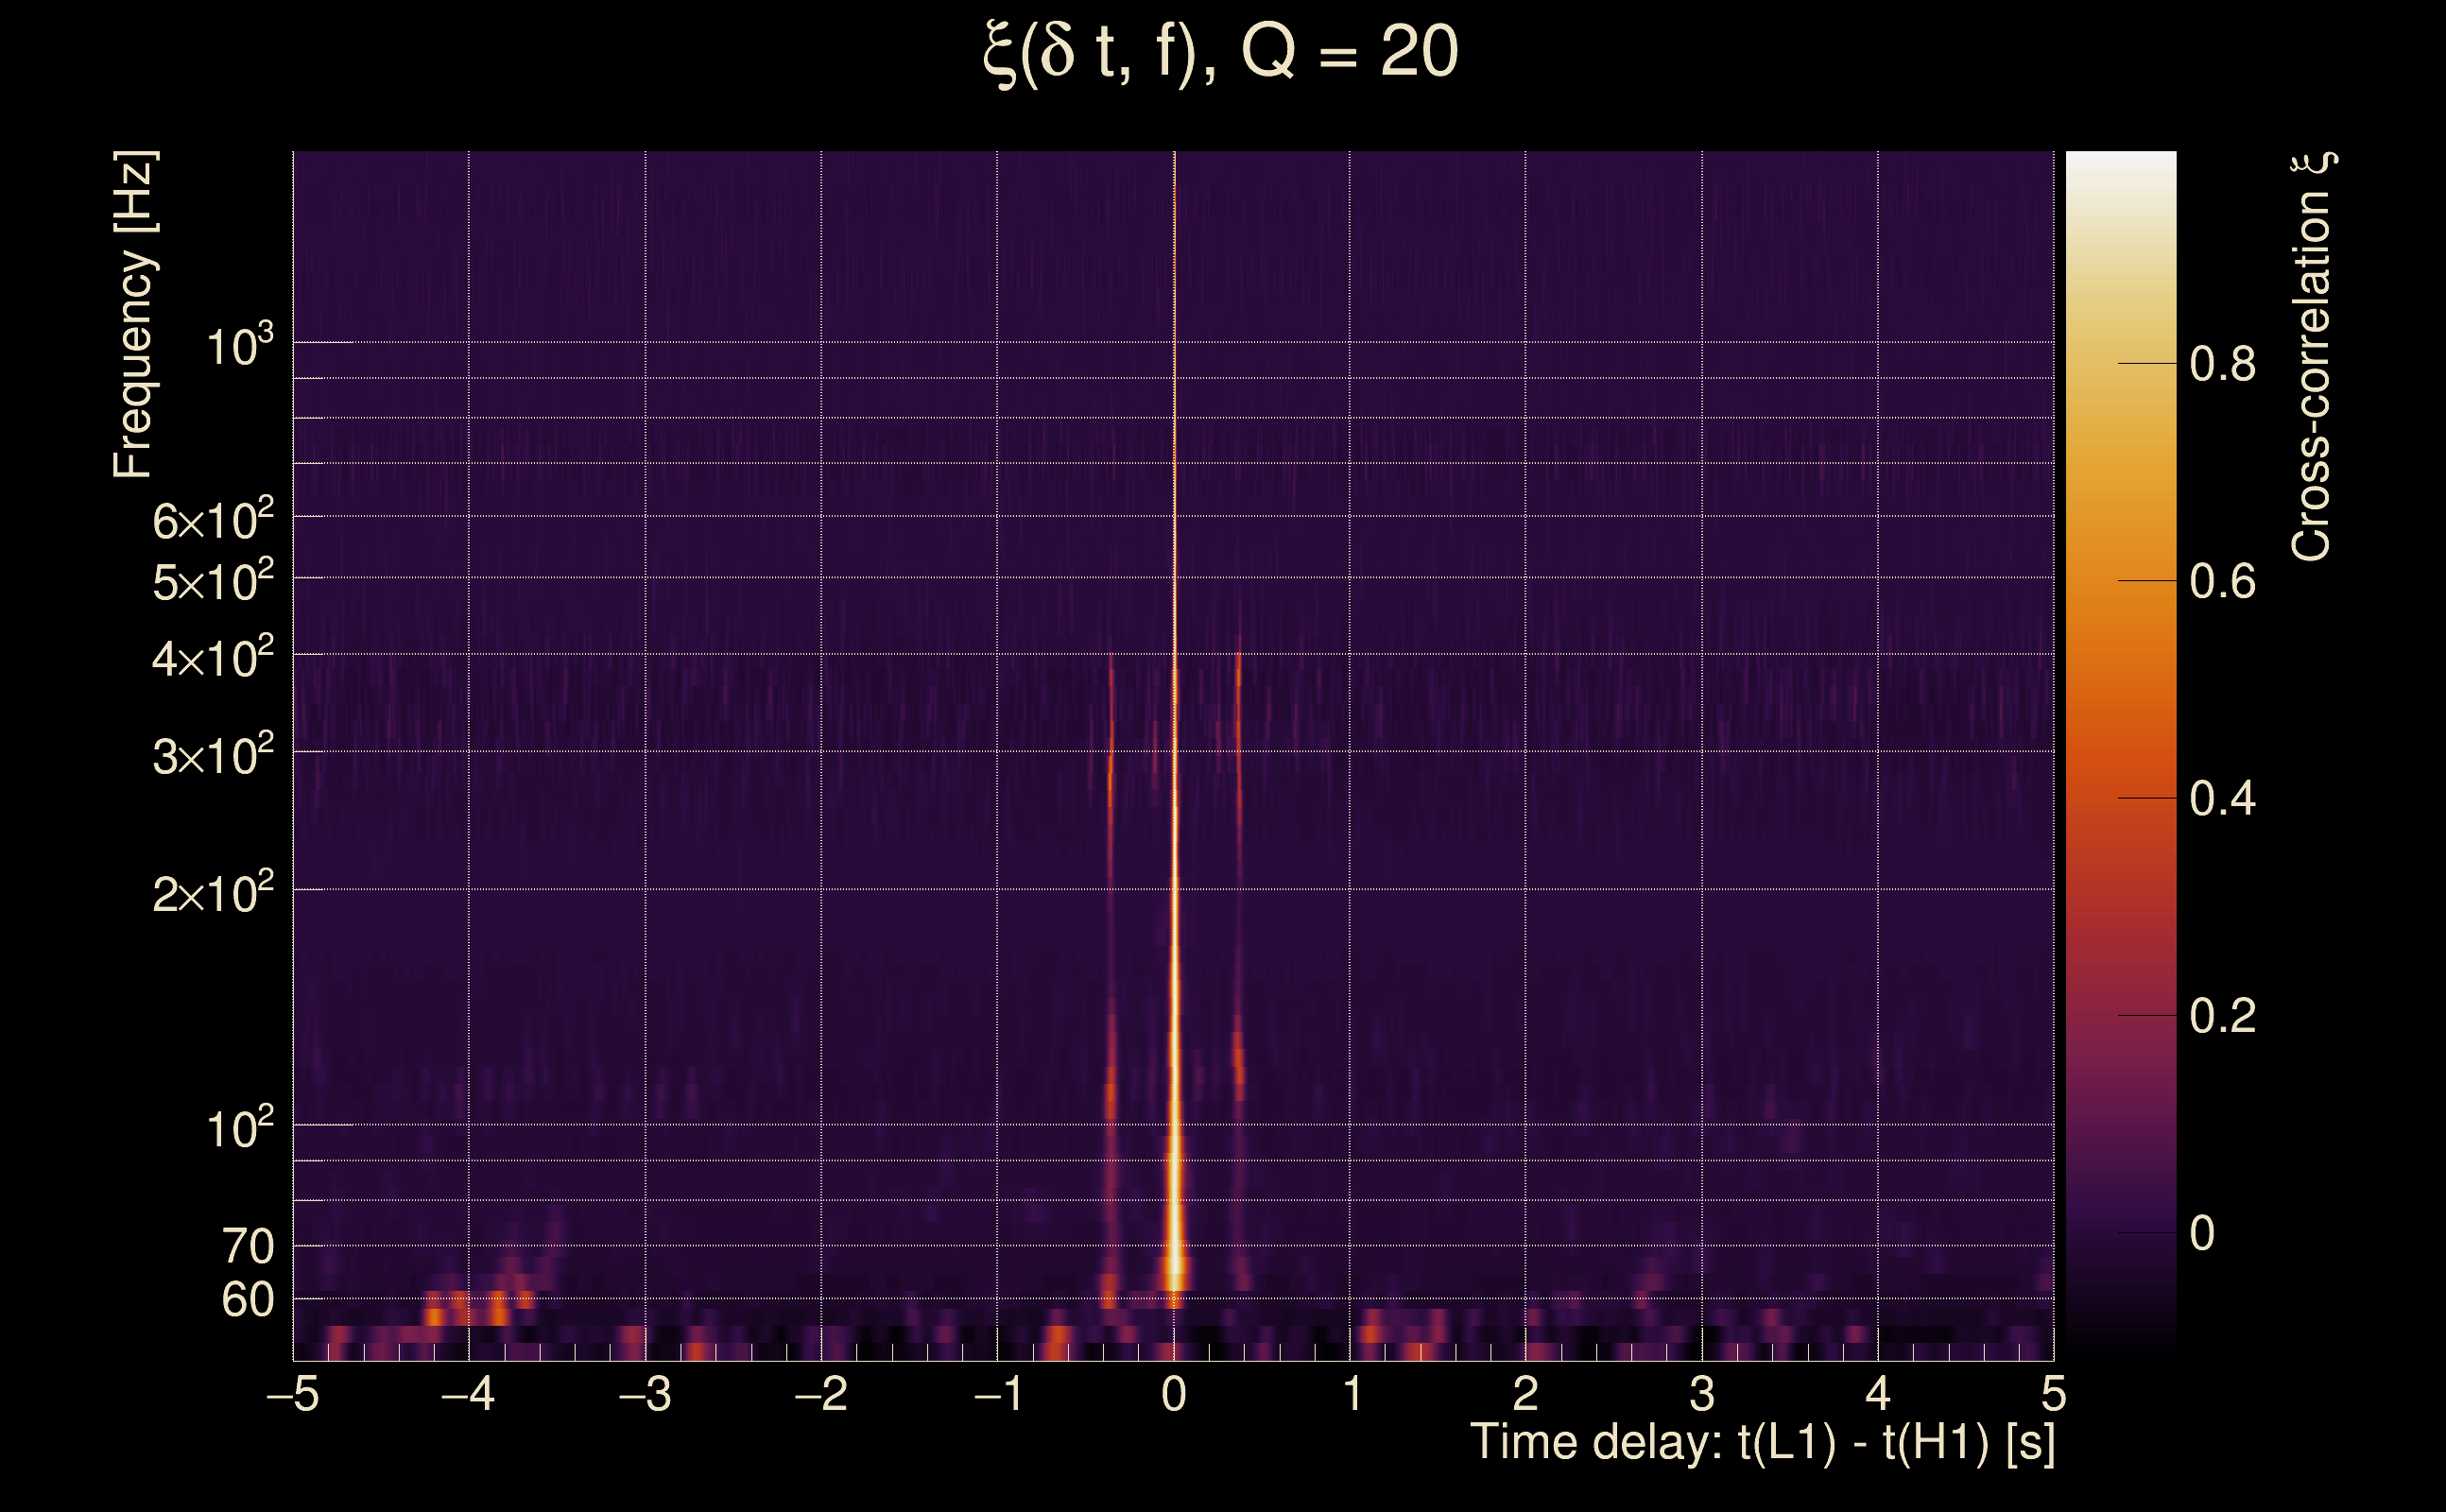
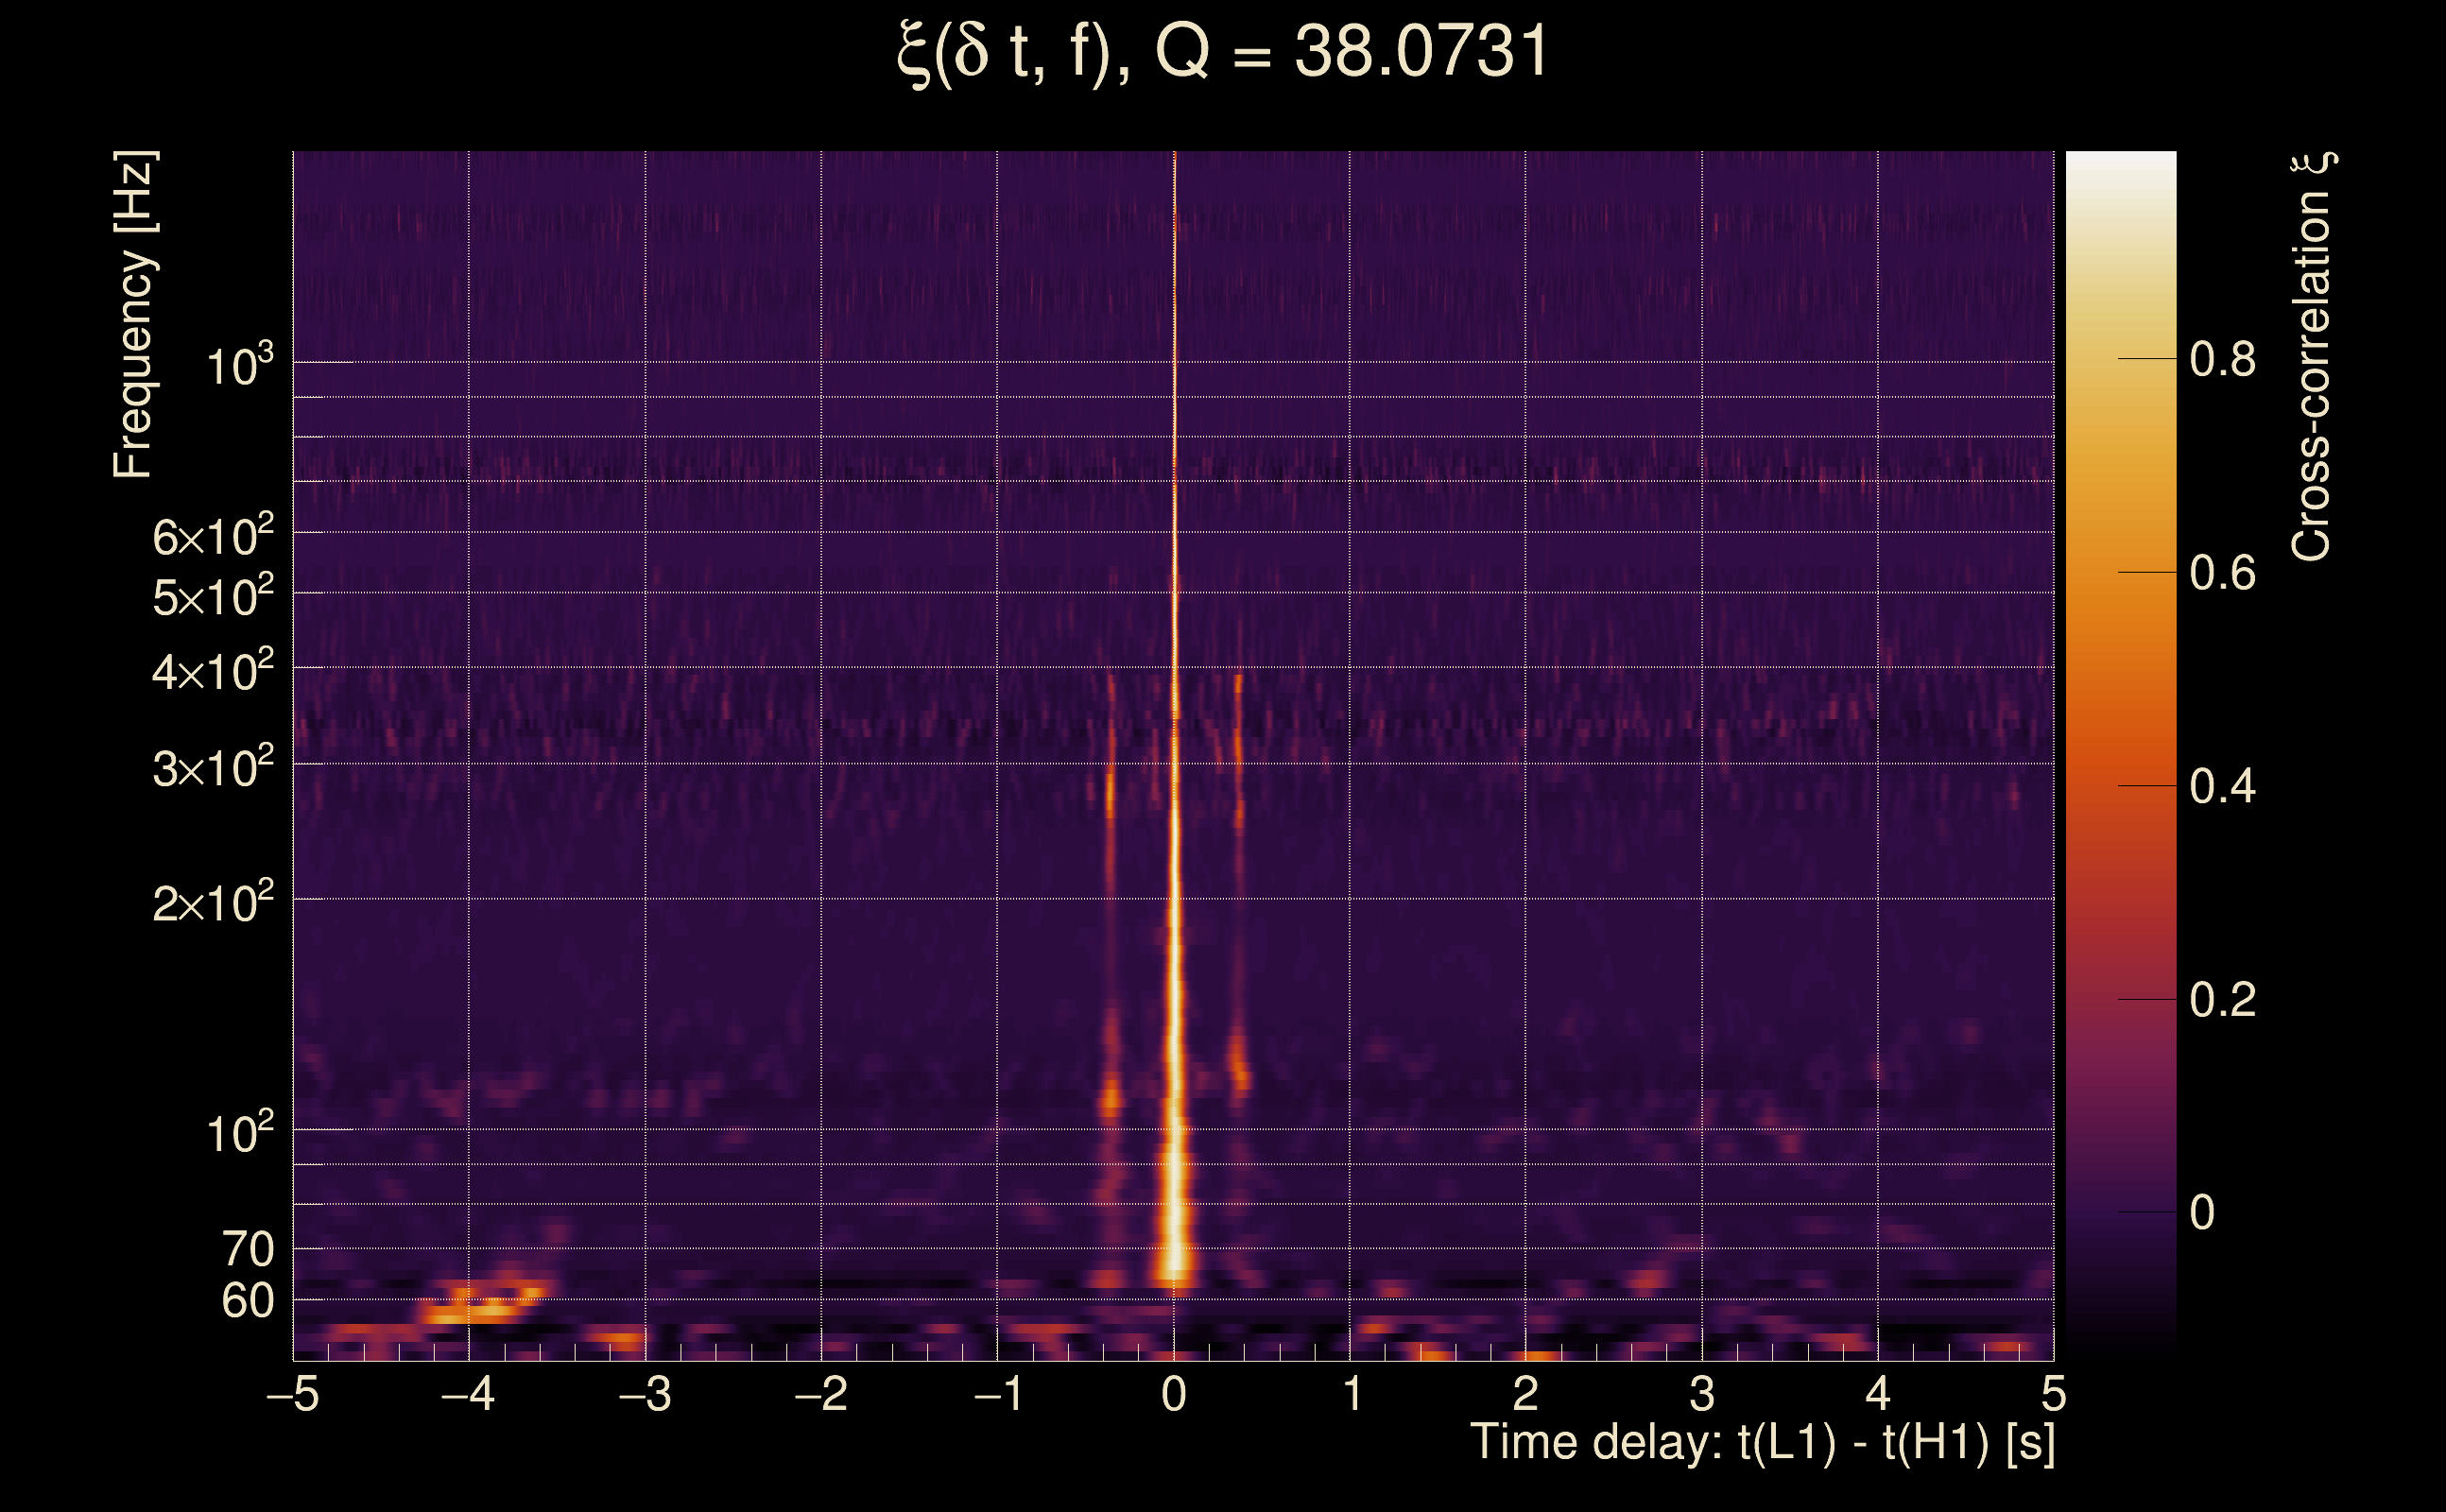
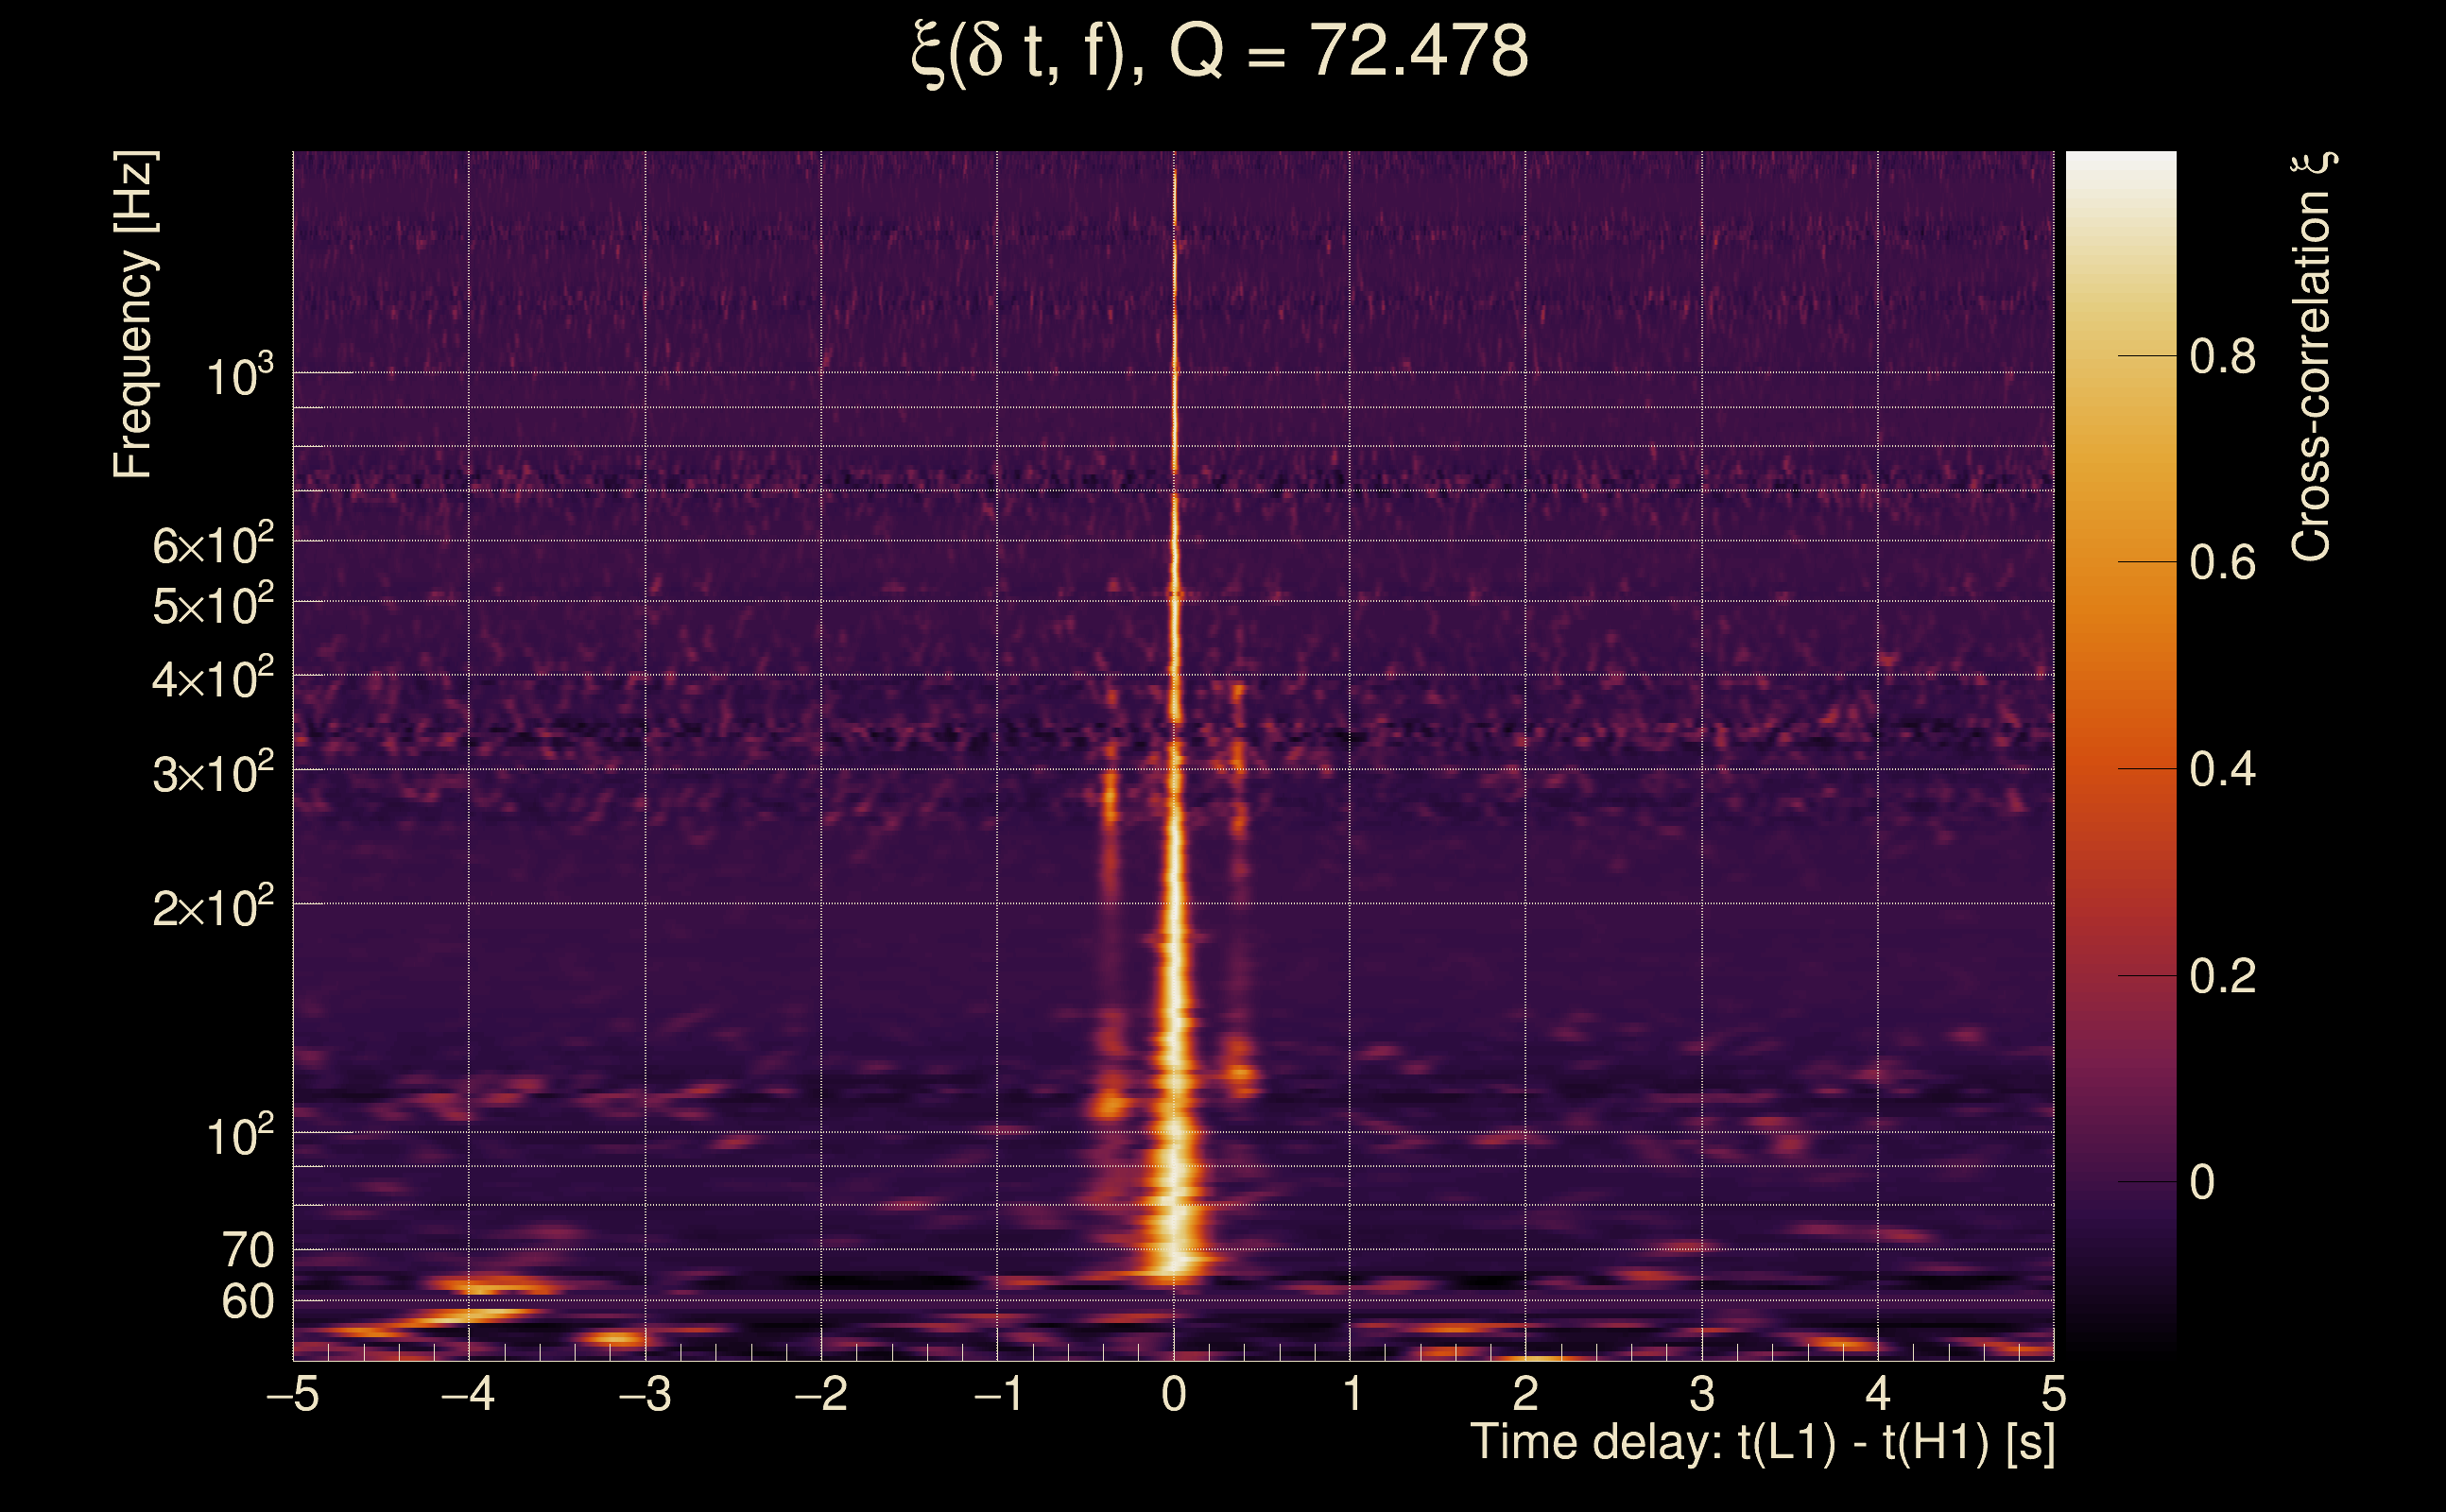
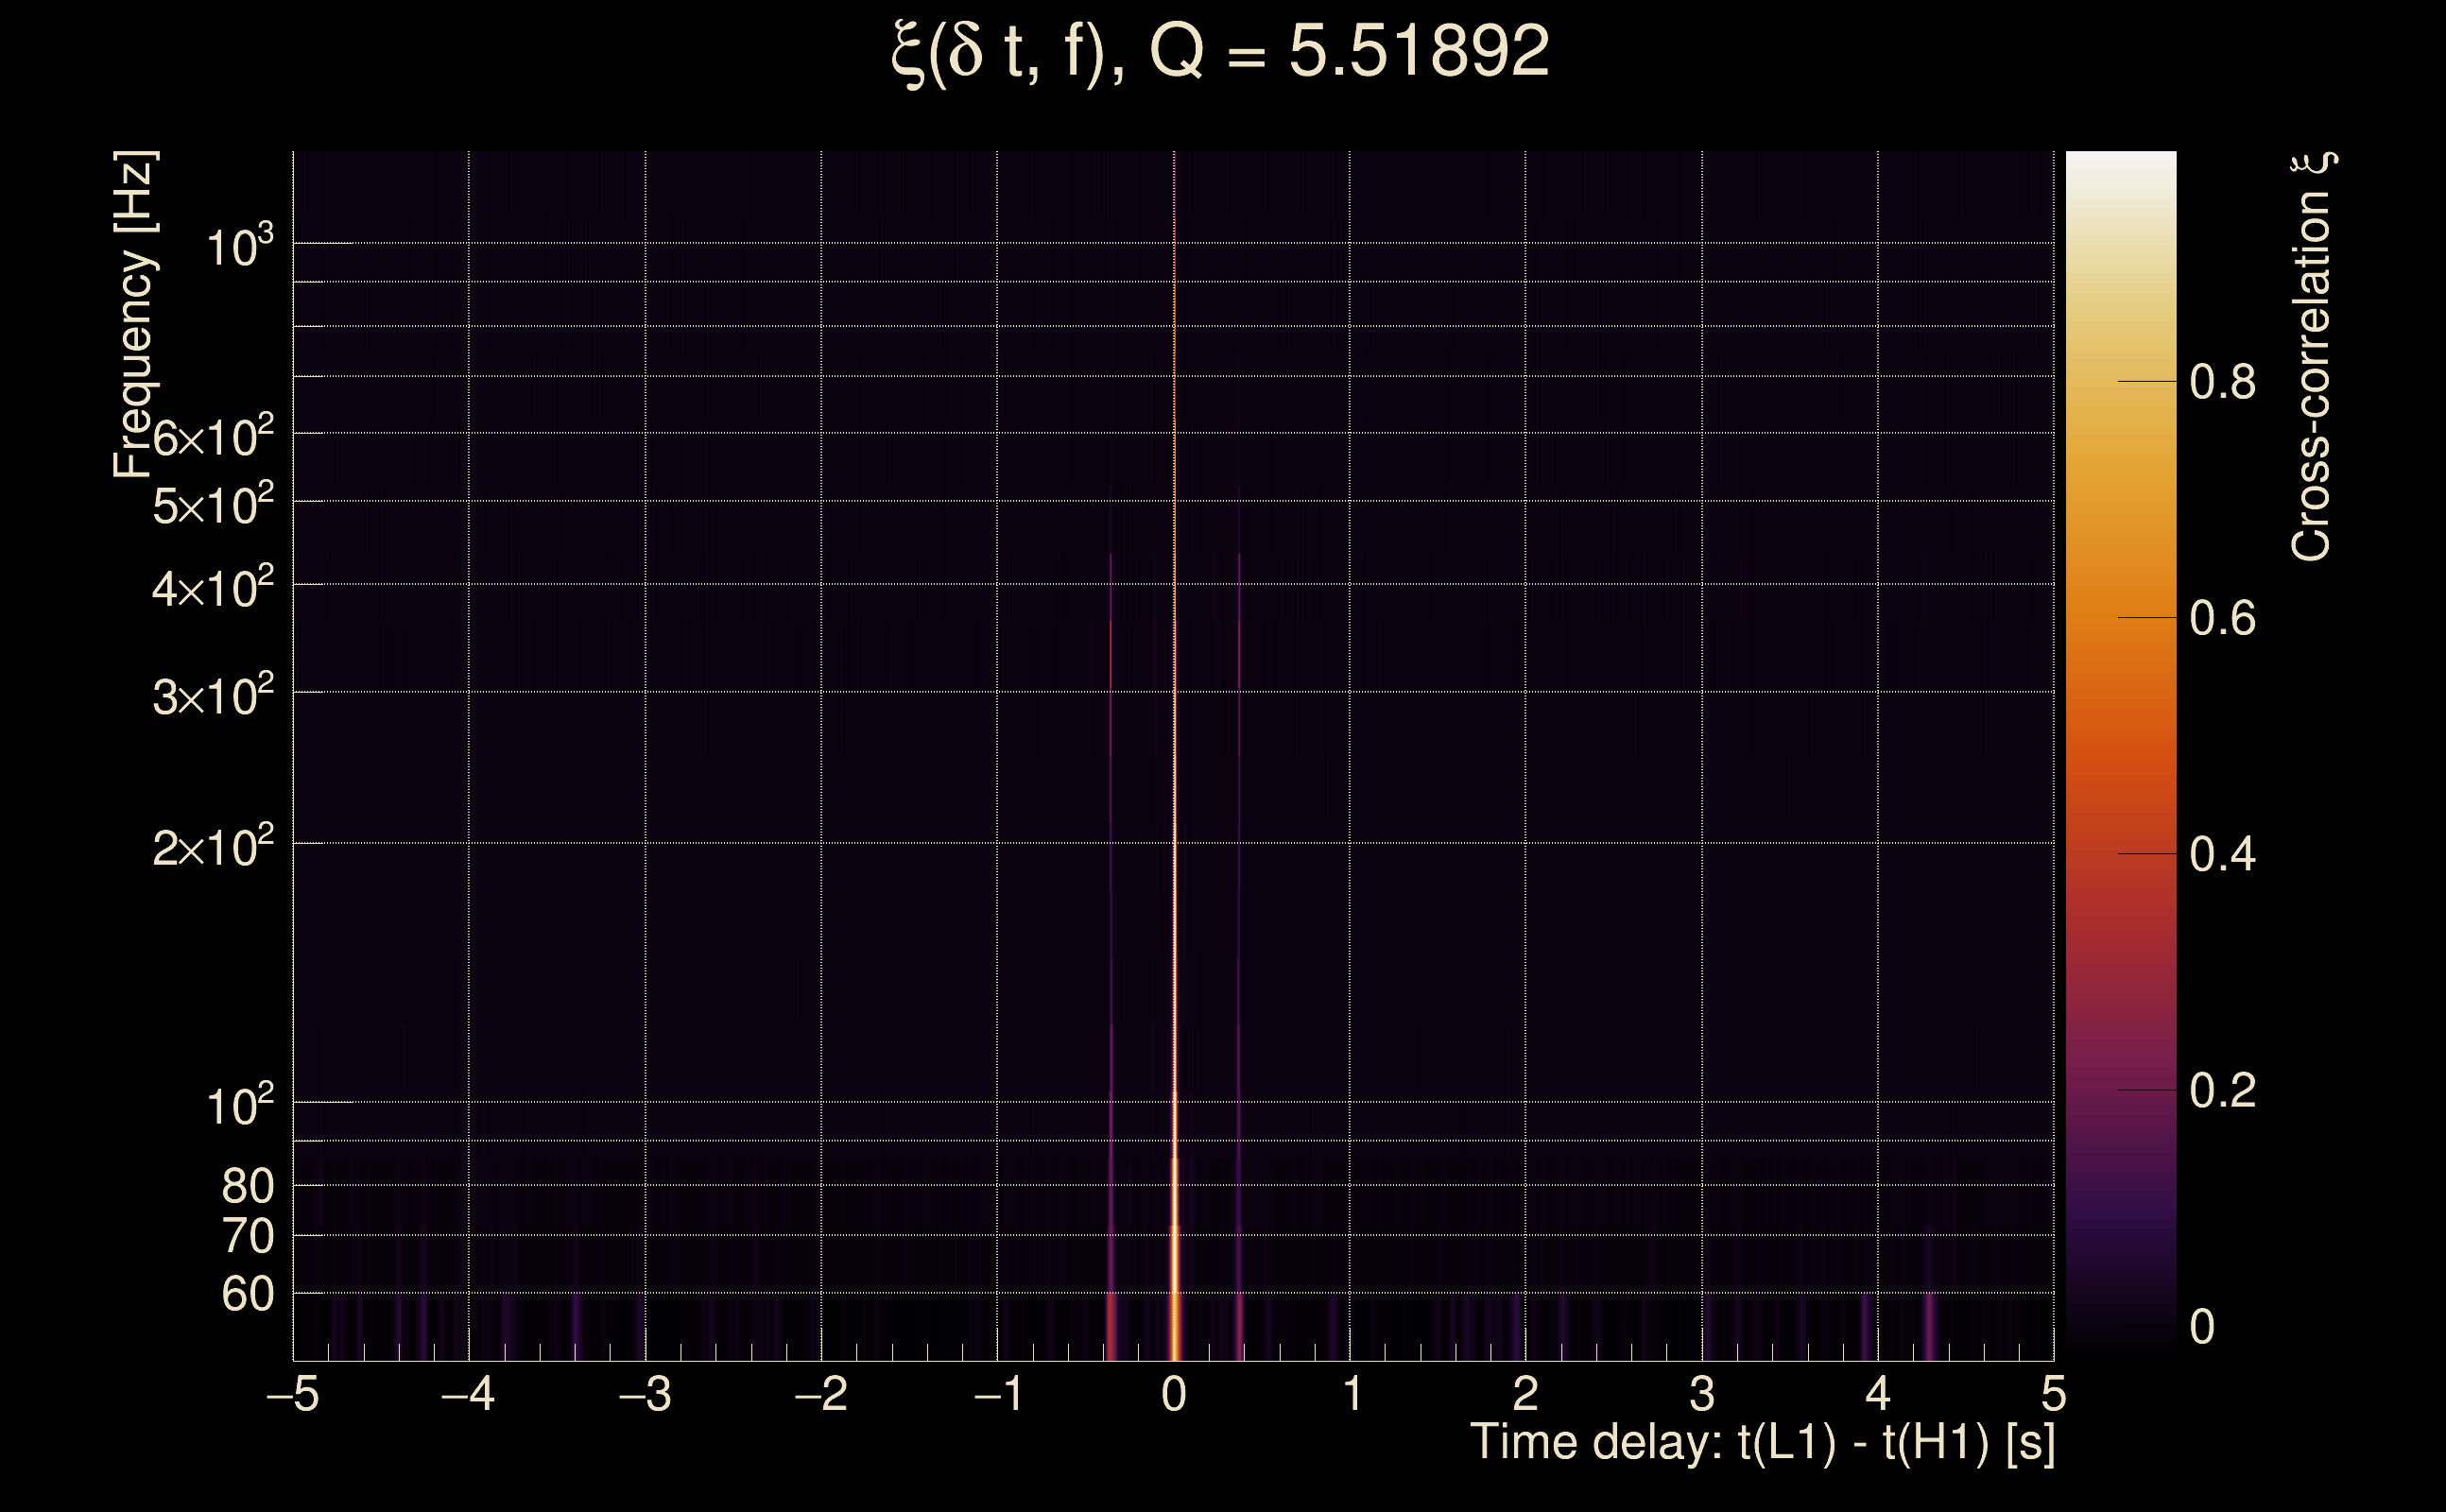
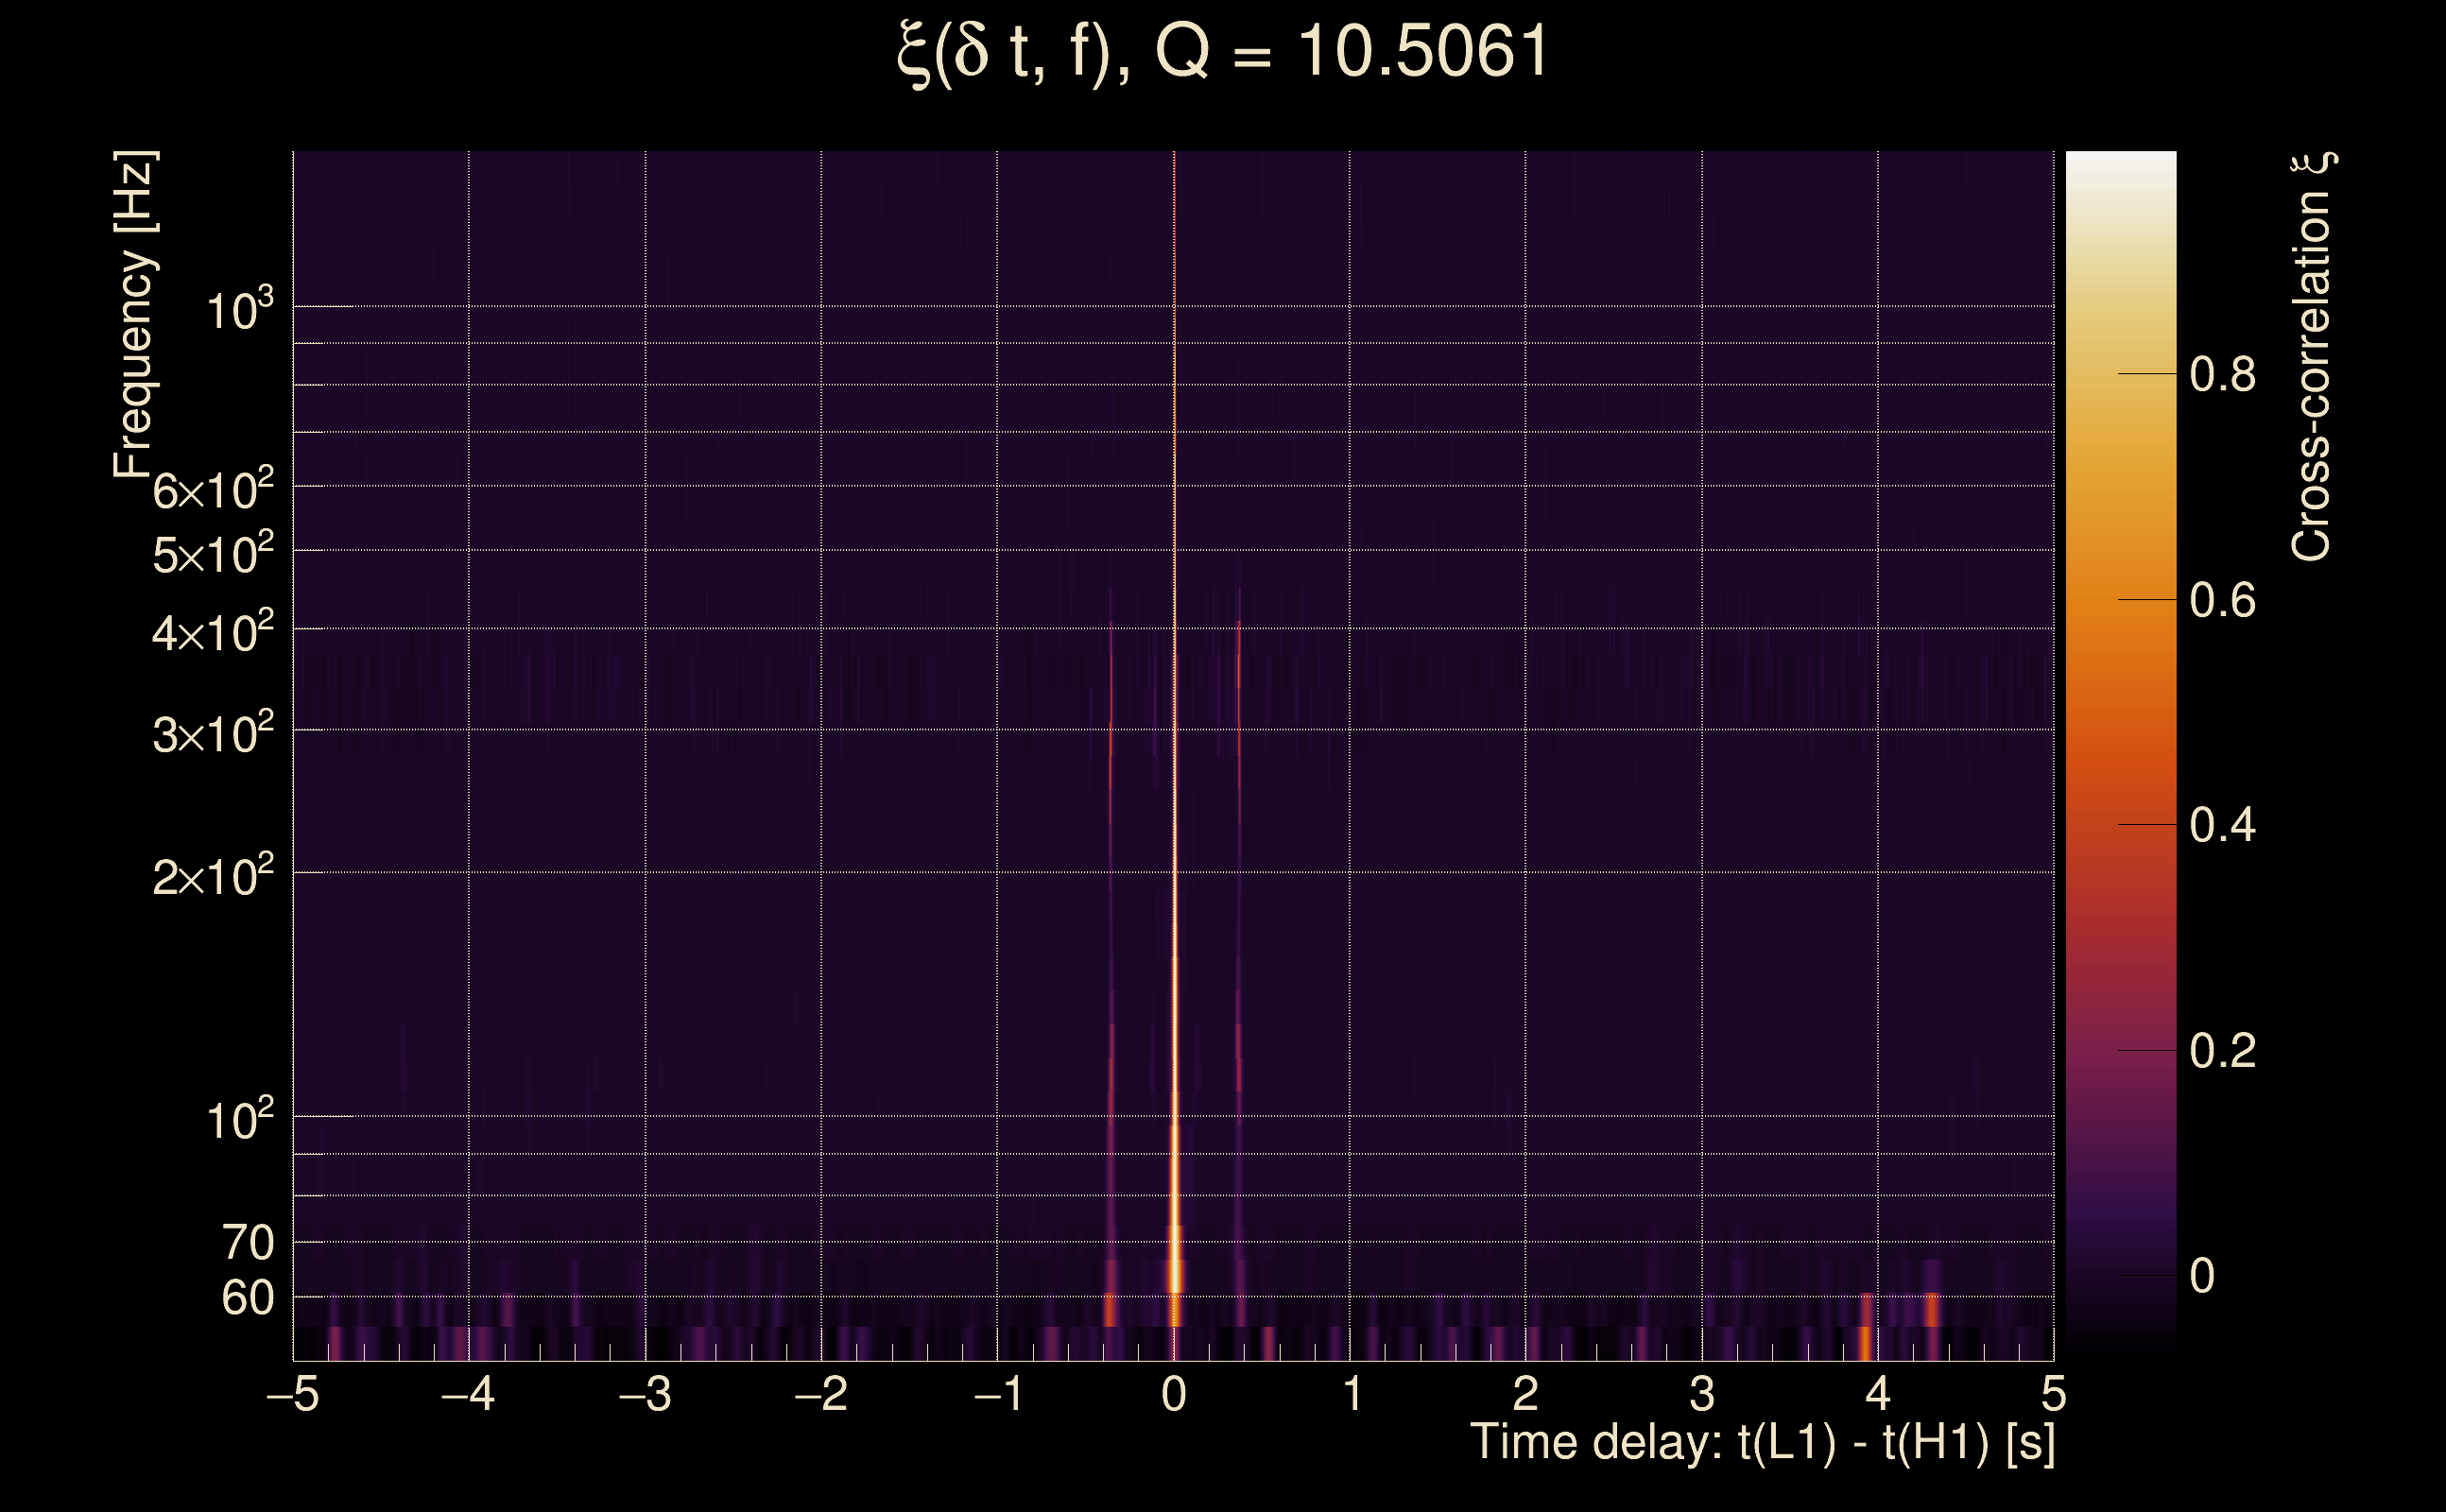
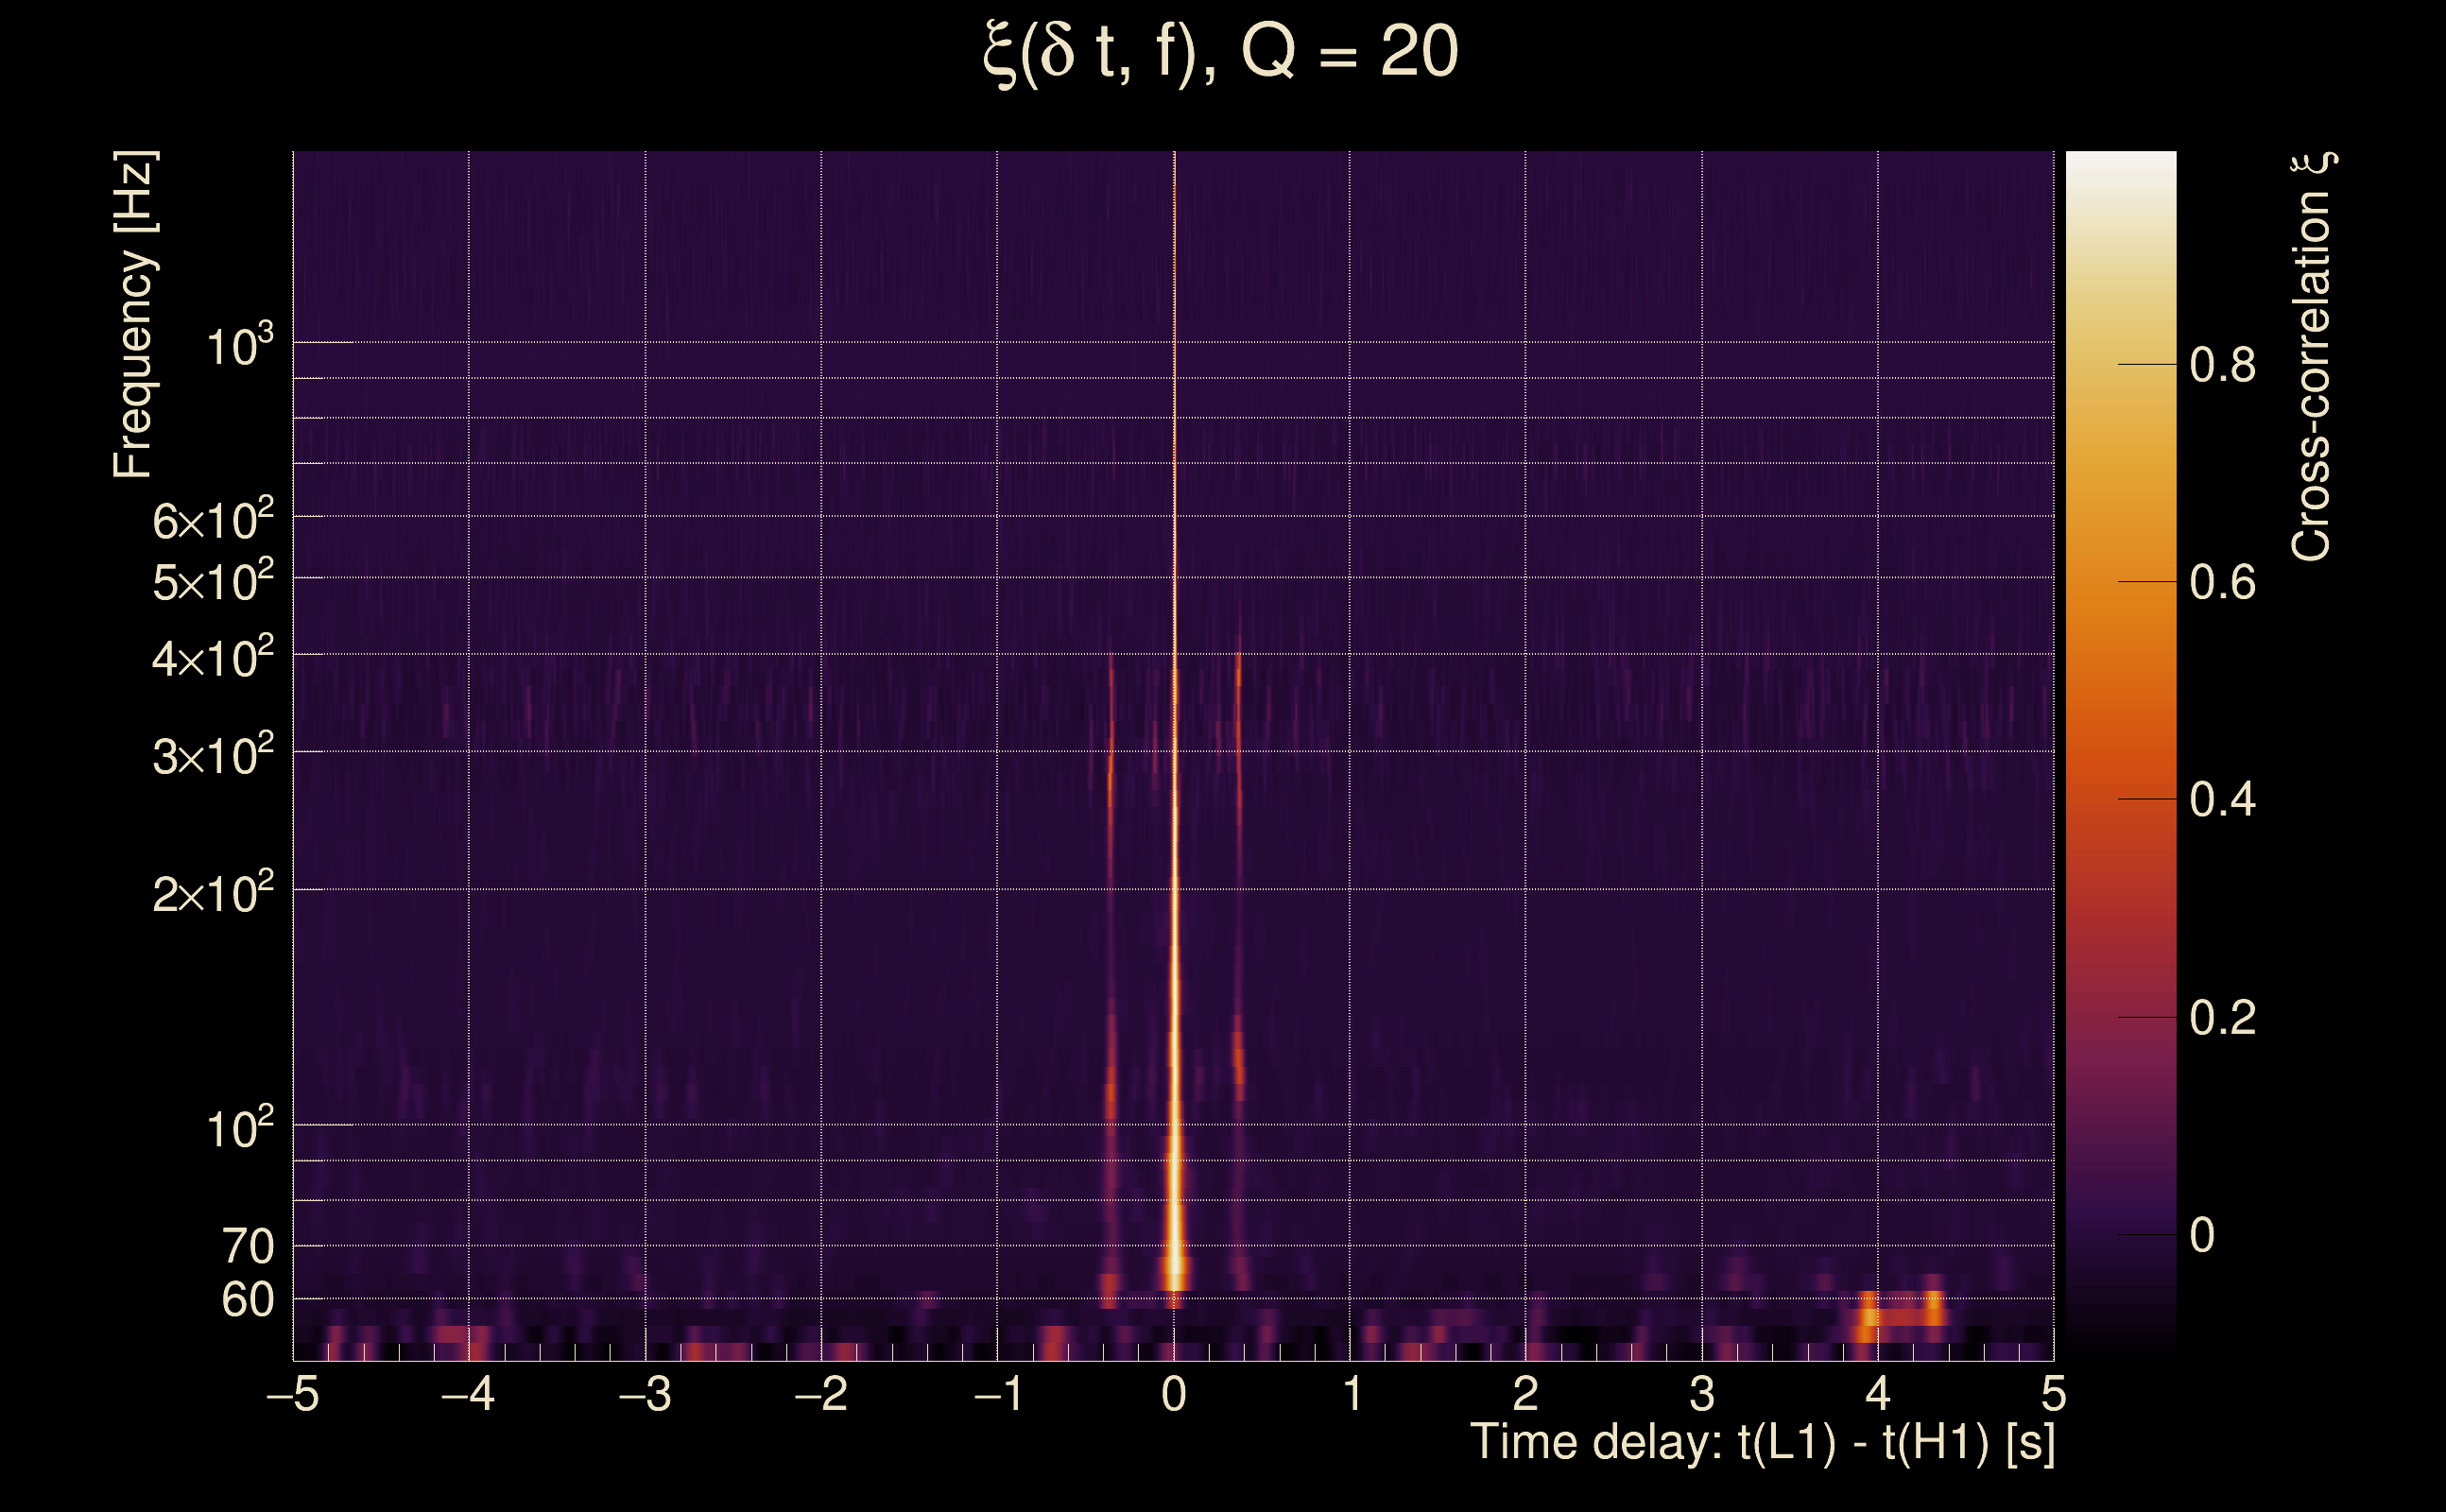
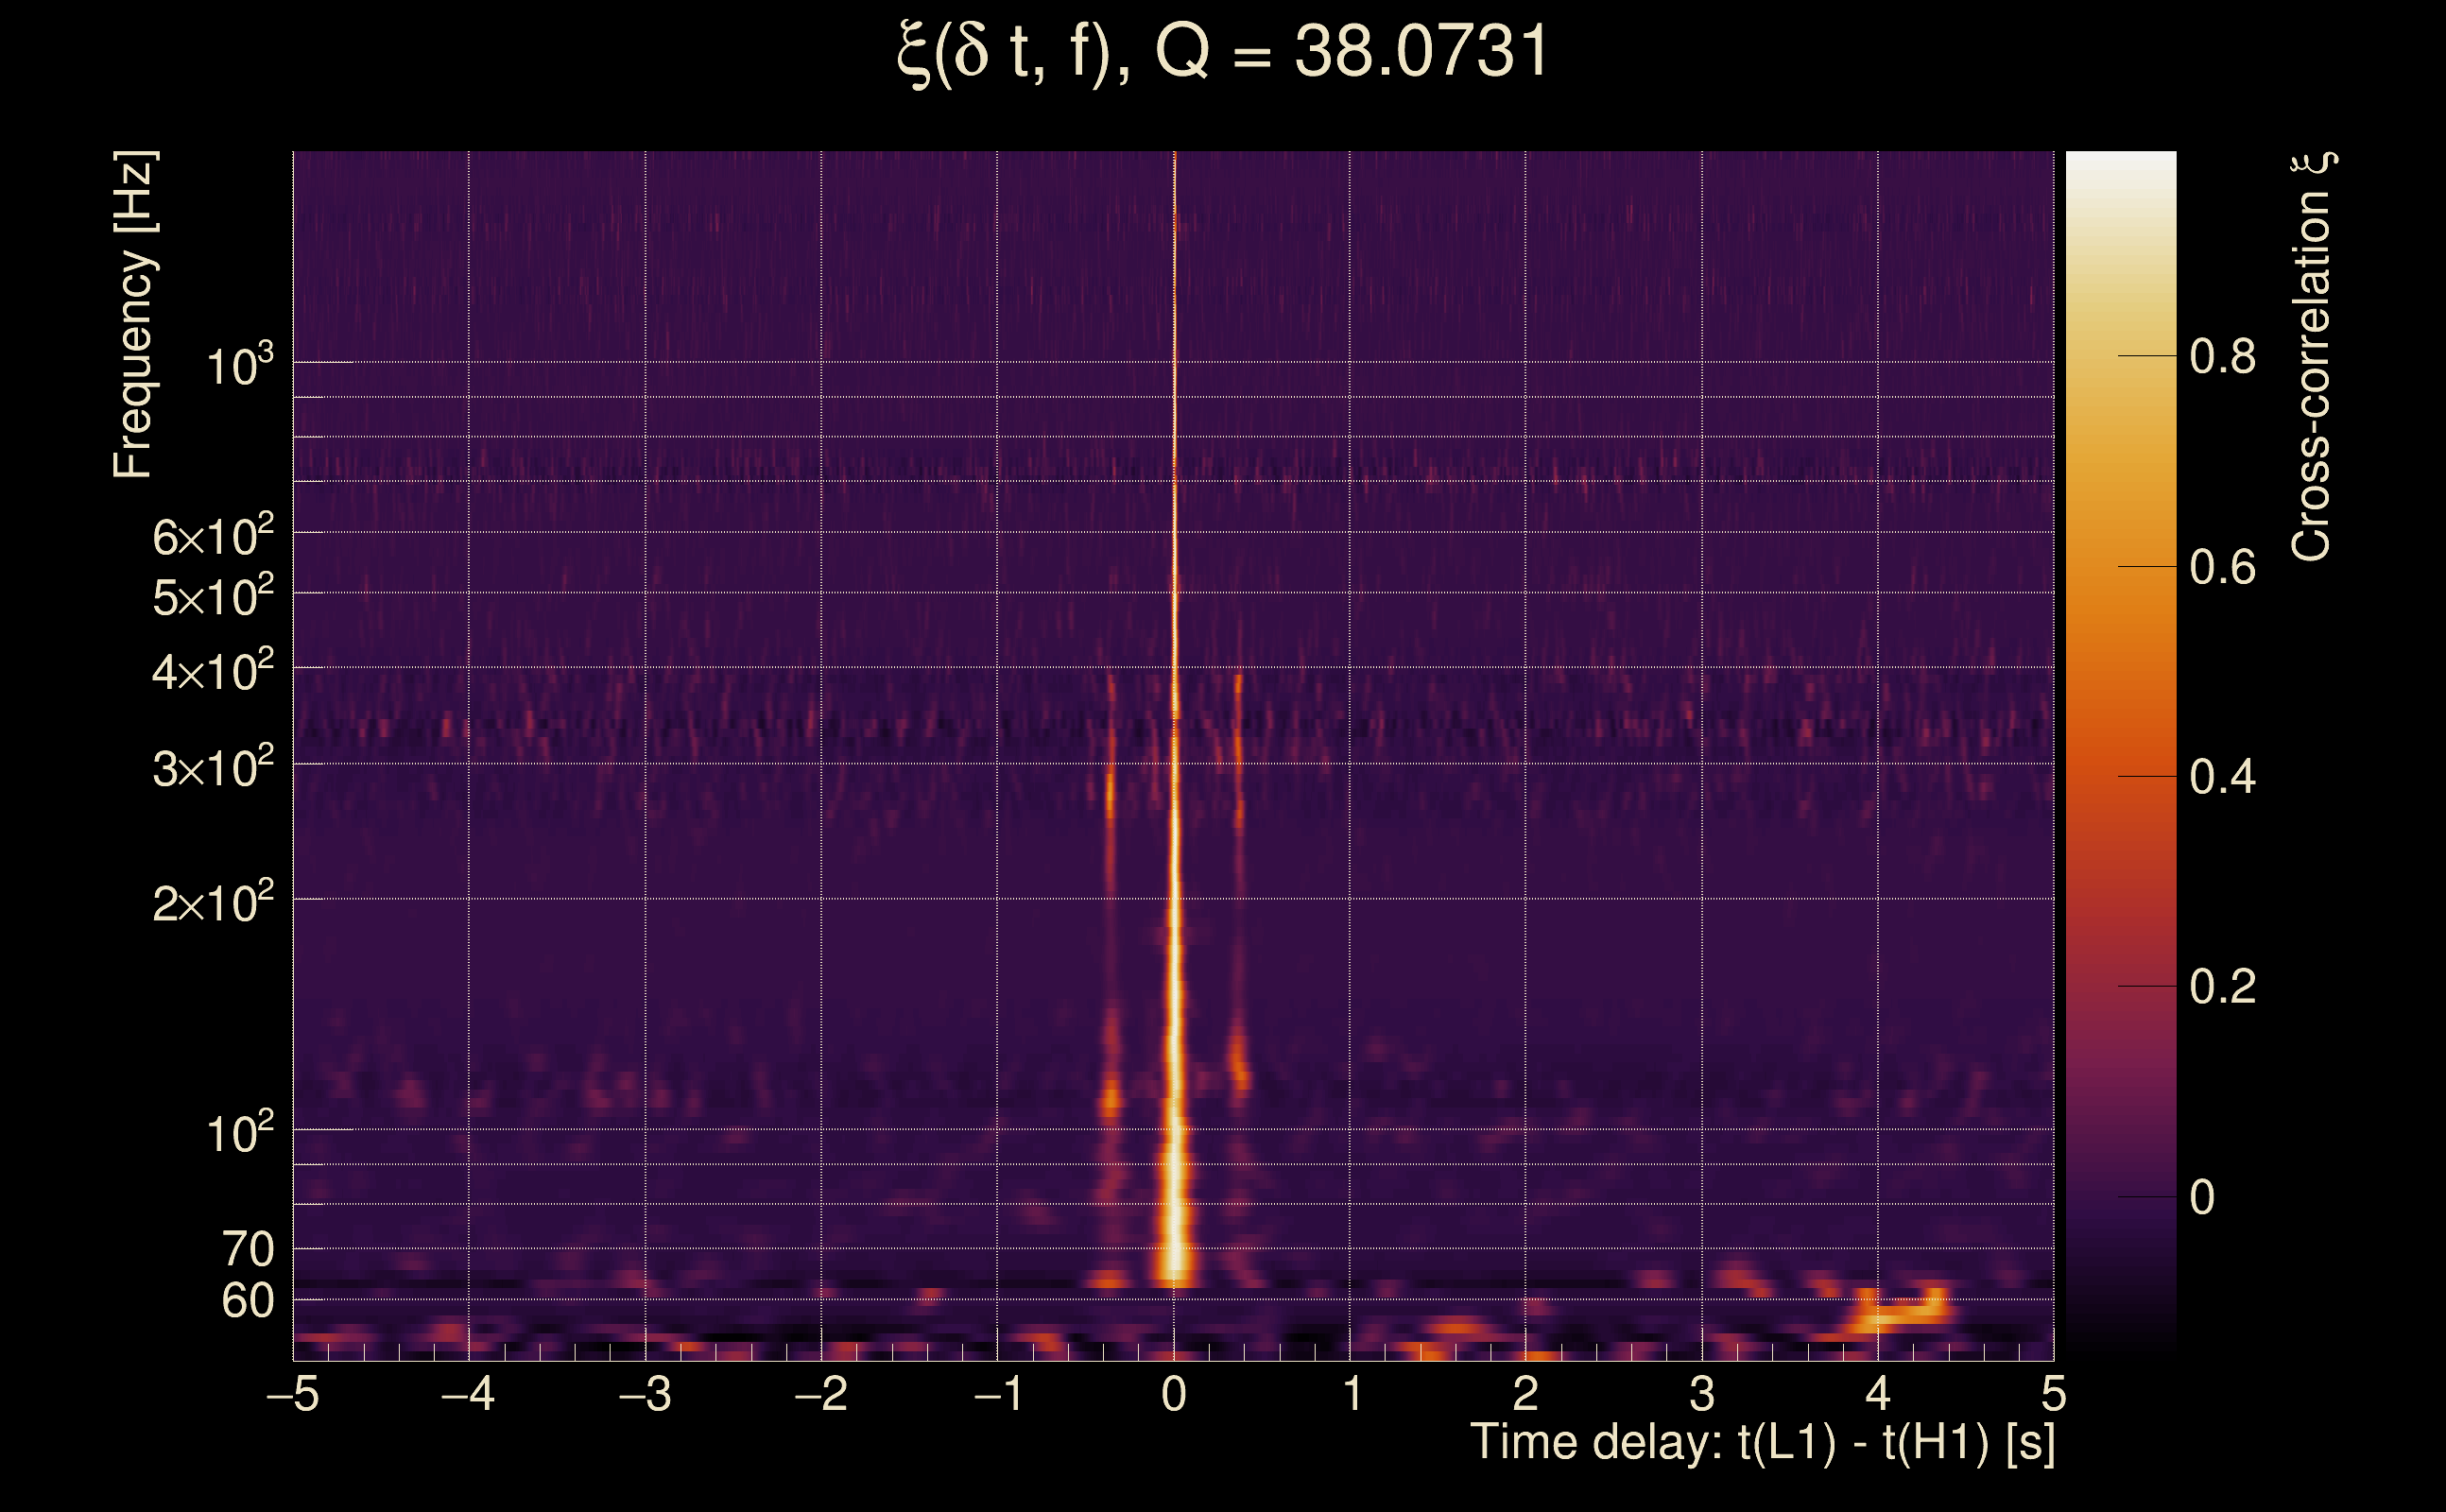
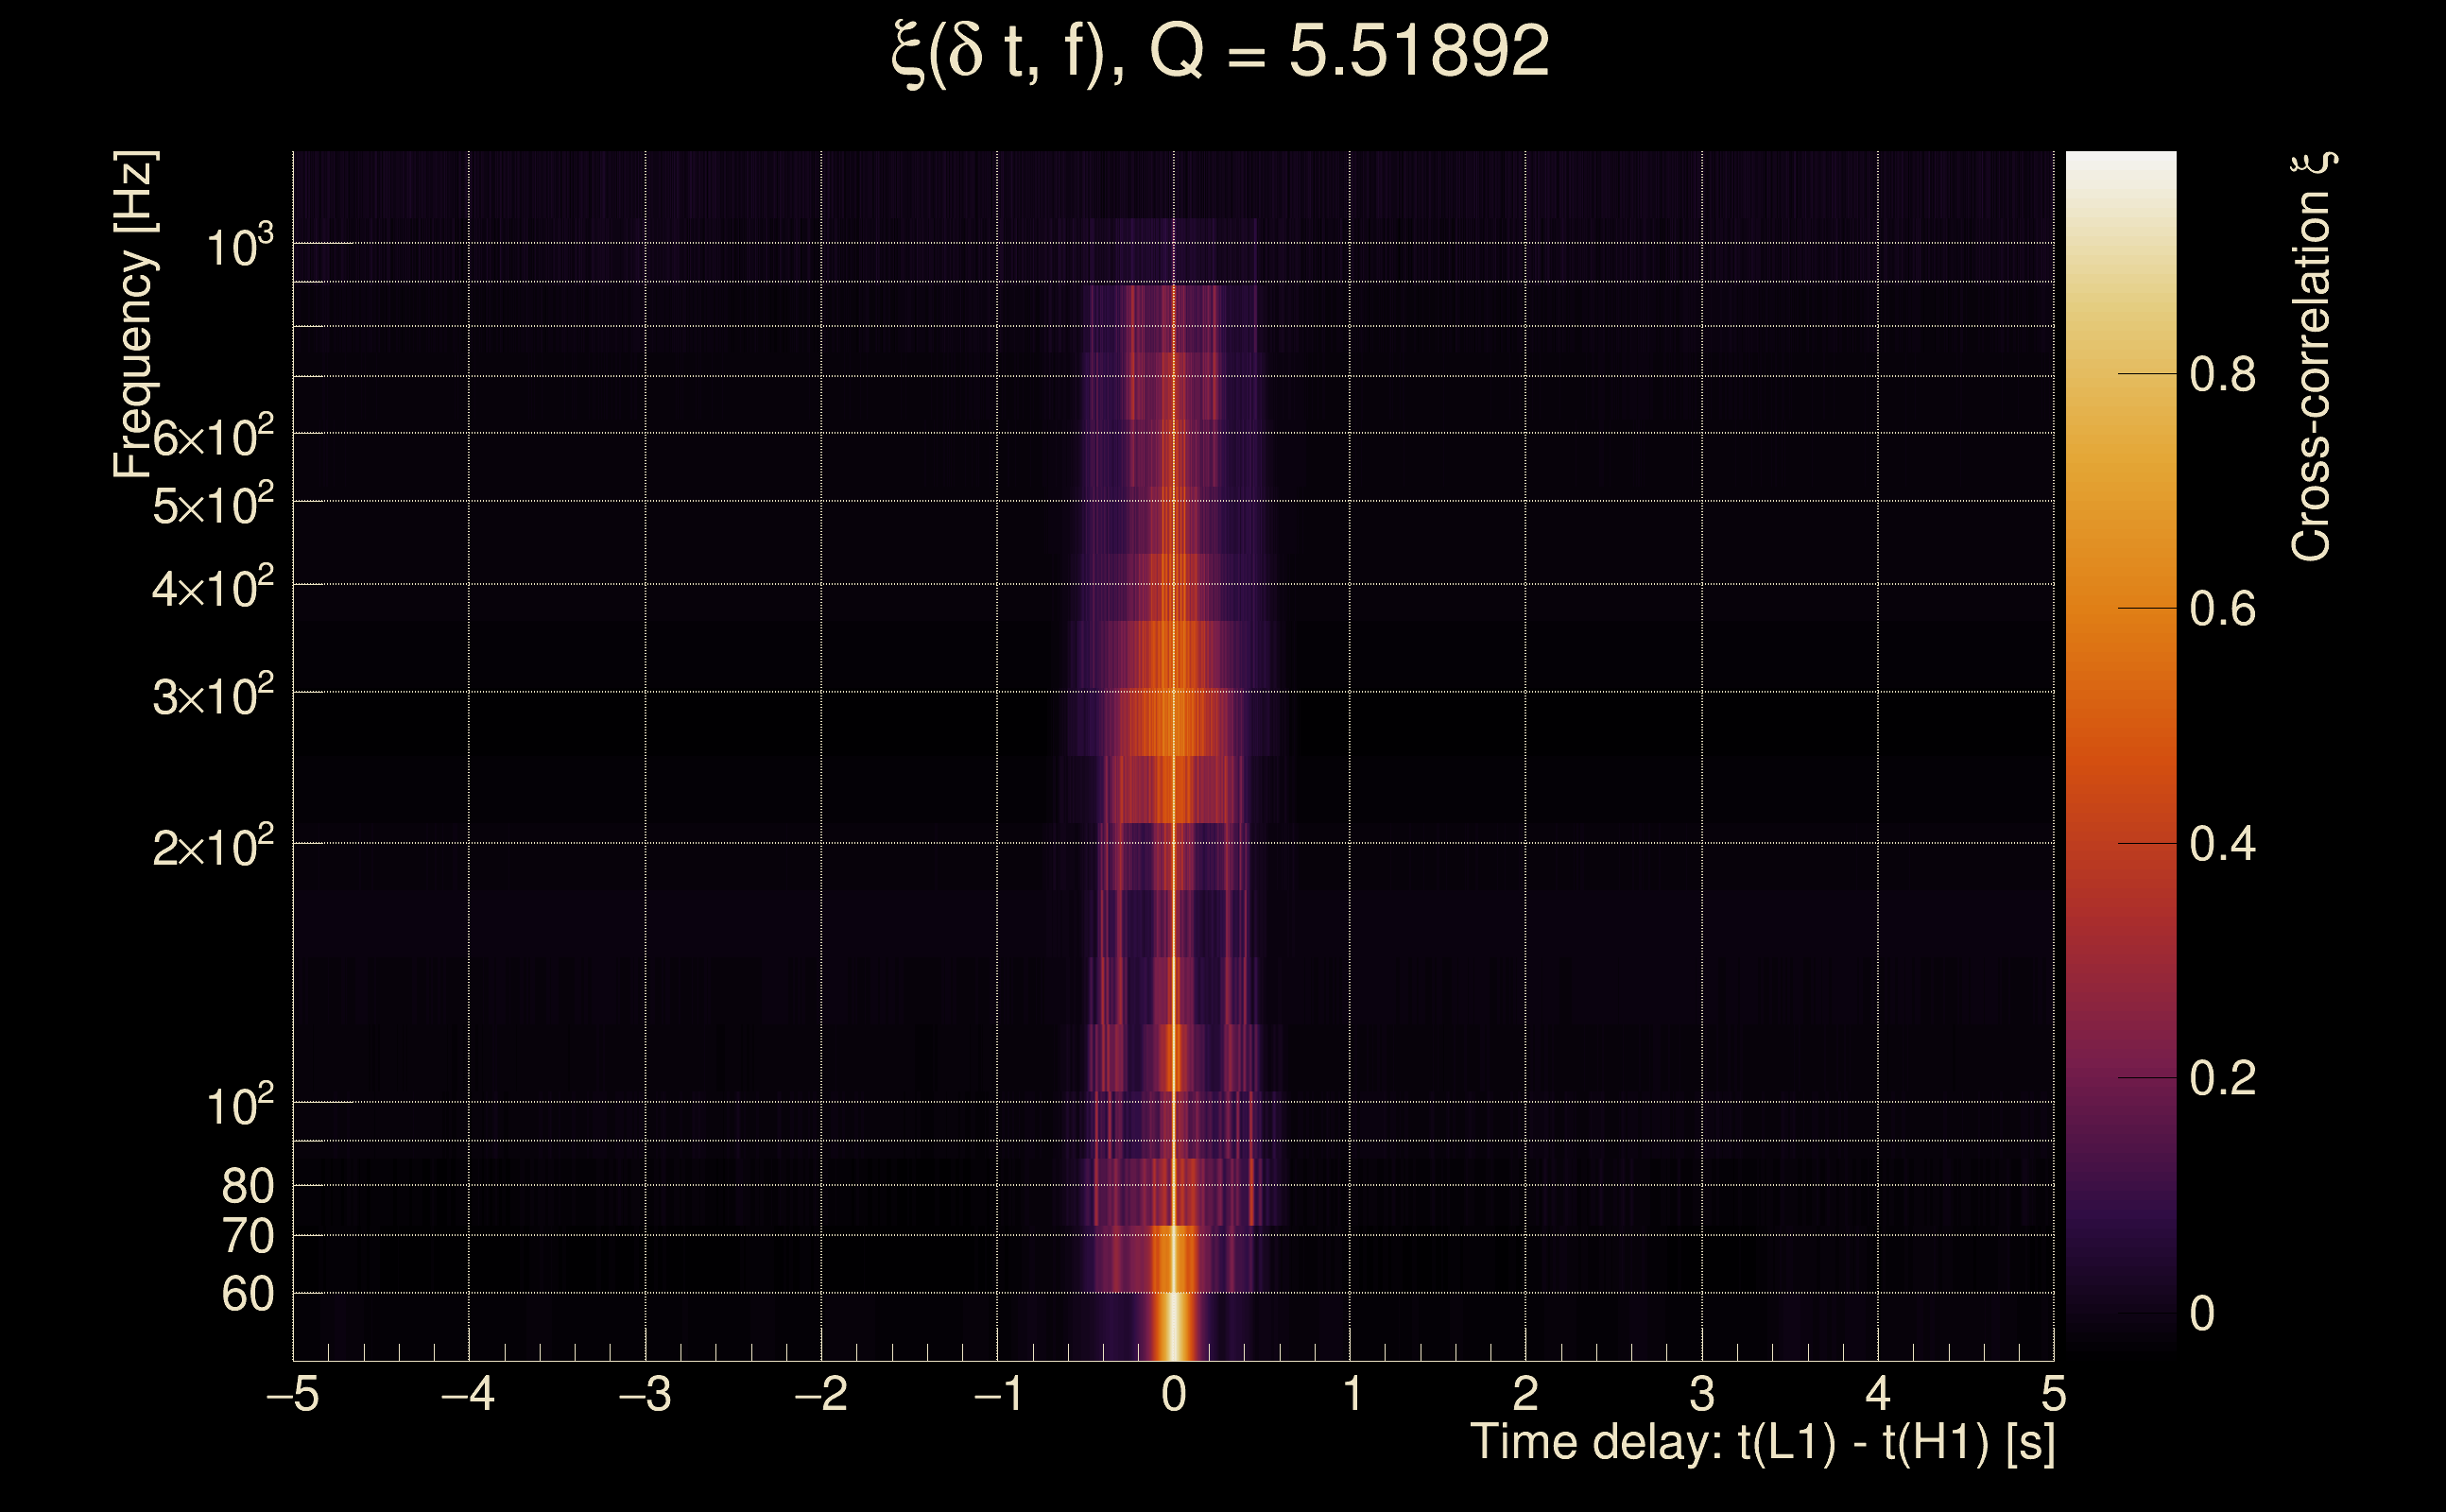
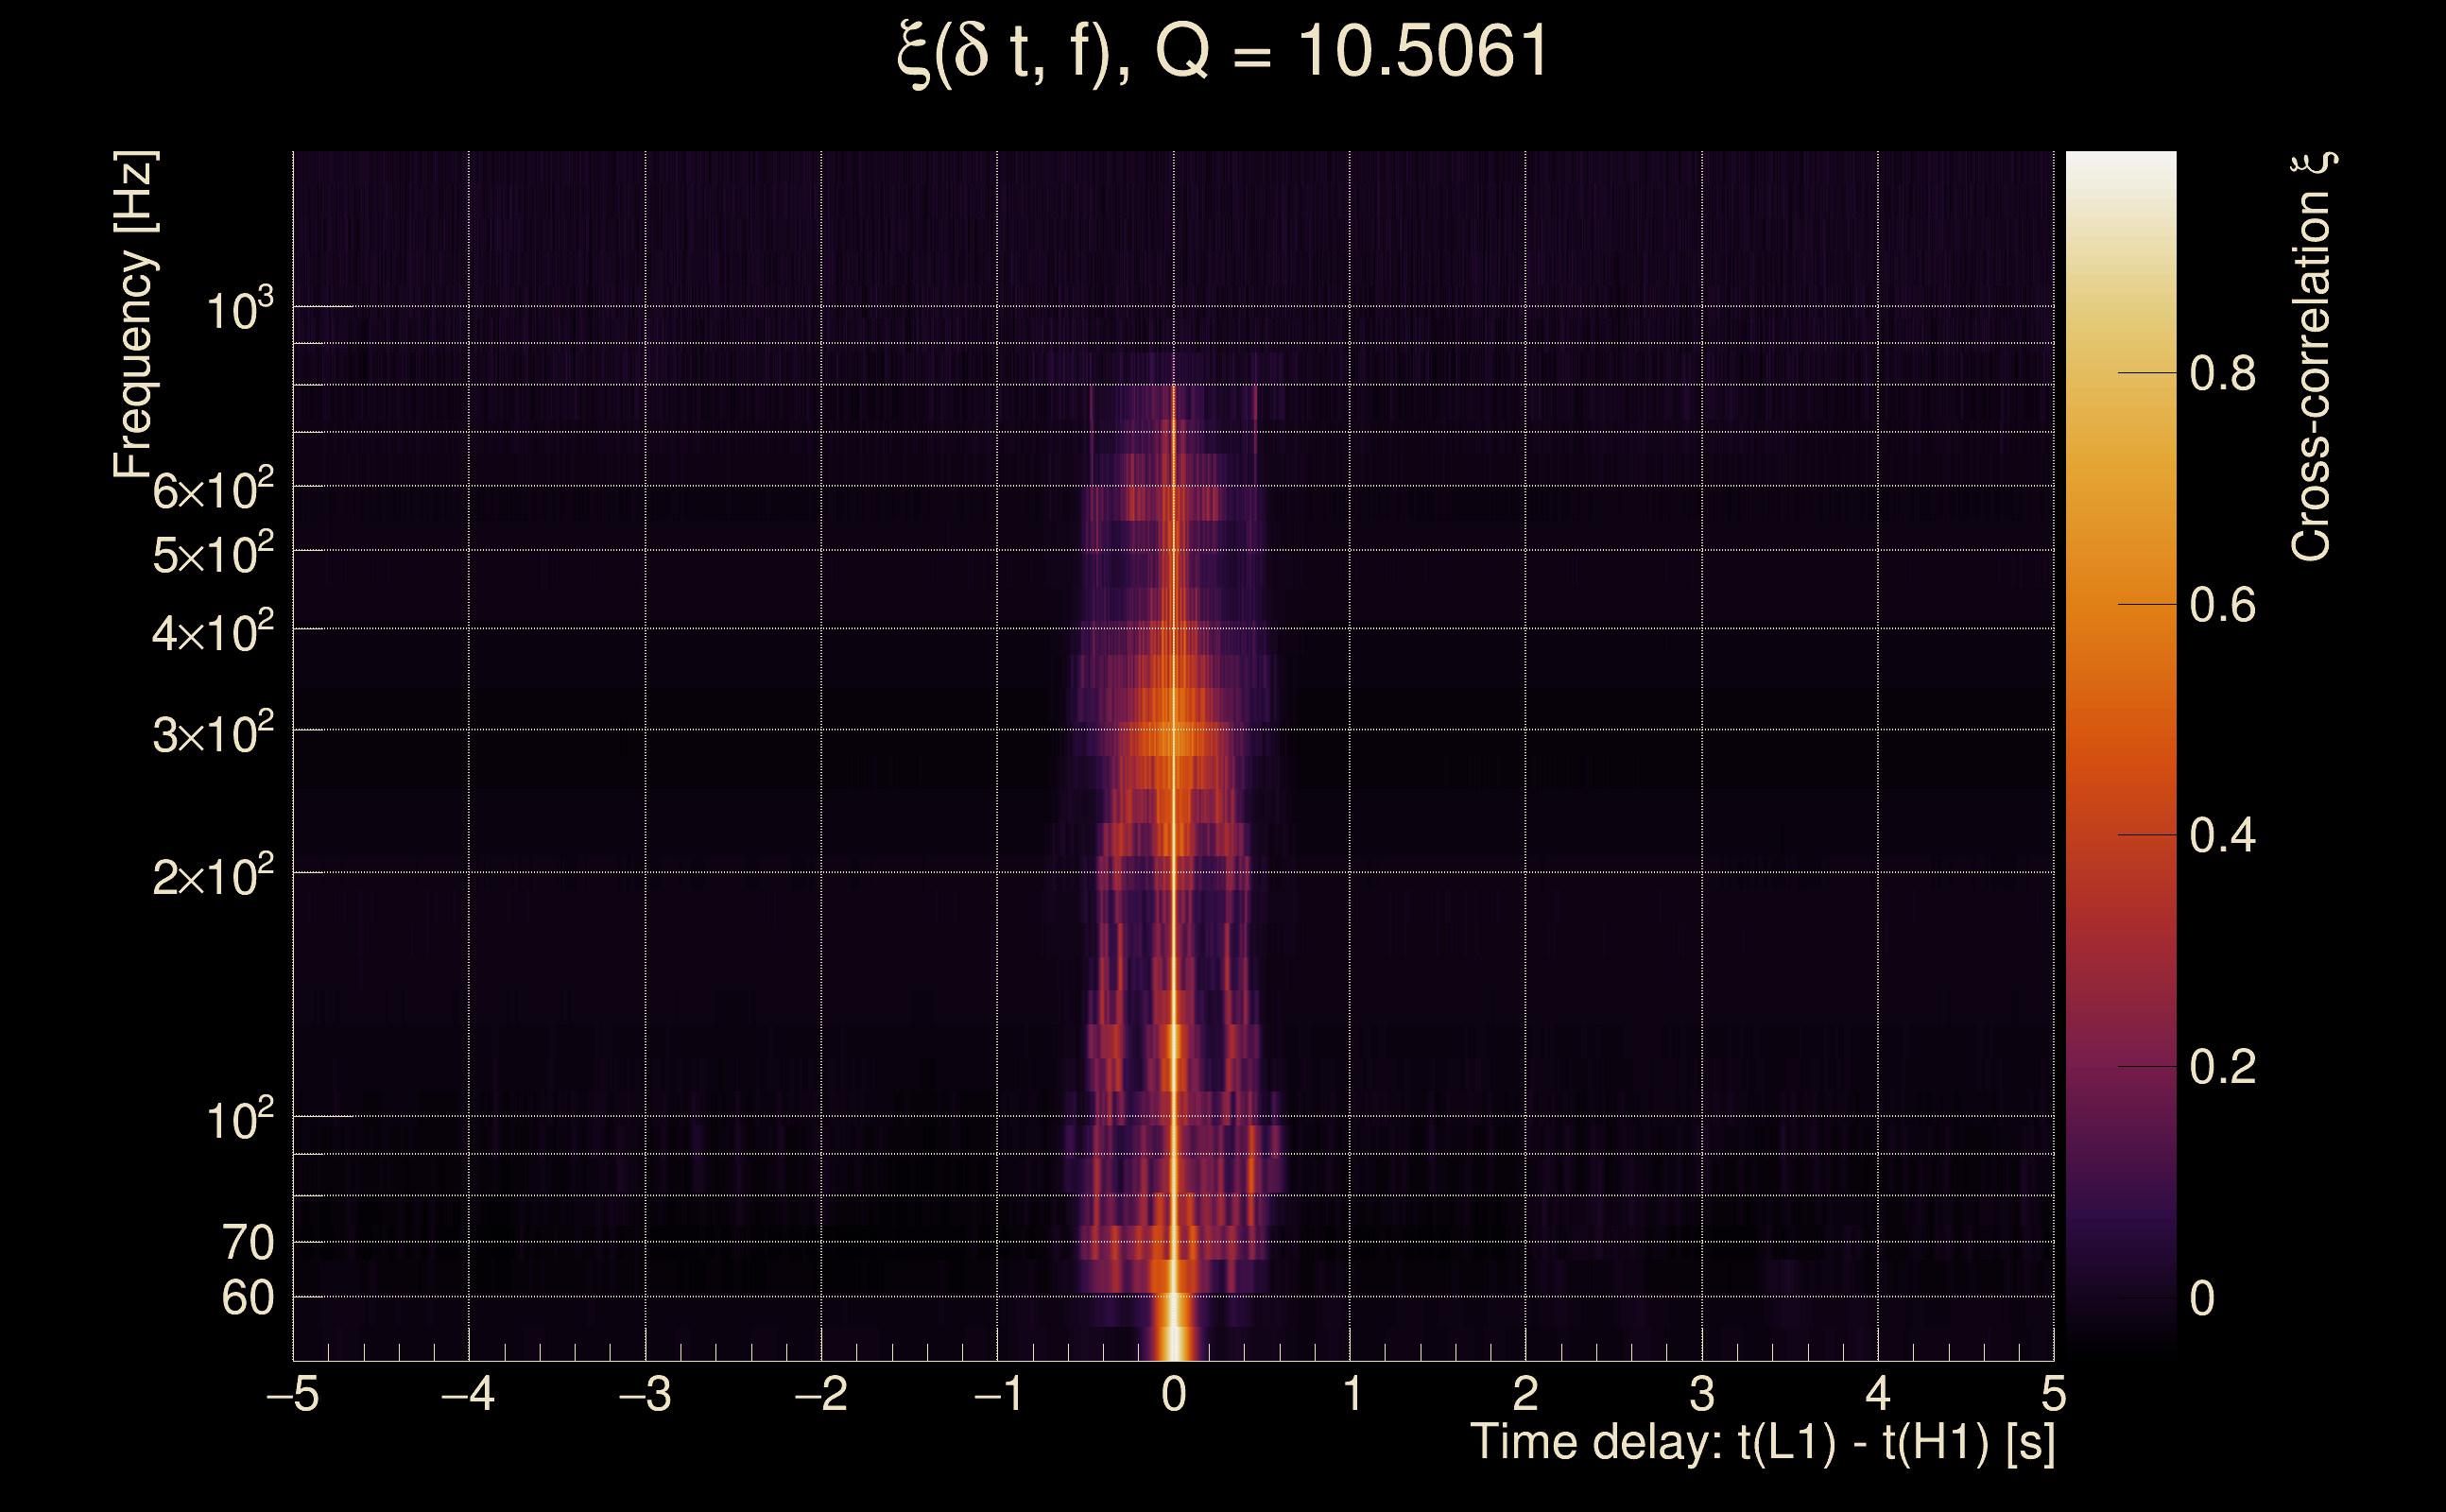
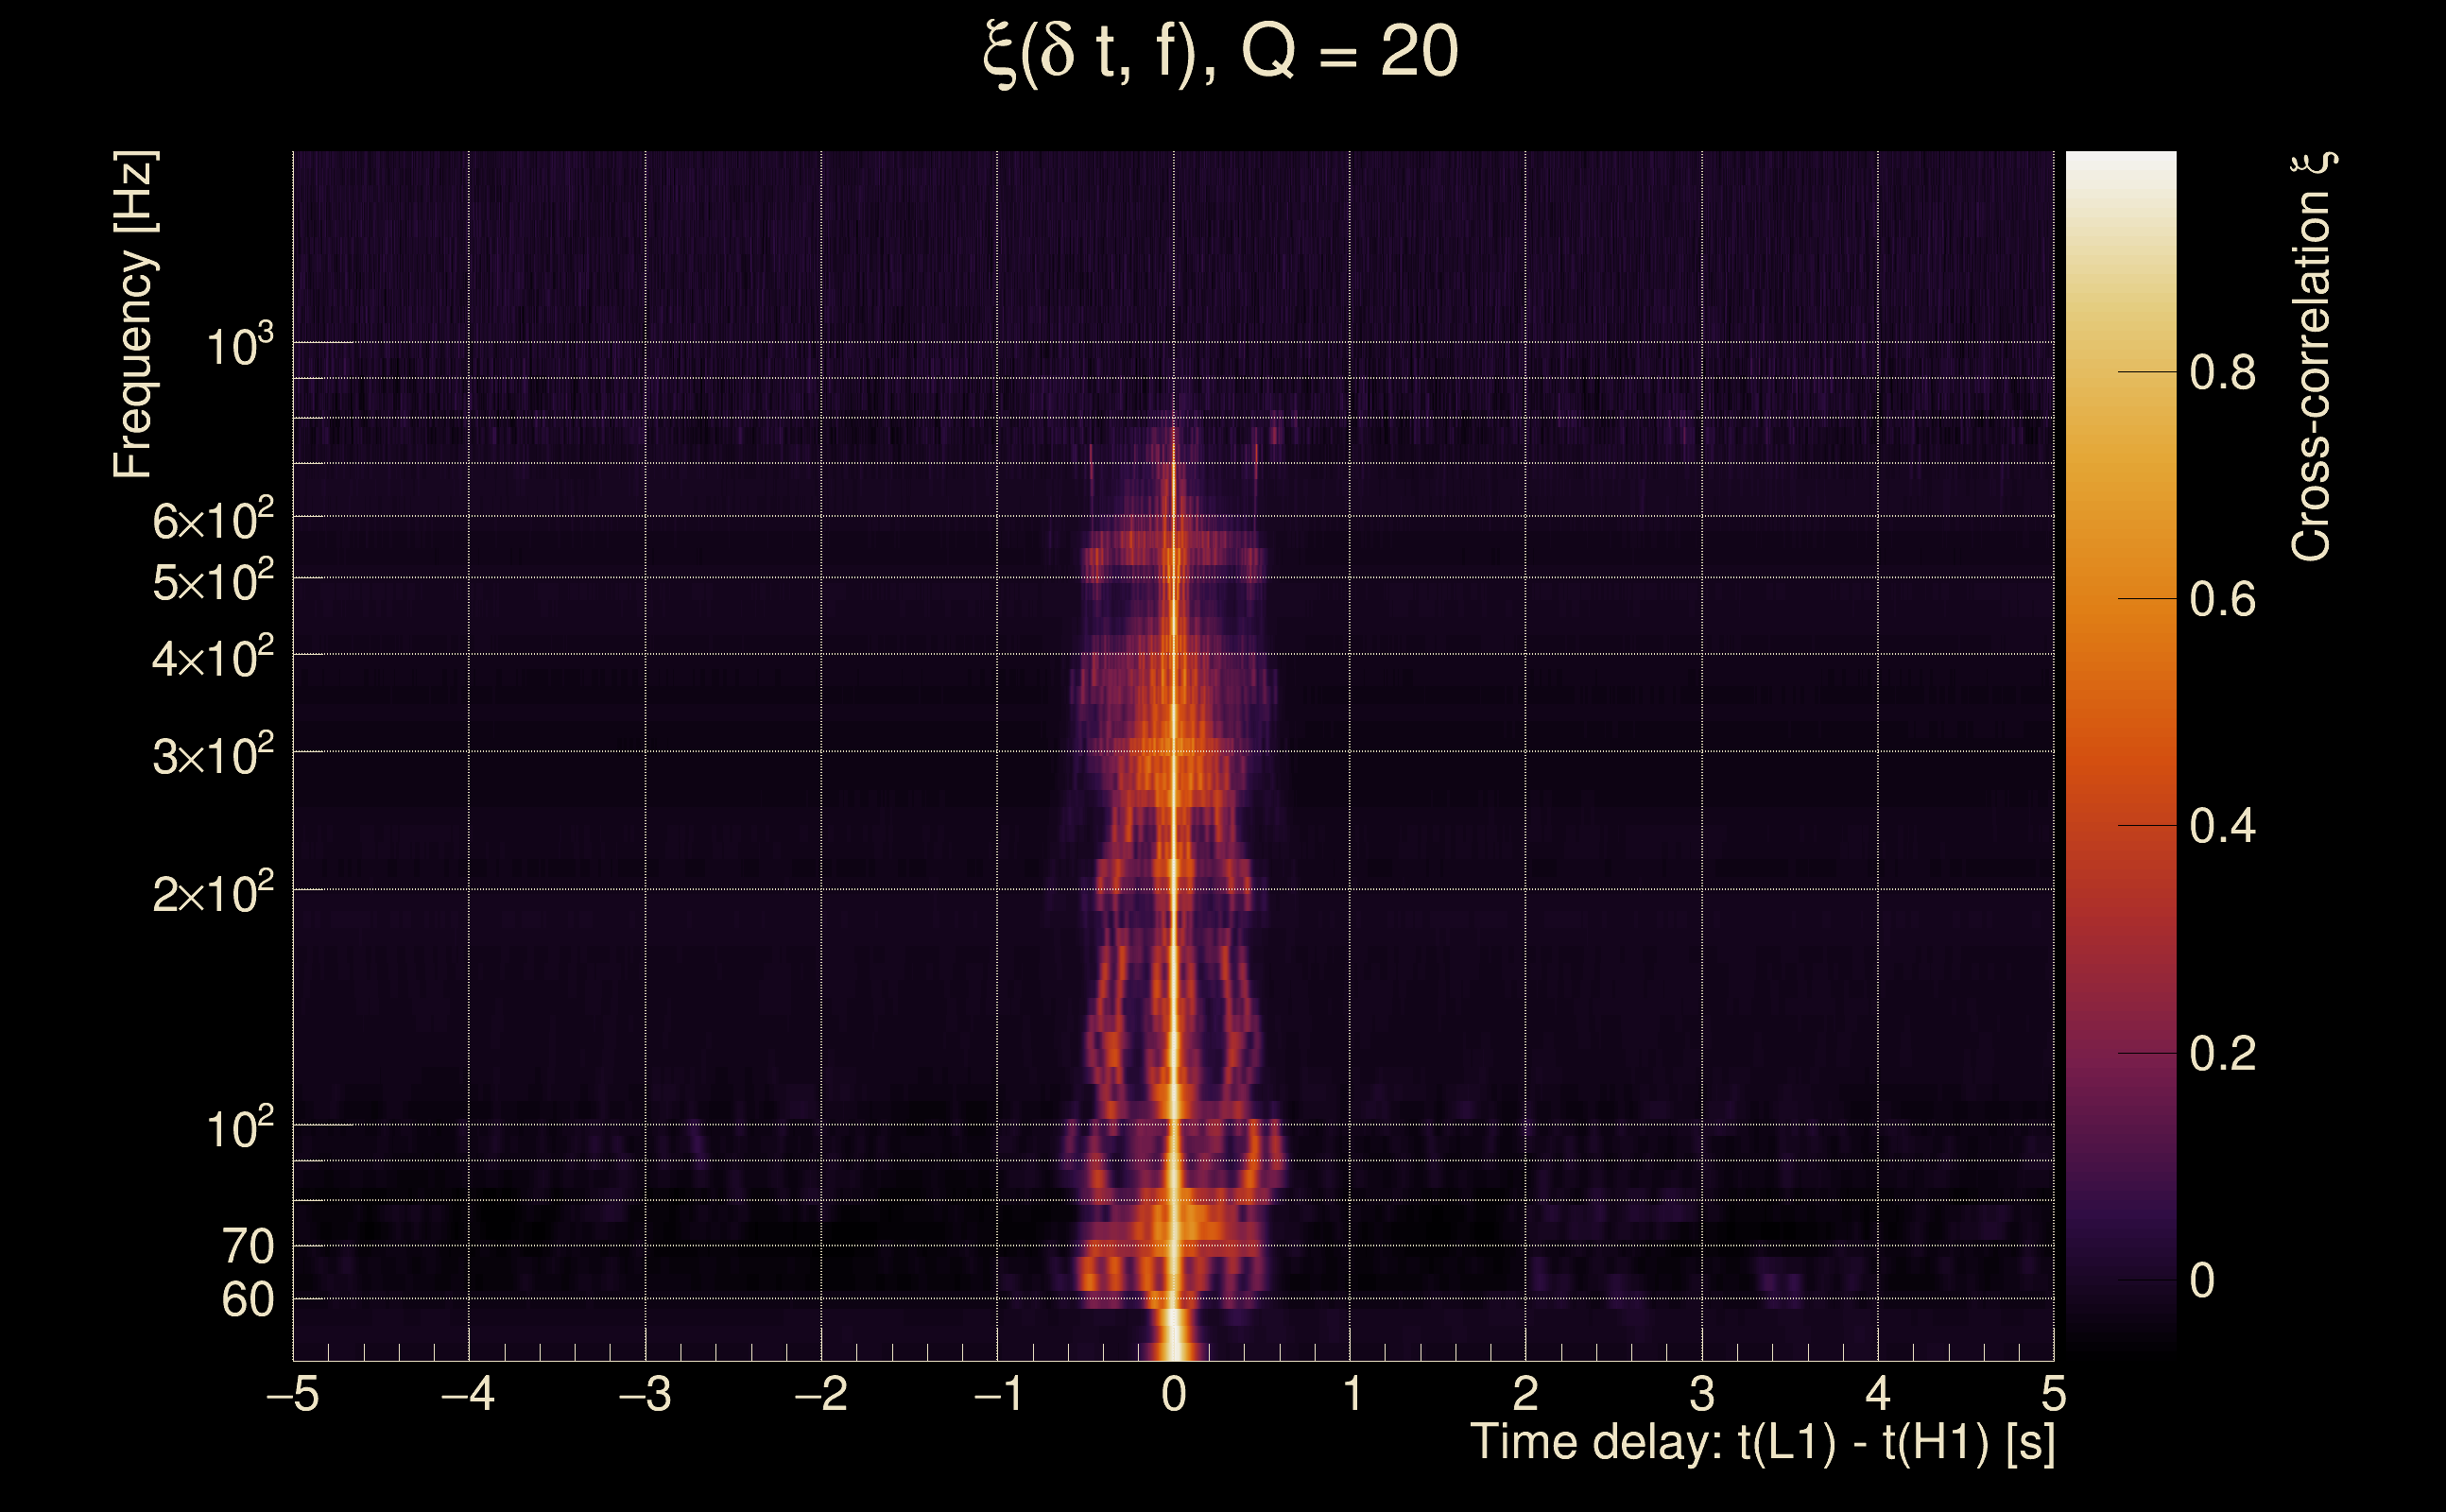
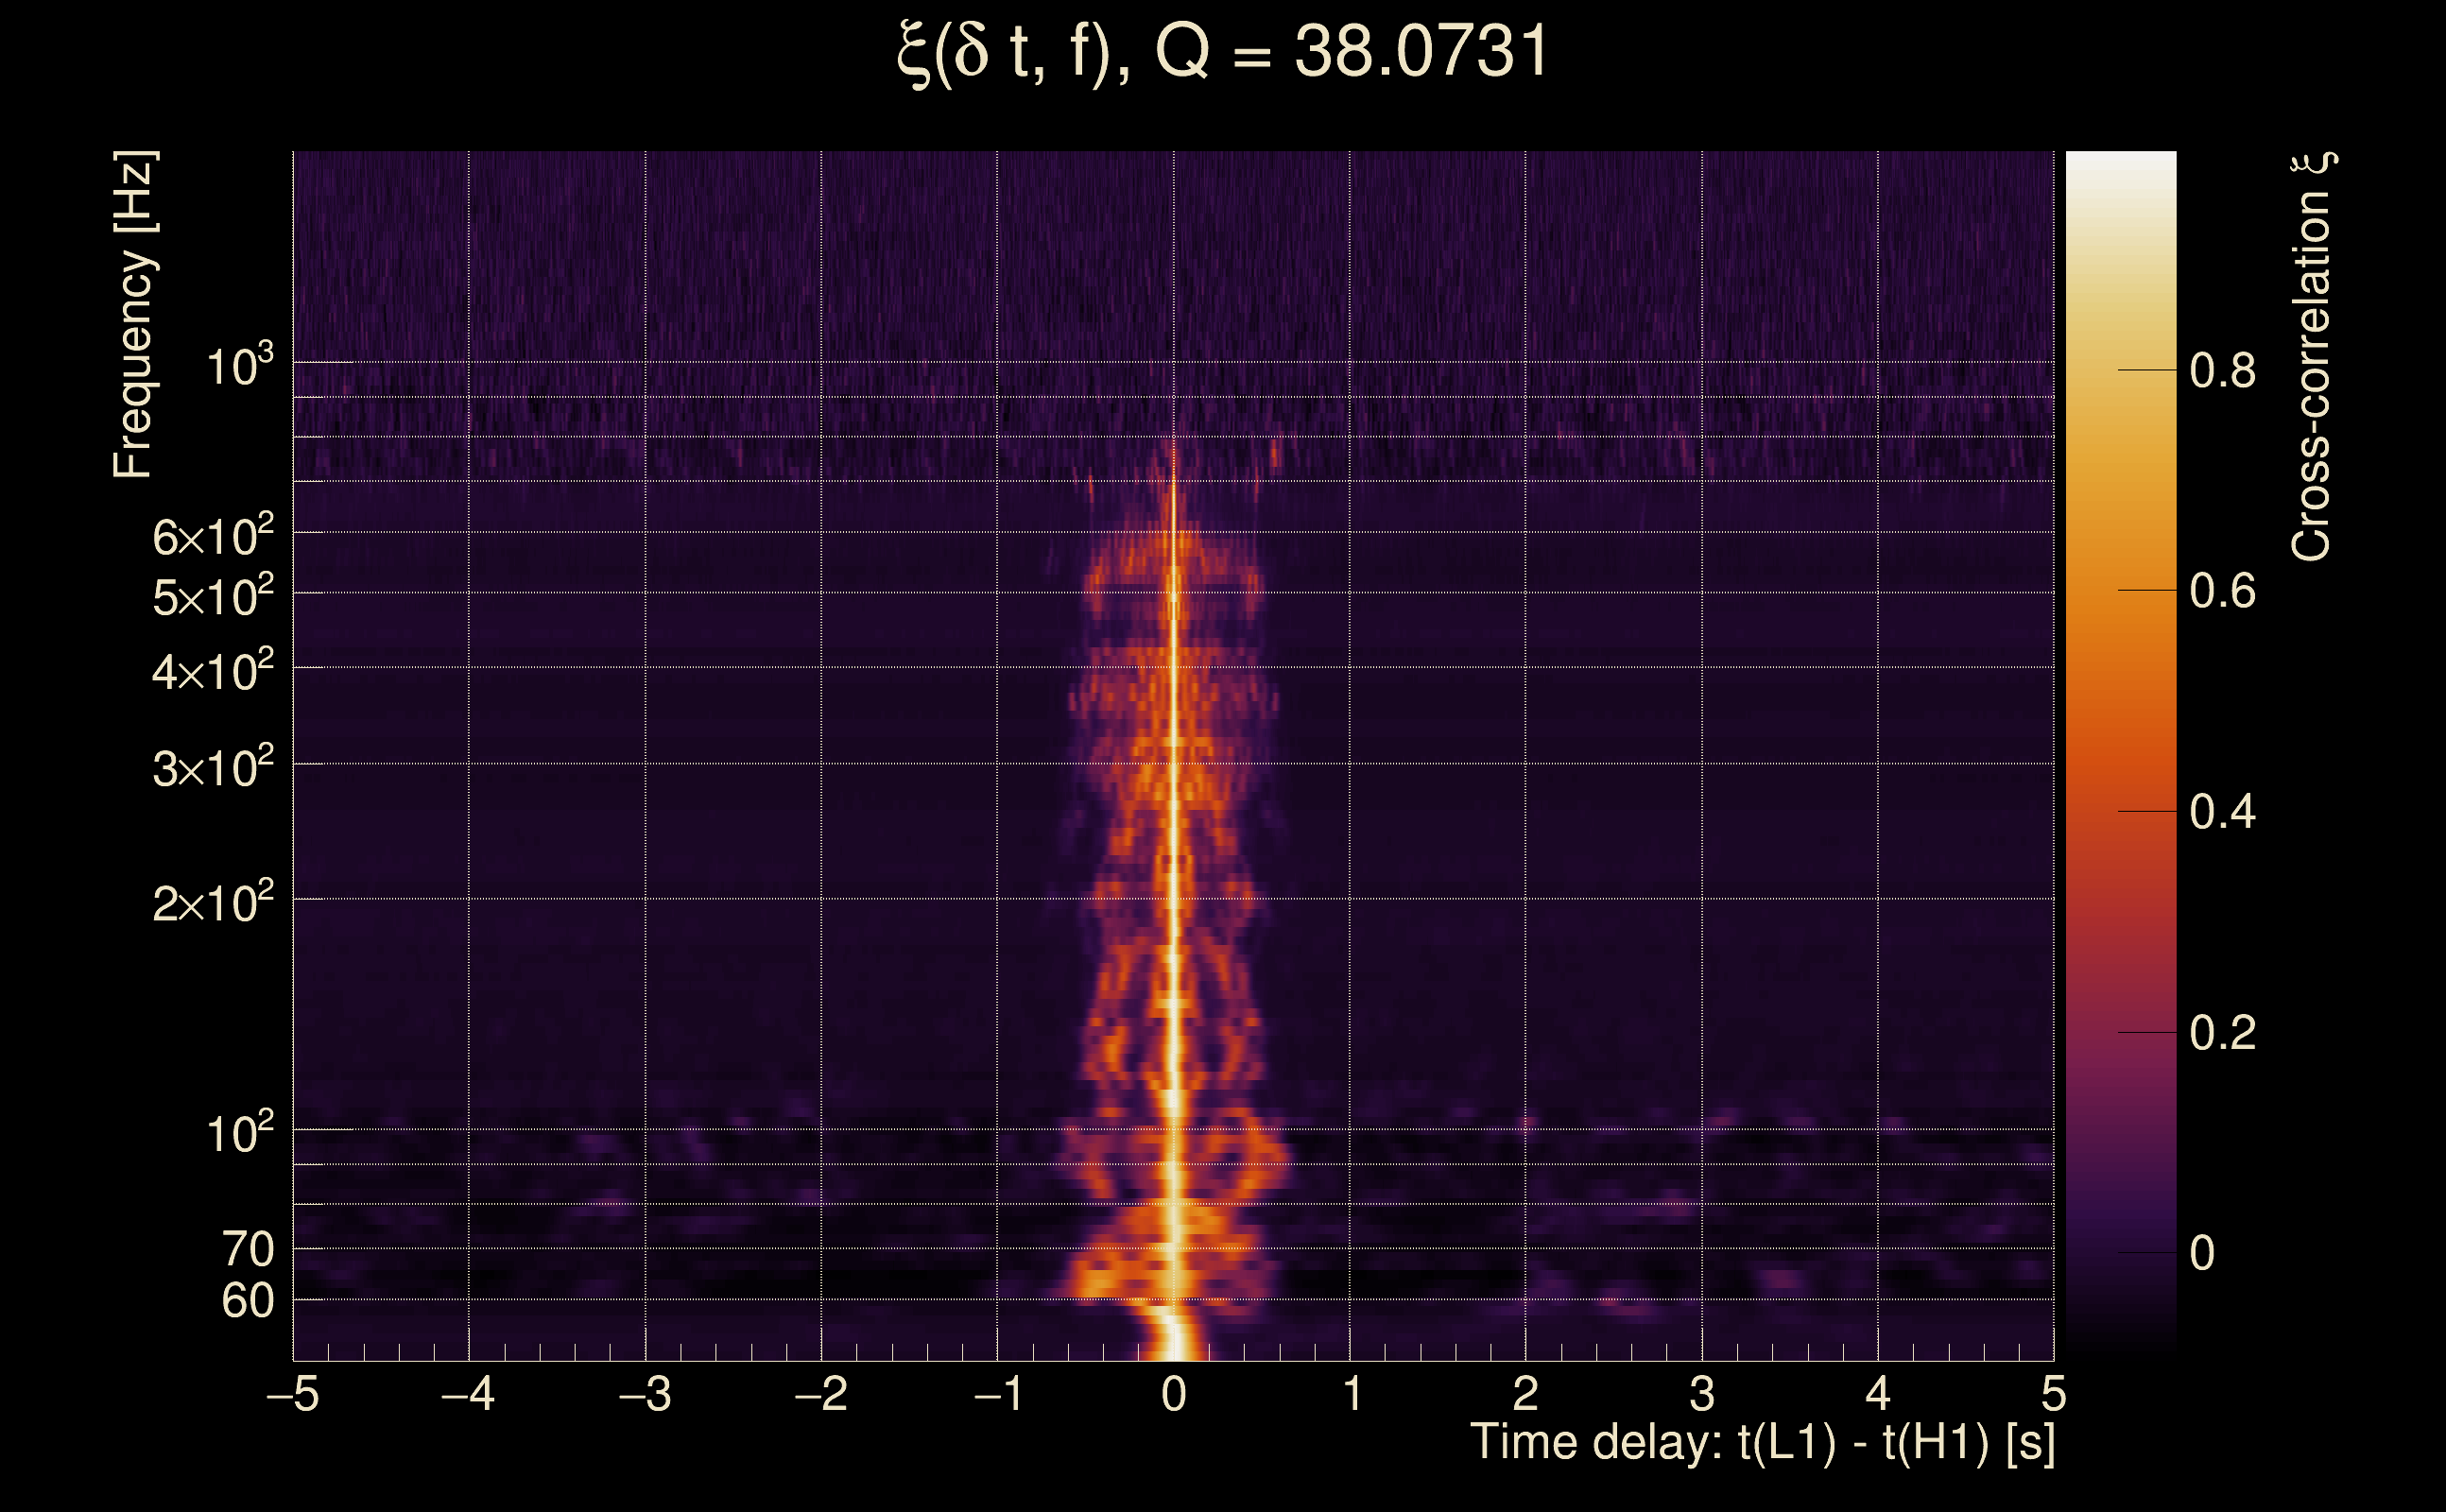
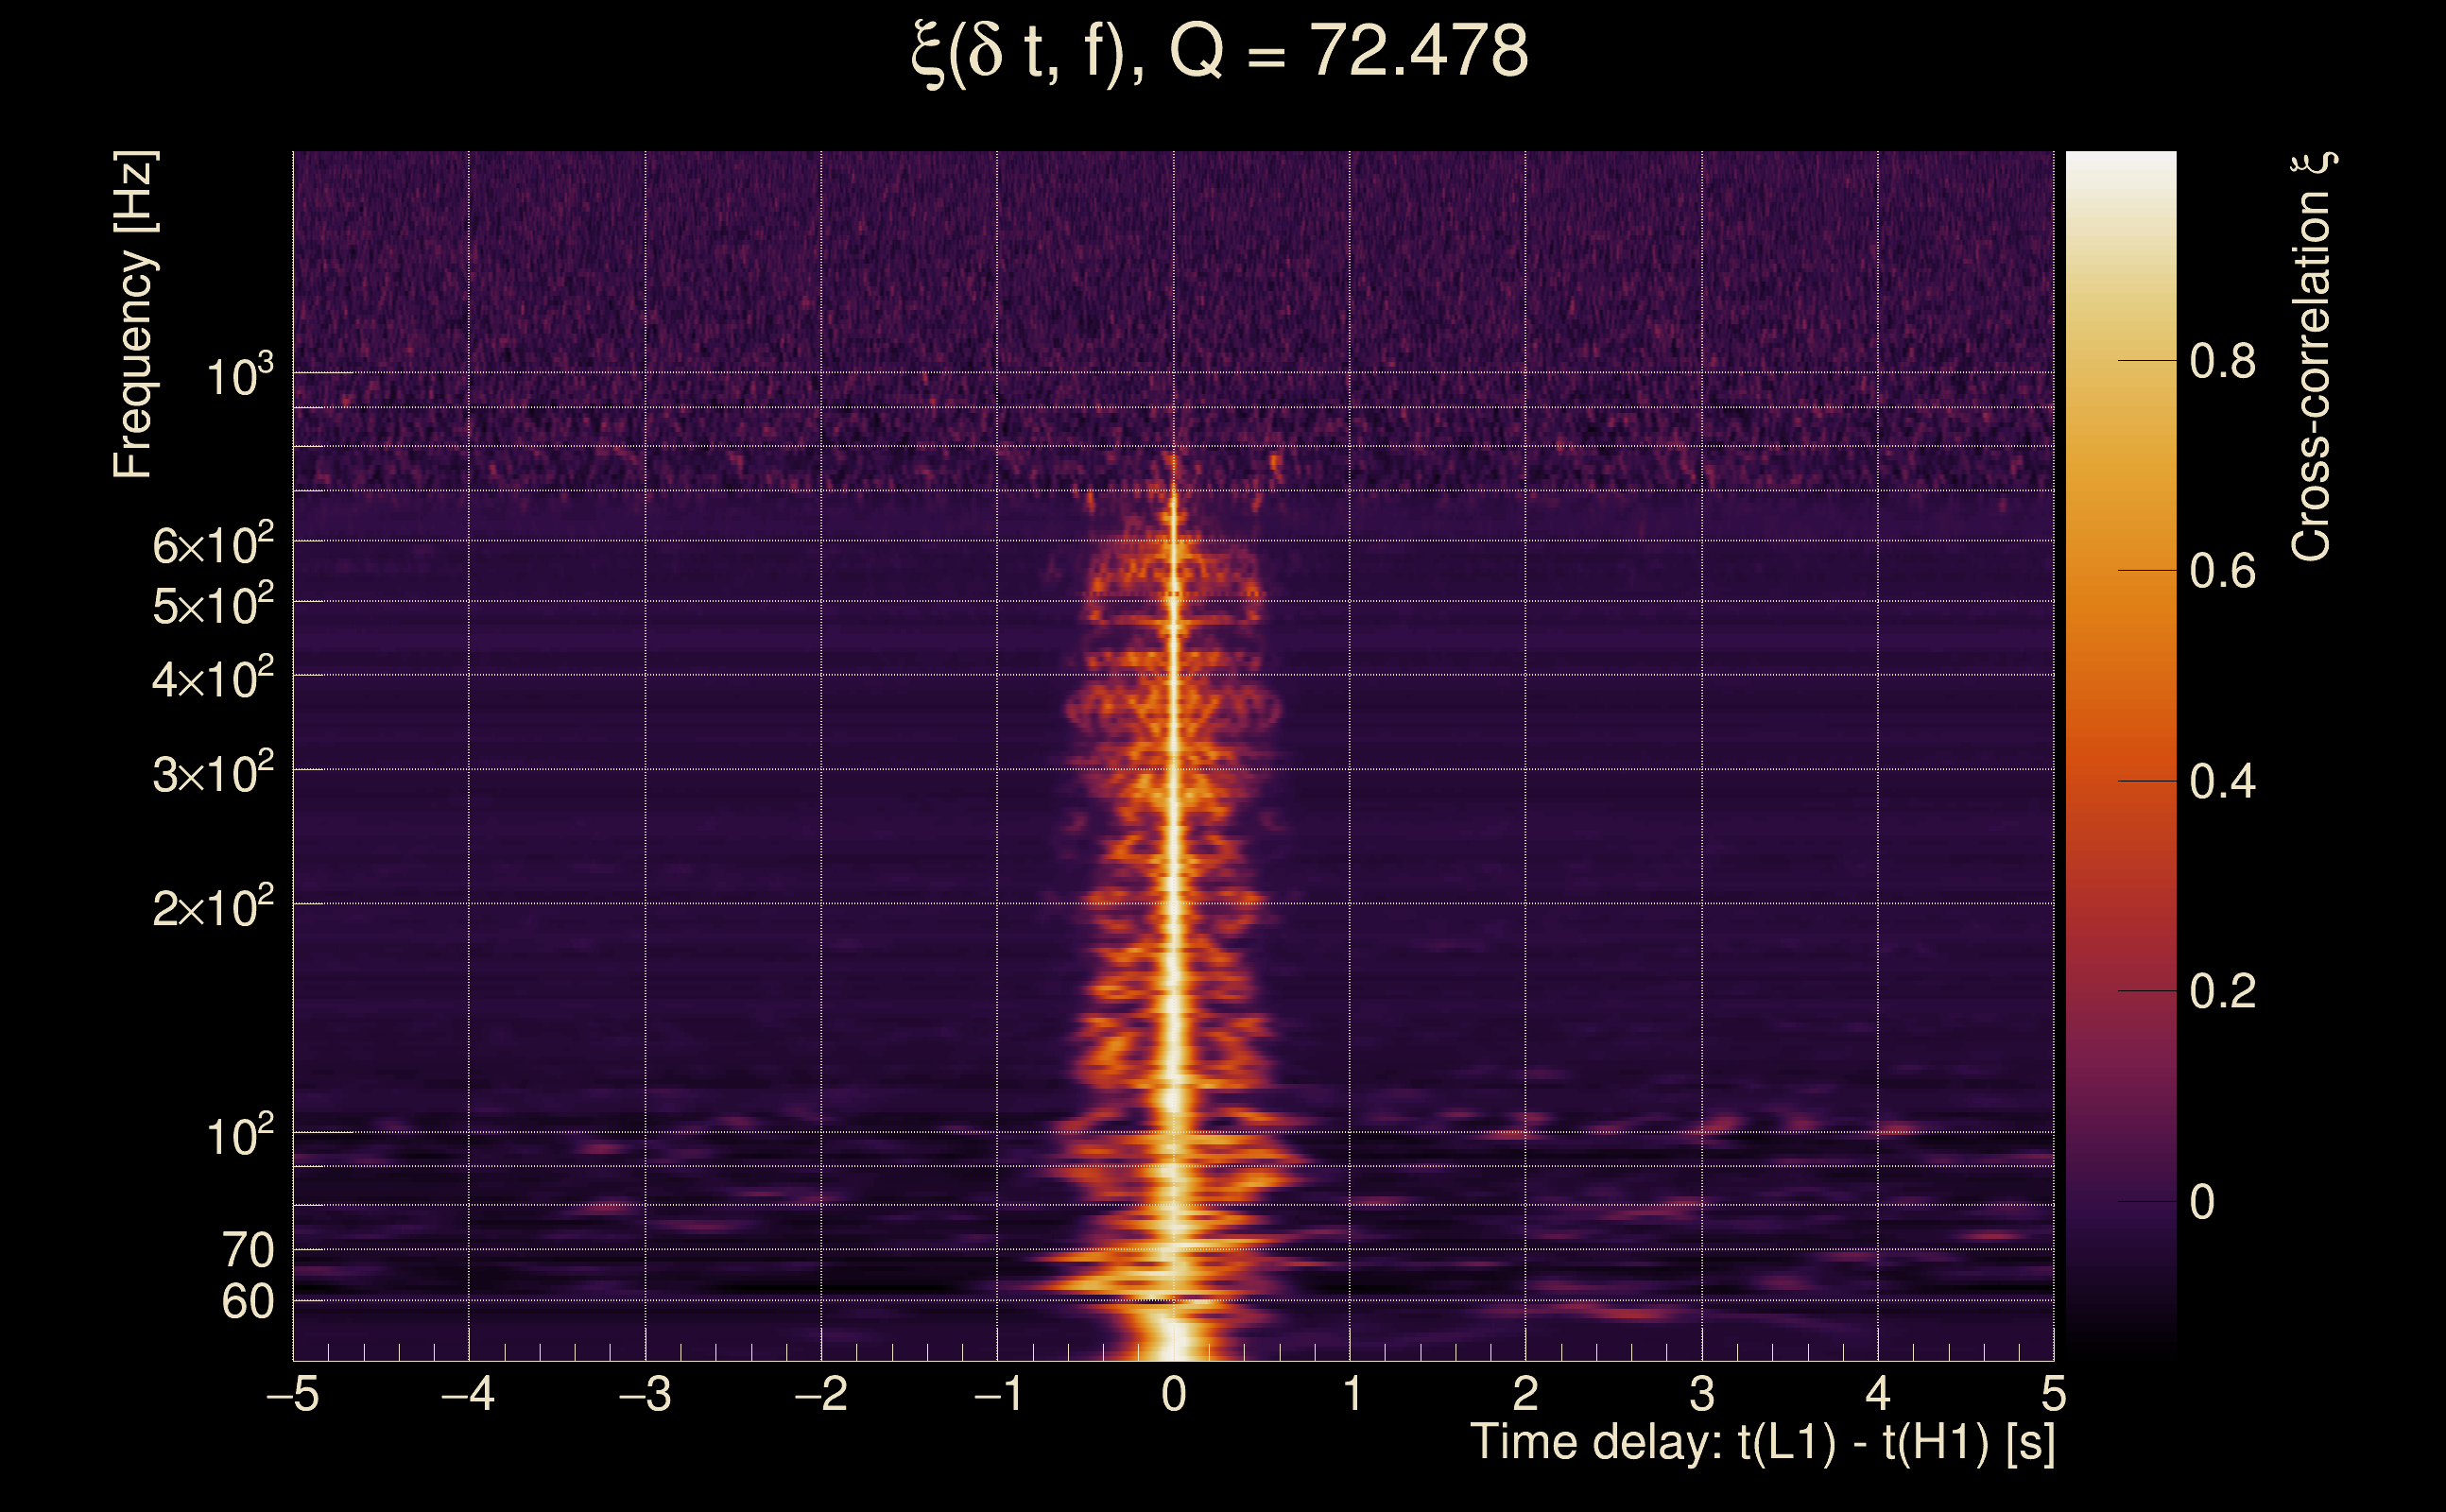
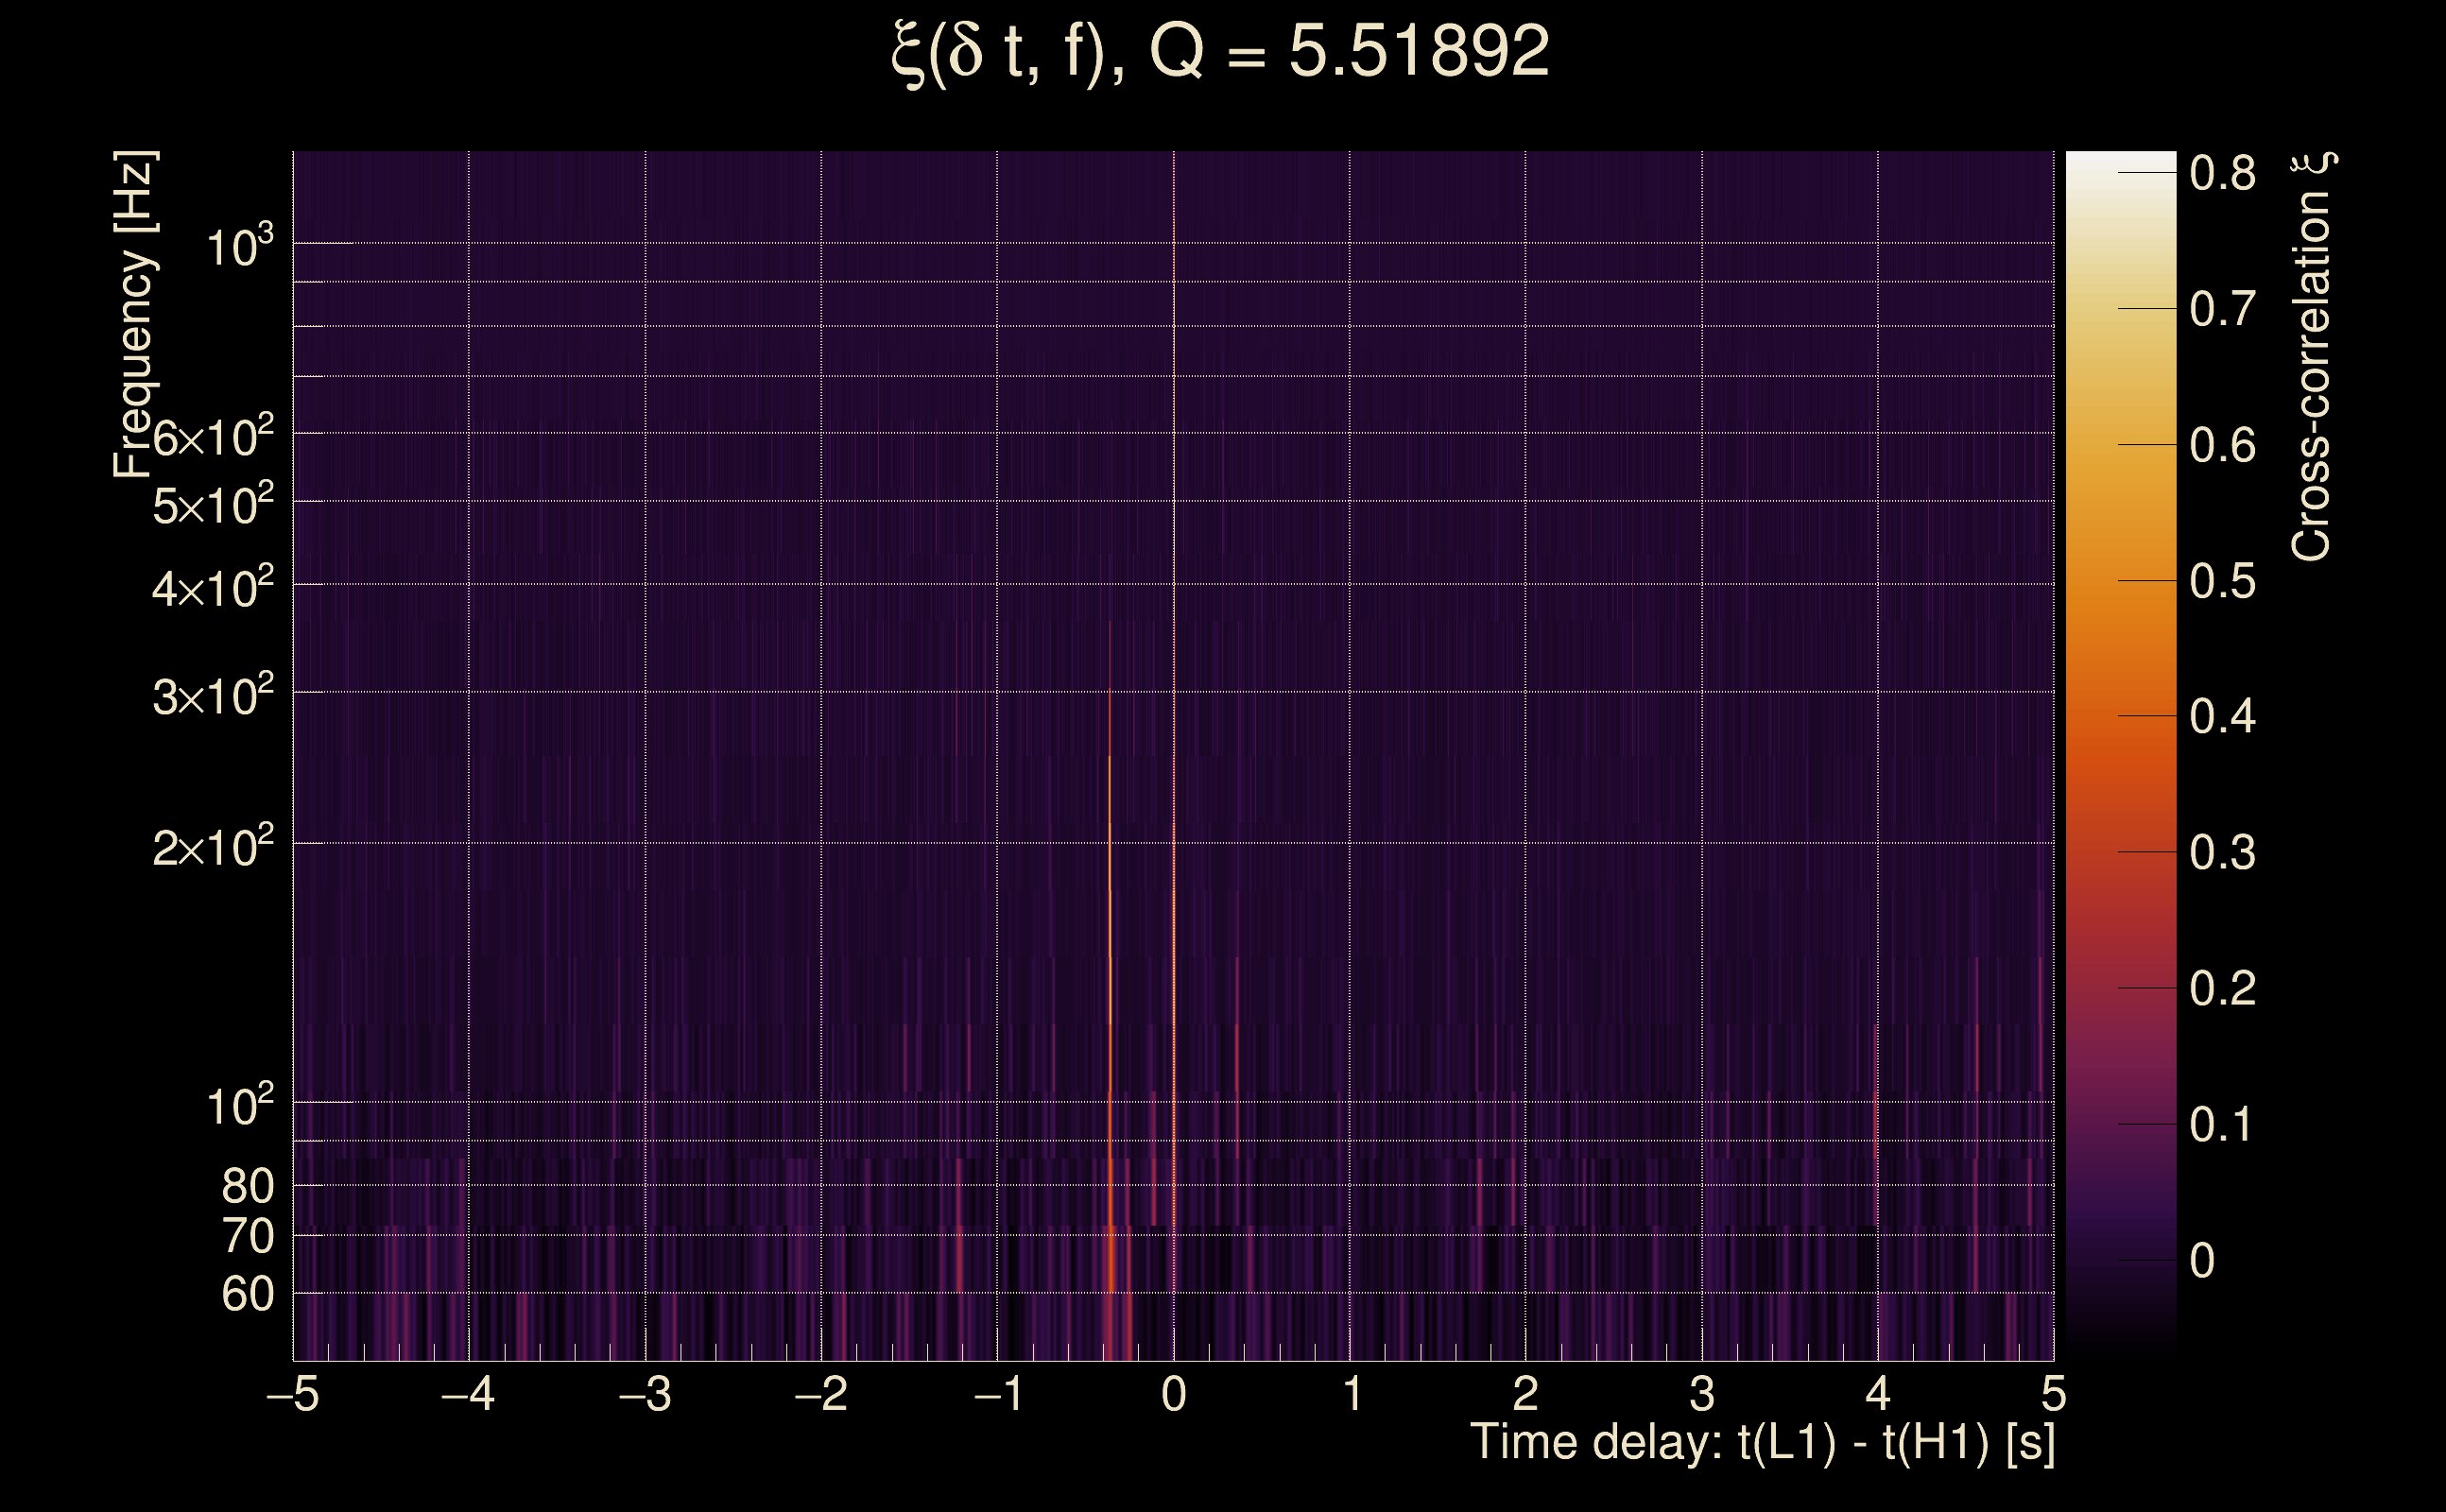
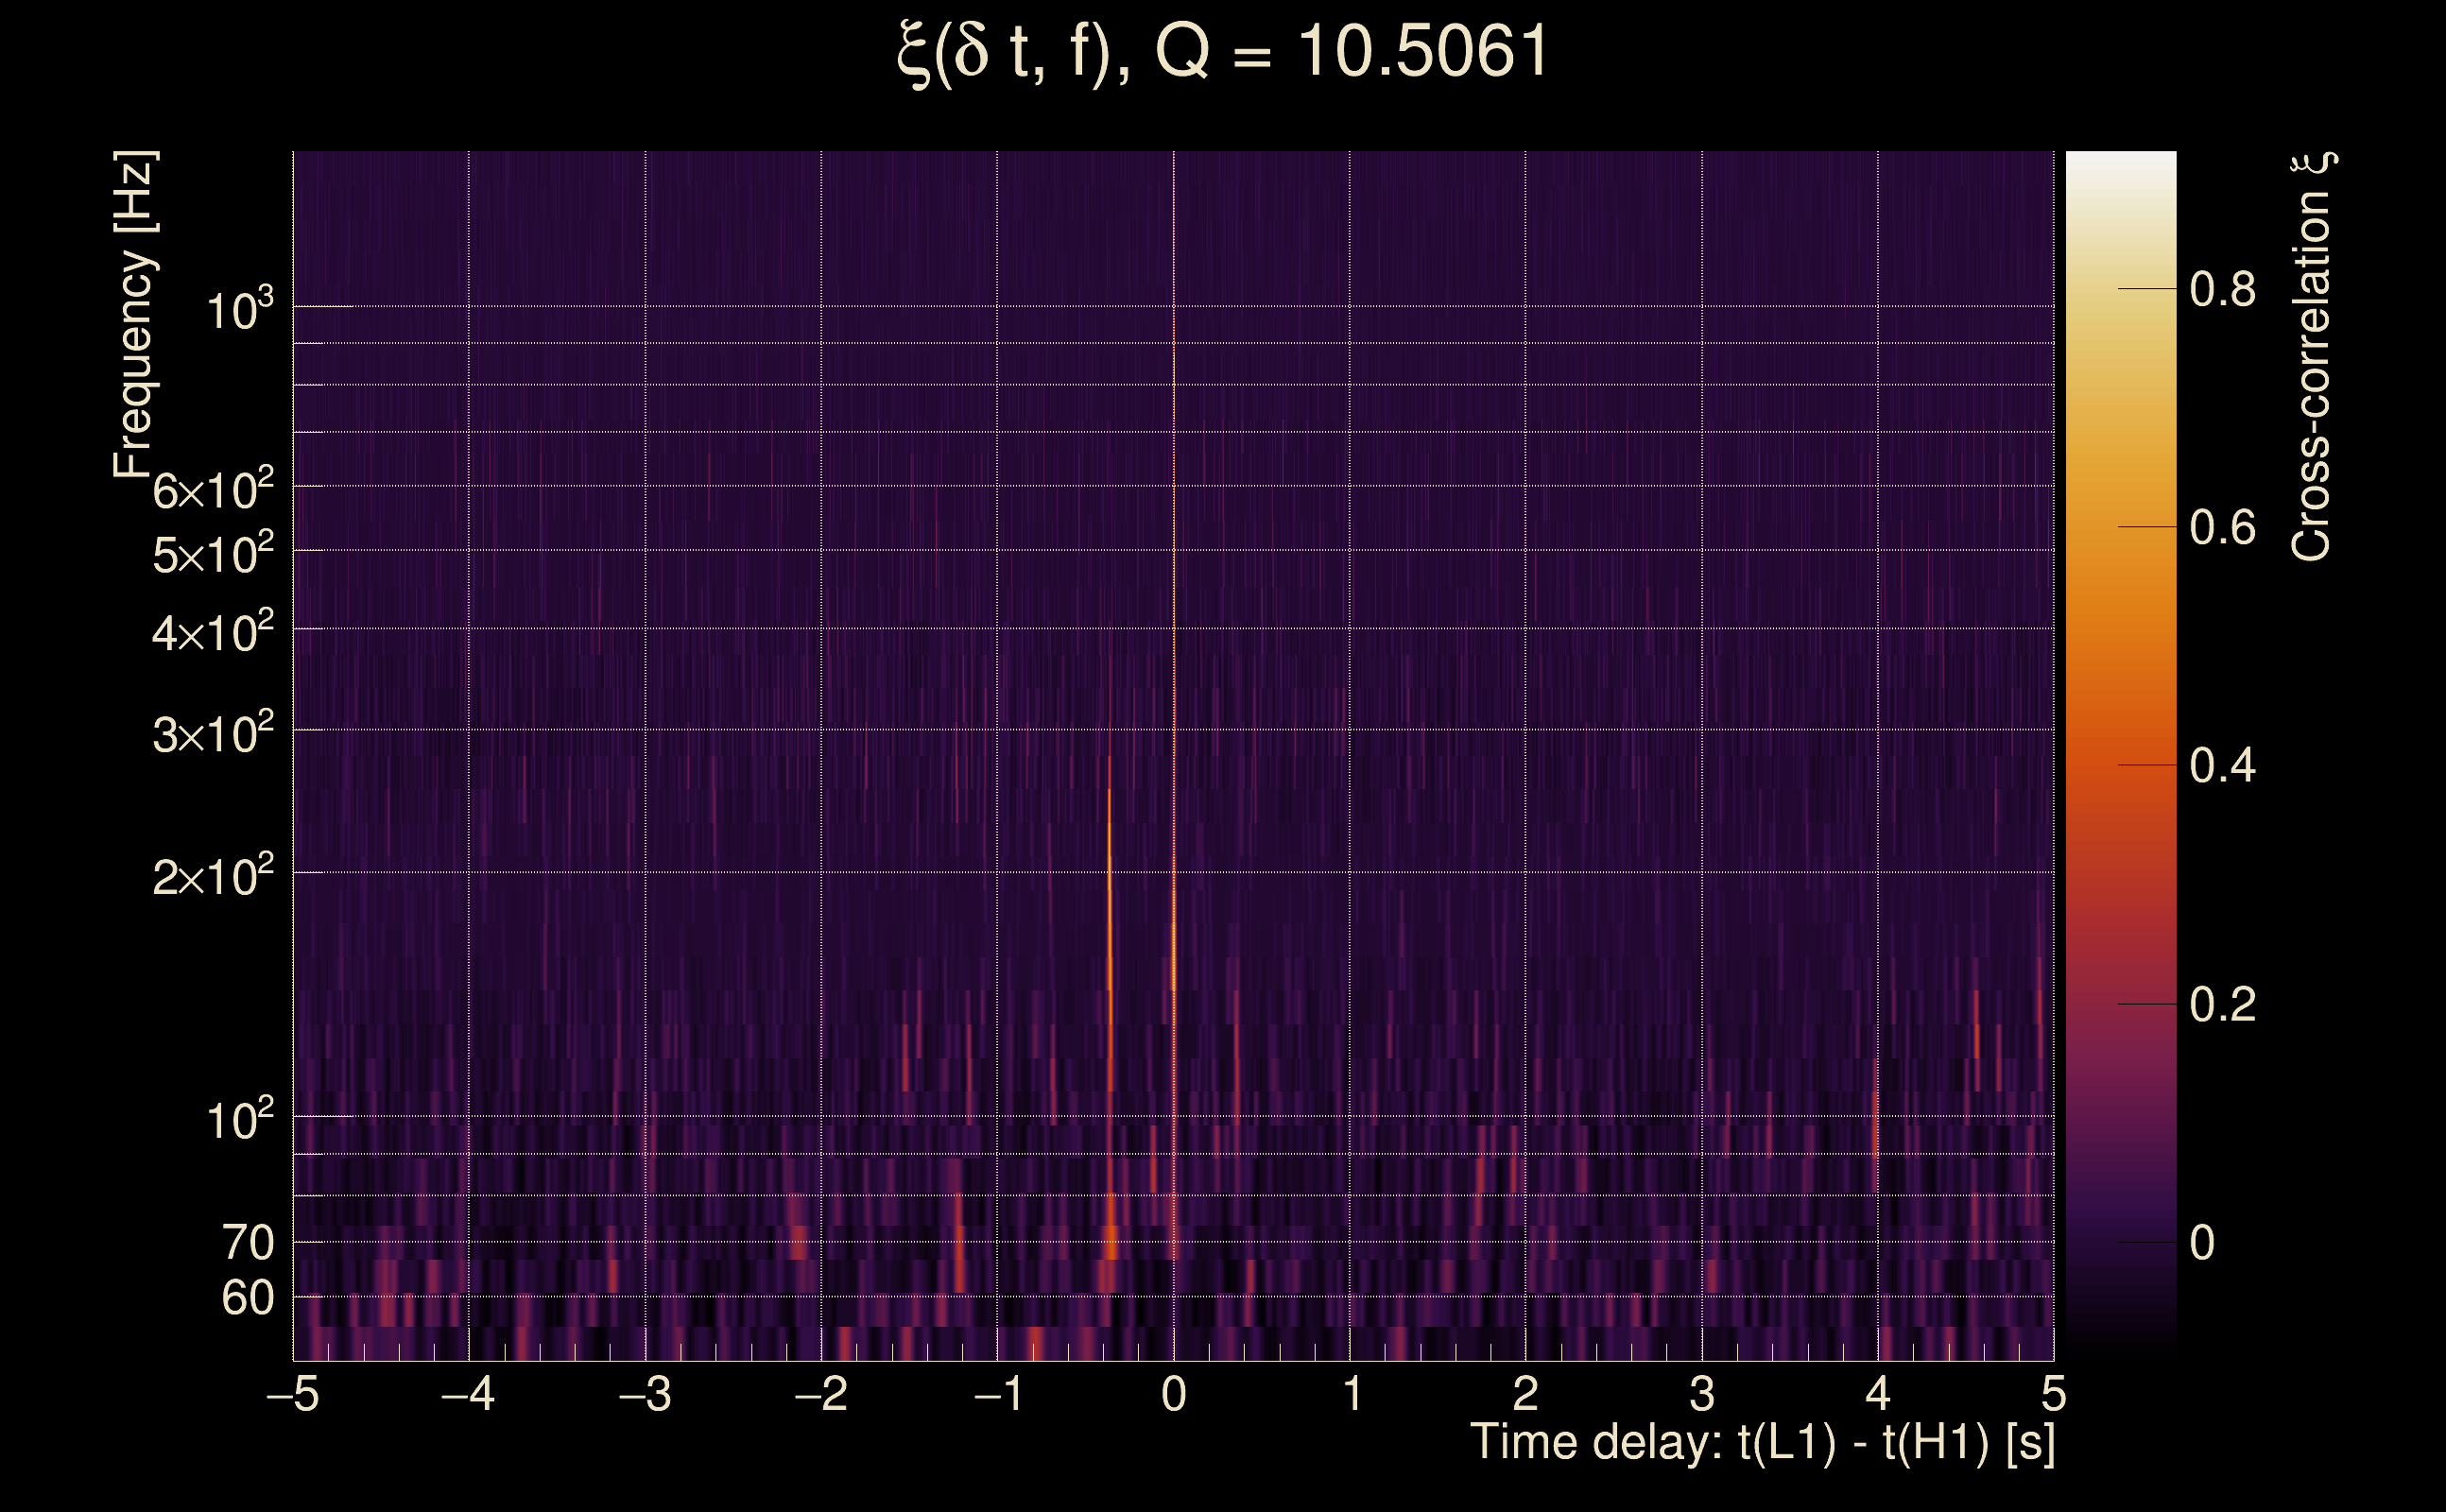
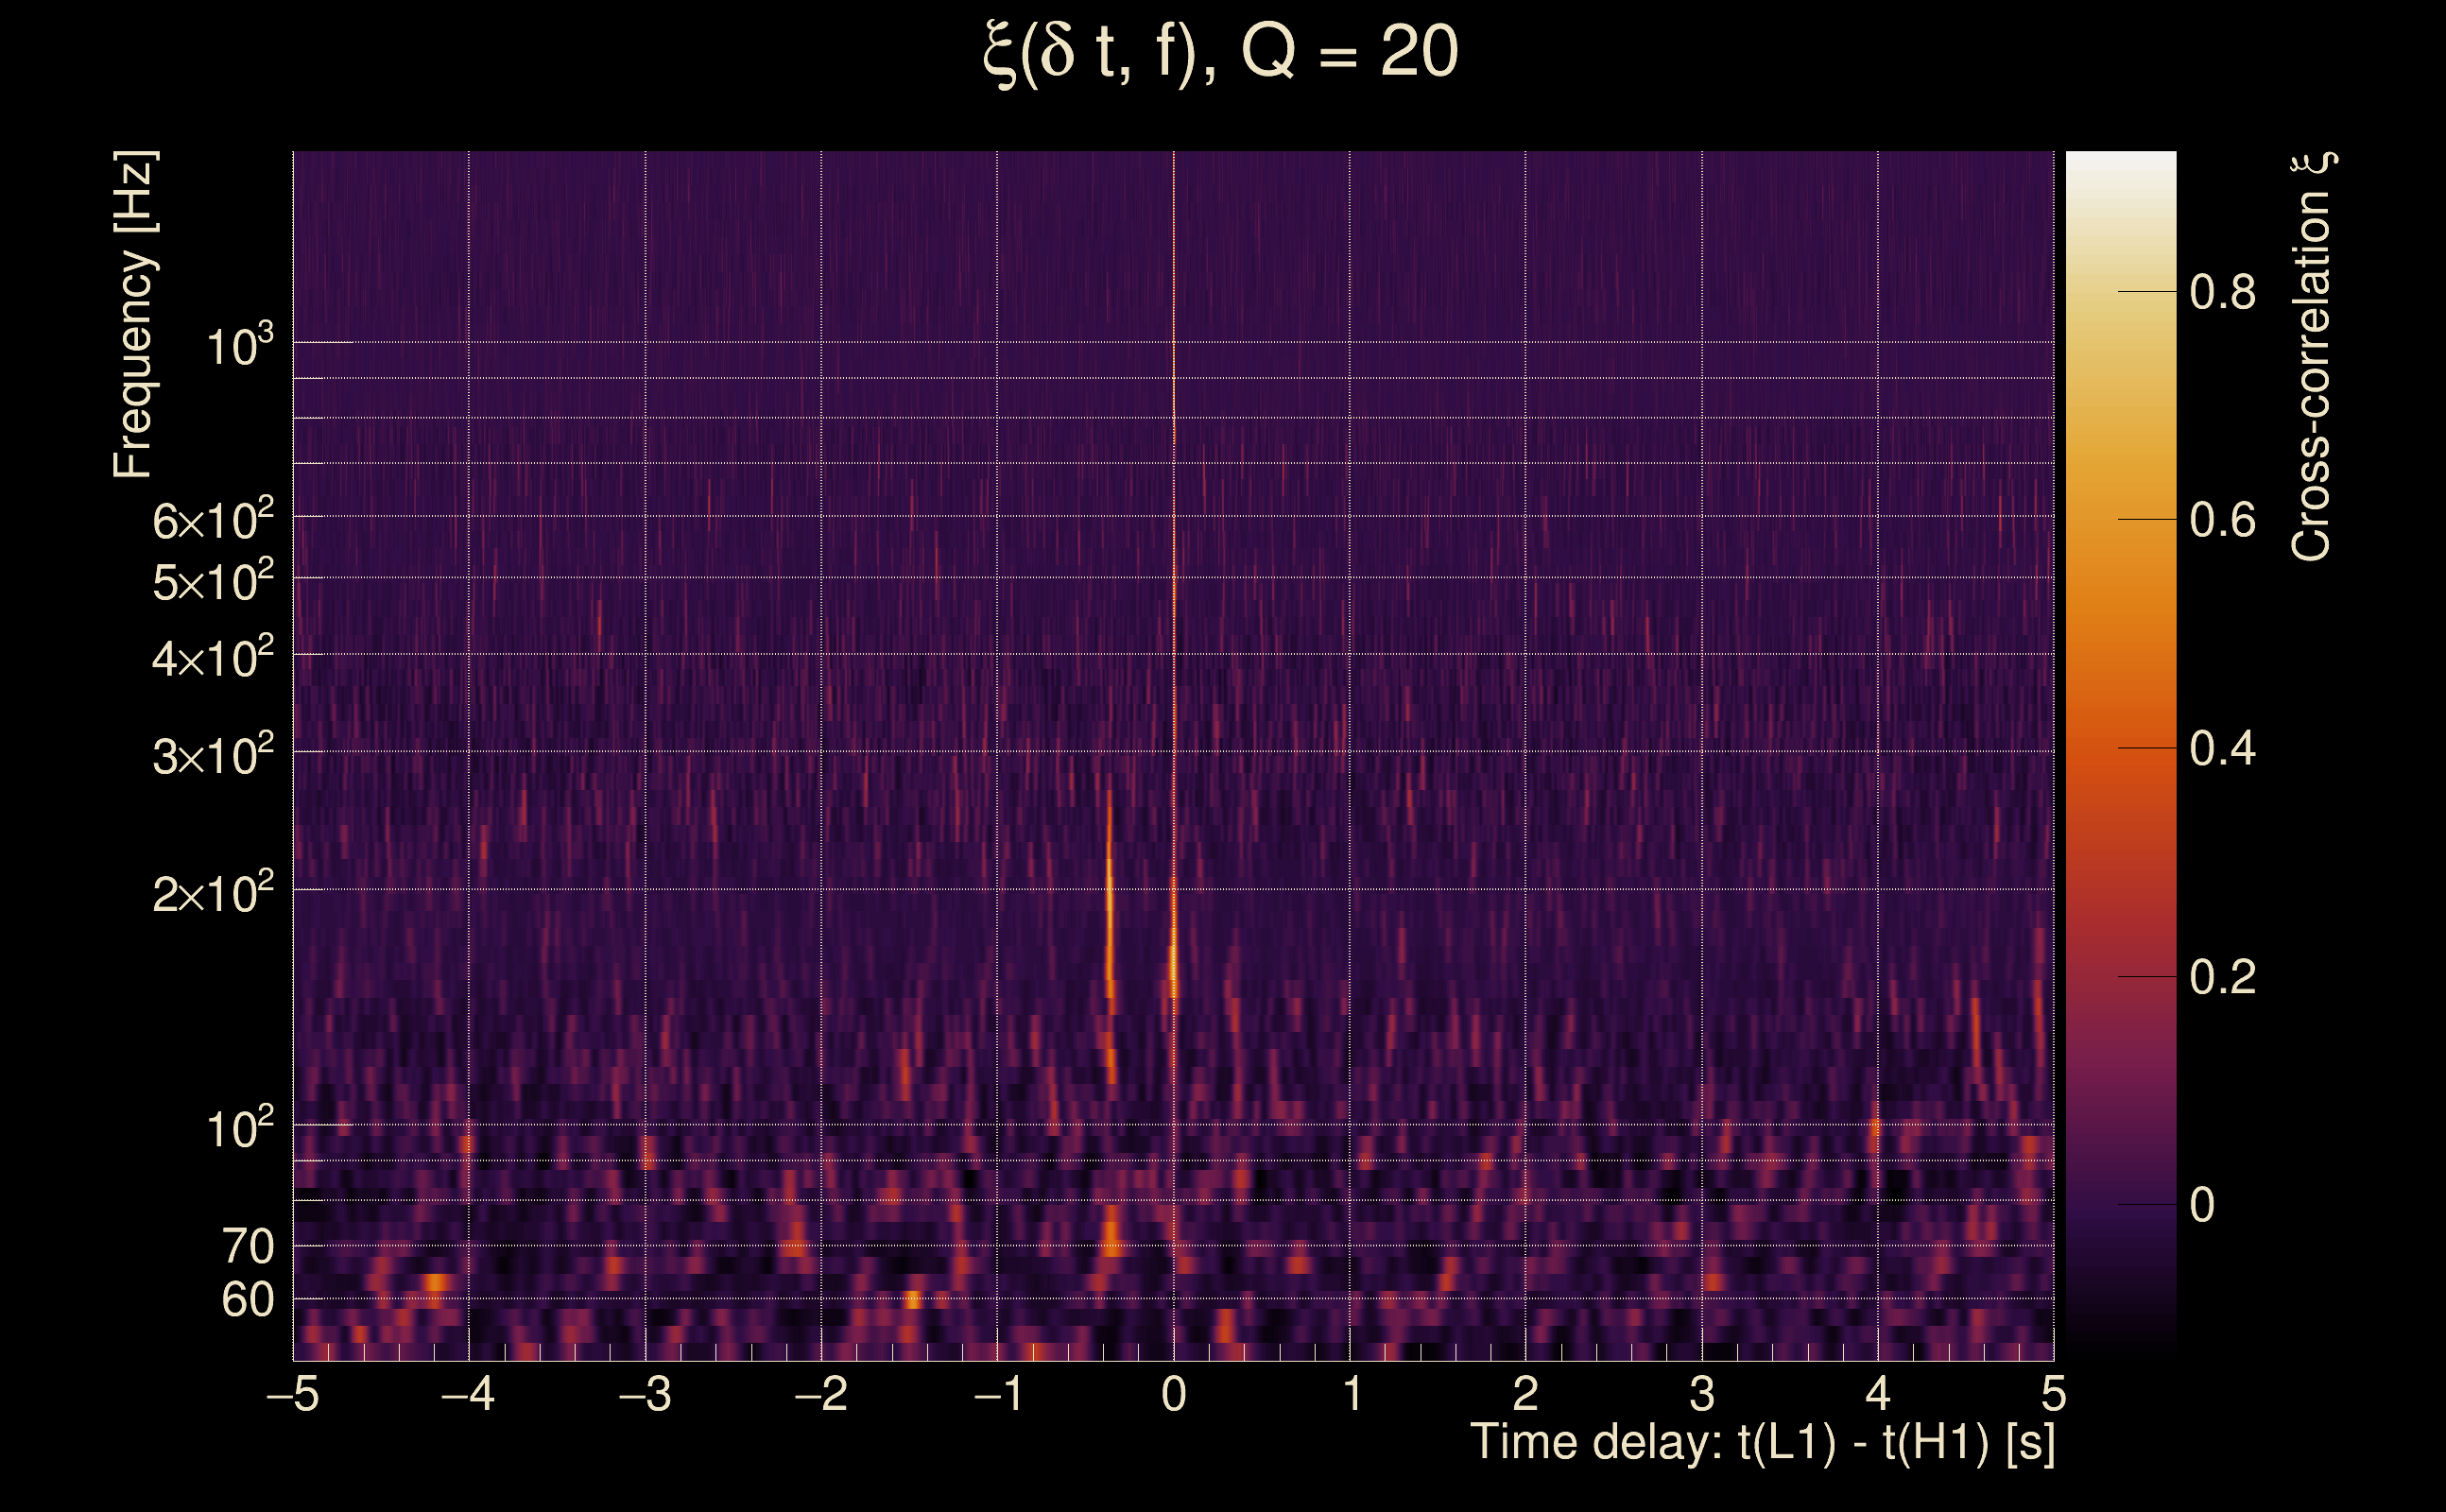
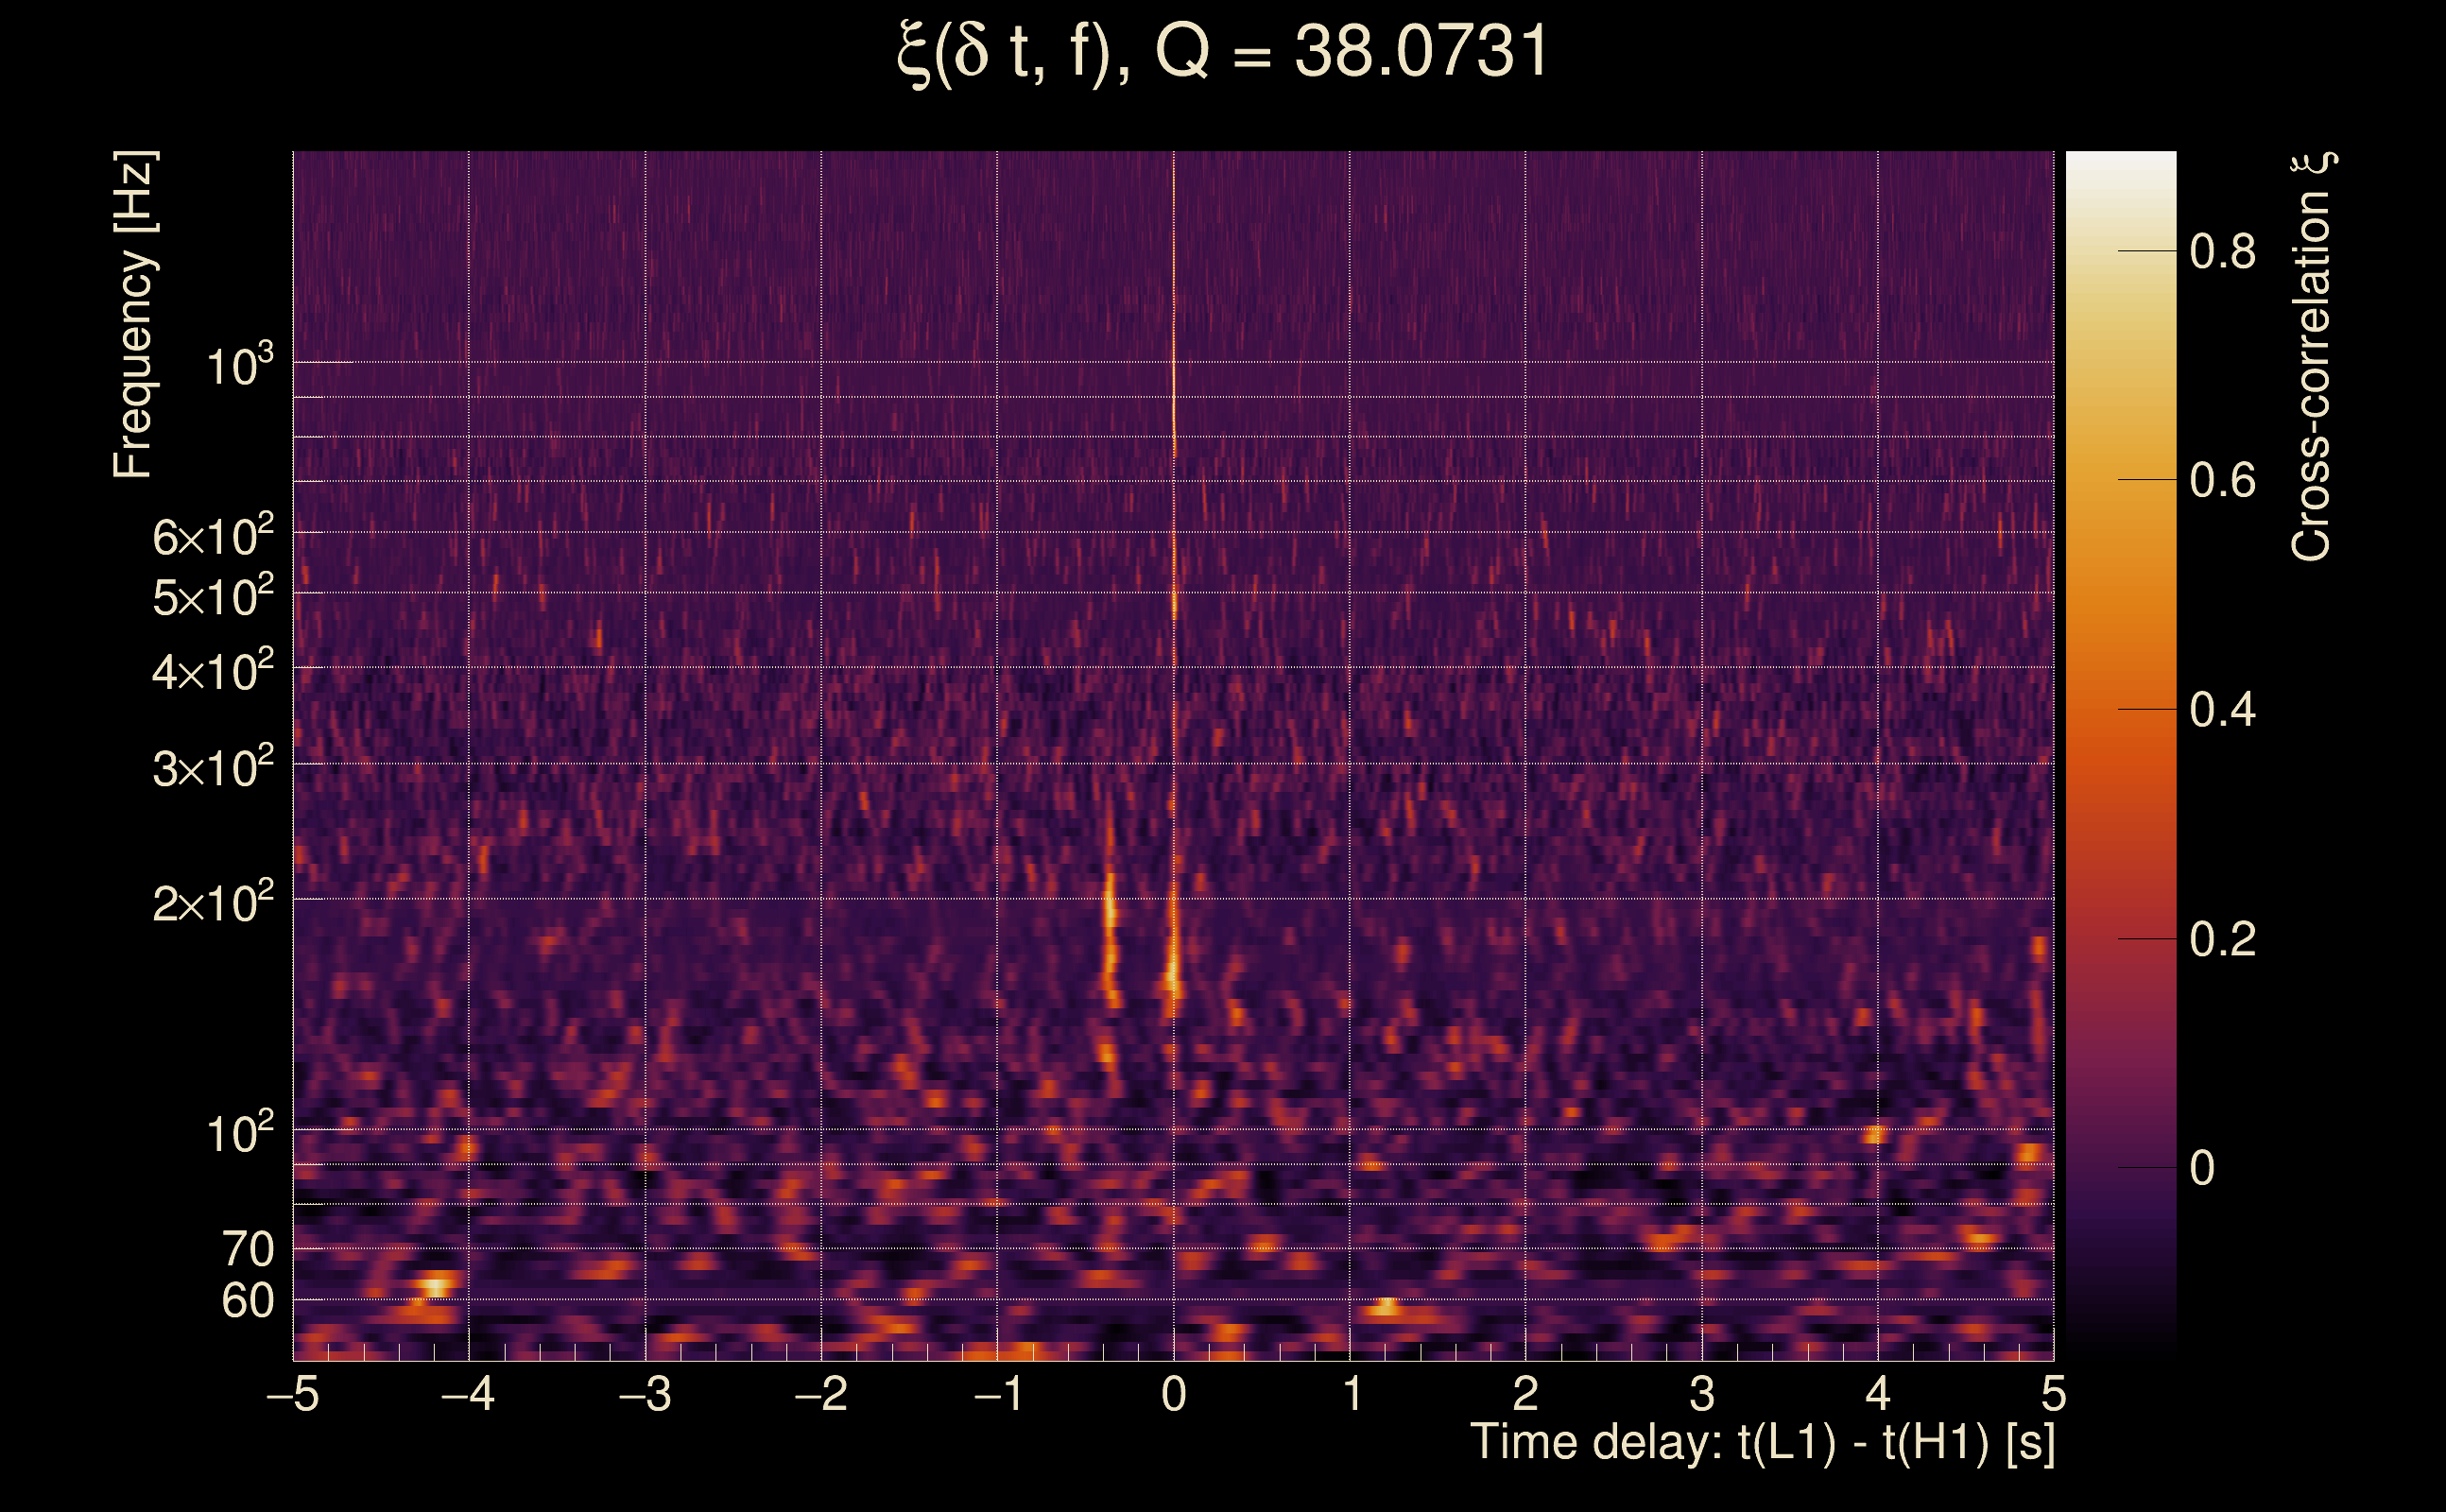
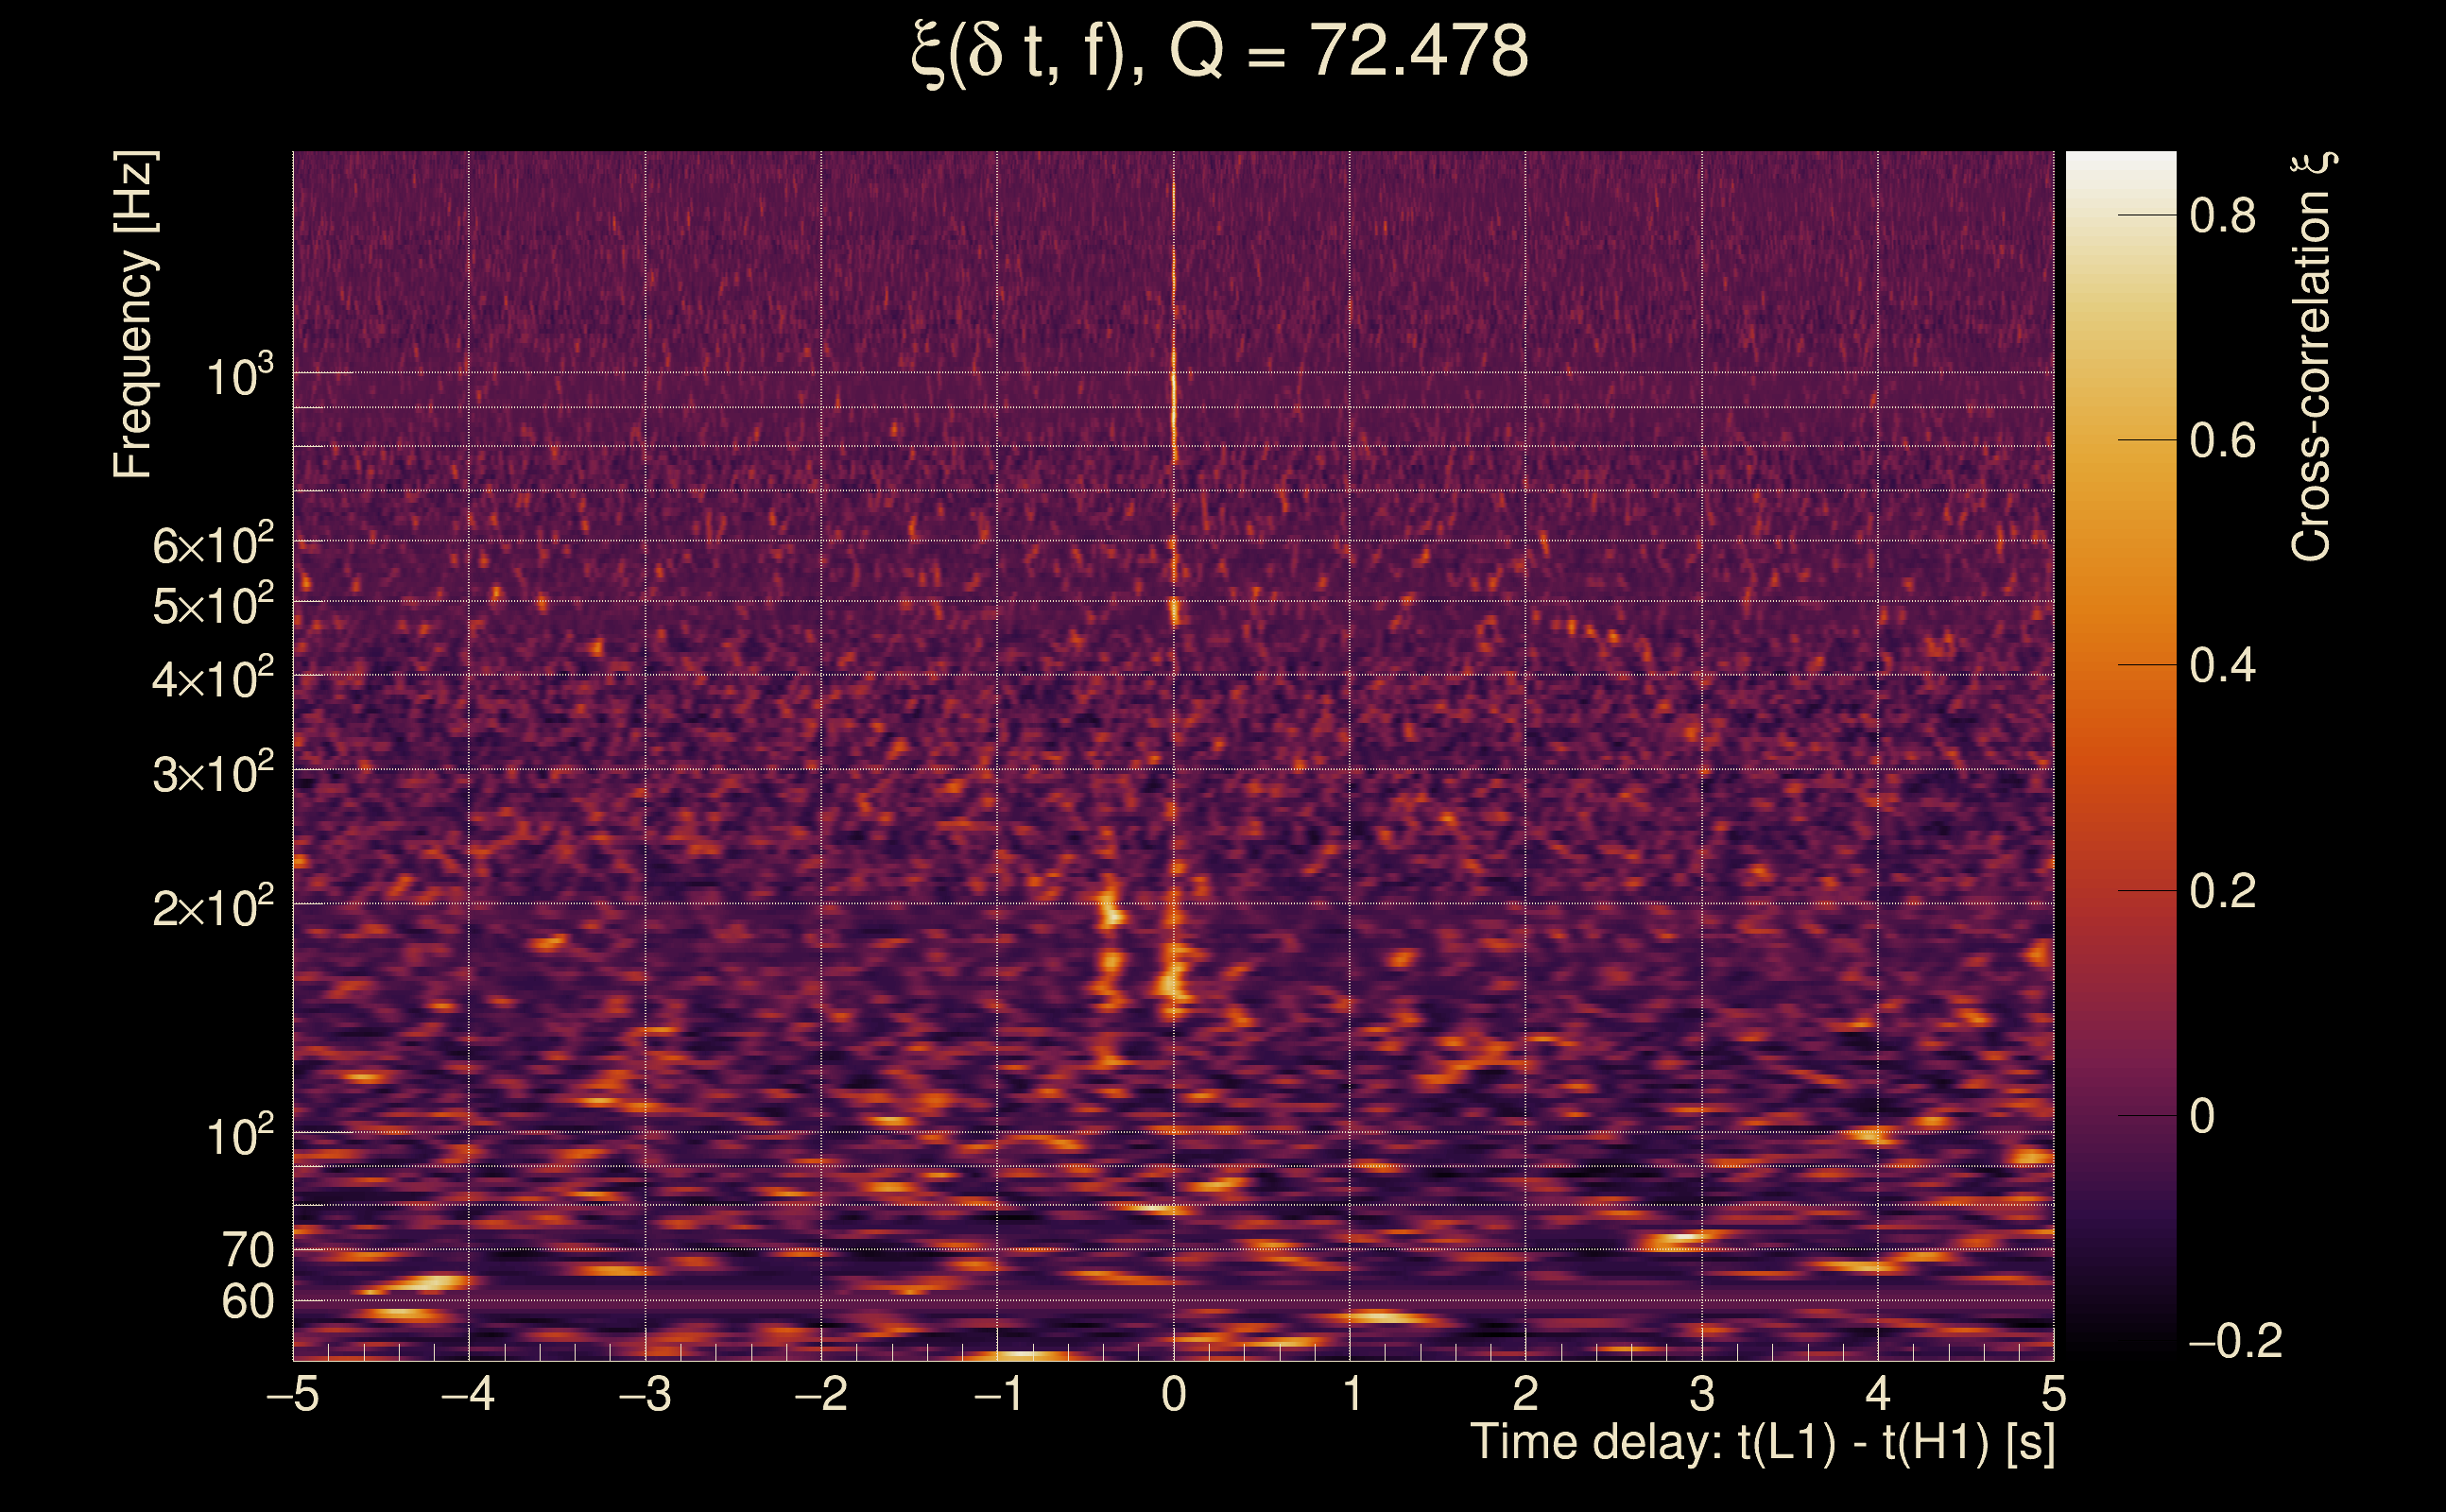
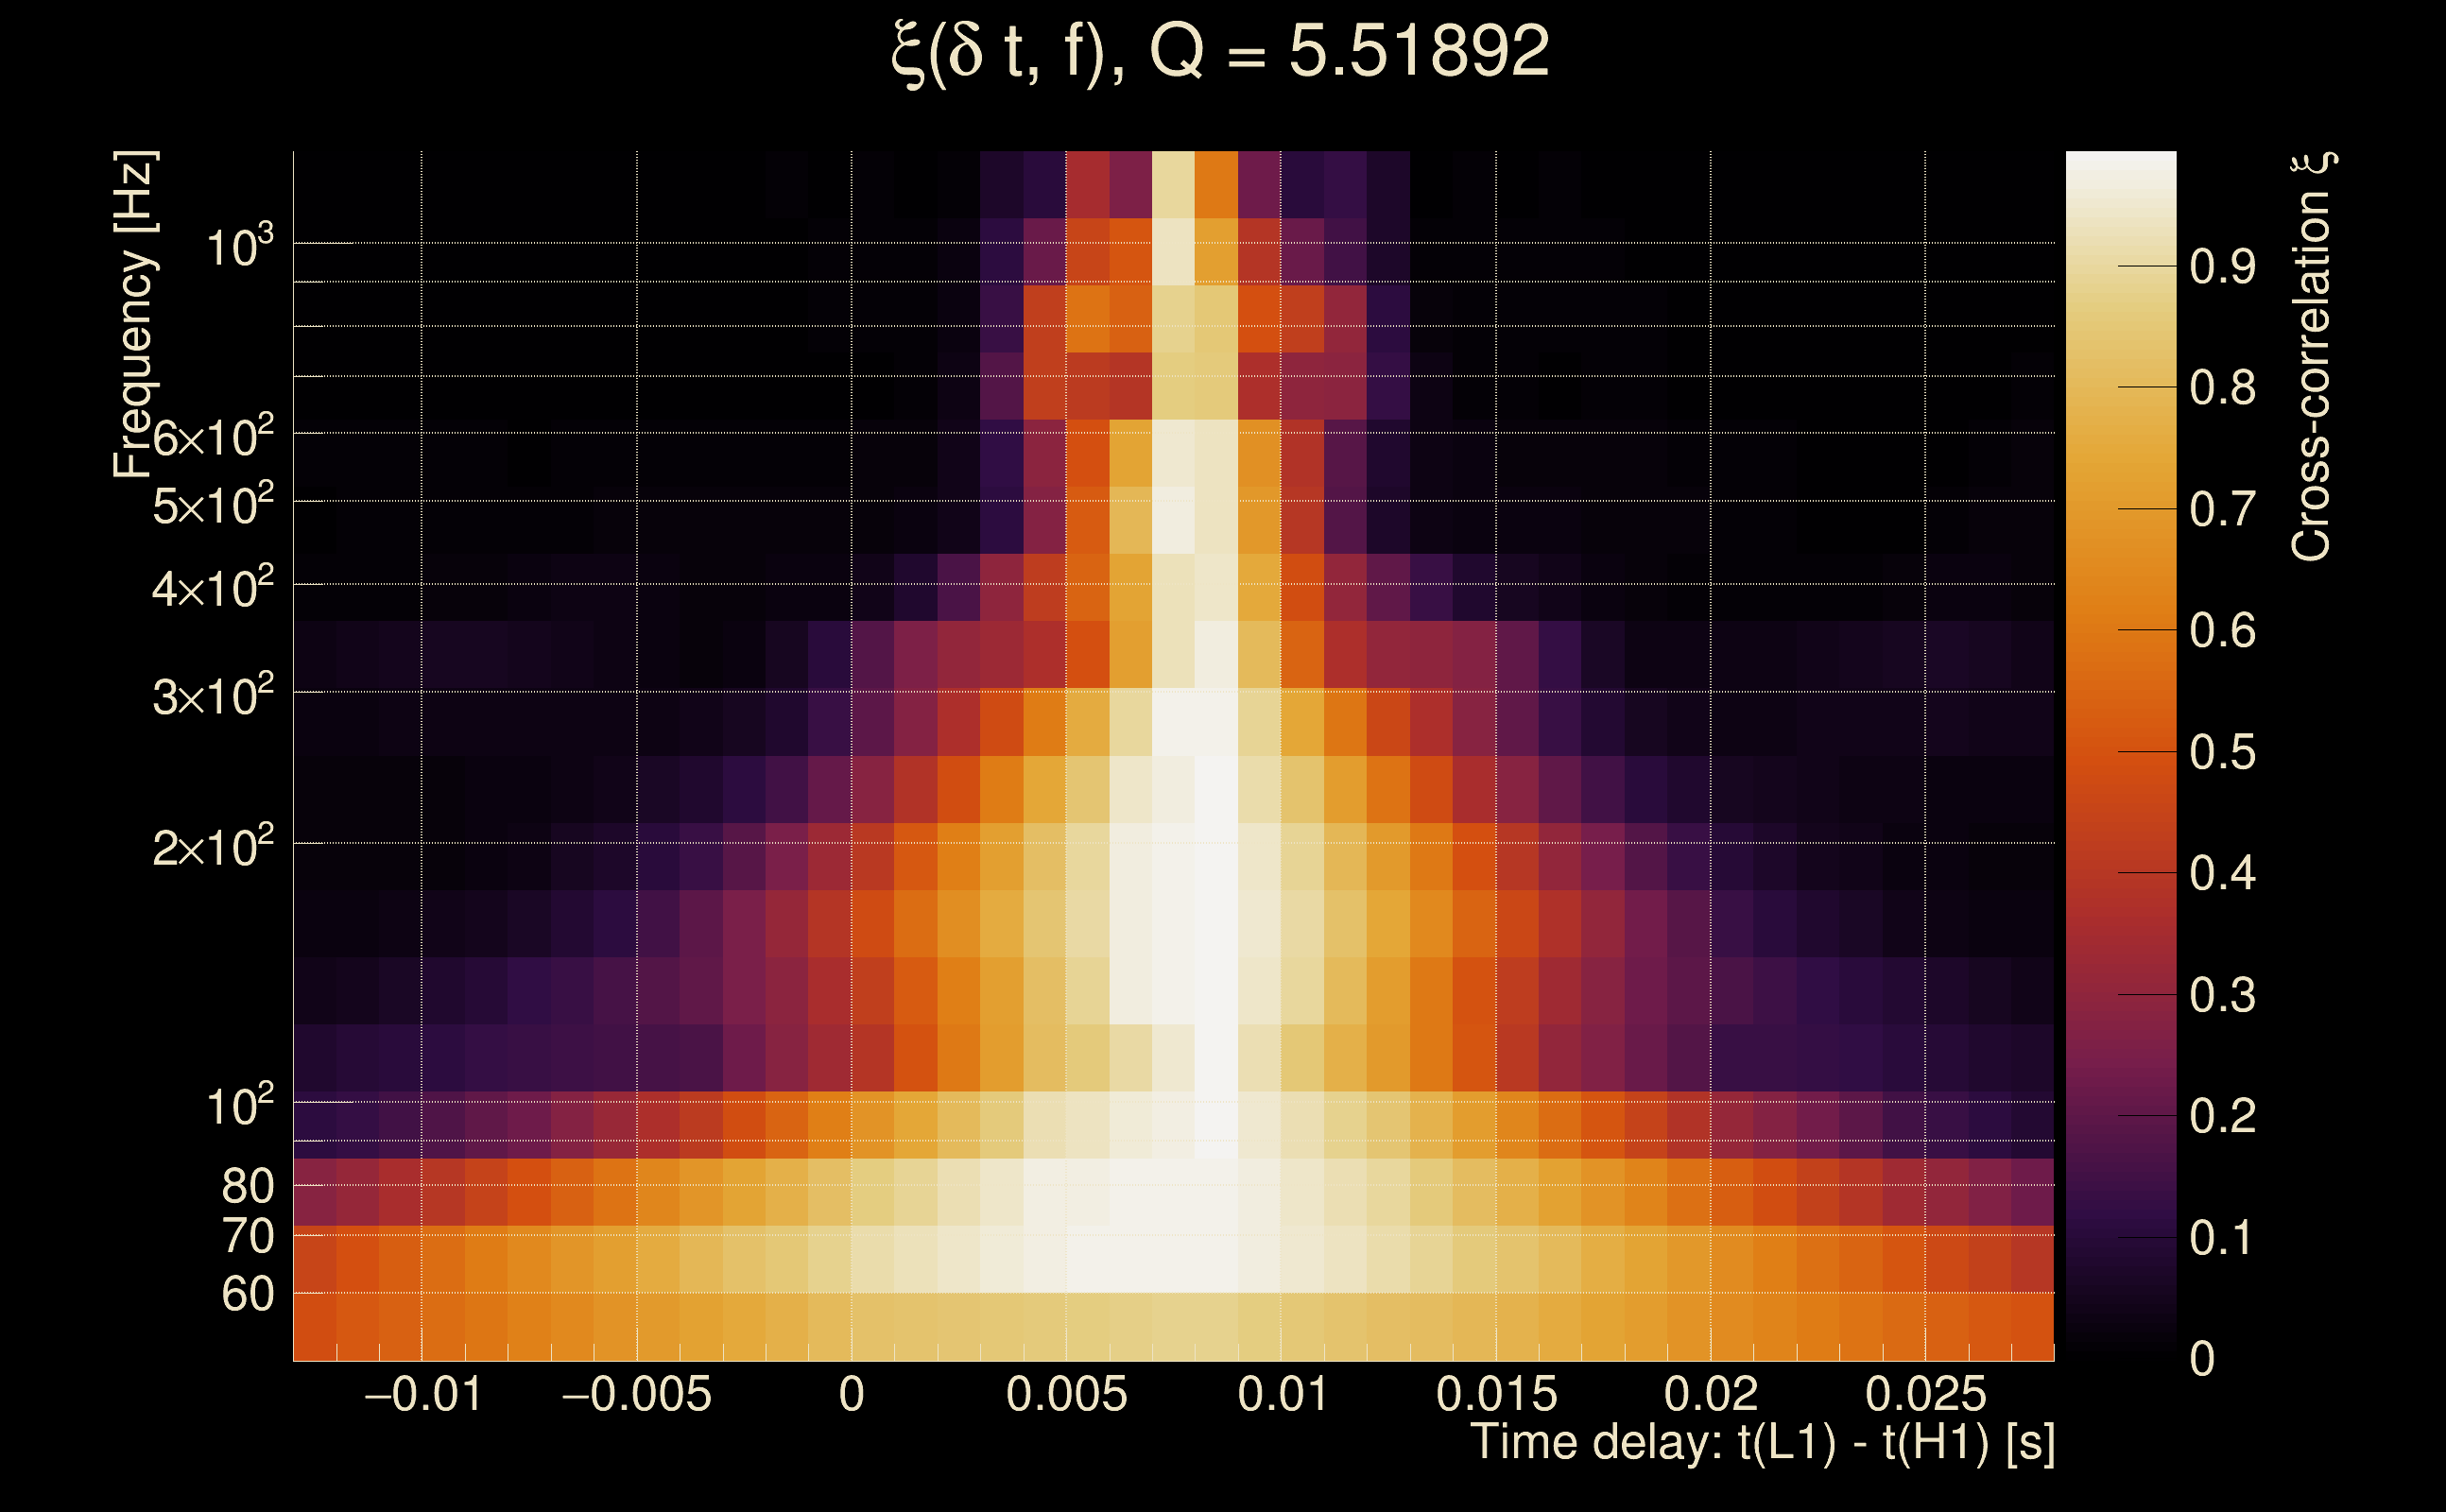
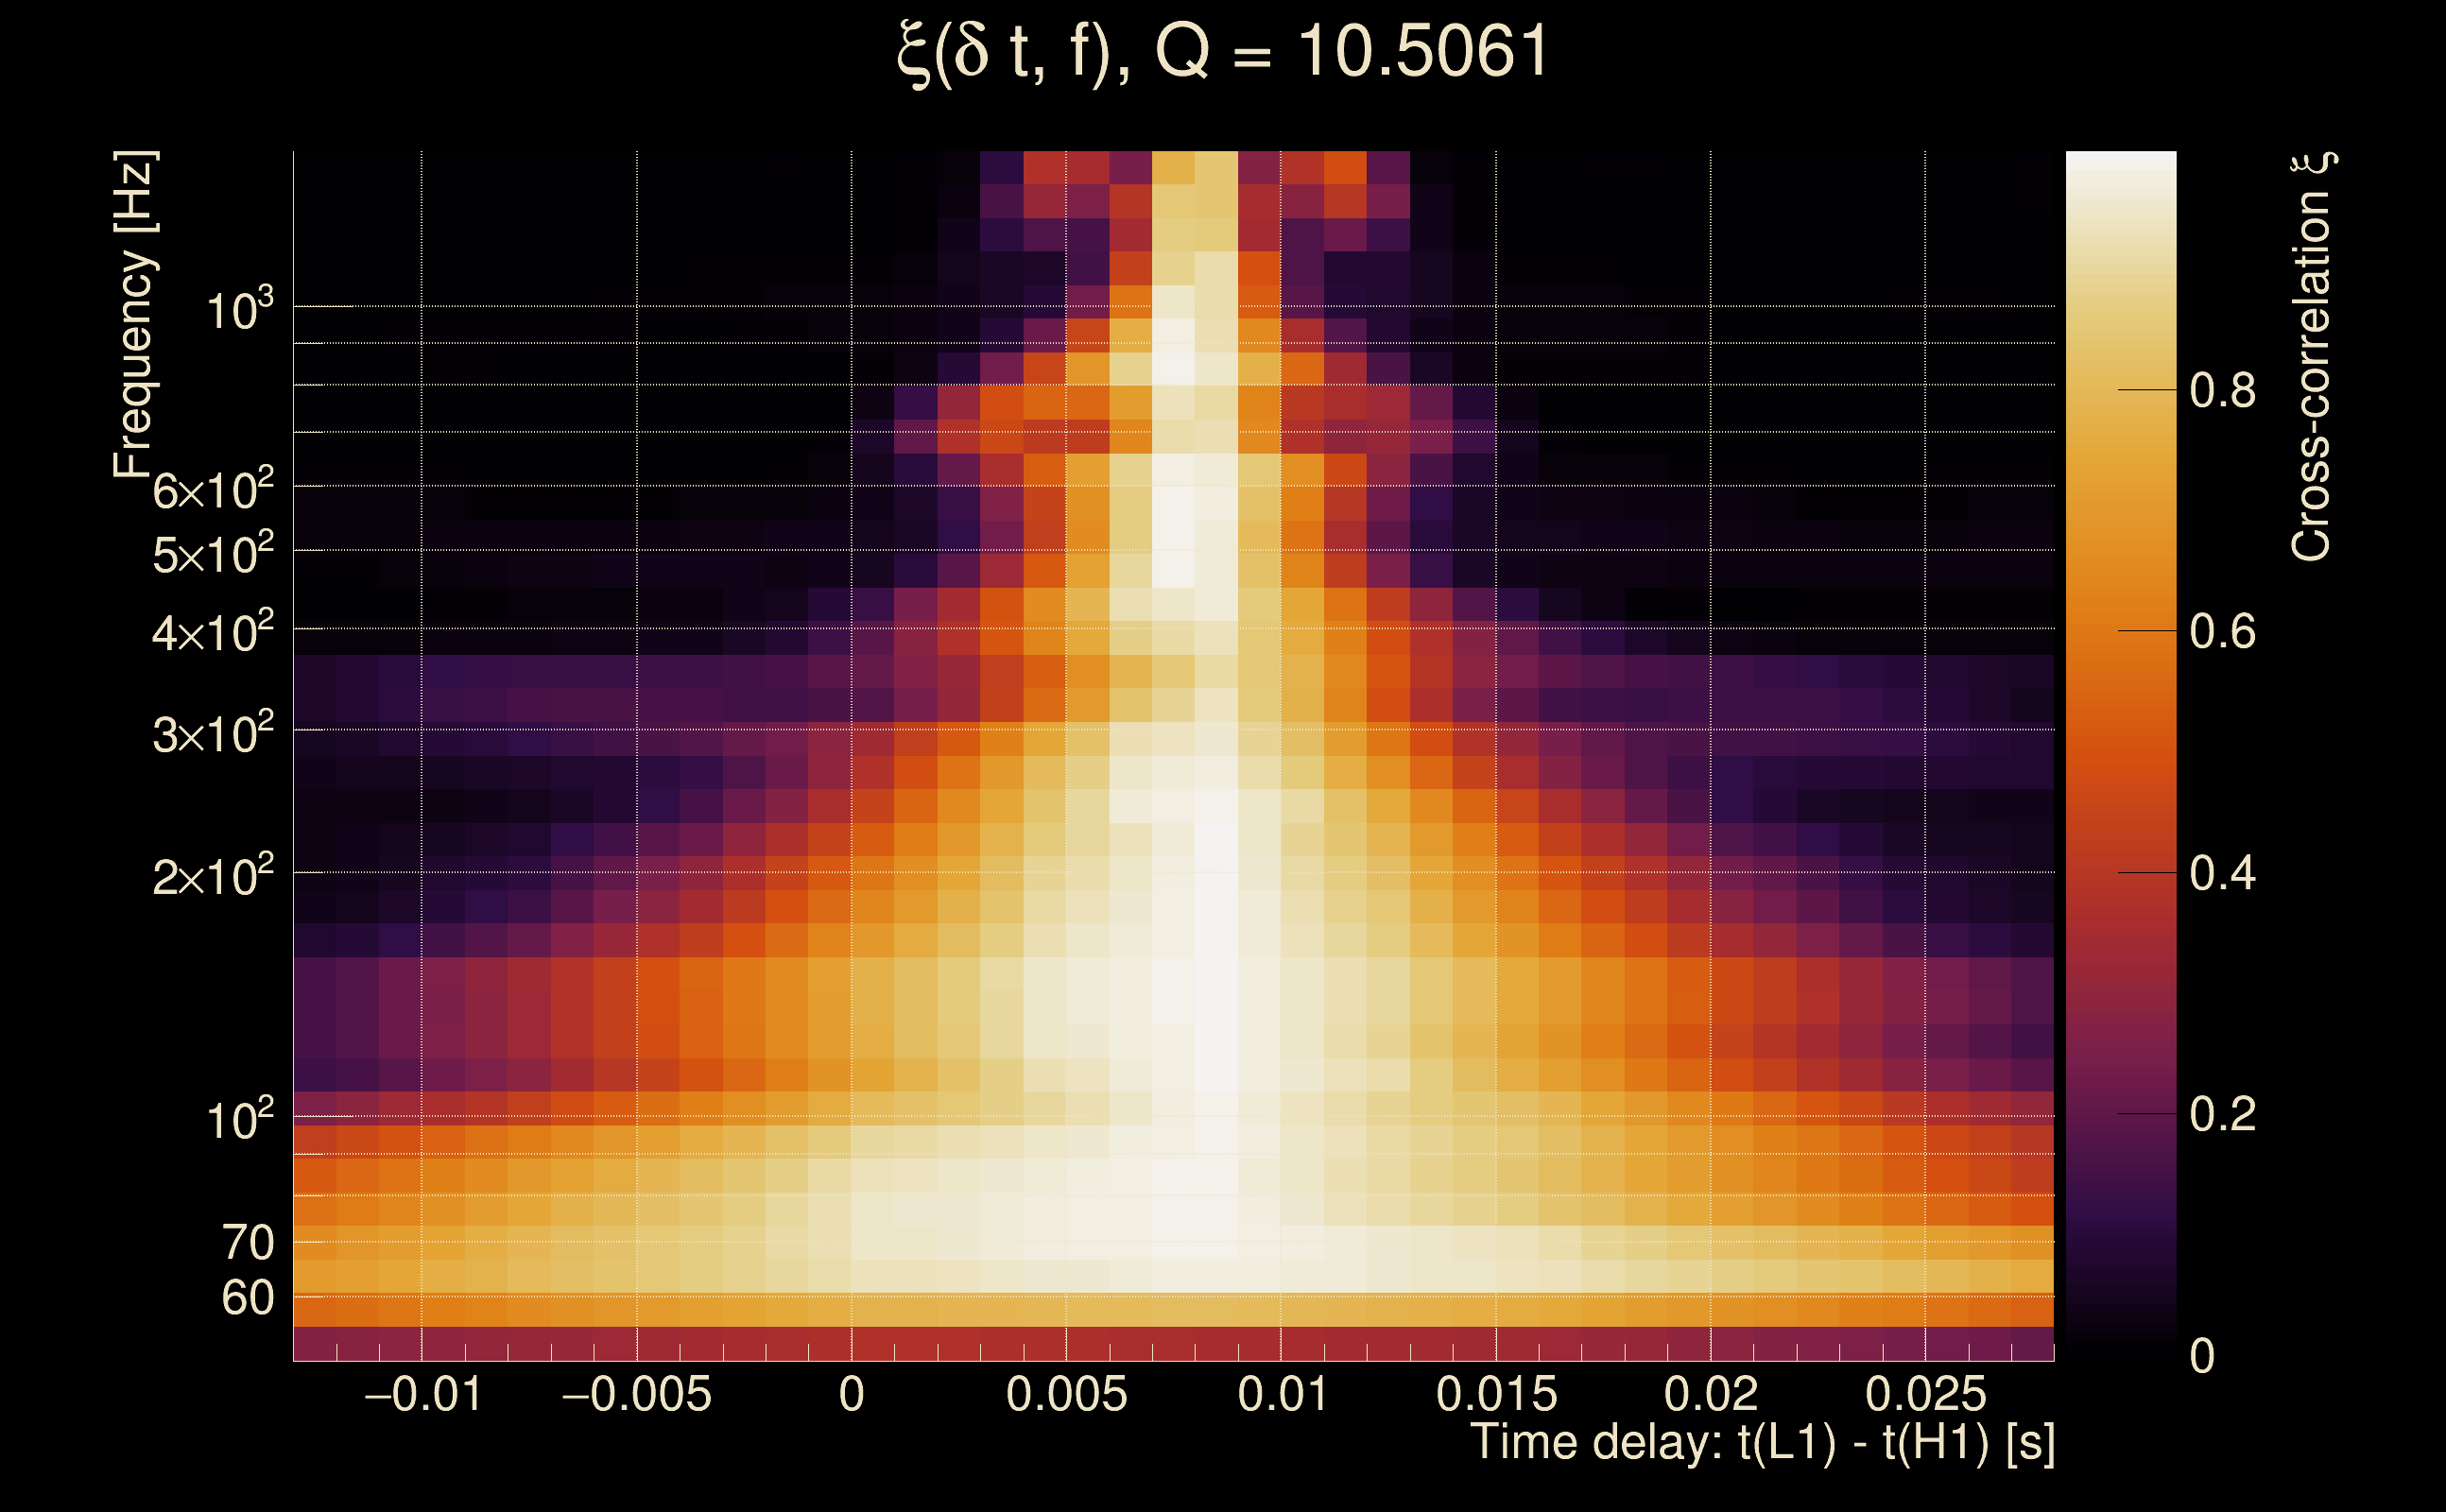
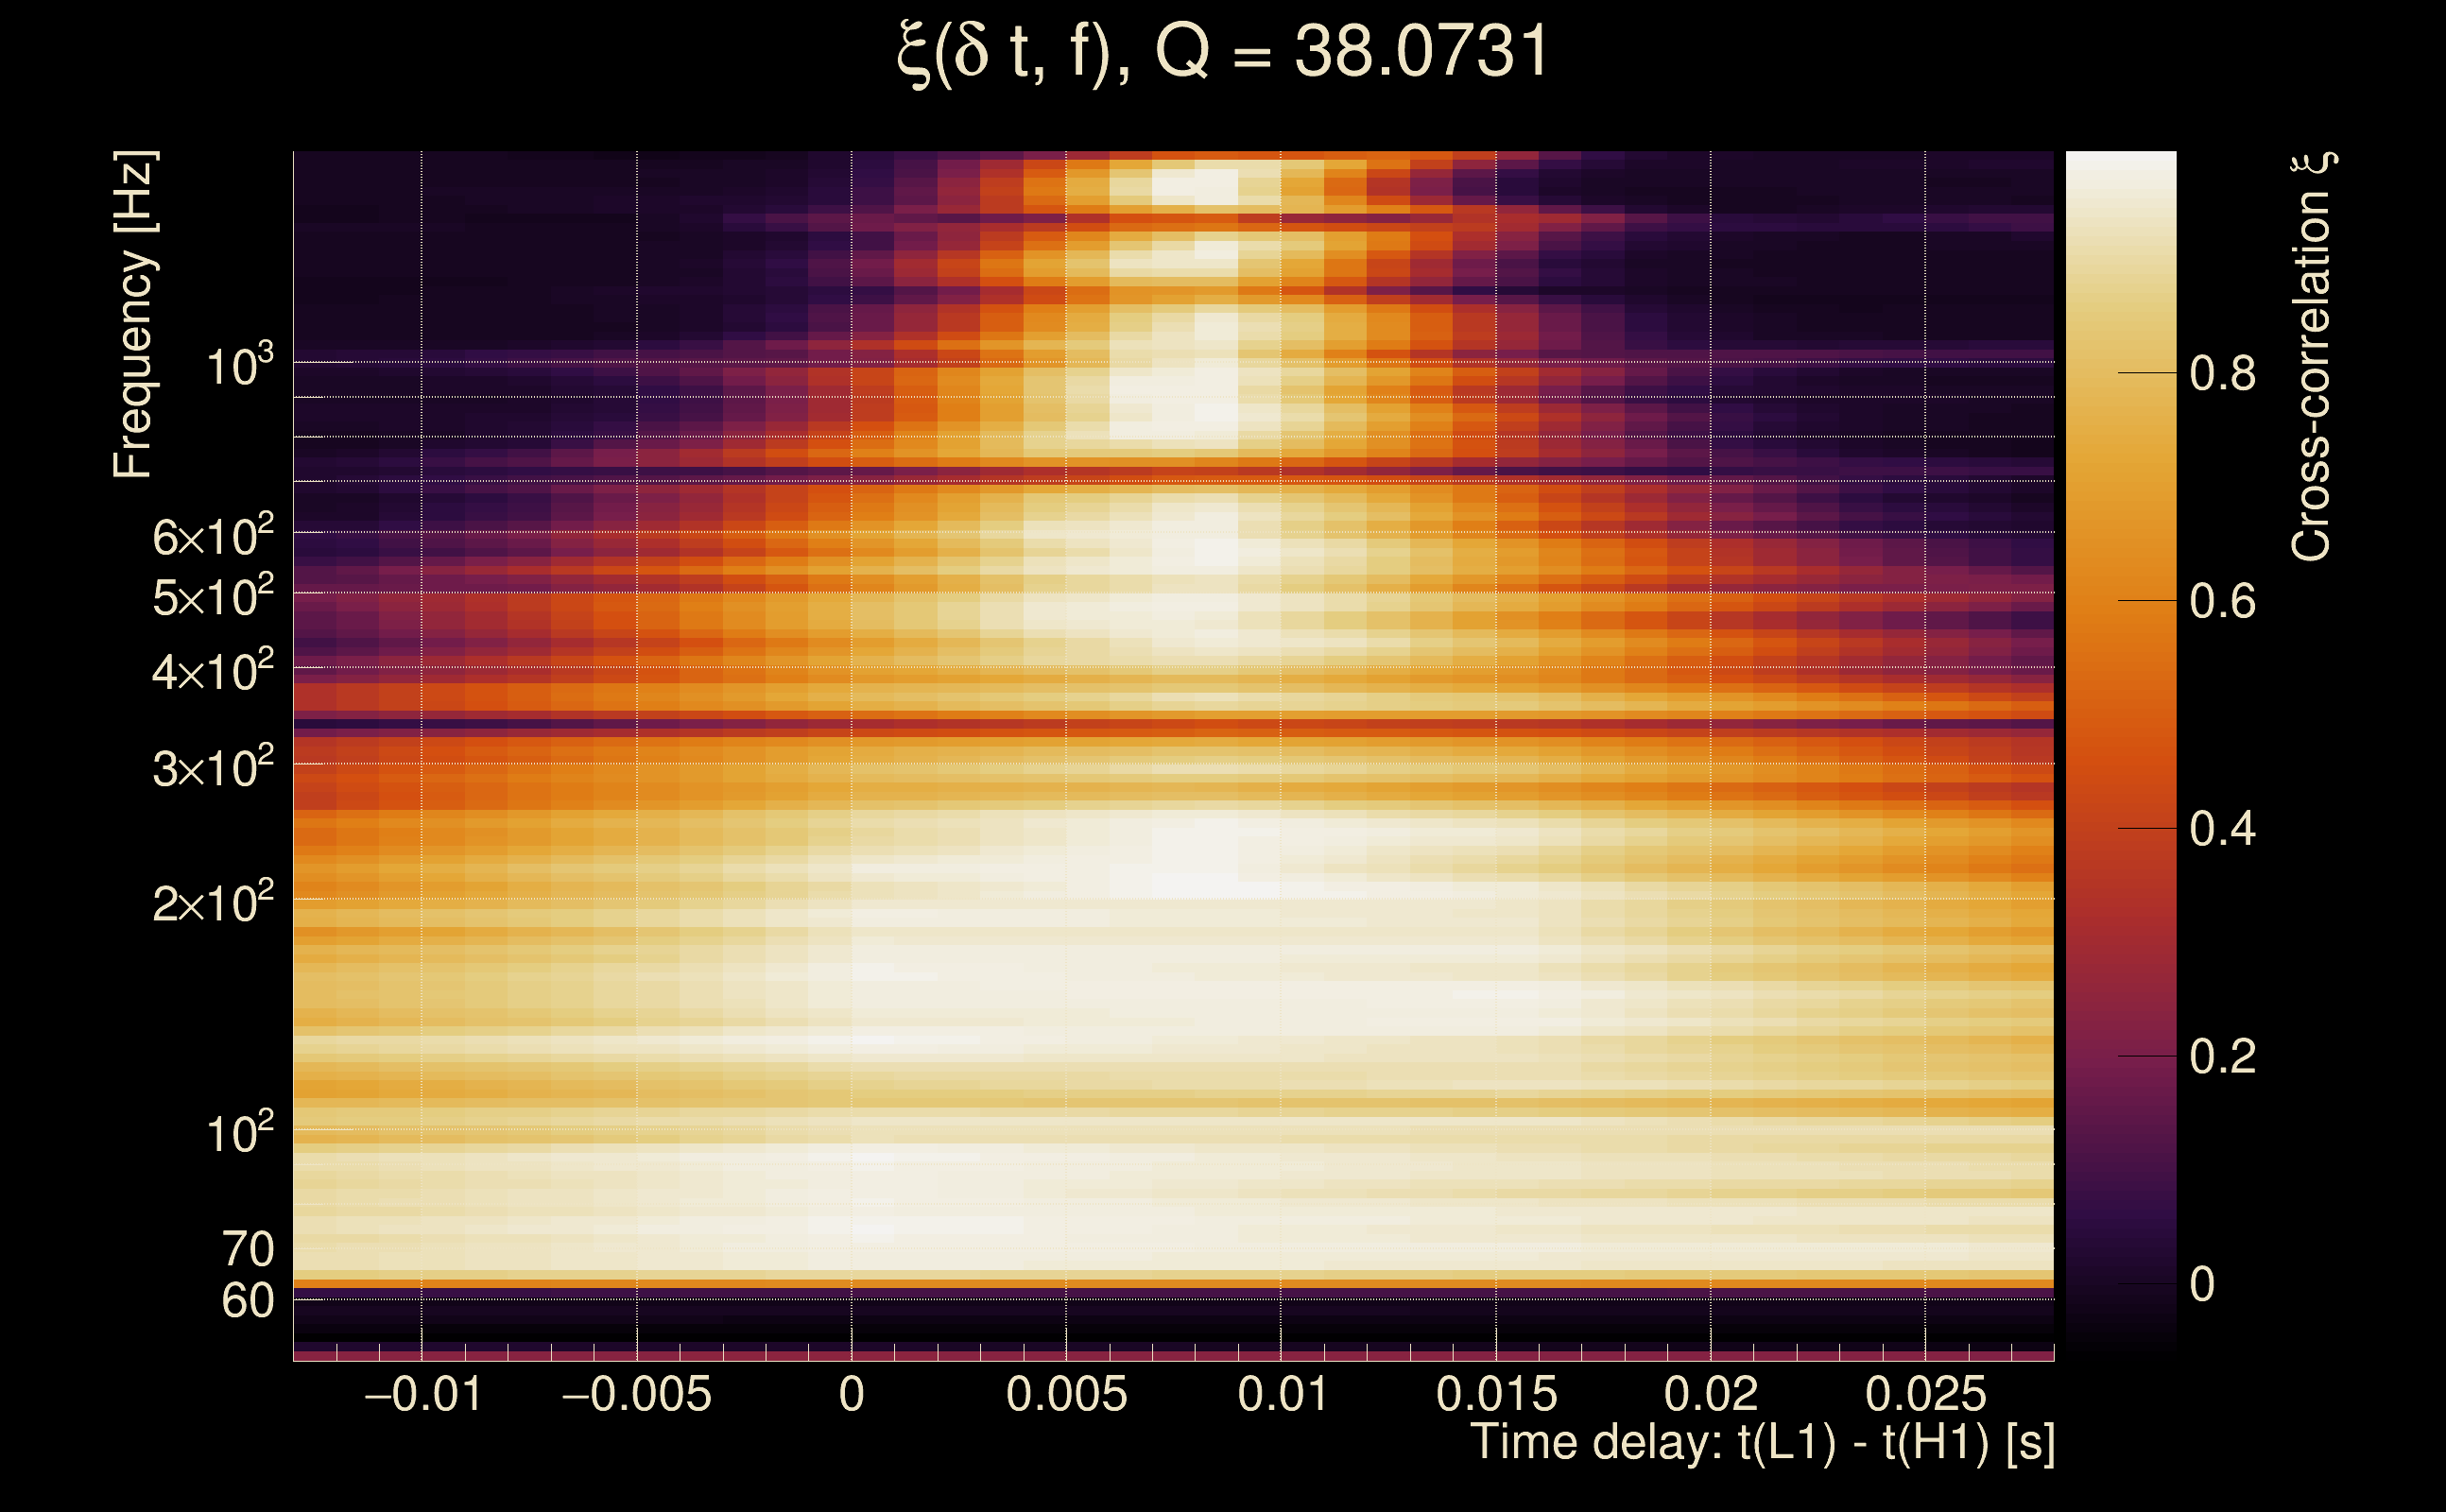
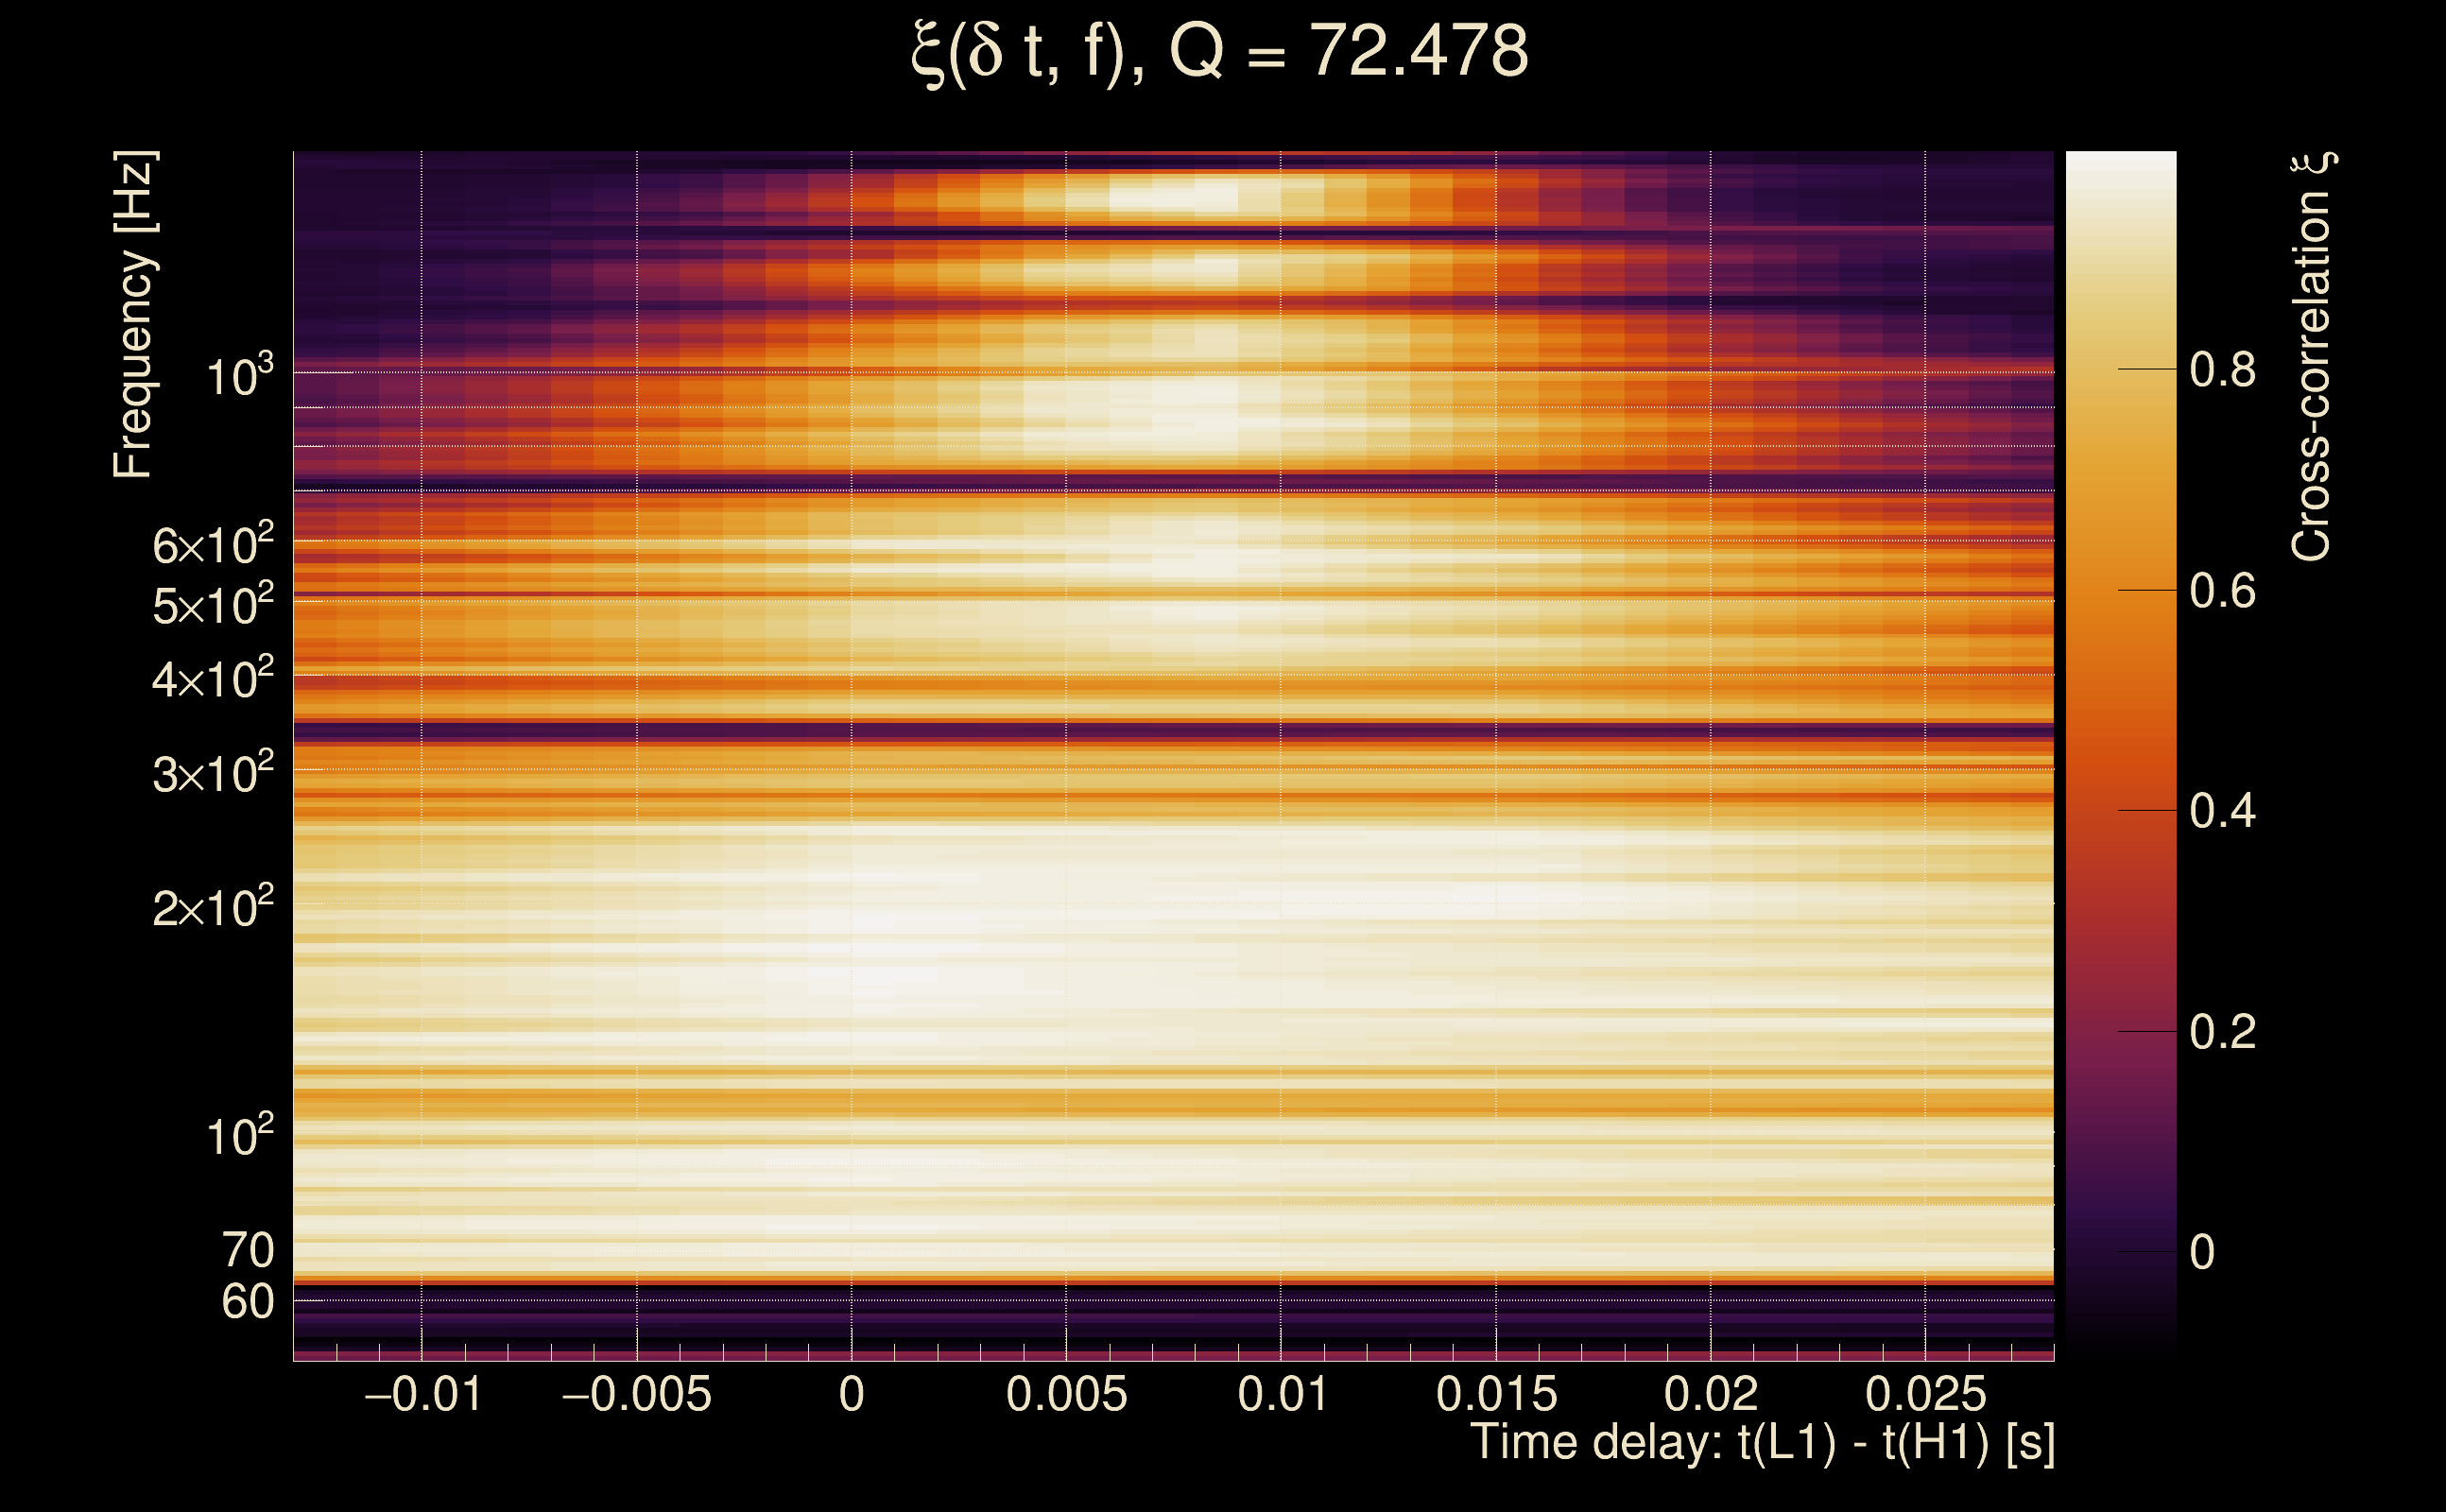
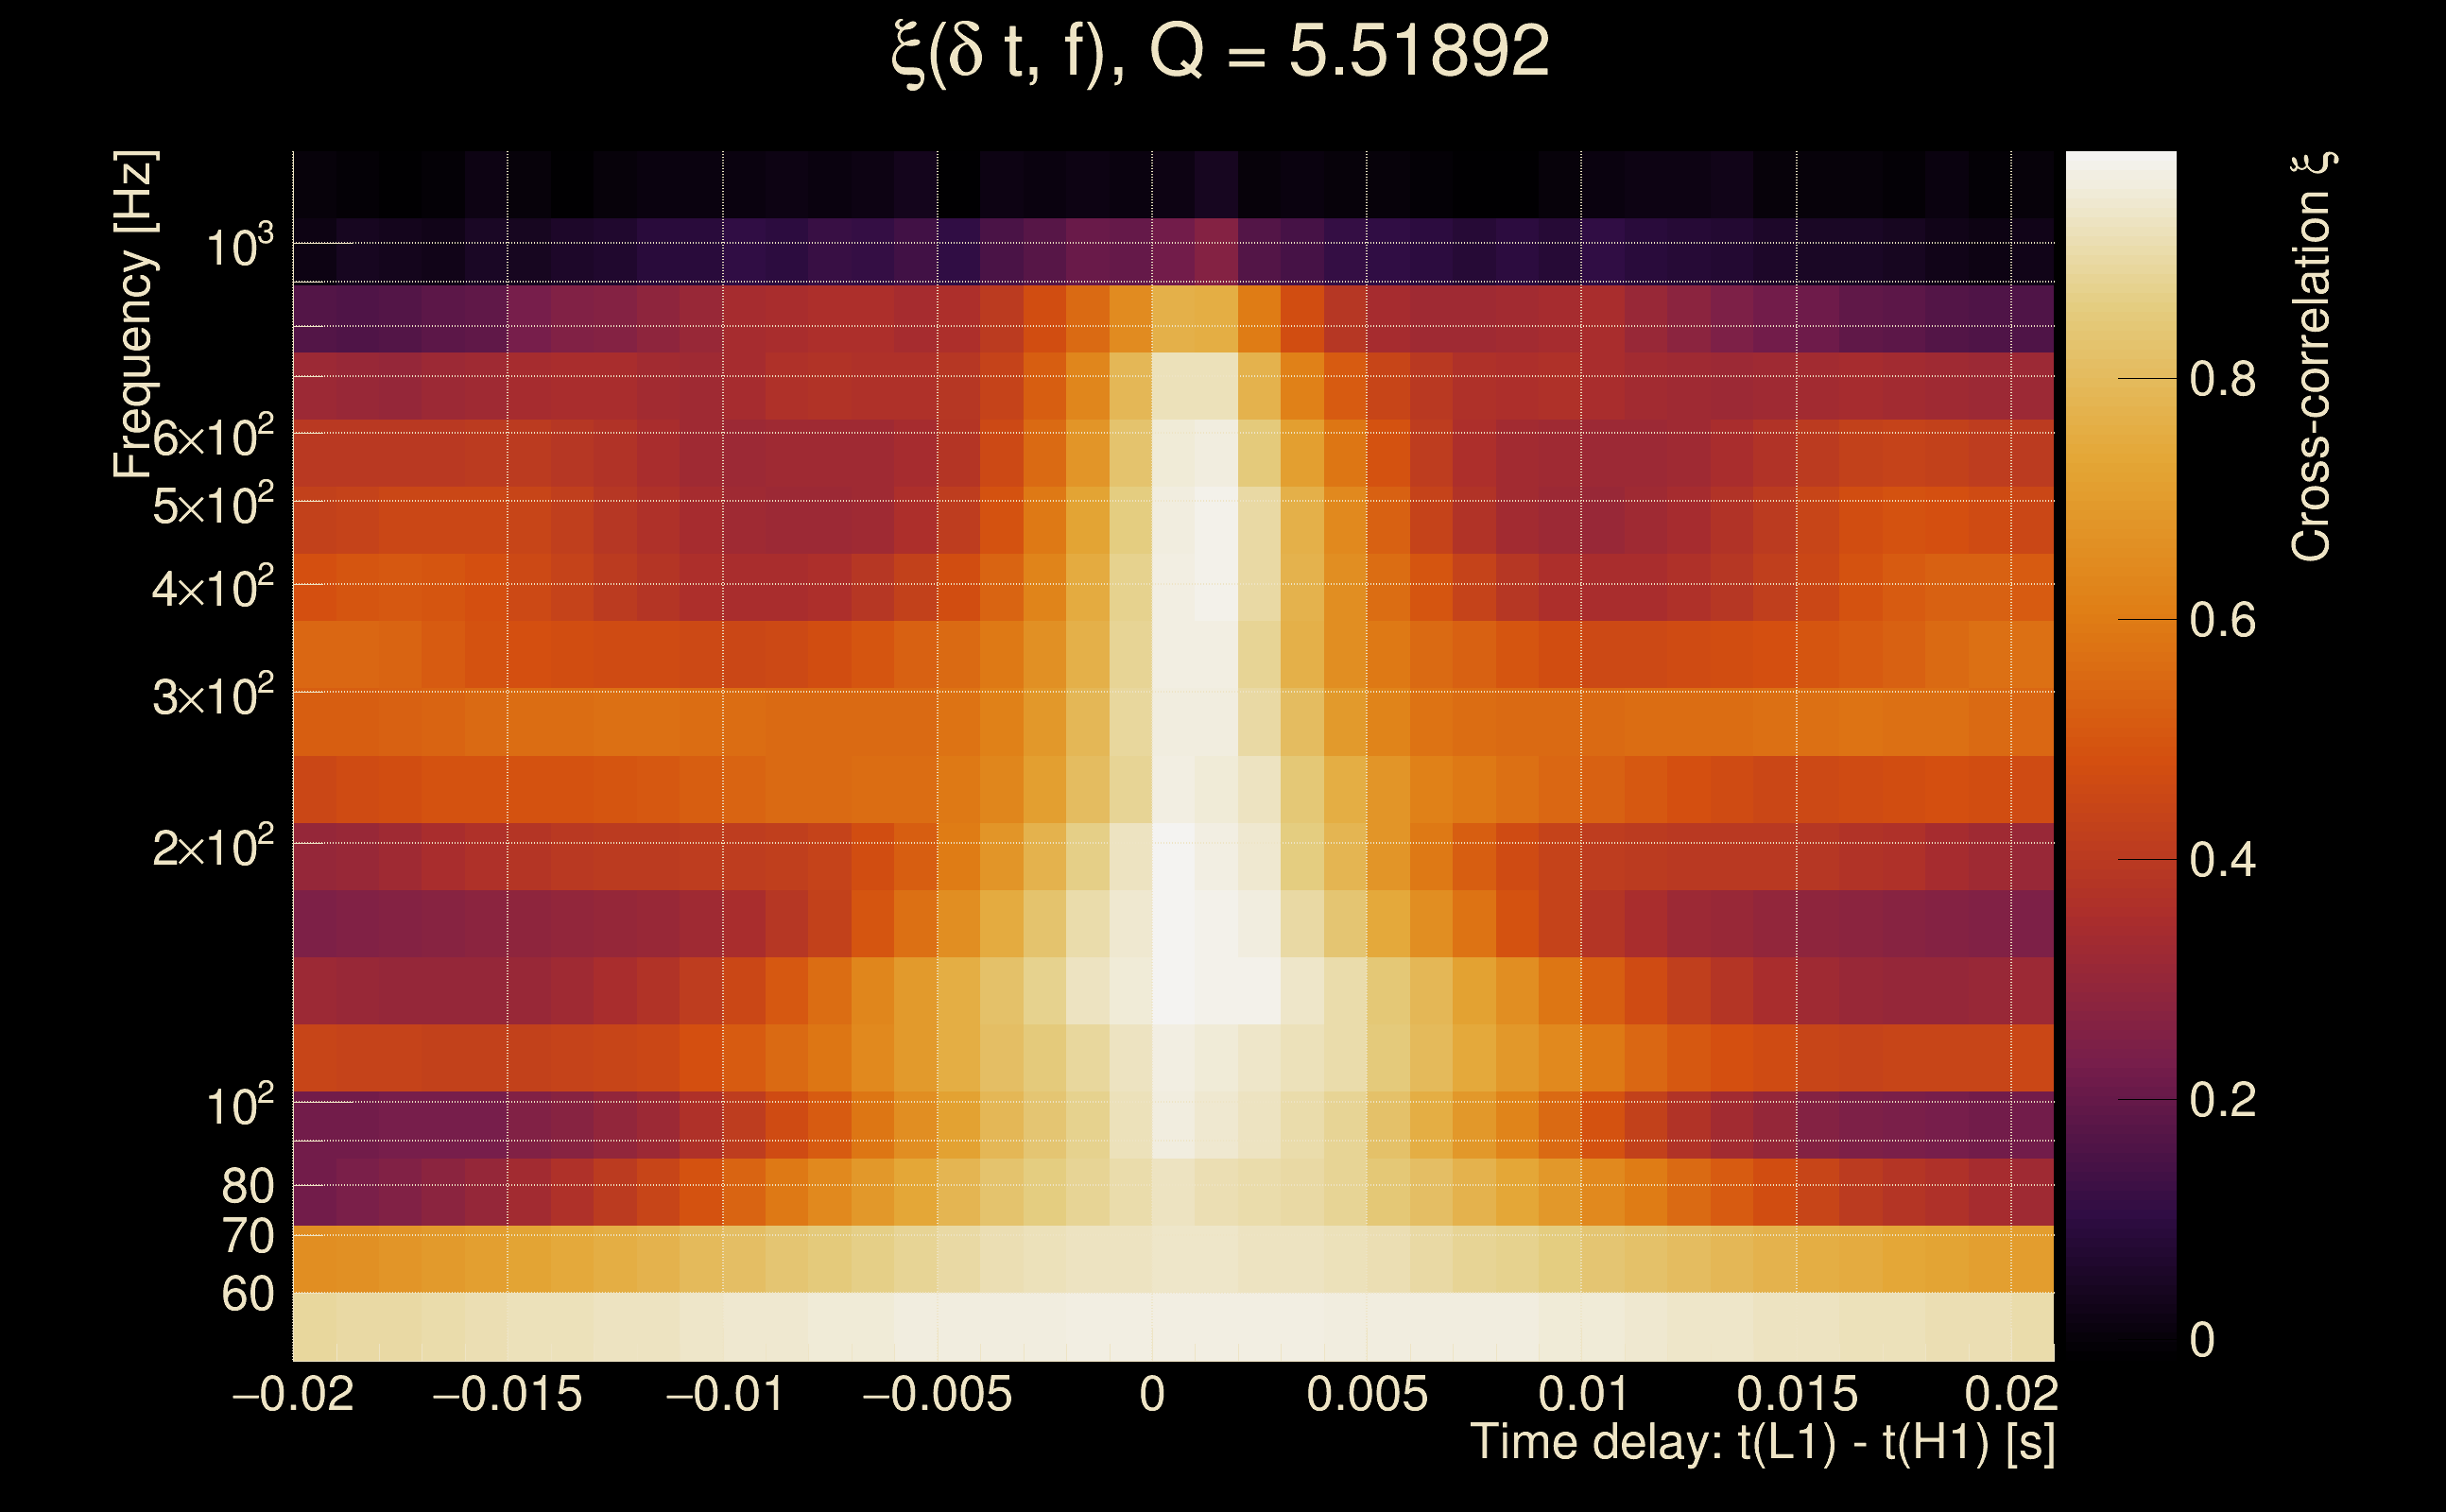
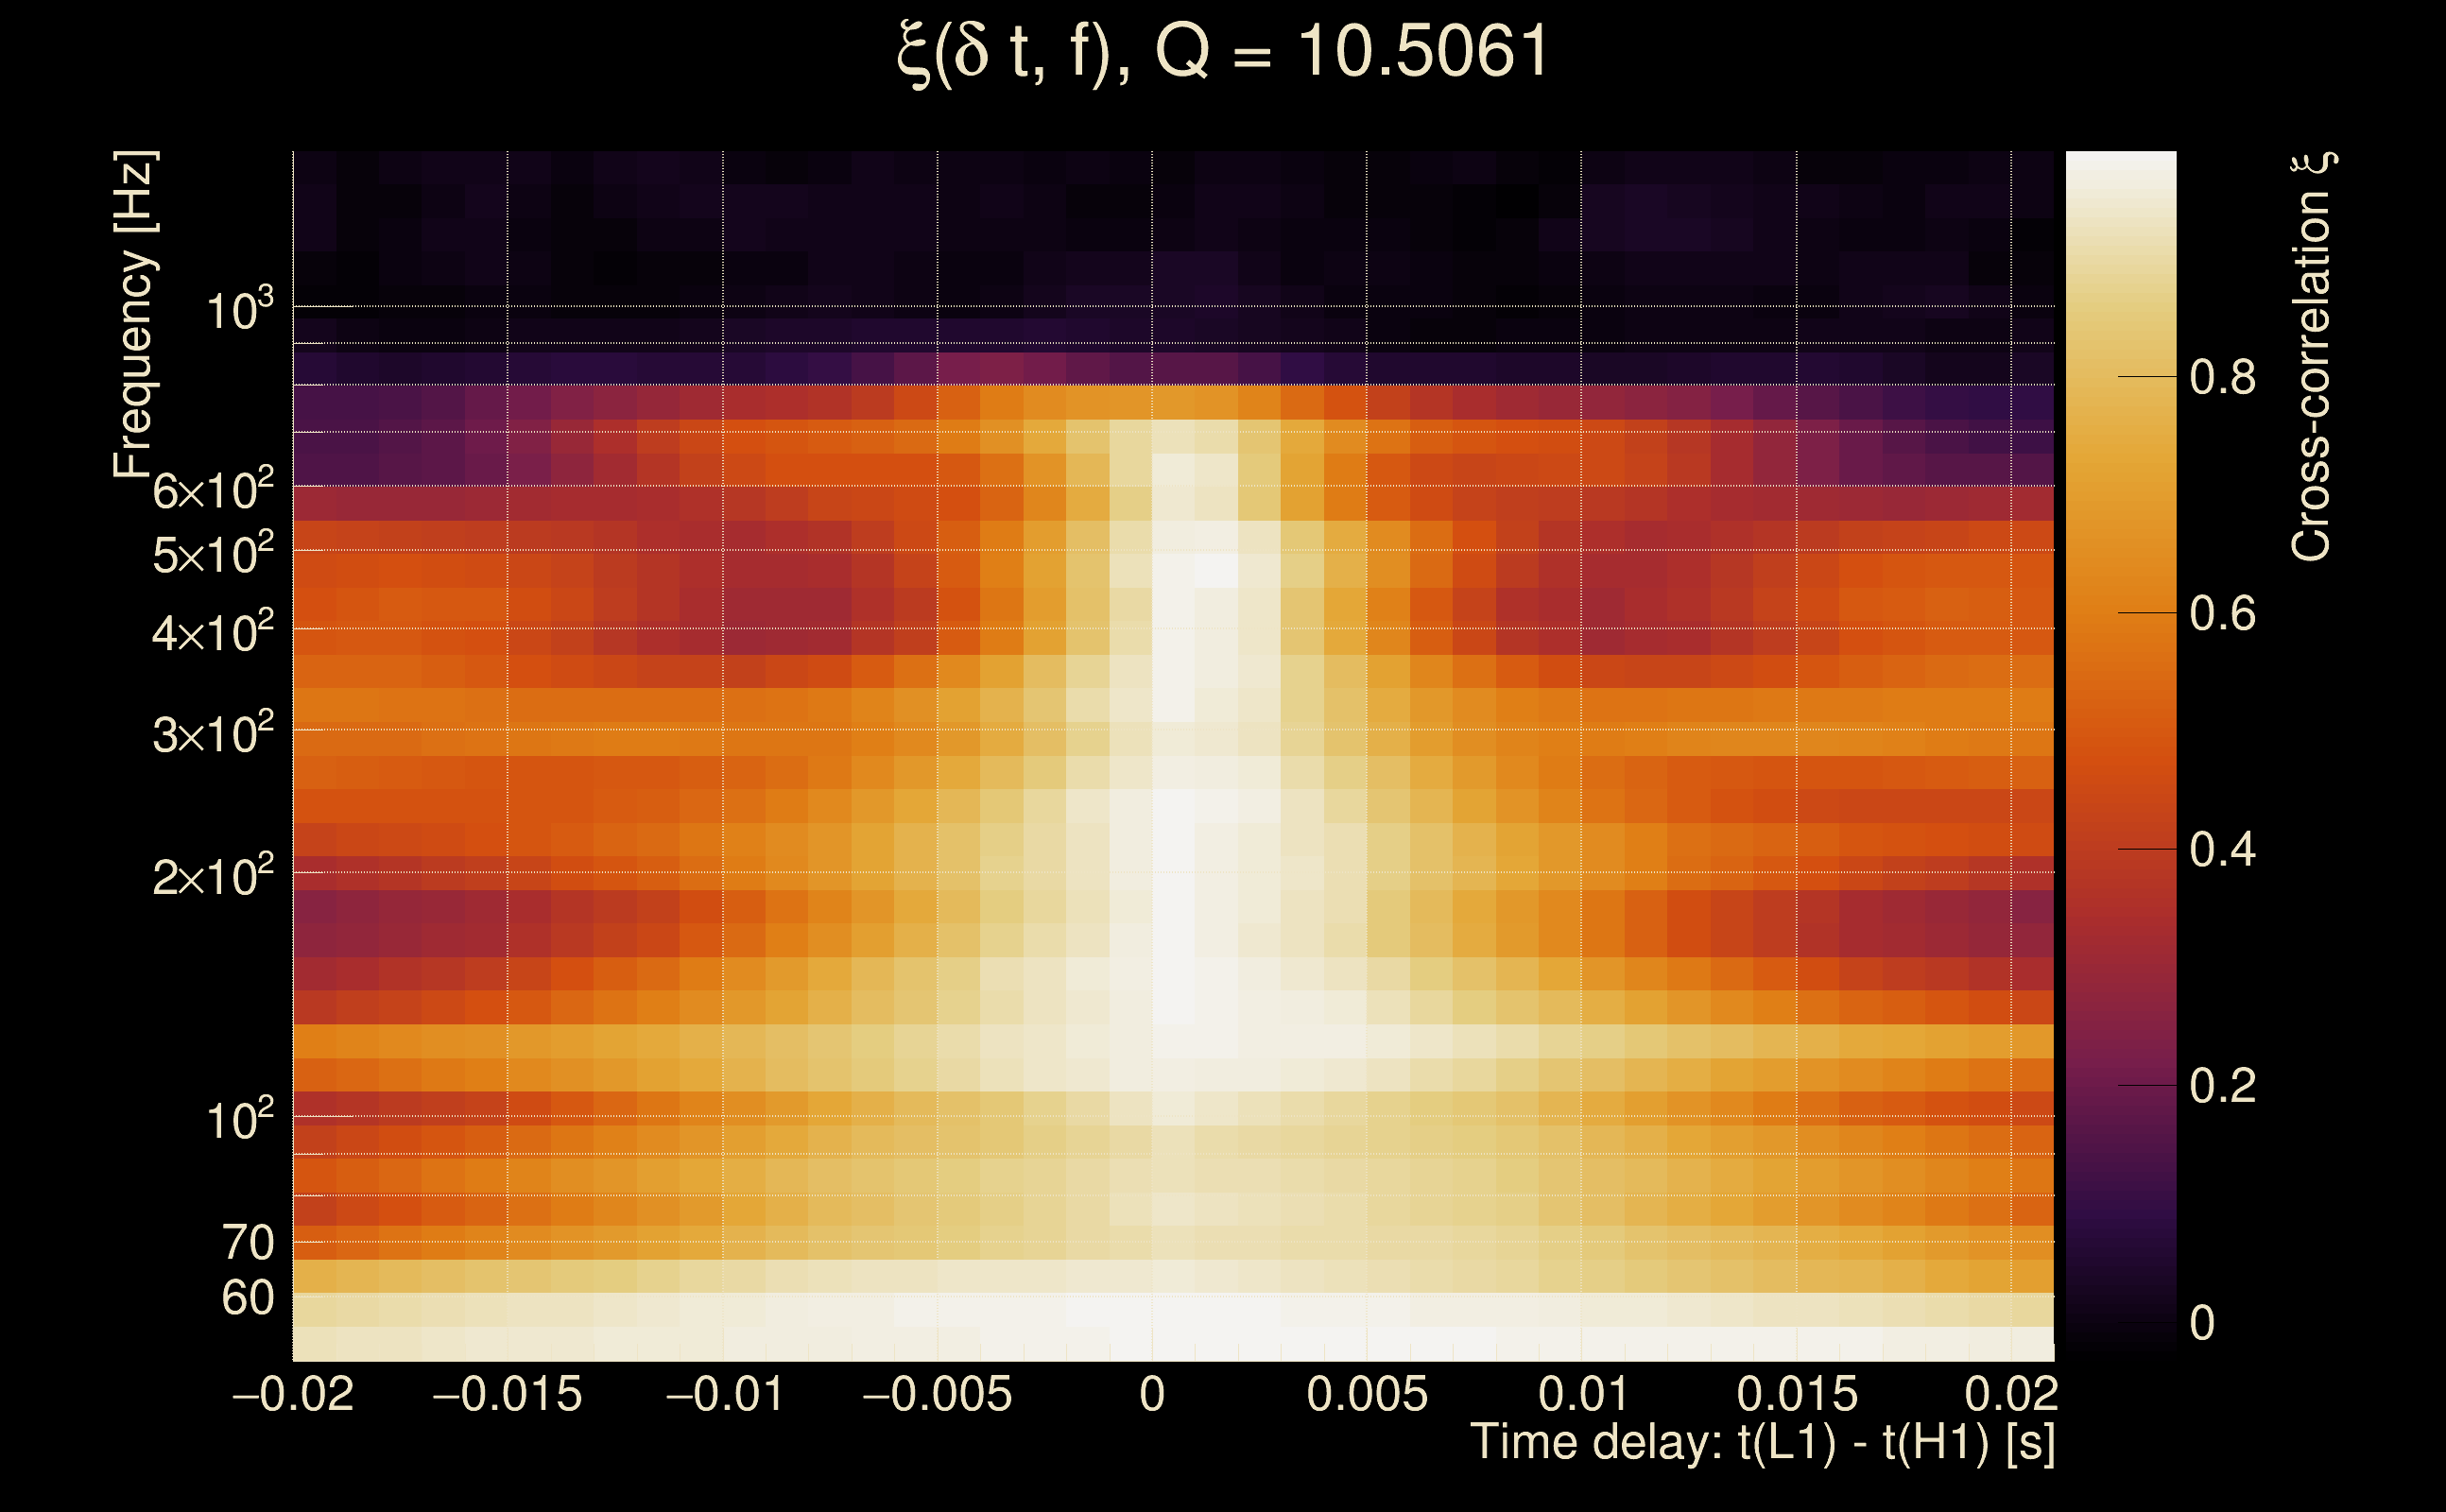
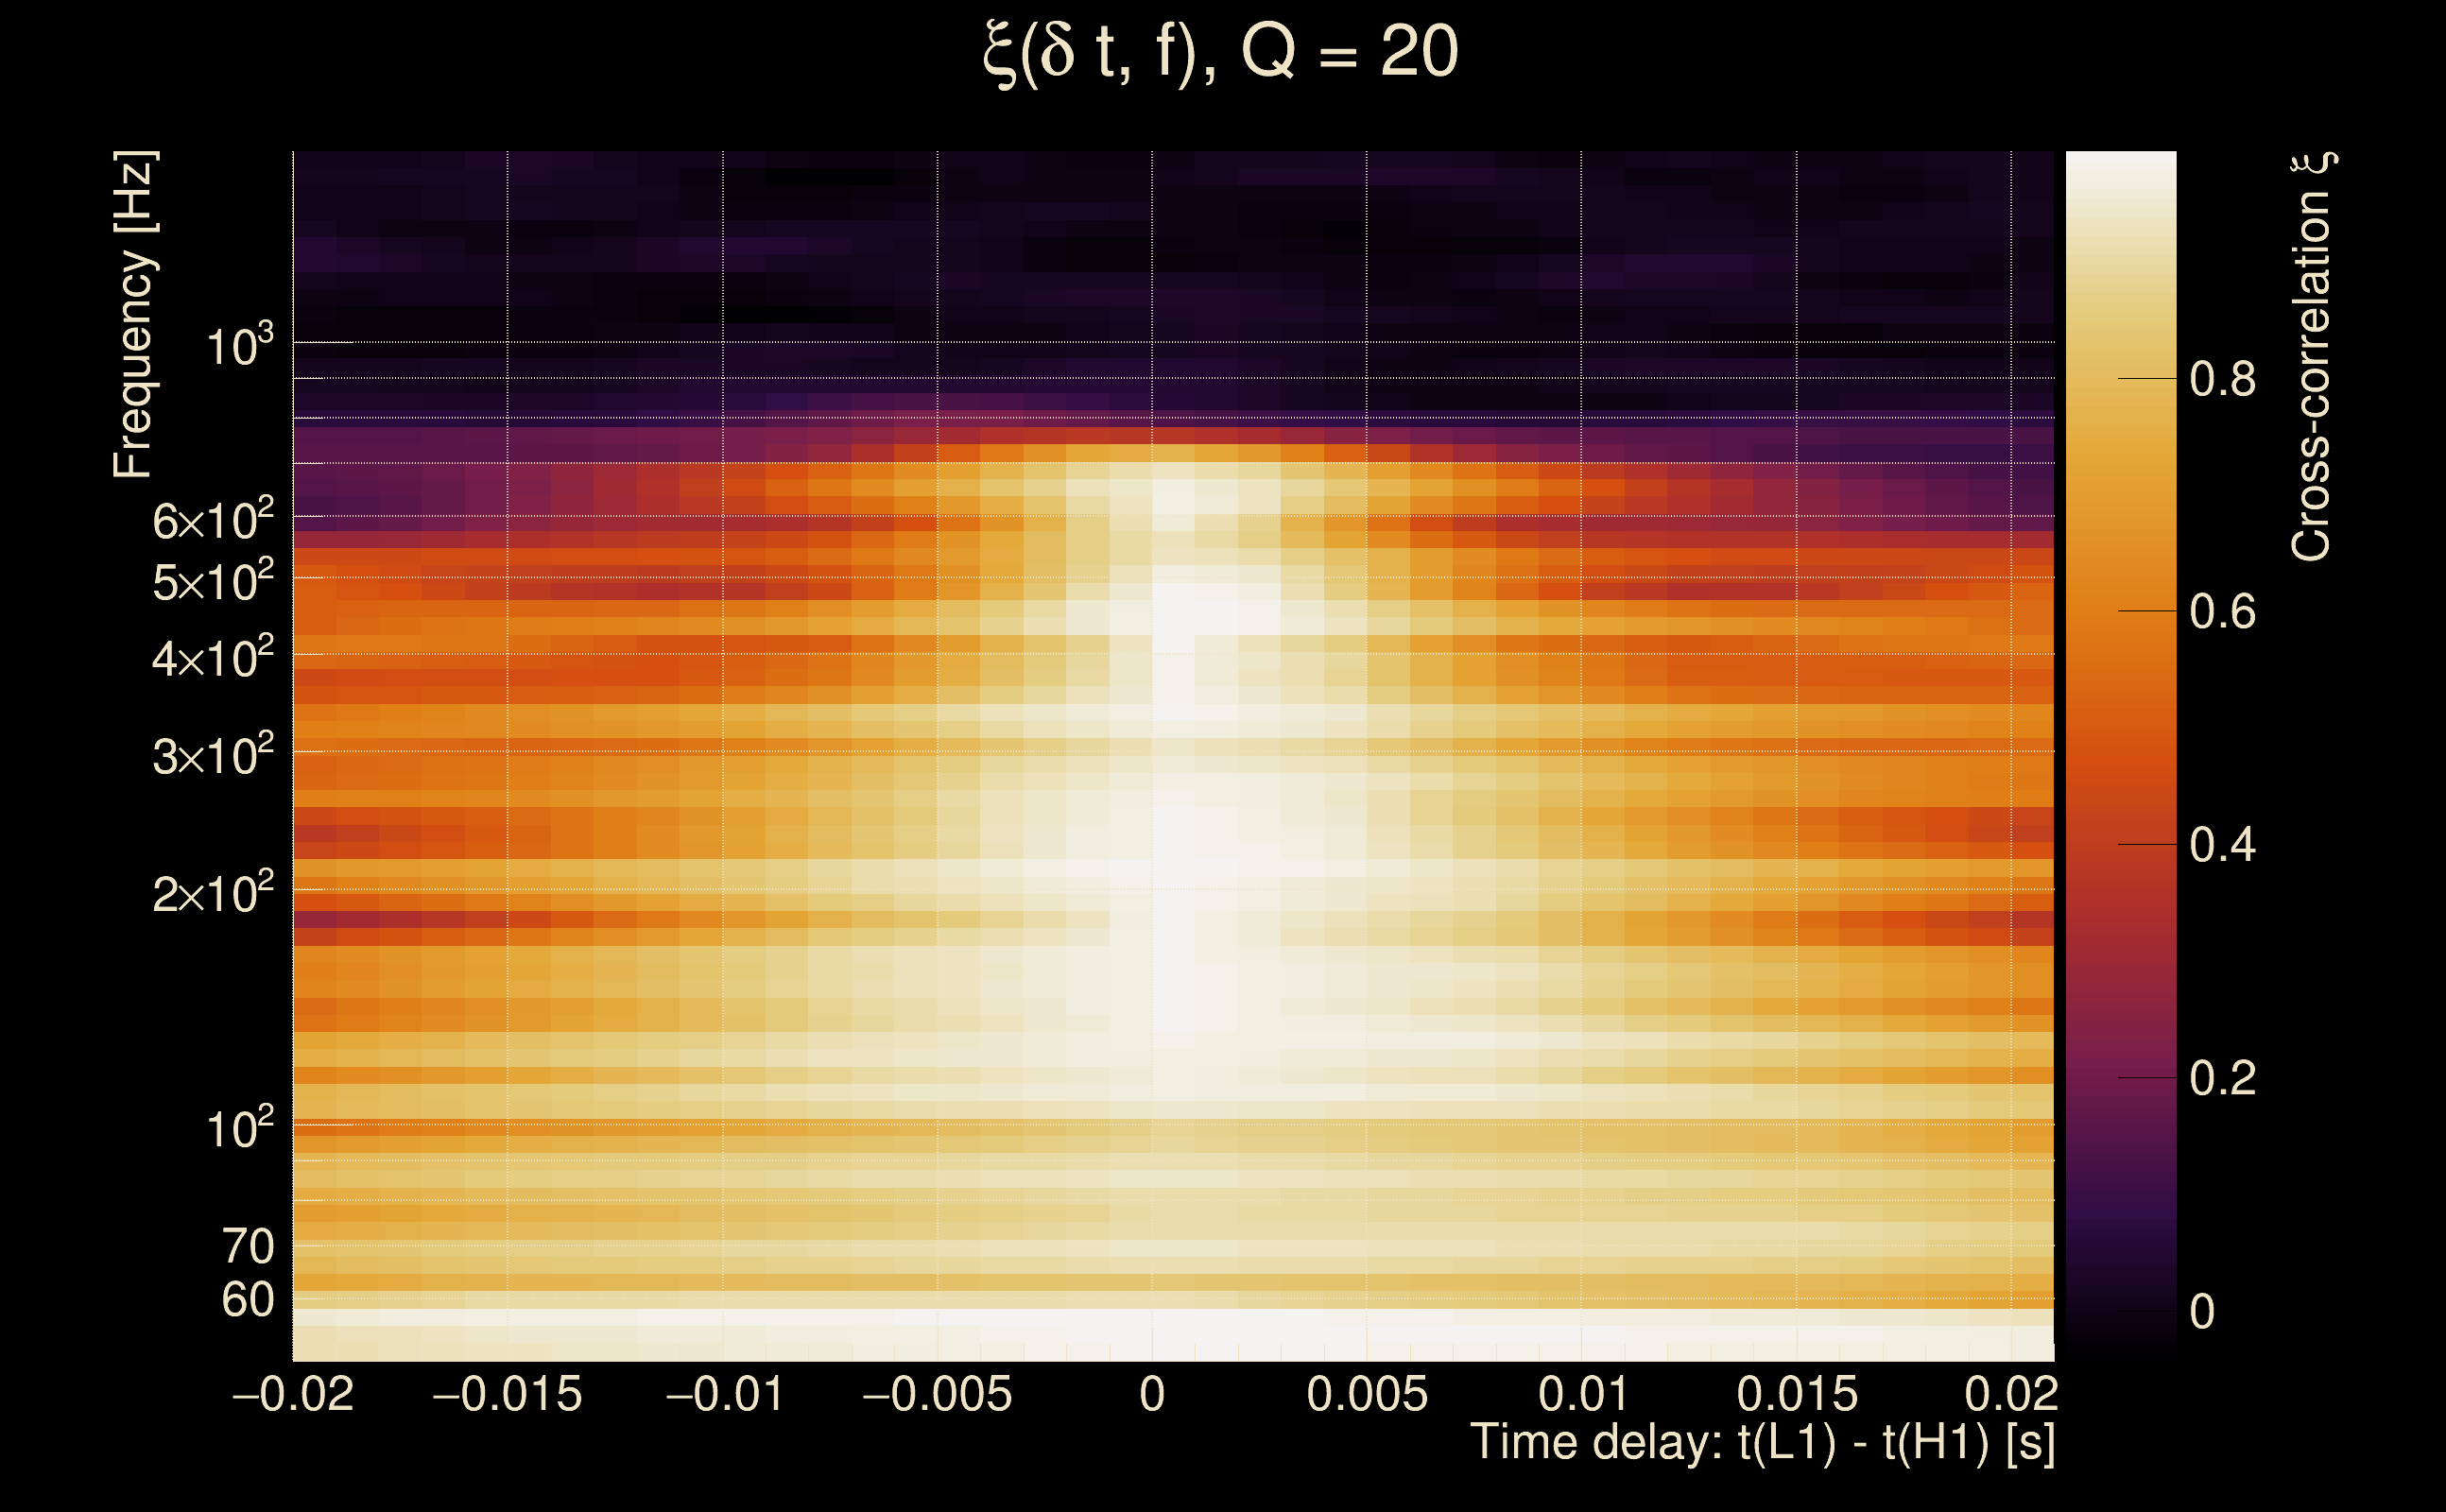
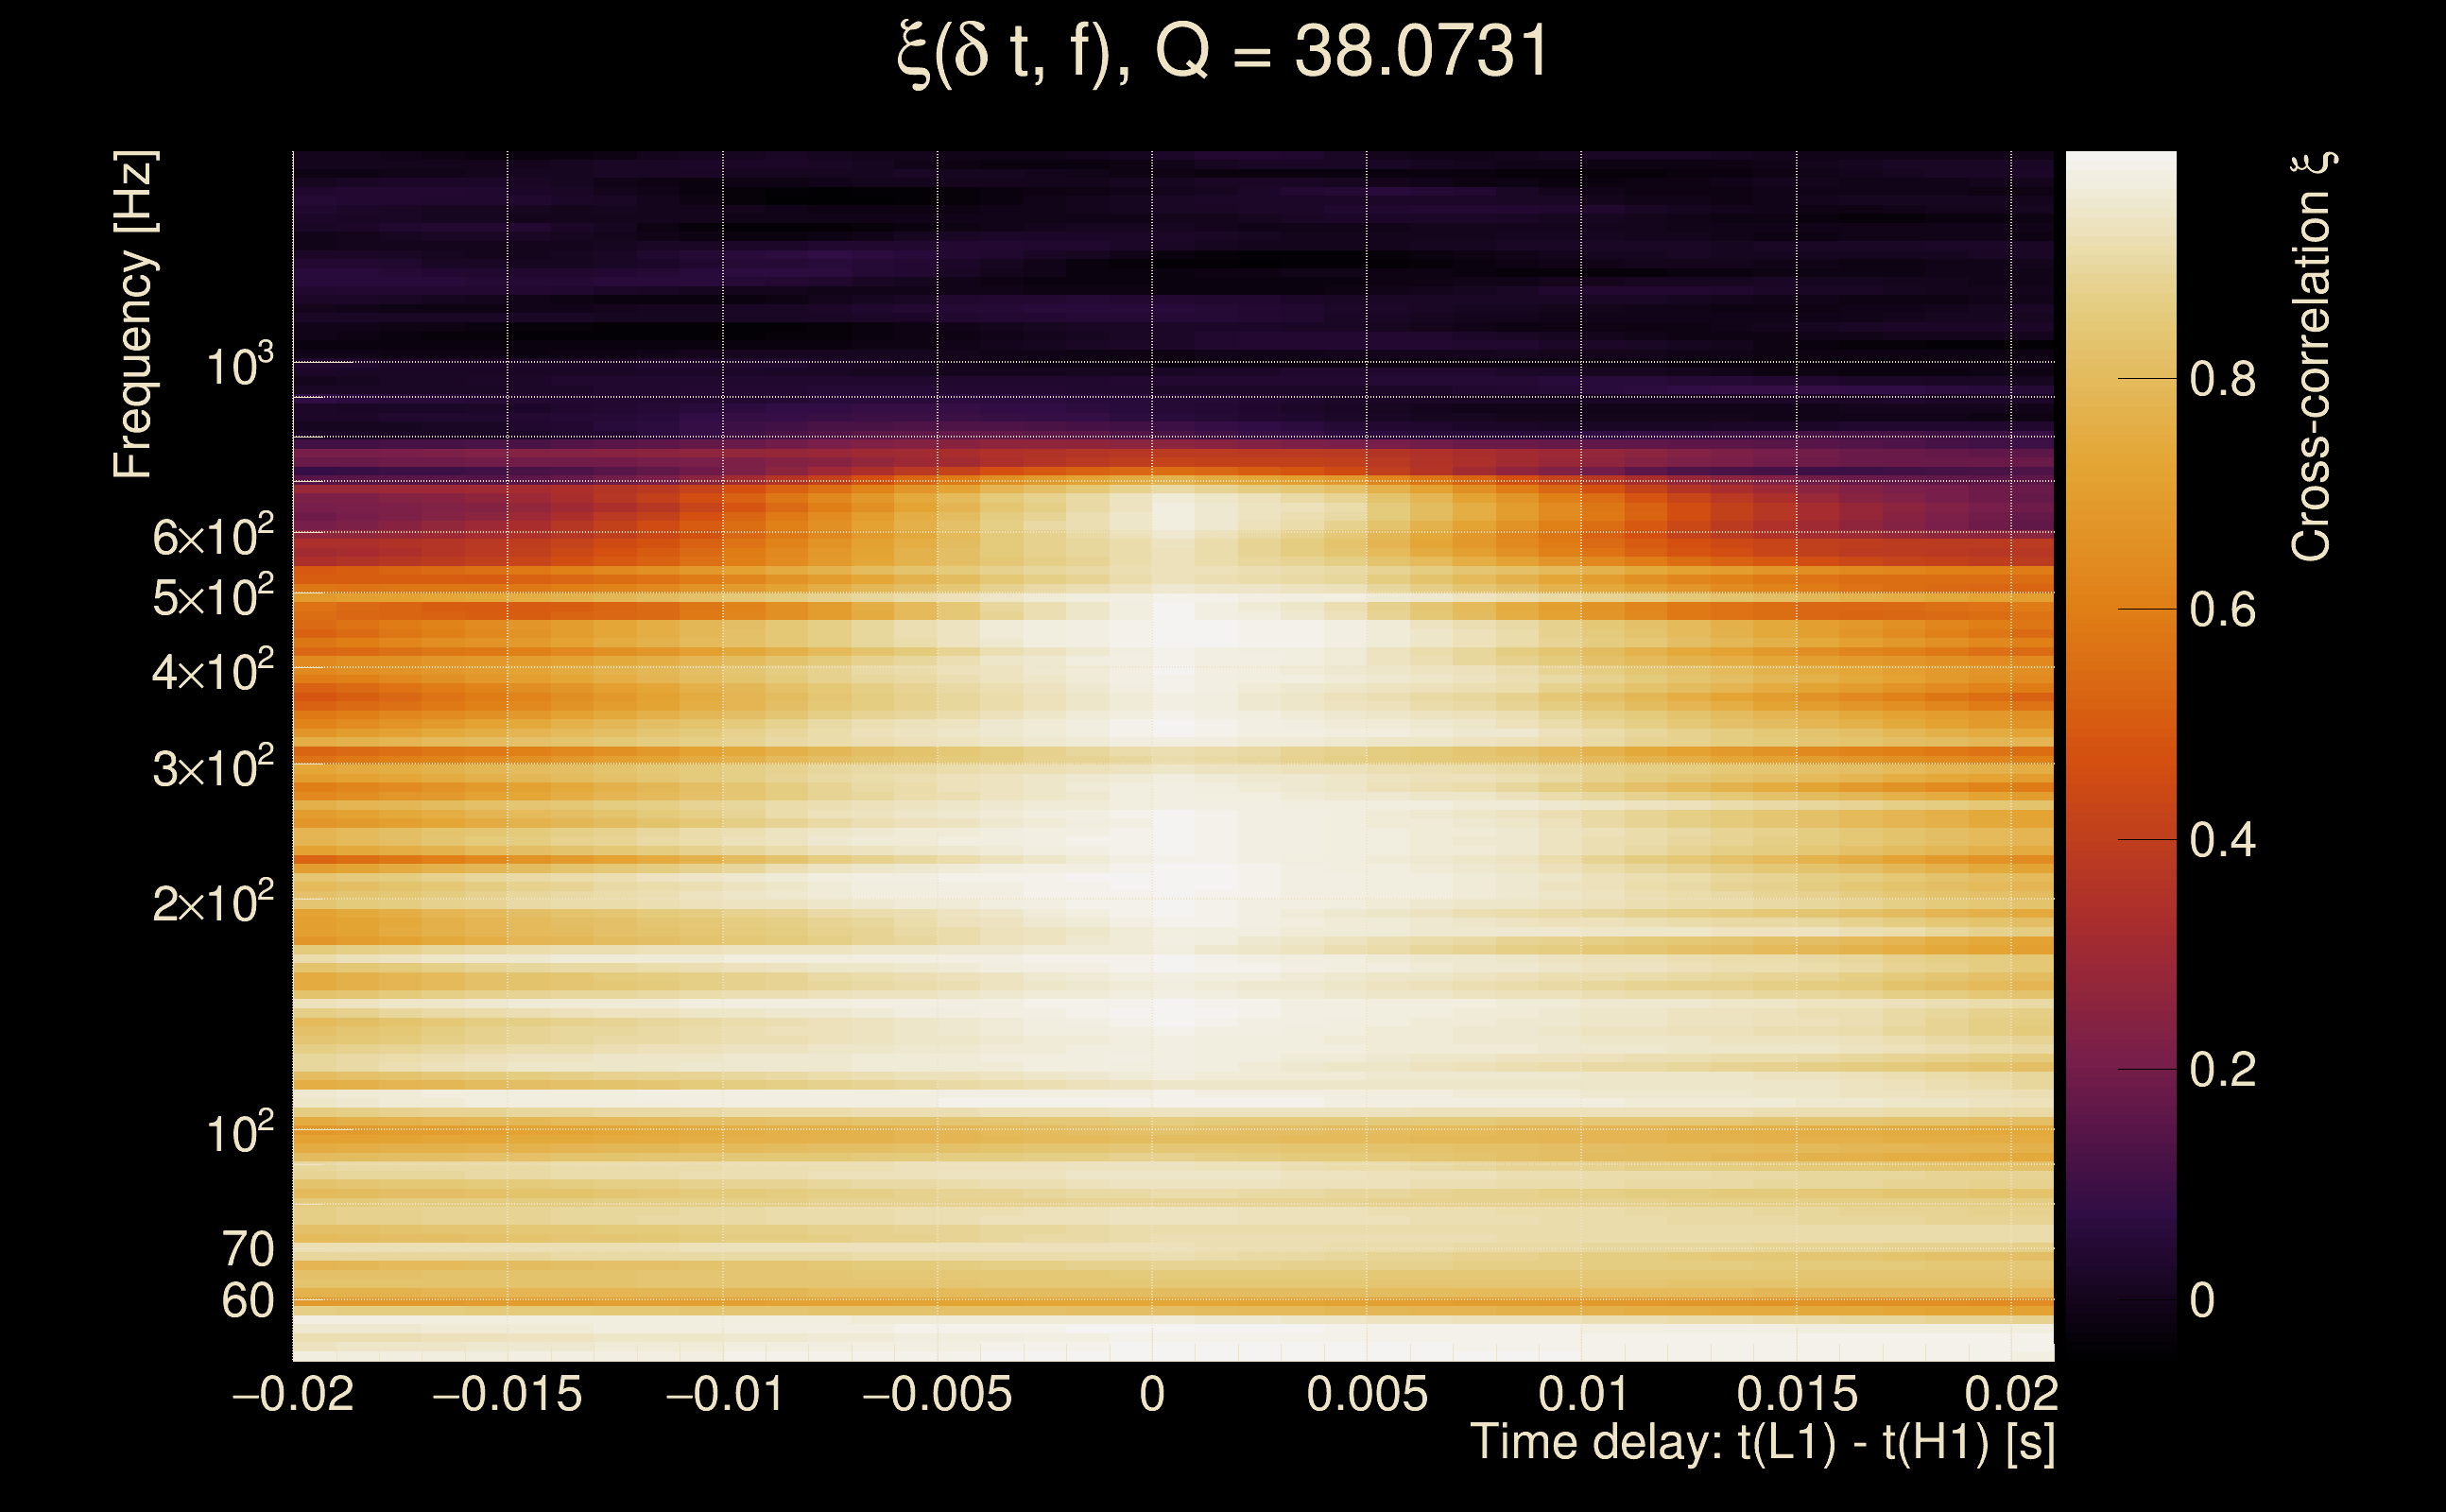
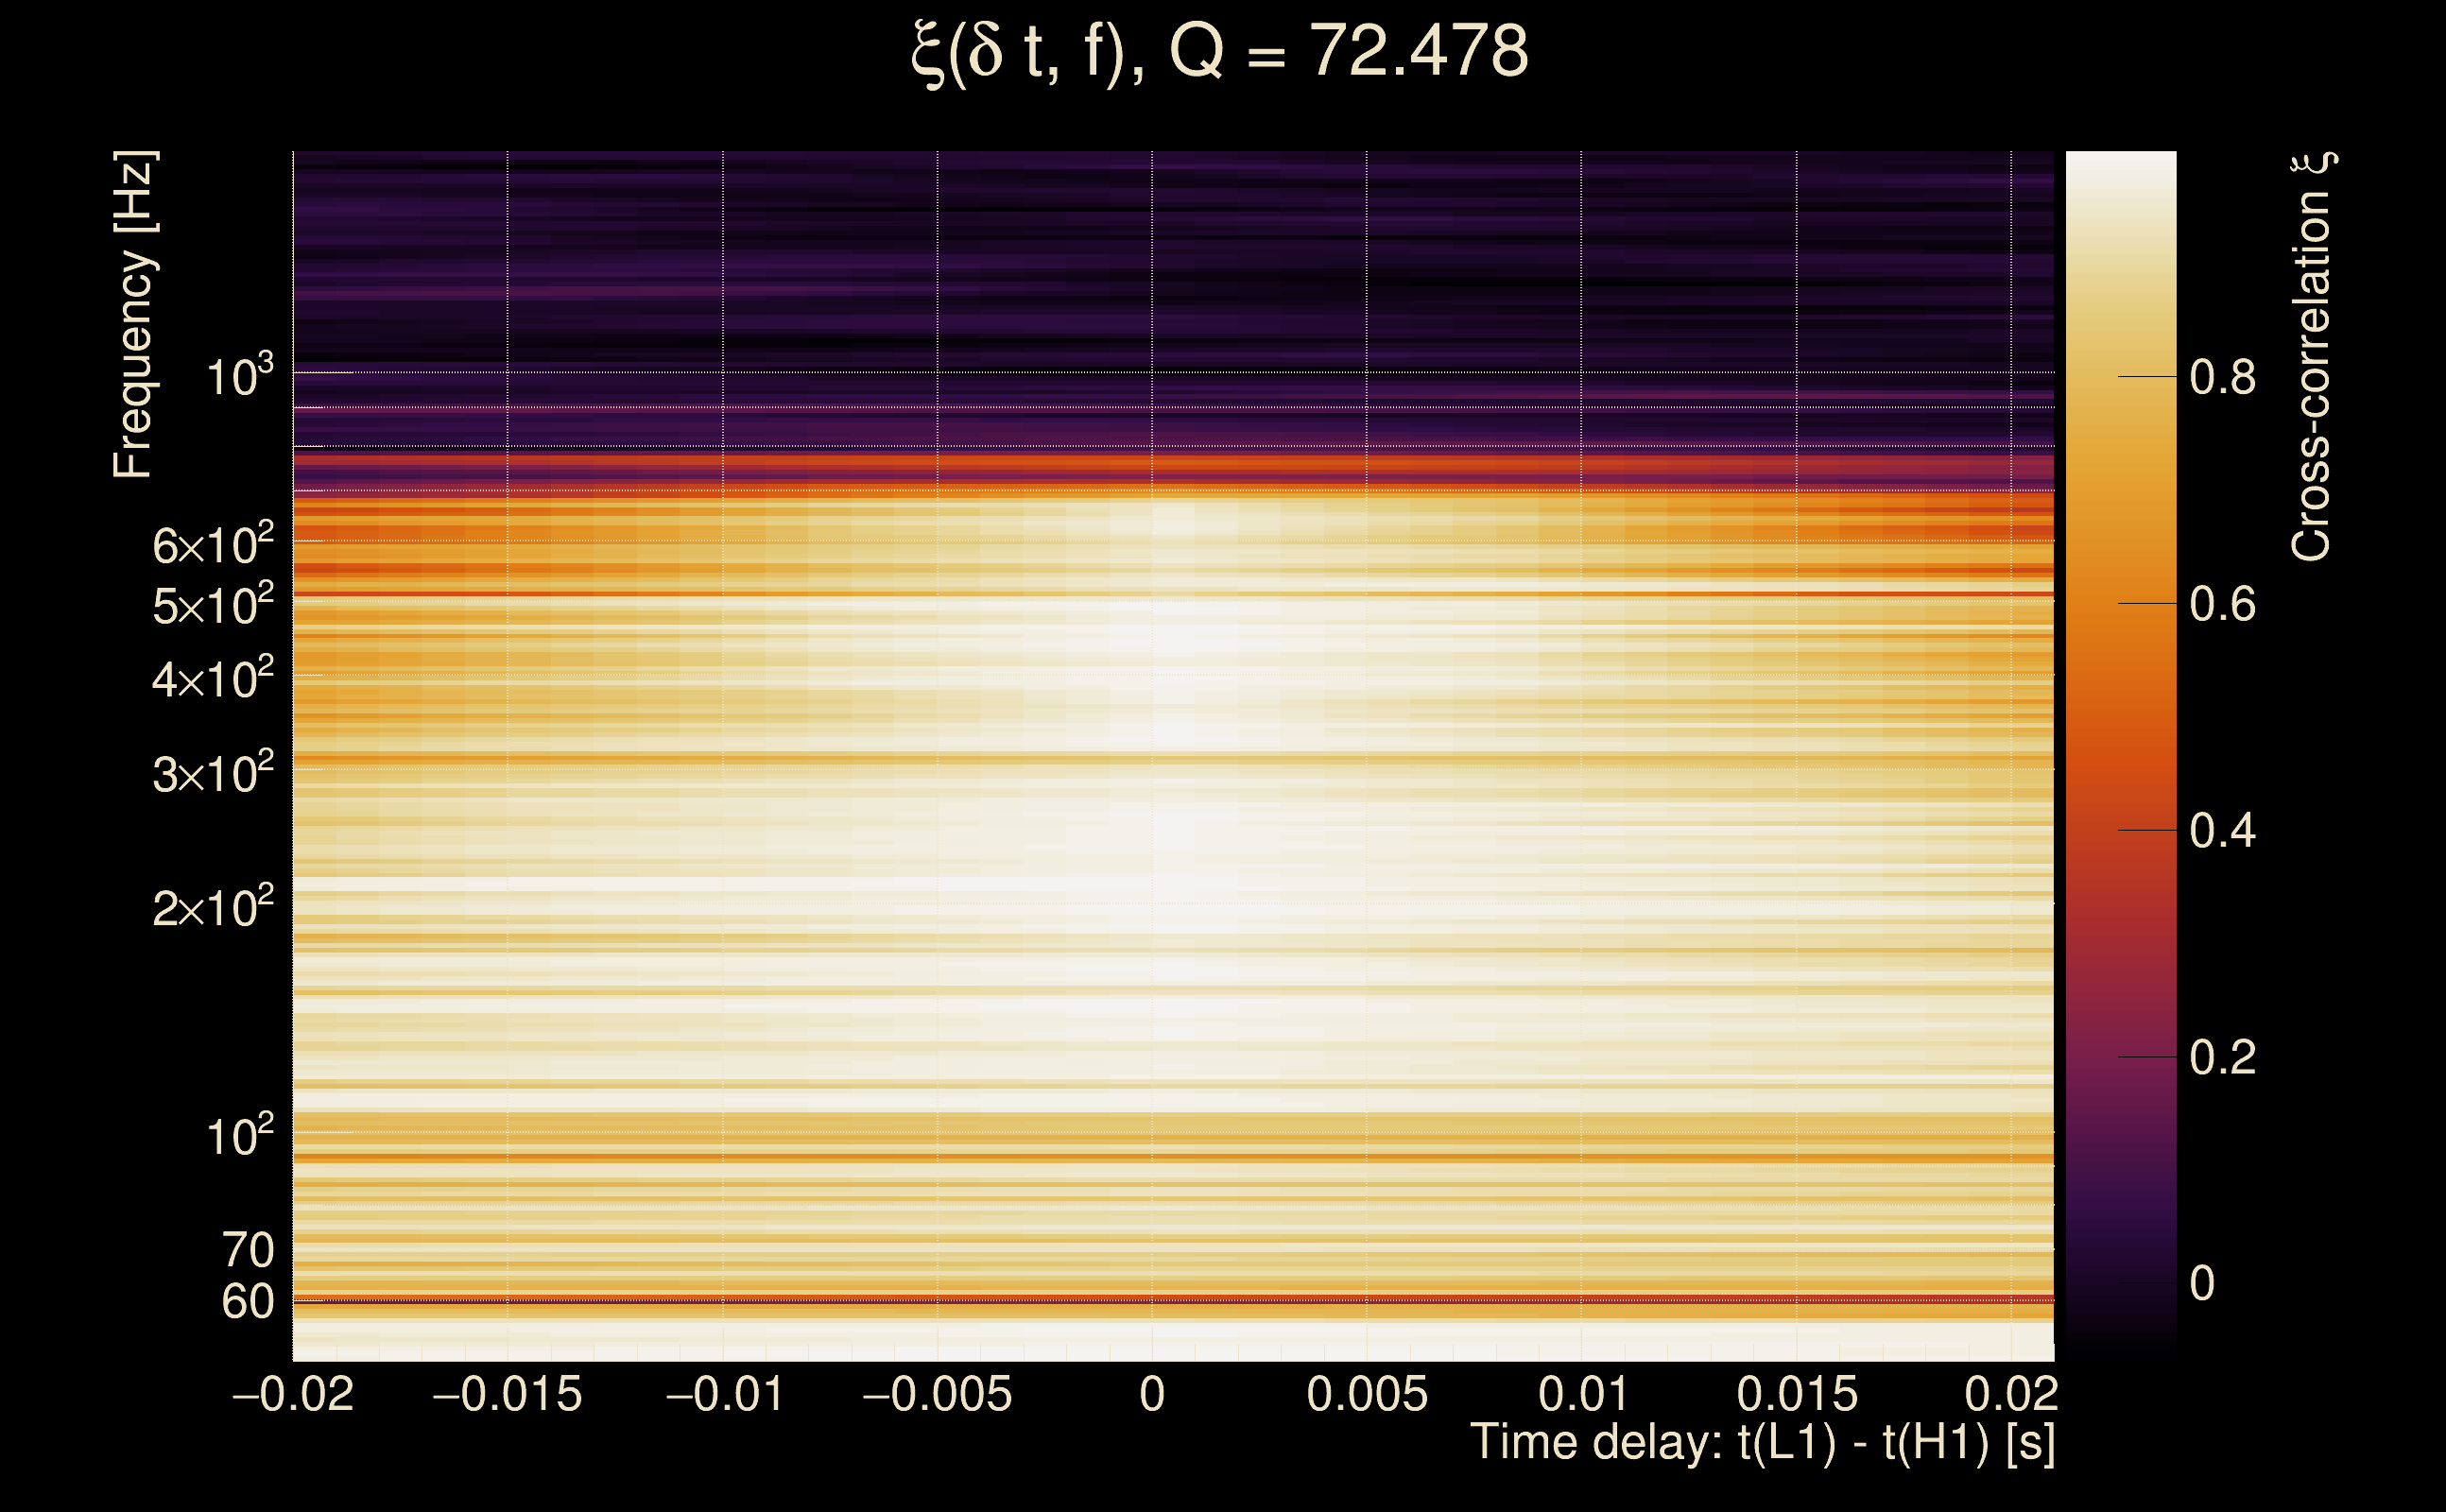
| Number of Q planes: | 5 (Q = 5.51892 → Q = 72.478) |
| Omicron frequency range: | 50 Hz → 1958.38 Hz |
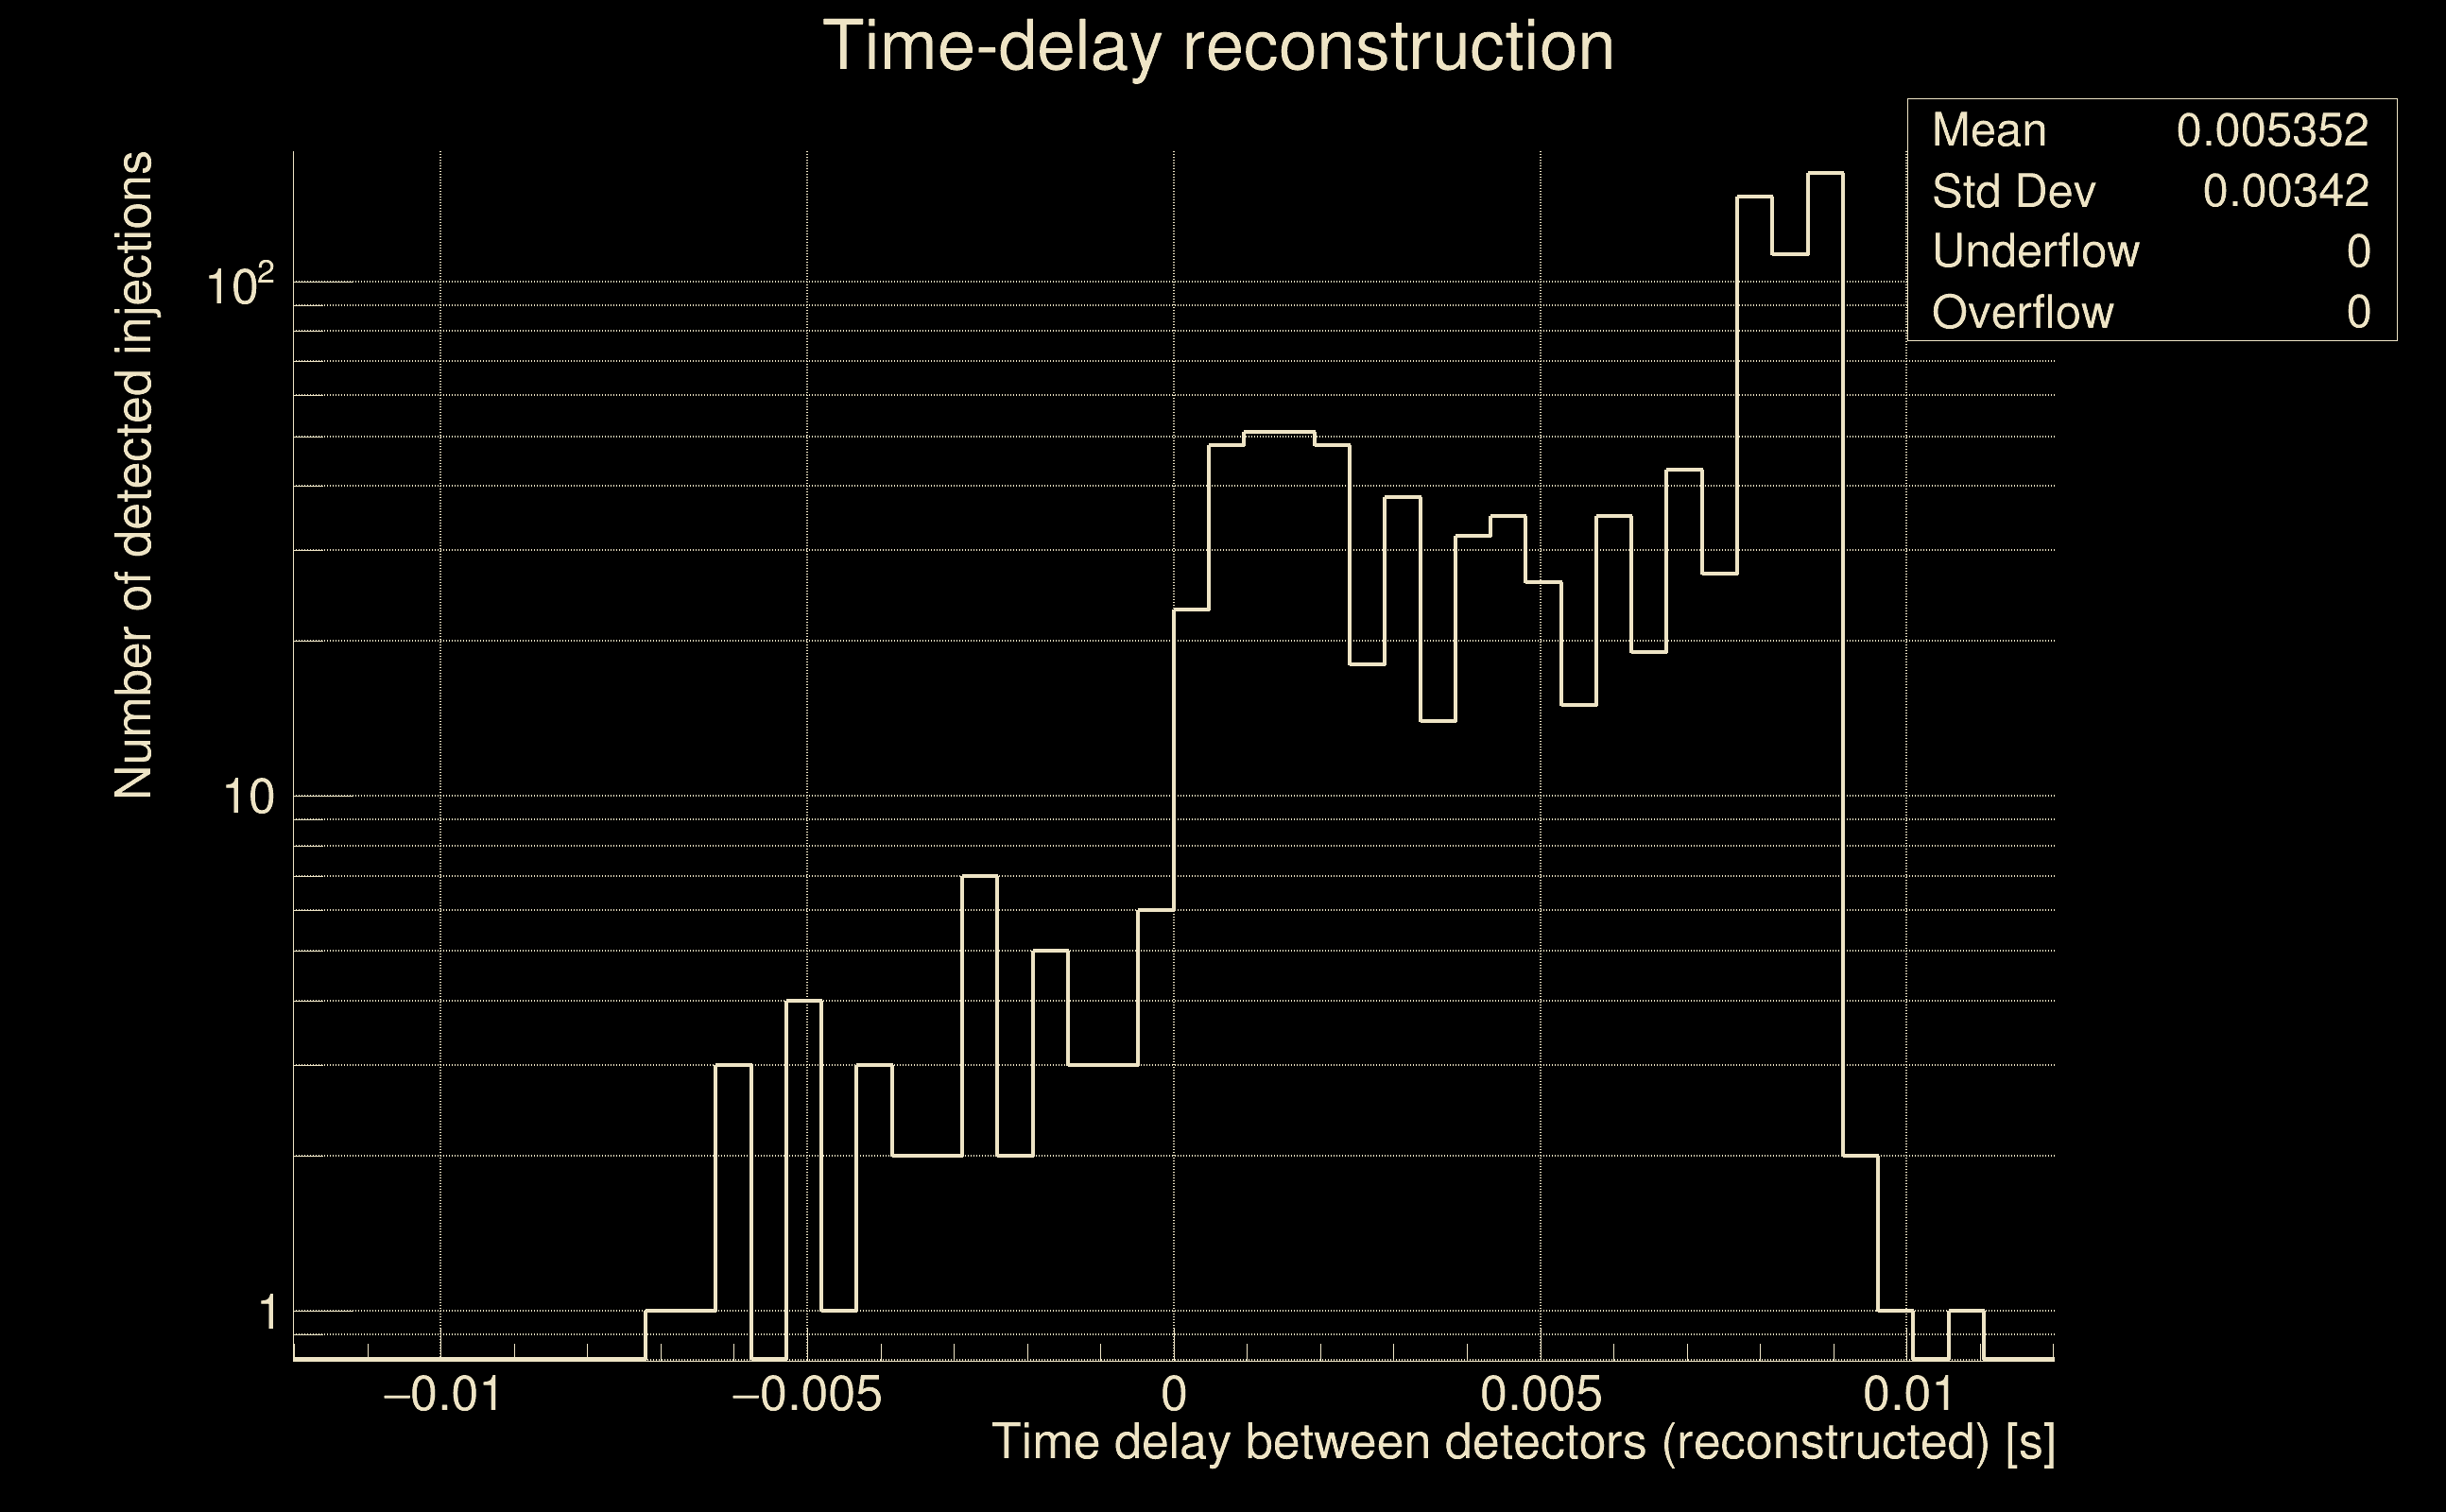
| Light travel time between detectors: | 0.0100128 s |
| Slice extra-time (calibration uncertainty + slice veto): | 0.0129872 s |
| Number of time-delay bins in a cross-correlation map: | 10000 |
| Number of slices in a cross-correlation map: | 217 |
| Number of time-delay bins in a slice: | 46 |
| SNR gating: | < 100 (detector 0), < 100 (detector 1) |
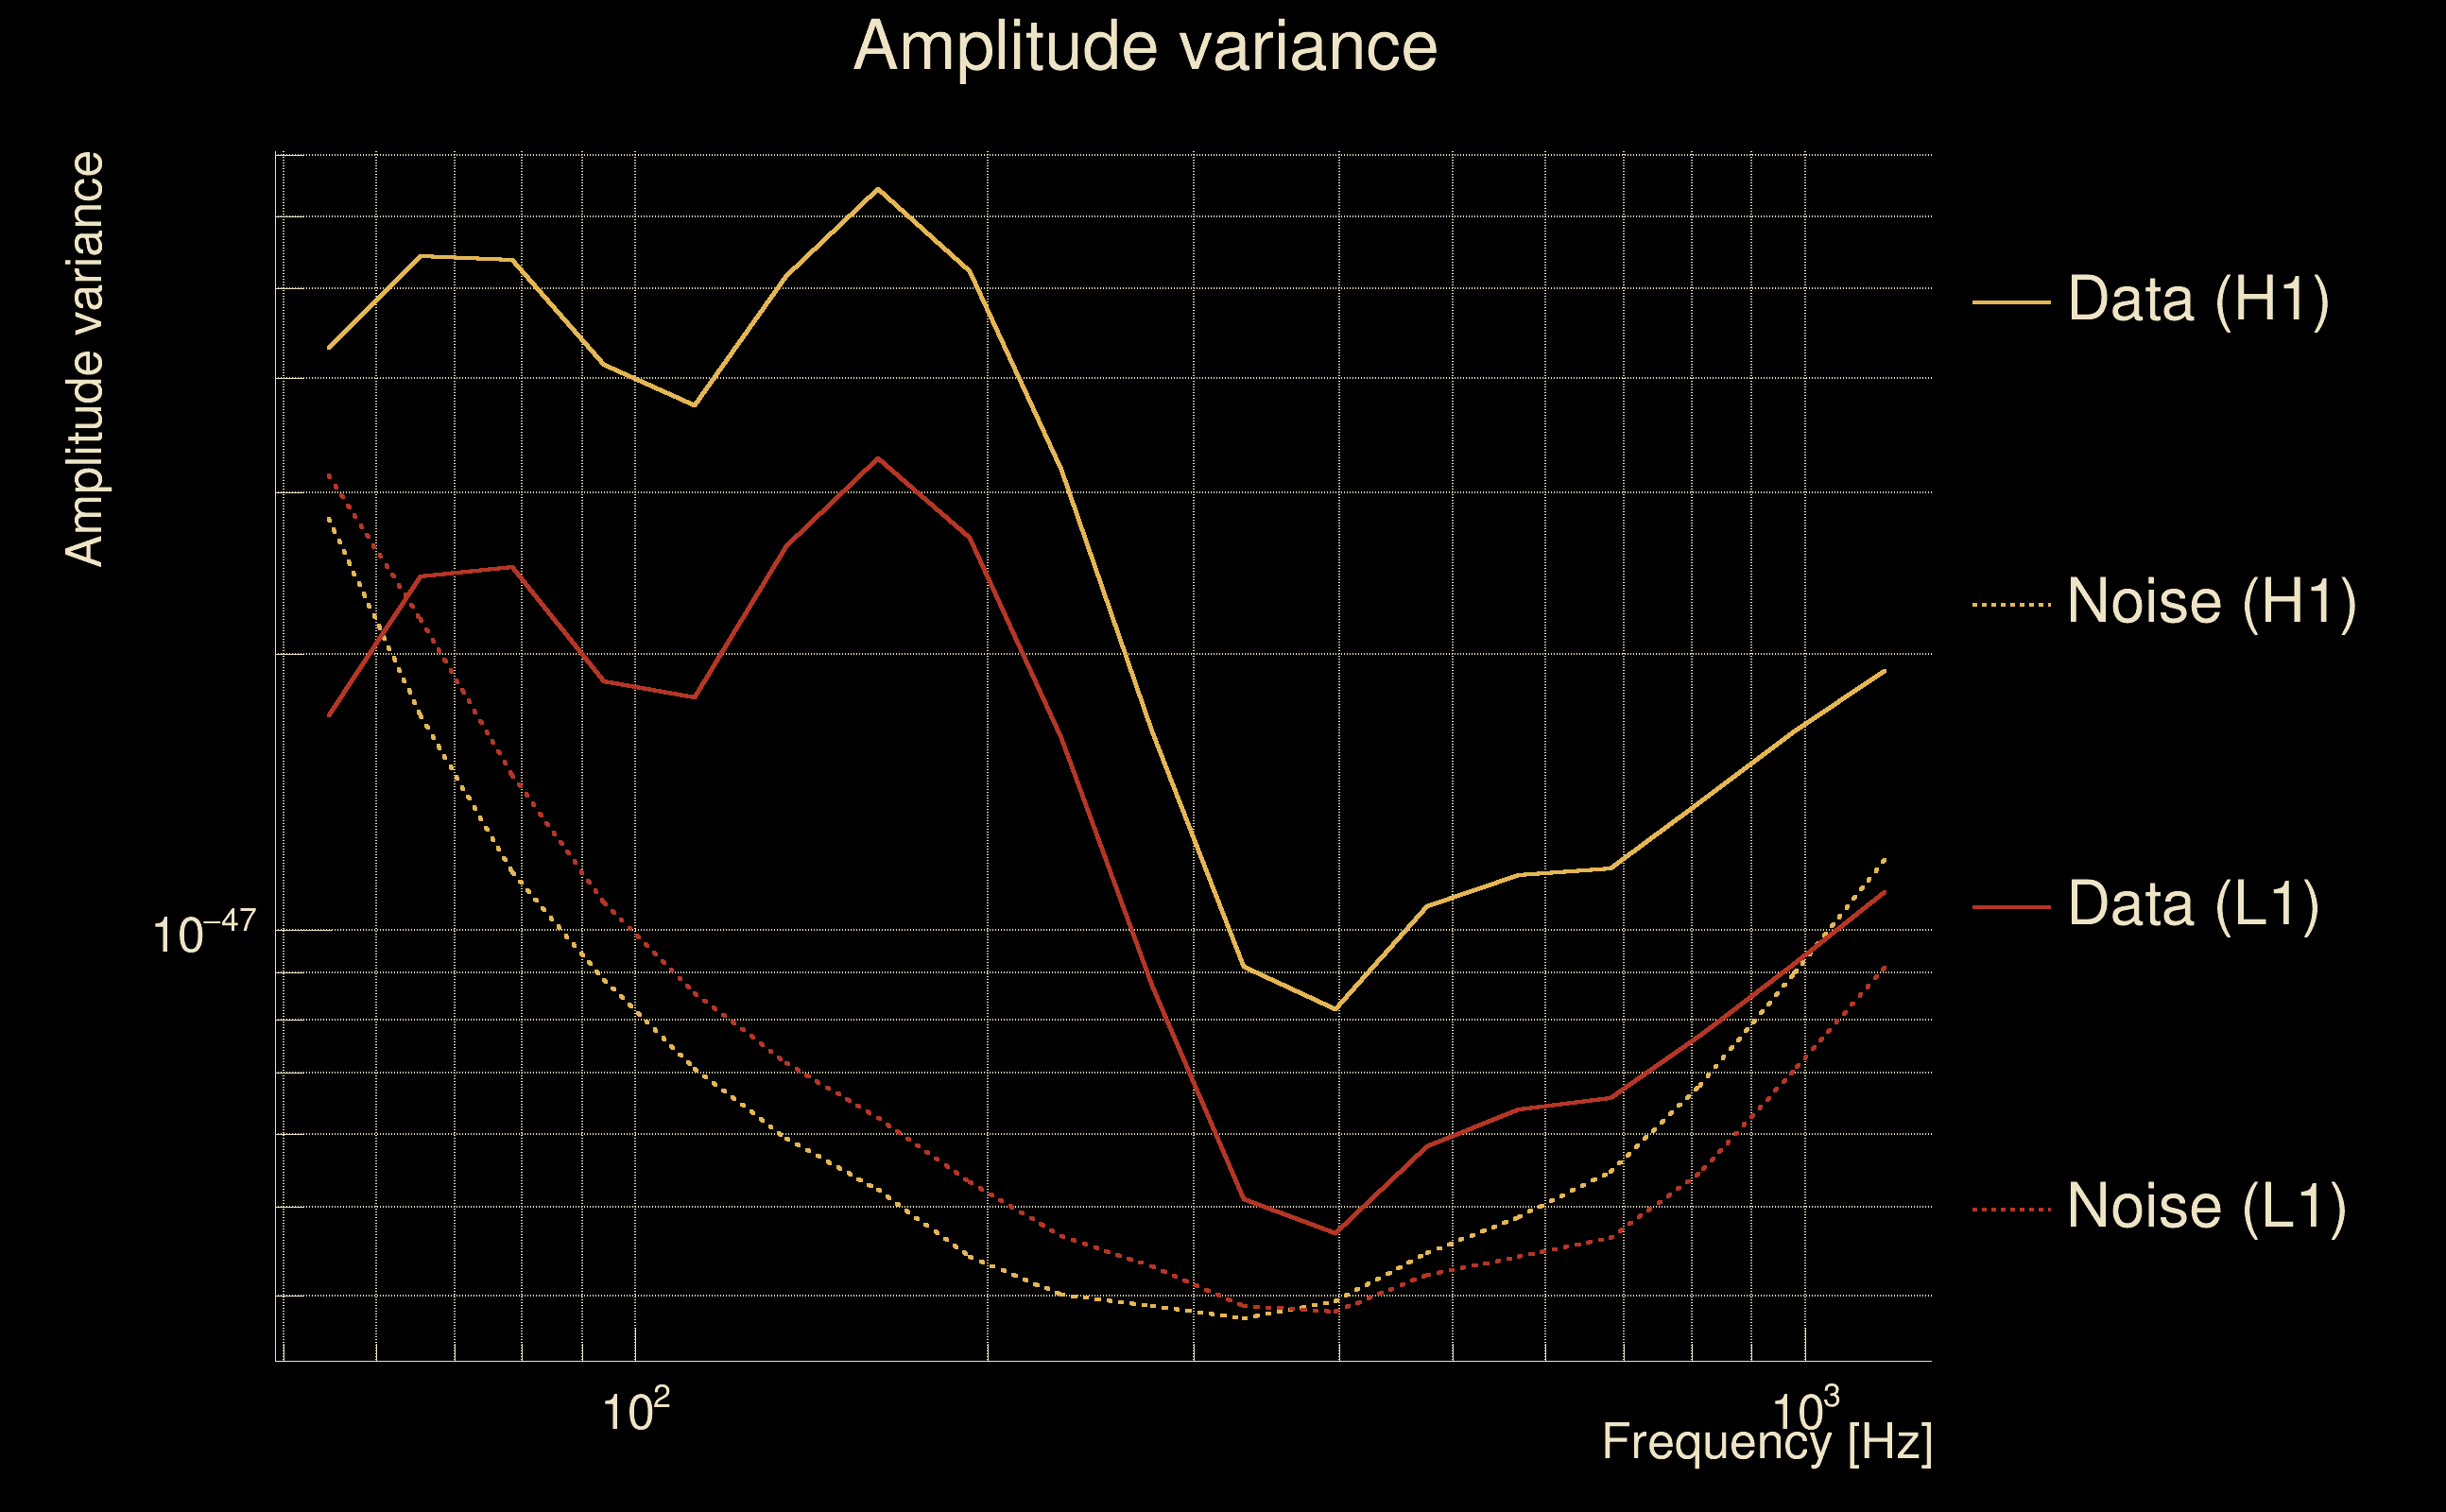
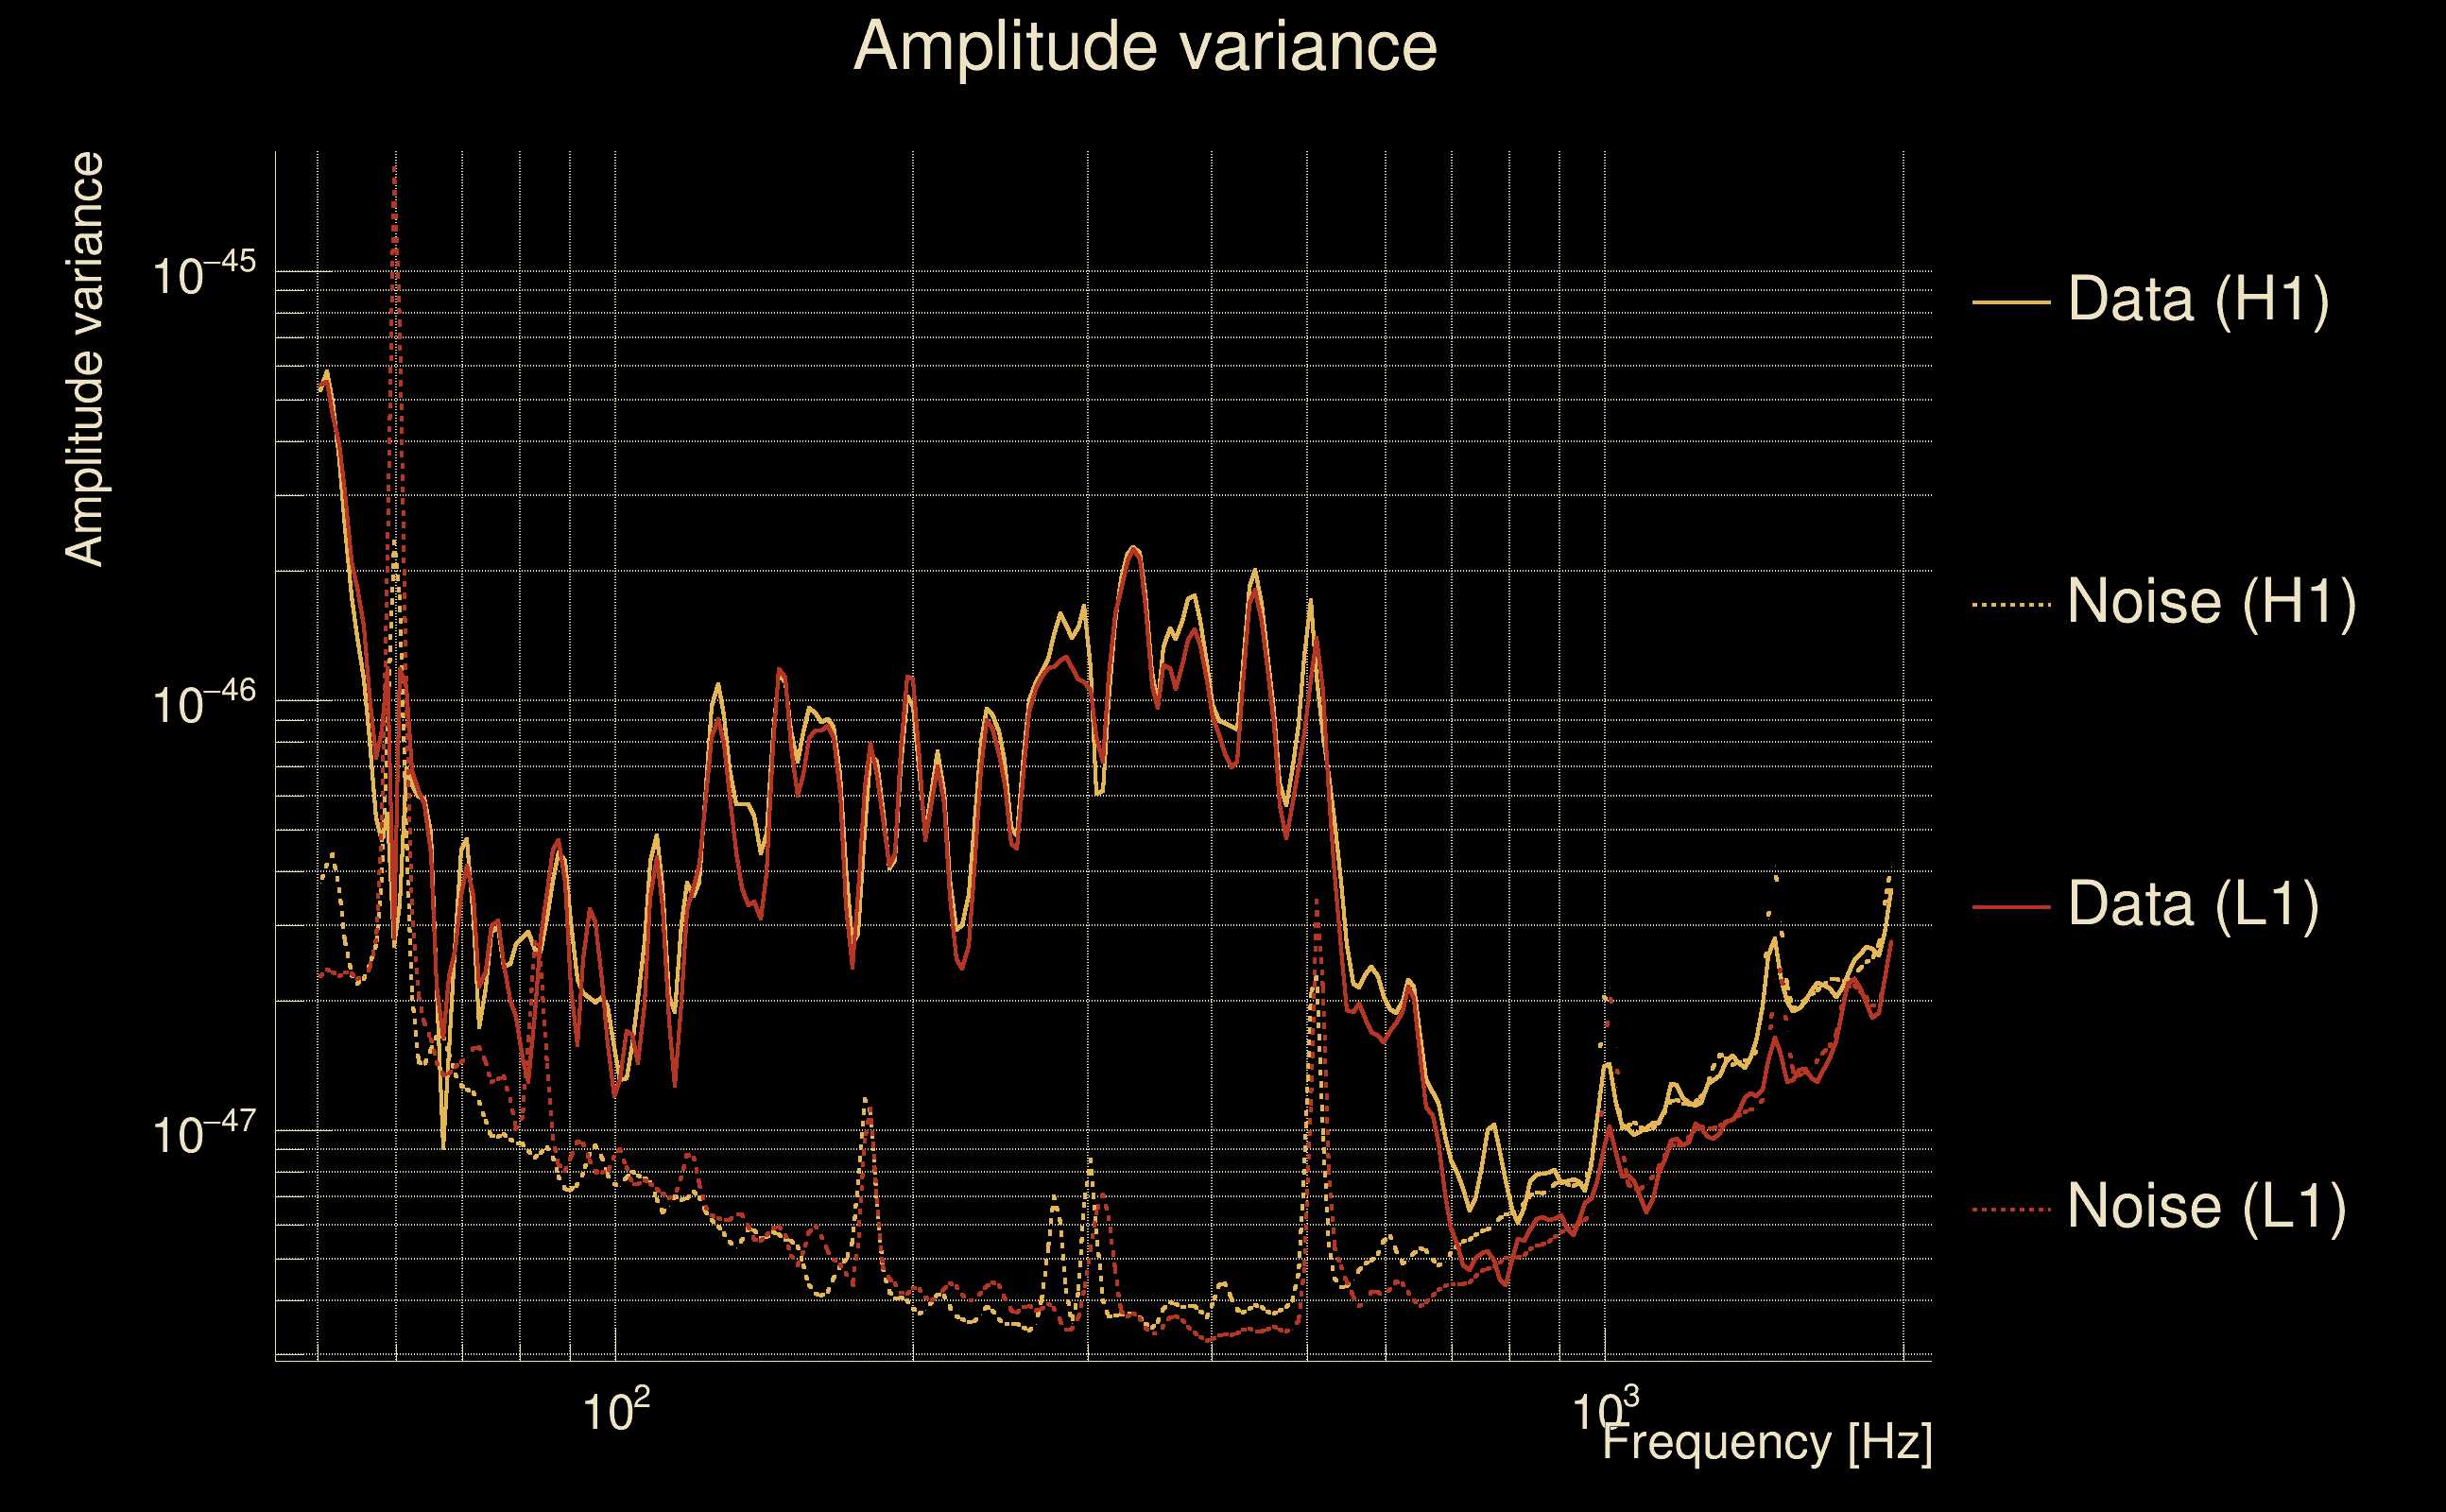
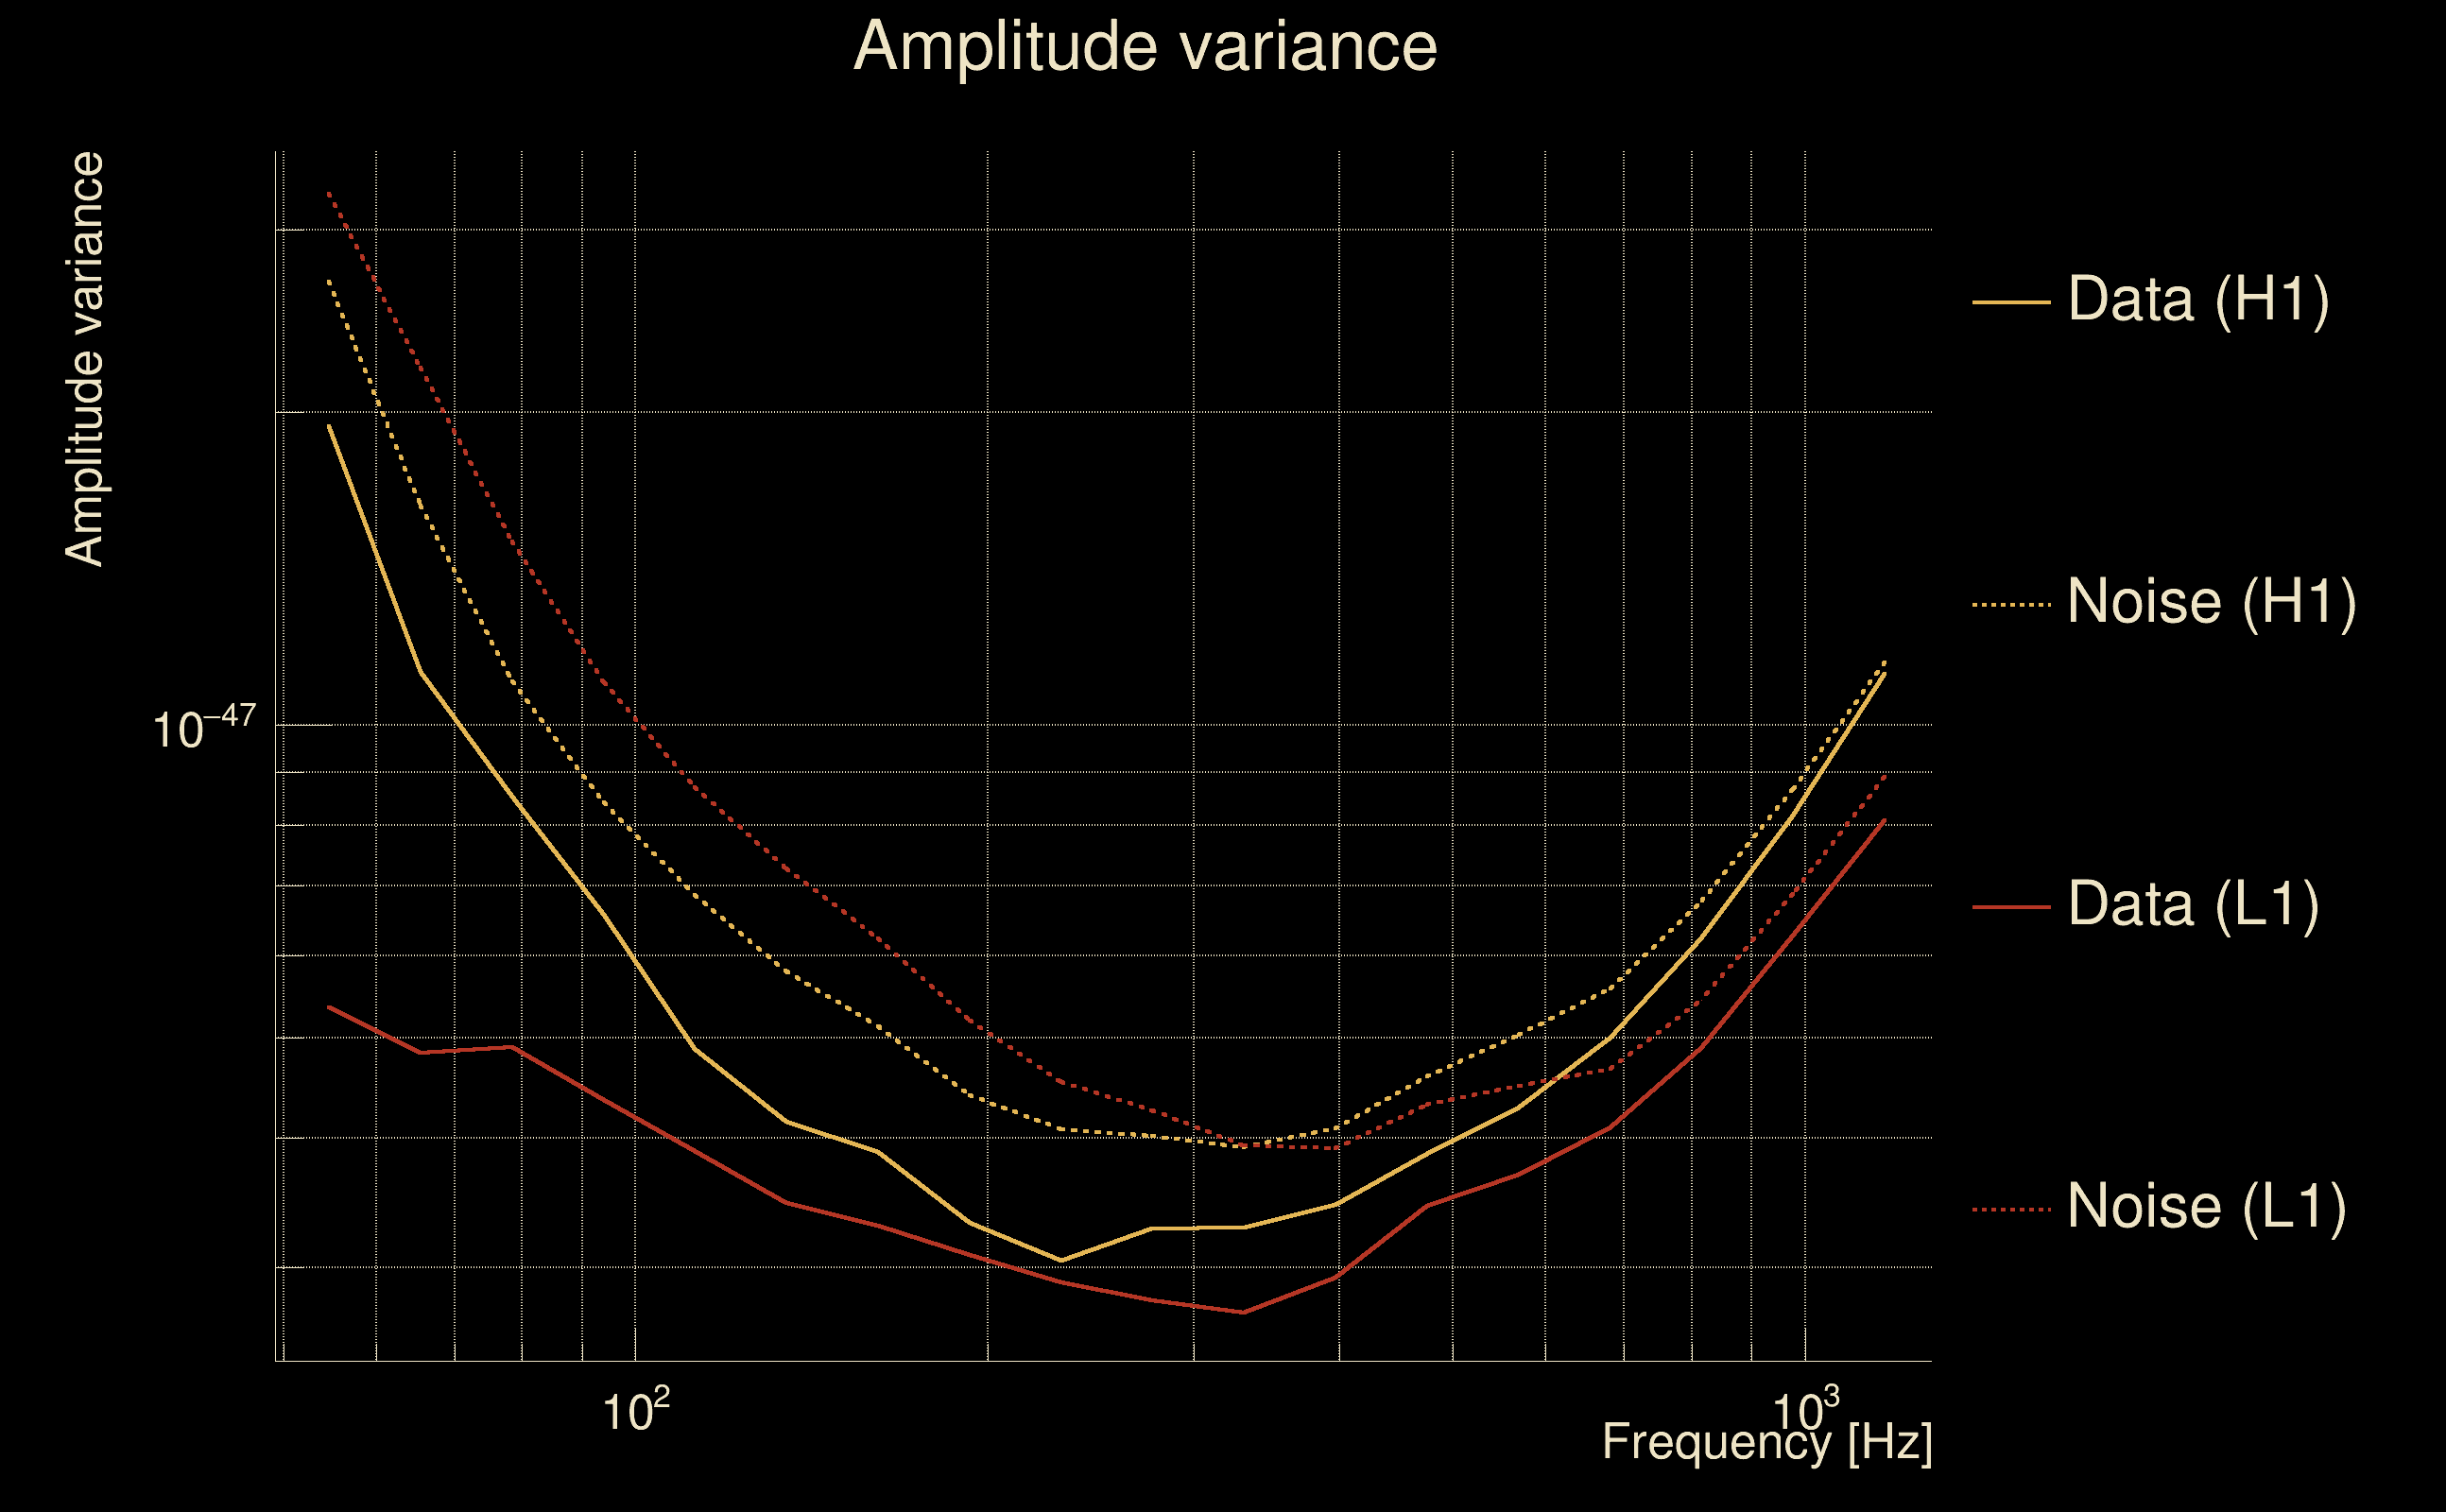
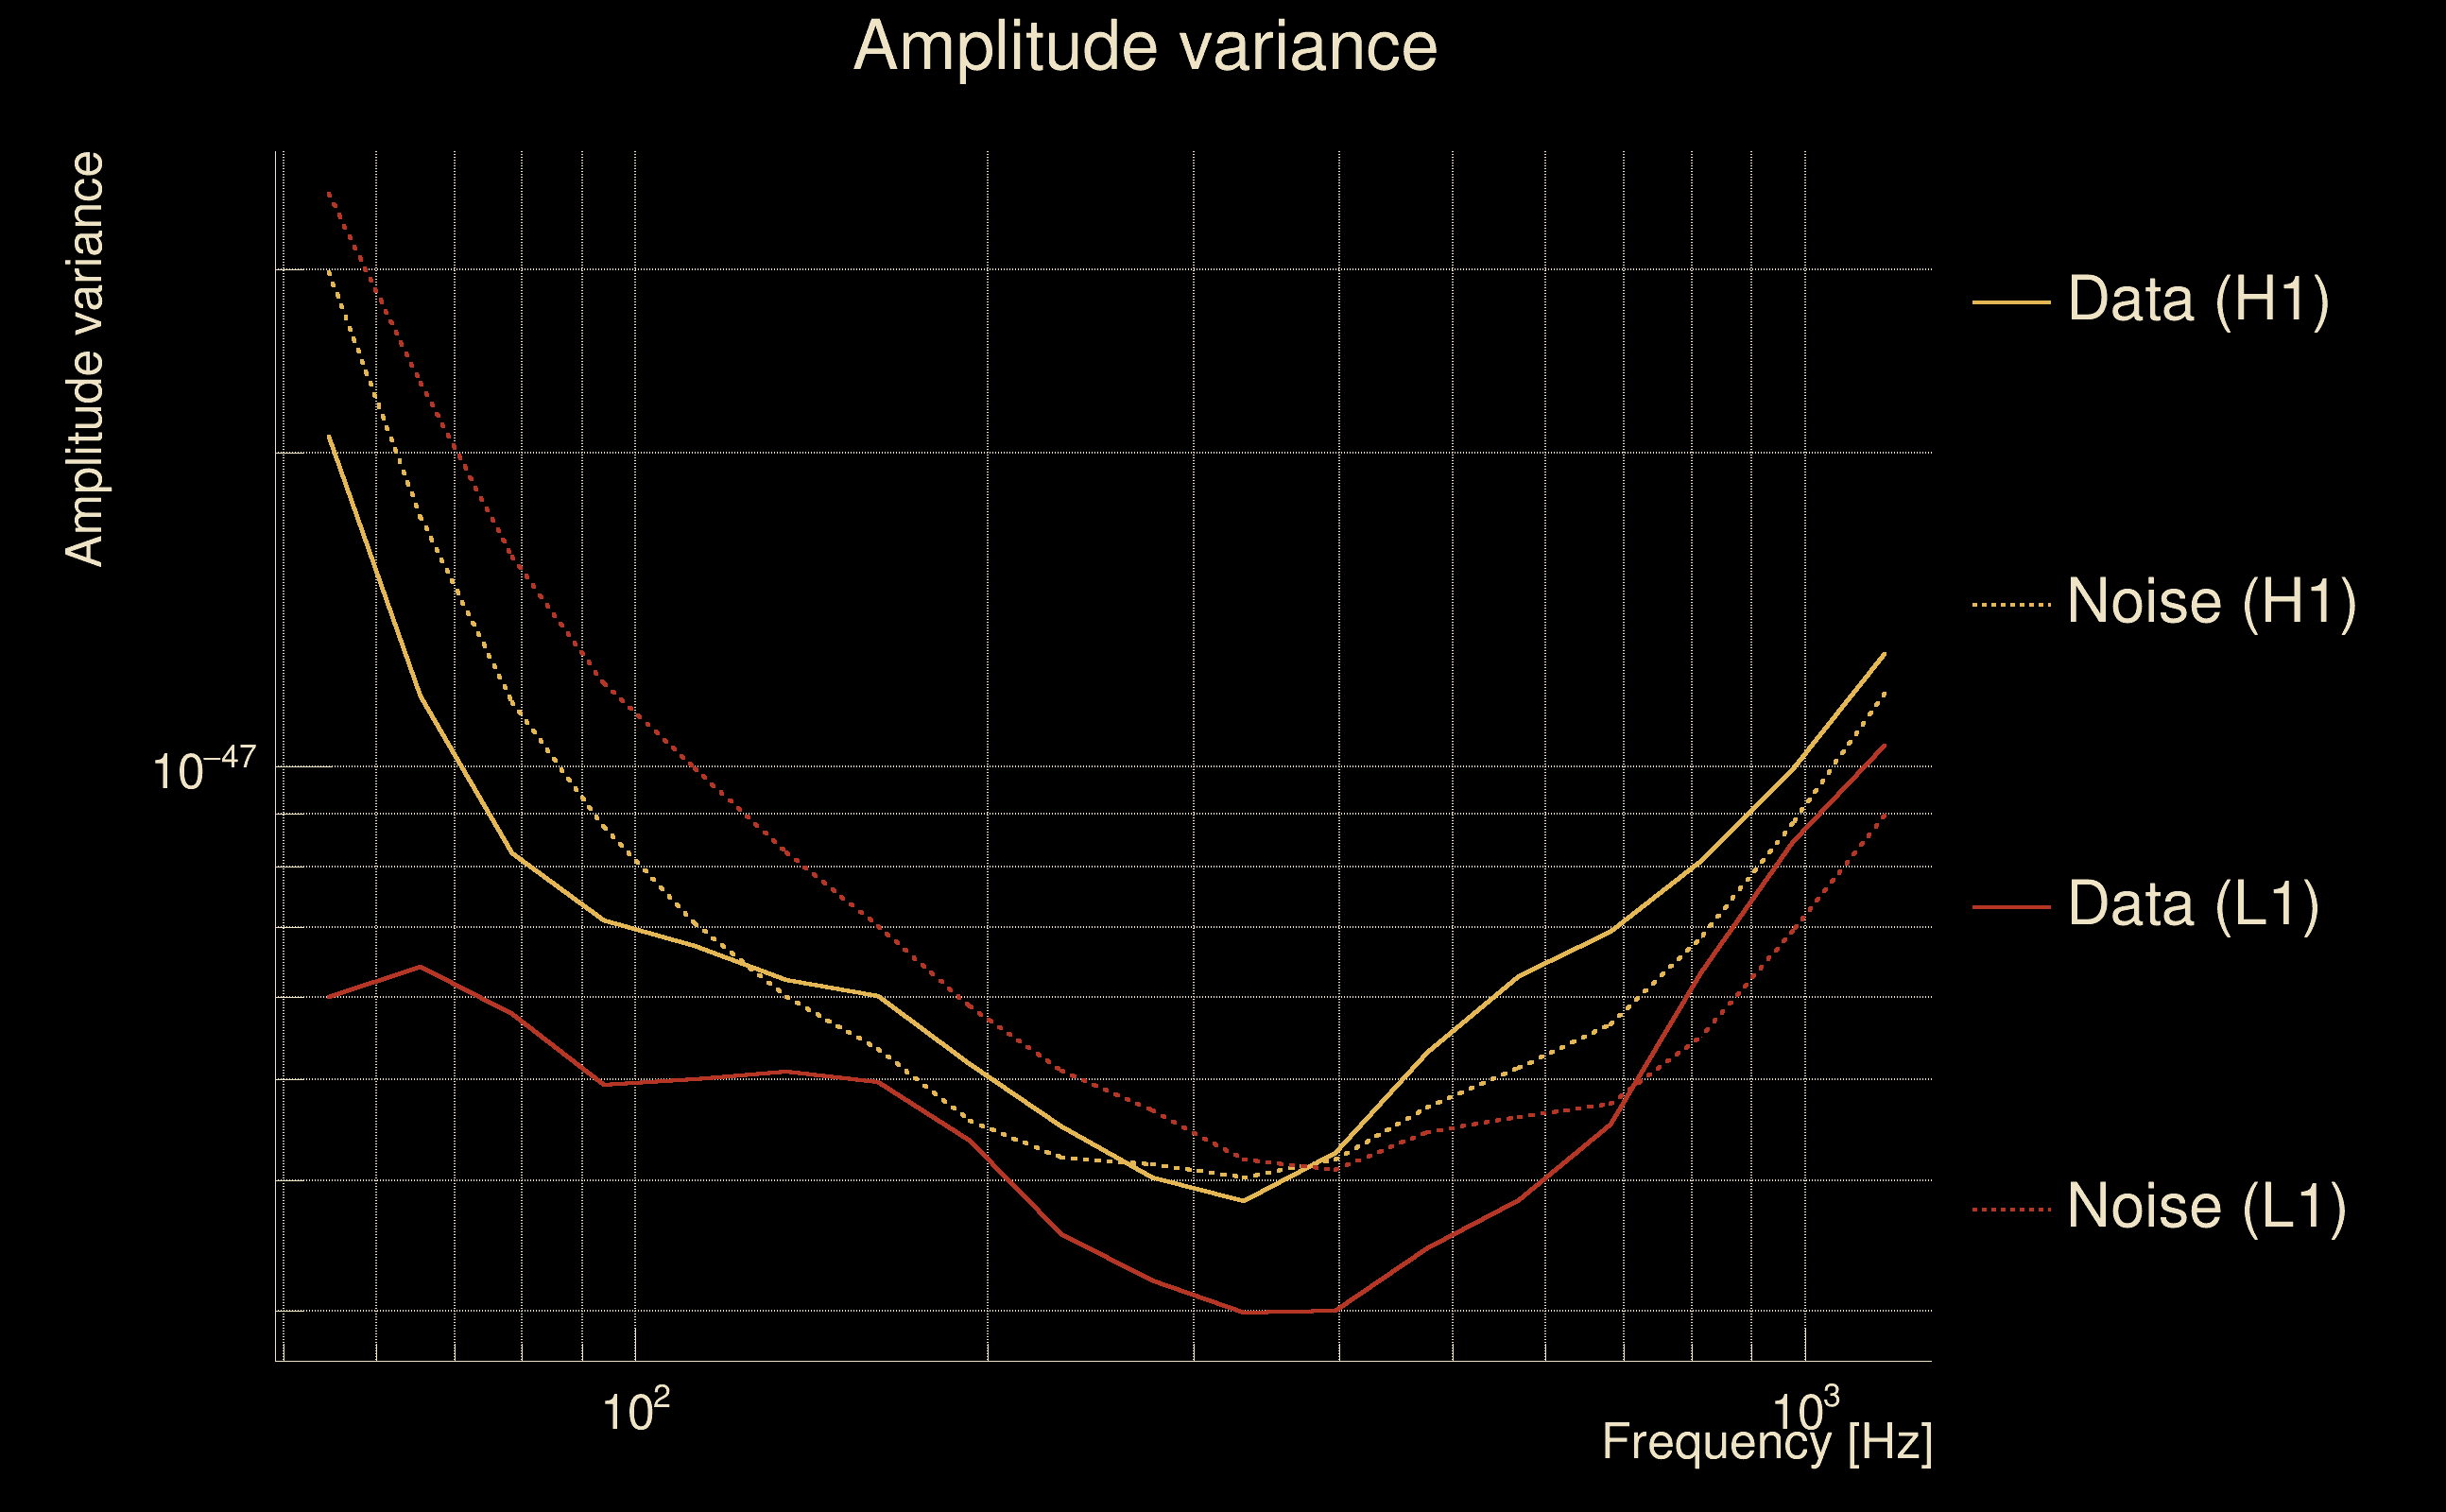
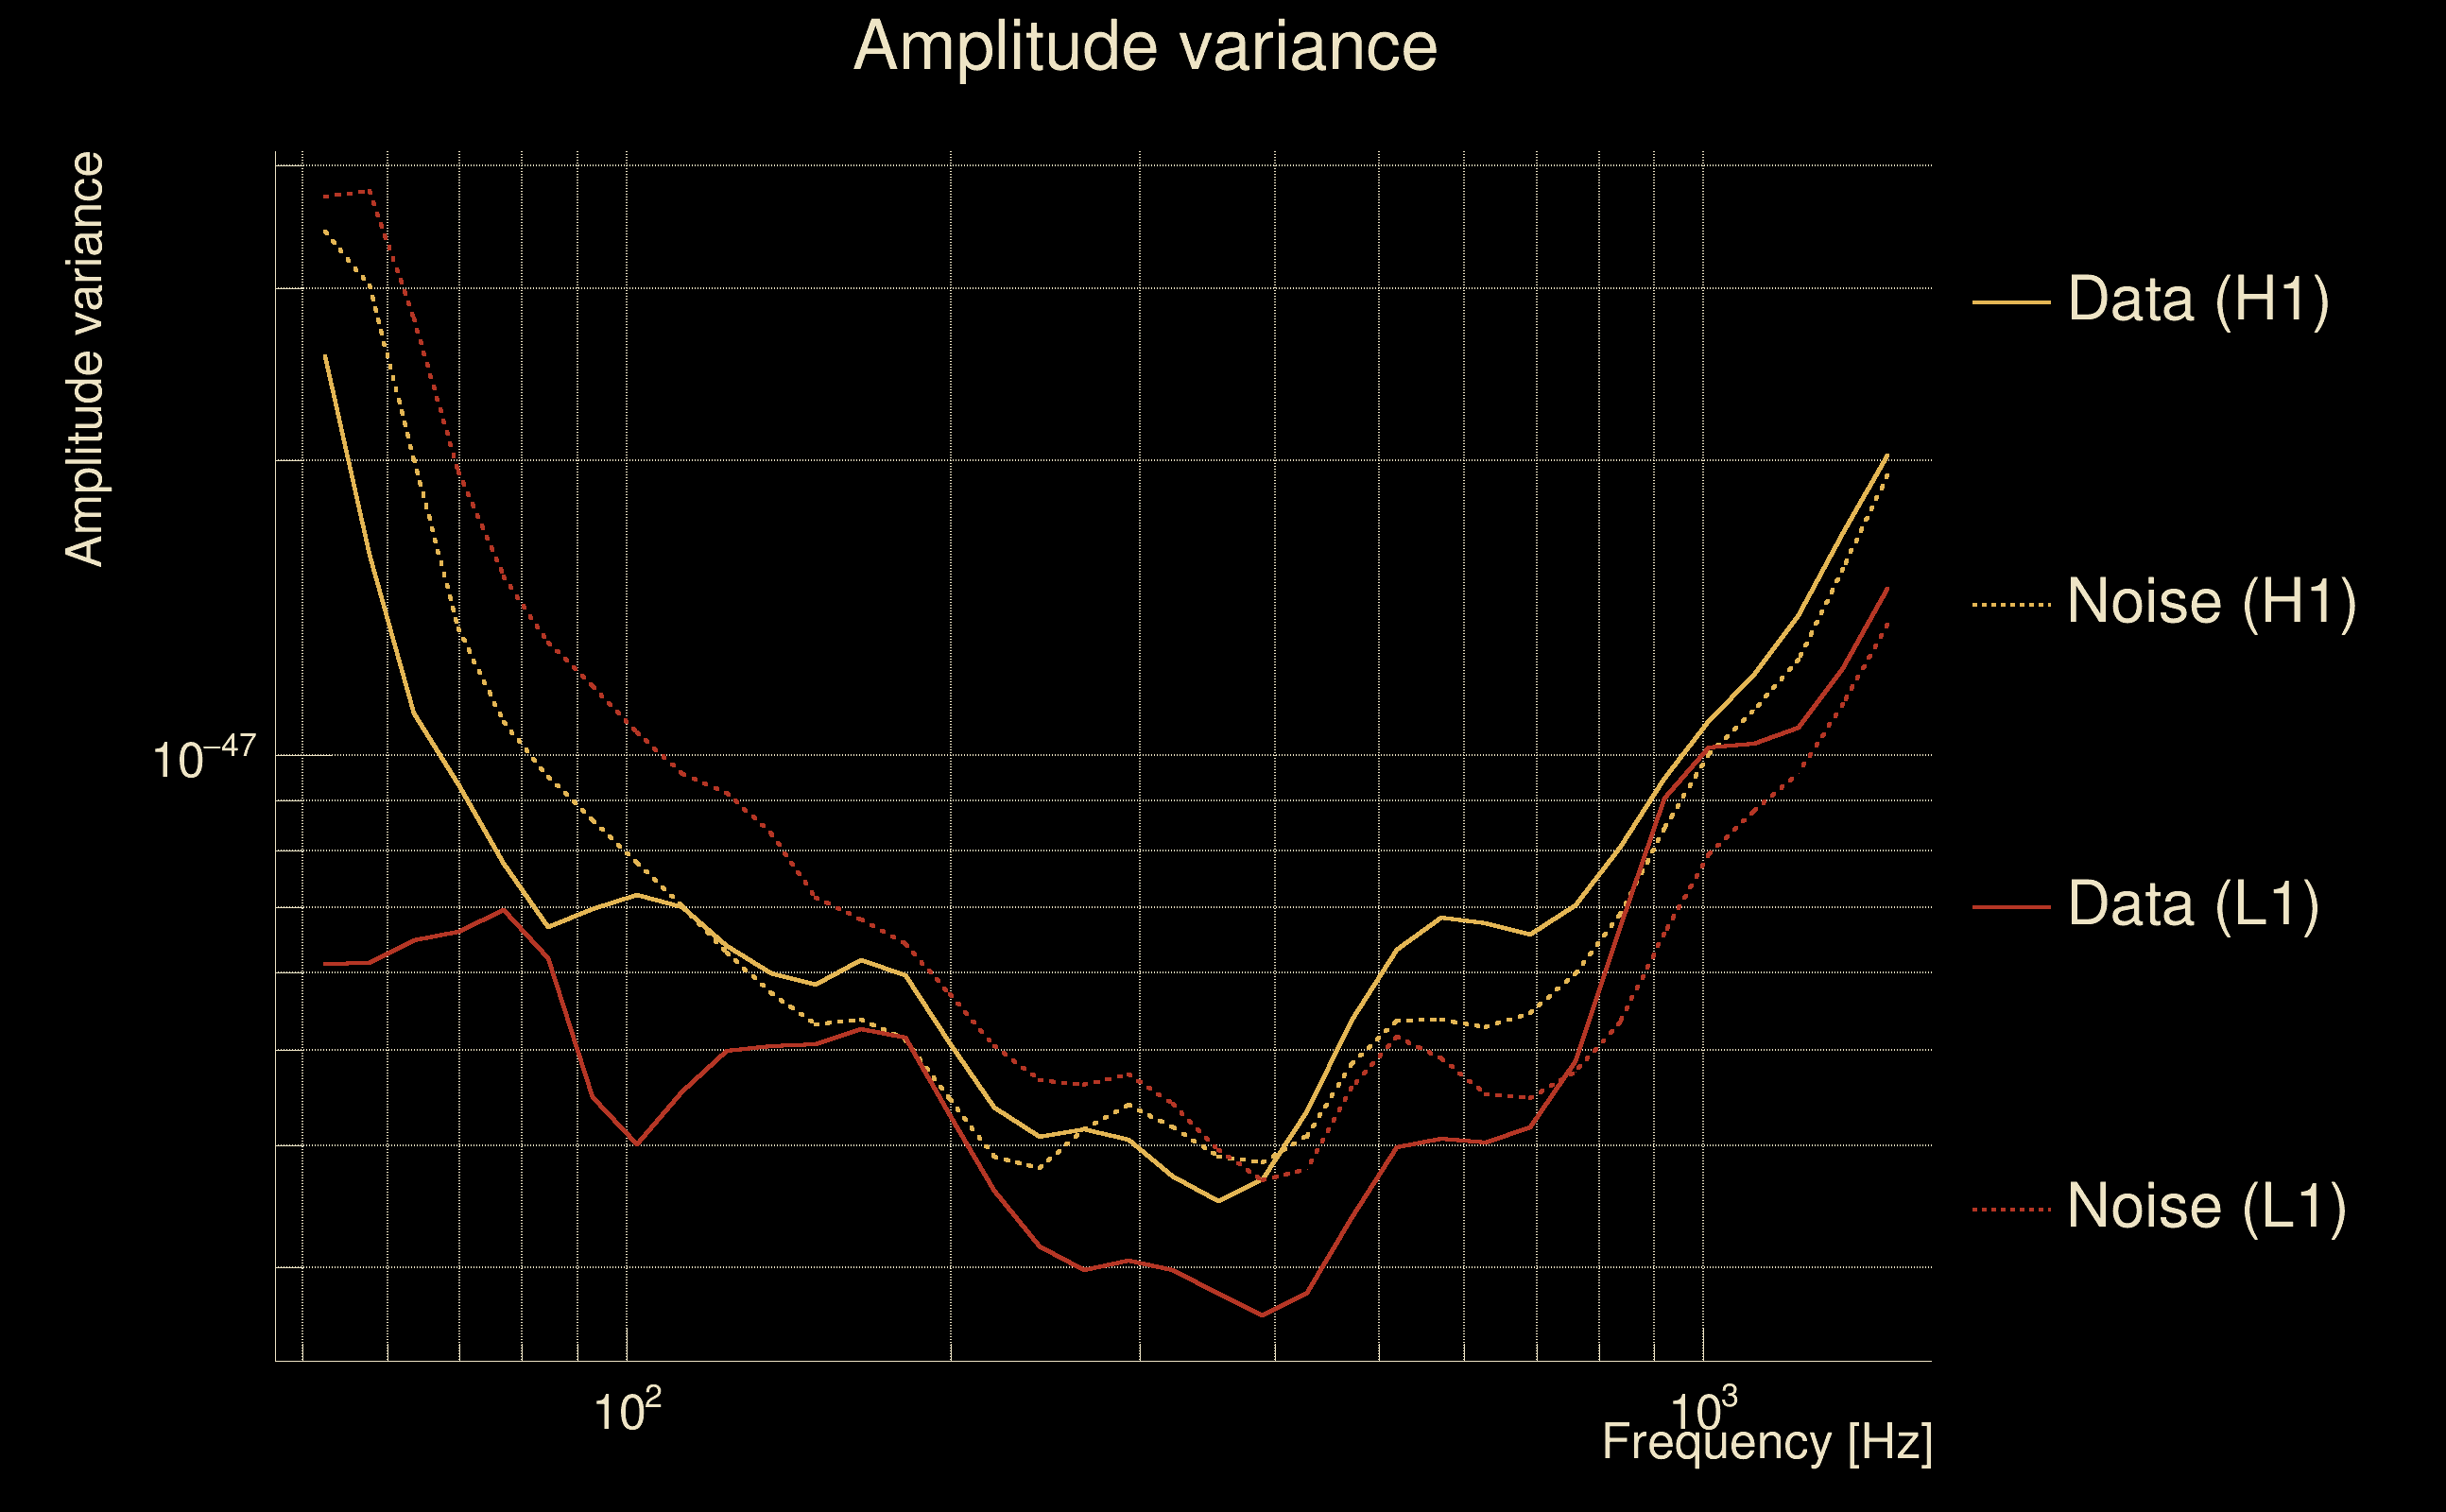
| Amplitude spectrograms: | normalization = 1e-22, power index = 2 |
| White noise SNR variance: | 0.523175 (after applying a correction factor = 1) |
| Amplitude ratio confidence level: | 3 sigma |
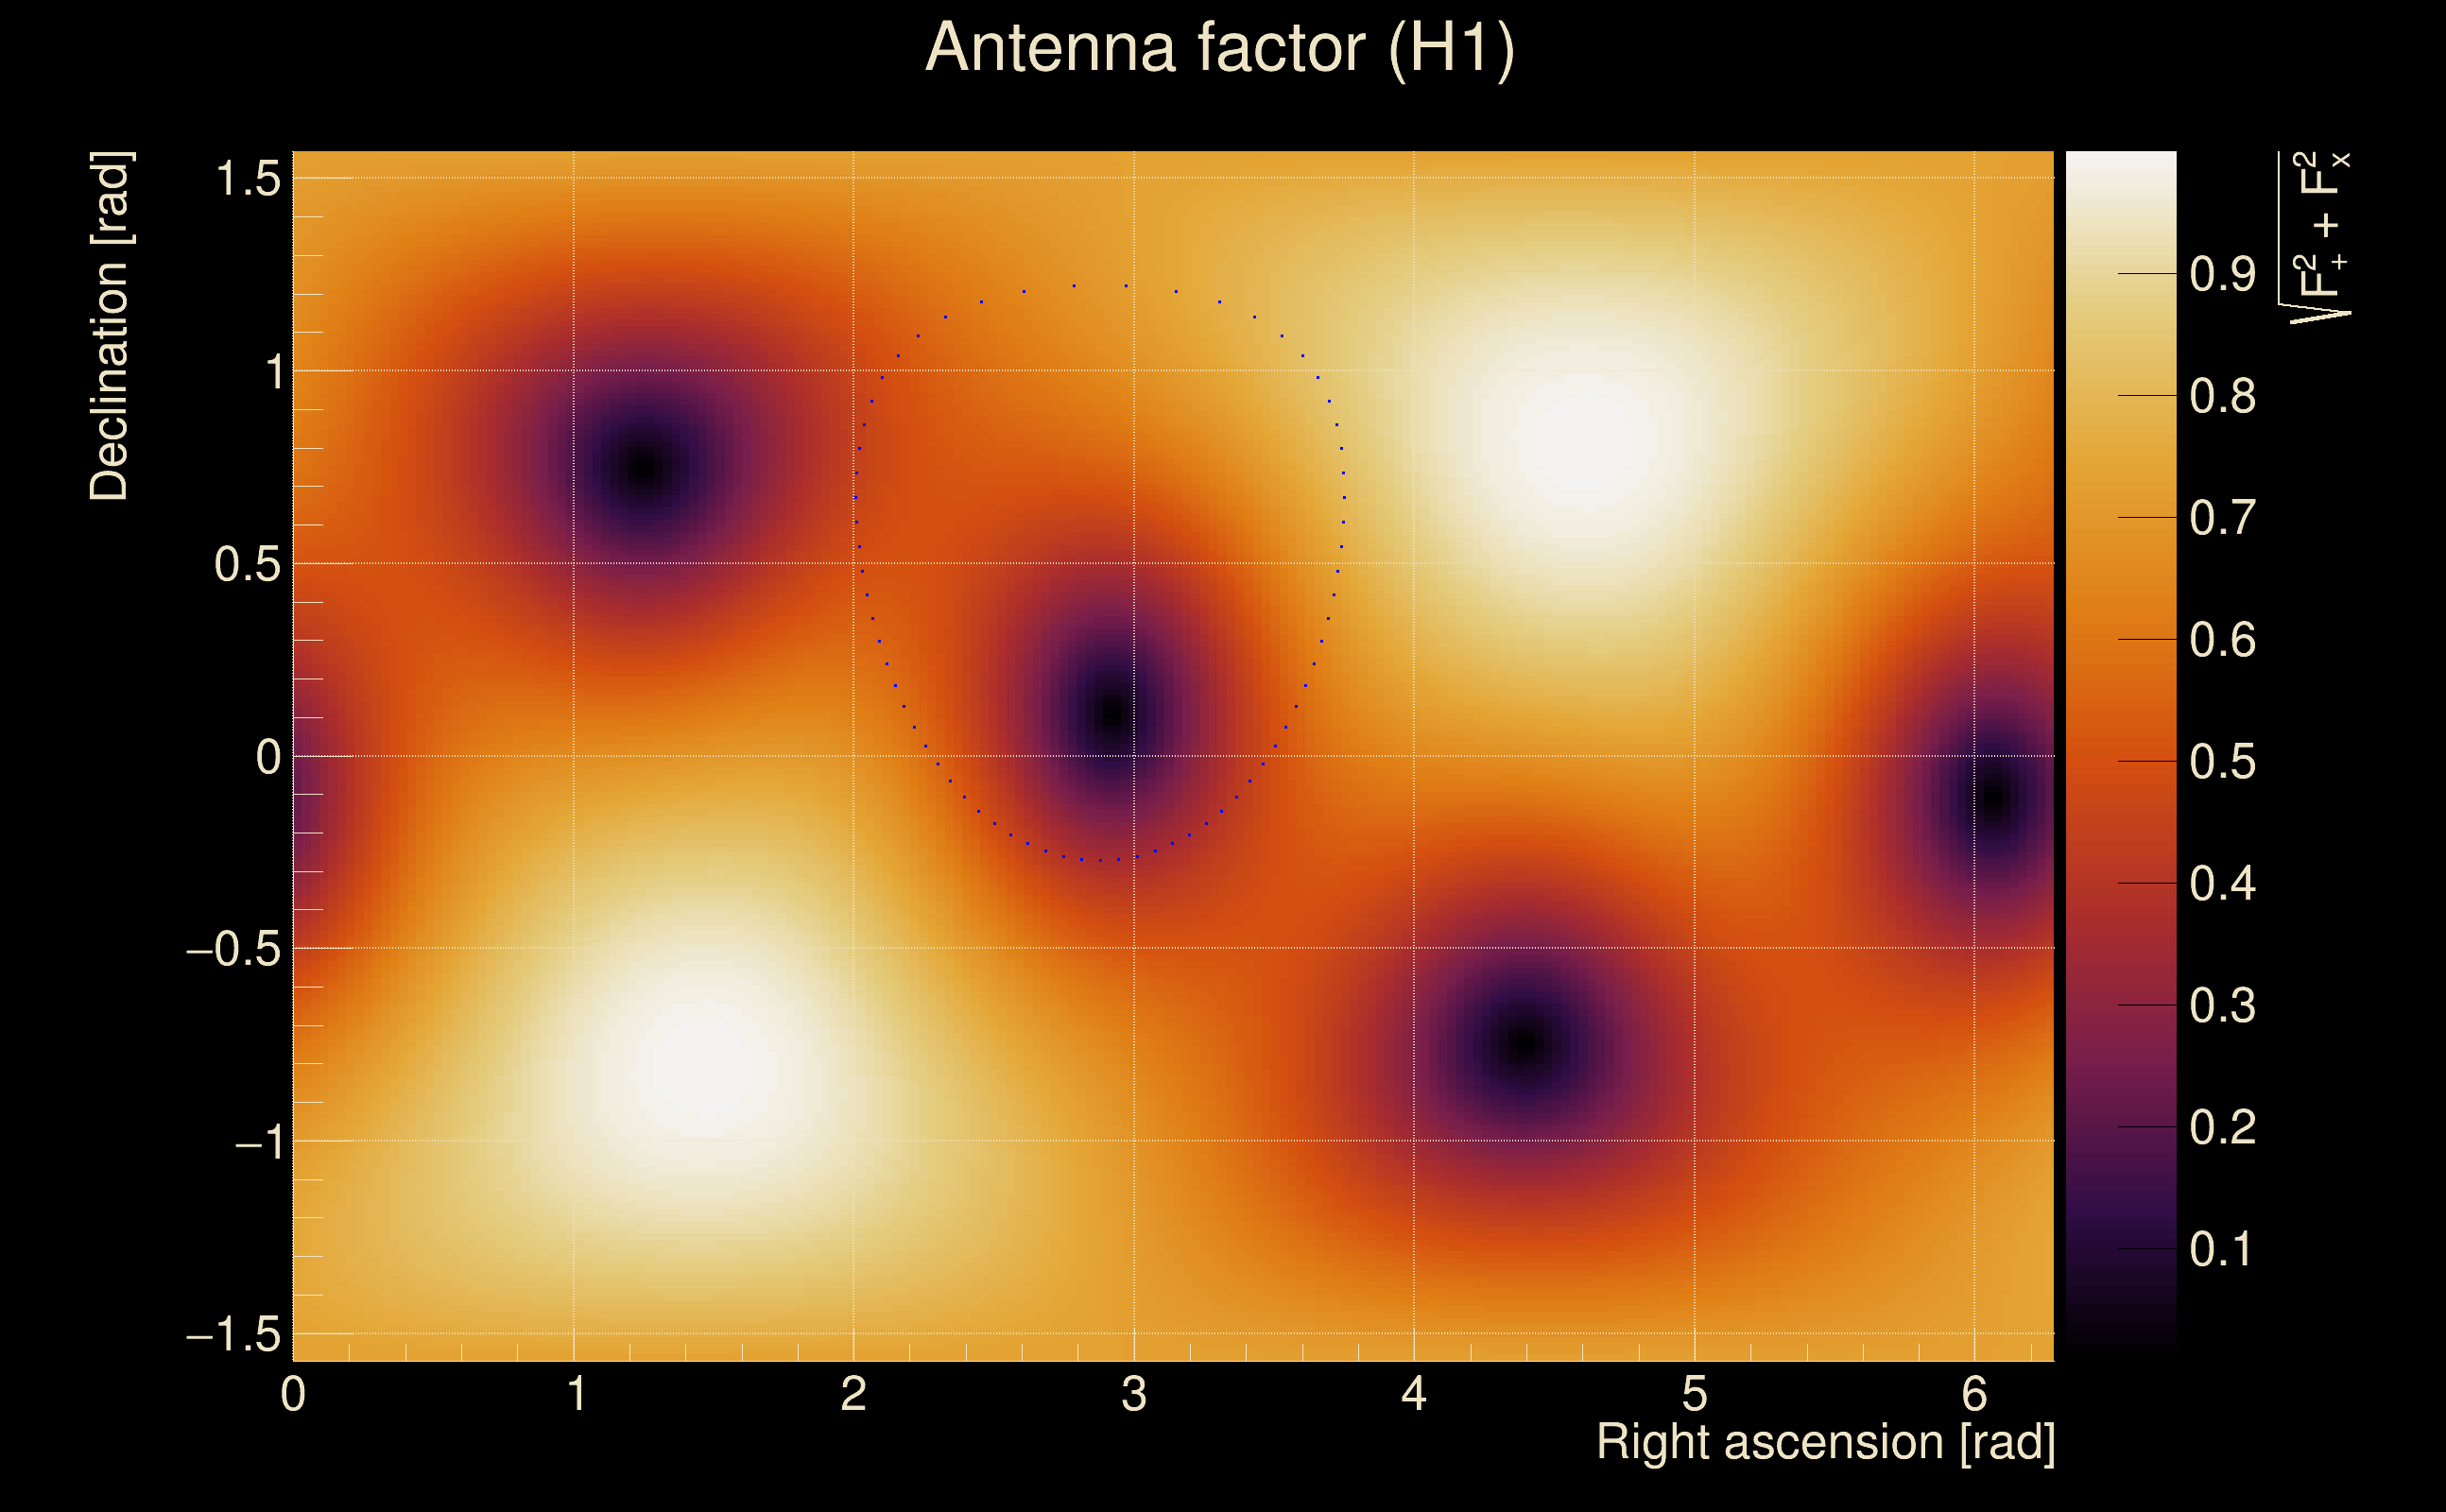
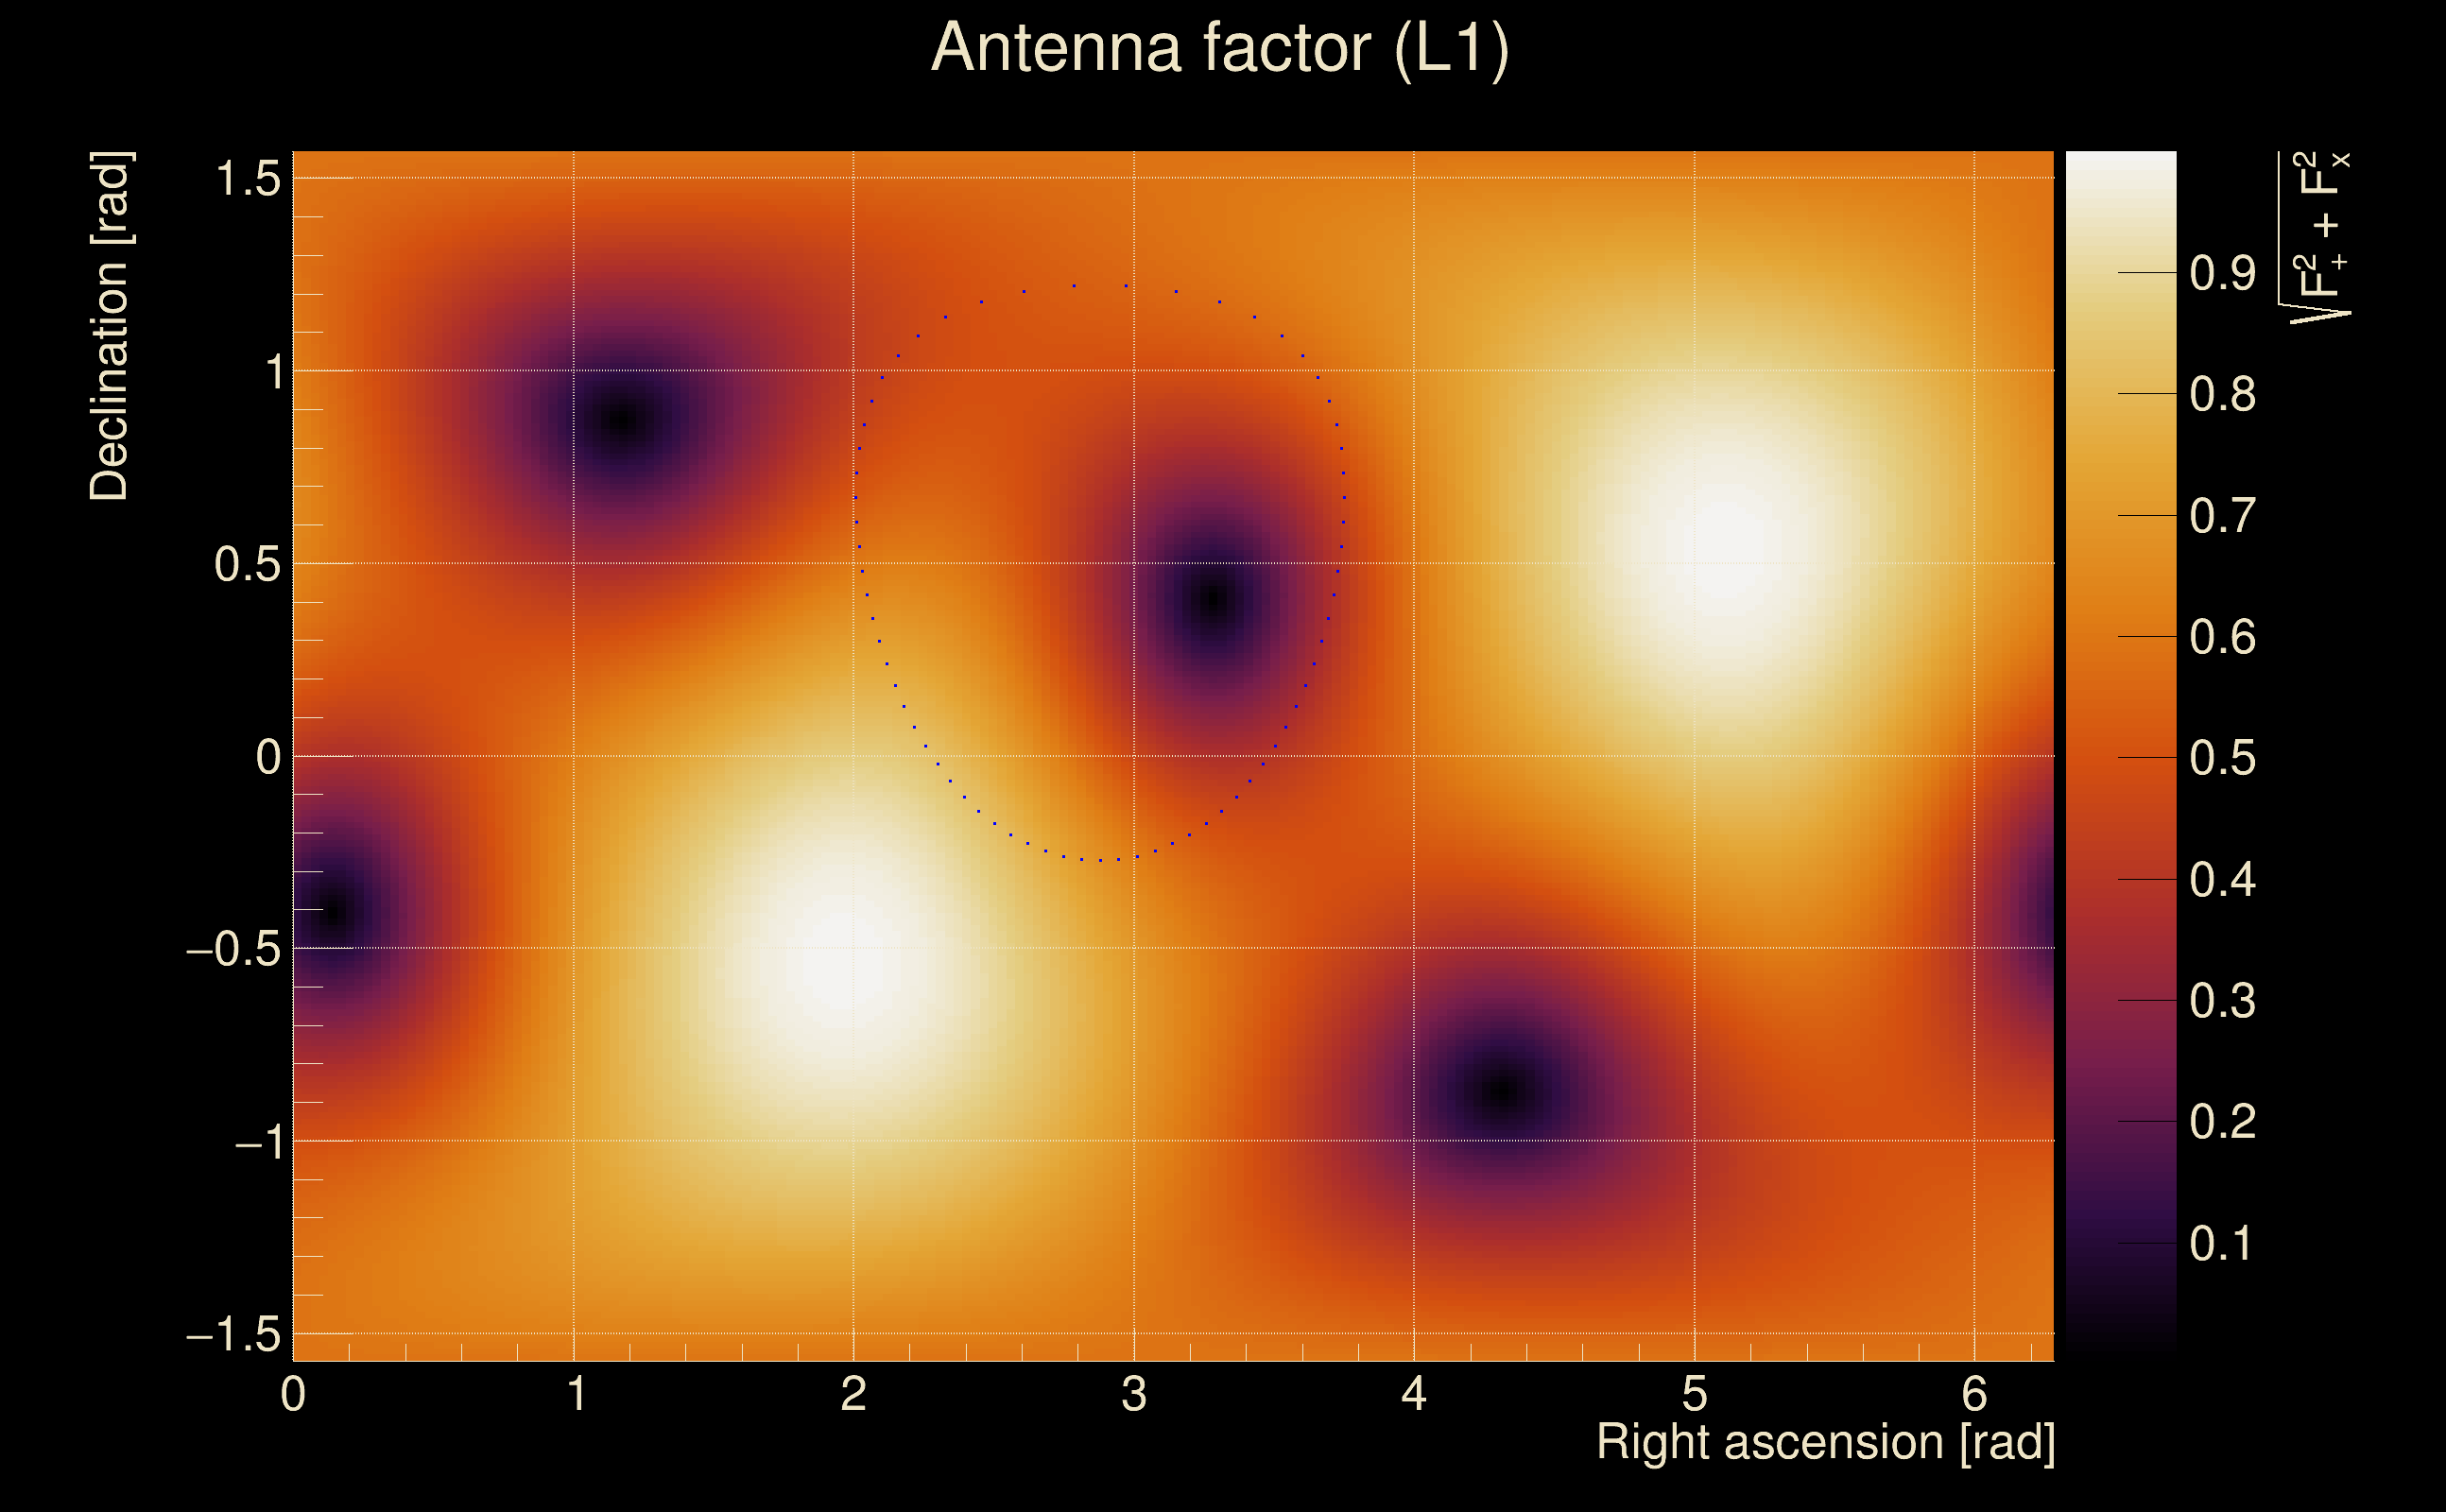
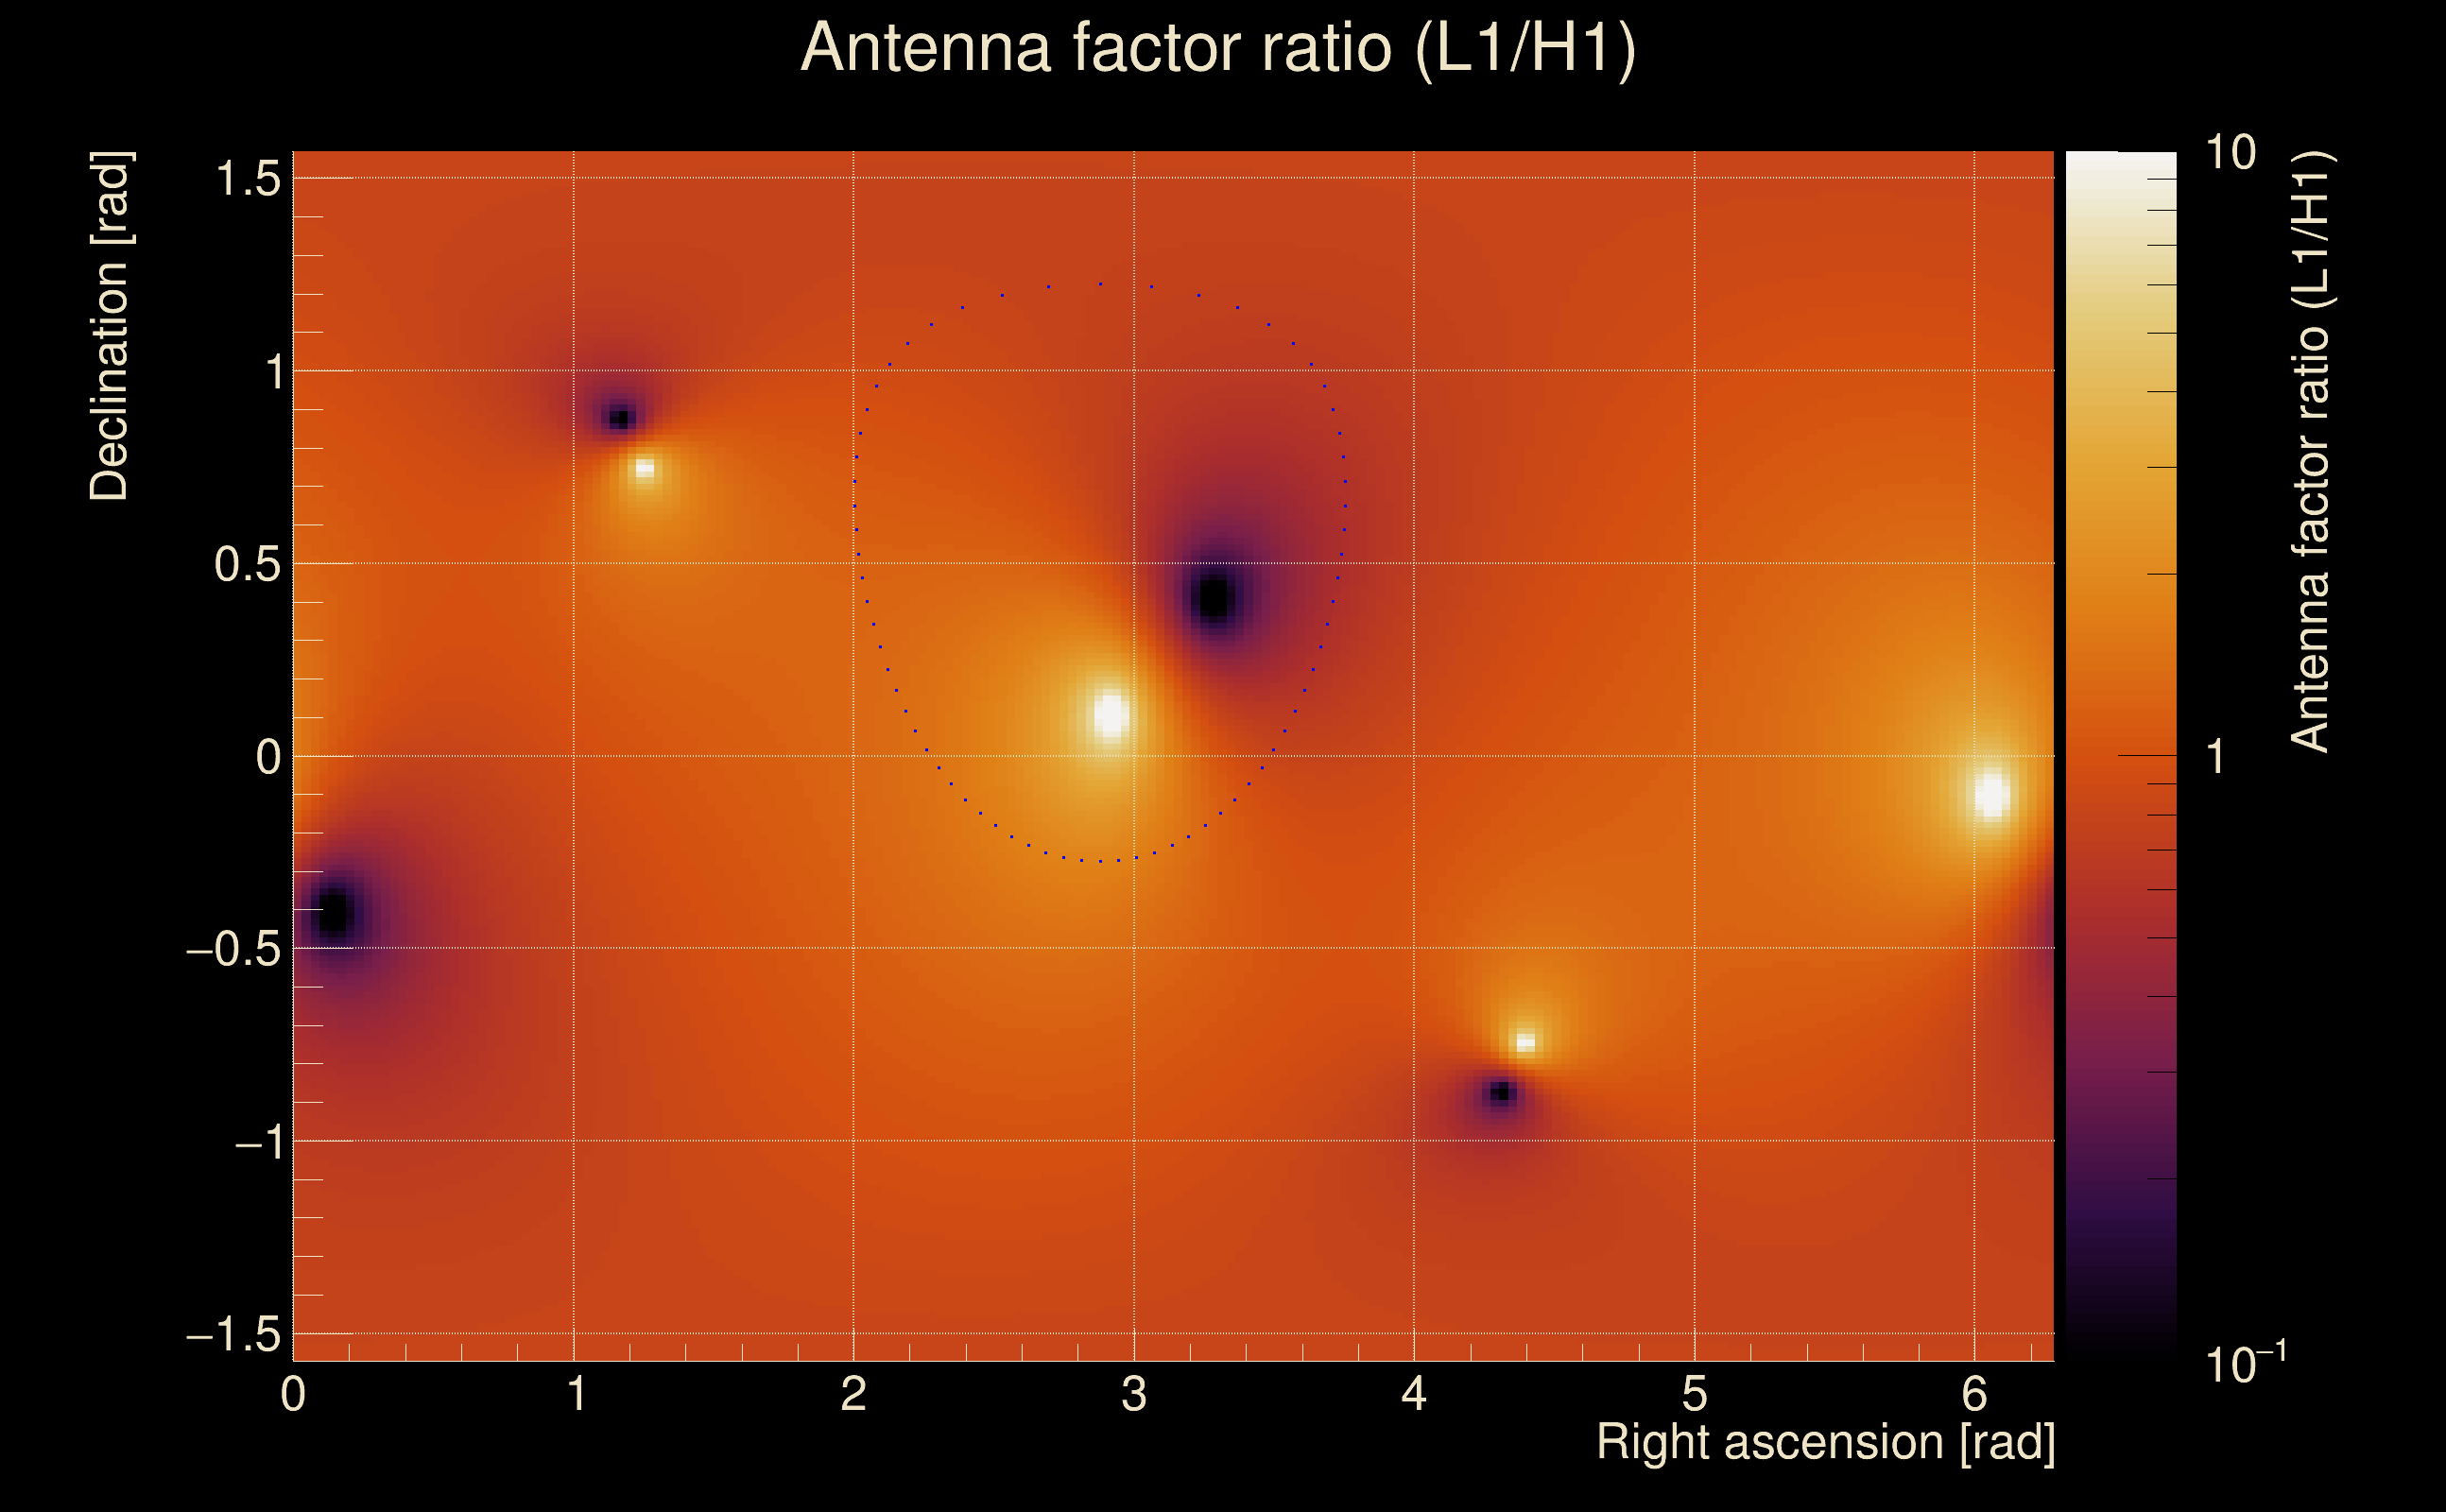
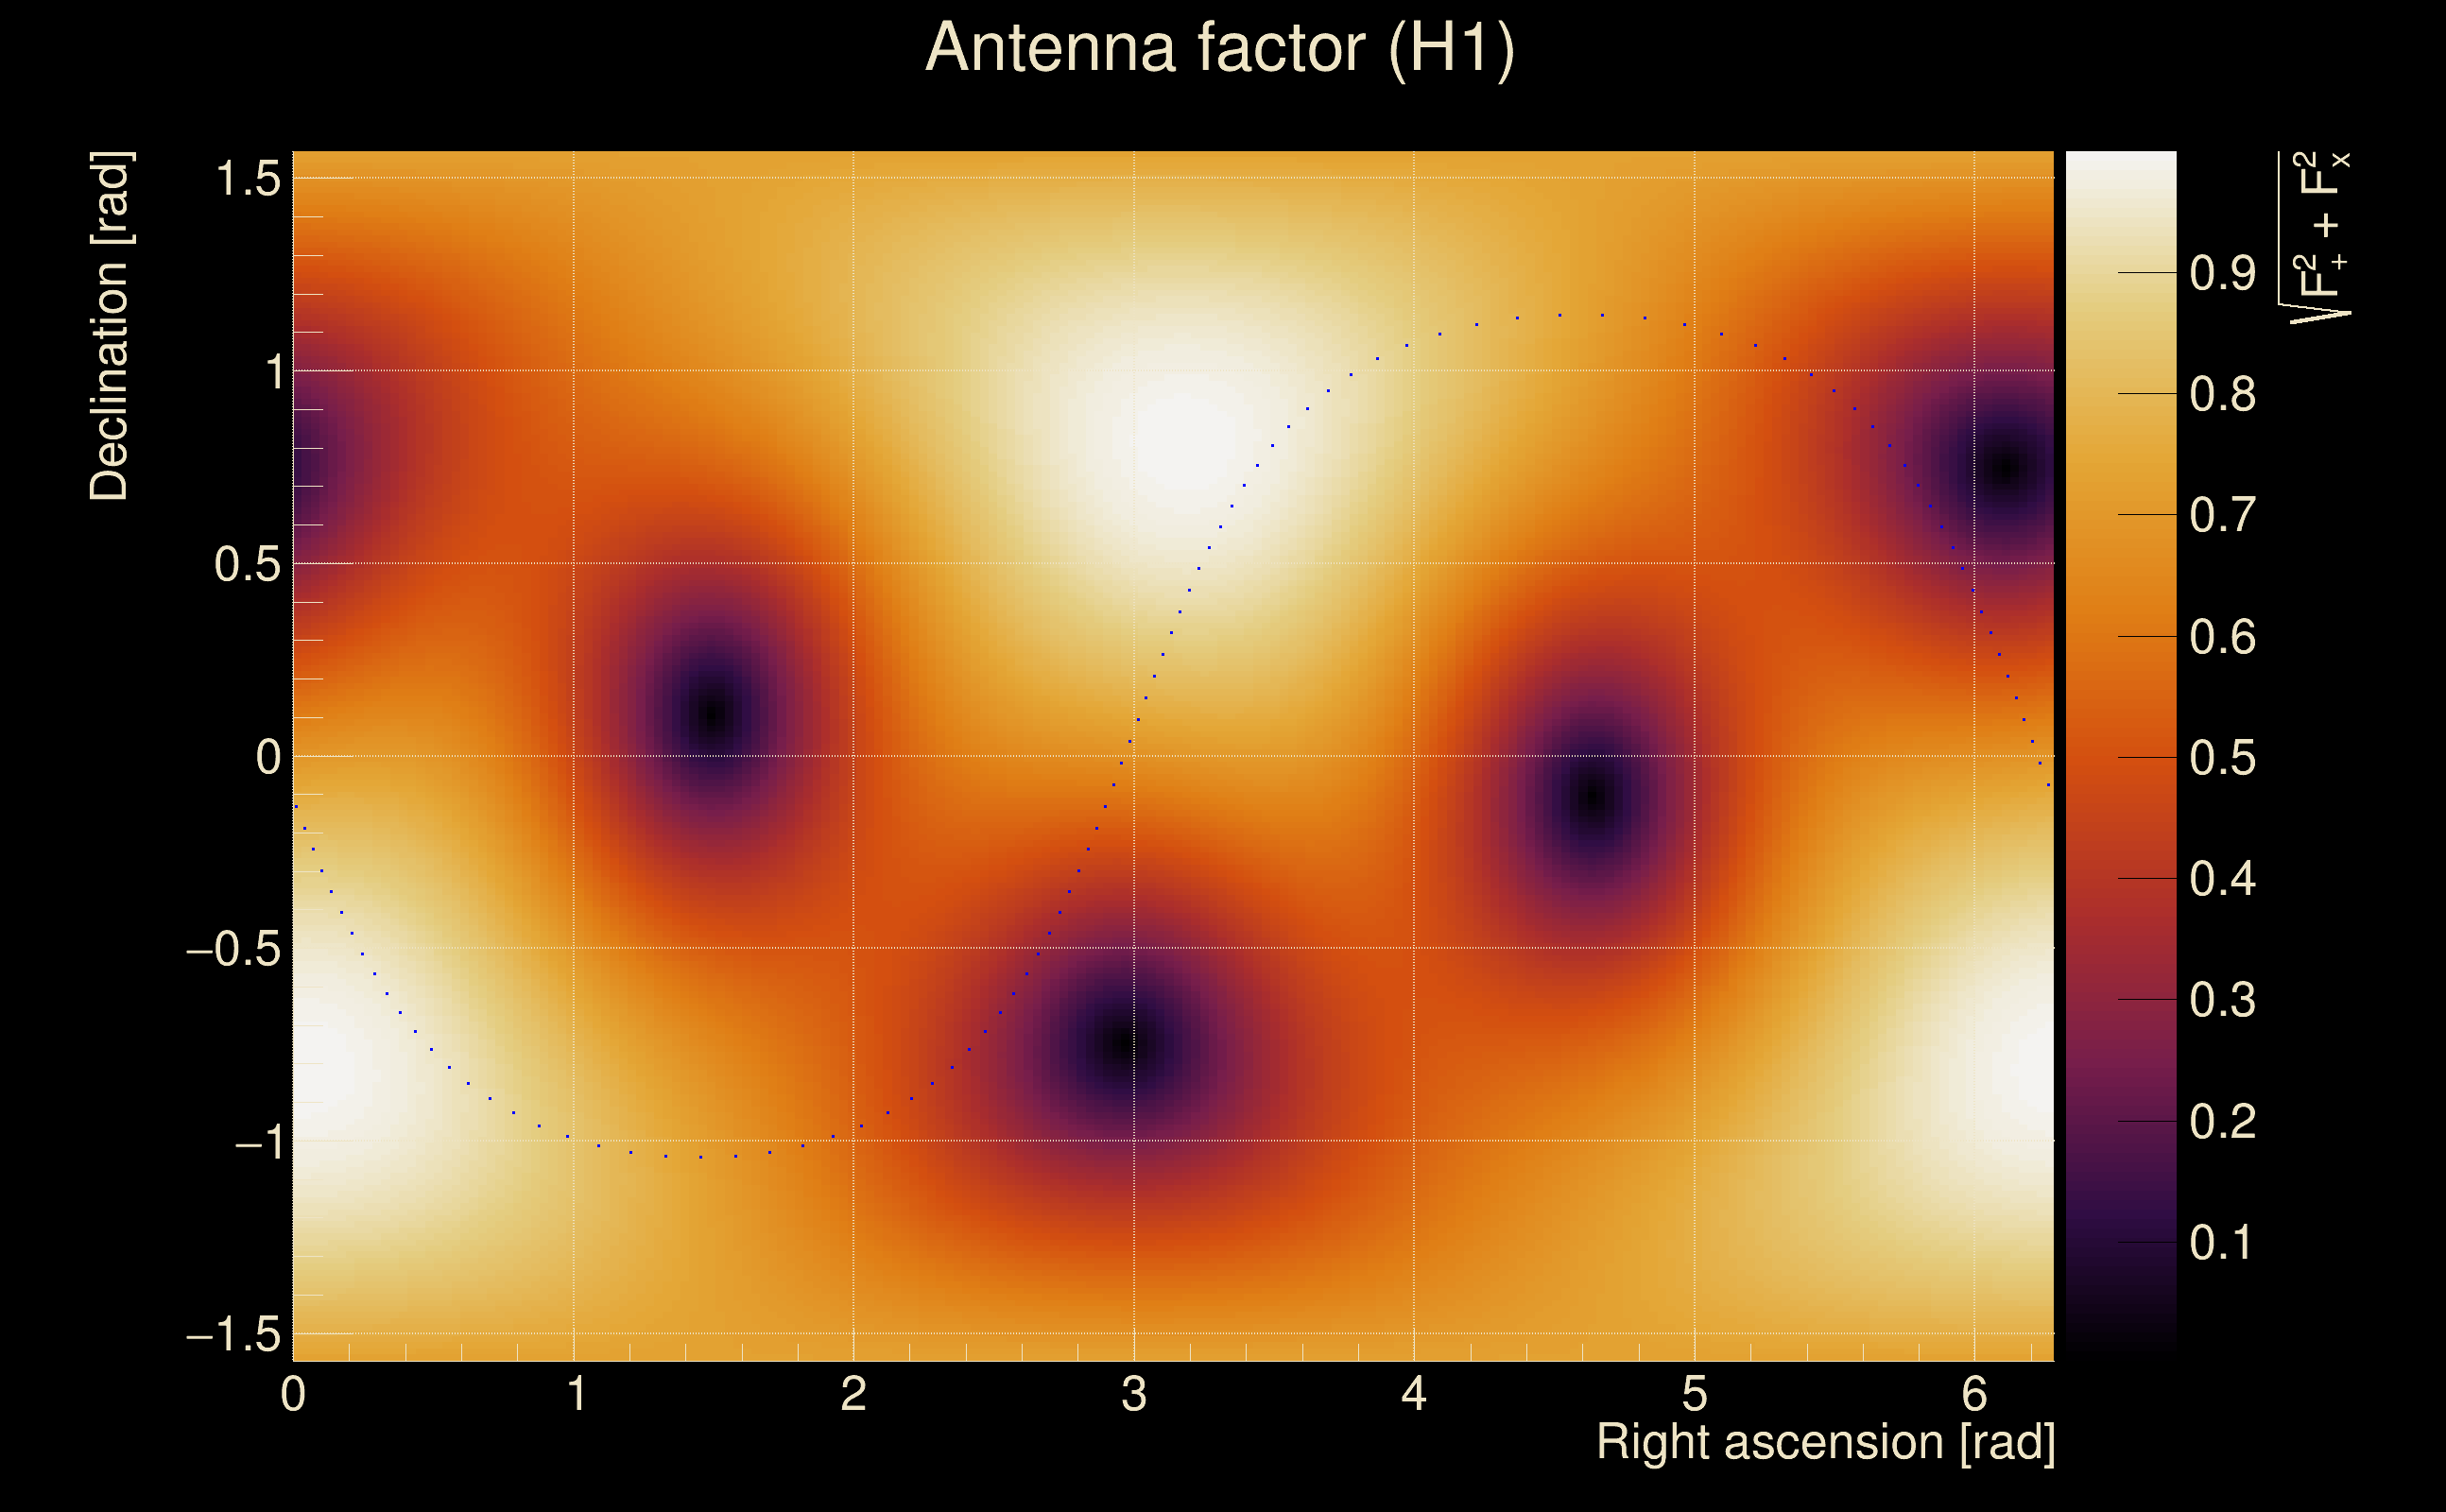
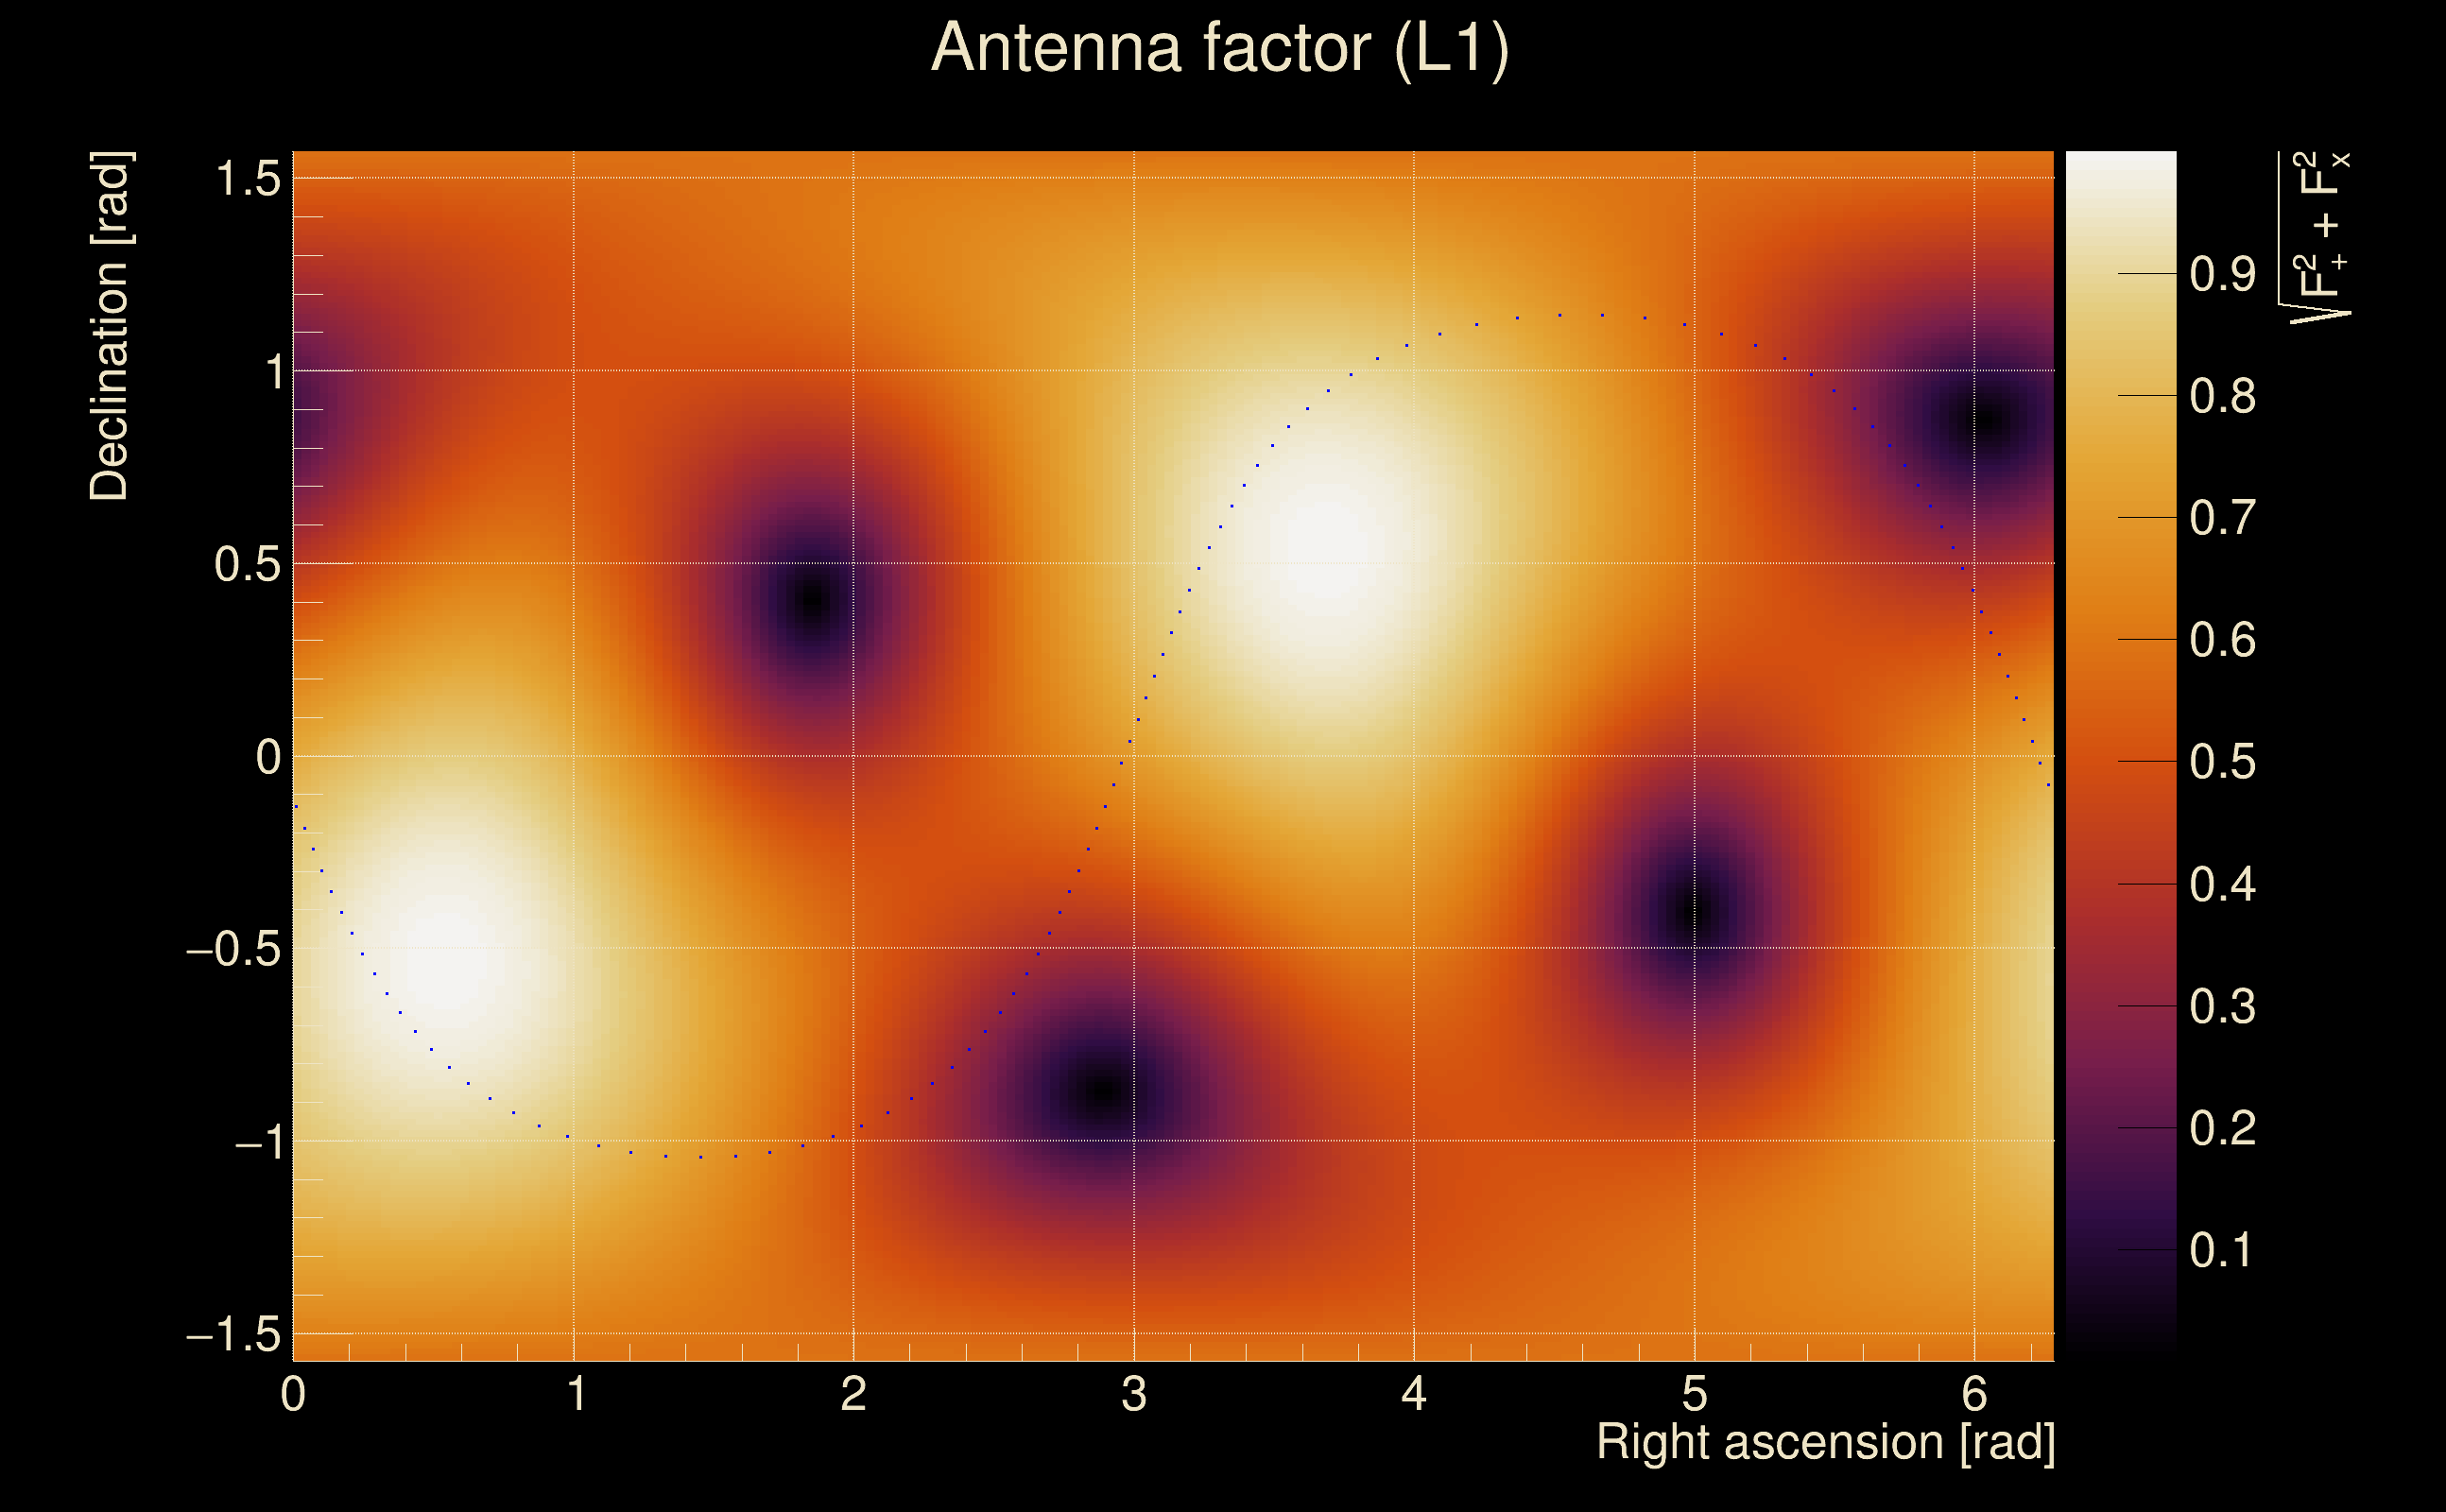
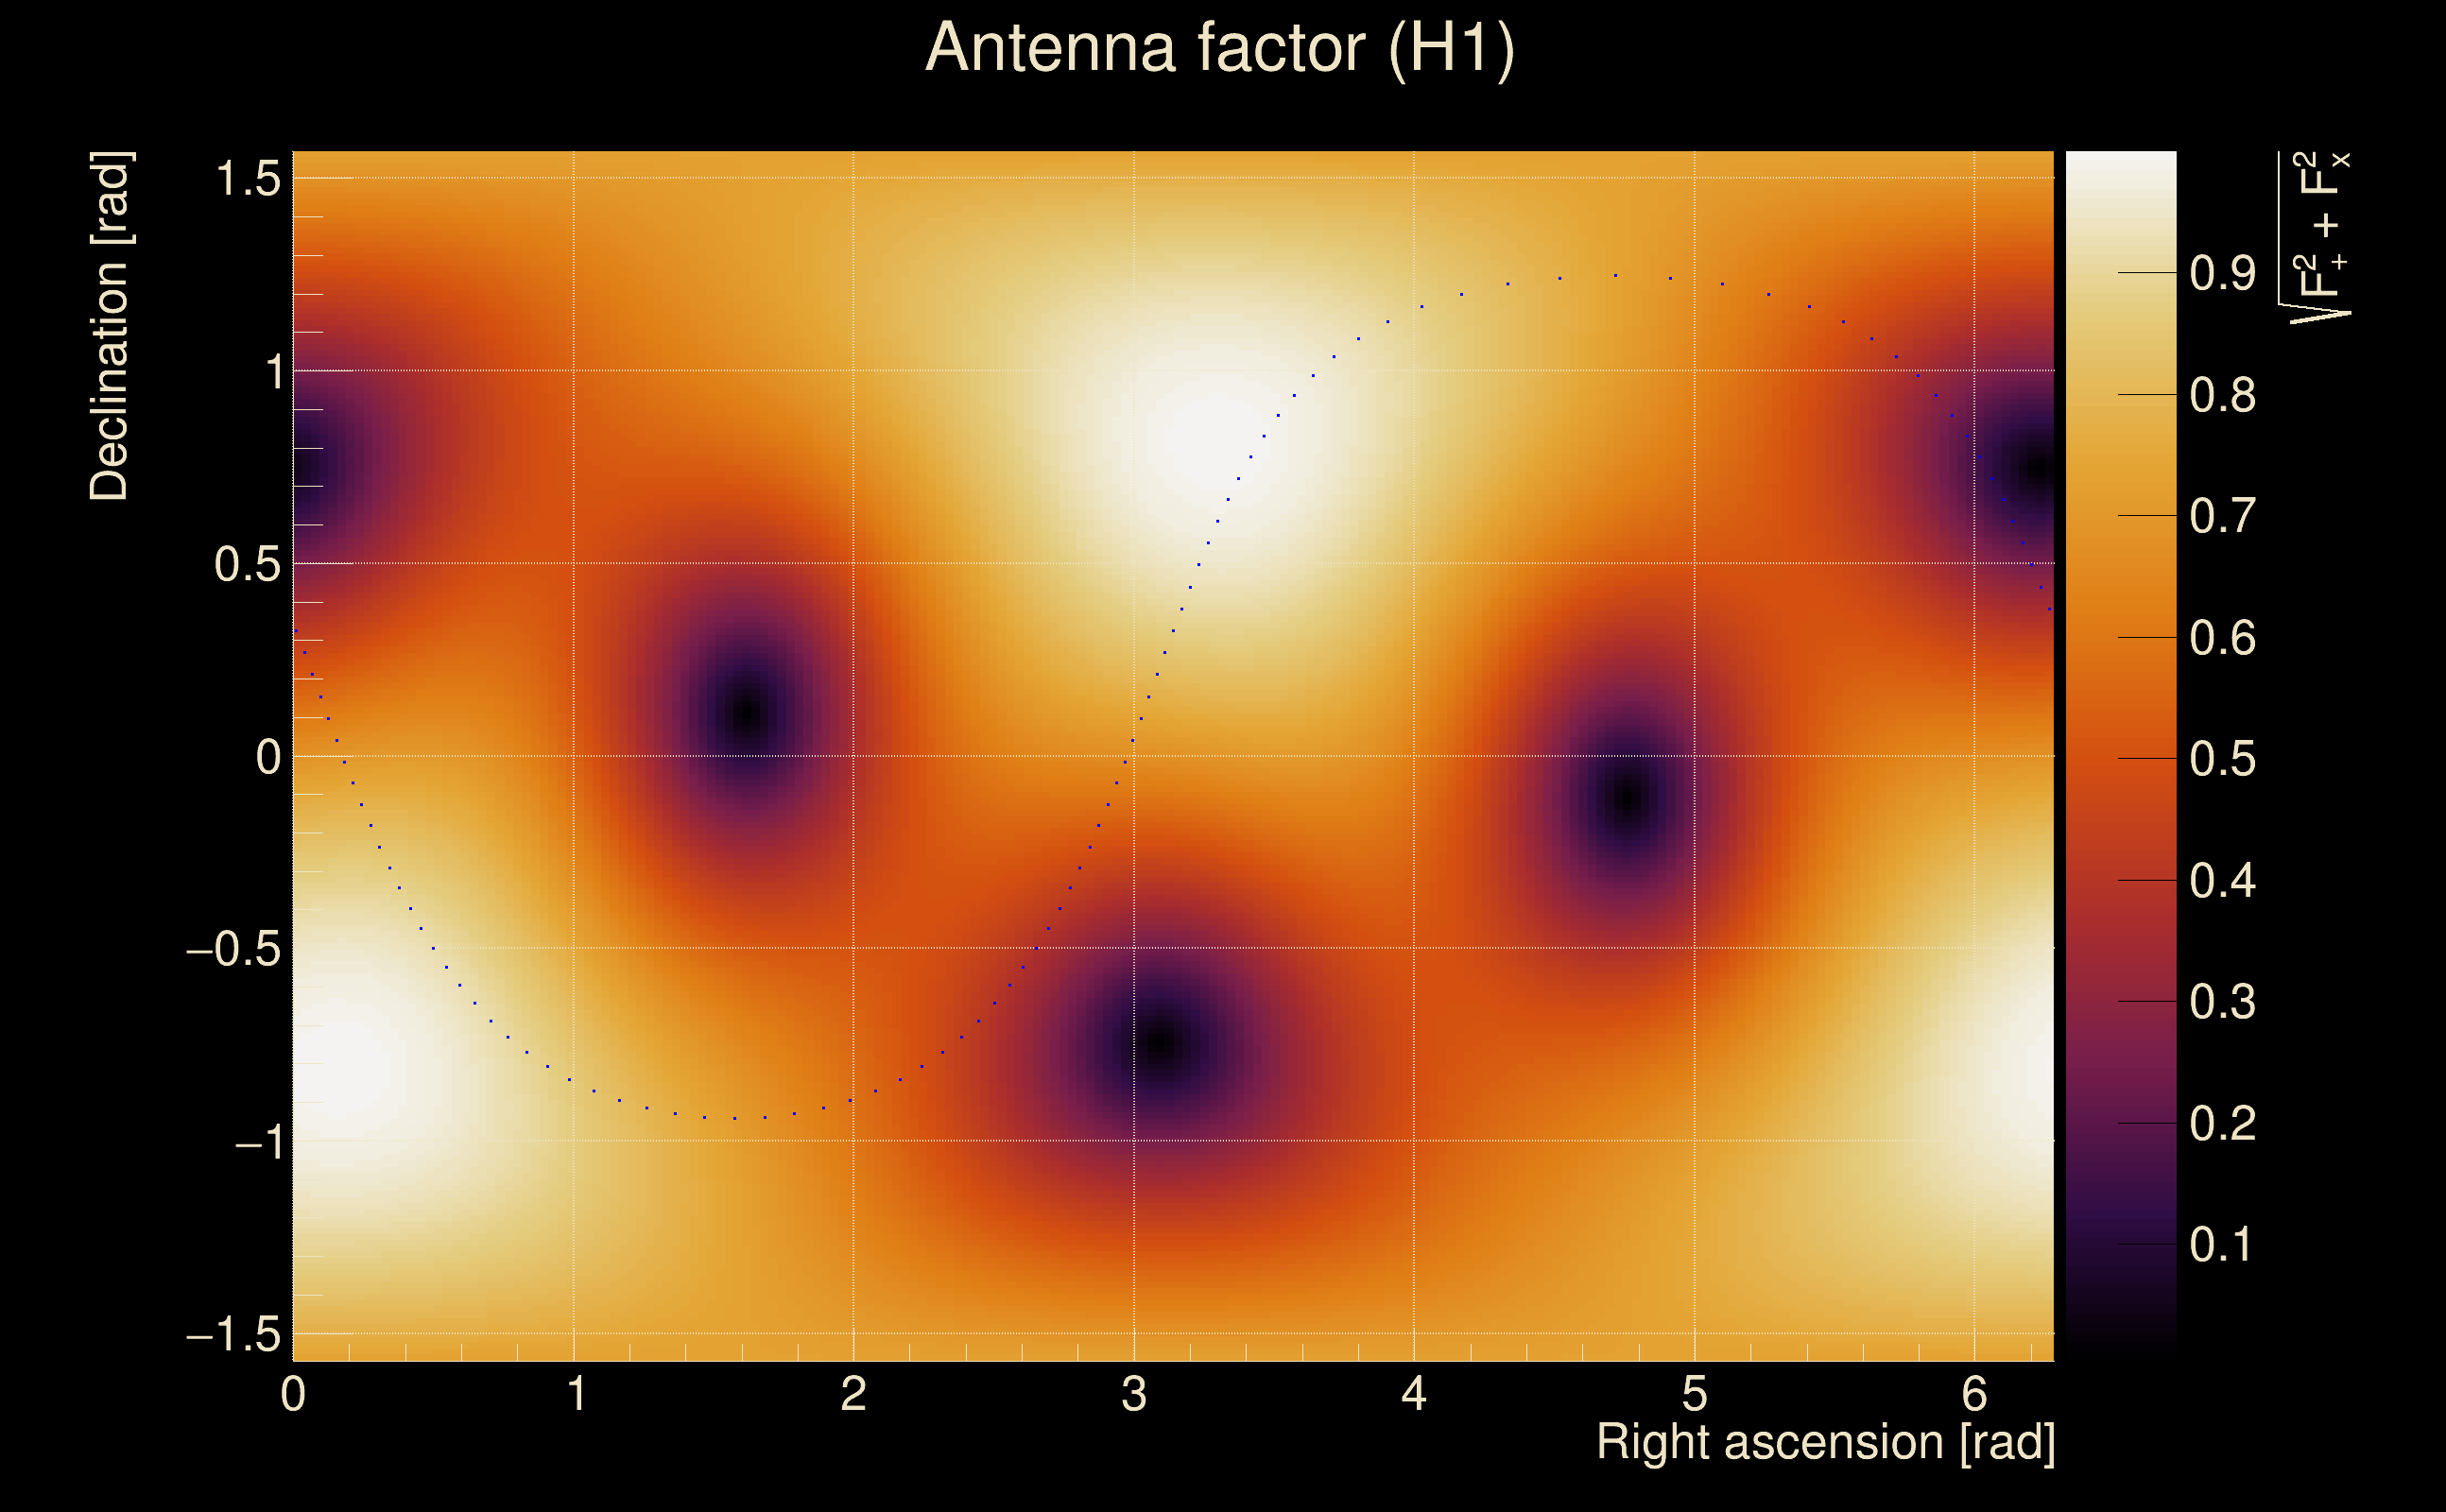
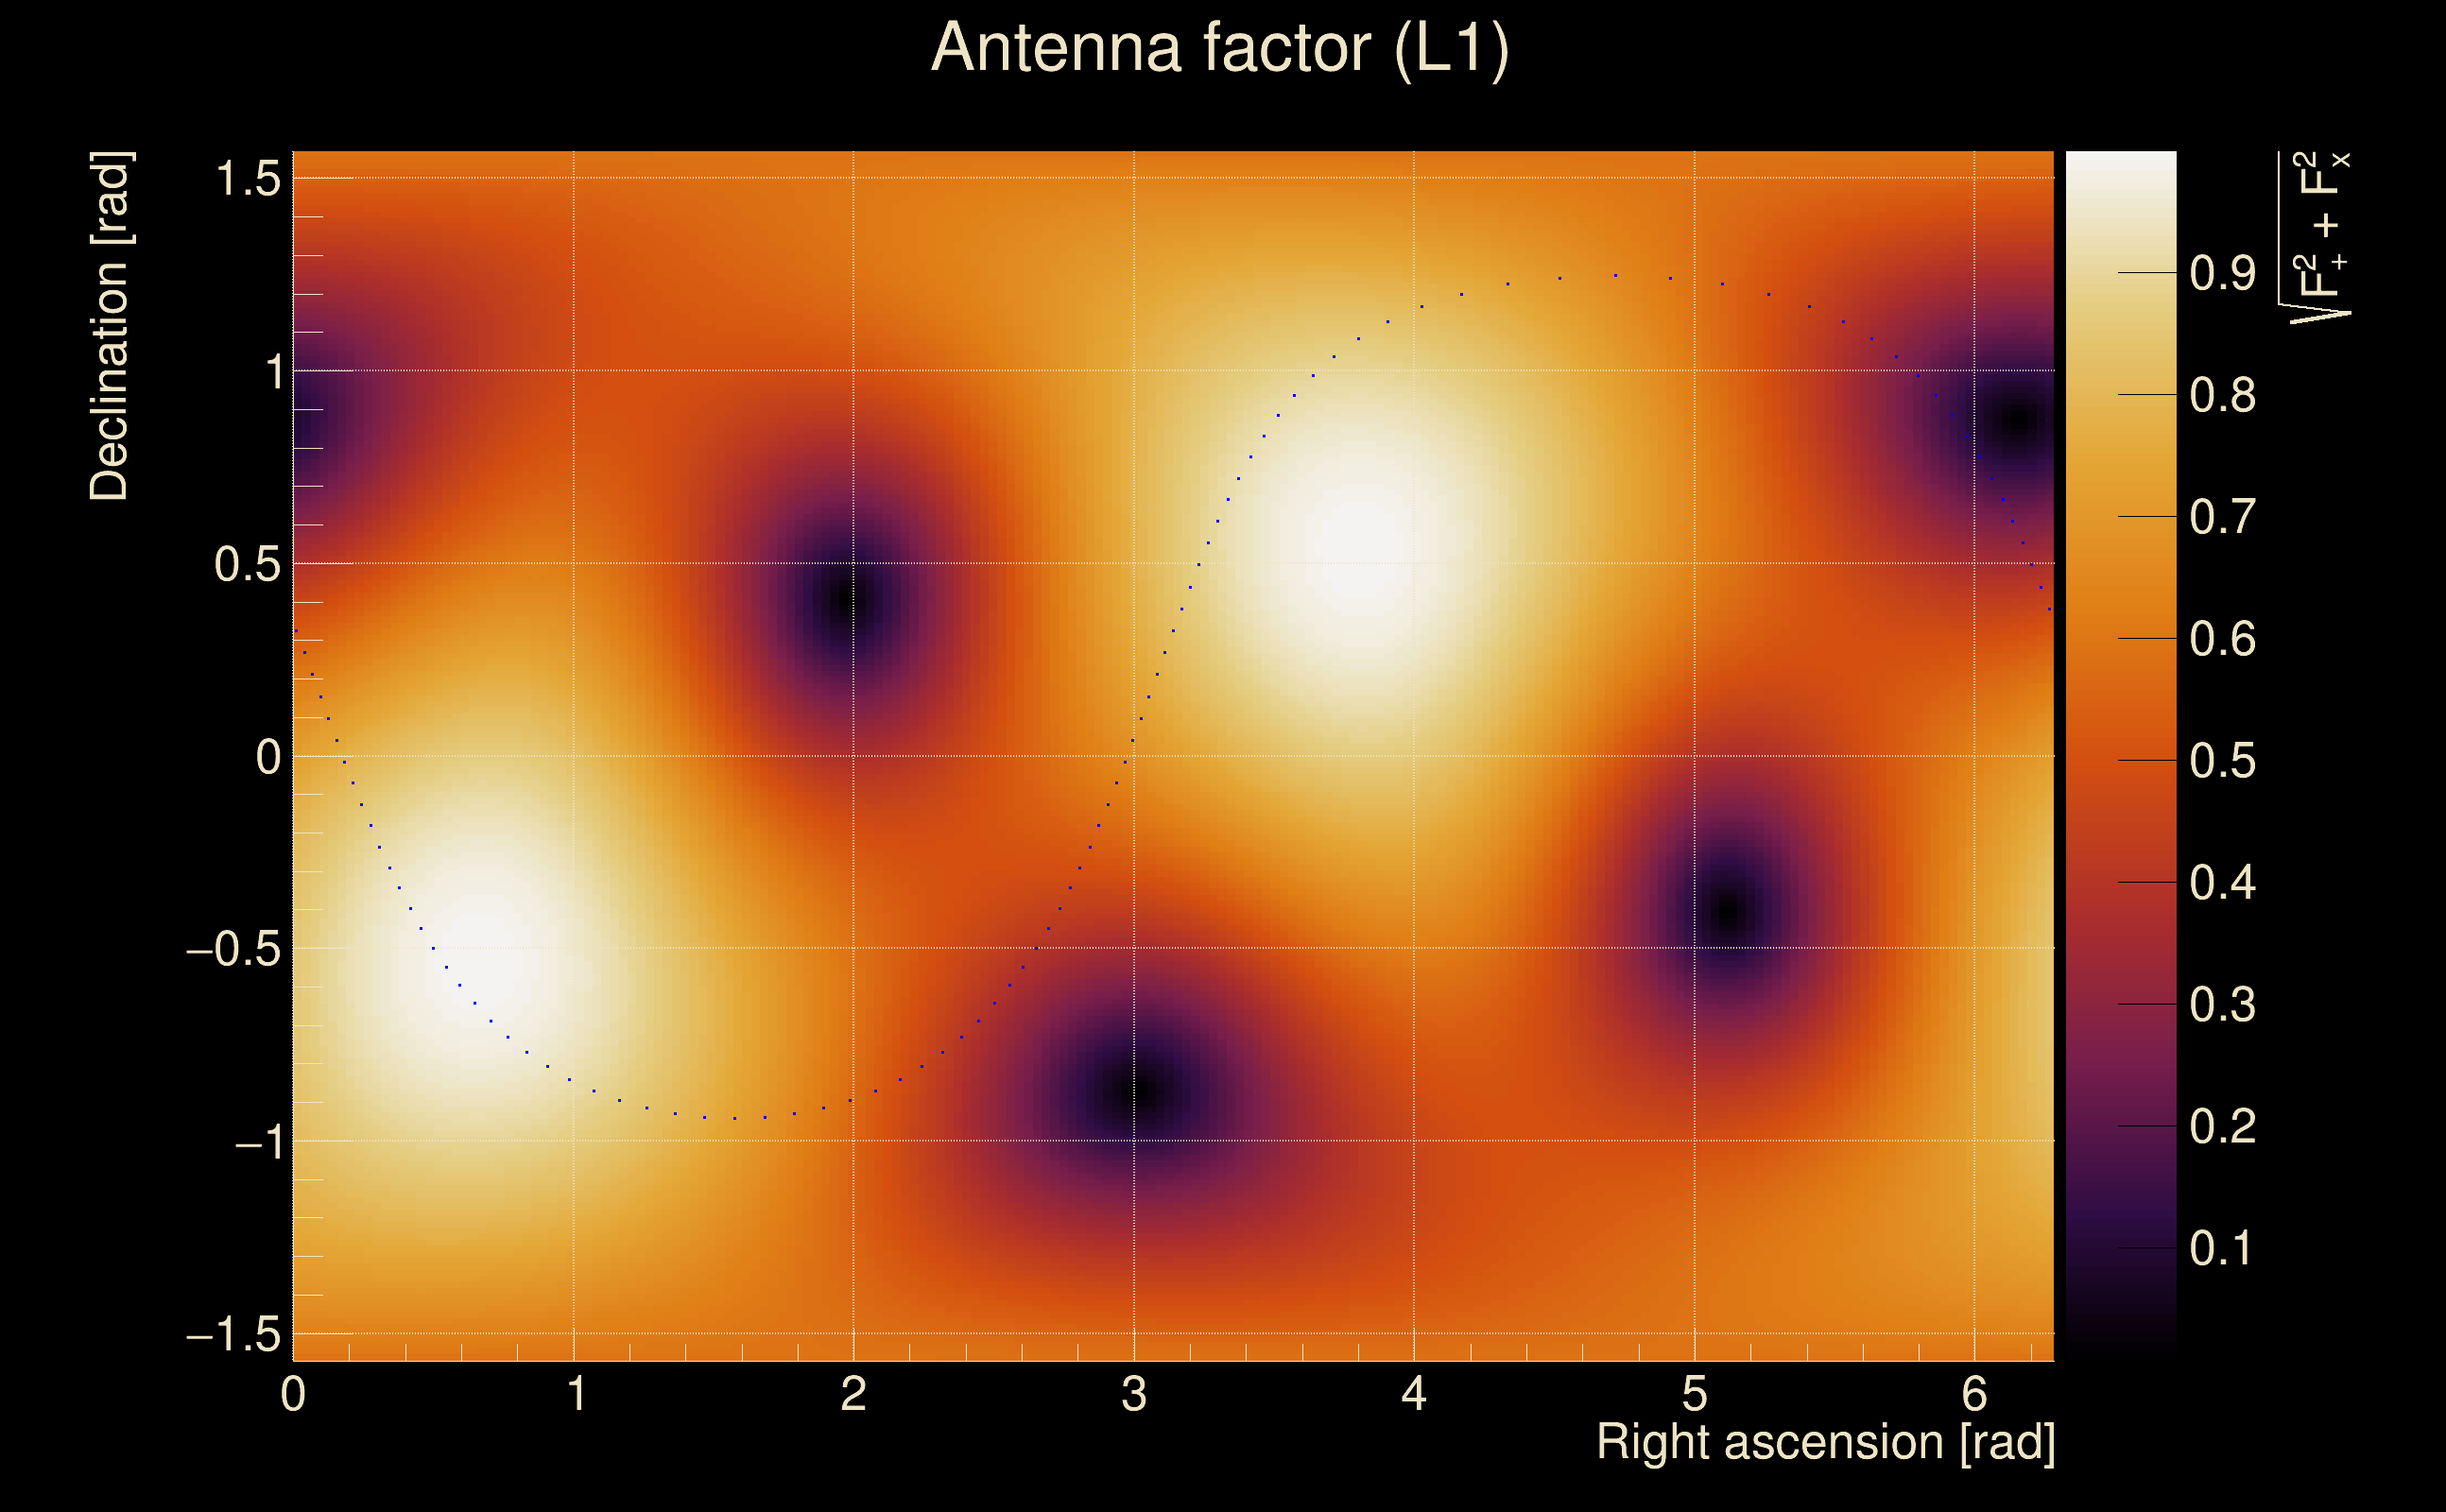
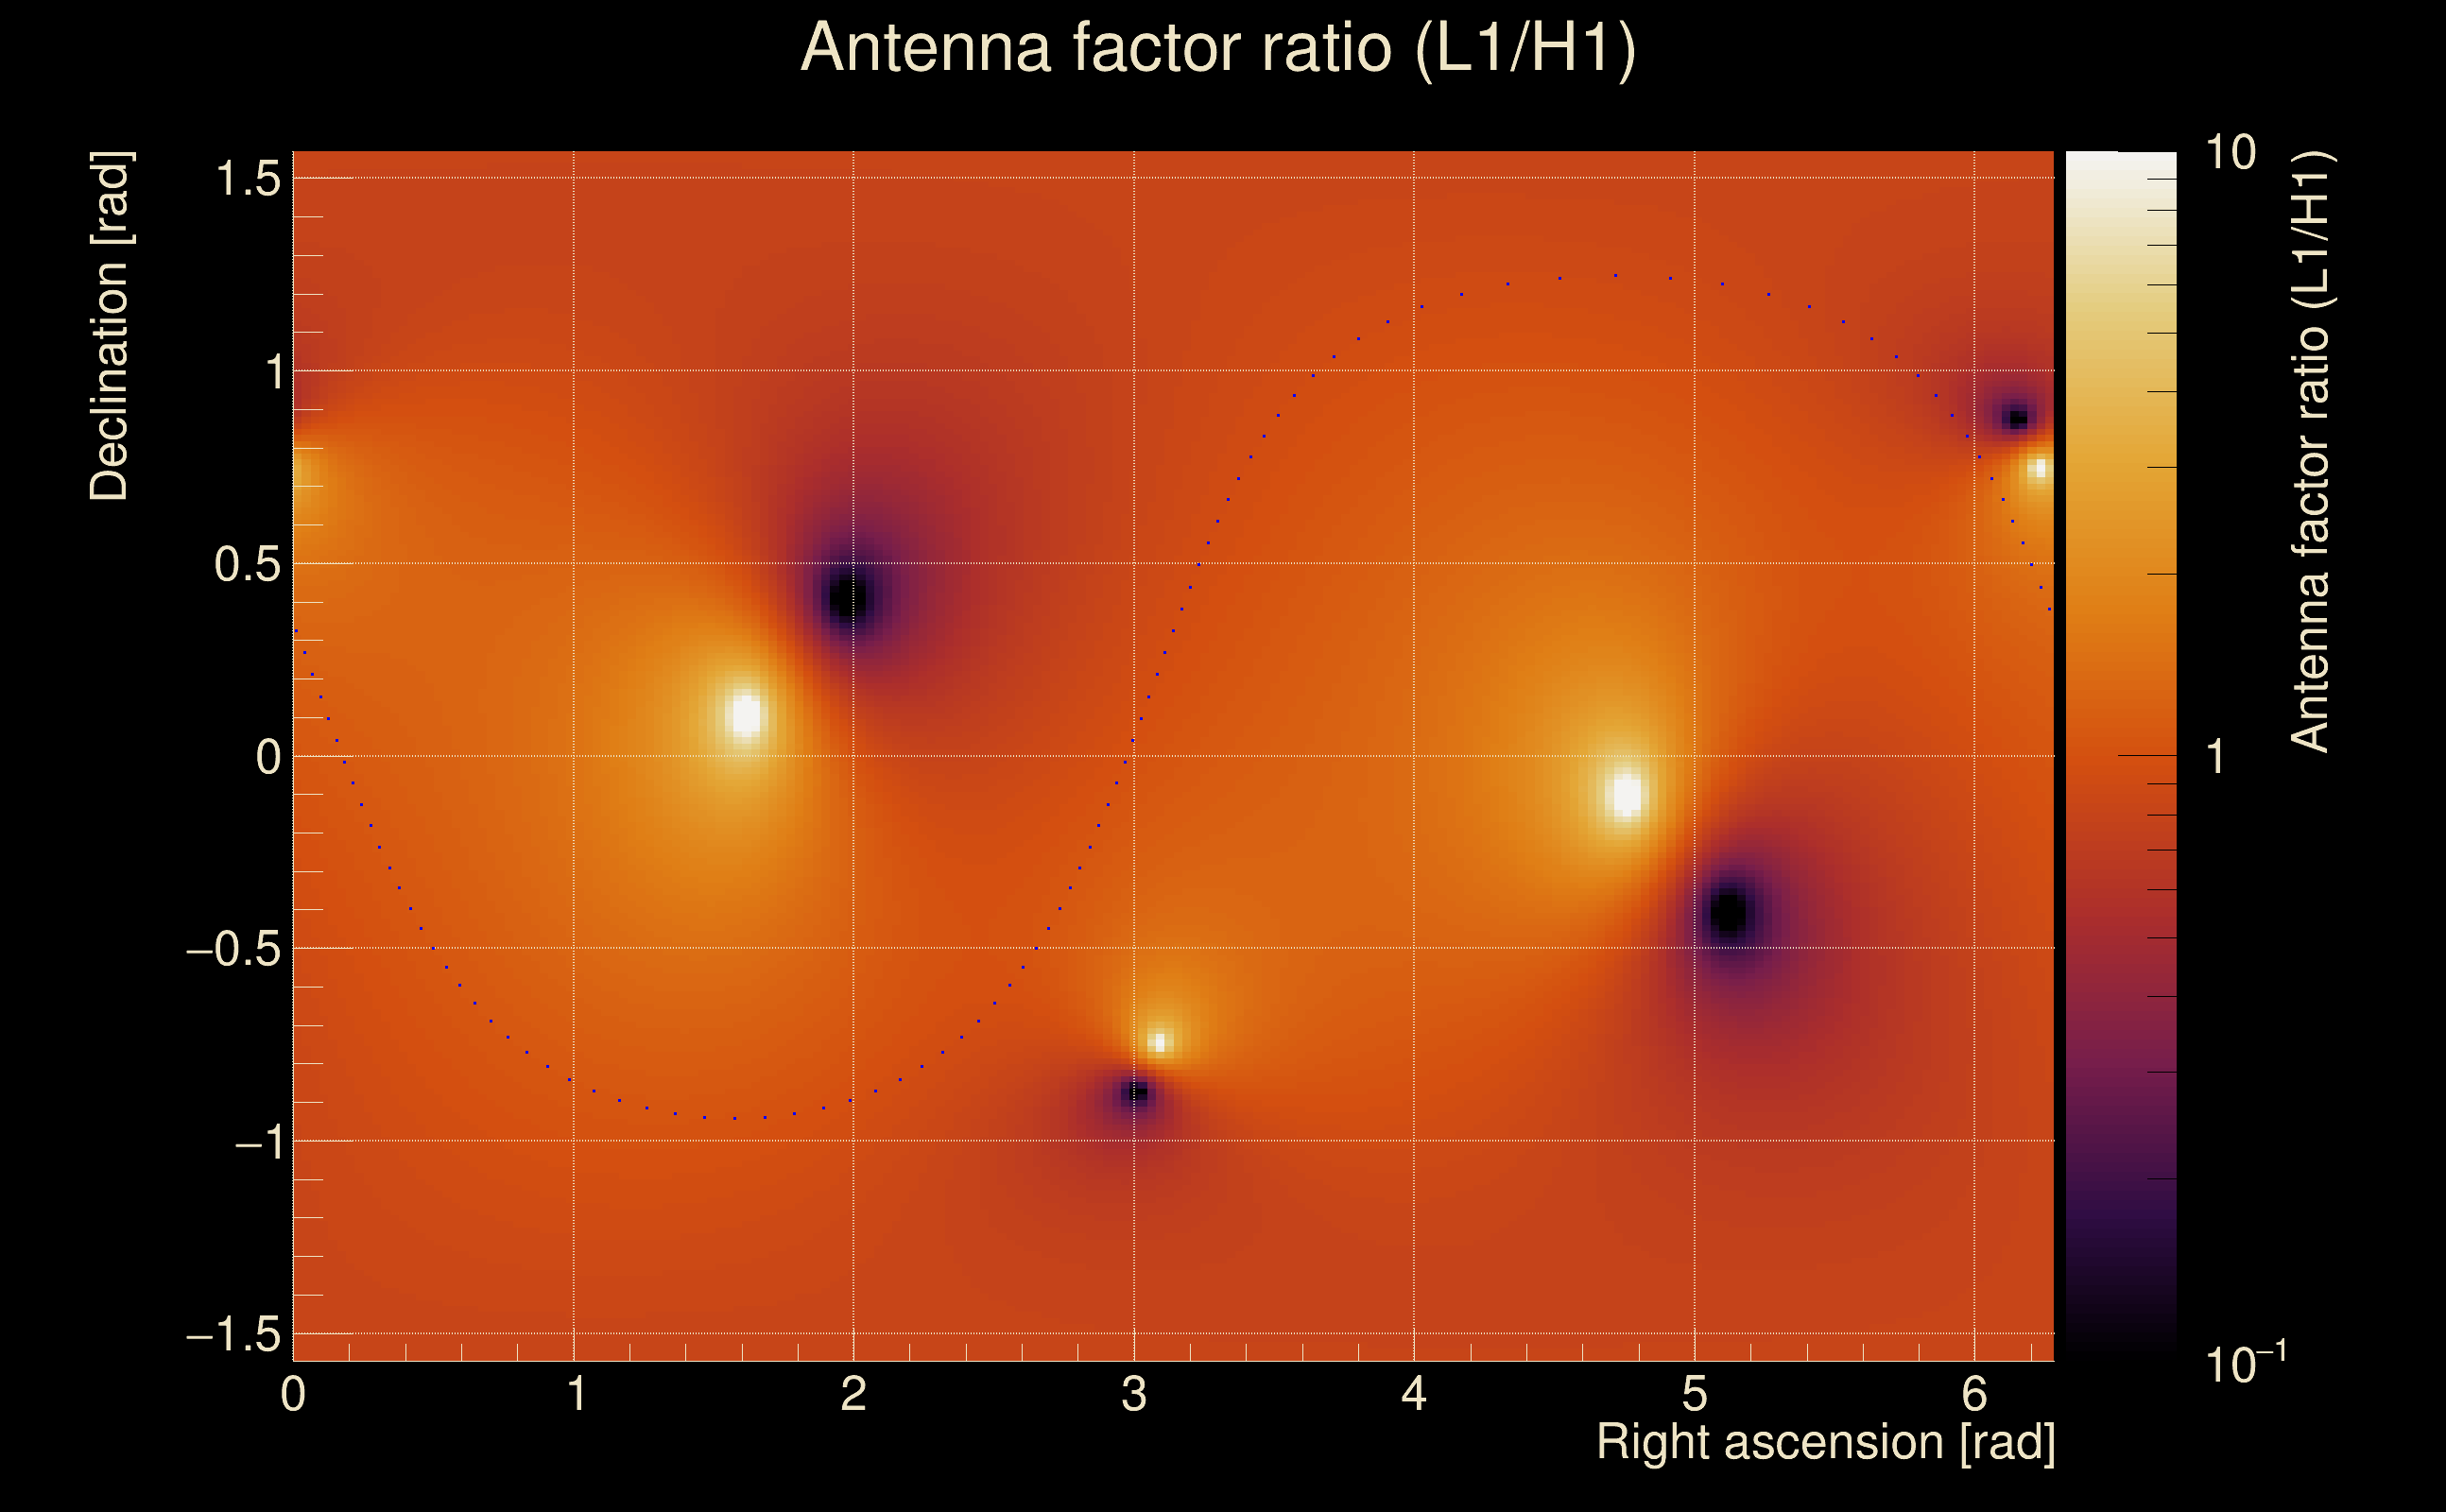
| Target sky positon: | Ra: 3.68109, Dec: 0.94792 [rad] |
| List of input Ox files: | TargIxfw_injpt3_file_list.txt (71 files) |
| Analysis result file: | TargIxfw_injpt3_results-0.root |
| Slice selected for the the fakeground: | slice index=180 (-3.312 s), time lag = 0 s |
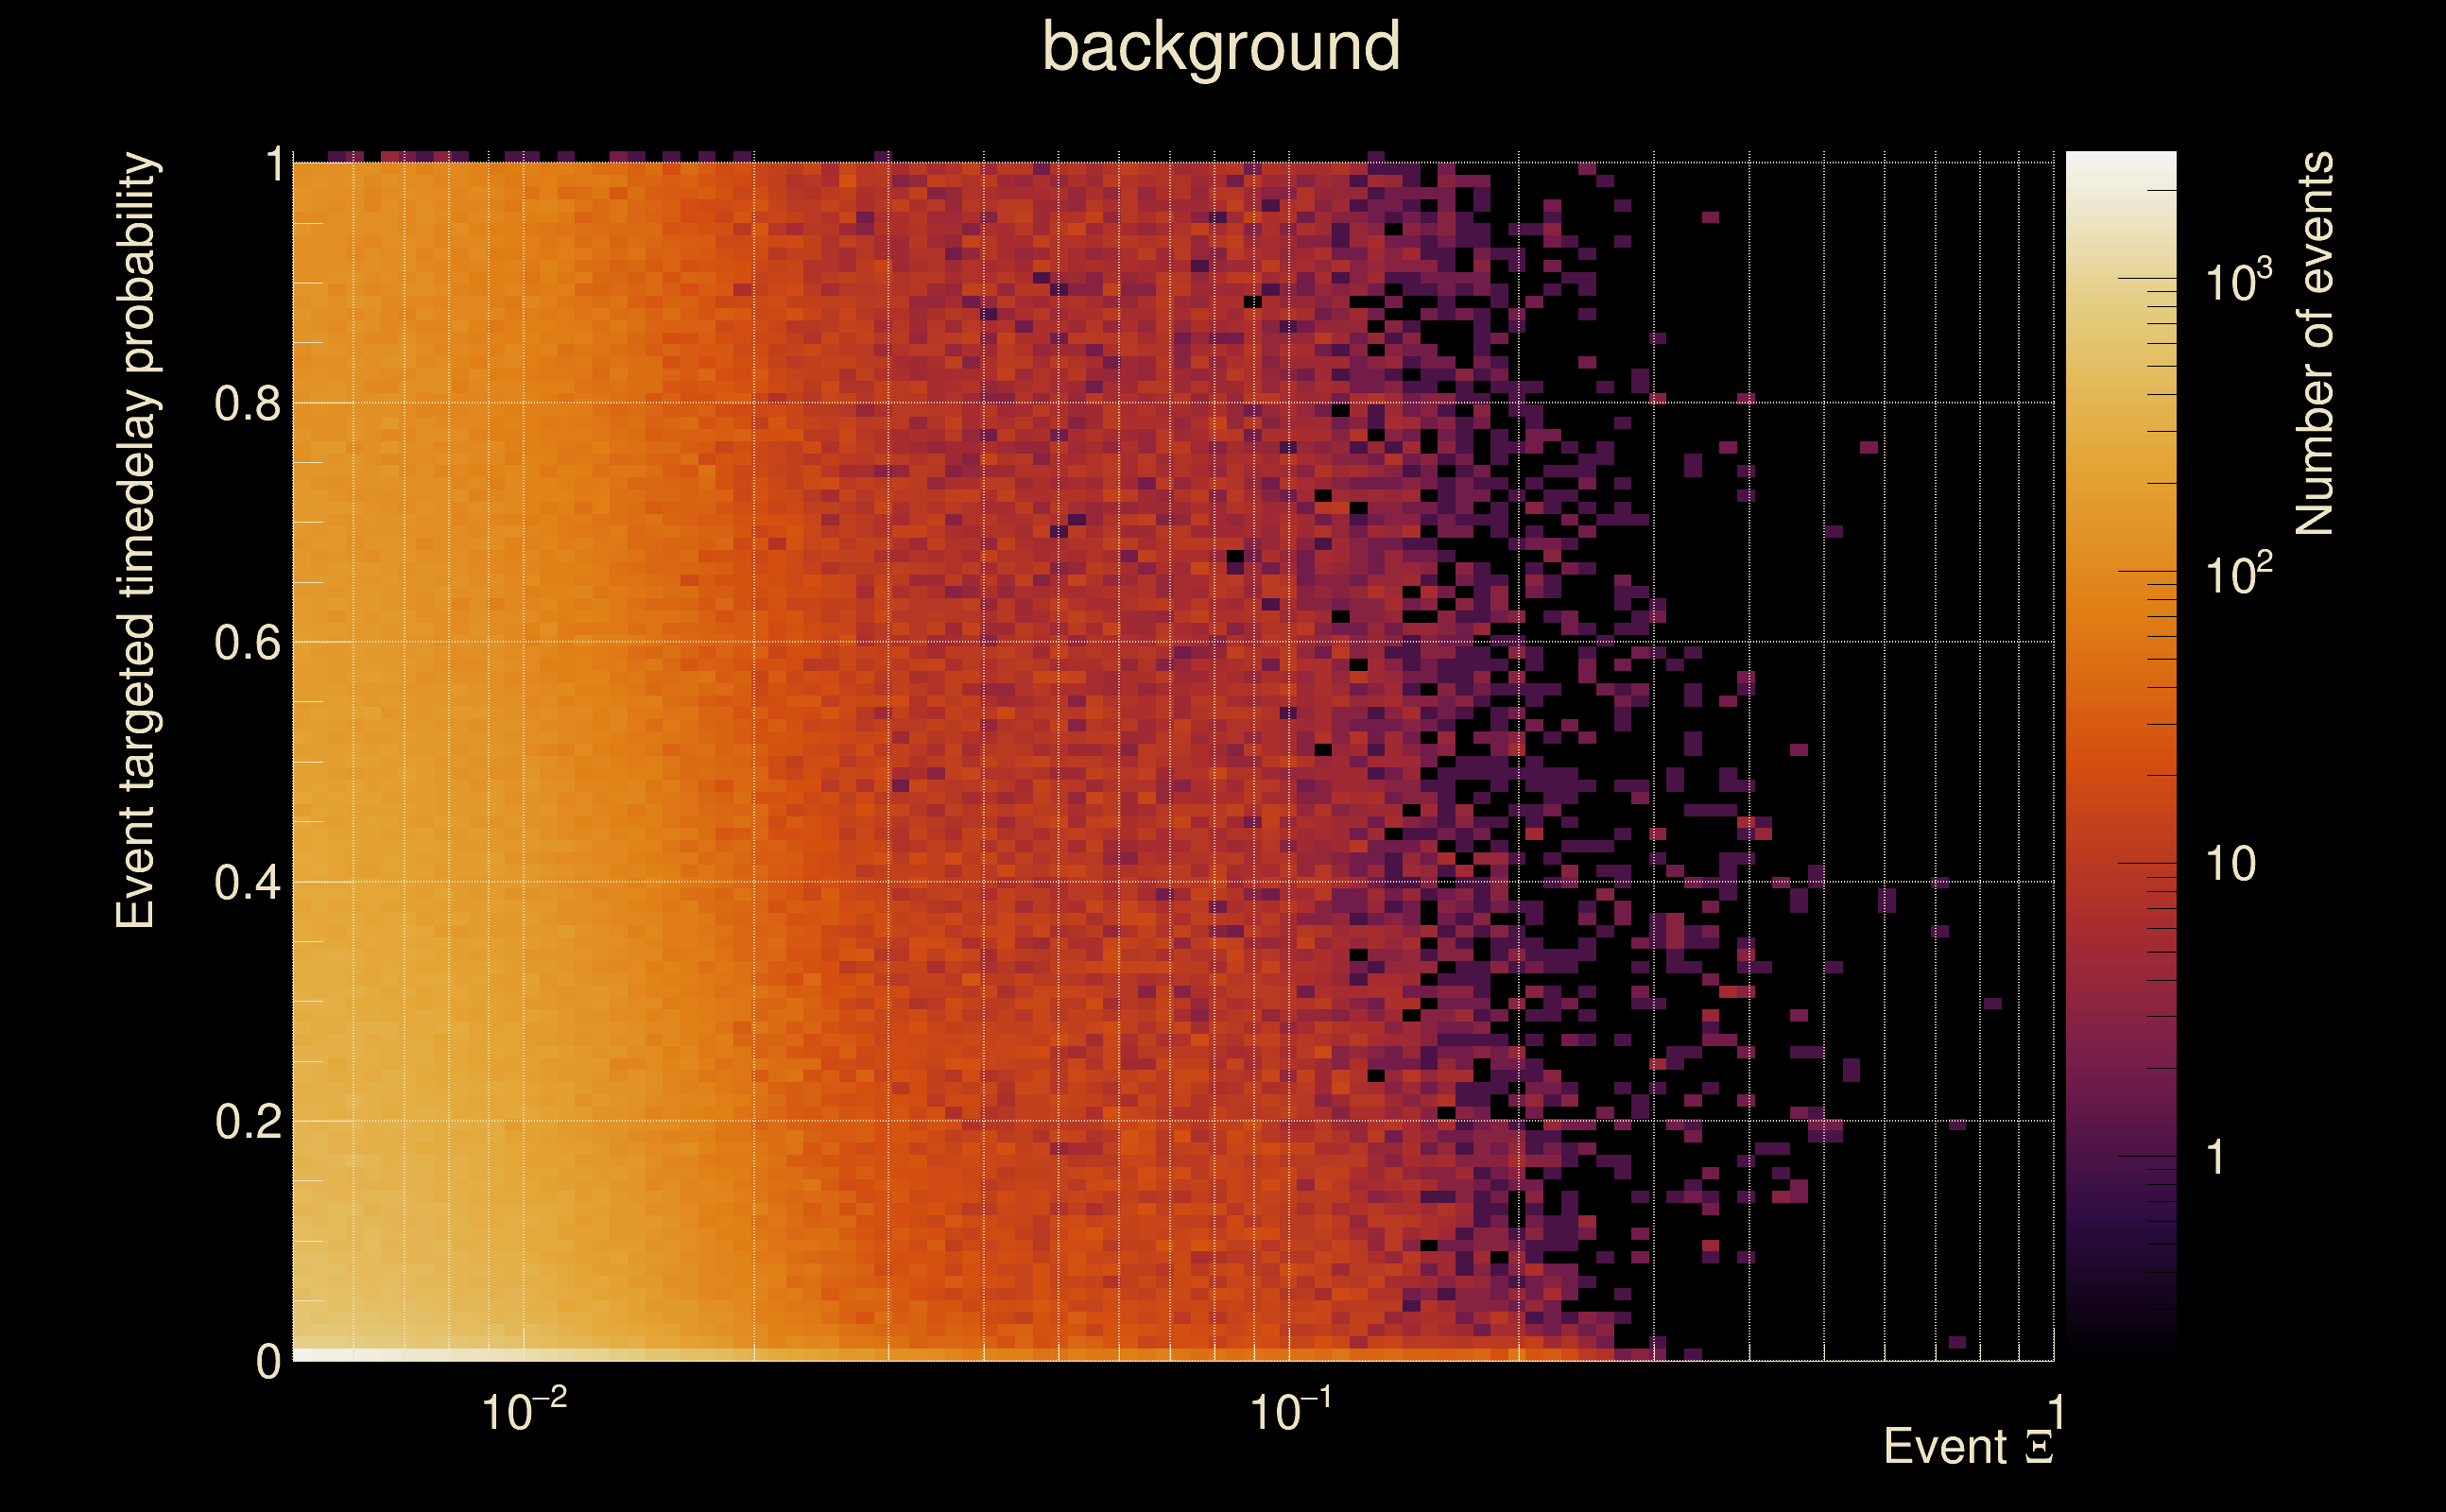
| Foreground | Fakeground | Background | ||
|---|---|---|---|---|
| Number of processed ox events | 12111 | 12111 | 2603865 | |
| Start Date (detector 0) | Mon May 15 14:13:25 2023 UTC | Mon May 15 14:13:25 2023 UTC | Mon May 15 14:13:25 2023 UTC | |
| End Date (detector 0) | Thu May 18 15:54:40 2023 UTC | Thu May 18 15:54:40 2023 UTC | Thu May 18 15:54:40 2023 UTC | |
| Start GPS (detector 0) | 1368195223 | 1368195223 | 1368195223 | |
| End GPS (detector 0) | 1368460498 | 1368460498 | 1368460498 | |
| Used livetime (detector 0) | 60875 s | 60875 s | 60875 s | |
| Start Date (detector 1) | Mon May 15 14:13:25 2023 UTC | Mon May 15 14:13:25 2023 UTC | Mon May 15 14:13:25 2023 UTC | |
| End Date (detector 1) | Thu May 18 15:54:40 2023 UTC | Thu May 18 15:54:40 2023 UTC | Thu May 18 15:54:40 2023 UTC | |
| Start GPS (detector 1) | 1368195223 | 1368195223 | 1368195223 | |
| End GPS (detector 1) | 1368460498 | 1368460498 | 1368460498 | |
| Used livetime (detector 1) | 60875 s | 60875 s | 60875 s | |
| Cumulative livetime | 121110 s | 121110 s | 26038650 s | |
| 0 years, 1 days, 9 hours, 38 min, 30 s | 0 years, 1 days, 9 hours, 38 min, 30 s | 0 years, 301 days, 8 hours, 57 min, 30 s |
|
|
| Event time t(H1): | GPS = 1368352486 (Wed May 17 09:54:28 2023 ) → GPS = 1368352496 (Wed May 17 09:54:38 2023 ) |
| Event time t(L1): | GPS = 1368352486 (Wed May 17 09:54:38 2023 ) → GPS = 1368352496 (Wed May 17 09:54:38 2023 ) |
| Omicron analysis time window (H1): | GPS = 1368352483 → GPS = 1368352499 |
| Omicron analysis time window (L1): | GPS = 1368352483 → GPS = 1368352499 |
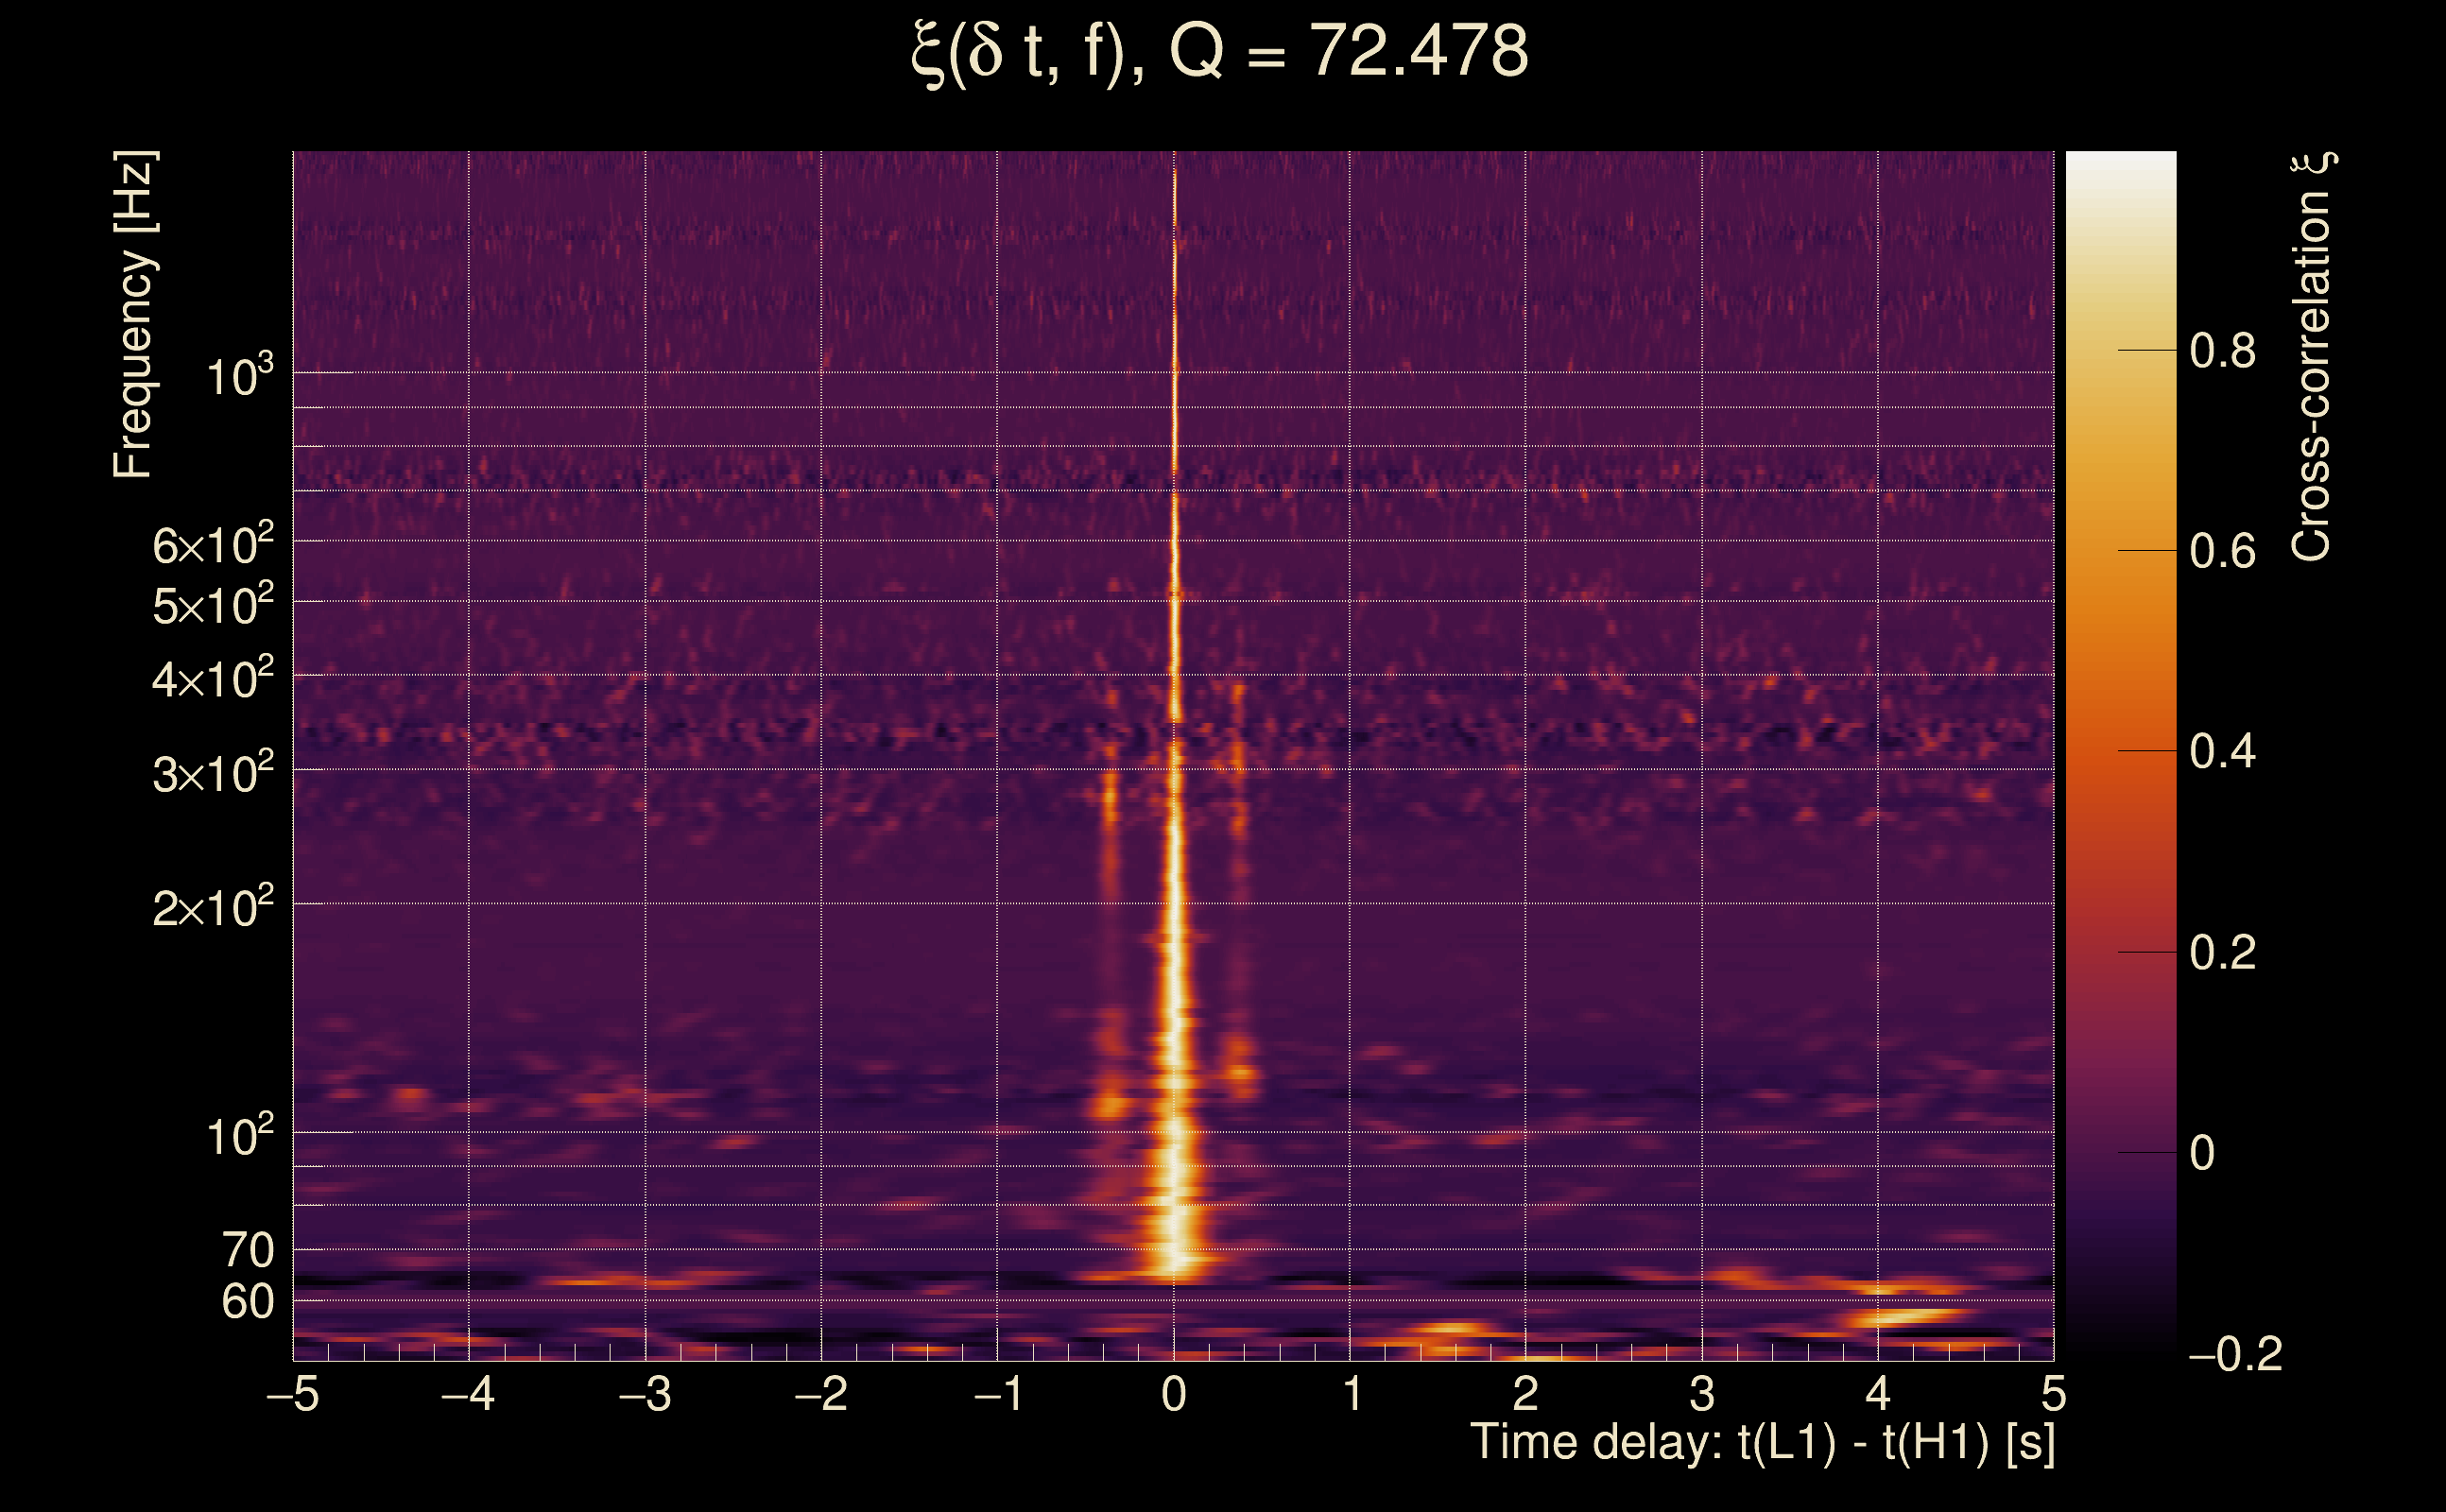
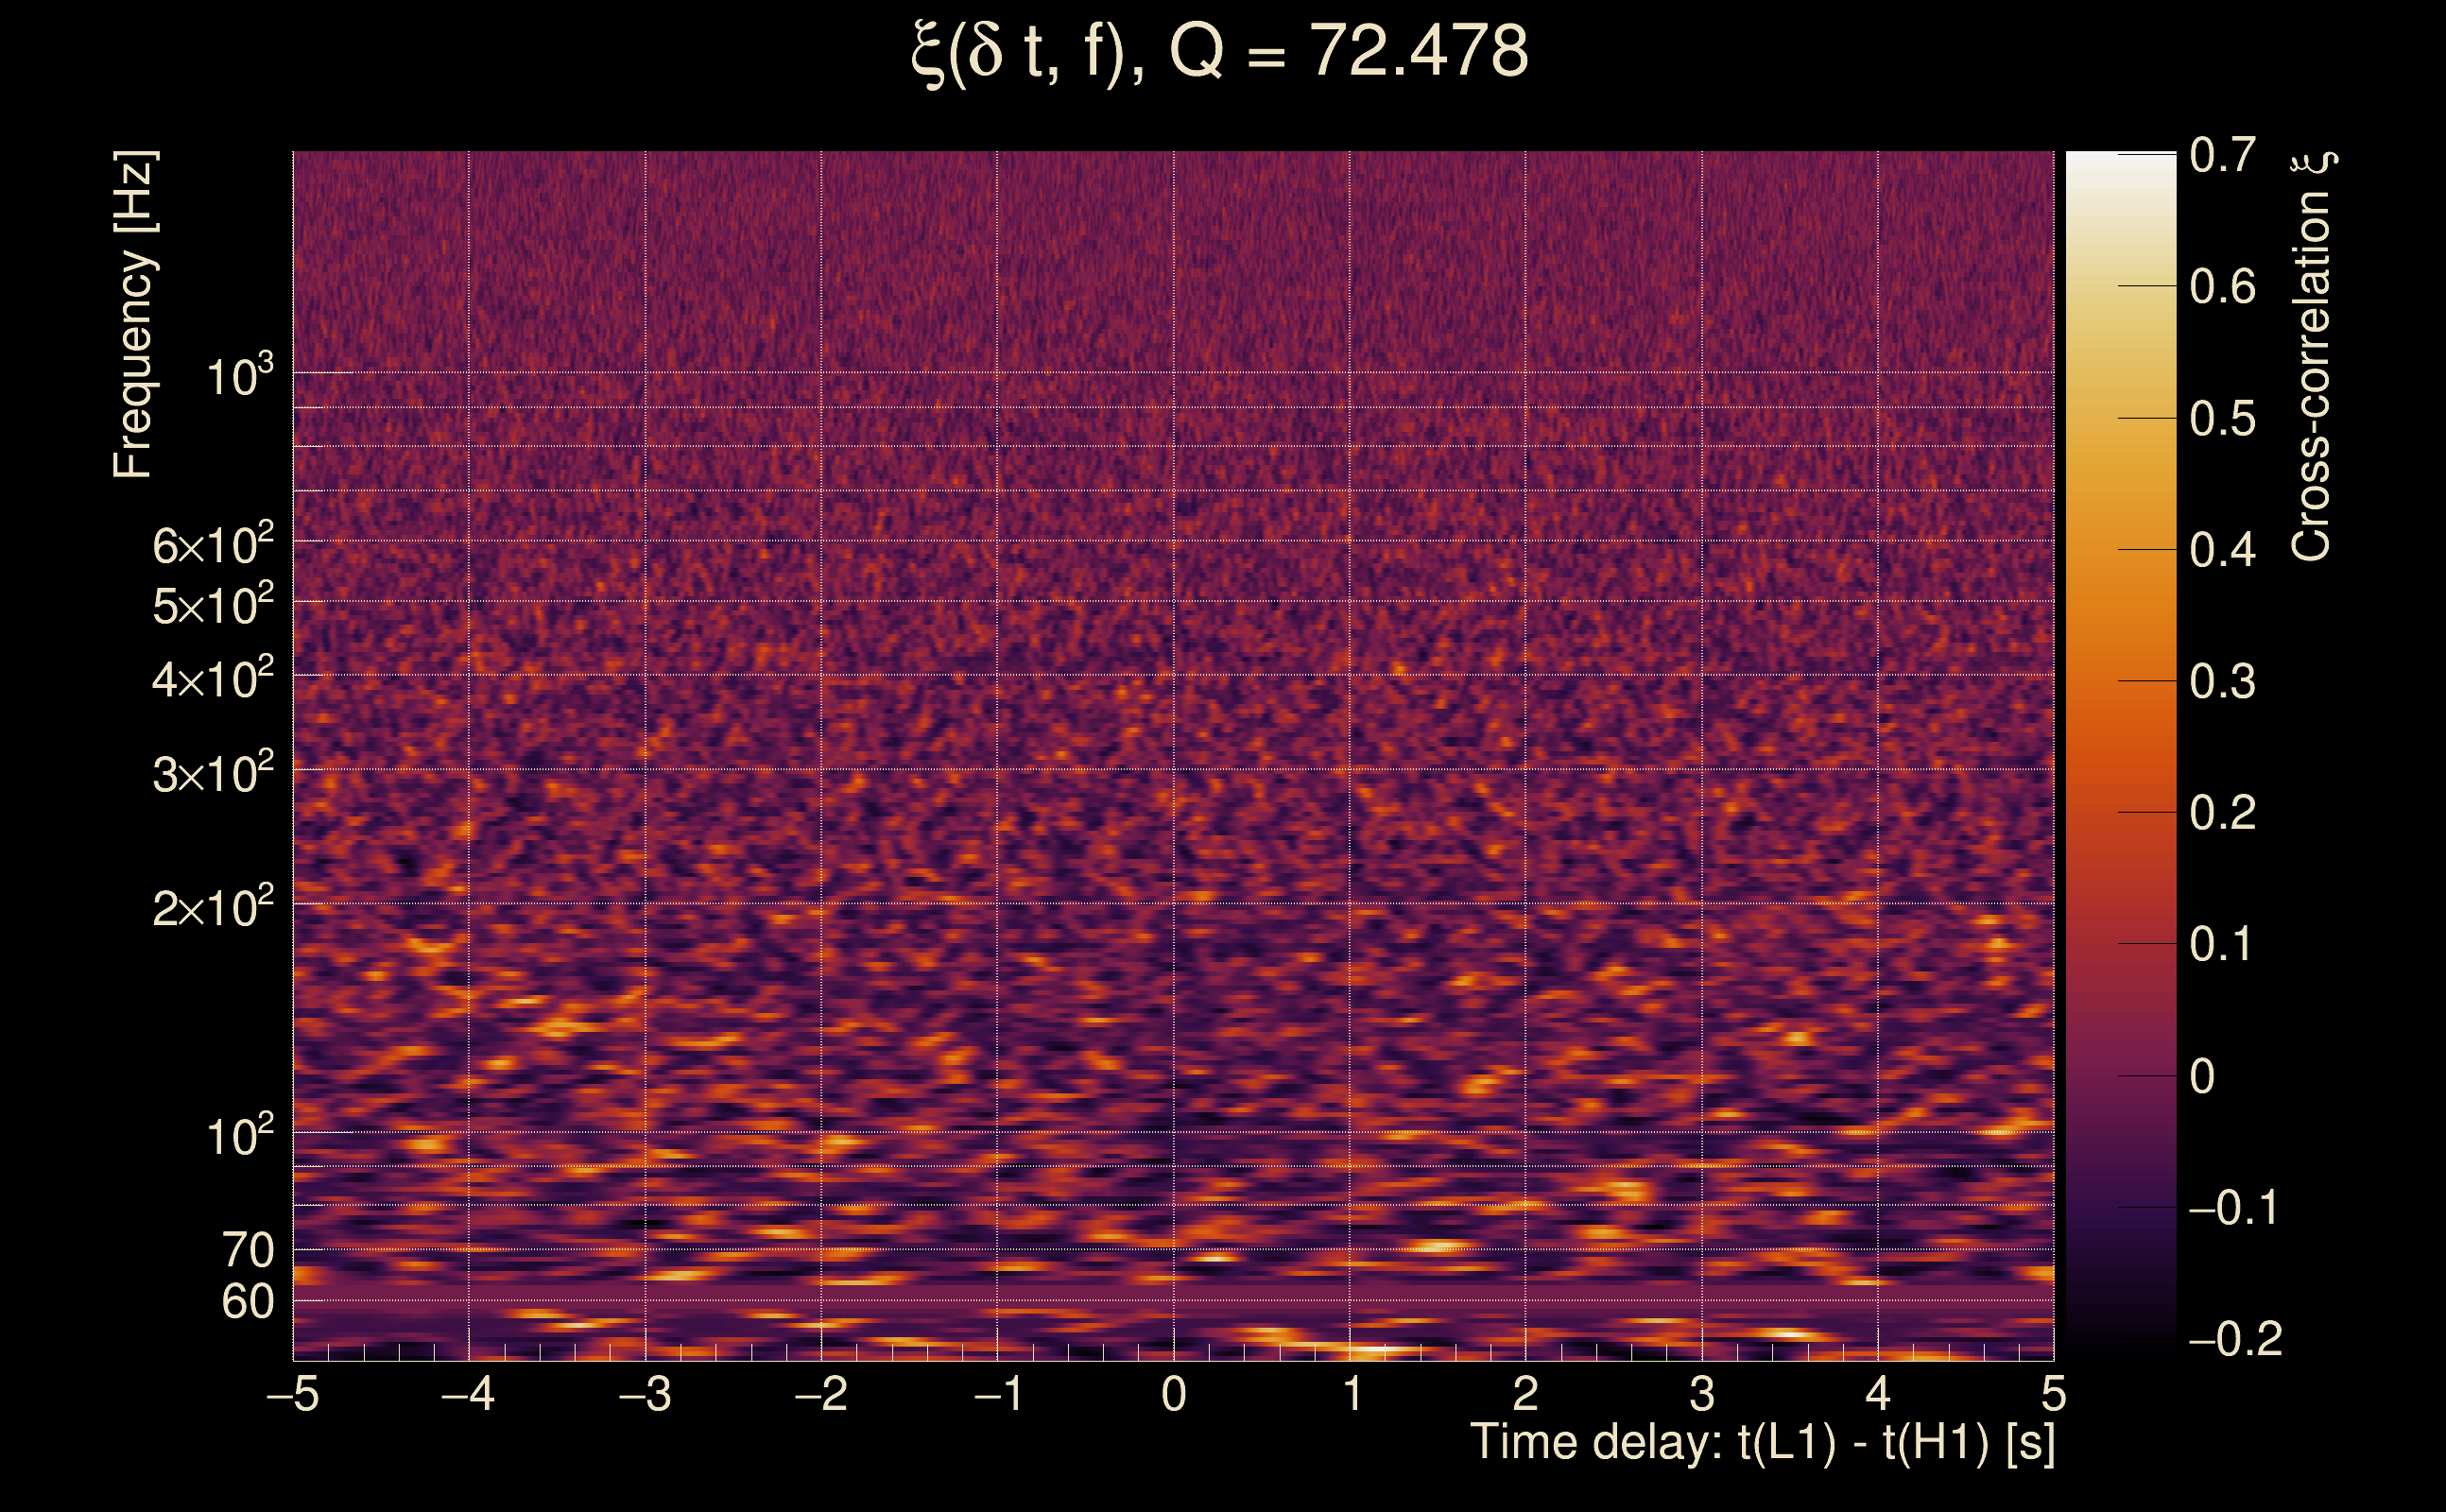
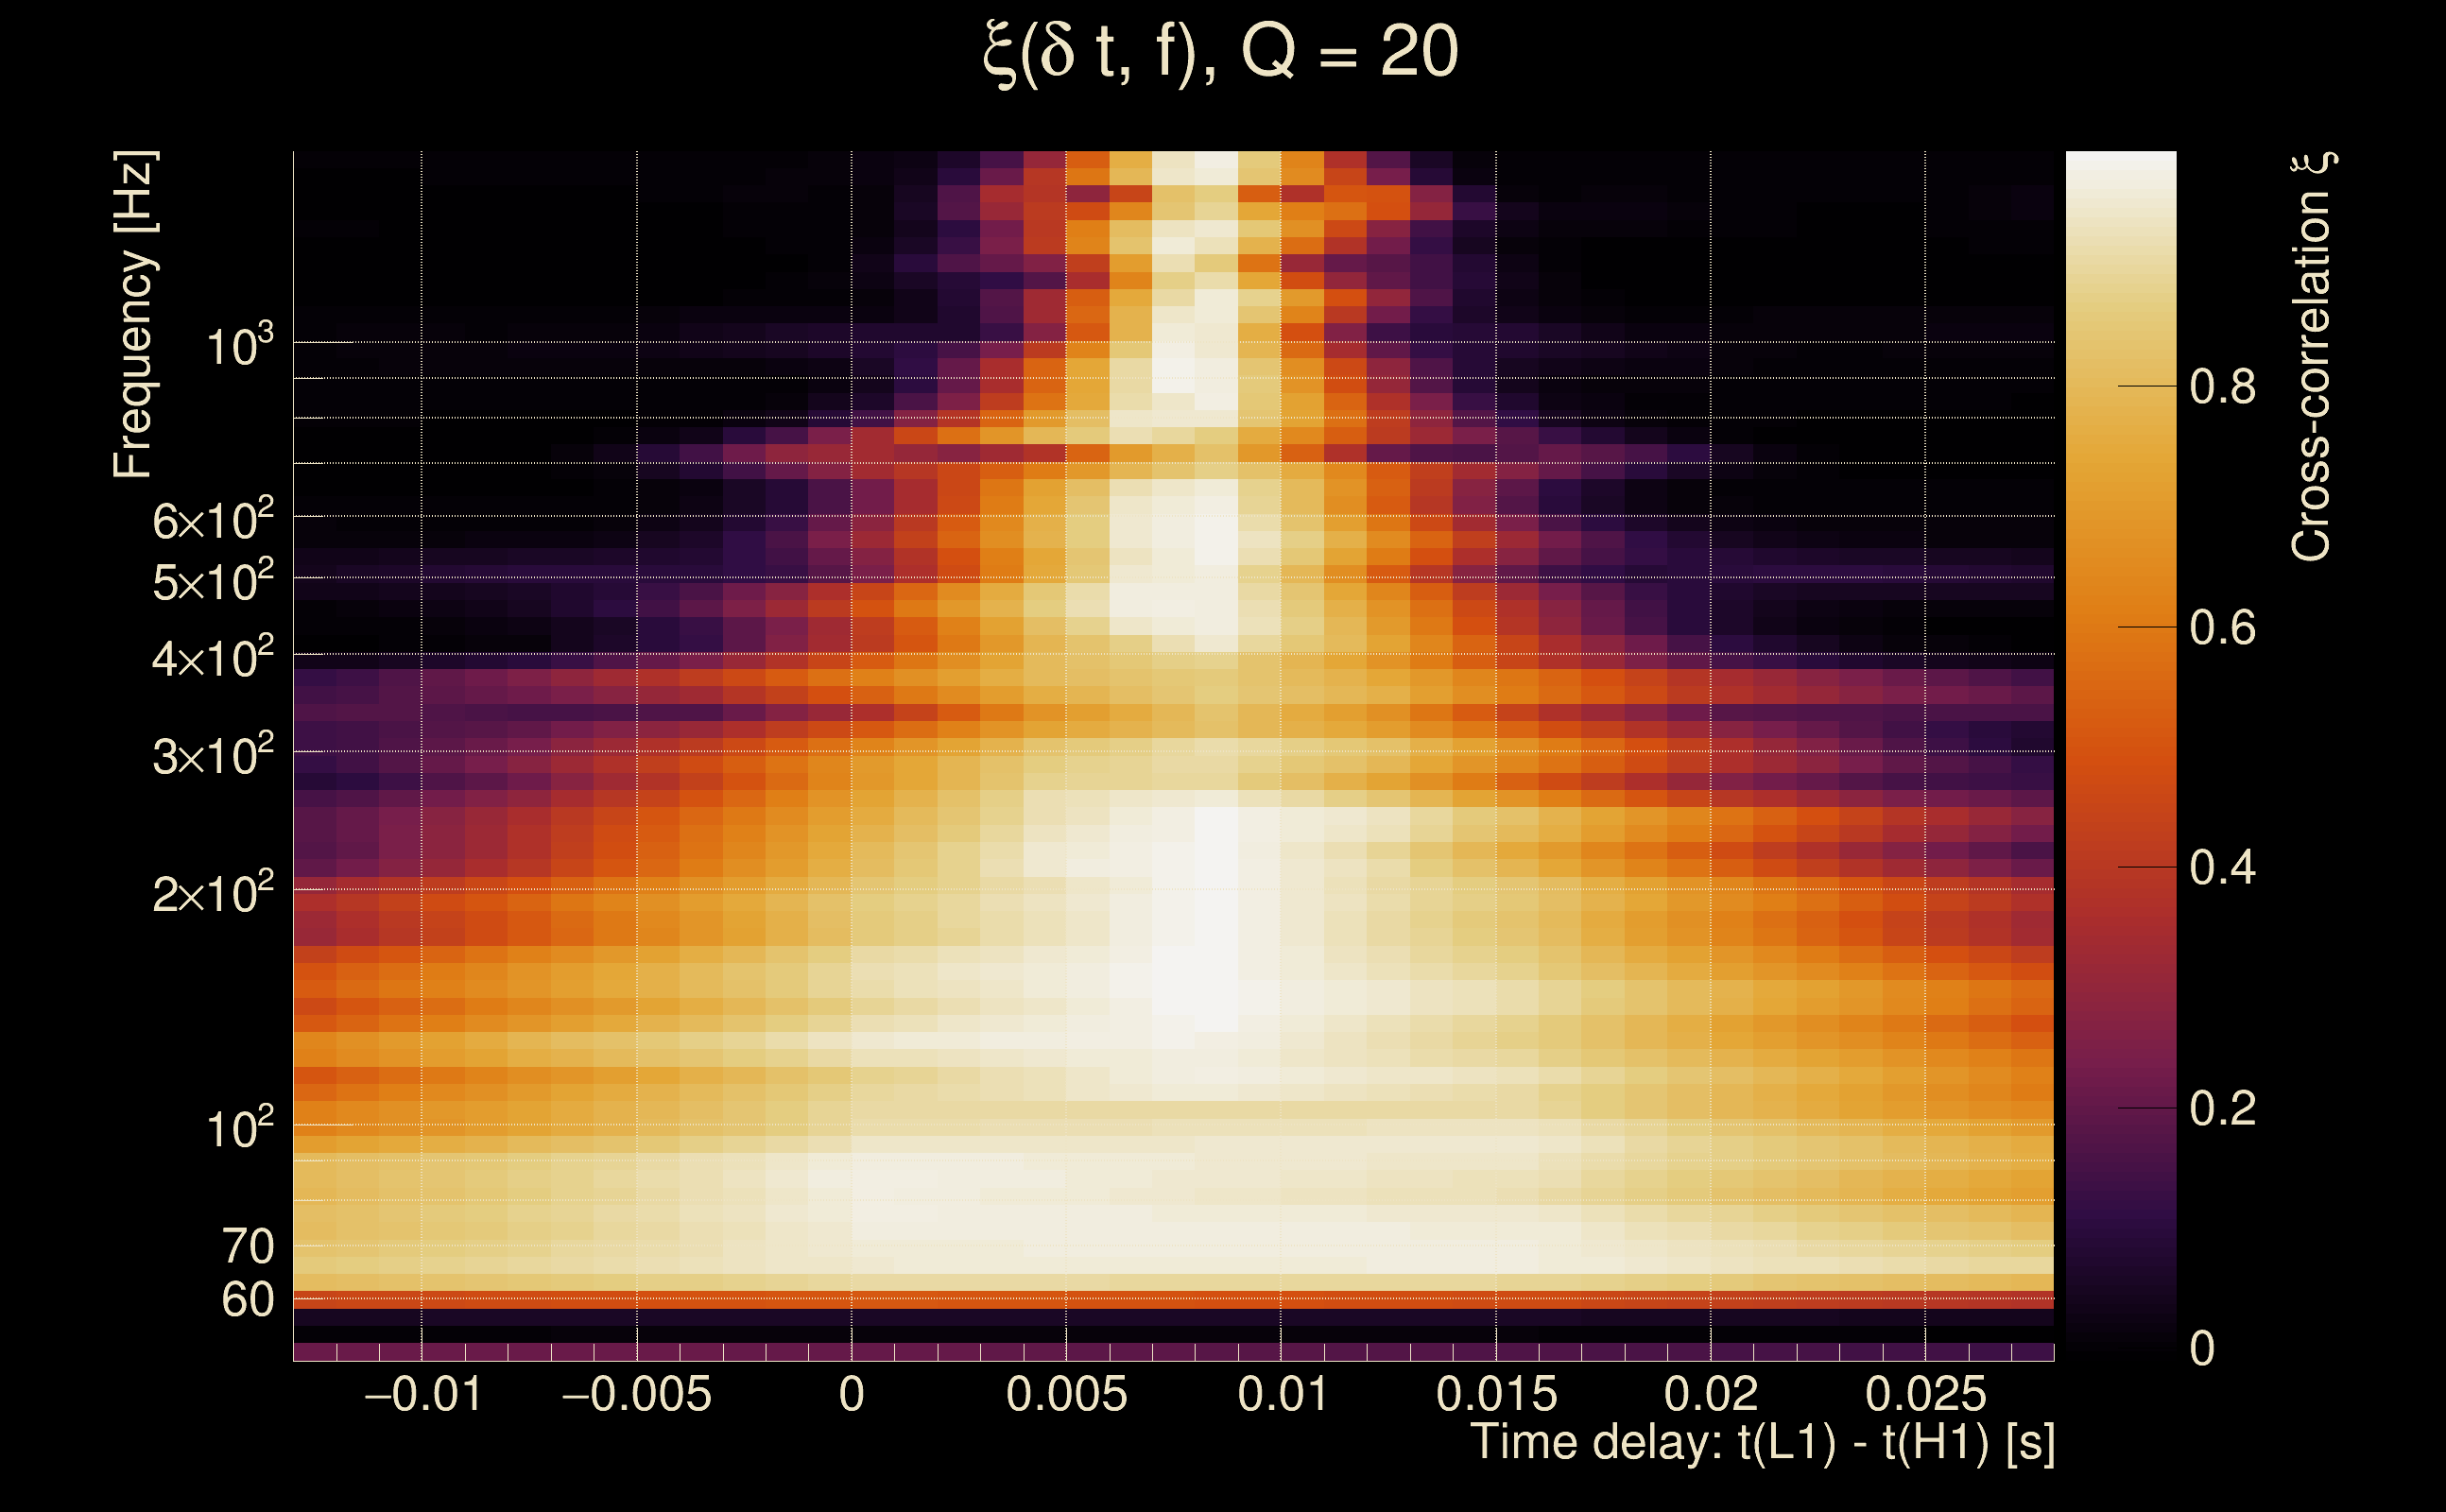
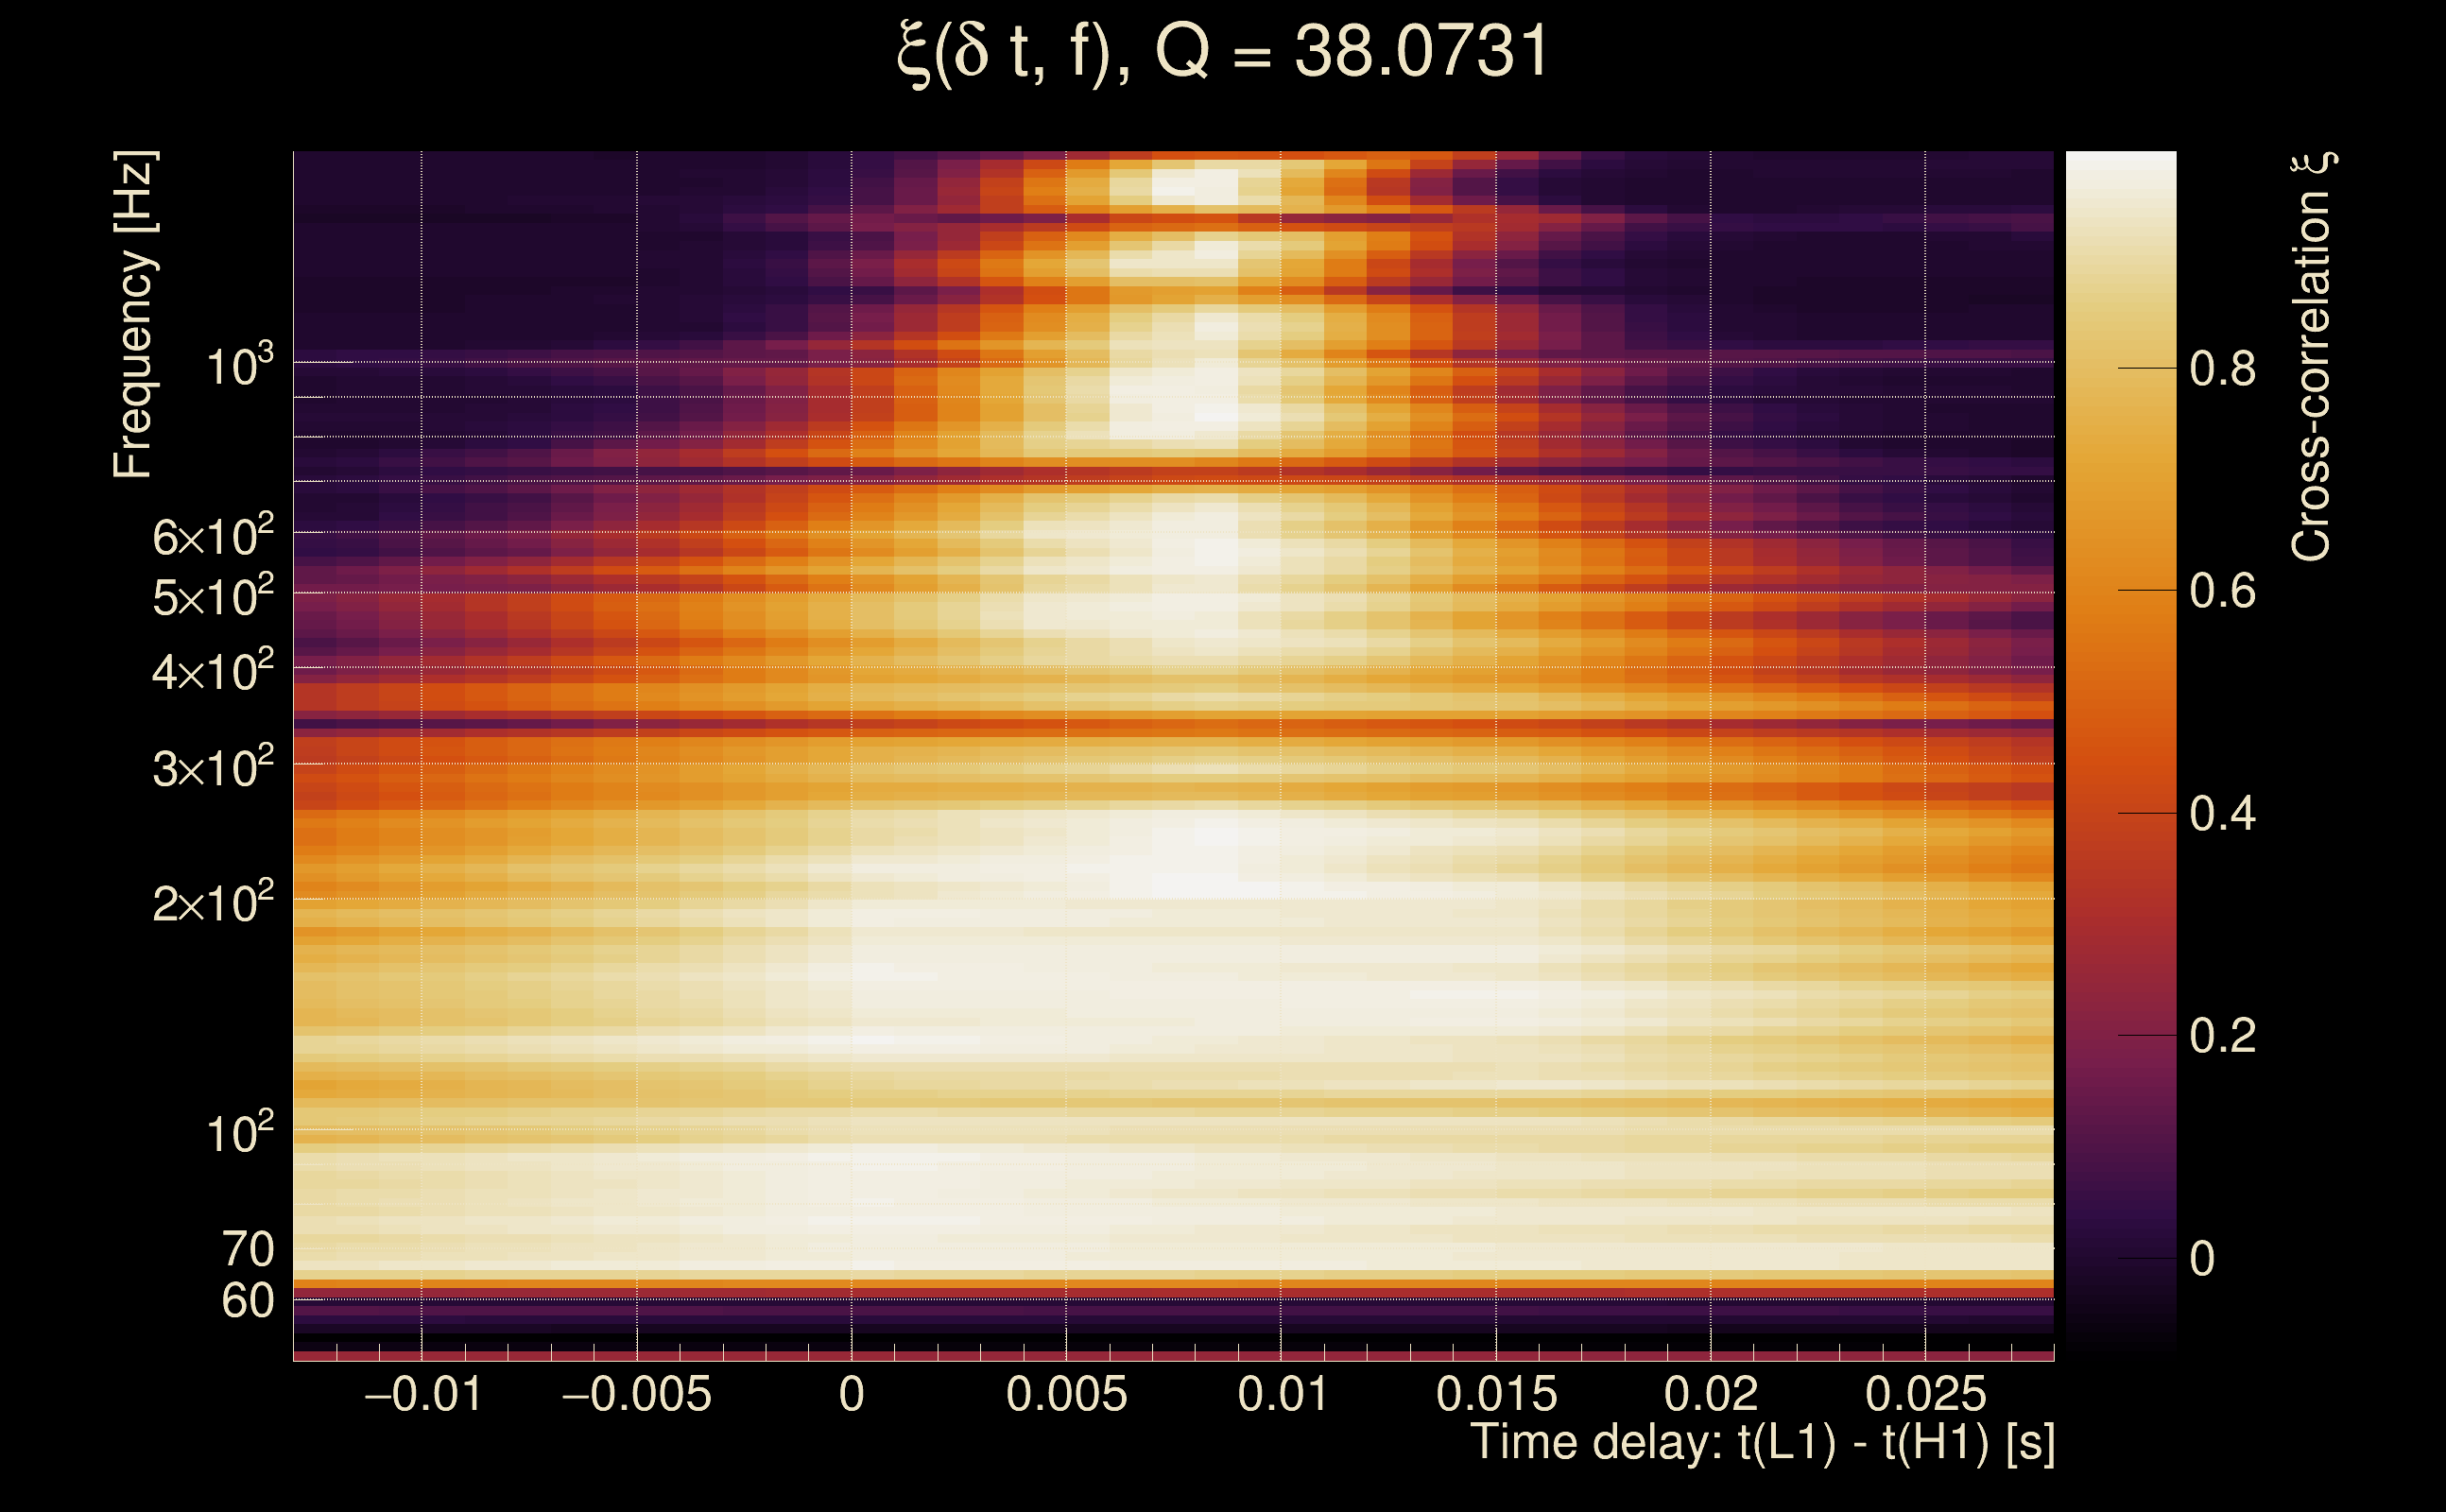
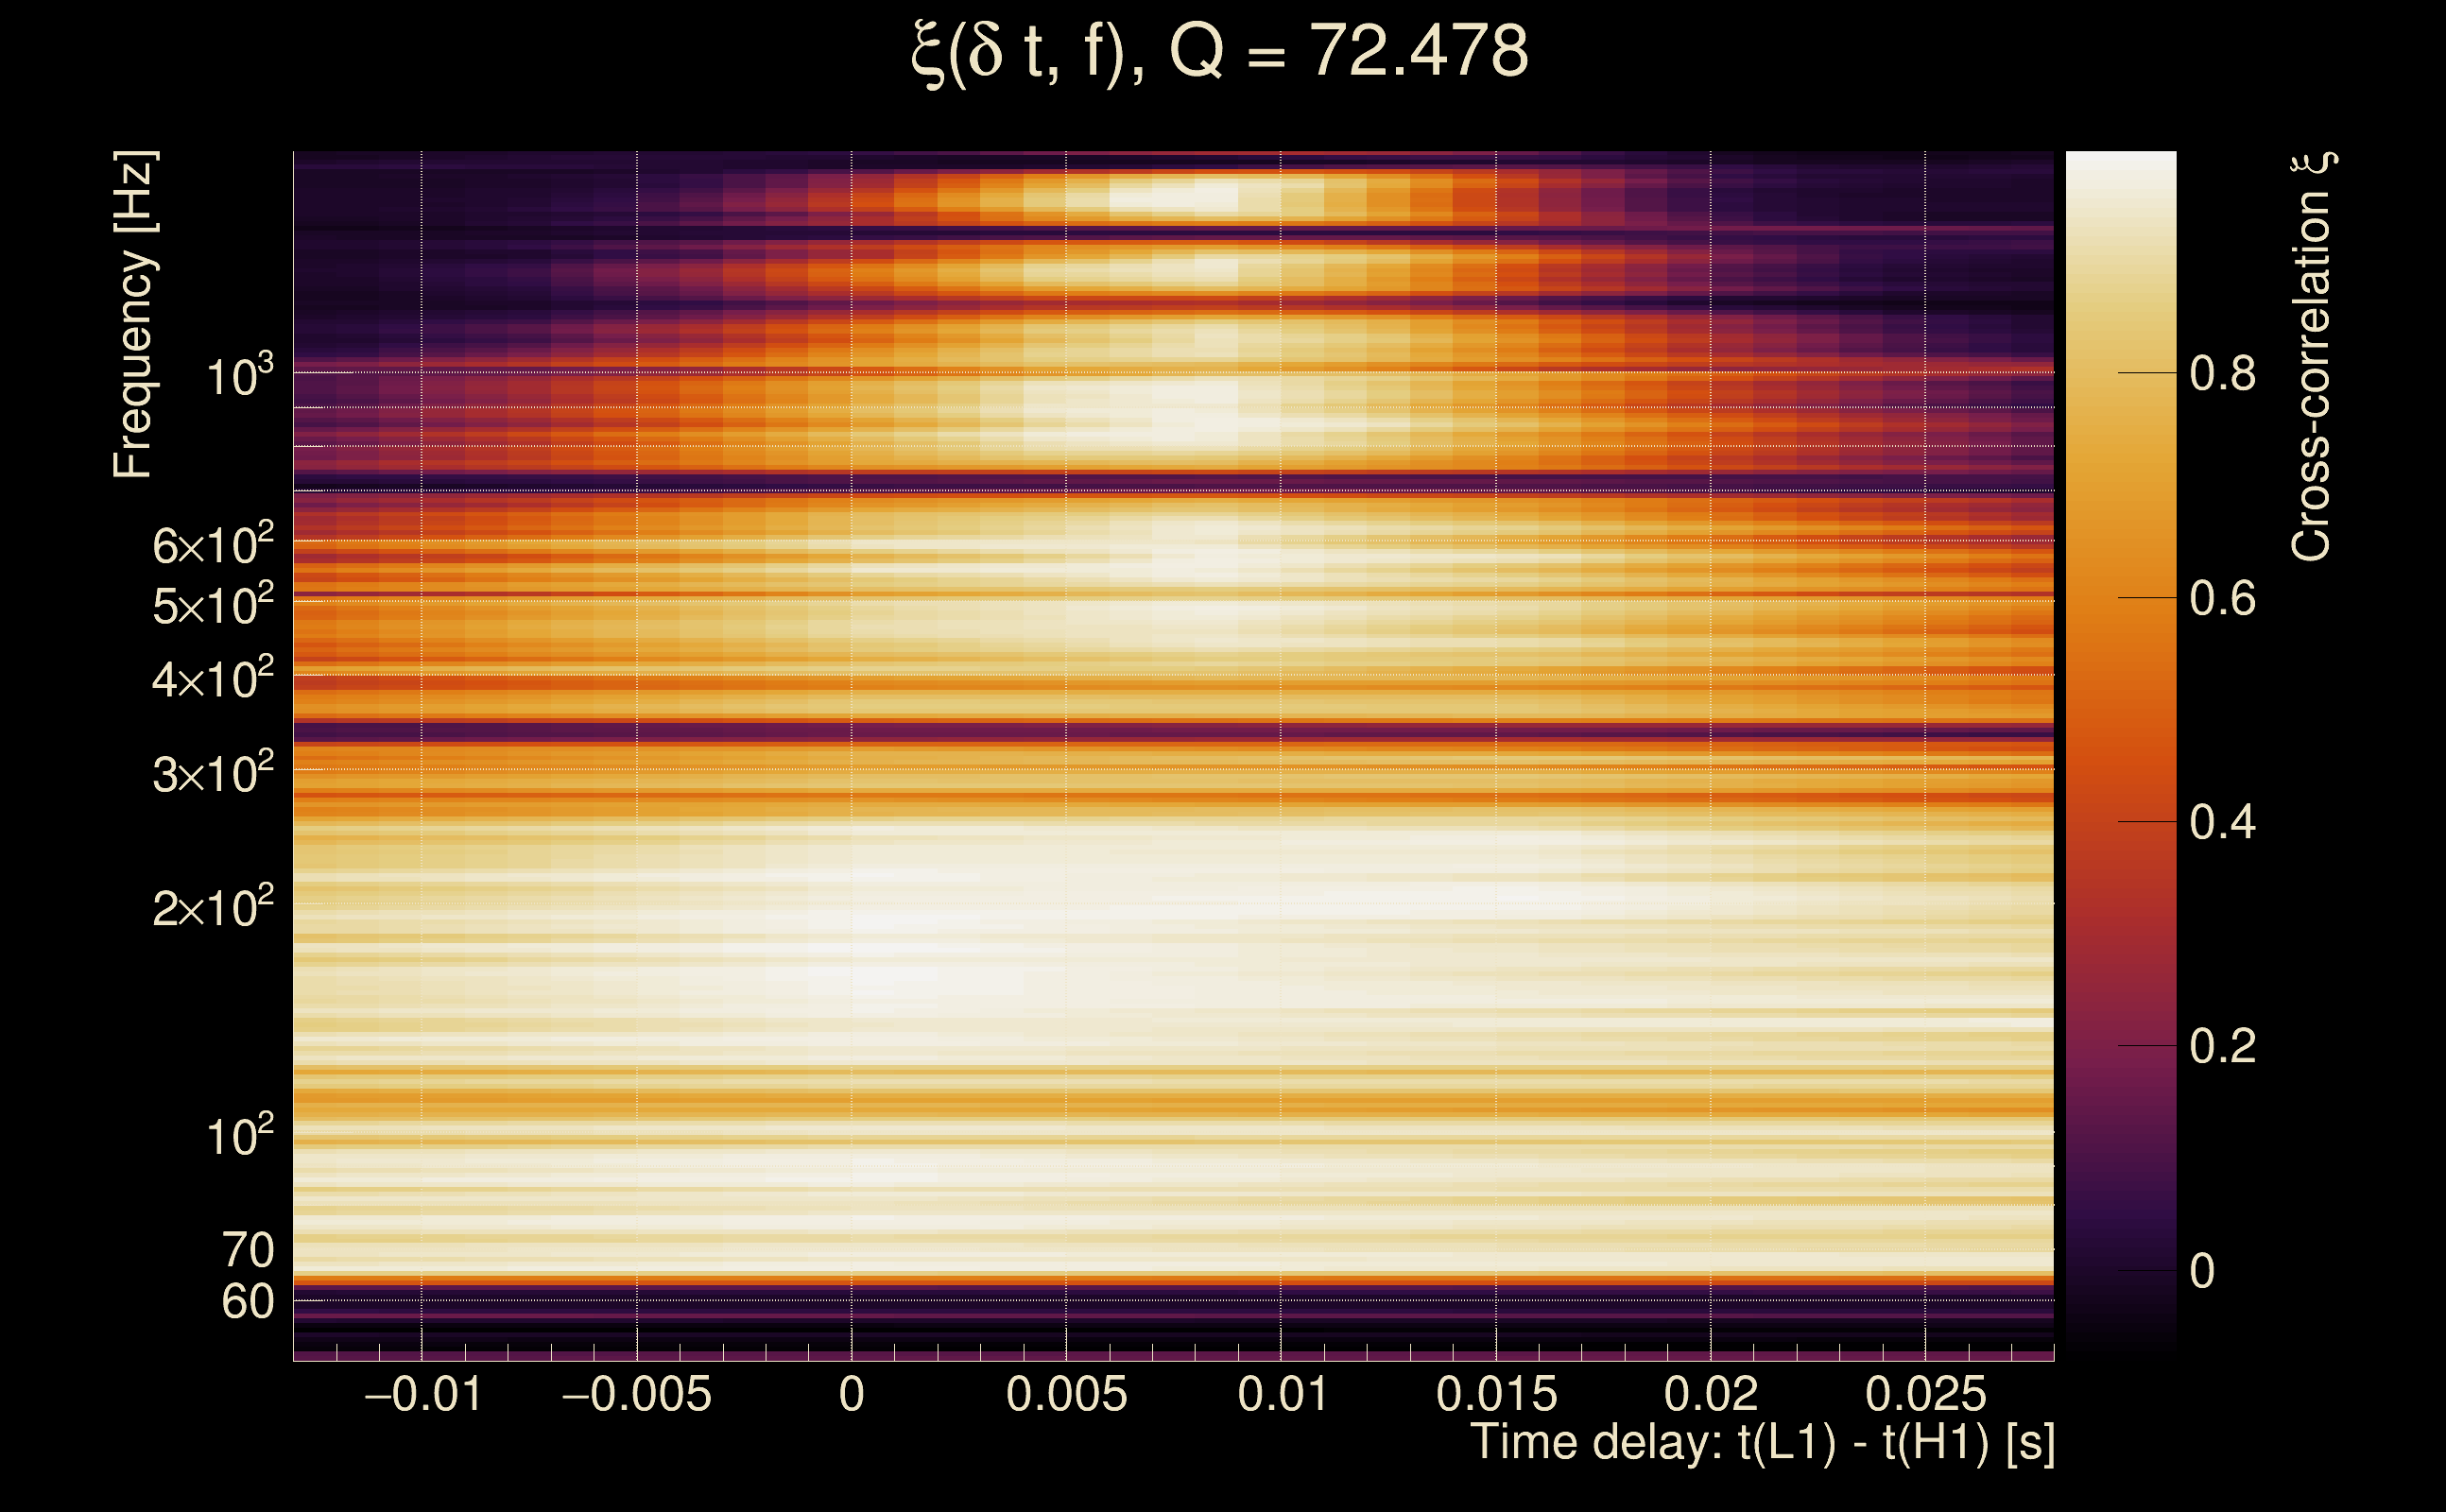
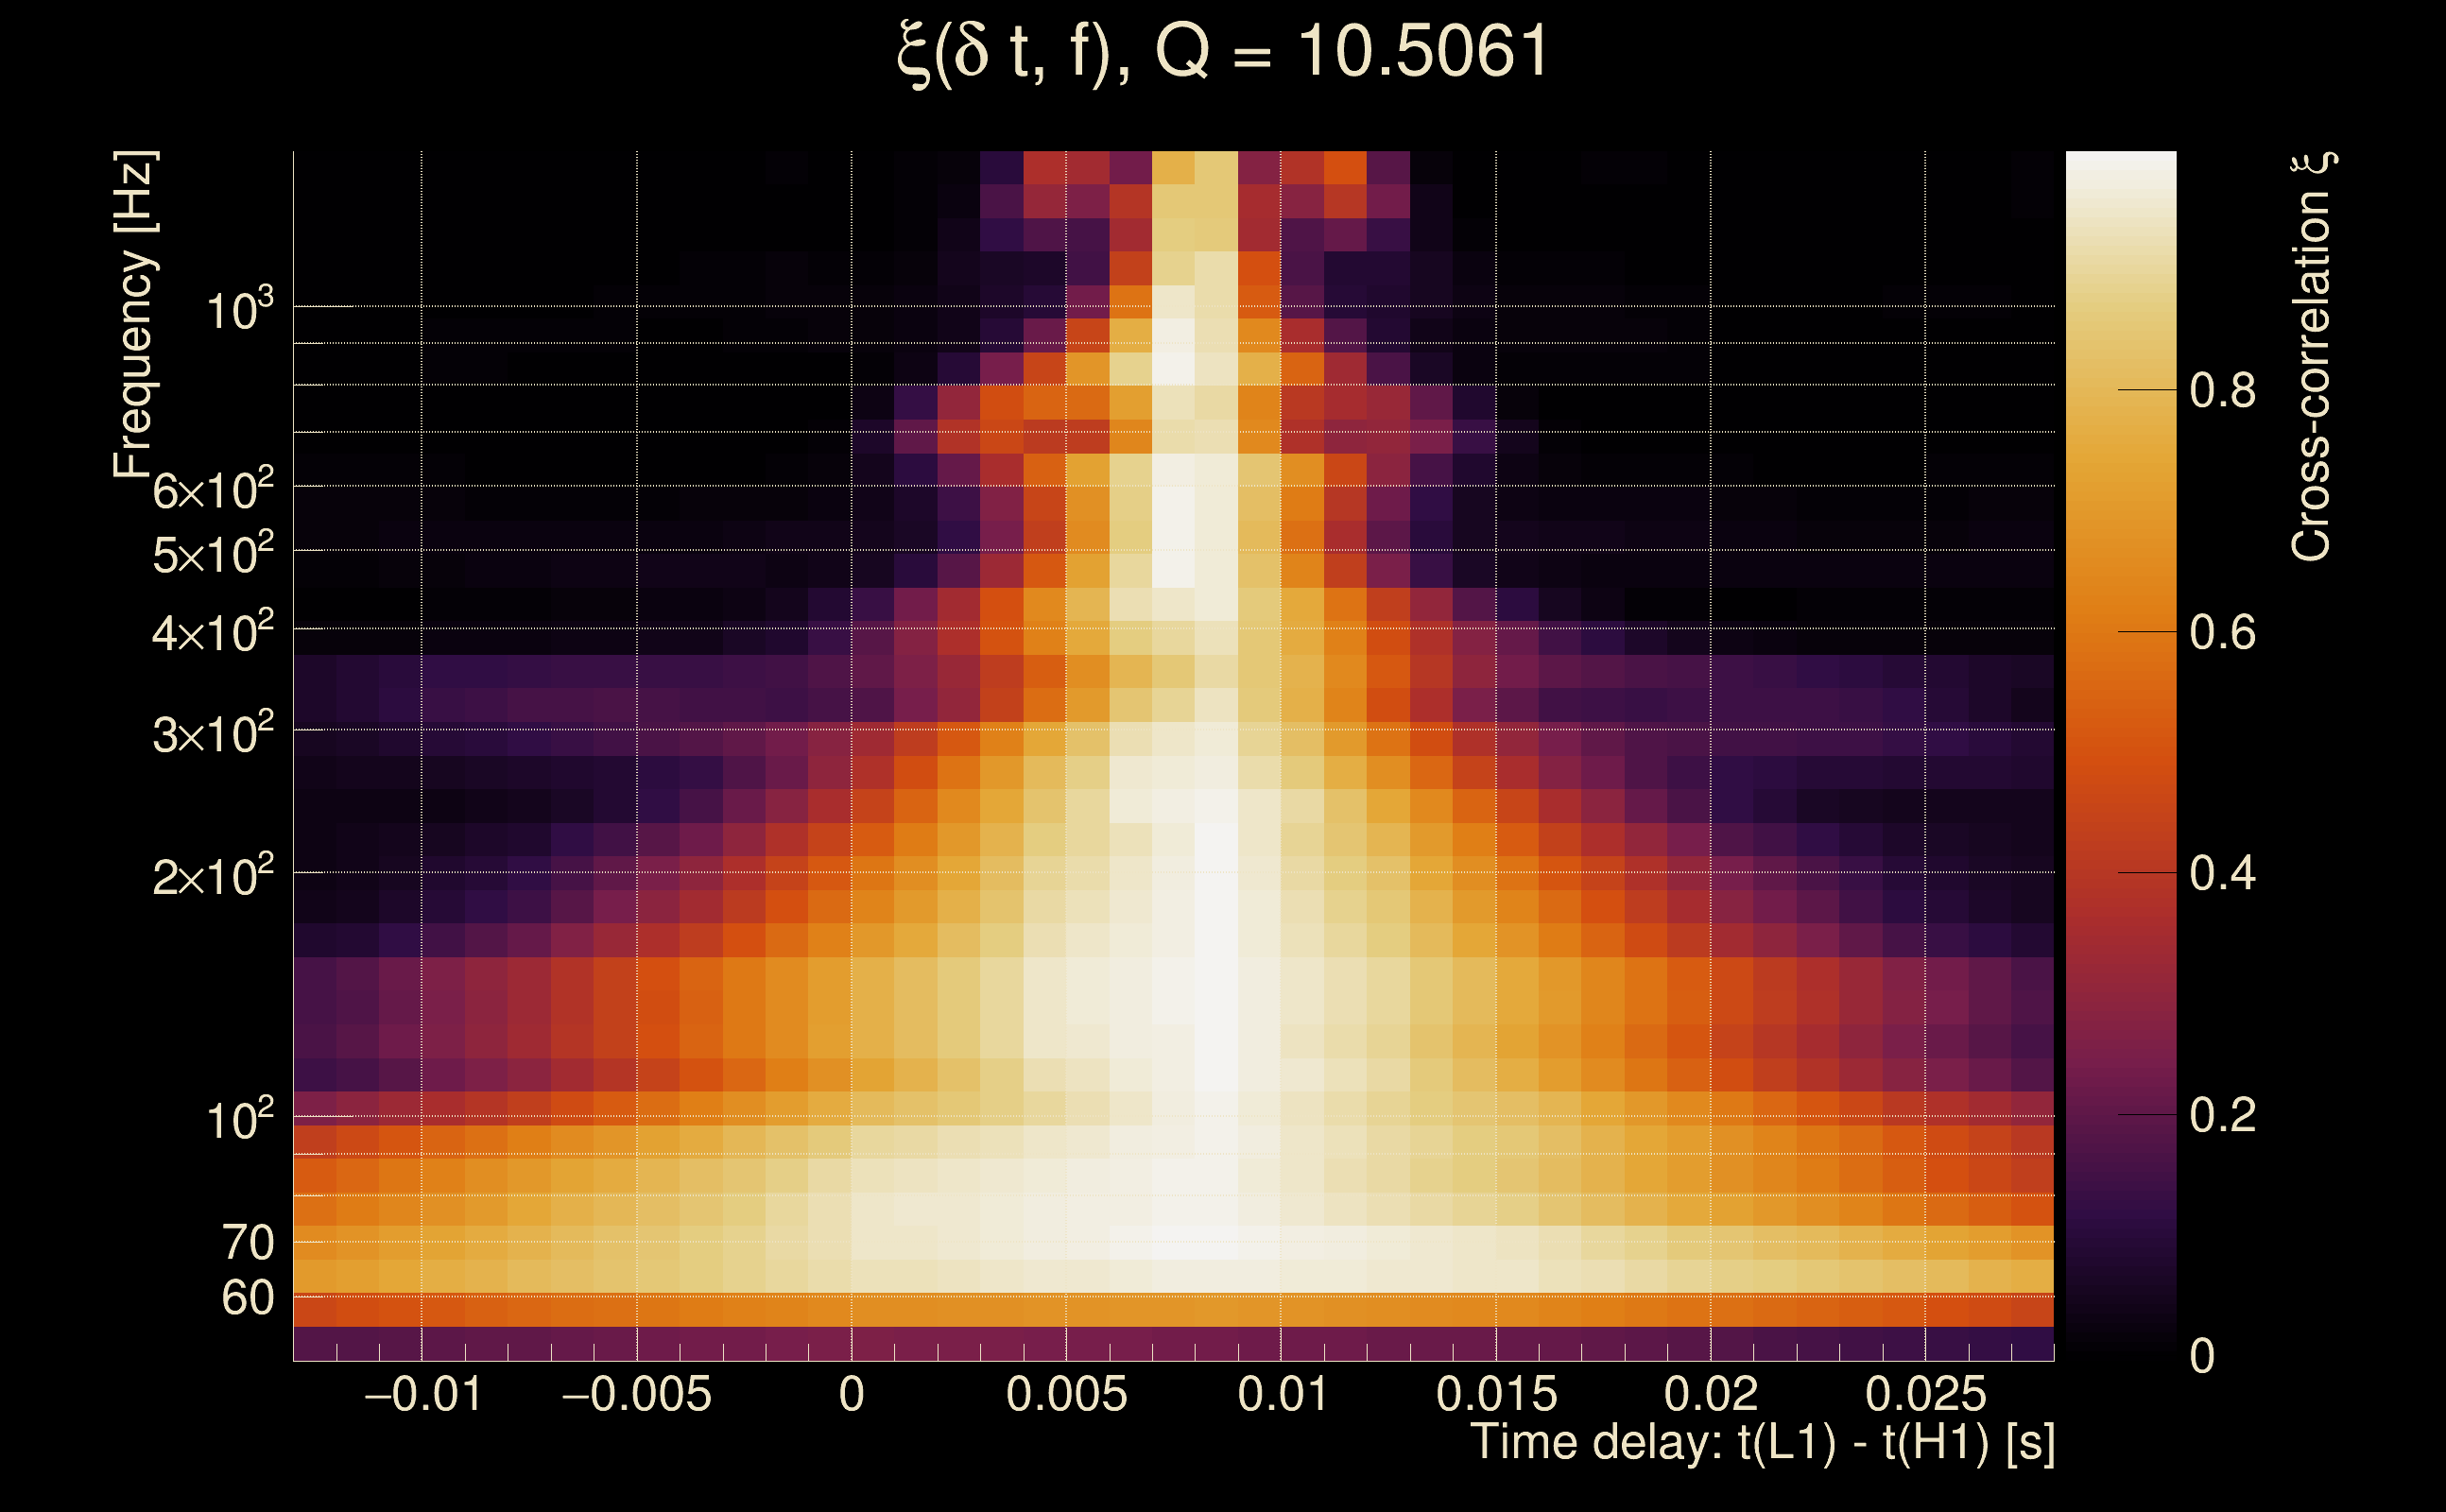
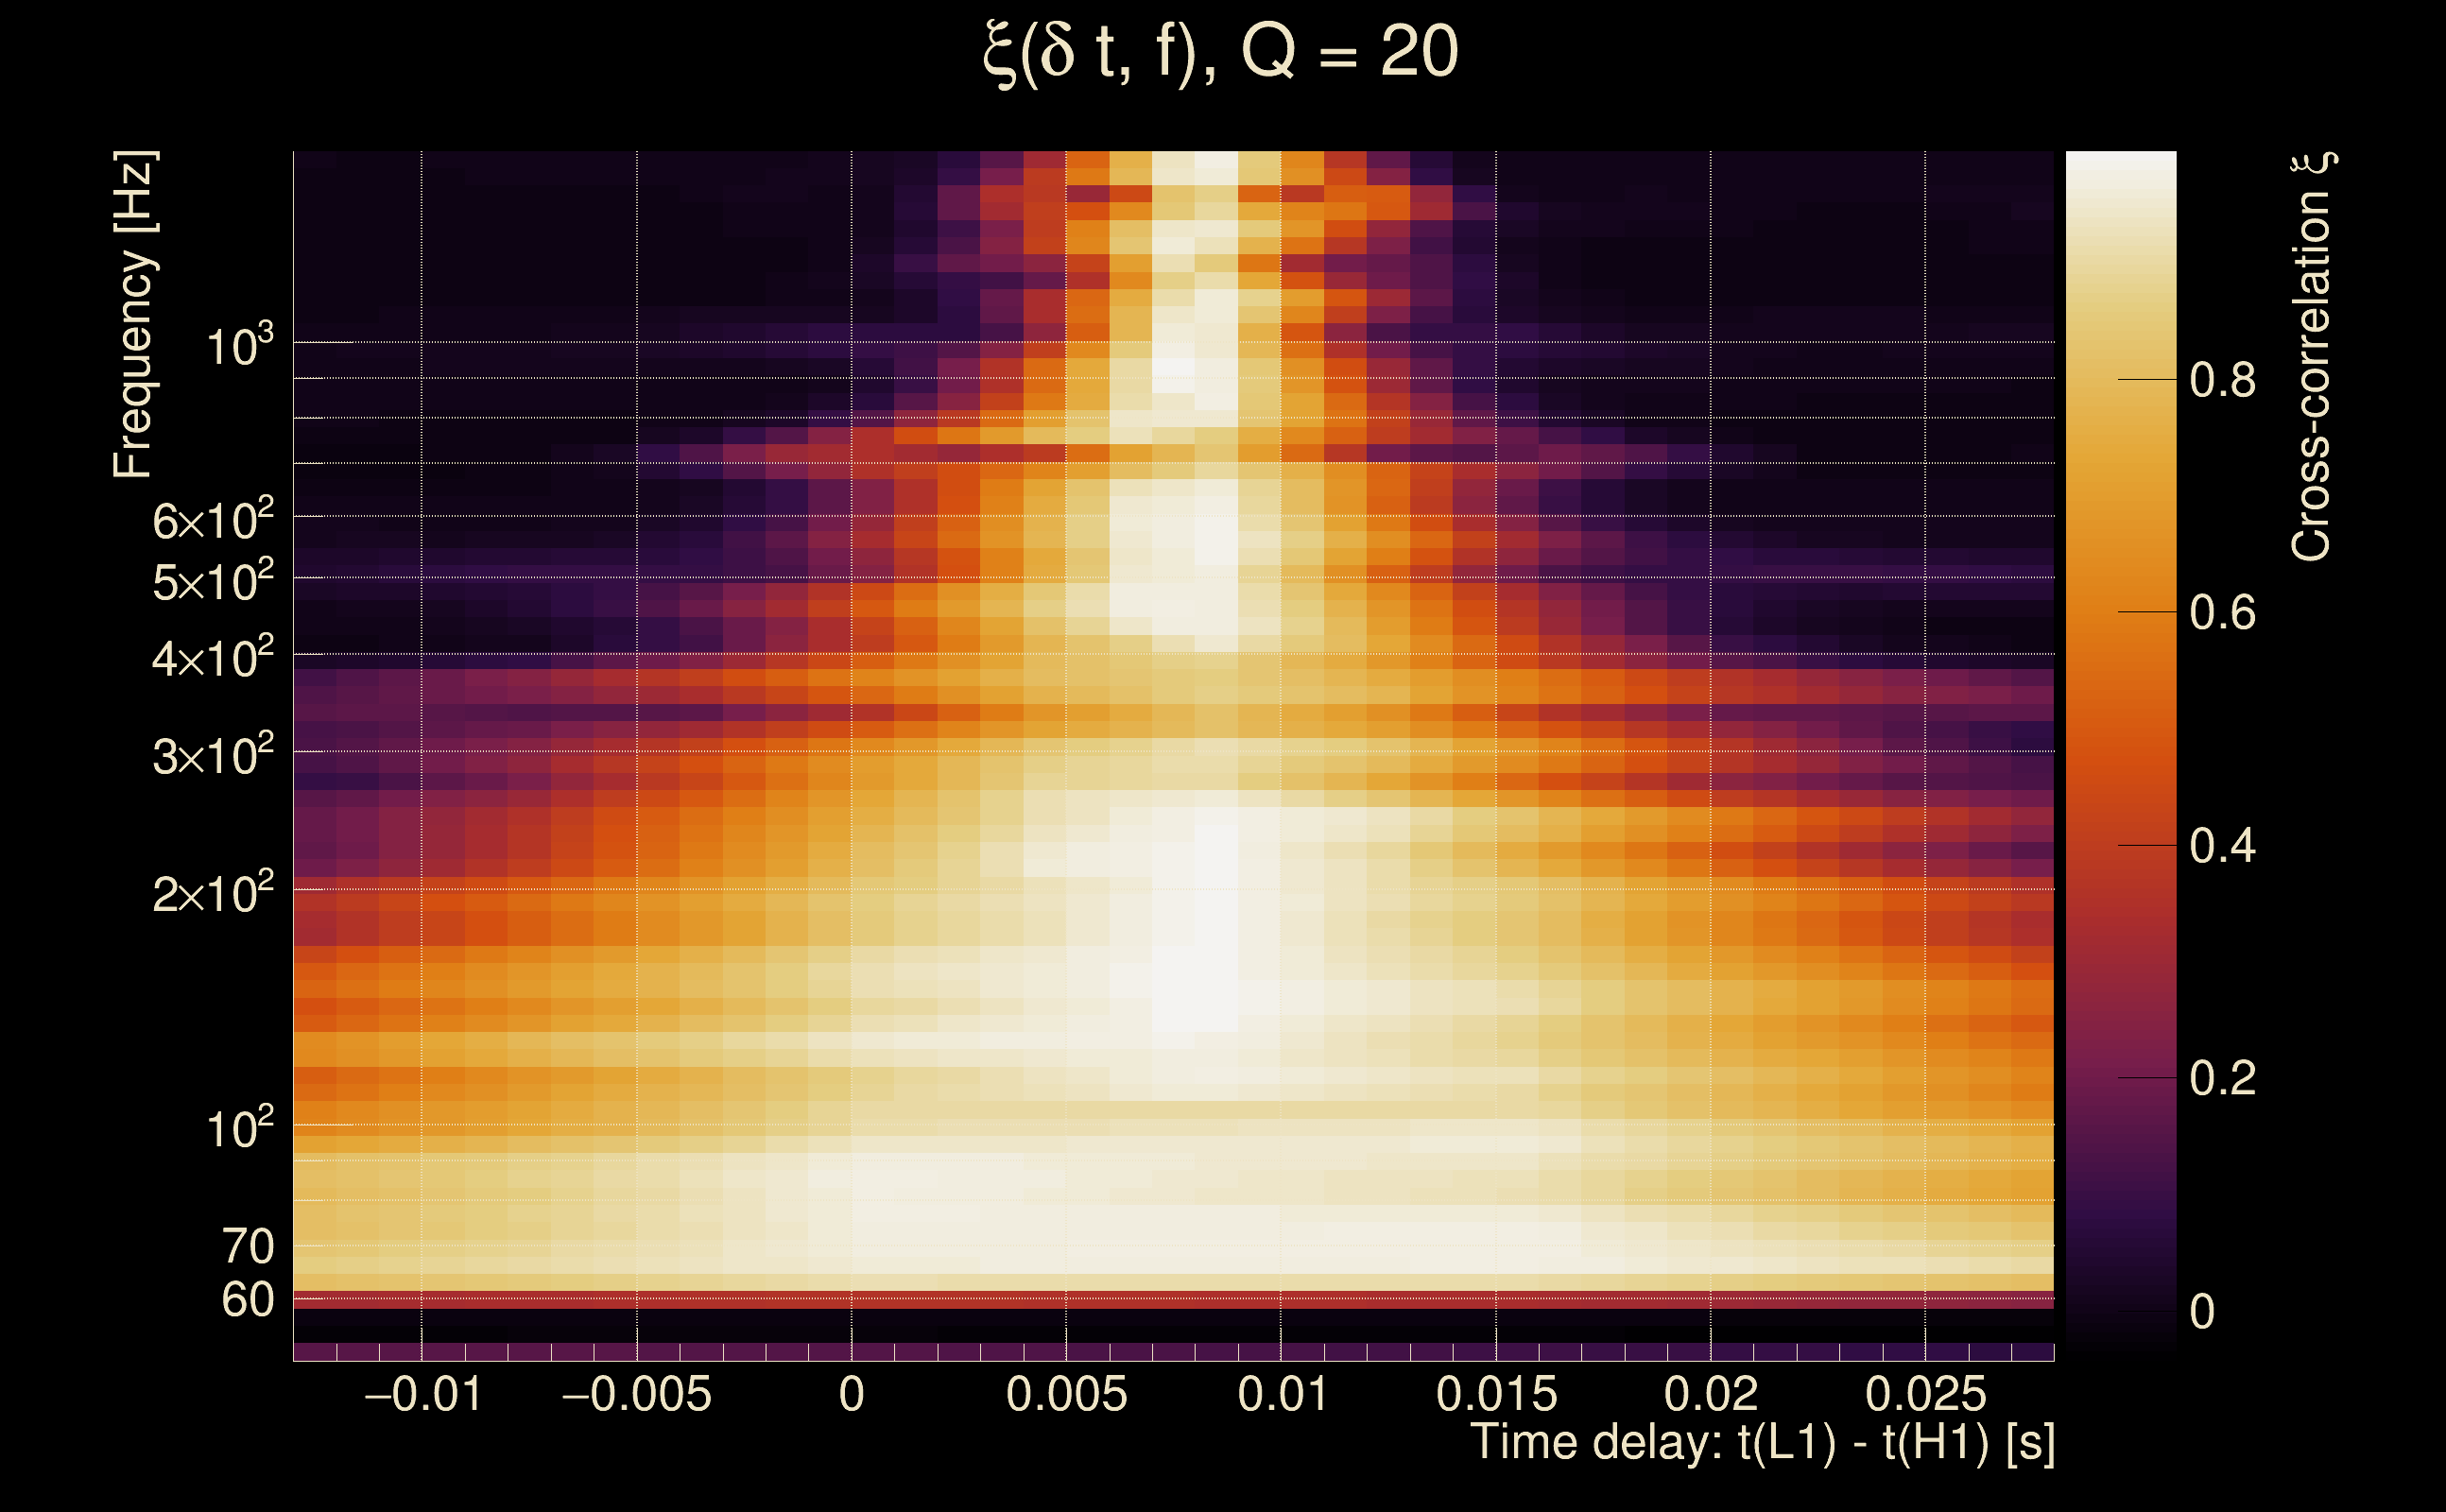
| Time delay between detectors t(L1) - t(H1): | 0.00733713 s (slice index = 108 / 217), δt_gw = 0.00733713 s |
| Time delay standard deviation: | 0.0246757 s |
| [targeted mode] Time delay probability: | 0.997768 (0.00279744 sigmas), δt_target = 1.72247e+45 s |
| Frequency: | 312.825 Hz |
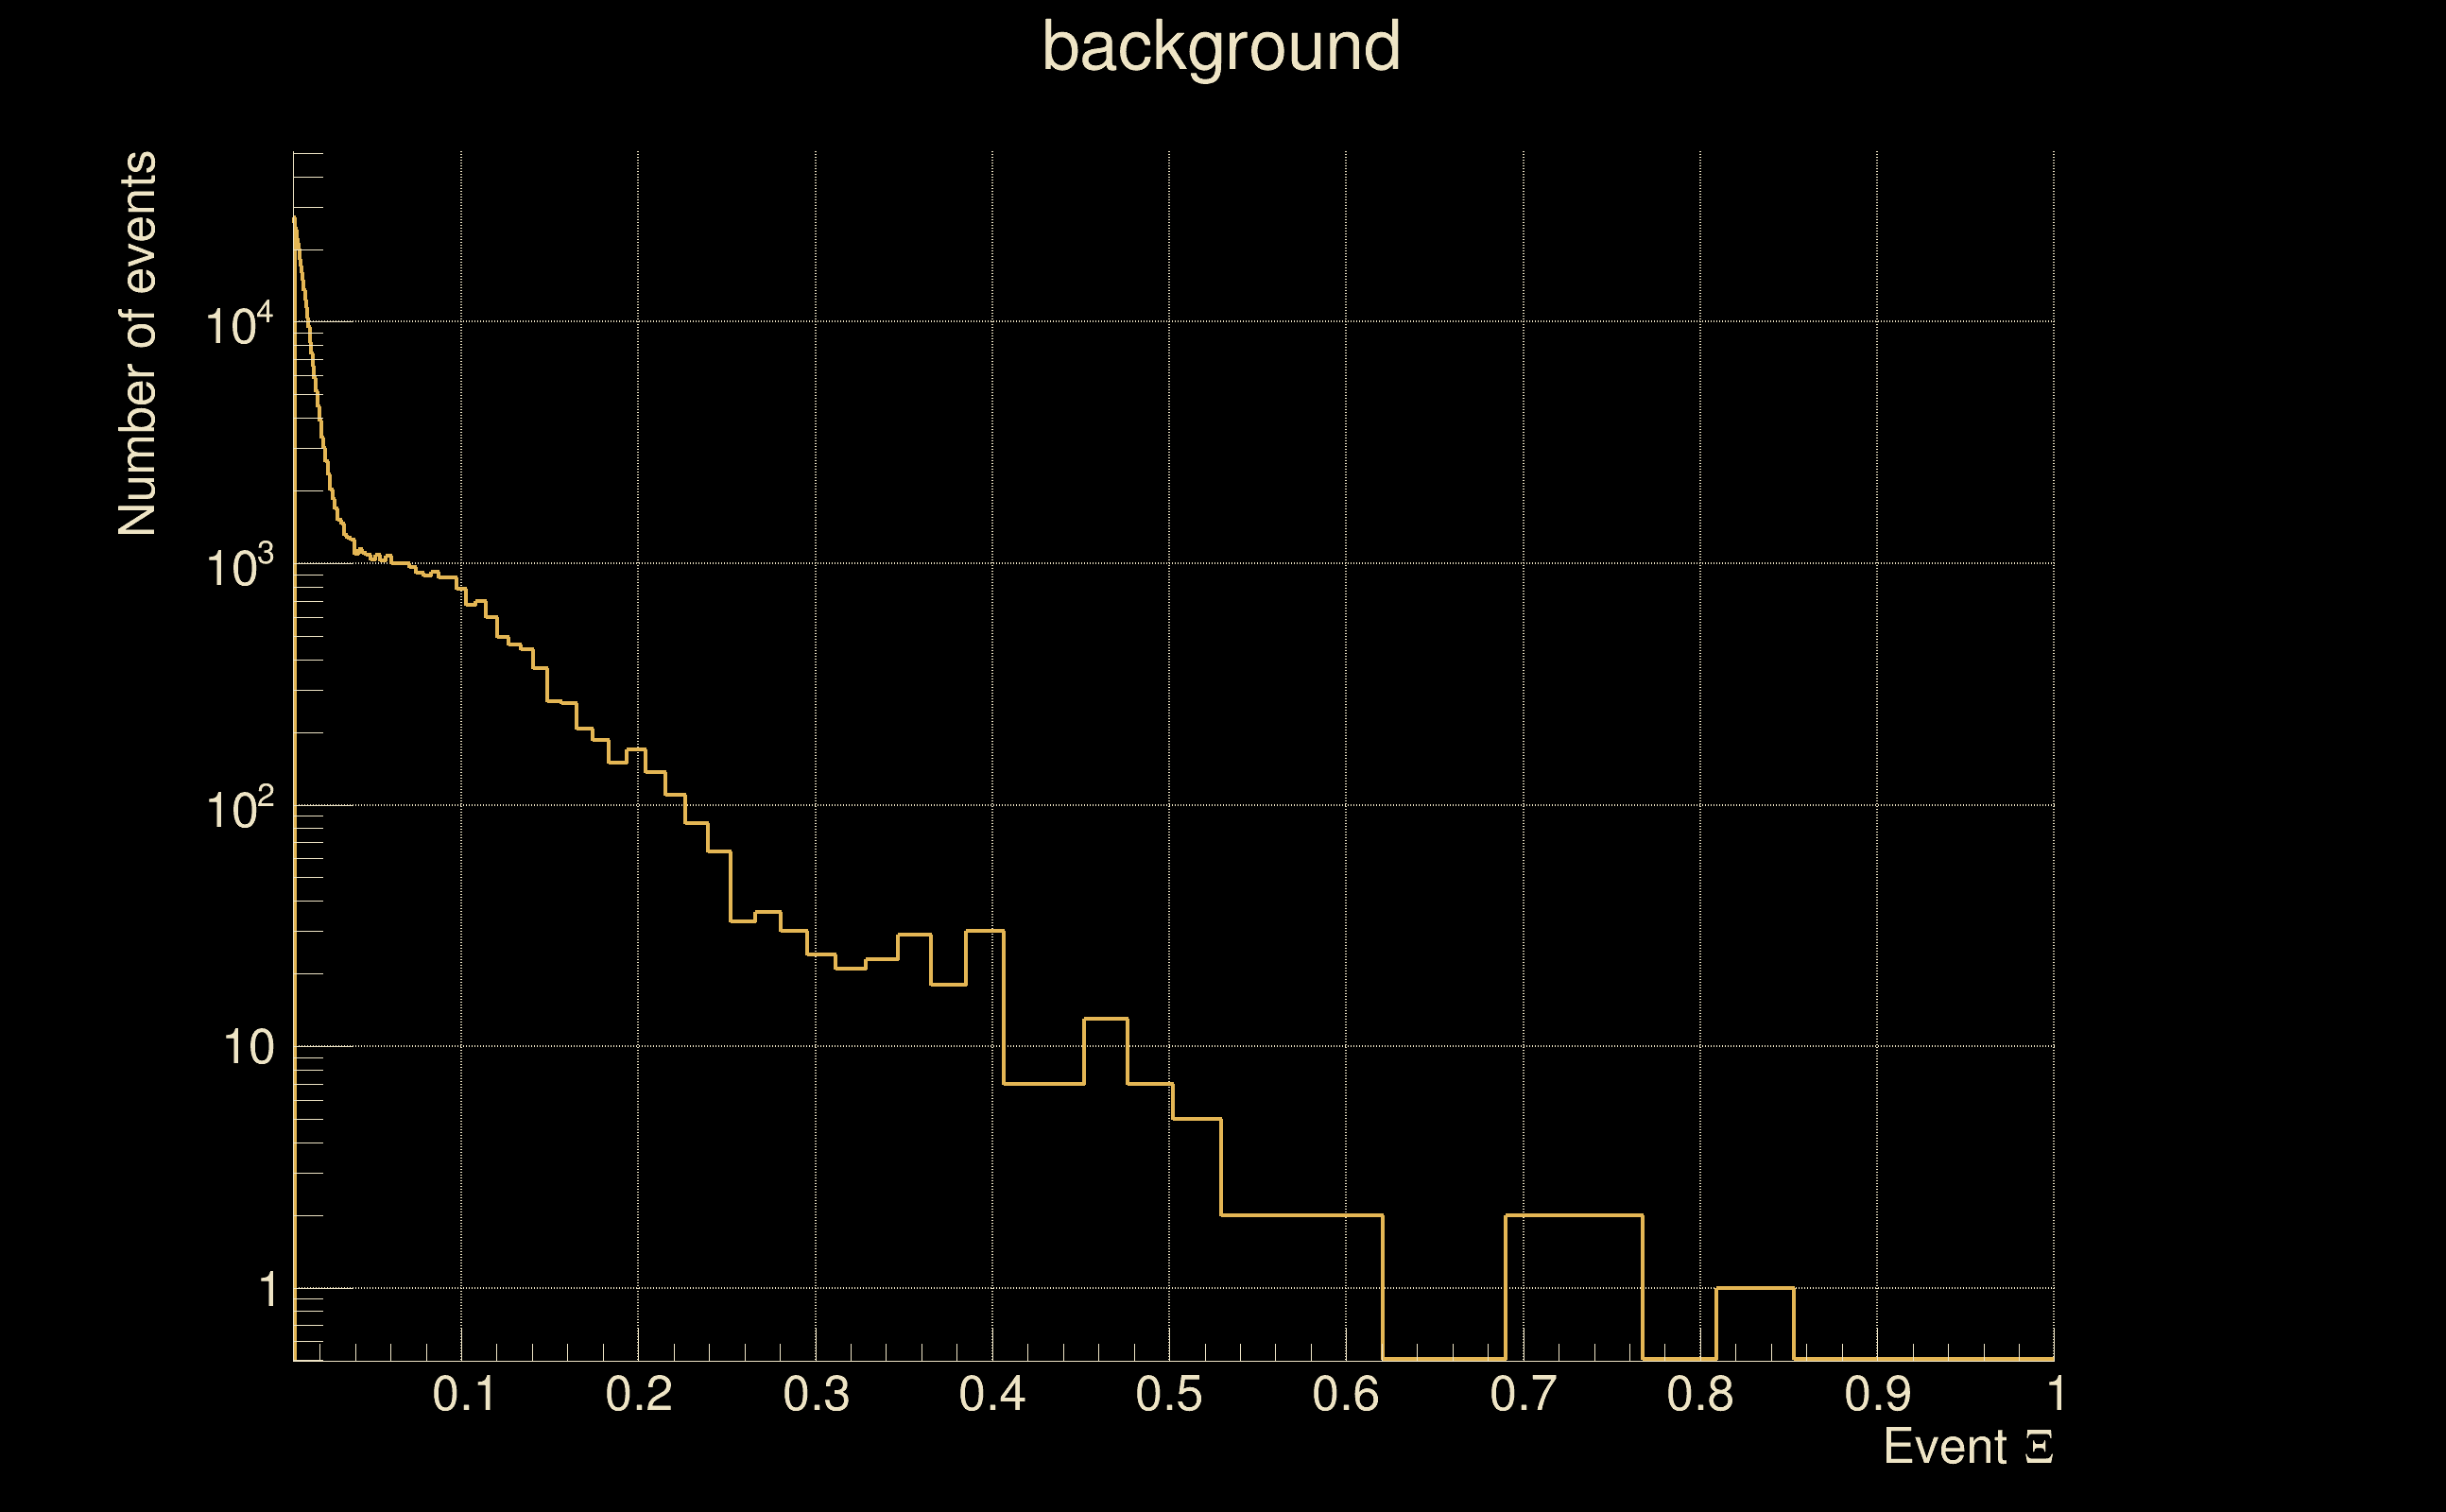
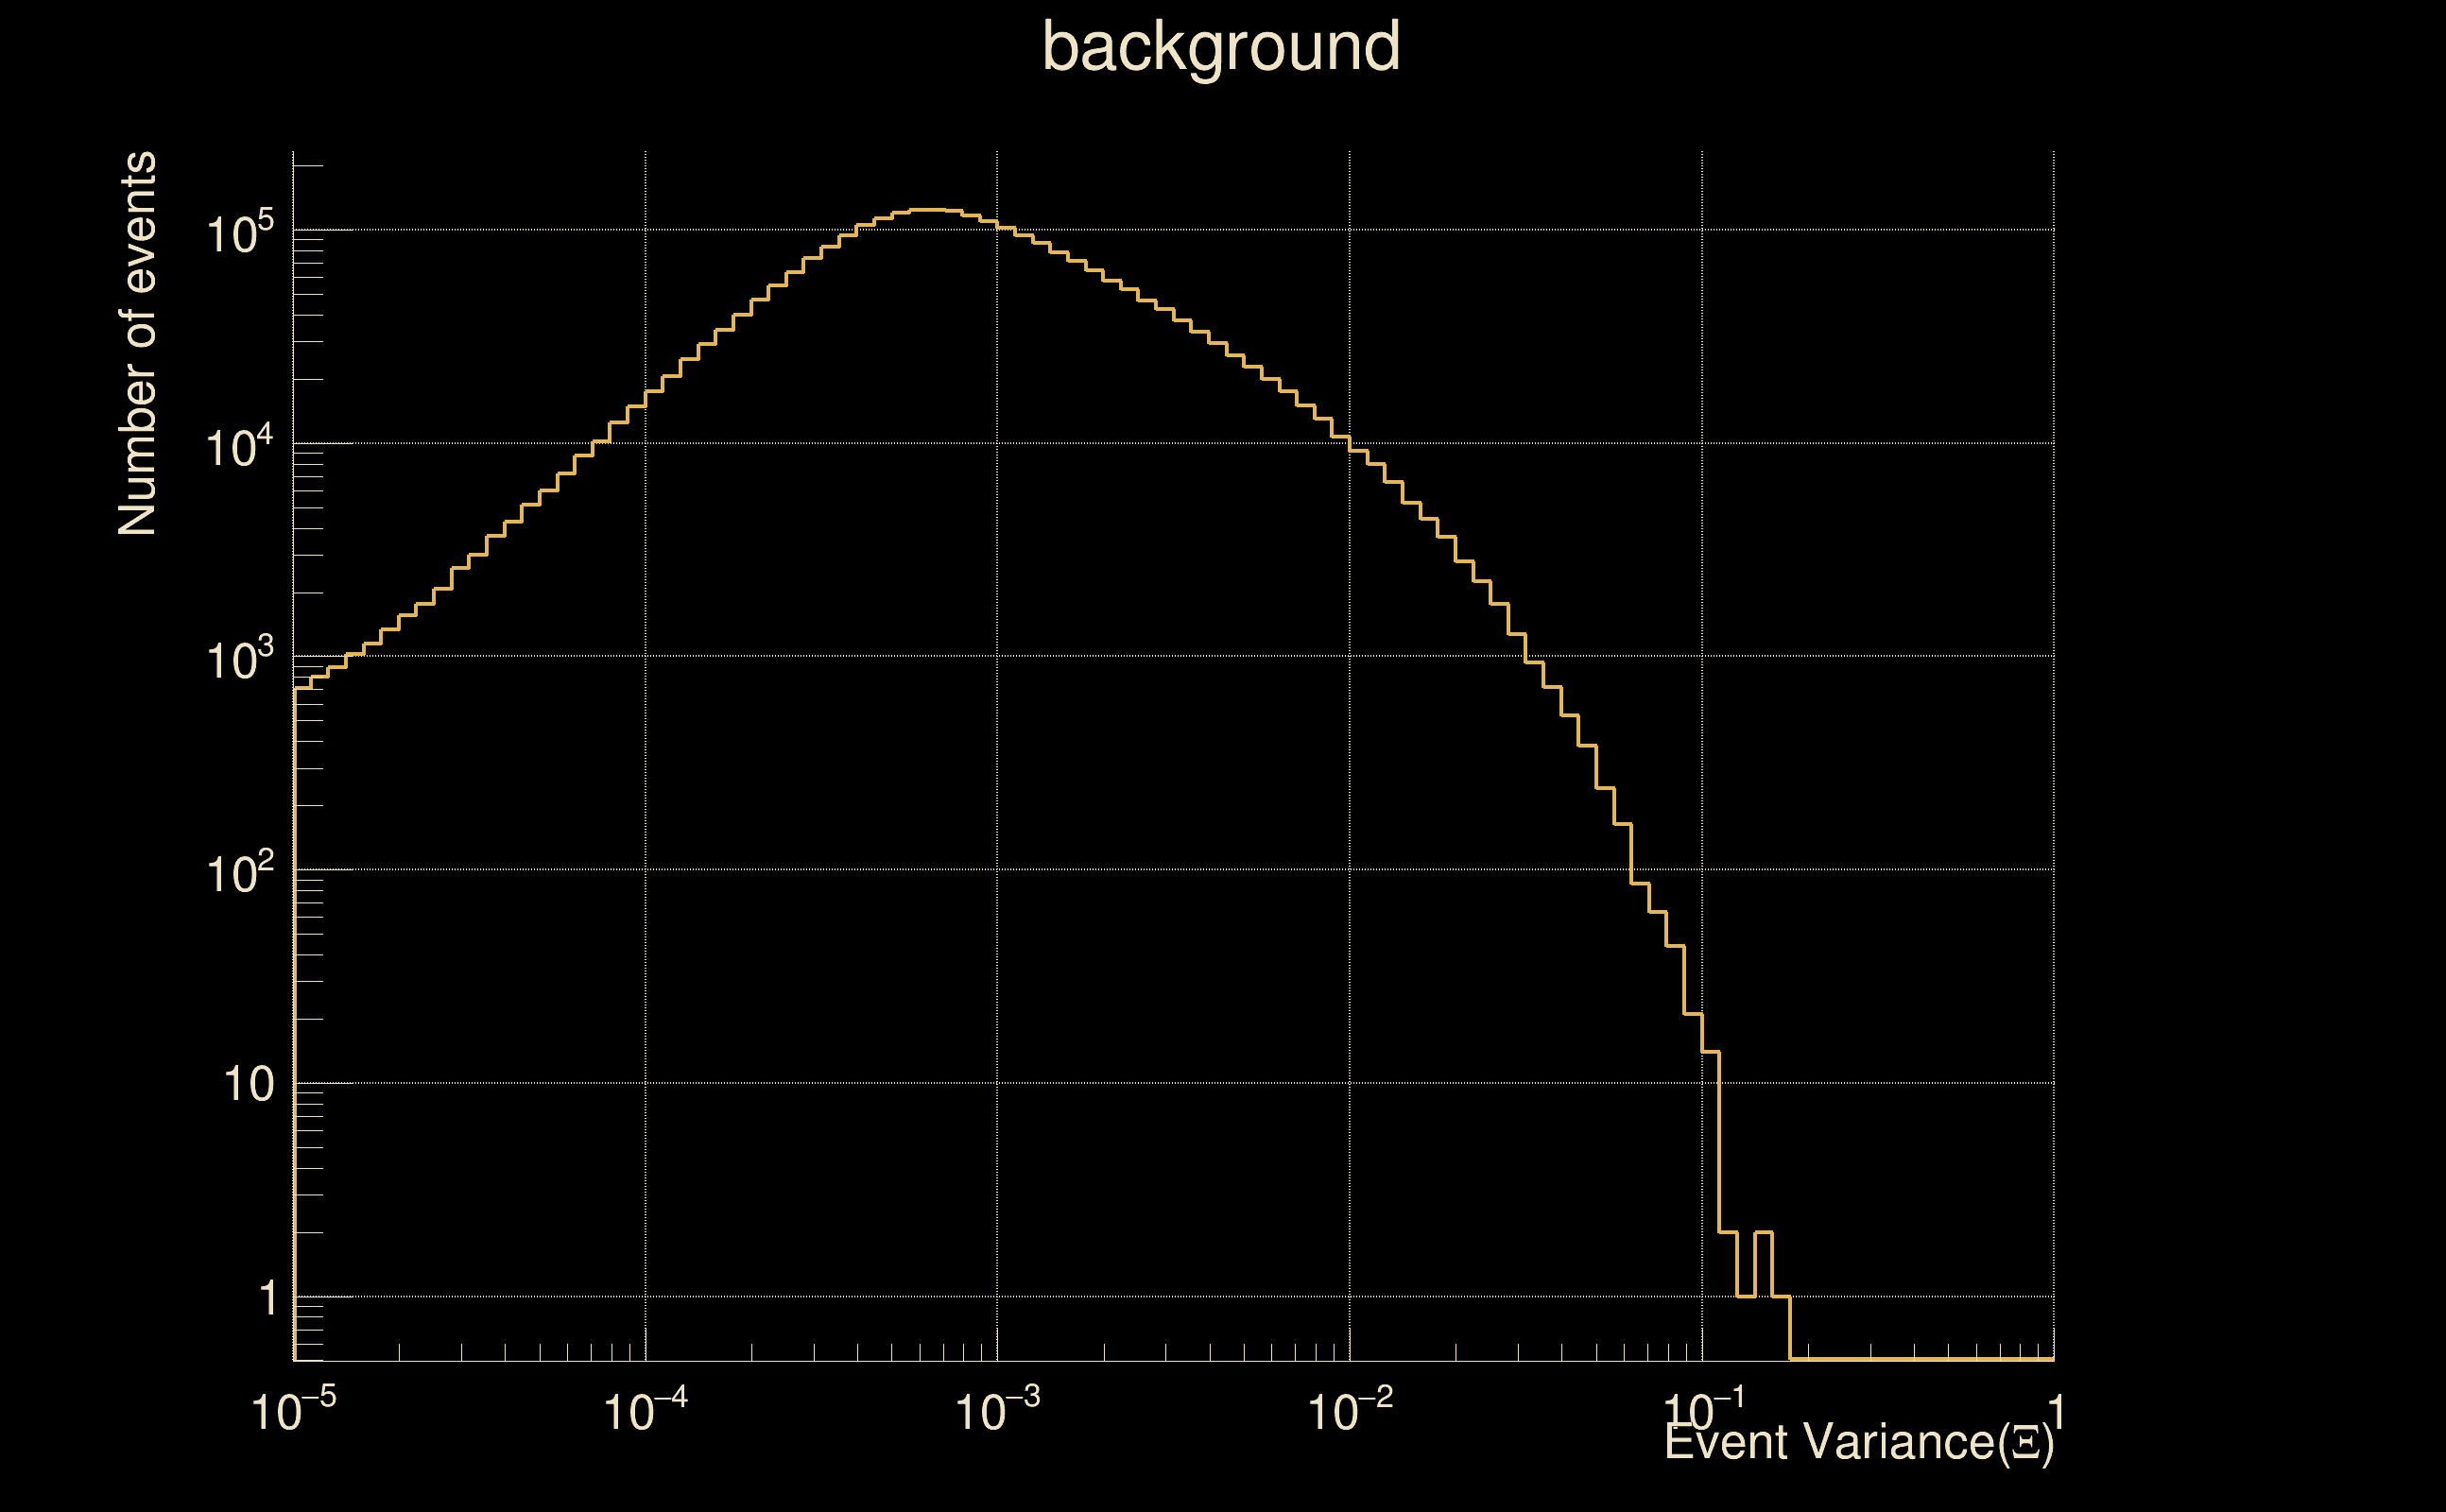
| Ξ: | 0.905352 ± 0.0210586 (variance = 0.000443463): Q0: 0.955059, Q1: 0.961847, Q2: 0.950189, Q3: 0.924929, Q4: 0.905598 |
| Rank: | R_A = 0.865508 |
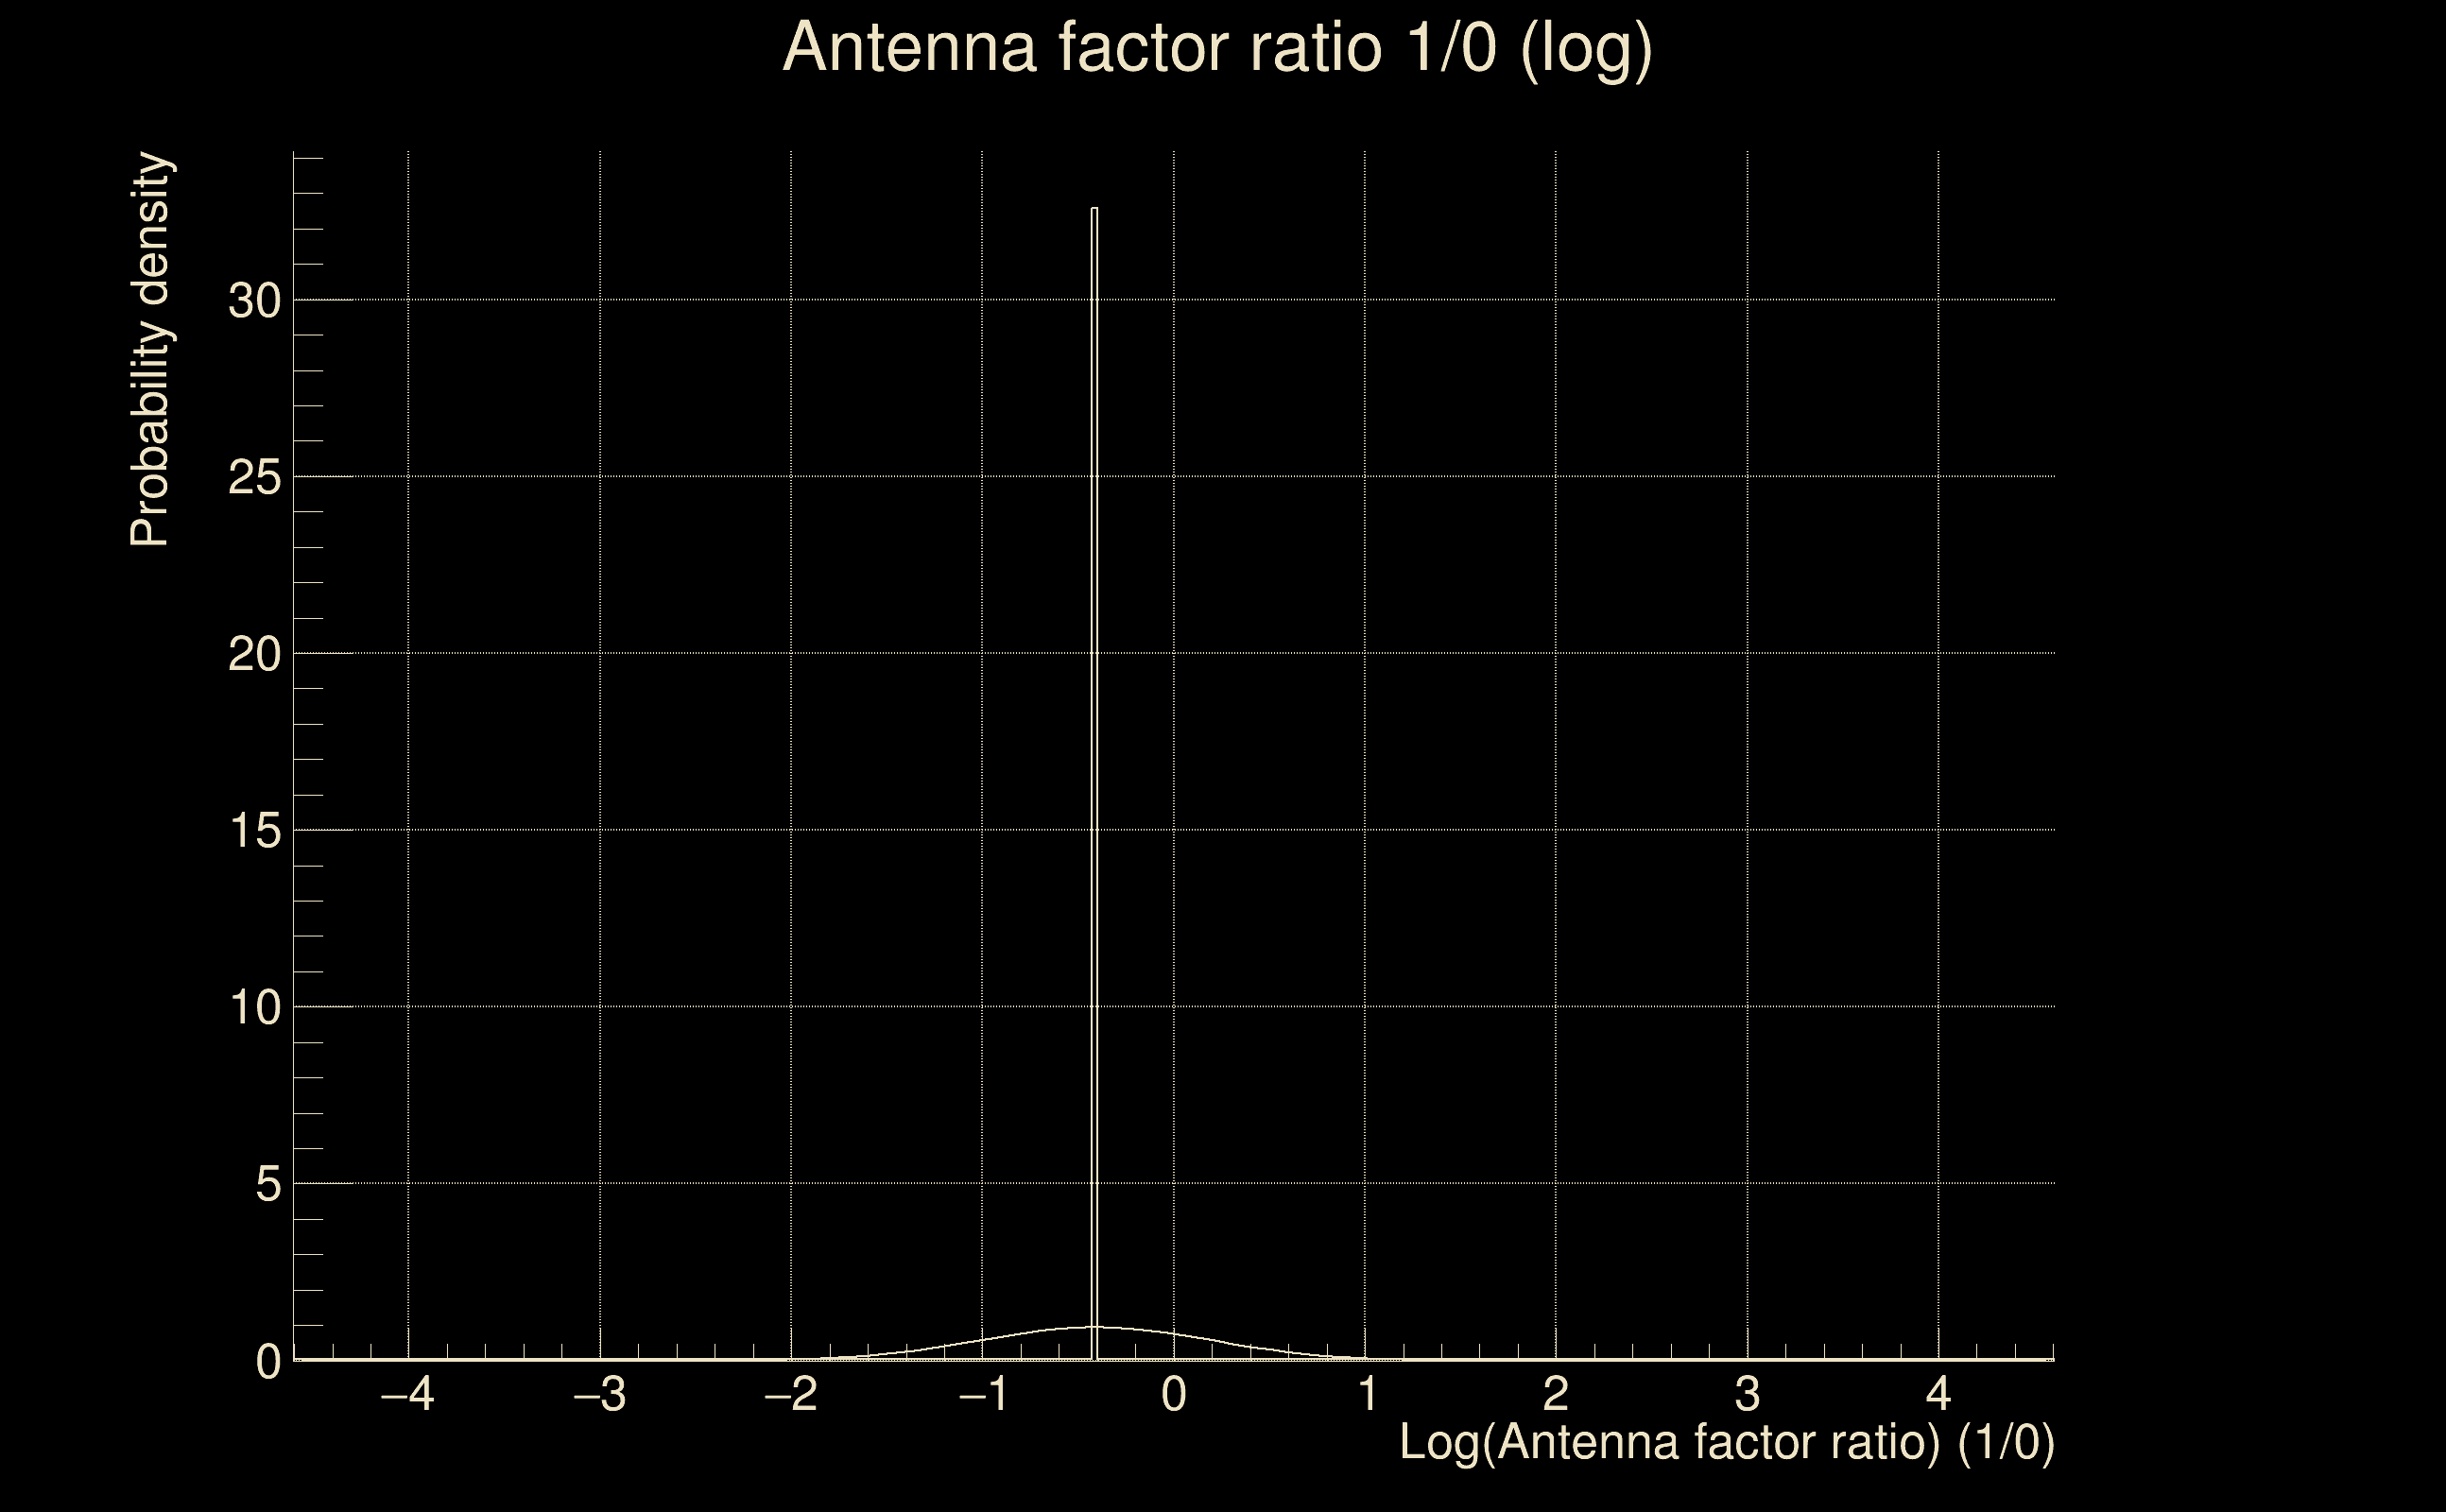
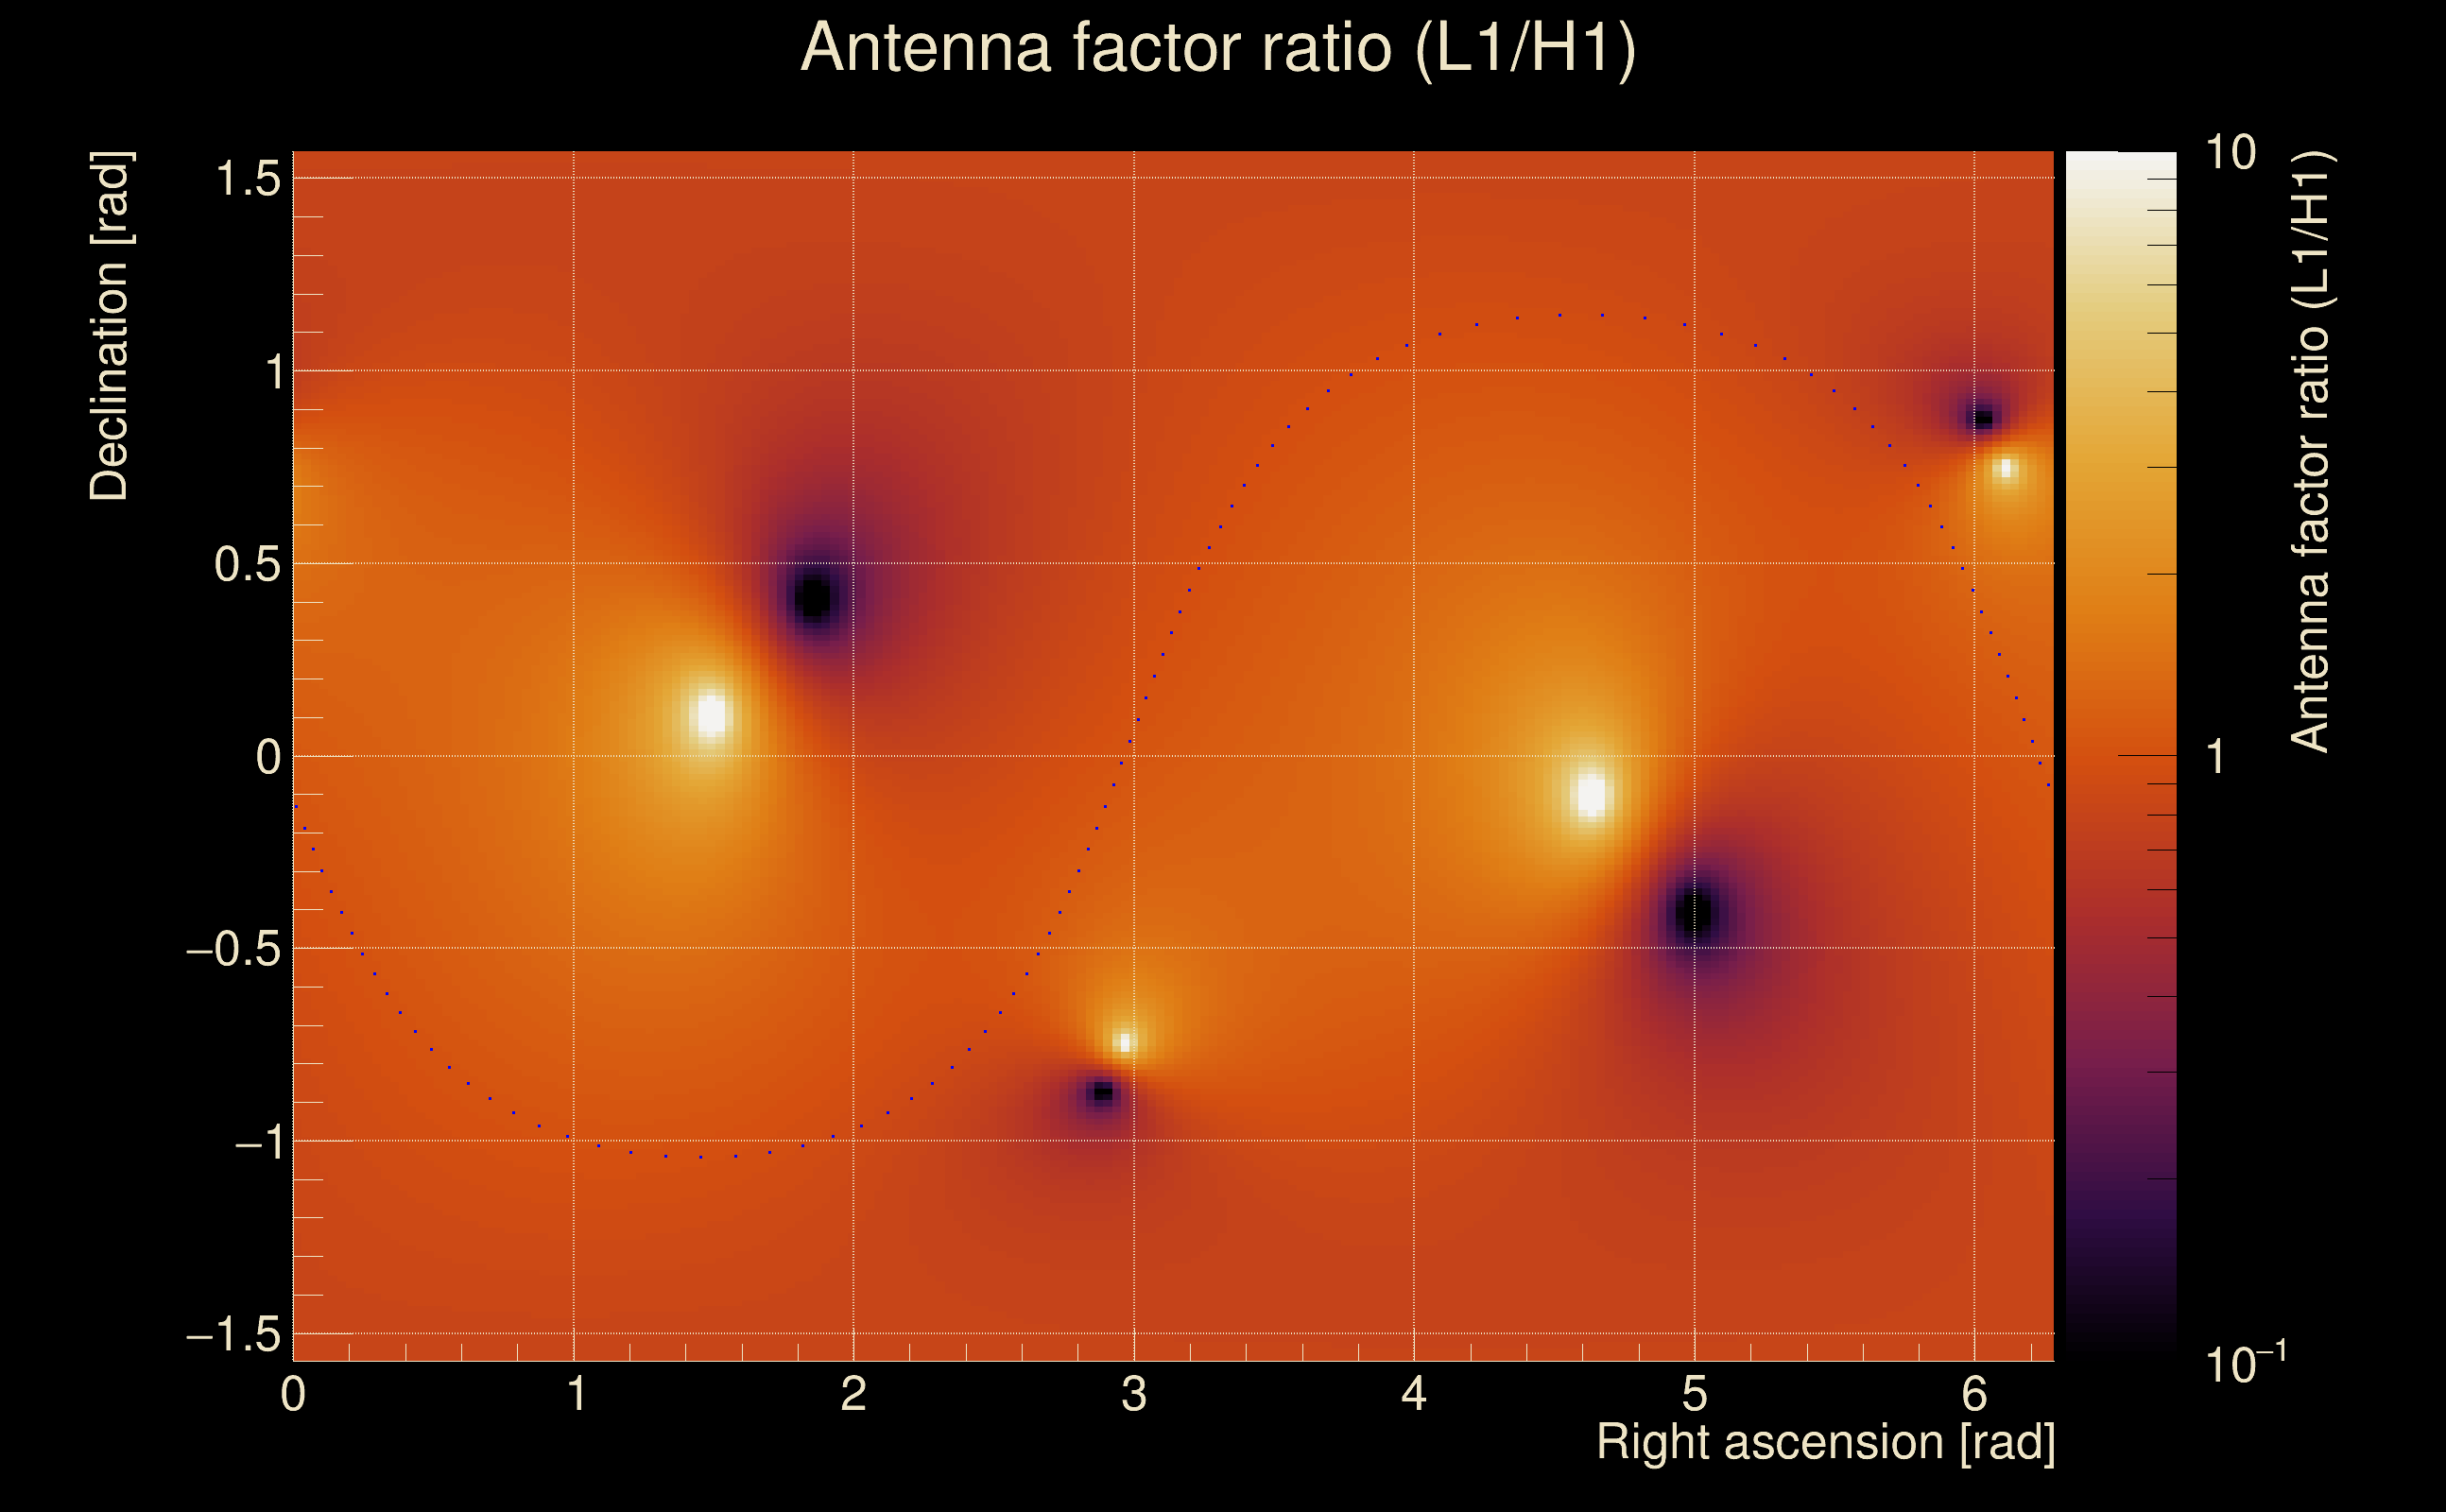
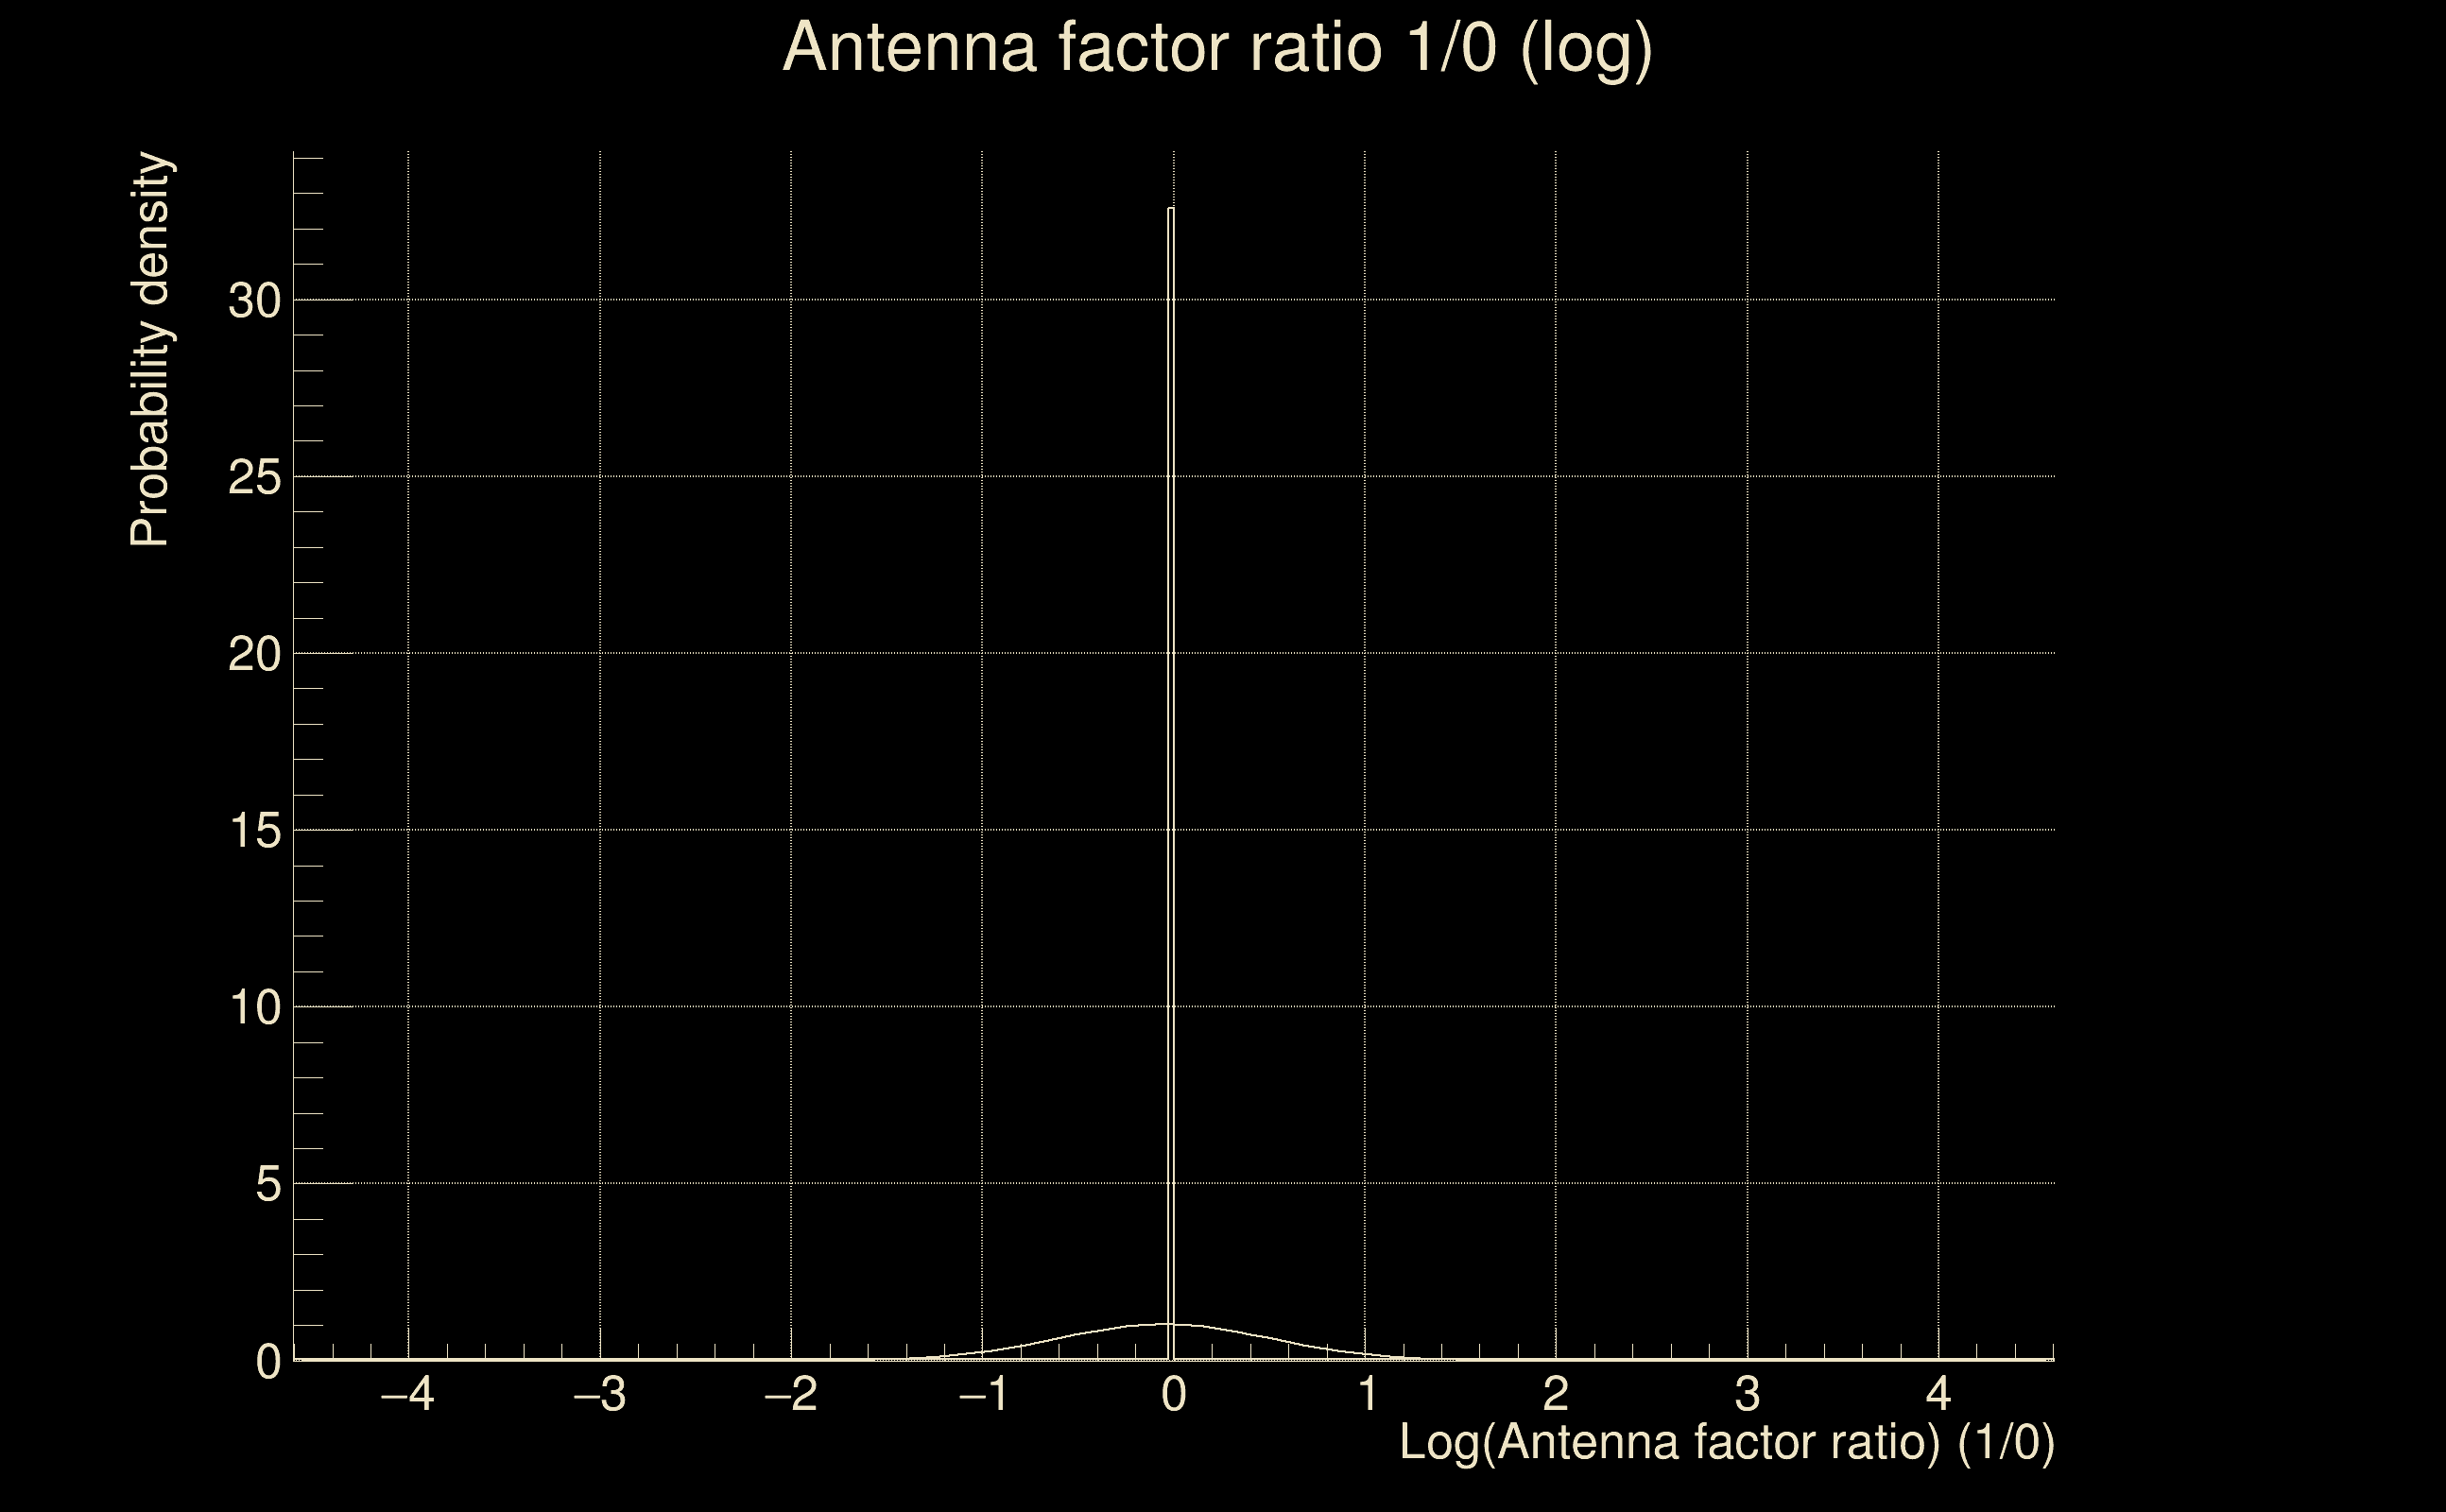
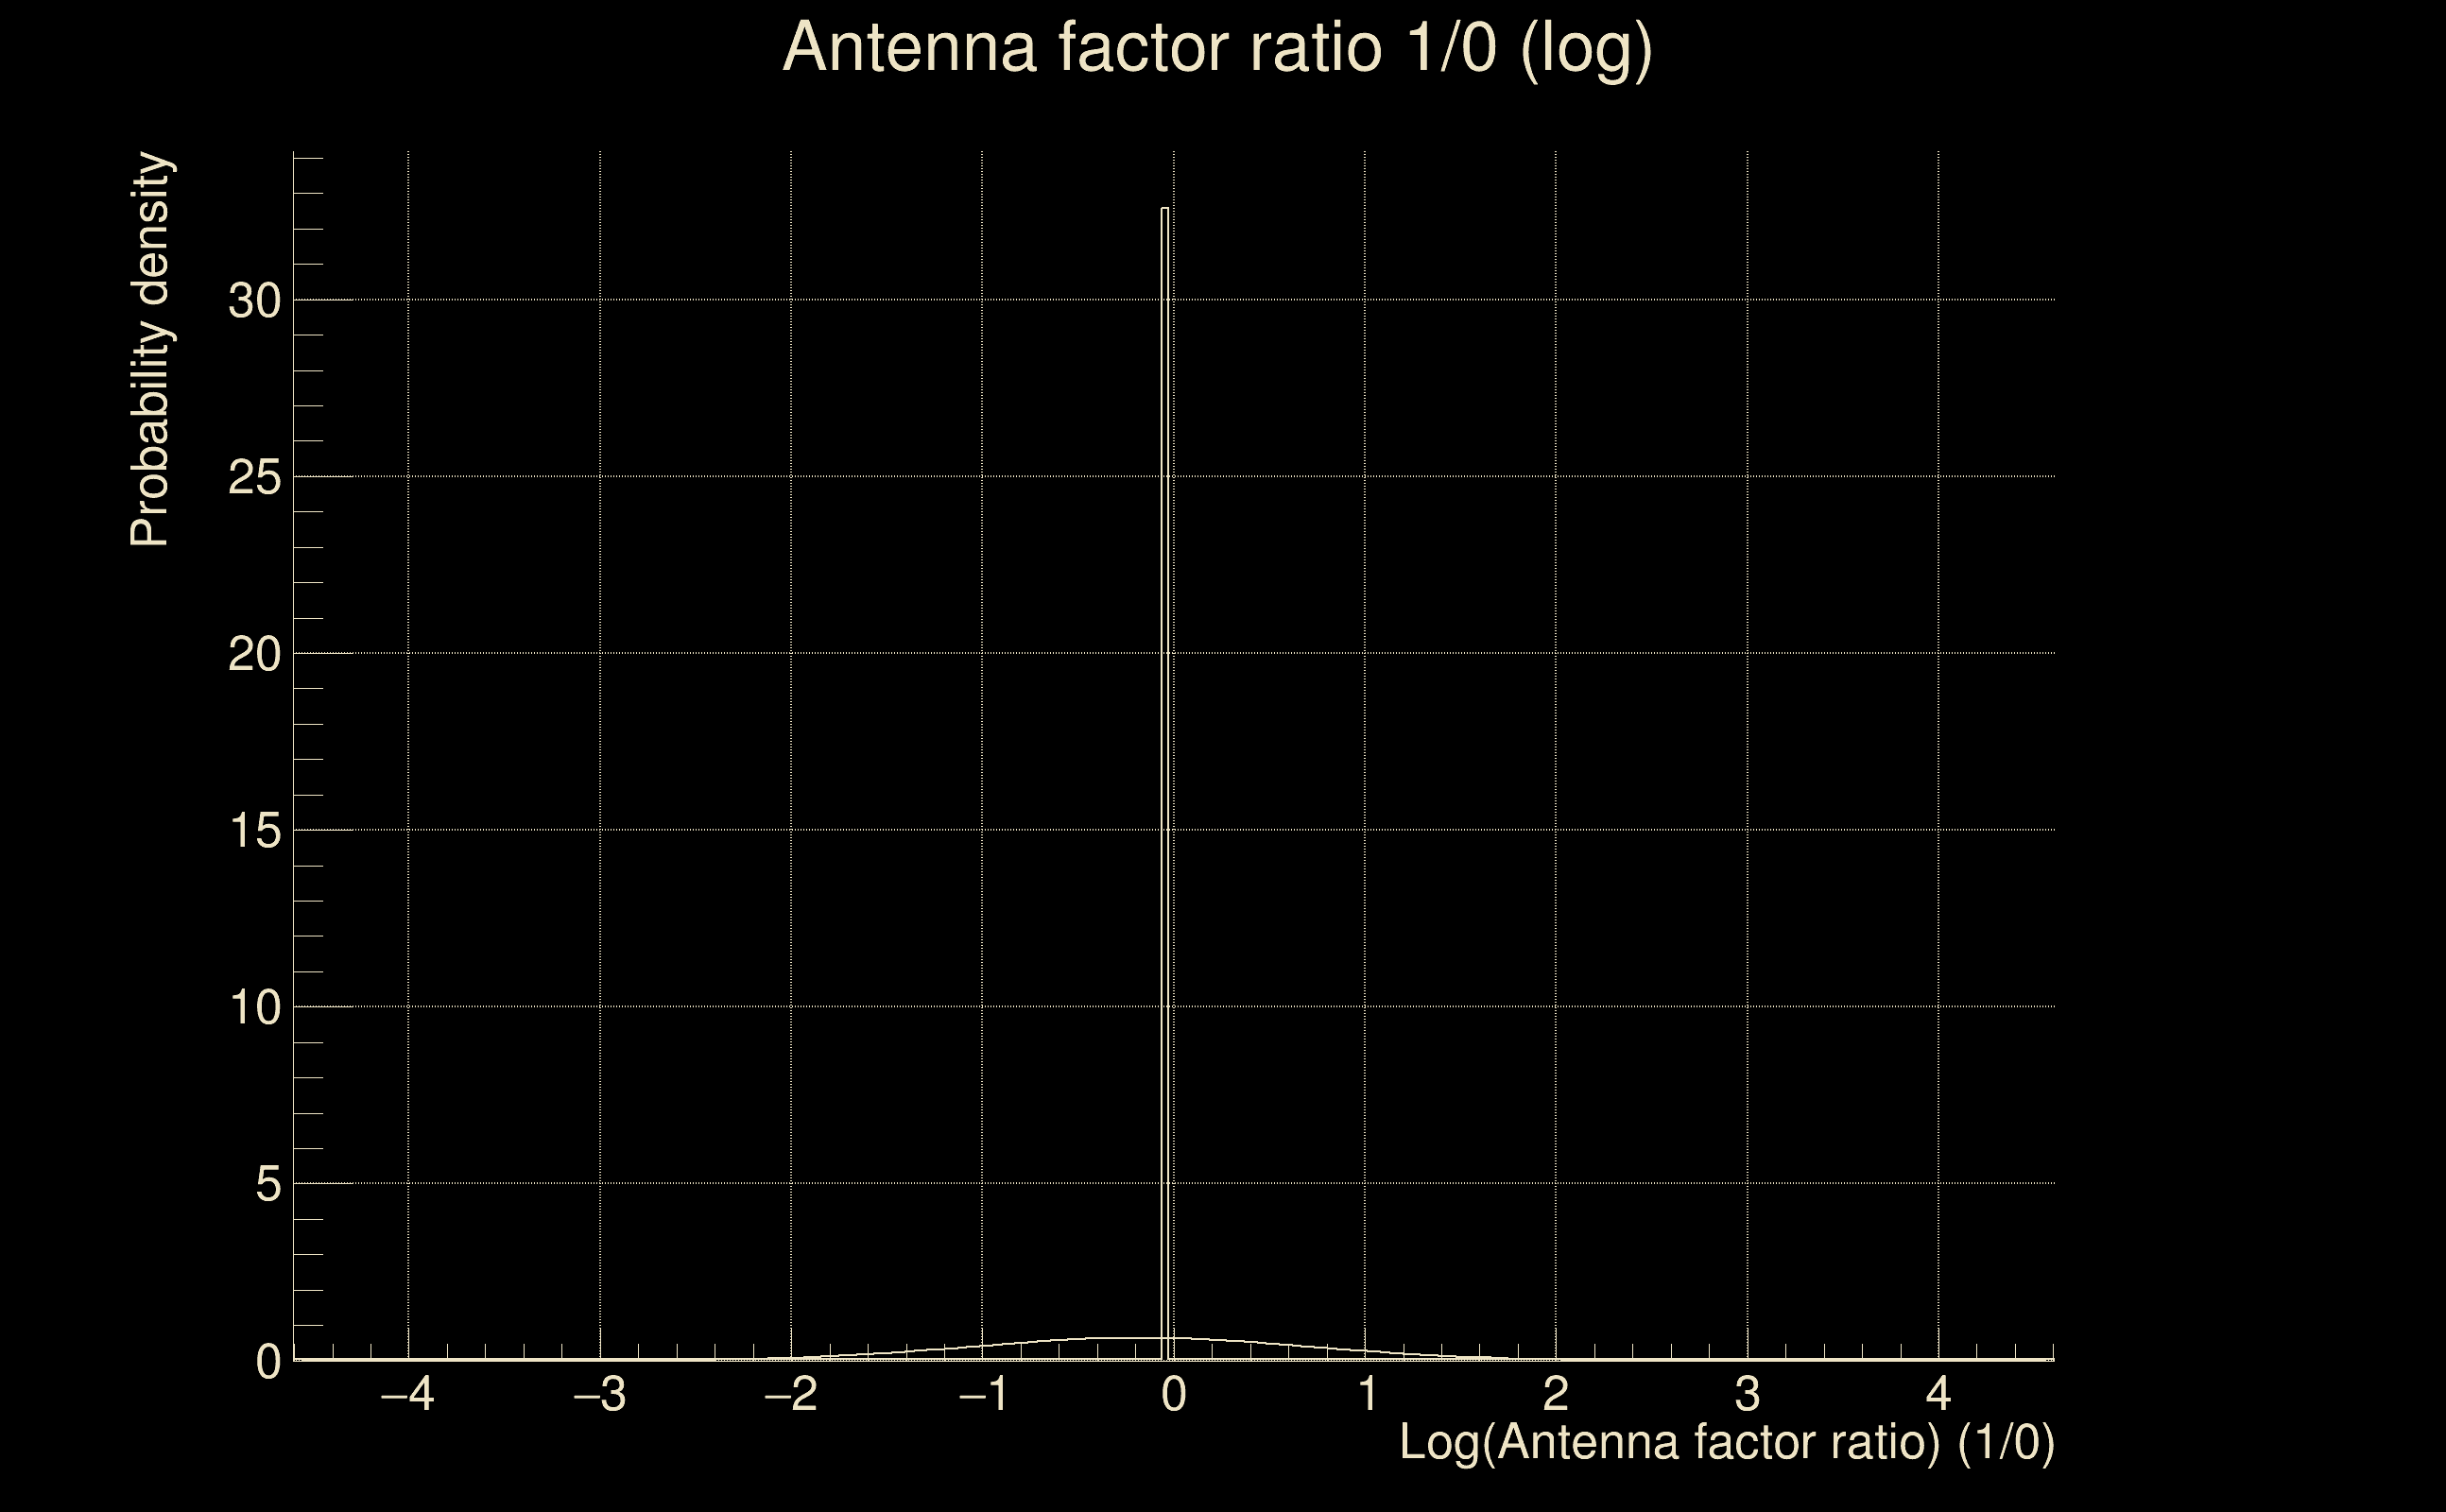
| Log of amplitude ratio (L1/H1): | -0.406505, variance = 0.172072 (L1/H1: -0.410942, variance = 0.308992, H1/L1: 0.397681, variance = 0.314928) |
| Amplitude ratio (L1/H1): | 0.665974 ⋇ 1.51409 (L1/H1: 0.663026 ⋇ 1.74346, H1/L1: 1.48837 ⋇ 1.75275) |
| Amplitude ratio H1|L1 compatibility (probability): | 0.986606 |
| Antenna factor probability: | 0.971137 |
| Number of rejected frequency rows: | Q0: 0 / 18, Q1: 2 / 36, Q2: 8 / 70, Q3: 23 / 134, Q4: 66 / 258 |
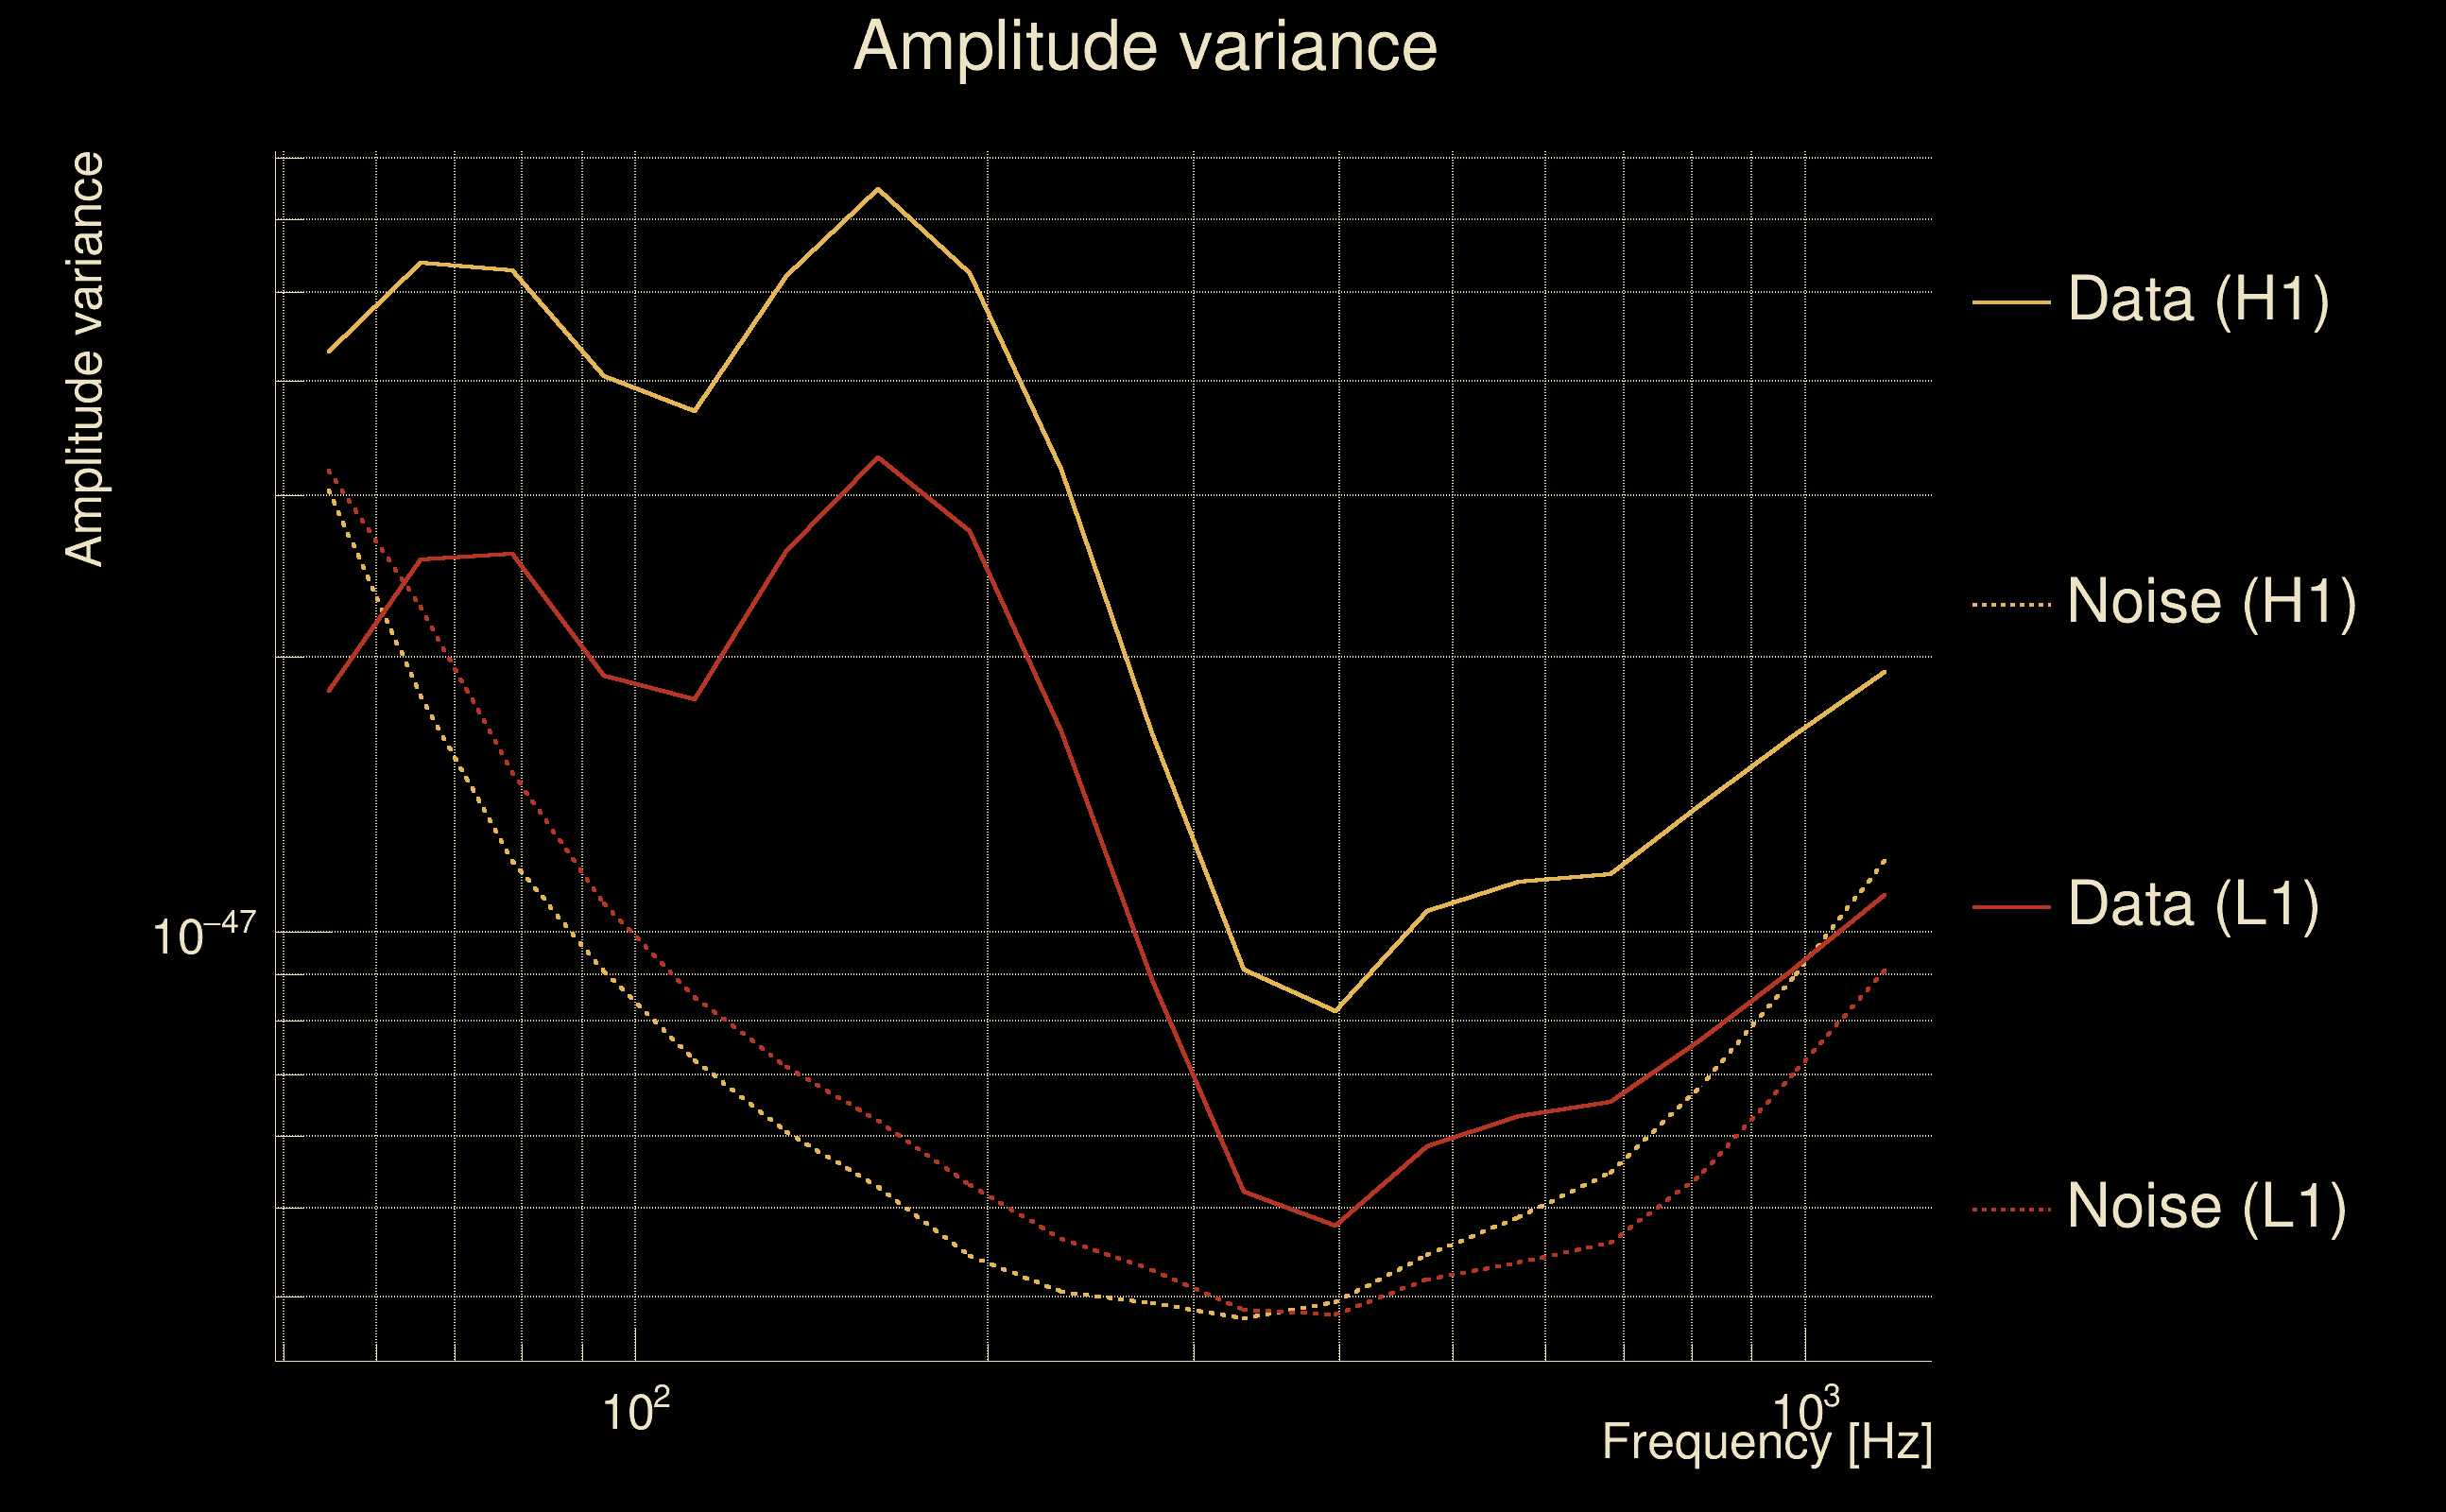
| Maximum signal-to-noise ratio: | H1: 75.2555, L1: 53.3624 |
| SNR variance: | H1: 2.32512, L1: 1.35886 |
| Click here for a zoomed plot | Click here for a zoomed plot | Click here for a zoomed plot | Click here for a zoomed plot | Click here for a zoomed plot |
 |
 |
 |
 |
 |
 |
 |
 |
 |
 |
 |
 |
 |
 |
 |
 |
 |
 |
 |
 |
 |
 |
 |
 |
 |
 |
 |
 |
 |
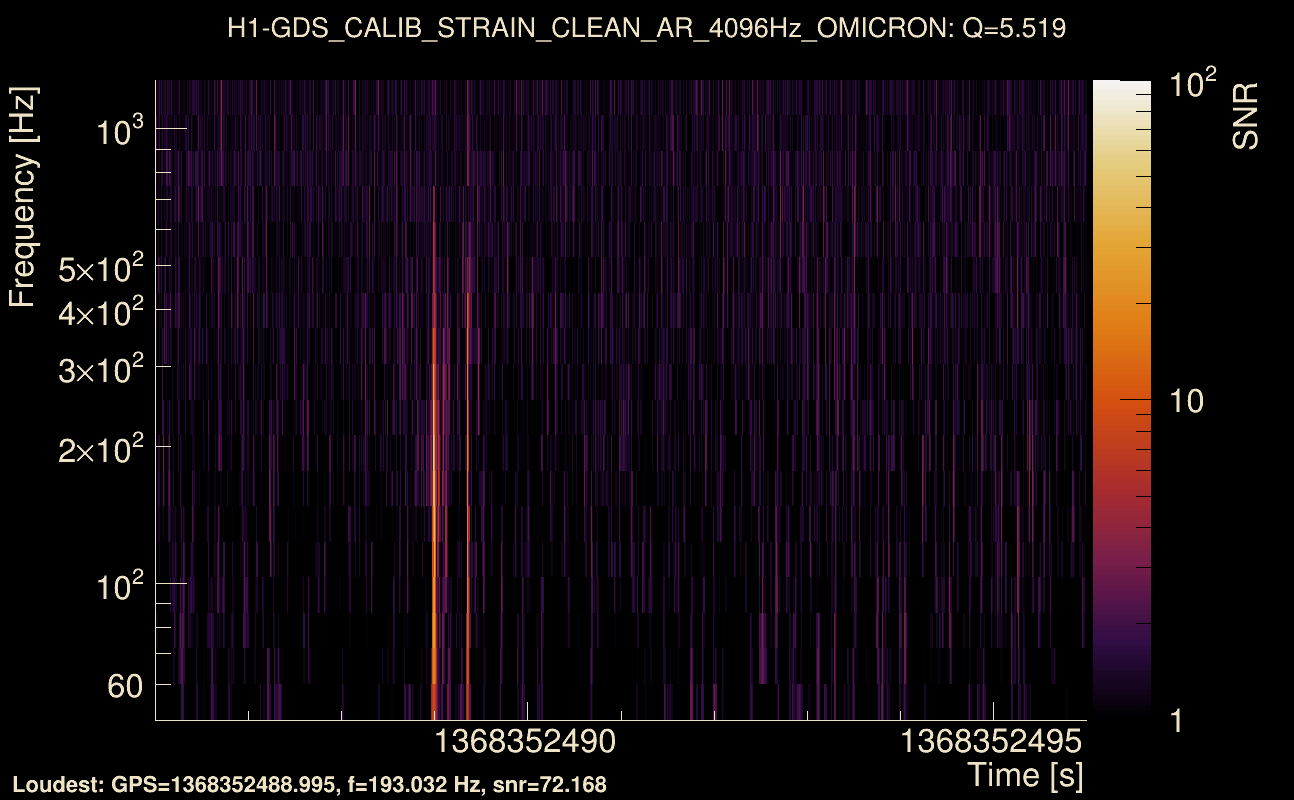
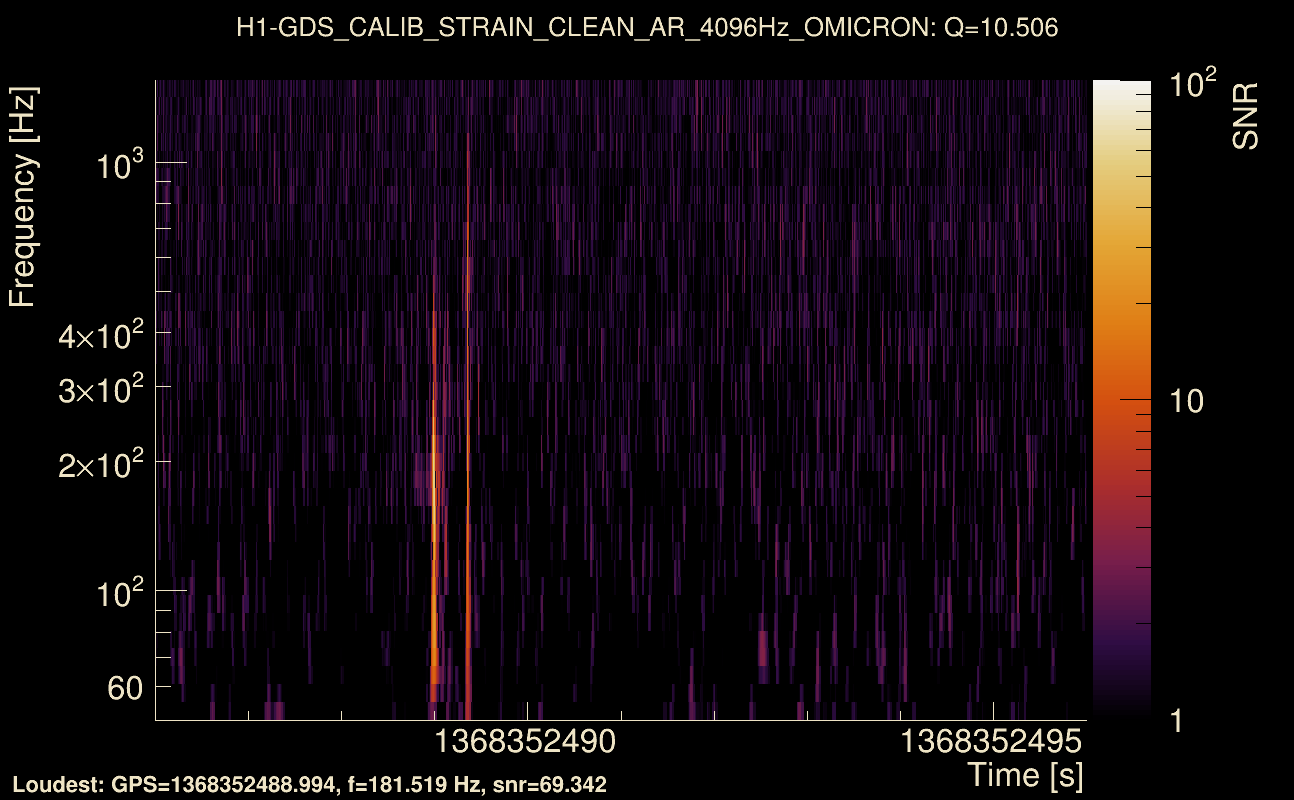
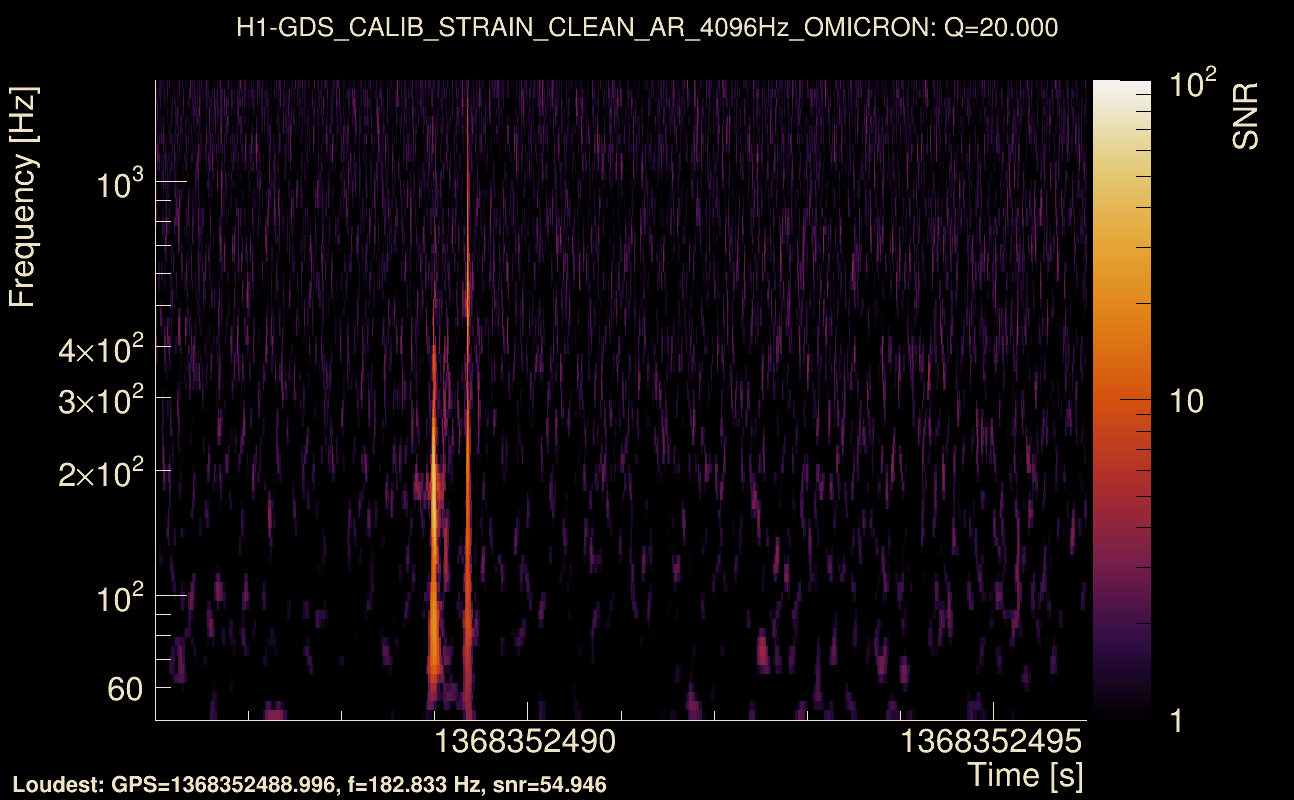
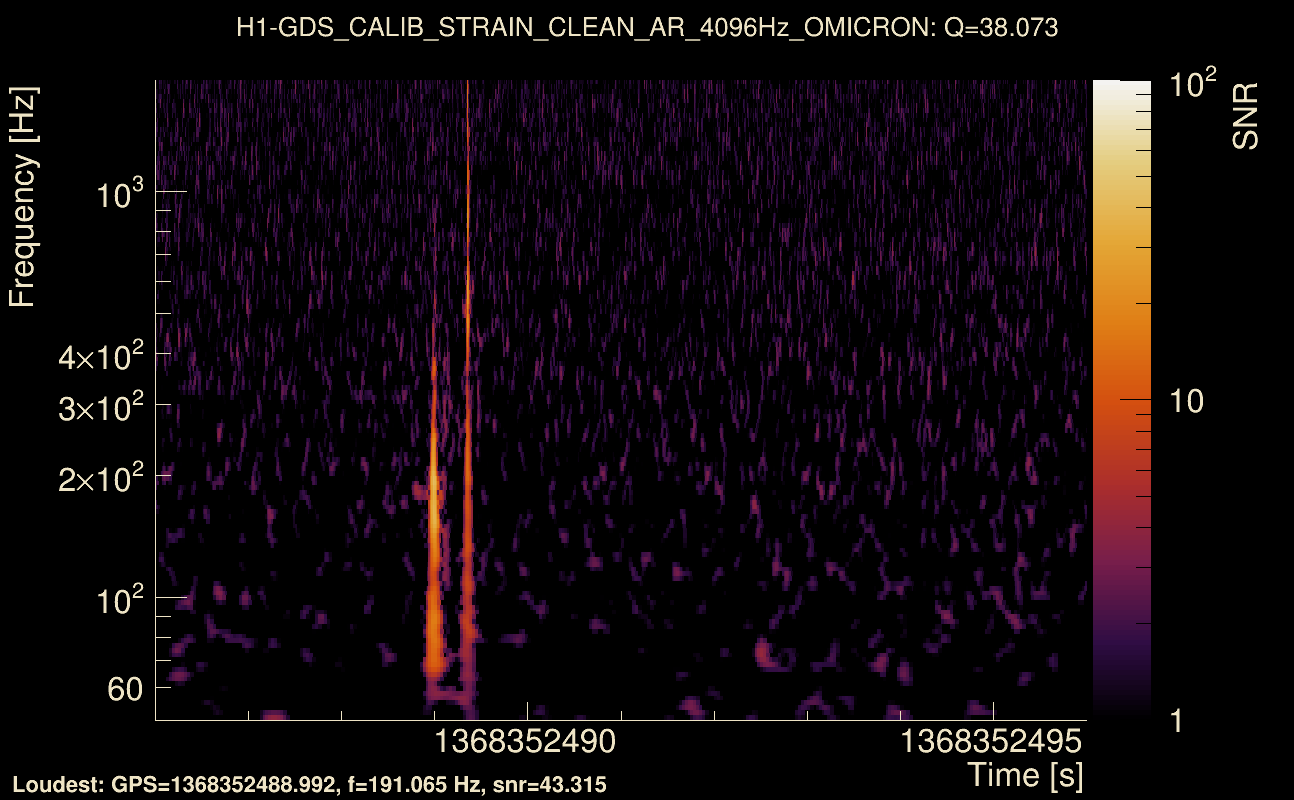
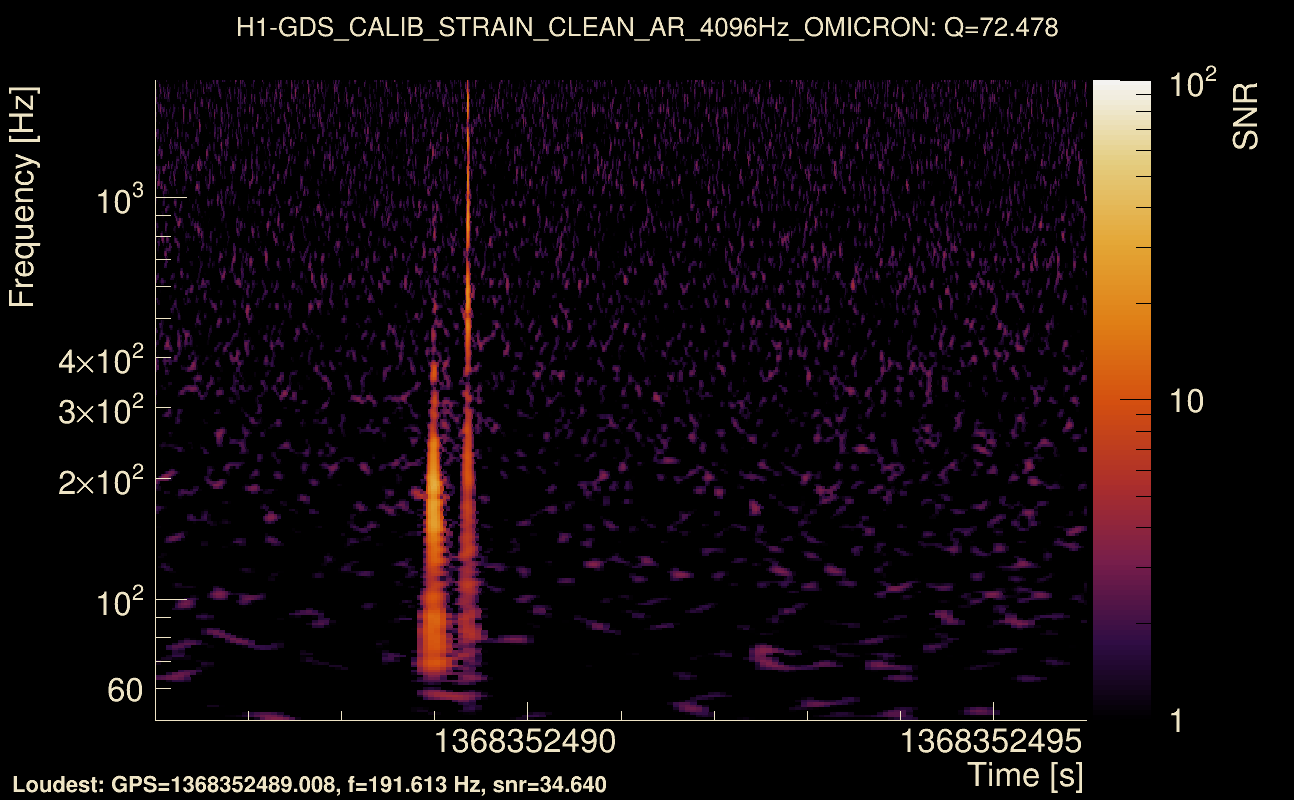
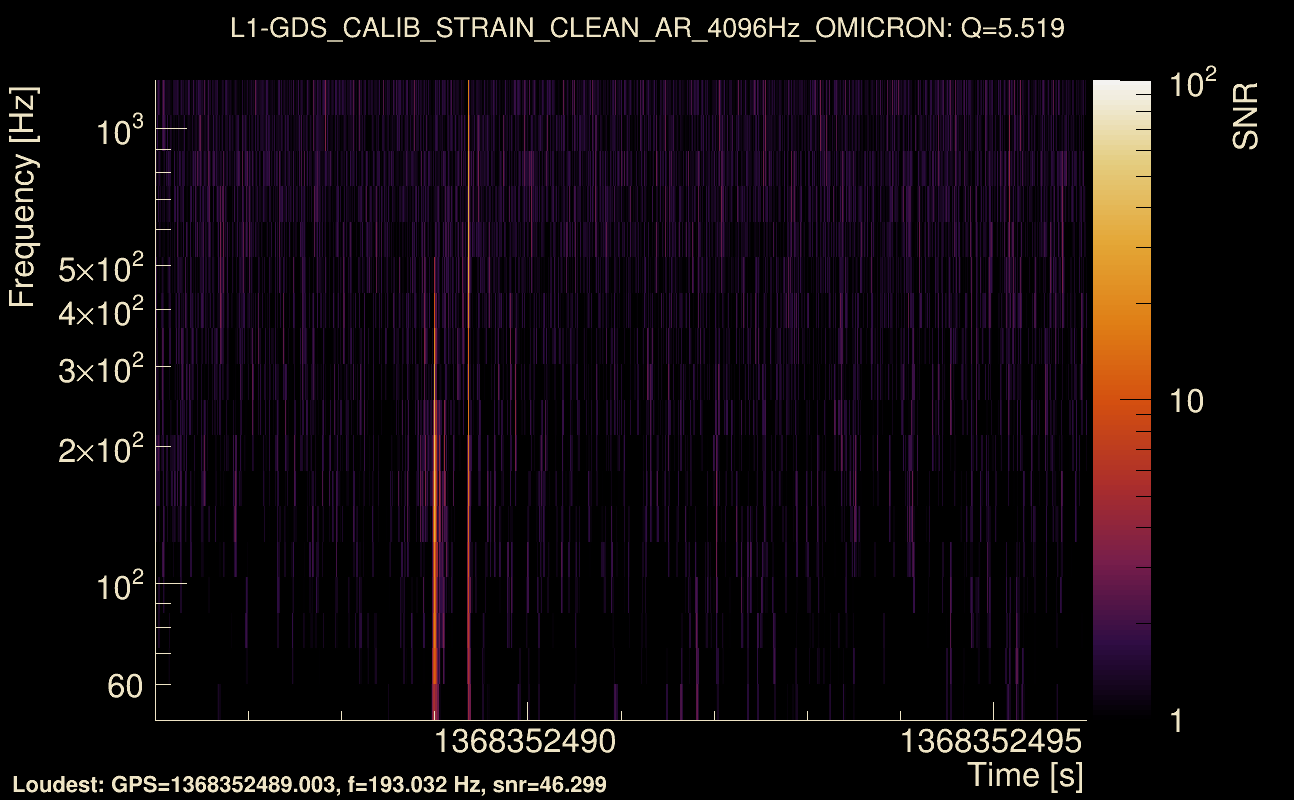
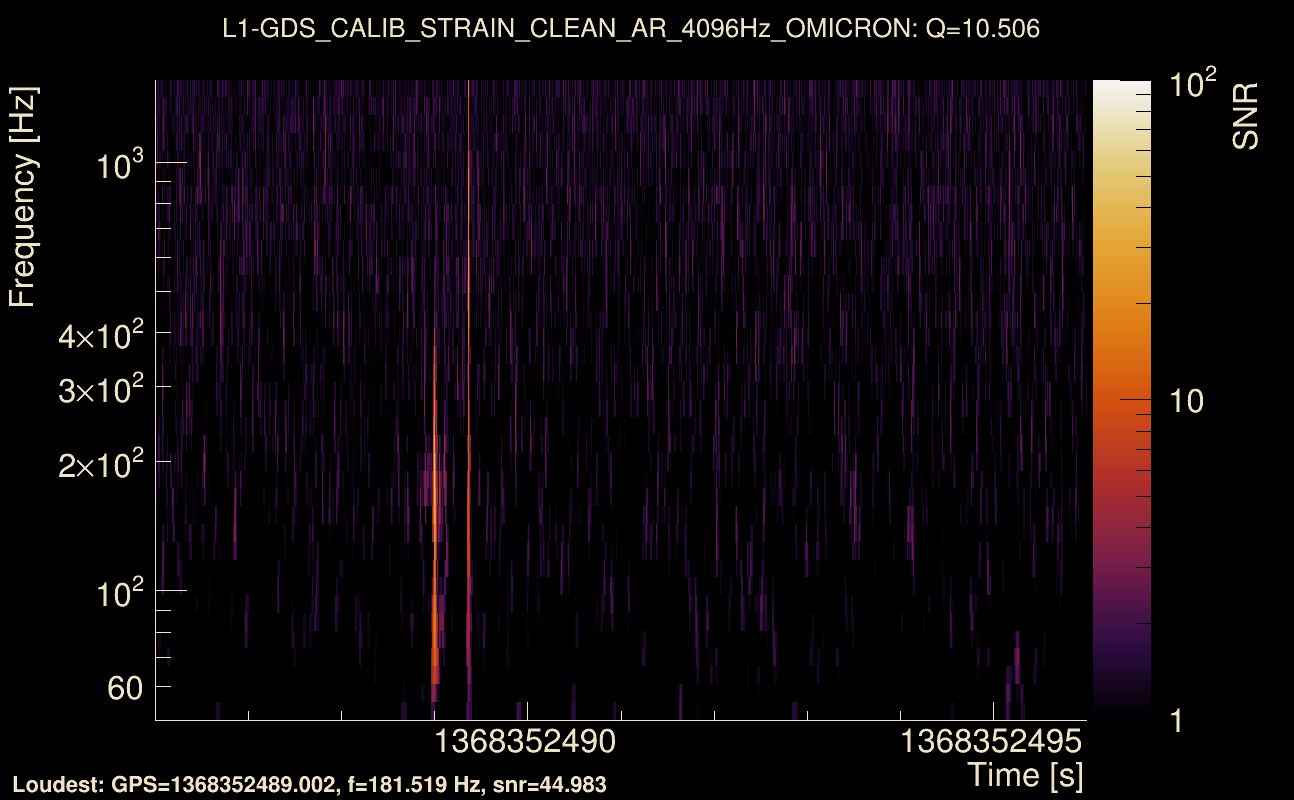
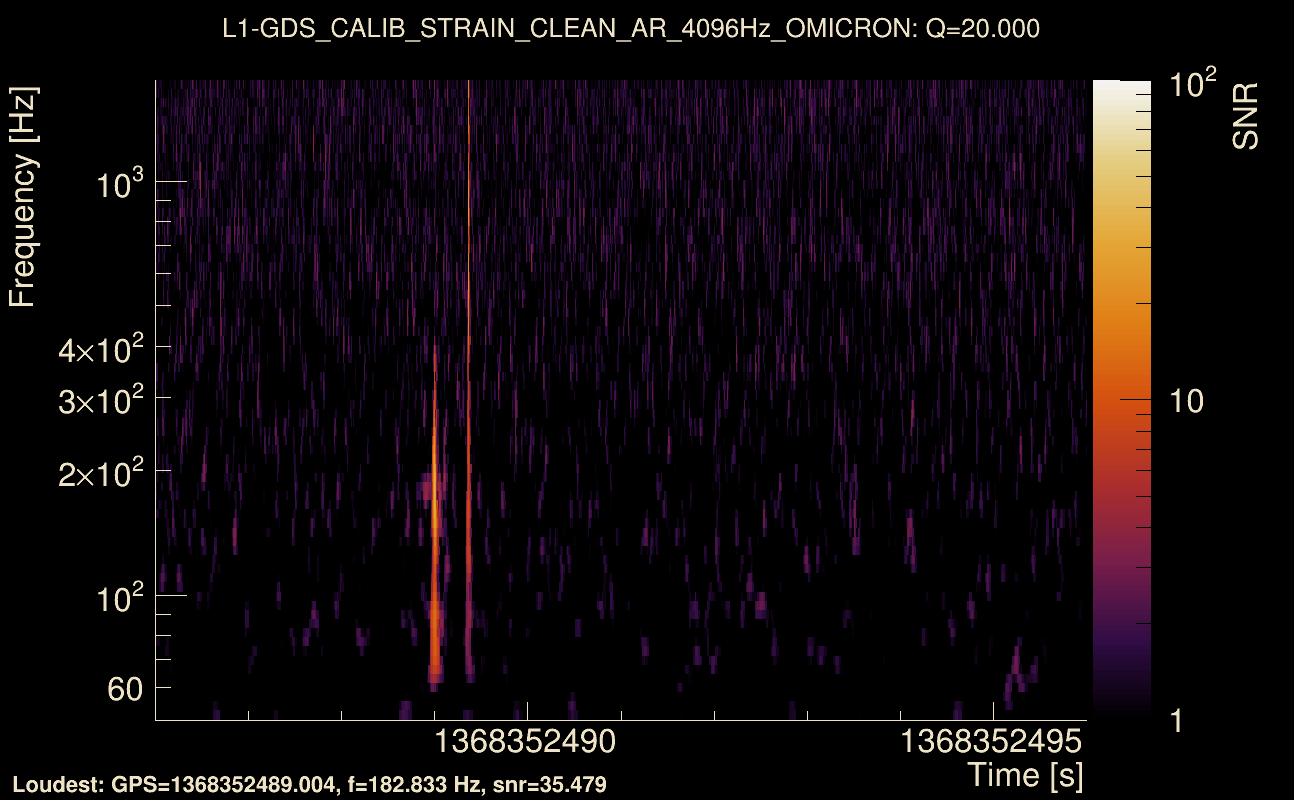
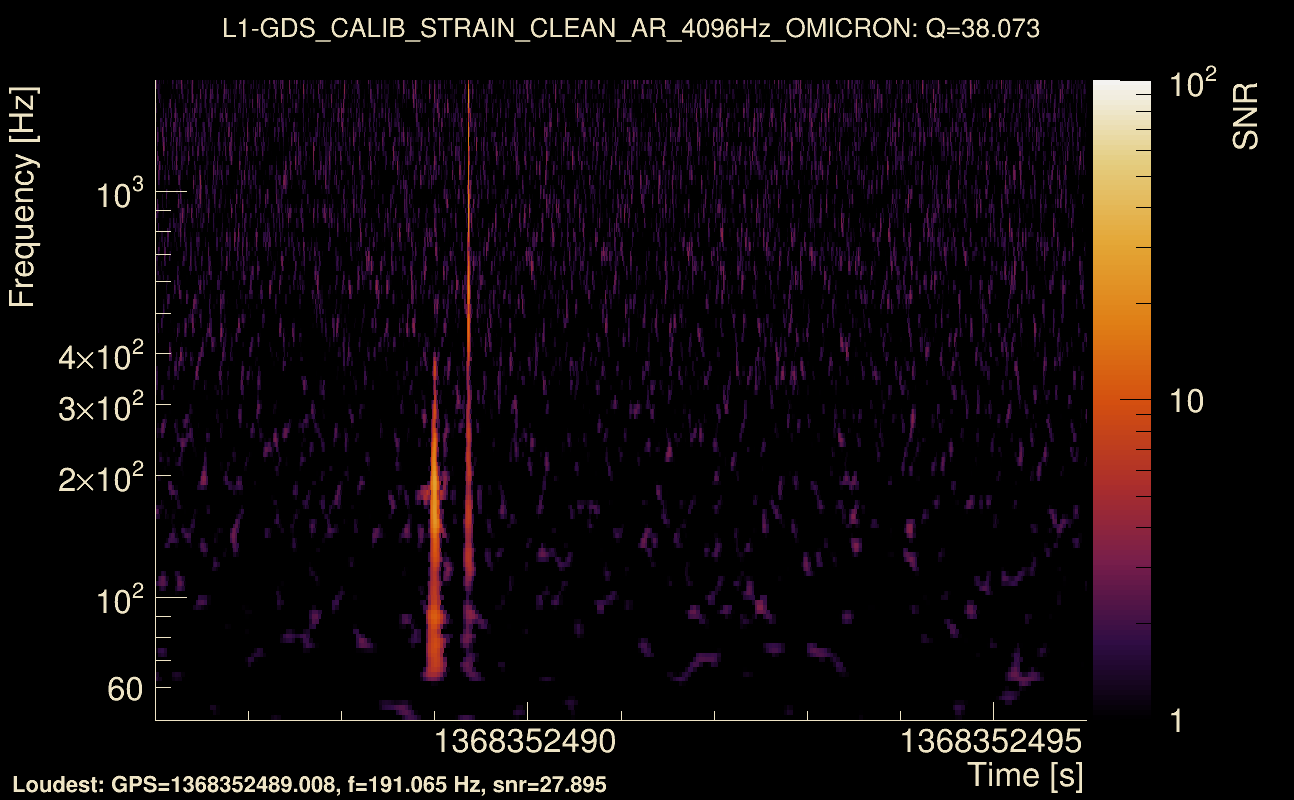
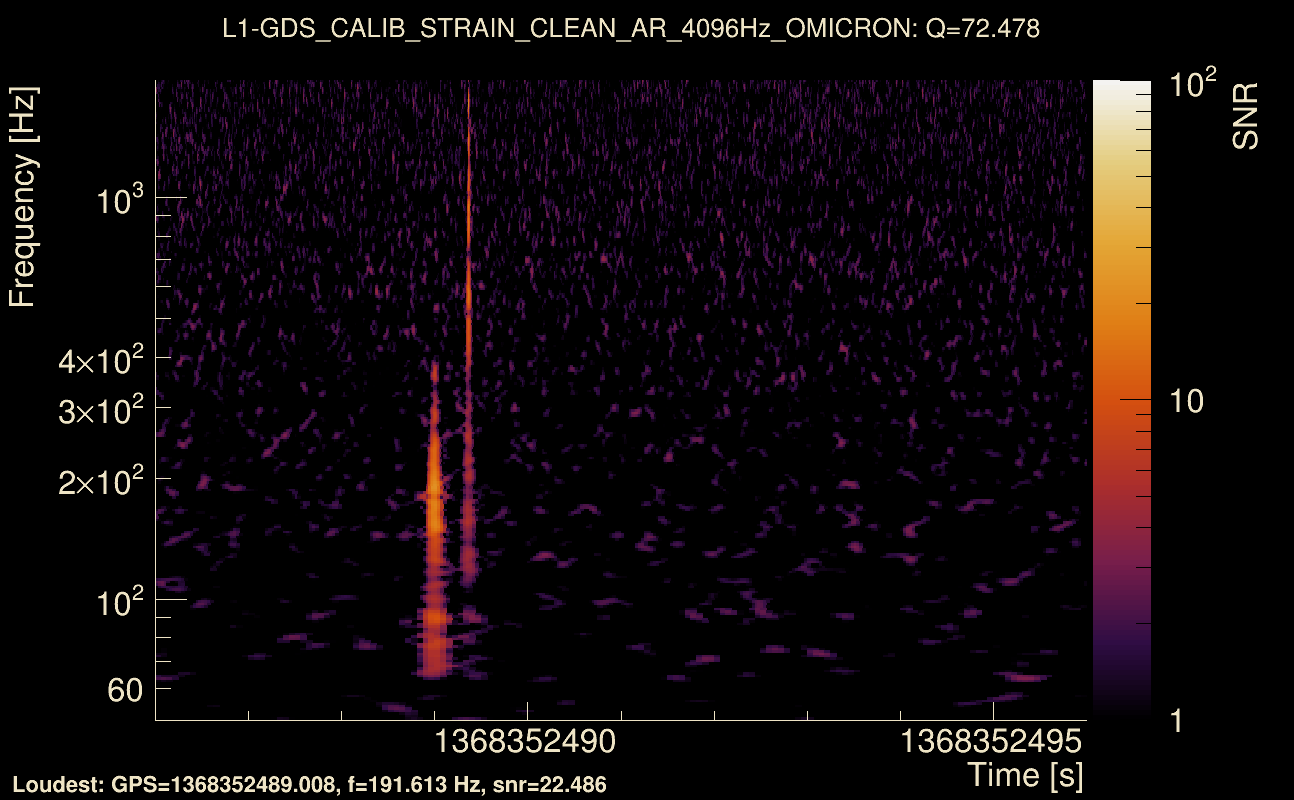
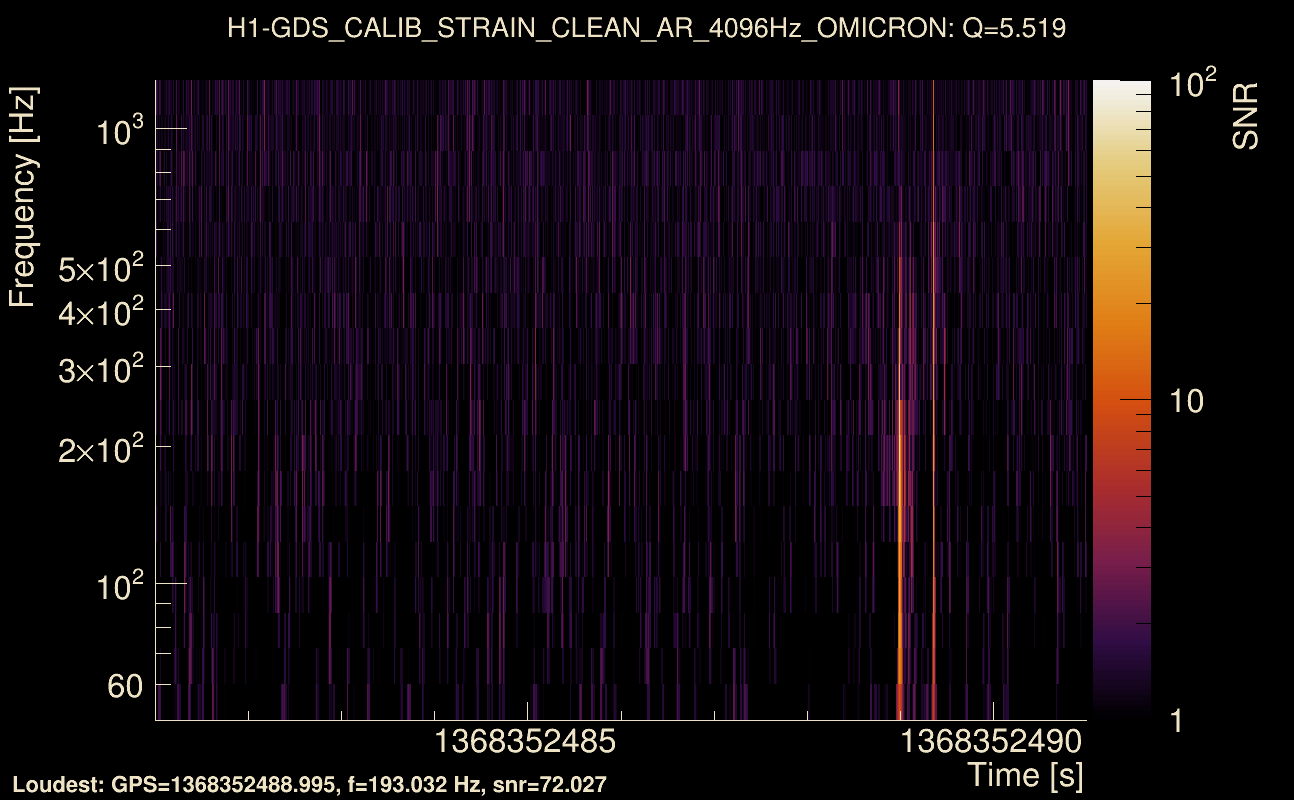
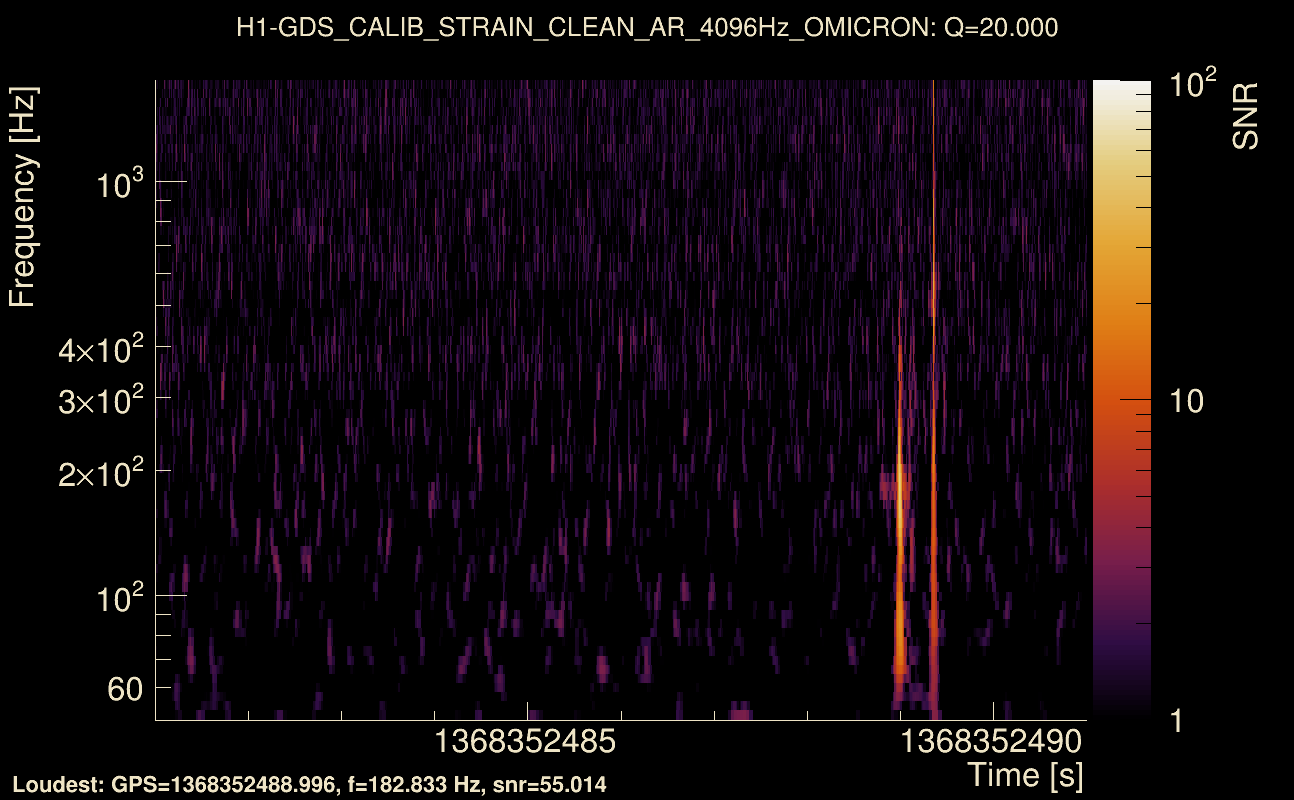
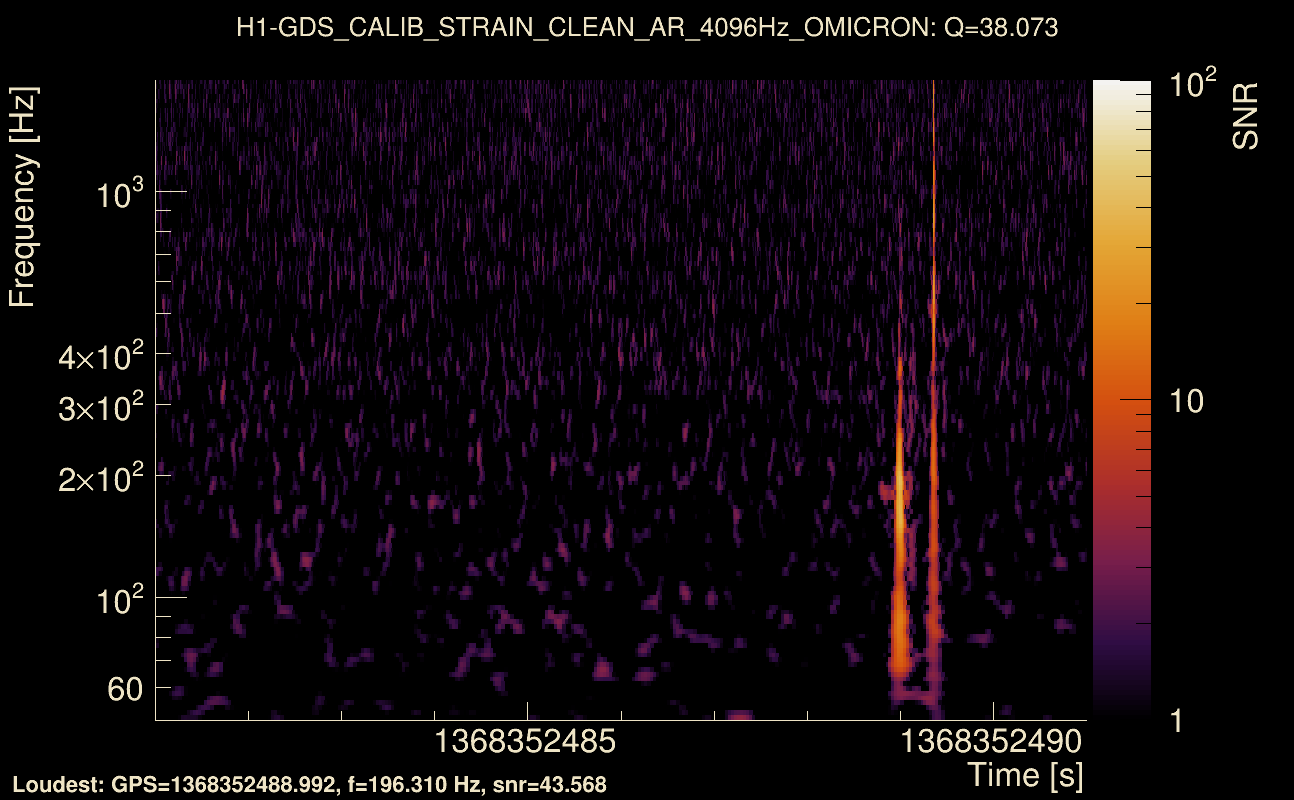
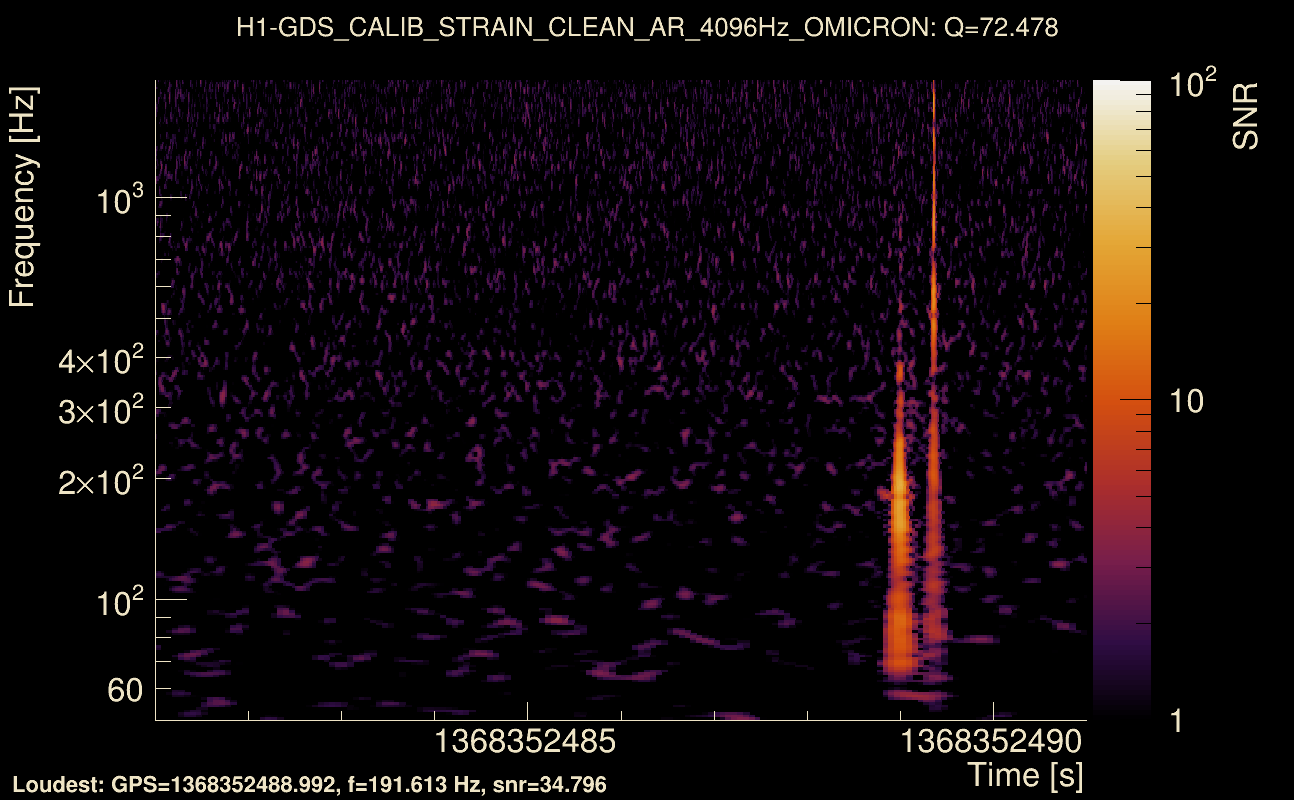
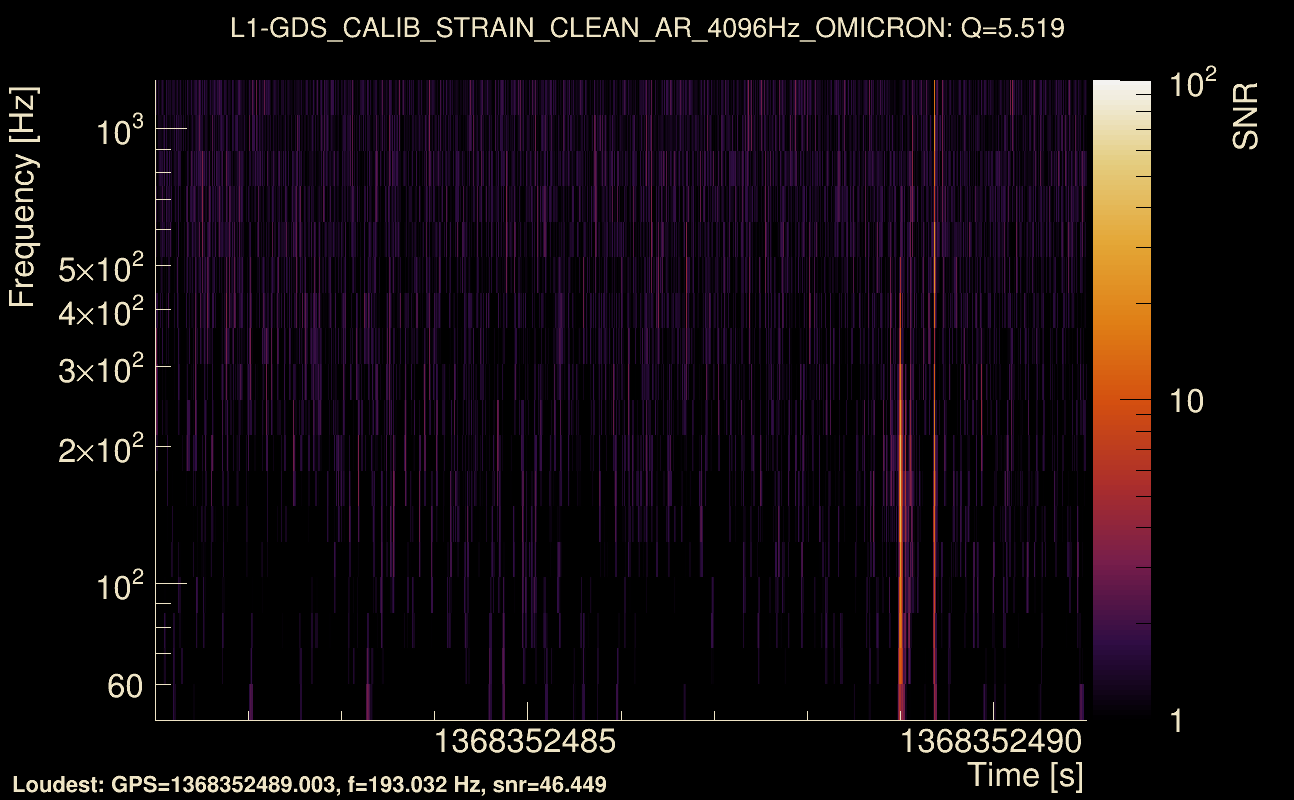
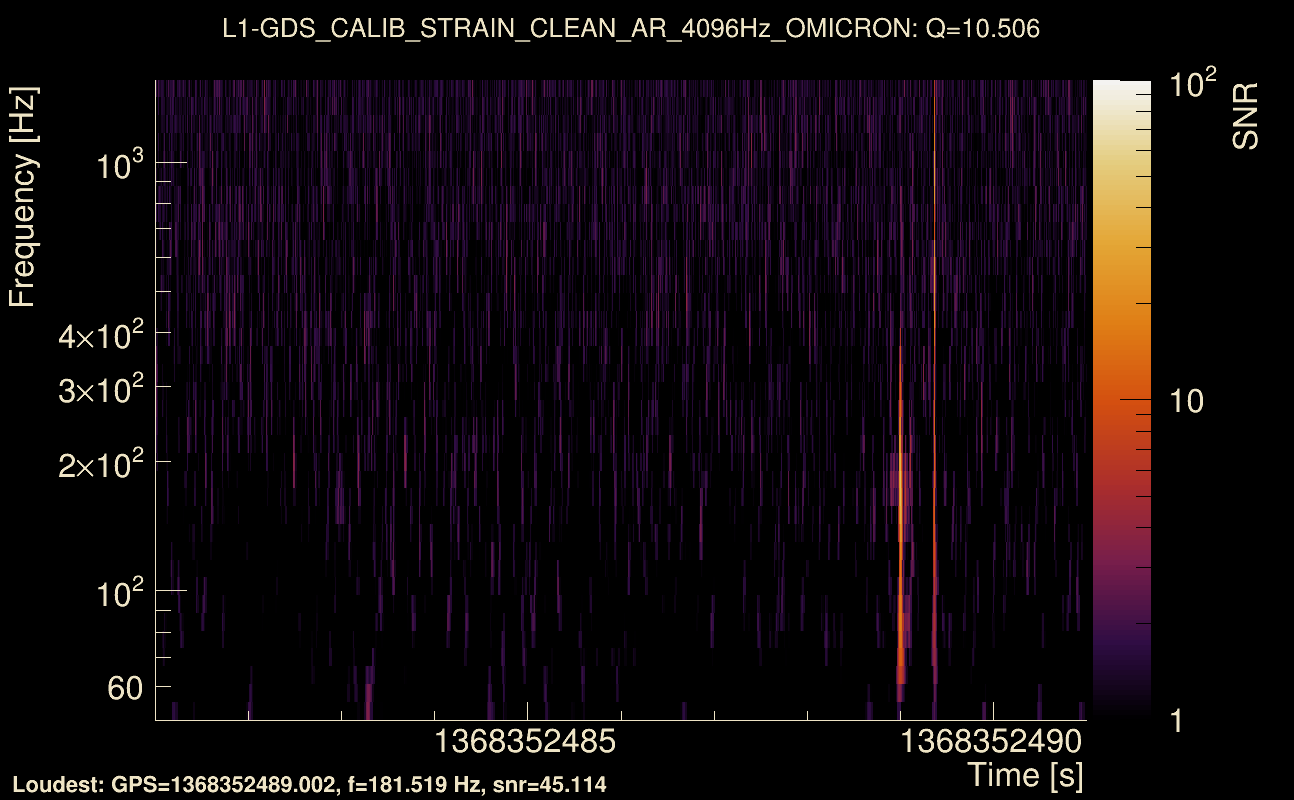
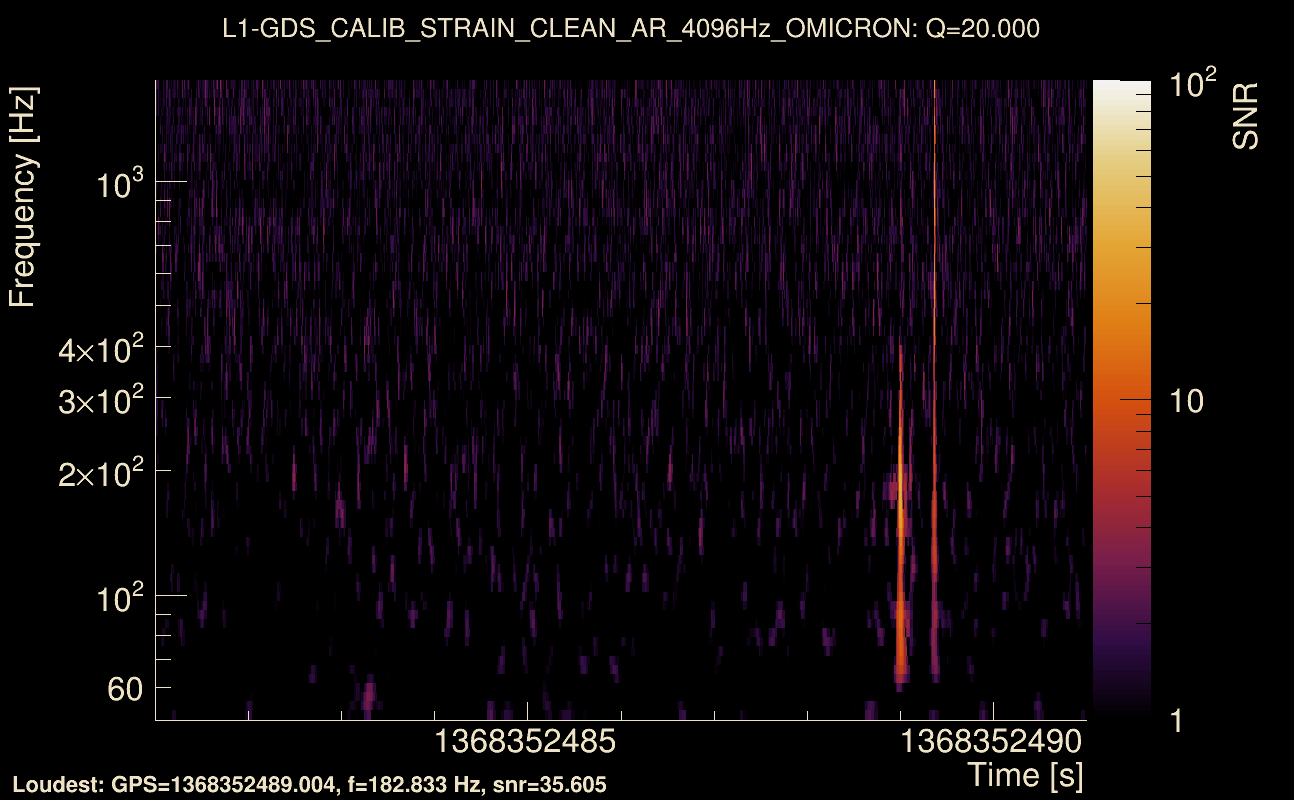
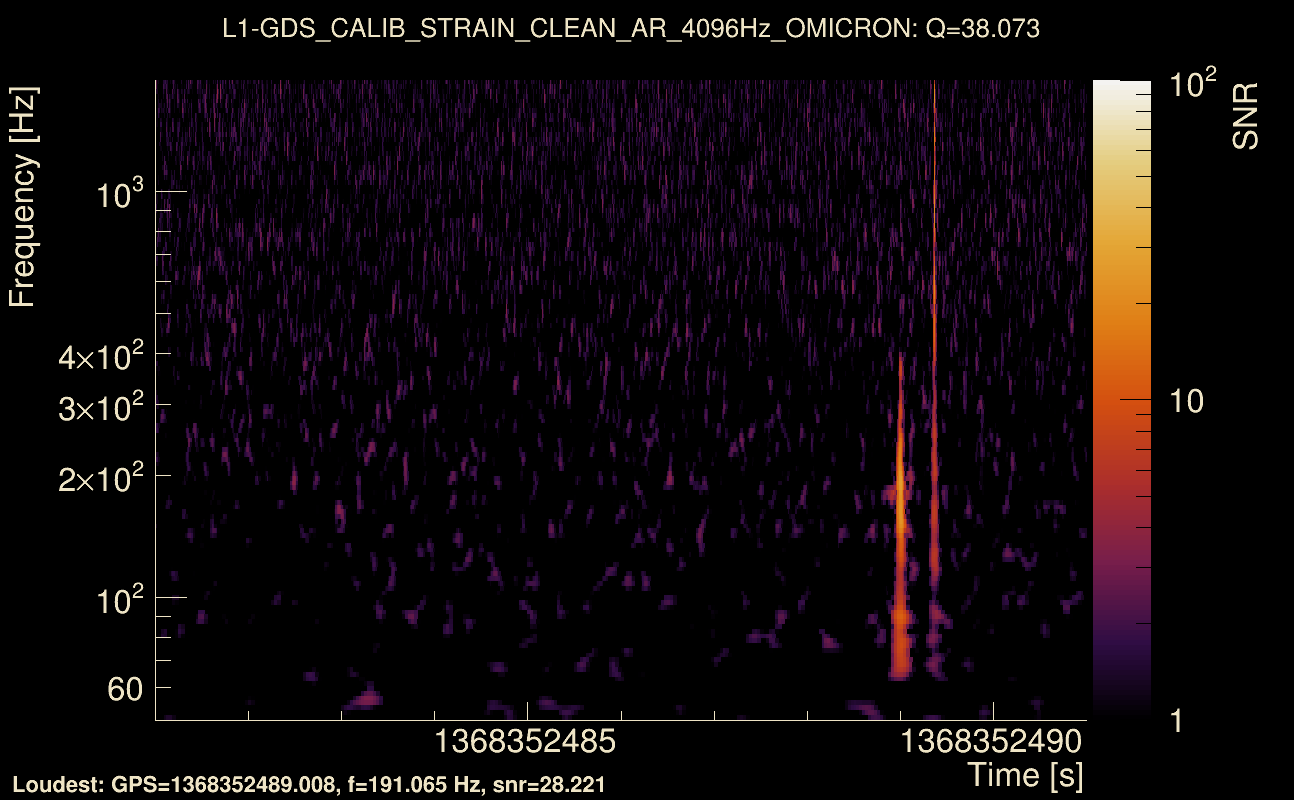
| Event time t(H1): | GPS = 1368352481 (Wed May 17 09:54:23 2023 ) → GPS = 1368352491 (Wed May 17 09:54:33 2023 ) |
| Event time t(L1): | GPS = 1368352481 (Wed May 17 09:54:33 2023 ) → GPS = 1368352491 (Wed May 17 09:54:33 2023 ) |
| Omicron analysis time window (H1): | GPS = 1368352478 → GPS = 1368352494 |
| Omicron analysis time window (L1): | GPS = 1368352478 → GPS = 1368352494 |
| Time delay between detectors t(L1) - t(H1): | 0.00732237 s (slice index = 108 / 217), δt_gw = 0.00732237 s |
| Time delay standard deviation: | 0.0233248 s |
| [targeted mode] Time delay probability: | 0.98296 (0.0213587 sigmas), δt_target = 0.00733542 s |
| Frequency: | 309.63 Hz |
| Ξ: | 0.913745 ± 0.0173781 (variance = 0.000301999): Q0: 0.953973, Q1: 0.950126, Q2: 0.951769, Q3: 0.925563, Q4: 0.910356 |
| Rank: | R_A = 0.863616 |
| Log of amplitude ratio (L1/H1): | -0.405239, variance = 0.171952 (L1/H1: -0.407733, variance = 0.308296, H1/L1: 0.400244, variance = 0.313845) |
| Amplitude ratio (L1/H1): | 0.666818 ⋇ 1.51387 (L1/H1: 0.665157 ⋇ 1.74237, H1/L1: 1.49219 ⋇ 1.75106) |
| Amplitude ratio H1|L1 compatibility (probability): | 0.992425 |
| Antenna factor probability: | 0.968863 |
| Number of rejected frequency rows: | Q0: 0 / 18, Q1: 0 / 36, Q2: 9 / 70, Q3: 23 / 134, Q4: 68 / 258 |
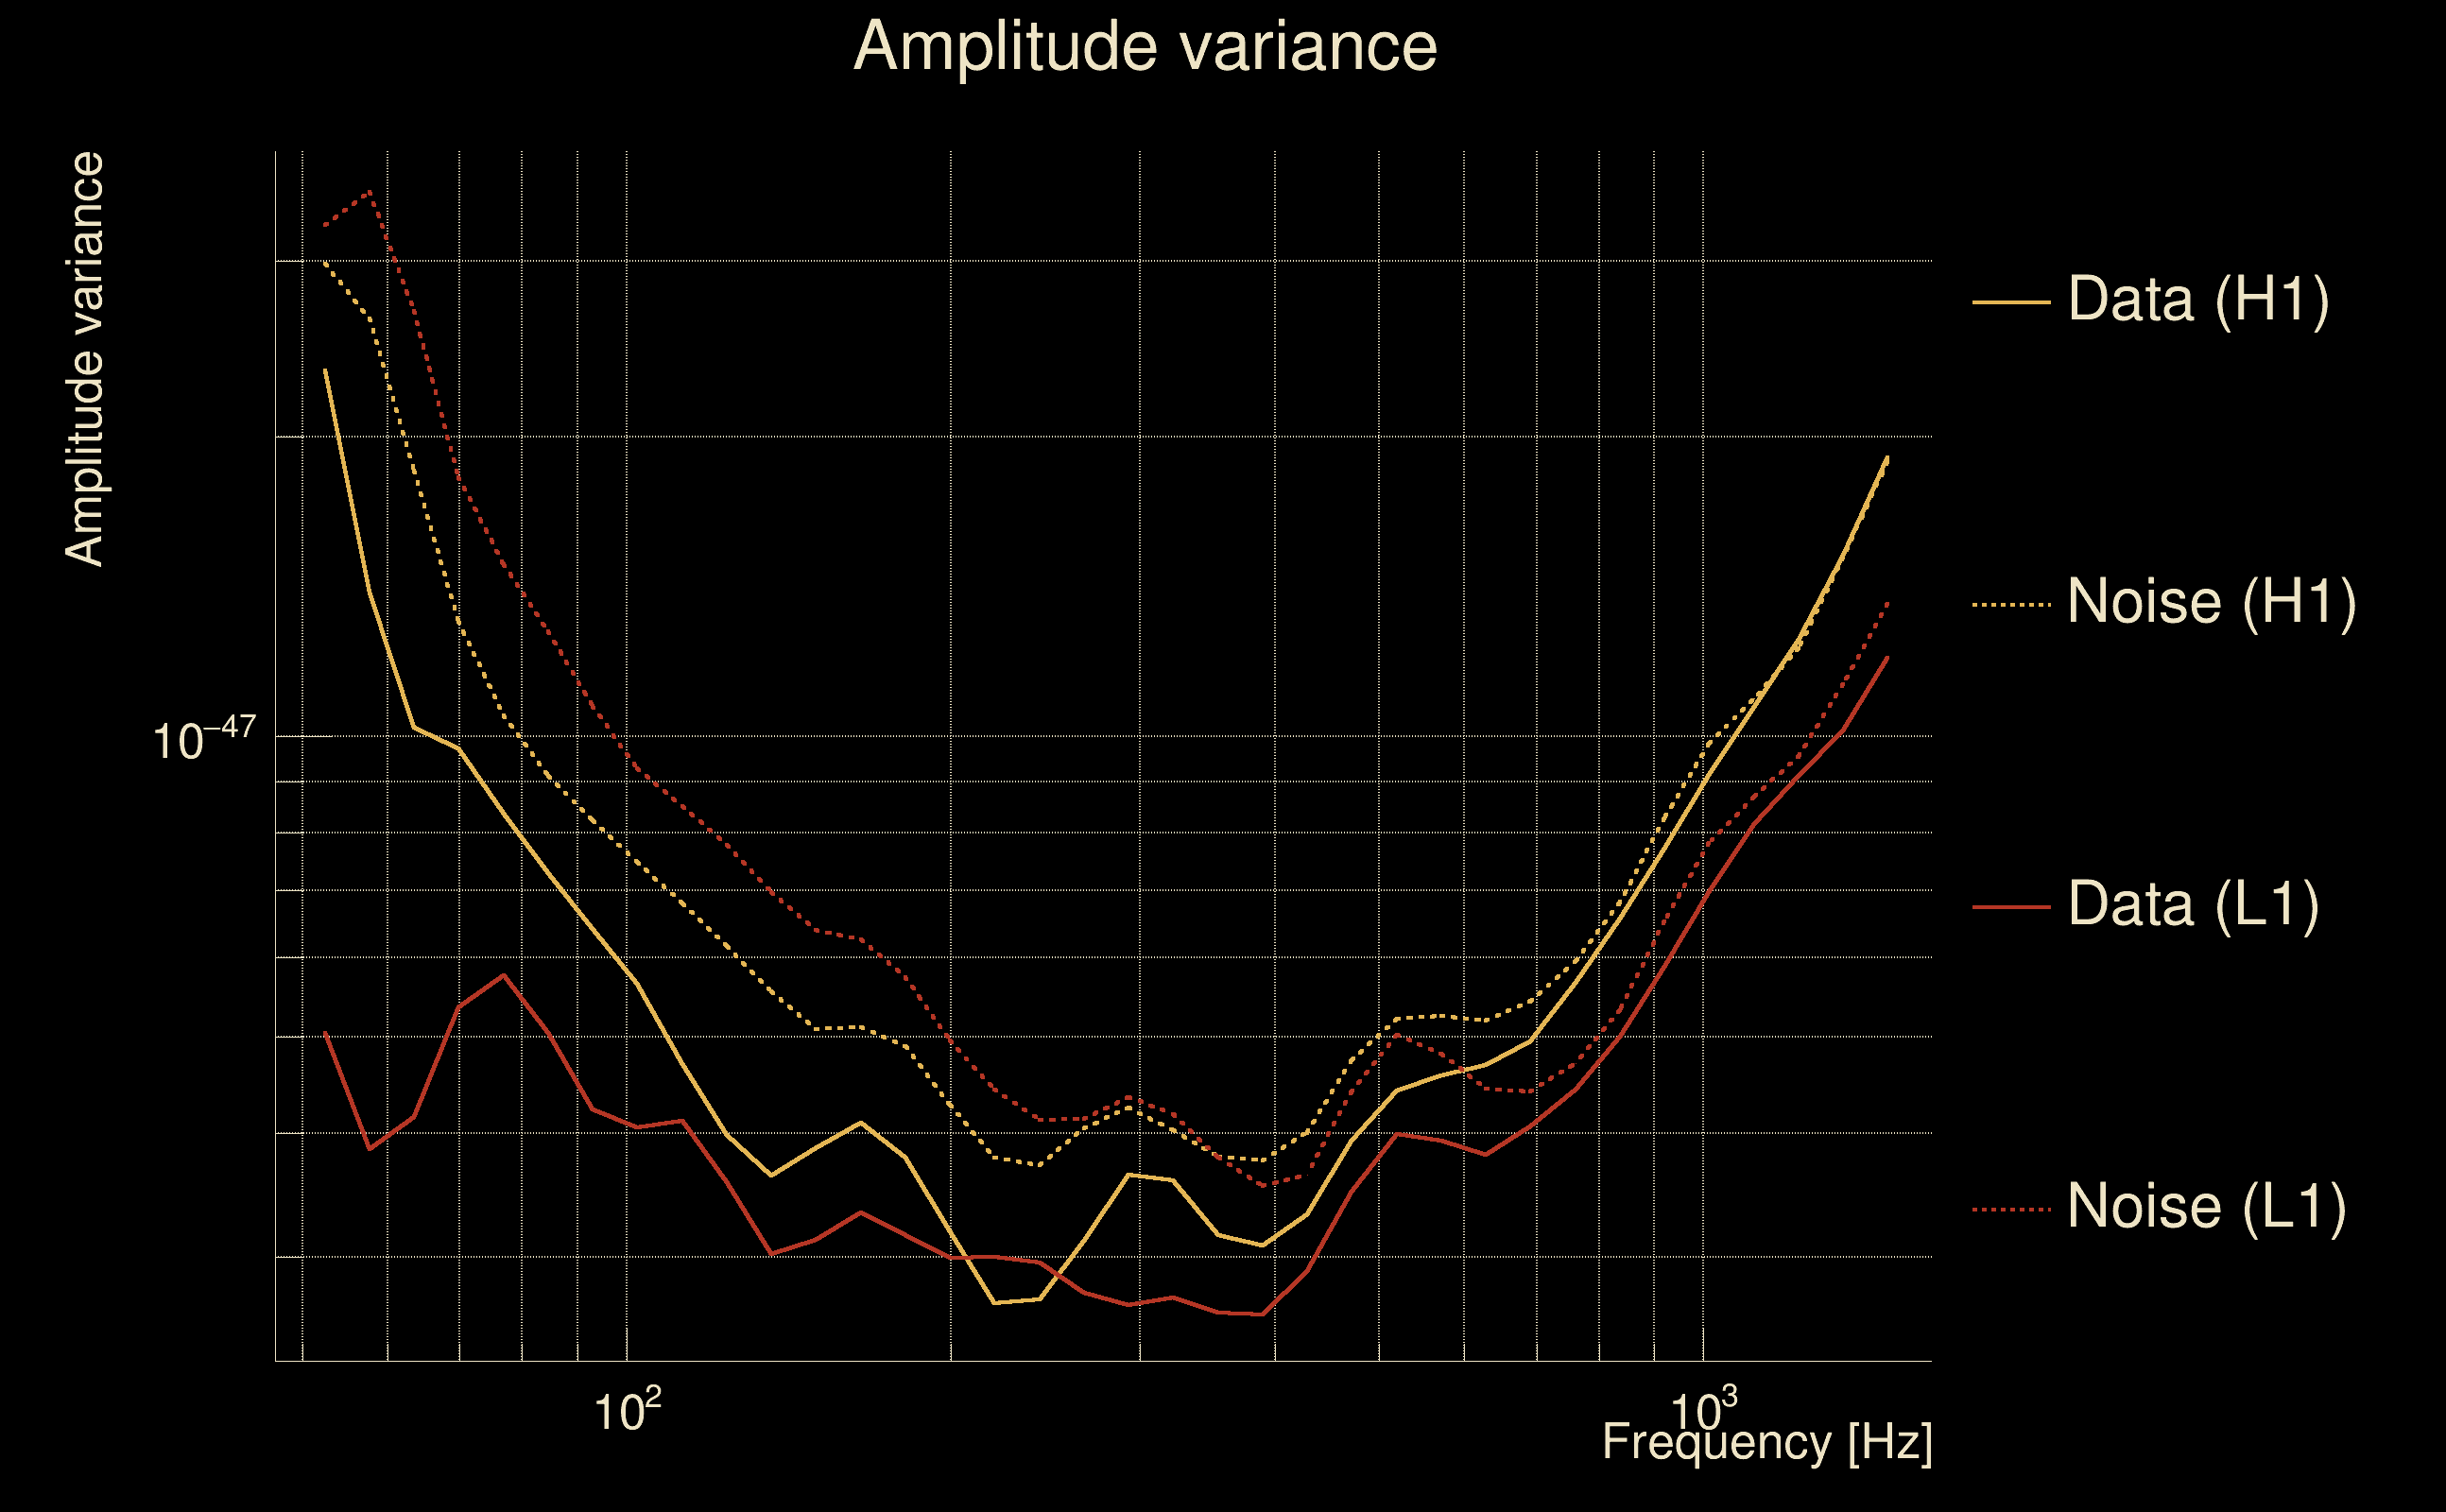
| Maximum signal-to-noise ratio: | H1: 75.9192, L1: 53.6474 |
| SNR variance: | H1: 0.505728, L1: 0.499509 |
| Click here for a zoomed plot | Click here for a zoomed plot | Click here for a zoomed plot | Click here for a zoomed plot | Click here for a zoomed plot |
 |
 |
 |
 |
 |
 |
 |
 |
 |
 |
 |
 |
 |
 |
 |
 |
 |
 |
 |
 |
 |
 |
 |
 |
 |
 |
 |
 |
 |
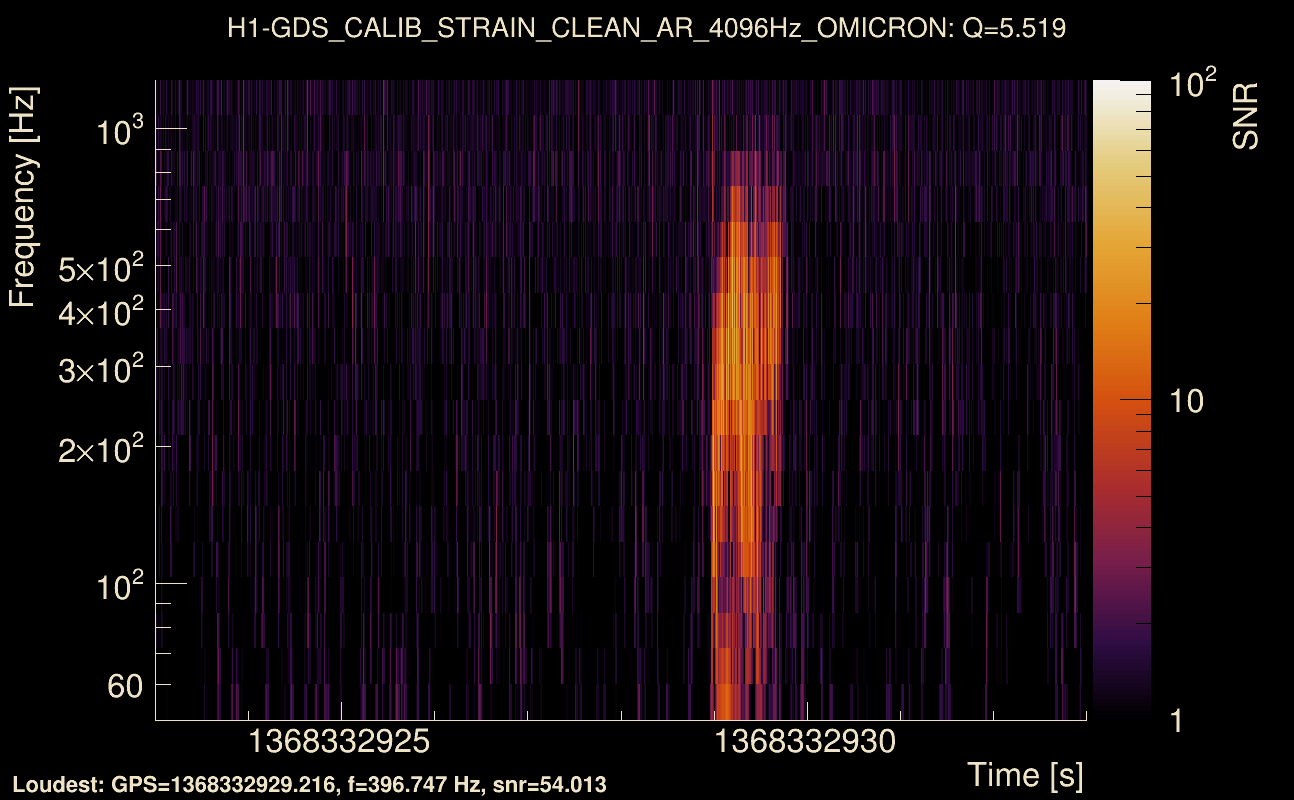
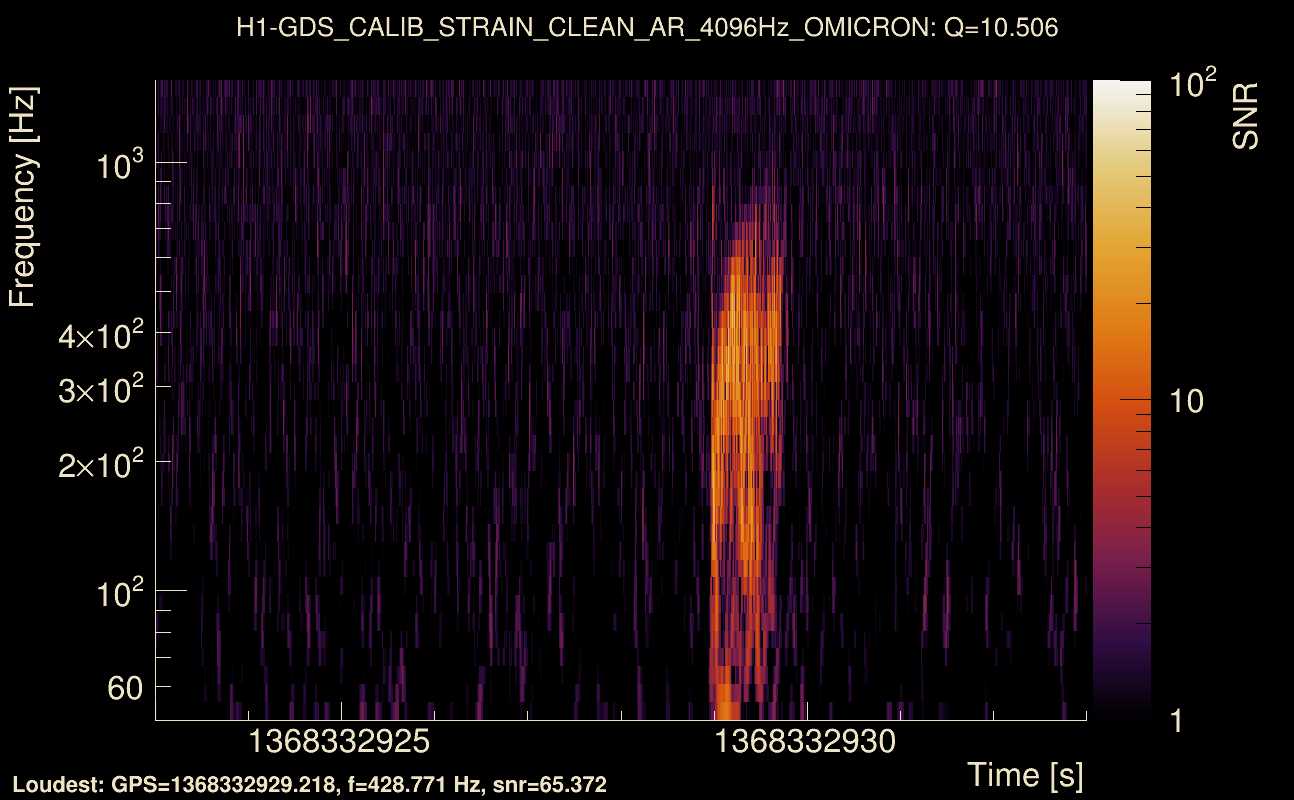
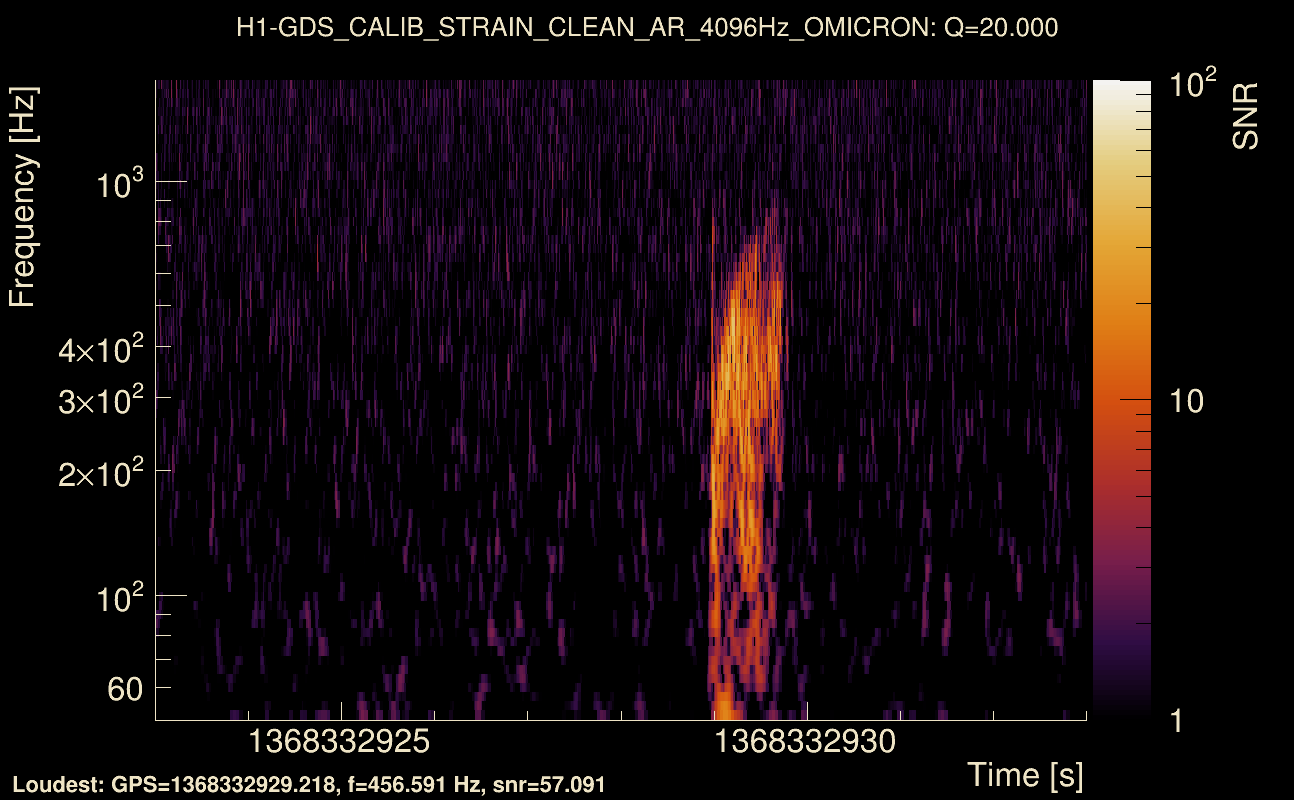
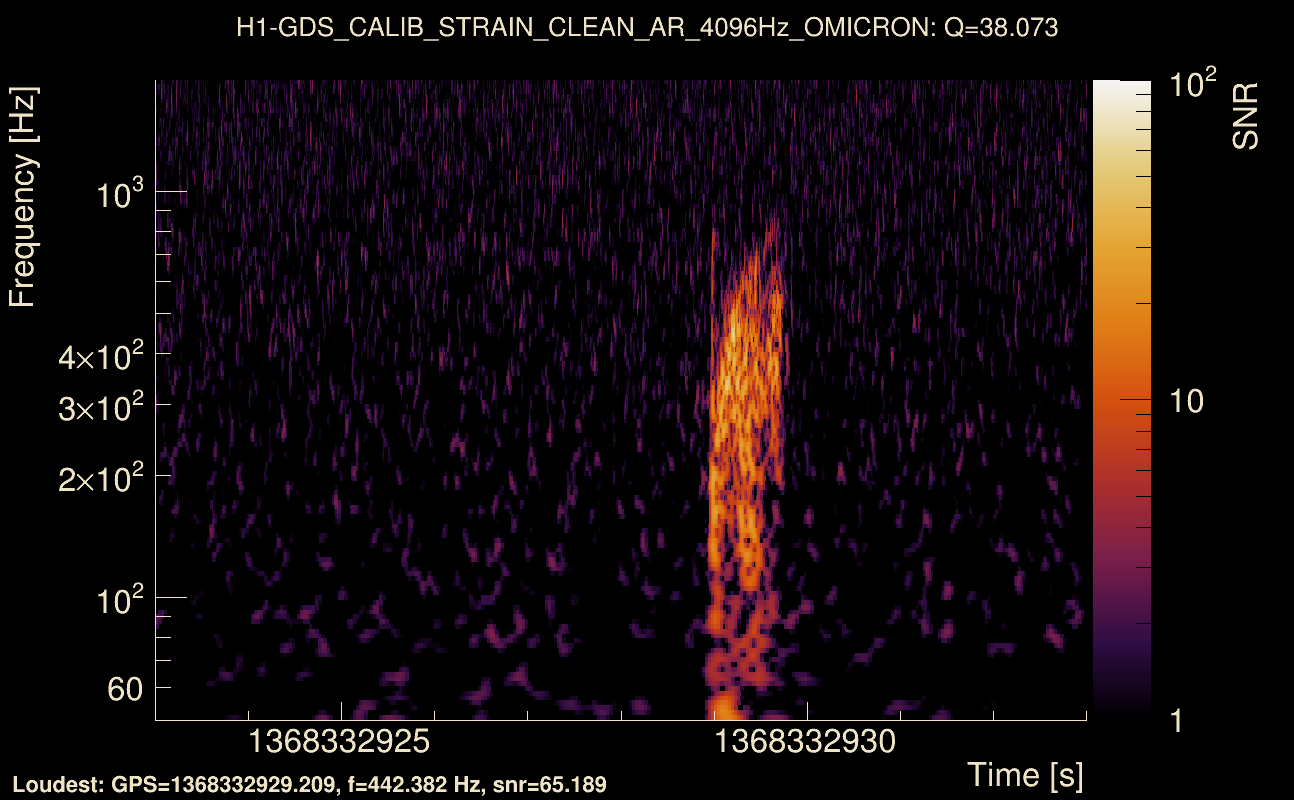
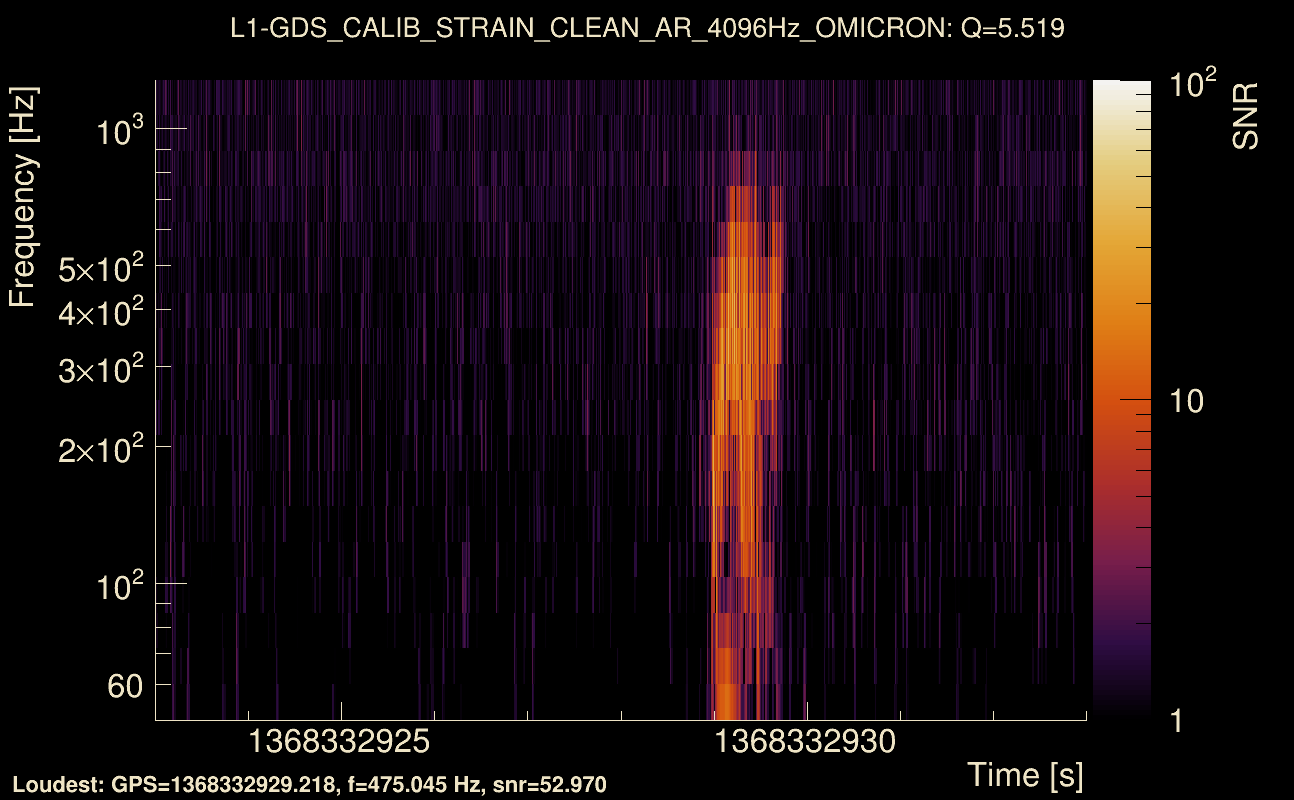
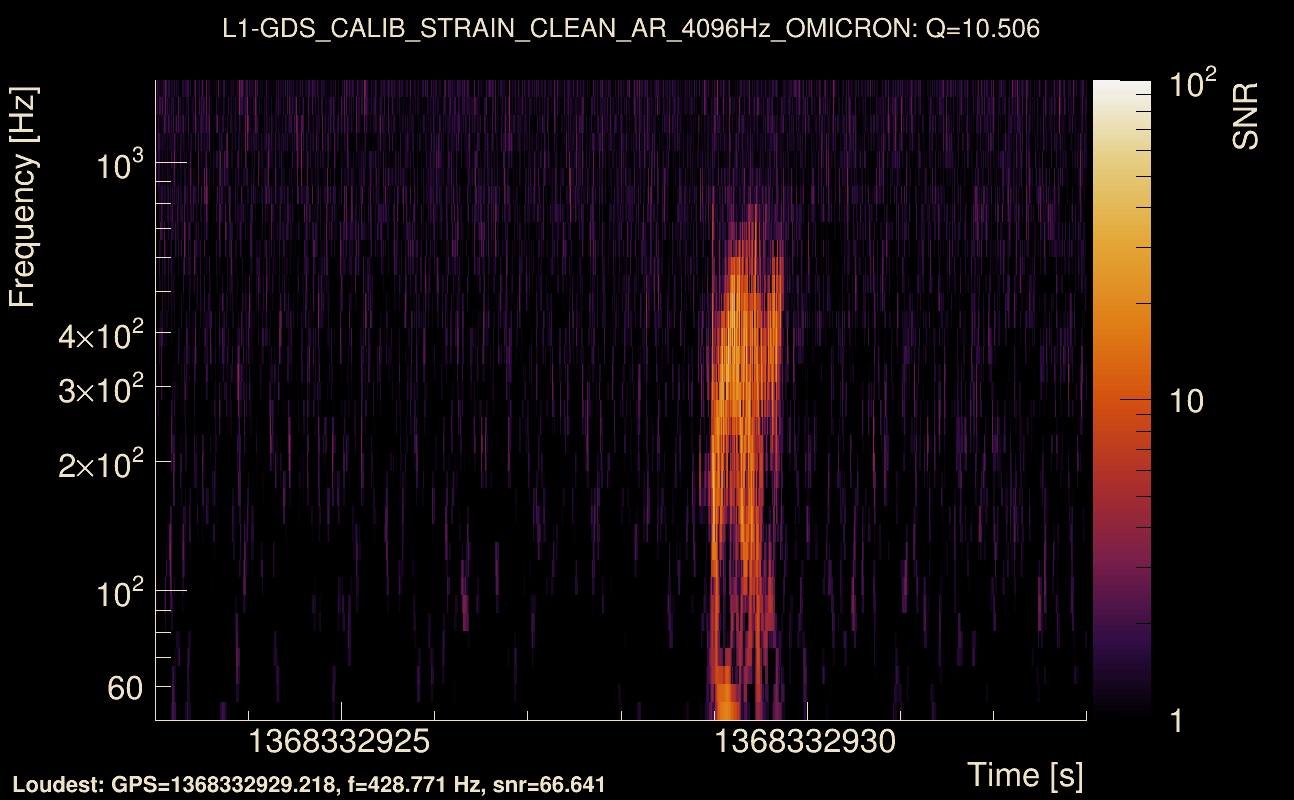
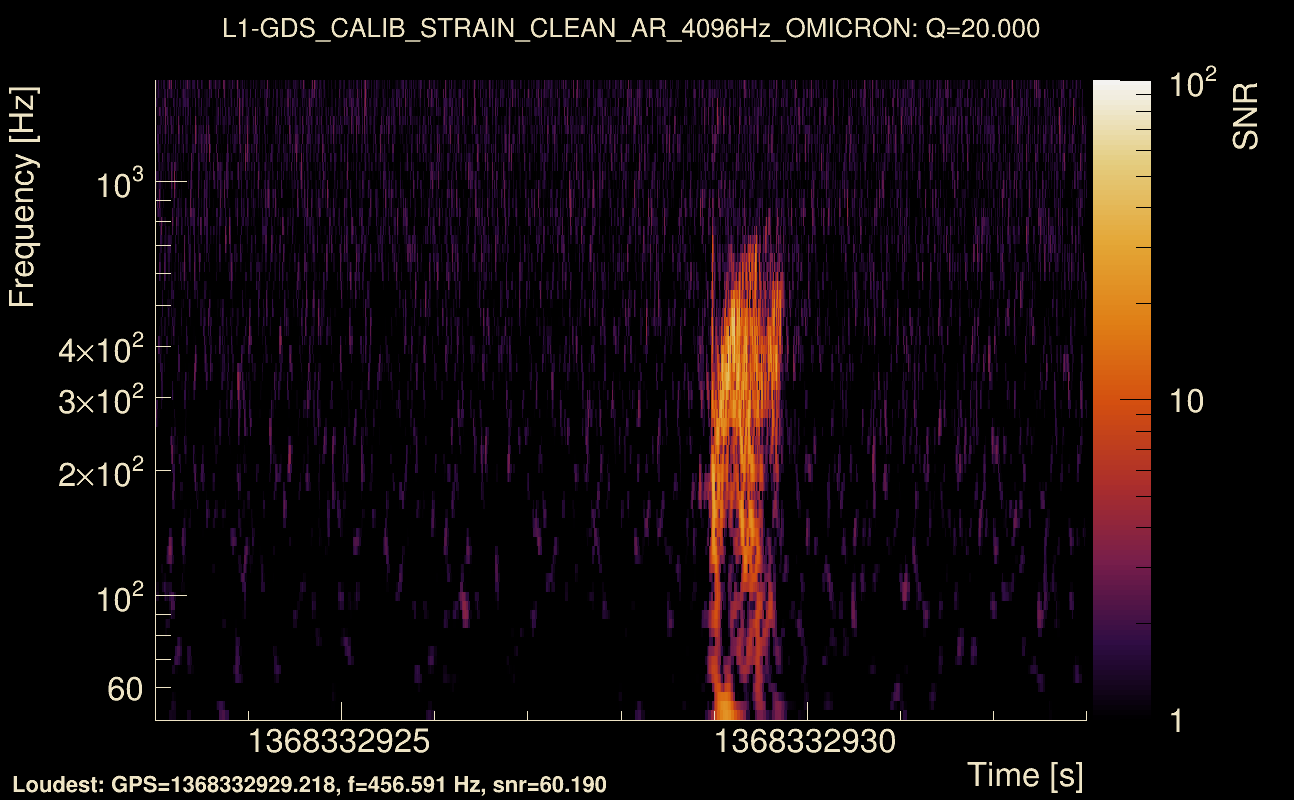
| Event time t(H1): | GPS = 1368332923 (Wed May 17 04:28:25 2023 ) → GPS = 1368332933 (Wed May 17 04:28:35 2023 ) |
| Event time t(L1): | GPS = 1368332923 (Wed May 17 04:28:35 2023 ) → GPS = 1368332933 (Wed May 17 04:28:35 2023 ) |
| Omicron analysis time window (H1): | GPS = 1368332920 → GPS = 1368332936 |
| Omicron analysis time window (L1): | GPS = 1368332920 → GPS = 1368332936 |
| Time delay between detectors t(L1) - t(H1): | 0.000525877 s (slice index = 108 / 217), δt_gw = 0.000525877 s |
| Time delay standard deviation: | 0.0357308 s |
| [targeted mode] Time delay probability: | 0.983565 (0.0206002 sigmas), δt_target = 0.00733399 s |
| Frequency: | 207.067 Hz |
| Ξ: | 0.898659 ± 0.00392672 (variance = 1.54191e-05): Q0: 0.938508, Q1: 0.945936, Q2: 0.946508, Q3: 0.937667, Q4: 0.938548 |
| Rank: | R_A = 0.818263 |
| Log of amplitude ratio (L1/H1): | -0.0478722, variance = 0.151974 (L1/H1: -0.065149, variance = 0.303164, H1/L1: 0.0313679, variance = 0.304358) |
| Amplitude ratio (L1/H1): | 0.953256 ⋇ 1.47674 (L1/H1: 0.936928 ⋇ 1.7343, H1/L1: 1.03187 ⋇ 1.73618) |
| Amplitude ratio H1|L1 compatibility (probability): | 0.96543 |
| Antenna factor probability: | 0.958903 |
| Number of rejected frequency rows: | Q0: 0 / 18, Q1: 1 / 36, Q2: 10 / 70, Q3: 22 / 134, Q4: 60 / 258 |
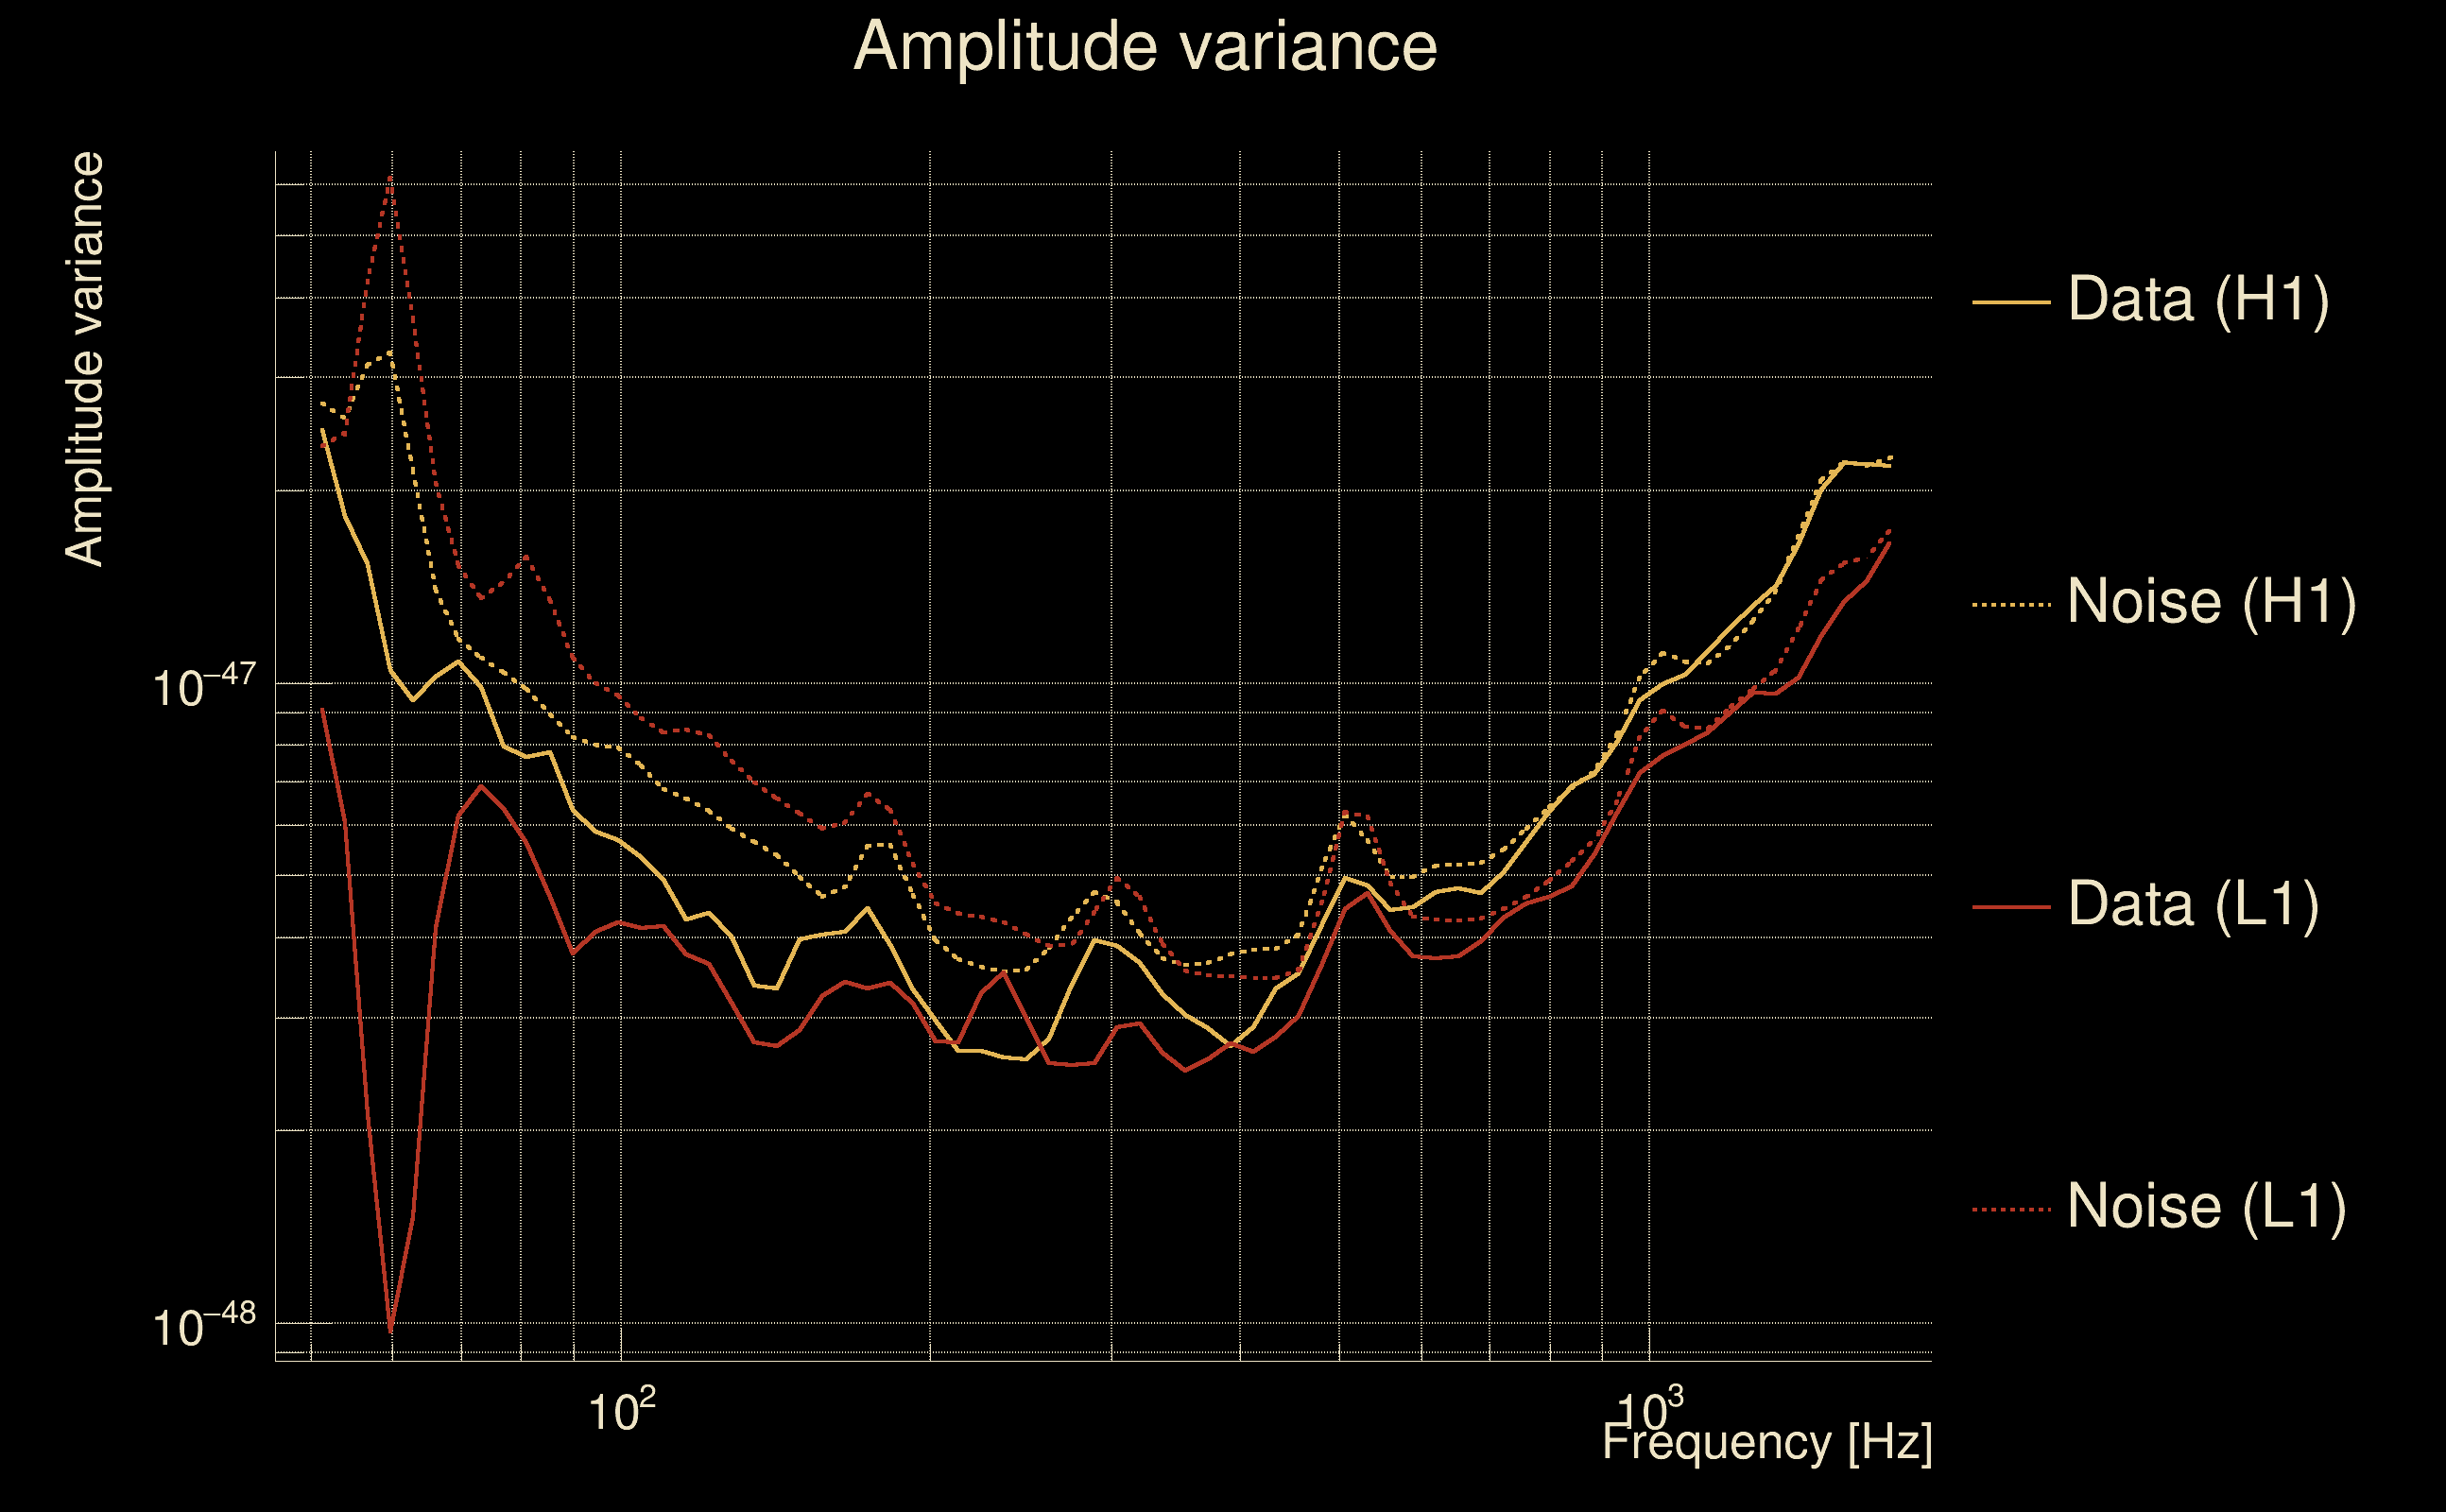
| Maximum signal-to-noise ratio: | H1: 68.4345, L1: 70.0178 |
| SNR variance: | H1: 0.521395, L1: 0.482864 |
| Click here for a zoomed plot | Click here for a zoomed plot | Click here for a zoomed plot | Click here for a zoomed plot | Click here for a zoomed plot |
 |
 |
 |
 |
 |
 |
 |
 |
 |
 |
 |
 |
 |
 |
 |
 |
 |
 |
 |
 |
 |
 |
 |
 |
 |
 |
 |
 |
 |
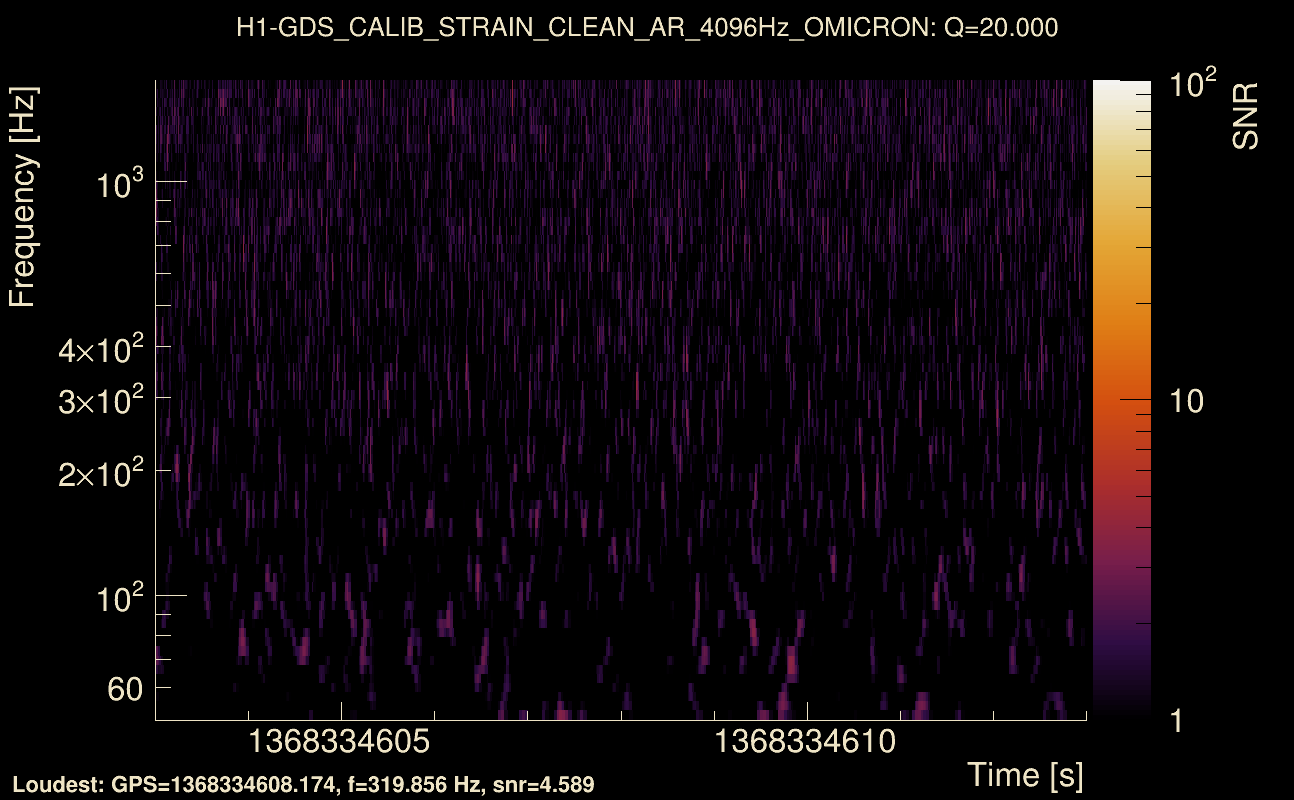
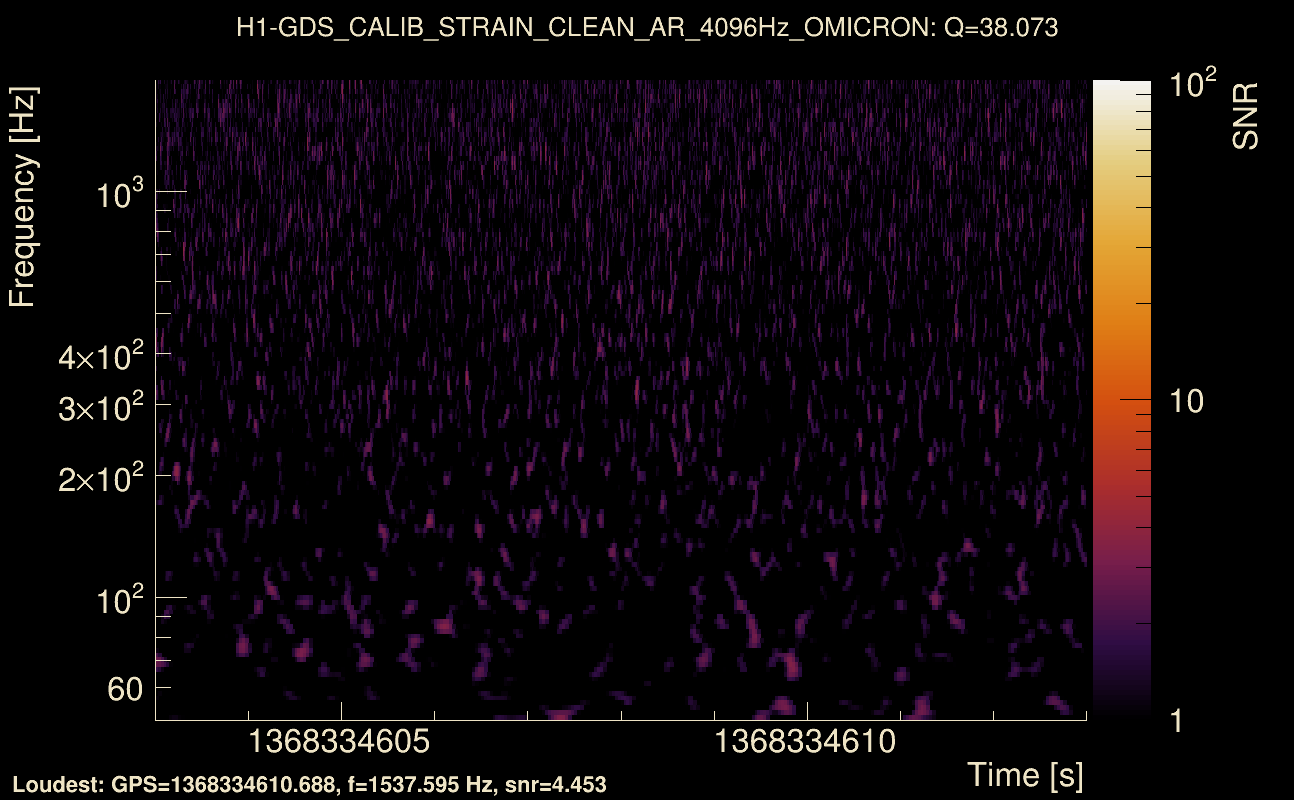
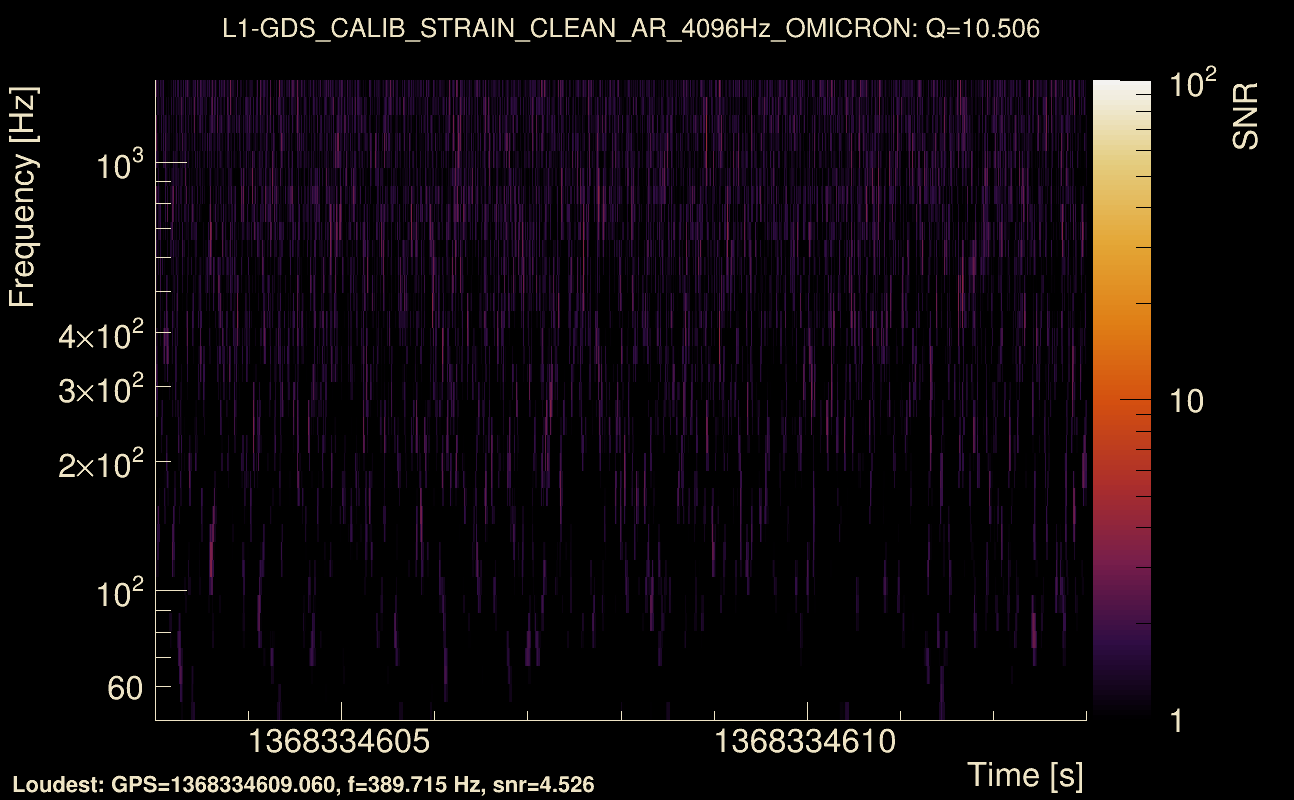
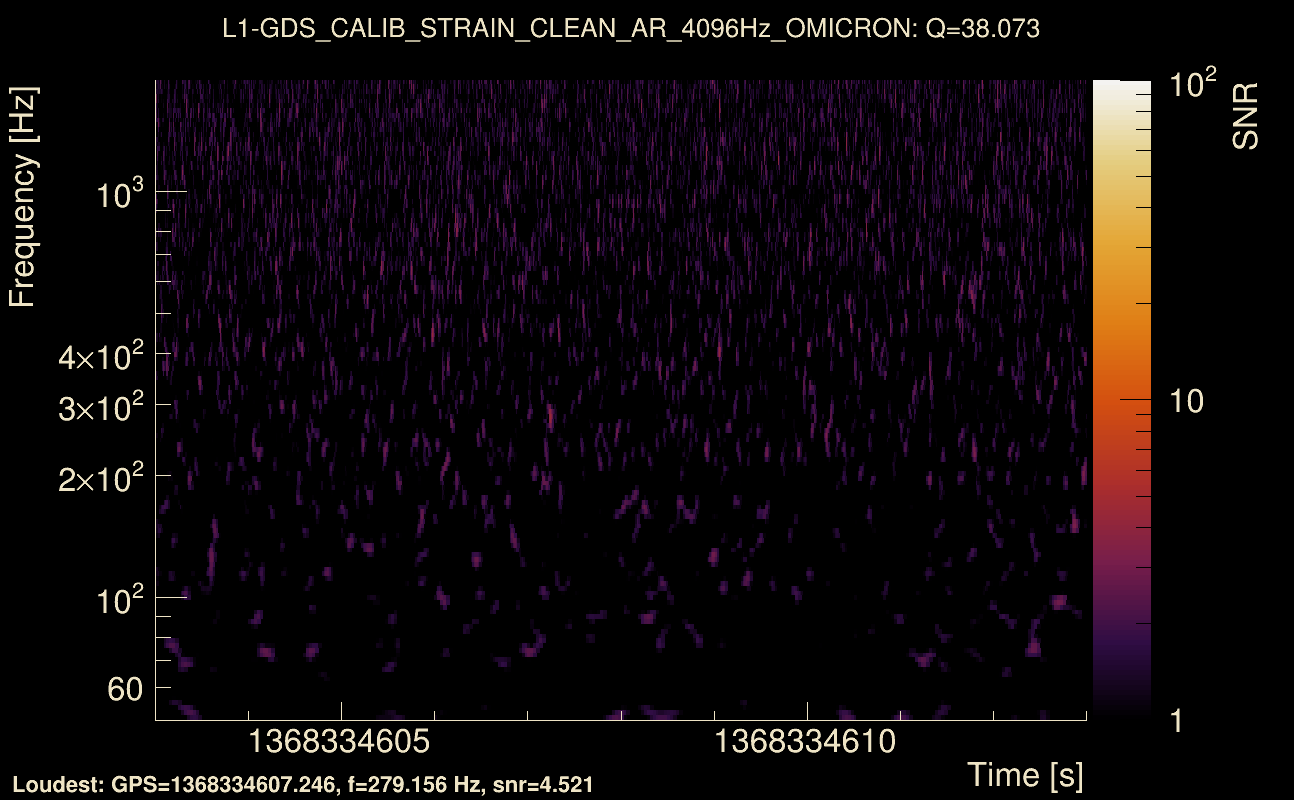
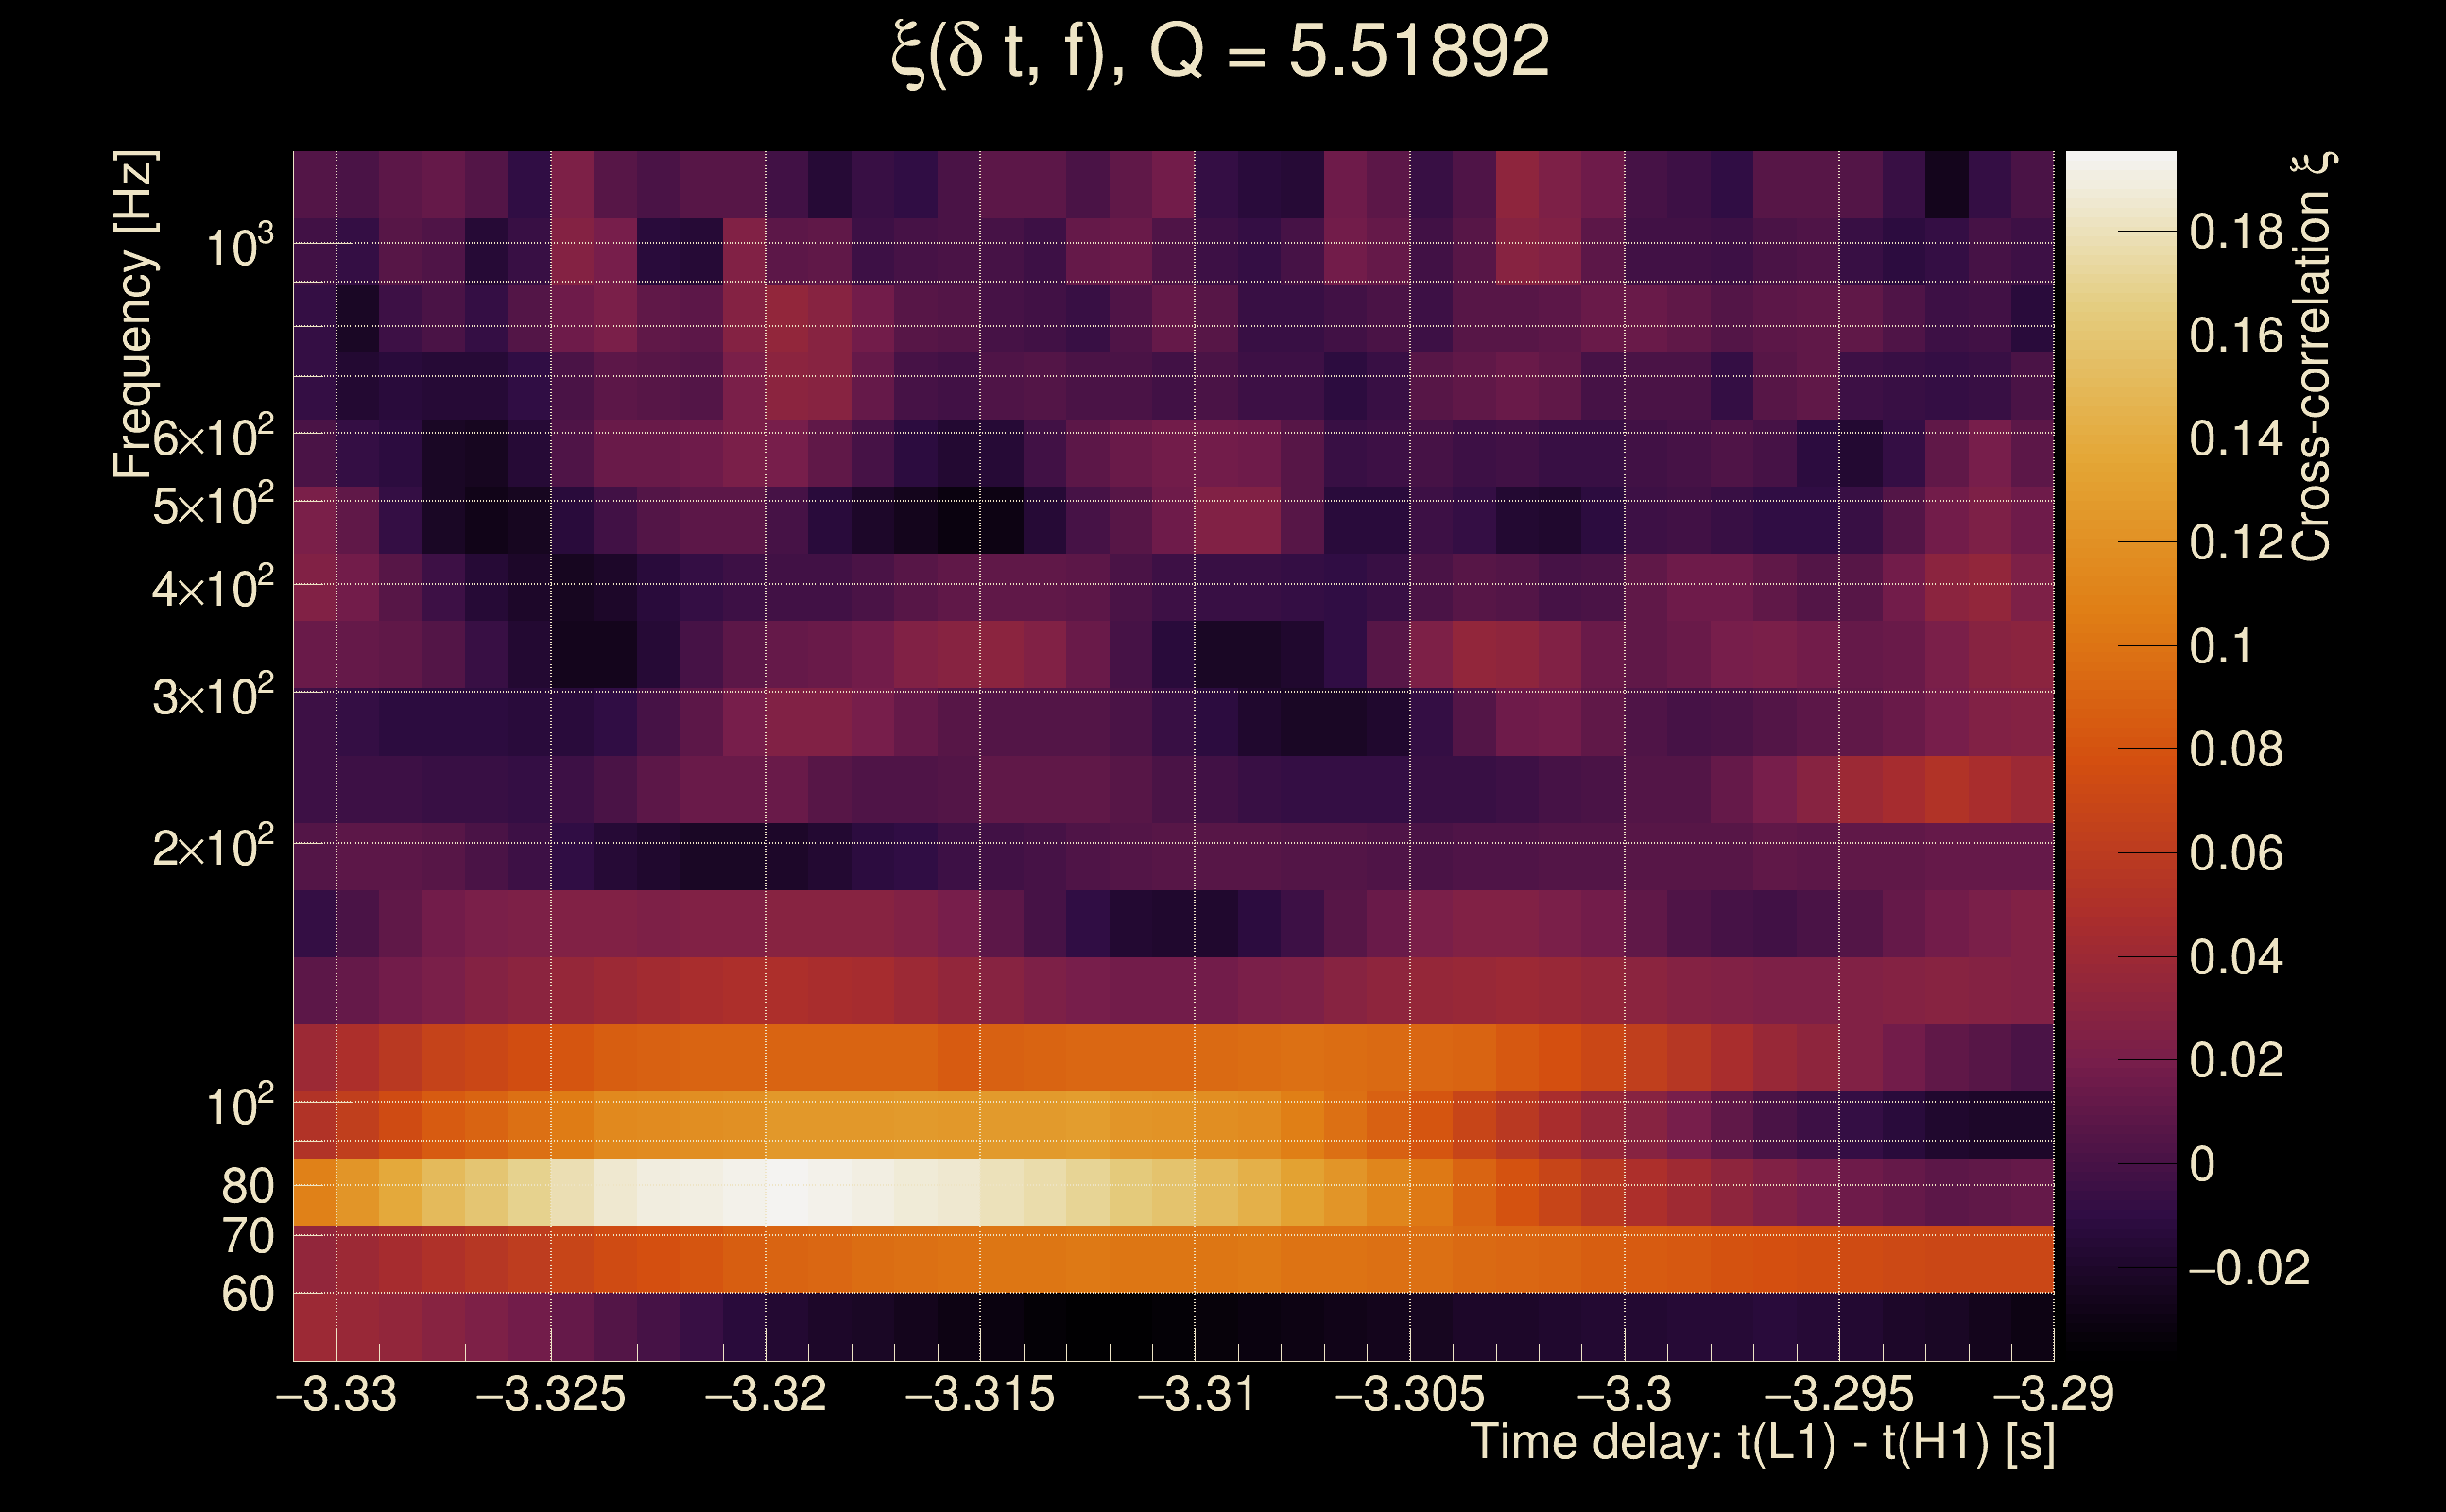
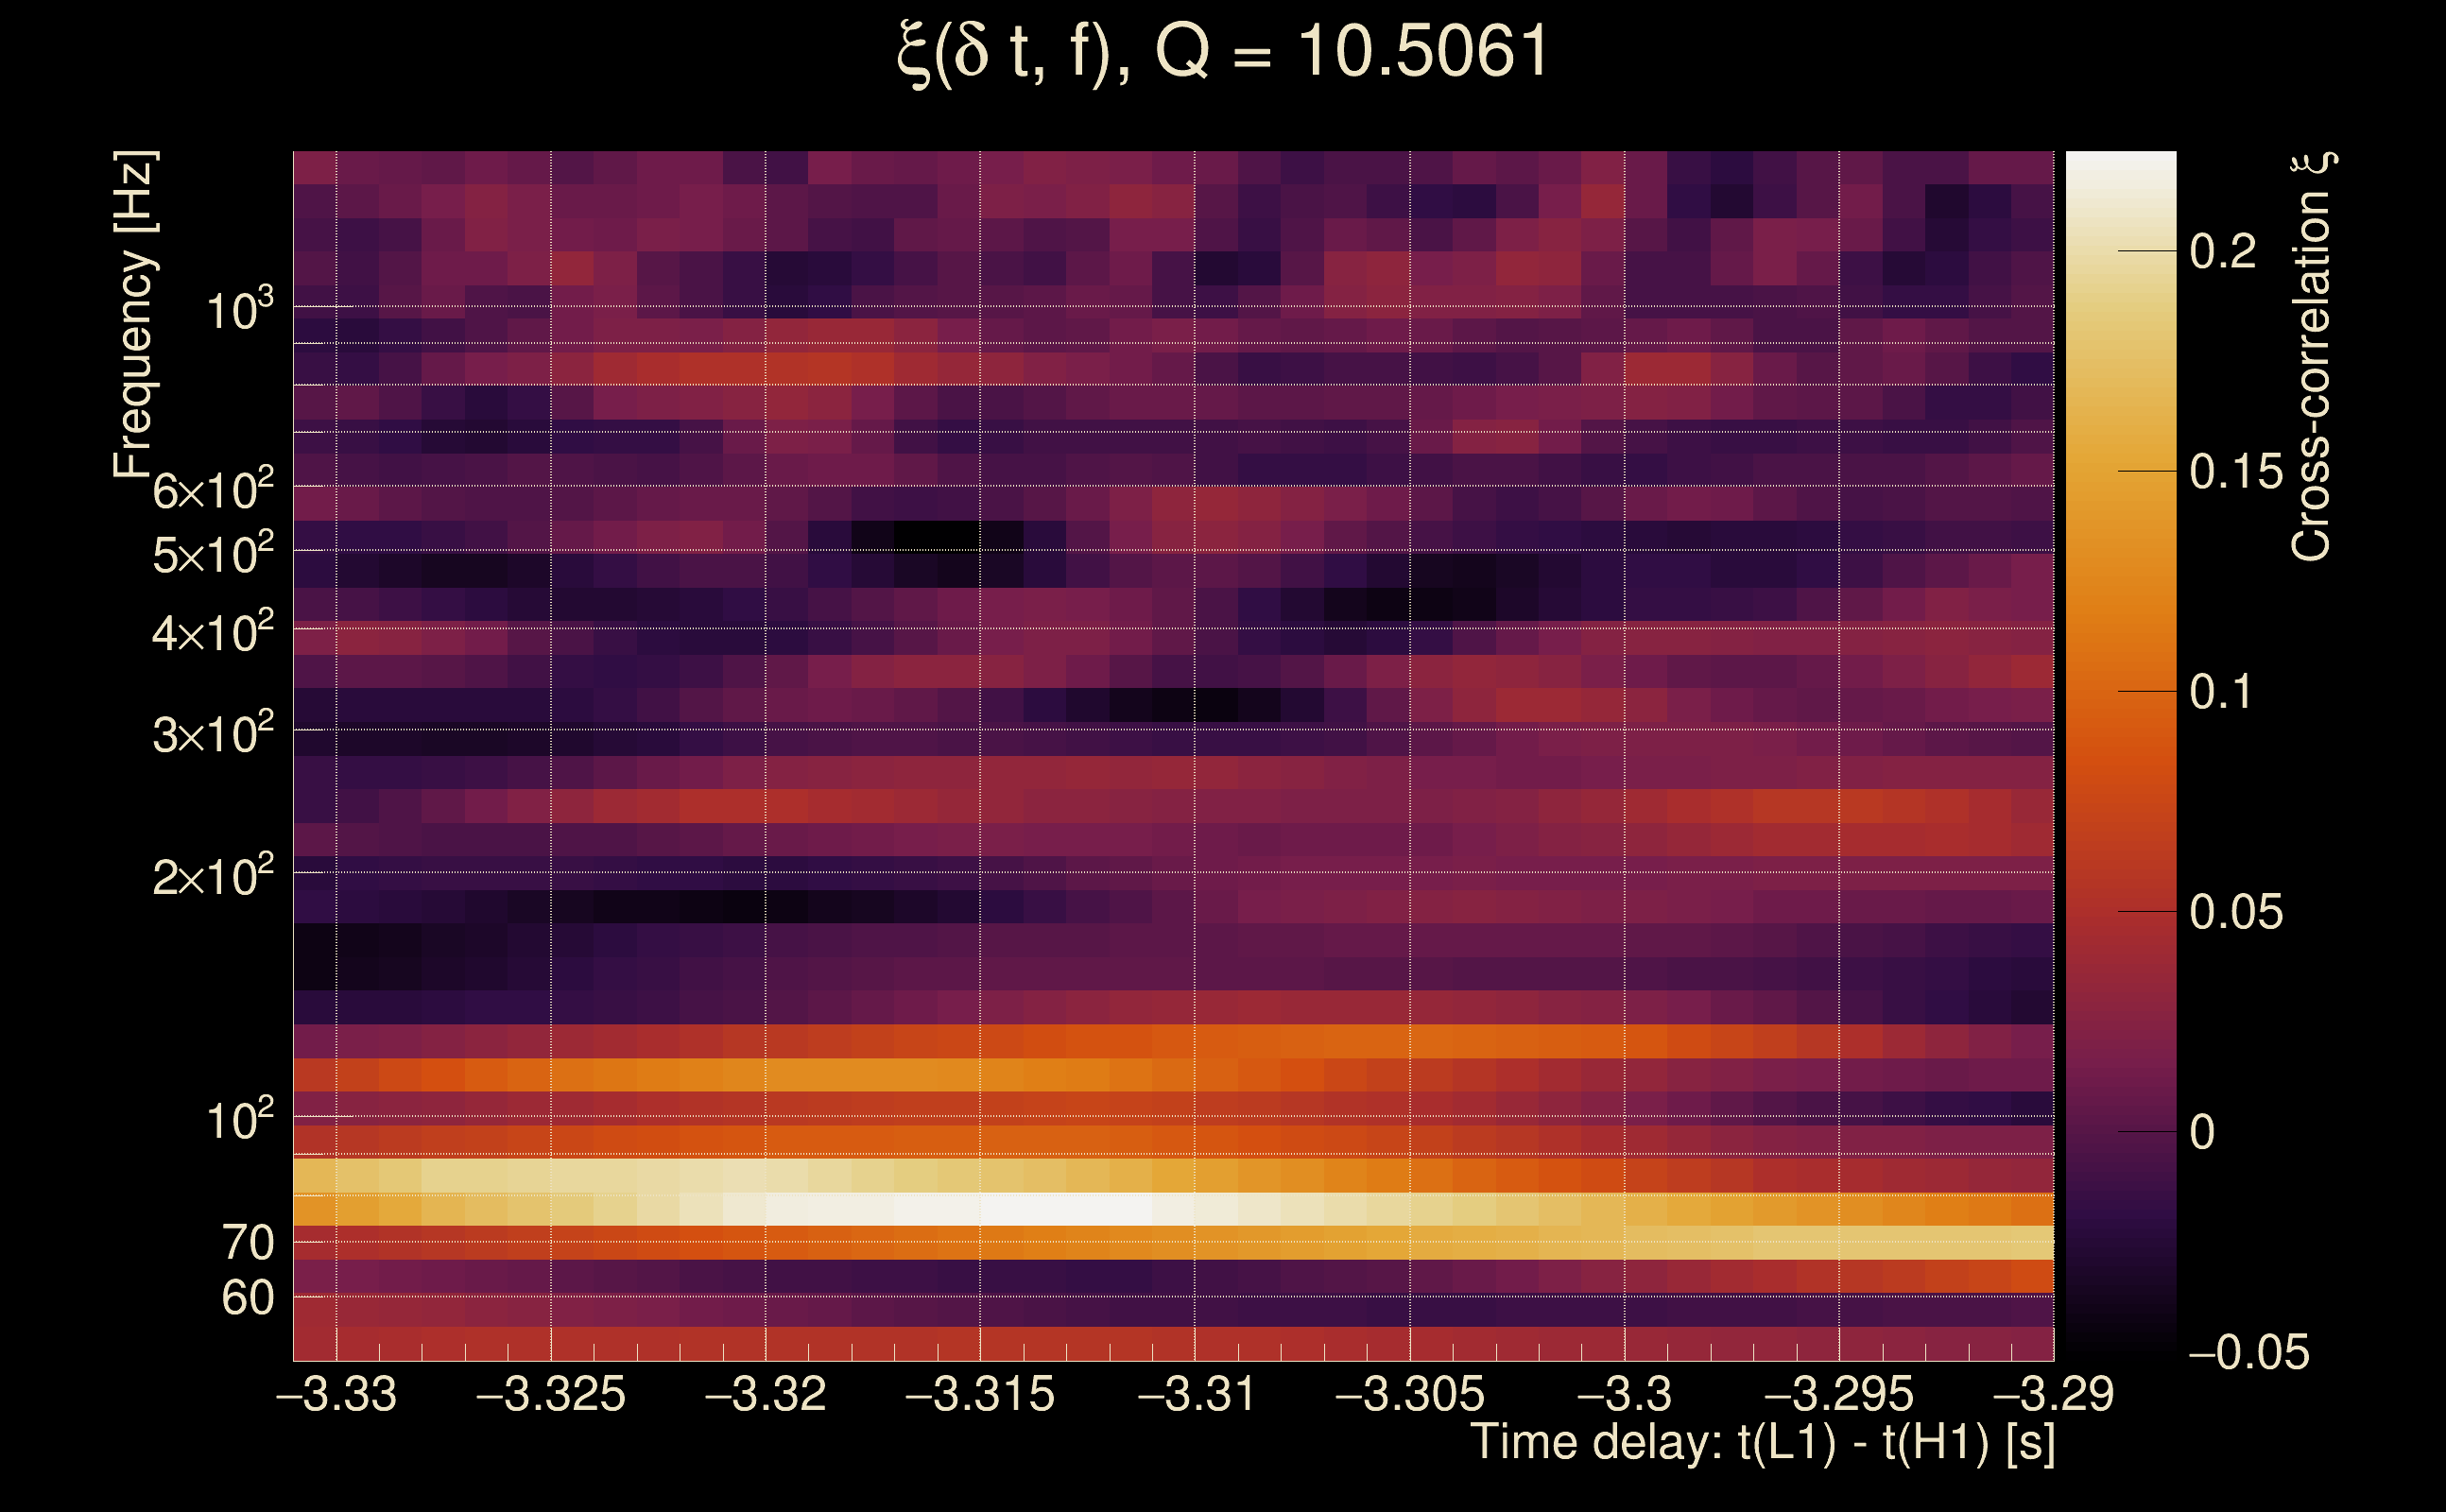
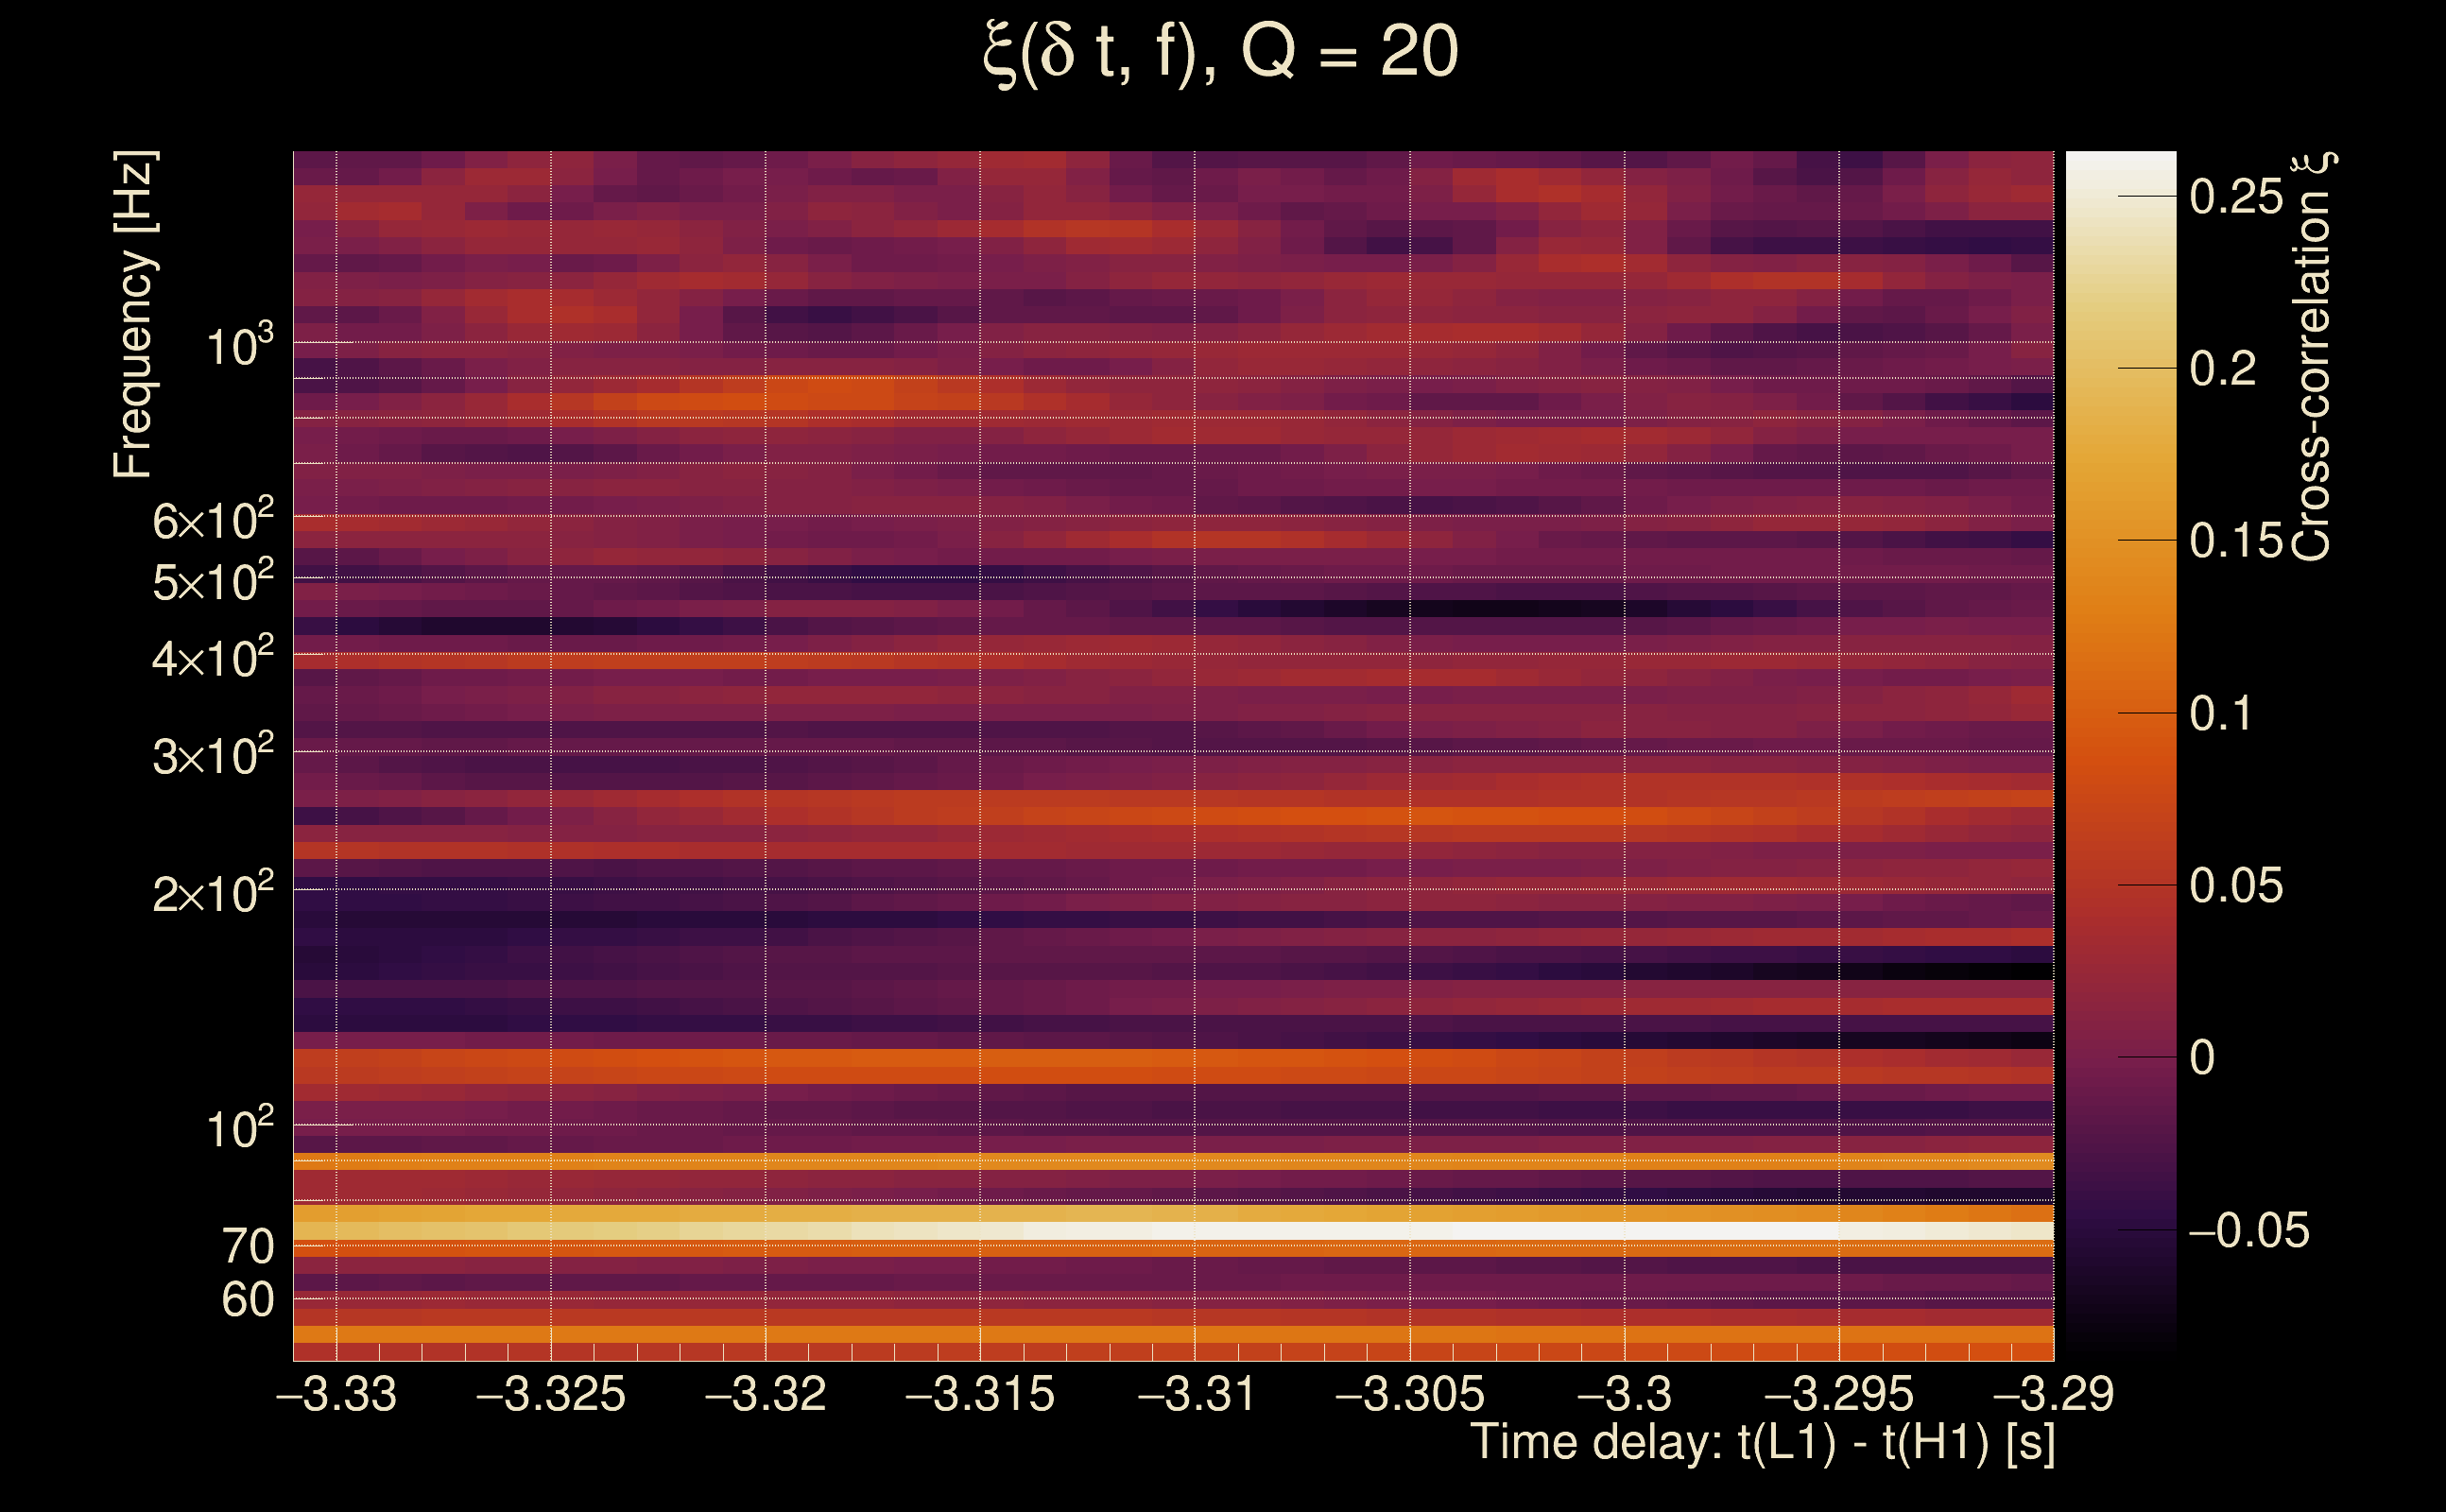
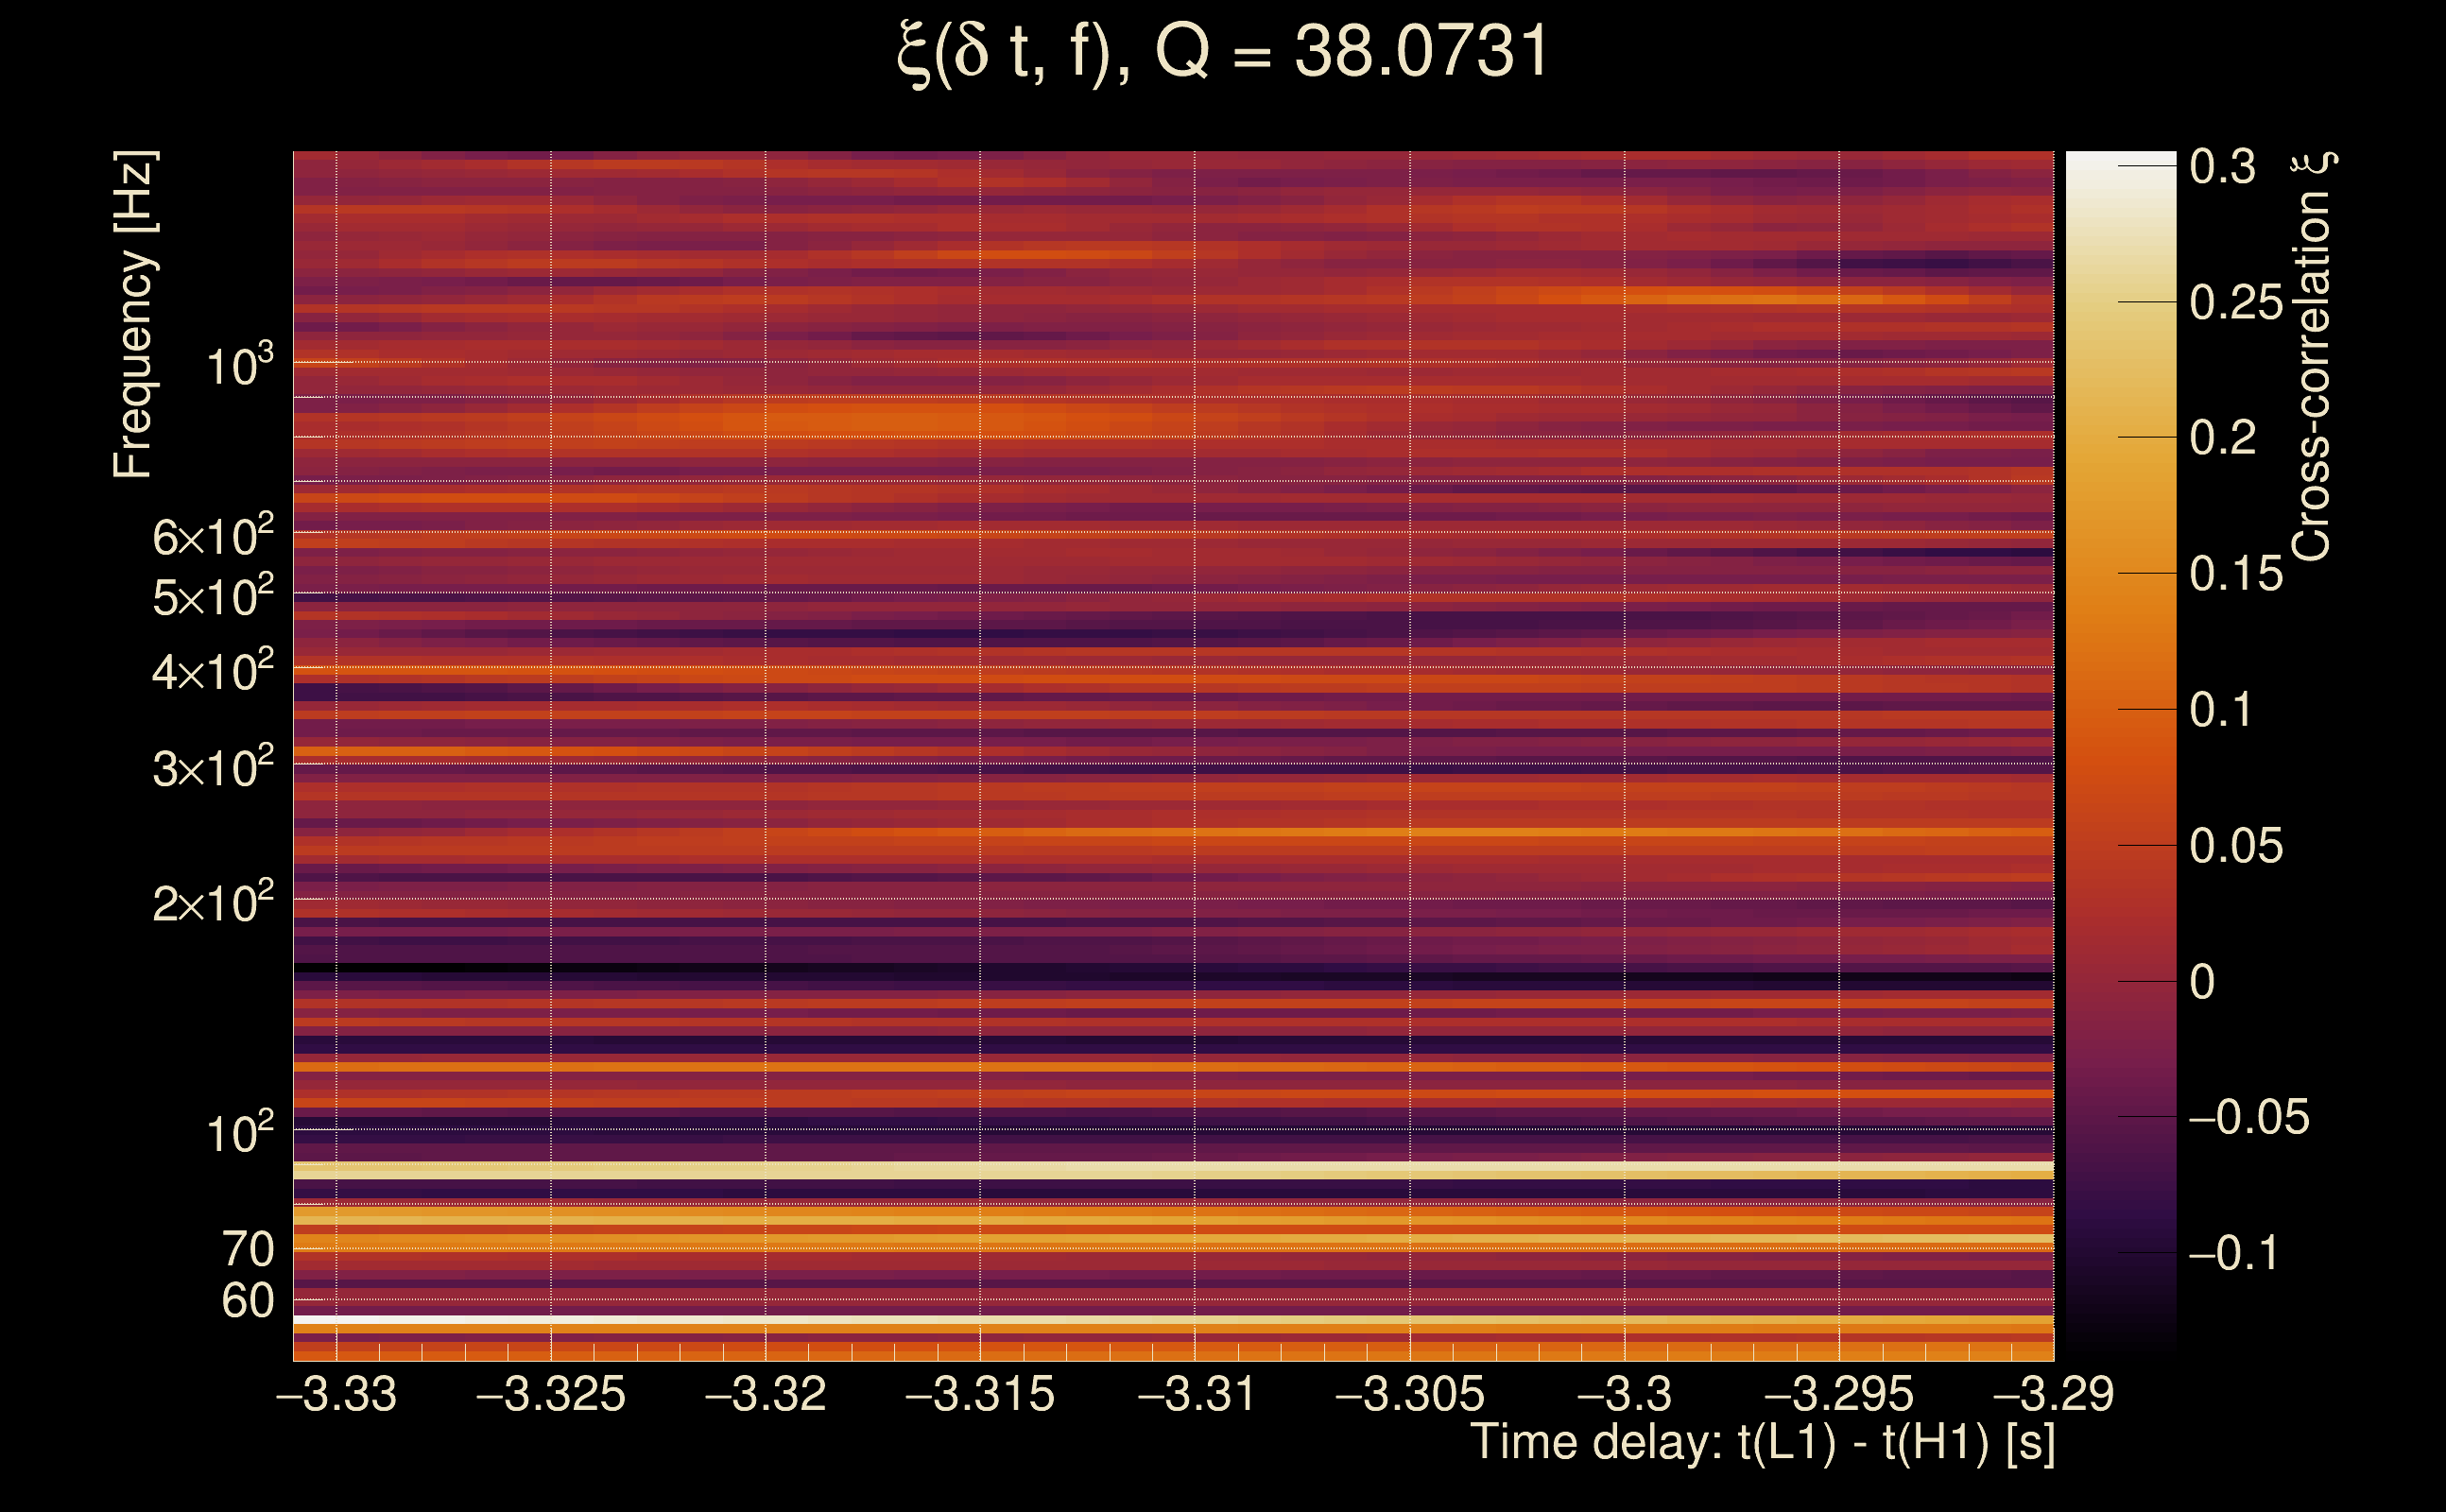
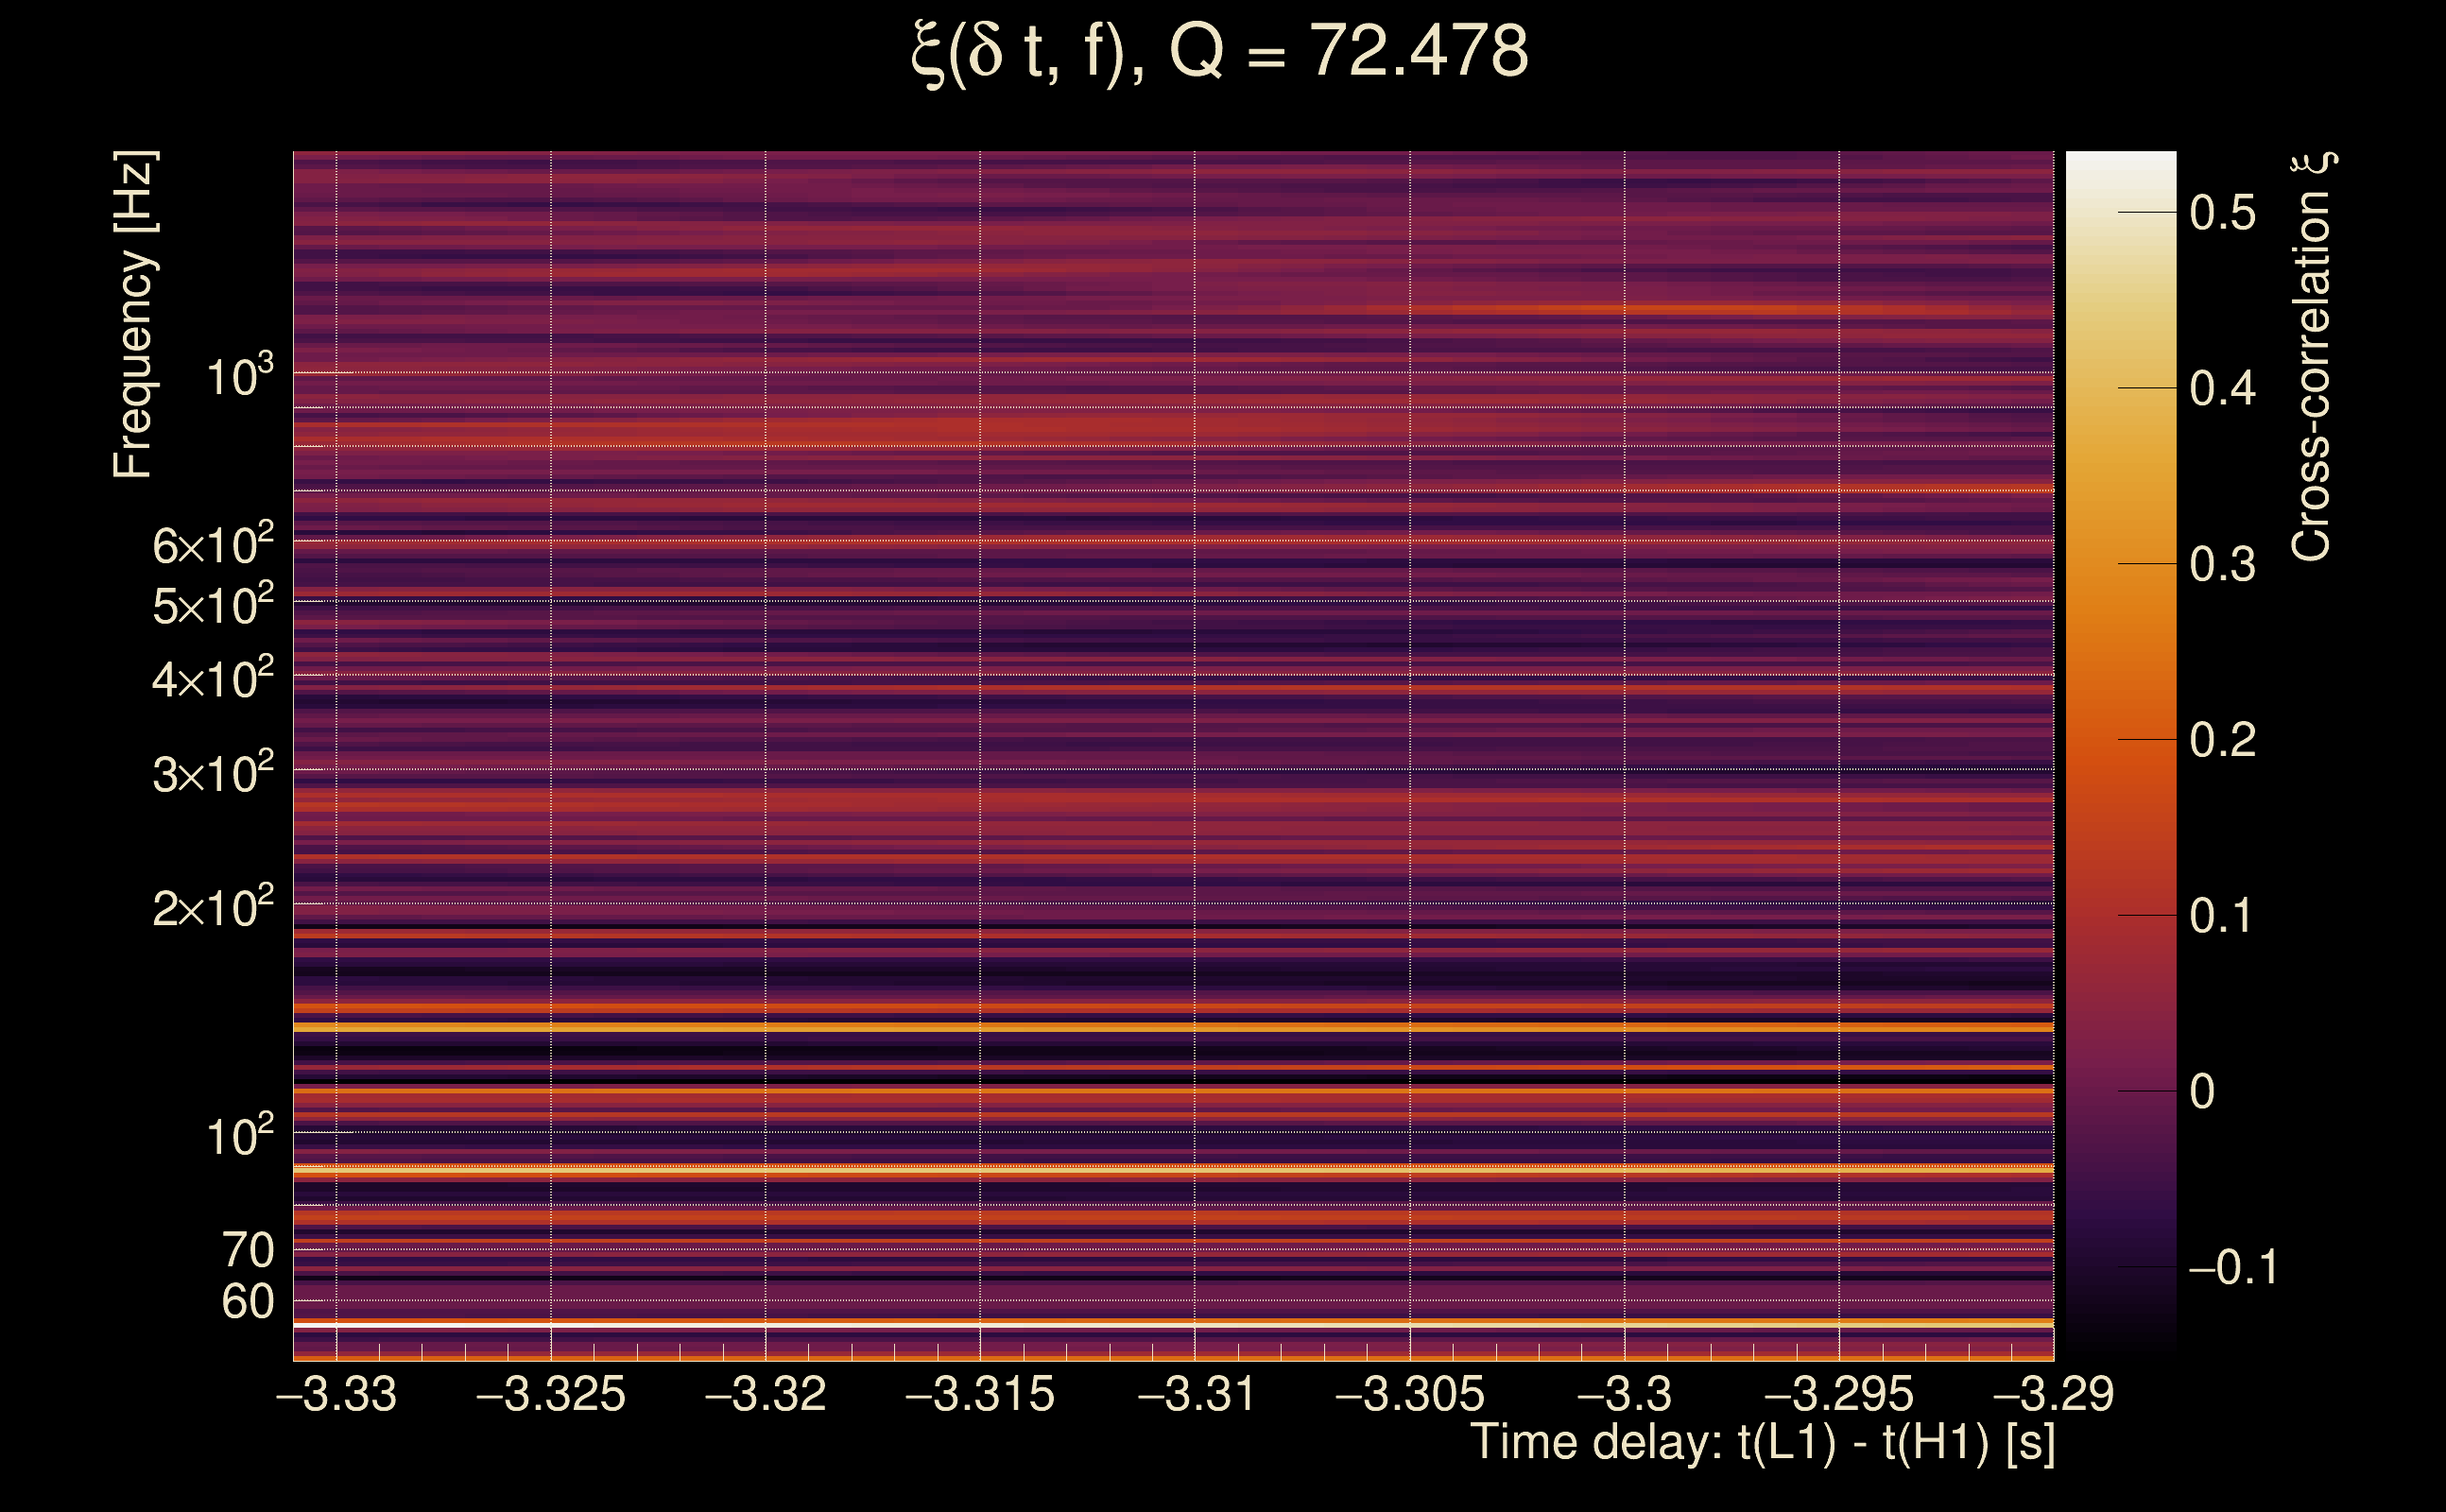
| Event time t(H1): | GPS = 1368334603 (Wed May 17 04:56:25 2023 ) → GPS = 1368334613 (Wed May 17 04:56:35 2023 ) |
| Event time t(L1): | GPS = 1368334603 (Wed May 17 04:56:35 2023 ) → GPS = 1368334613 (Wed May 17 04:56:35 2023 ) |
| Omicron analysis time window (H1): | GPS = 1368334600 → GPS = 1368334616 |
| Omicron analysis time window (L1): | GPS = 1368334600 → GPS = 1368334616 |
| Time delay between detectors t(L1) - t(H1): | -3.31047 s (slice index = 180 / 217), δt_gw = 0.00152697 s |
| Time delay standard deviation: | 0.0907883 s |
| [targeted mode] Time delay probability: | 0.956527 (0.0545128 sigmas), δt_target = 0.000552177 s |
| Frequency: | 119.234 Hz |
| Ξ: | 0.01521 ± 0.0353526 (variance = 0.00124981): Q0: 0.14033, Q1: 0.168874, Q2: 0.170917, Q3: 0.0975477, Q4: 0.0859453 |
| Rank: | R_A = 0.0113936 |
| Log of amplitude ratio (L1/H1): | -0.175318, variance = 0.391843 (L1/H1: -0.12172, variance = 0.676665, H1/L1: 0.234104, variance = 0.908757) |
| Amplitude ratio (L1/H1): | 0.839191 ⋇ 1.87007 (L1/H1: 0.885396 ⋇ 2.2764, H1/L1: 1.26378 ⋇ 2.59422) |
| Amplitude ratio H1|L1 compatibility (probability): | 0.928879 |
| Antenna factor probability: | 0.843093 |
| Number of rejected frequency rows: | Q0: 16 / 18, Q1: 32 / 36, Q2: 64 / 70, Q3: 125 / 134, Q4: 249 / 258 |
| Maximum signal-to-noise ratio: | H1: 5.14093, L1: 4.90881 |
| SNR variance: | H1: 0.504702, L1: 0.519305 |
| Click here for a zoomed plot | Click here for a zoomed plot | Click here for a zoomed plot | Click here for a zoomed plot | Click here for a zoomed plot |
 |
 |
 |
 |
 |
 |
 |
 |
 |
 |
 |
 |
 |
 |
 |
 |
 |
 |
 |
 |
 |
 |
 |
 |
 |
 |
 |
 |
 |
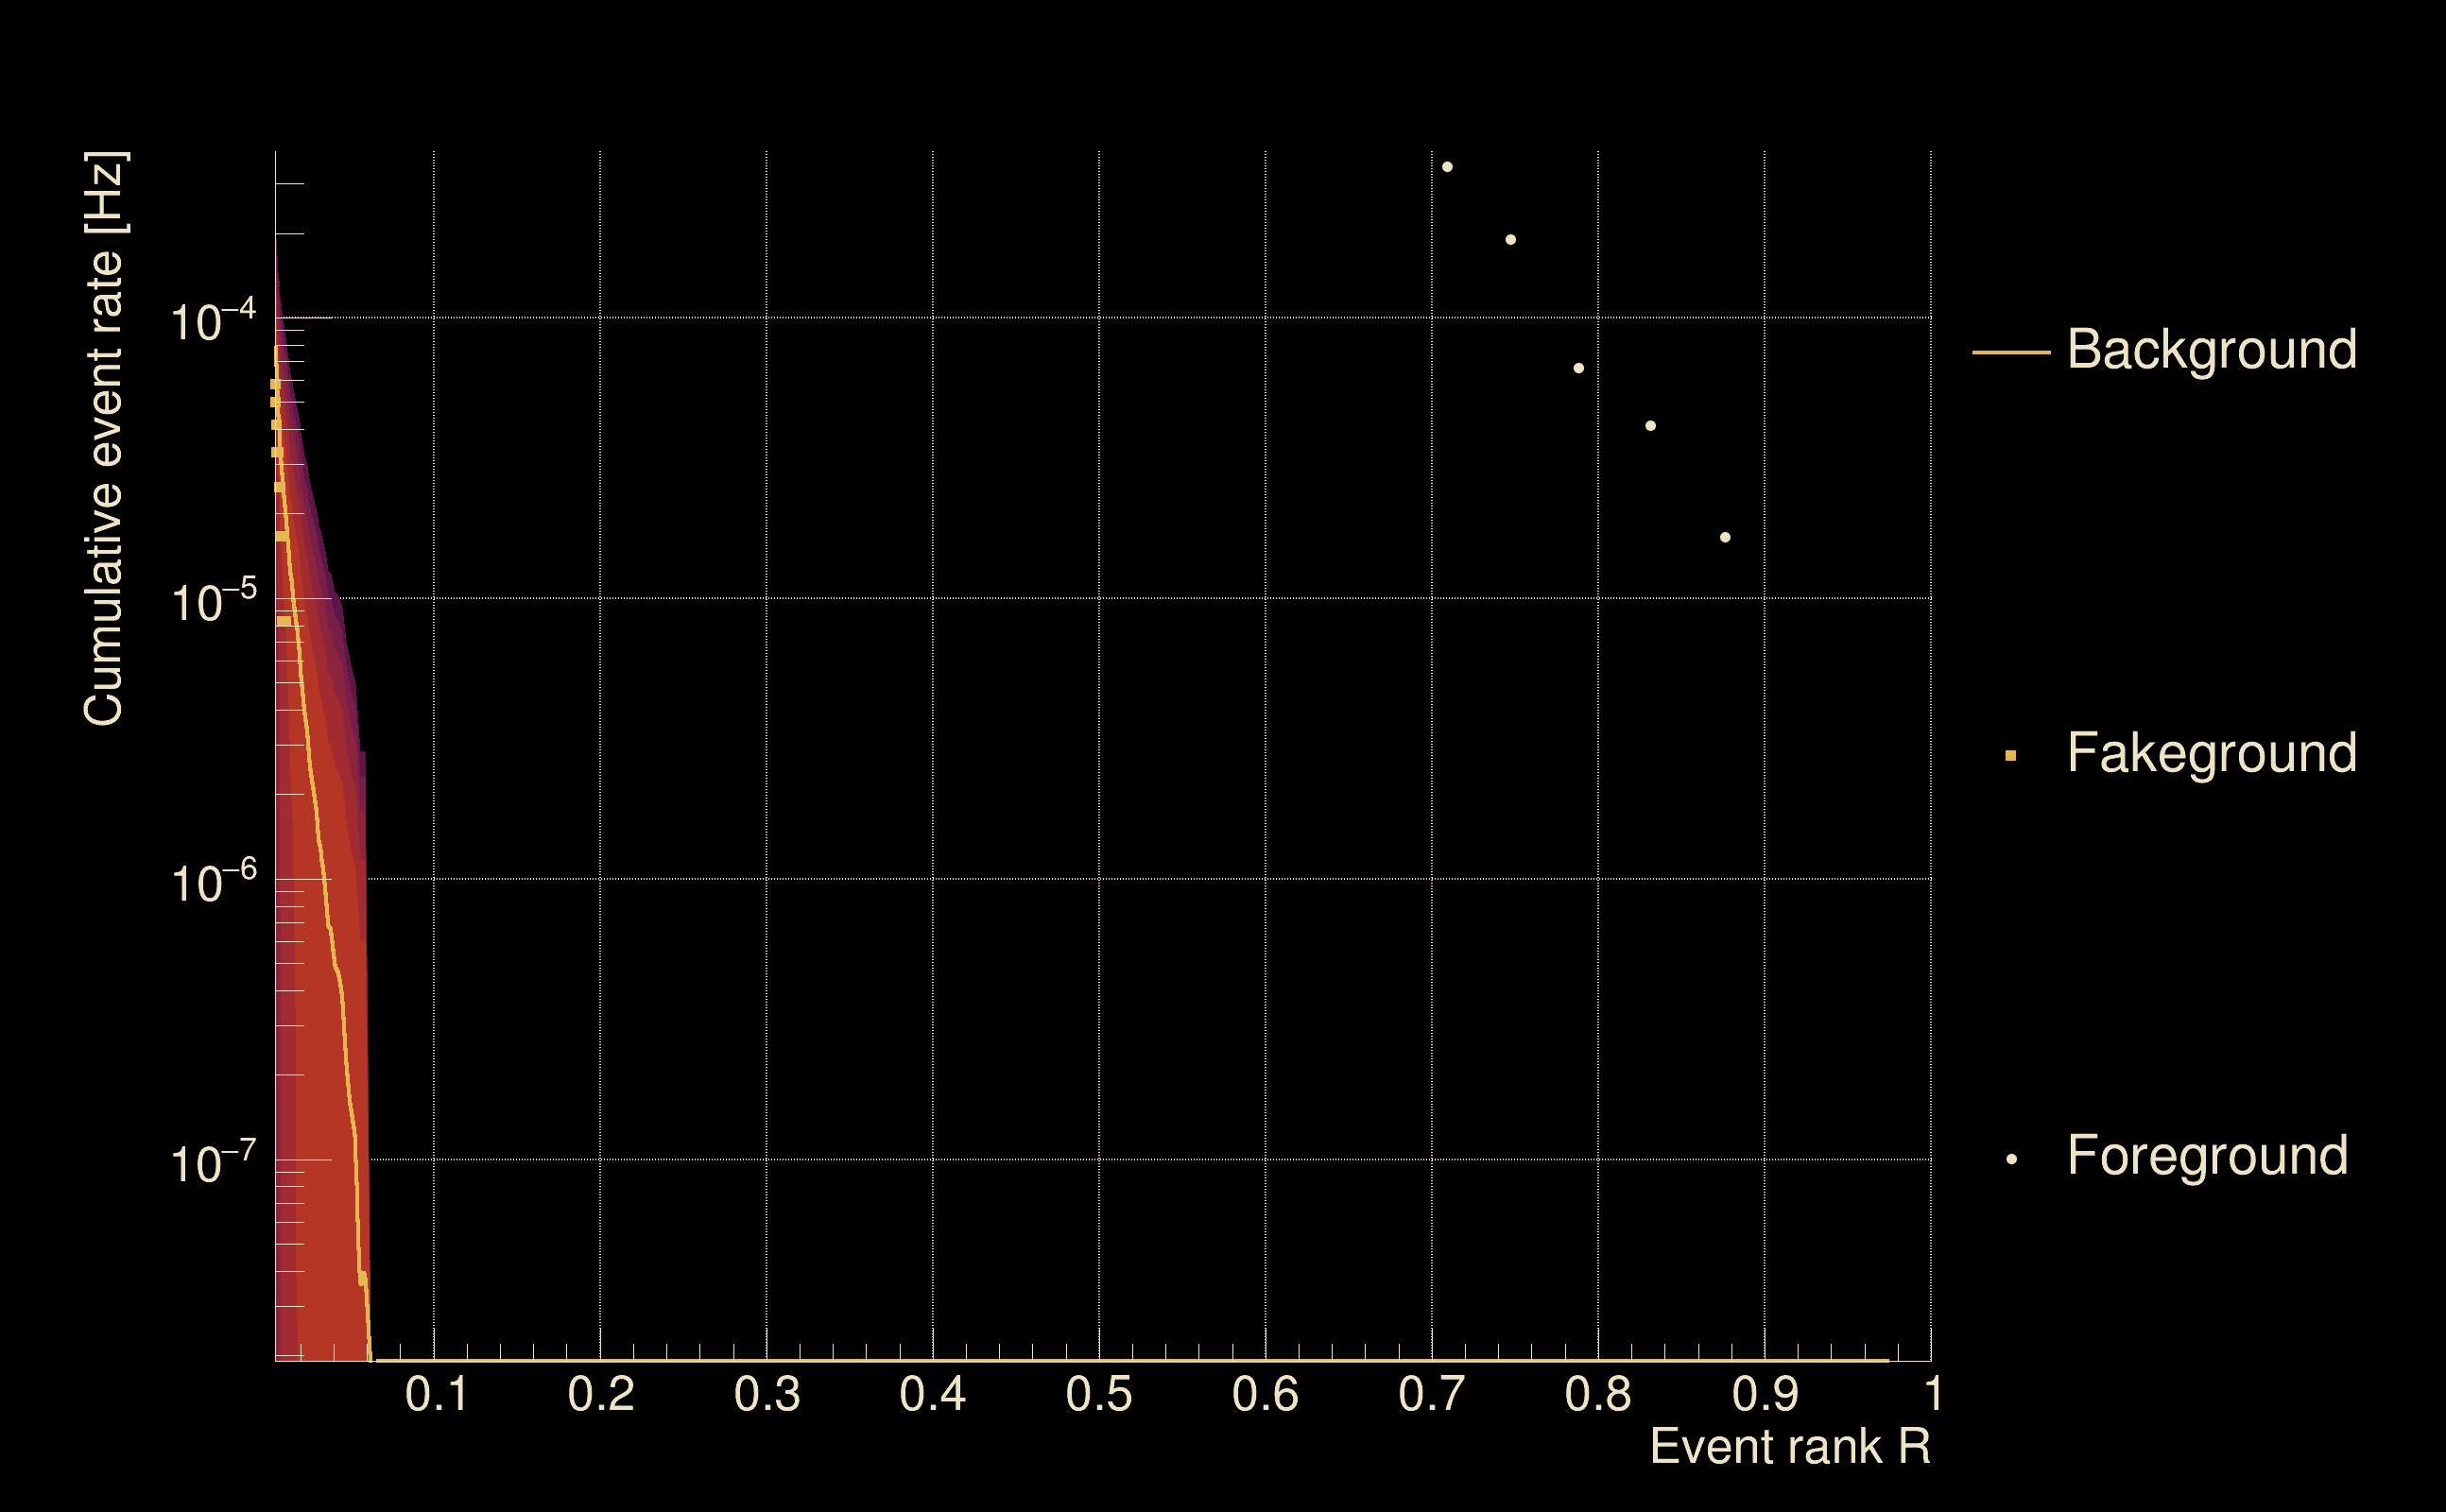
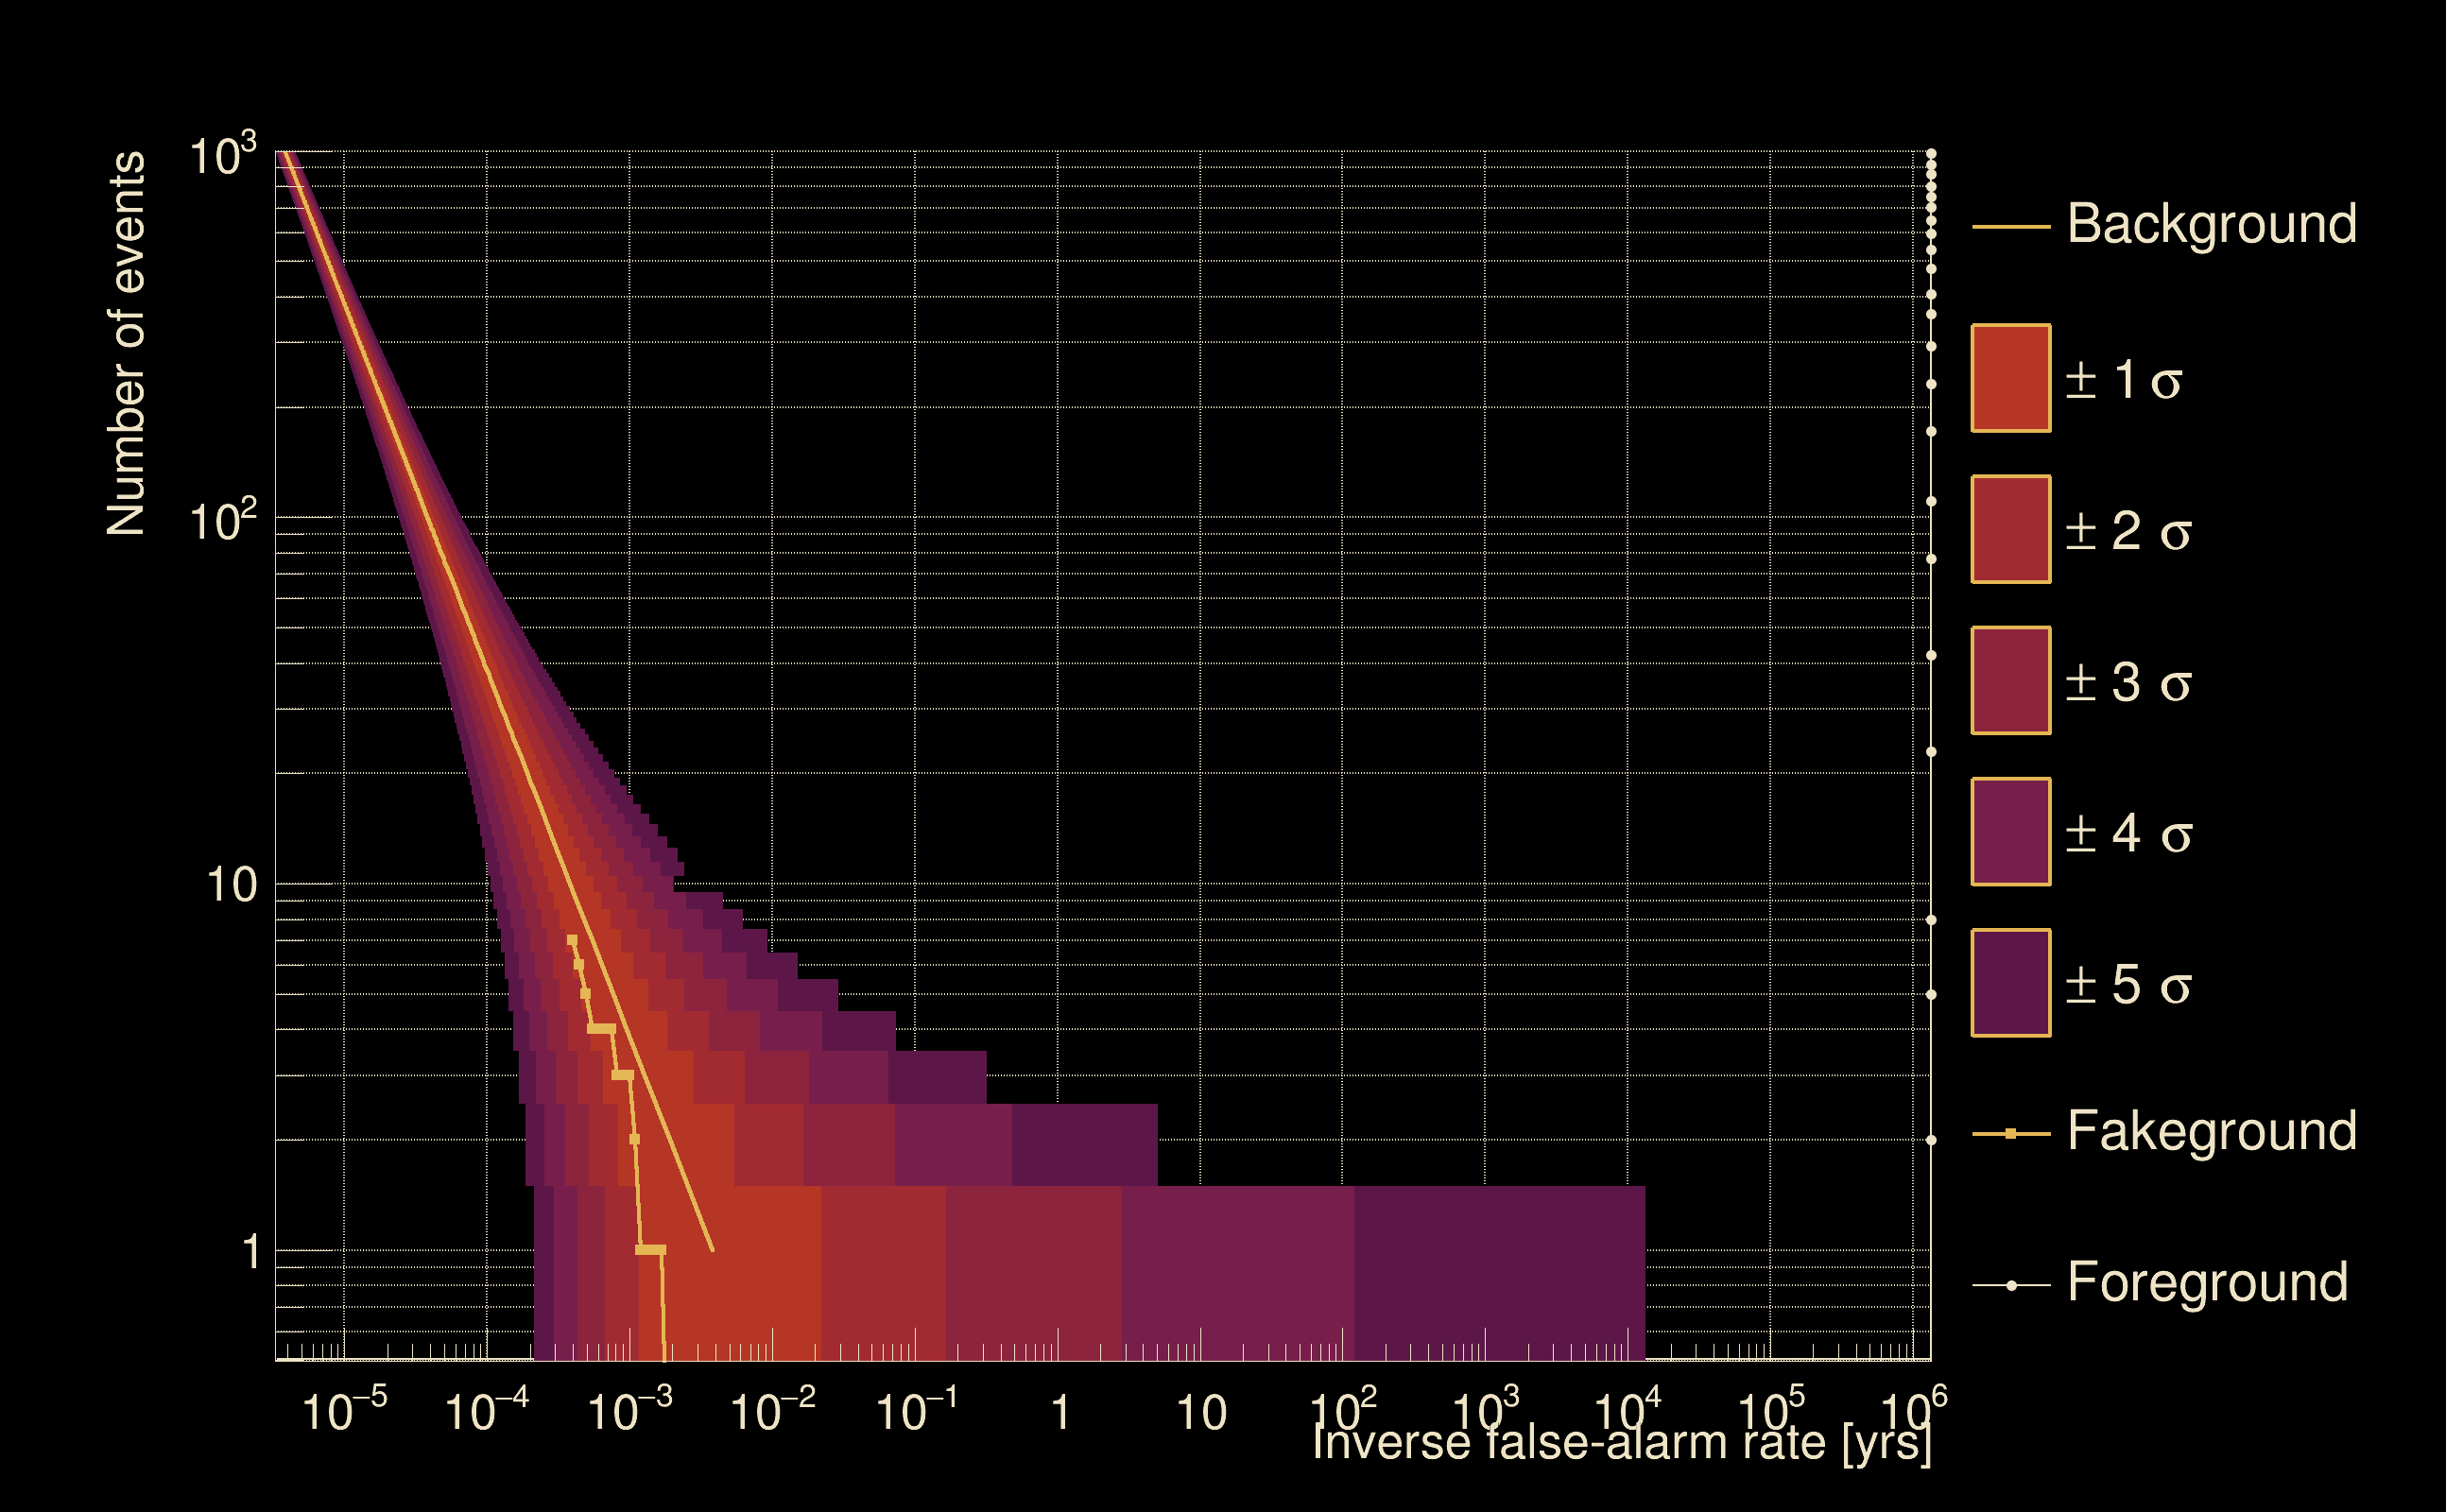
| Detection threshold: | R > 0.0314201 |
| False-alarm rate above that detection threshold: | 1.25107e-06 |
| Alternative threshold at 1/1000 yrs: | R > 0.0587626 |
| Alternative threshold at 1/100 yrs: | R > 0.0587626 |
| Alternative threshold at 1/10 yrs: | R > 0.0587626 |
| Alternative threshold at 1/1 yr: | R > 0.0587626 |
| Alternative threshold at 1/1 d: | R > 0.0140721 |
 |
|
 |
 |
 |
 |
 |
 |
 |
 |
 |
 |
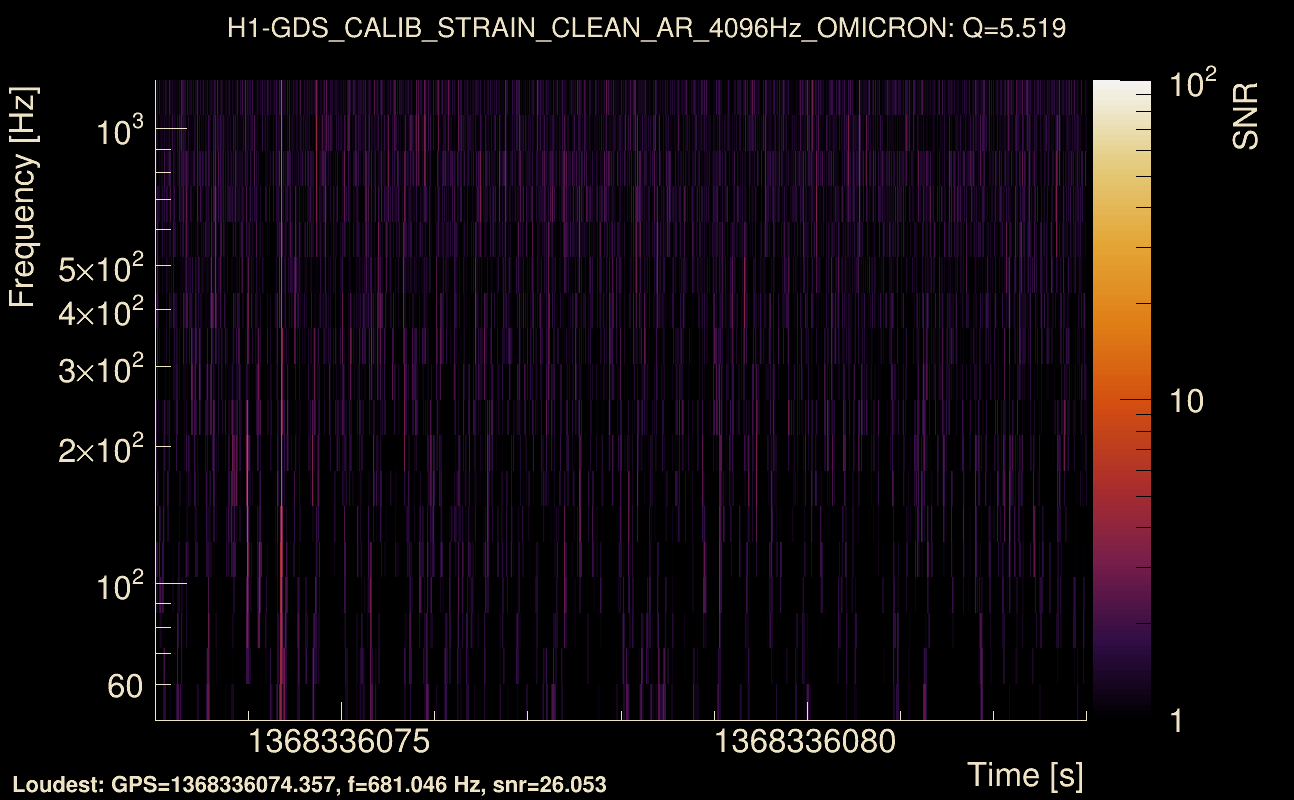
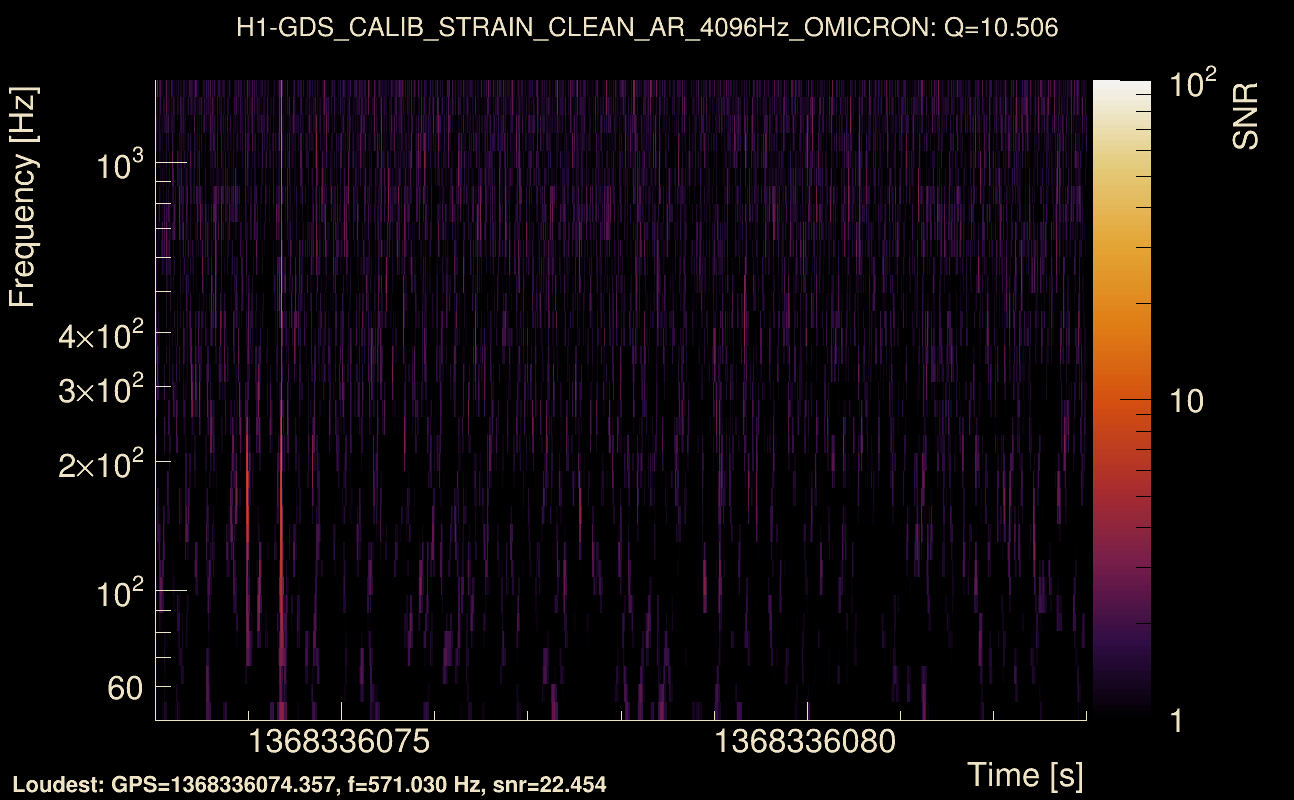
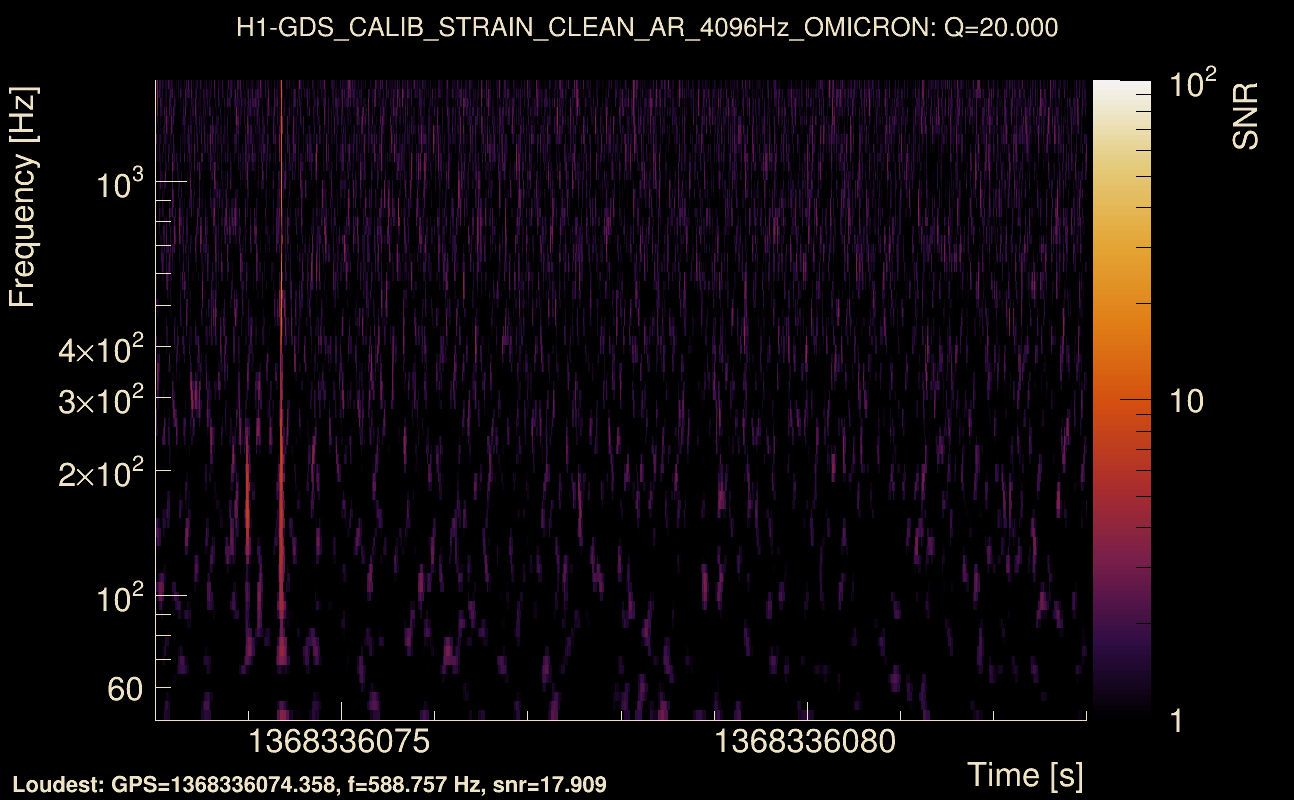
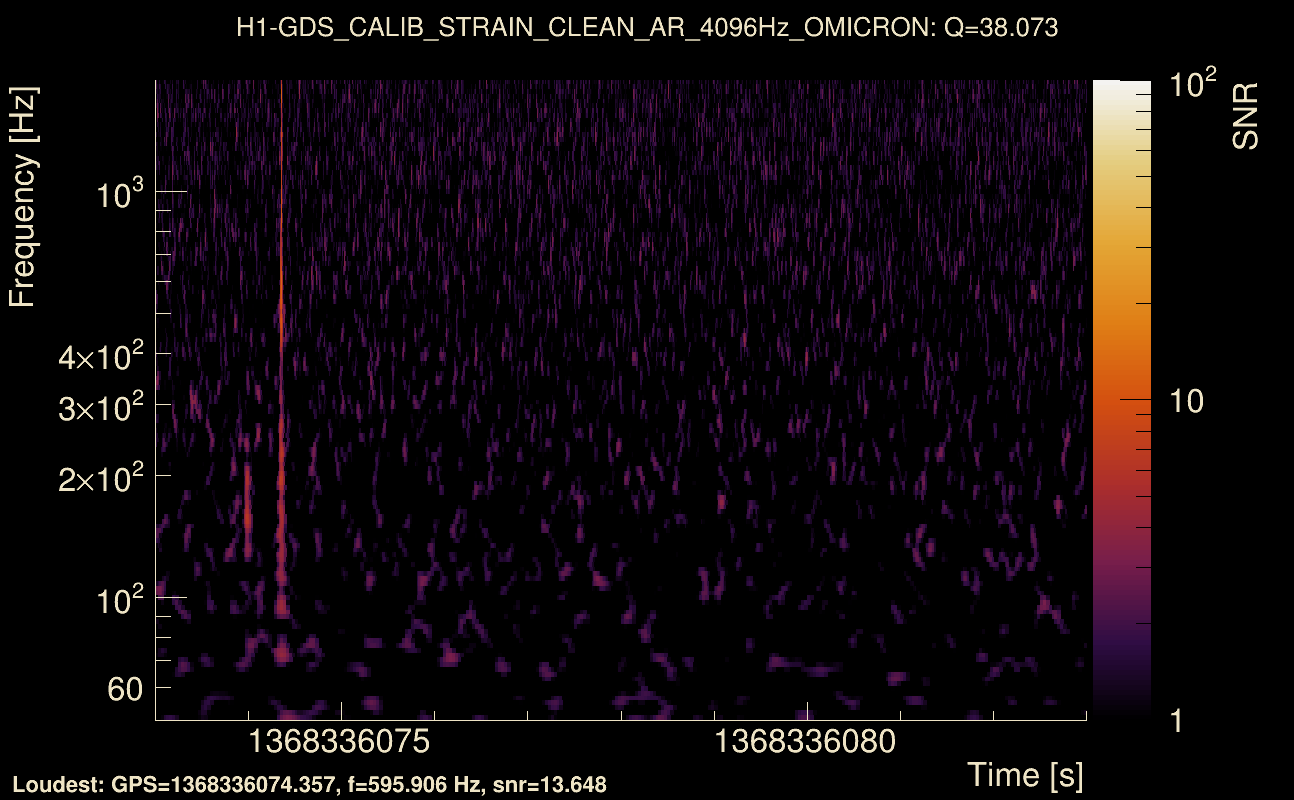
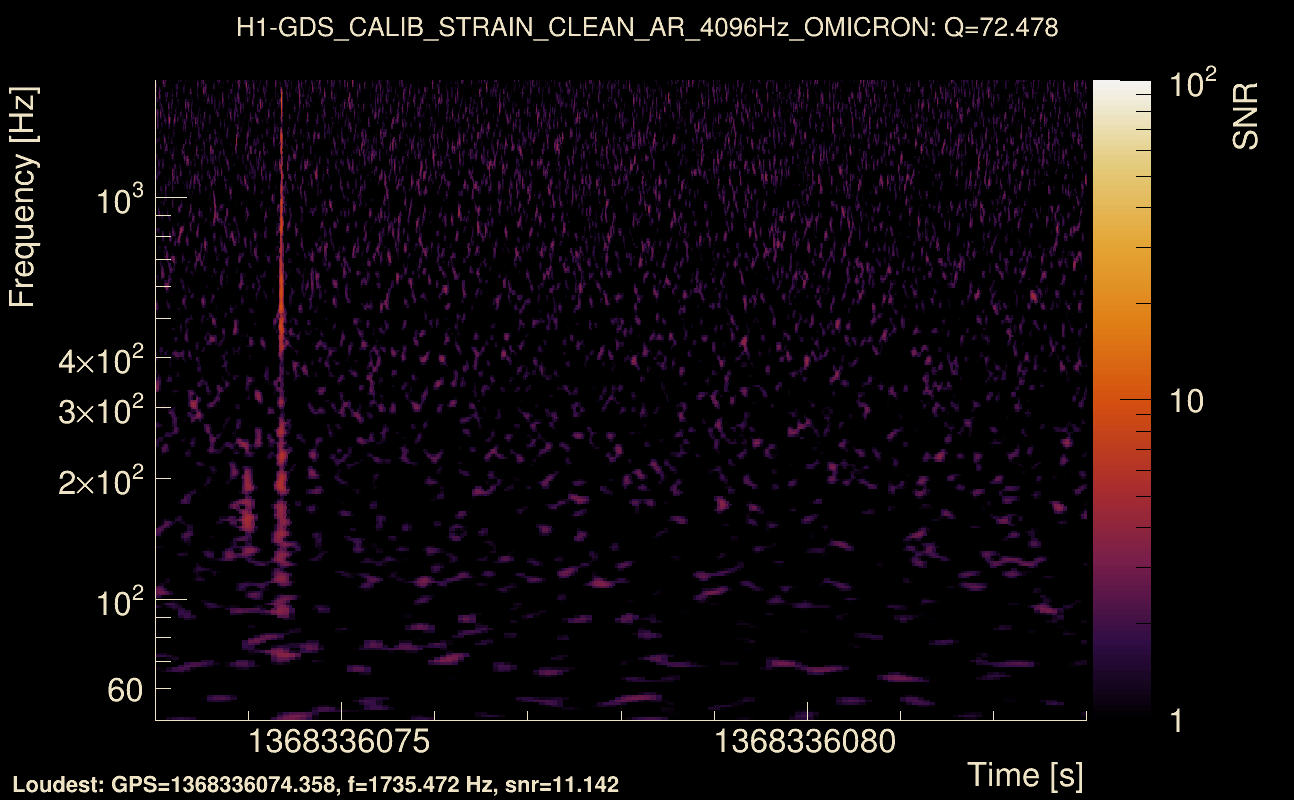
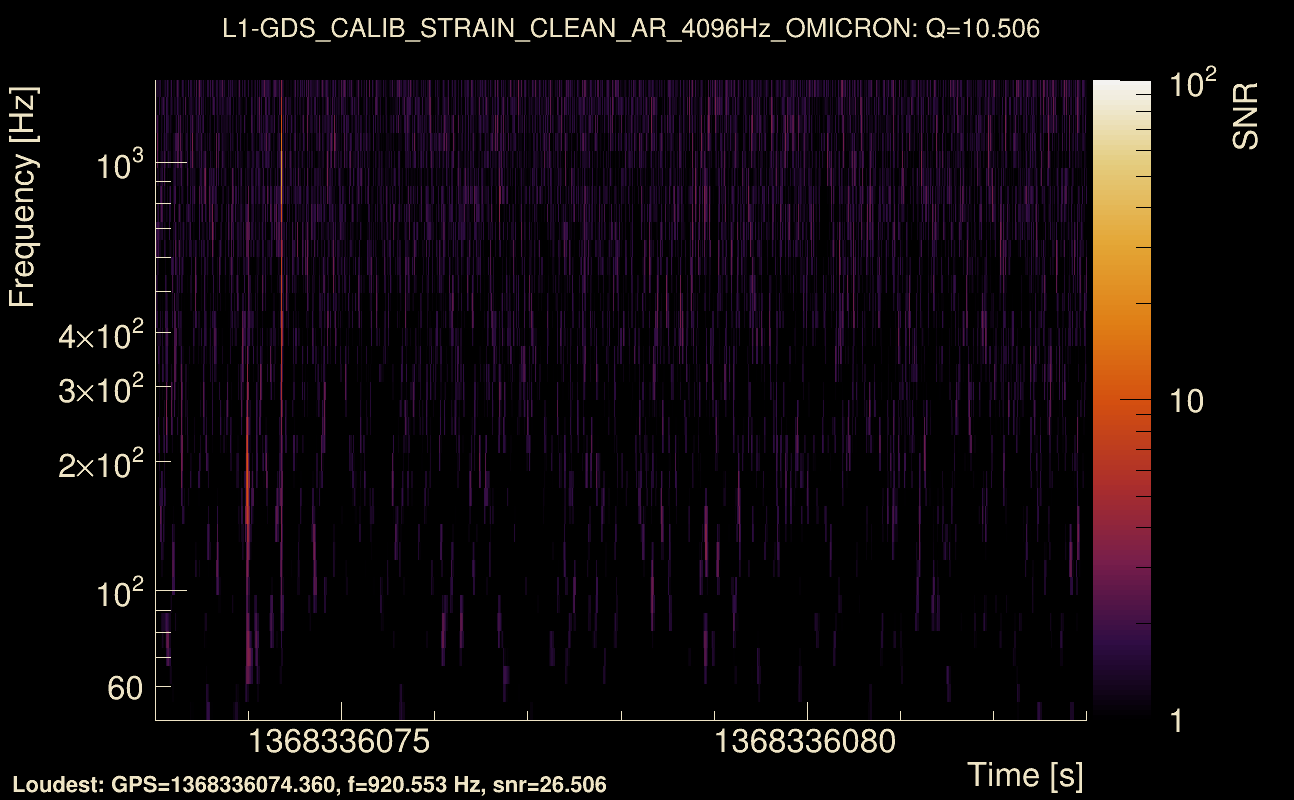
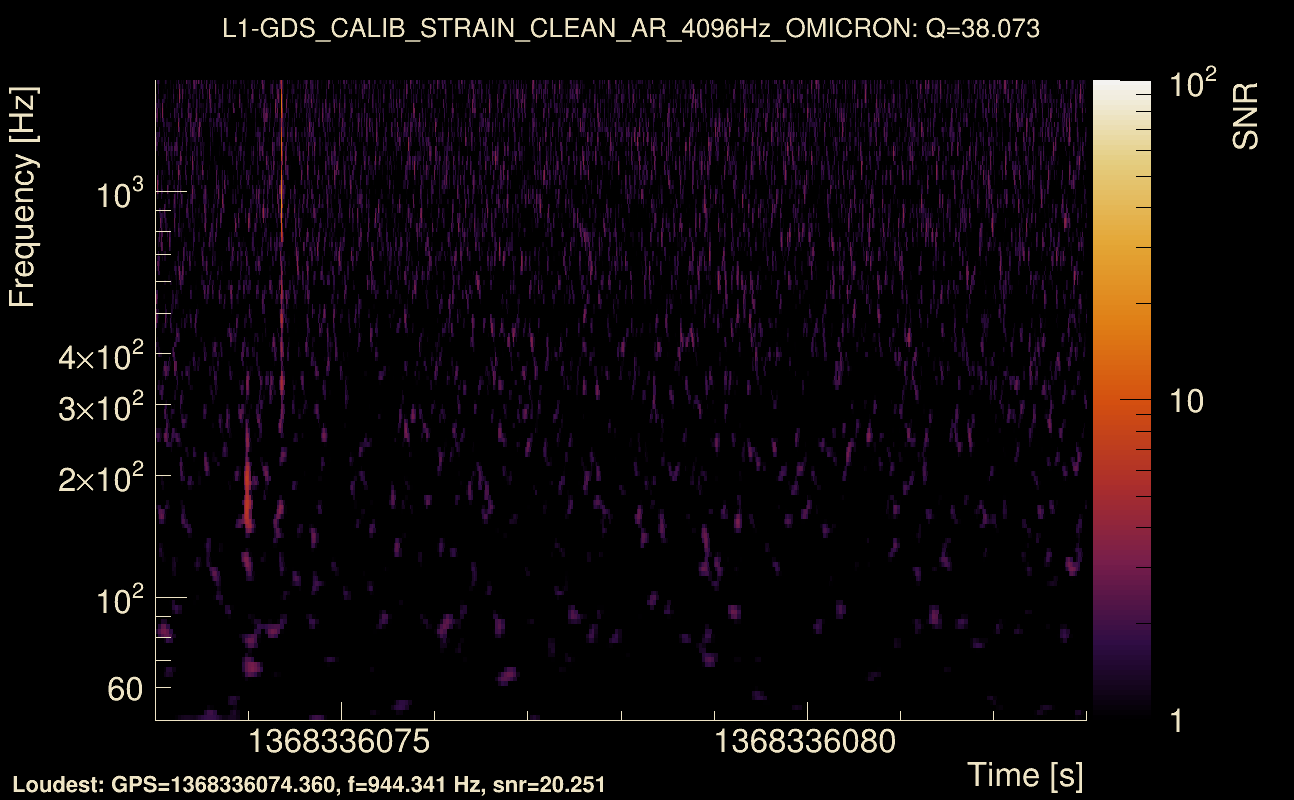
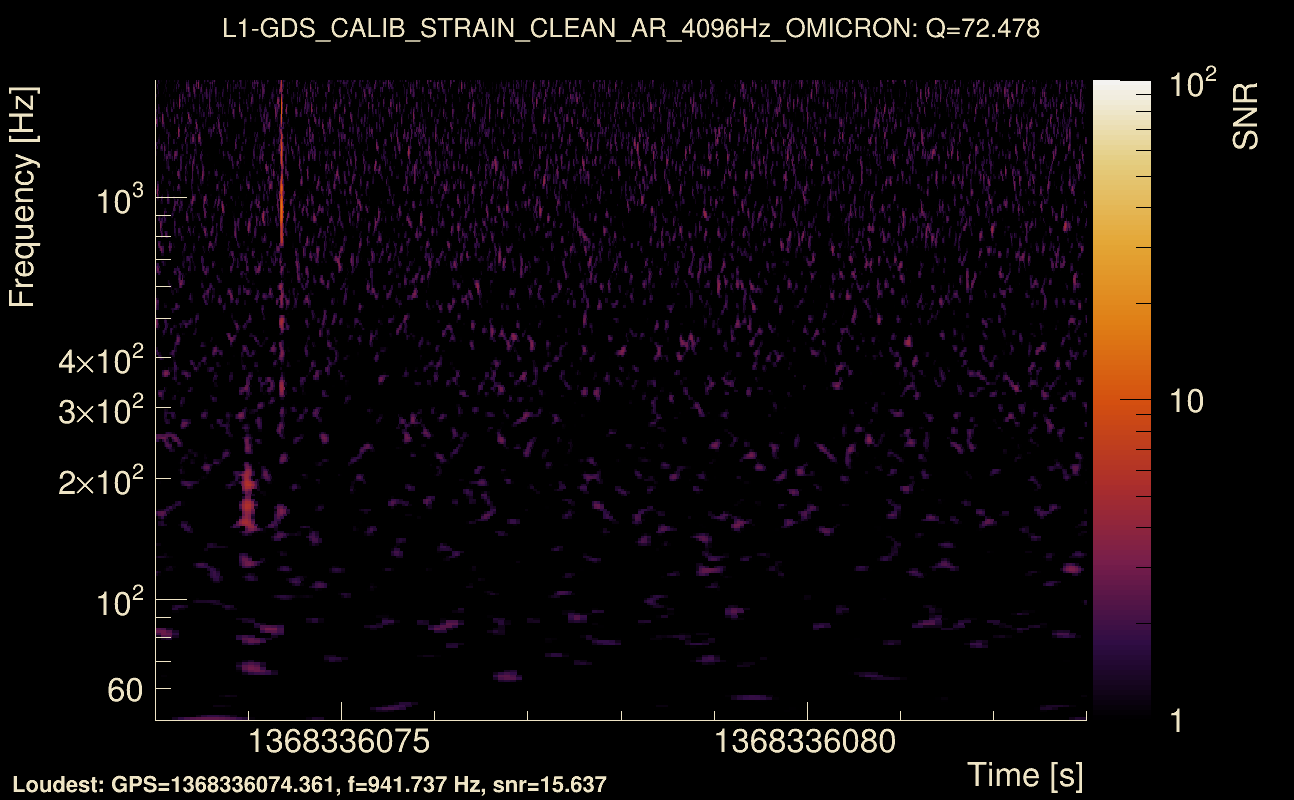
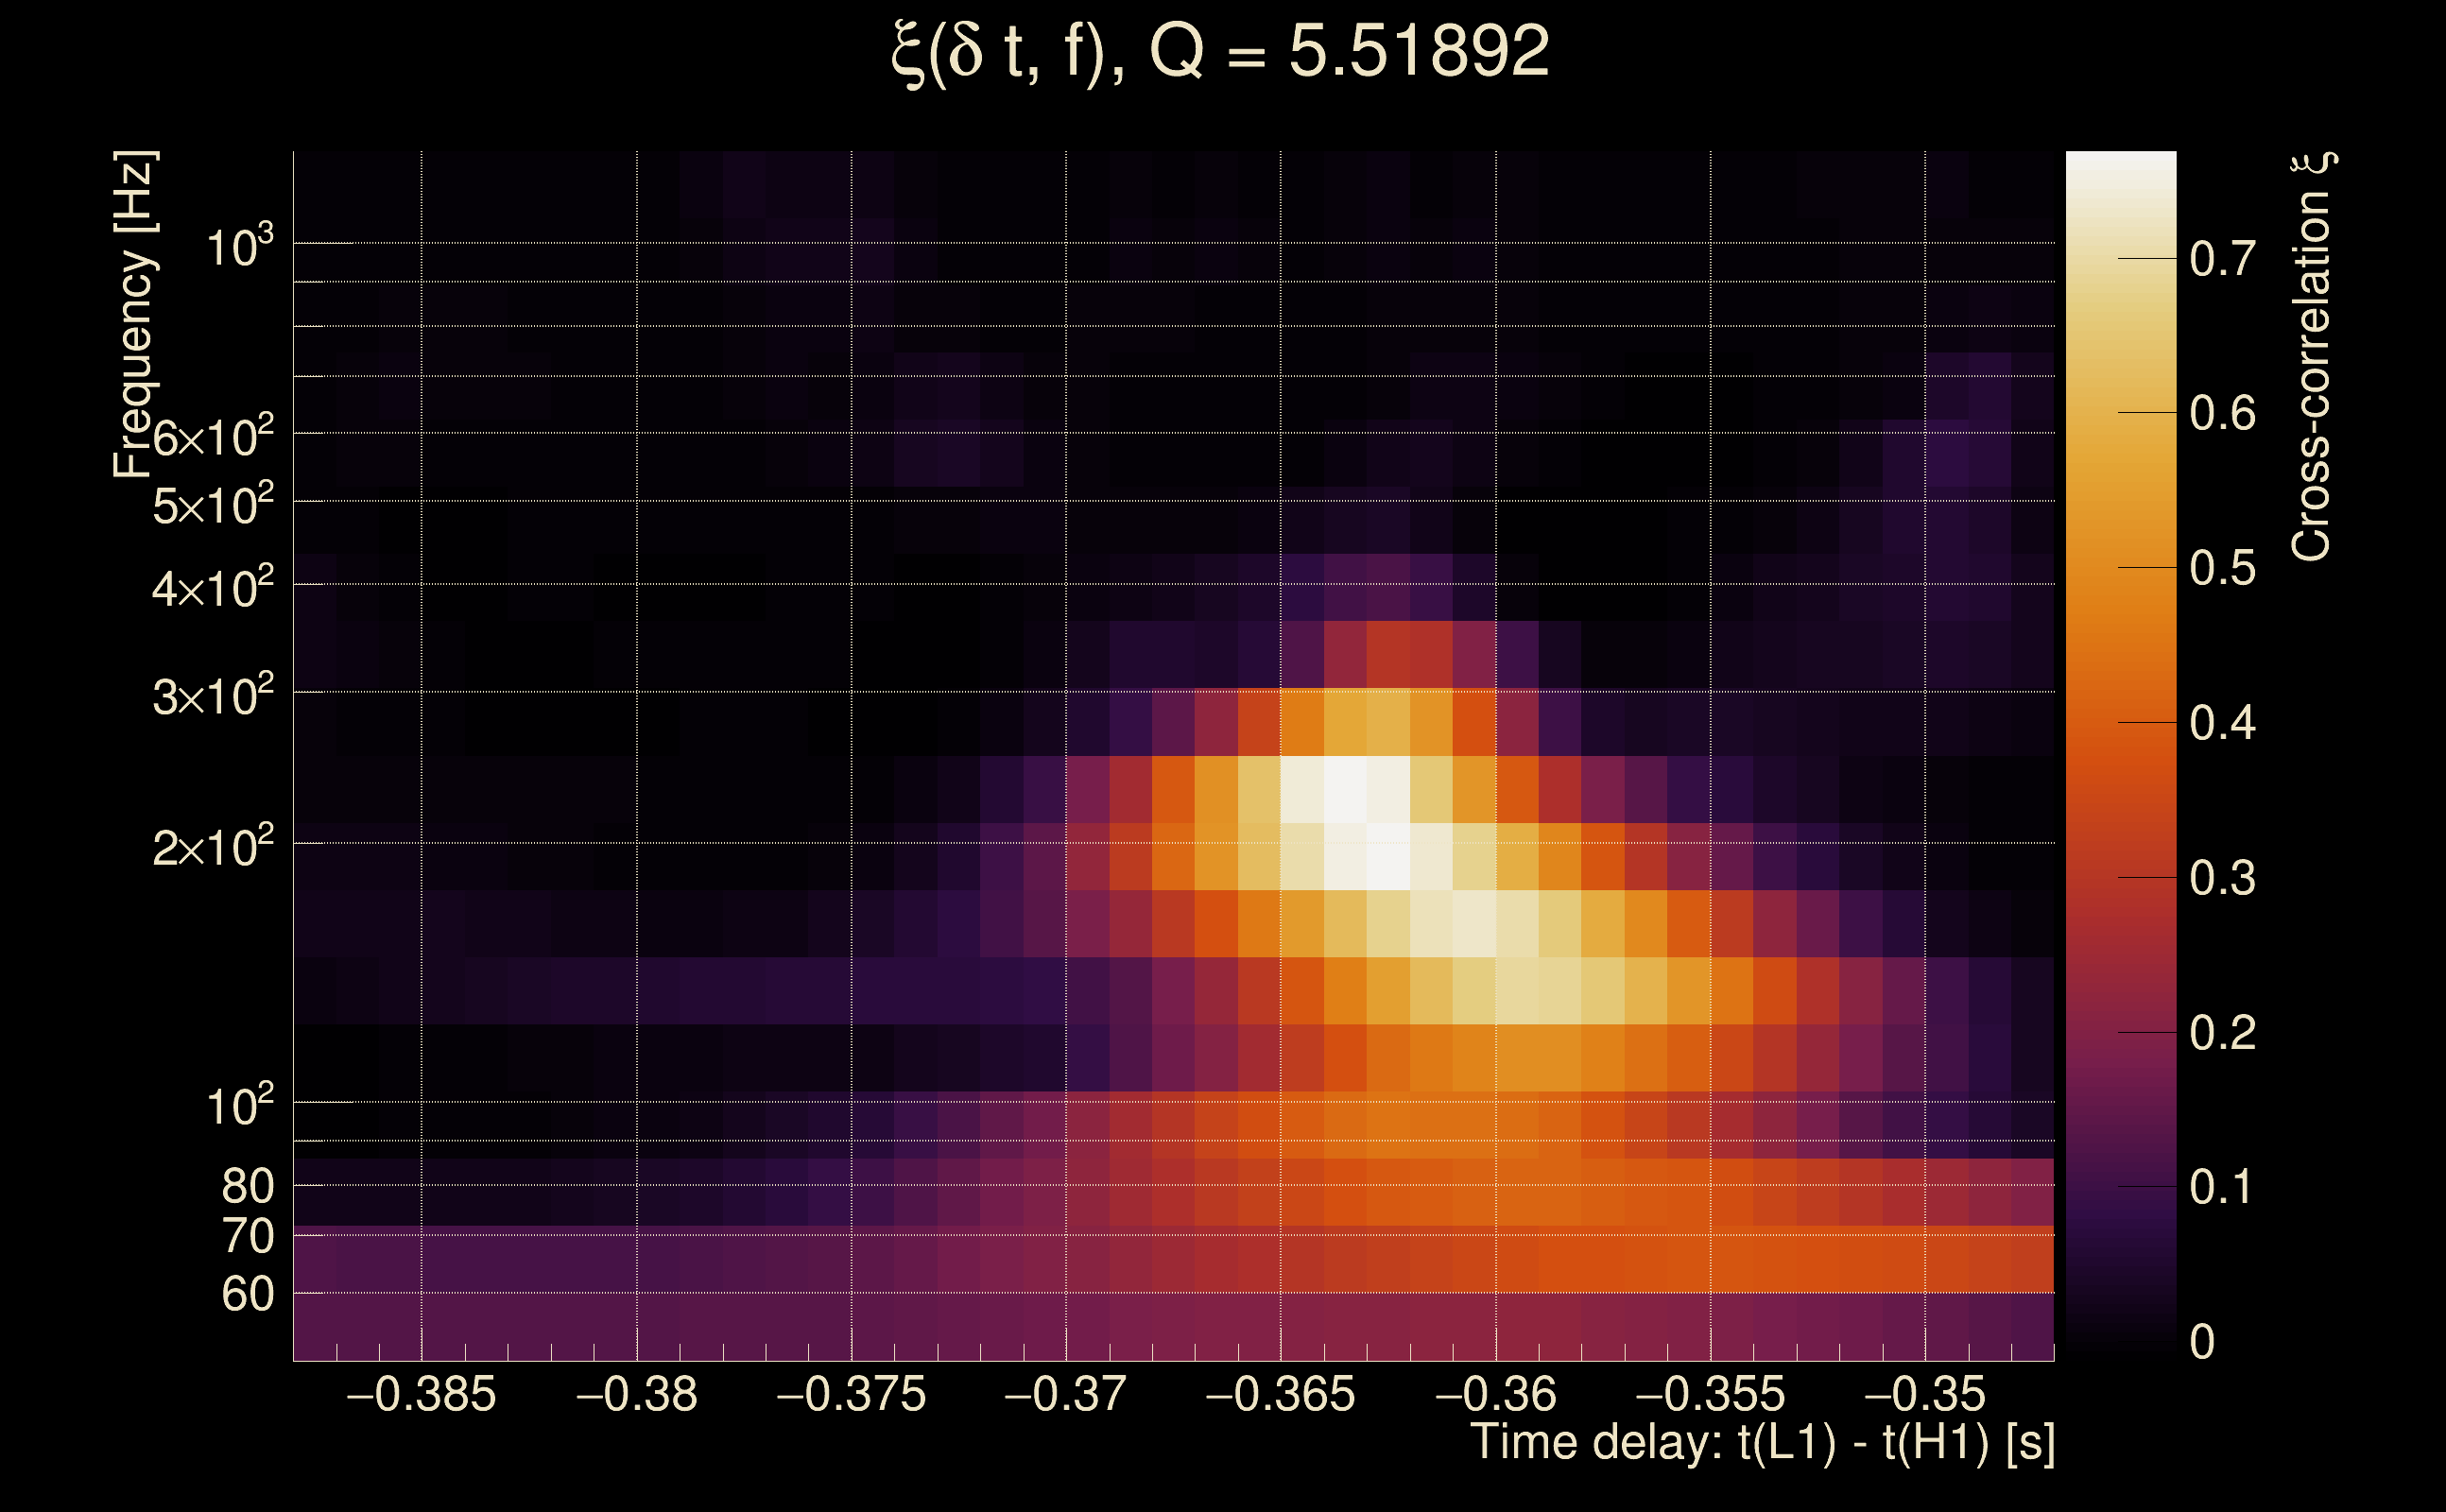
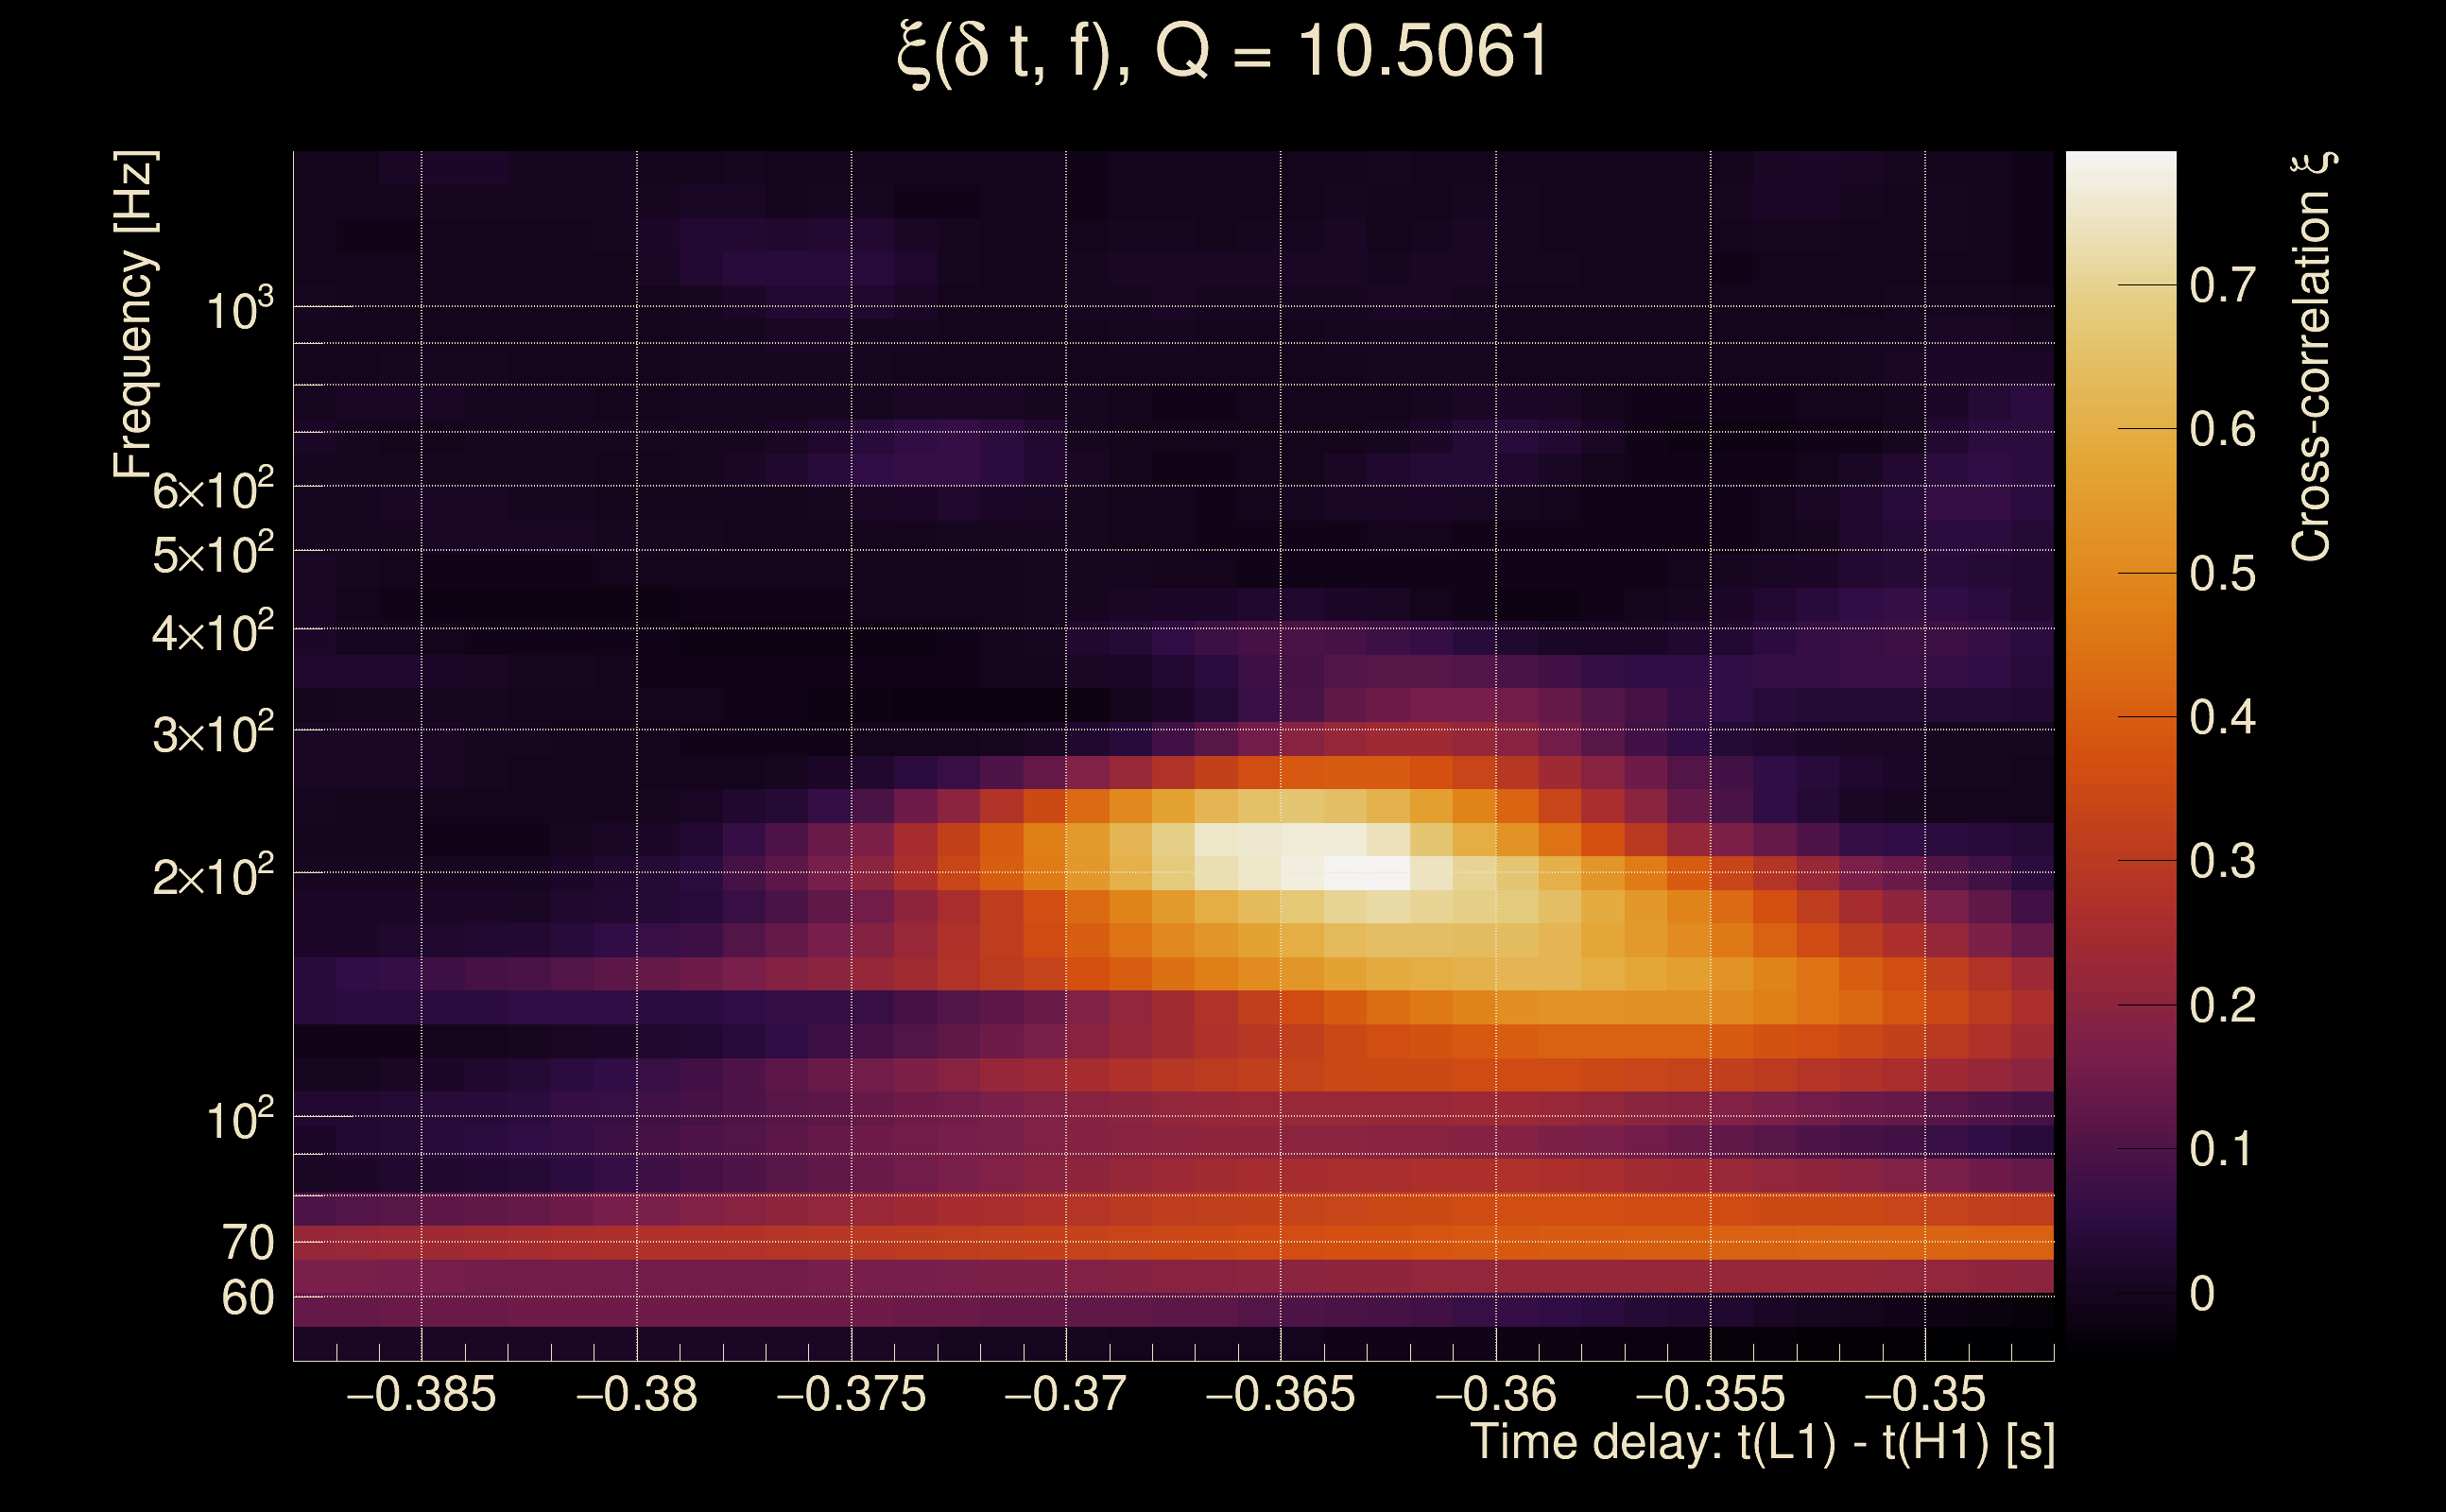
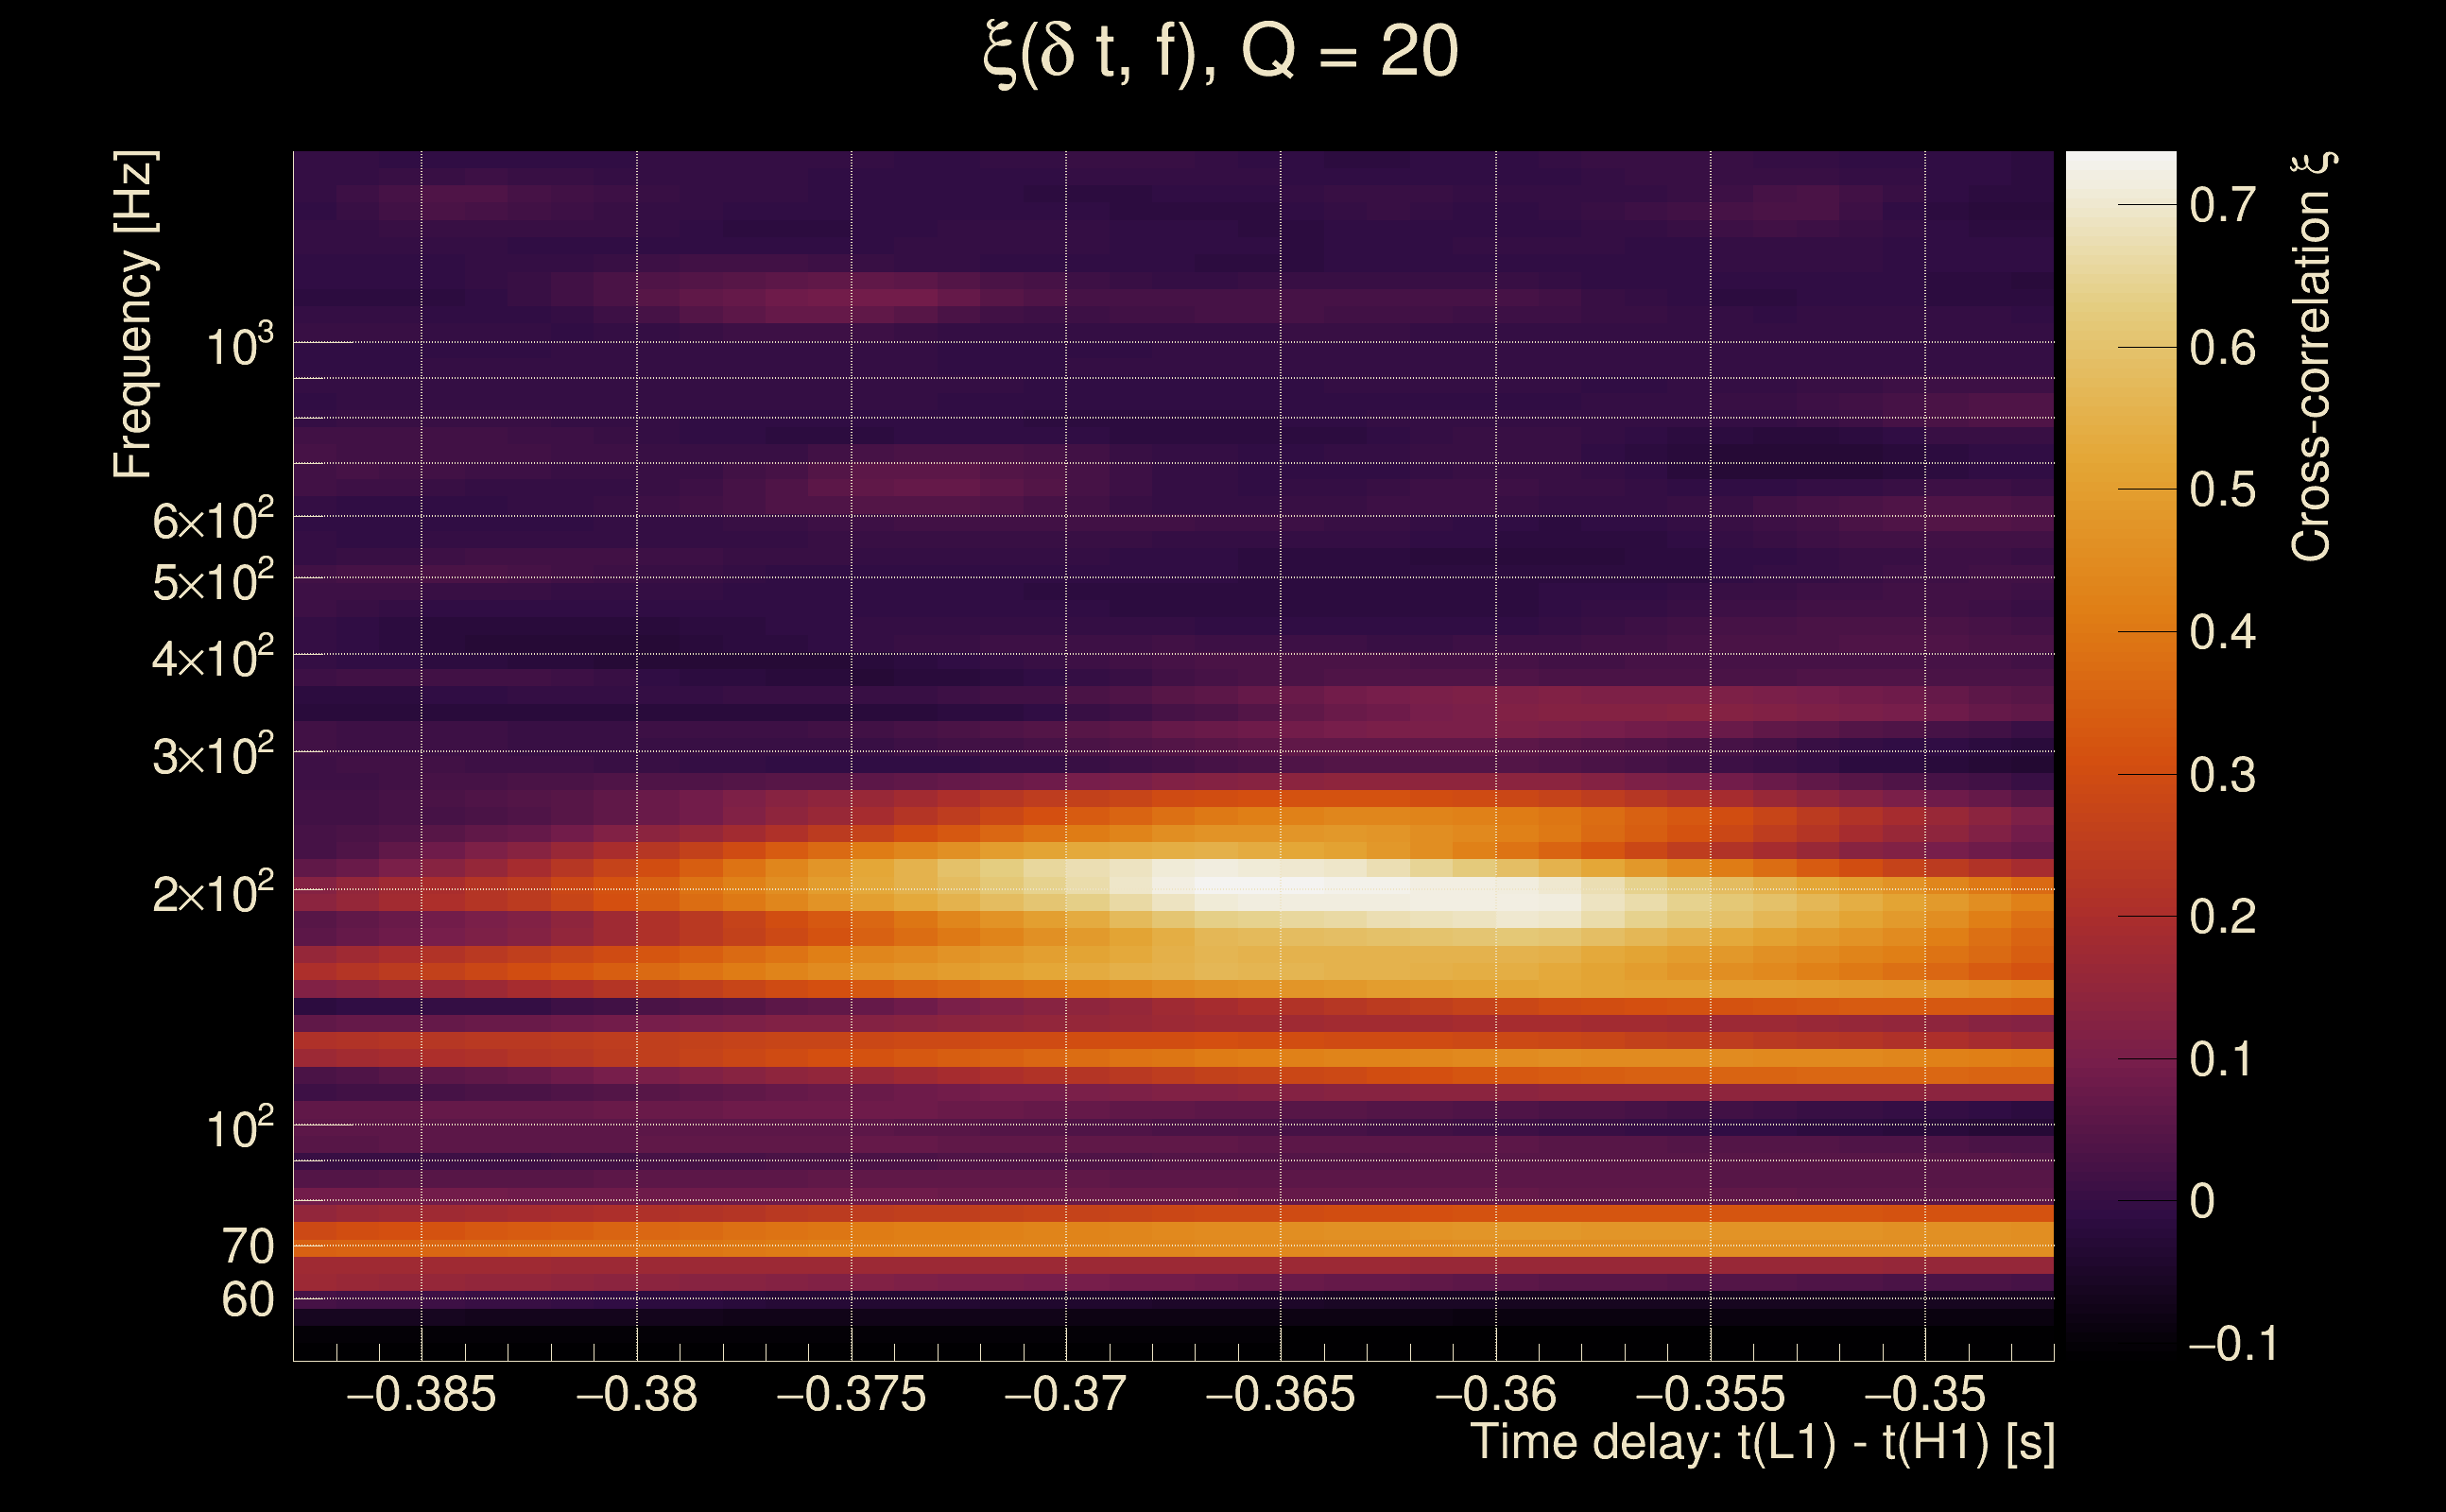
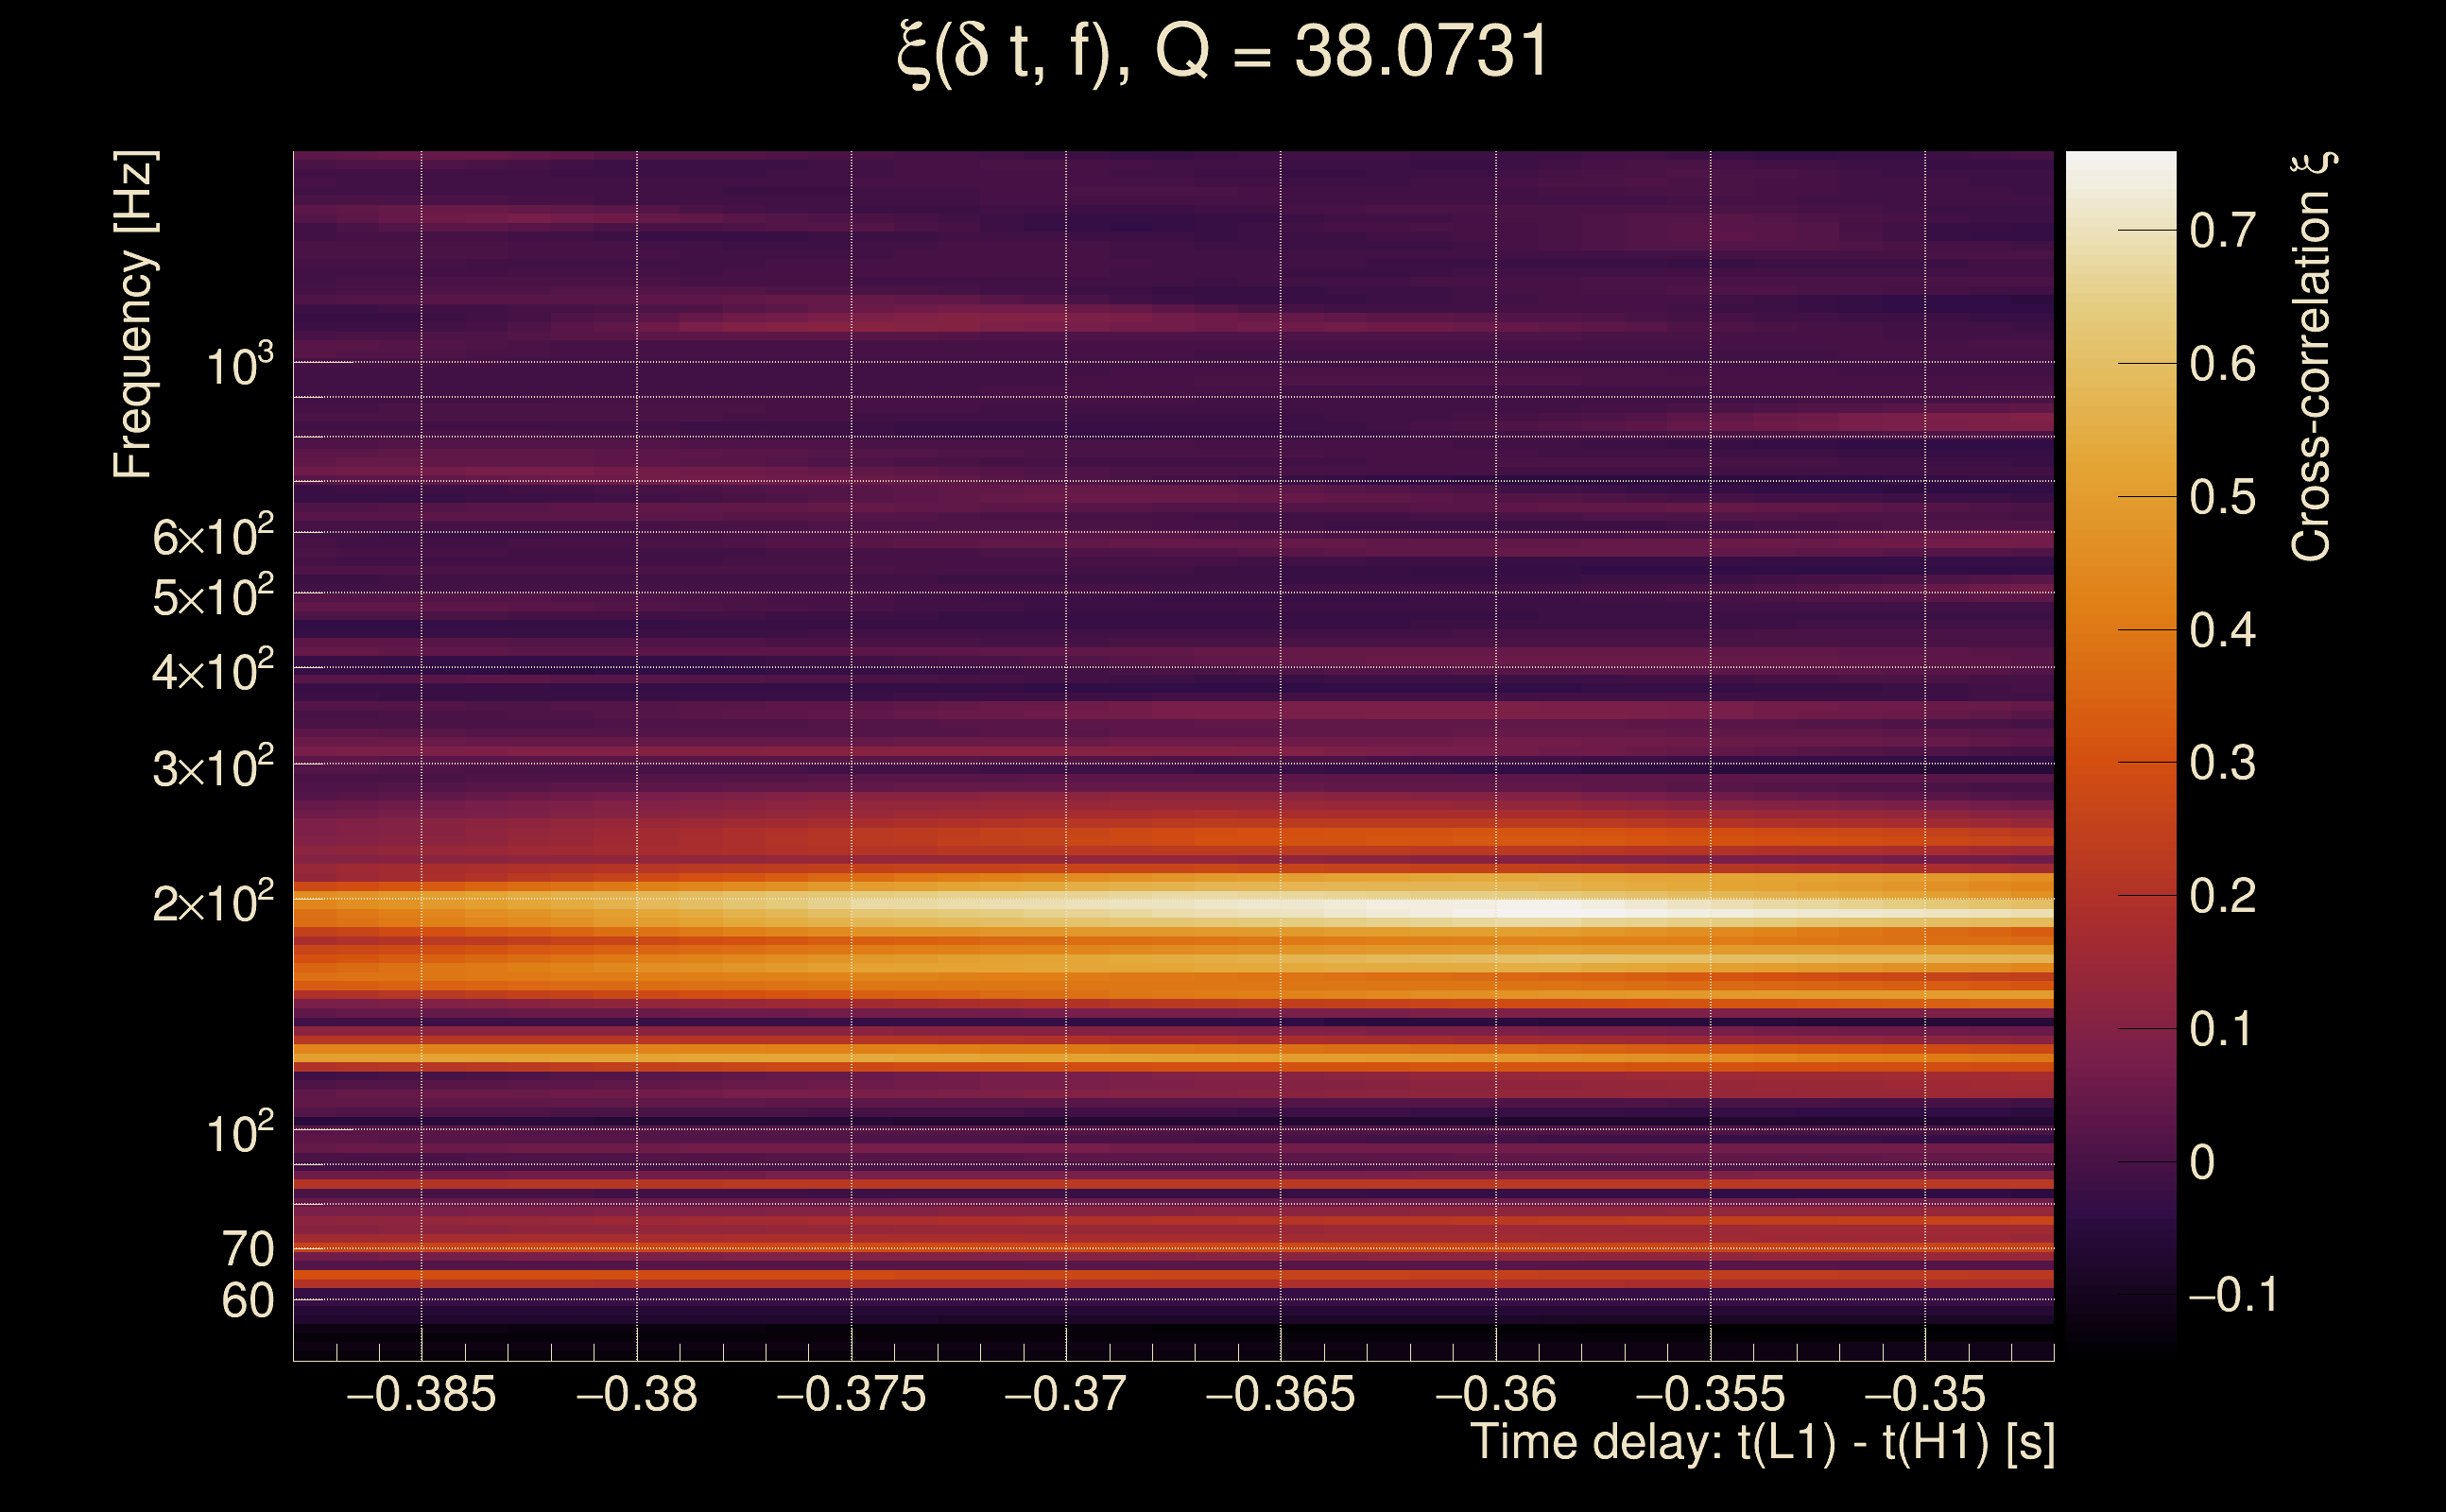
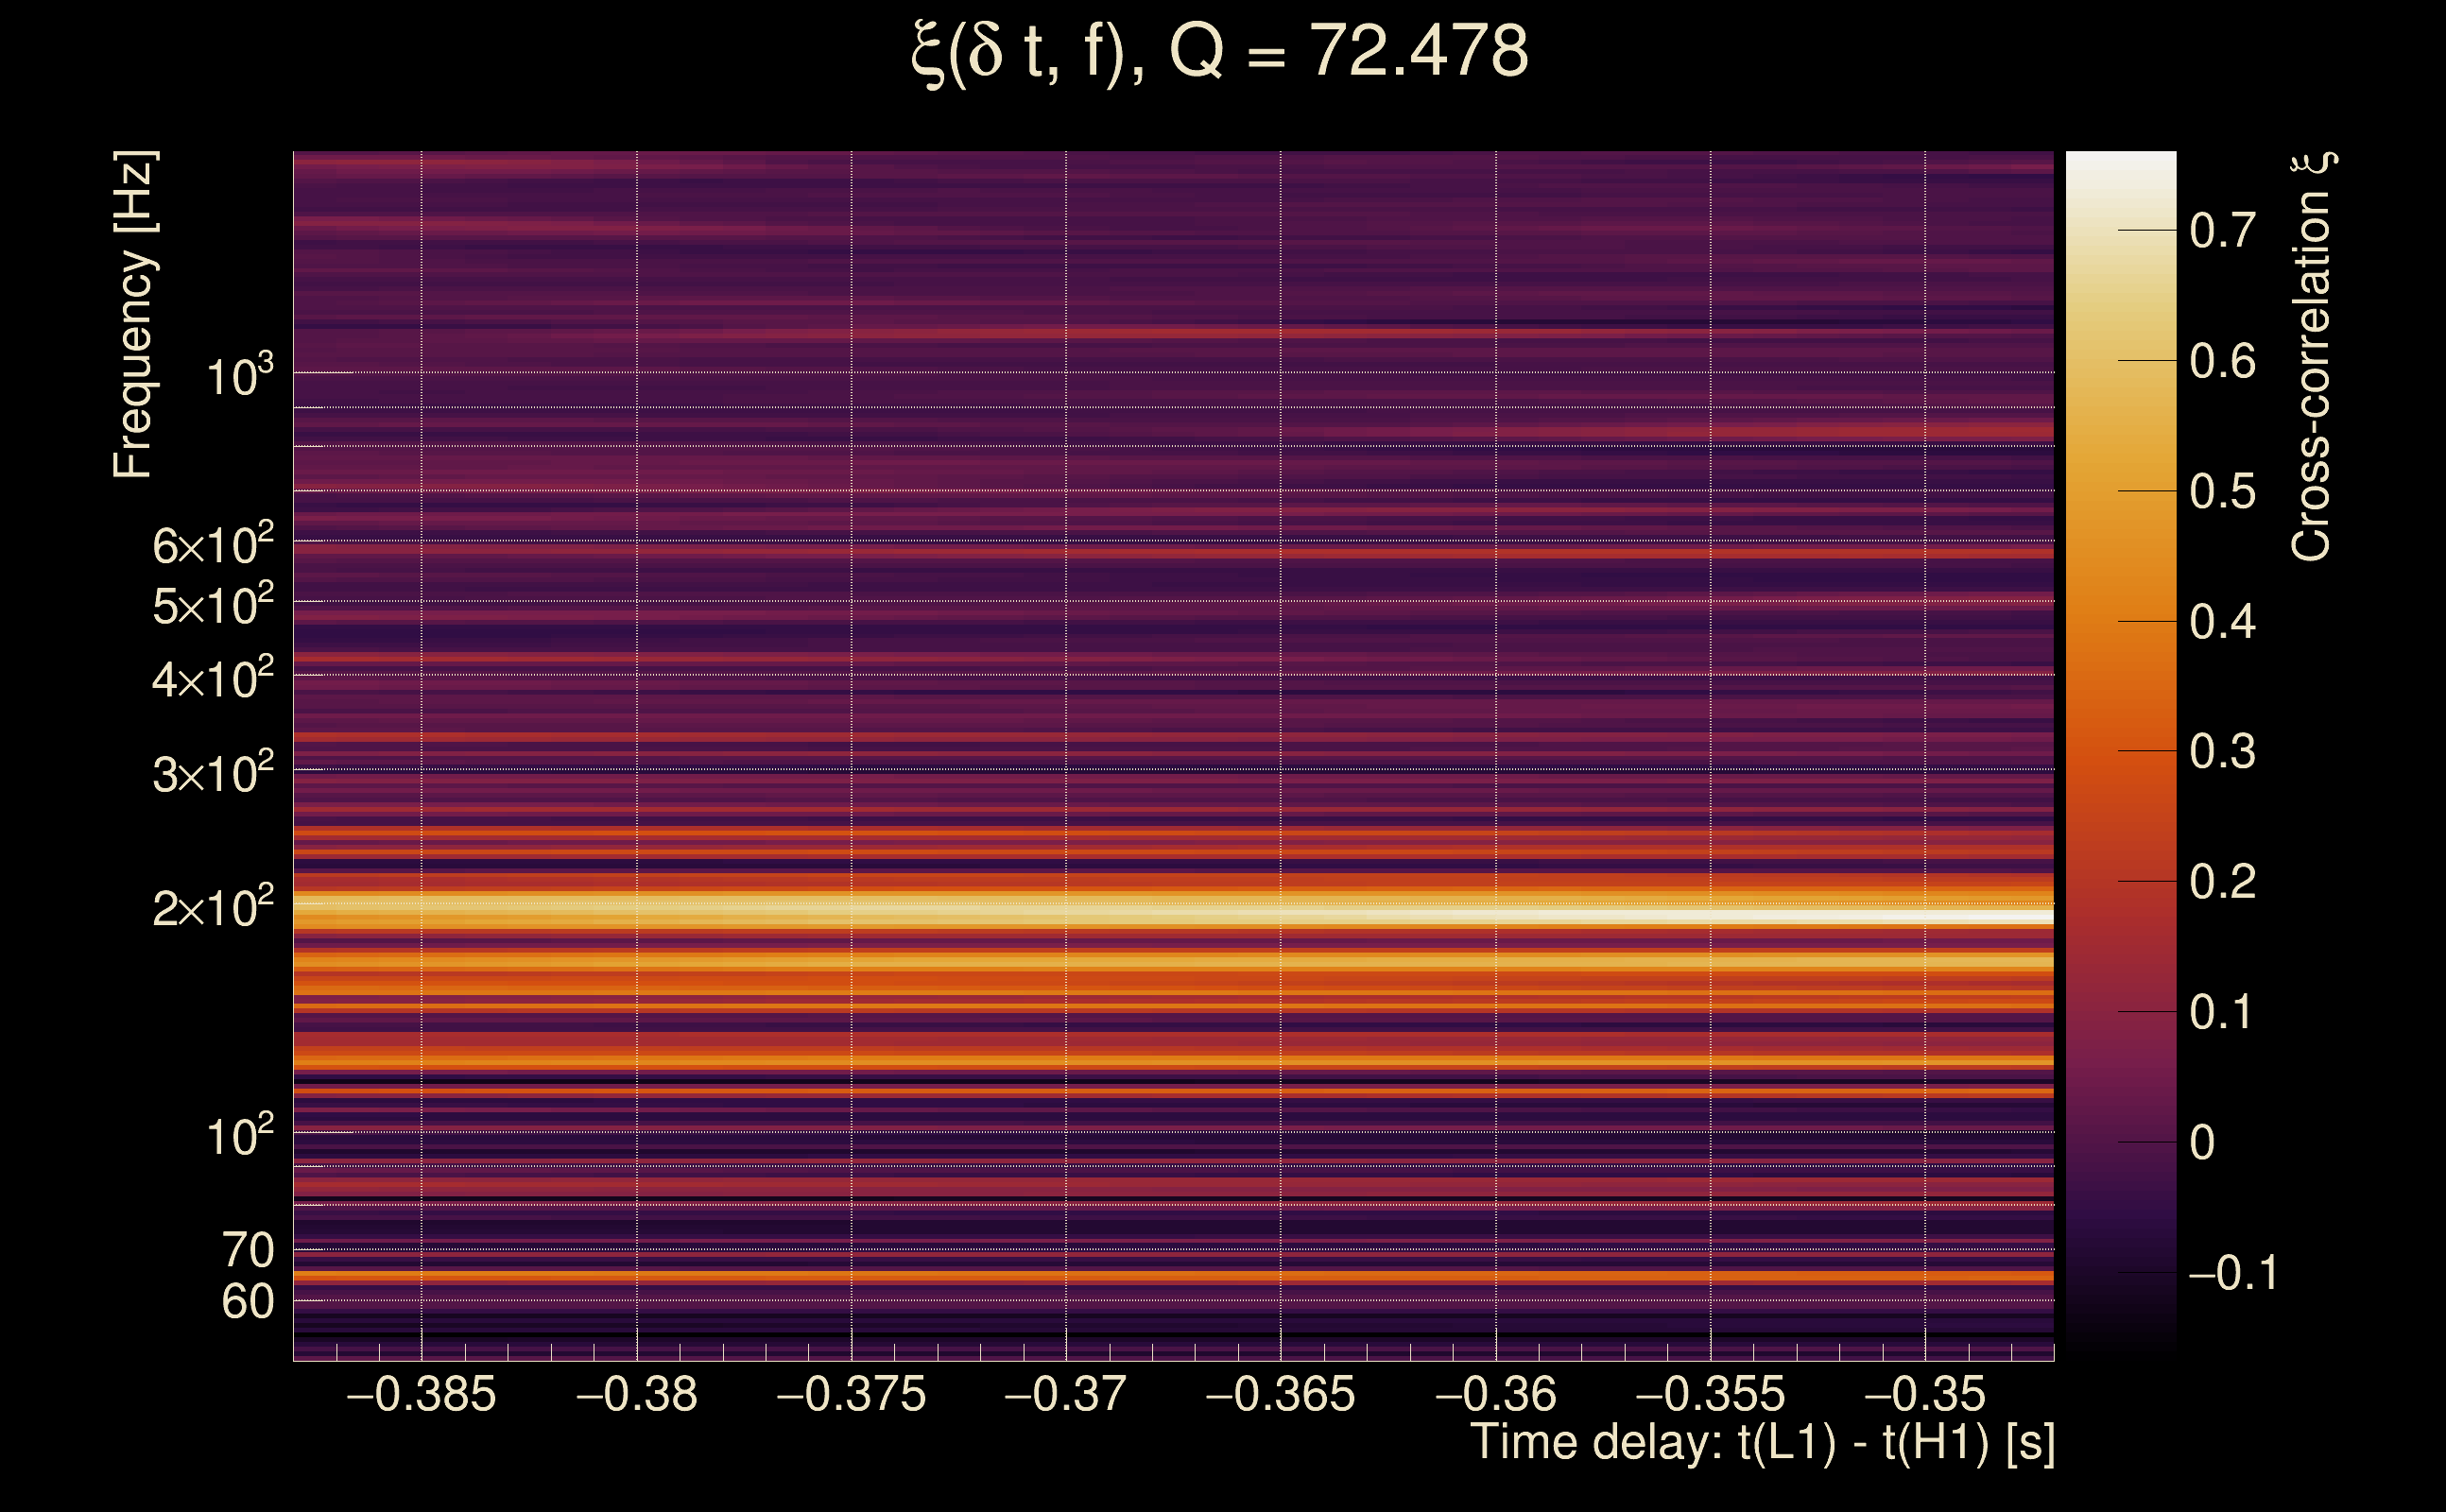
| Event time t(H1): | GPS = 1368336073 (Wed May 17 05:20:55 2023 ) → GPS = 1368336083 (Wed May 17 05:21:05 2023 ) |
| Event time t(L1): | GPS = 1368336073 (Wed May 17 05:21:05 2023 ) → GPS = 1368336083 (Wed May 17 05:21:05 2023 ) |
| Omicron analysis time window (H1): | GPS = 1368336070 → GPS = 1368336086 |
| Omicron analysis time window (L1): | GPS = 1368336070 → GPS = 1368336086 |
| Time delay between detectors t(L1) - t(H1): | -0.367944 s (slice index = 116 / 217), δt_gw = 5.64078e-05 s |
| Time delay standard deviation: | 0.0819737 s |
| [targeted mode] Time delay probability: | 0.821733 (0.225317 sigmas), δt_target = 0.00107765 s |
| Frequency: | 186.531 Hz |
| Ξ: | 0.293772 ± 0.0721215 (variance = 0.00520151): Q0: 0.572499, Q1: 0.539599, Q2: 0.491923, Q3: 0.454114, Q4: 0.365128 |
| Rank: | R_A = 0.0586828 |
| Log of amplitude ratio (L1/H1): | 0.128124, variance = 0.516184 (L1/H1: -0.618468, variance = 0.86305, H1/L1: -0.824709, variance = 1.17745) |
| Amplitude ratio (L1/H1): | 1.13669 ⋇ 2.05127 (L1/H1: 0.538769 ⋇ 2.53199, H1/L1: 0.438363 ⋇ 2.95974) |
| Amplitude ratio H1|L1 compatibility (probability): | 0.31235 |
| Antenna factor probability: | 0.778265 |
| Number of rejected frequency rows: | Q0: 6 / 18, Q1: 19 / 36, Q2: 44 / 70, Q3: 97 / 134, Q4: 225 / 258 |
| Maximum signal-to-noise ratio: | H1: 26.2023, L1: 27.1265 |
| SNR variance: | H1: 0.582391, L1: 0.586559 |
| Click here for a zoomed plot | Click here for a zoomed plot | Click here for a zoomed plot | Click here for a zoomed plot | Click here for a zoomed plot |
 |
 |
 |
 |
 |
 |
 |
 |
 |
 |
 |
 |
 |
 |
 |
 |
 |
 |
 |
 |
 |
 |
 |
 |
 |
 |
 |
 |
 |
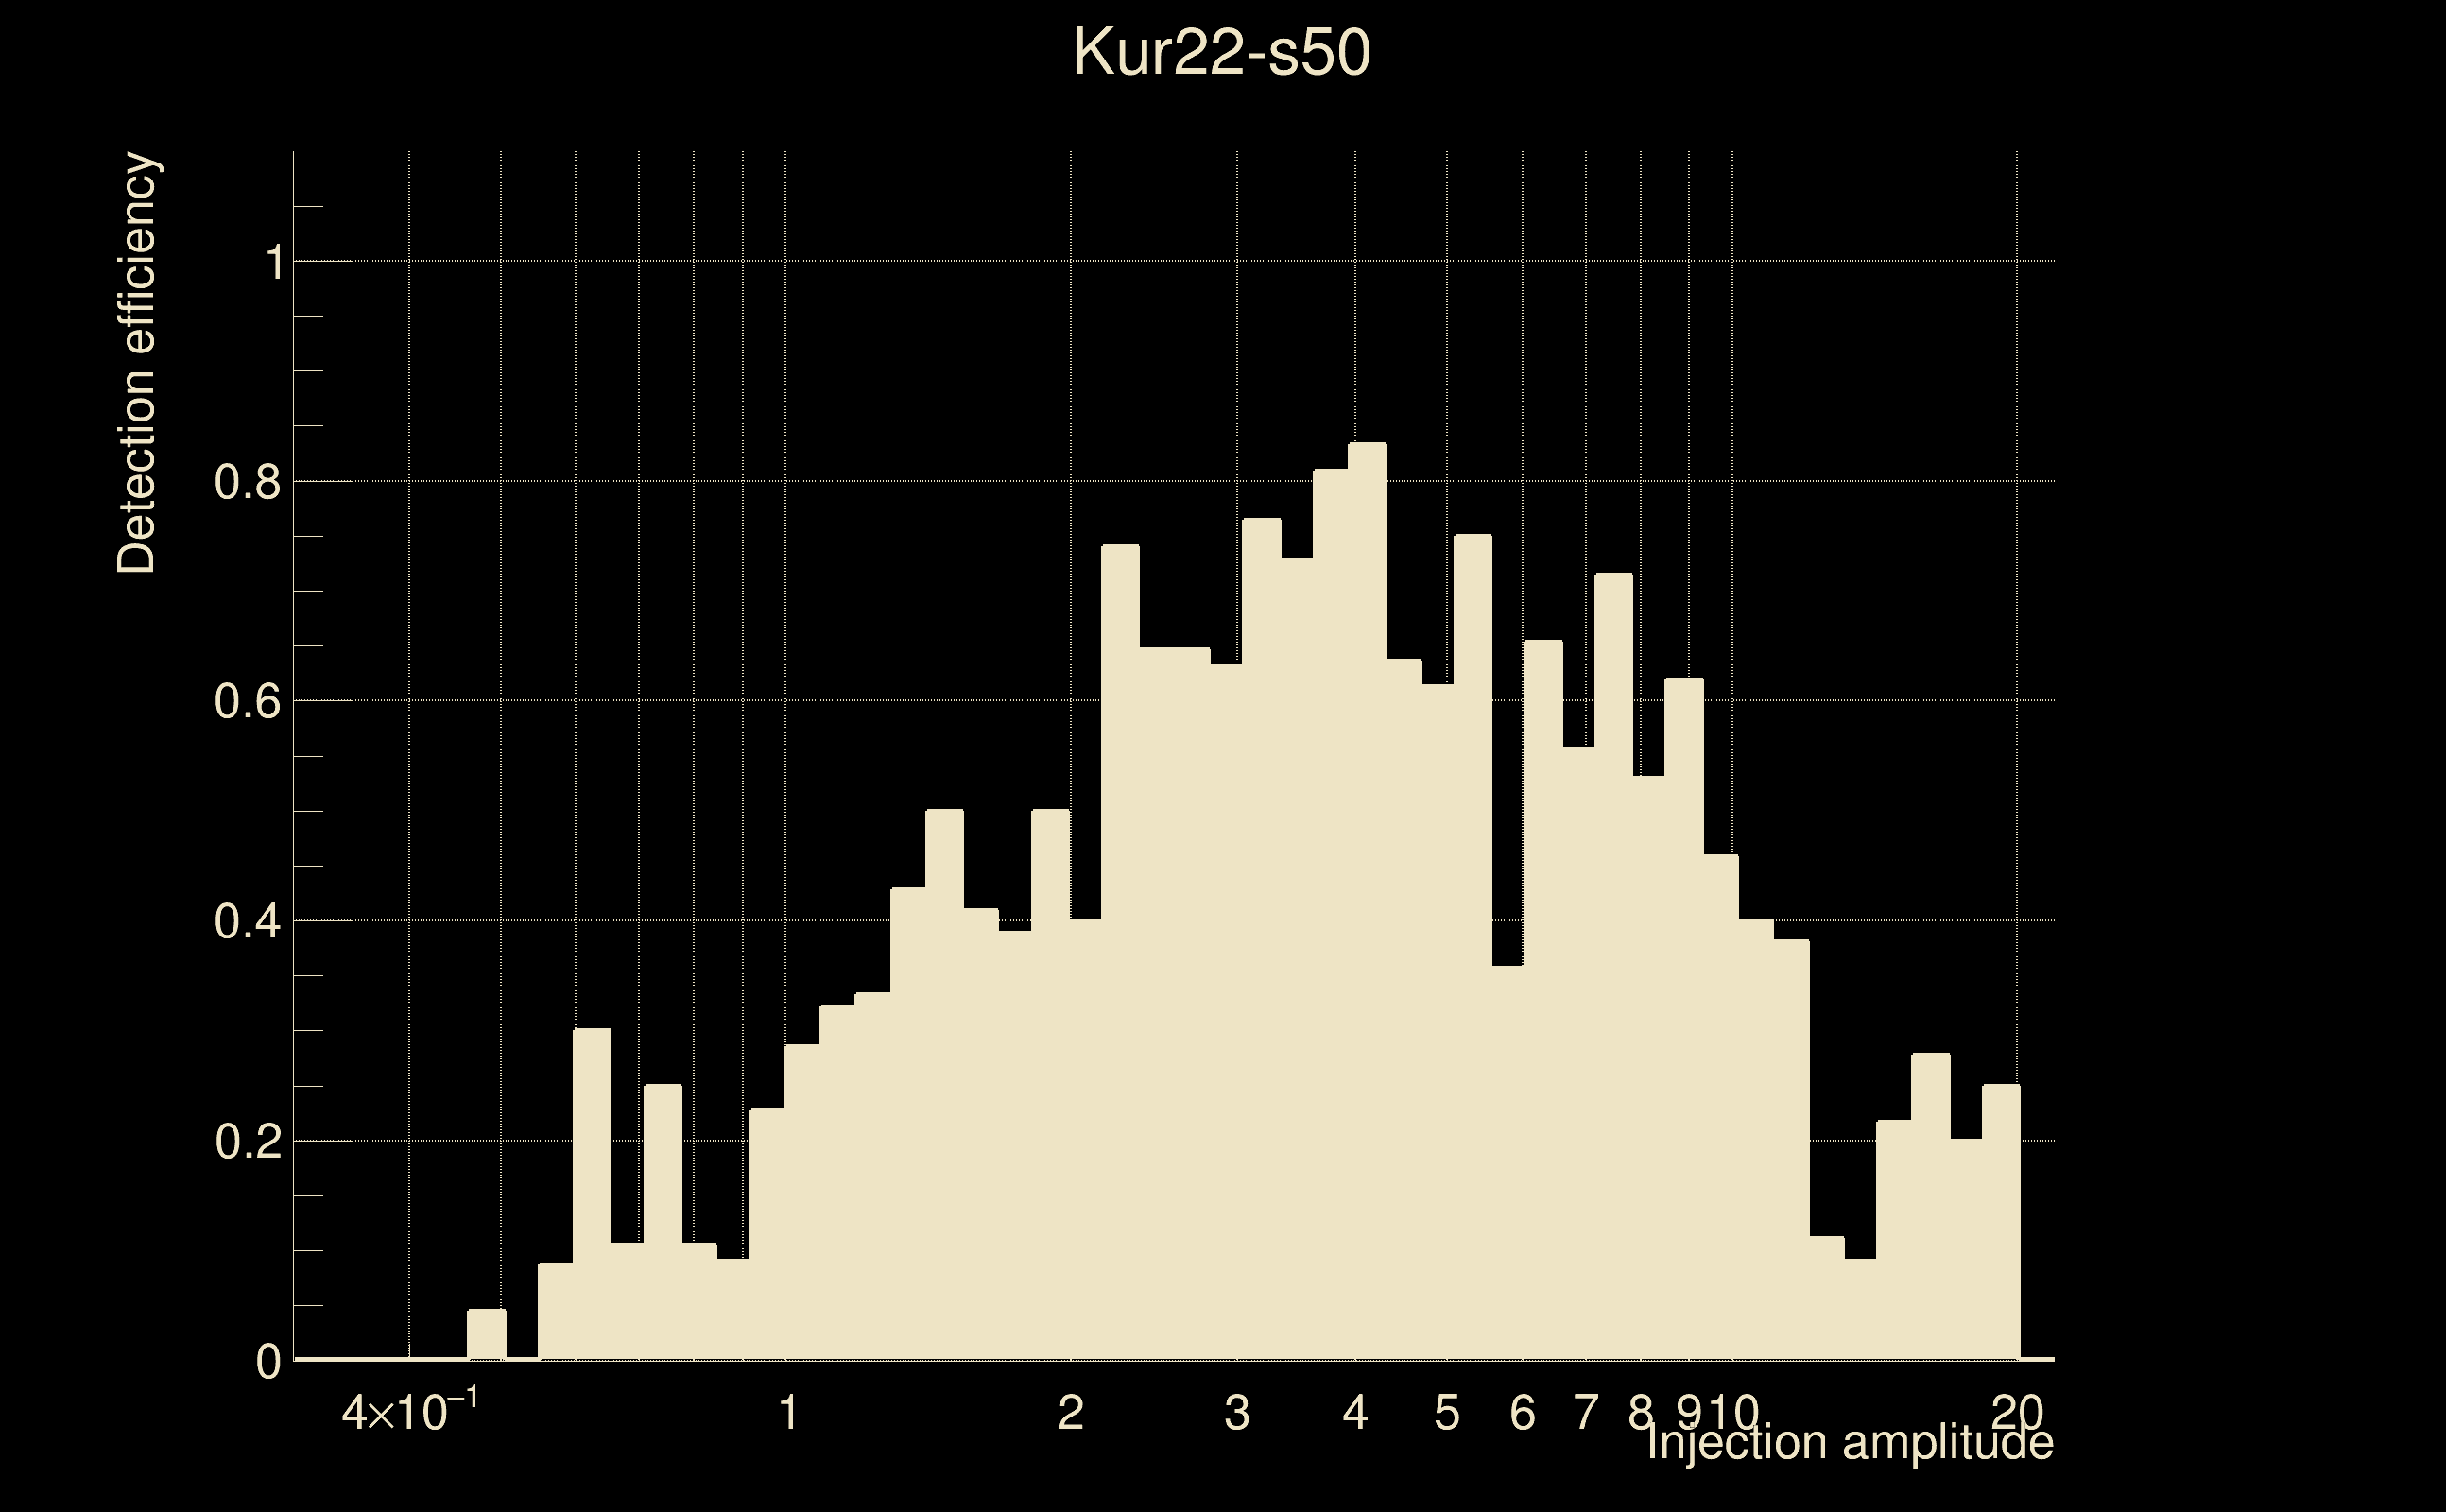
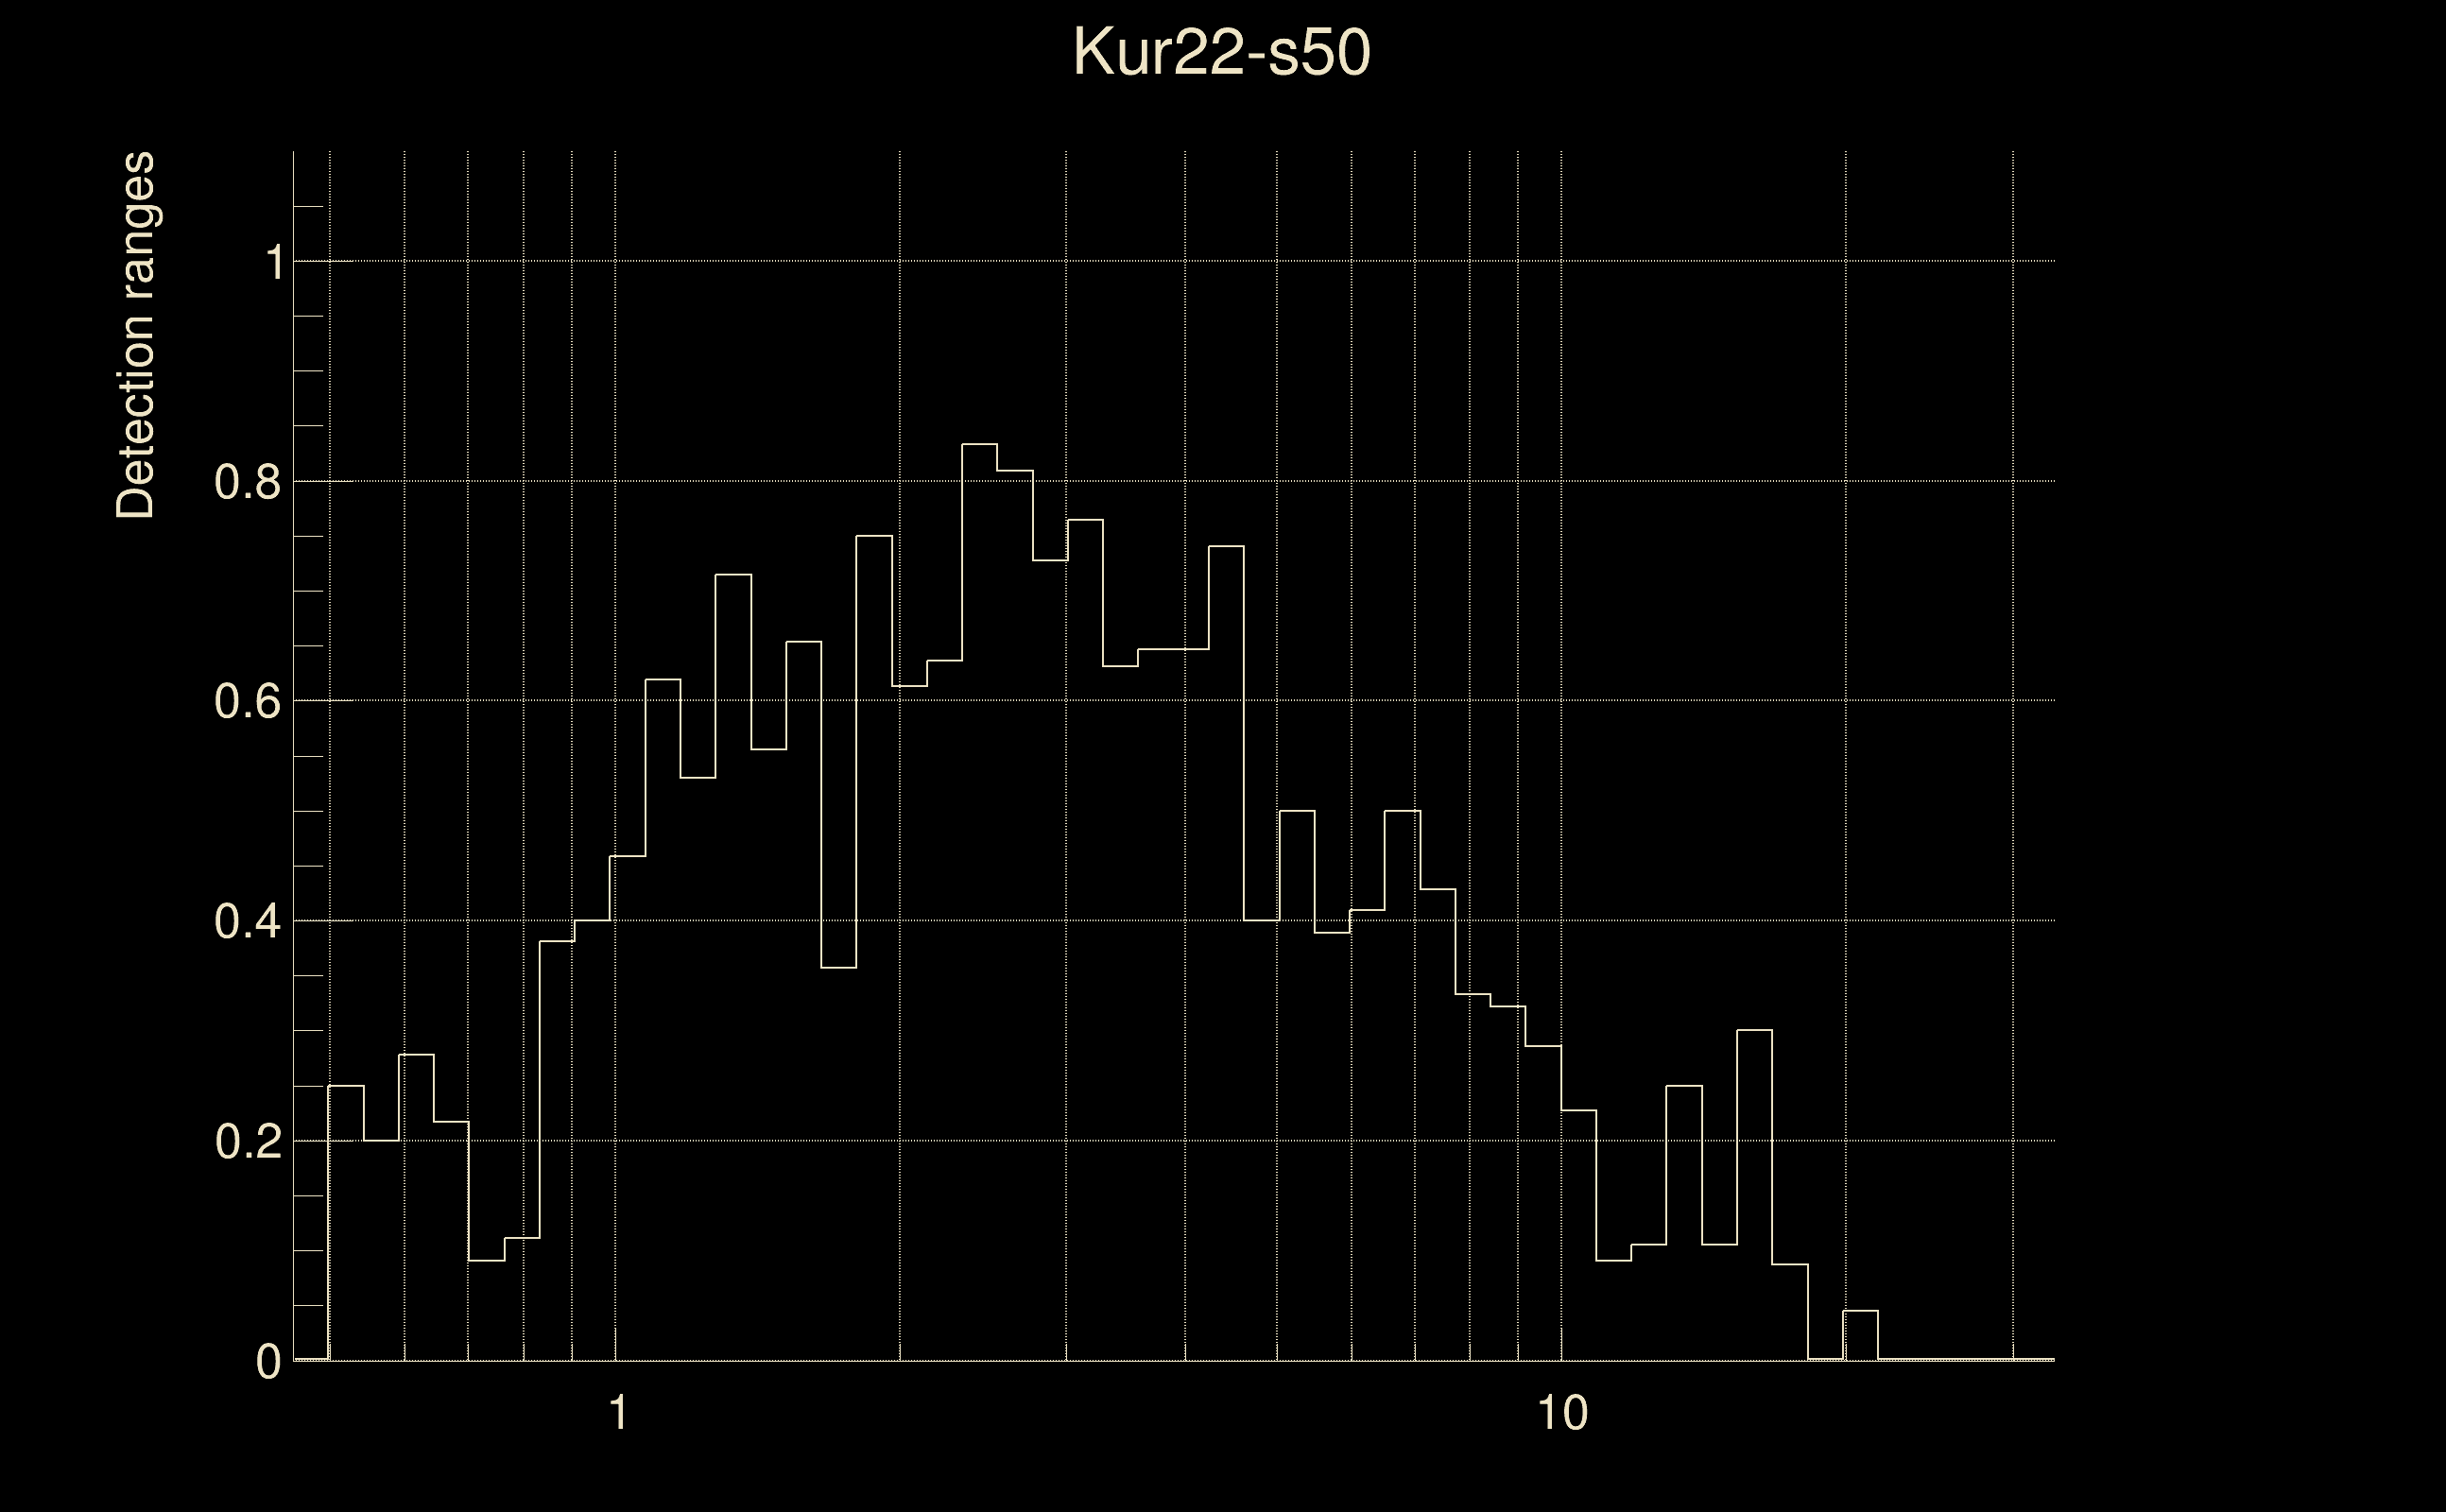
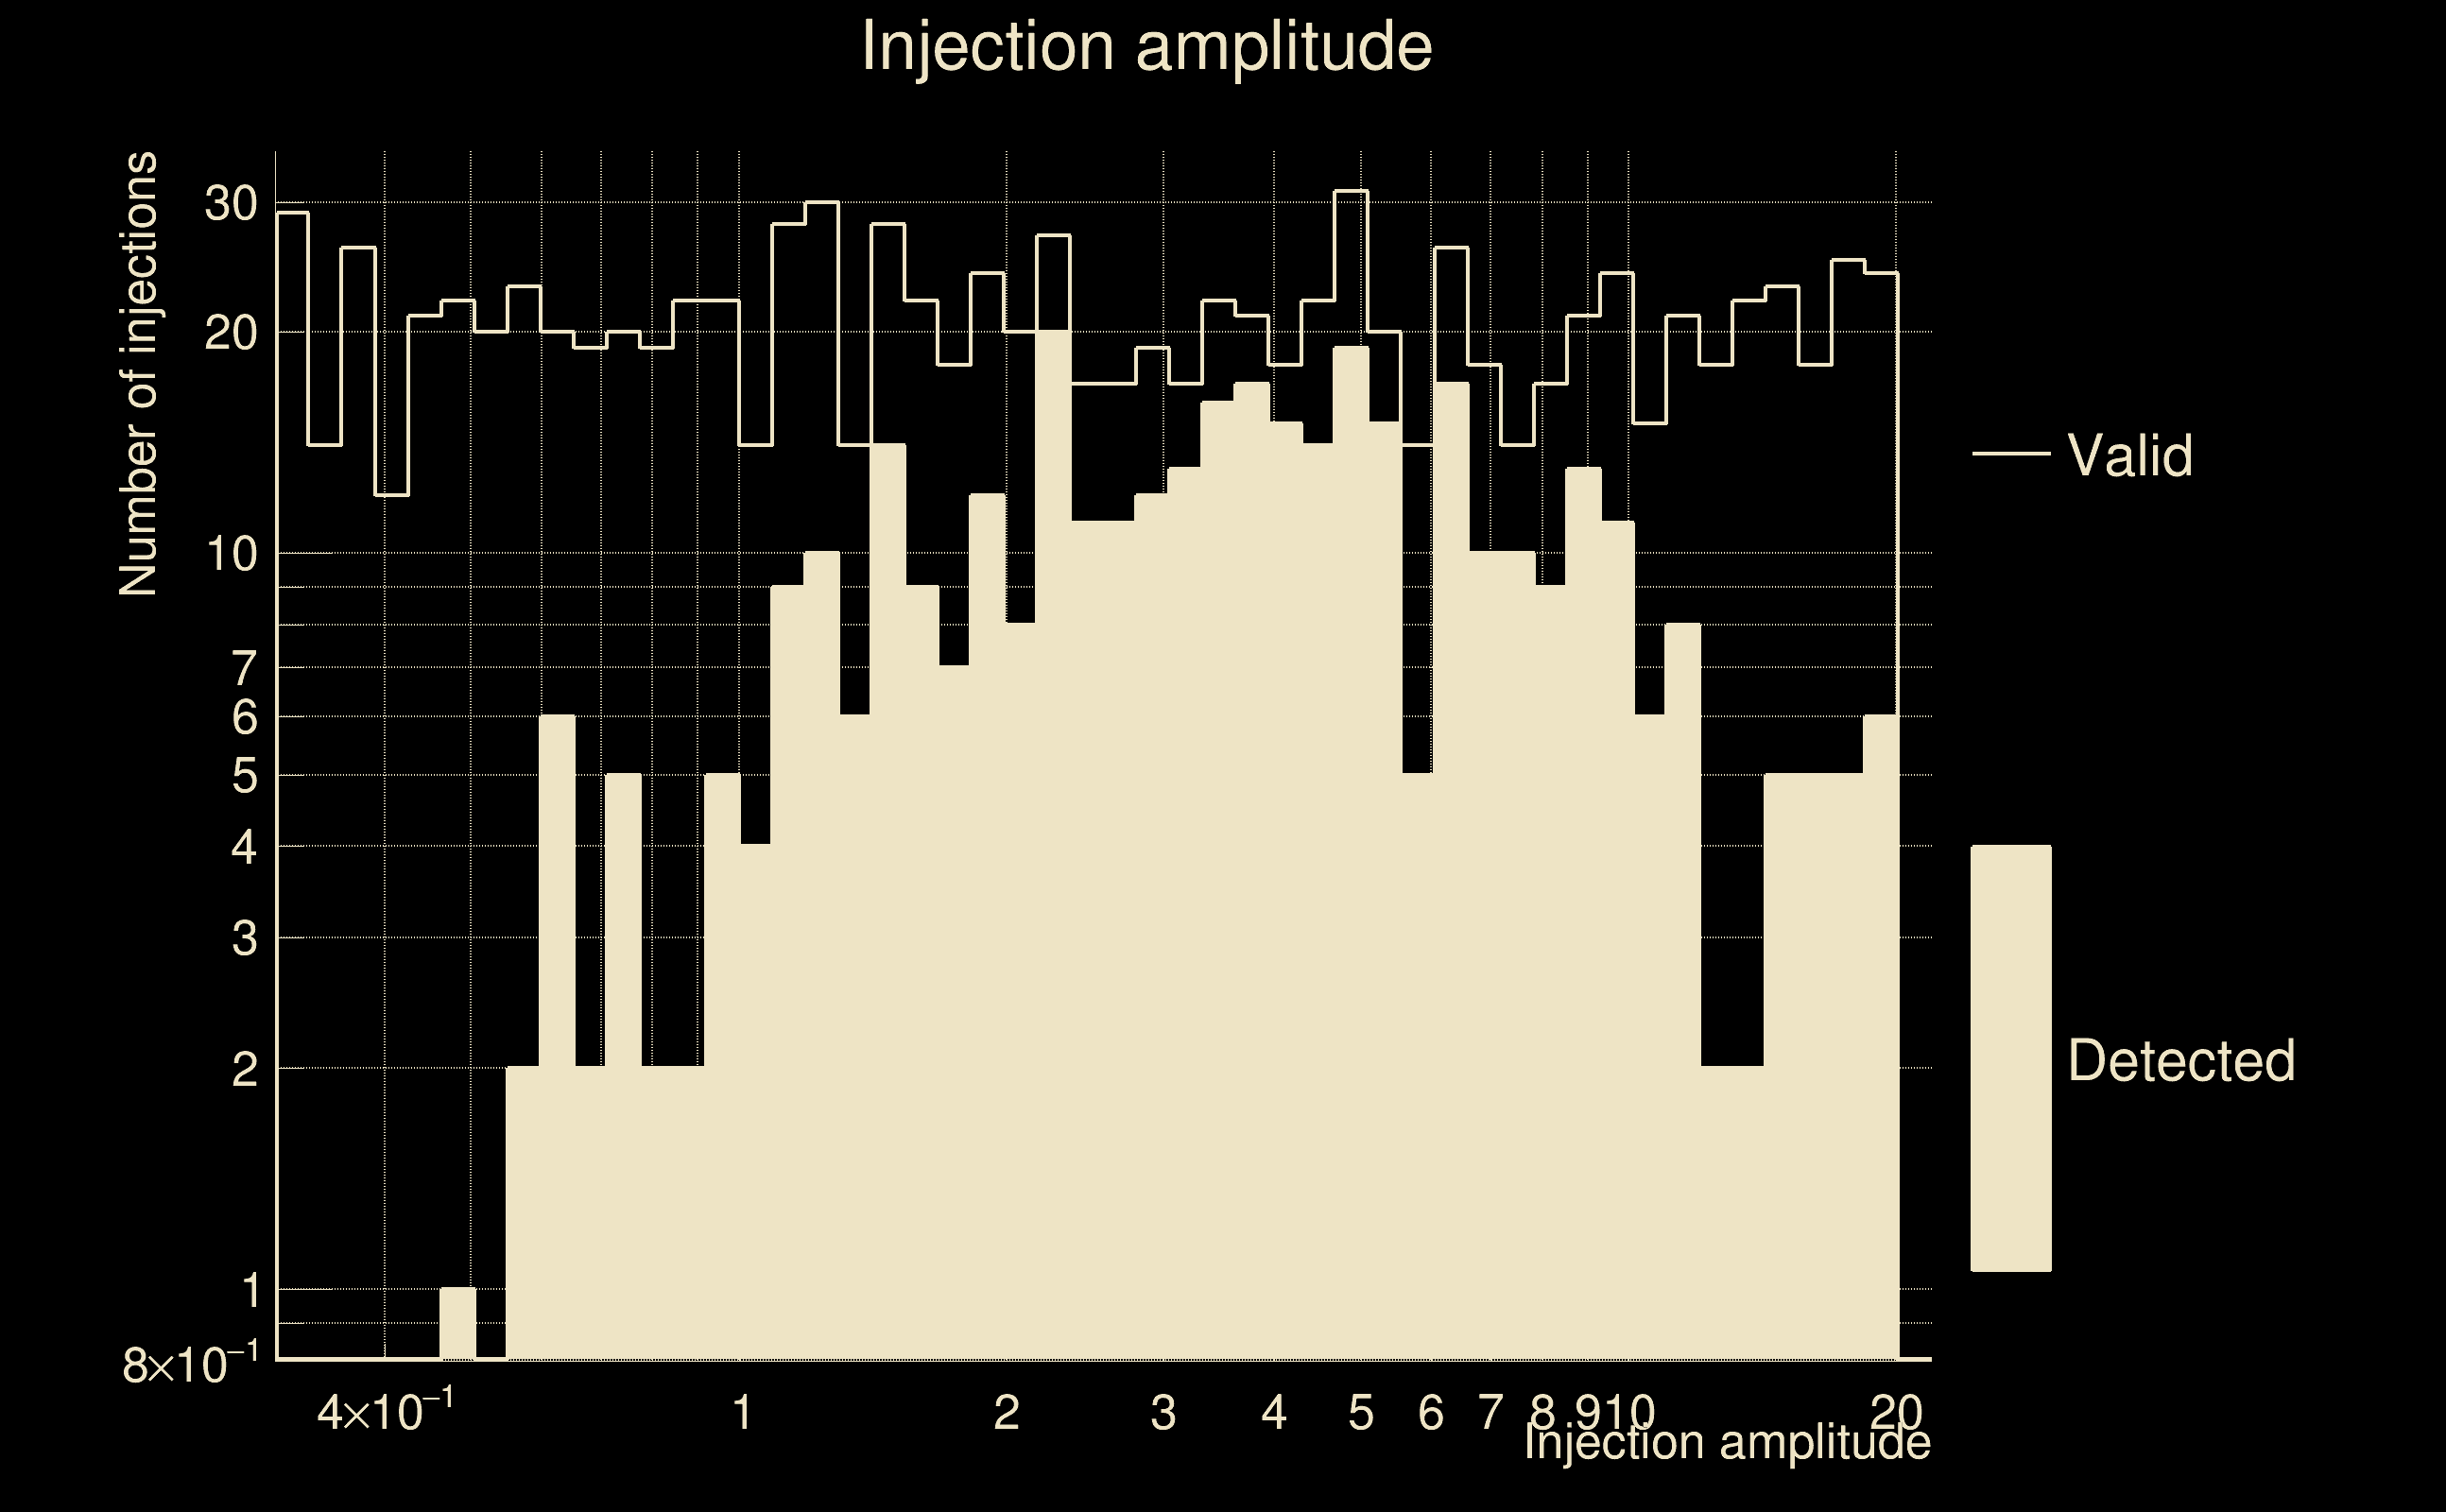
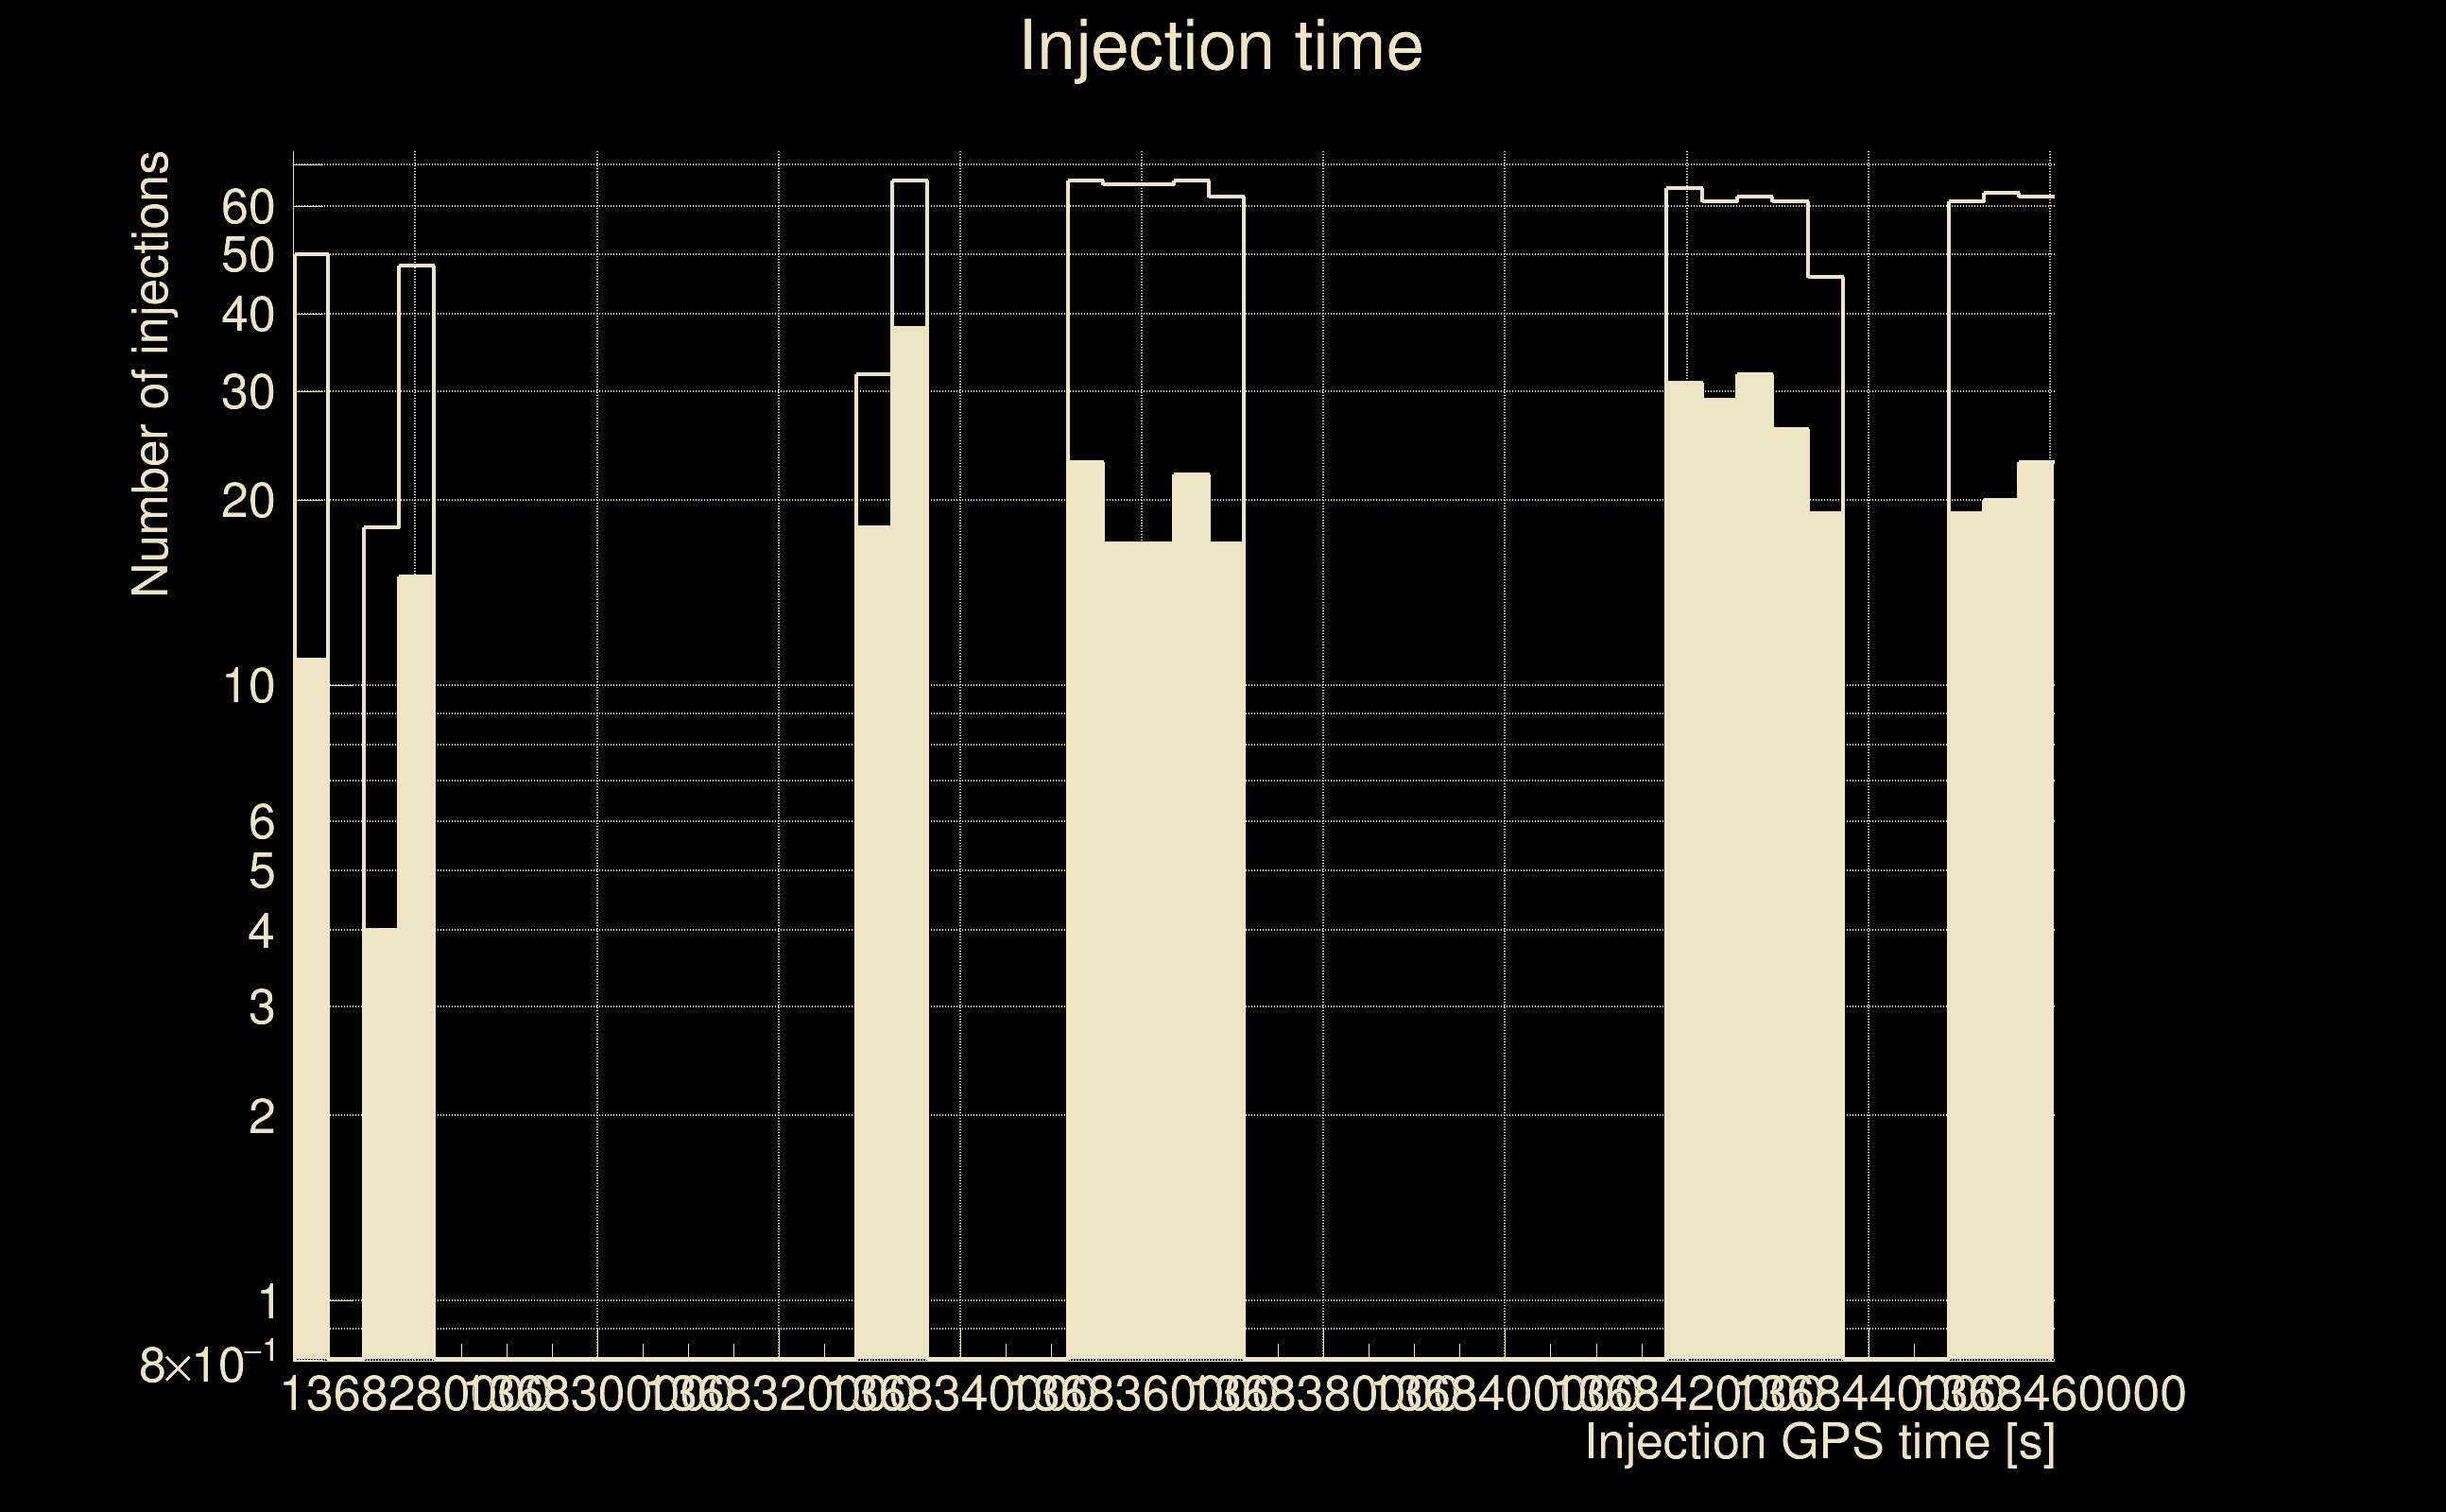
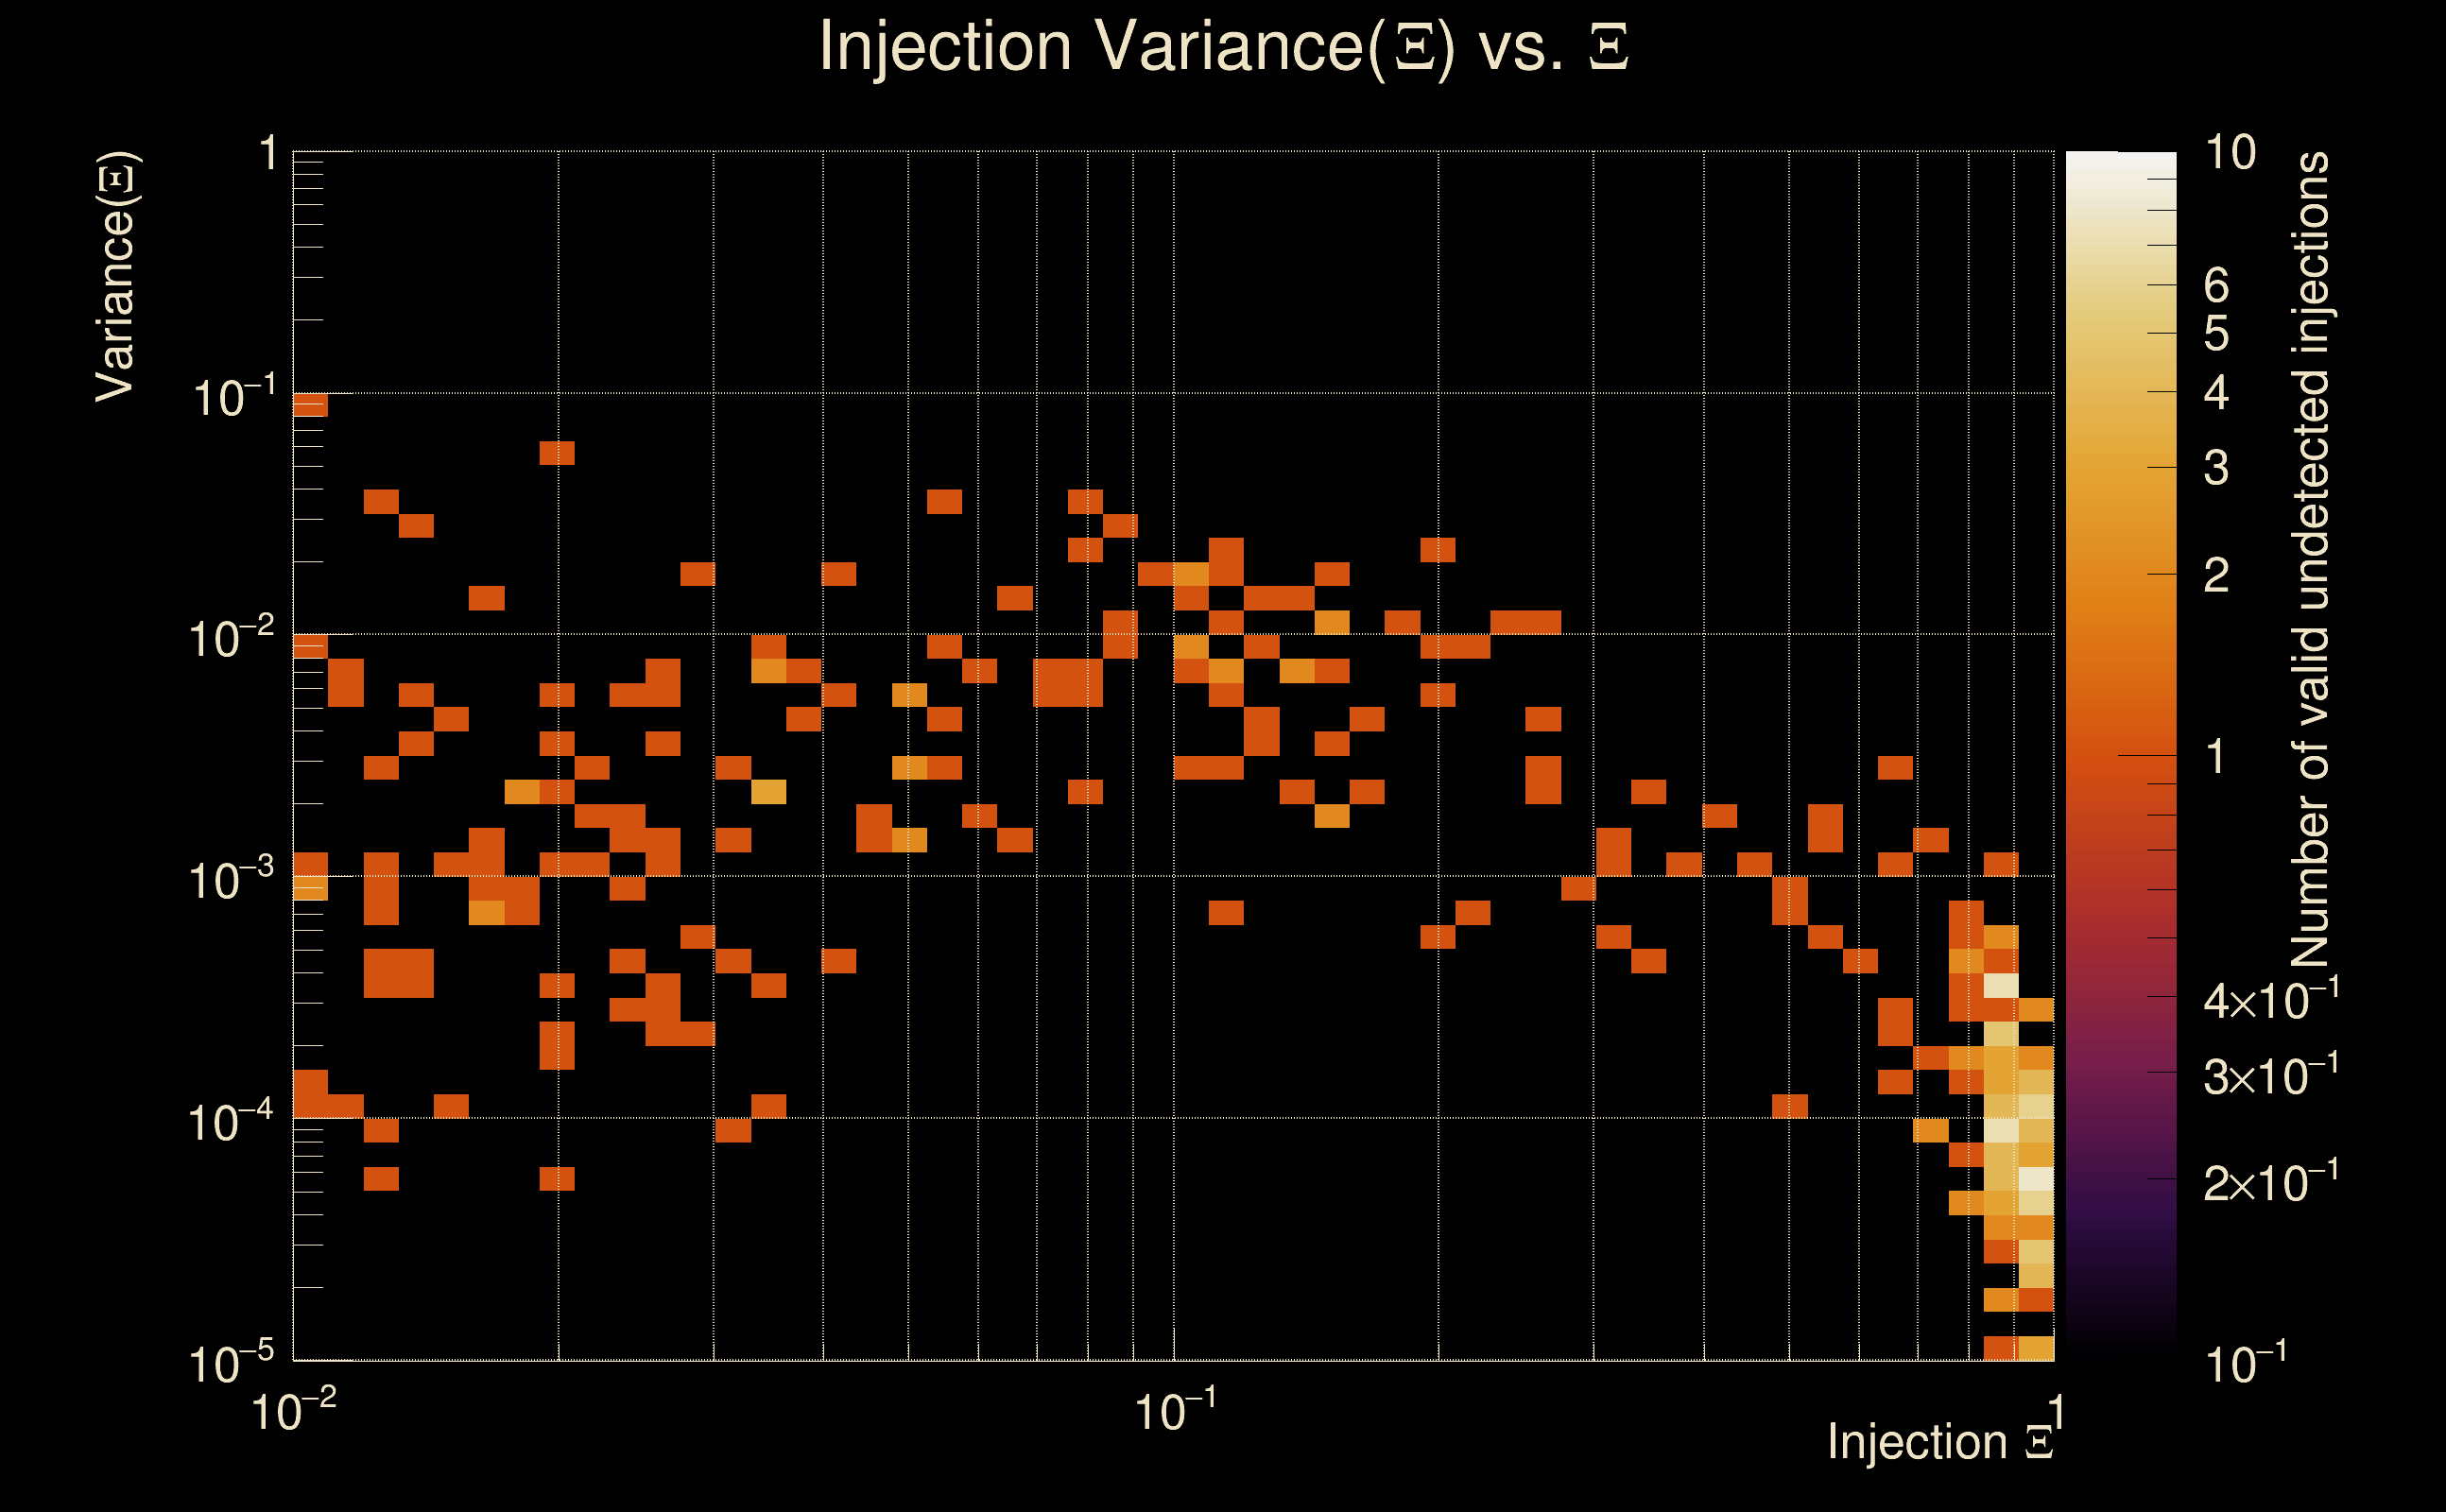
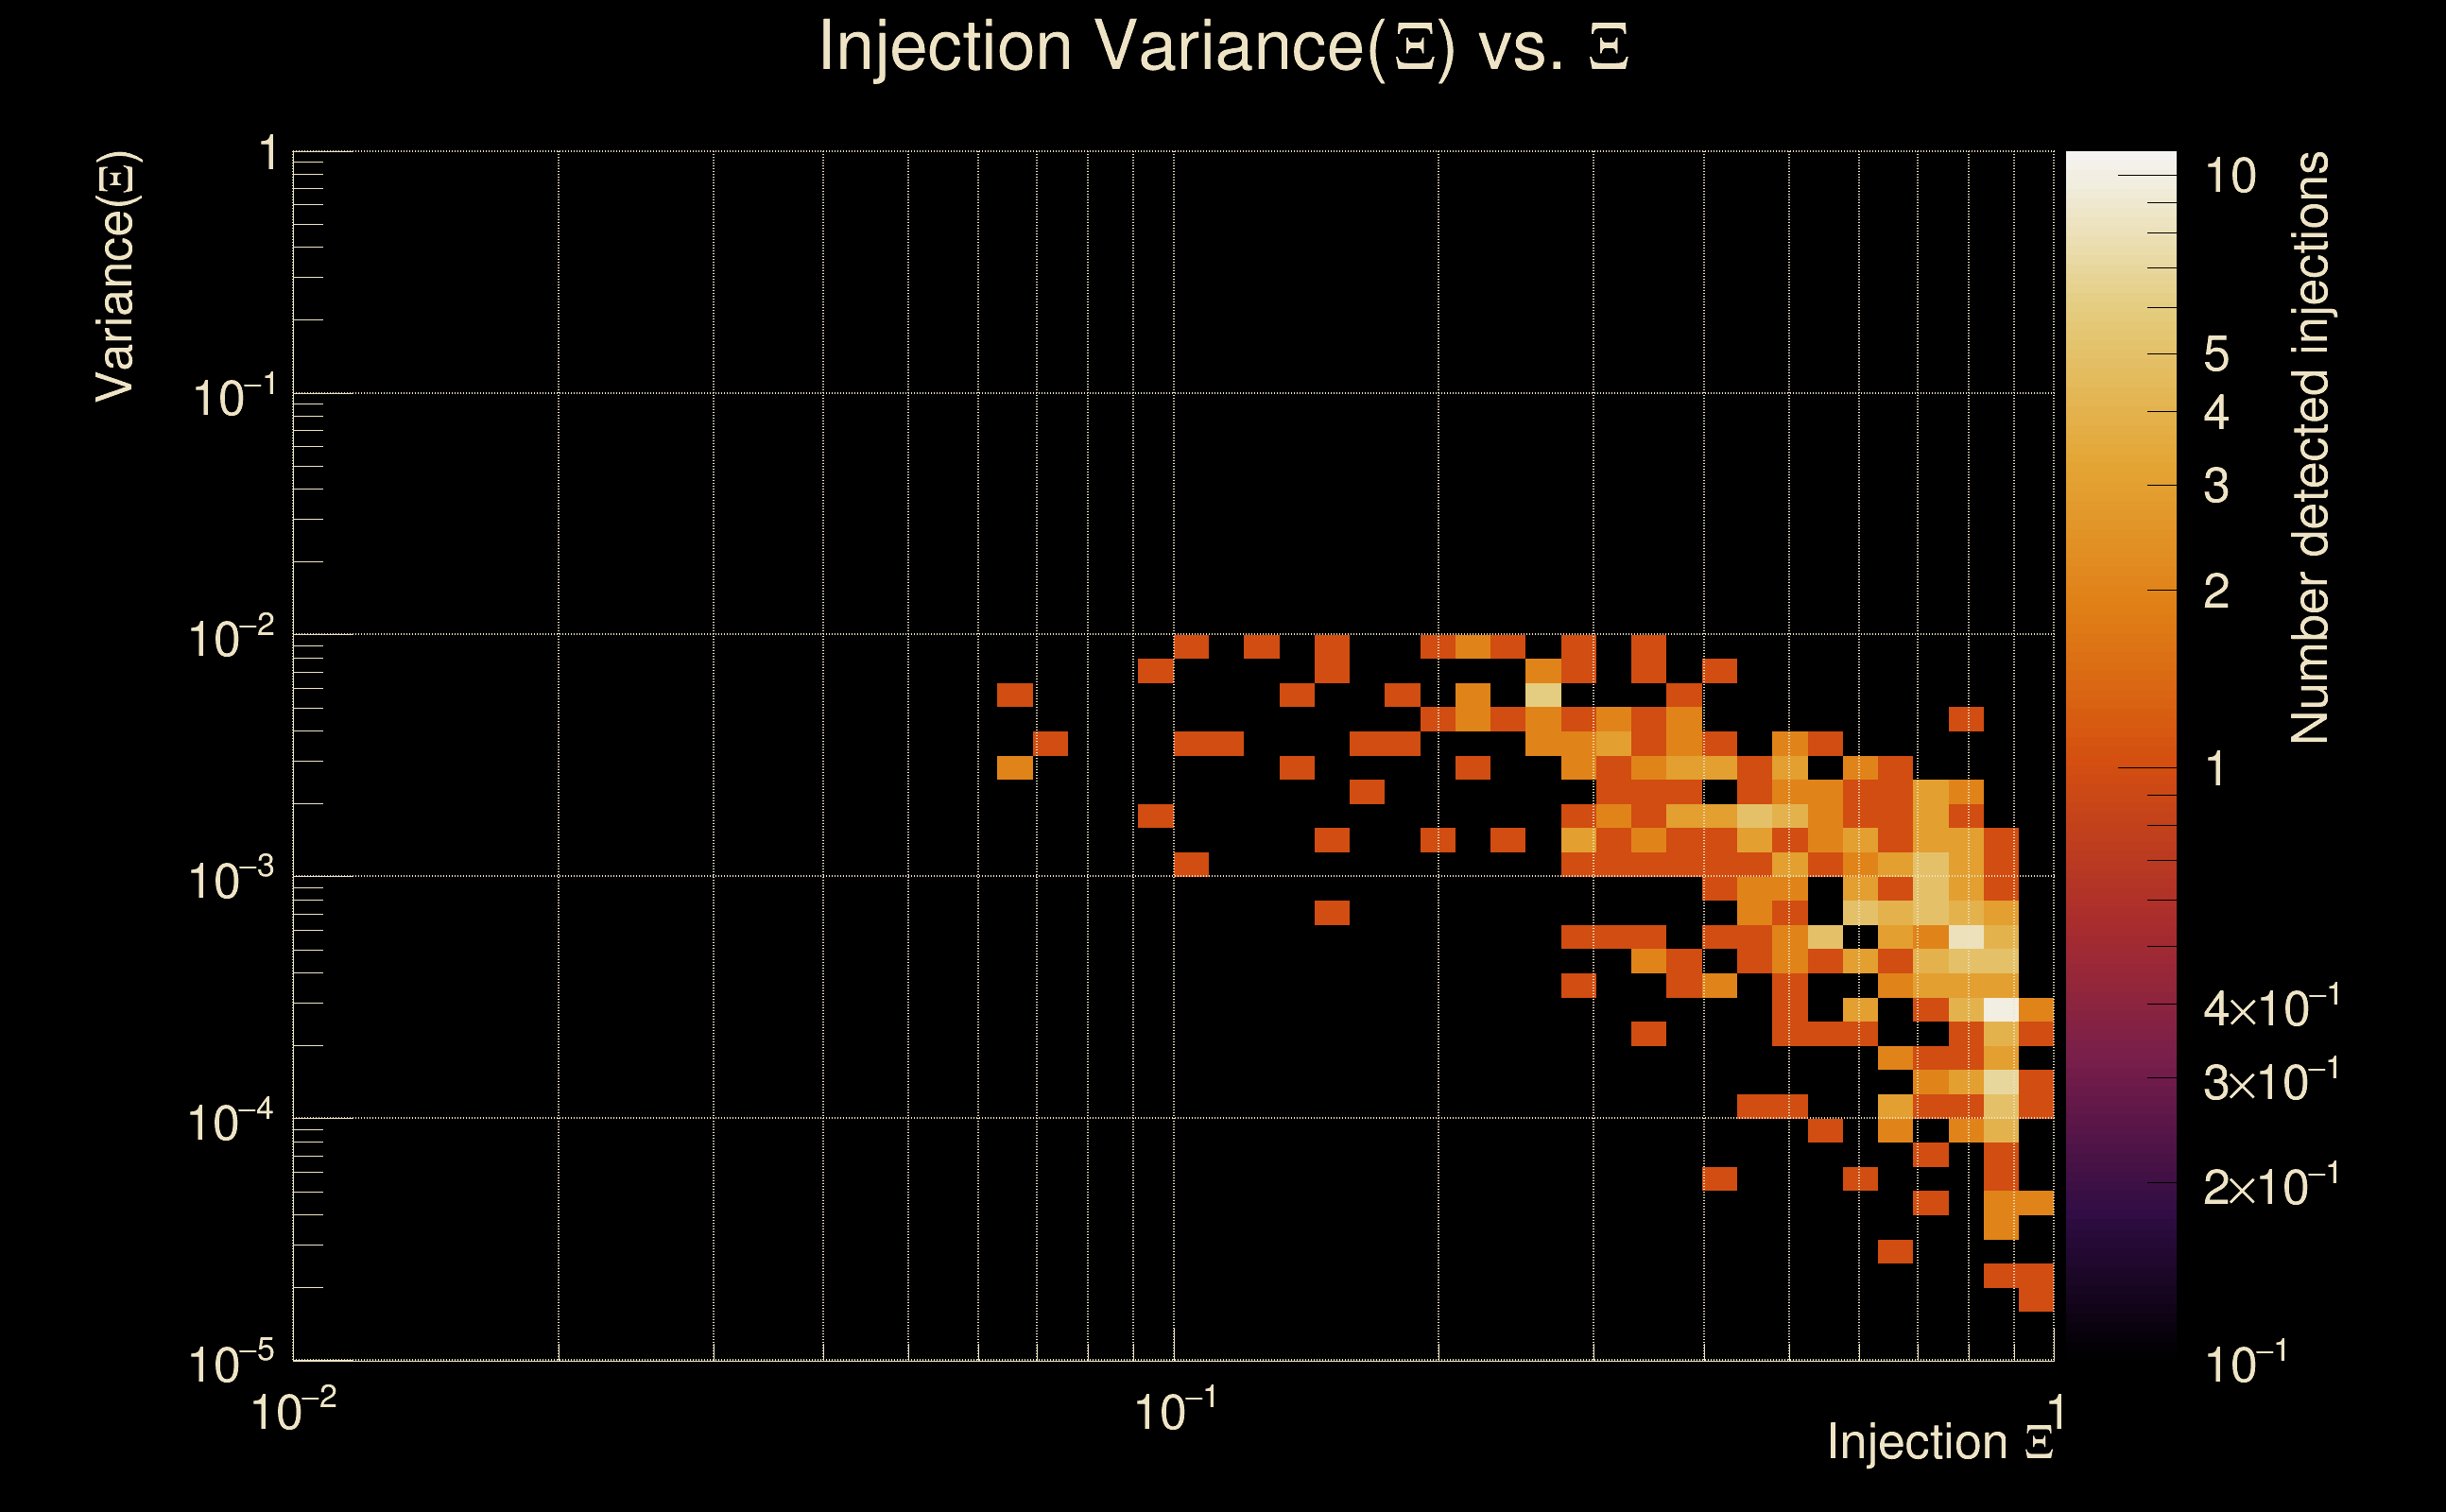
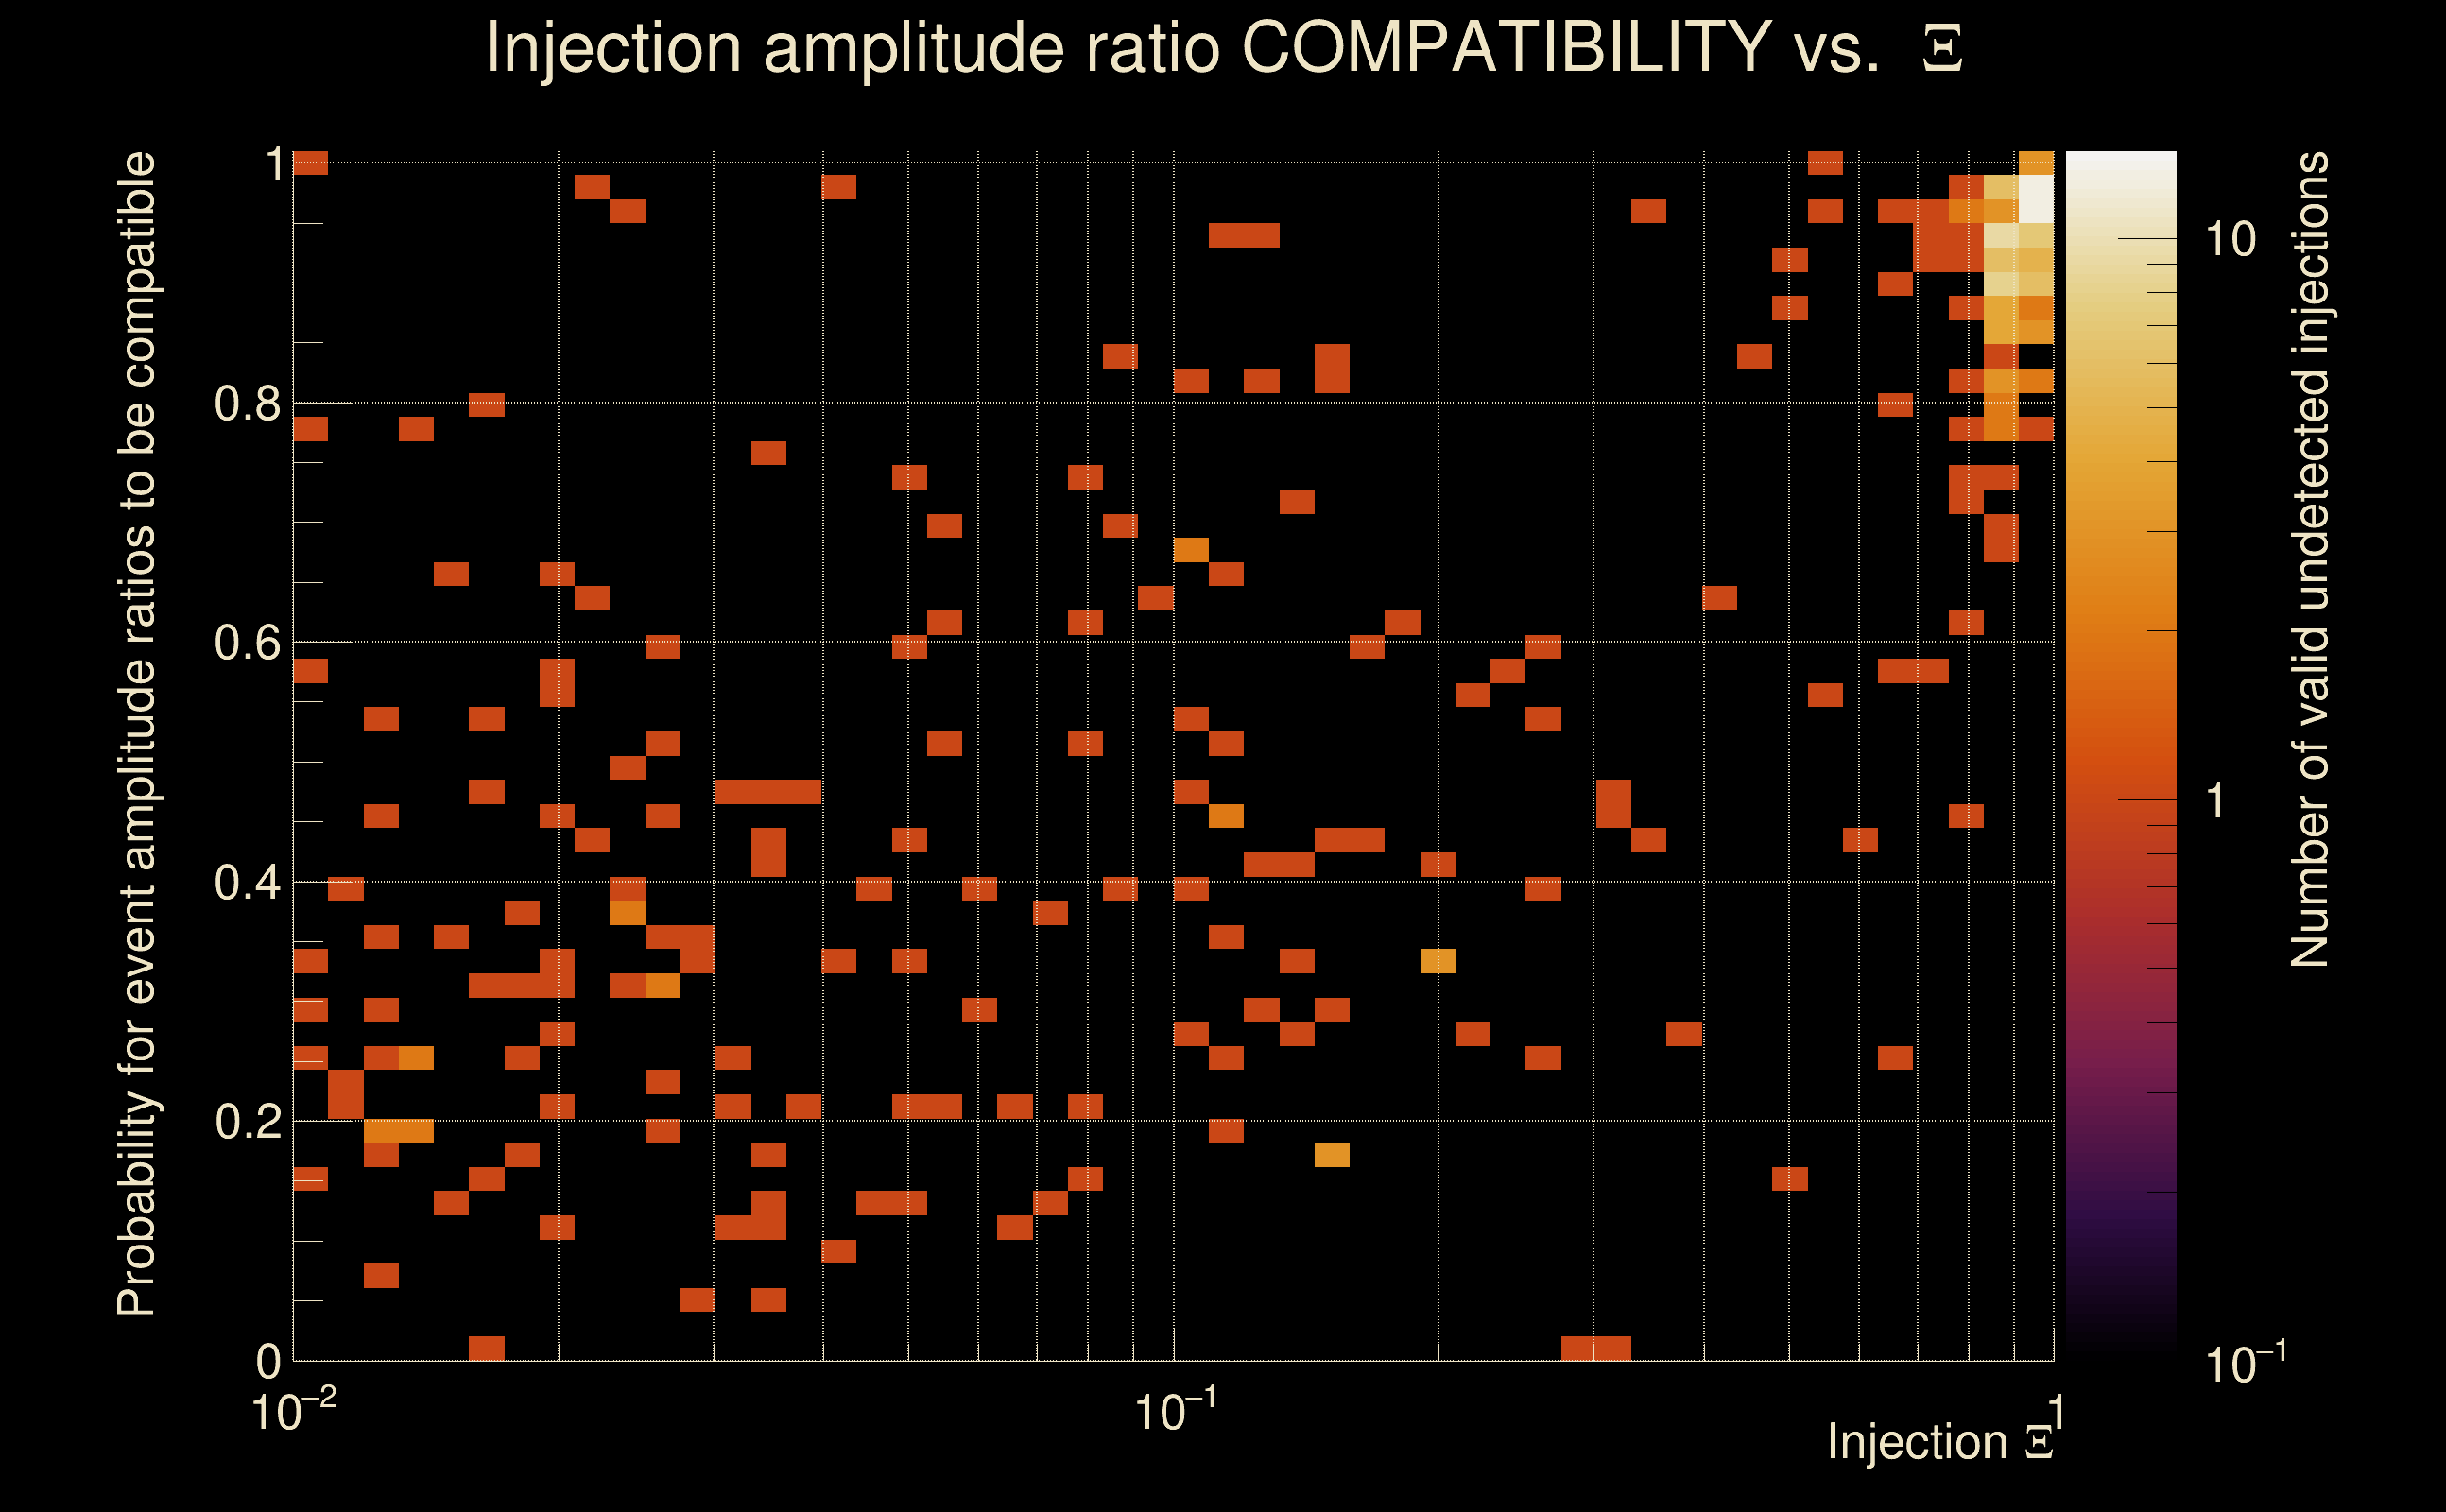
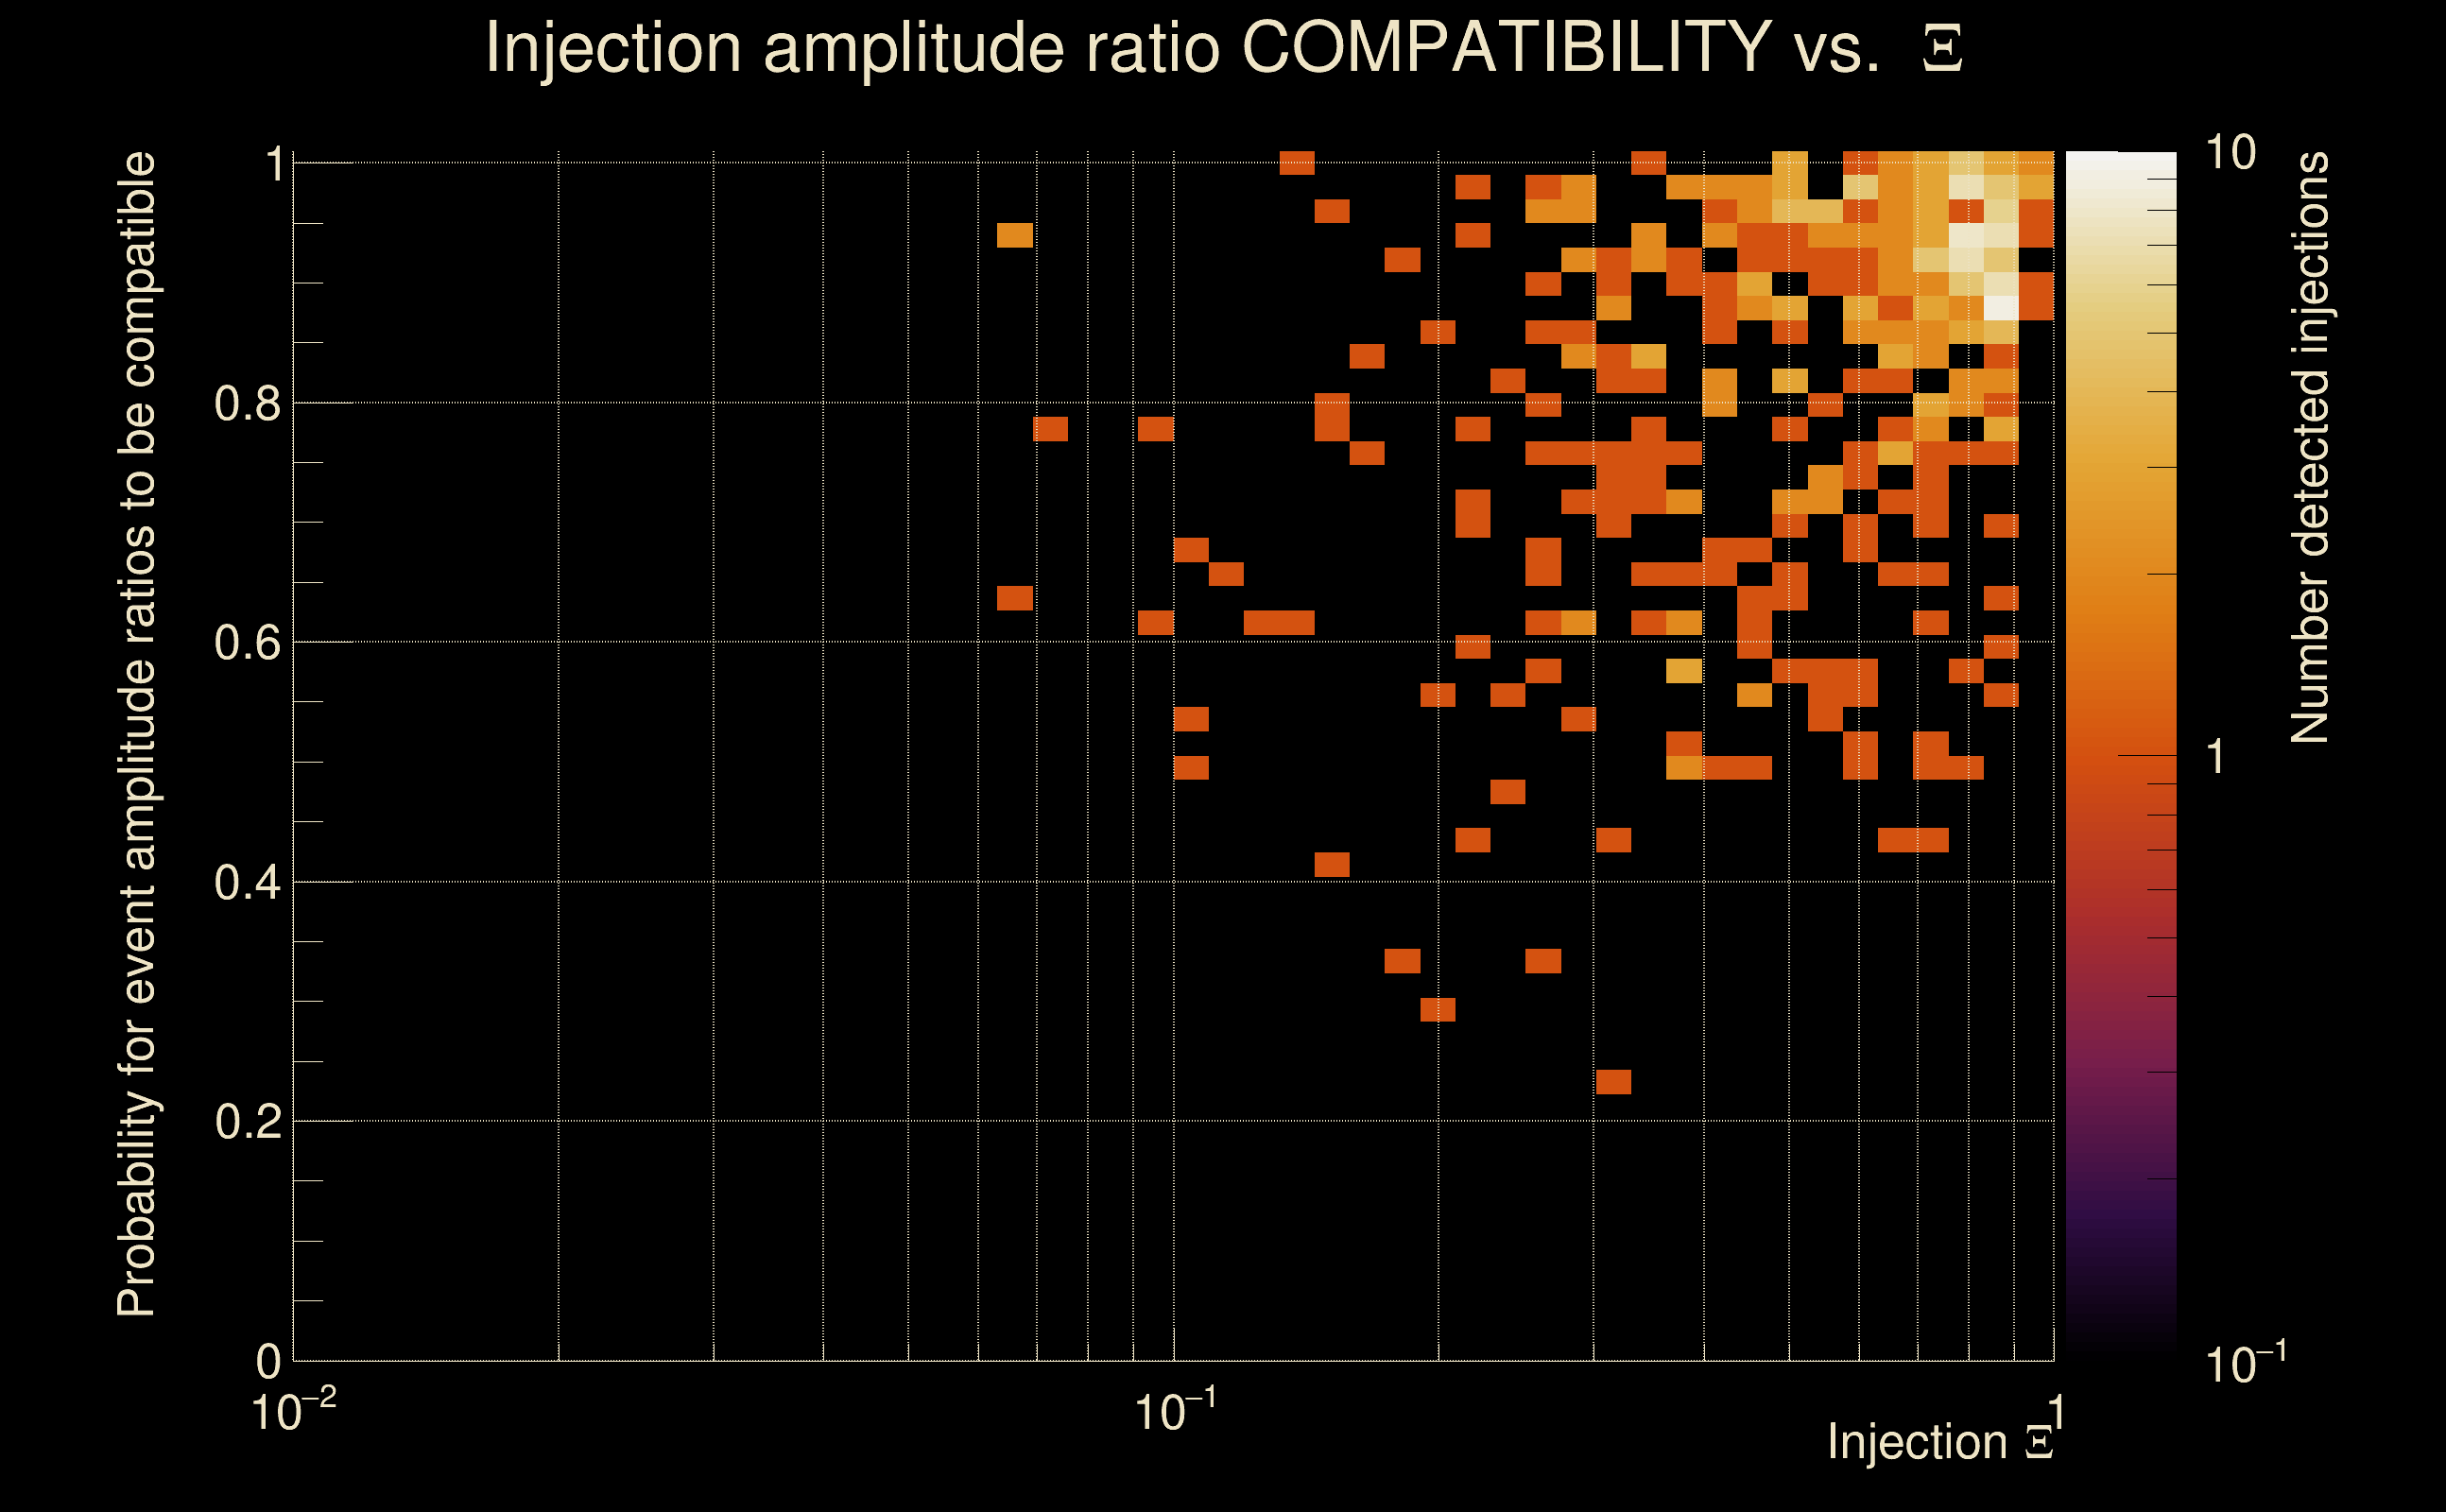
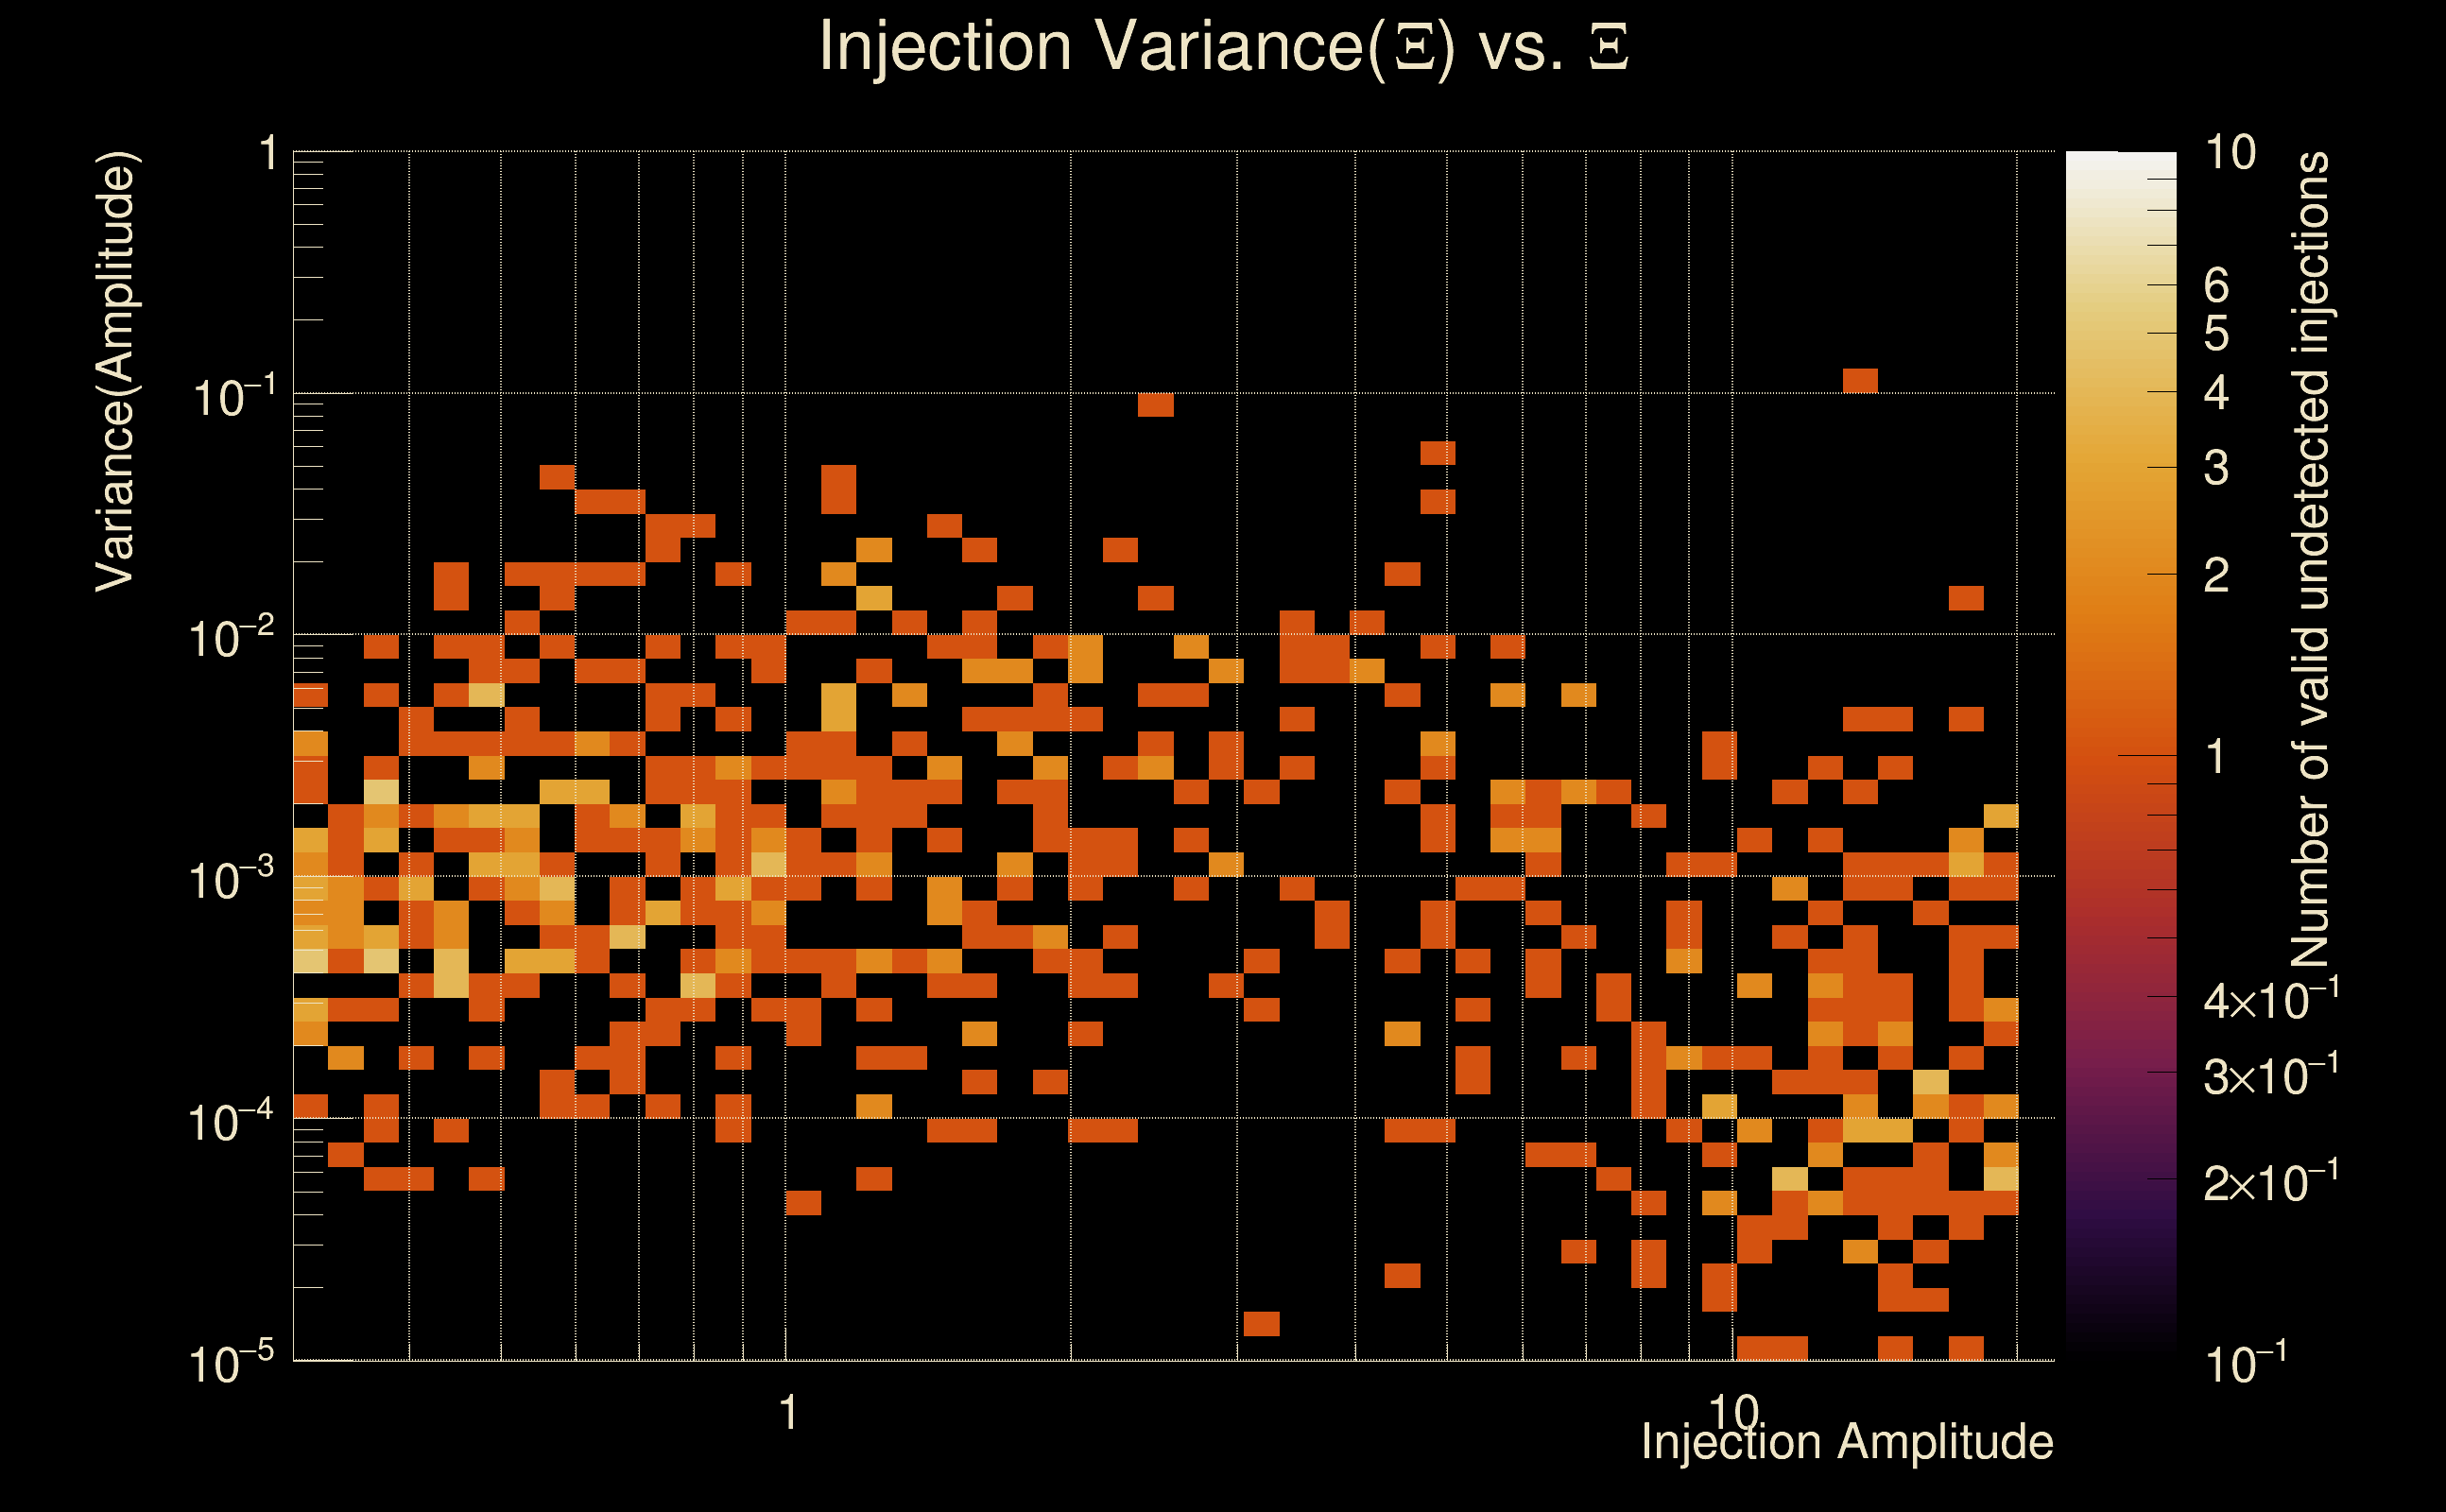
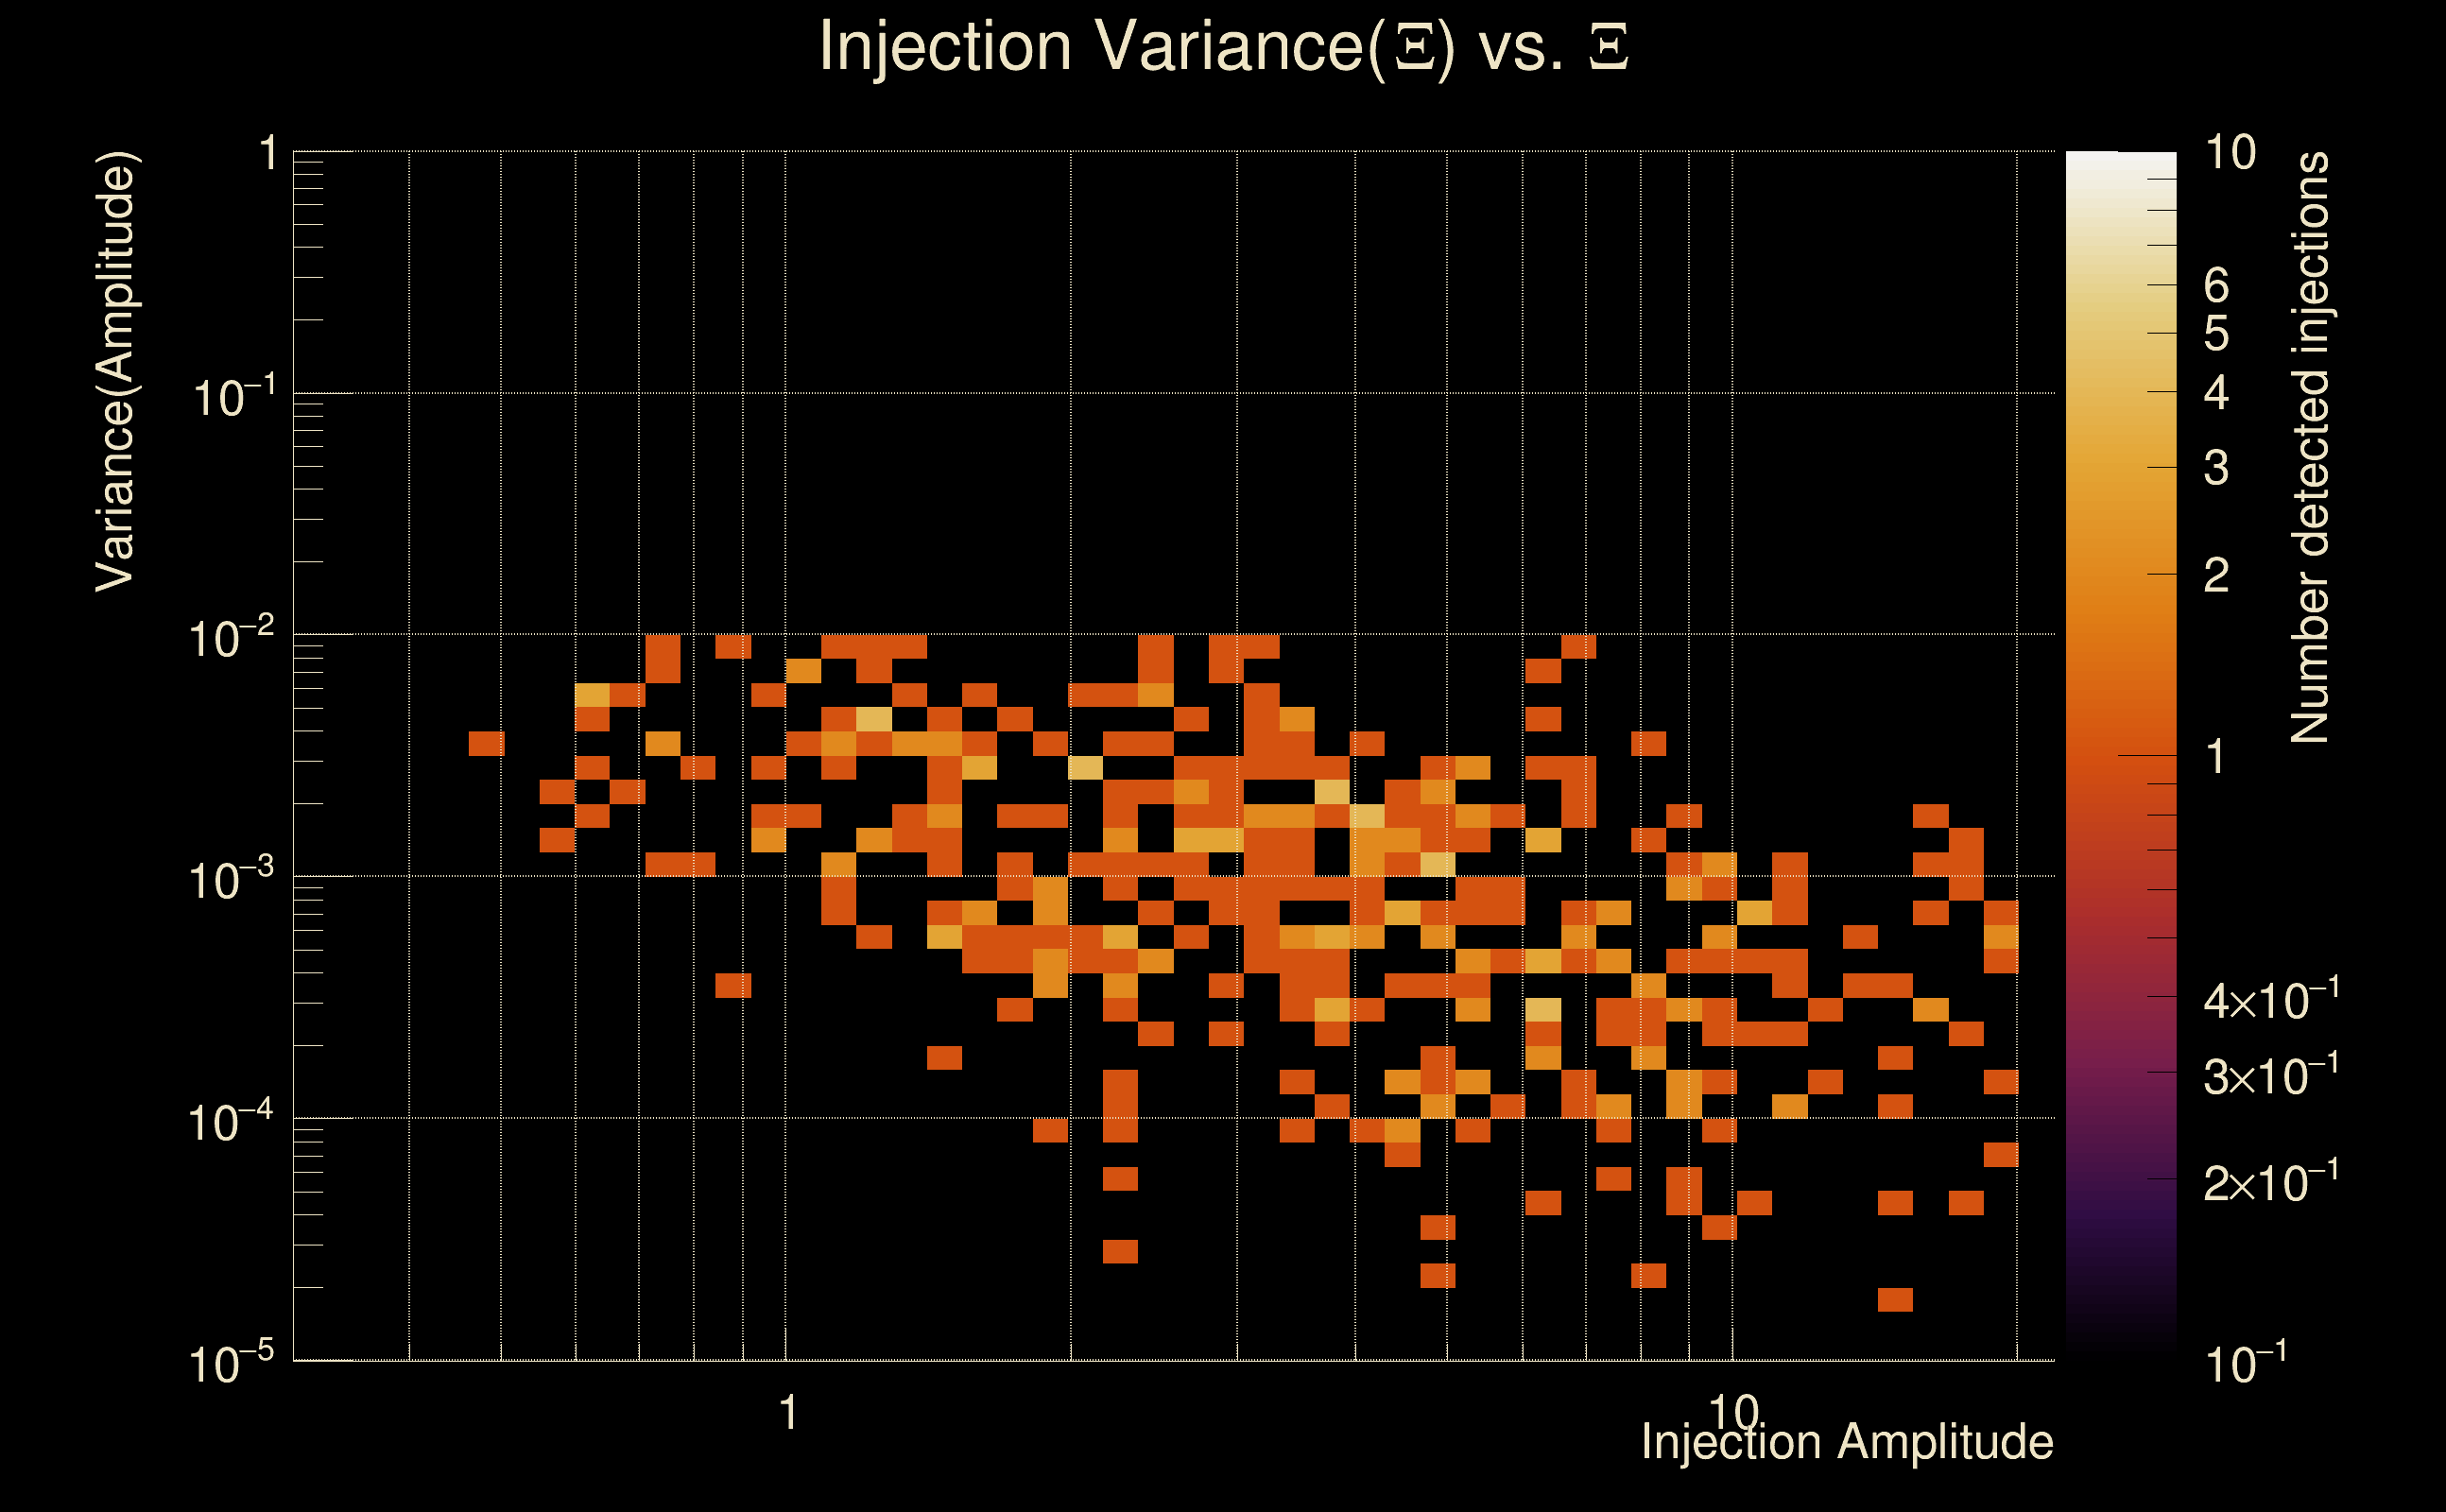
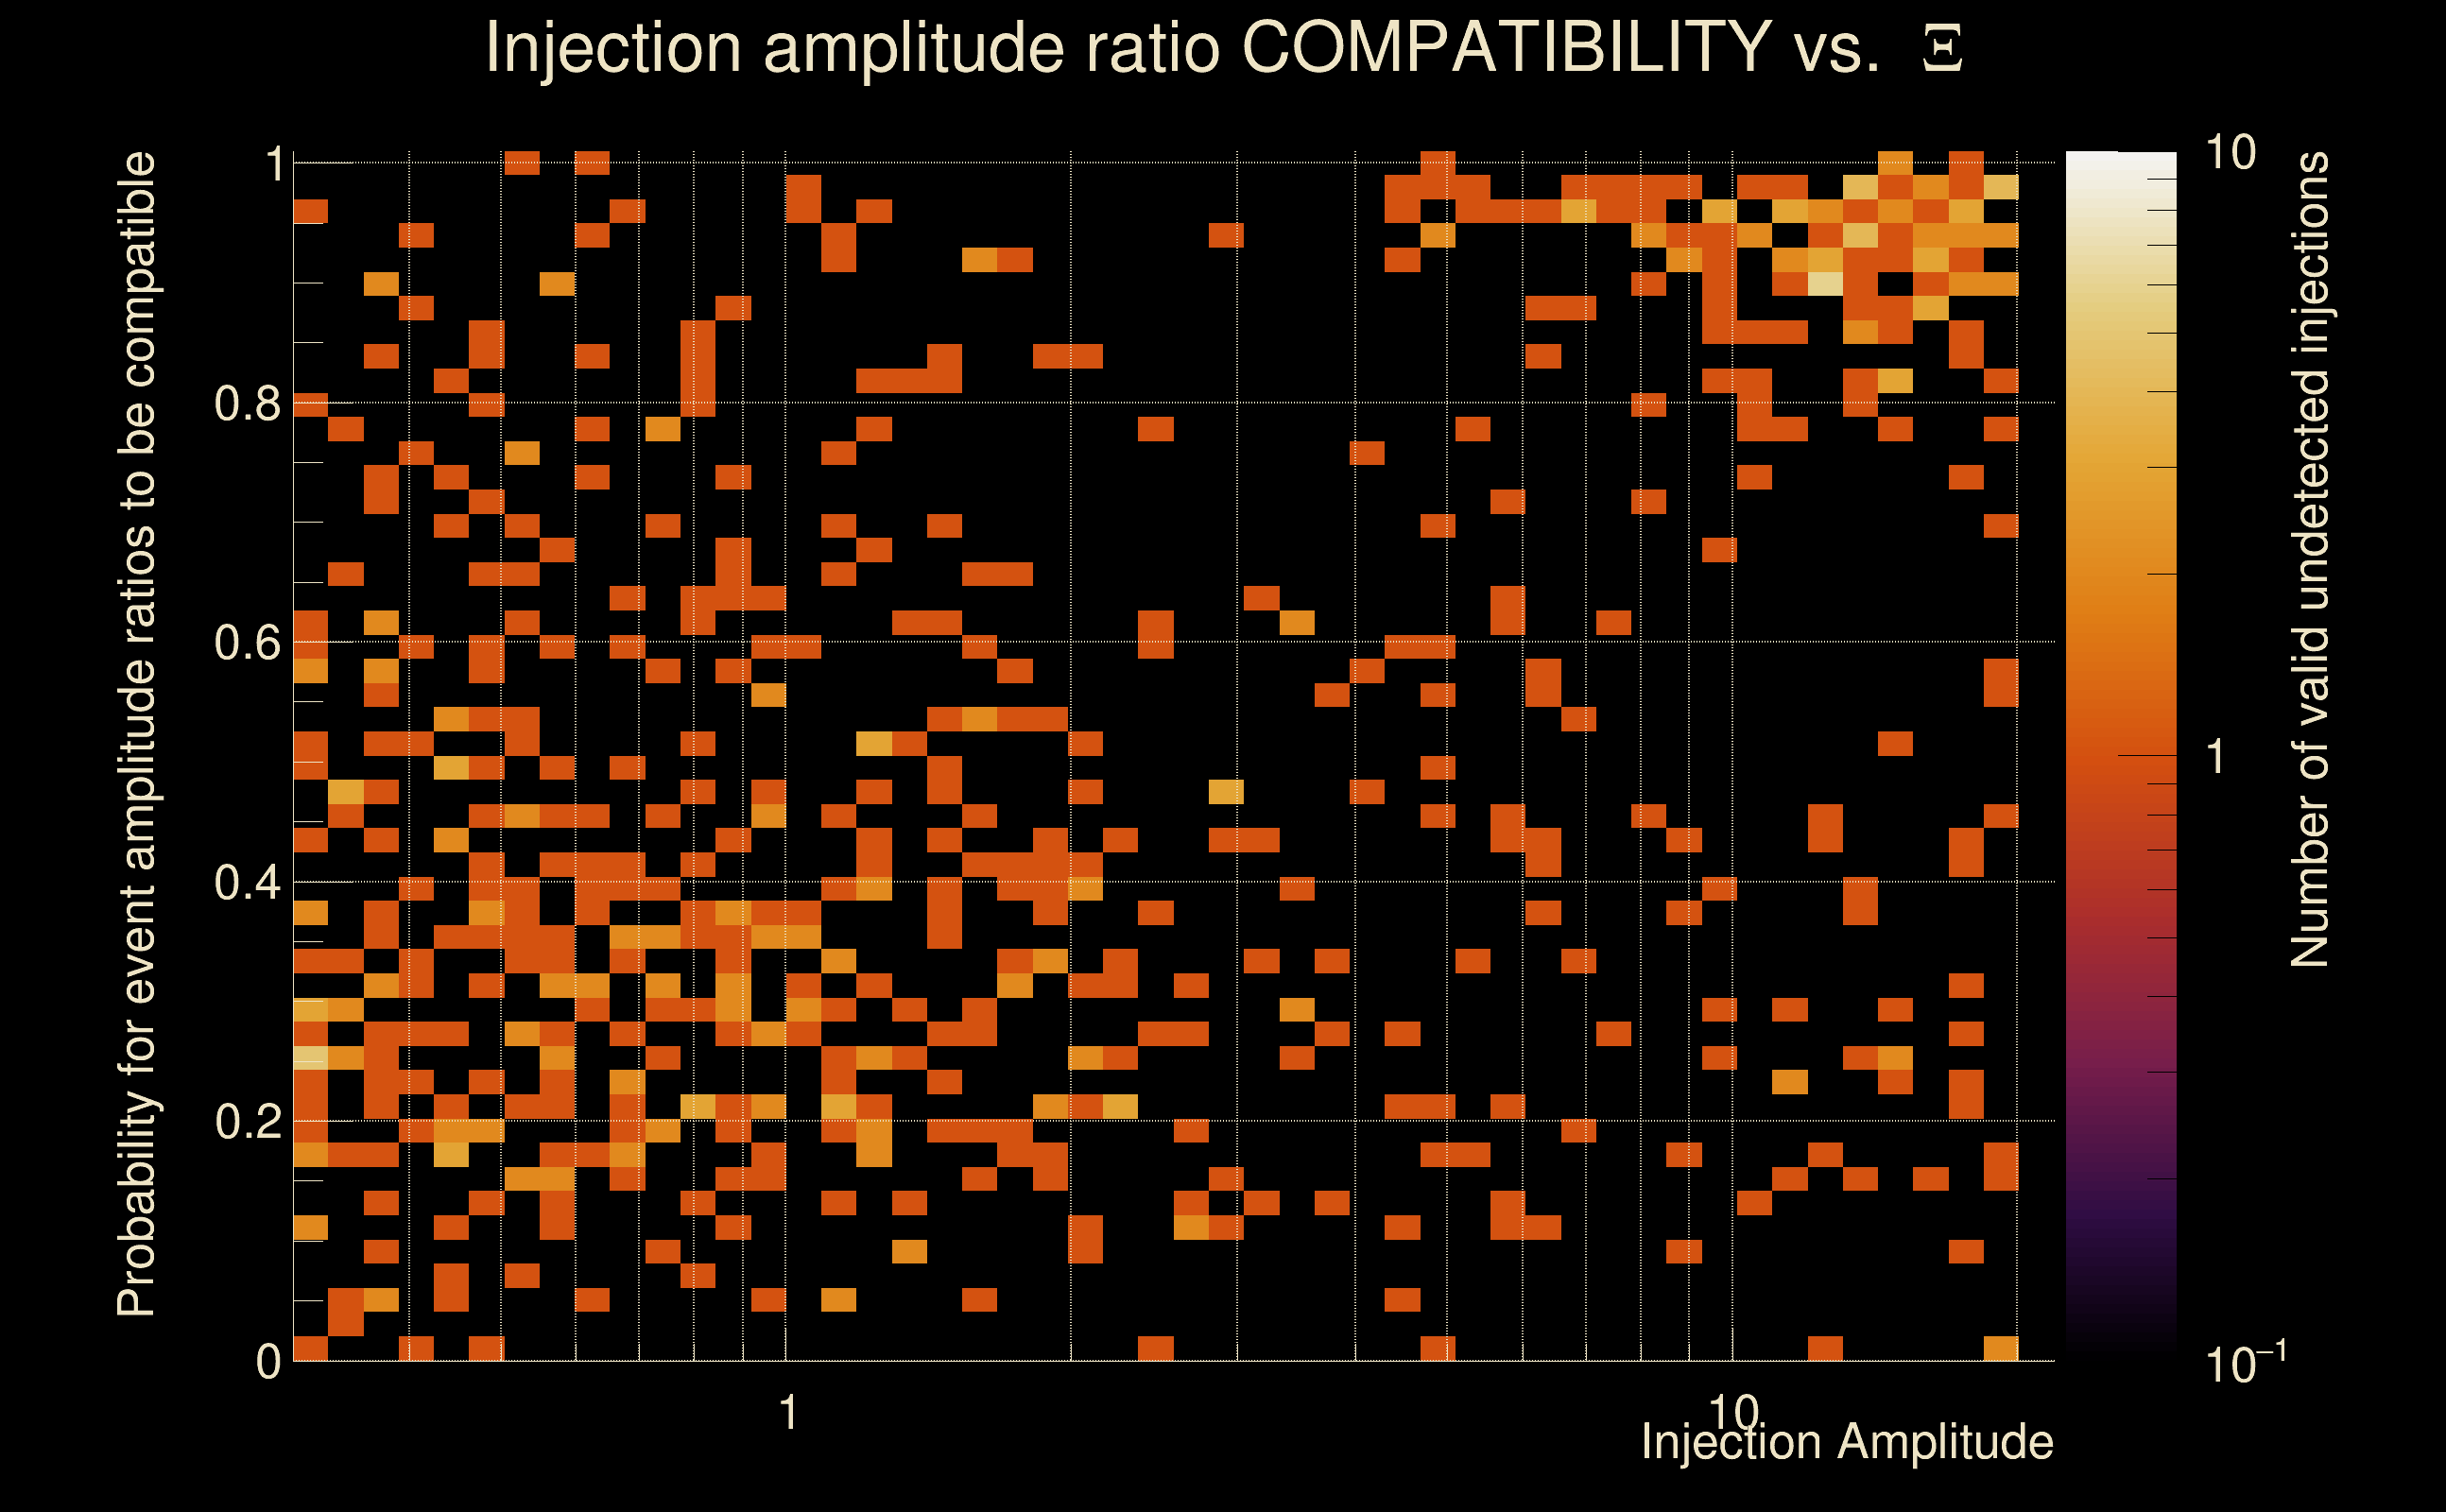
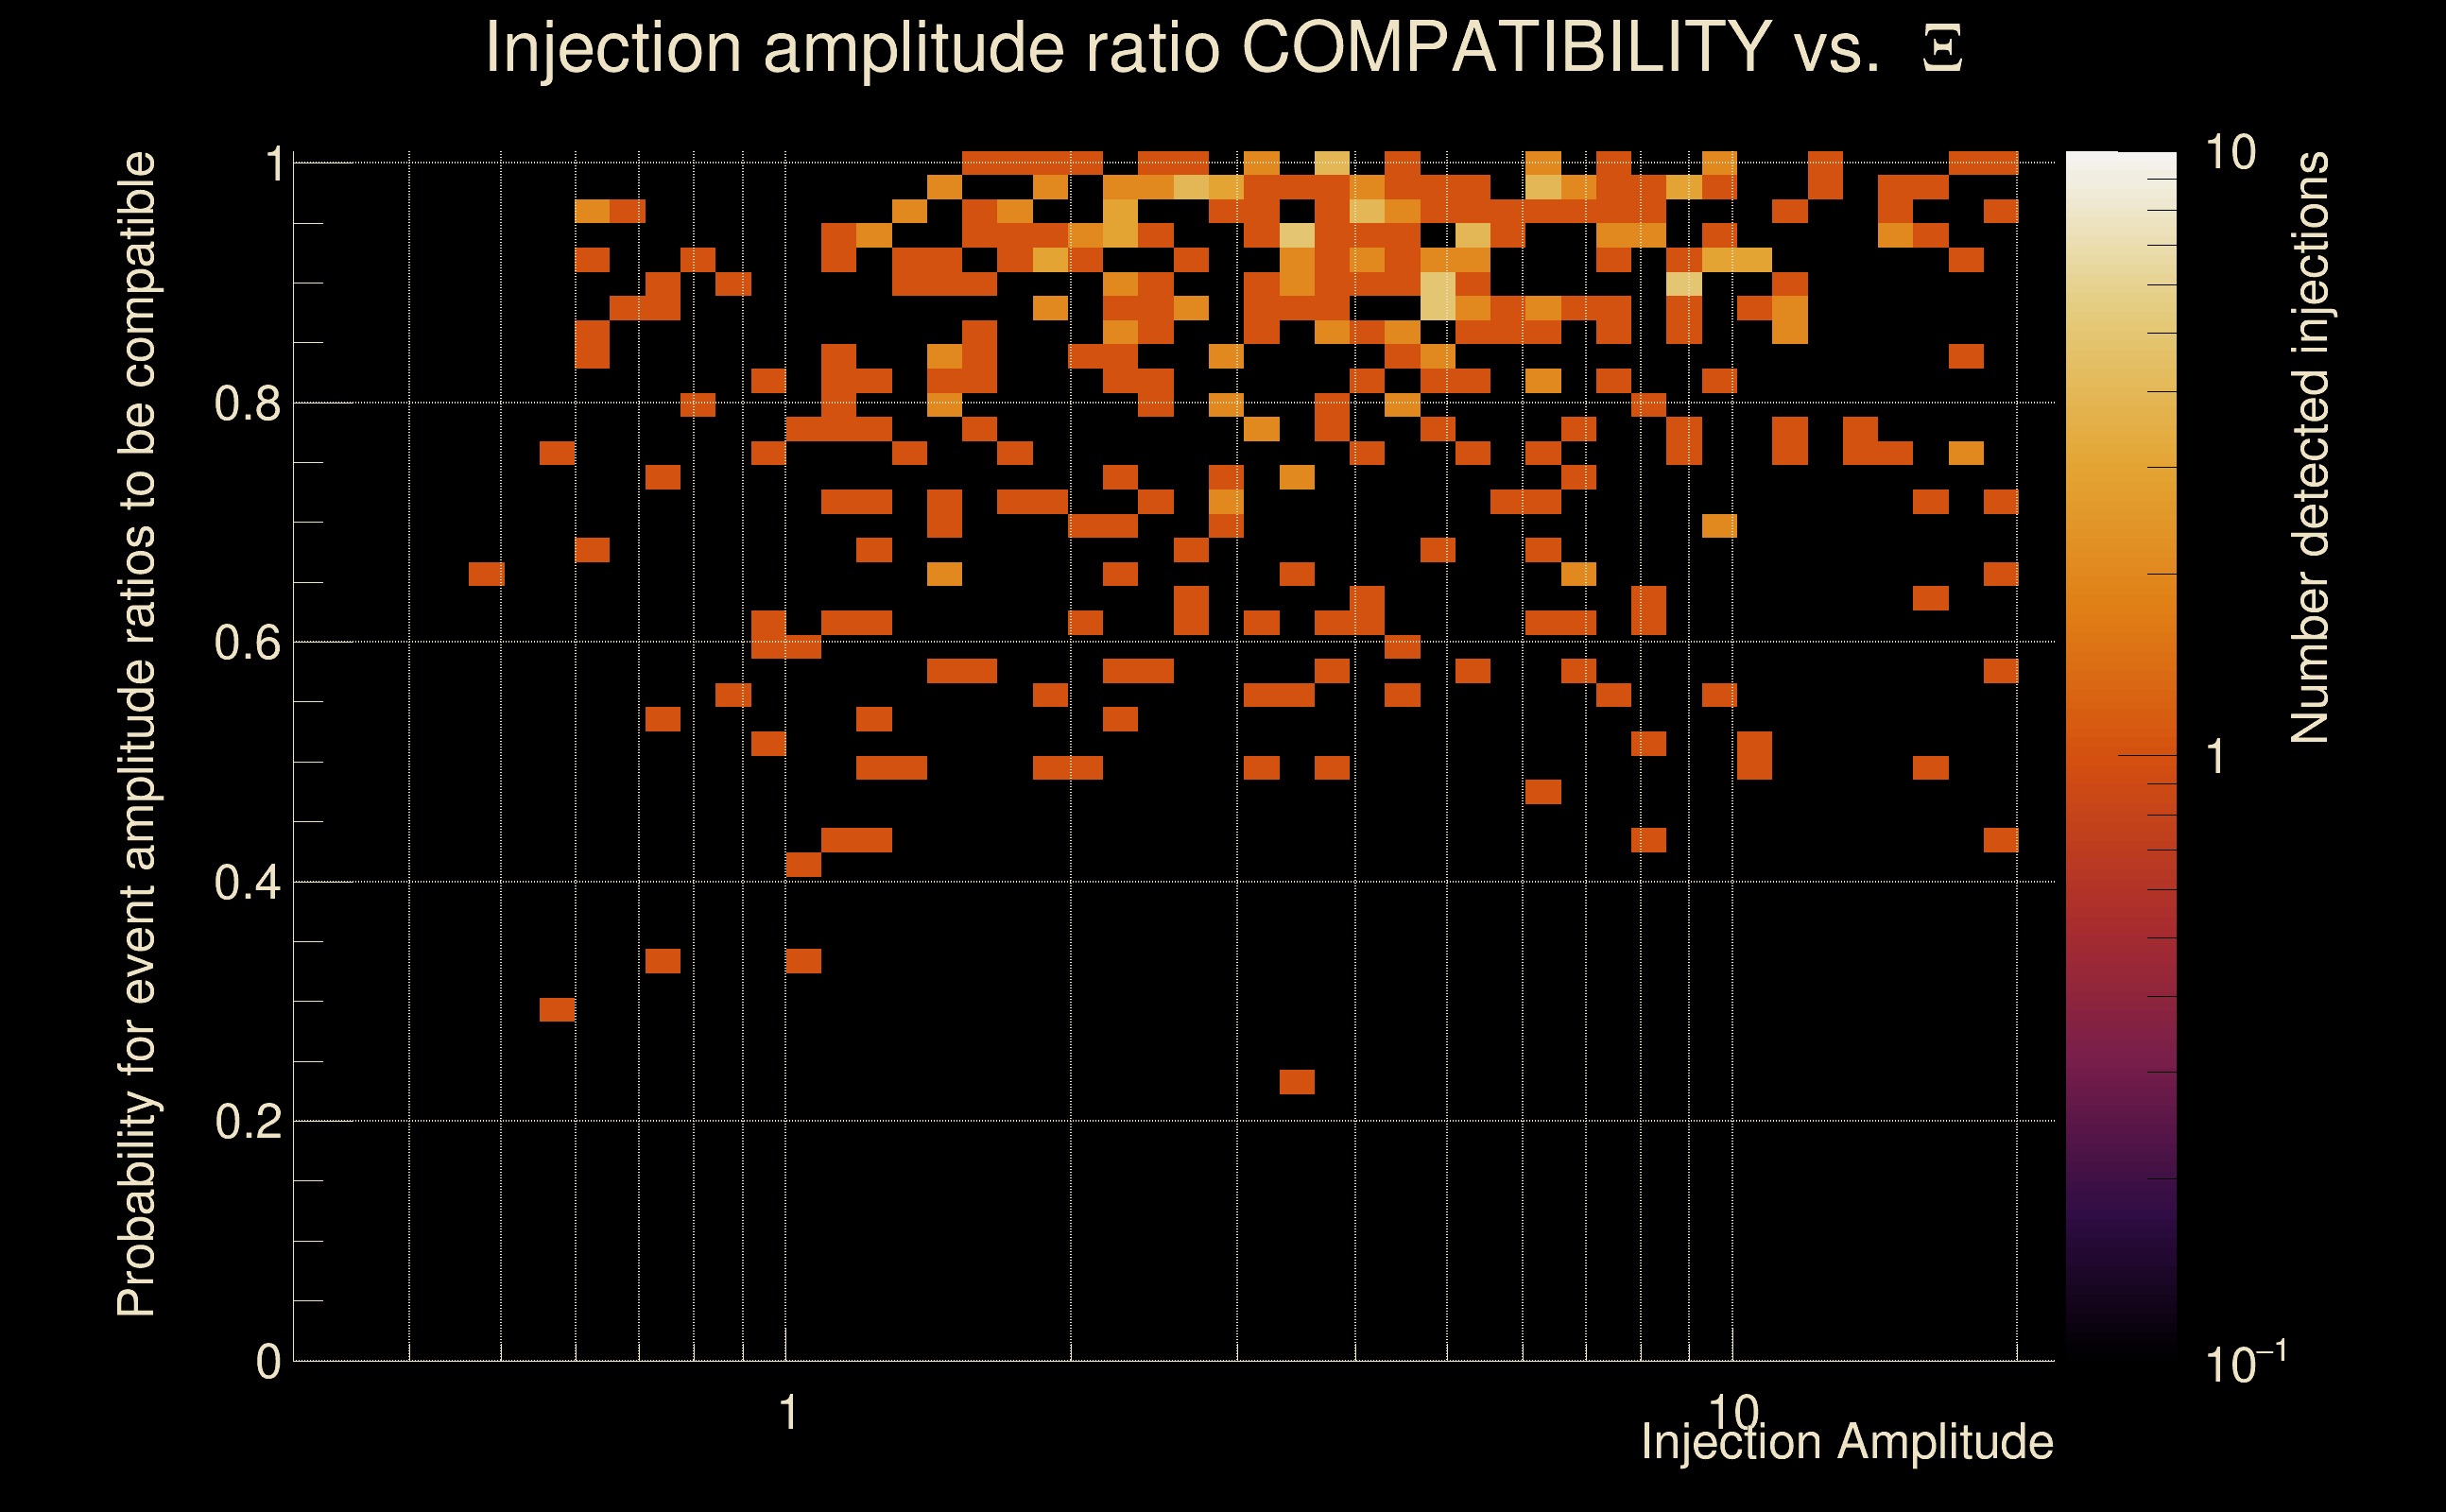
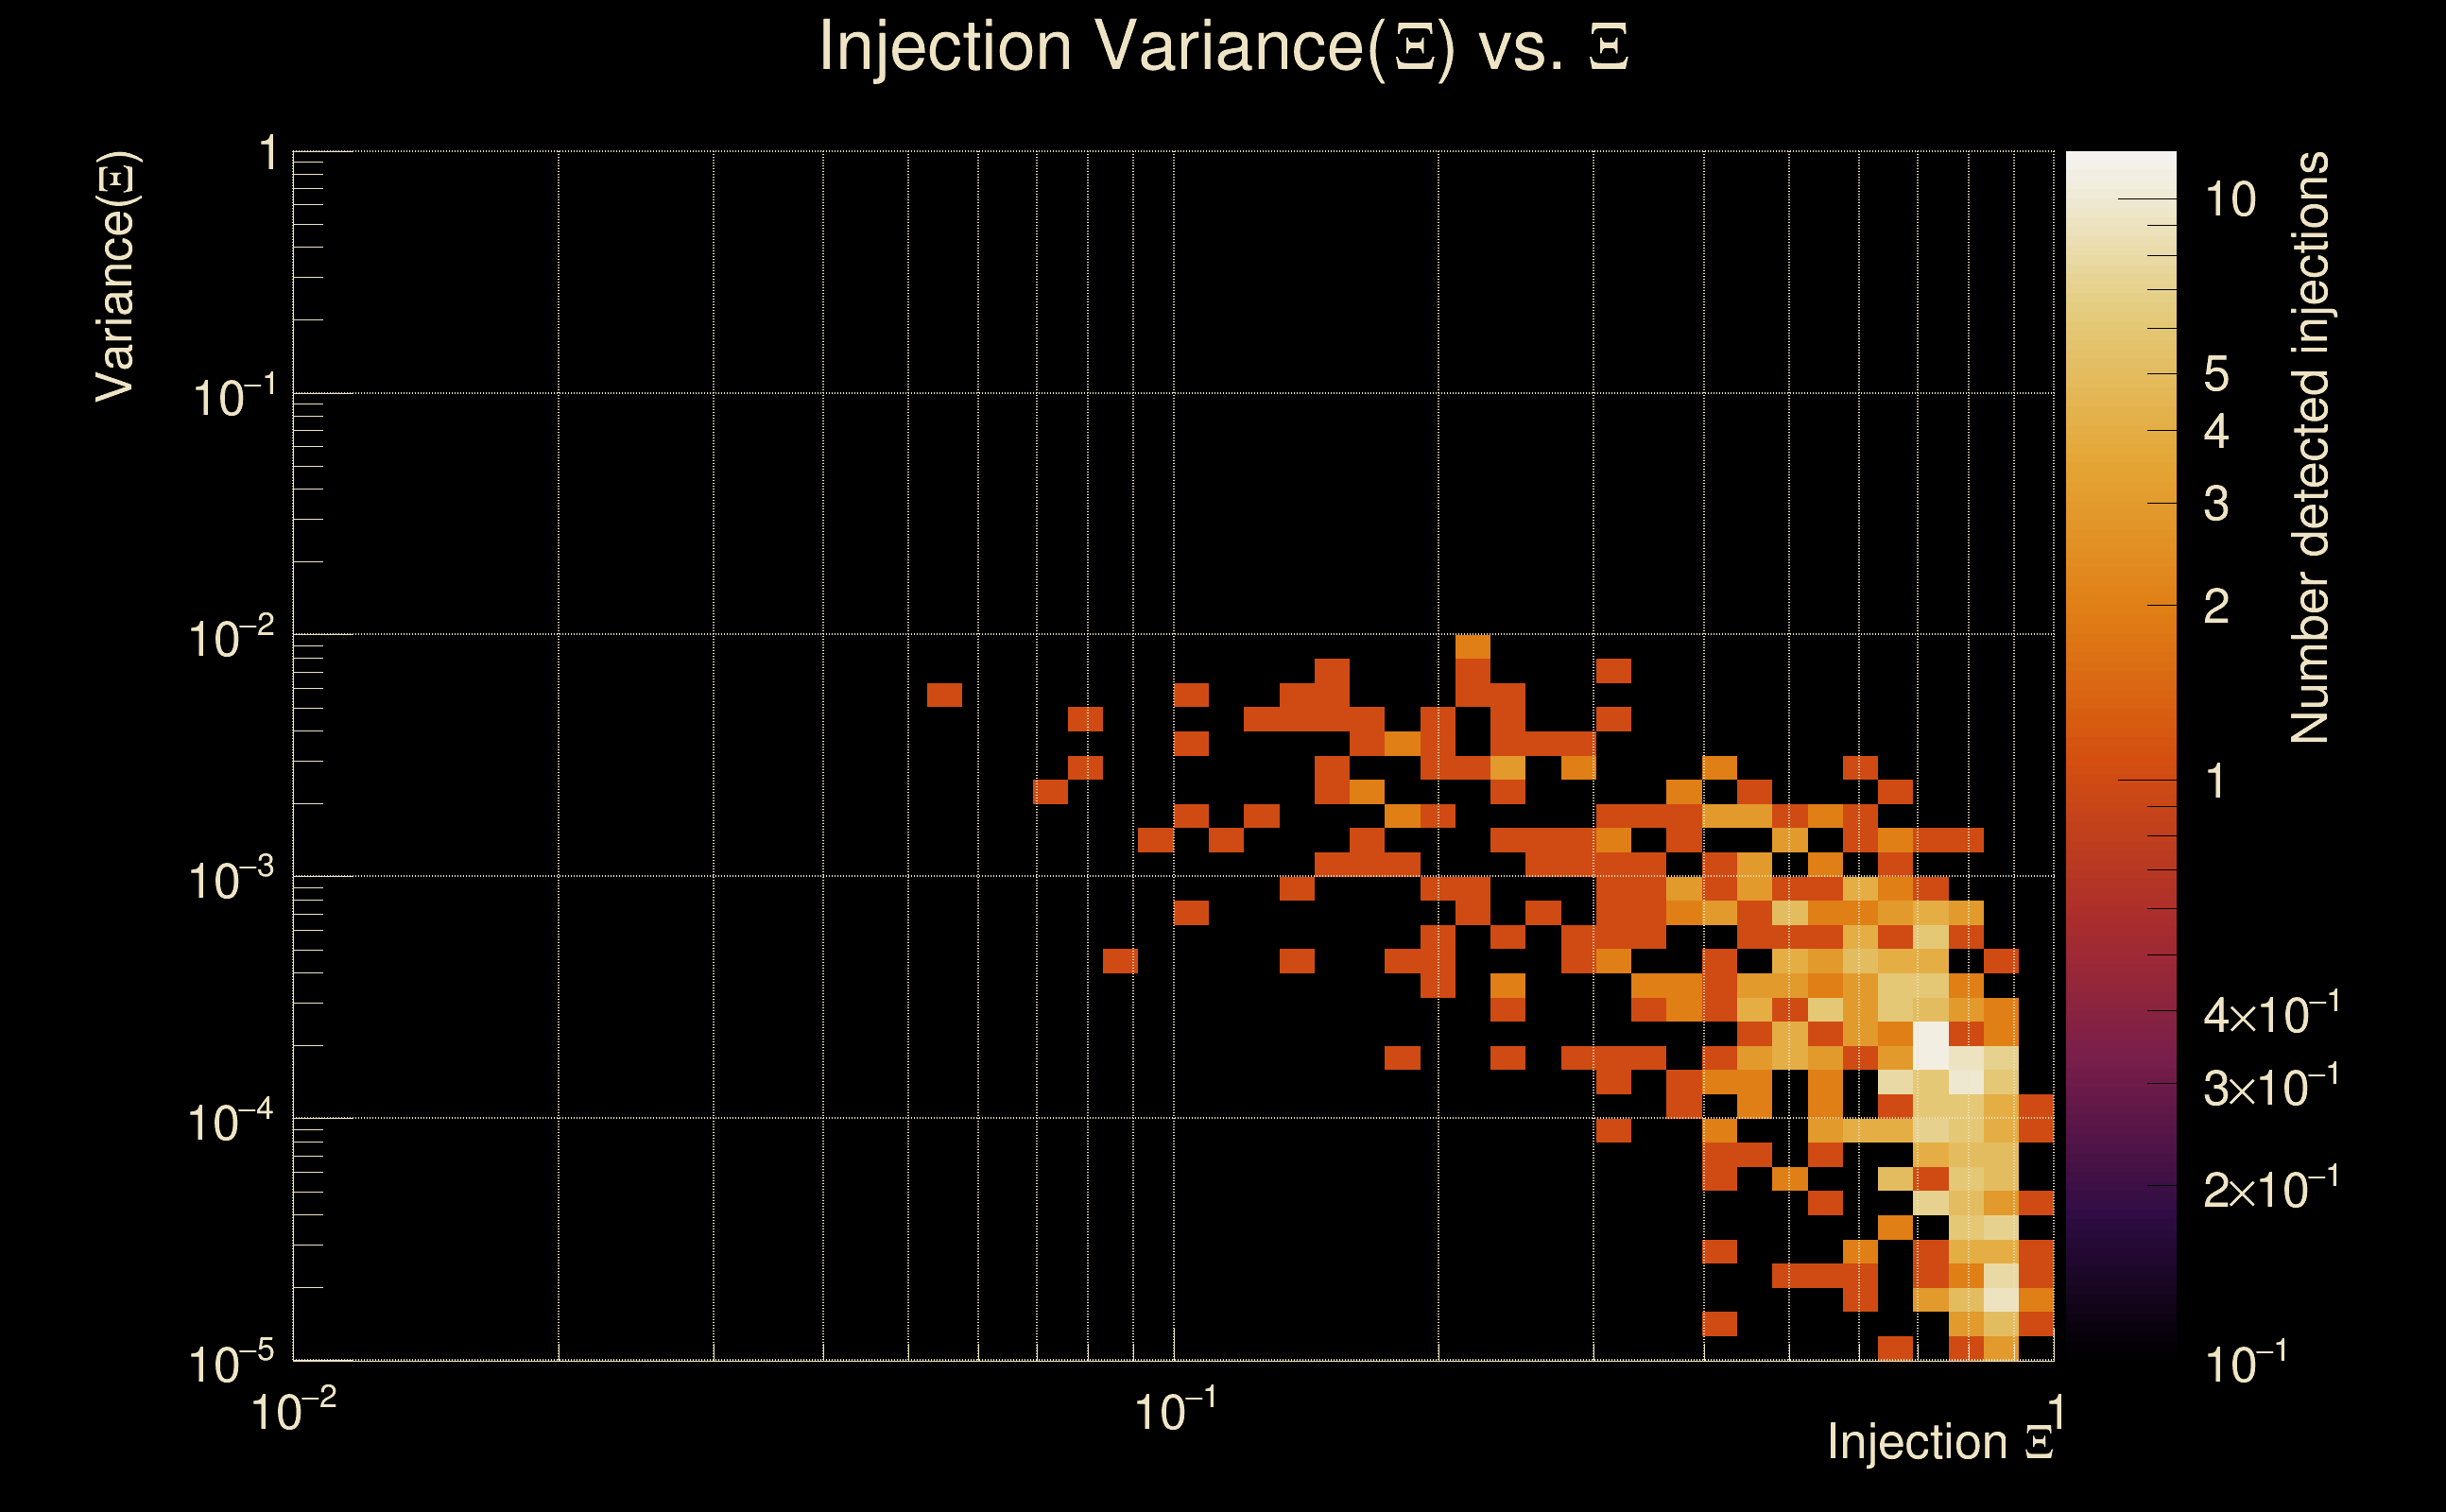
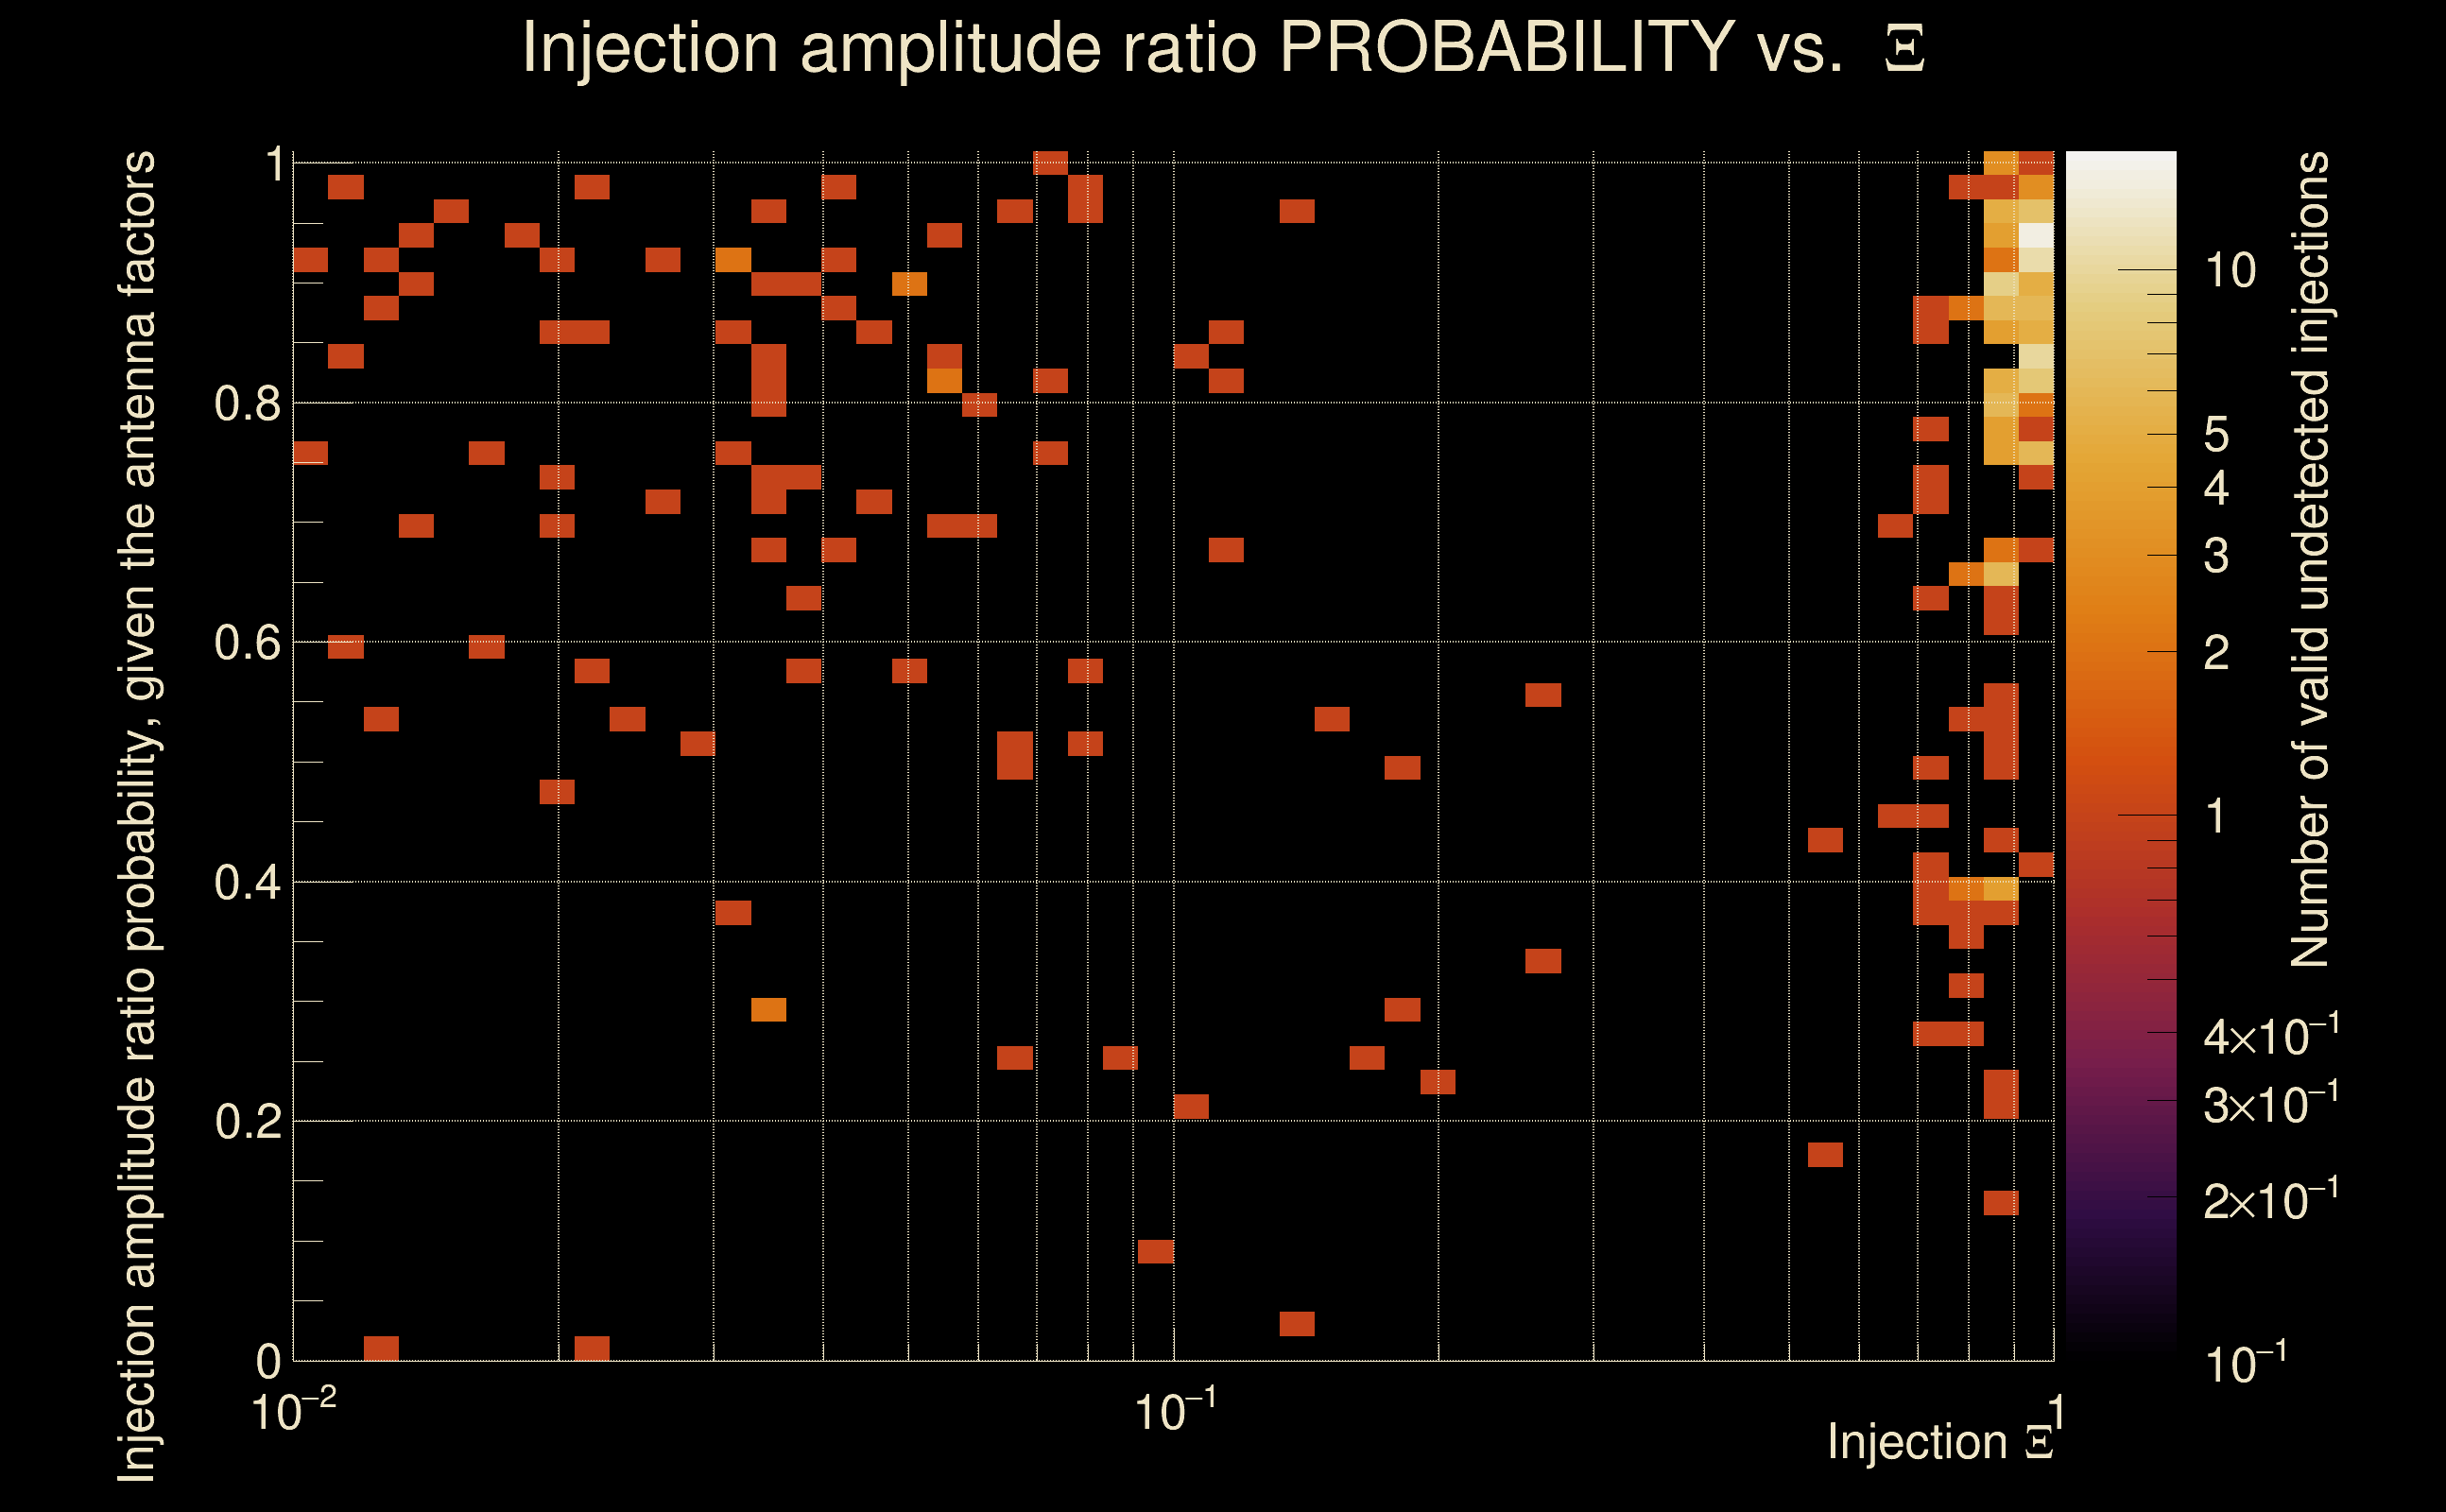
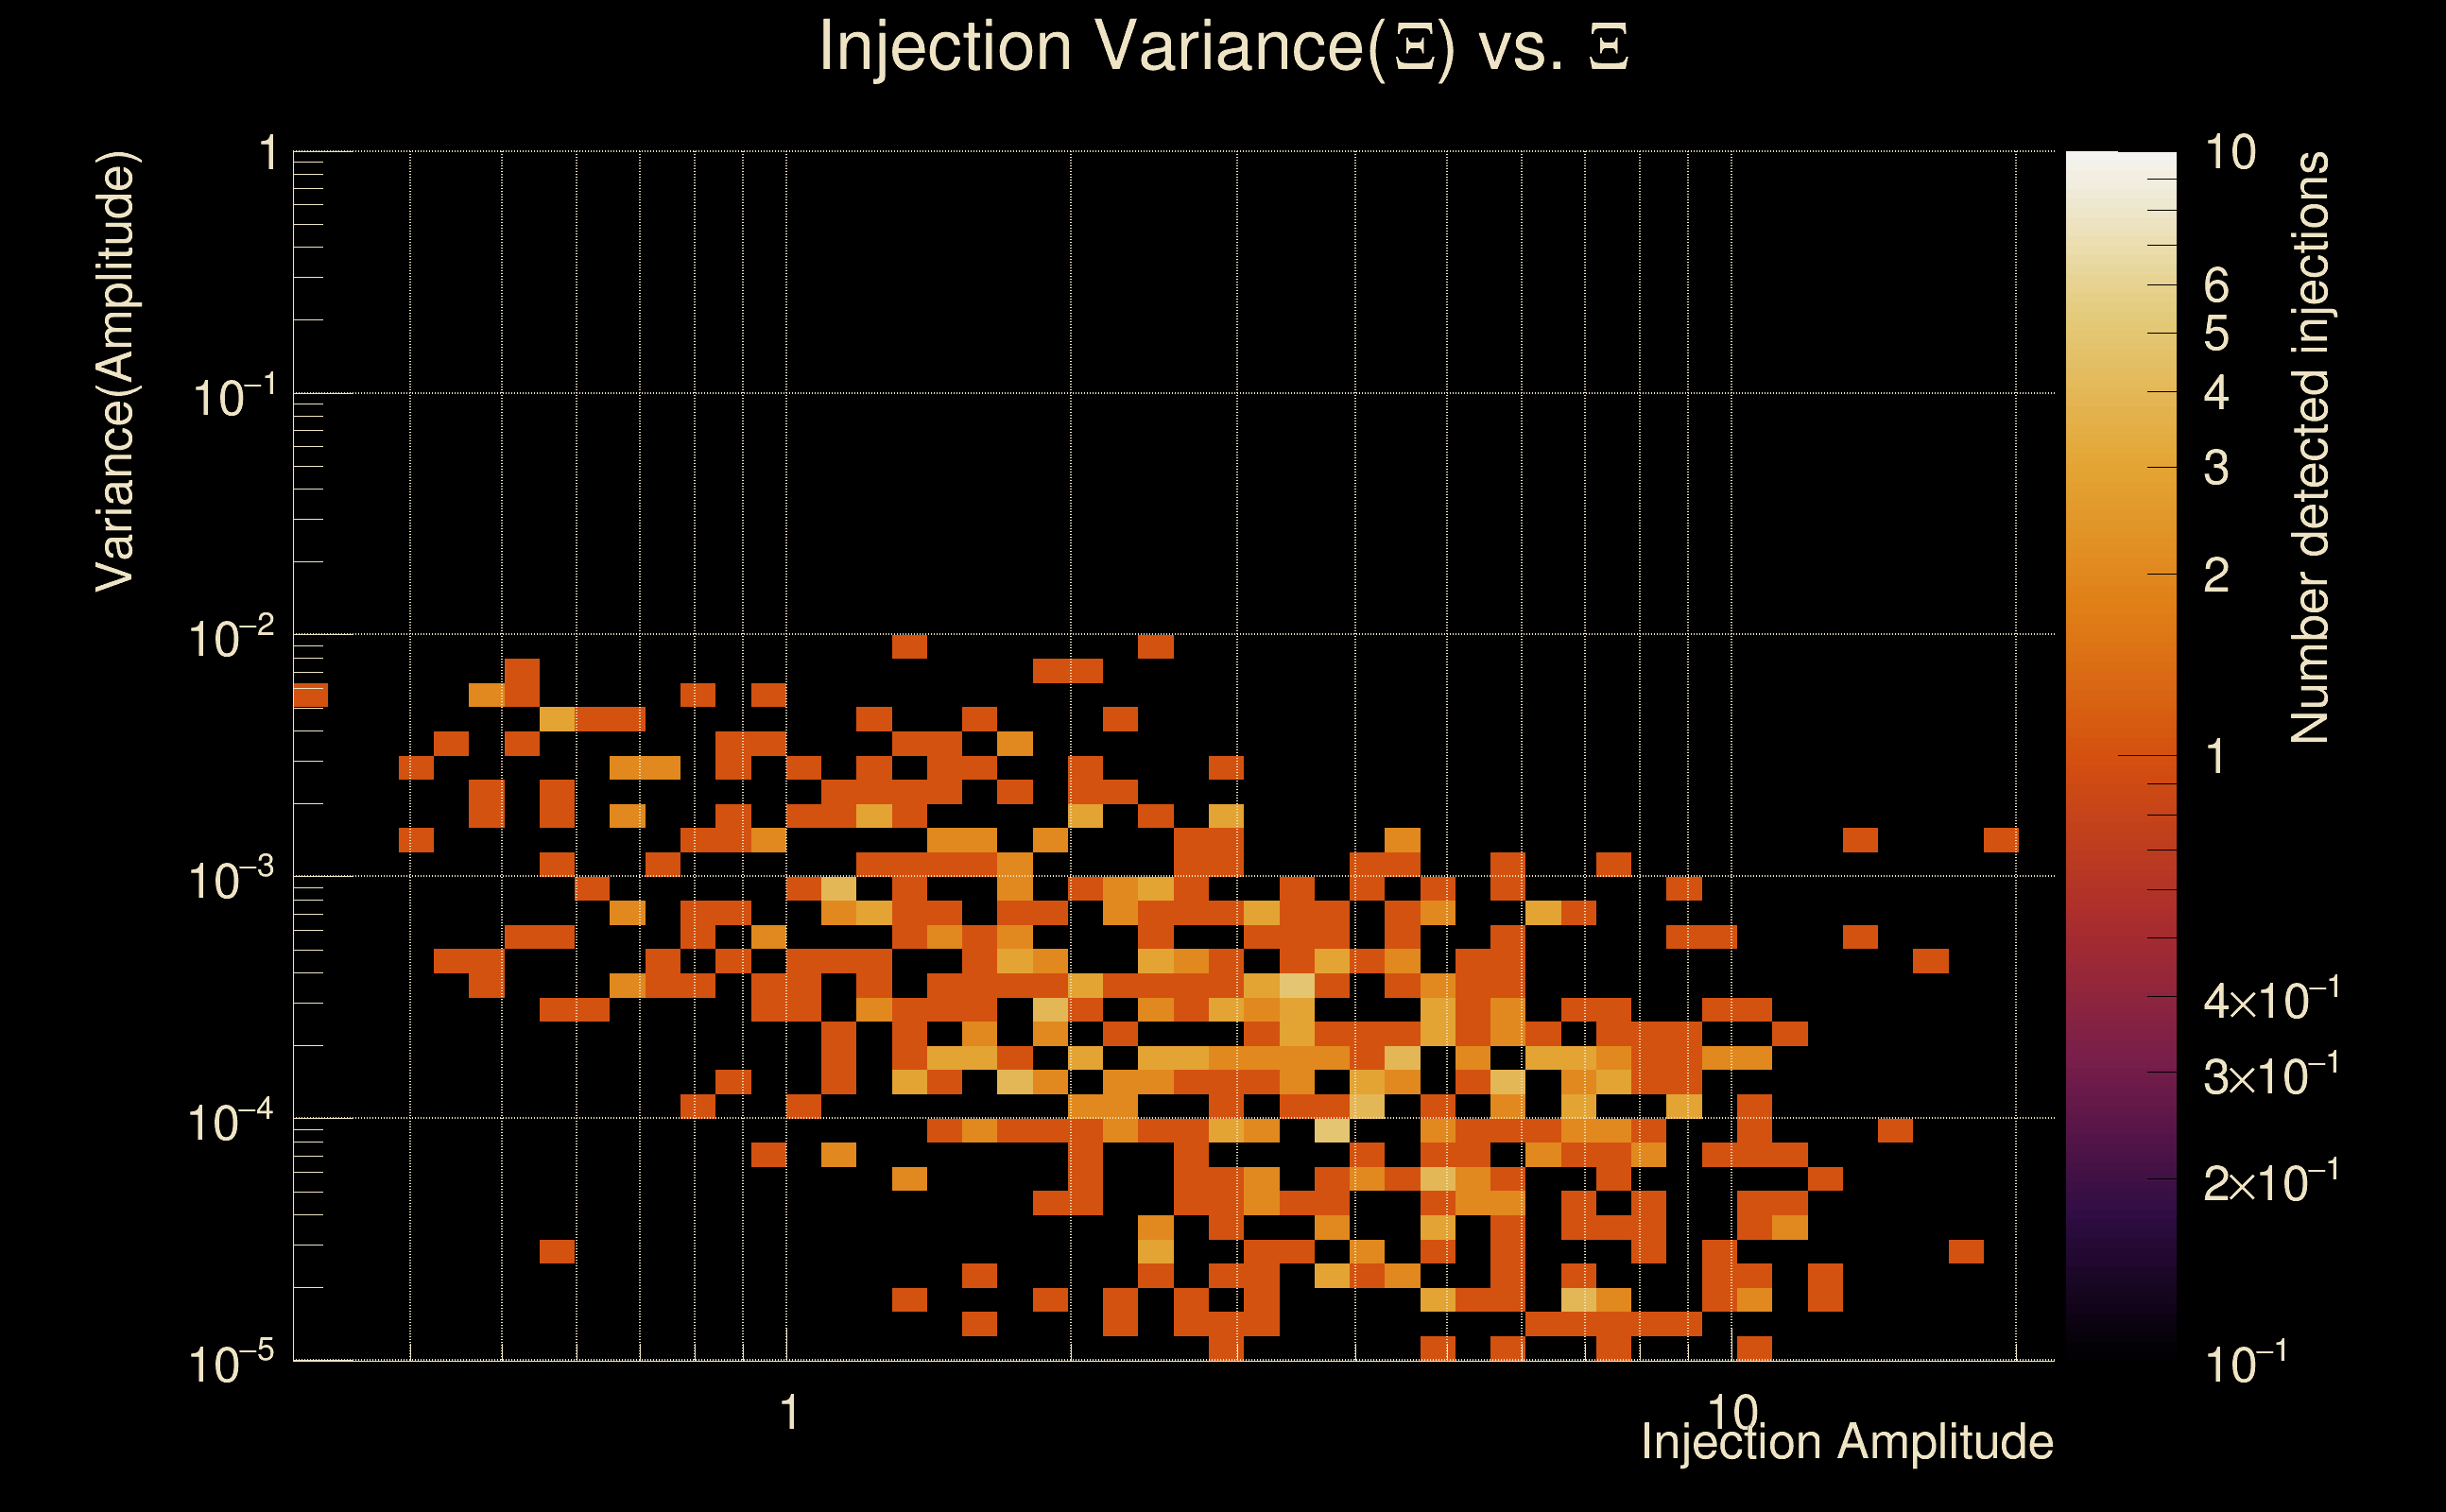
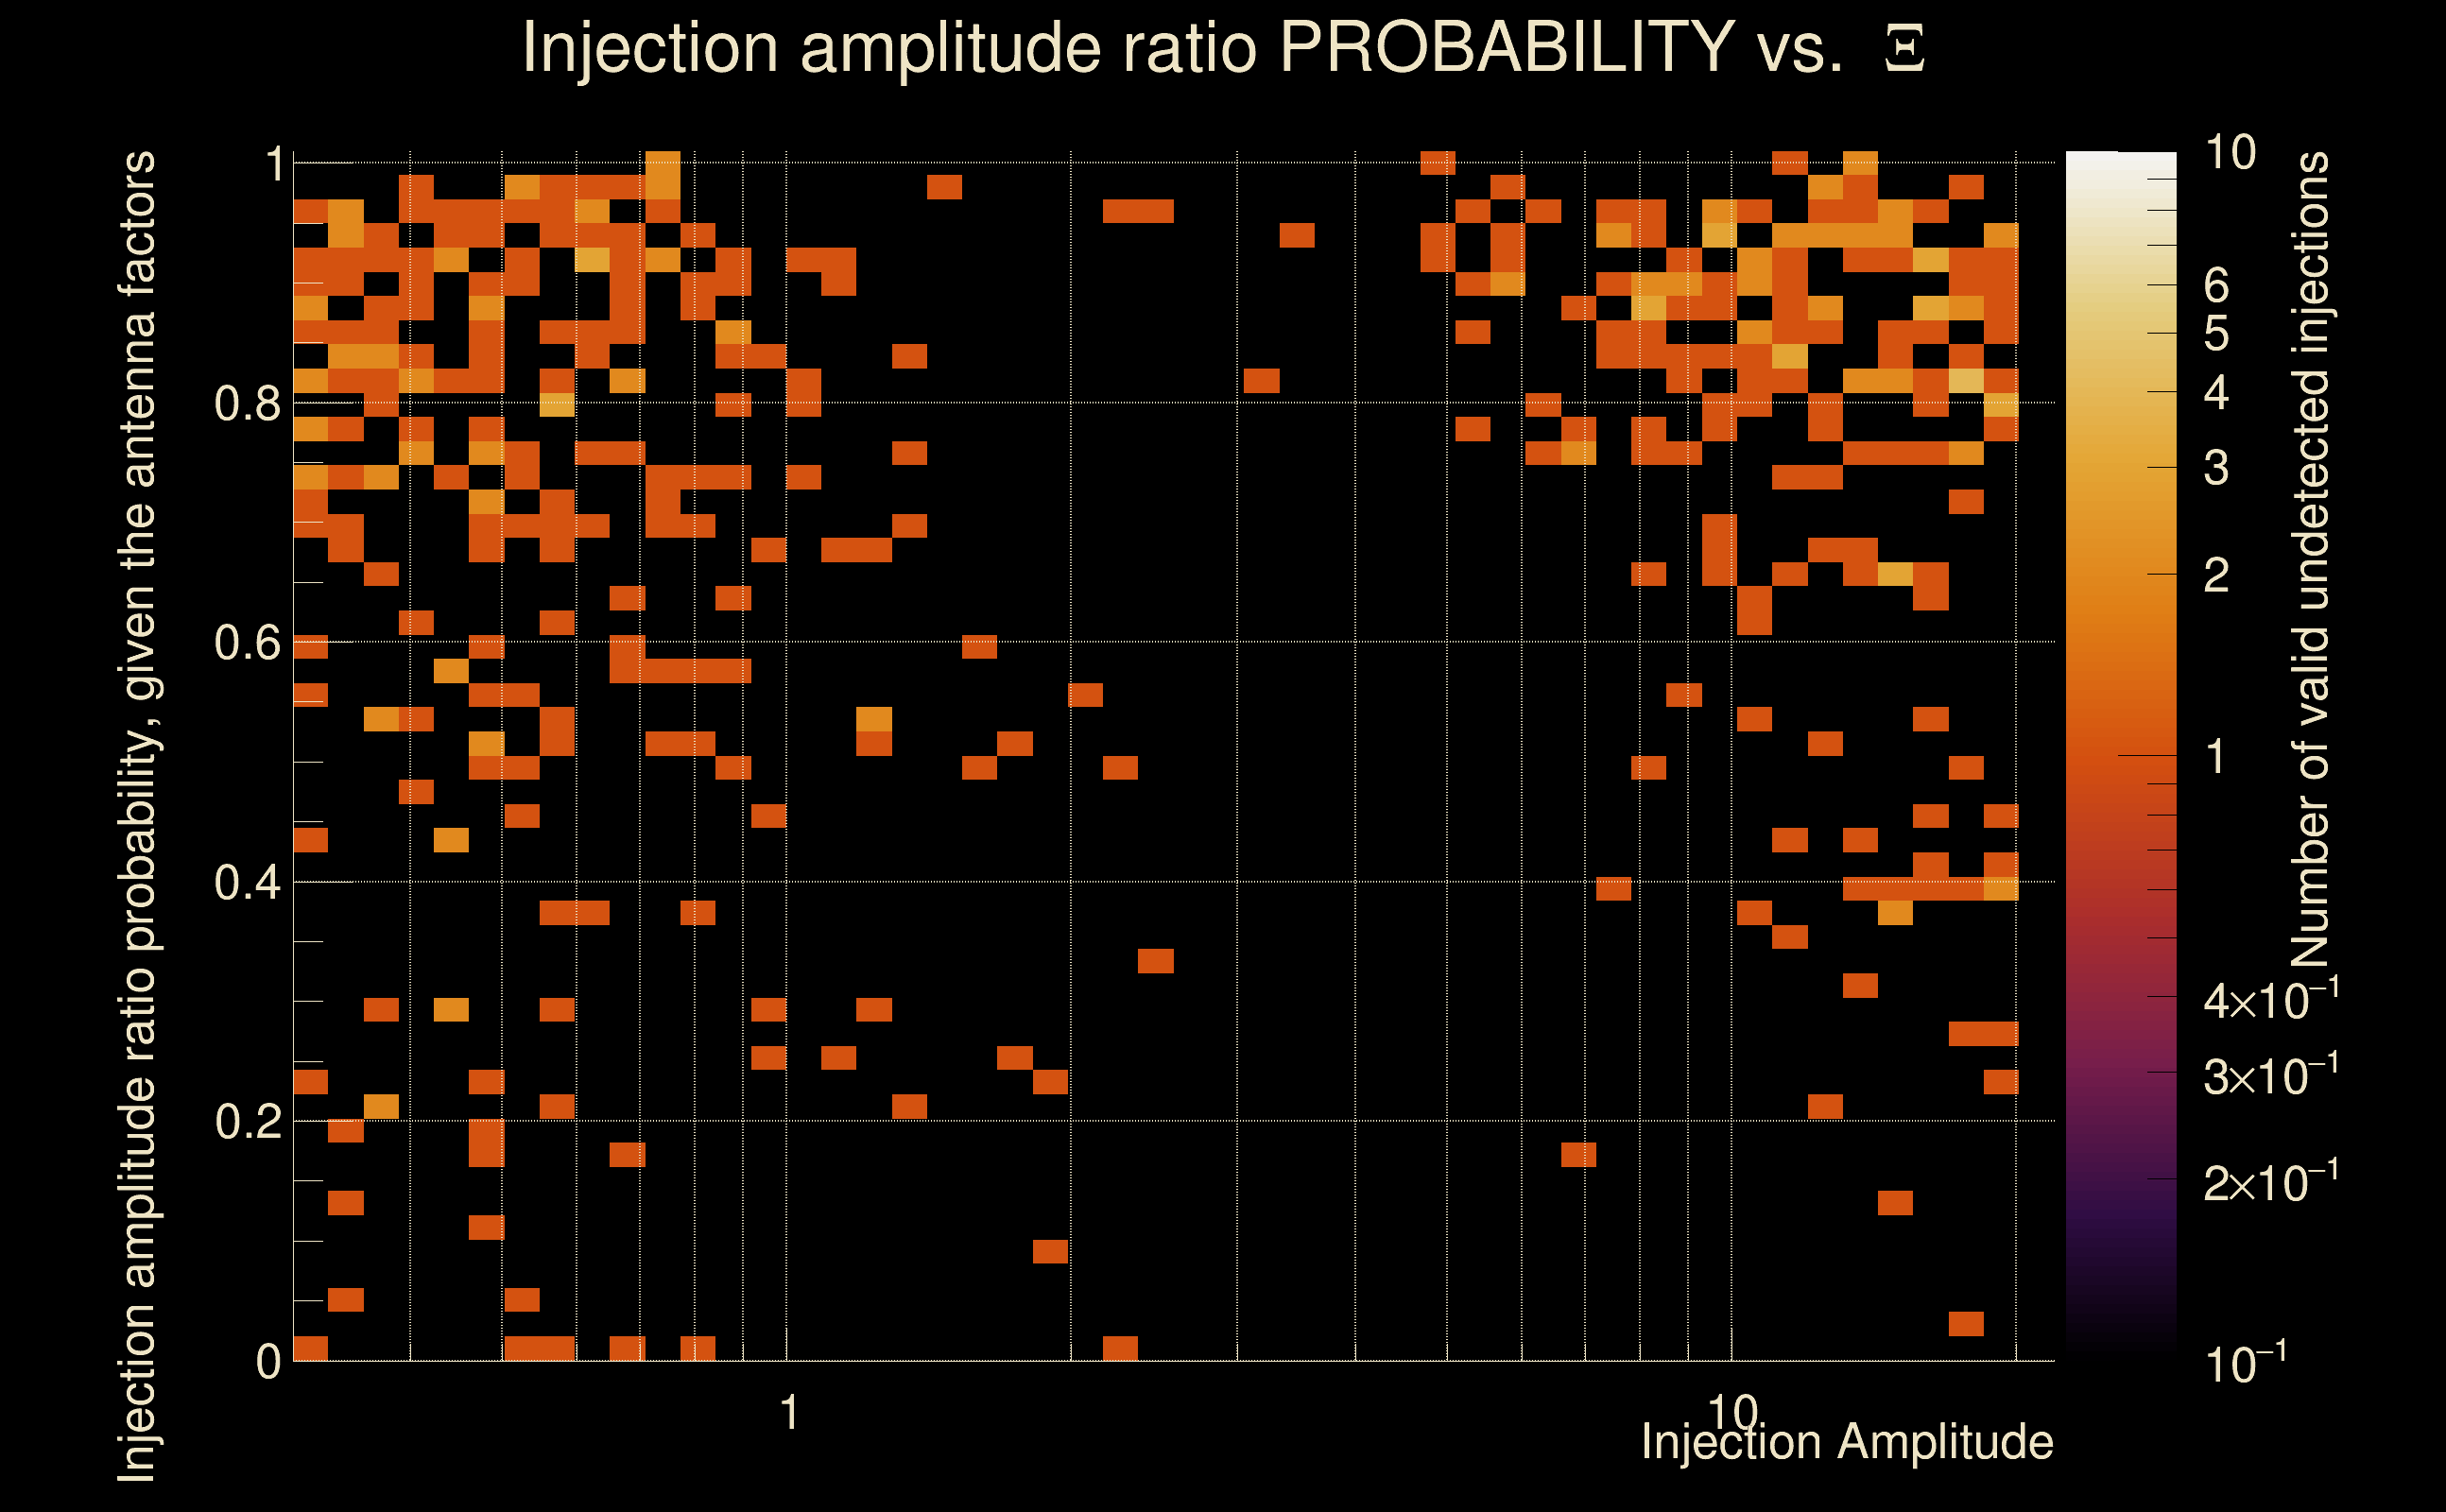
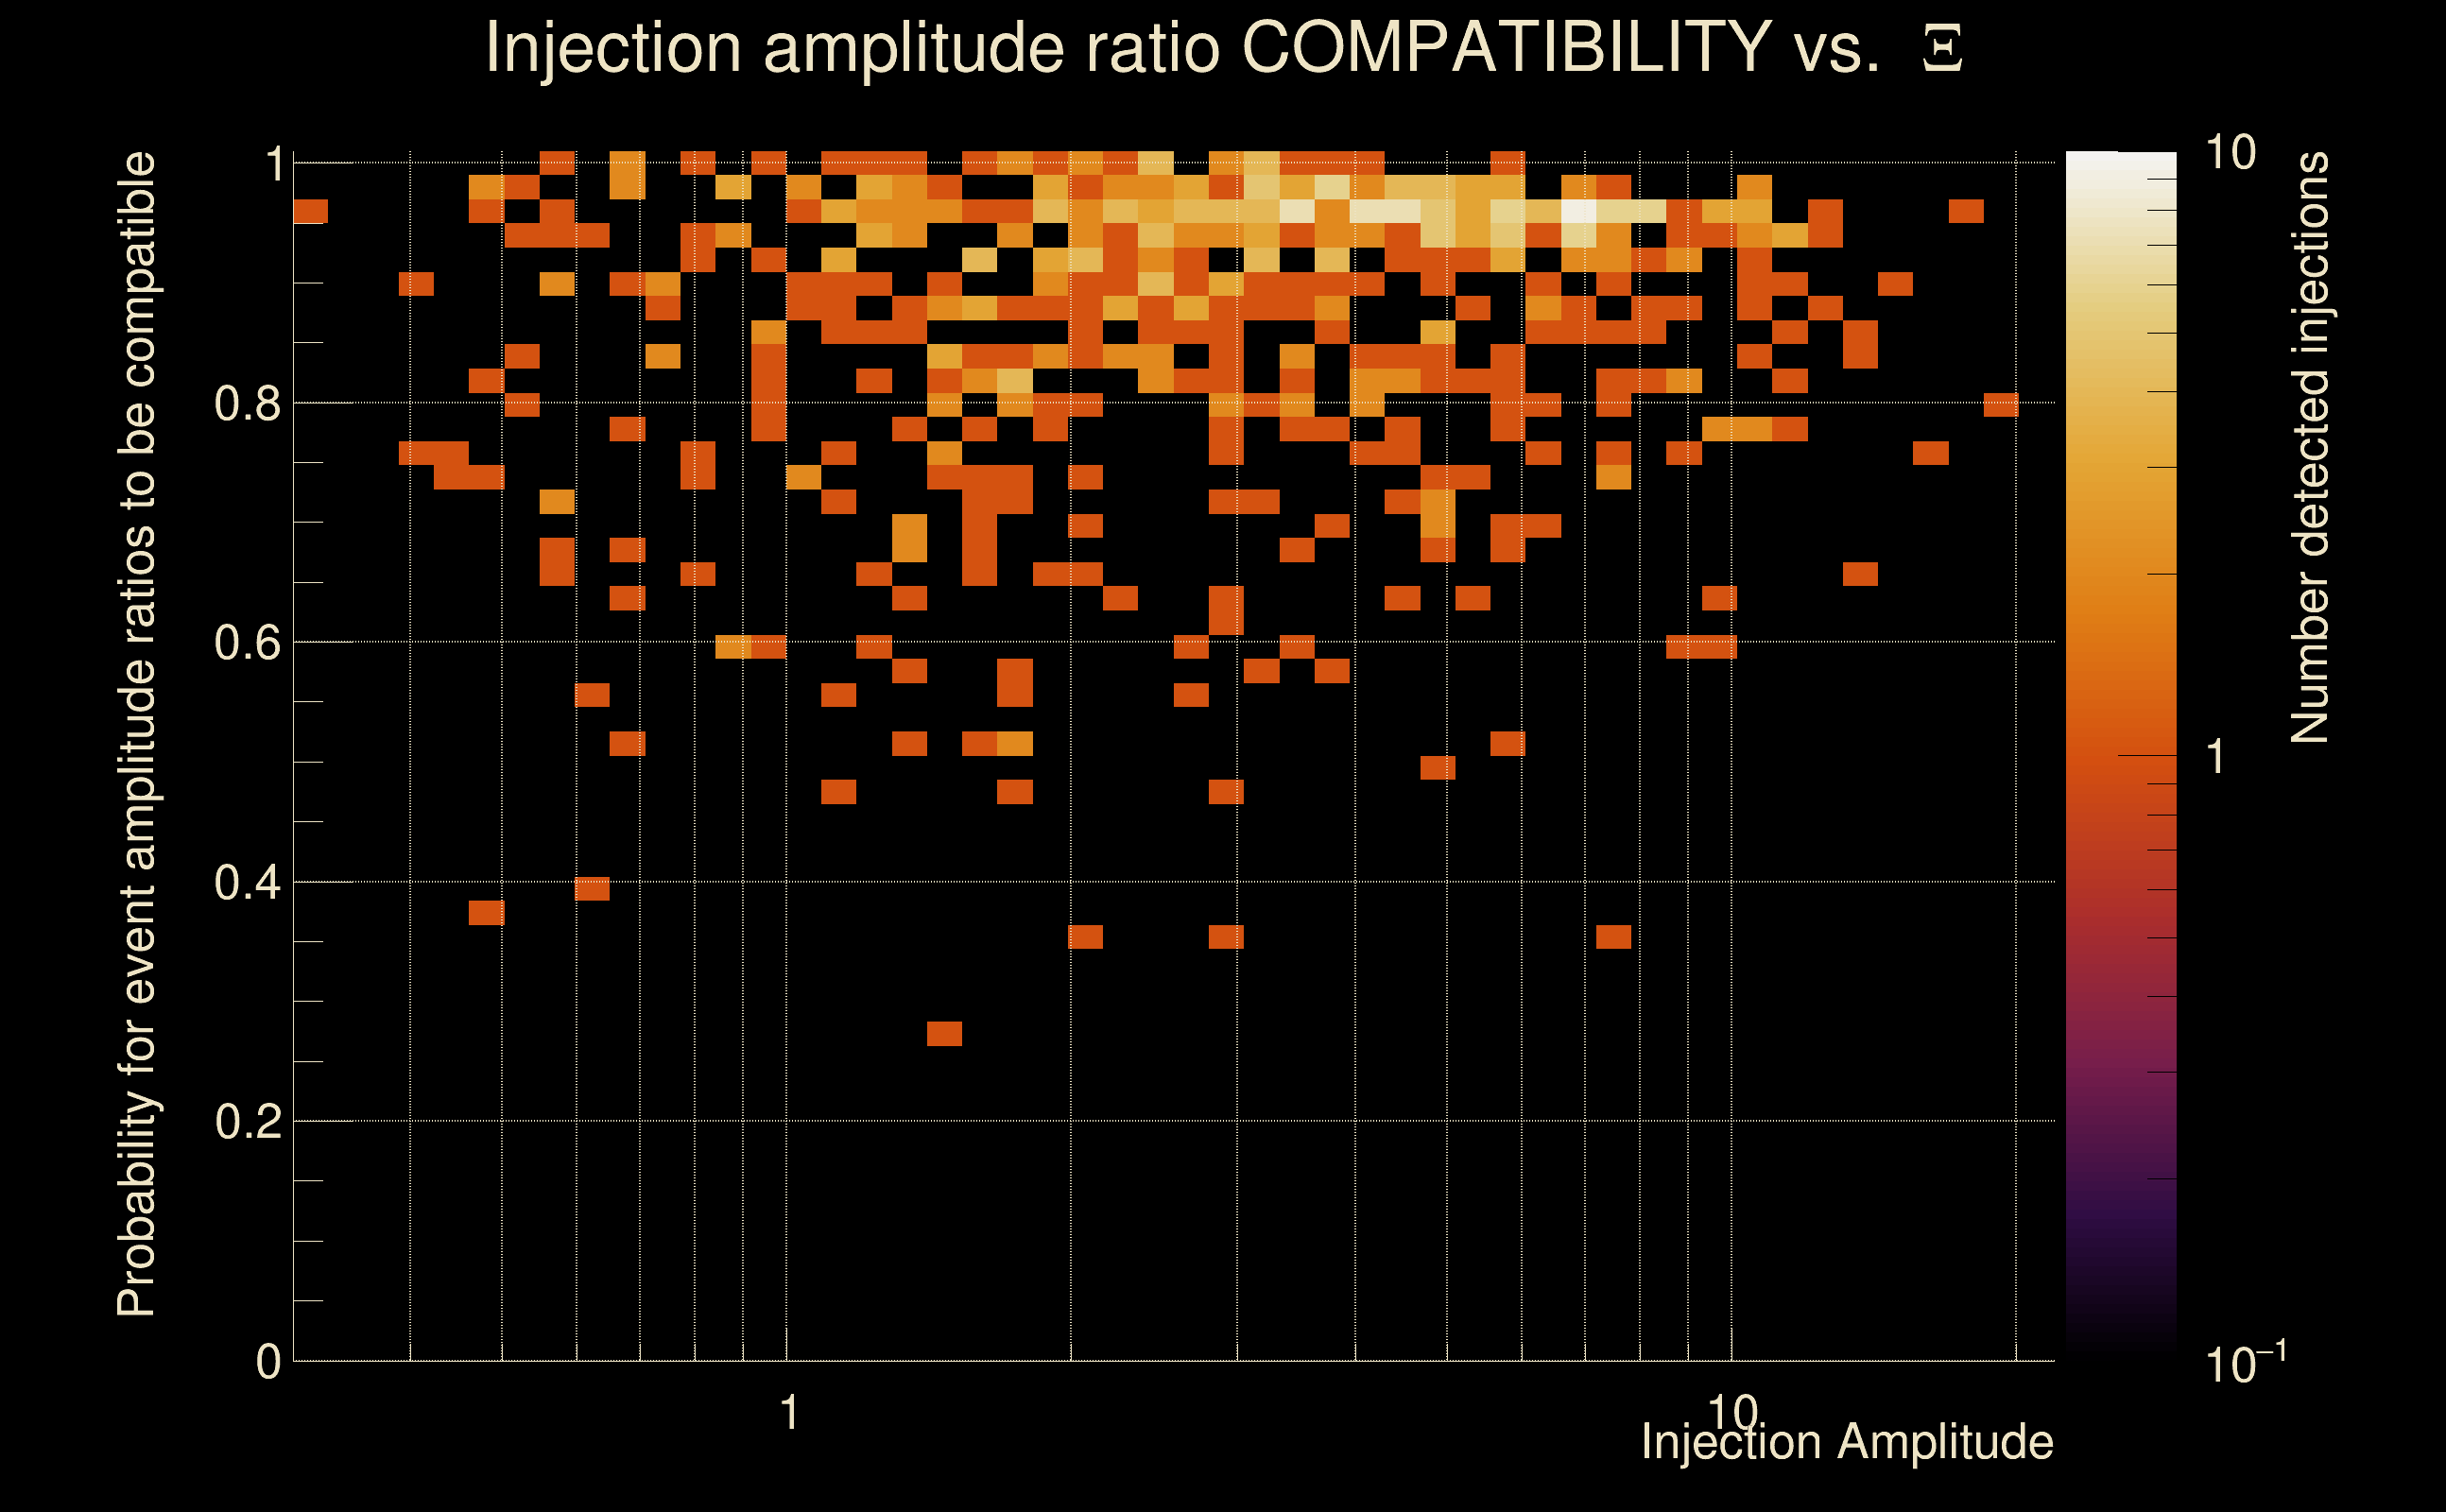
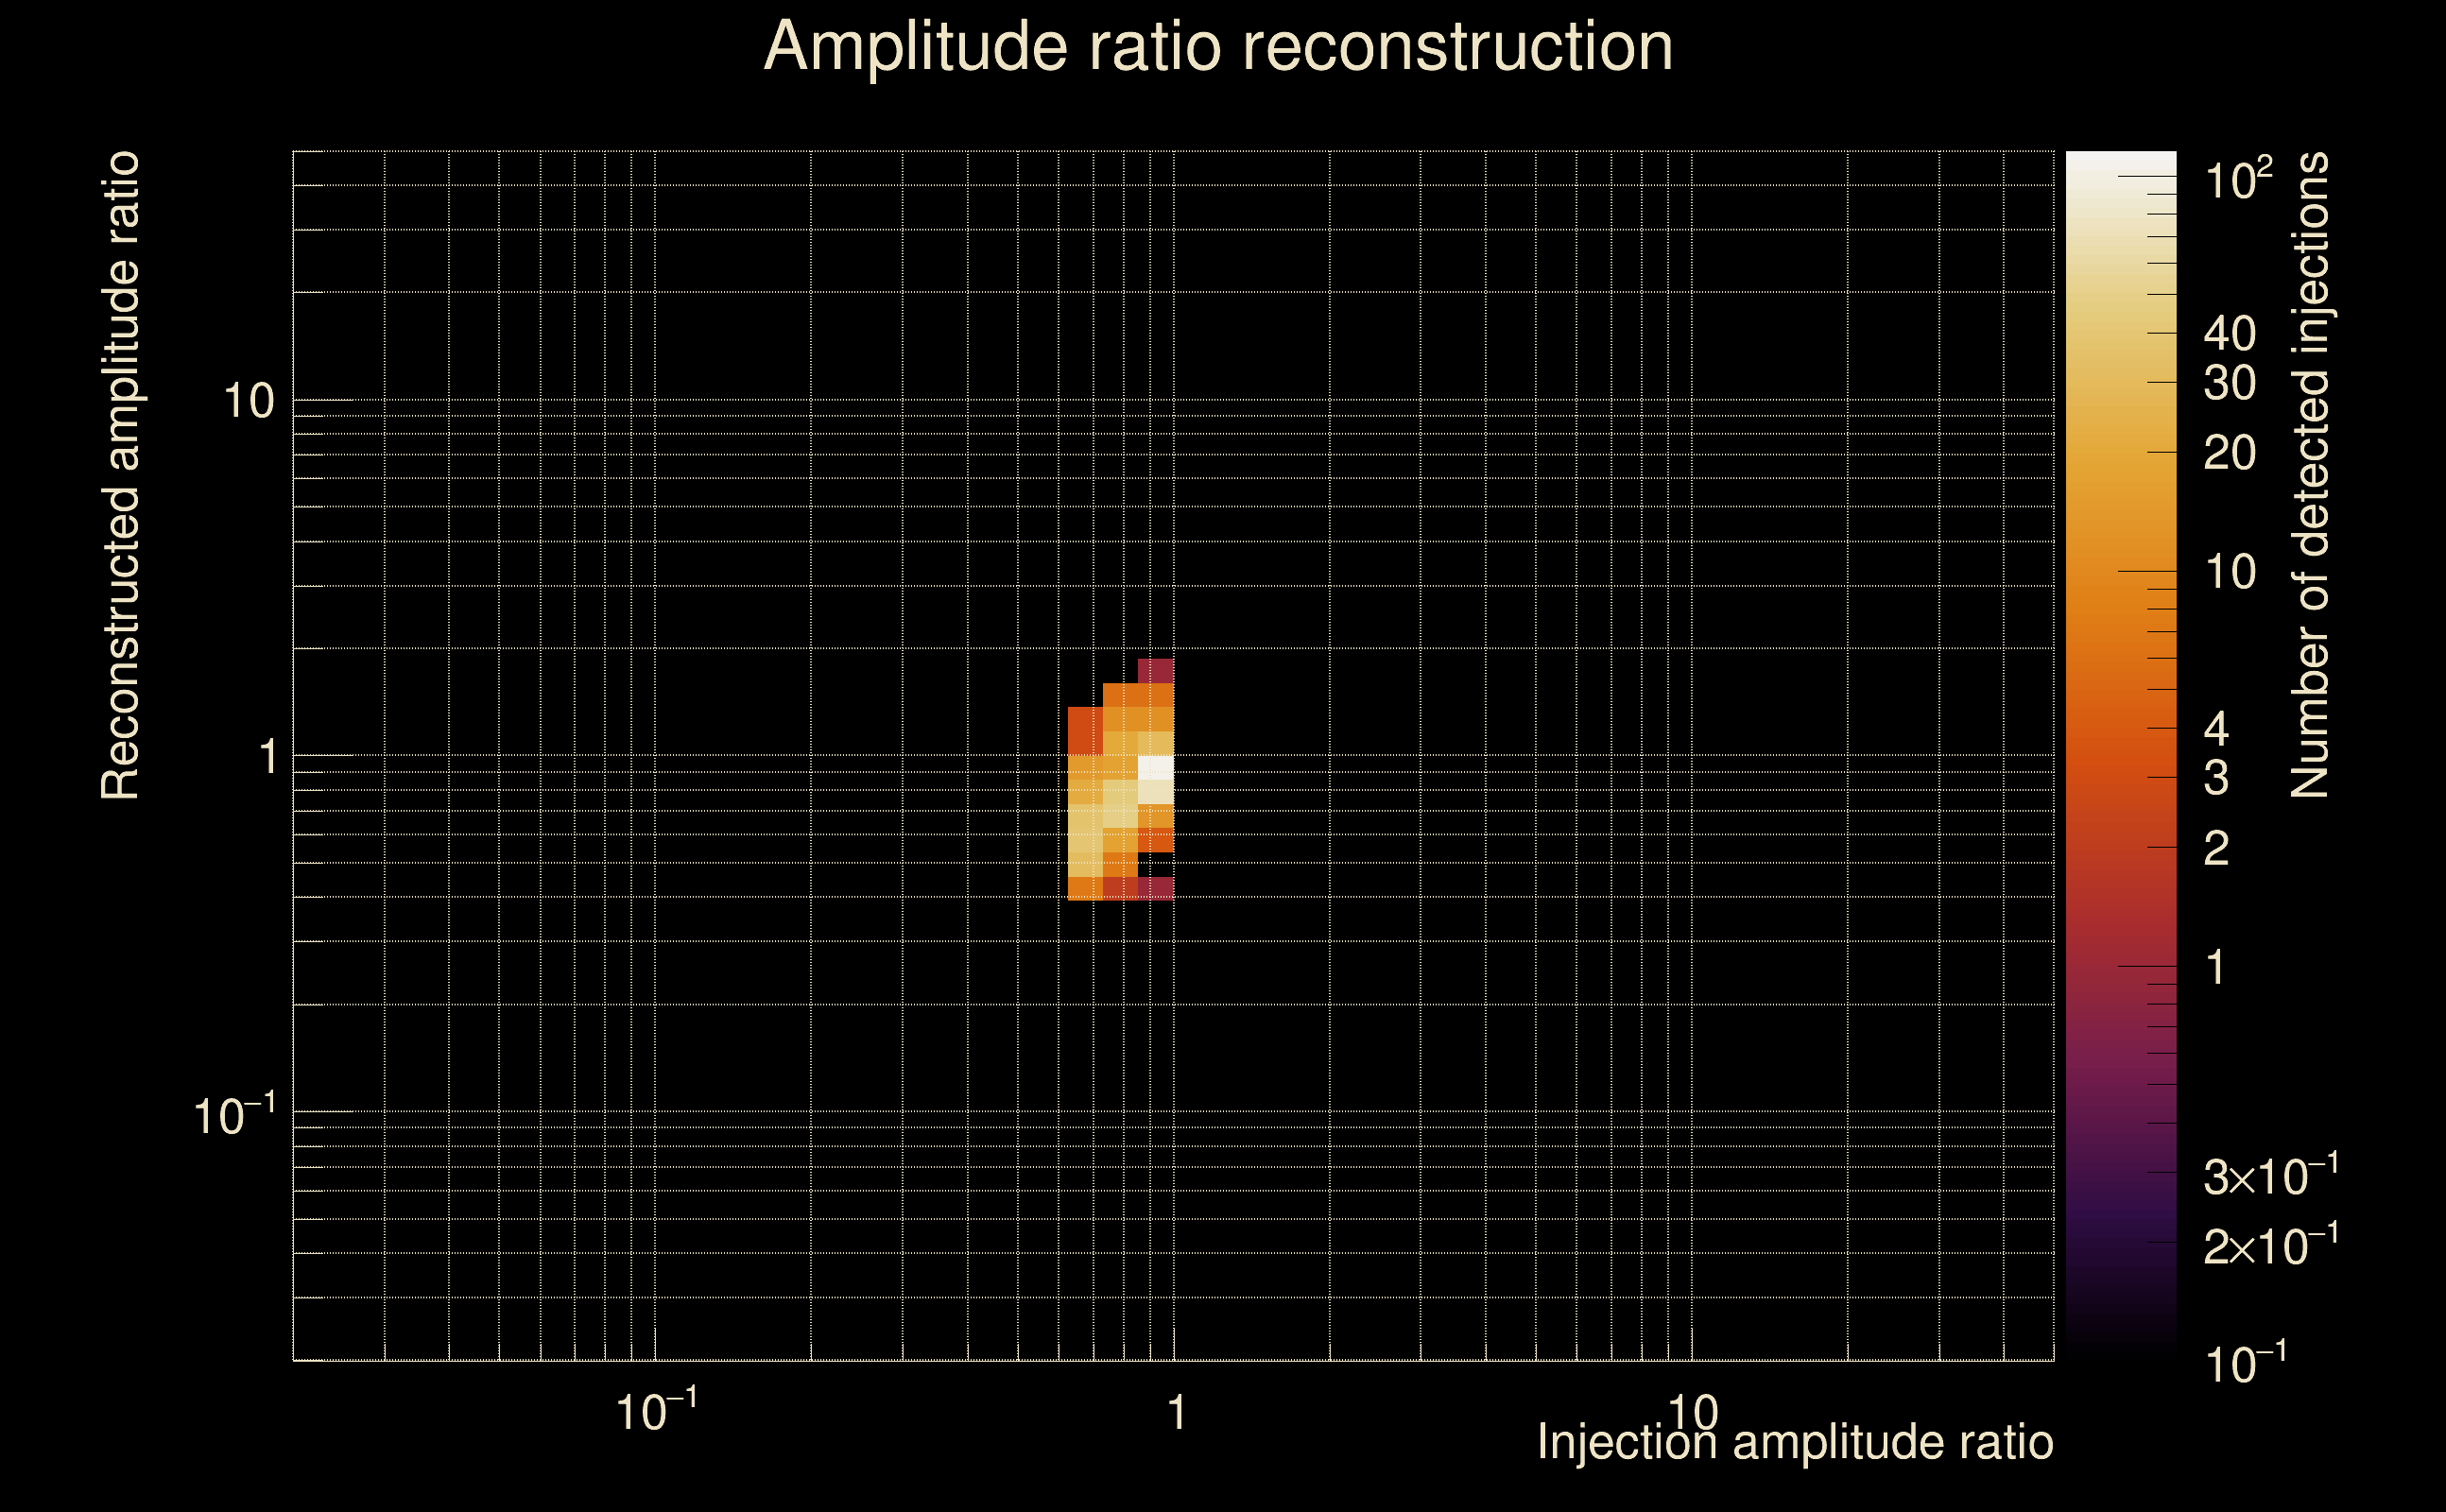
| Number of injections (total/valid/detected): | 1162 / 1018 / 381 |
| List of missed injections: | ./Kur22-s50_missed.txt |
| Injection amplitude at 90% detection efficiency: | -1 |
| Injection amplitude at 50% detection efficiency: | 2.1277 |
| Injection amplitude at 10% detection efficiency: | 0.885339 |
 |
 |
 |
 |
 |
 |
 |
|
 |
 |
|
 |
 |
|
 |
 |
|
 |
 |
|
 |
 |
|
 |
 |
|
 |
 |
|
 |
 |
 |
 |
 |
 |
 |
 |
 |
 |
 |
 |
 |
 |
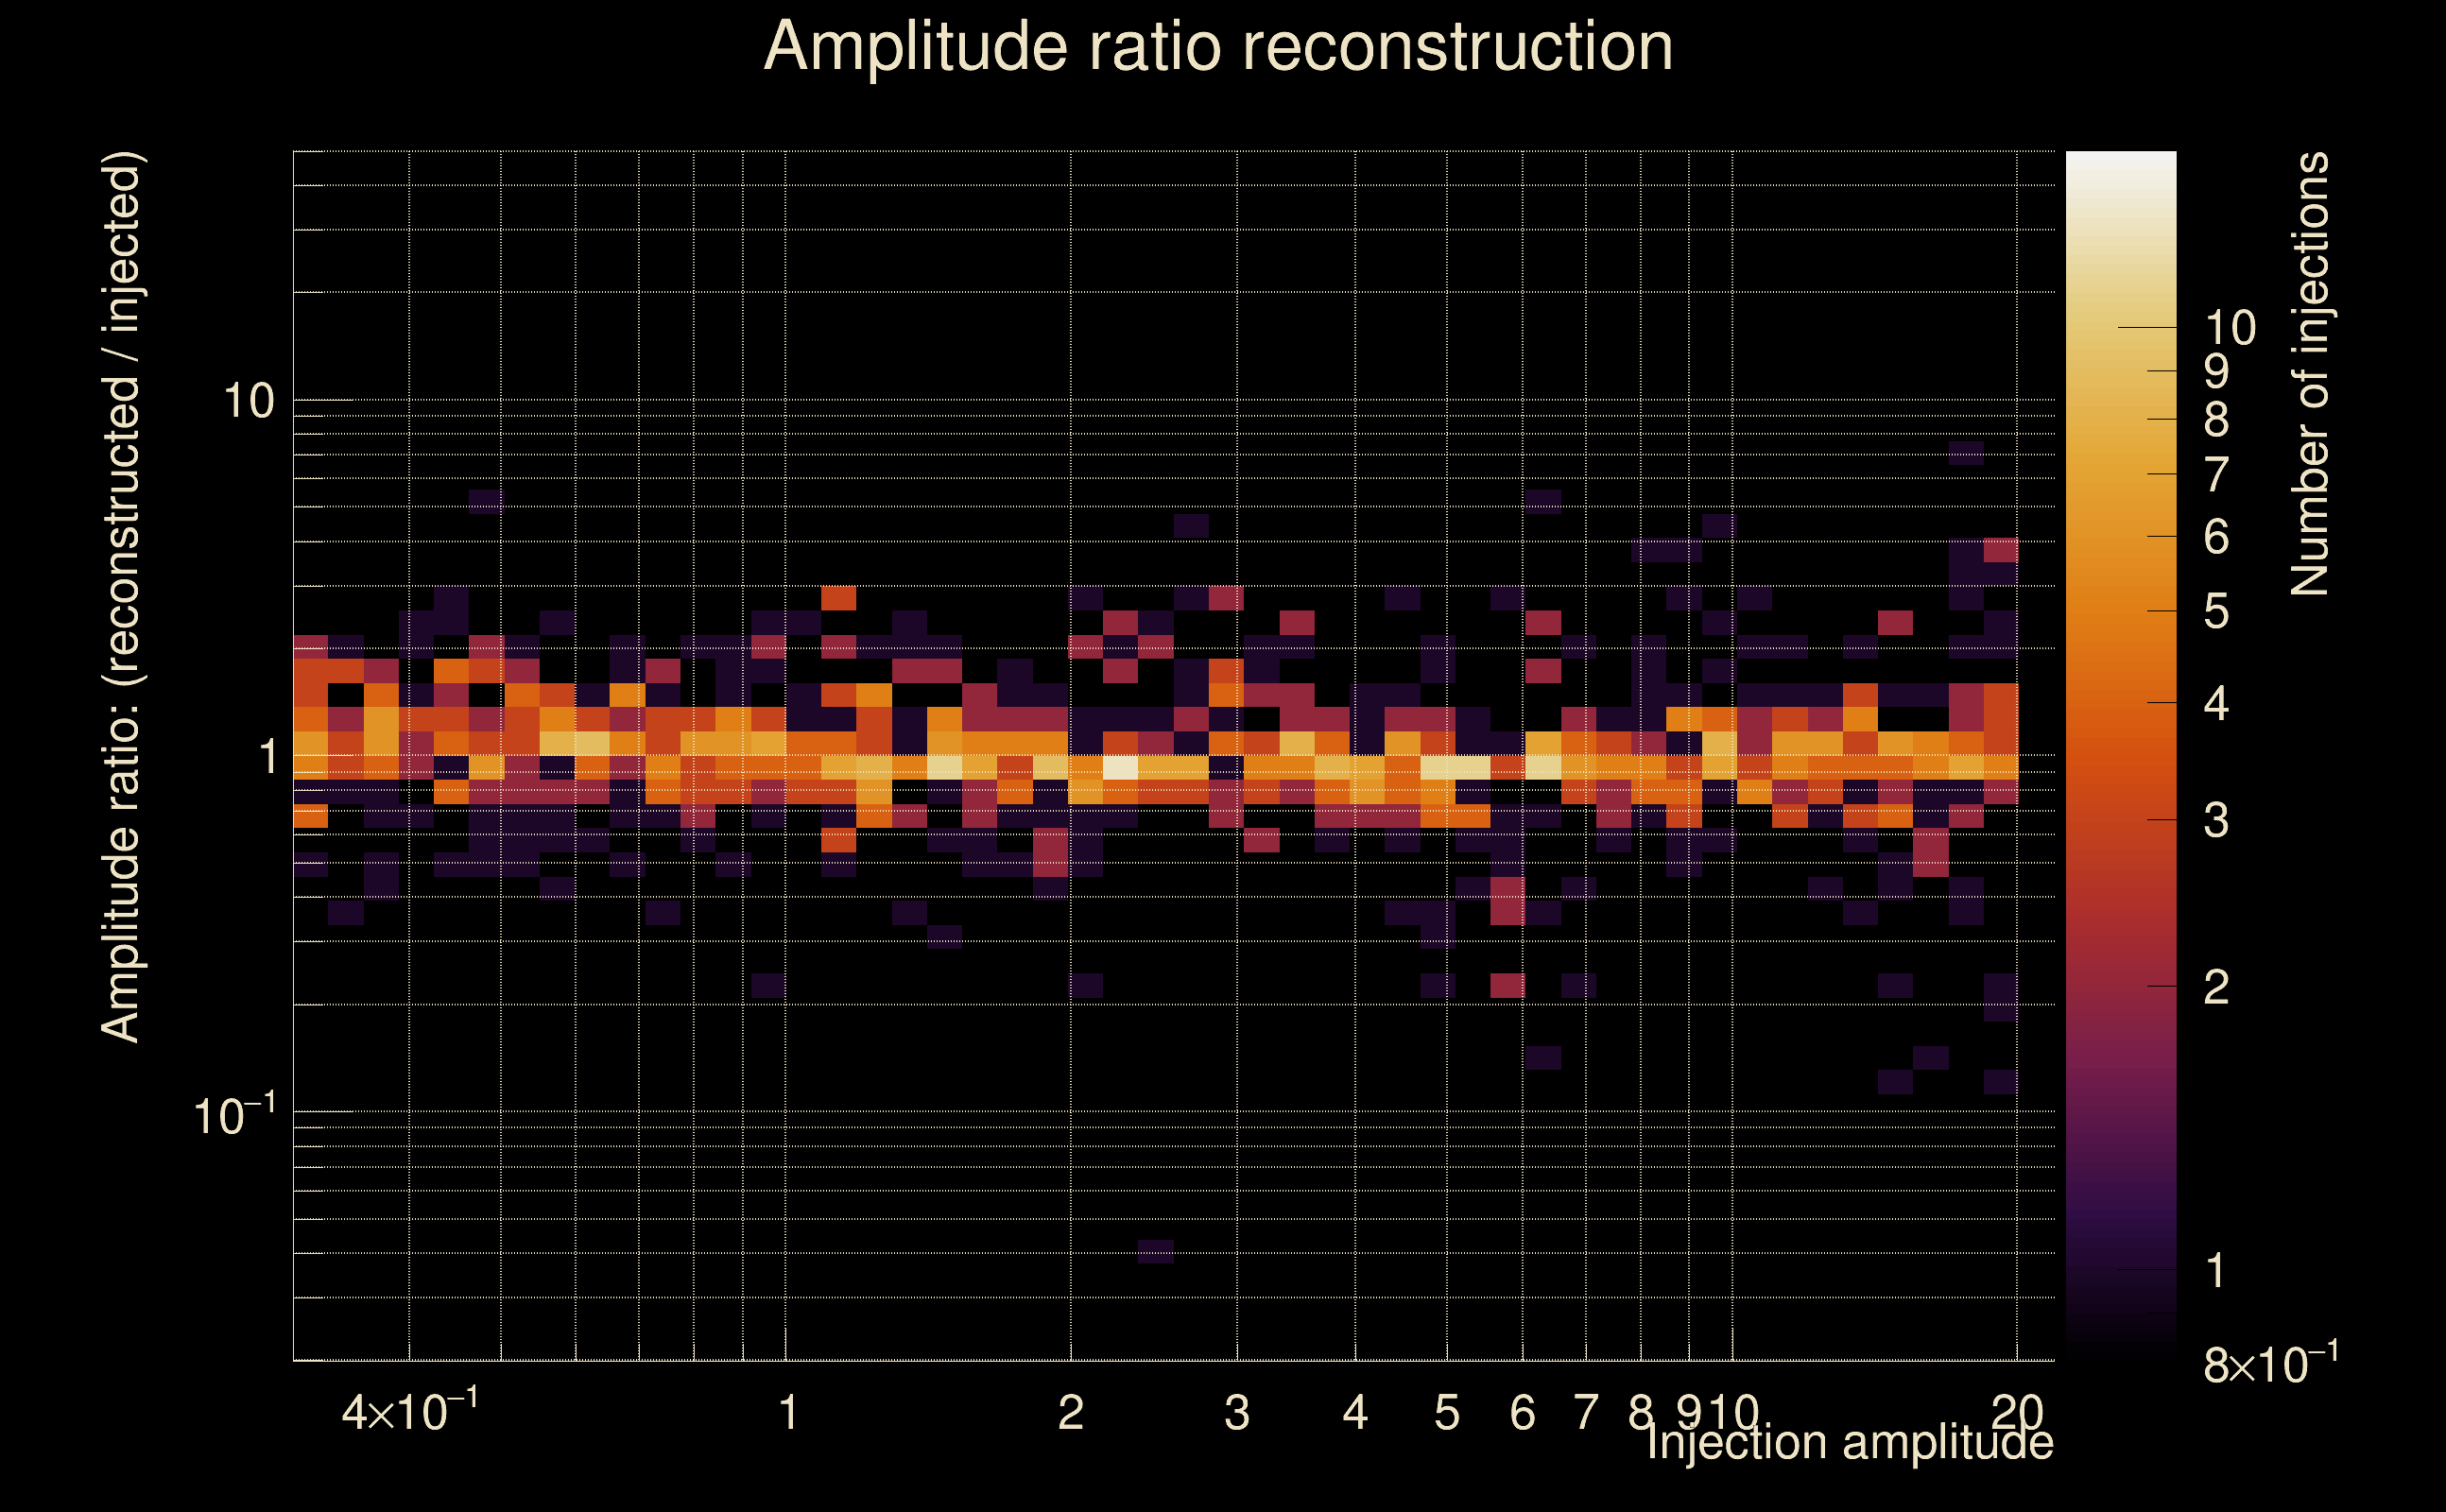 |
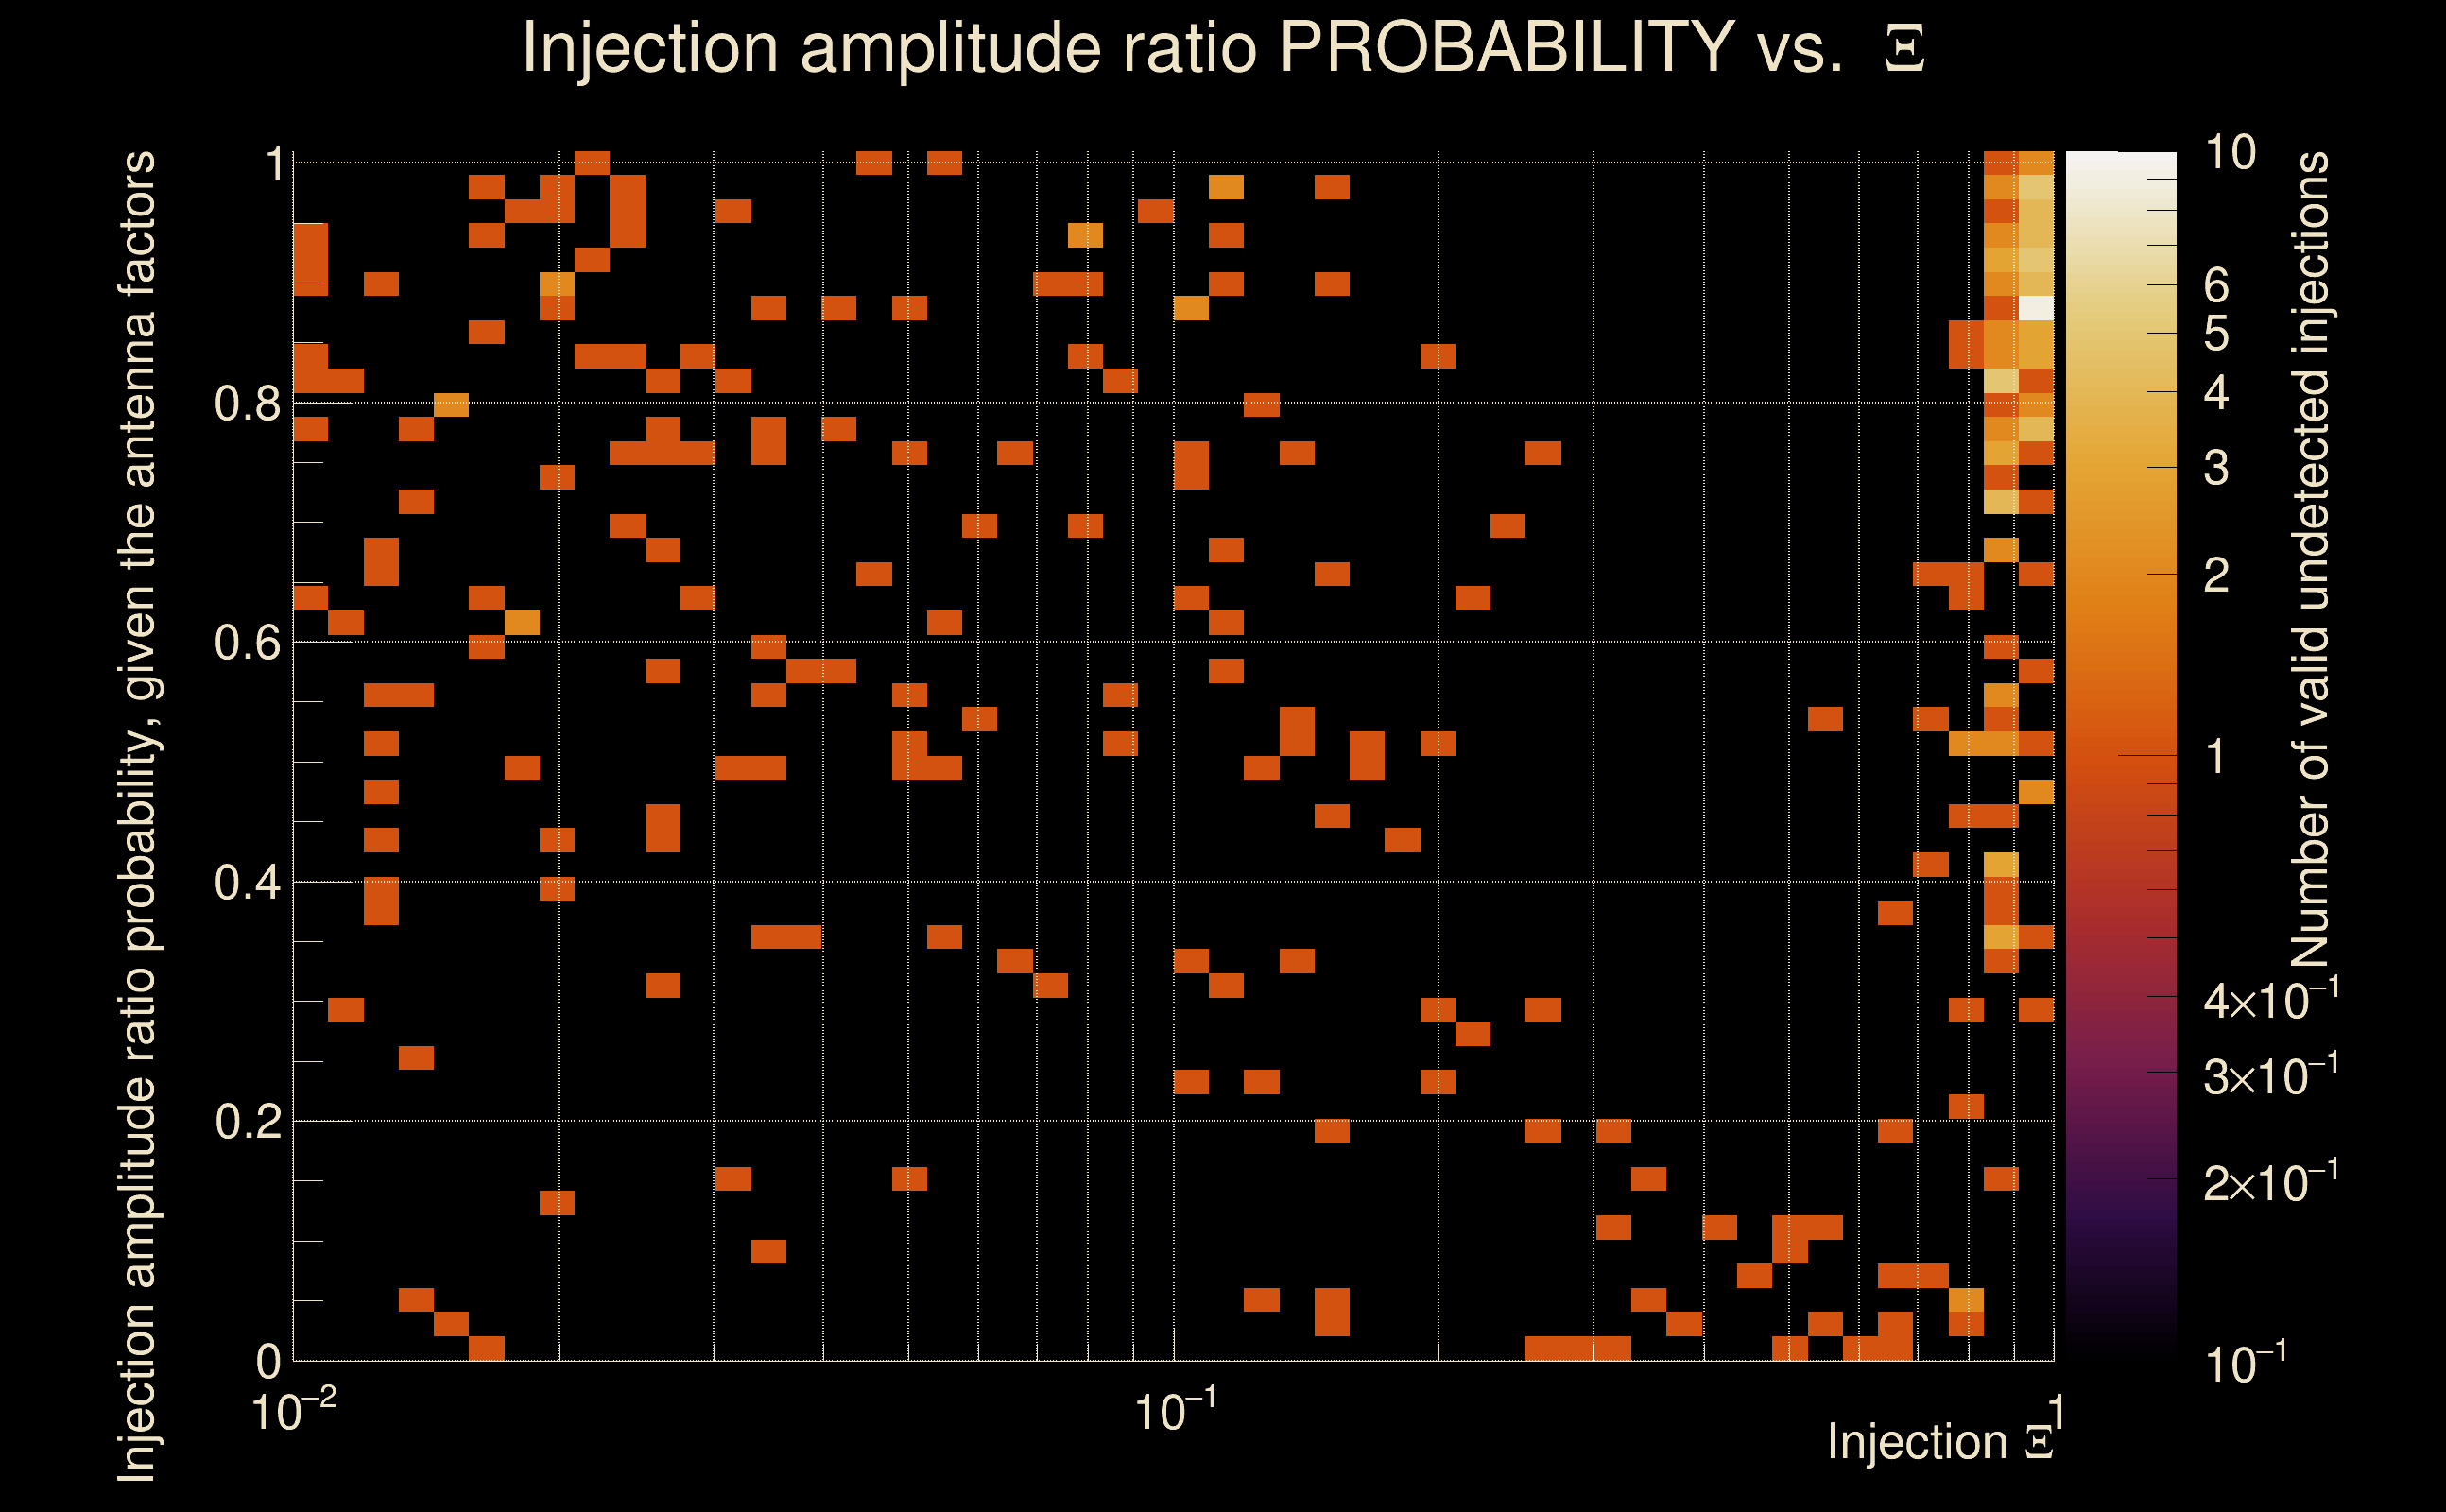
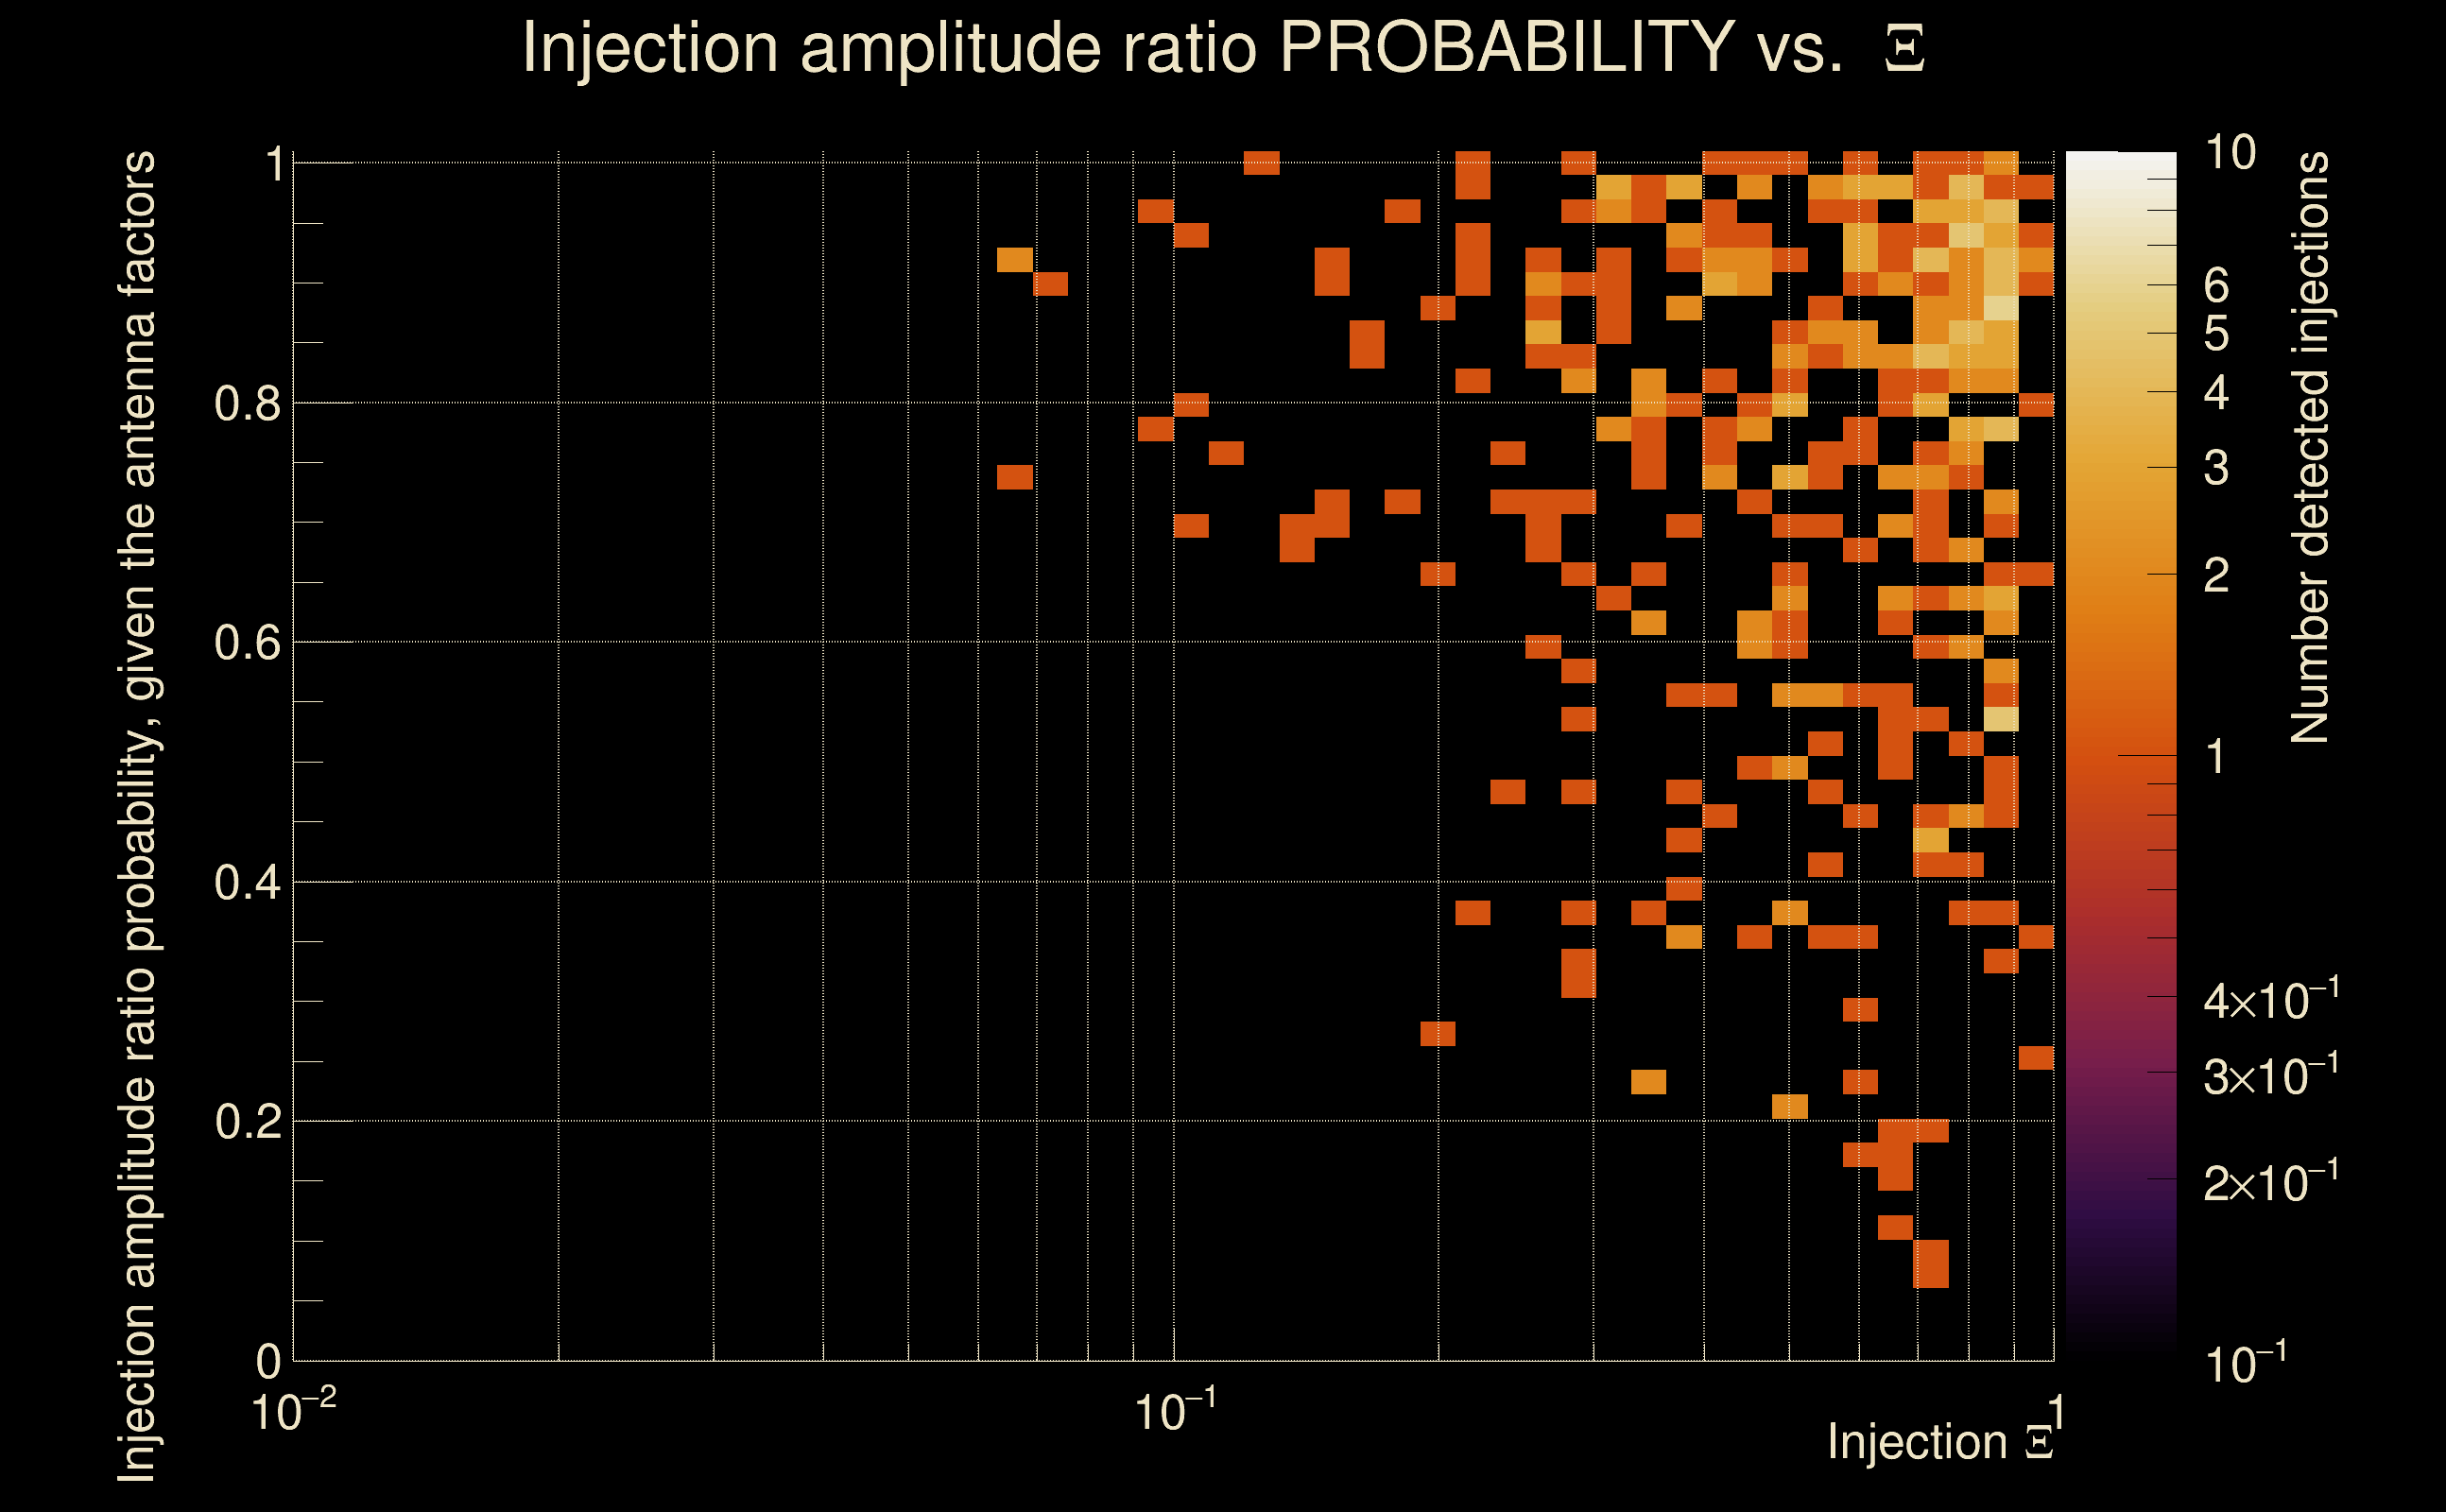
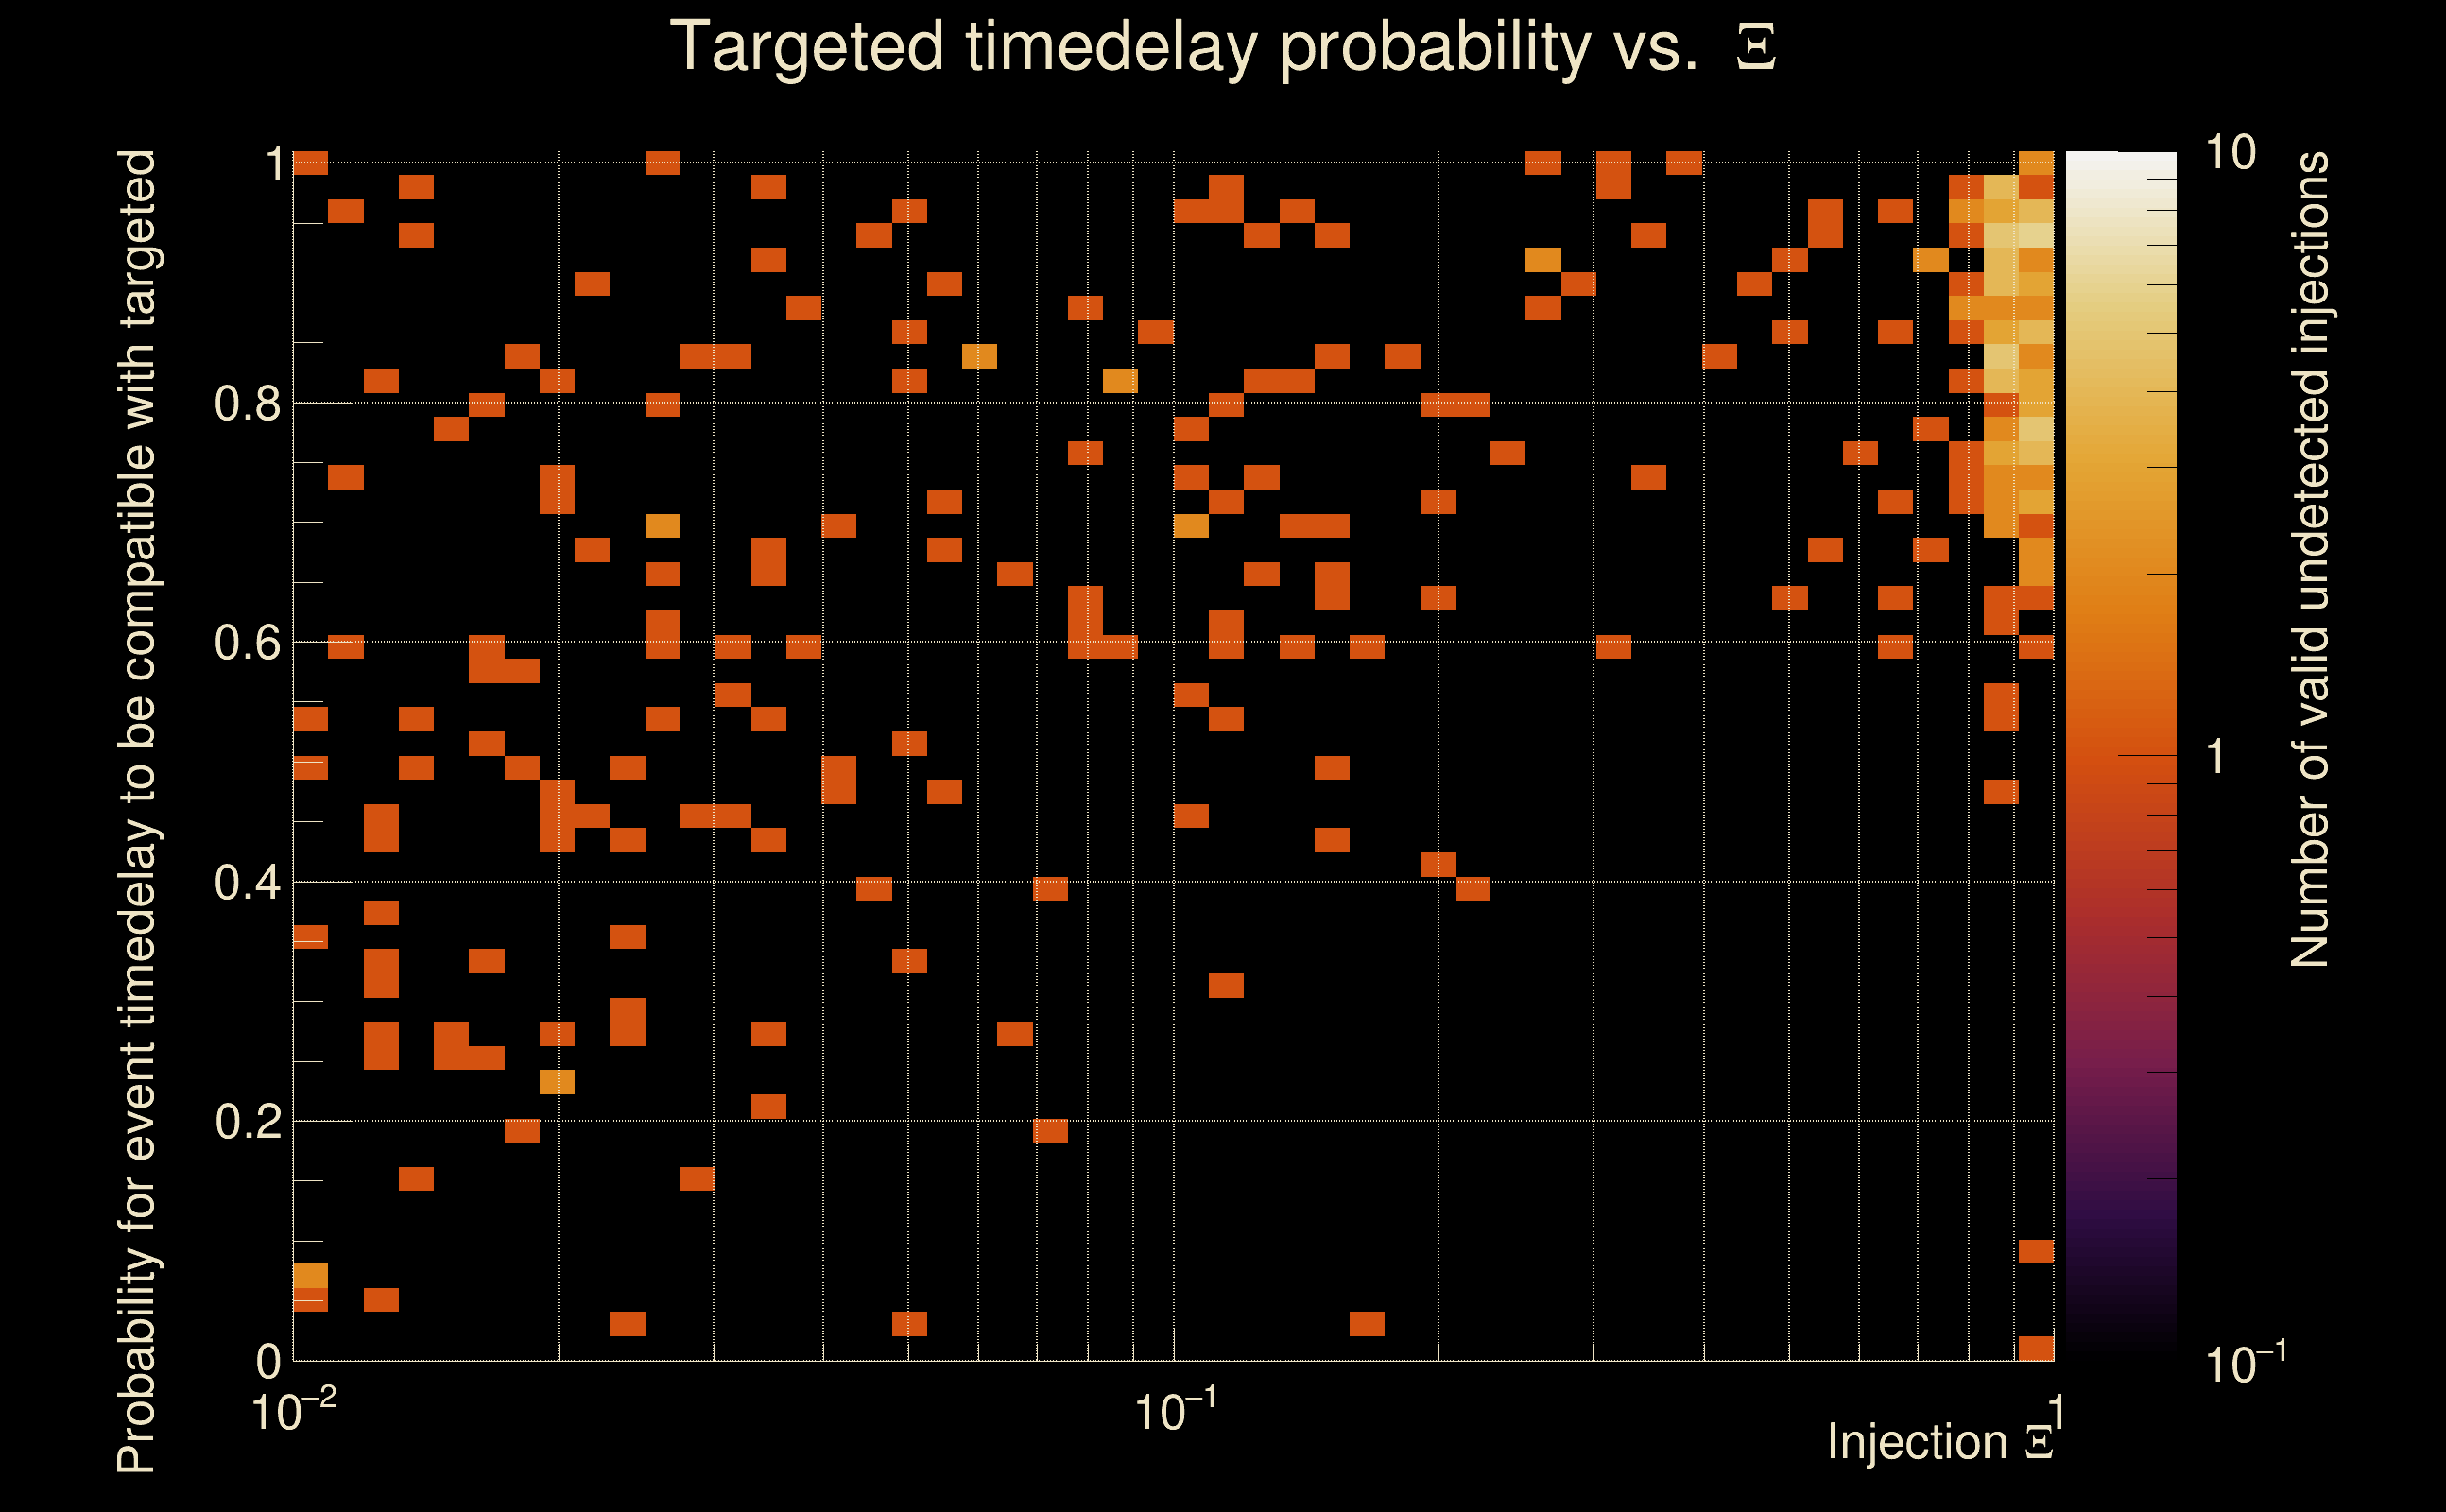
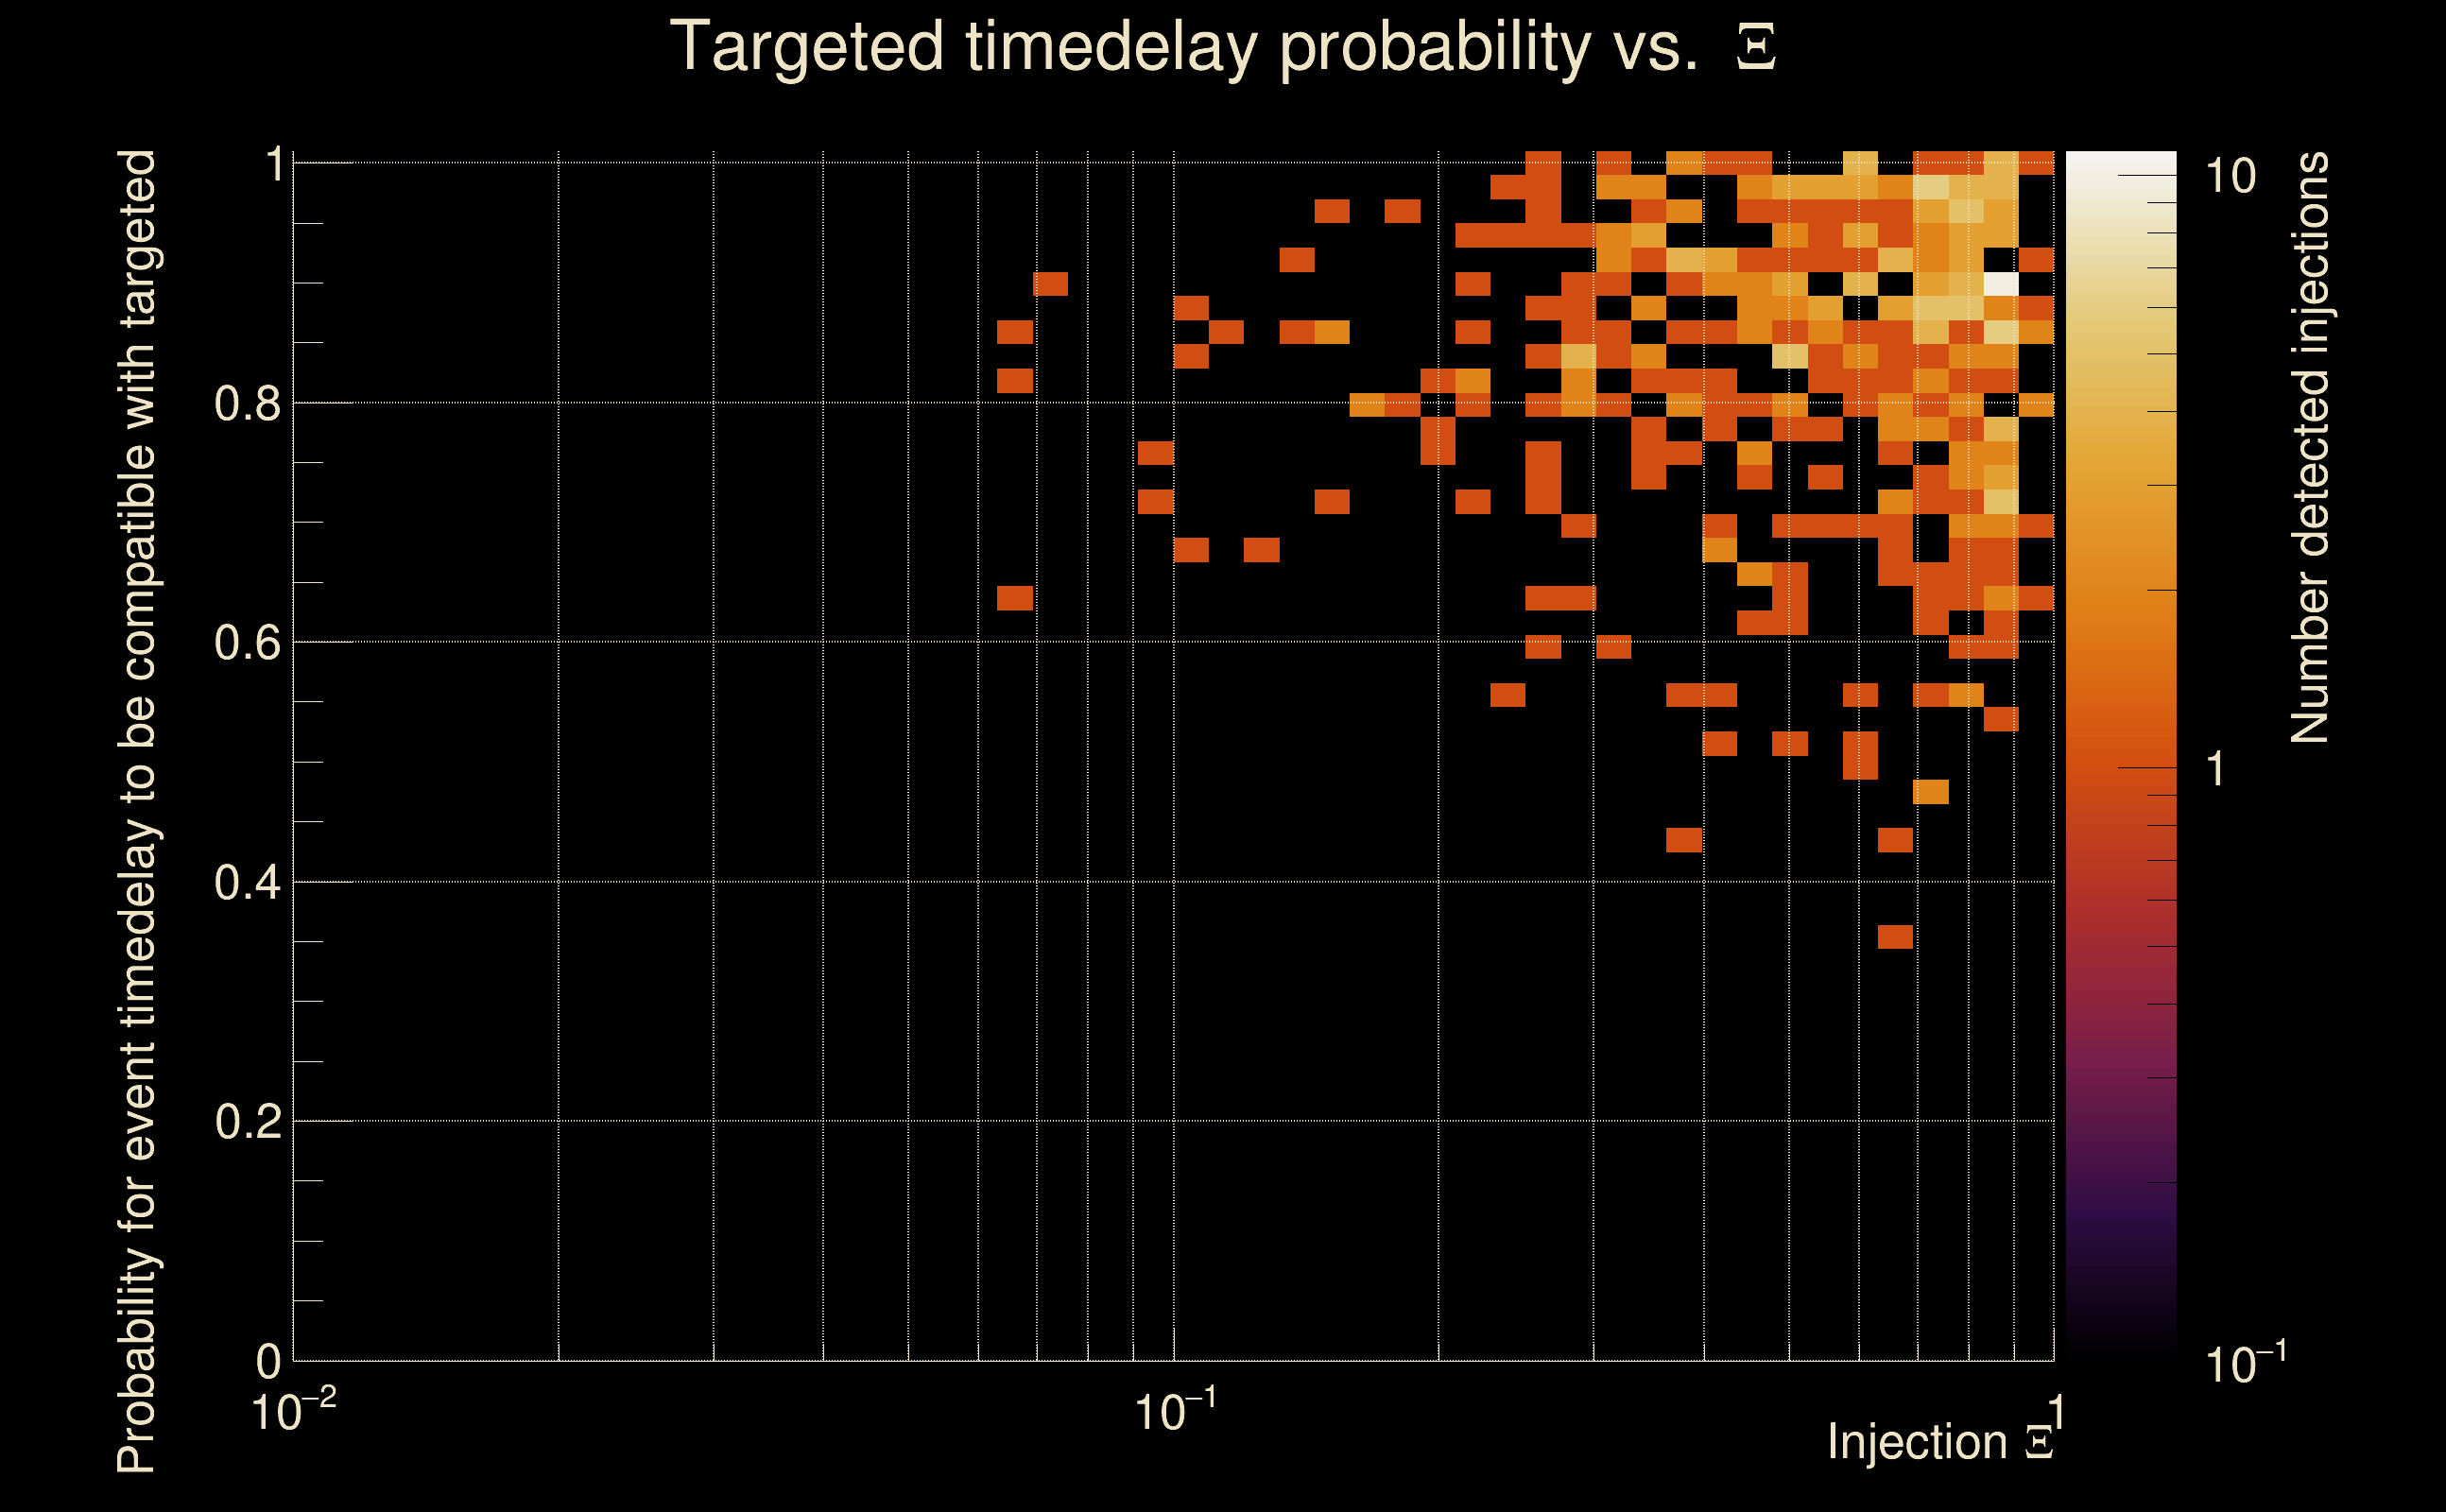
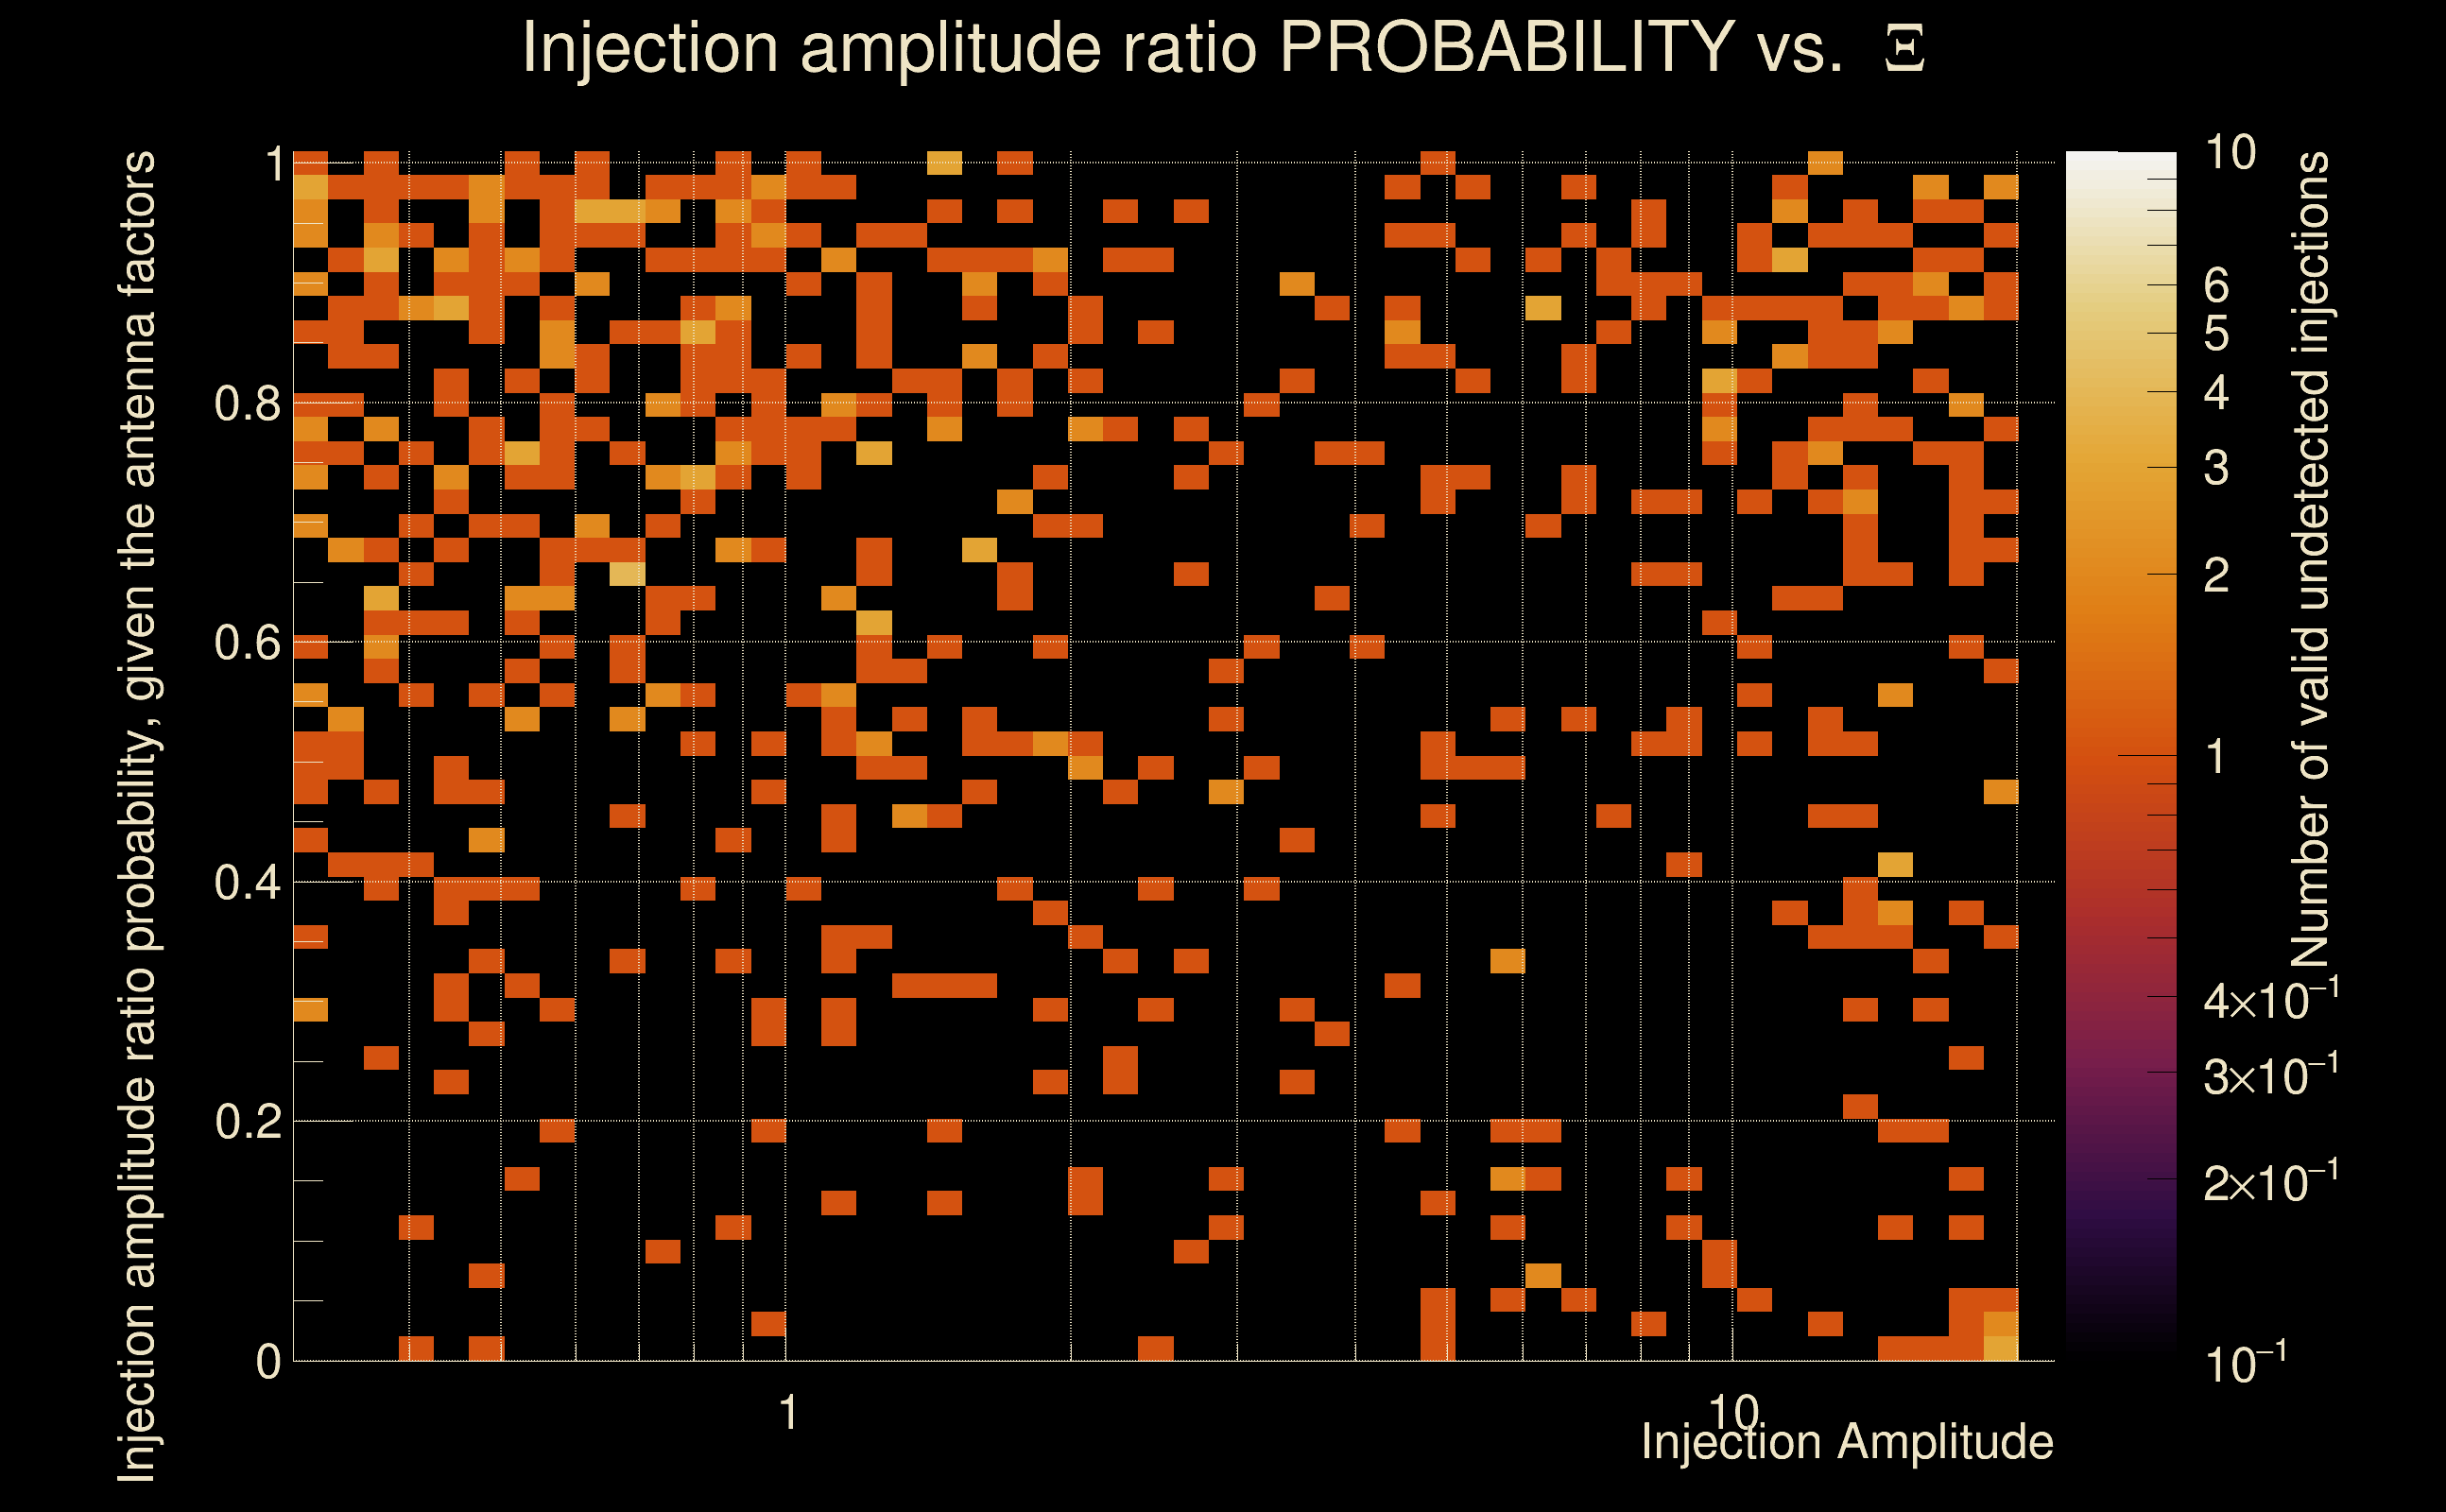
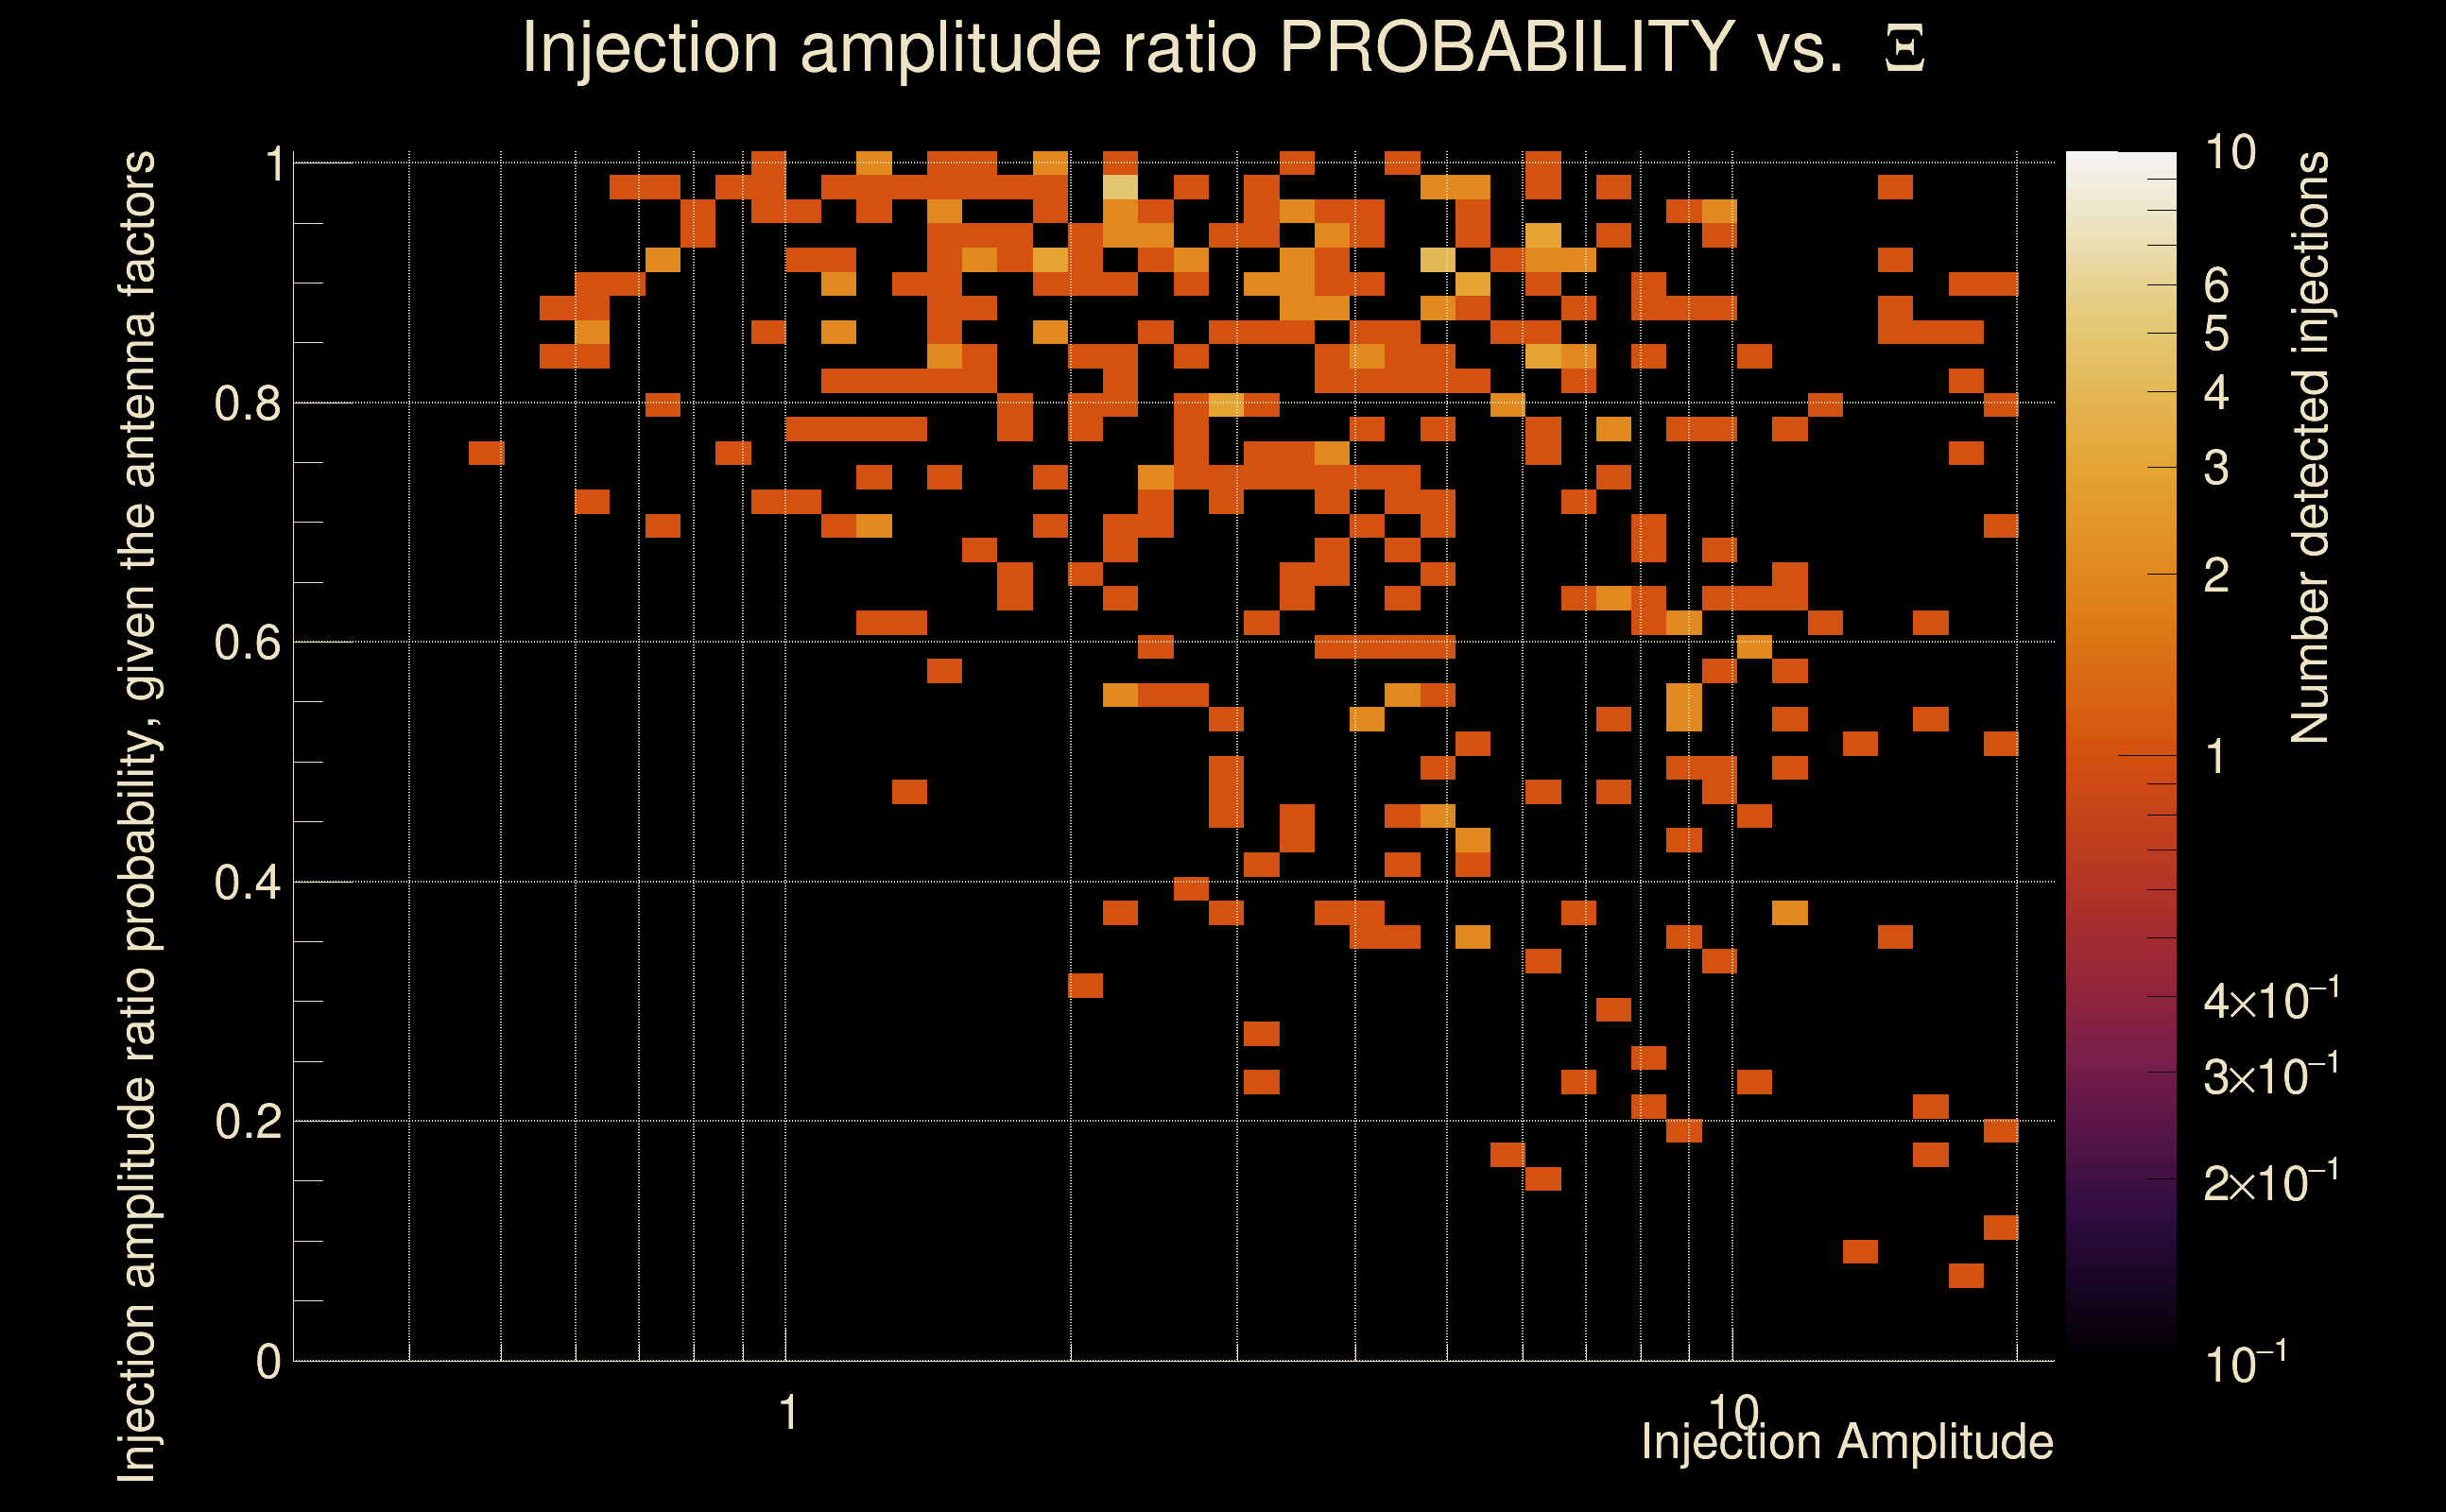
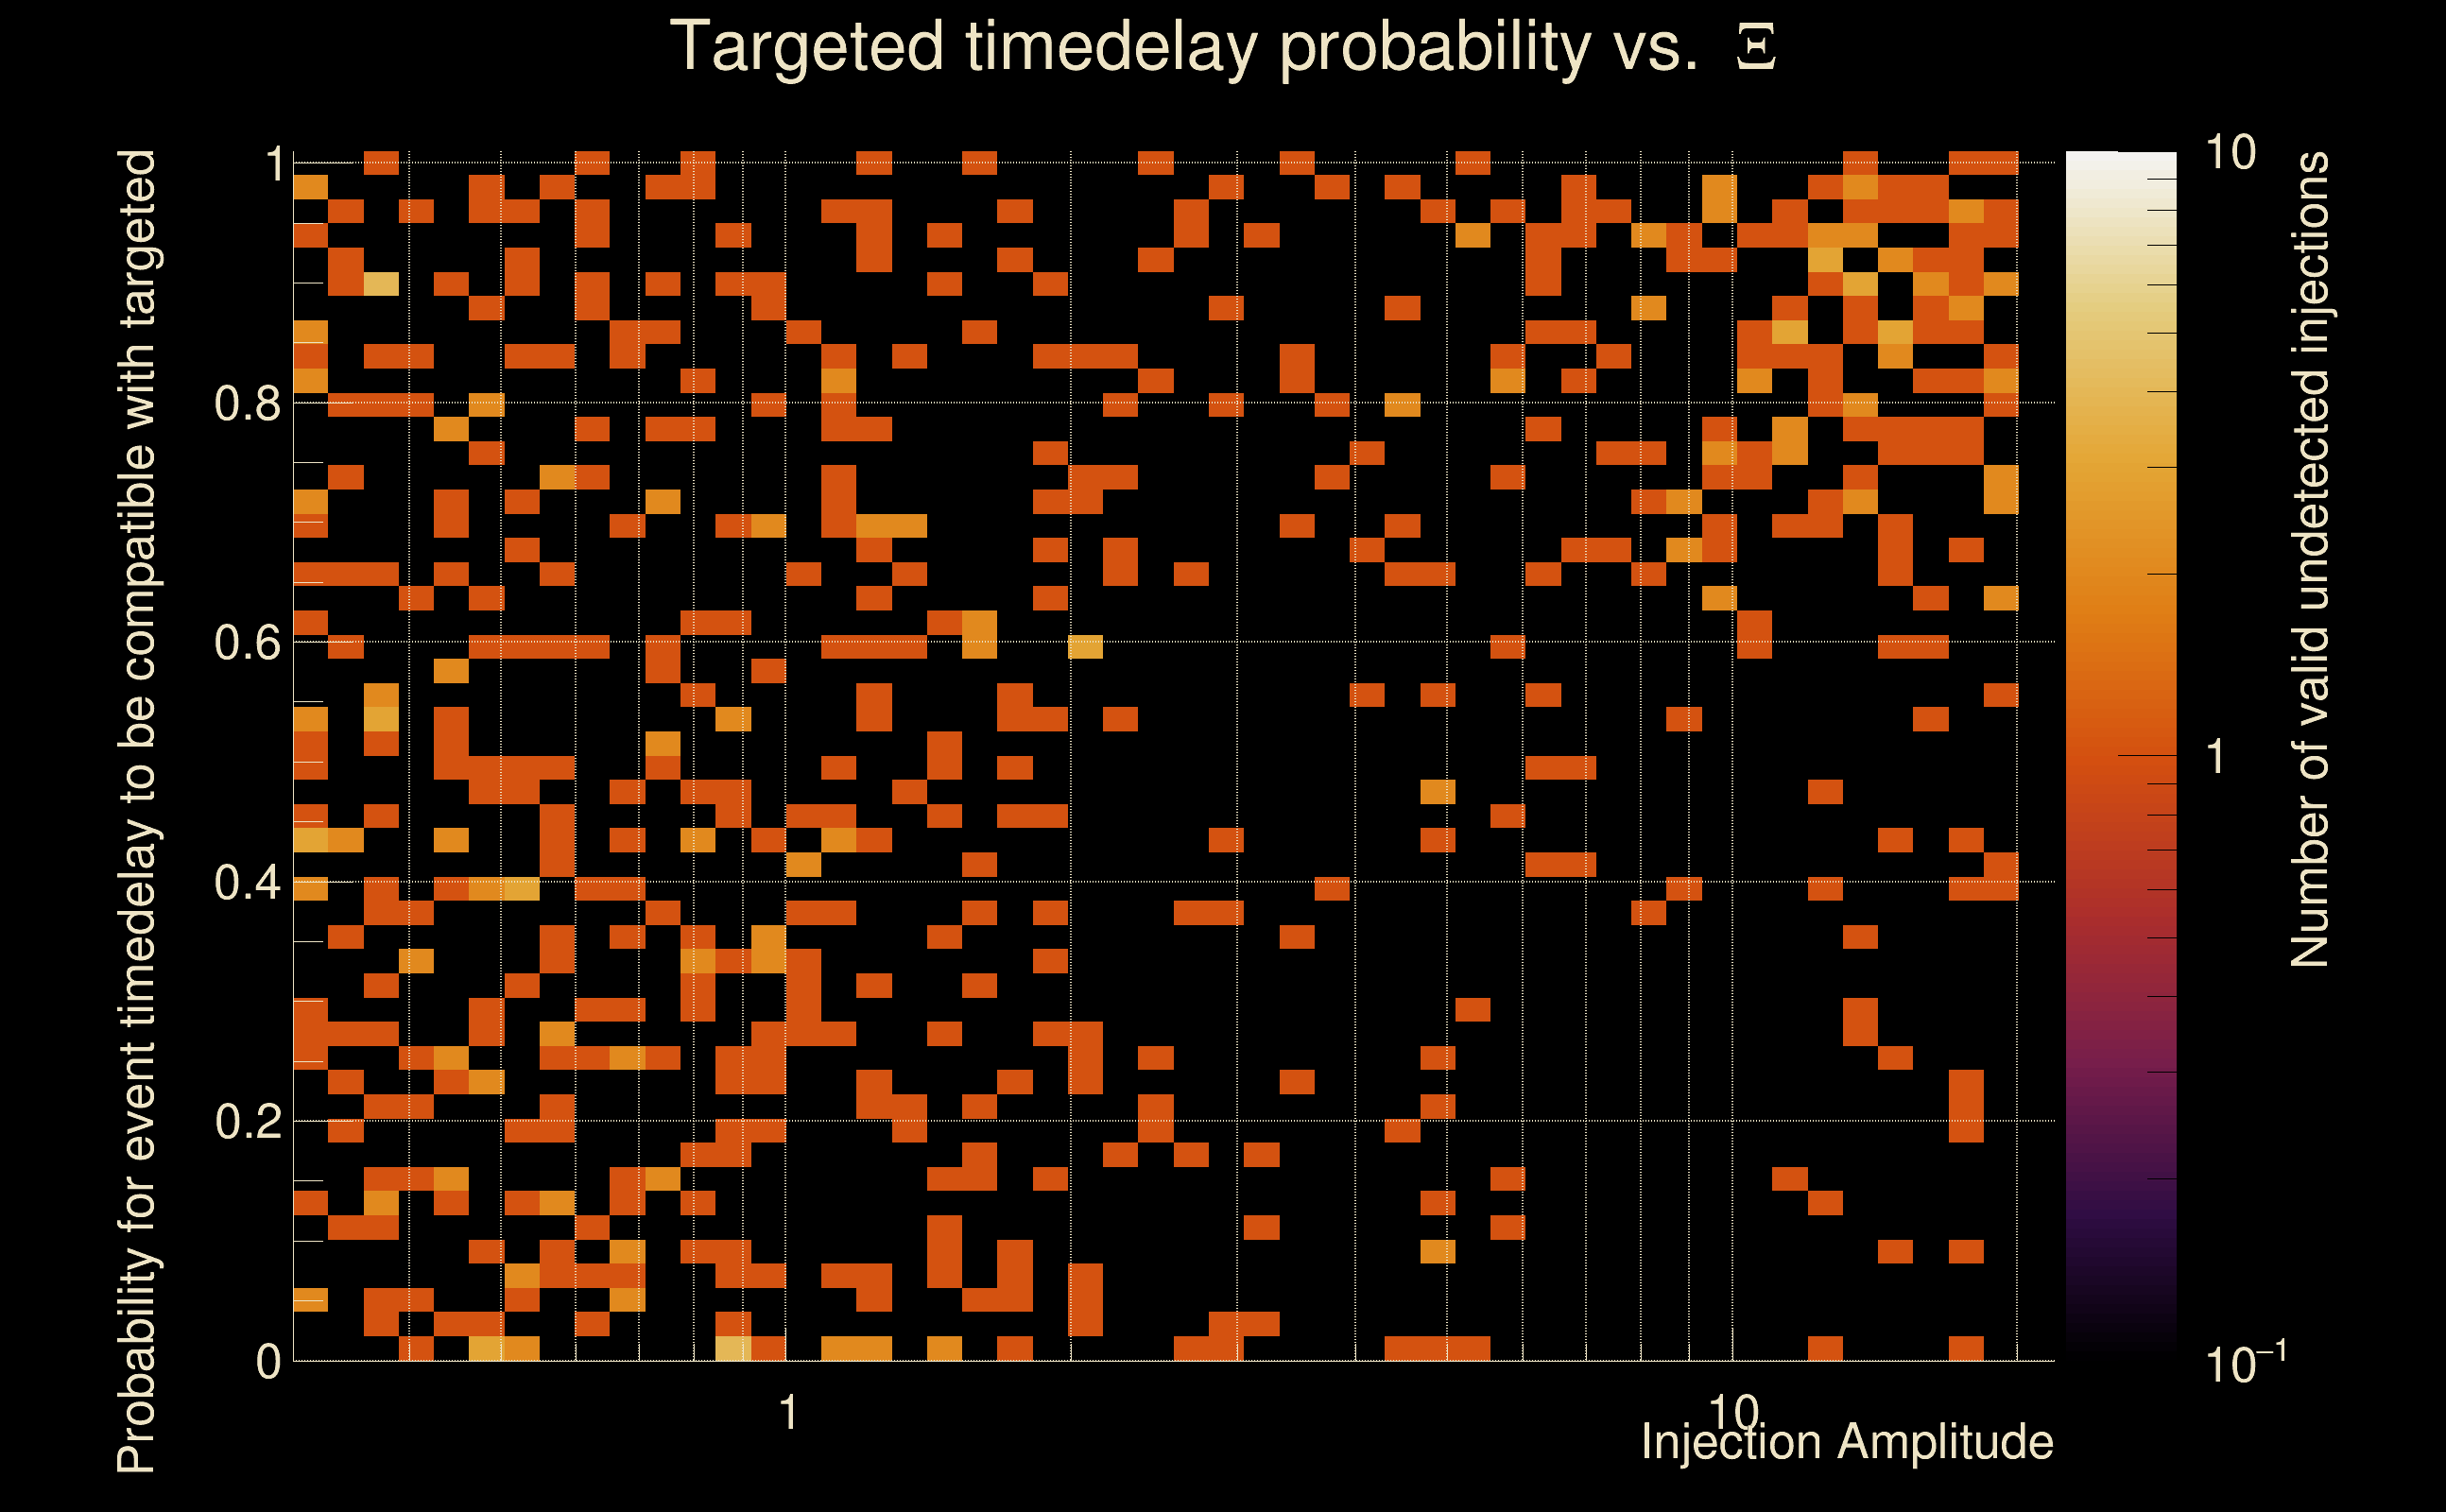
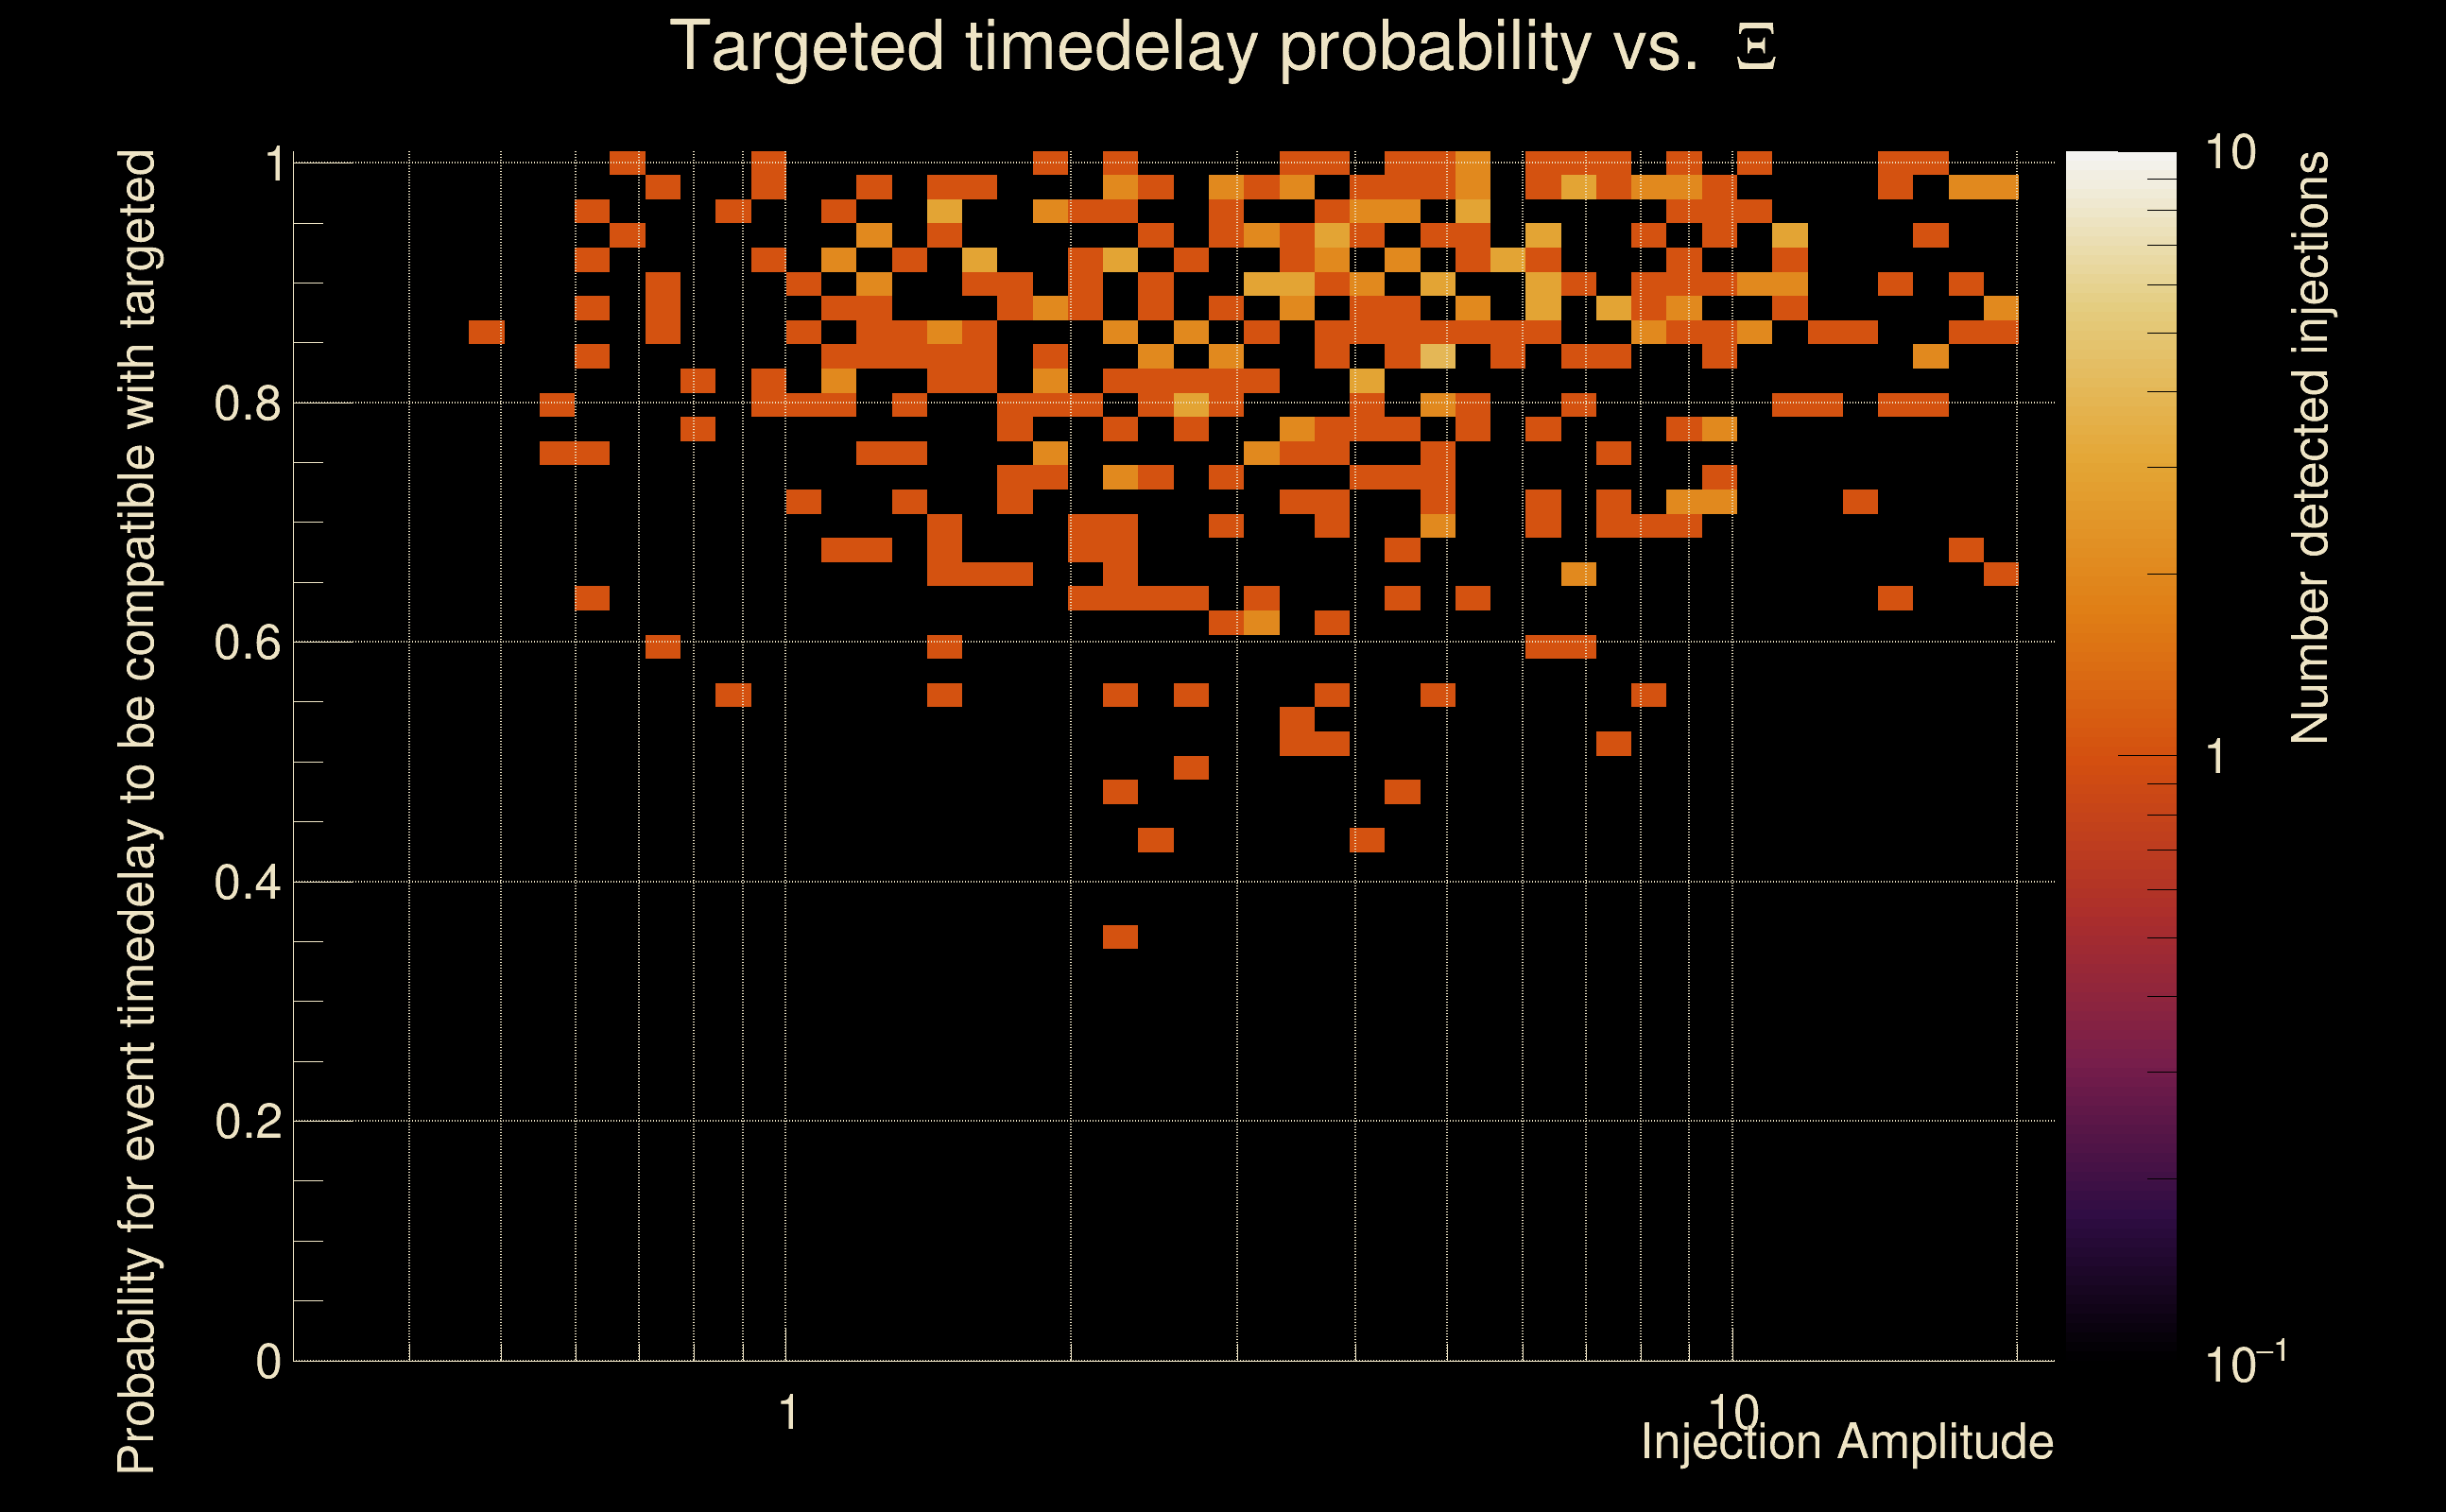
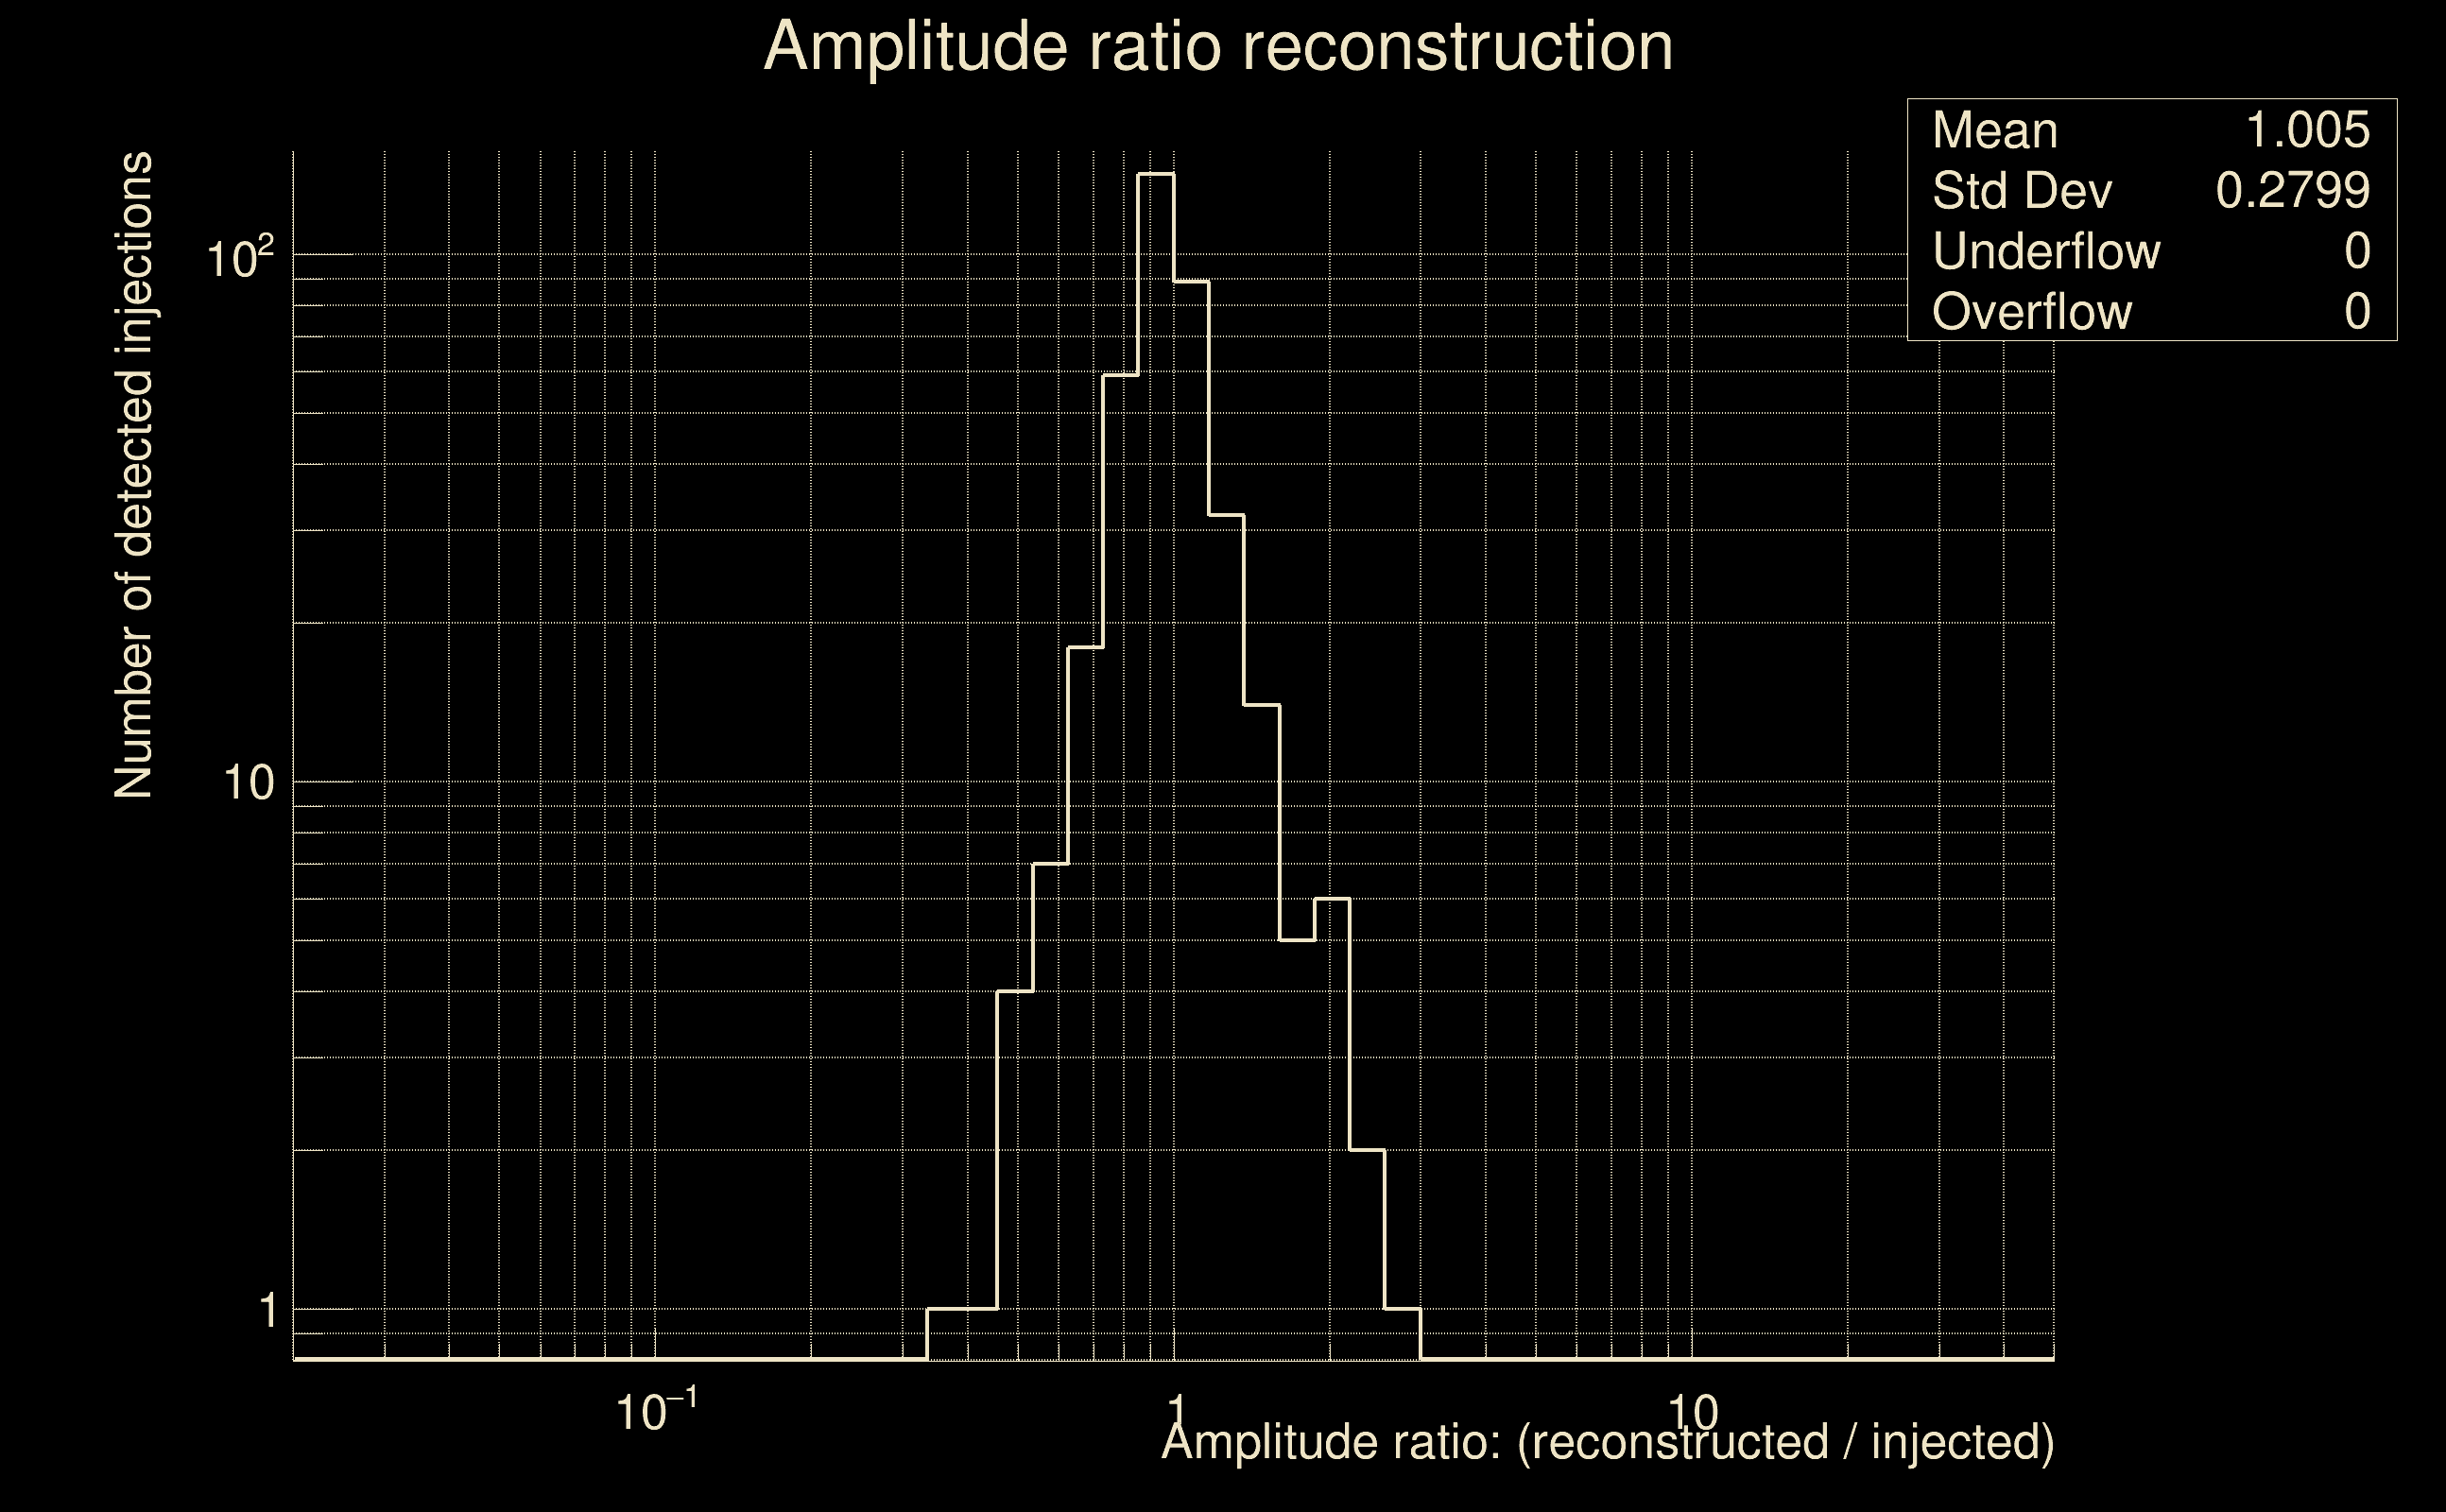
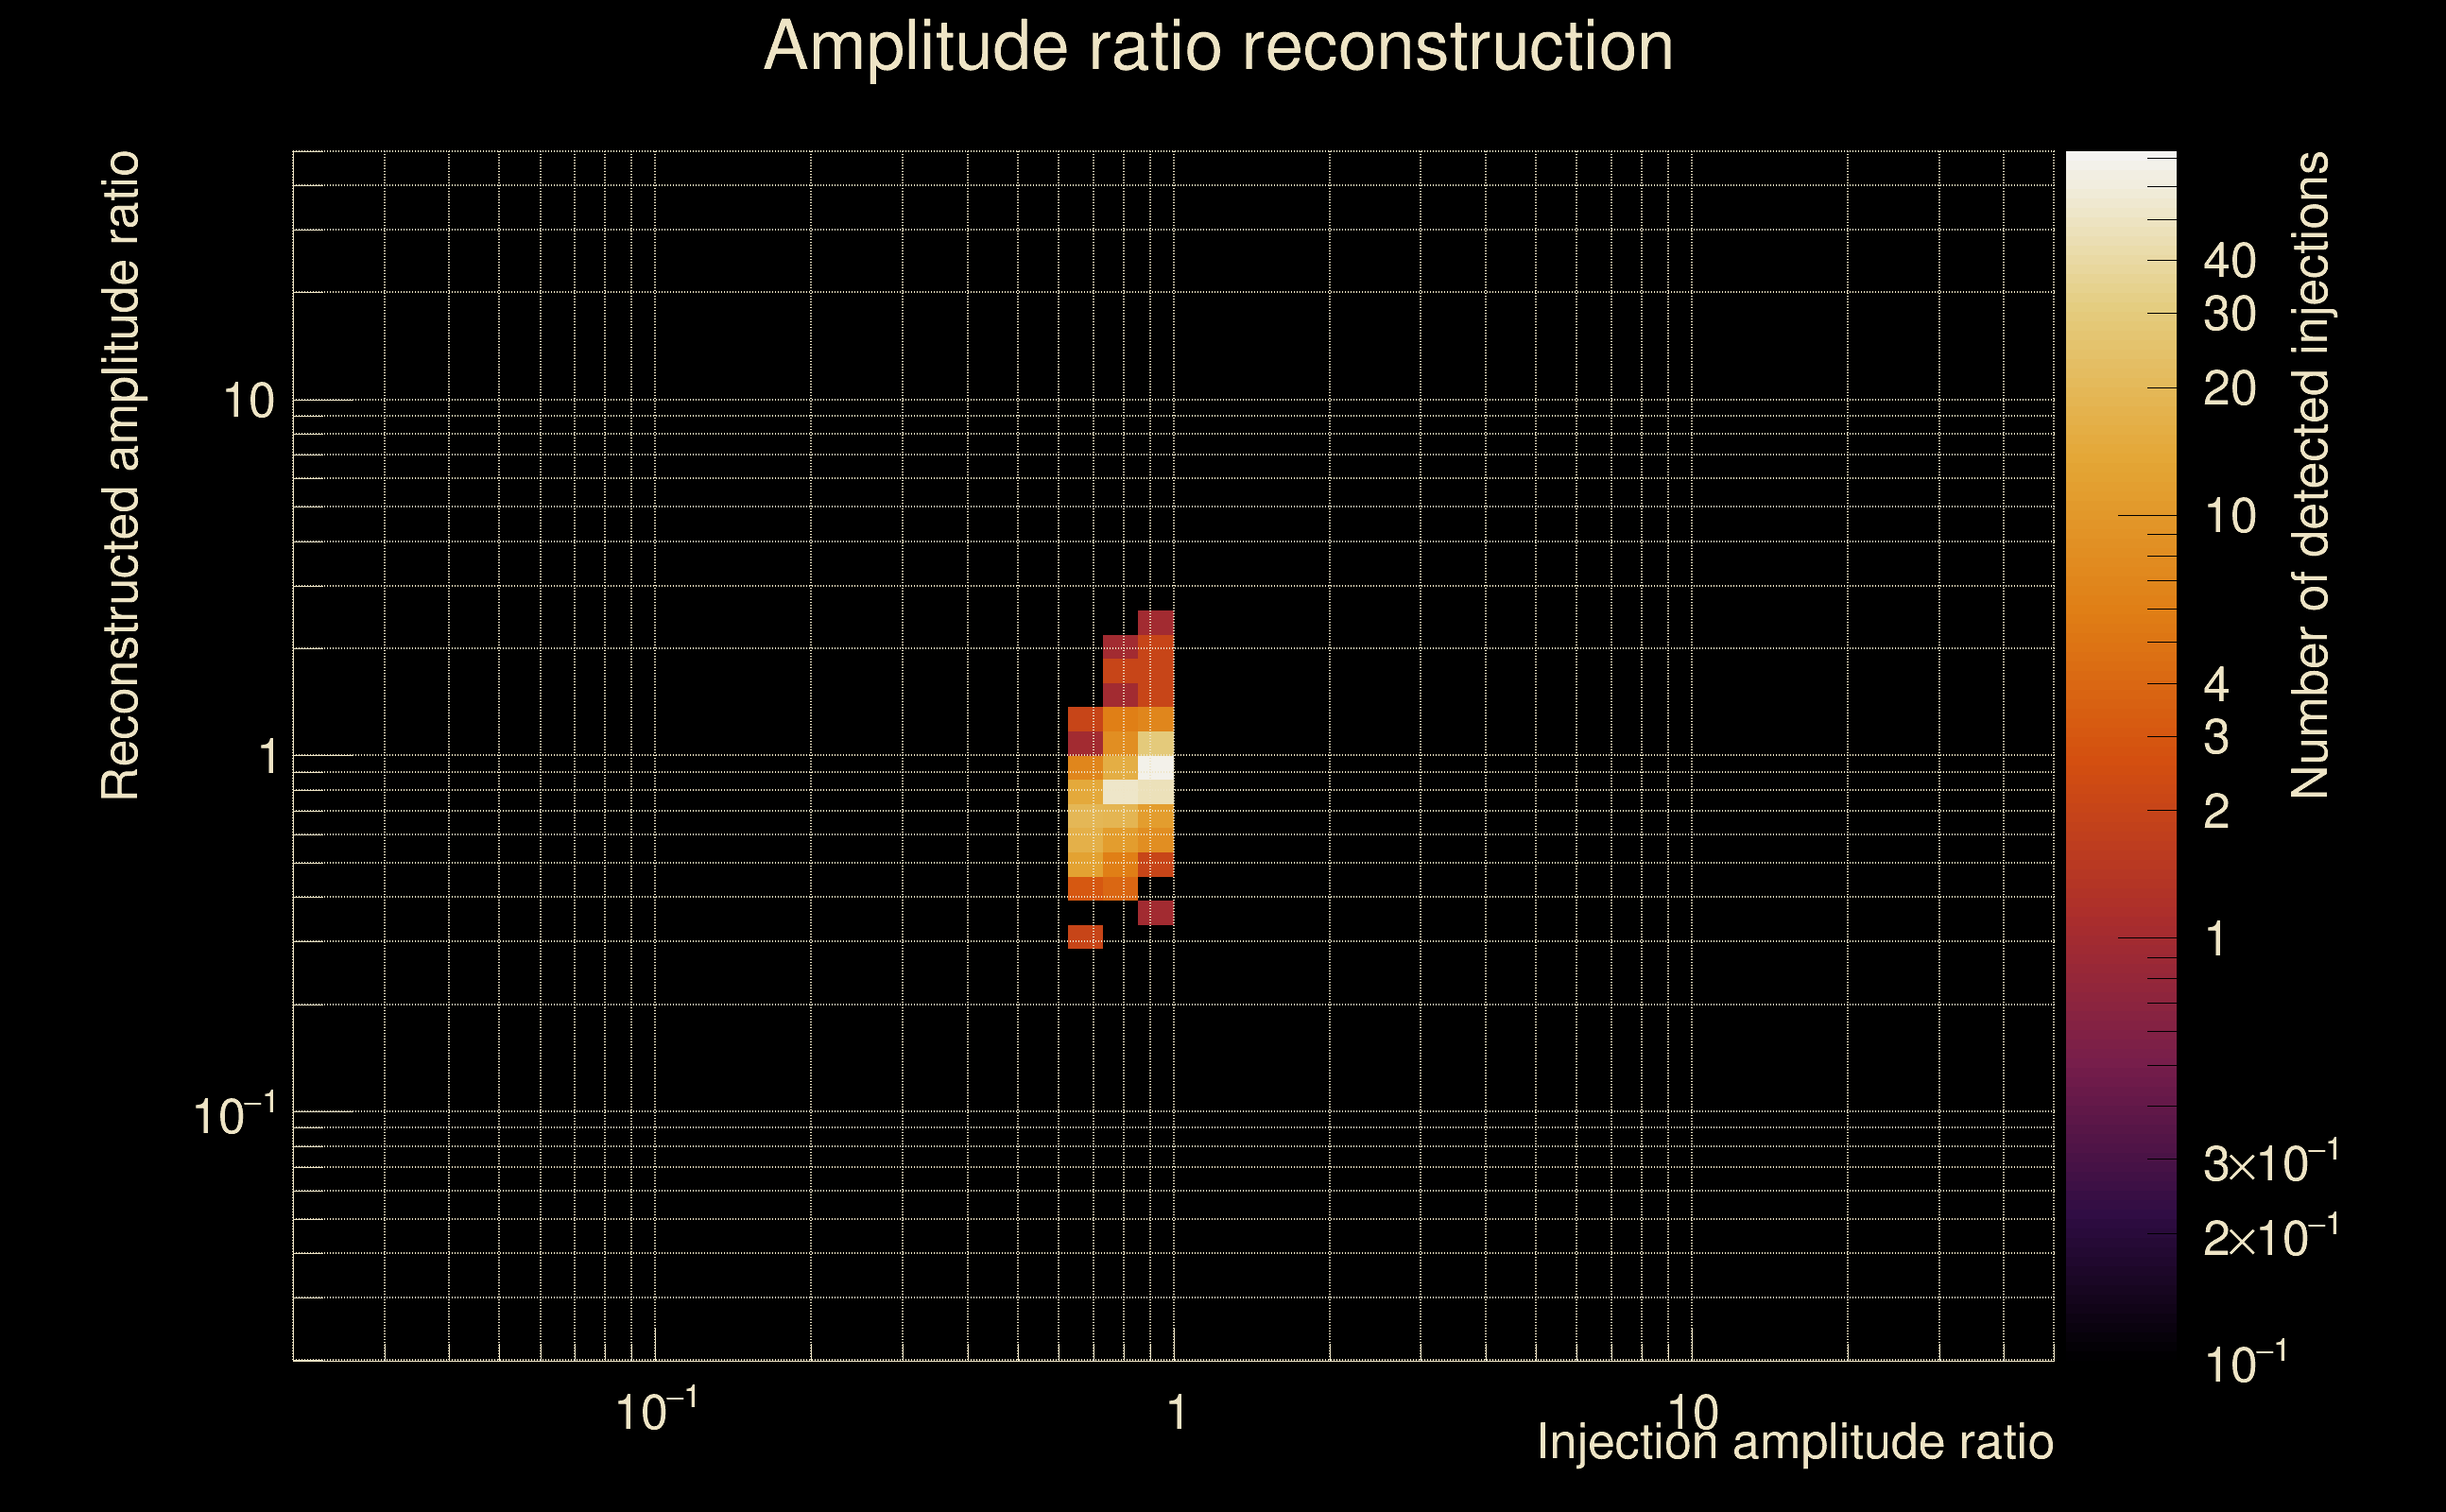
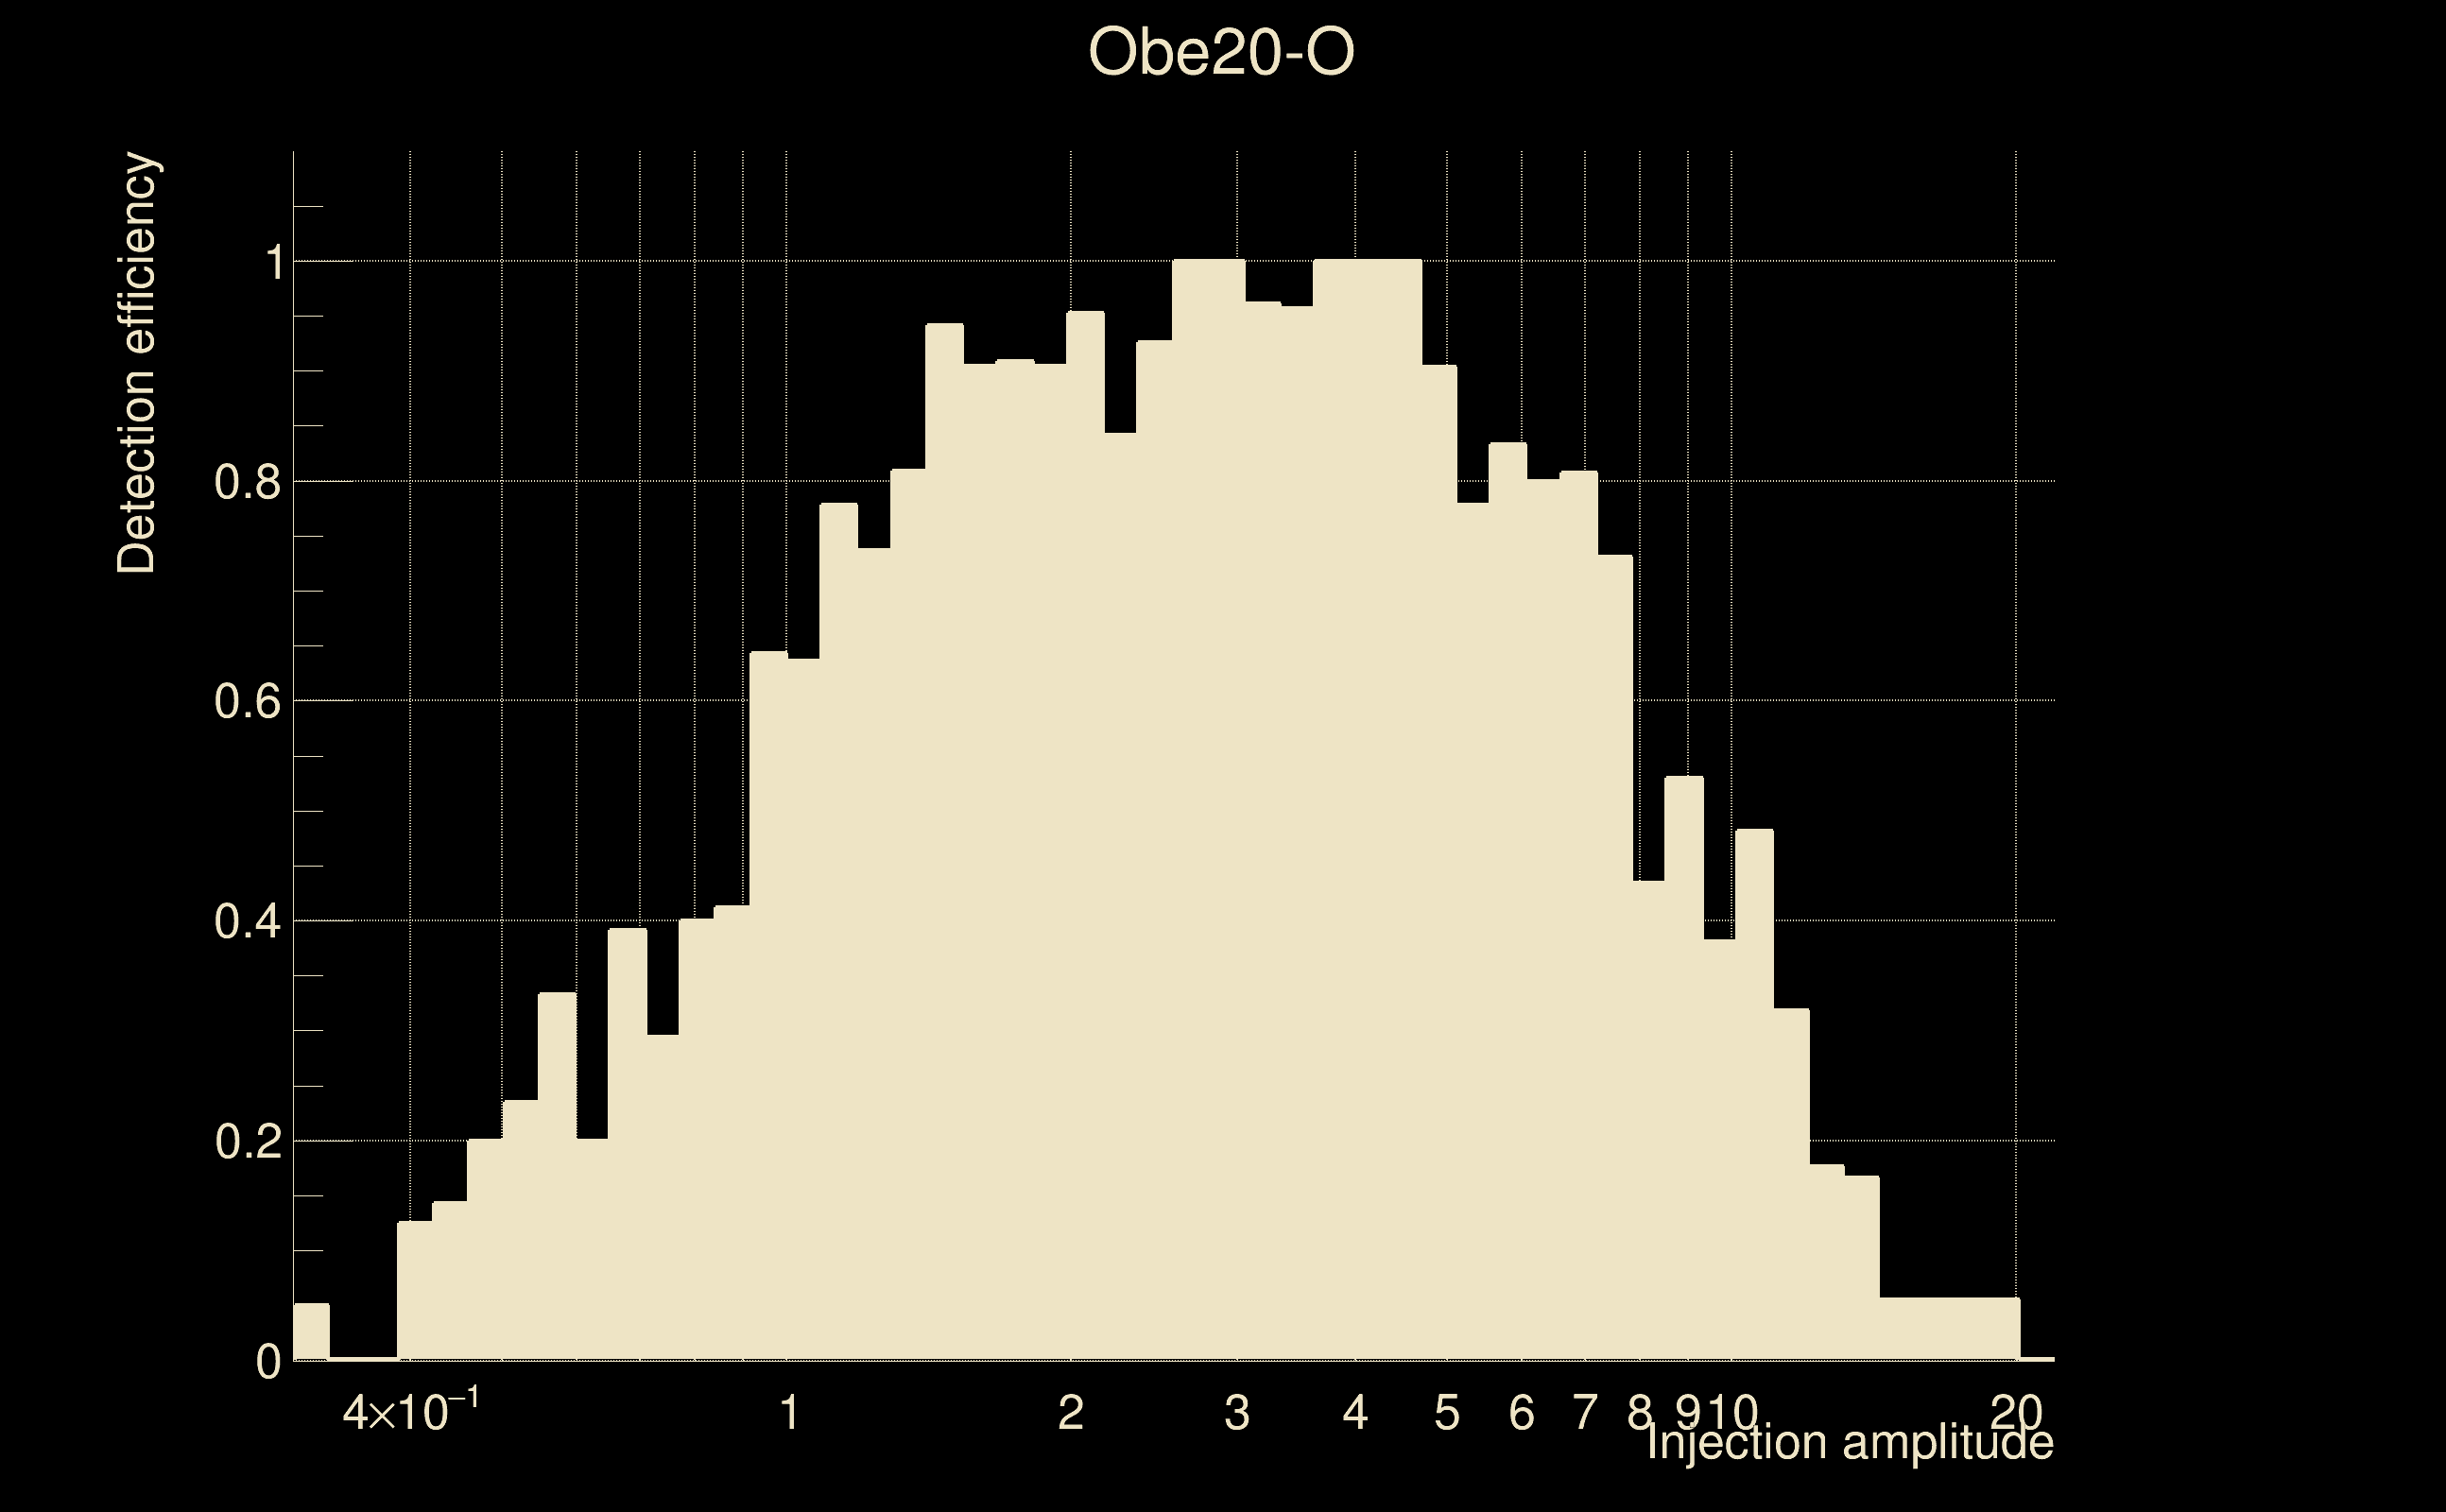
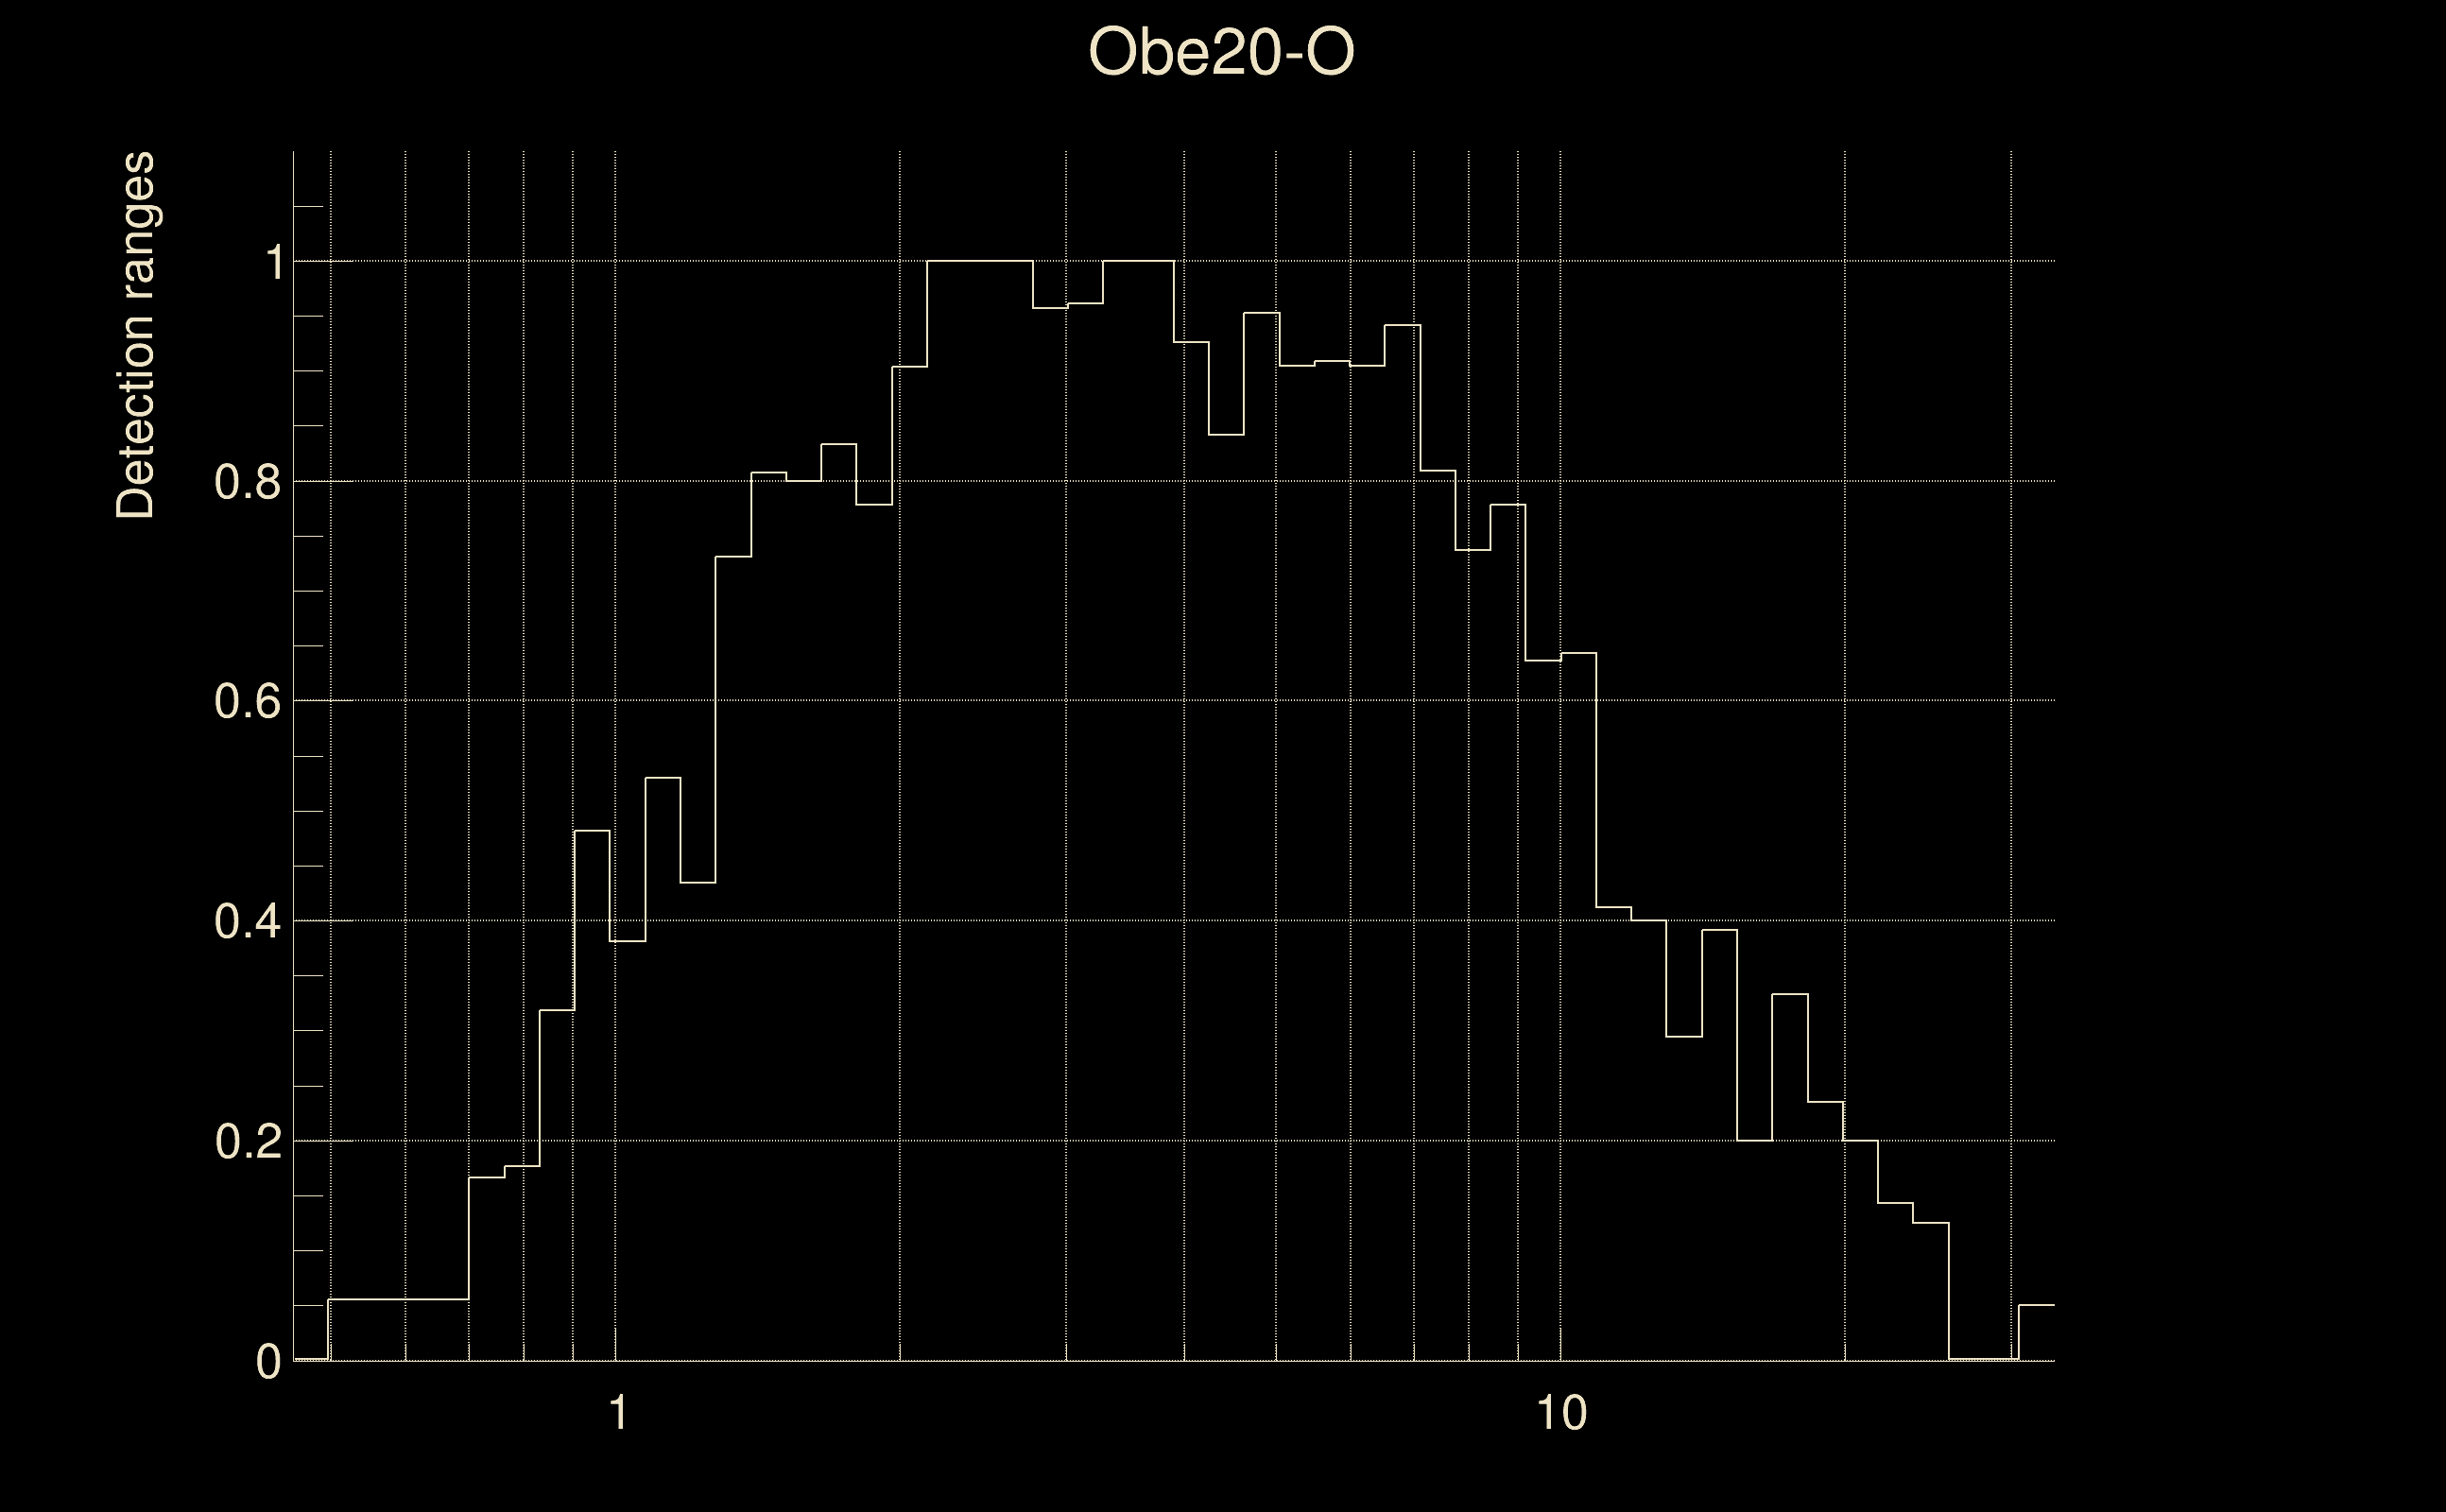
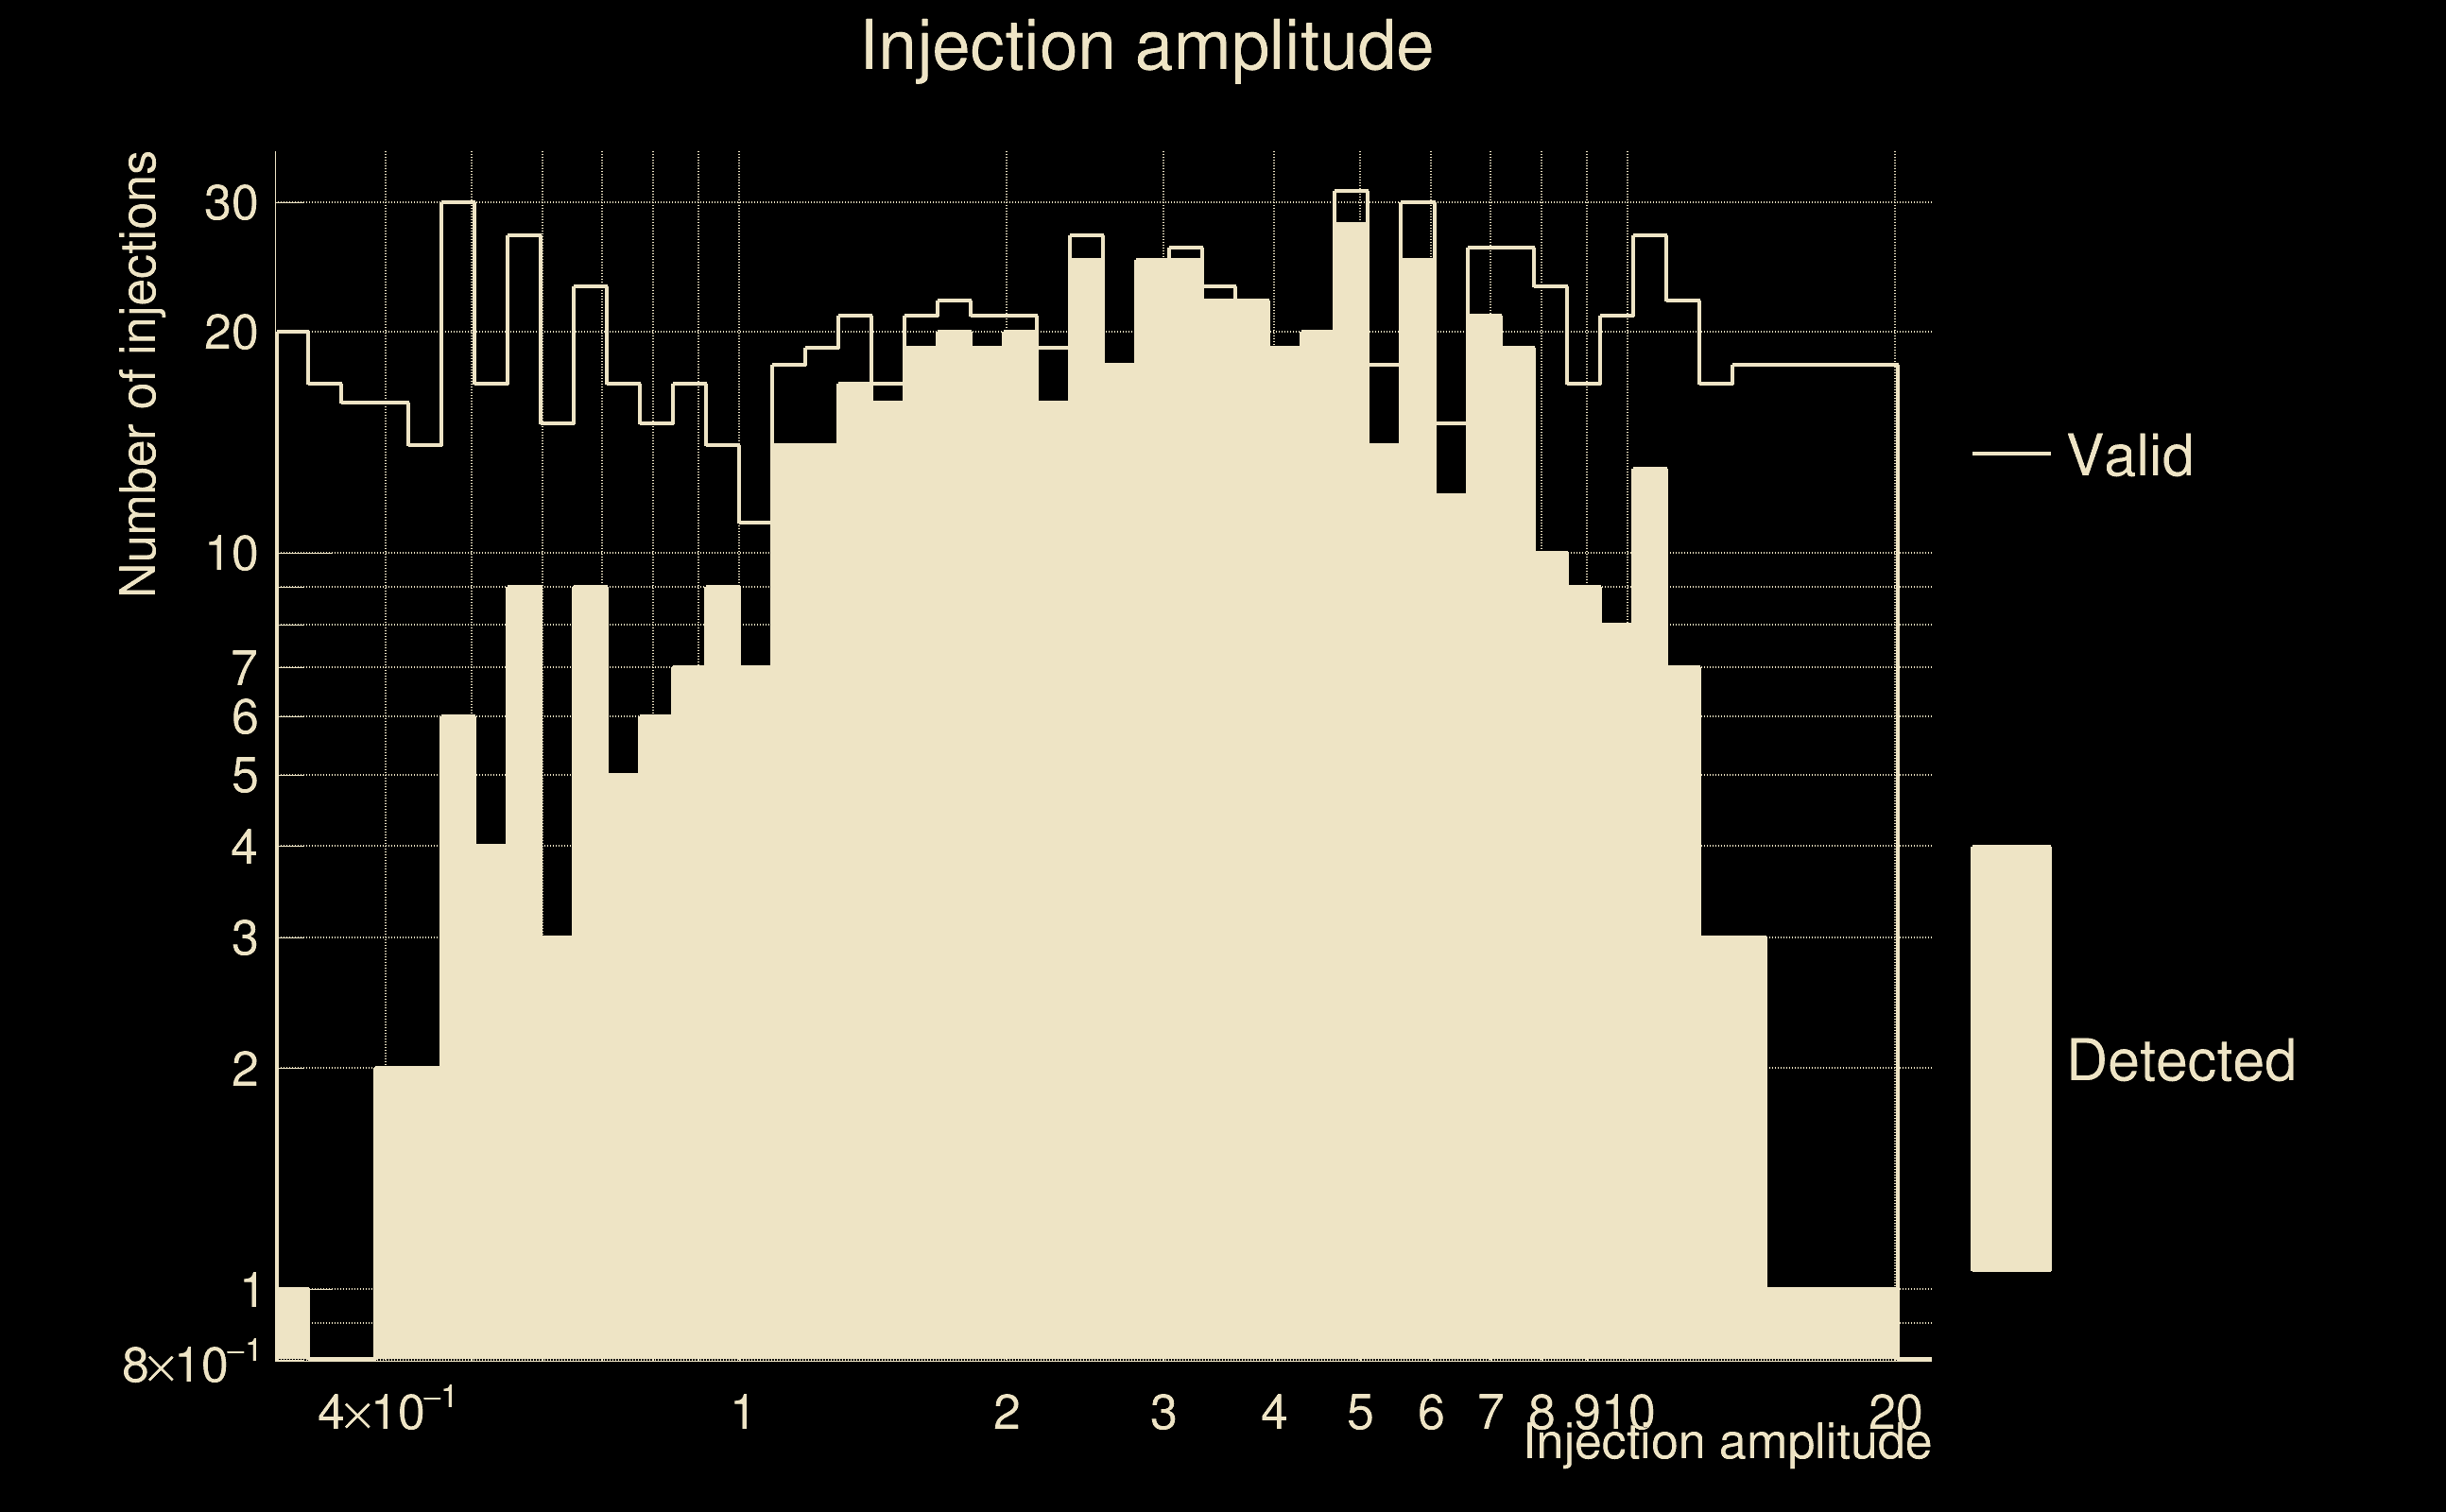
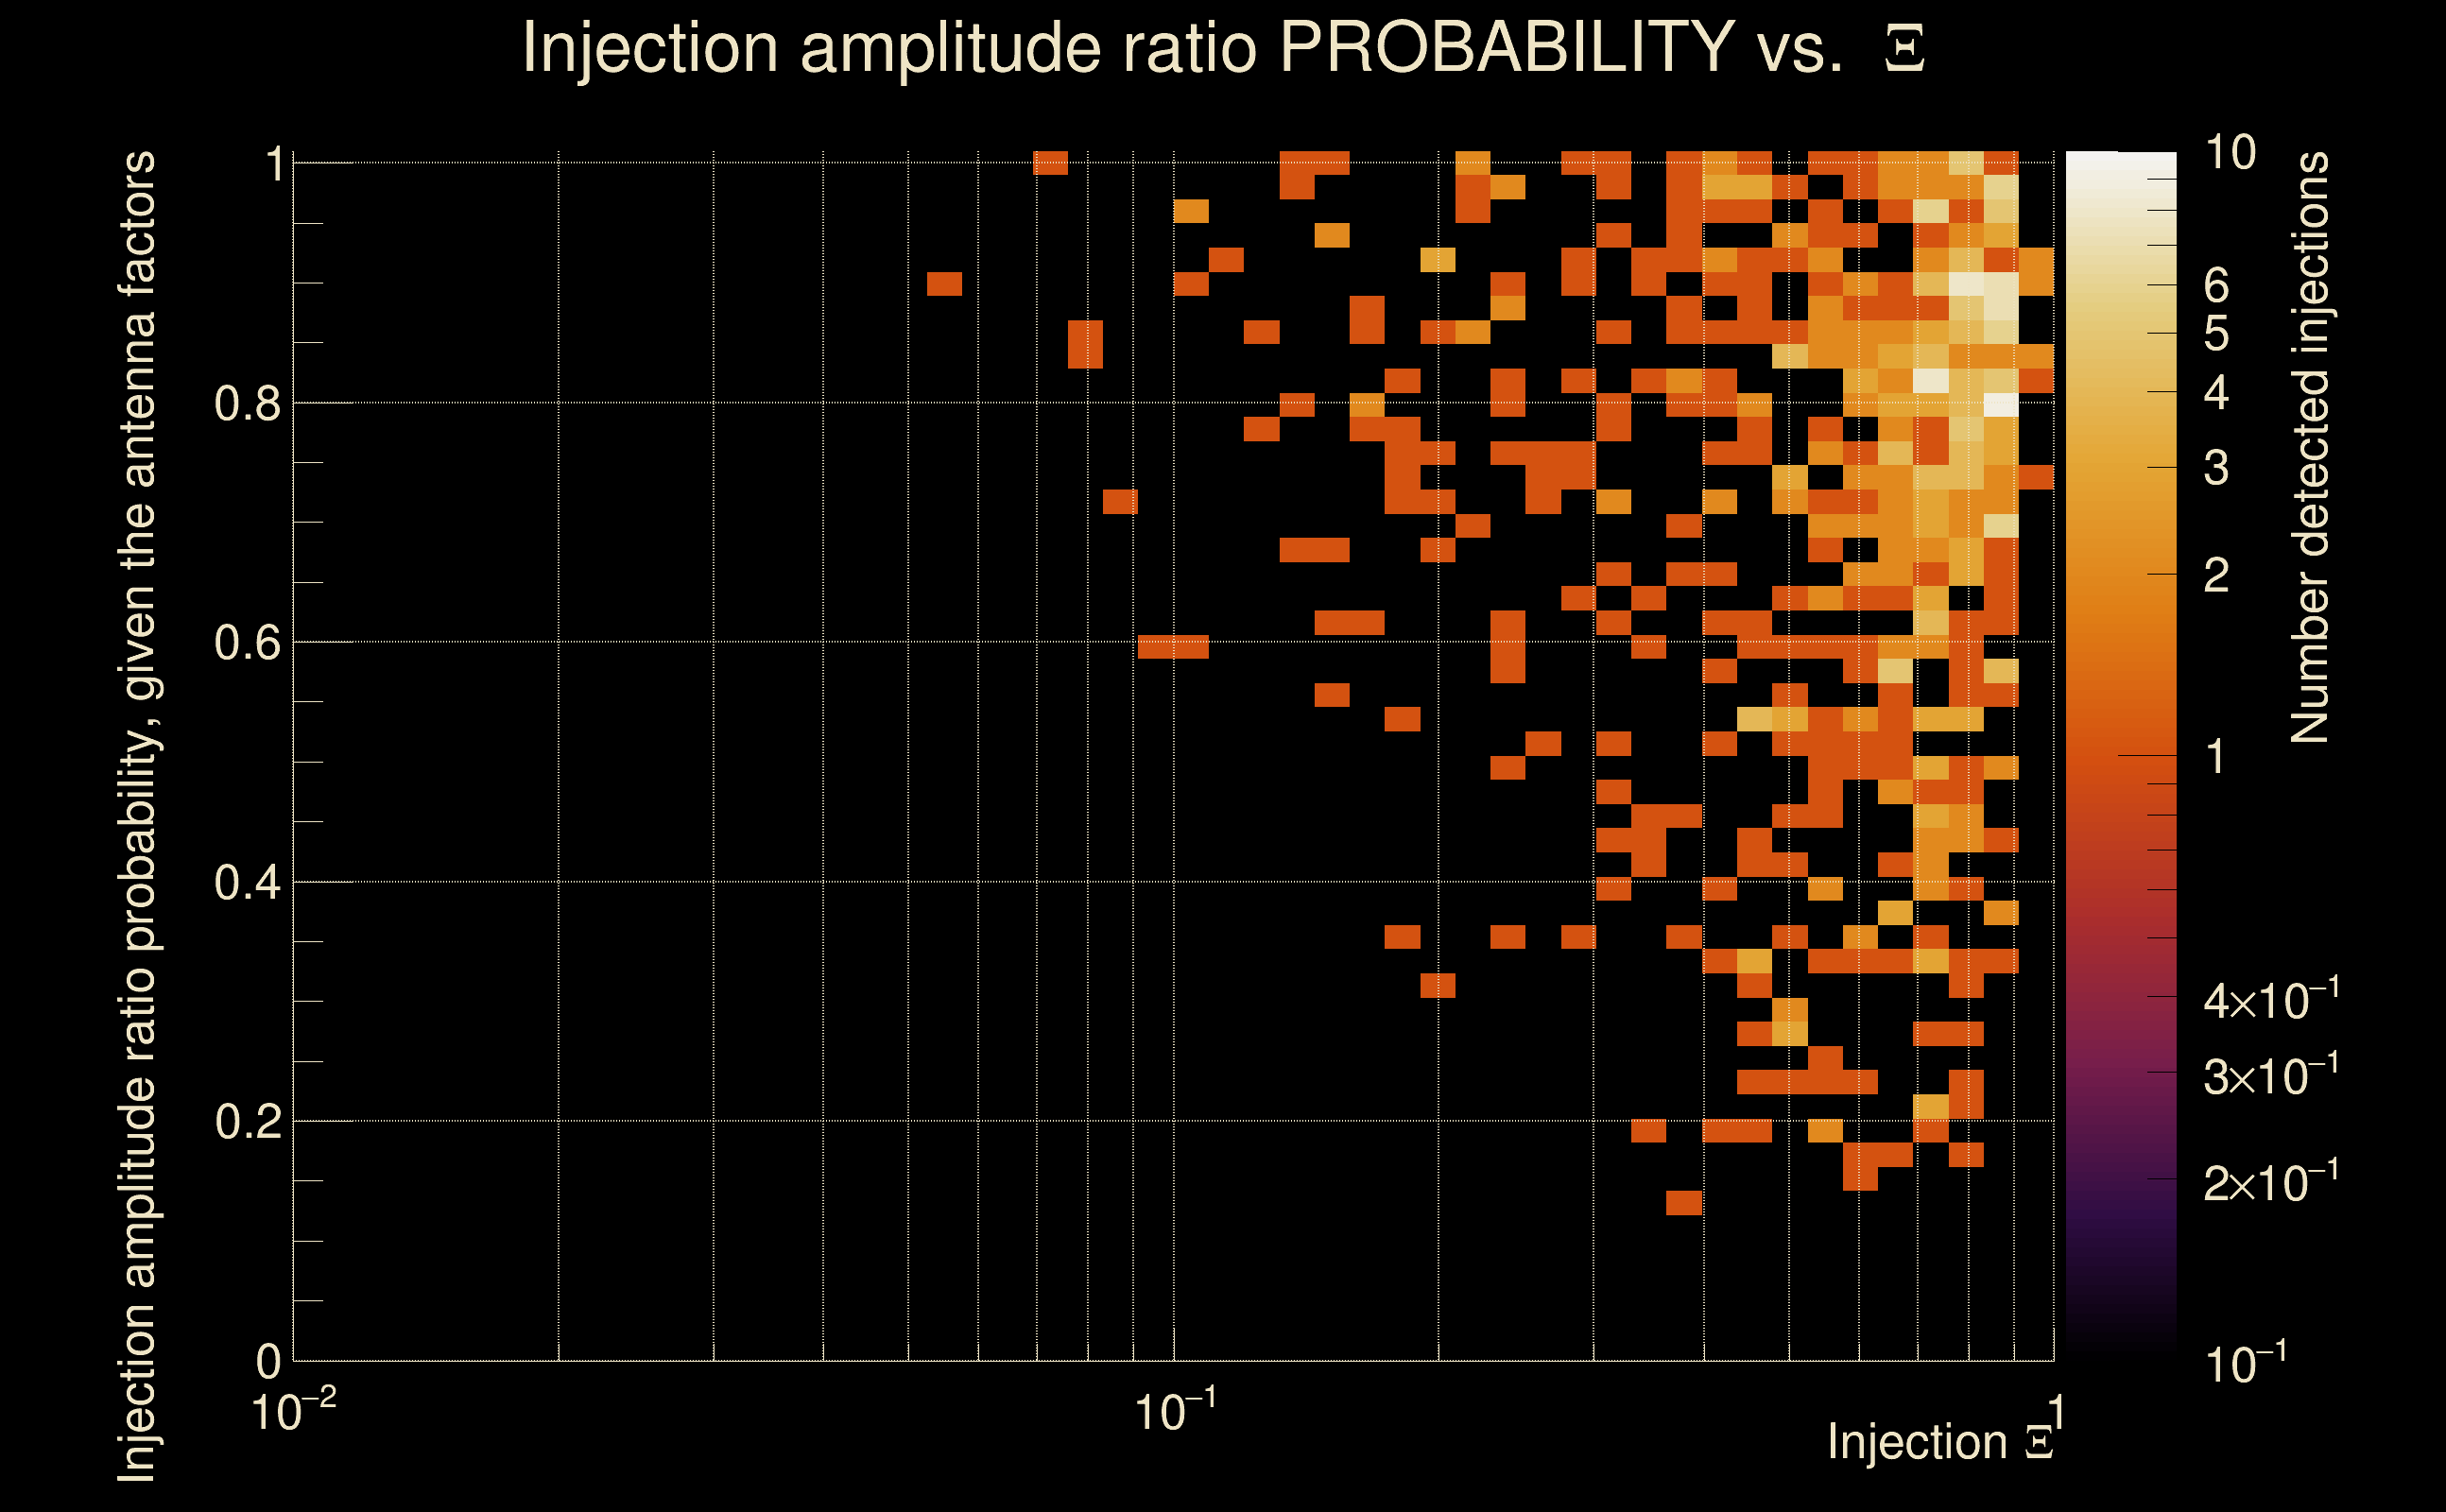
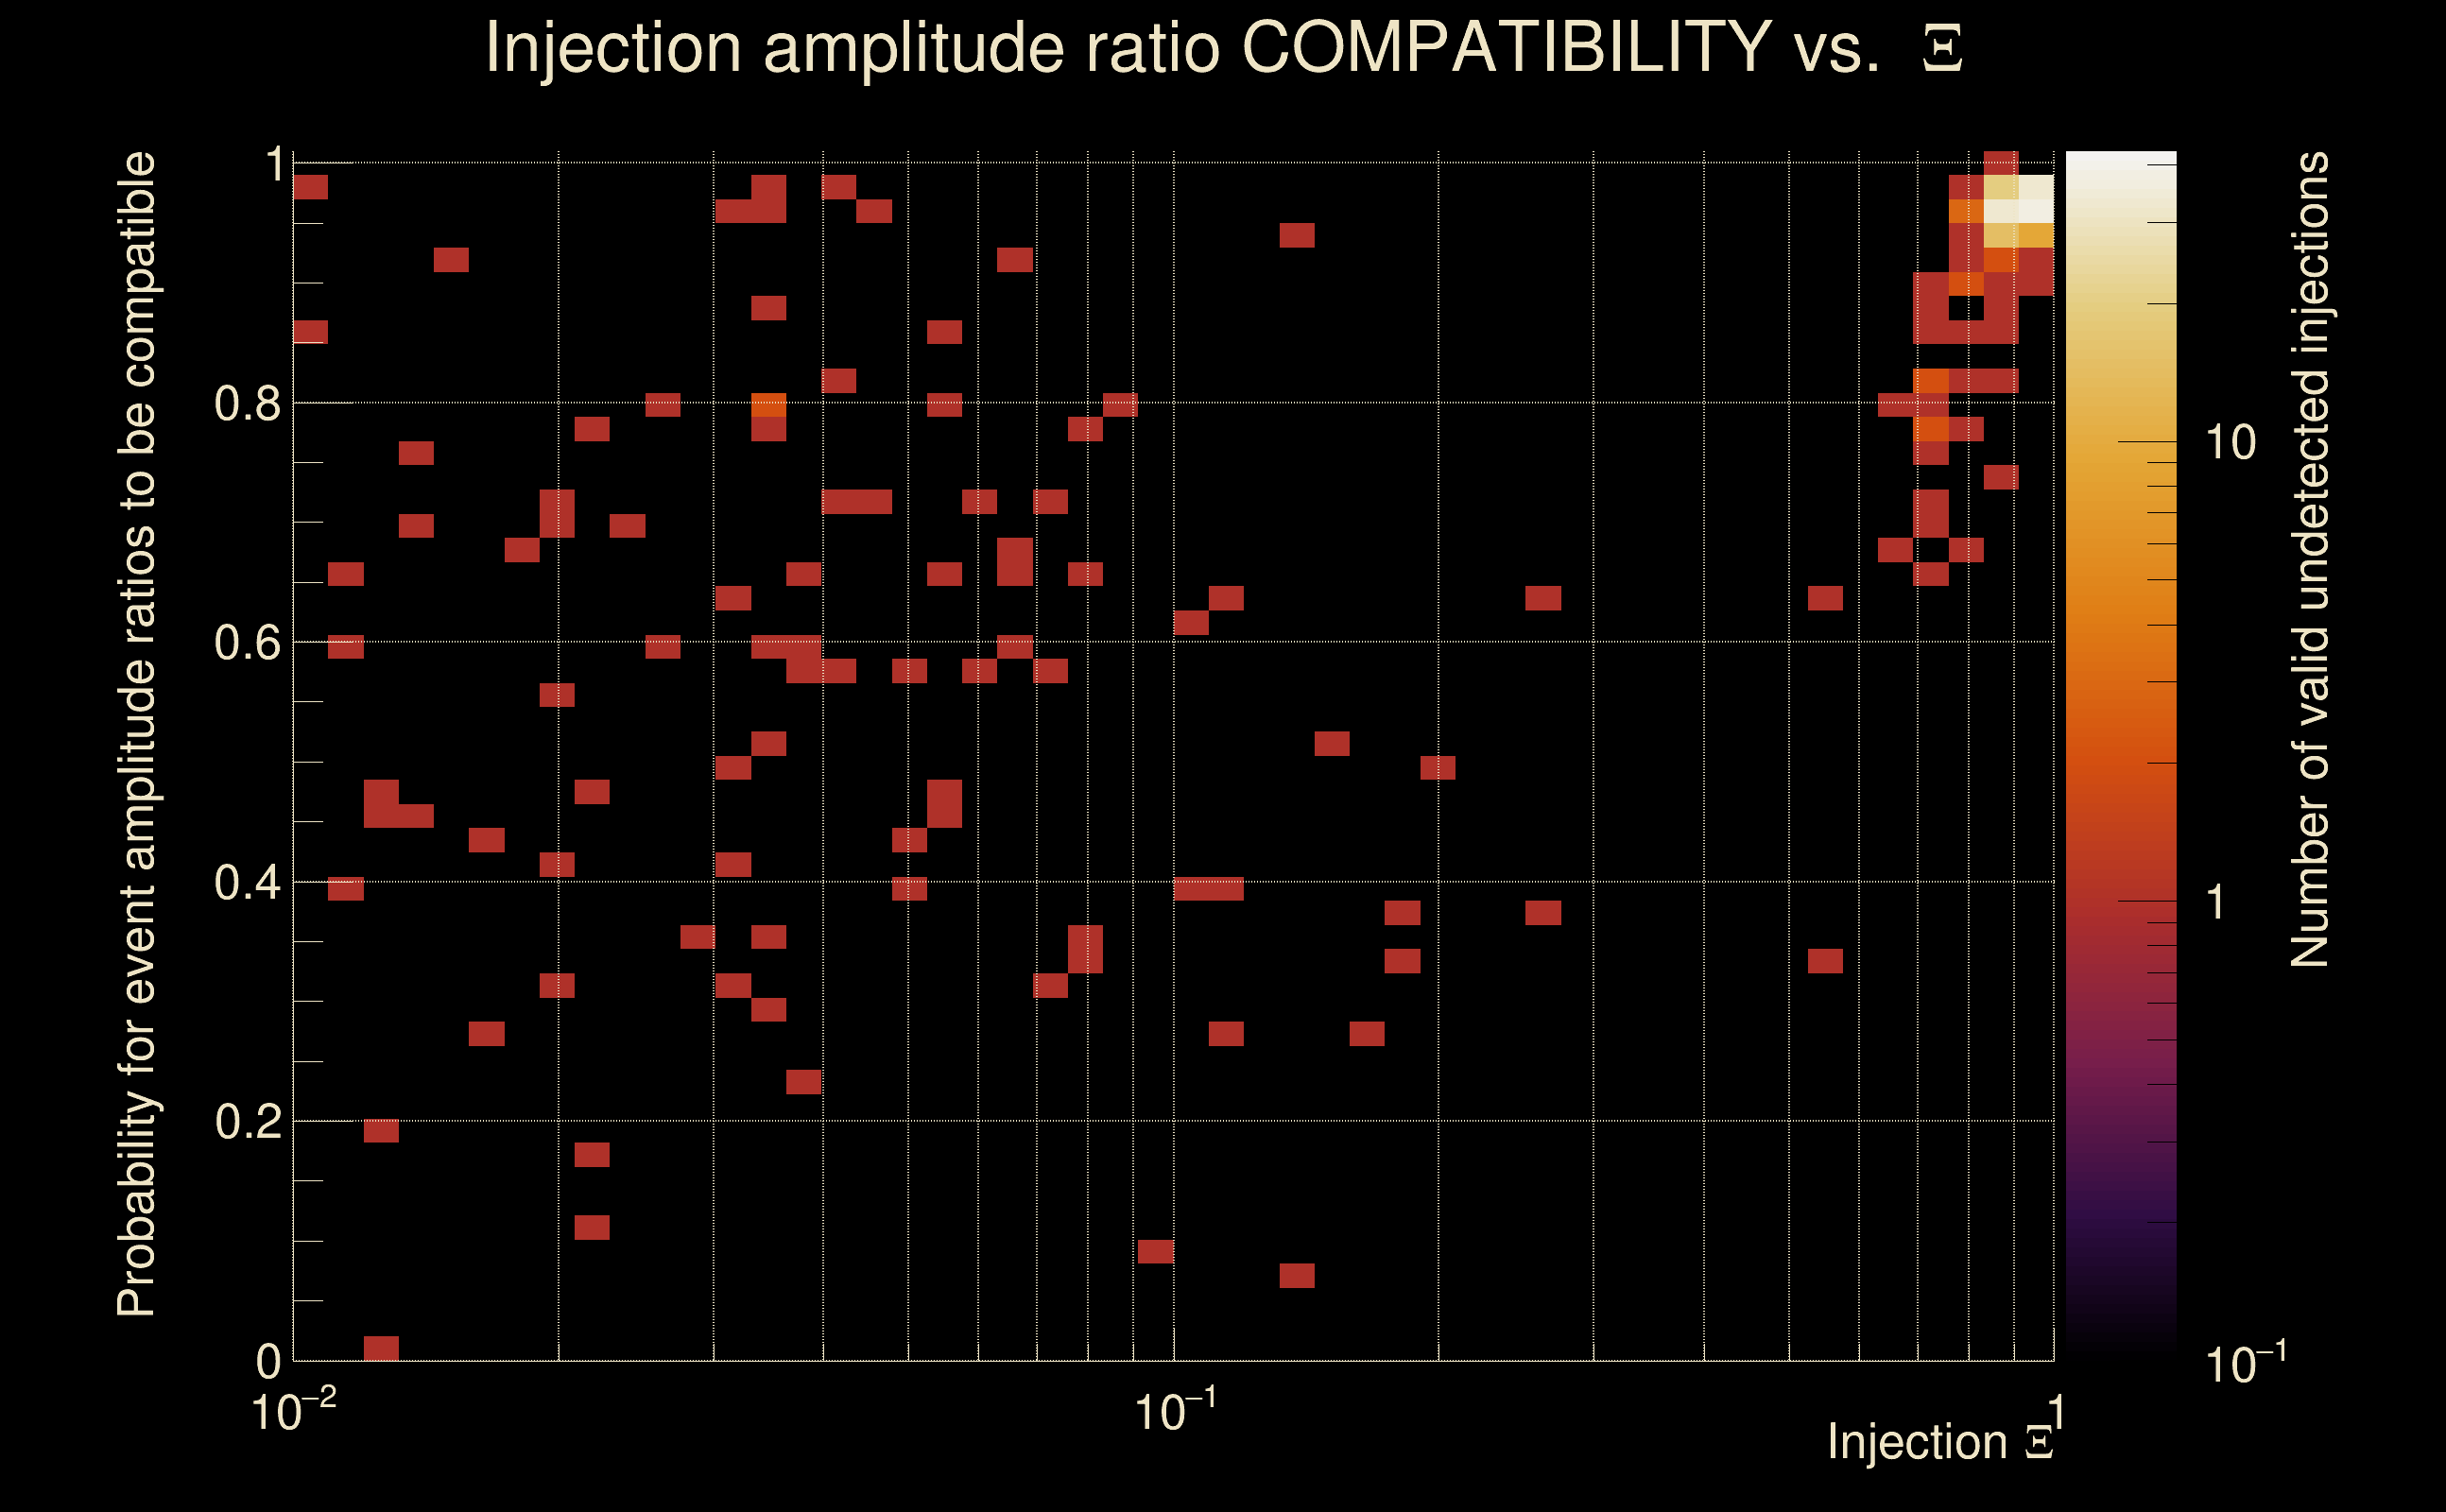
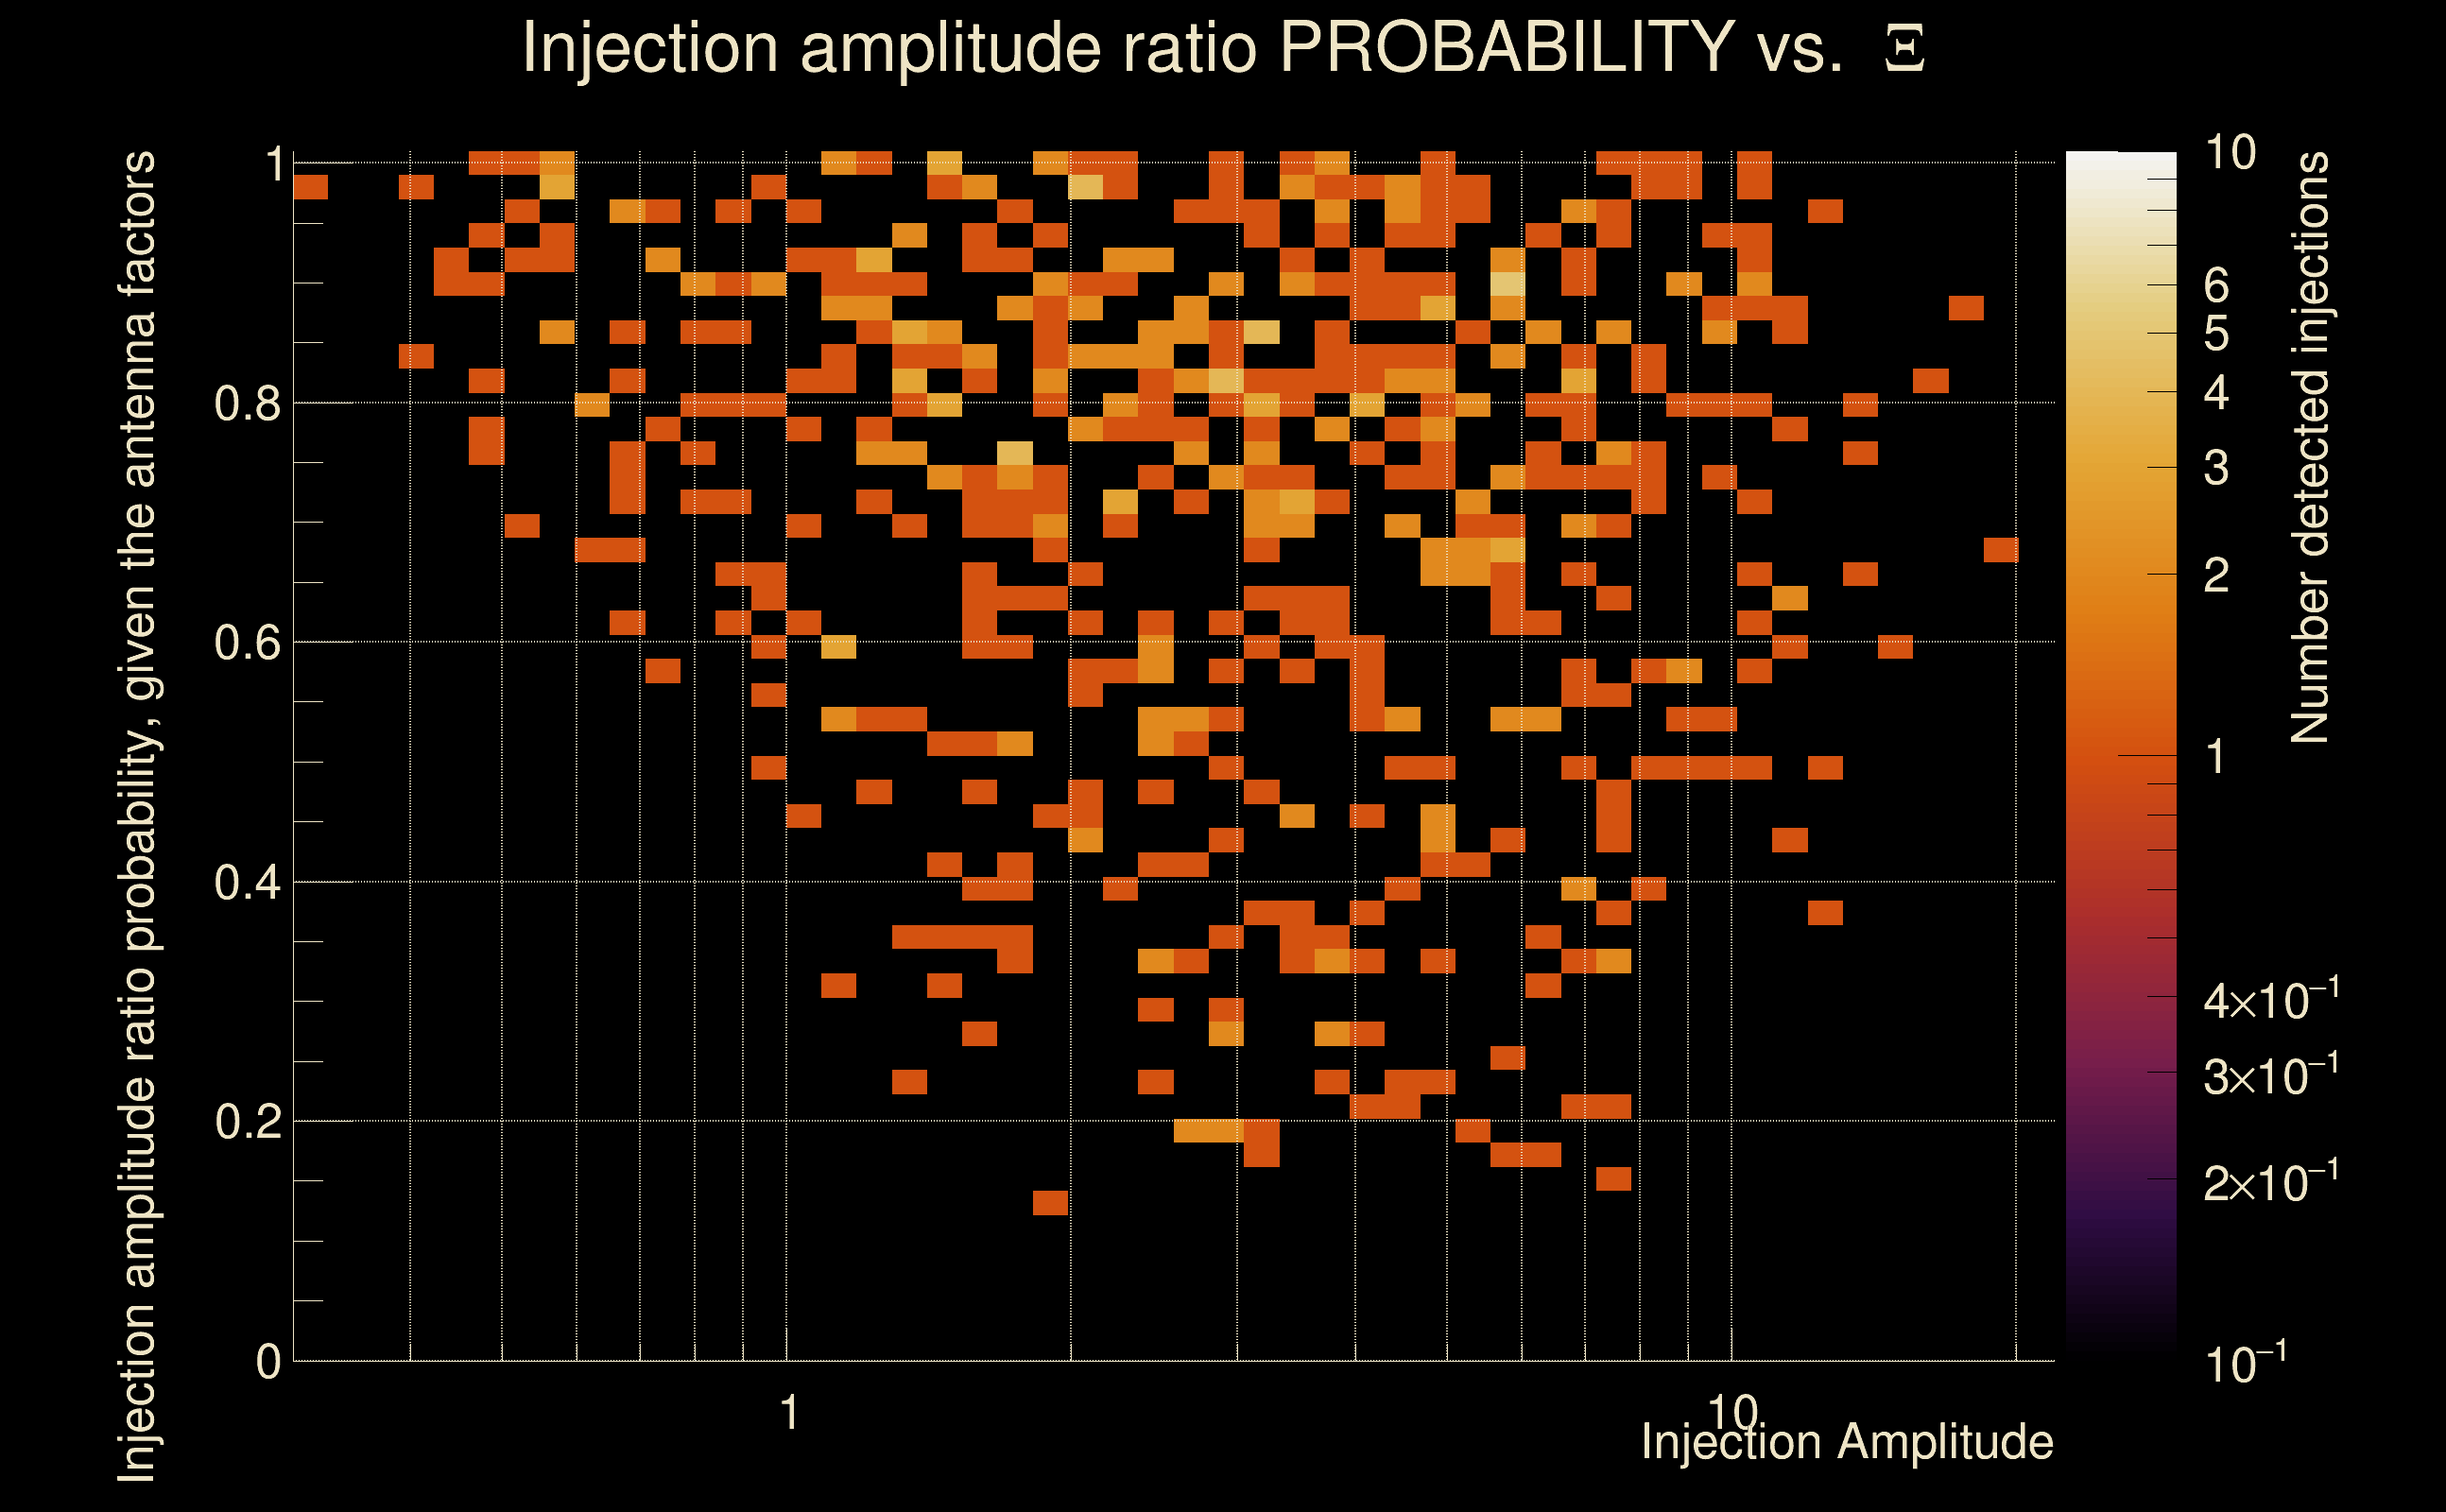
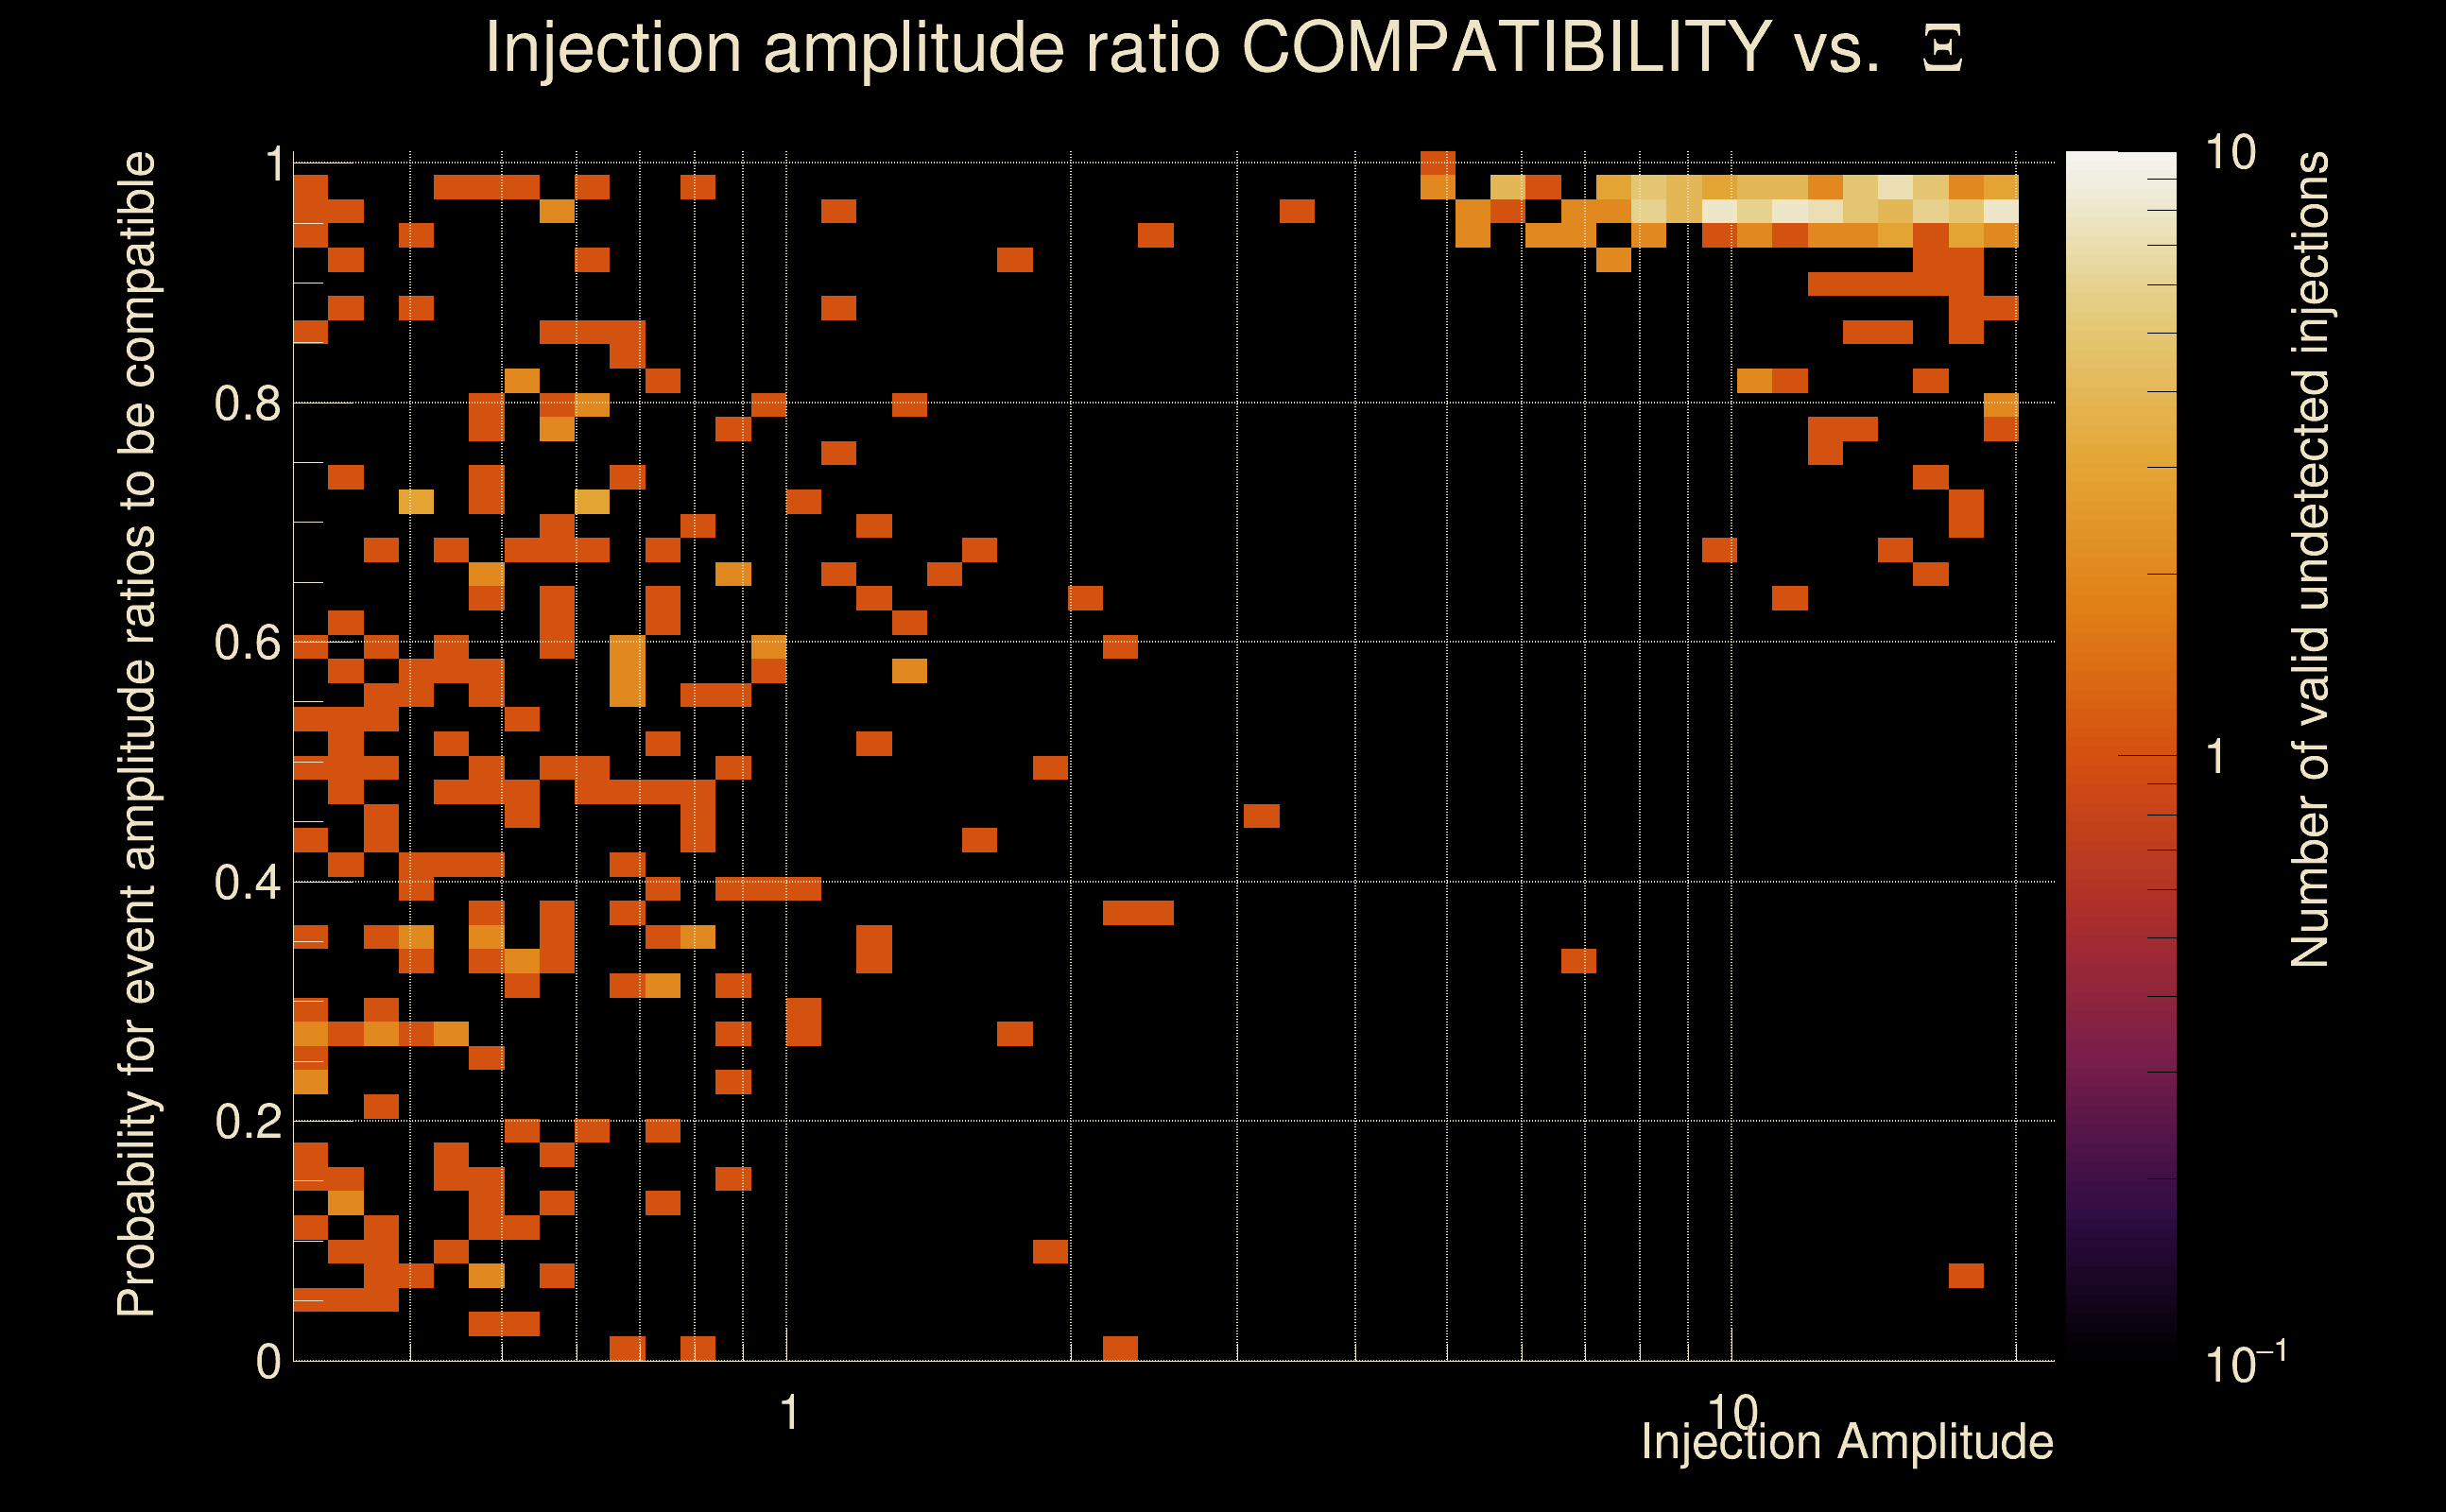
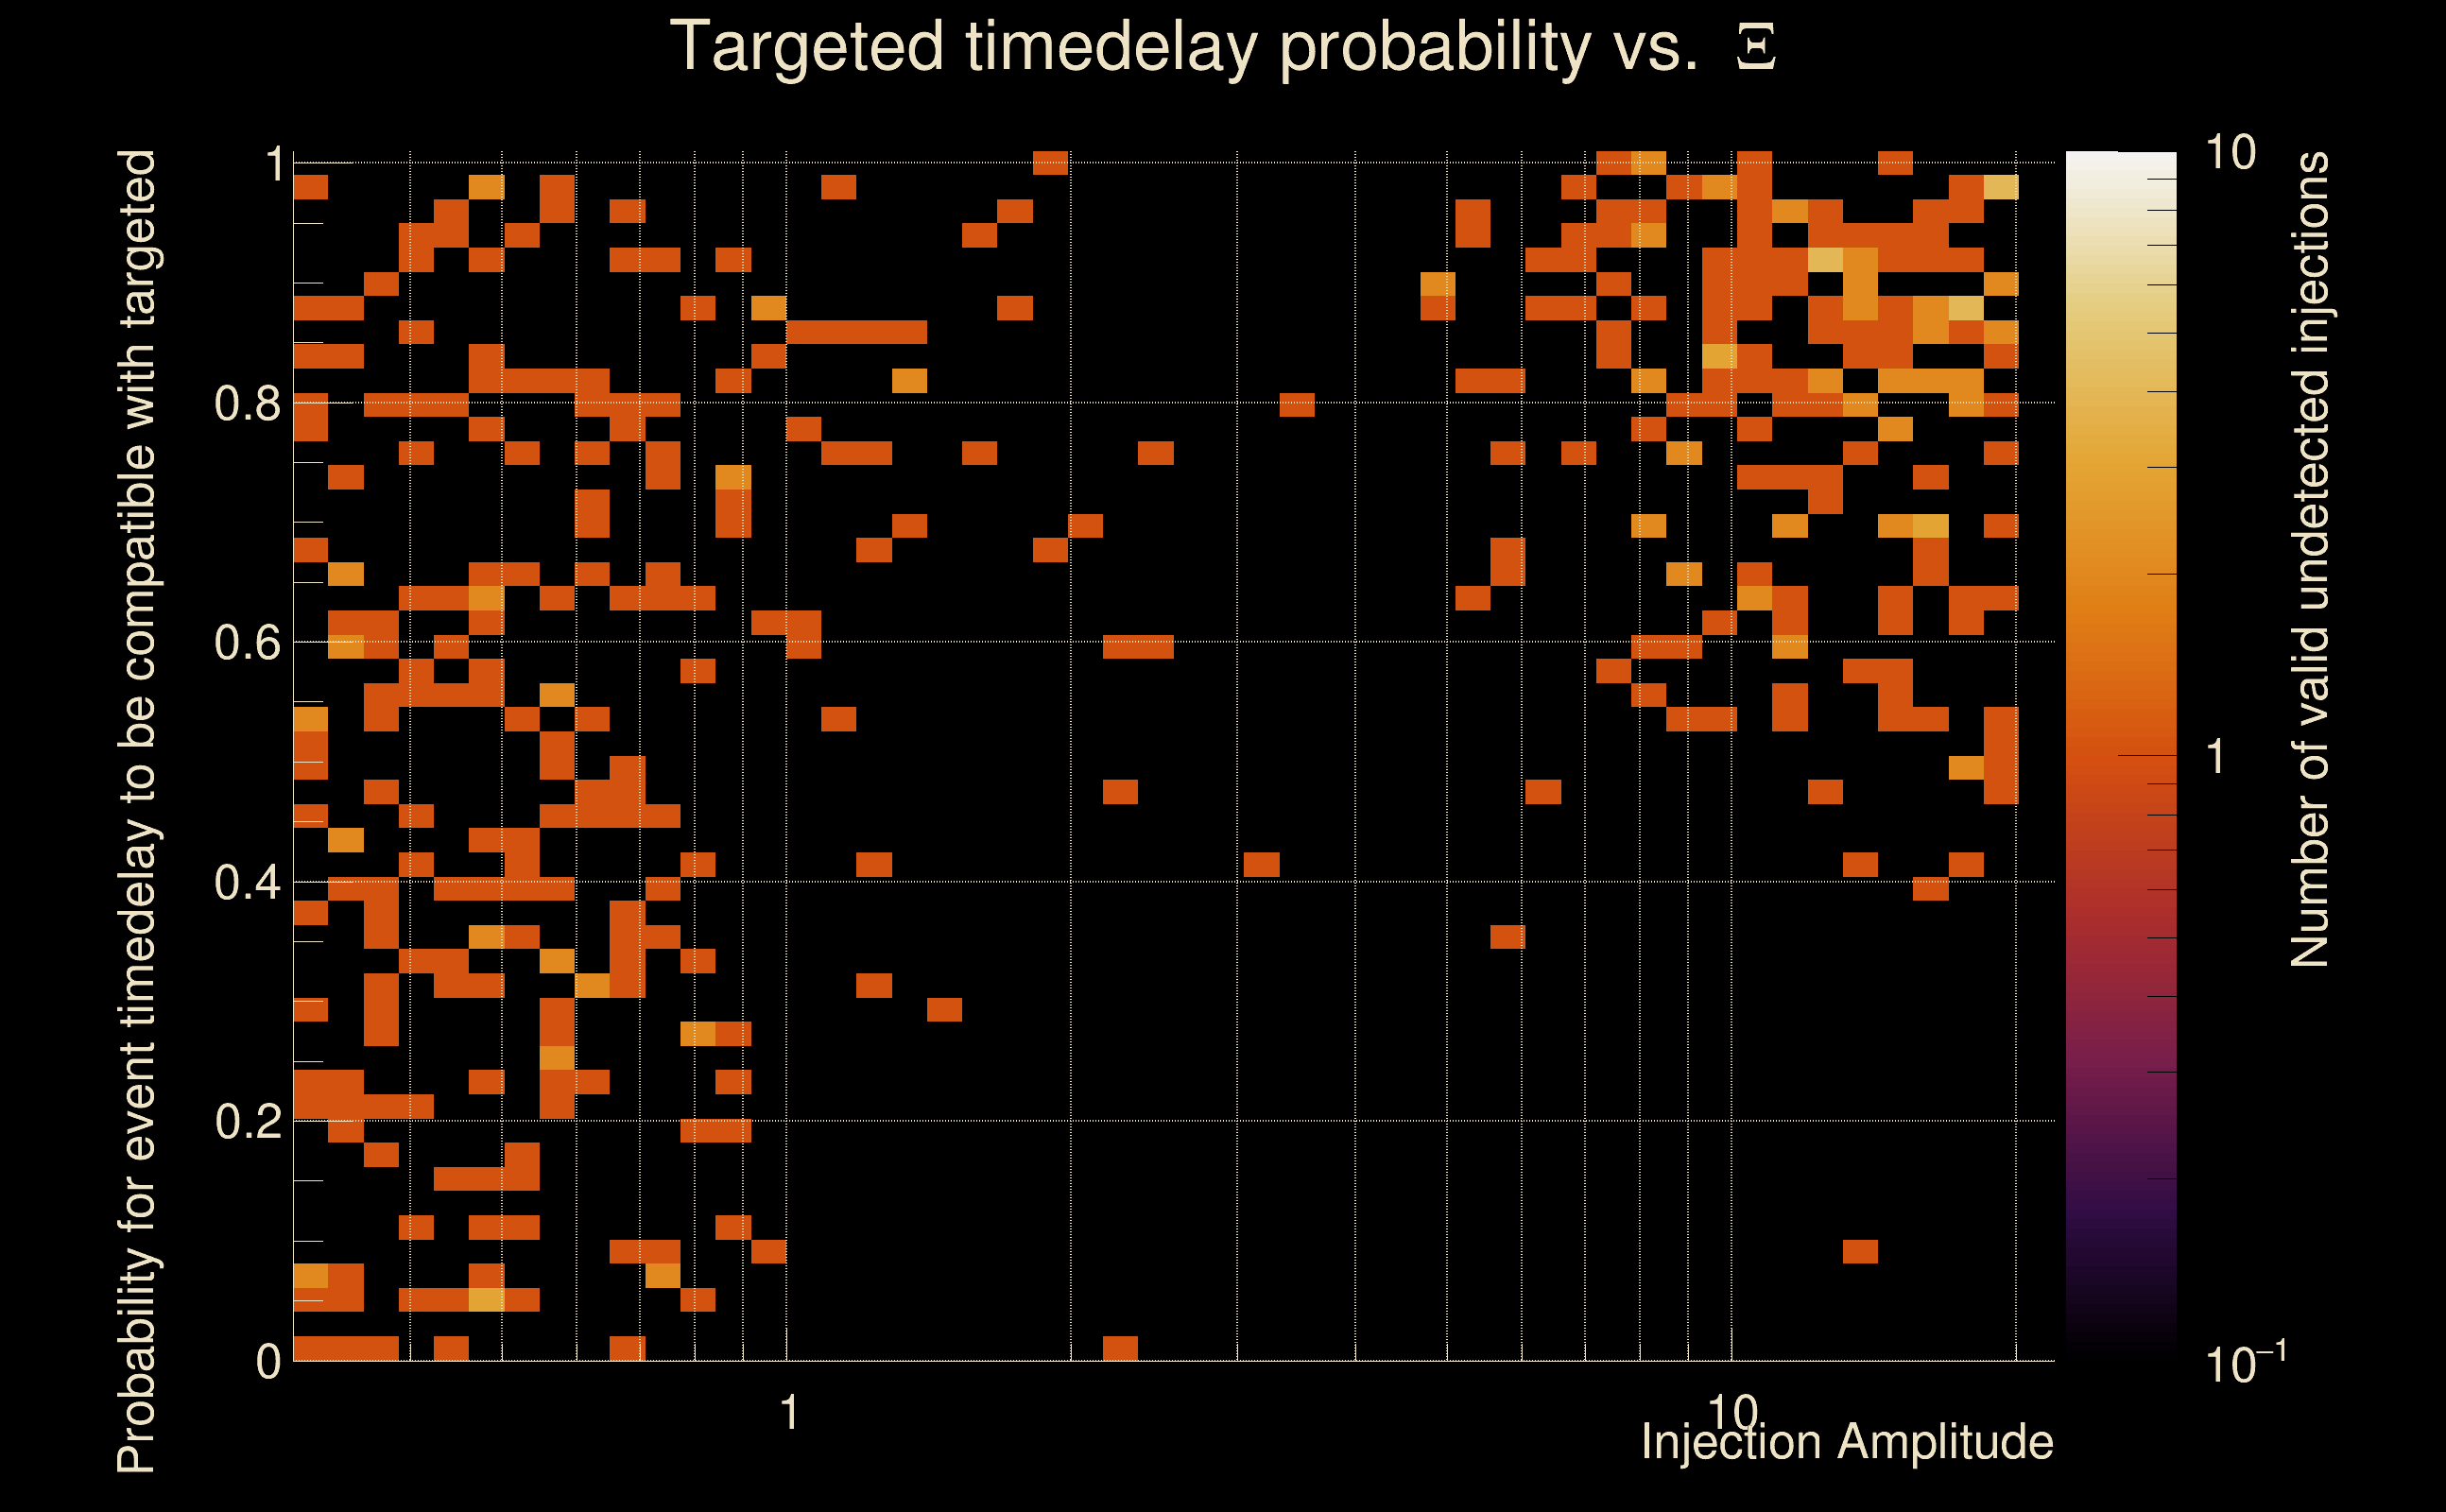
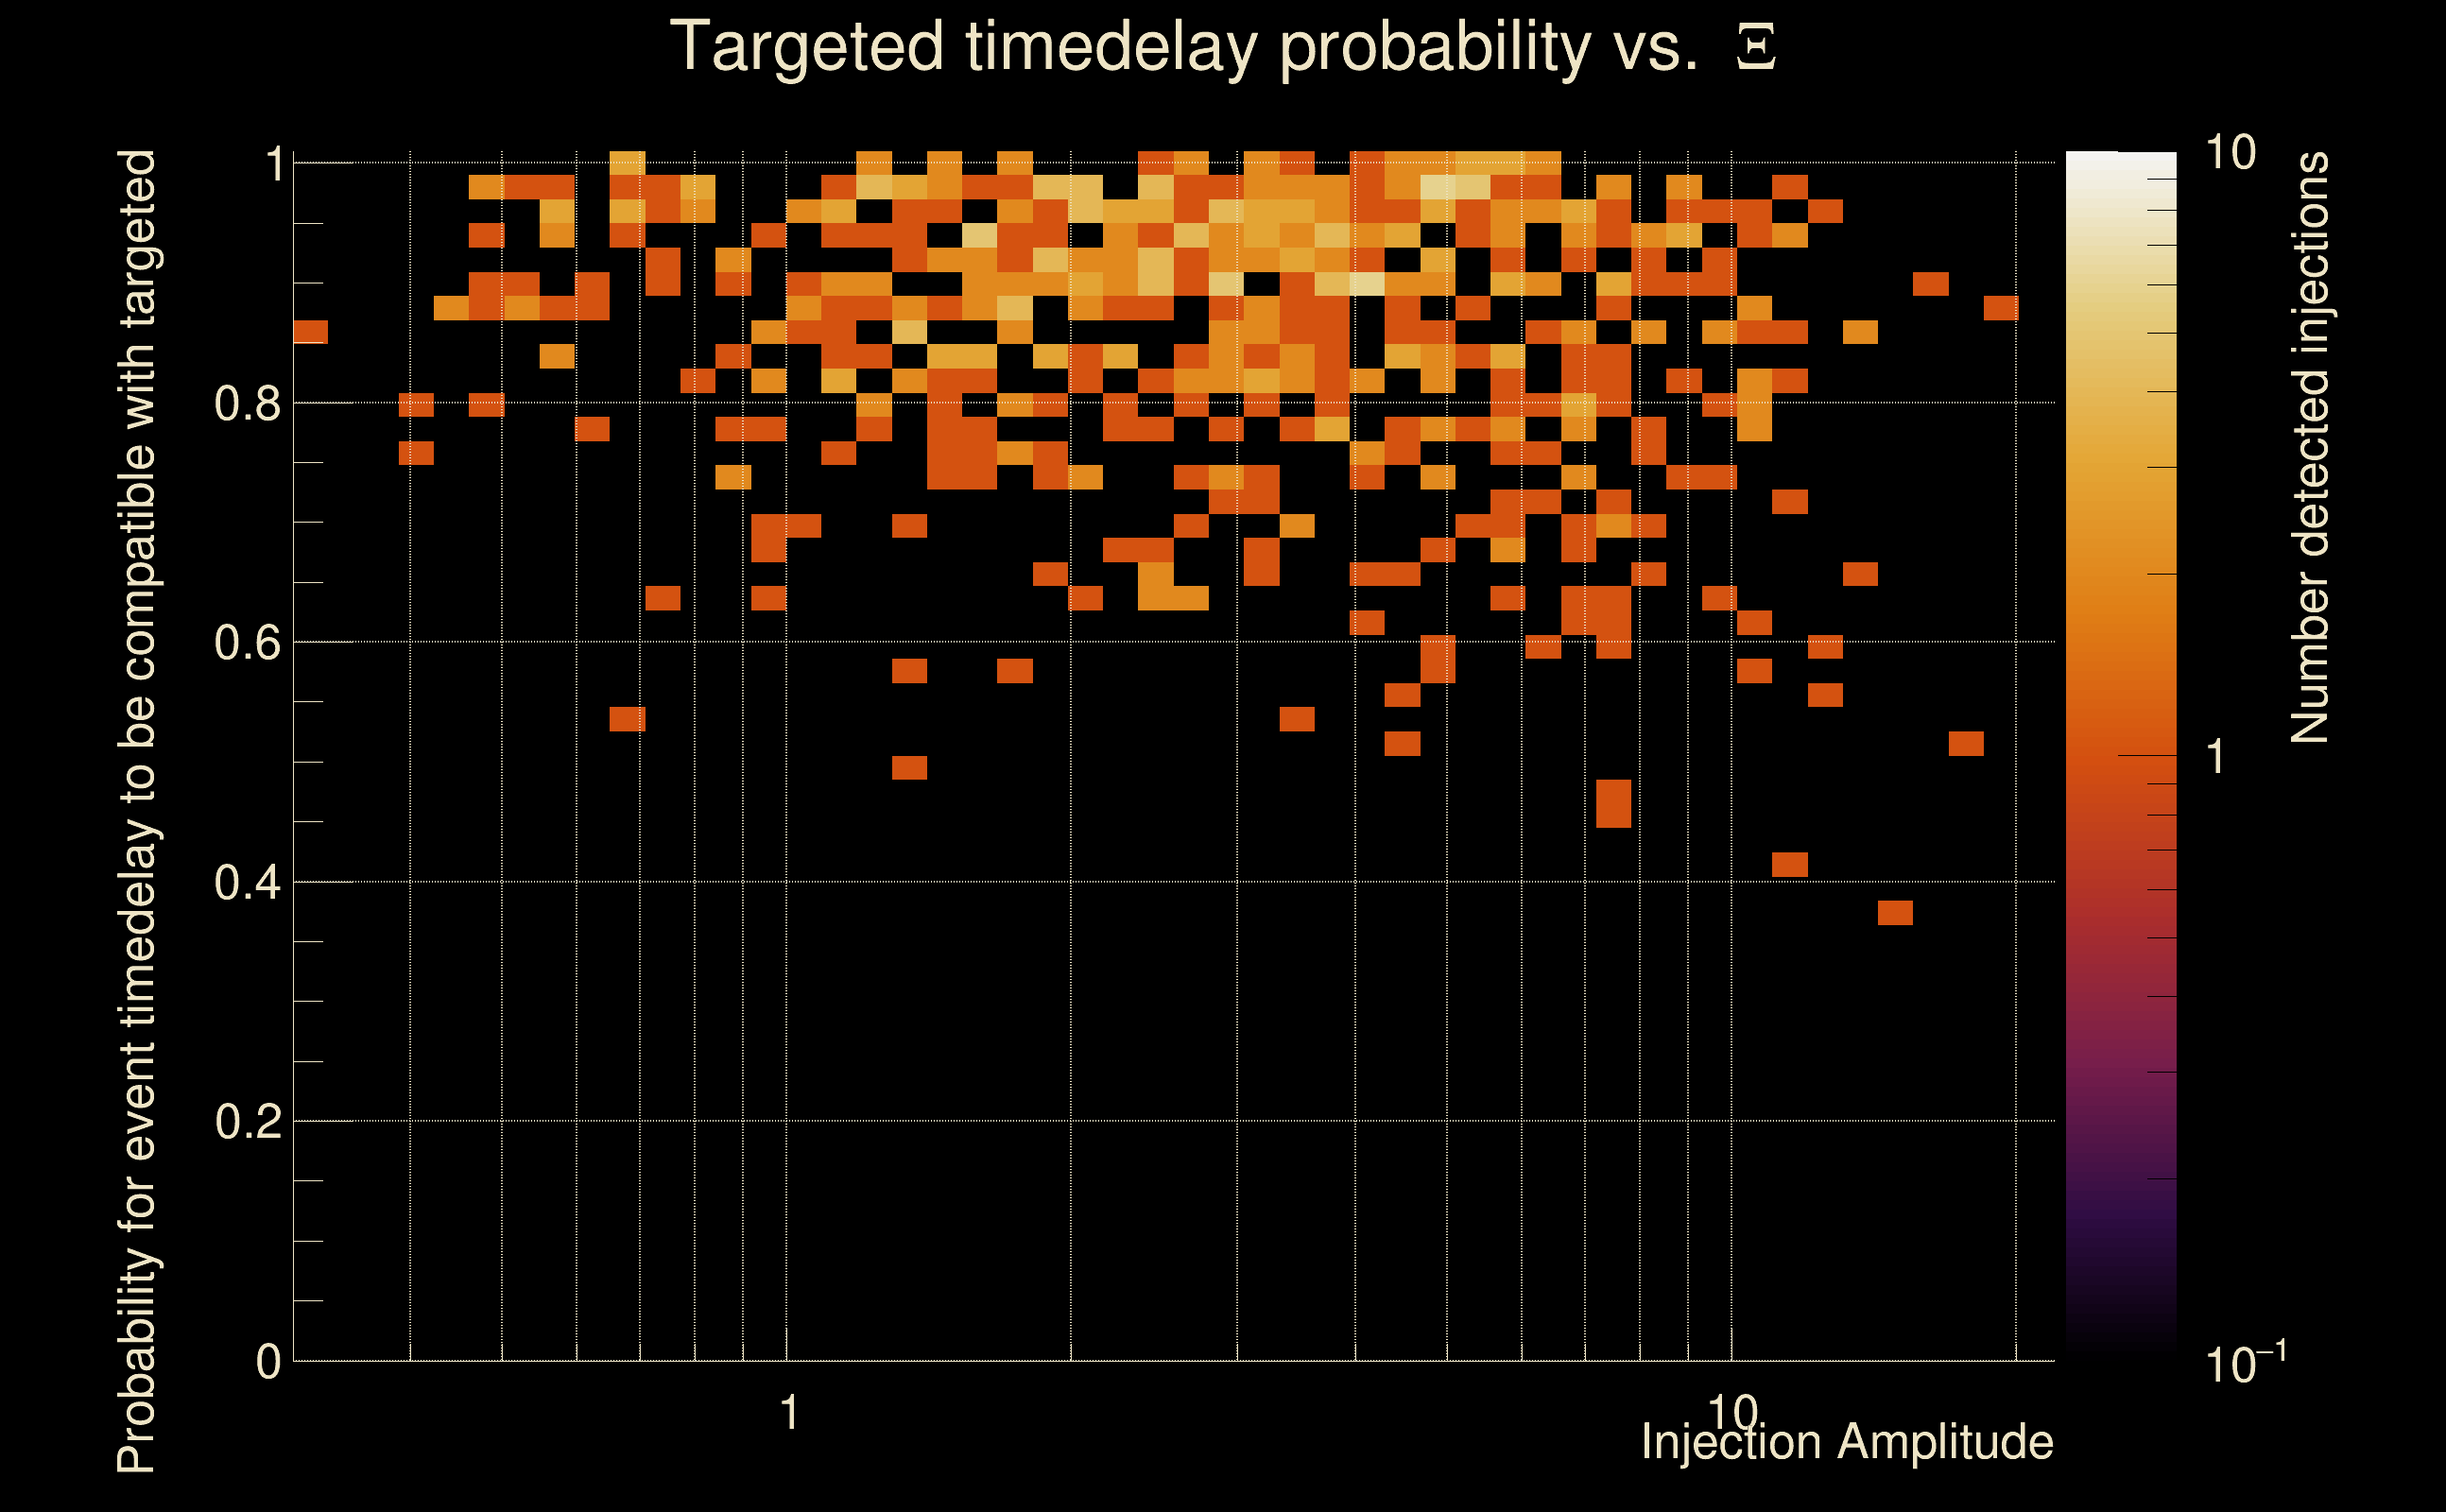
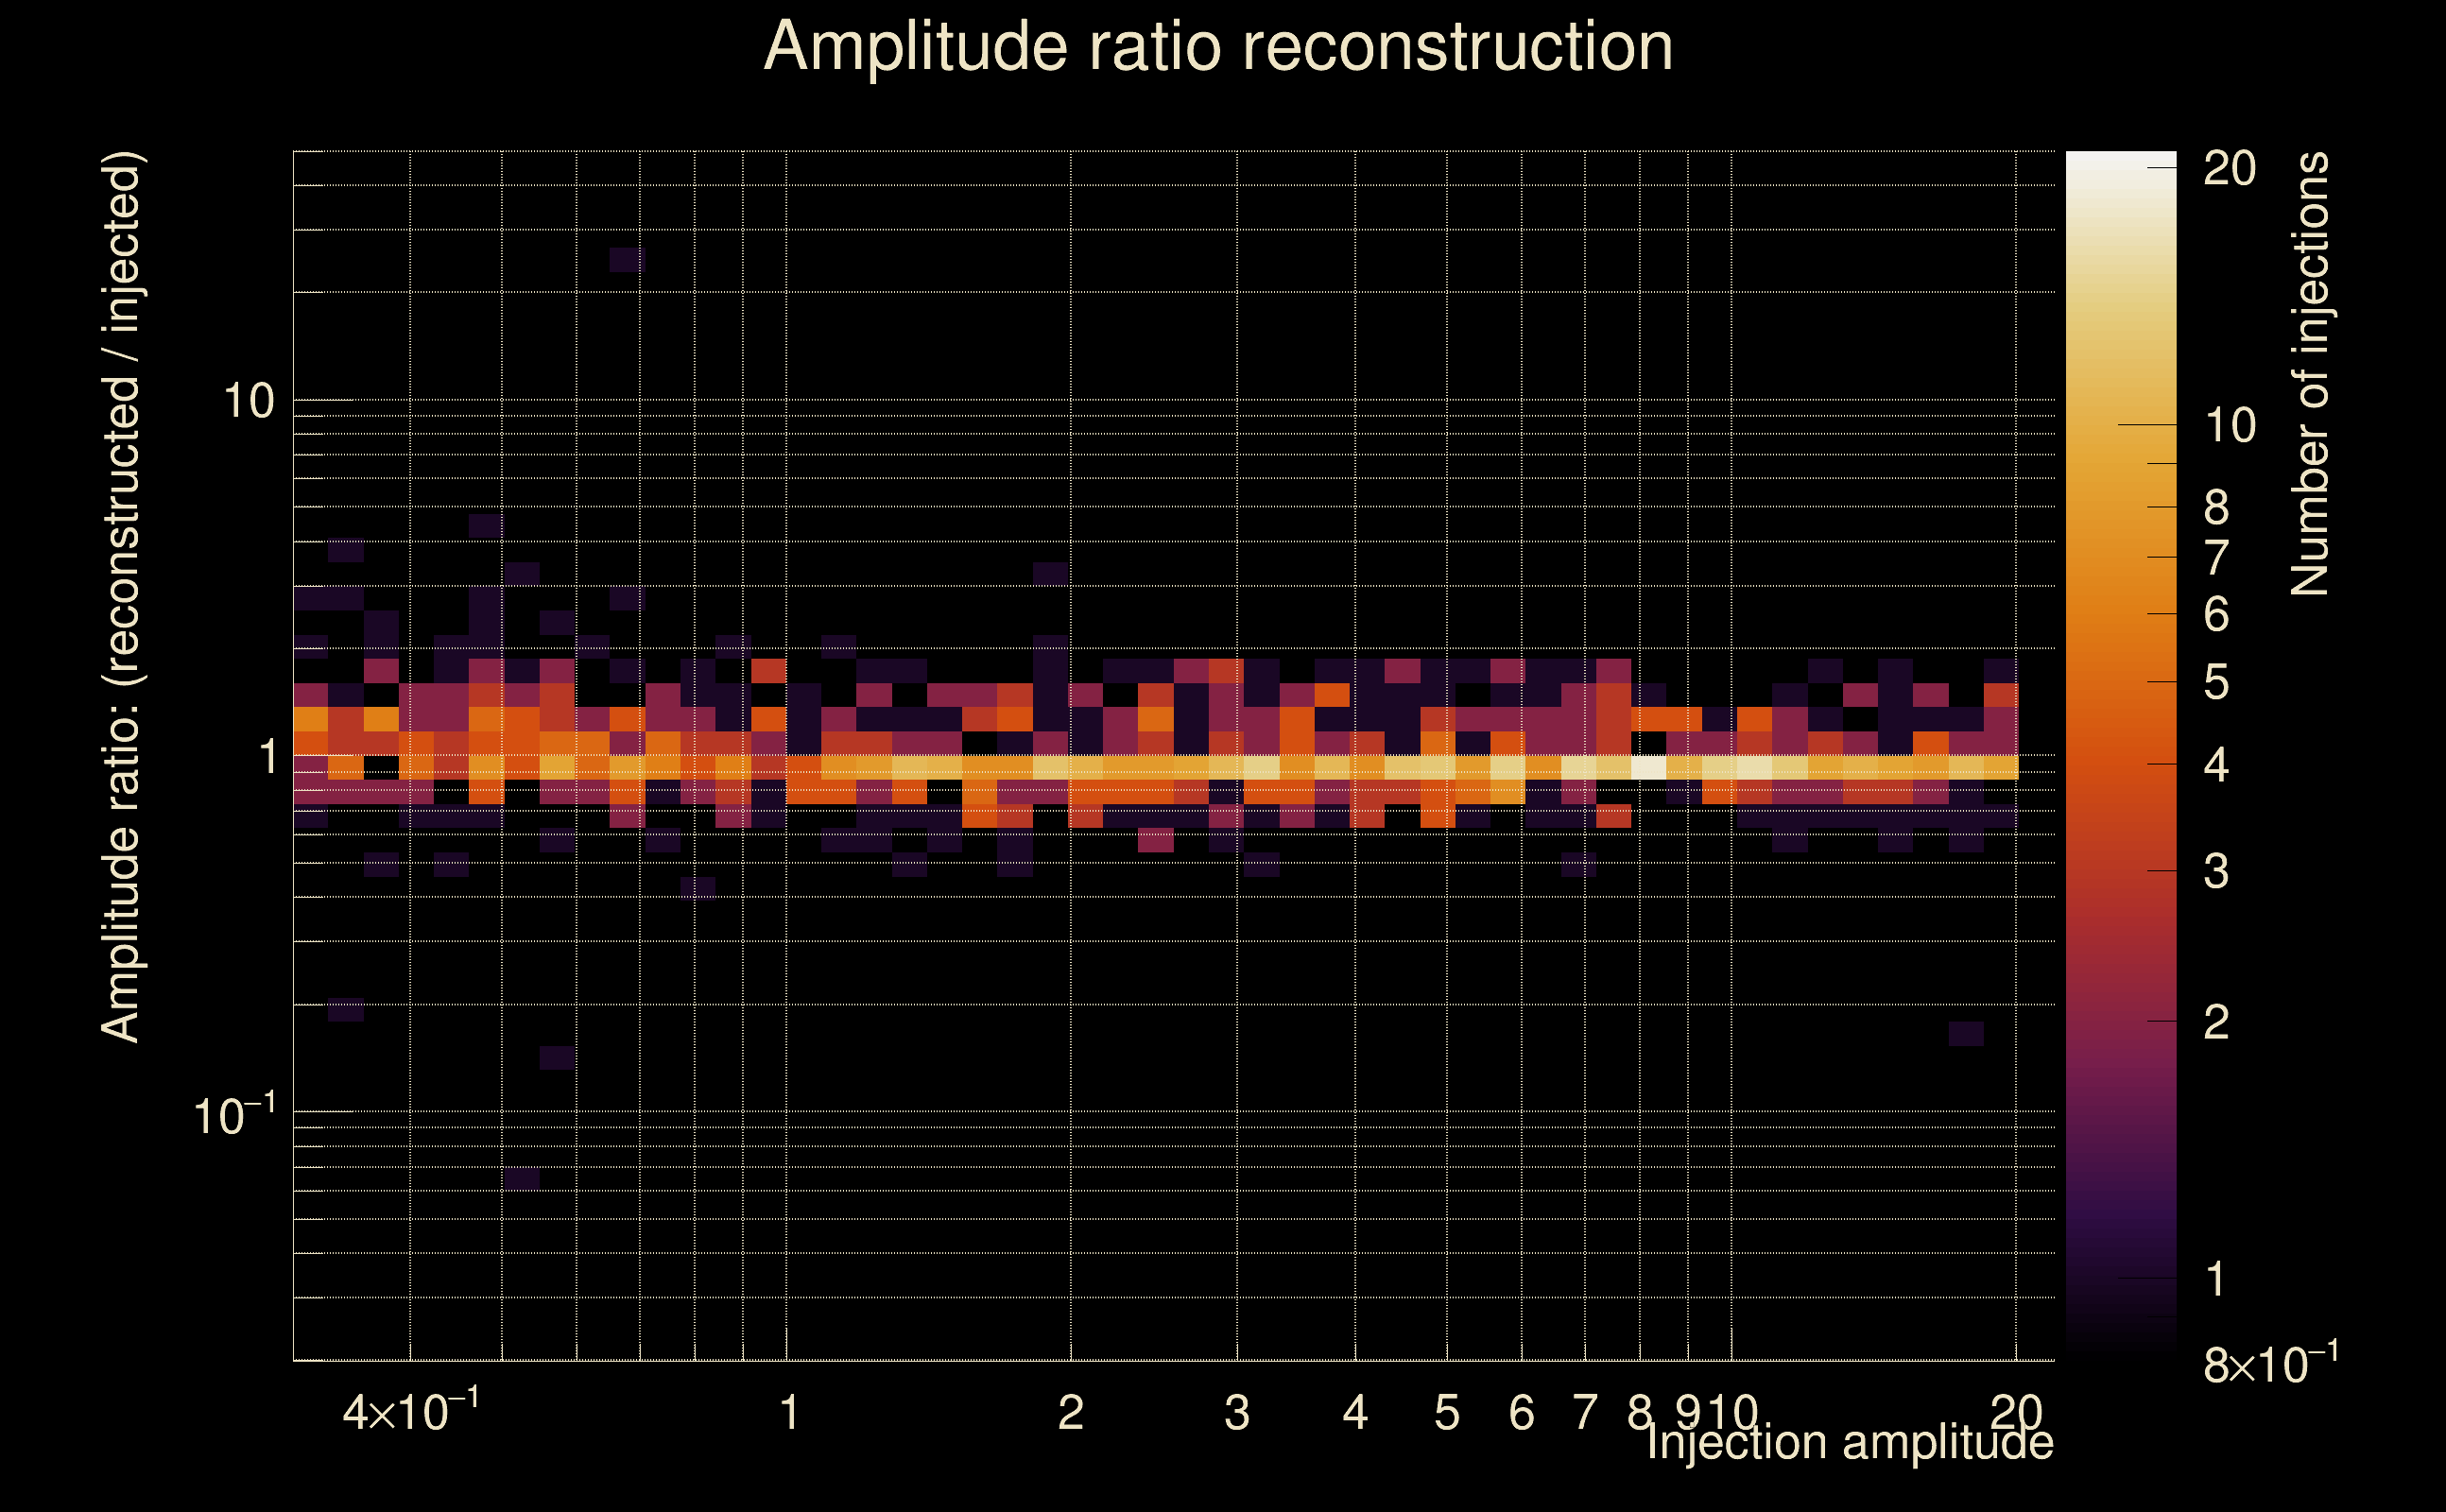
| Number of injections (total/valid/detected): | 1116 / 991 / 577 |
| List of missed injections: | ./Obe20-O_missed.txt |
| Injection amplitude at 90% detection efficiency: | 2.3975 |
| Injection amplitude at 50% detection efficiency: | 0.908541 |
| Injection amplitude at 10% detection efficiency: | 0.399139 |
 |
 |
 |
 |
 |
 |
 |
|
 |
 |
|
 |
 |
|
 |
 |
|
 |
 |
|
 |
 |
|
 |
 |
|
 |
 |
|
 |
 |
 |
 |
 |
 |
 |
 |
 |
 |
 |
 |
 |
 |
 |
| florent.robinet@ijclab.in2p3.fr |