| Omicron version: | 4.2.0: documentation gitlab repository |
| Omicron run by: | unknown |
| Report produced on: | Wed Dec 17 09:45:55 2025 UTC |
| Ox option file: | TargIxfw_injpt3_options.txt |
| Omicron option files: | detector 0, detector 1 |
| Detector channel names: | H1:GDS-CALIB_STRAIN_CLEAN_AR_4096Hz, L1:GDS-CALIB_STRAIN_CLEAN_AR_4096Hz |
| Omicron analysis time window and overlap: | 16 s, 6 s |
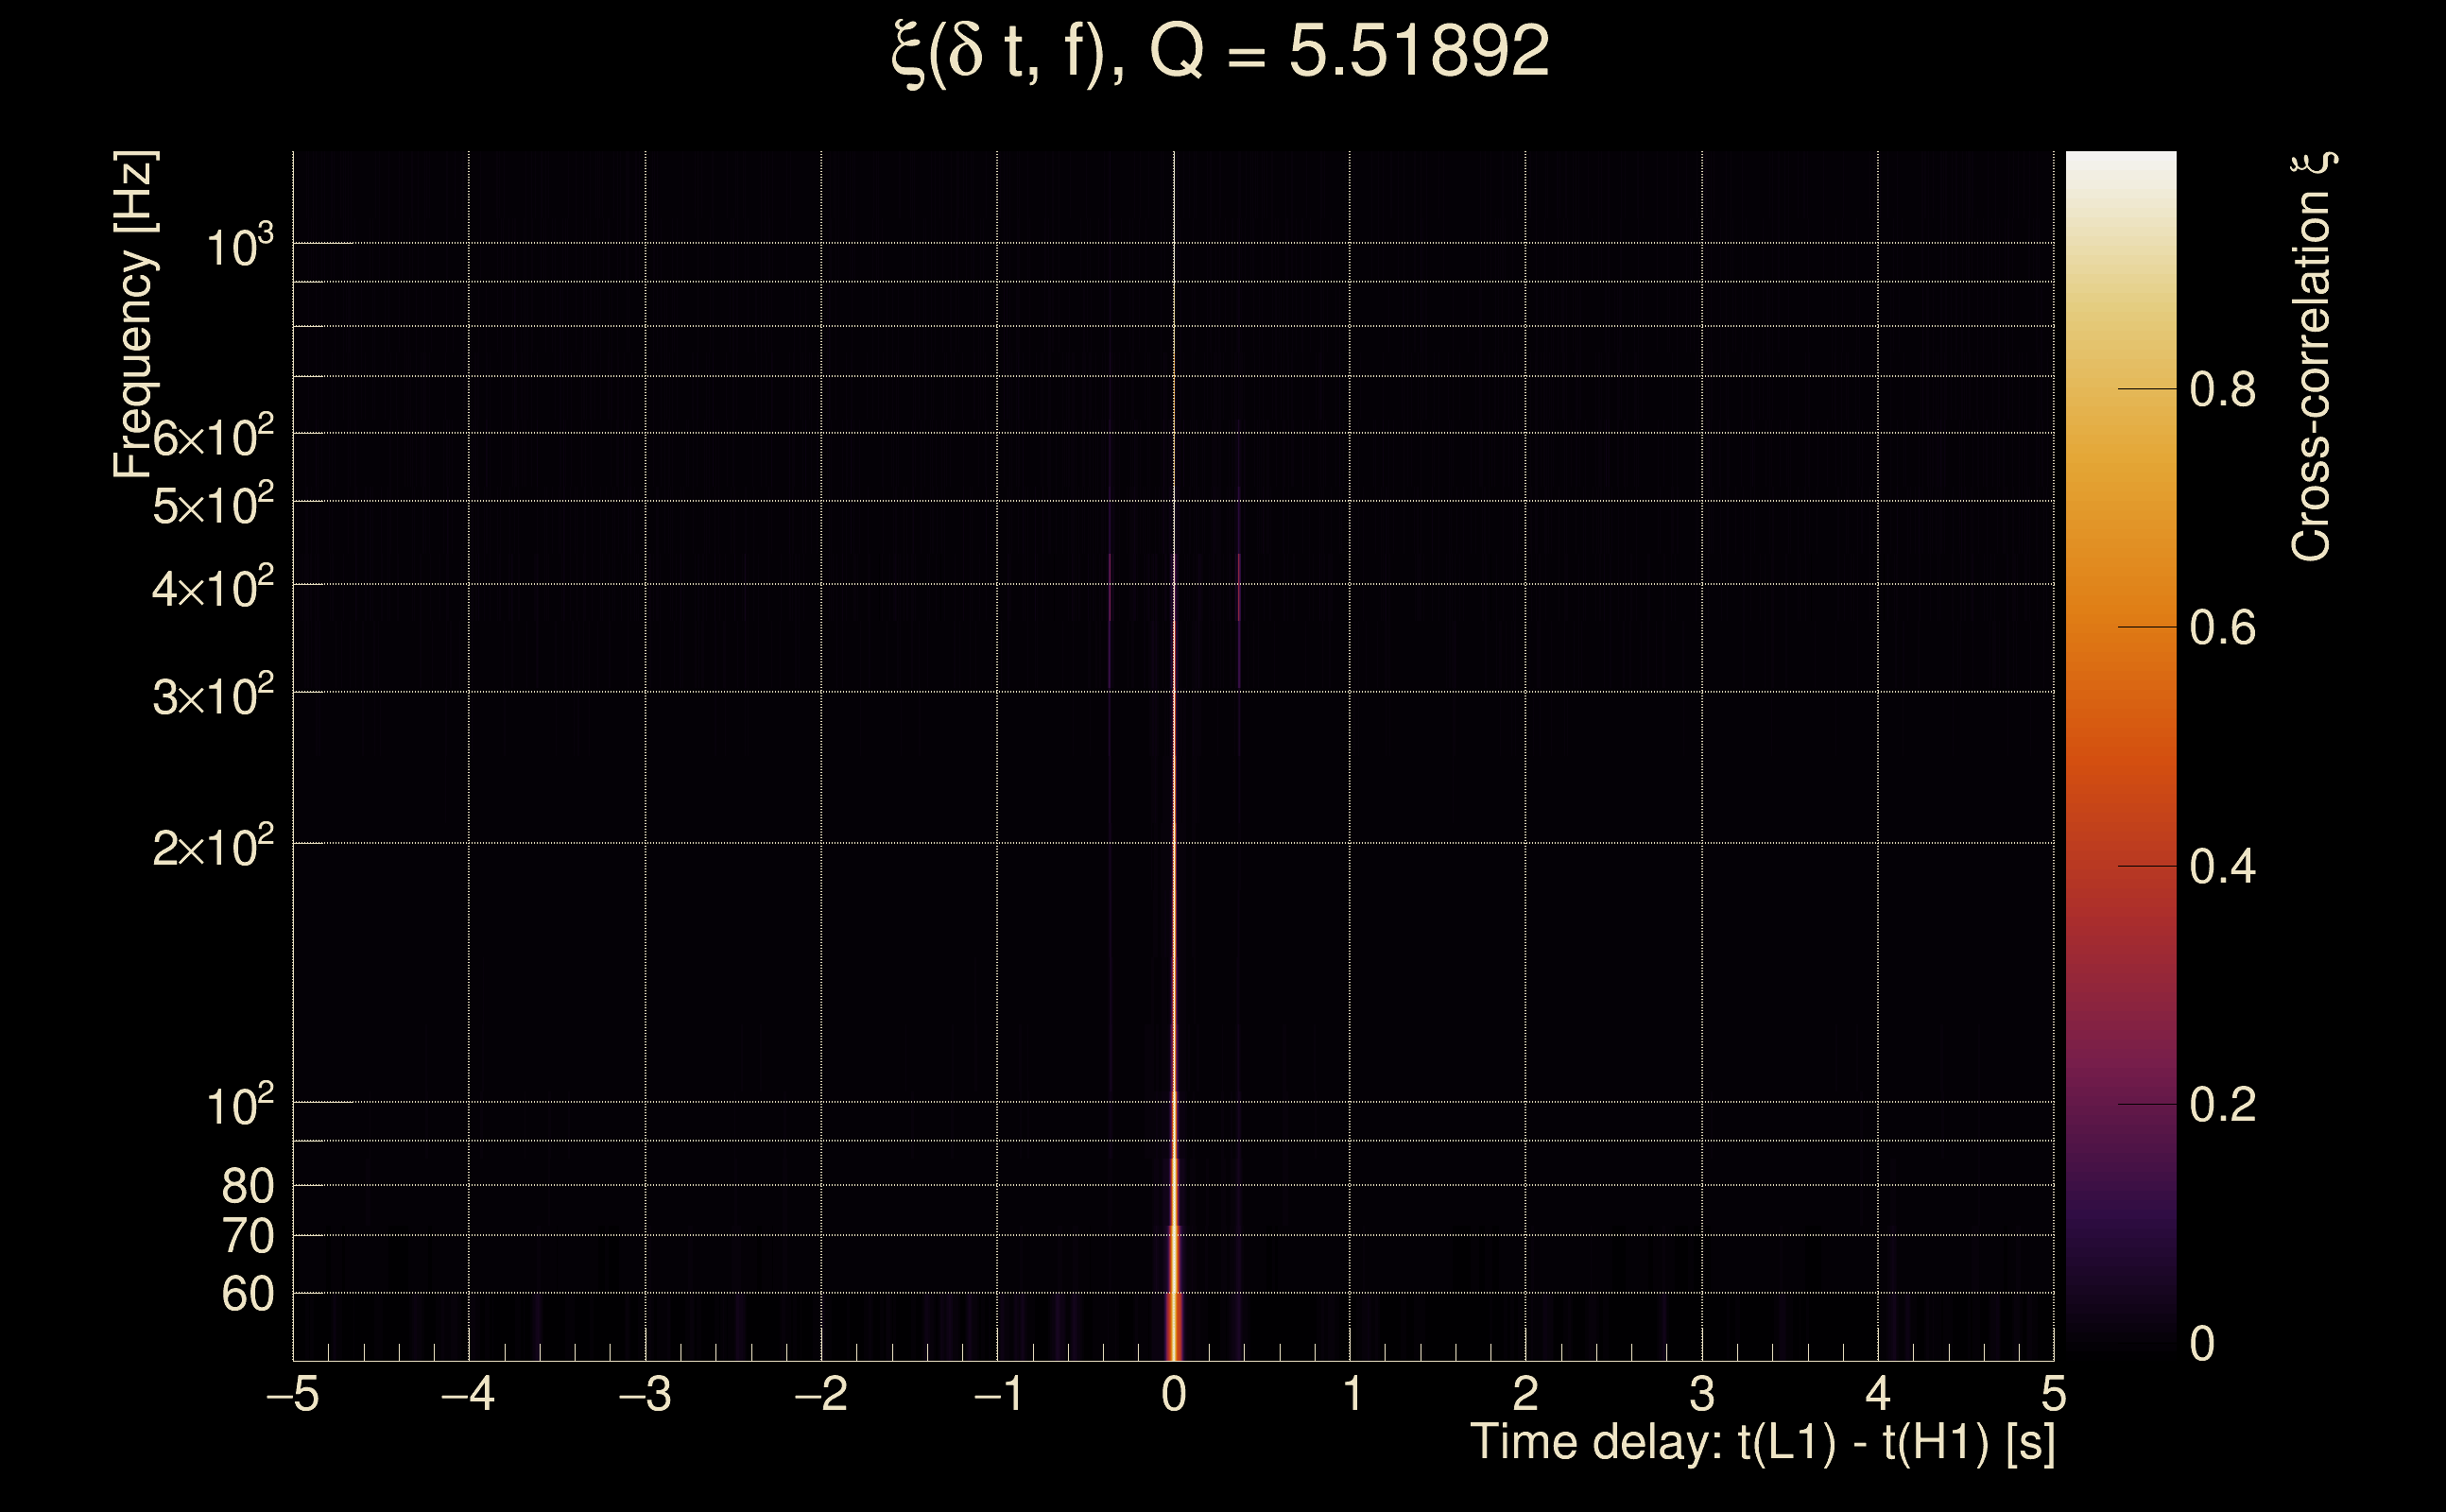
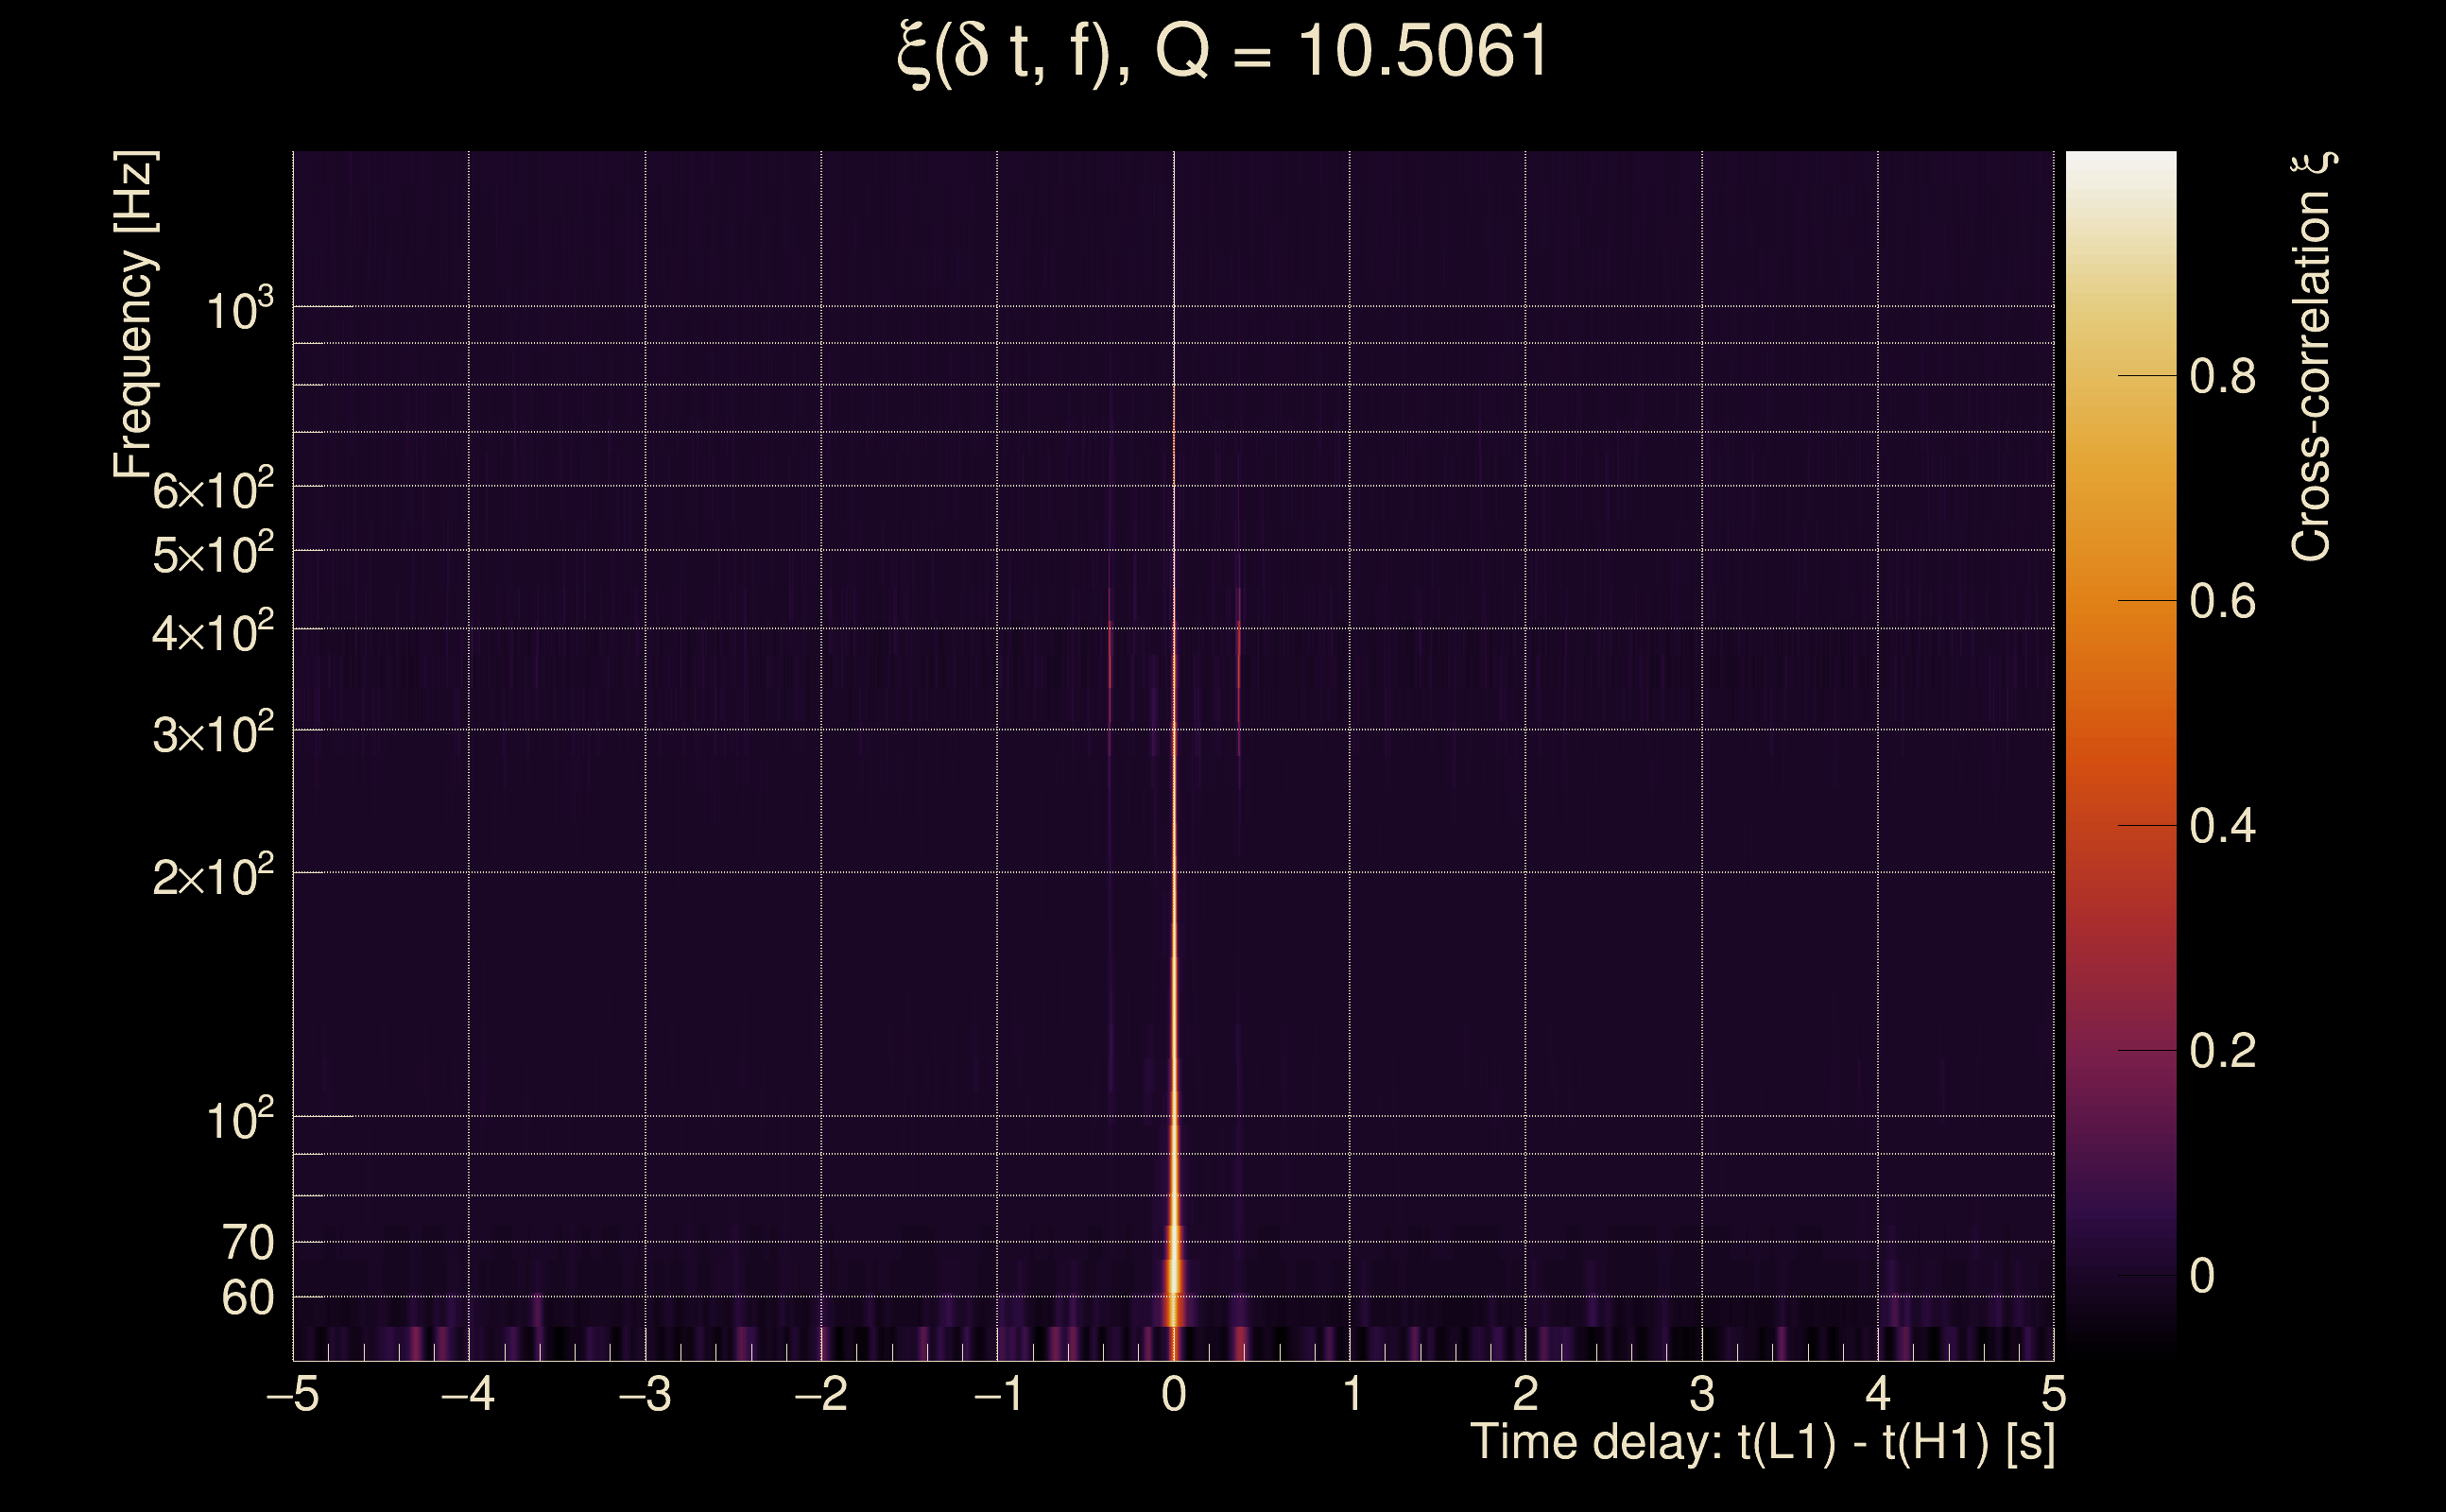
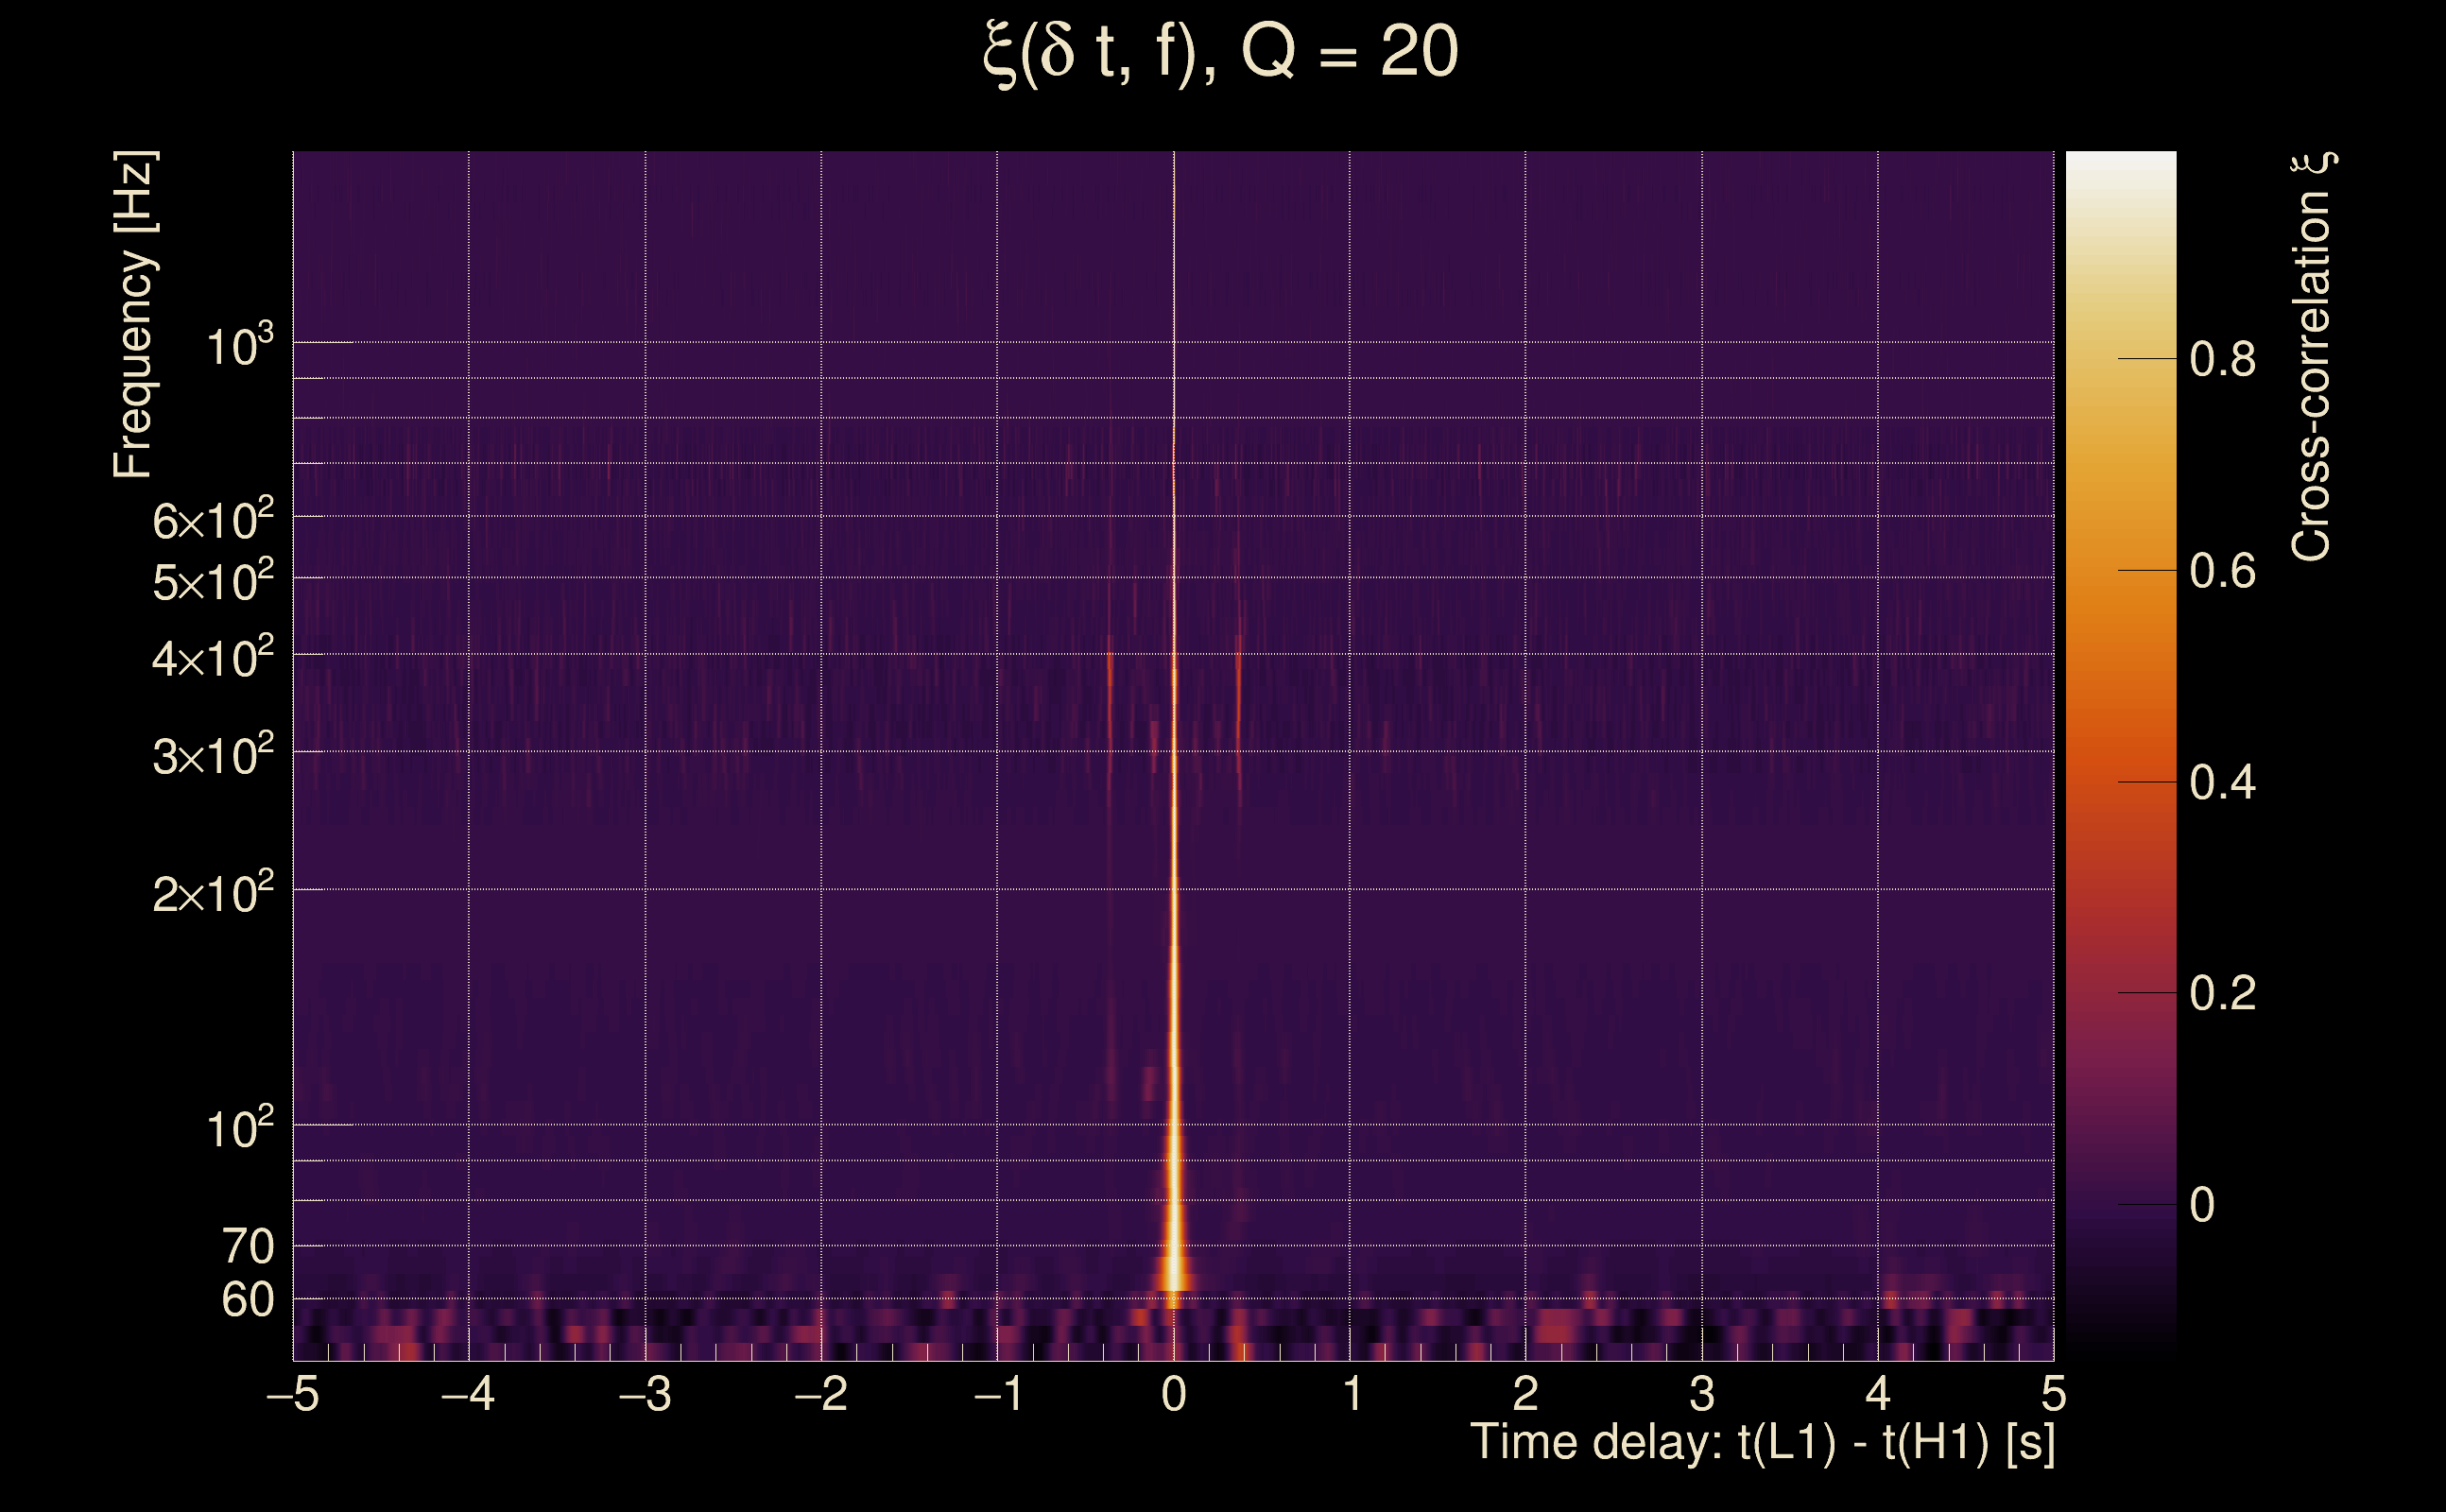
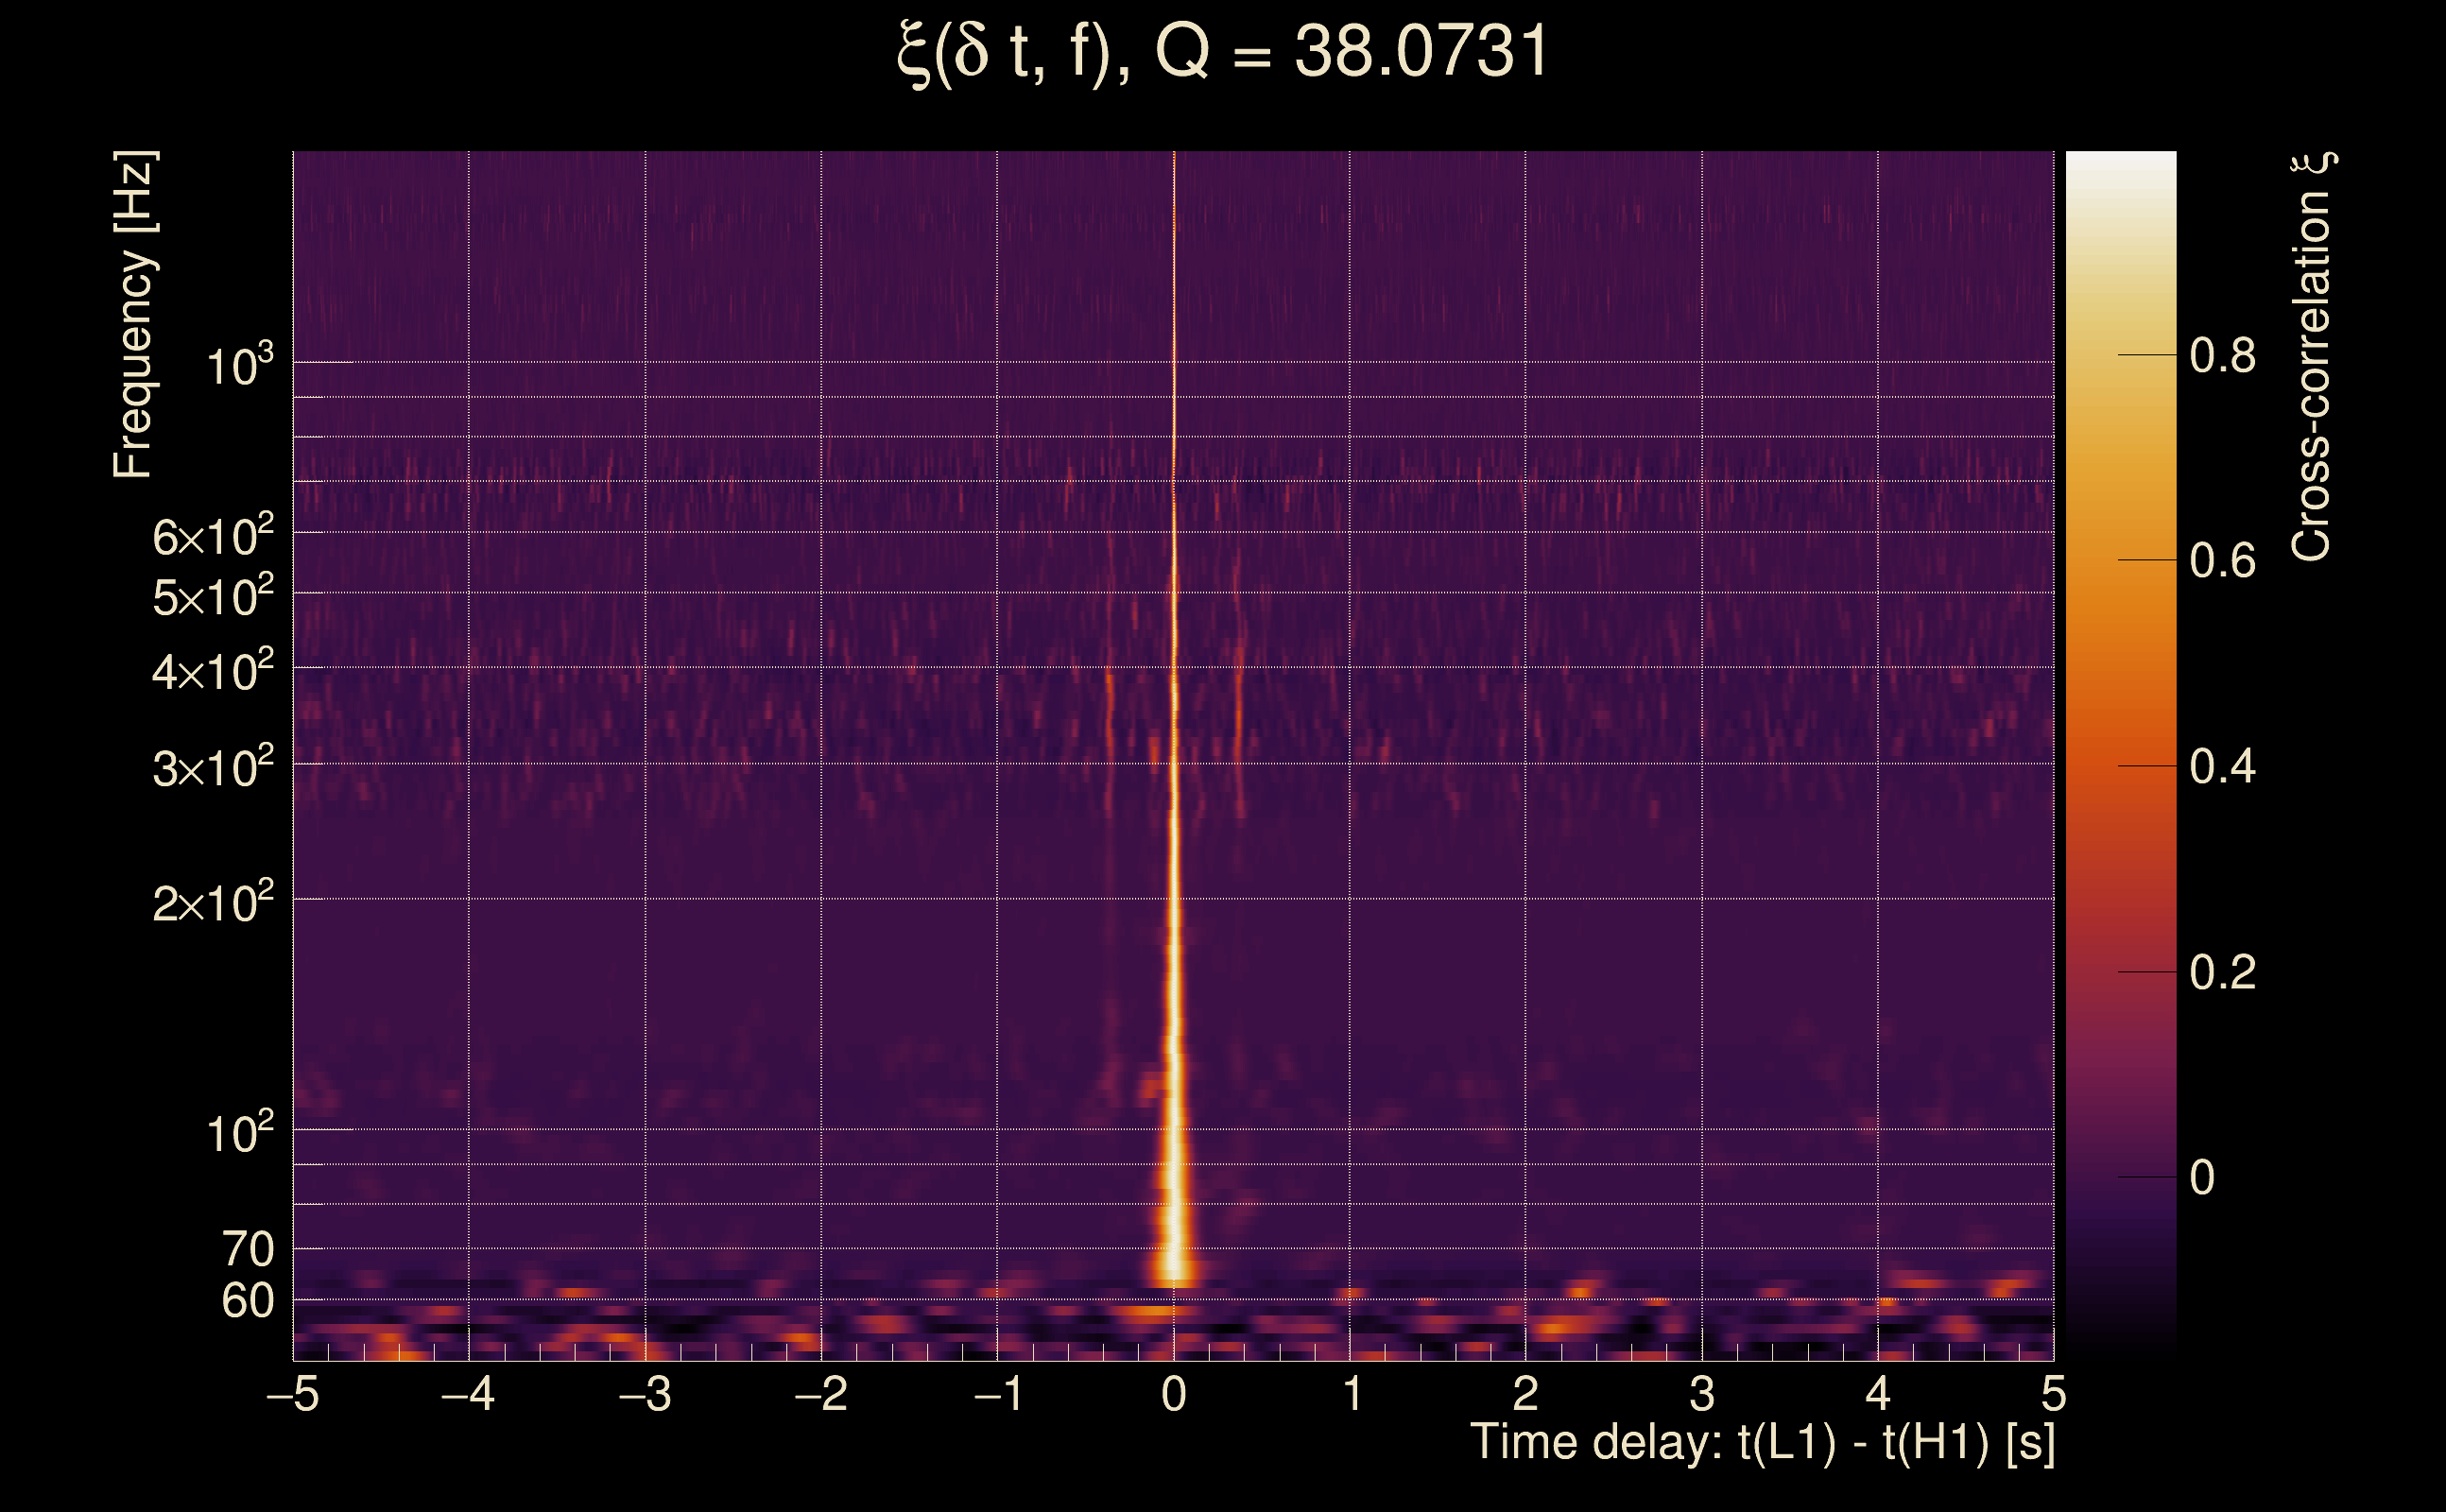
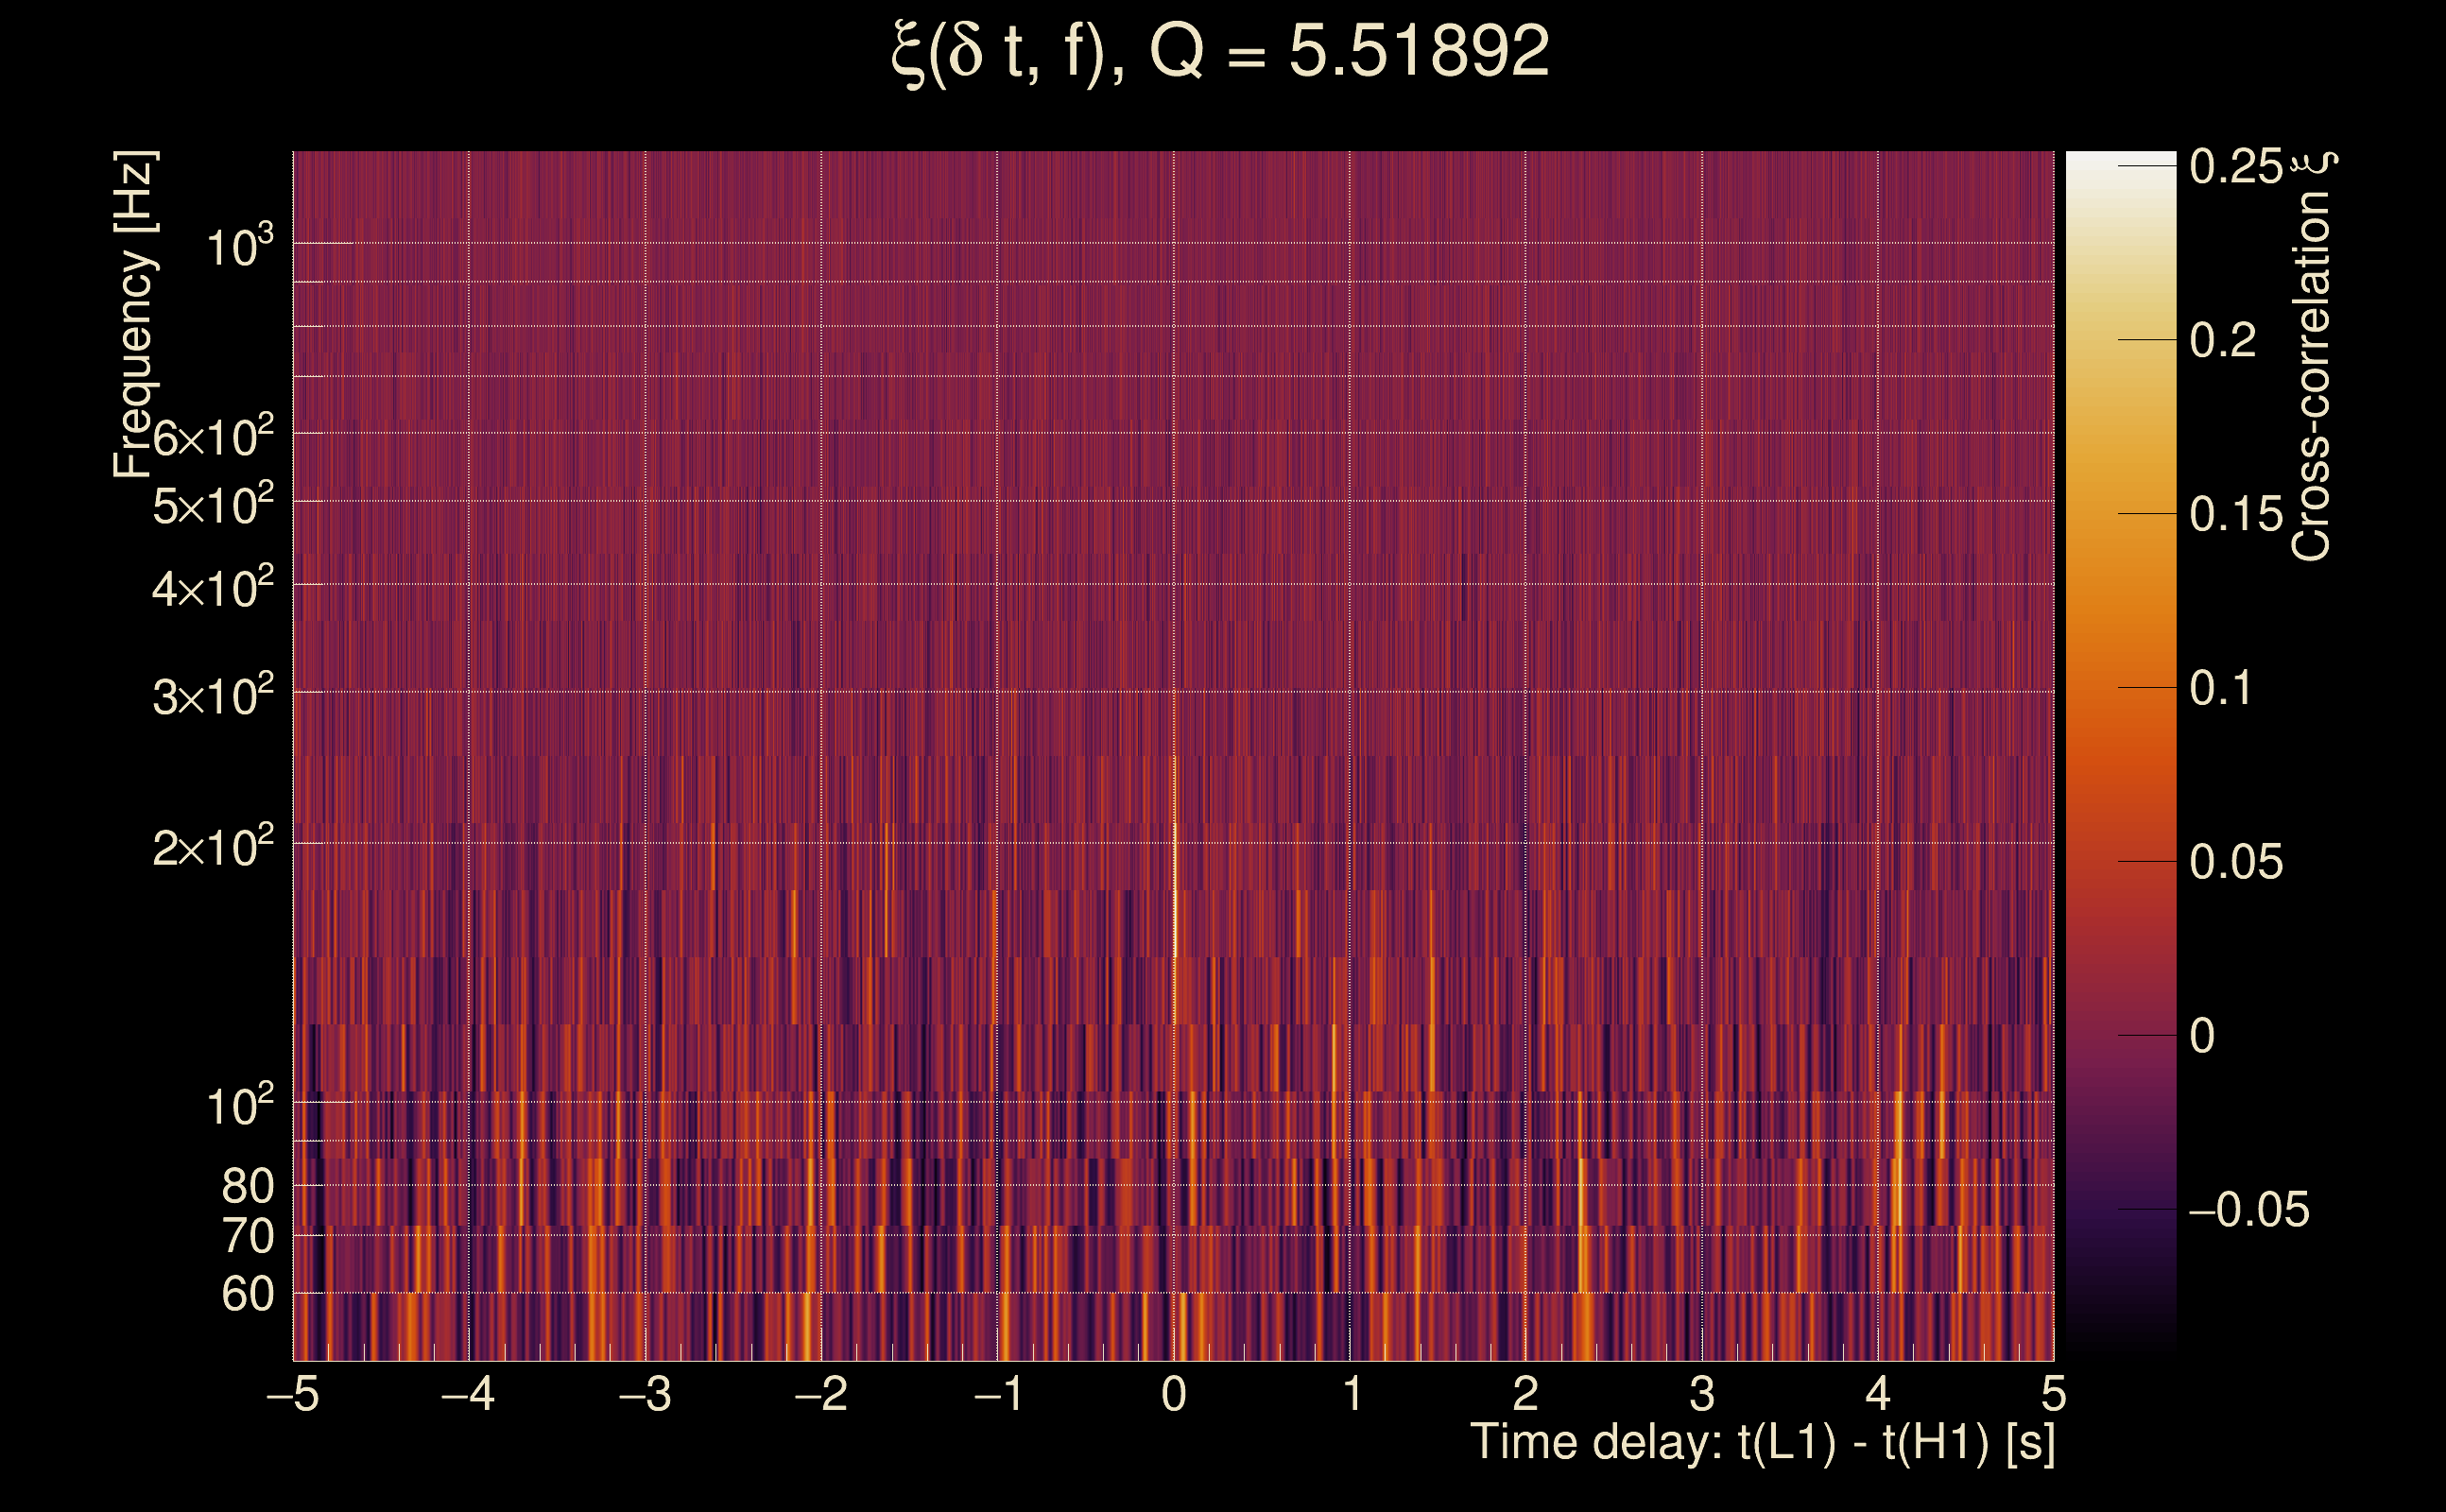
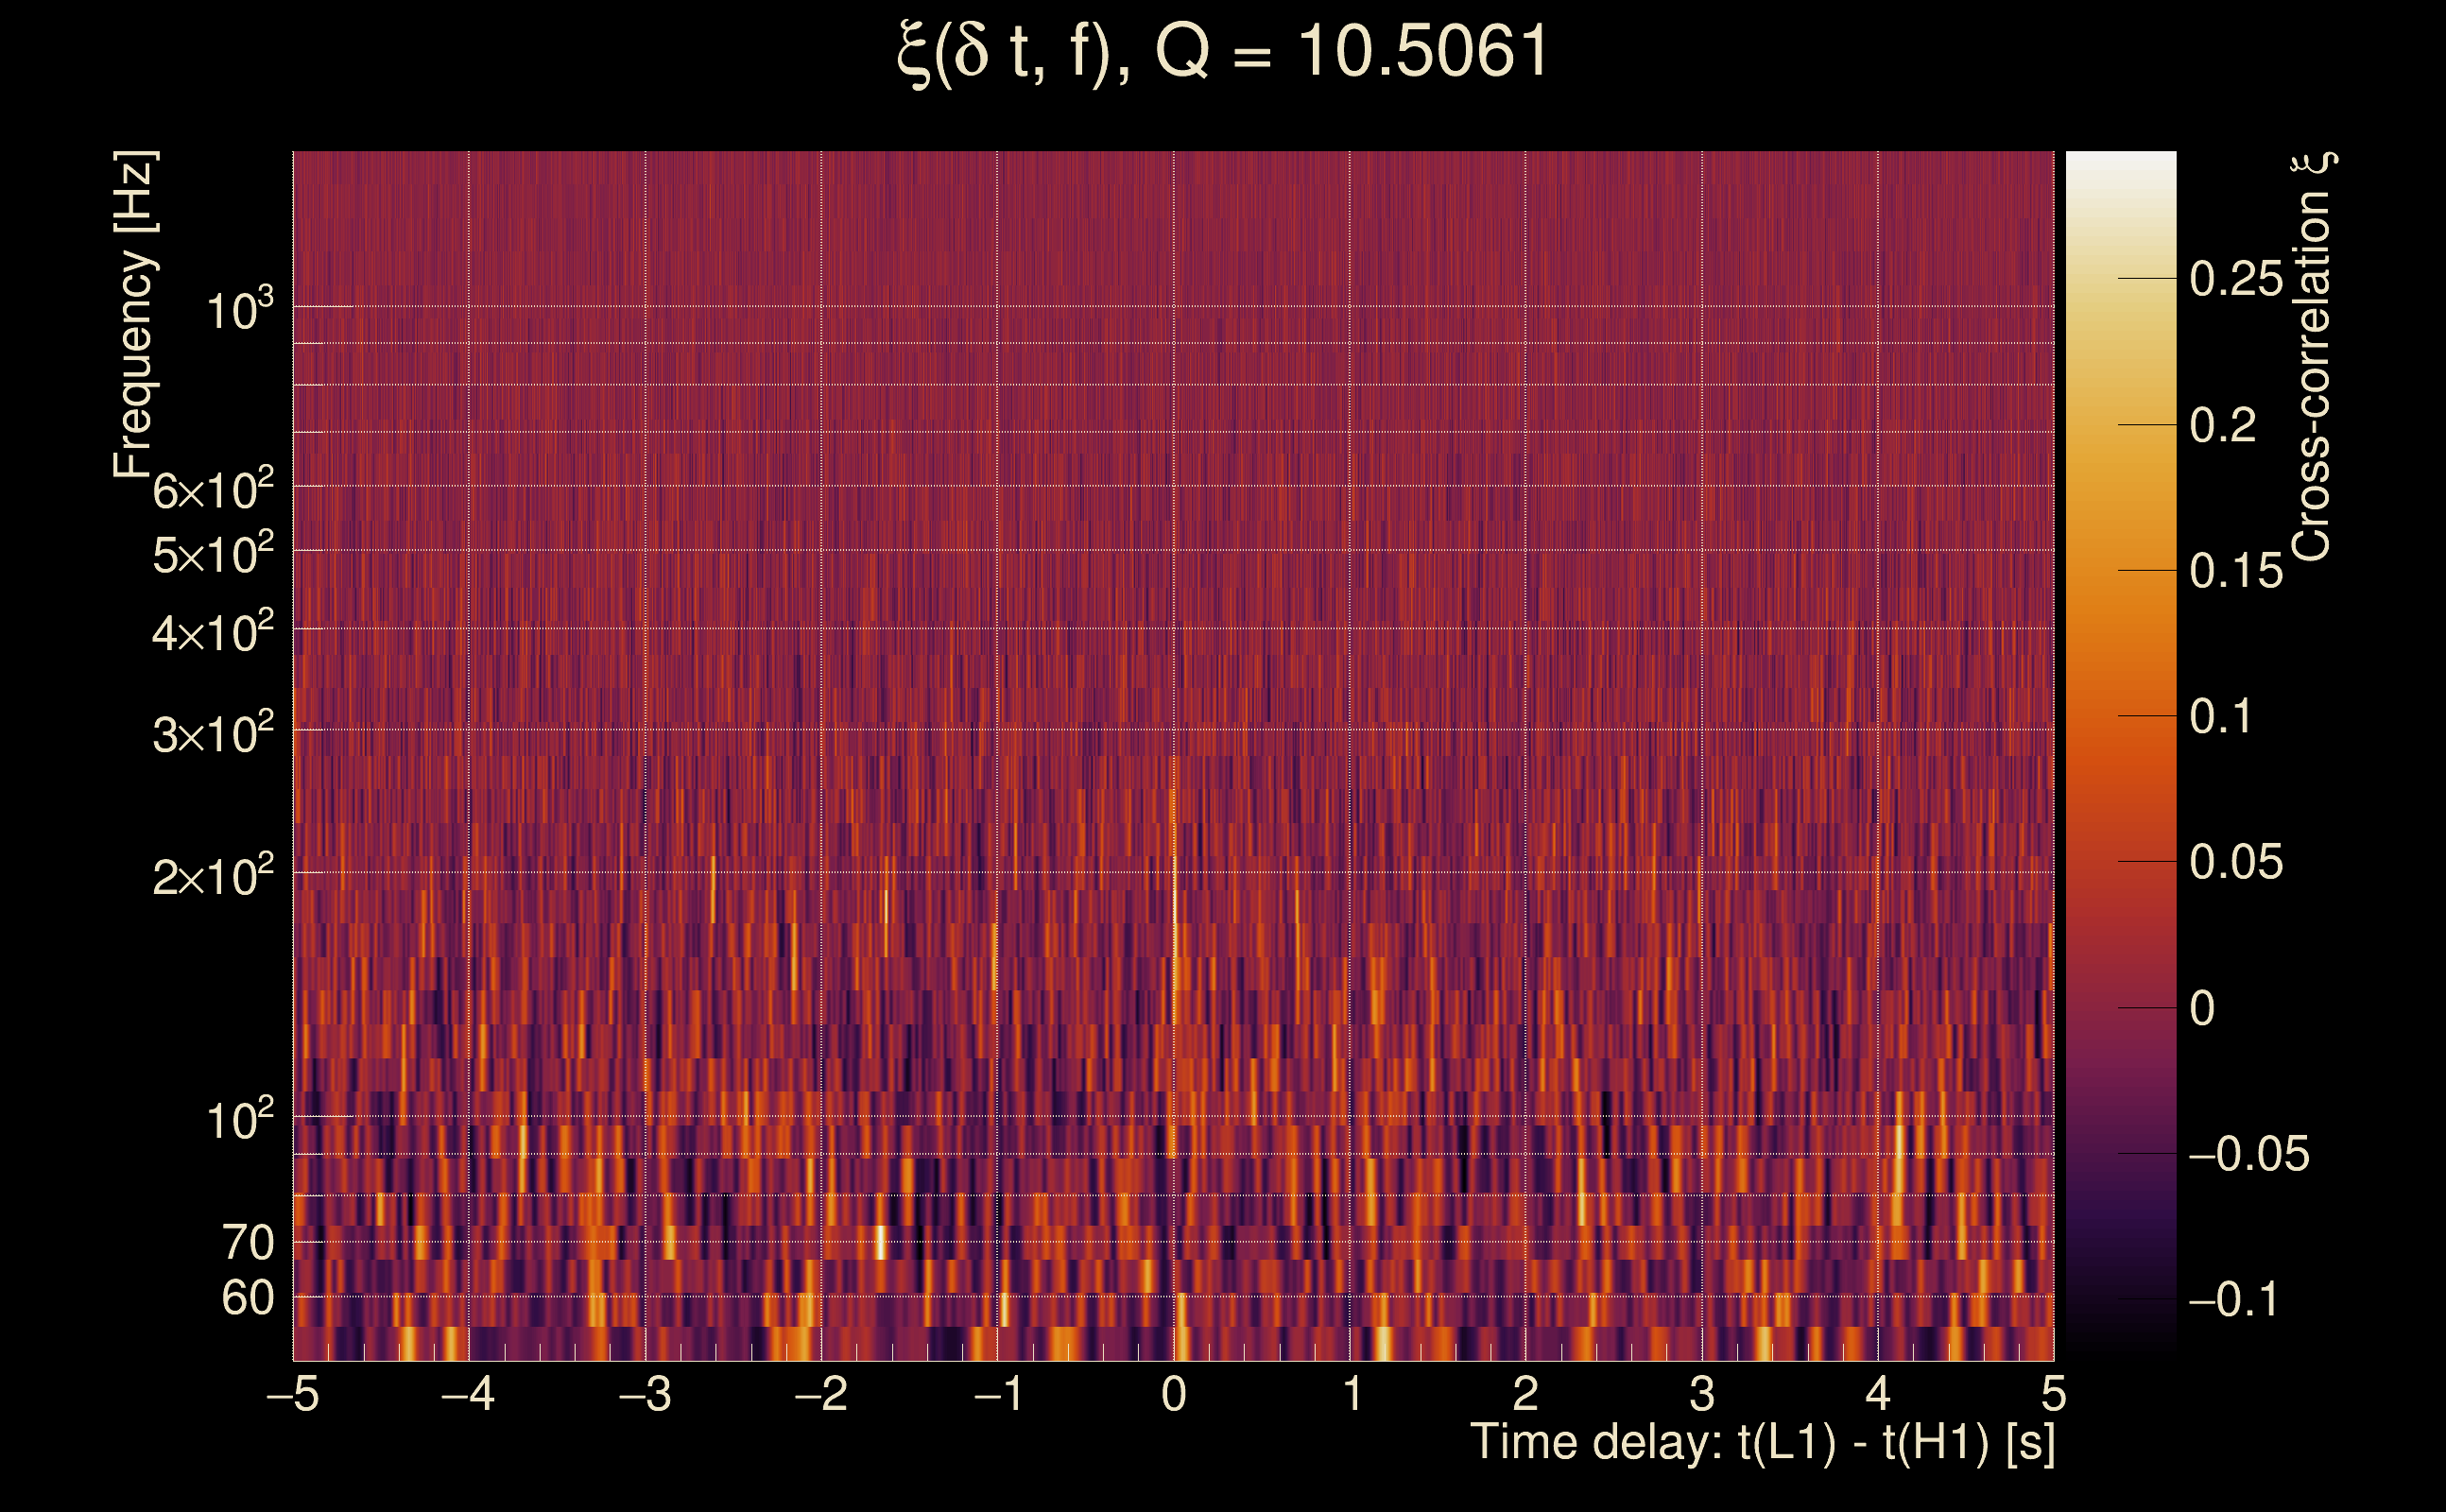
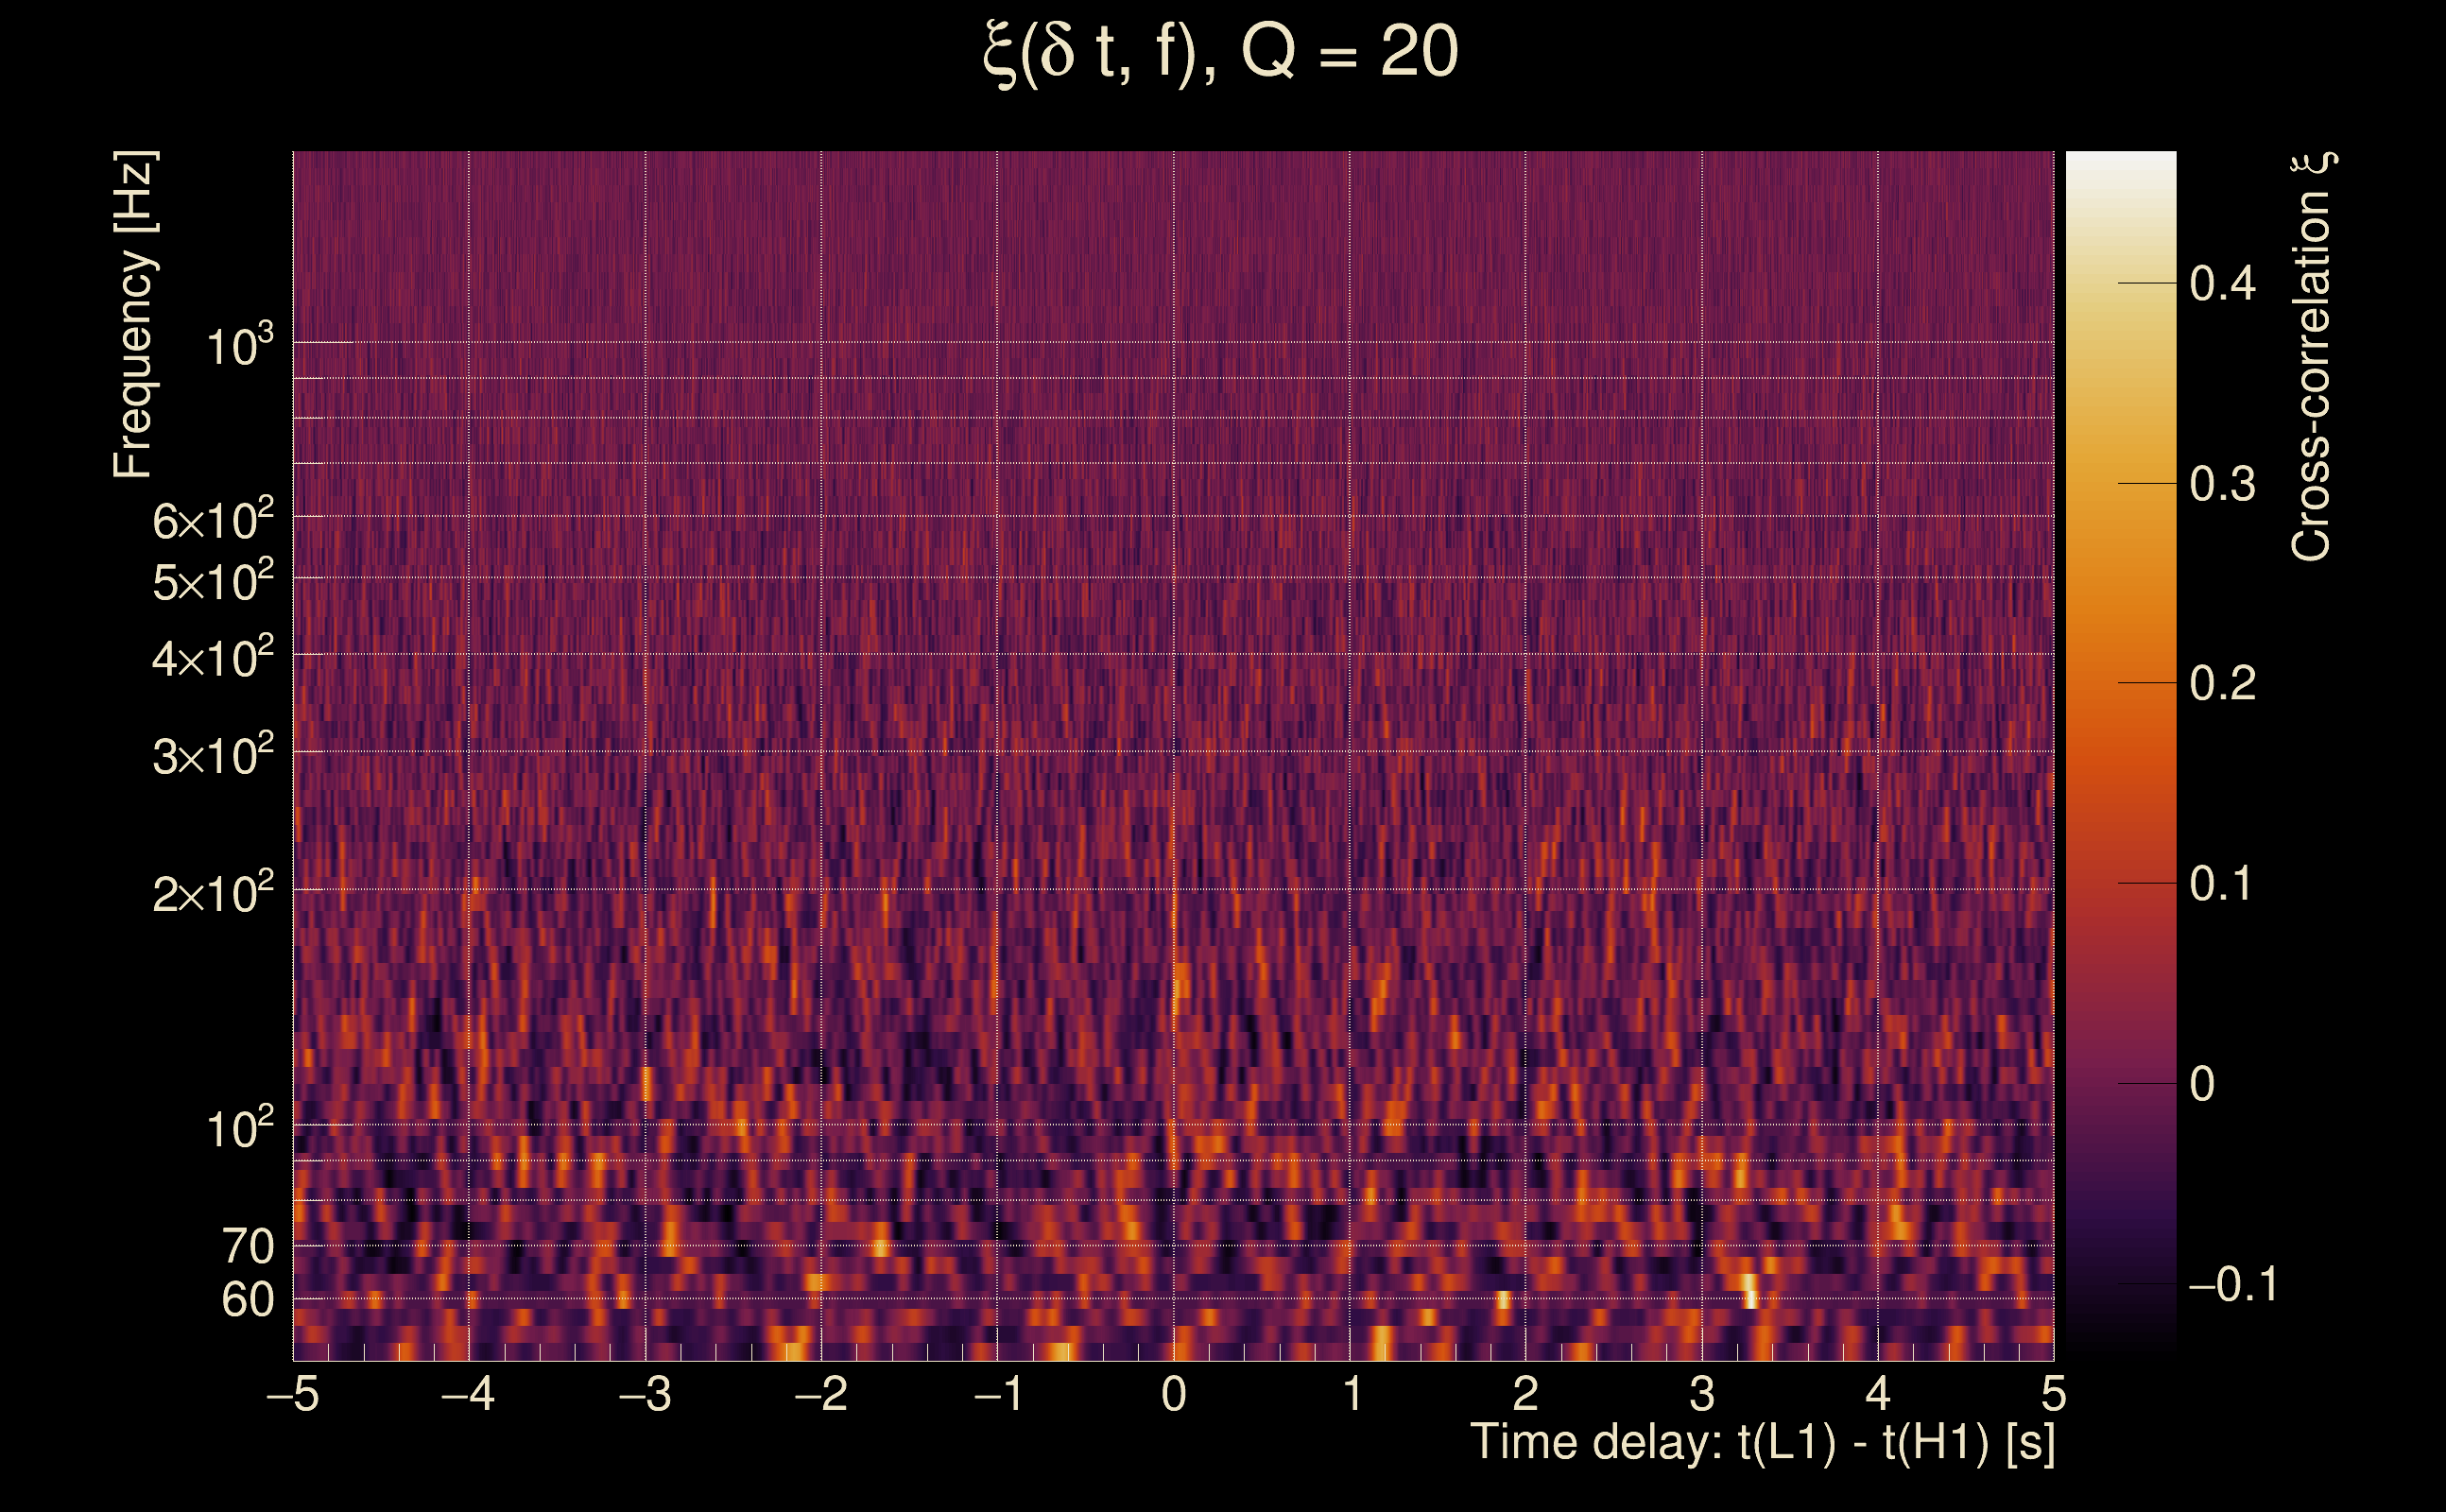
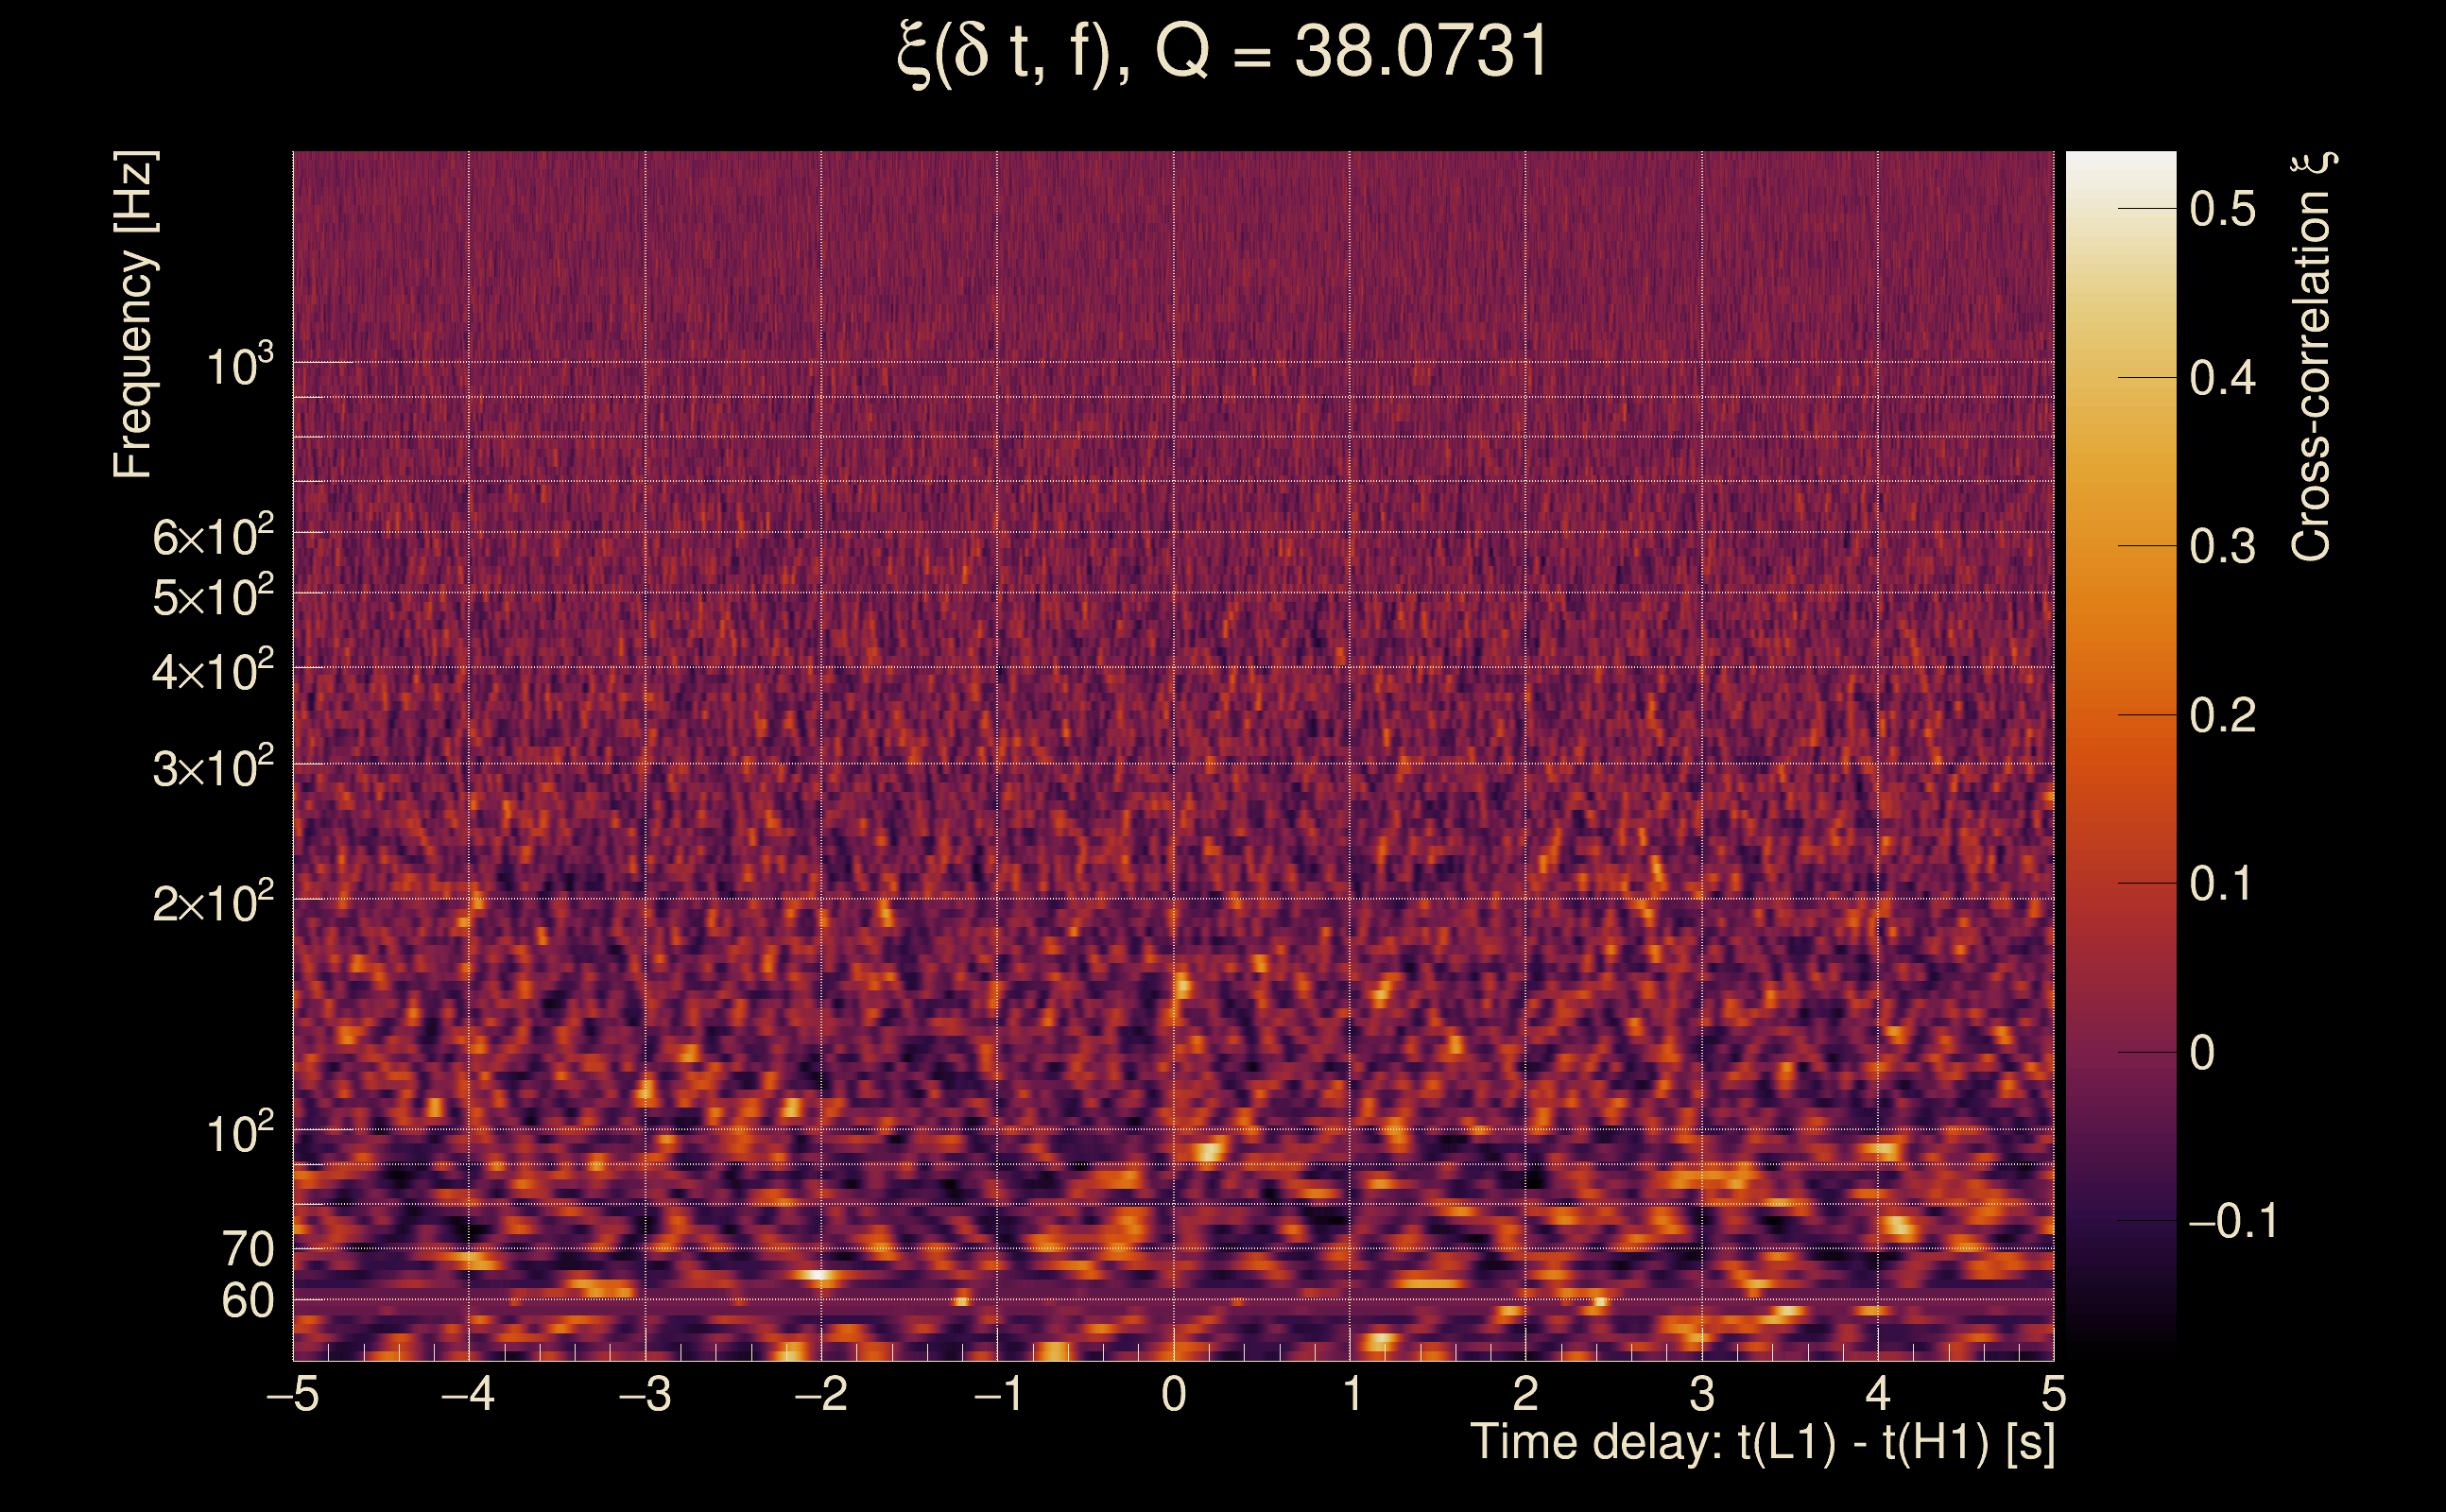
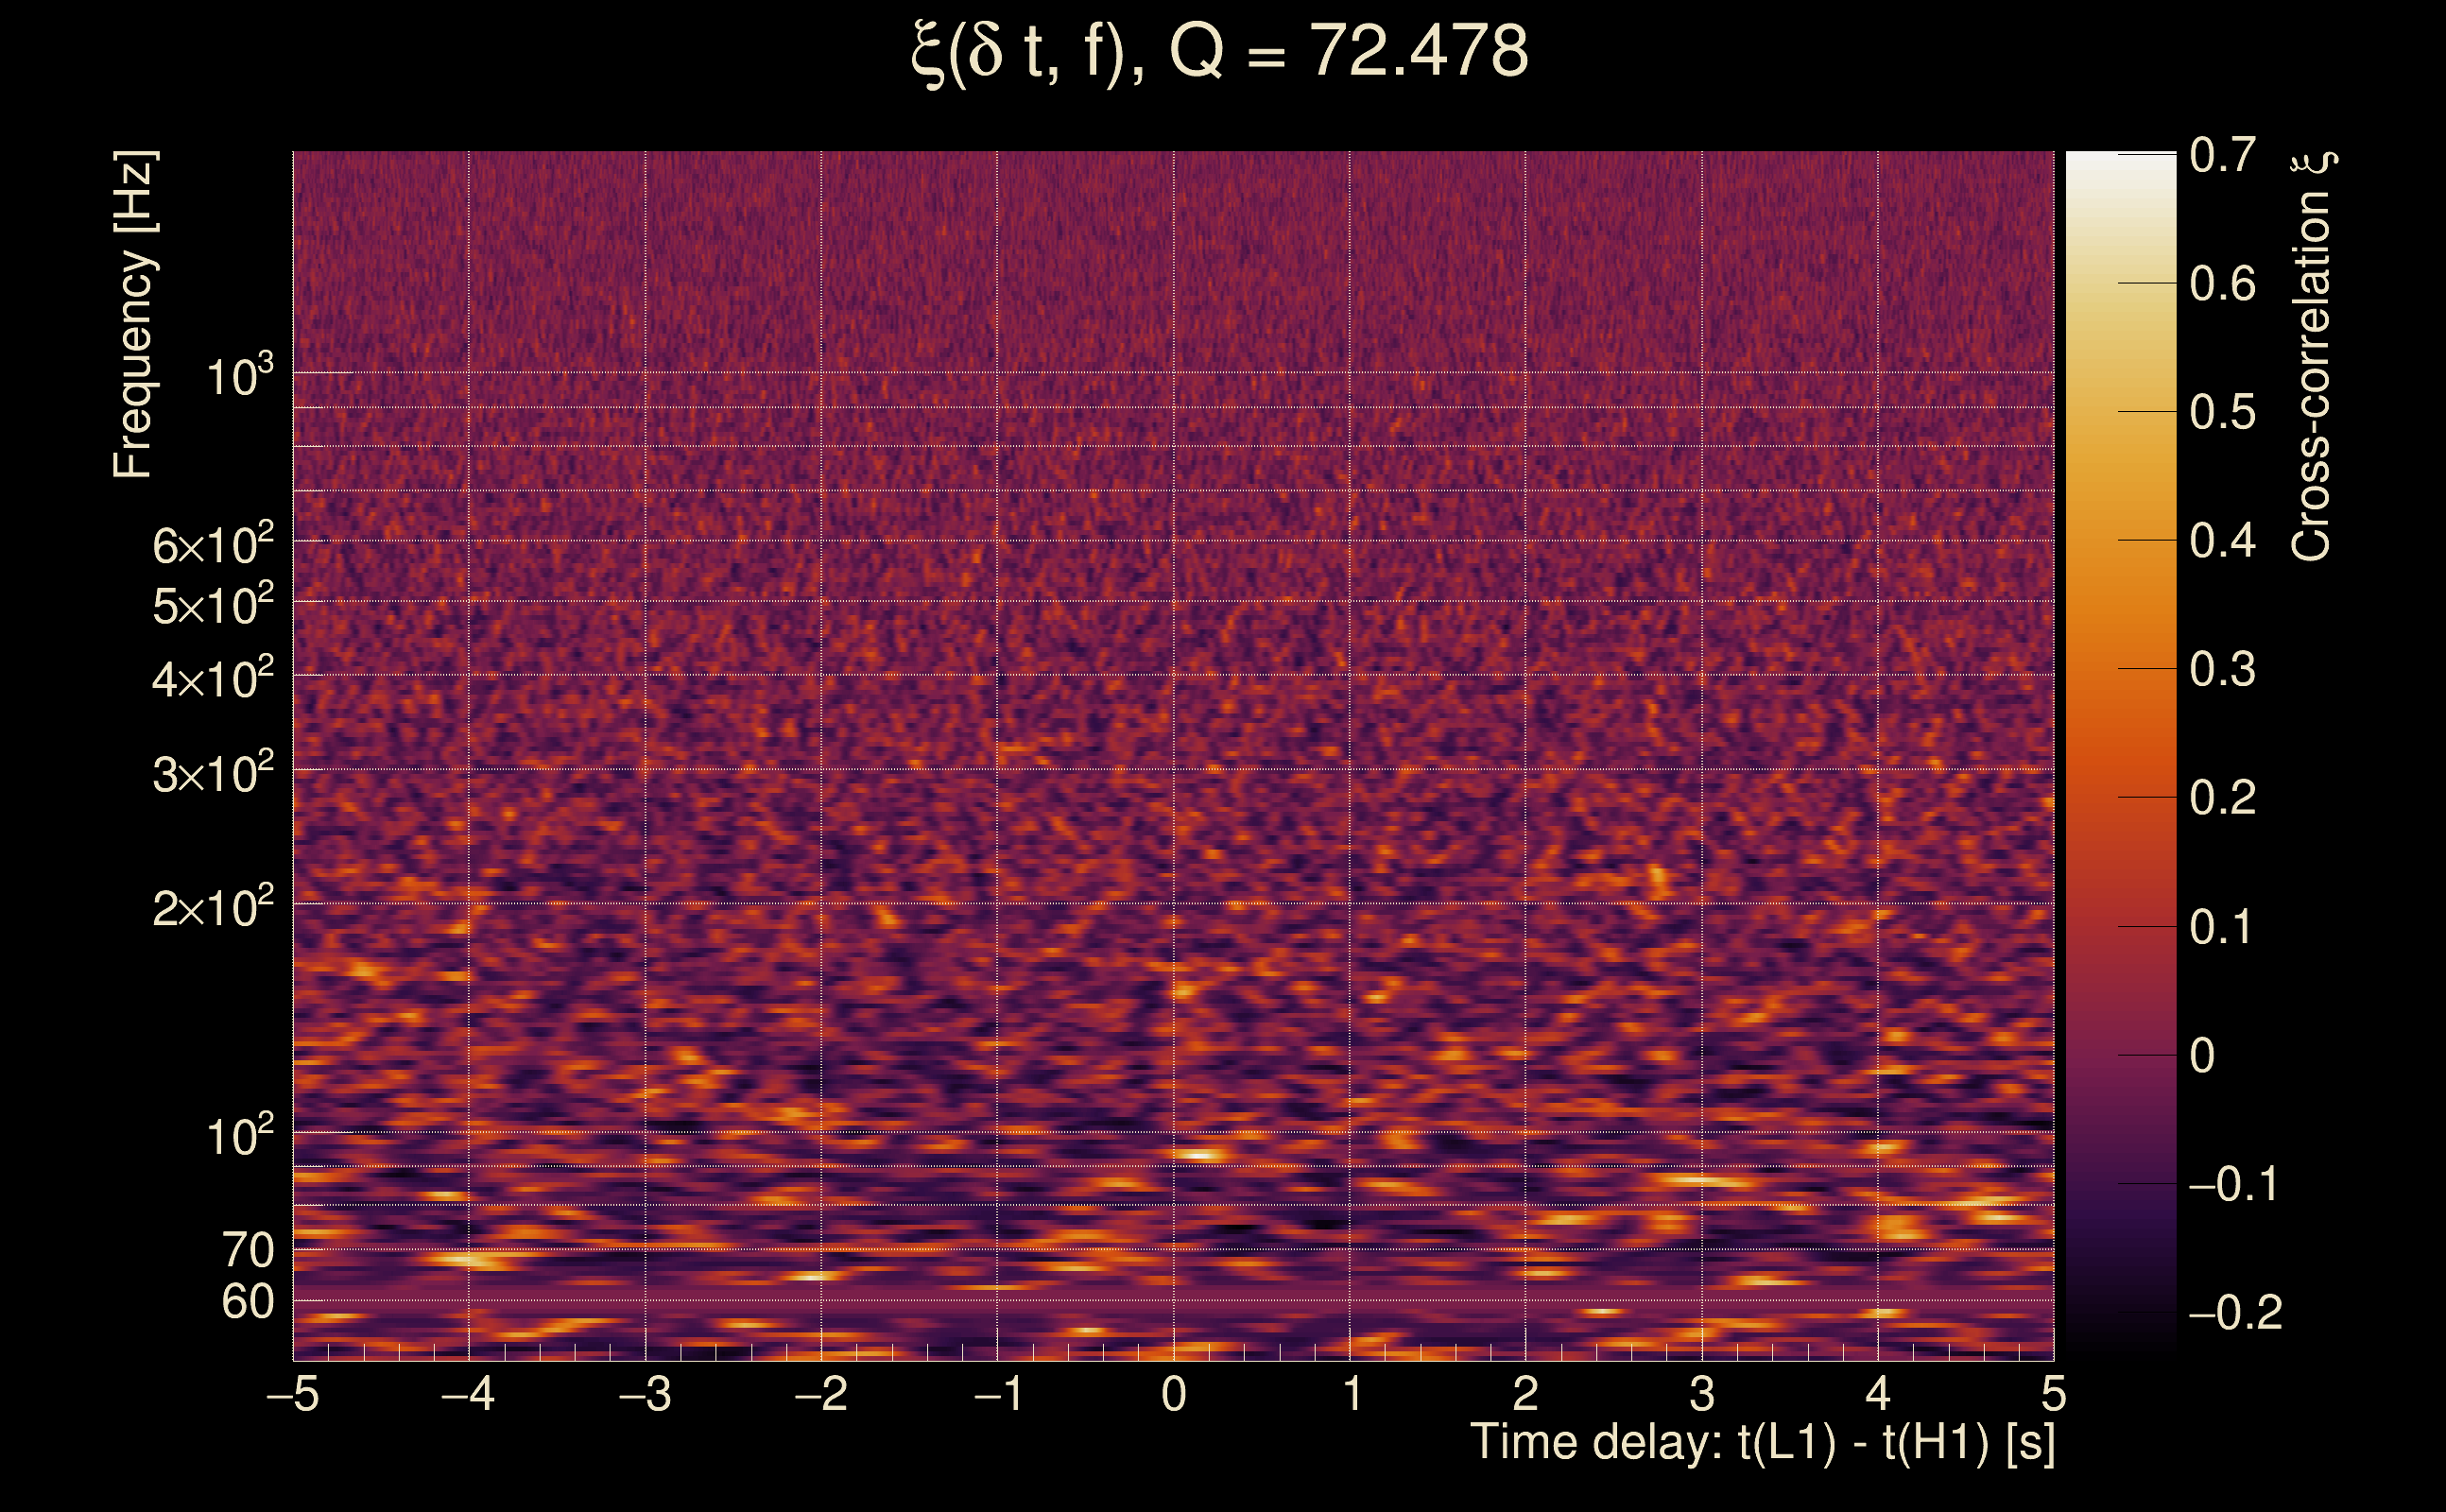
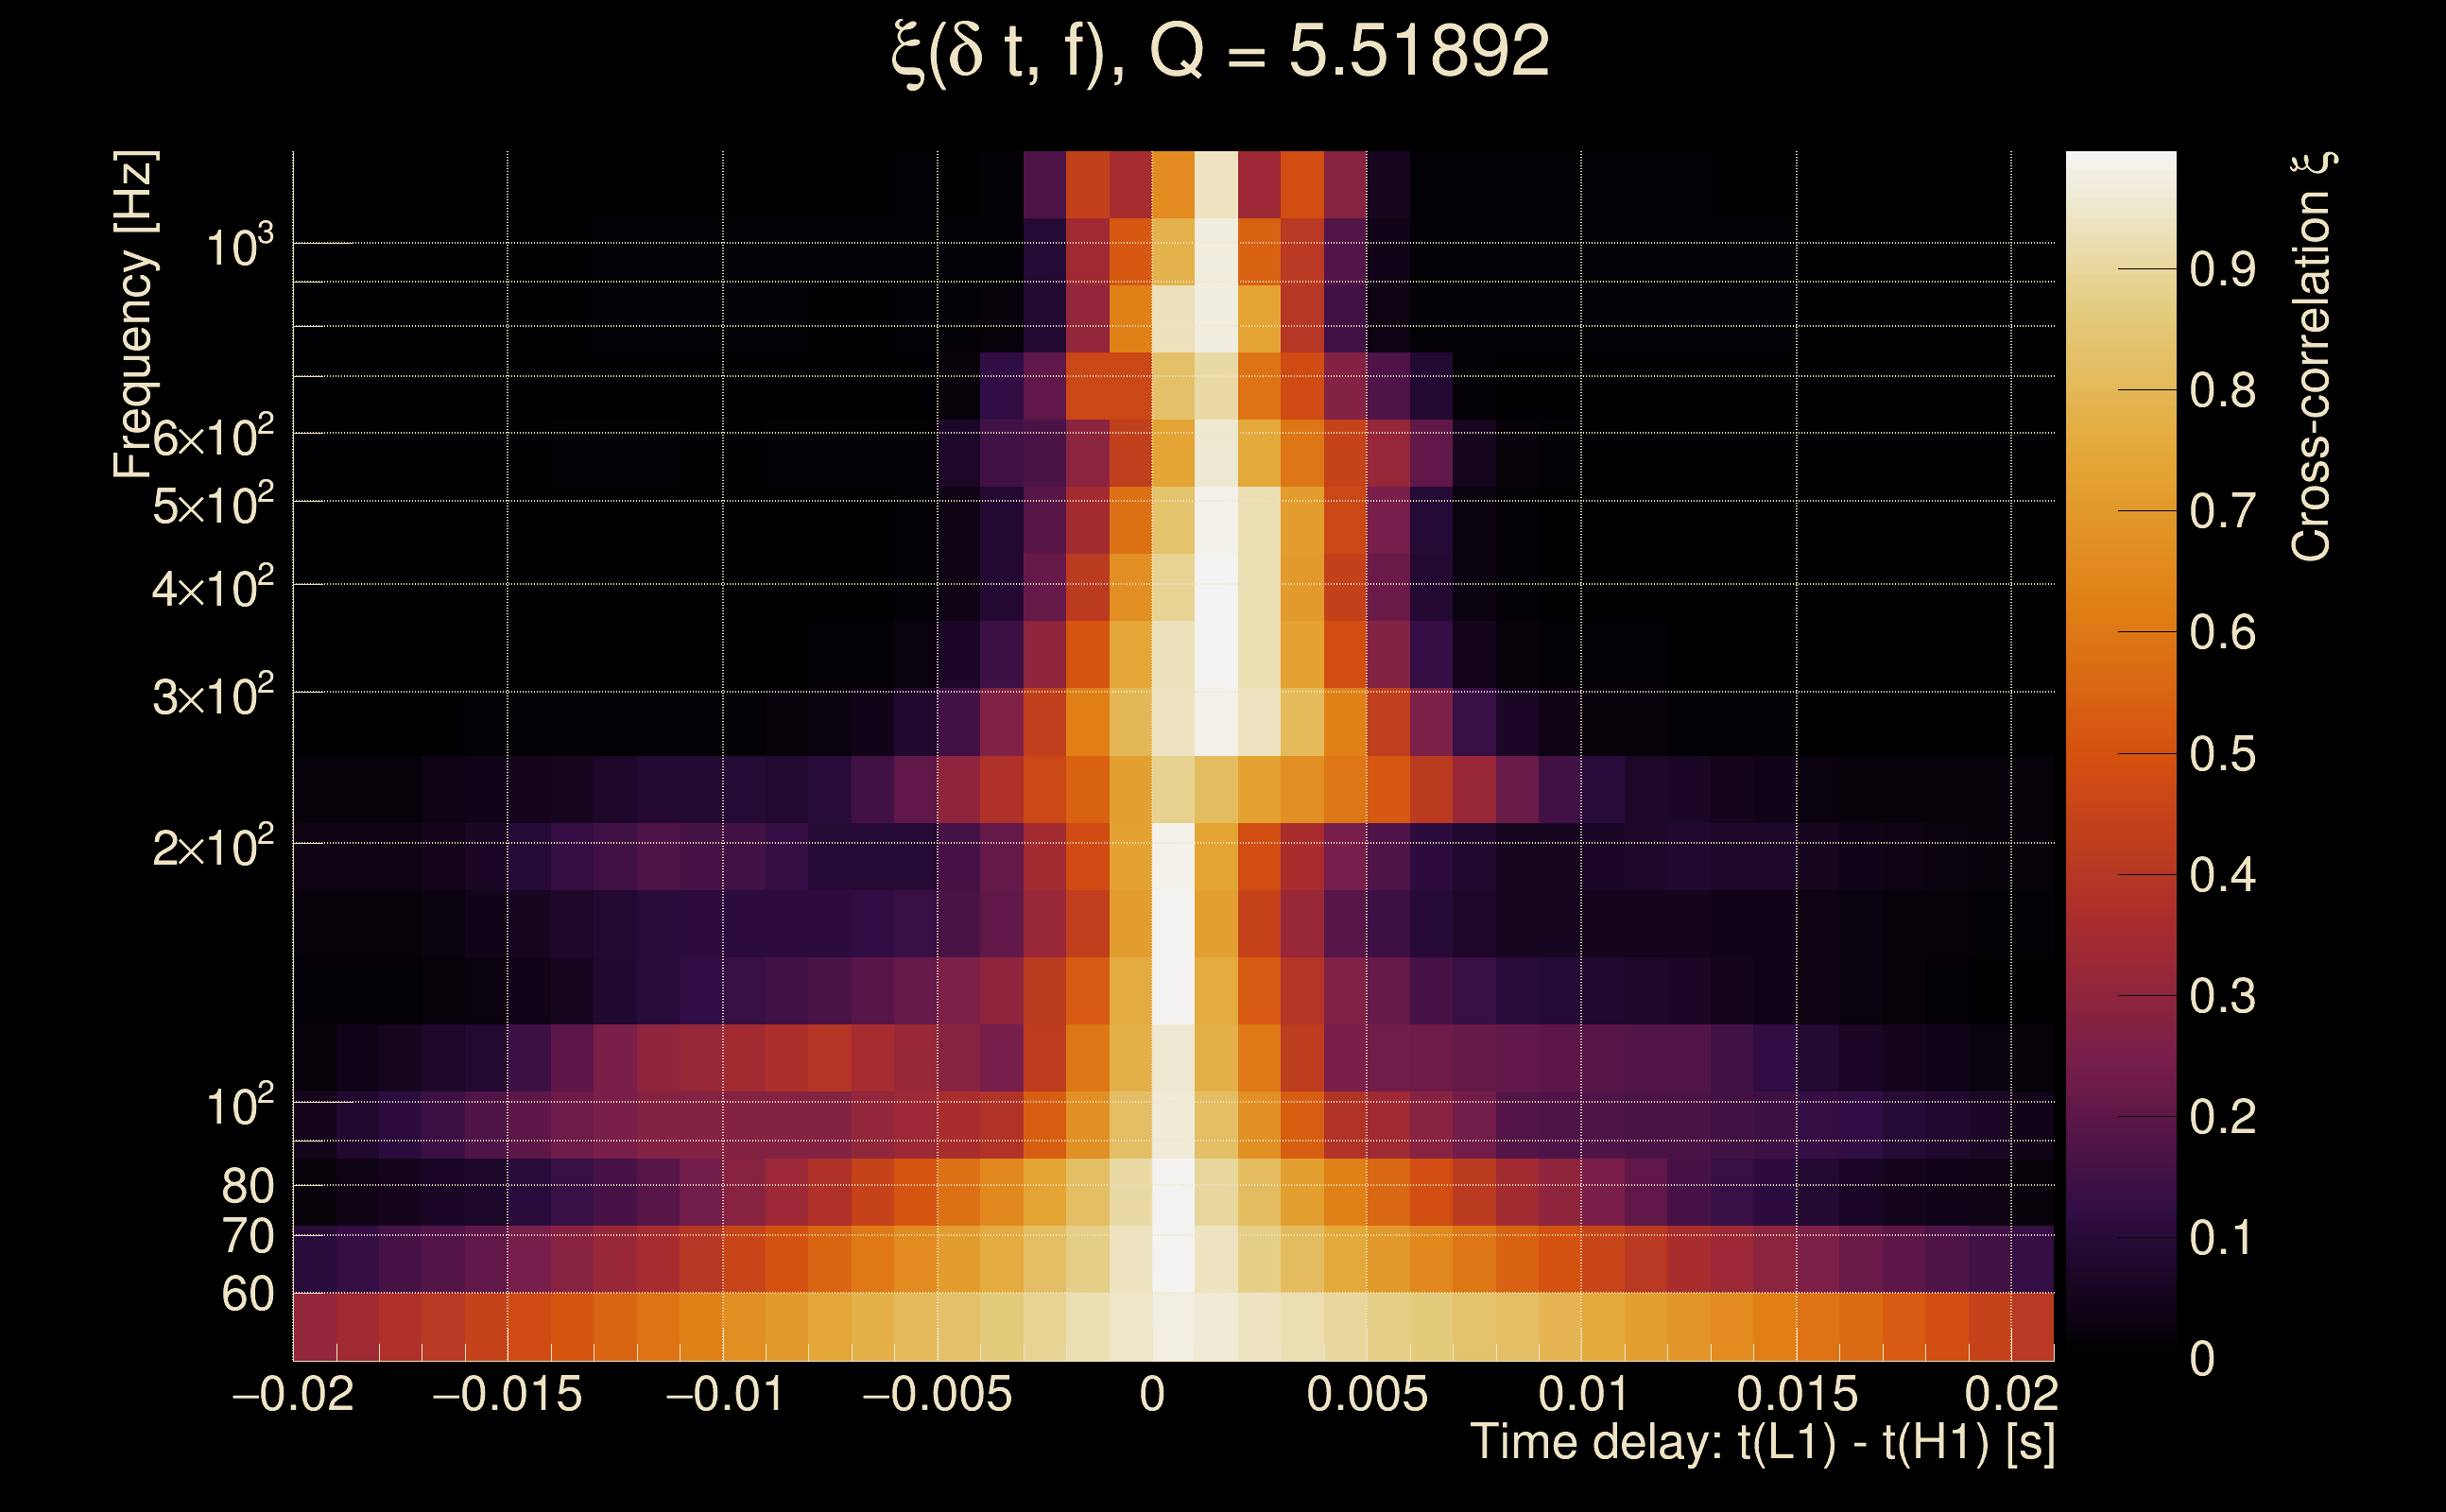
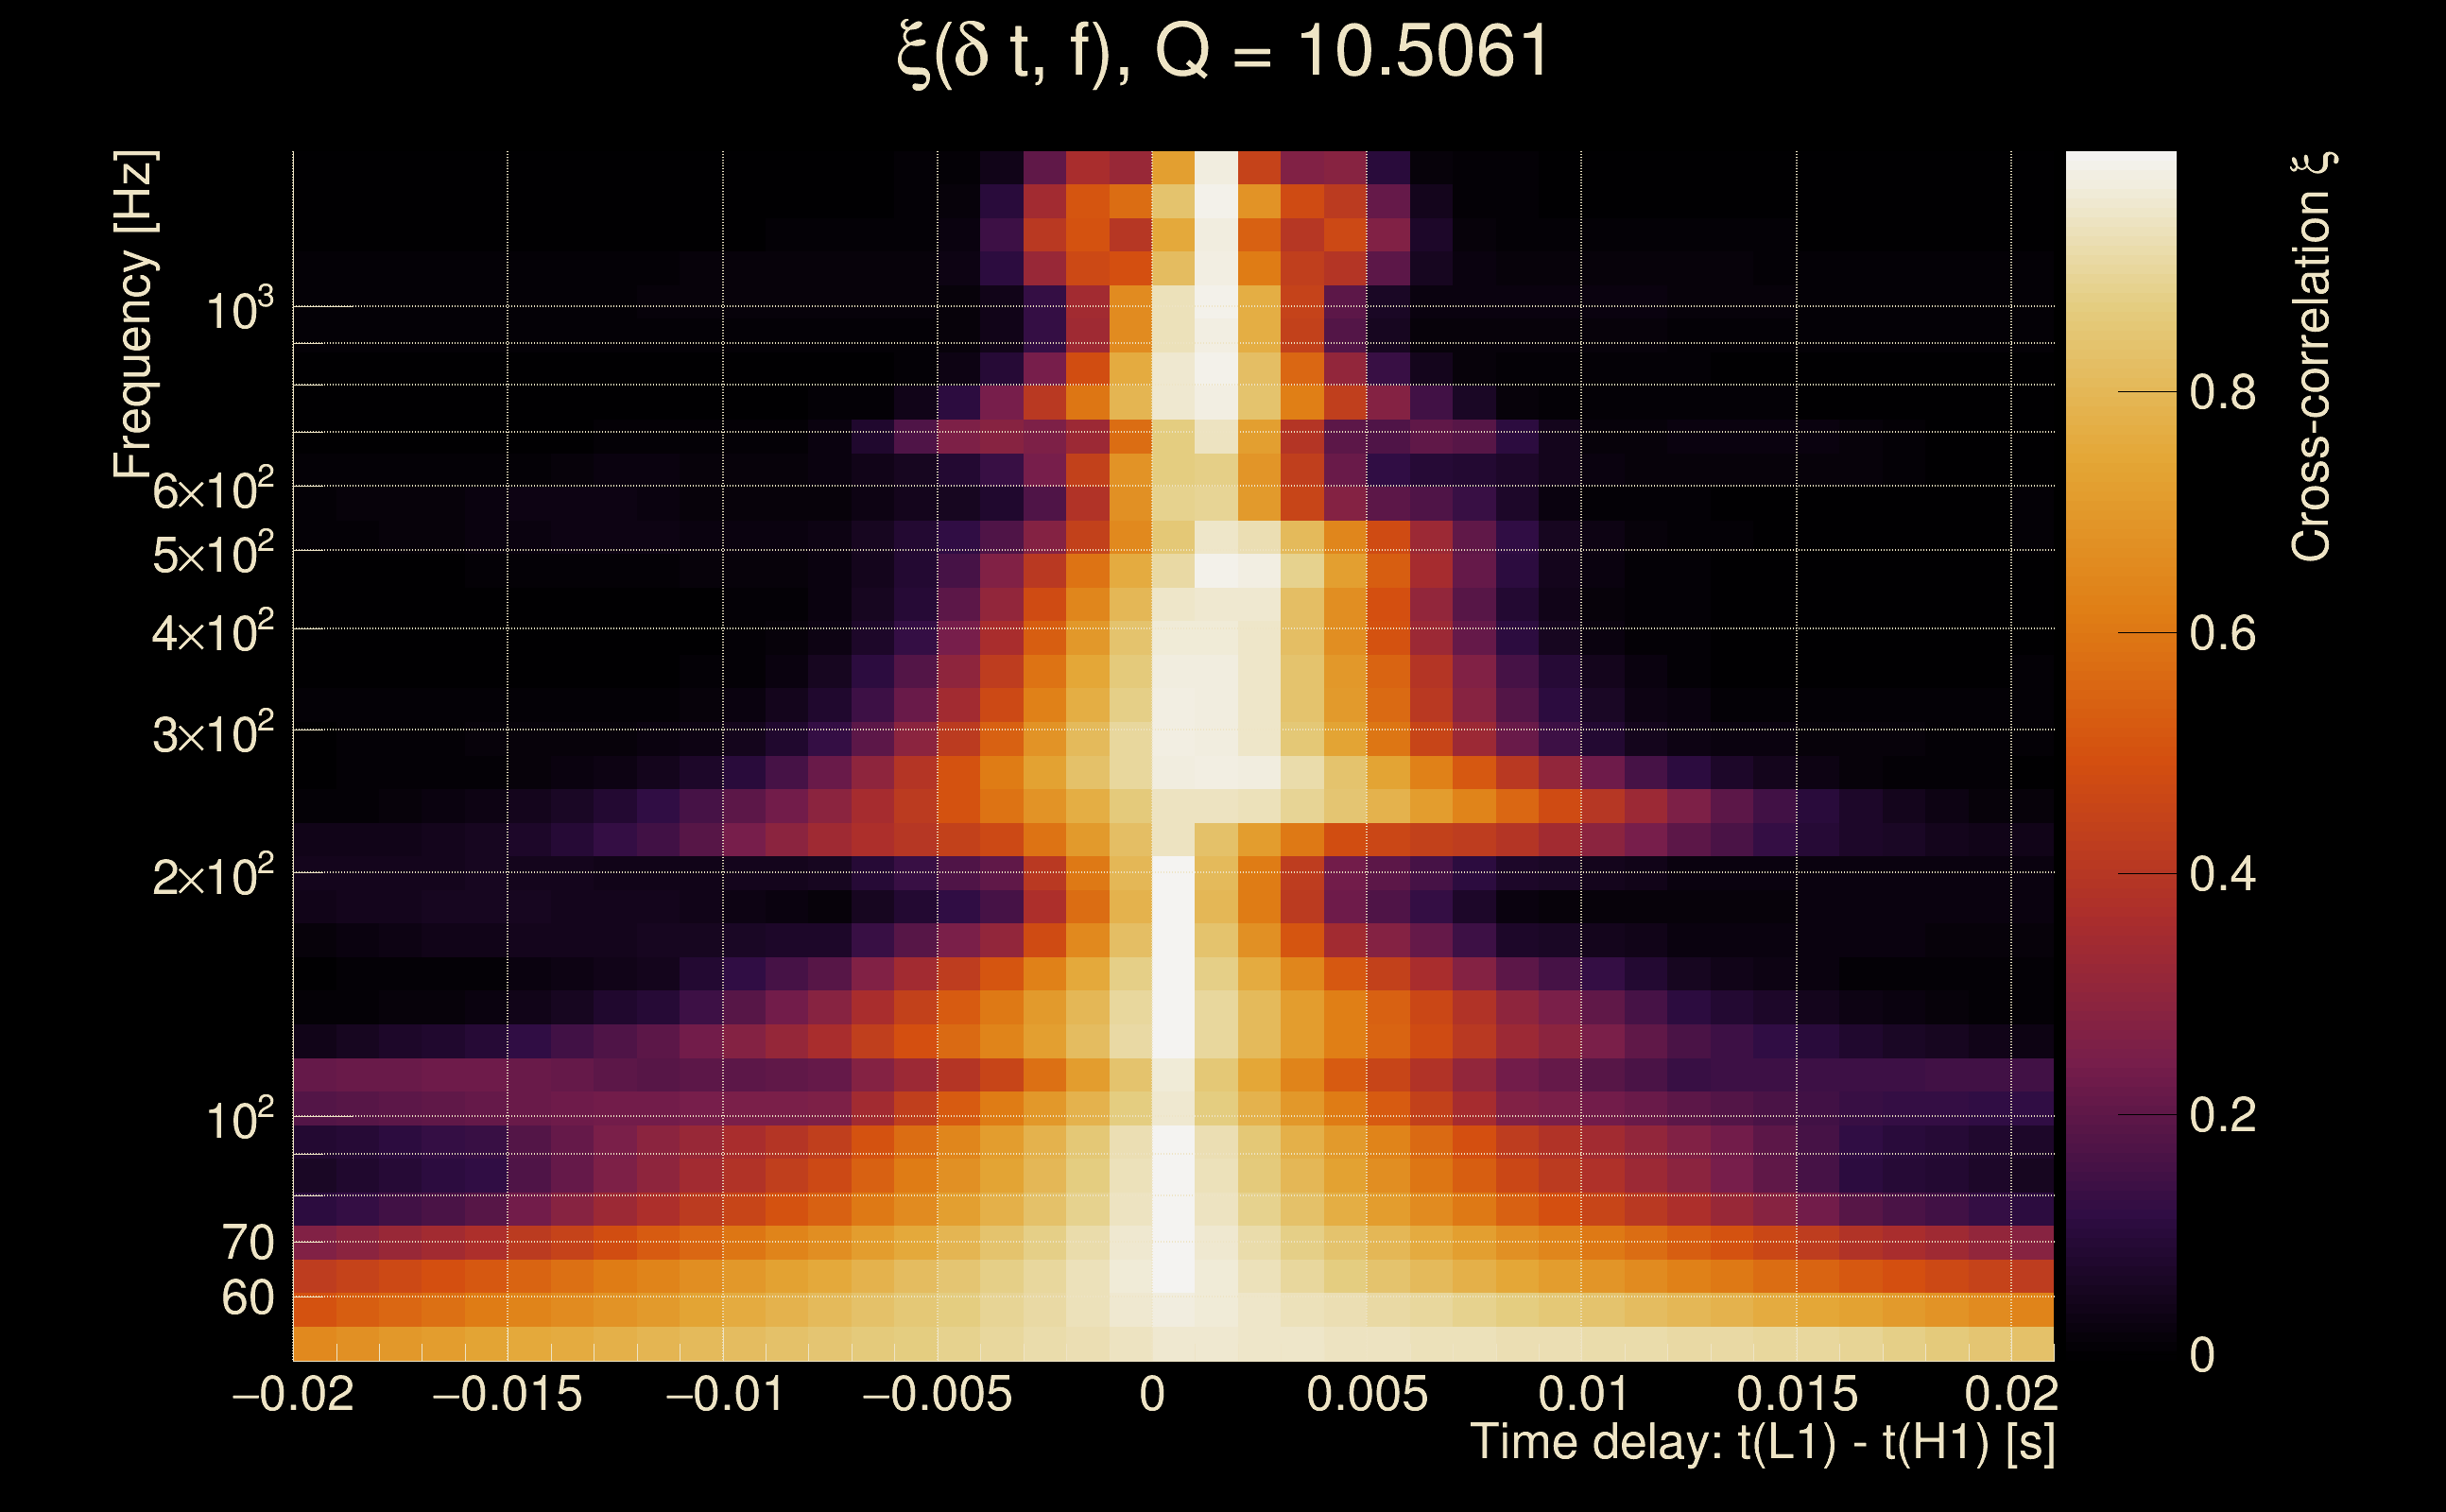
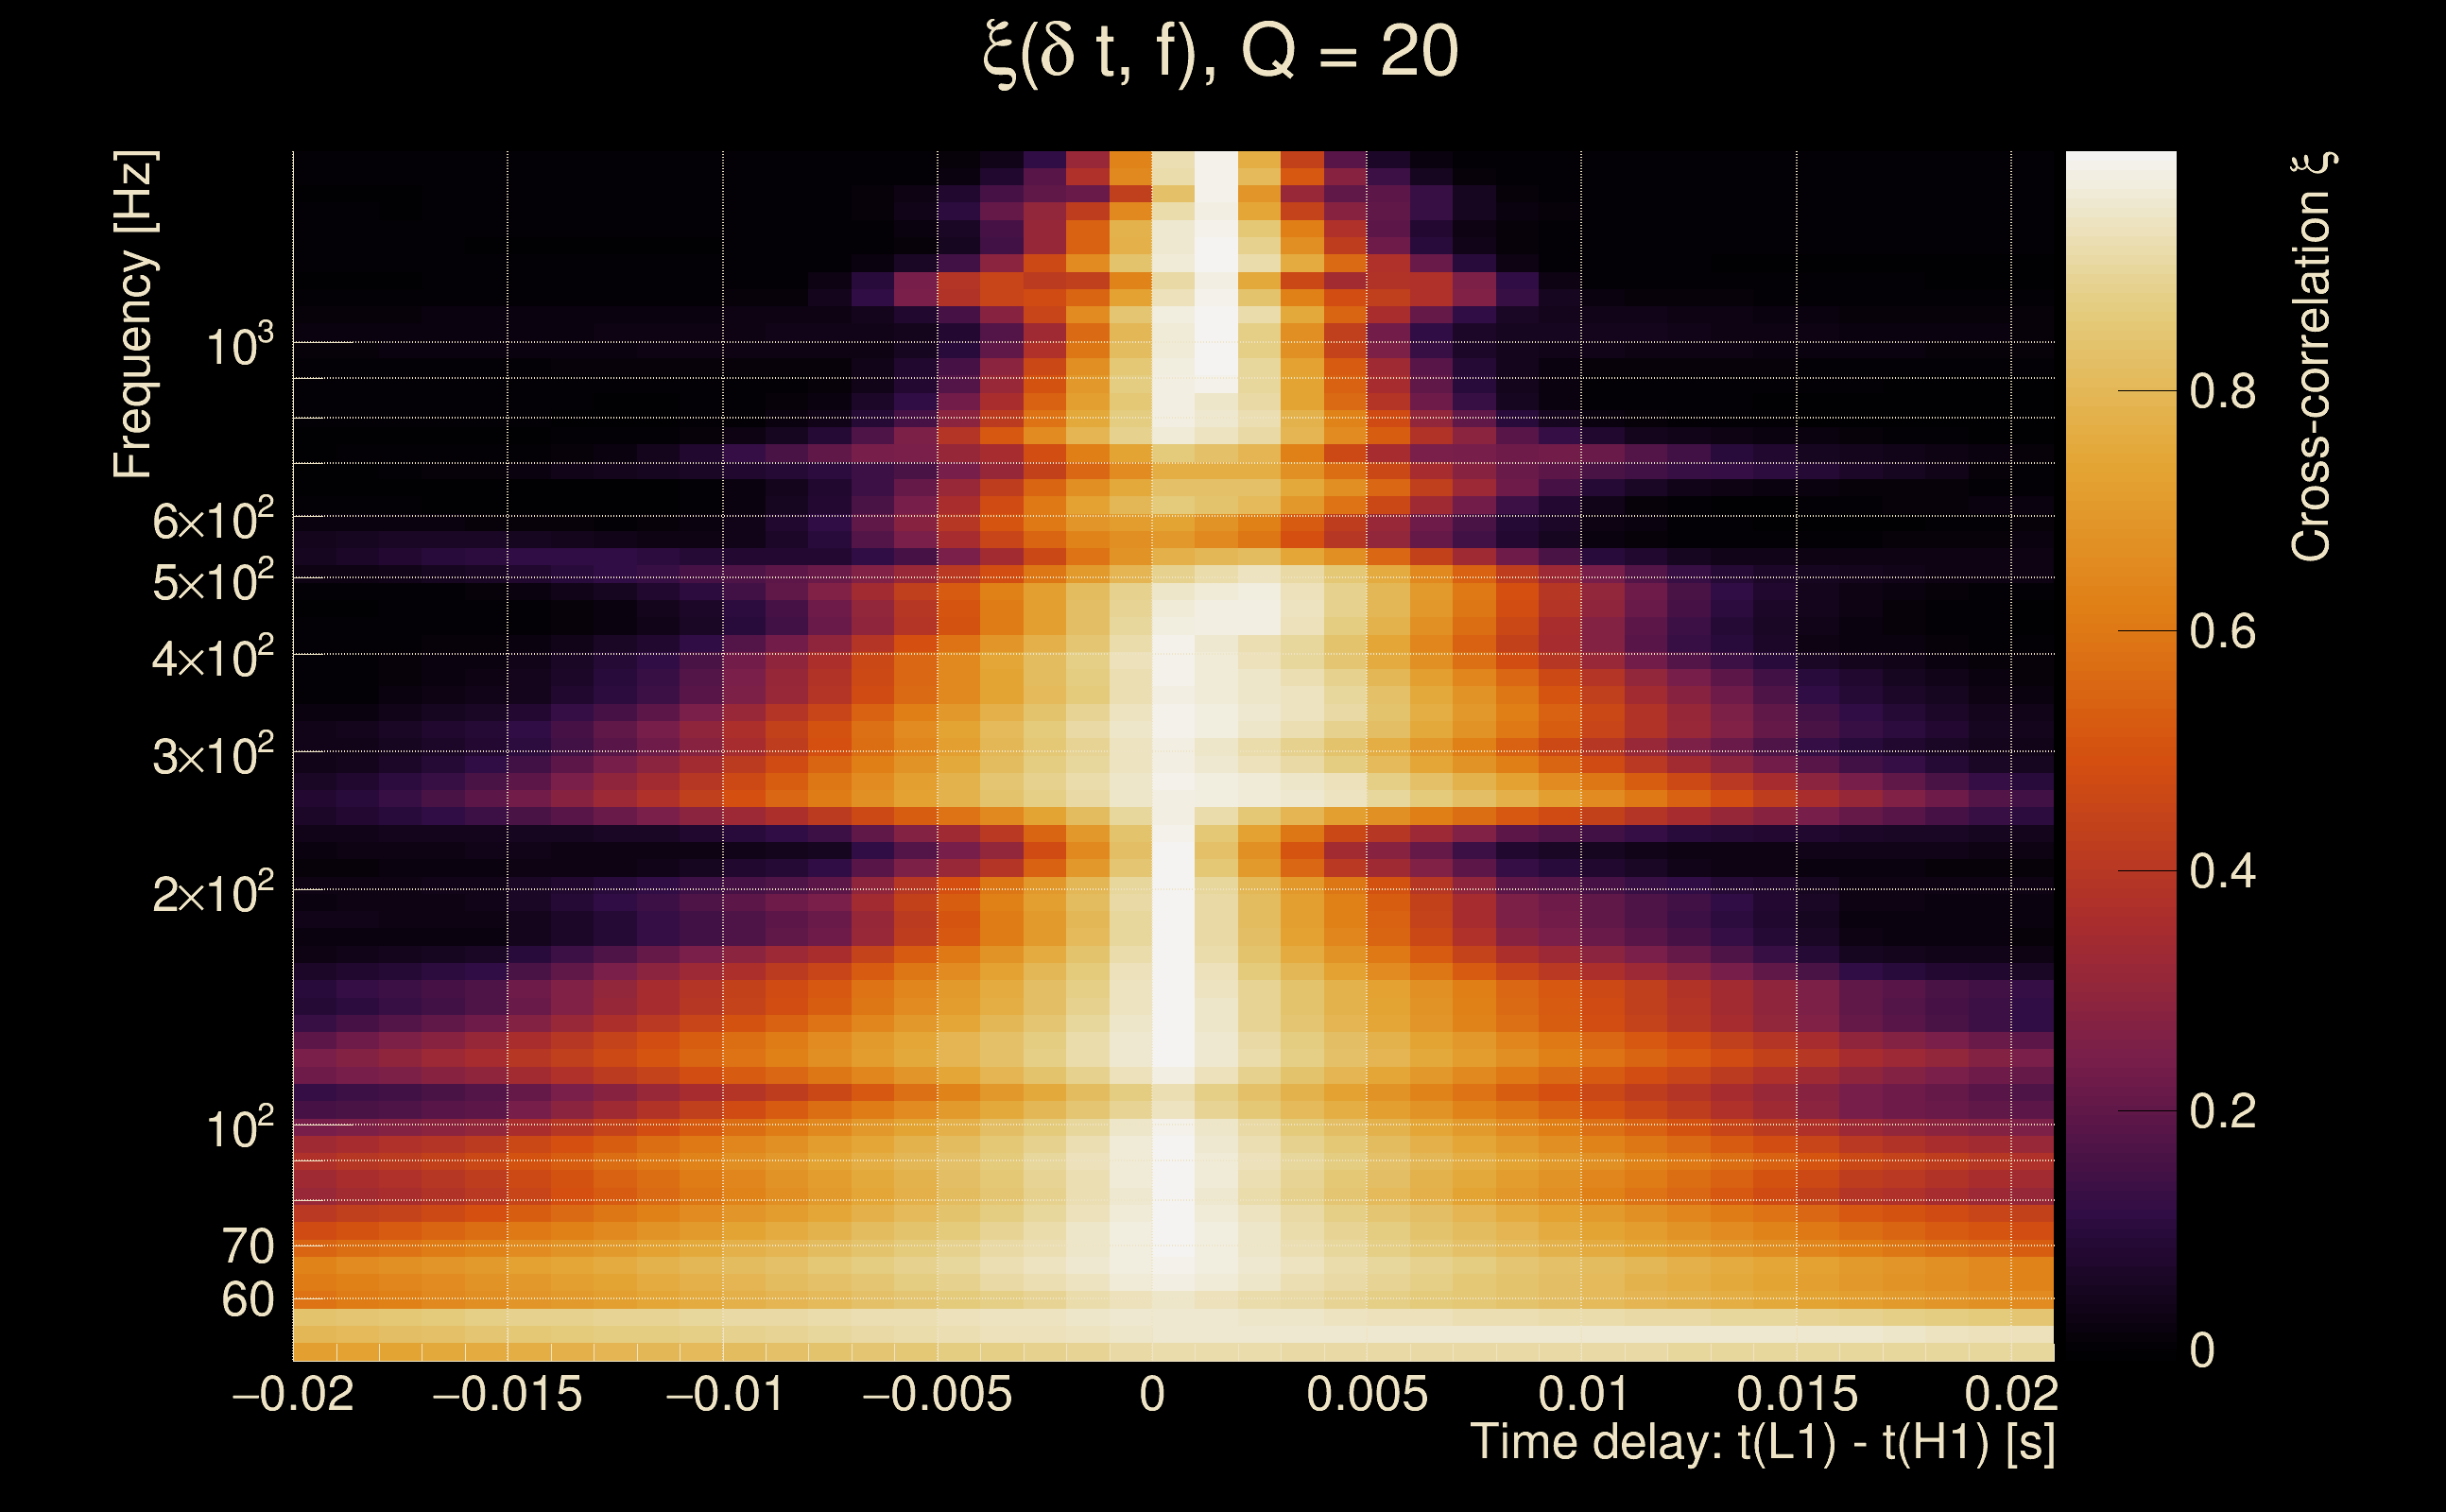
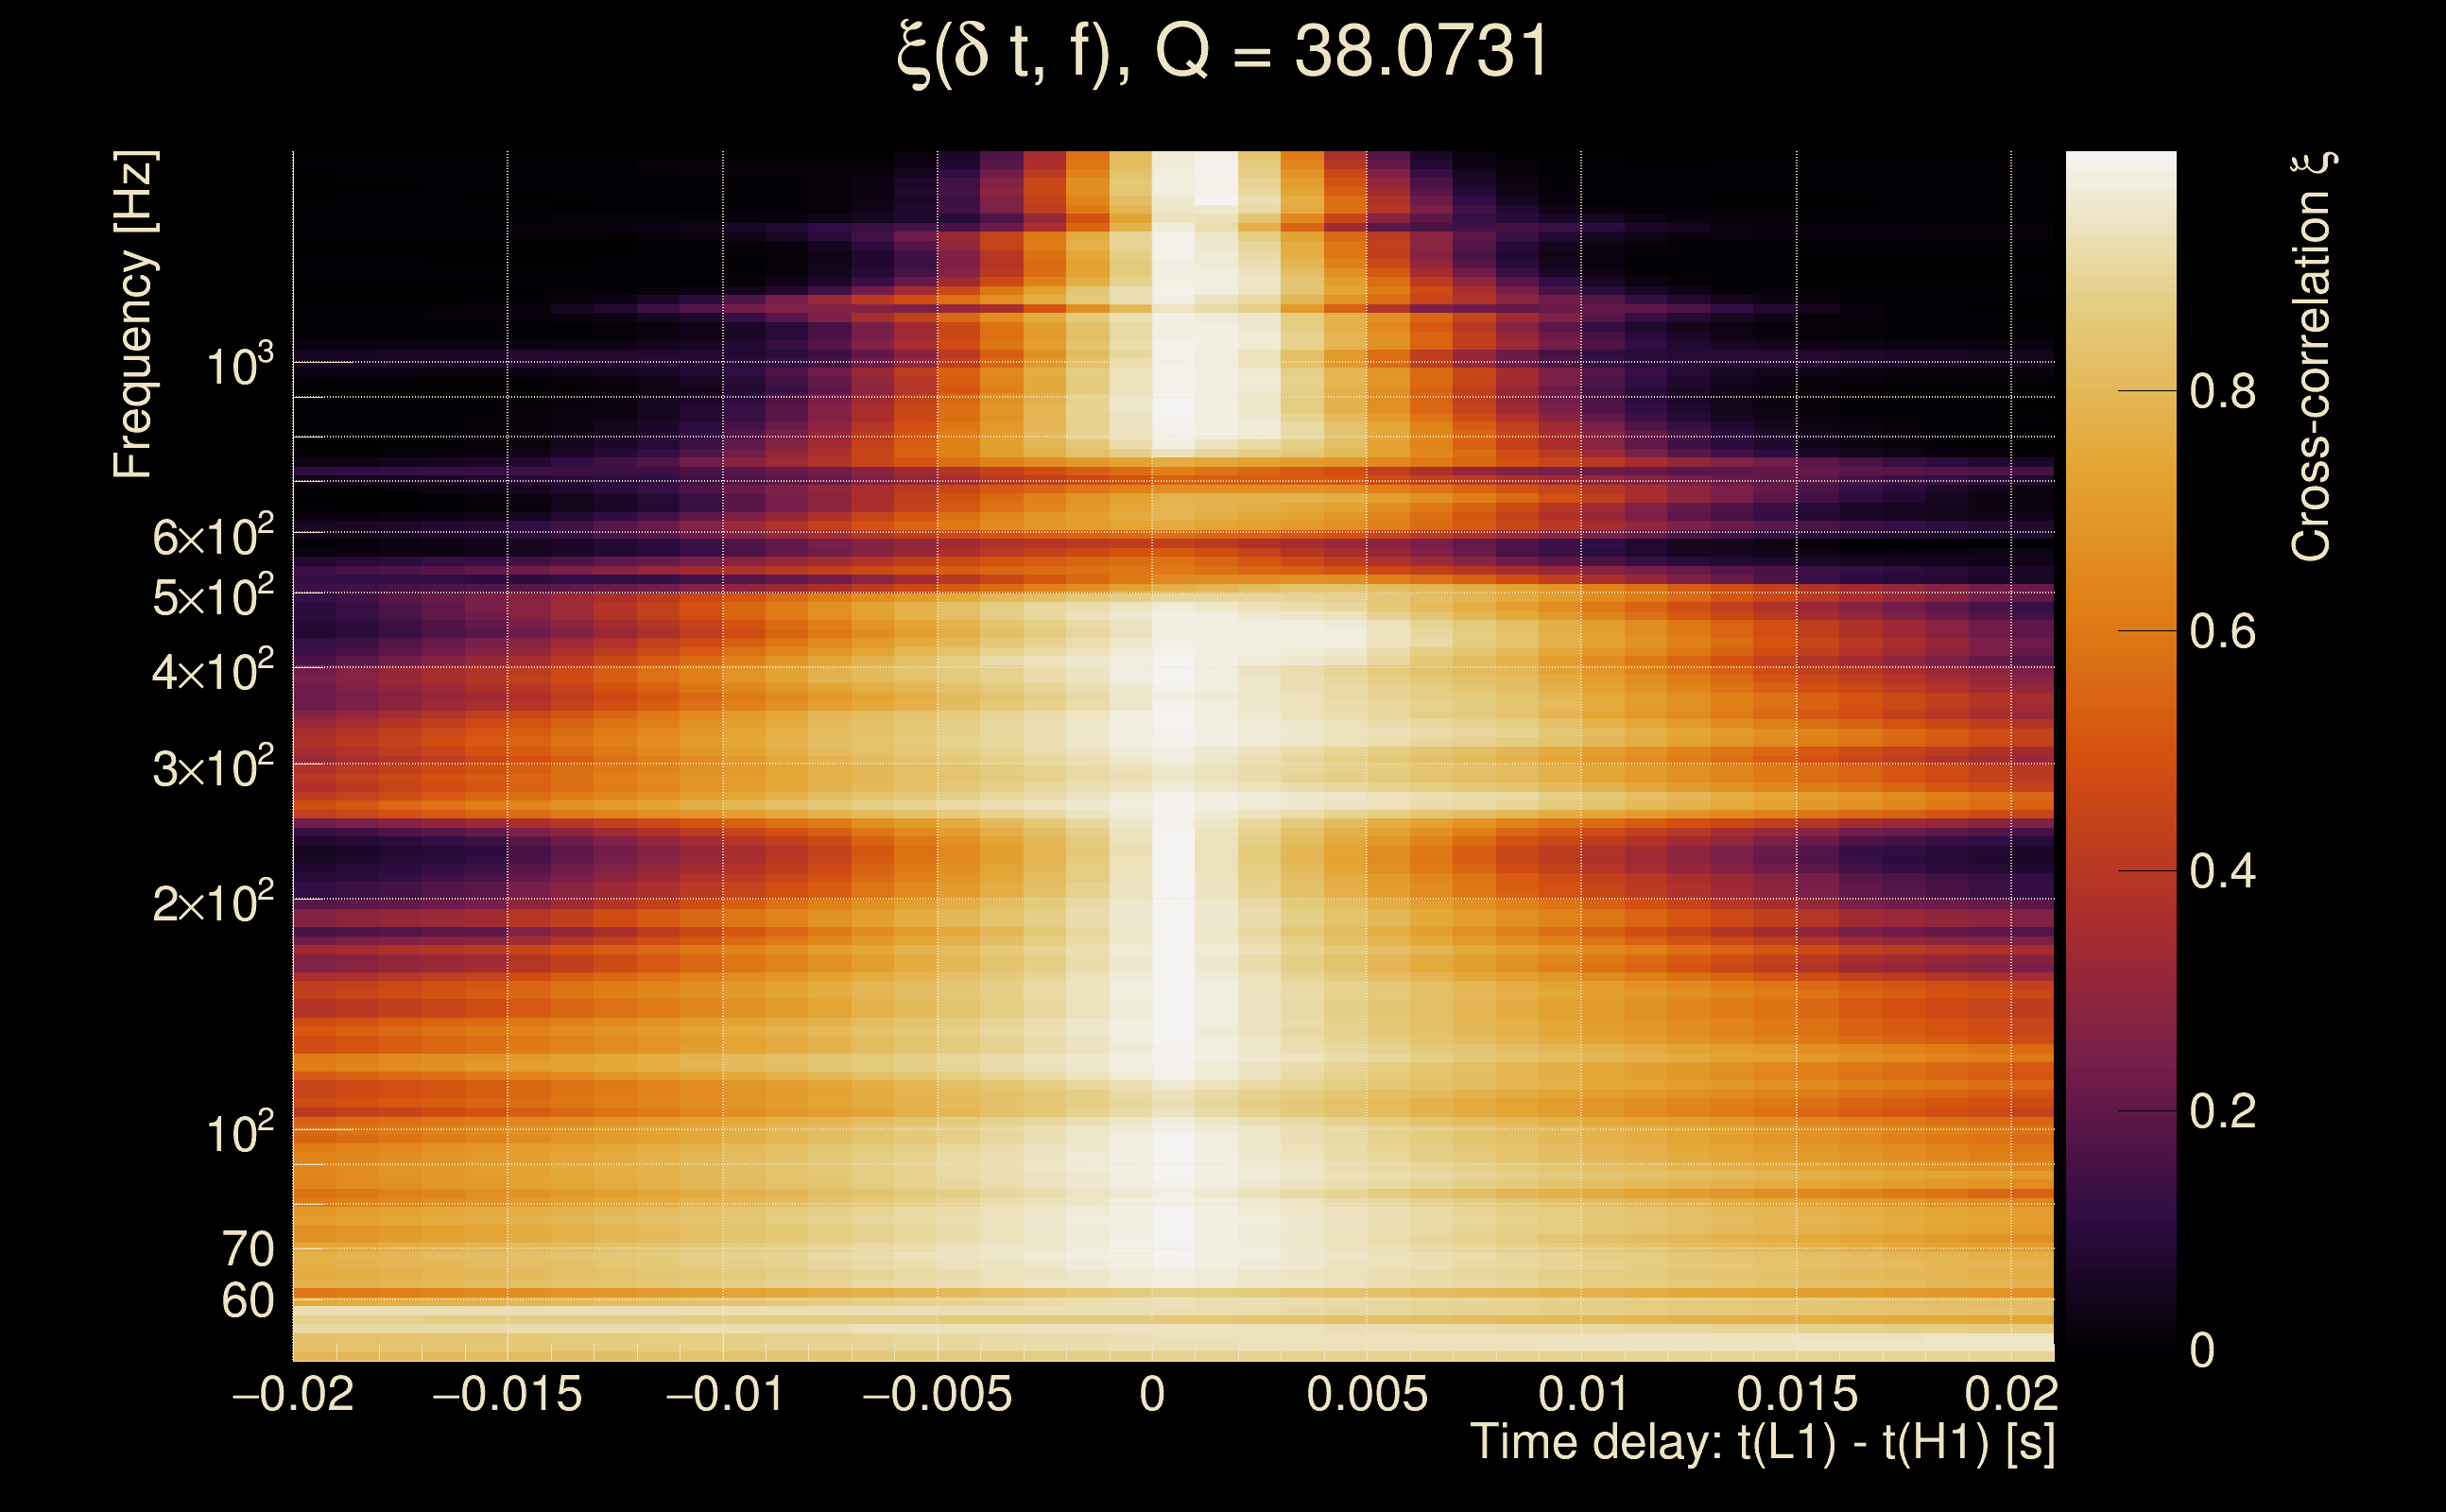
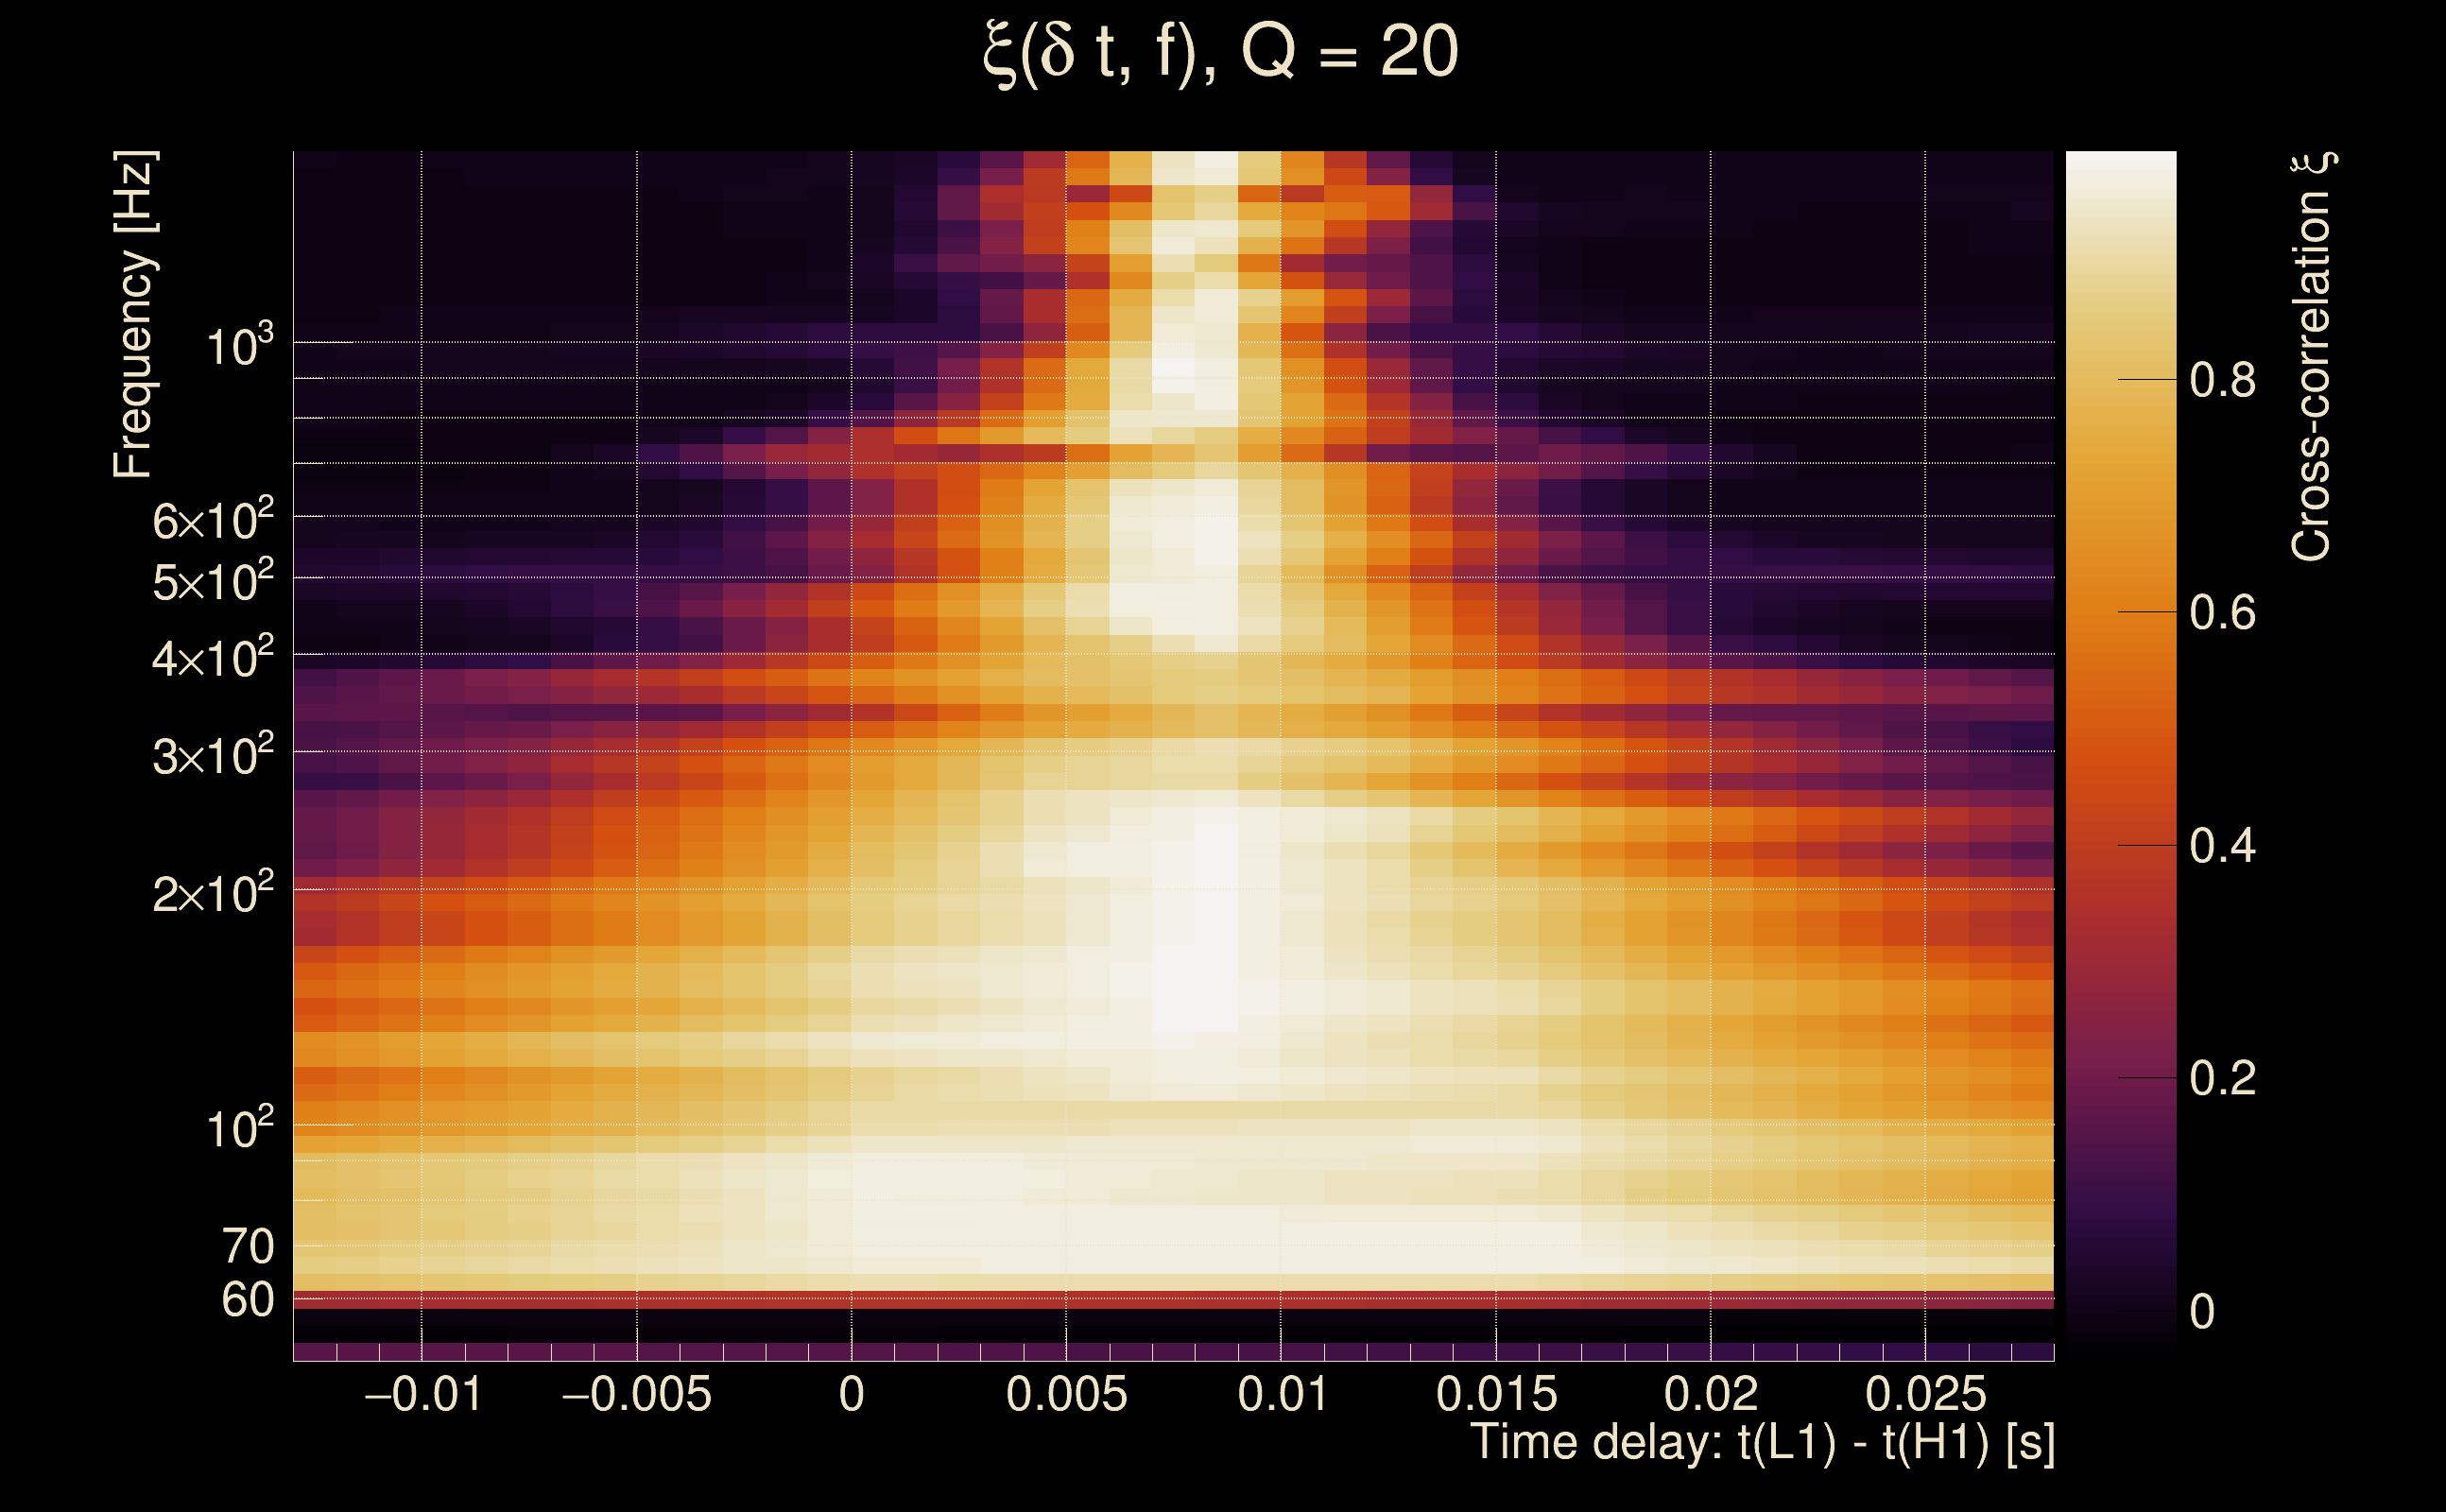
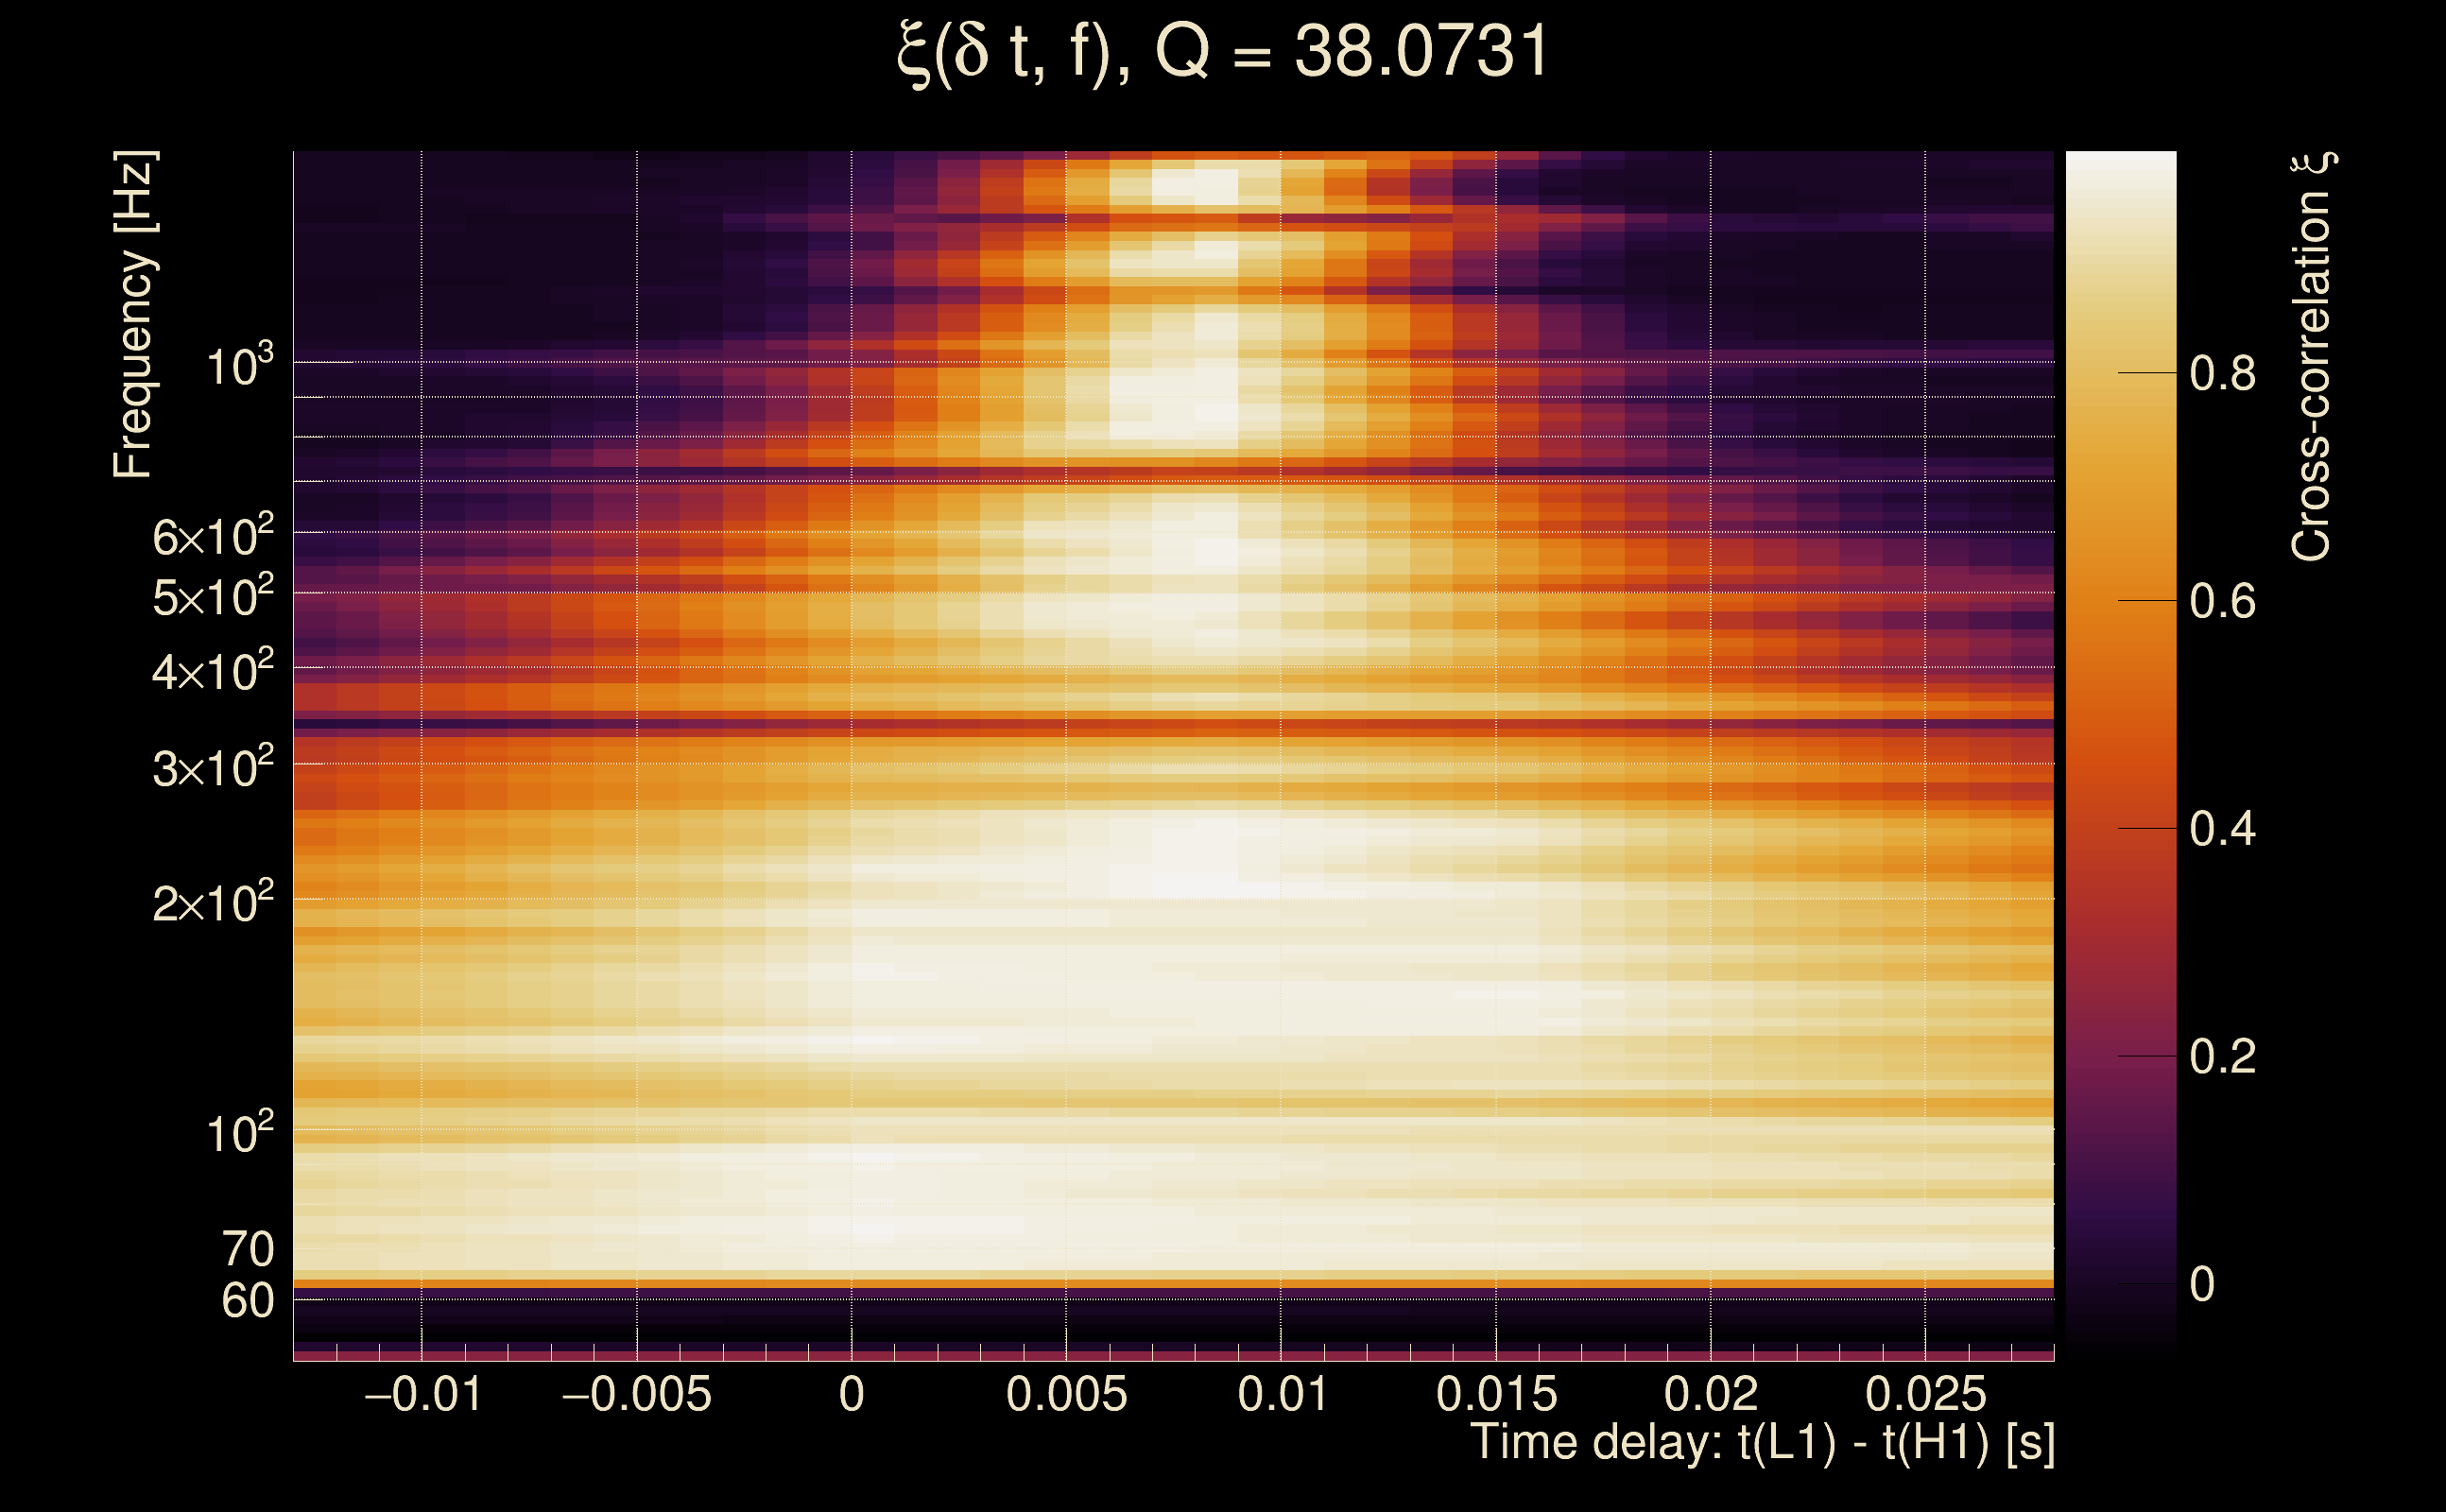
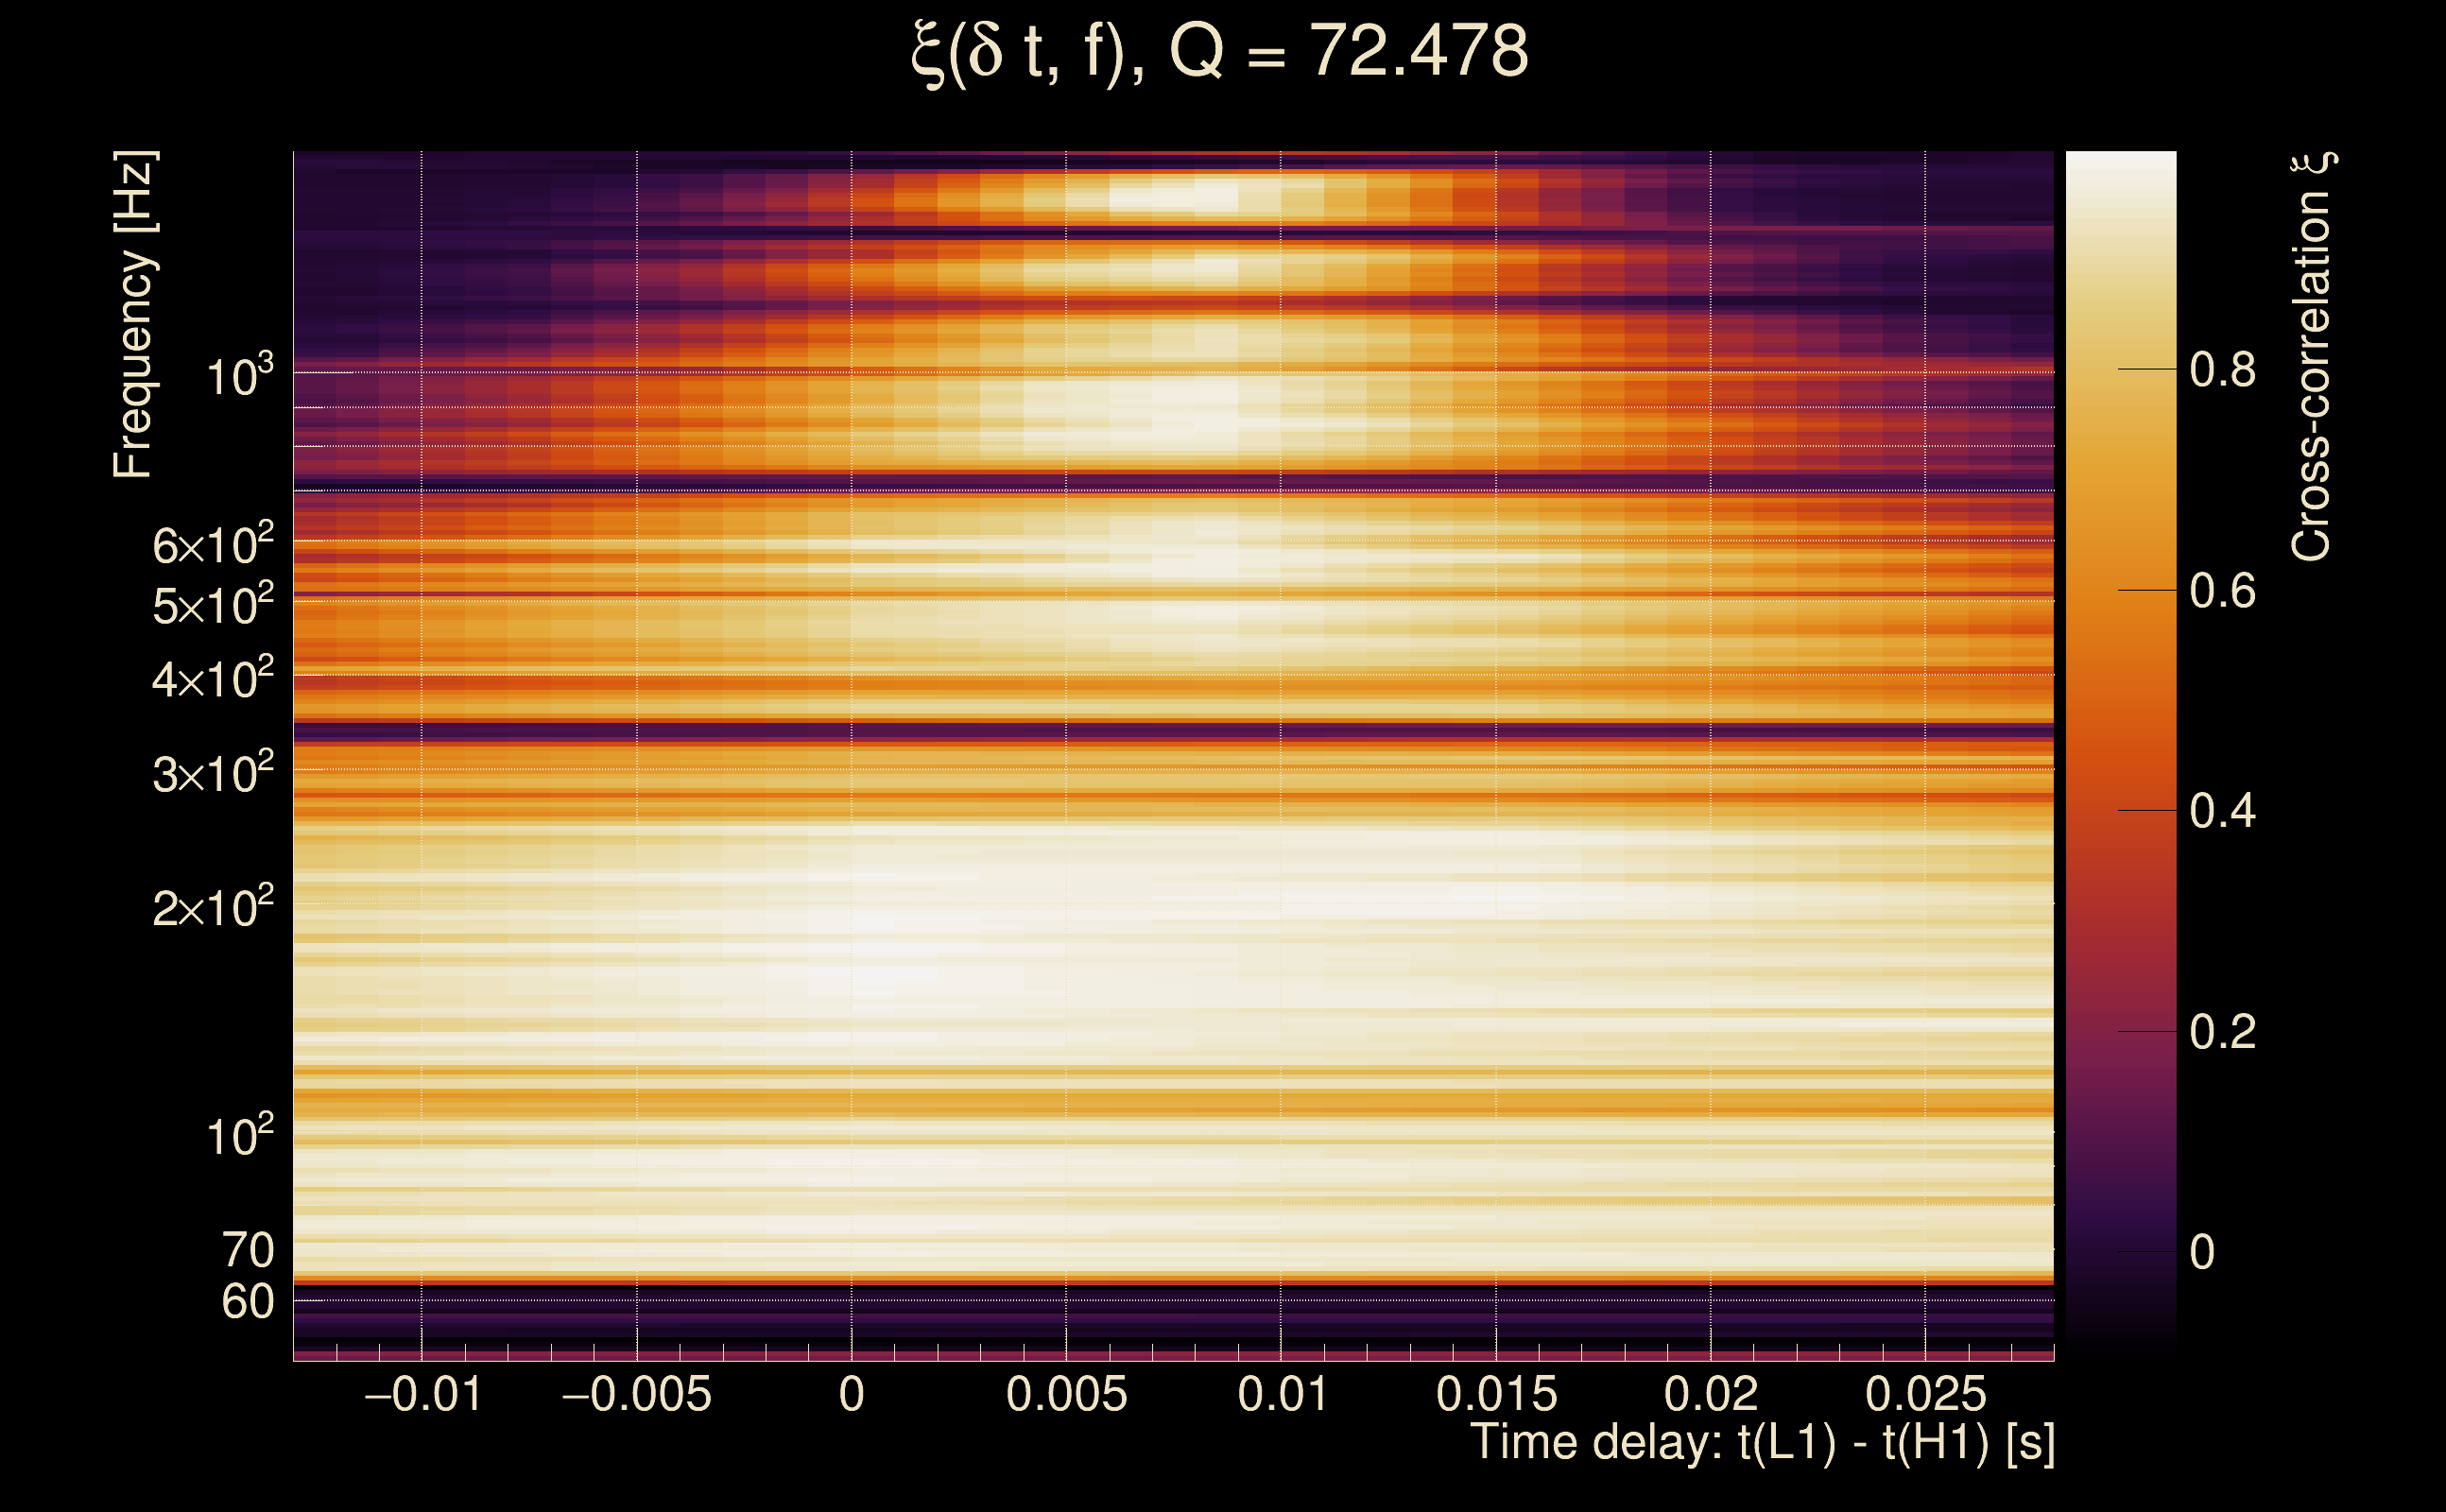
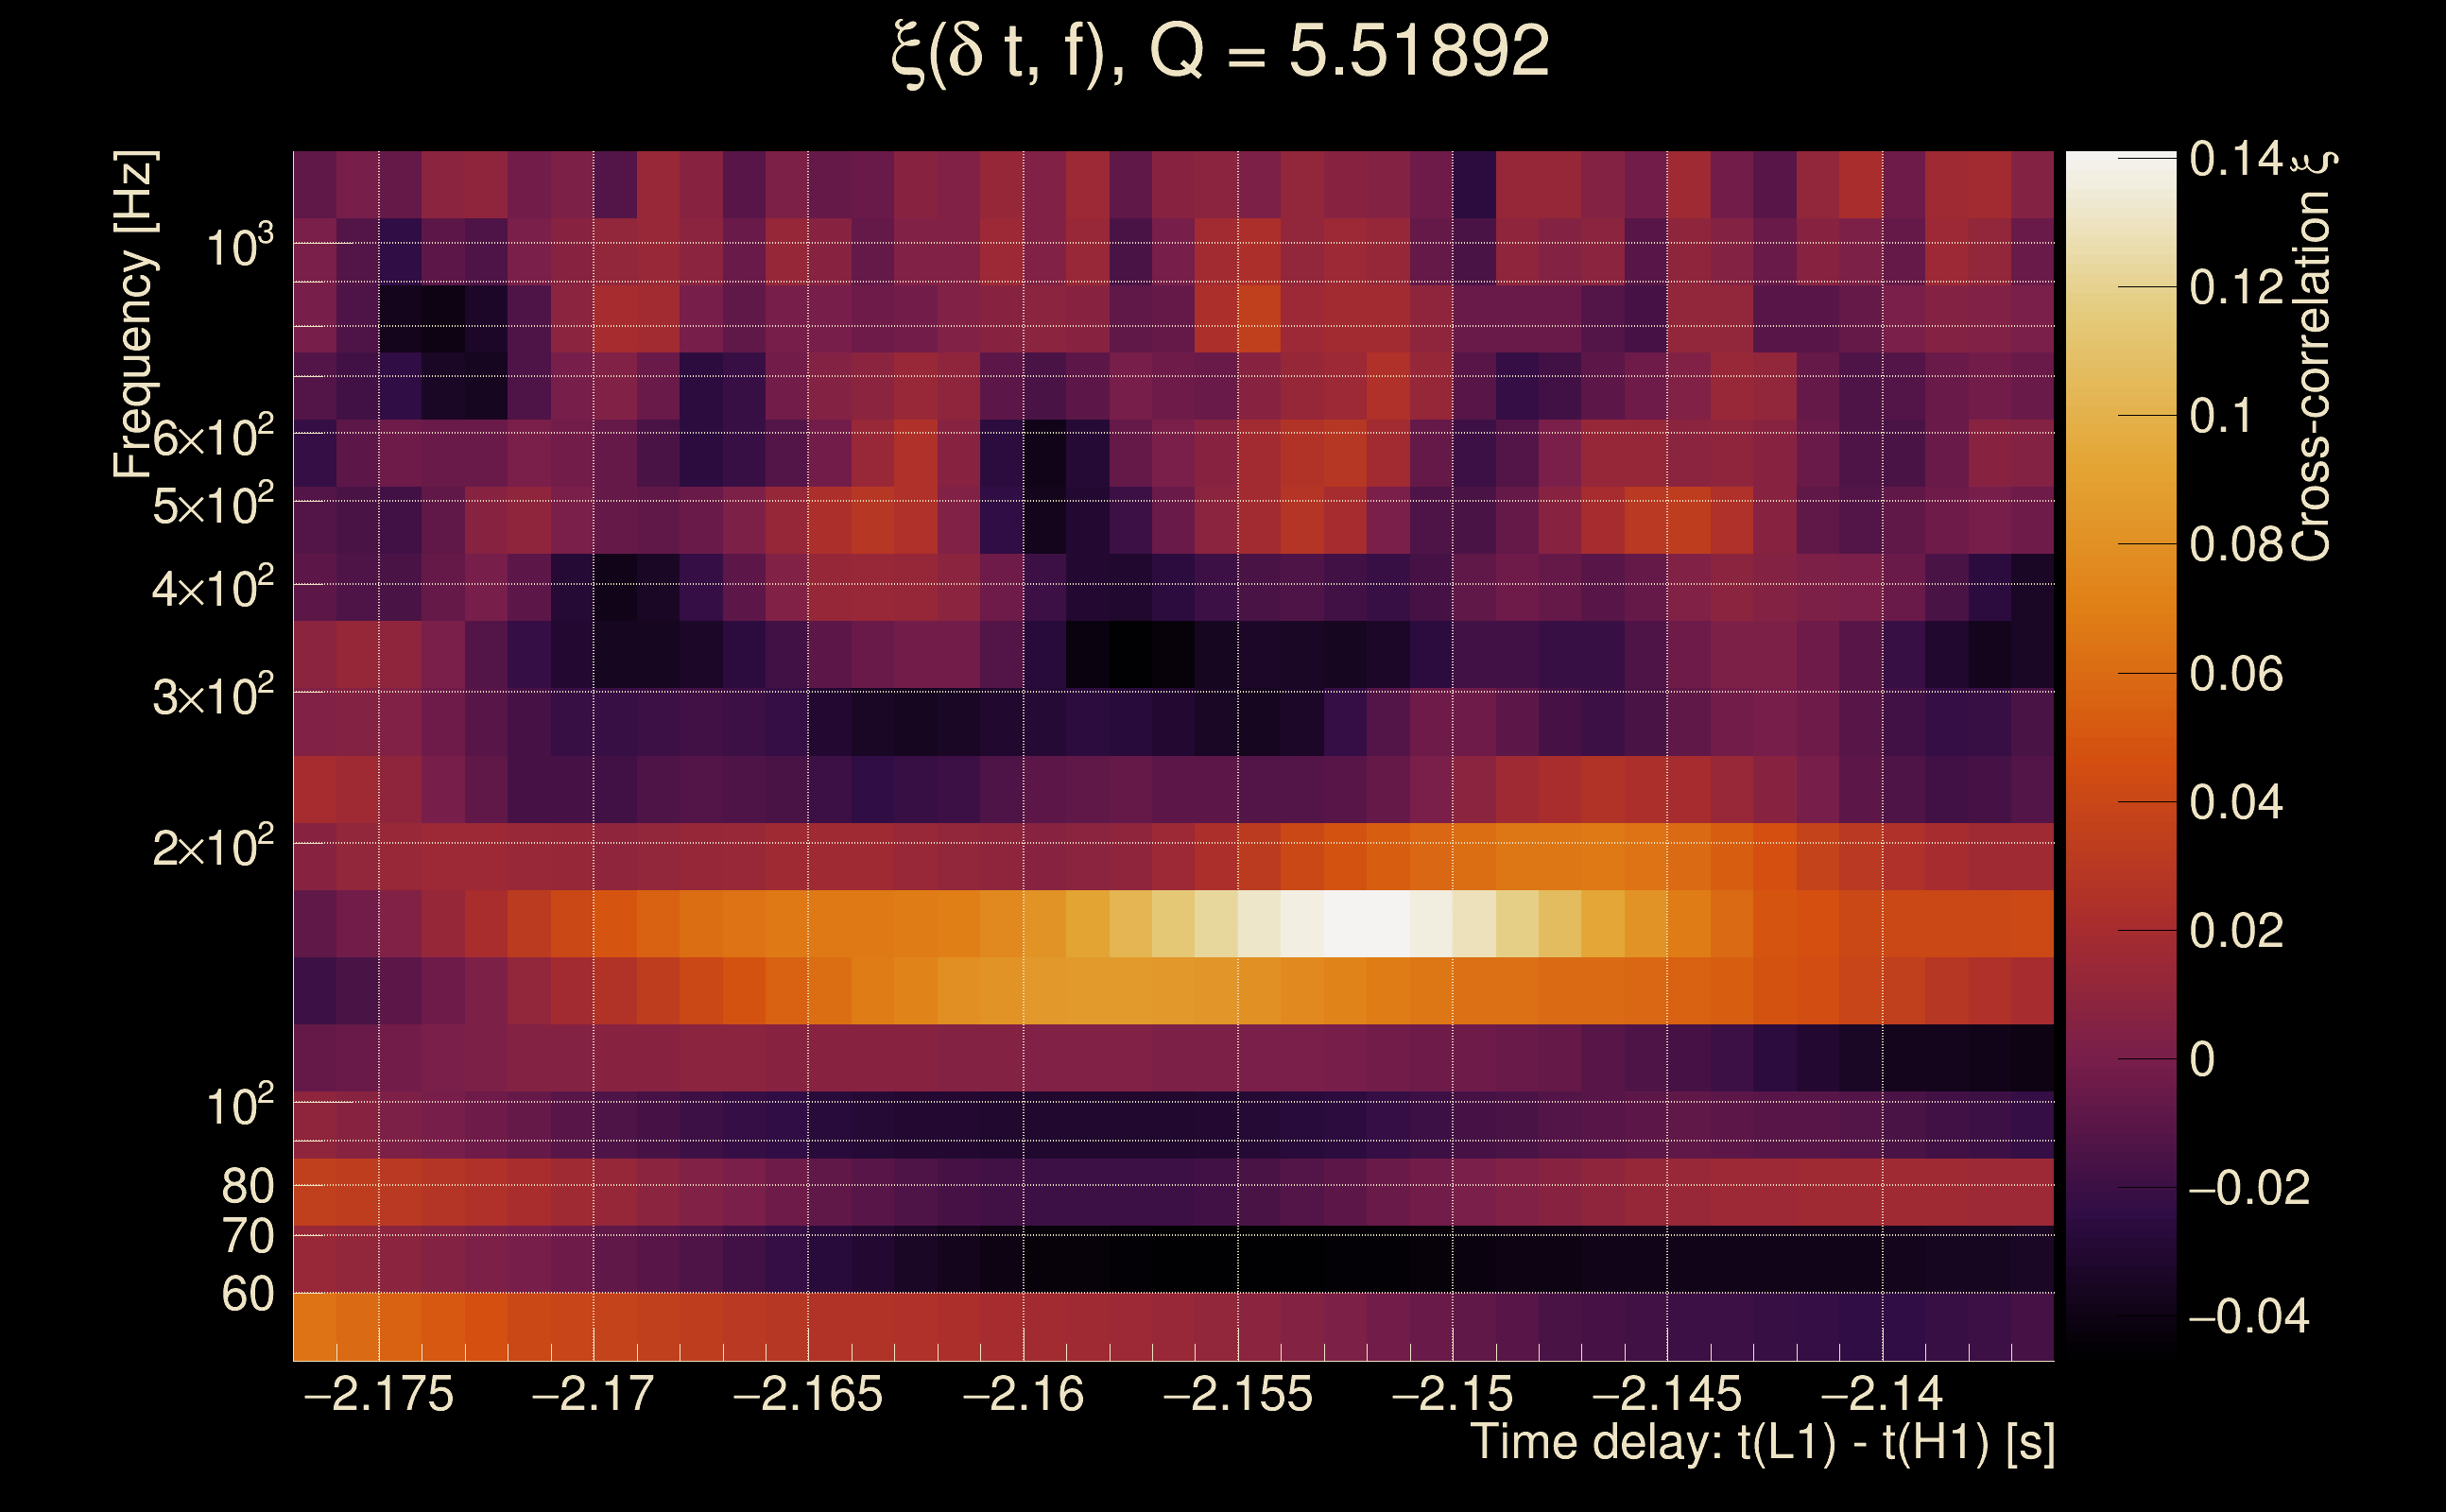
| Number of Q planes: | 5 (Q = 5.51892 → Q = 72.478) |
| Omicron frequency range: | 50 Hz → 1958.38 Hz |
| Light travel time between detectors: | 0.0100128 s |
| Slice extra-time (calibration uncertainty + slice veto): | 0.0129872 s |
| Number of time-delay bins in a cross-correlation map: | 10000 |
| Number of slices in a cross-correlation map: | 217 |
| Number of time-delay bins in a slice: | 46 |
| SNR gating: | < 100 (detector 0), < 100 (detector 1) |
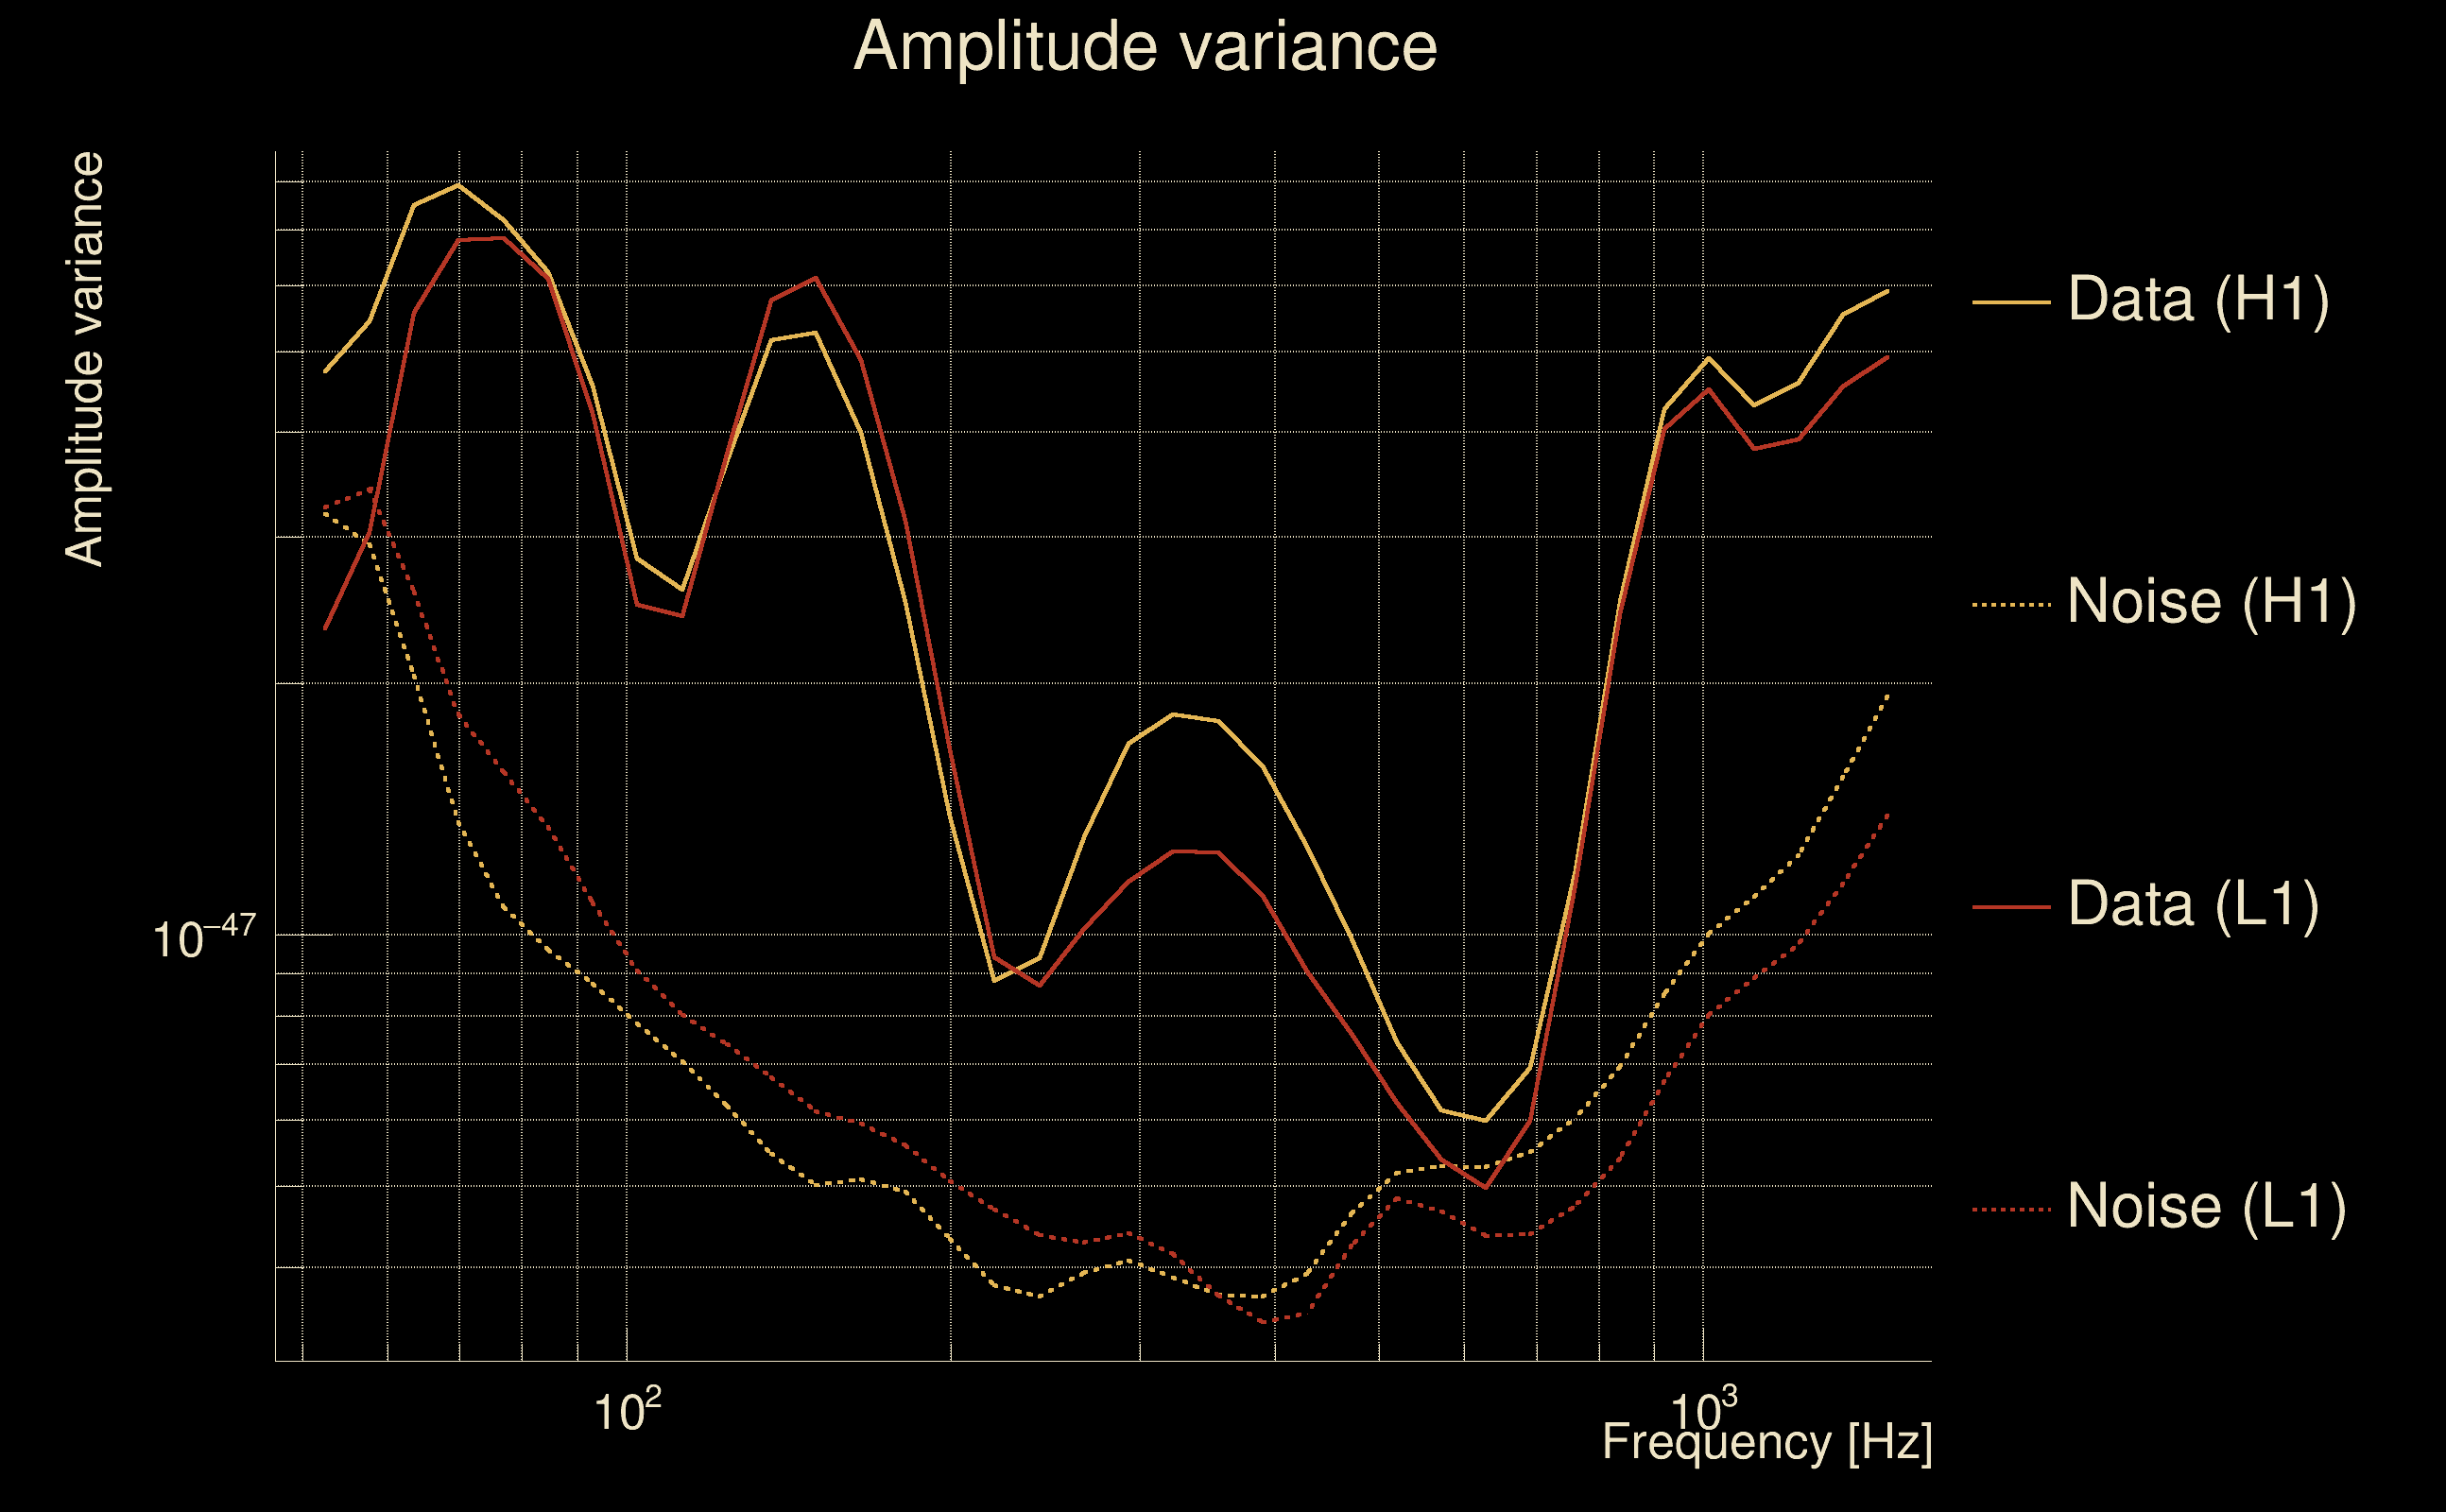
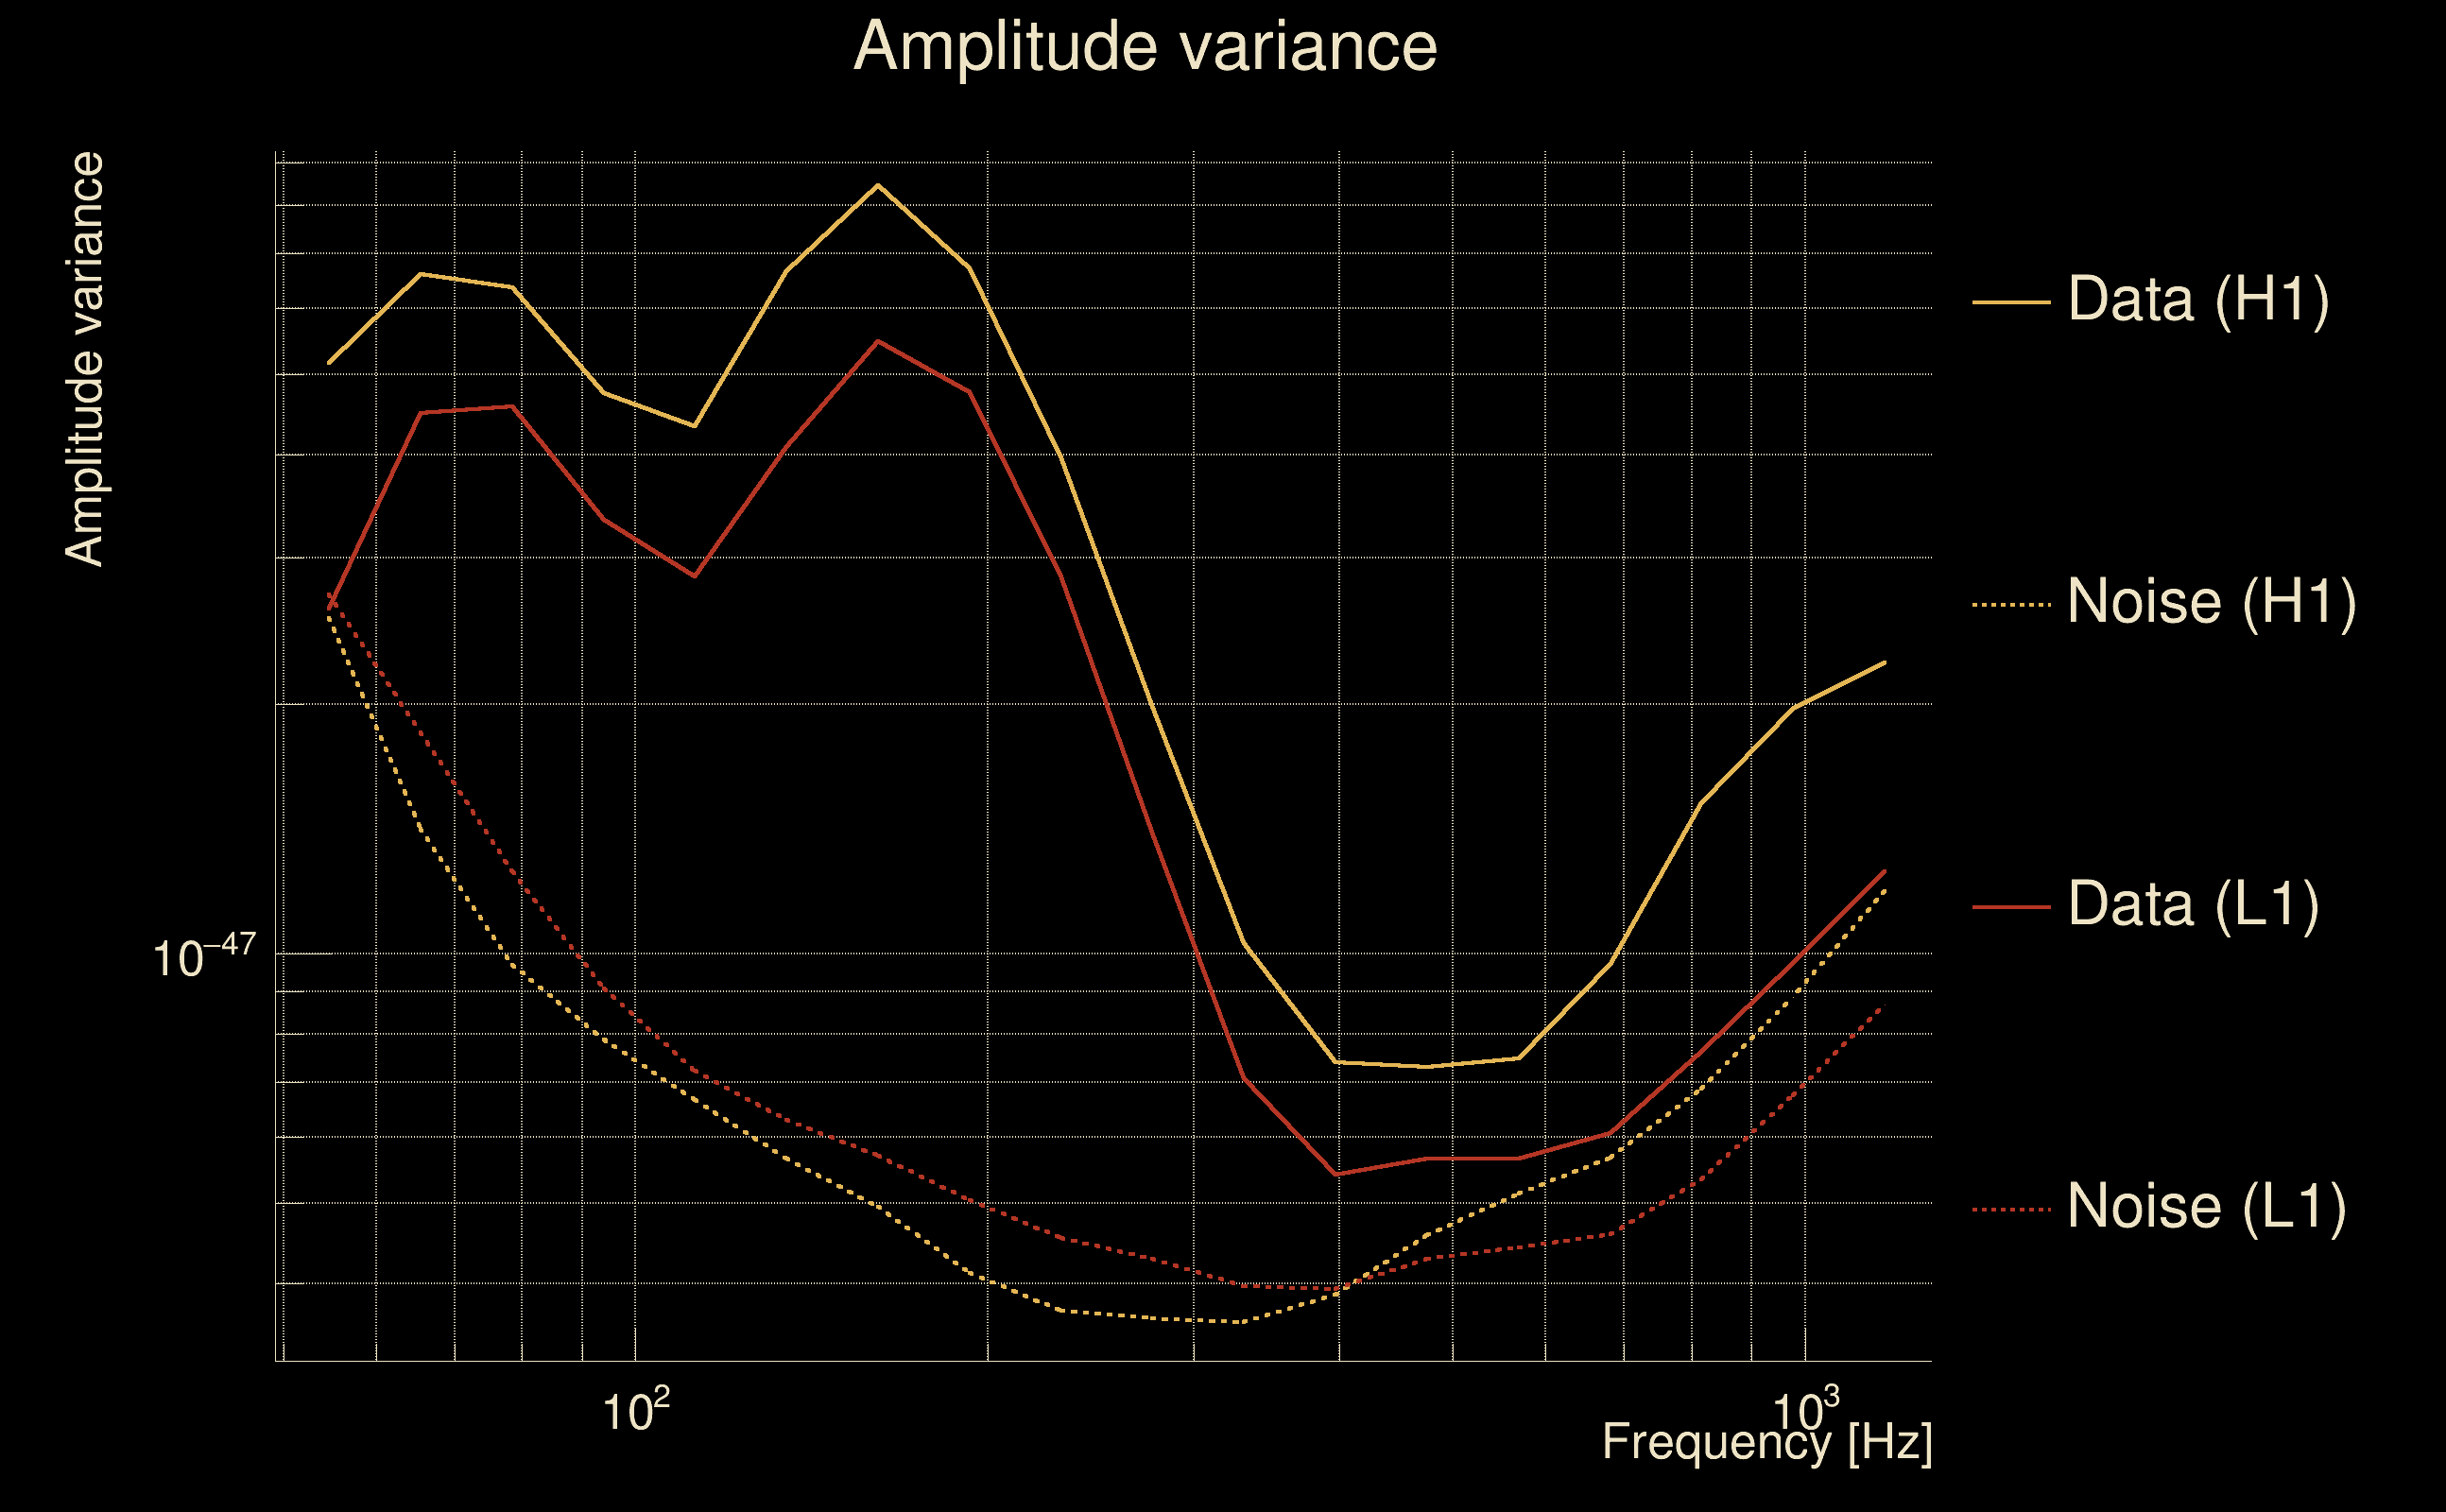
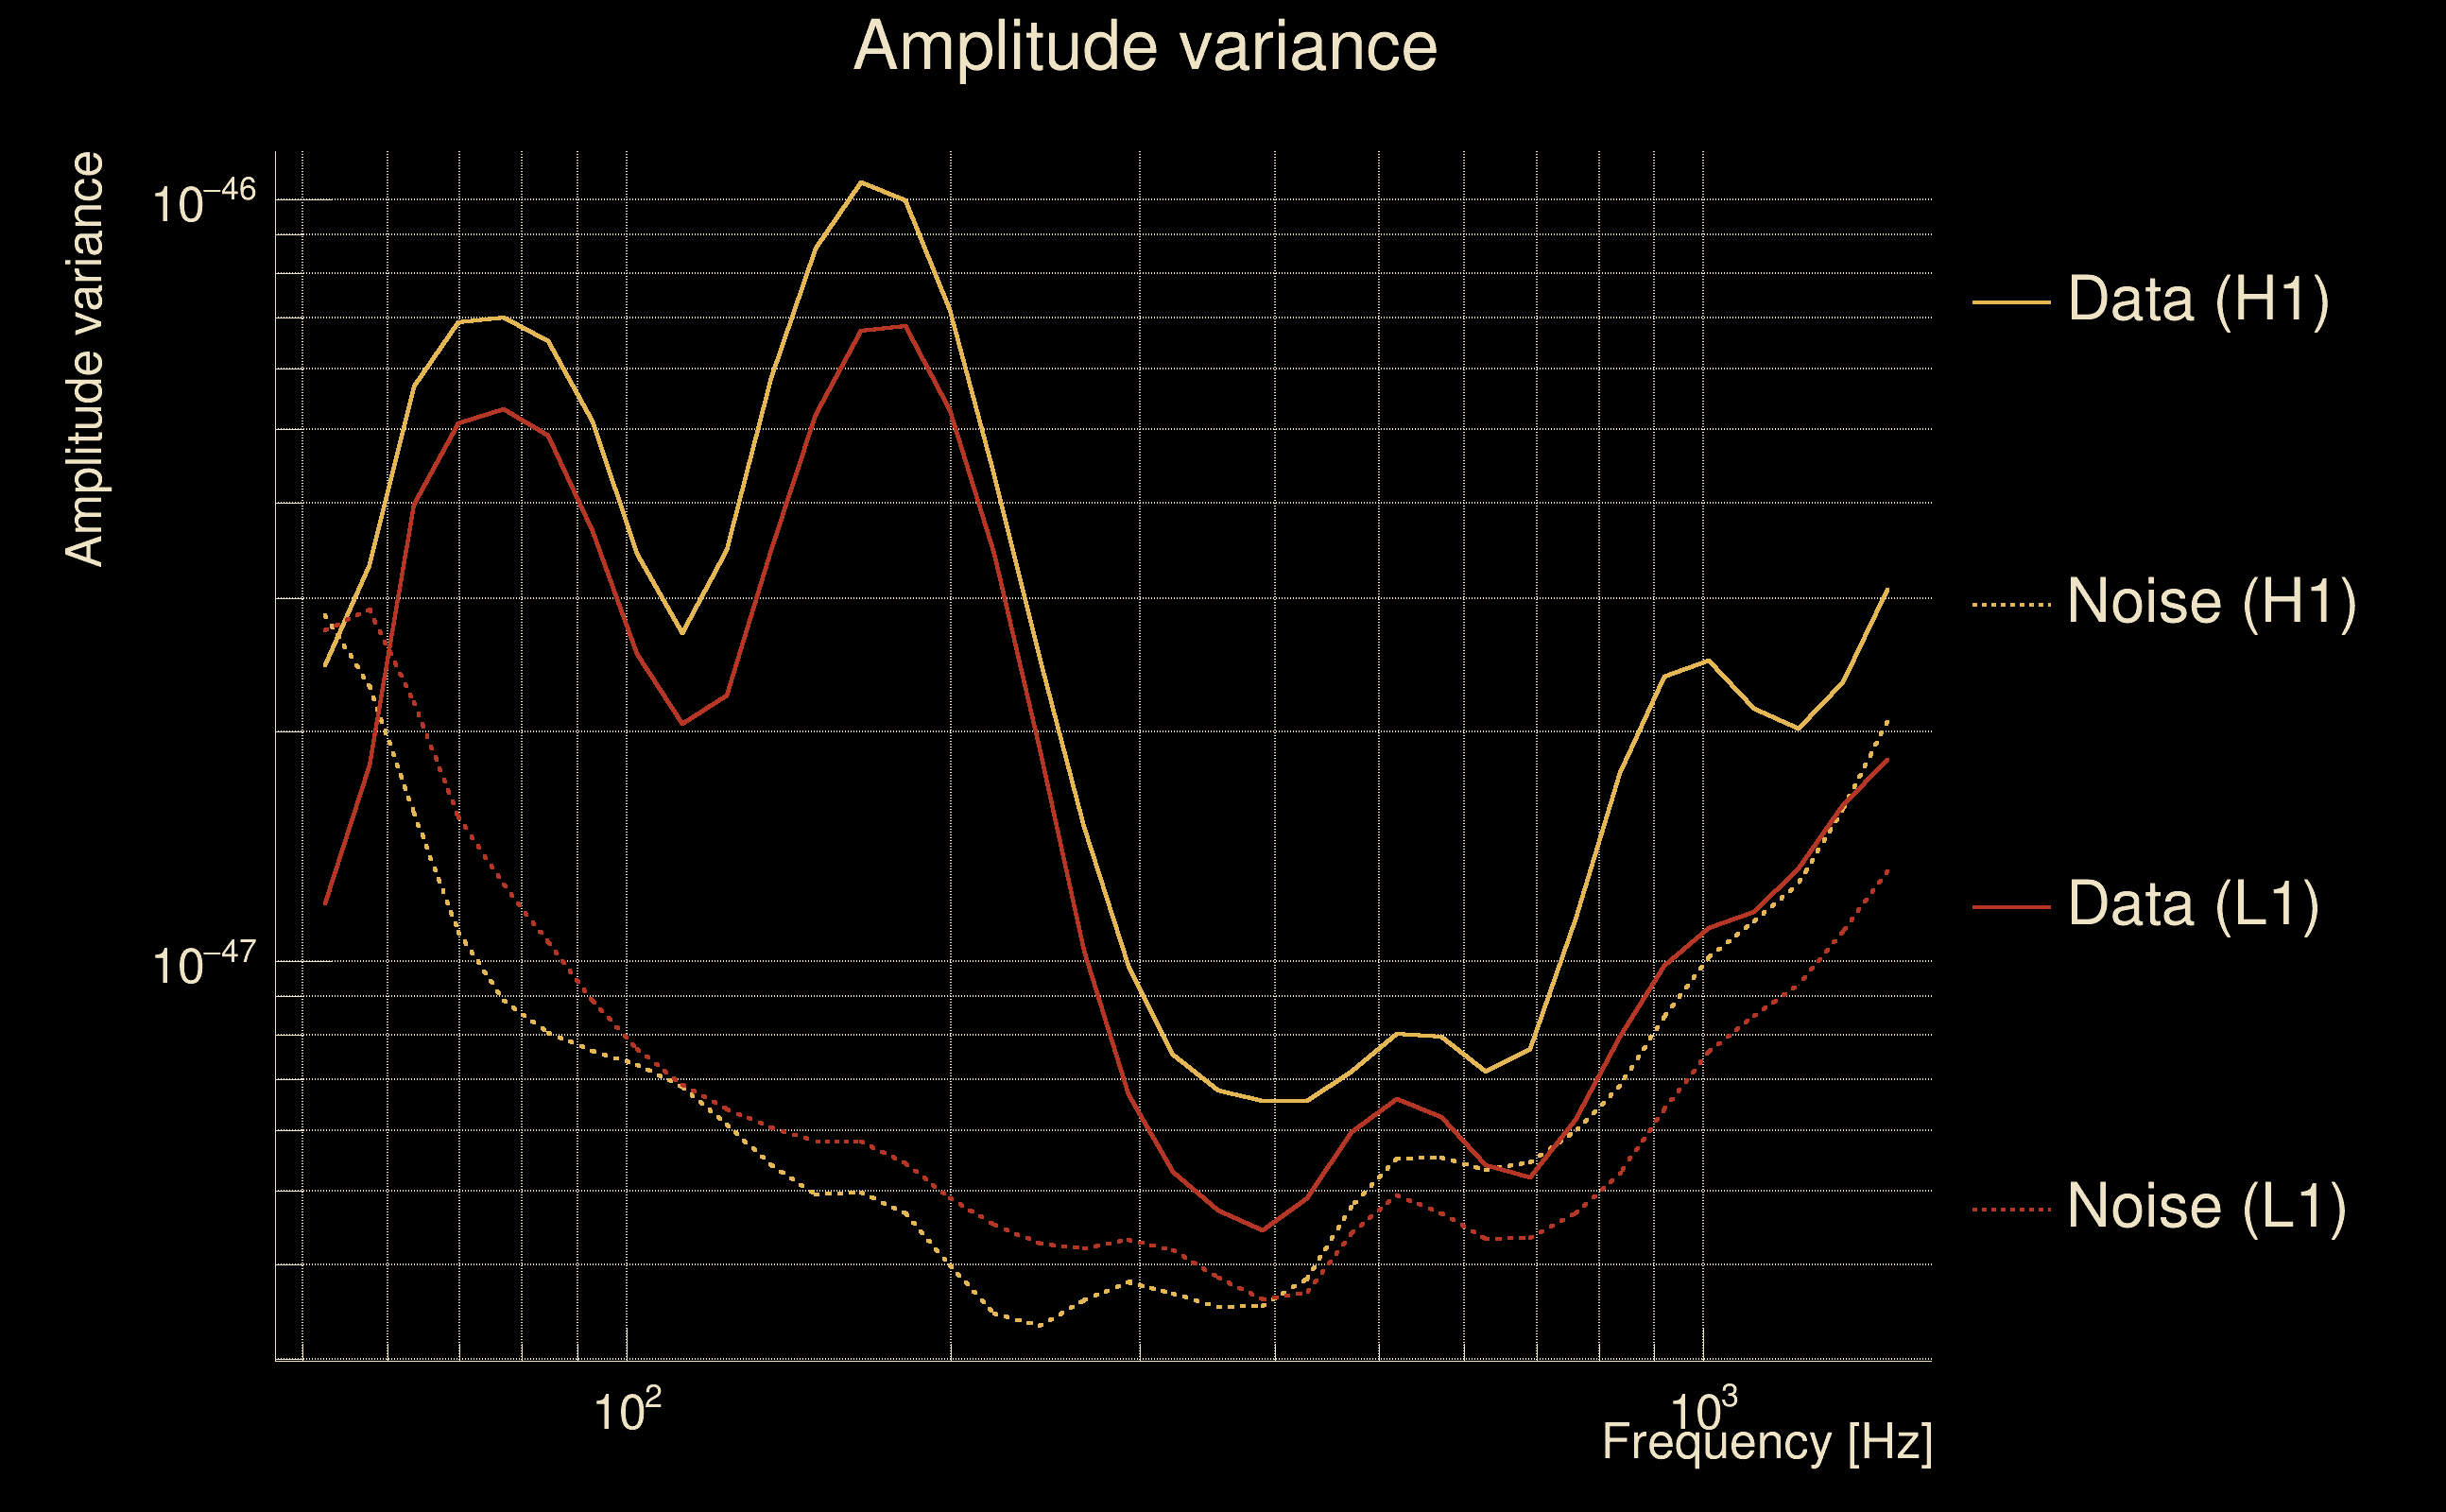
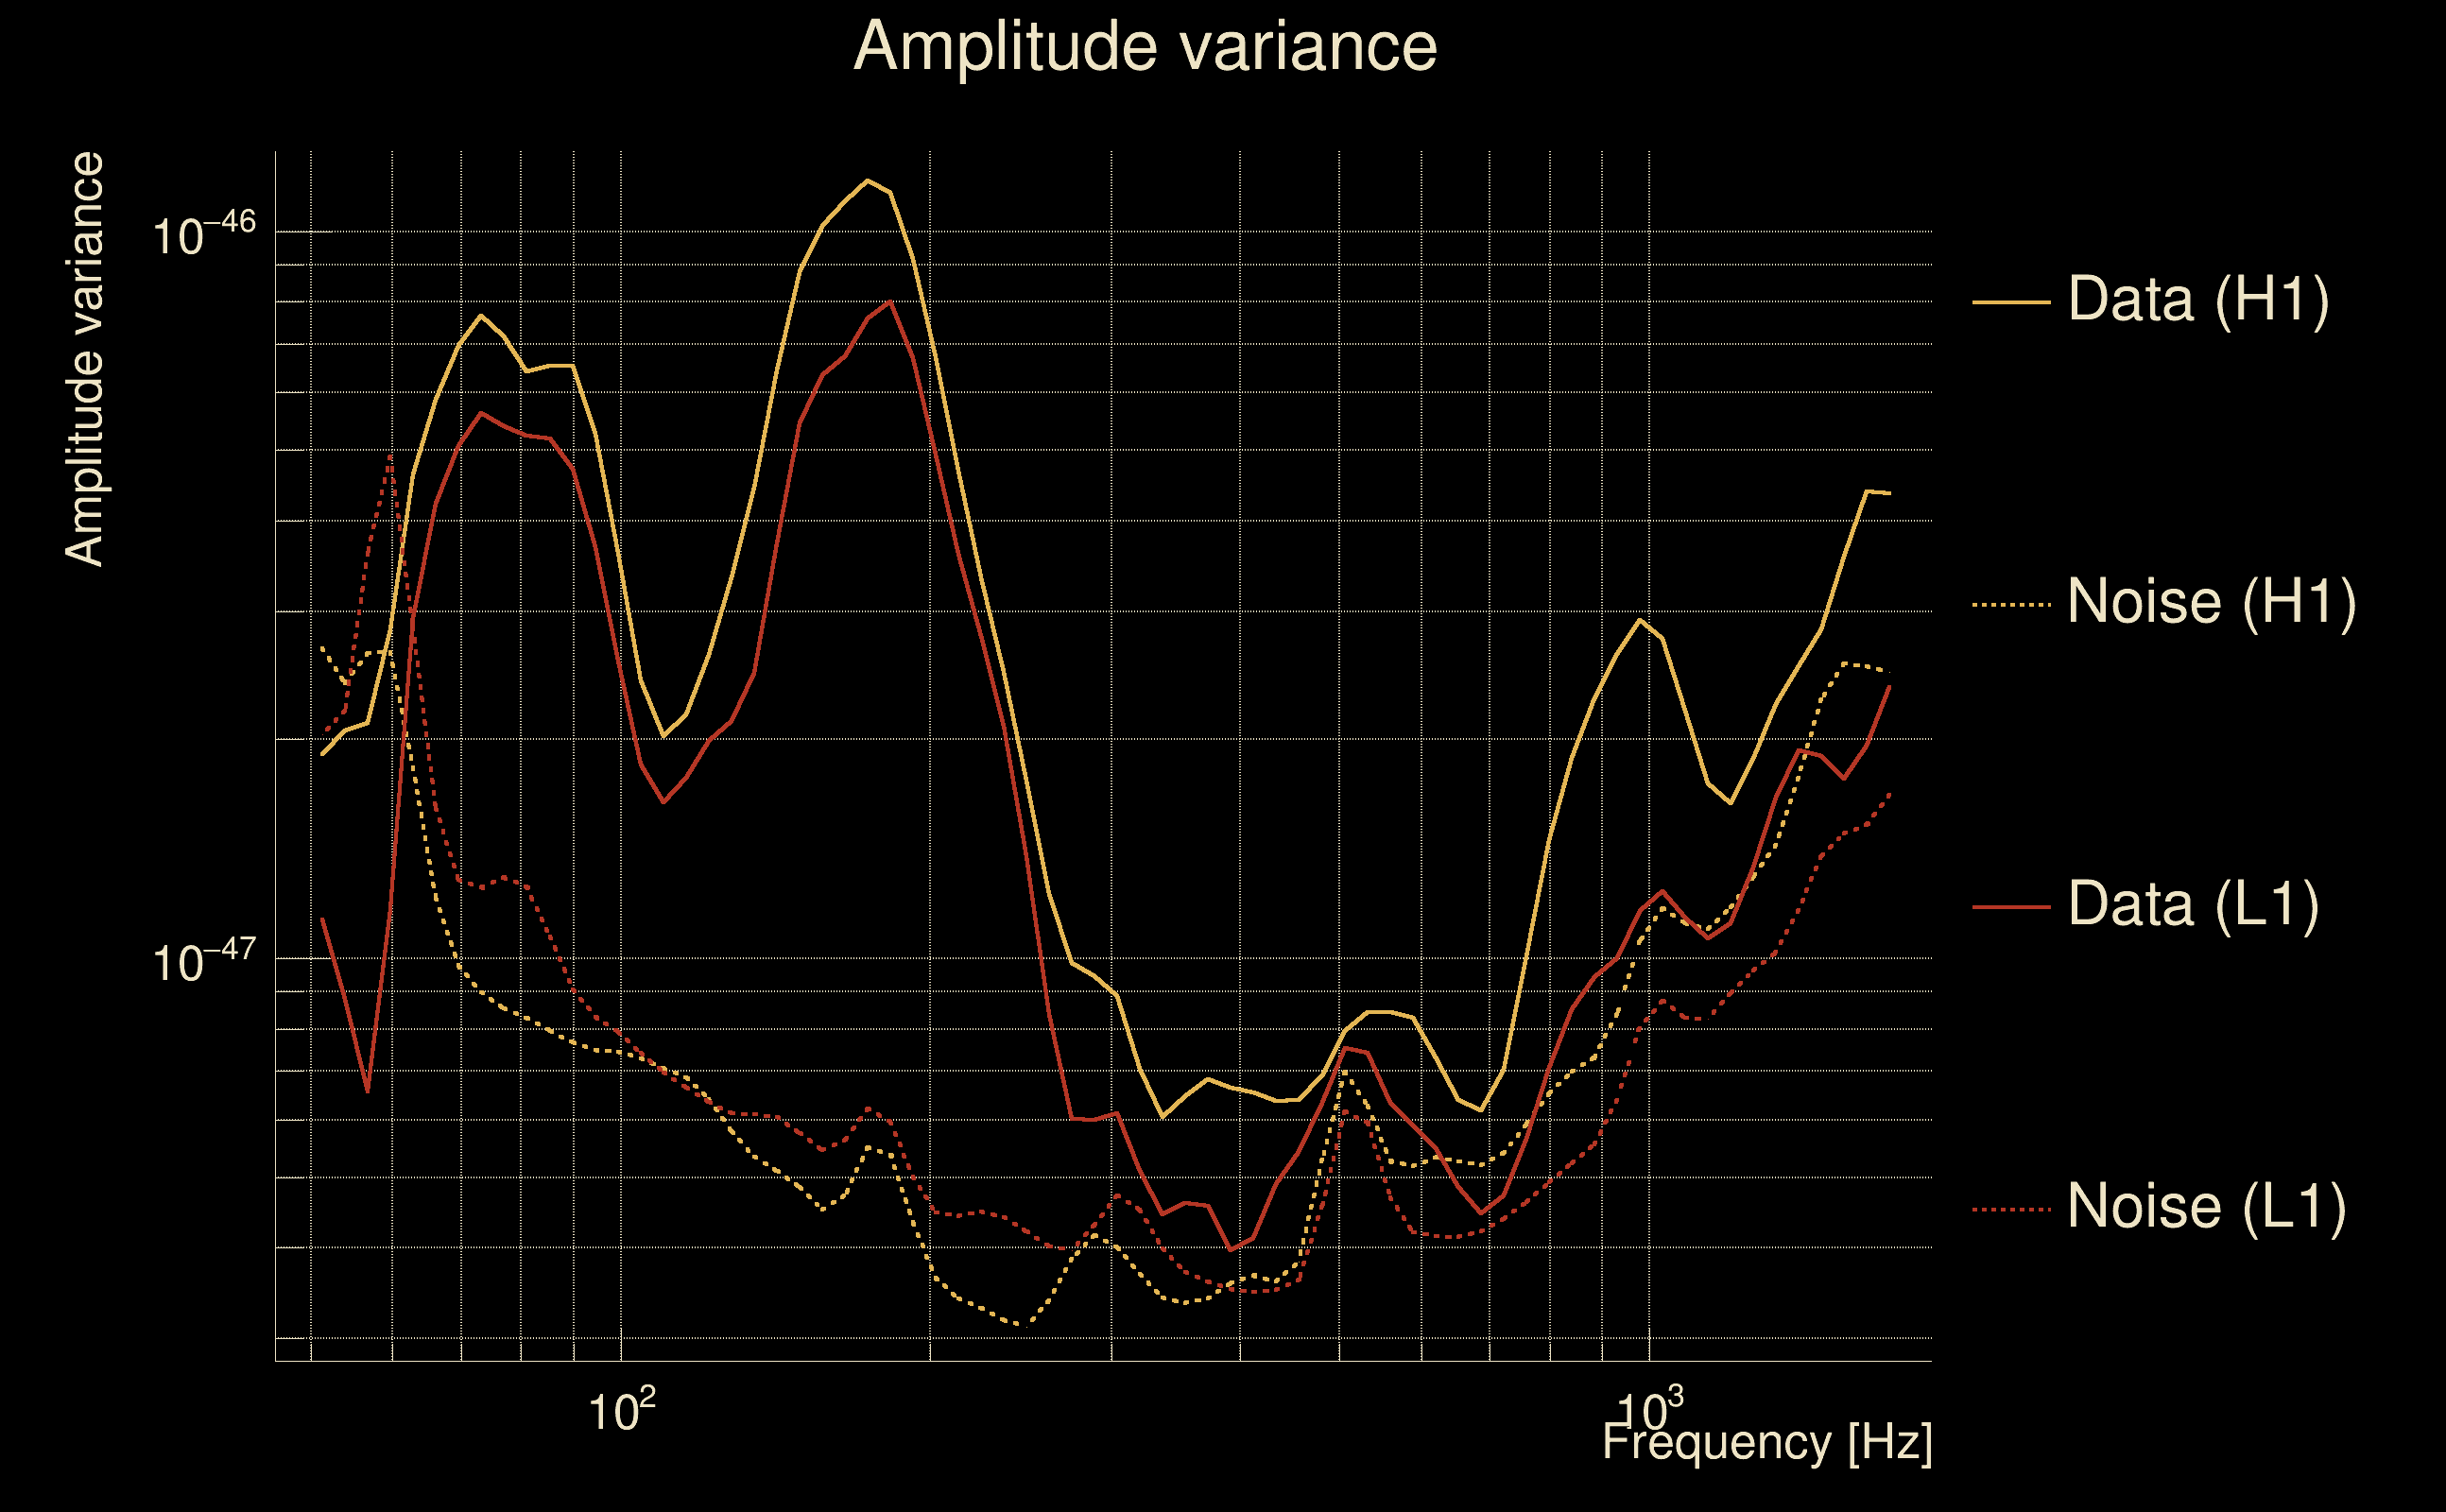
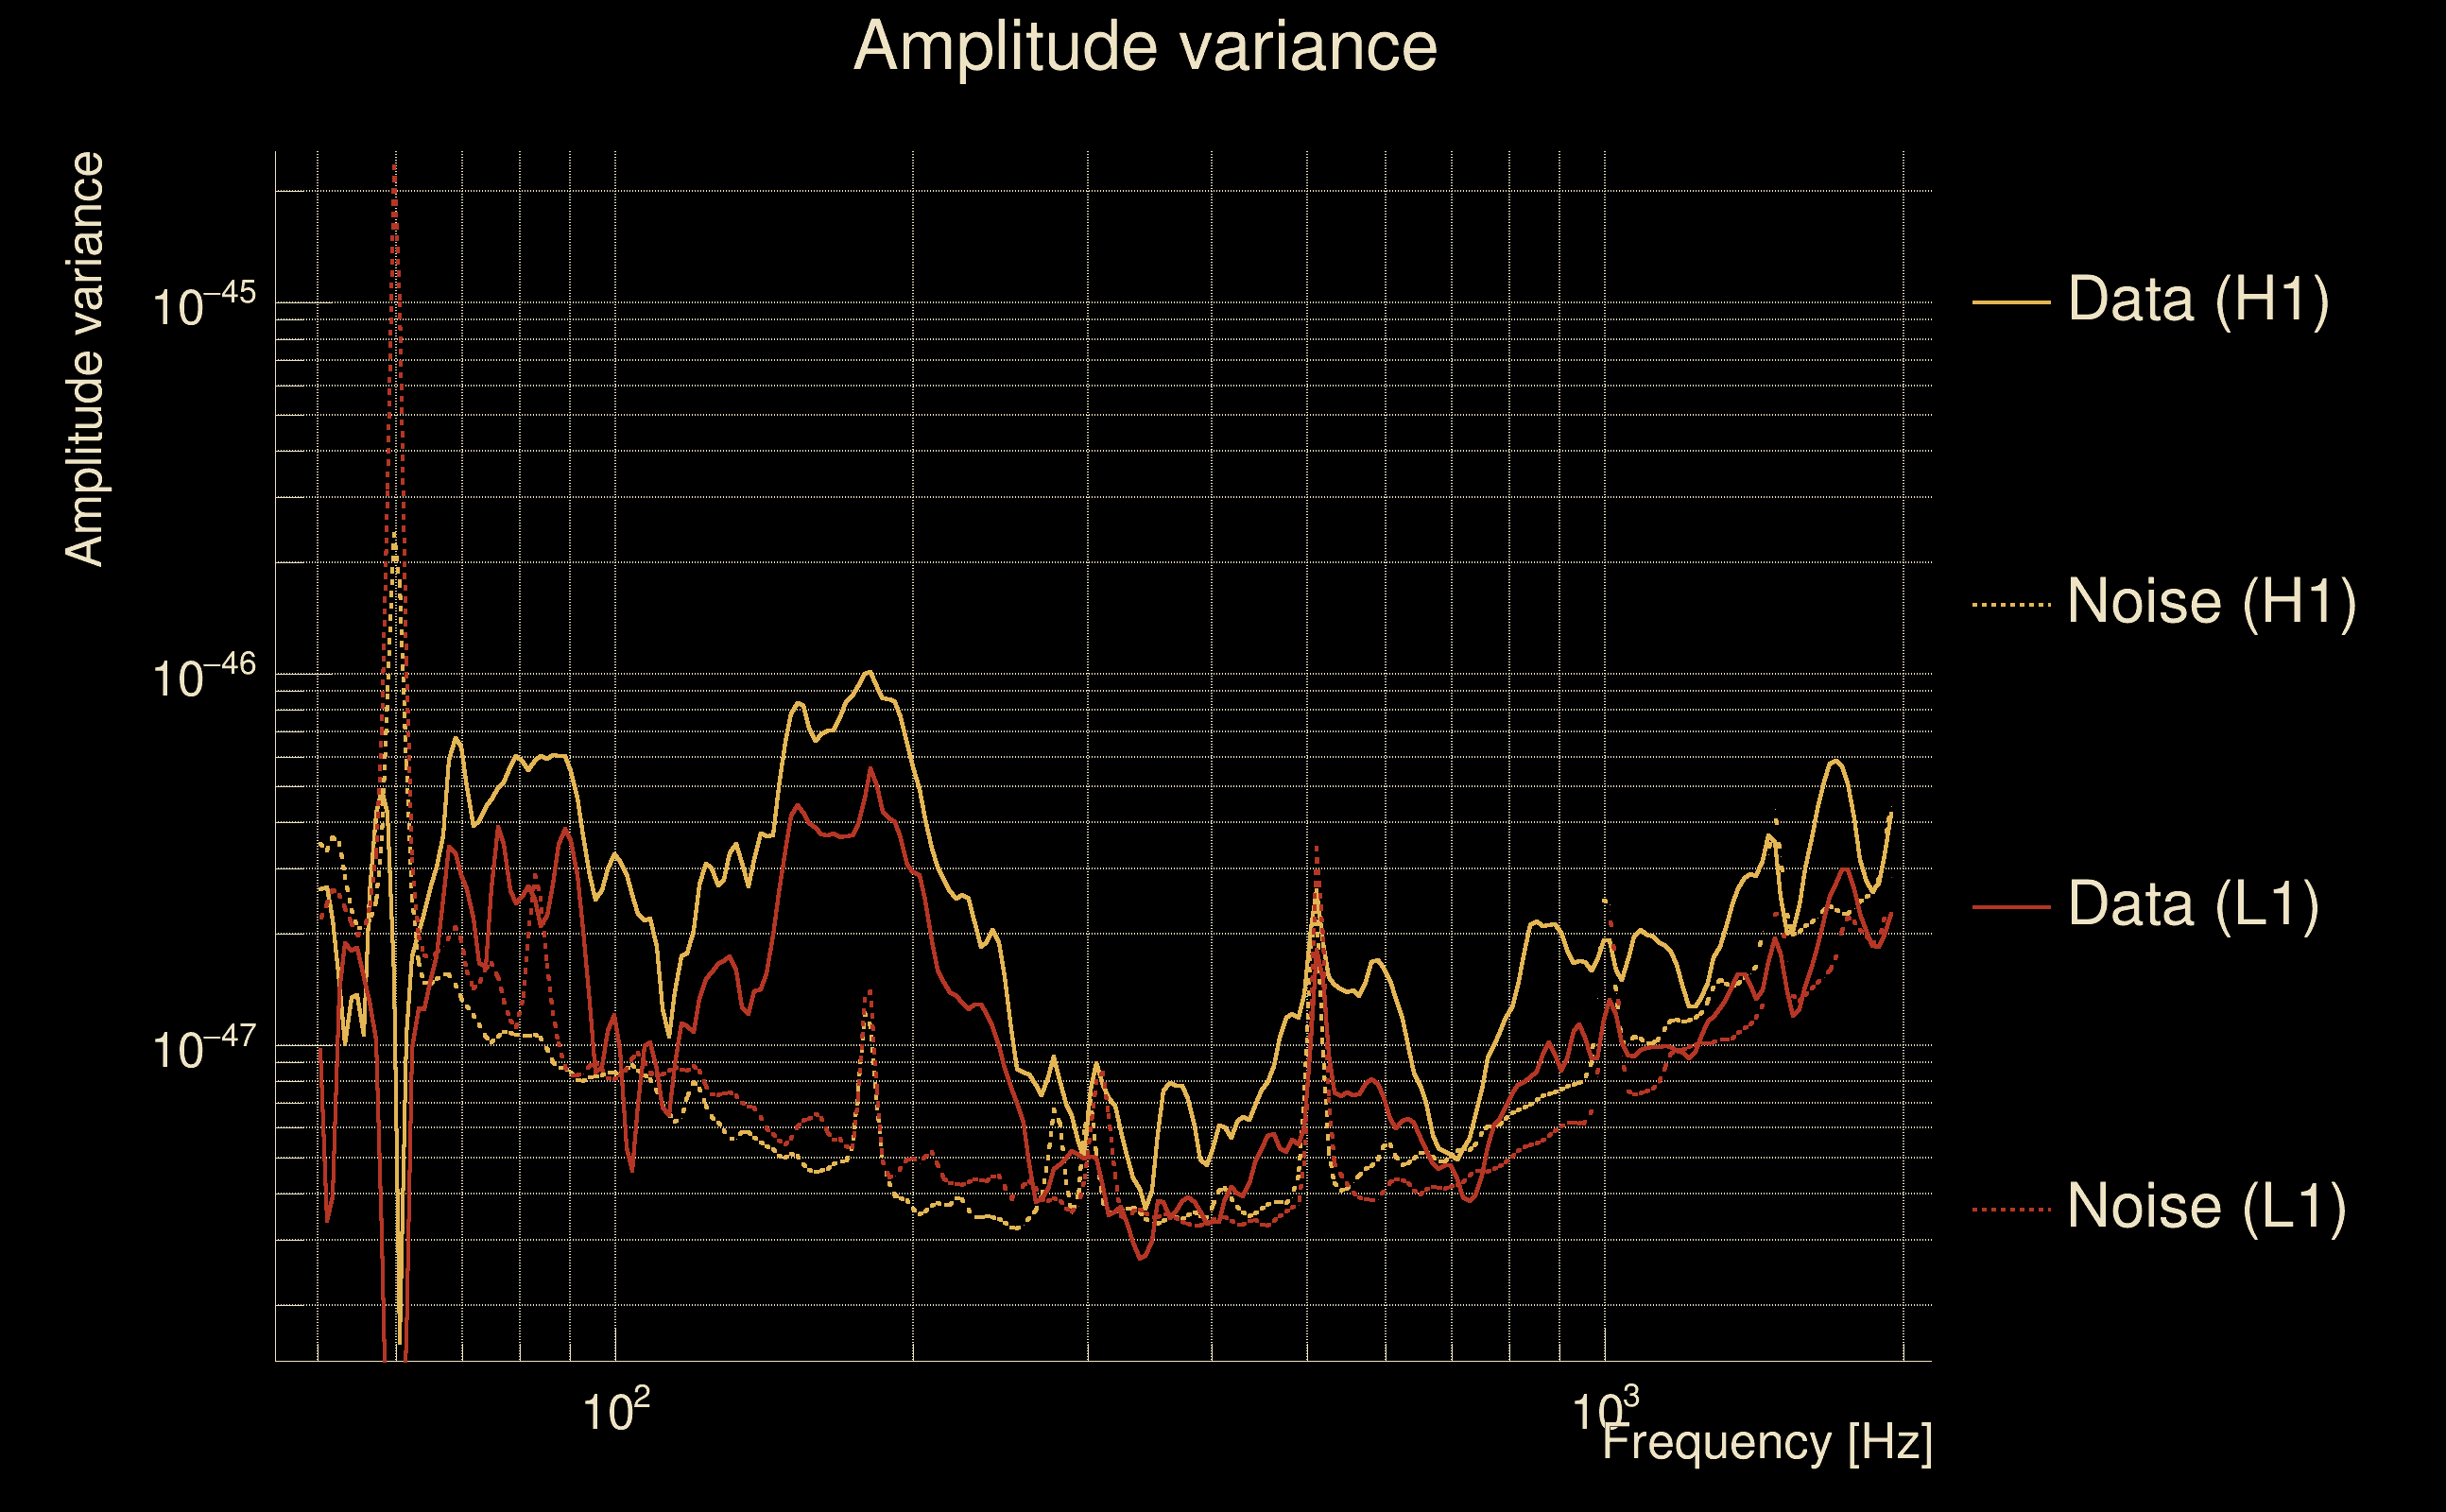
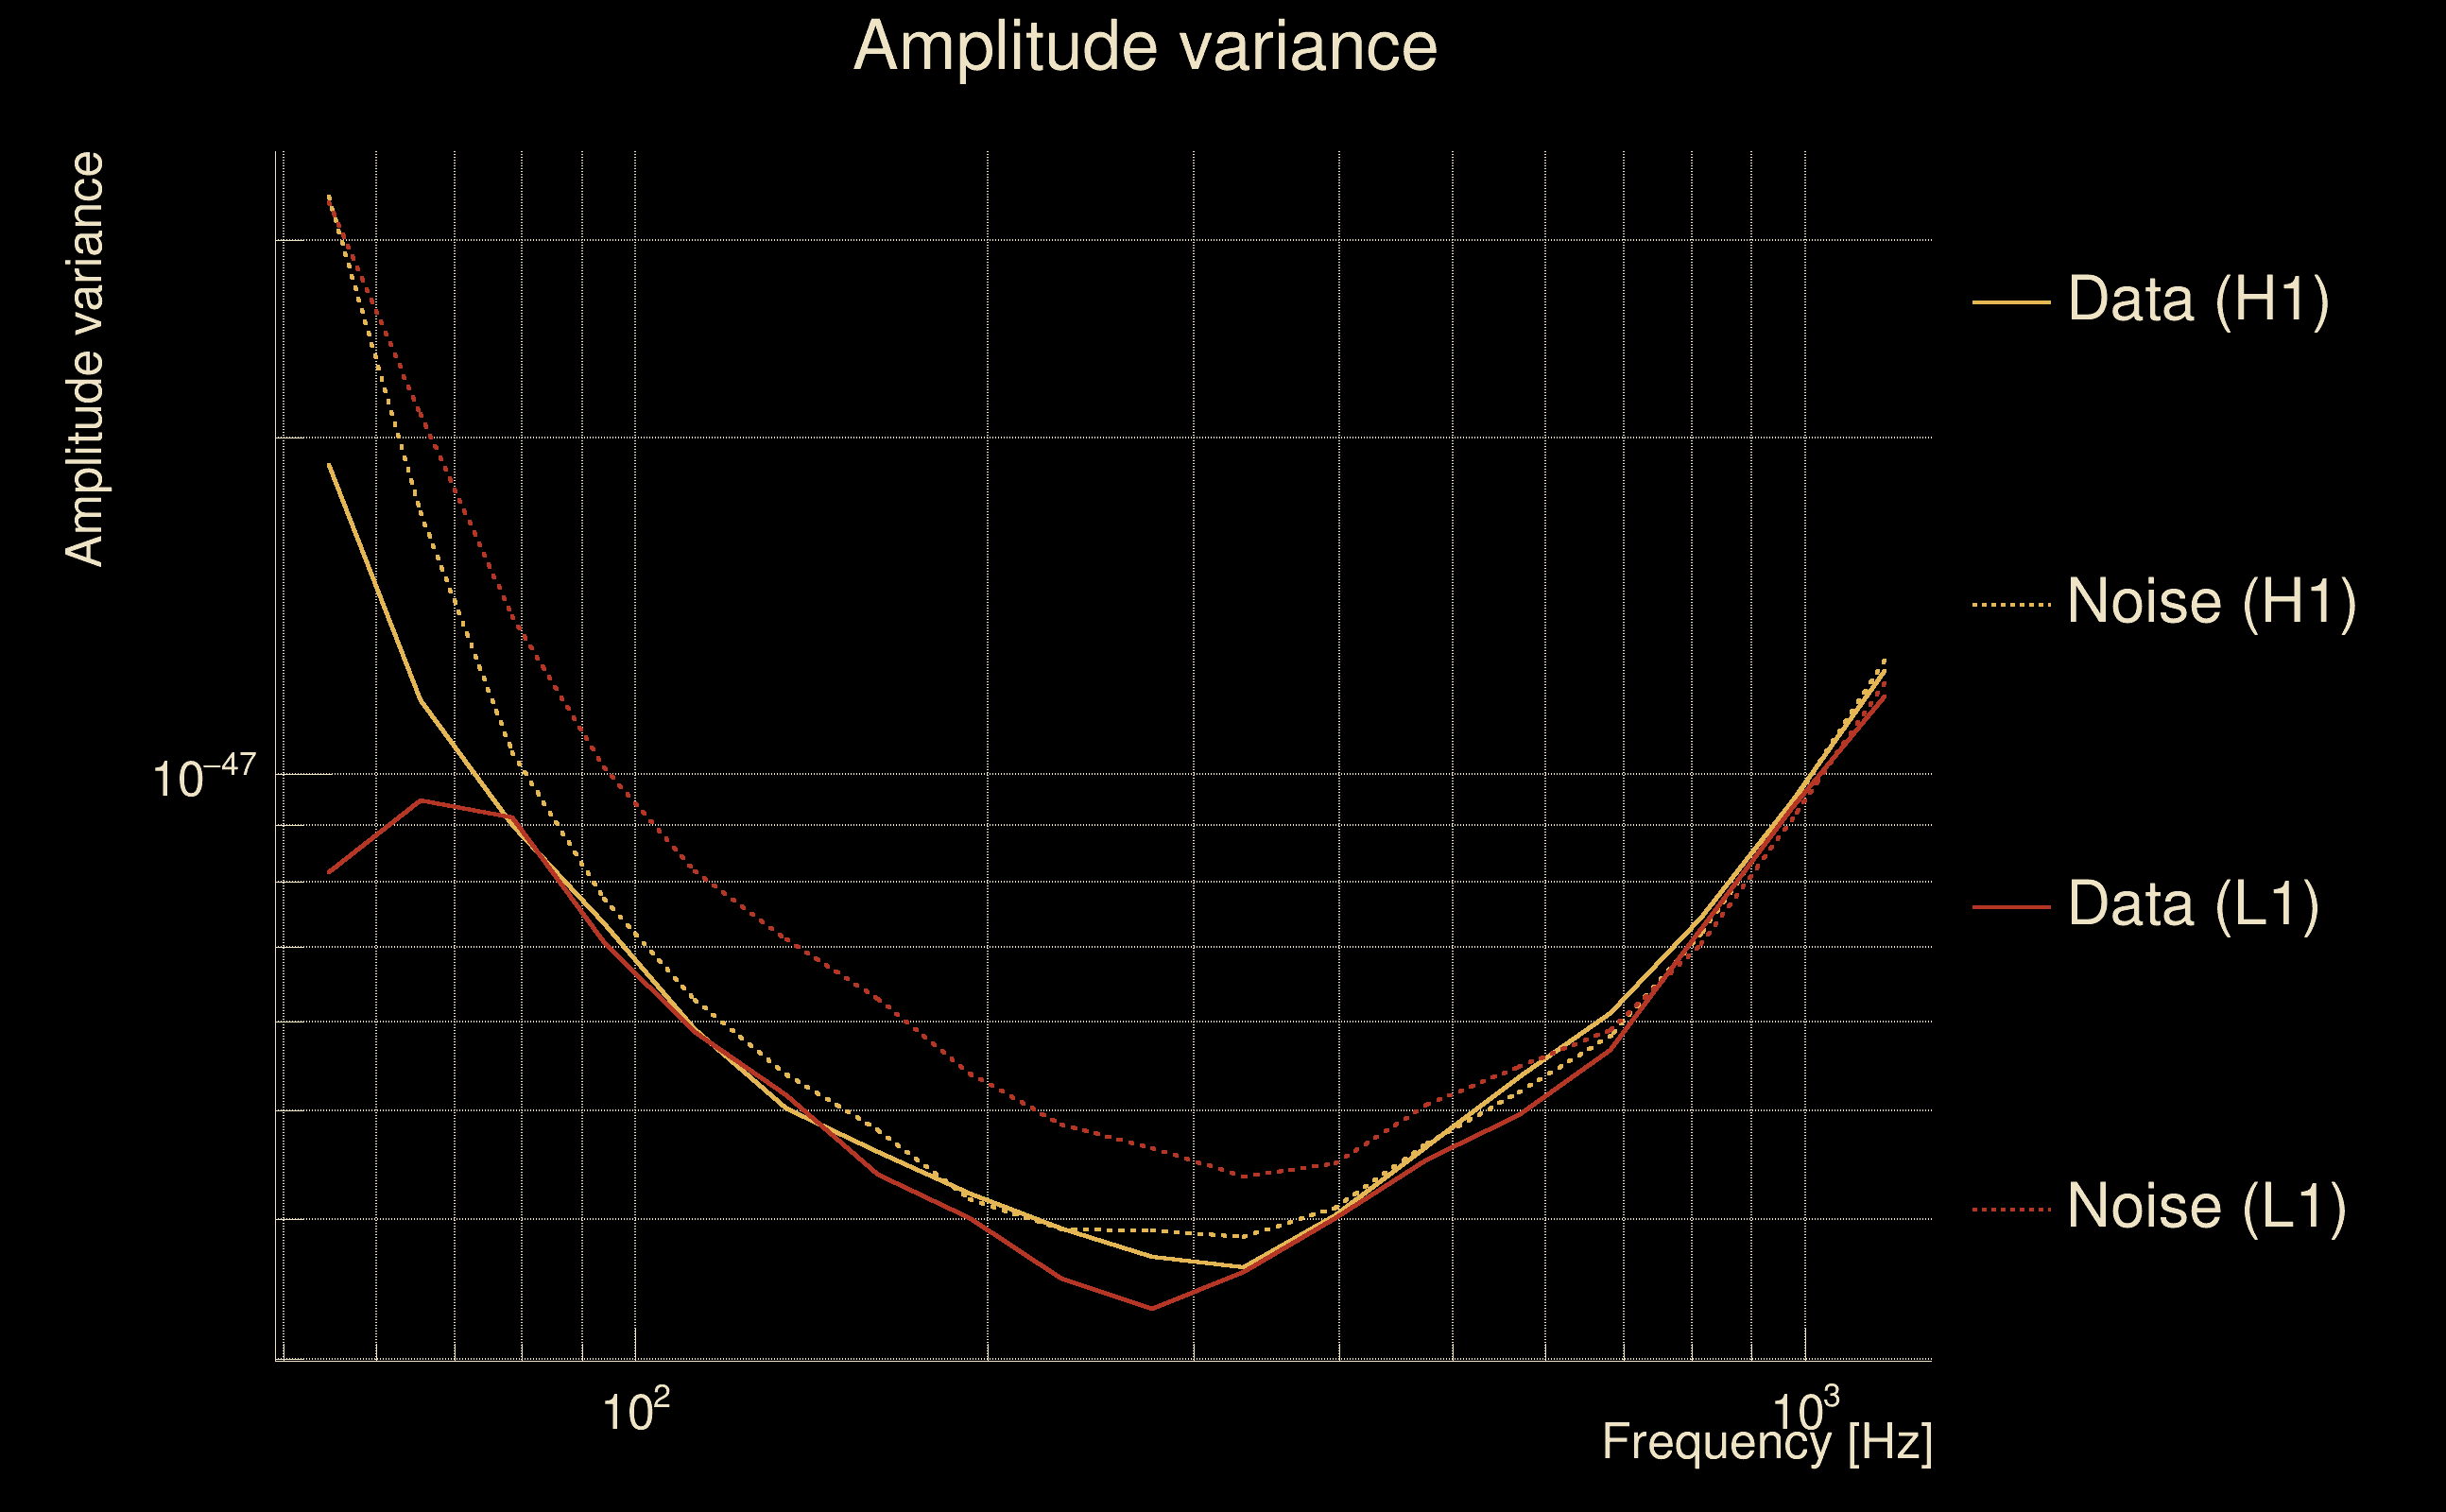
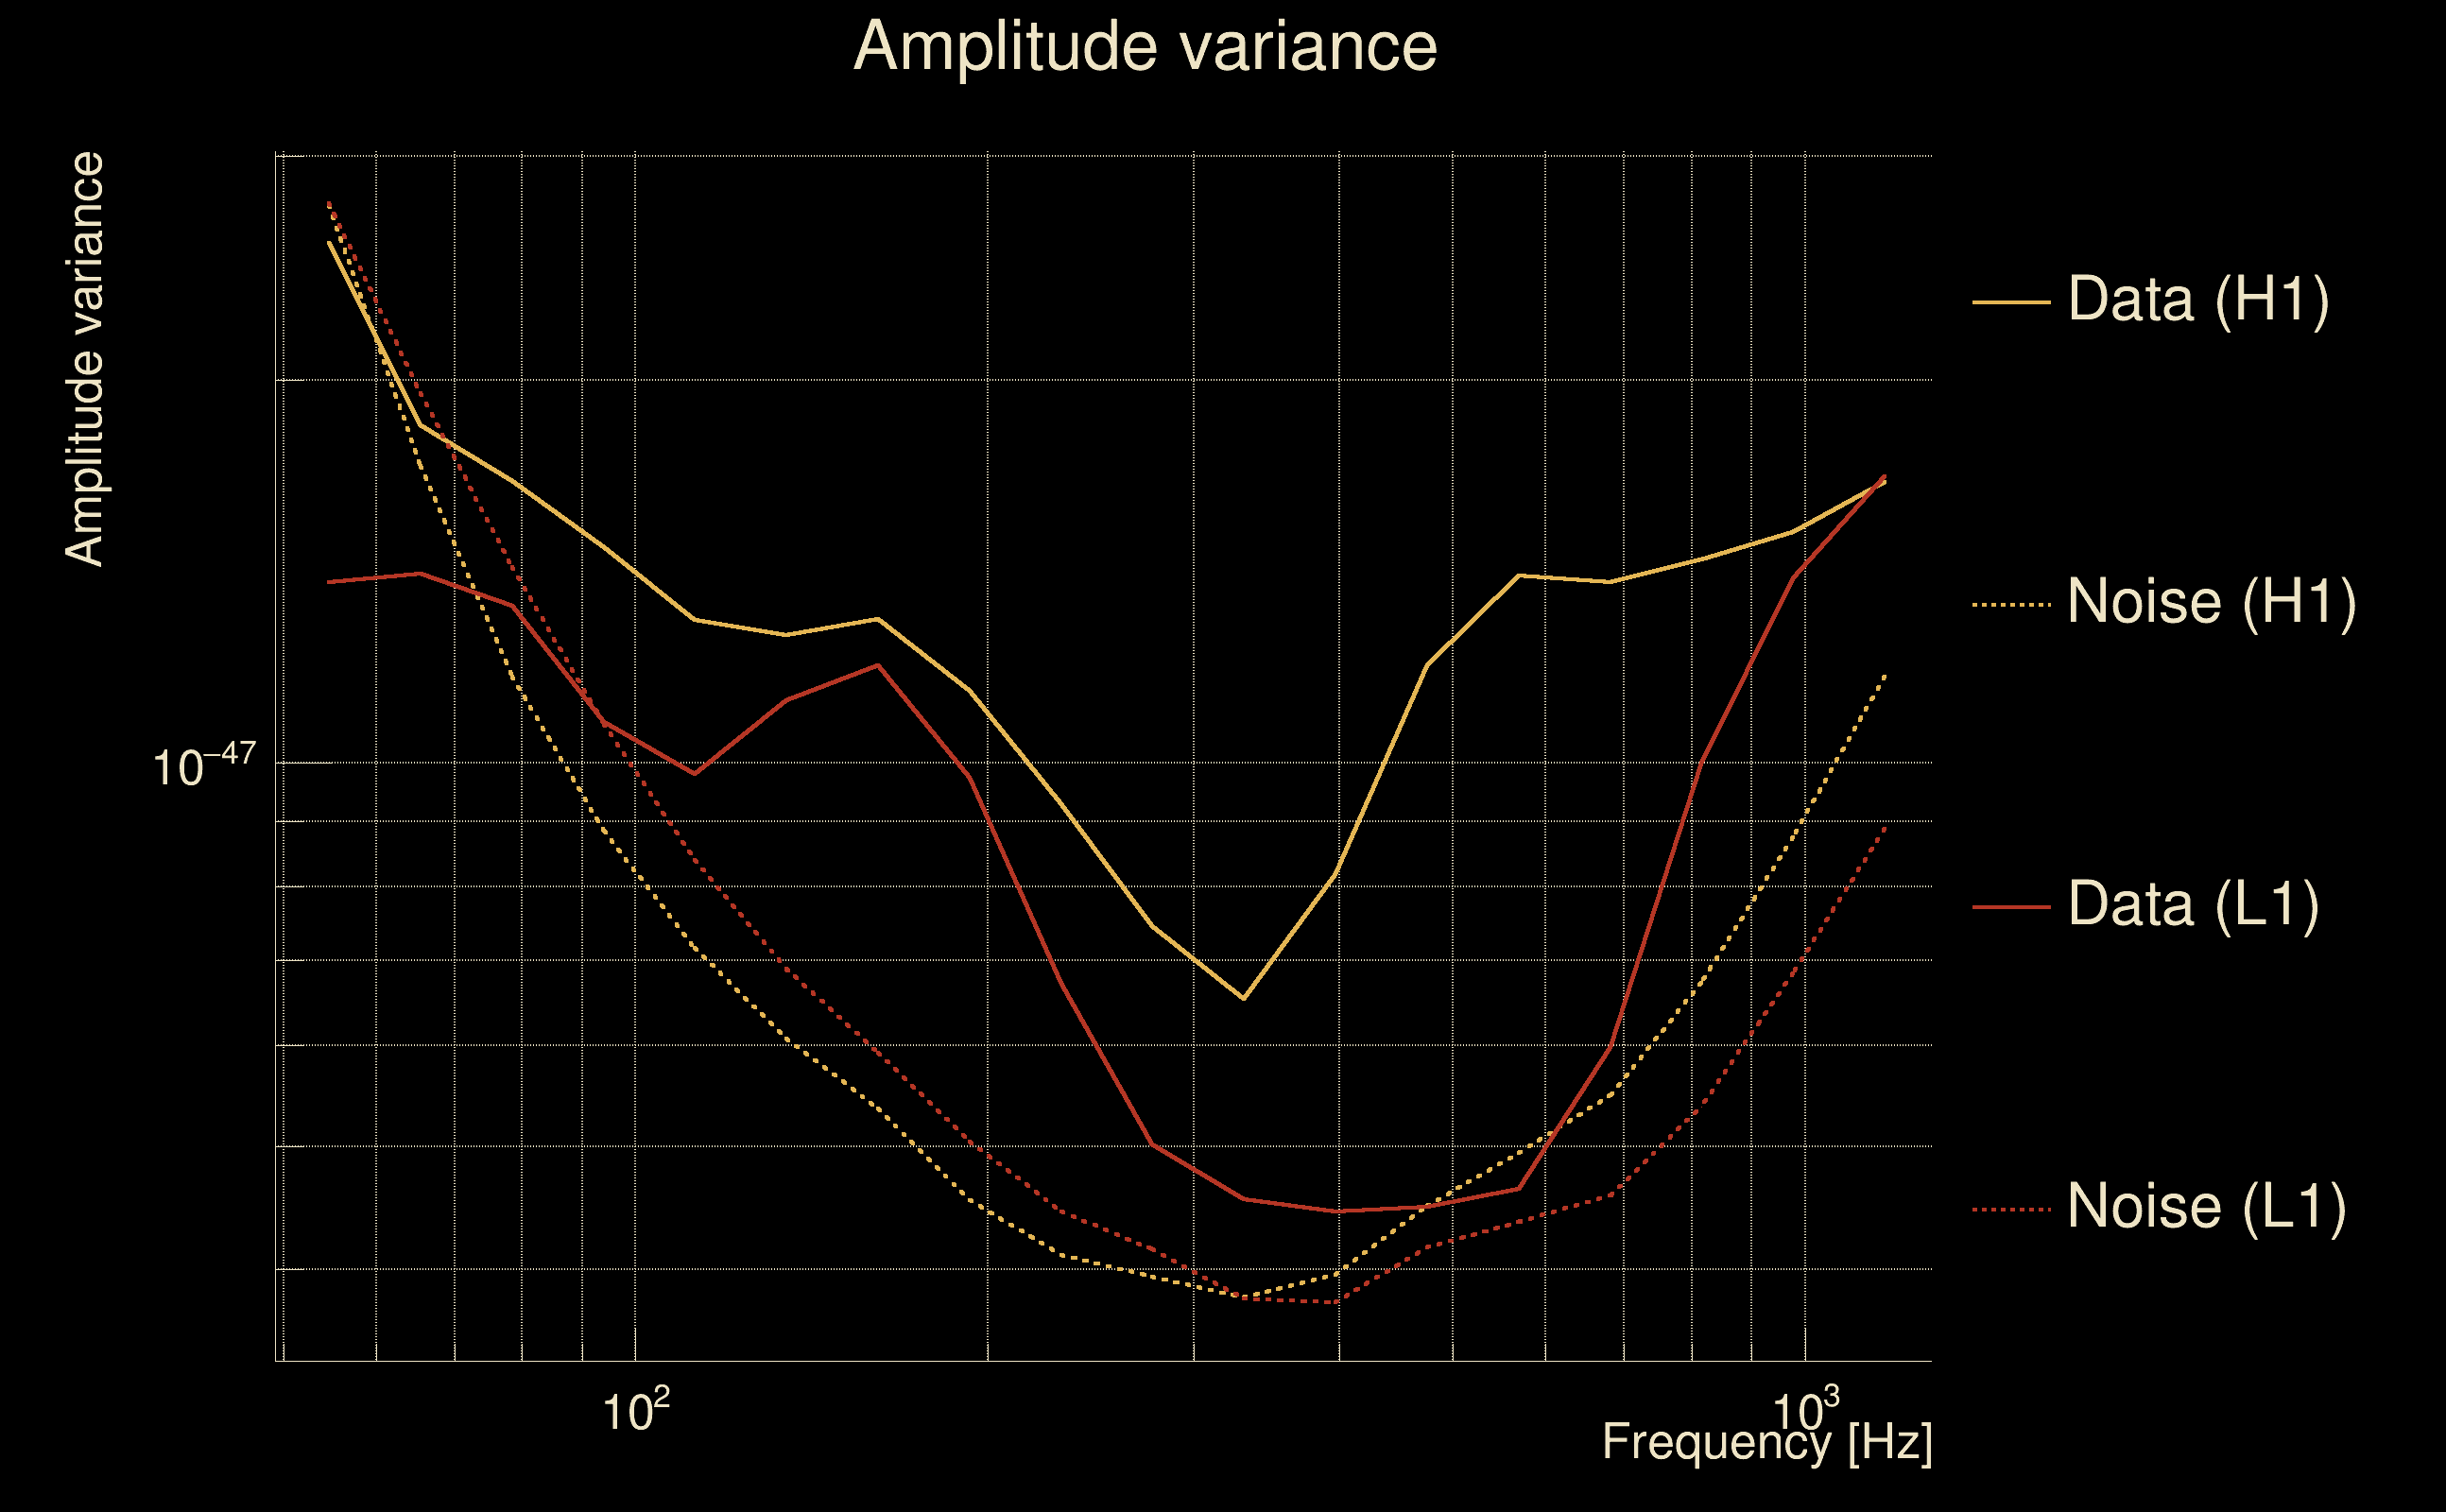
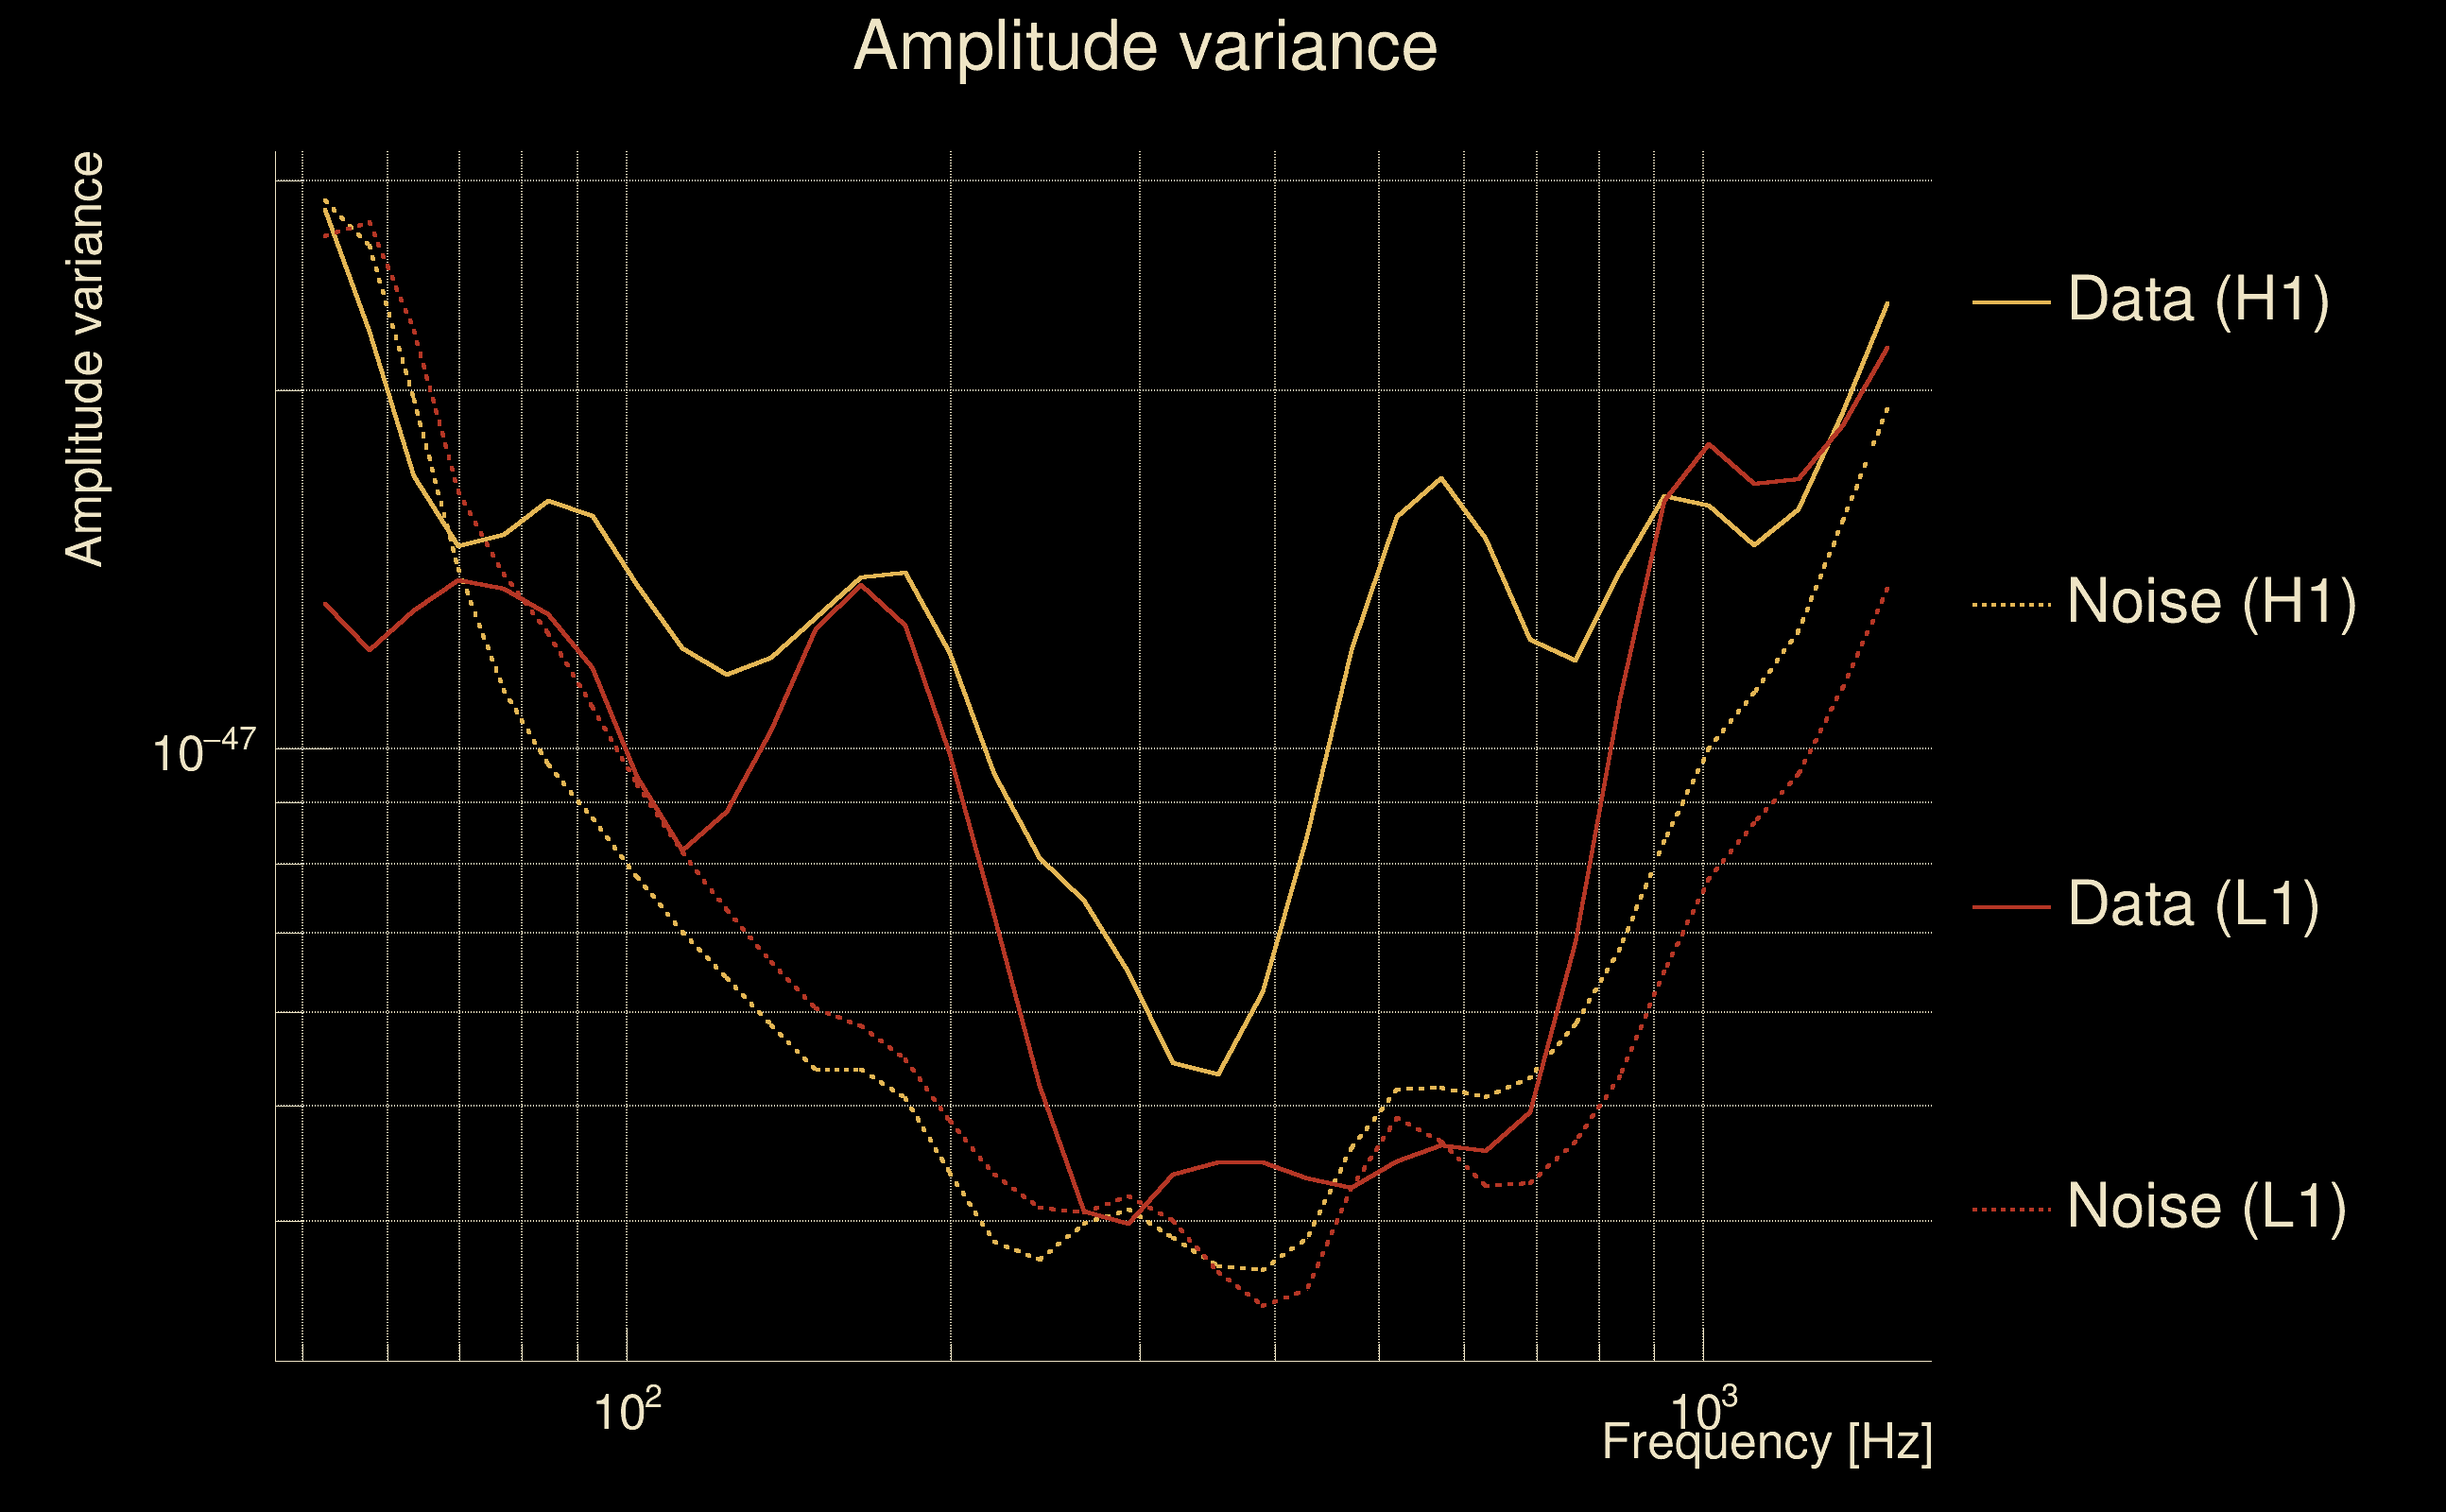
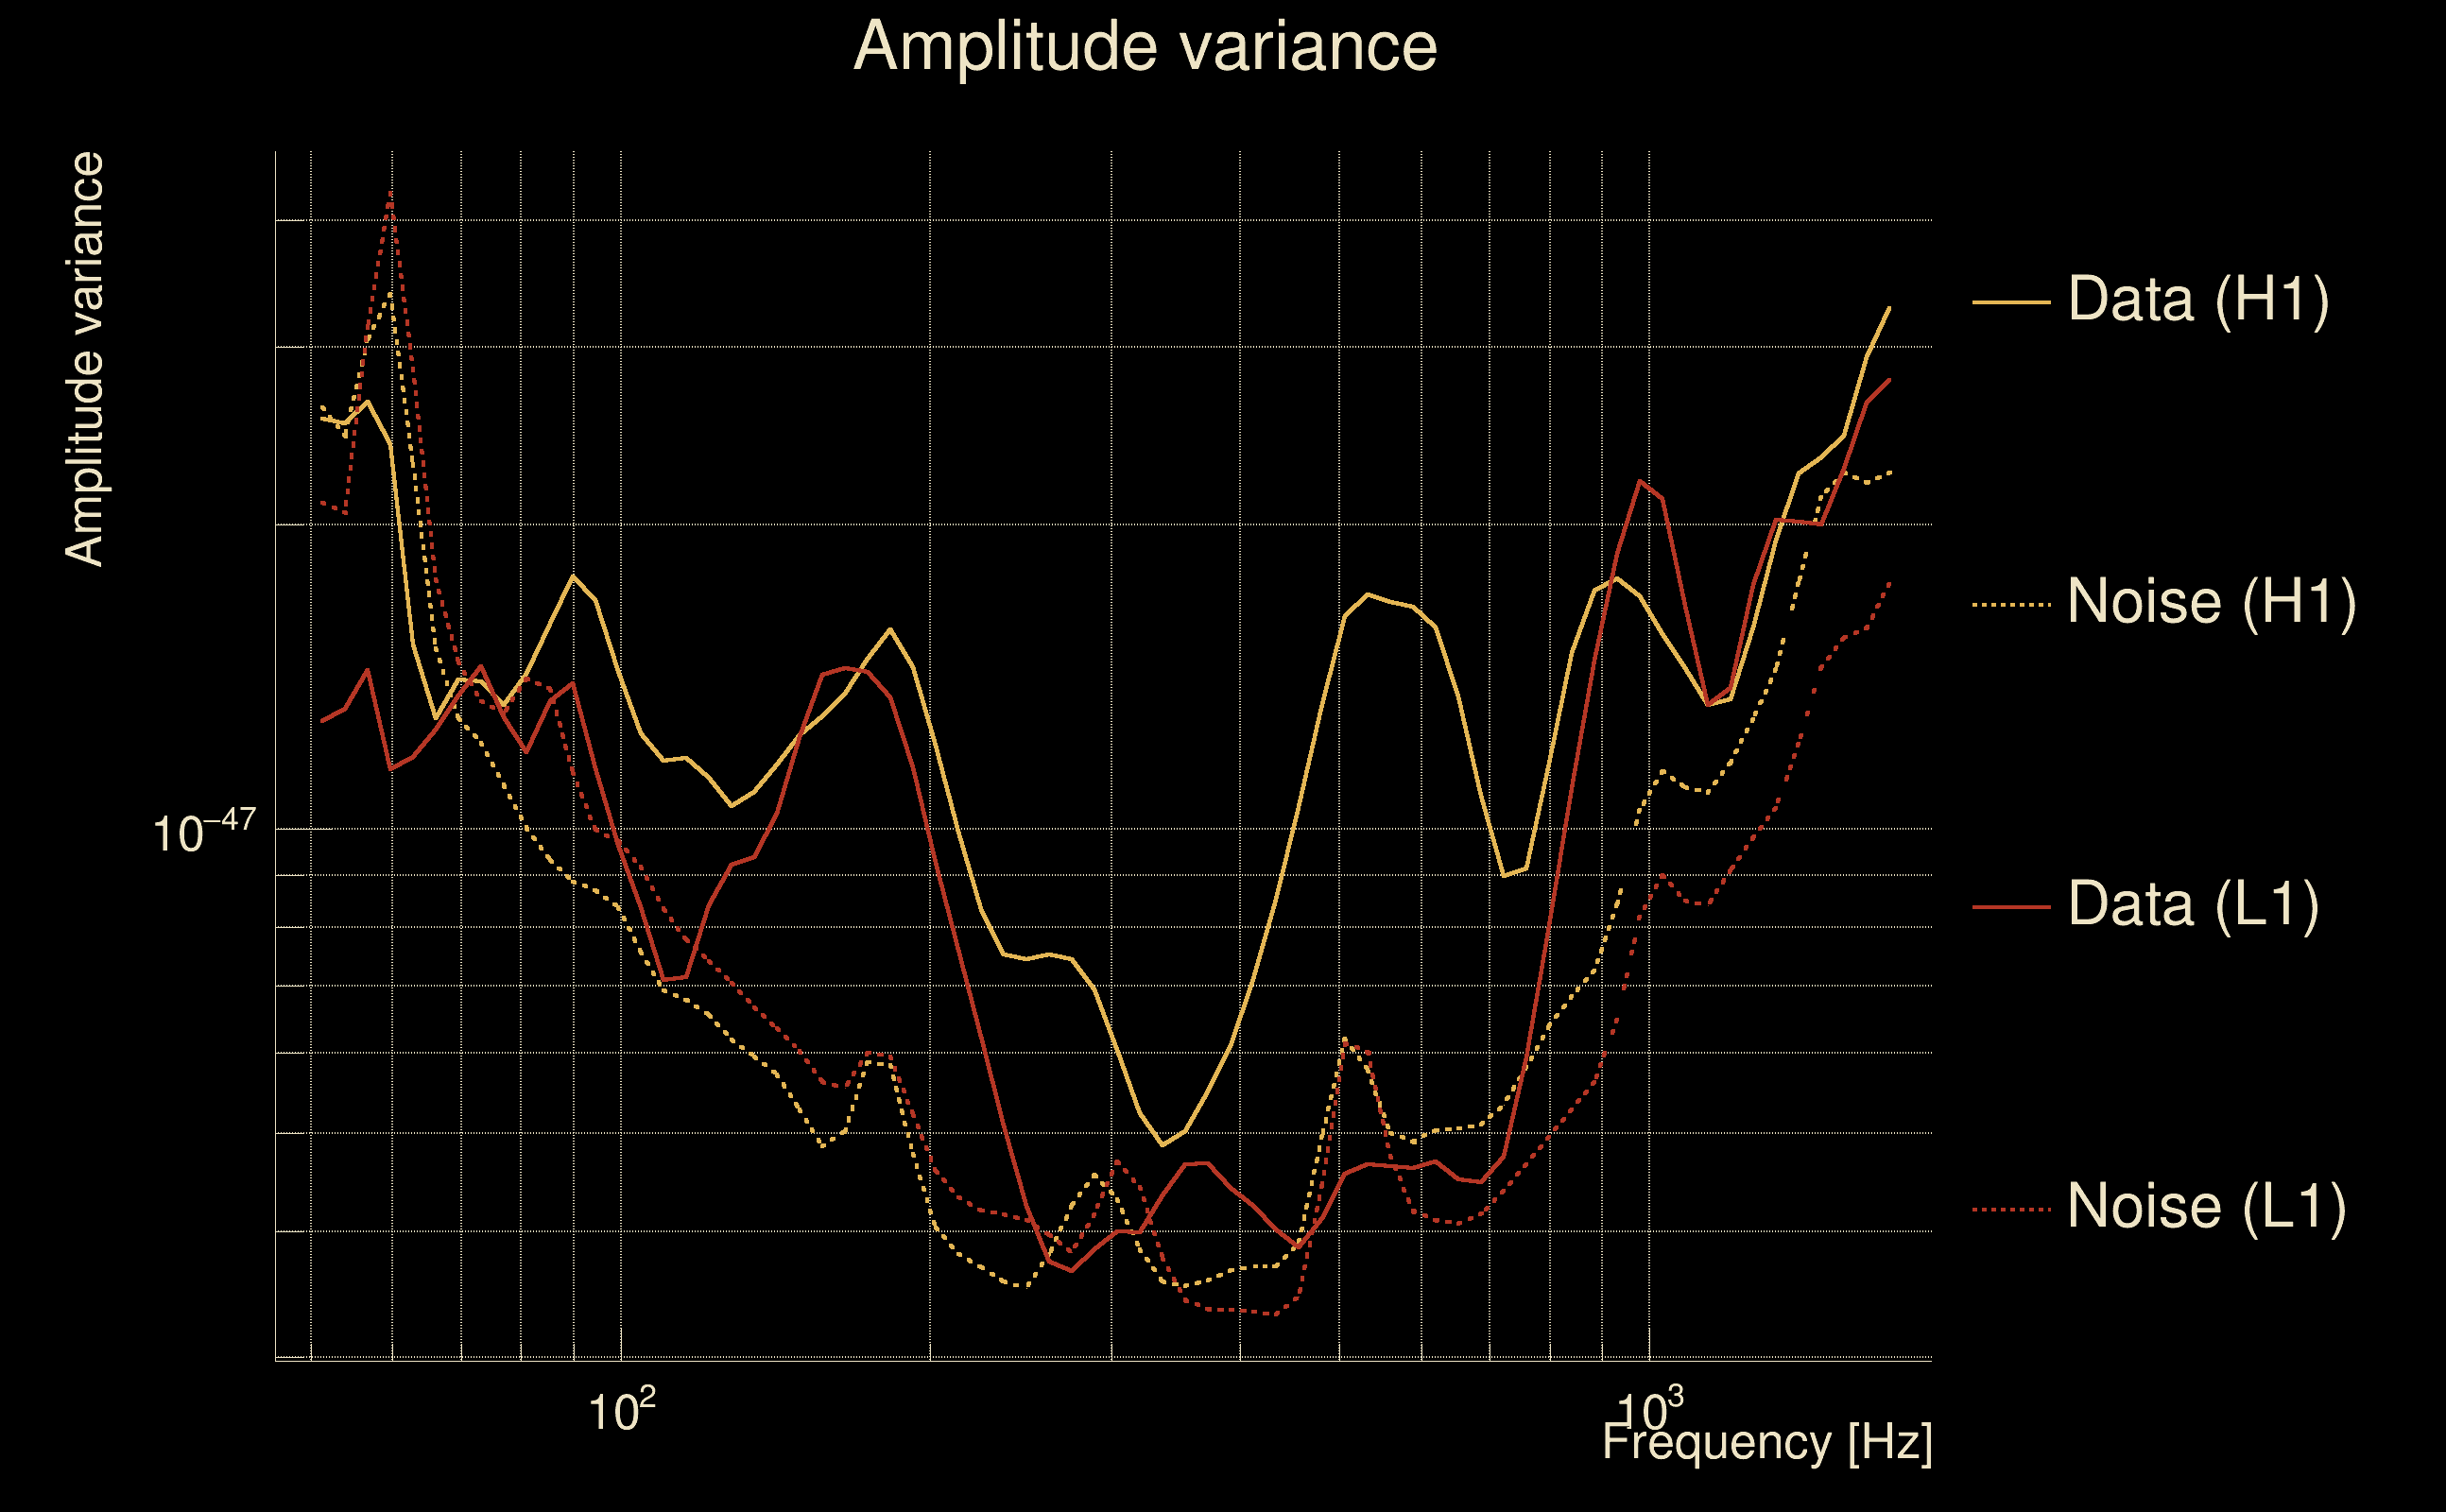
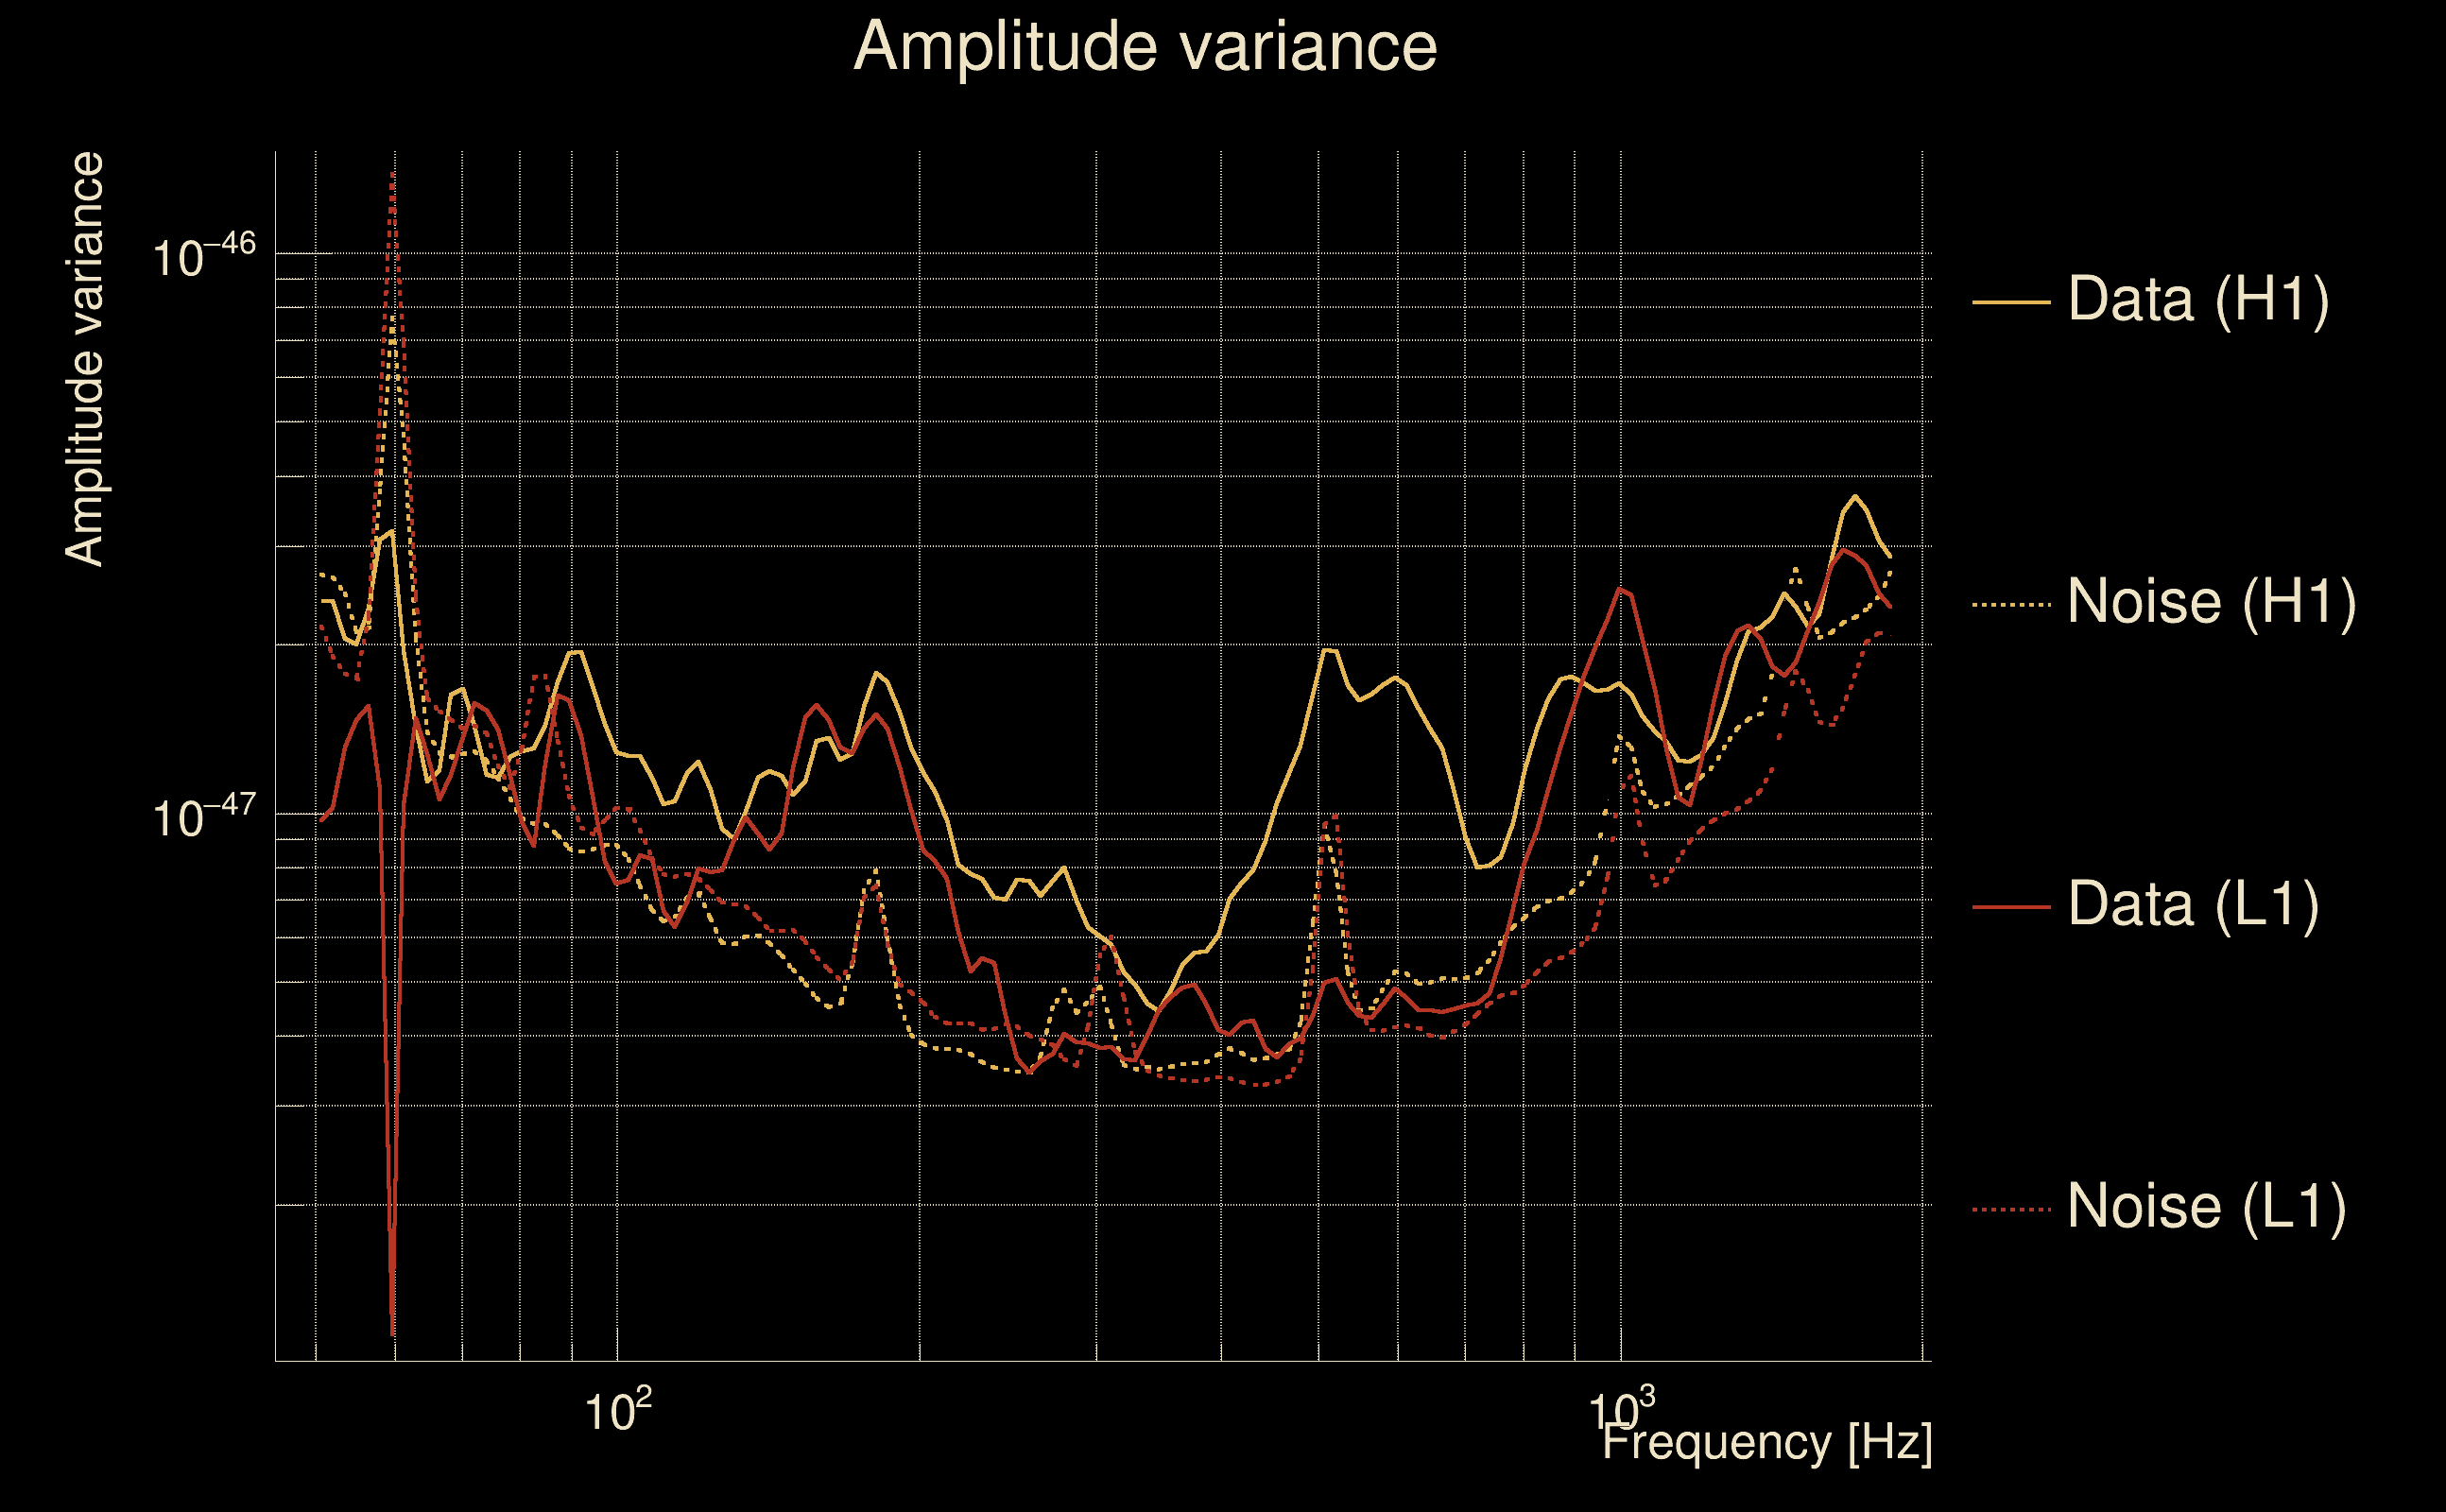
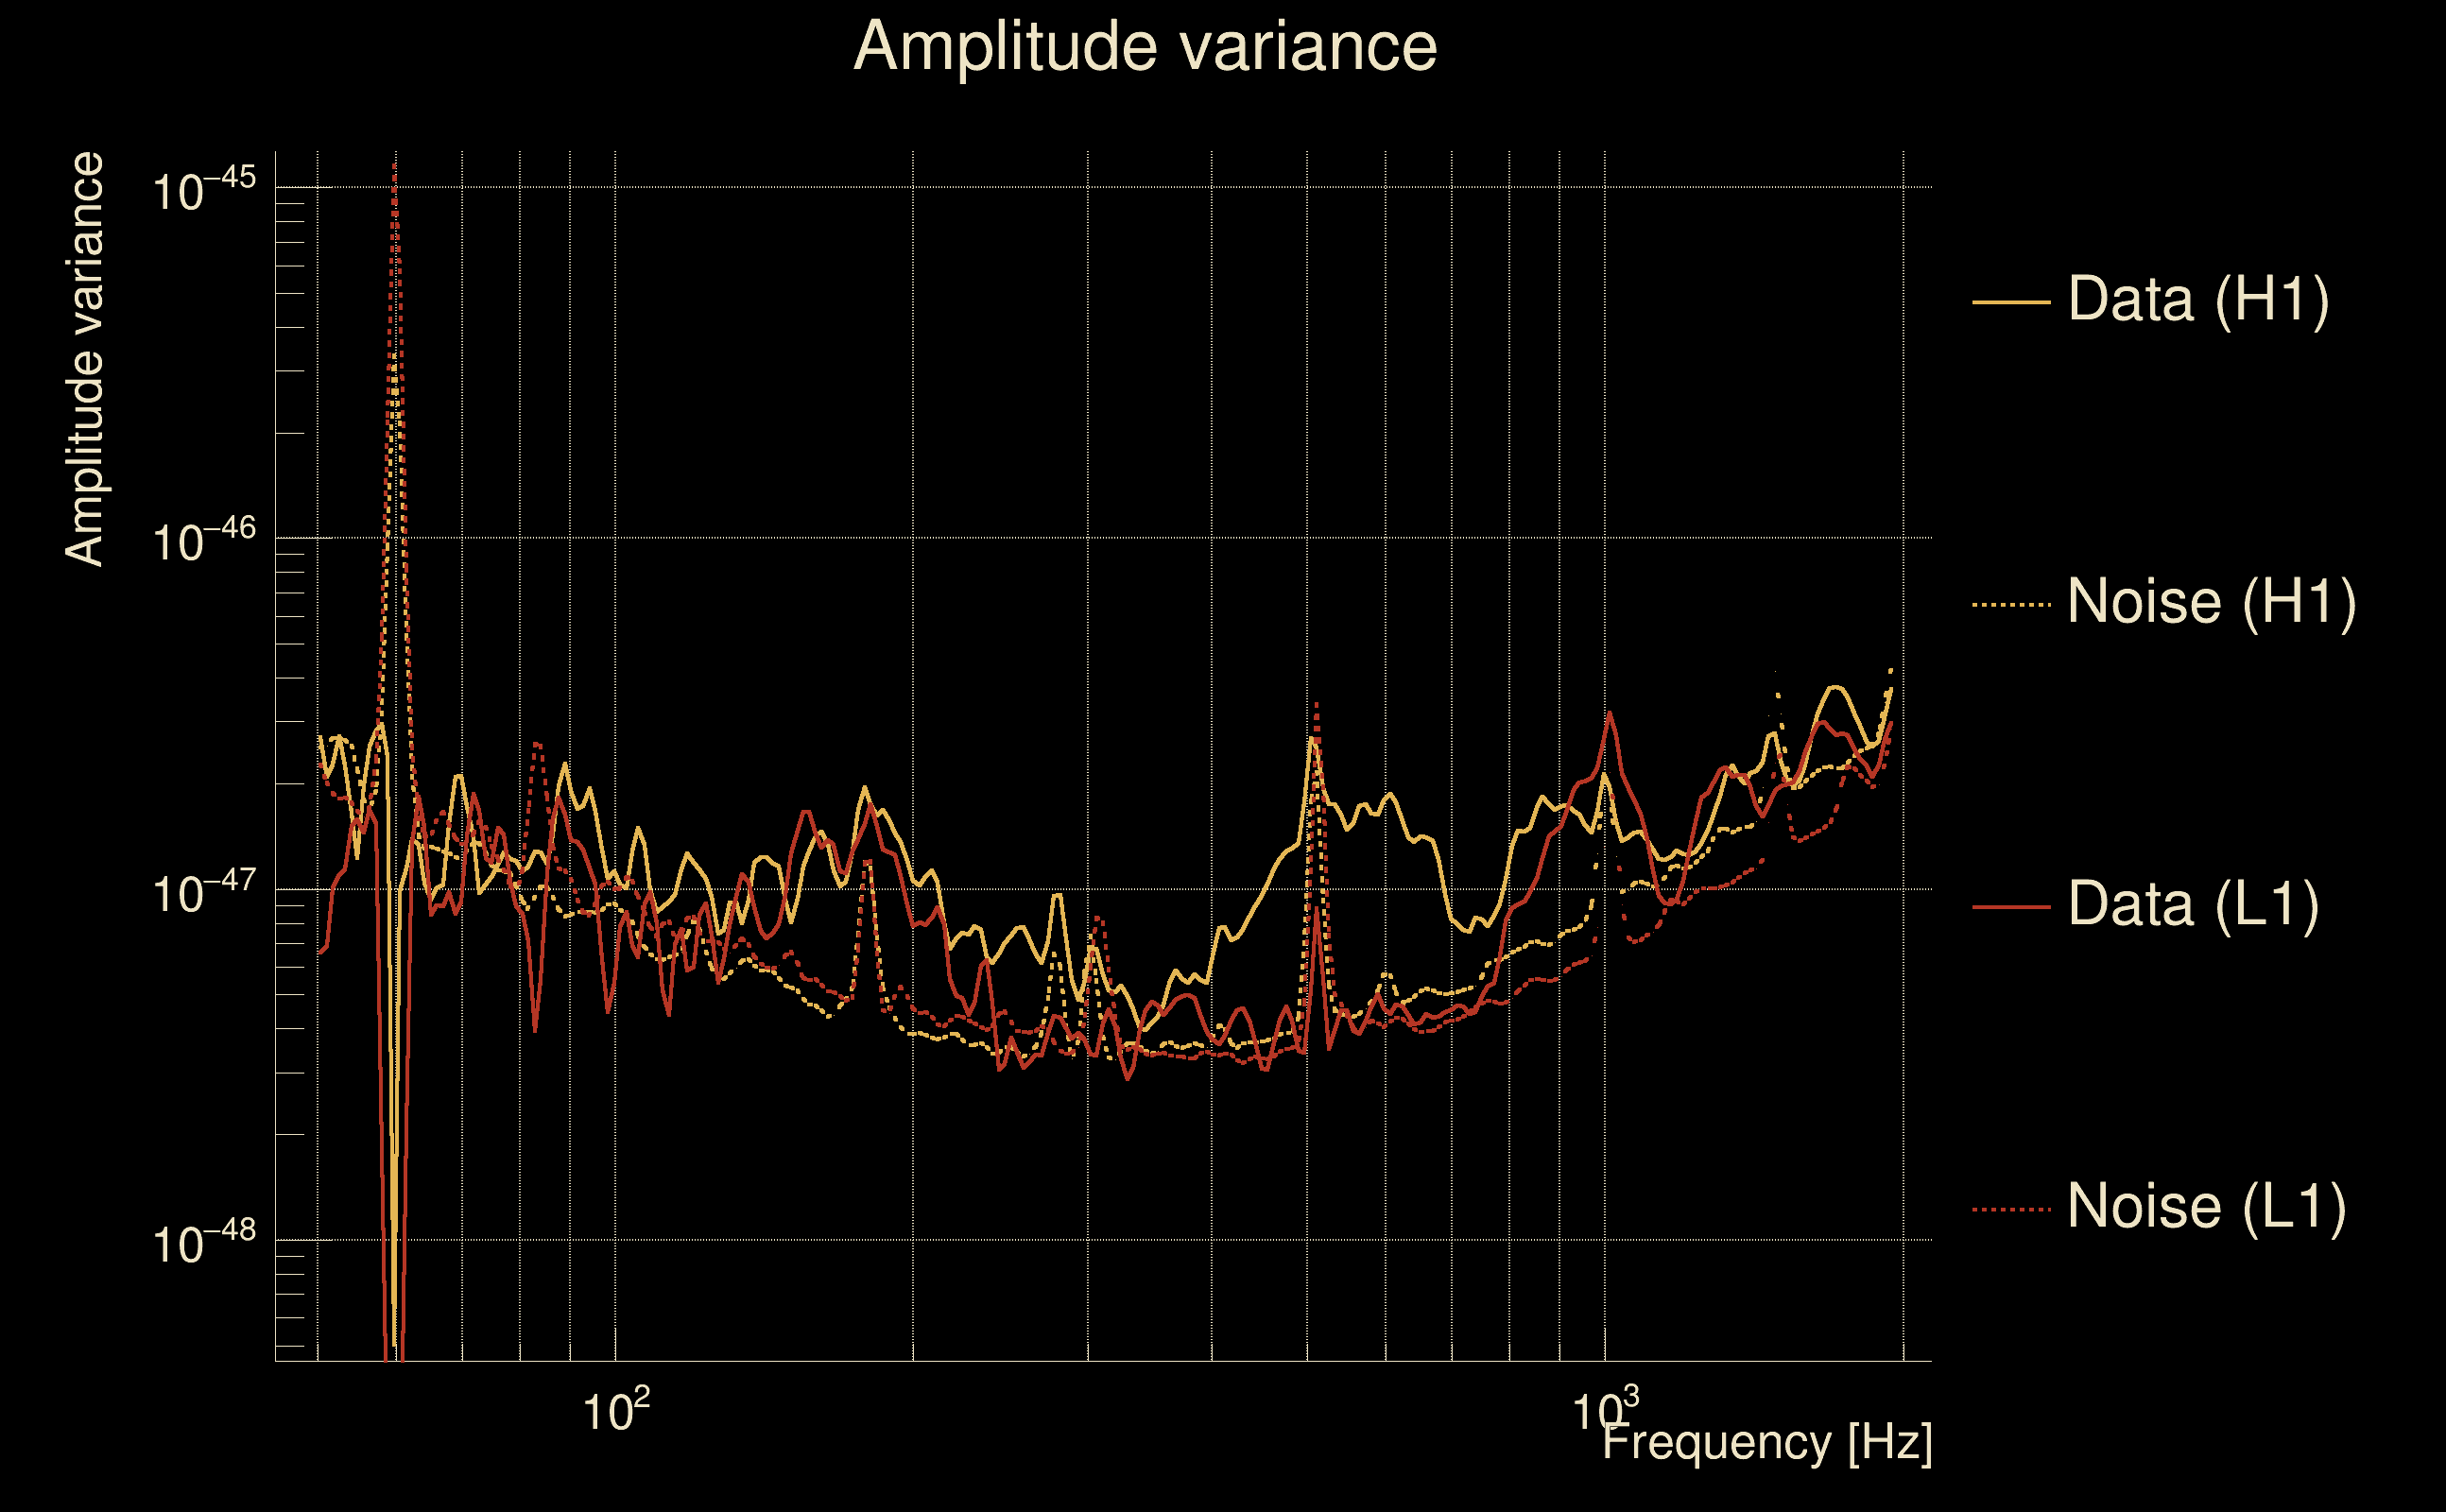
| Amplitude spectrograms: | normalization = 1e-22, power index = 2 |
| White noise SNR variance: | 0.523175 (after applying a correction factor = 1) |
| Amplitude ratio confidence level: | 3 sigma |
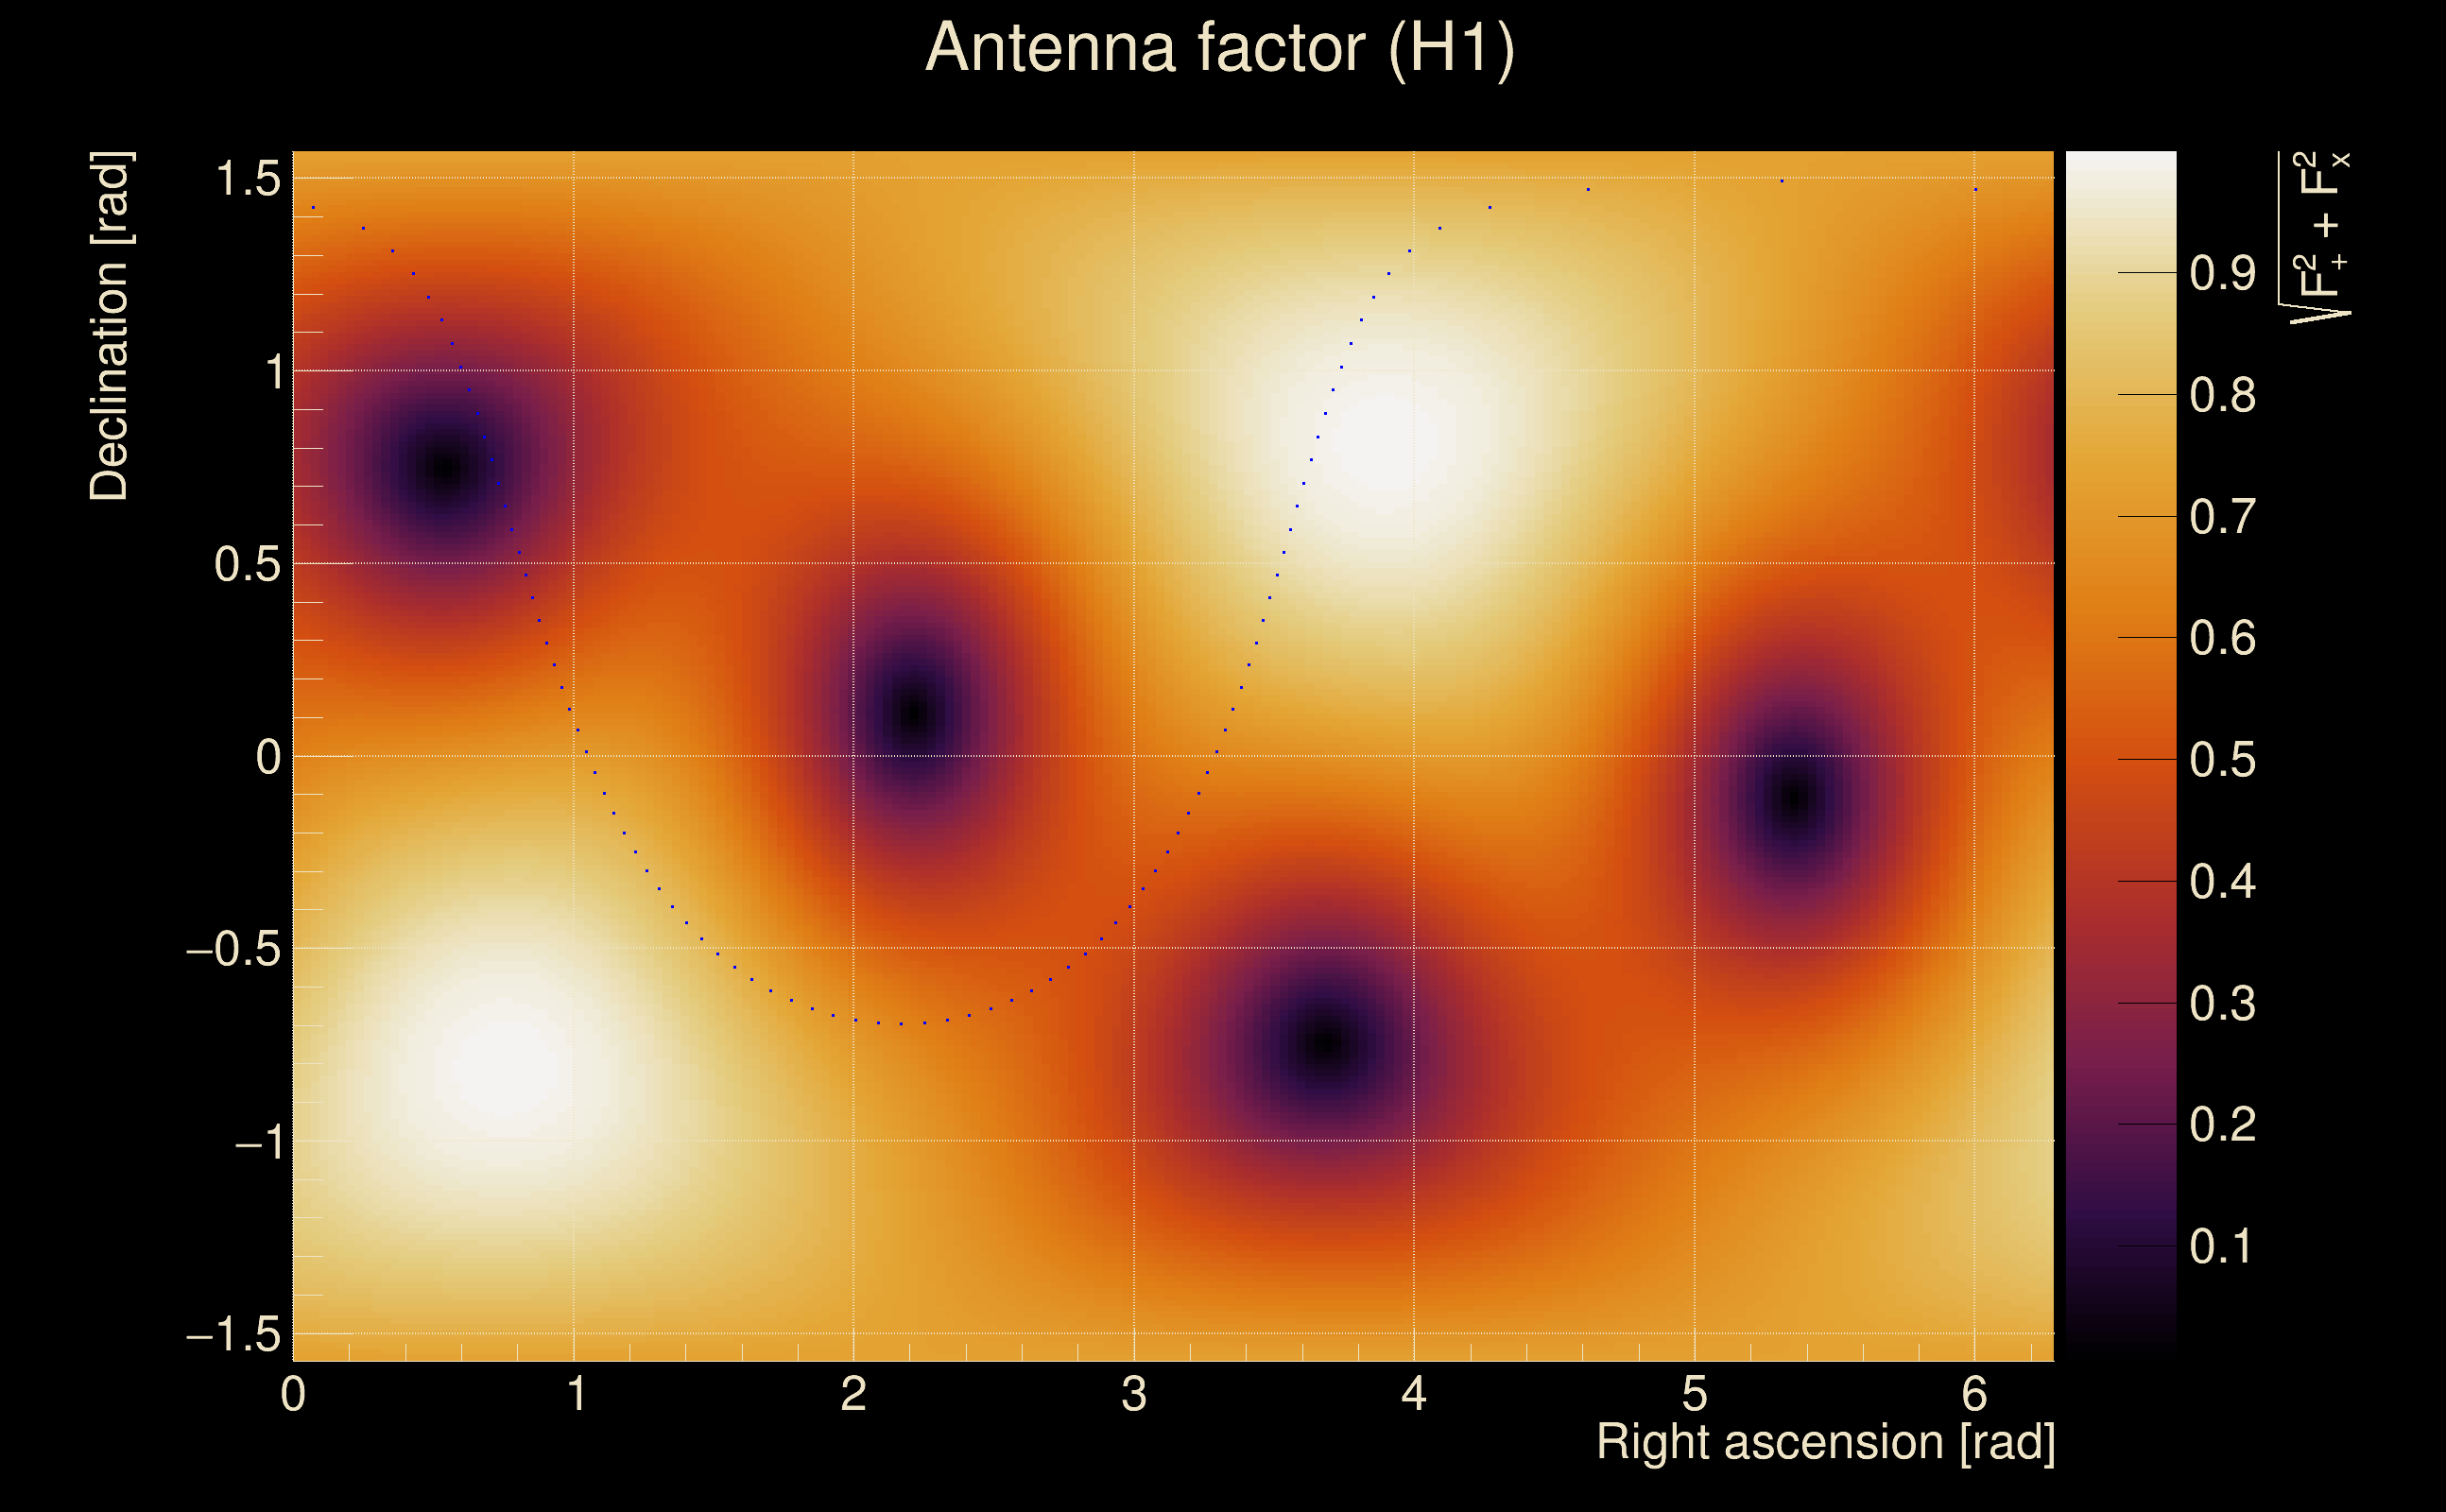
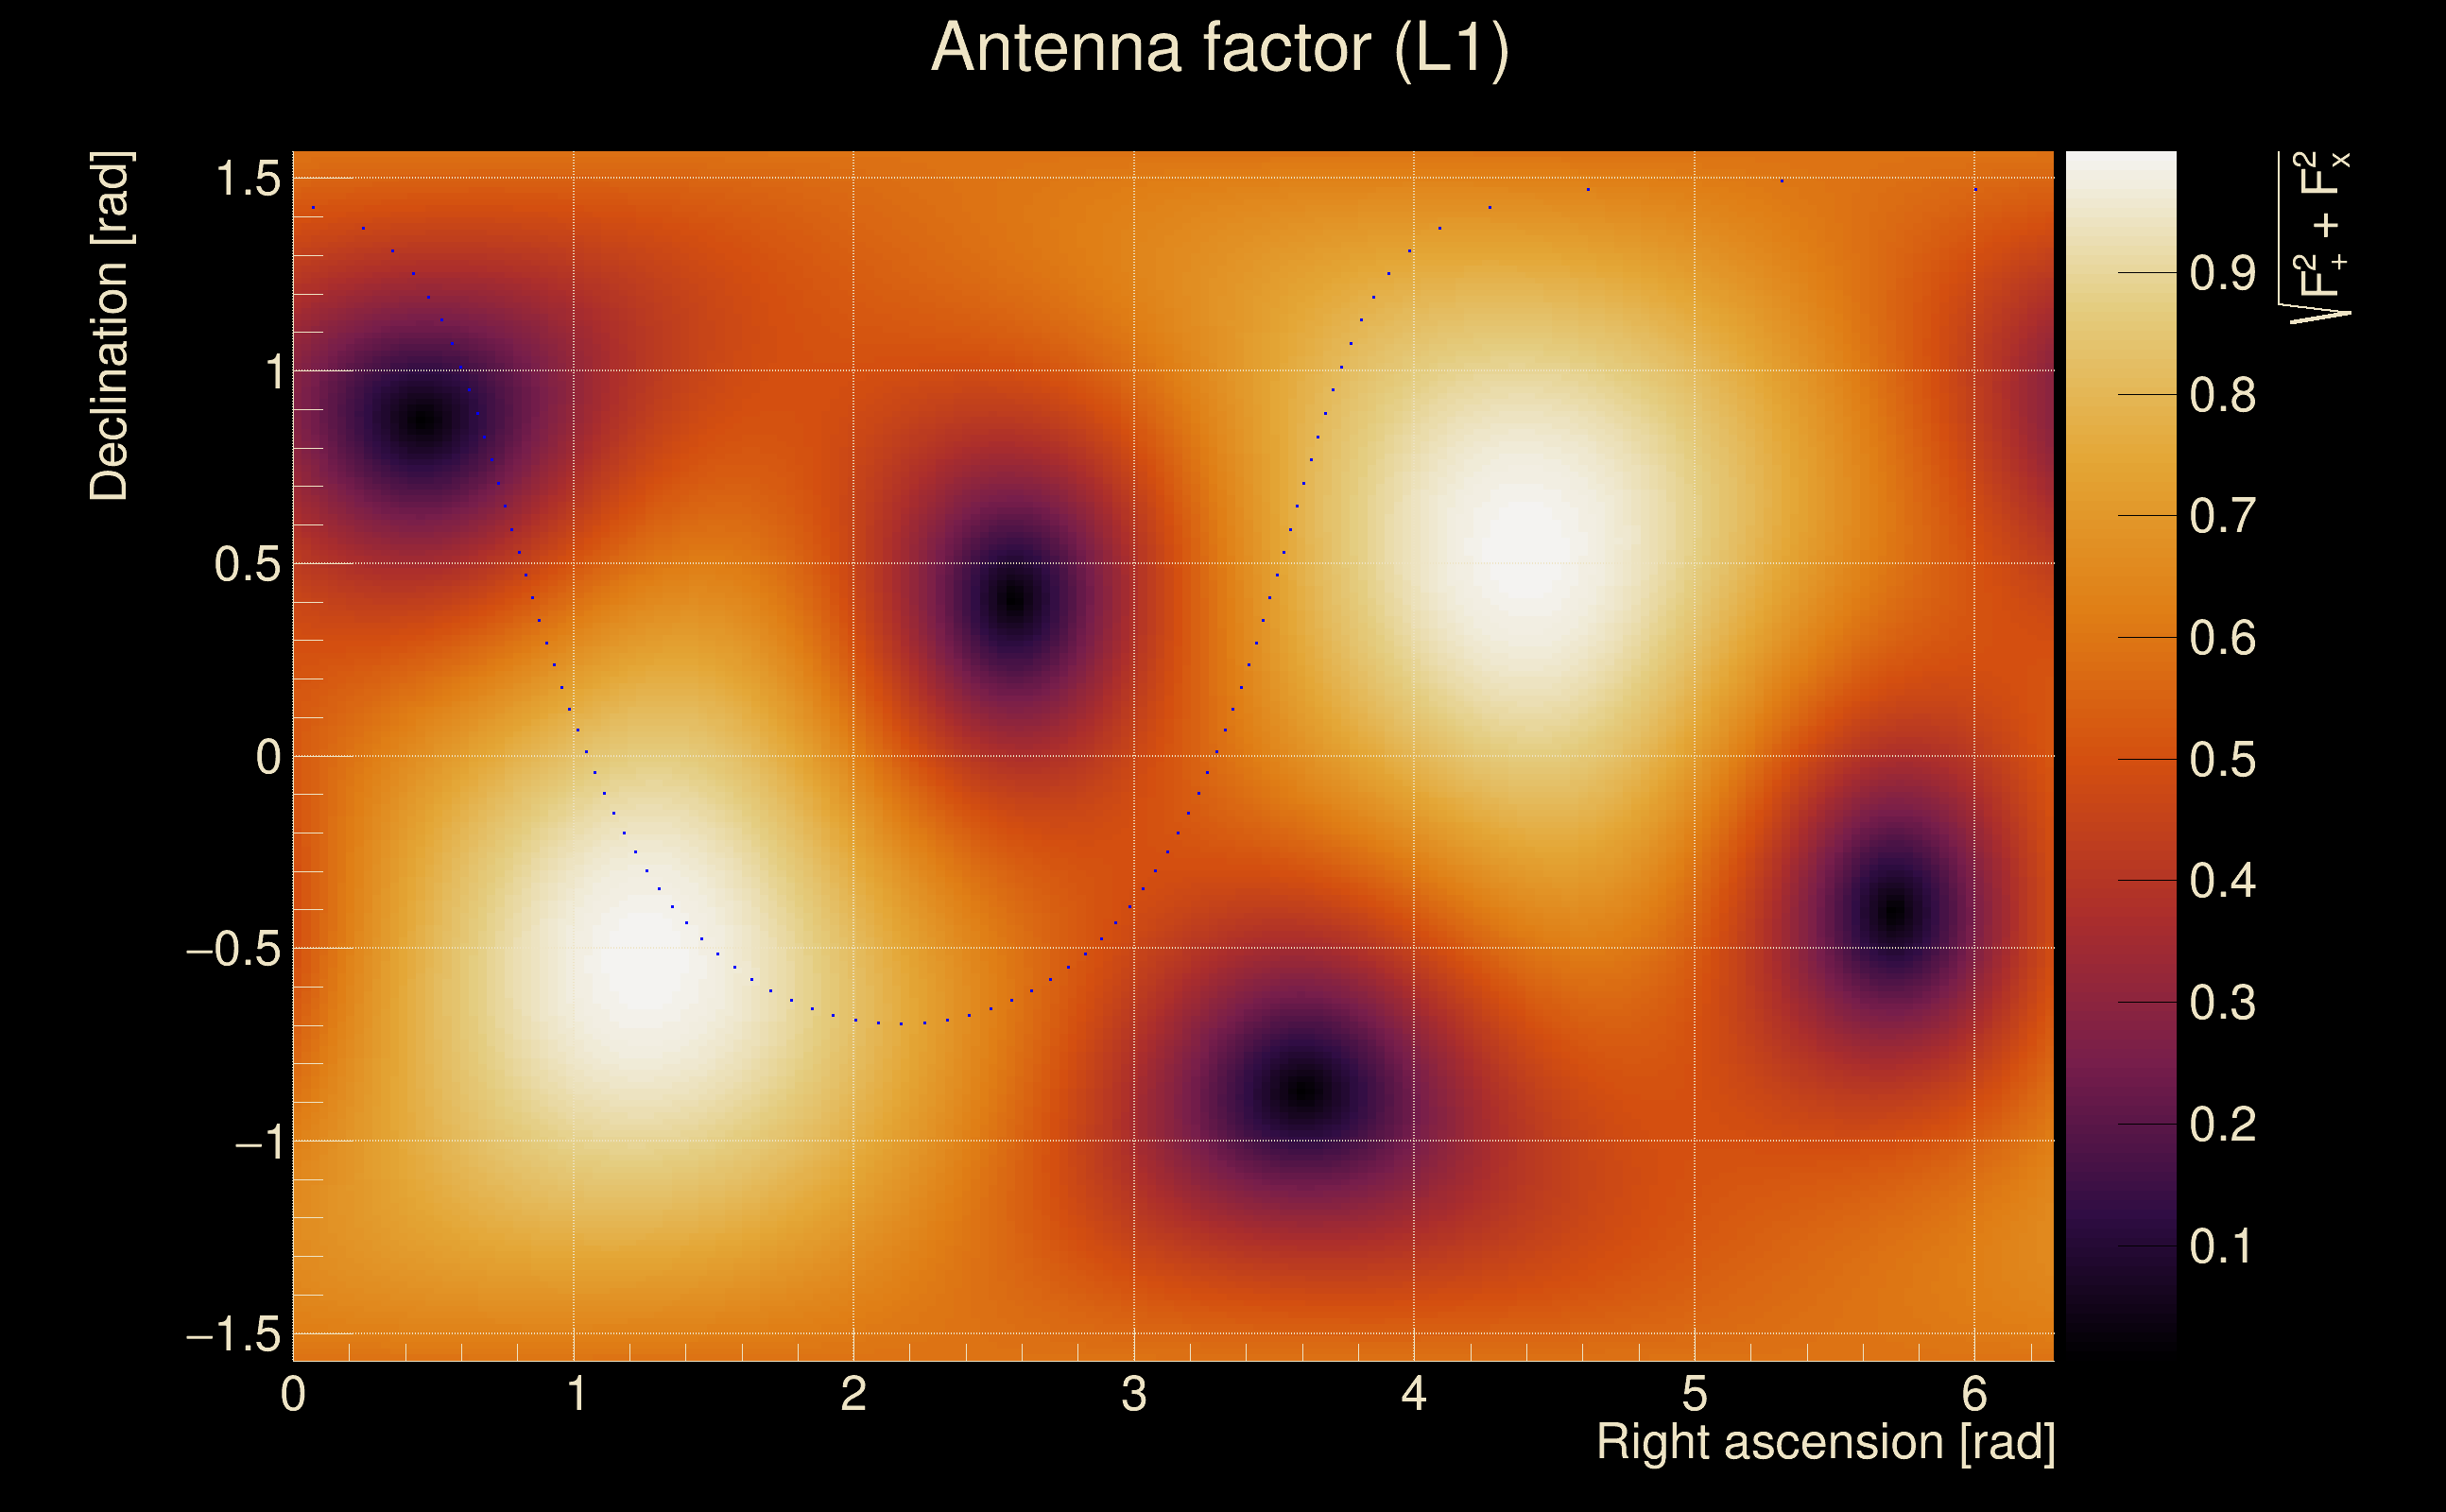
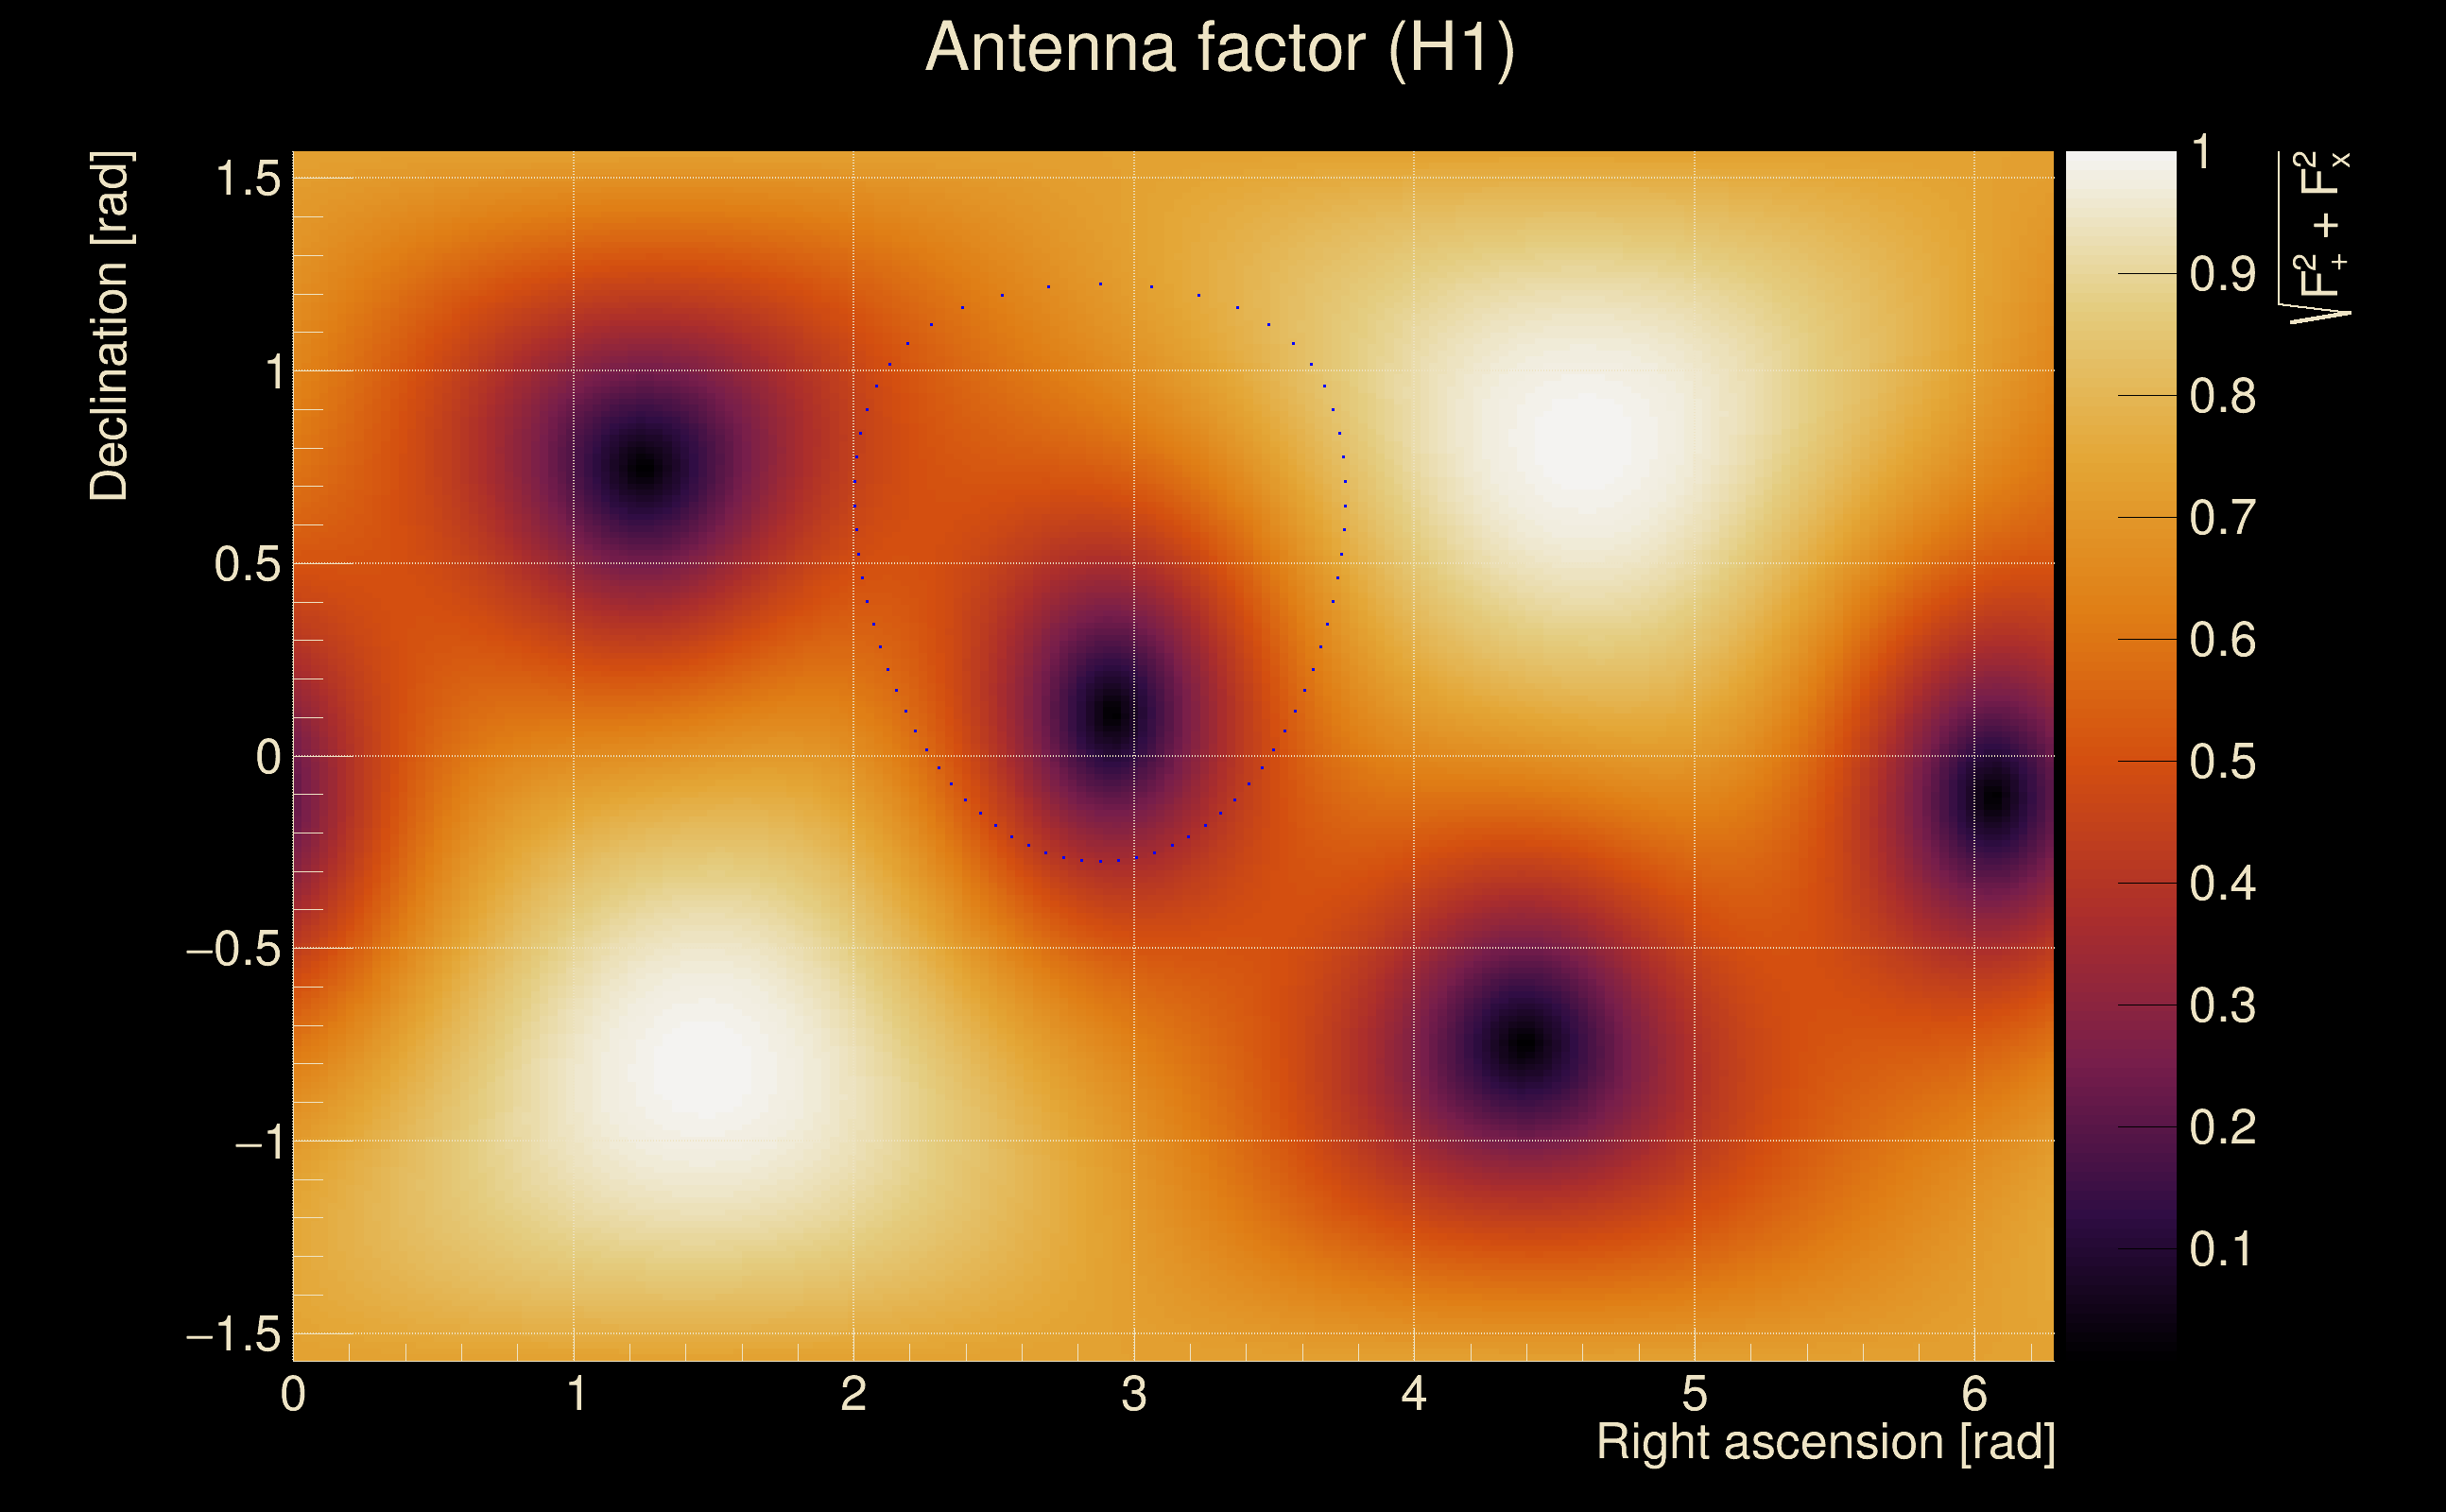
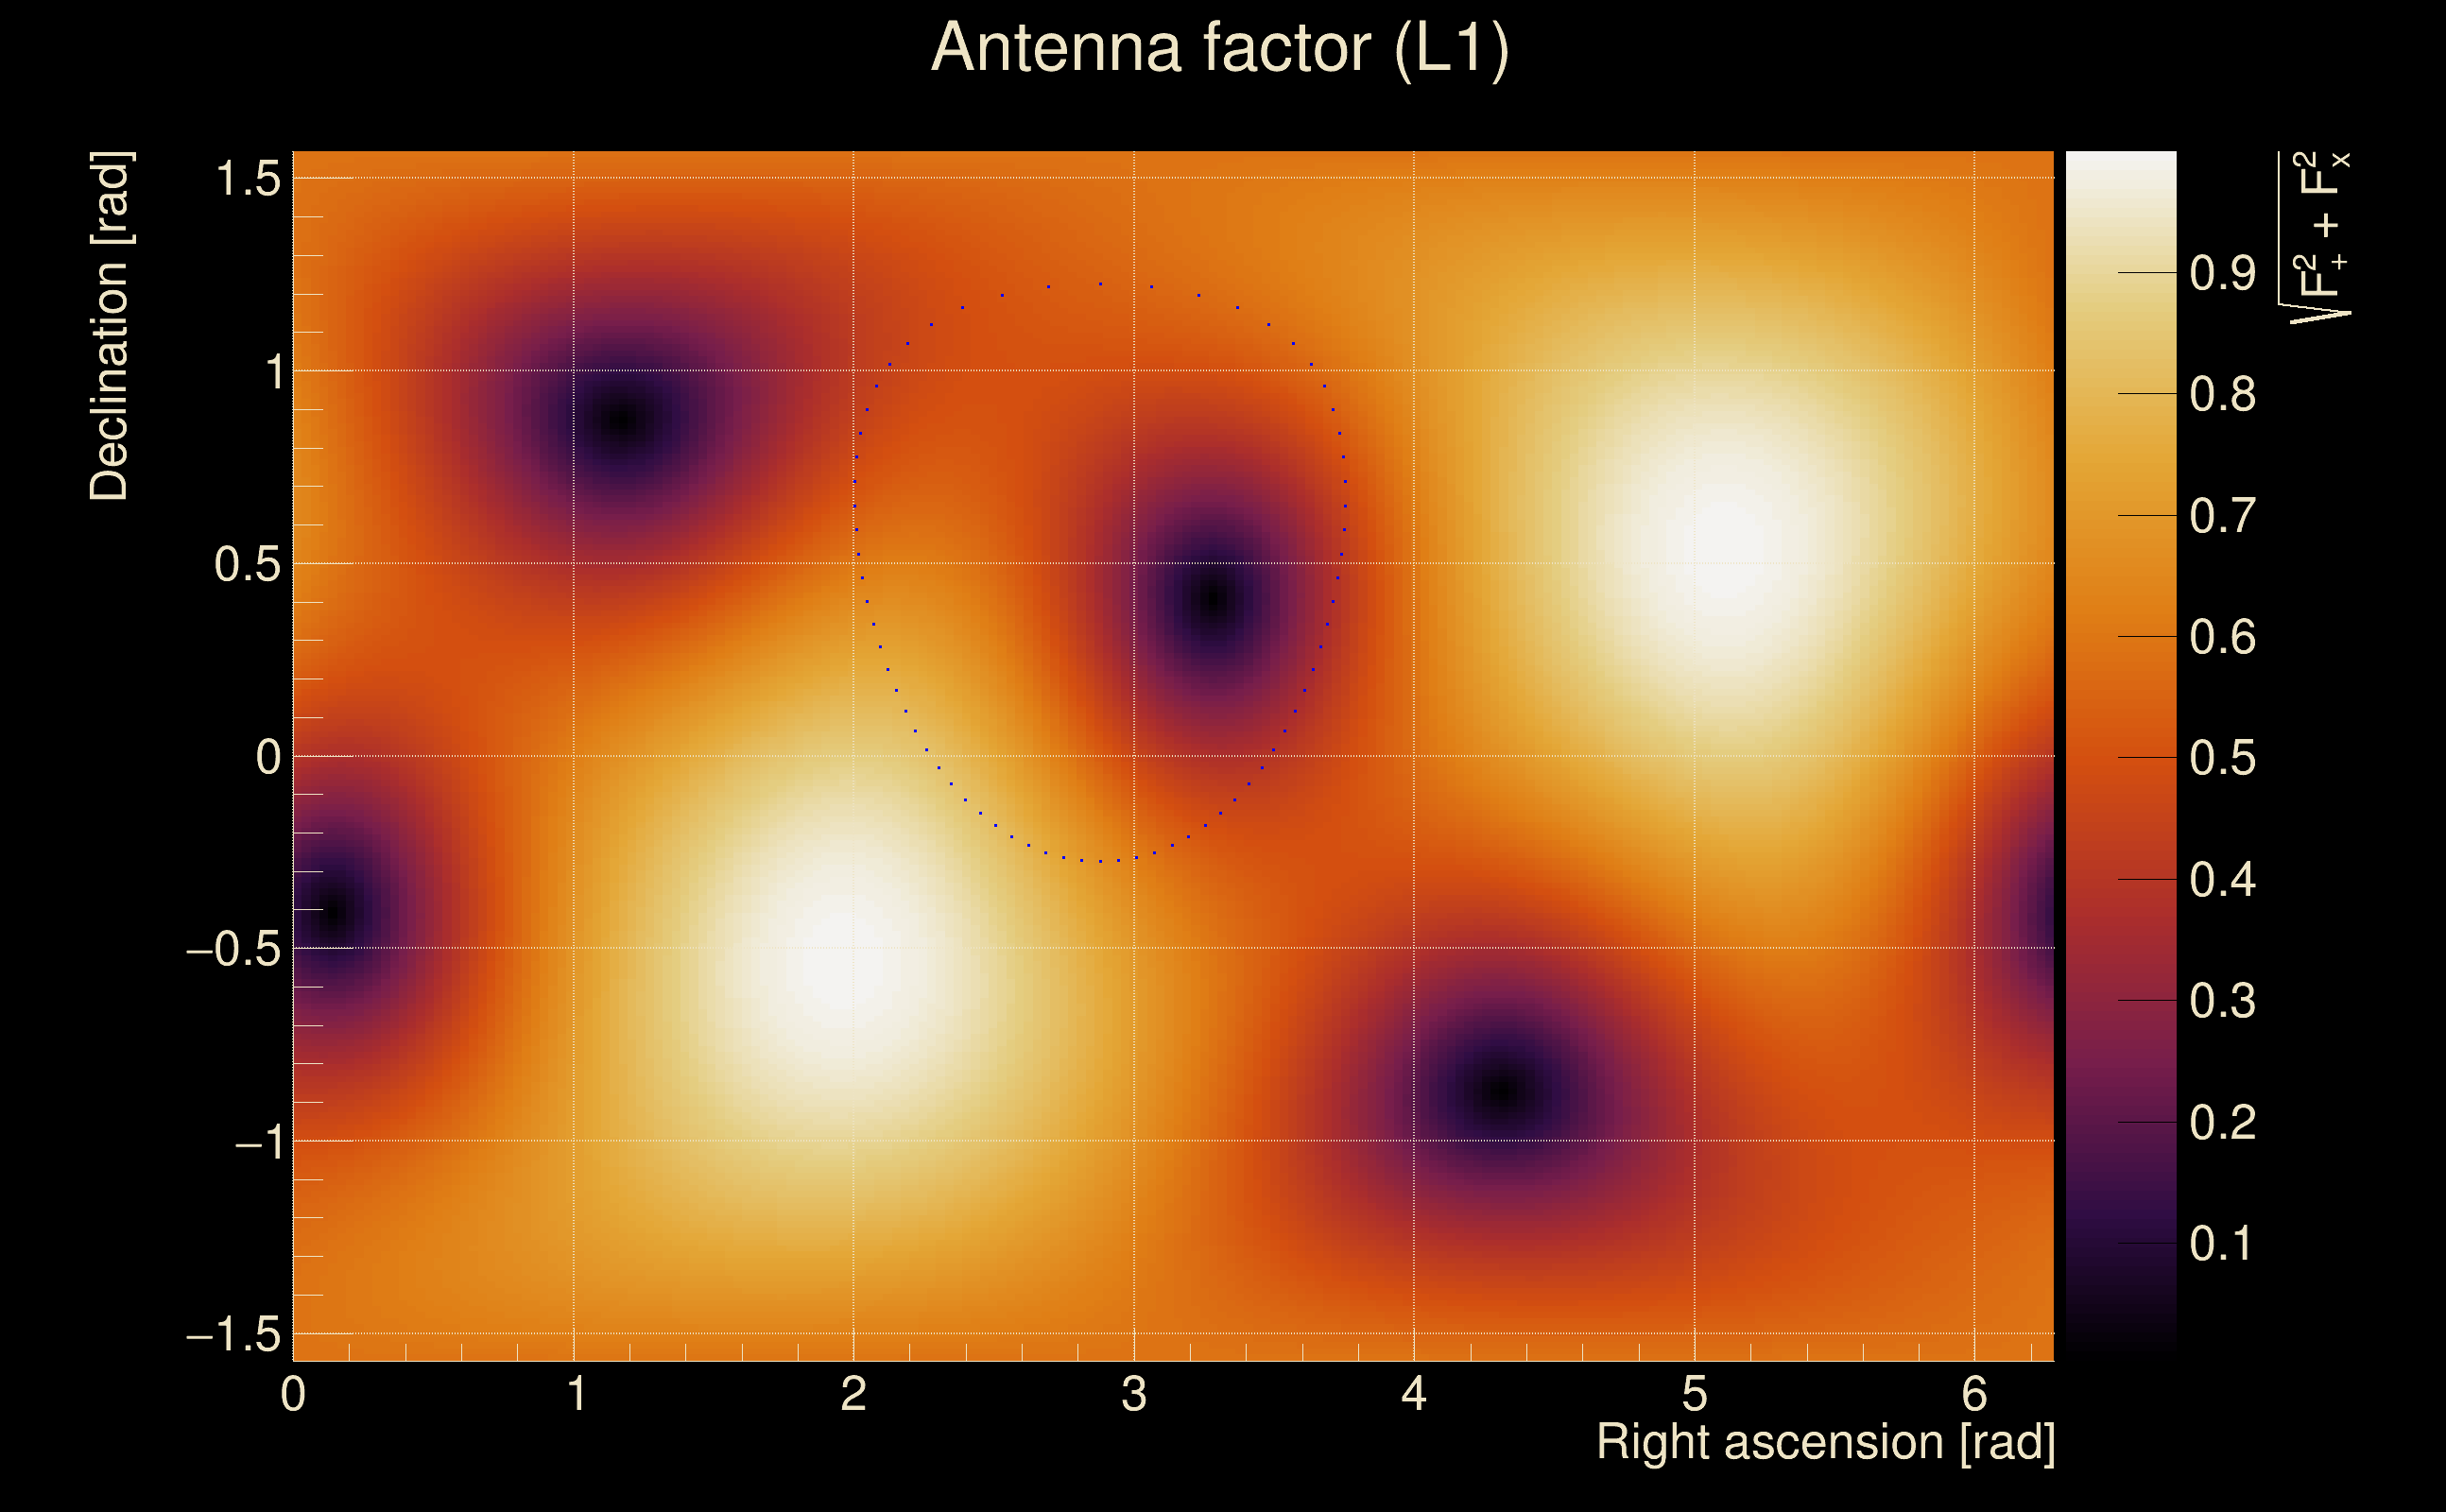
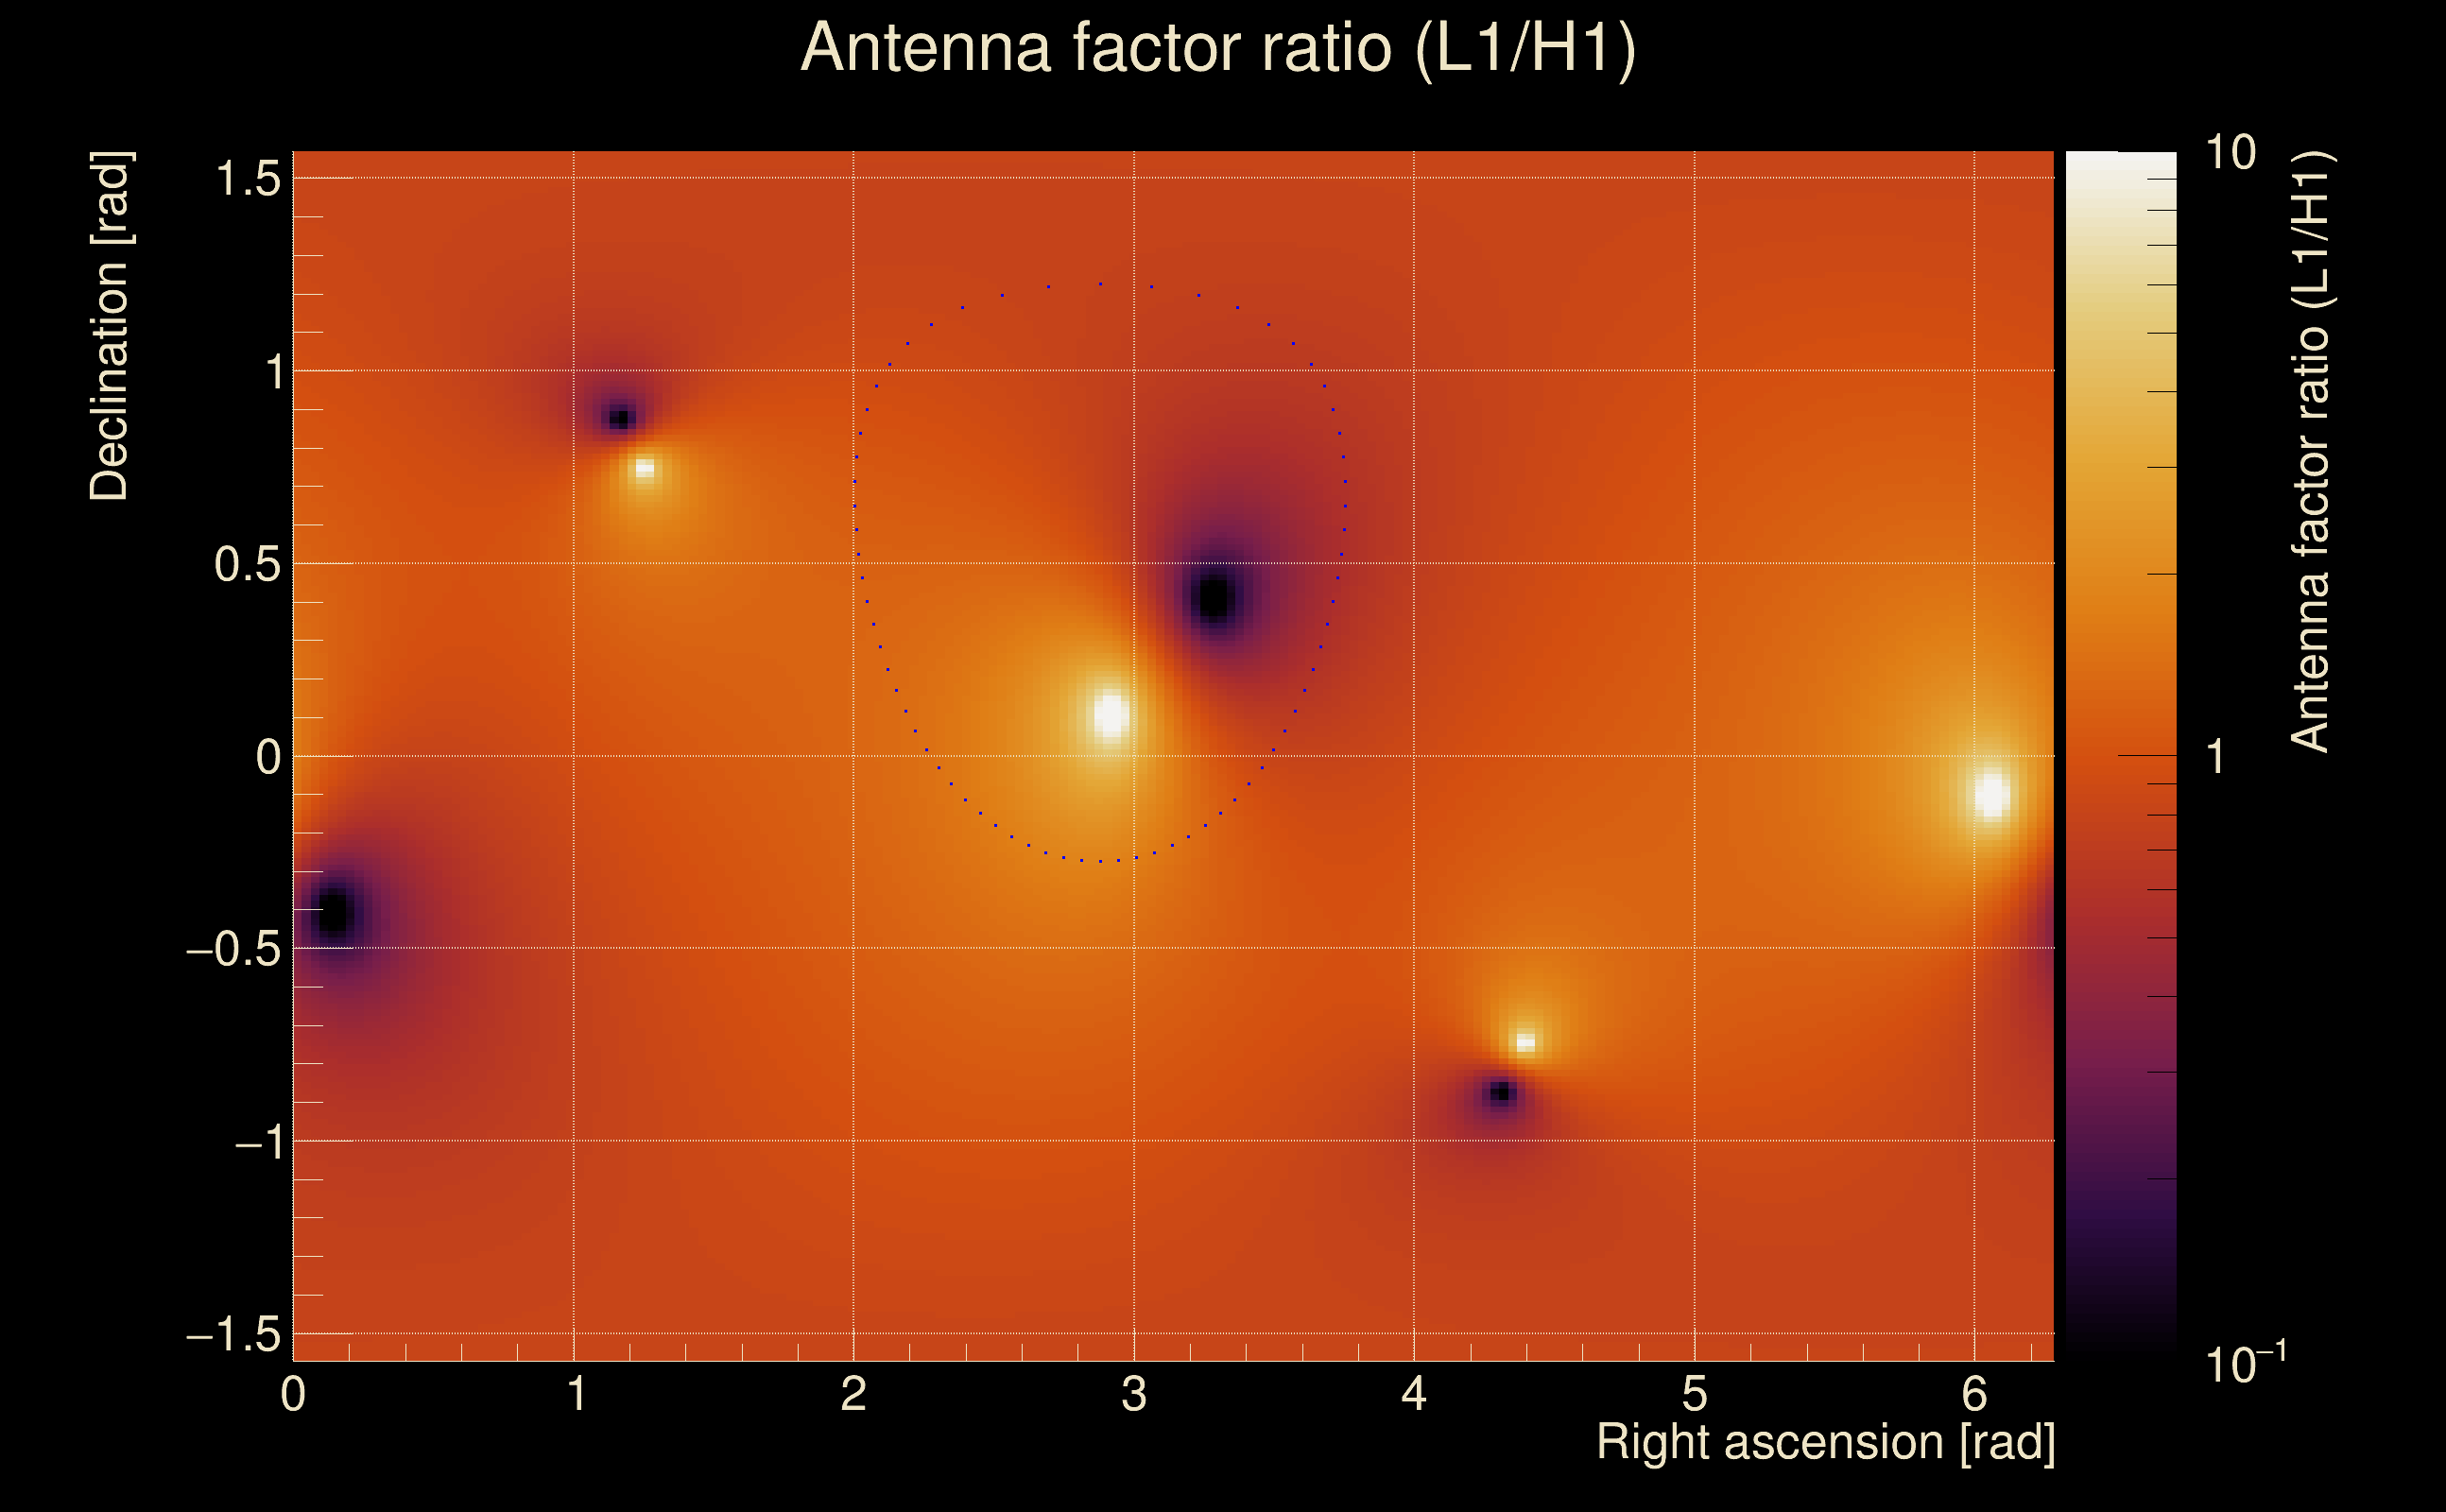
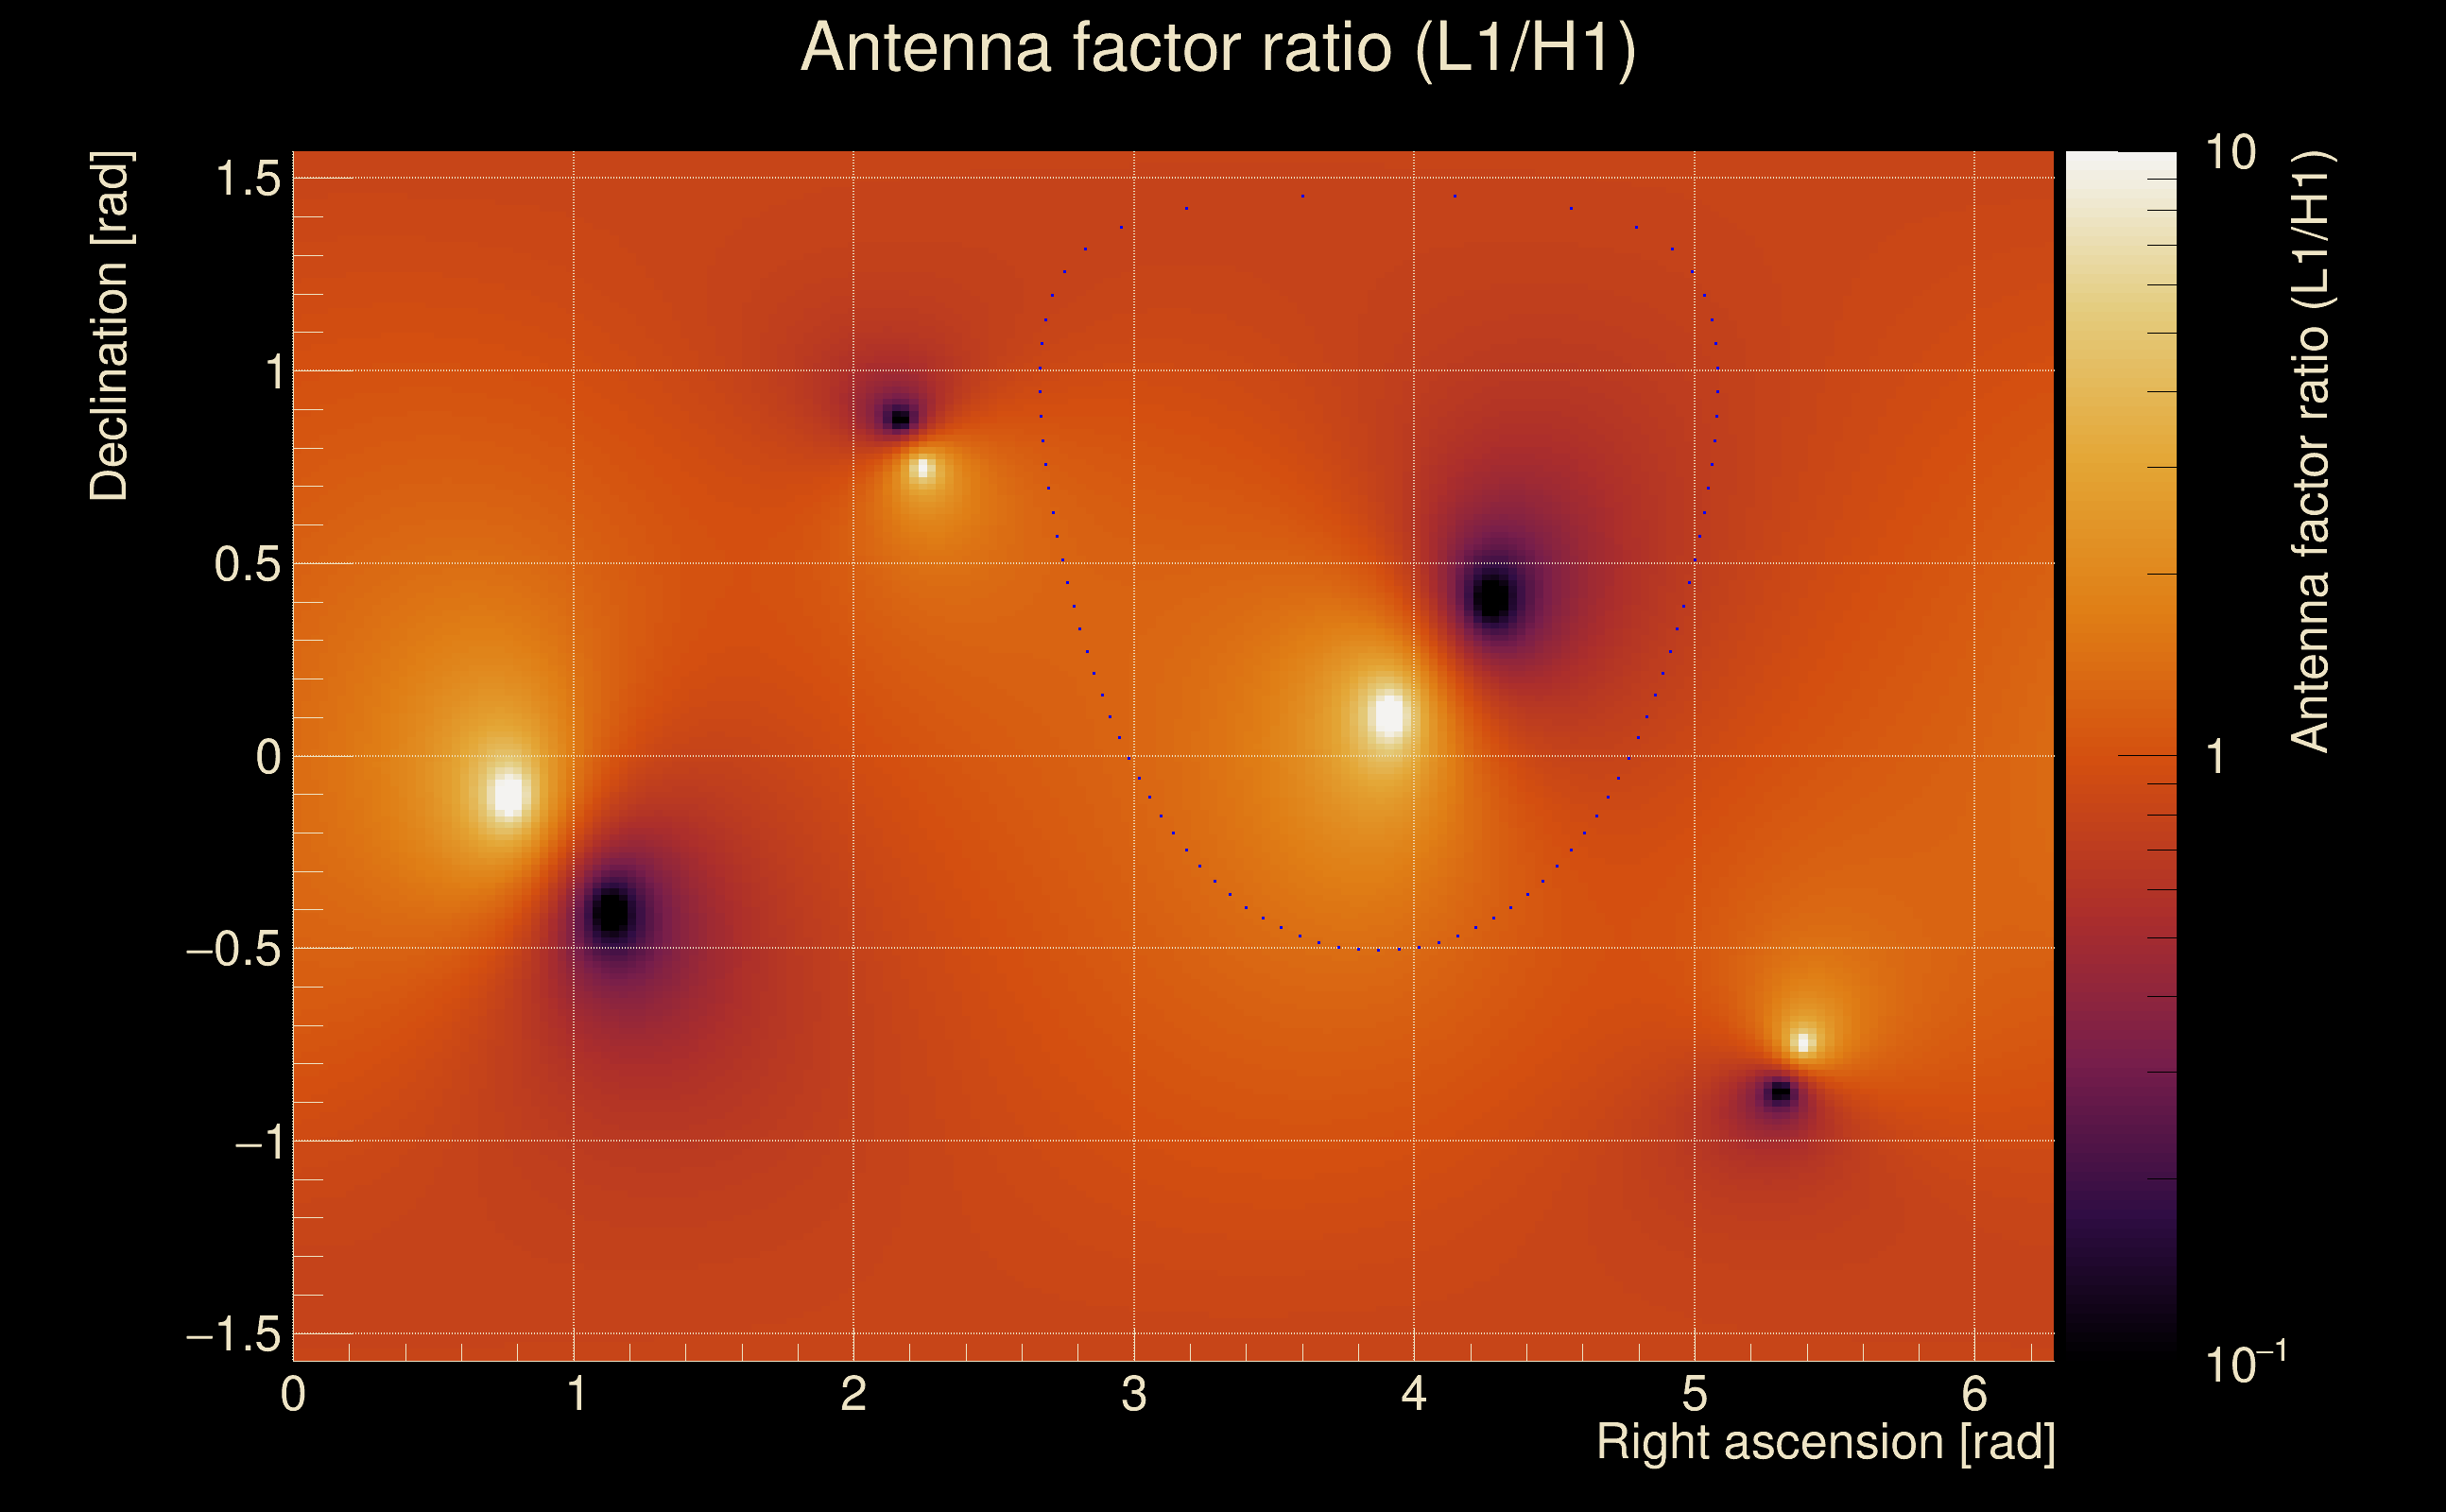
| Target sky positon: | Ra: 10, Dec: 10 [rad] |
| List of input Ox files: | TargIxfw_injpt3_file_list.txt (71 files) |
| Analysis result file: | TargIxfw_injpt3_results-0.root |
| Slice selected for the the fakeground: | slice index=155 (-2.162 s), time lag = 0 s |
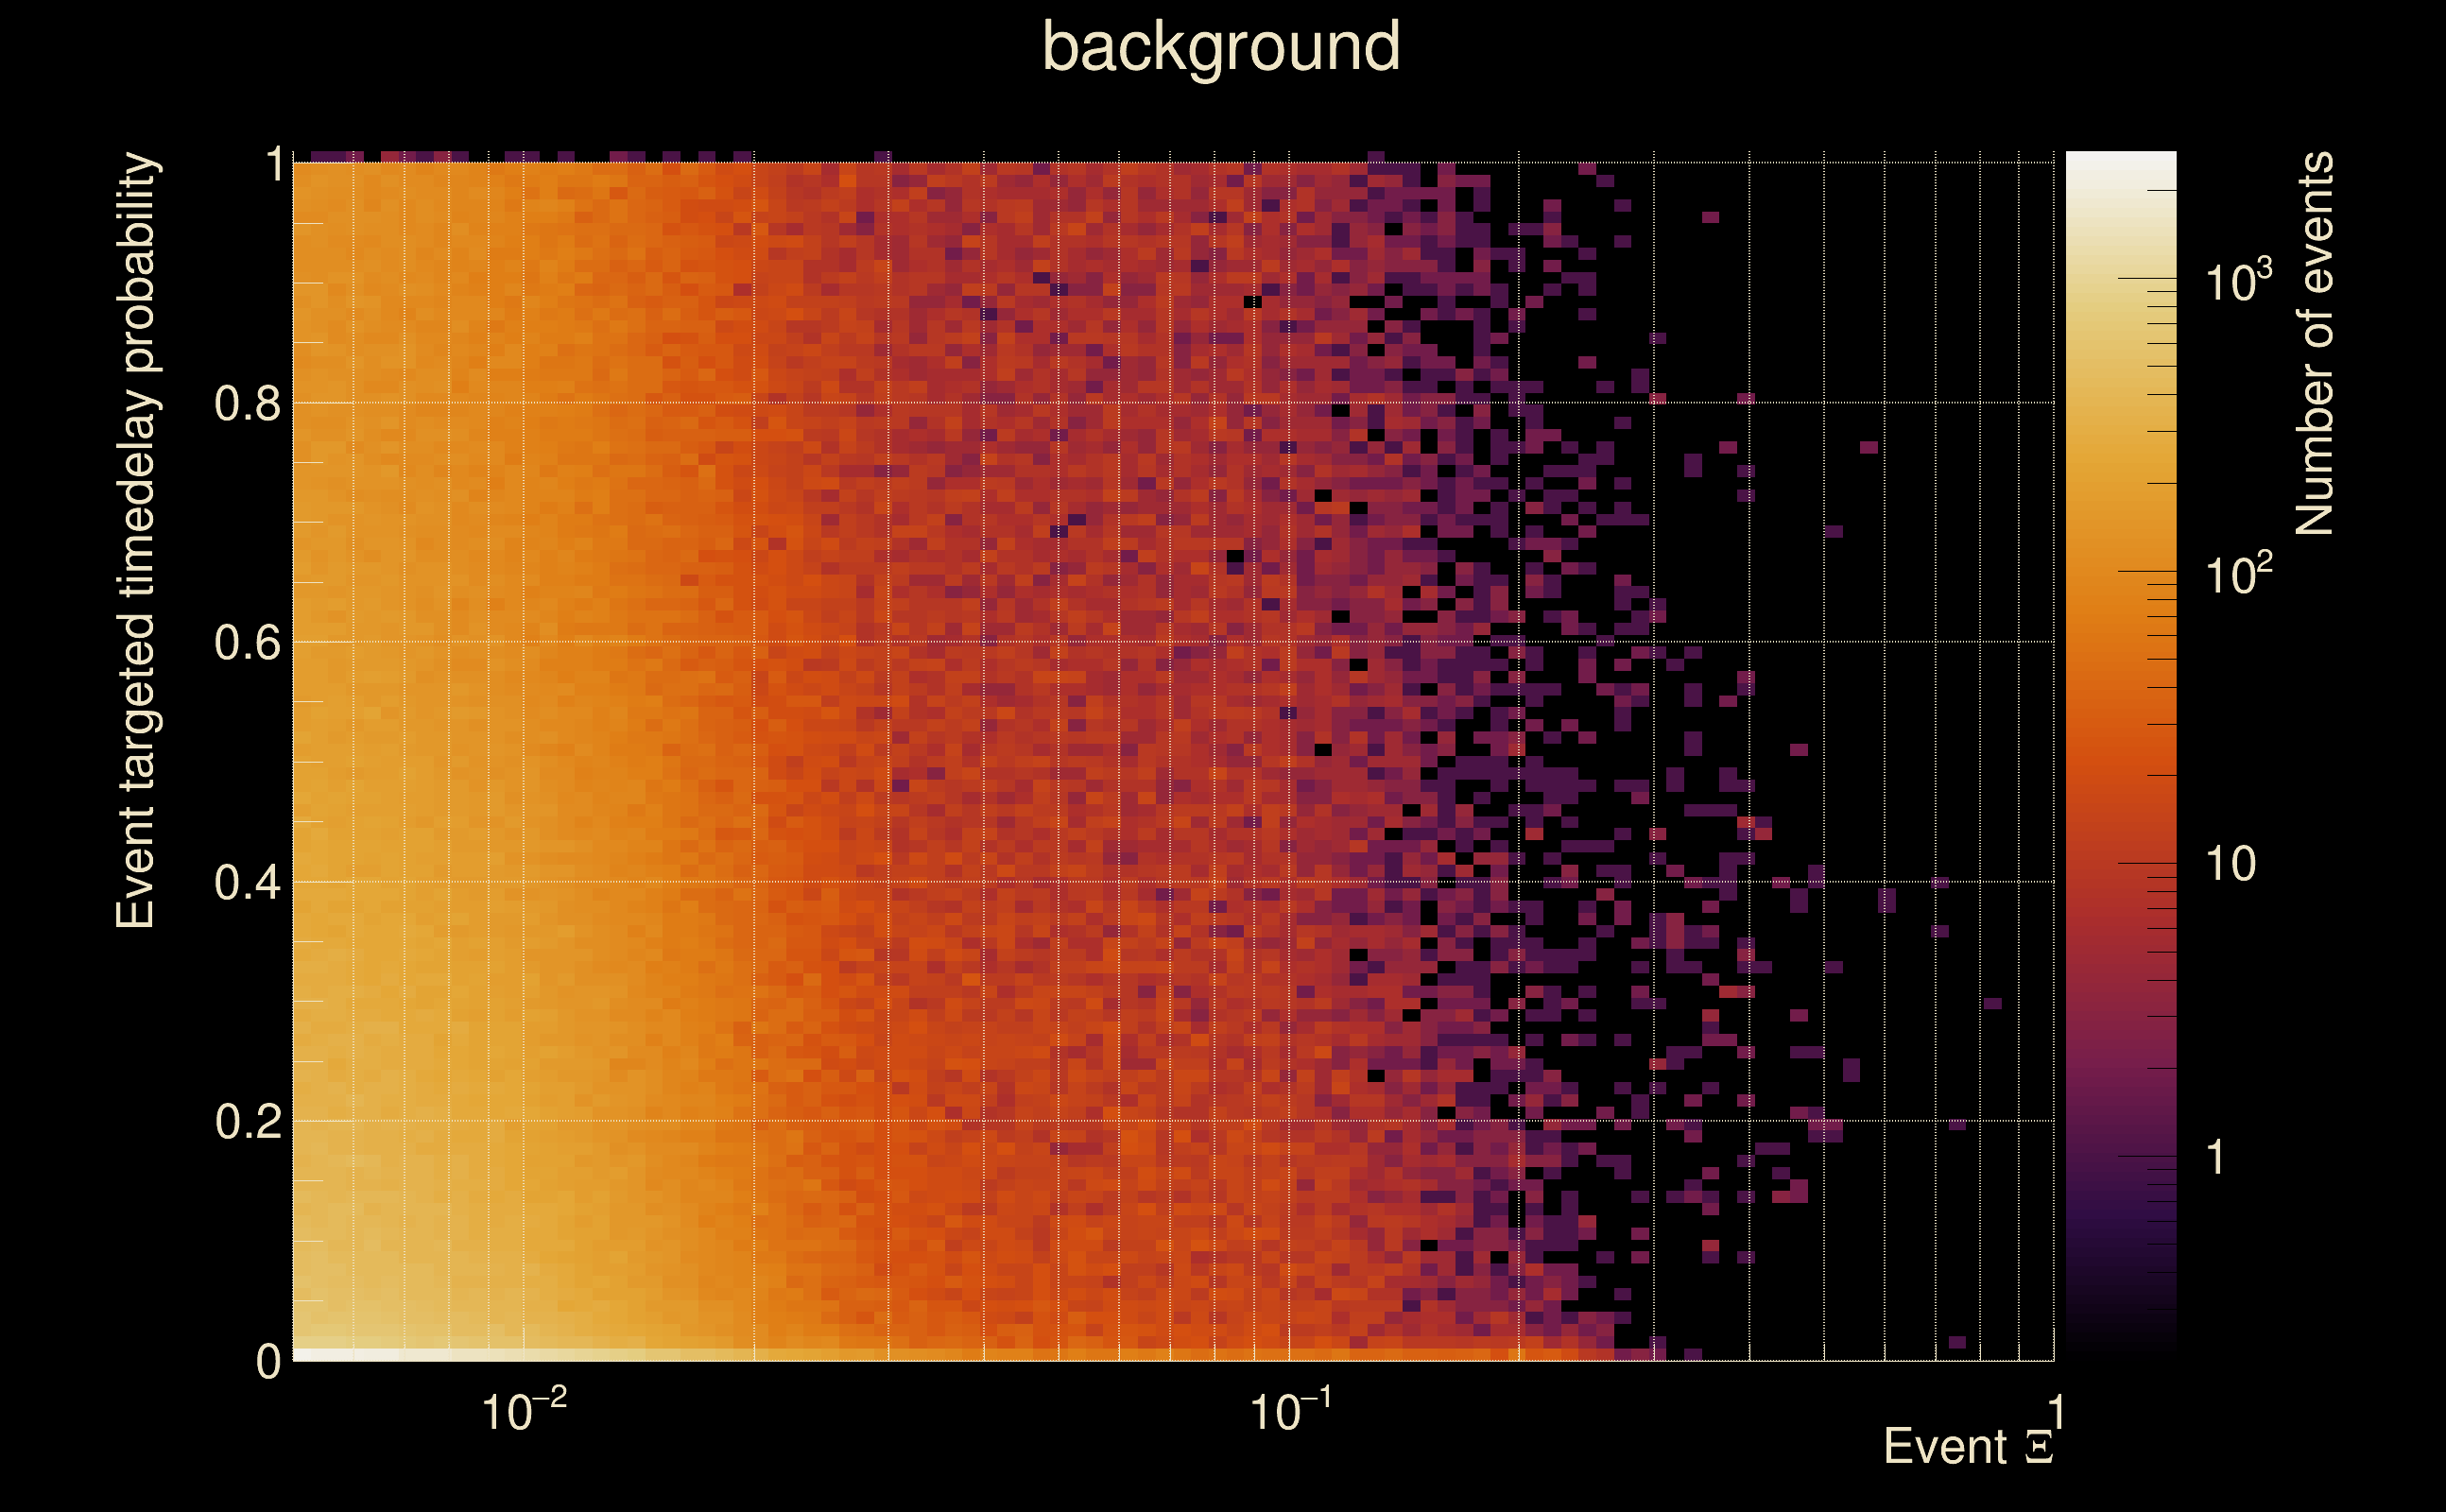
| Foreground | Fakeground | Background | ||
|---|---|---|---|---|
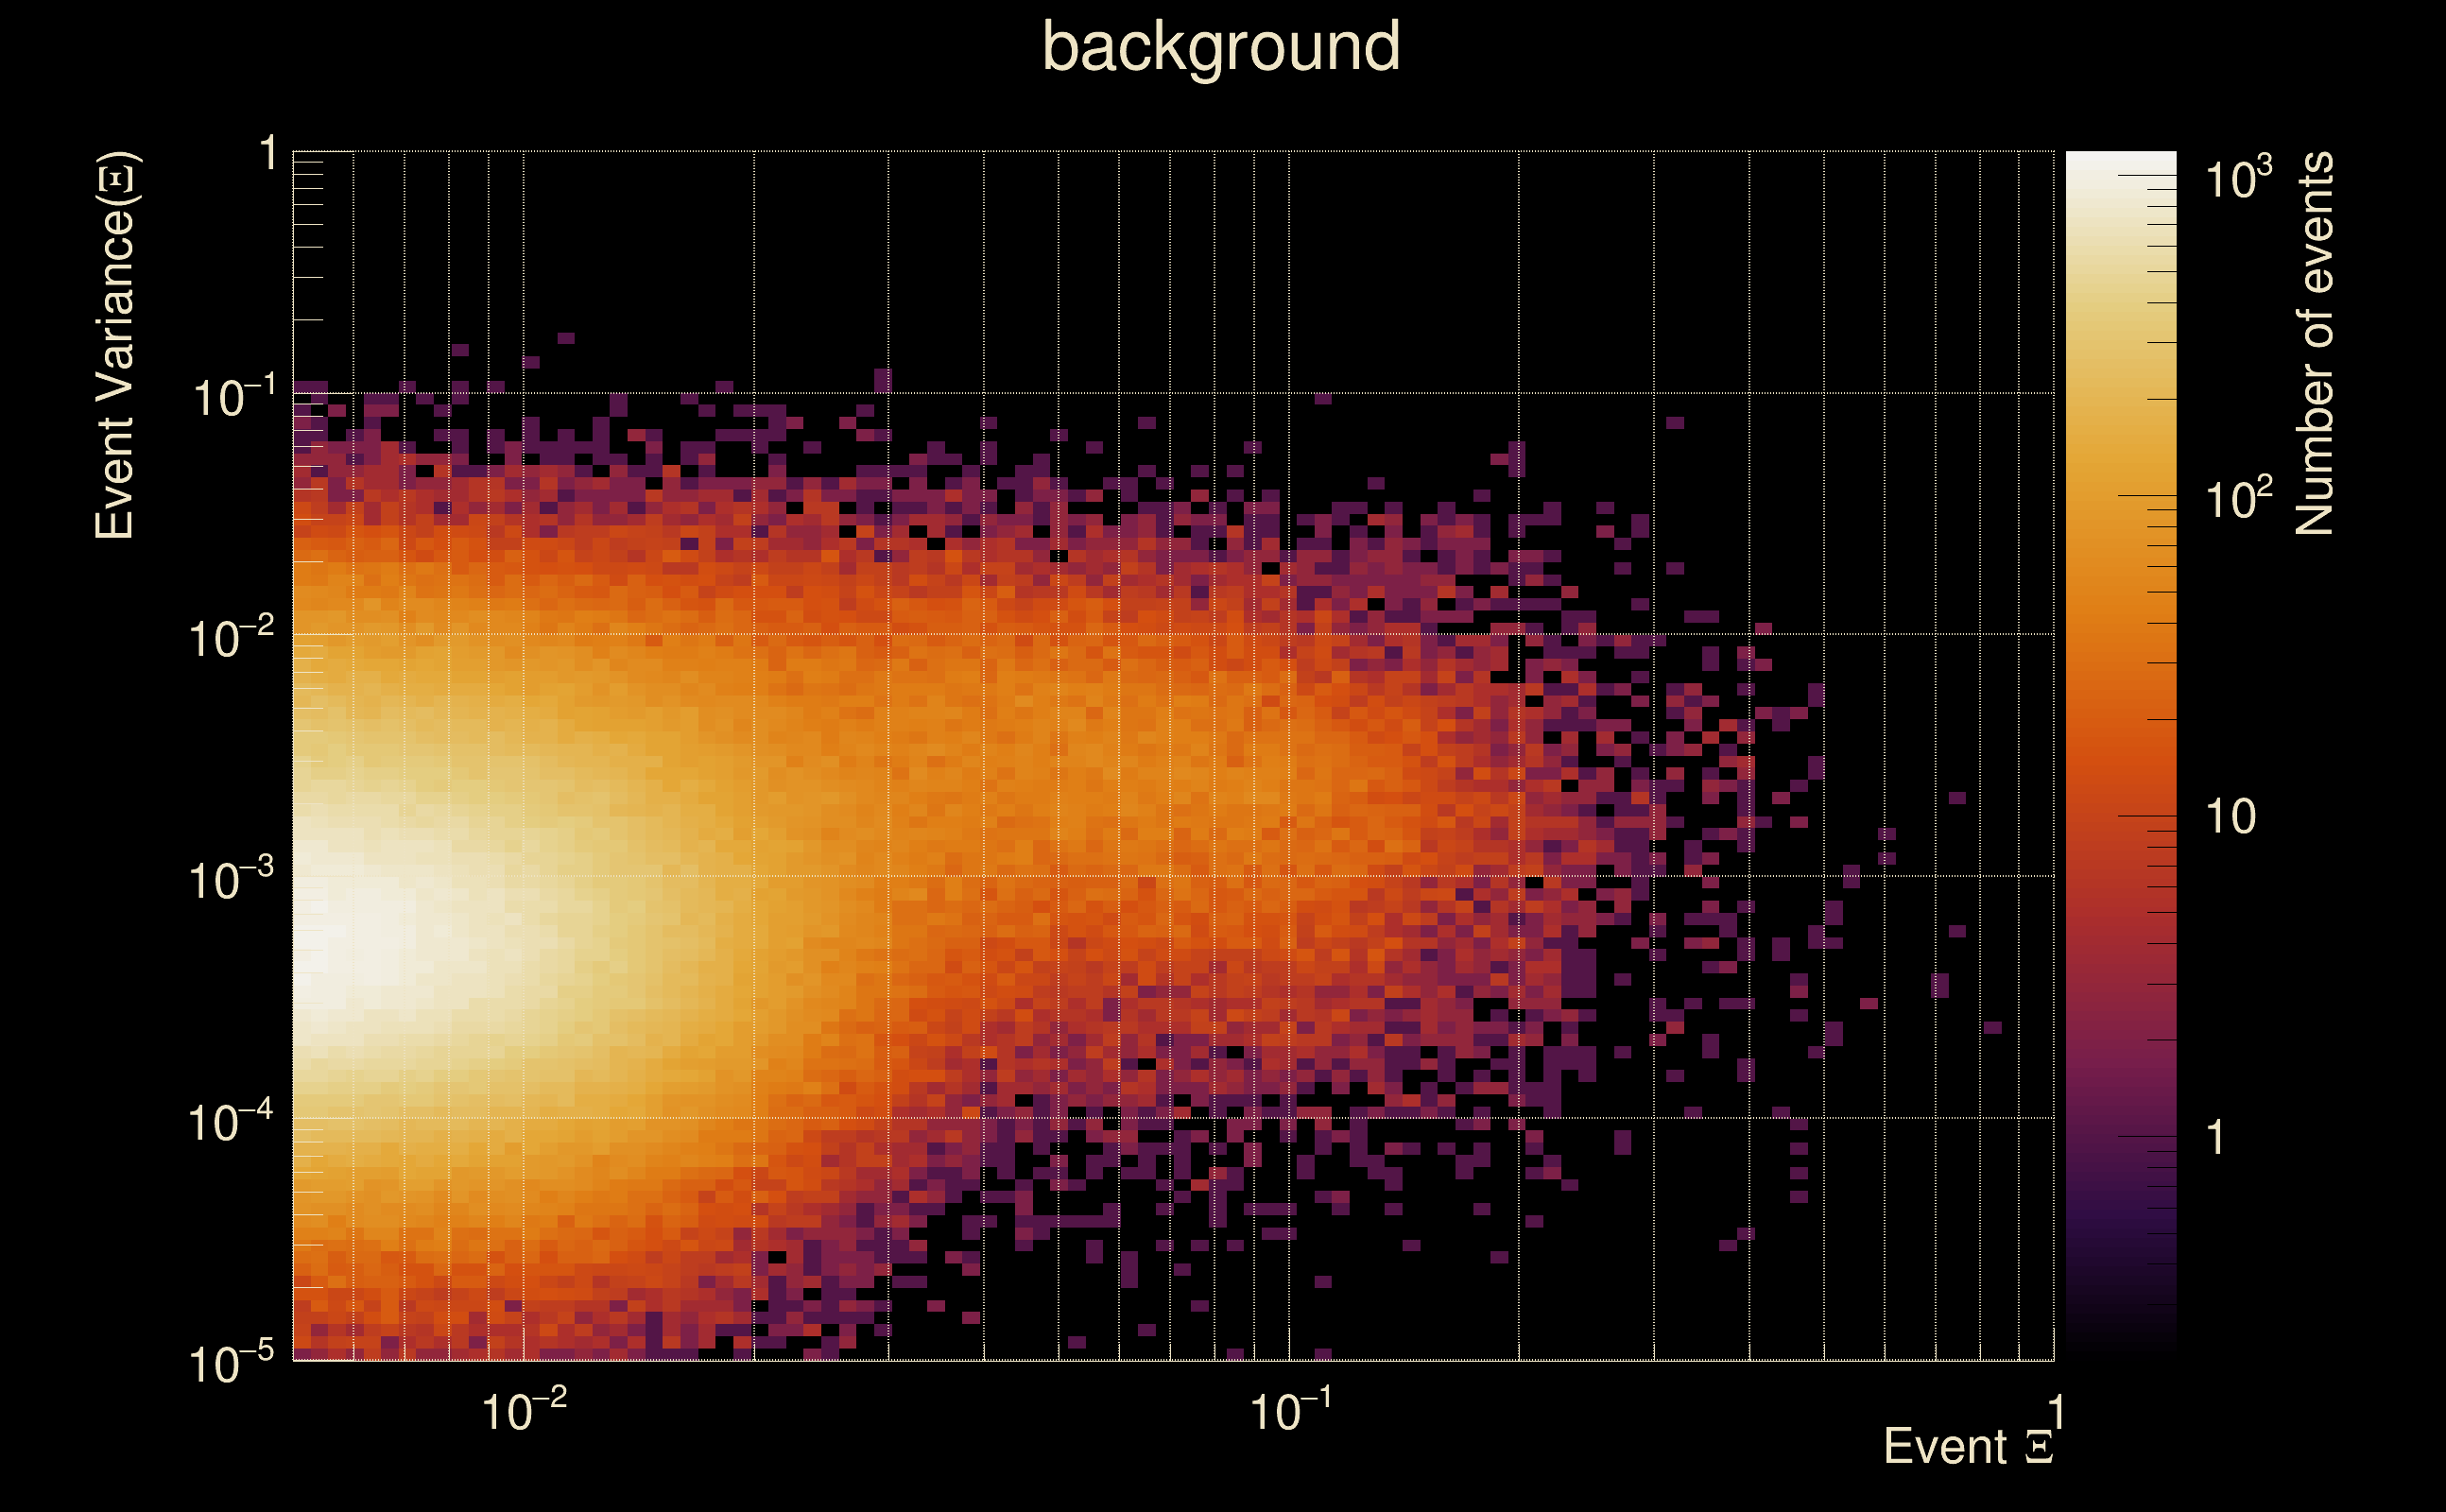
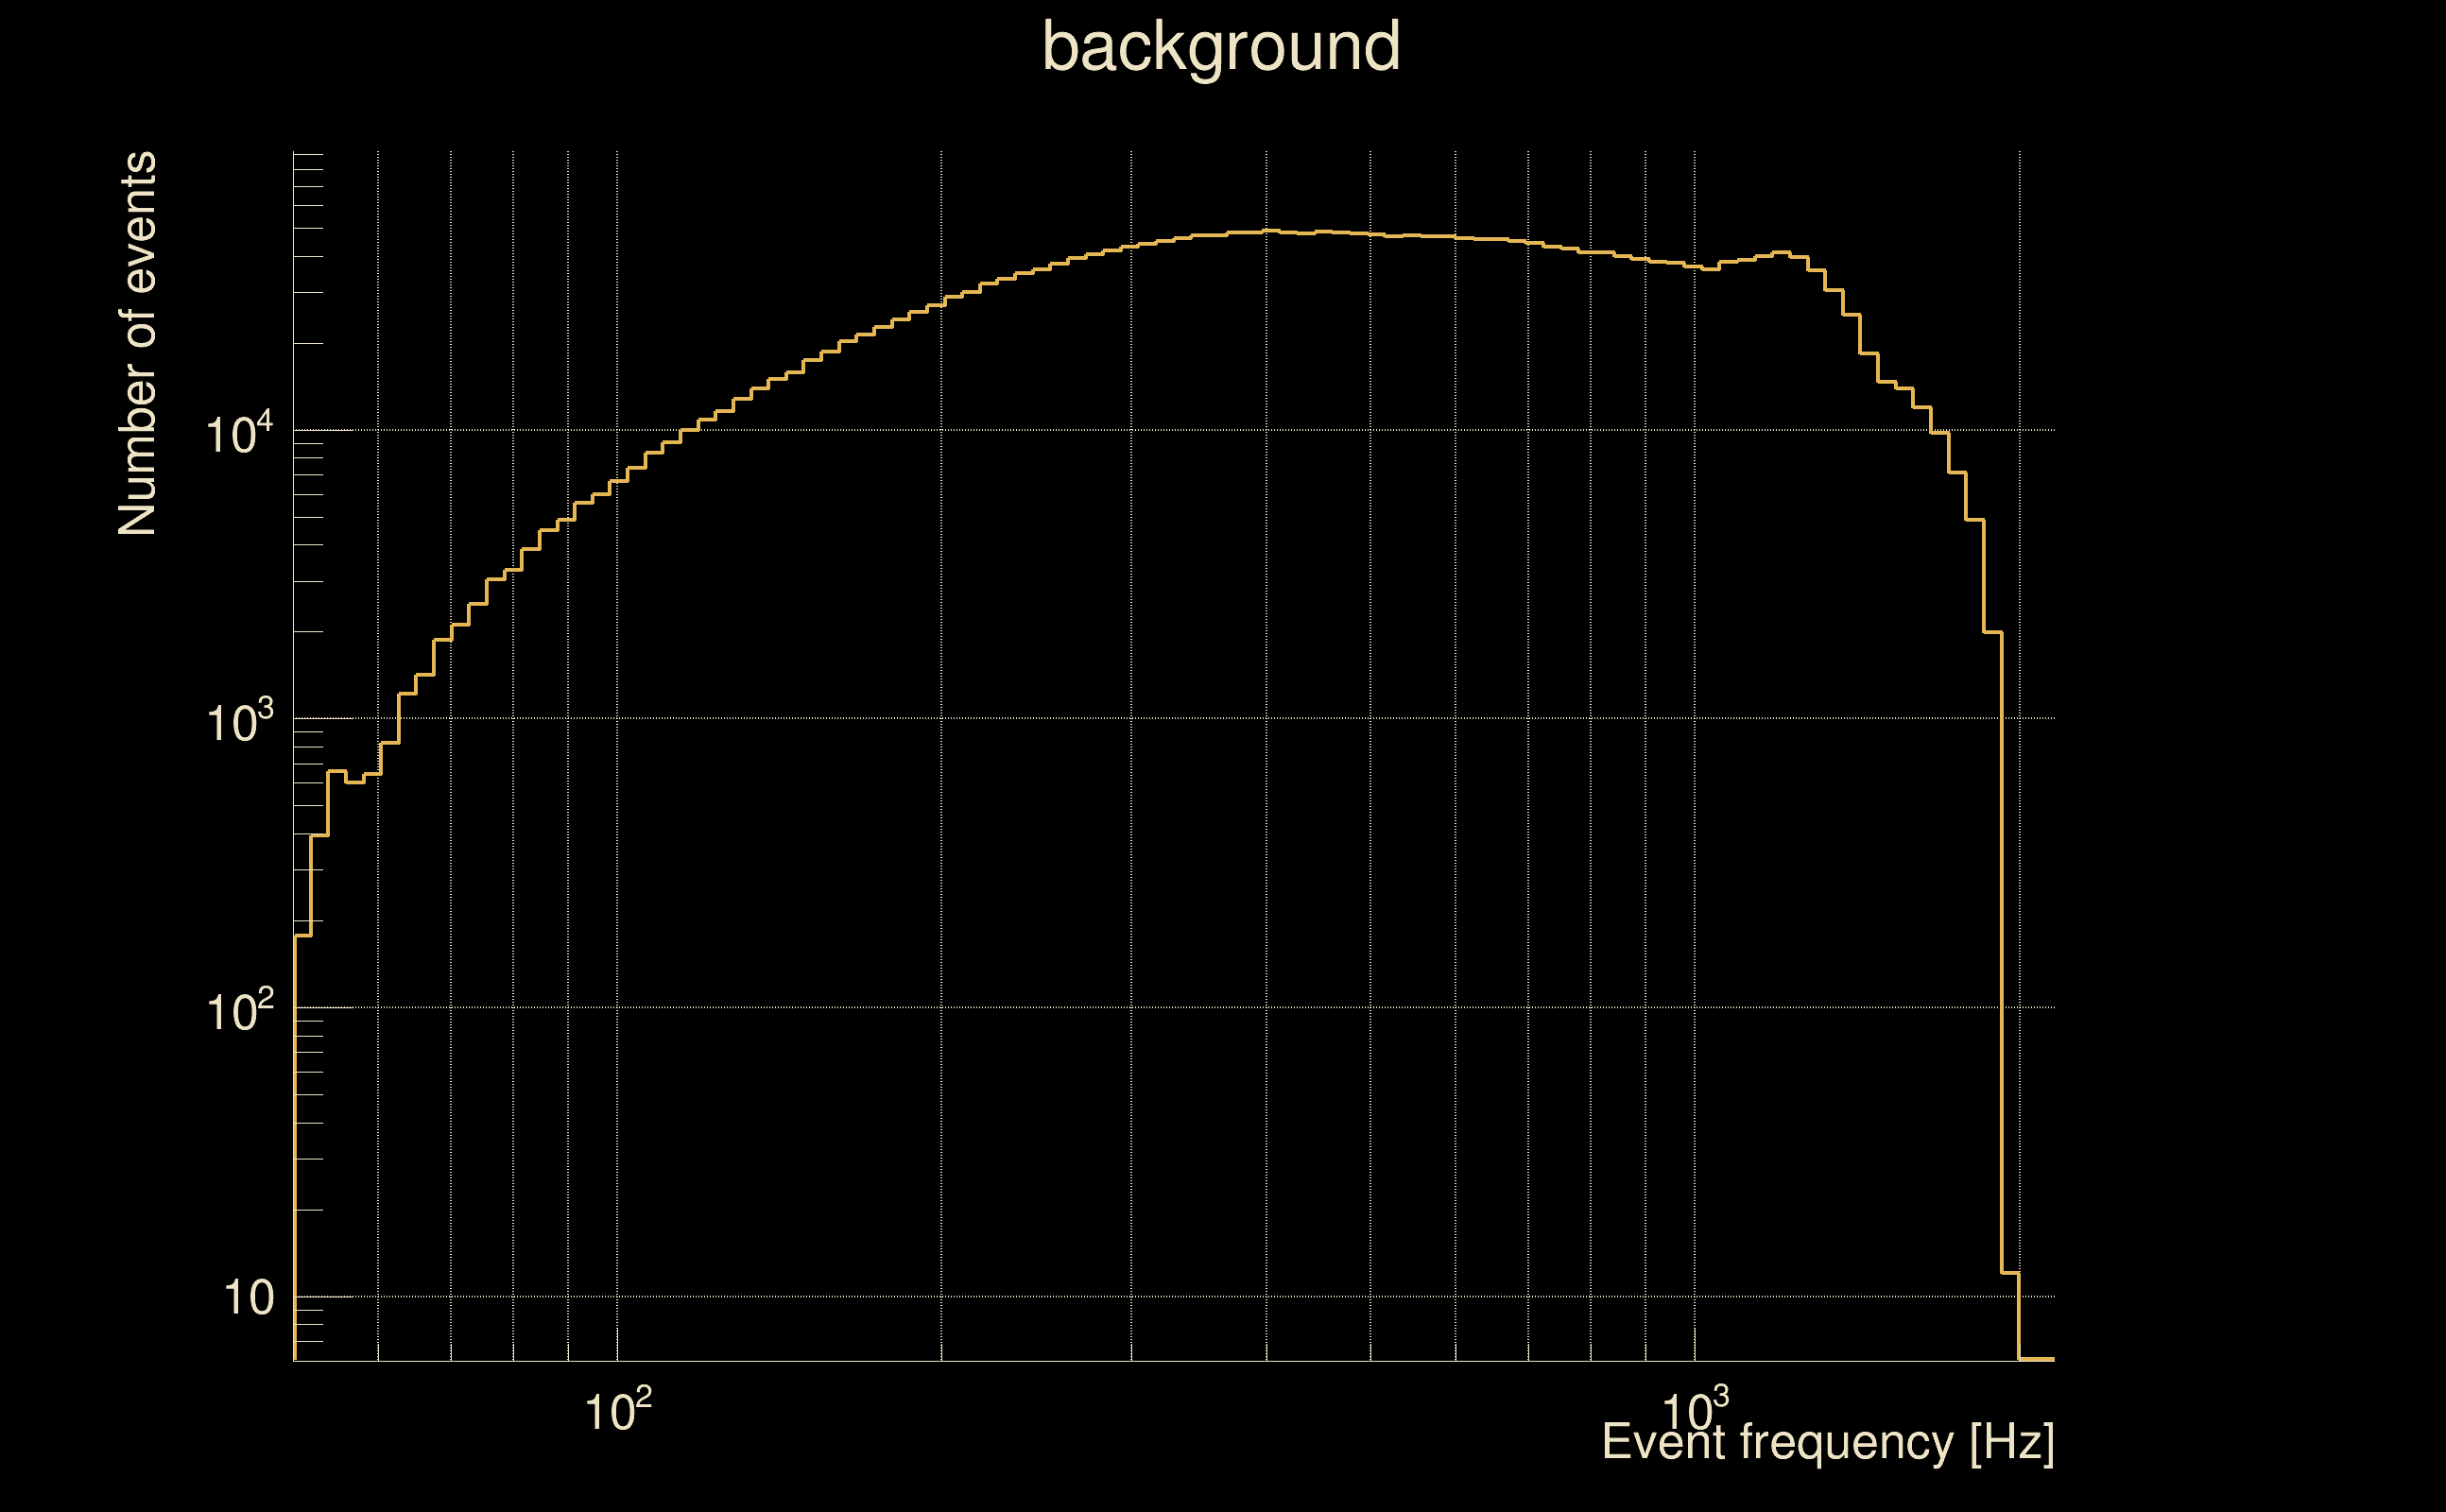
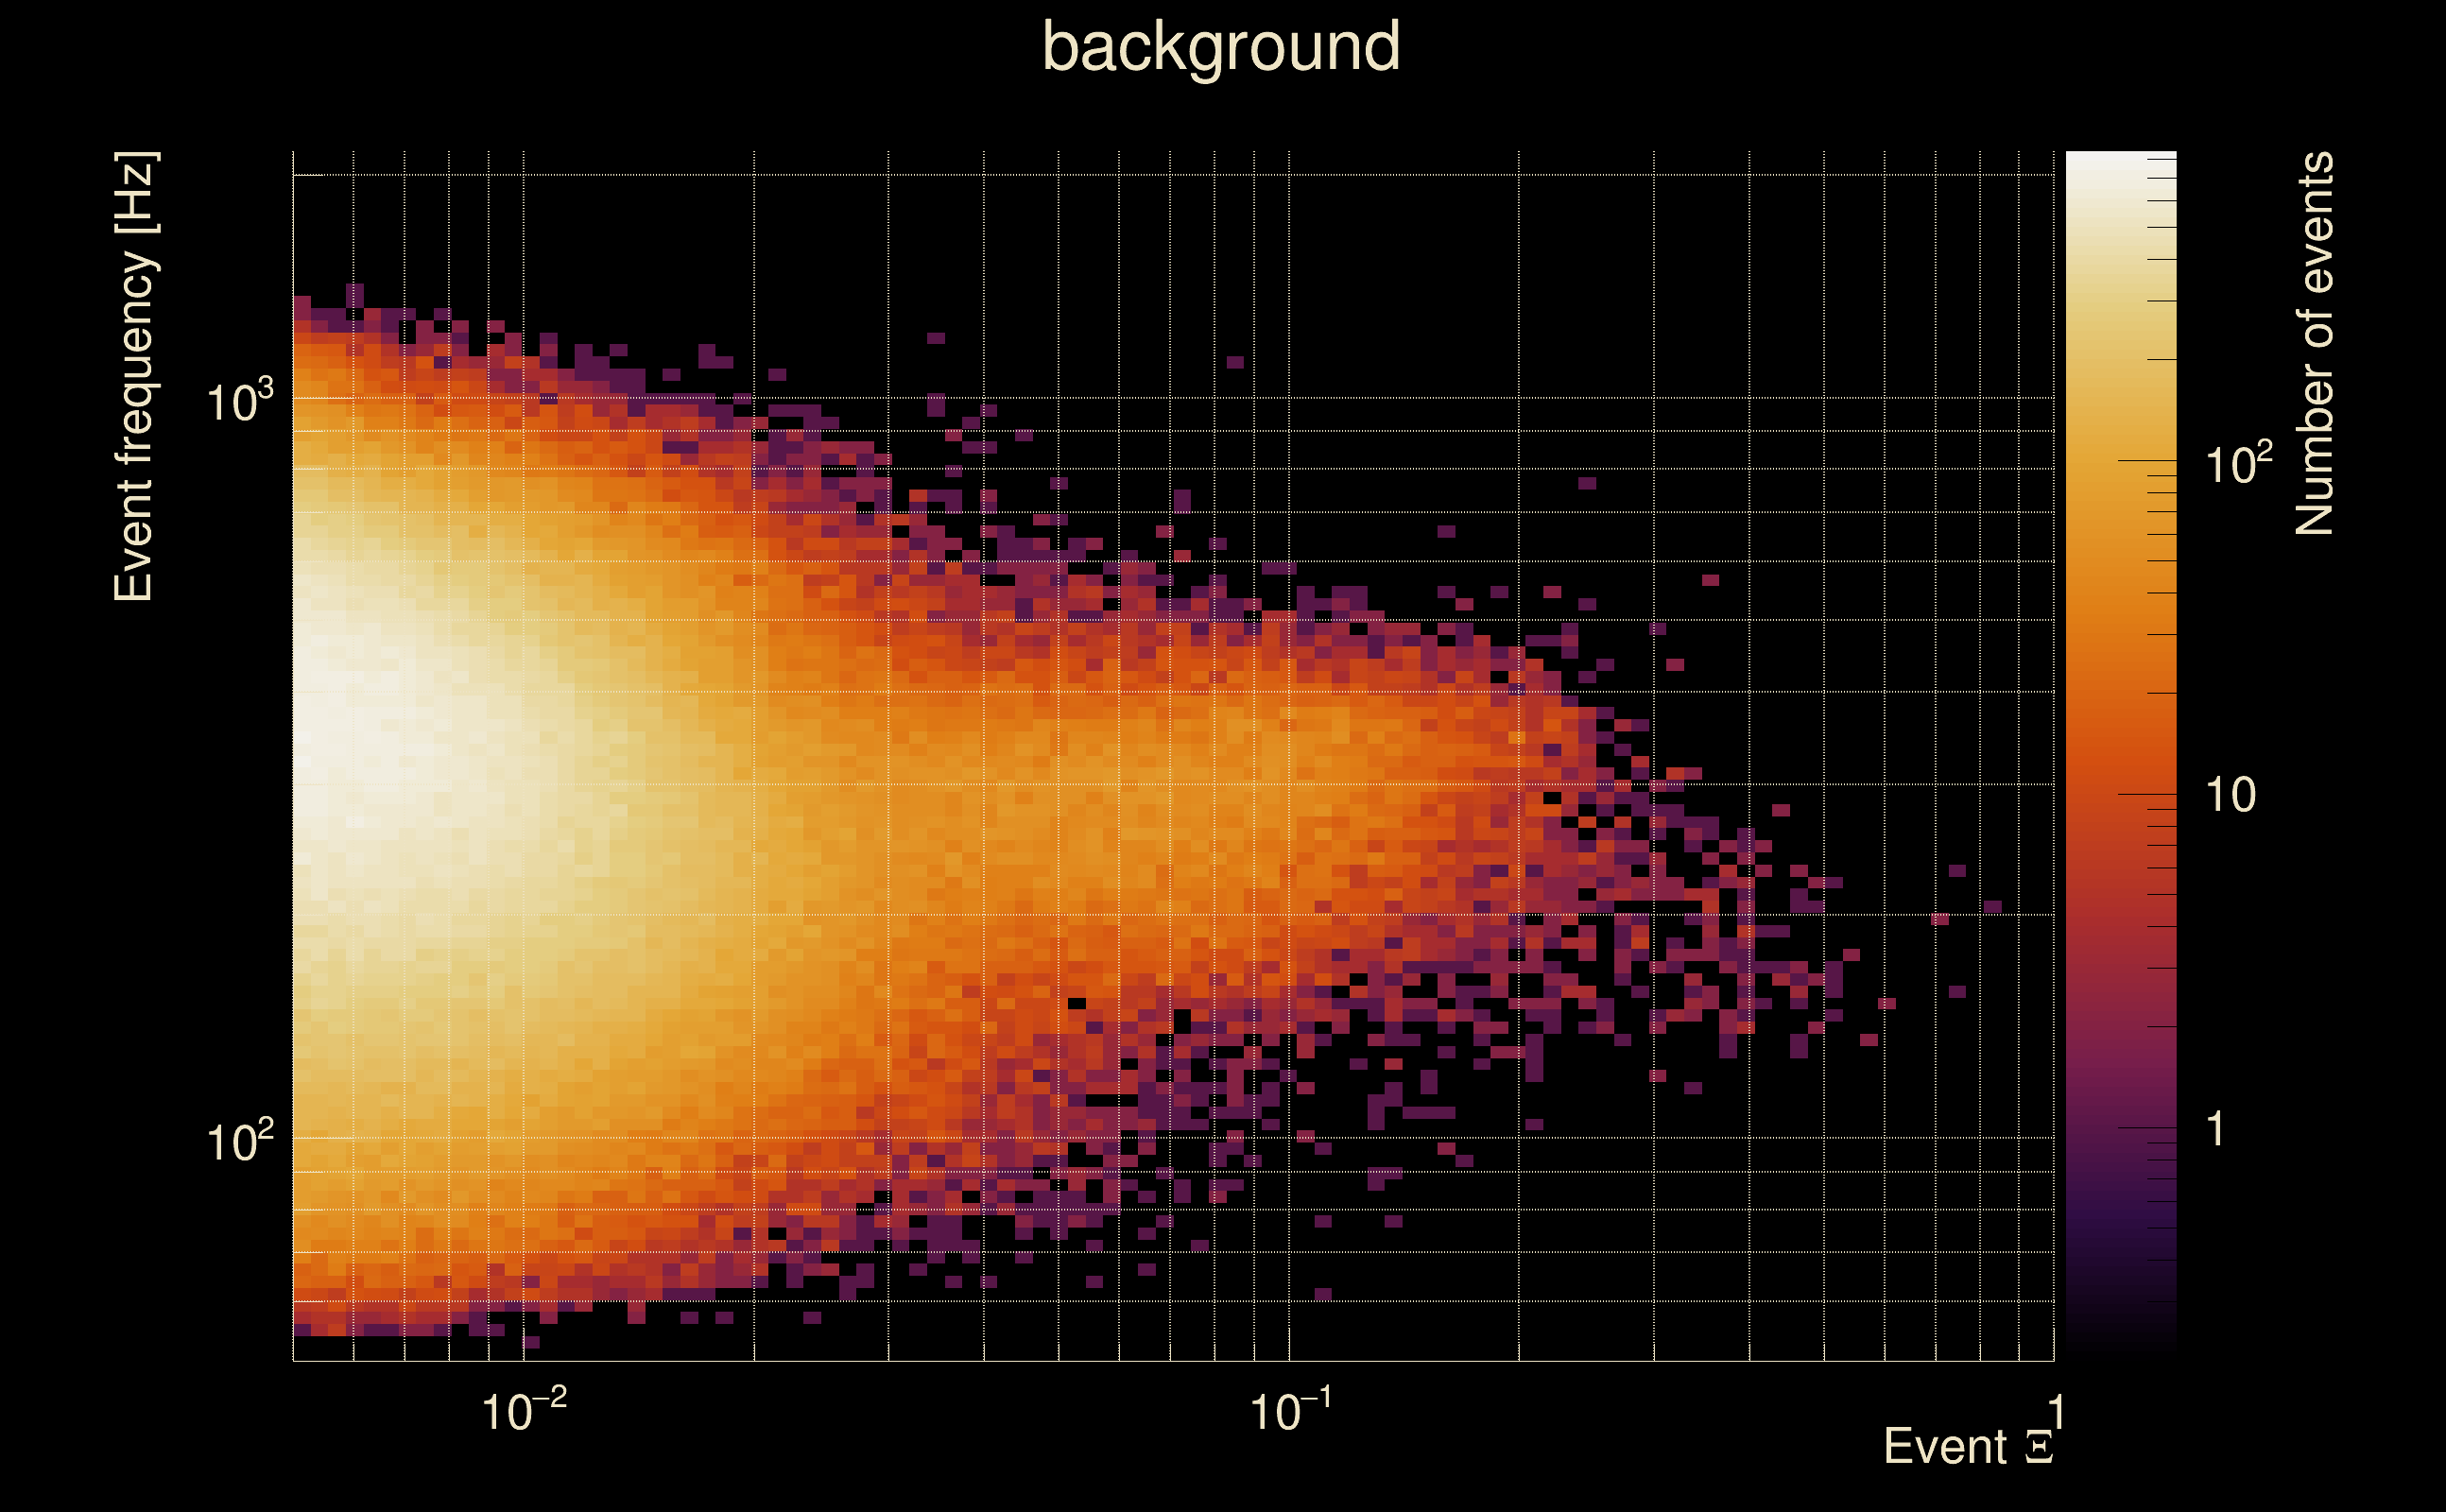
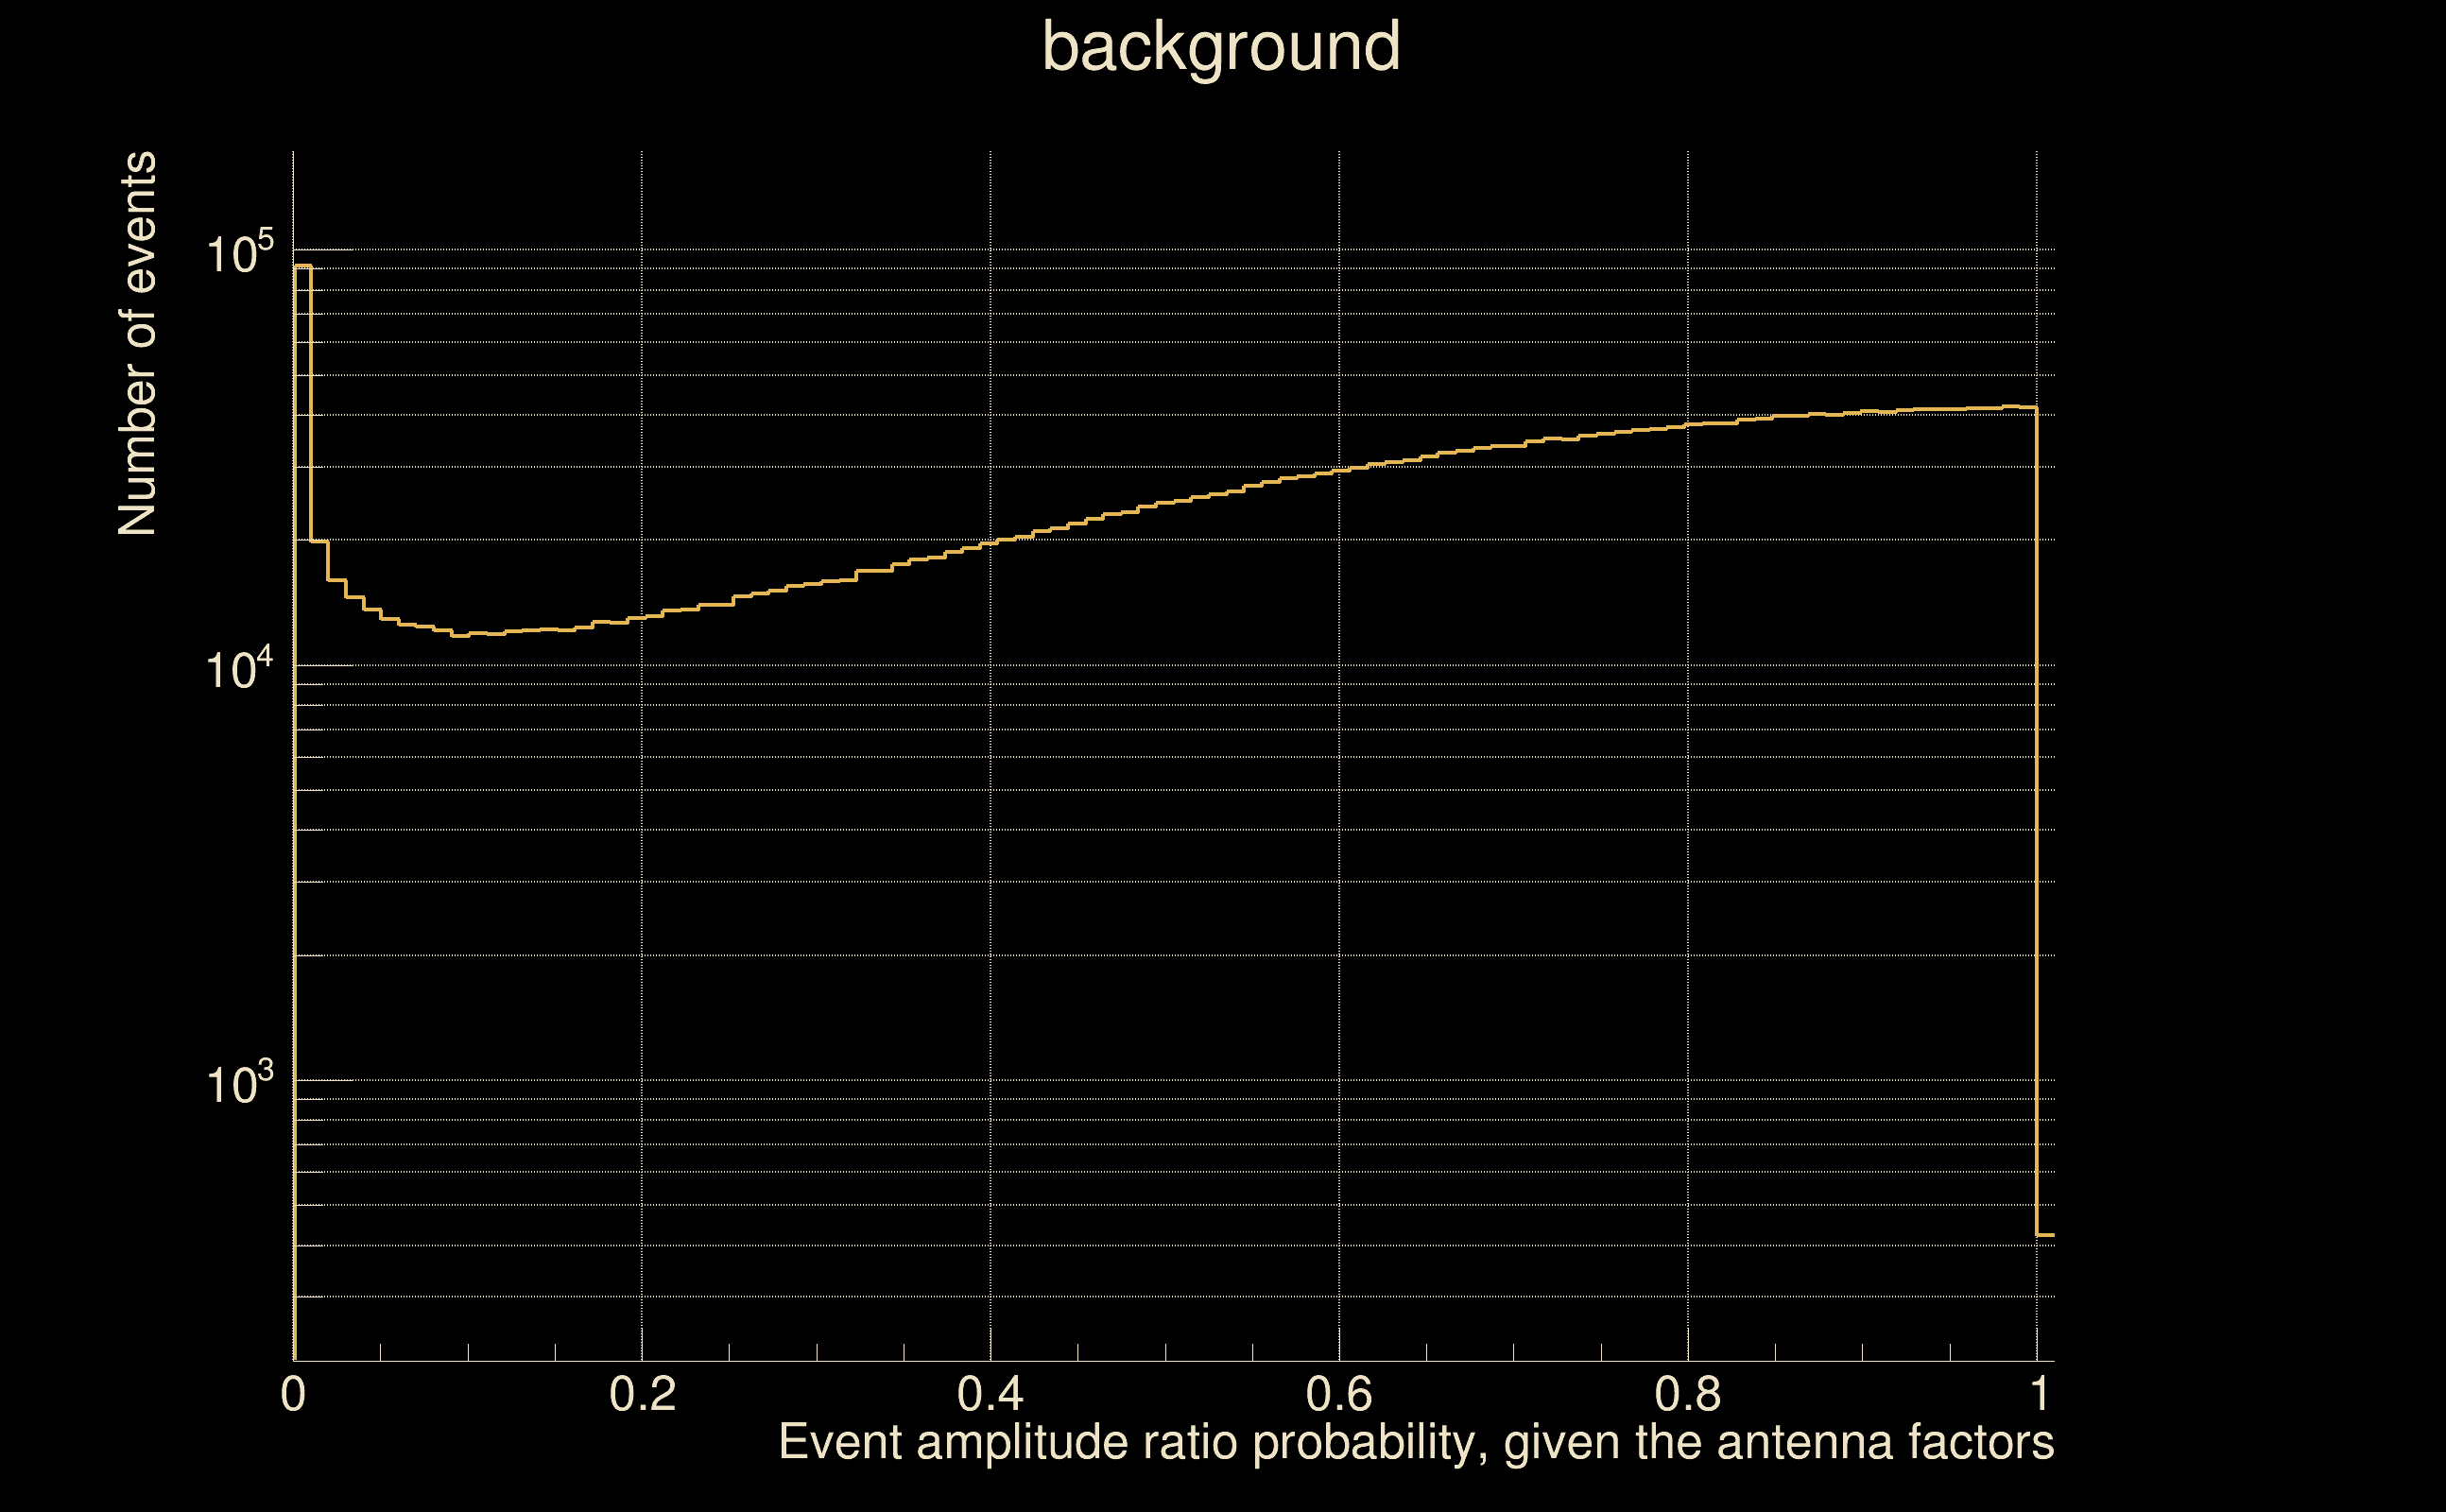
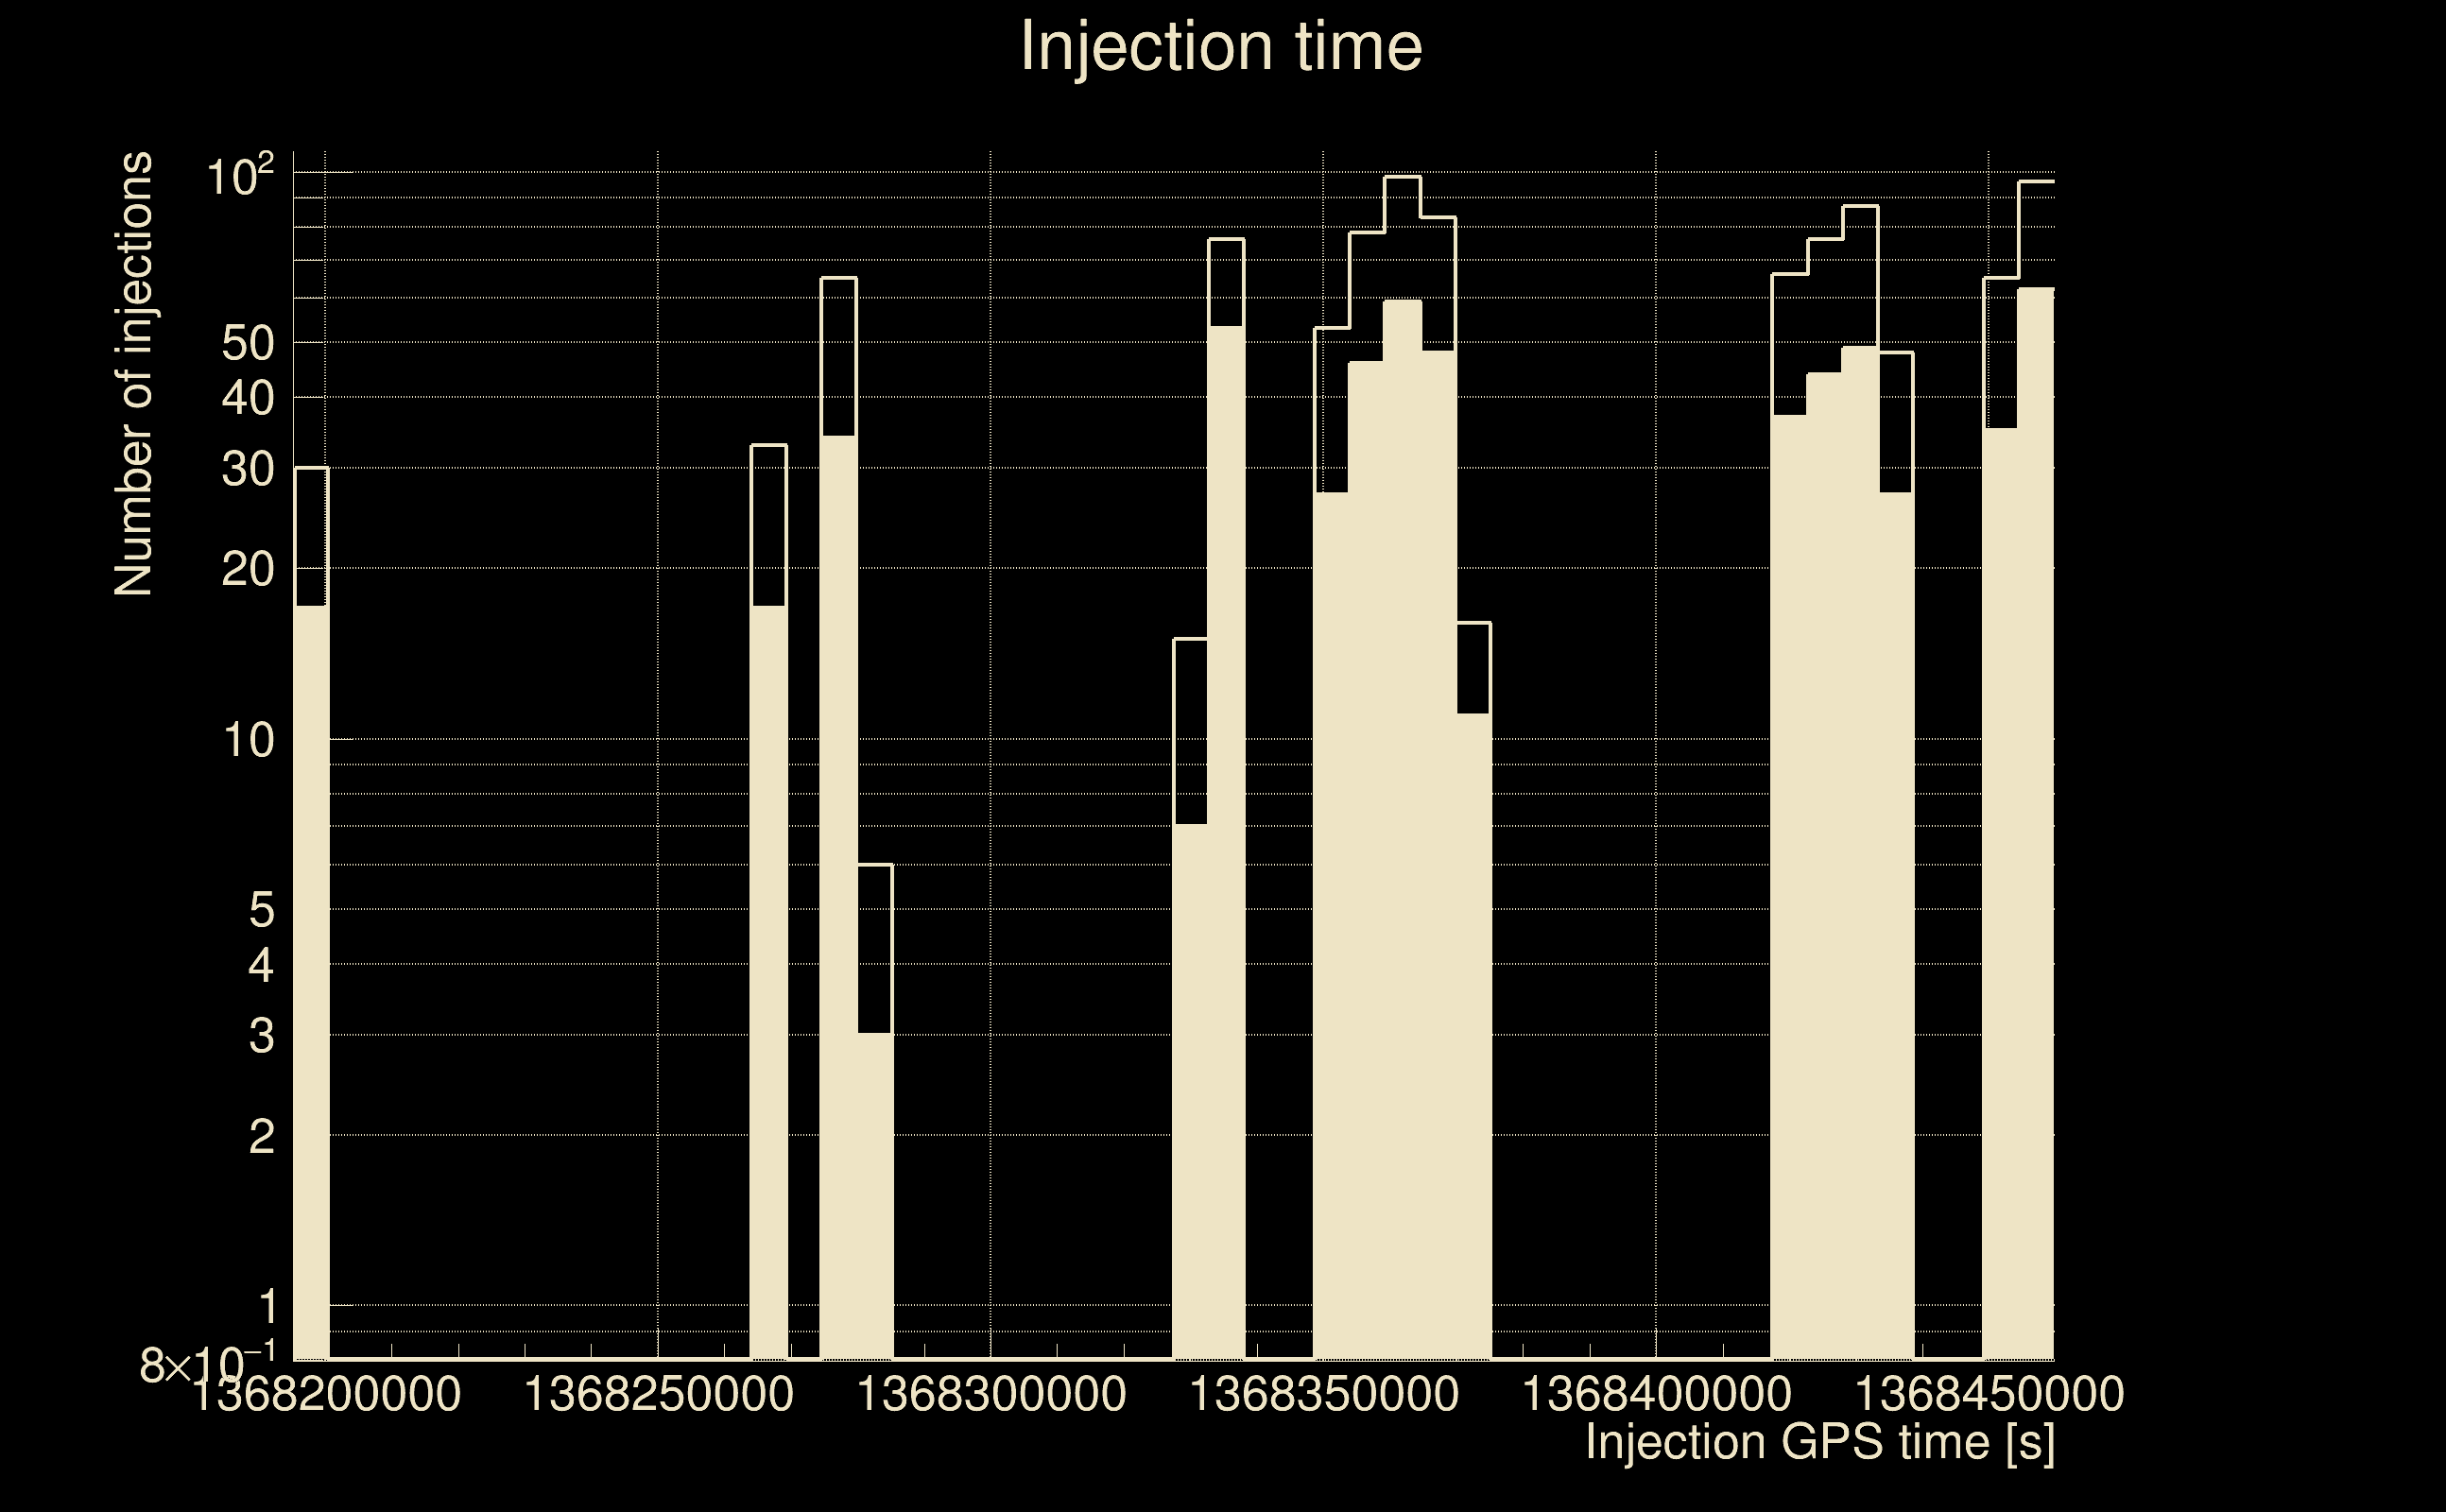
| Number of processed ox events | 12111 | 12111 | 2603865 | |
| Start Date (detector 0) | Mon May 15 14:13:25 2023 UTC | Mon May 15 14:13:25 2023 UTC | Mon May 15 14:13:25 2023 UTC | |
| End Date (detector 0) | Thu May 18 15:54:40 2023 UTC | Thu May 18 15:54:40 2023 UTC | Thu May 18 15:54:40 2023 UTC | |
| Start GPS (detector 0) | 1368195223 | 1368195223 | 1368195223 | |
| End GPS (detector 0) | 1368460498 | 1368460498 | 1368460498 | |
| Used livetime (detector 0) | 60875 s | 60875 s | 60875 s | |
| Start Date (detector 1) | Mon May 15 14:13:25 2023 UTC | Mon May 15 14:13:25 2023 UTC | Mon May 15 14:13:25 2023 UTC | |
| End Date (detector 1) | Thu May 18 15:54:40 2023 UTC | Thu May 18 15:54:40 2023 UTC | Thu May 18 15:54:40 2023 UTC | |
| Start GPS (detector 1) | 1368195223 | 1368195223 | 1368195223 | |
| End GPS (detector 1) | 1368460498 | 1368460498 | 1368460498 | |
| Used livetime (detector 1) | 60875 s | 60875 s | 60875 s | |
| Cumulative livetime | 121110 s | 121110 s | 26038650 s | |
| 0 years, 1 days, 9 hours, 38 min, 30 s | 0 years, 1 days, 9 hours, 38 min, 30 s | 0 years, 301 days, 8 hours, 57 min, 30 s |
|
|
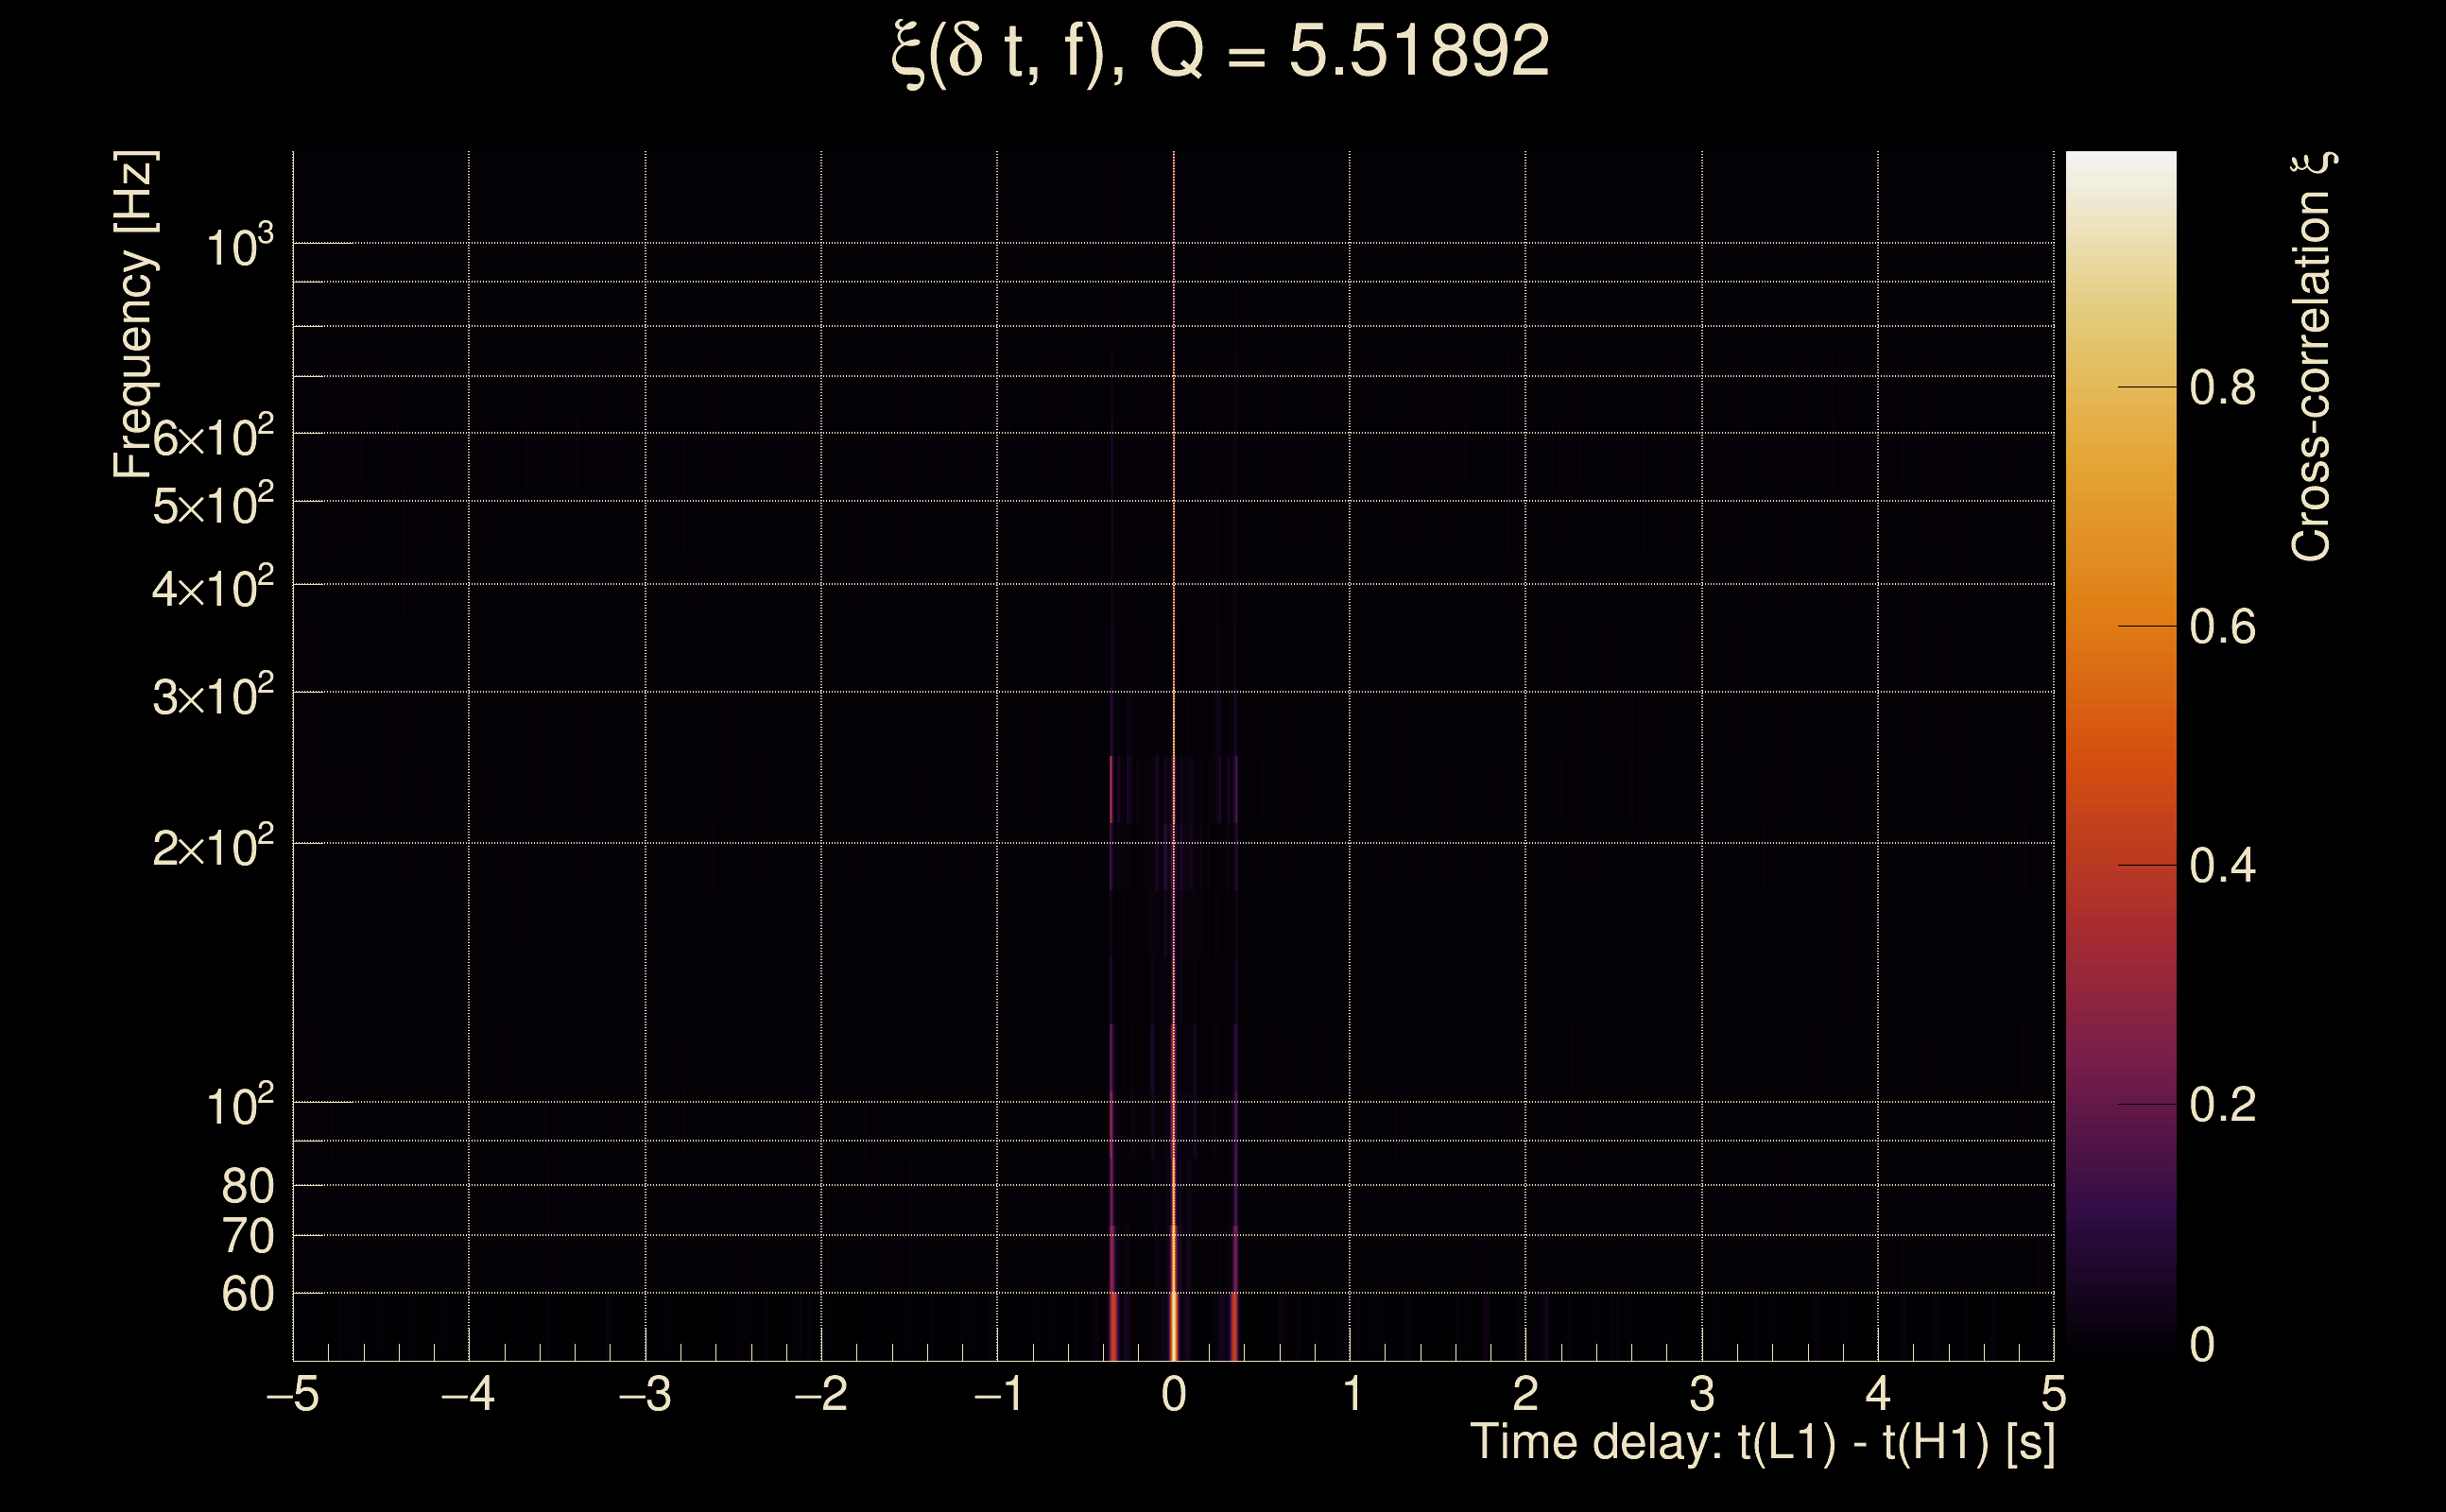
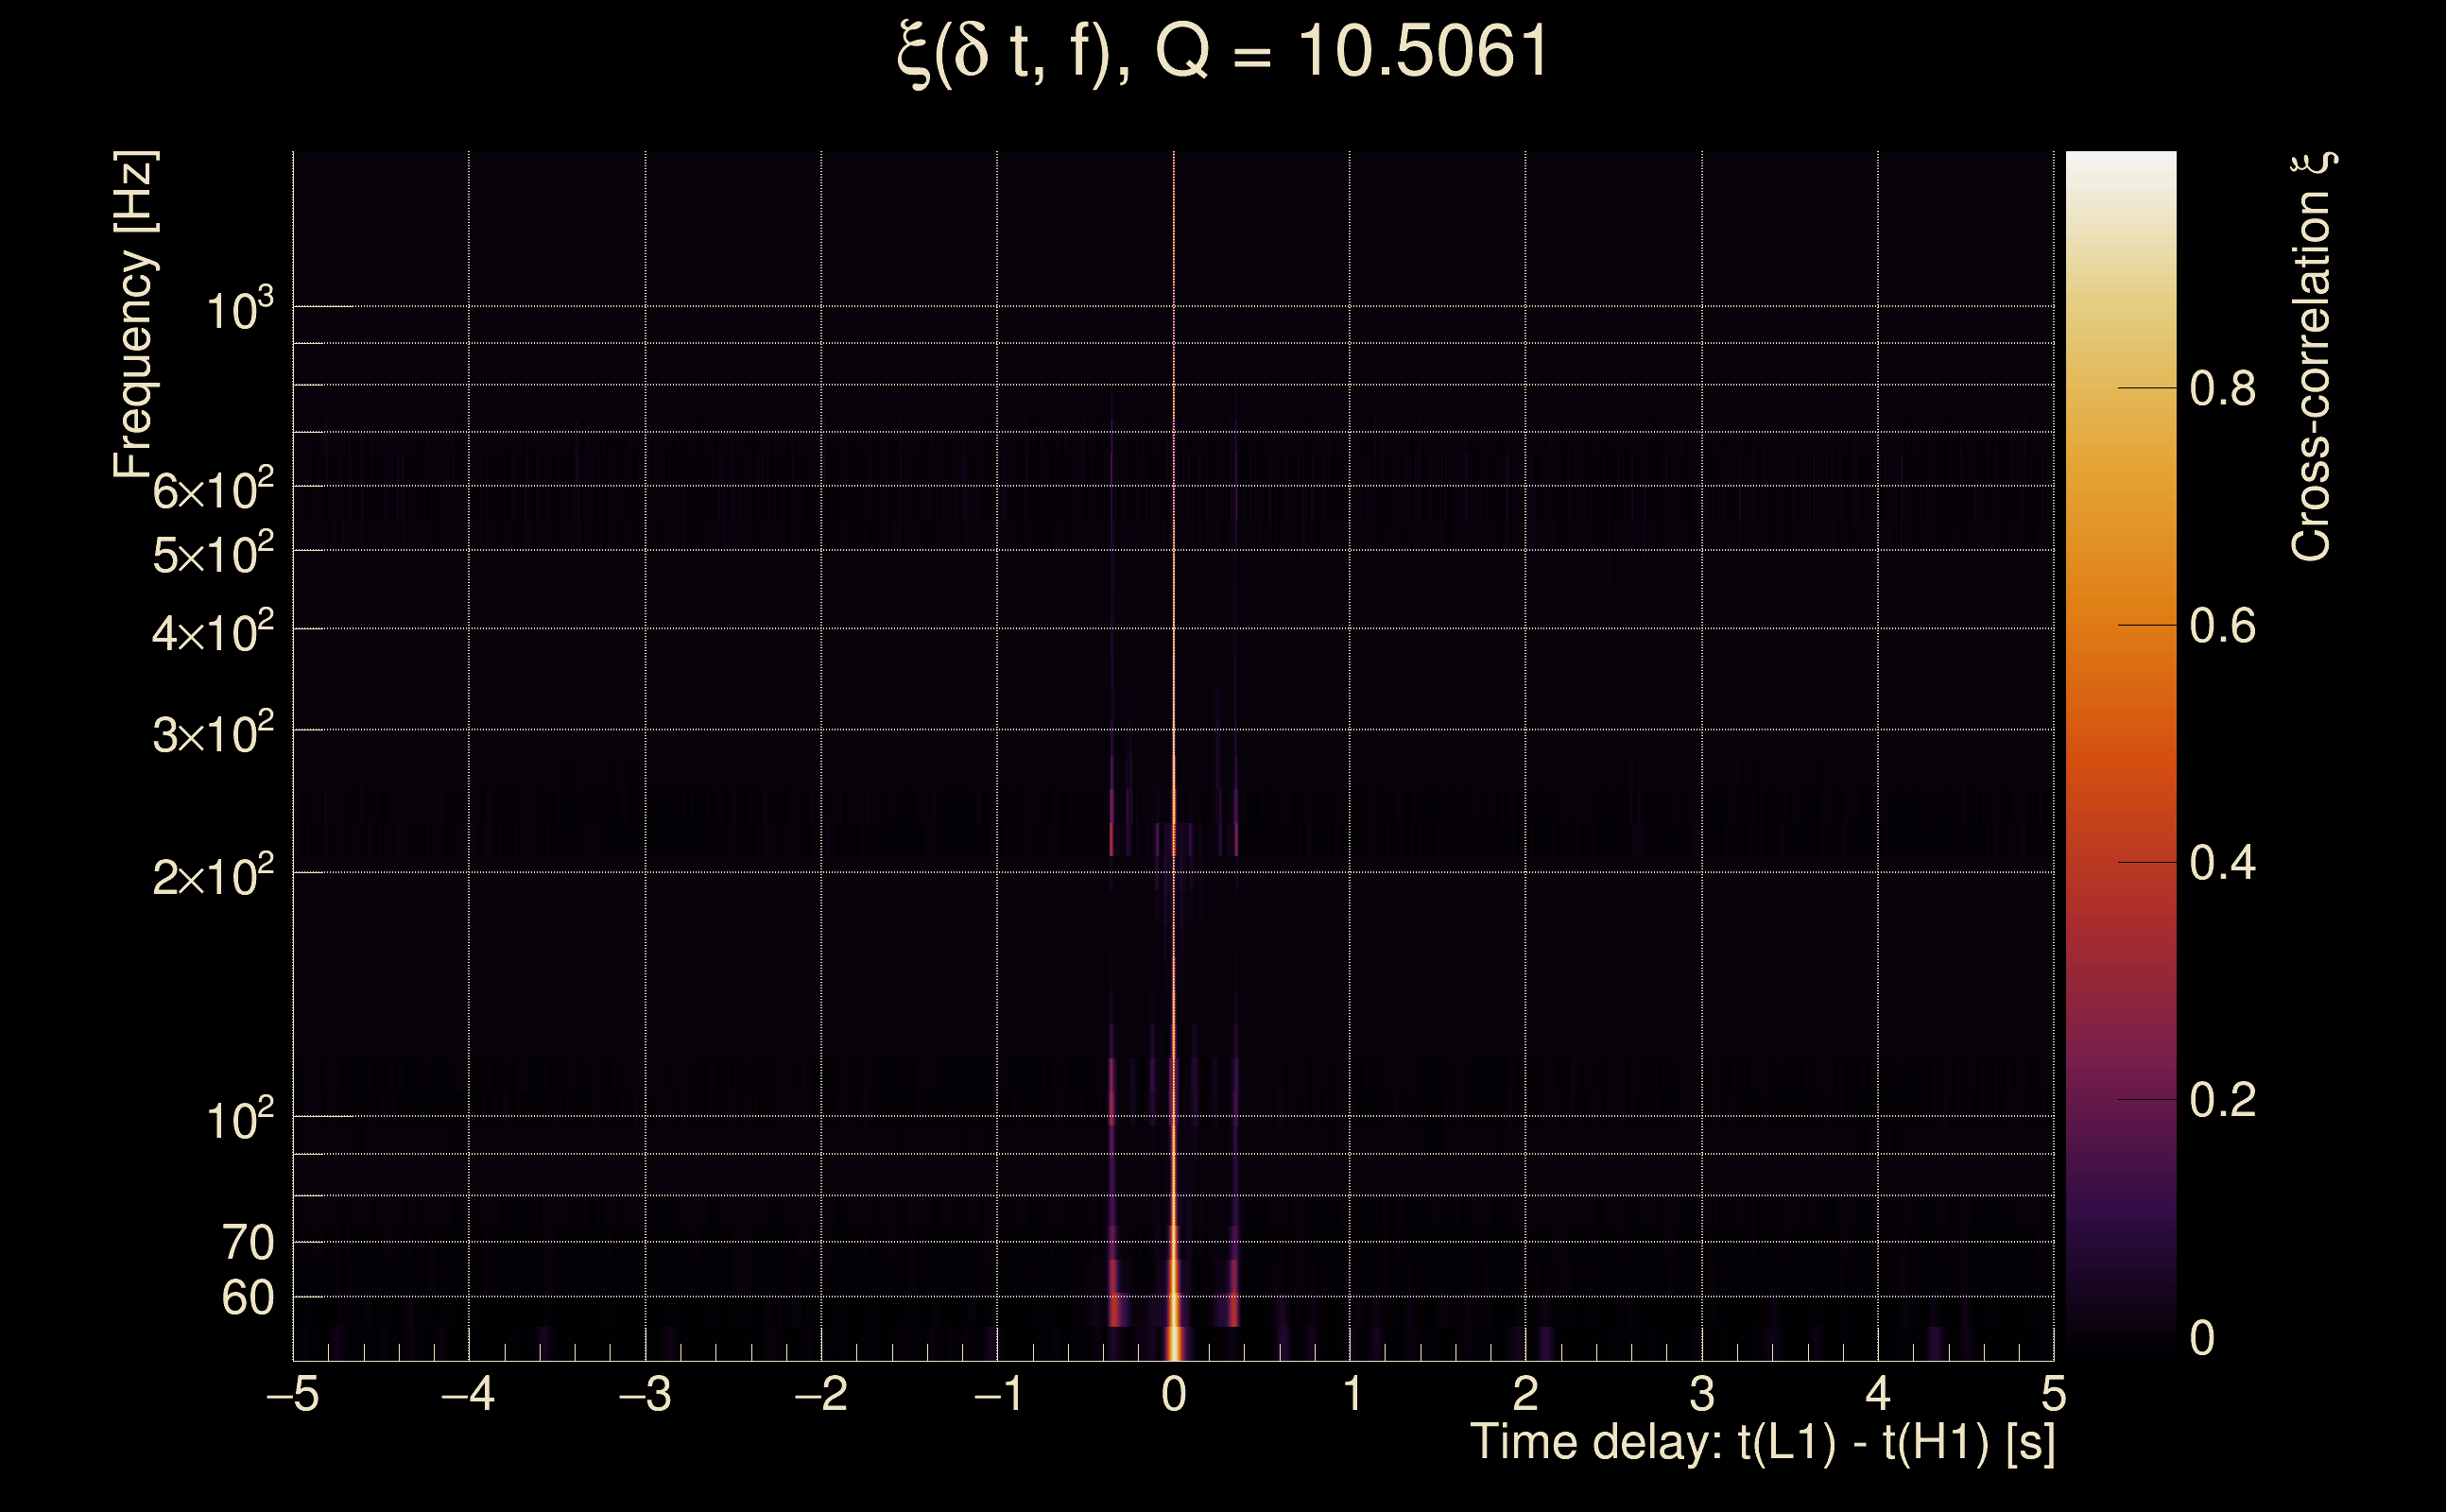
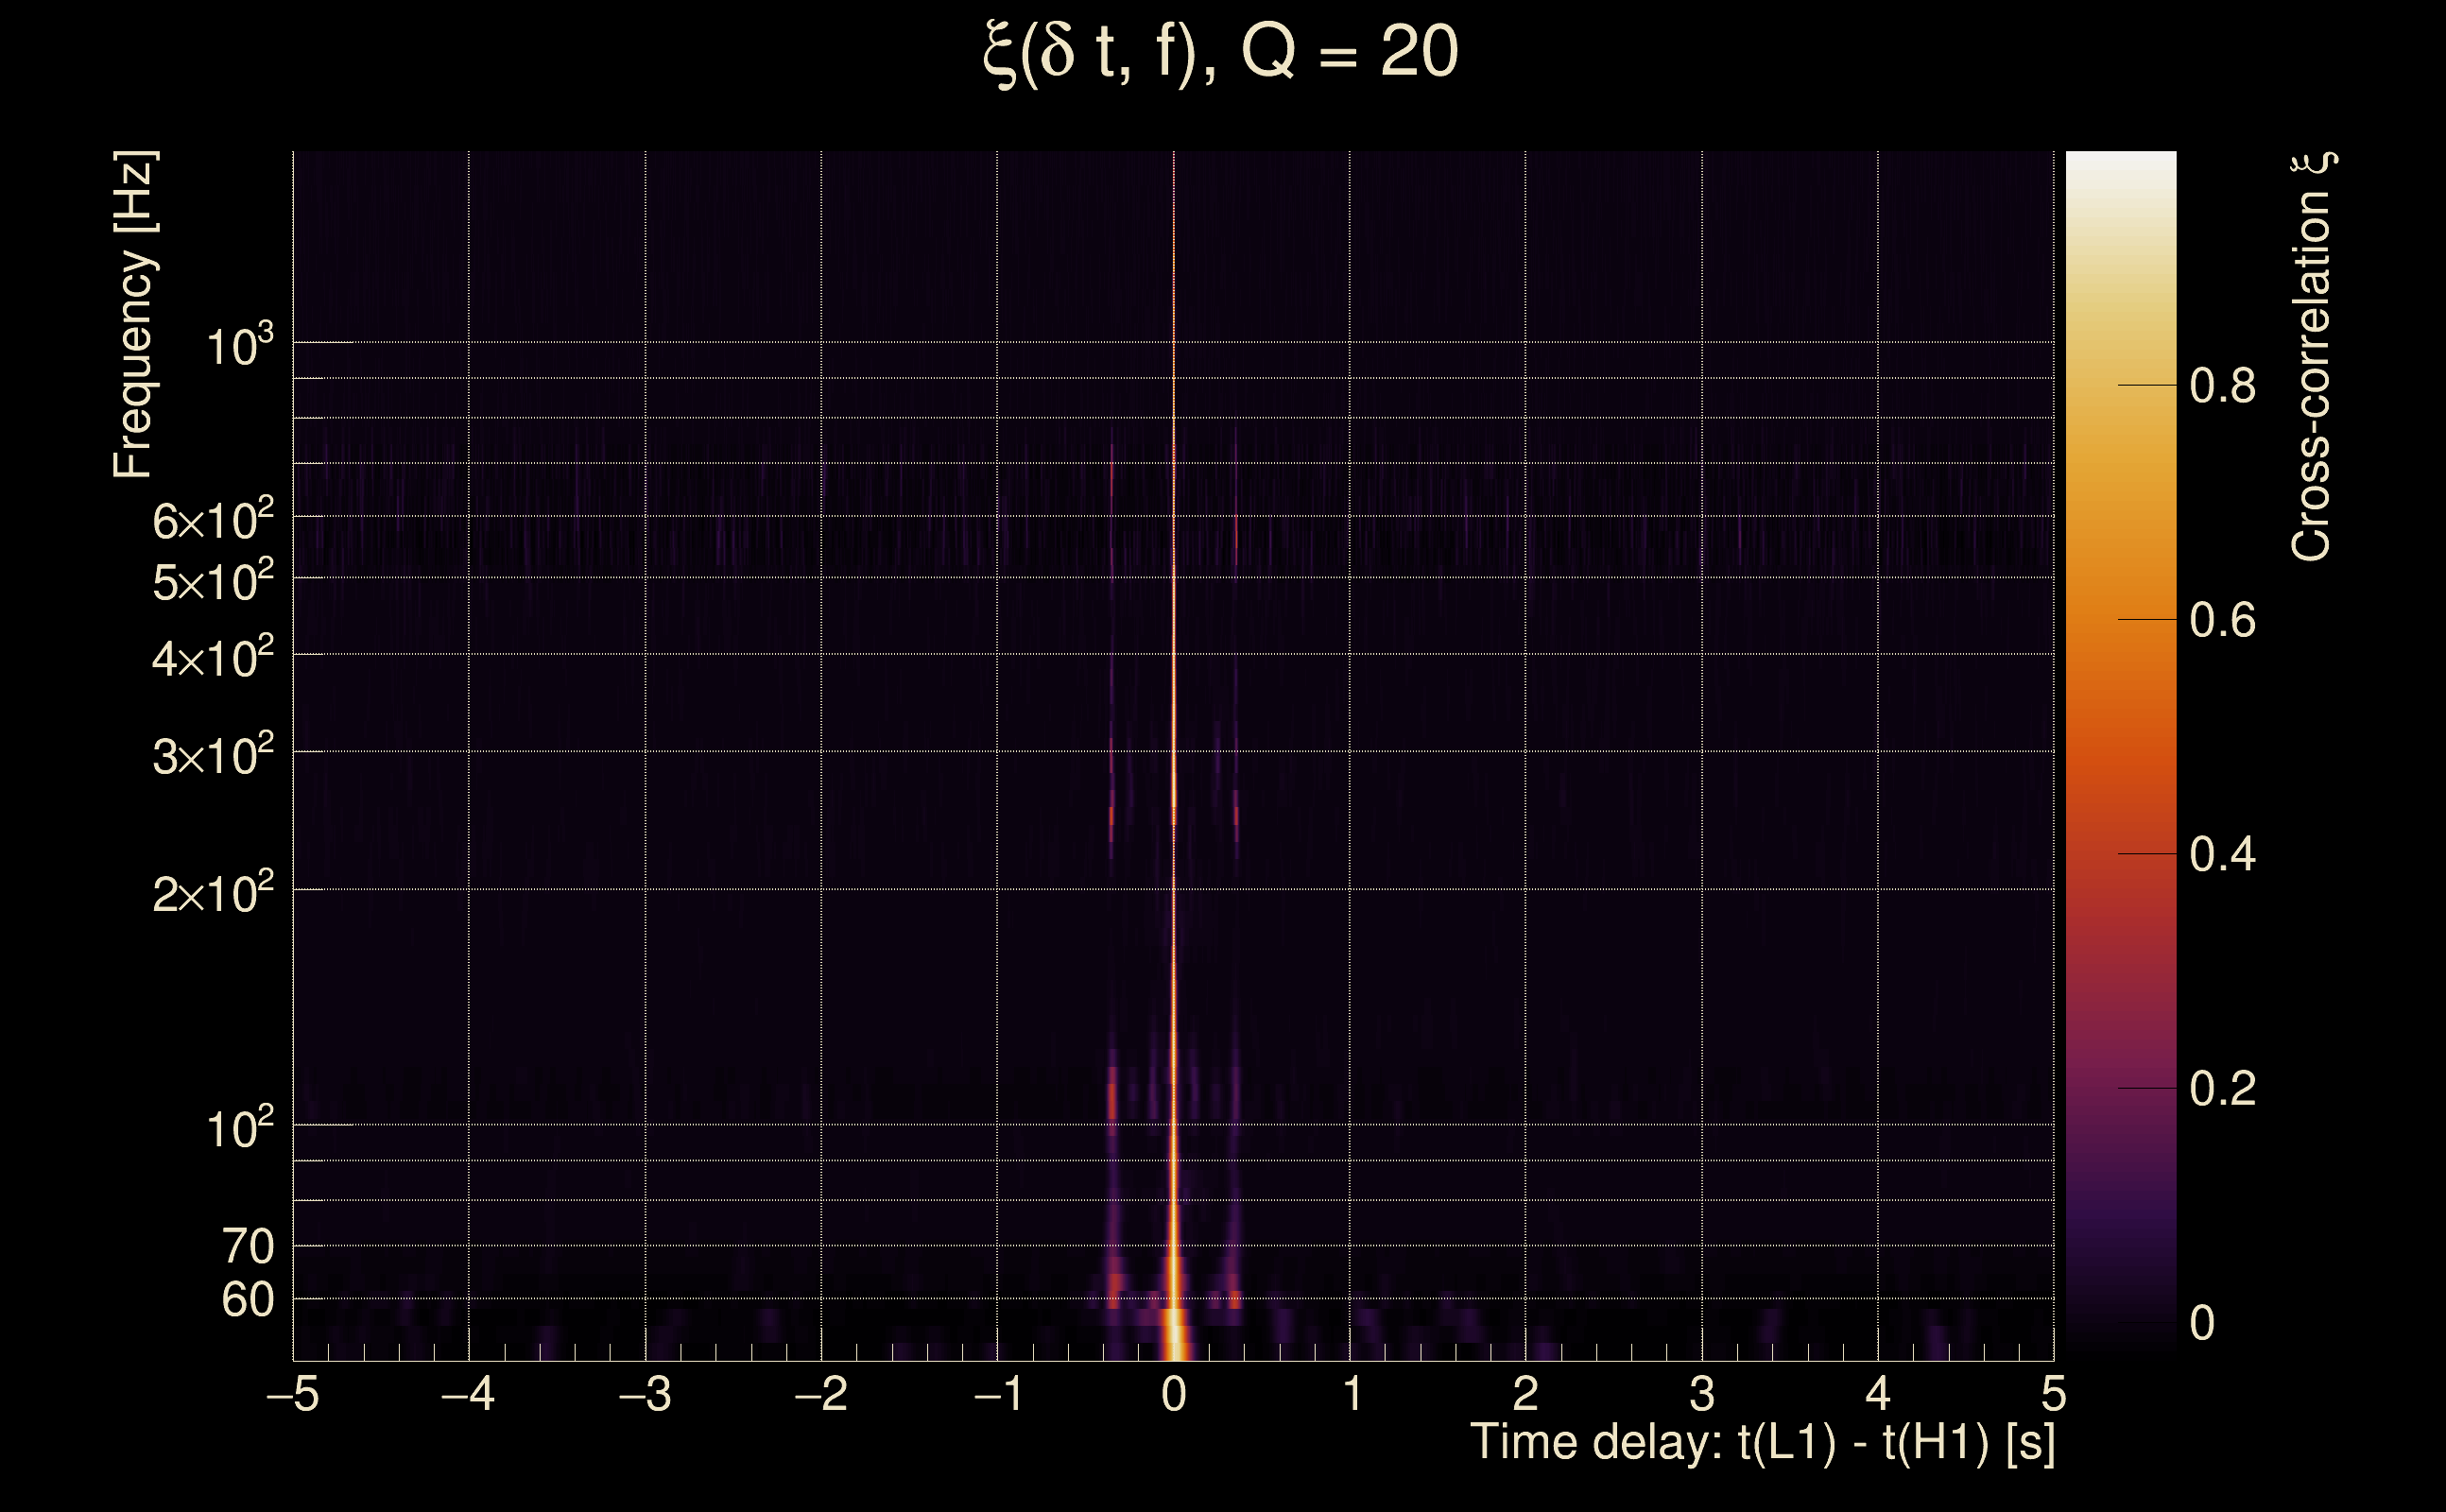
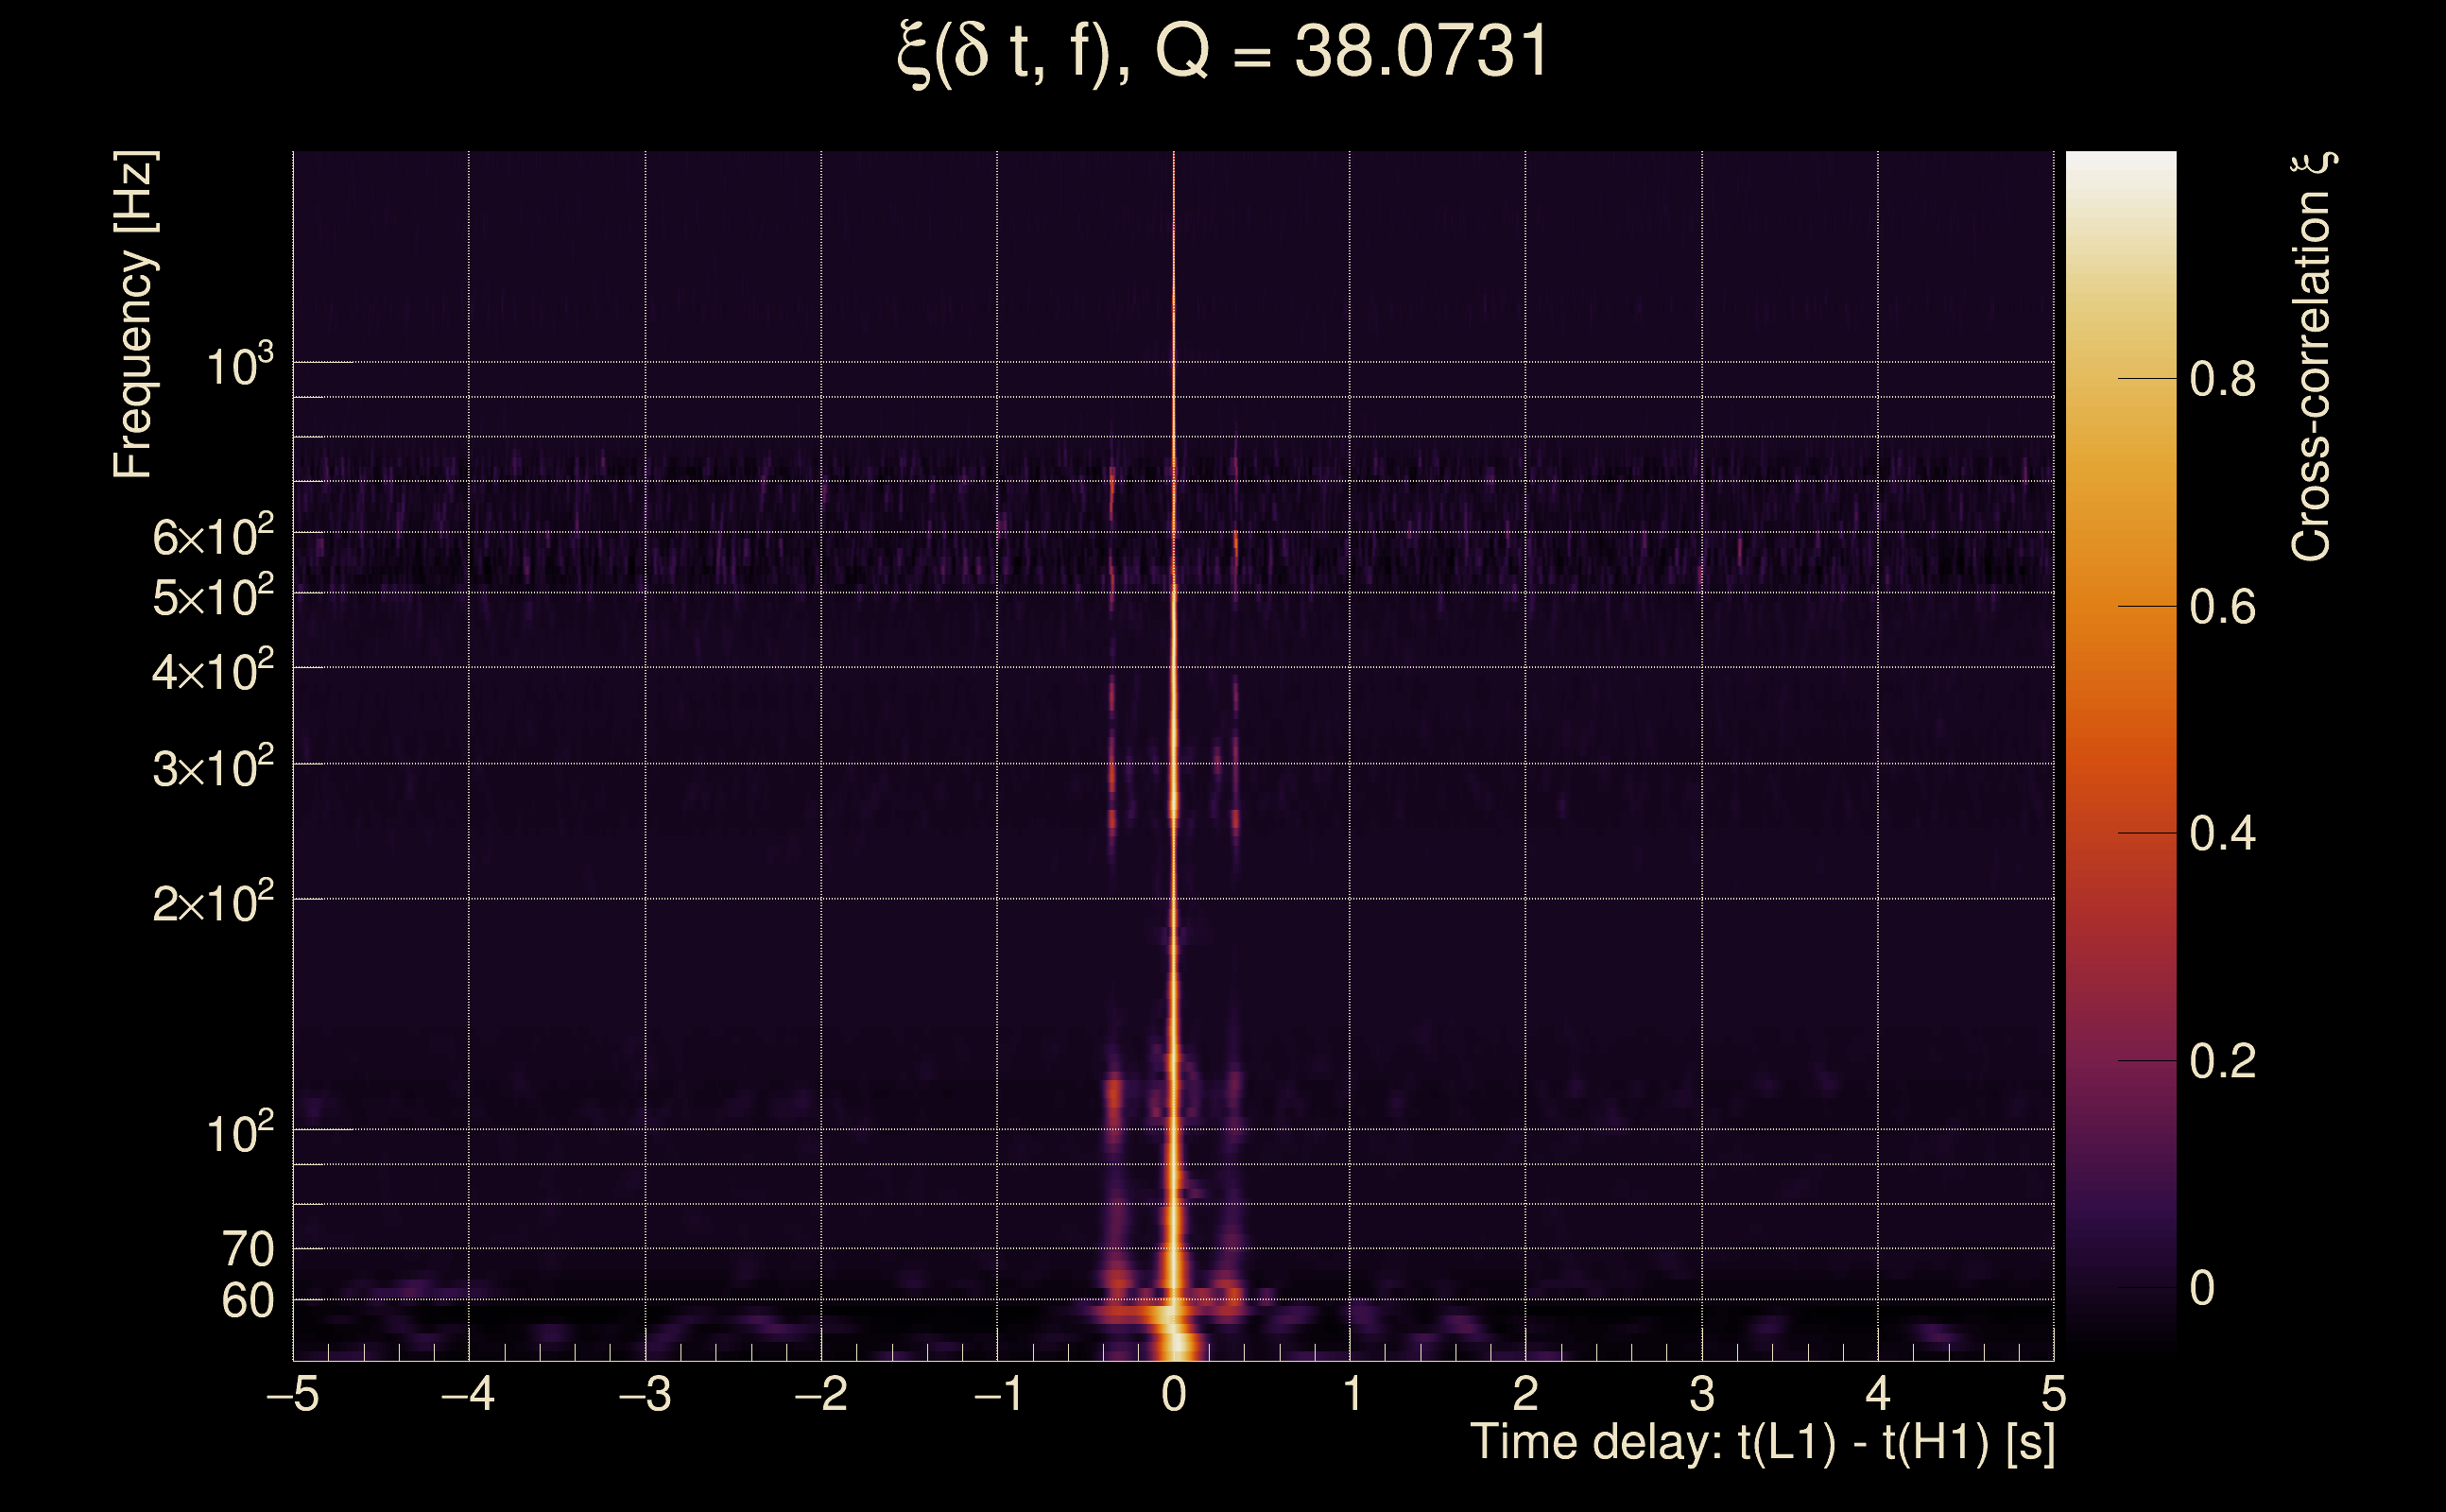
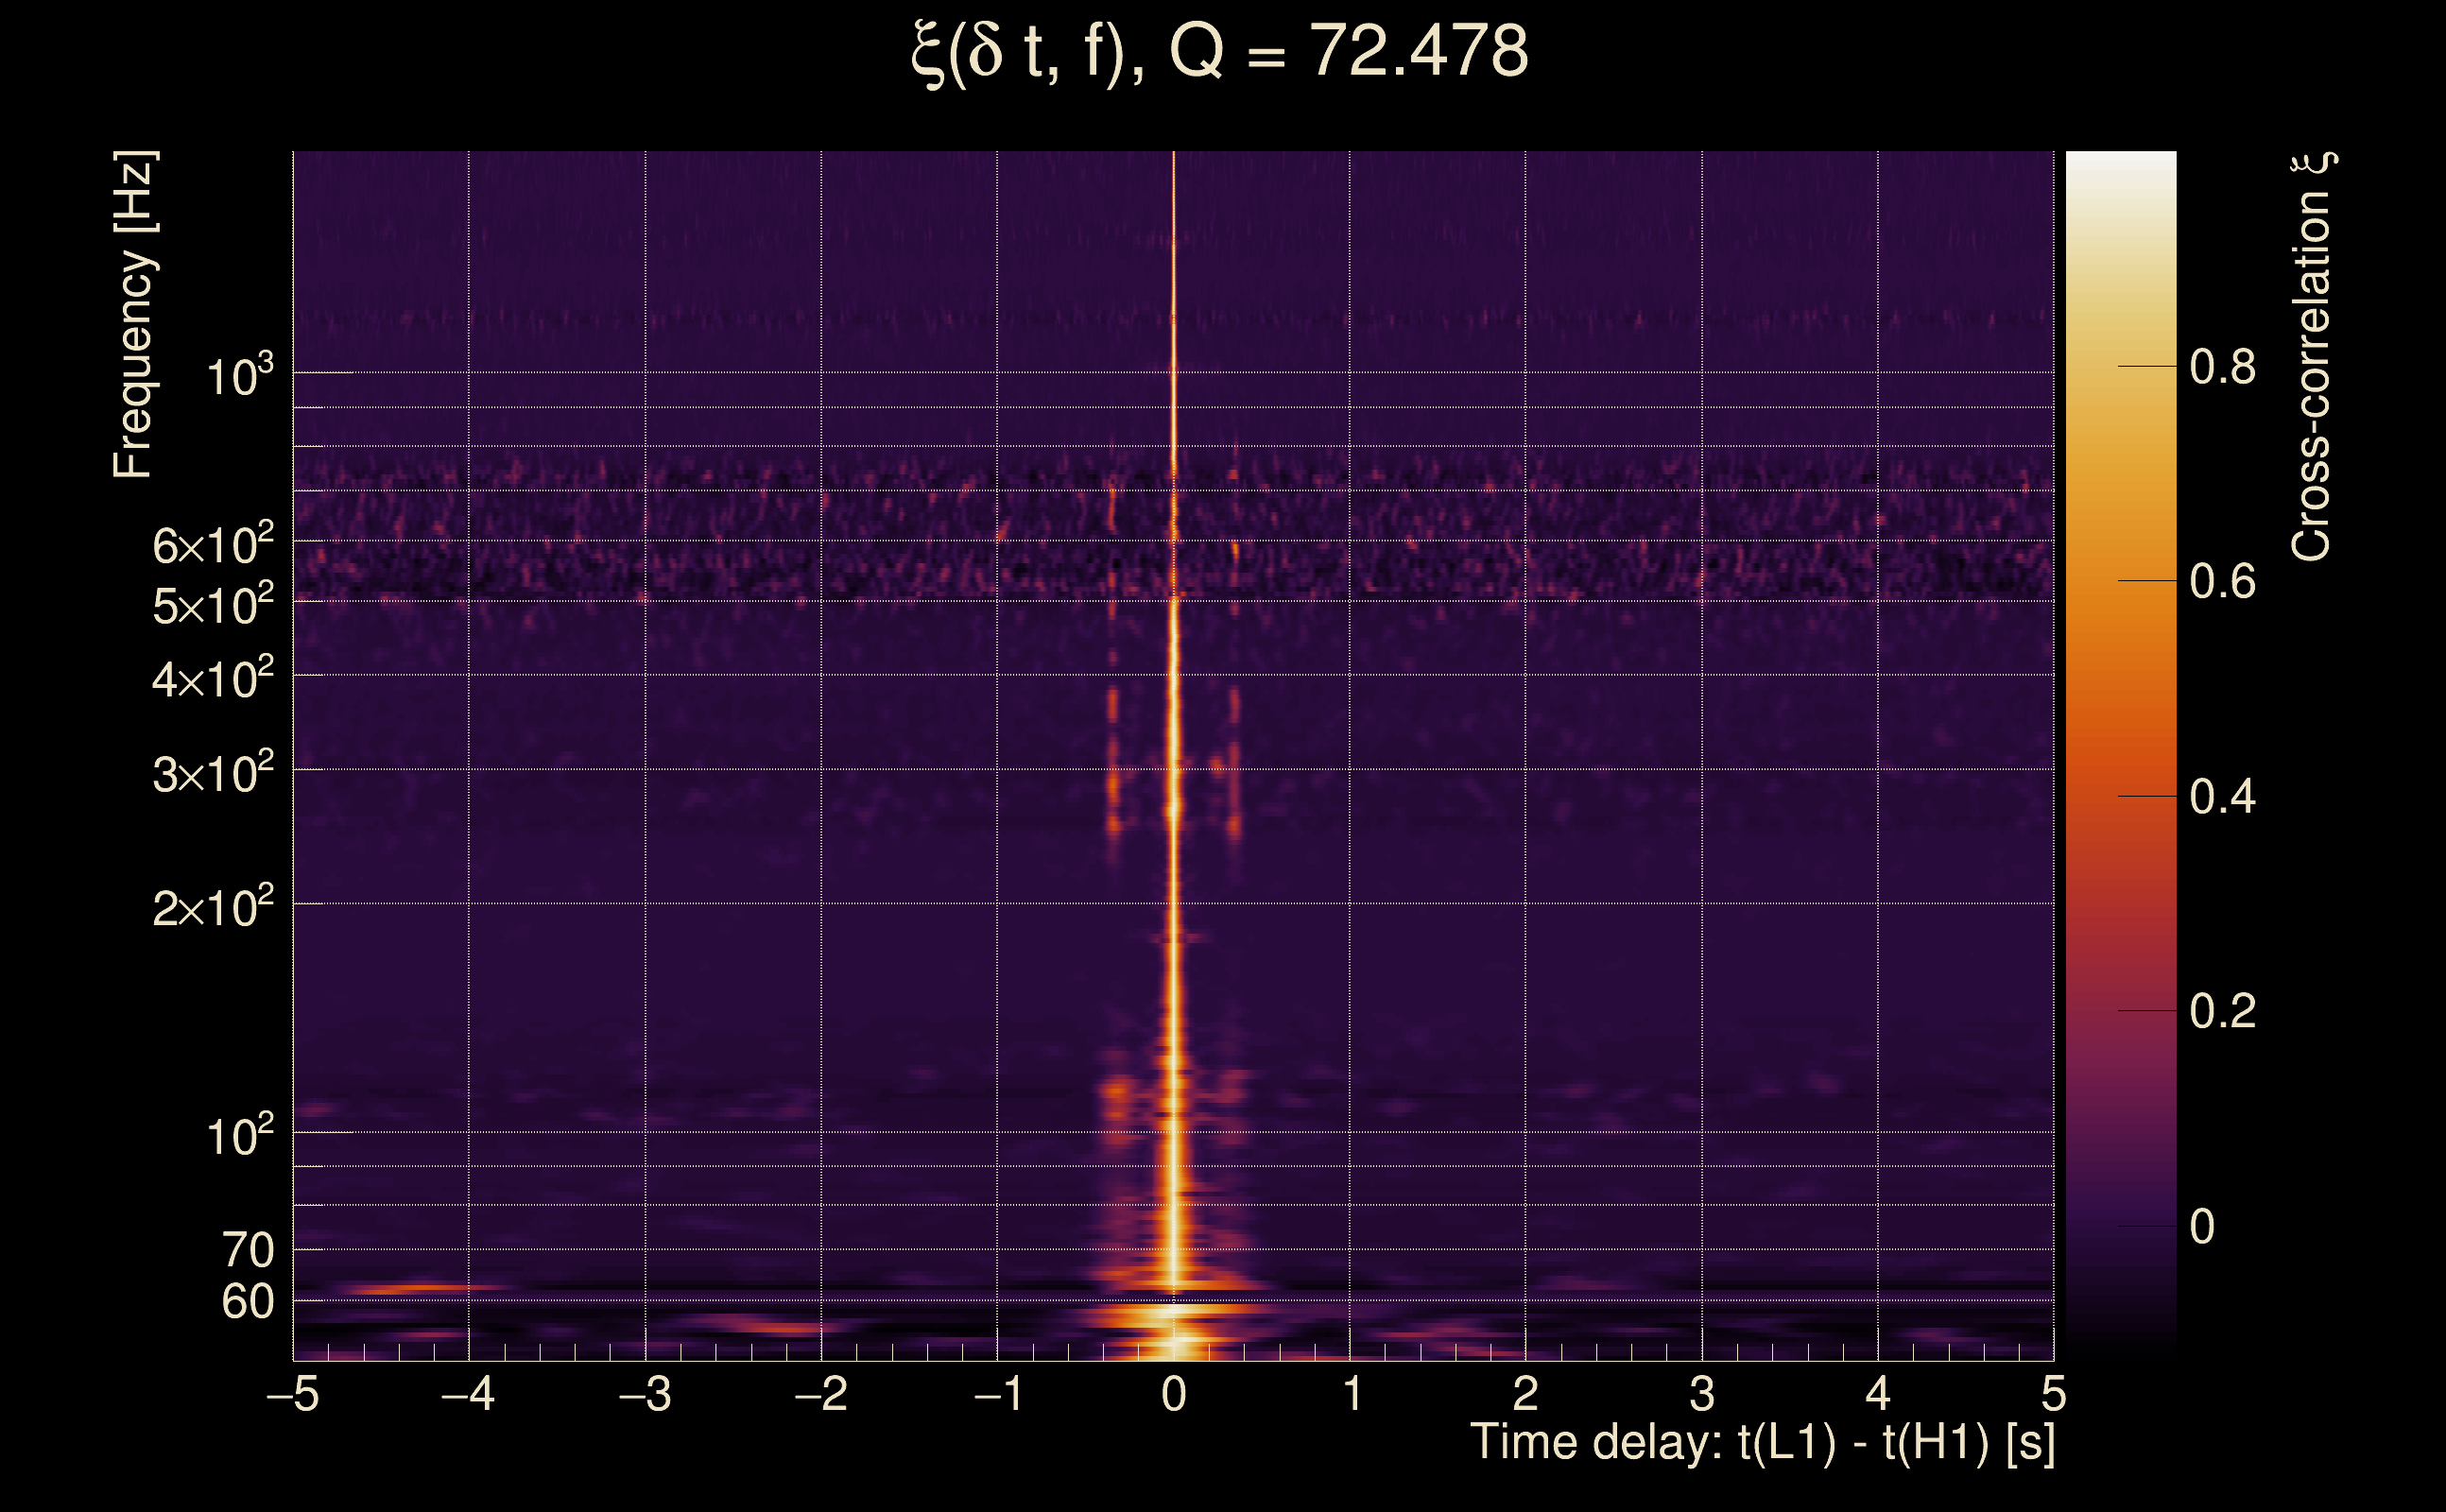
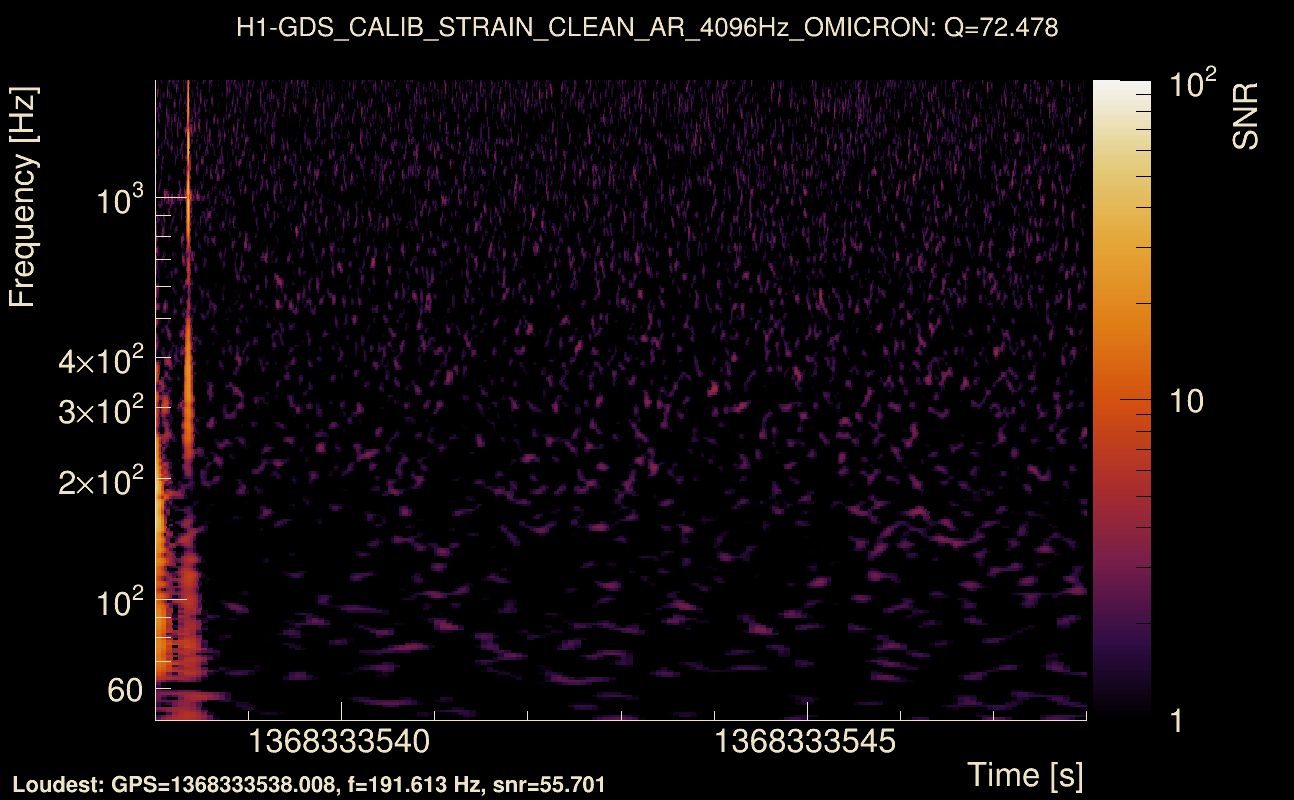
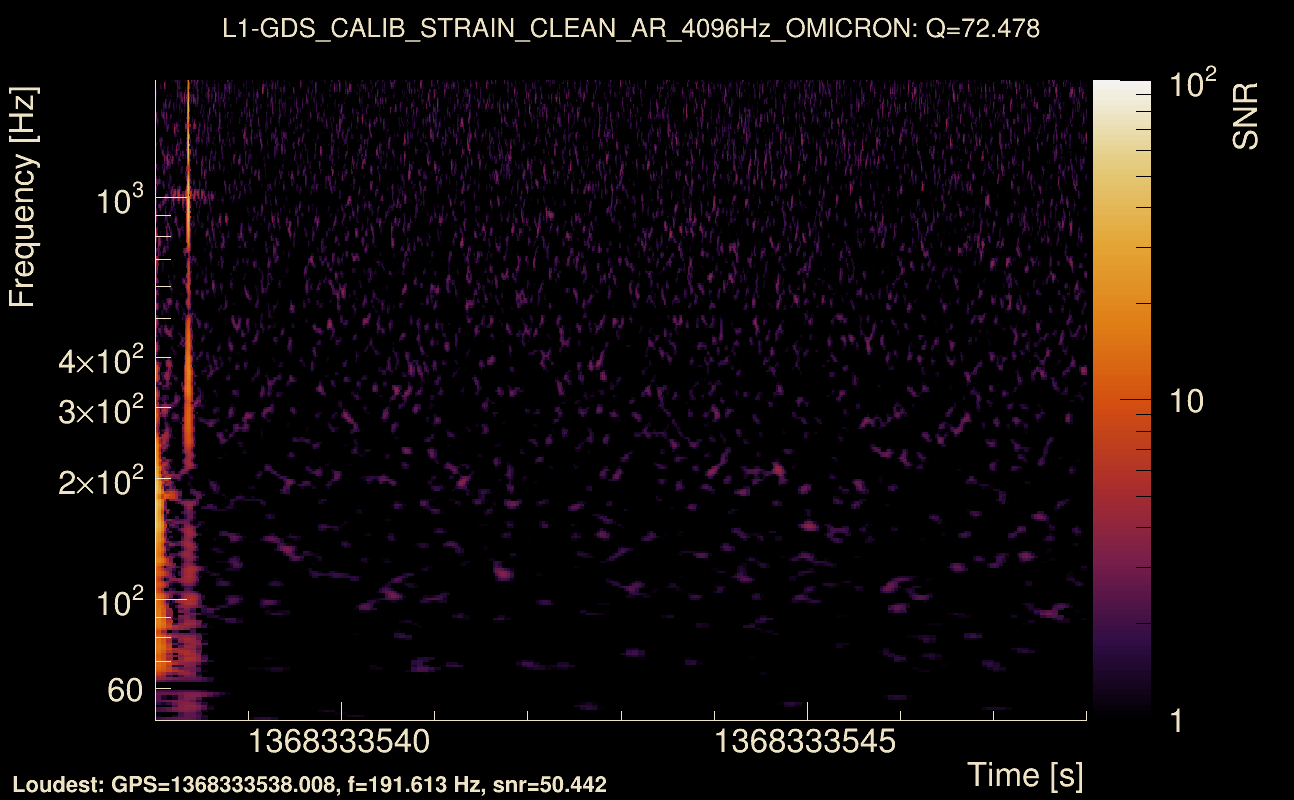
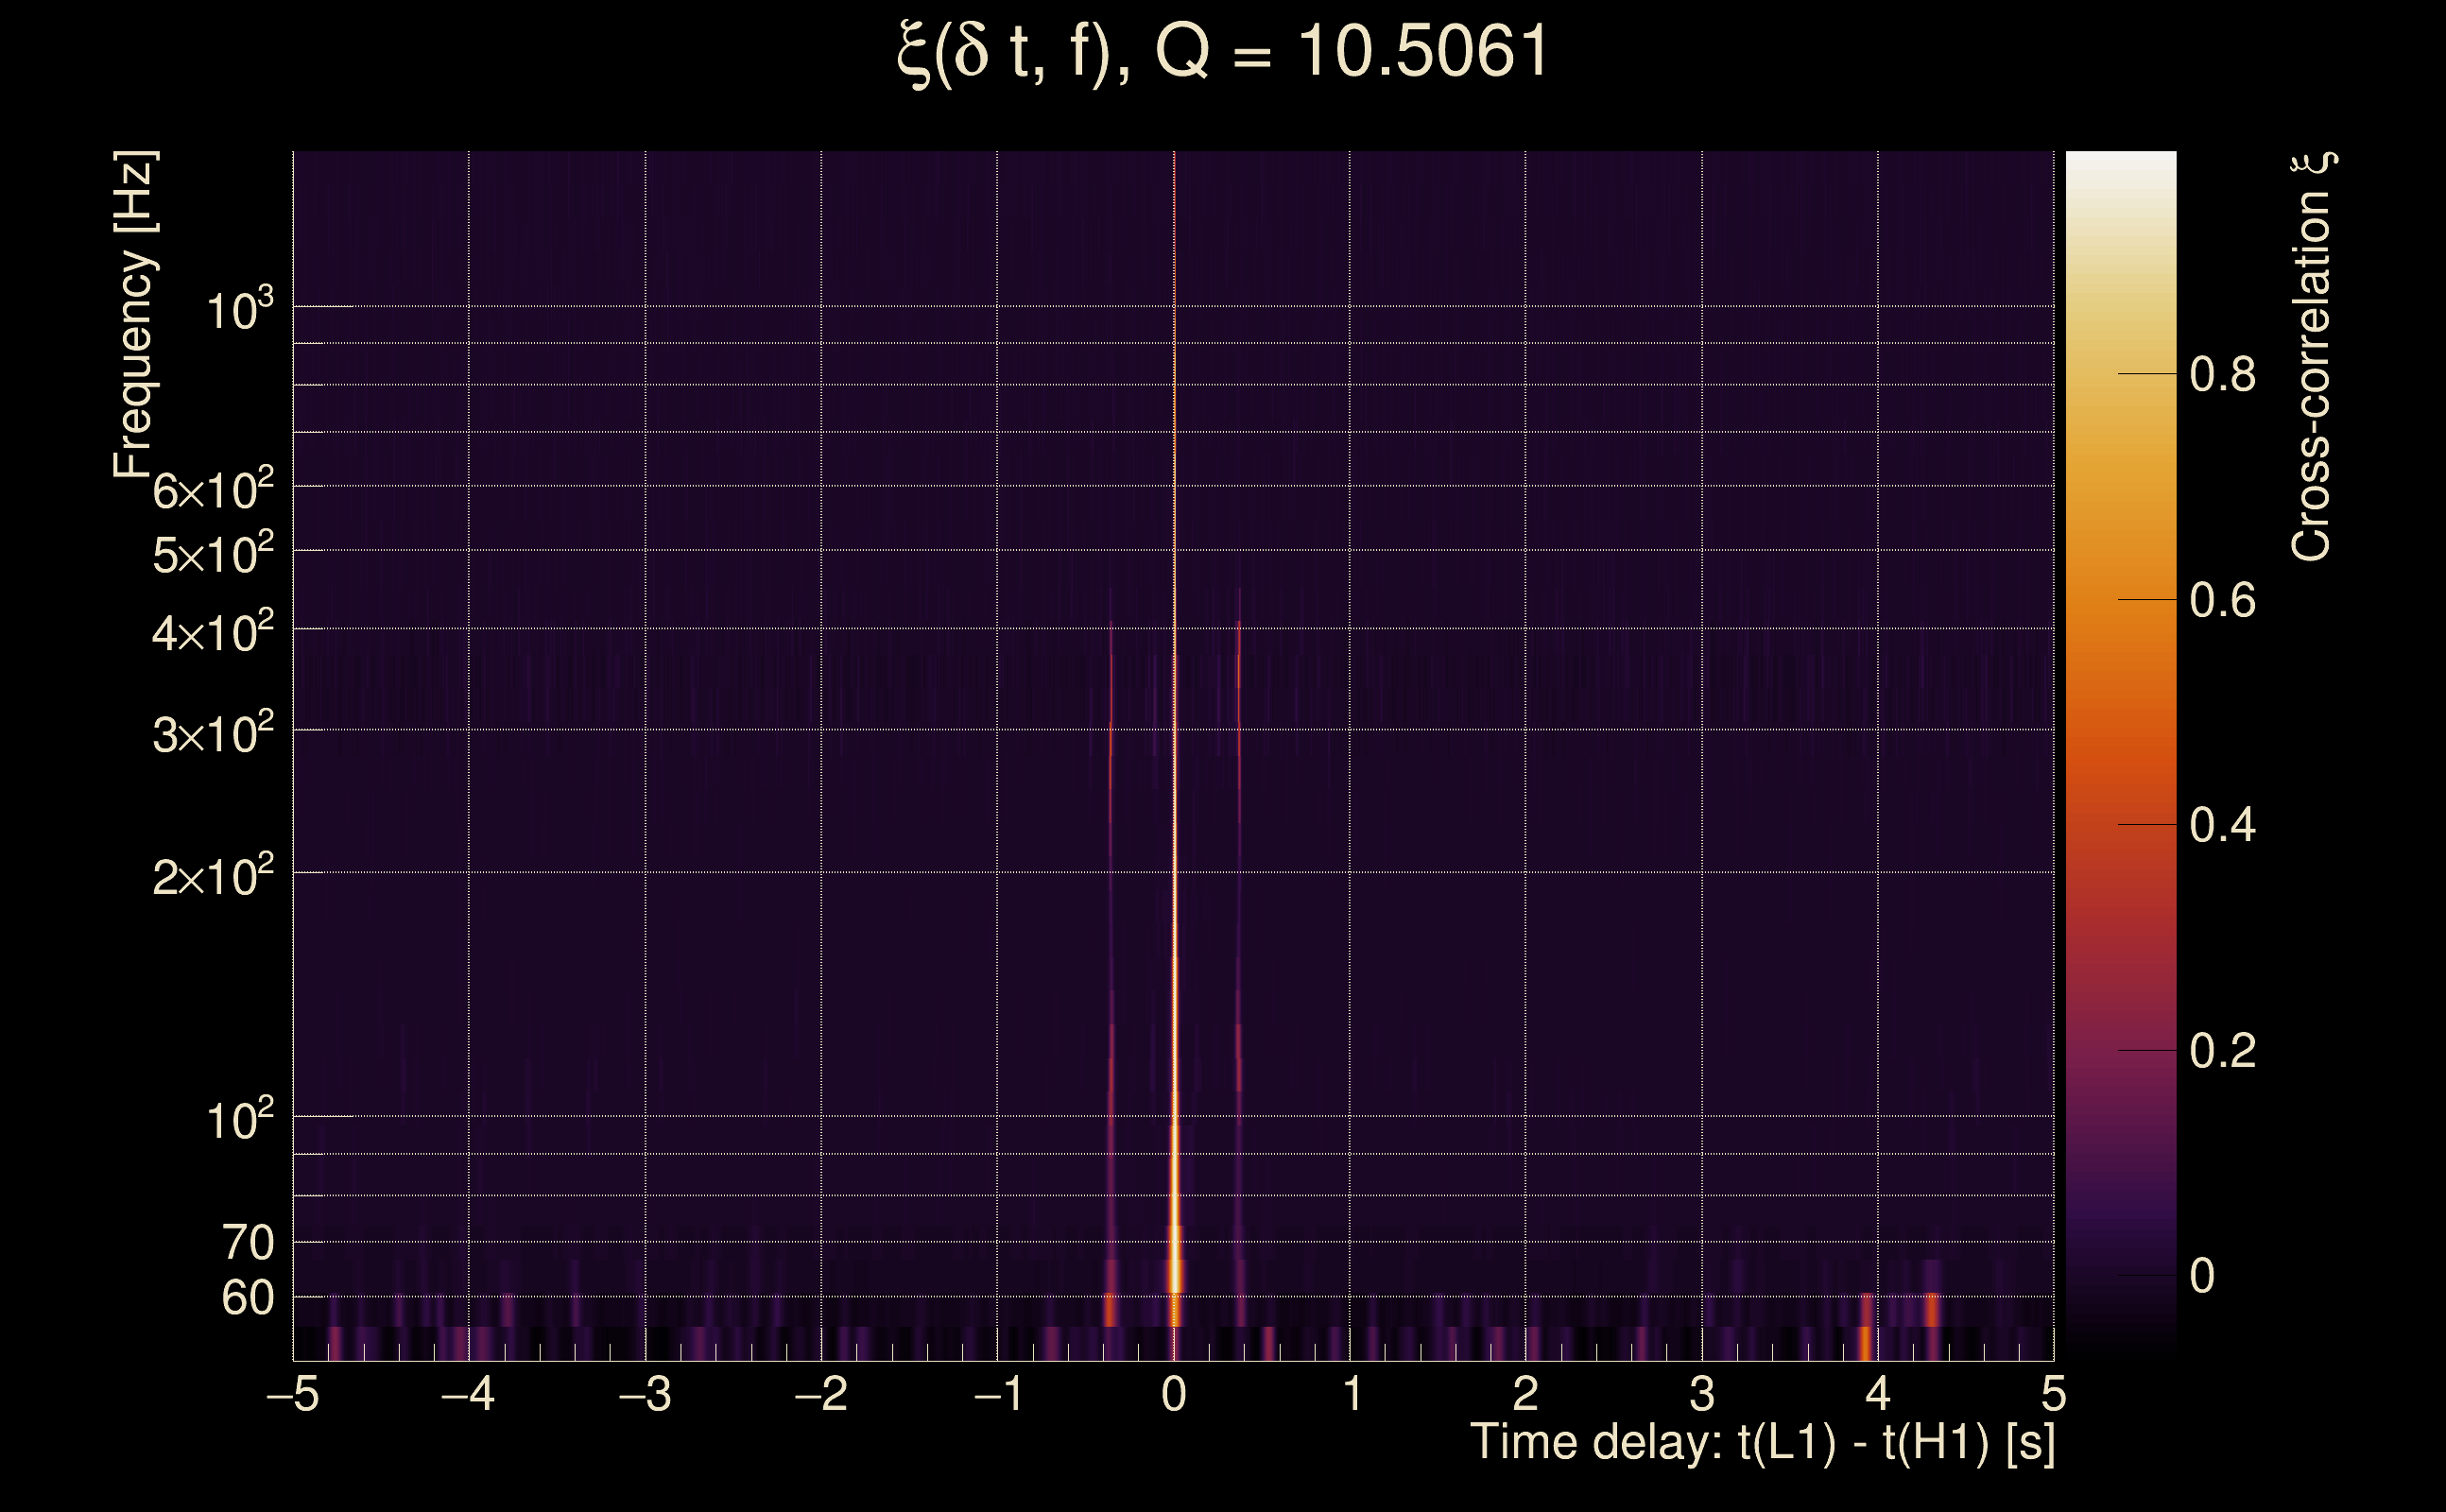
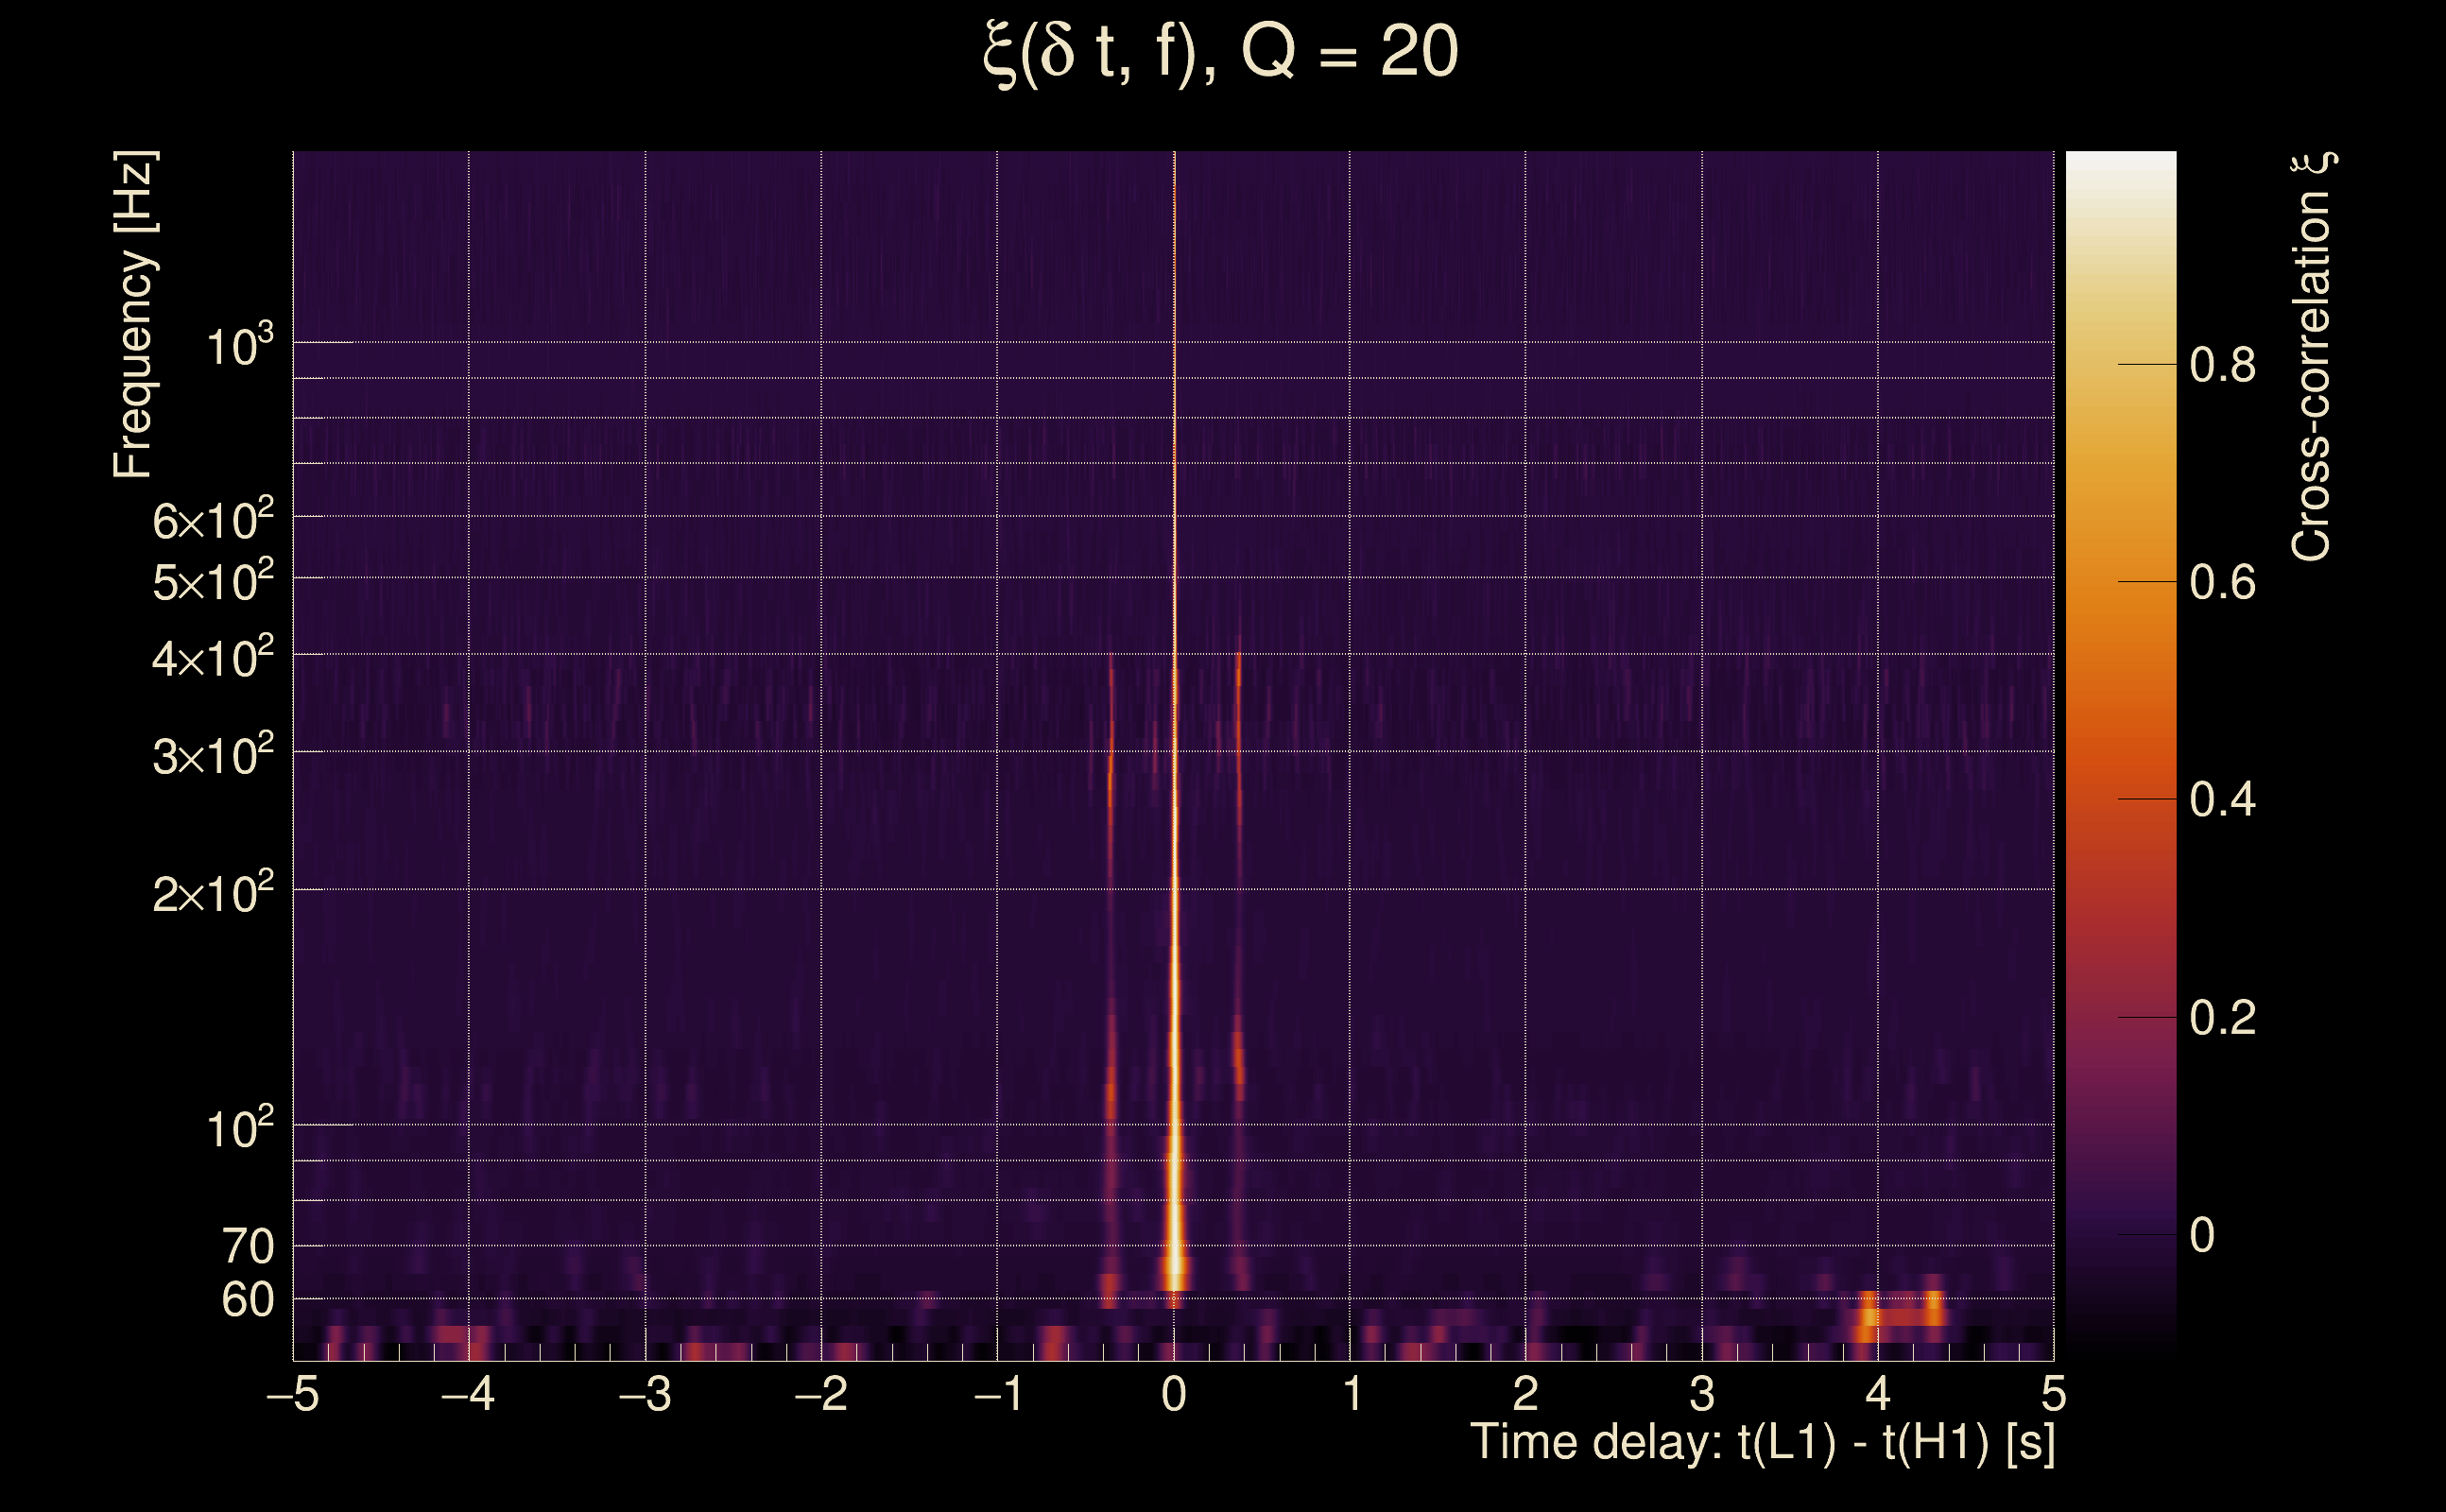
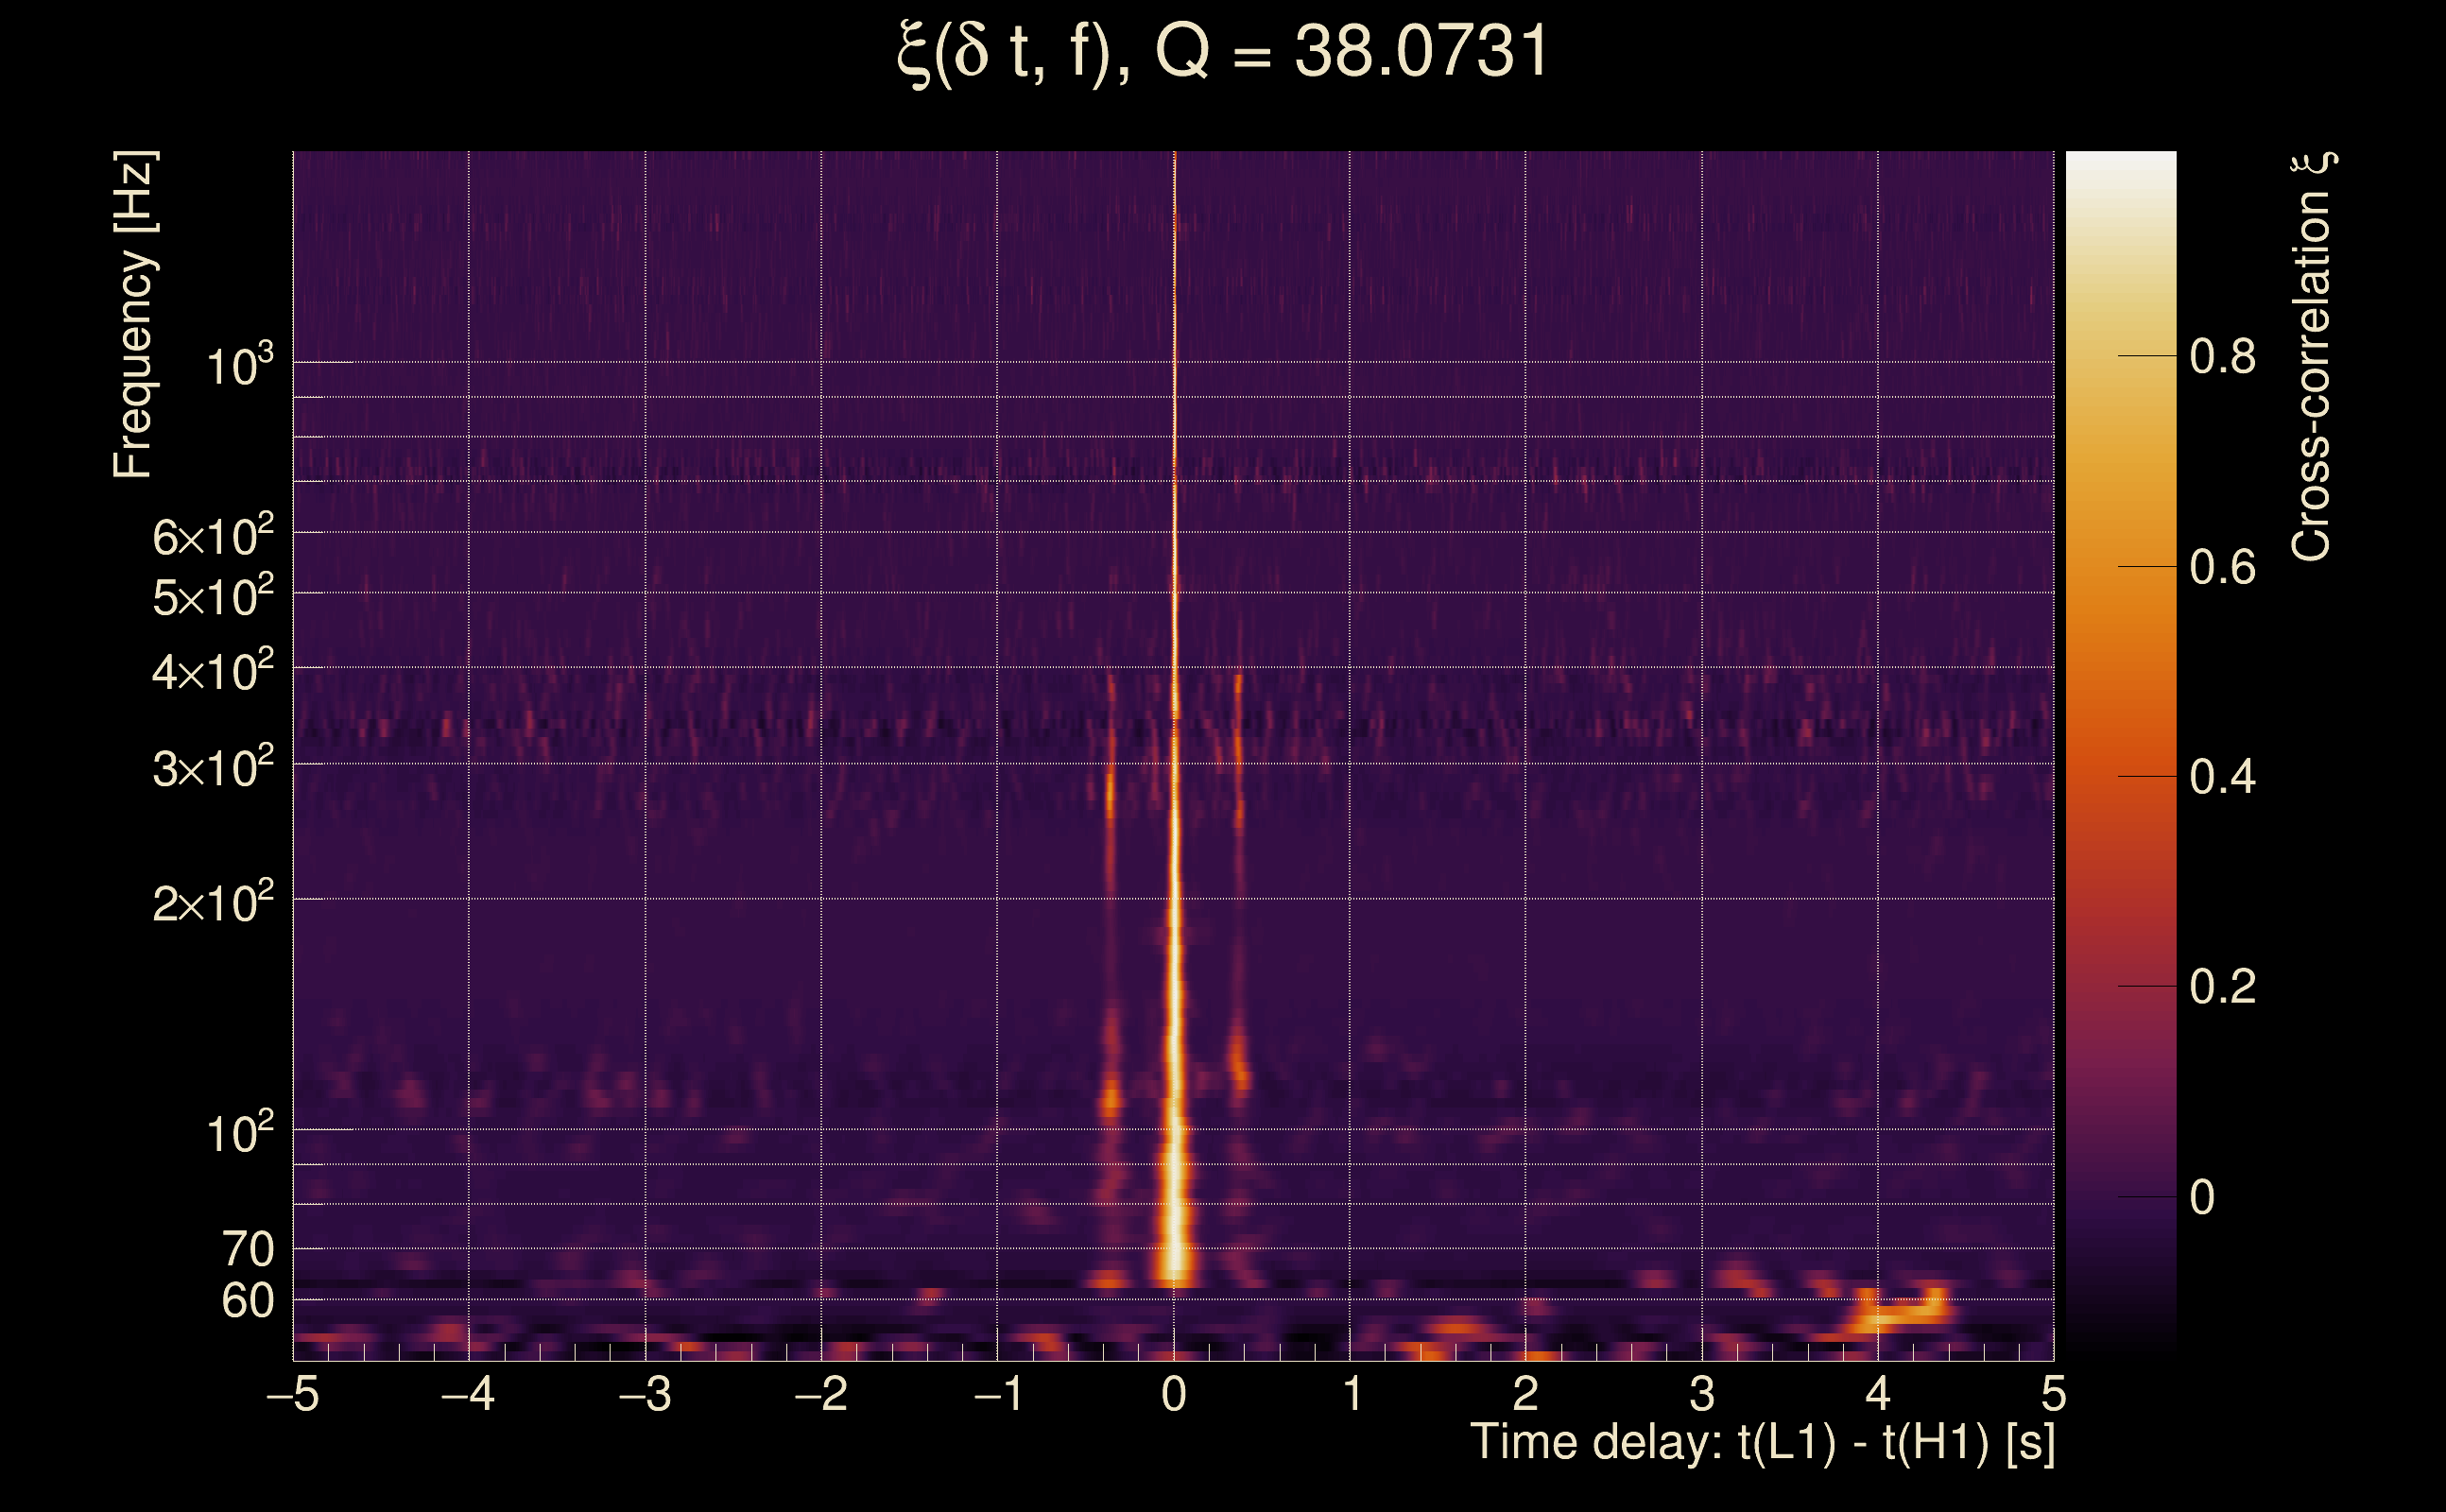
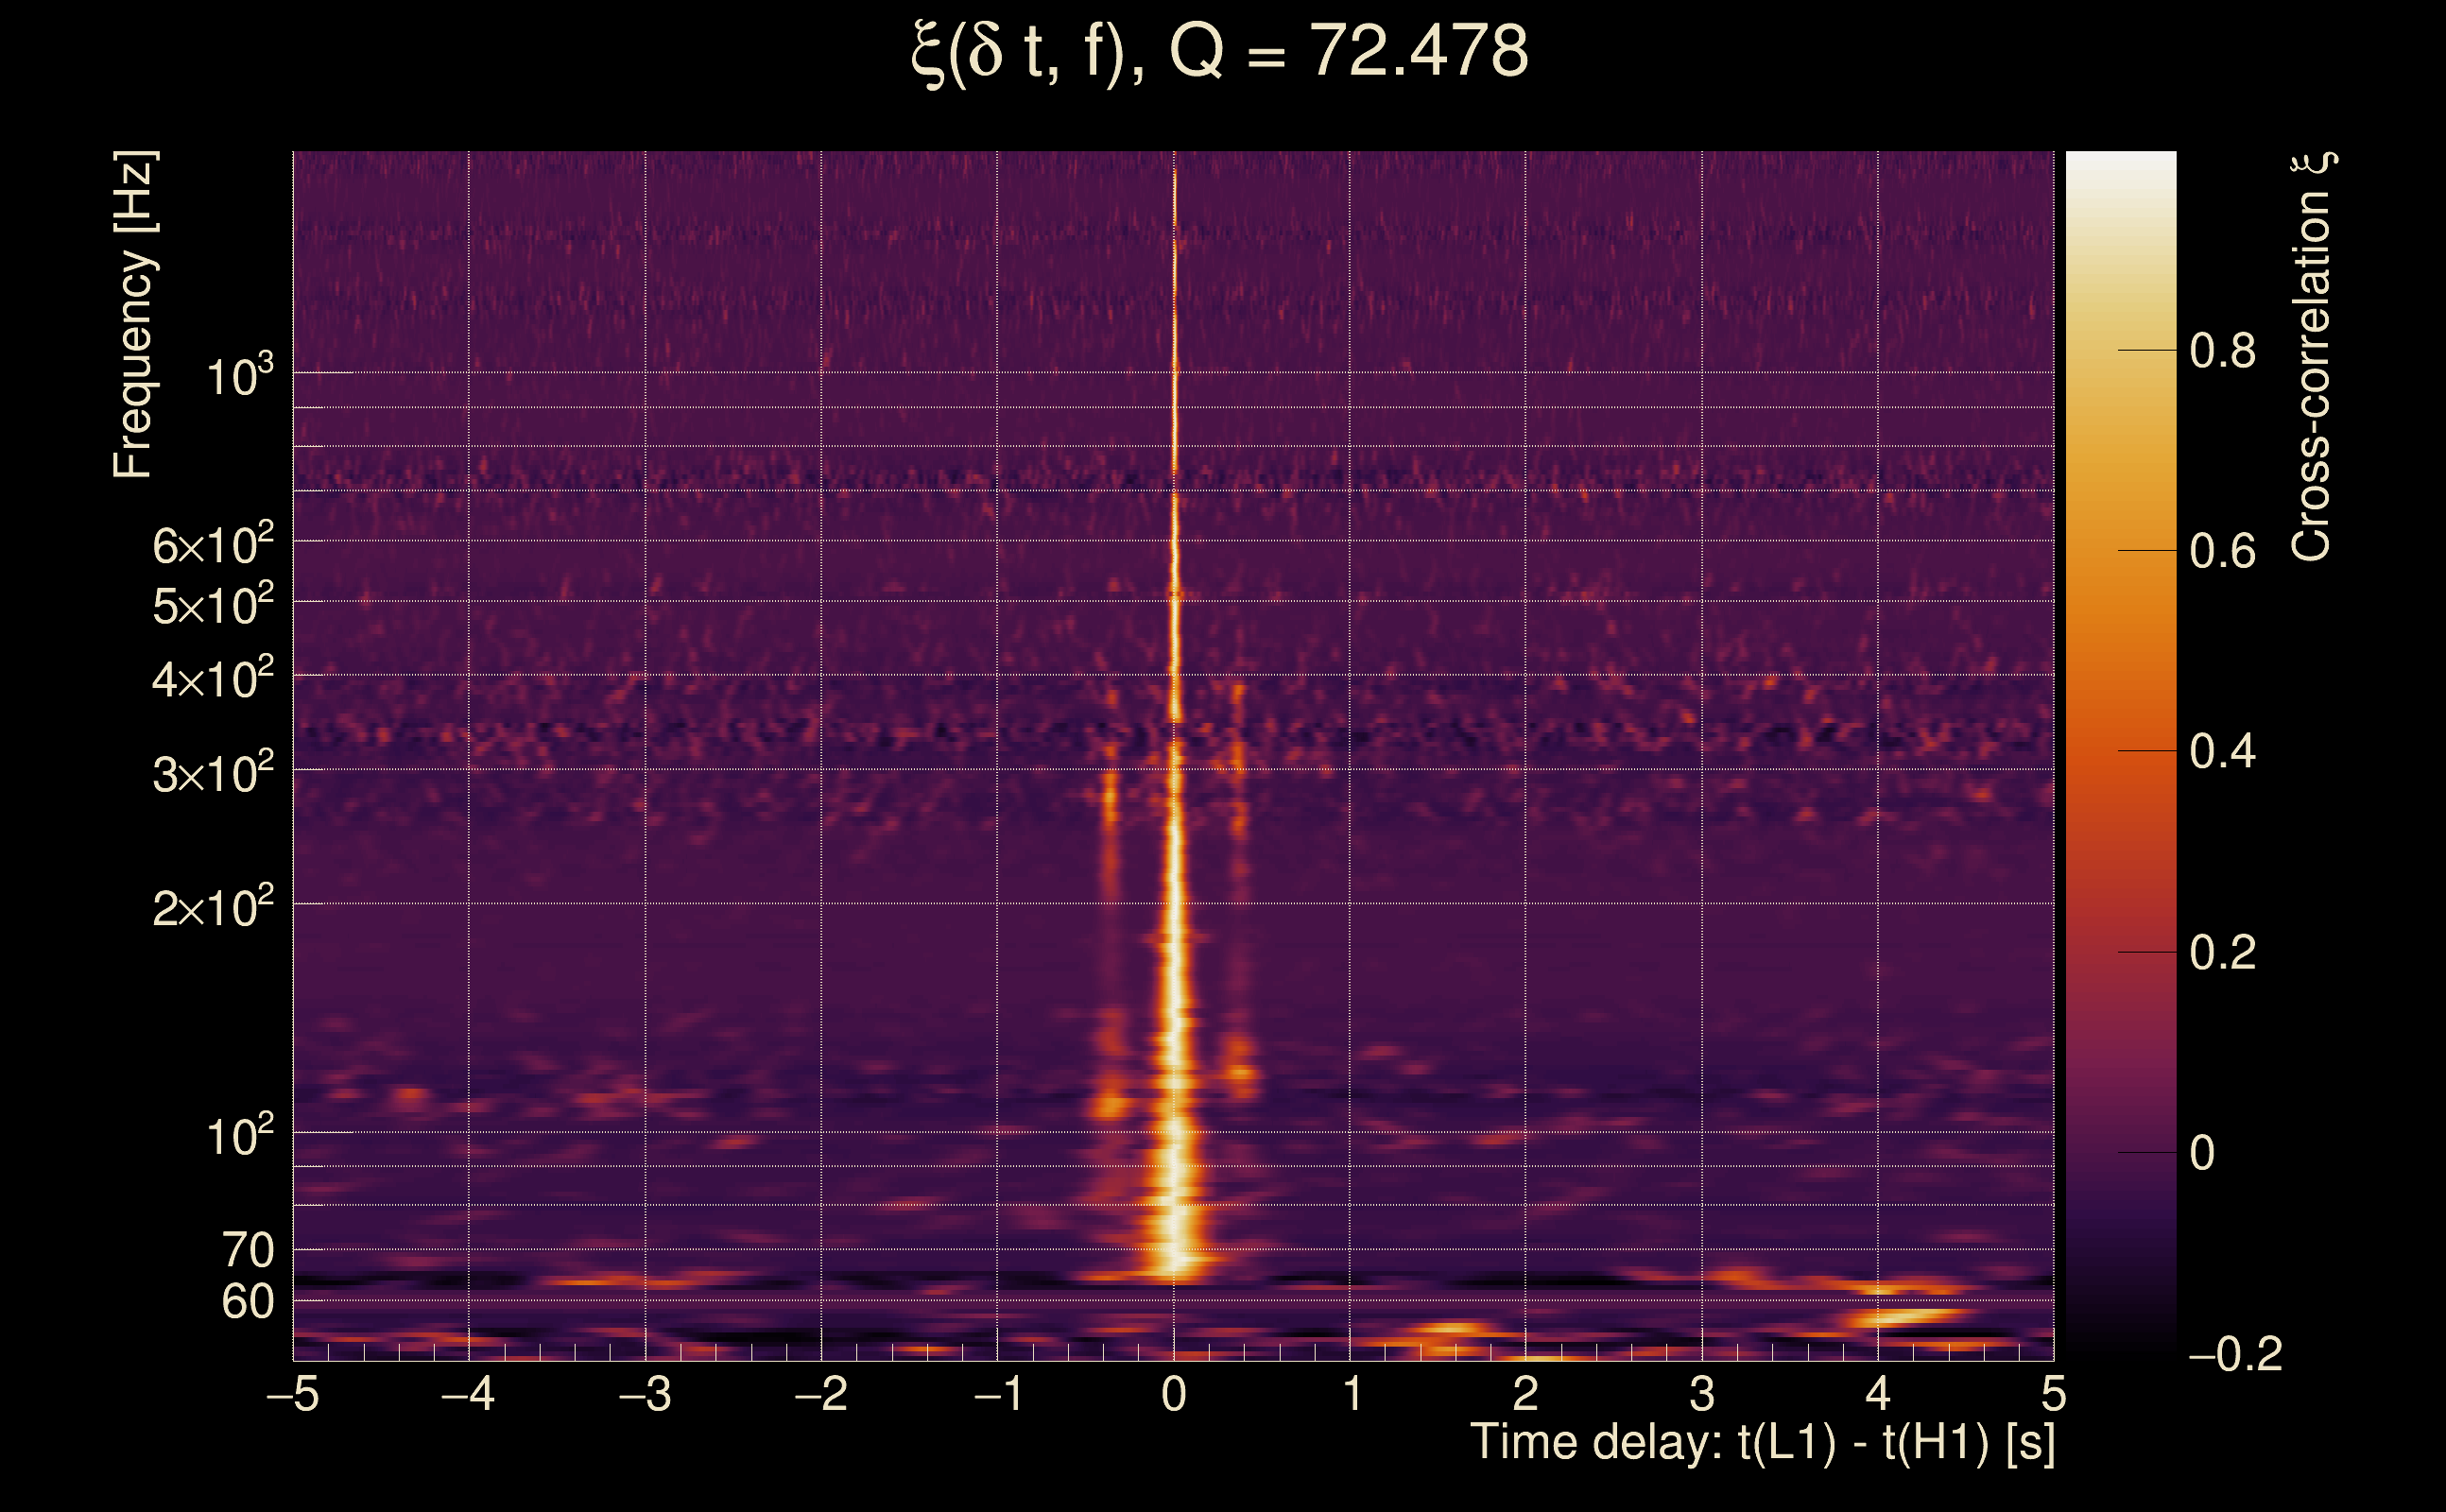
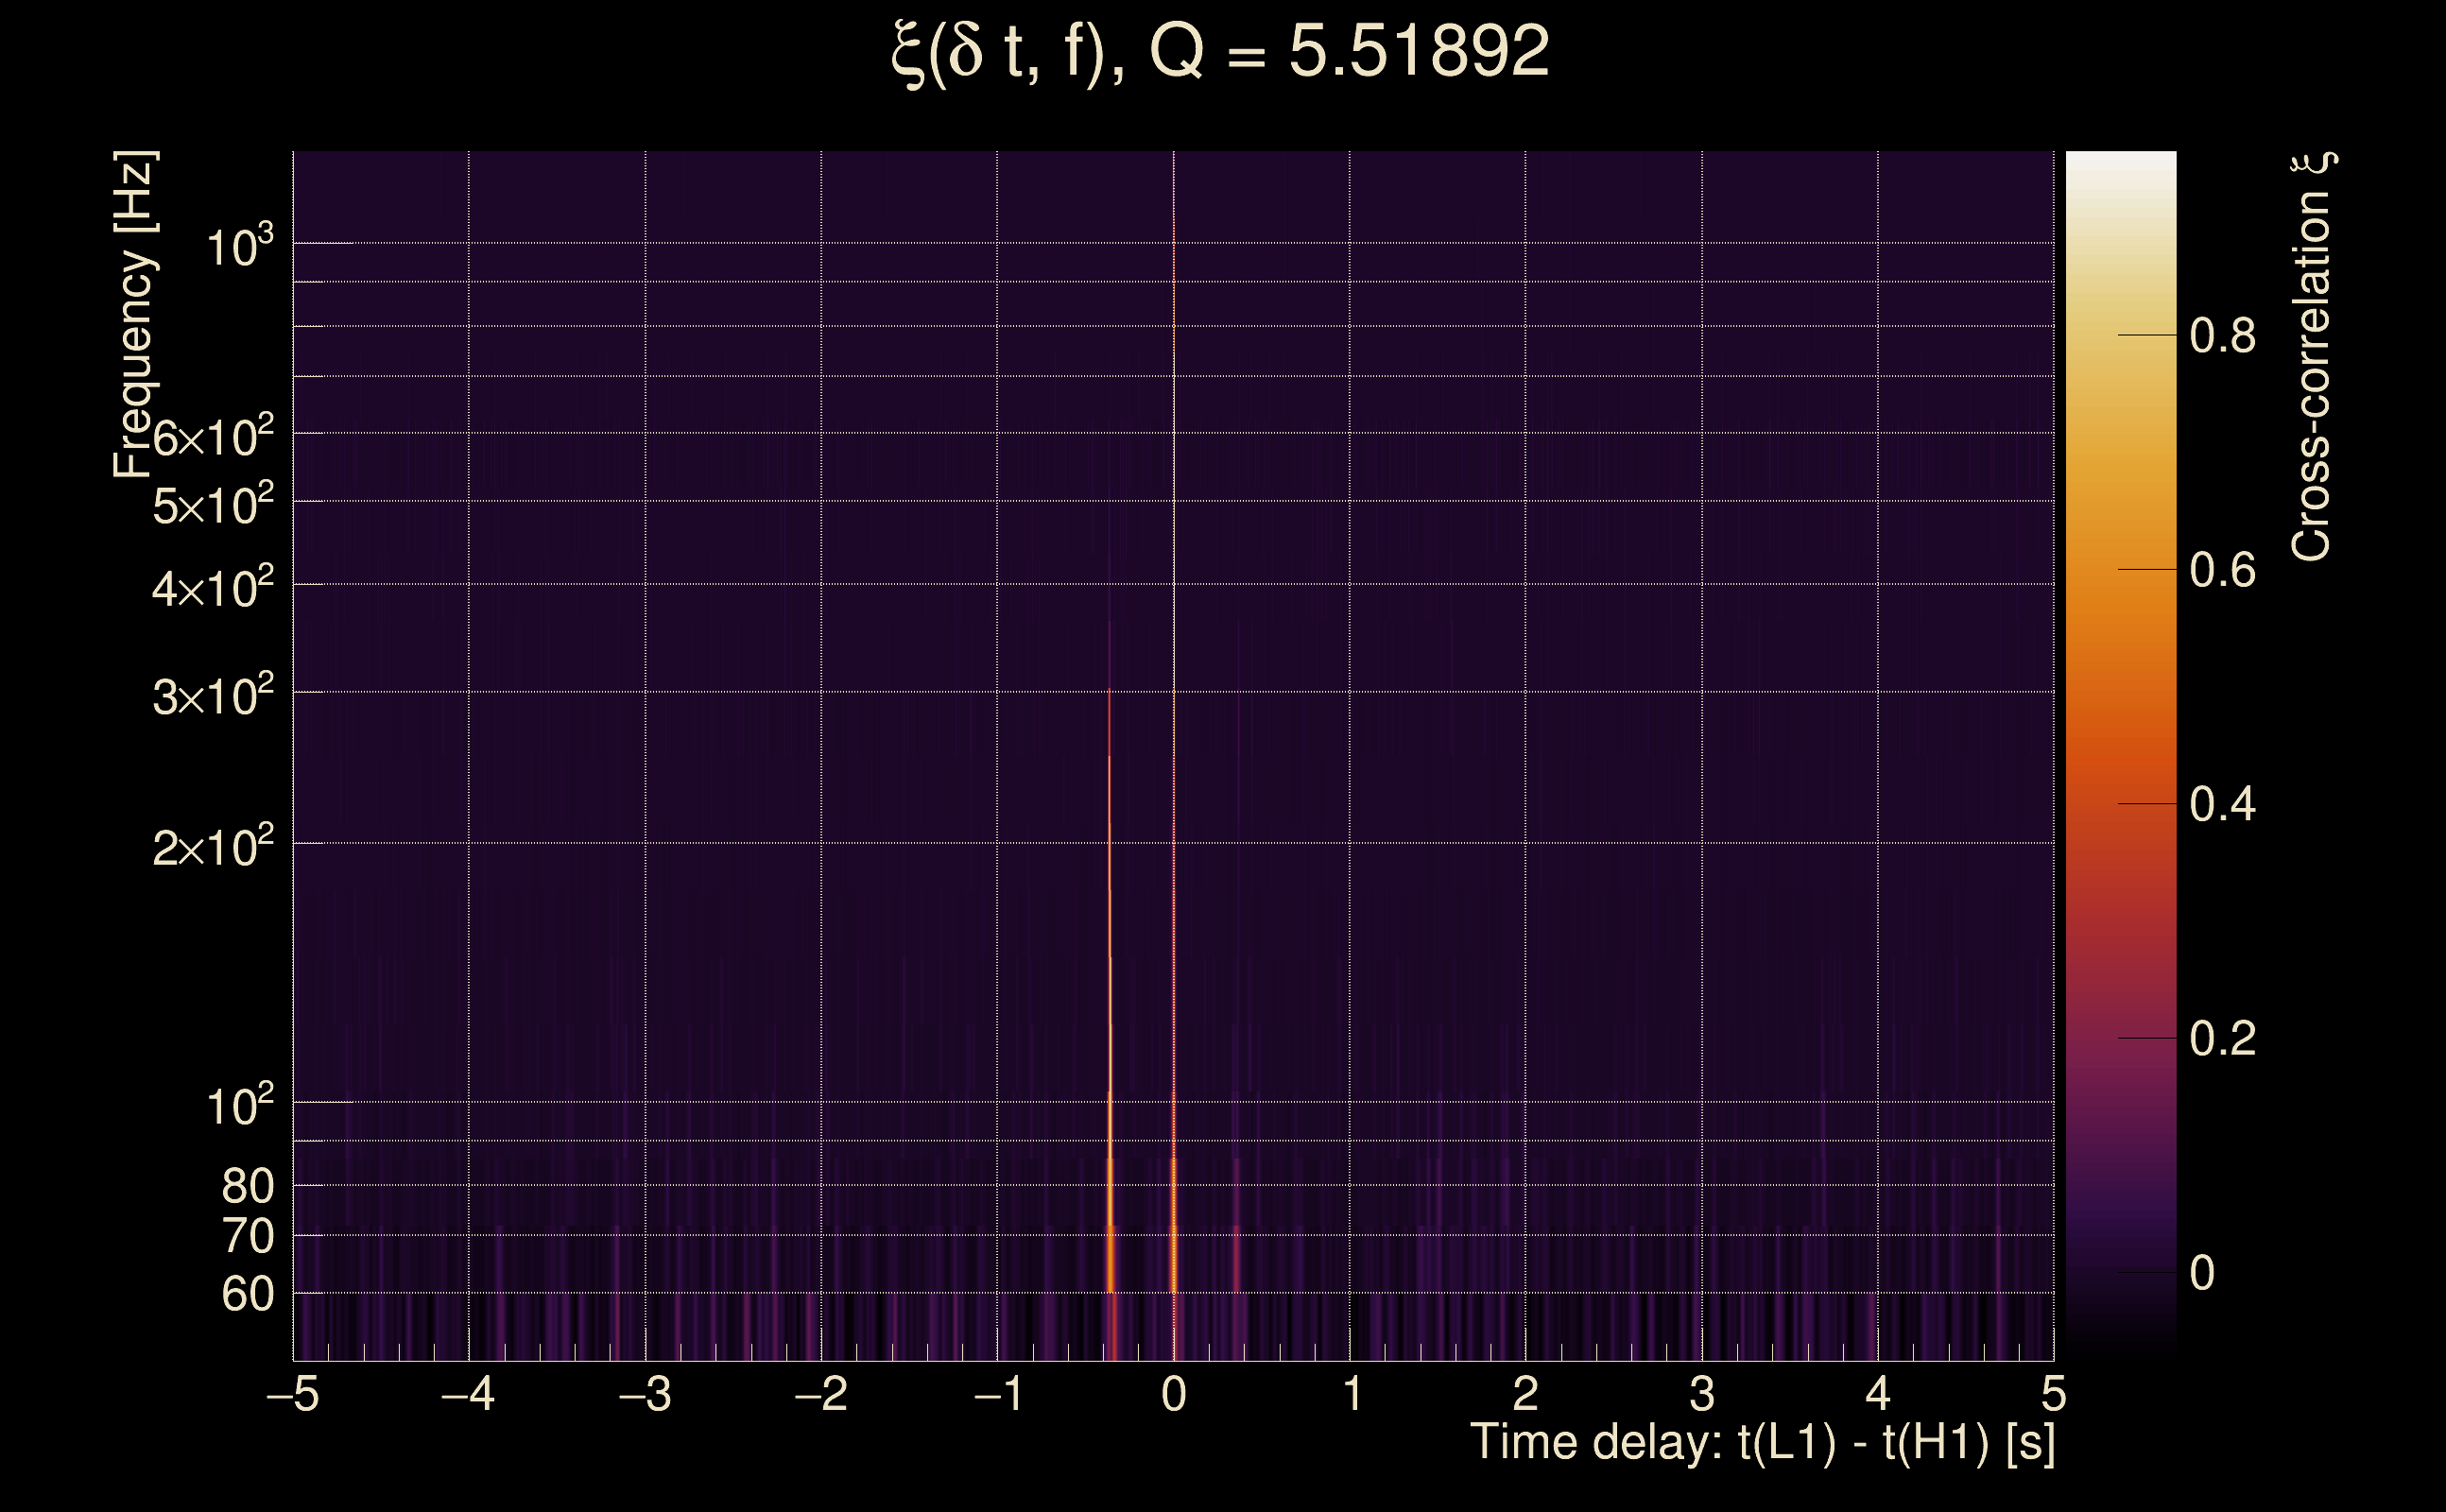
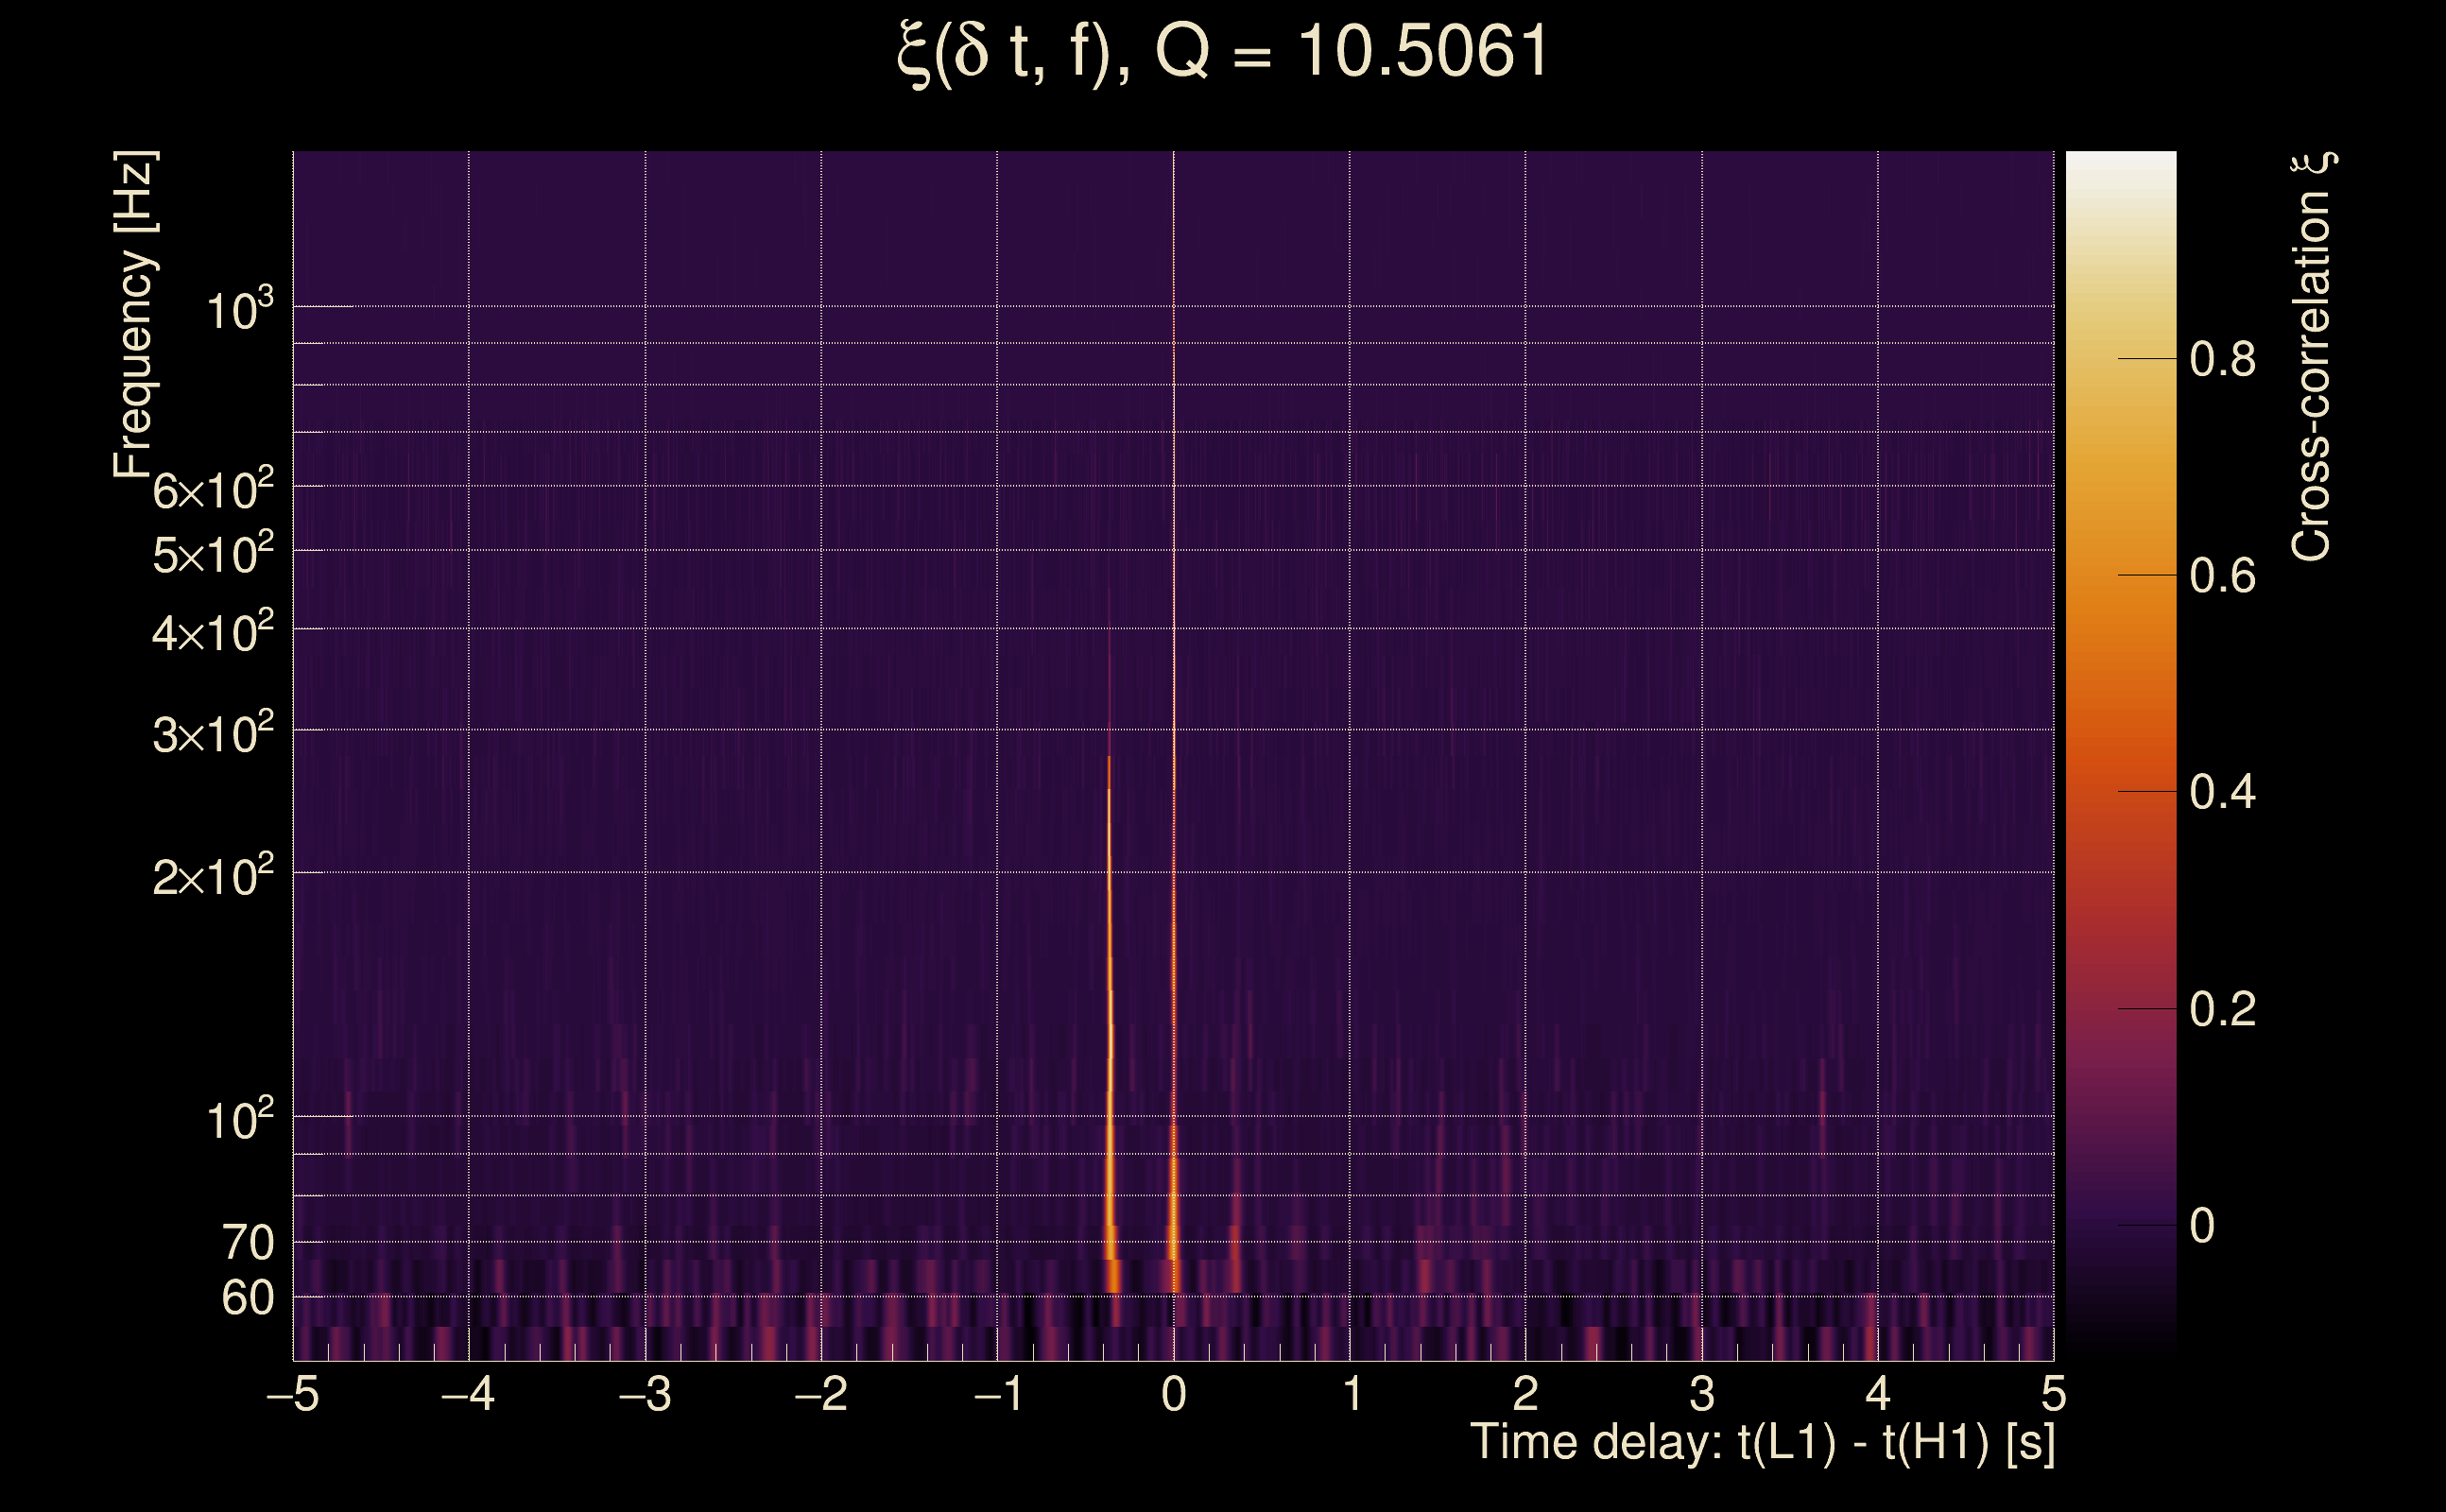
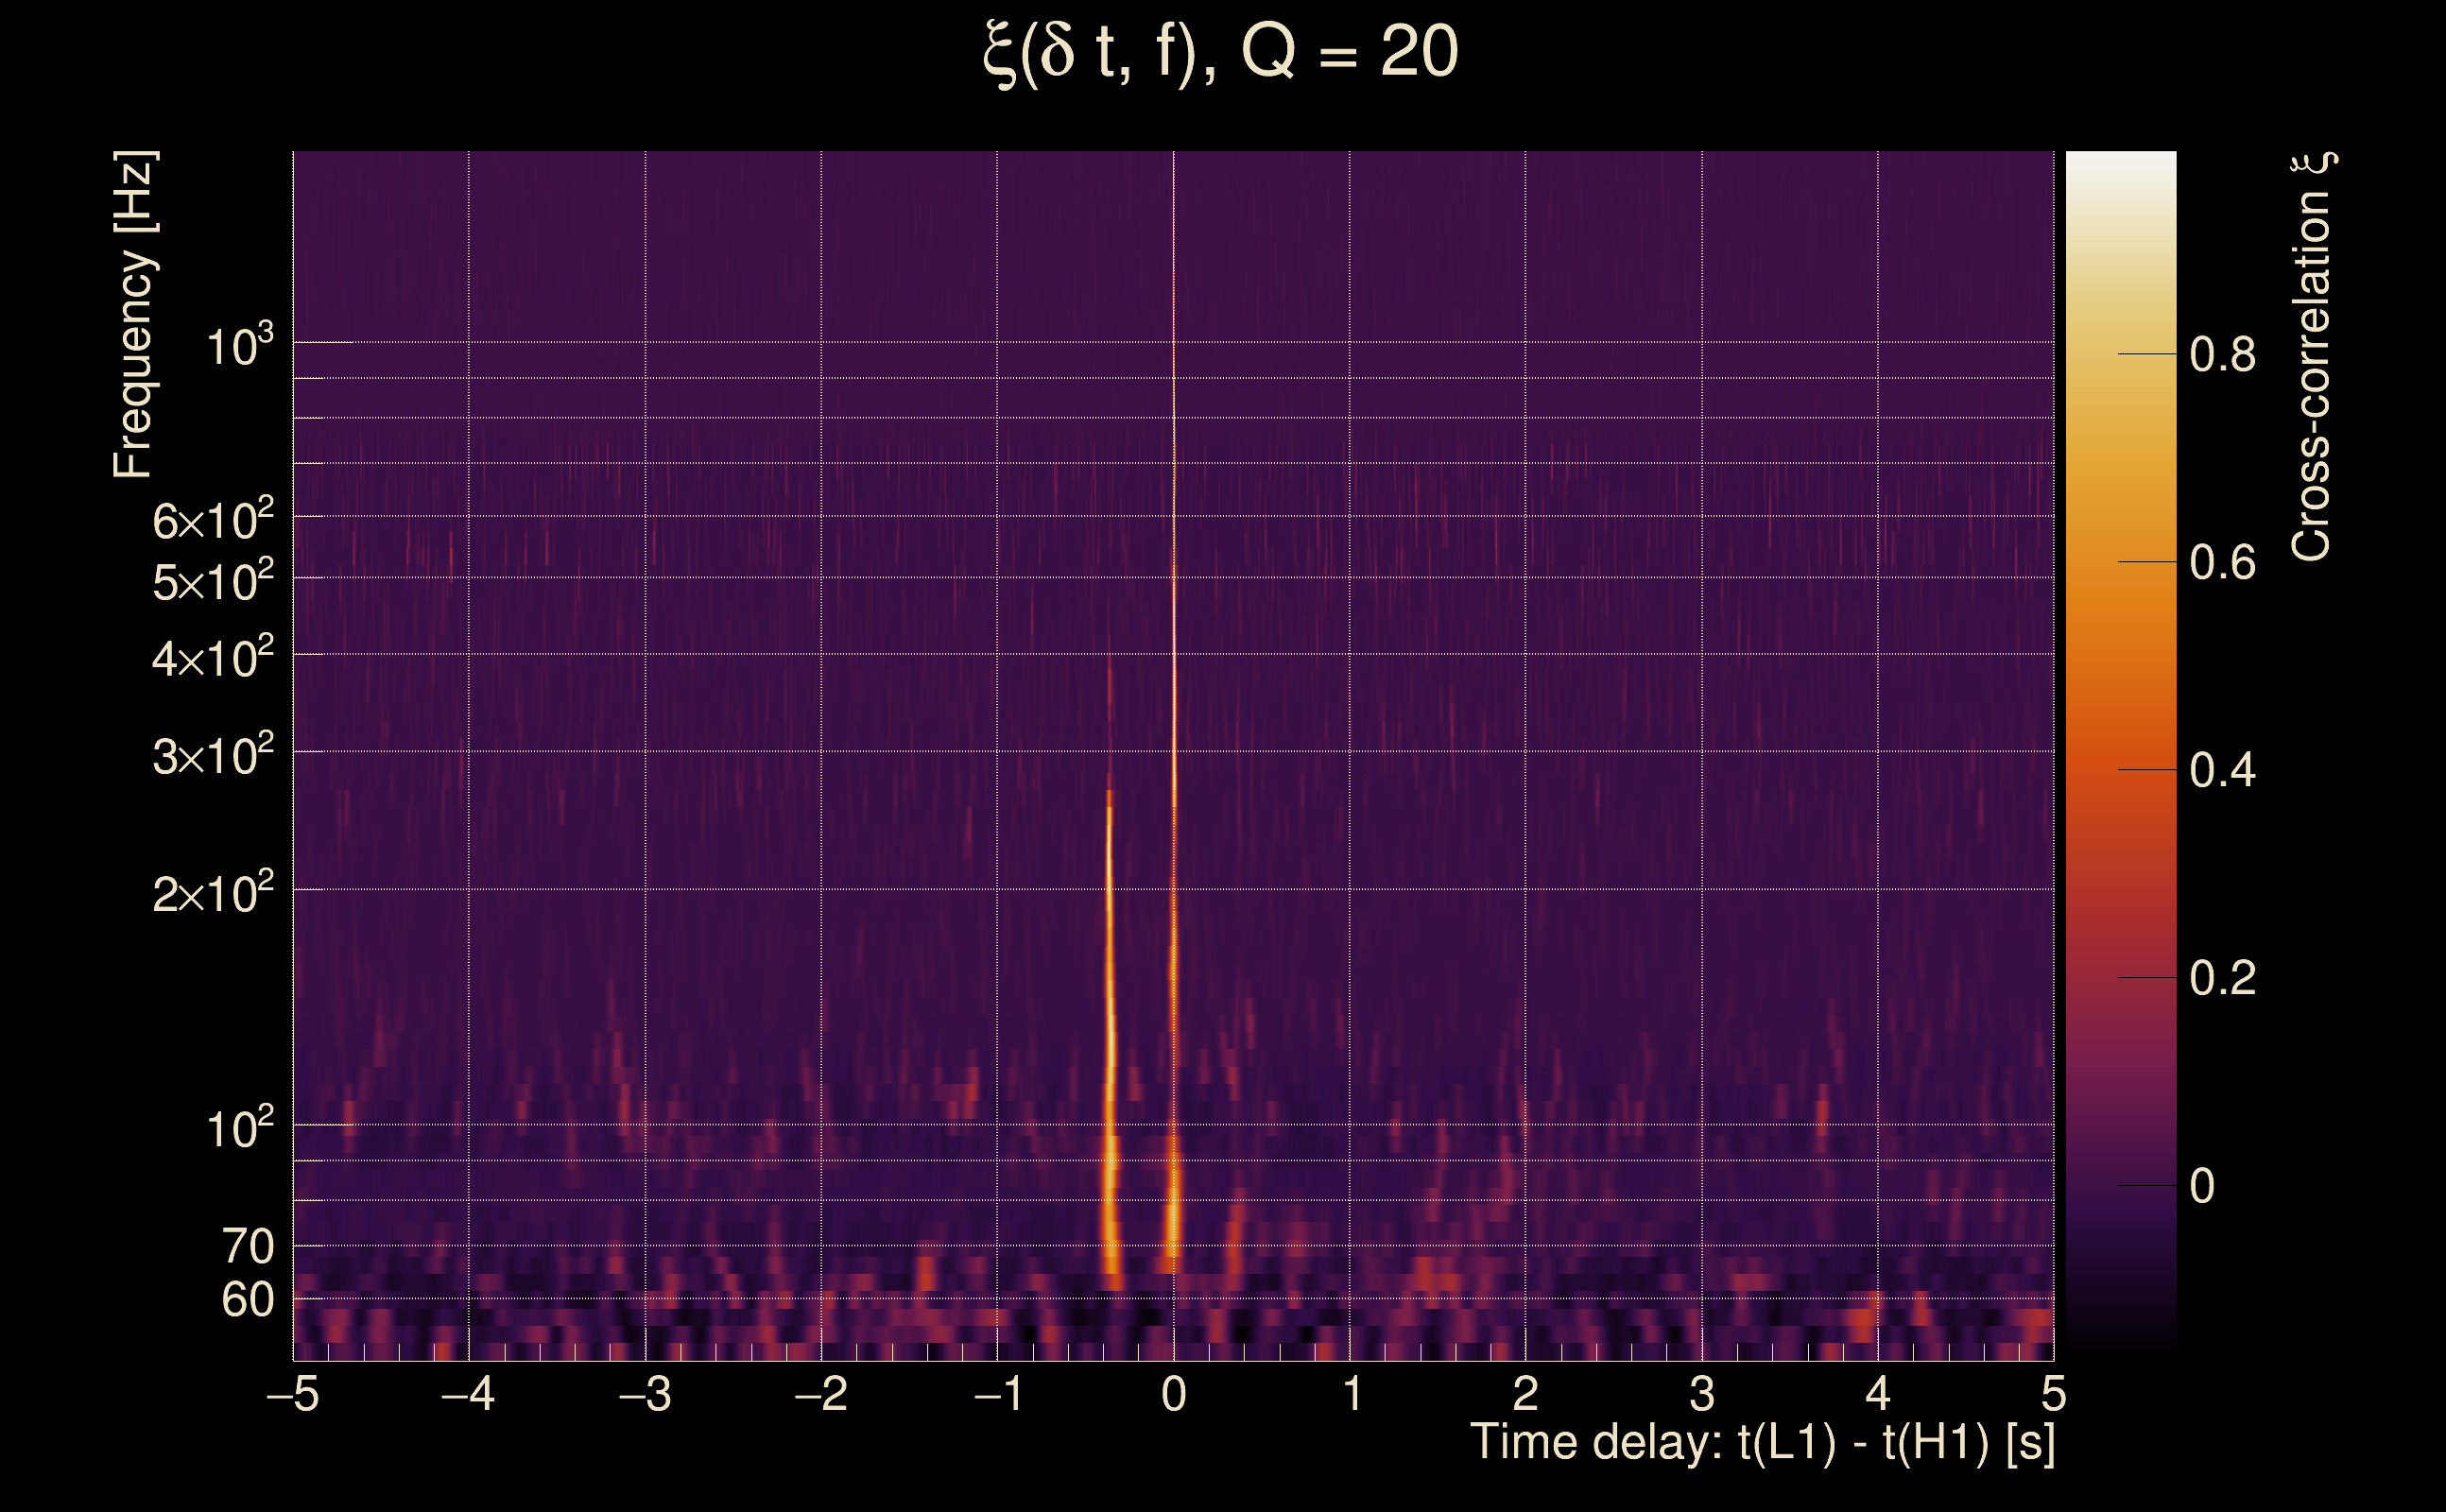
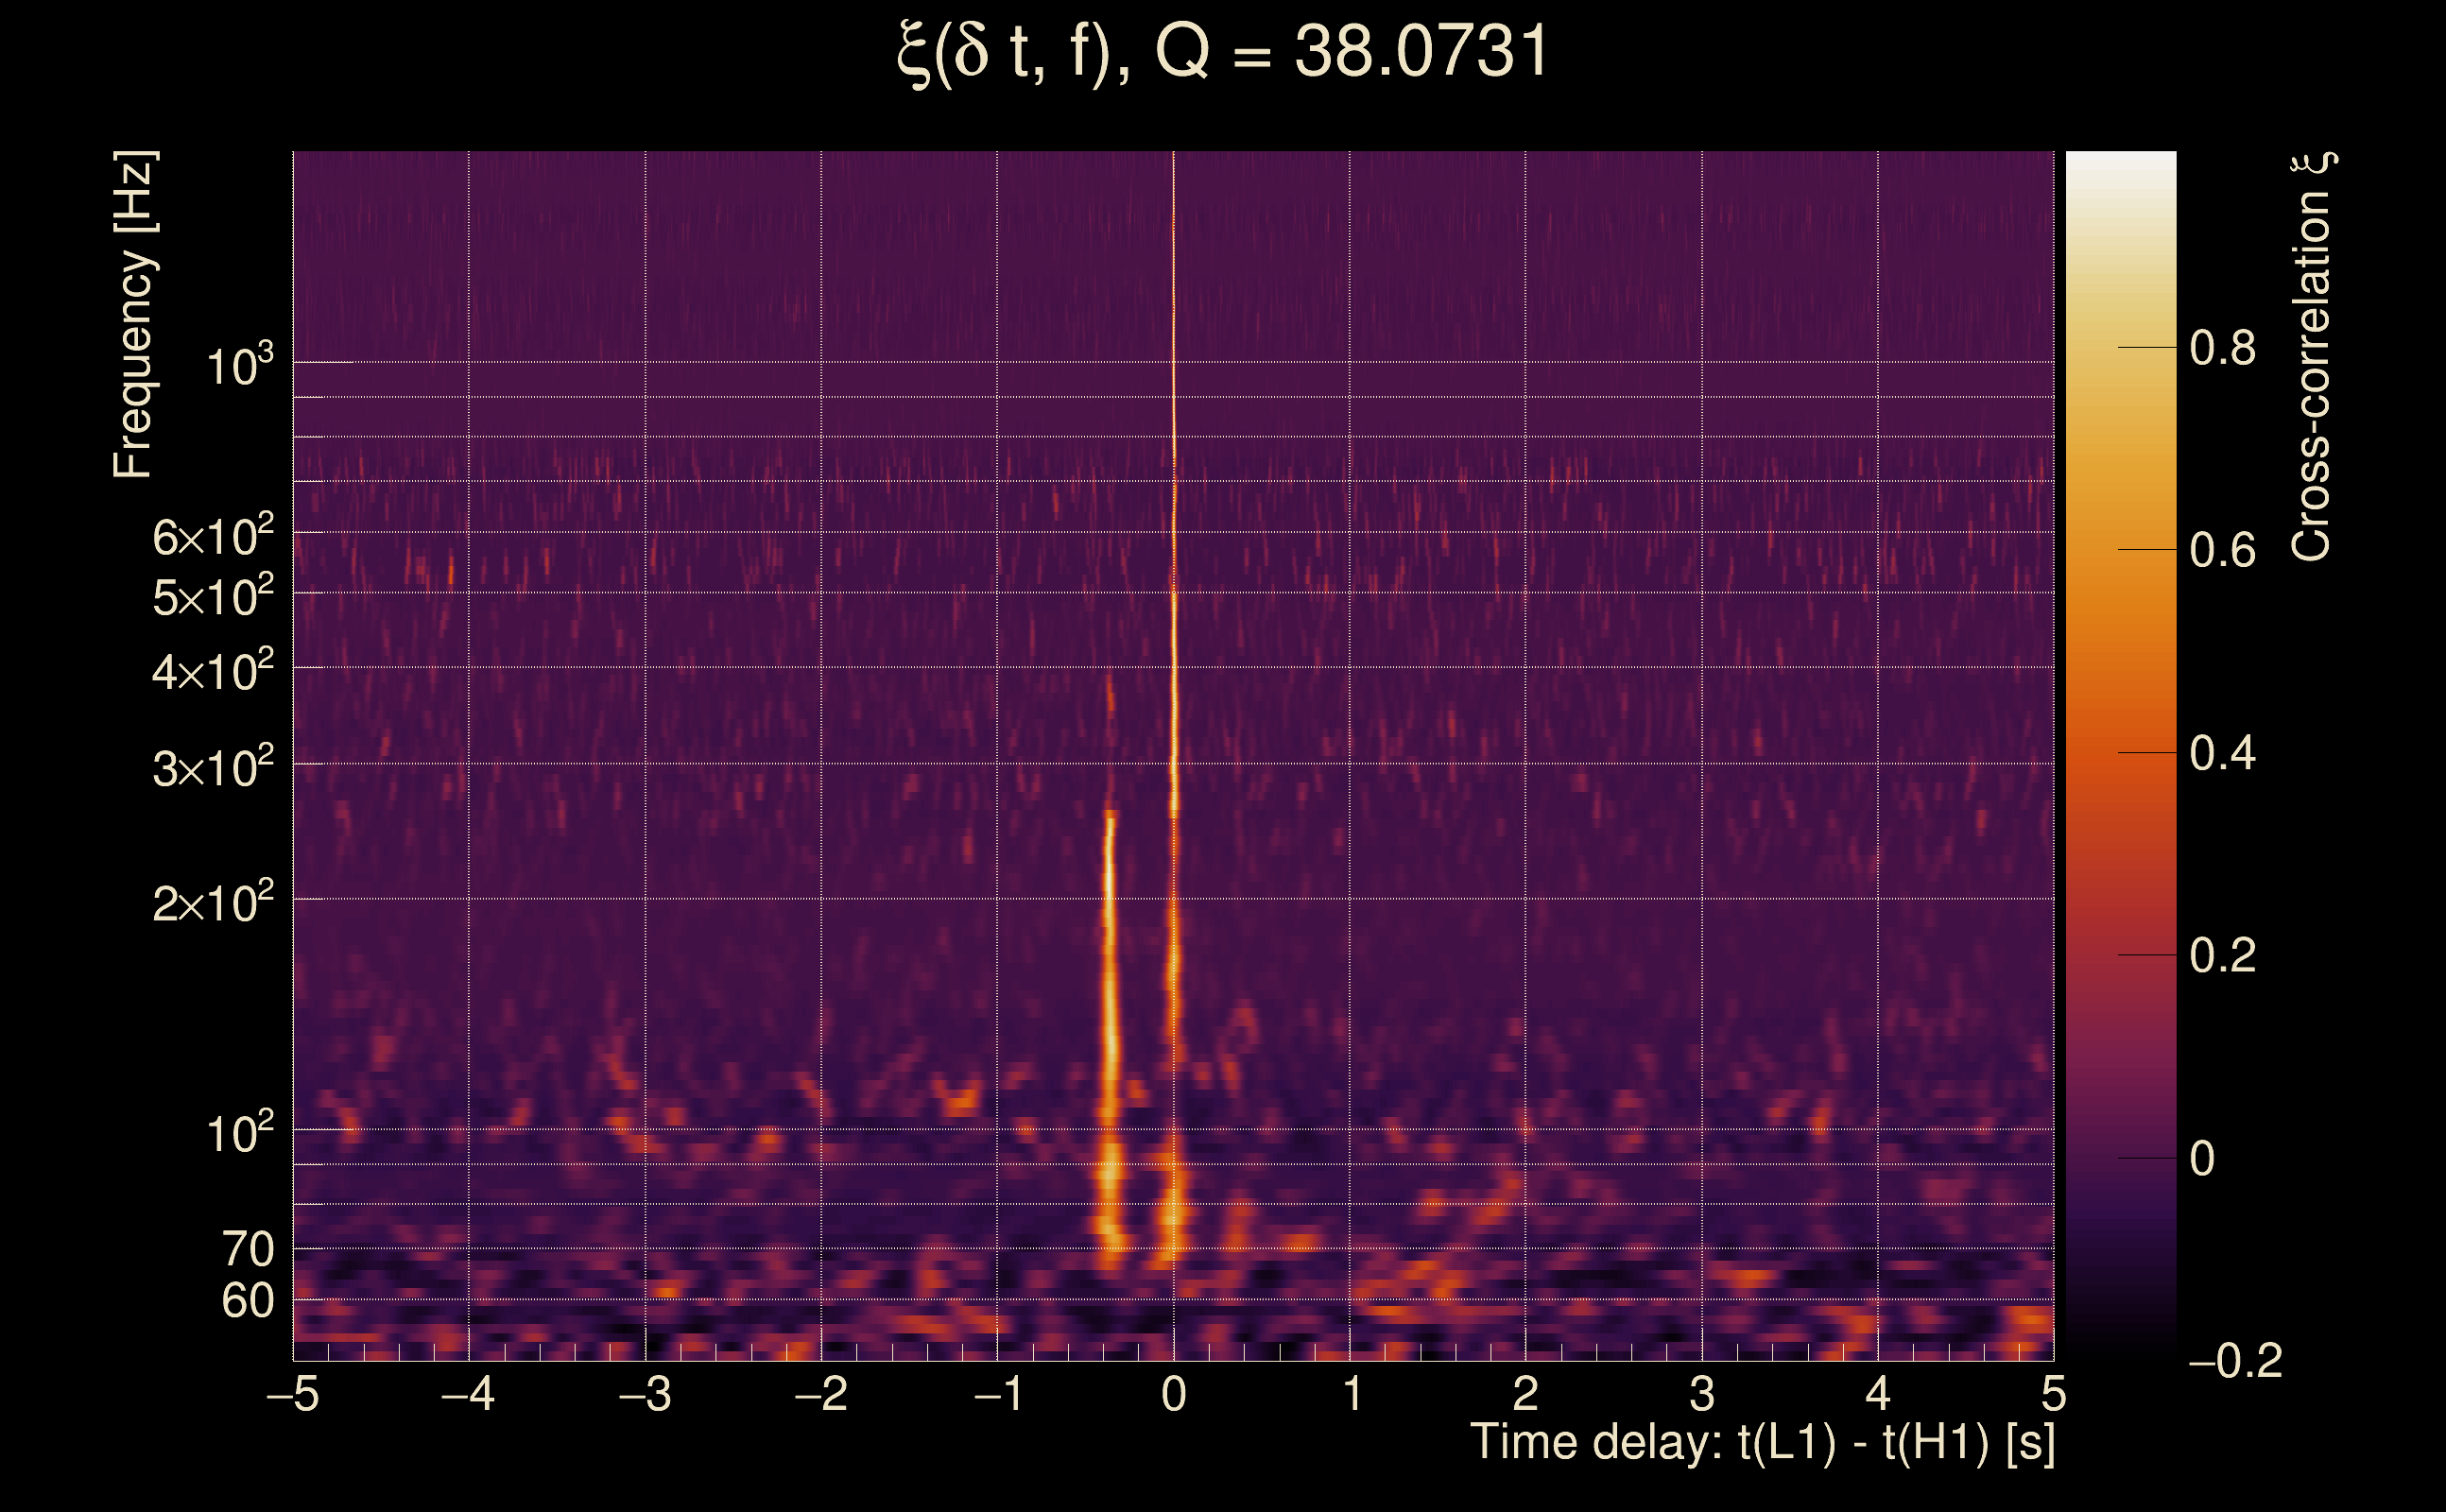
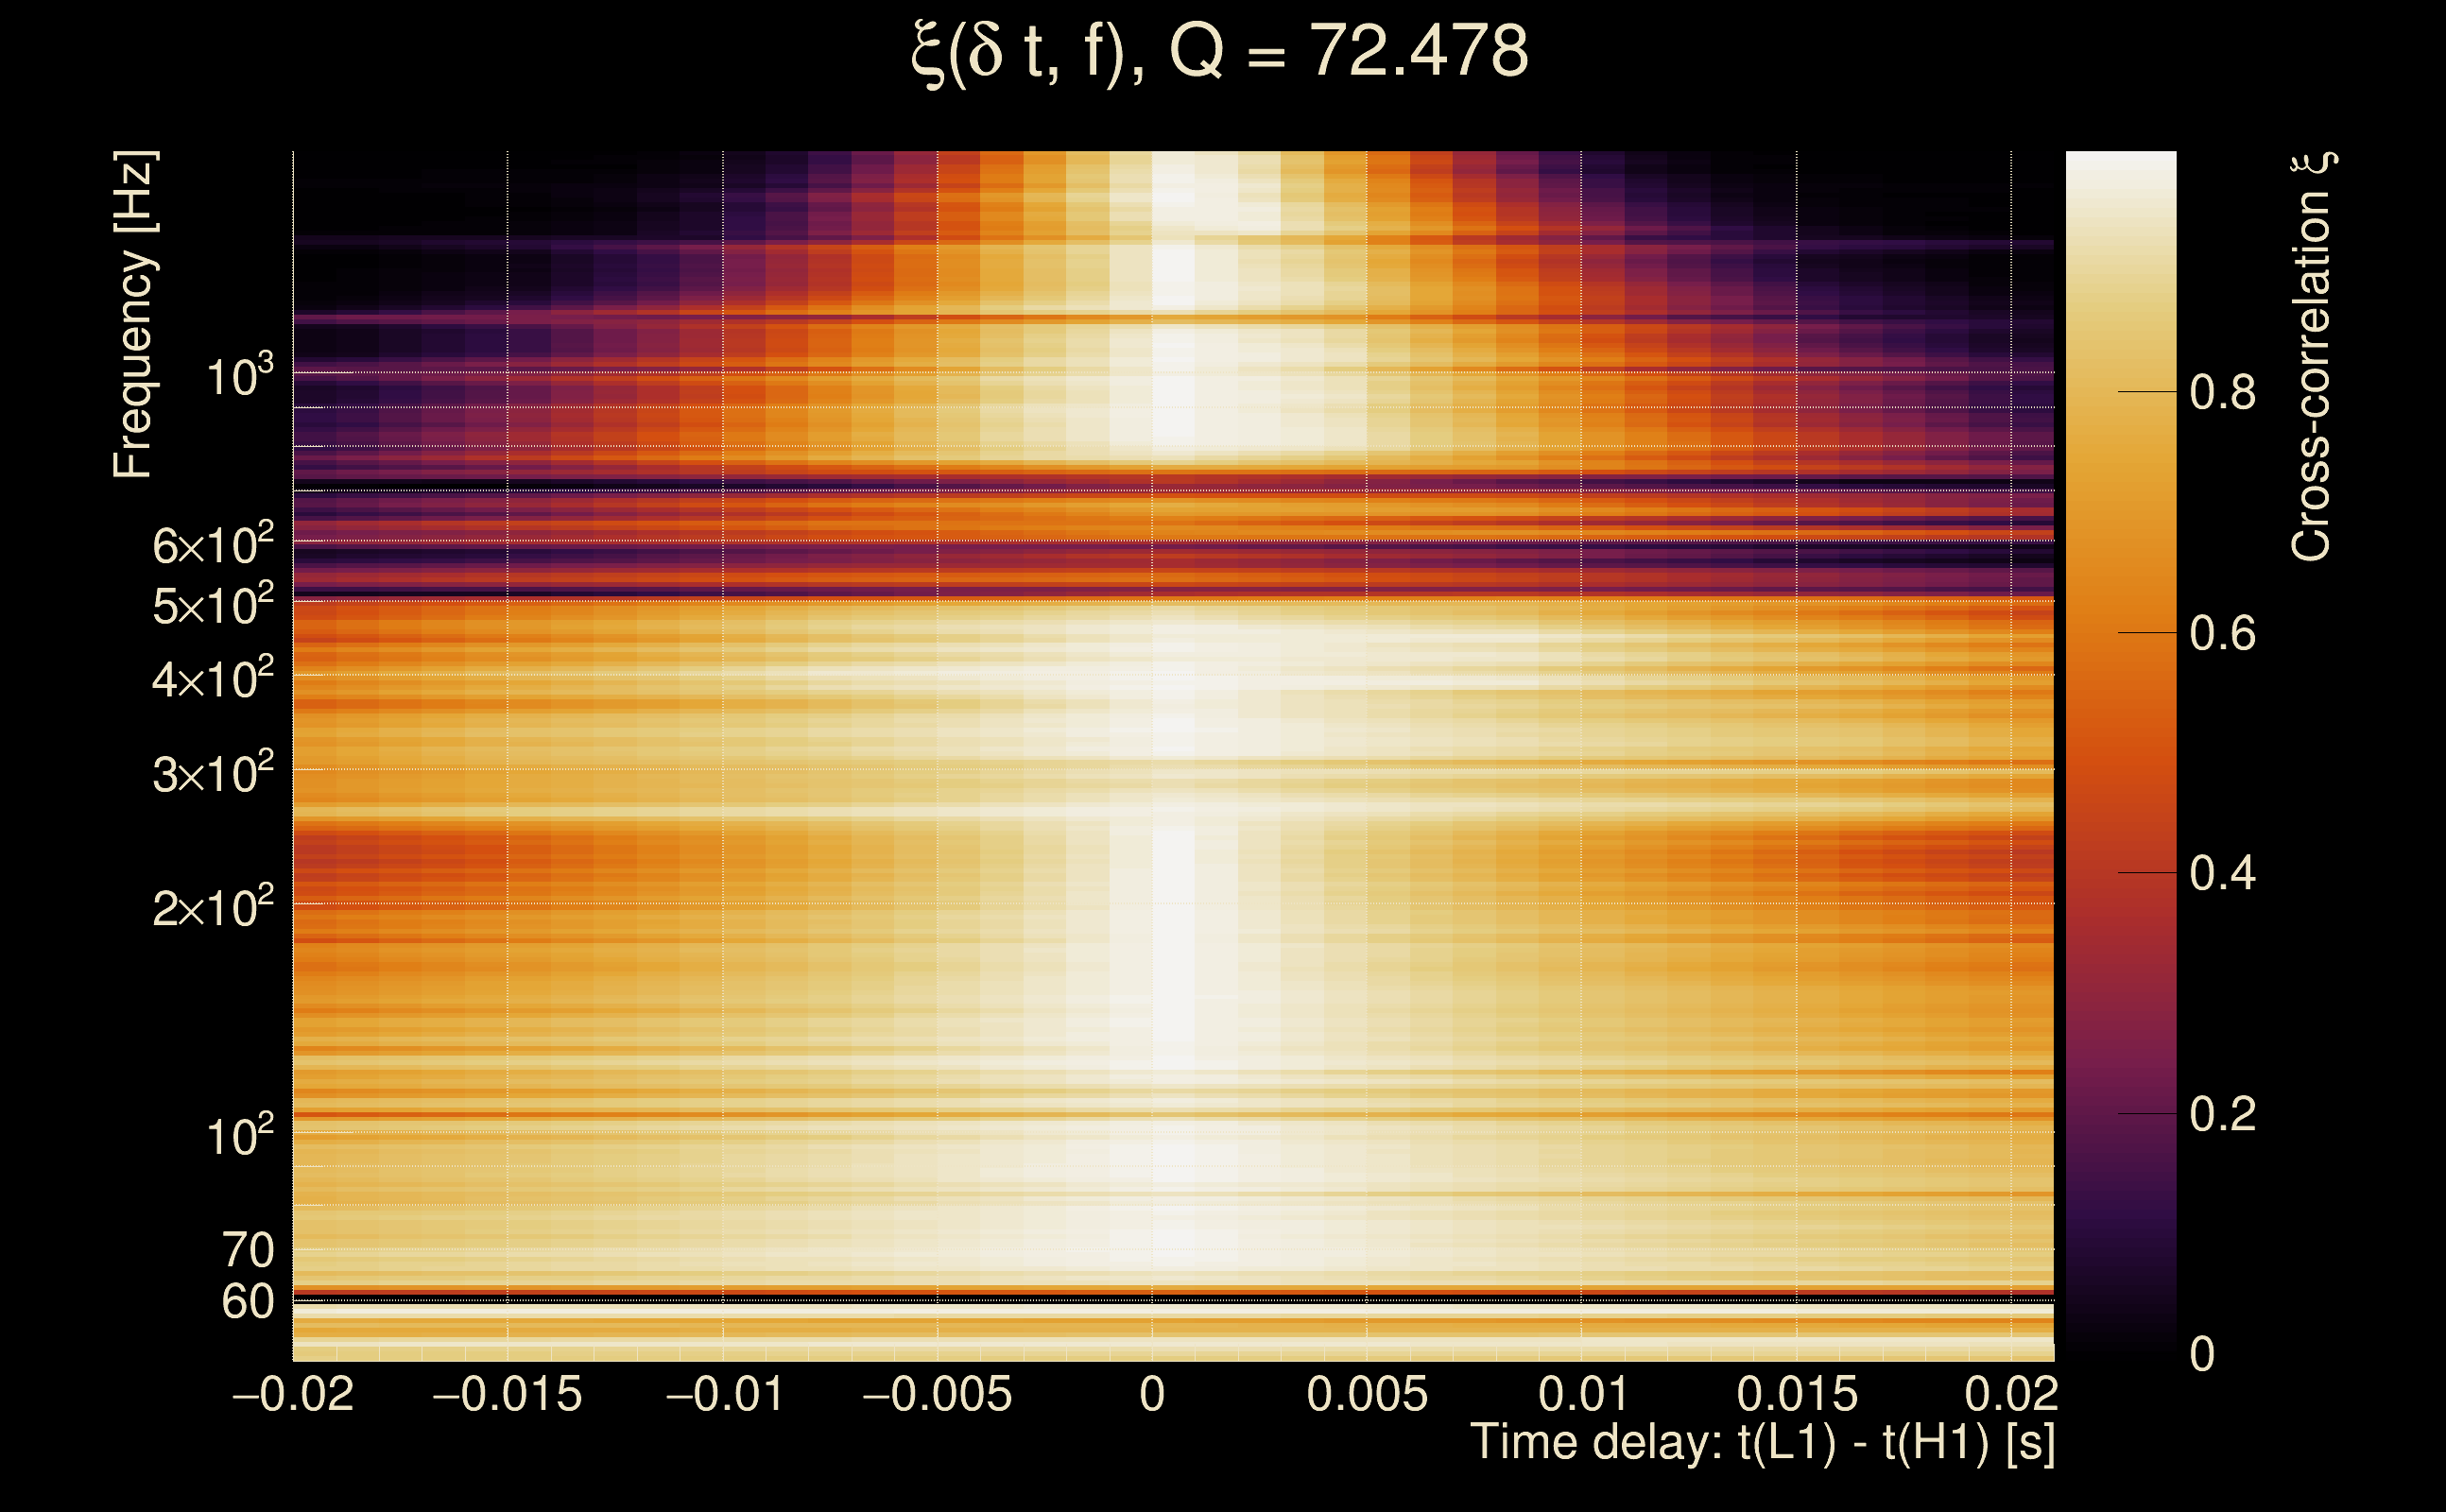
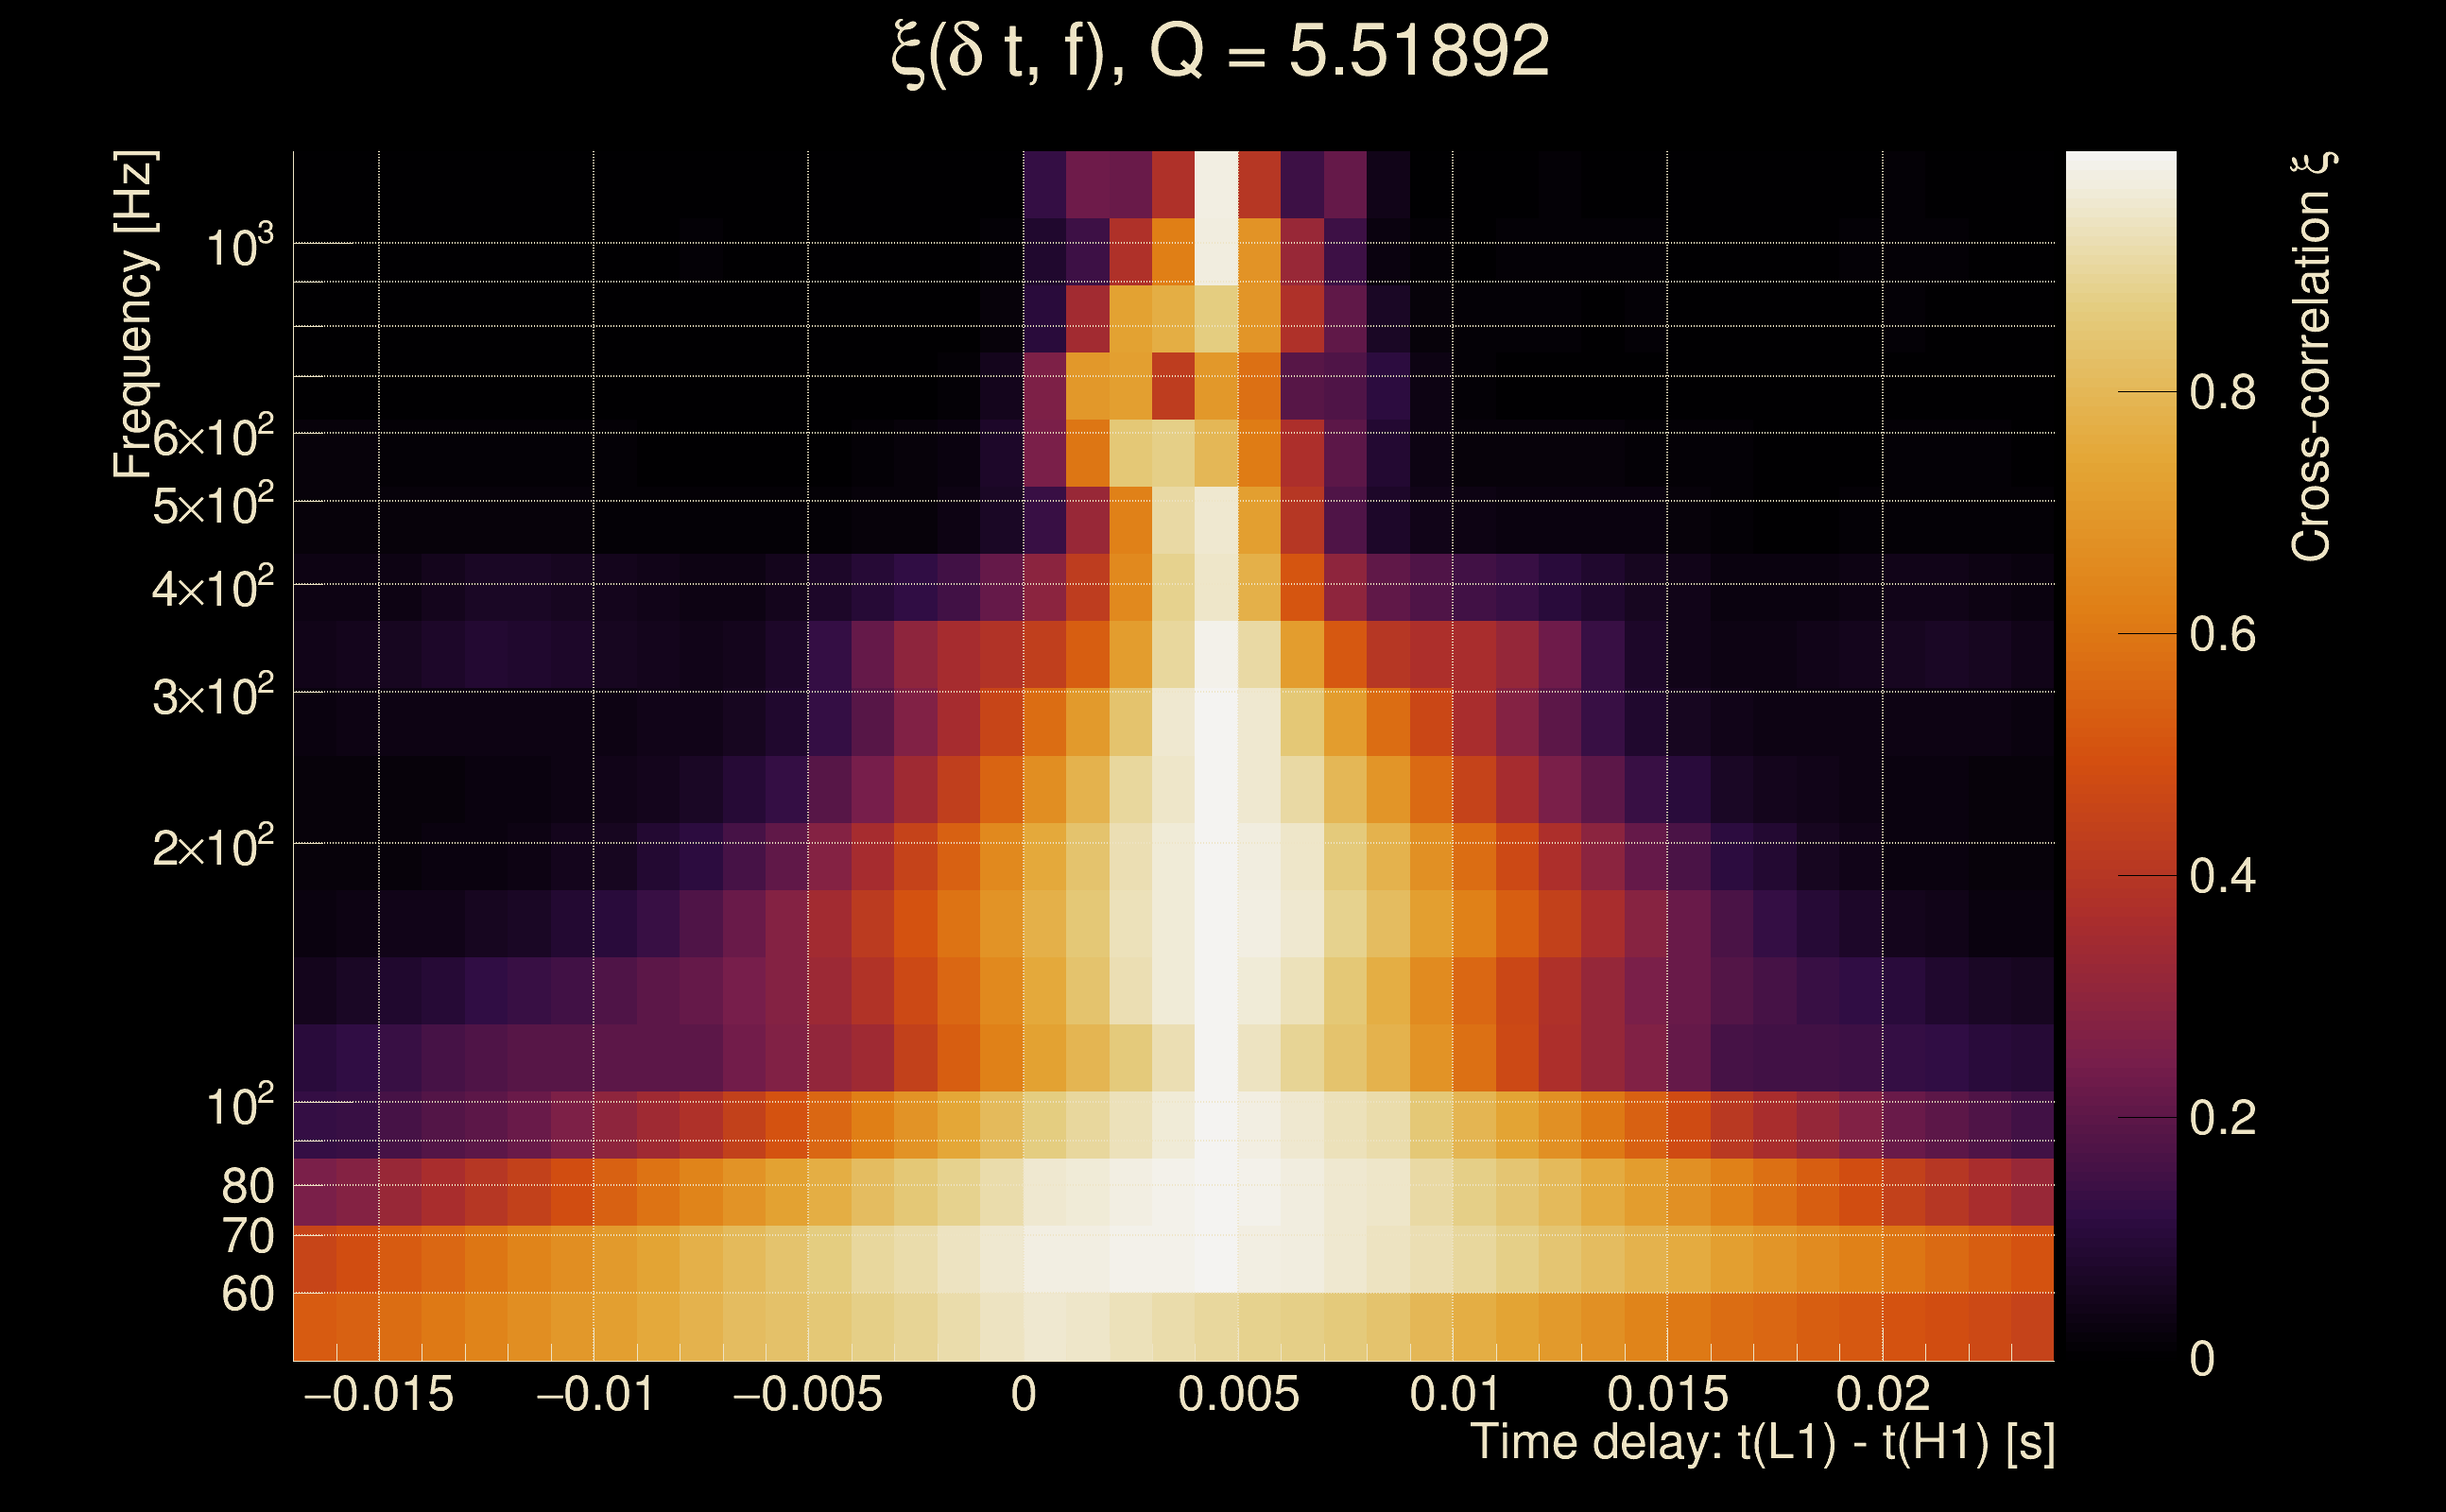
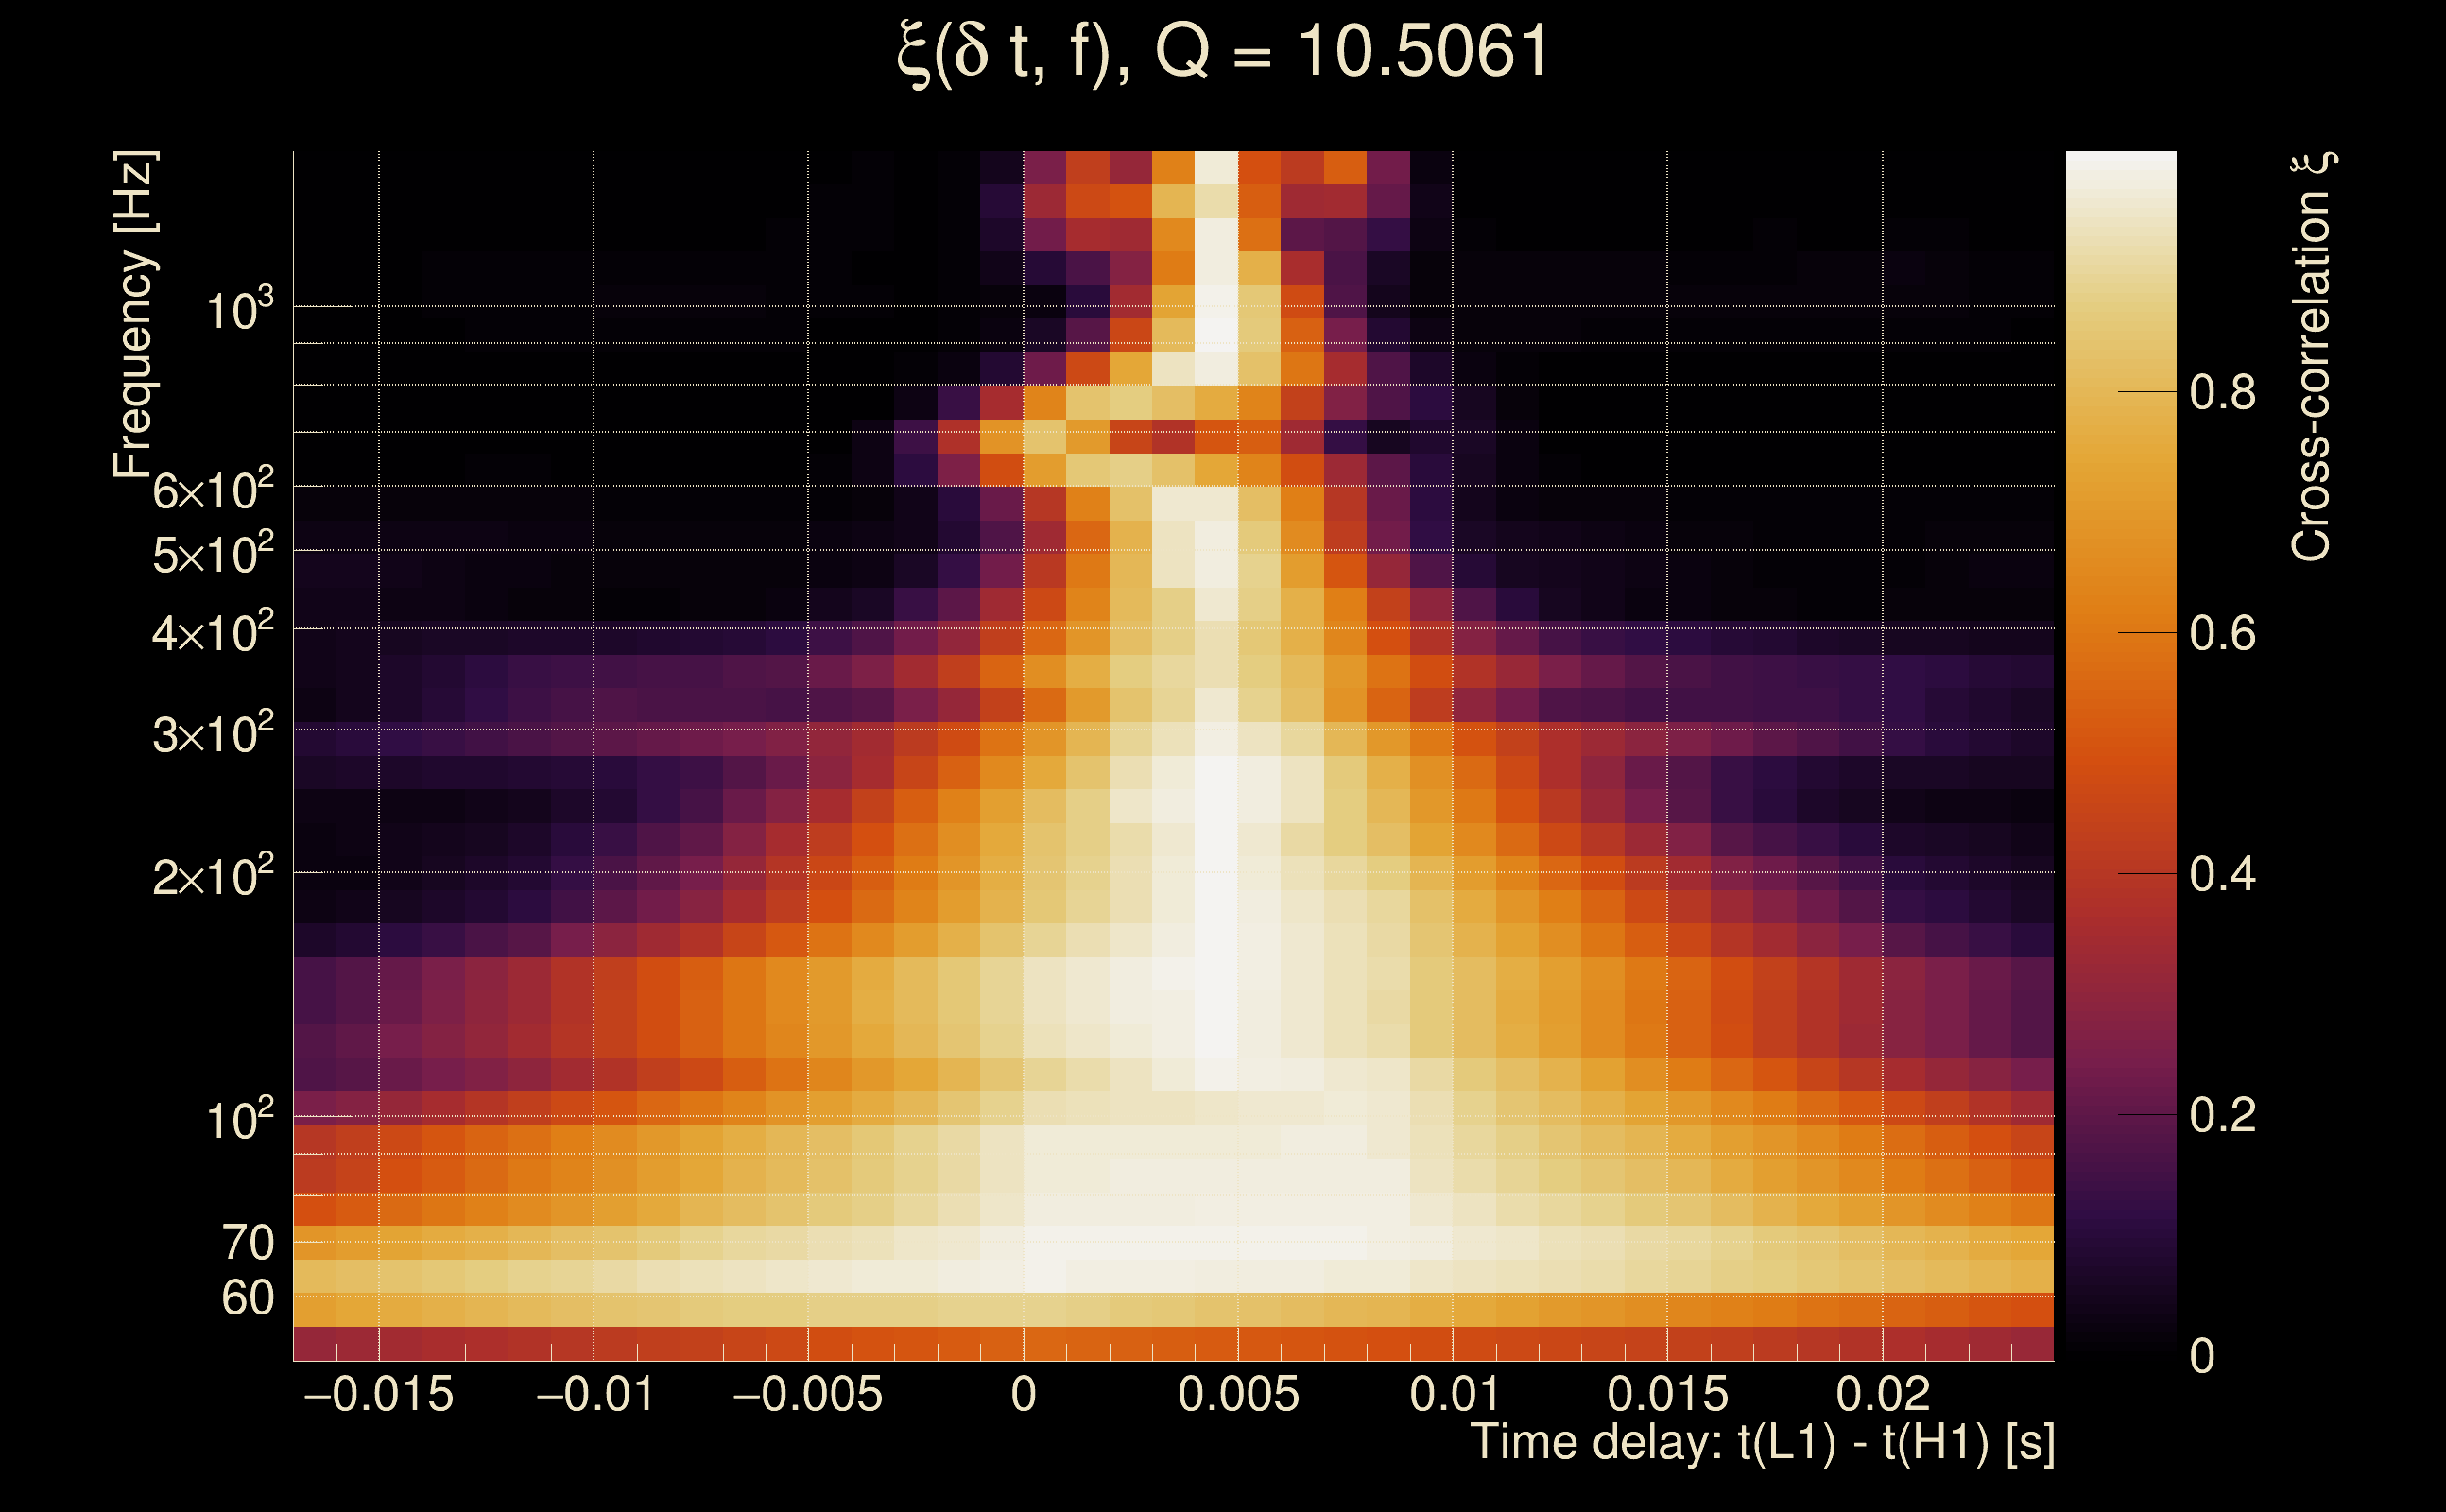
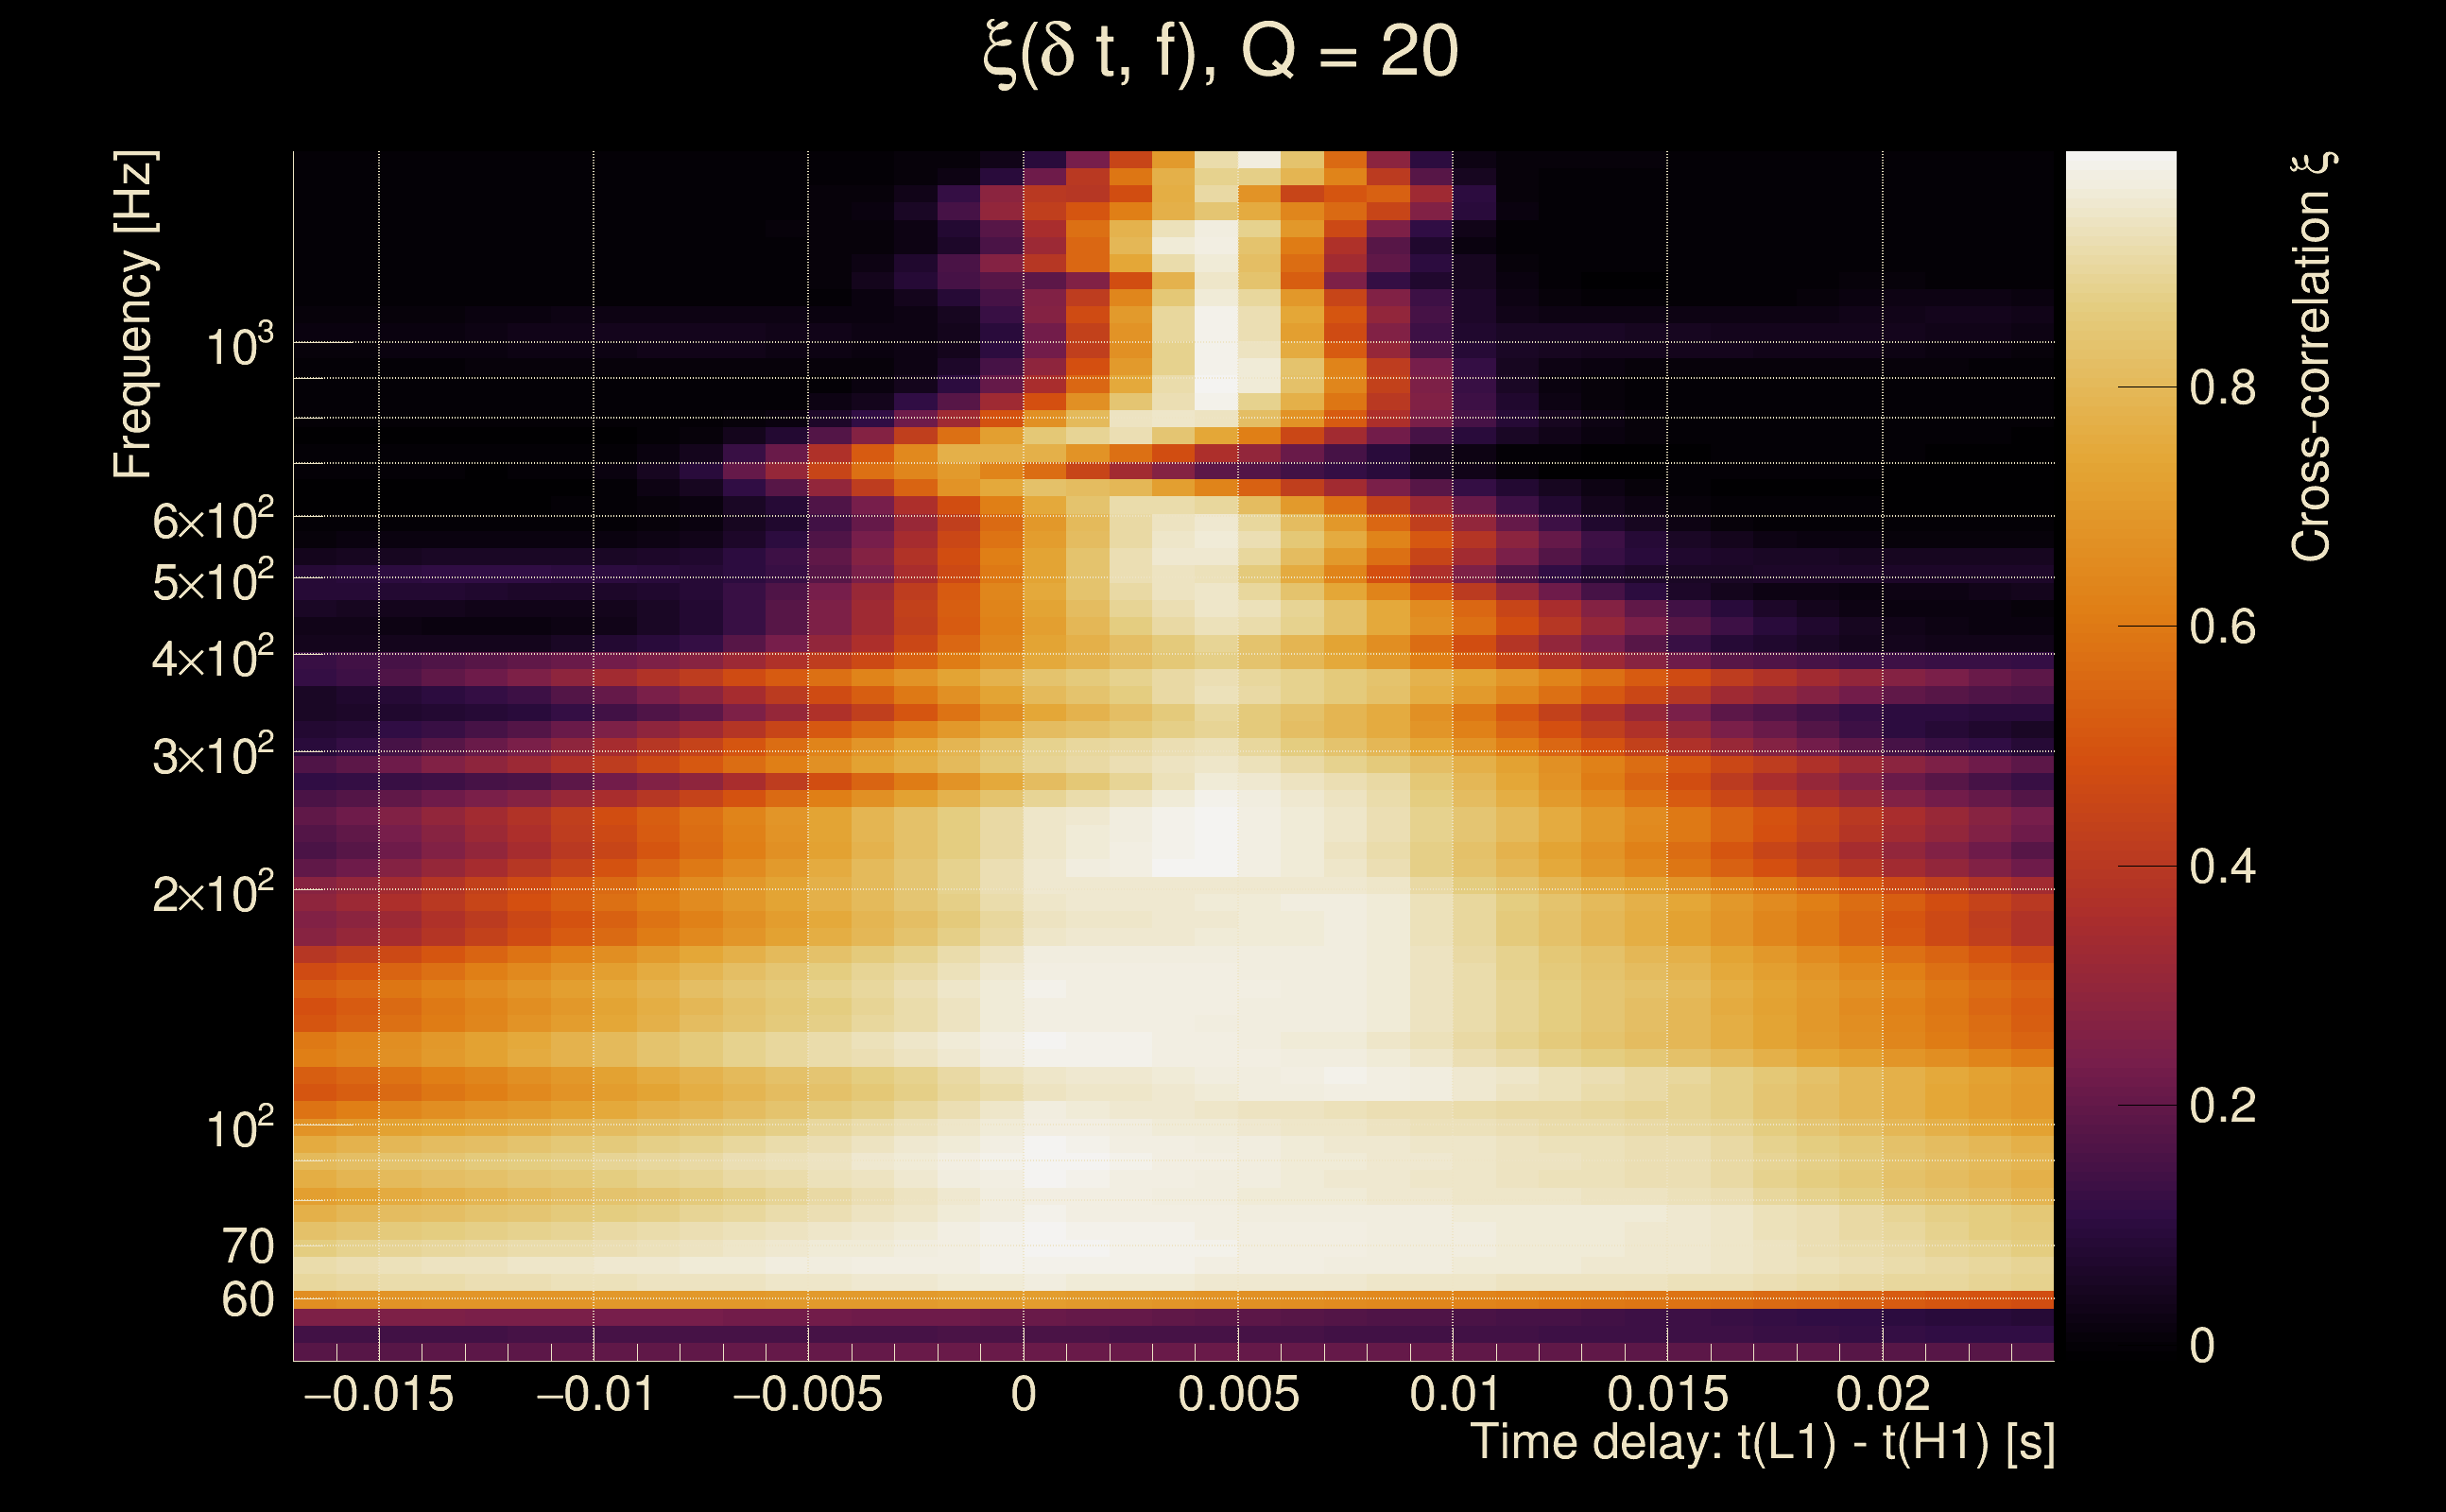
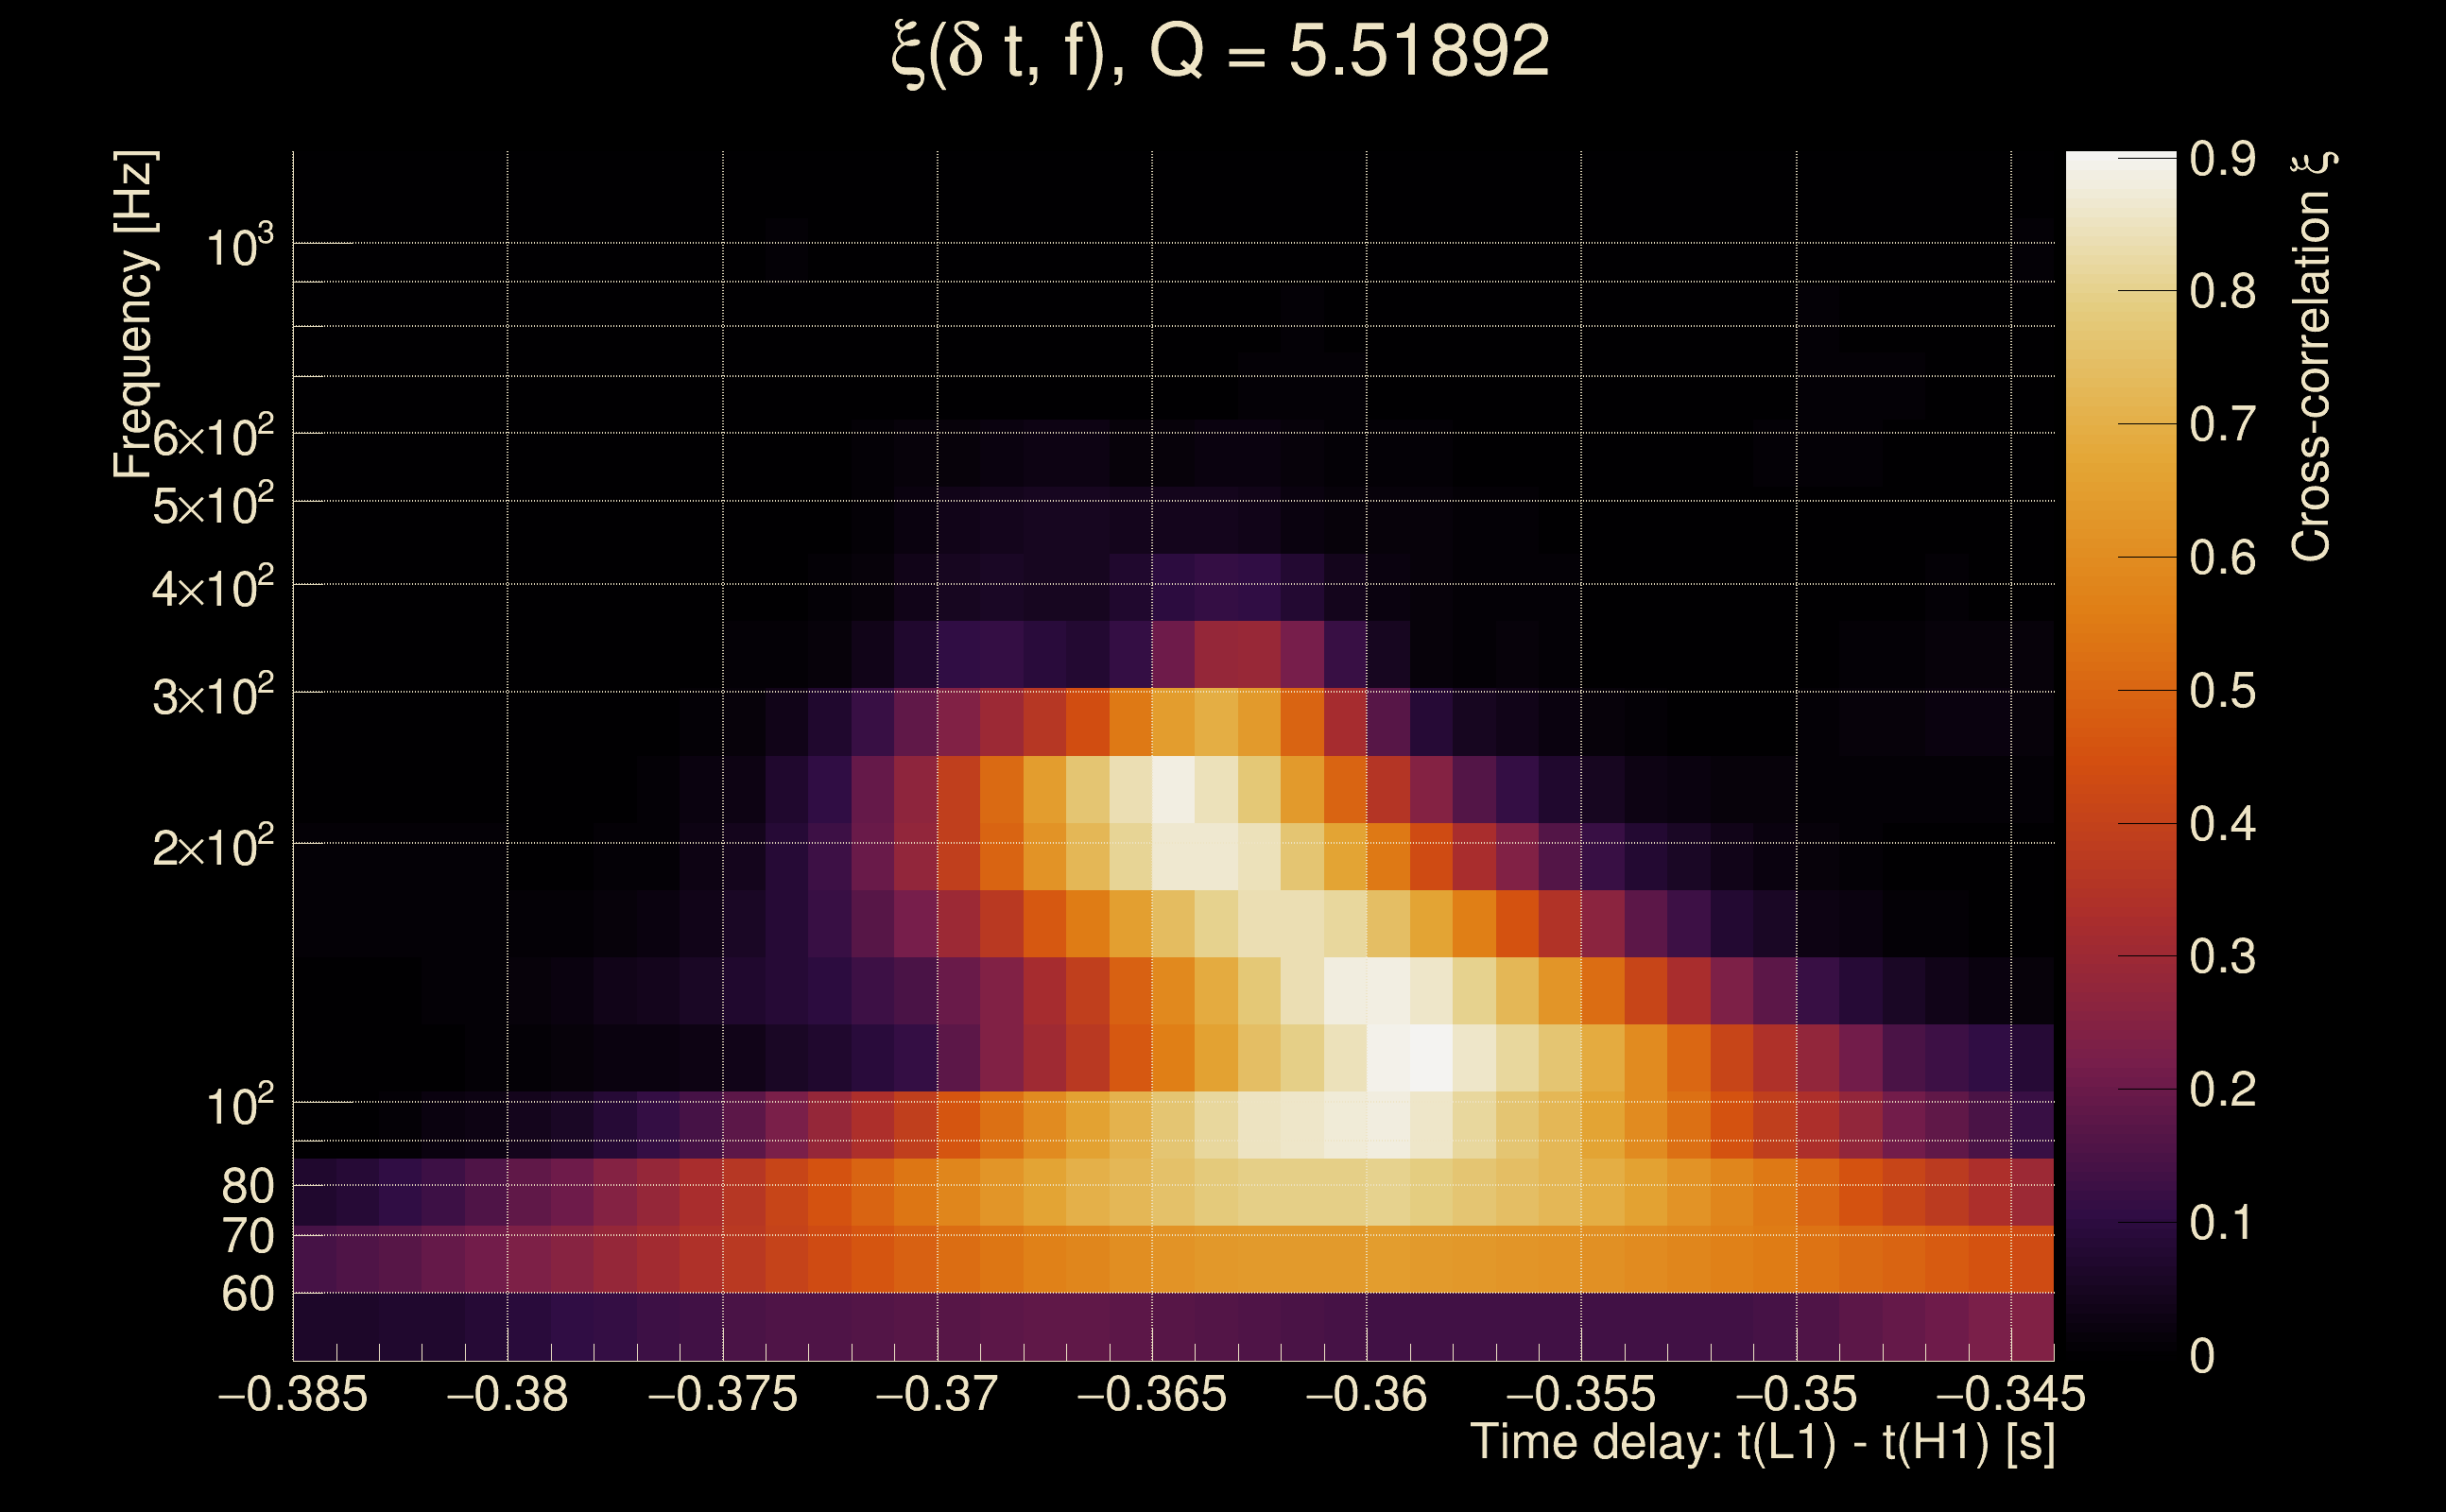
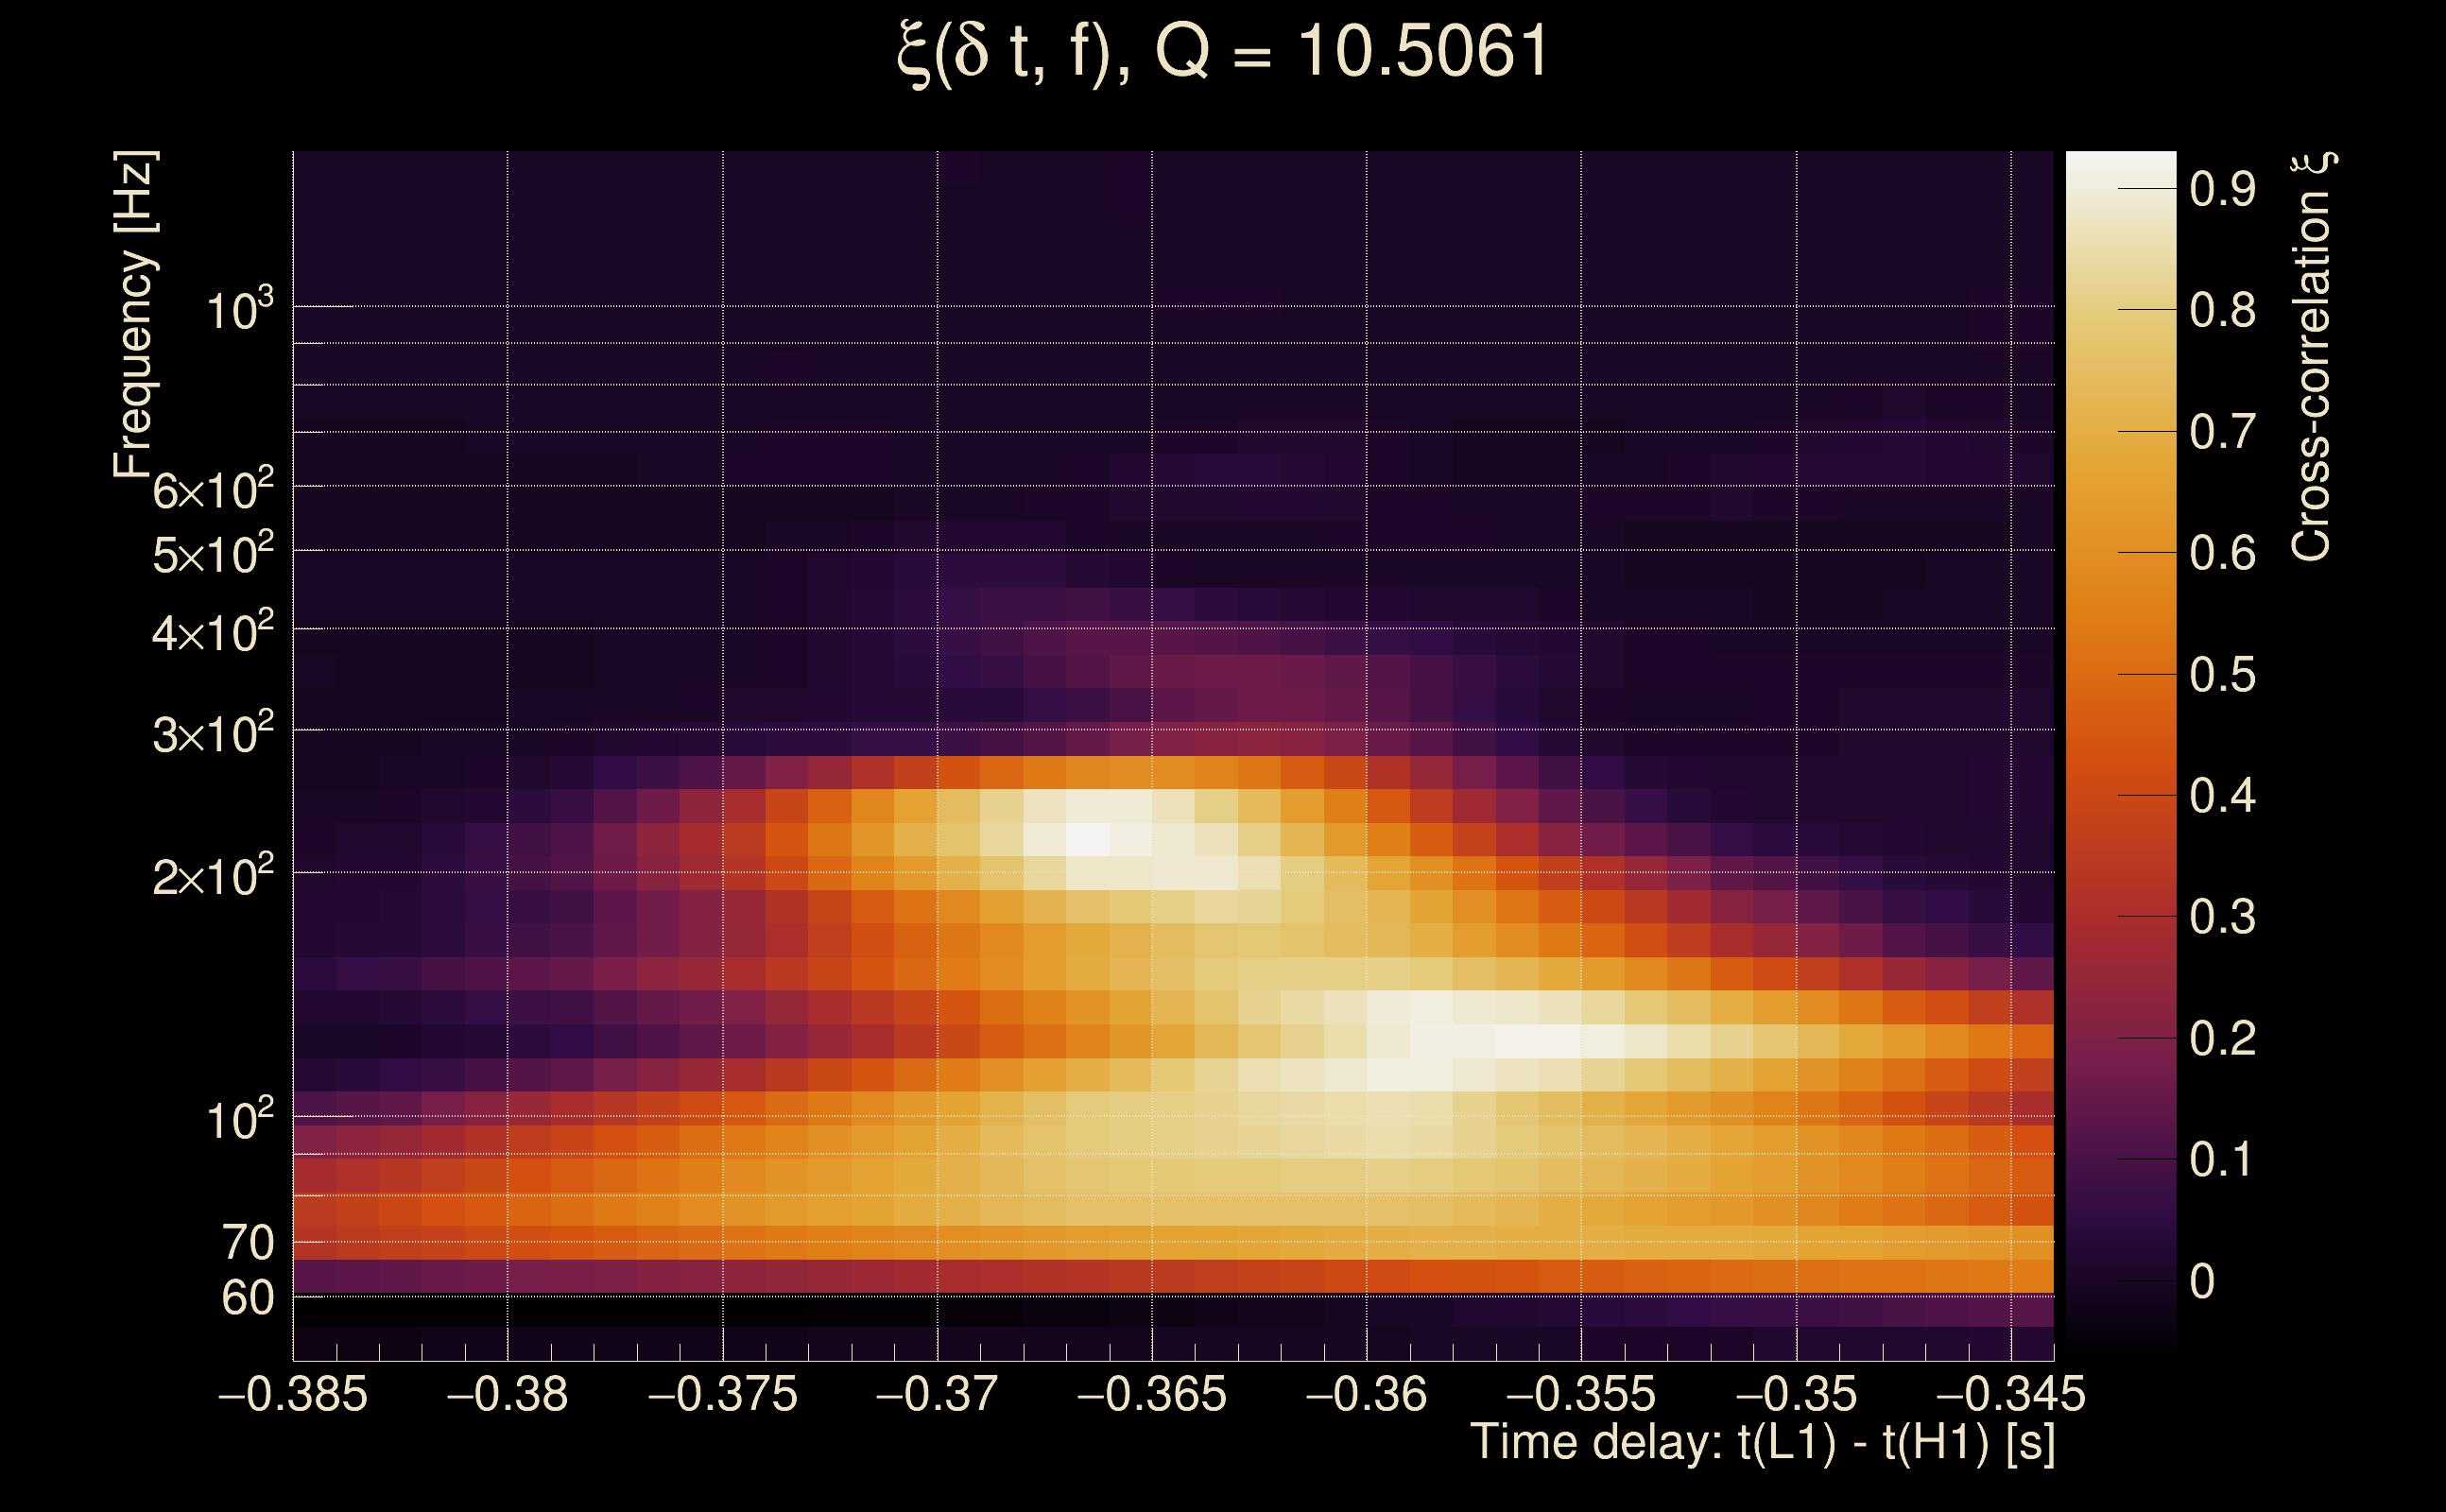
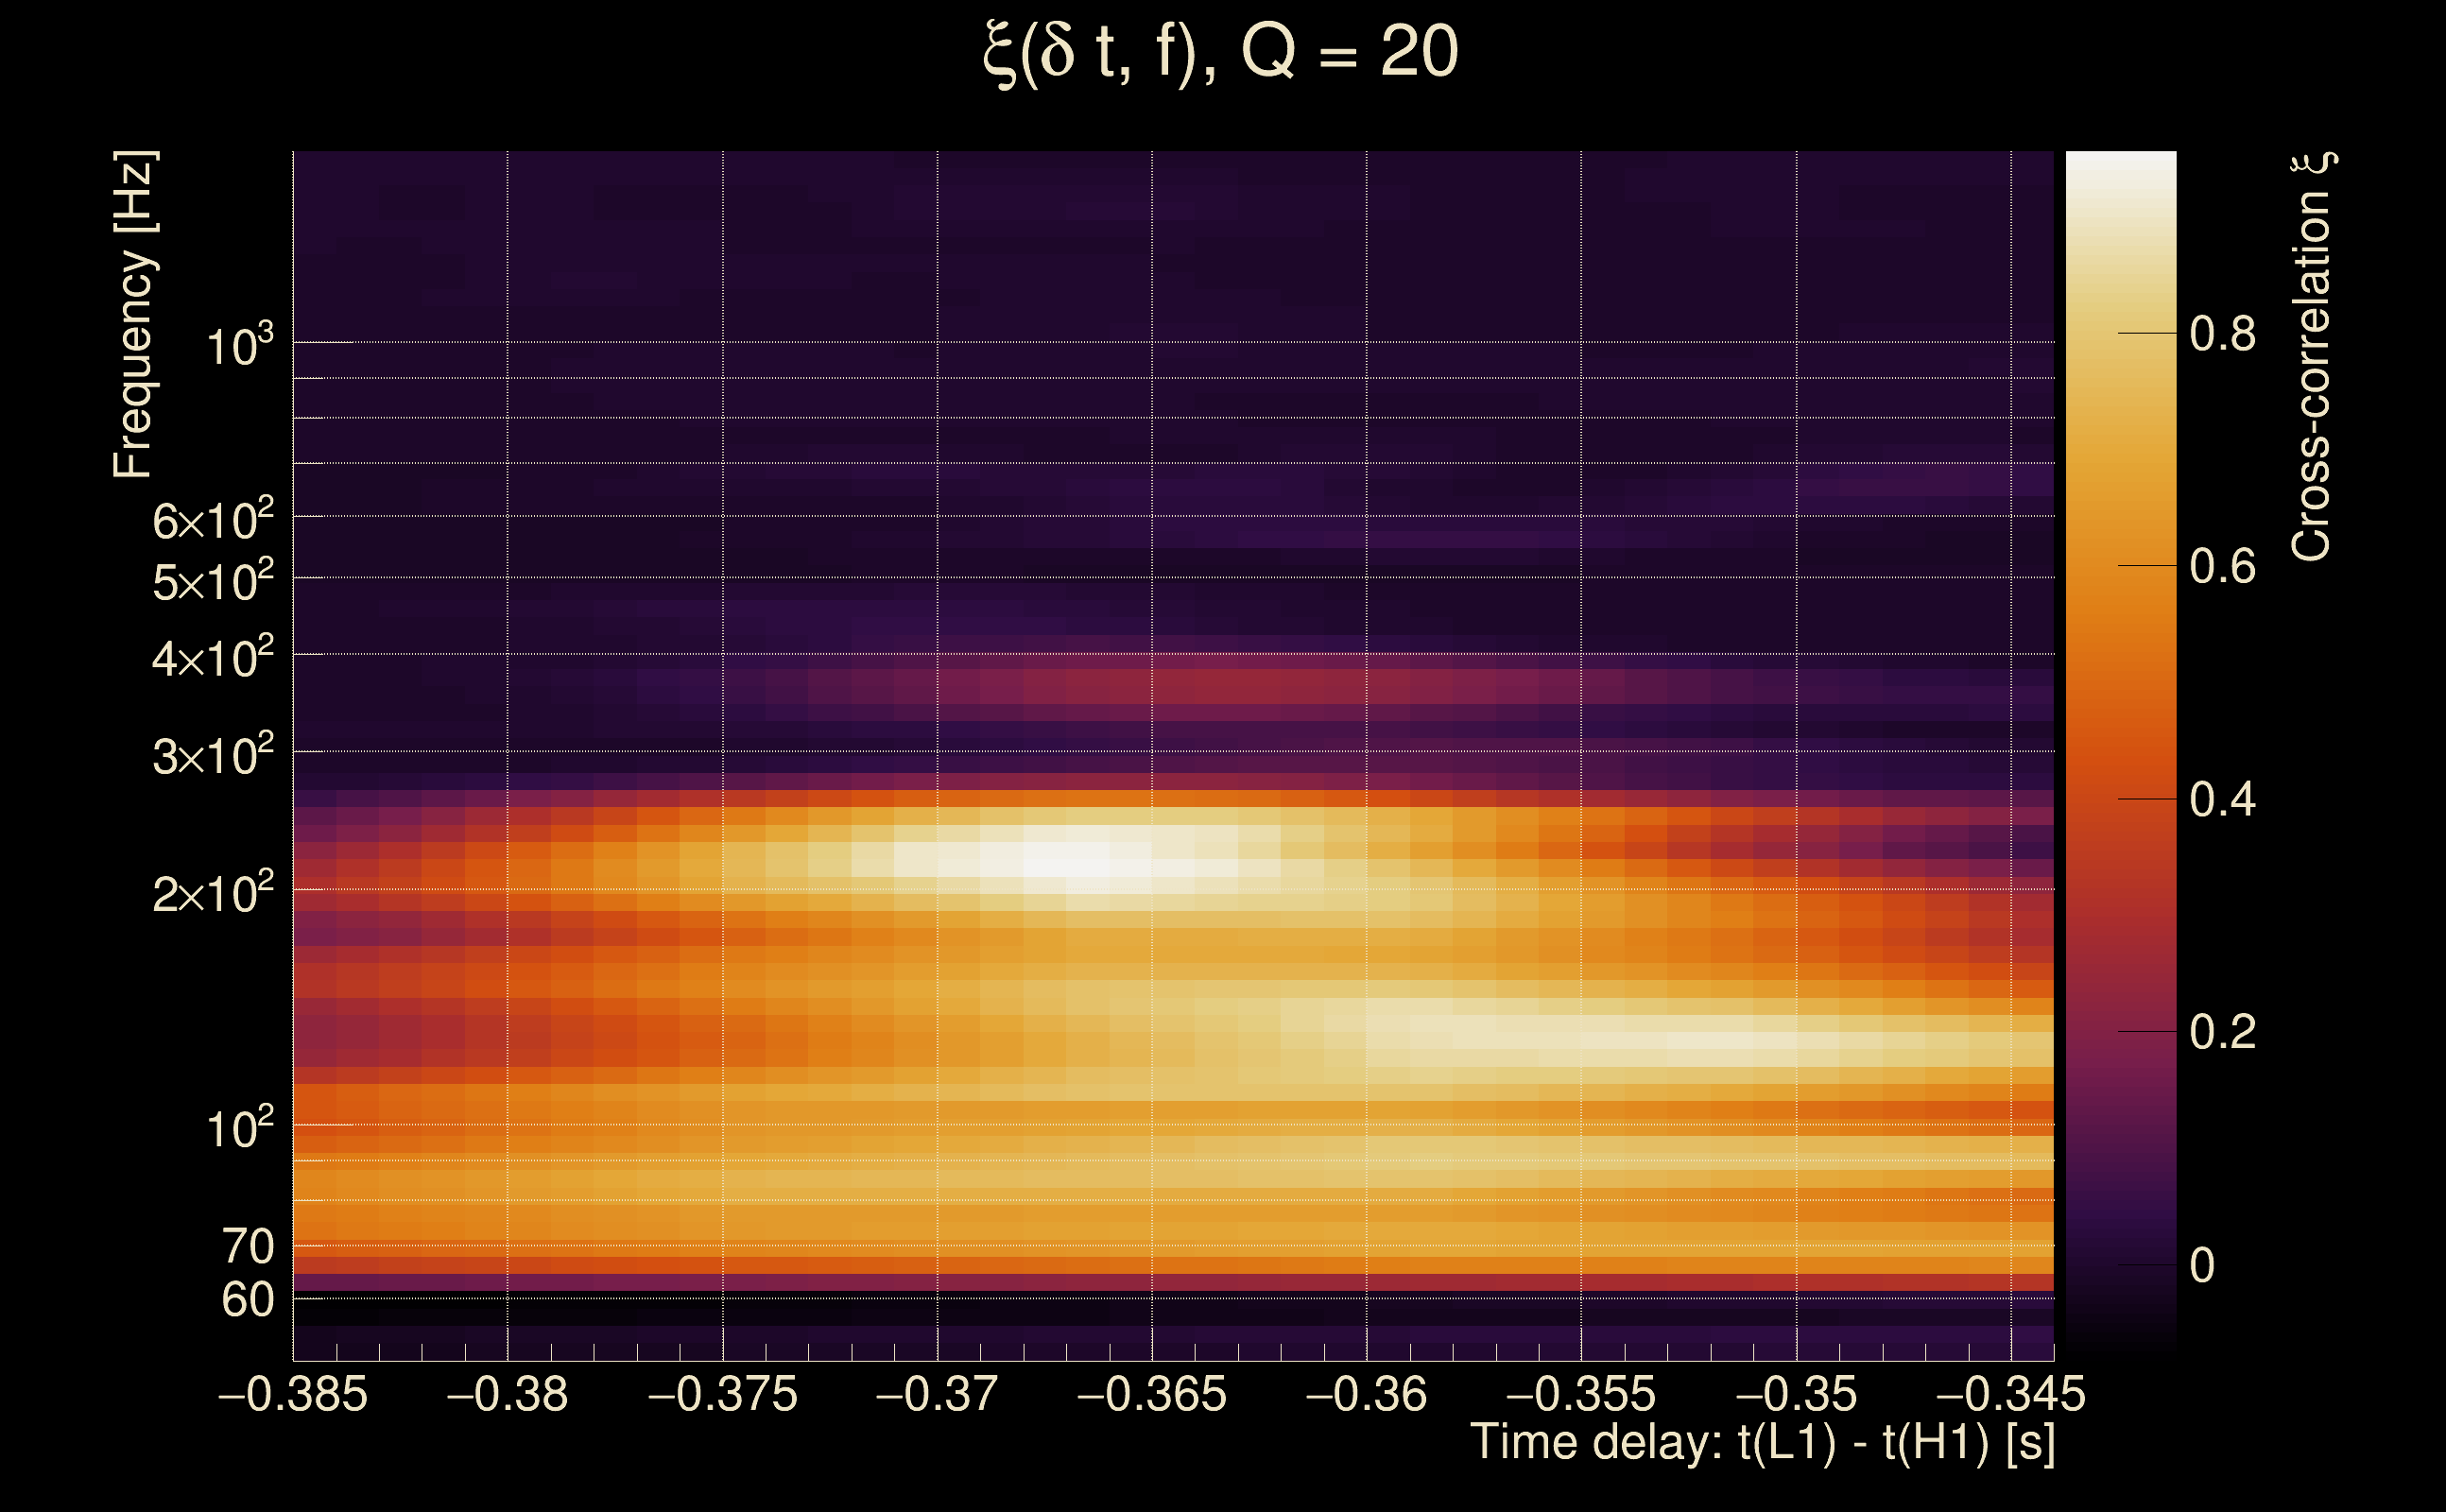
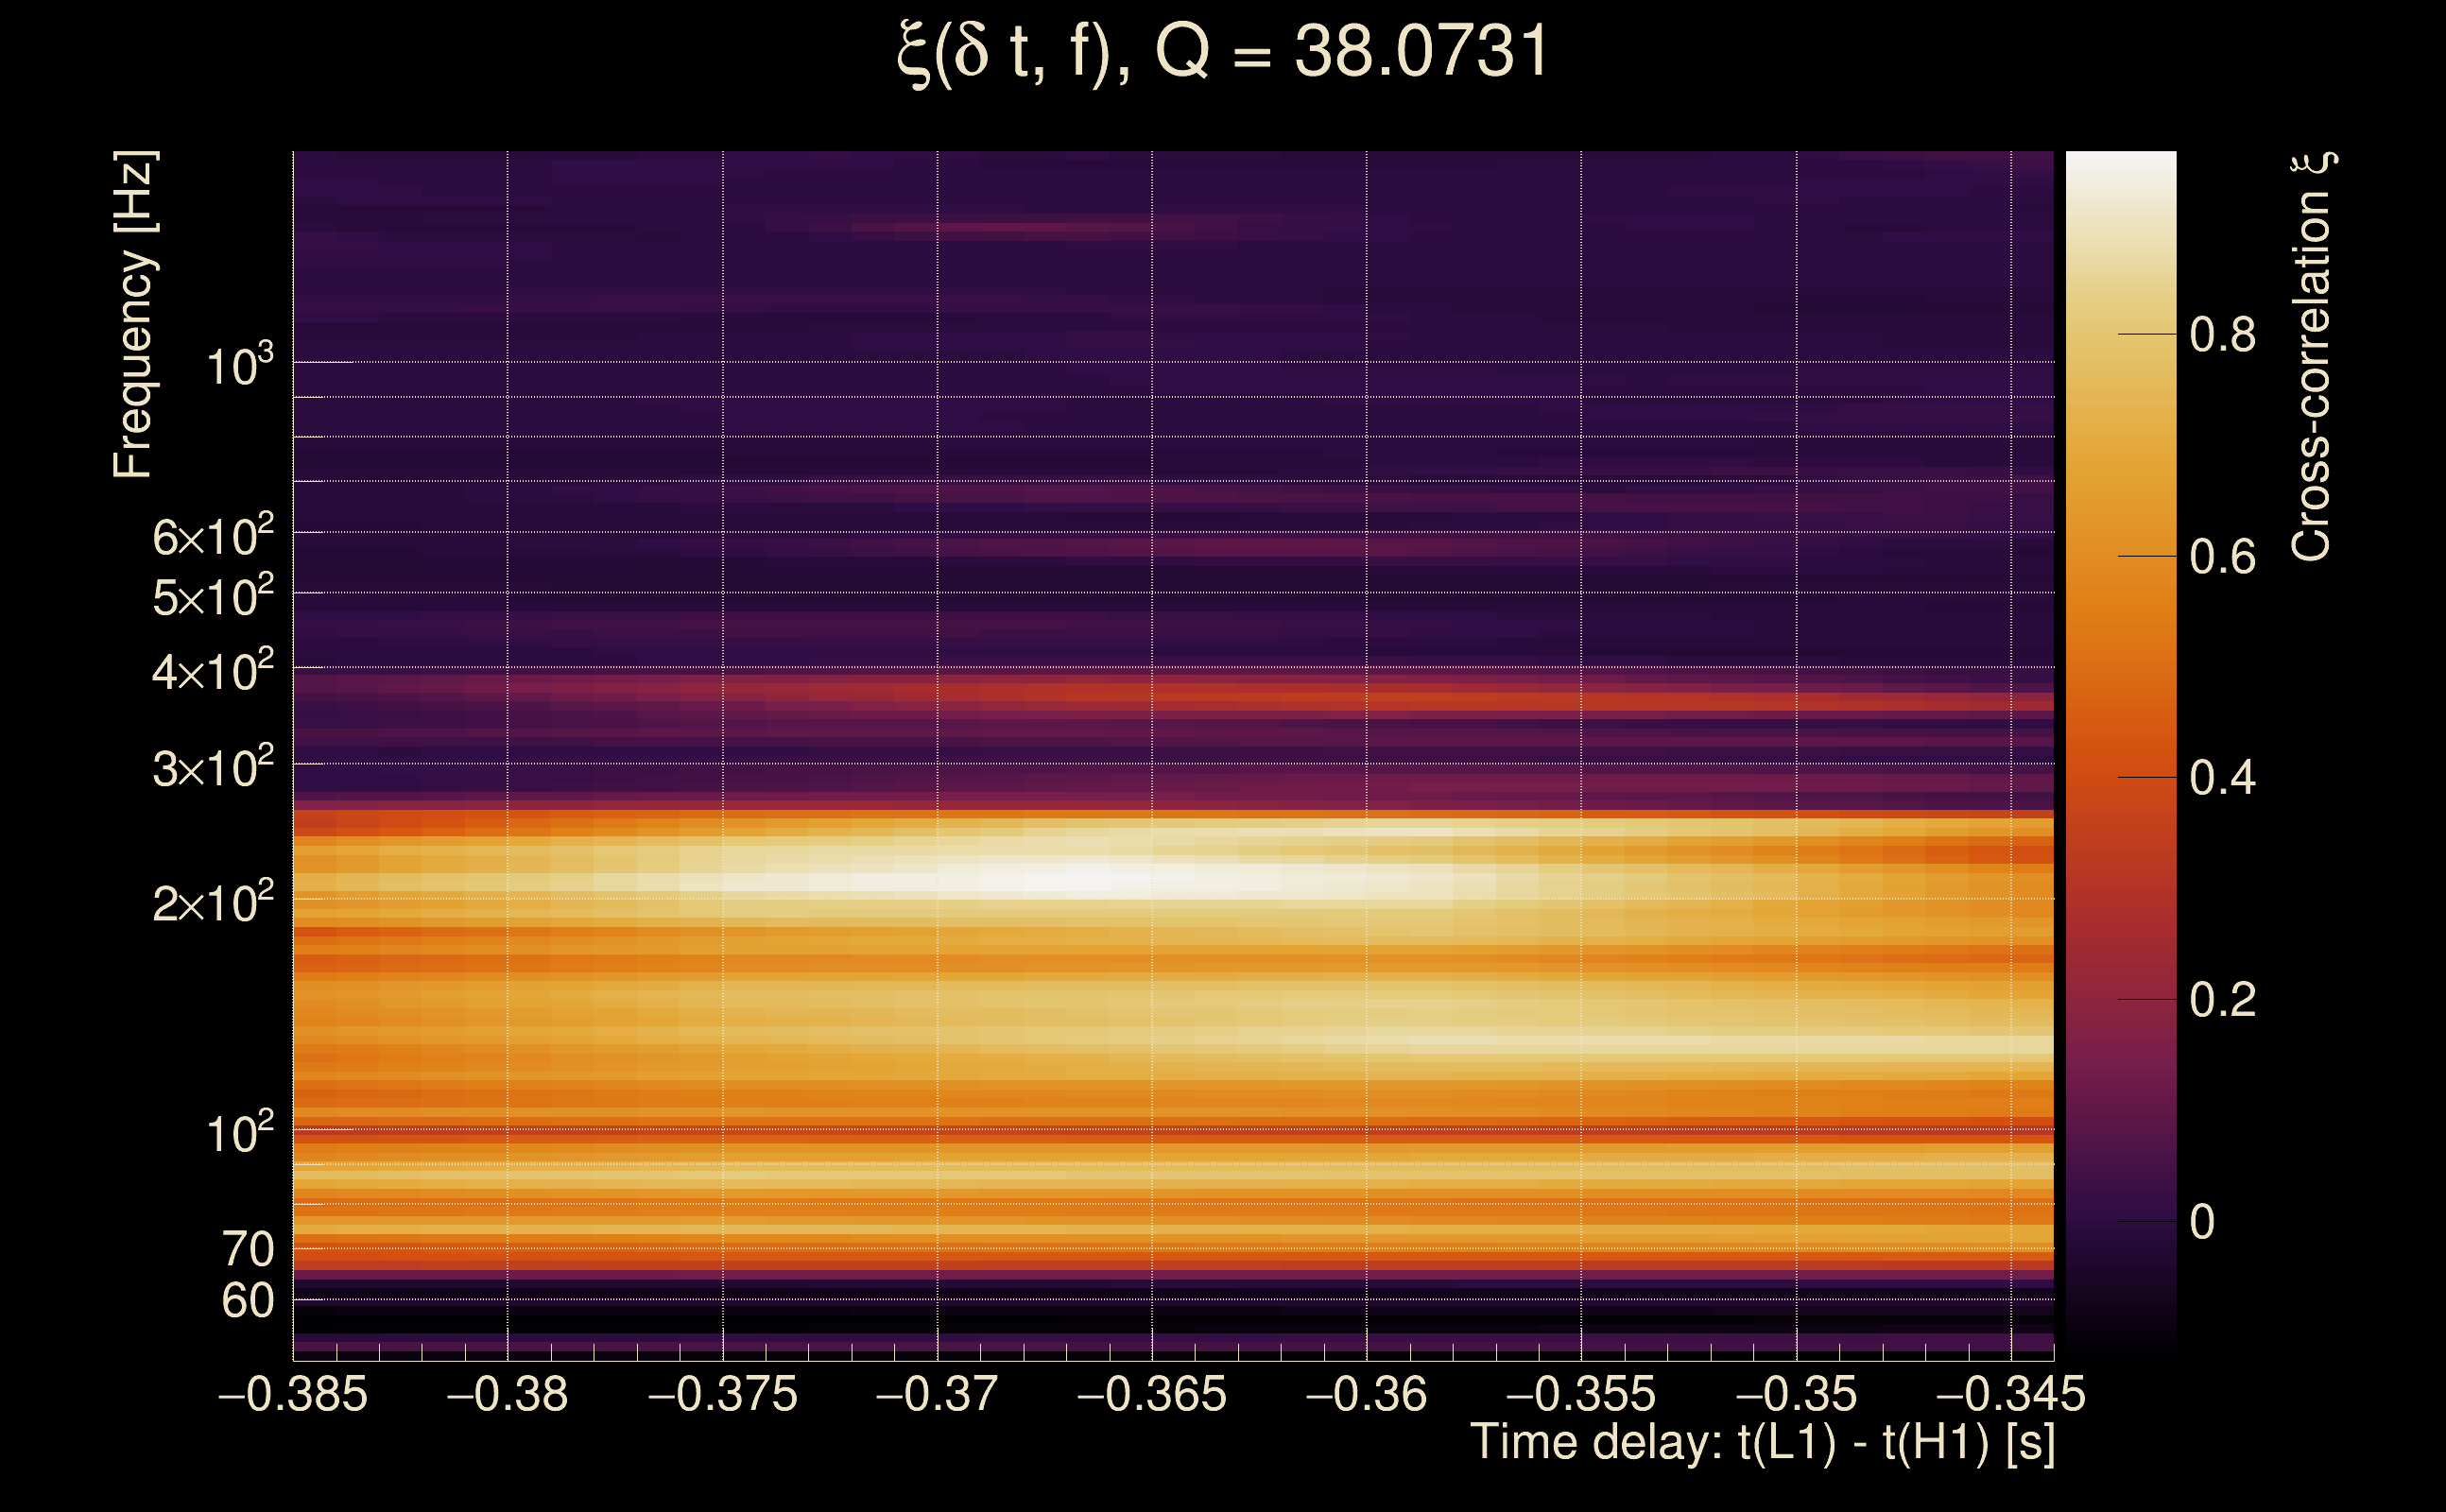
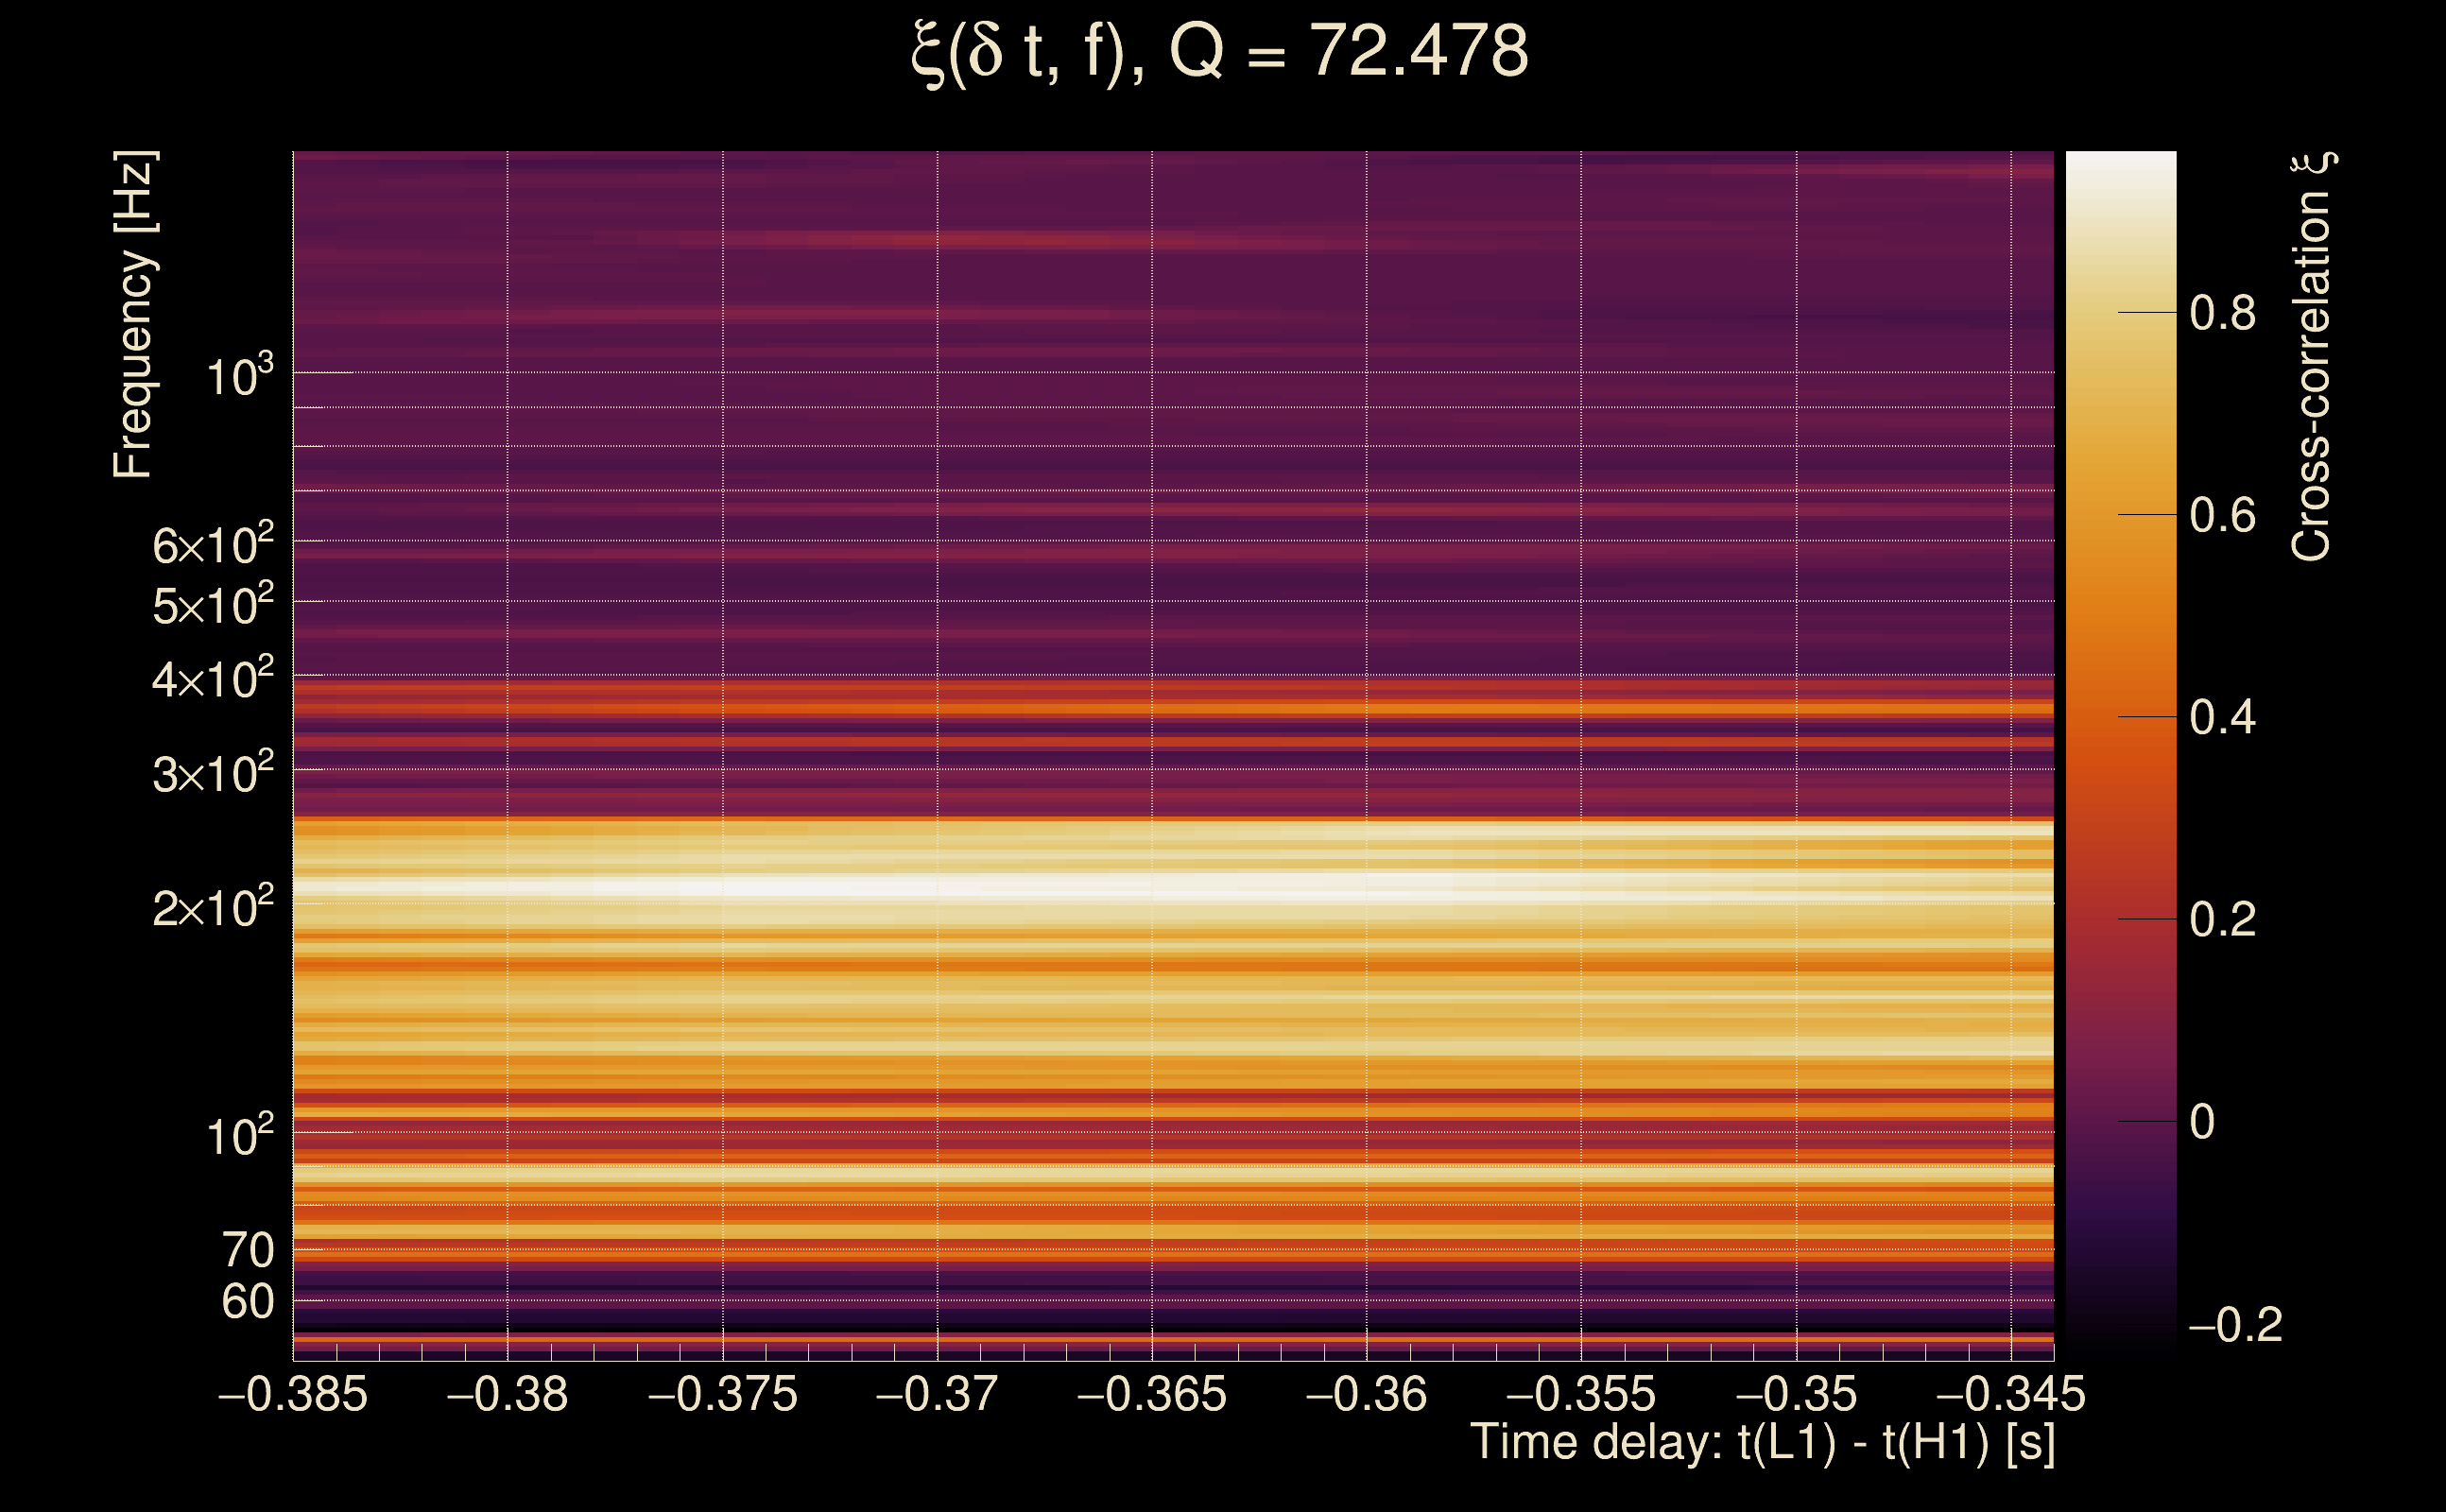
| Event time t(H1): | GPS = 1368333538 (Wed May 17 04:38:40 2023 ) → GPS = 1368333548 (Wed May 17 04:38:50 2023 ) |
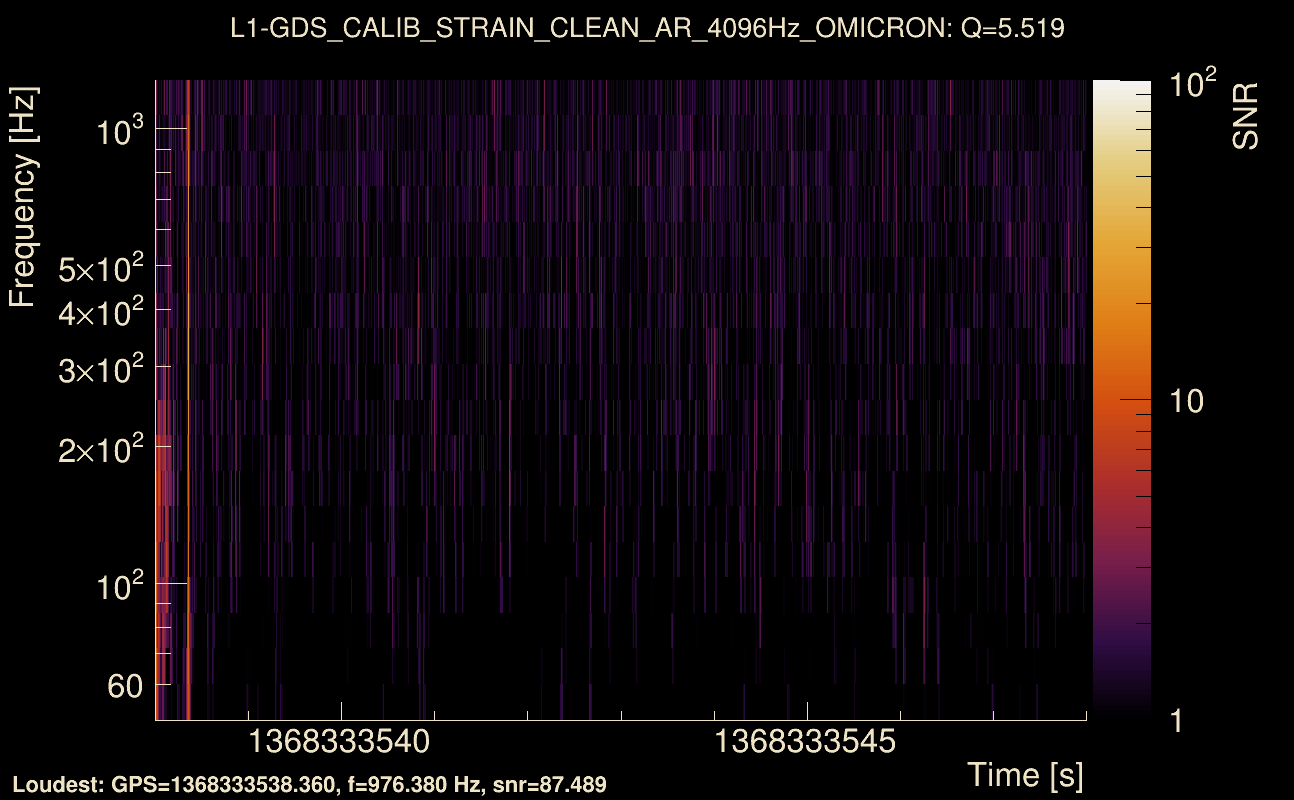
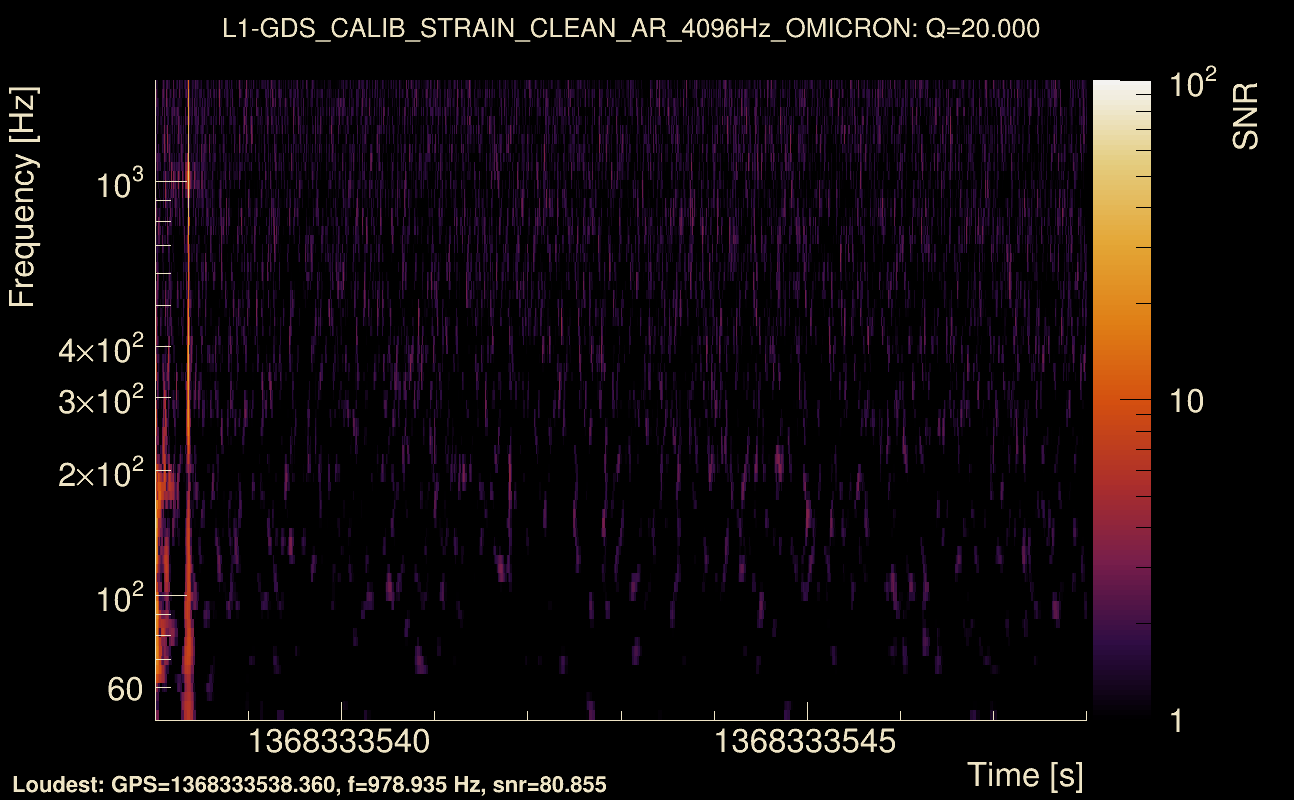
| Event time t(L1): | GPS = 1368333538 (Wed May 17 04:38:50 2023 ) → GPS = 1368333548 (Wed May 17 04:38:50 2023 ) |
| Omicron analysis time window (H1): | GPS = 1368333535 → GPS = 1368333551 |
| Omicron analysis time window (L1): | GPS = 1368333535 → GPS = 1368333551 |
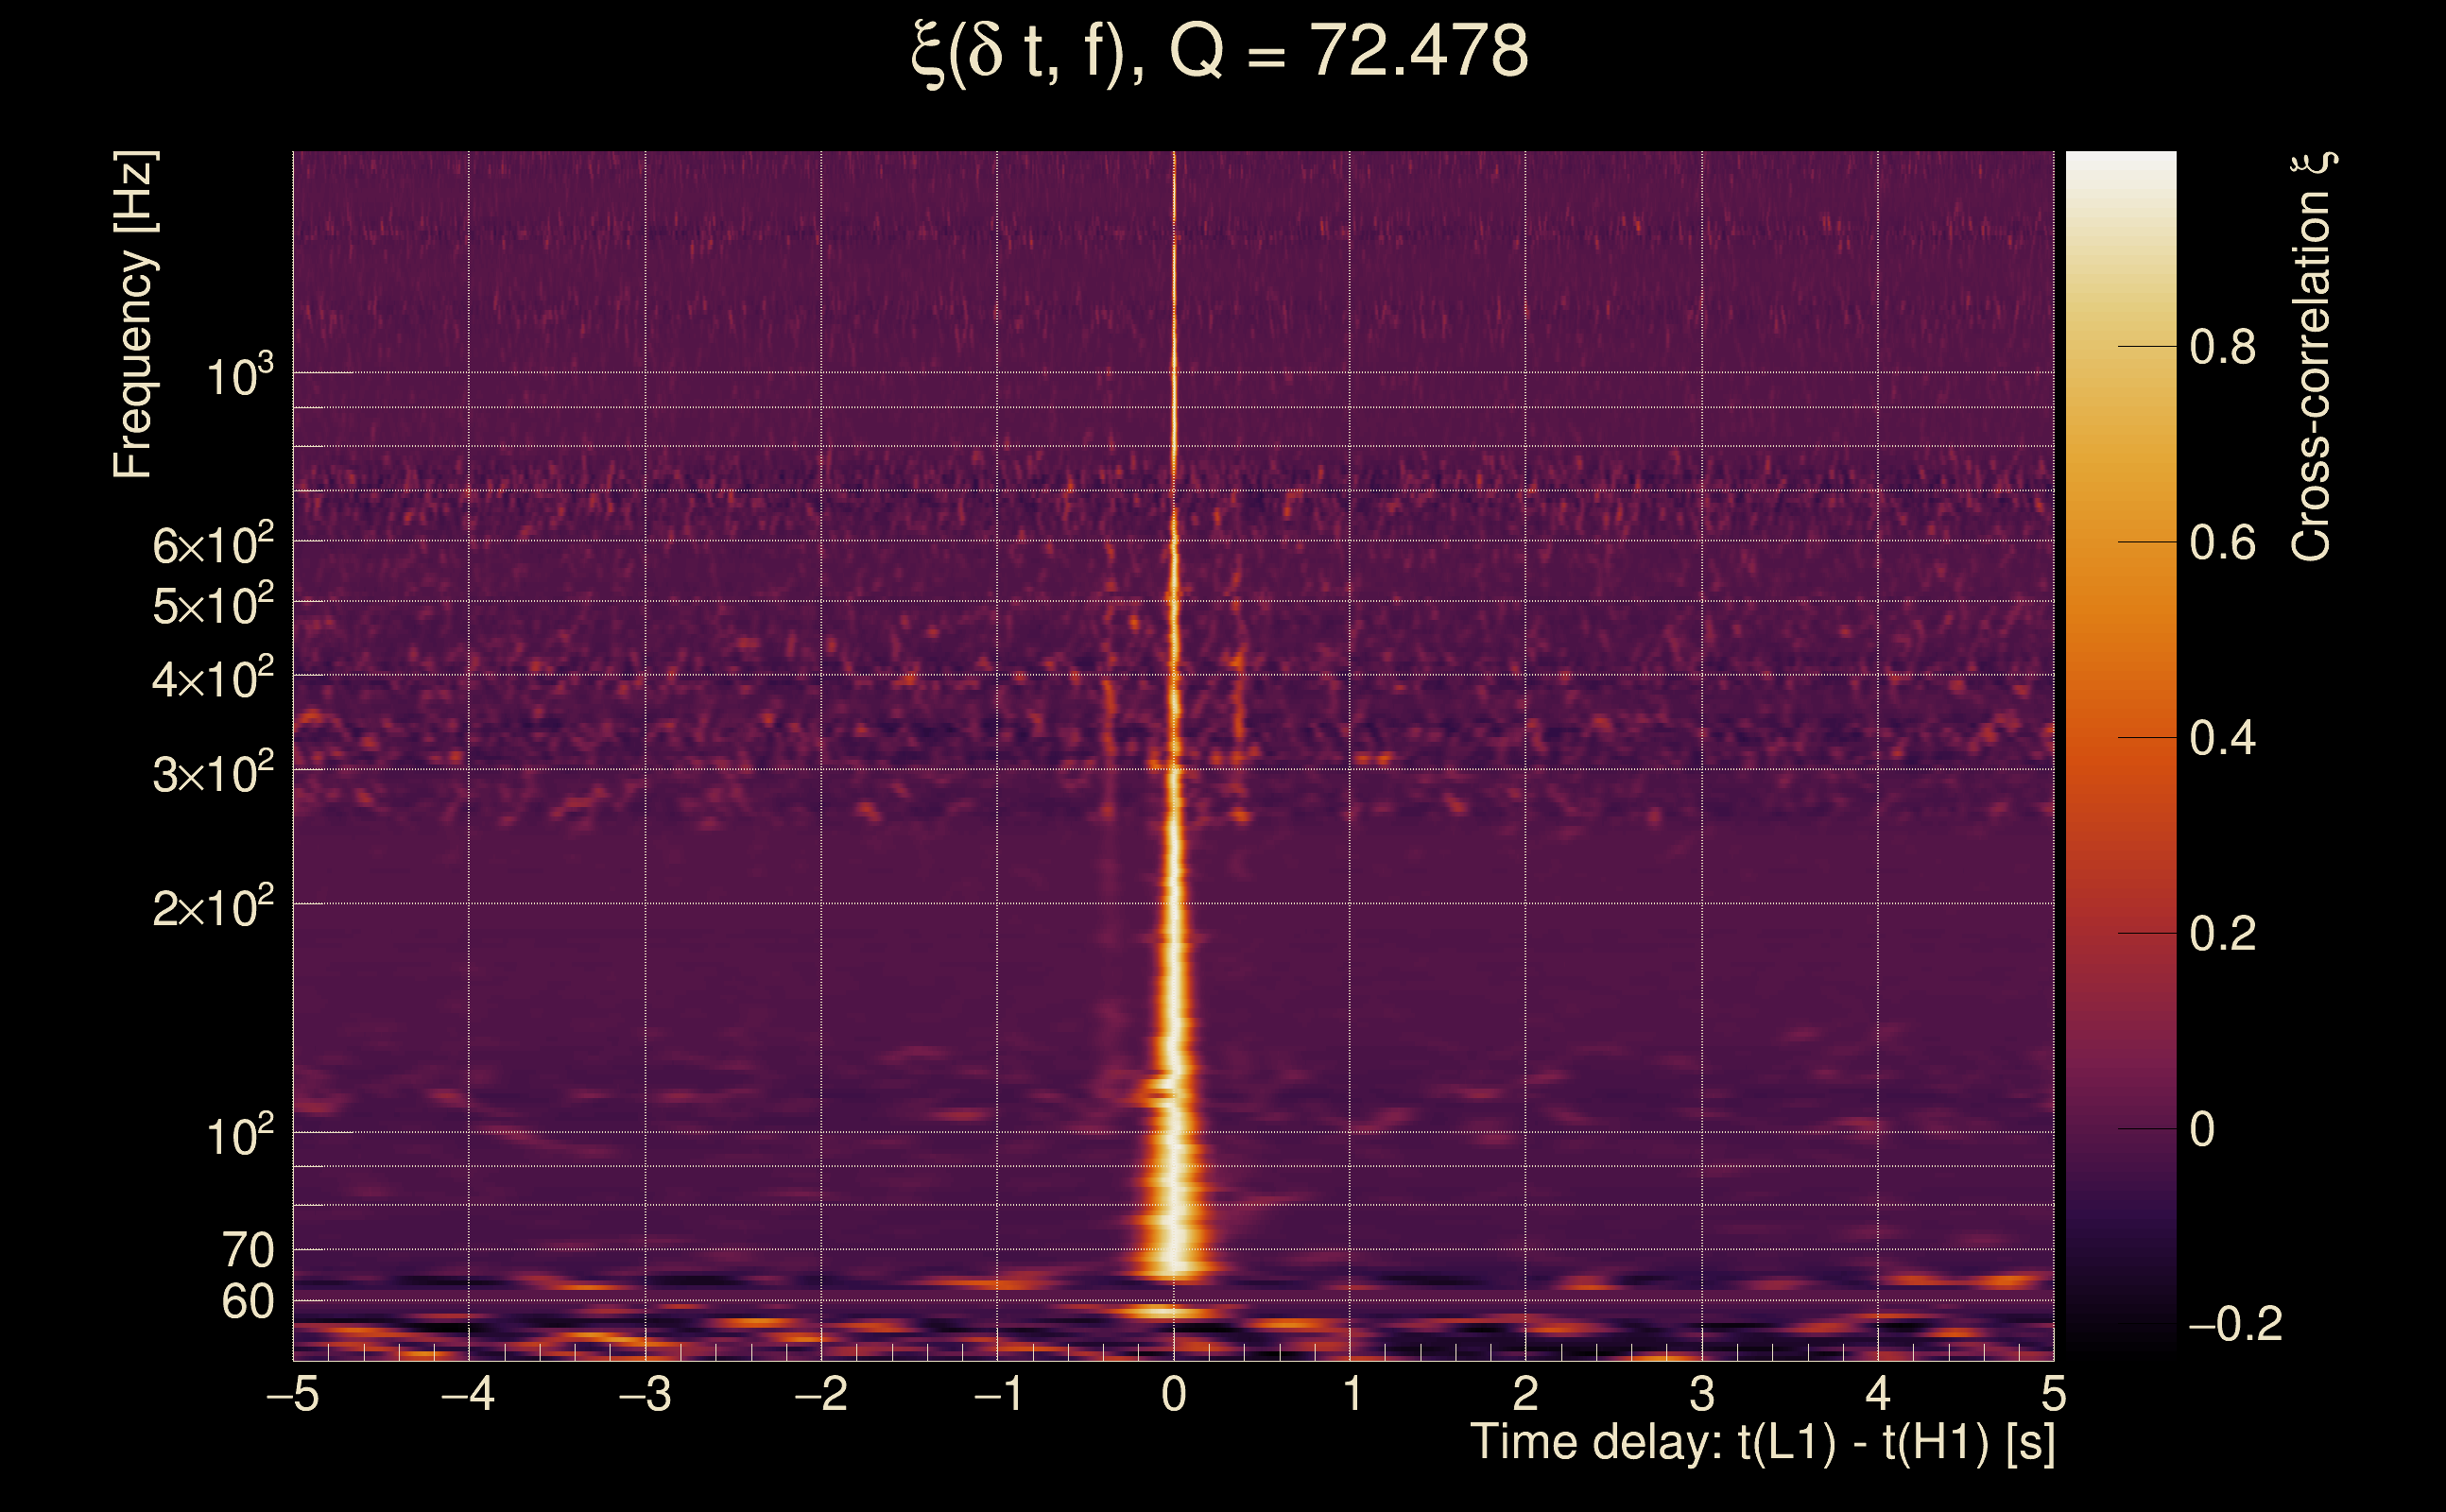
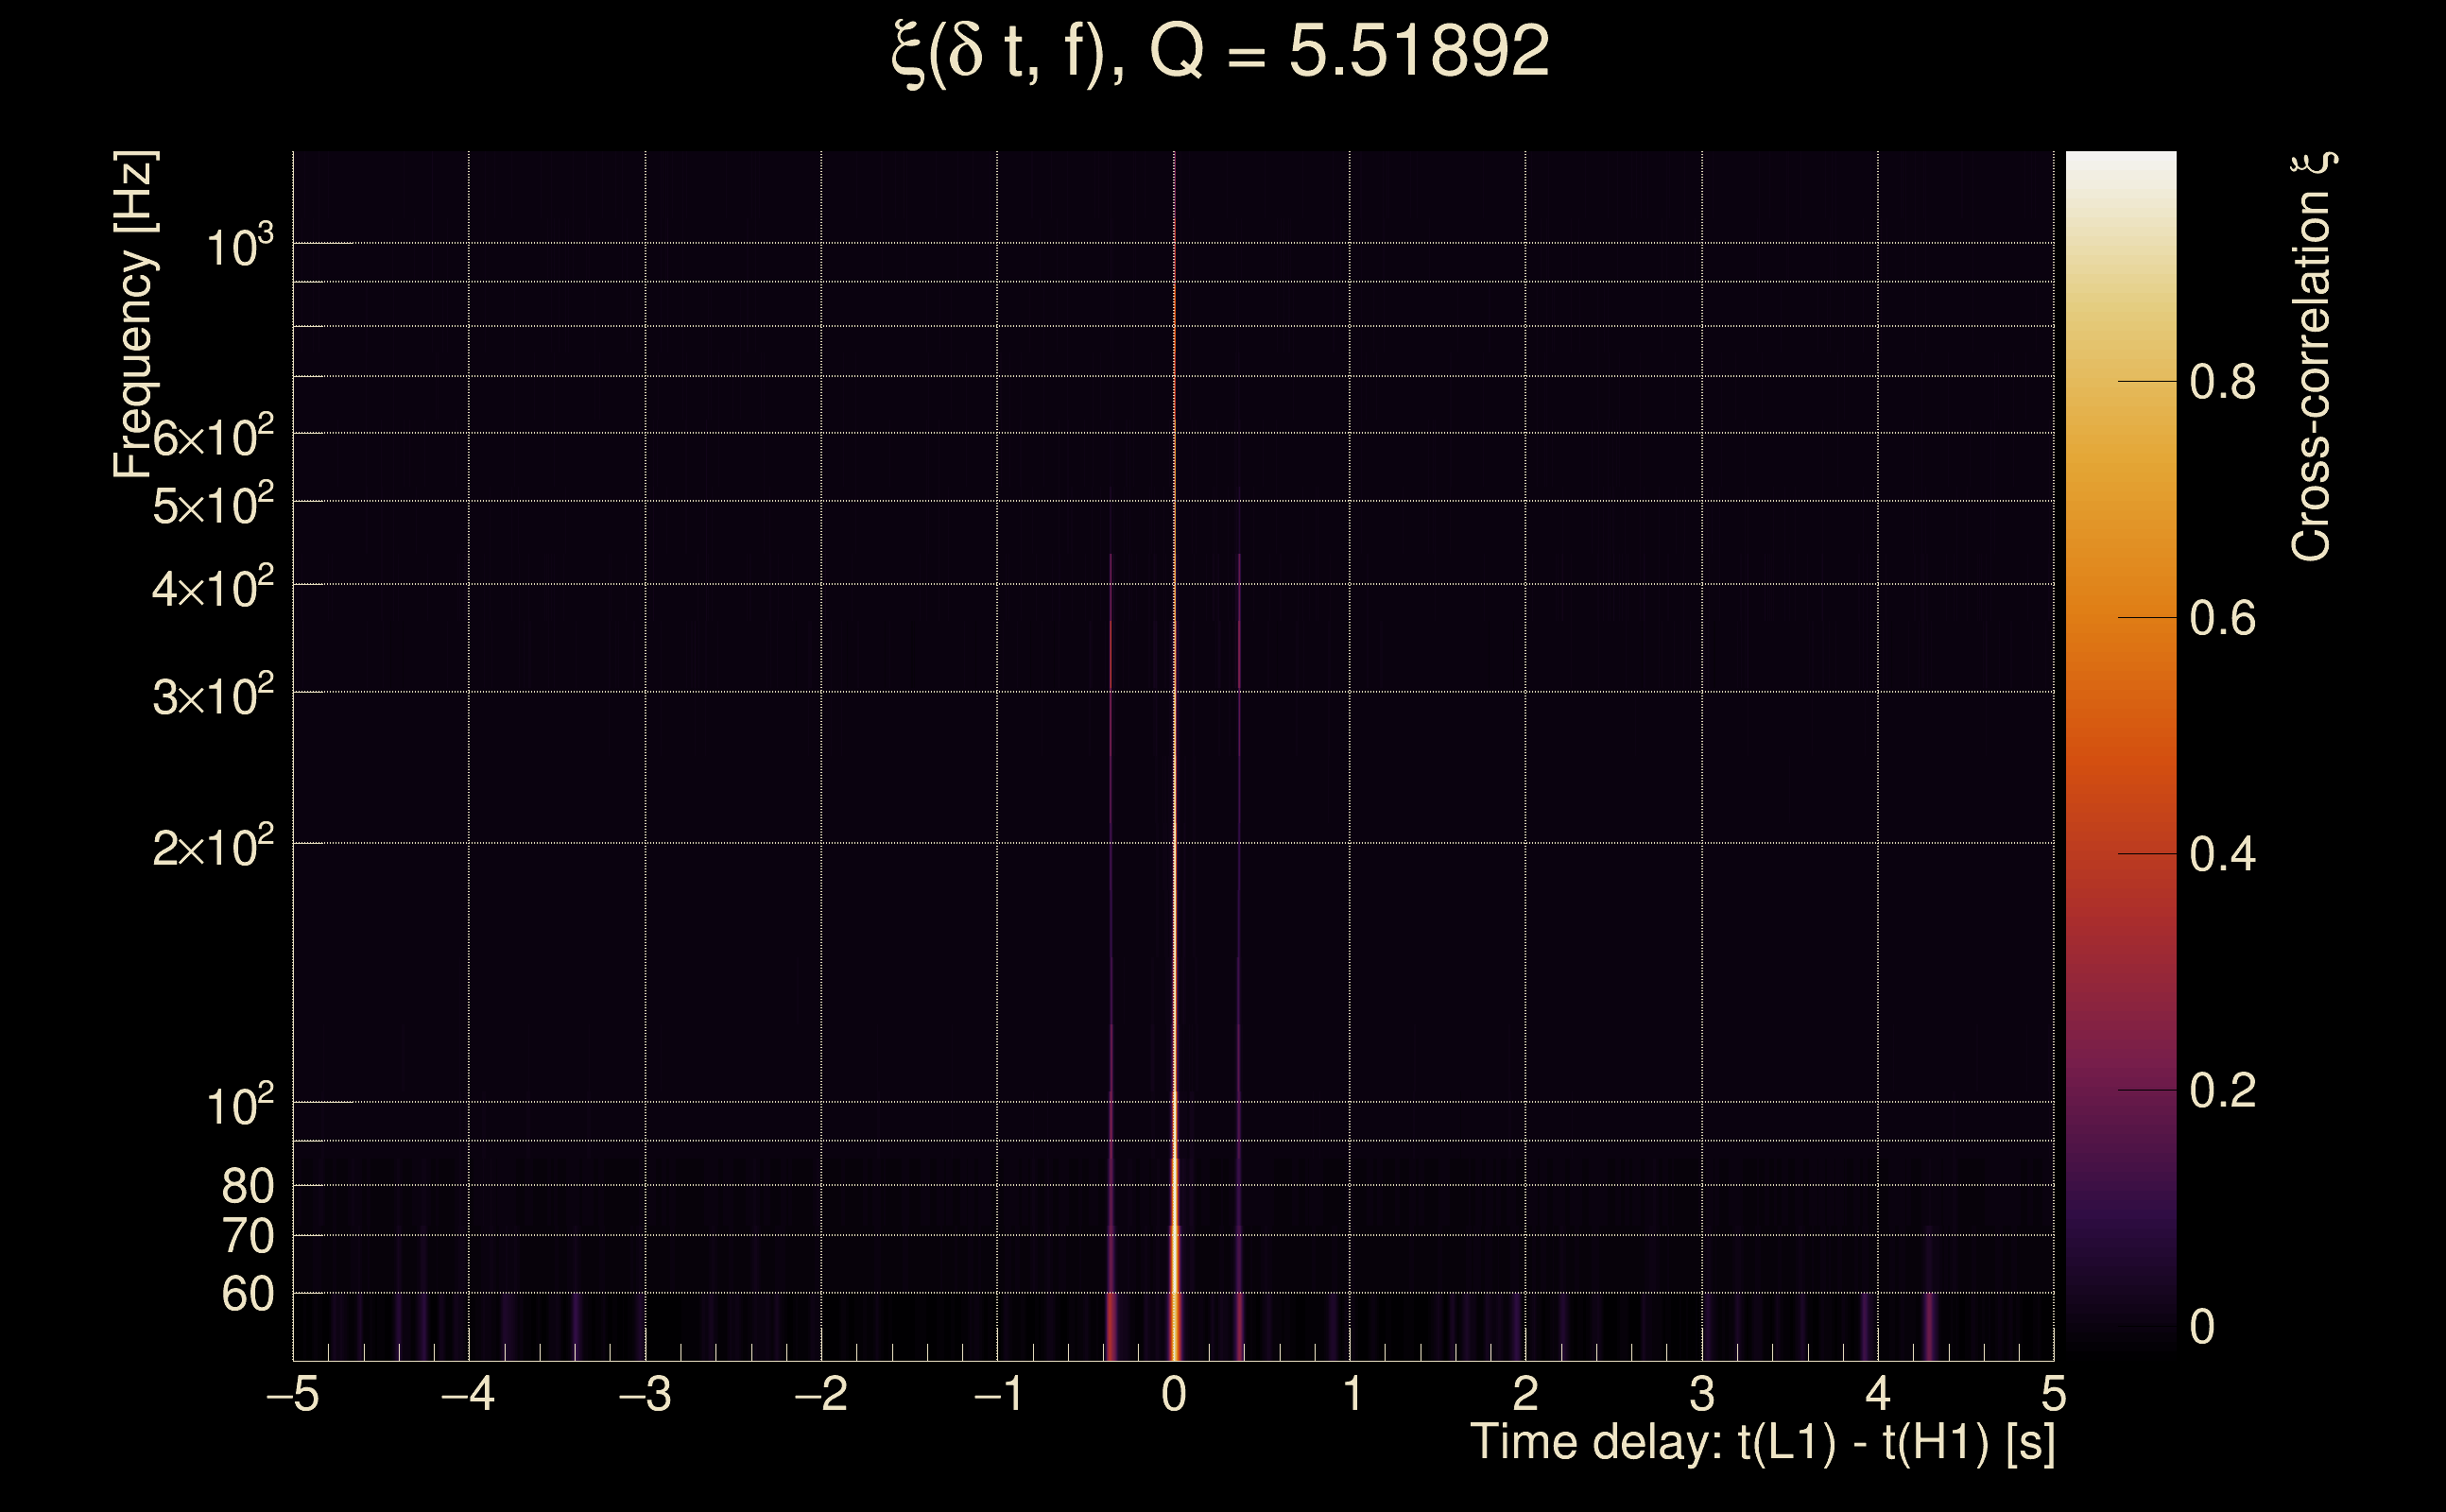
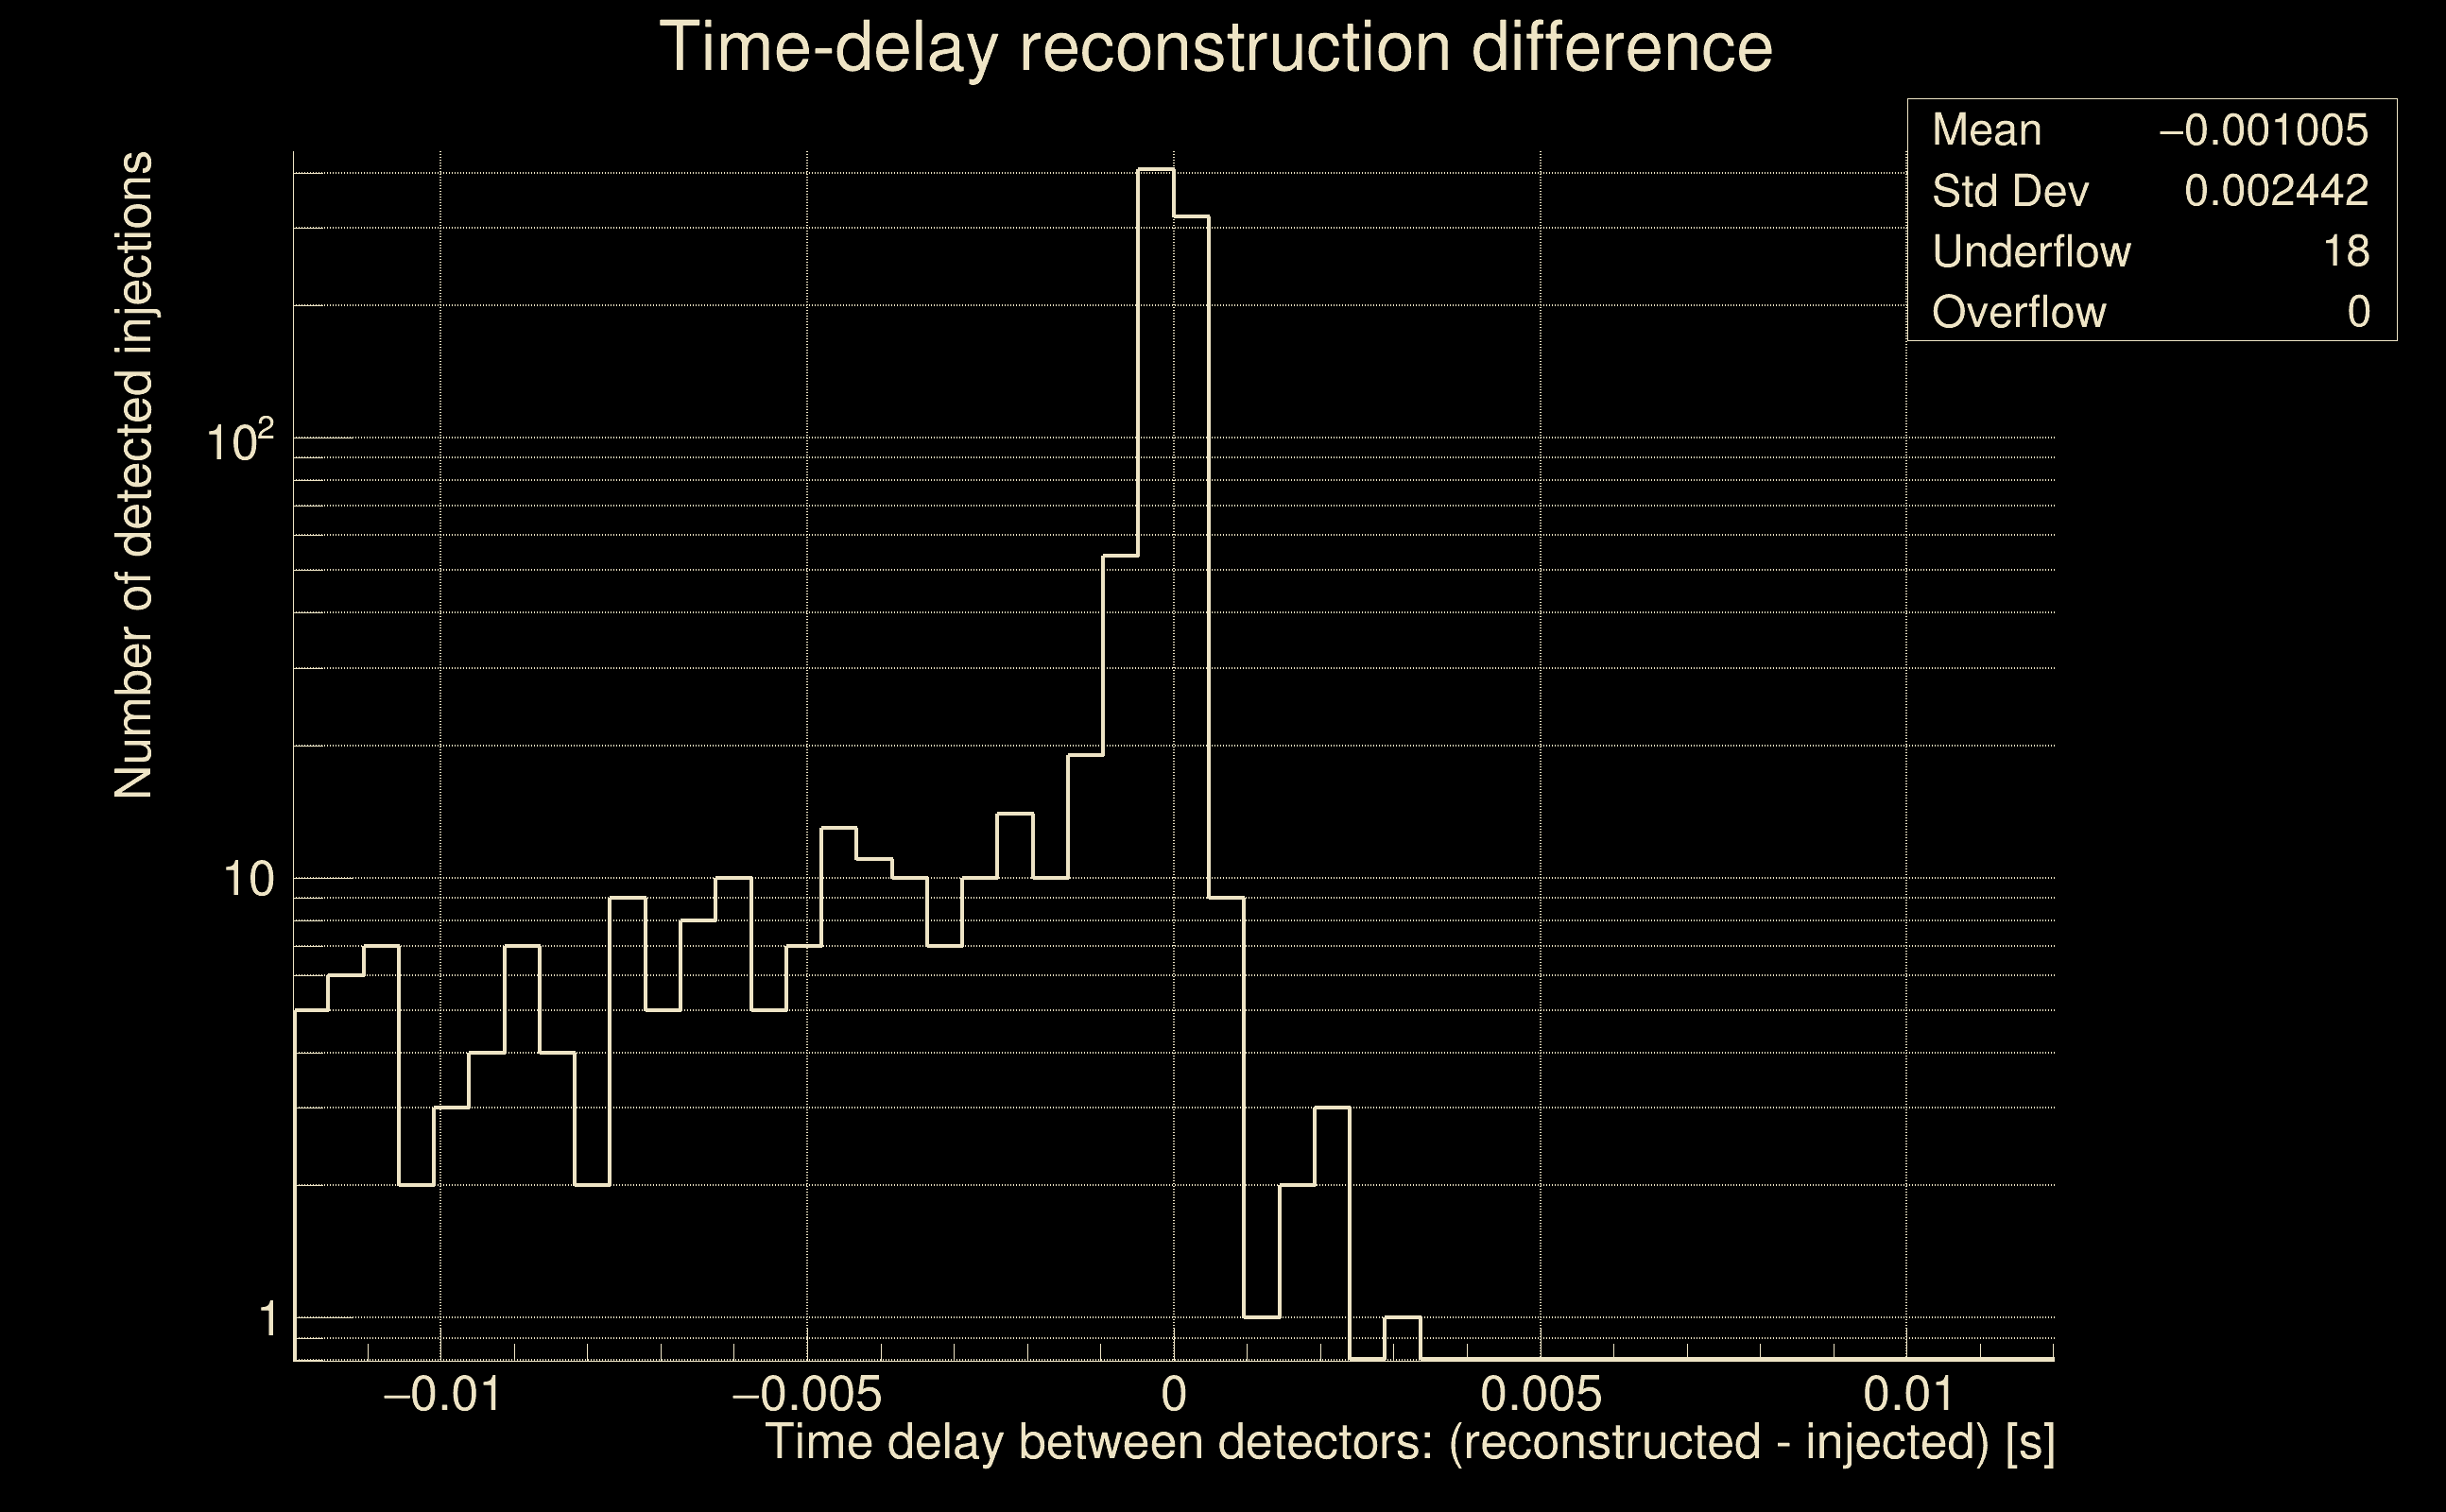
| Time delay between detectors t(L1) - t(H1): | 0.000911576 s (slice index = 108 / 217), δt_gw = 0.000911576 s |
| Time delay standard deviation: | 0.0191273 s |
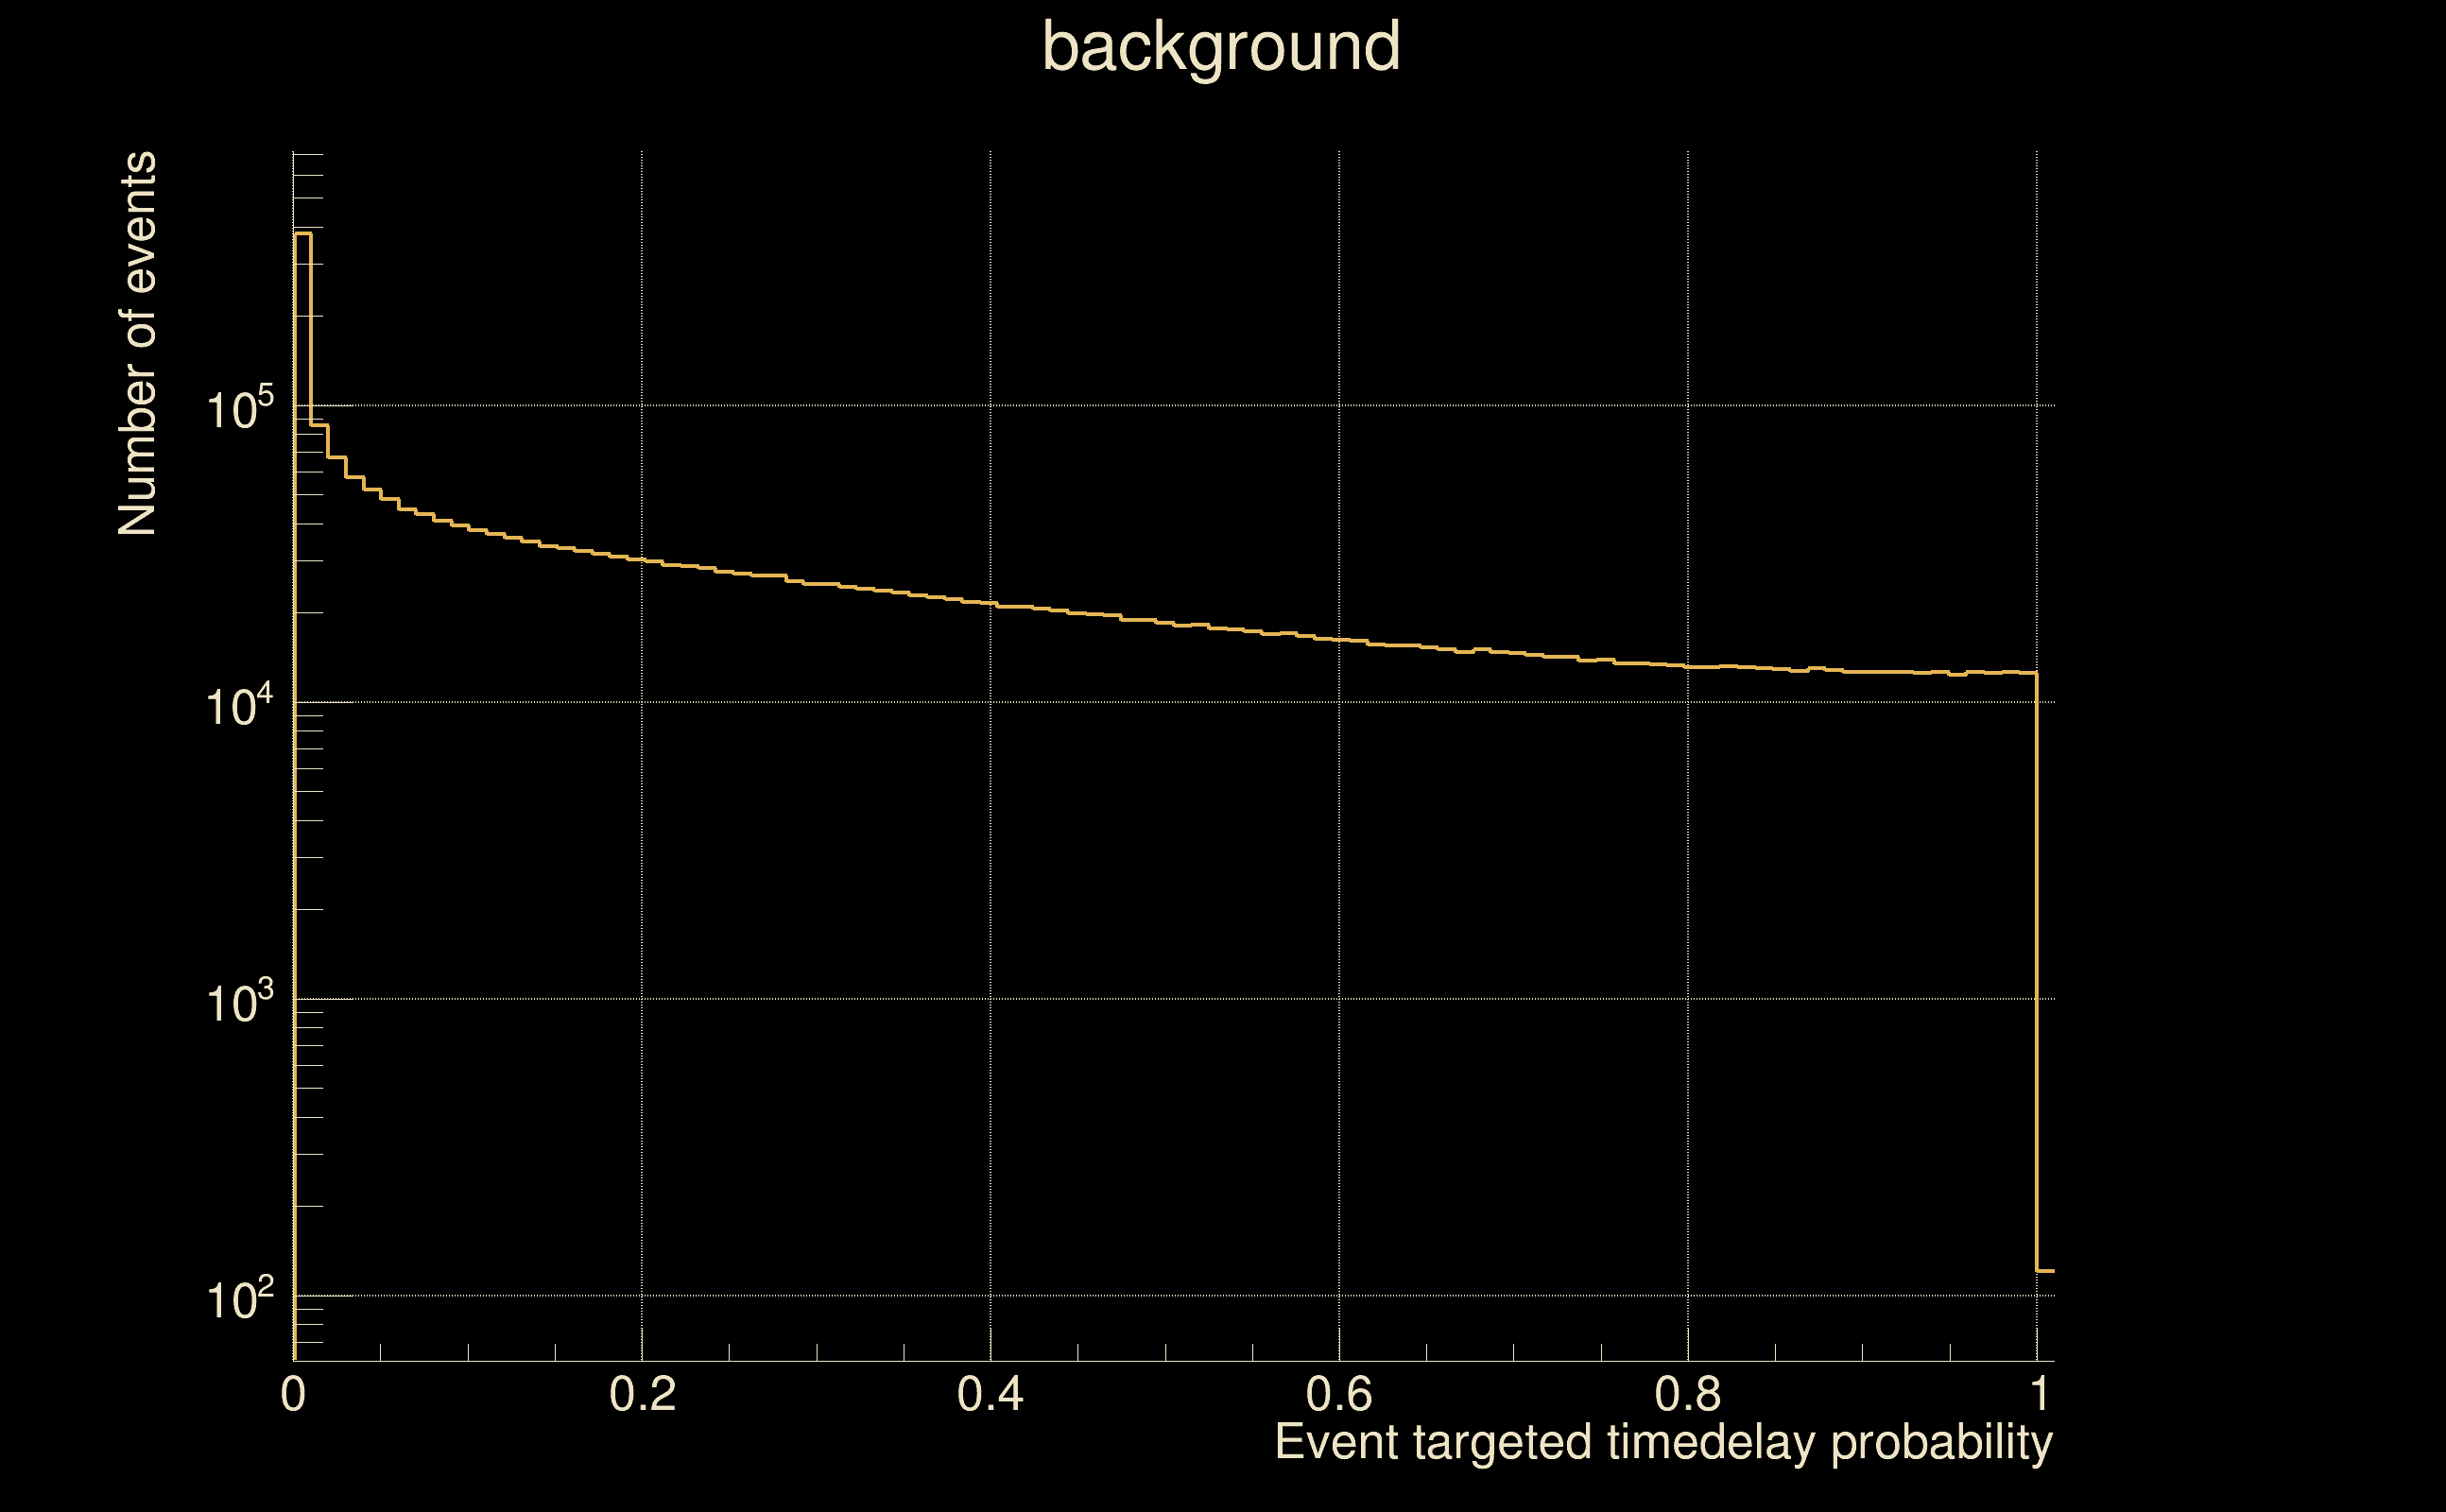
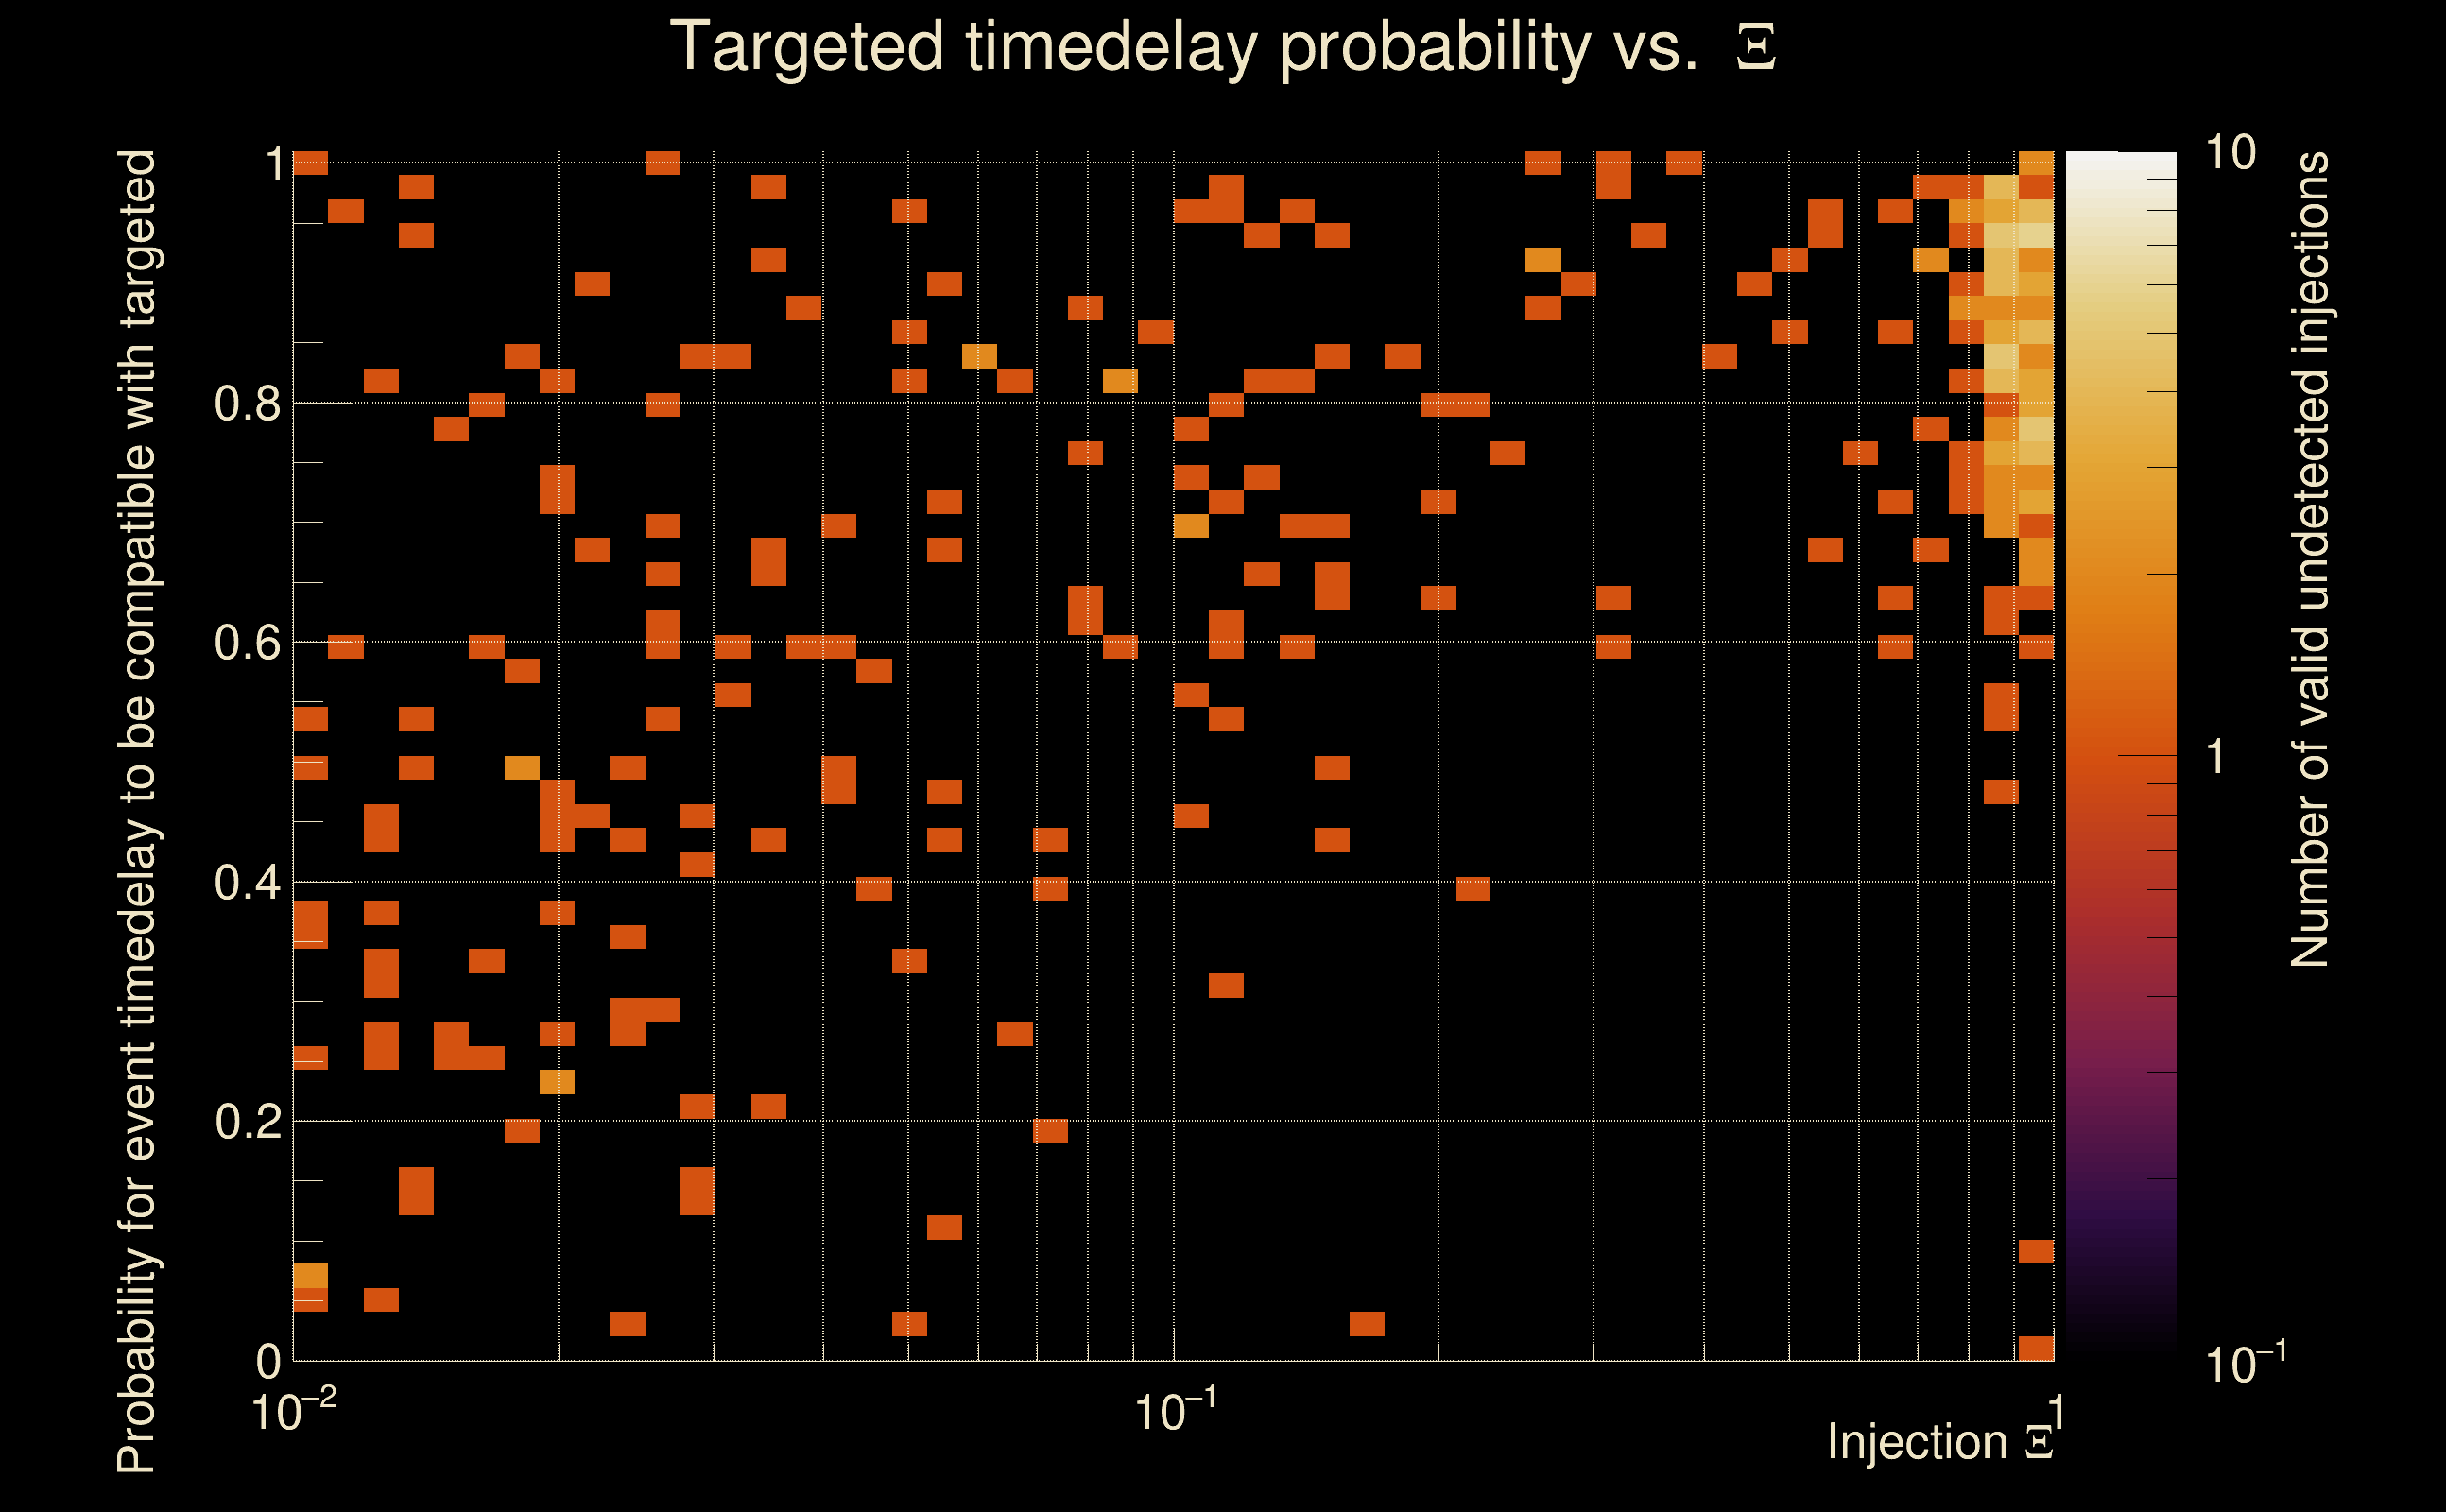
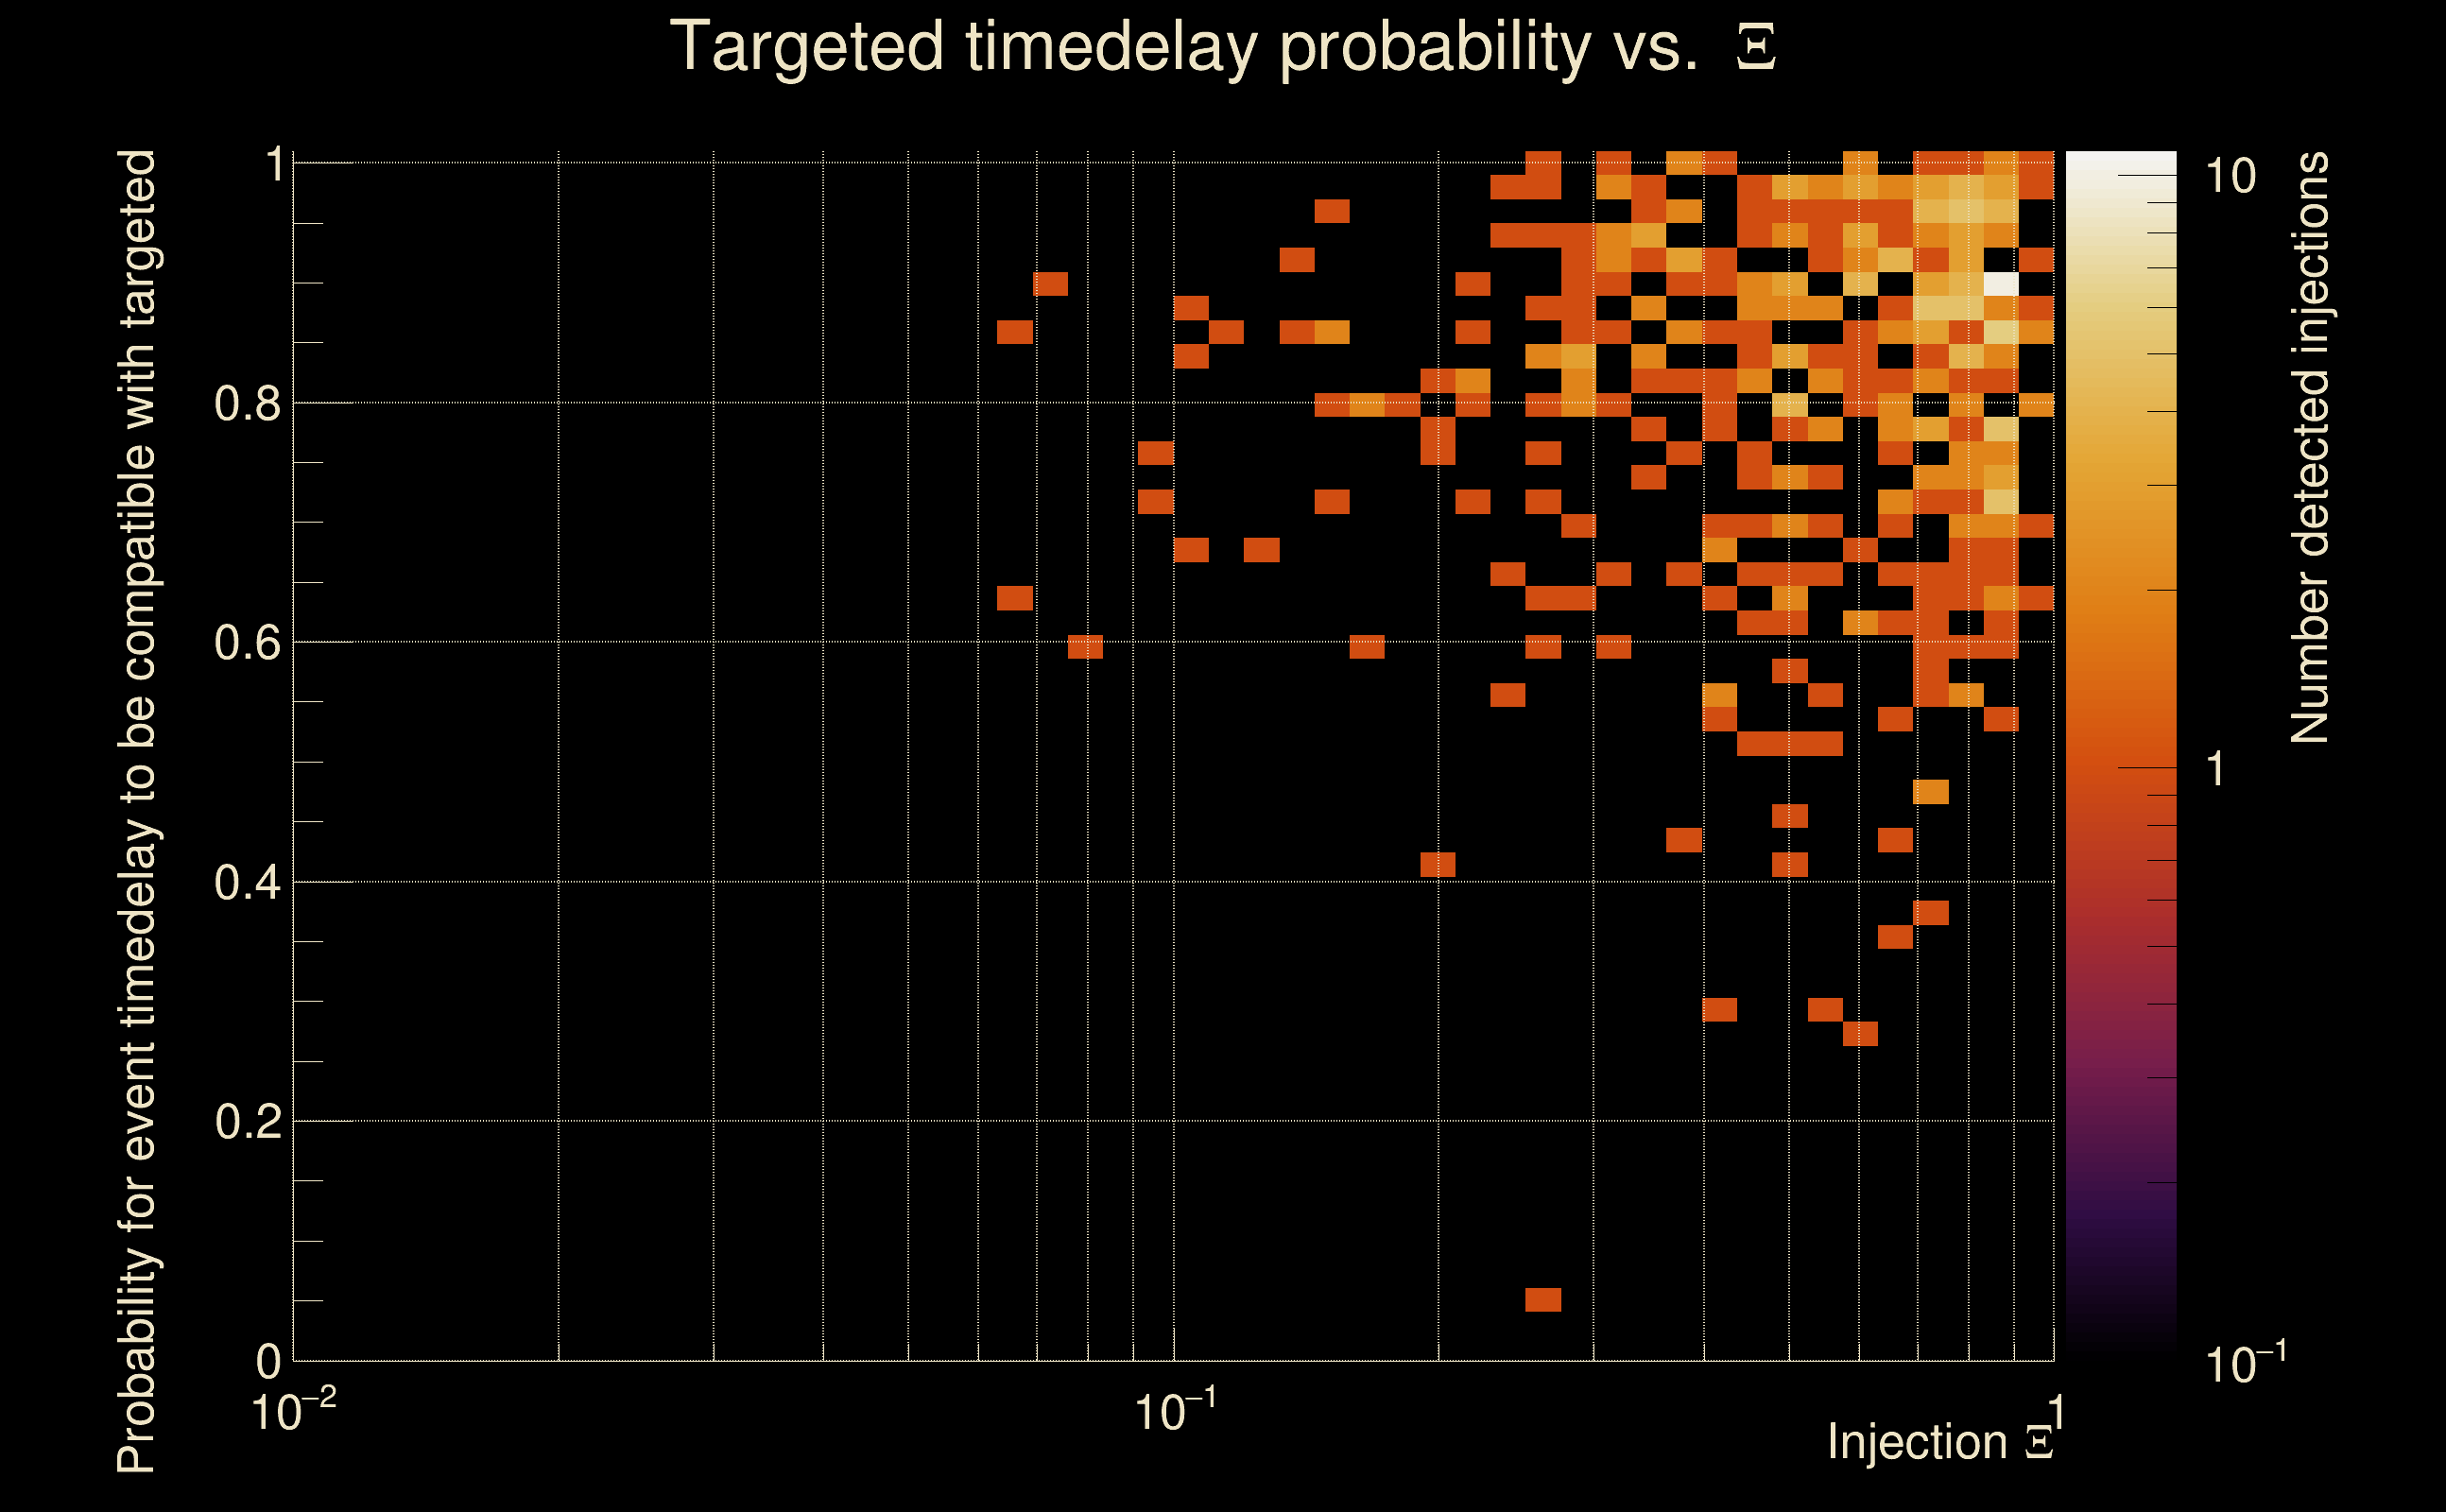
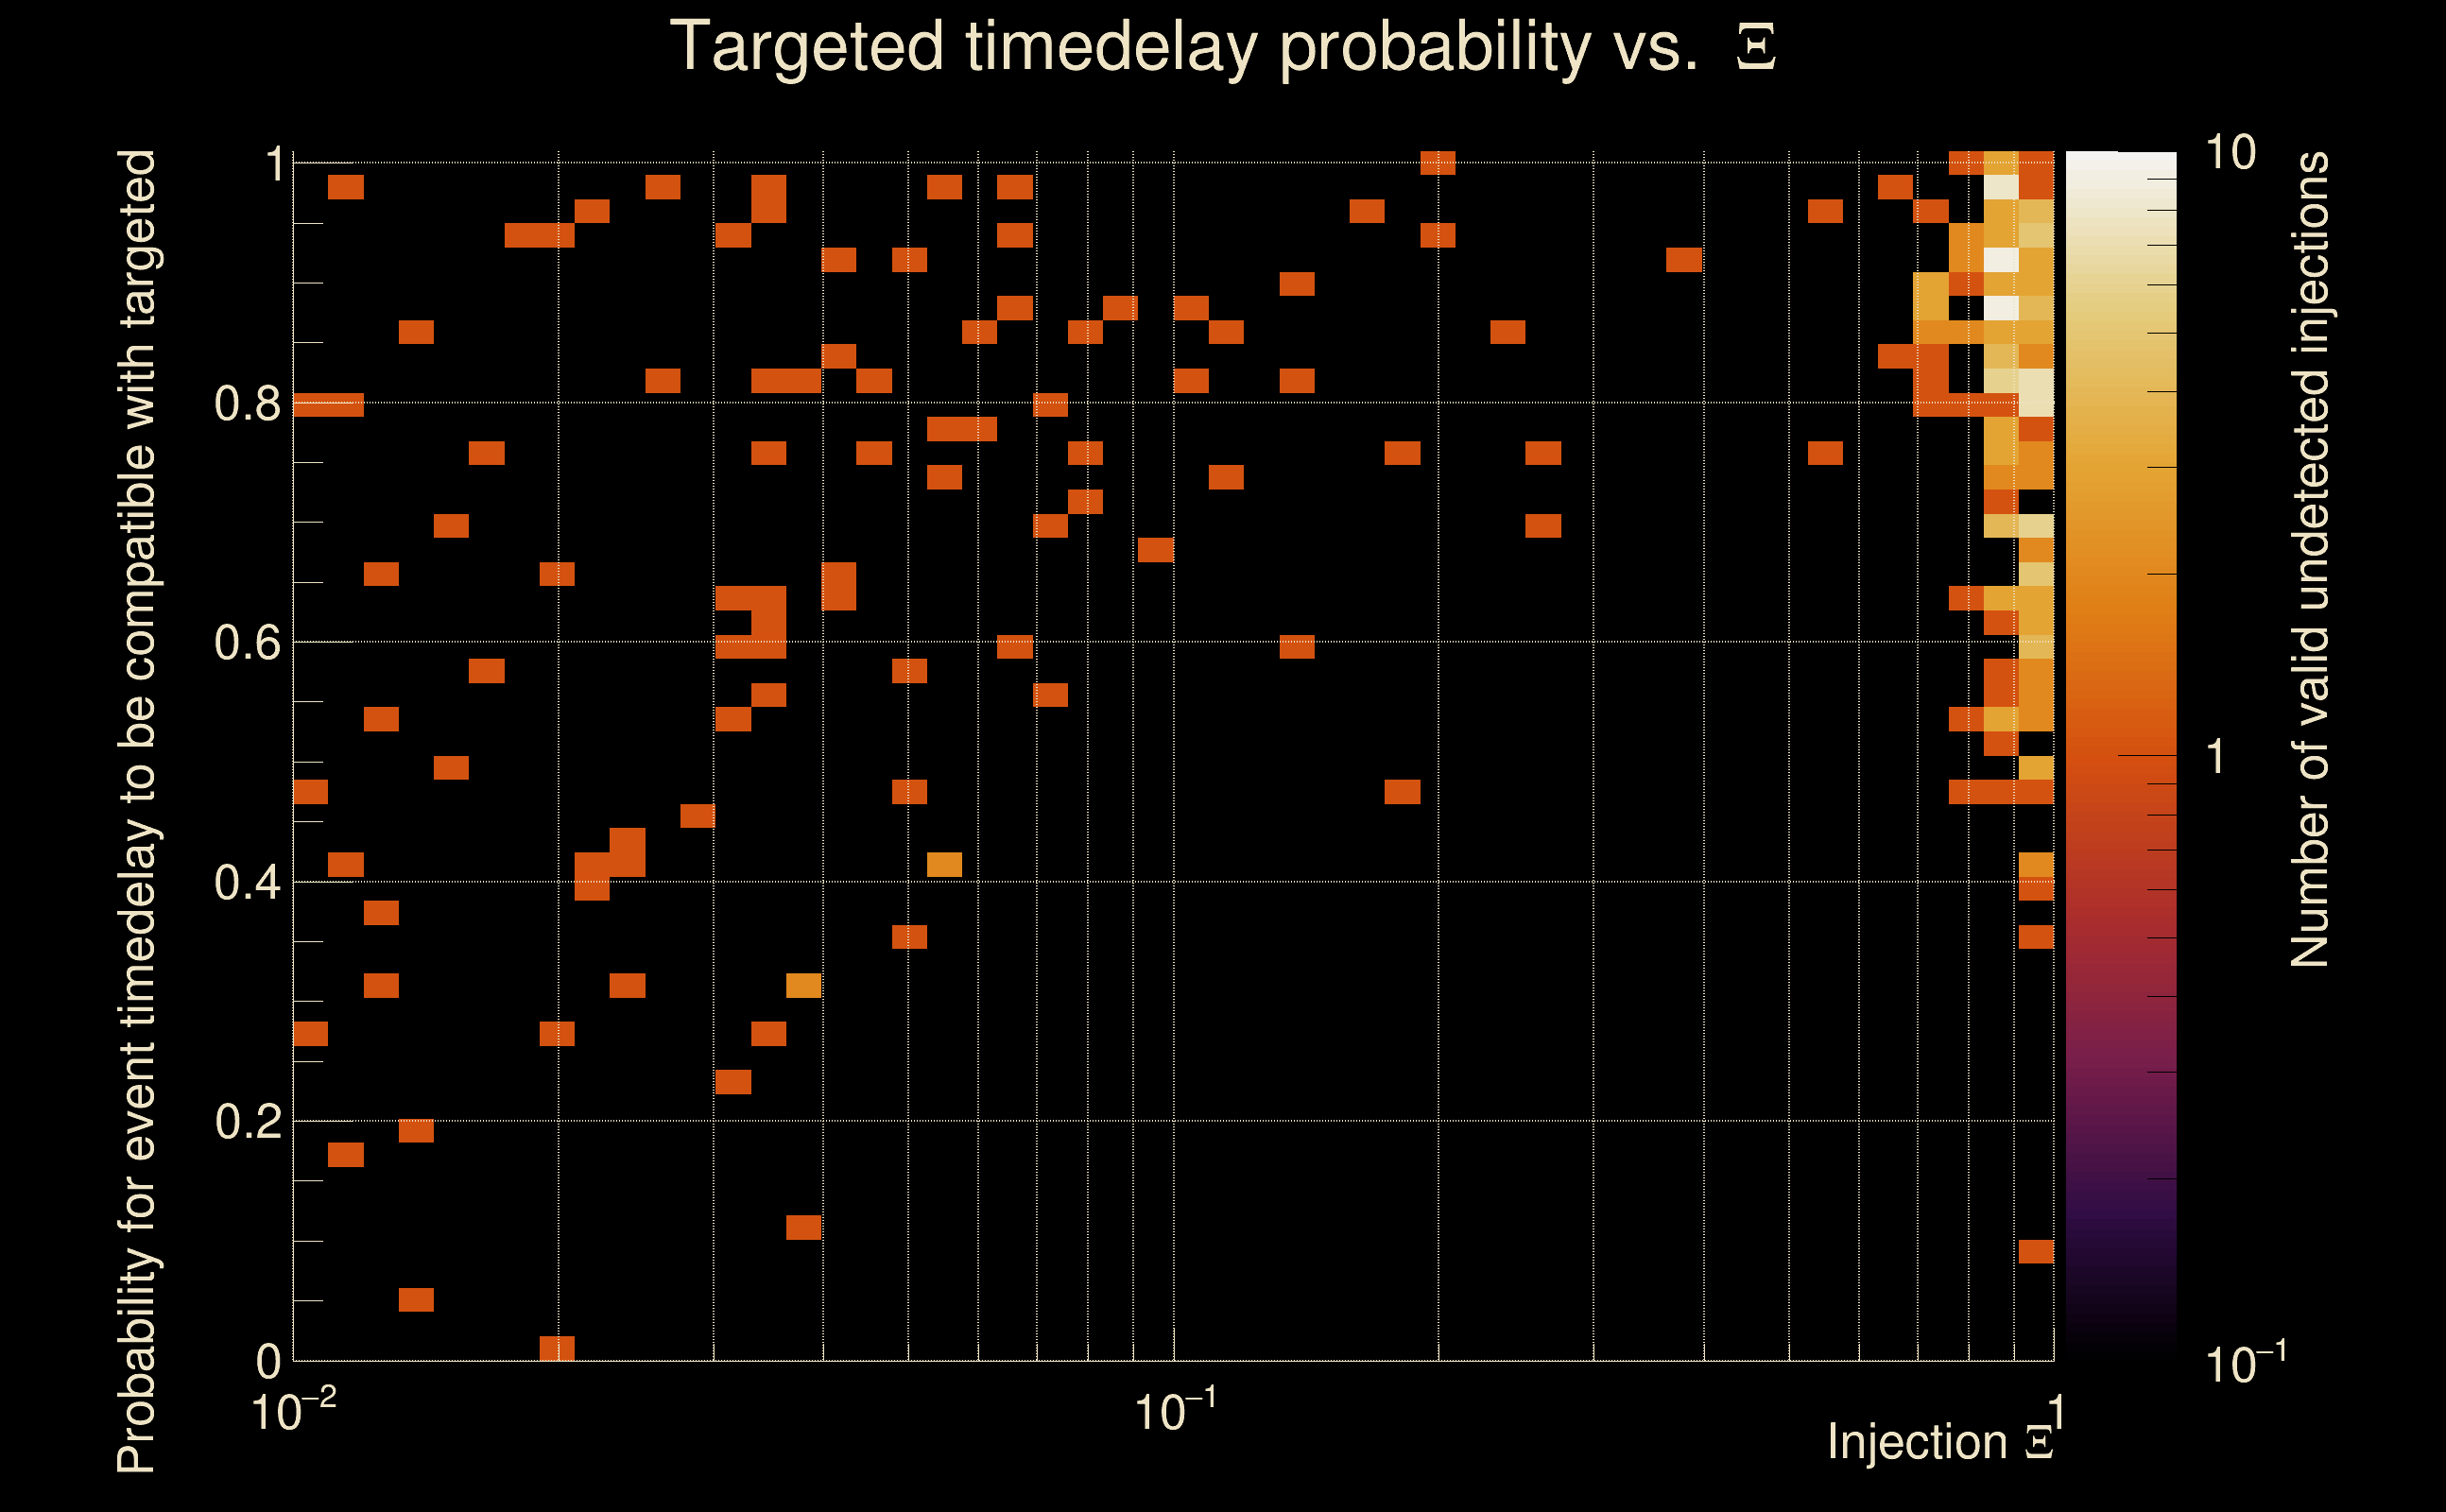
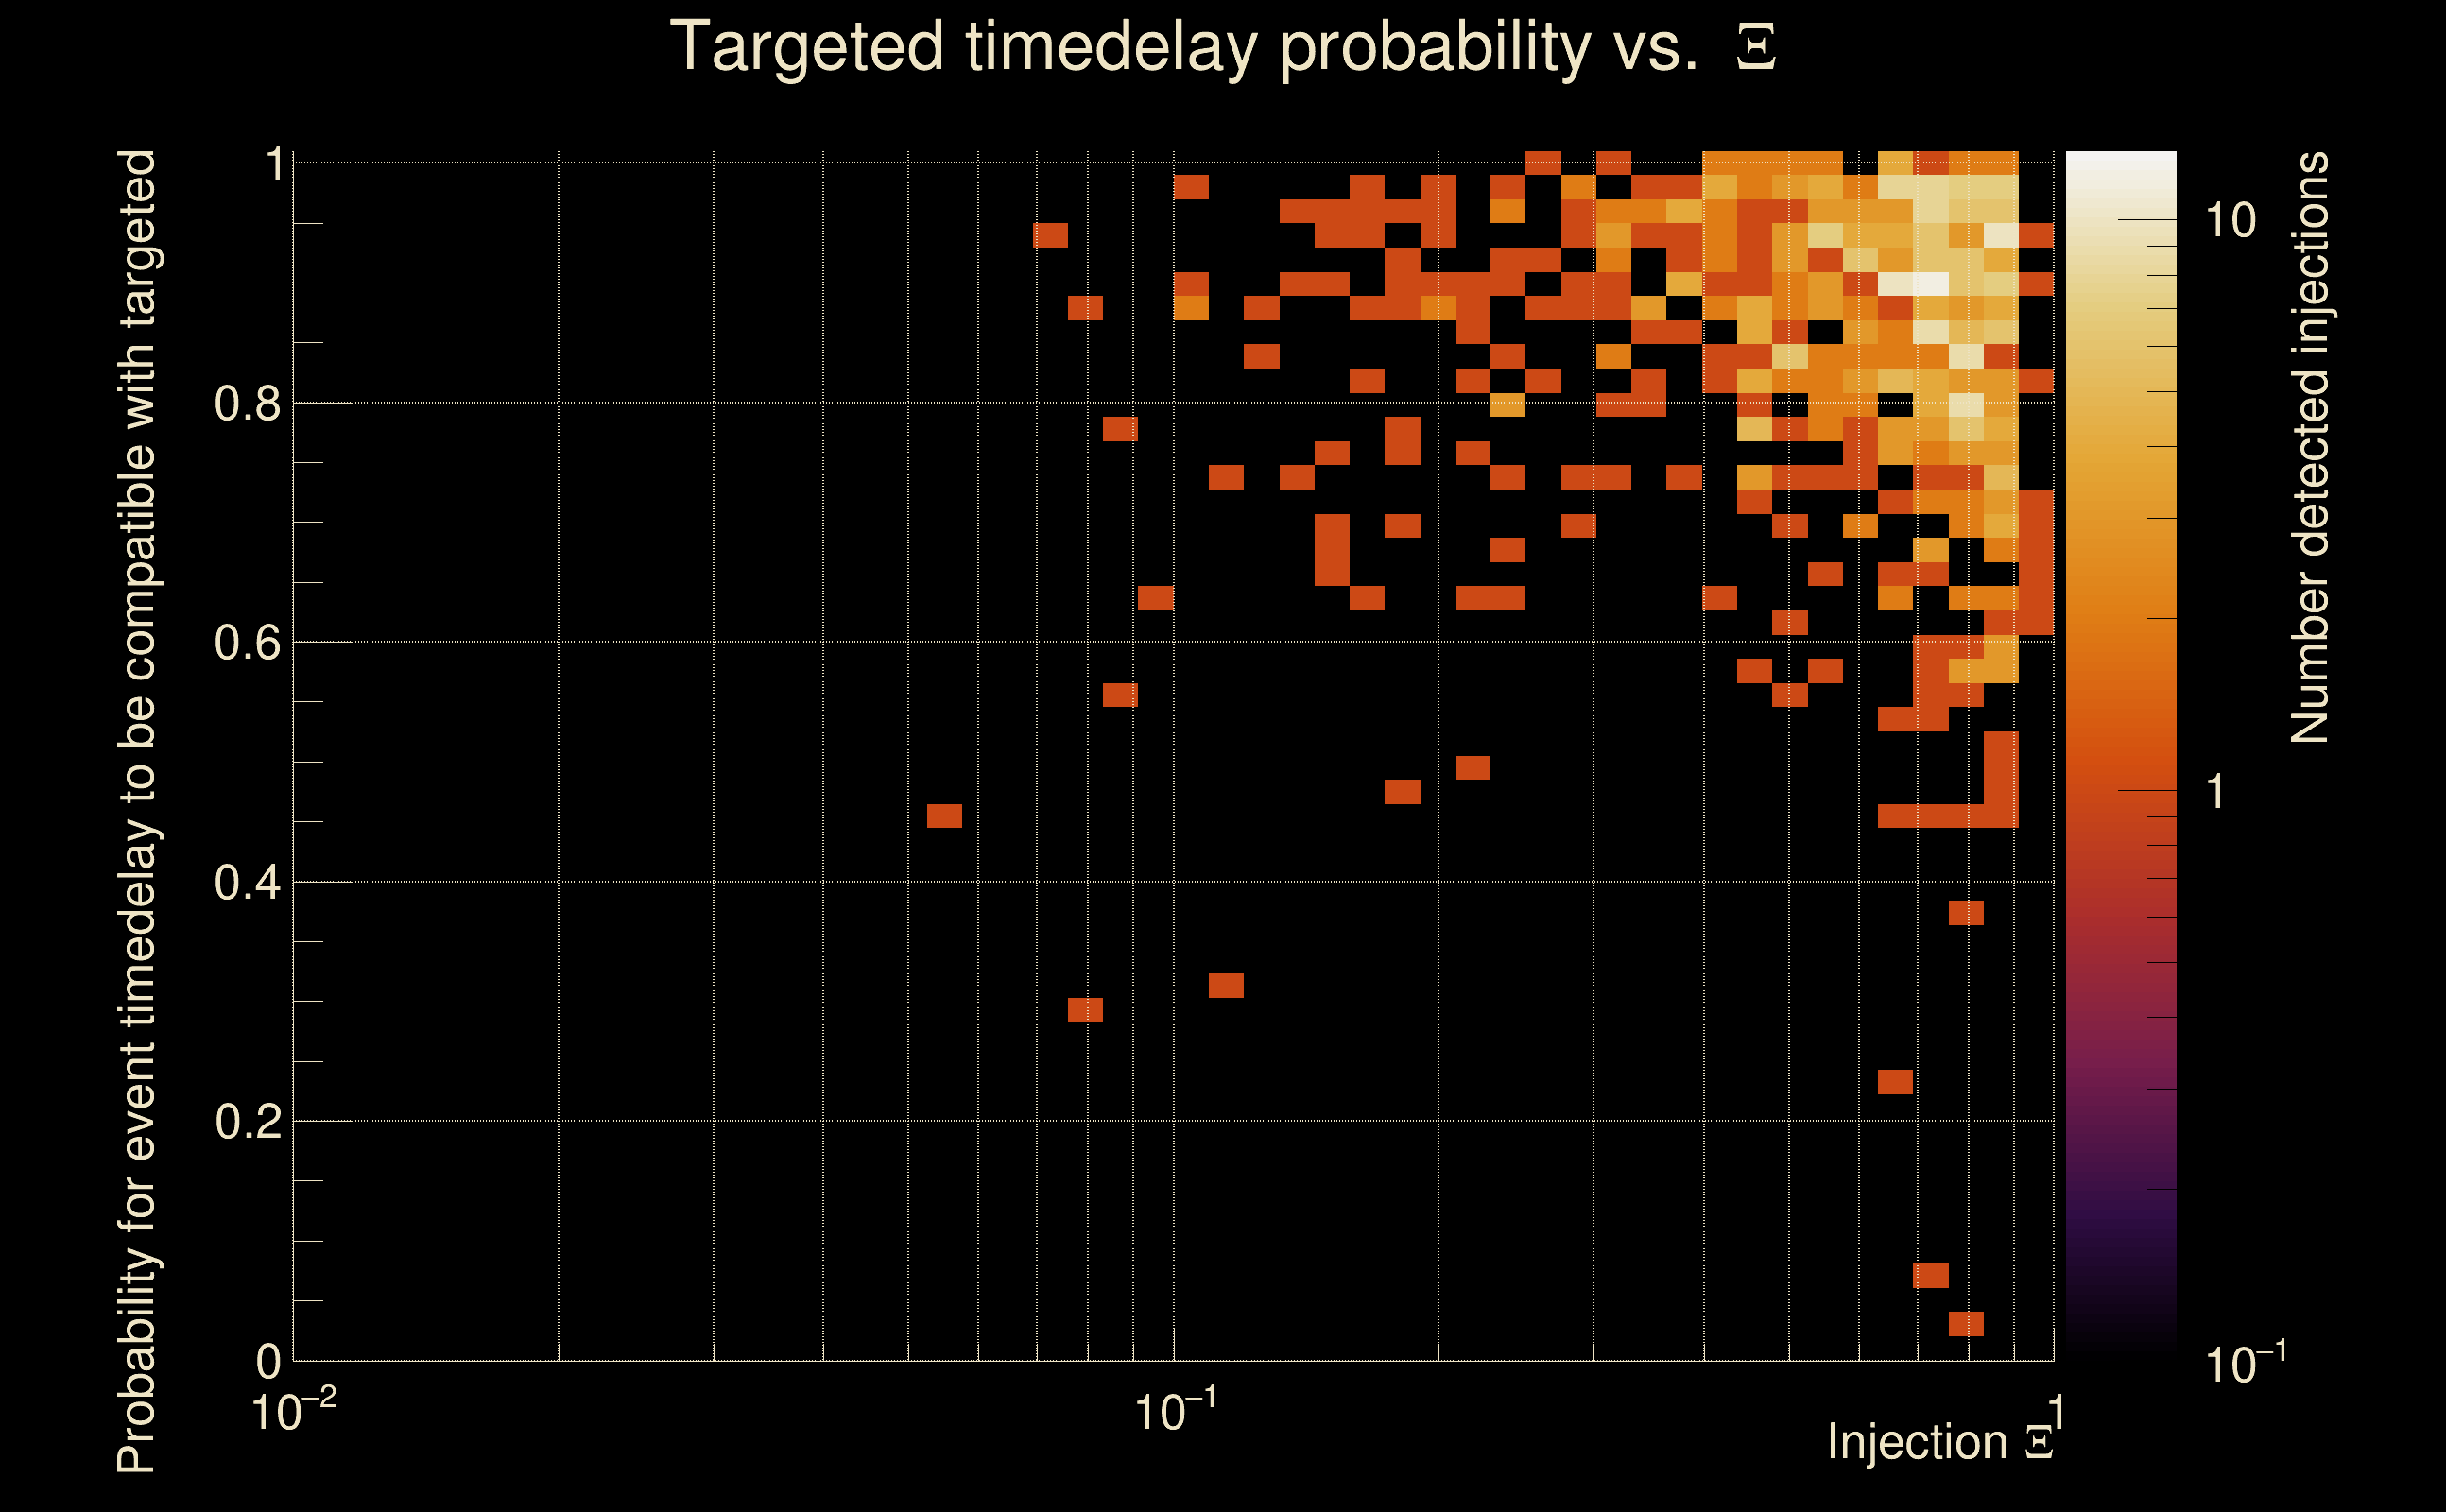
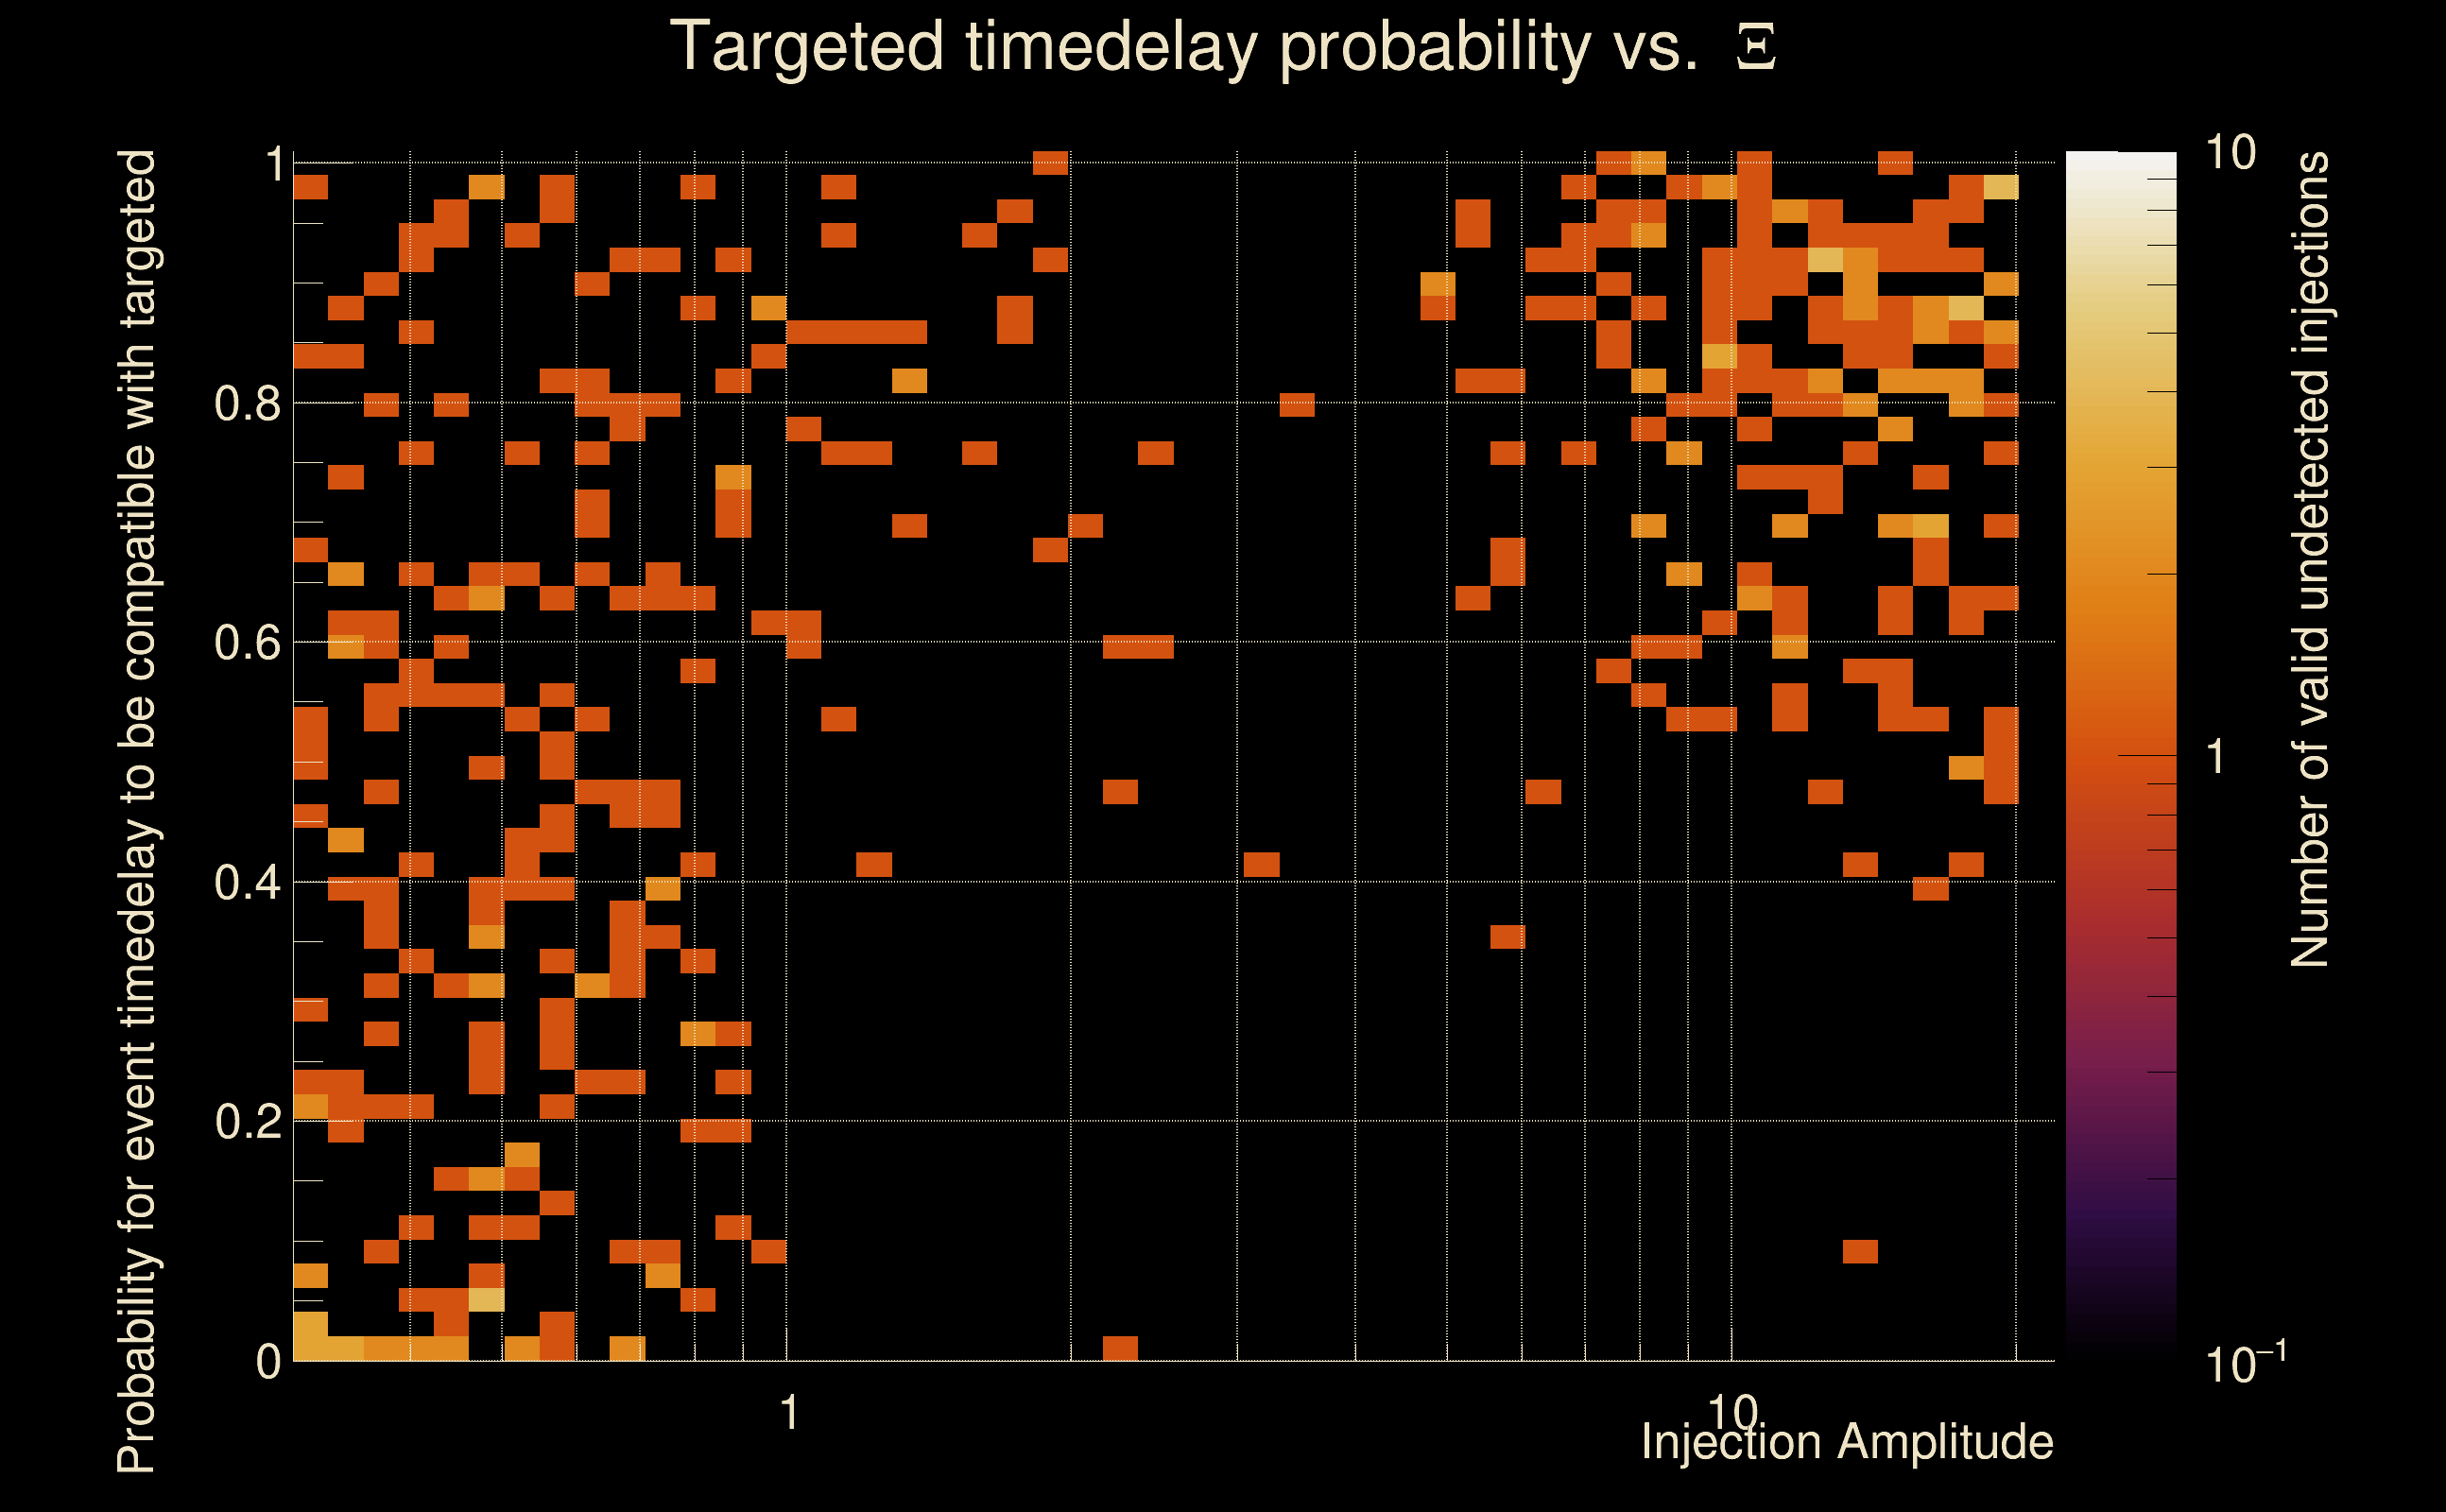
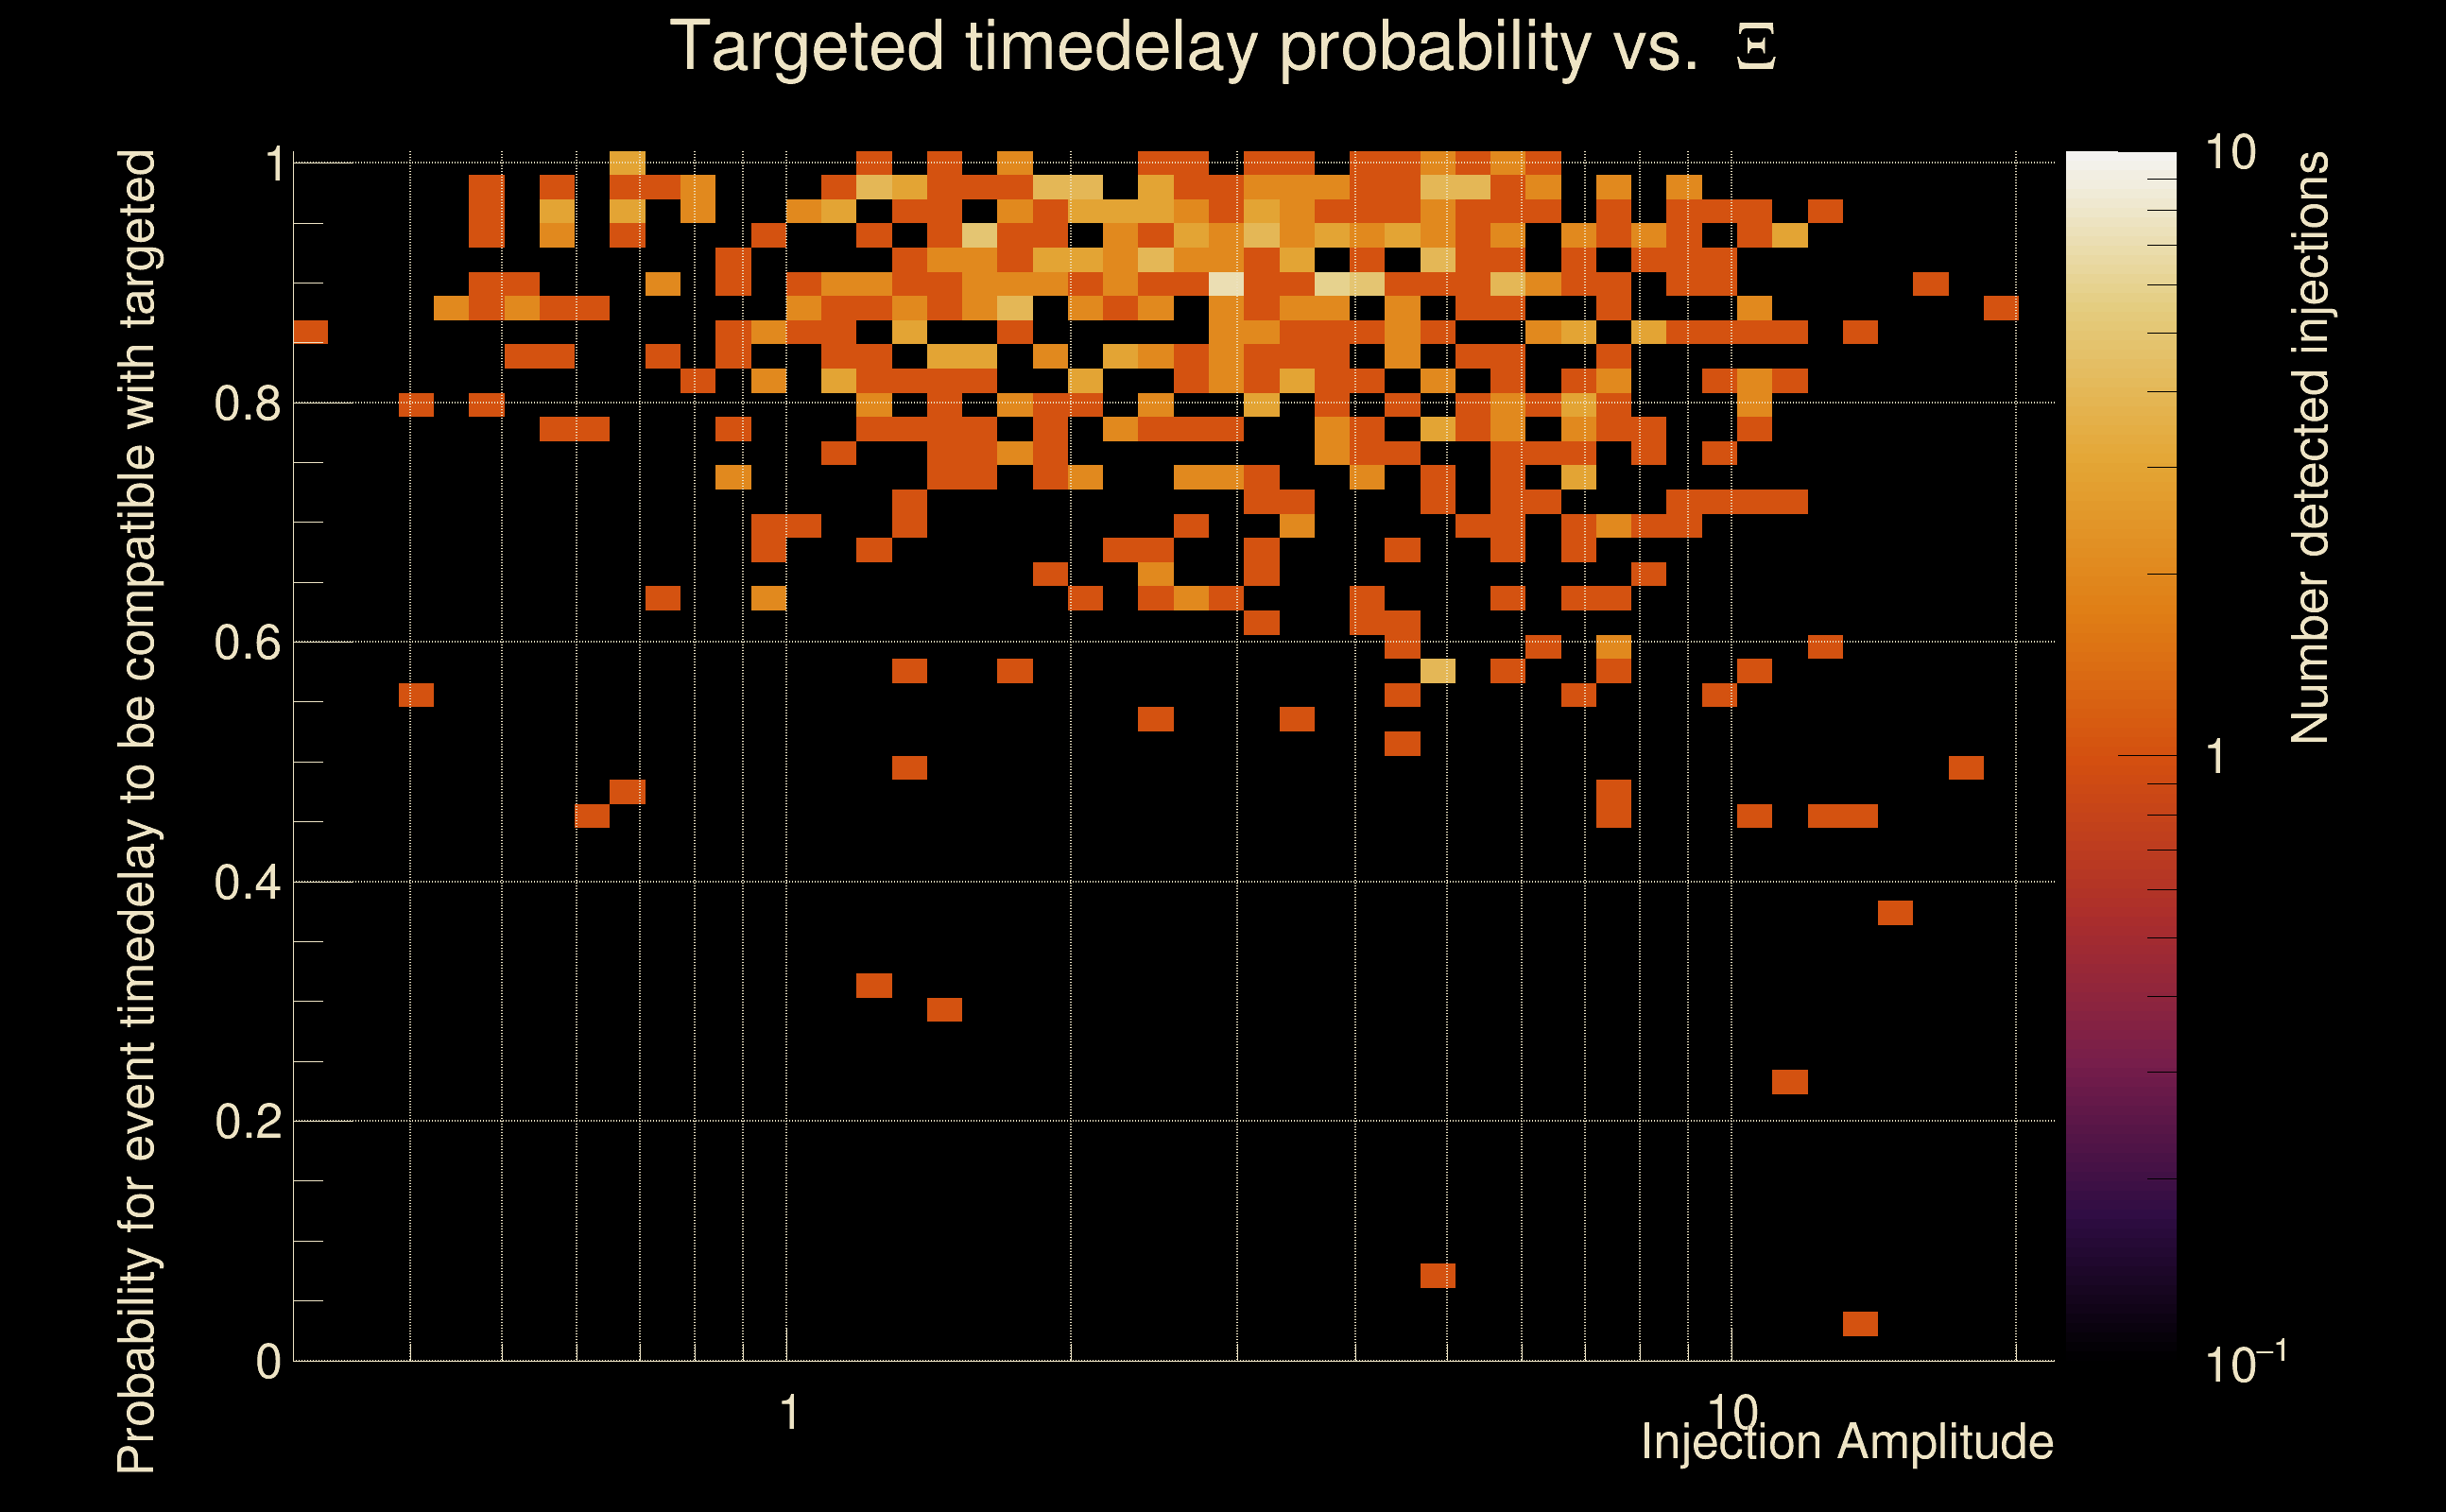
| [targeted mode] Time delay probability: | 0.637792 (0.470788 sigmas), δt_target = 1.72247e+45 s |
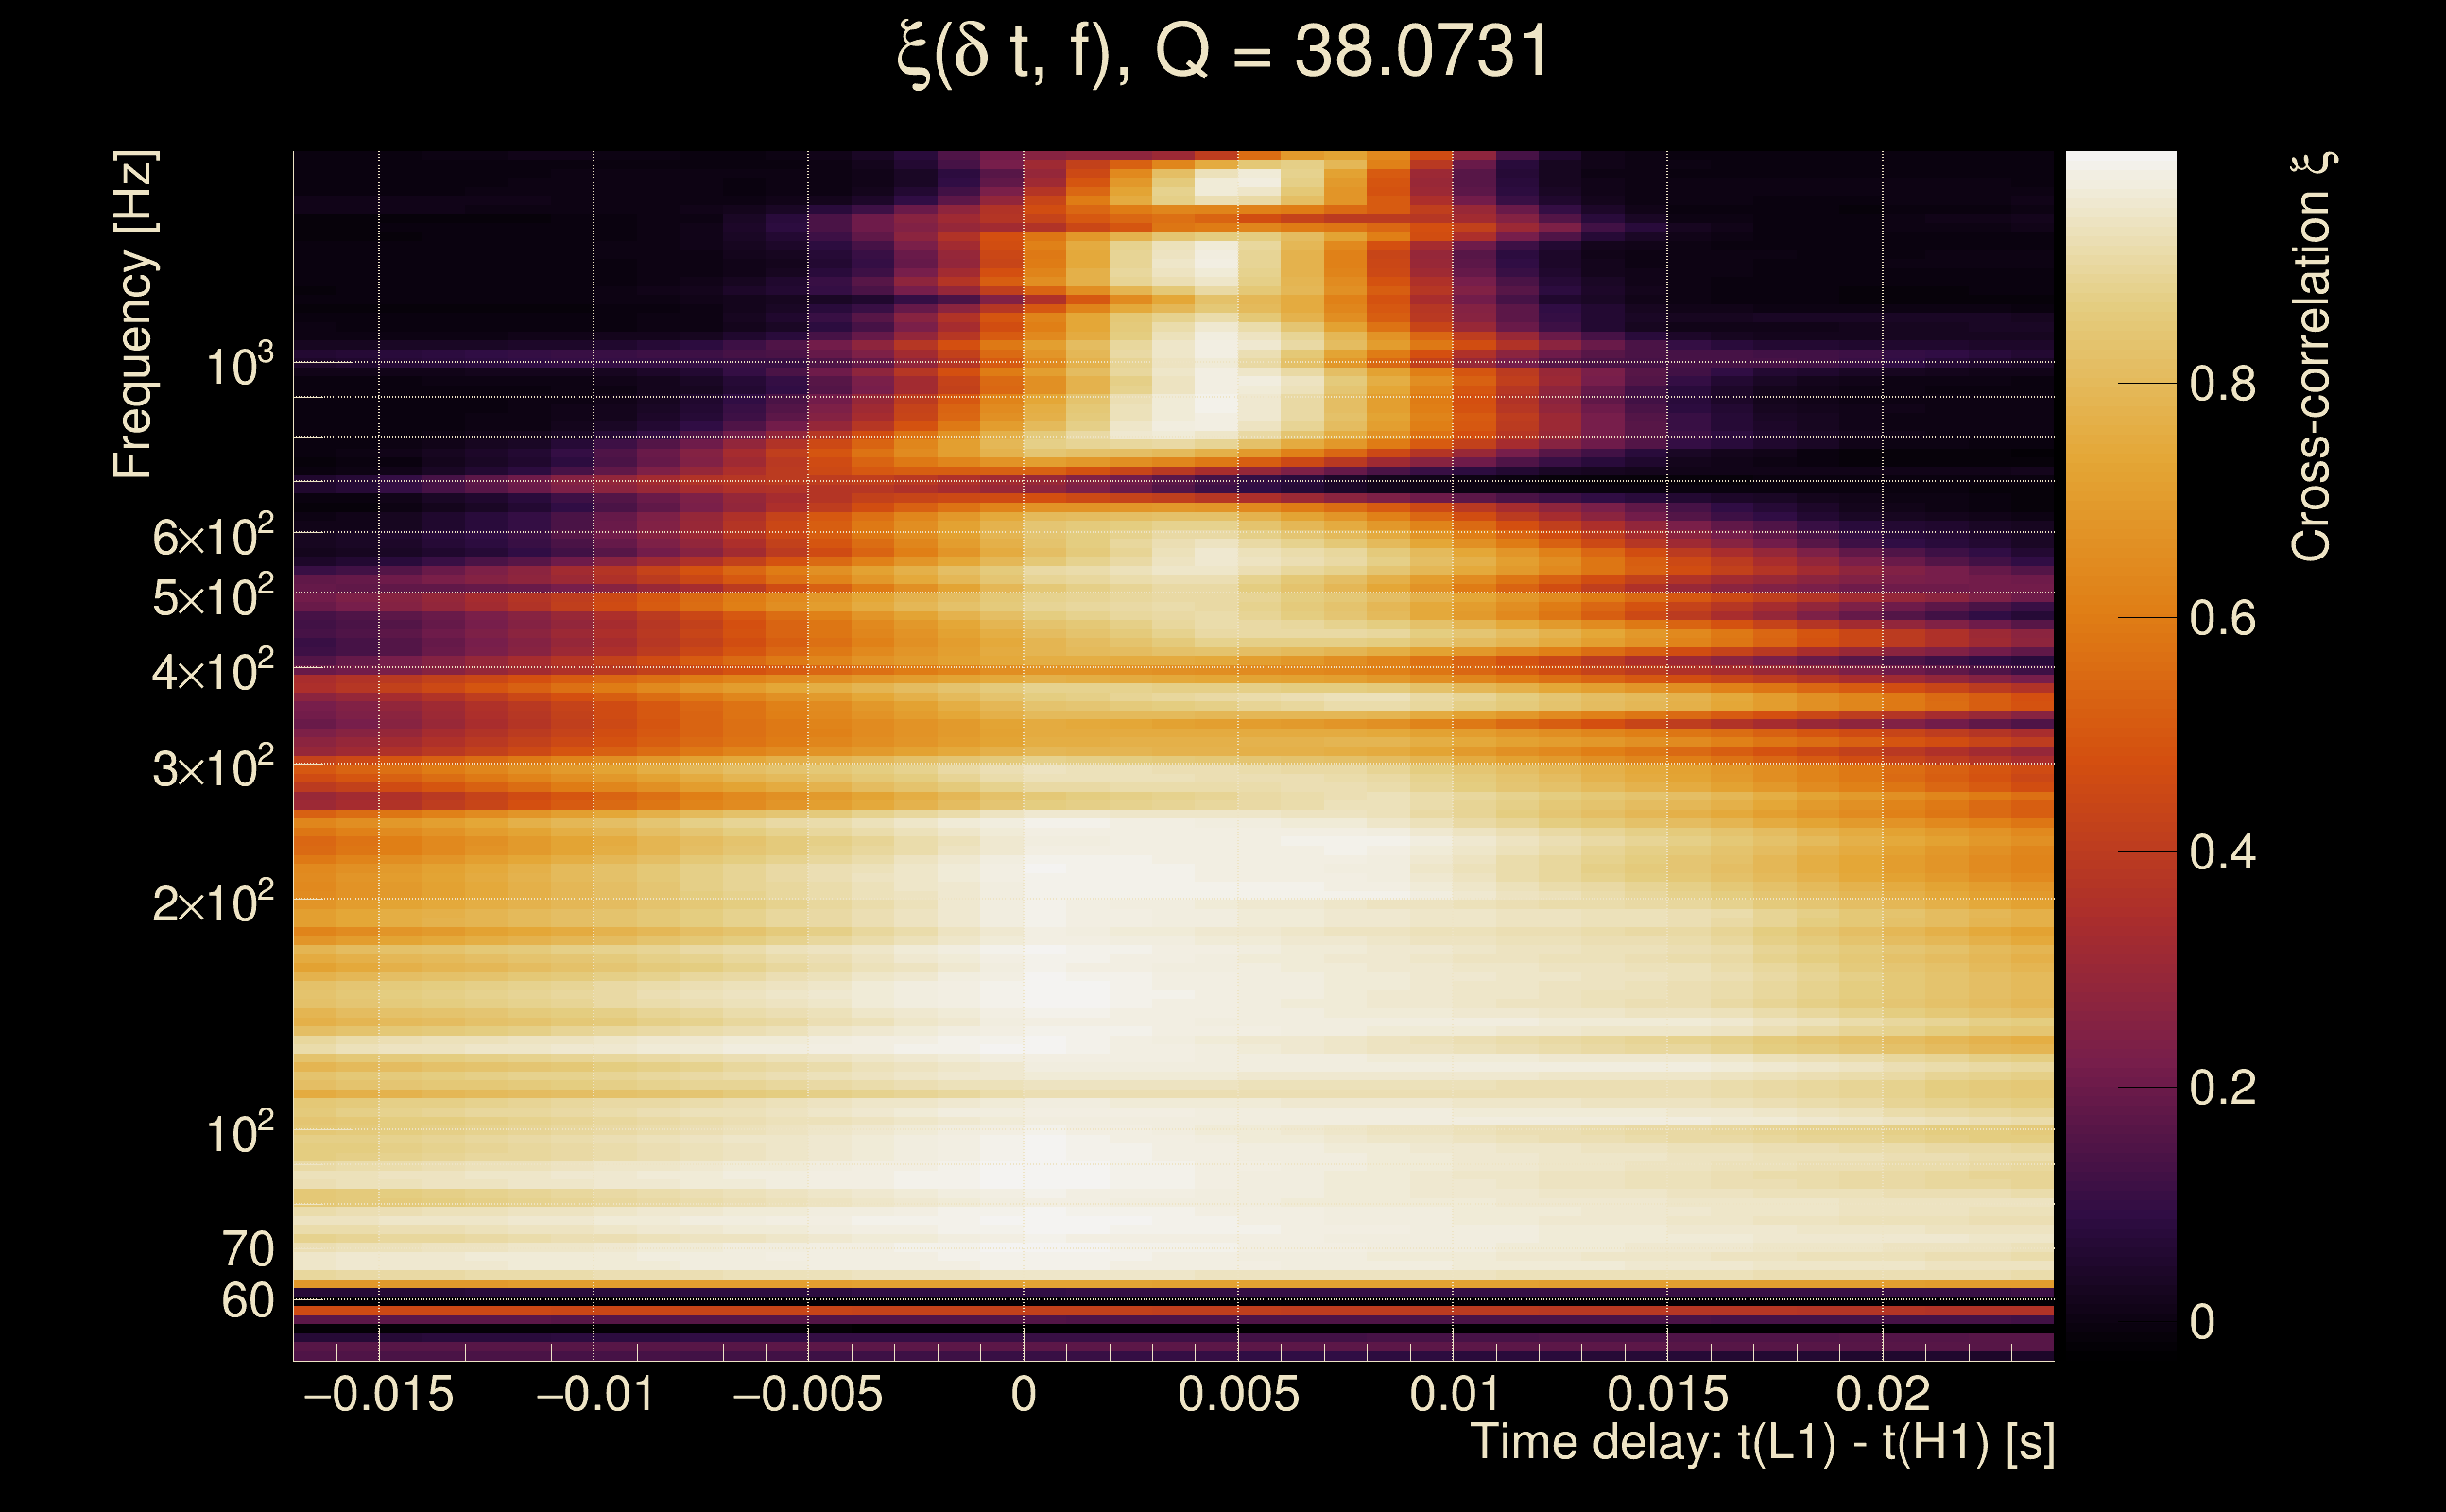
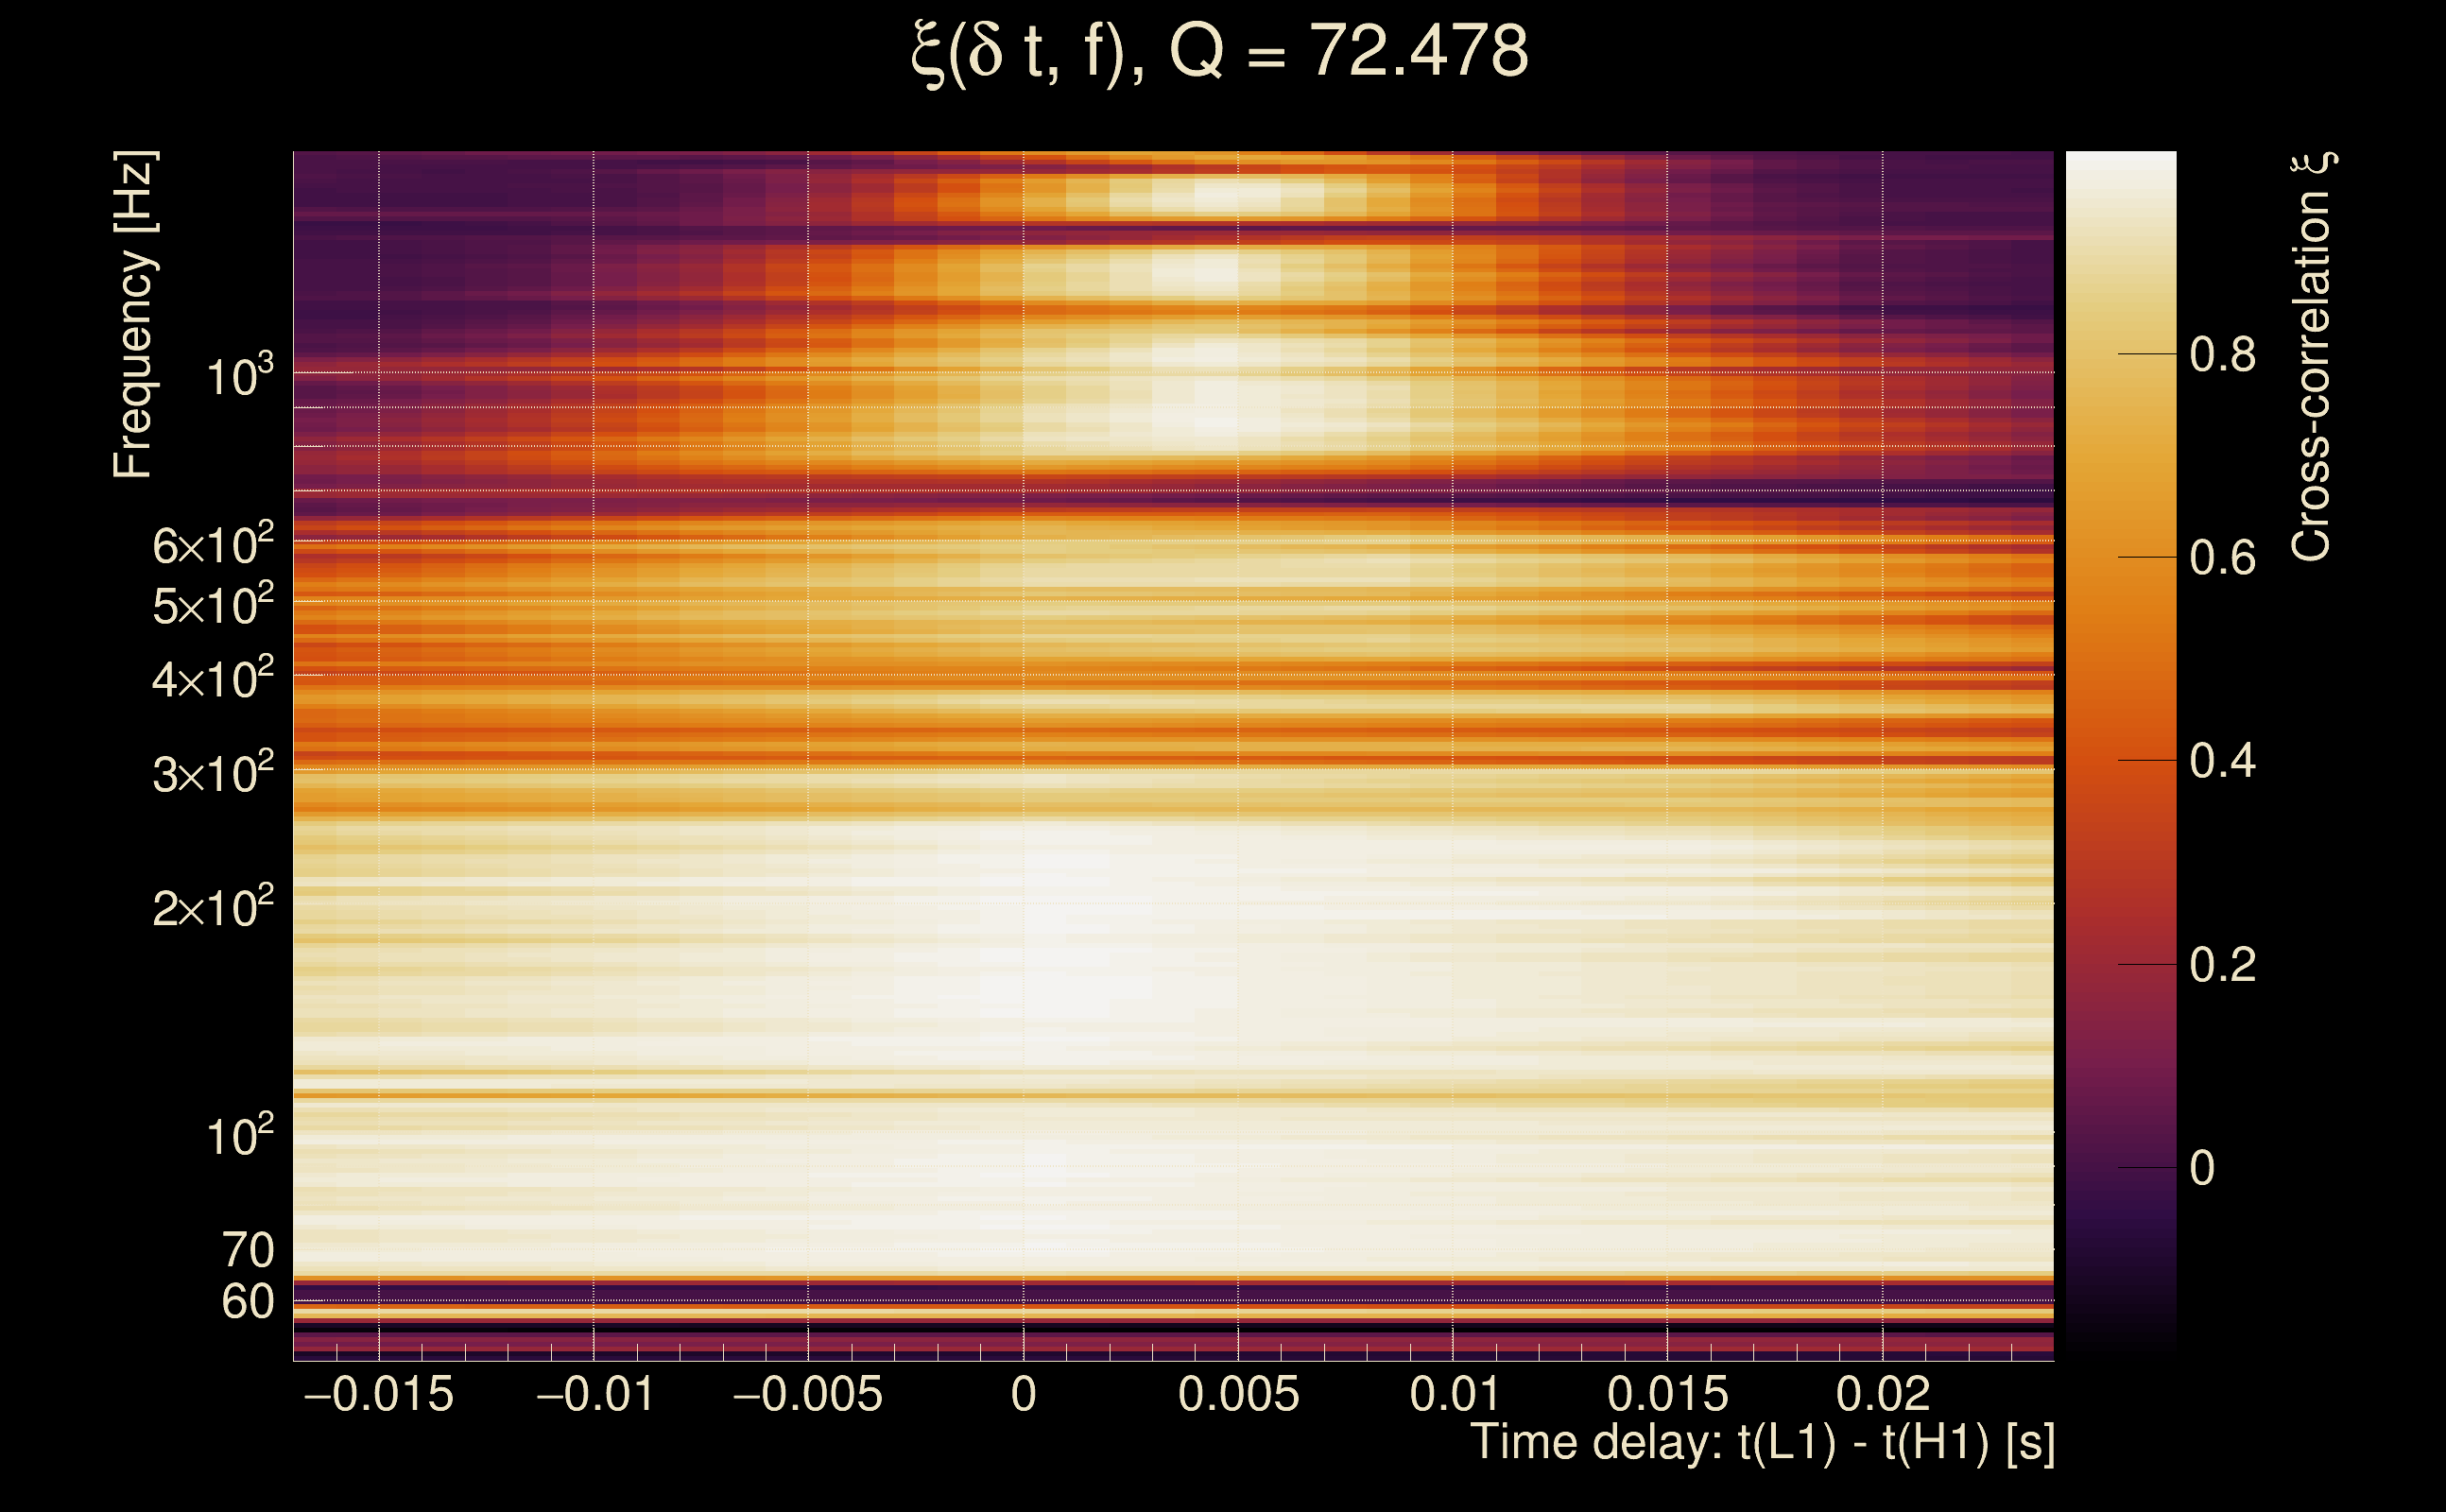
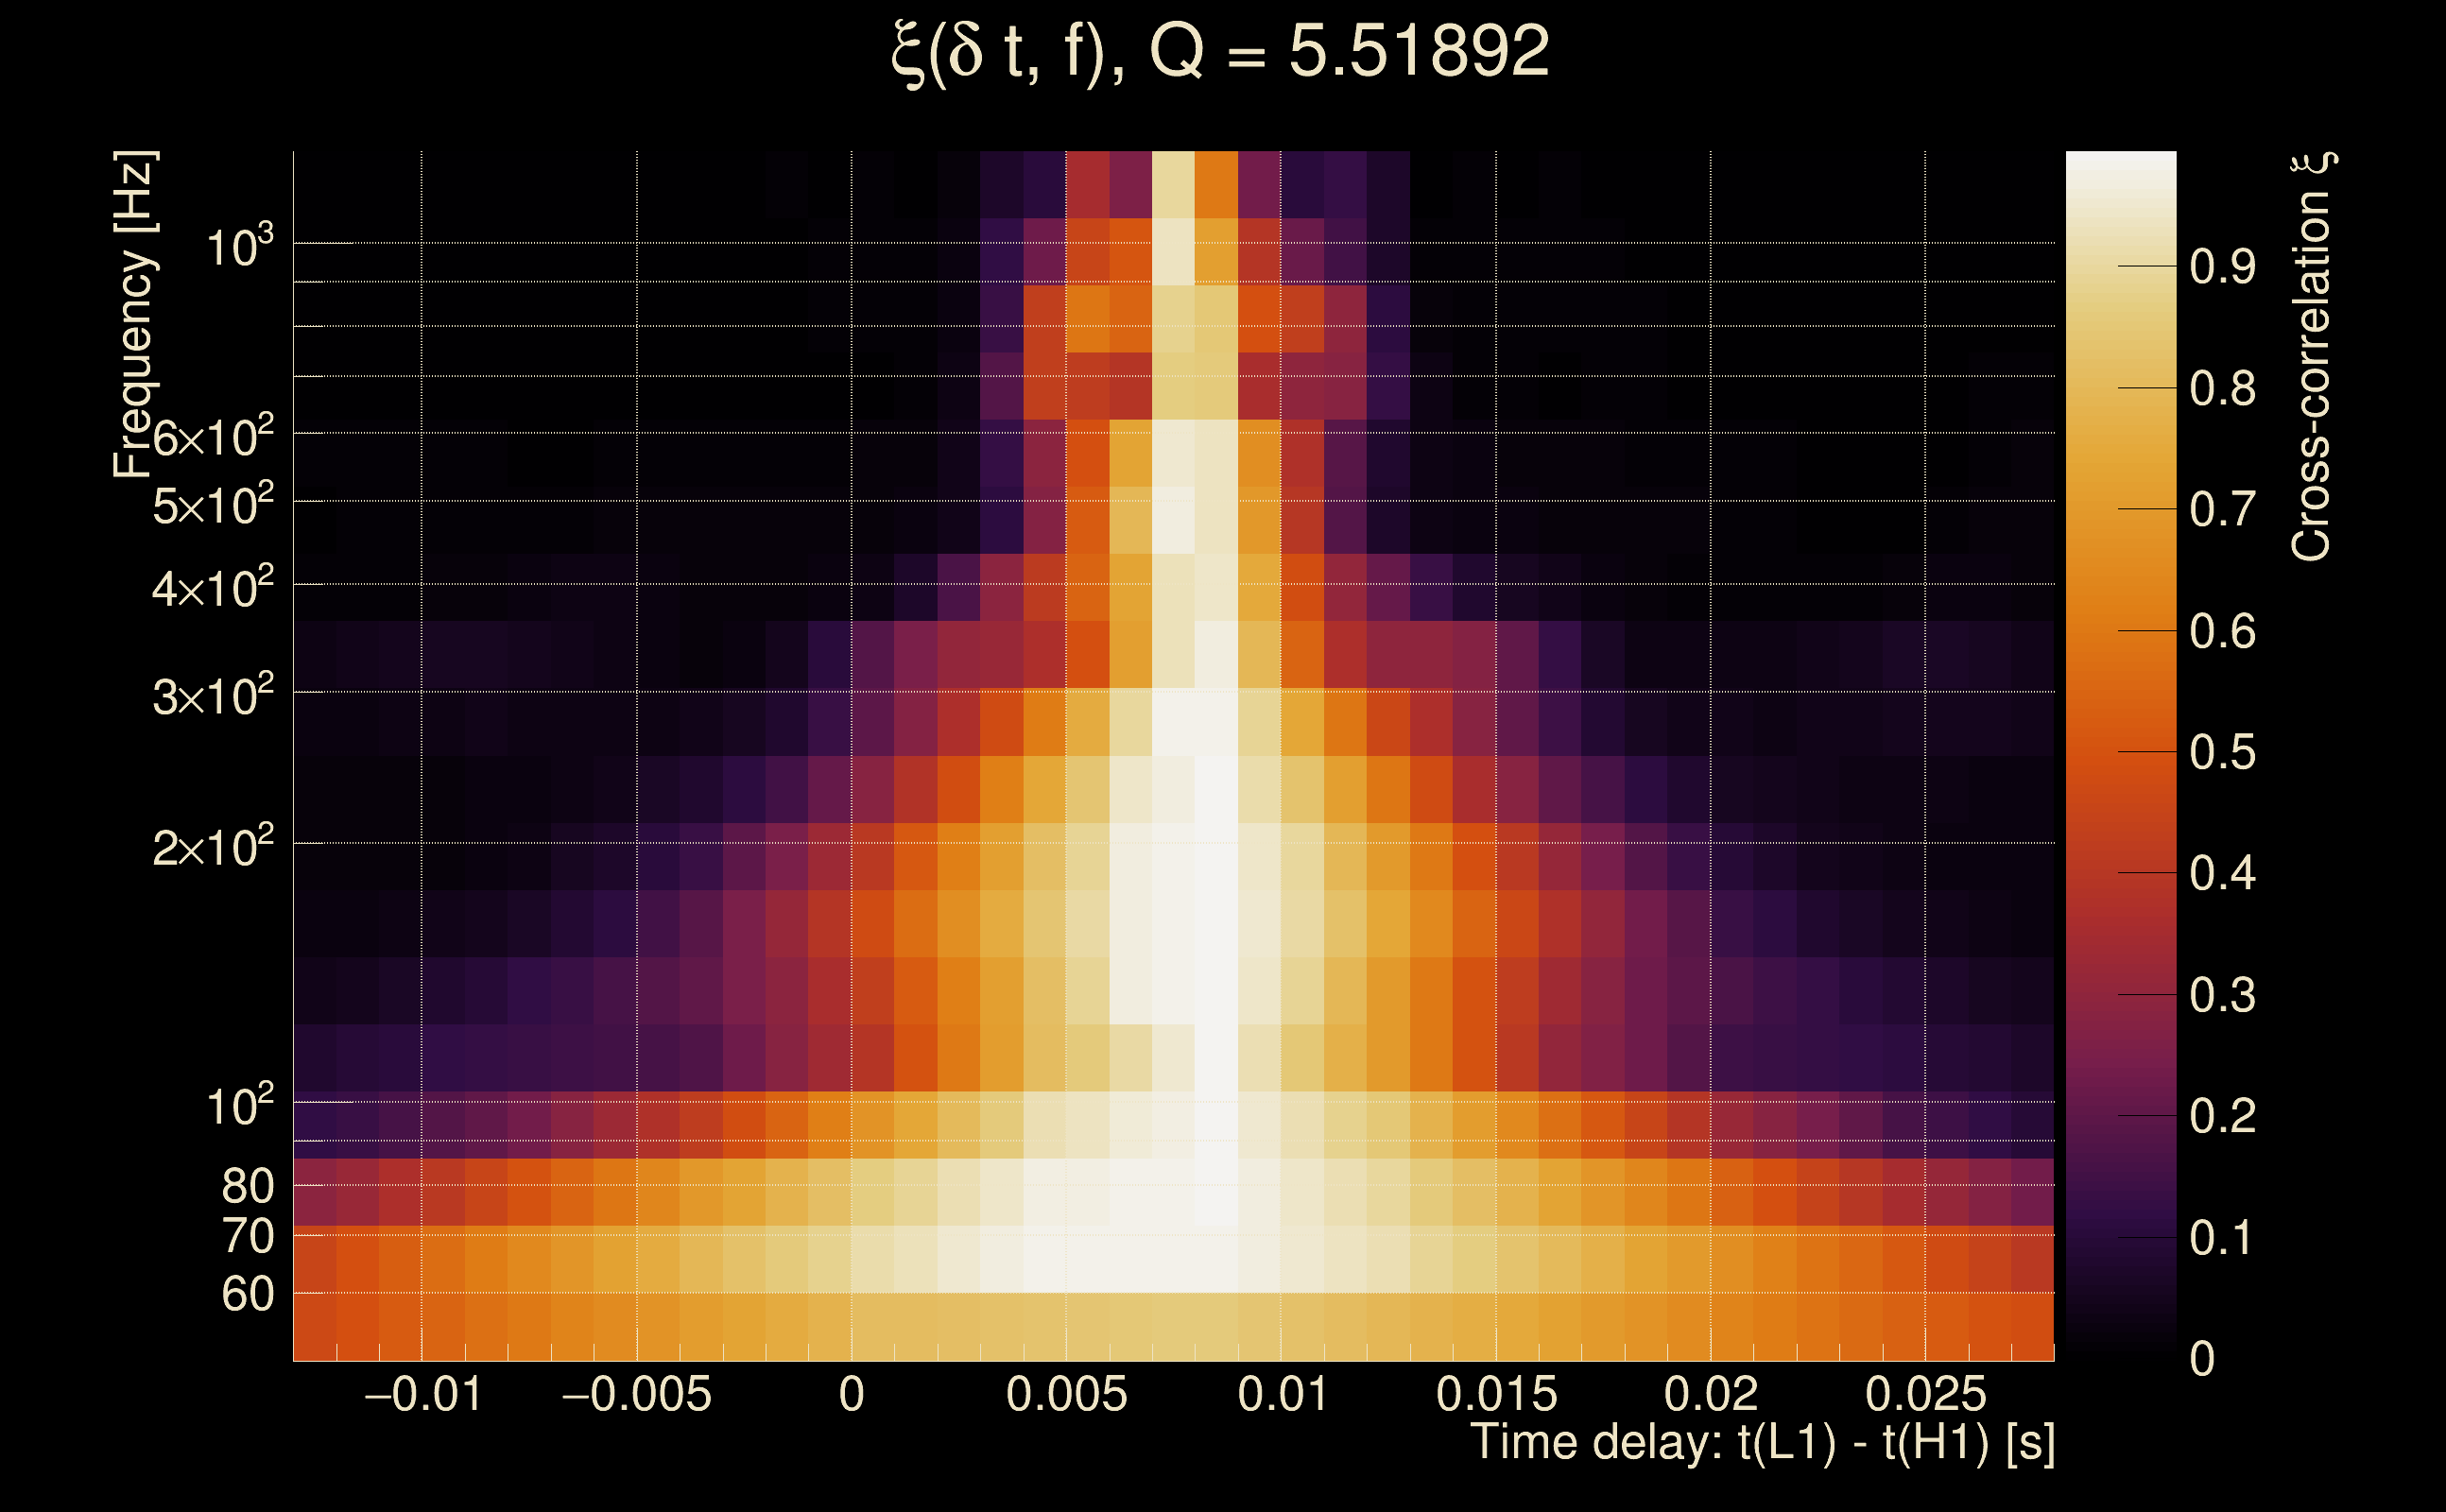
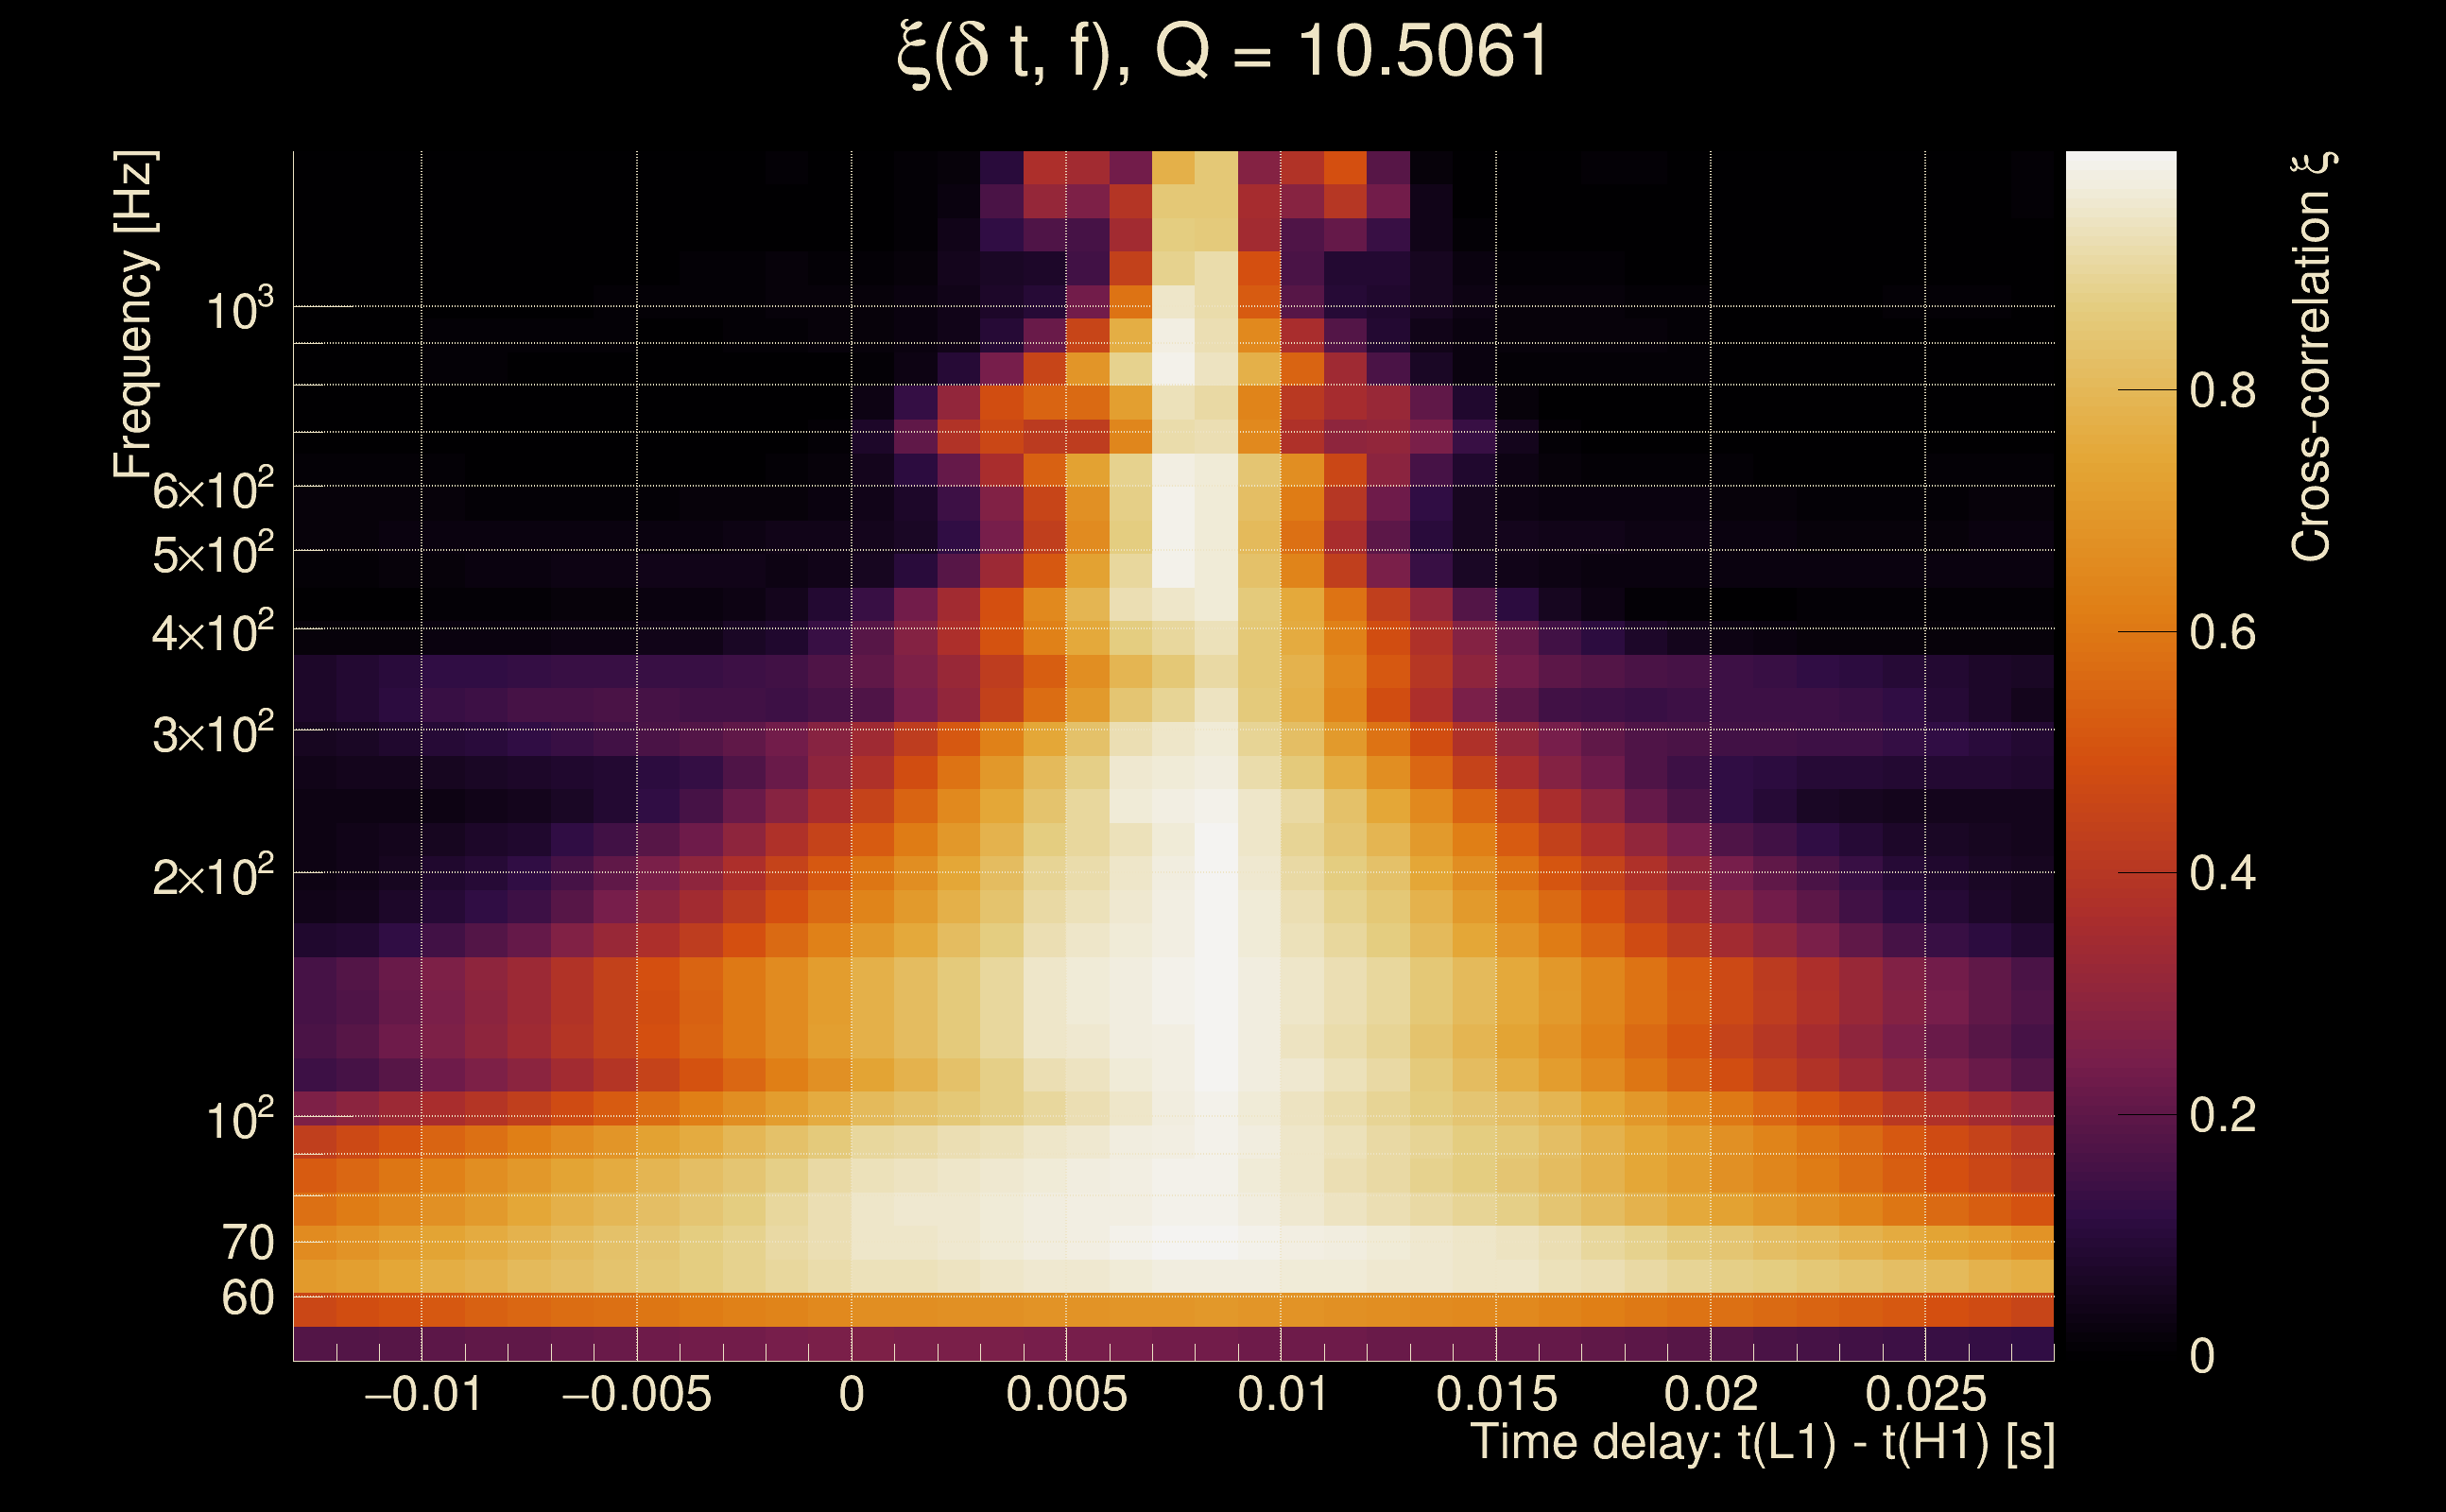
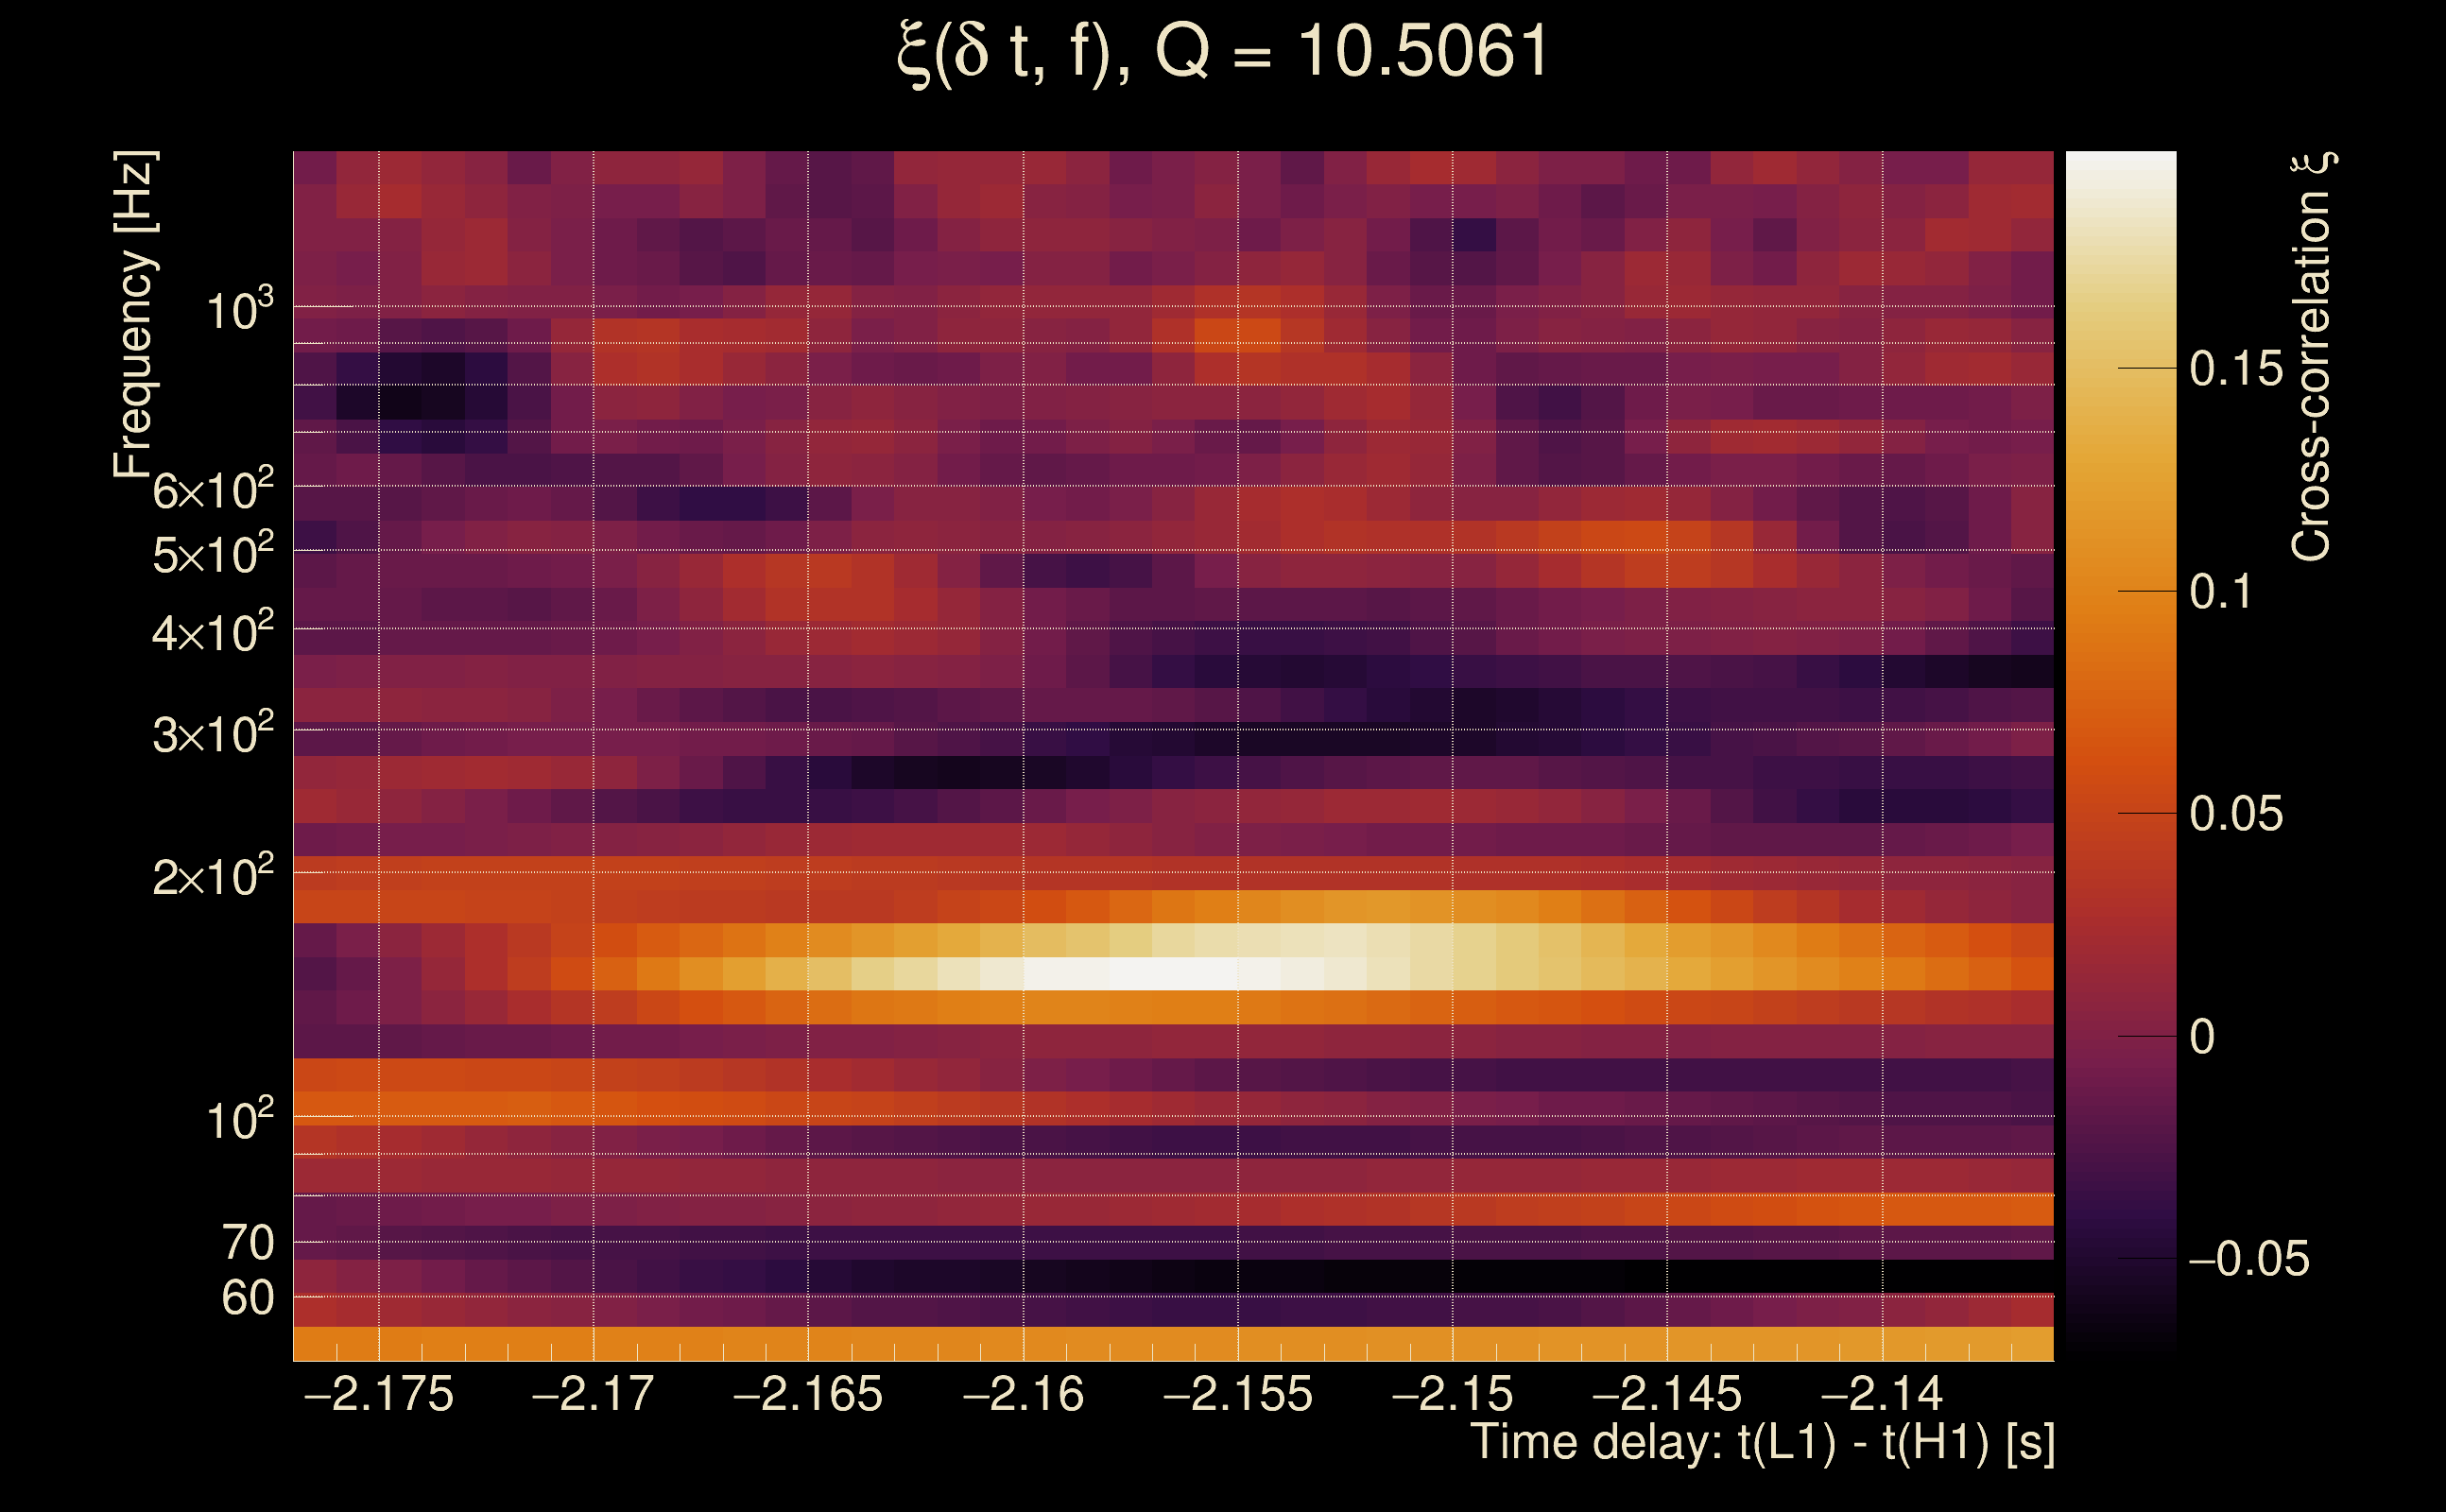
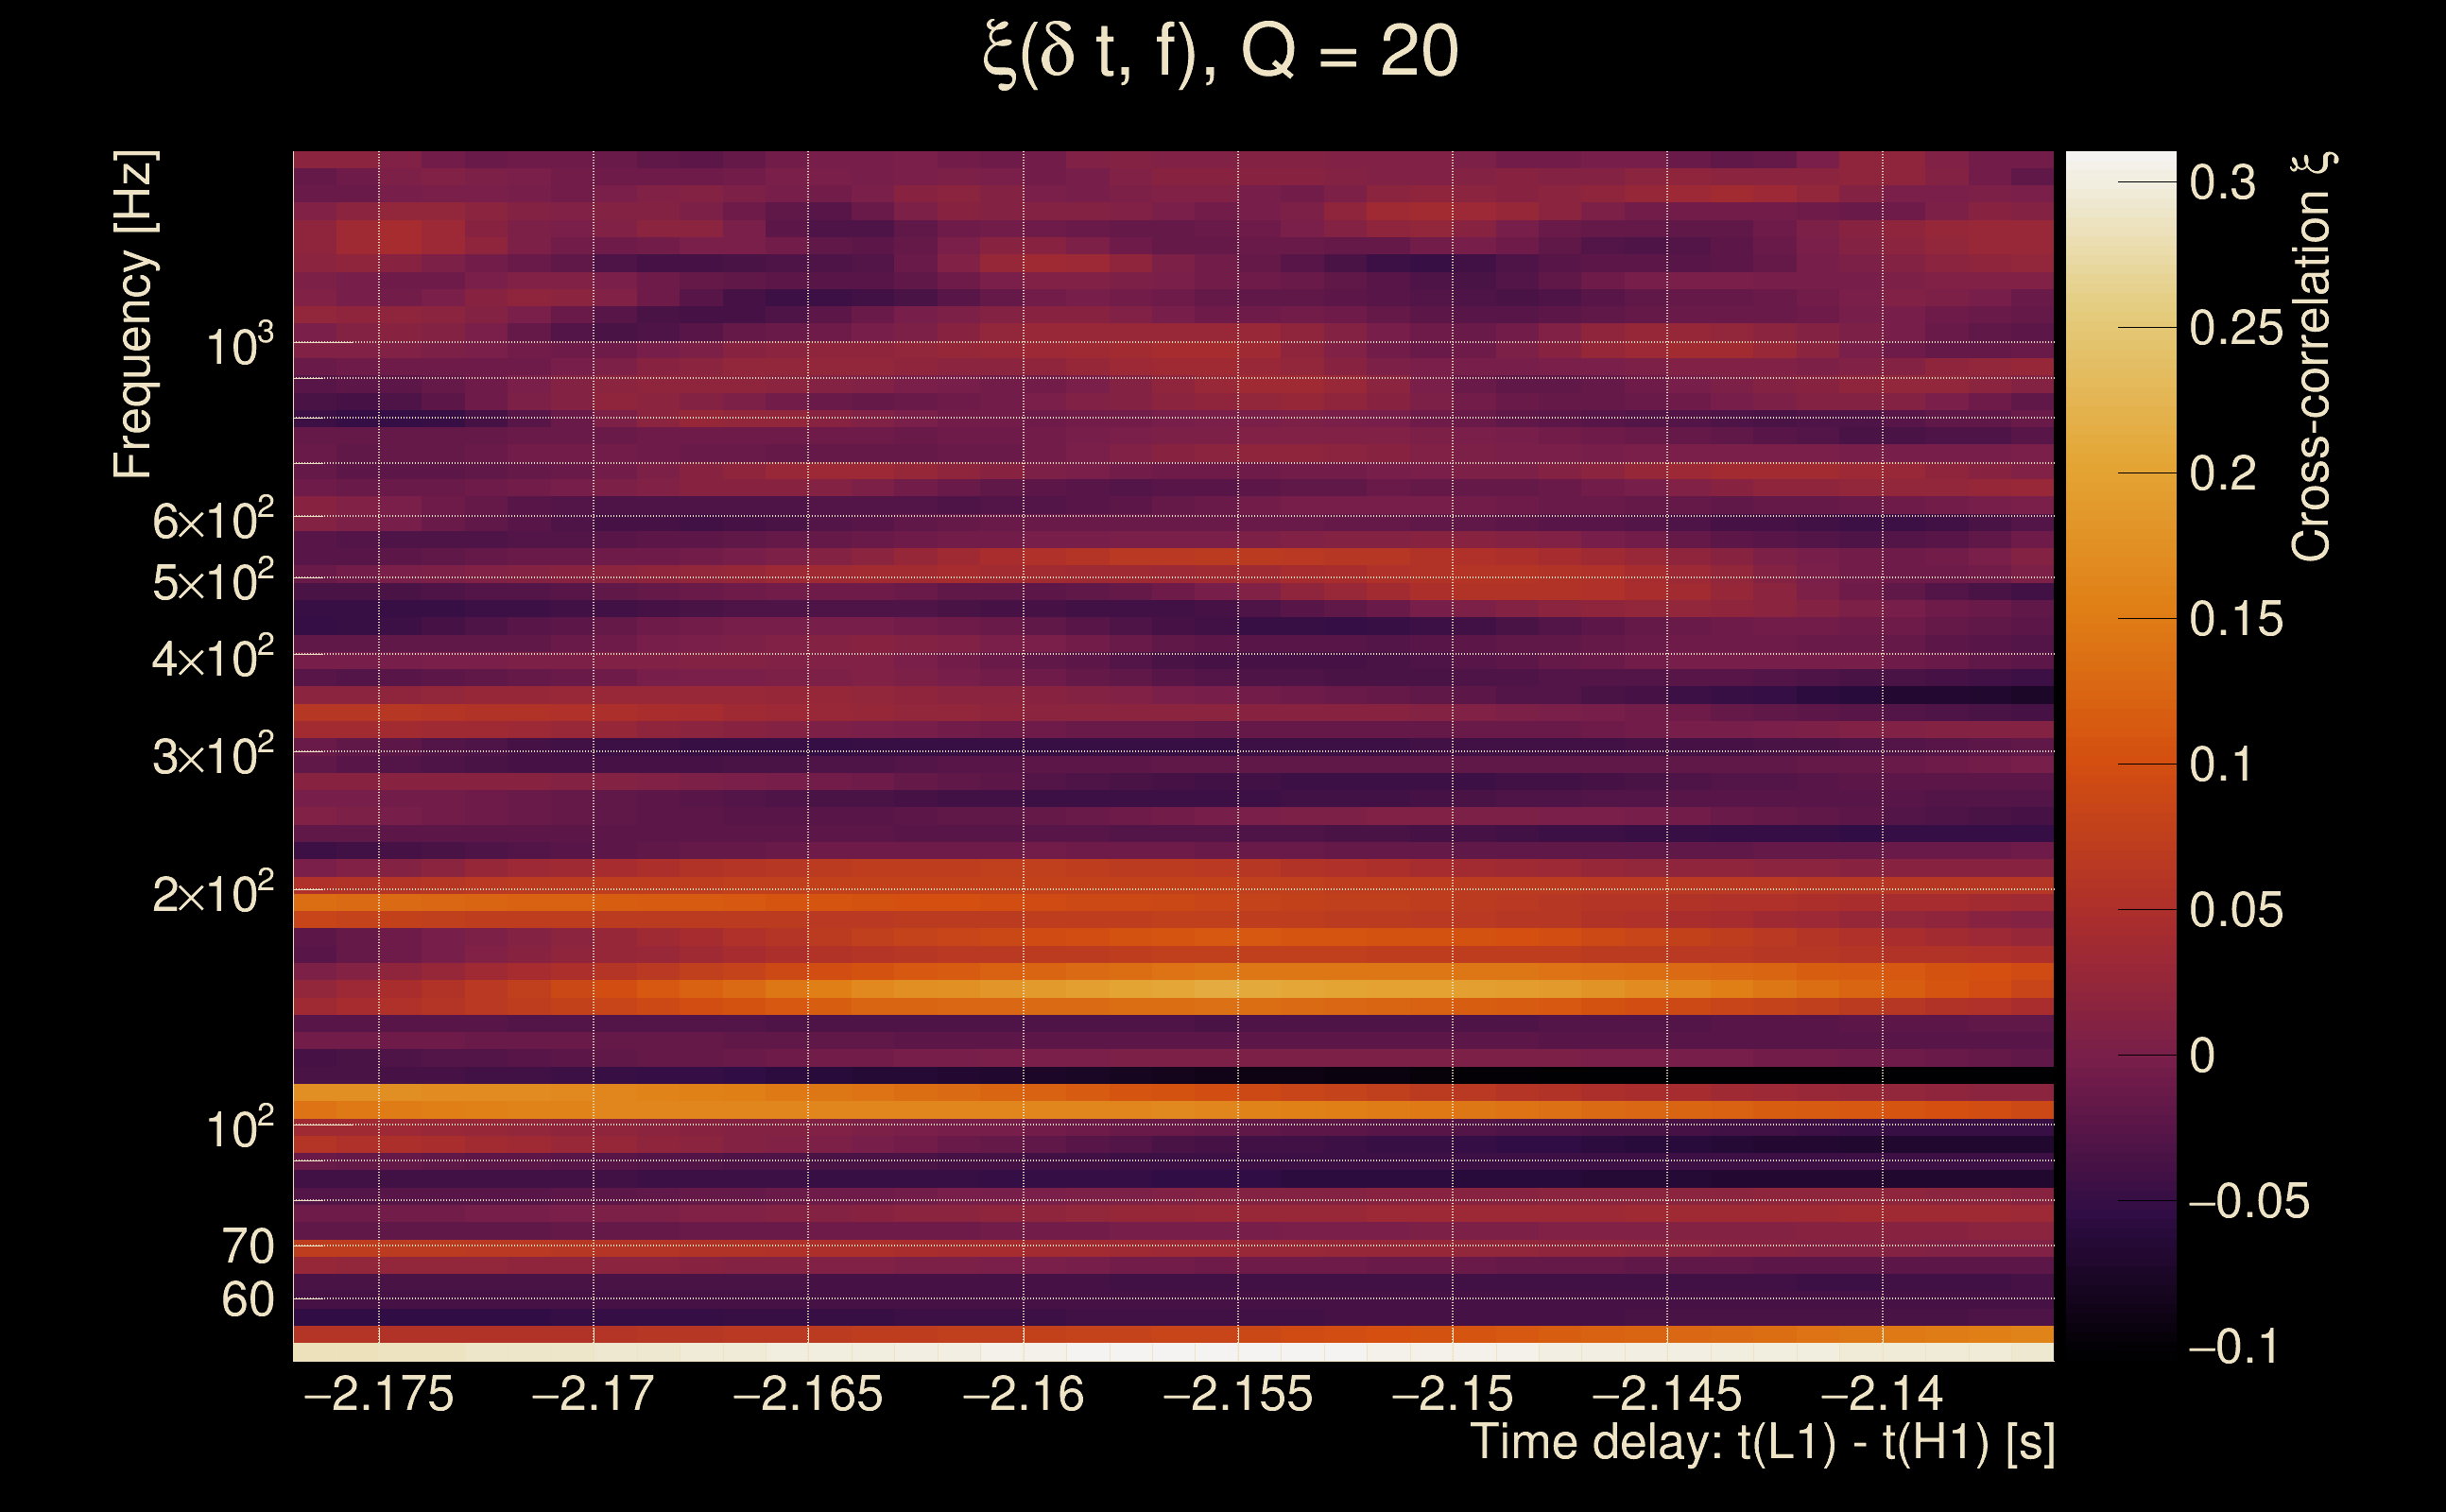
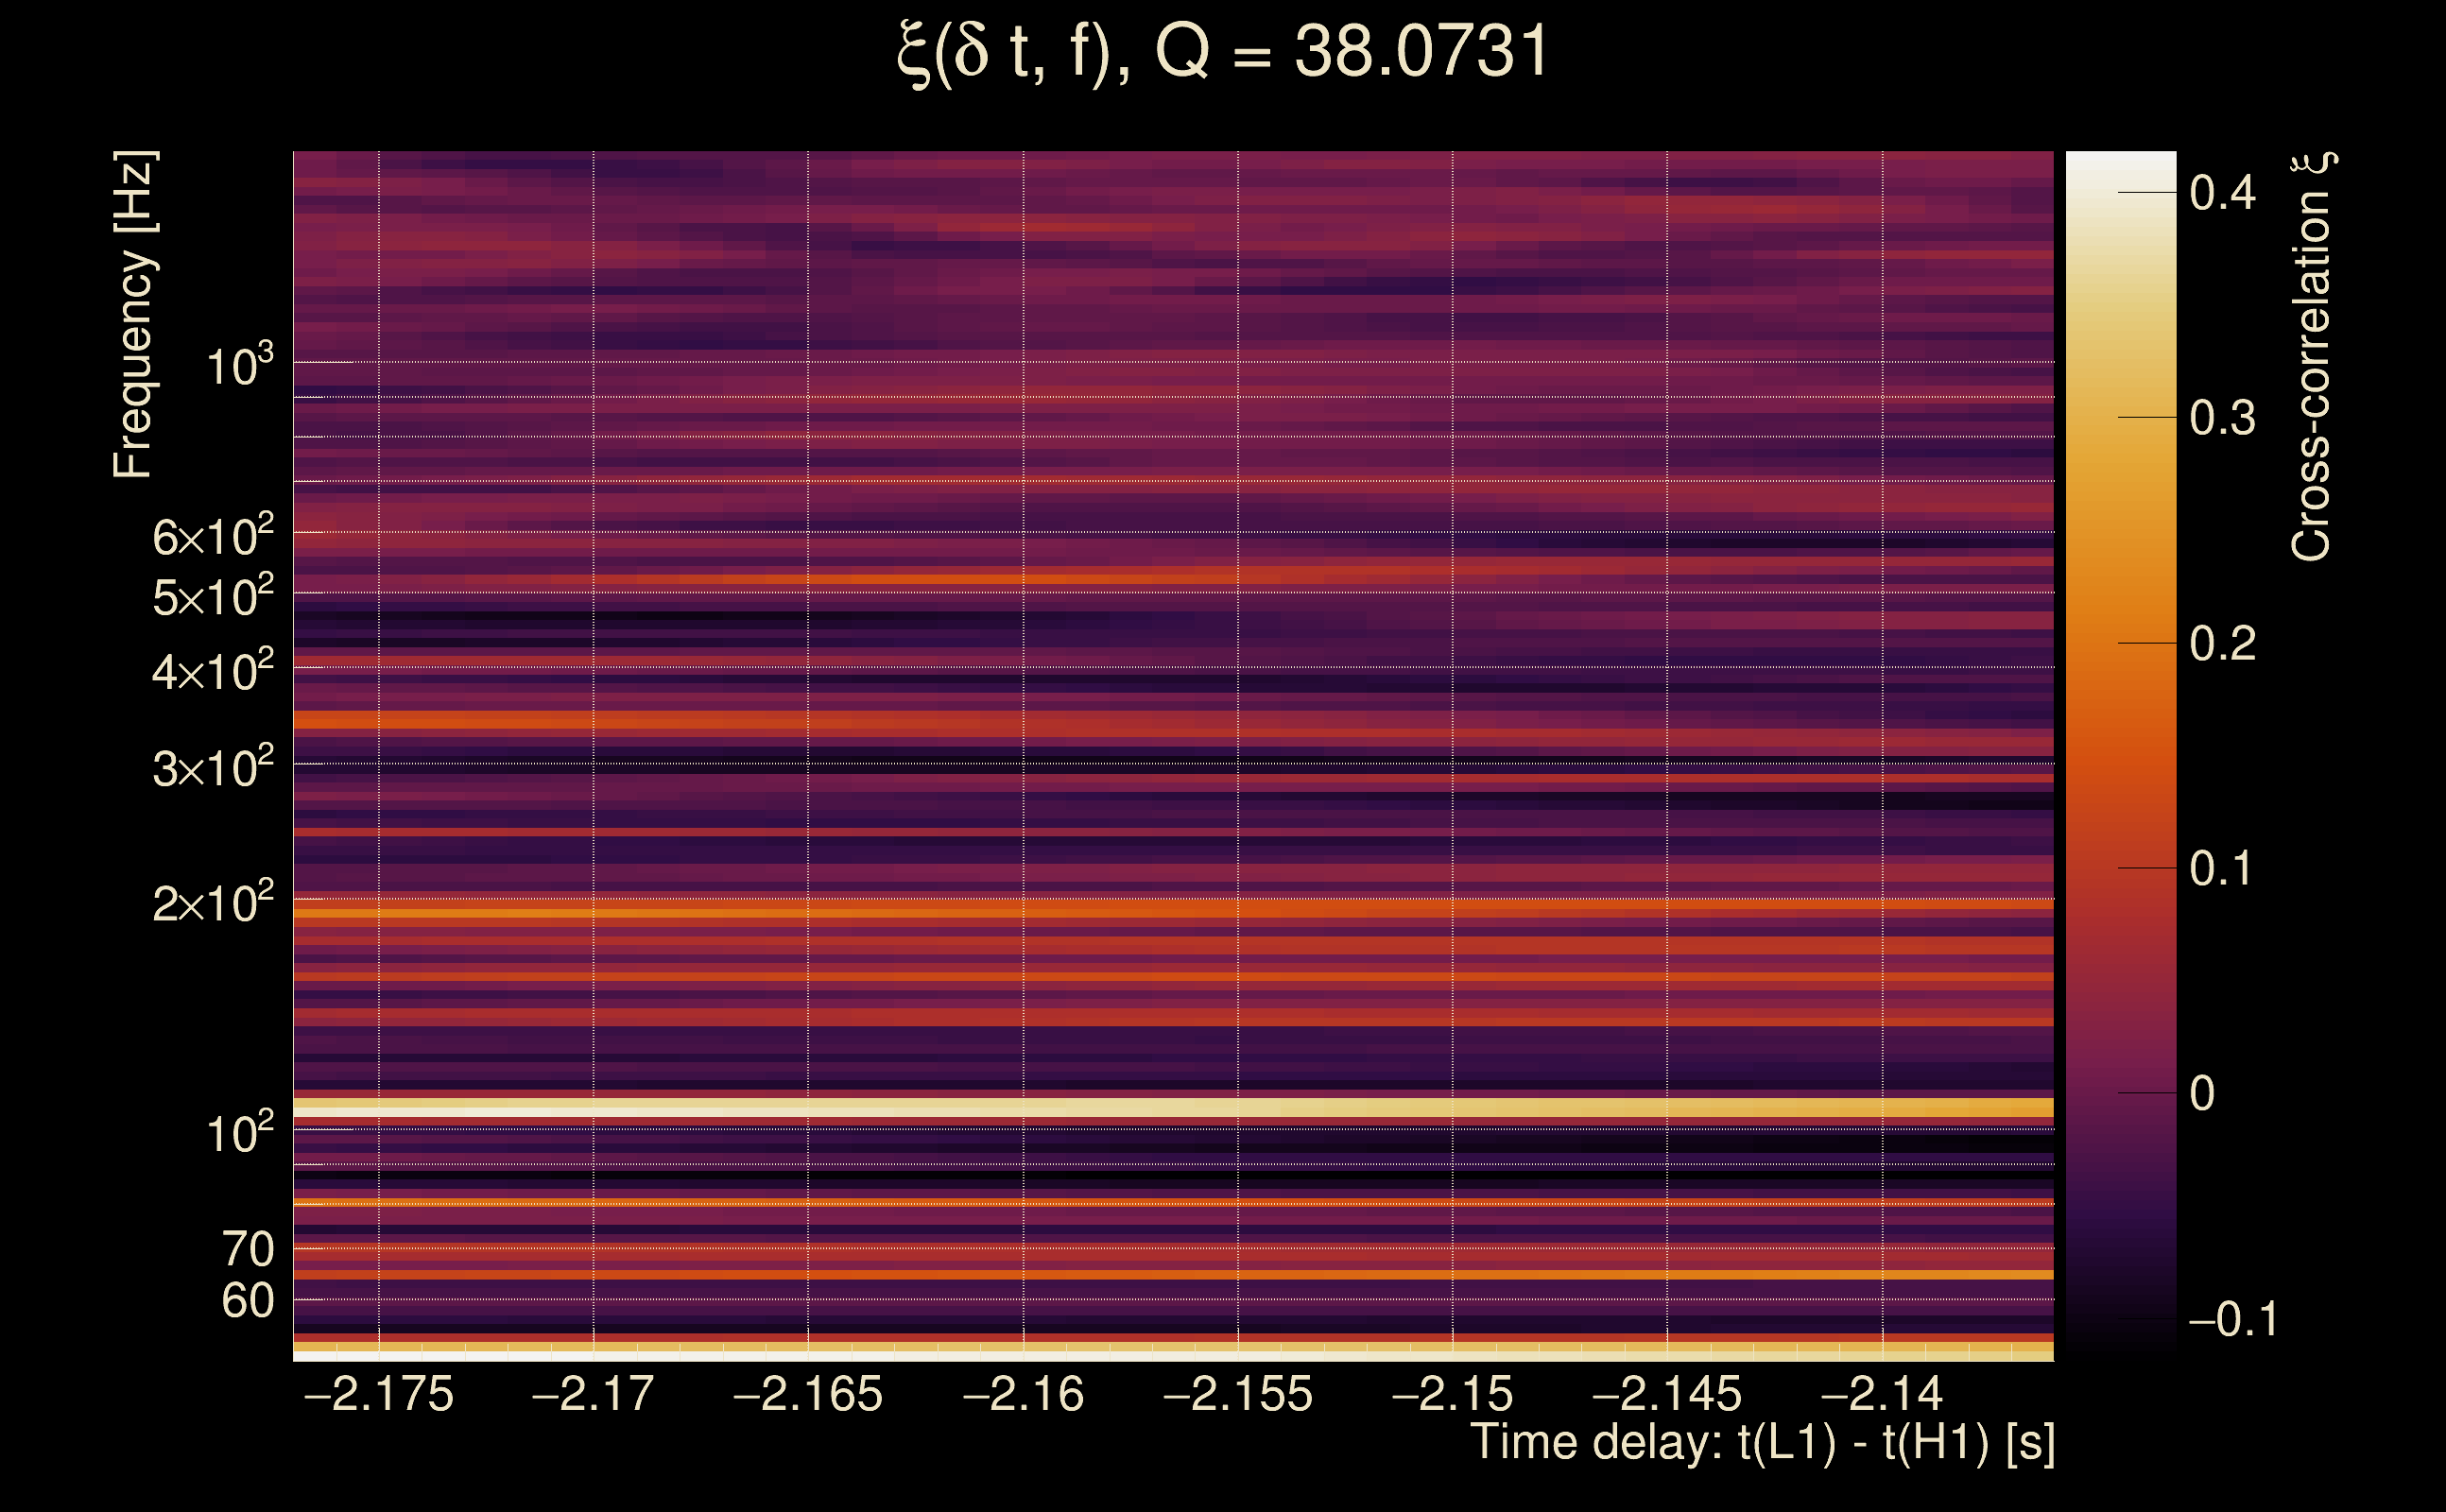
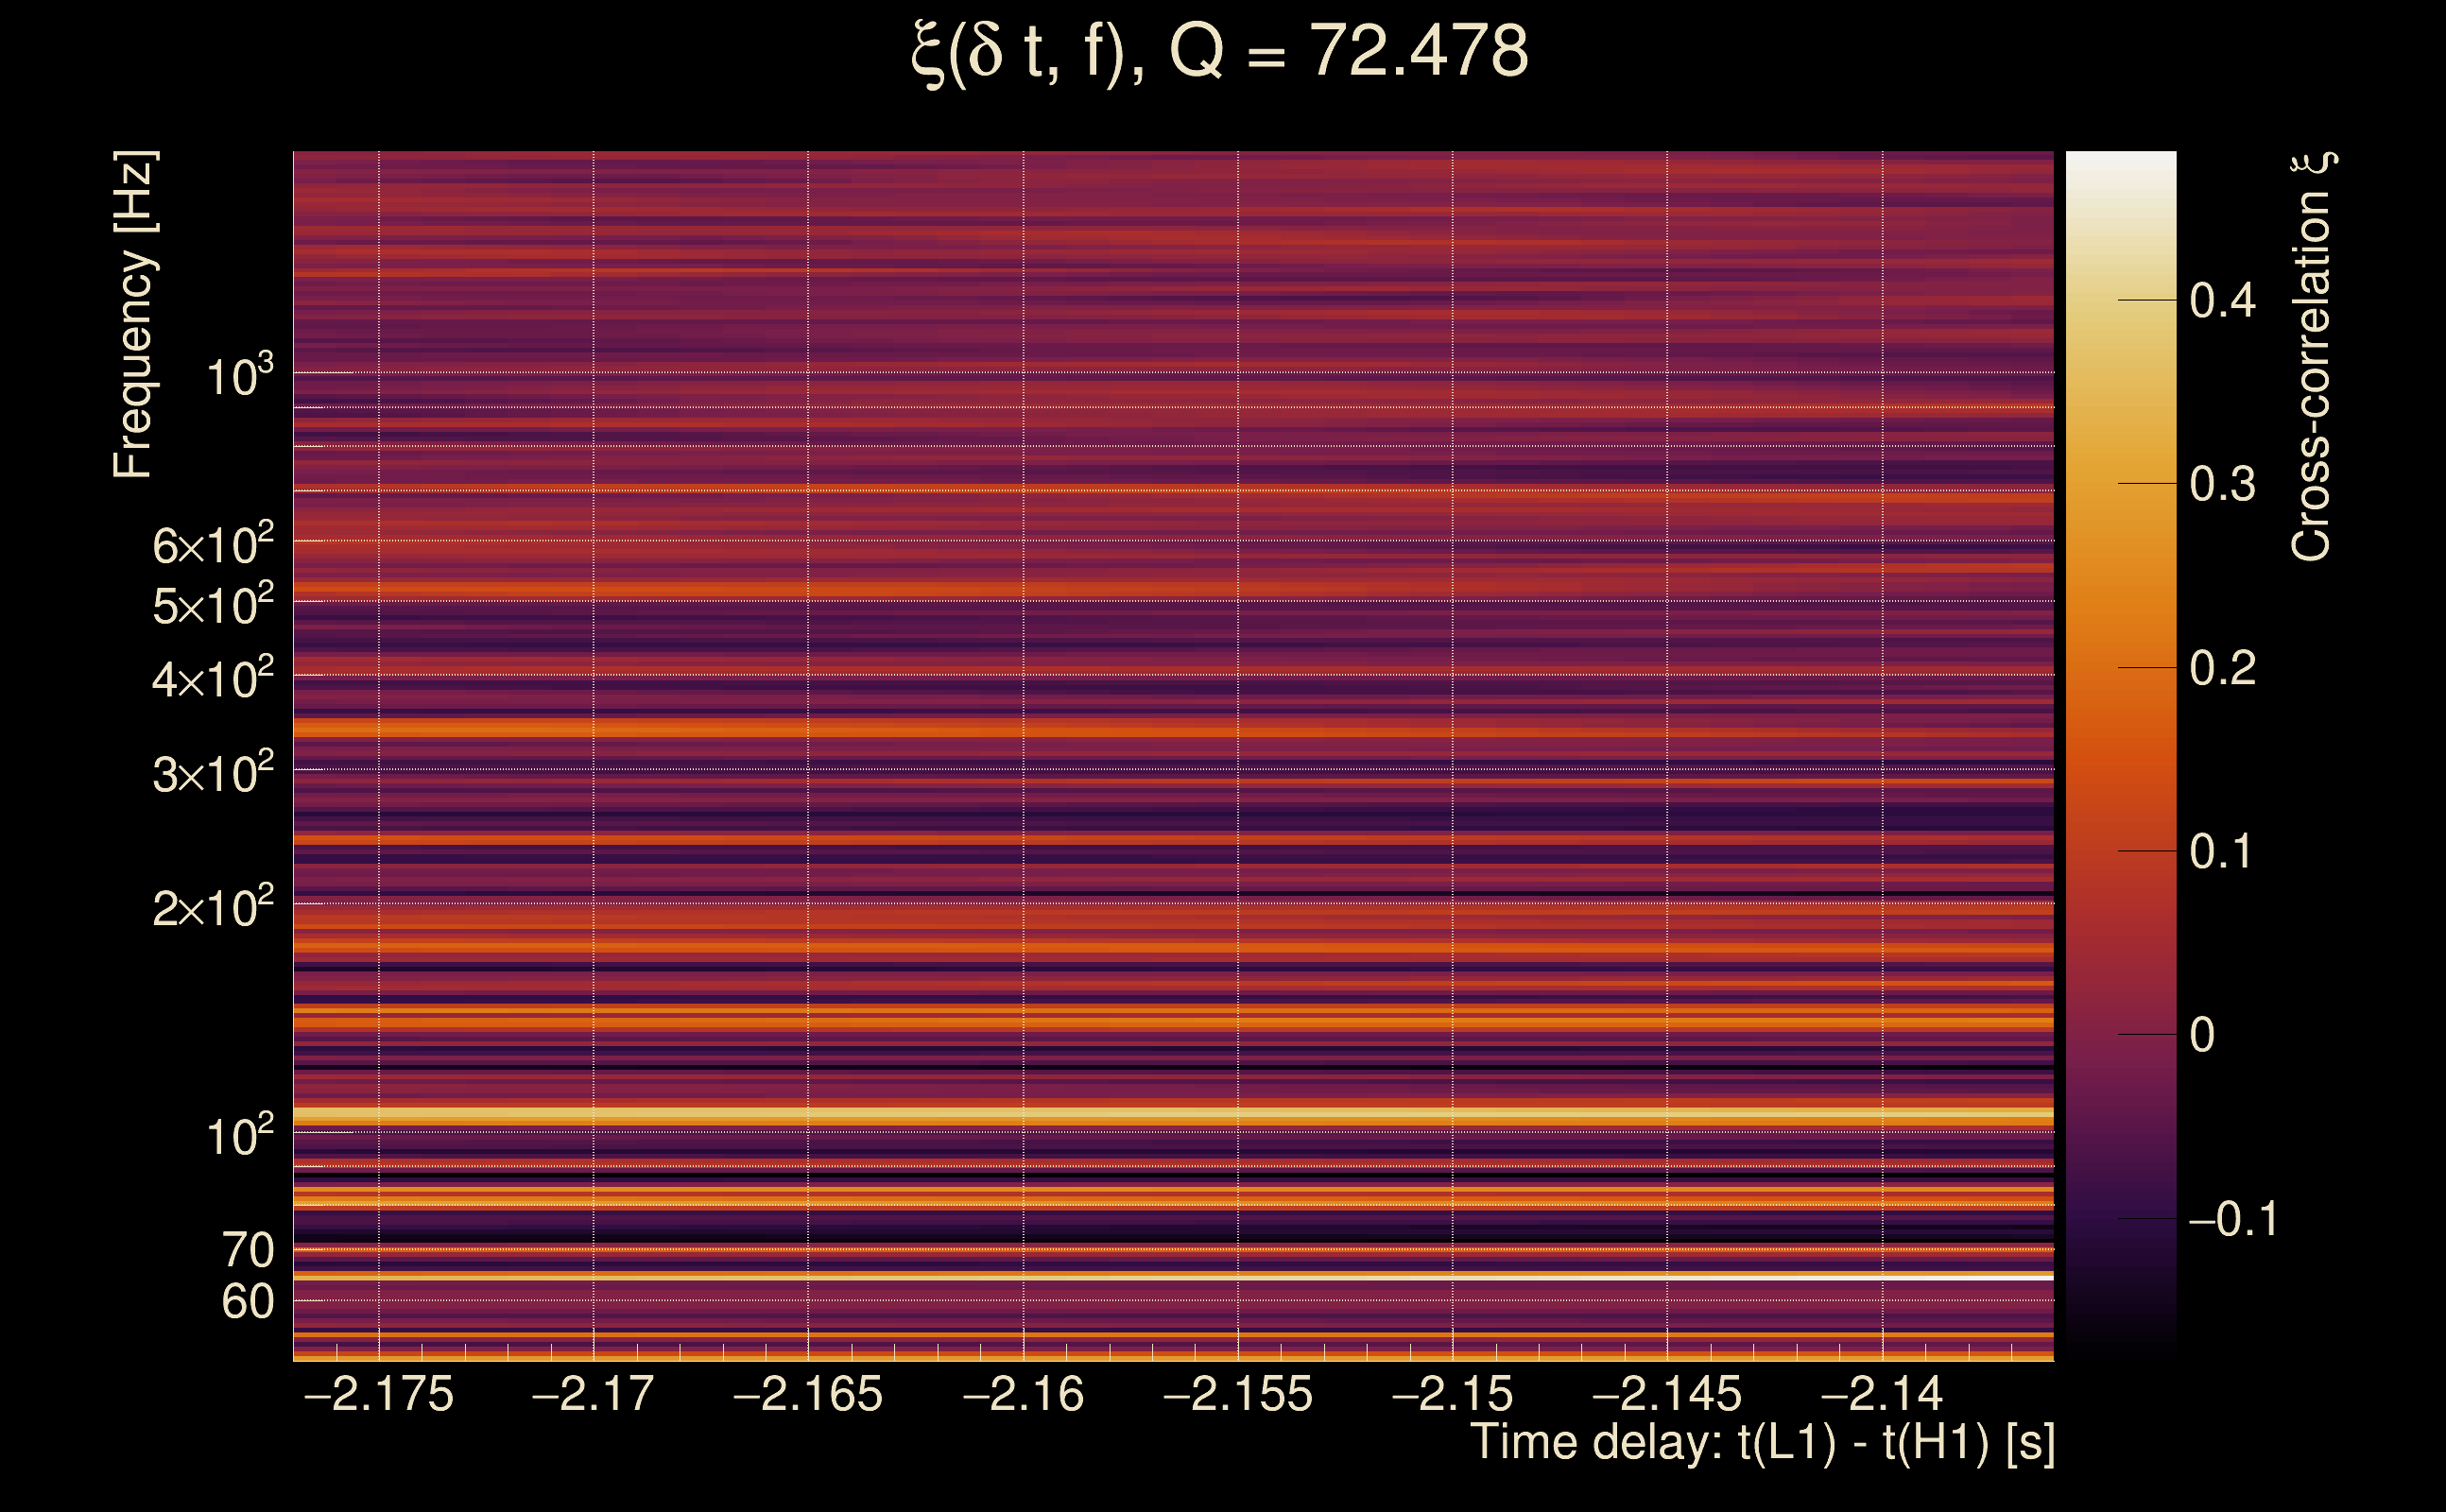
| Frequency: | 289.649 Hz |
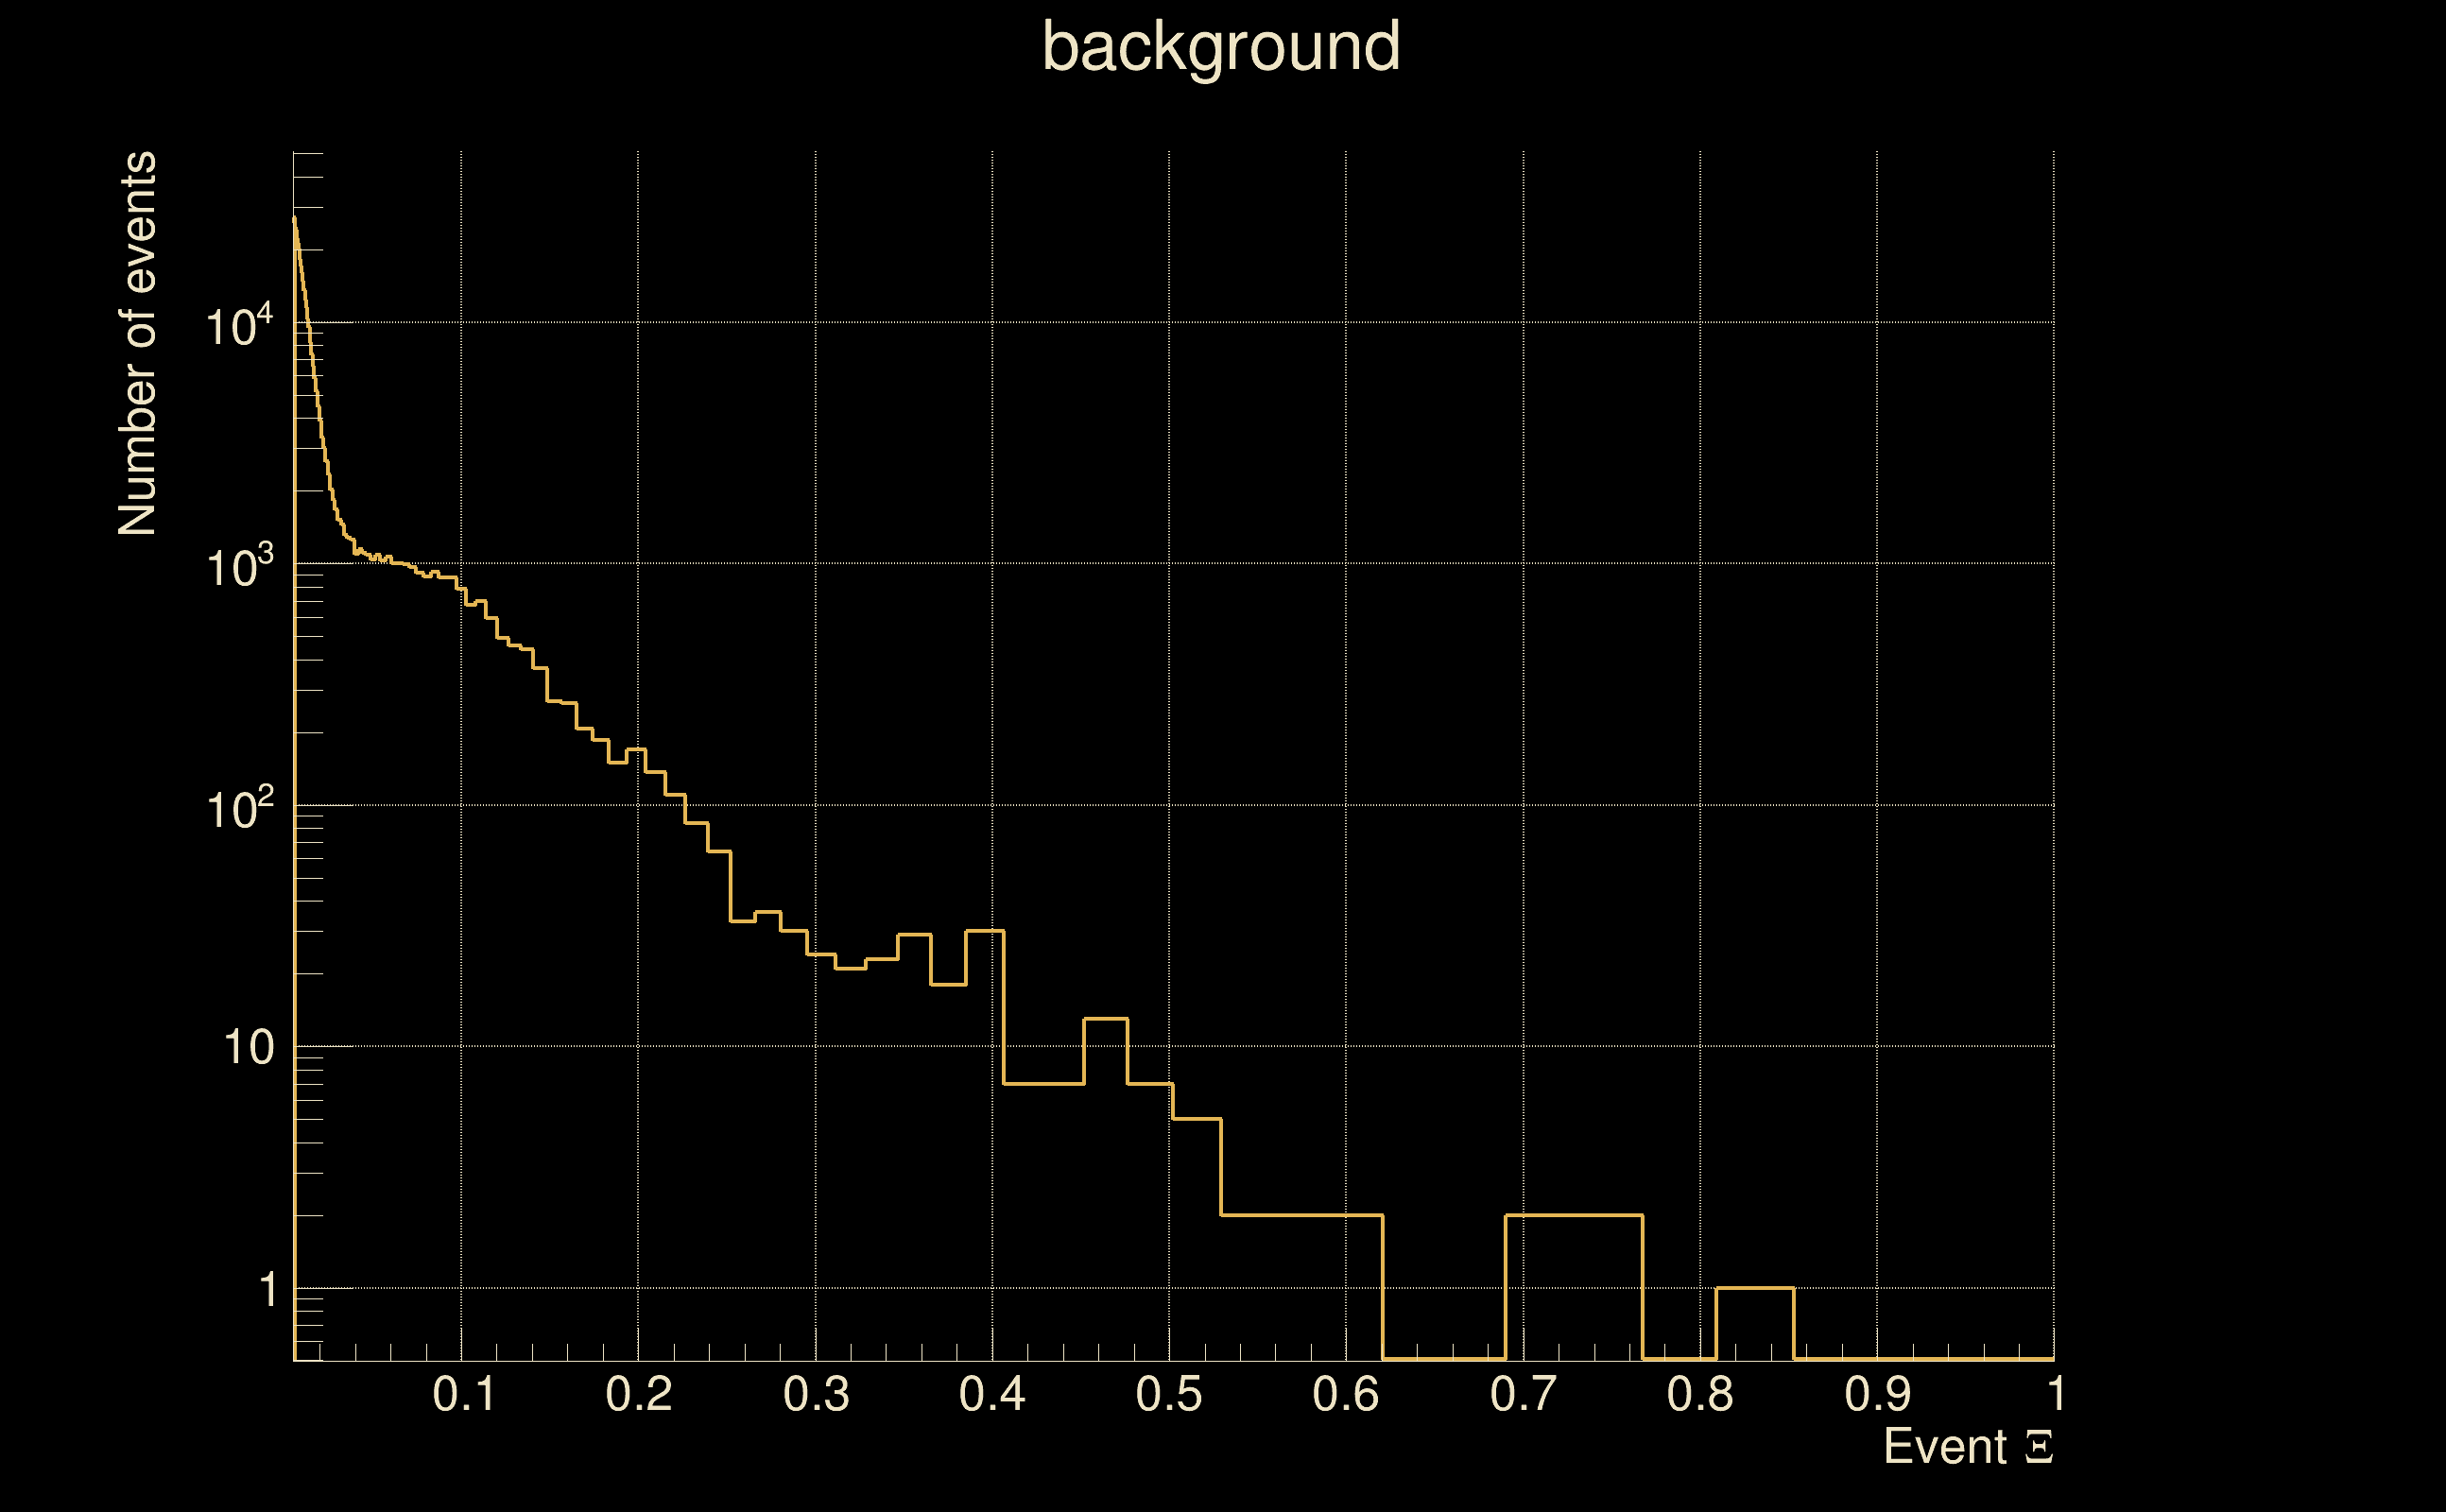
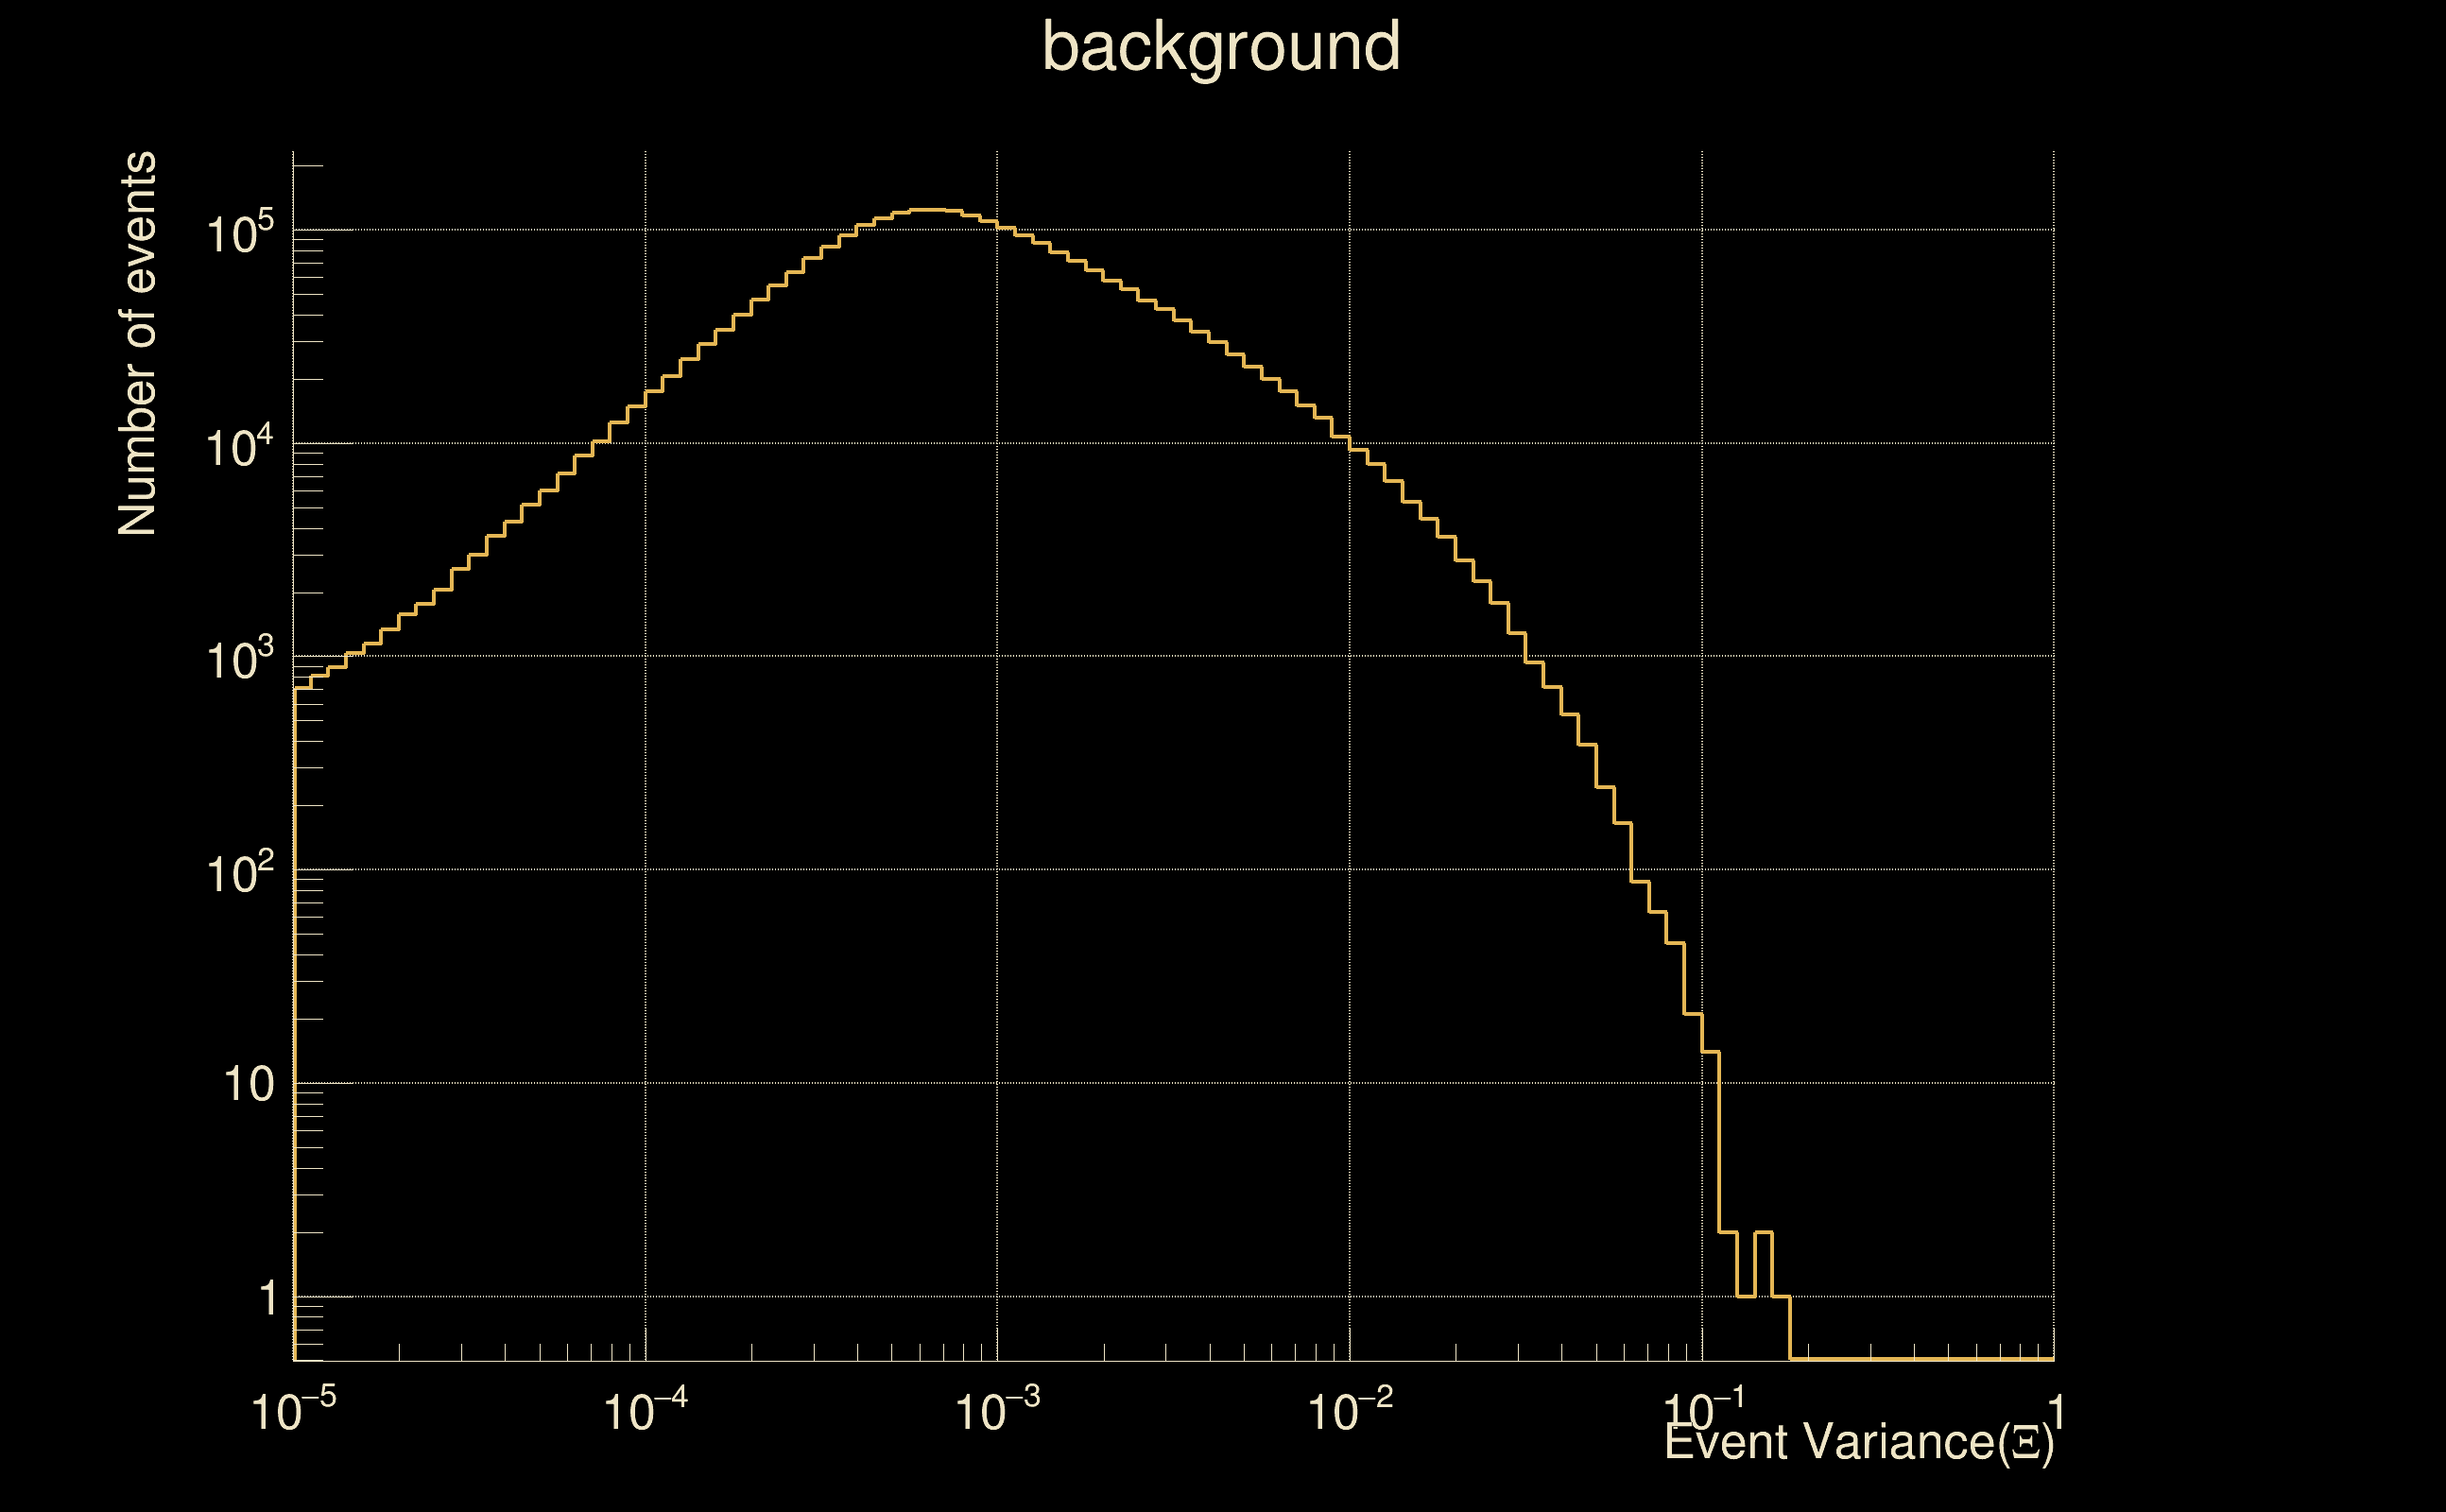
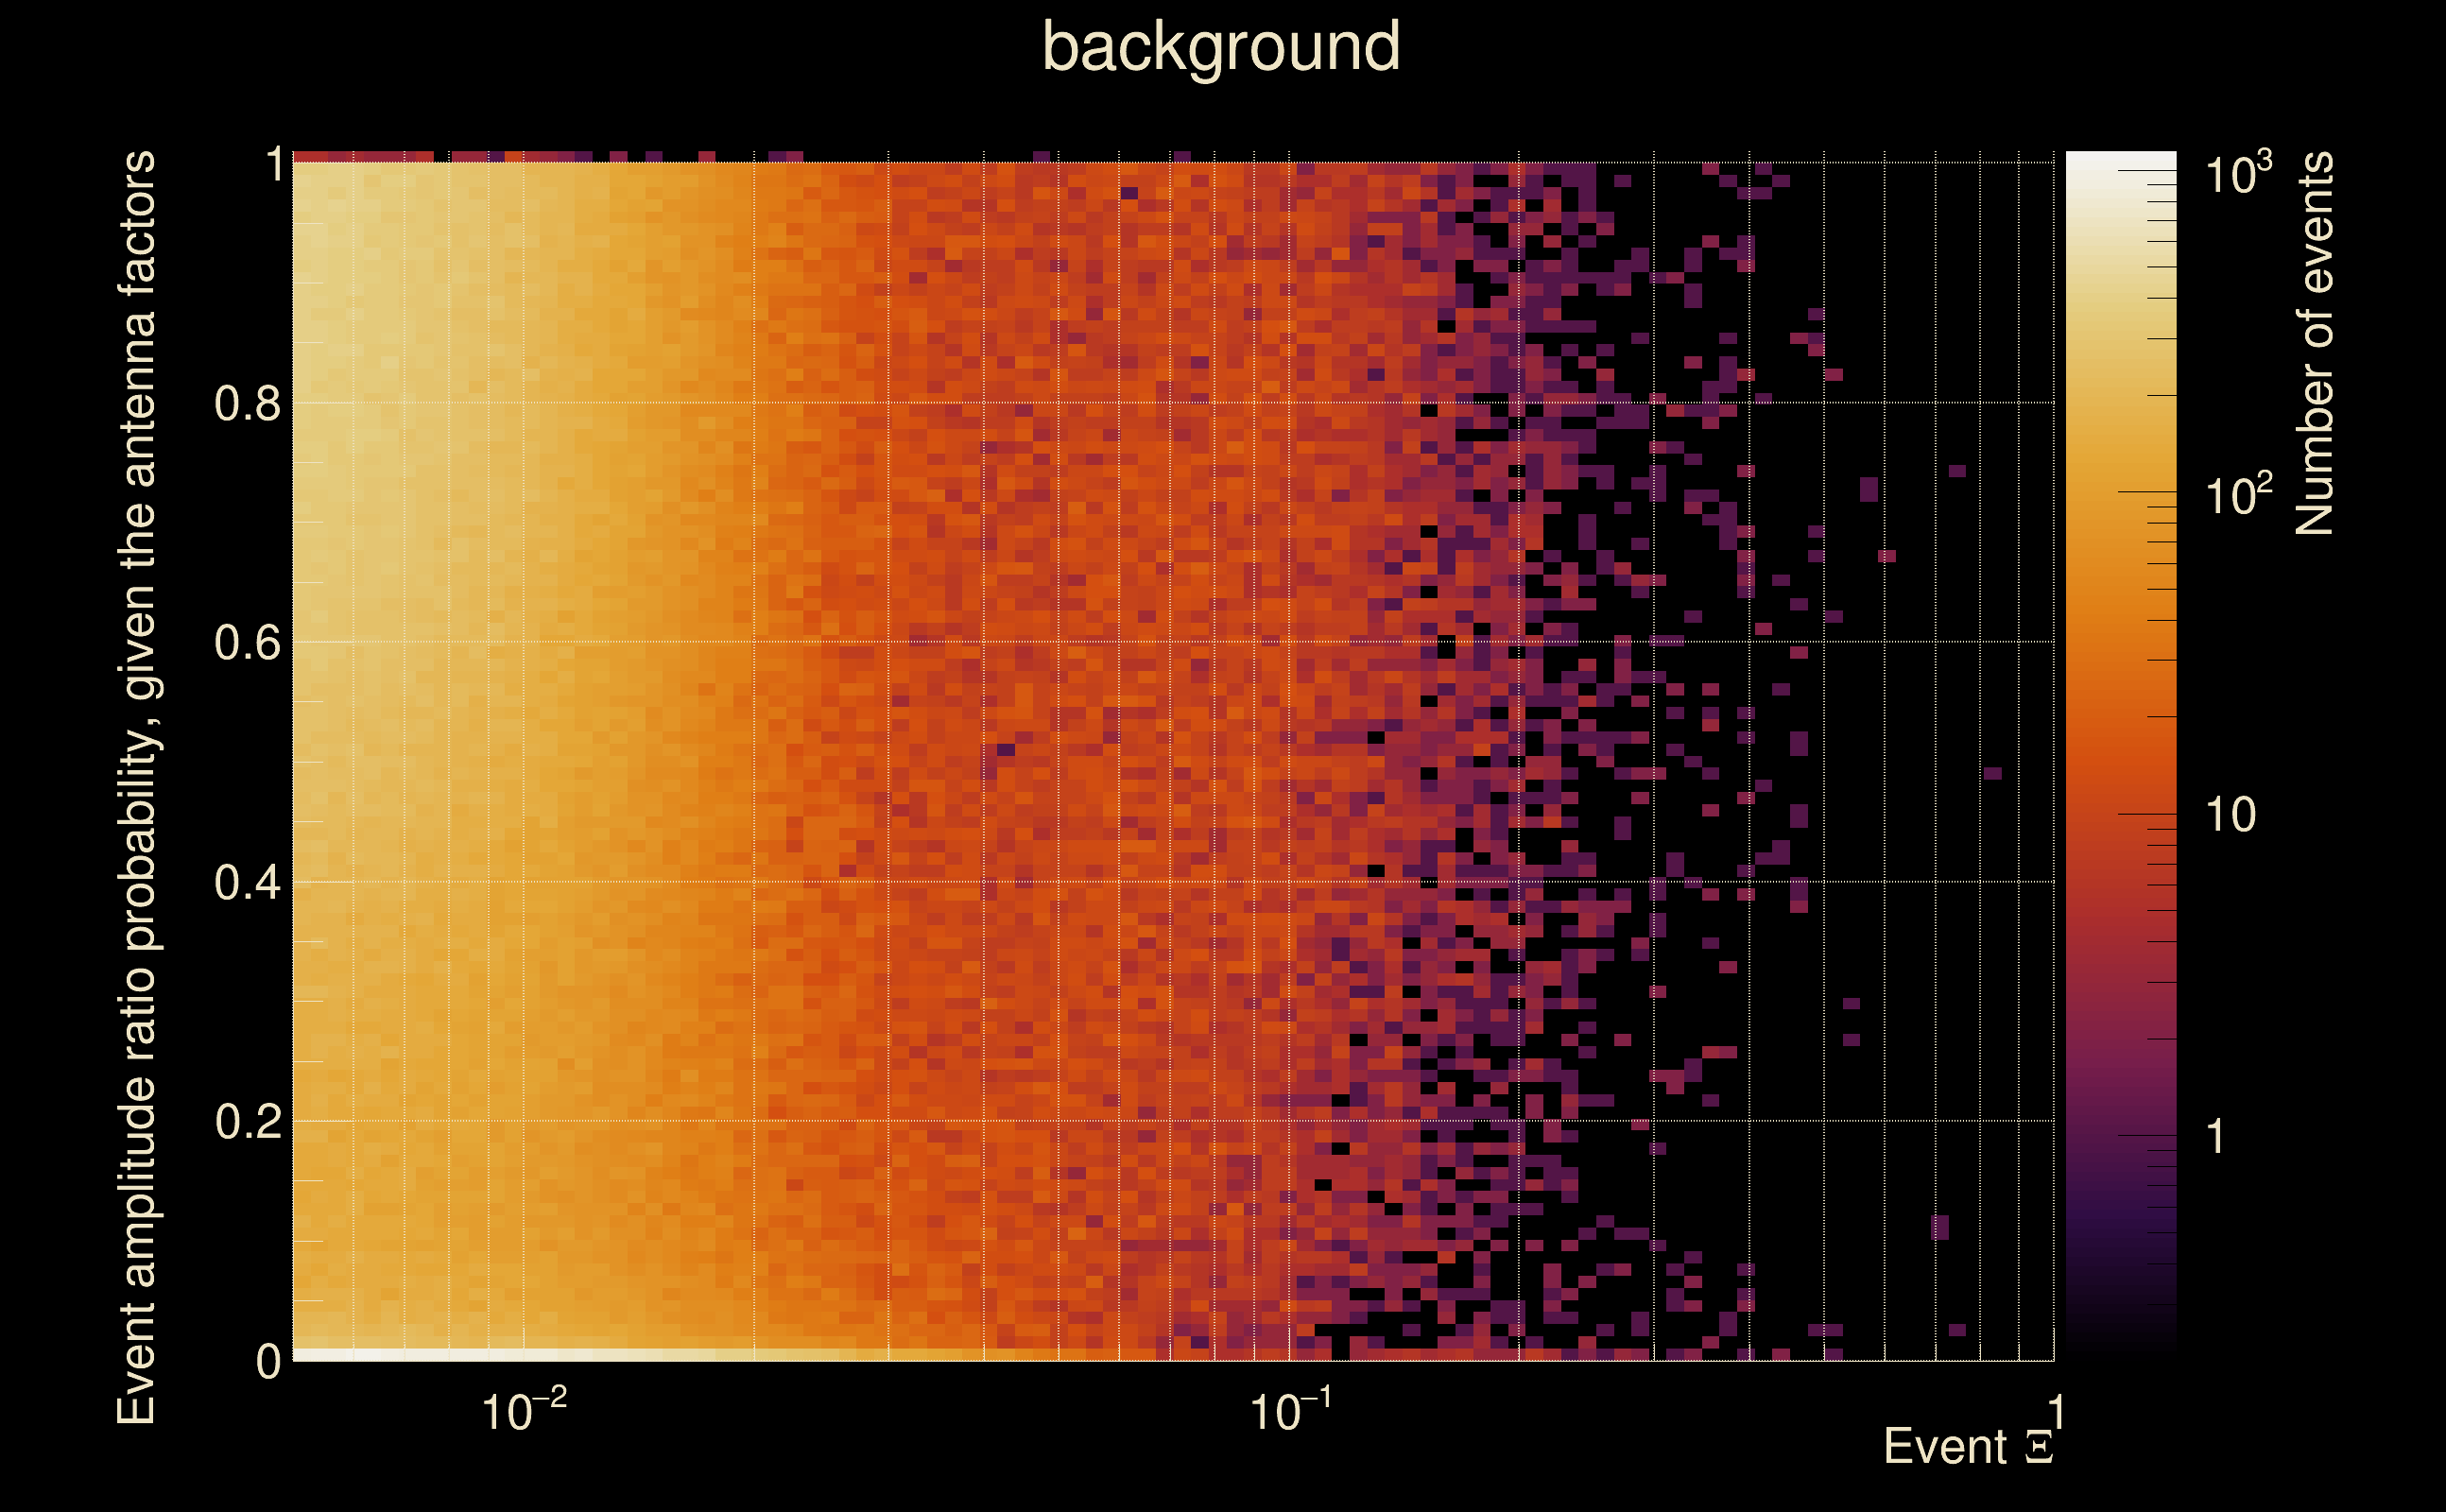
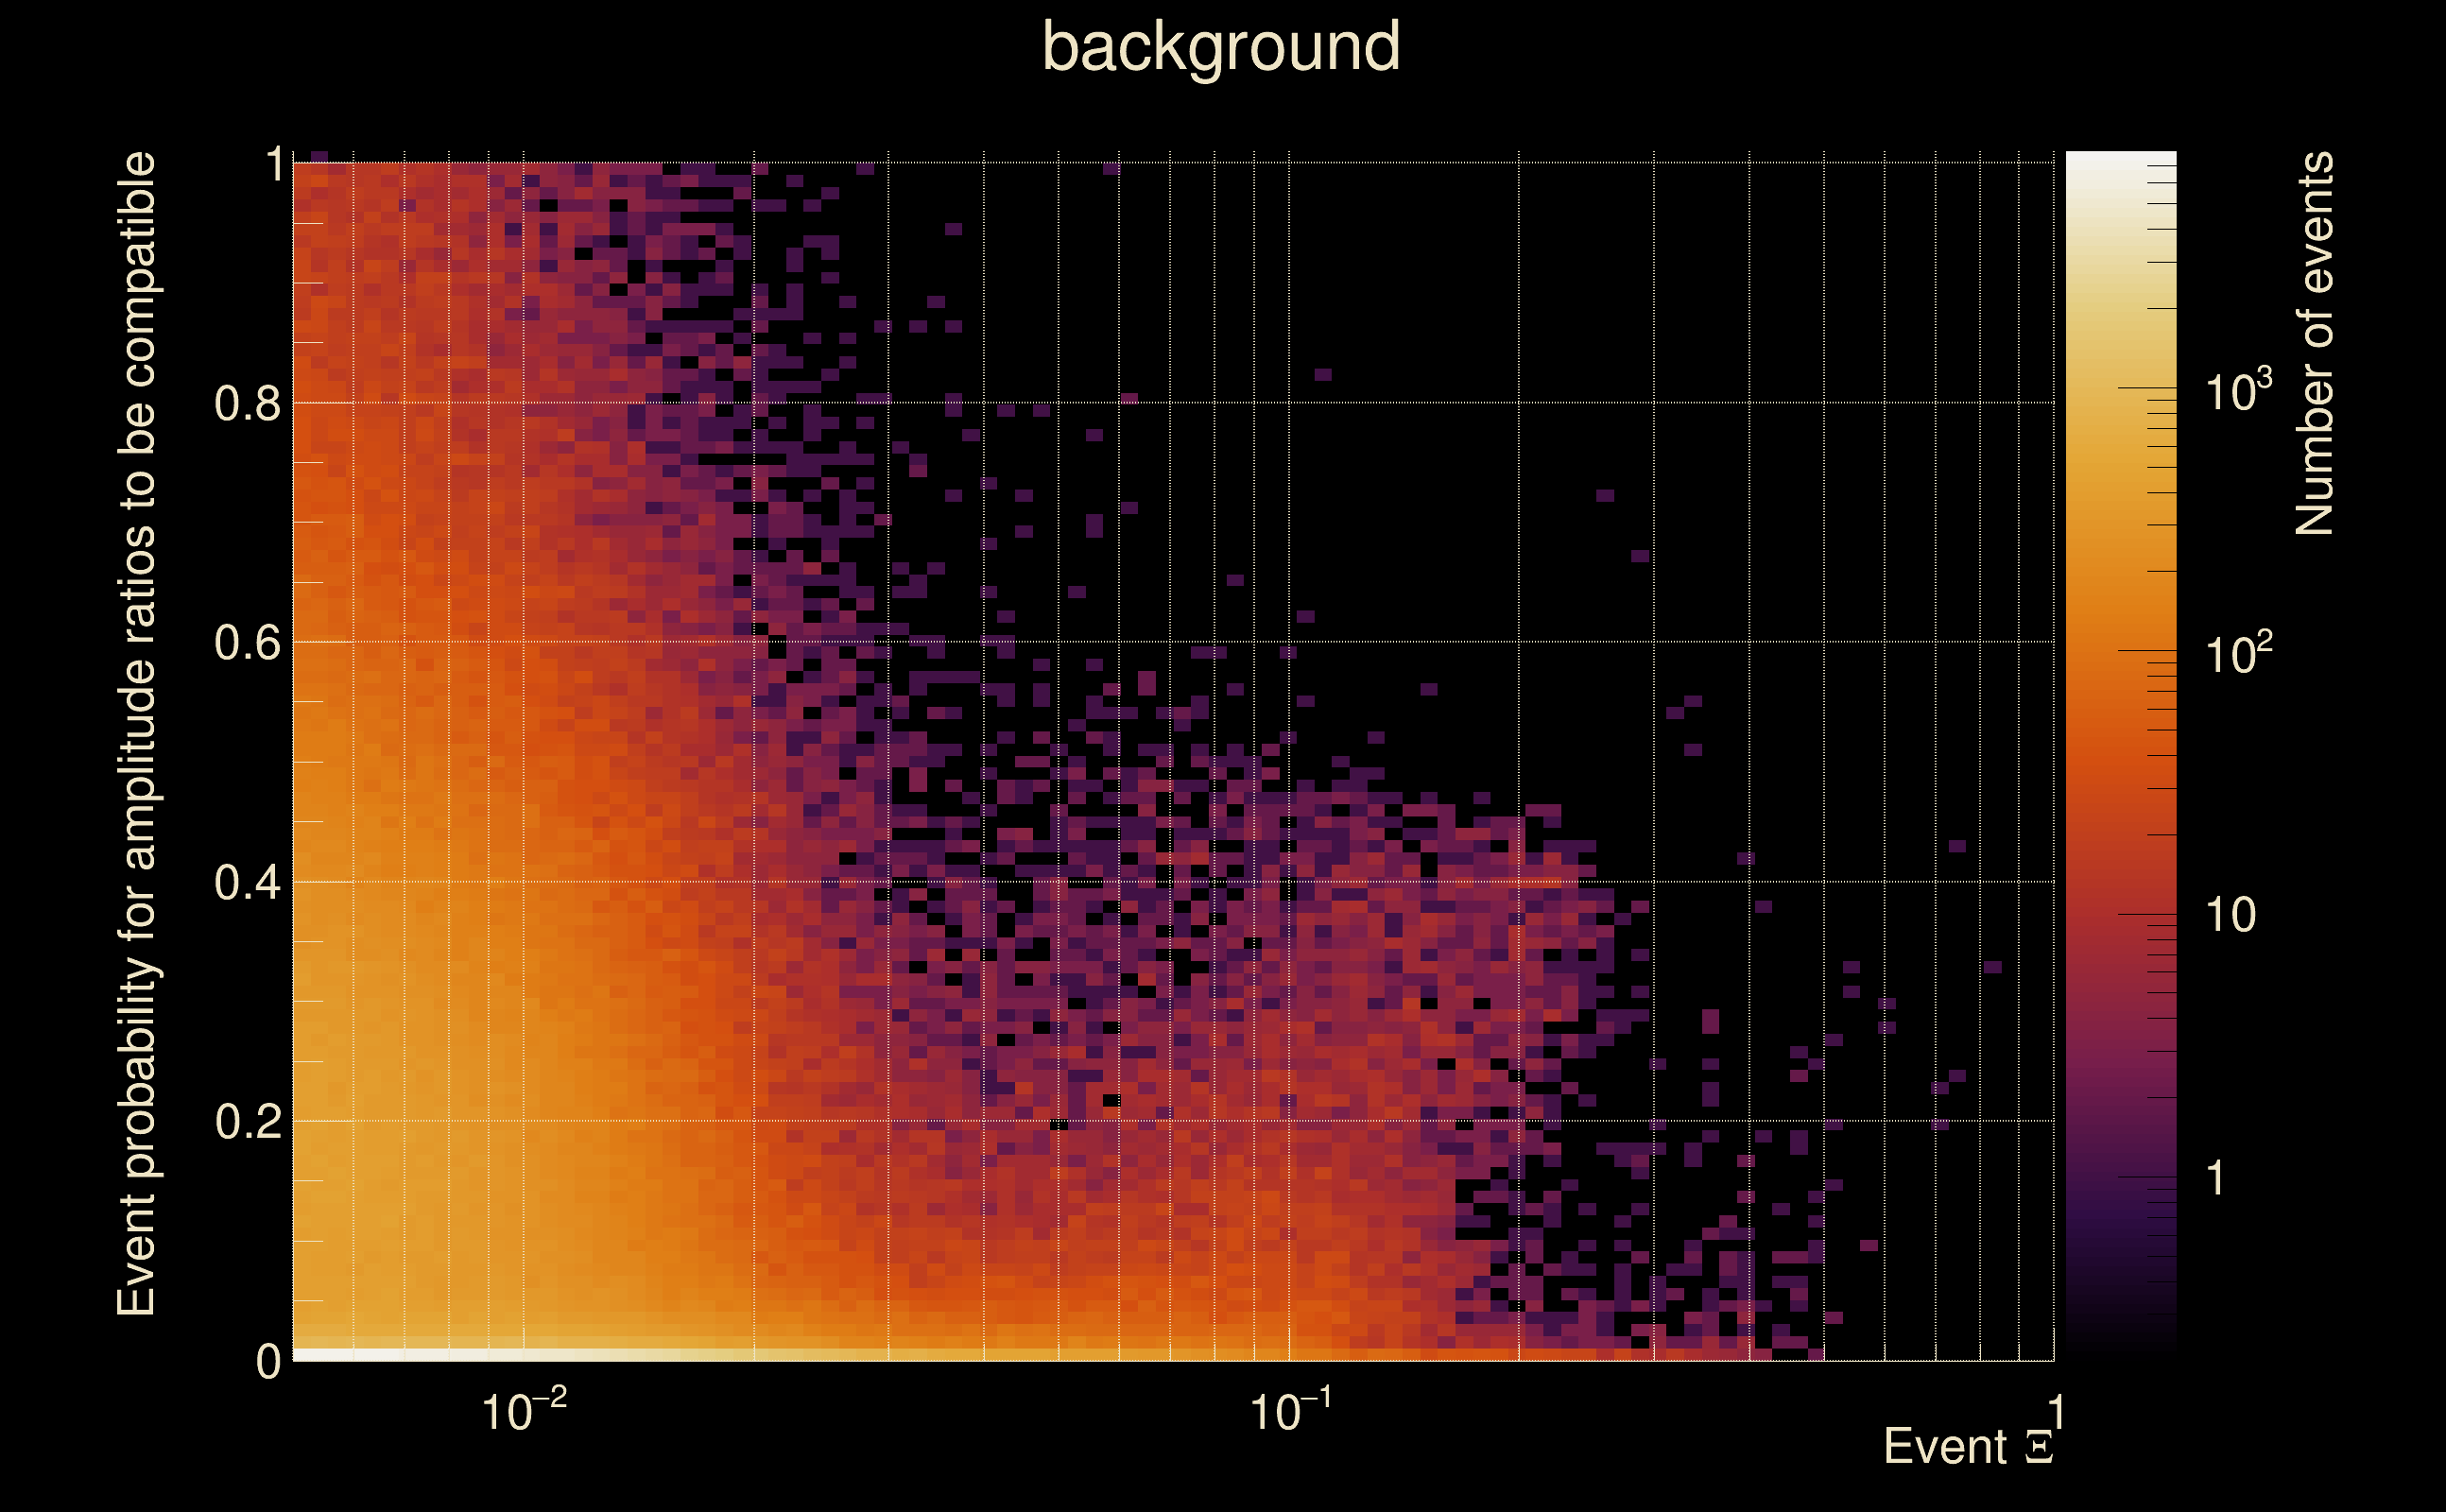
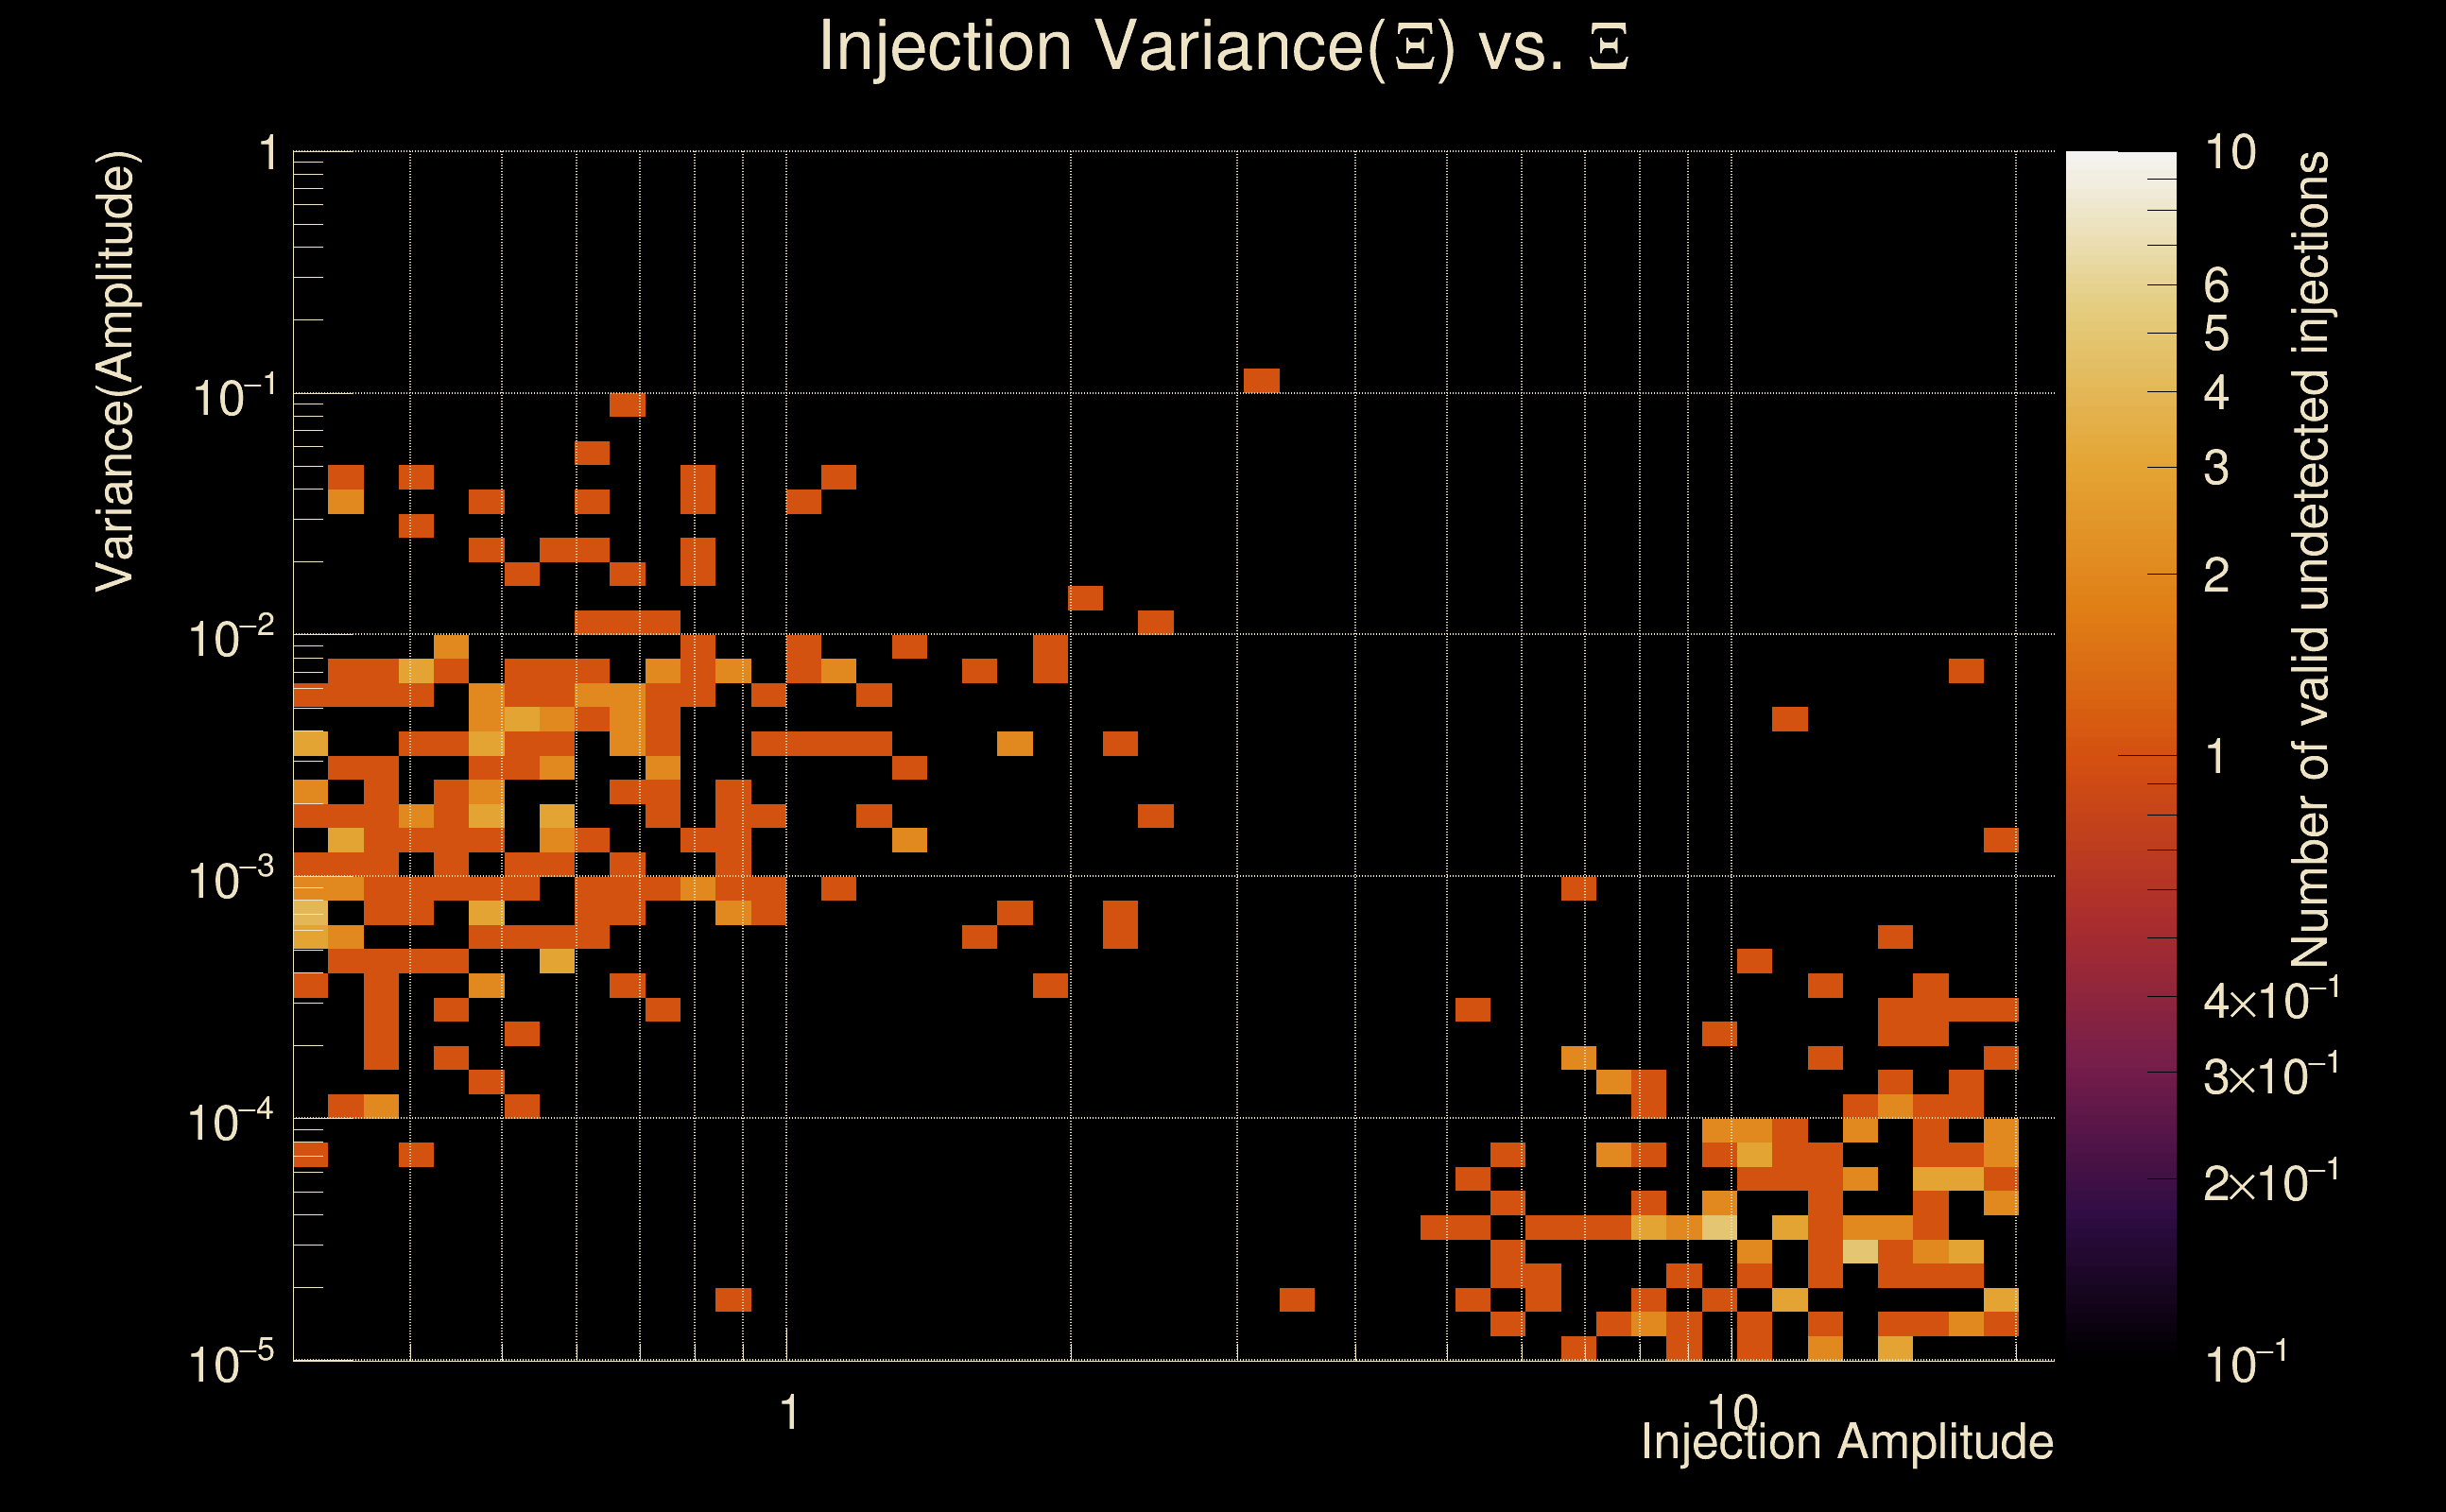
| Ξ: | 0.964007 ± 0.00690558 (variance = 4.7687e-05): Q0: 0.968059, Q1: 0.97246, Q2: 0.968695, Q3: 0.959619, Q4: 0.953501 |
| Rank: | R_A = 0.919355 |
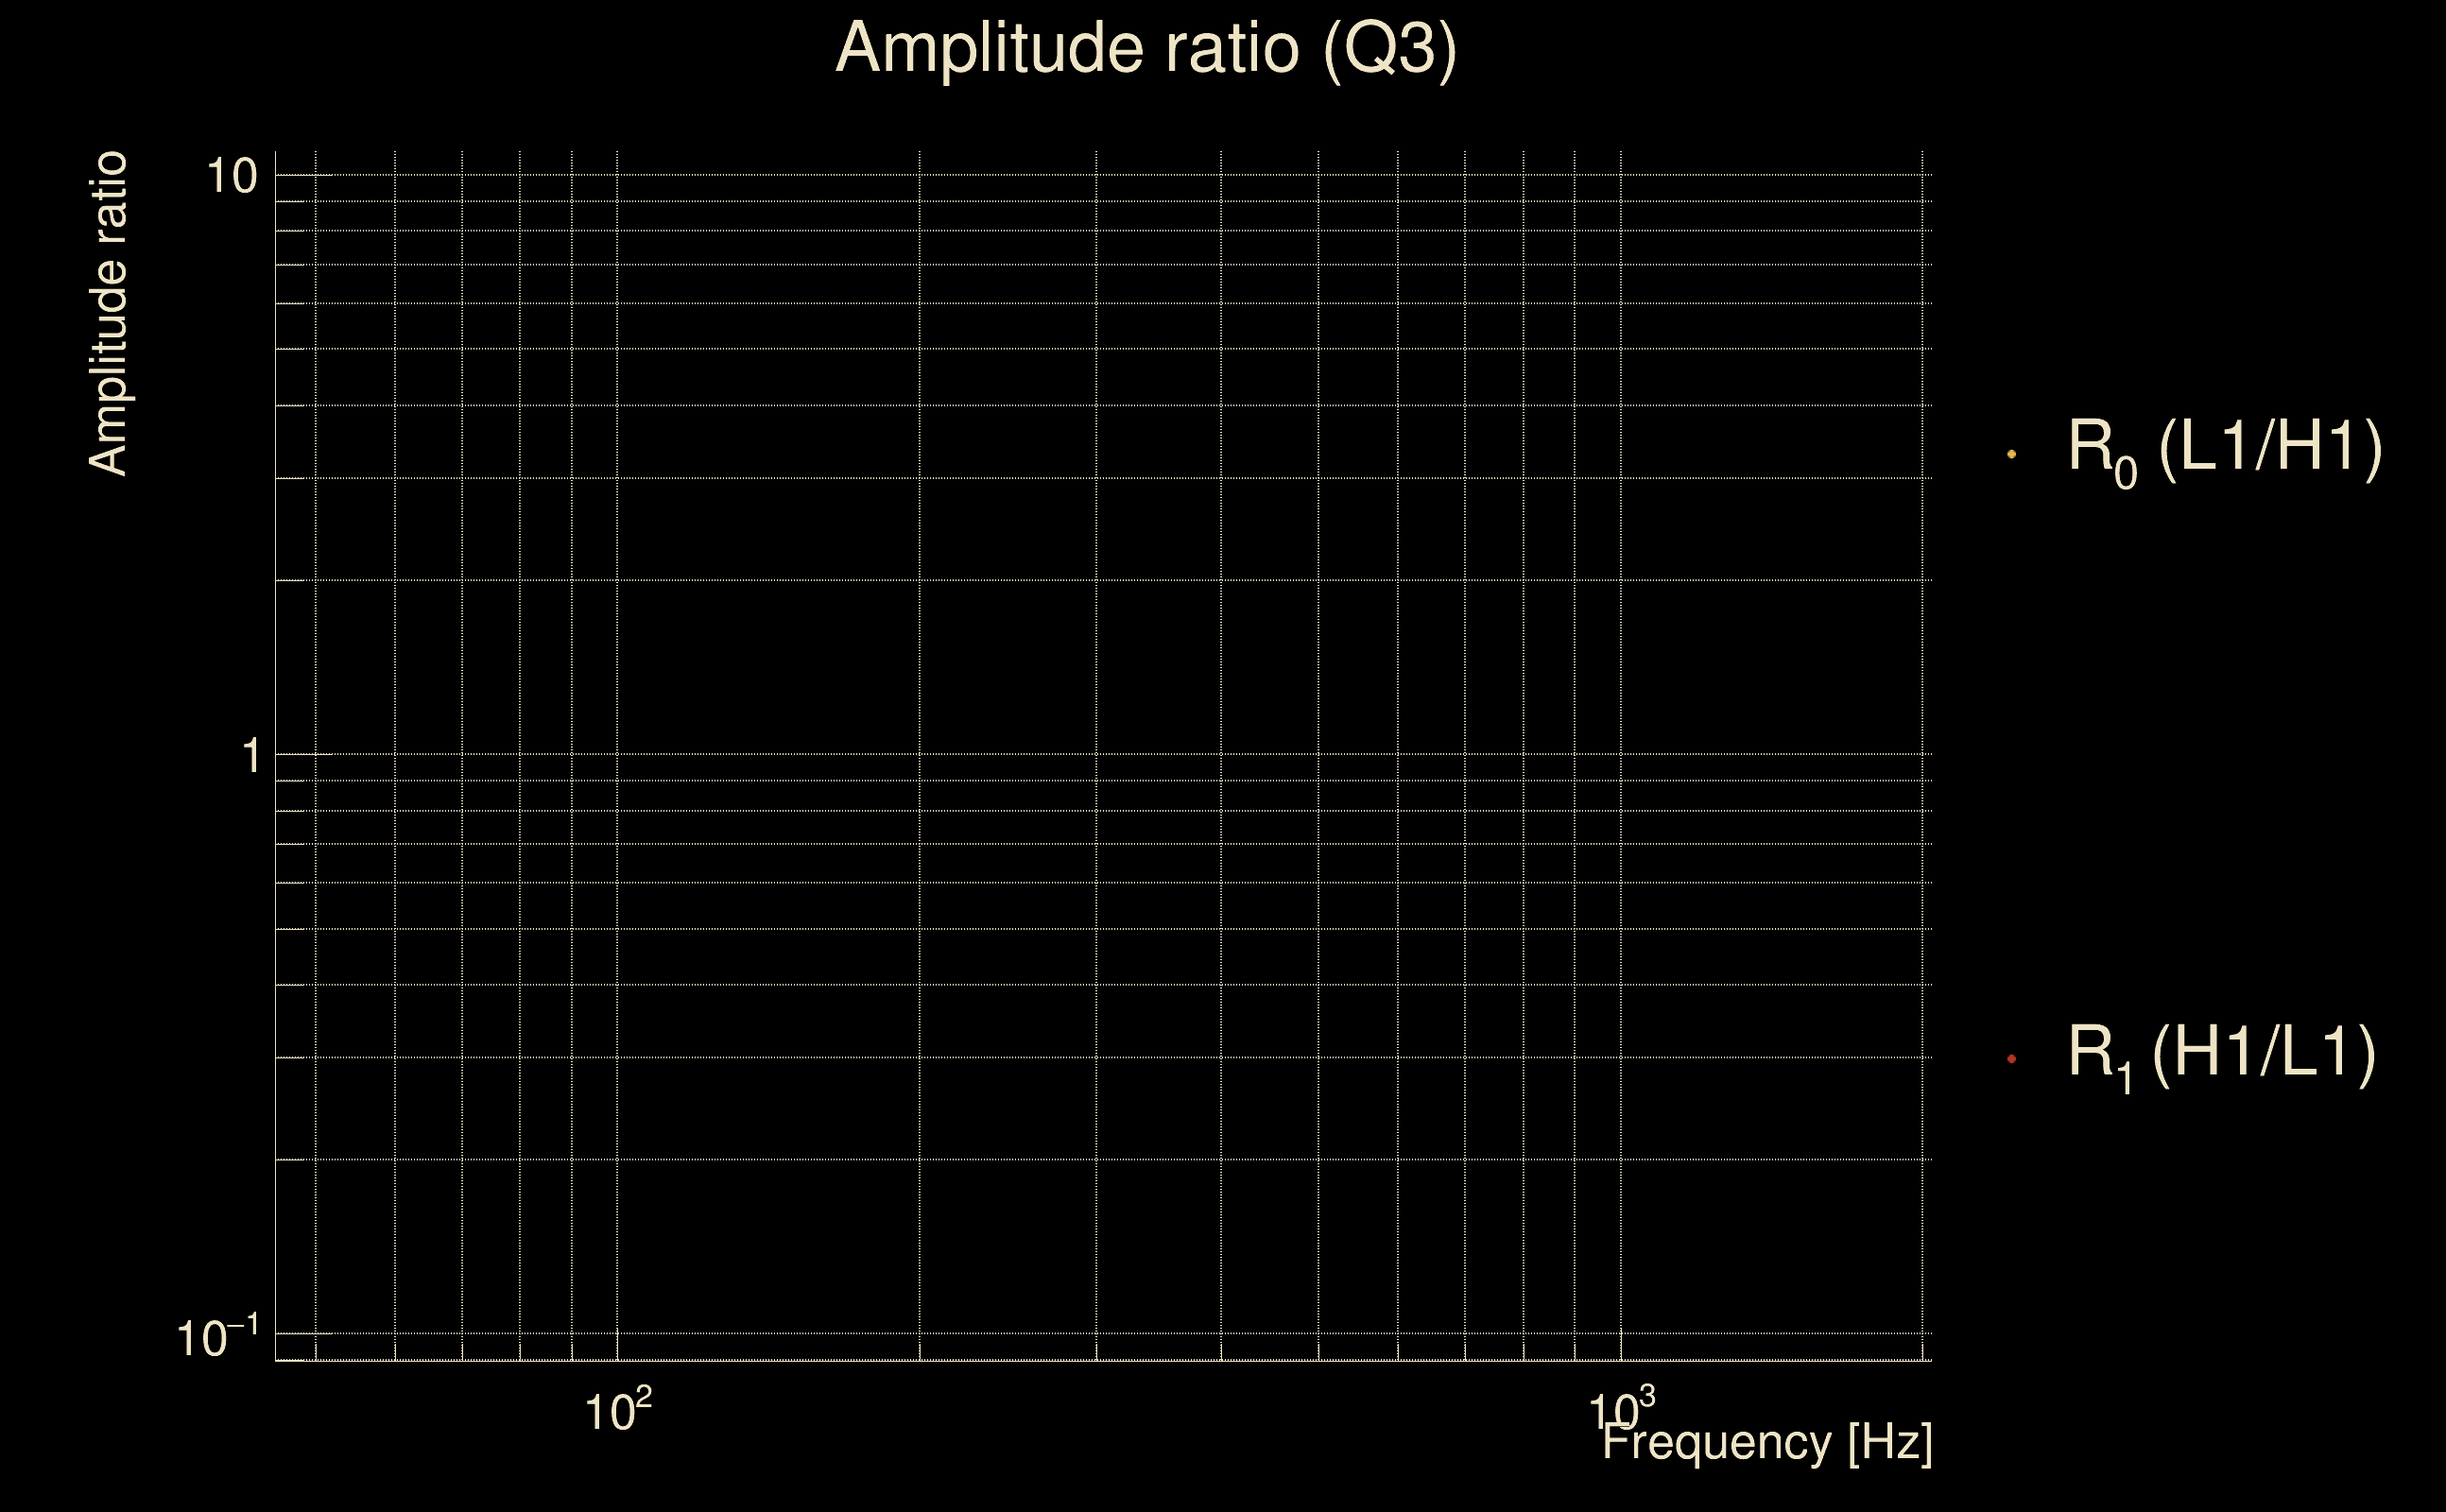
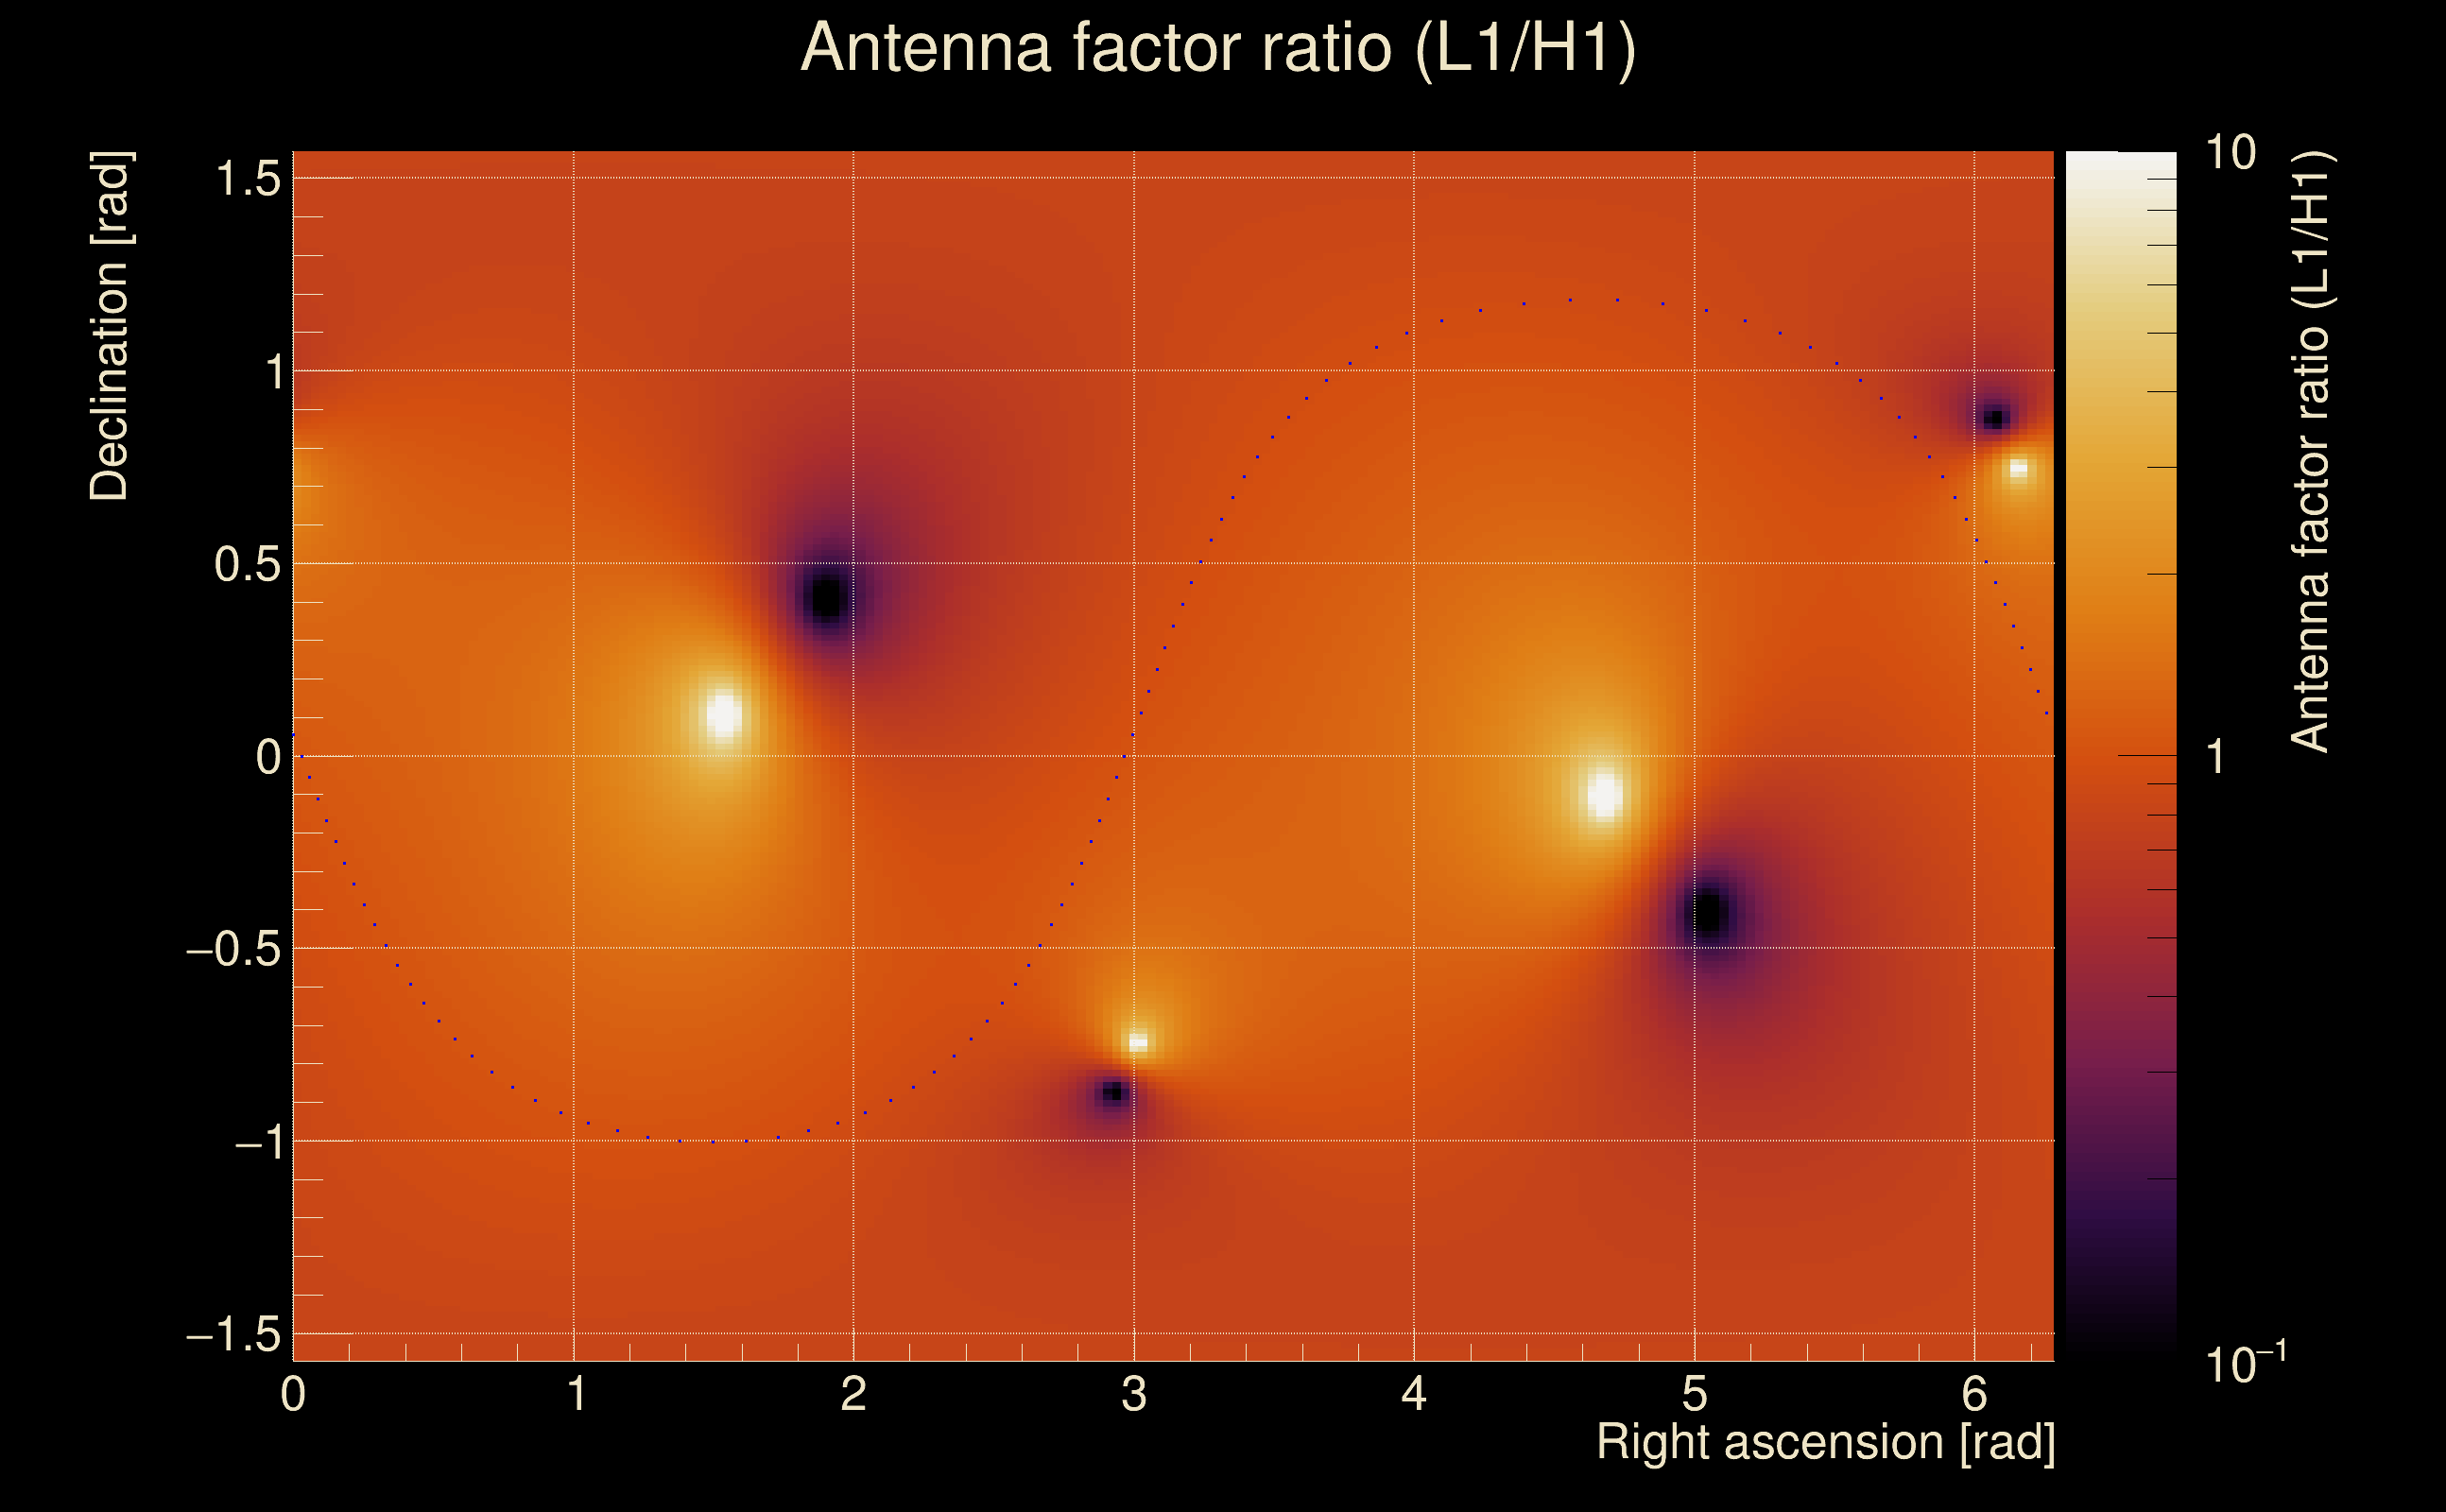
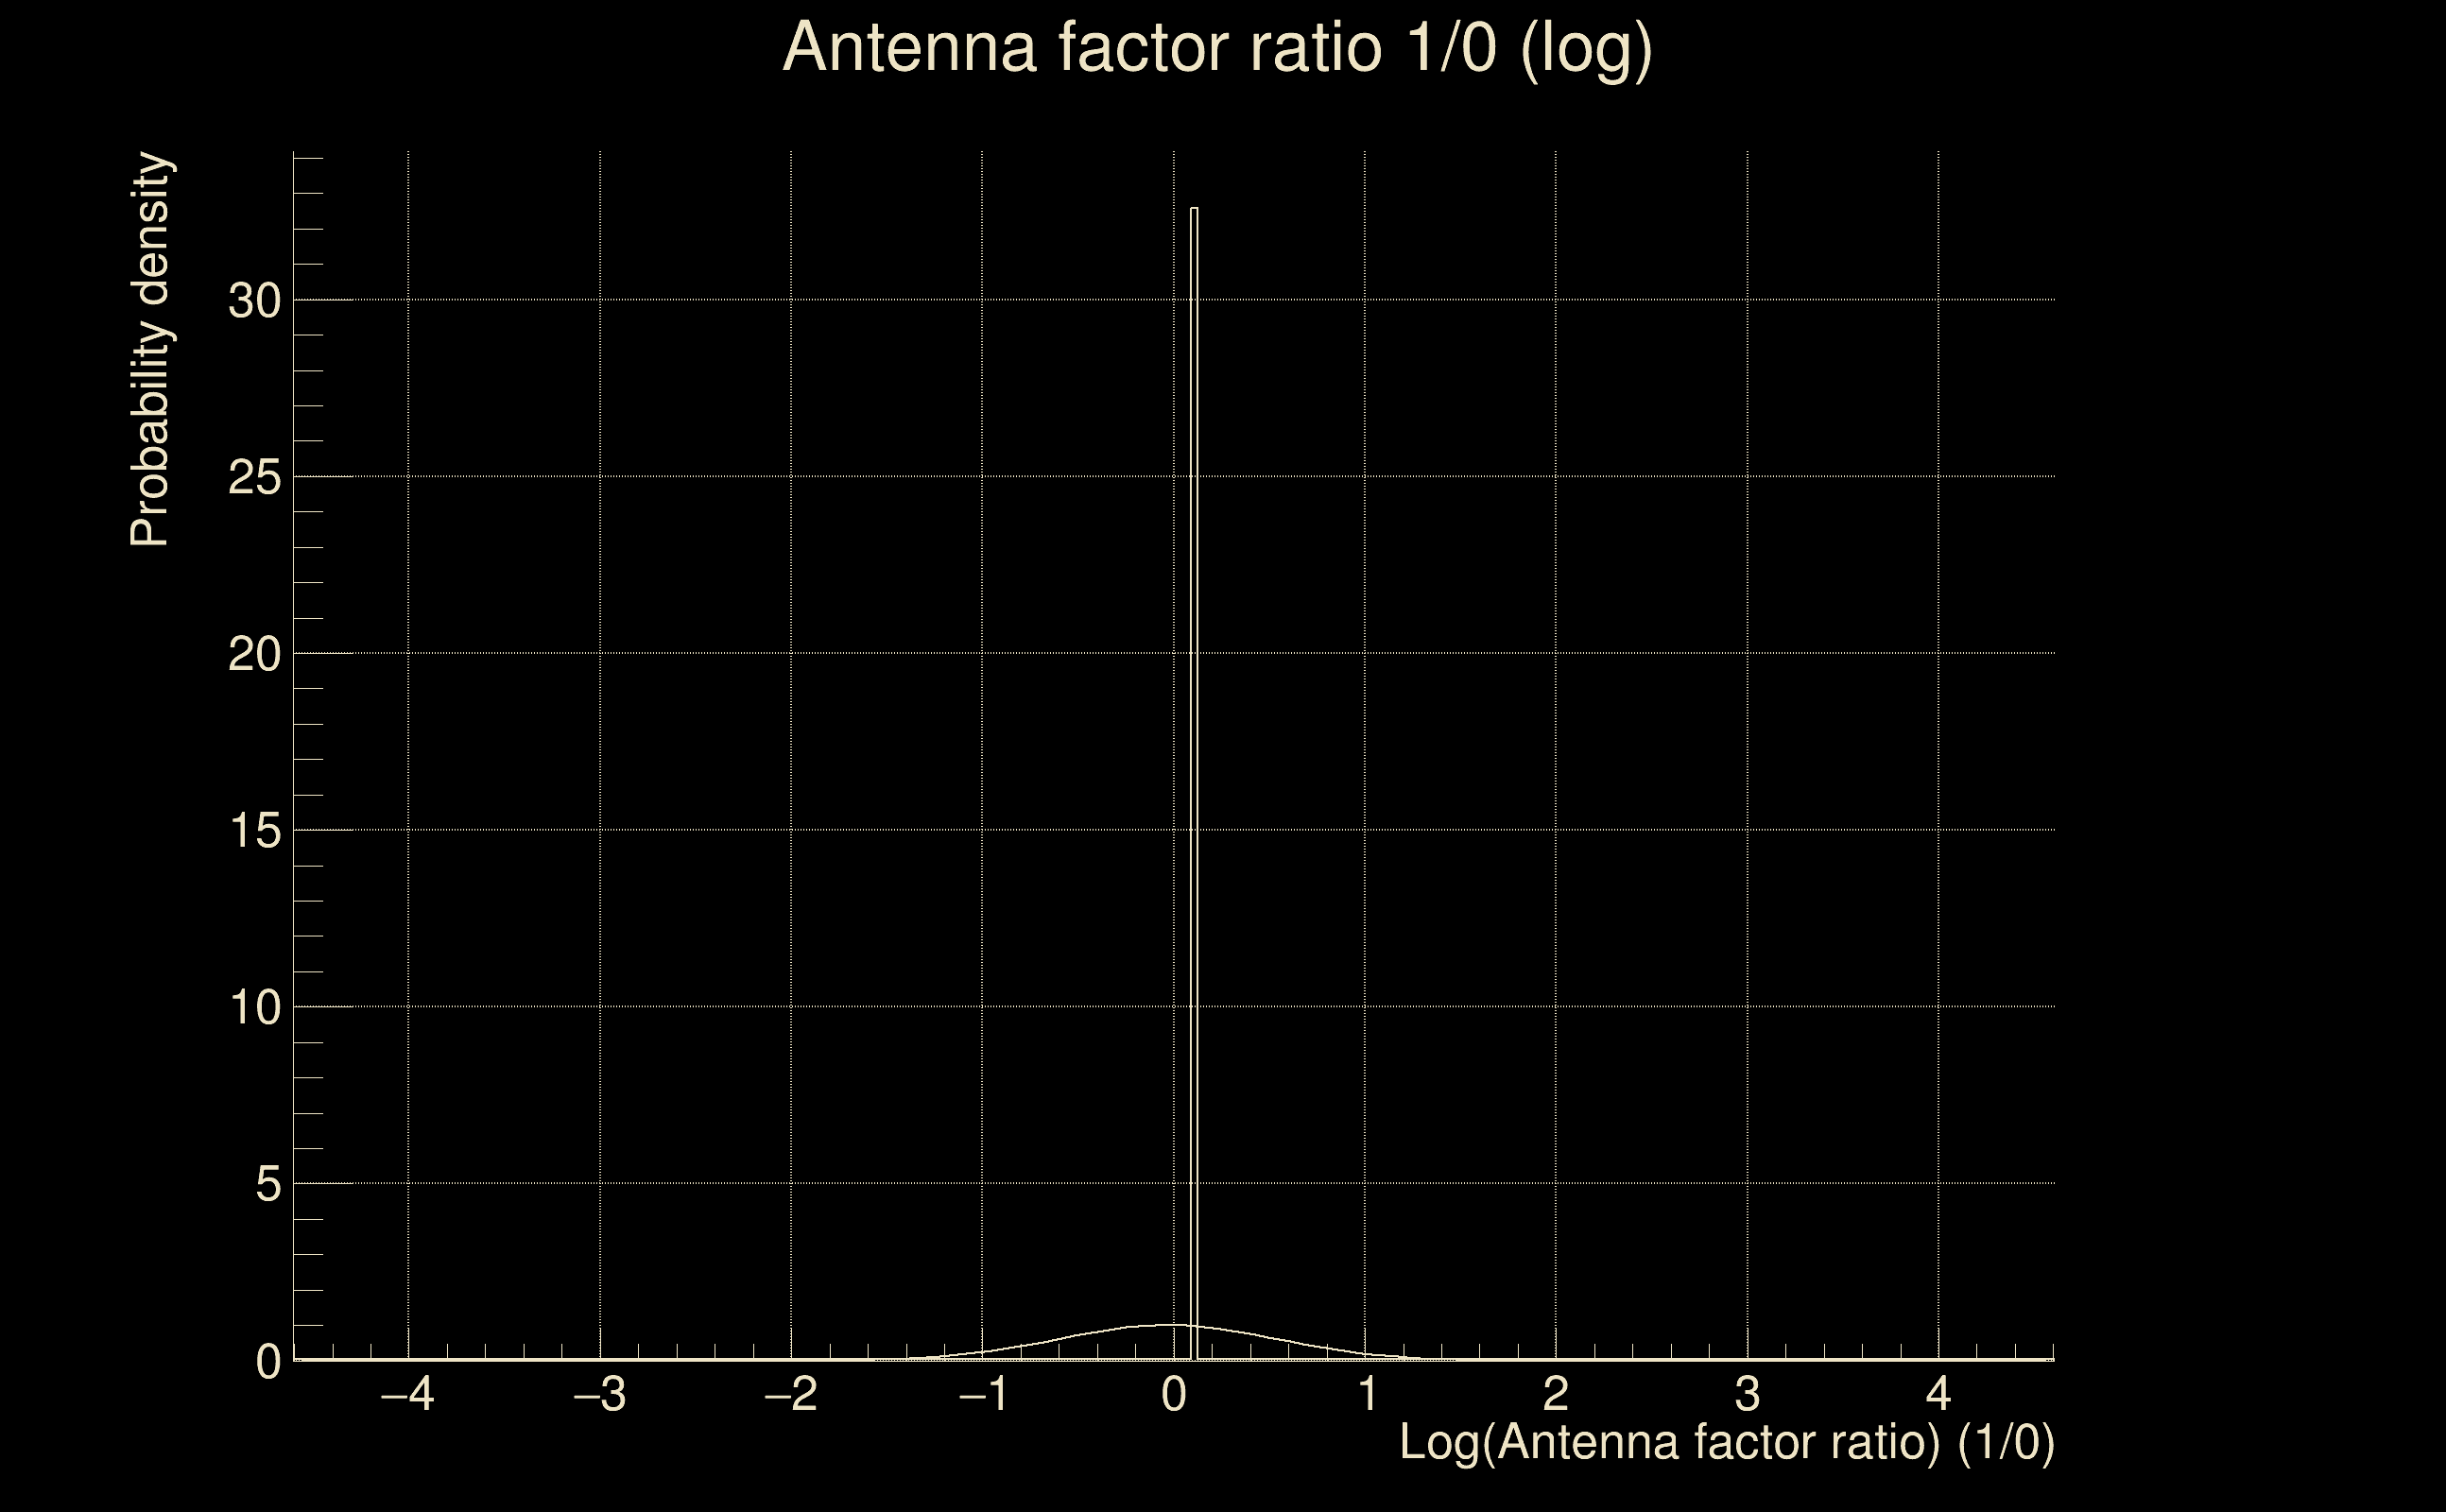
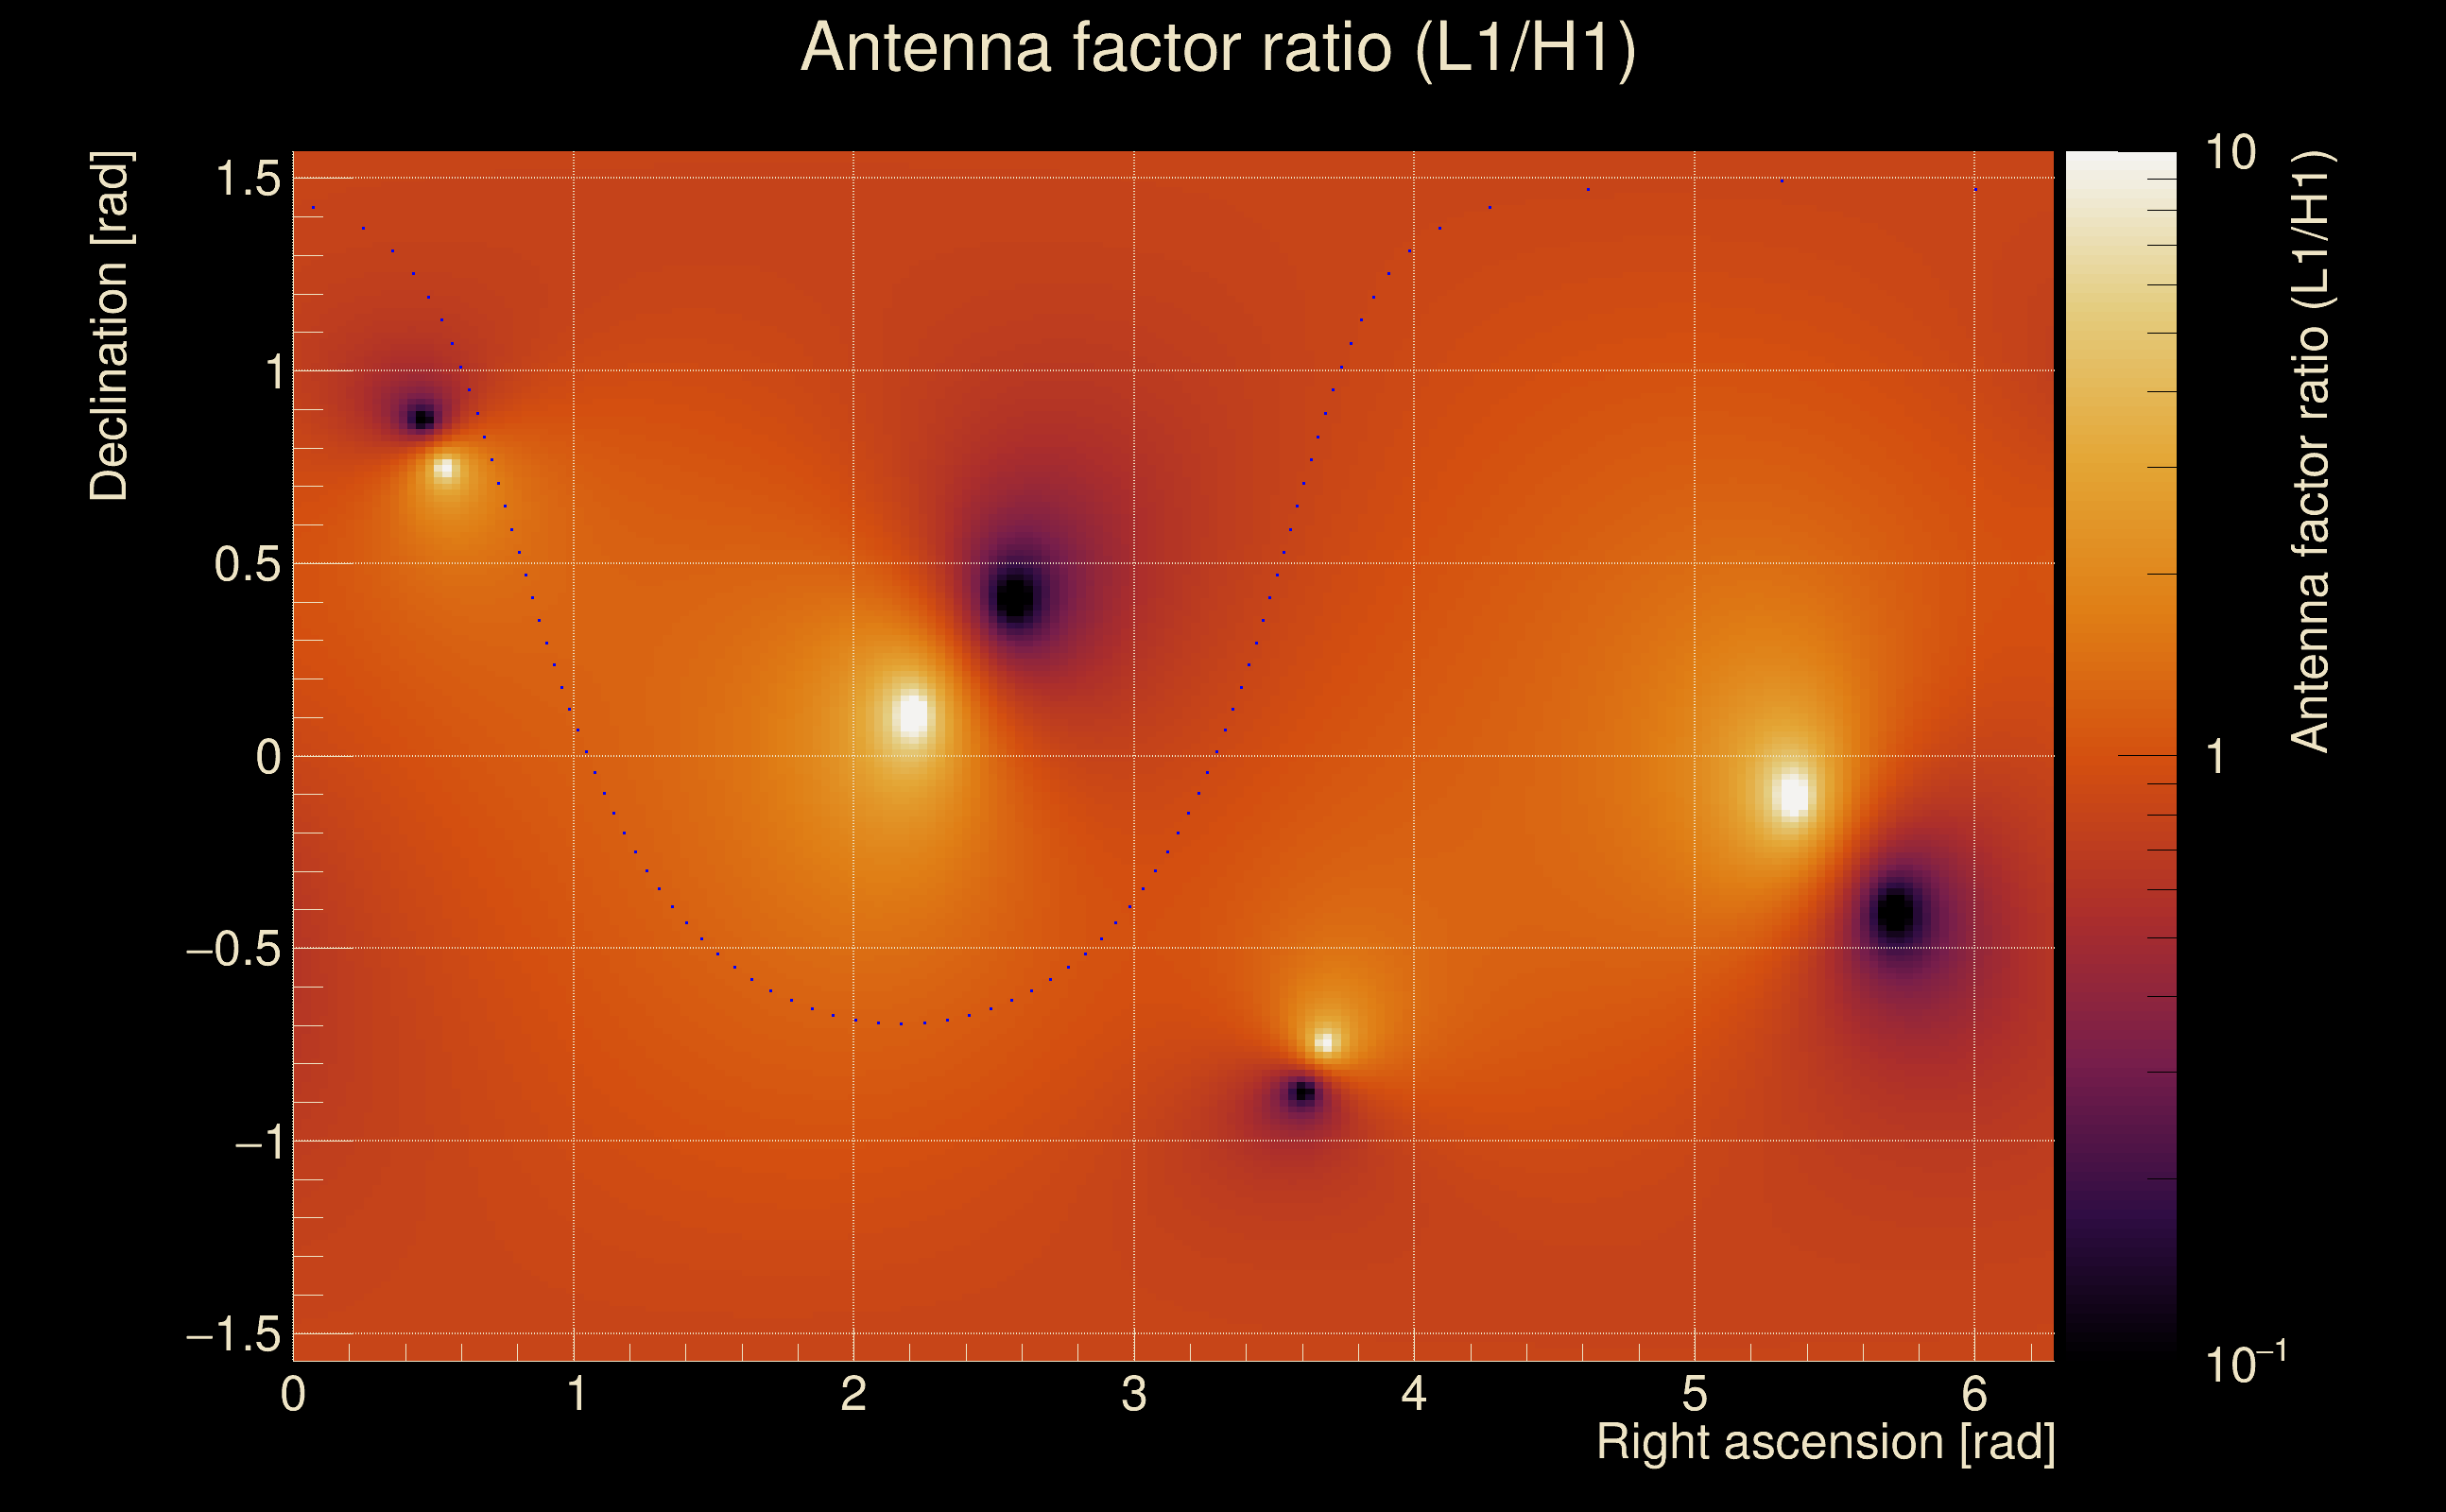
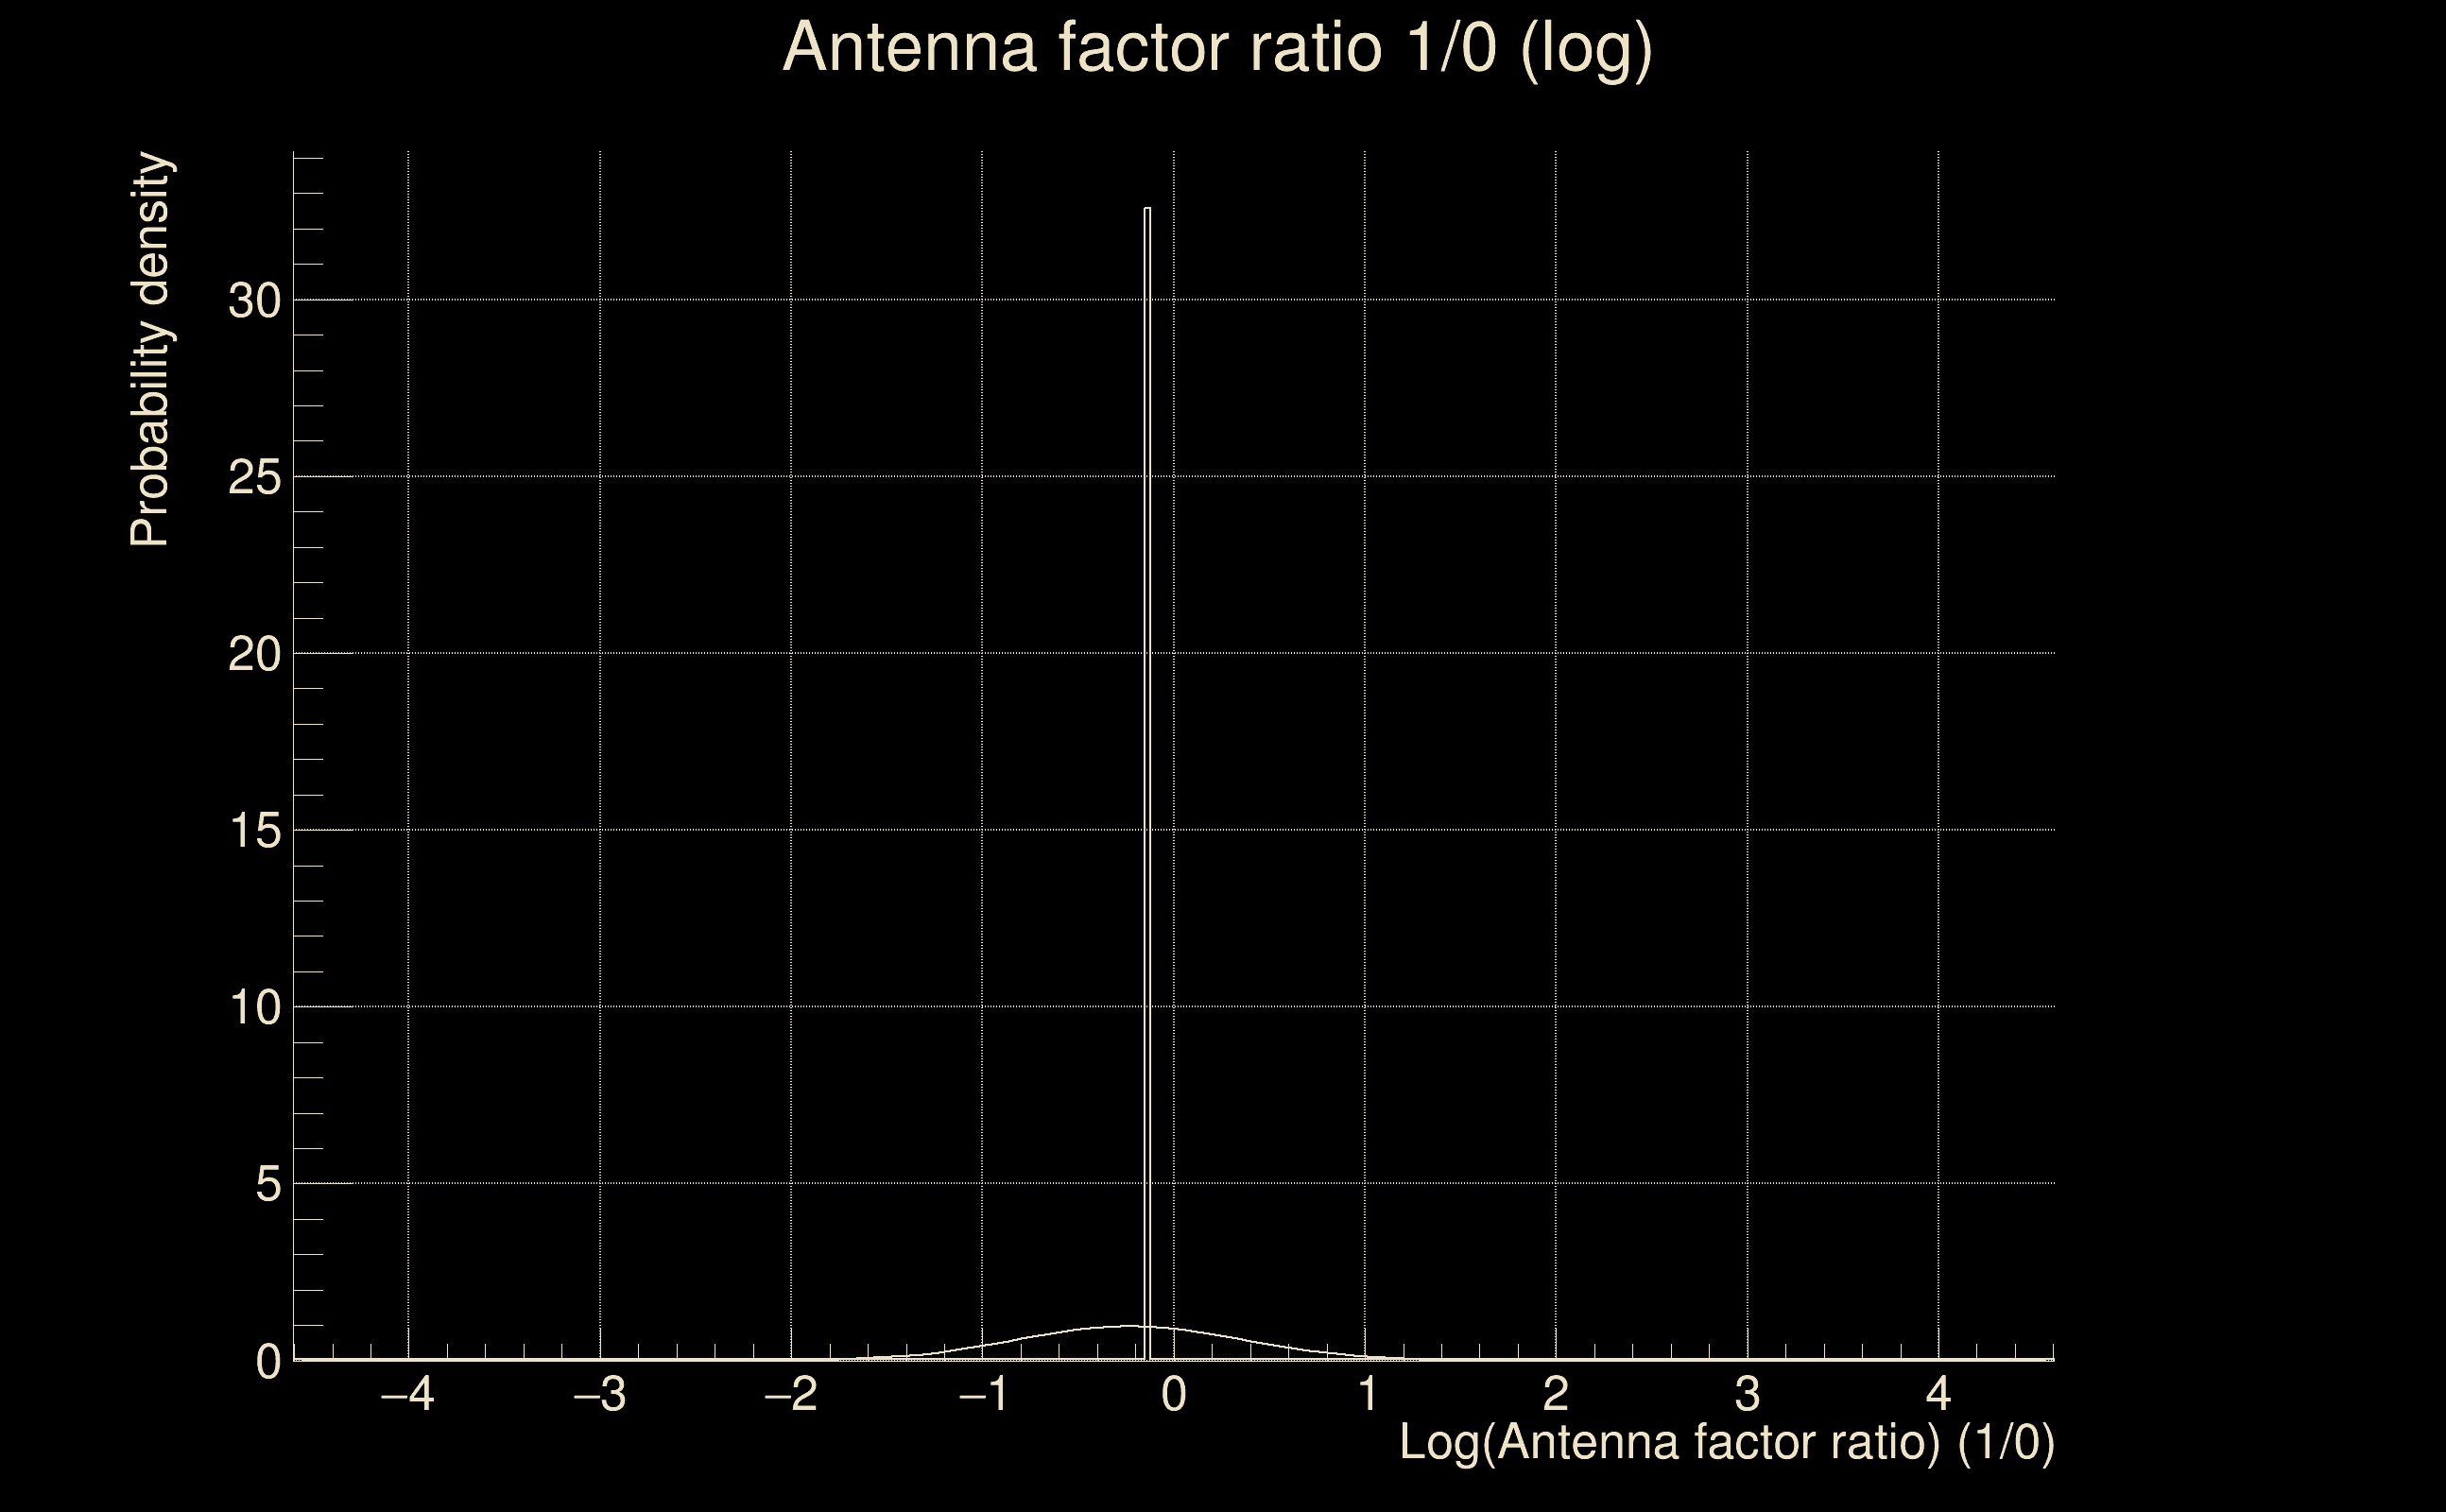
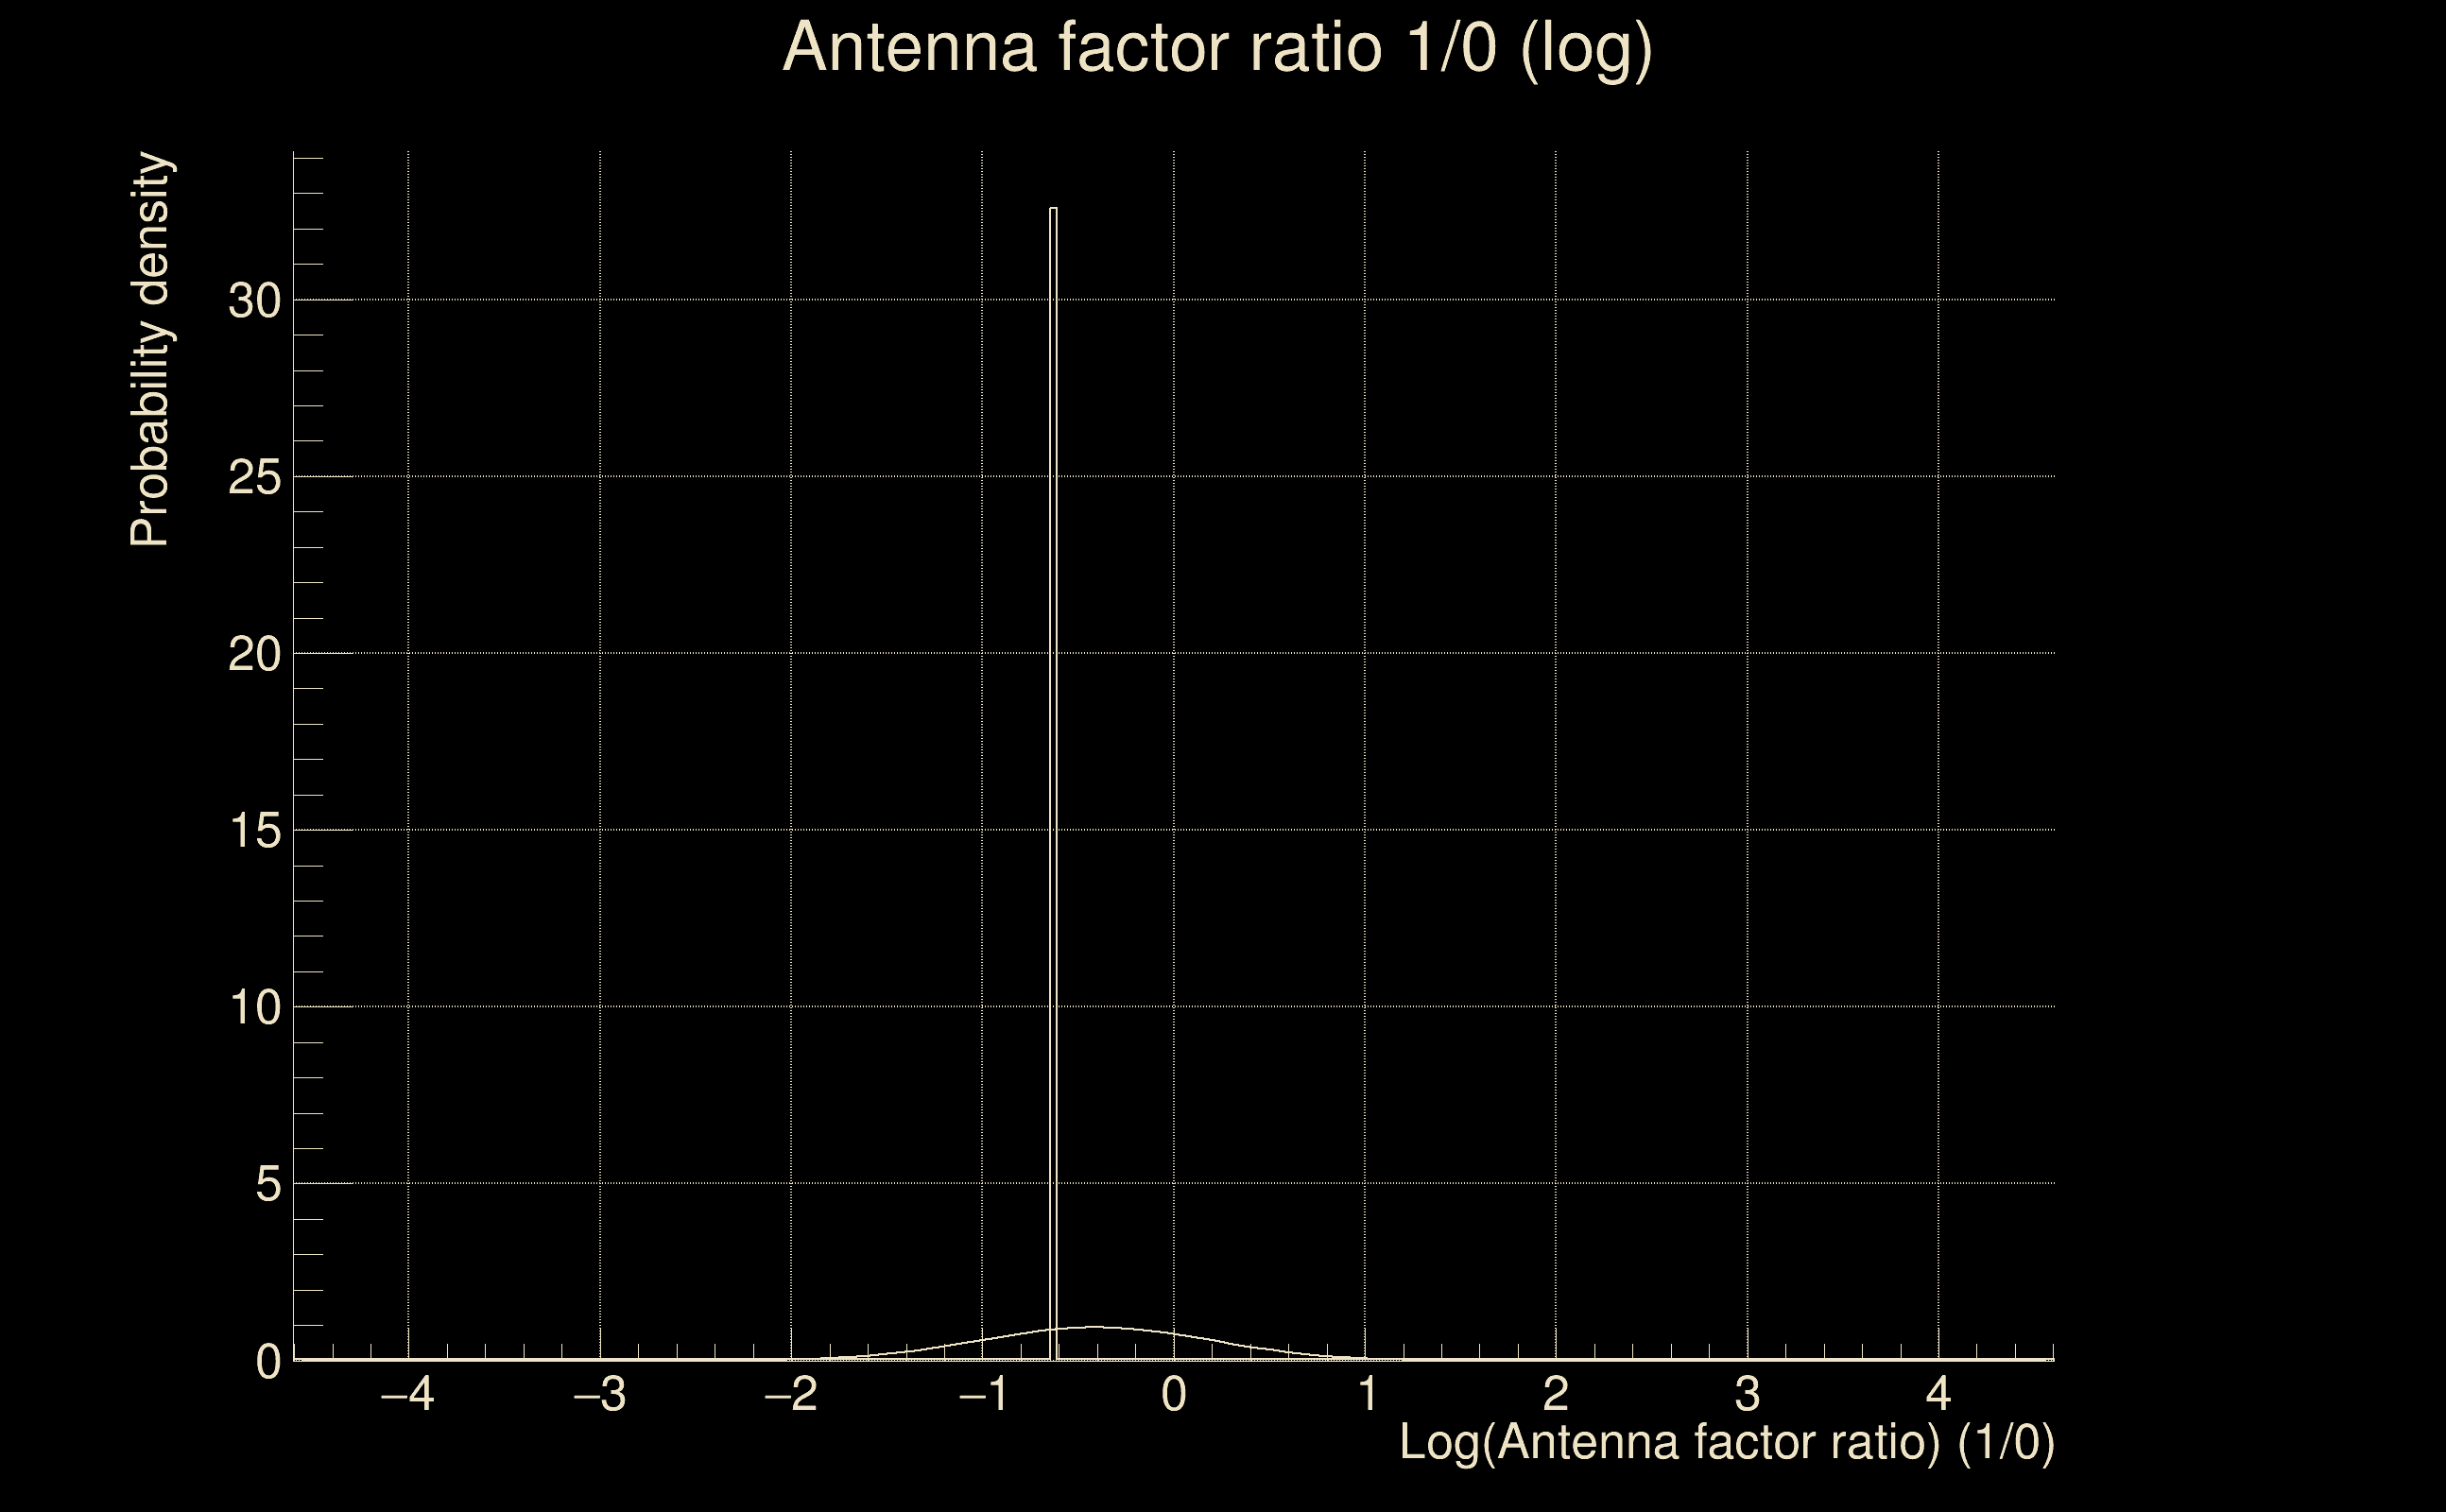
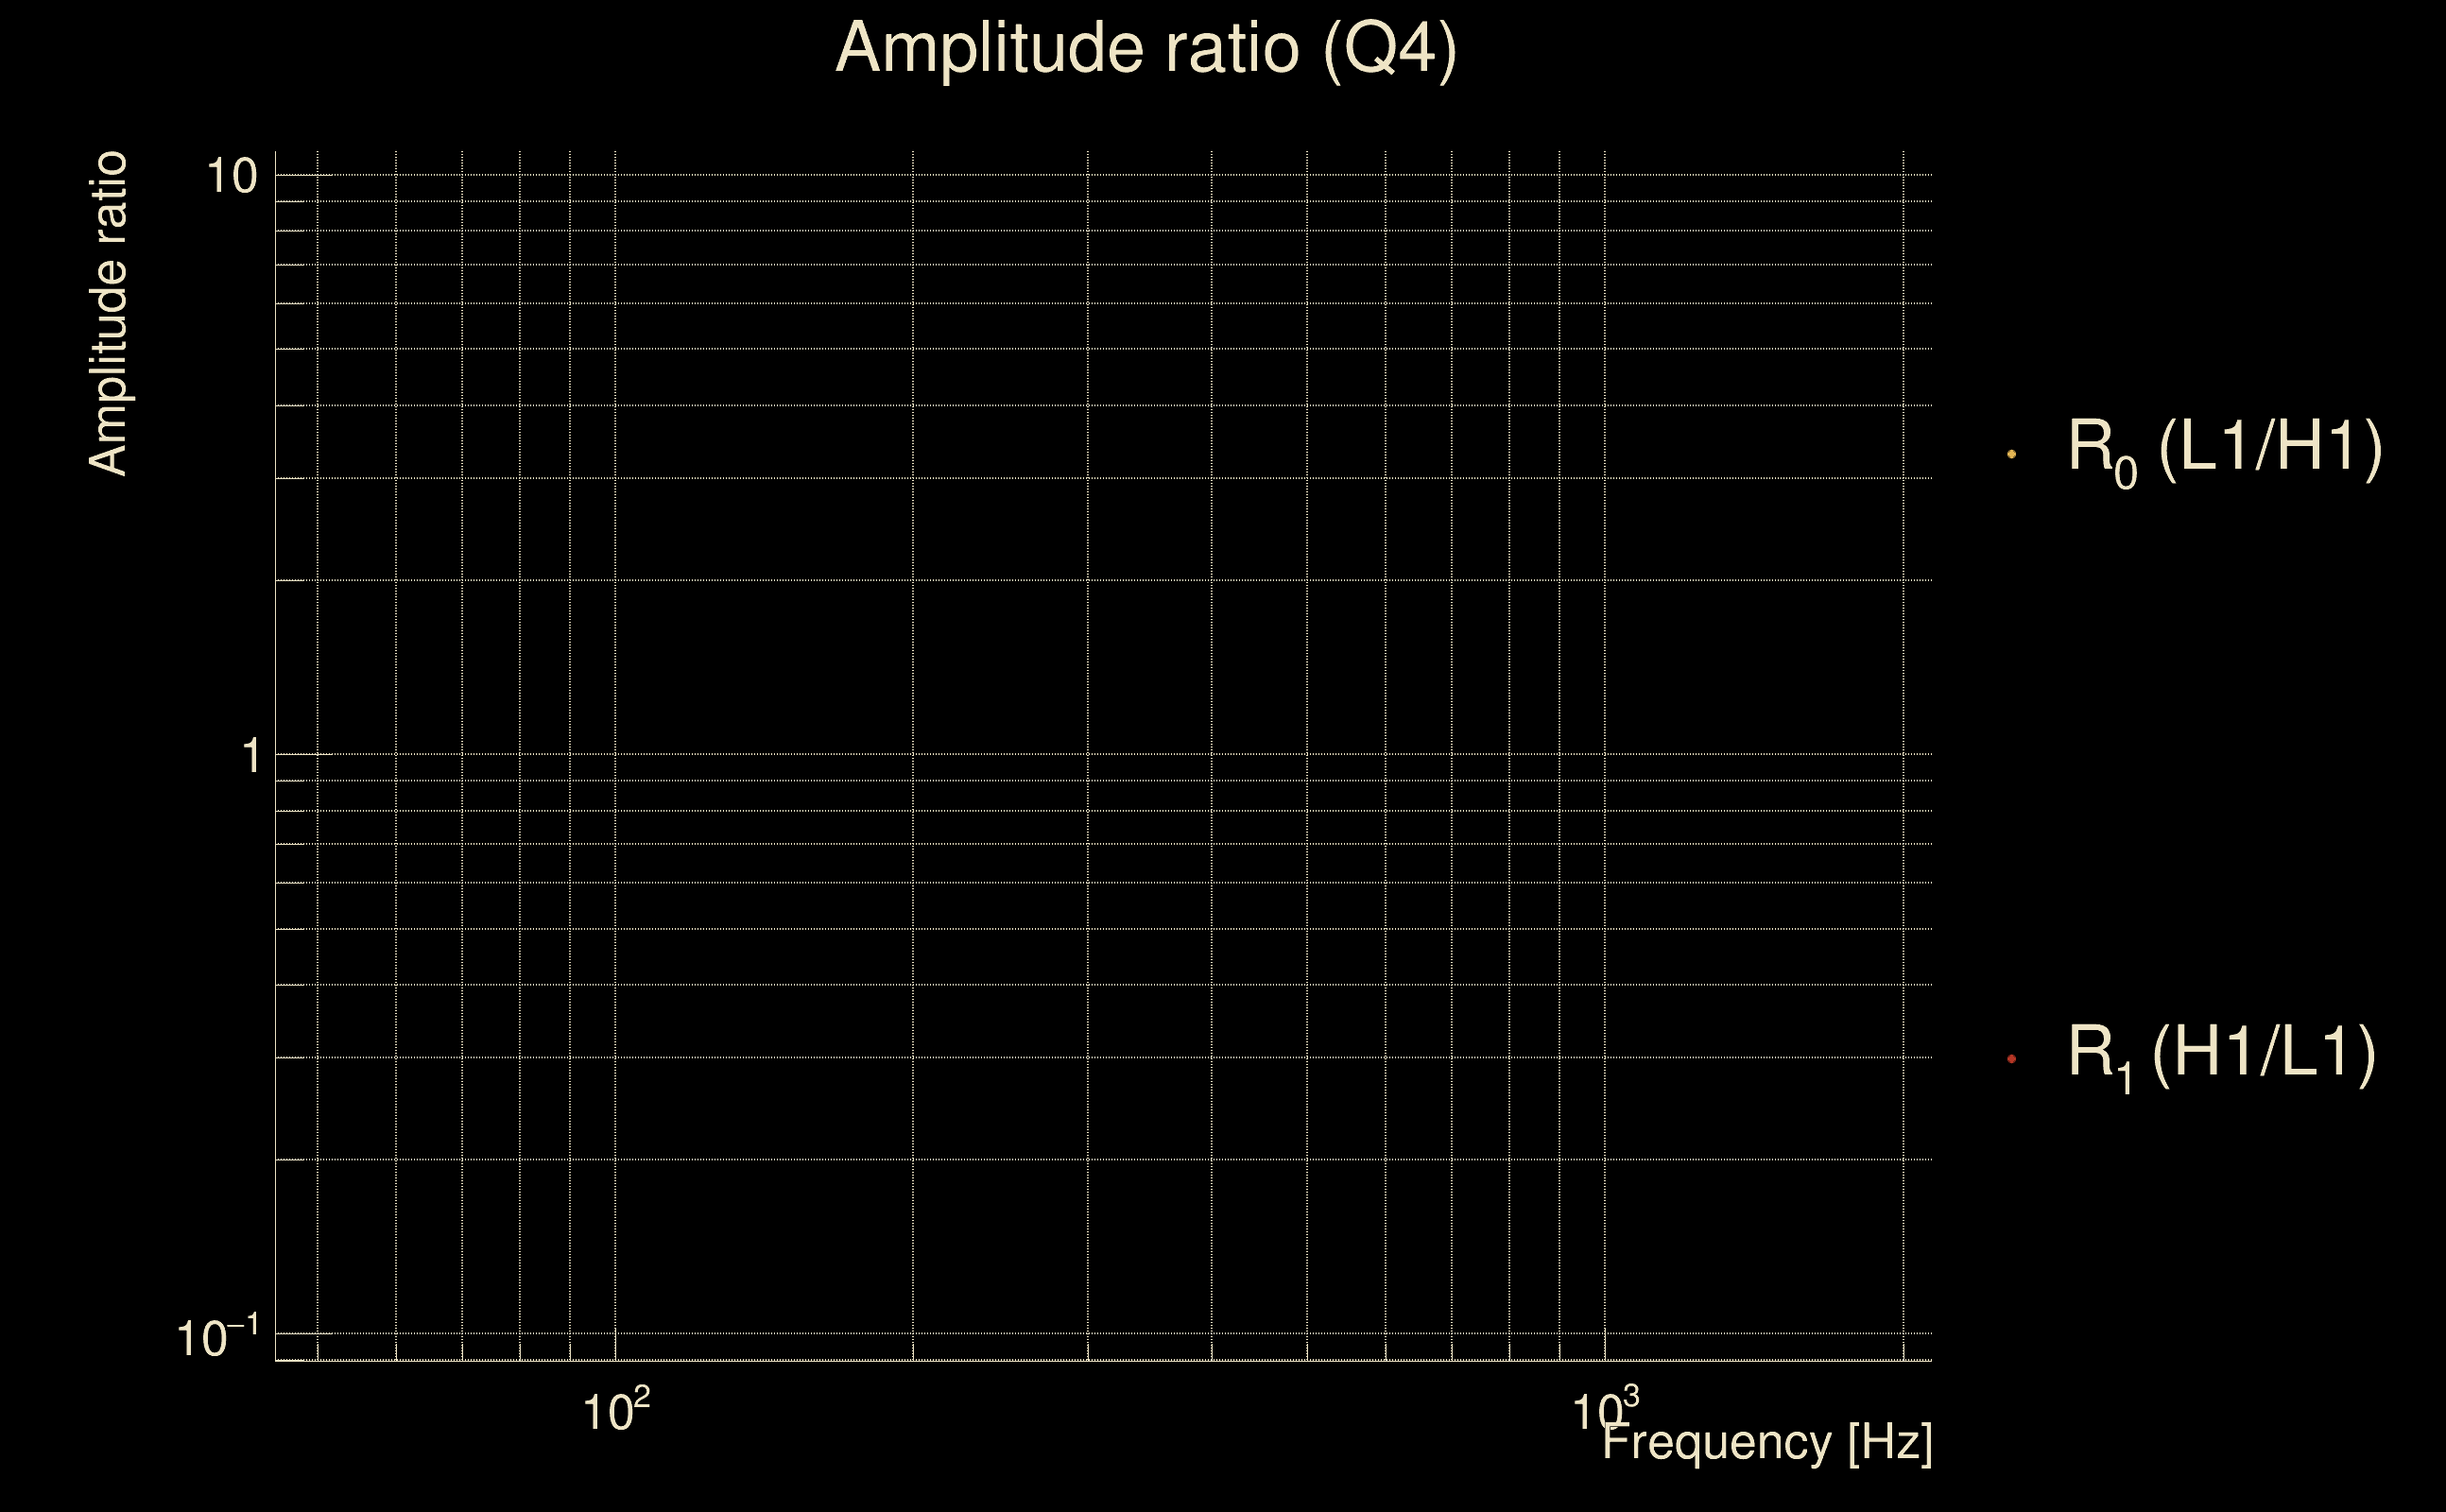
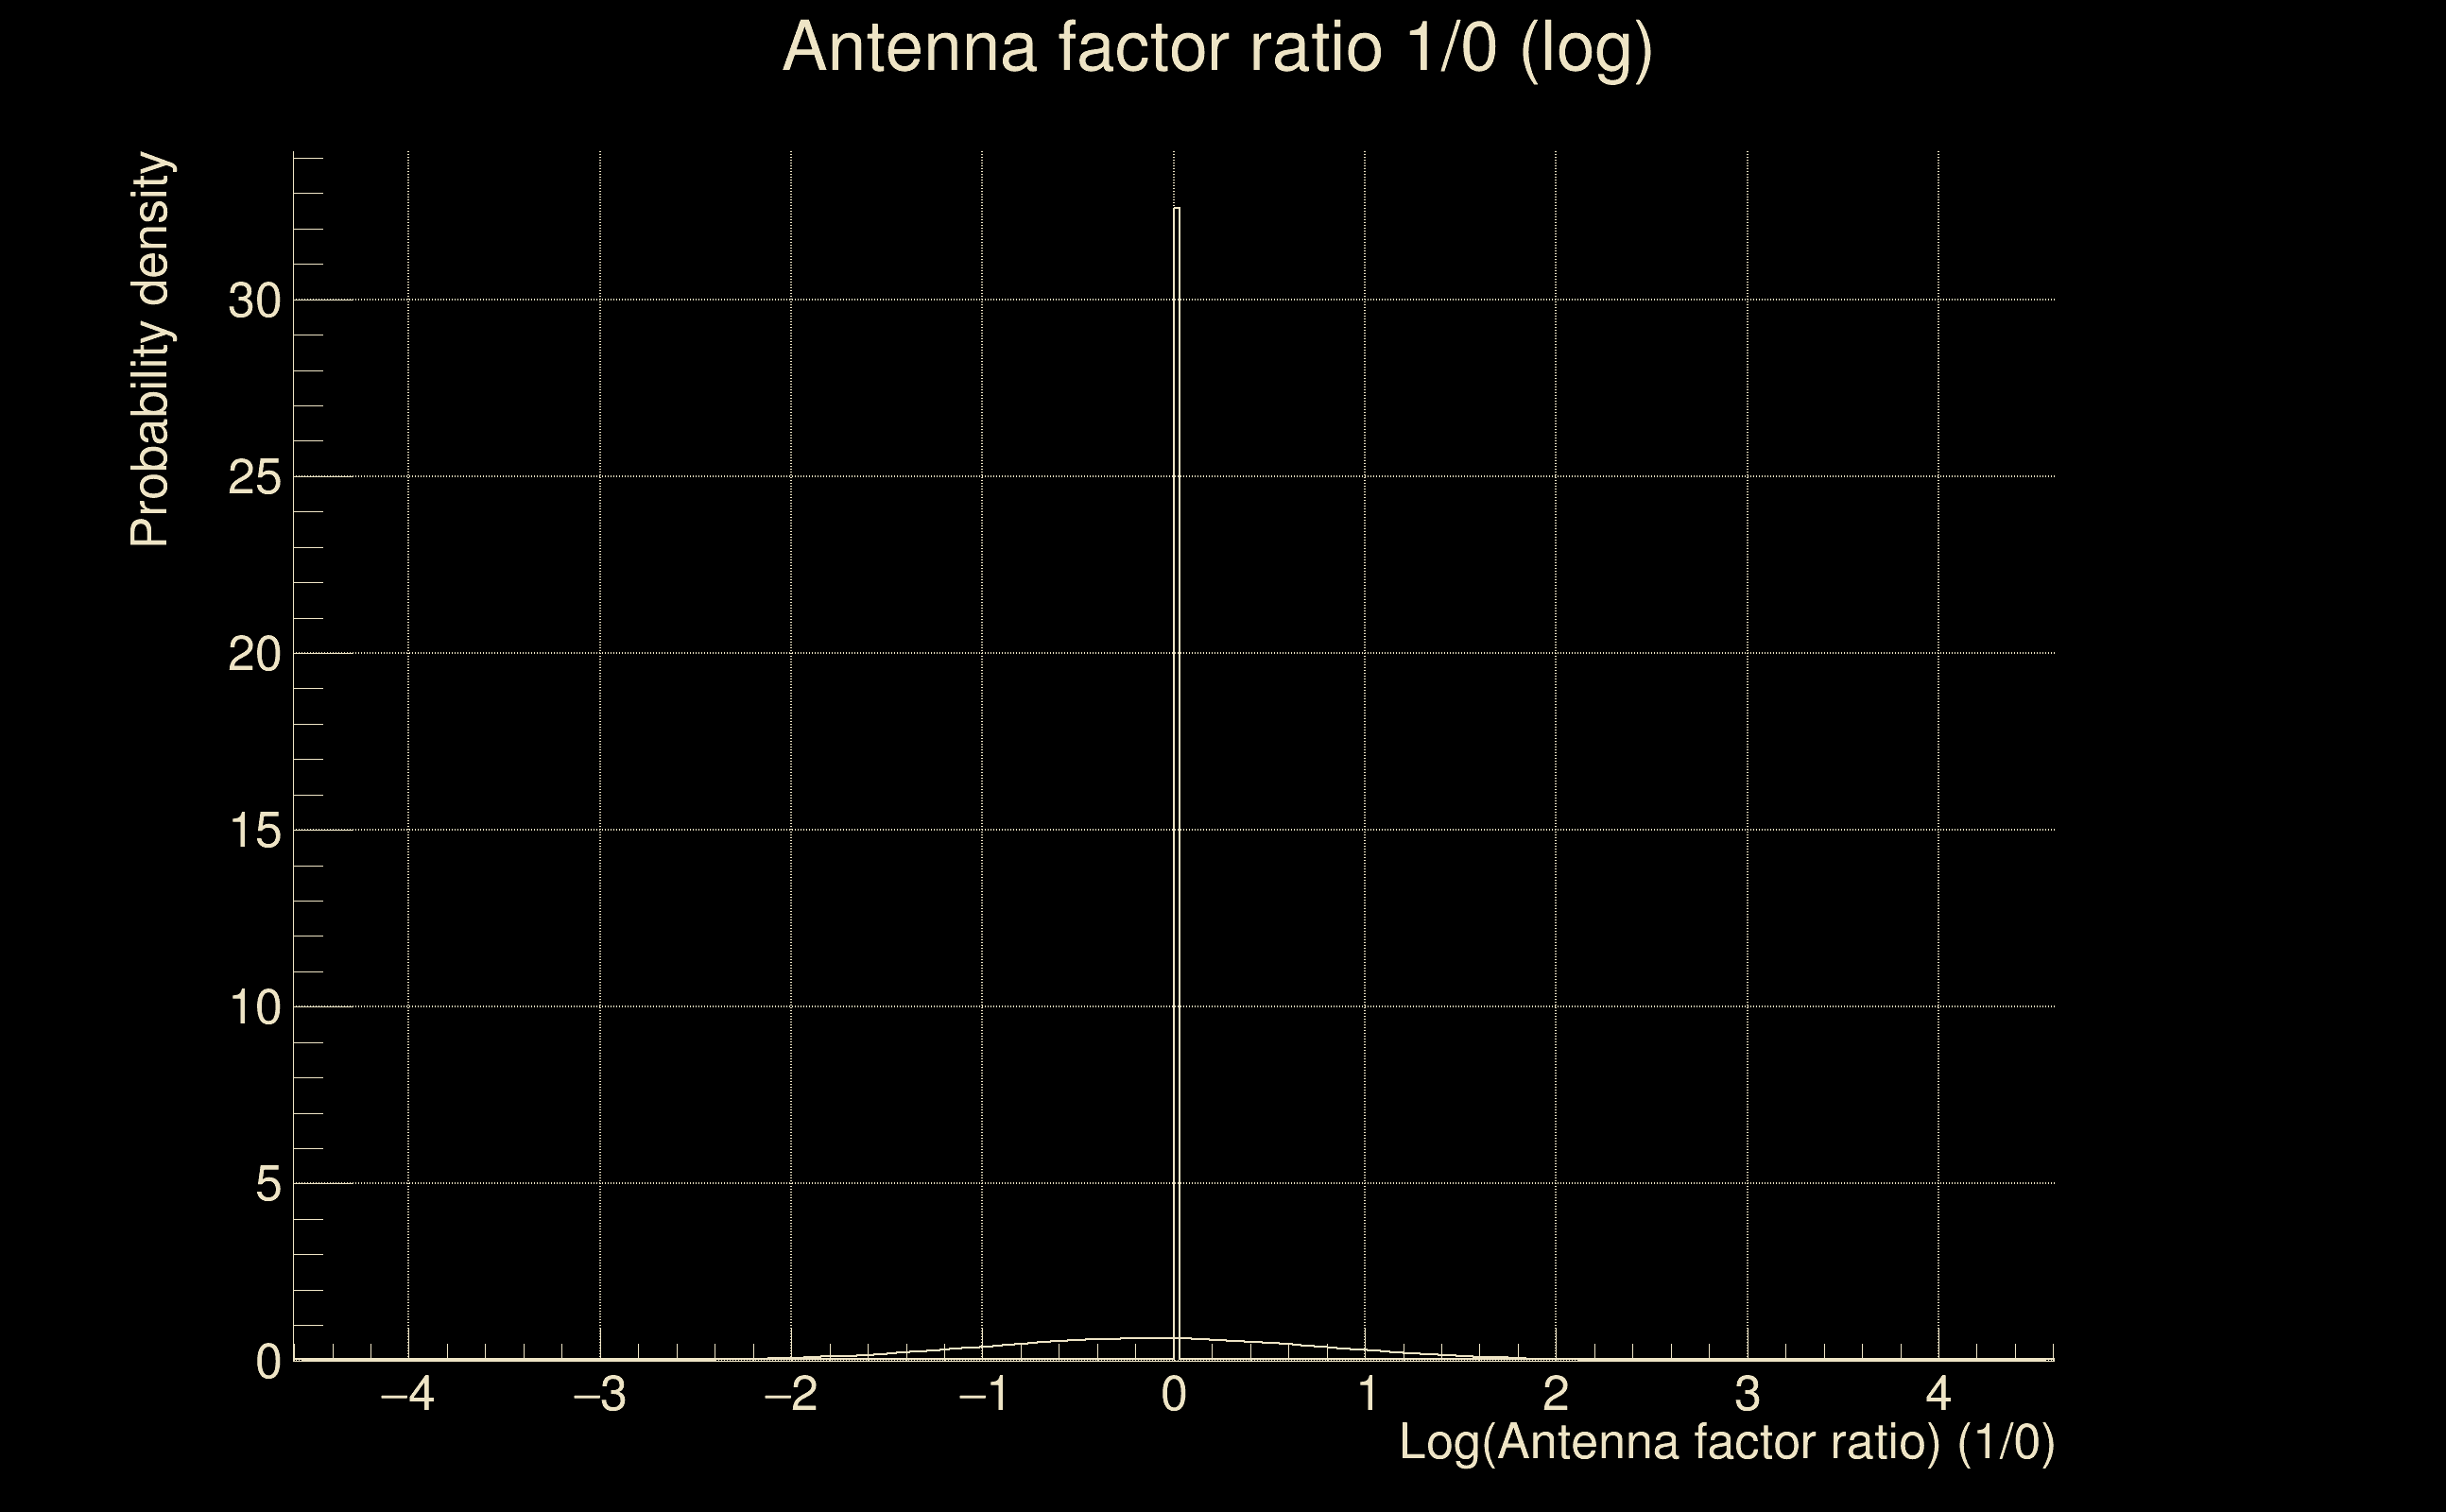
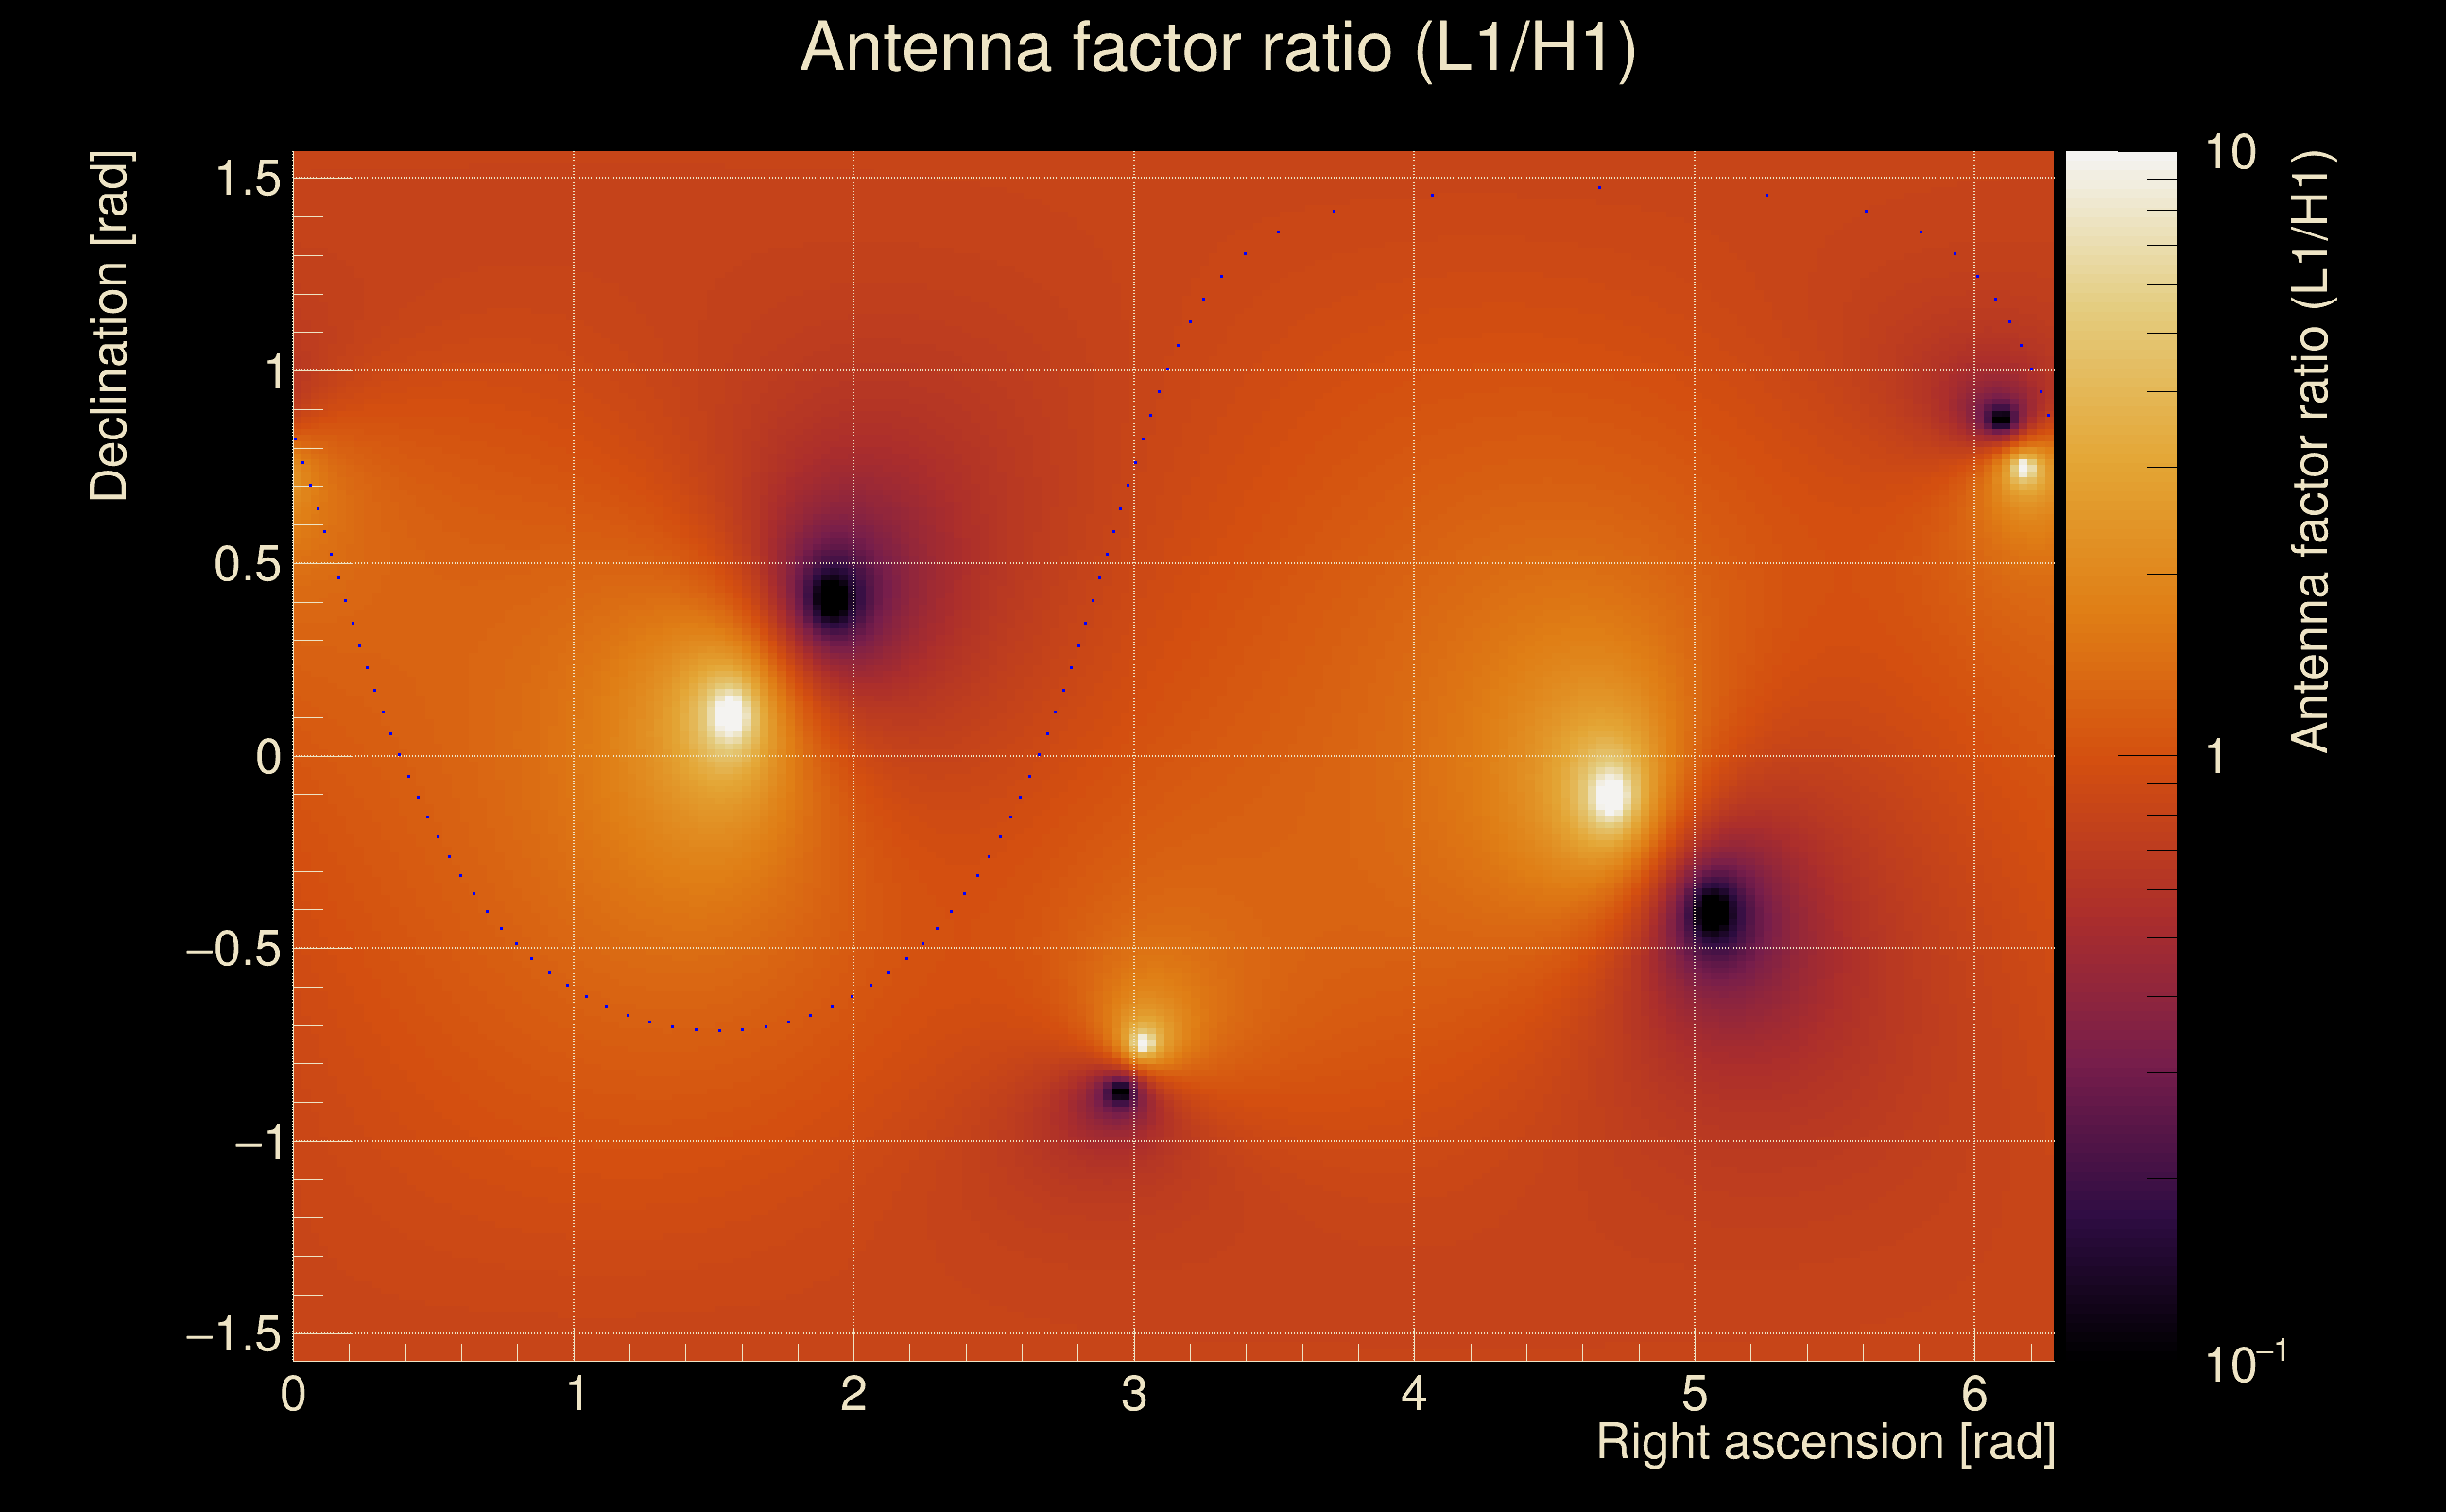
| Log of amplitude ratio (L1/H1): | -0.0293481, variance = 0.158657 (L1/H1: -0.0475872, variance = 0.31273, H1/L1: 0.0146319, variance = 0.31438) |
| Amplitude ratio (L1/H1): | 0.971078 ⋇ 1.48932 (L1/H1: 0.953527 ⋇ 1.74931, H1/L1: 1.01474 ⋇ 1.75189) |
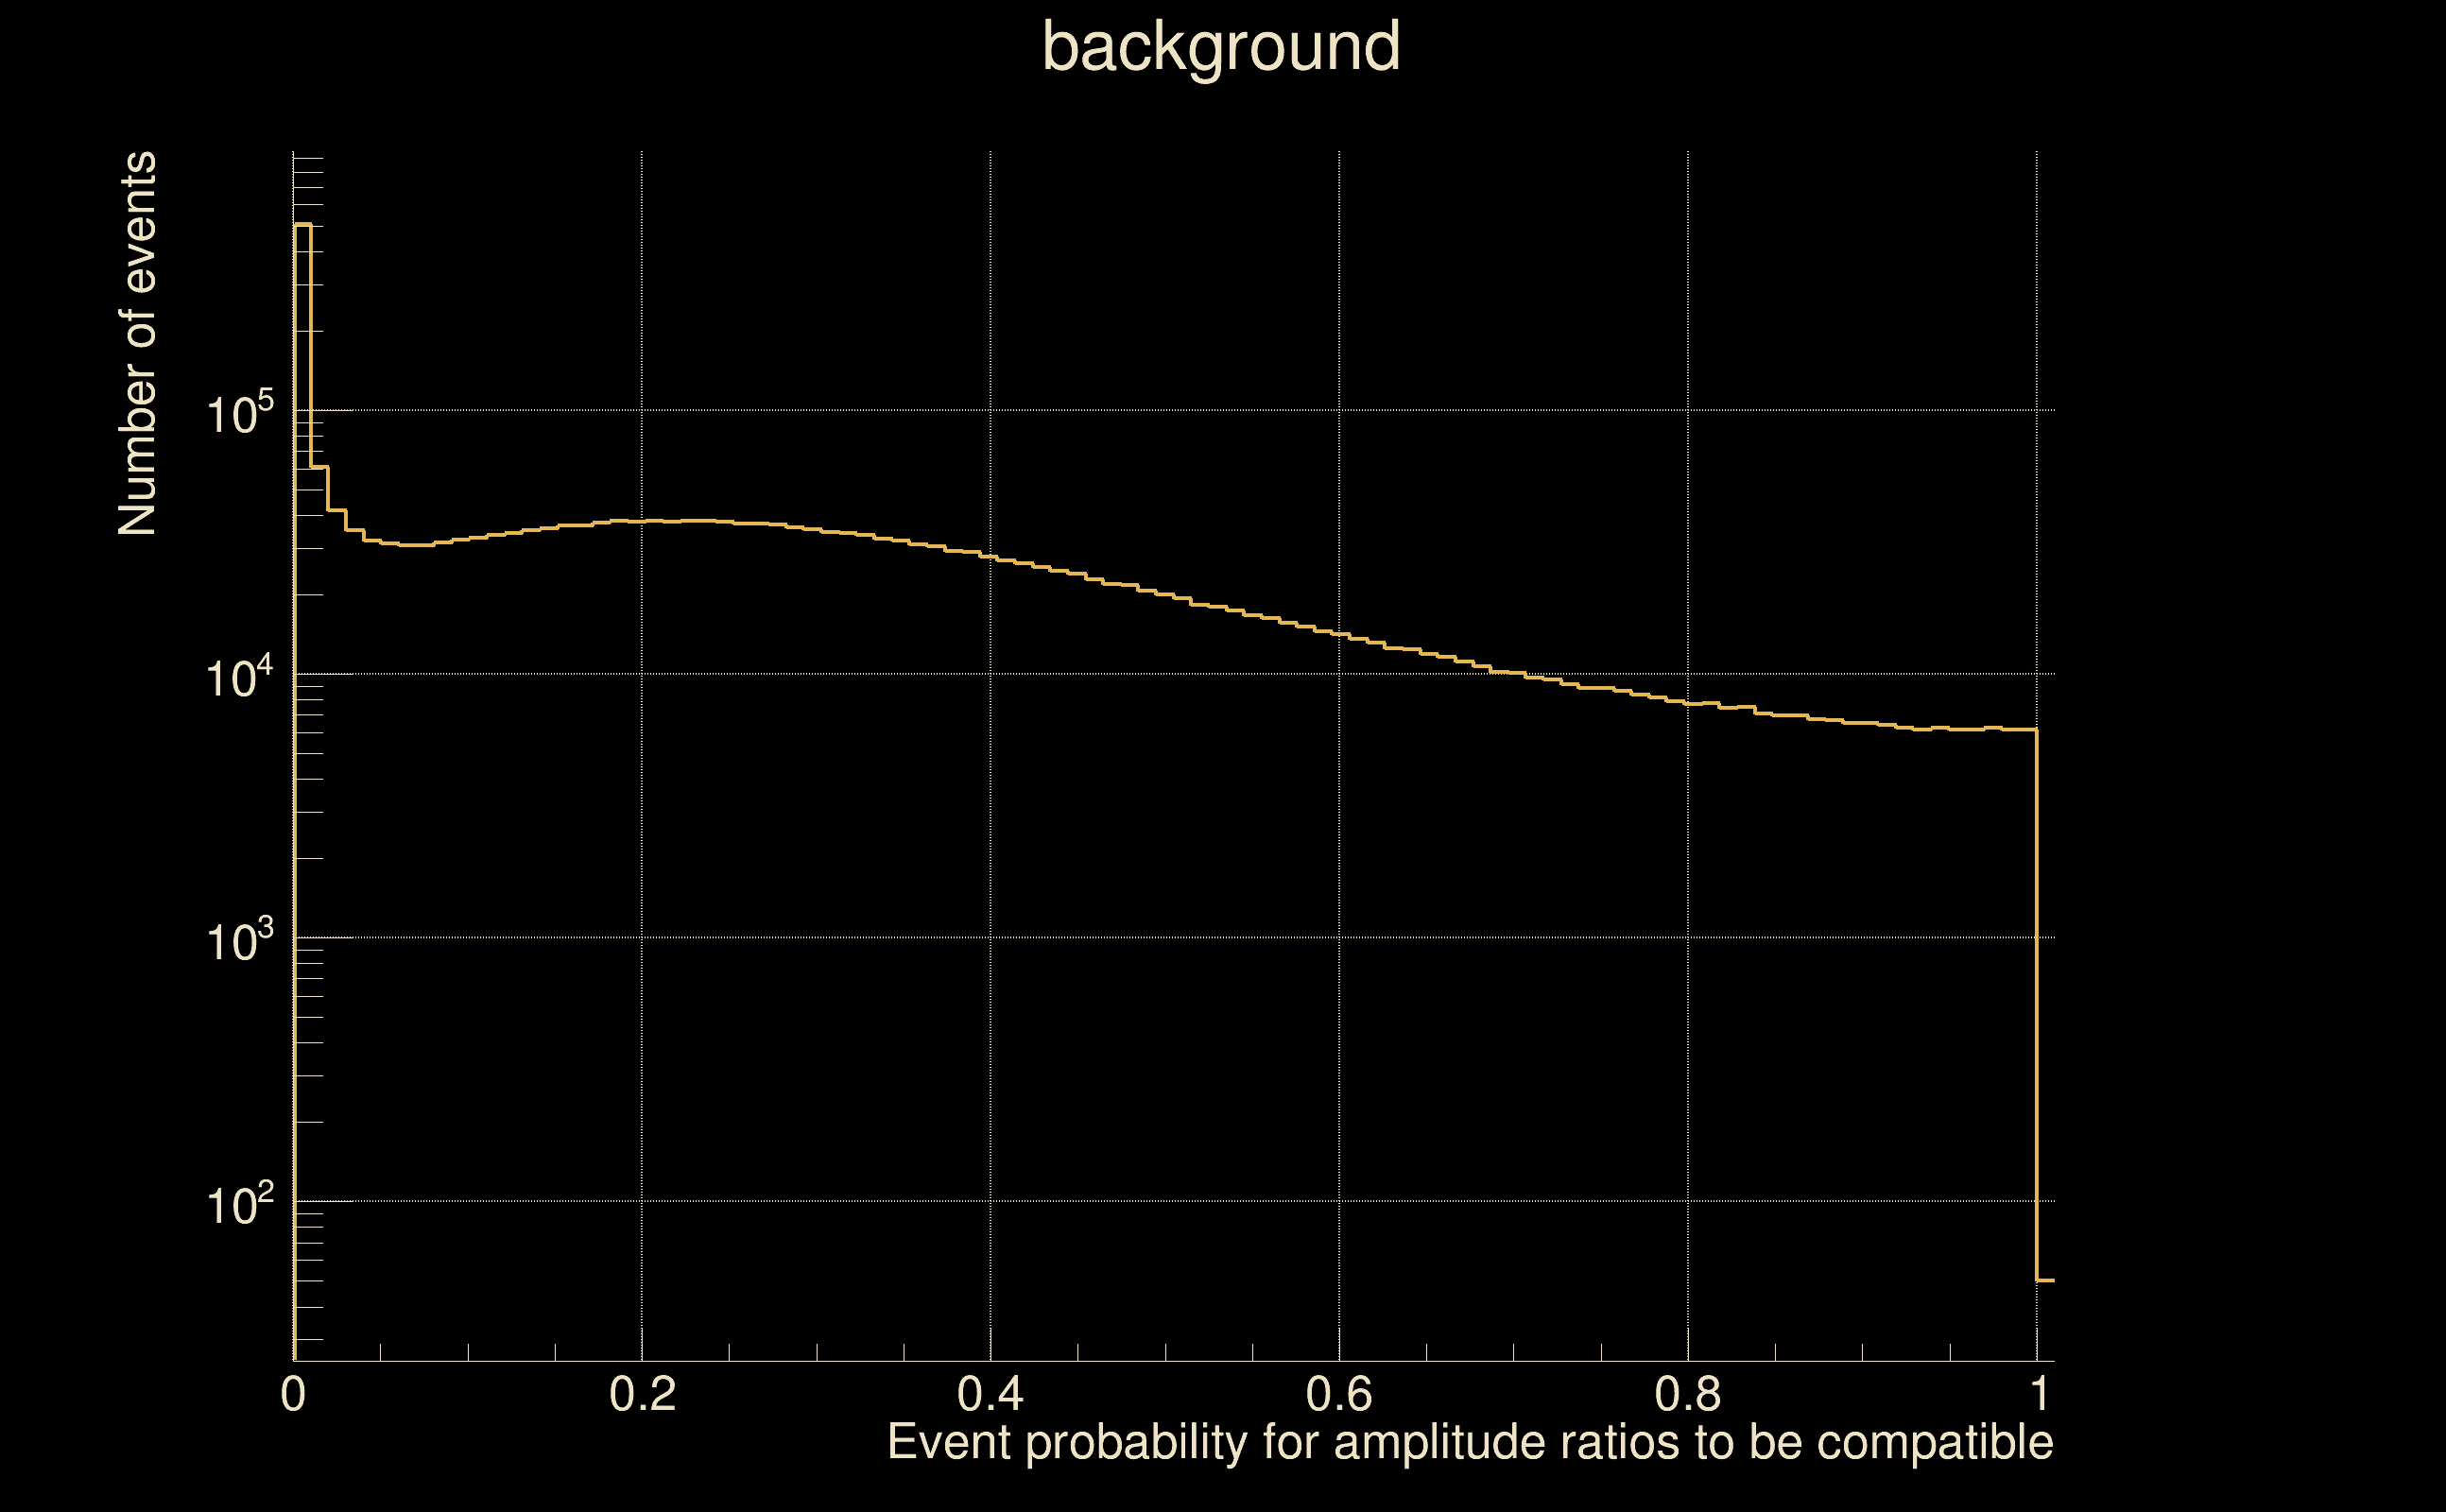
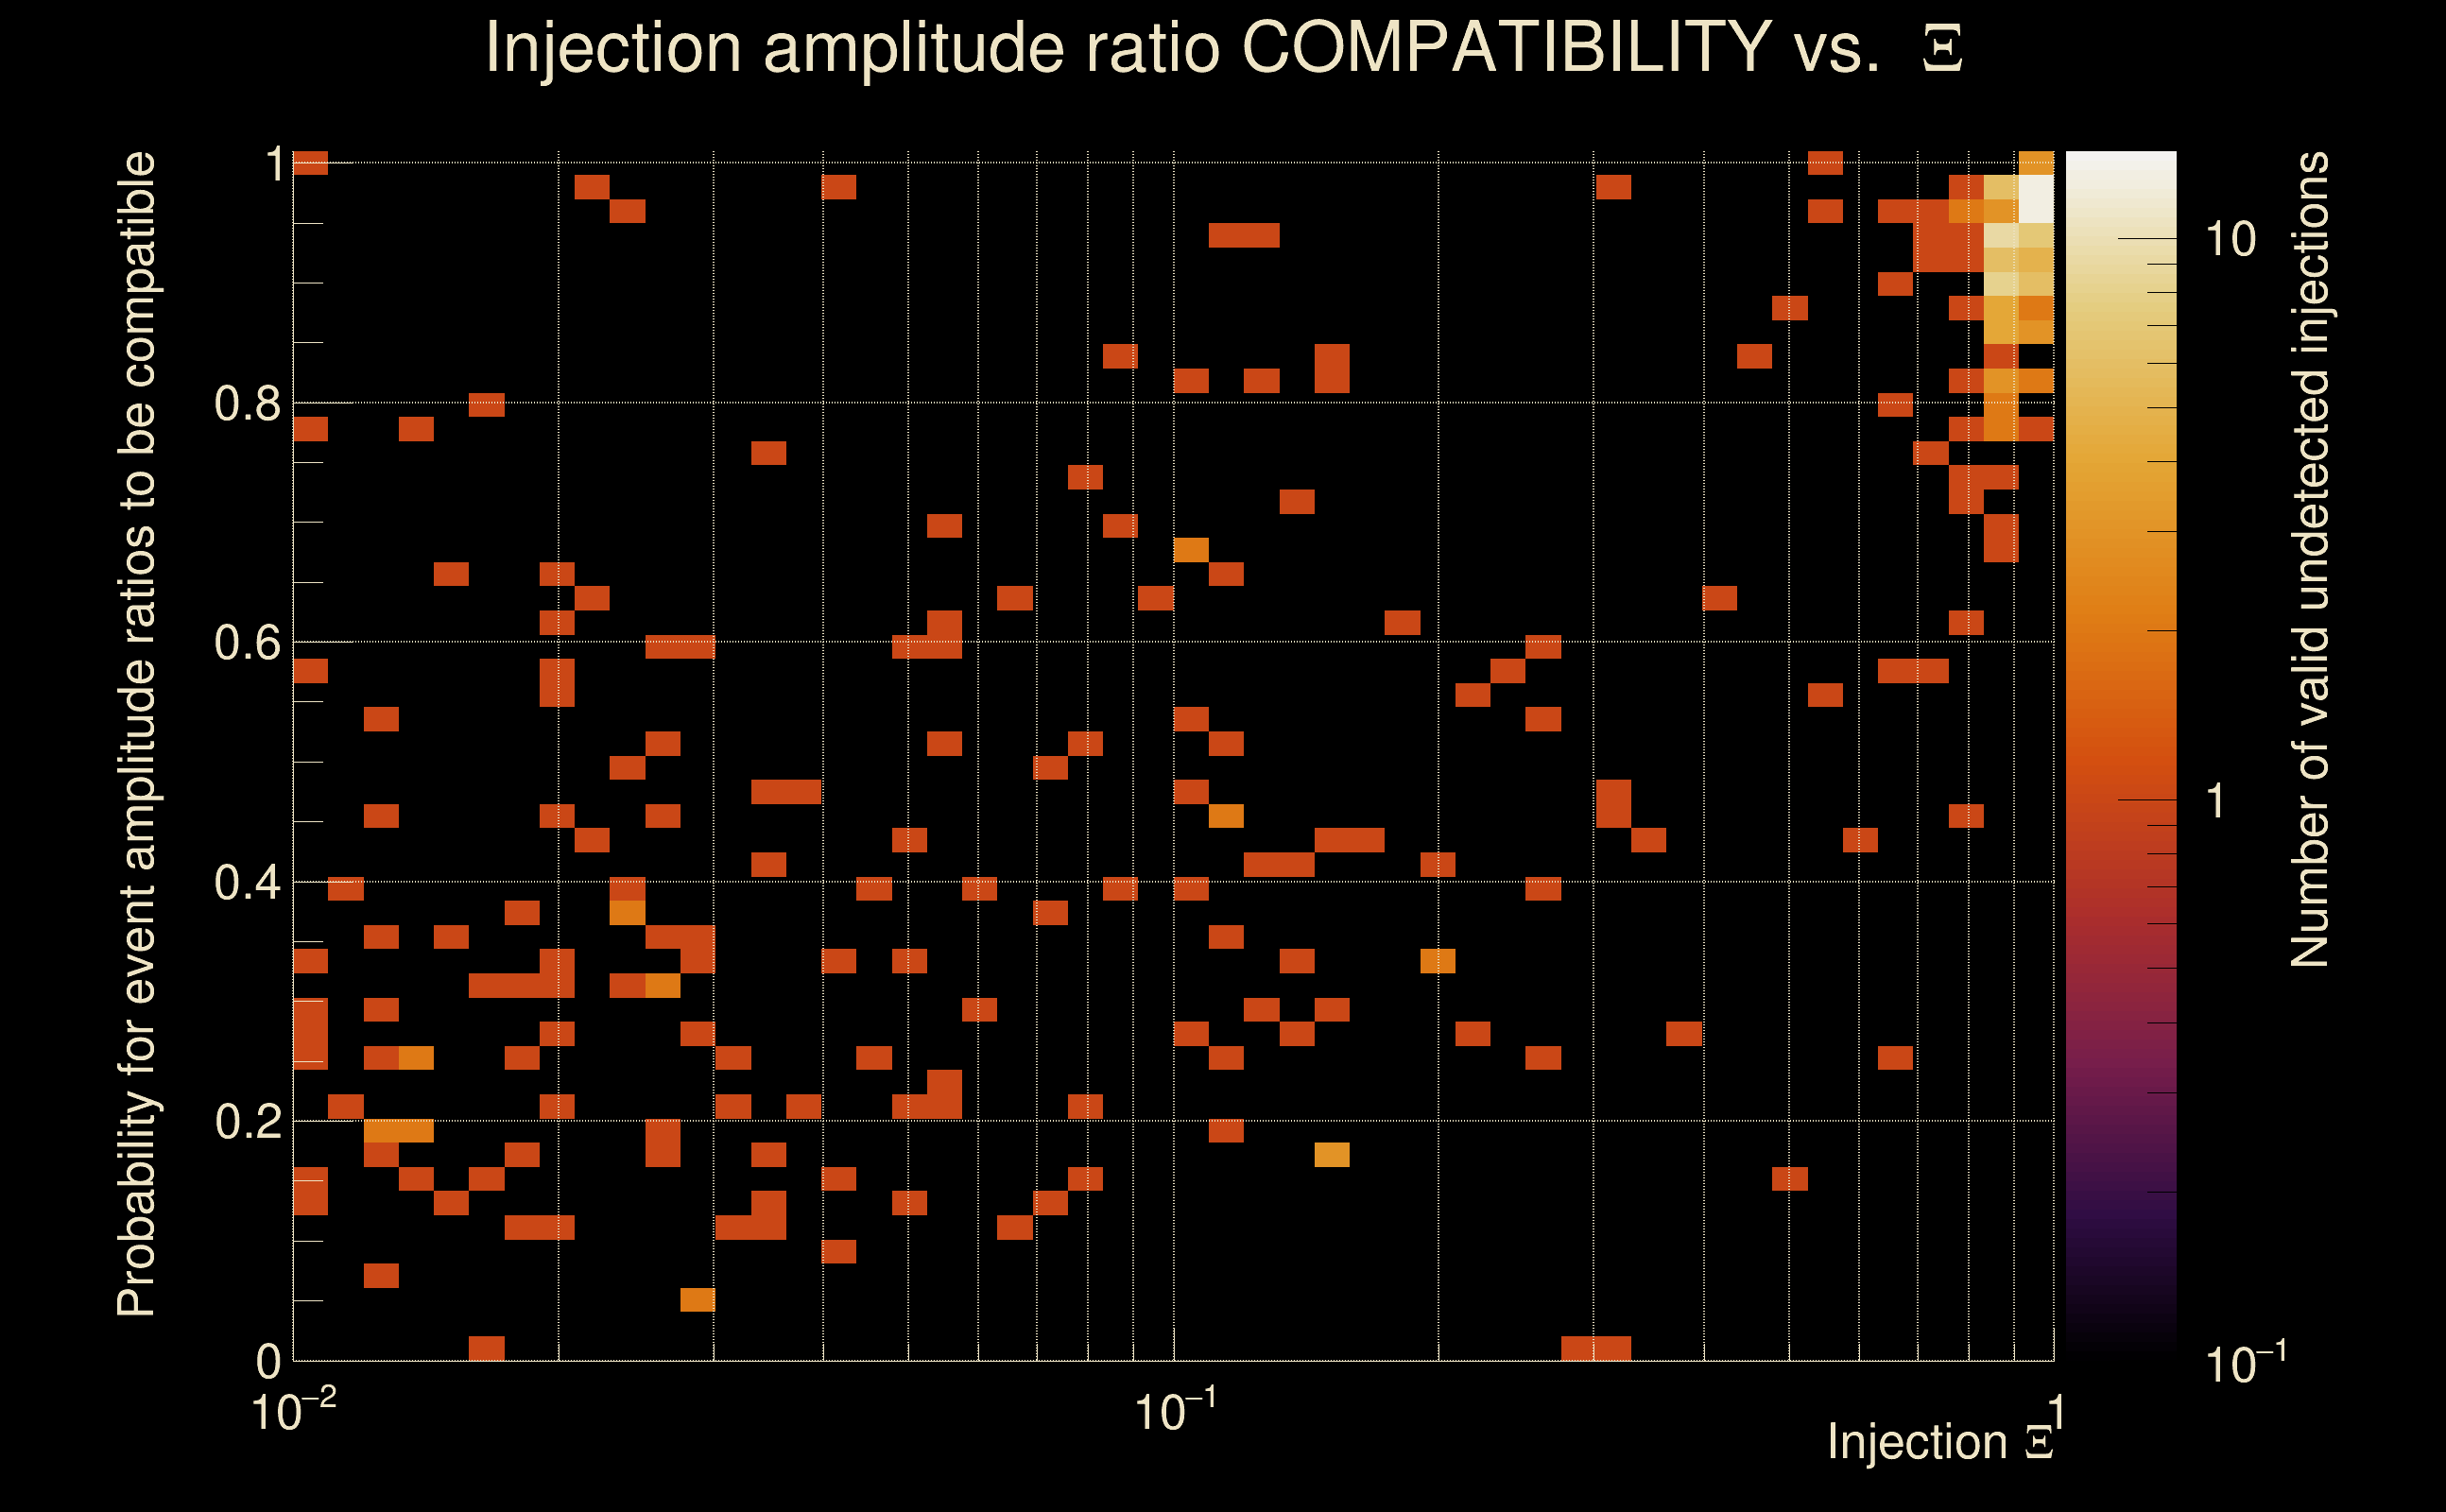
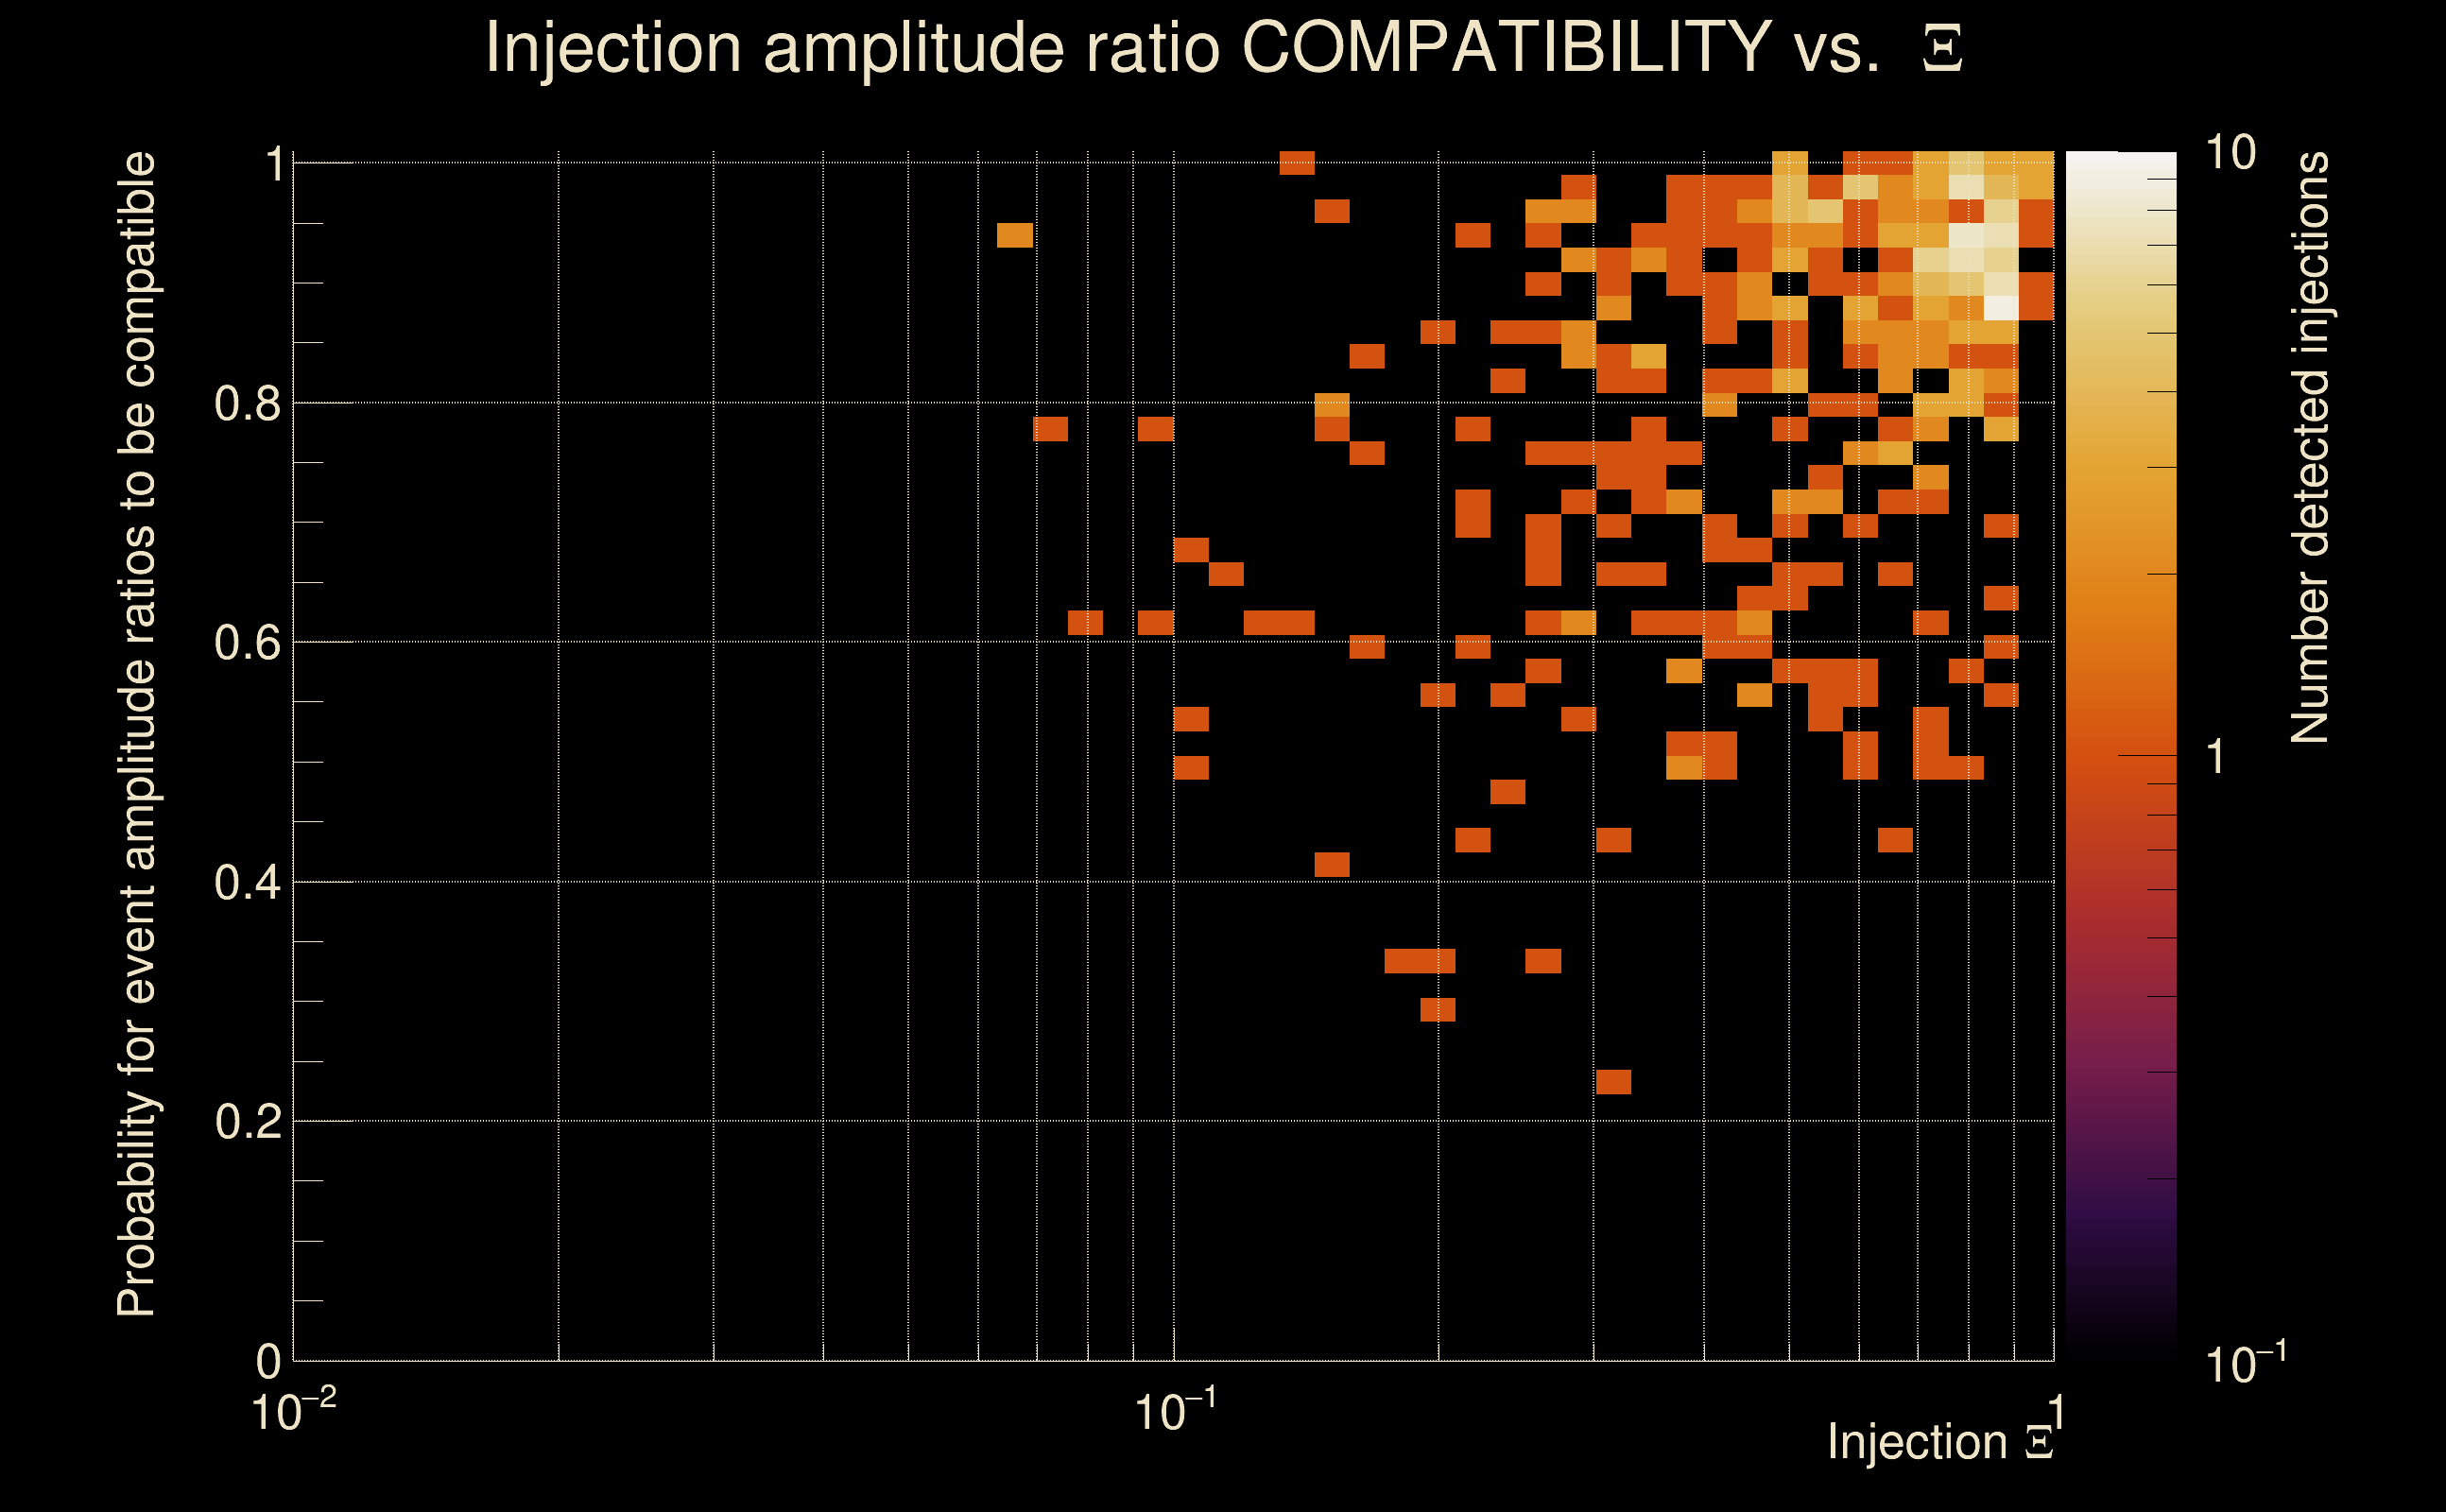
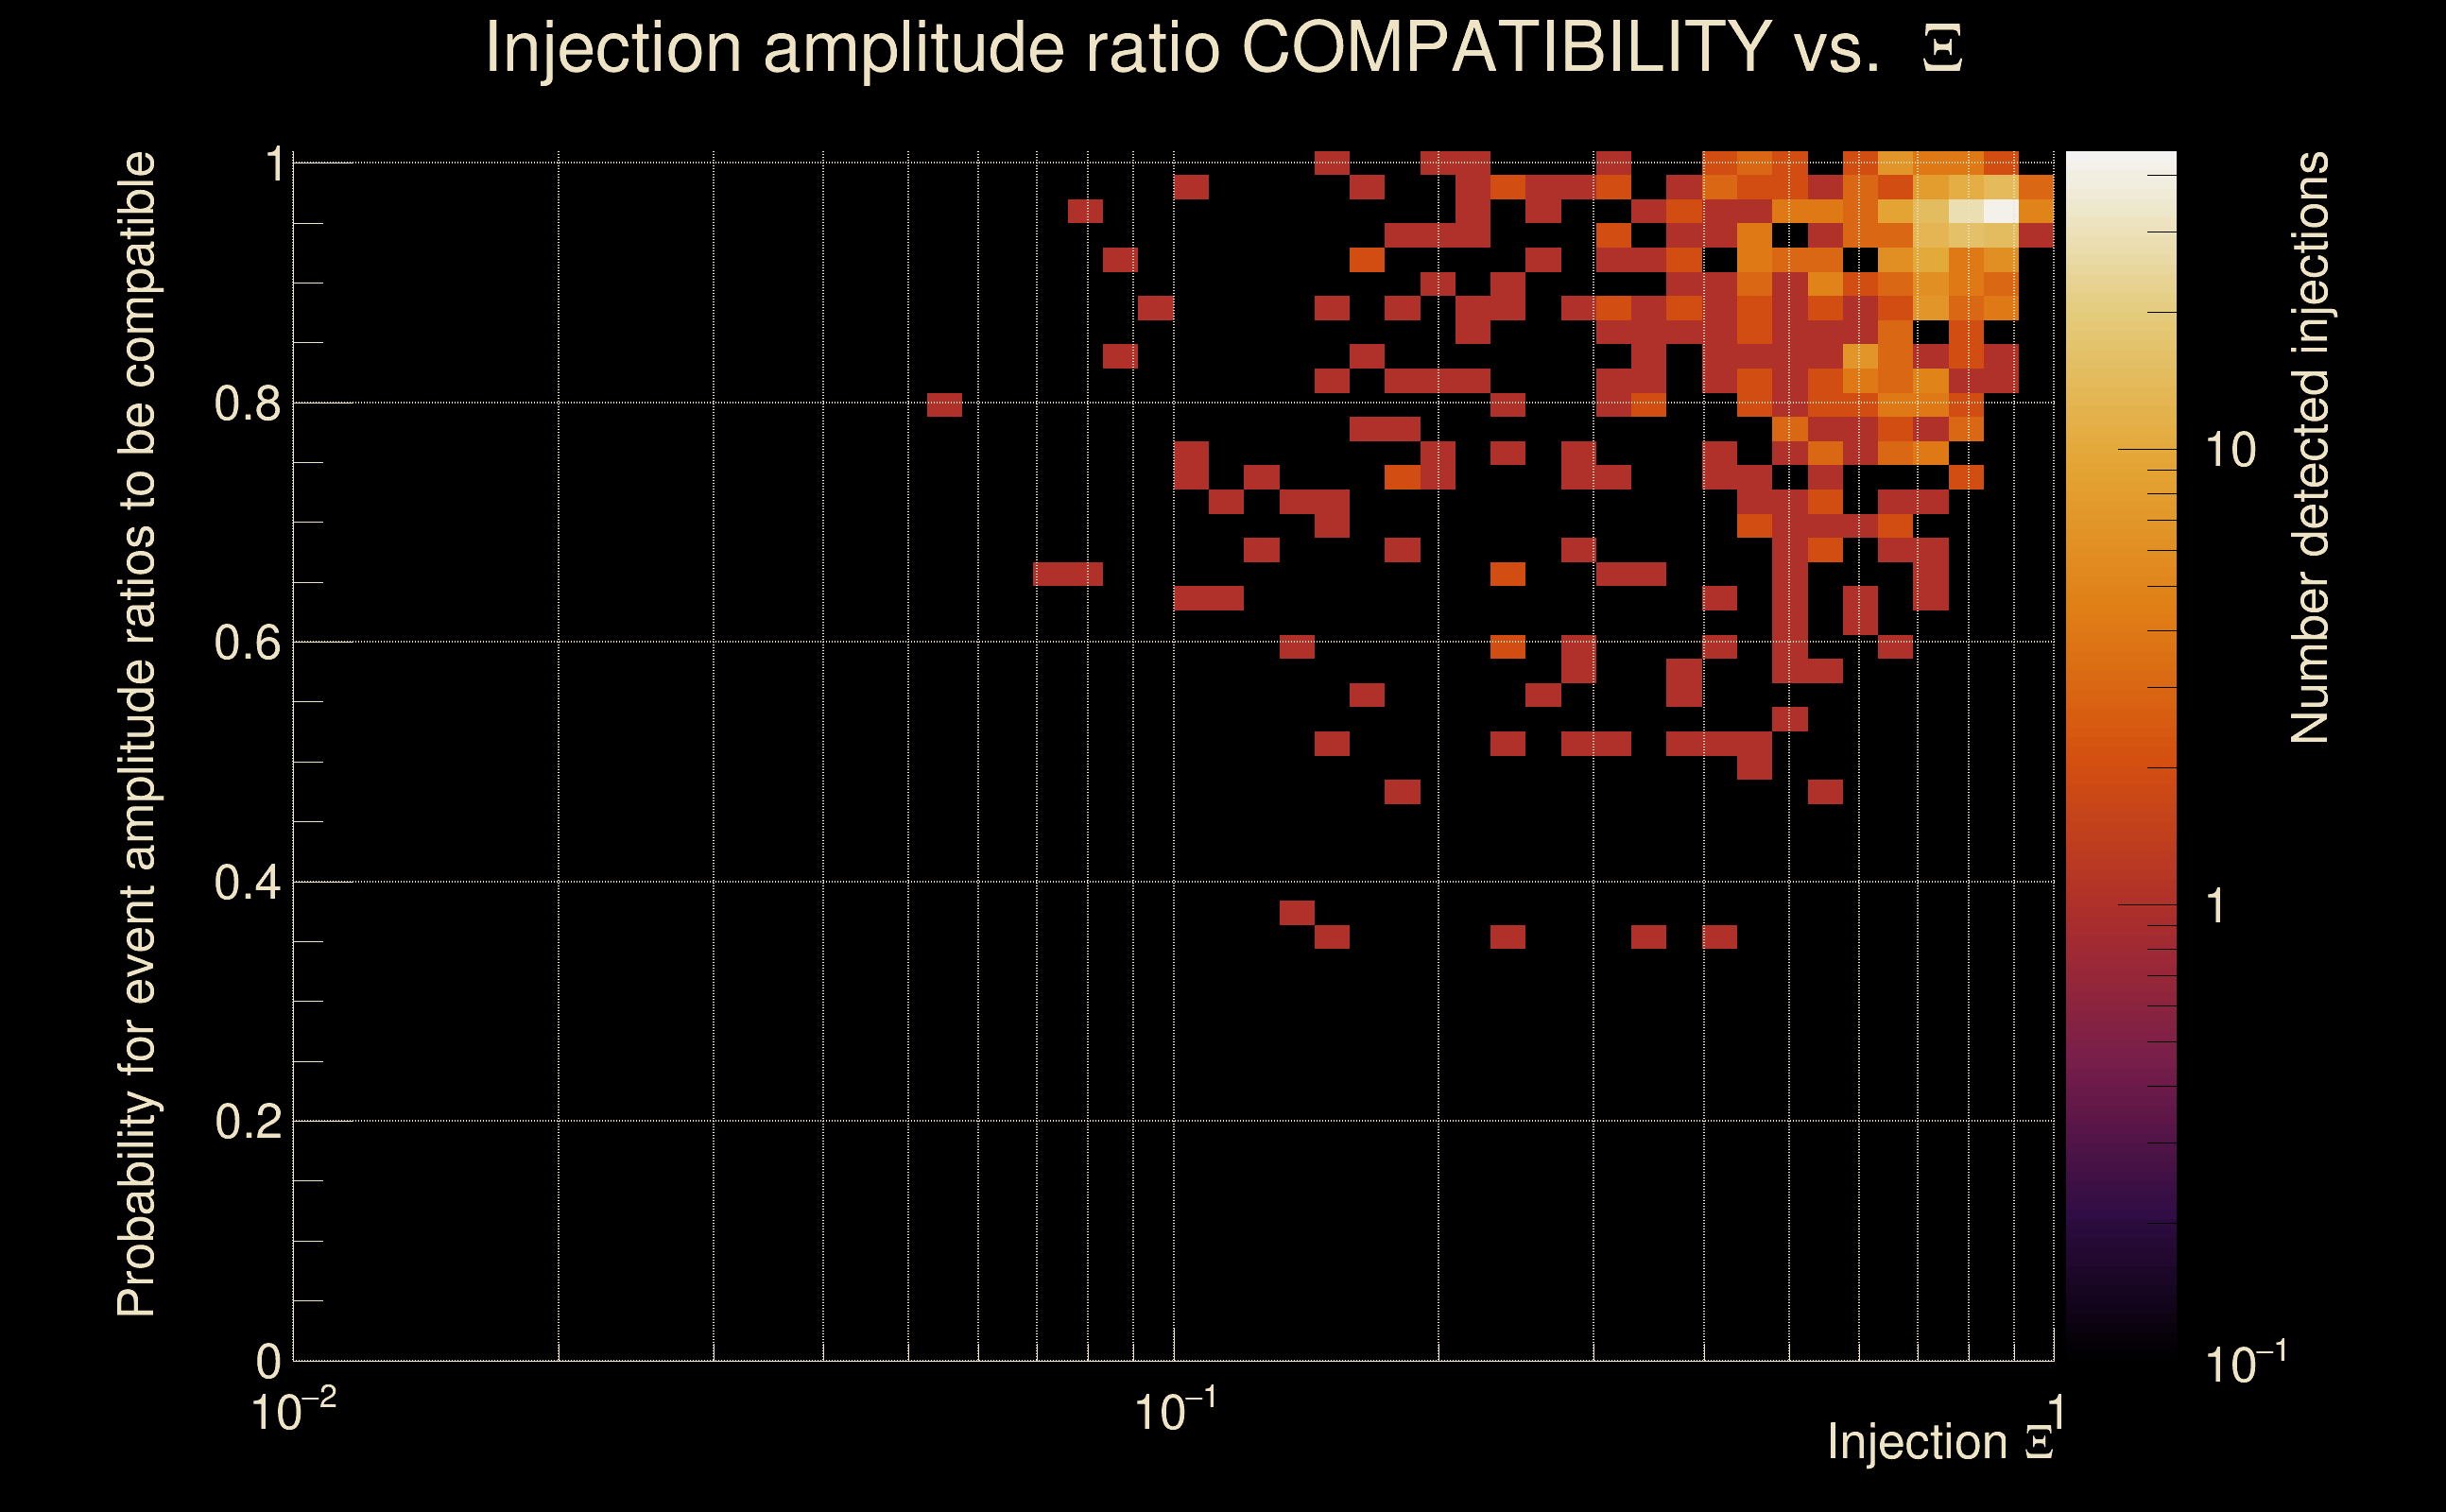
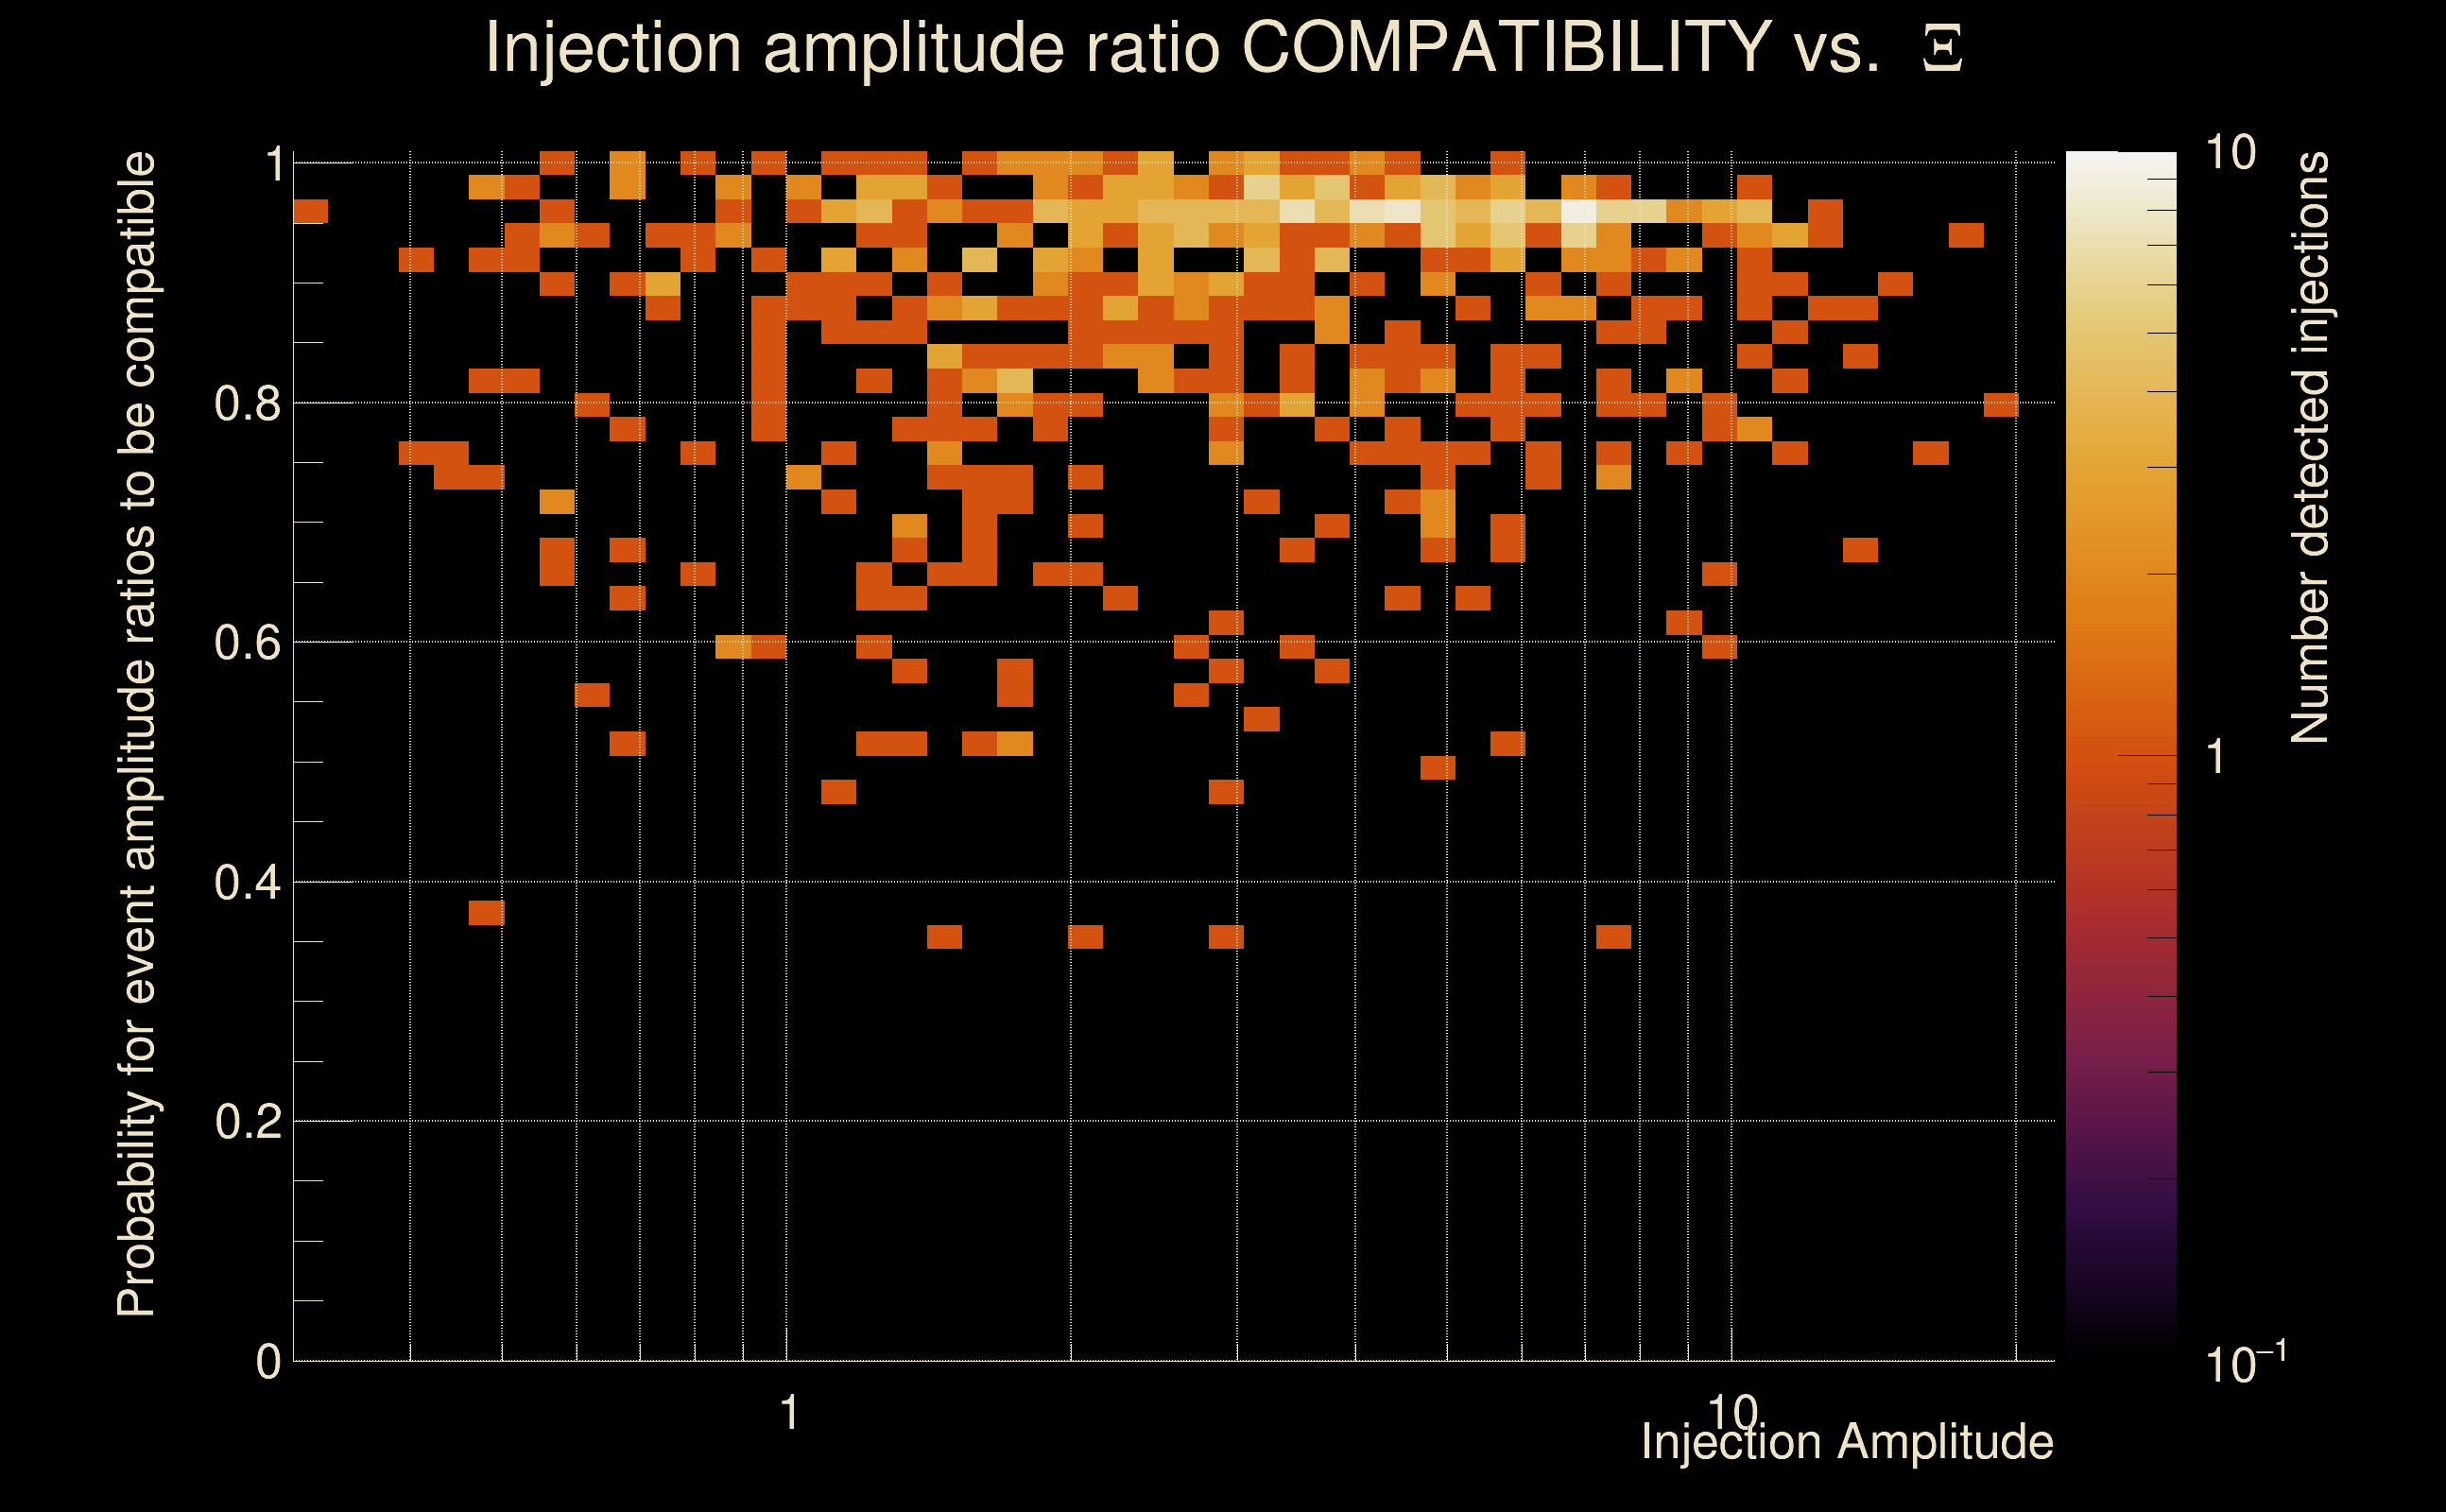
| Amplitude ratio H1|L1 compatibility (probability): | 0.966805 |
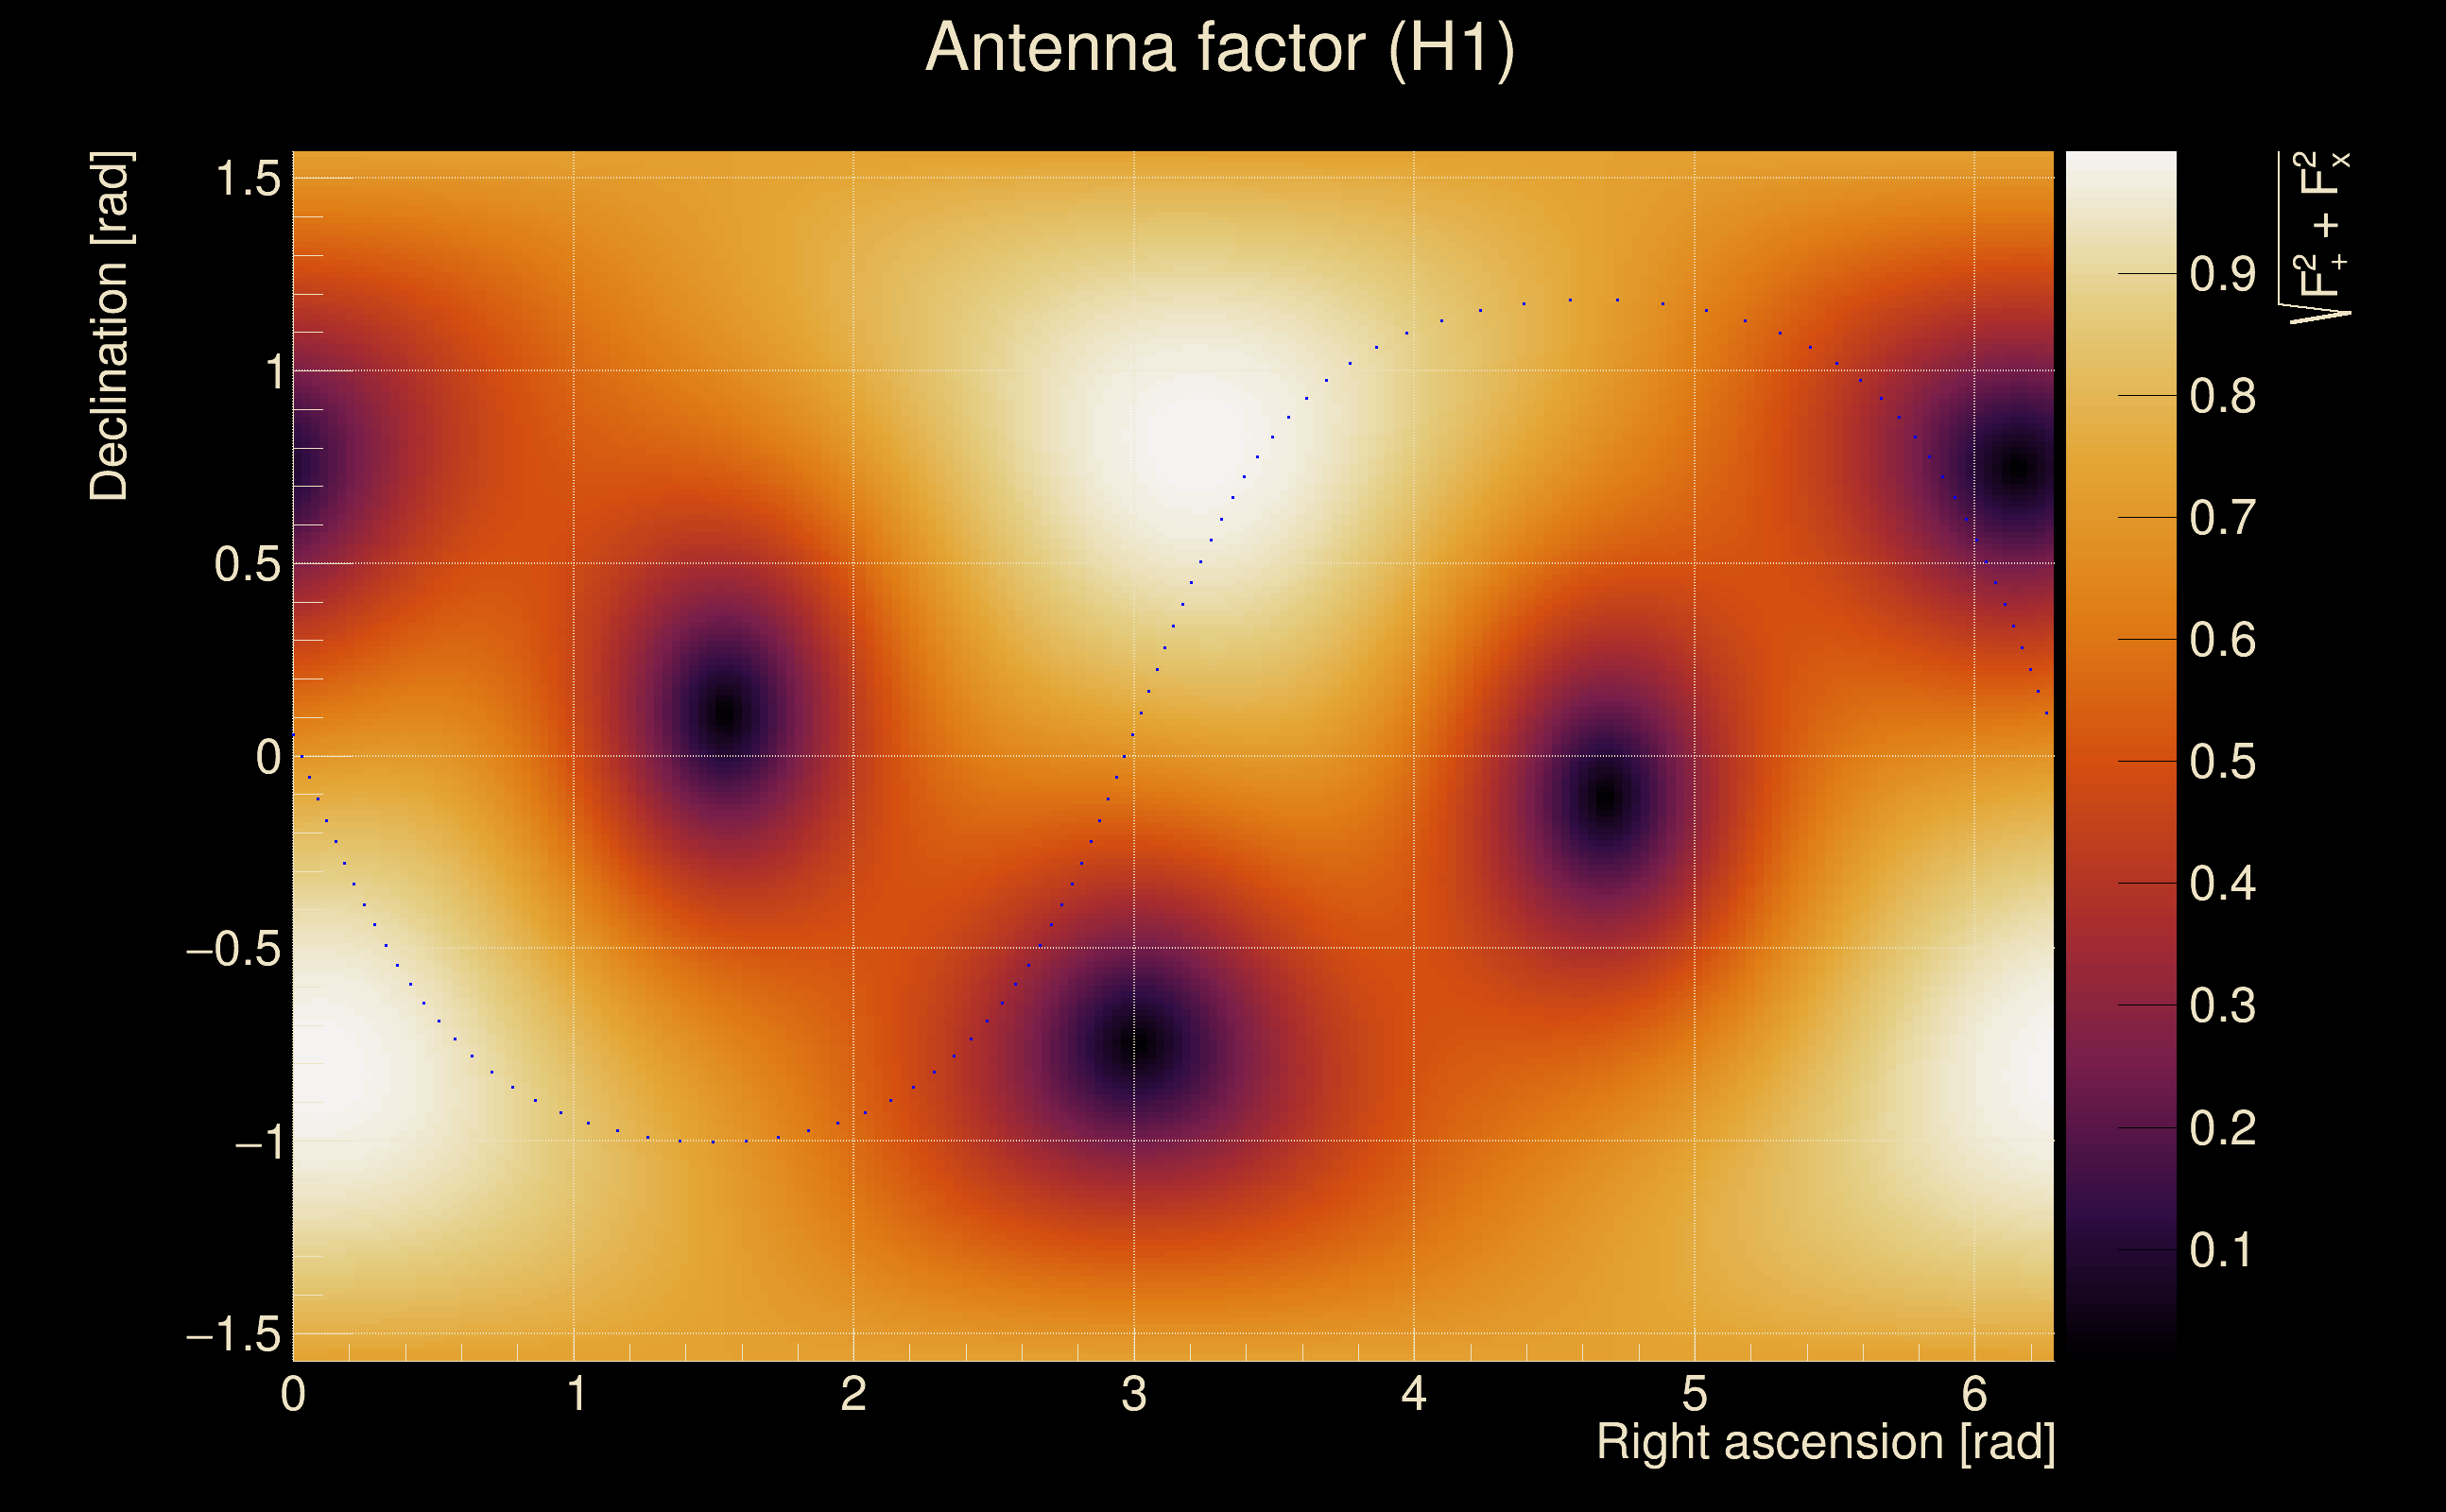
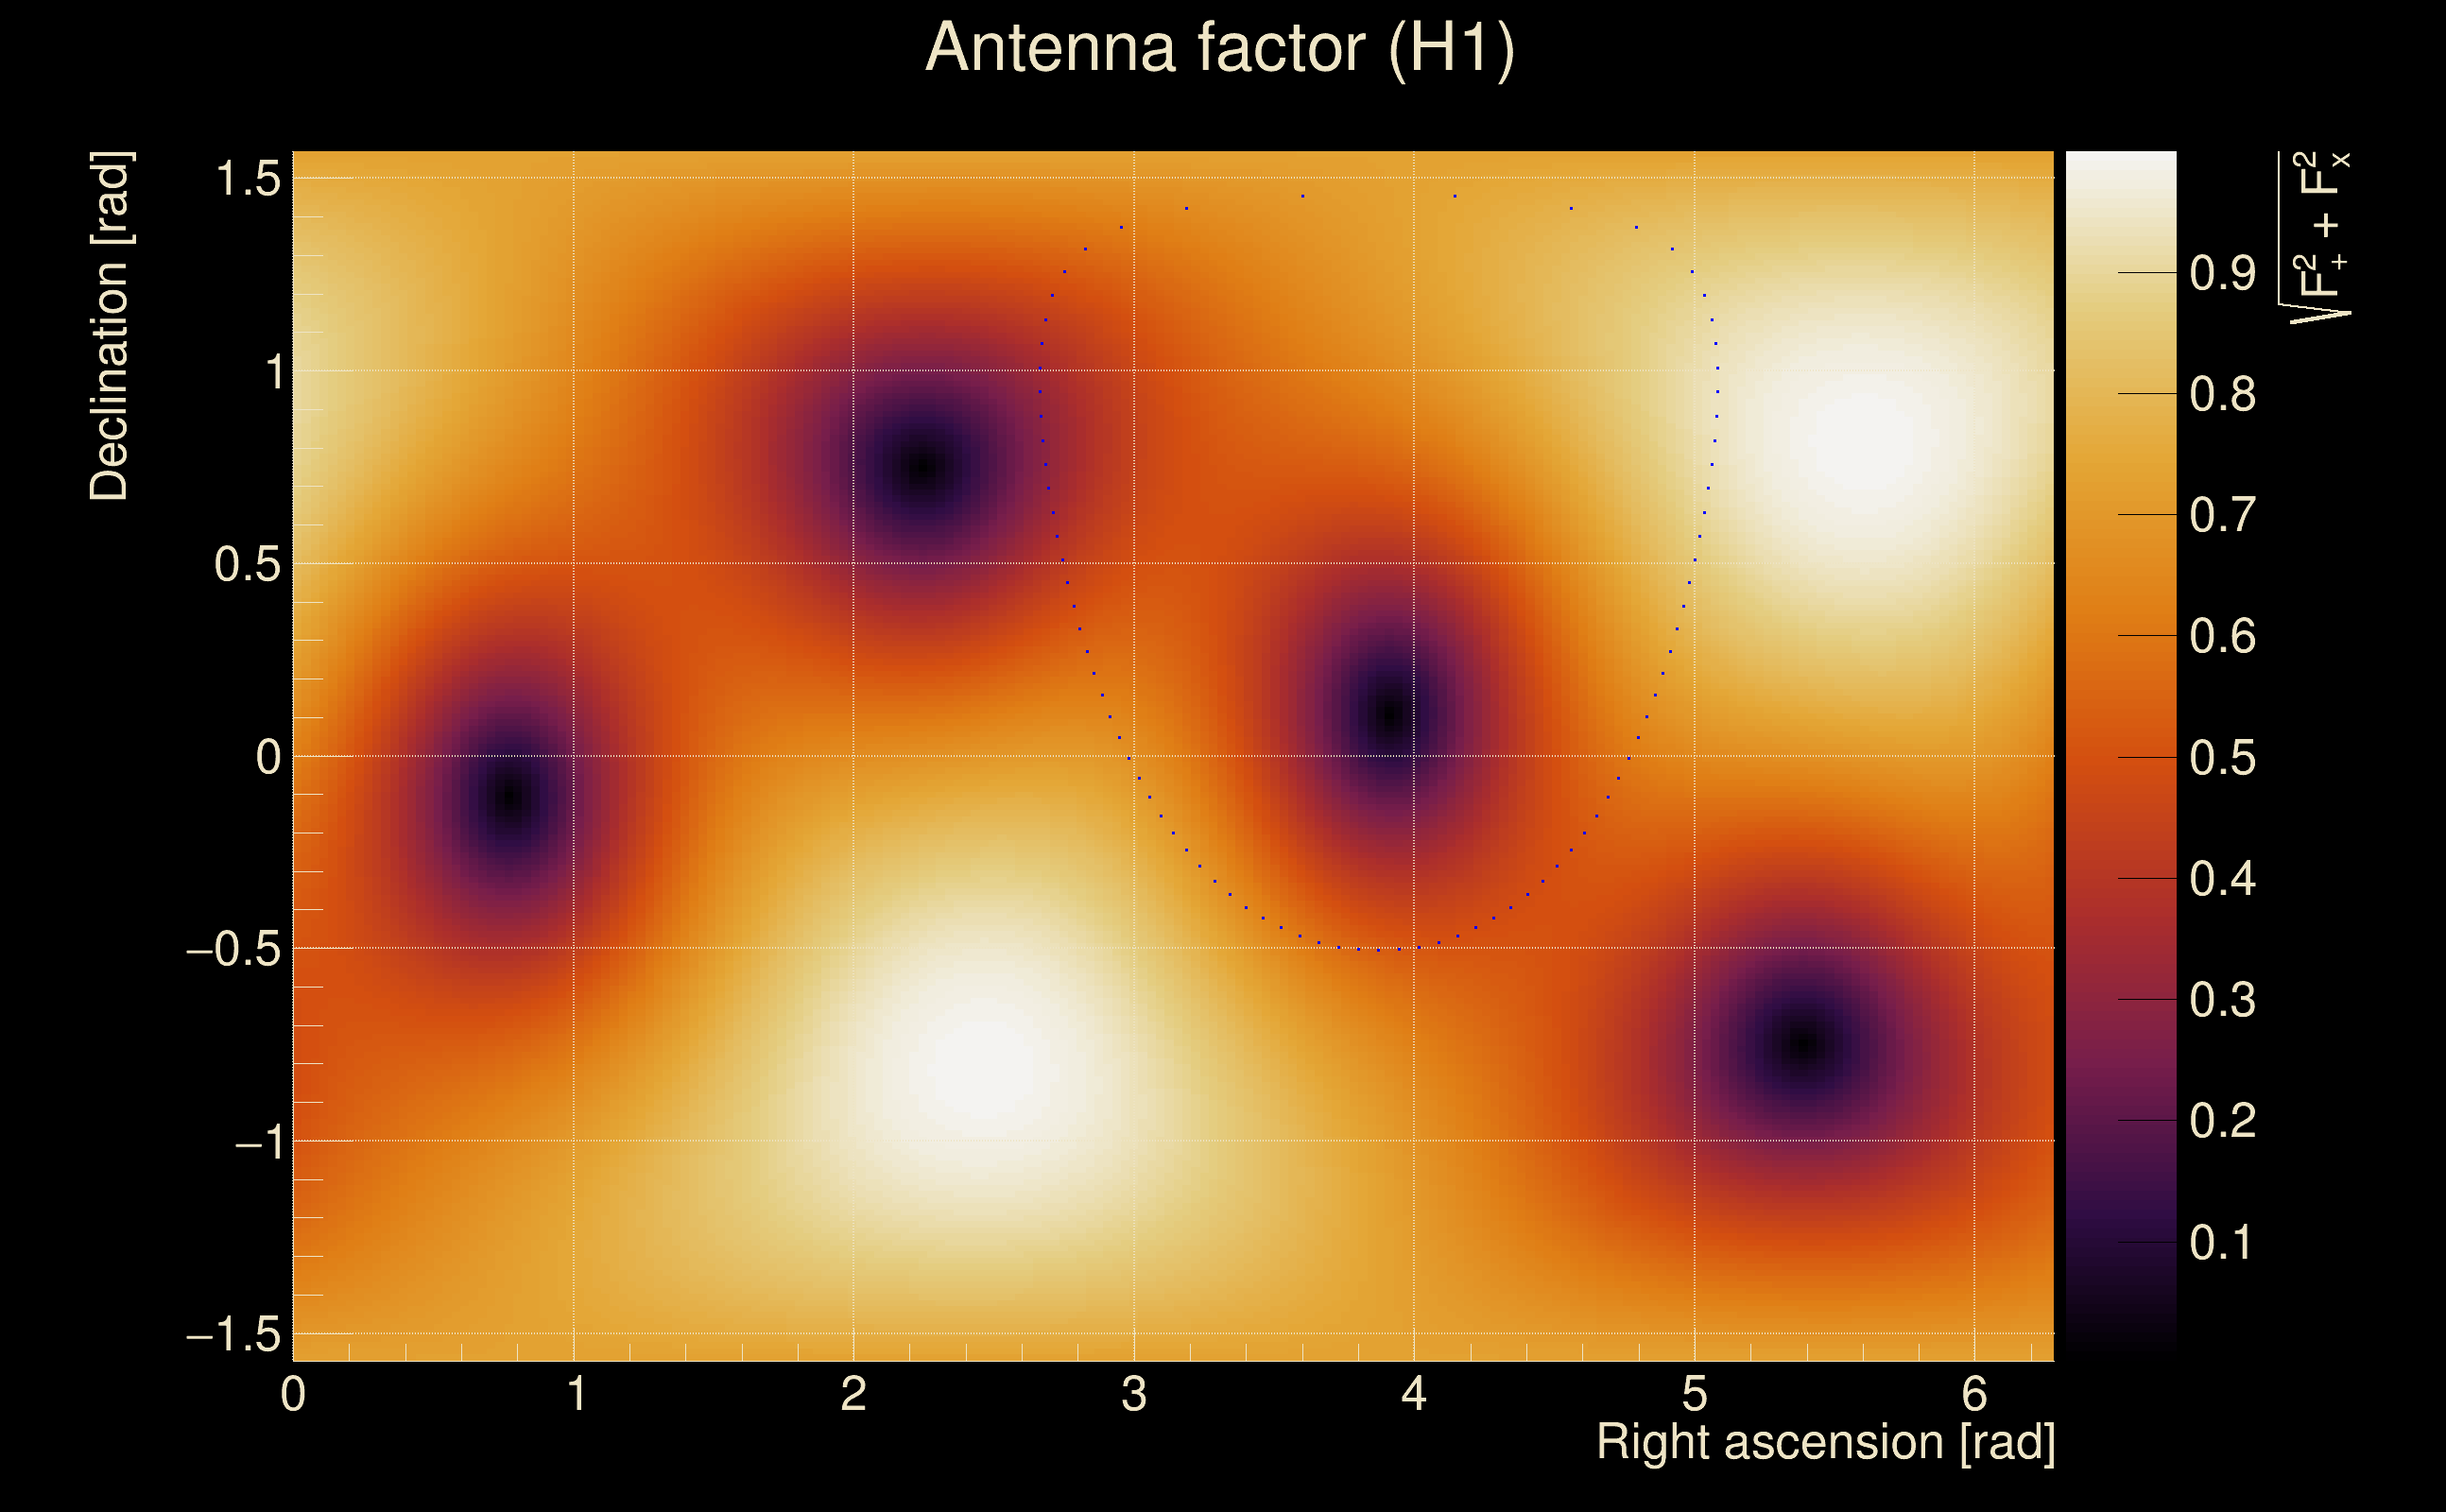
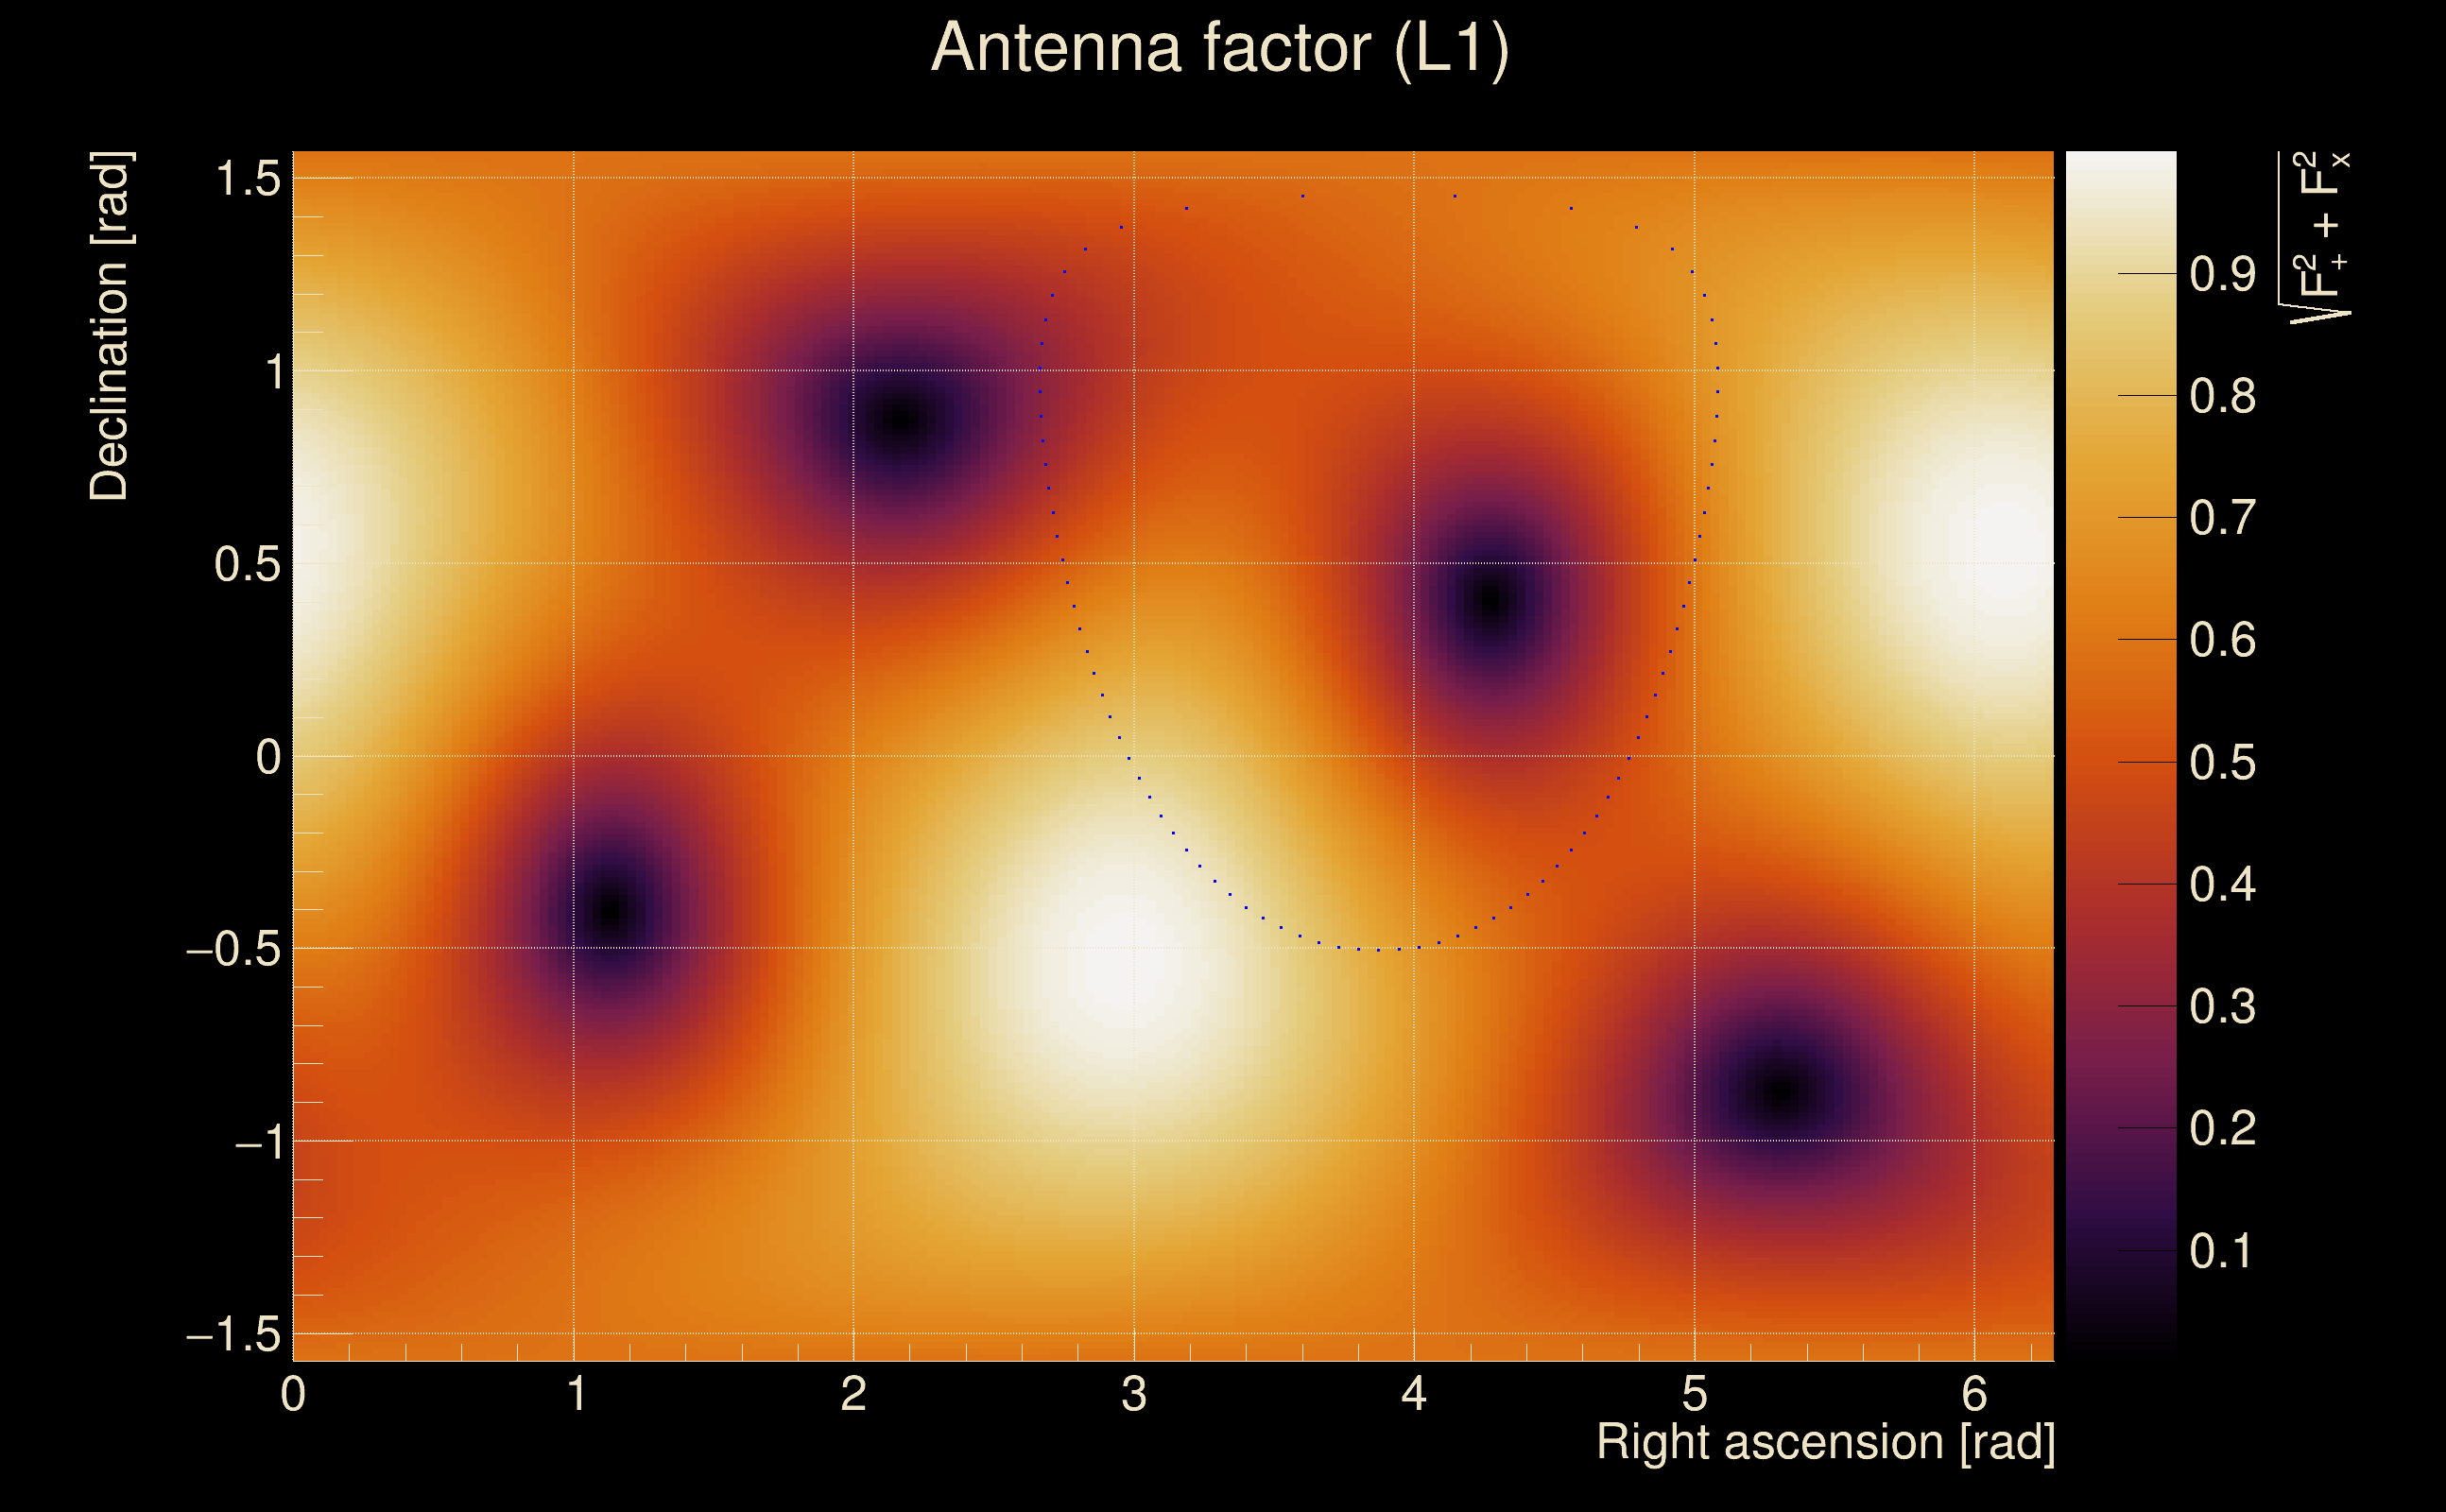
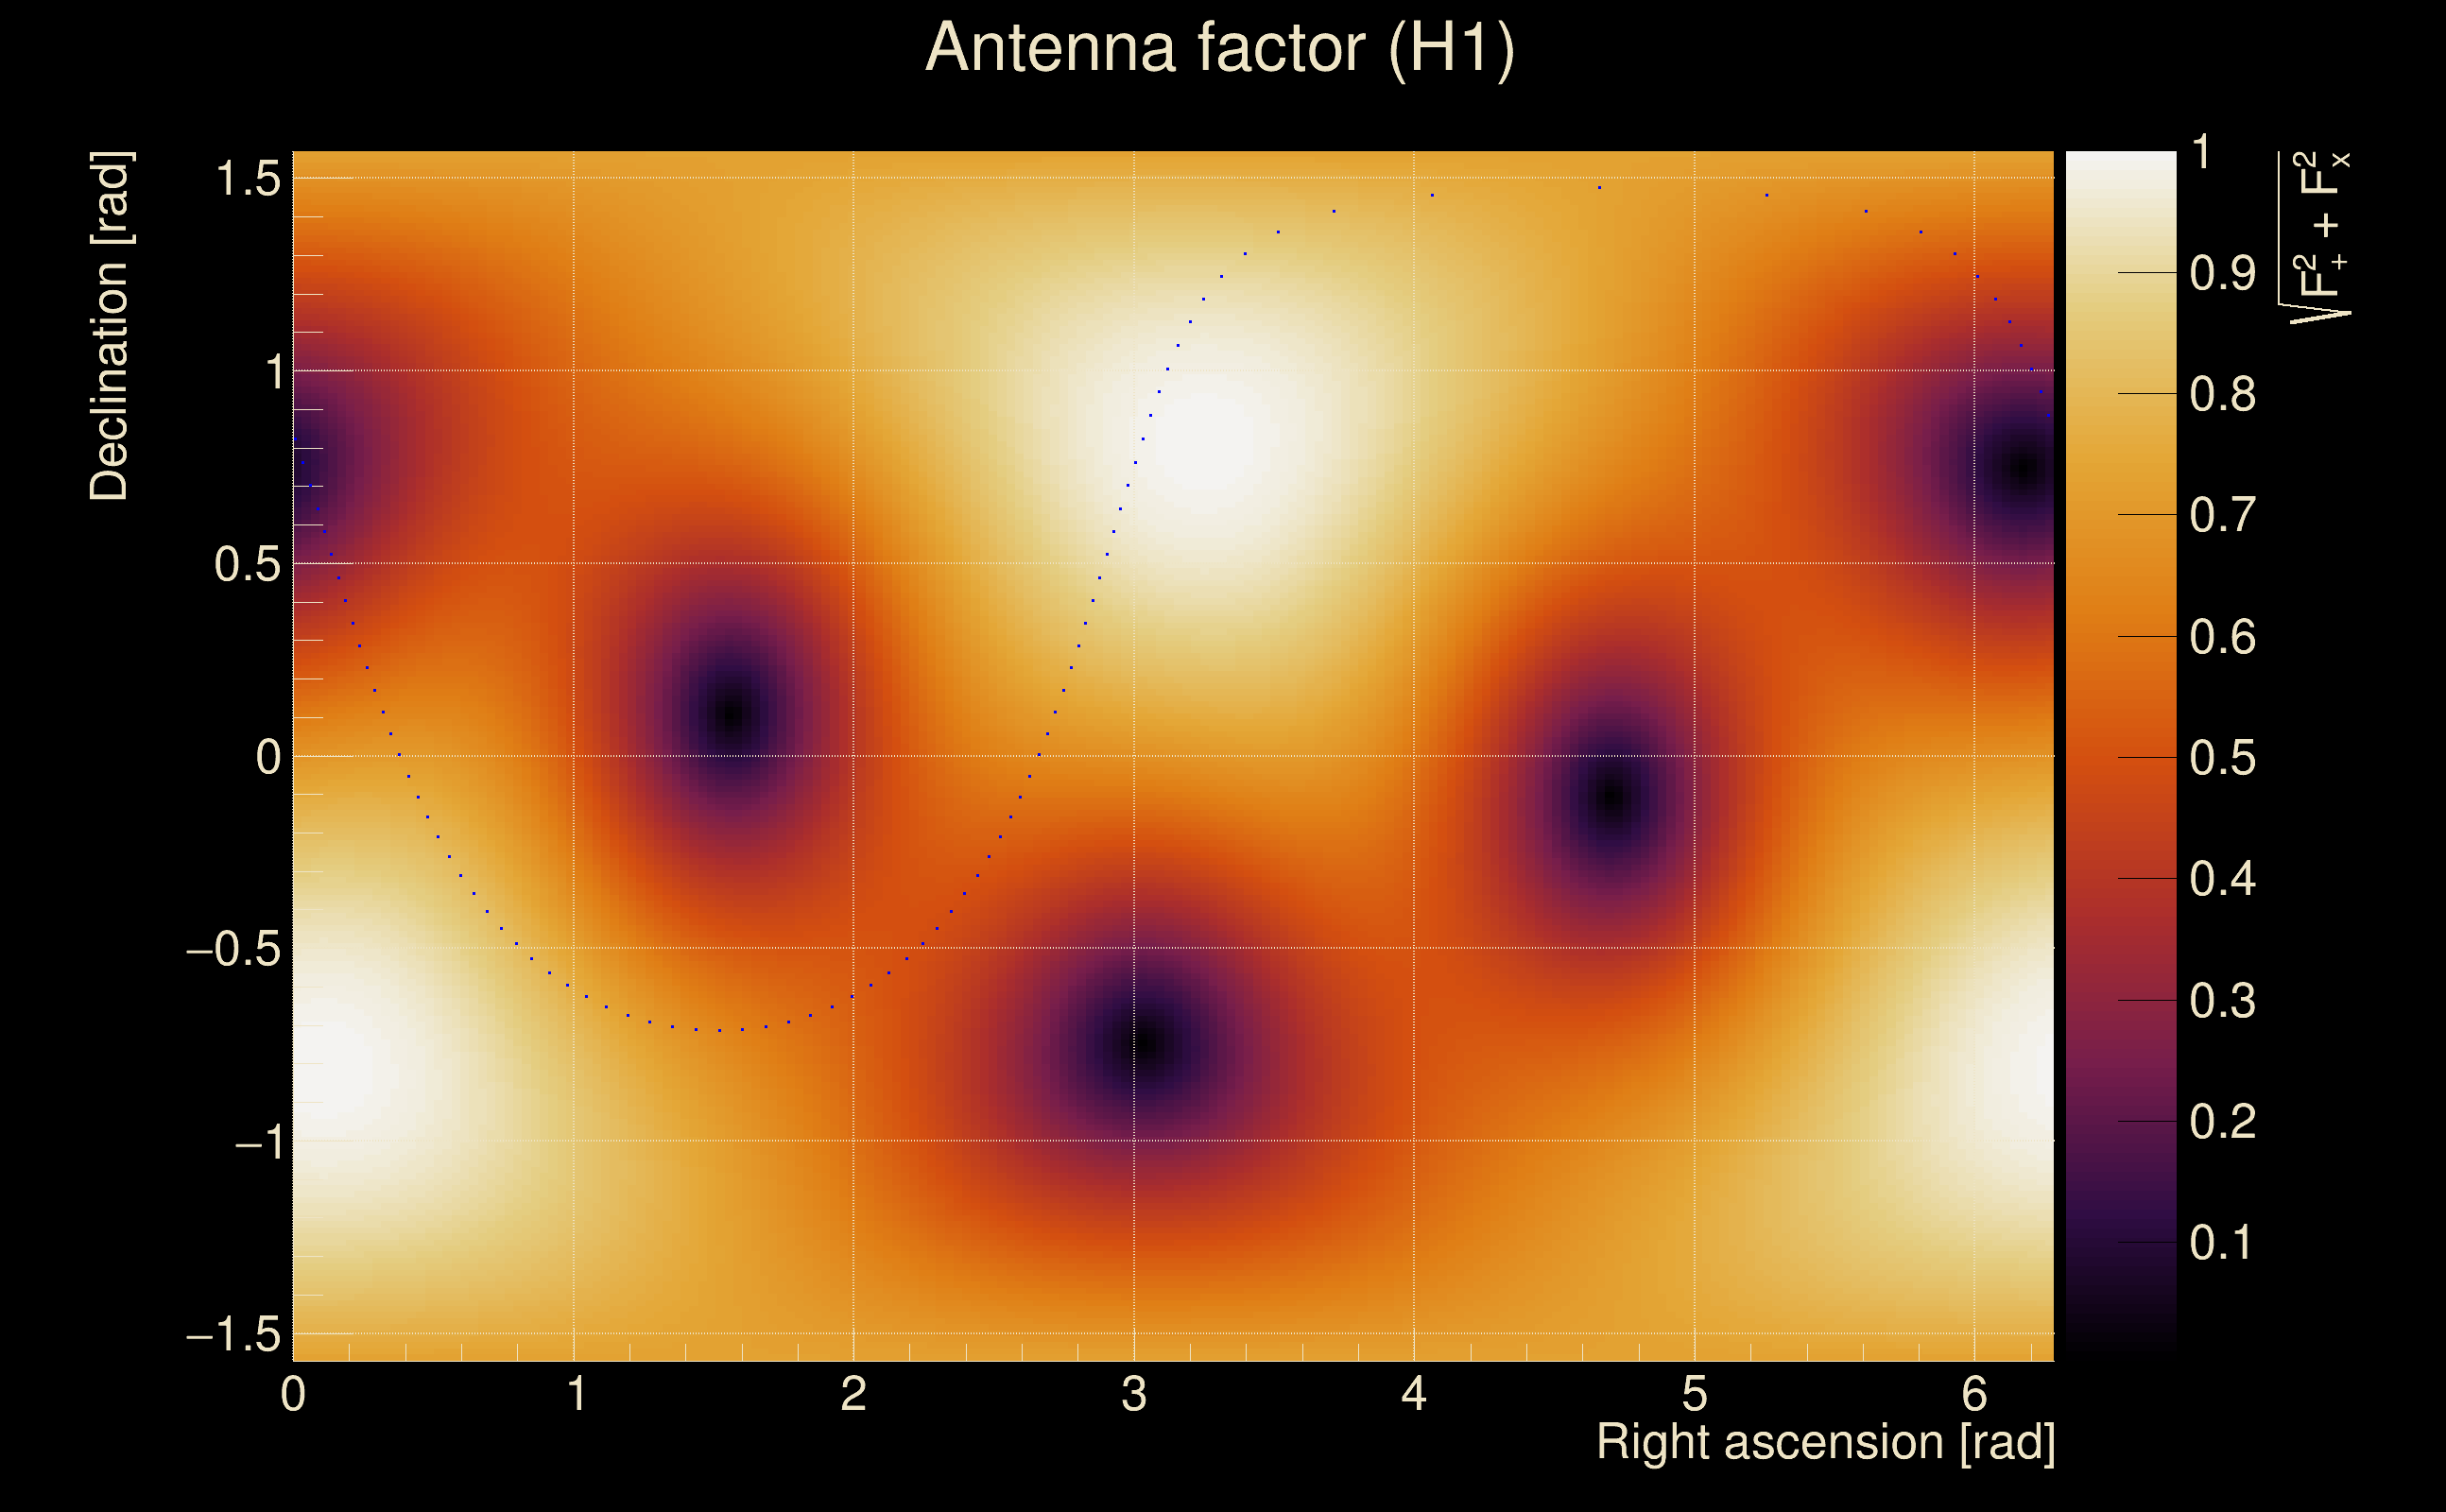
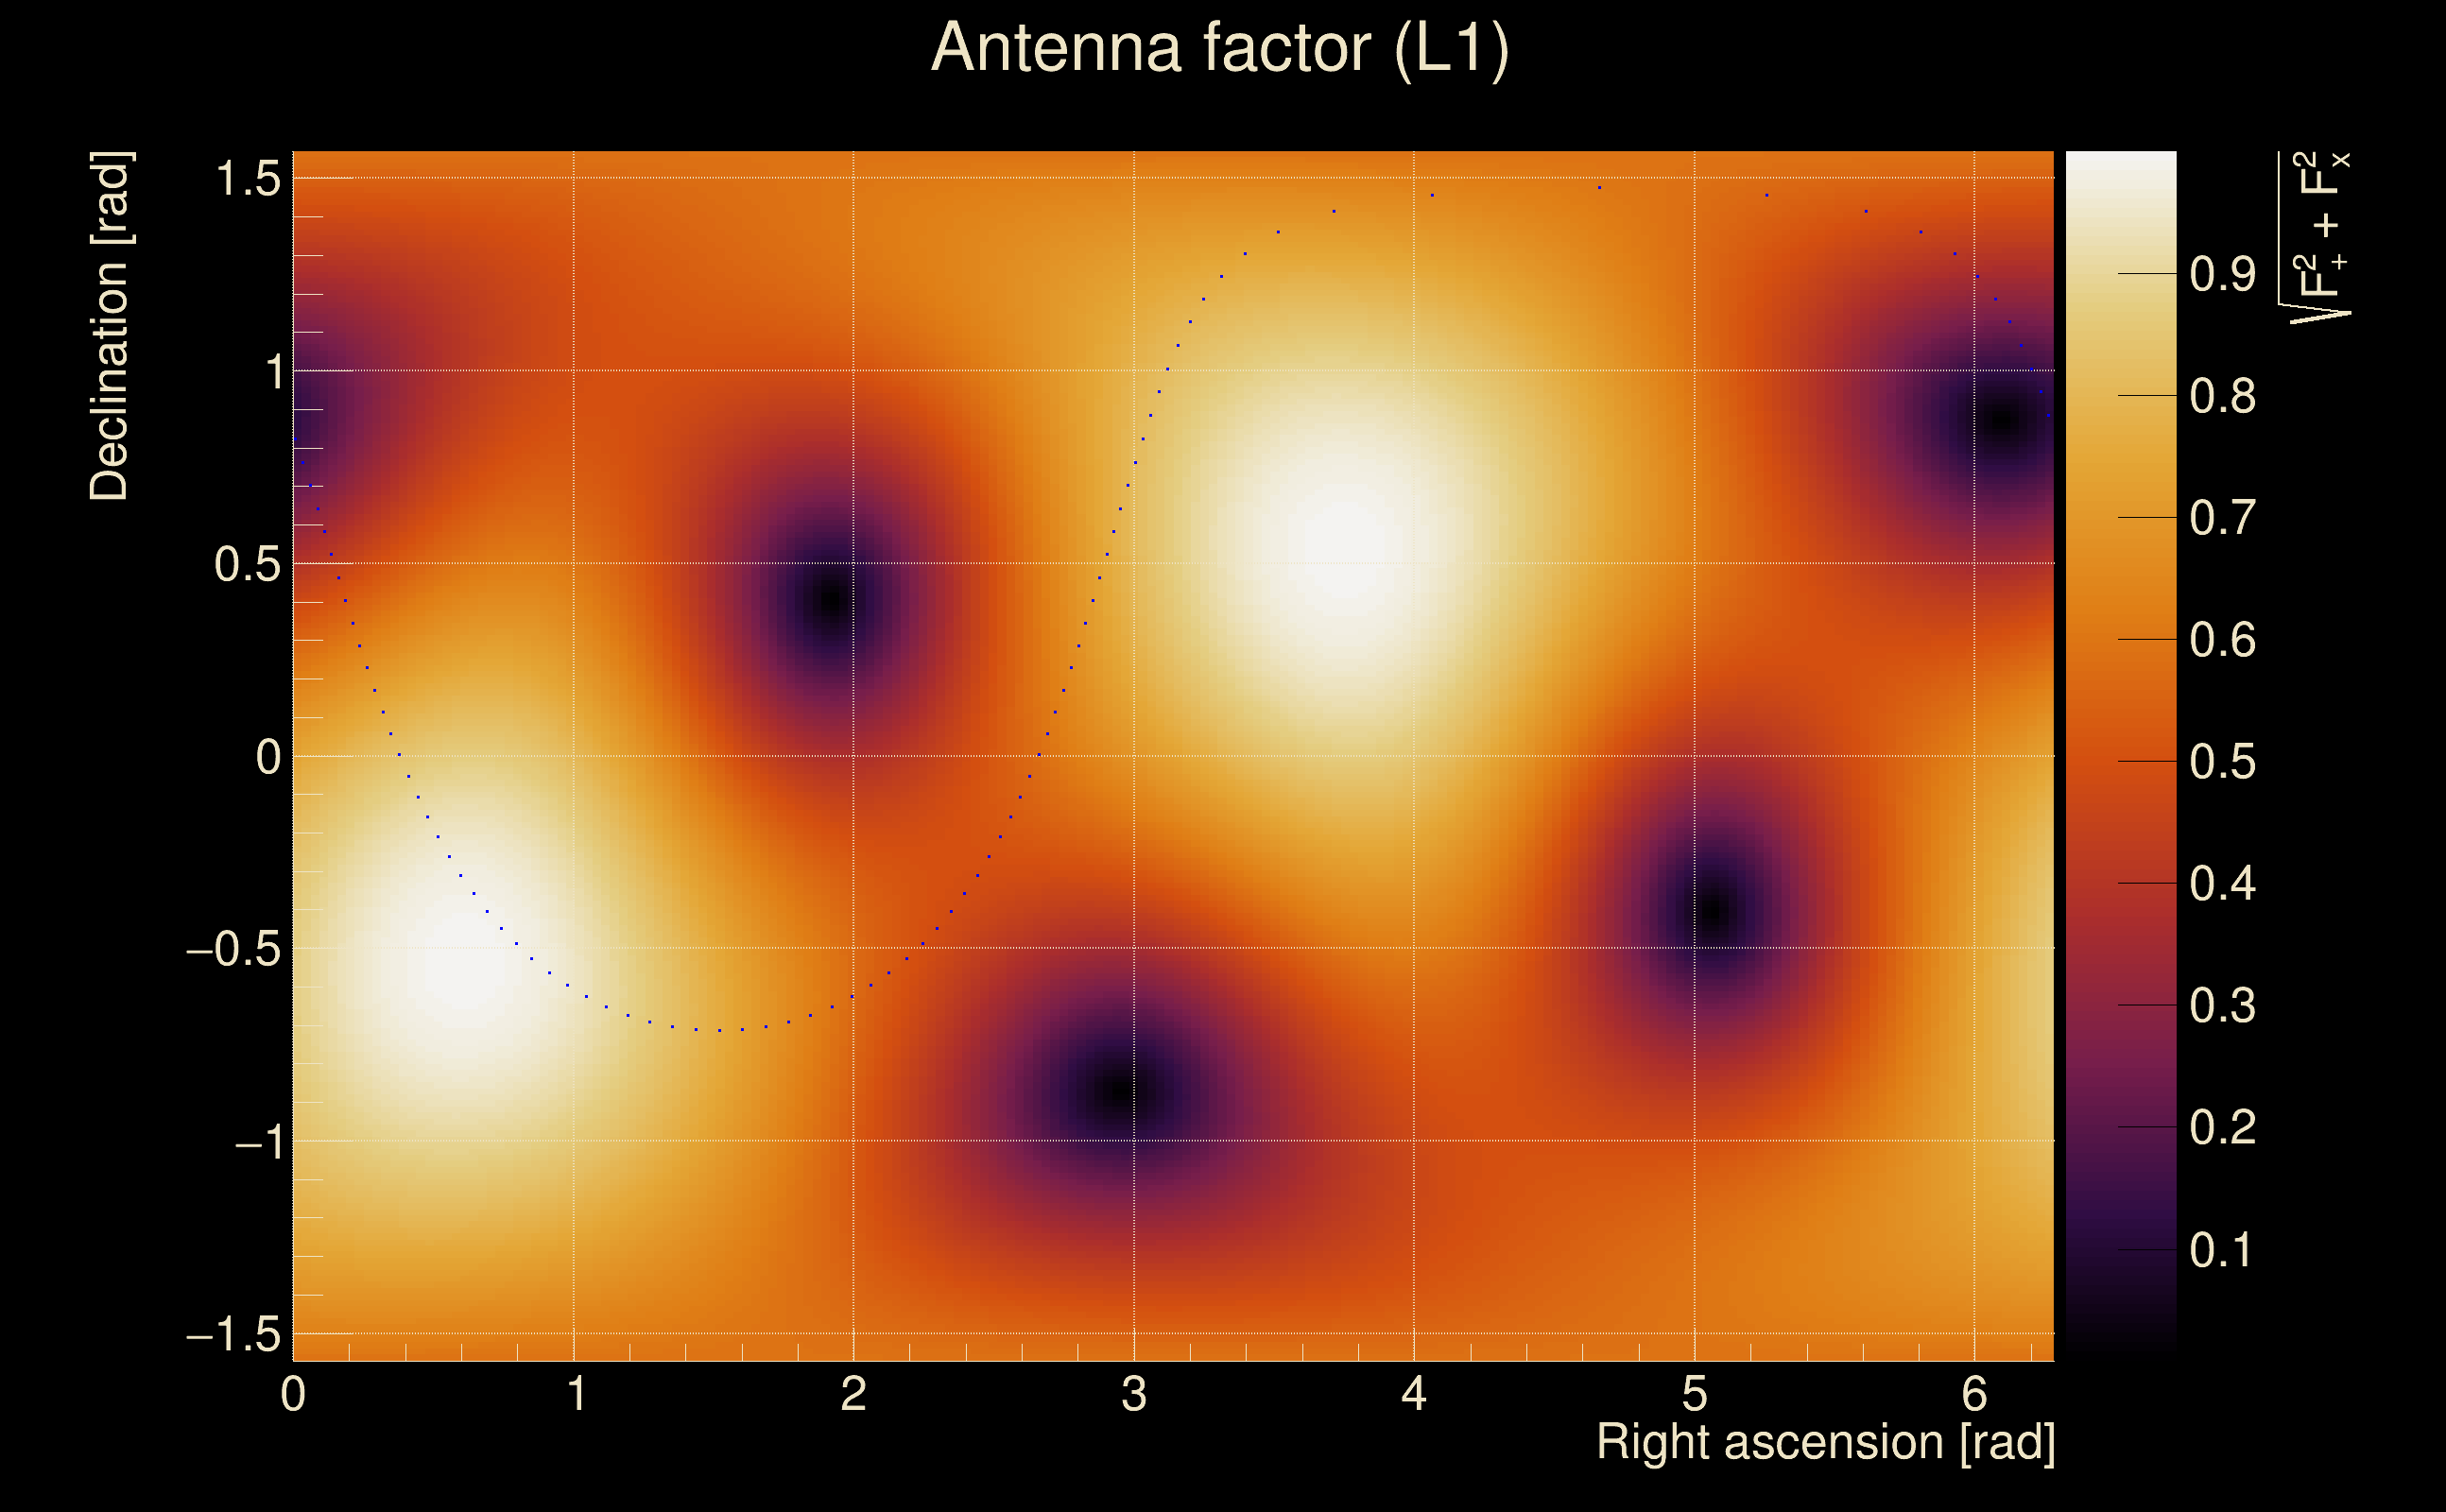
| Antenna factor probability: | 0.986425 |
| Number of rejected frequency rows: | Q0: 0 / 18, Q1: 0 / 36, Q2: 0 / 70, Q3: 5 / 134, Q4: 13 / 258 |
| Maximum signal-to-noise ratio: | H1: 82.9071, L1: 92.2983 |
| SNR variance: | H1: 5.37913, L1: 5.4097 |
| Click here for a zoomed plot | Click here for a zoomed plot | Click here for a zoomed plot | Click here for a zoomed plot | Click here for a zoomed plot |
 |
 |
 |
 |
 |
 |
 |
 |
 |
 |
 |
 |
 |
 |
 |
 |
 |
 |
 |
 |
 |
 |
 |
 |
 |
 |
 |
 |
 |
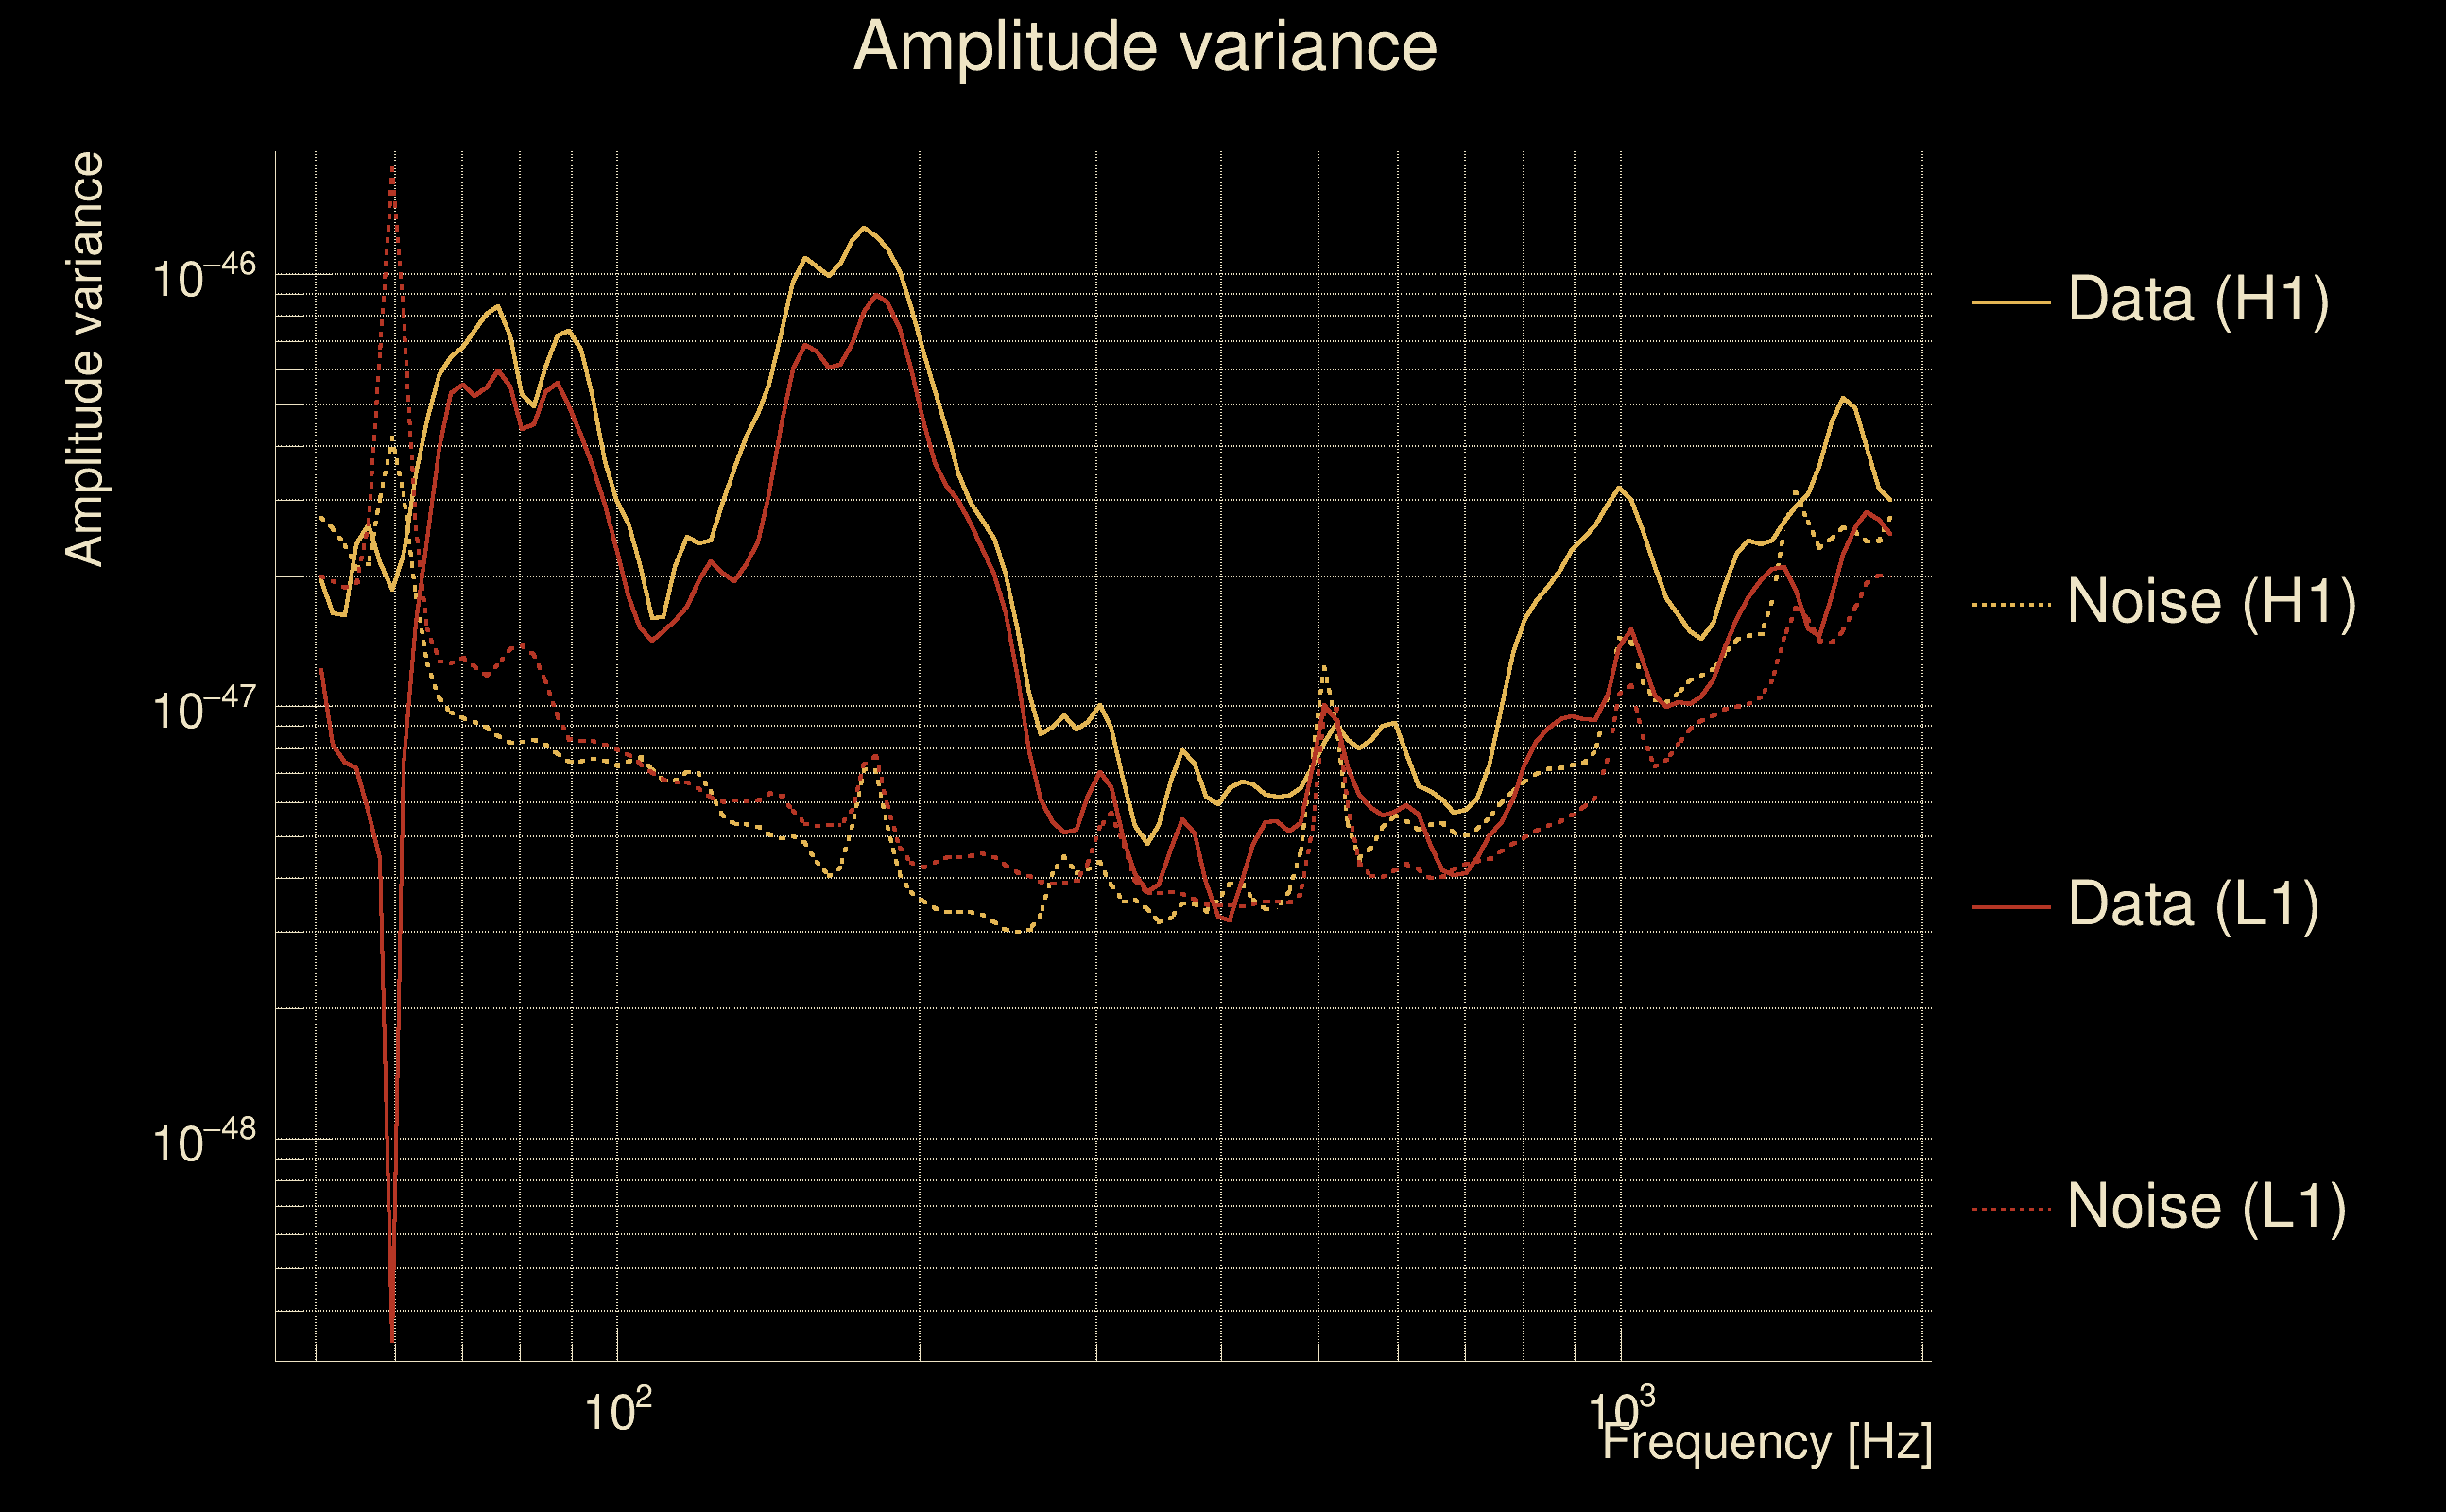
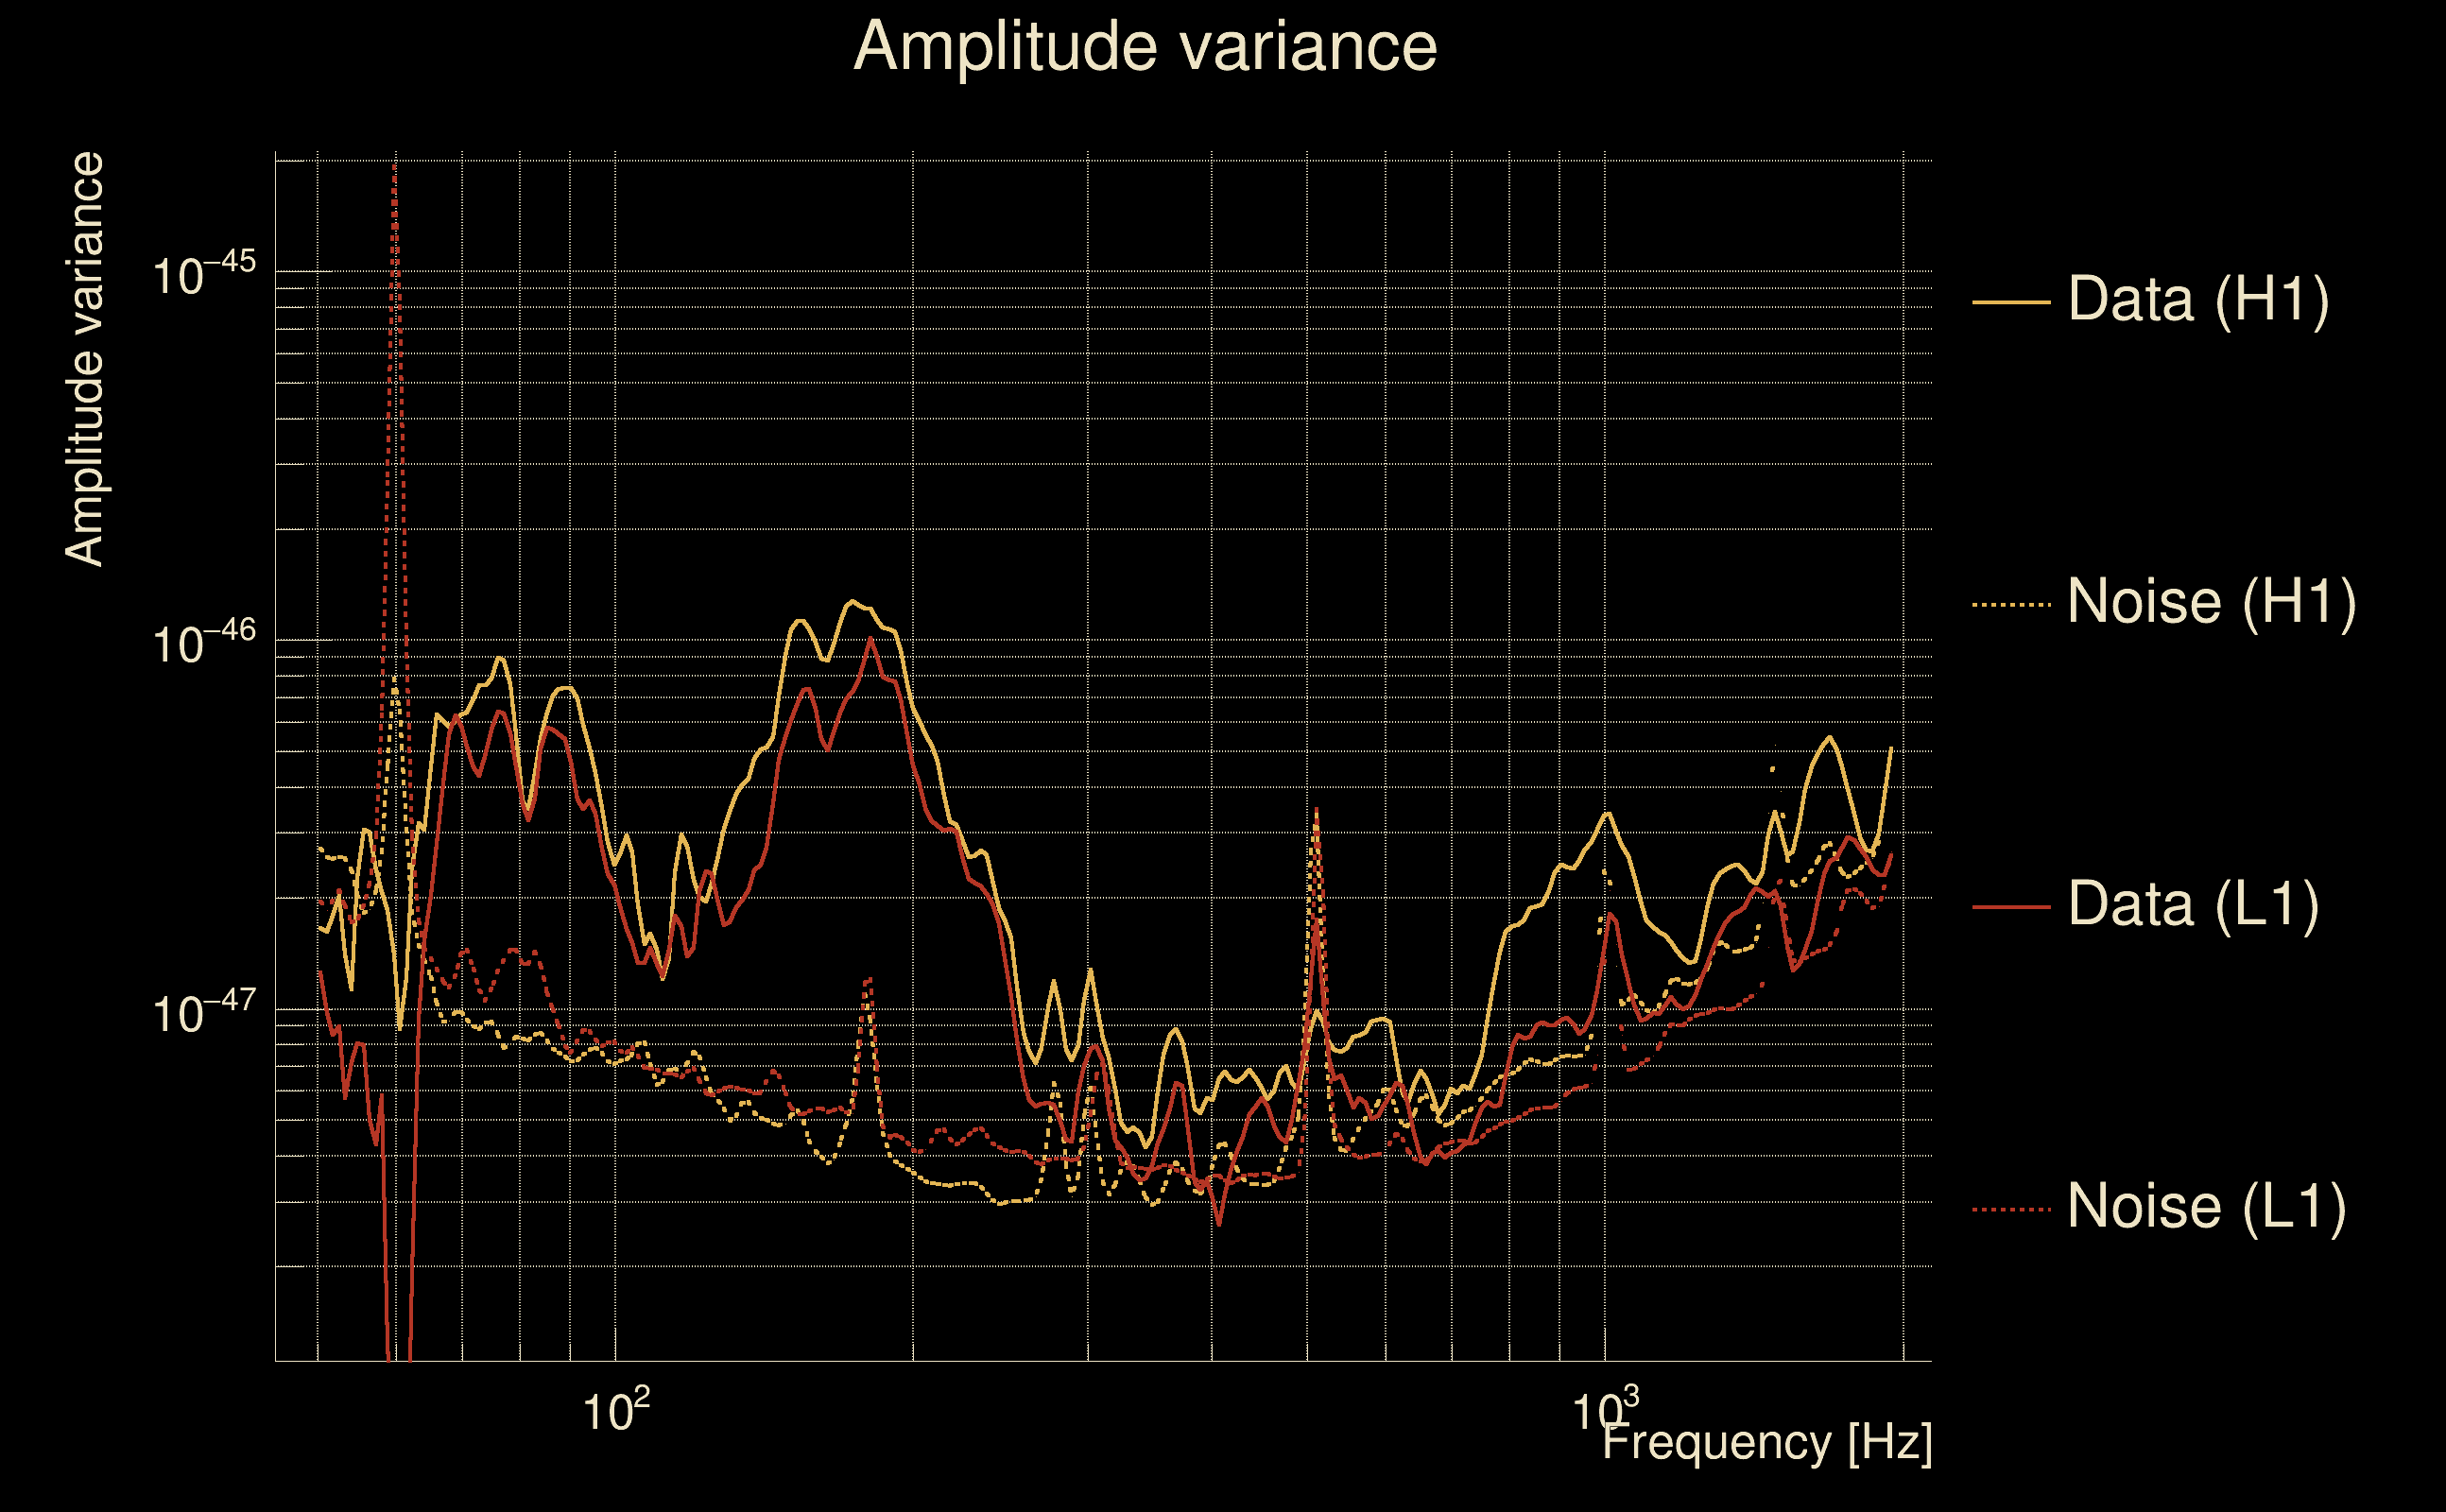
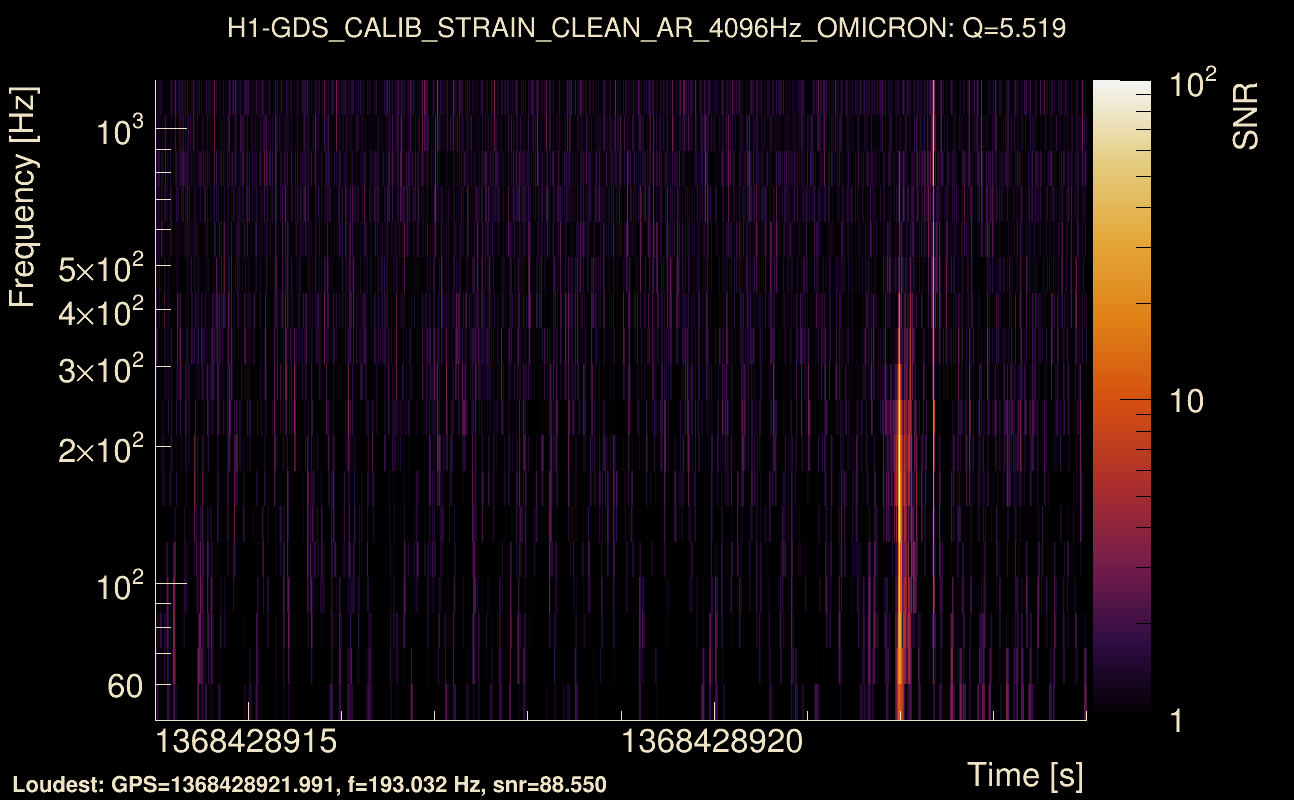
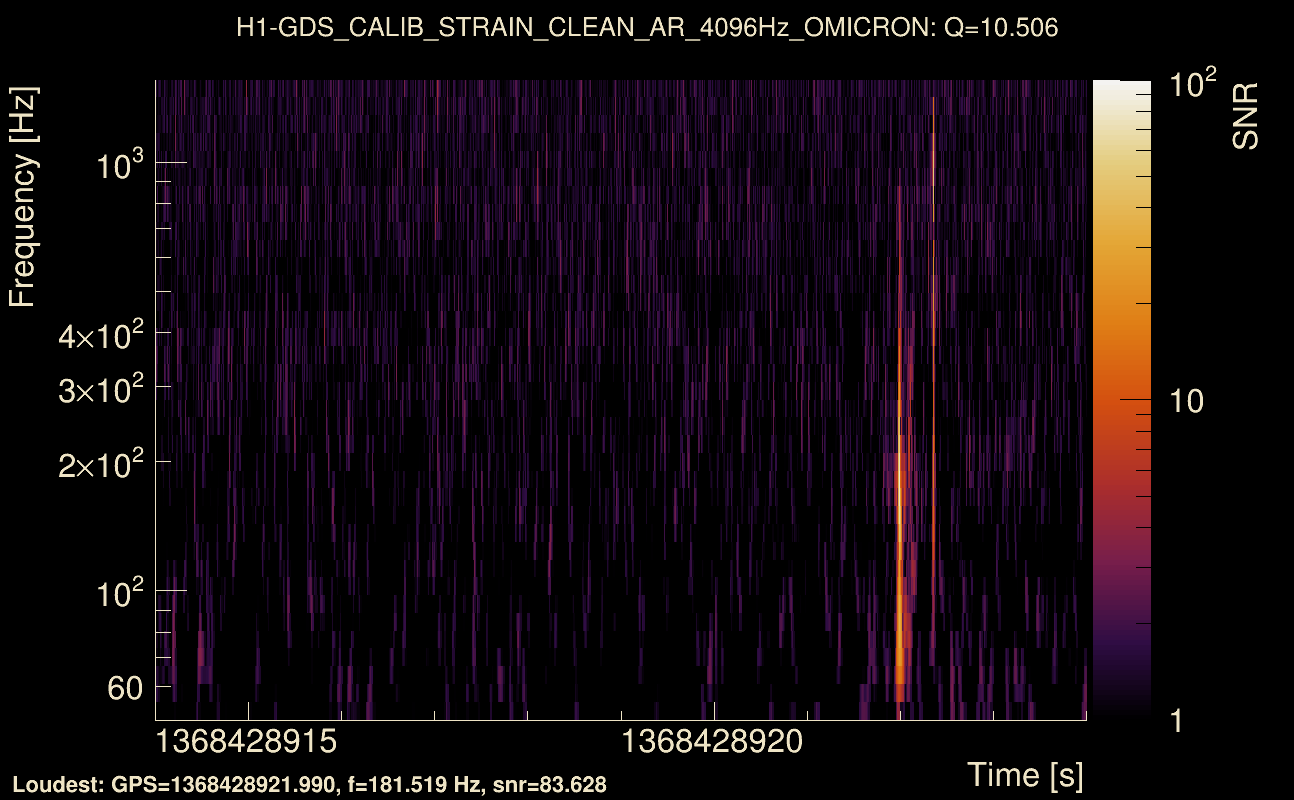
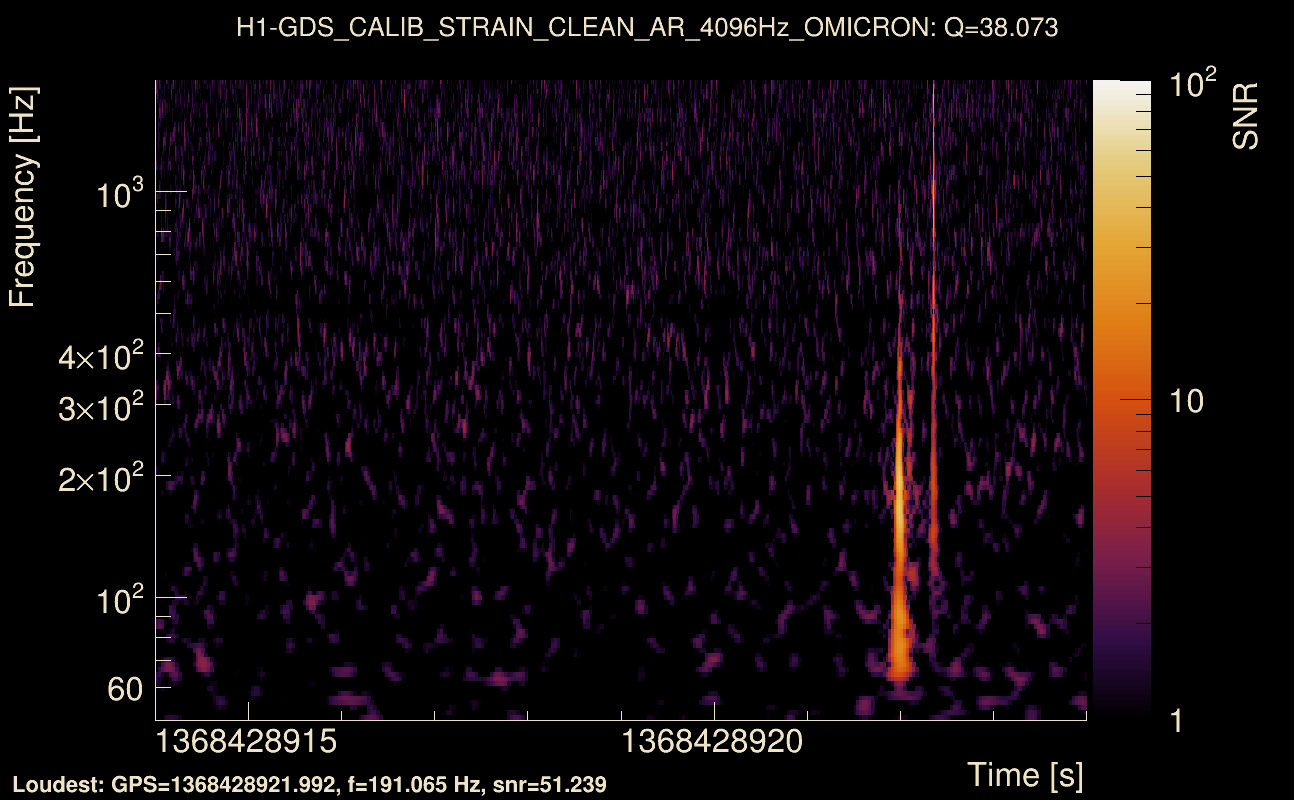
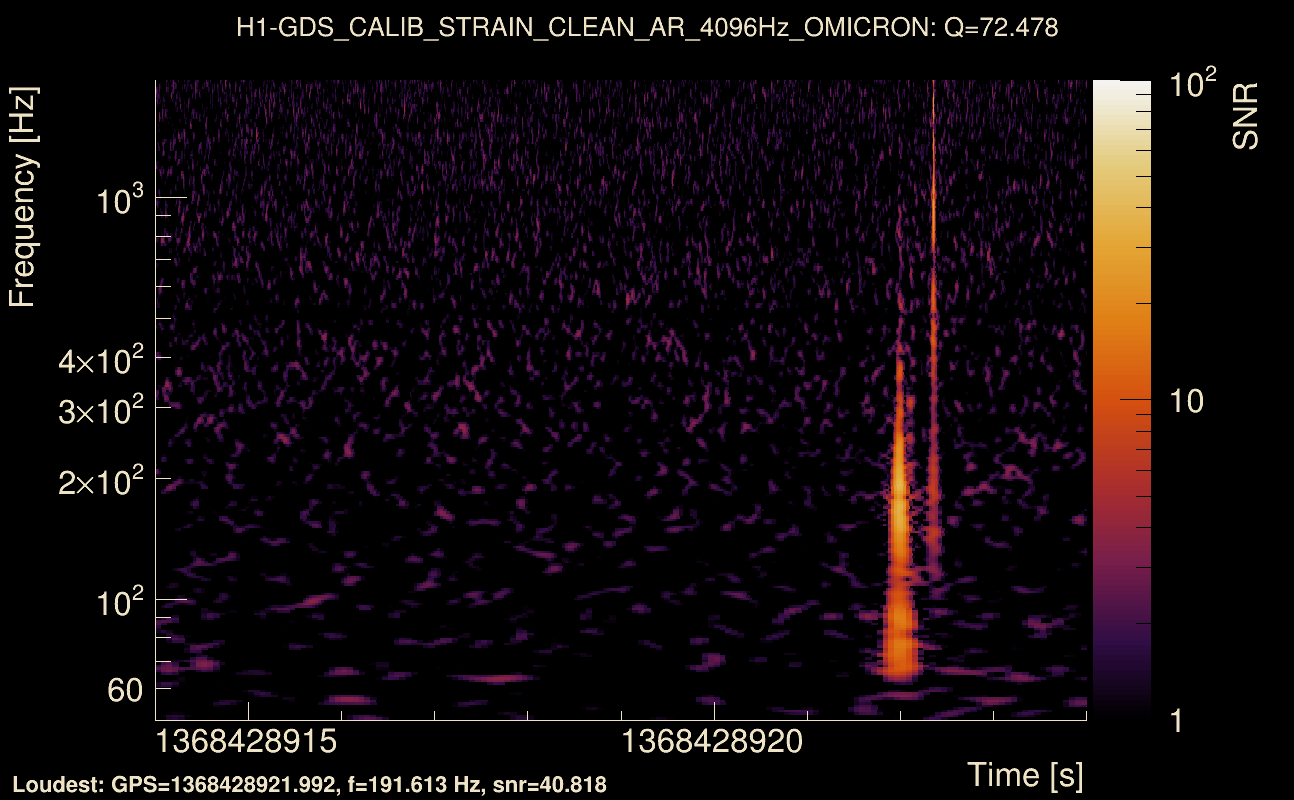
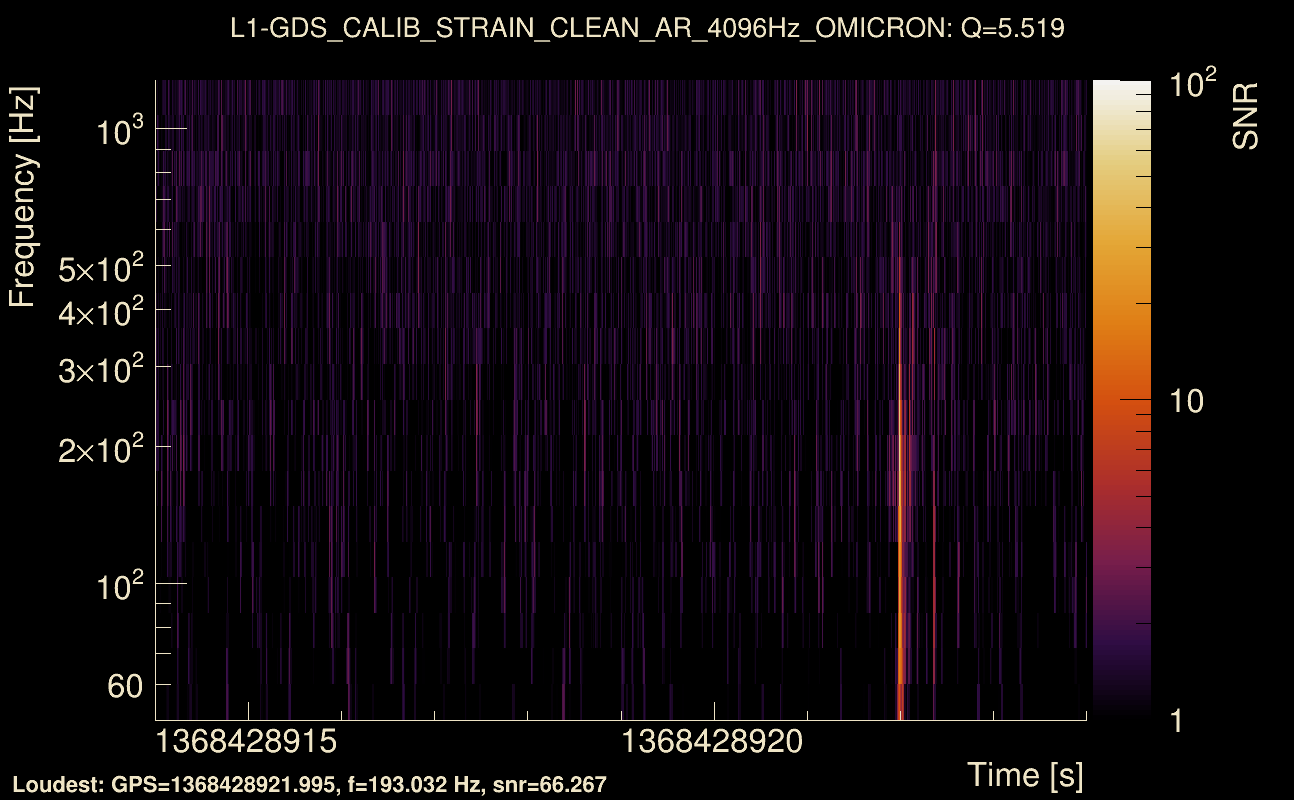
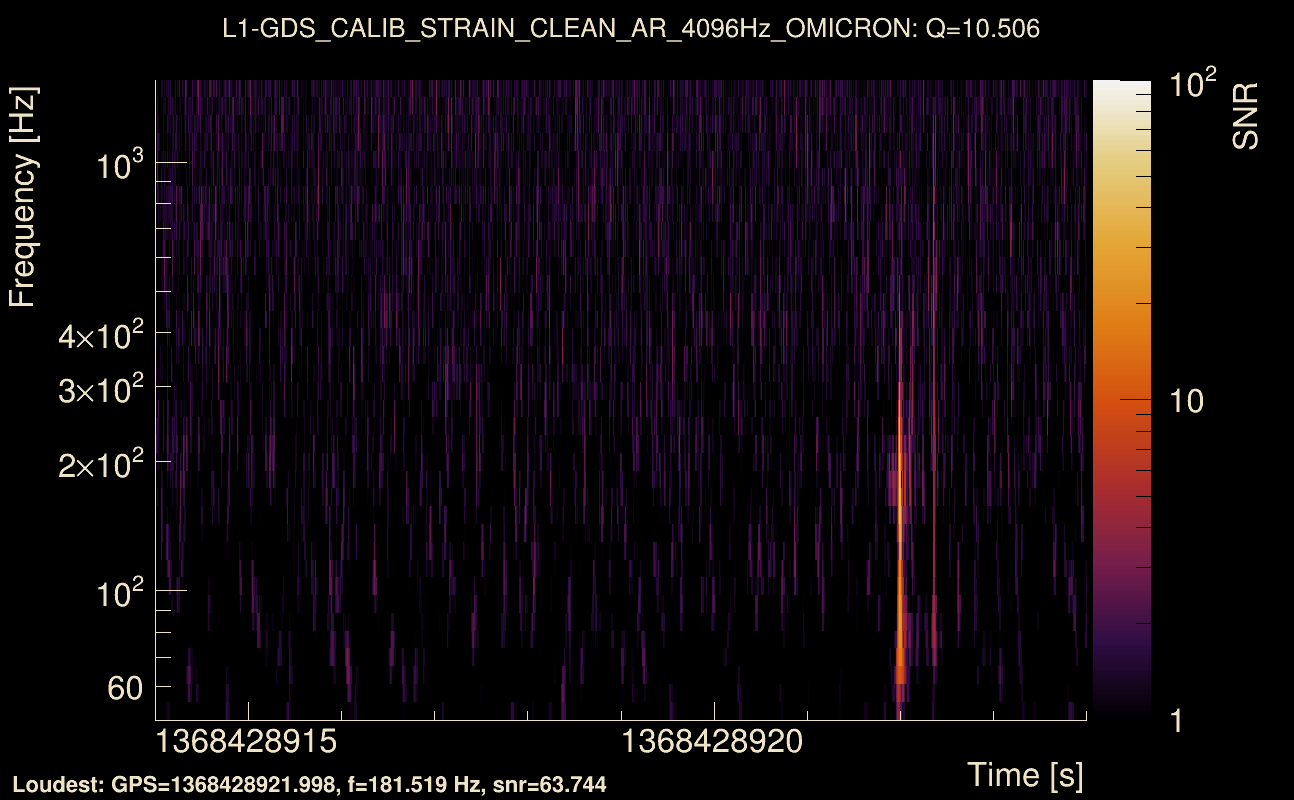
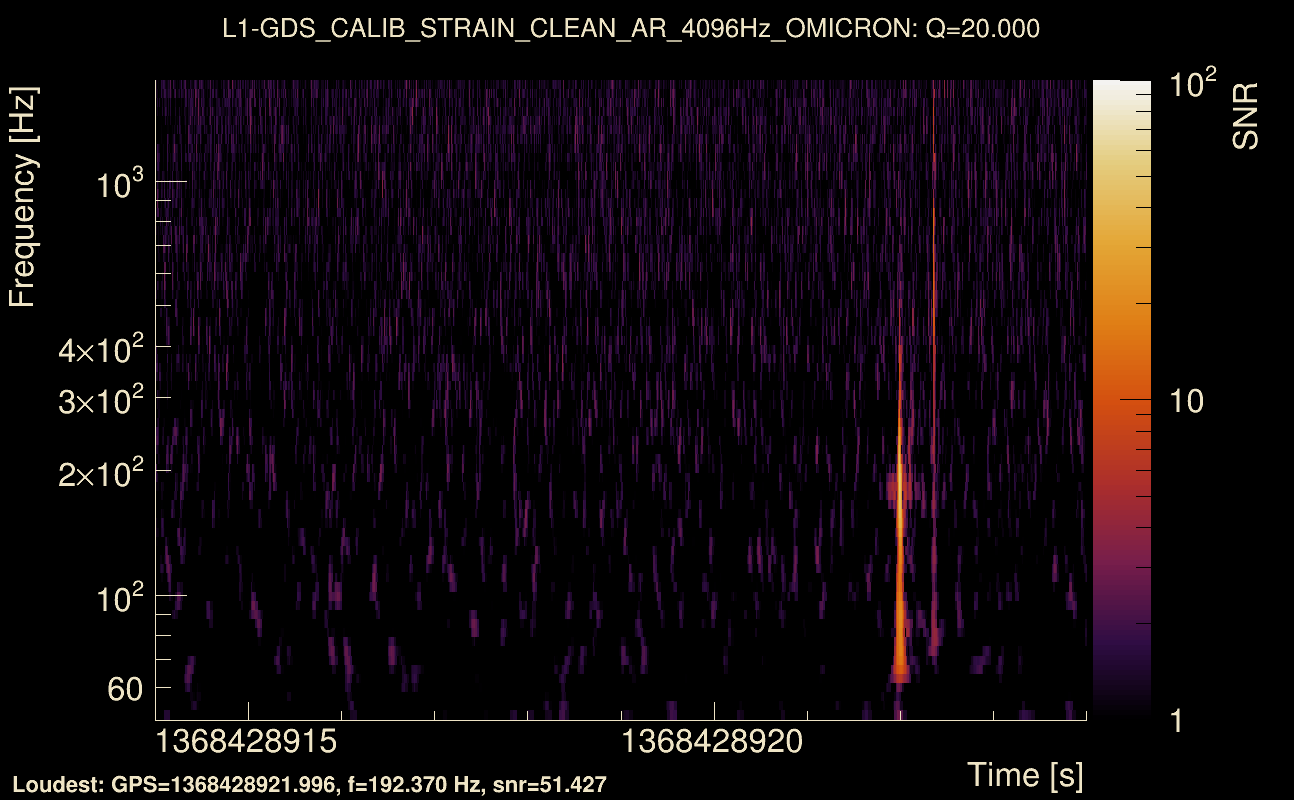
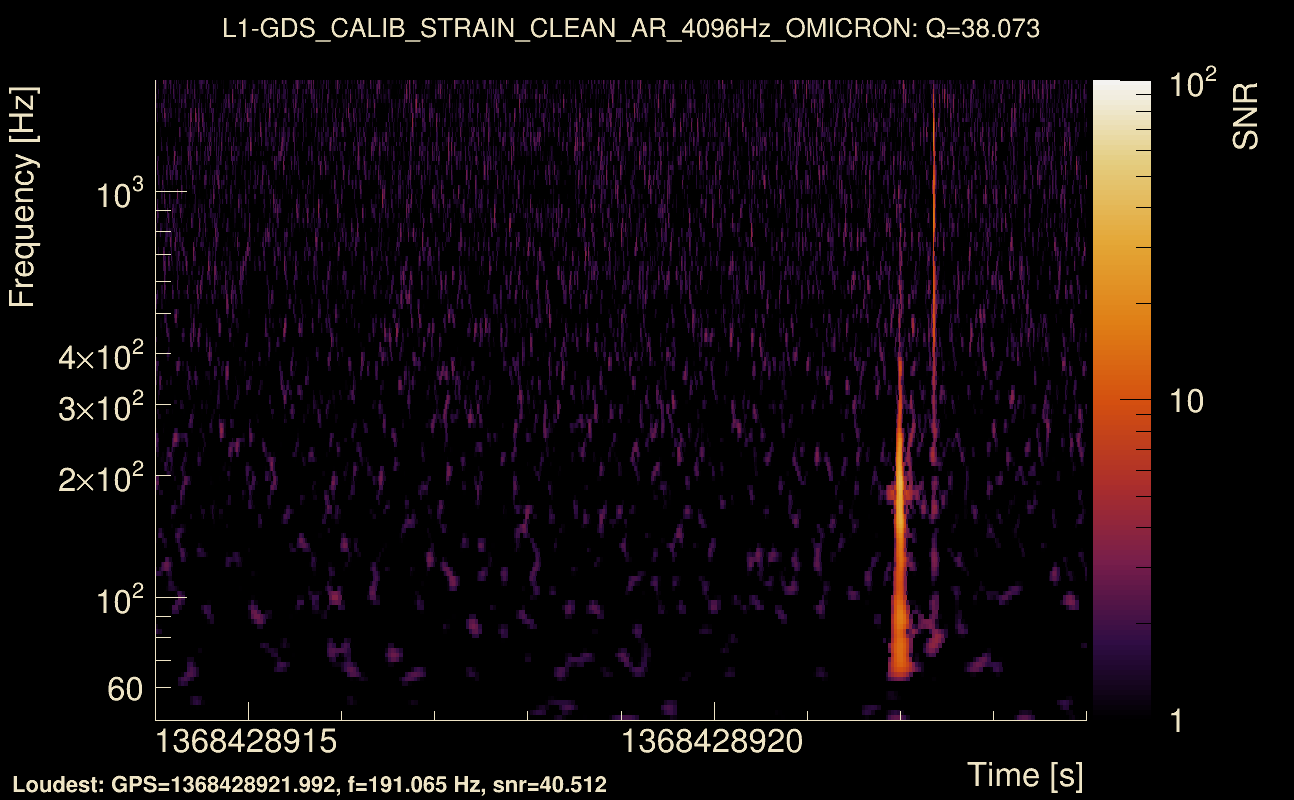
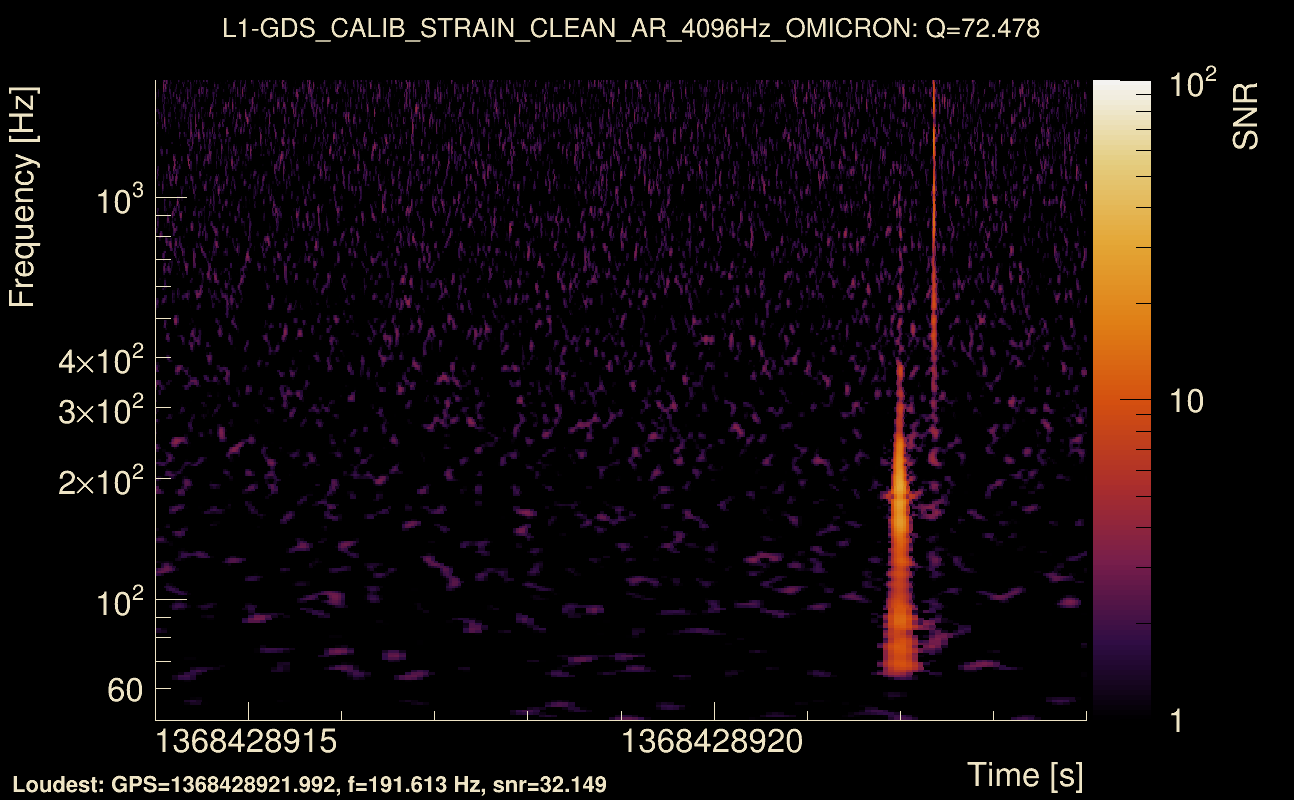
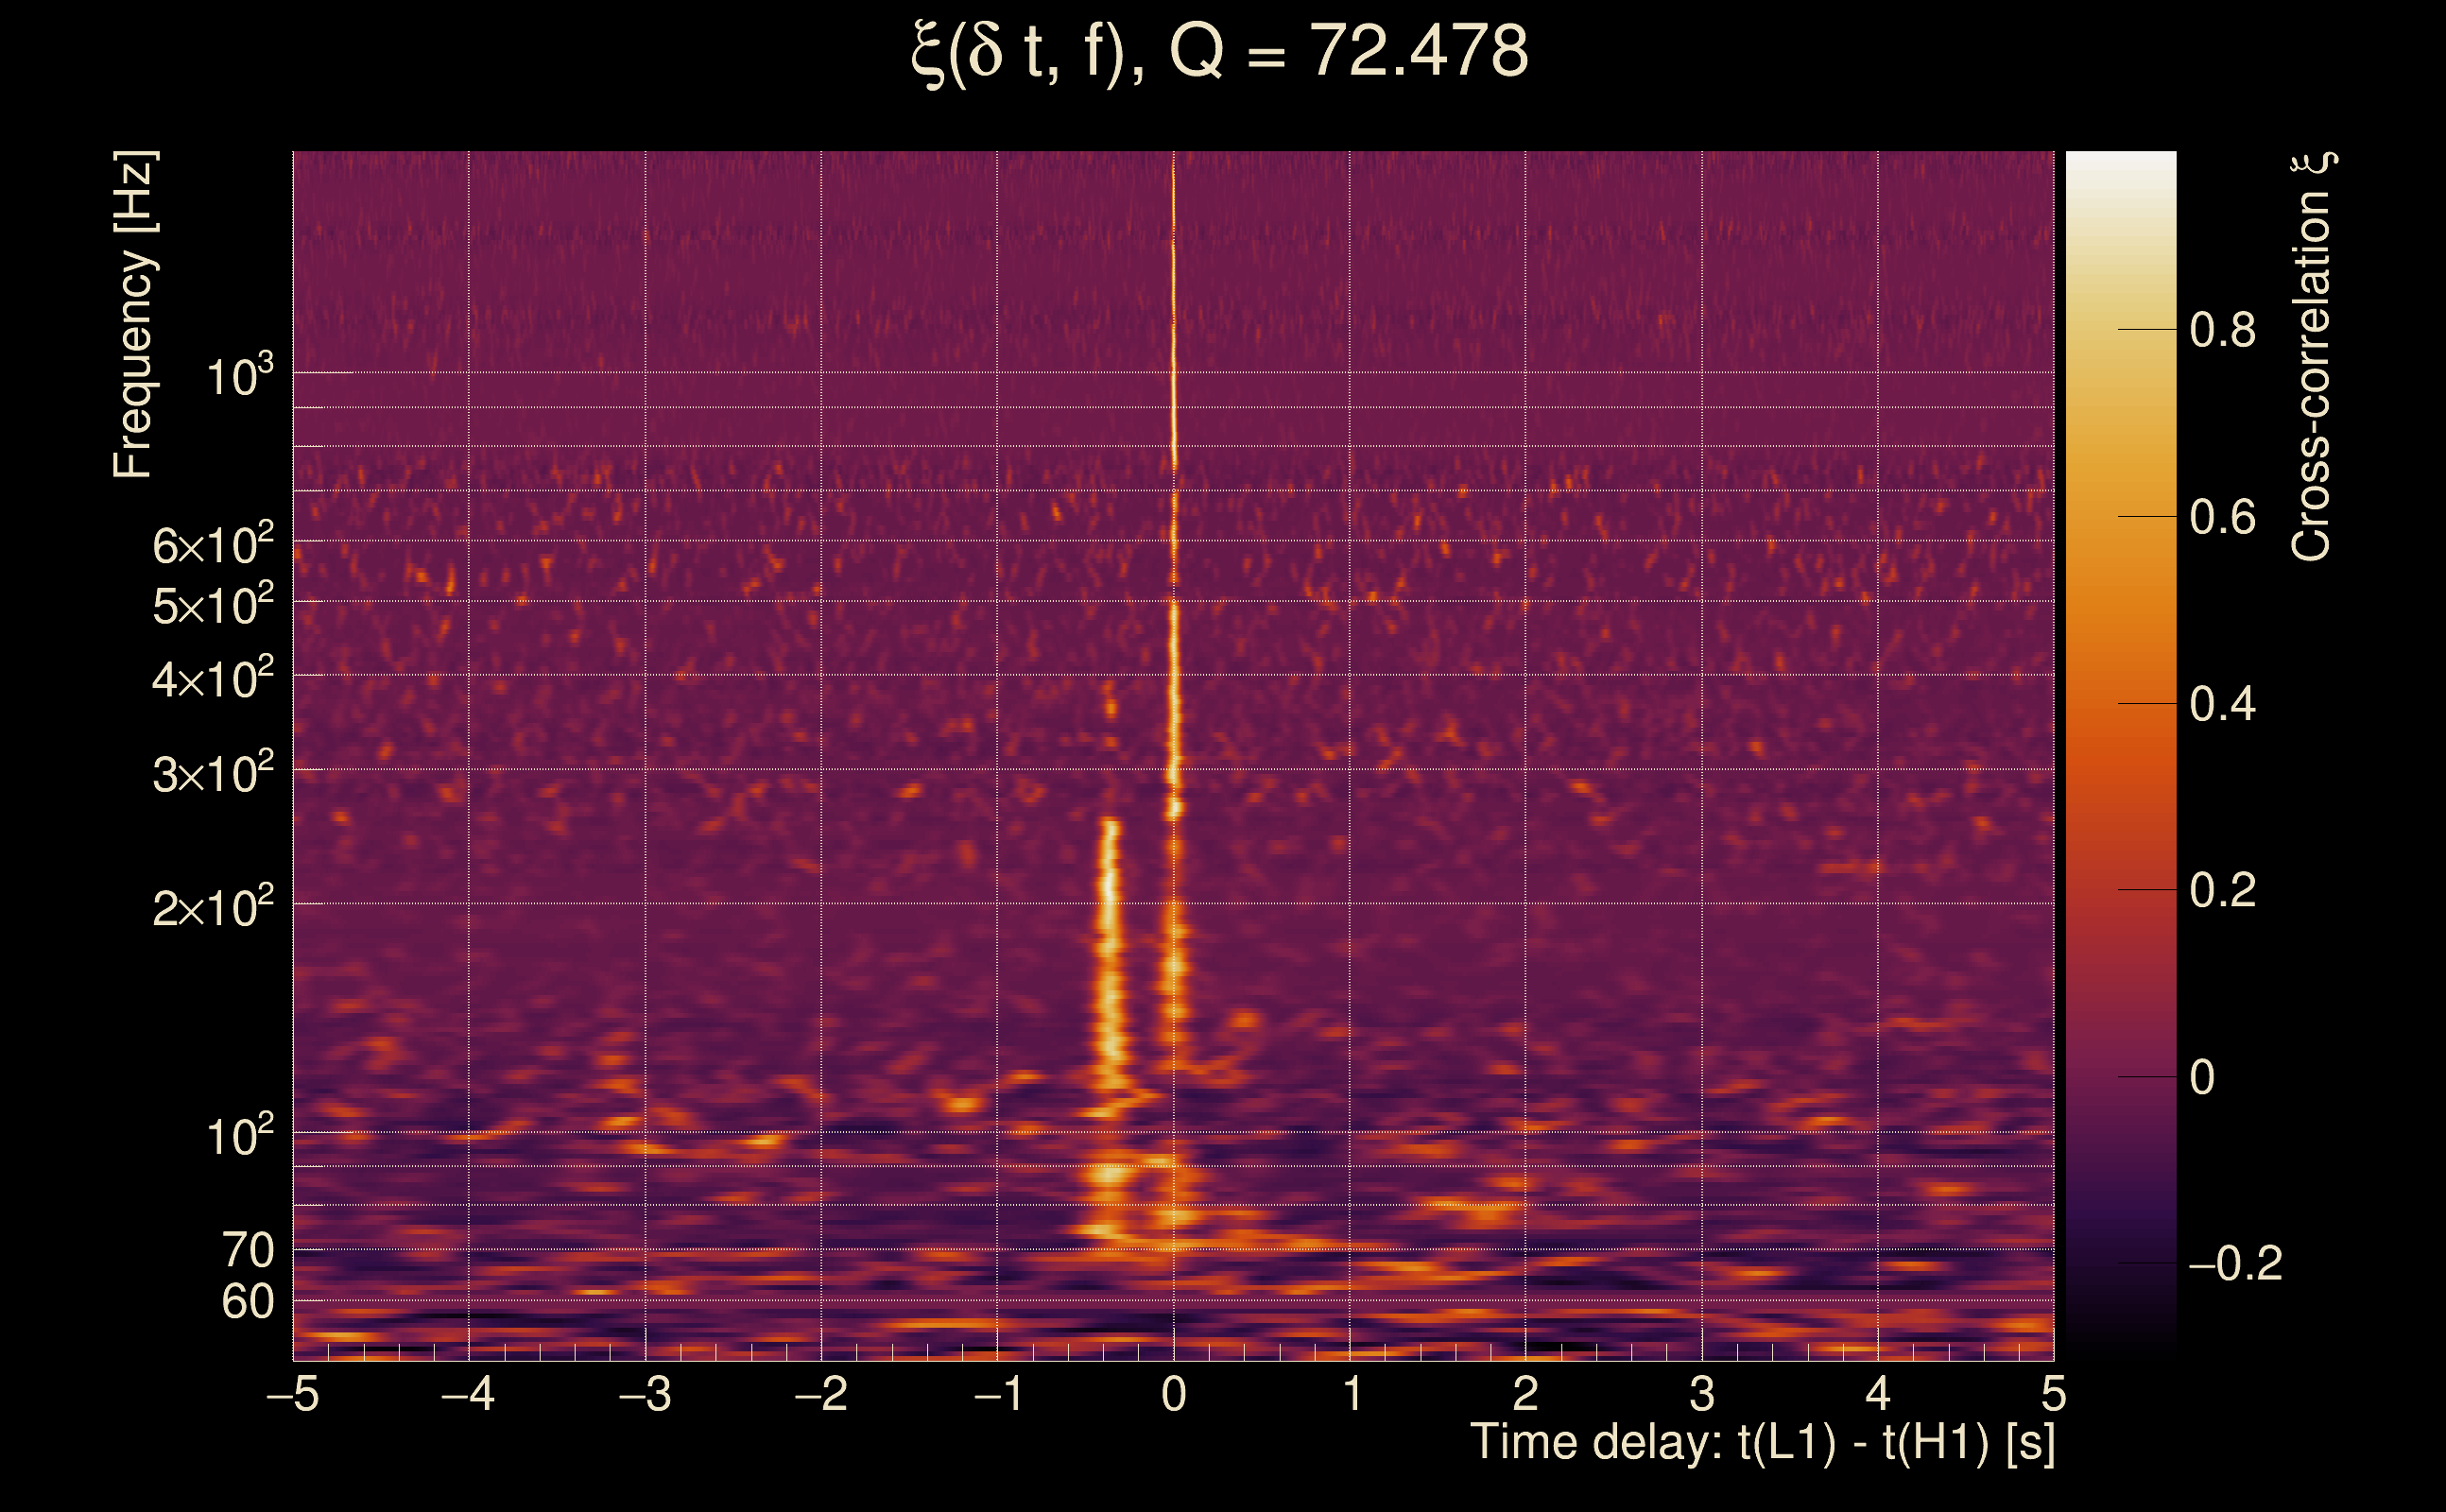
| Event time t(H1): | GPS = 1368428914 (Thu May 18 07:08:16 2023 ) → GPS = 1368428924 (Thu May 18 07:08:26 2023 ) |
| Event time t(L1): | GPS = 1368428914 (Thu May 18 07:08:26 2023 ) → GPS = 1368428924 (Thu May 18 07:08:26 2023 ) |
| Omicron analysis time window (H1): | GPS = 1368428911 → GPS = 1368428927 |
| Omicron analysis time window (L1): | GPS = 1368428911 → GPS = 1368428927 |
| Time delay between detectors t(L1) - t(H1): | 0.00388784 s (slice index = 108 / 217), δt_gw = 0.00388784 s |
| Time delay standard deviation: | 0.0287621 s |
| [targeted mode] Time delay probability: | 0.863119 (0.172405 sigmas), δt_target = 0.00201678 s |
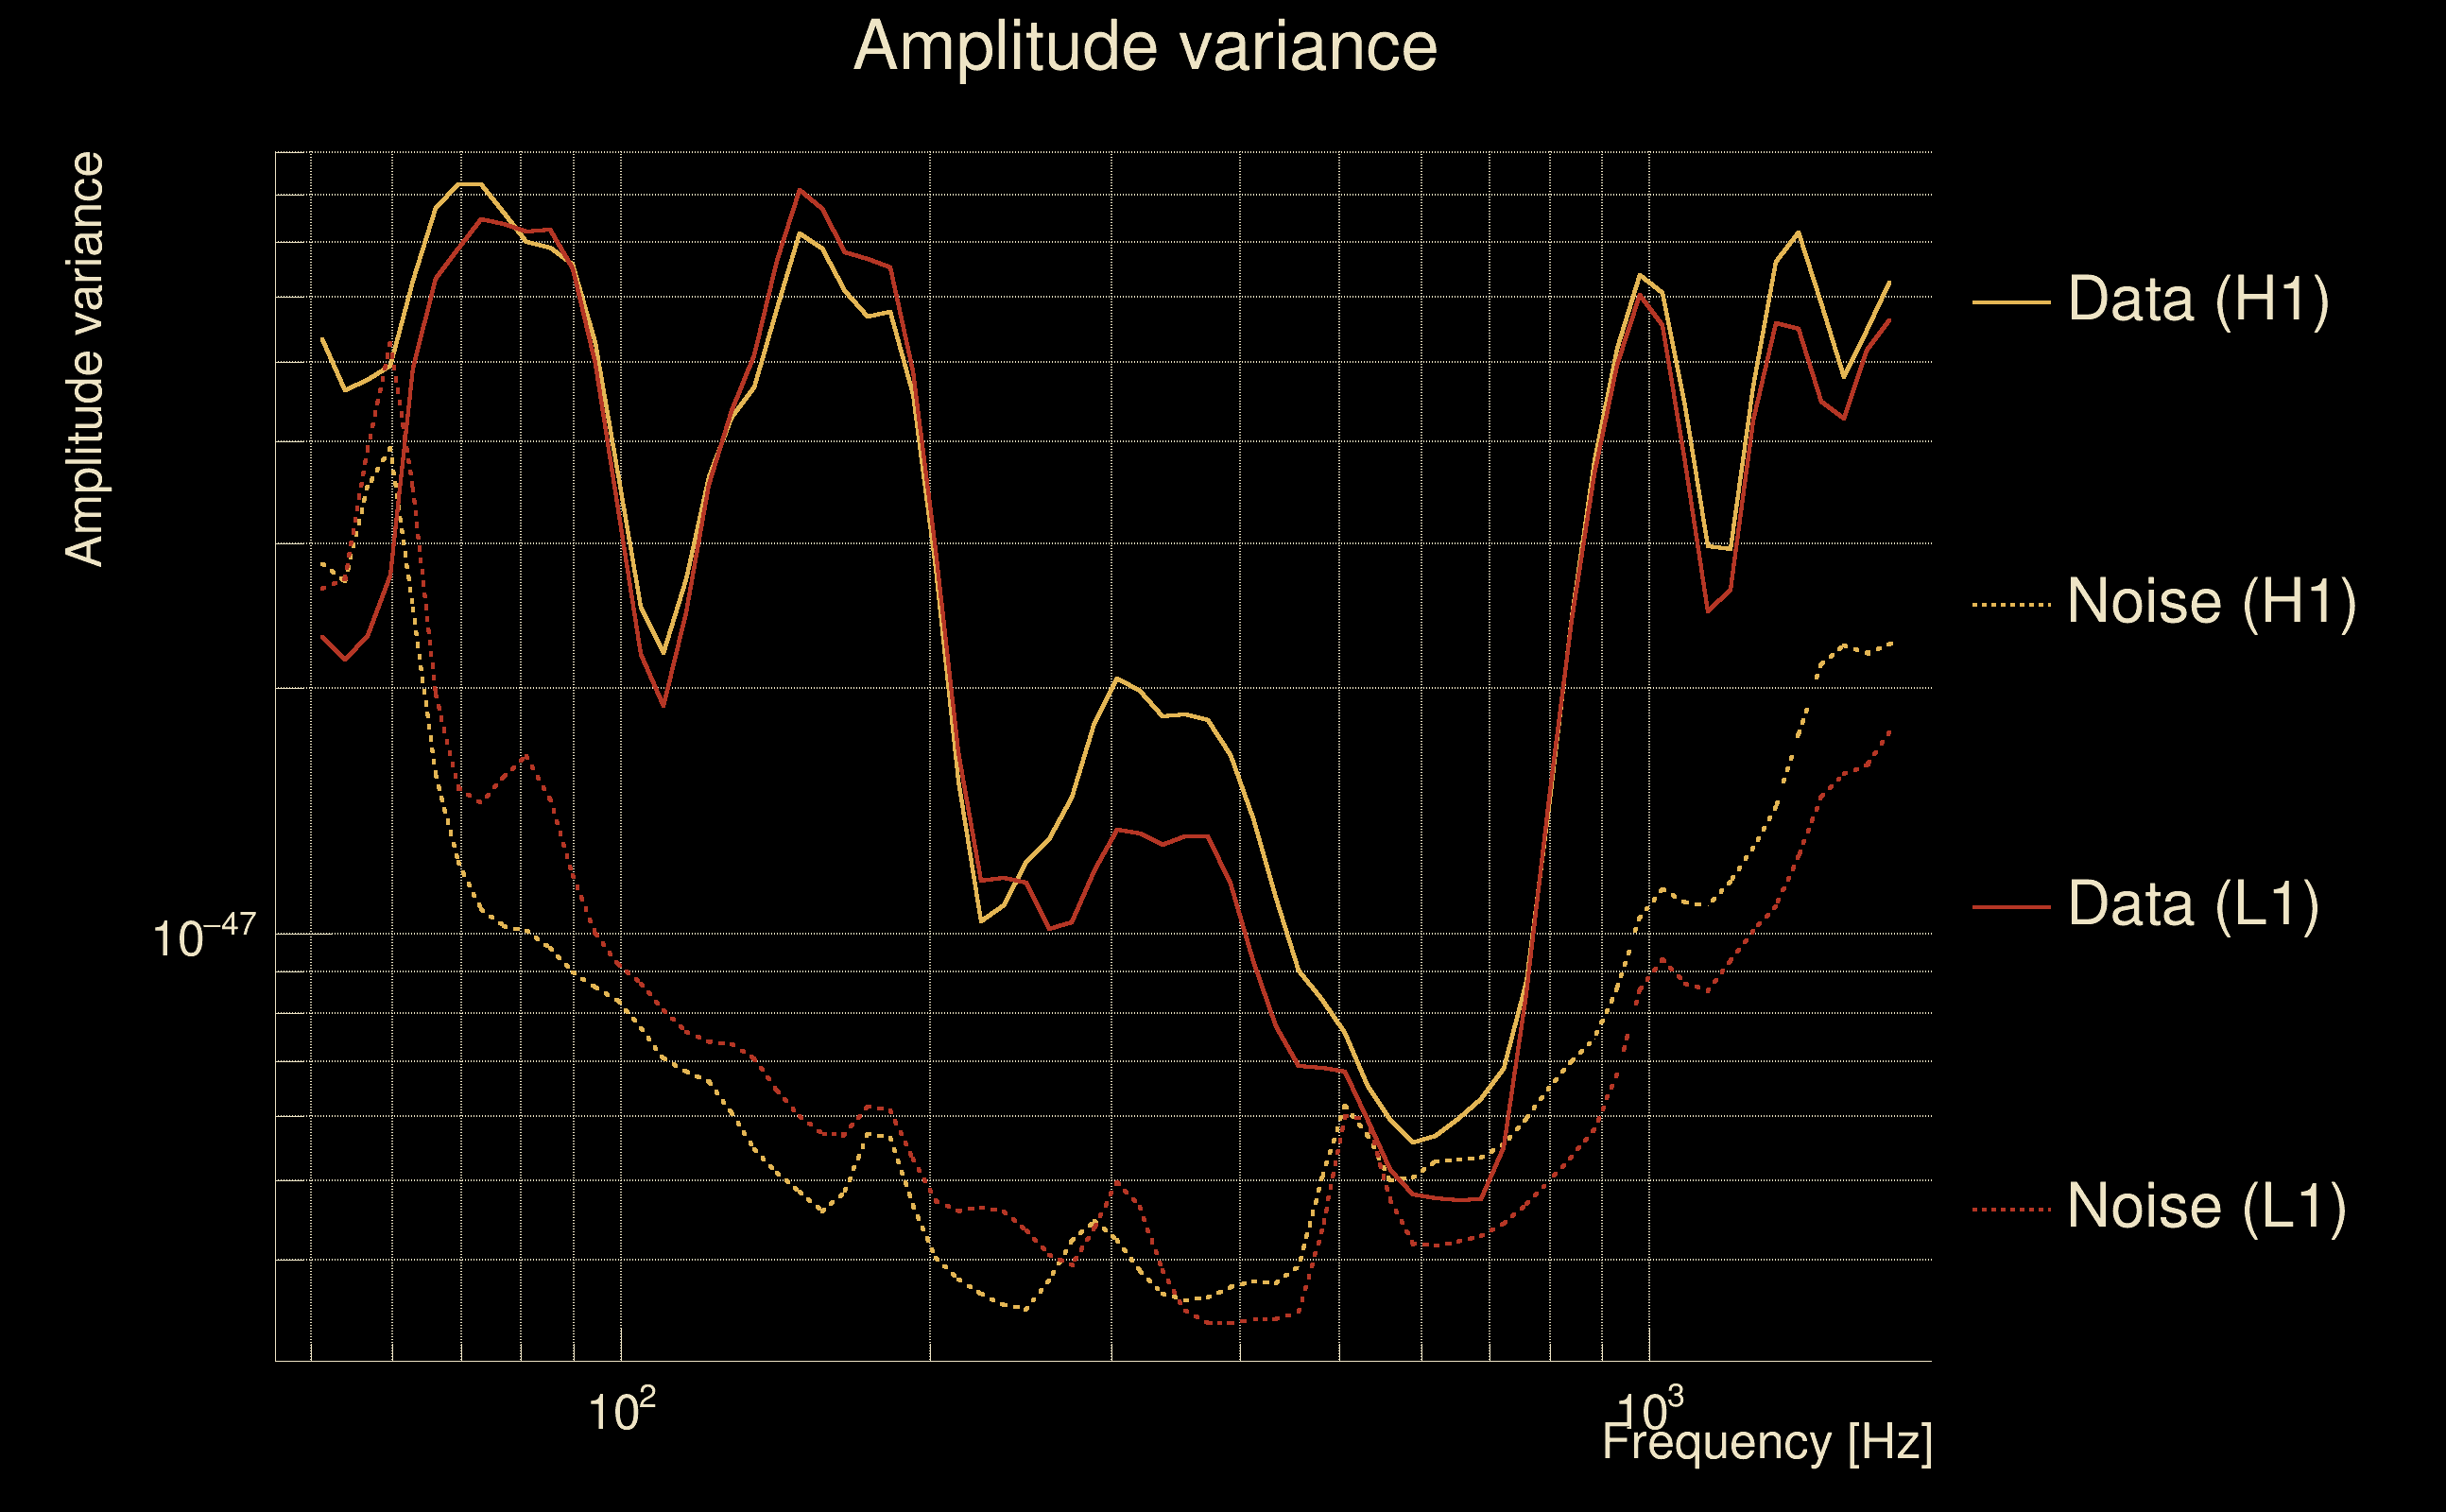
| Frequency: | 290.128 Hz |
| Ξ: | 0.936142 ± 0.0166728 (variance = 0.000277981): Q0: 0.963062, Q1: 0.95835, Q2: 0.953138, Q3: 0.934883, Q4: 0.9182 |
| Rank: | R_A = 0.884591 |
| Log of amplitude ratio (L1/H1): | -0.227657, variance = 0.164734 (L1/H1: -0.228215, variance = 0.313918, H1/L1: 0.226786, variance = 0.3156) |
| Amplitude ratio (L1/H1): | 0.796397 ⋇ 1.50061 (L1/H1: 0.795953 ⋇ 1.75117, H1/L1: 1.25456 ⋇ 1.7538) |
| Amplitude ratio H1|L1 compatibility (probability): | 0.998563 |
| Antenna factor probability: | 0.946293 |
| Number of rejected frequency rows: | Q0: 0 / 18, Q1: 0 / 36, Q2: 4 / 70, Q3: 15 / 134, Q4: 52 / 258 |
| Maximum signal-to-noise ratio: | H1: 90.0951, L1: 72.1253 |
| SNR variance: | H1: 0.482811, L1: 0.46515 |
| Click here for a zoomed plot | Click here for a zoomed plot | Click here for a zoomed plot | Click here for a zoomed plot | Click here for a zoomed plot |
 |
 |
 |
 |
 |
 |
 |
 |
 |
 |
 |
 |
 |
 |
 |
 |
 |
 |
 |
 |
 |
 |
 |
 |
 |
 |
 |
 |
 |
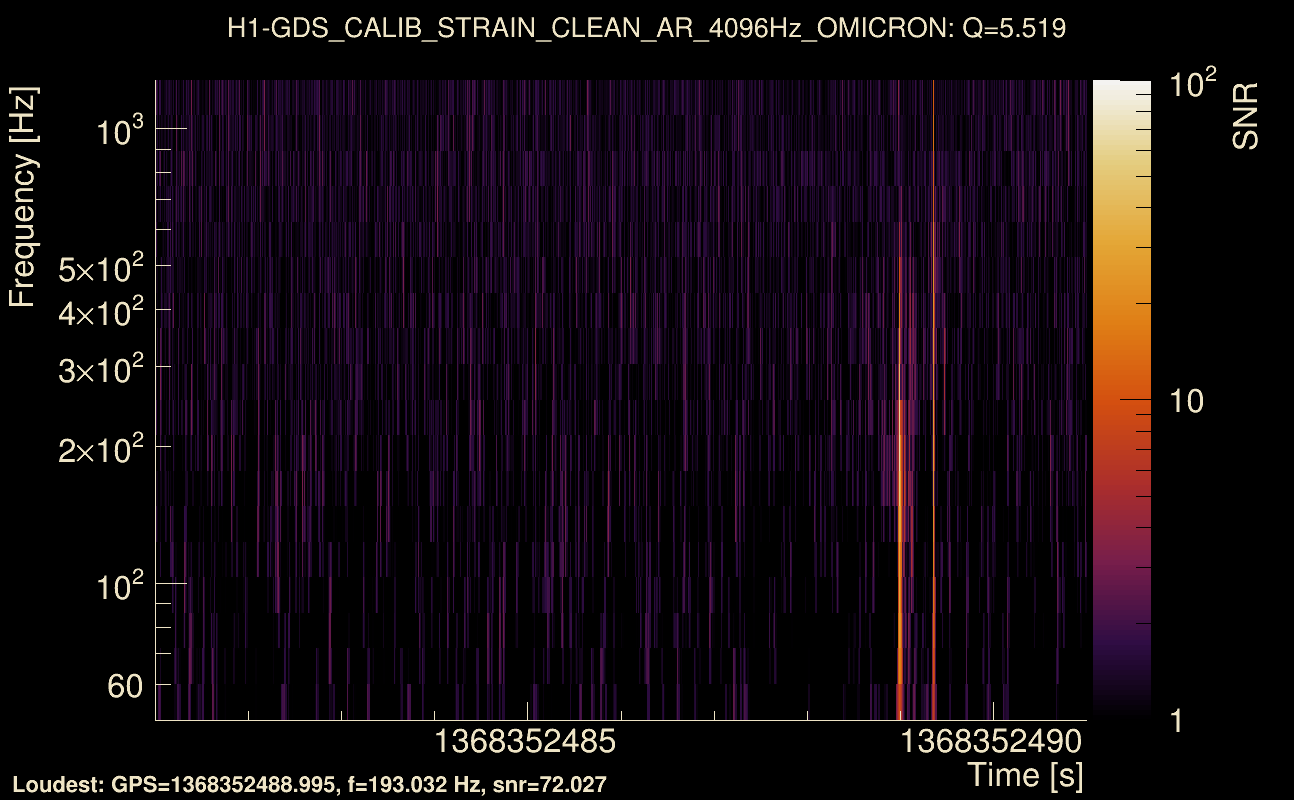
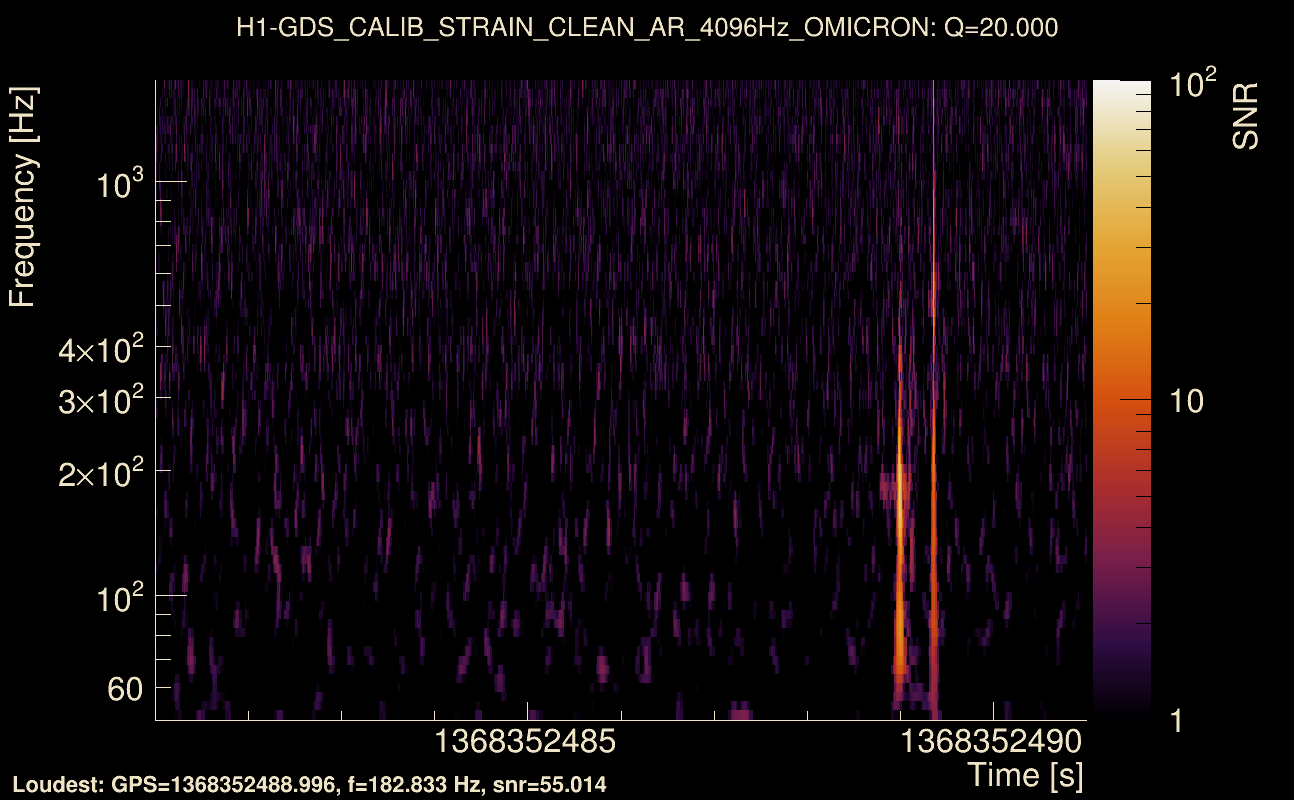
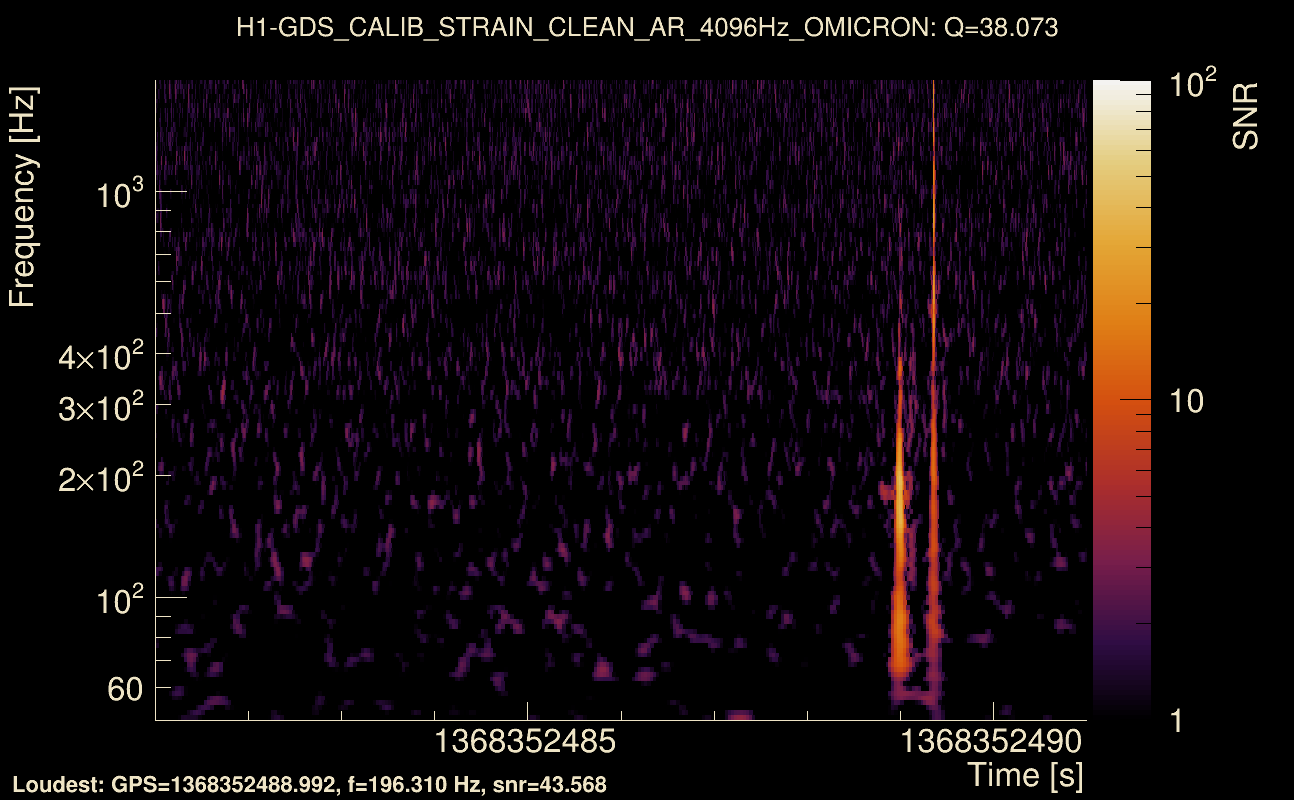
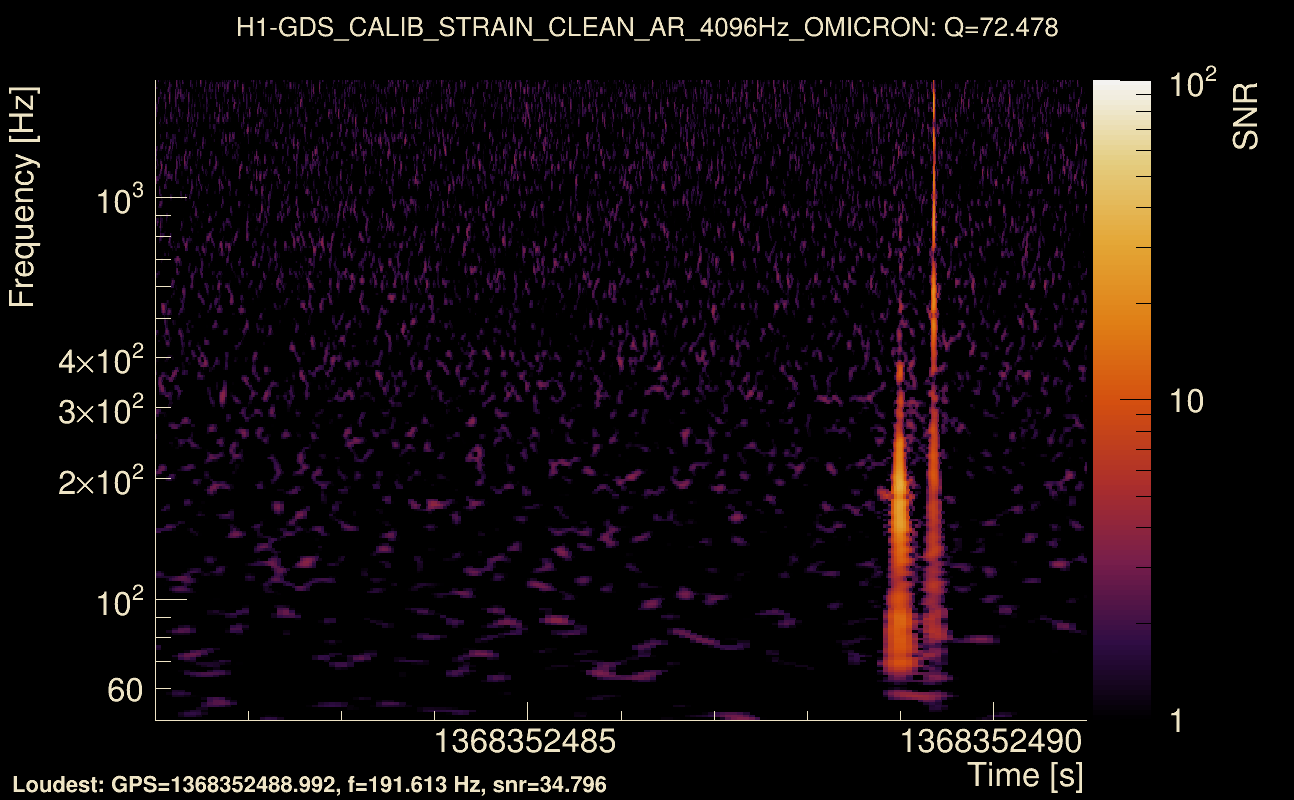
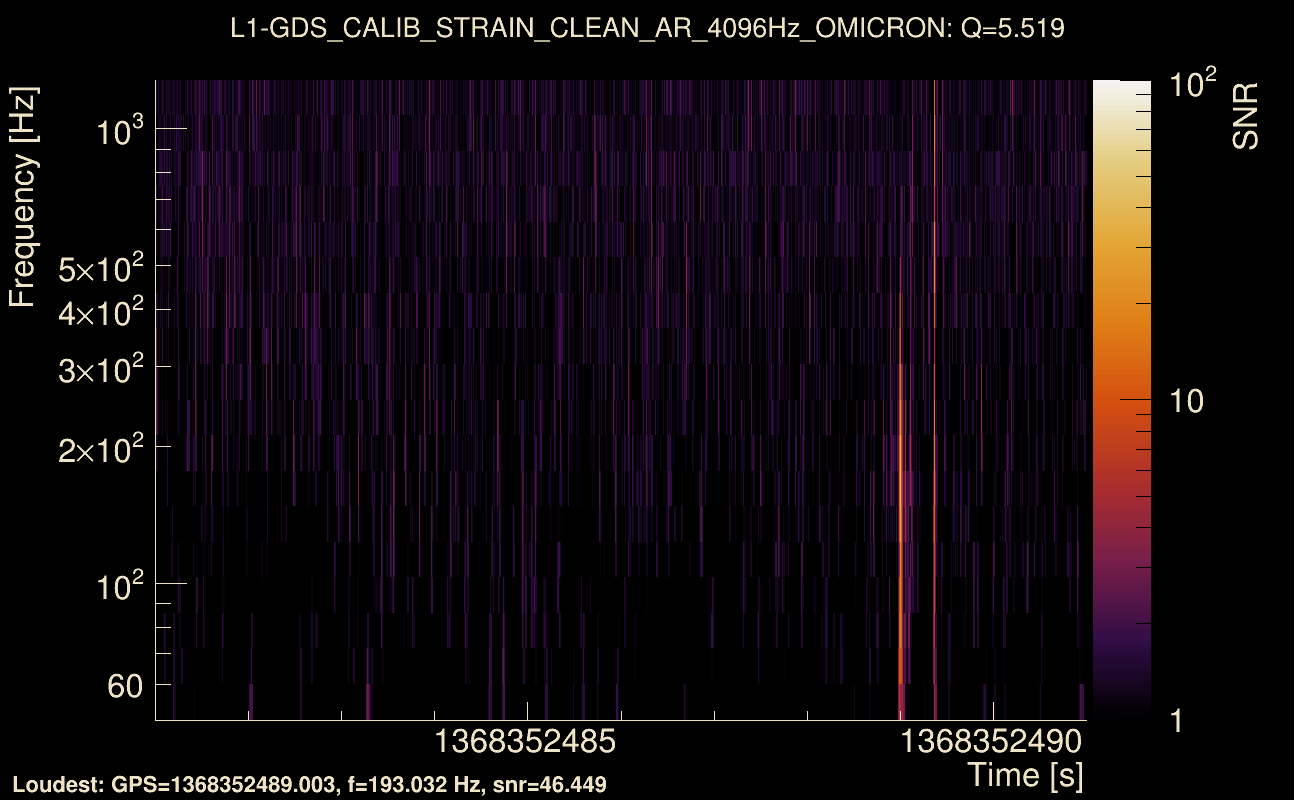
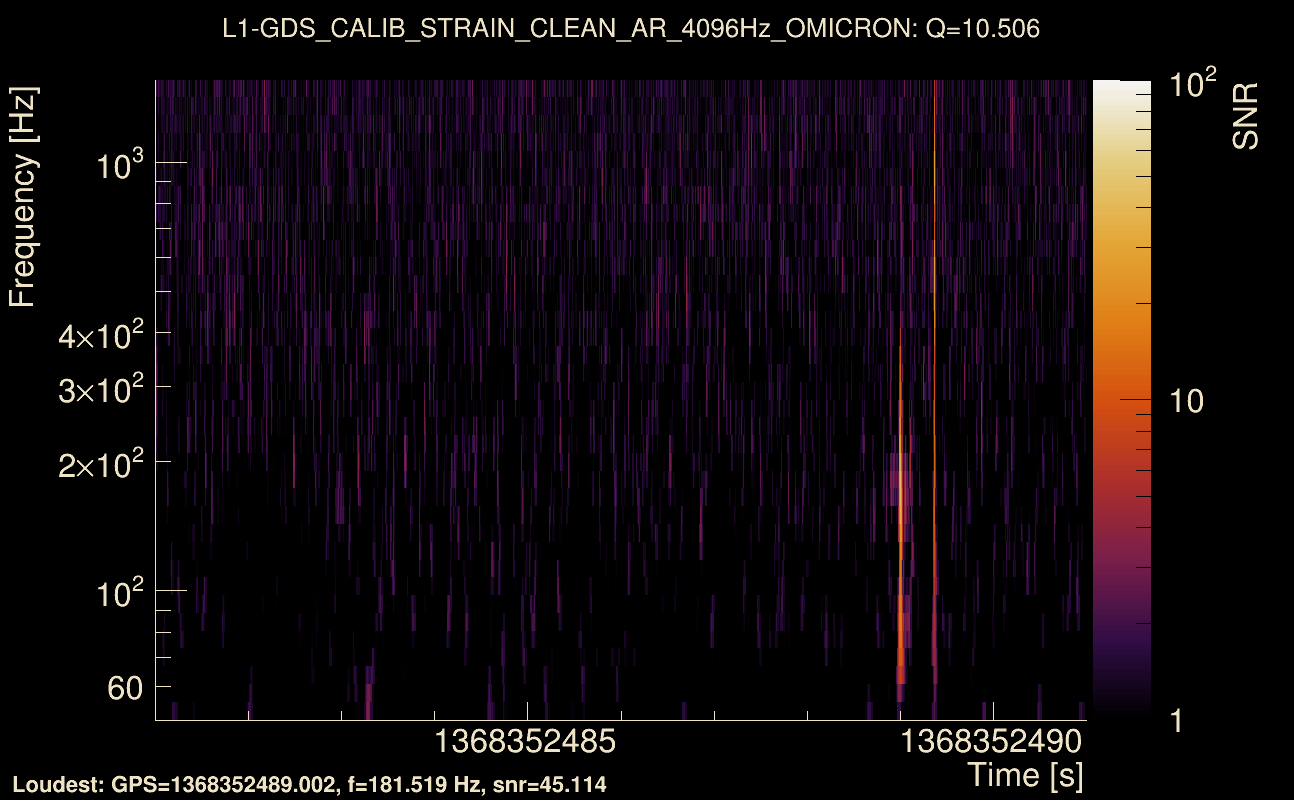
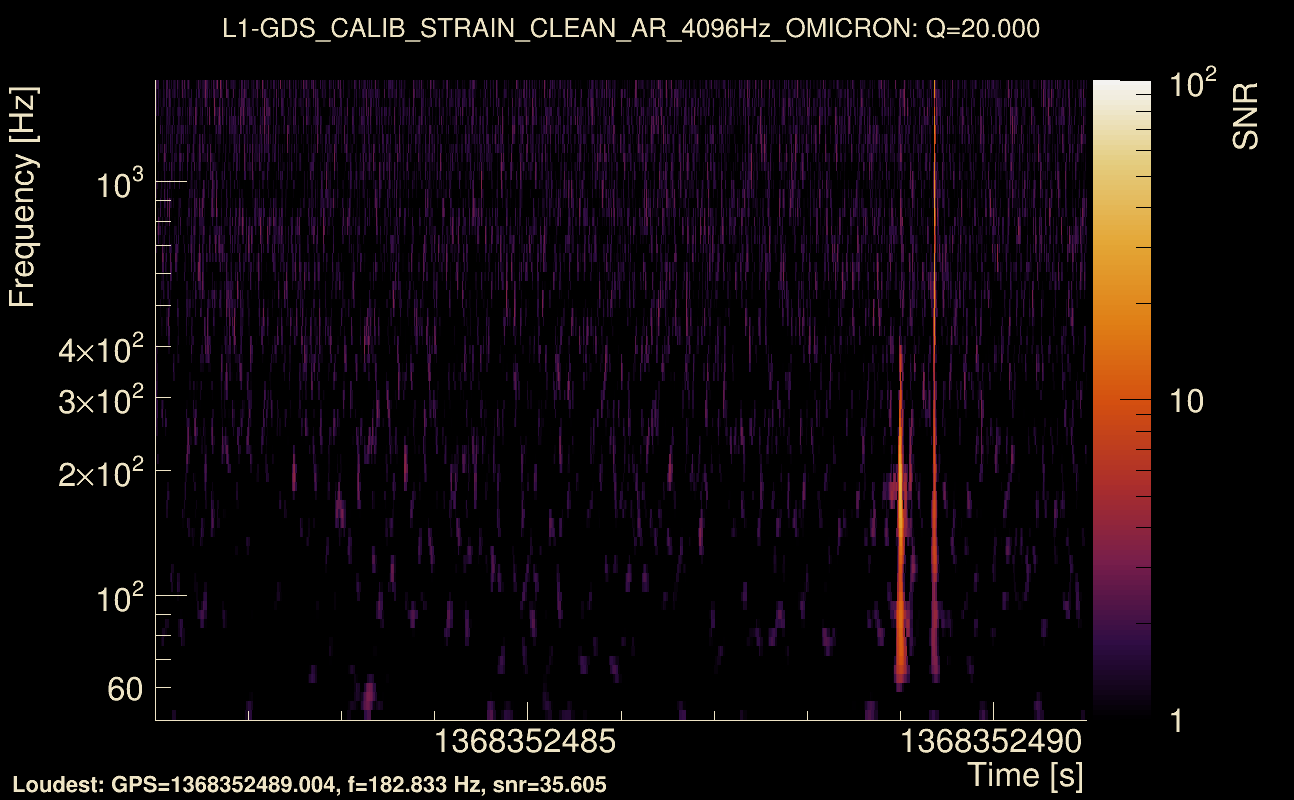
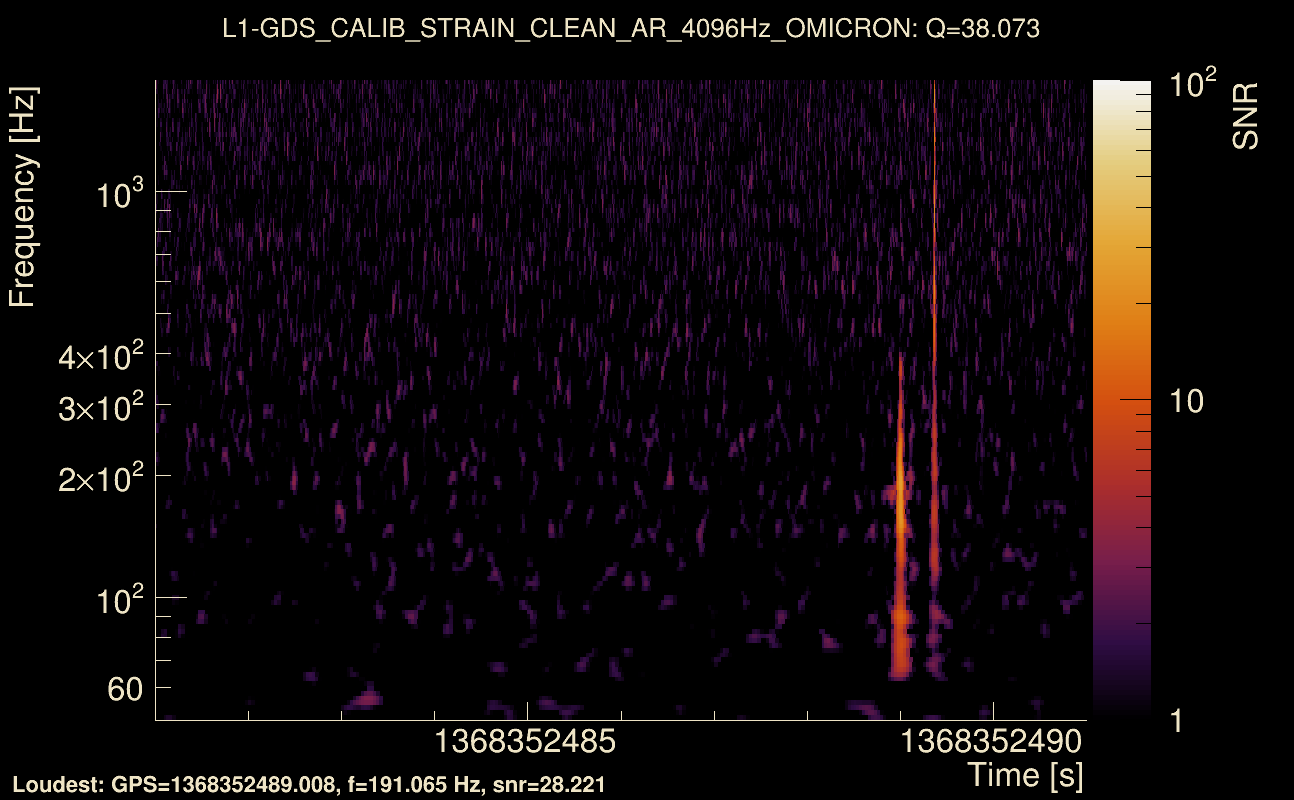
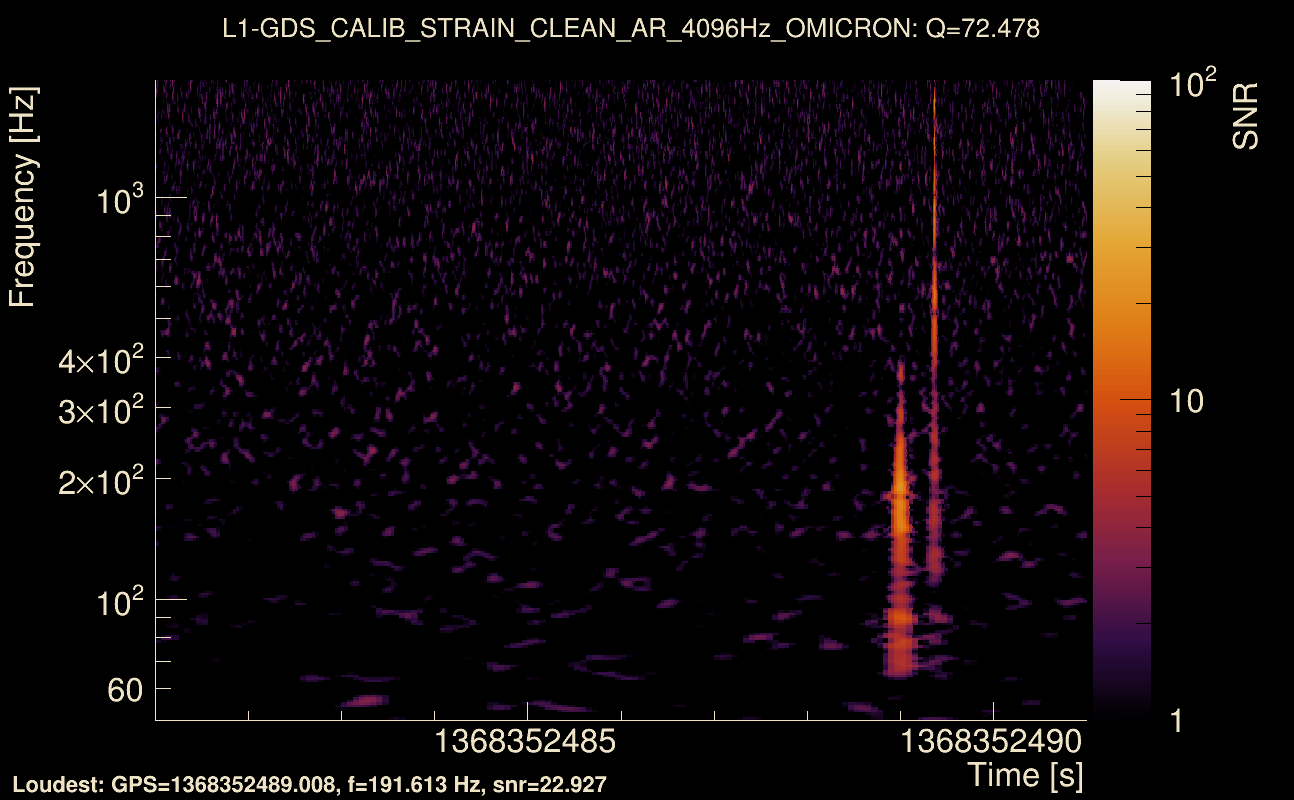
| Event time t(H1): | GPS = 1368352481 (Wed May 17 09:54:23 2023 ) → GPS = 1368352491 (Wed May 17 09:54:33 2023 ) |
| Event time t(L1): | GPS = 1368352481 (Wed May 17 09:54:33 2023 ) → GPS = 1368352491 (Wed May 17 09:54:33 2023 ) |
| Omicron analysis time window (H1): | GPS = 1368352478 → GPS = 1368352494 |
| Omicron analysis time window (L1): | GPS = 1368352478 → GPS = 1368352494 |
| Time delay between detectors t(L1) - t(H1): | 0.00732237 s (slice index = 108 / 217), δt_gw = 0.00732237 s |
| Time delay standard deviation: | 0.0233248 s |
| [targeted mode] Time delay probability: | 0.98296 (0.0213587 sigmas), δt_target = -0.00266528 s |
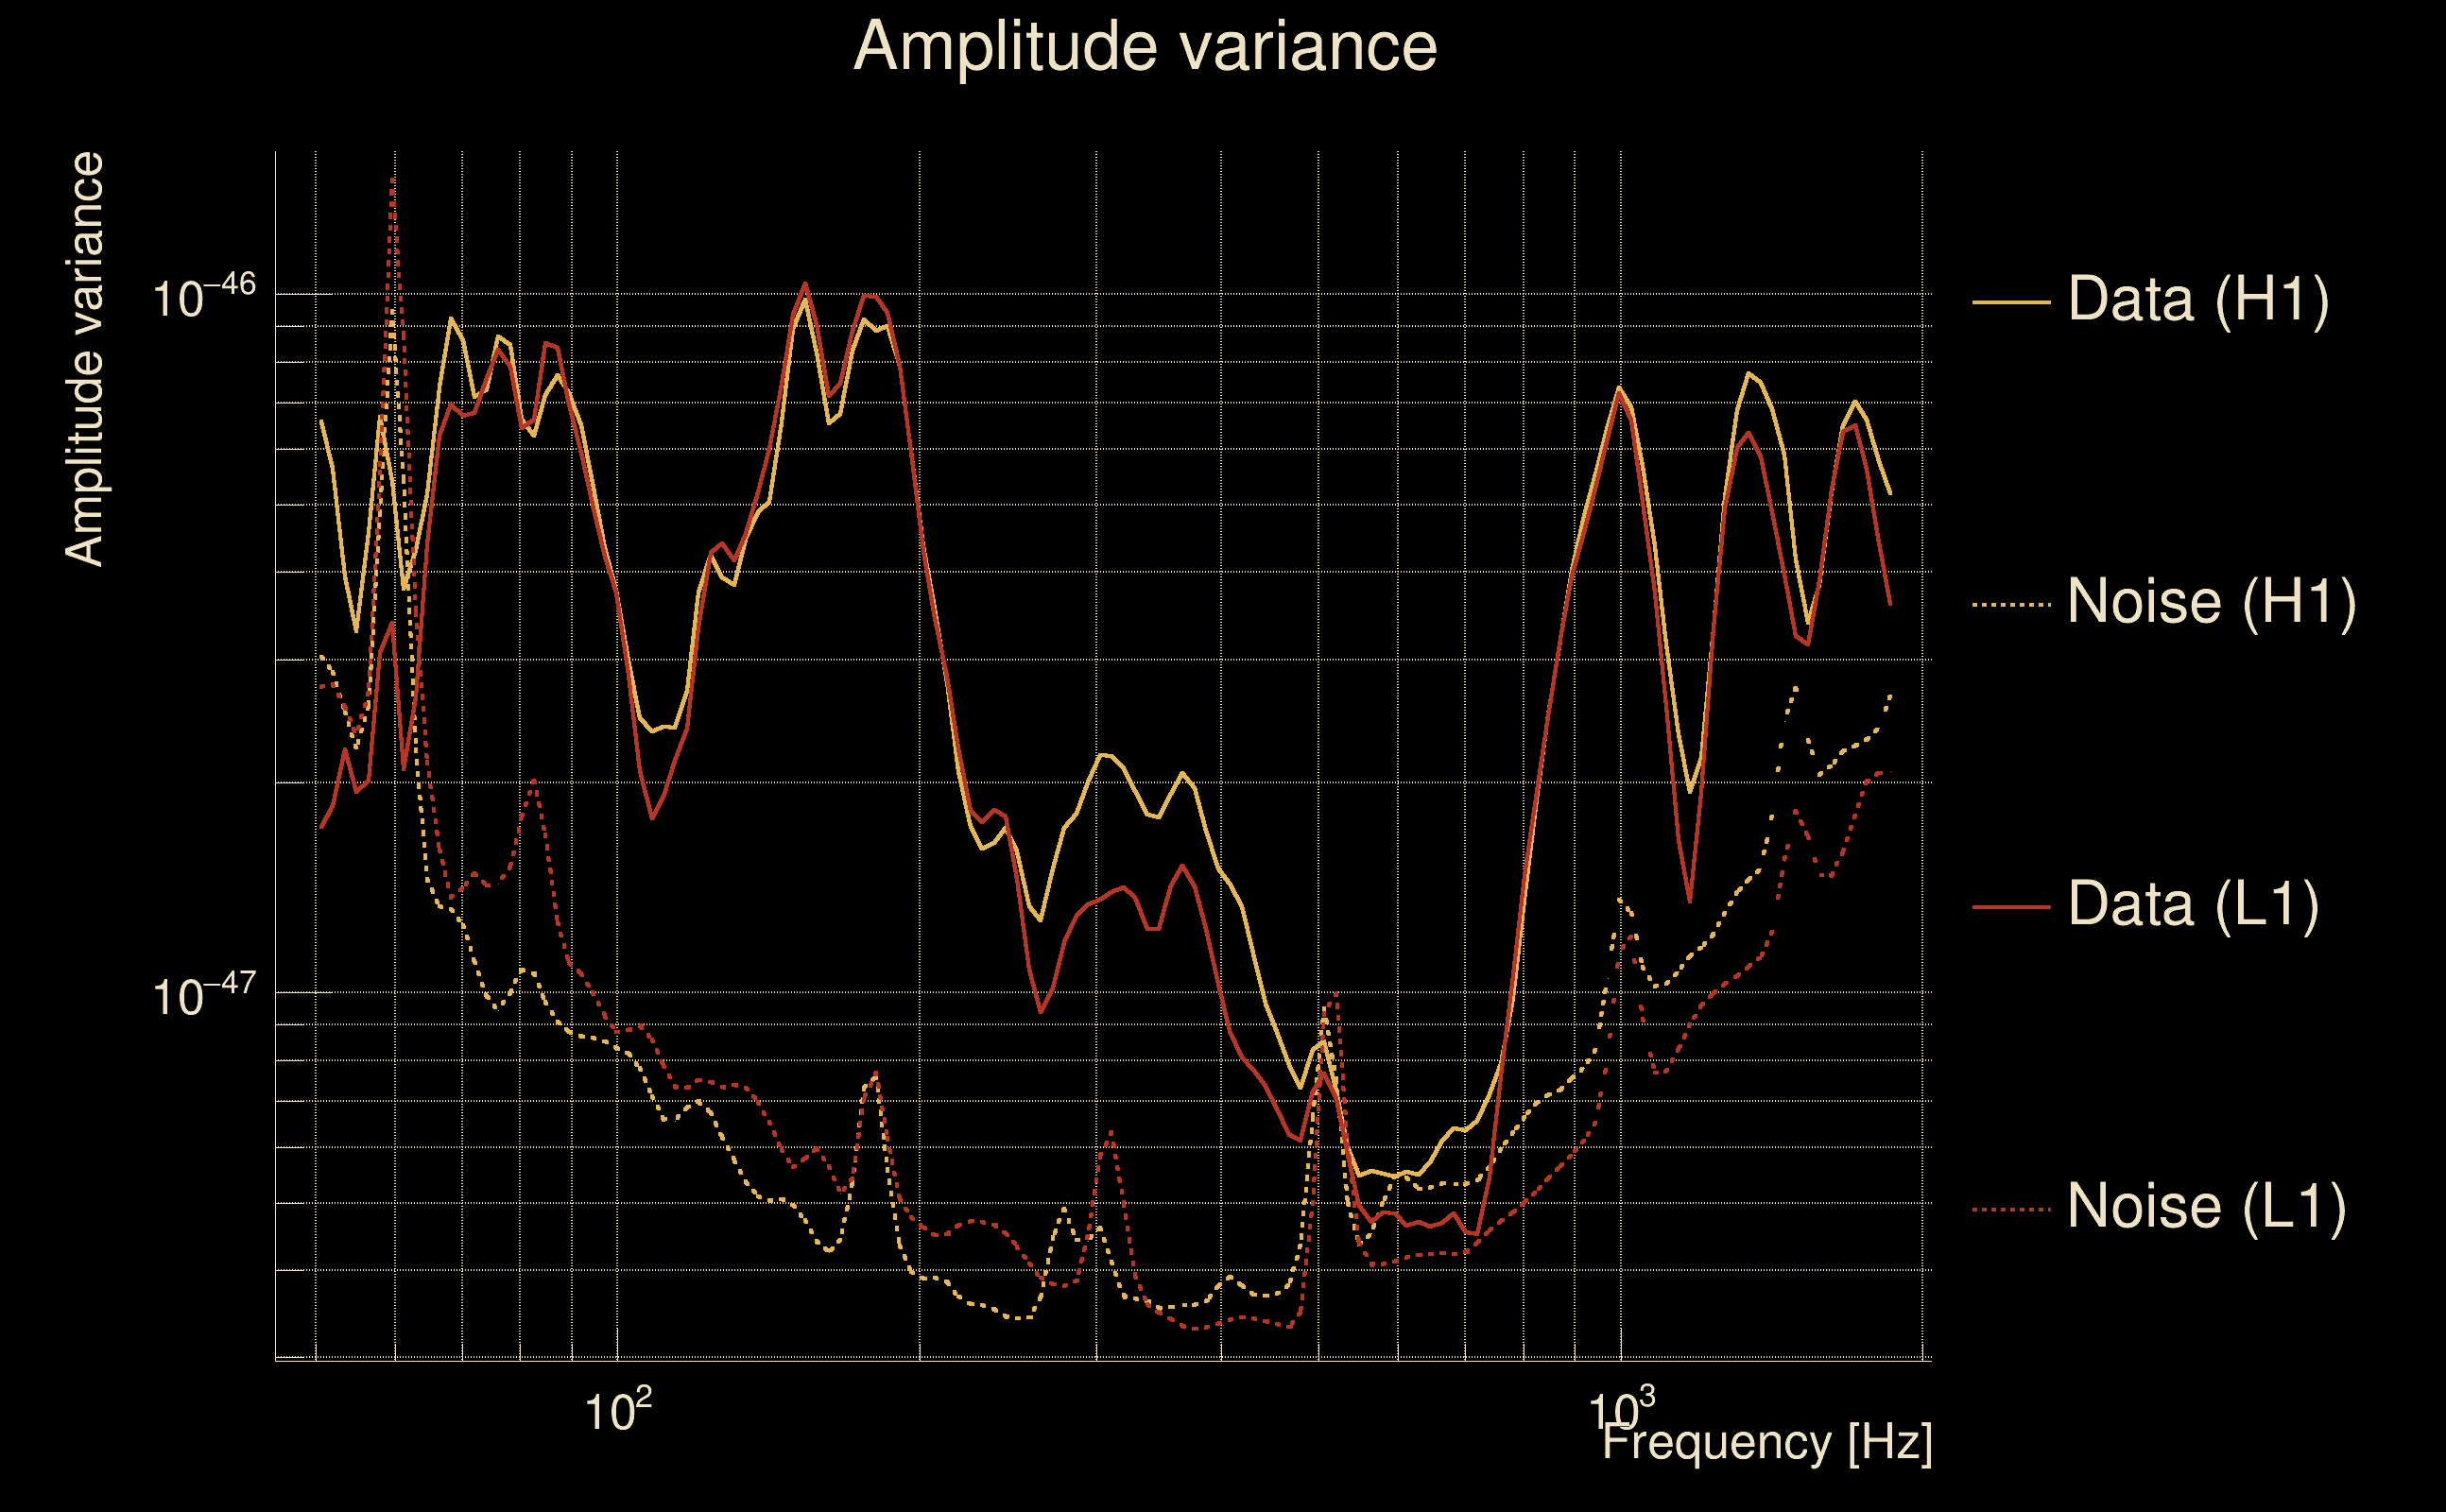
| Frequency: | 309.63 Hz |
| Ξ: | 0.913745 ± 0.0173781 (variance = 0.000301999): Q0: 0.953973, Q1: 0.950126, Q2: 0.951769, Q3: 0.925563, Q4: 0.910356 |
| Rank: | R_A = 0.878587 |
| Log of amplitude ratio (L1/H1): | -0.405239, variance = 0.171952 (L1/H1: -0.407733, variance = 0.308296, H1/L1: 0.400244, variance = 0.313845) |
| Amplitude ratio (L1/H1): | 0.666818 ⋇ 1.51387 (L1/H1: 0.665157 ⋇ 1.74237, H1/L1: 1.49219 ⋇ 1.75106) |
| Amplitude ratio H1|L1 compatibility (probability): | 0.992425 |
| Antenna factor probability: | 0.968863 |
| Number of rejected frequency rows: | Q0: 0 / 18, Q1: 0 / 36, Q2: 9 / 70, Q3: 23 / 134, Q4: 68 / 258 |
| Maximum signal-to-noise ratio: | H1: 75.9192, L1: 53.6474 |
| SNR variance: | H1: 0.505728, L1: 0.499509 |
| Click here for a zoomed plot | Click here for a zoomed plot | Click here for a zoomed plot | Click here for a zoomed plot | Click here for a zoomed plot |
 |
 |
 |
 |
 |
 |
 |
 |
 |
 |
 |
 |
 |
 |
 |
 |
 |
 |
 |
 |
 |
 |
 |
 |
 |
 |
 |
 |
 |
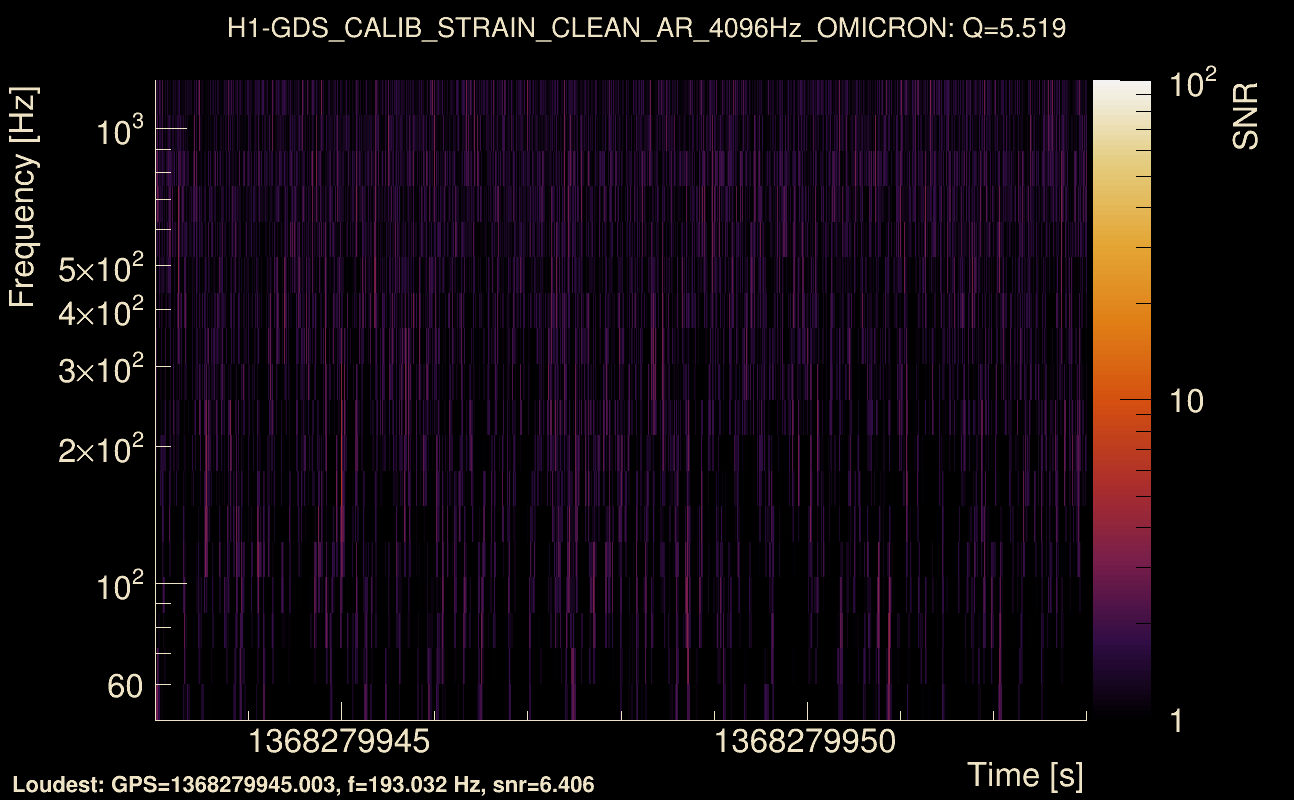
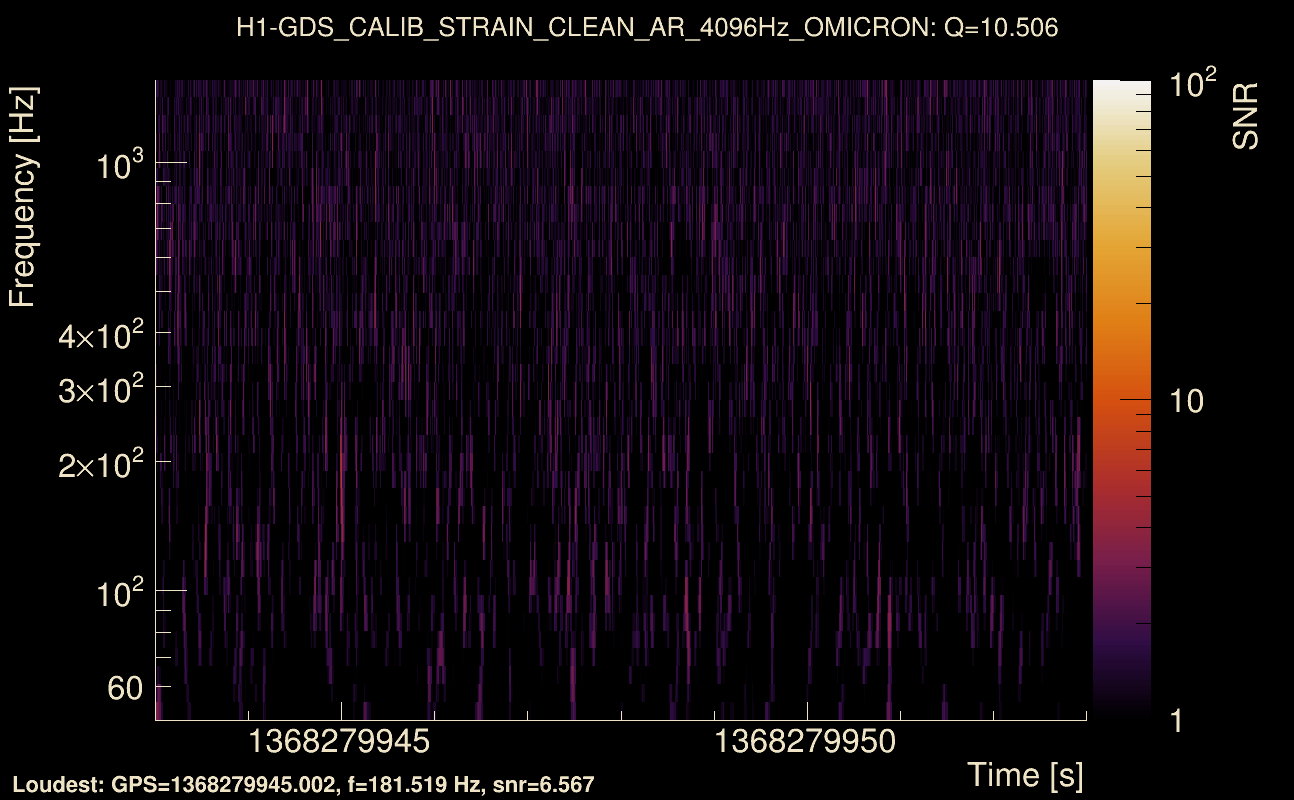
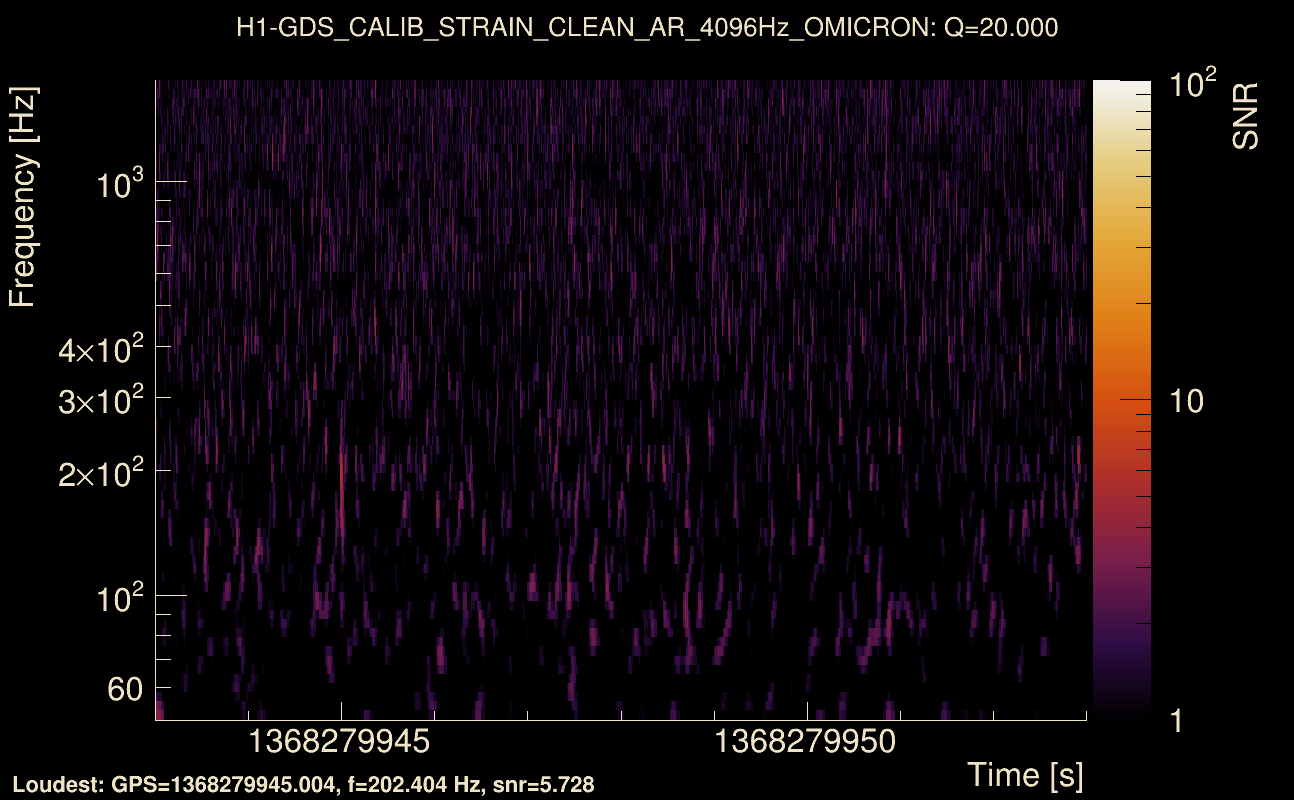
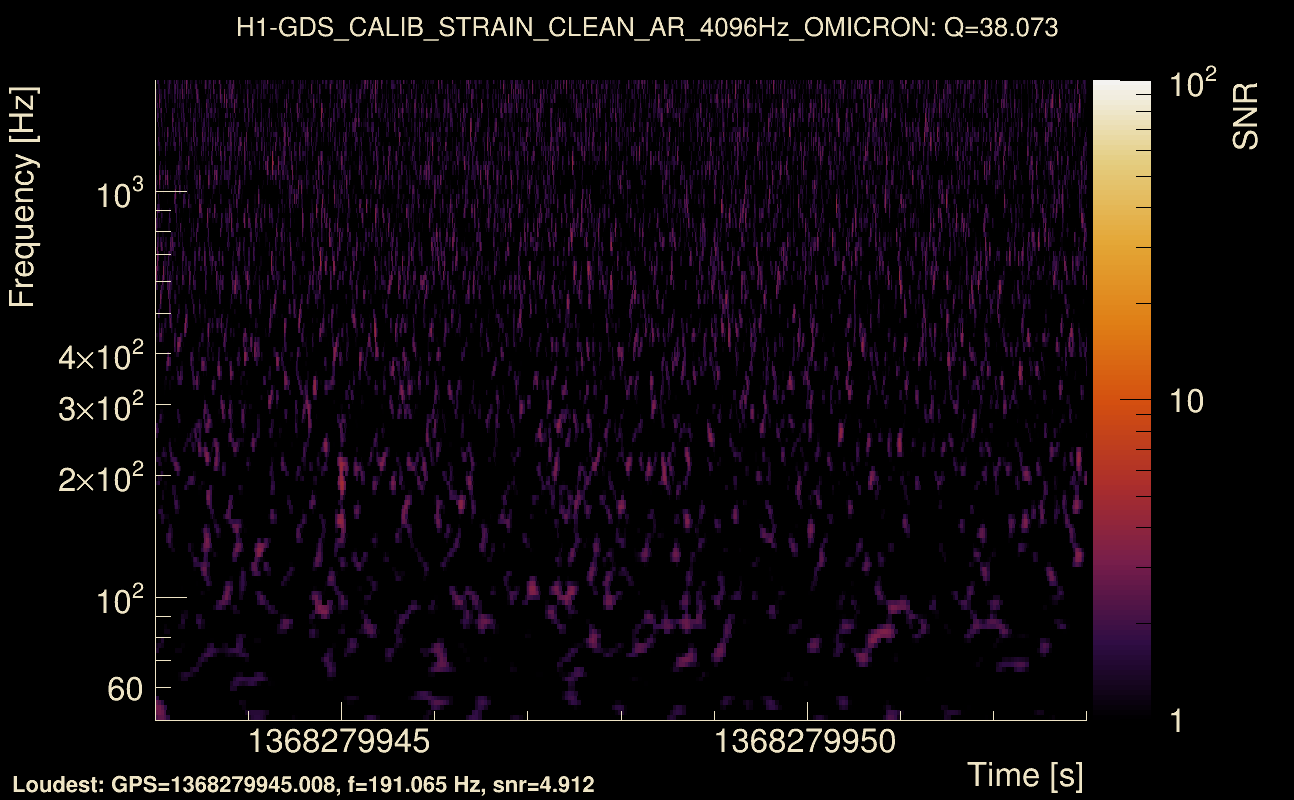
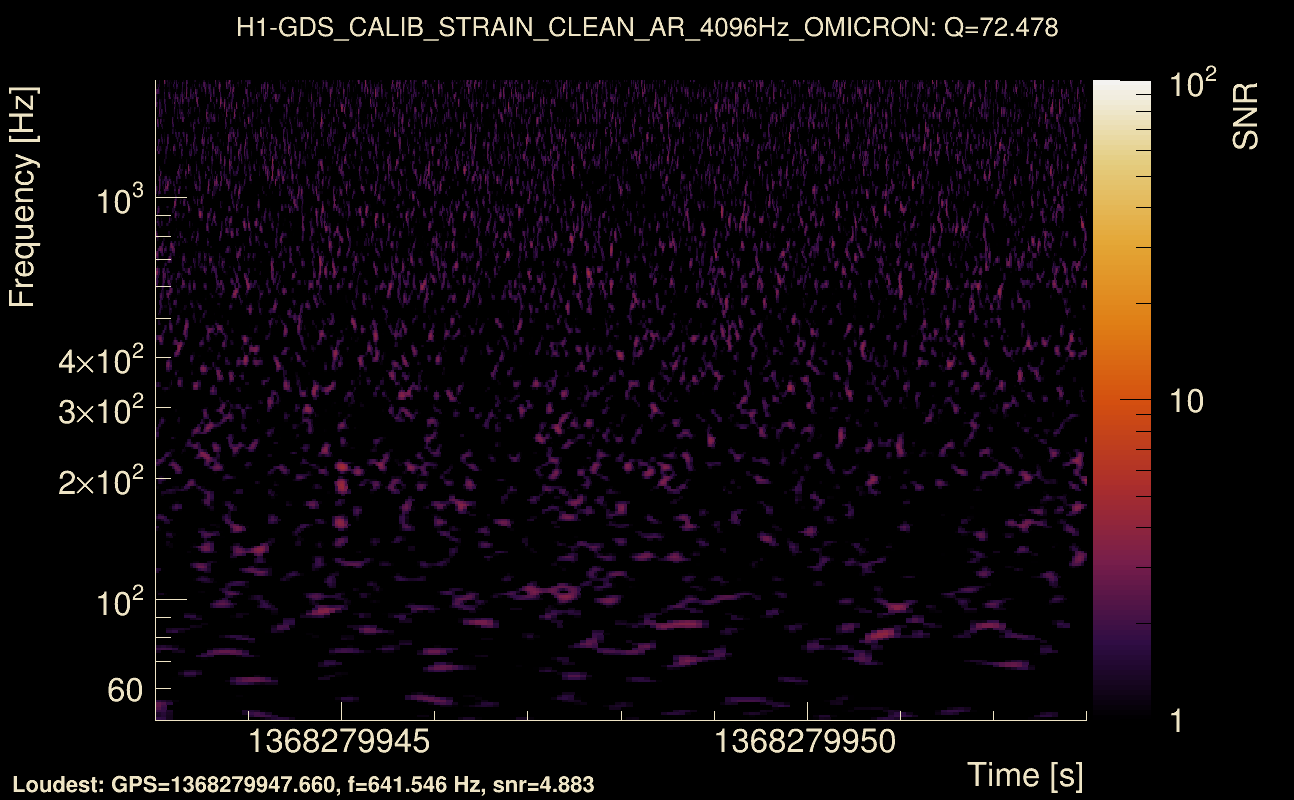
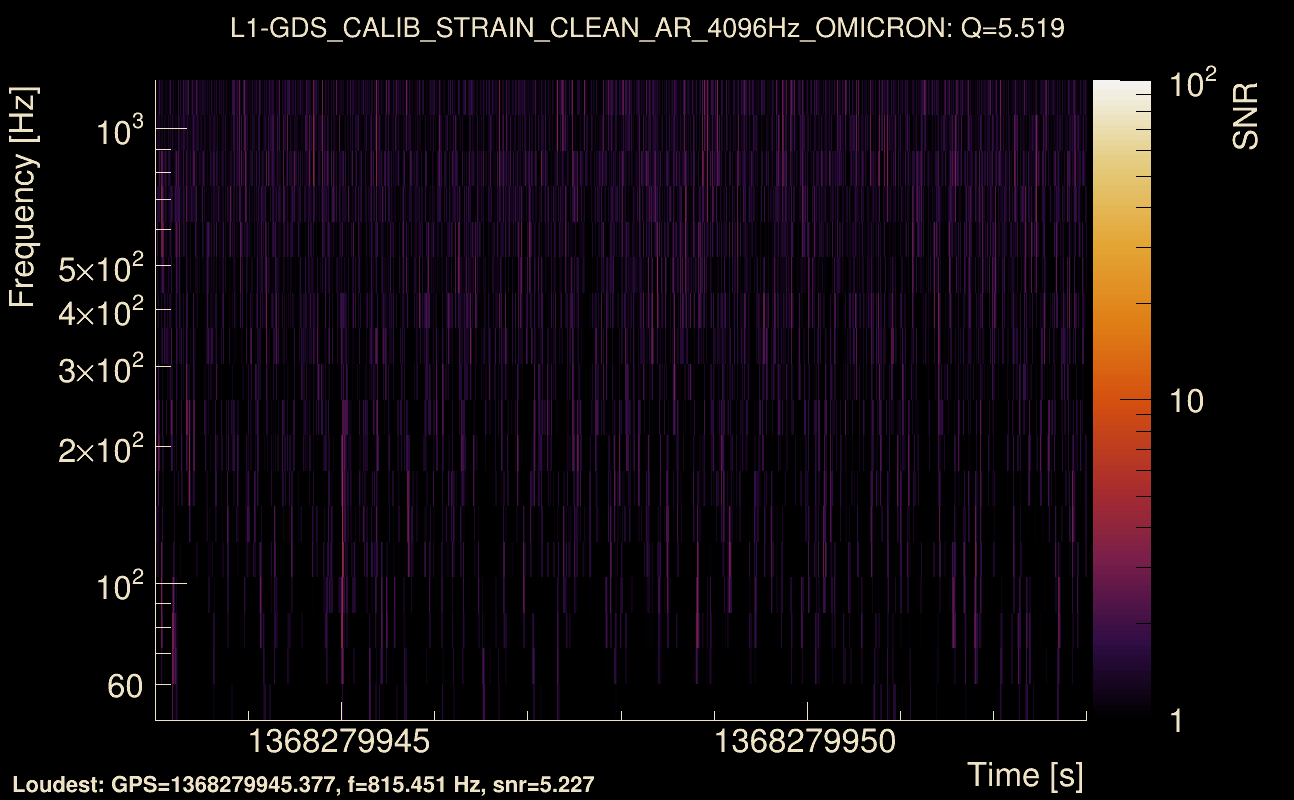
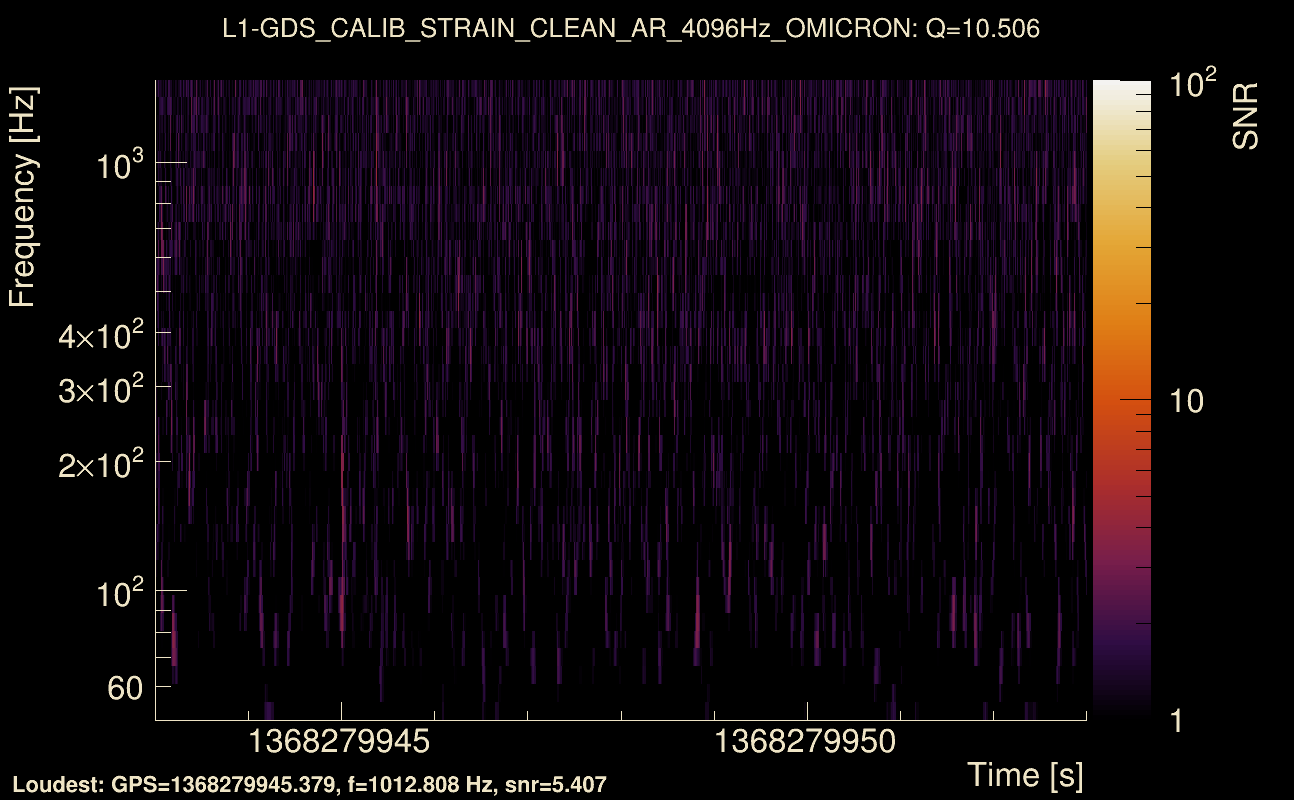
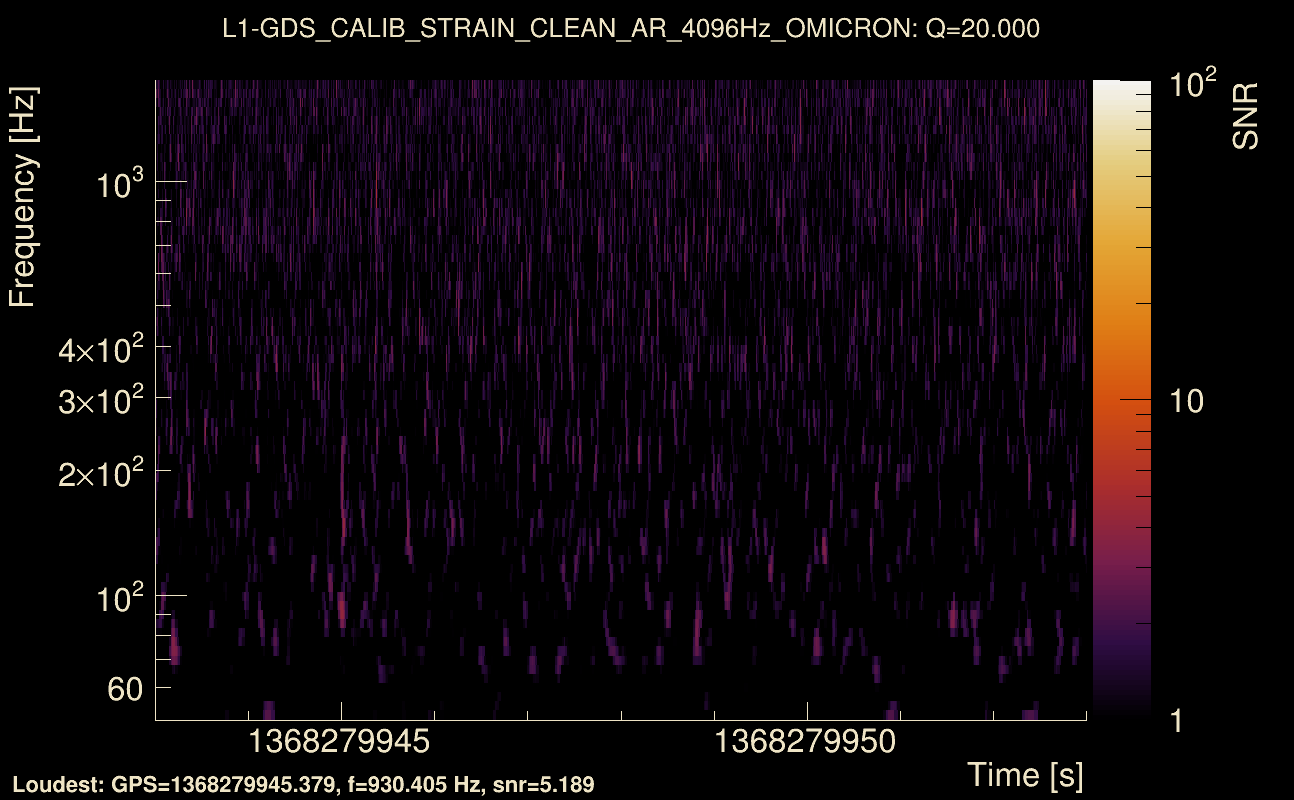
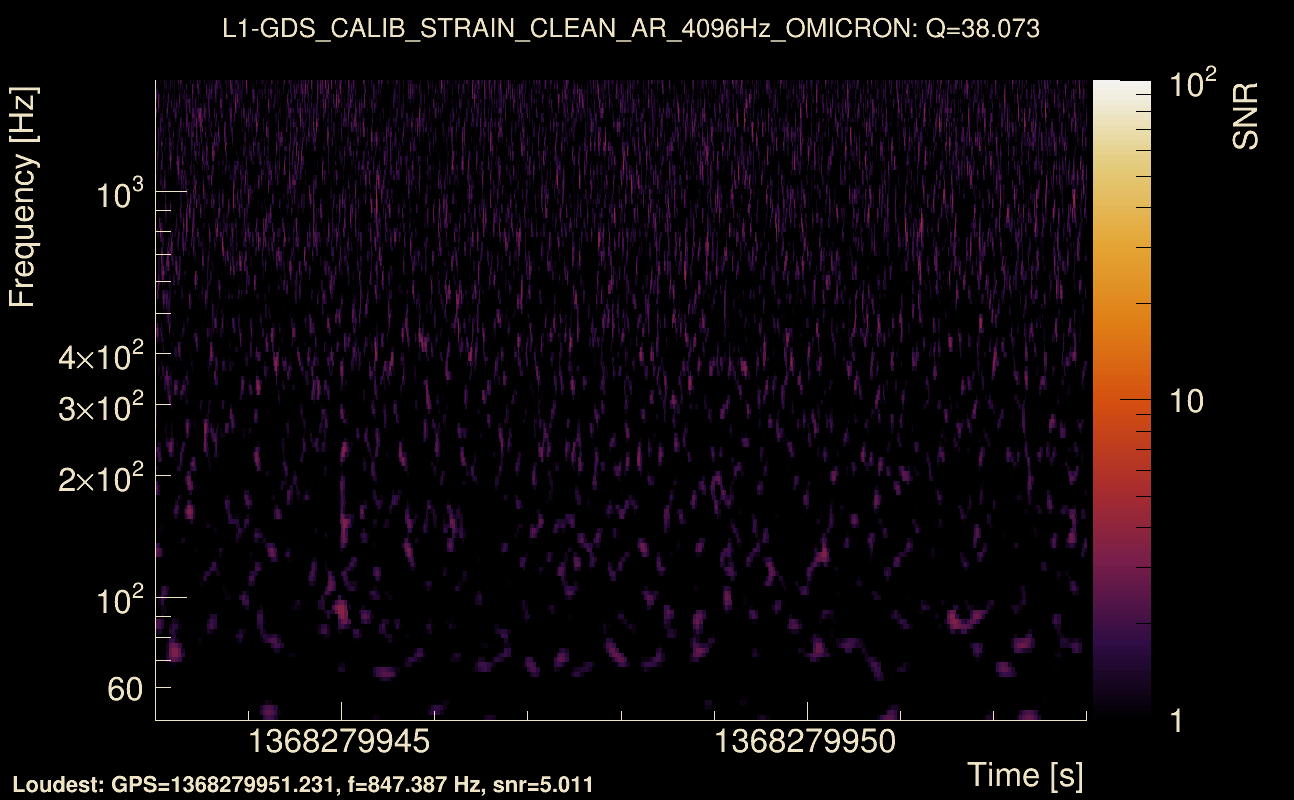
| Event time t(H1): | GPS = 1368279943 (Tue May 16 13:45:25 2023 ) → GPS = 1368279953 (Tue May 16 13:45:35 2023 ) |
| Event time t(L1): | GPS = 1368279943 (Tue May 16 13:45:35 2023 ) → GPS = 1368279953 (Tue May 16 13:45:35 2023 ) |
| Omicron analysis time window (H1): | GPS = 1368279940 → GPS = 1368279956 |
| Omicron analysis time window (L1): | GPS = 1368279940 → GPS = 1368279956 |
| Time delay between detectors t(L1) - t(H1): | -2.15643 s (slice index = 155 / 217), δt_gw = 0.00556508 s |
| Time delay standard deviation: | 0.0619003 s |
| [targeted mode] Time delay probability: | 0.394844 (0.850866 sigmas), δt_target = -0.00748825 s |
| Frequency: | 207.294 Hz |
| Ξ: | 0.0257227 ± 0.0348898 (variance = 0.0012173): Q0: 0.0953509, Q1: 0.126884, Q2: 0.162328, Q3: 0.0588304, Q4: 0.127922 |
| Rank: | R_A = 0.0138172 |
| Log of amplitude ratio (L1/H1): | -0.0966782, variance = 0.394965 (L1/H1: -0.37803, variance = 0.830967, H1/L1: -0.244416, variance = 0.711807) |
| Amplitude ratio (L1/H1): | 0.907848 ⋇ 1.87473 (L1/H1: 0.68521 ⋇ 2.48824, H1/L1: 0.783162 ⋇ 2.32492) |
| Amplitude ratio H1|L1 compatibility (probability): | 0.61628 |
| Antenna factor probability: | 0.871615 |
| Number of rejected frequency rows: | Q0: 13 / 18, Q1: 27 / 36, Q2: 58 / 70, Q3: 125 / 134, Q4: 246 / 258 |
| Maximum signal-to-noise ratio: | H1: 6.44926, L1: 5.85731 |
| SNR variance: | H1: 0.553535, L1: 0.515168 |
| Click here for a zoomed plot | Click here for a zoomed plot | Click here for a zoomed plot | Click here for a zoomed plot | Click here for a zoomed plot |
 |
 |
 |
 |
 |
 |
 |
 |
 |
 |
 |
 |
 |
 |
 |
 |
 |
 |
 |
 |
 |
 |
 |
 |
 |
 |
 |
 |
 |
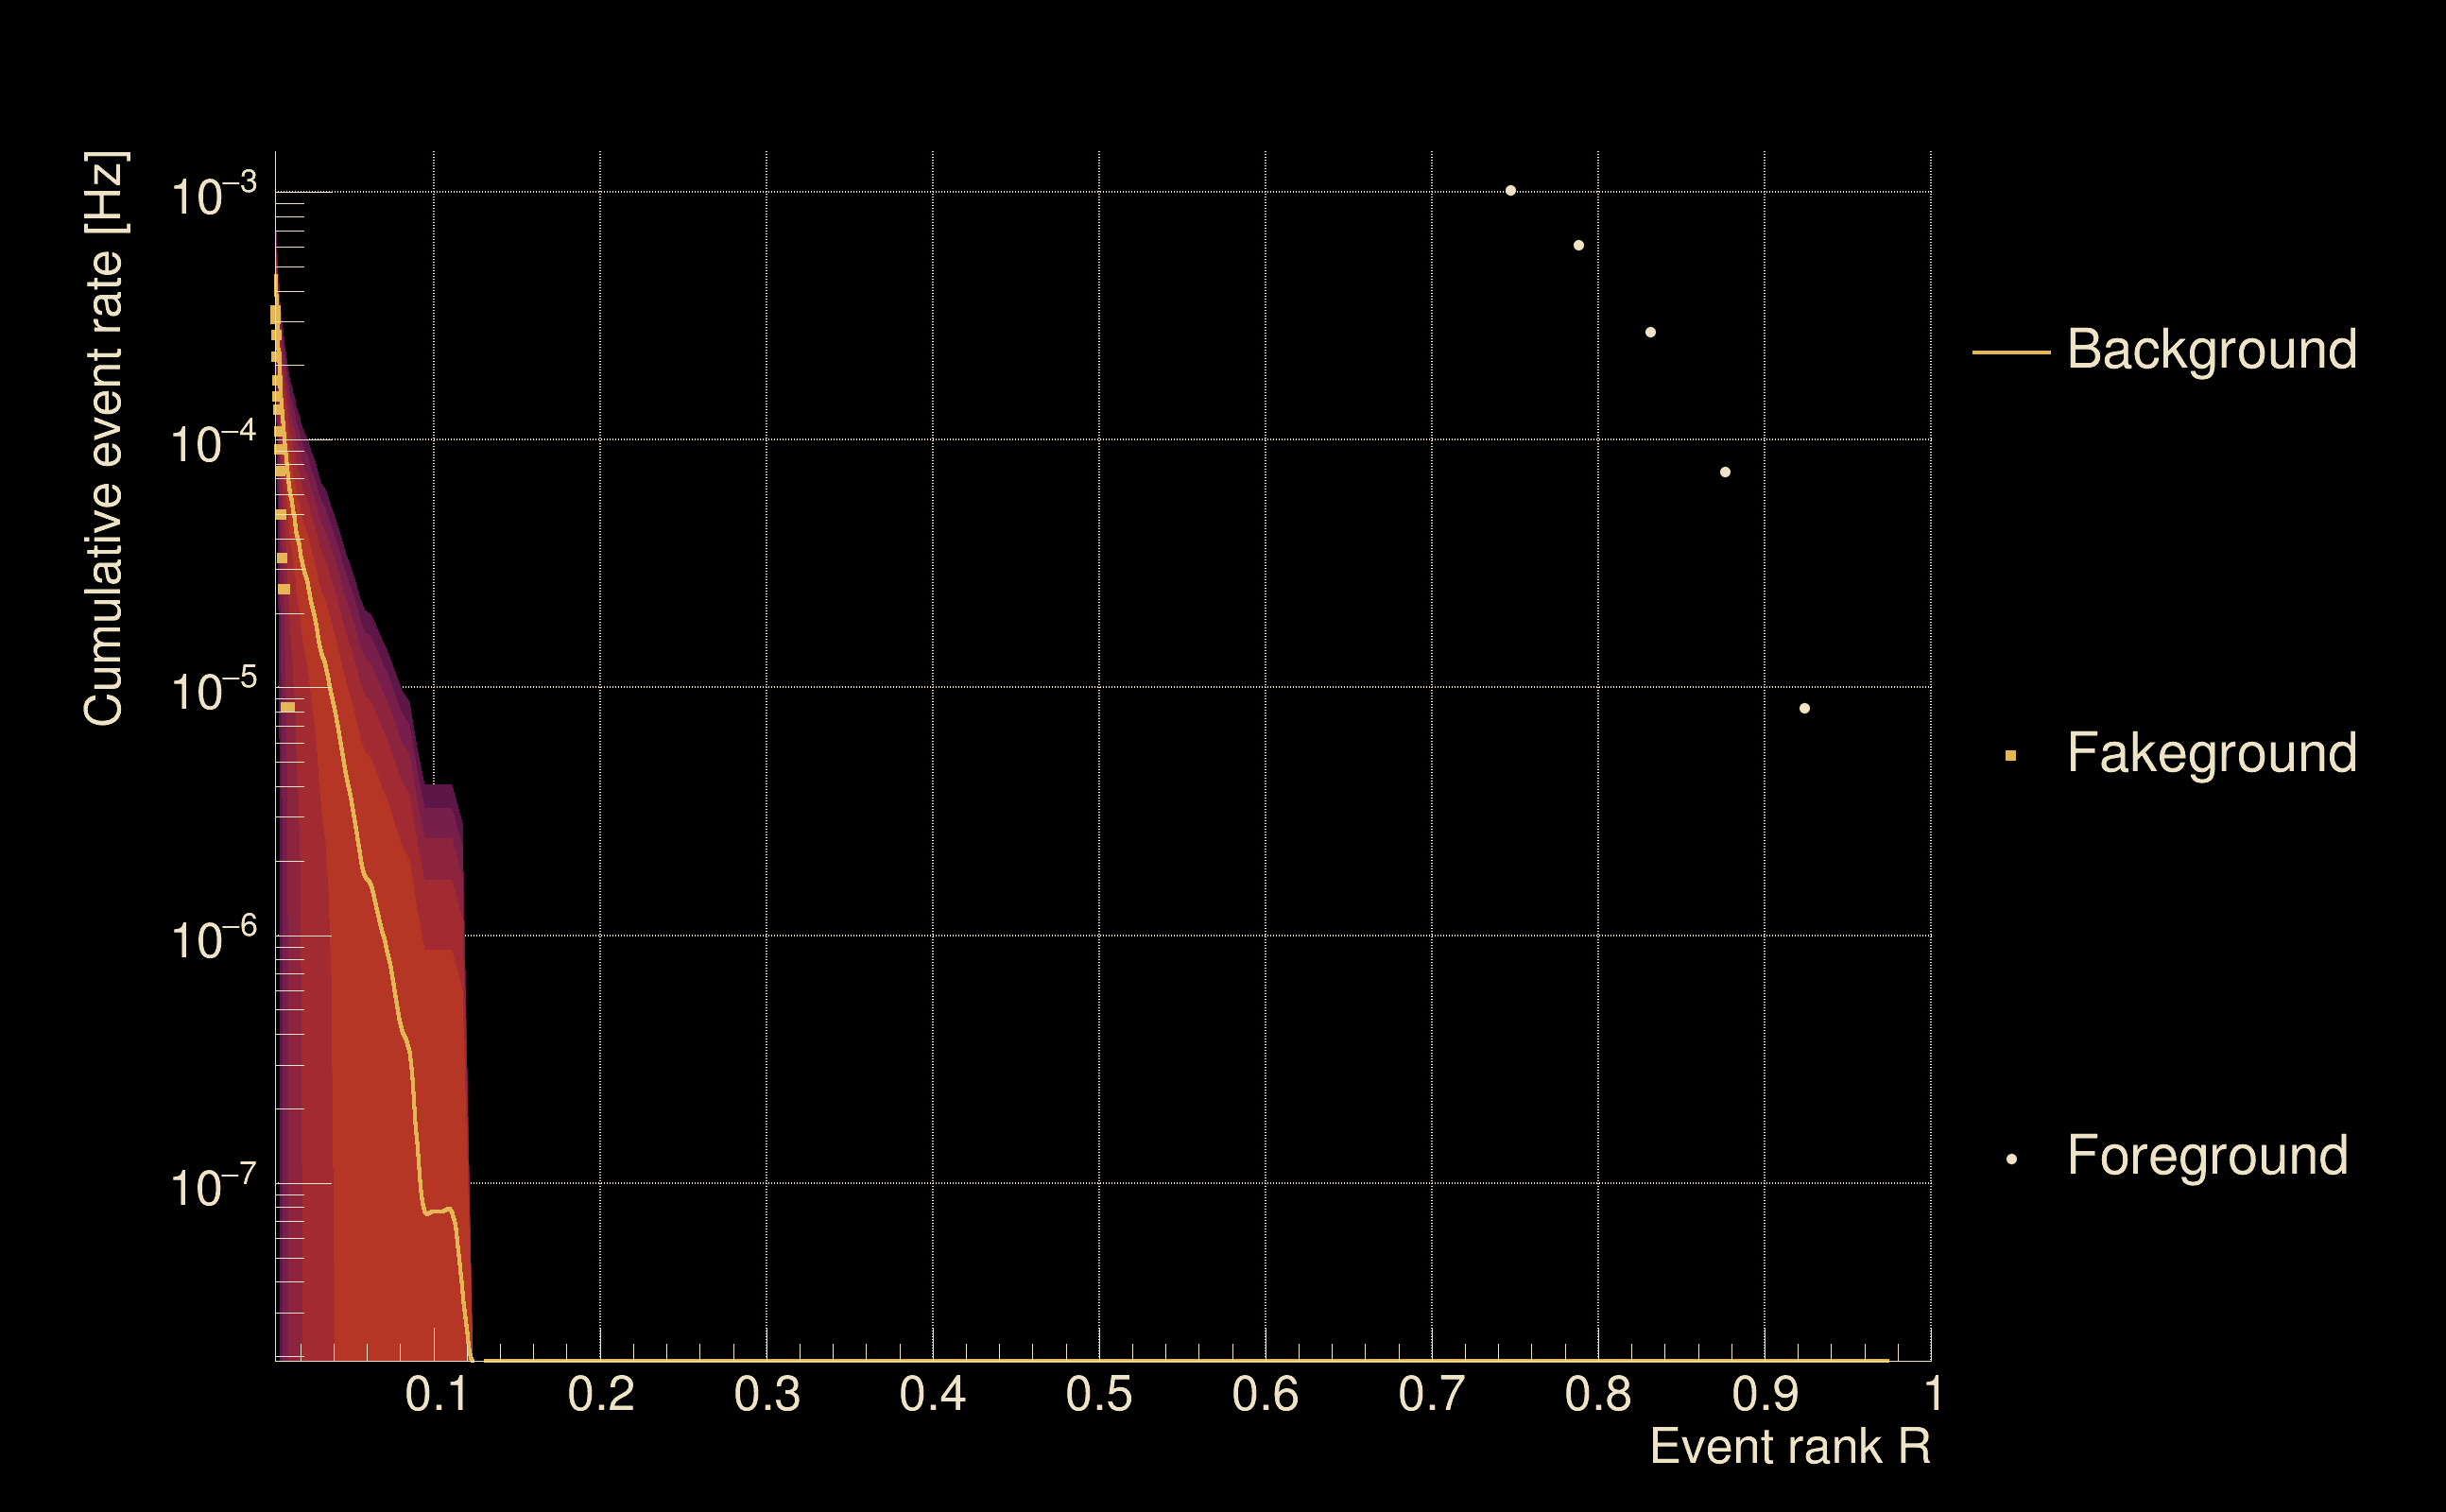
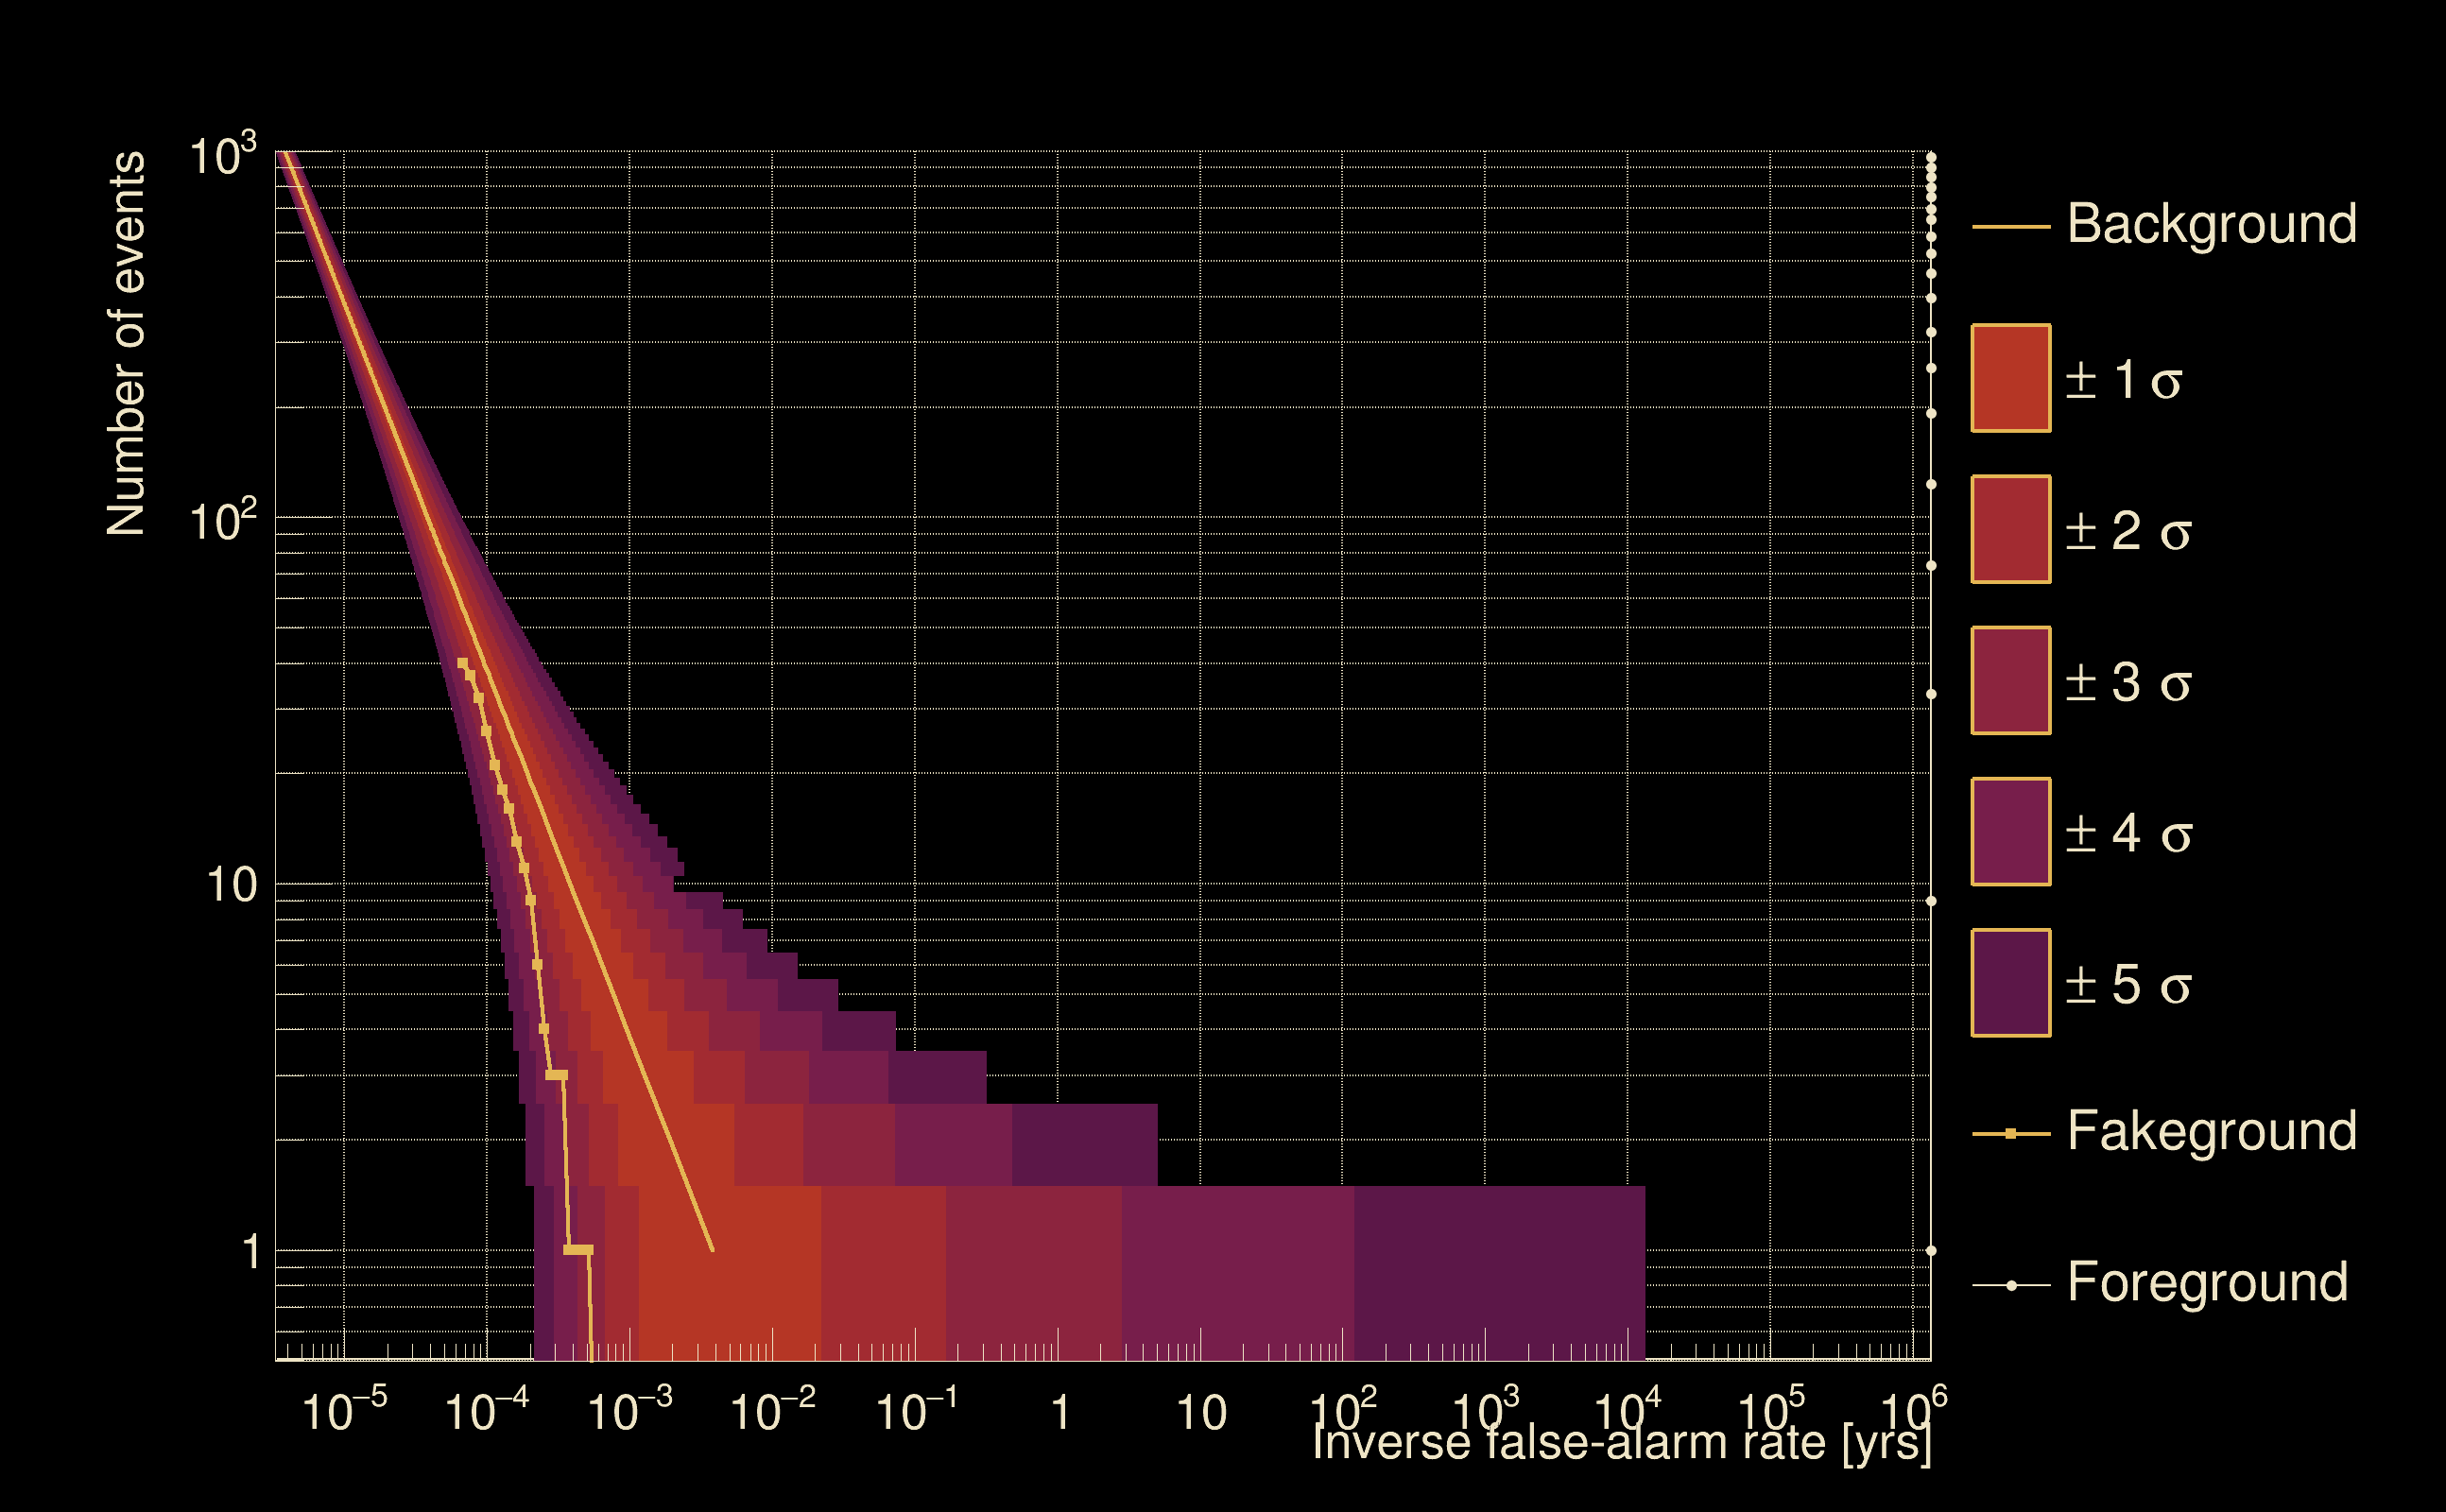
| Detection threshold: | R > 0.0410955 |
| False-alarm rate above that detection threshold: | 7.14009e-06 |
| Alternative threshold at 1/1000 yrs: | R > 0.117013 |
| Alternative threshold at 1/100 yrs: | R > 0.117013 |
| Alternative threshold at 1/10 yrs: | R > 0.117013 |
| Alternative threshold at 1/1 yr: | R > 0.117013 |
| Alternative threshold at 1/1 d: | R > 0.0346334 |
 |
|
 |
 |
 |
 |
 |
 |
 |
 |
 |
 |
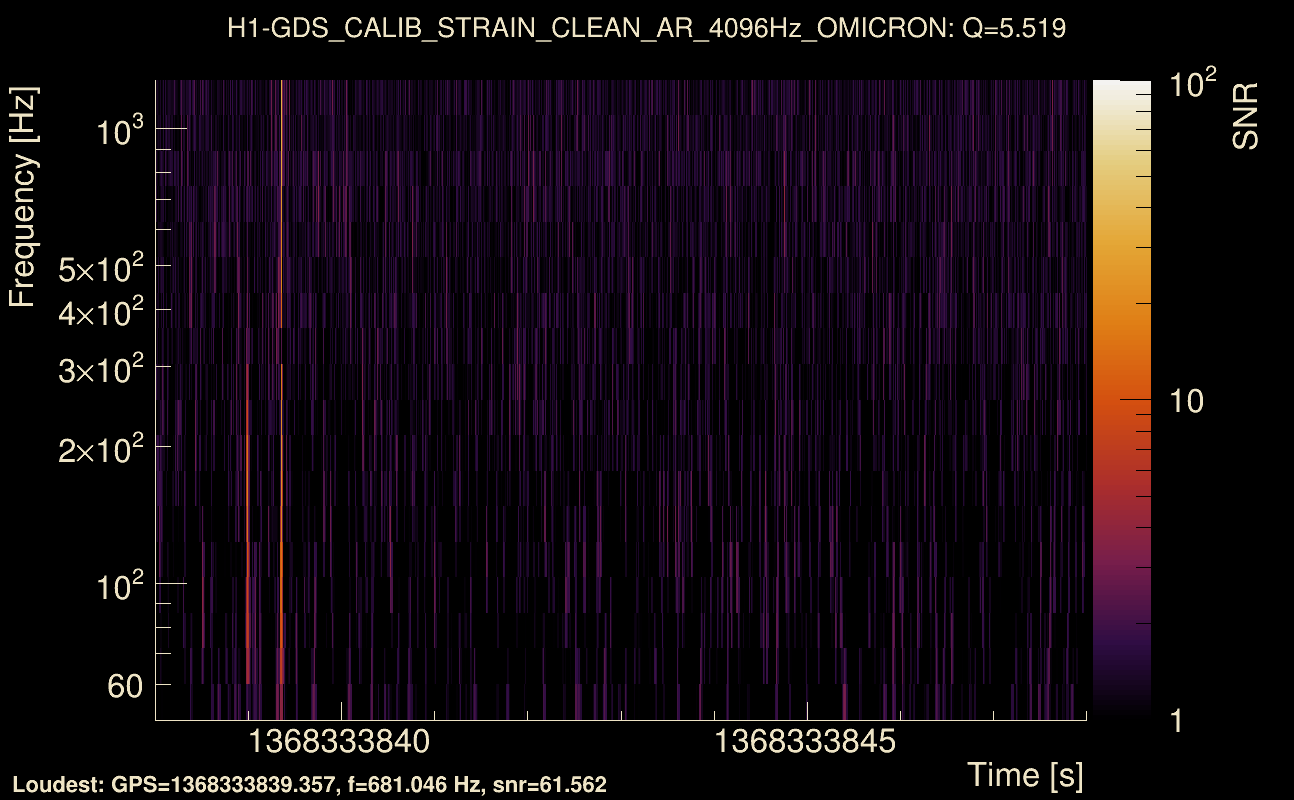
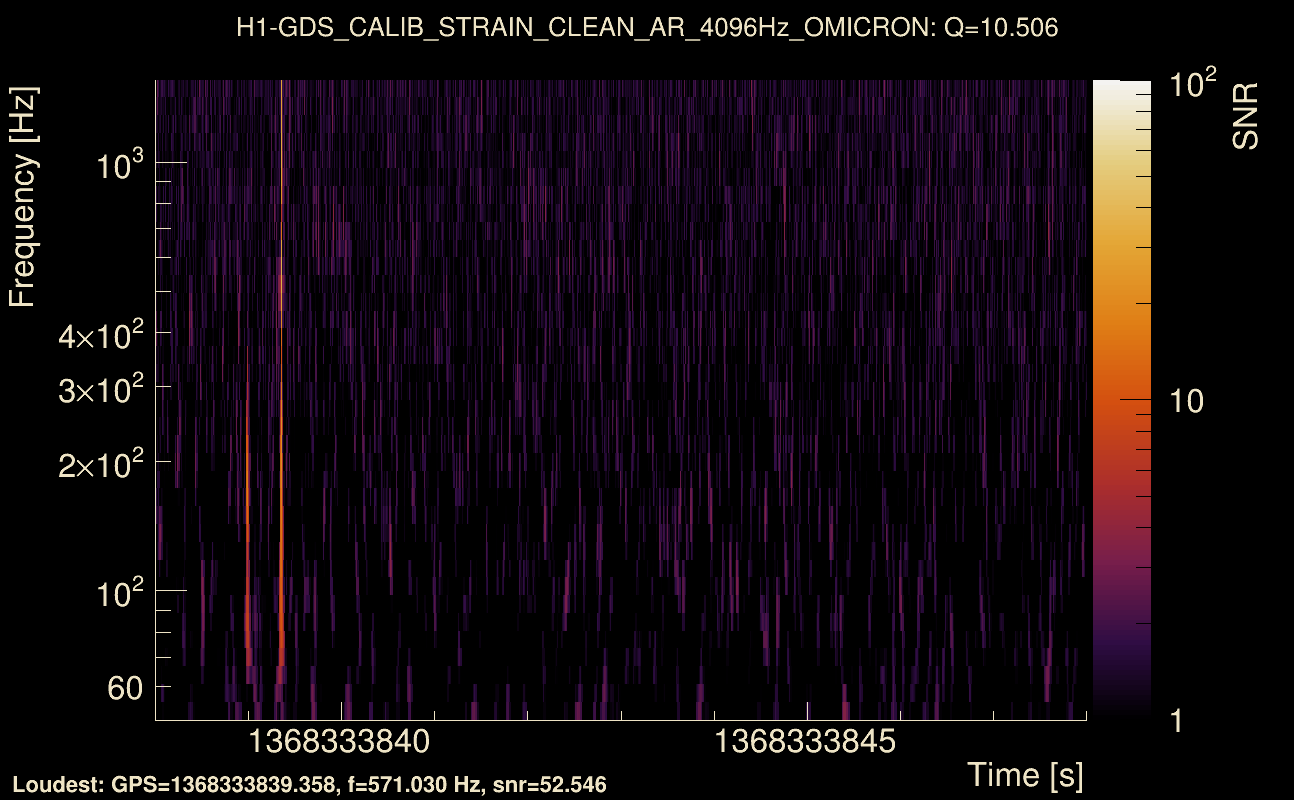
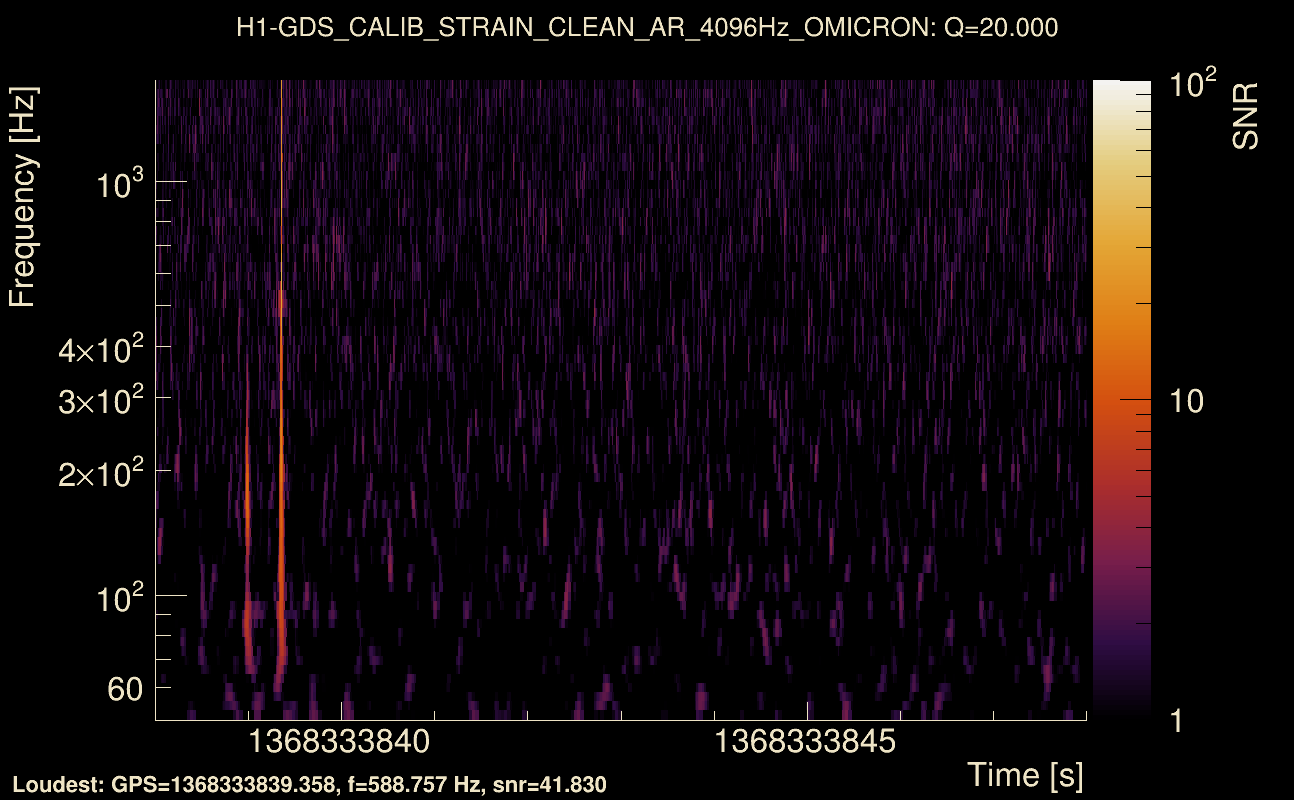
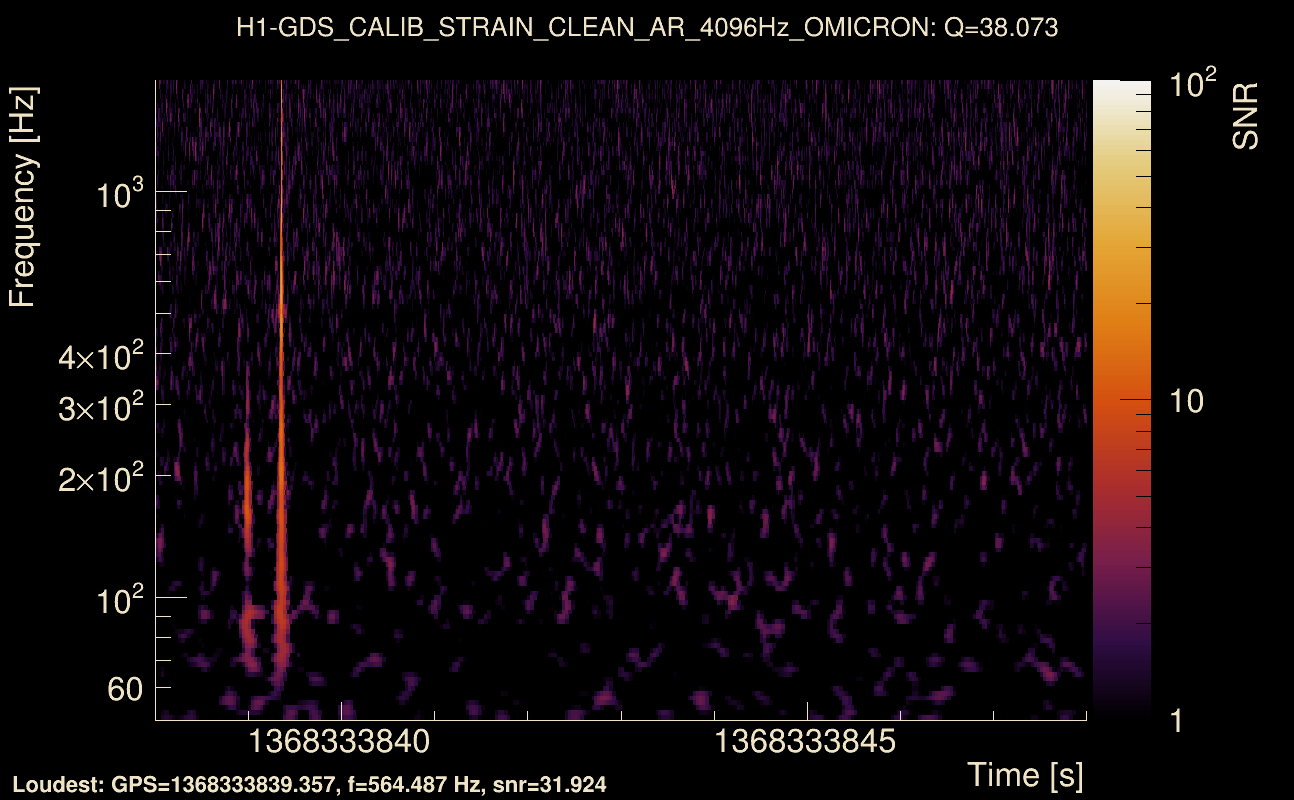
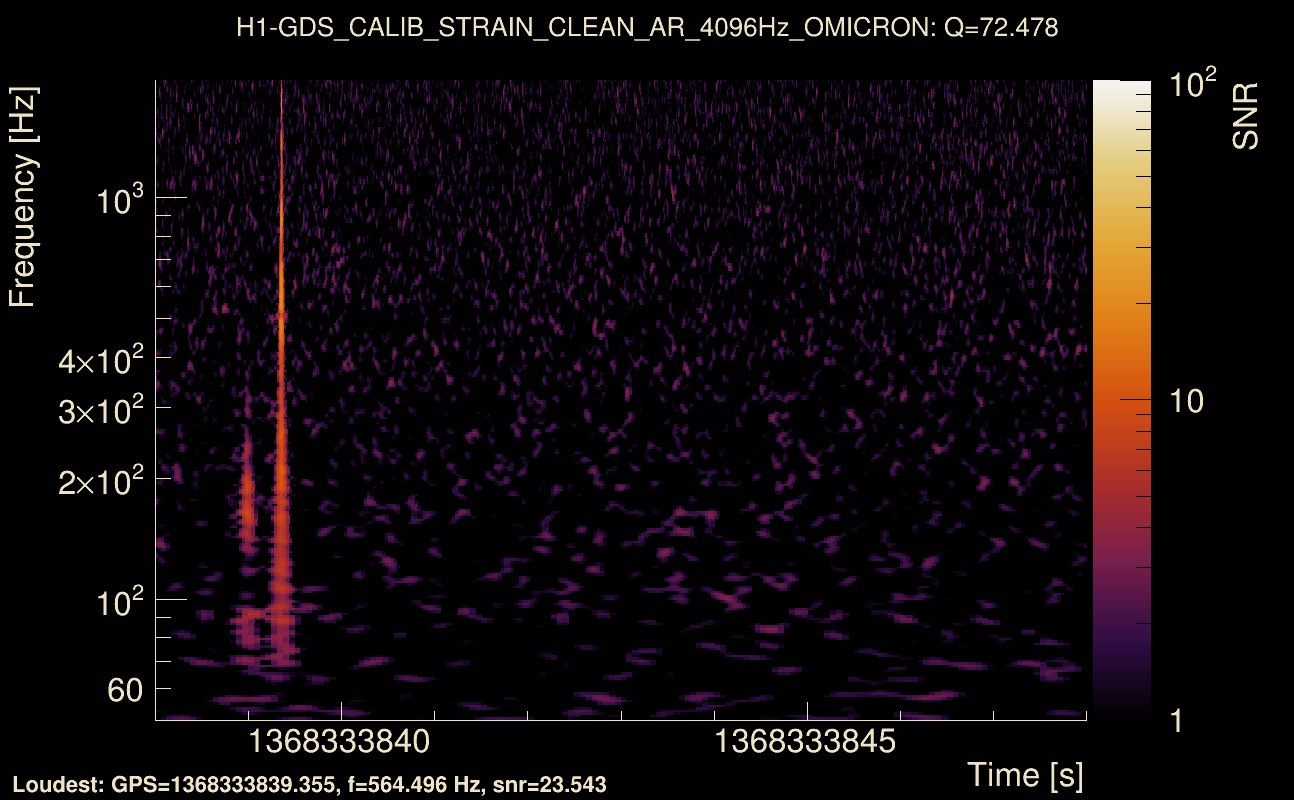
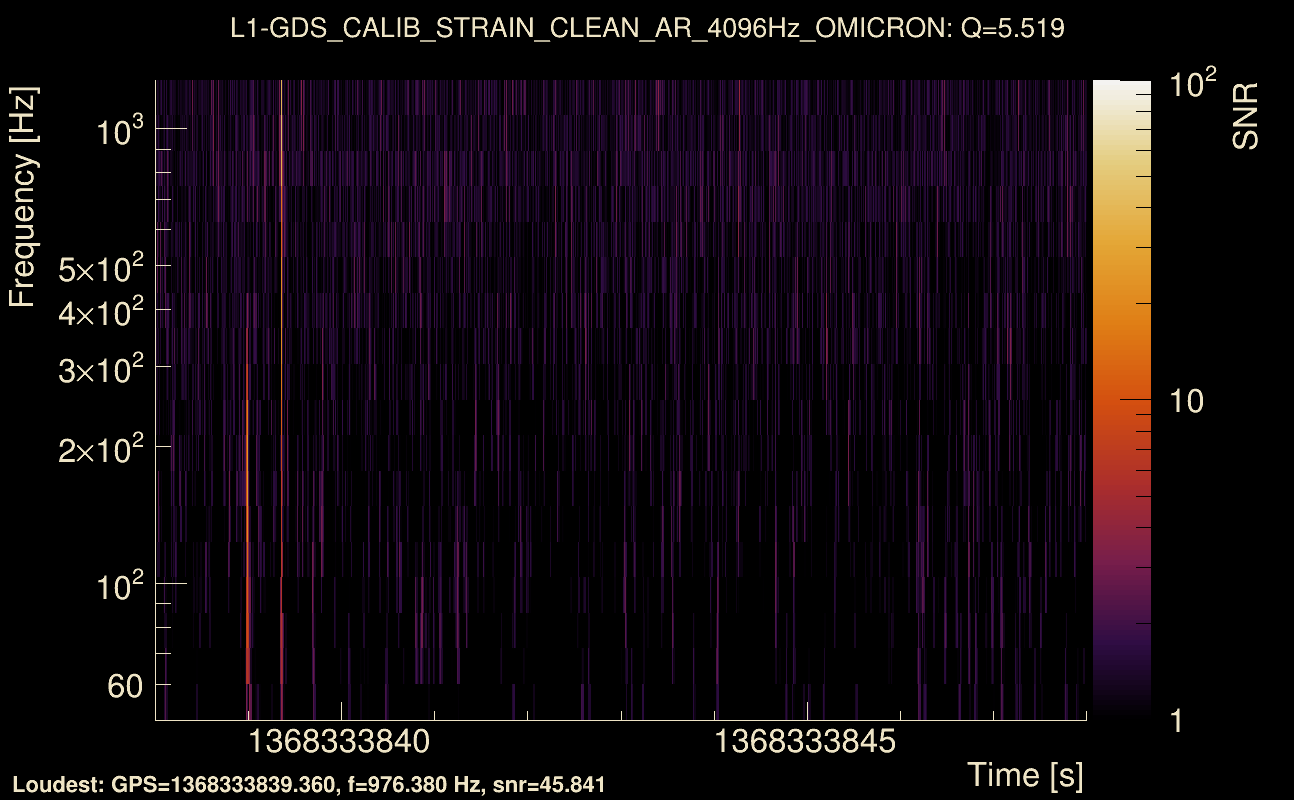
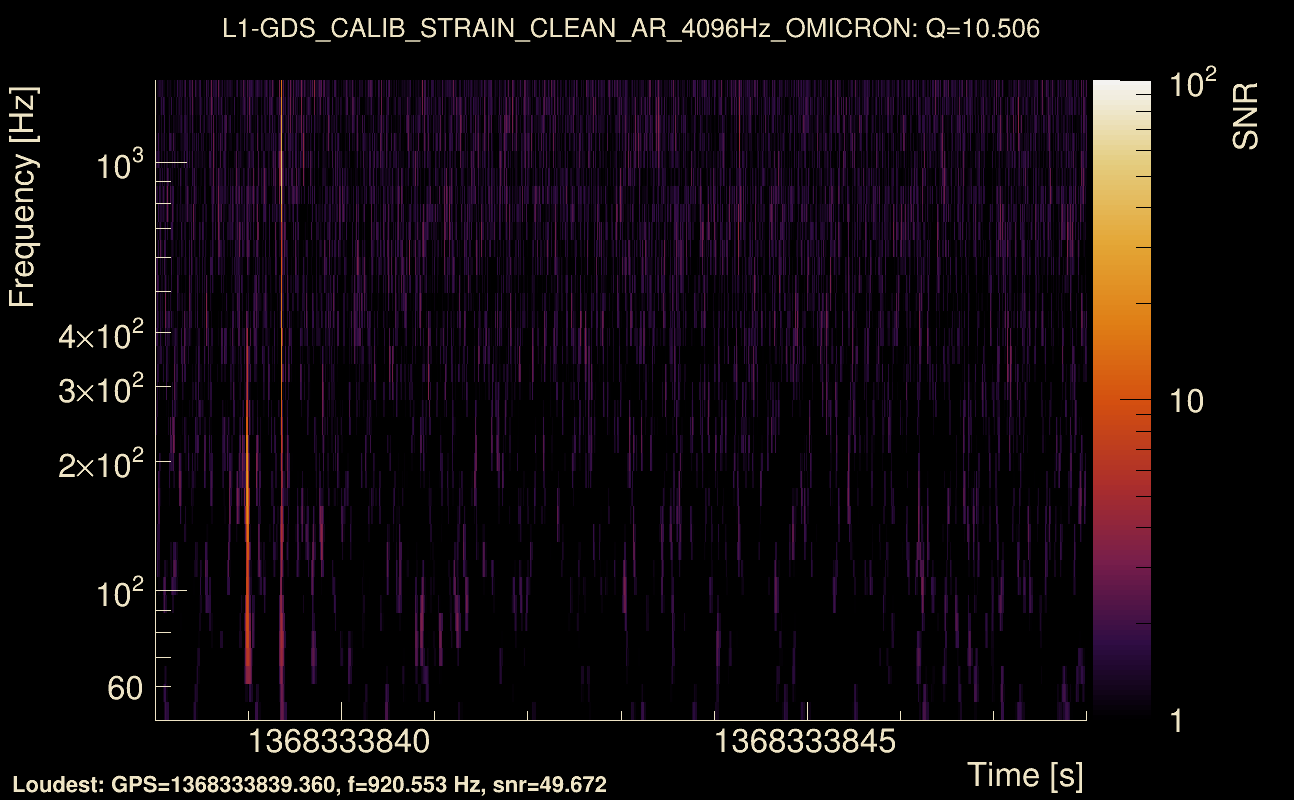
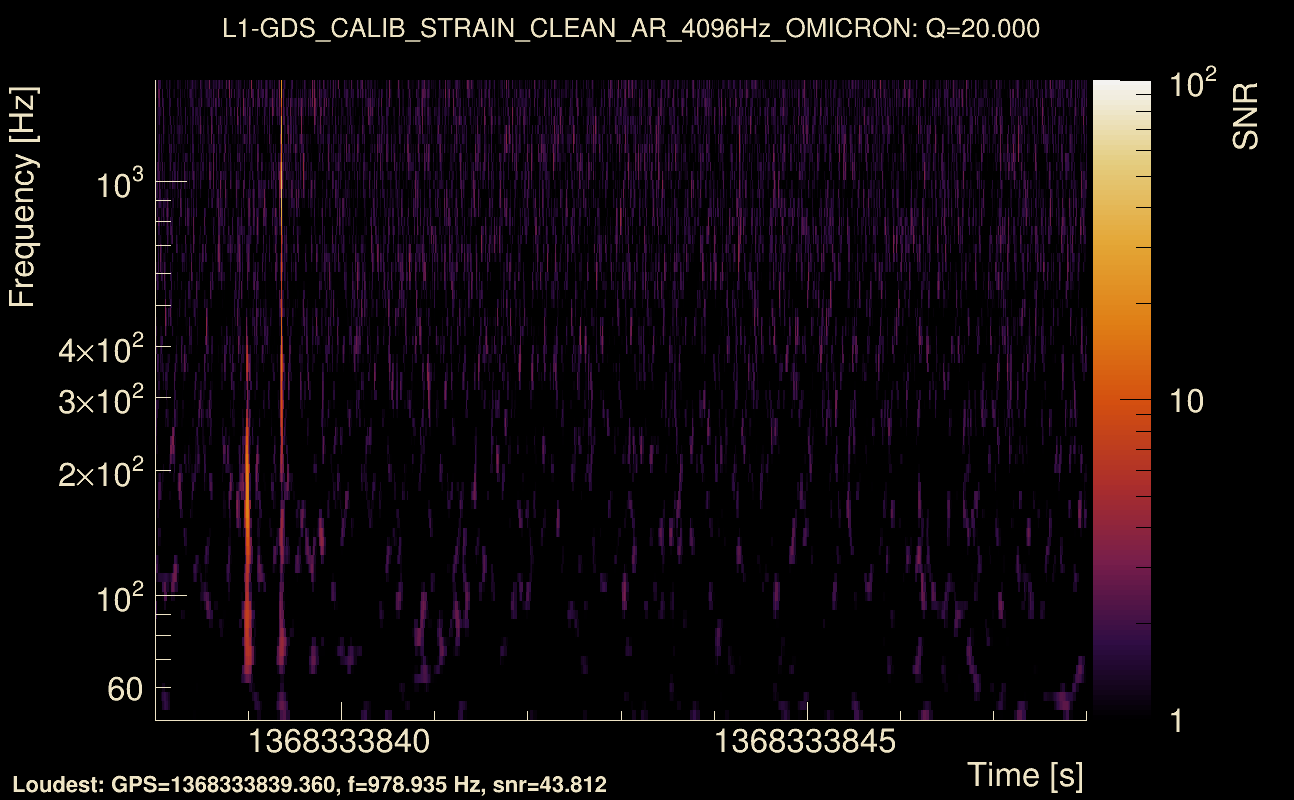
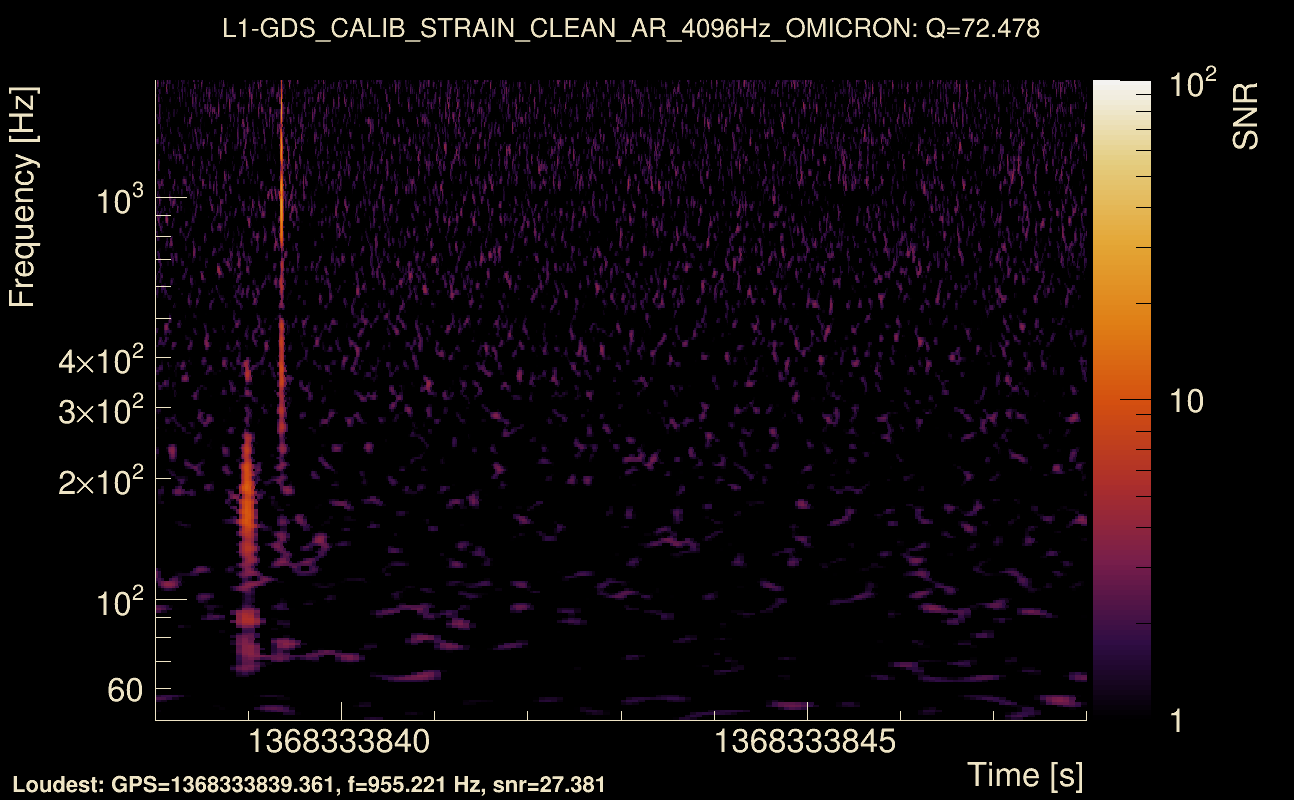
| Event time t(H1): | GPS = 1368333838 (Wed May 17 04:43:40 2023 ) → GPS = 1368333848 (Wed May 17 04:43:50 2023 ) |
| Event time t(L1): | GPS = 1368333838 (Wed May 17 04:43:50 2023 ) → GPS = 1368333848 (Wed May 17 04:43:50 2023 ) |
| Omicron analysis time window (H1): | GPS = 1368333835 → GPS = 1368333851 |
| Omicron analysis time window (L1): | GPS = 1368333835 → GPS = 1368333851 |
| Time delay between detectors t(L1) - t(H1): | -0.364274 s (slice index = 116 / 217), δt_gw = 0.00372616 s |
| Time delay standard deviation: | 0.0573654 s |
| [targeted mode] Time delay probability: | 0.379316 (0.879157 sigmas), δt_target = -0.00987434 s |
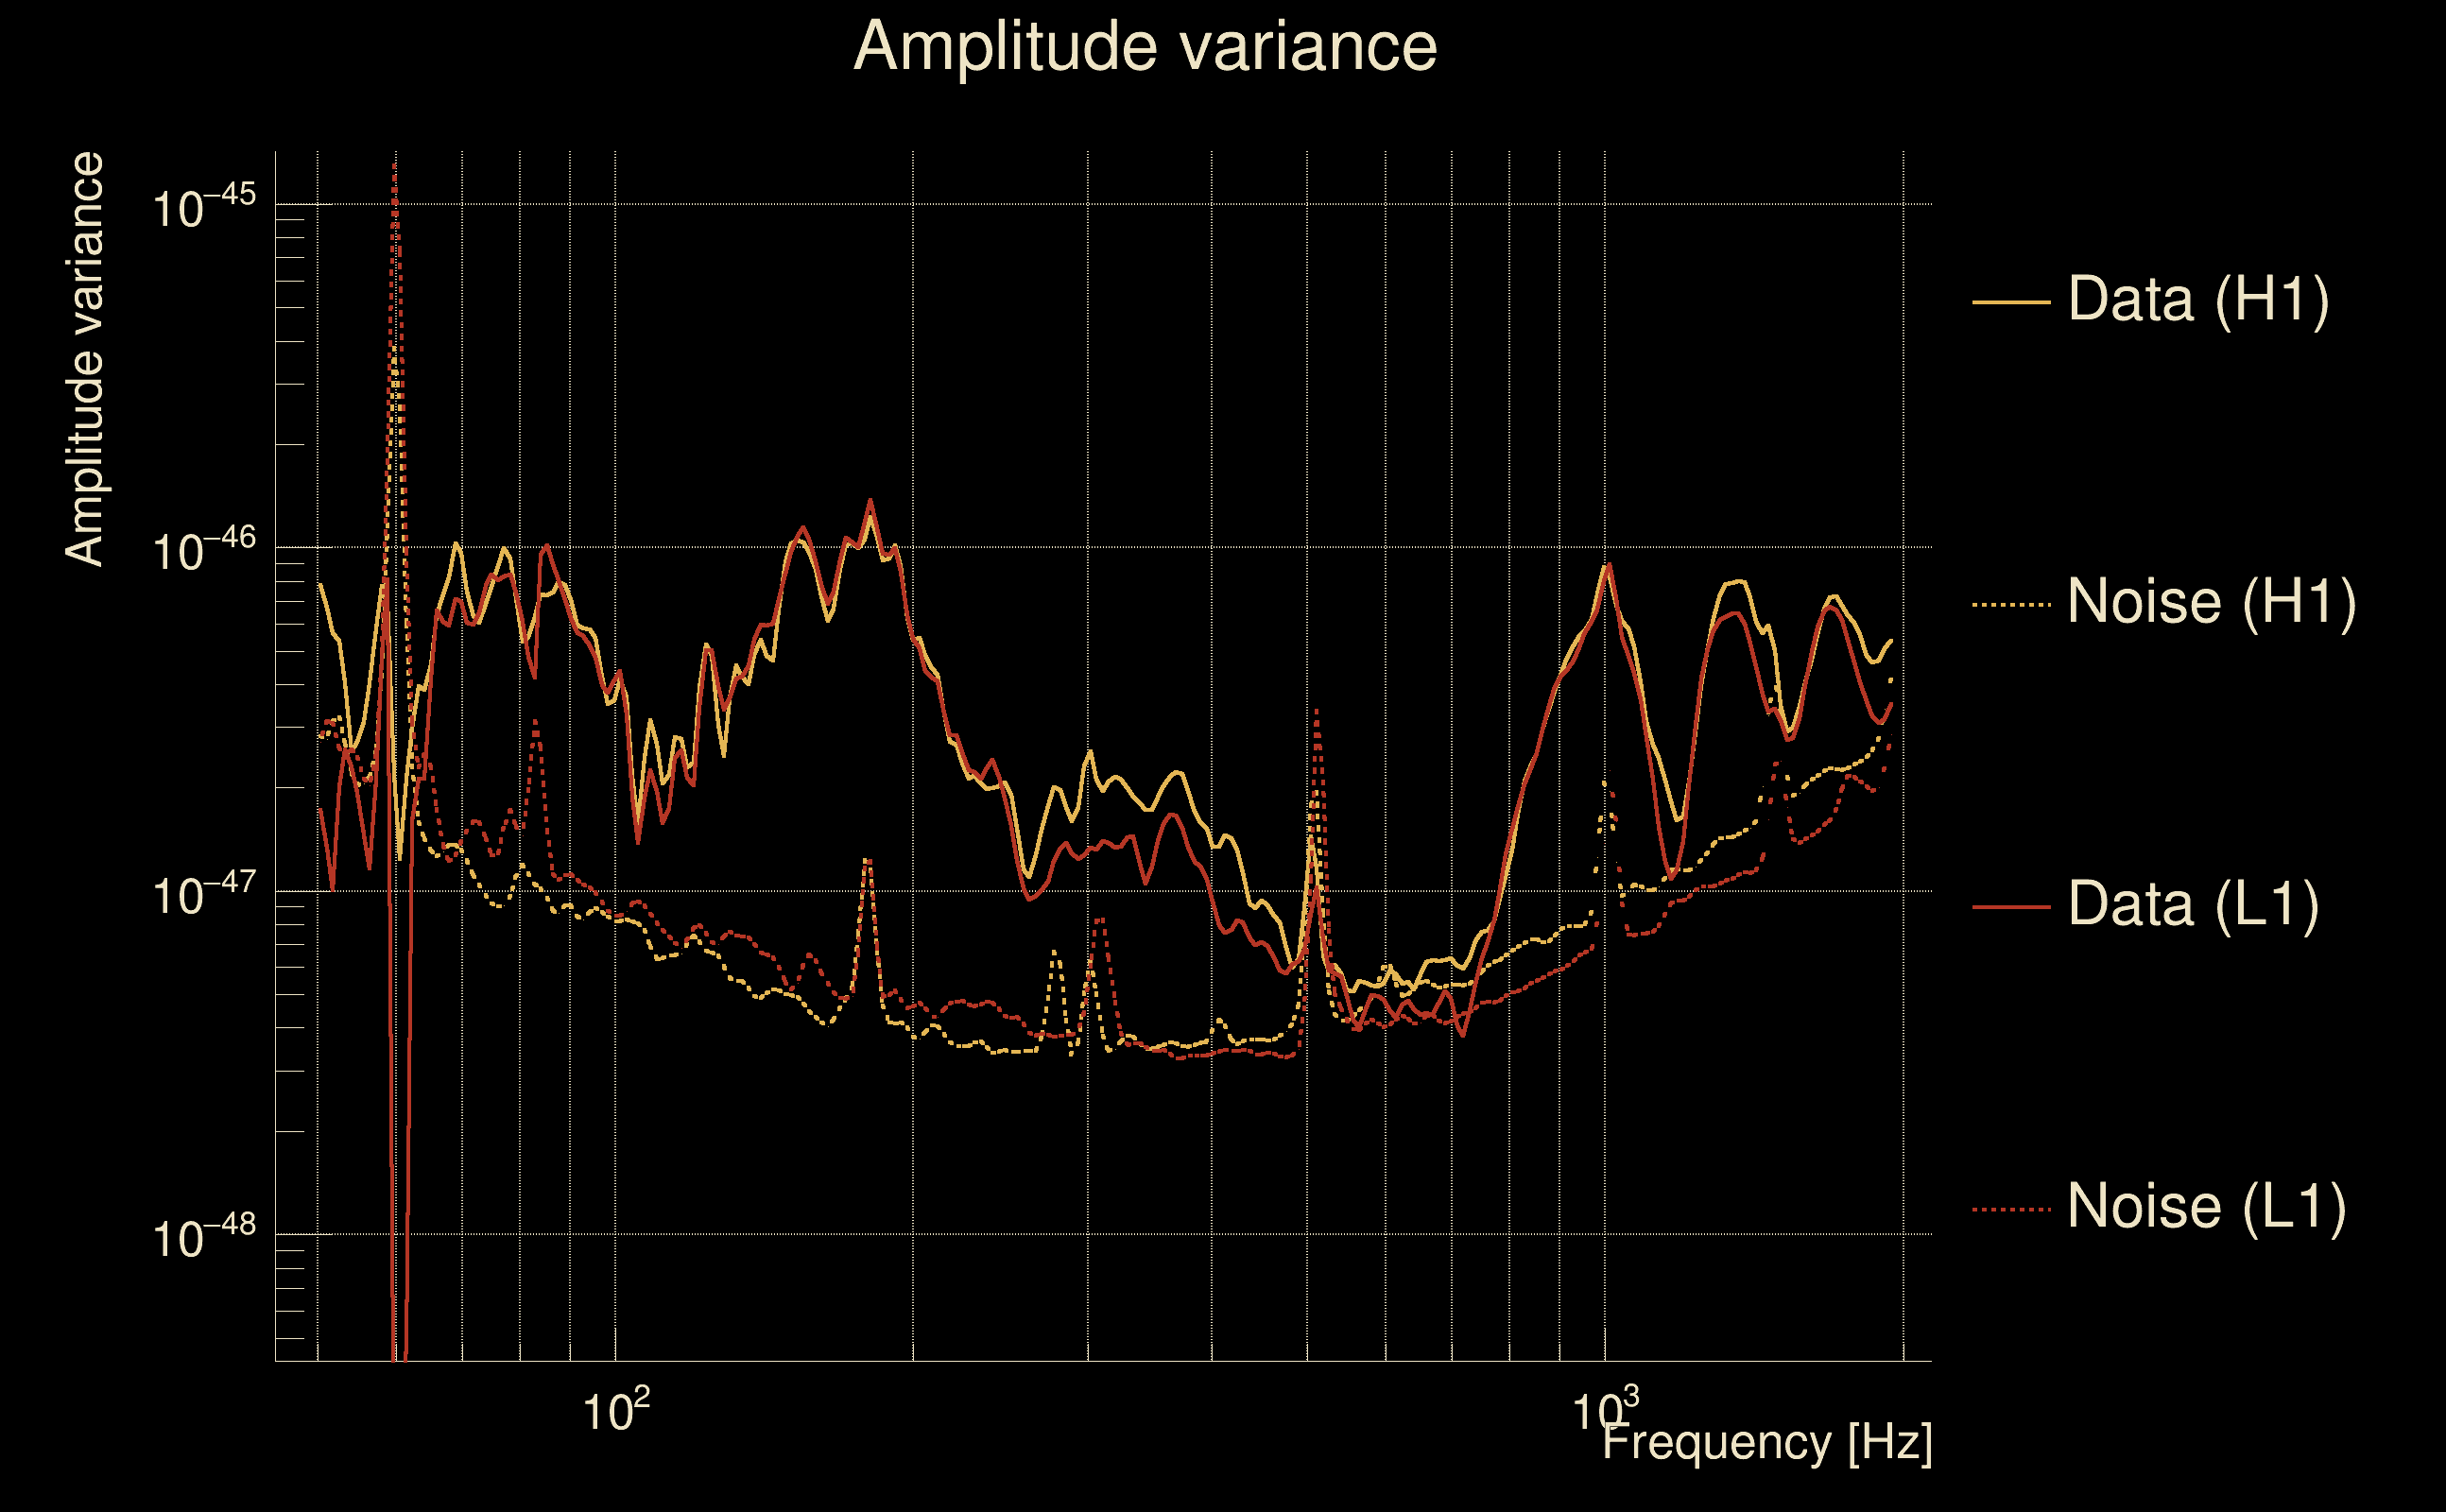
| Frequency: | 151.199 Hz |
| Ξ: | 0.590537 ± 0.0348609 (variance = 0.00121528): Q0: 0.789351, Q1: 0.788834, Q2: 0.745574, Q3: 0.720383, Q4: 0.703916 |
| Rank: | R_A = 0.118242 |
| Log of amplitude ratio (L1/H1): | -0.446998, variance = 0.937524 (L1/H1: -1.22715, variance = 1.82681, H1/L1: -0.740566, variance = 1.73115) |
| Amplitude ratio (L1/H1): | 0.639545 ⋇ 2.63335 (L1/H1: 0.293127 ⋇ 3.86359, H1/L1: 0.476844 ⋇ 3.72747) |
| Amplitude ratio H1|L1 compatibility (probability): | 0.296862 |
| Antenna factor probability: | 0.674483 |
| Number of rejected frequency rows: | Q0: 3 / 18, Q1: 9 / 36, Q2: 25 / 70, Q3: 48 / 134, Q4: 157 / 258 |
| Maximum signal-to-noise ratio: | H1: 60.86, L1: 49.3279 |
| SNR variance: | H1: 1.02509, L1: 0.864721 |
| Click here for a zoomed plot | Click here for a zoomed plot | Click here for a zoomed plot | Click here for a zoomed plot | Click here for a zoomed plot |
 |
 |
 |
 |
 |
 |
 |
 |
 |
 |
 |
 |
 |
 |
 |
 |
 |
 |
 |
 |
 |
 |
 |
 |
 |
 |
 |
 |
 |
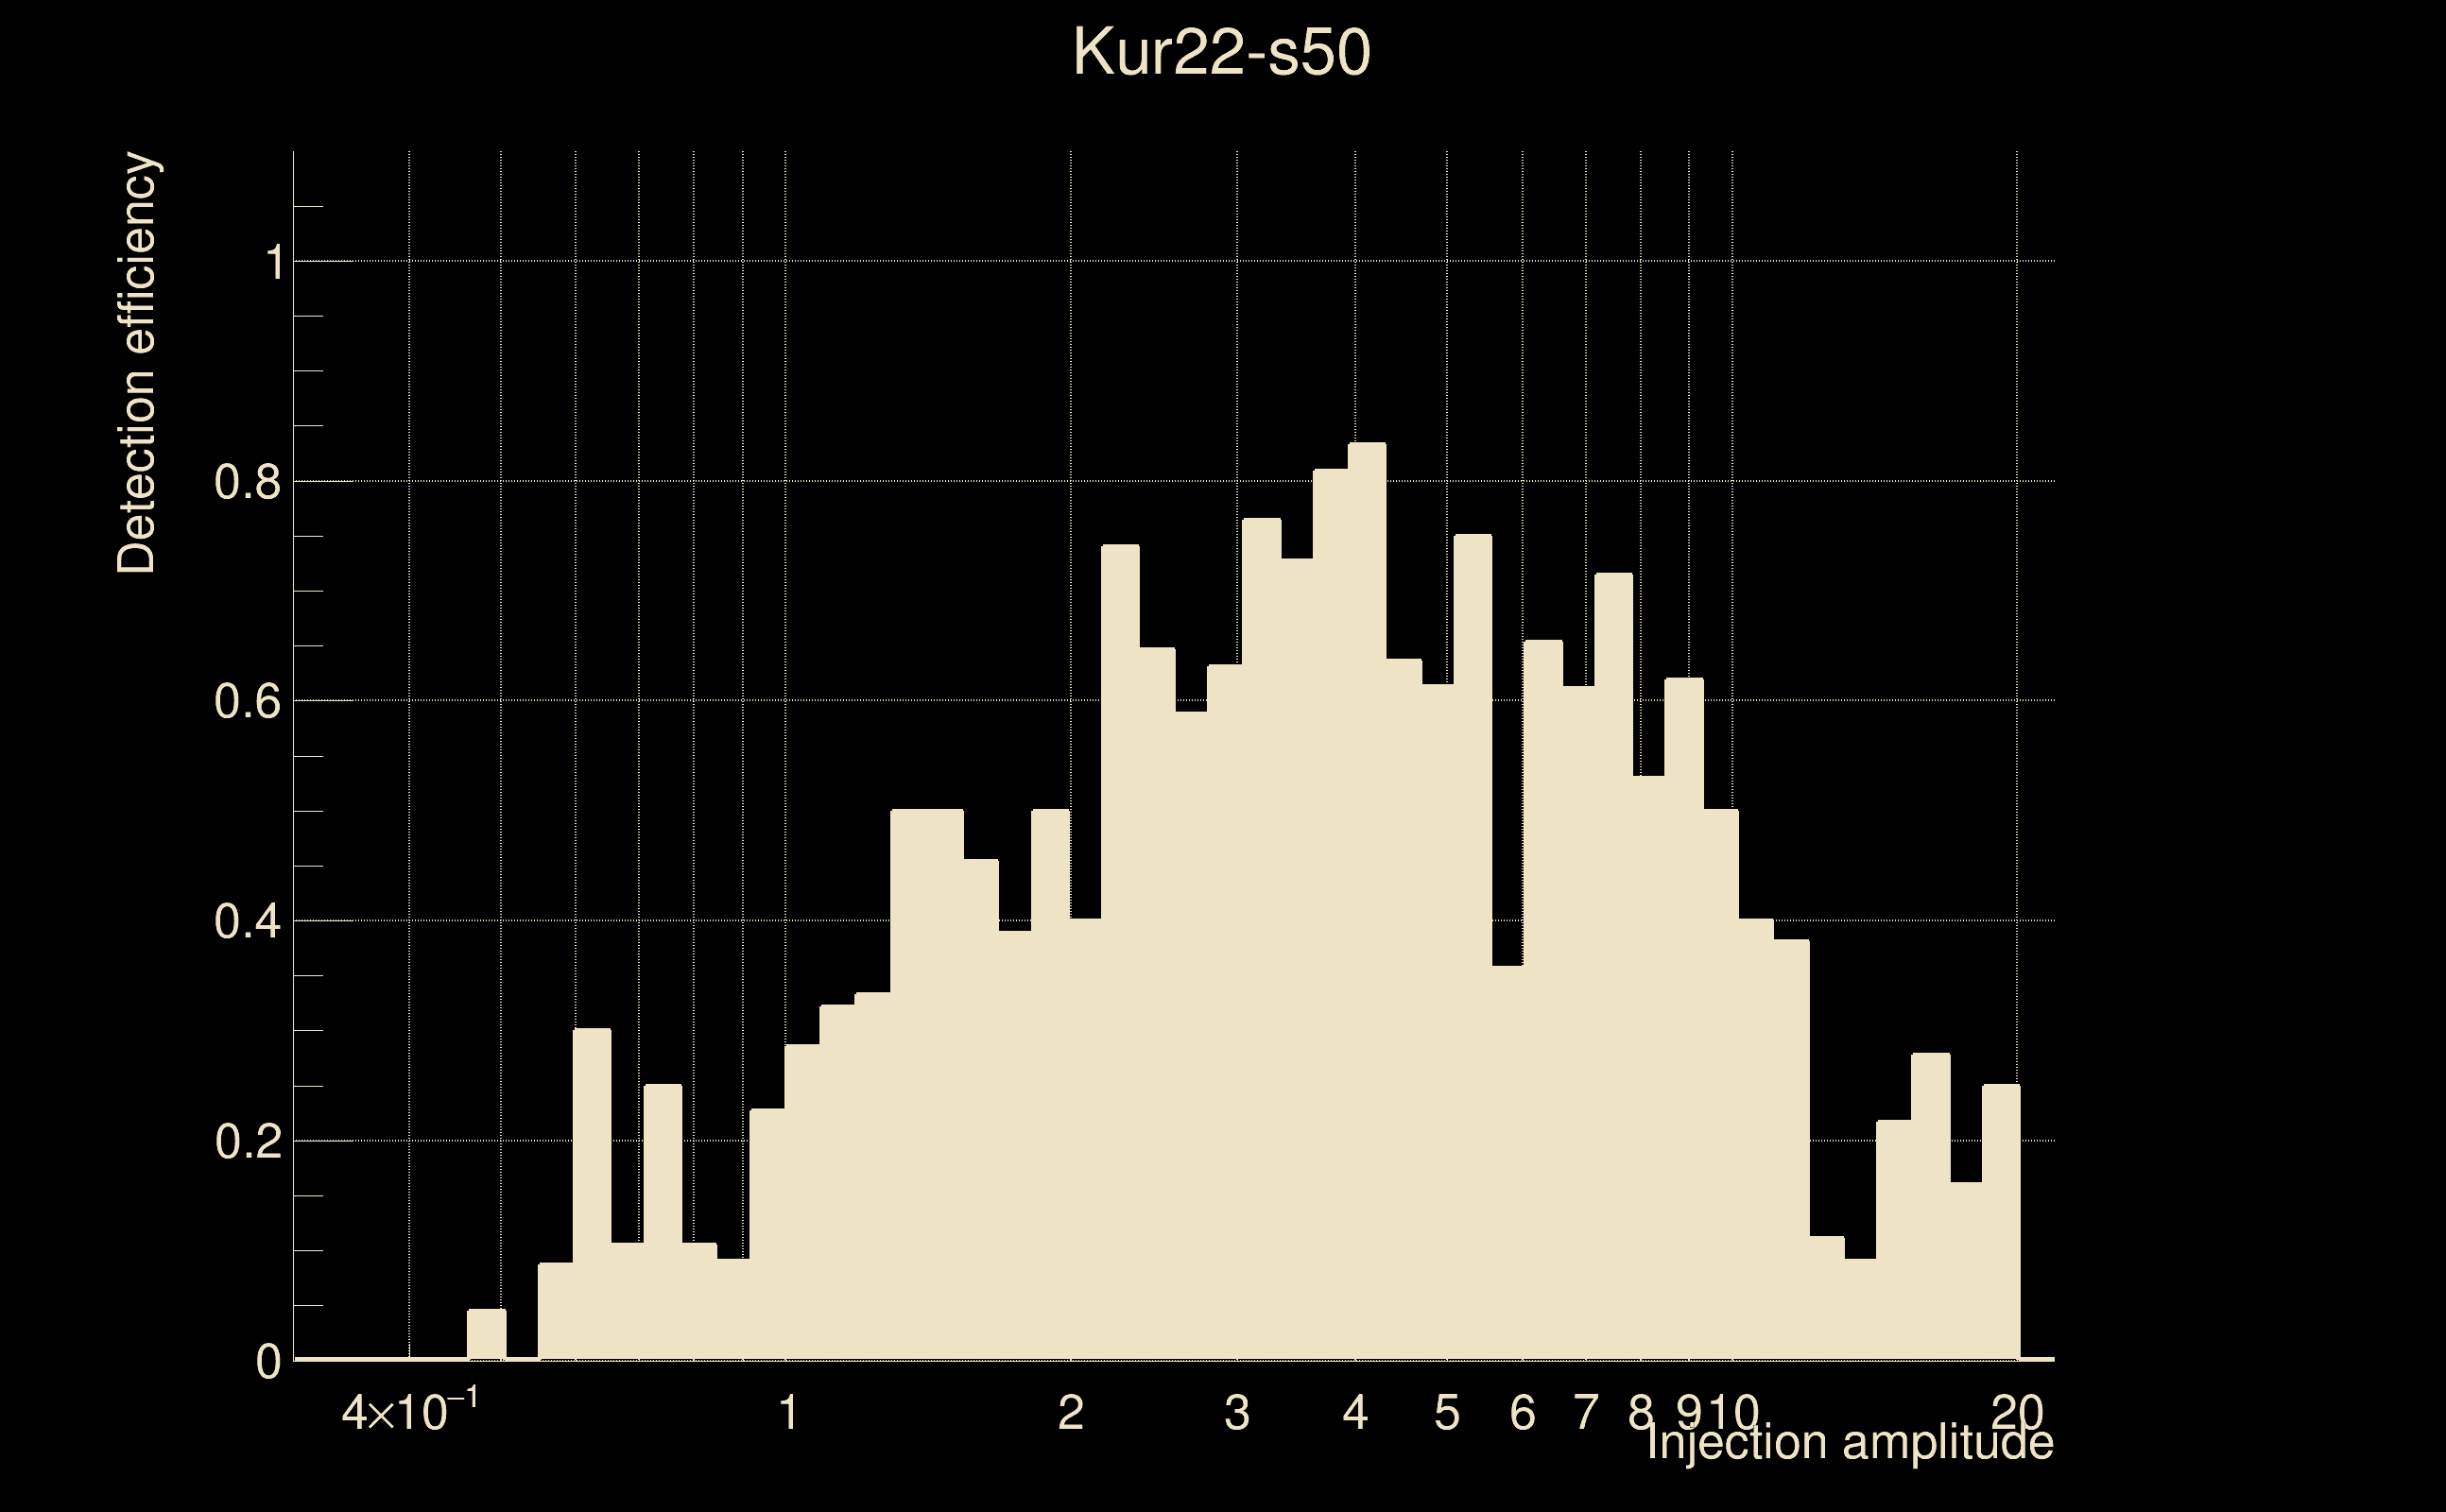
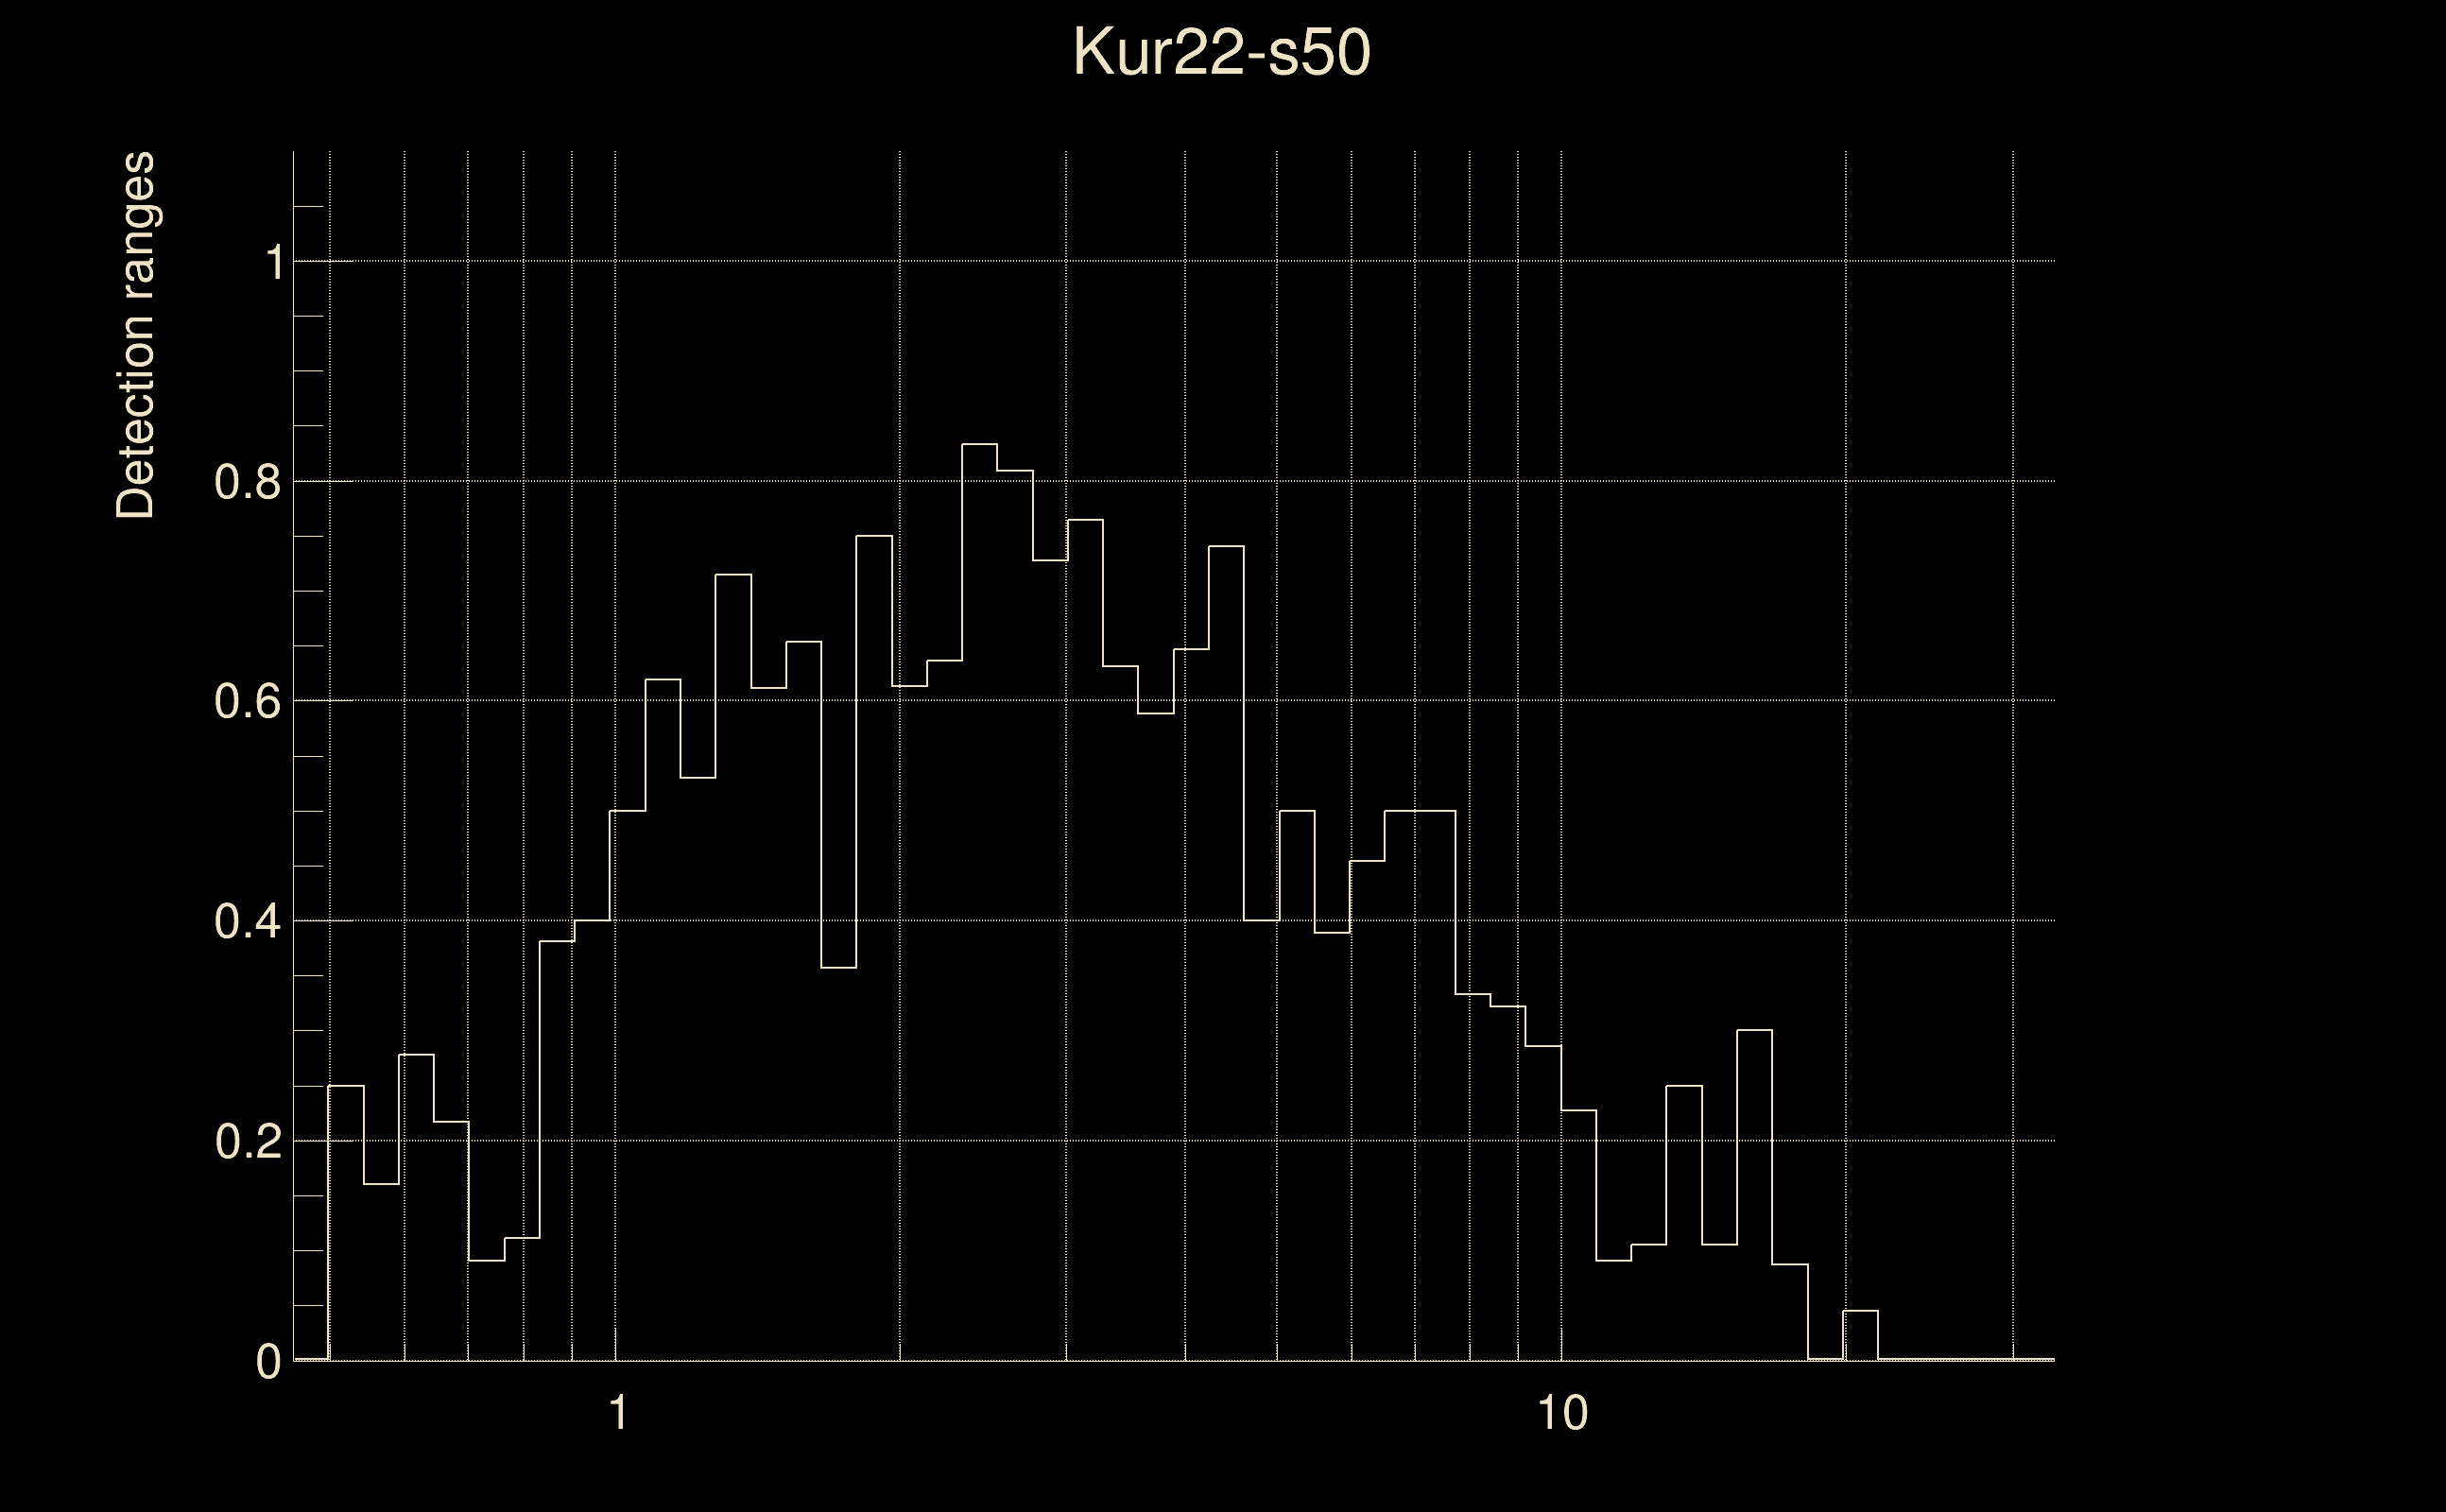
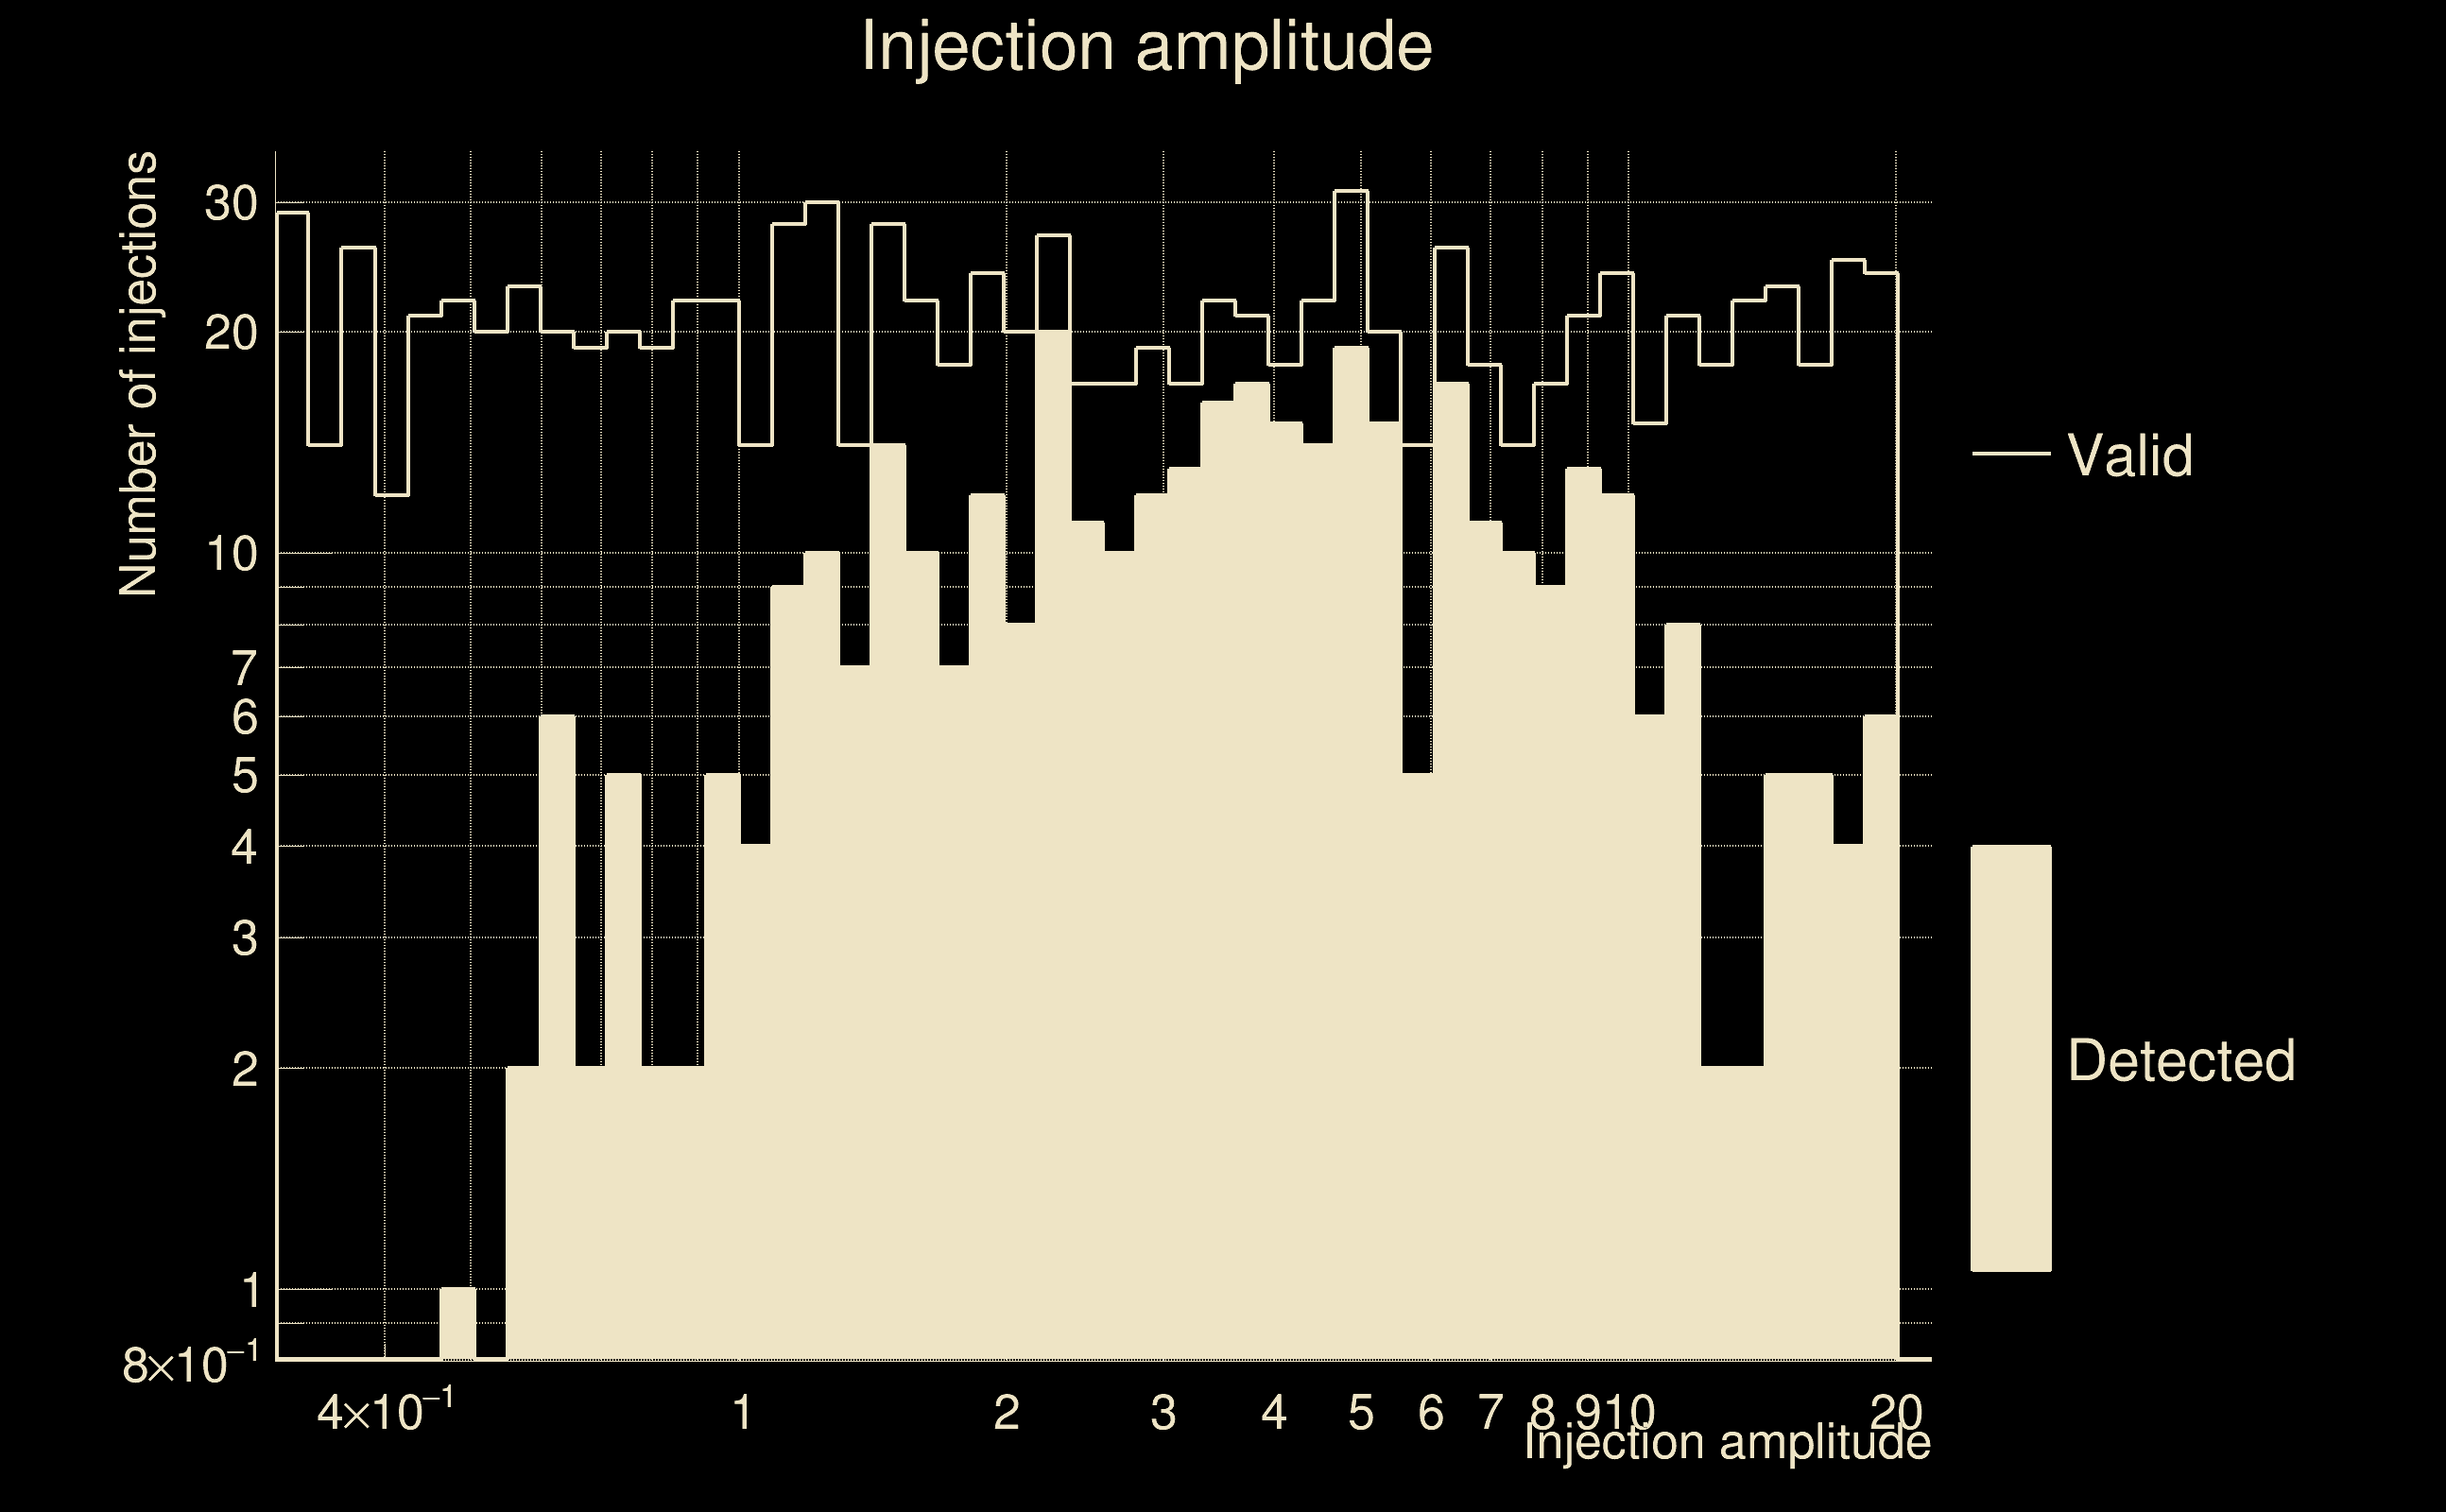
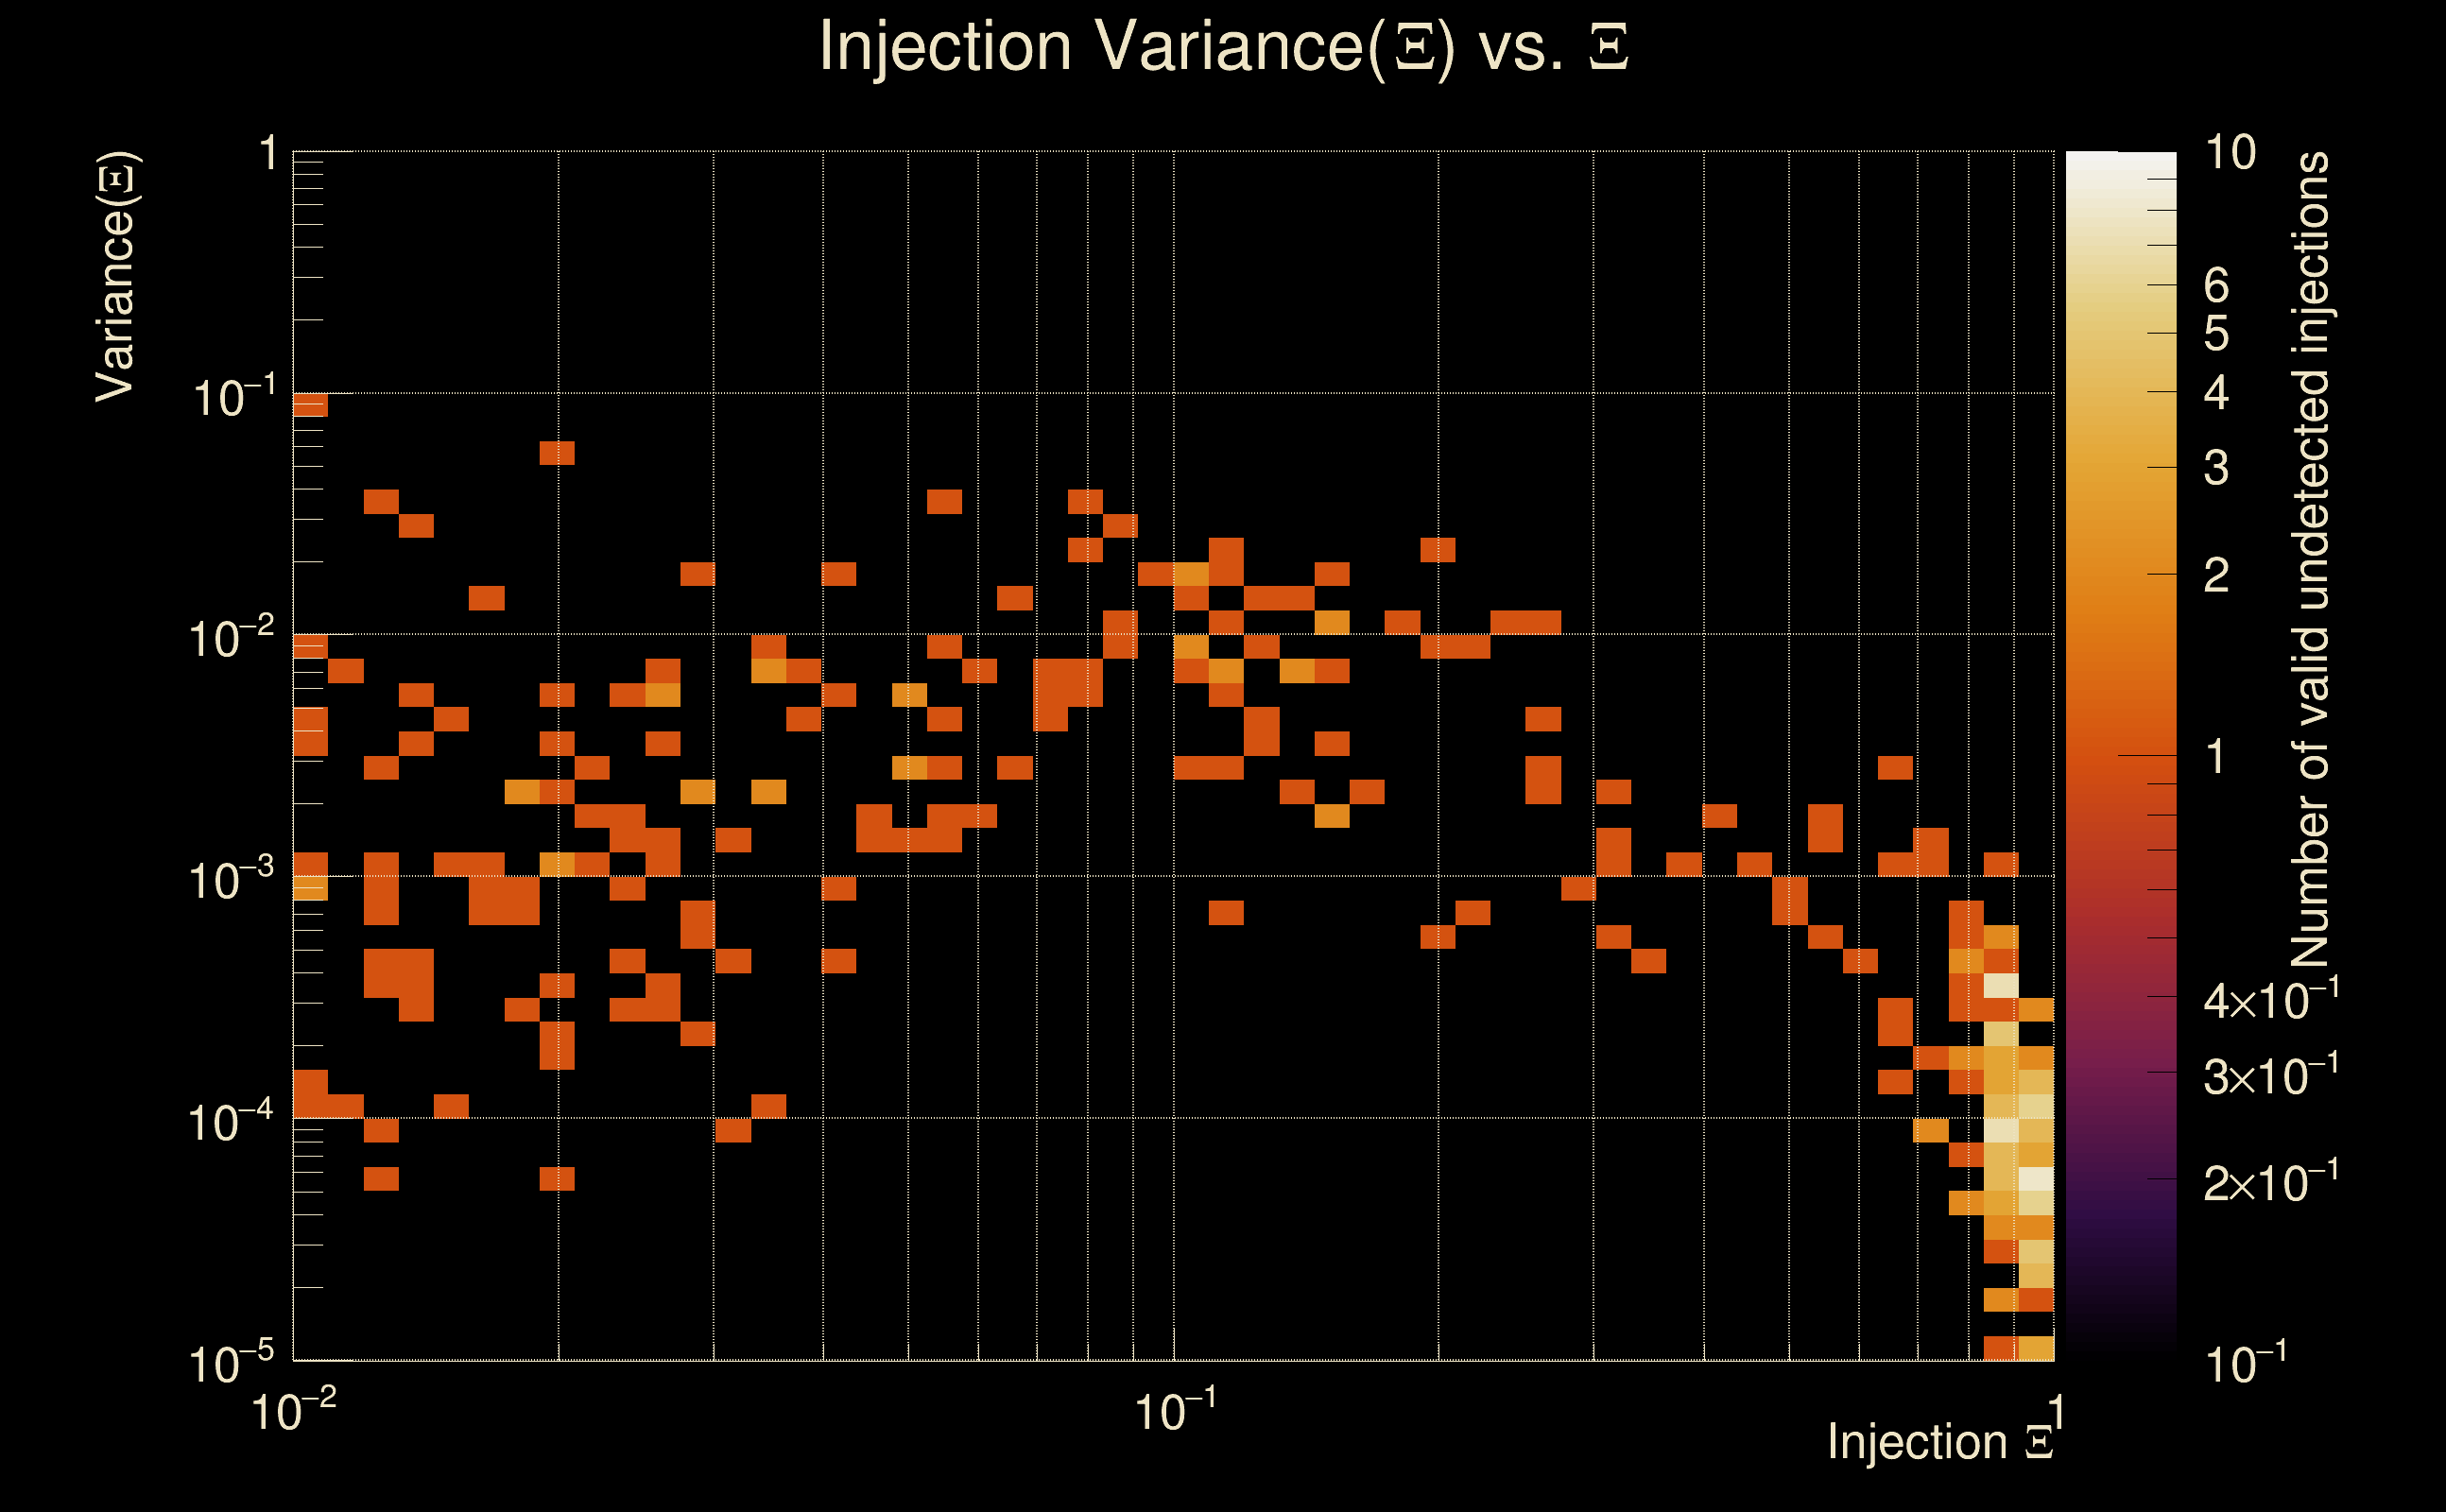
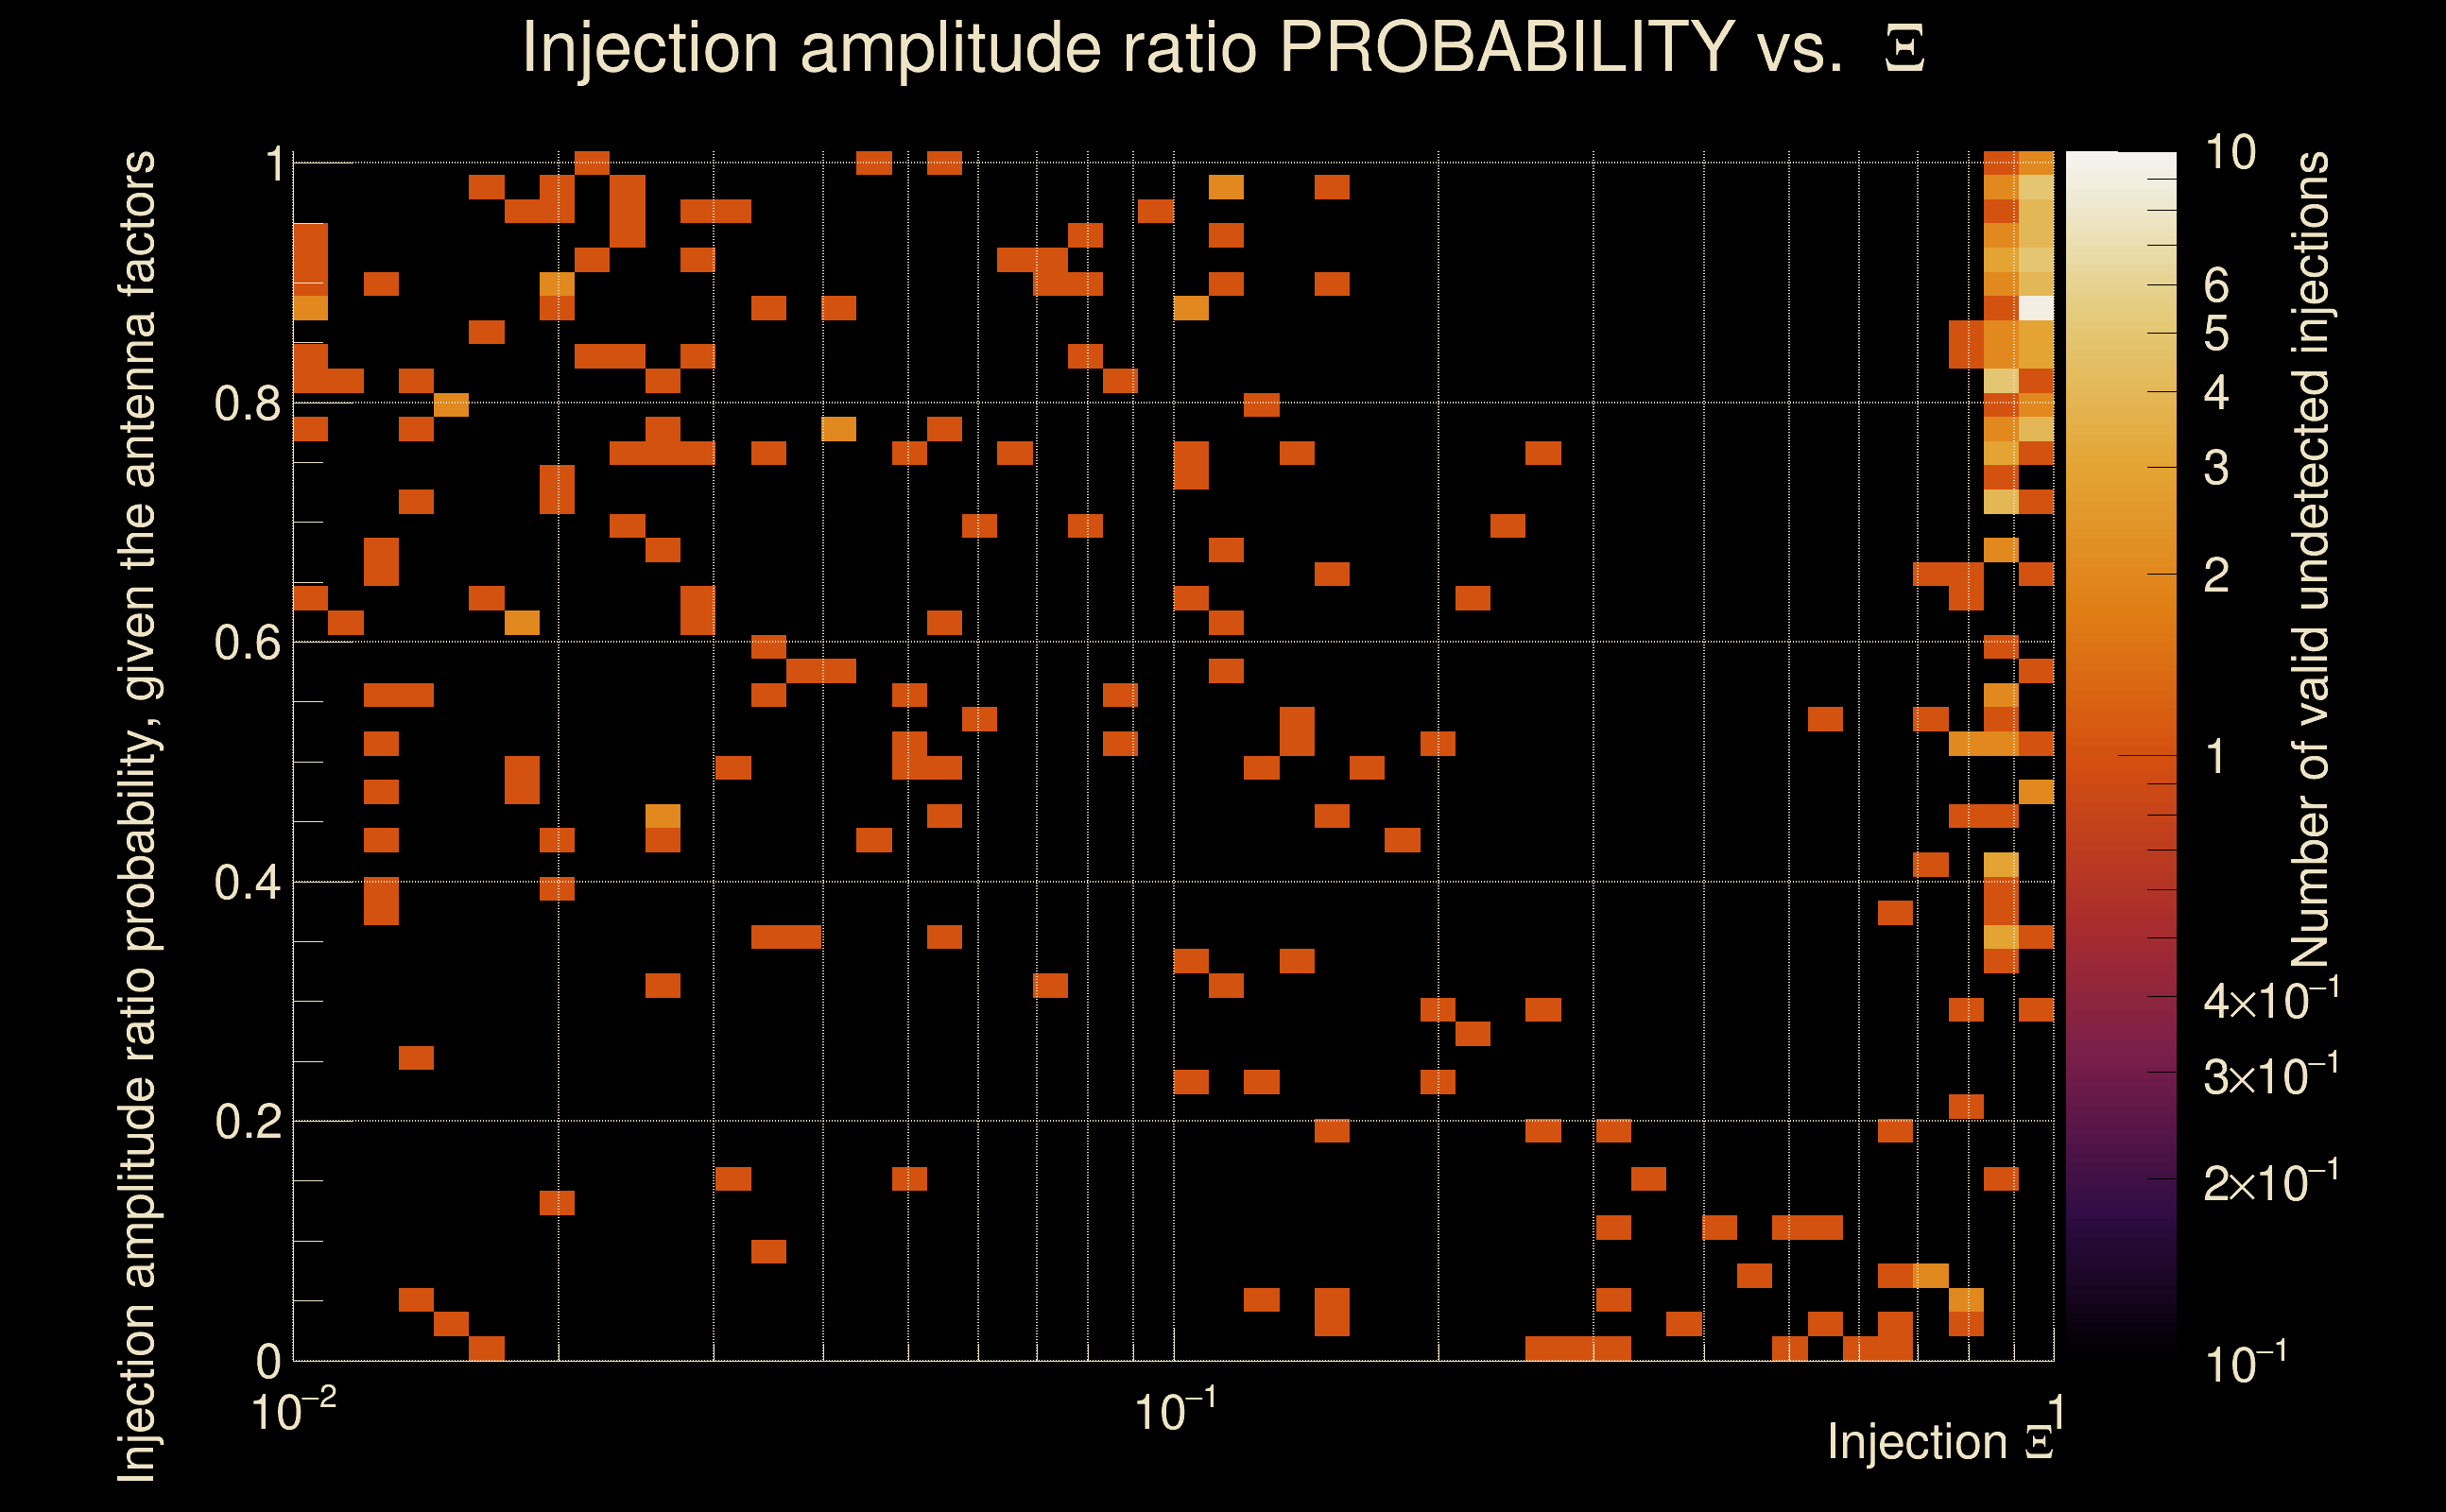
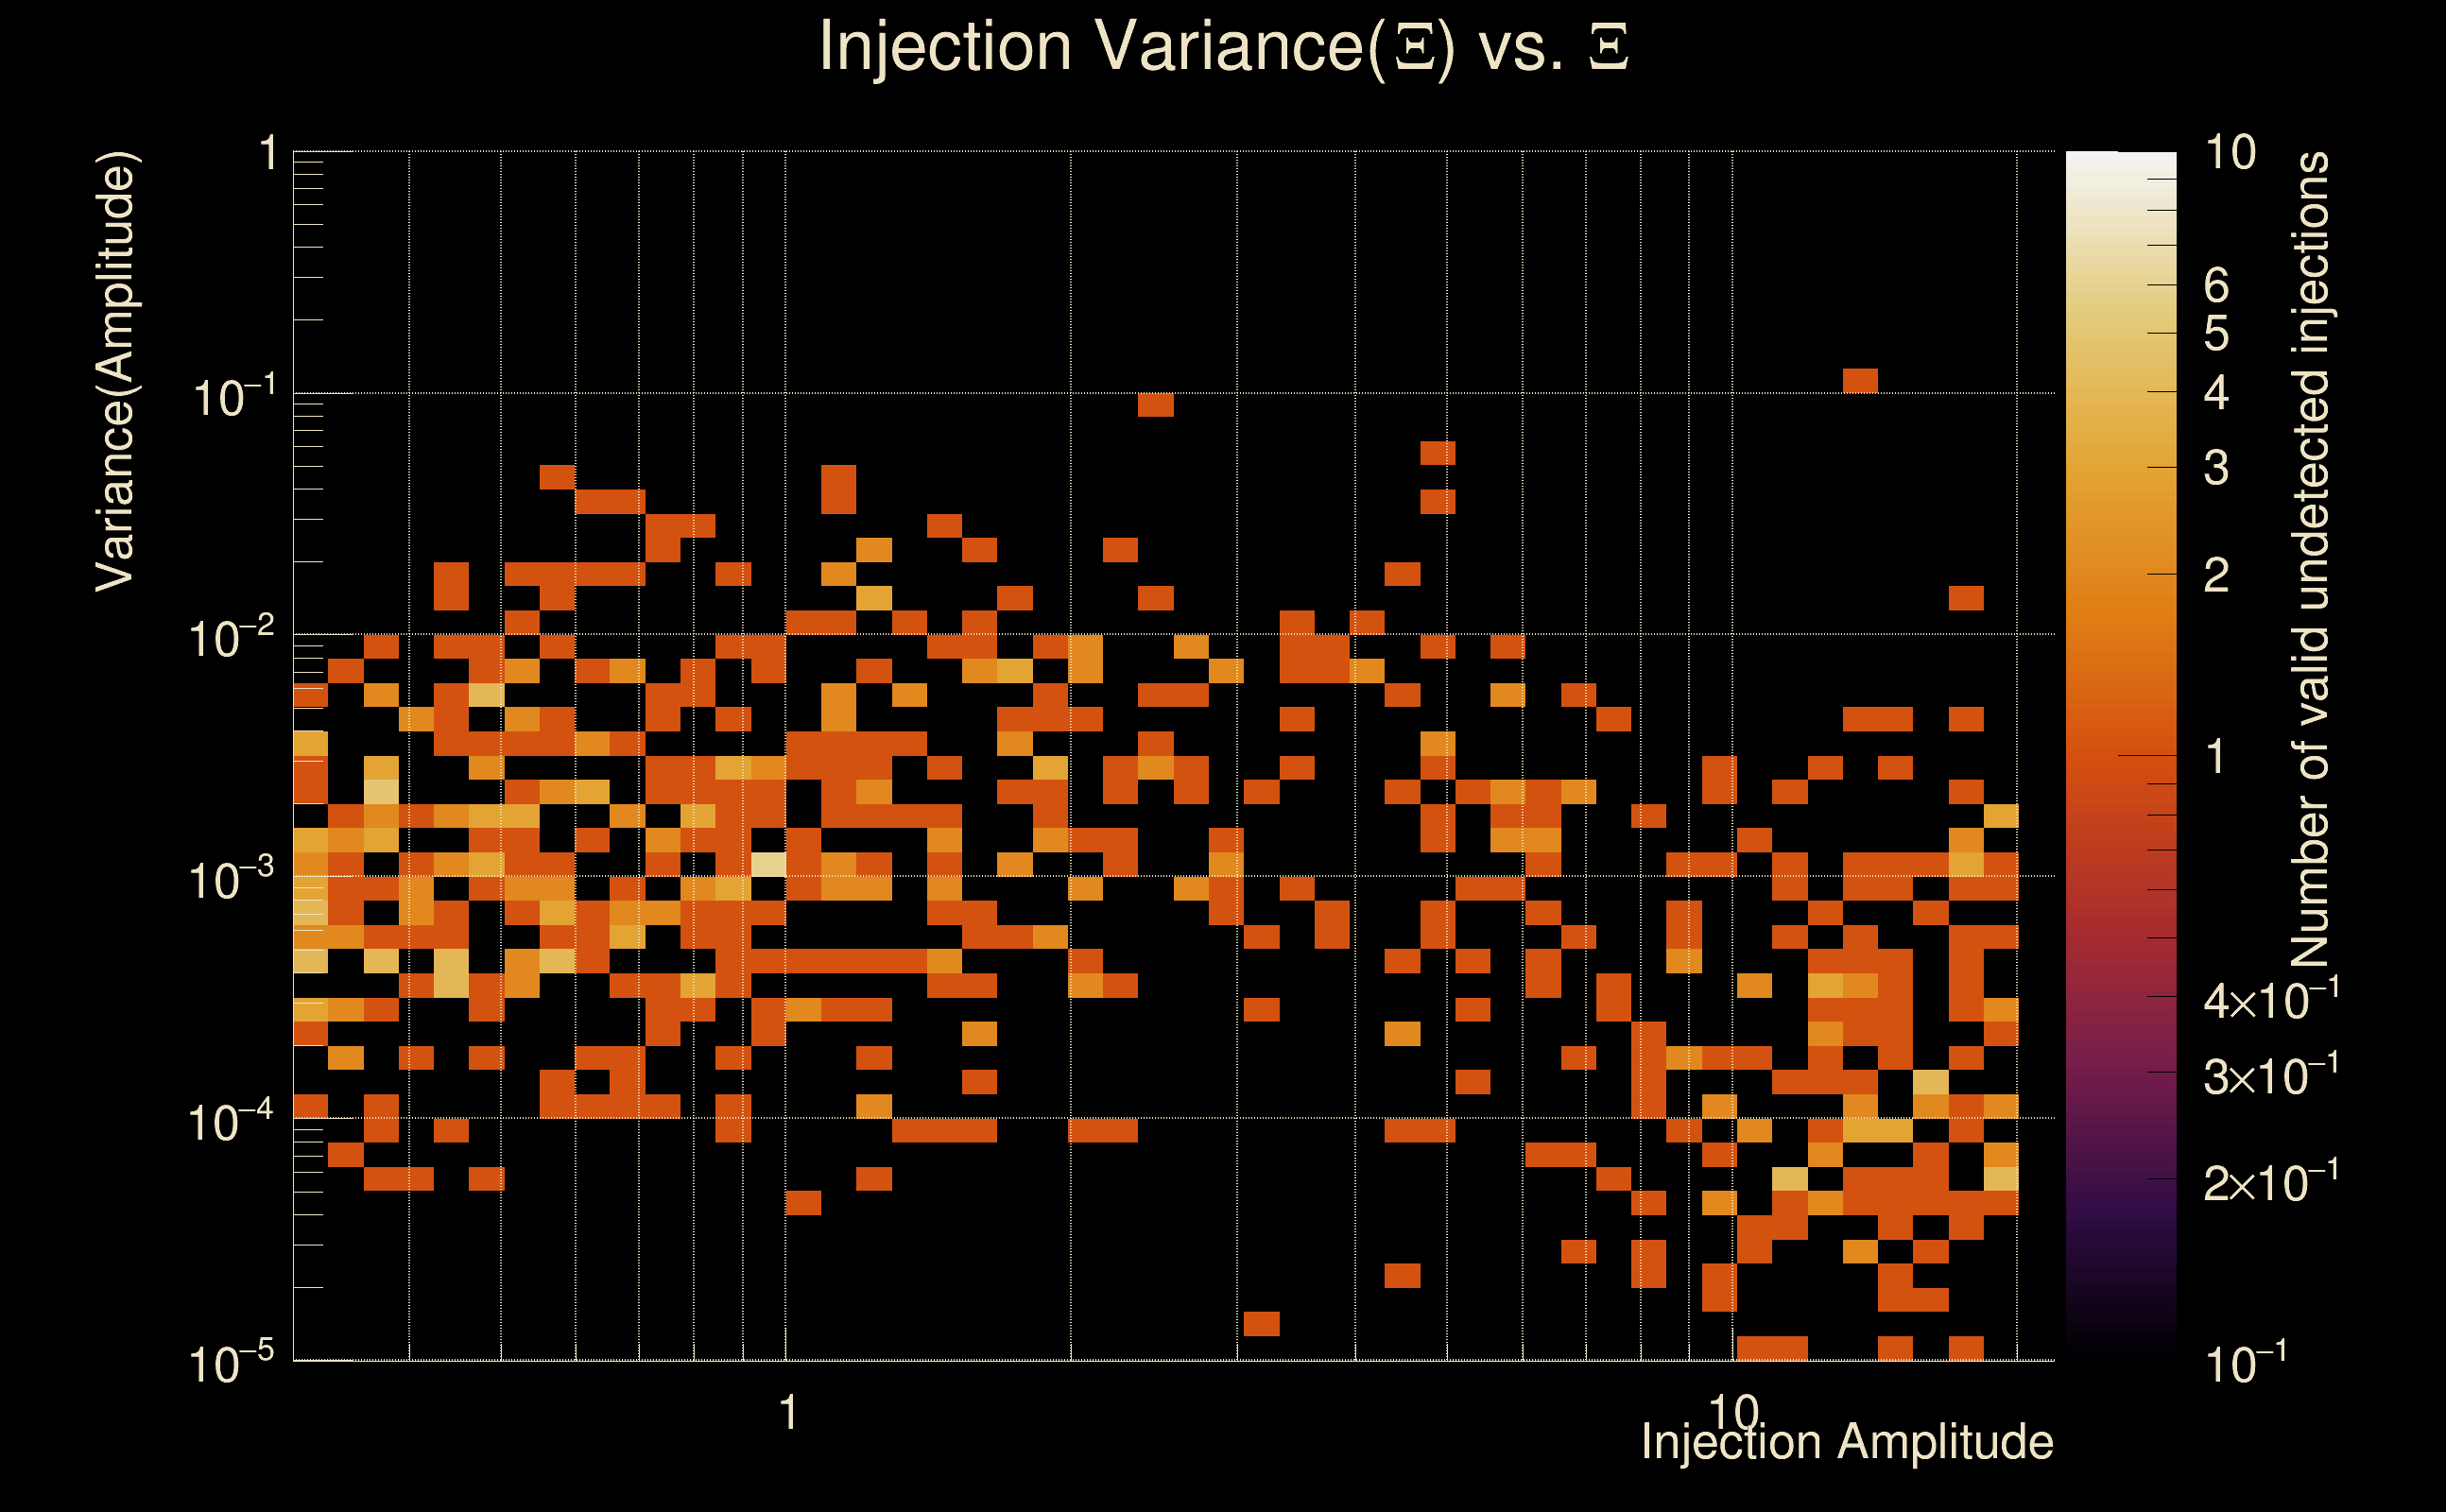
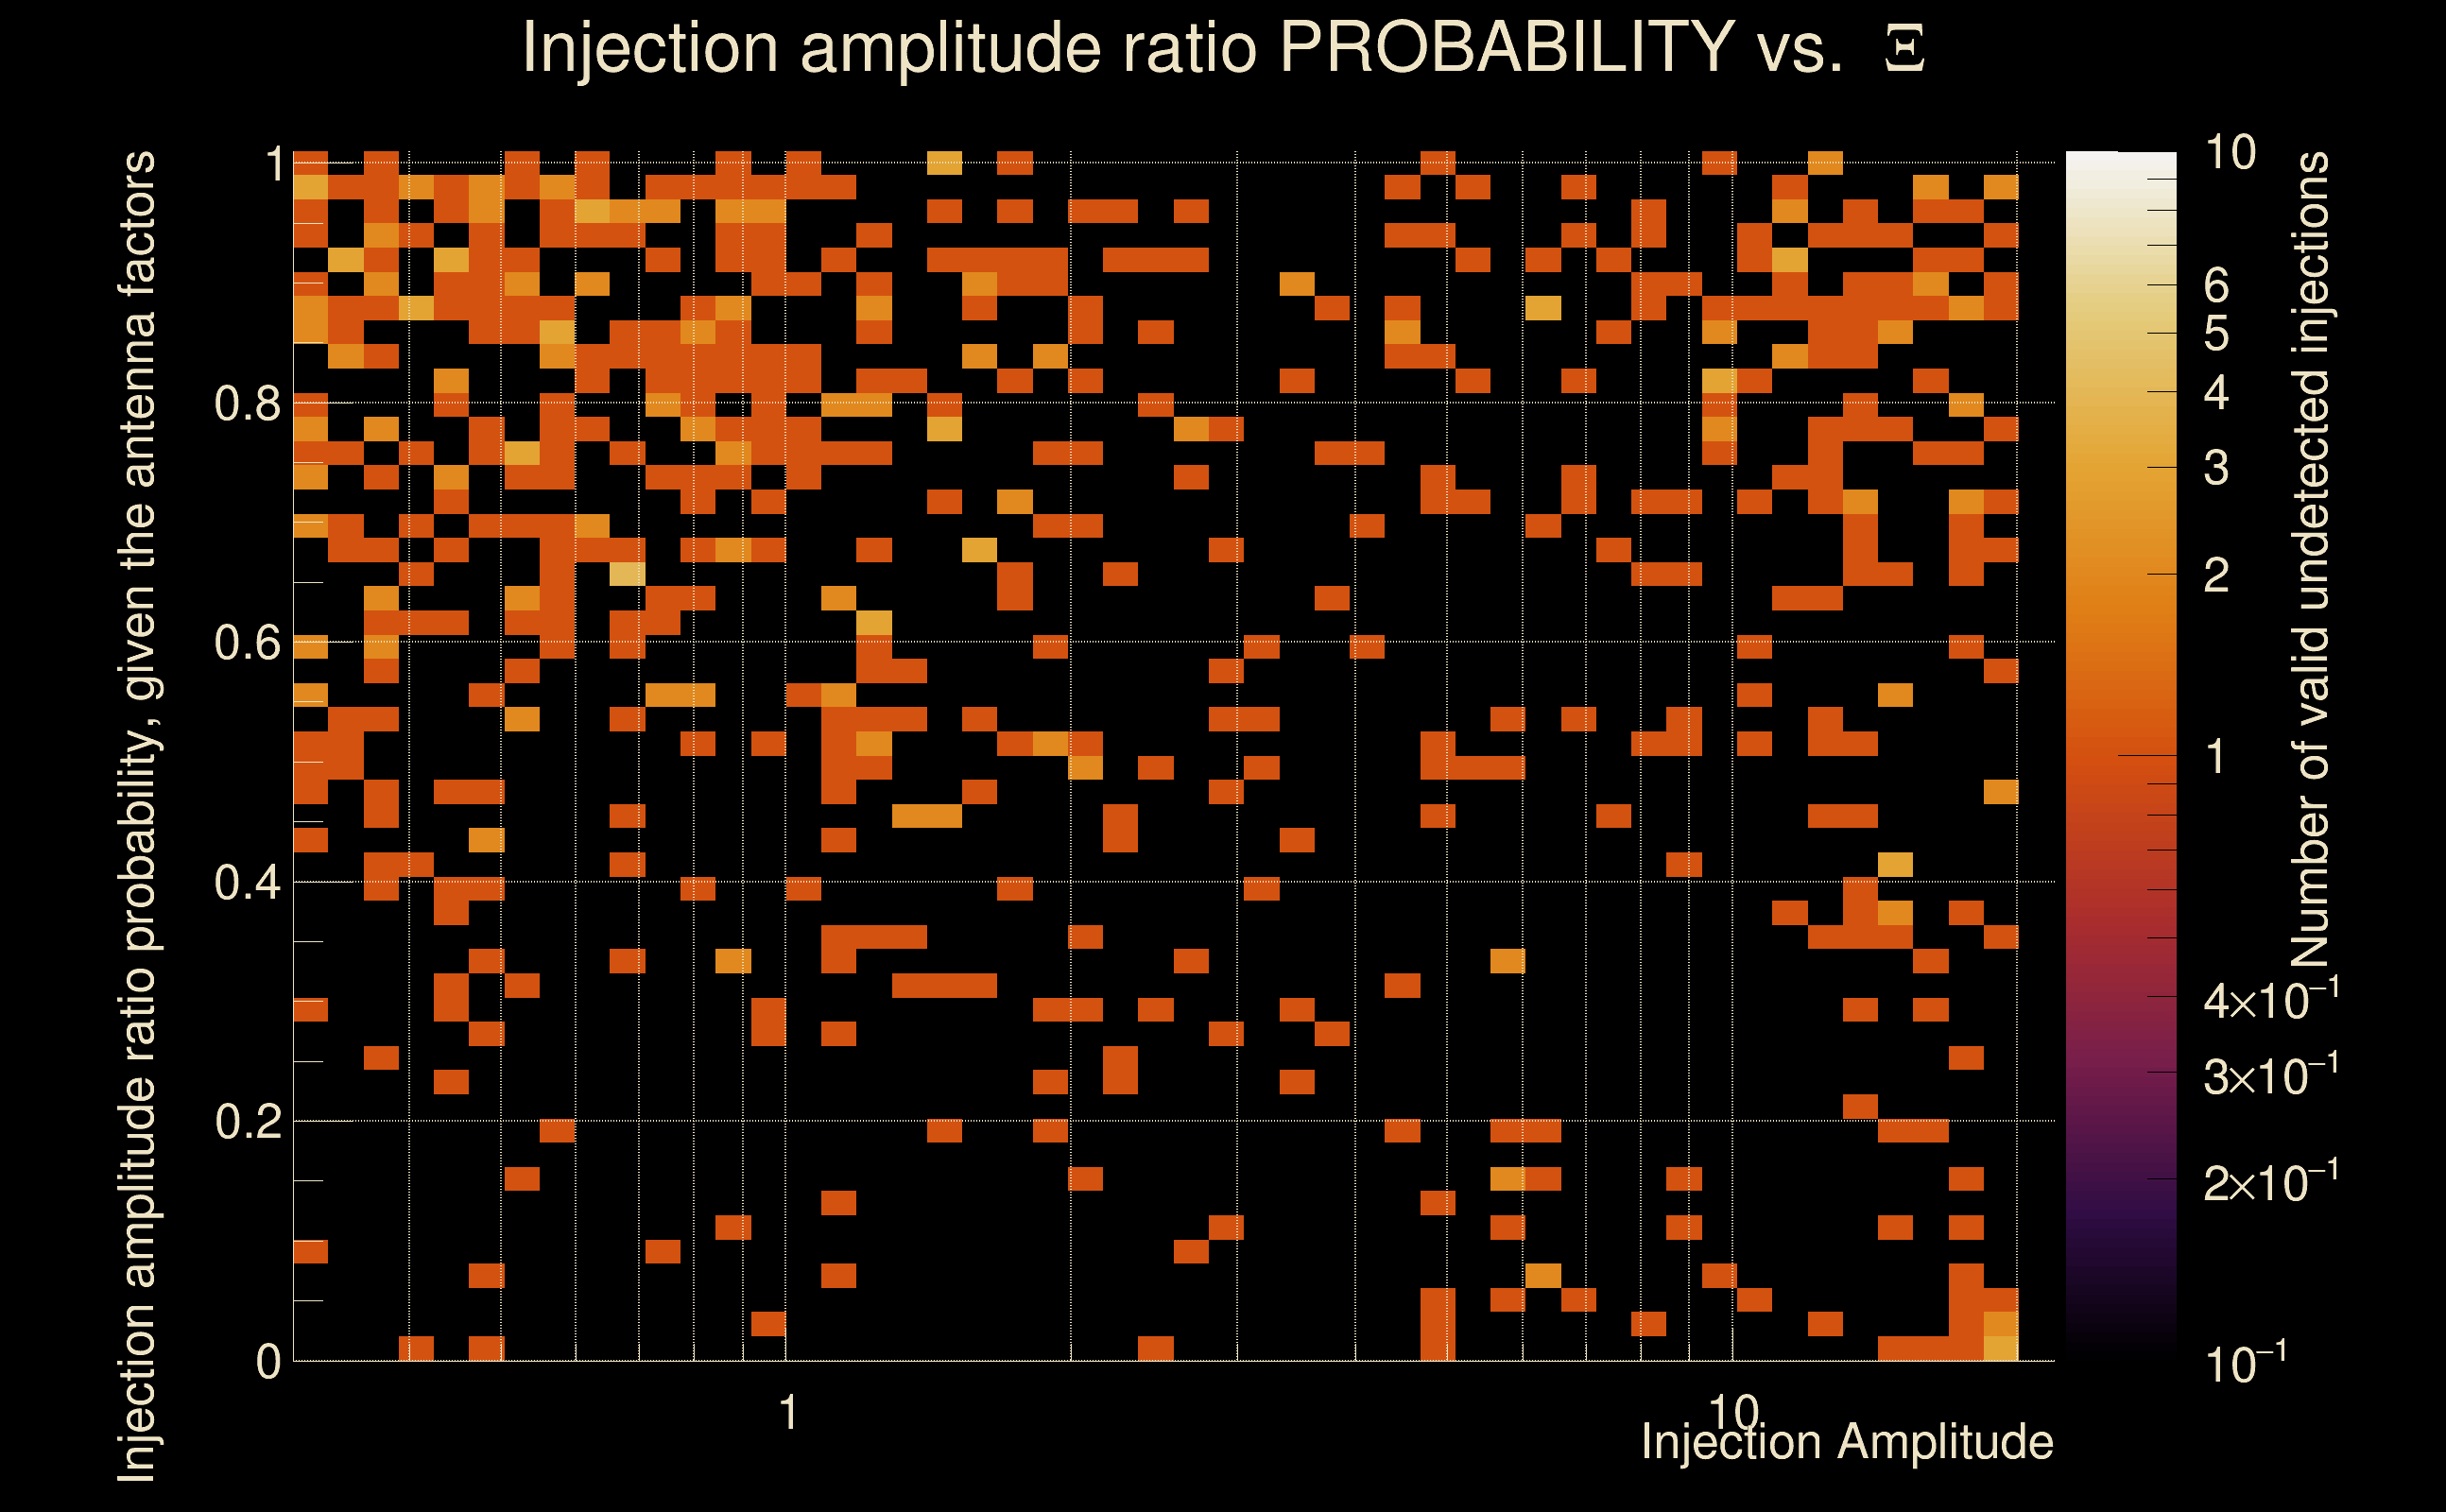
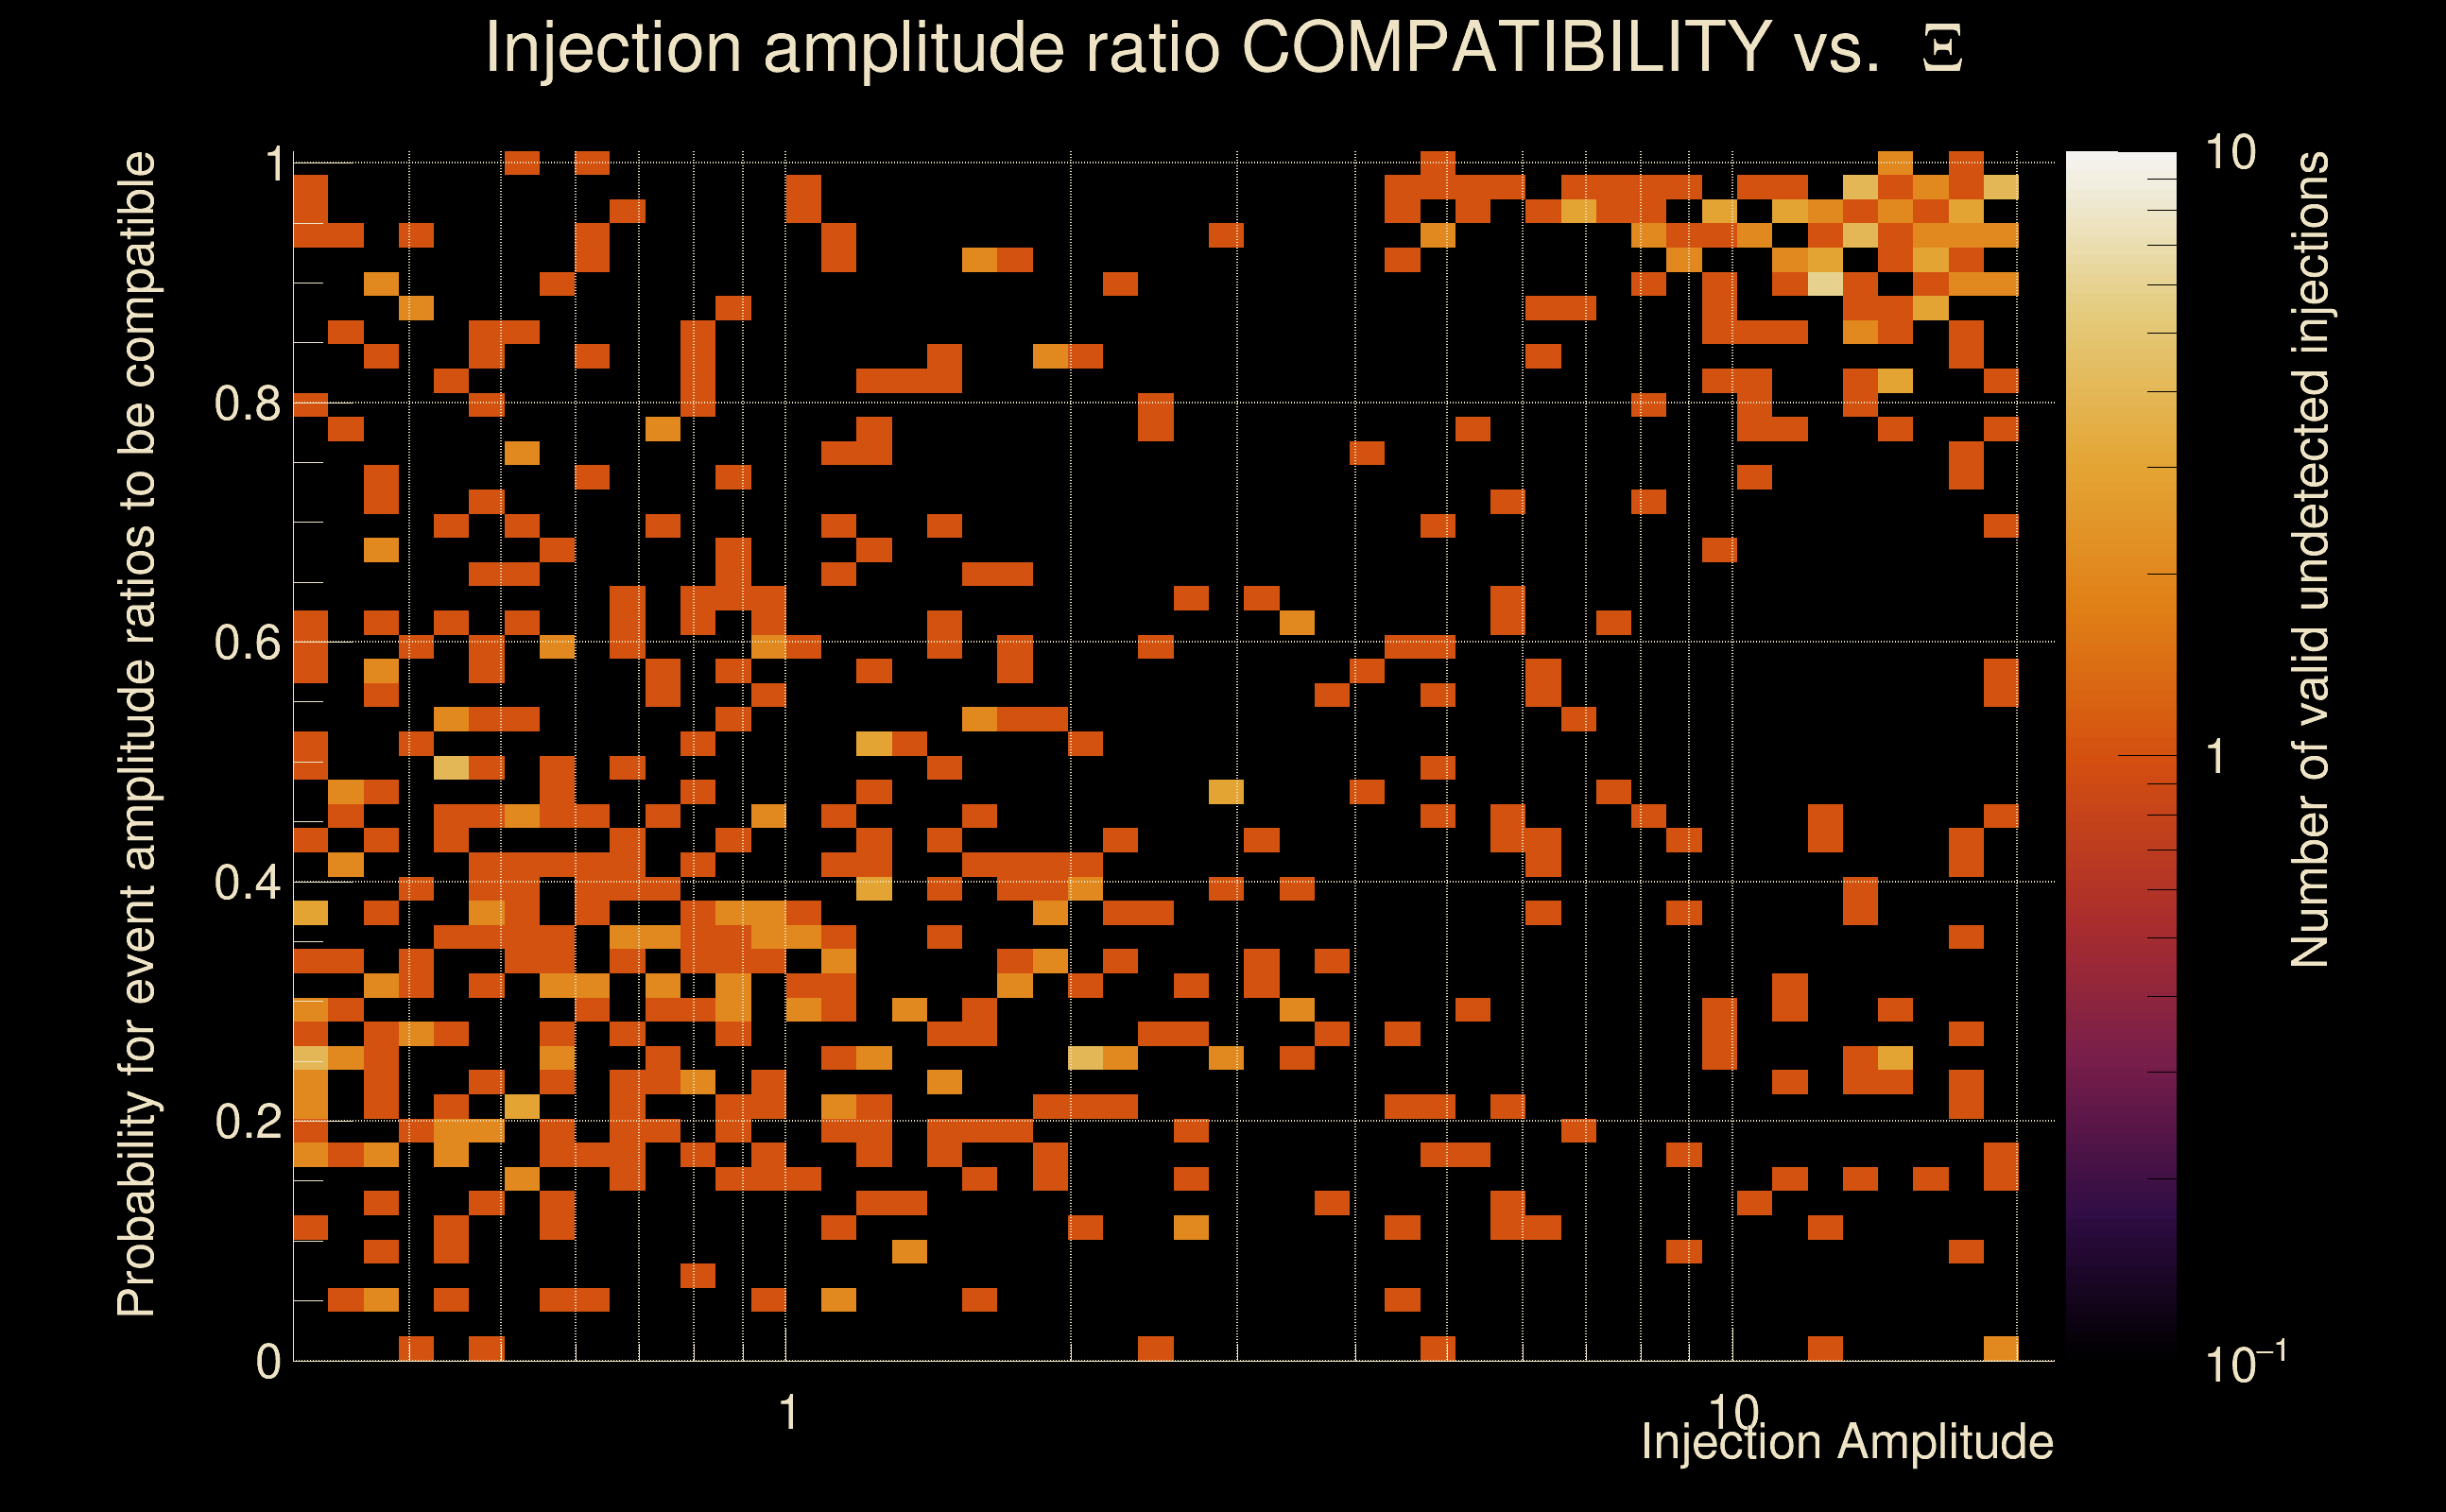
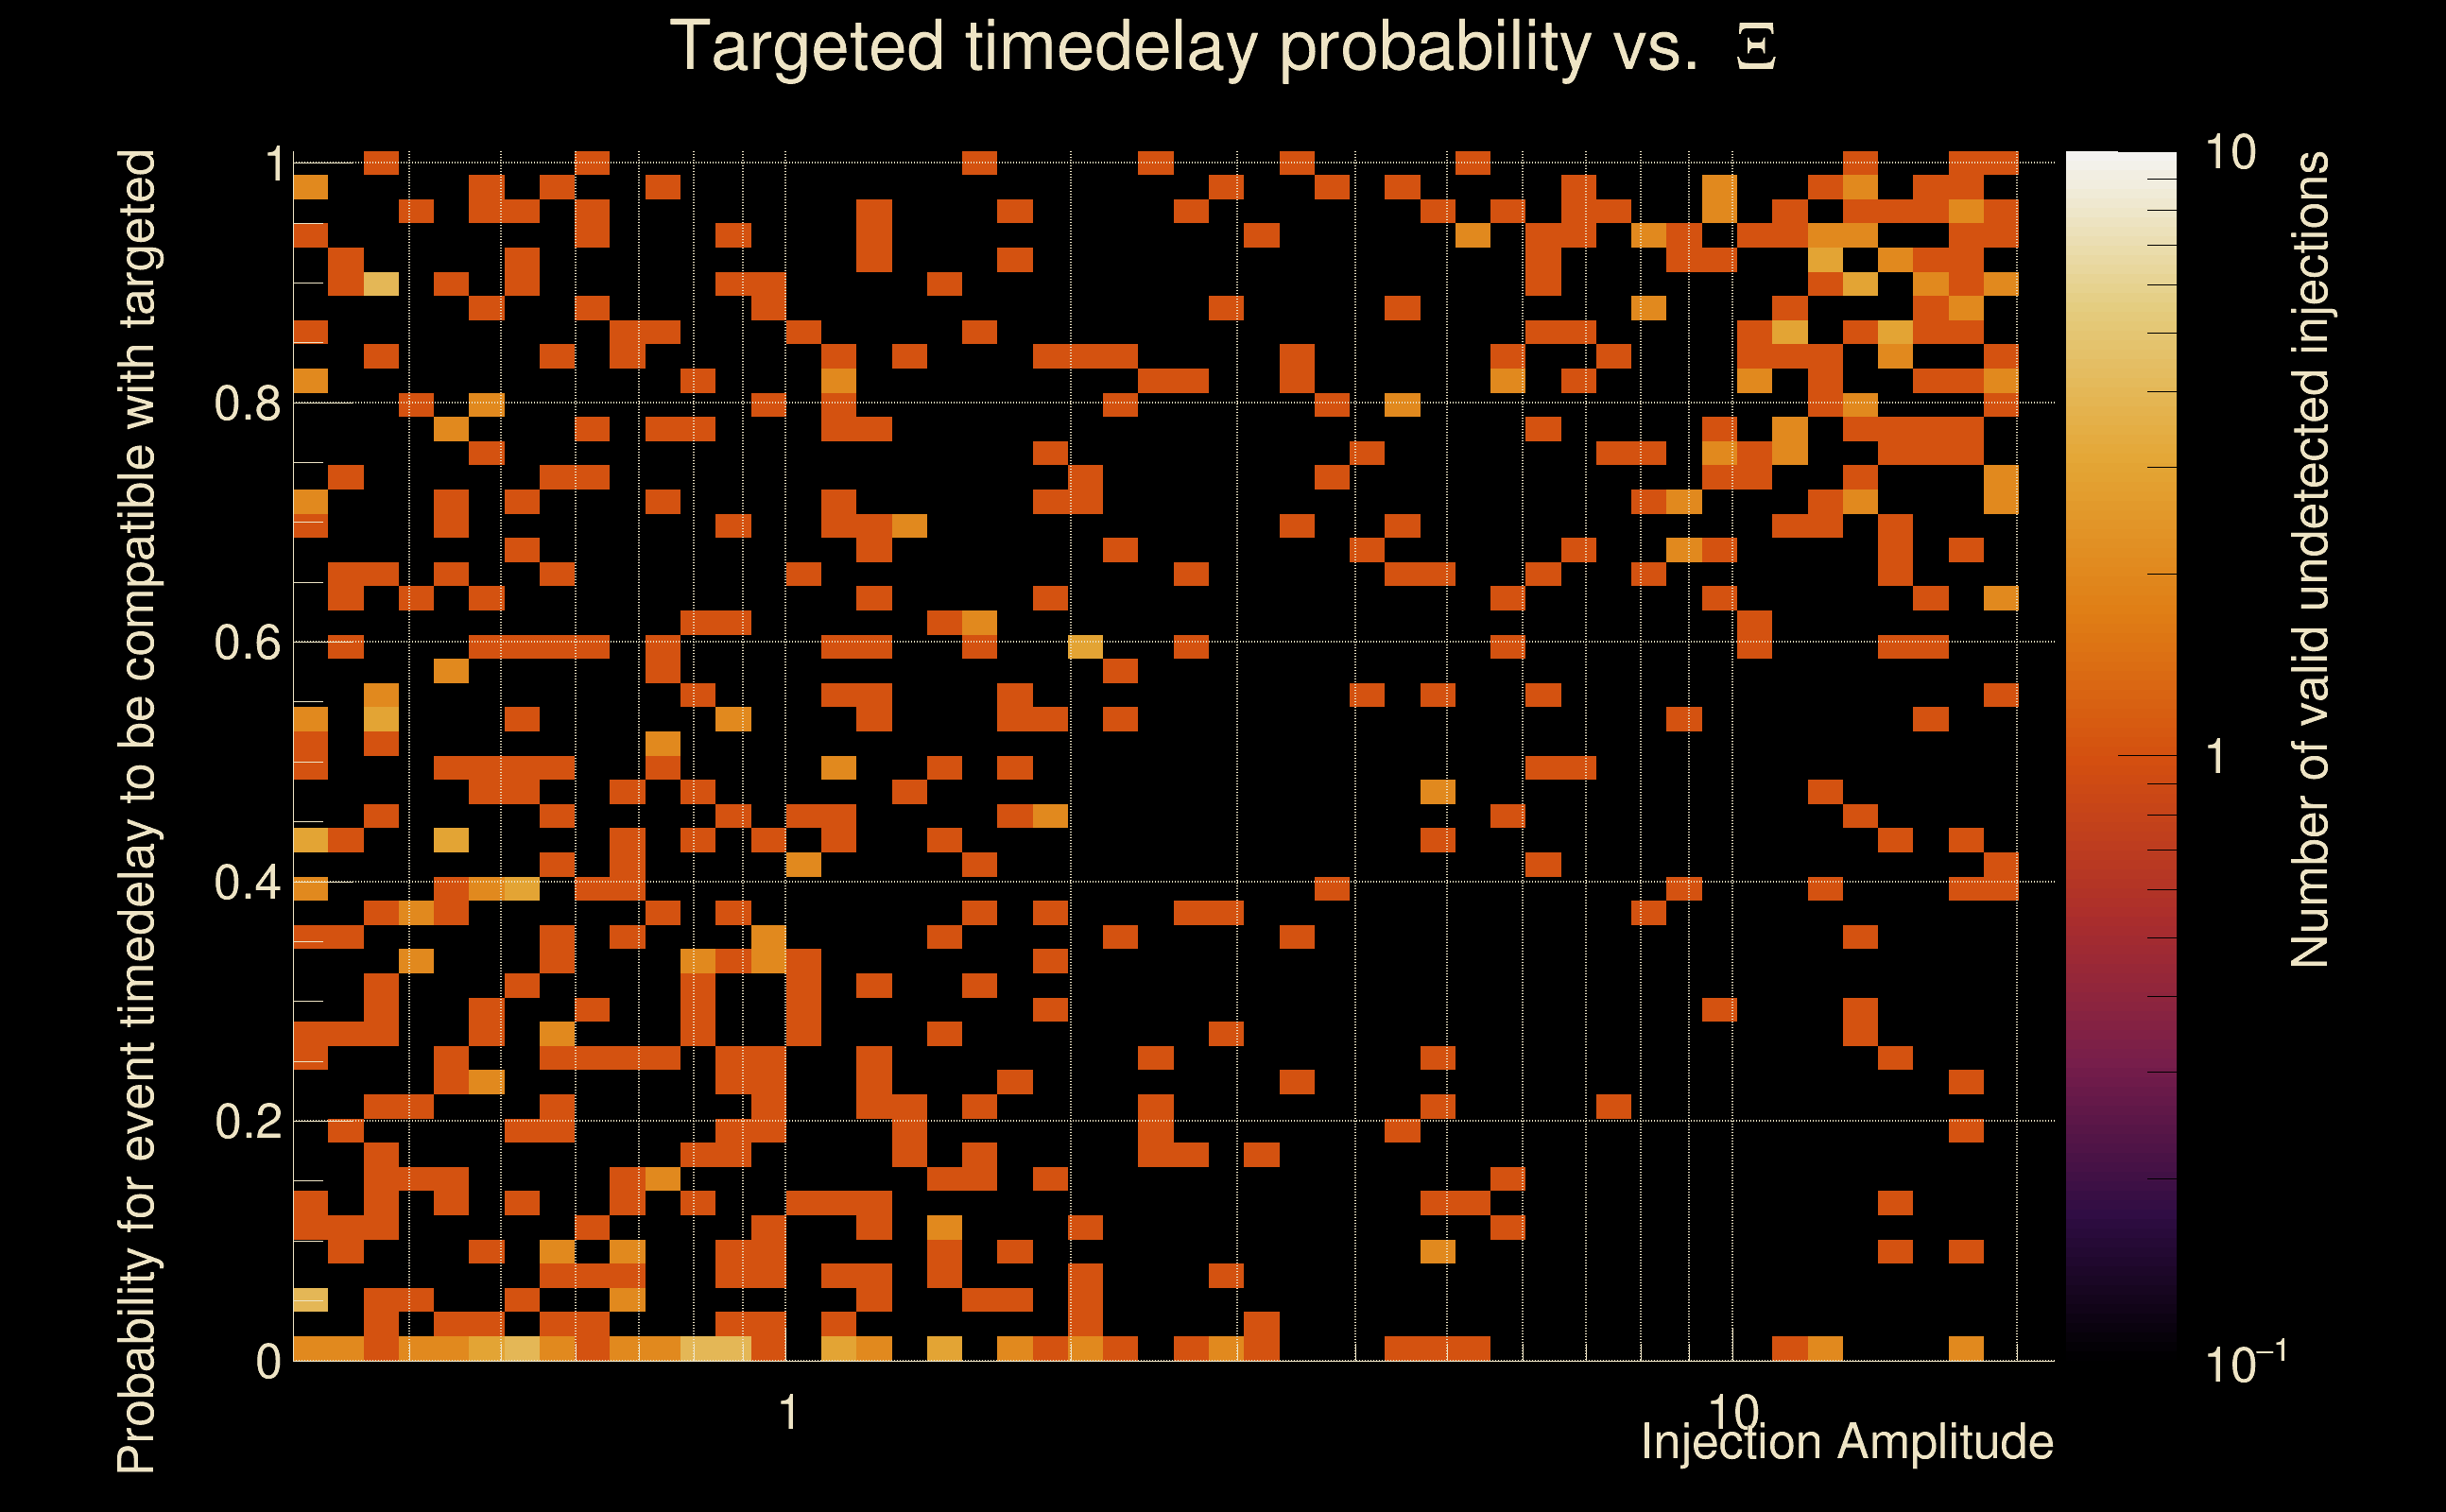
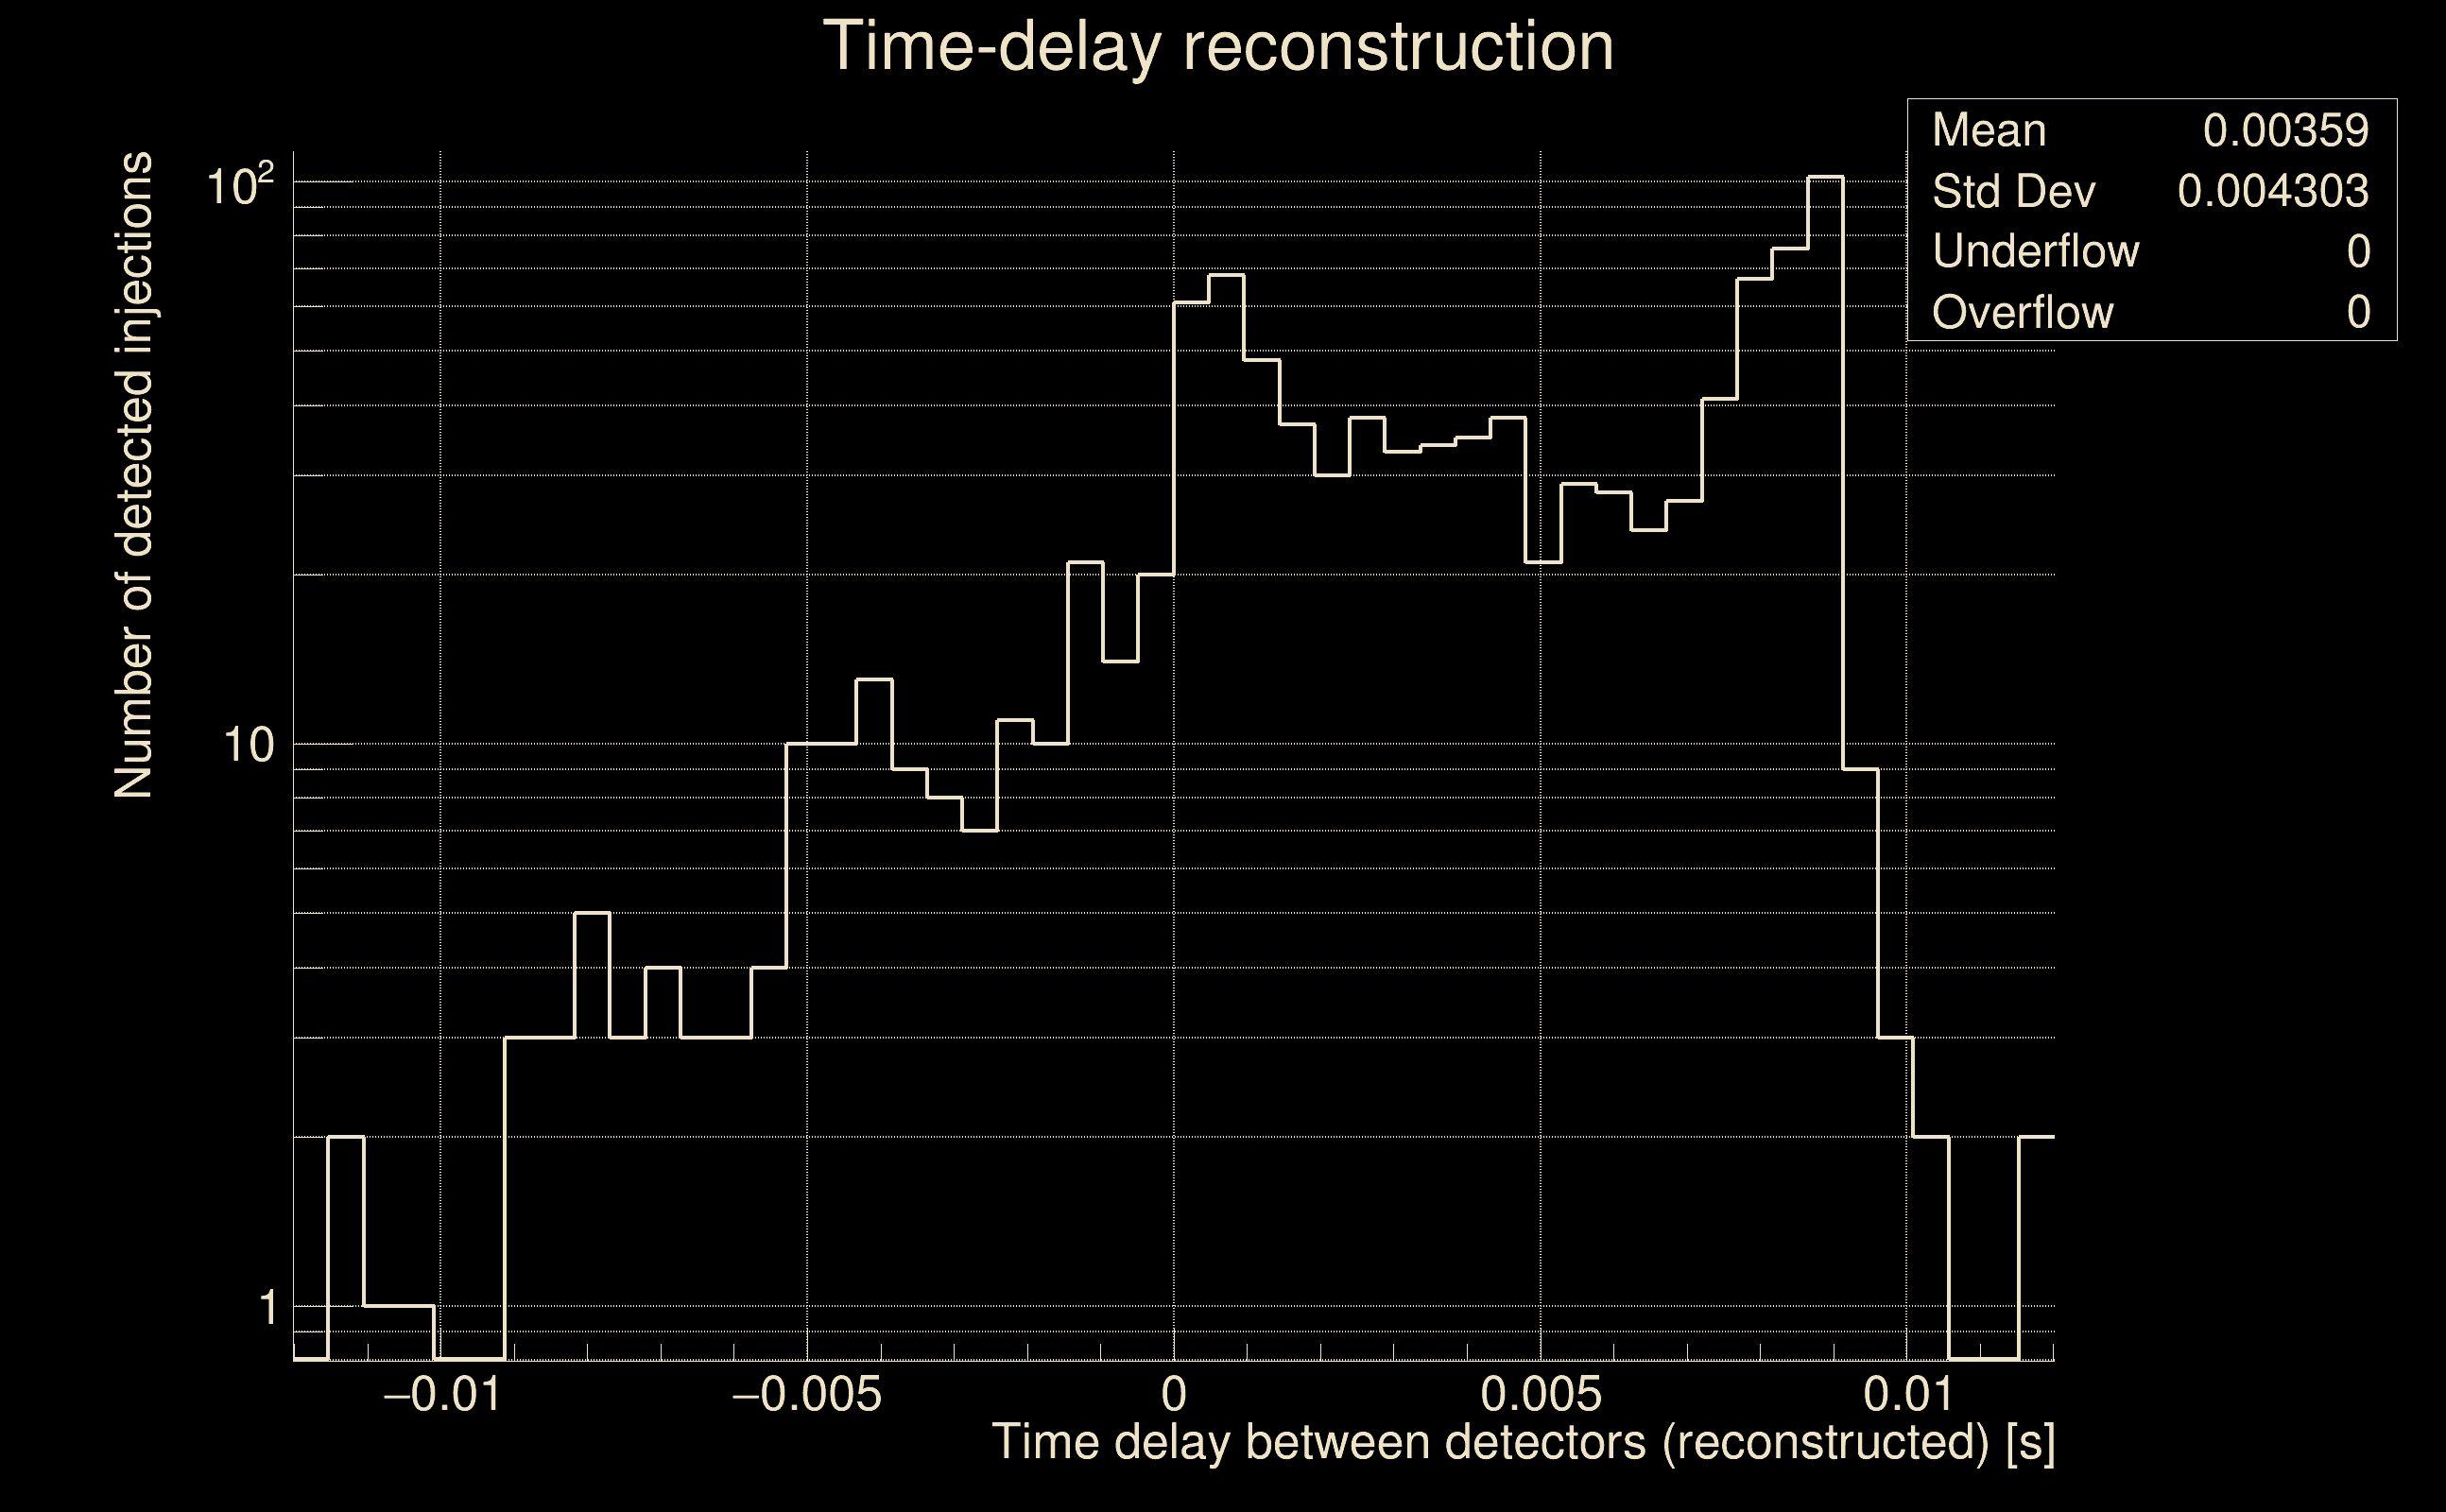
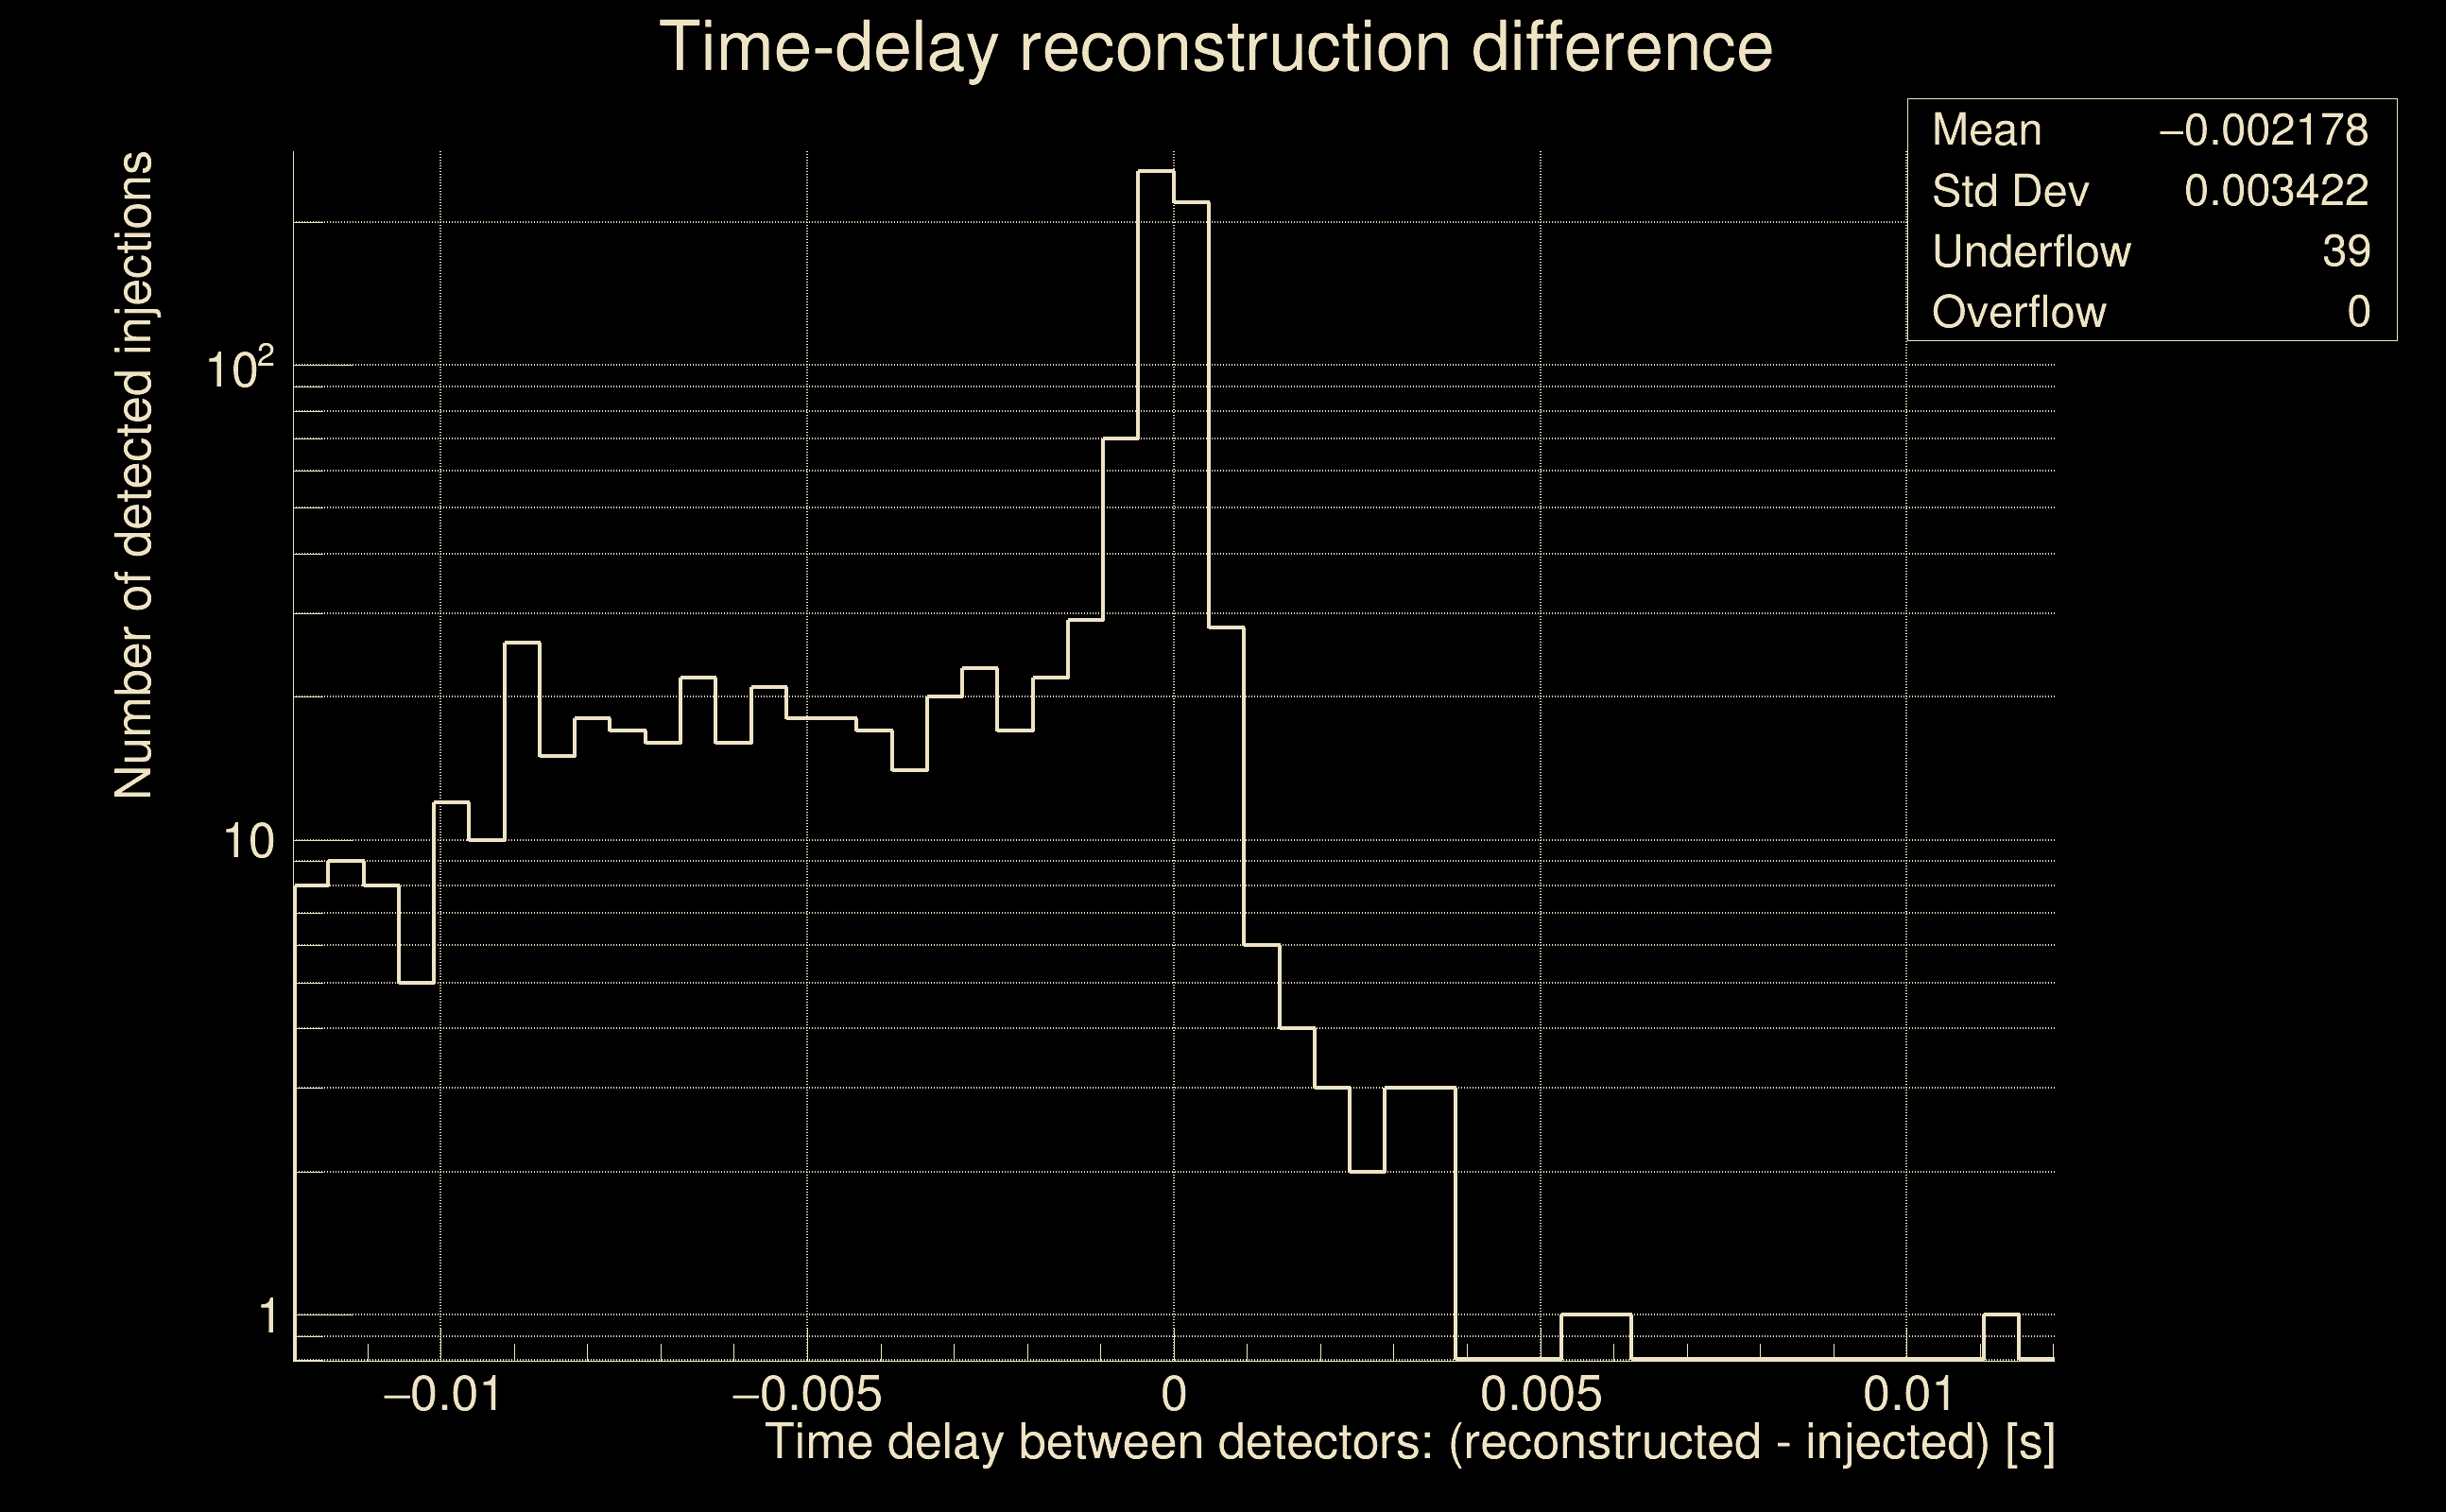
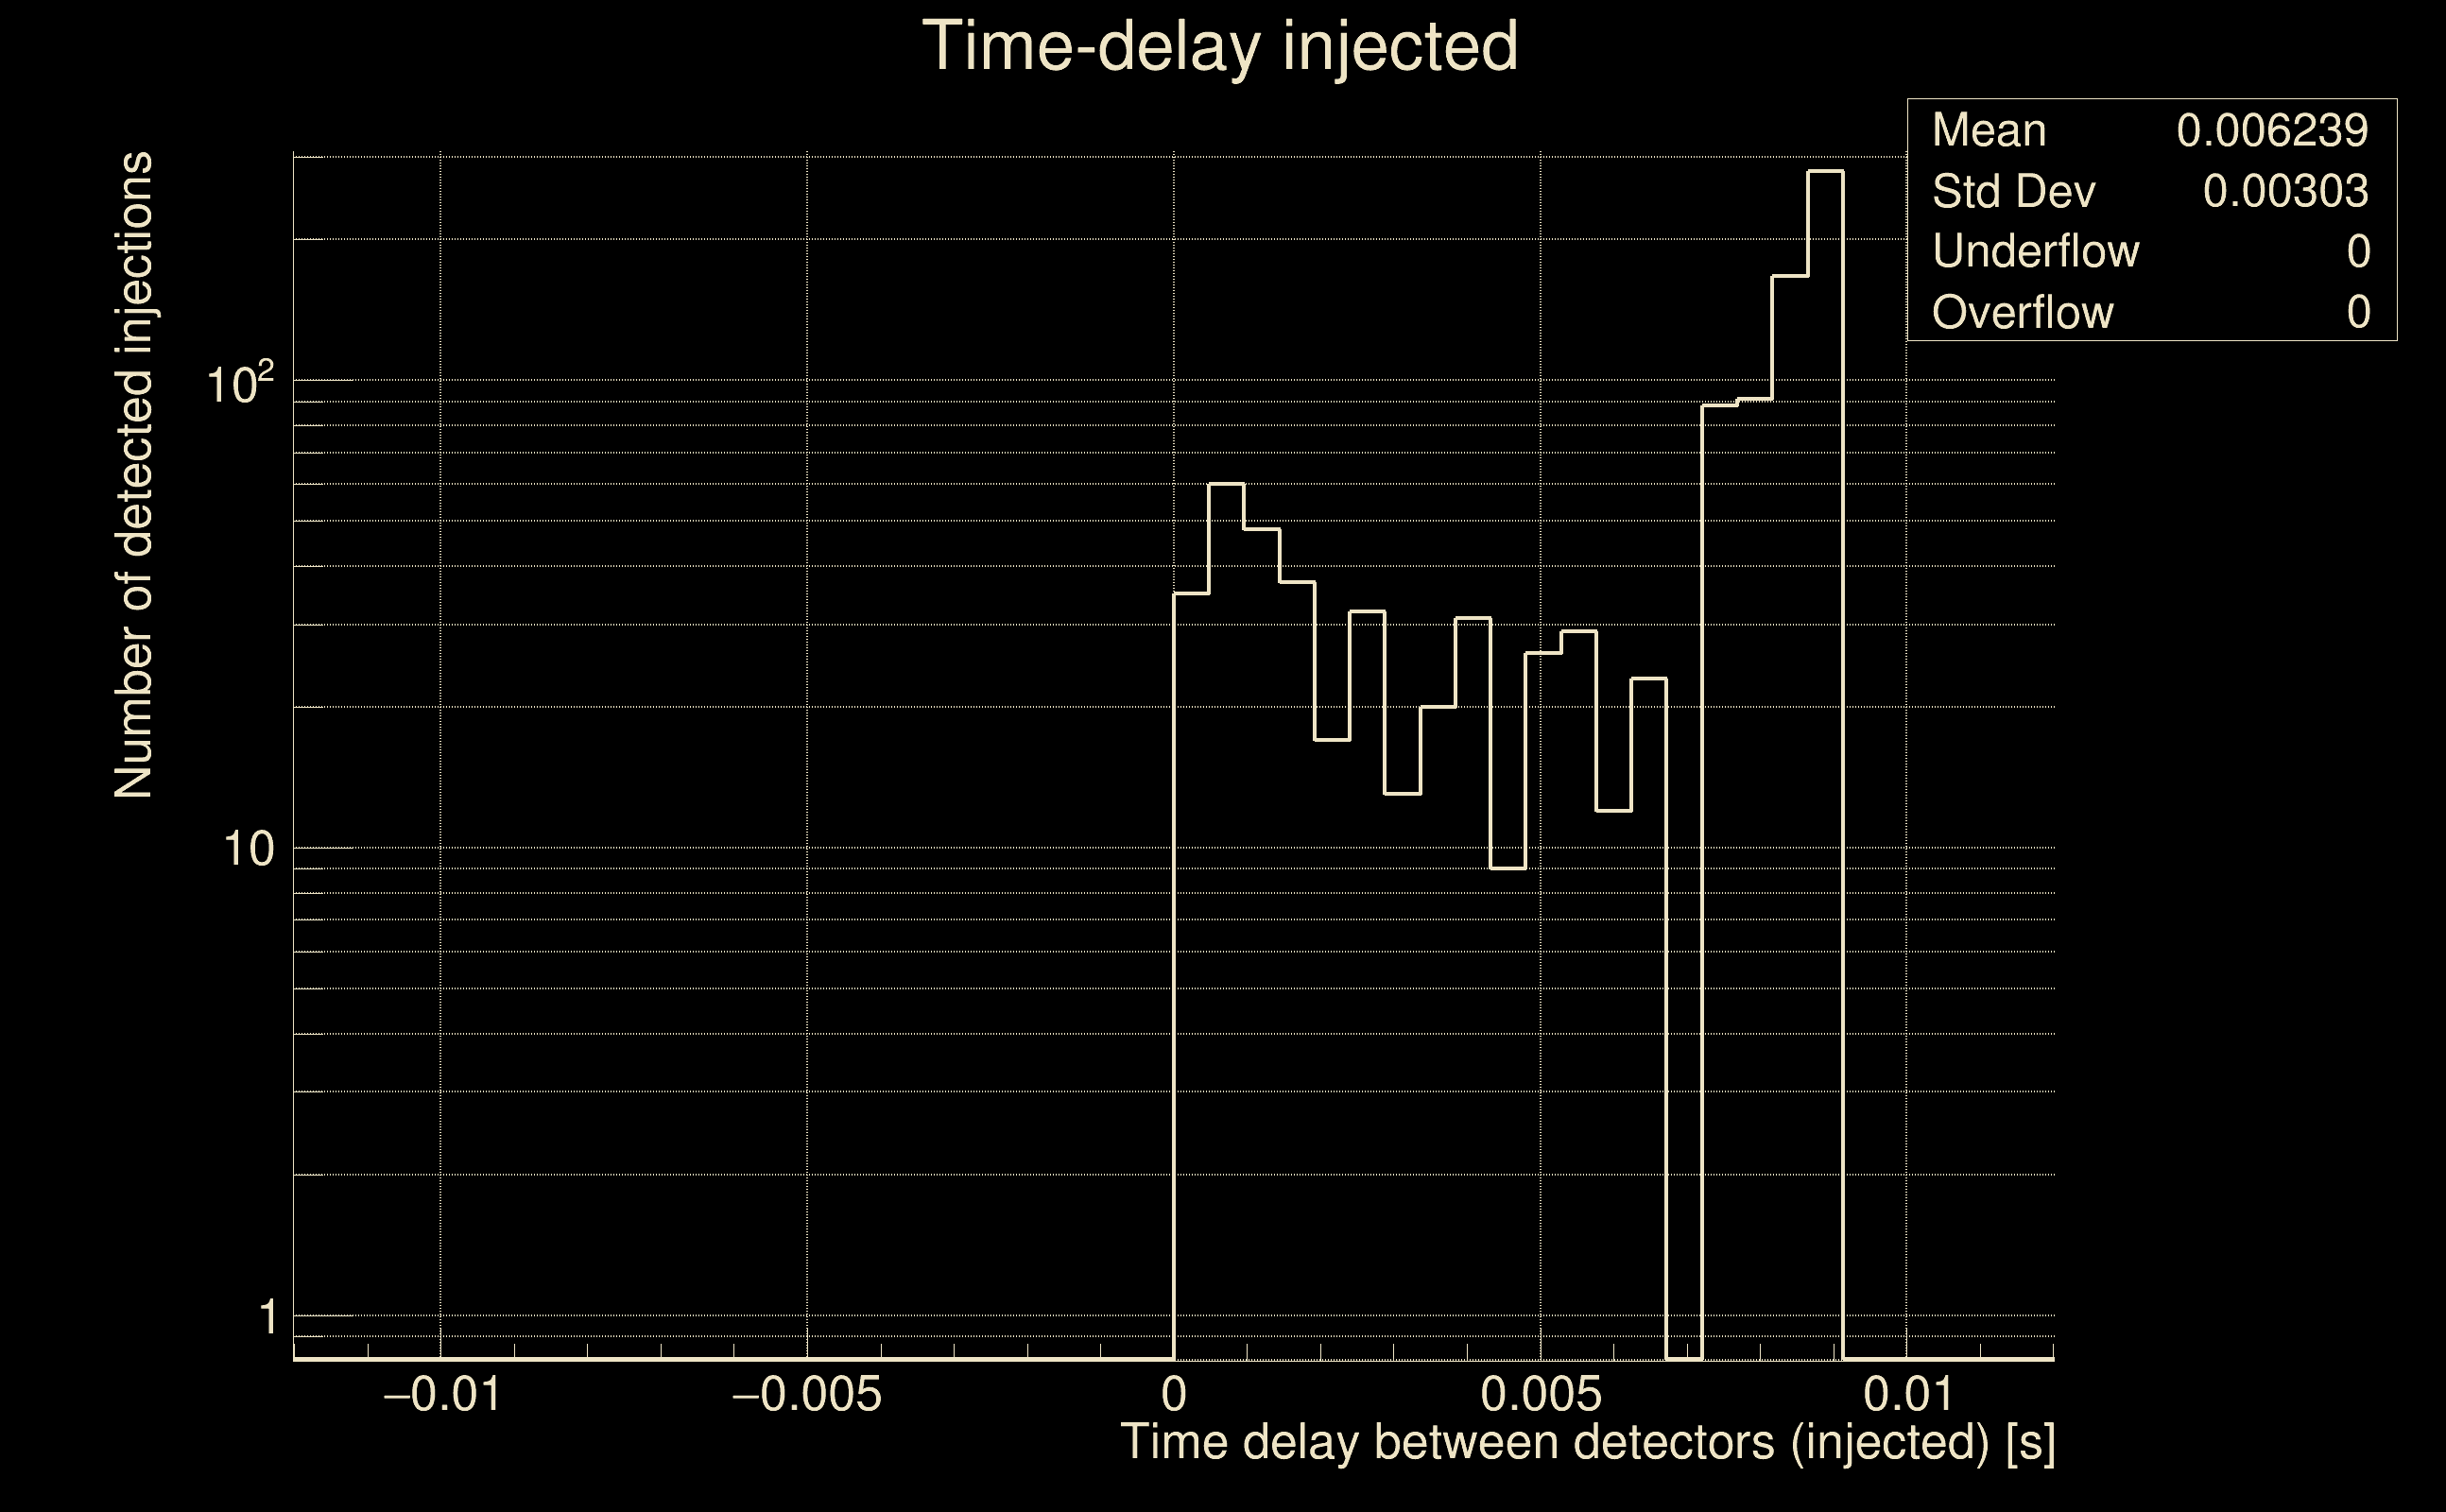
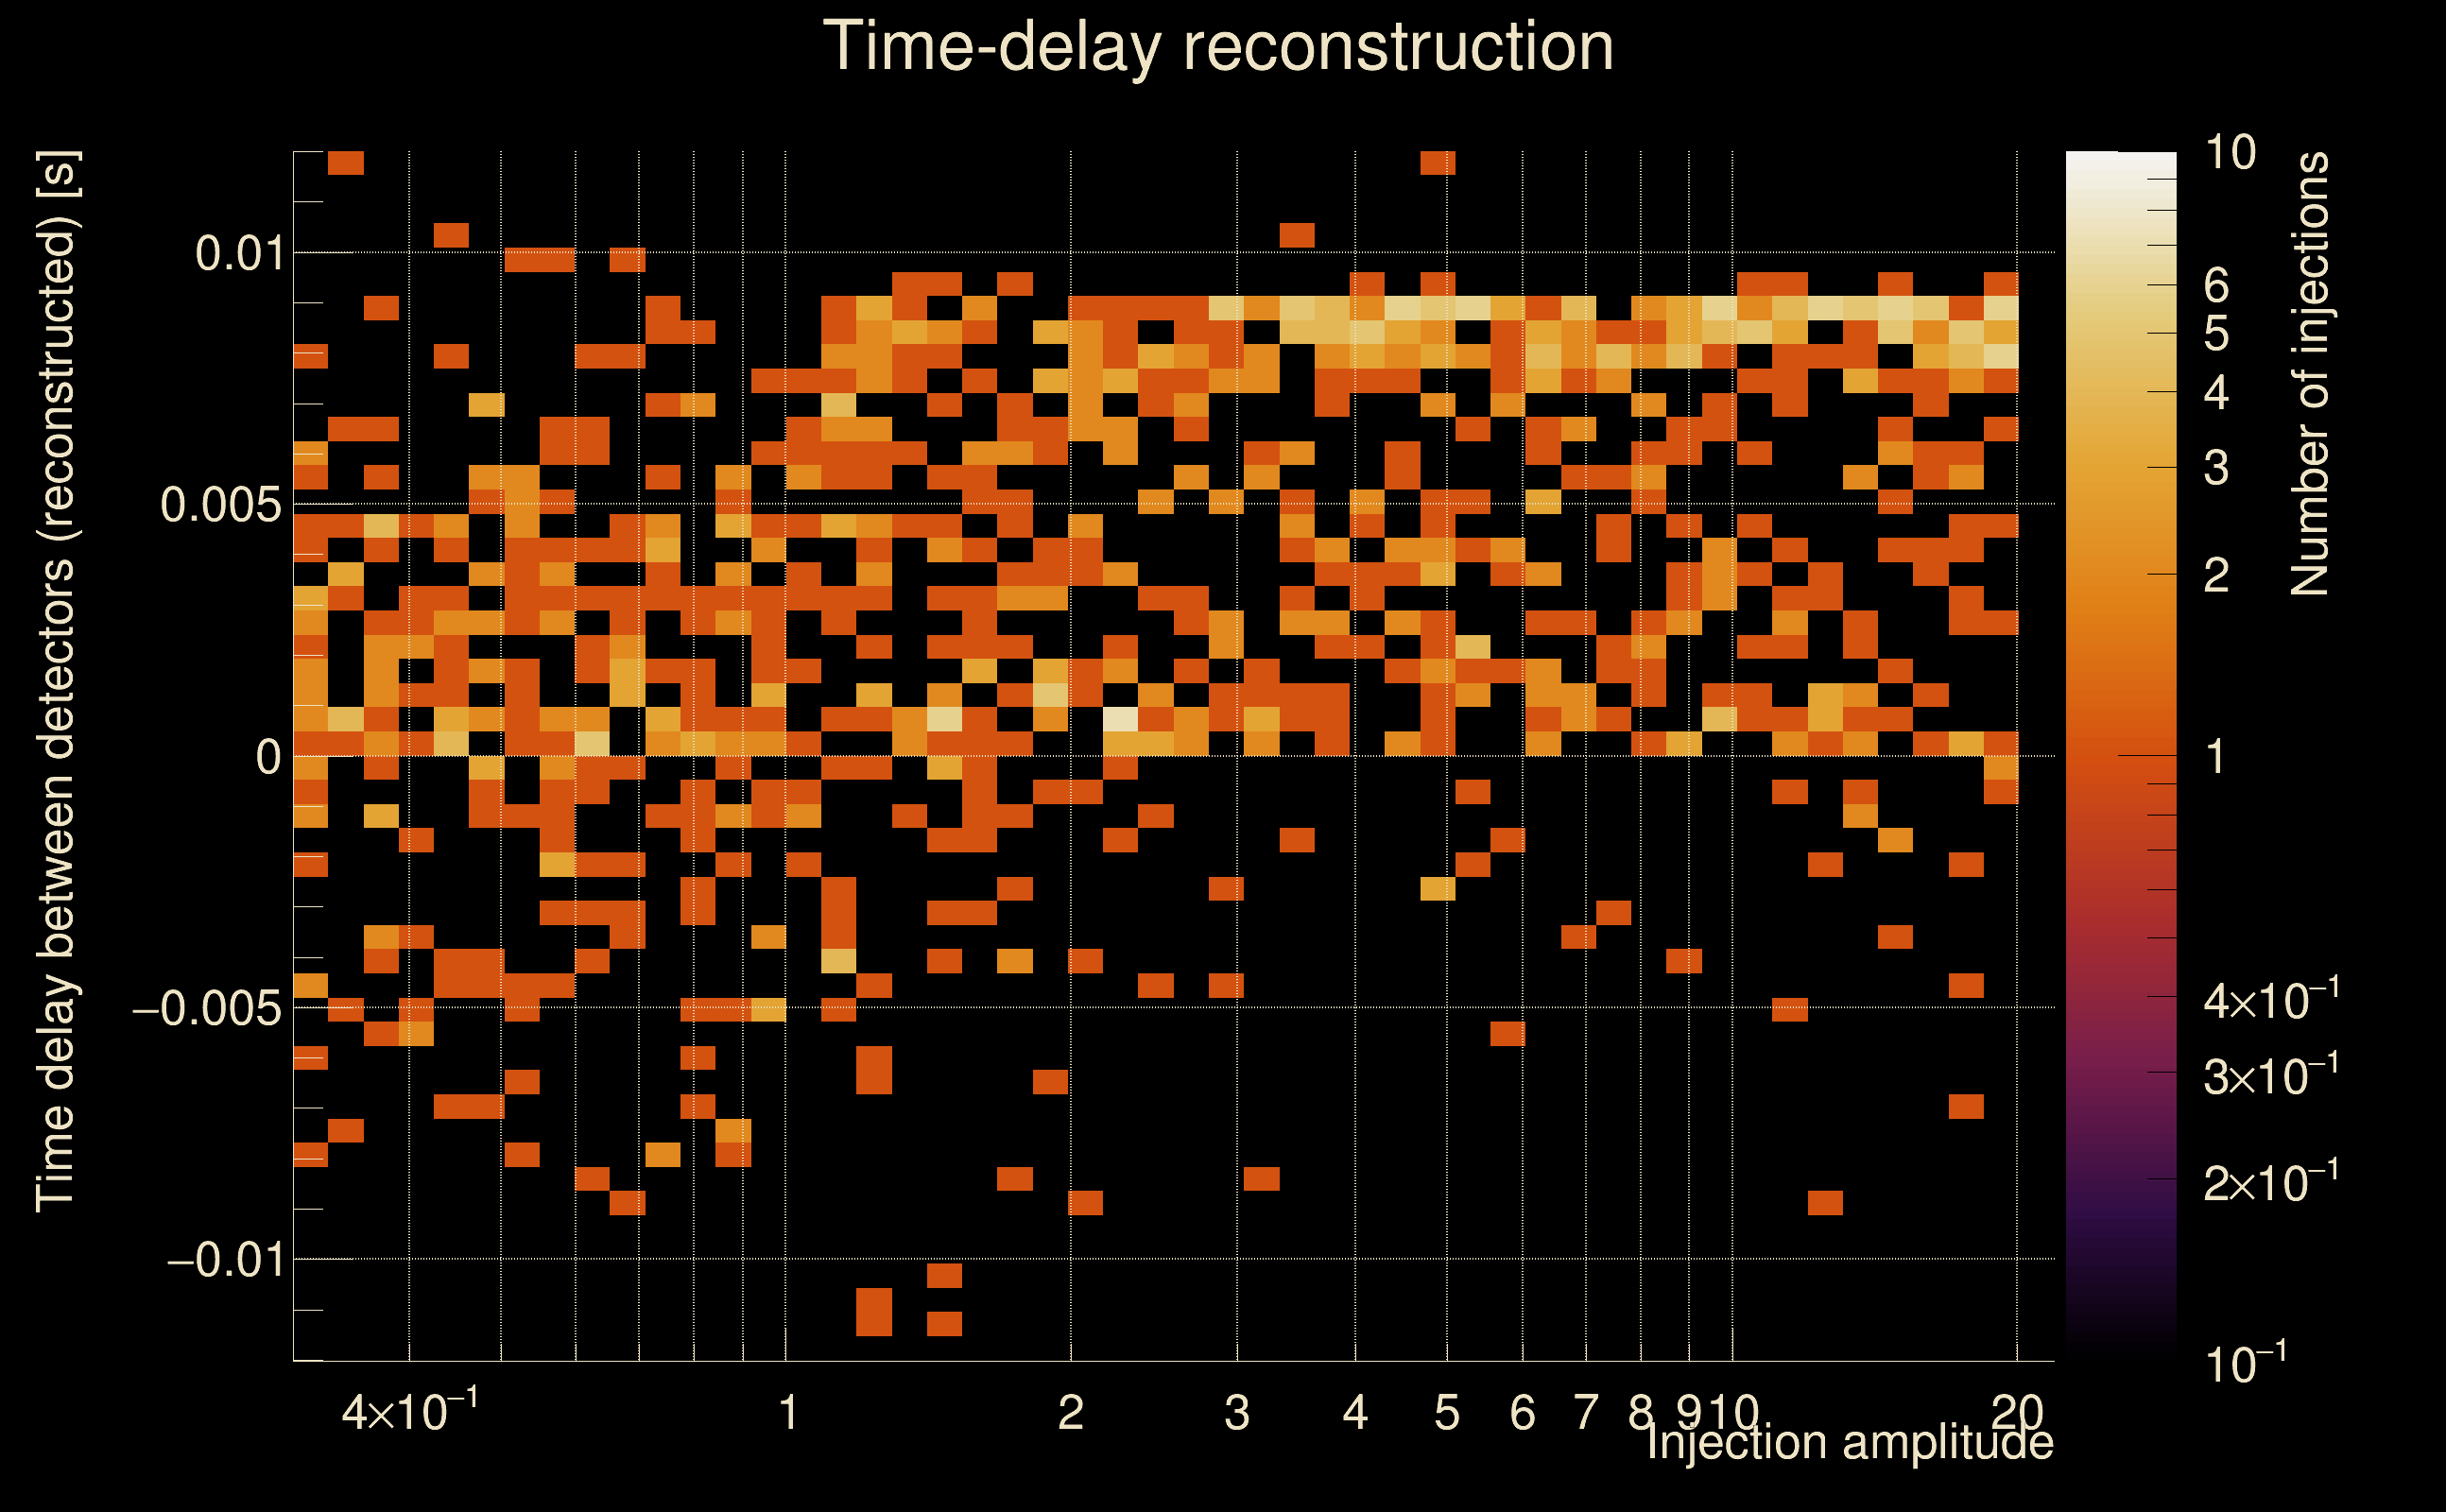
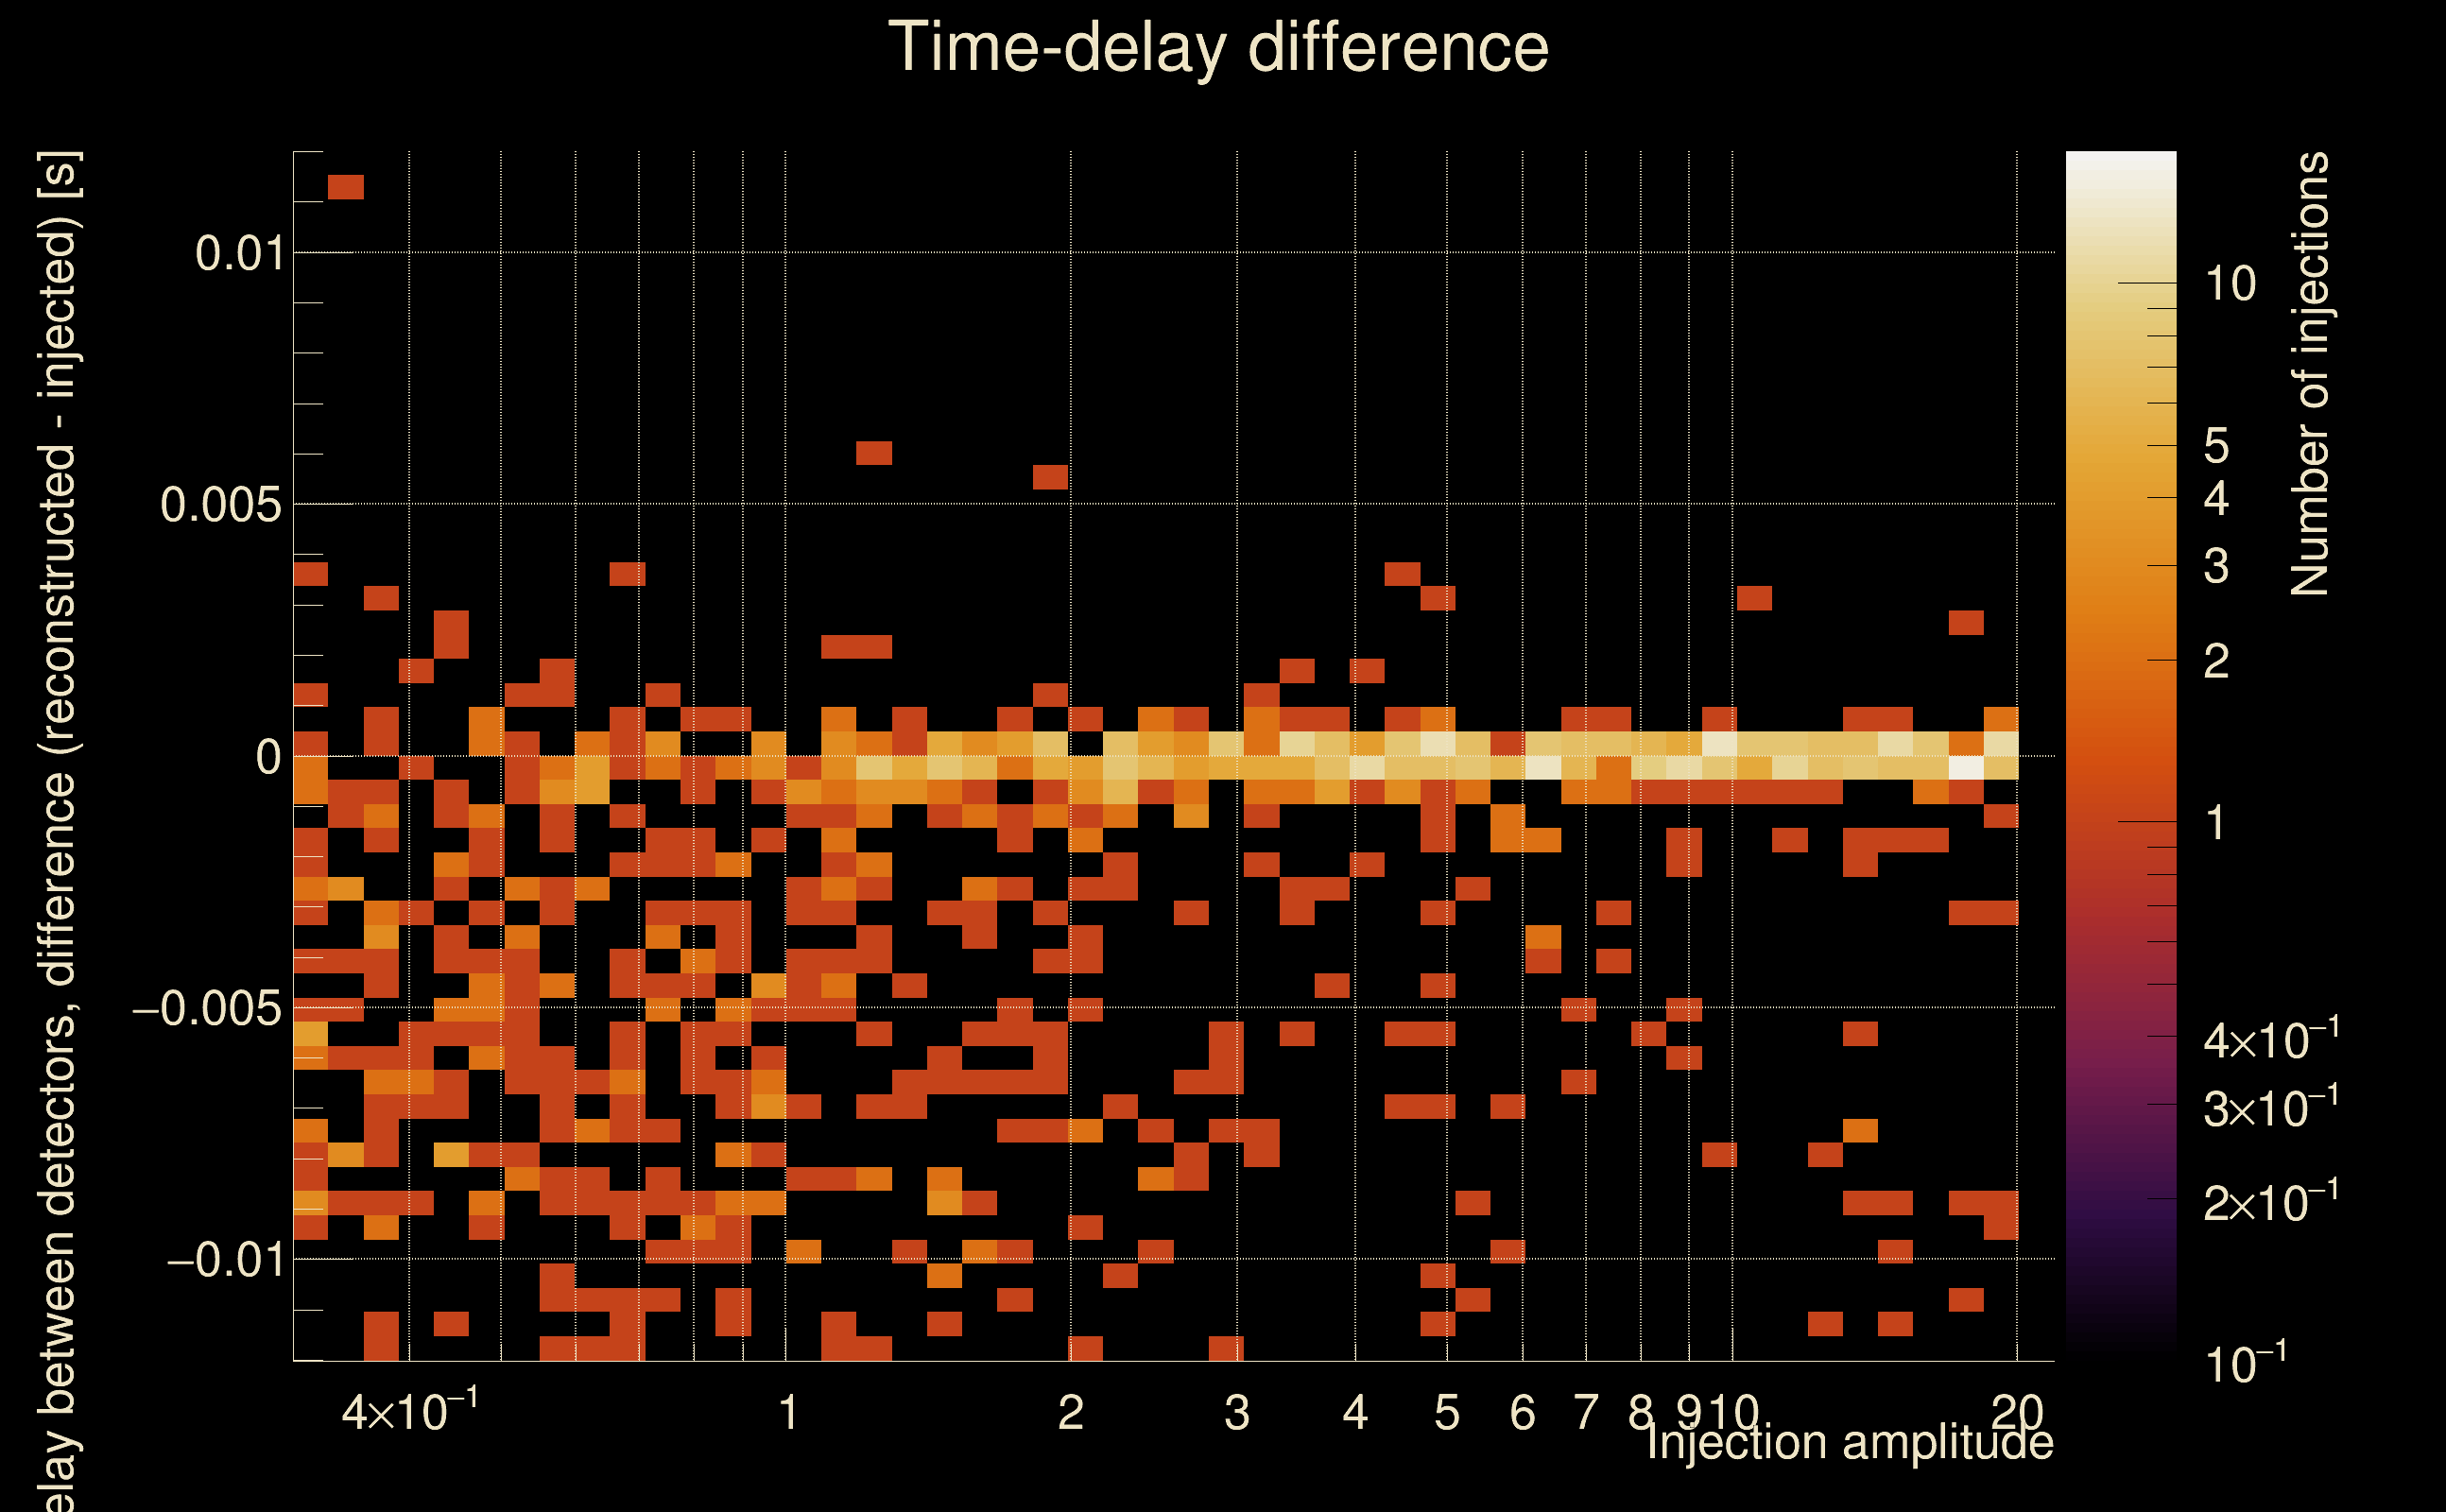
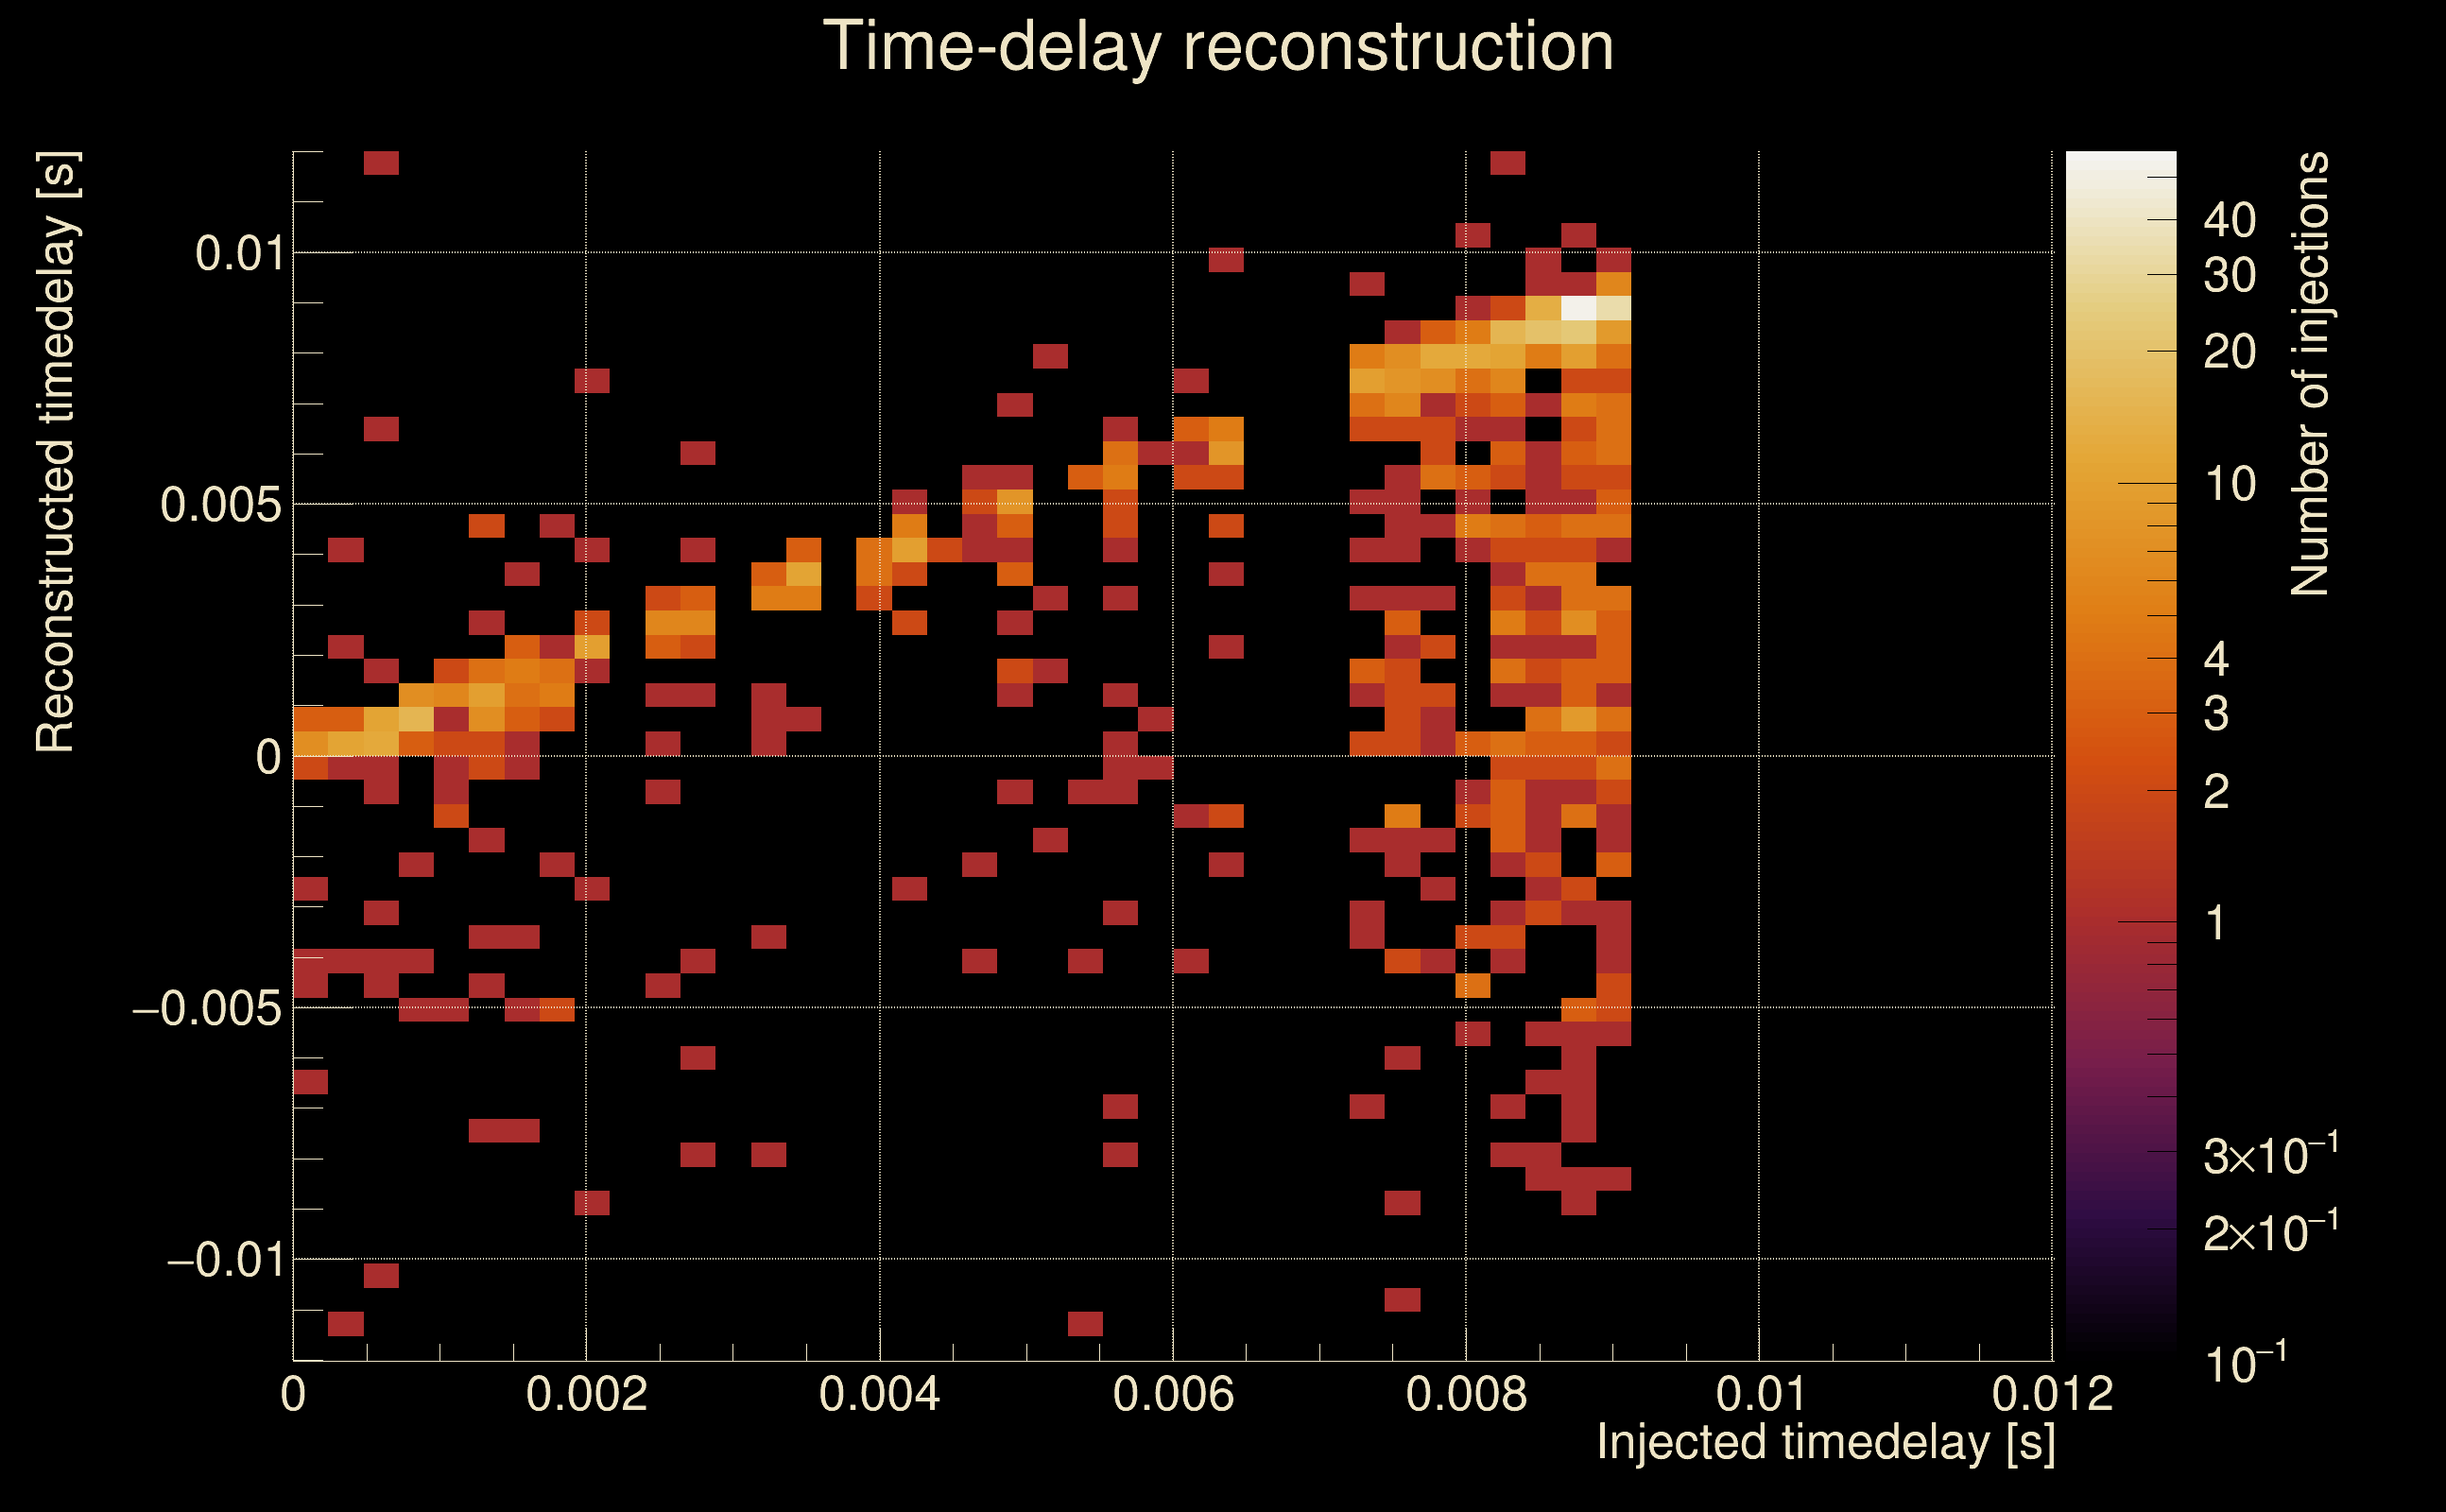
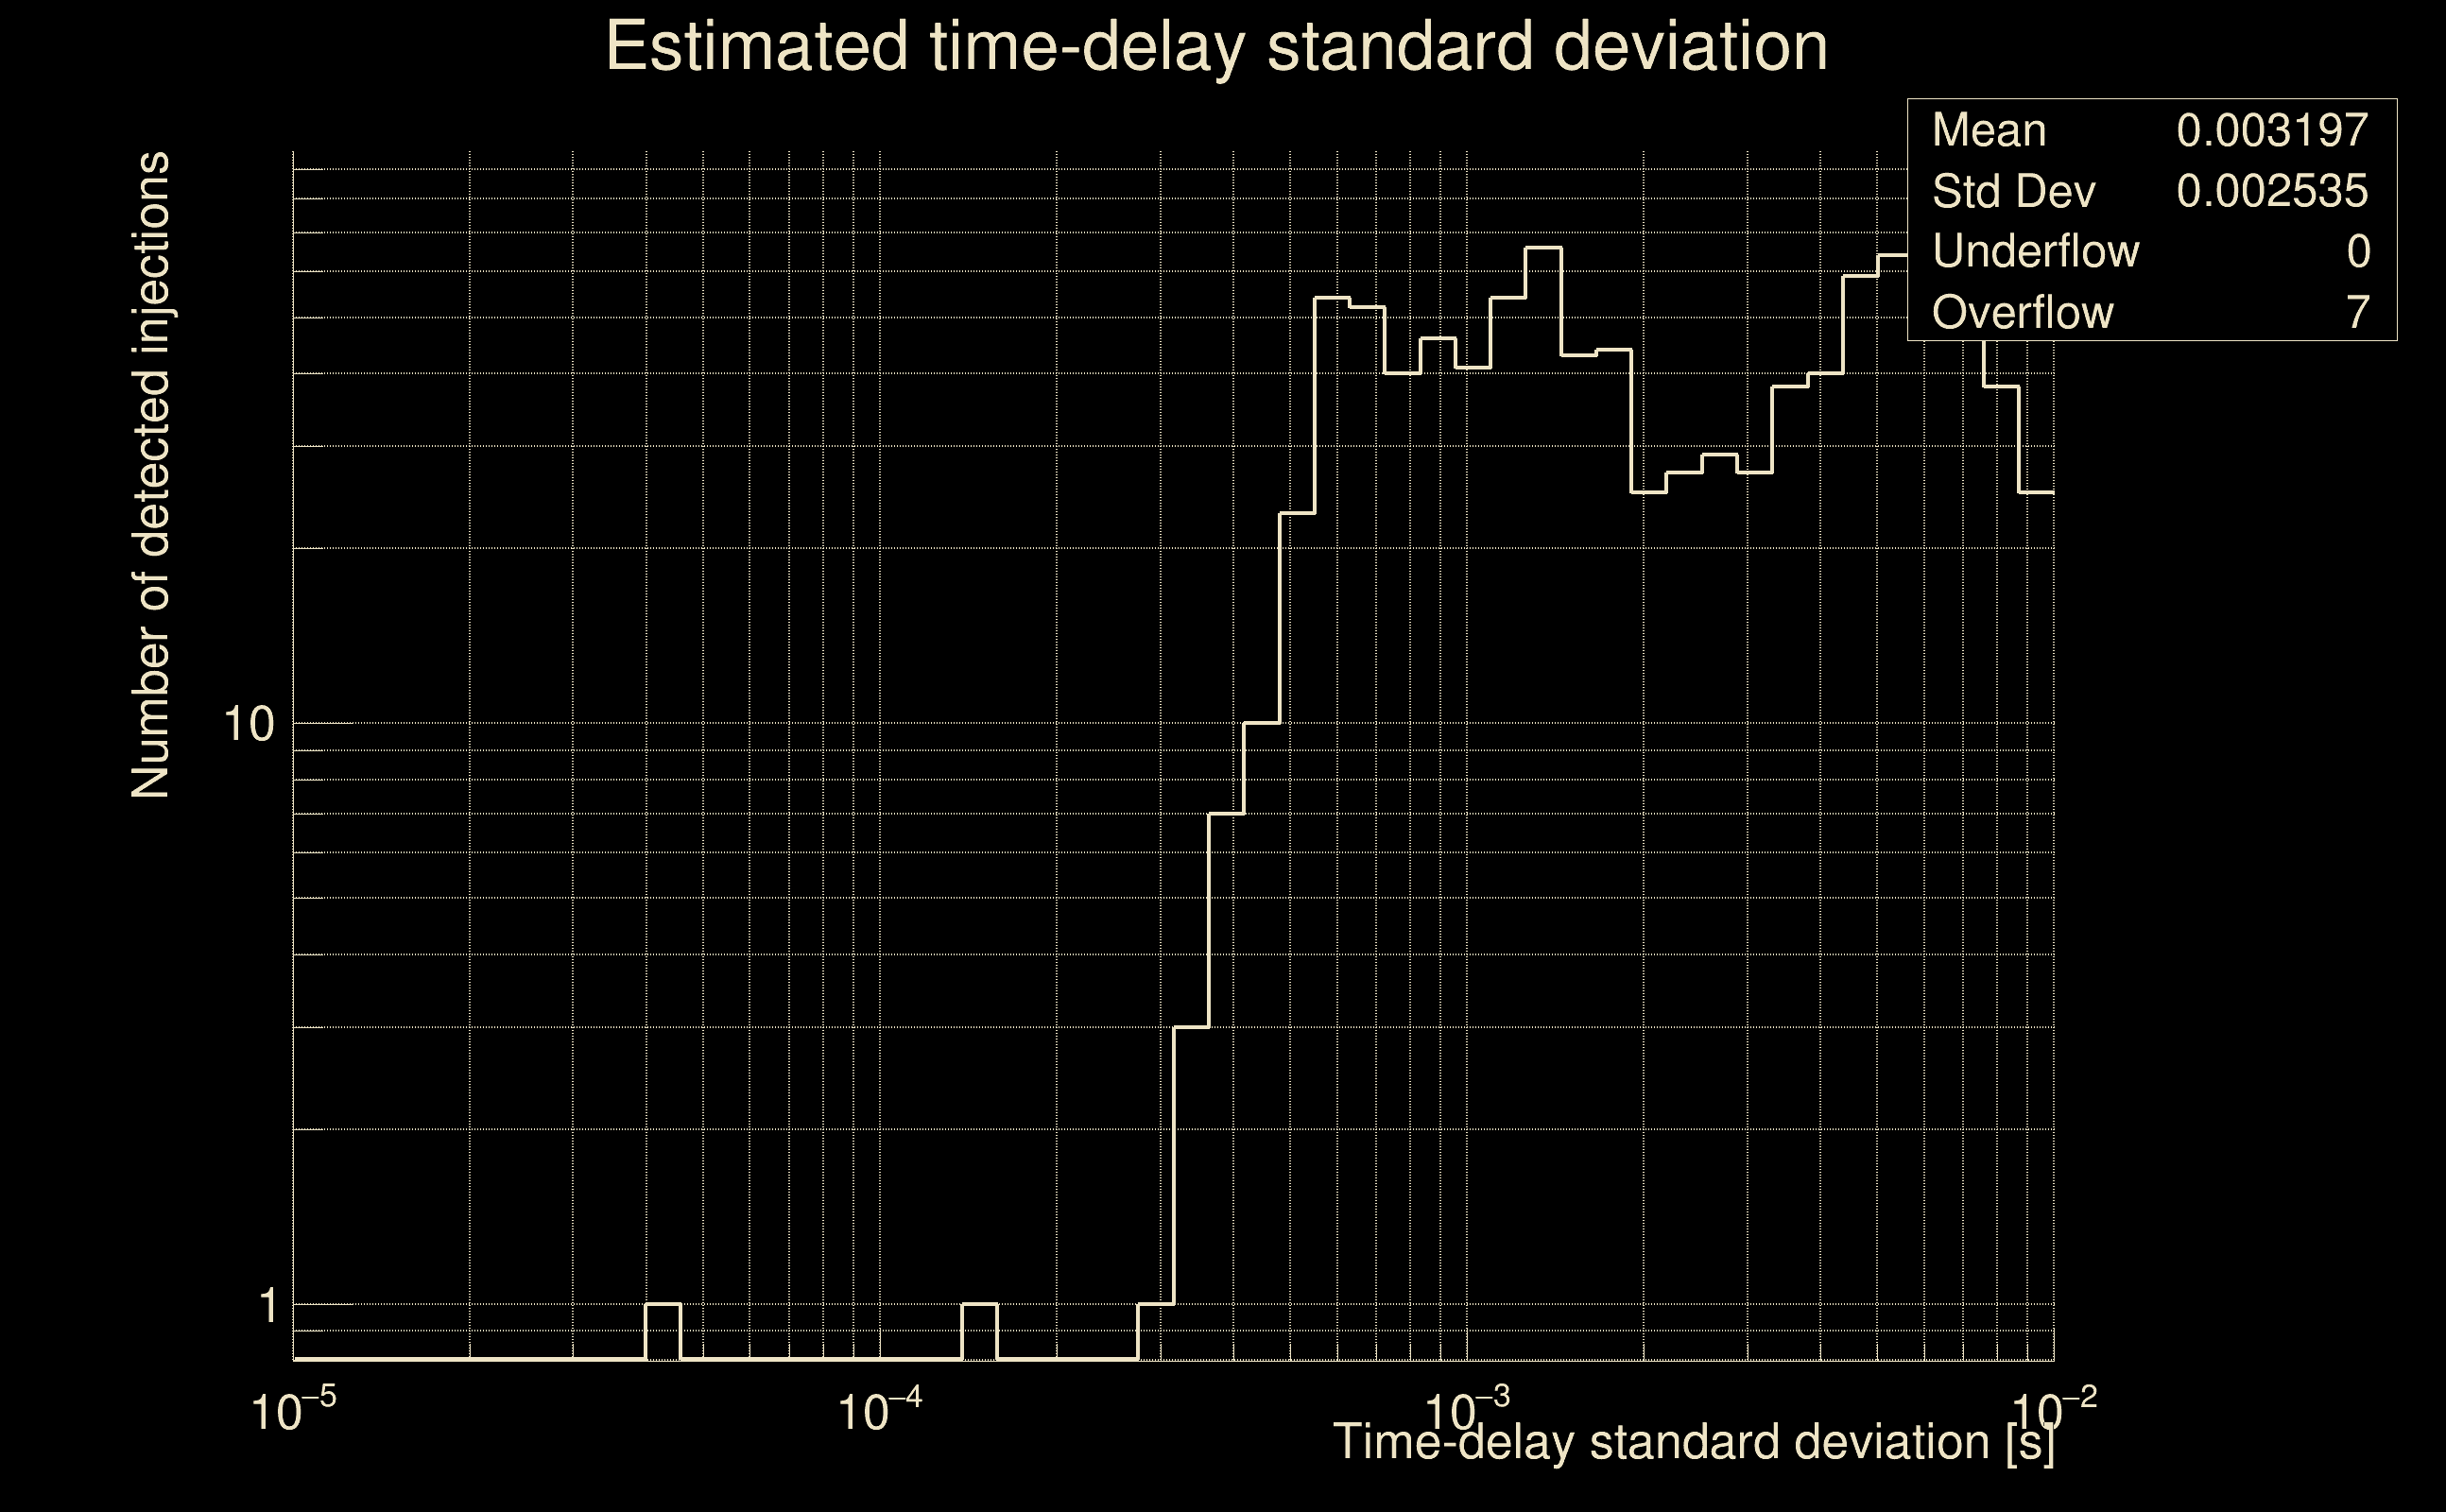
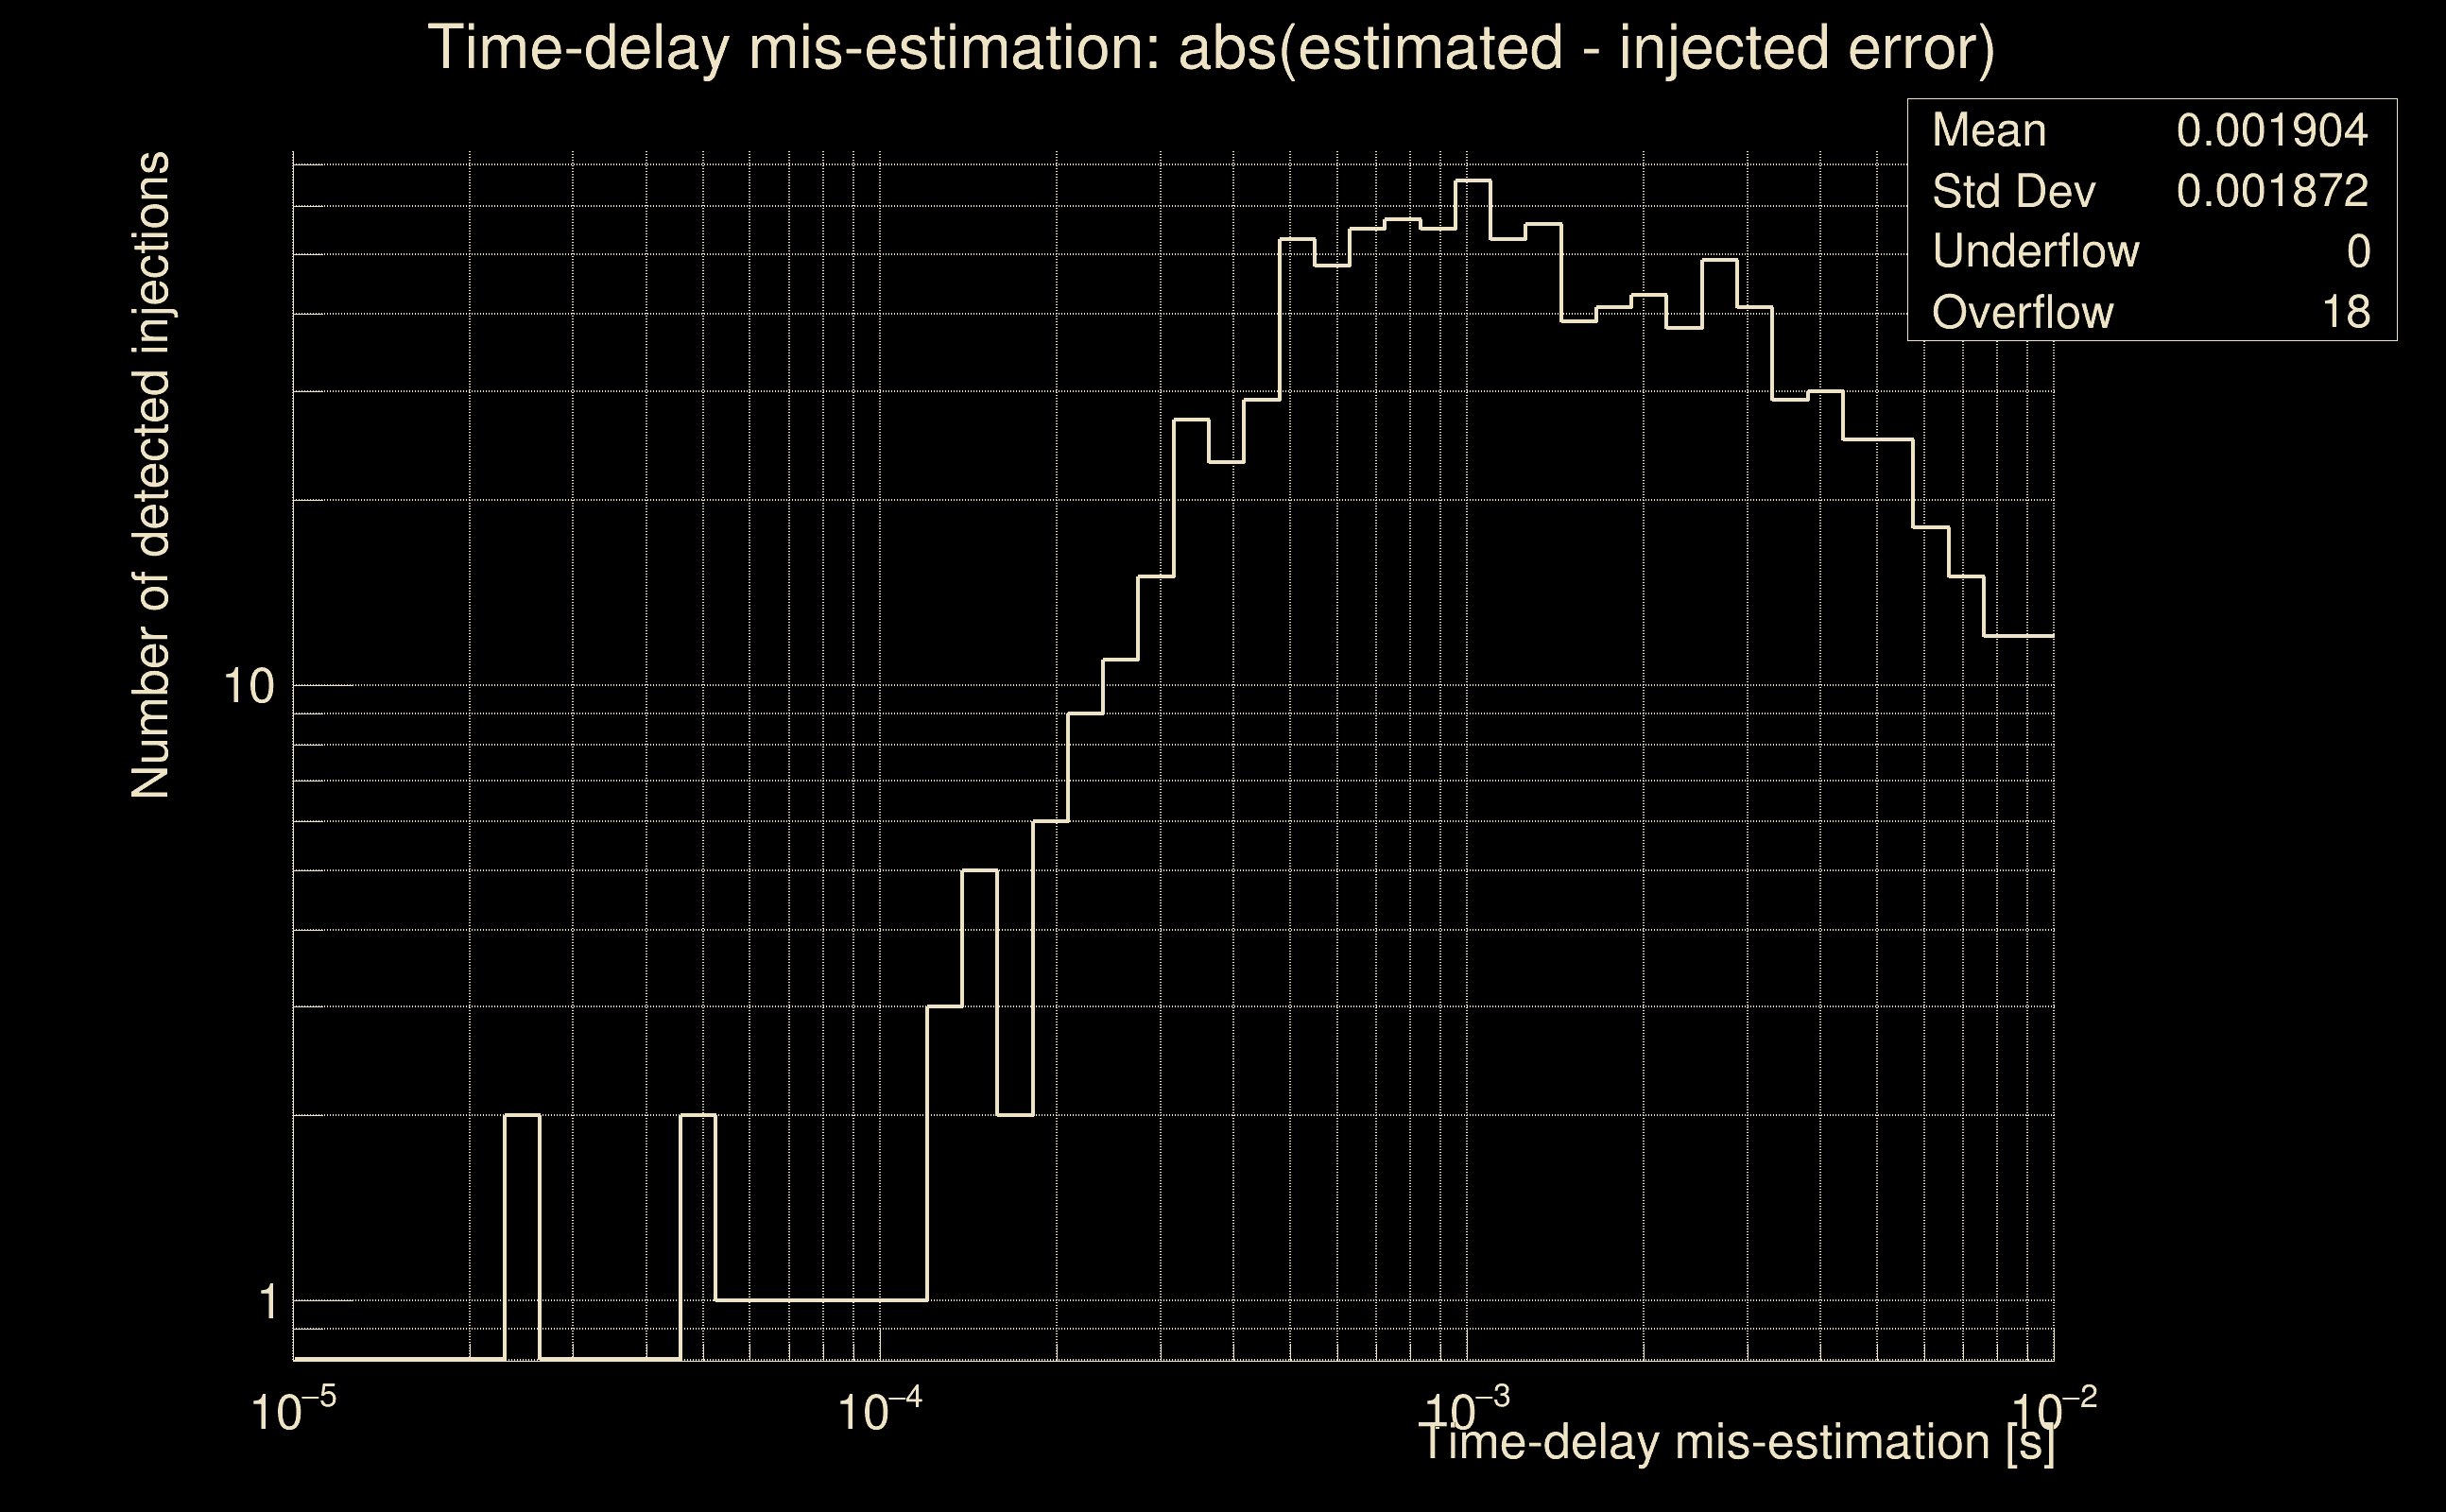
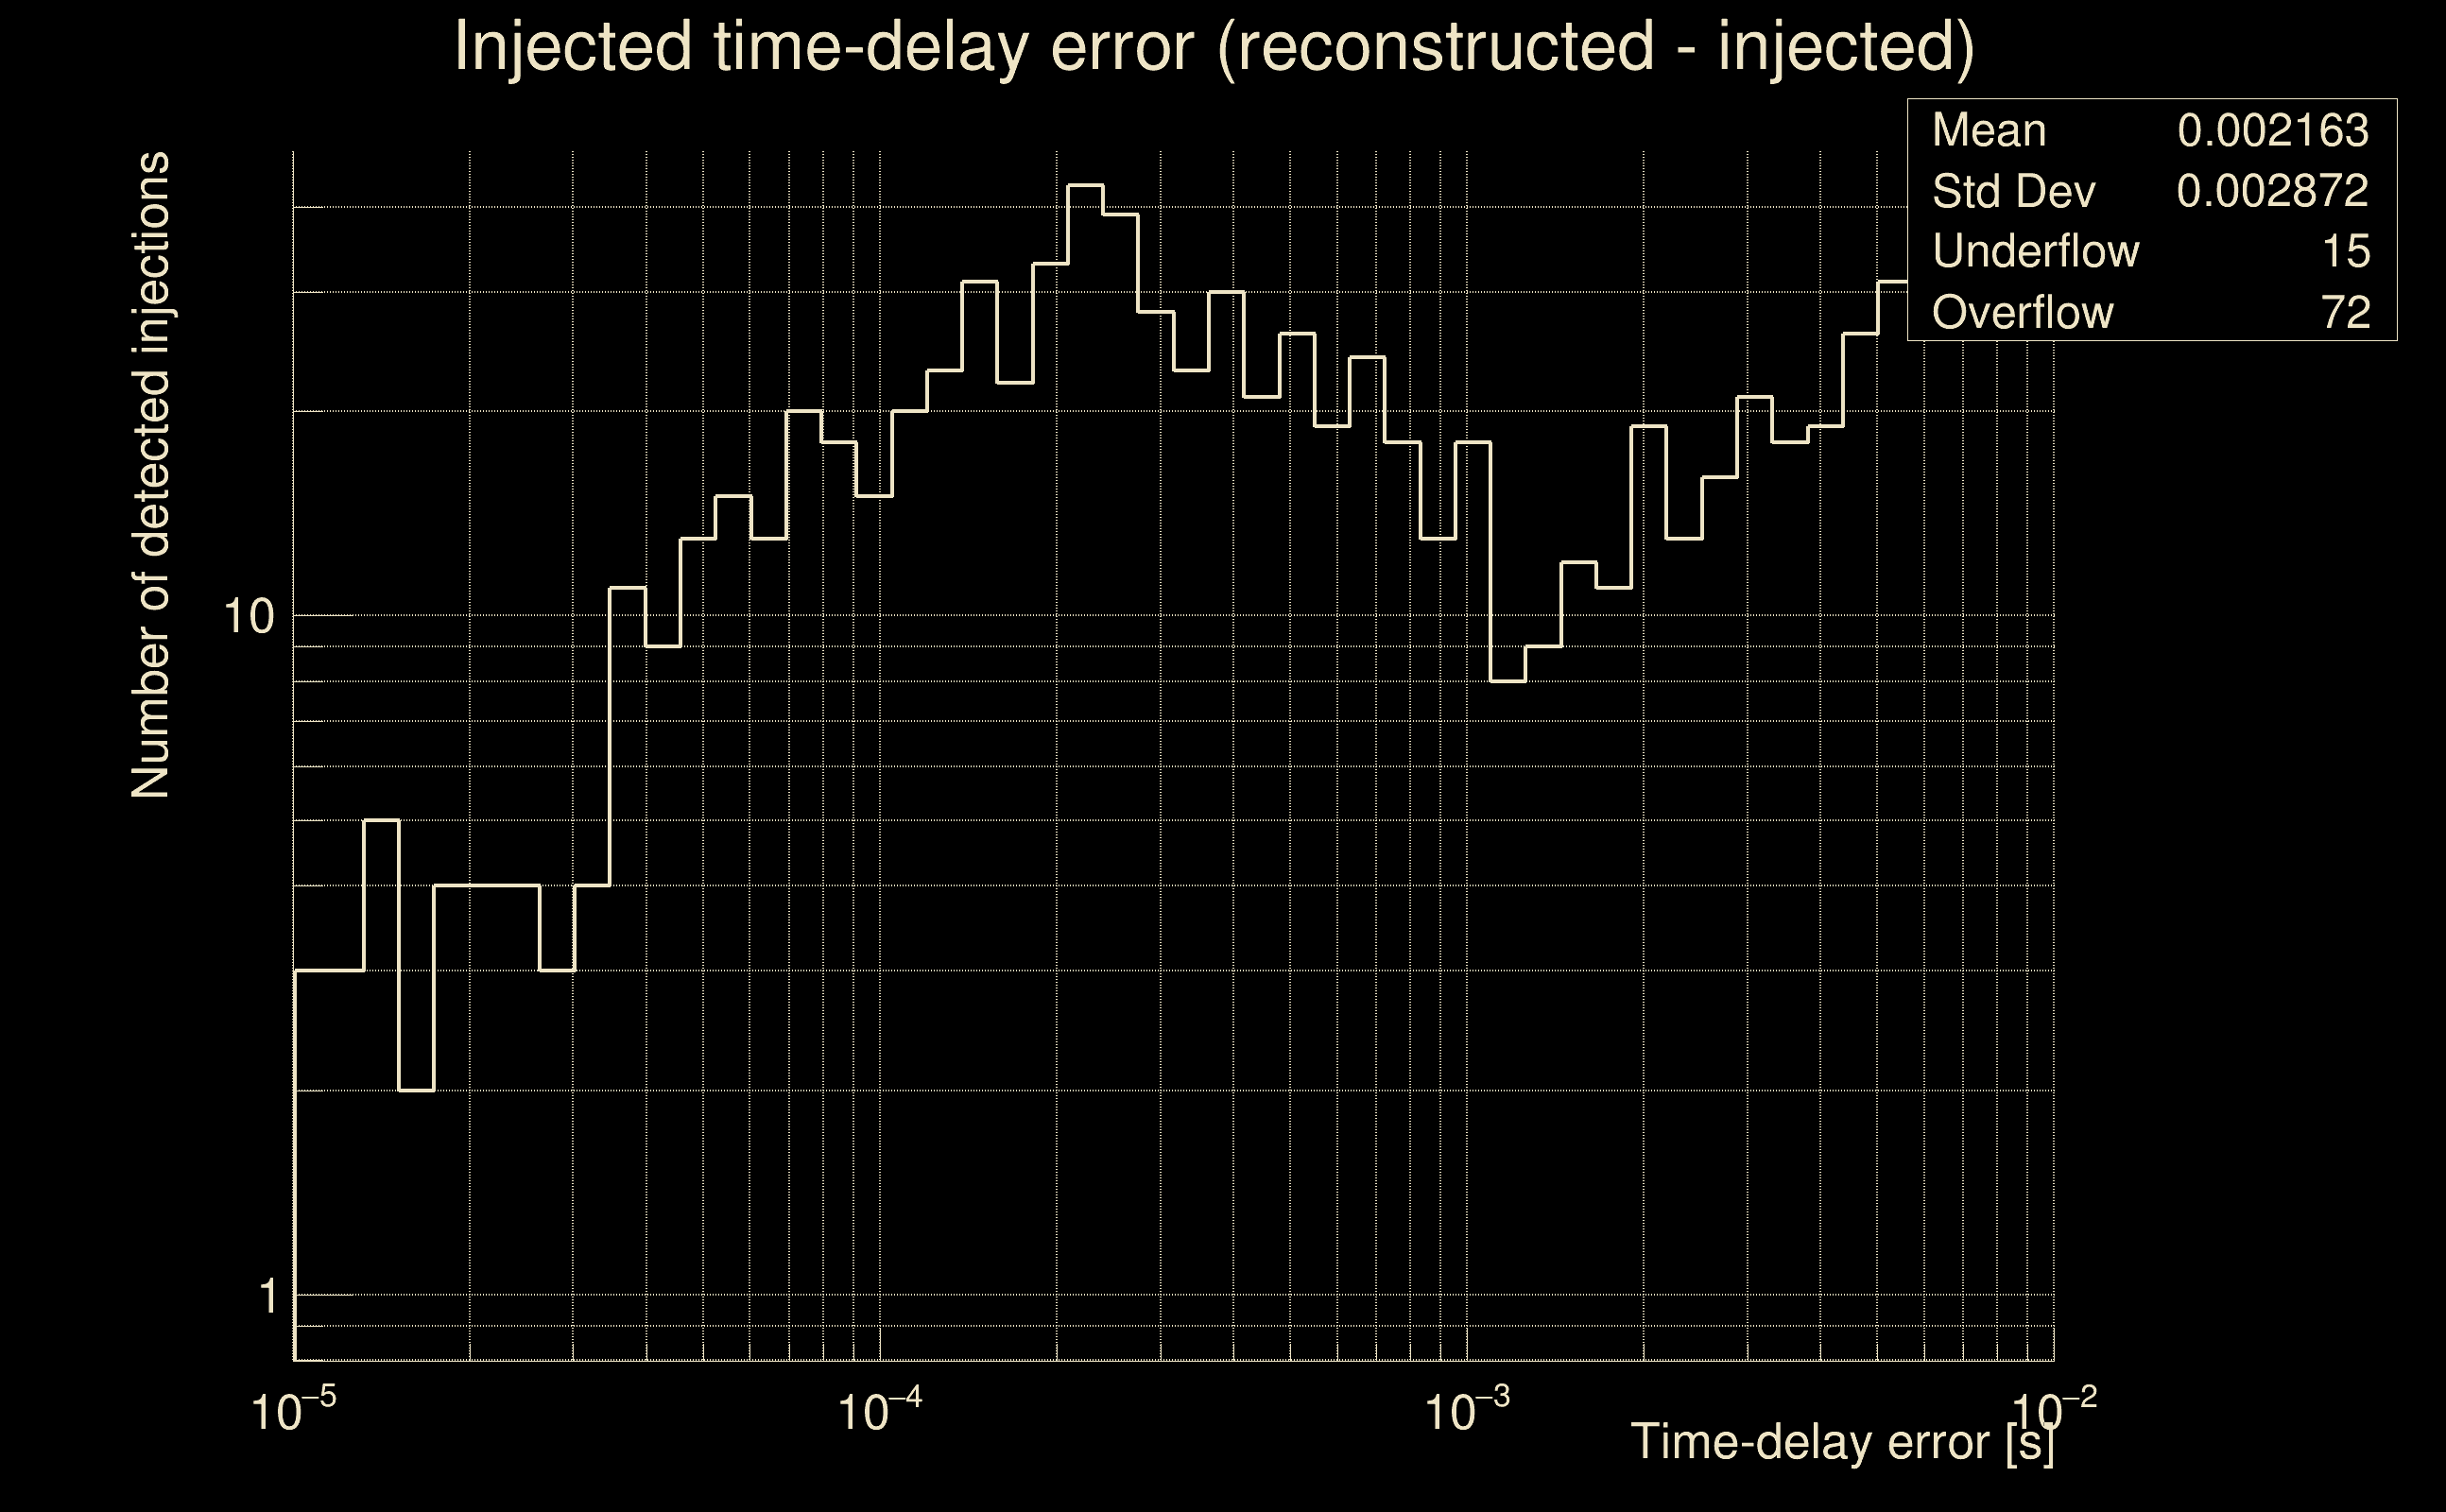
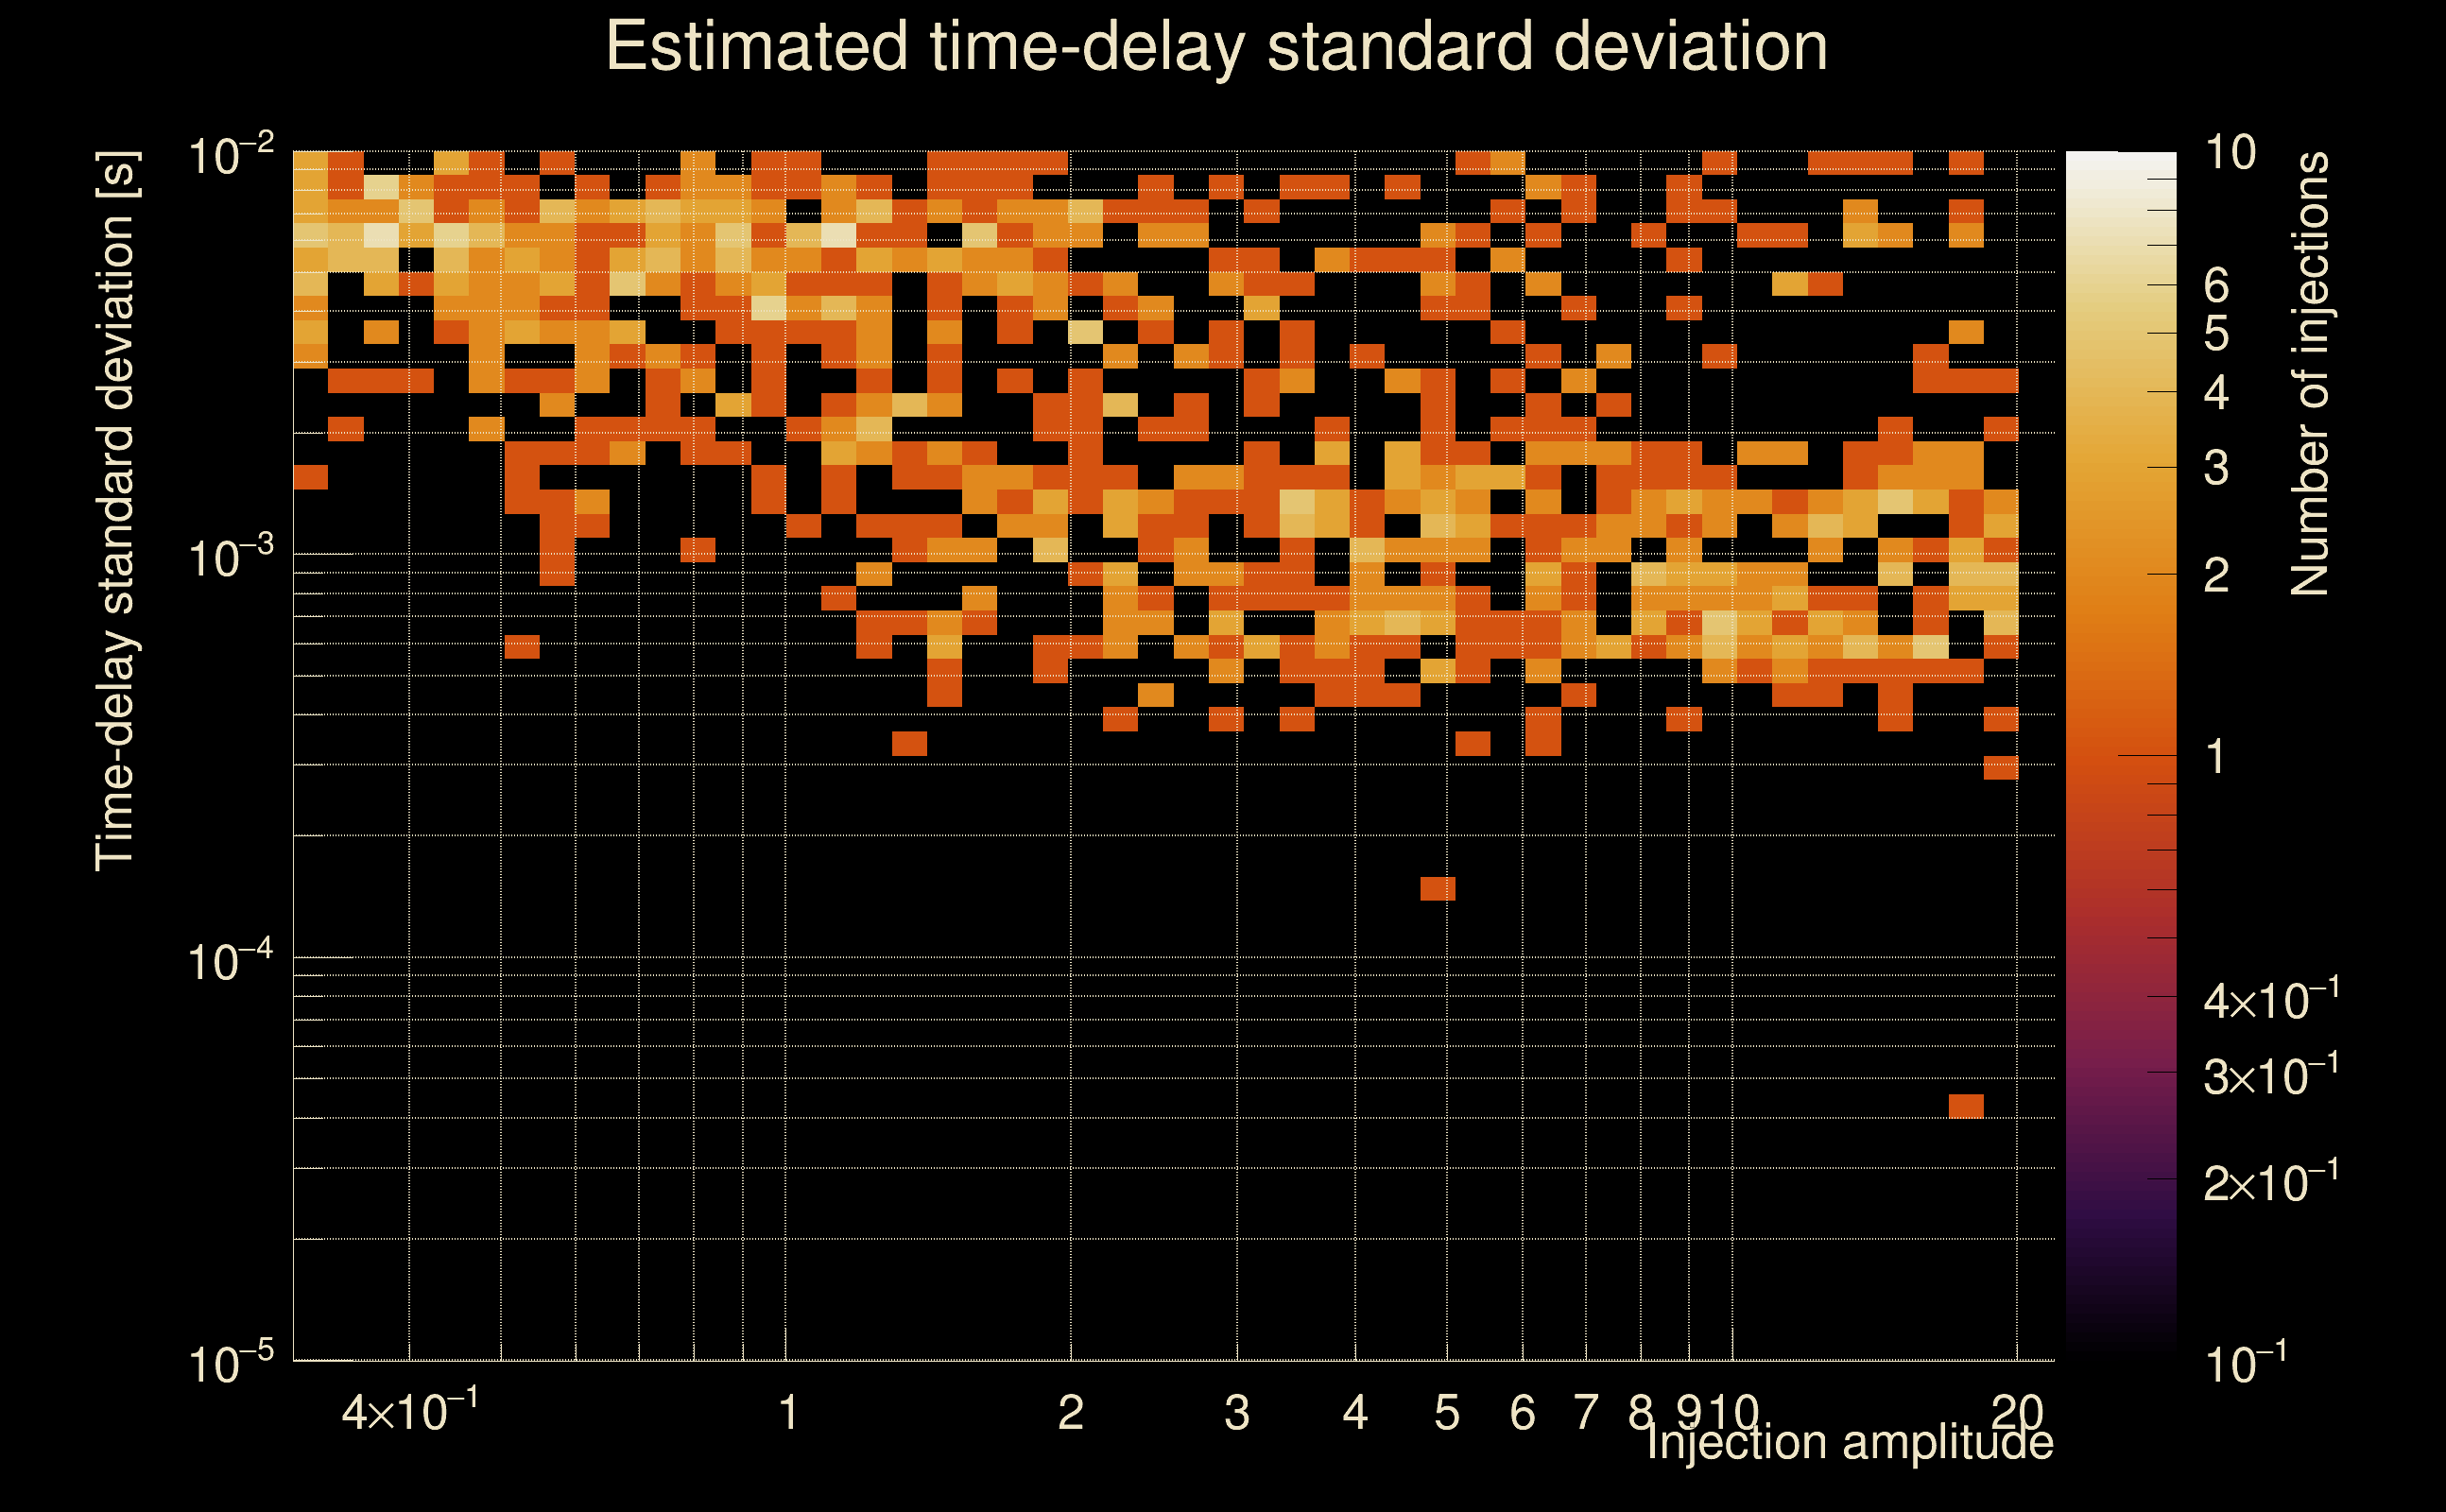
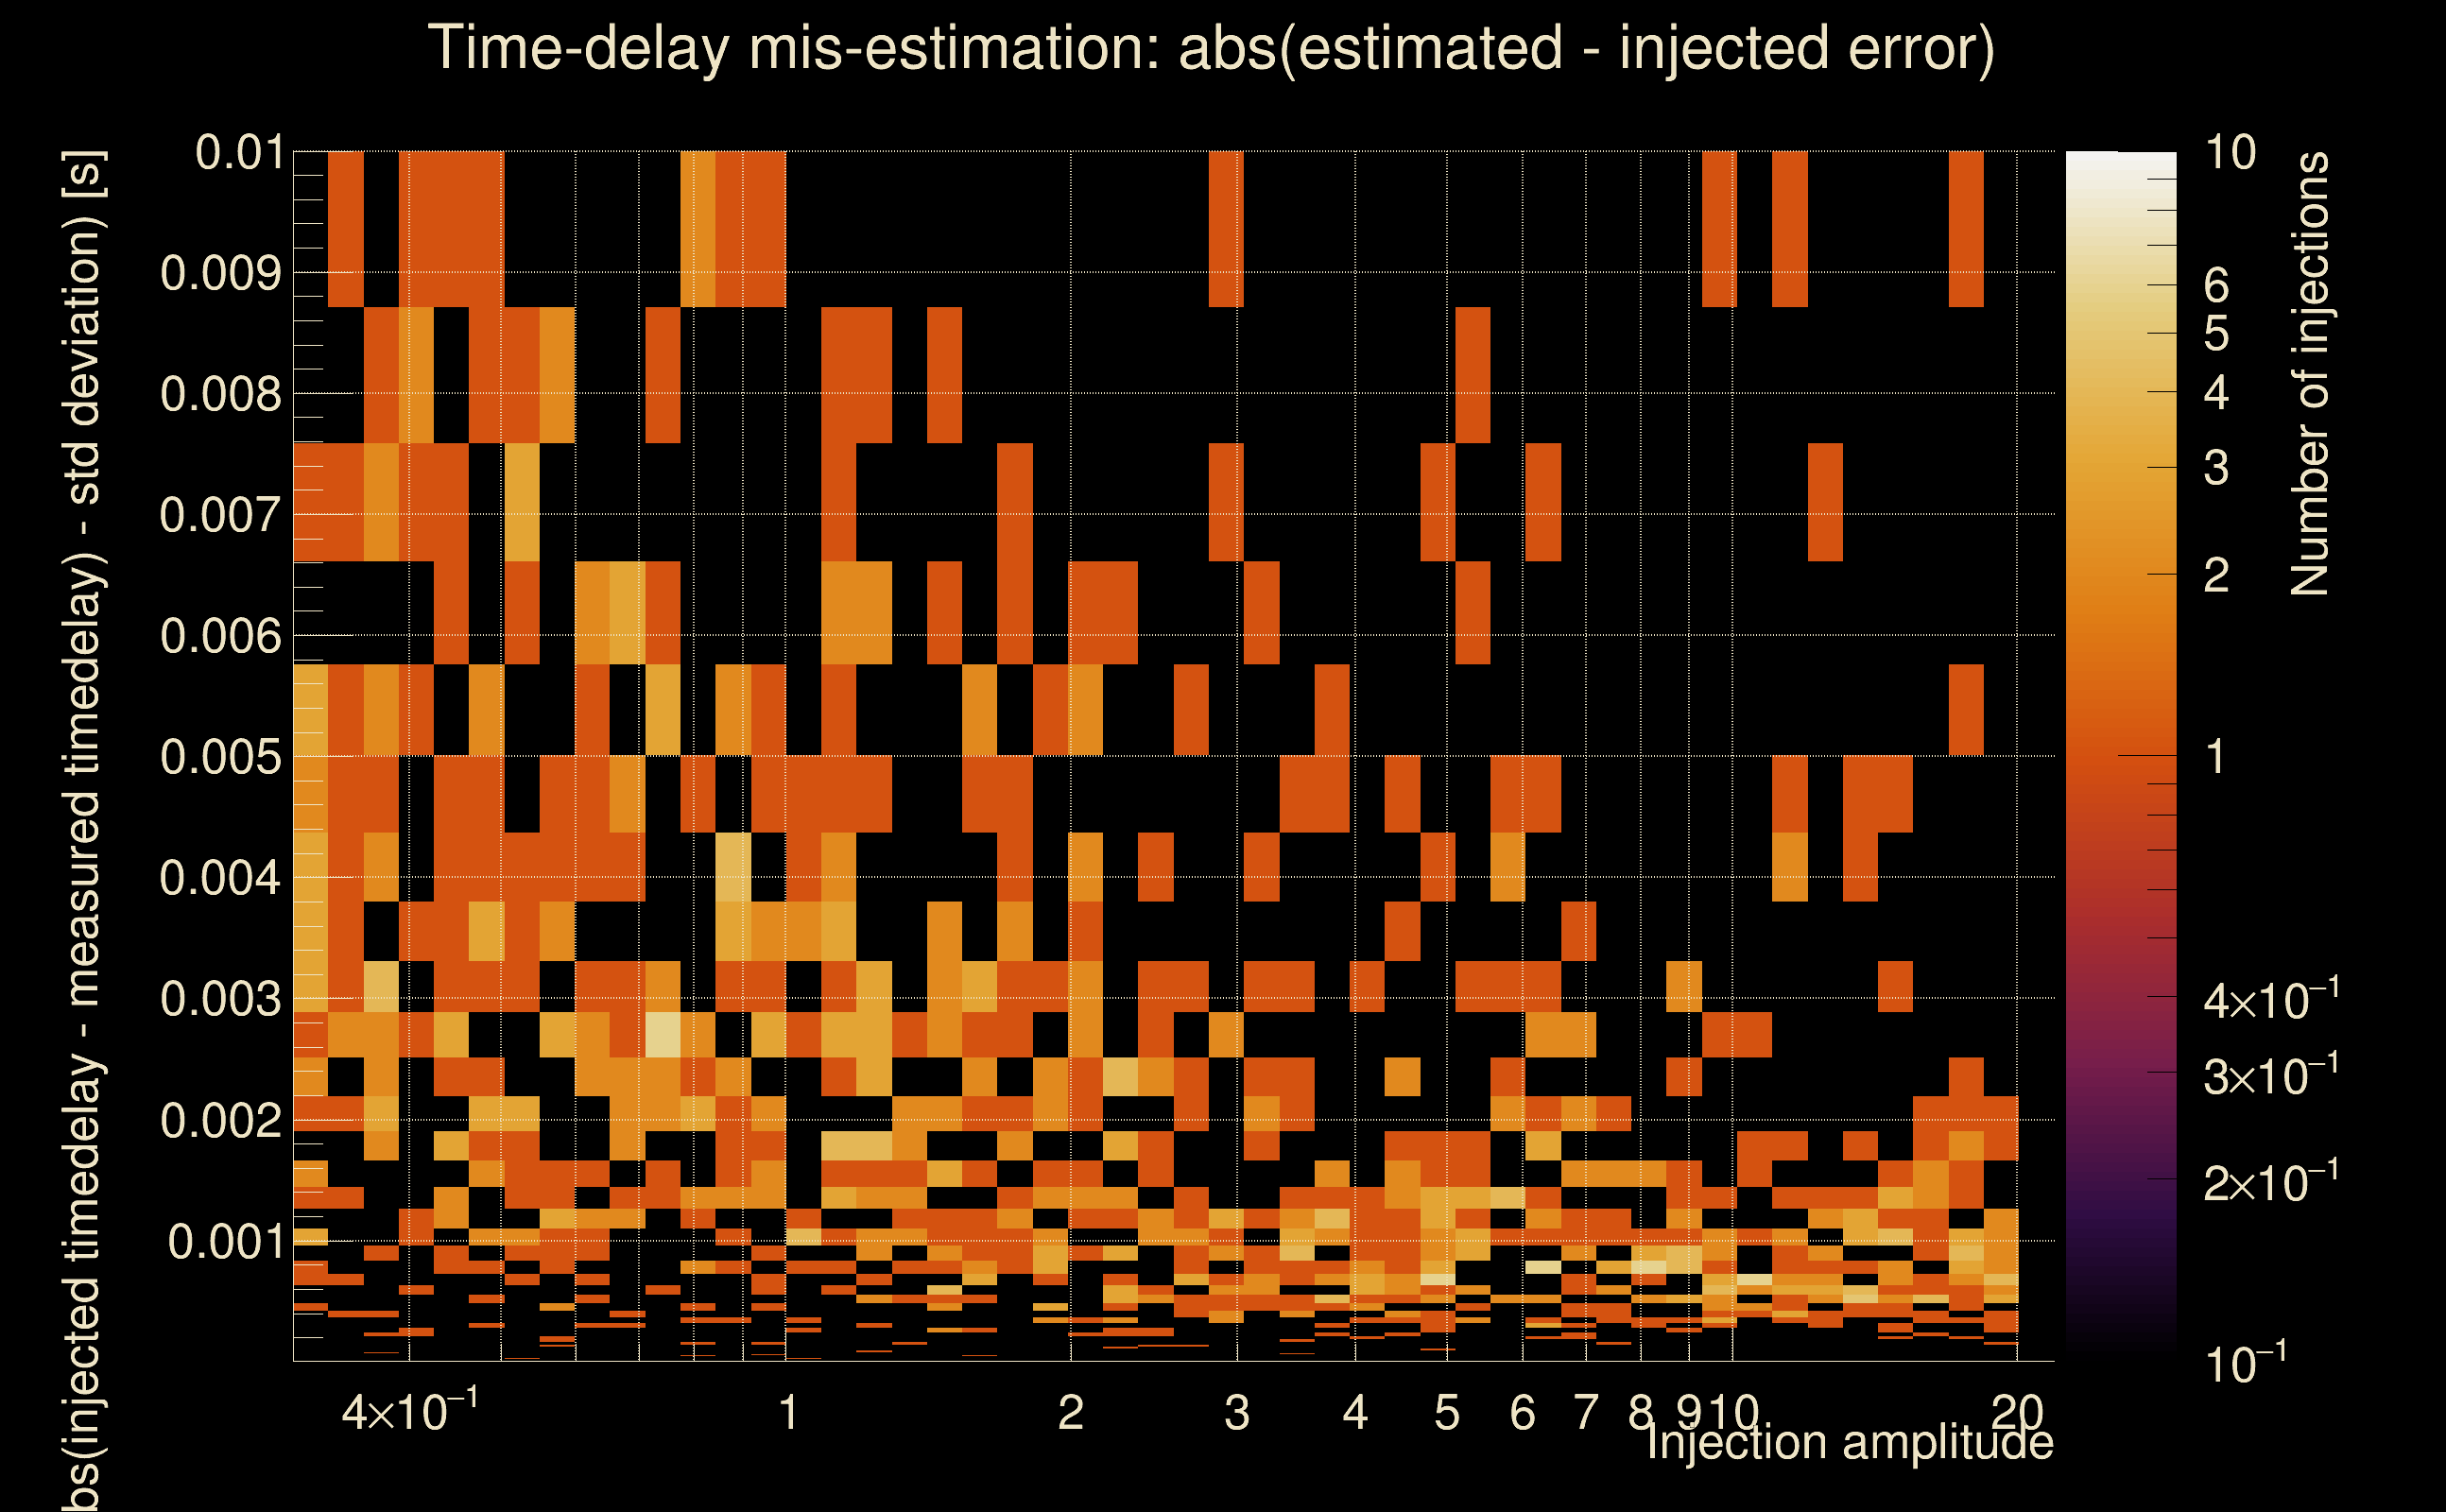
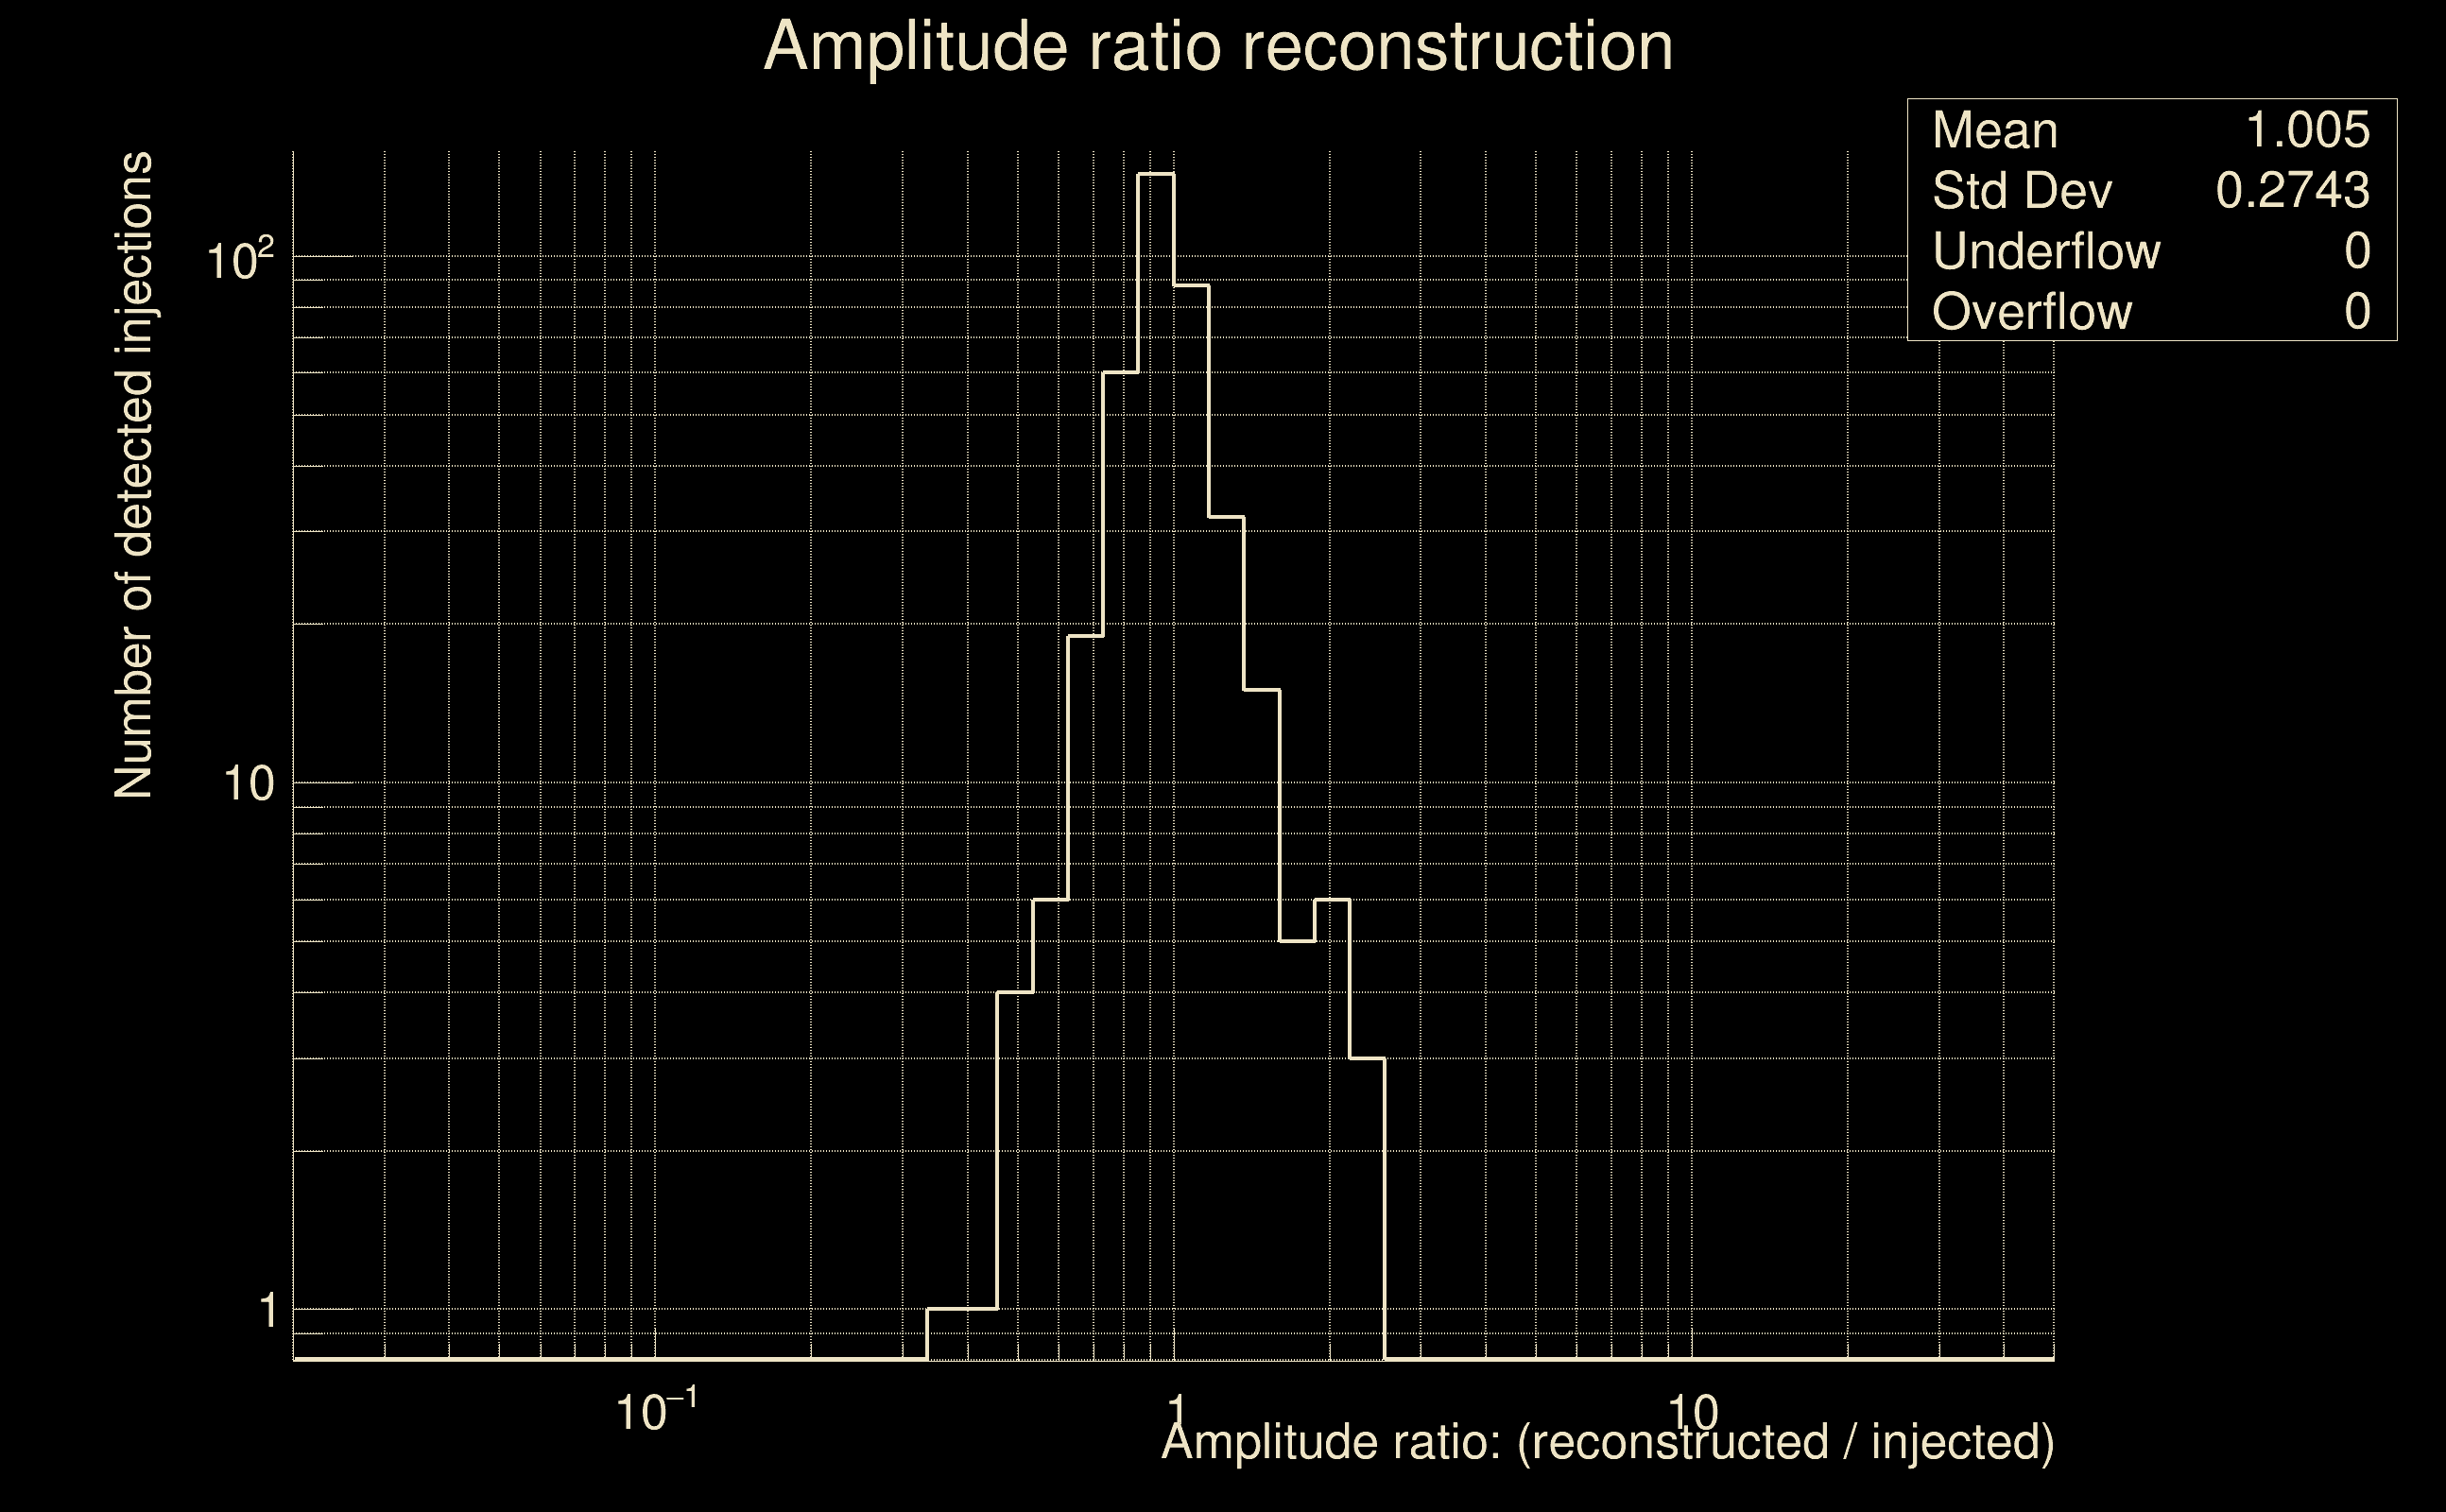
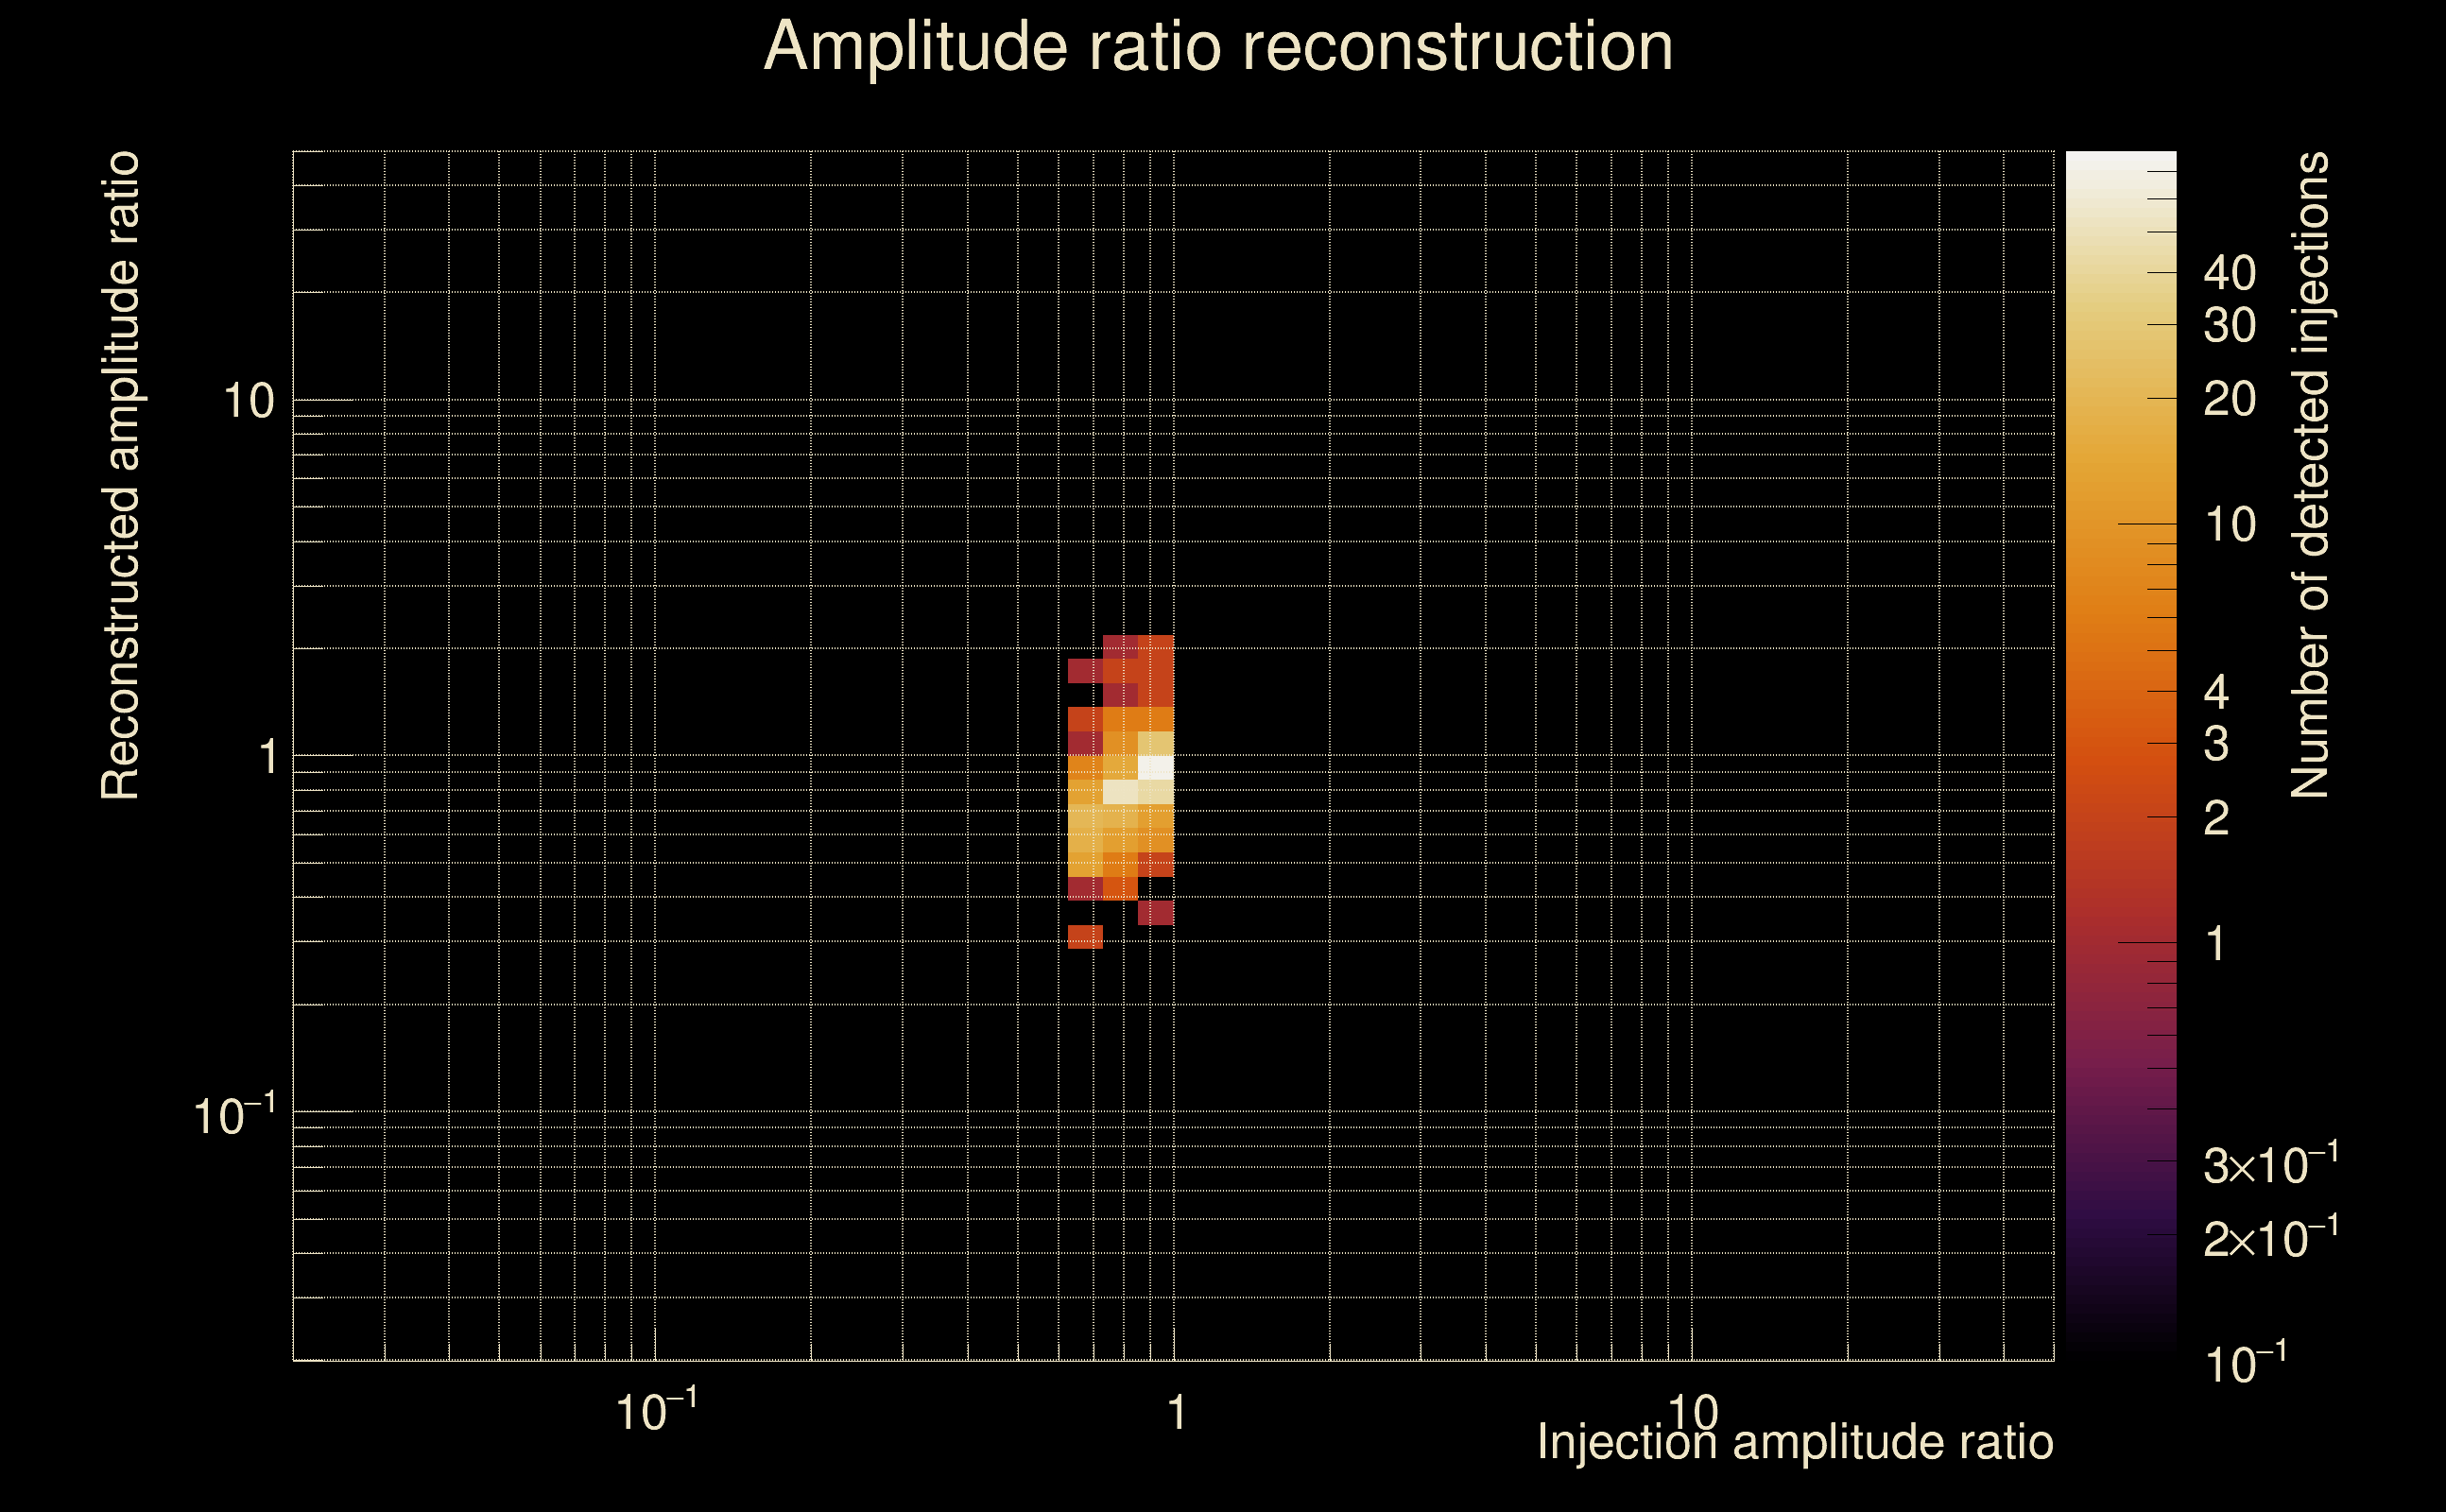
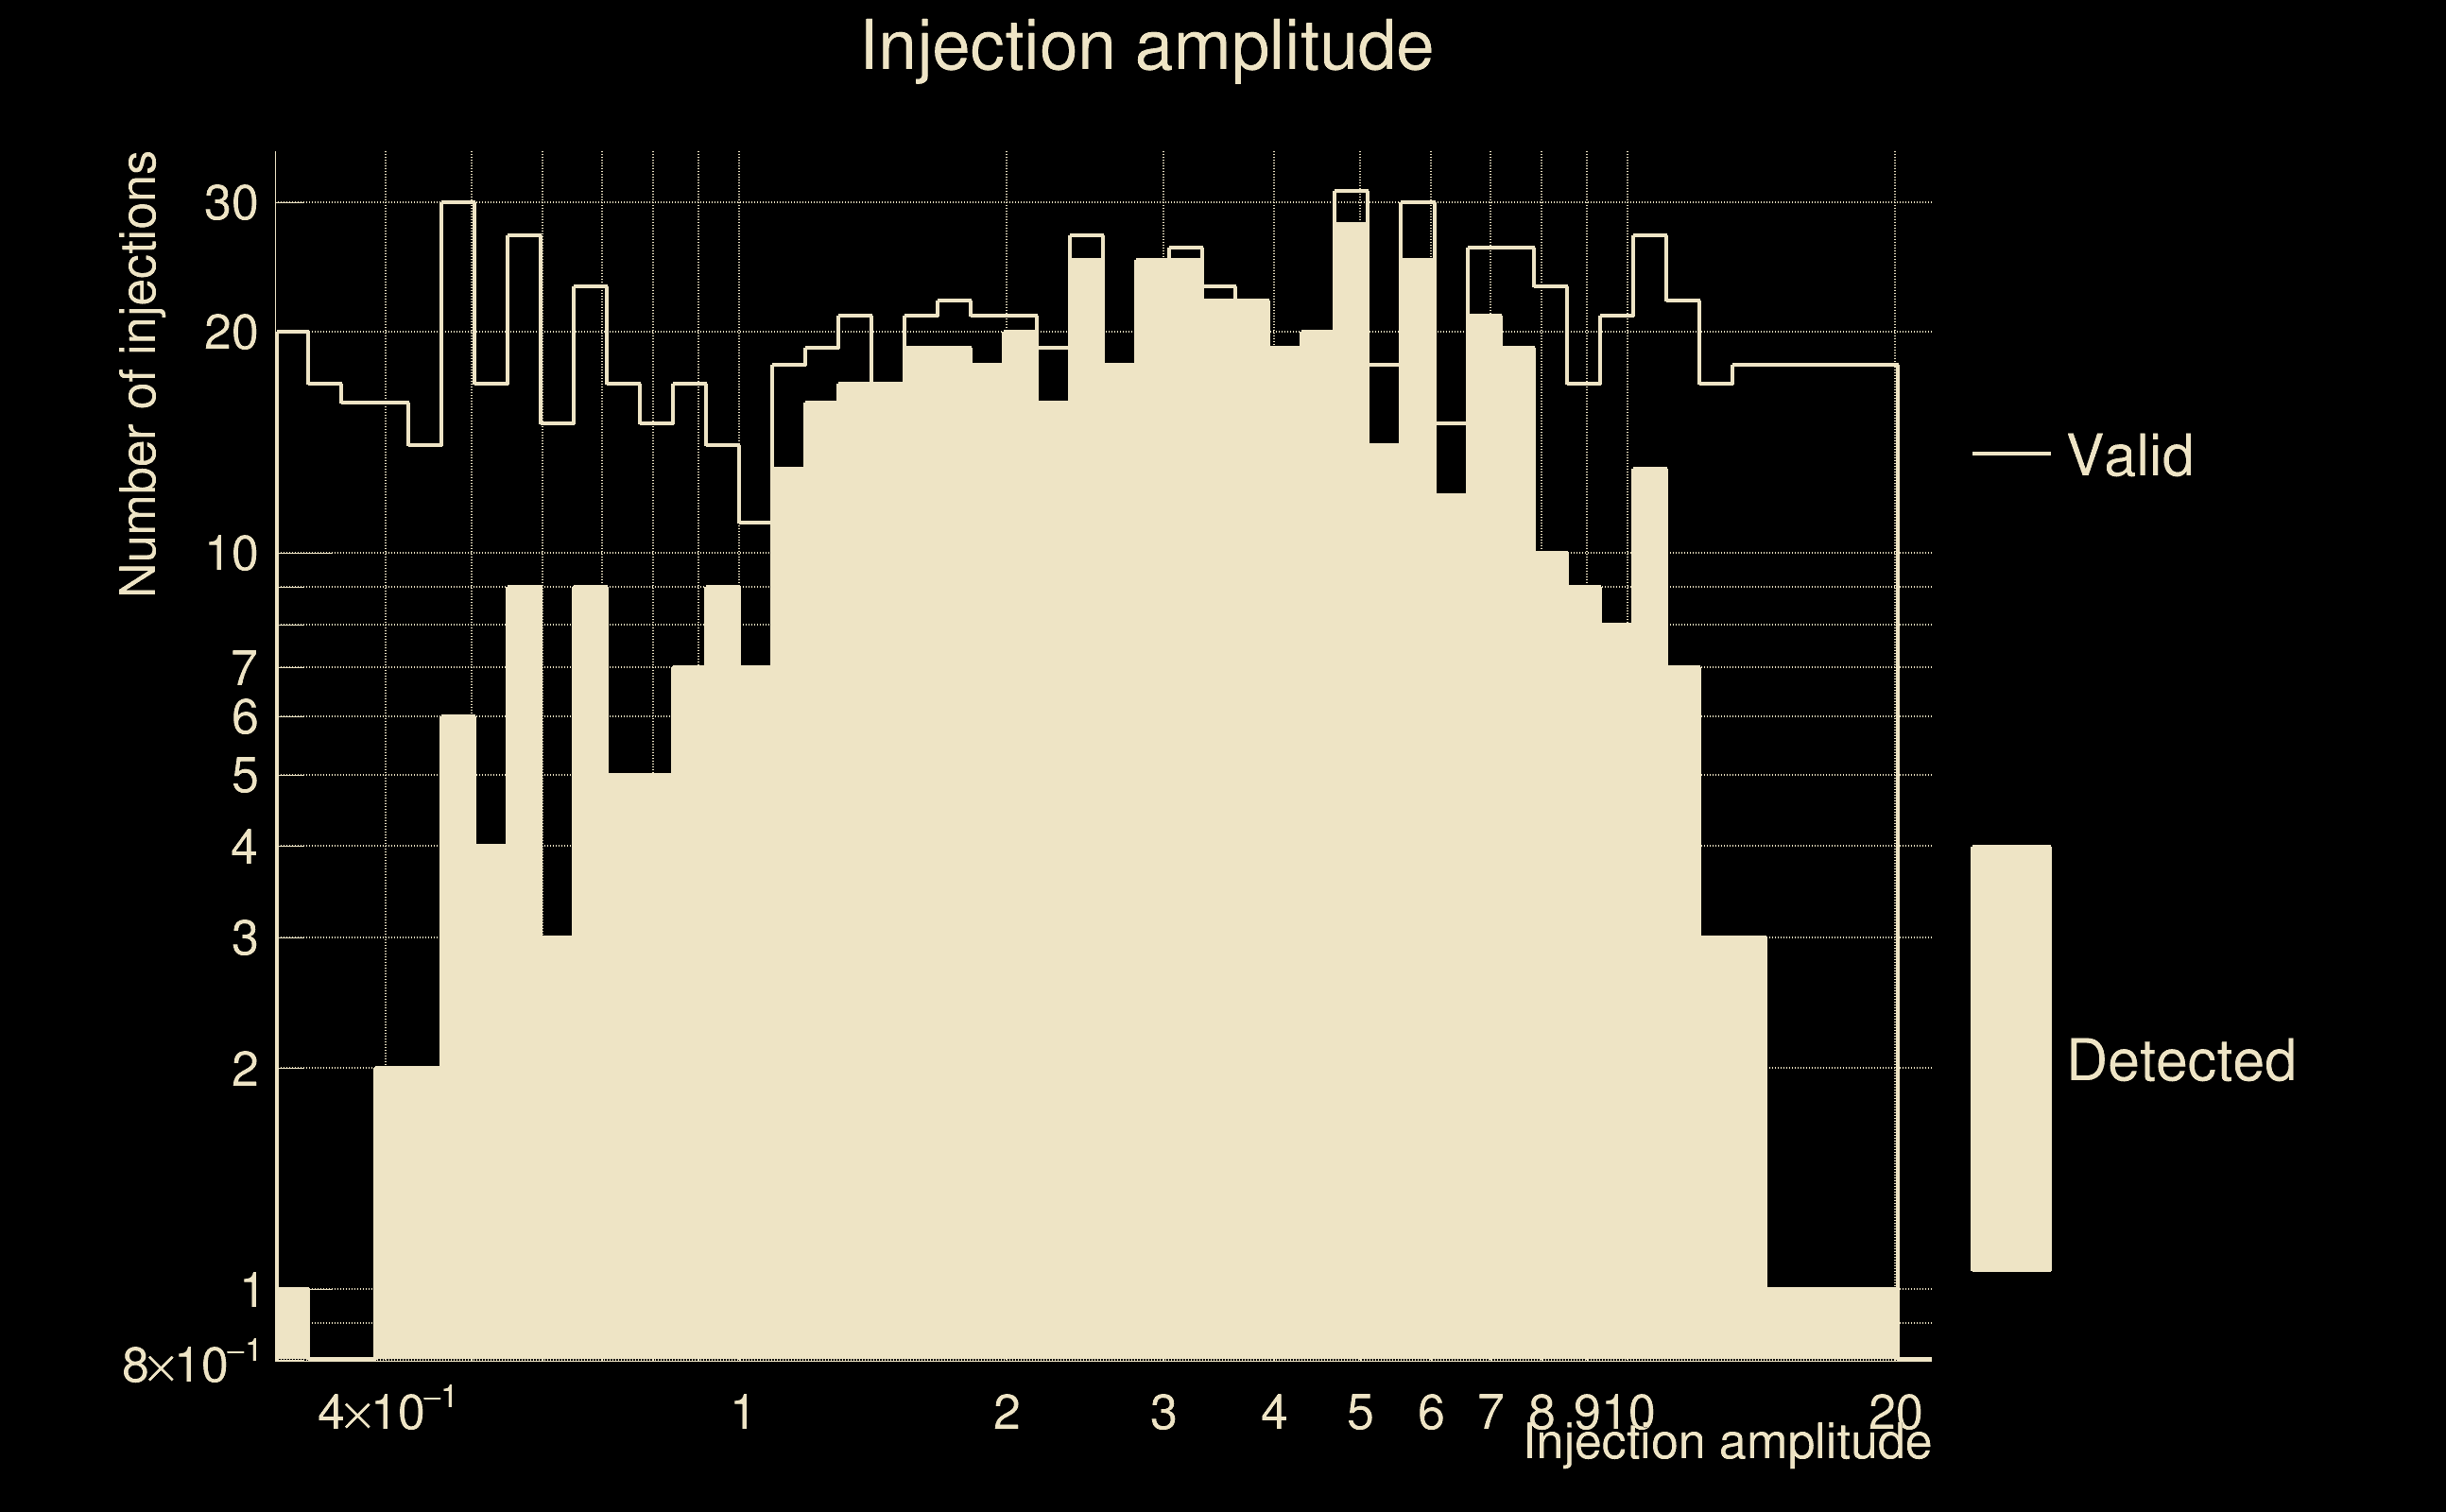
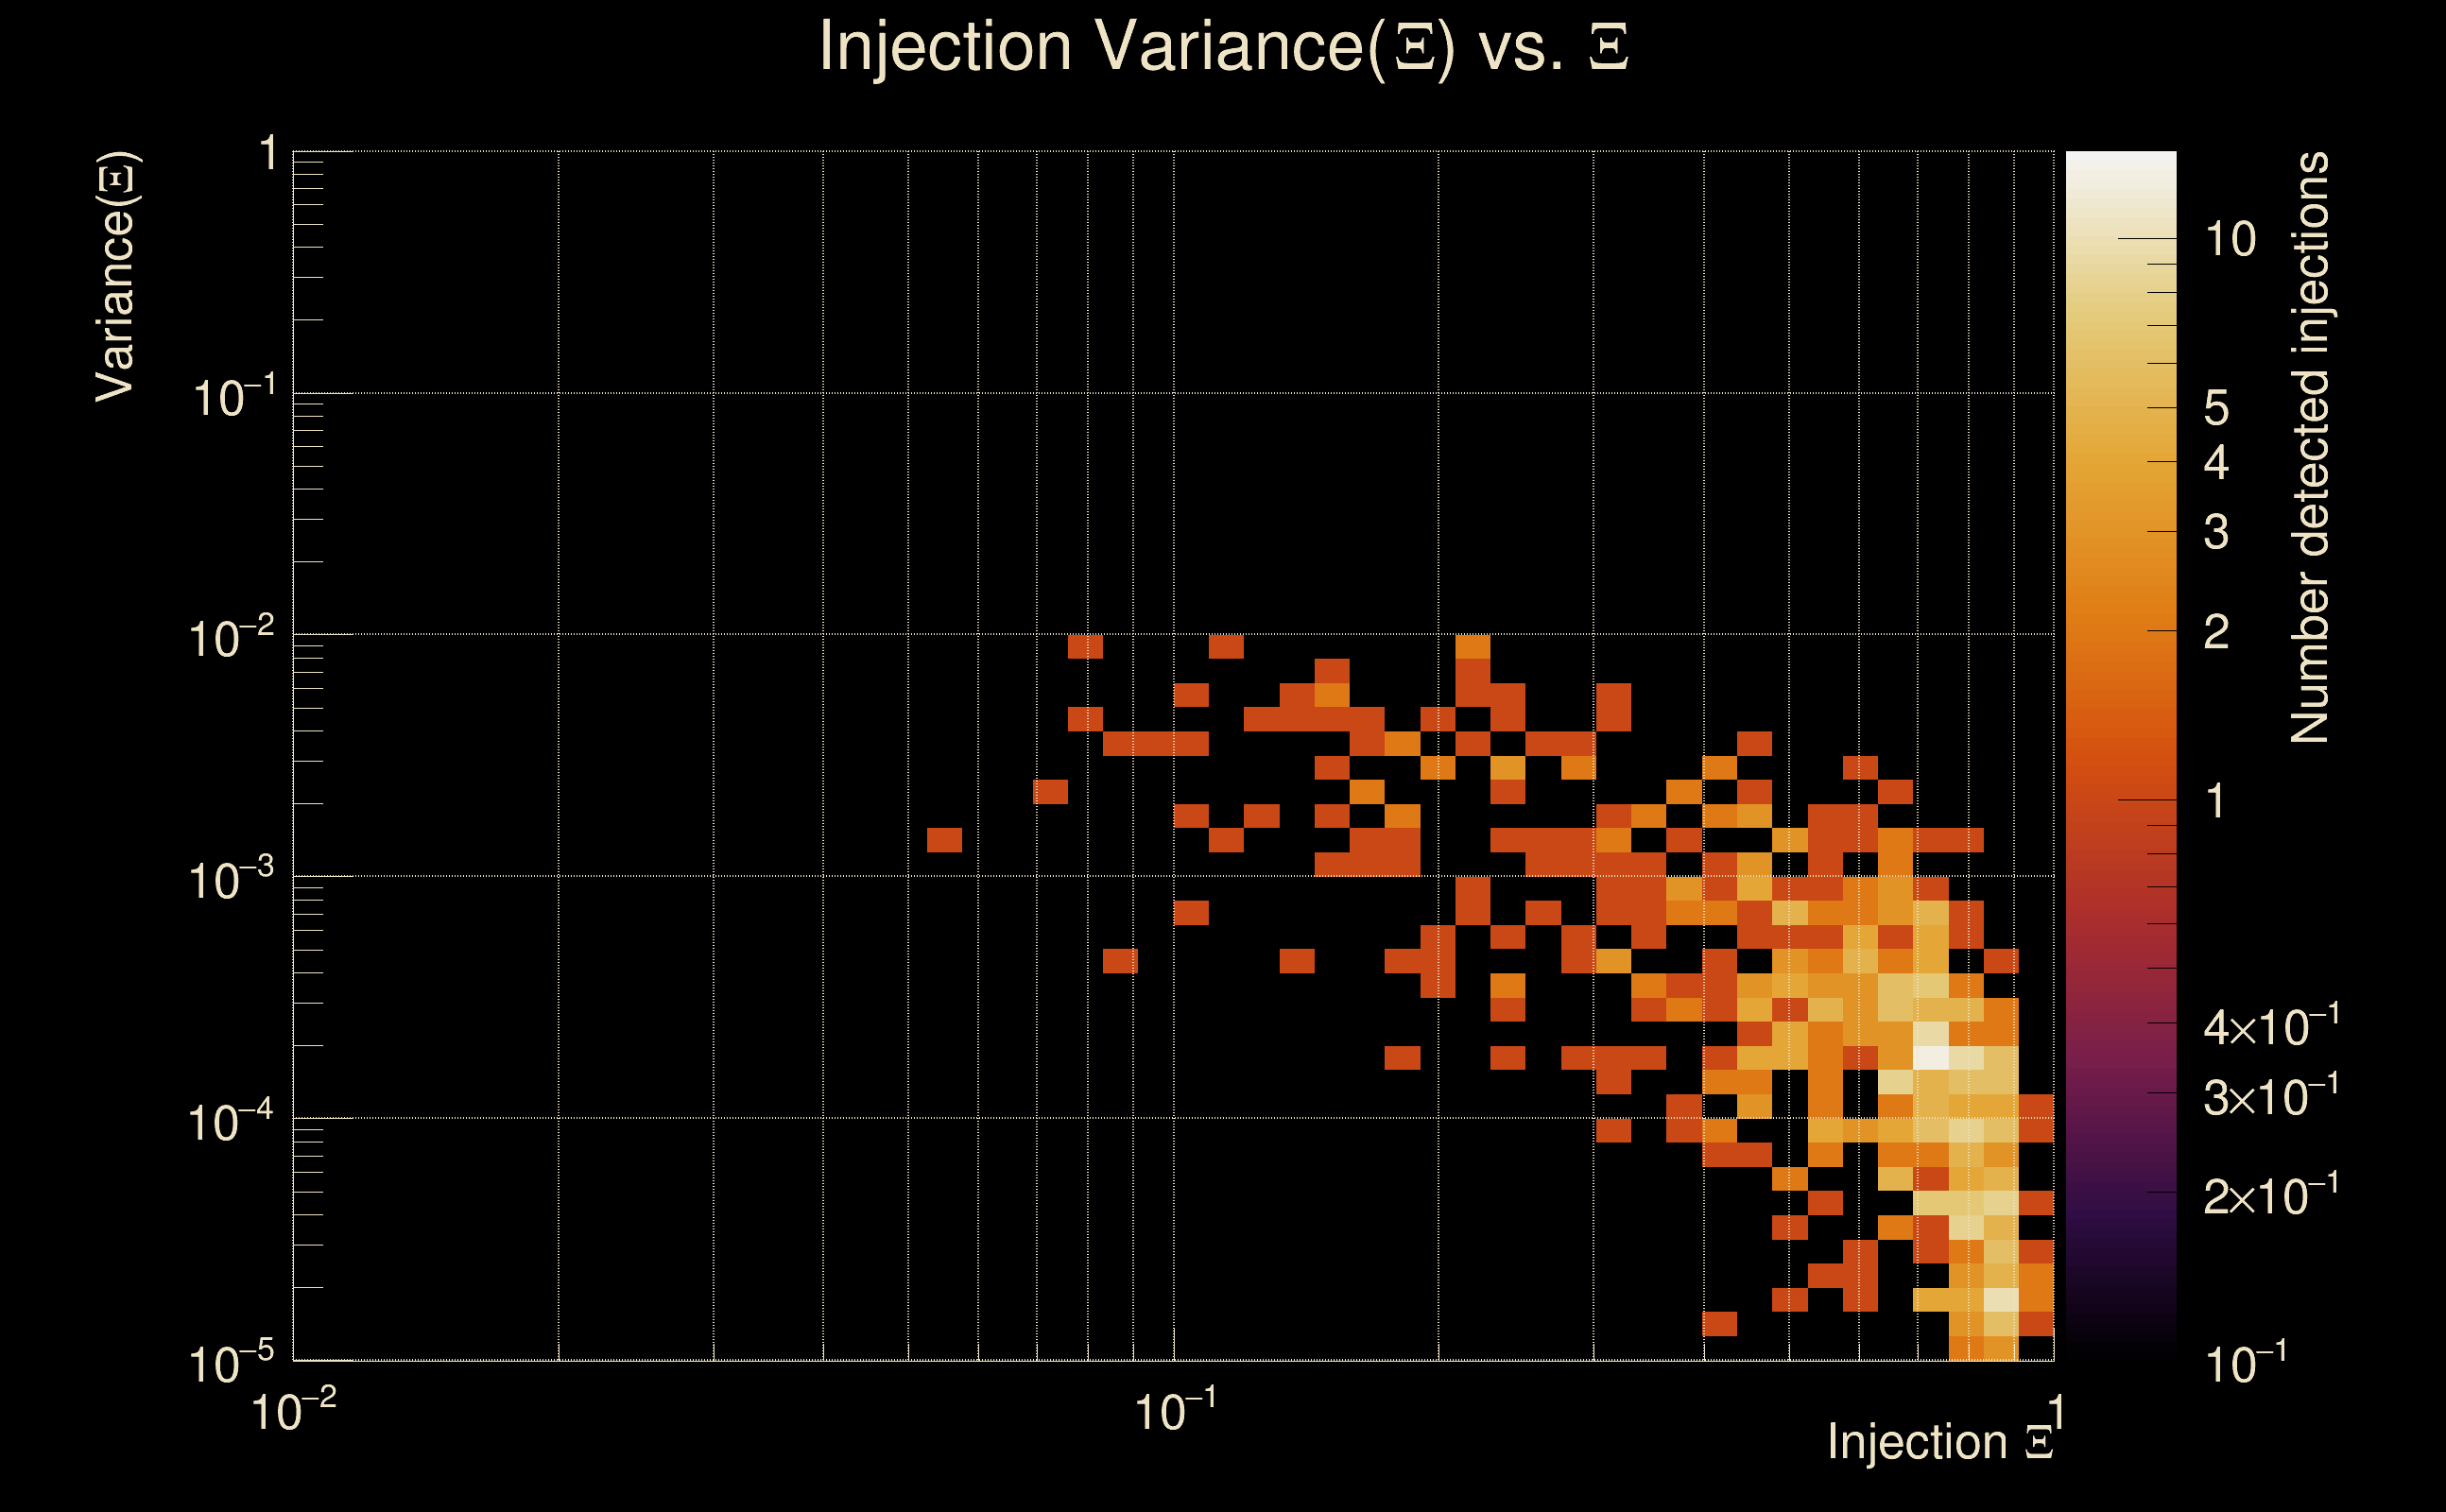
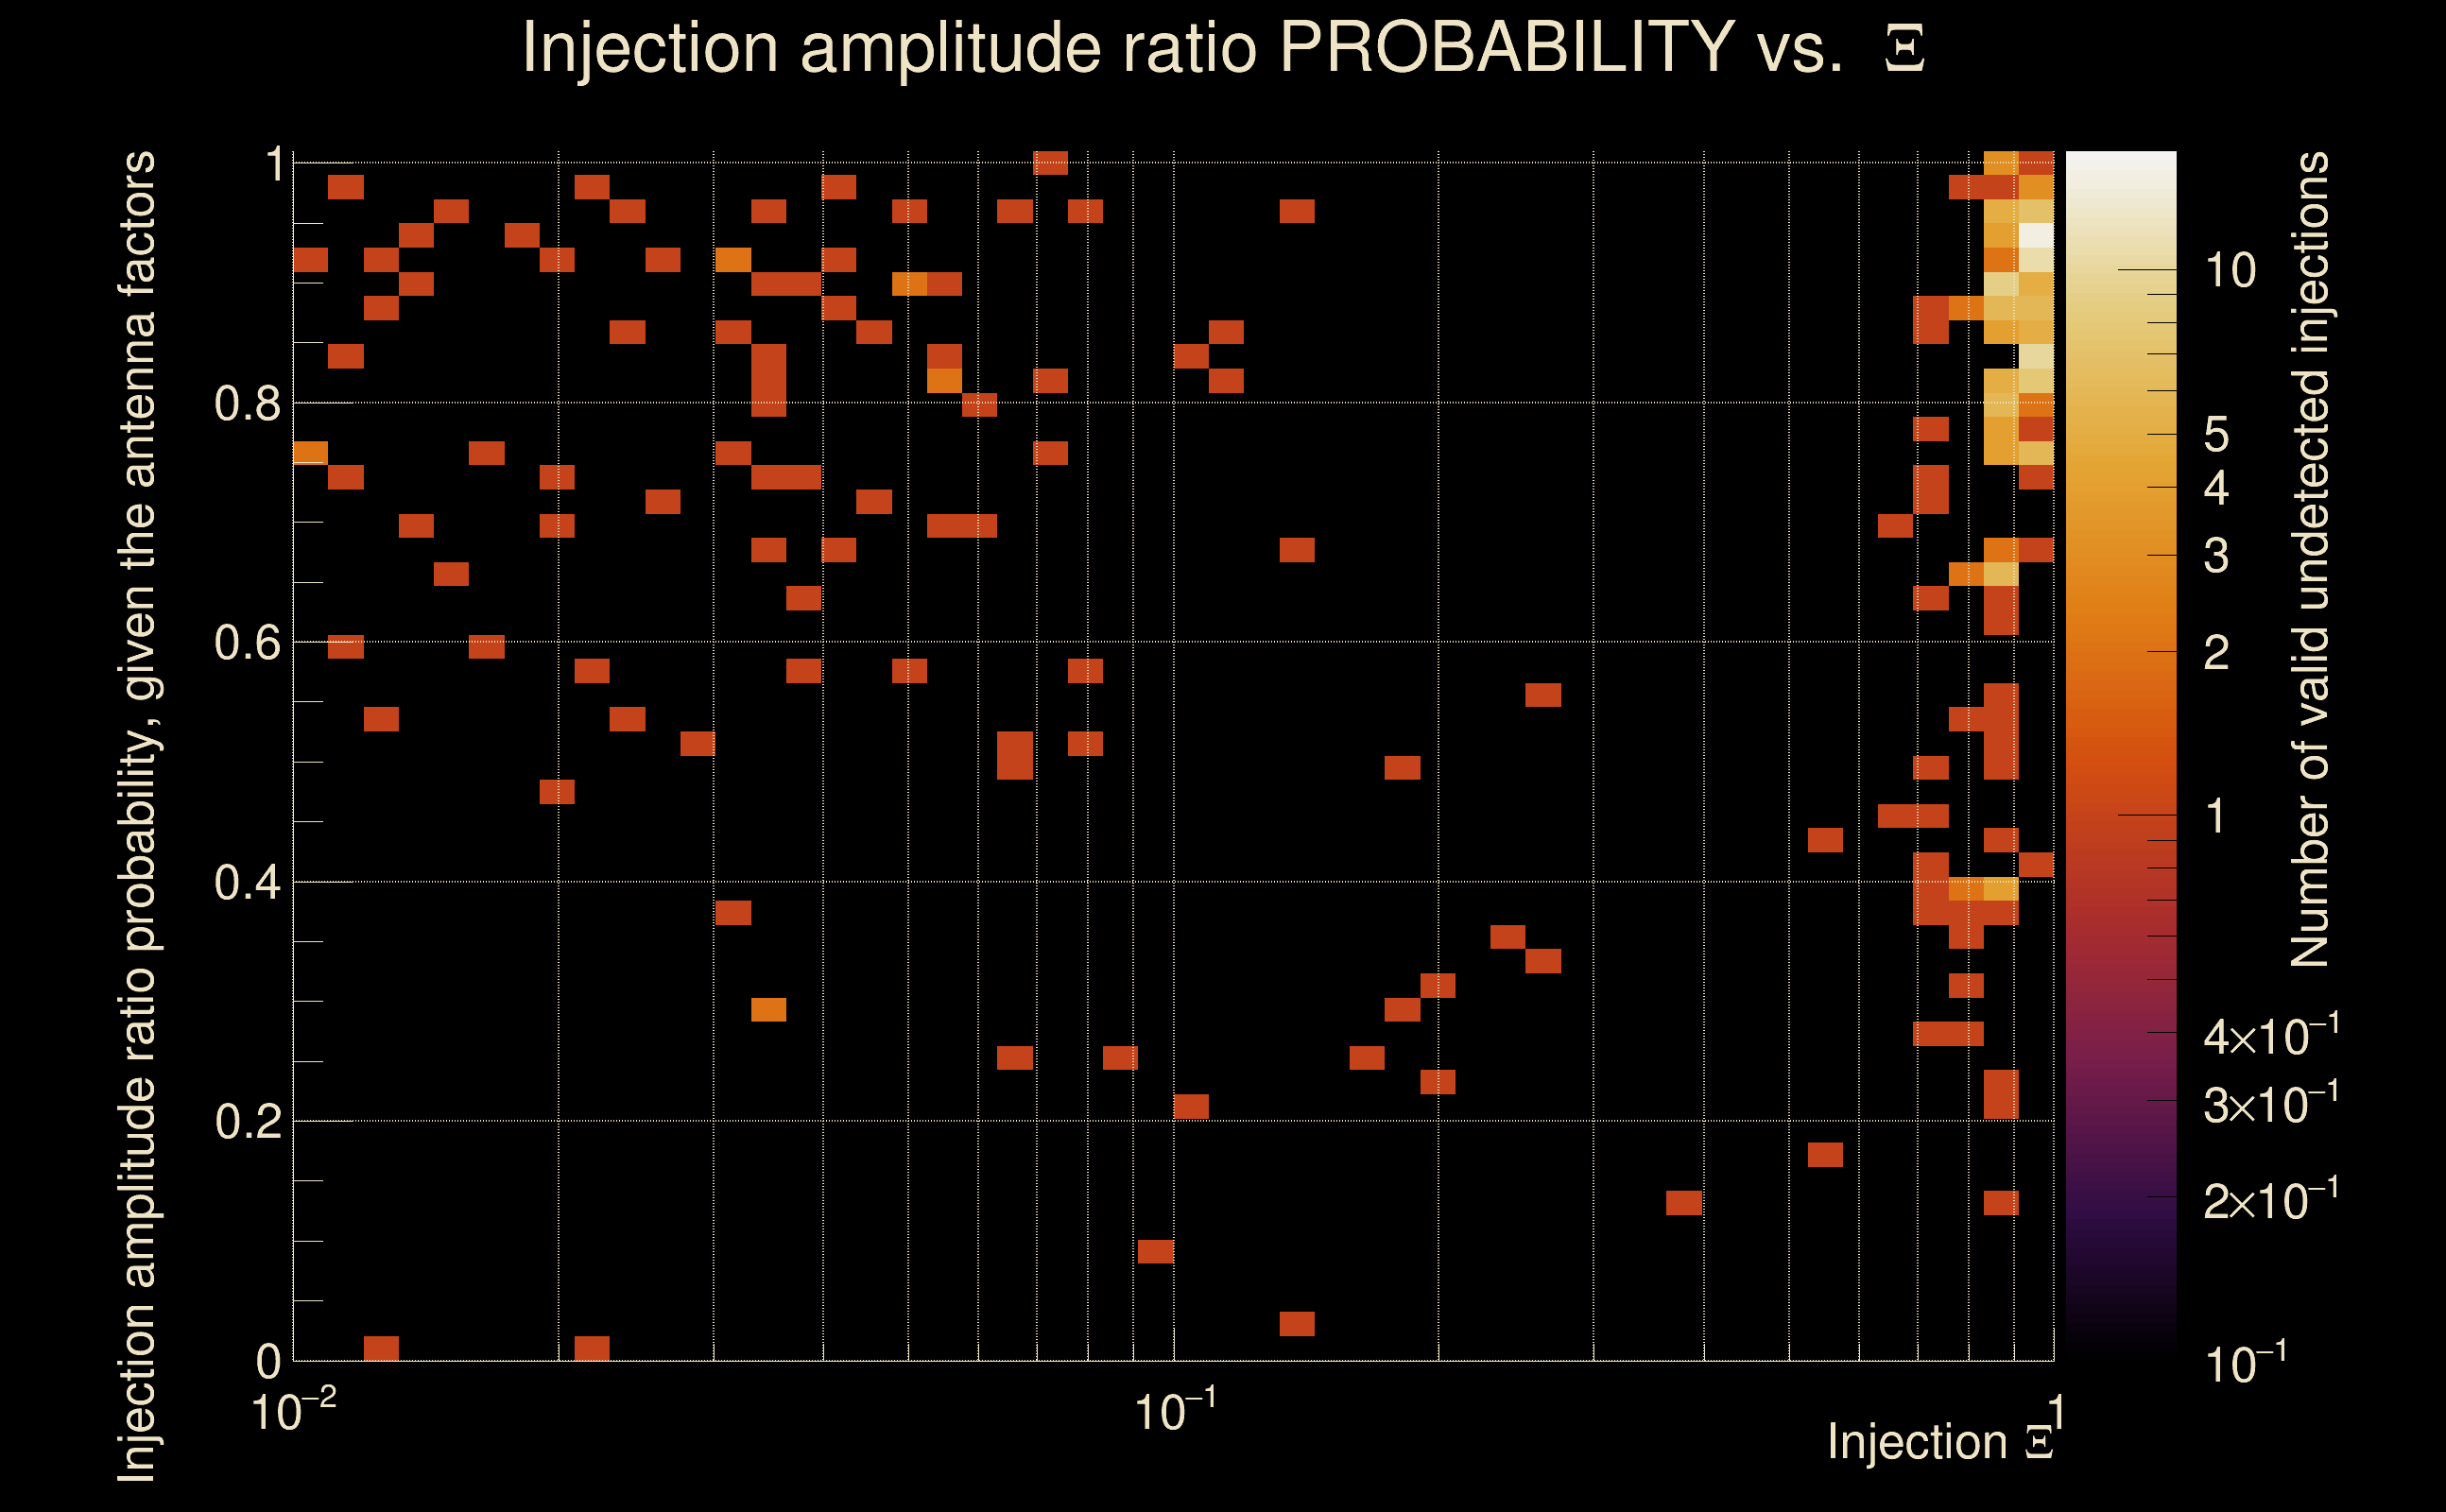
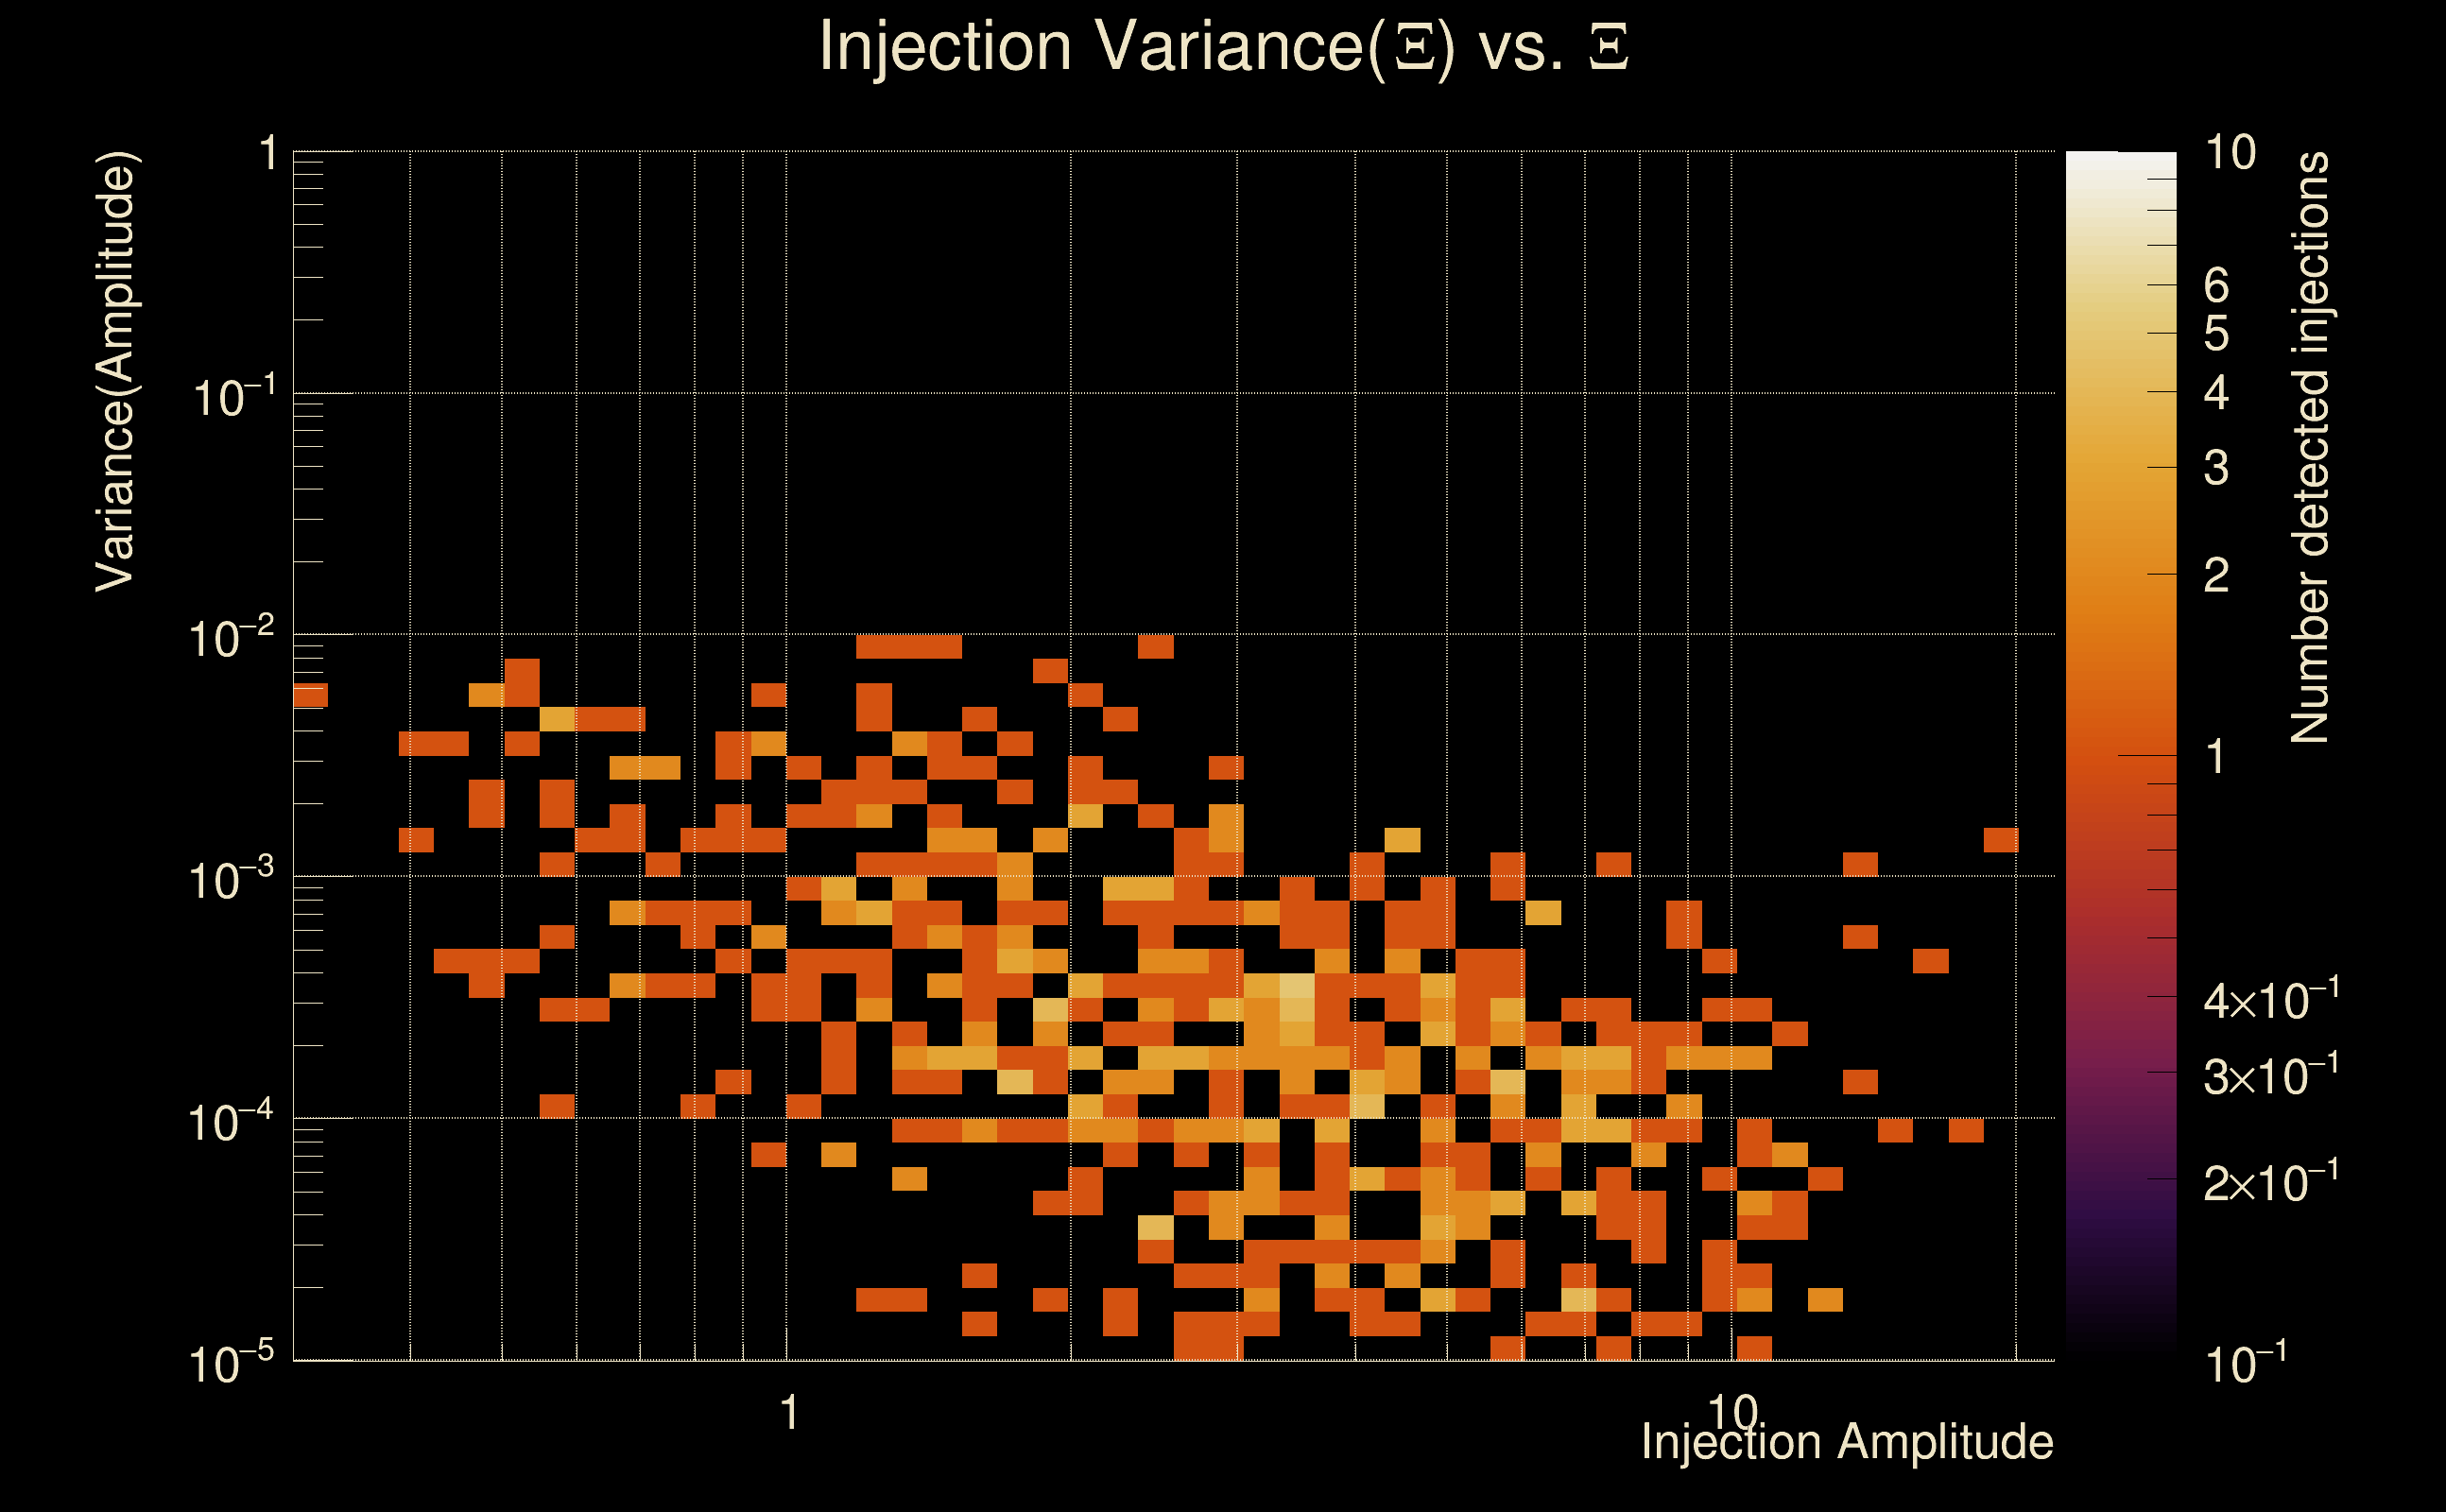
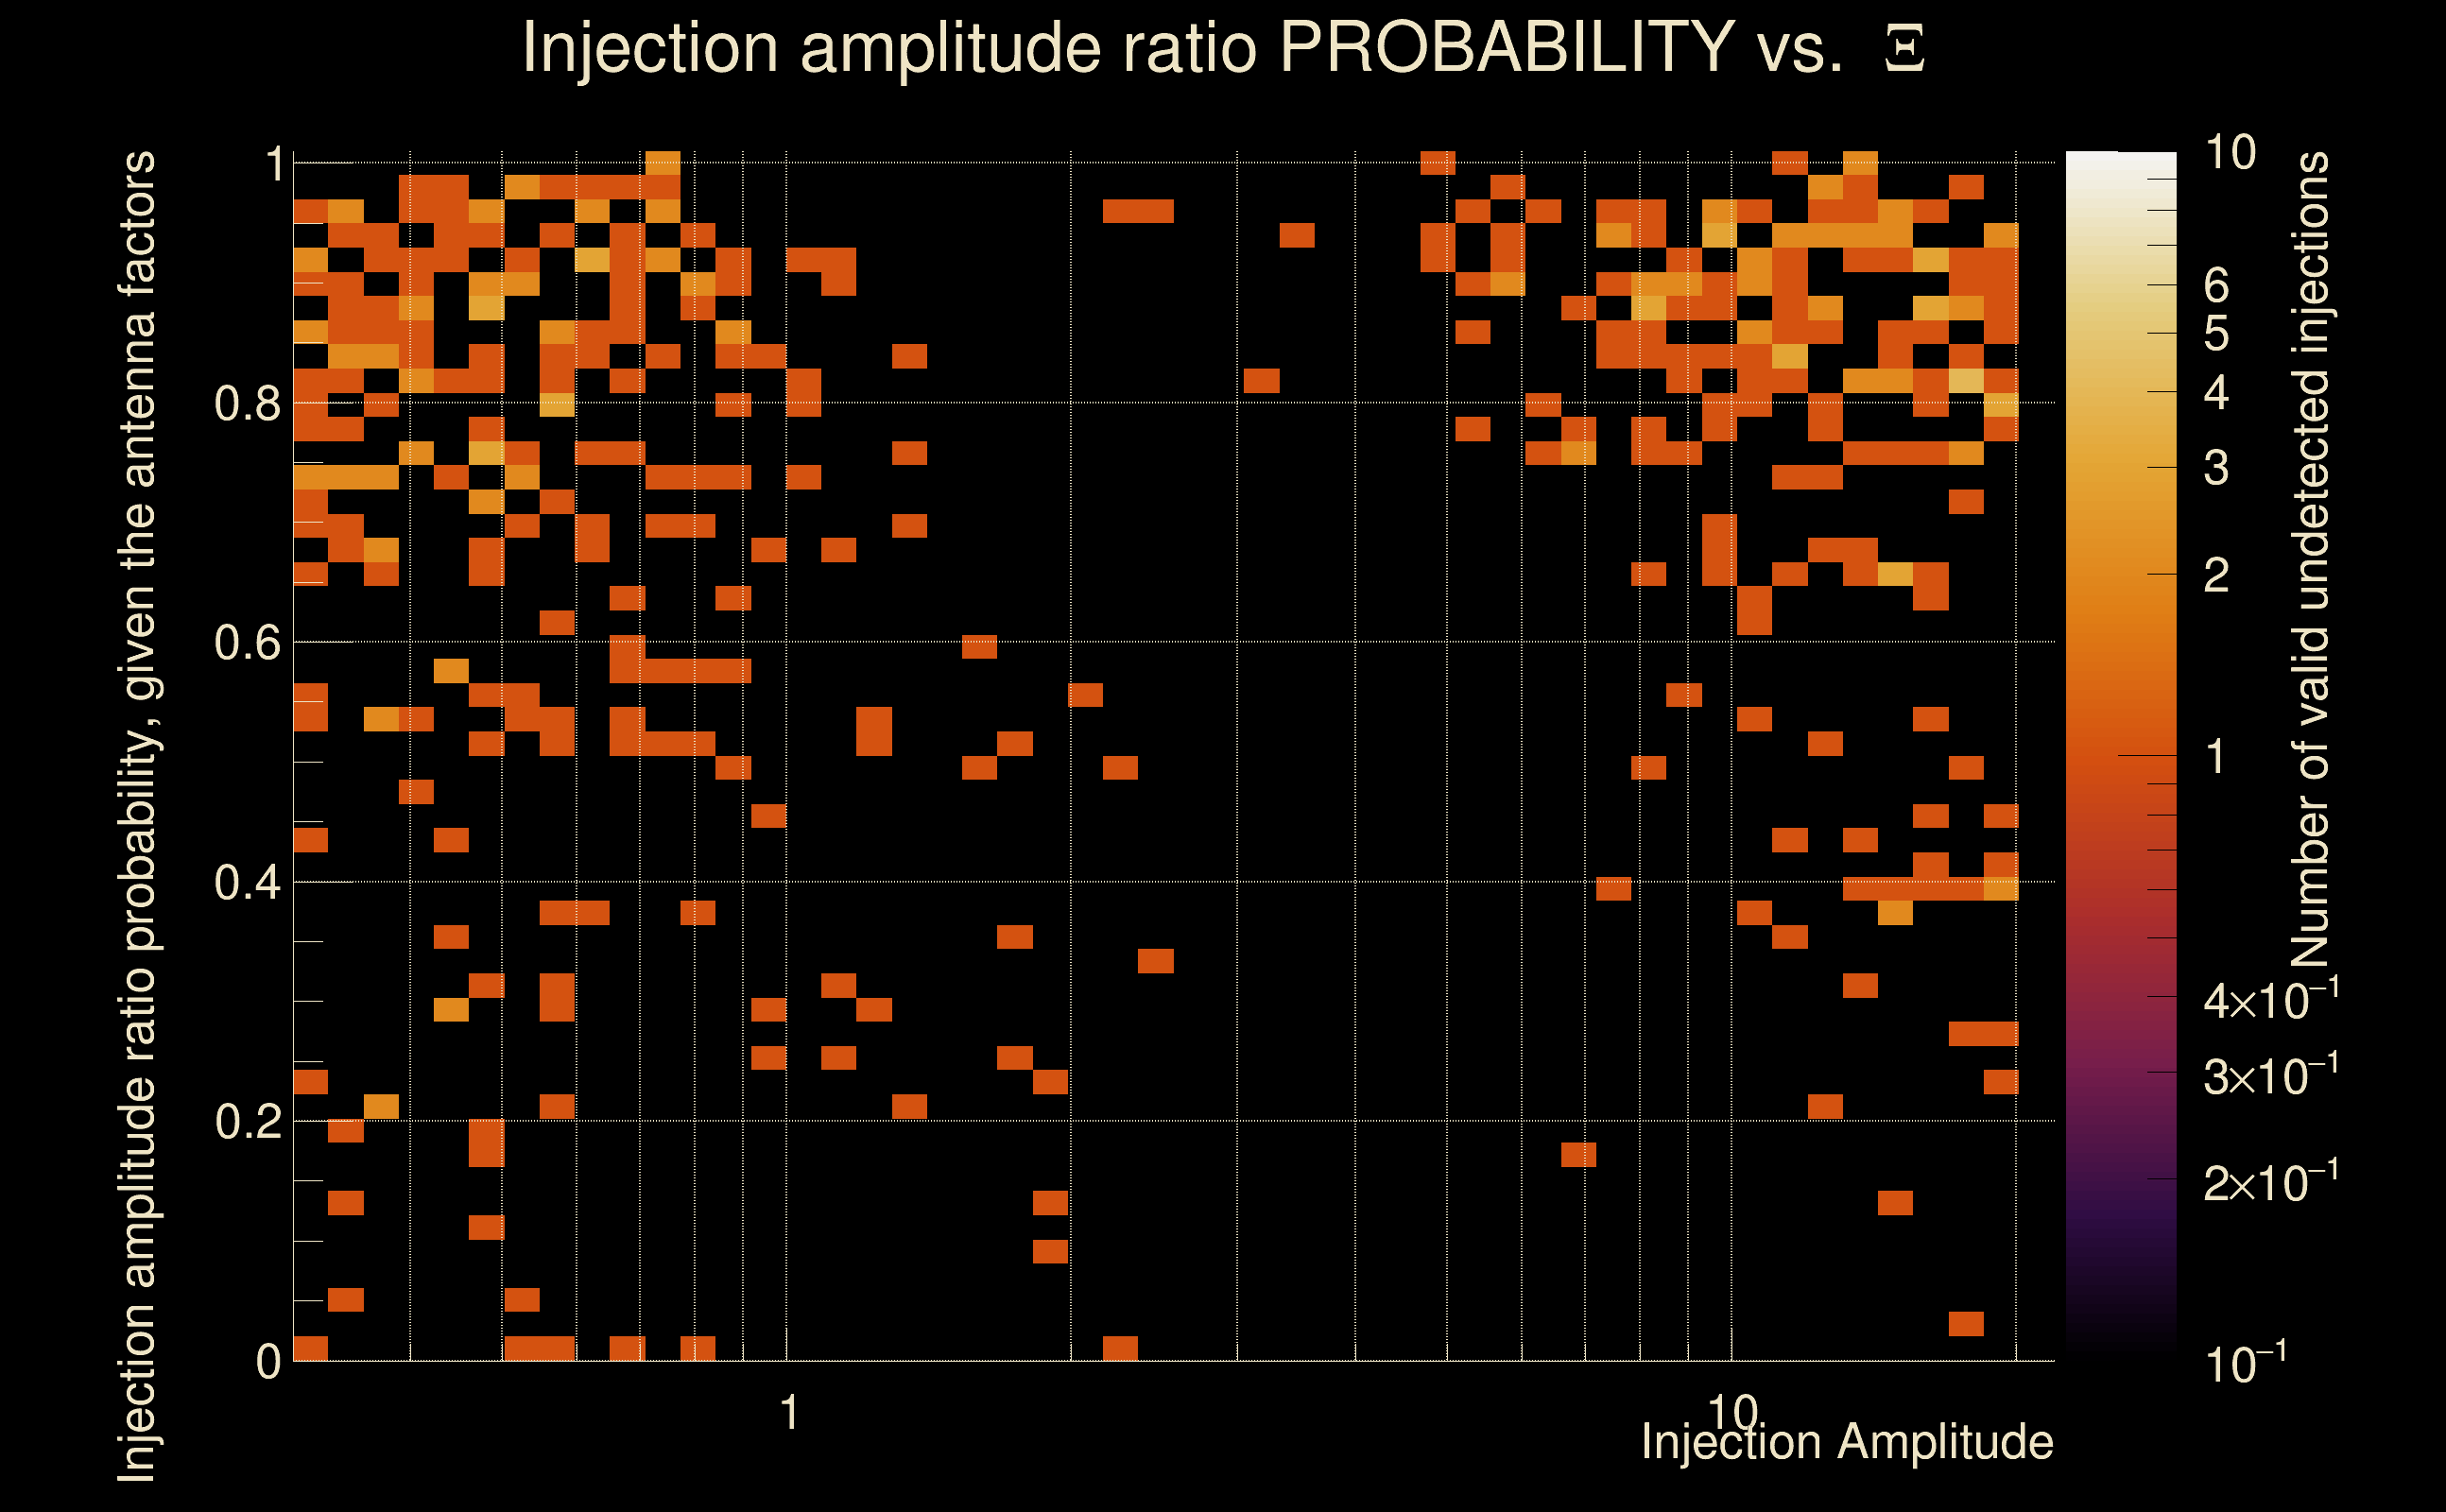
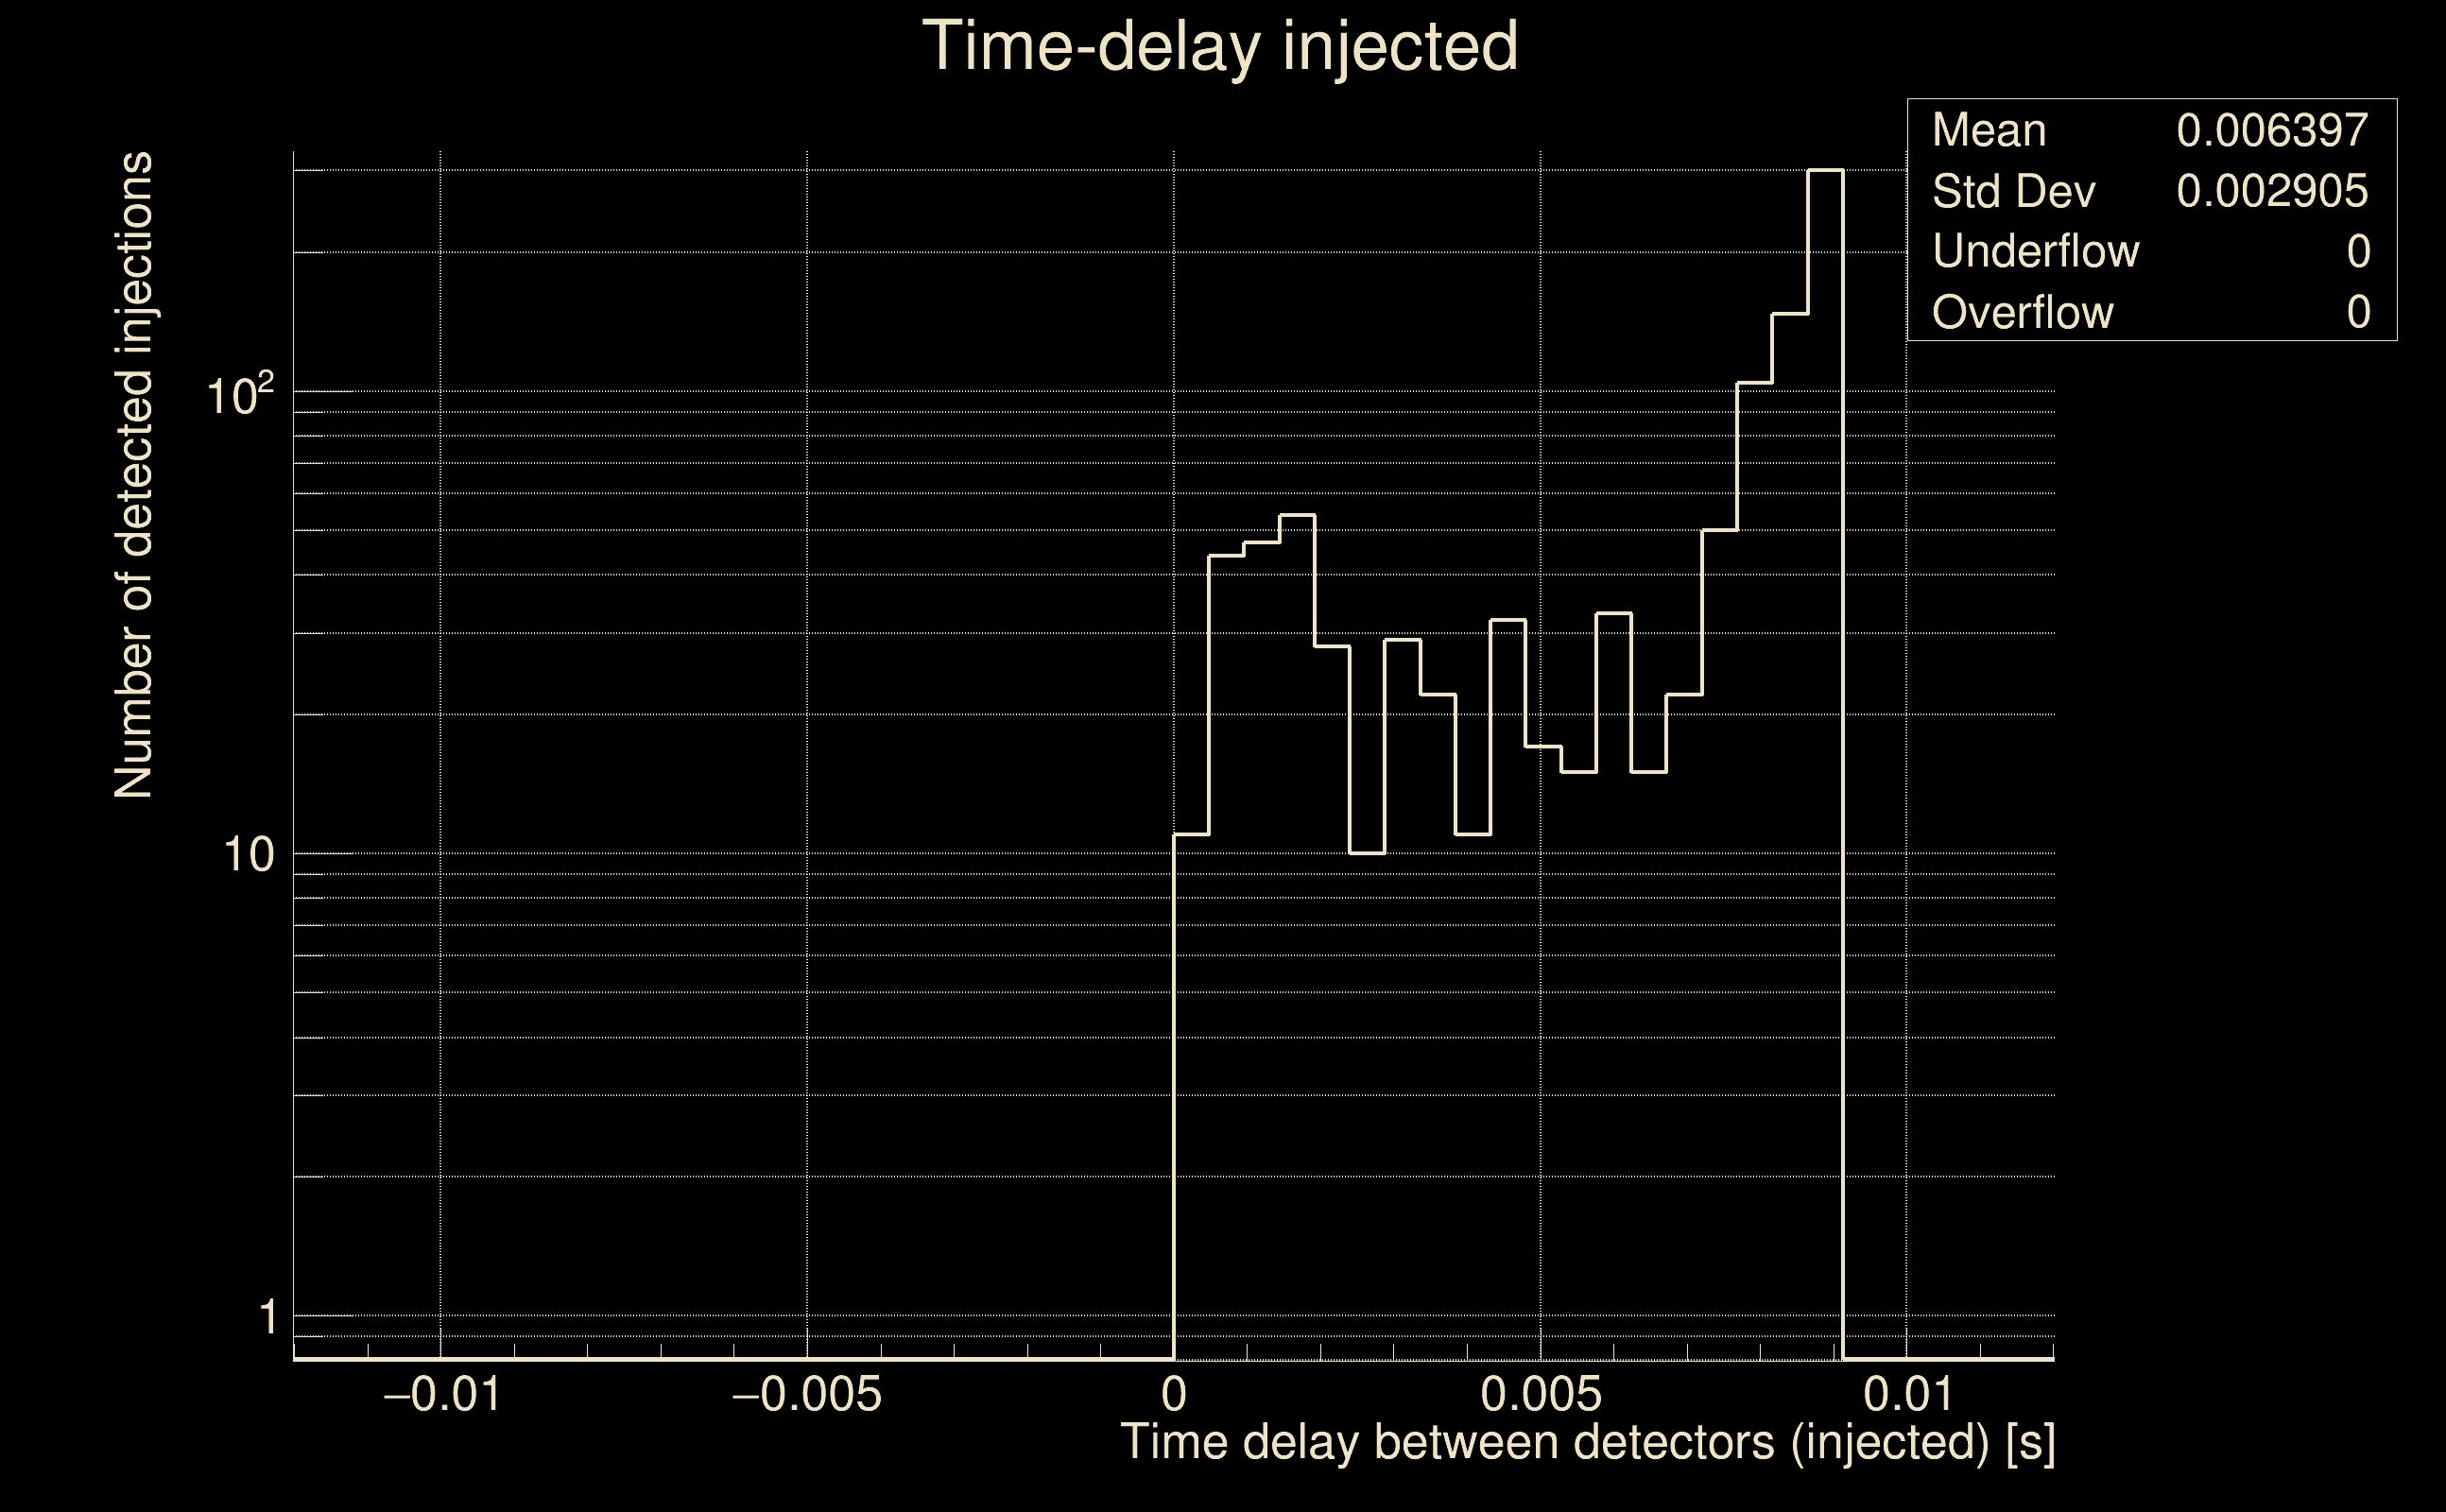
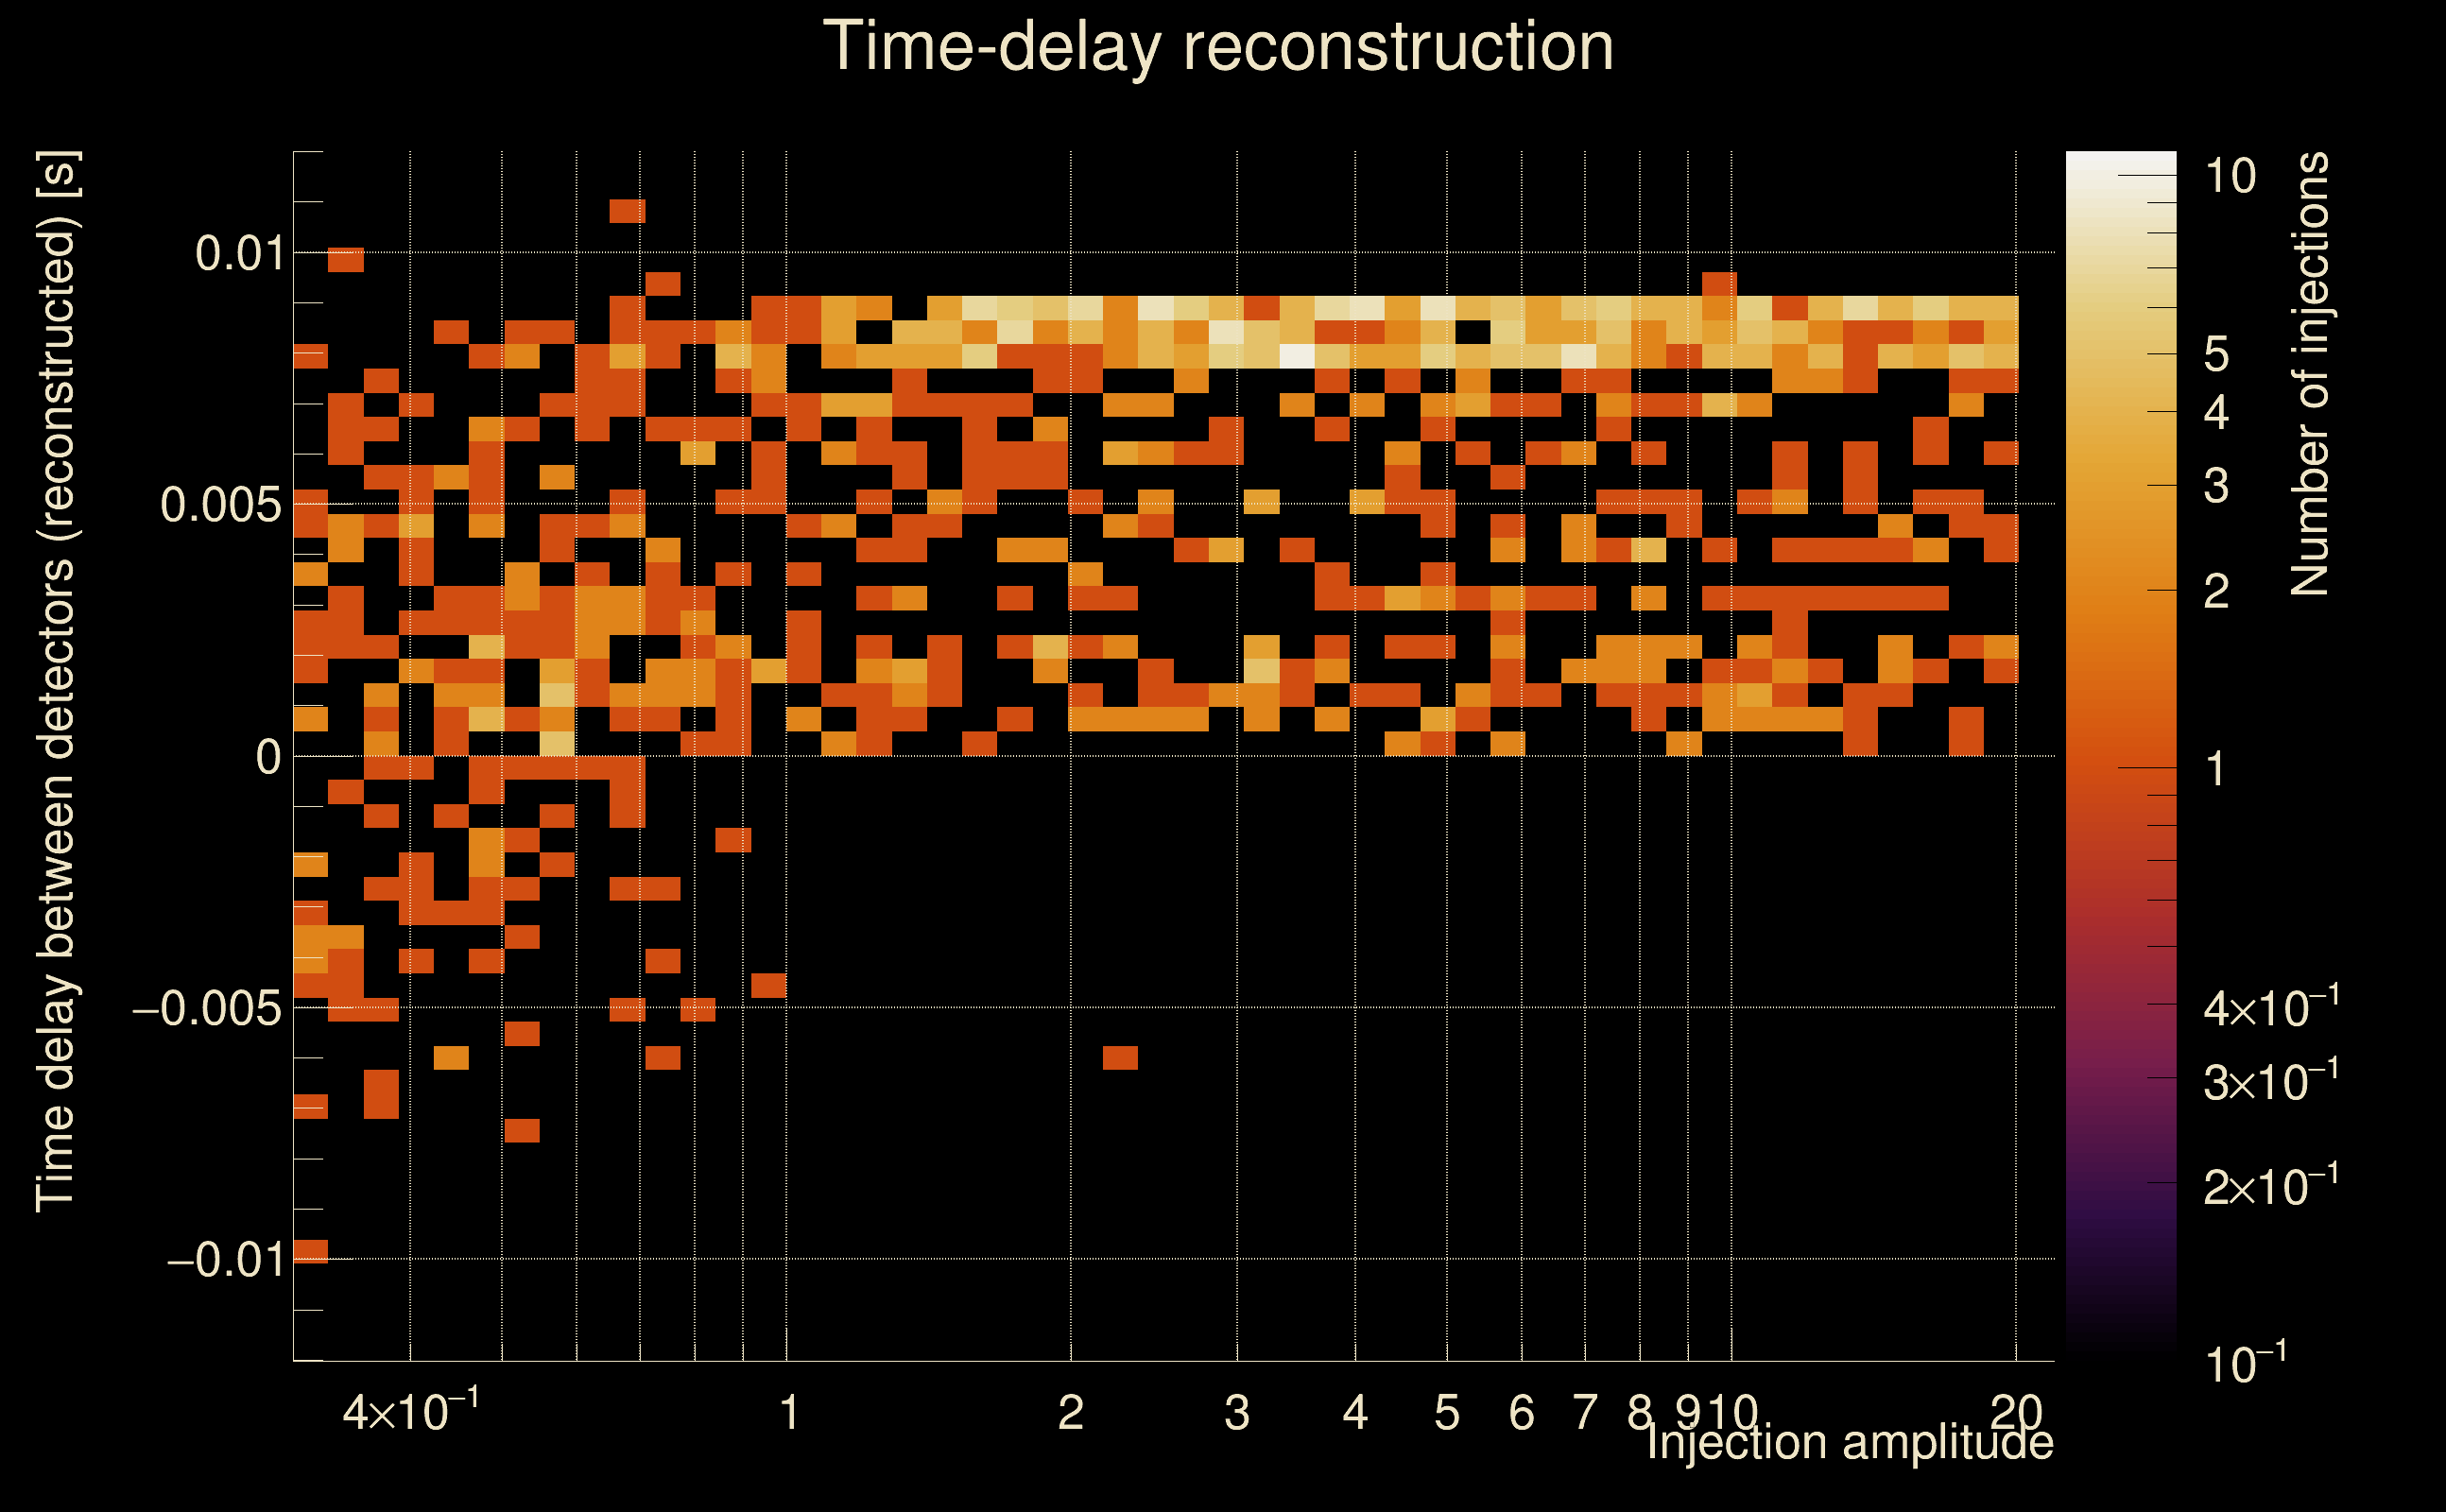
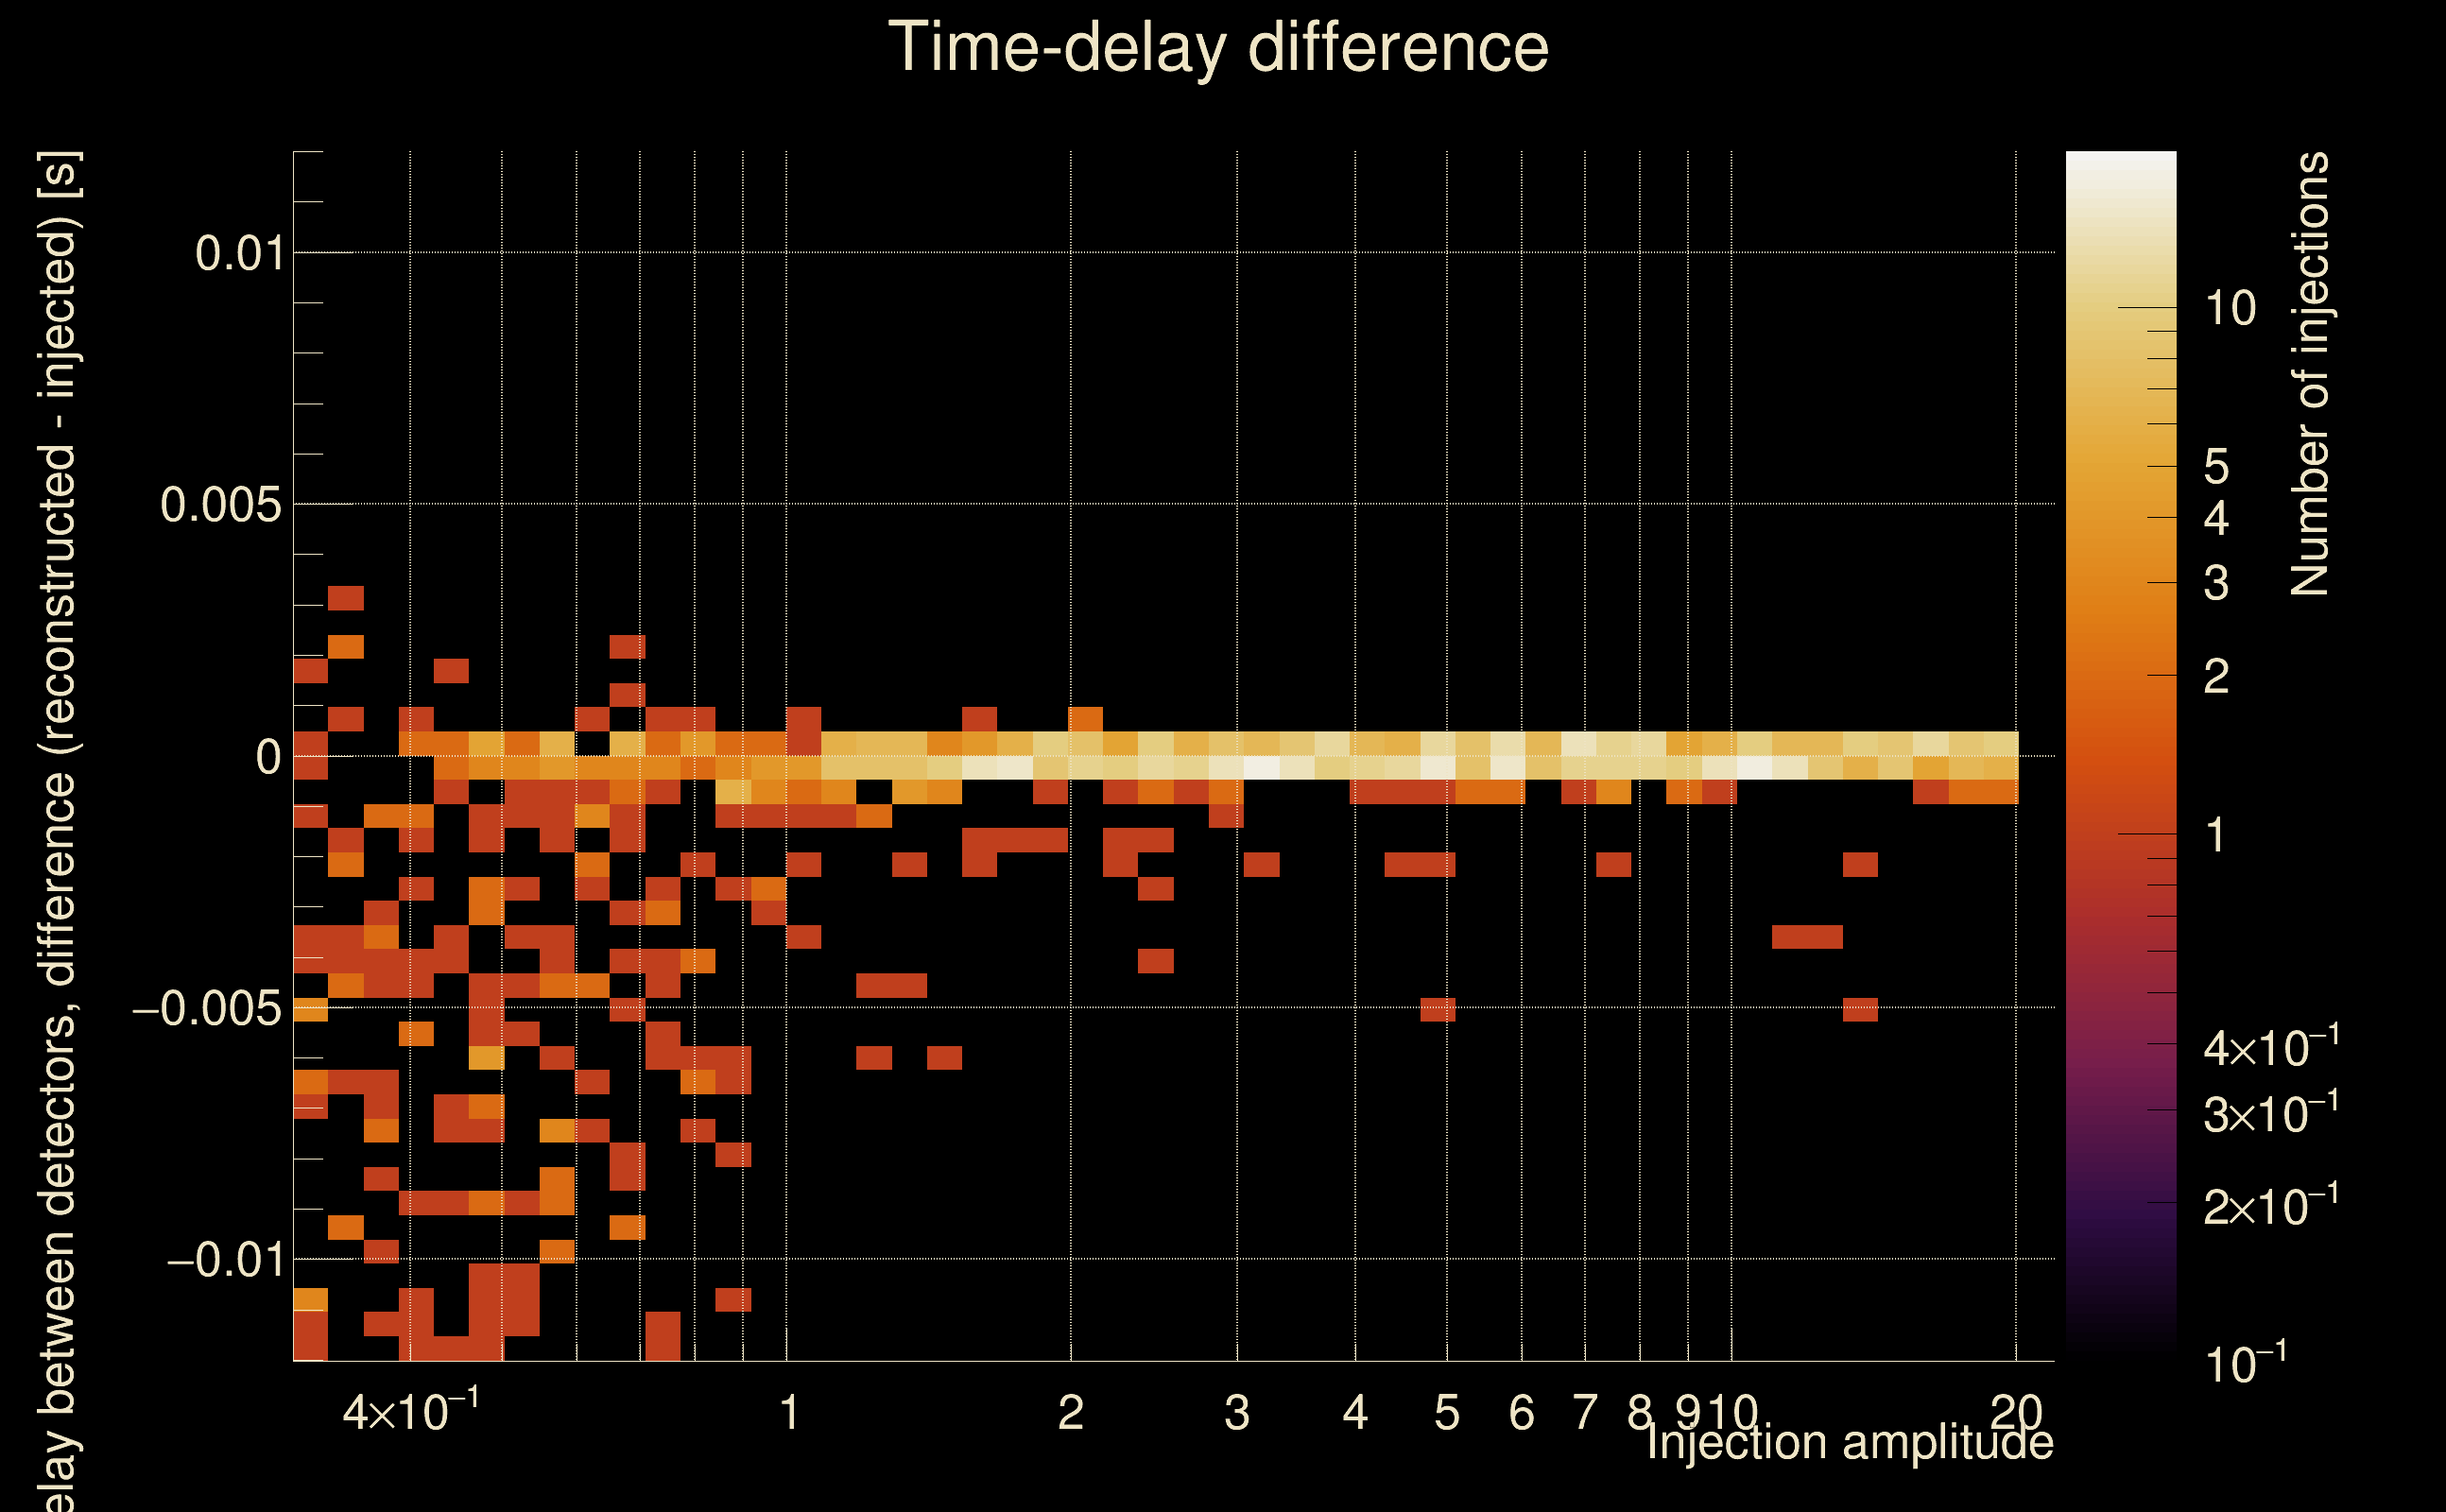
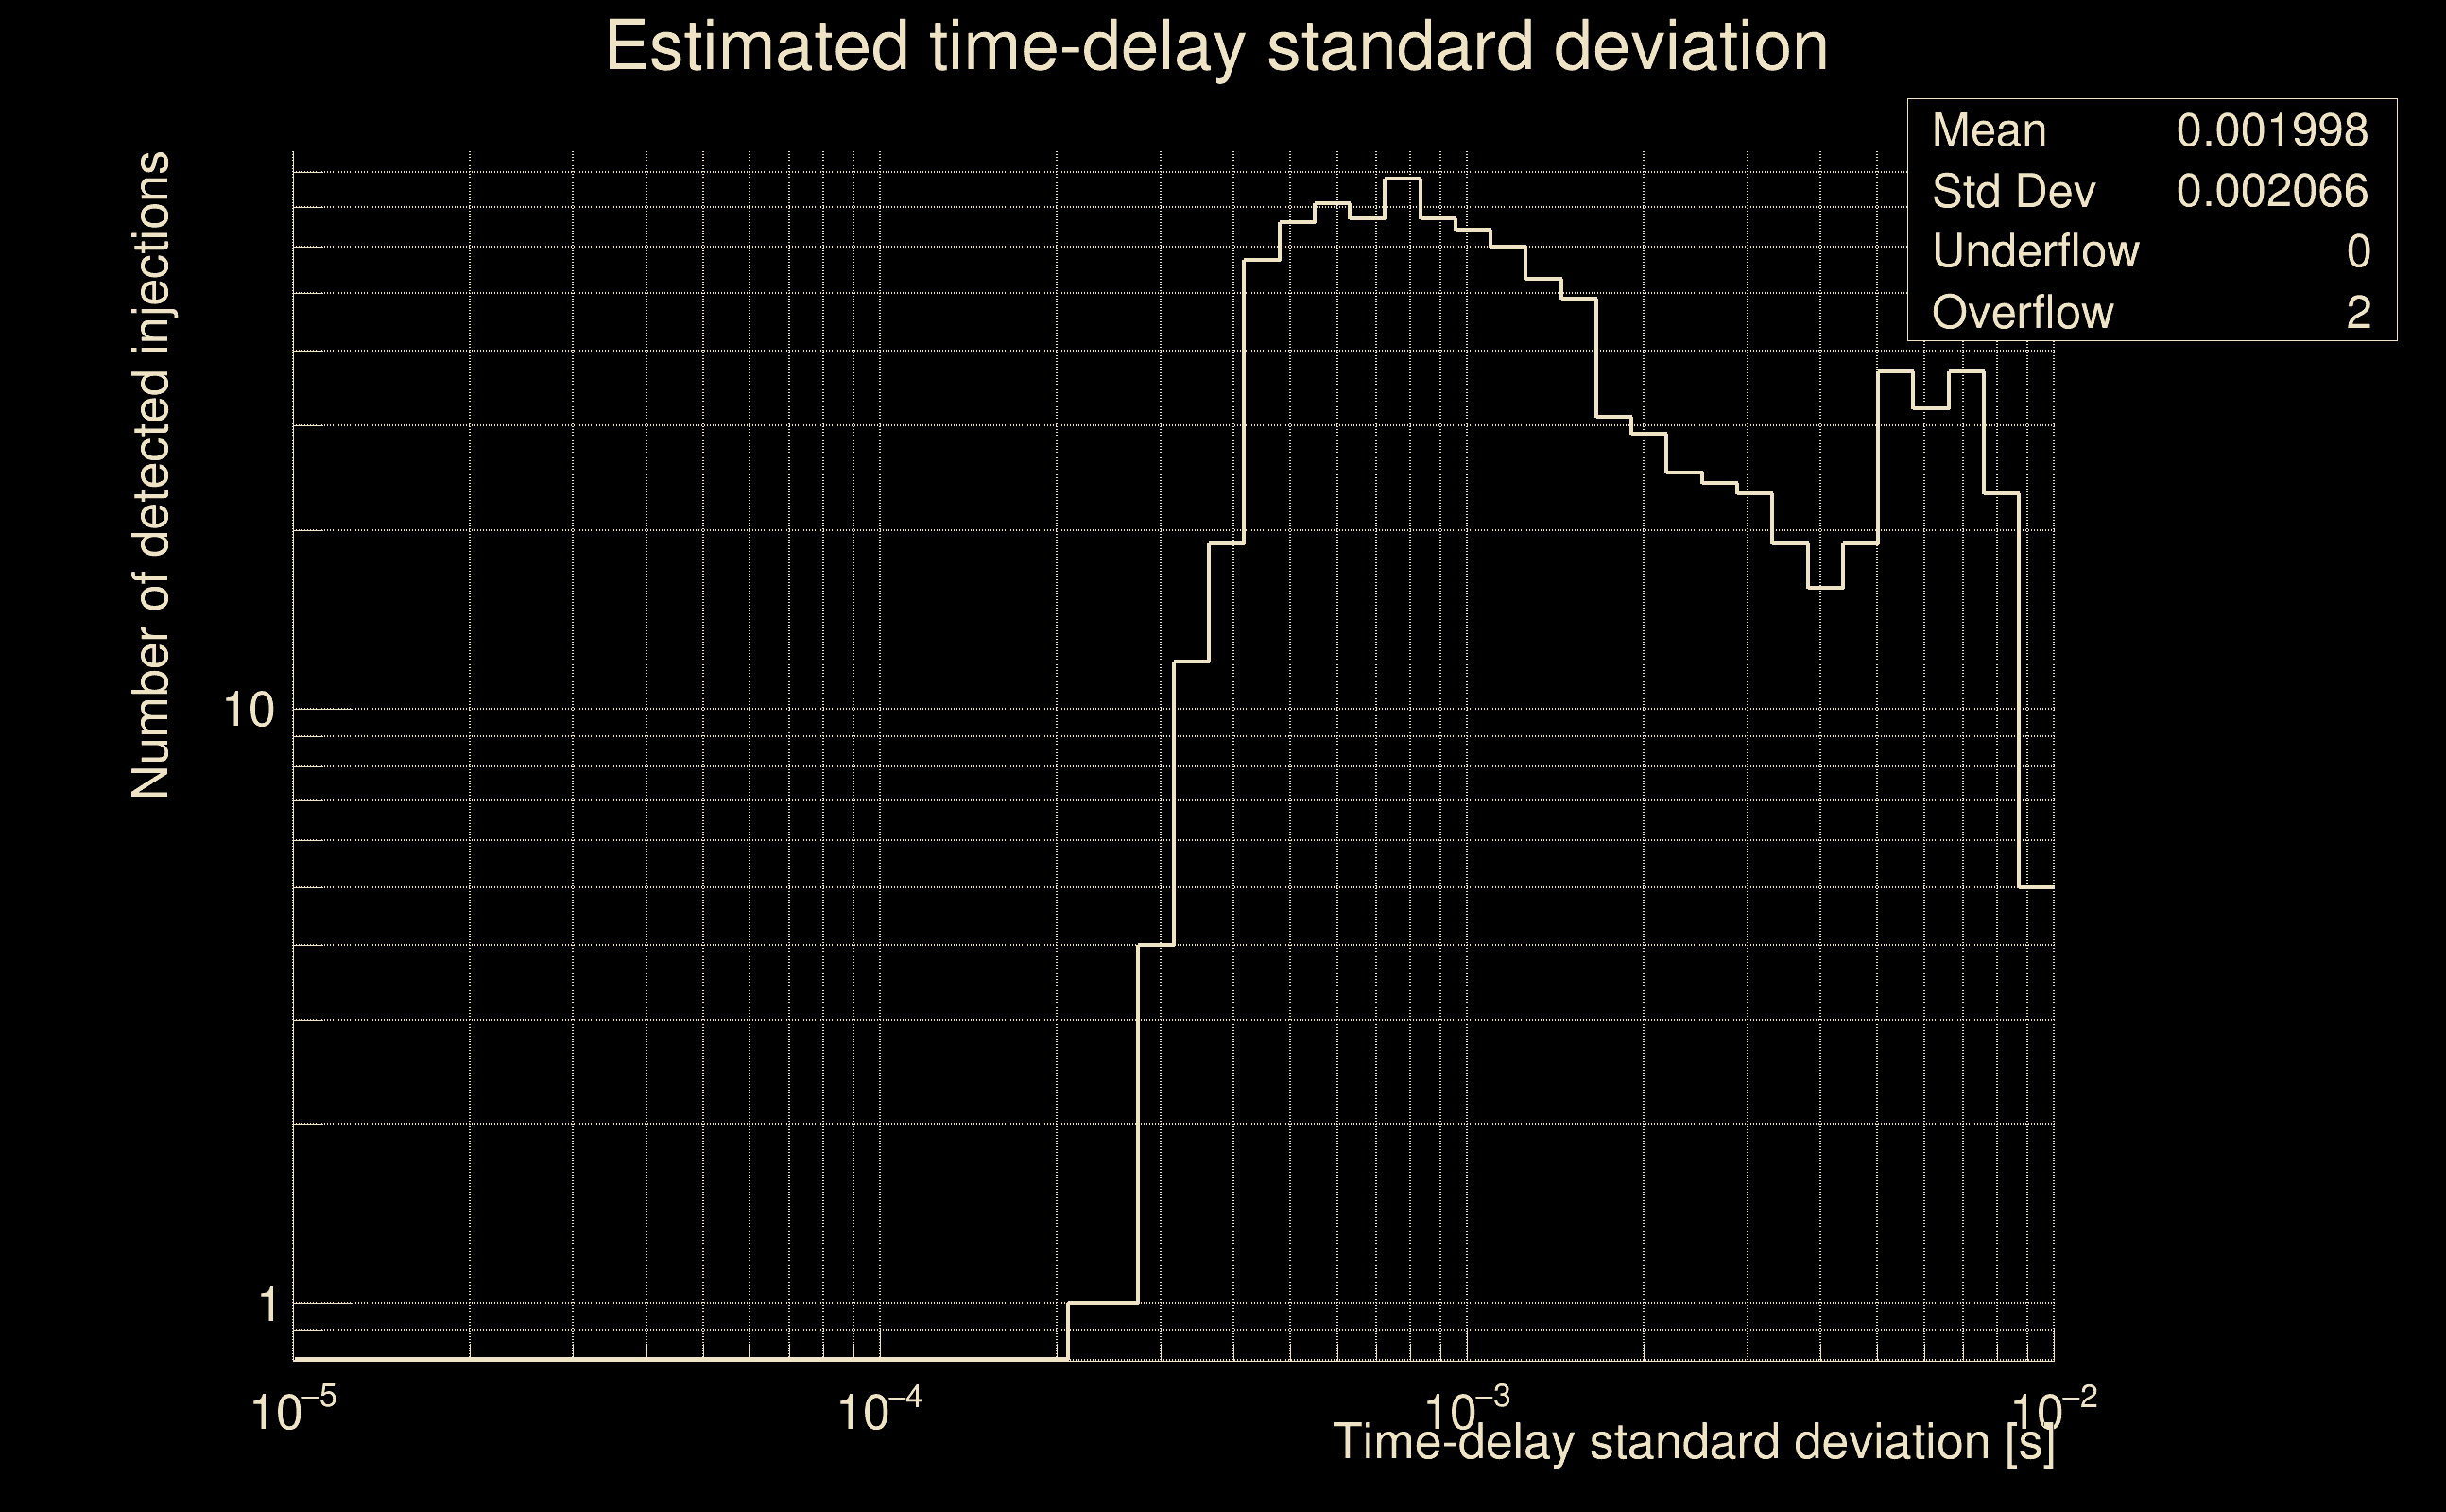
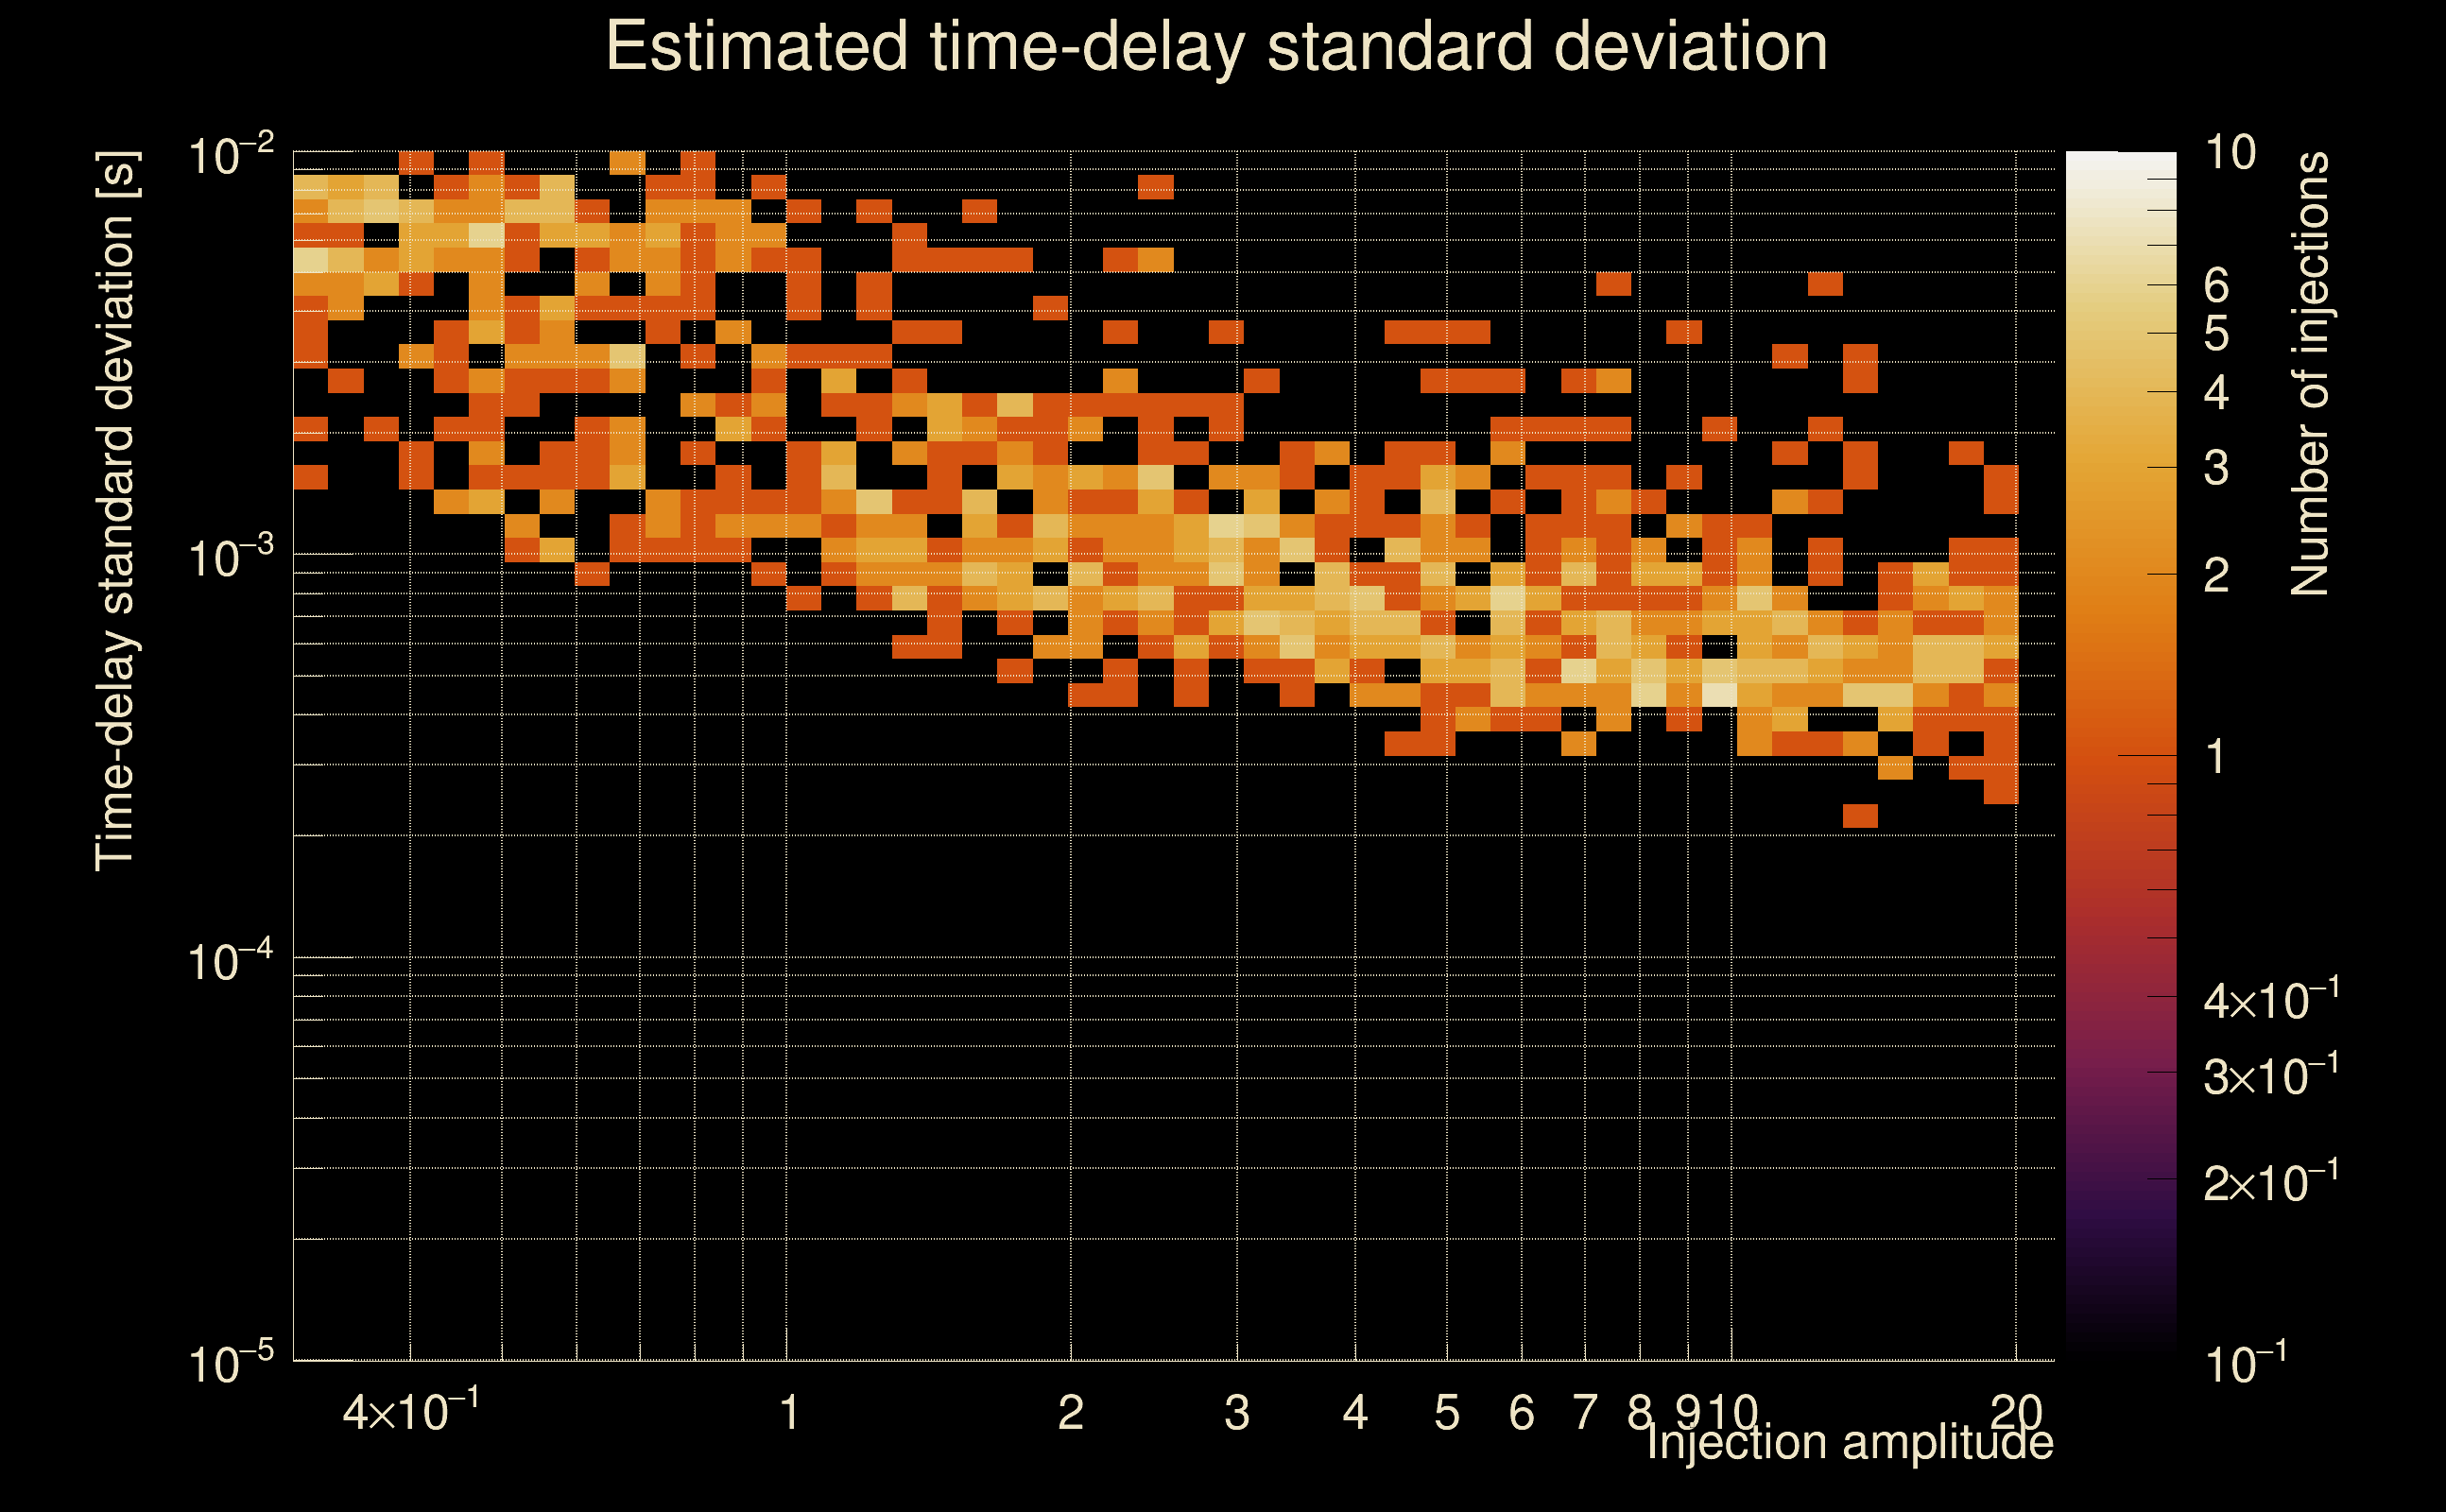
| Number of injections (total/valid/detected): | 1162 / 1018 / 383 |
| List of missed injections: | ./Kur22-s50_missed.txt |
| Injection amplitude at 90% detection efficiency: | -1 |
| Injection amplitude at 50% detection efficiency: | 2.1277 |
| Injection amplitude at 10% detection efficiency: | 0.885339 |
 |
 |
 |
 |
 |
 |
 |
|
 |
 |
|
 |
 |
|
 |
 |
|
 |
 |
|
 |
 |
|
 |
 |
|
 |
 |
|
 |
 |
 |
 |
 |
 |
 |
 |
 |
 |
 |
 |
 |
 |
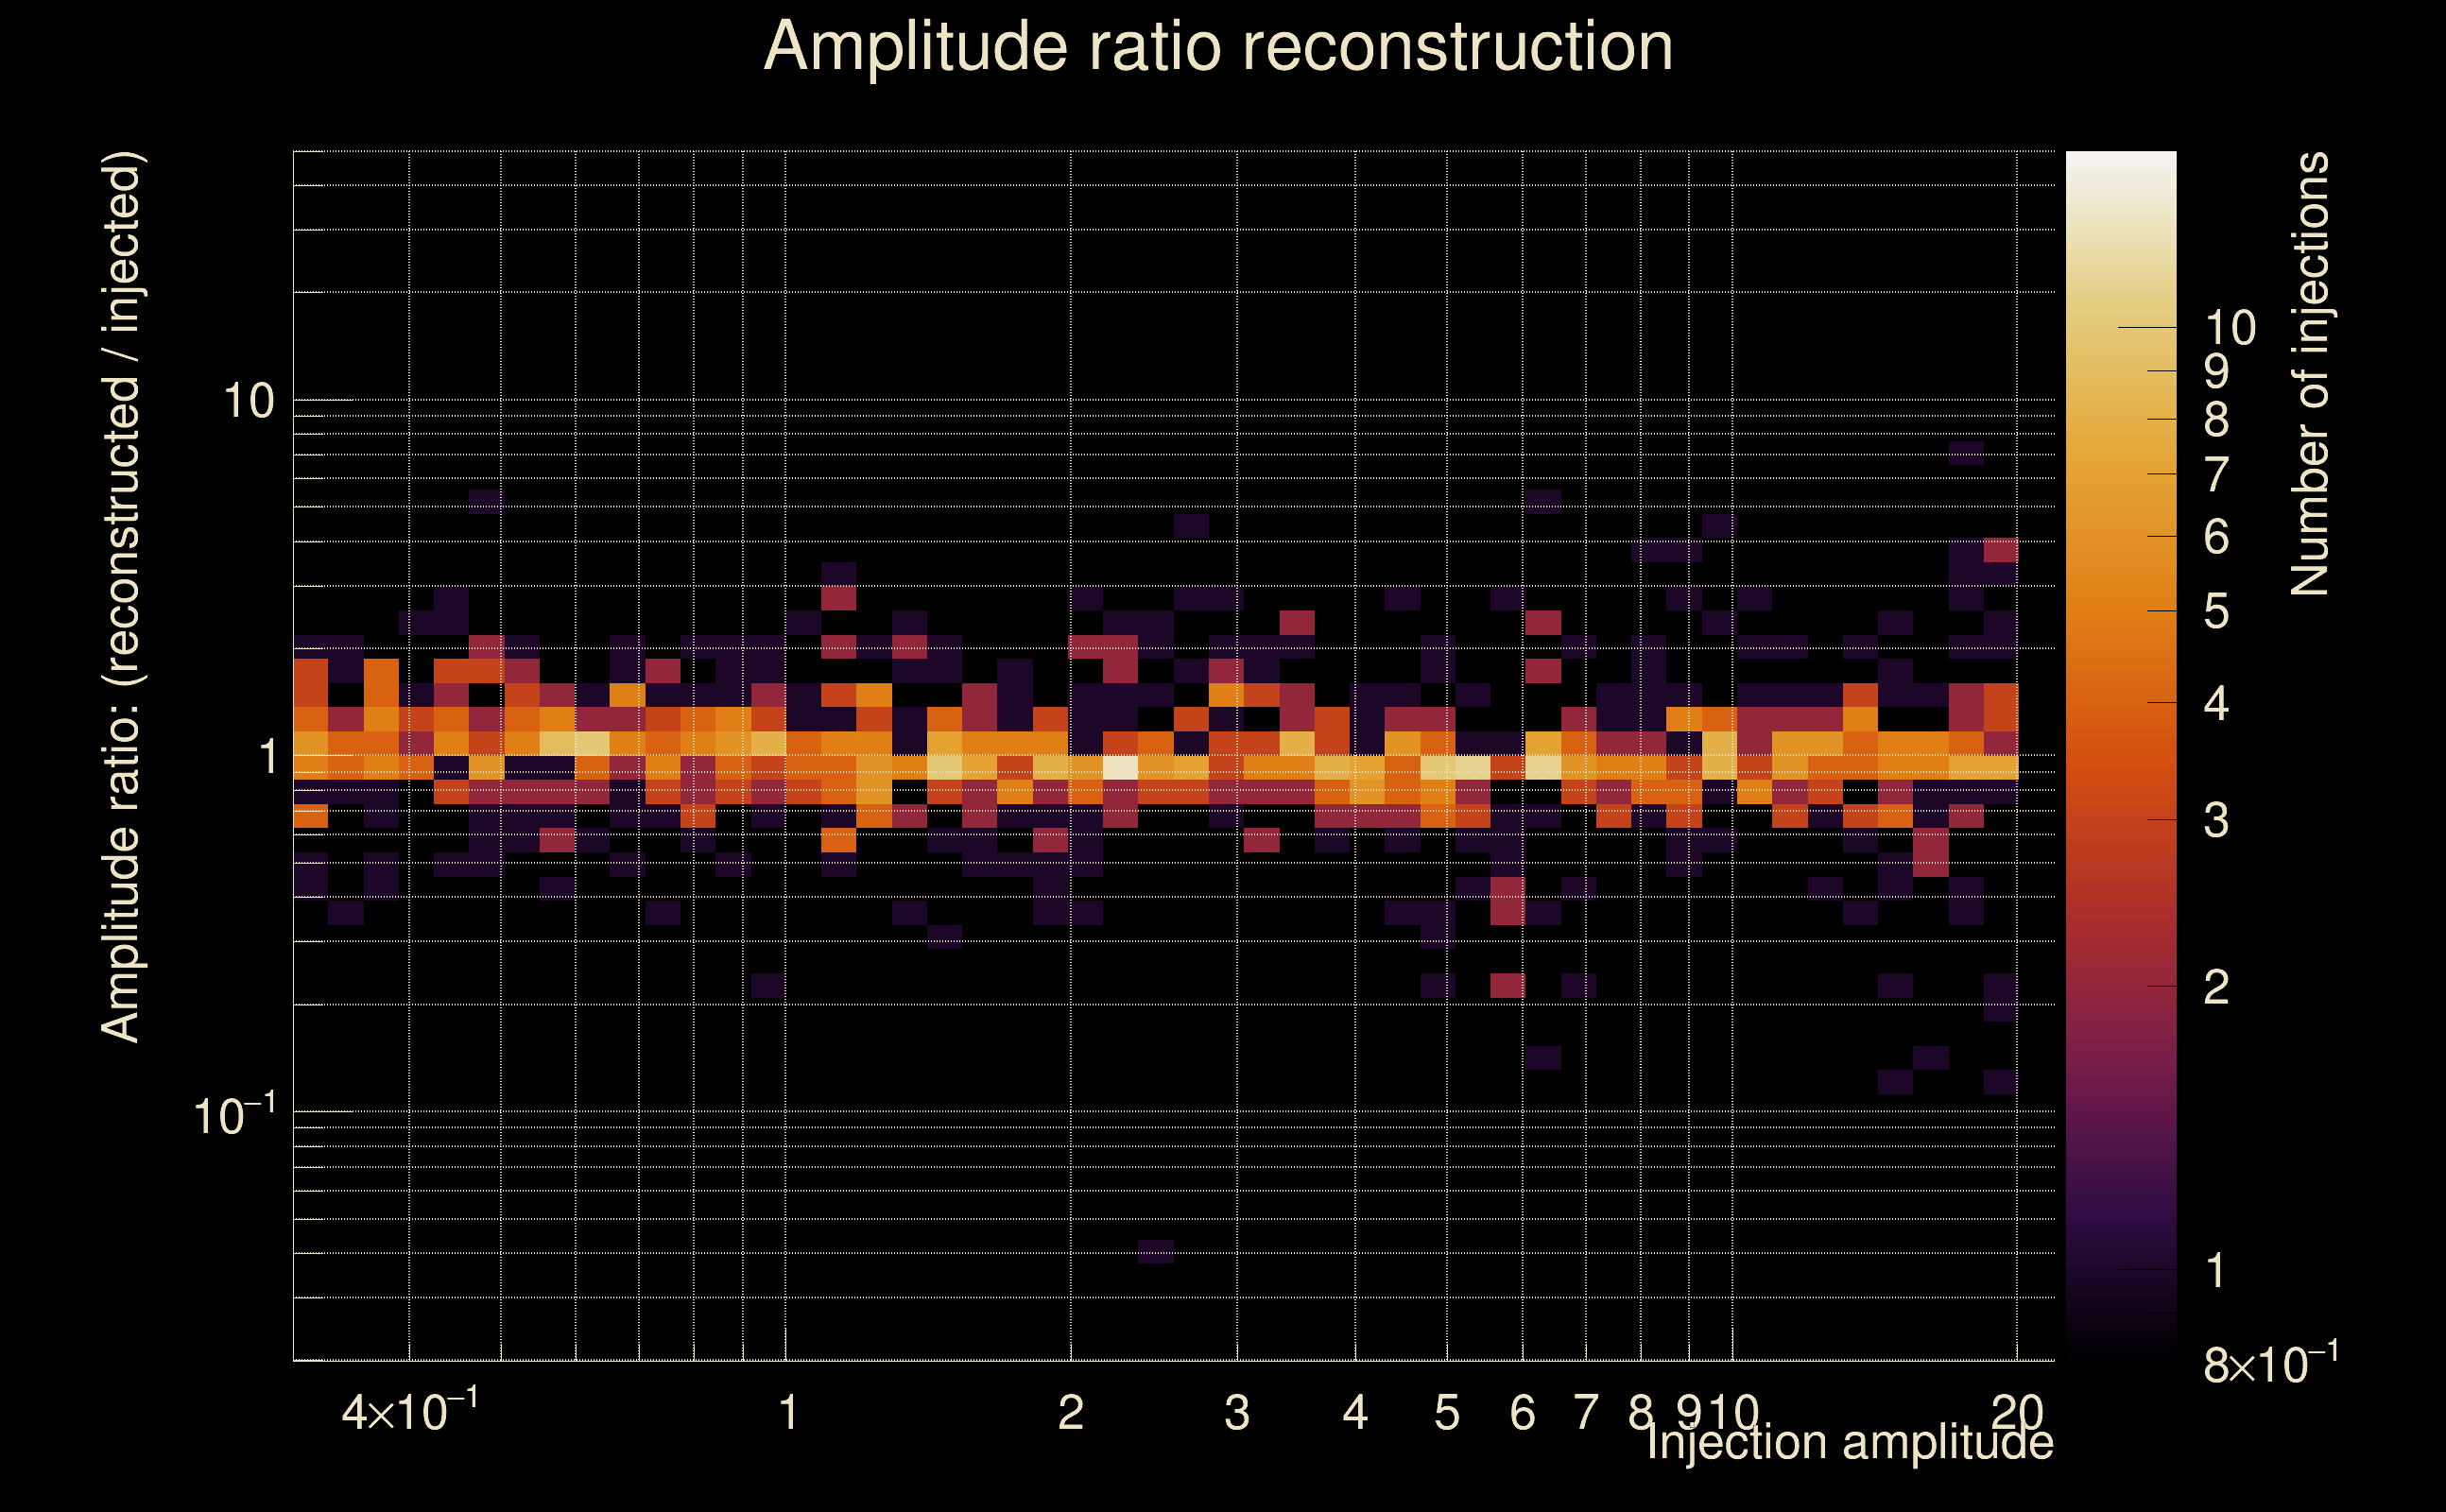 |
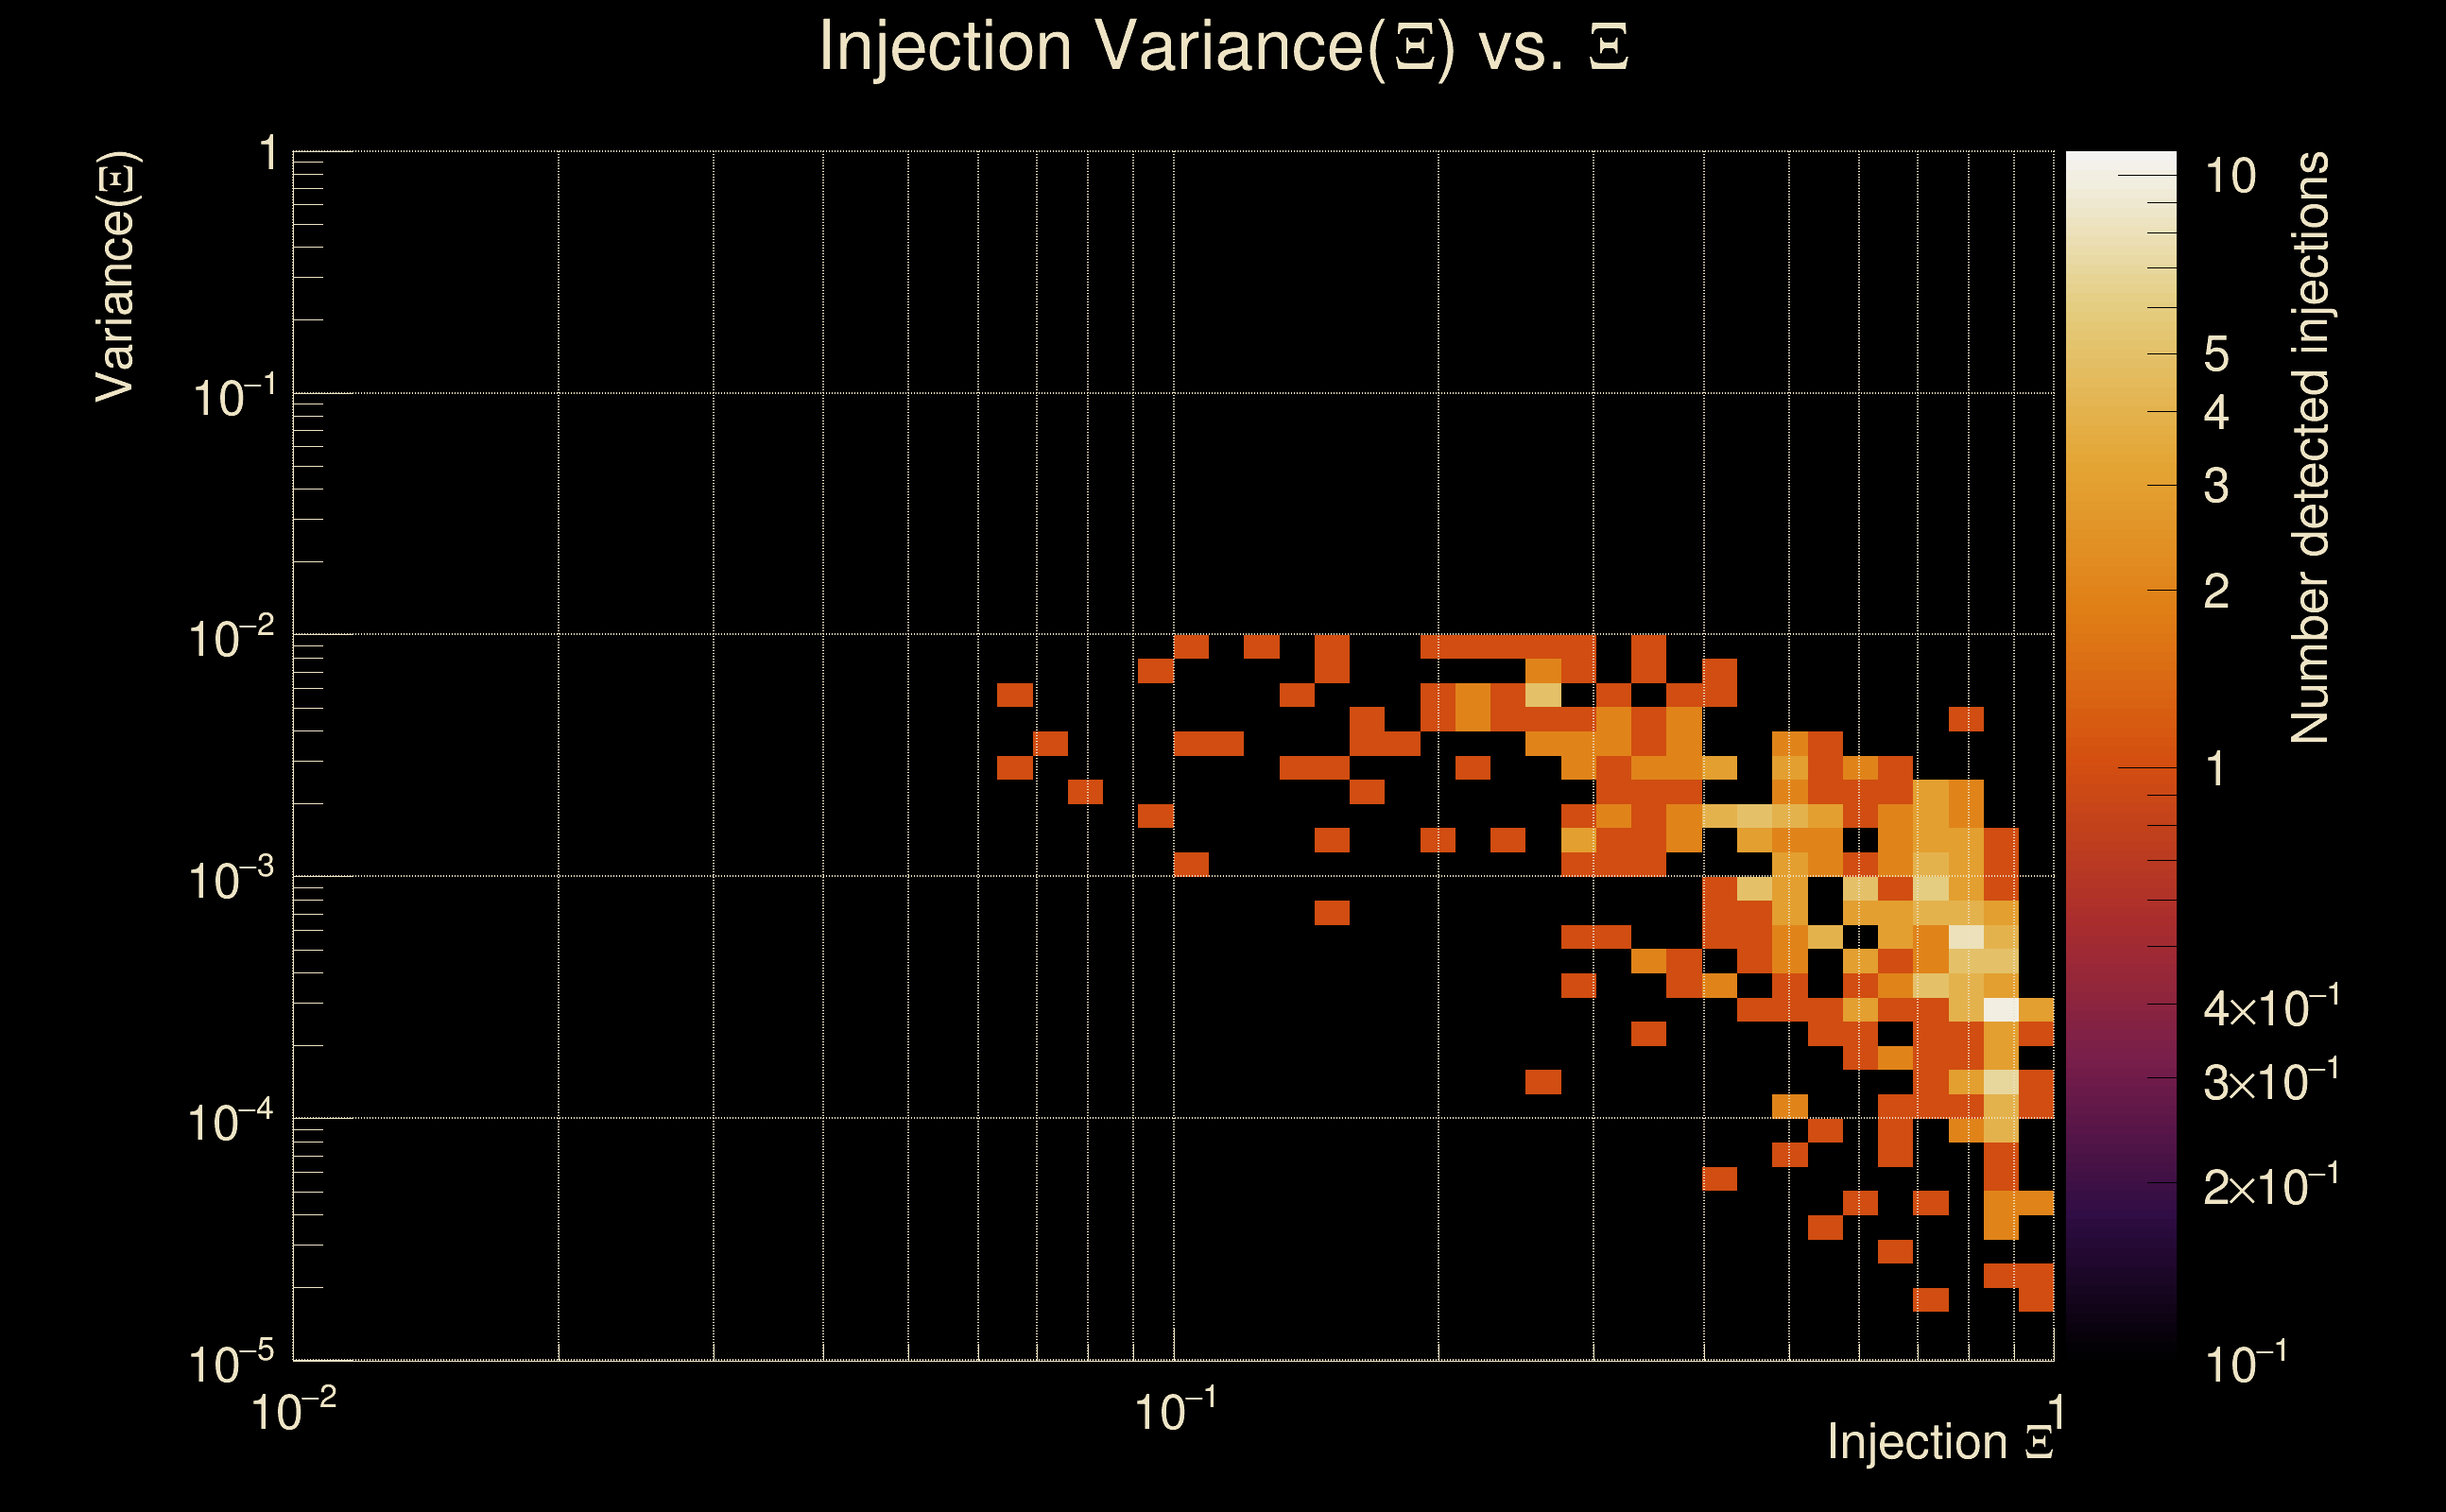
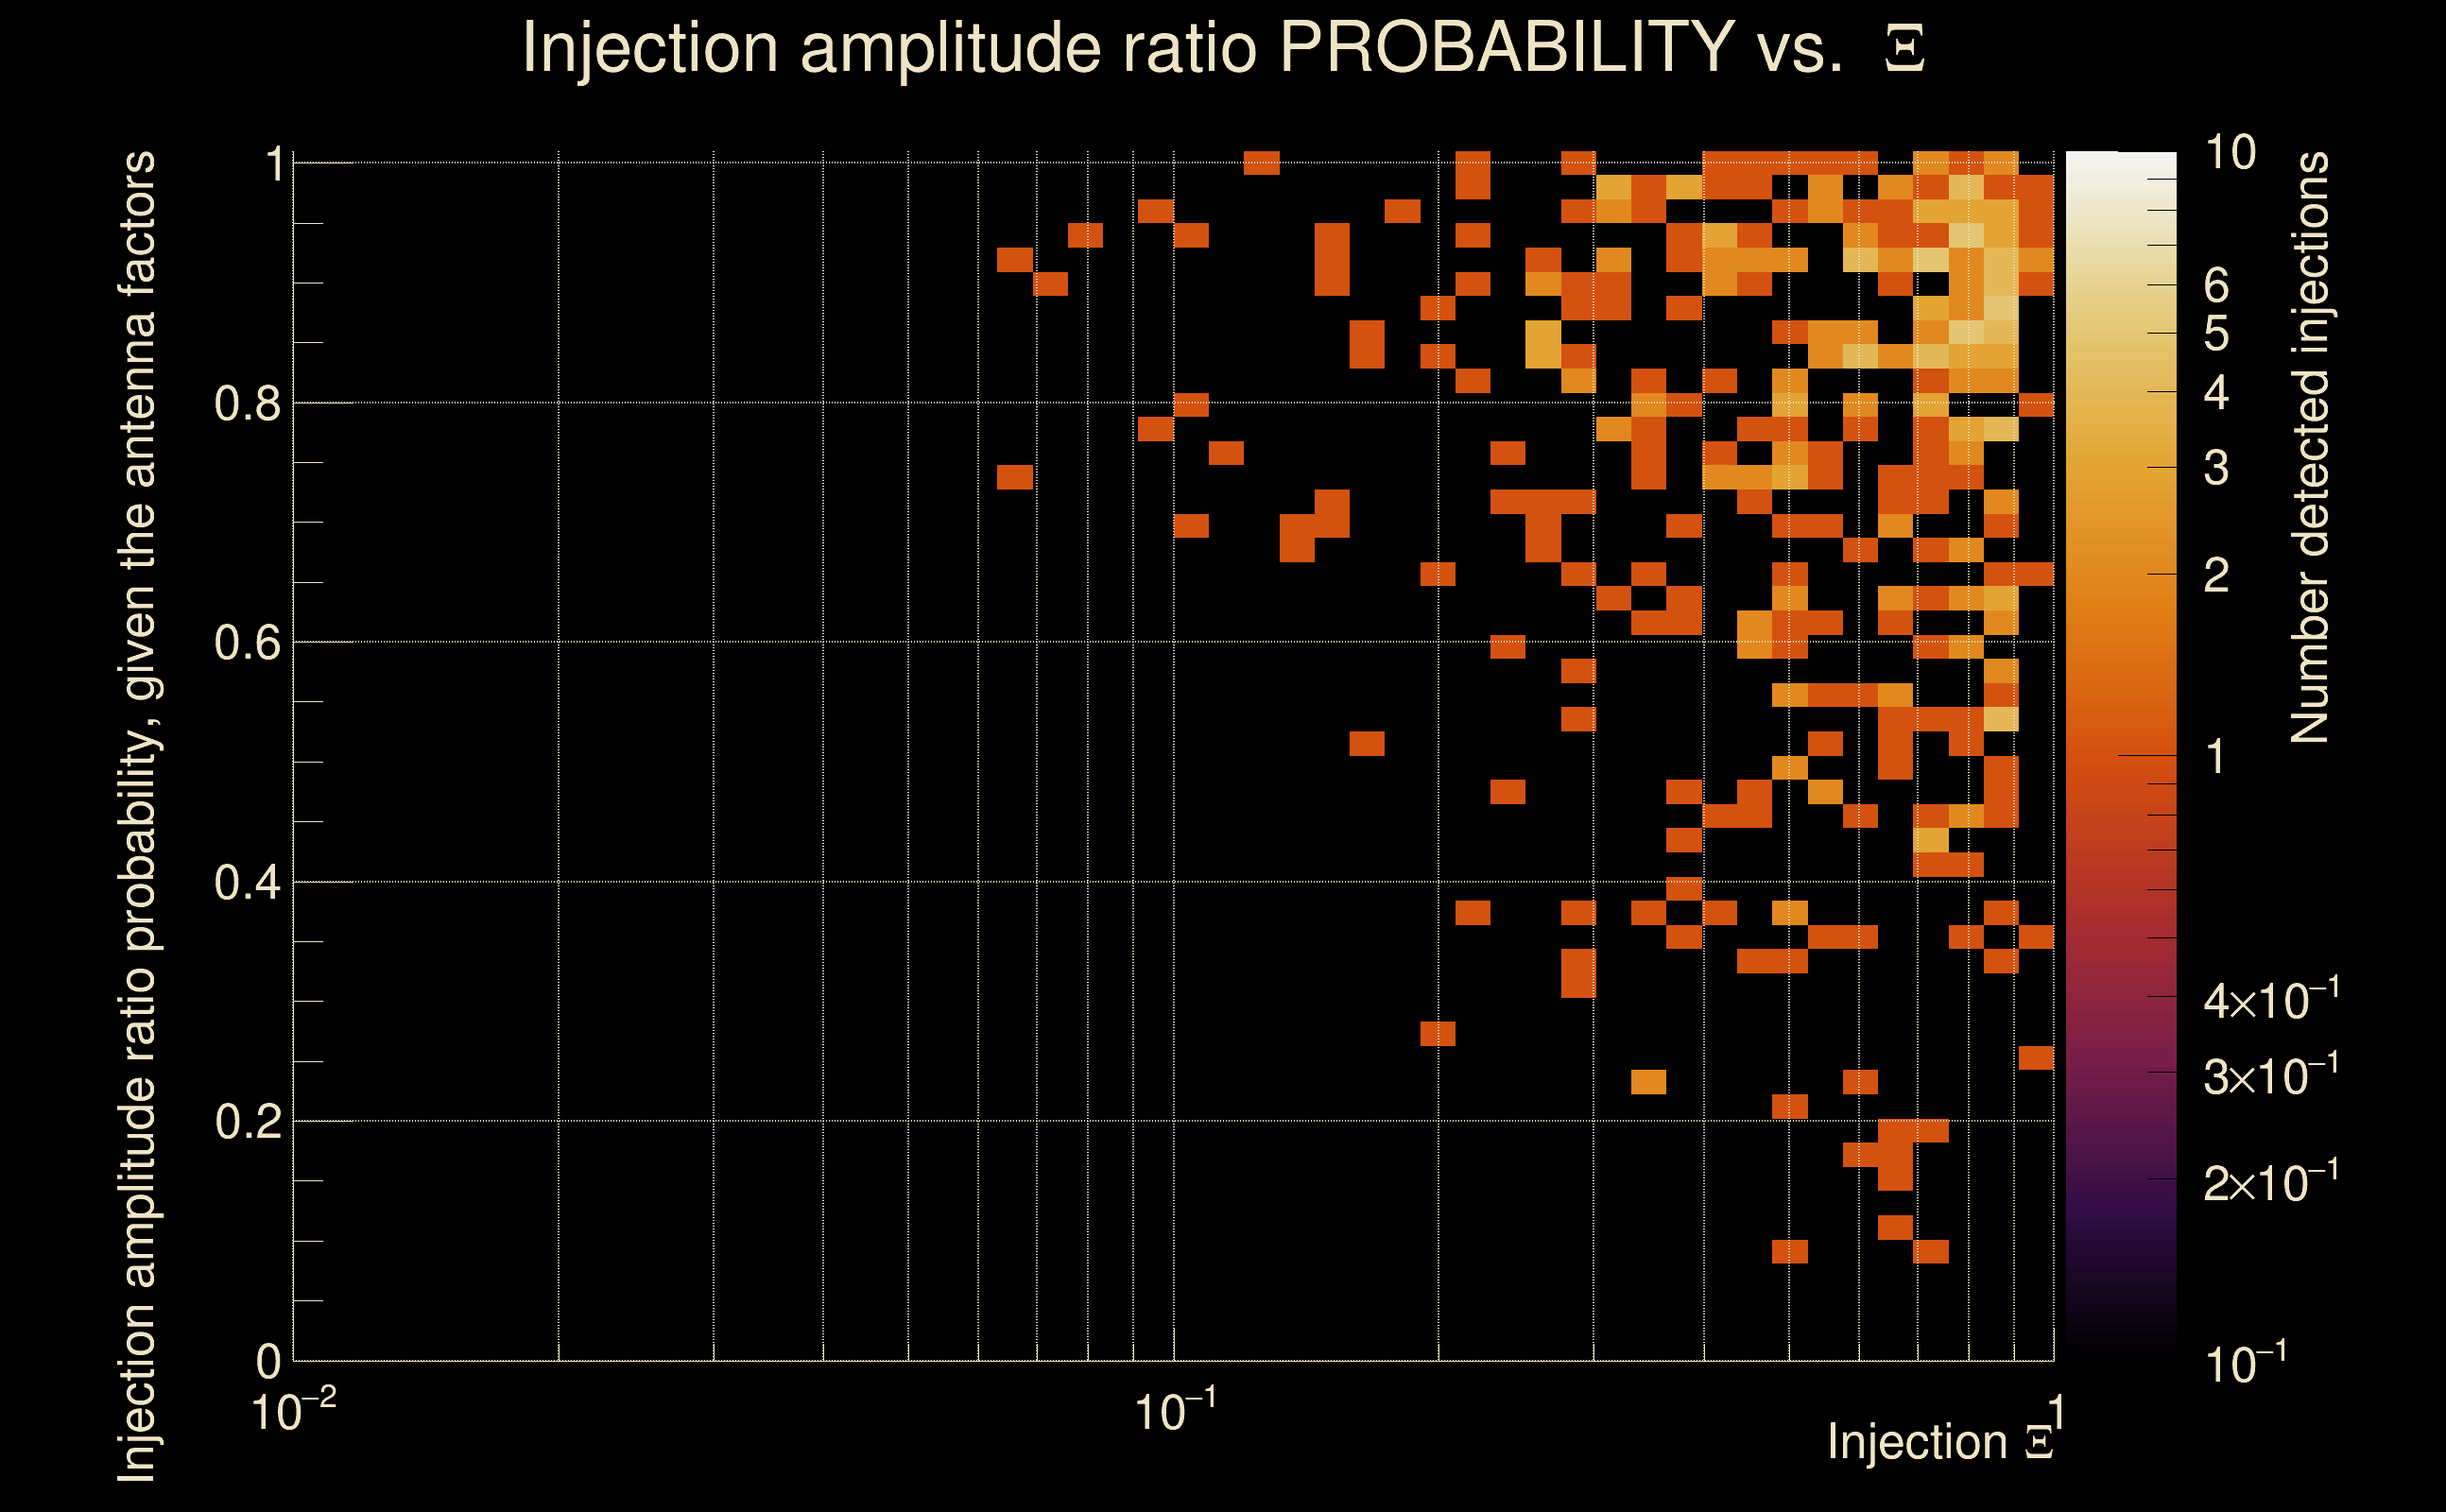
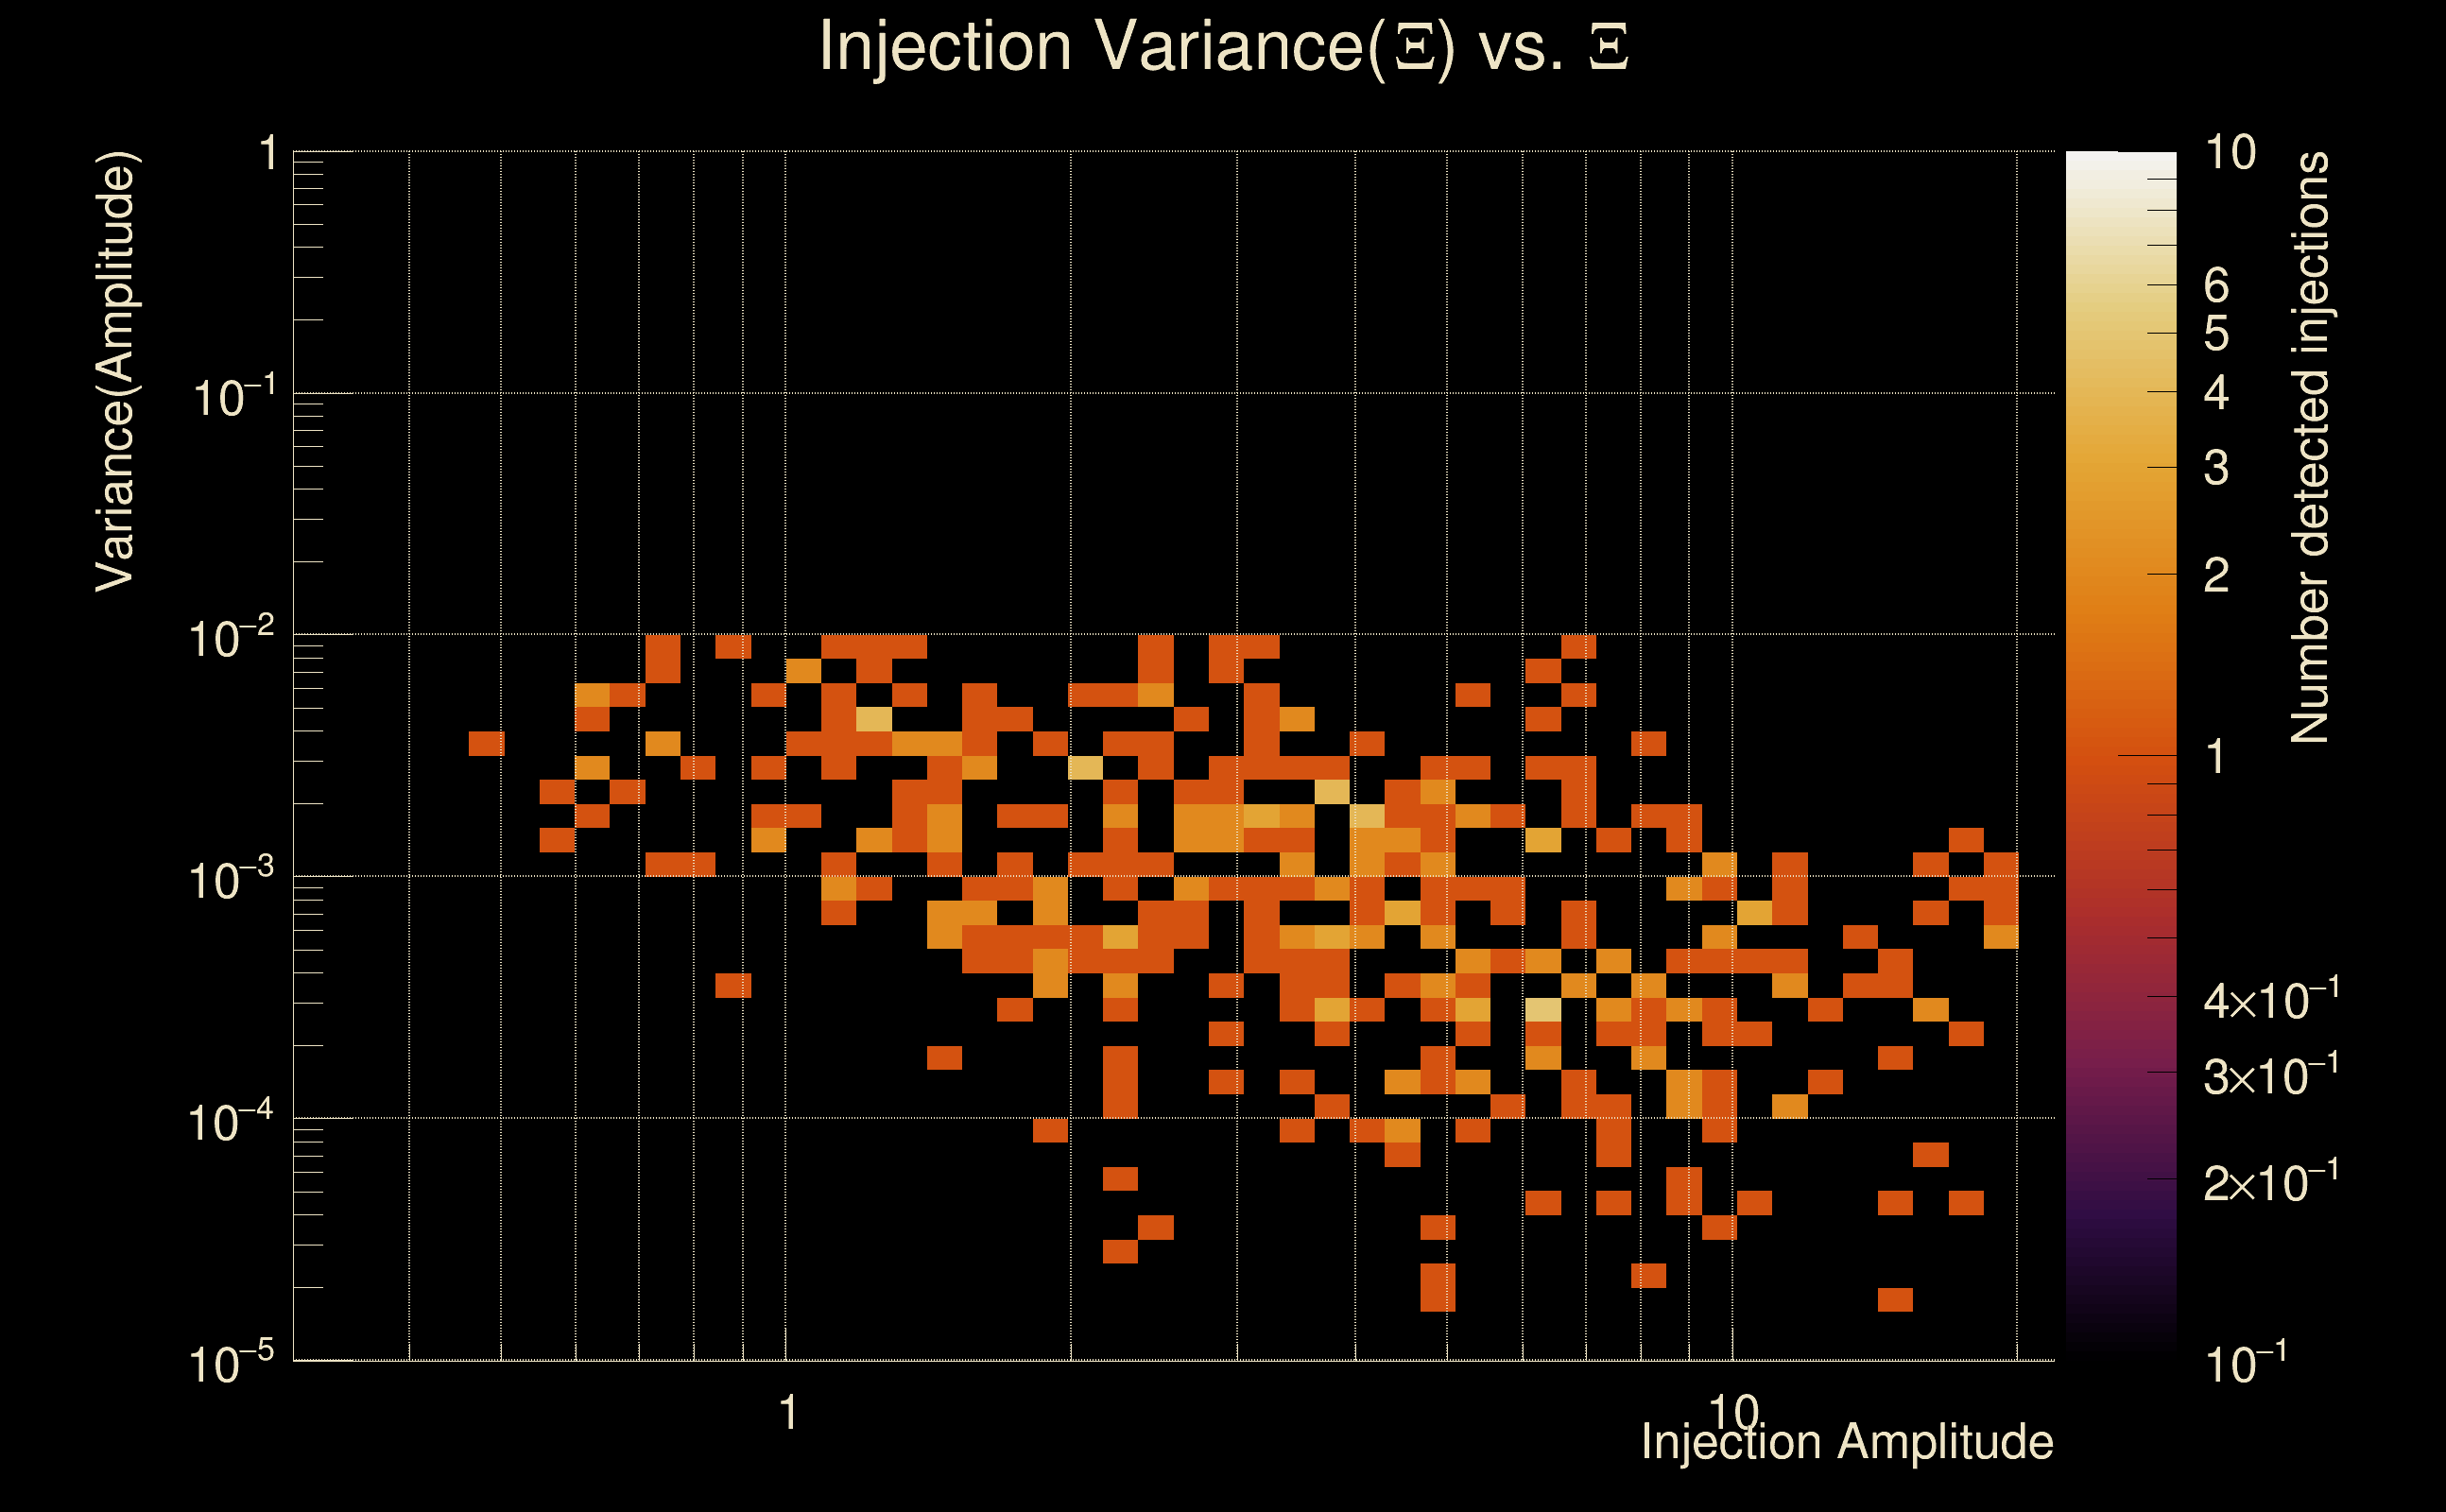
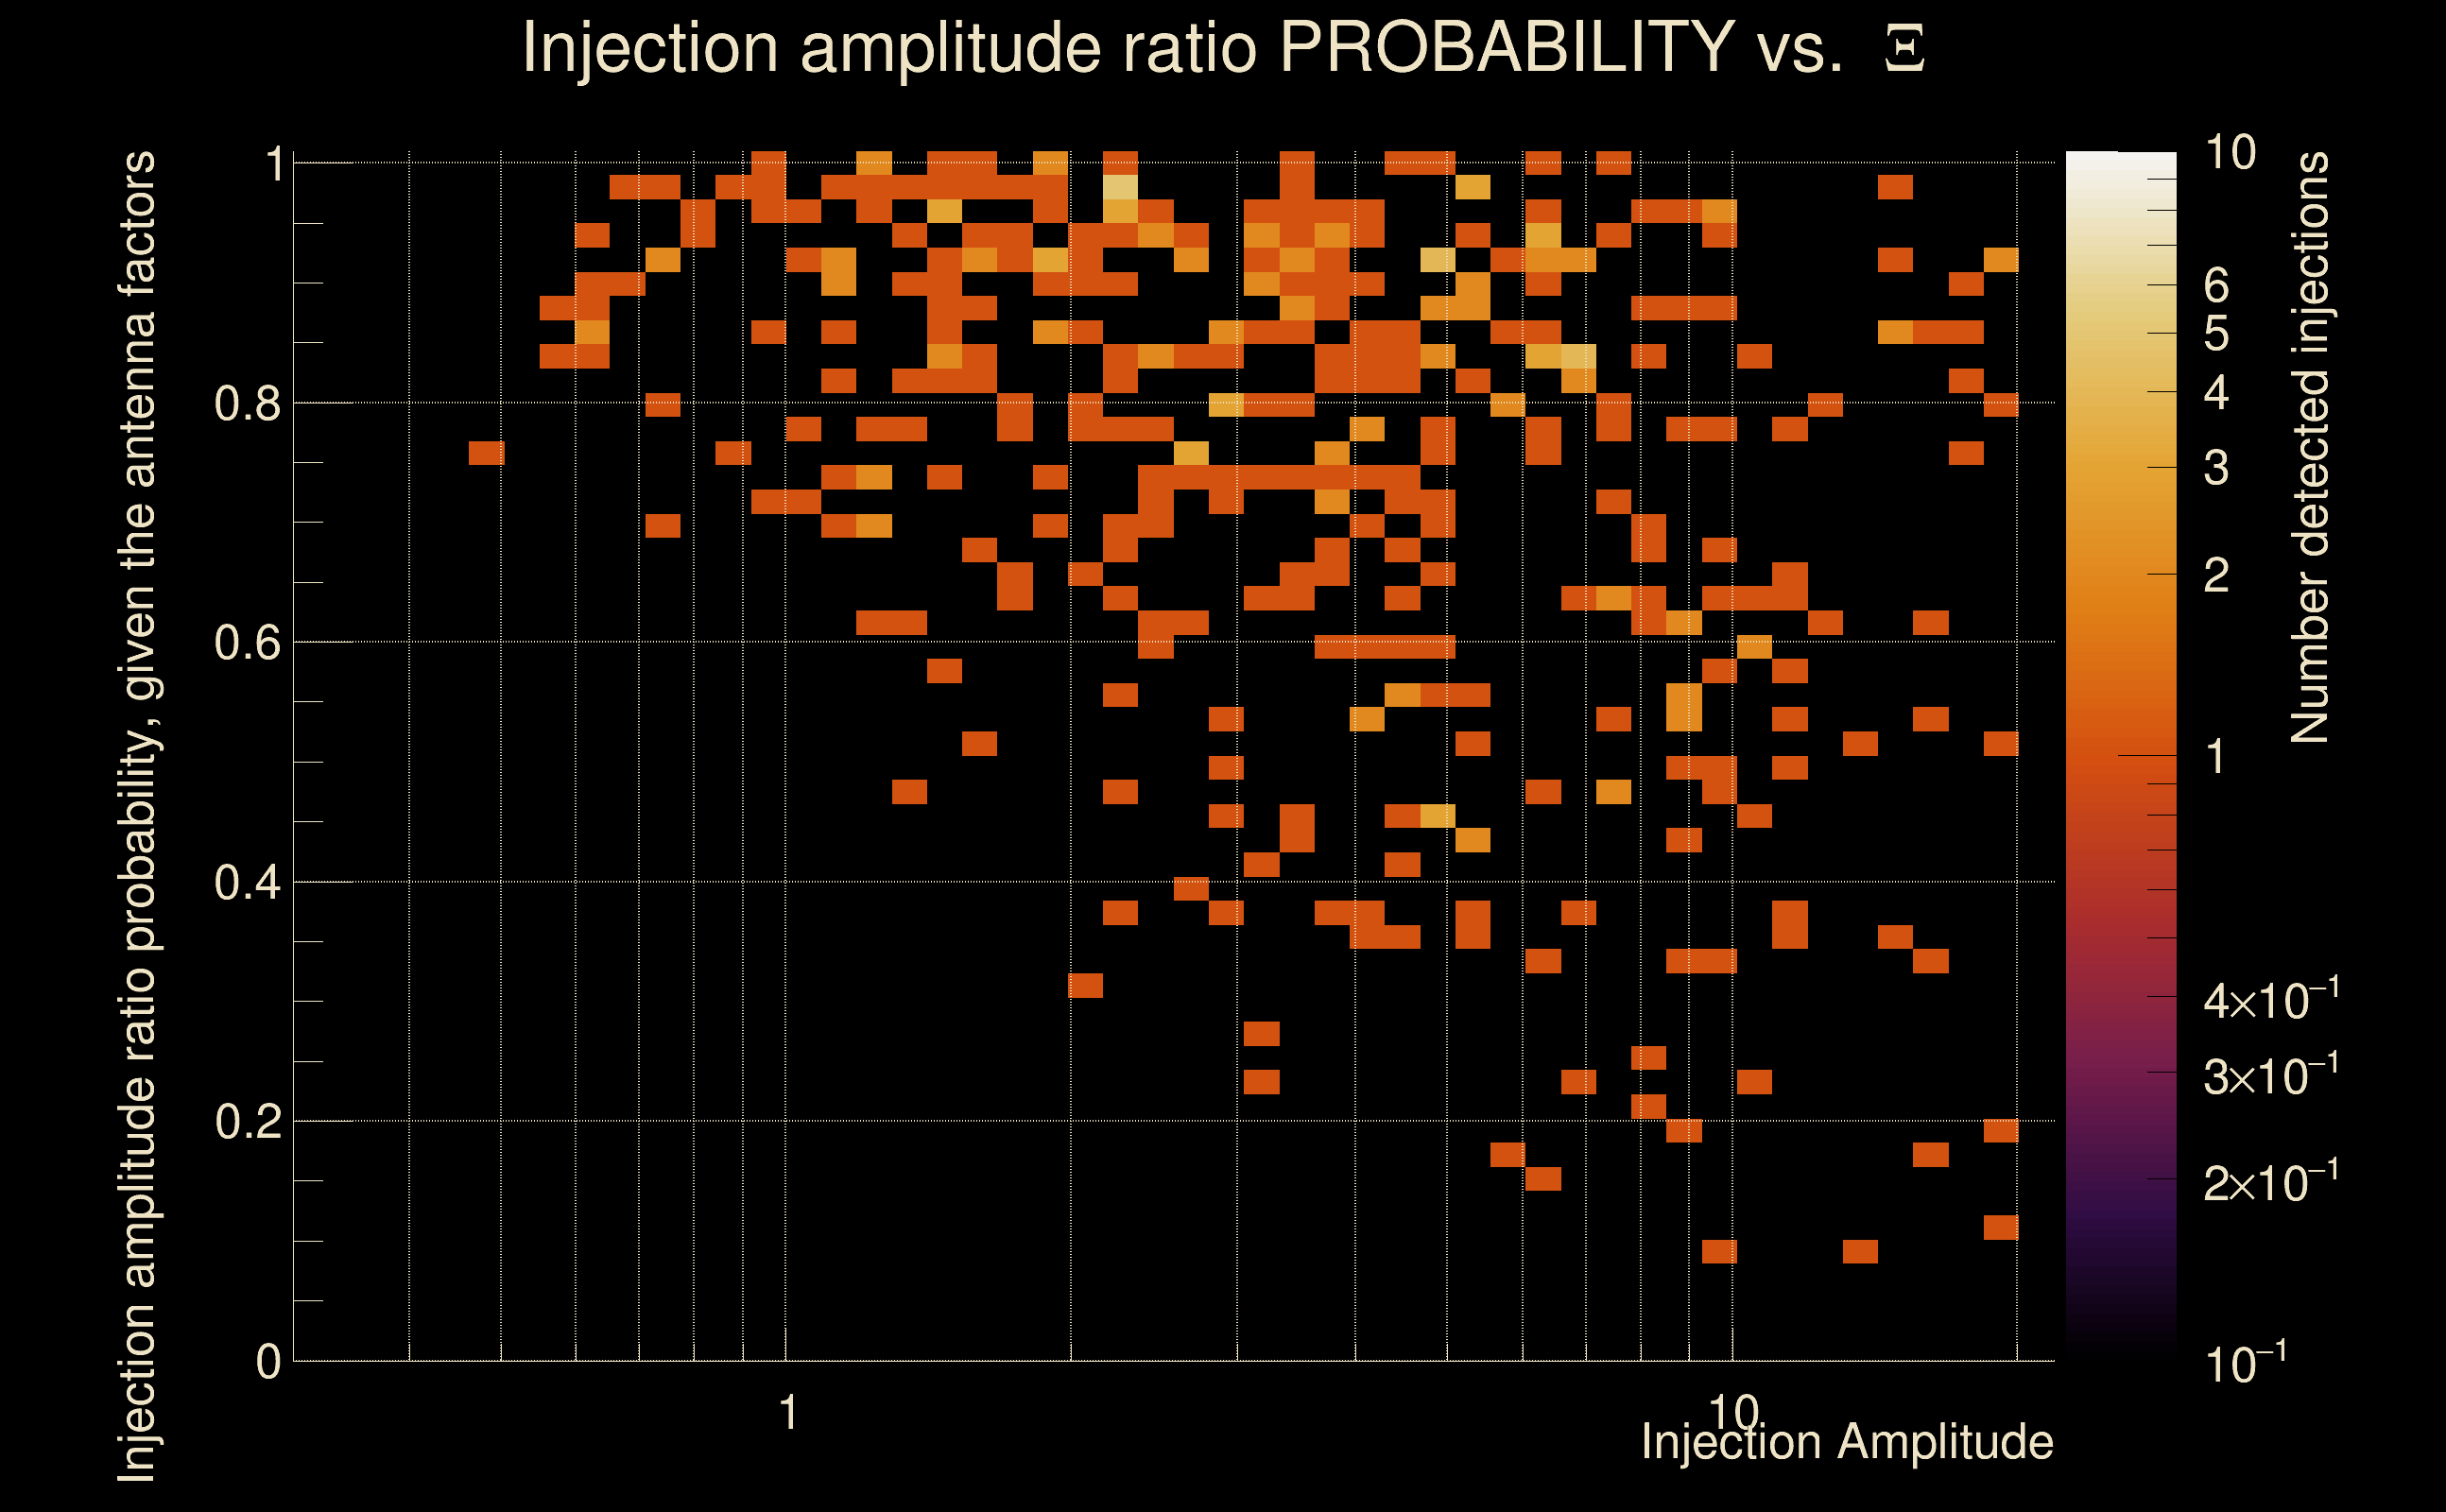
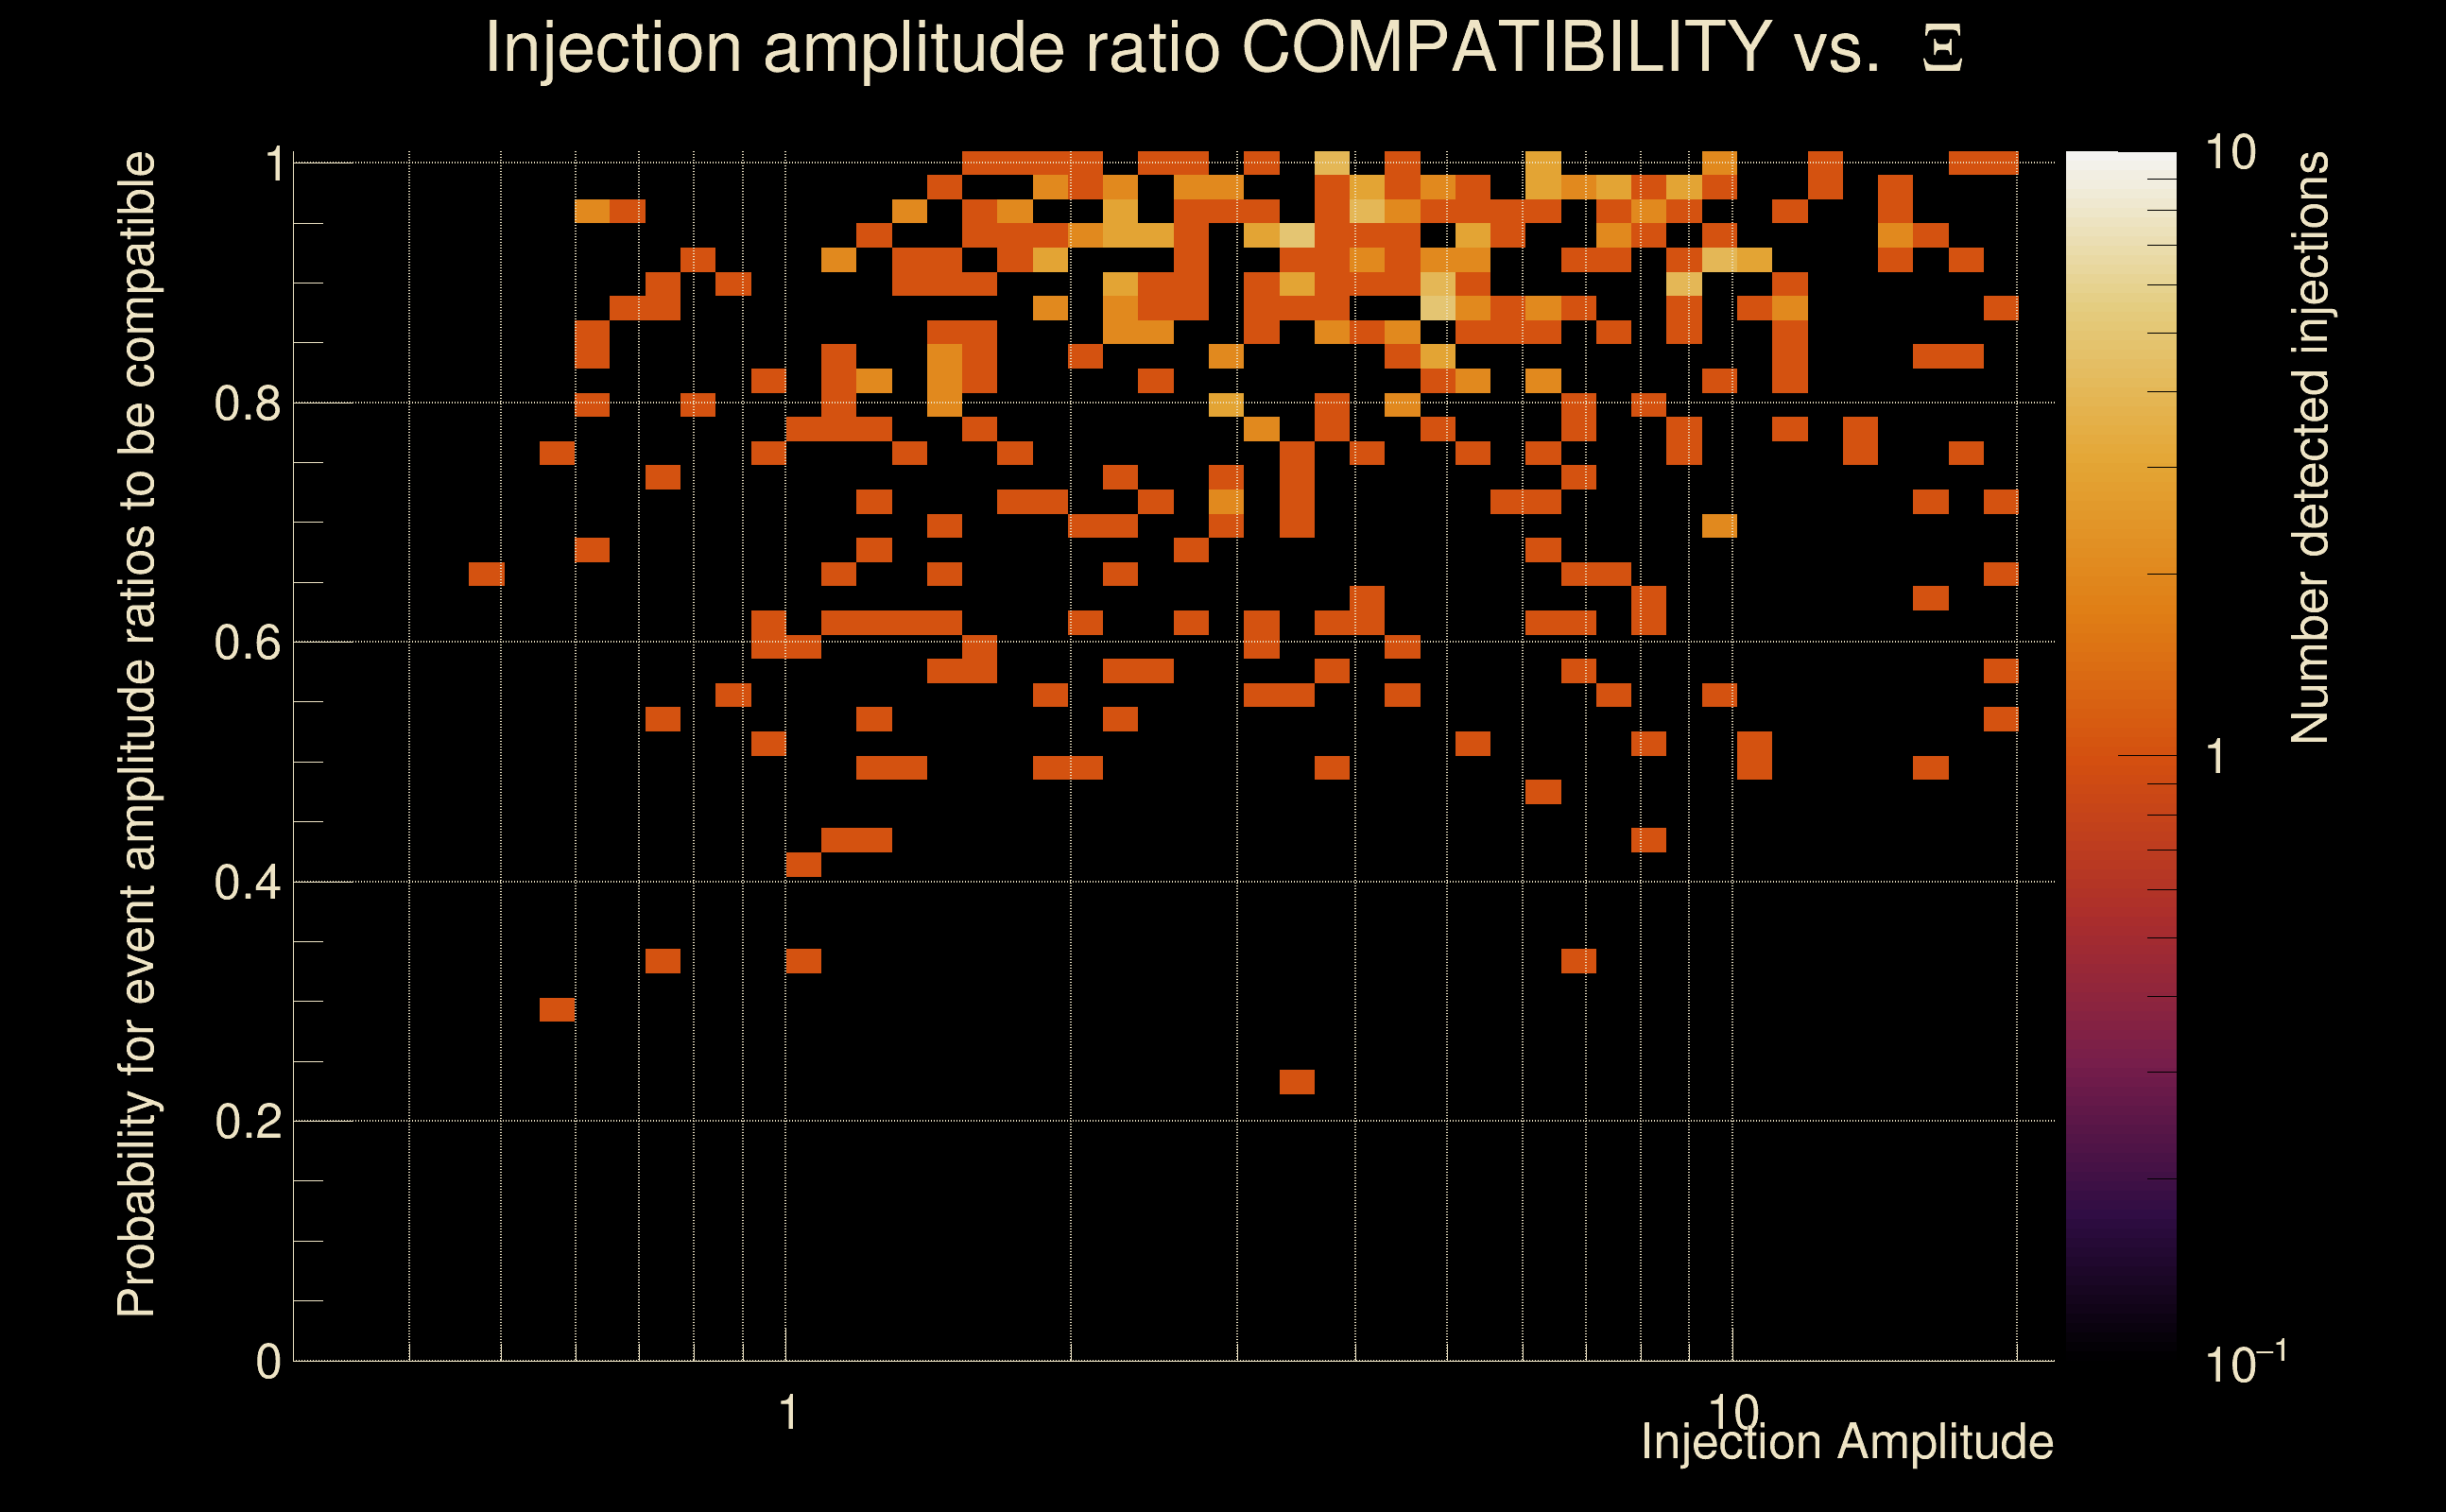
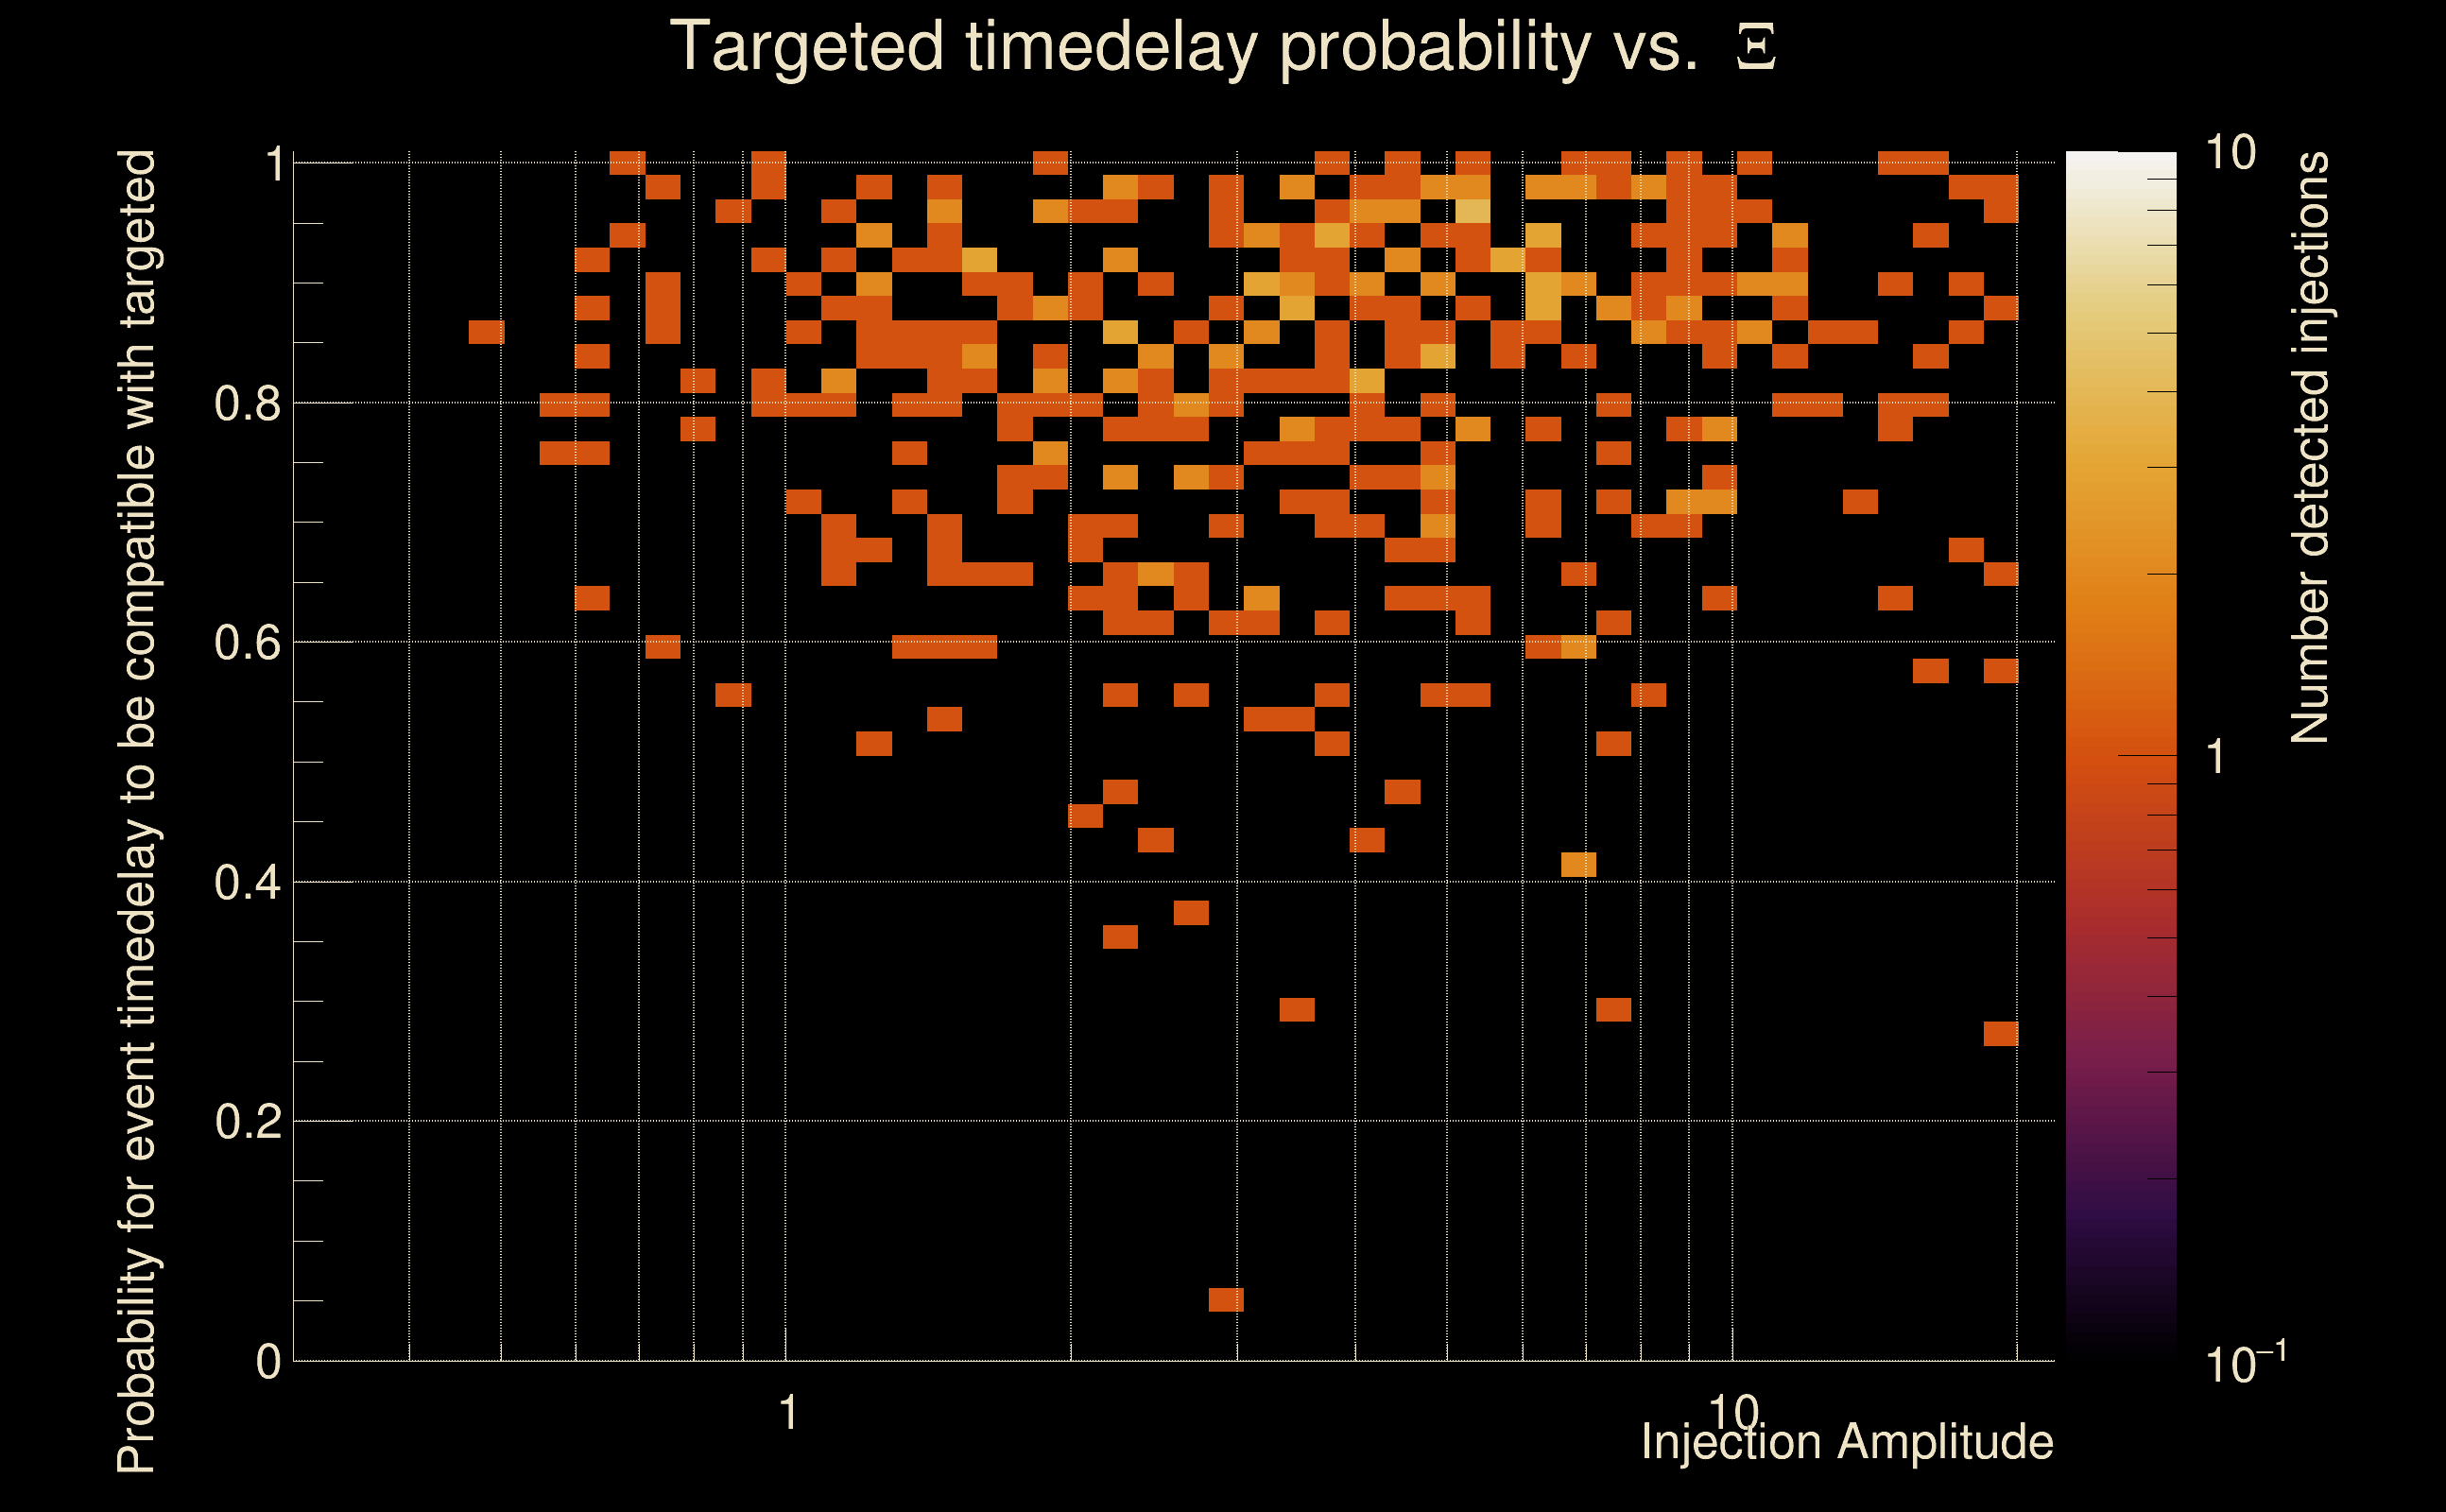
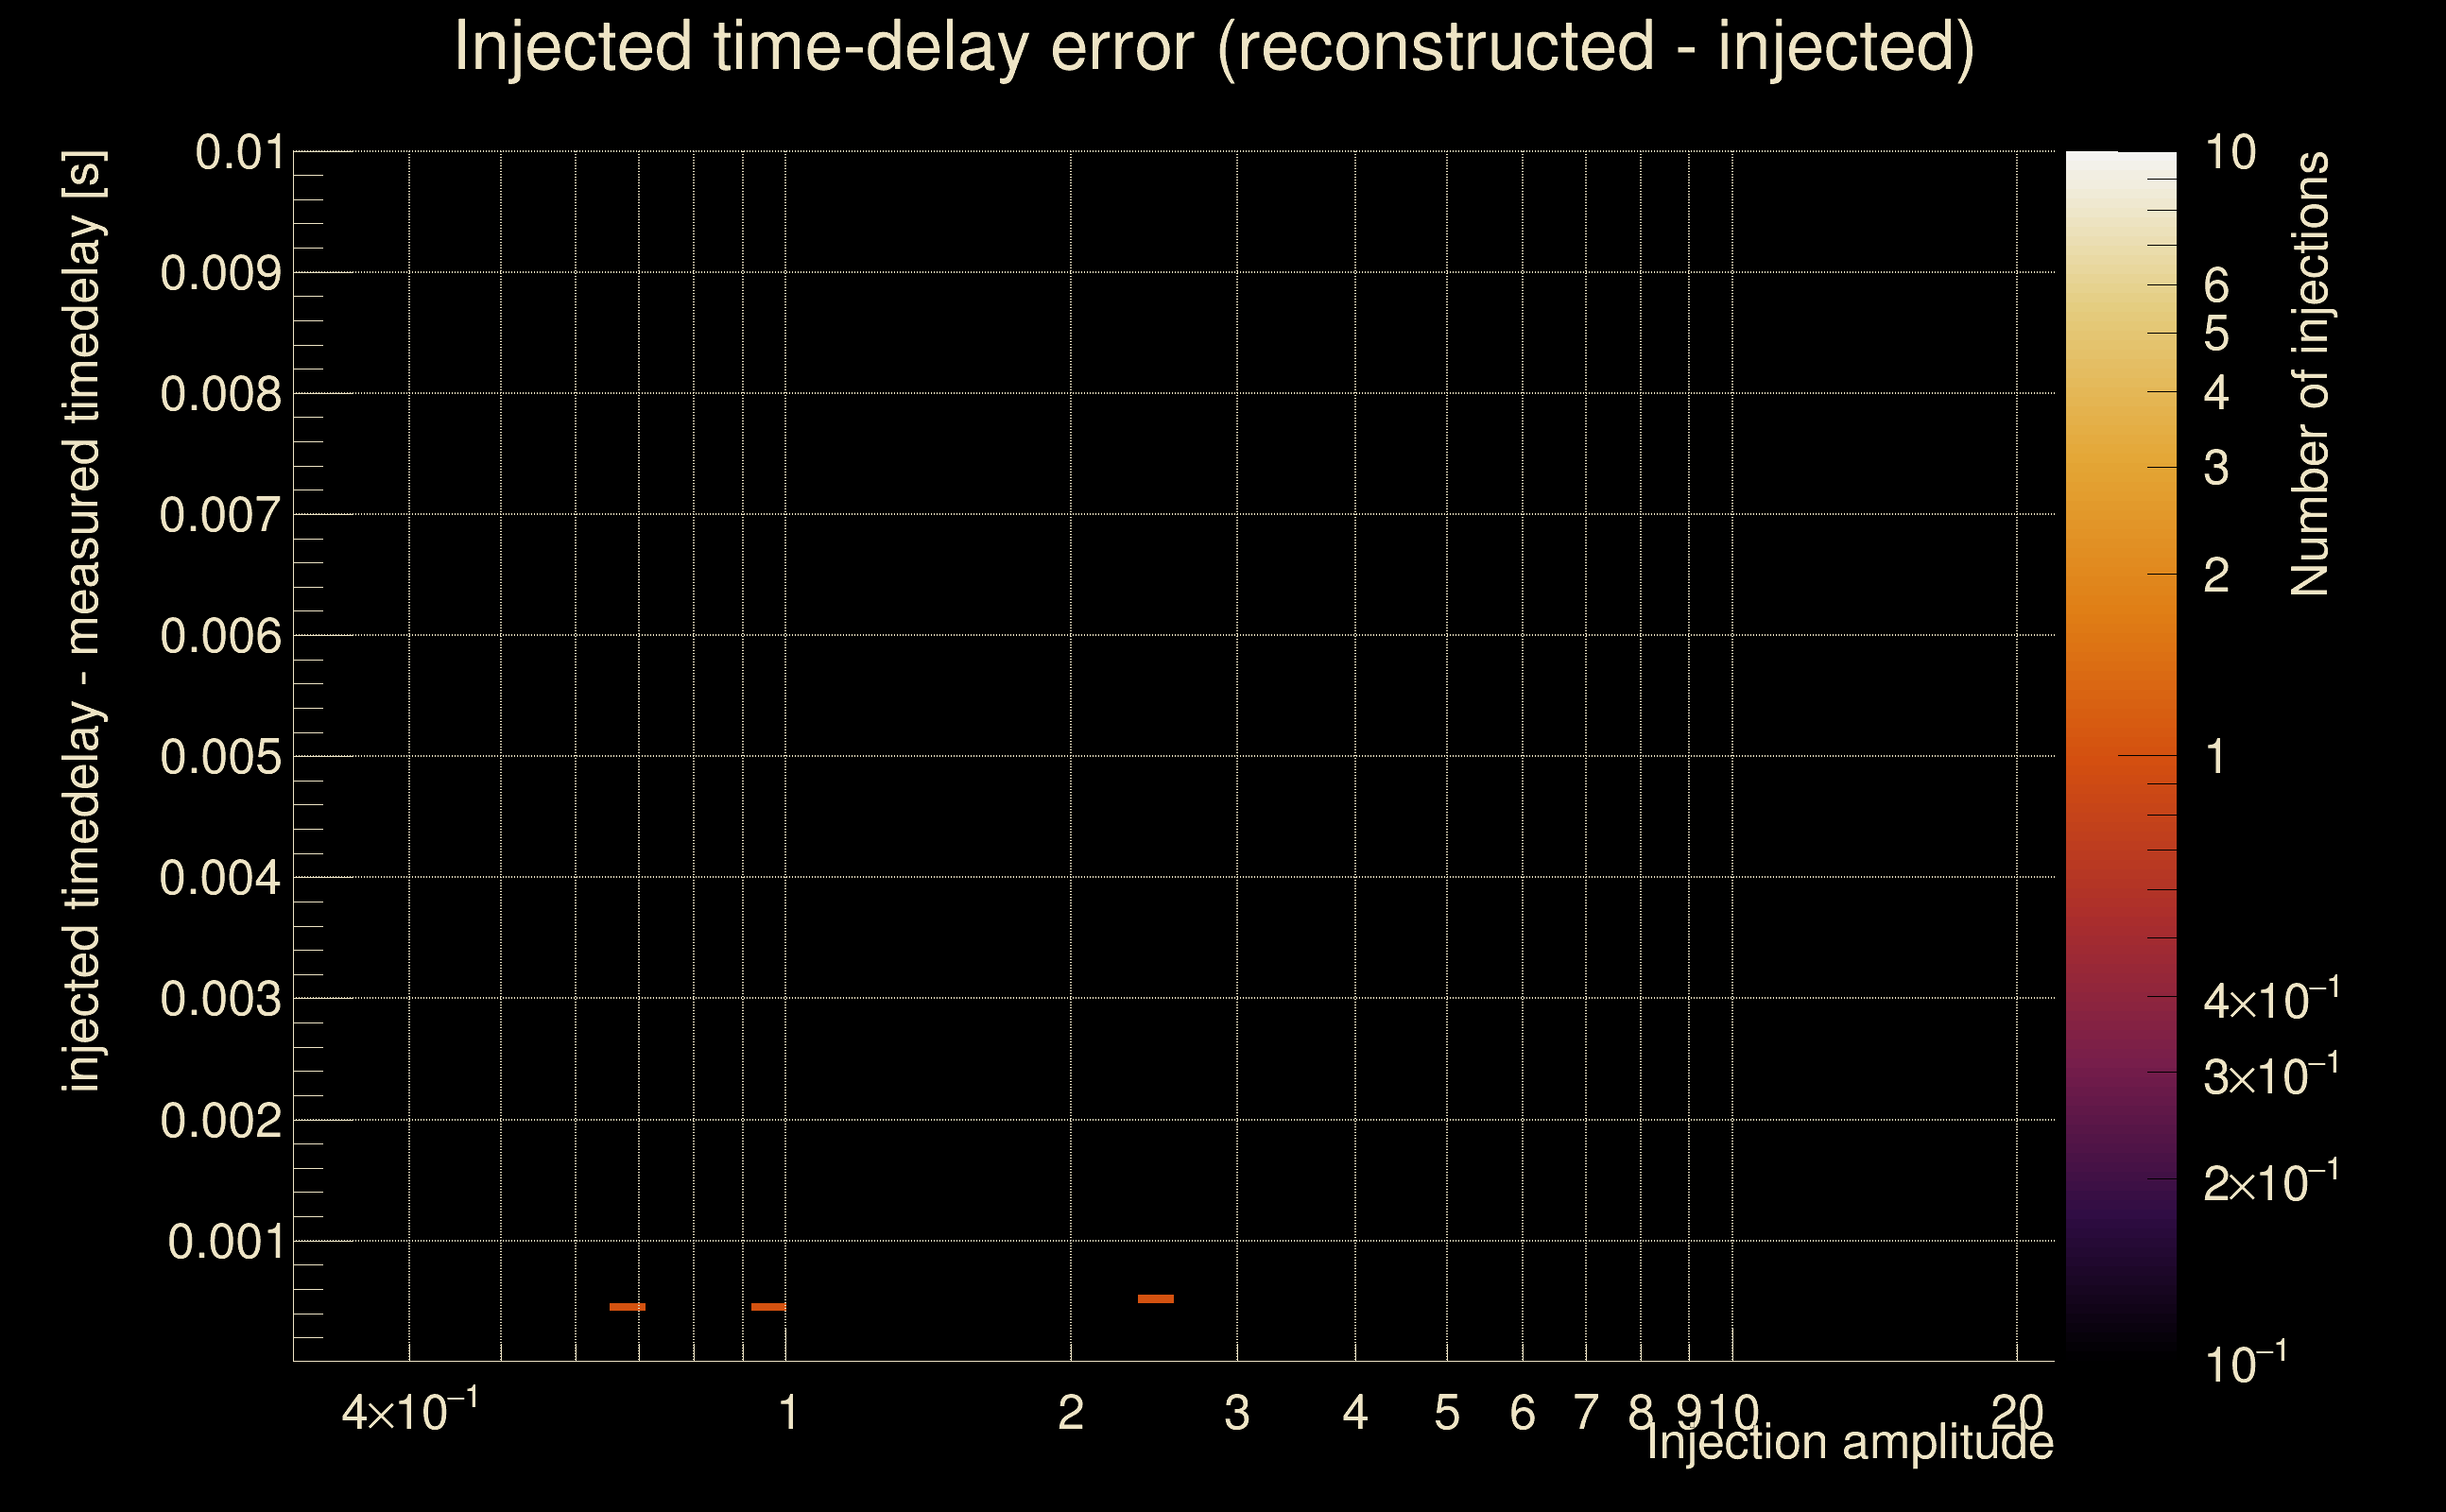
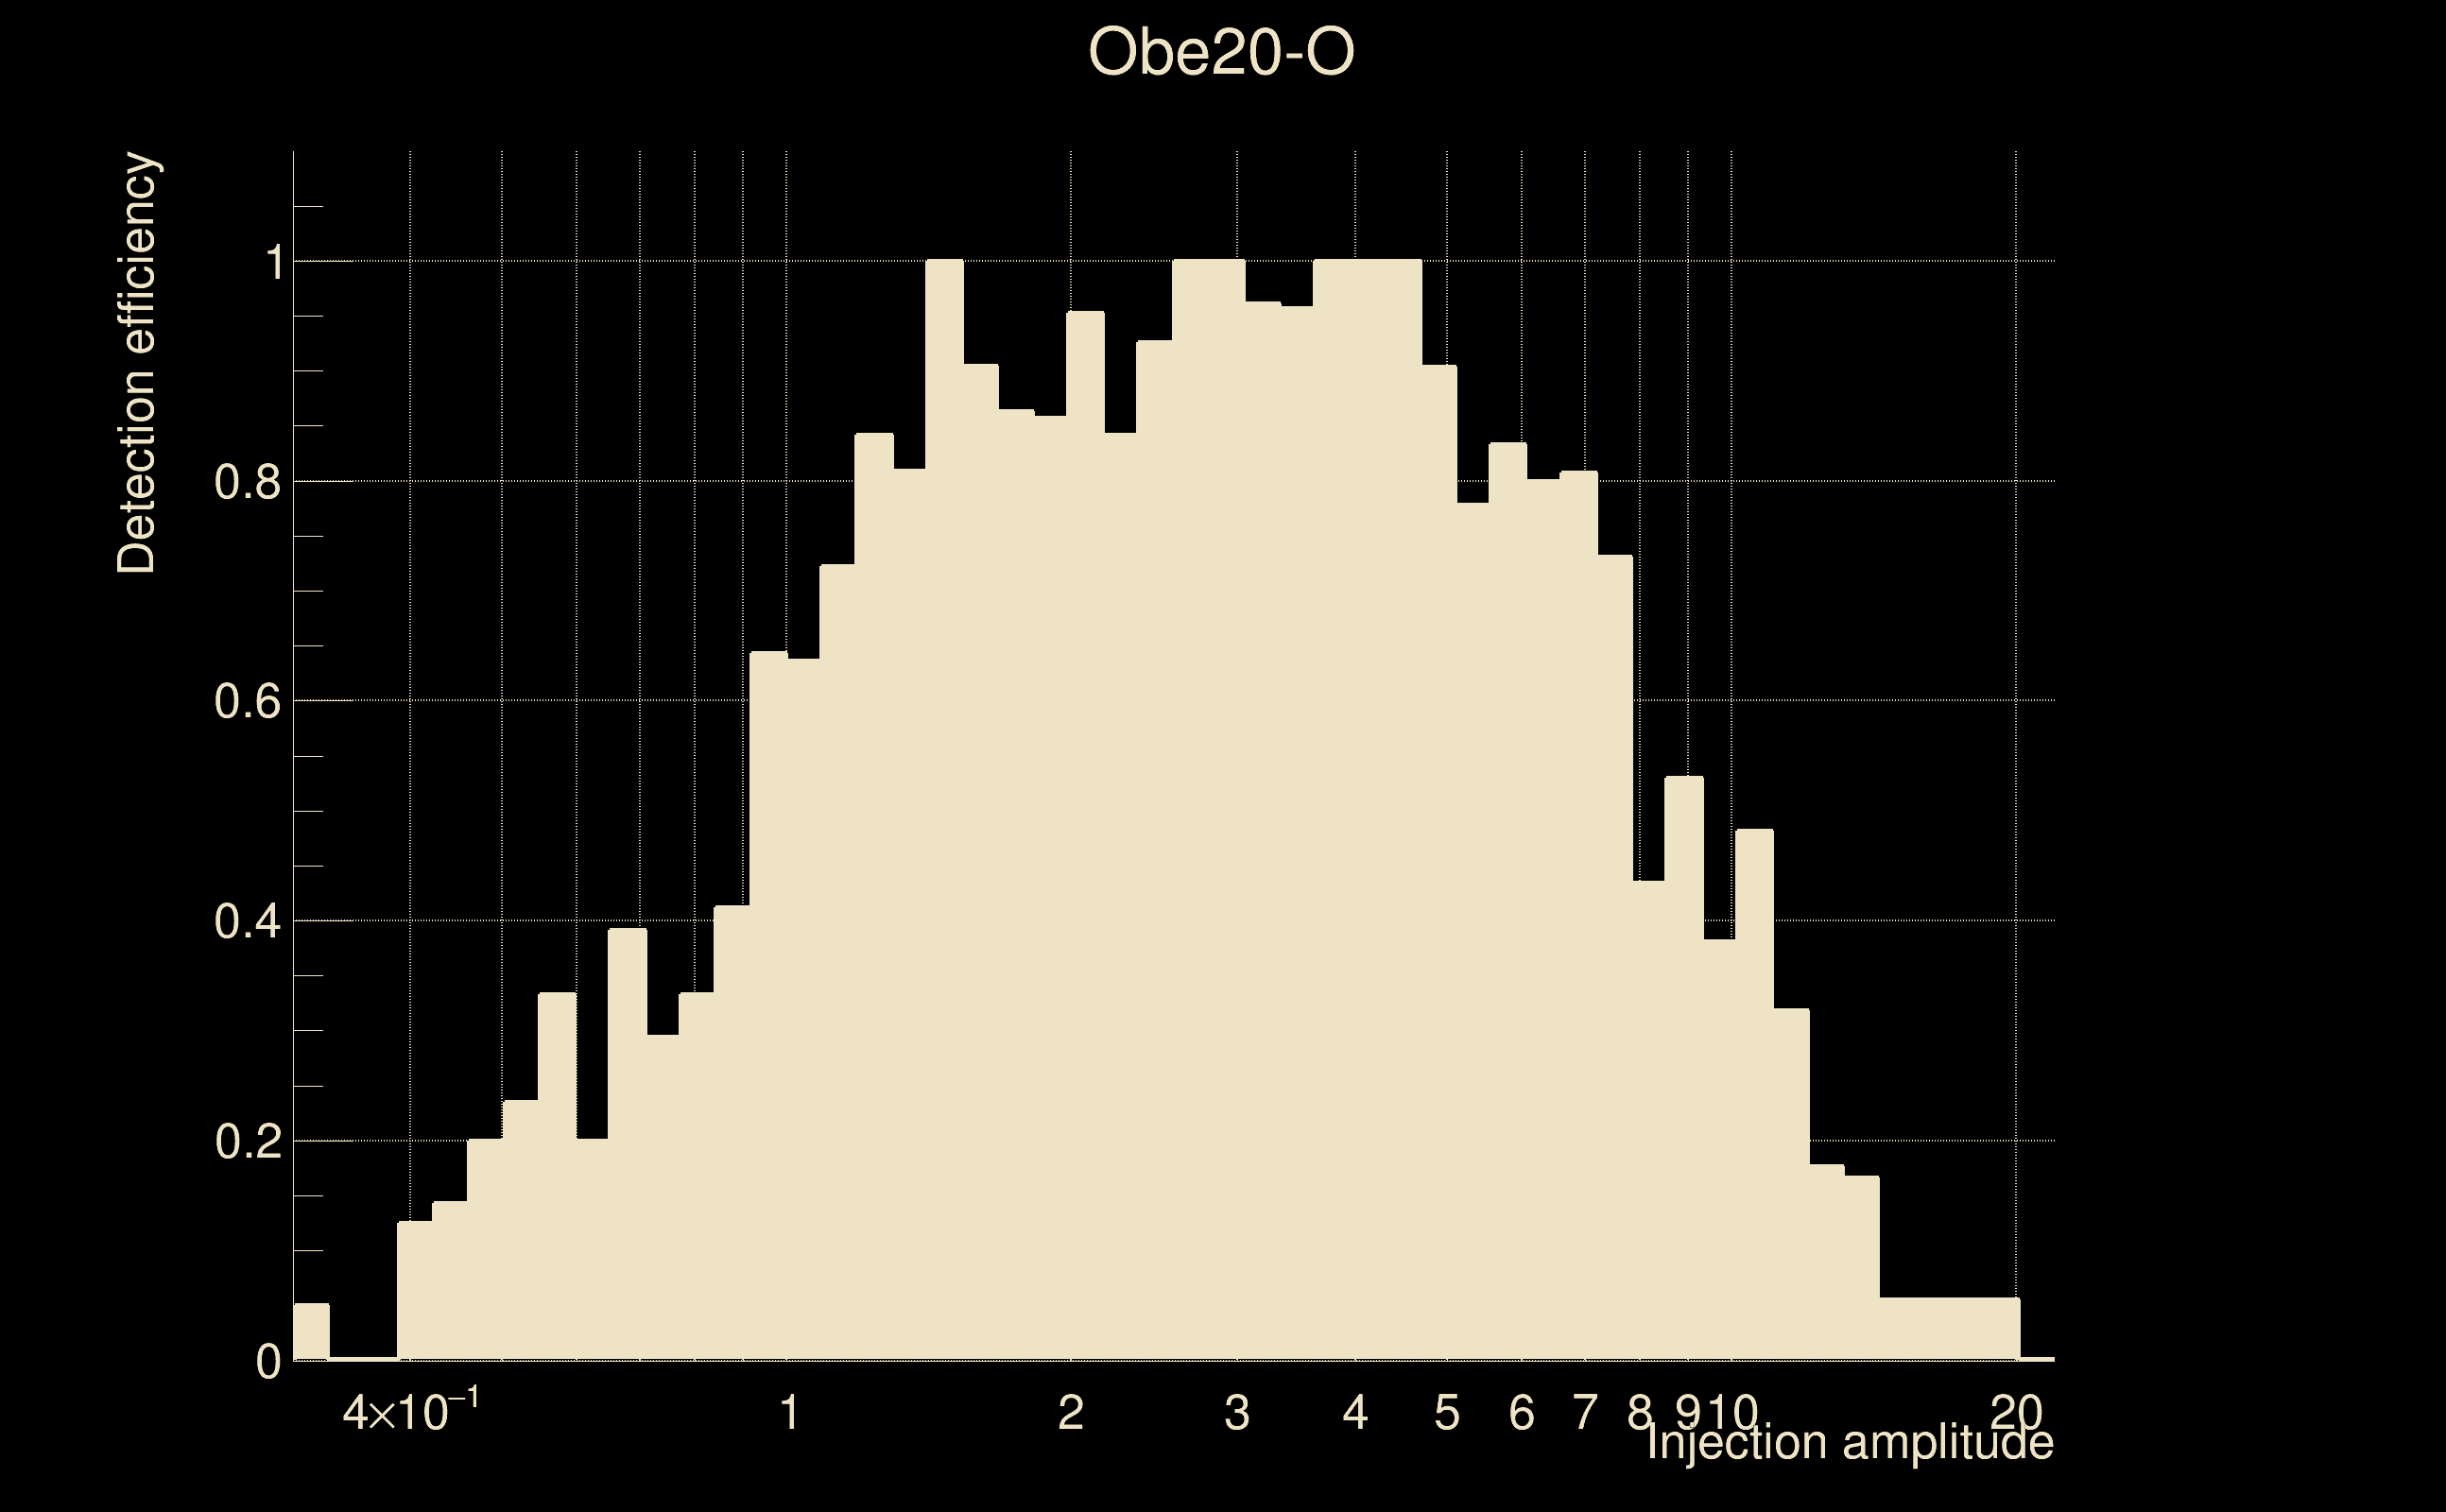
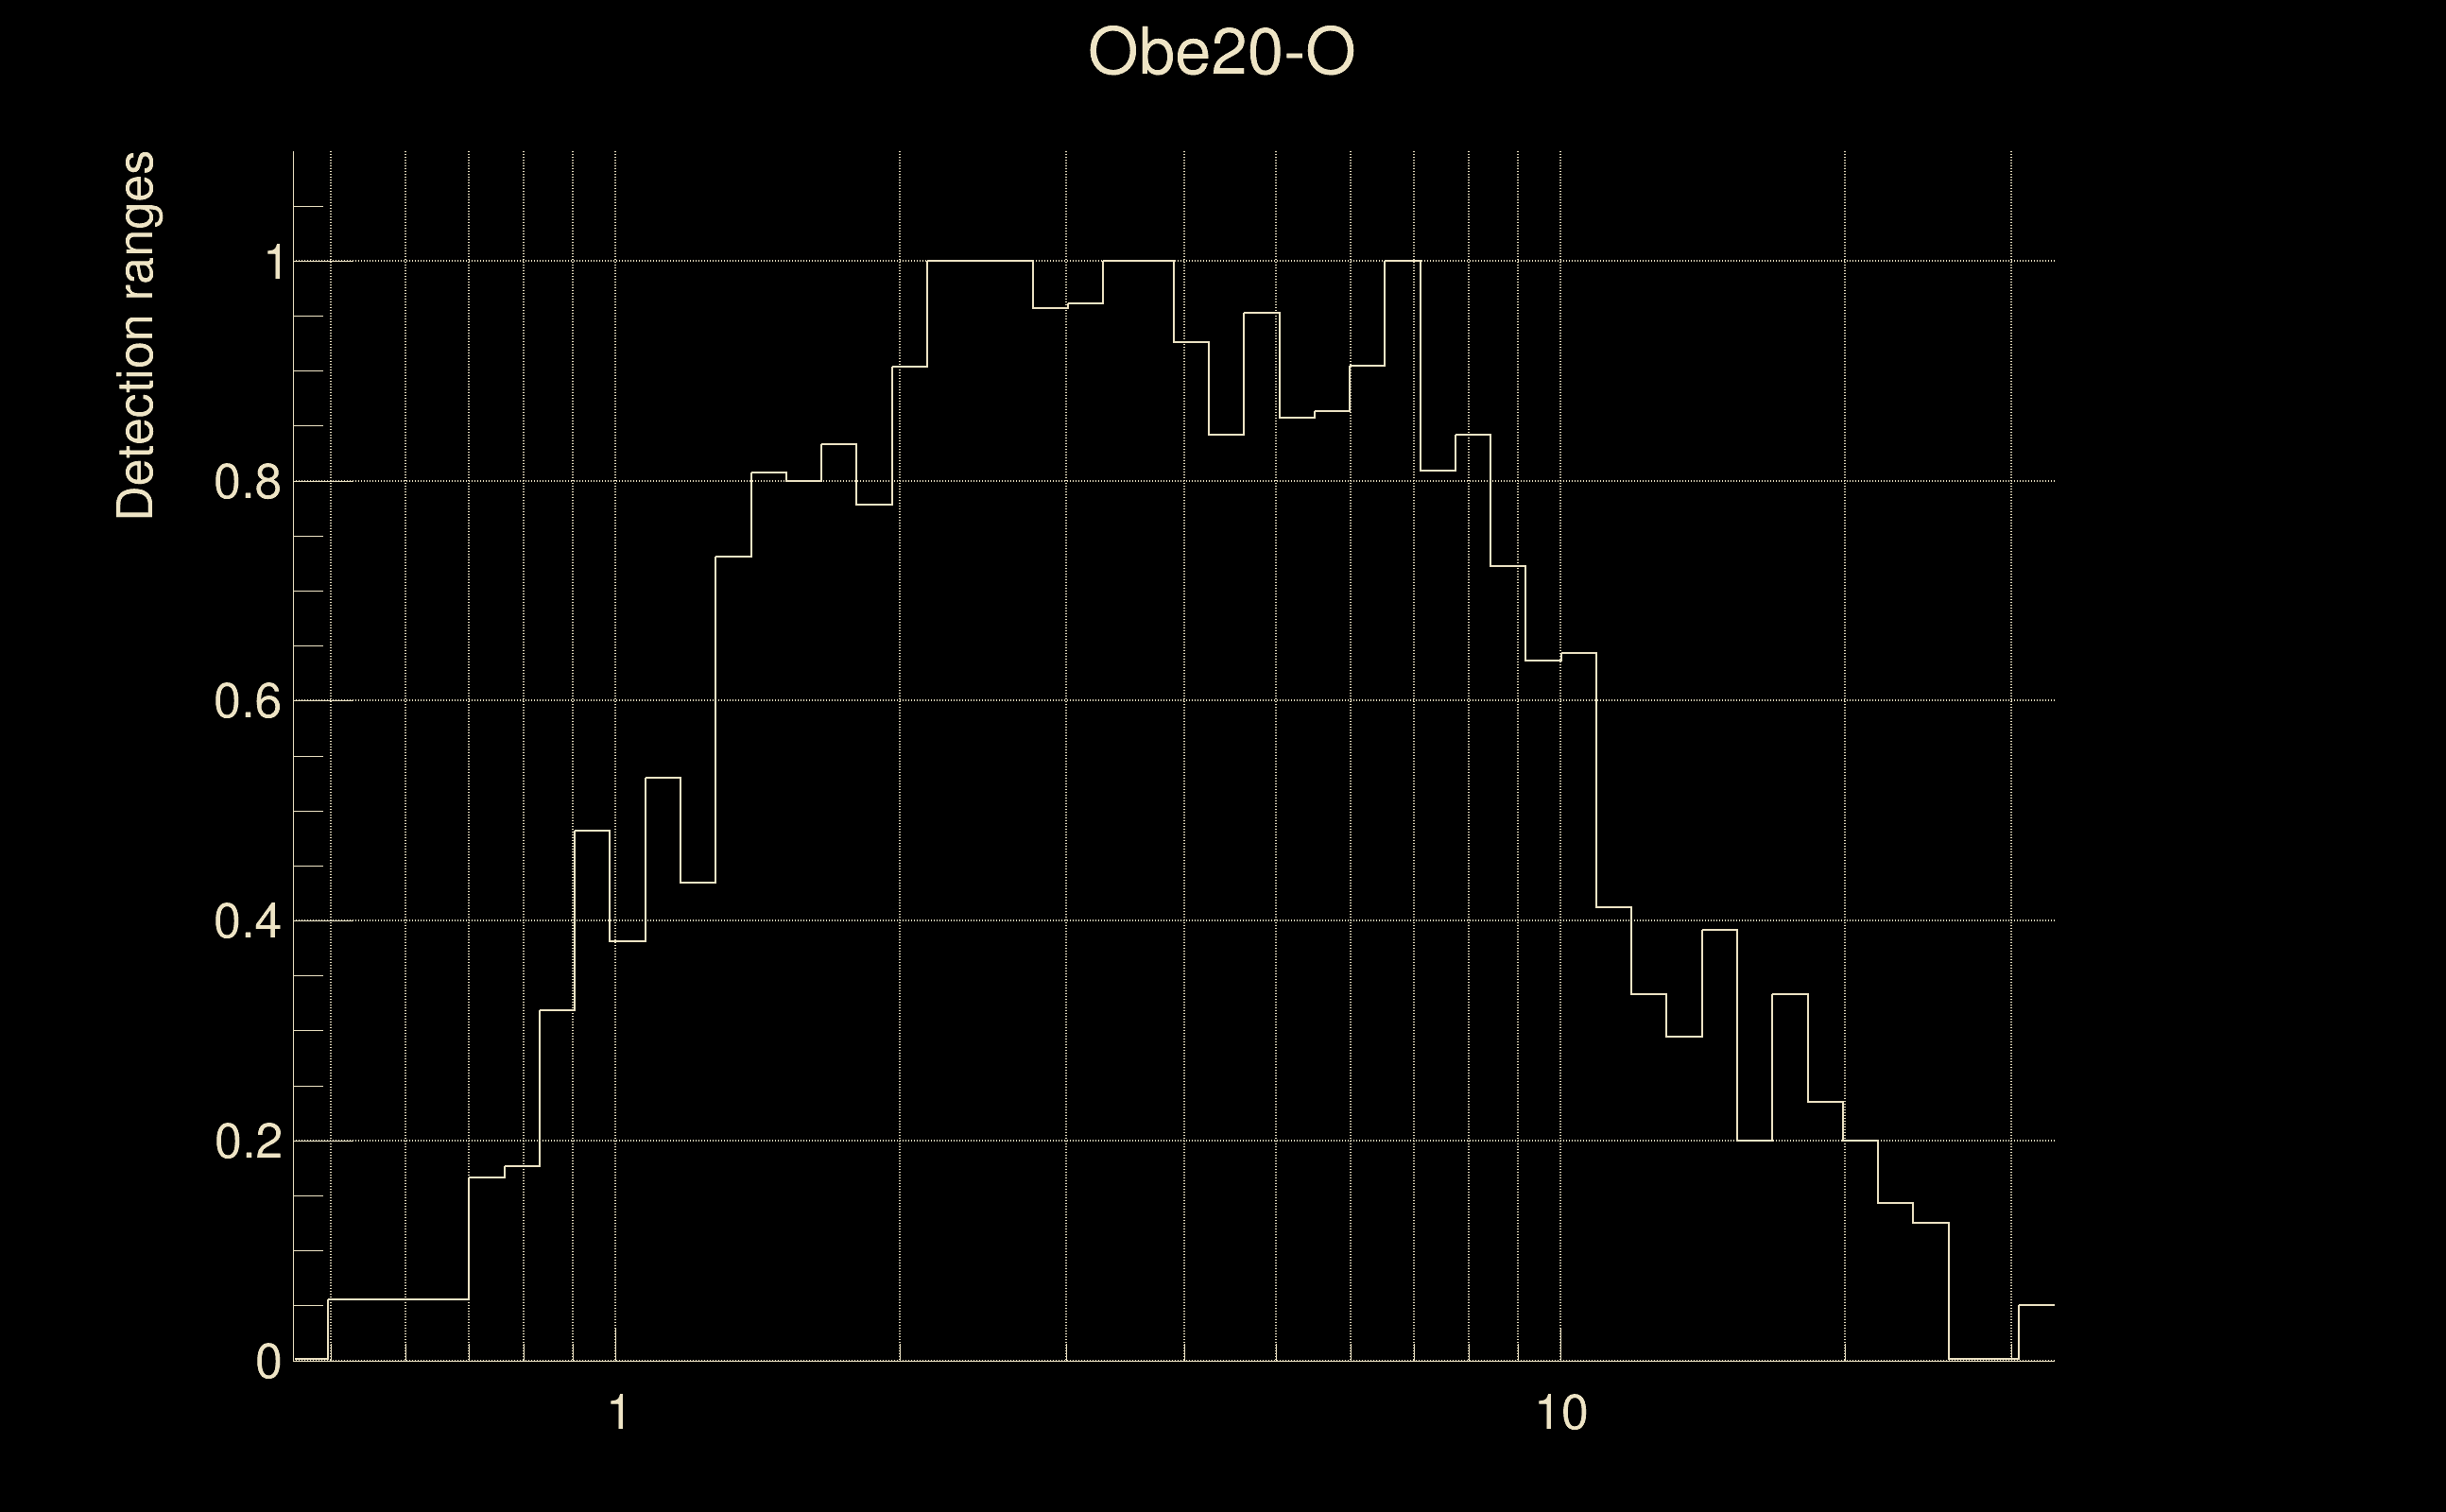
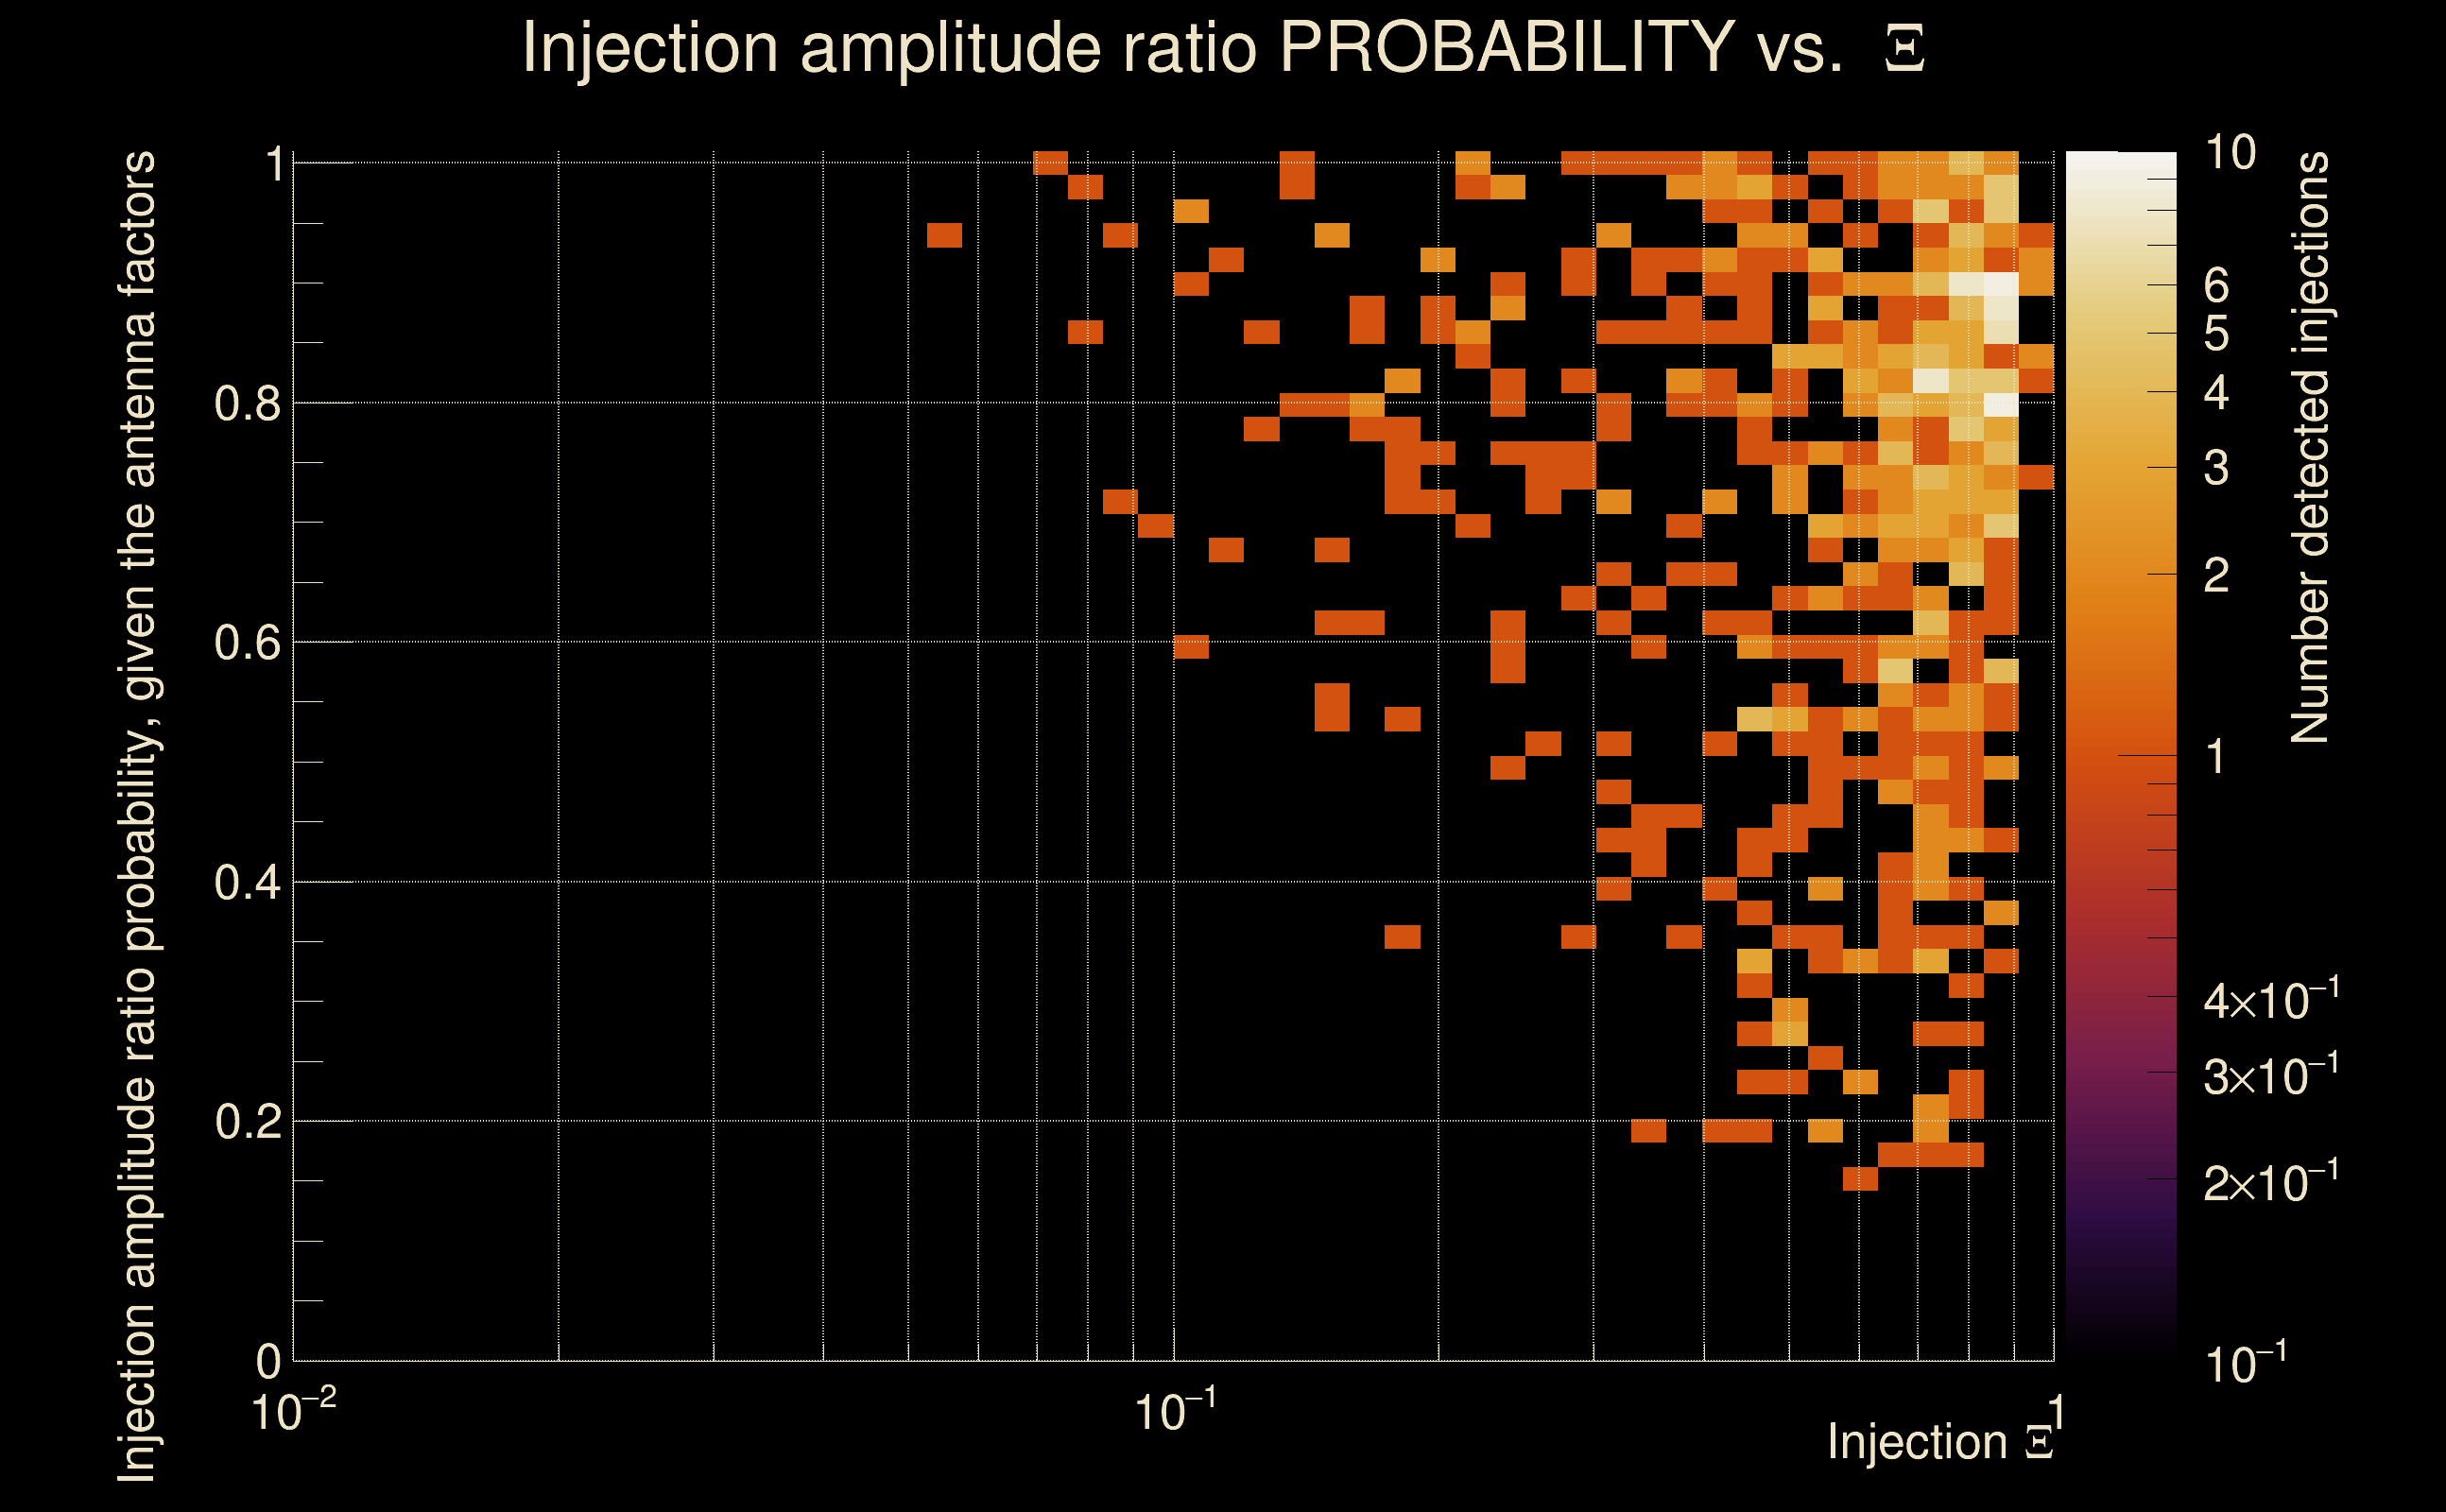
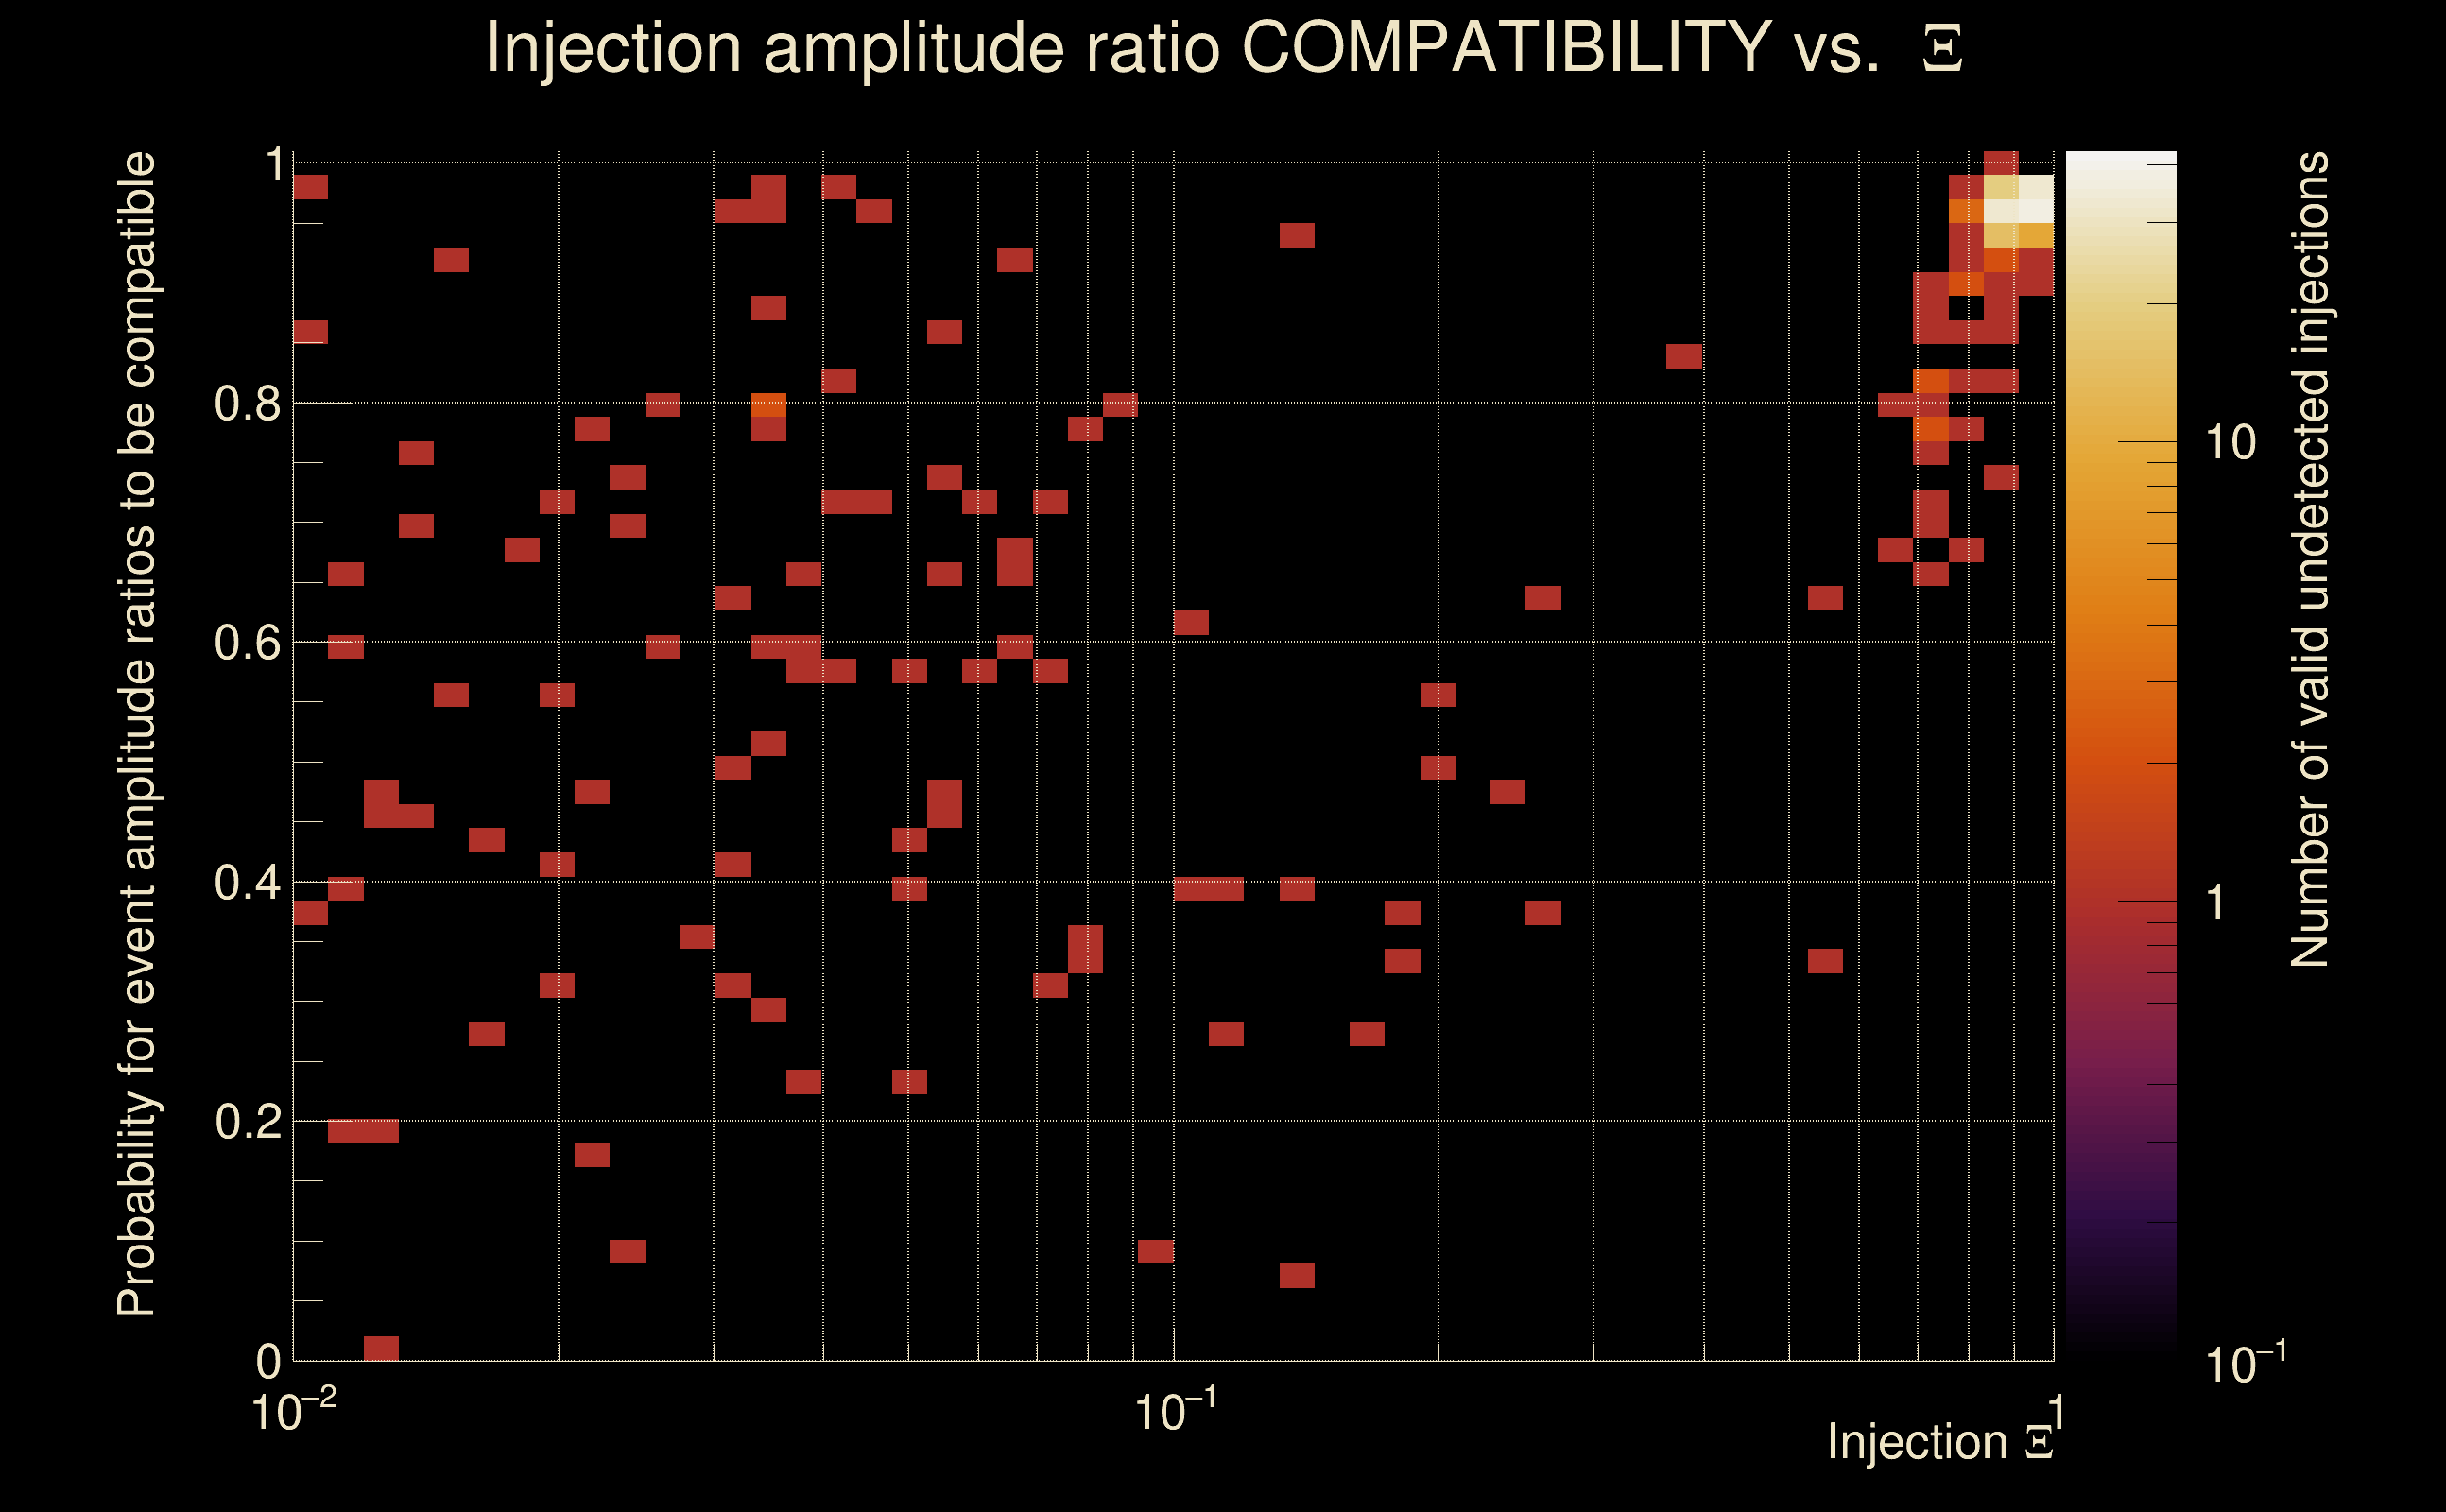
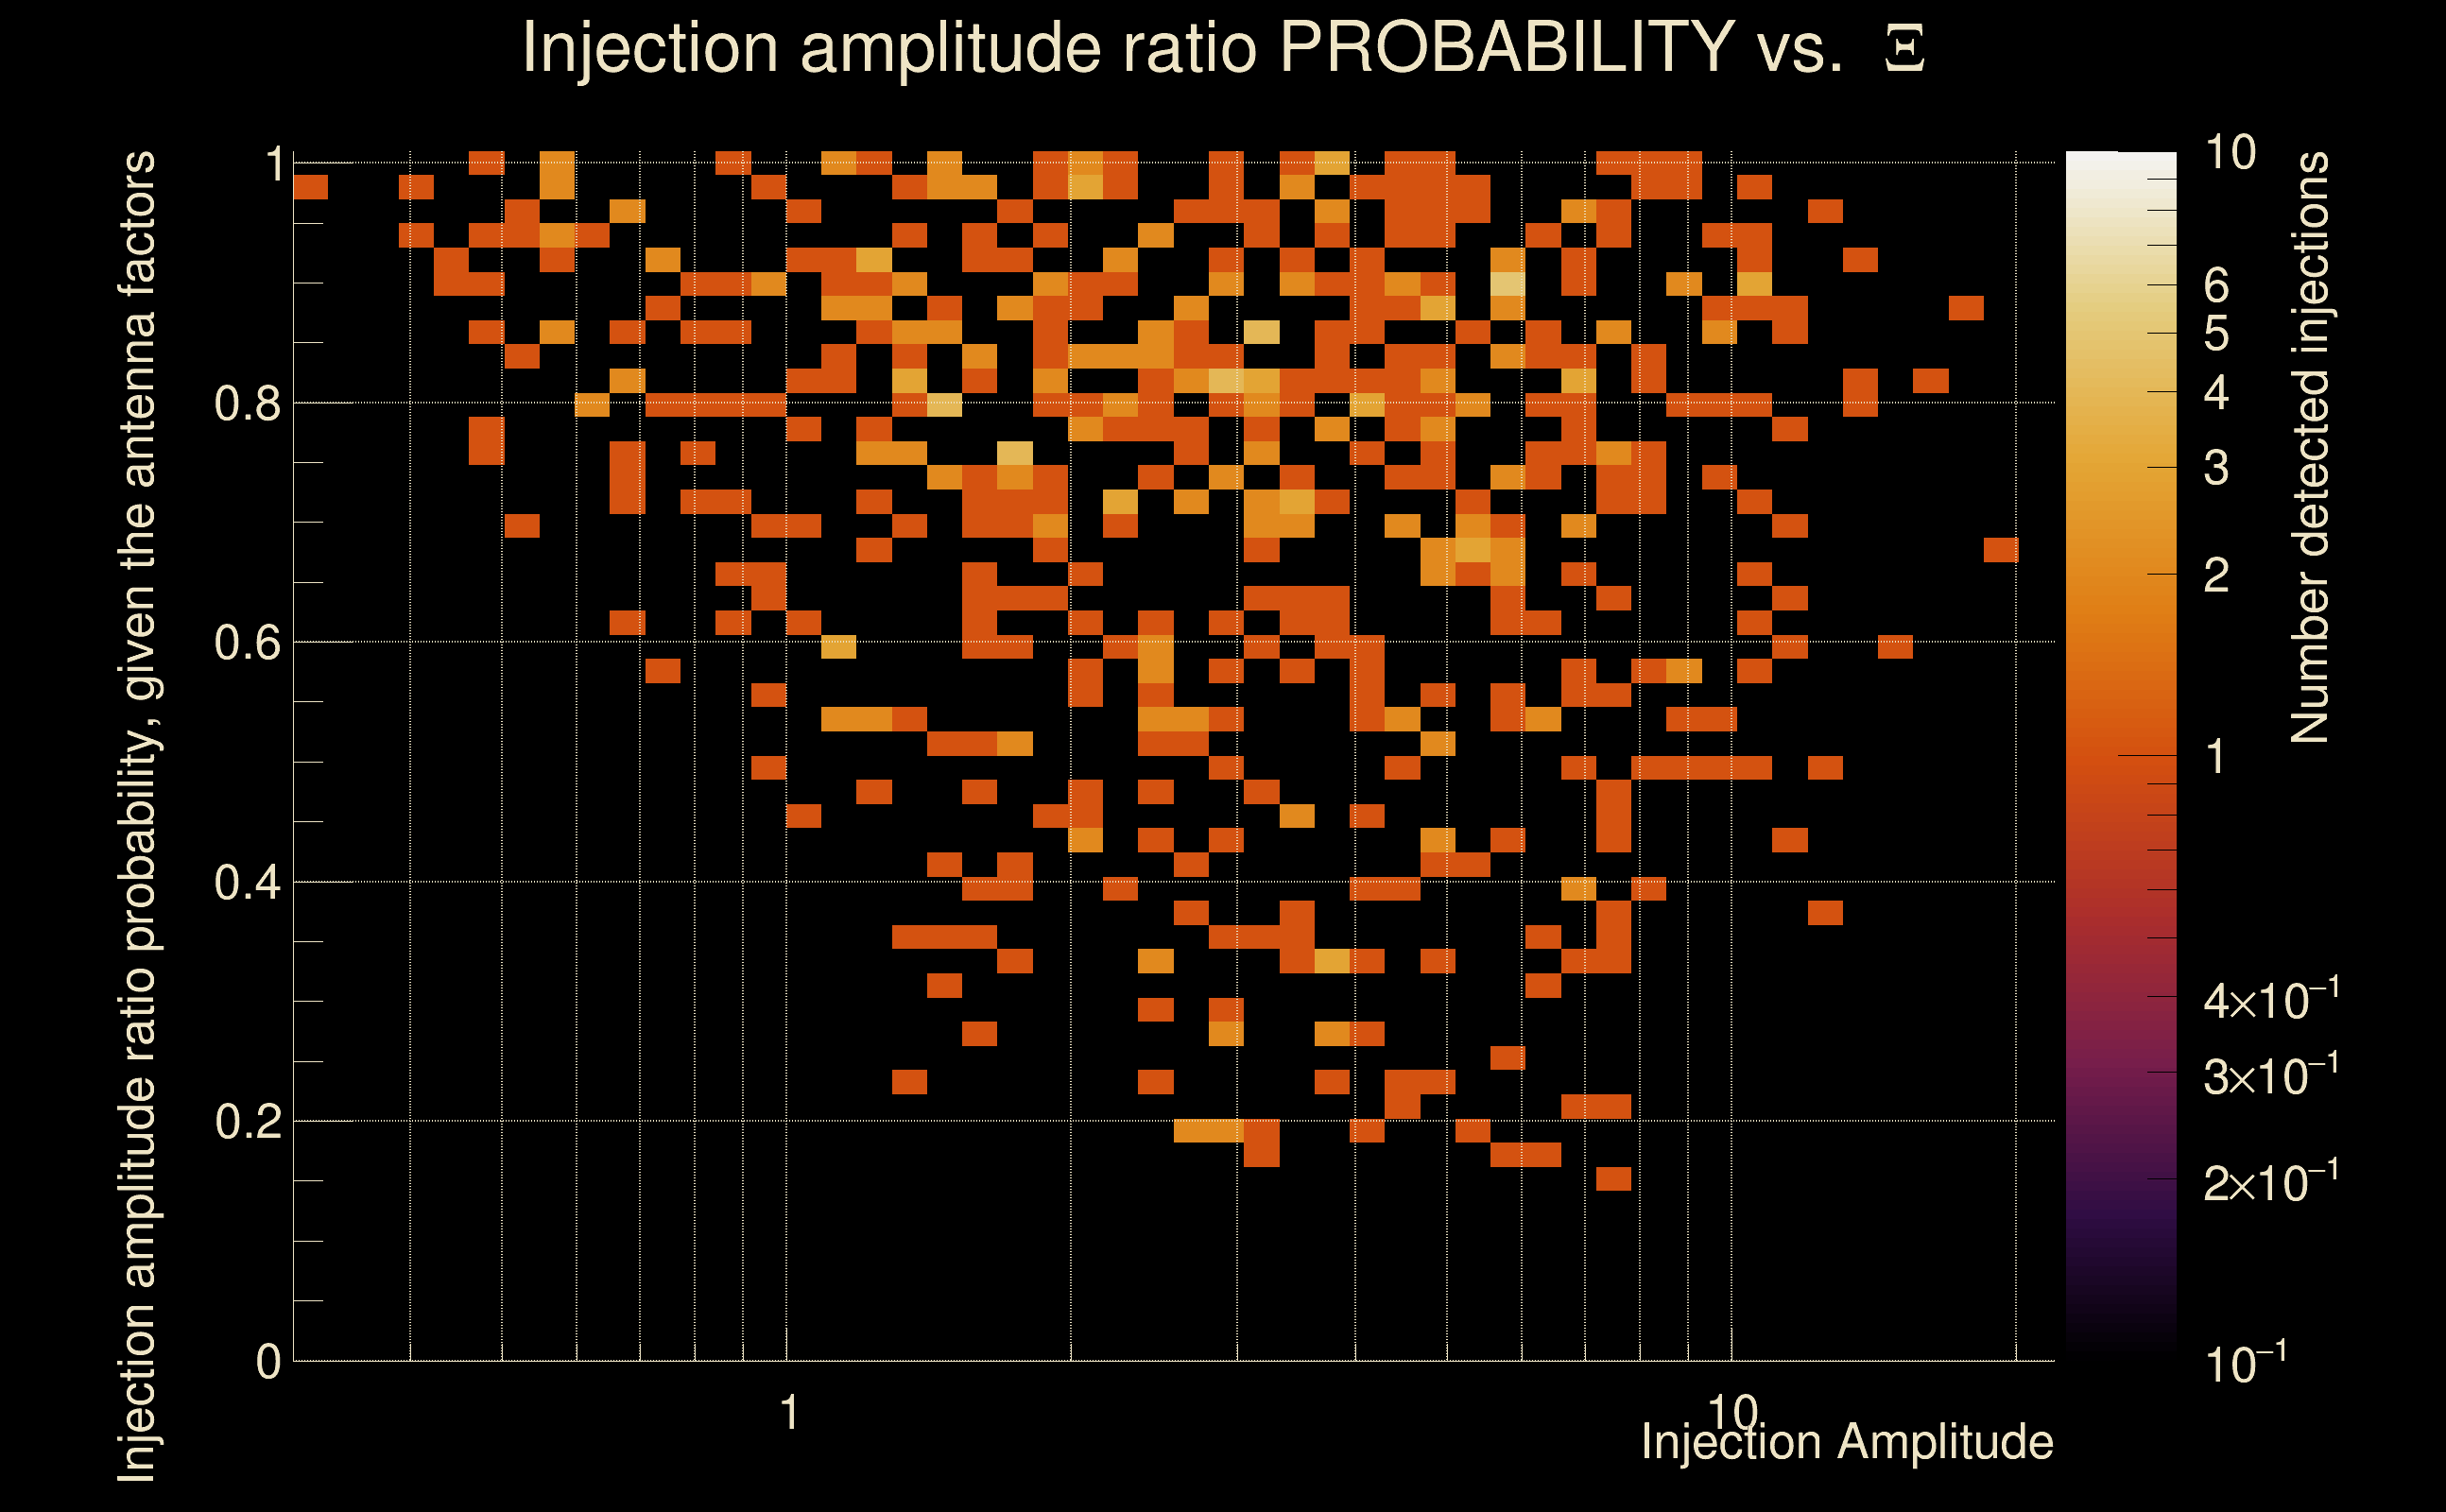
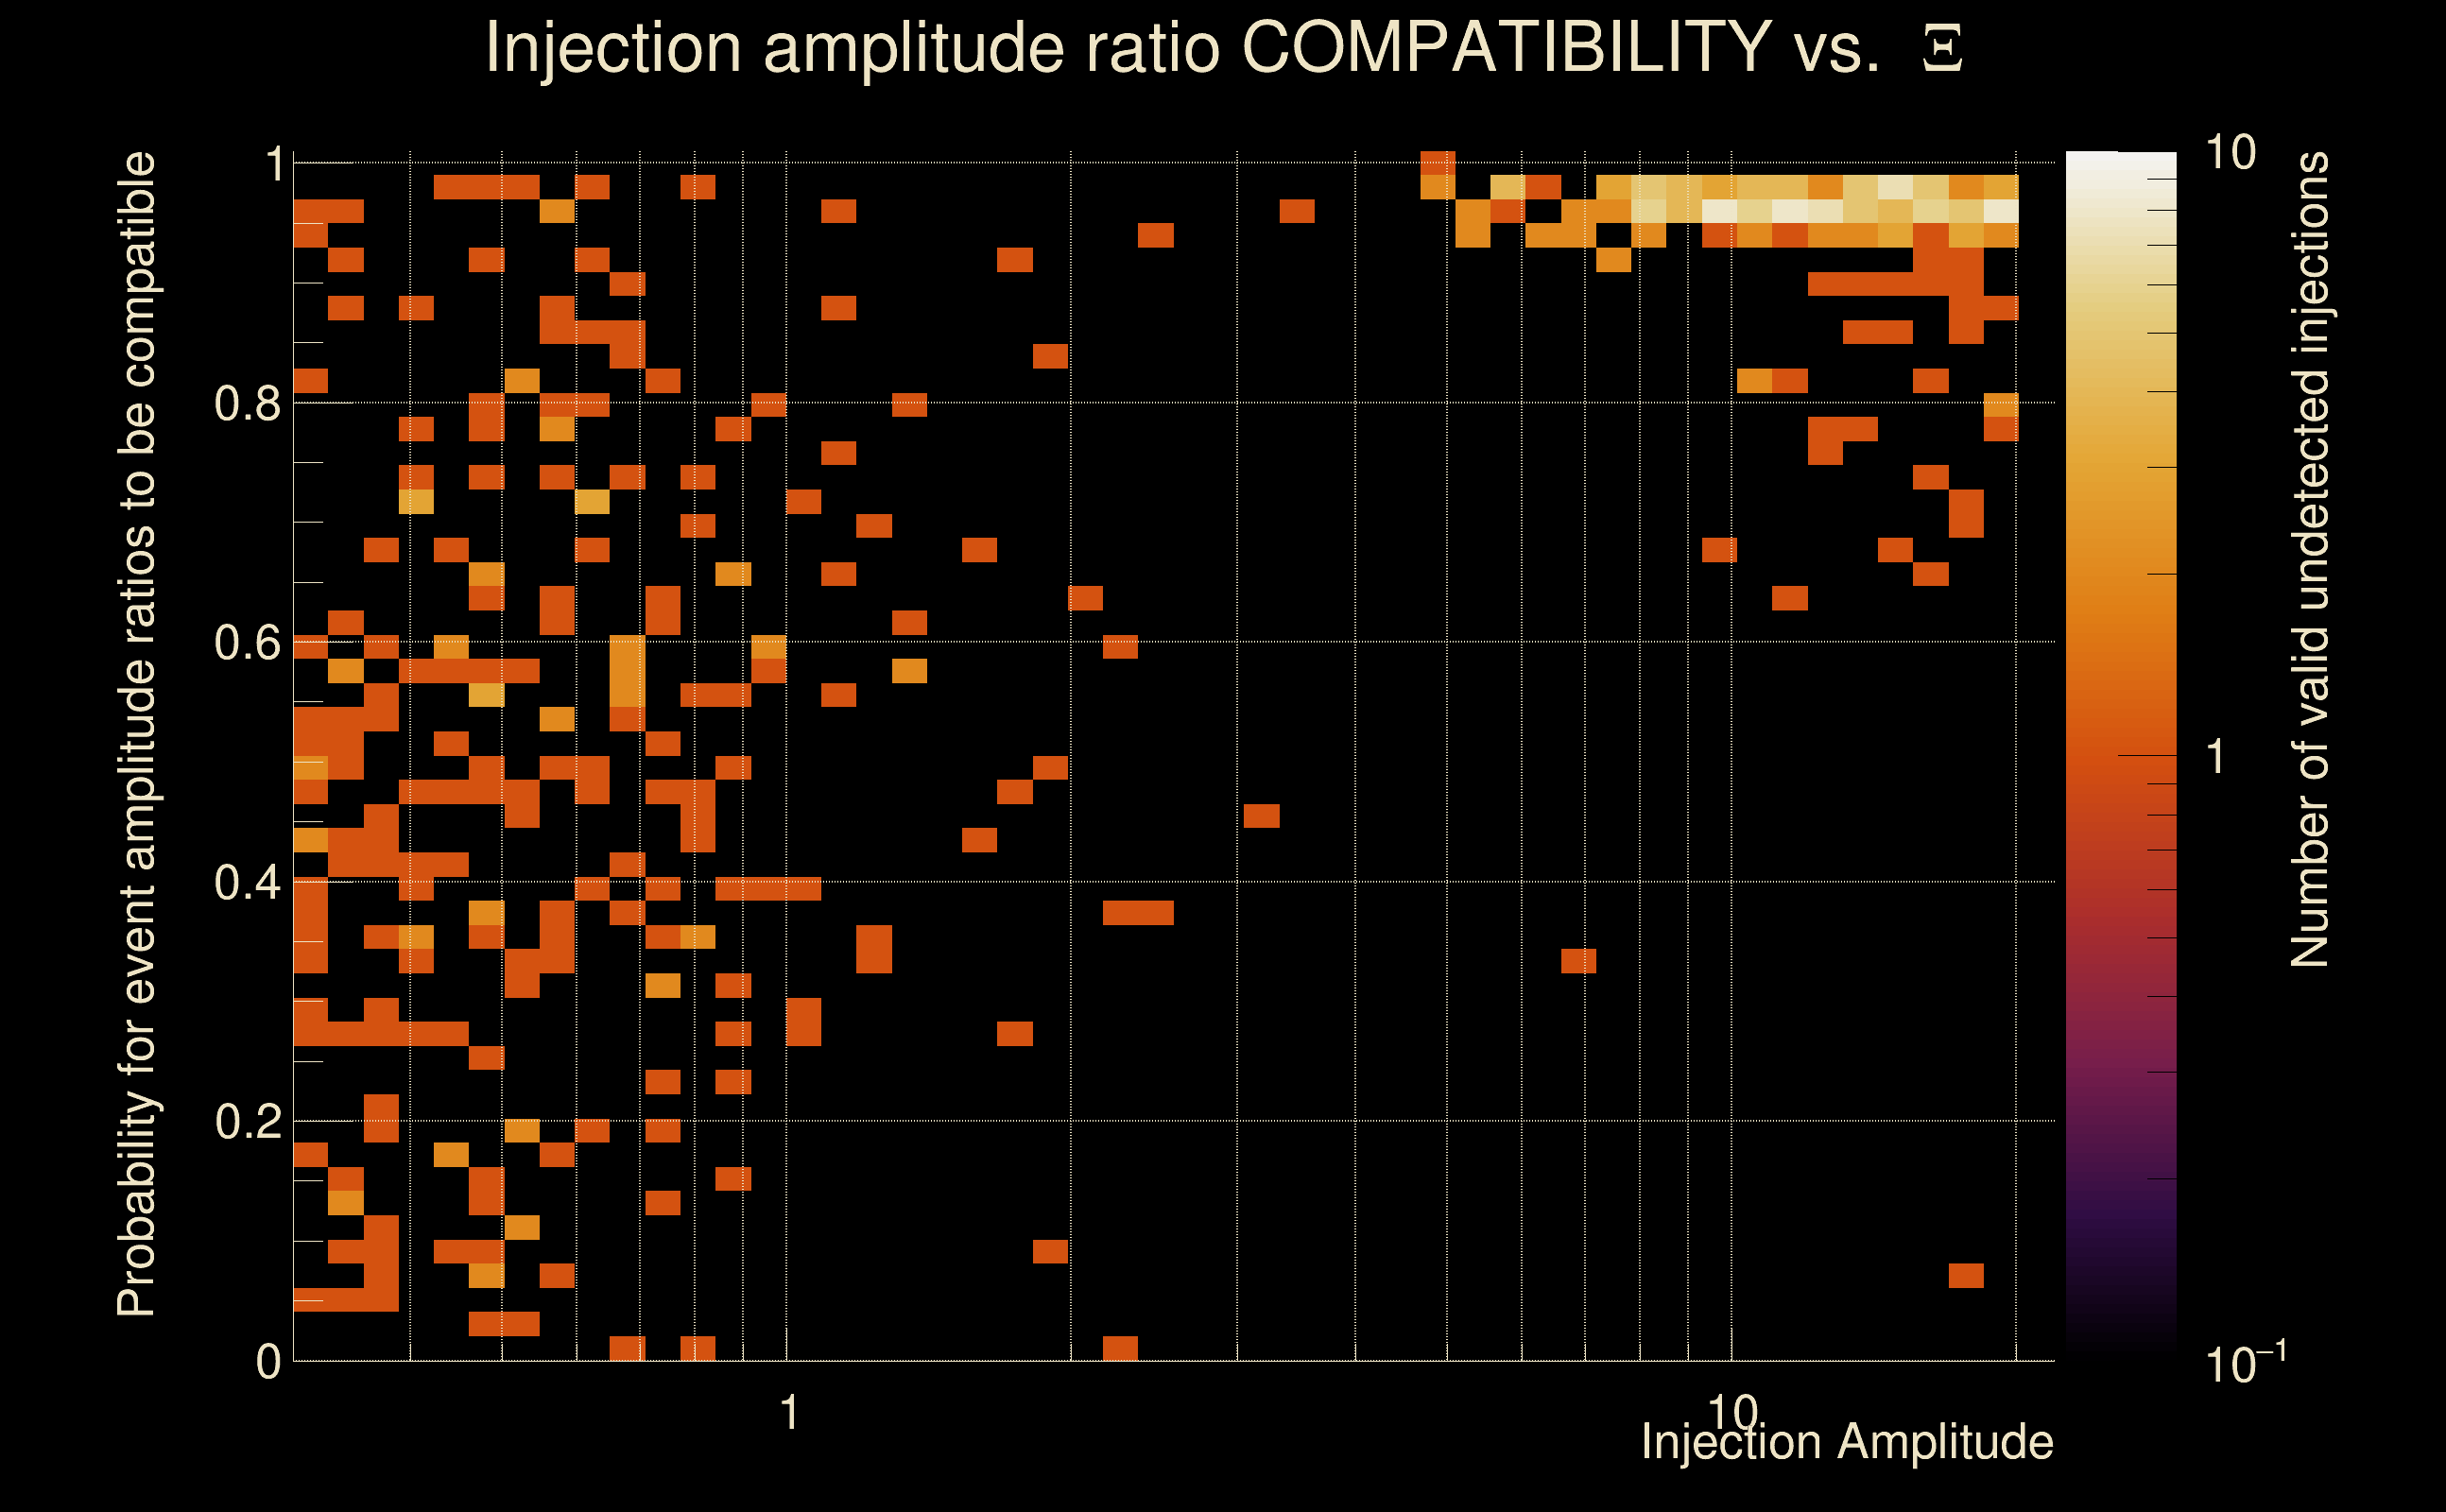
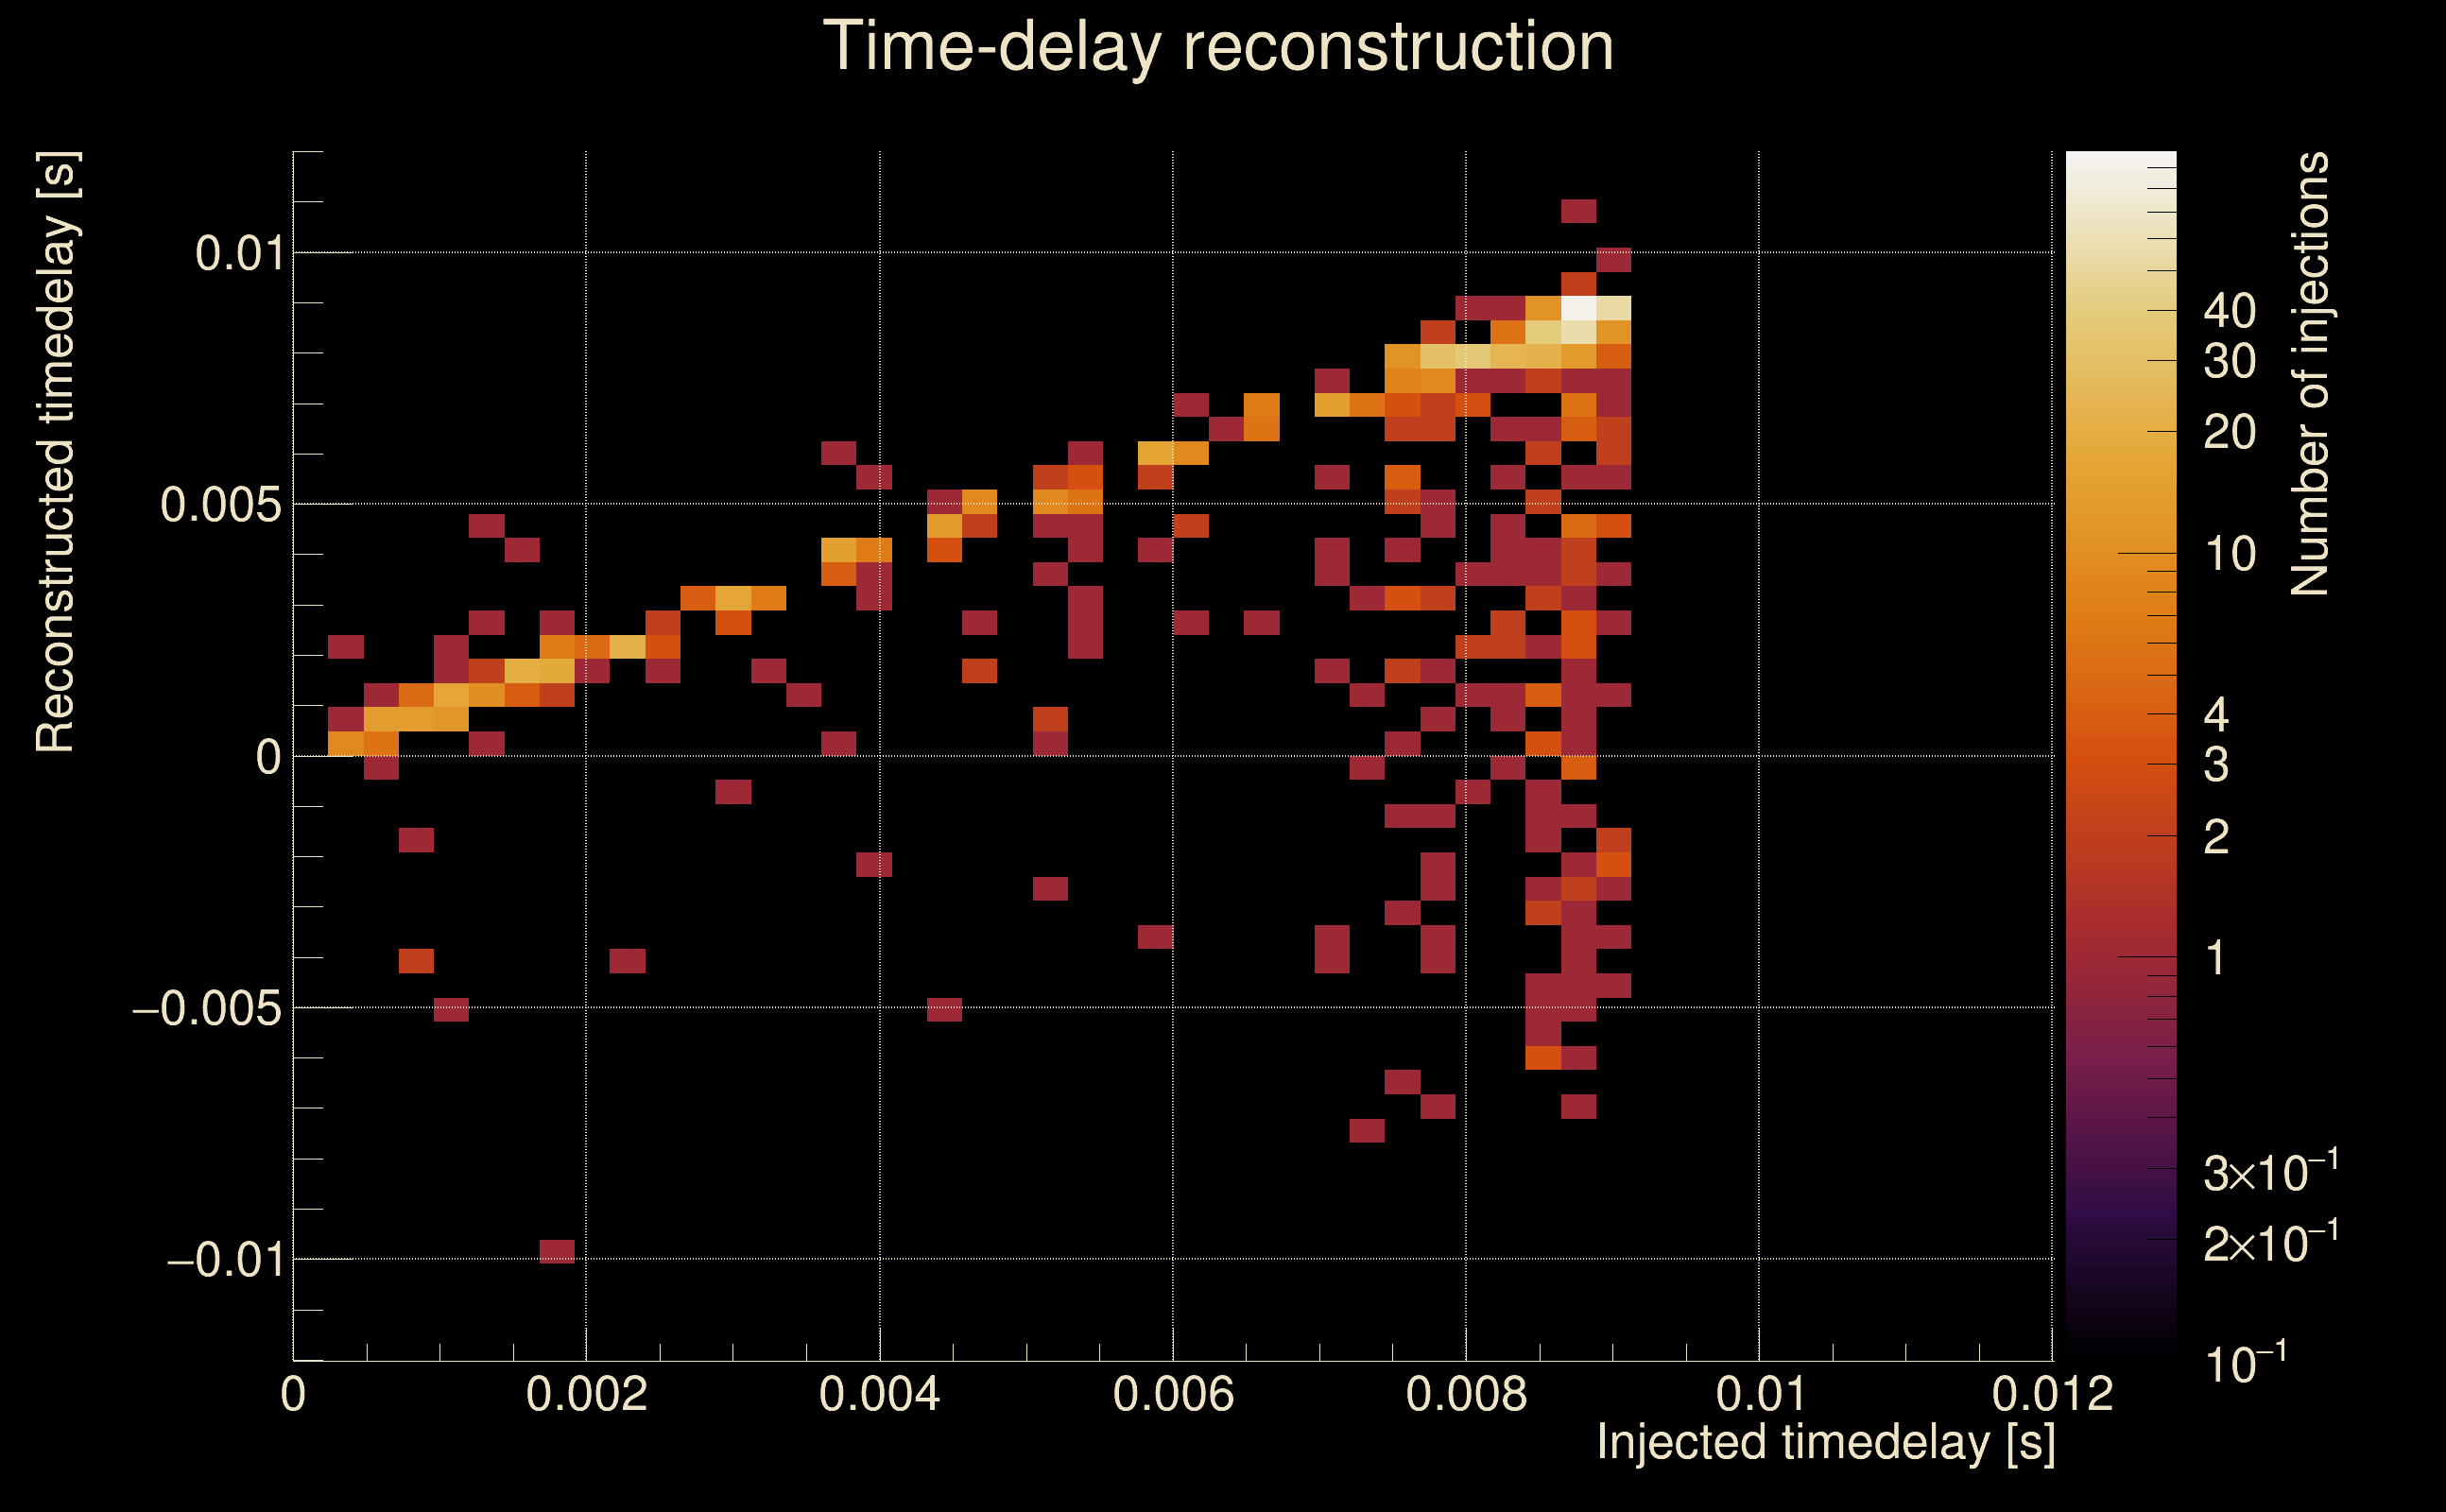
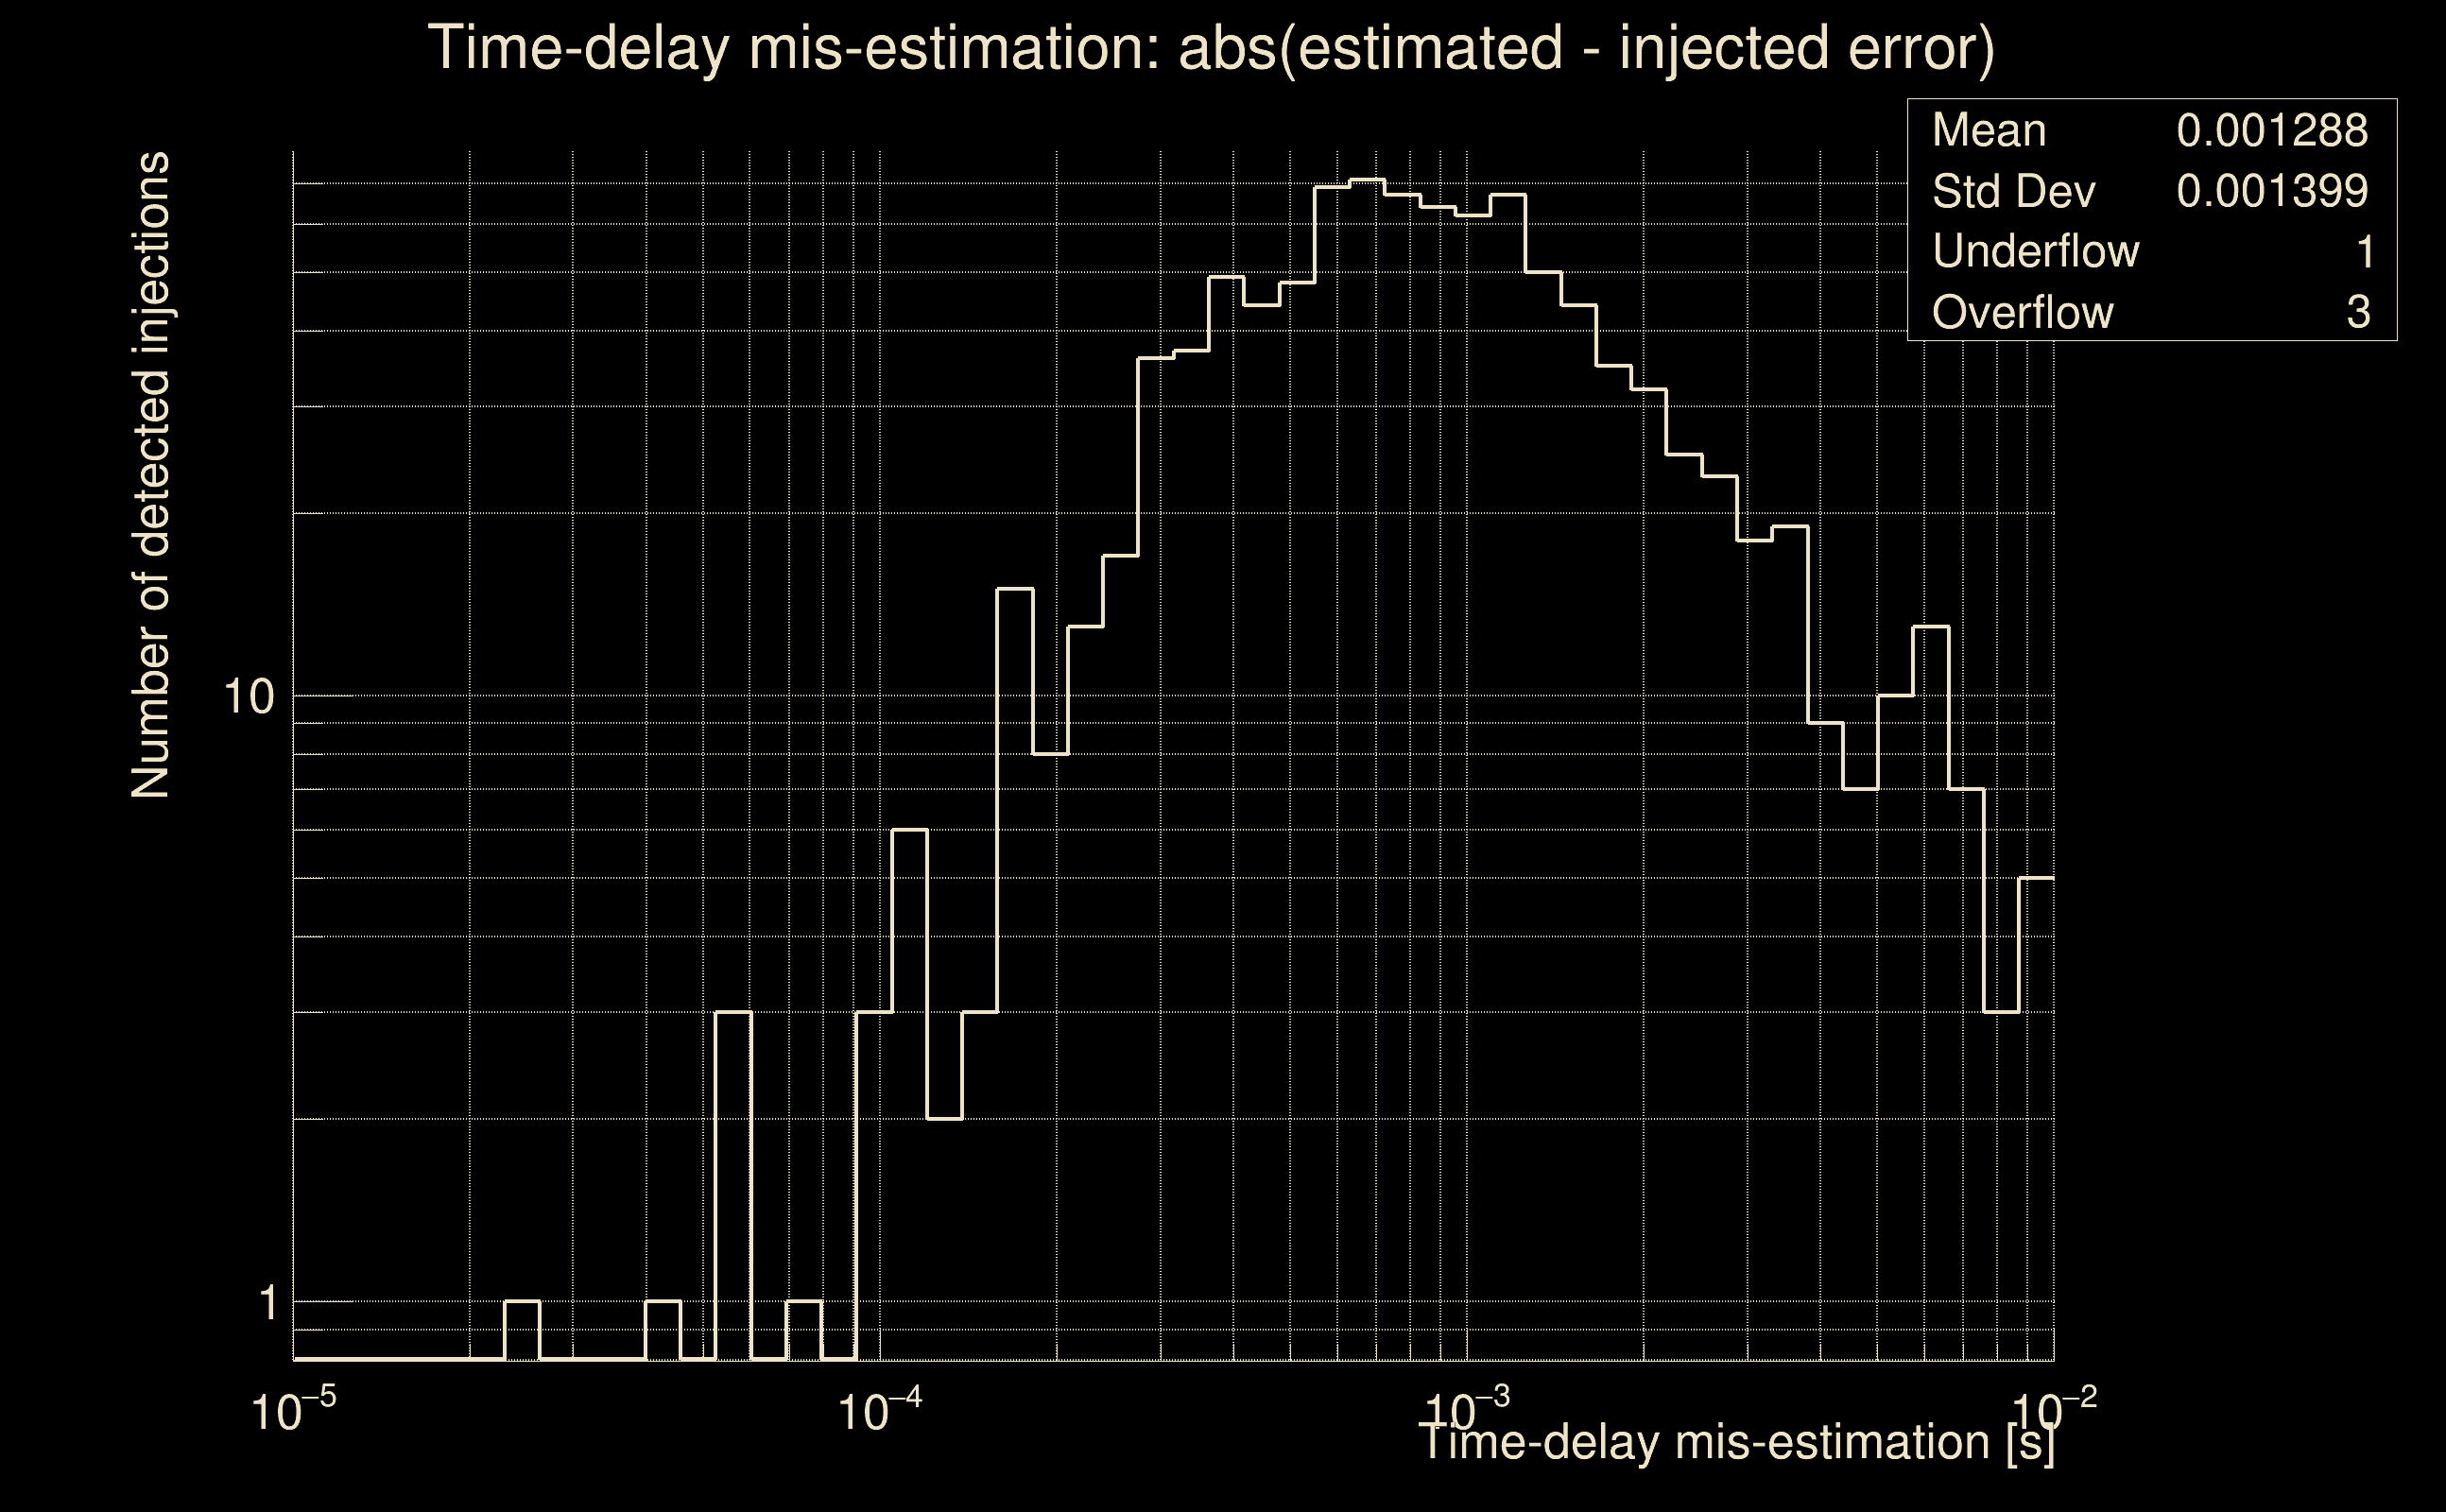
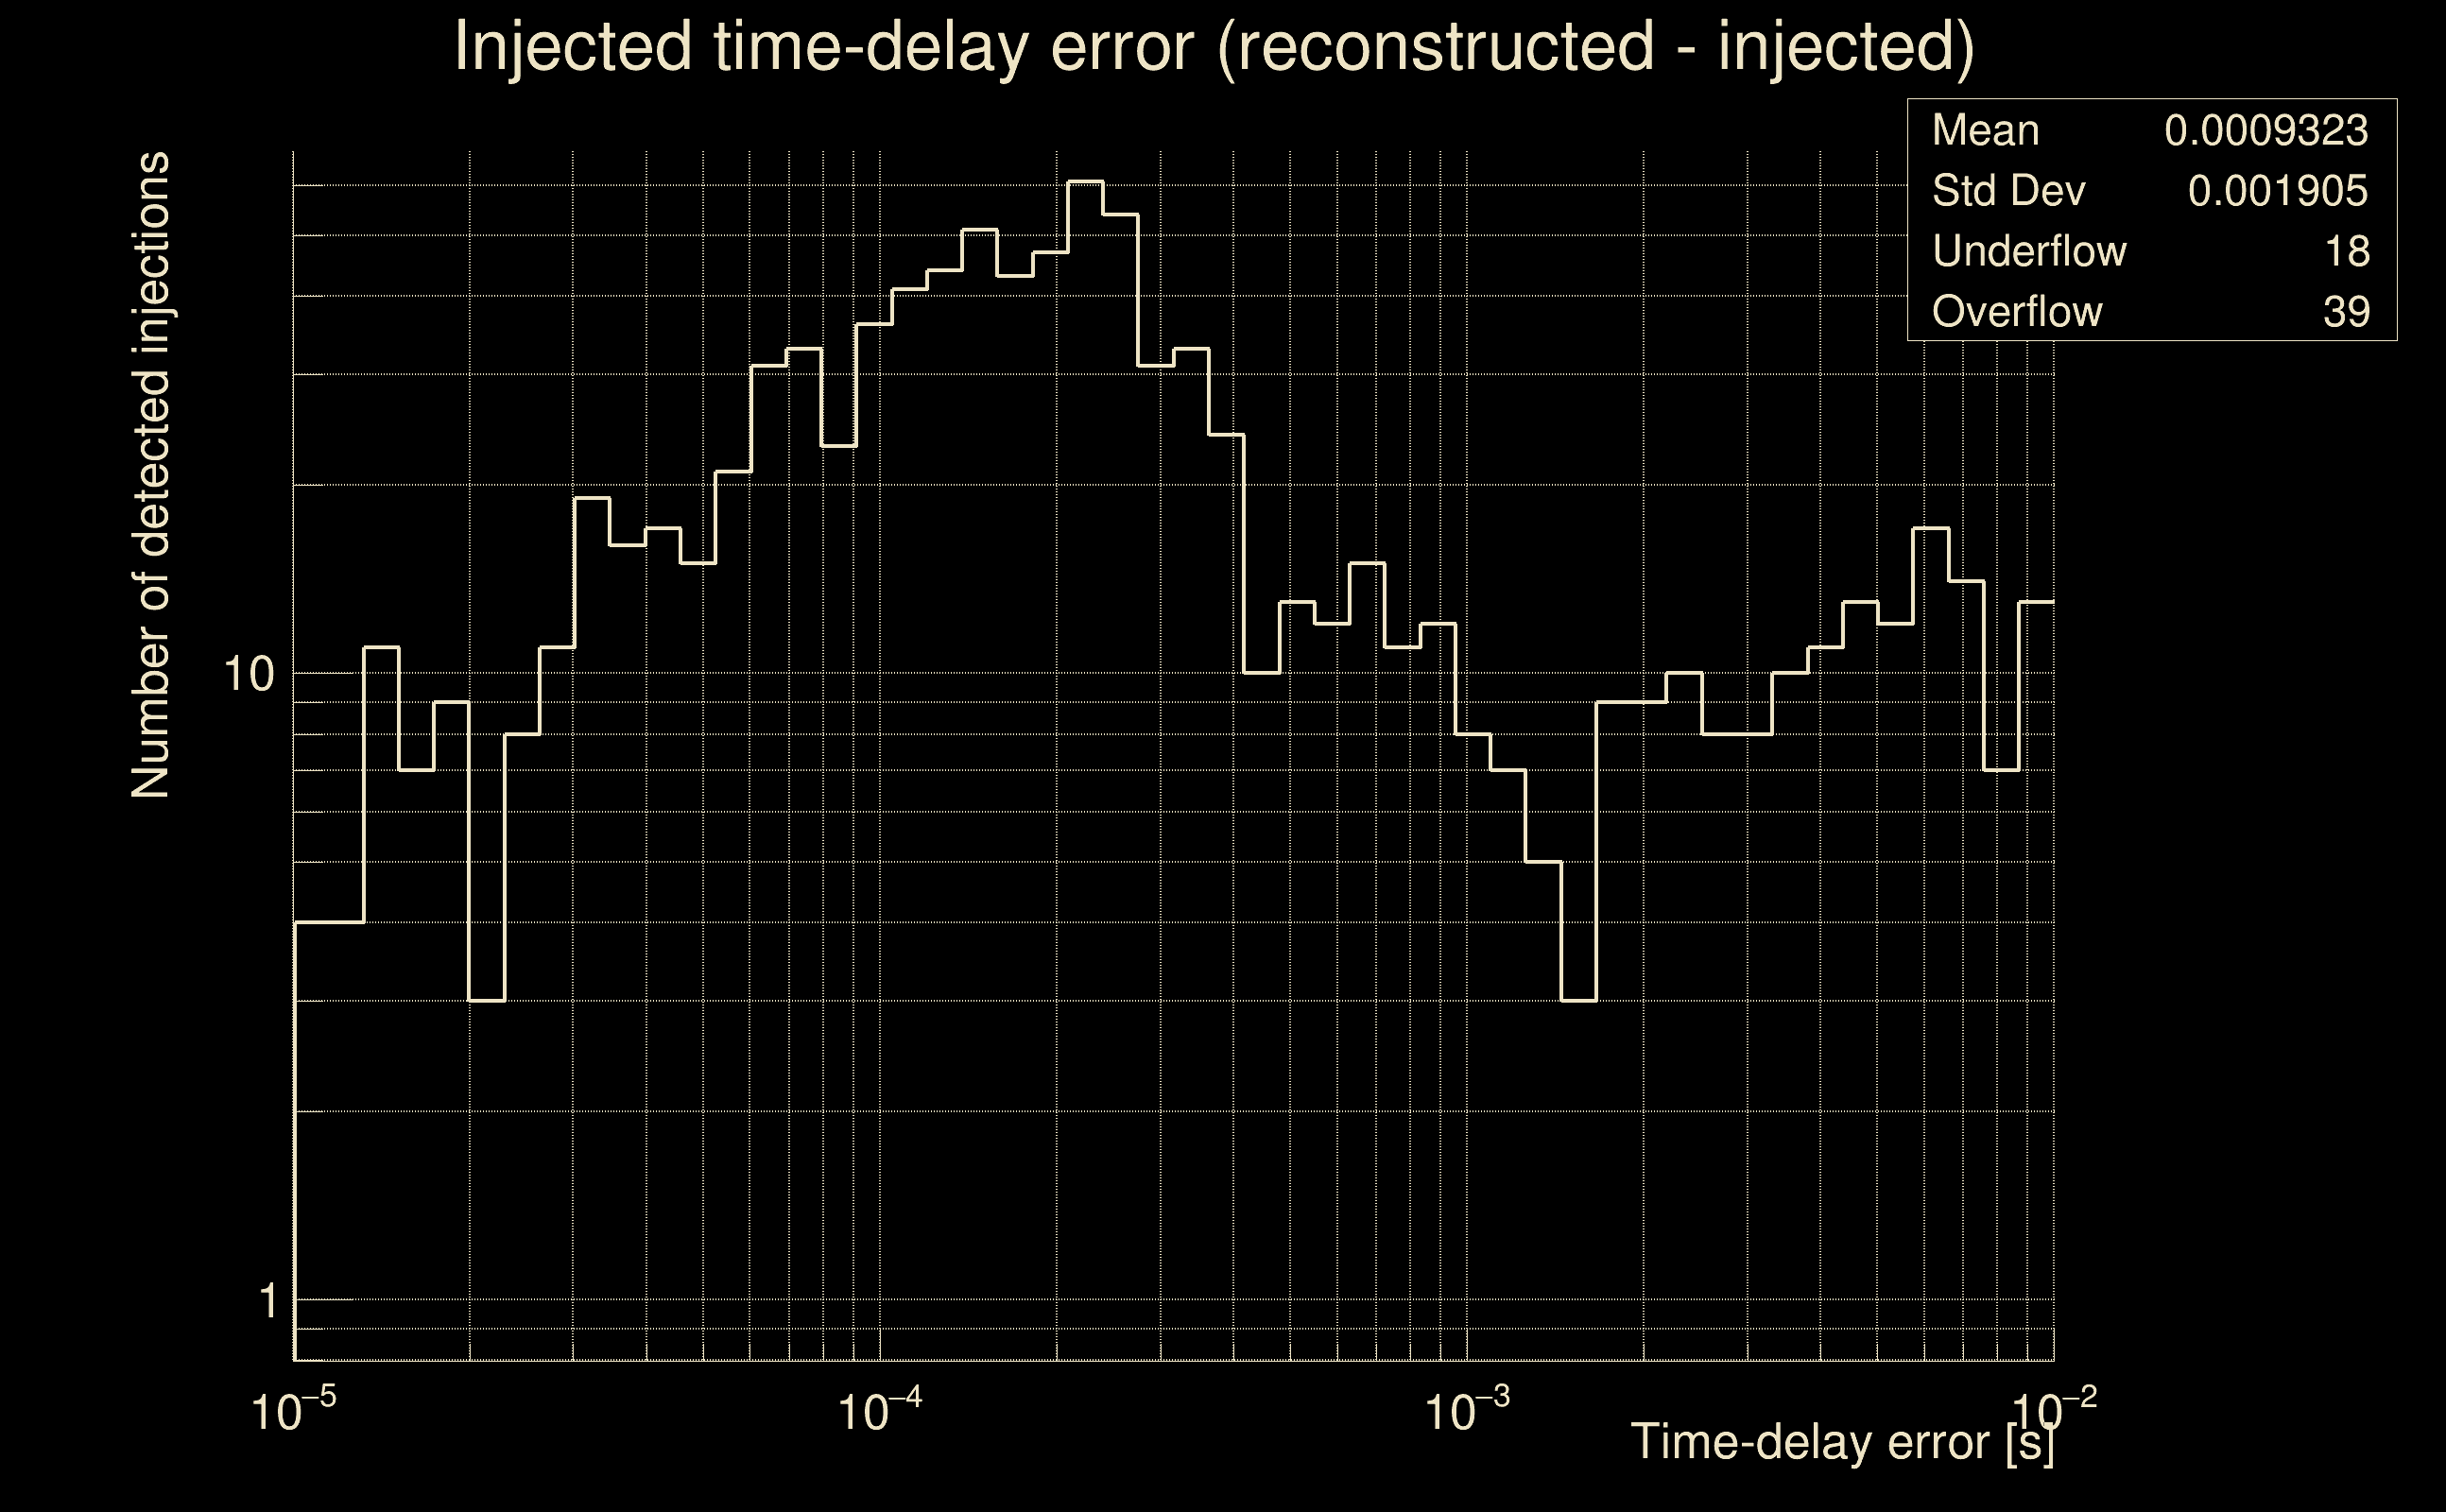
| Number of injections (total/valid/detected): | 1116 / 991 / 576 |
| List of missed injections: | ./Obe20-O_missed.txt |
| Injection amplitude at 90% detection efficiency: | 1.40661 |
| Injection amplitude at 50% detection efficiency: | 0.908541 |
| Injection amplitude at 10% detection efficiency: | 0.399139 |
 |
 |
 |
 |
 |
 |
 |
|
 |
 |
|
 |
 |
|
 |
 |
|
 |
 |
|
 |
 |
|
 |
 |
|
 |
 |
|
 |
 |
 |
 |
 |
 |
 |
 |
 |
 |
 |
 |
 |
 |
 |
| florent.robinet@ijclab.in2p3.fr |