| Omicron version: | 4.2.0: documentation gitlab repository |
| Omicron run by: | unknown |
| Report produced on: | Wed Dec 17 09:46:01 2025 UTC |
| Ox option file: | TargIxfw_injpt3_options.txt |
| Omicron option files: | detector 0, detector 1 |
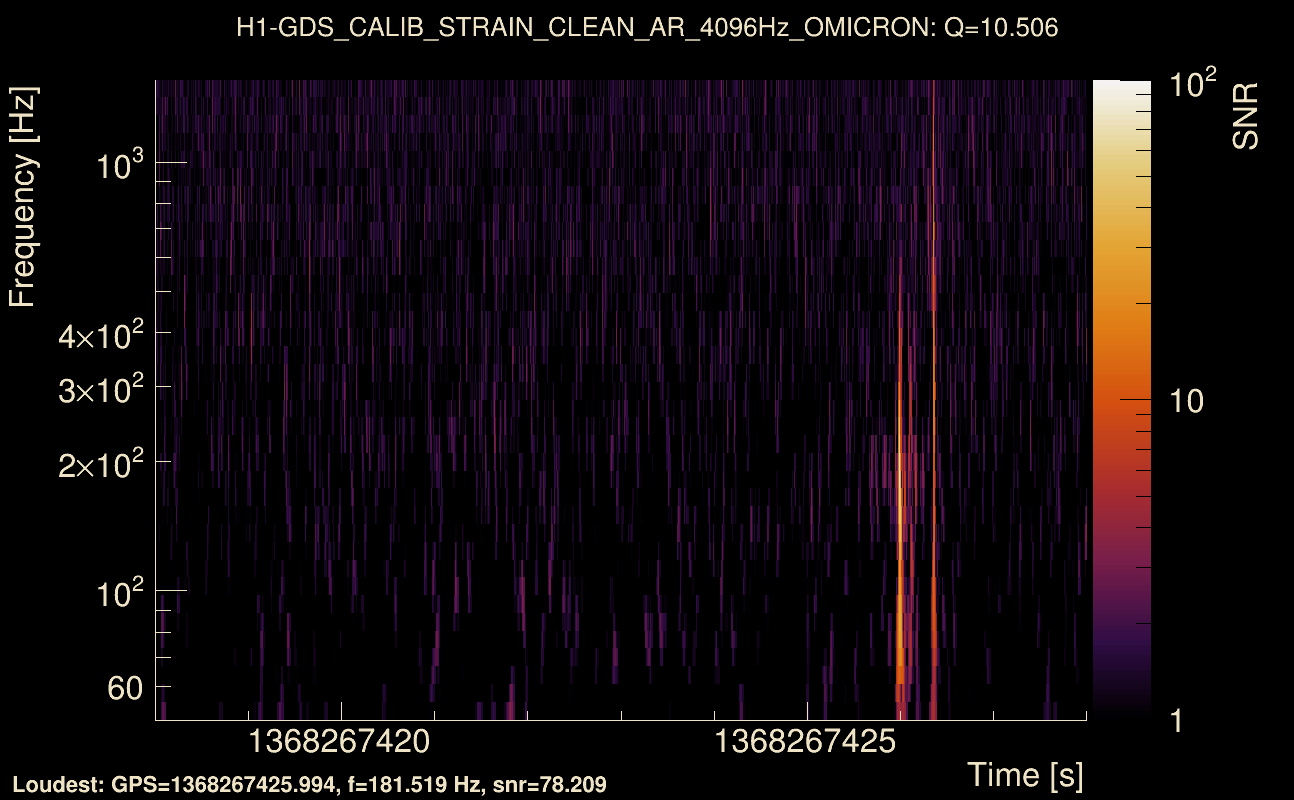
| Detector channel names: | H1:GDS-CALIB_STRAIN_CLEAN_AR_4096Hz, L1:GDS-CALIB_STRAIN_CLEAN_AR_4096Hz |
| Omicron analysis time window and overlap: | 16 s, 6 s |
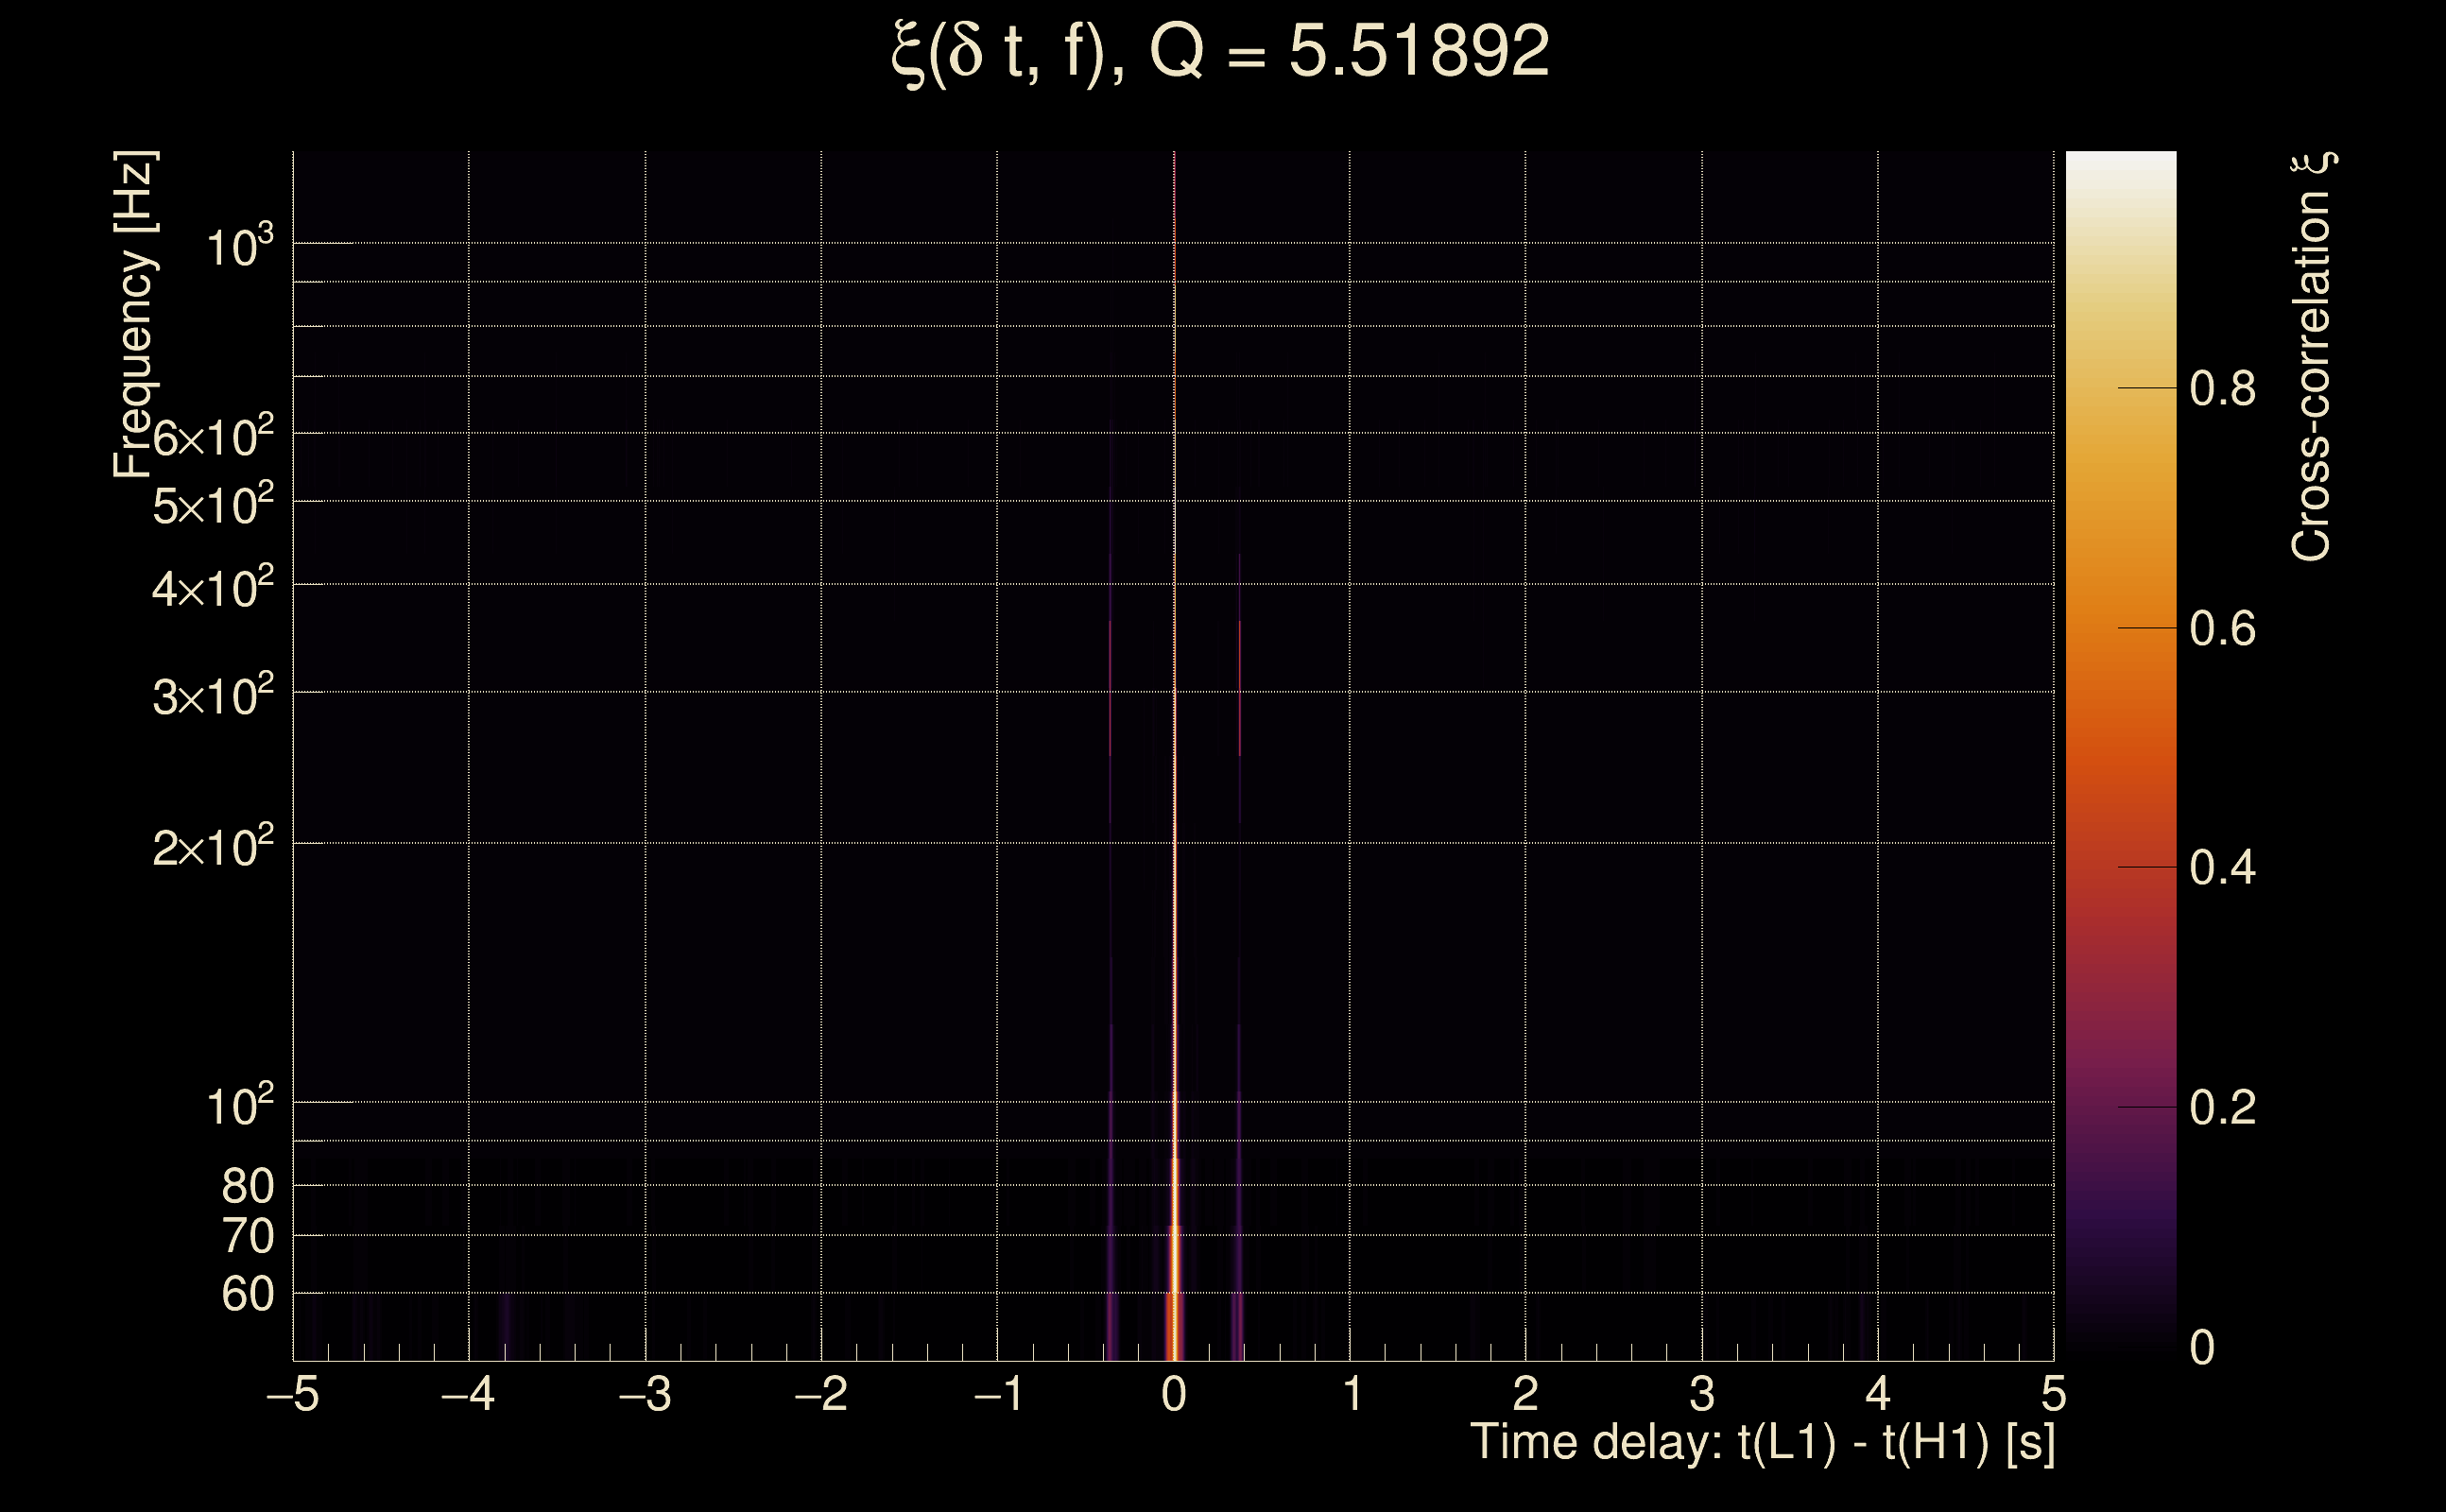
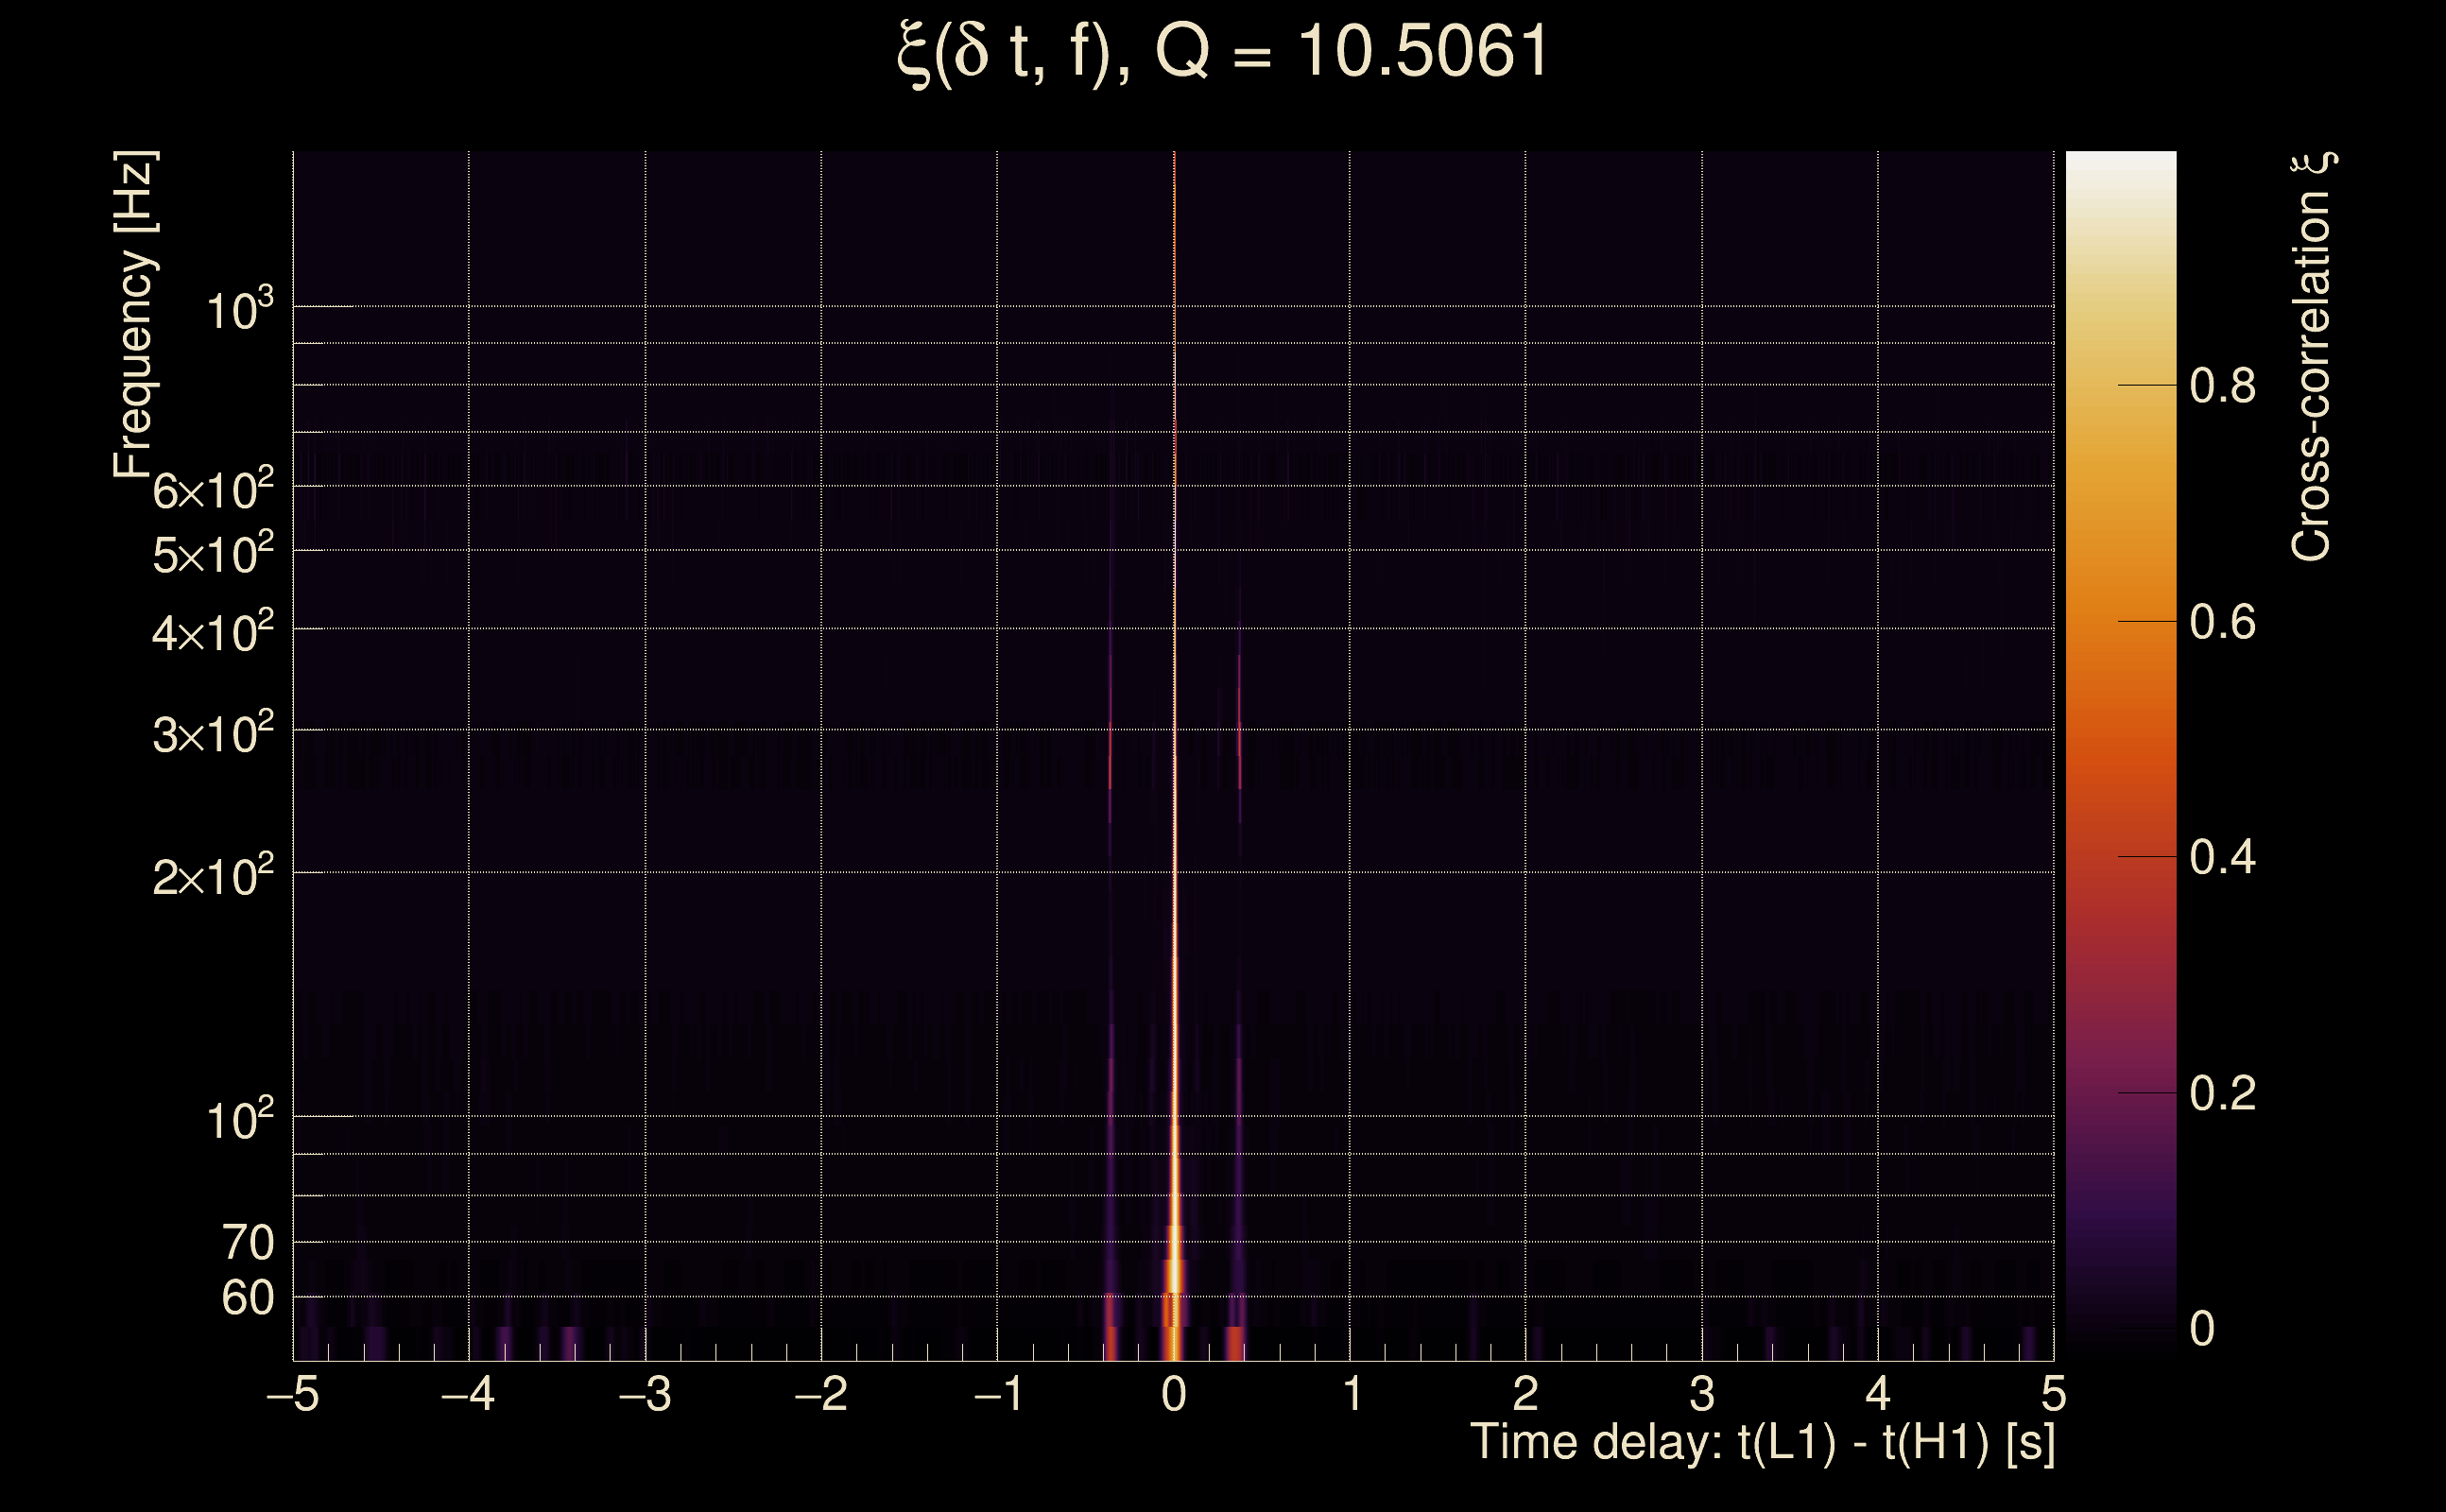
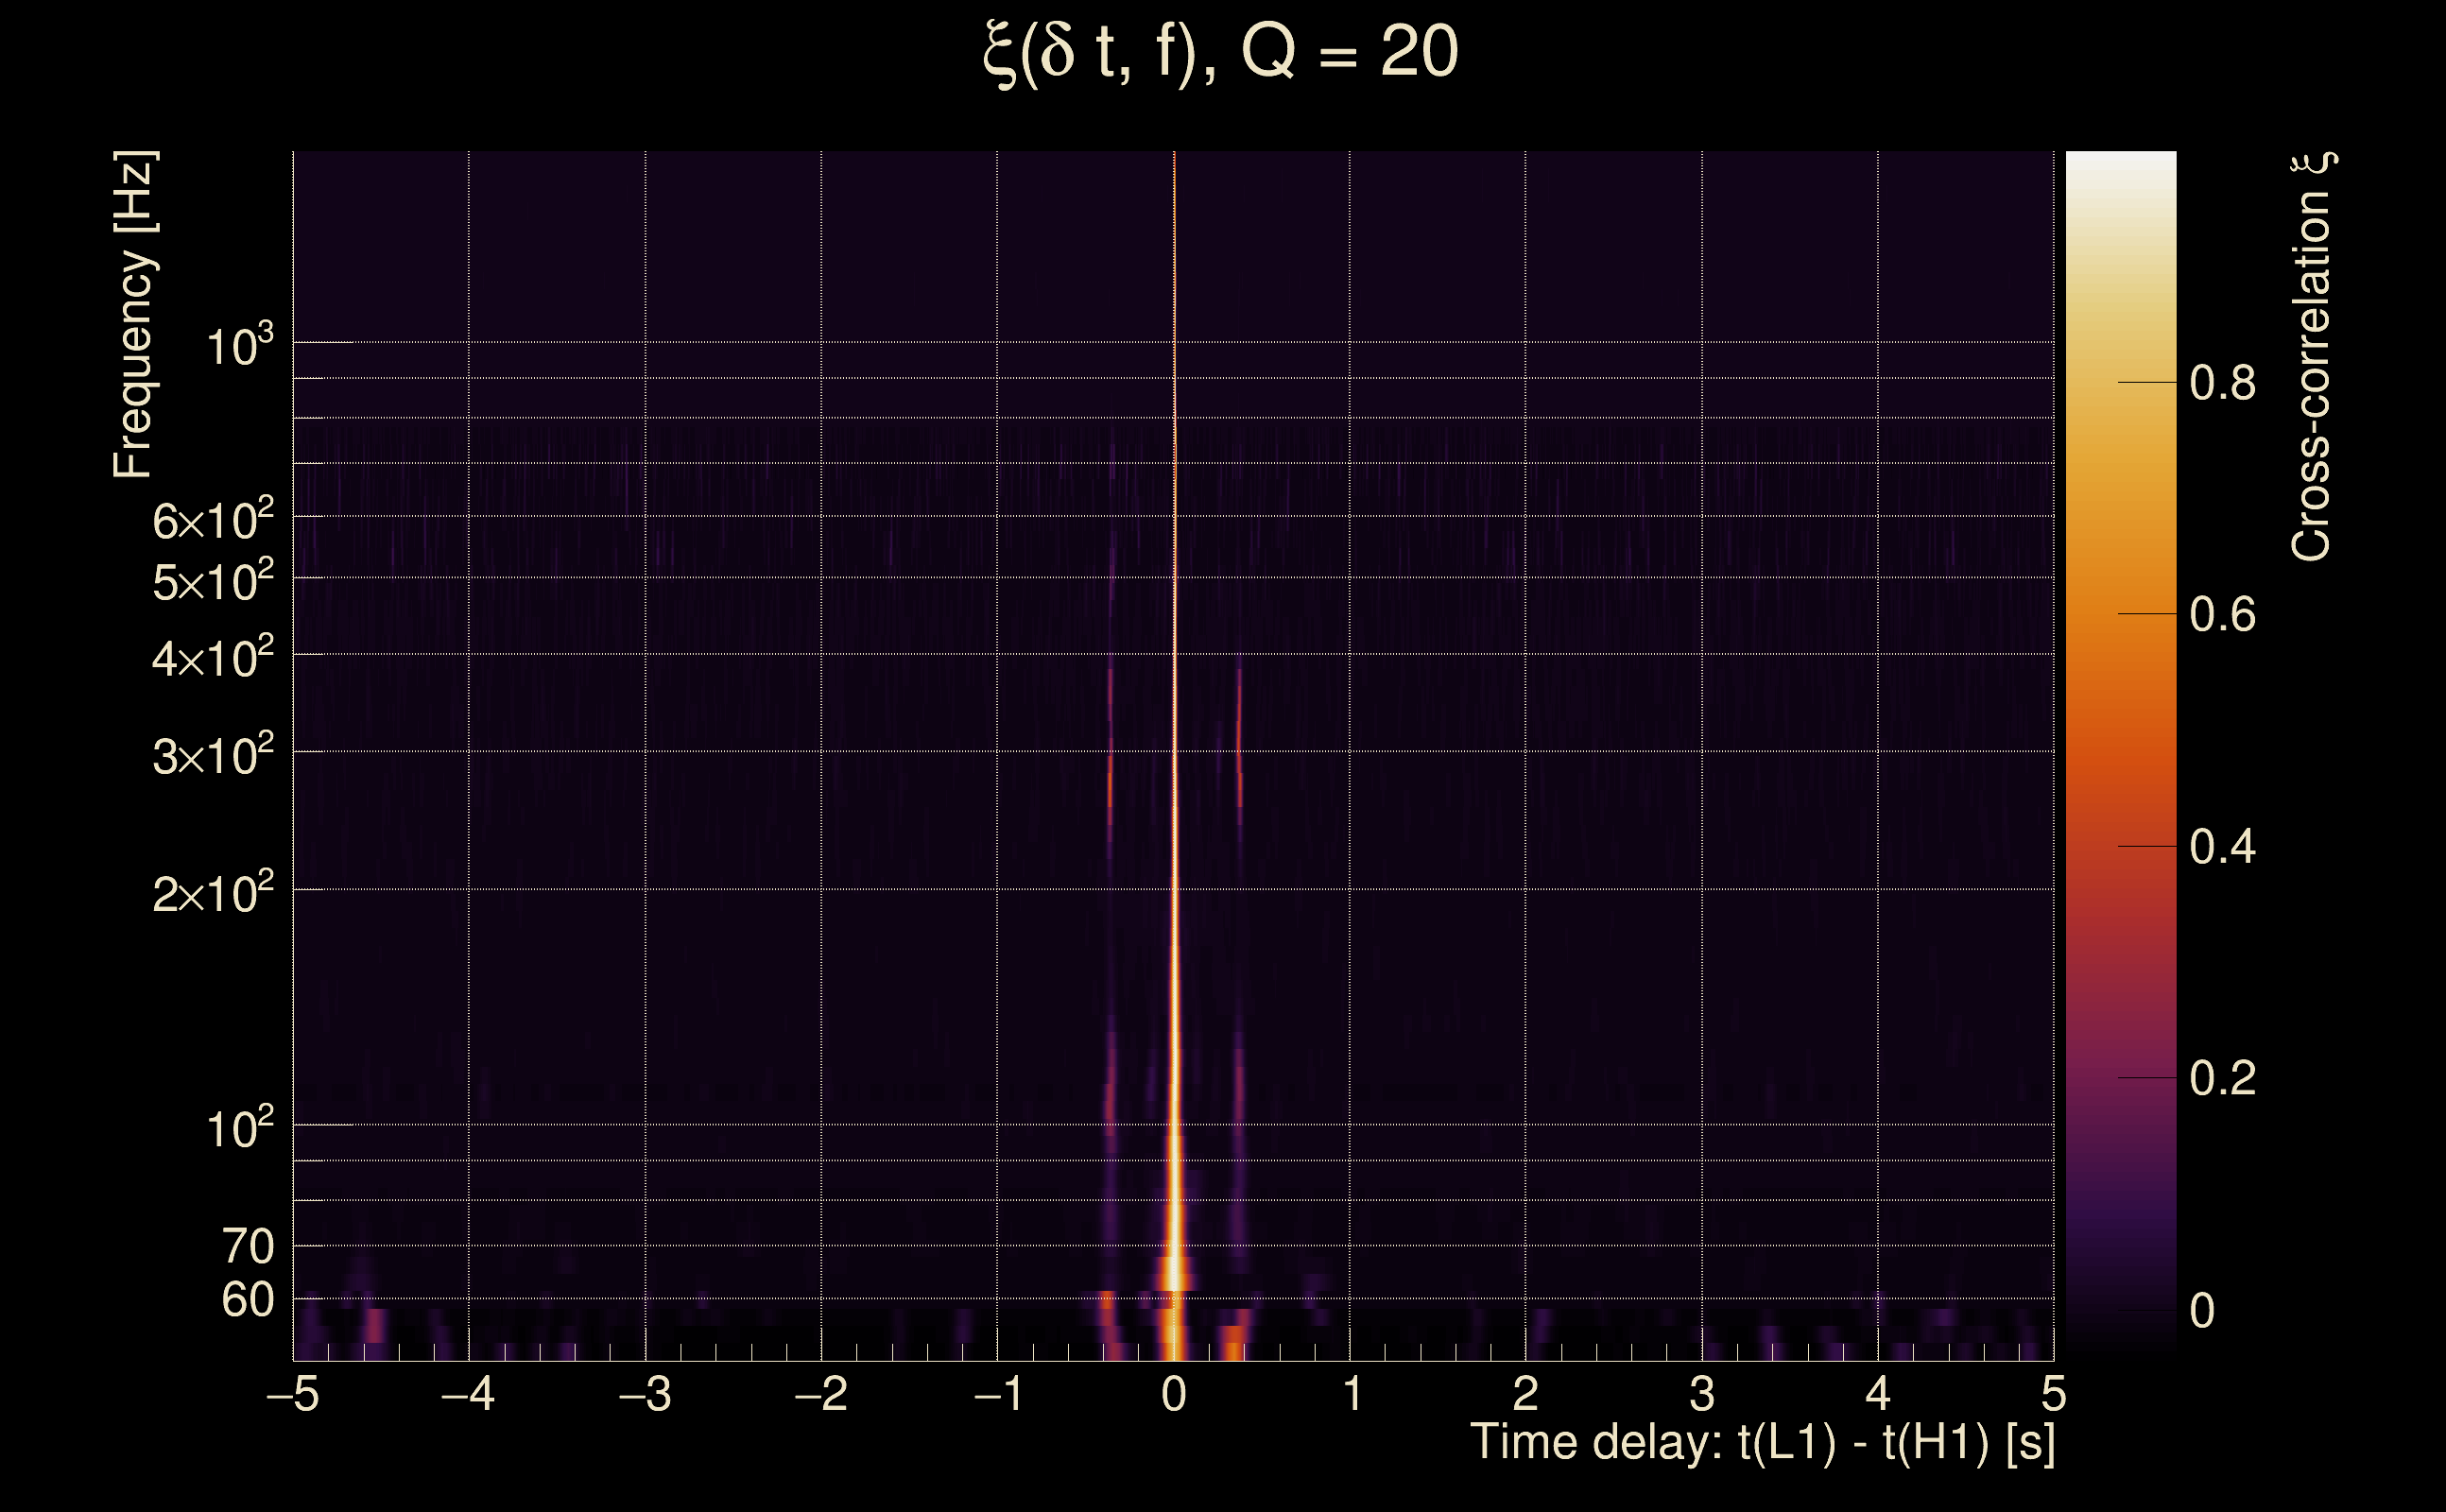
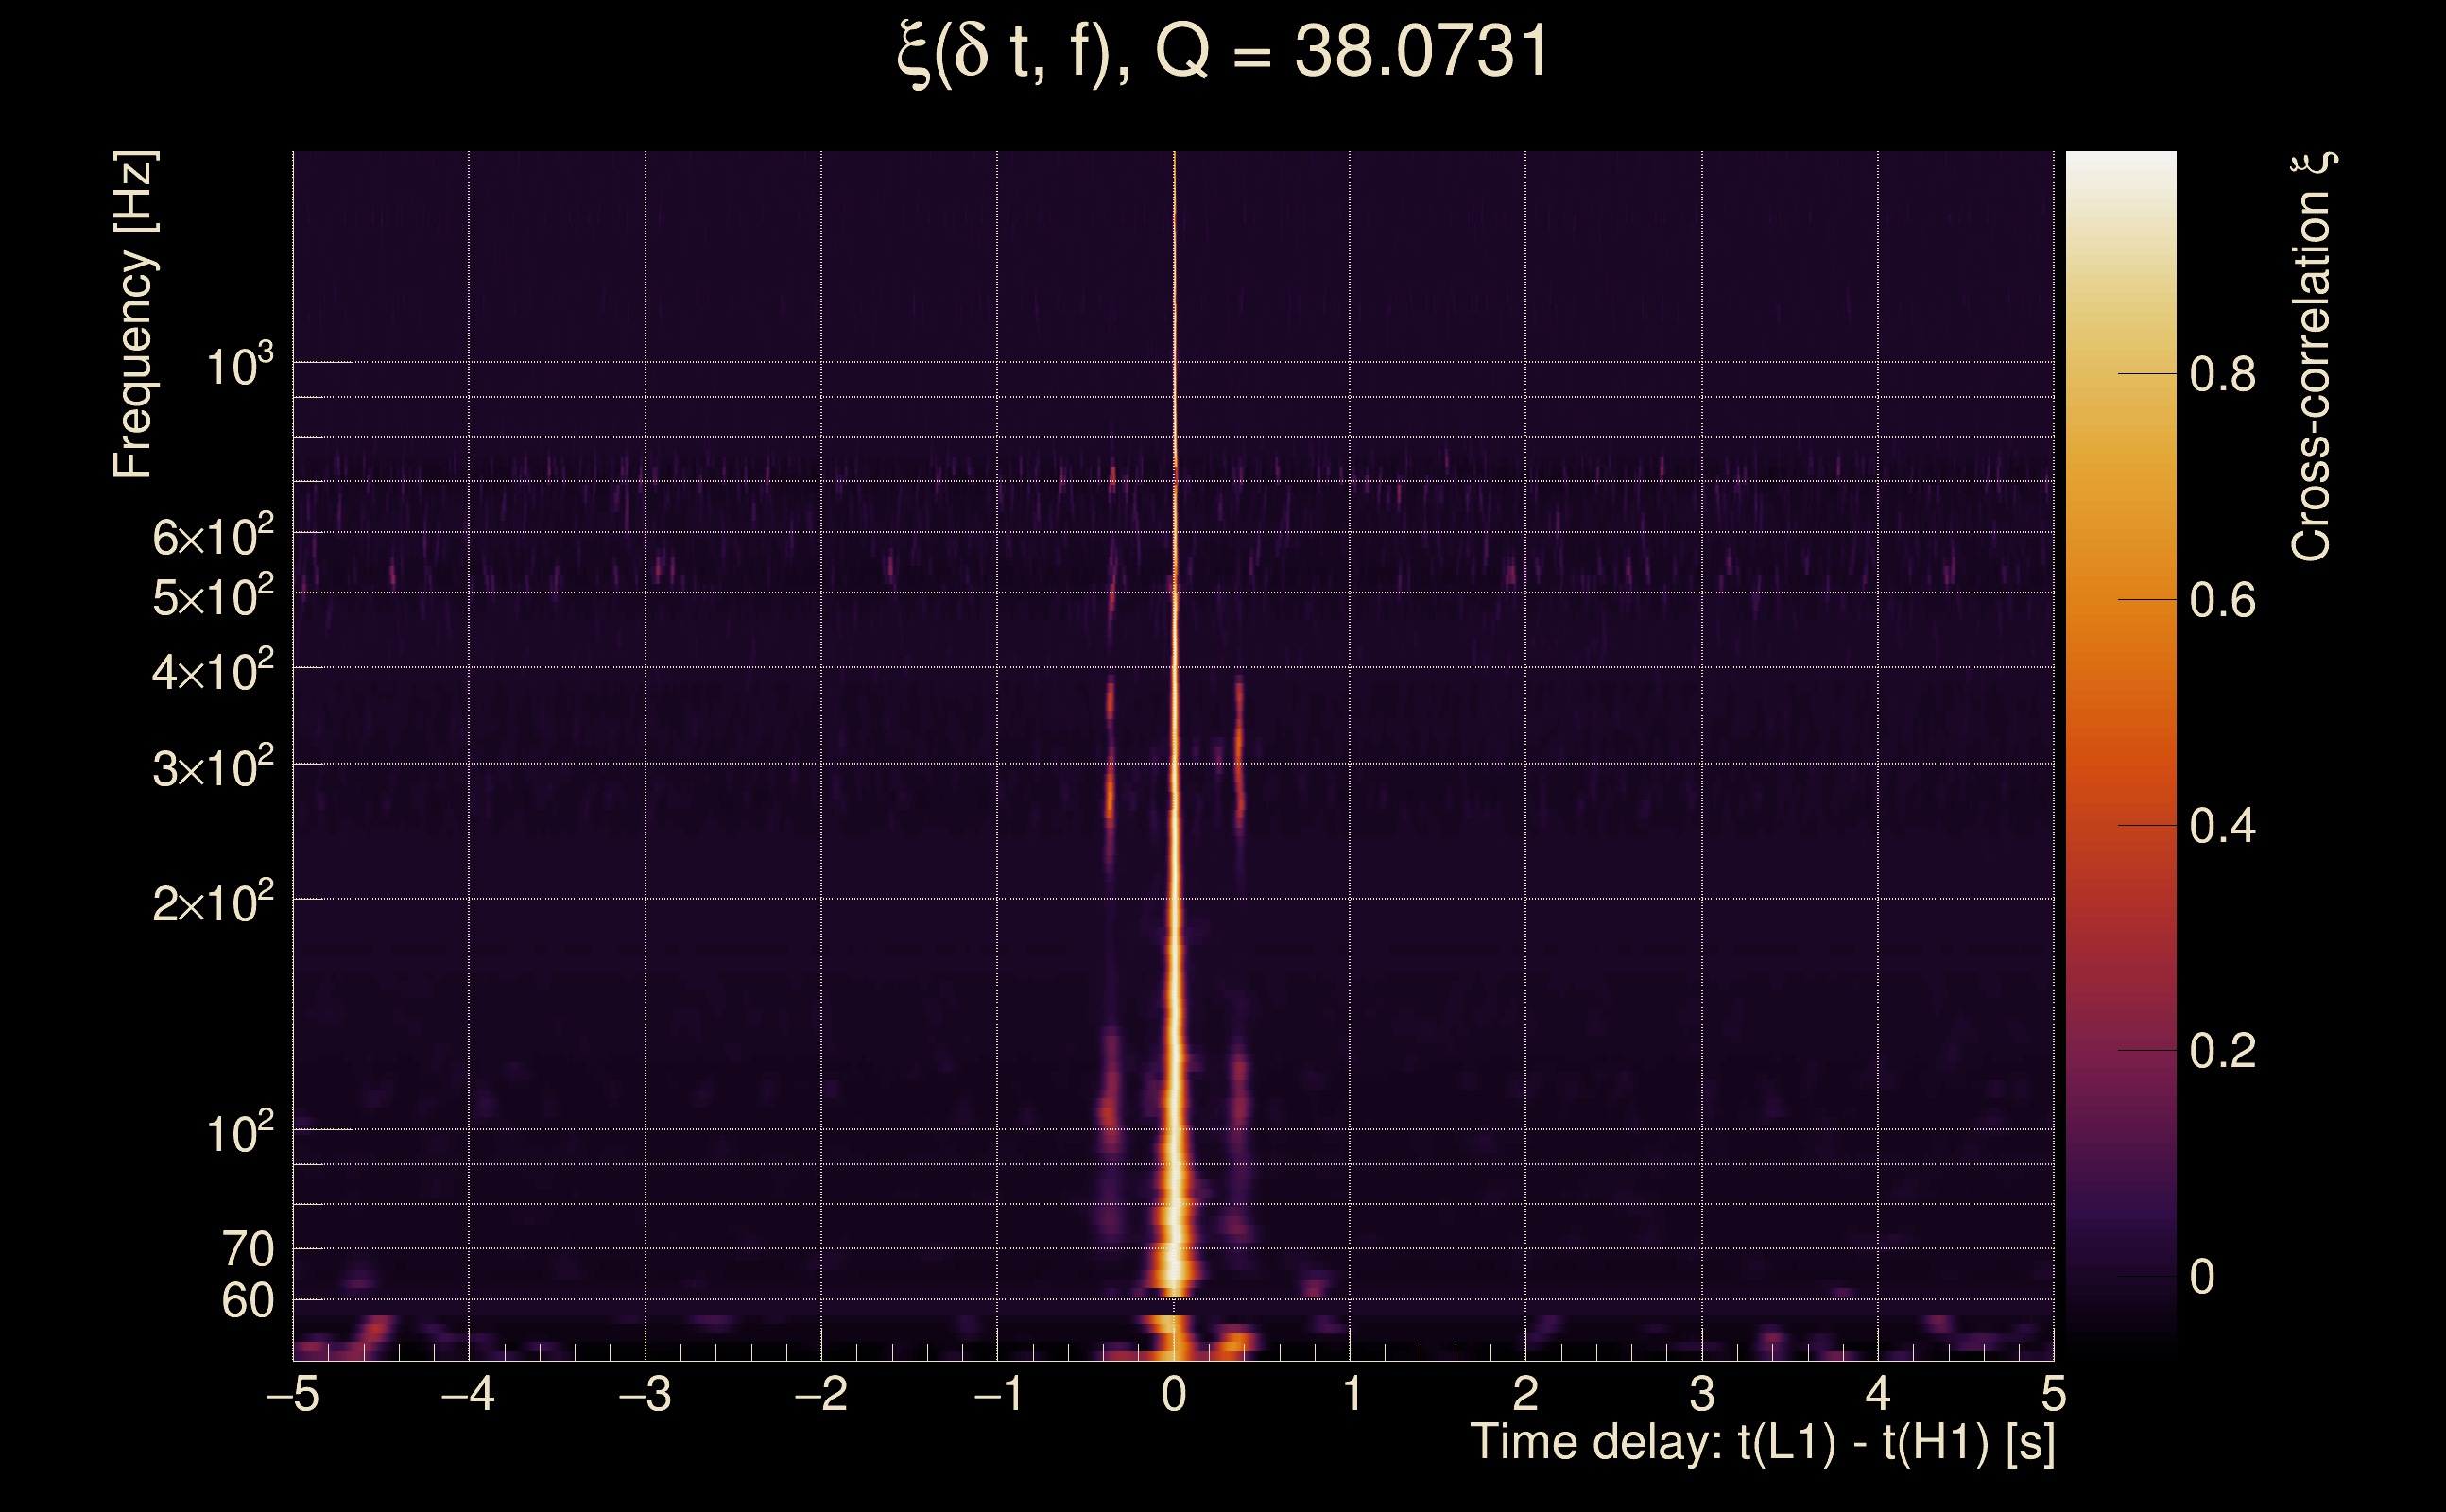
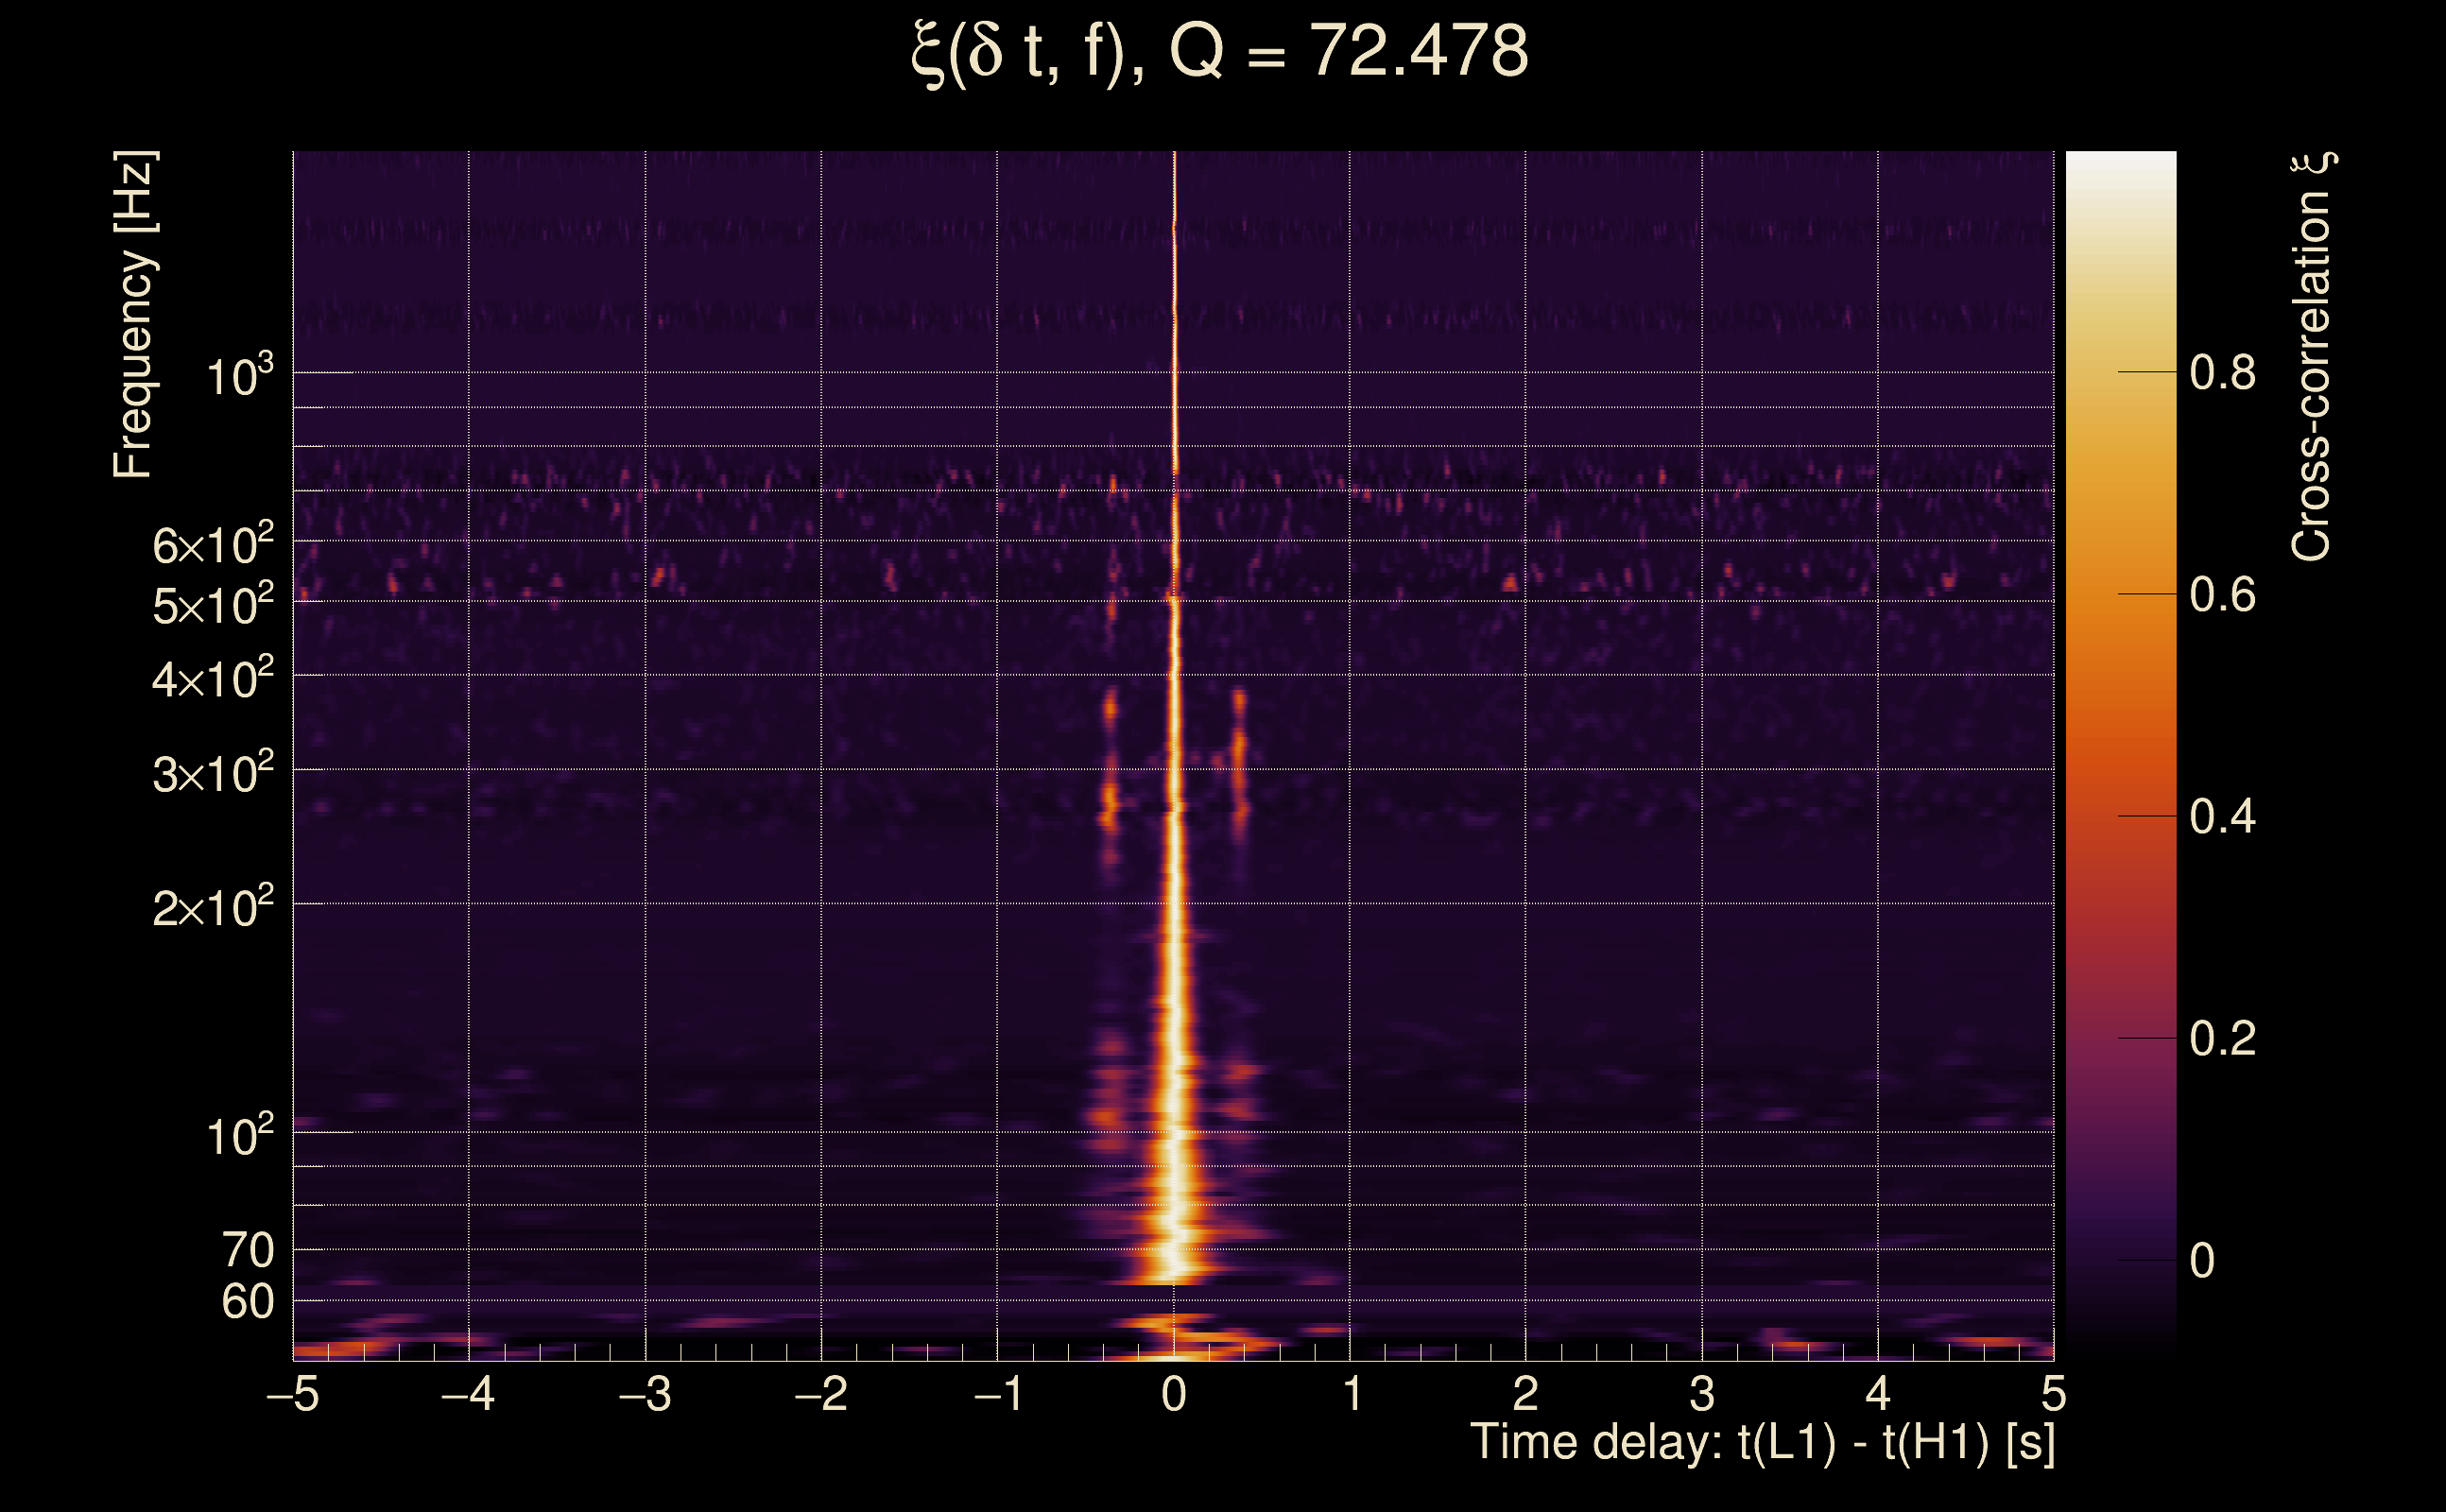
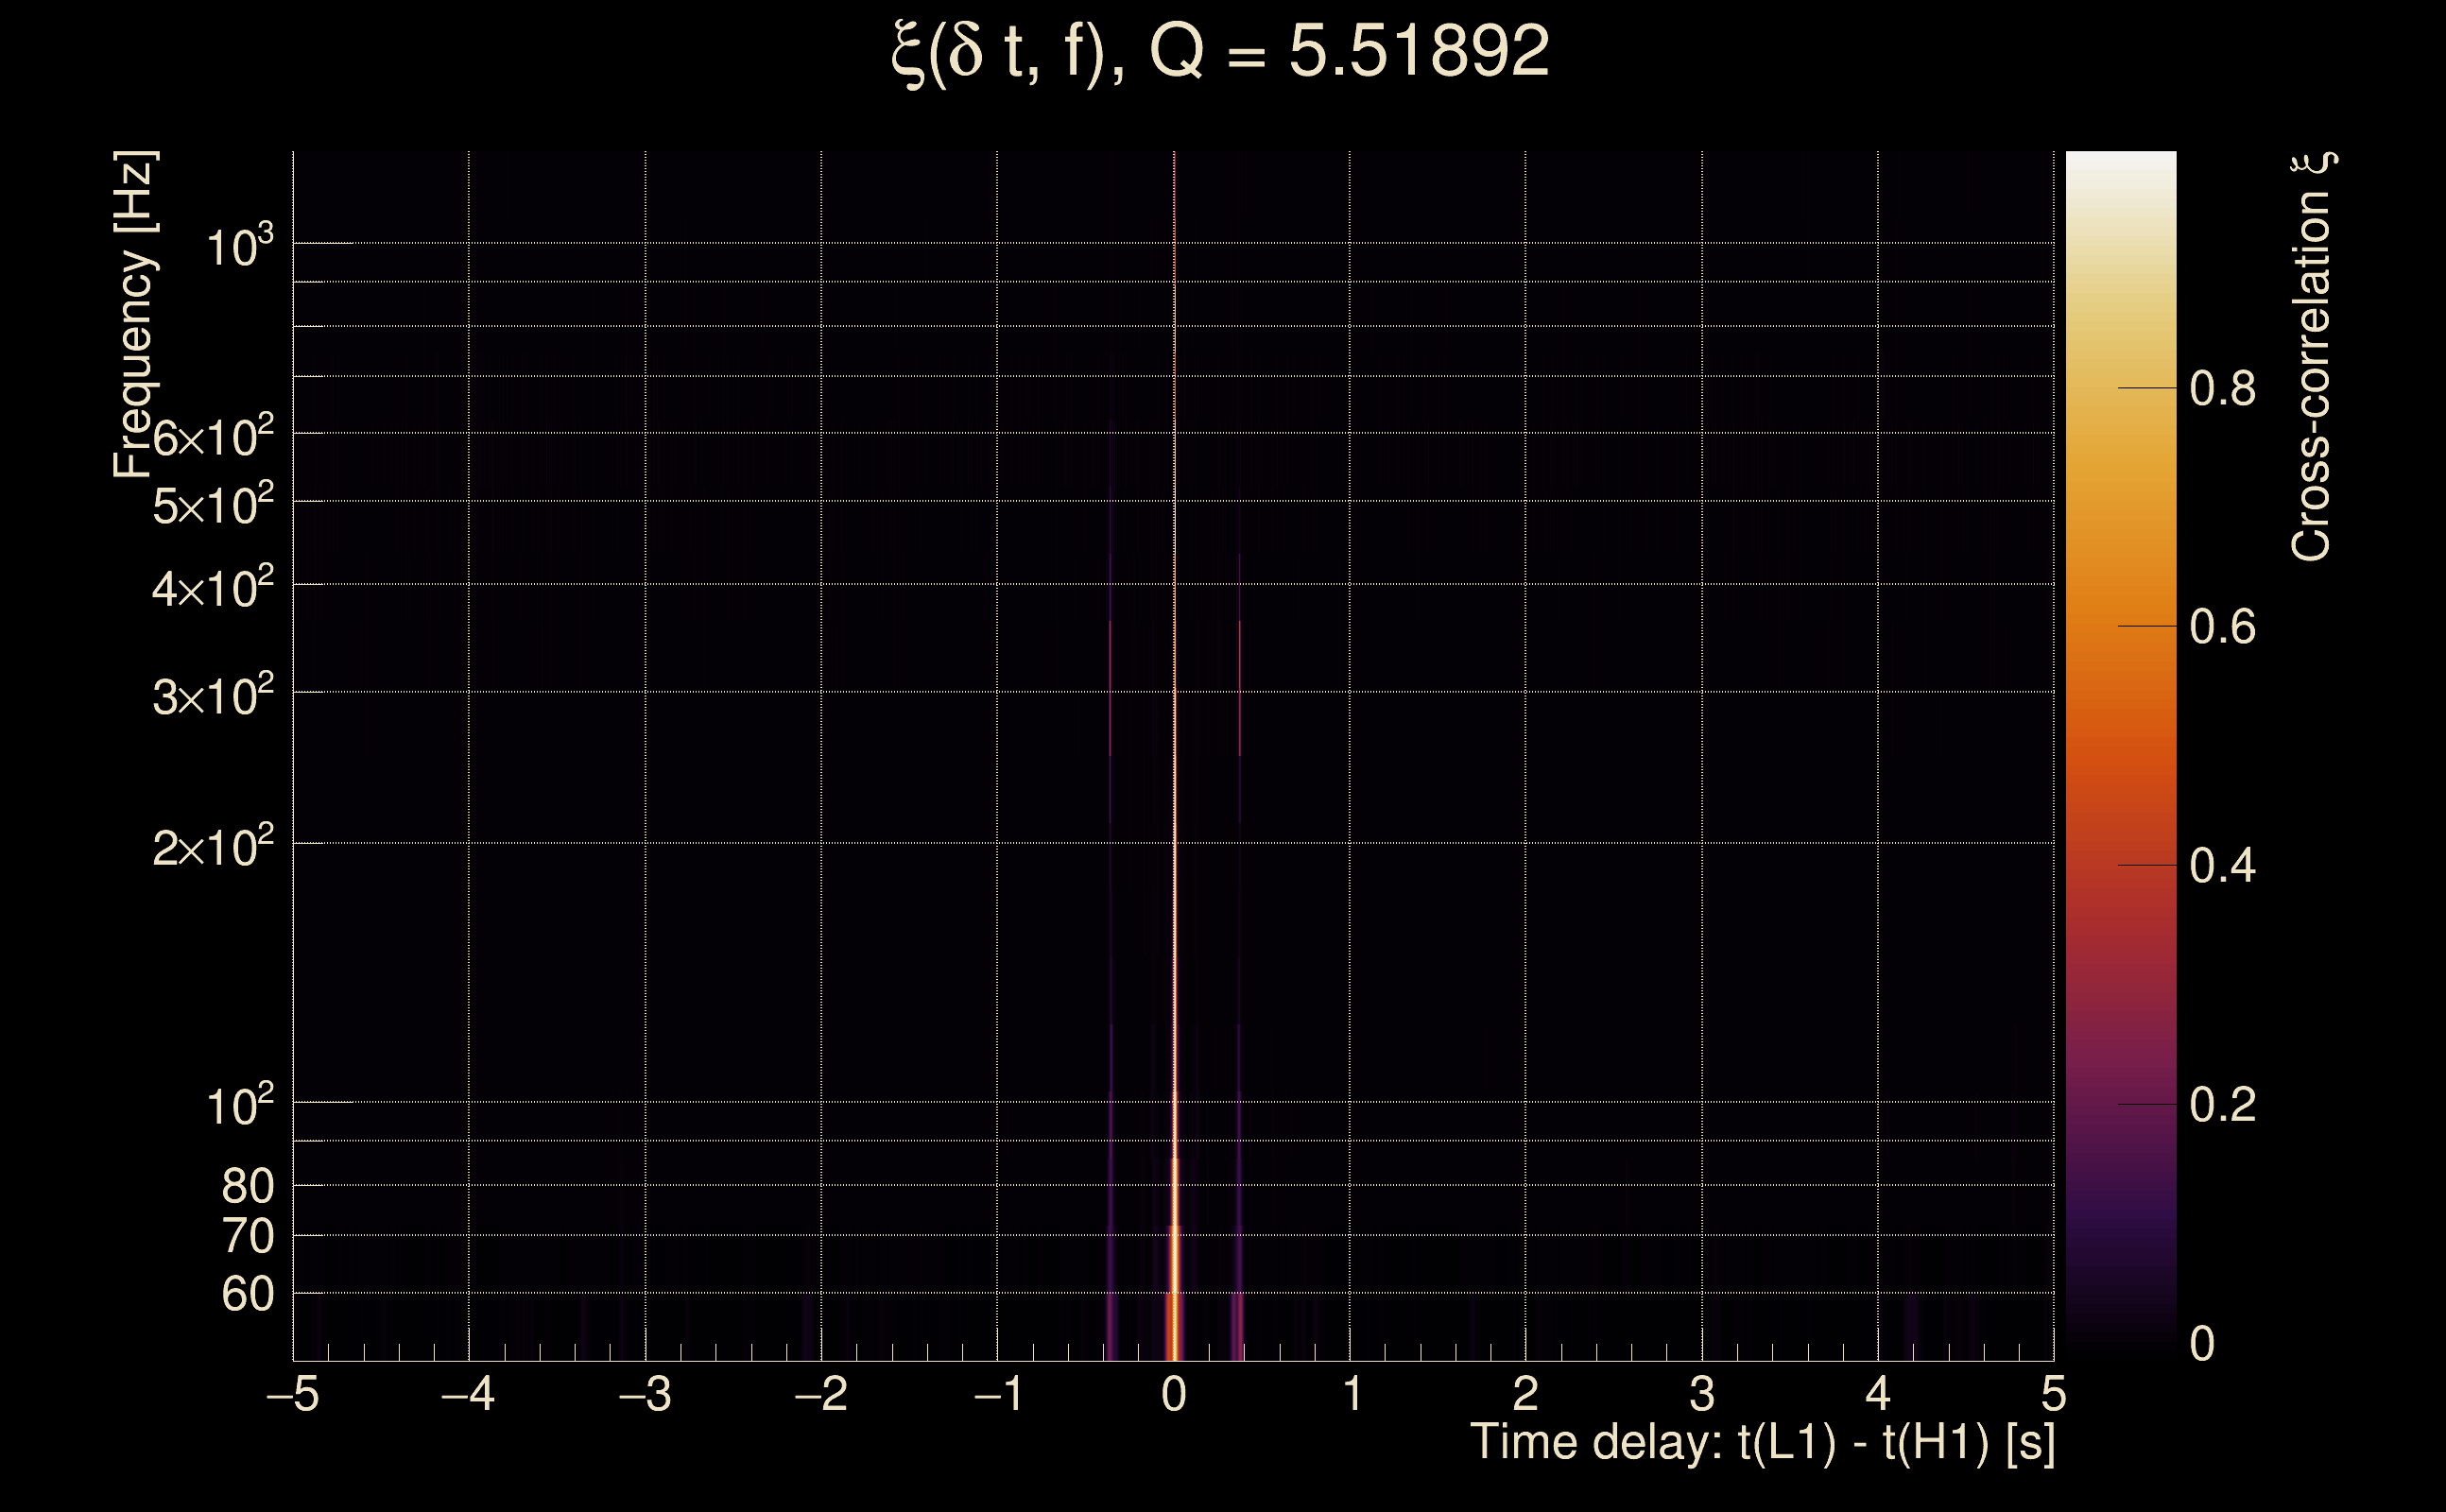
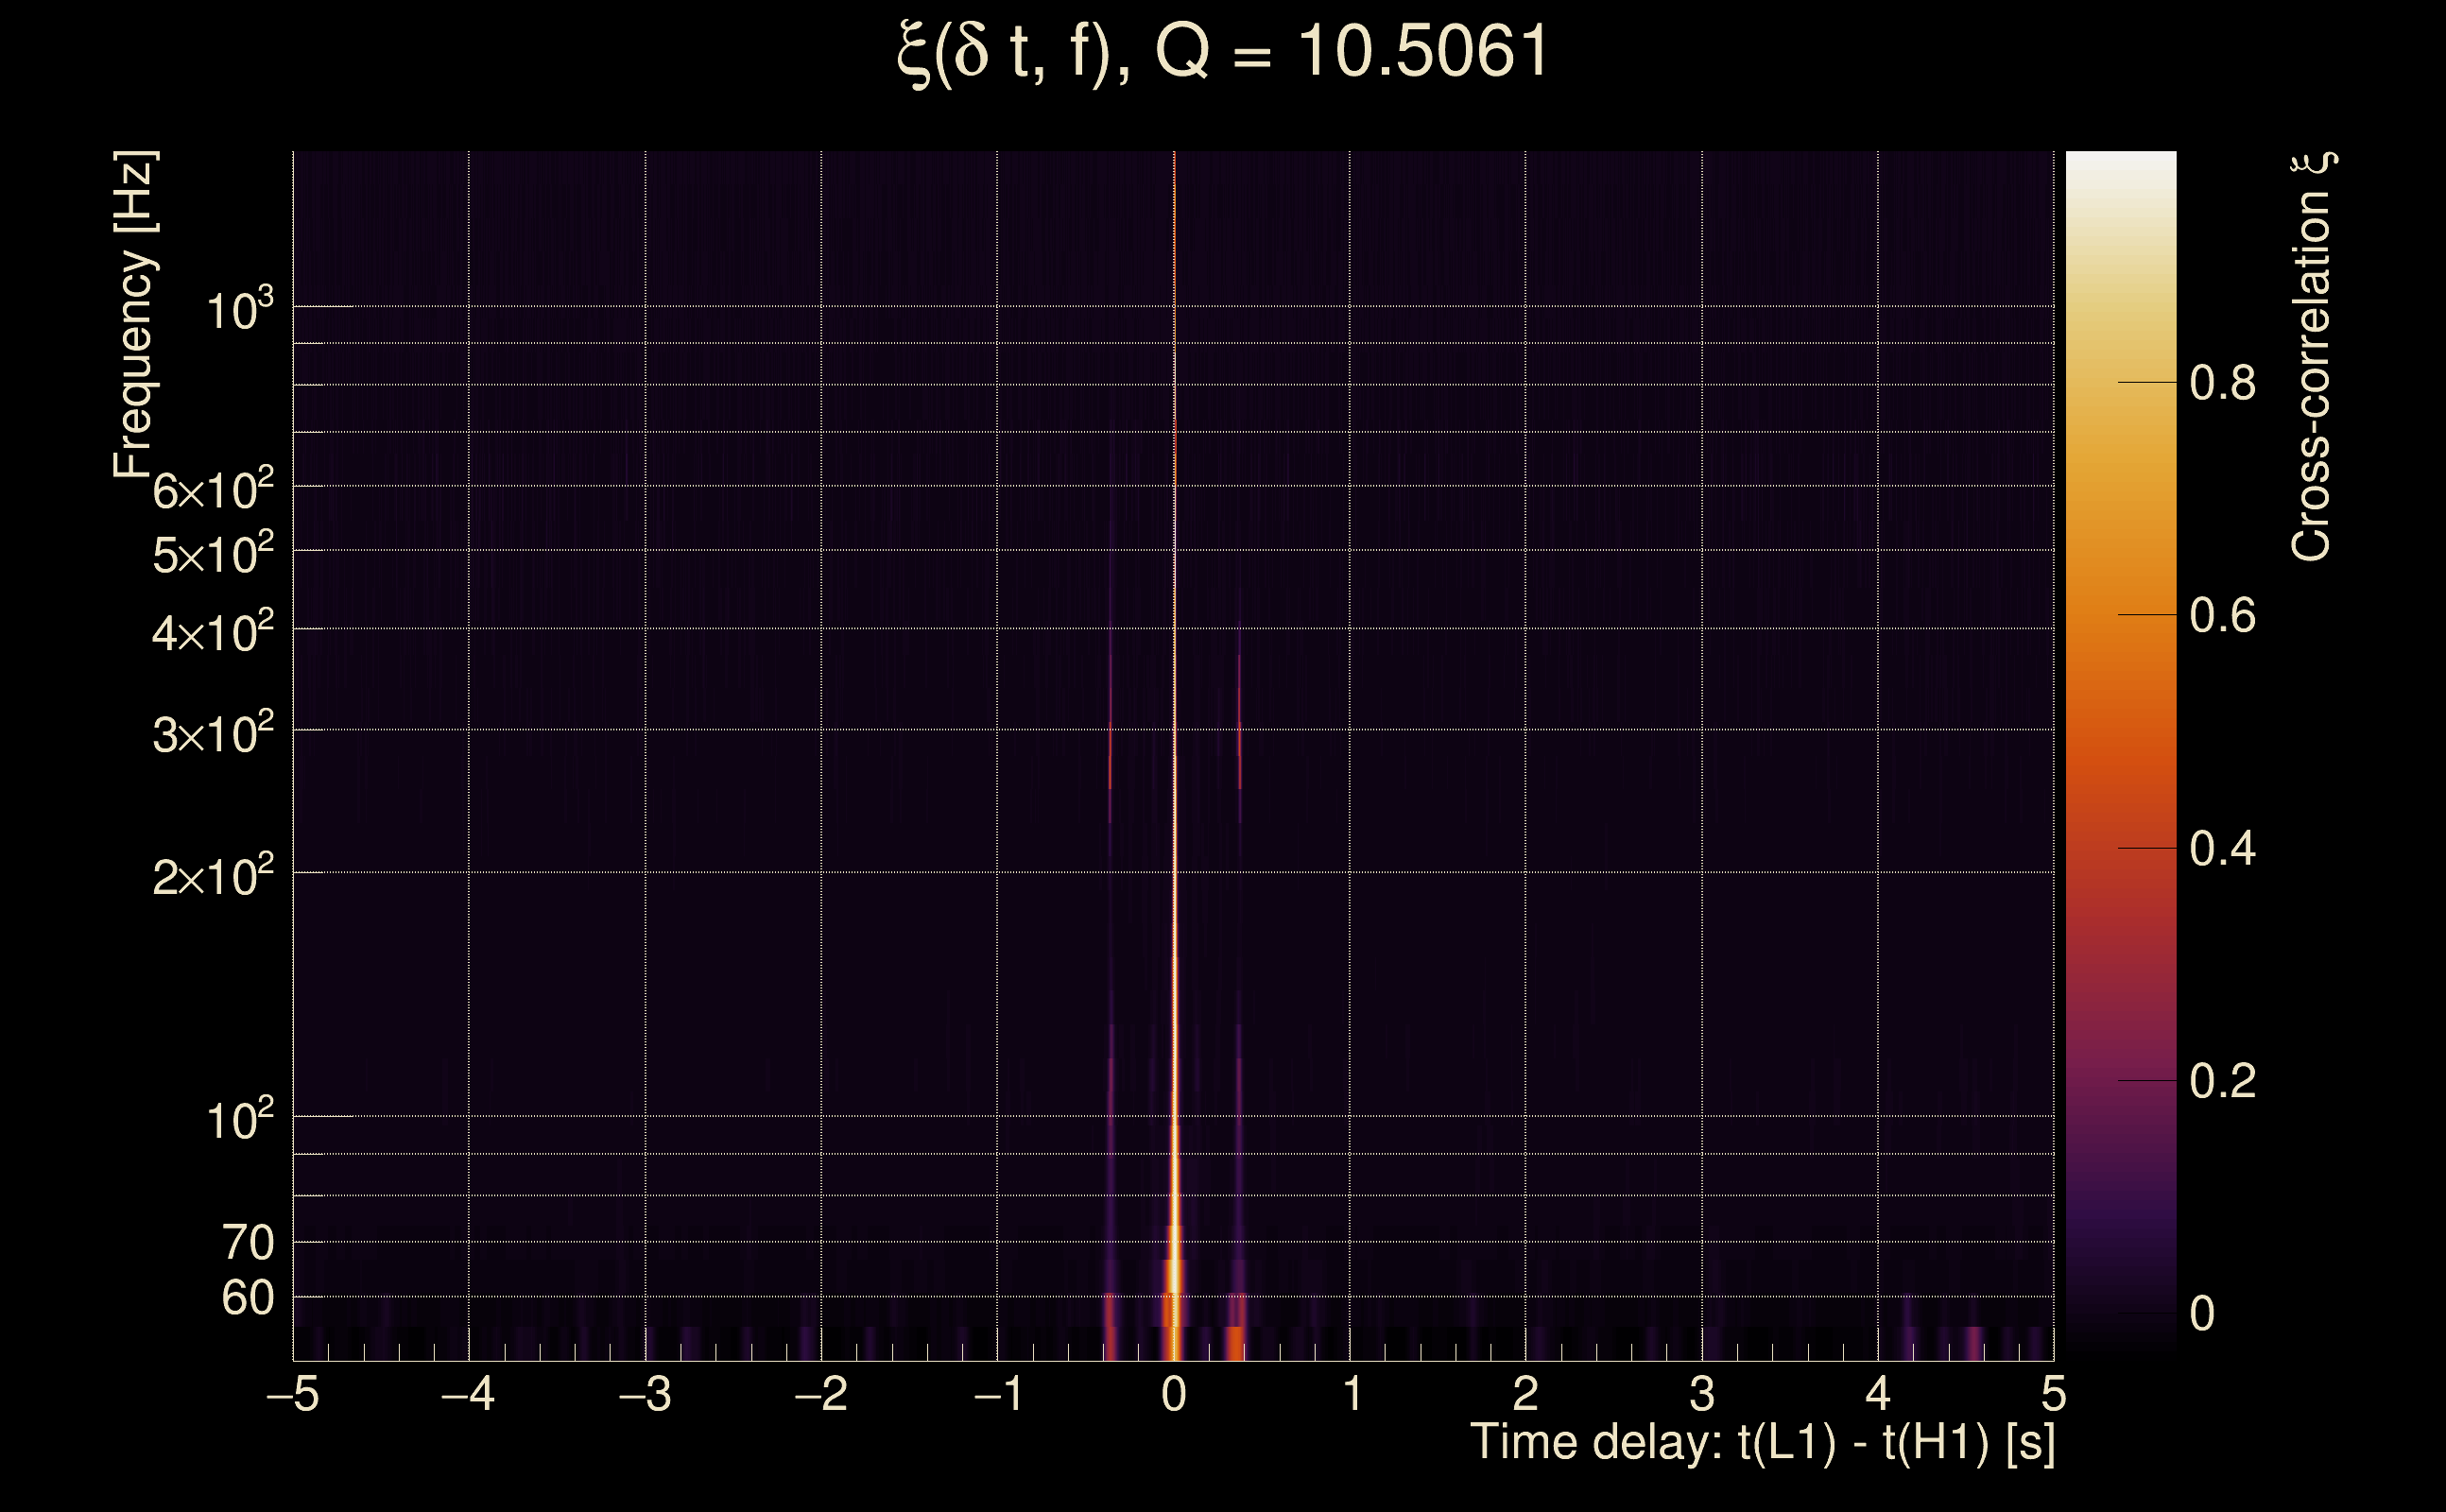
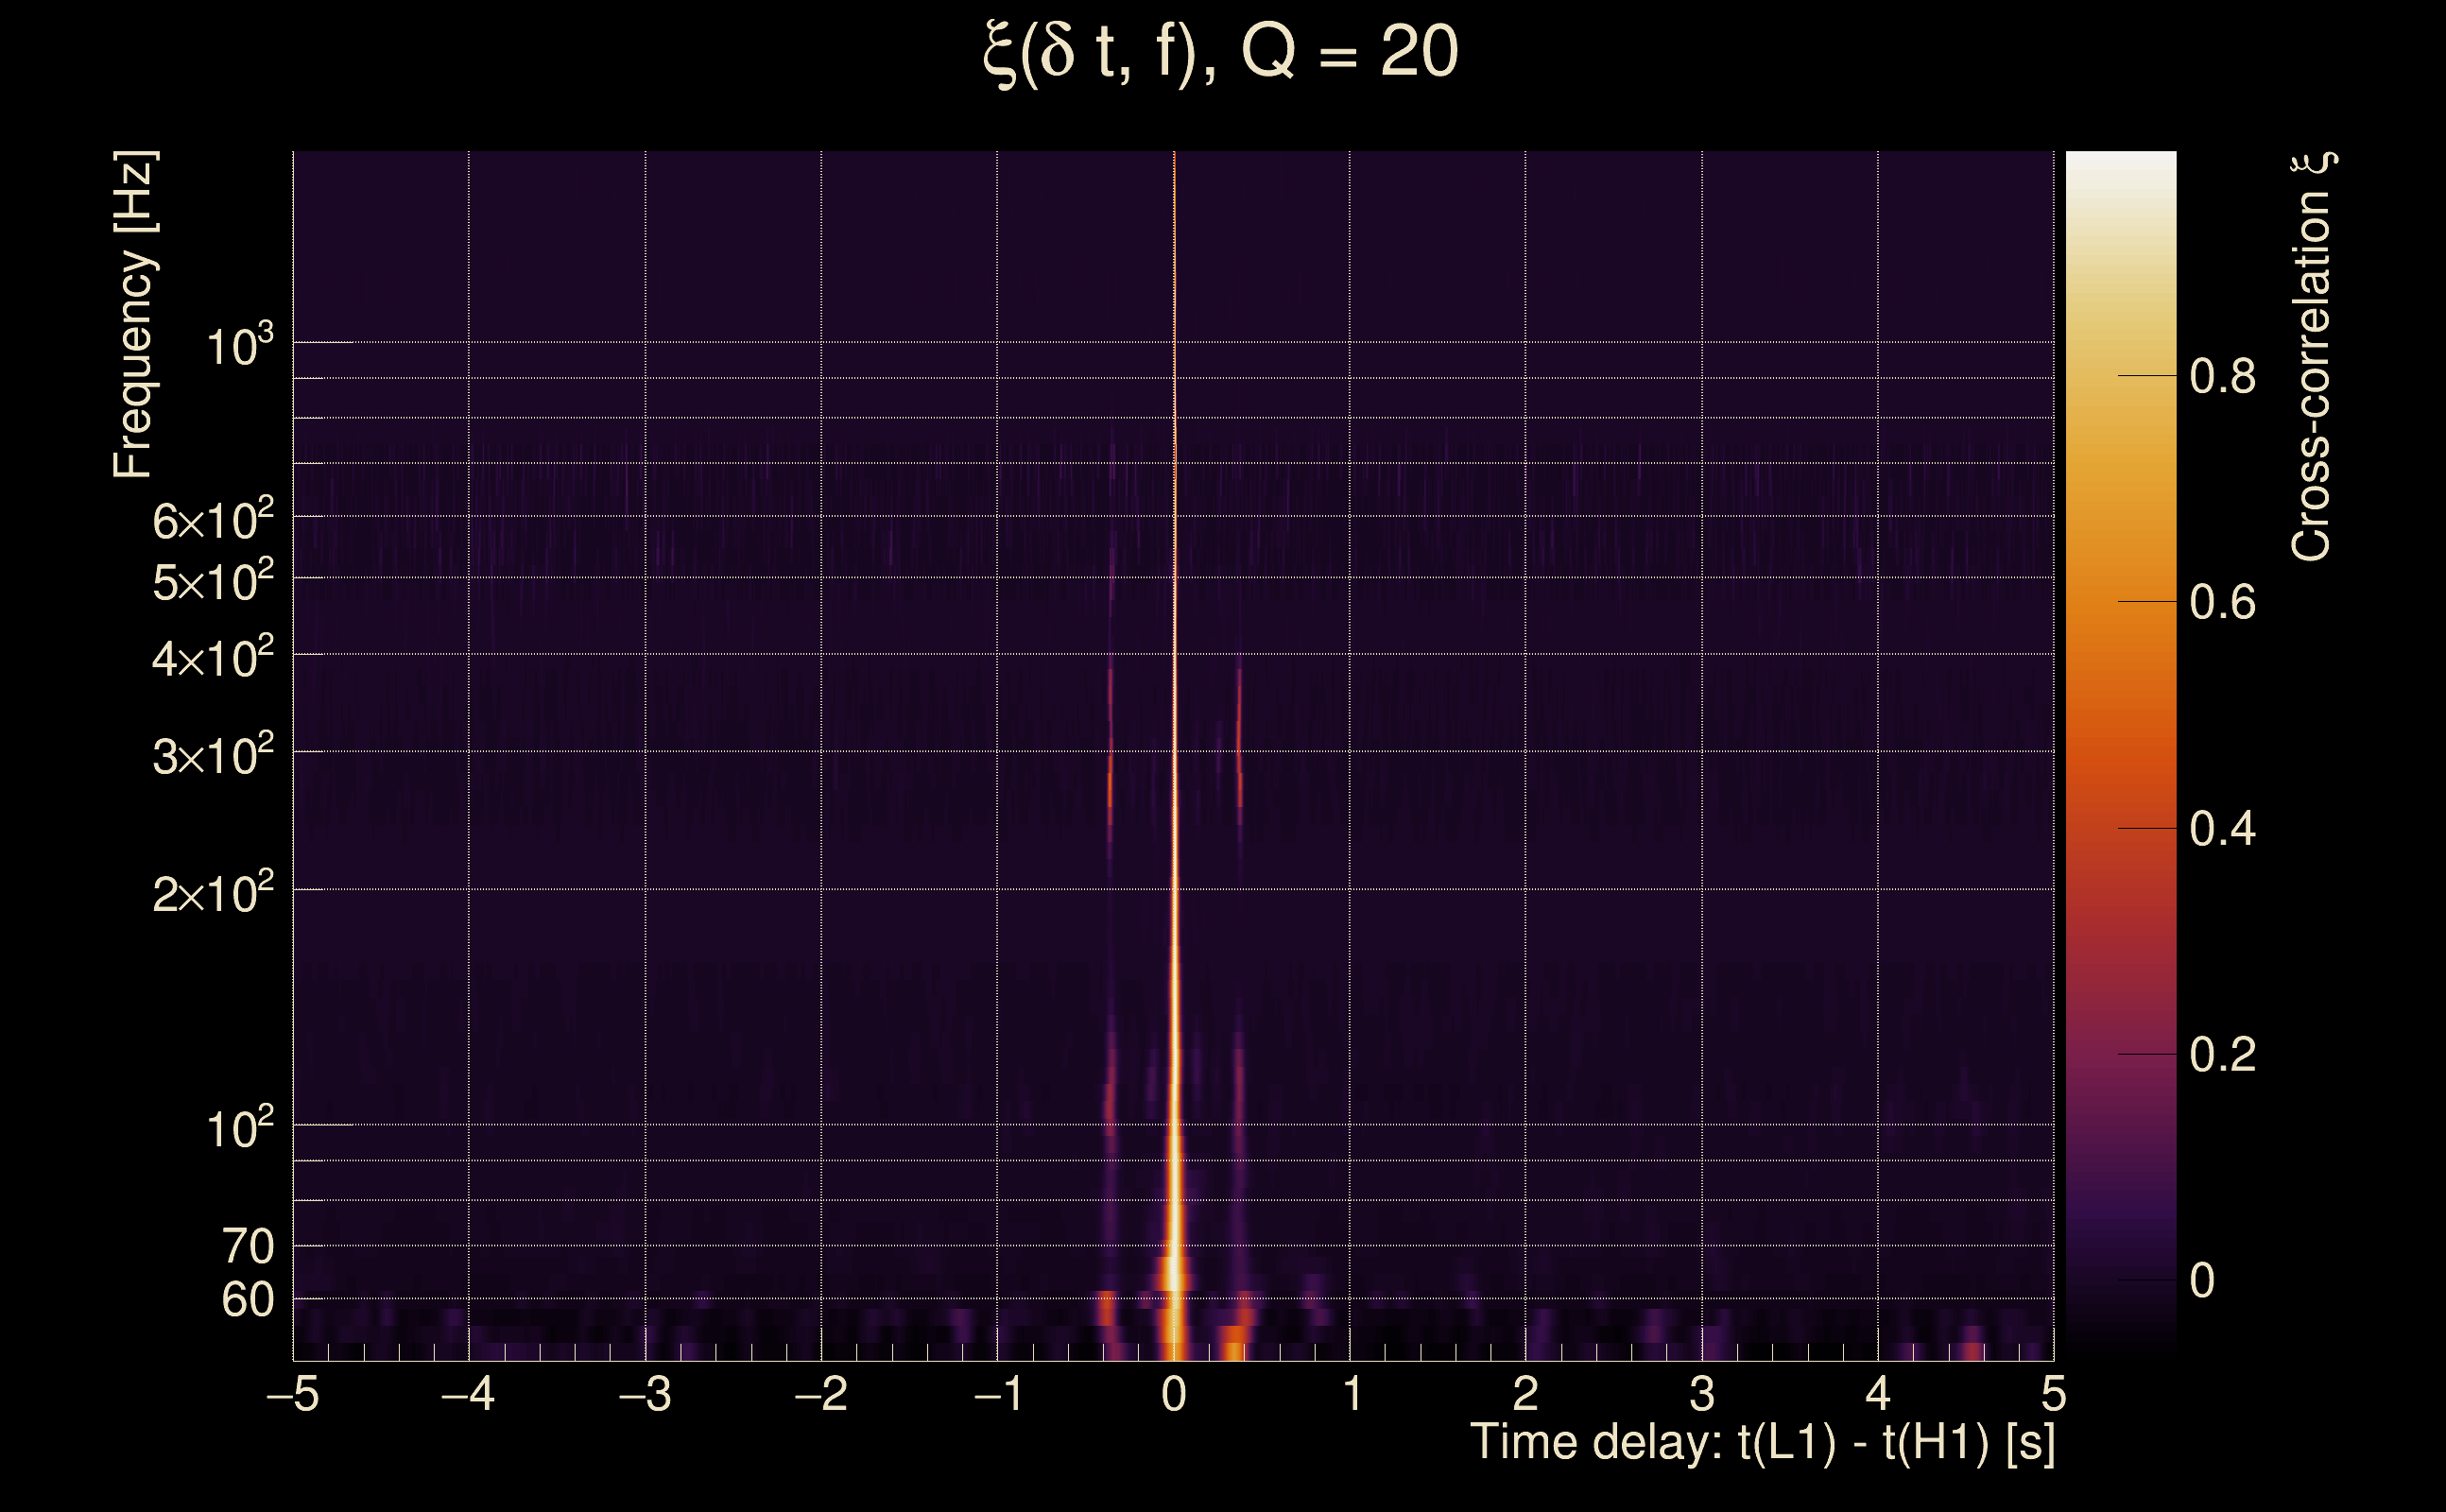
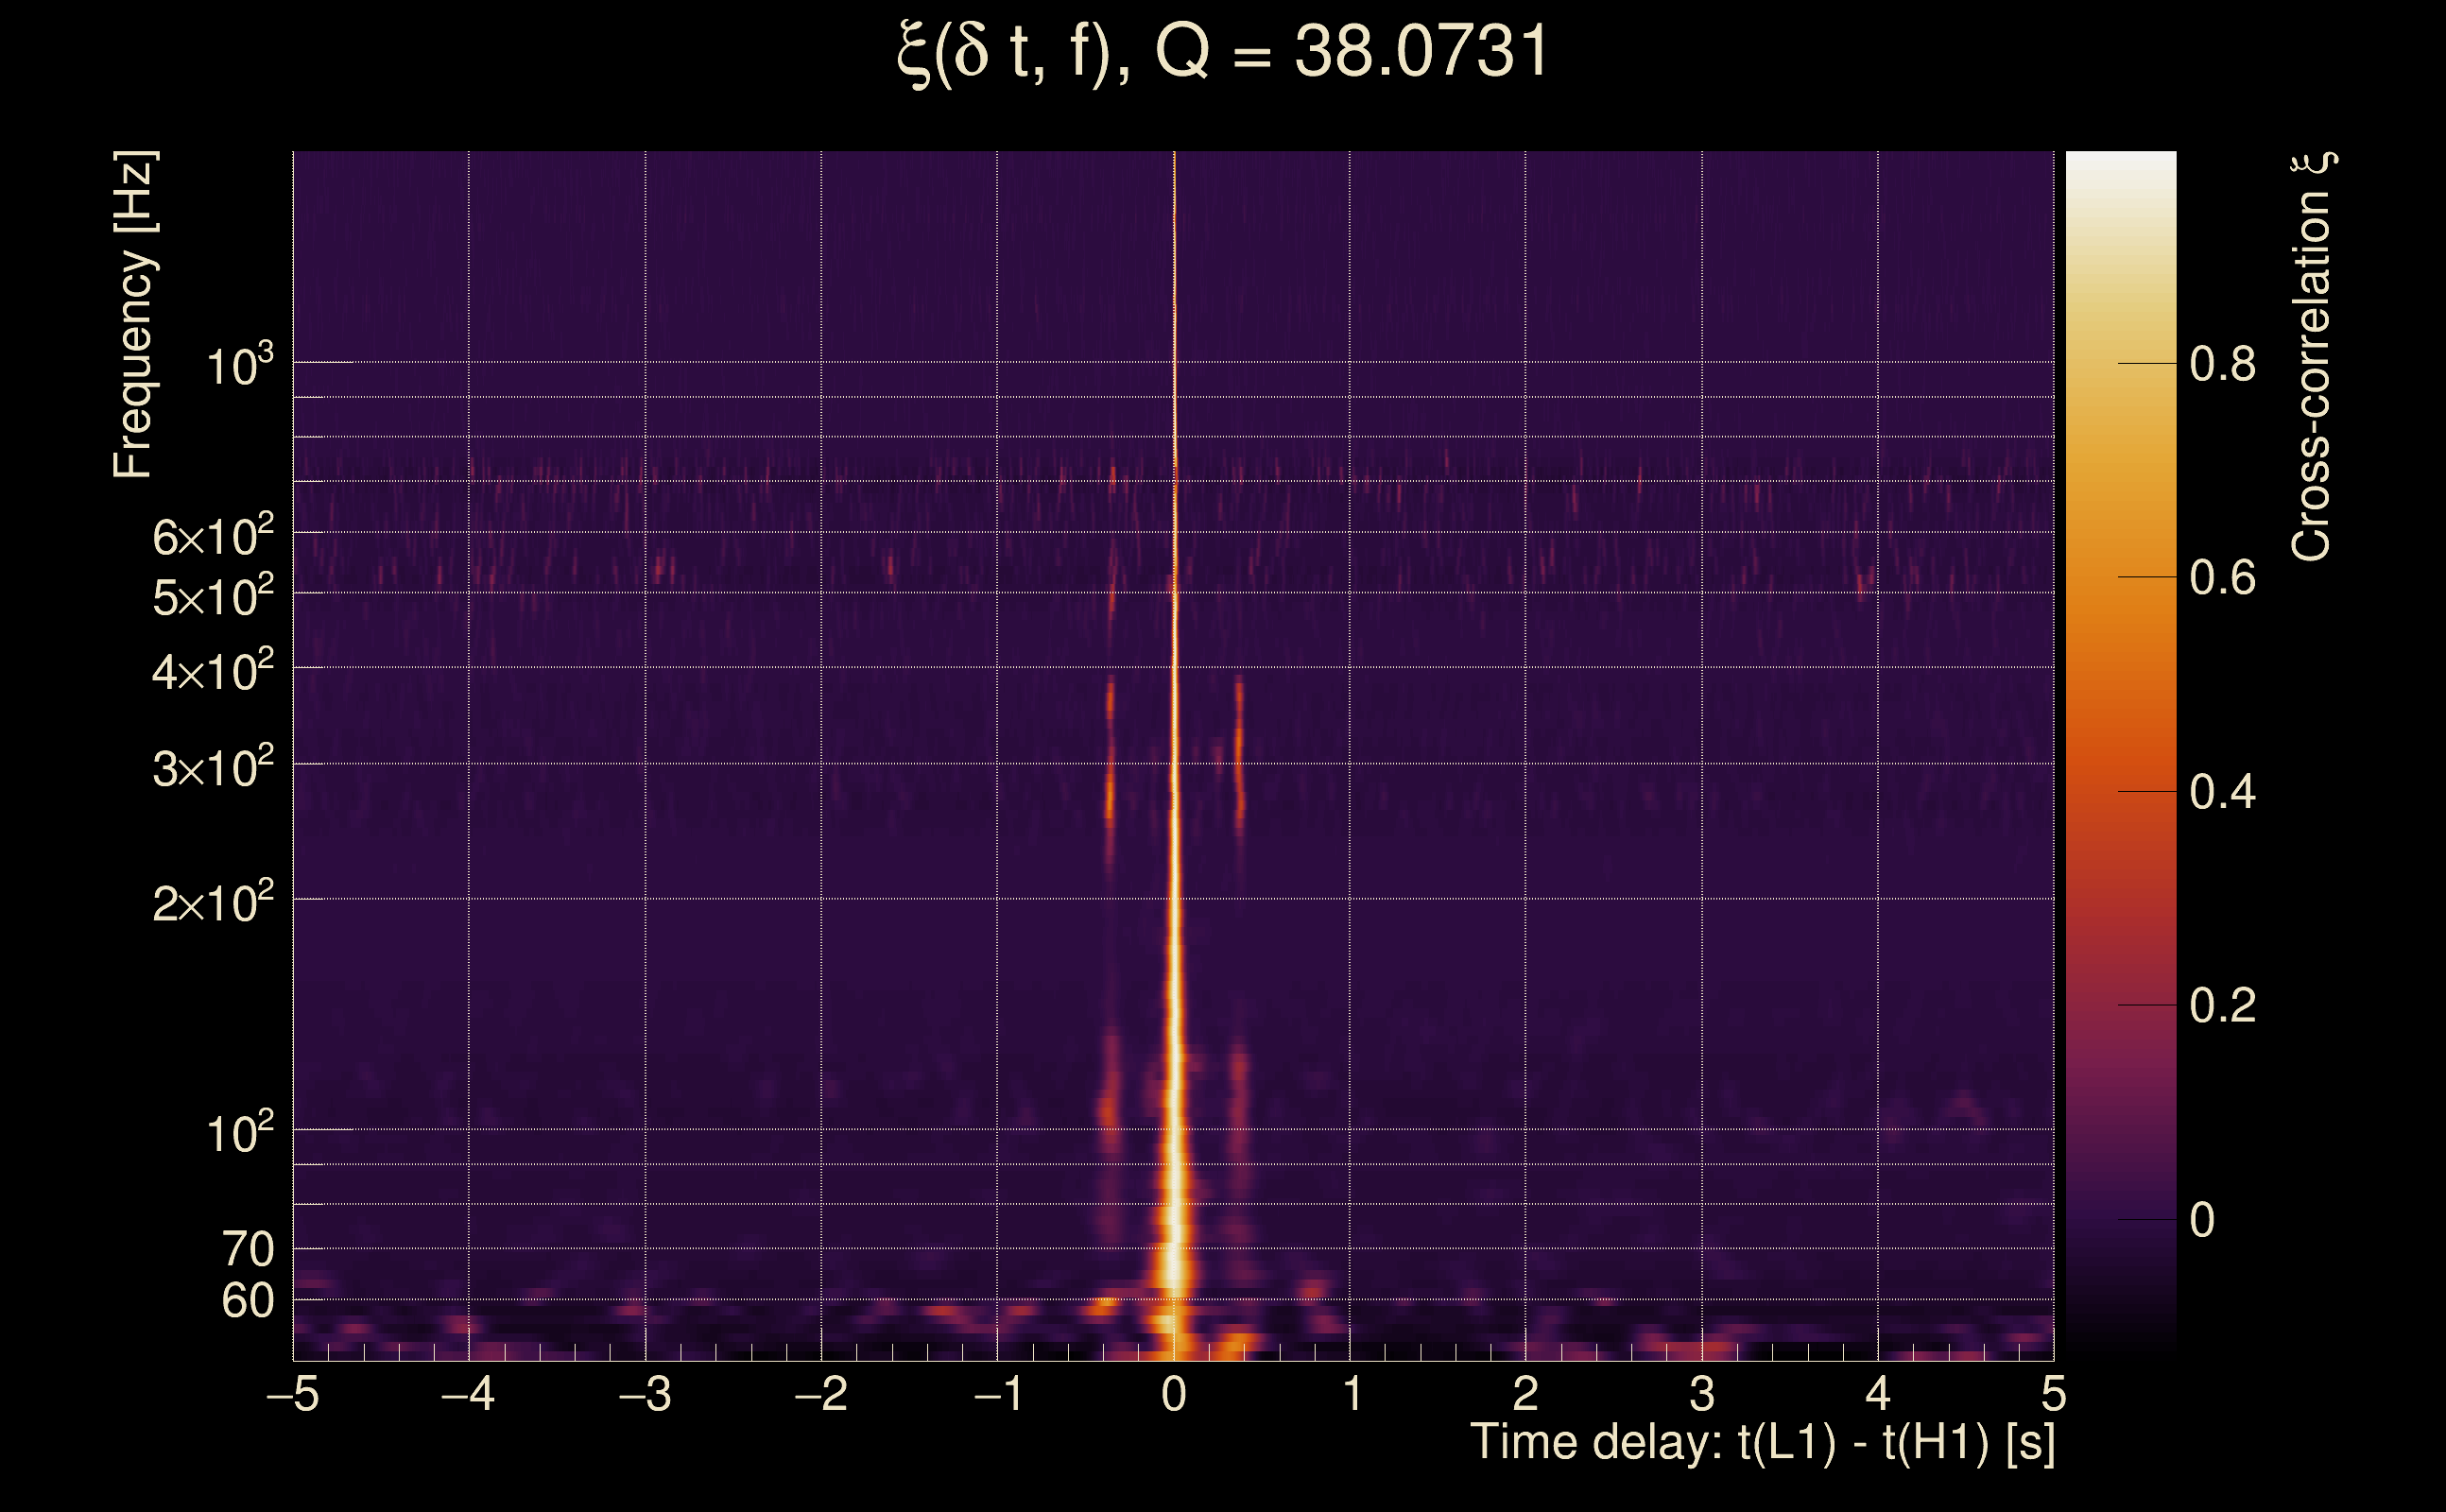
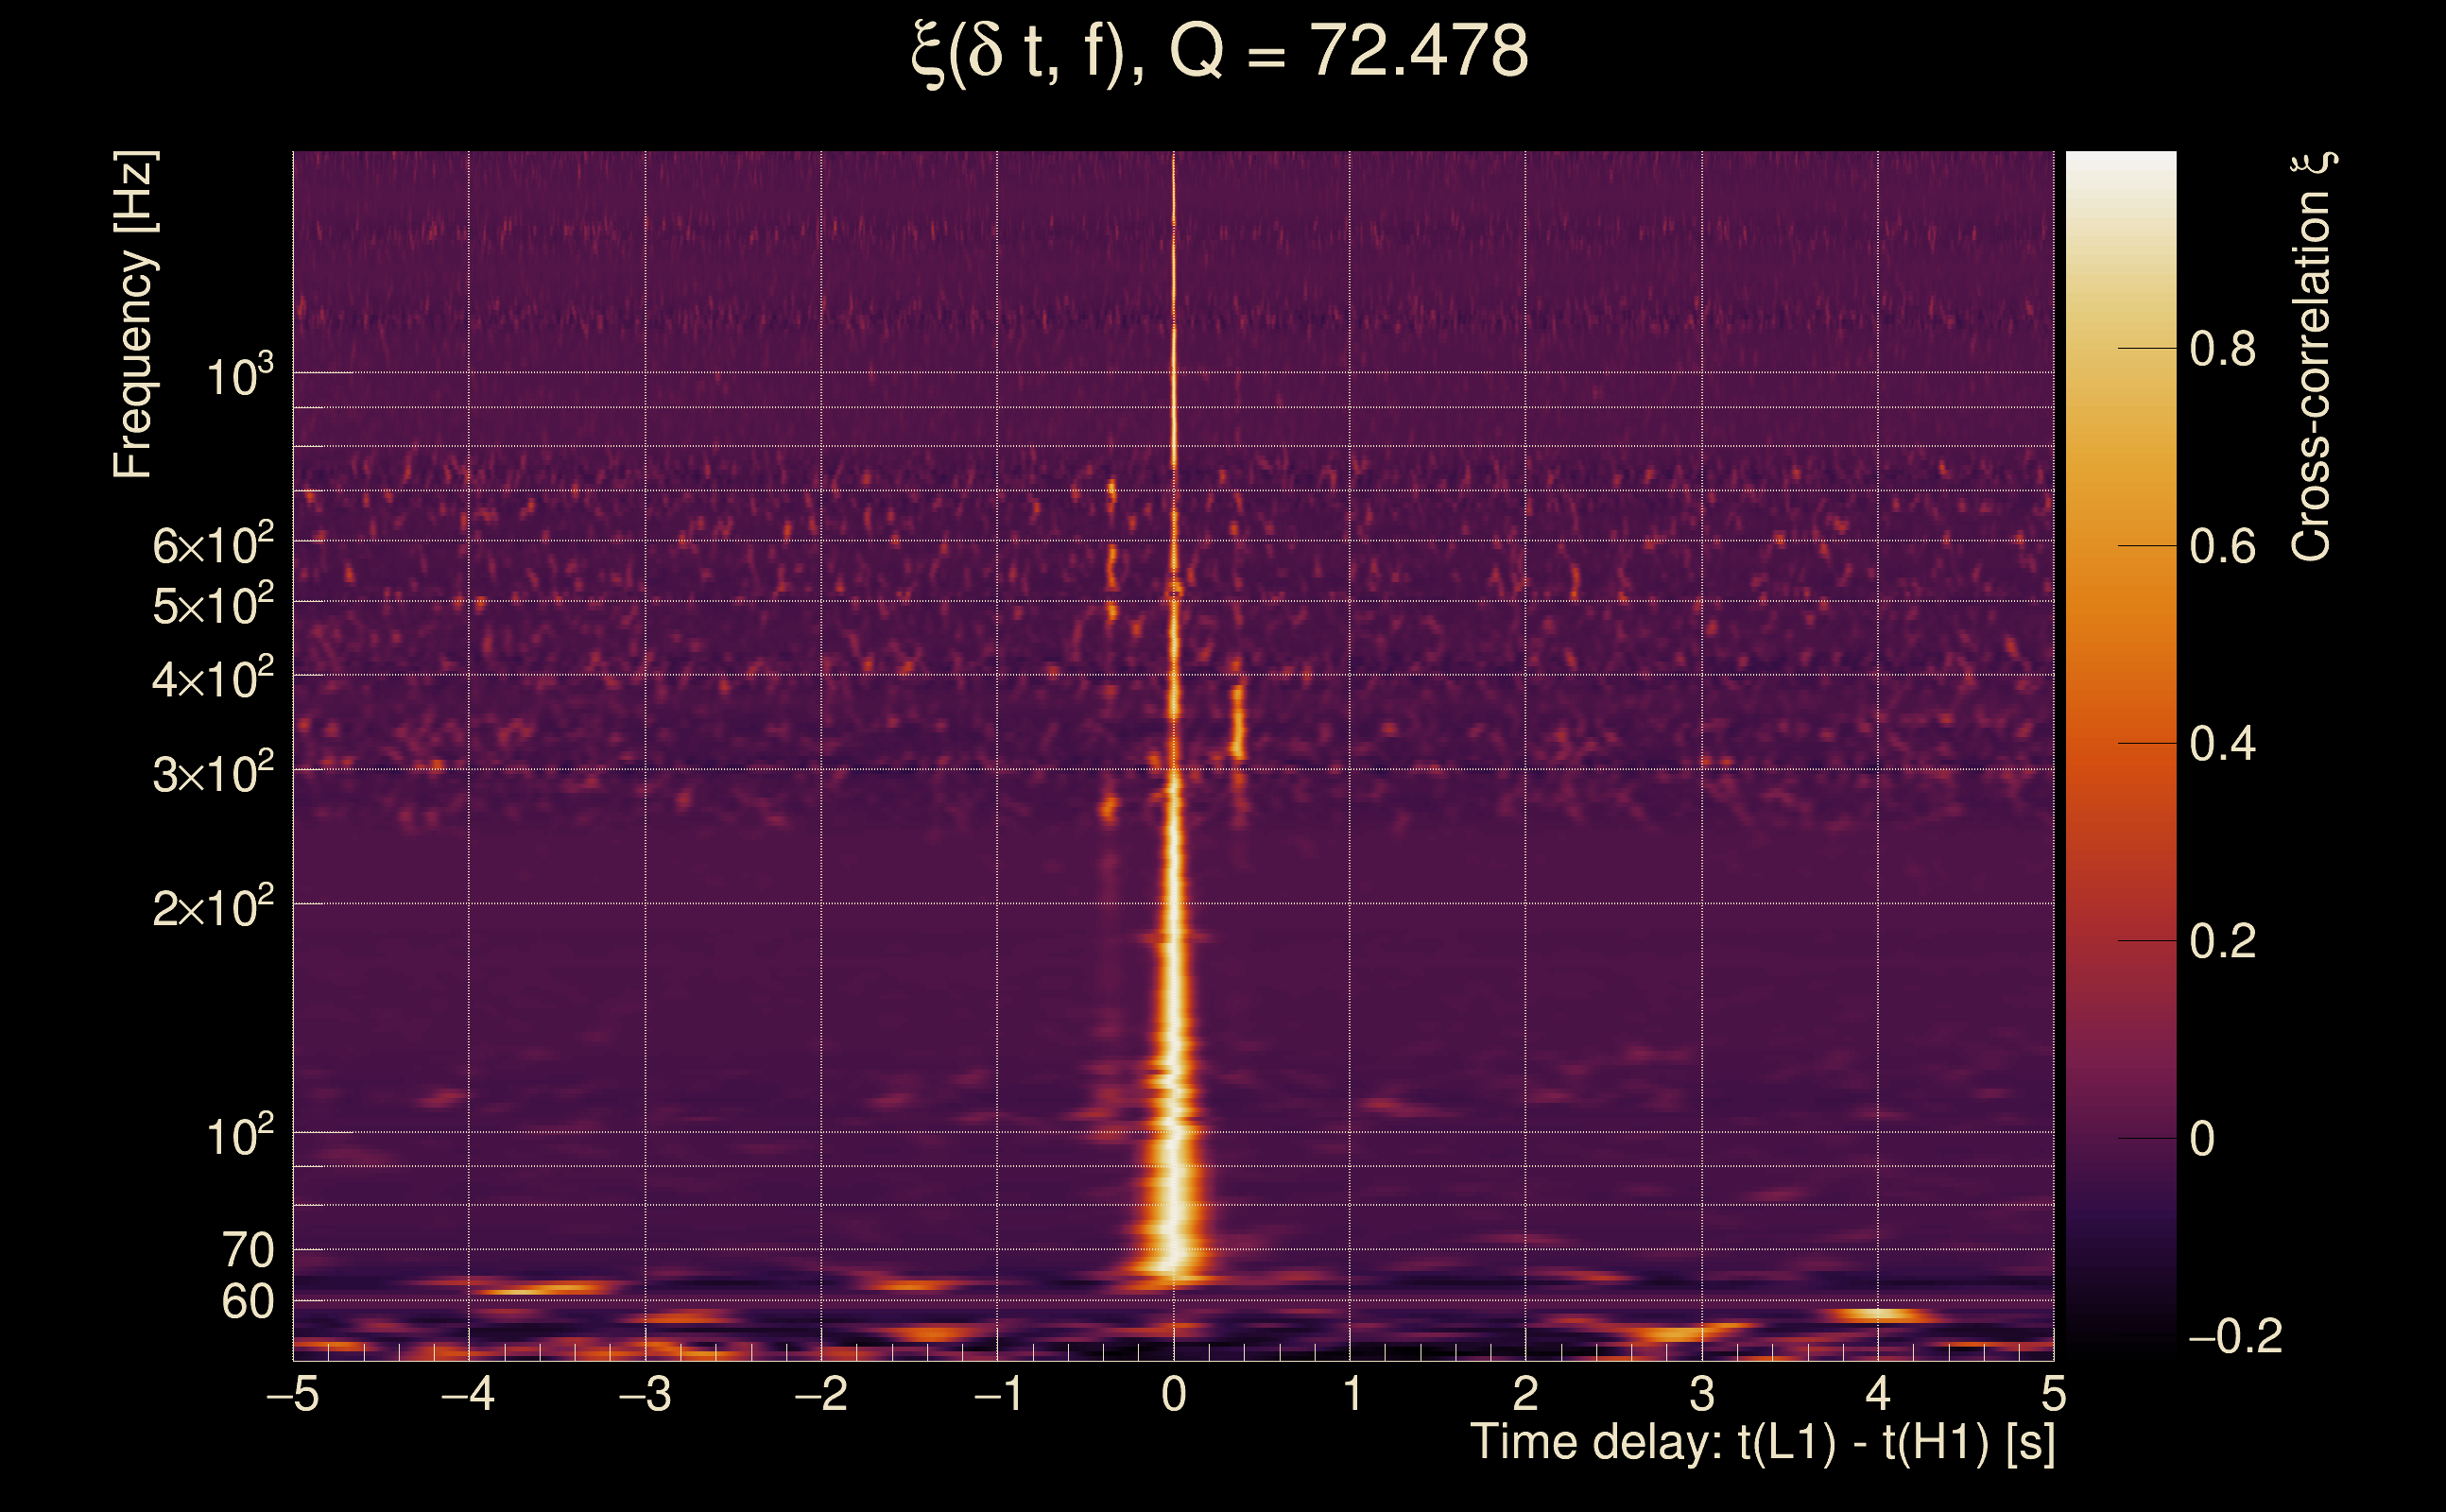
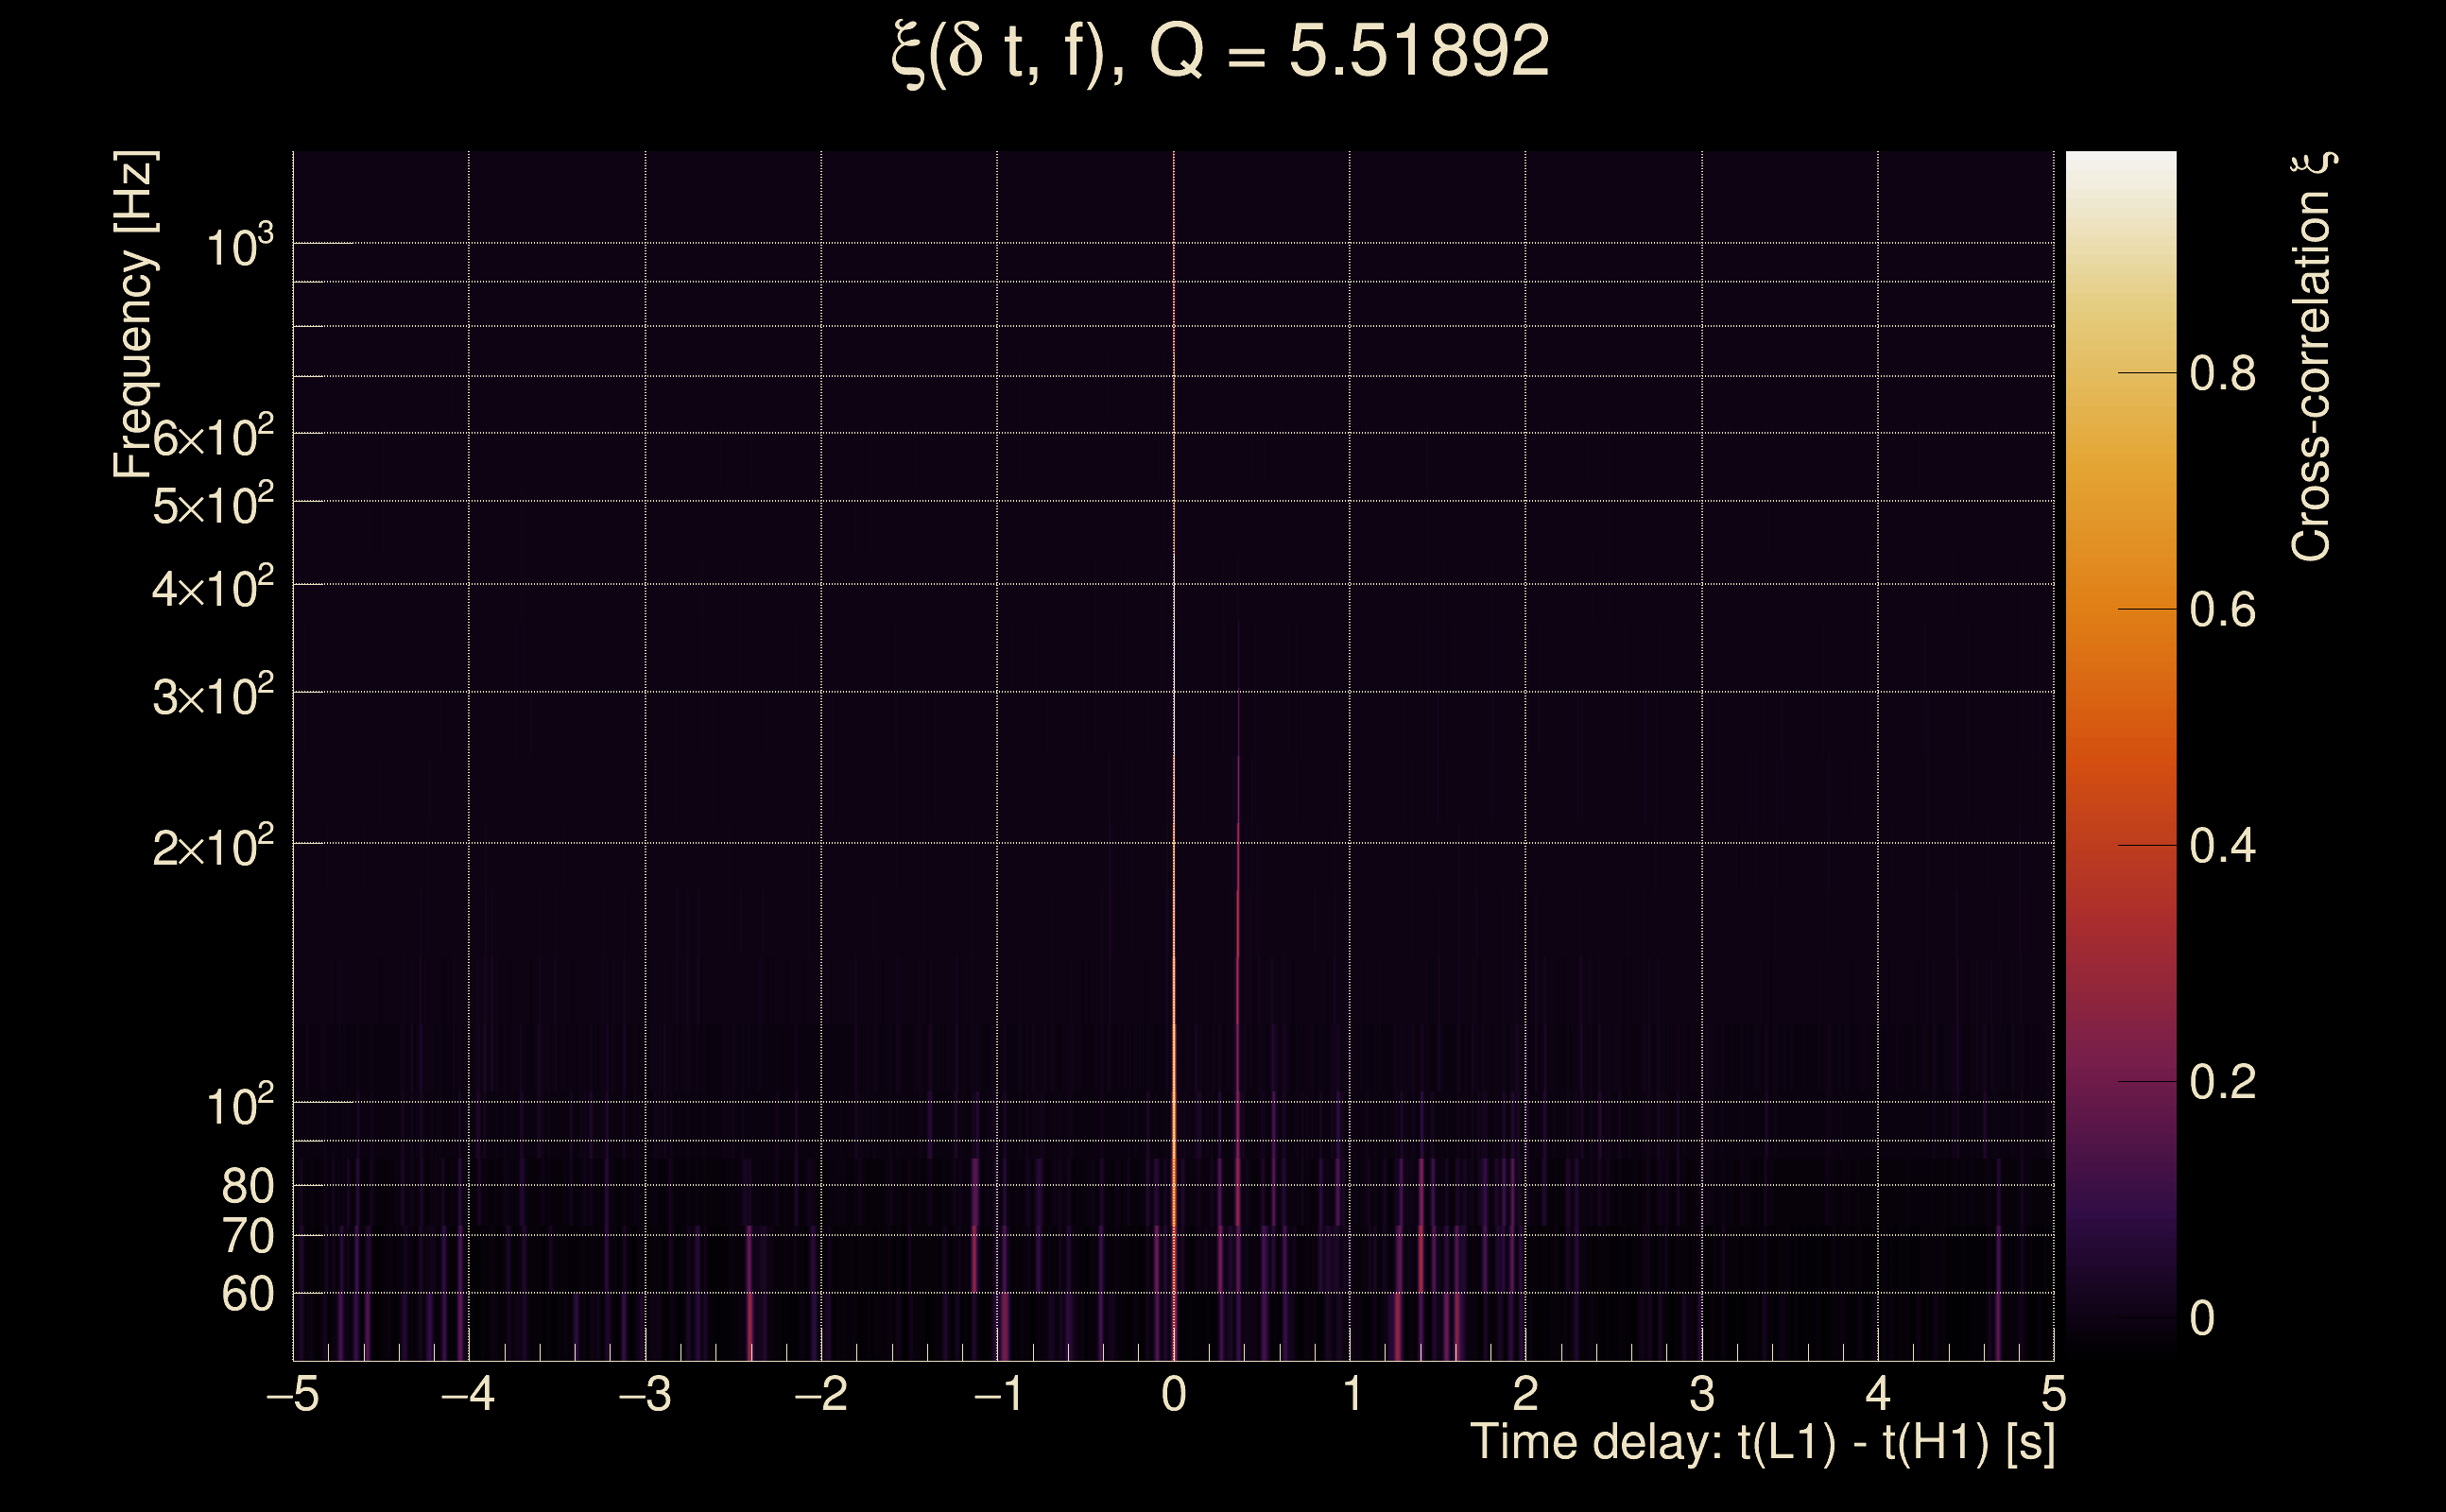
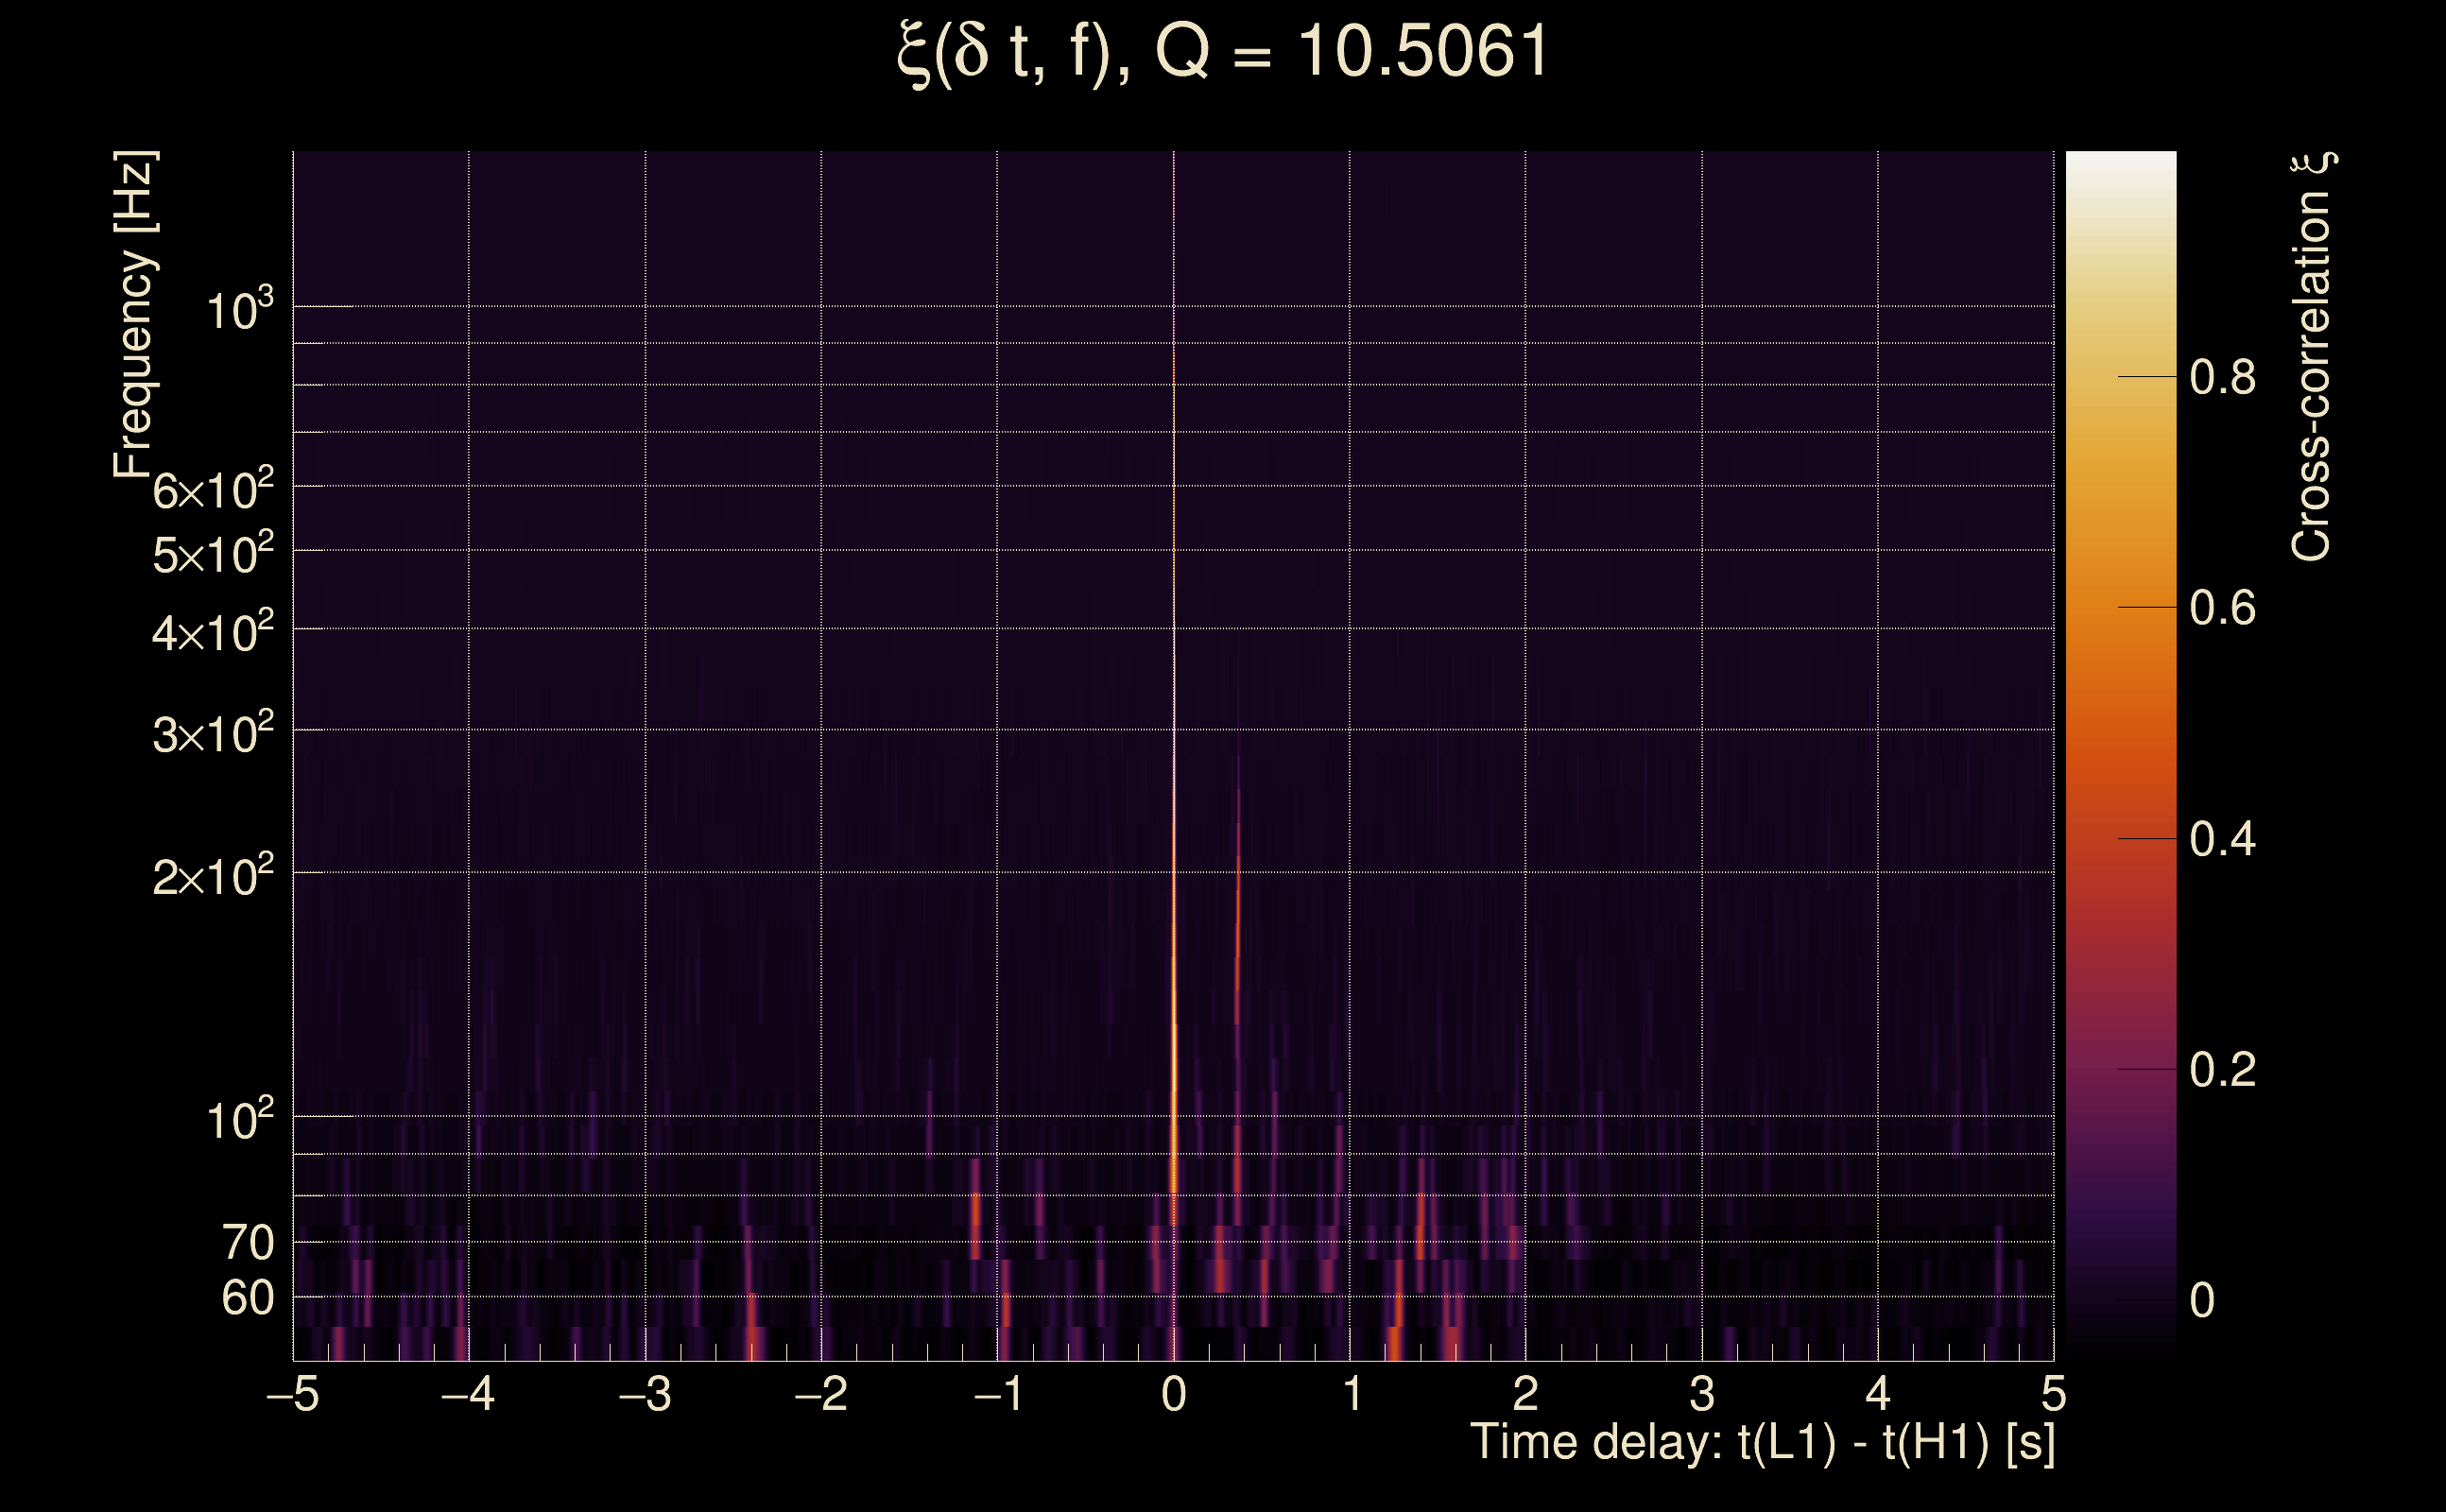
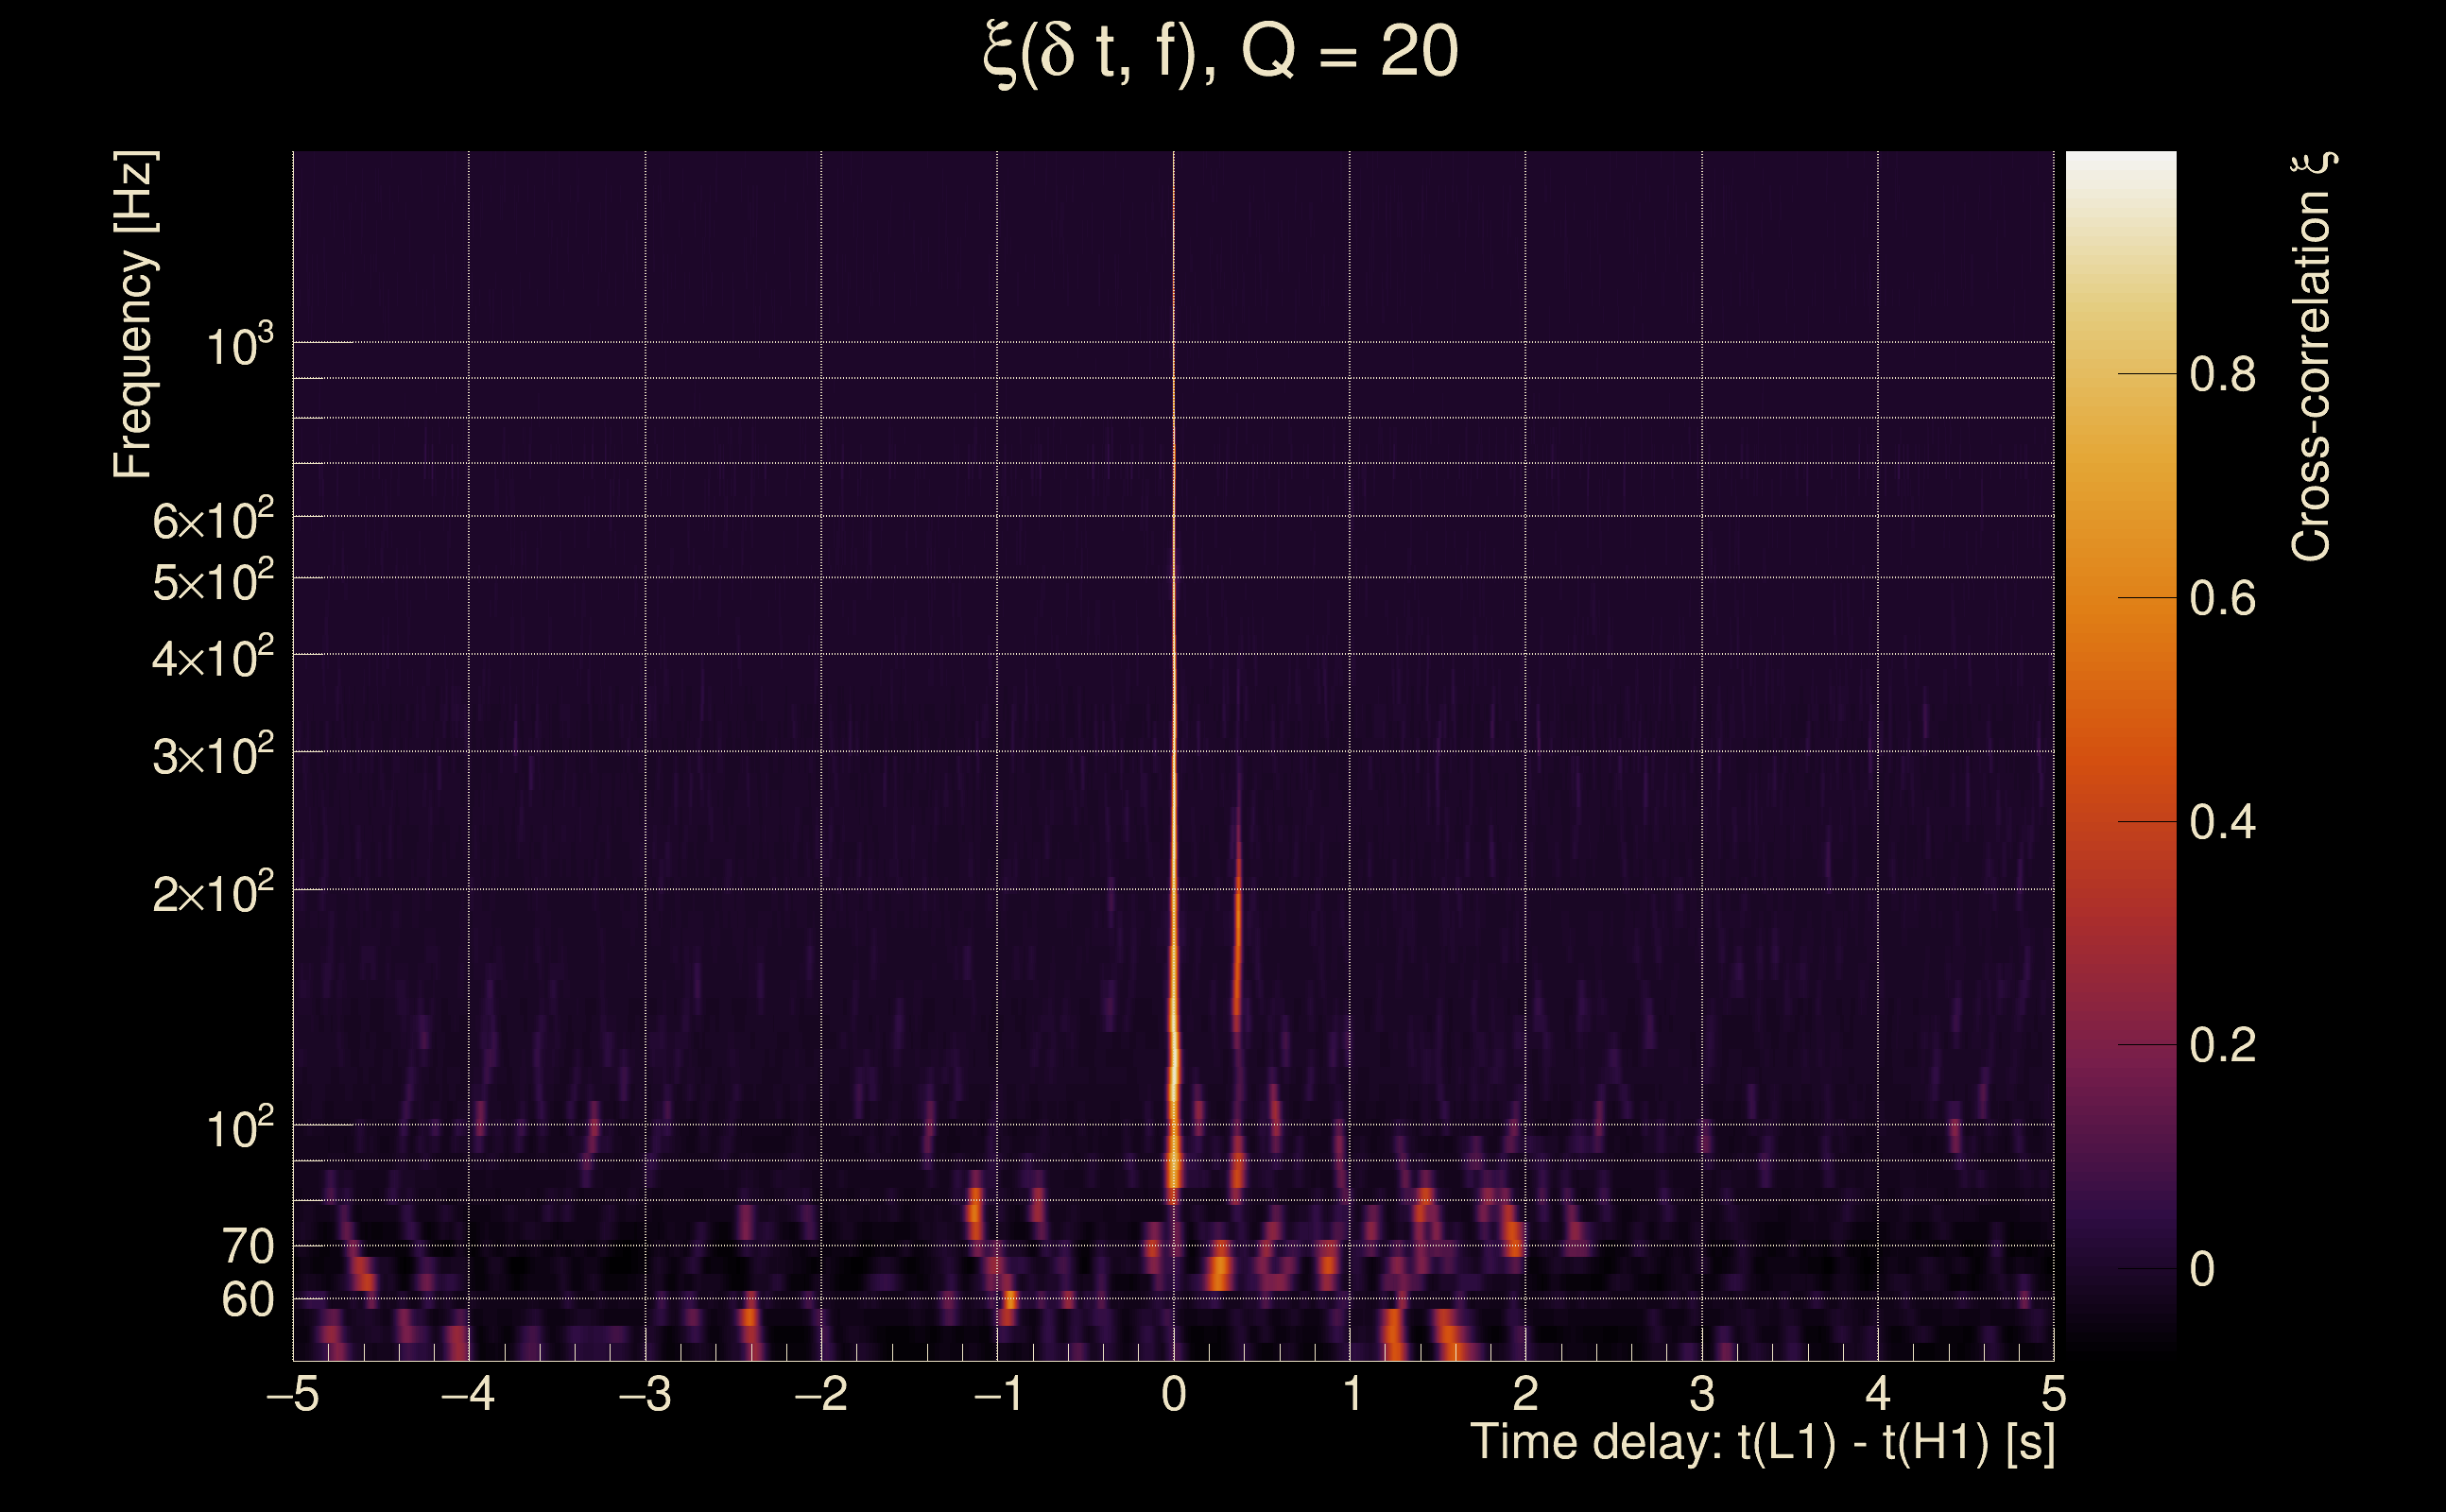
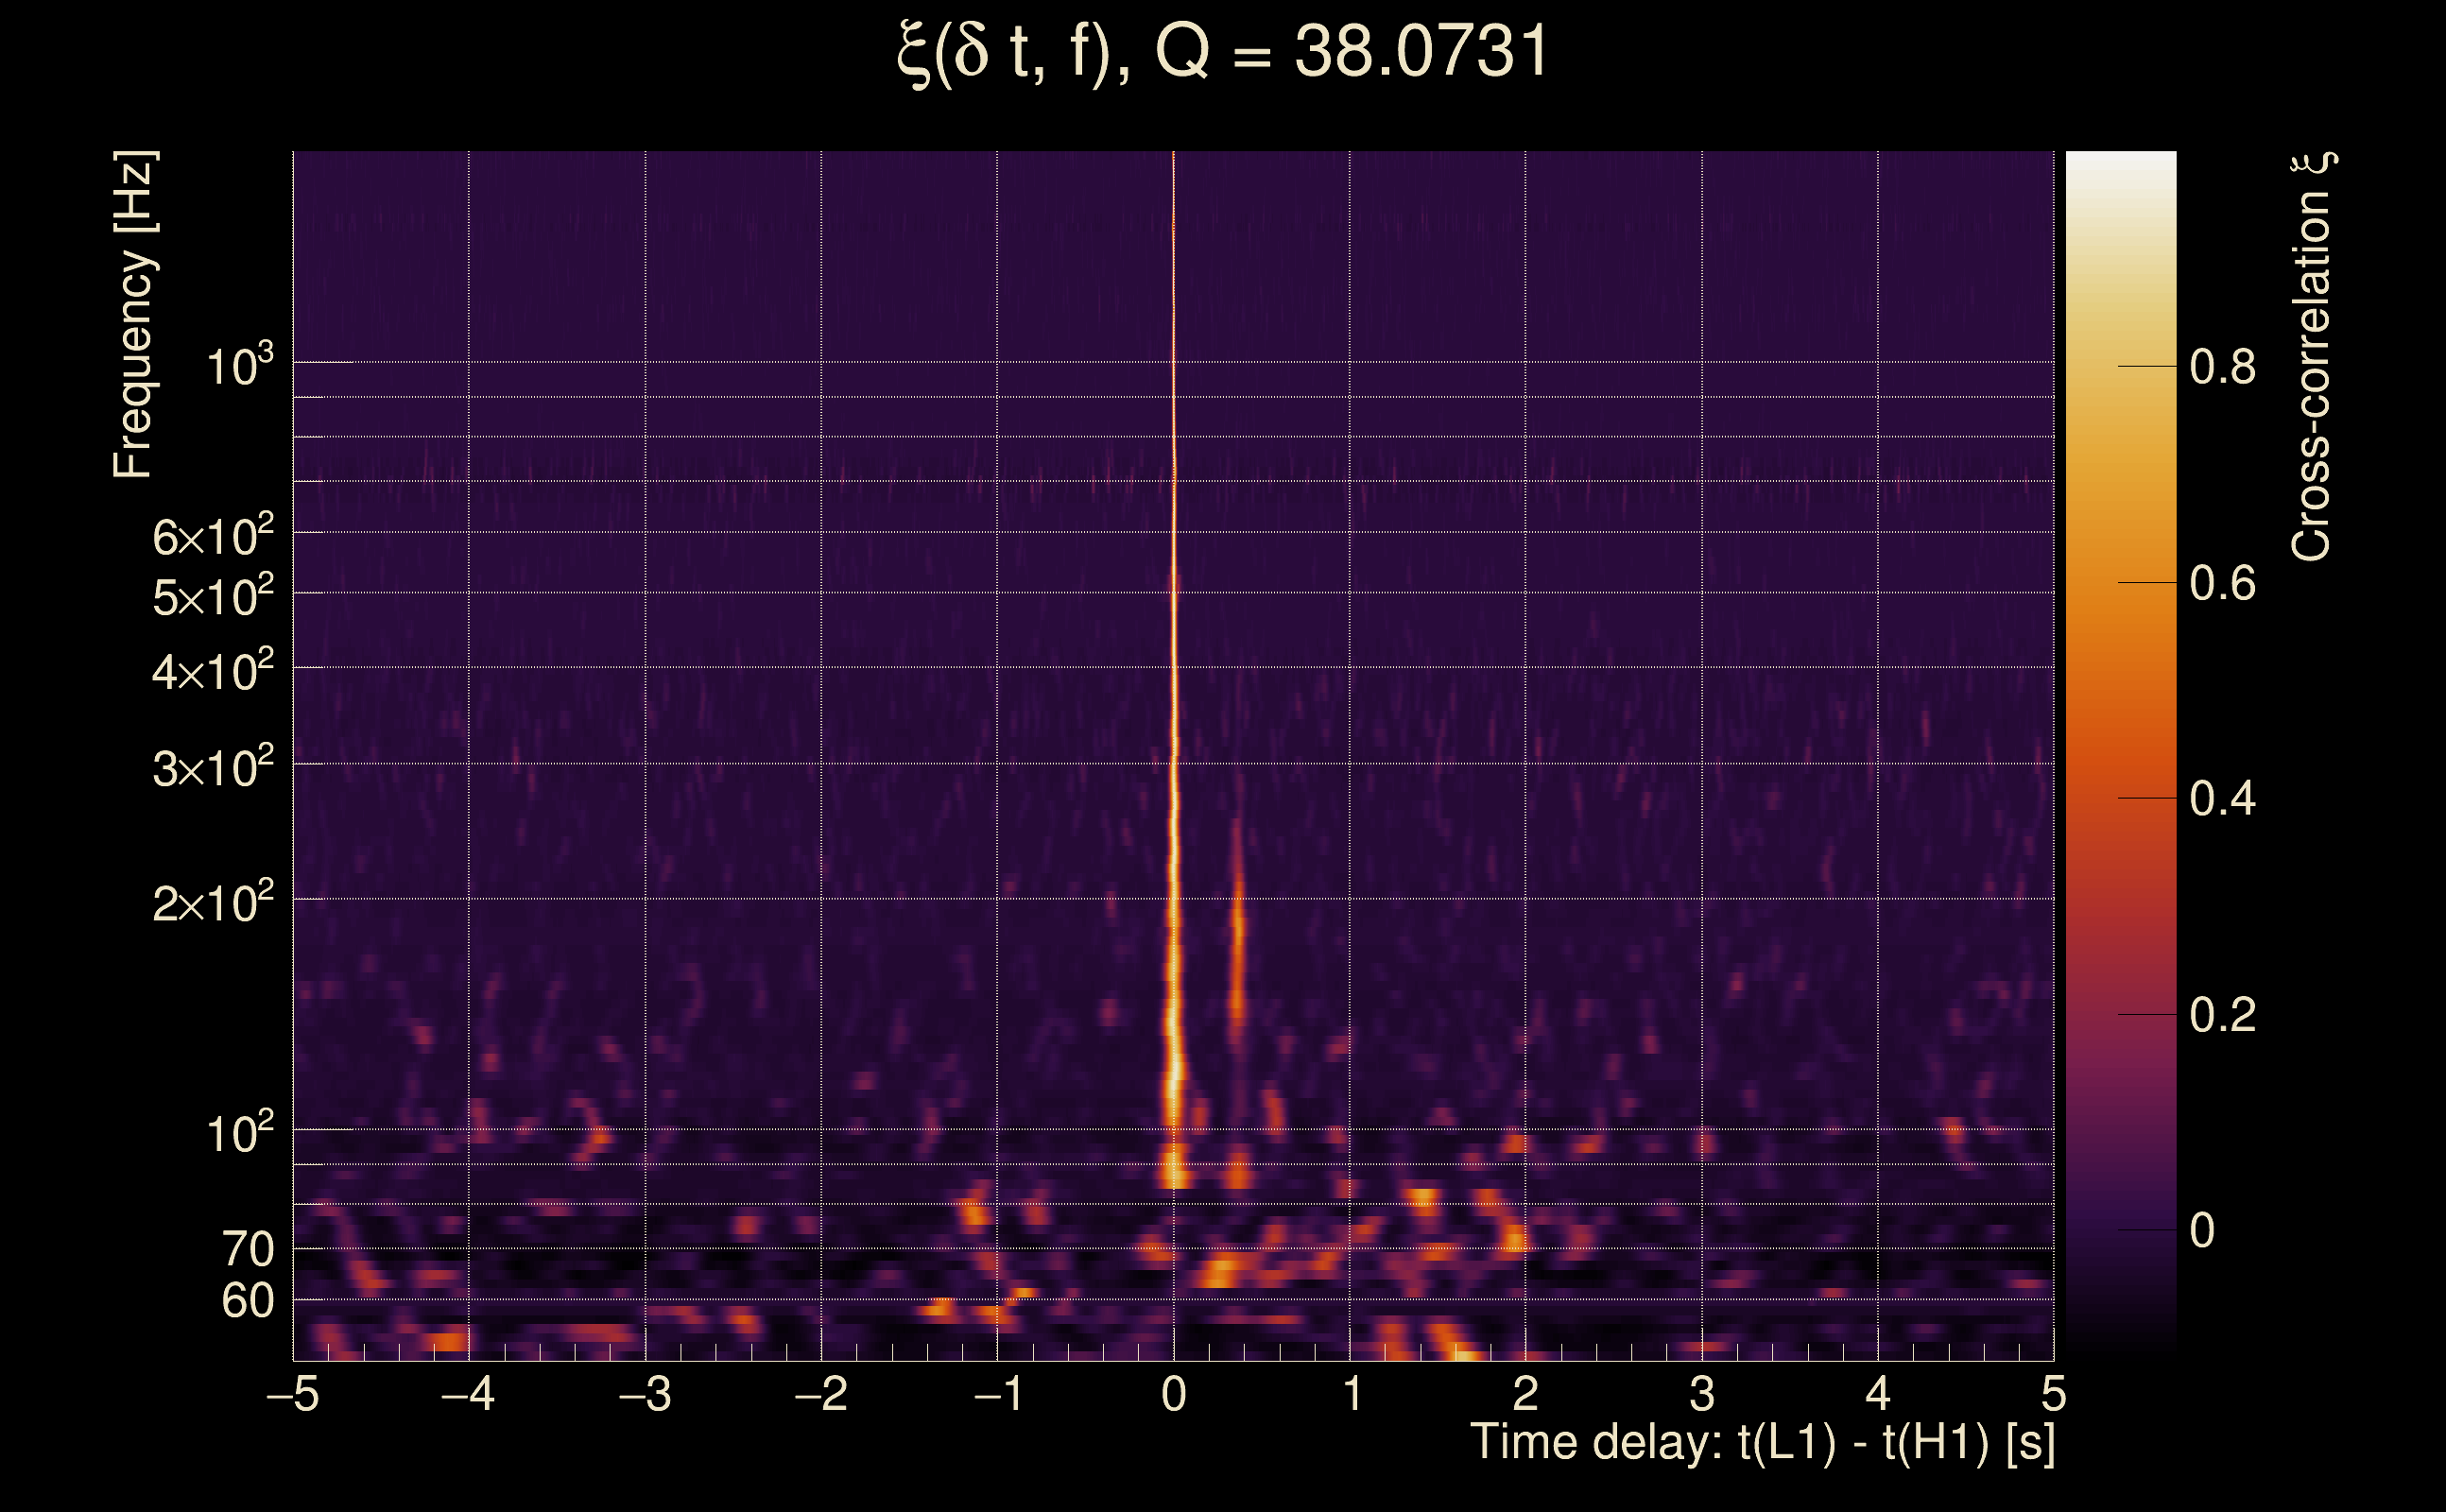
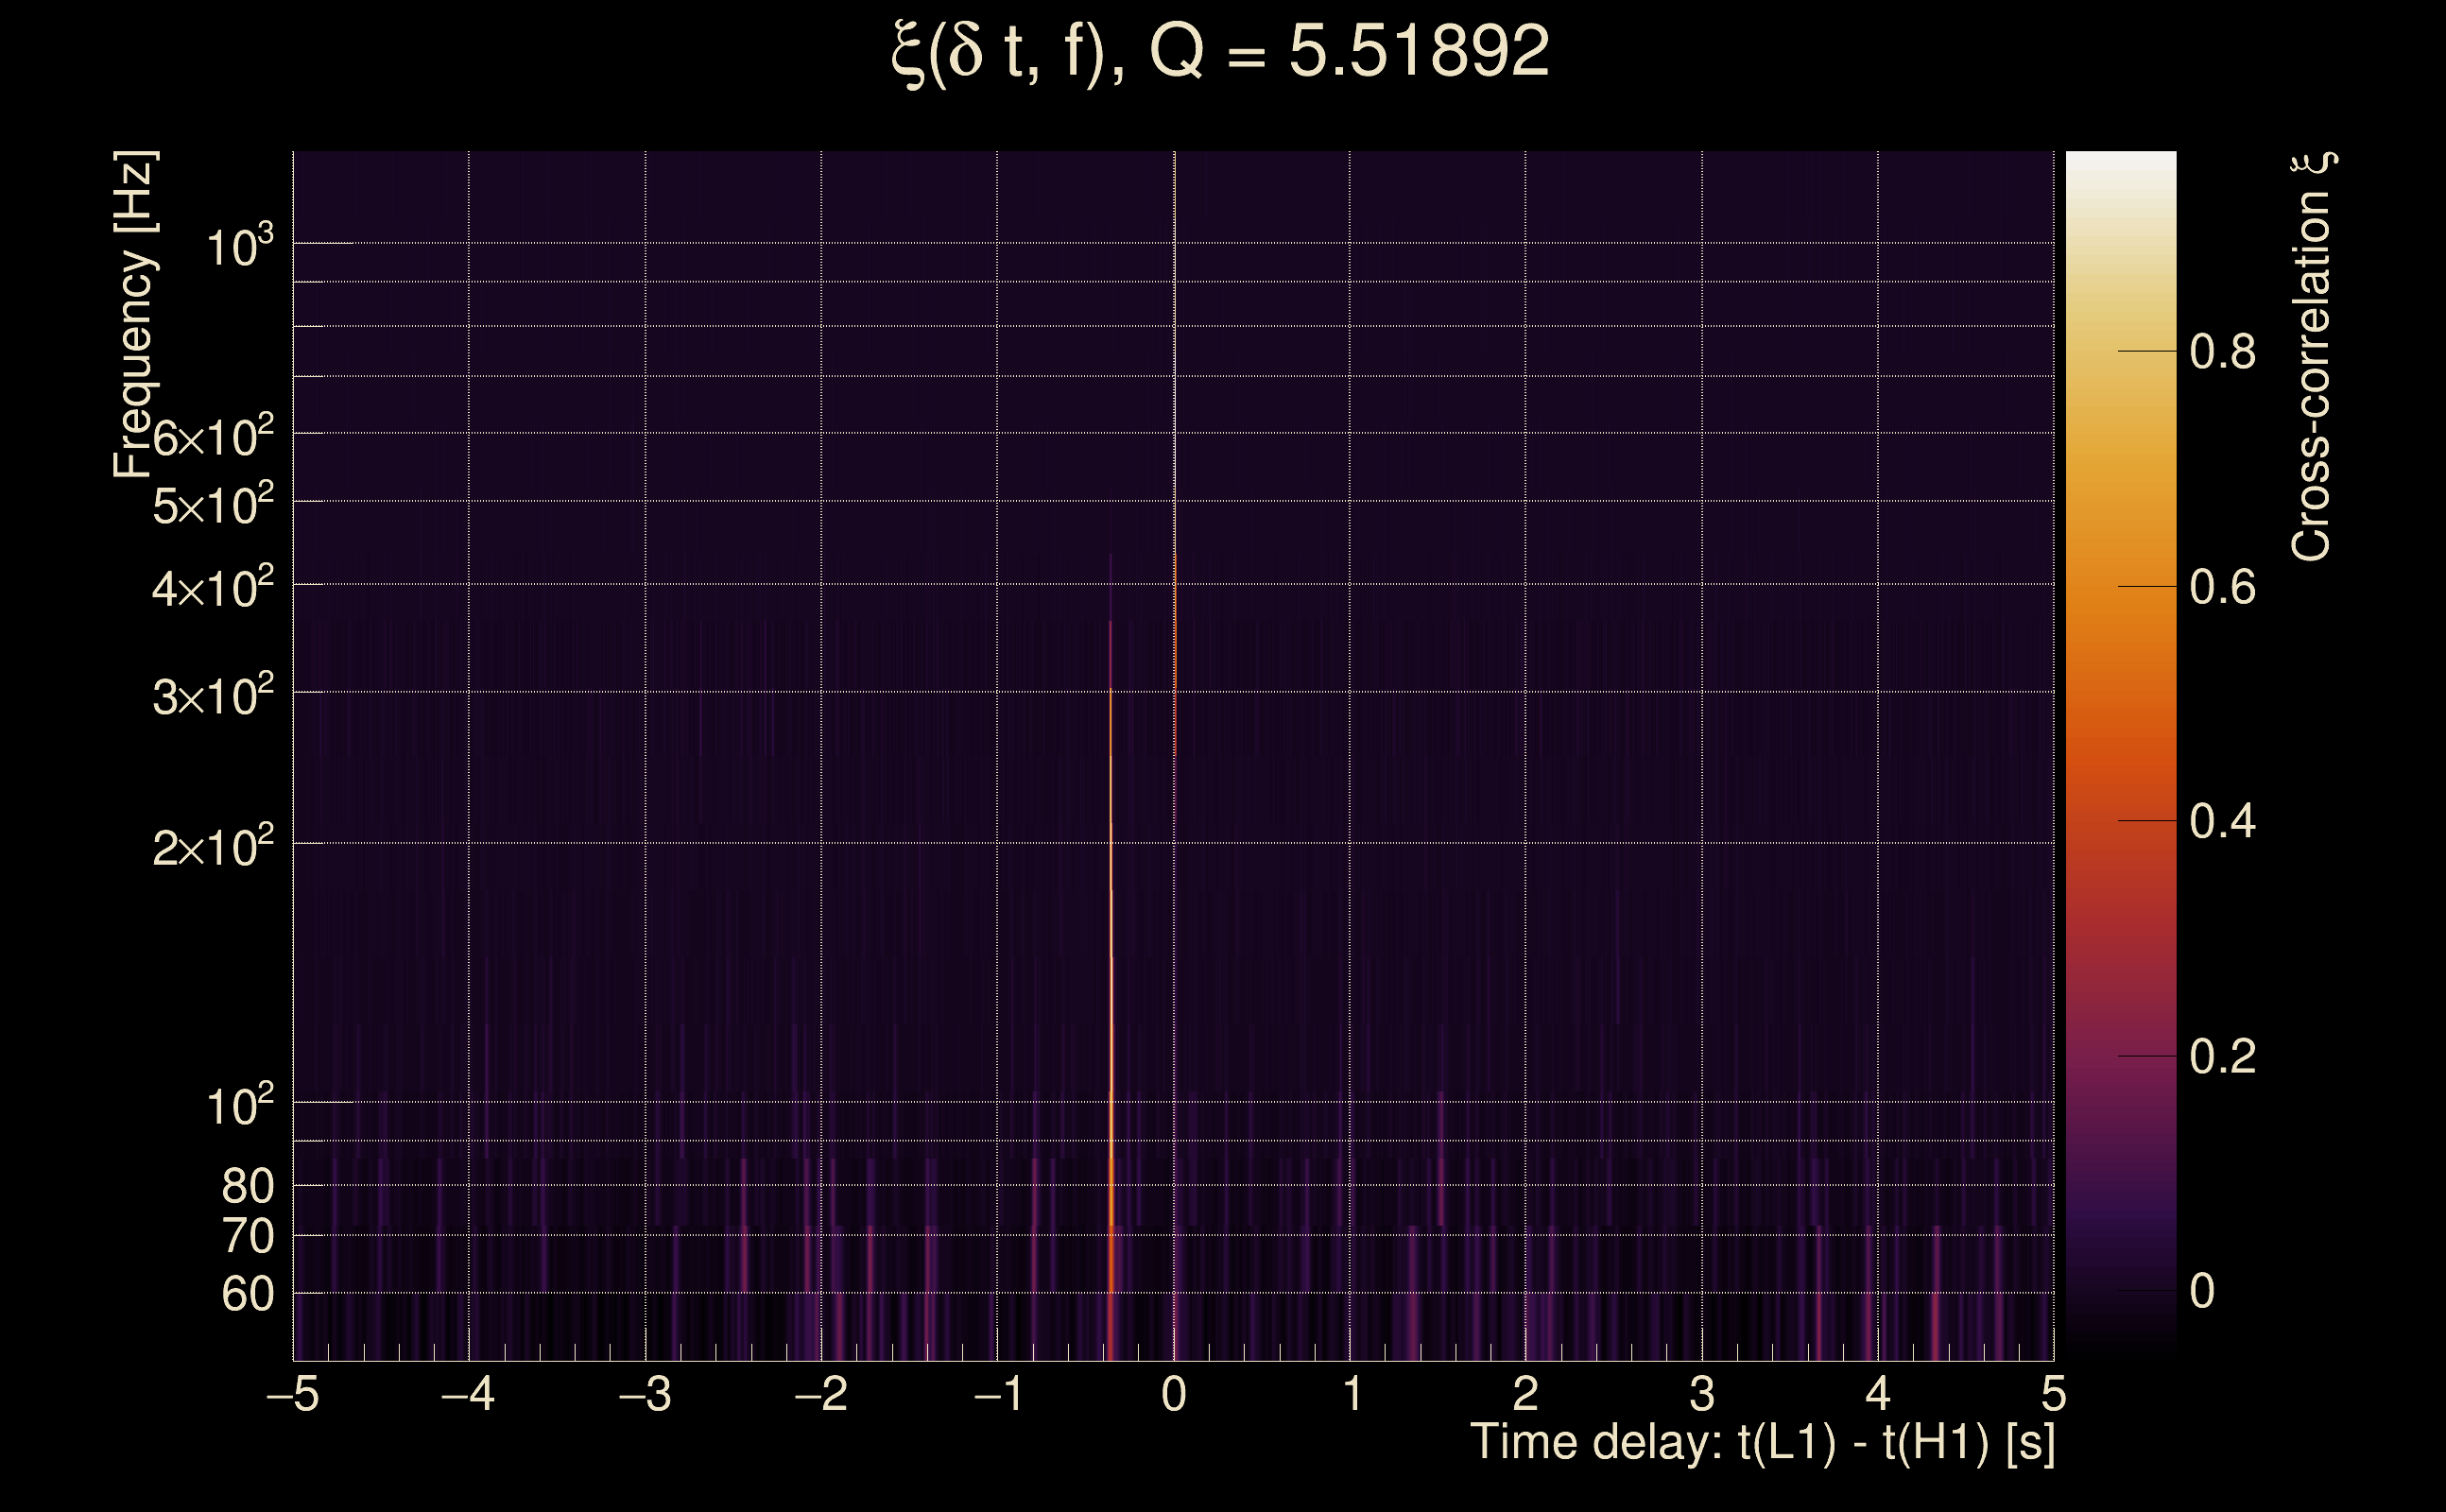
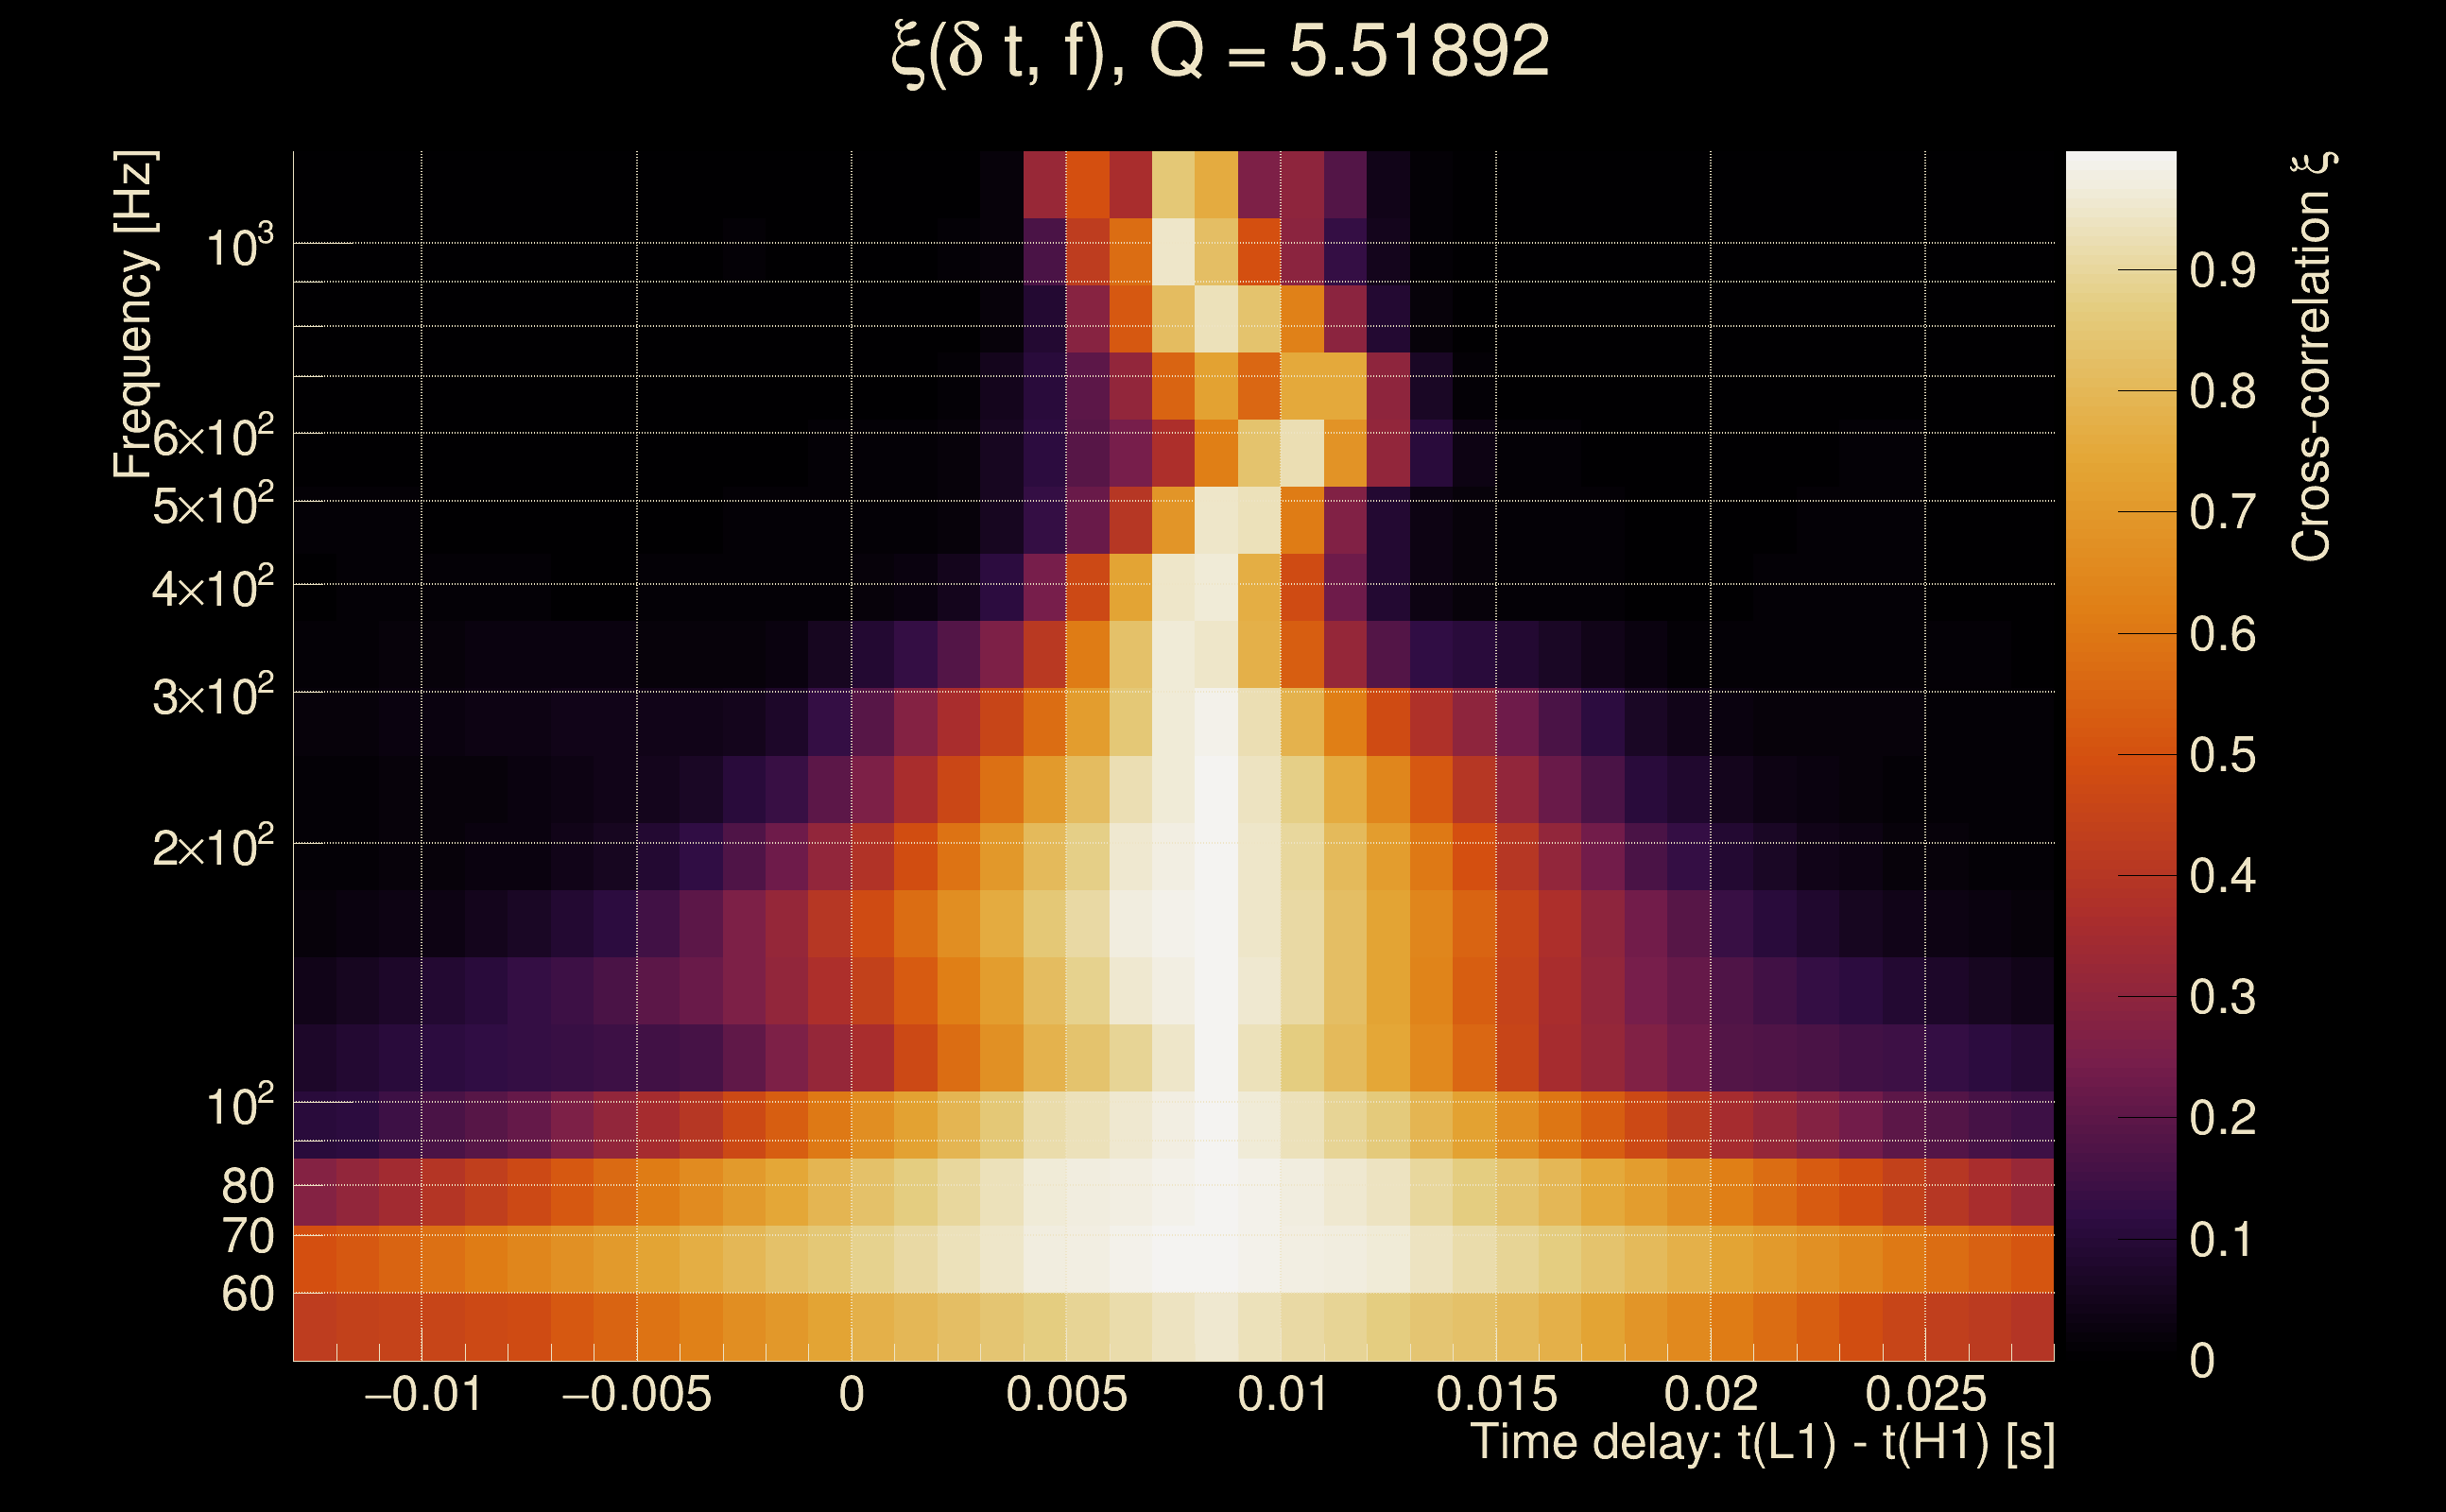
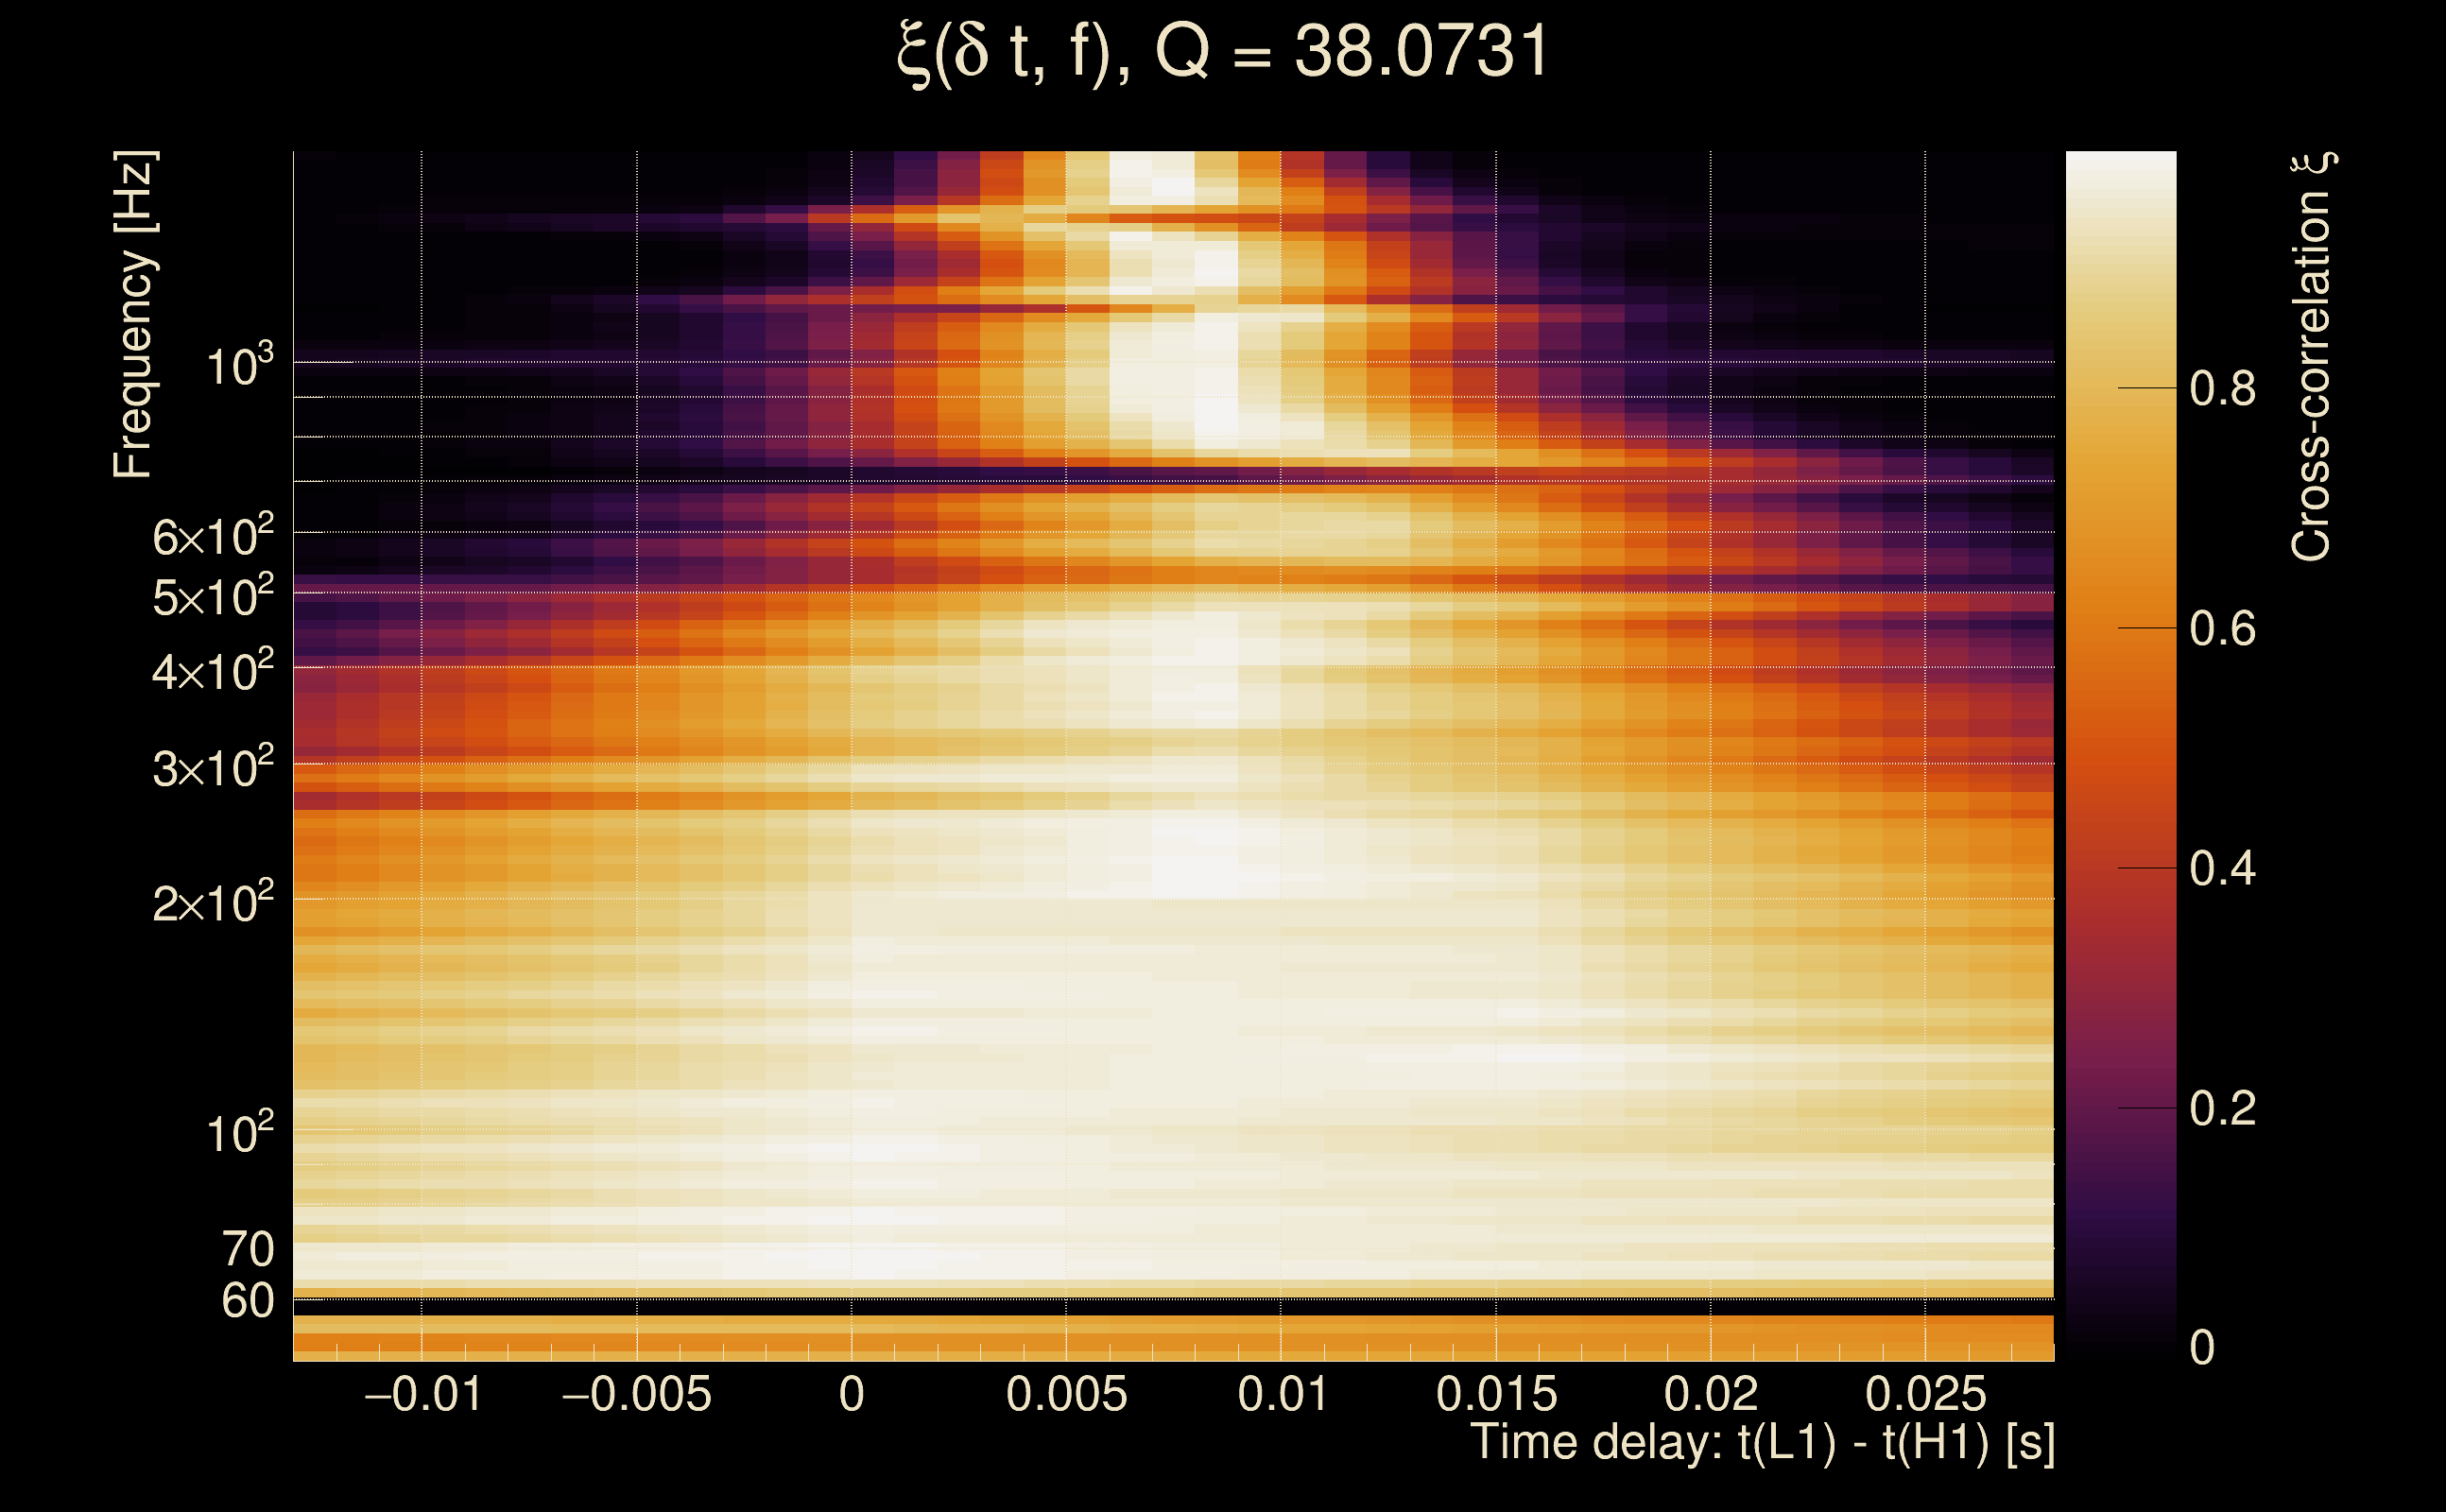
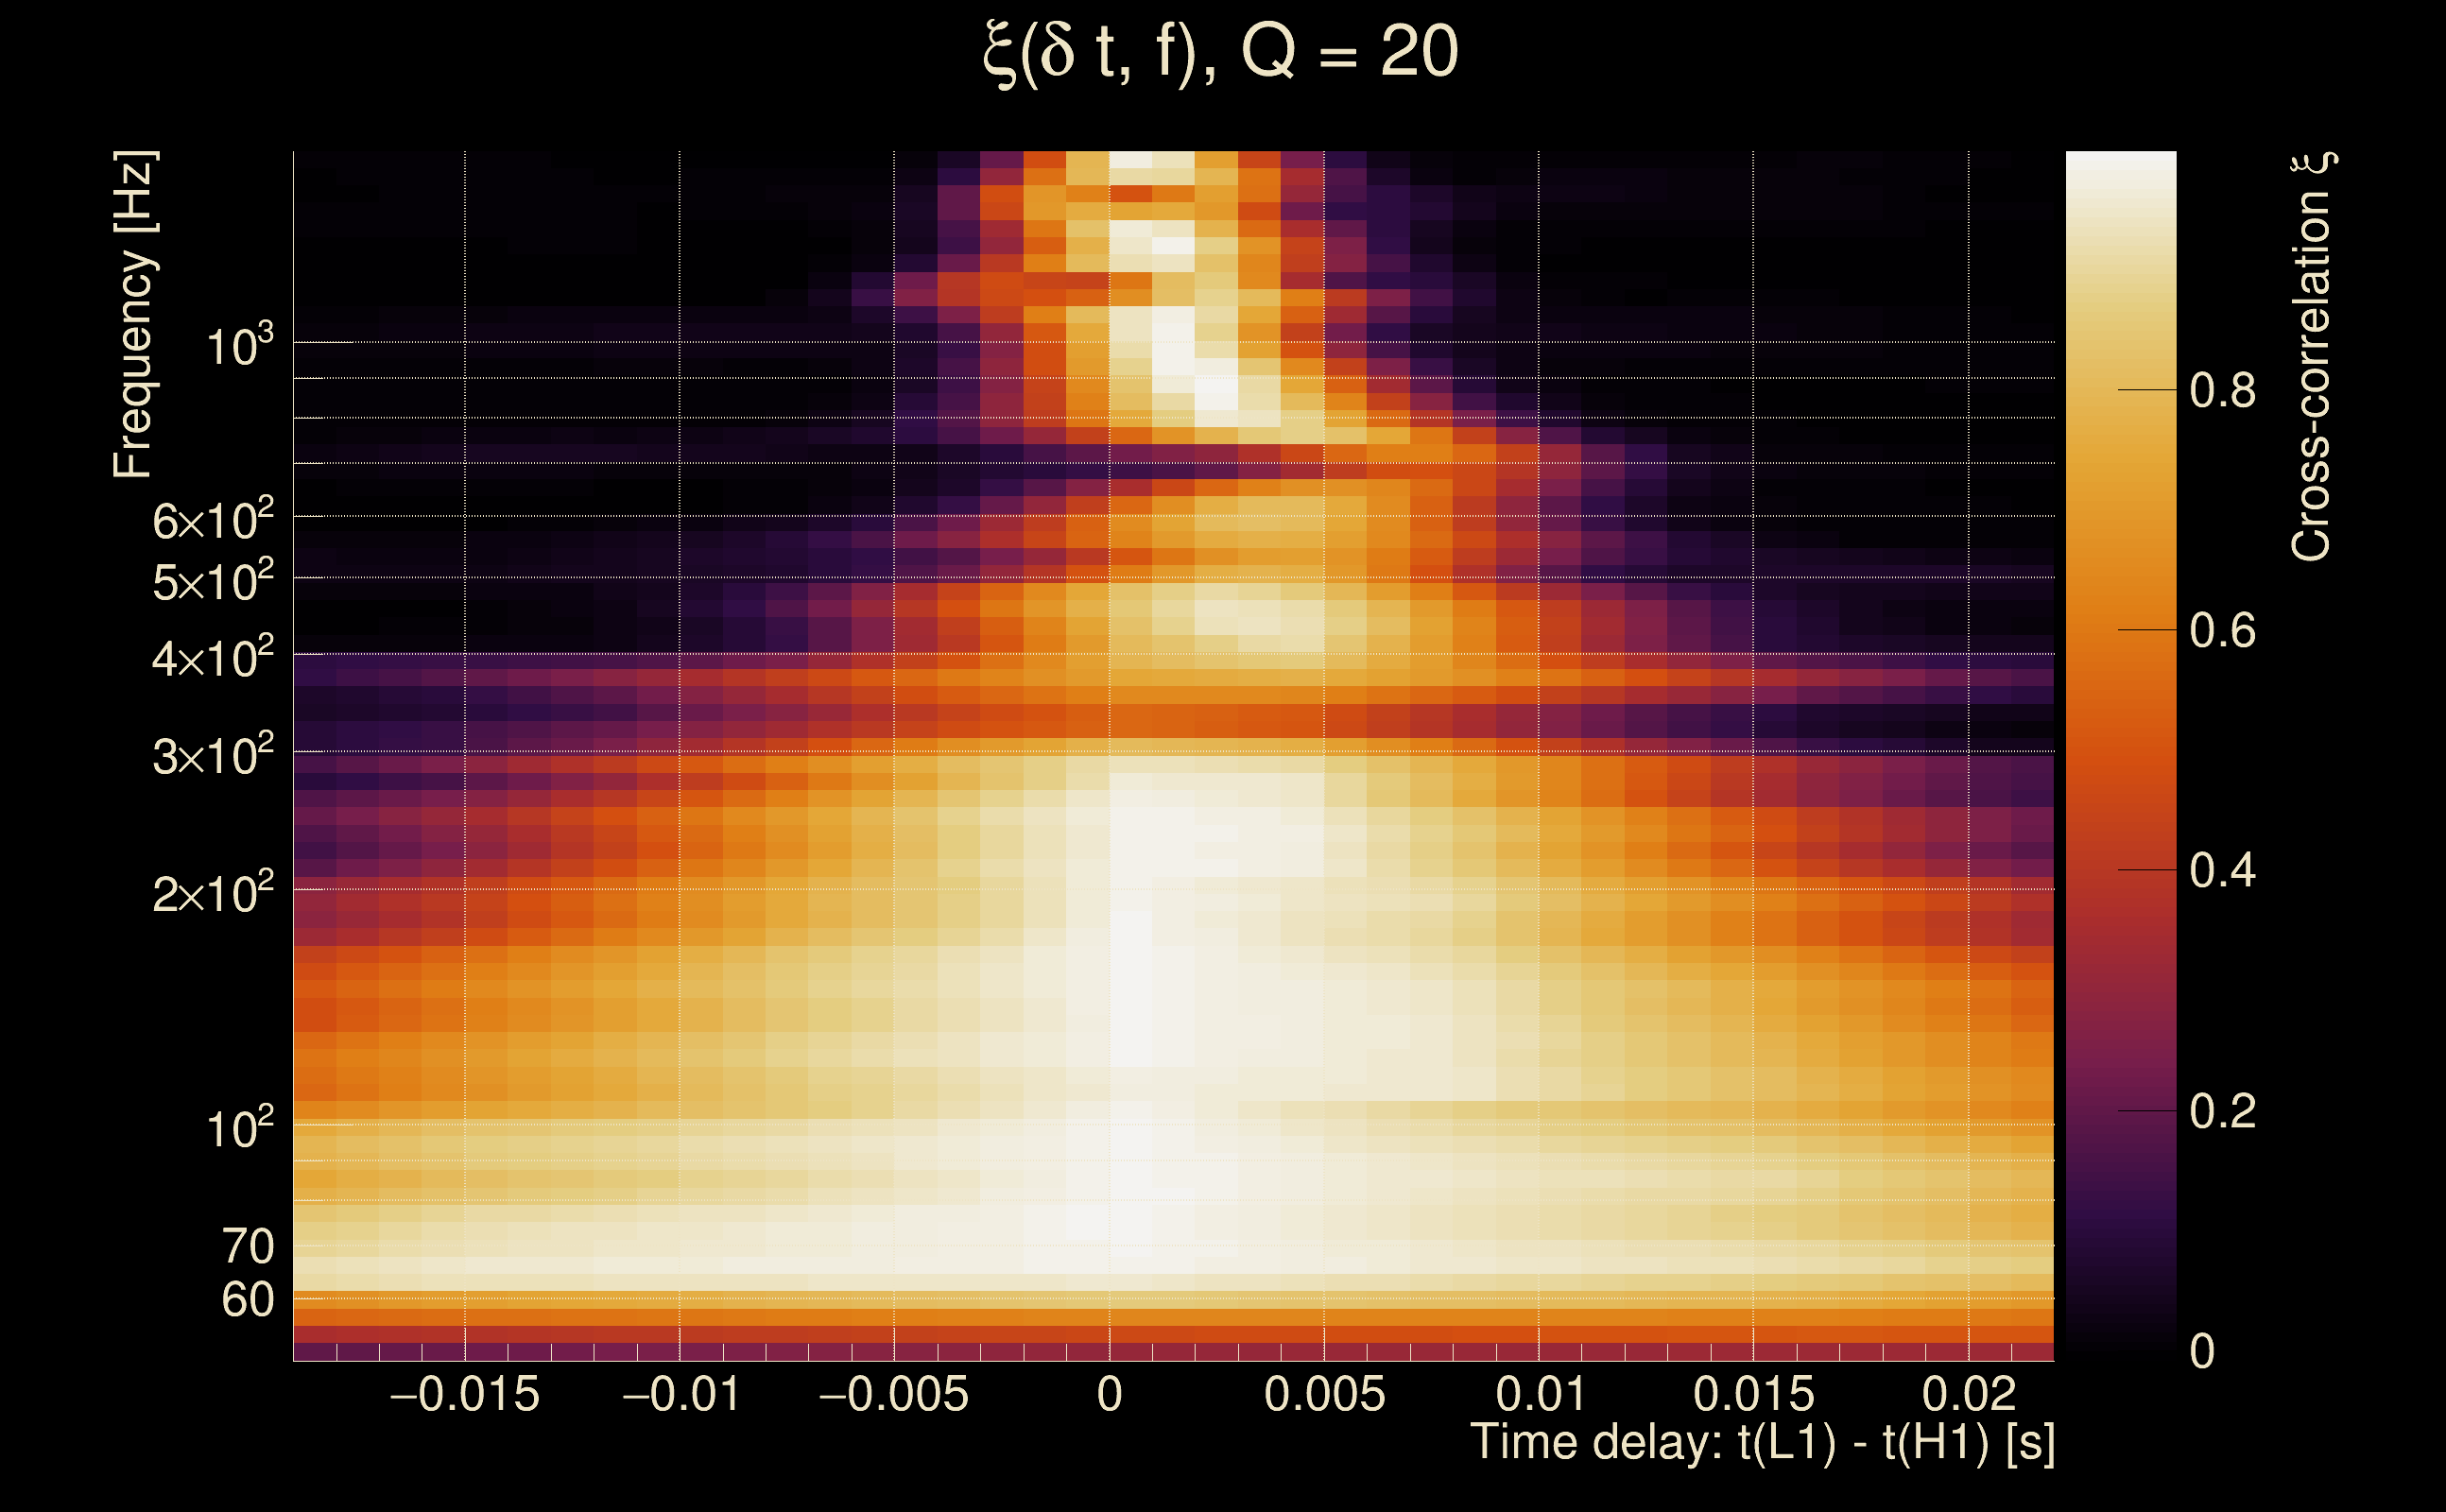
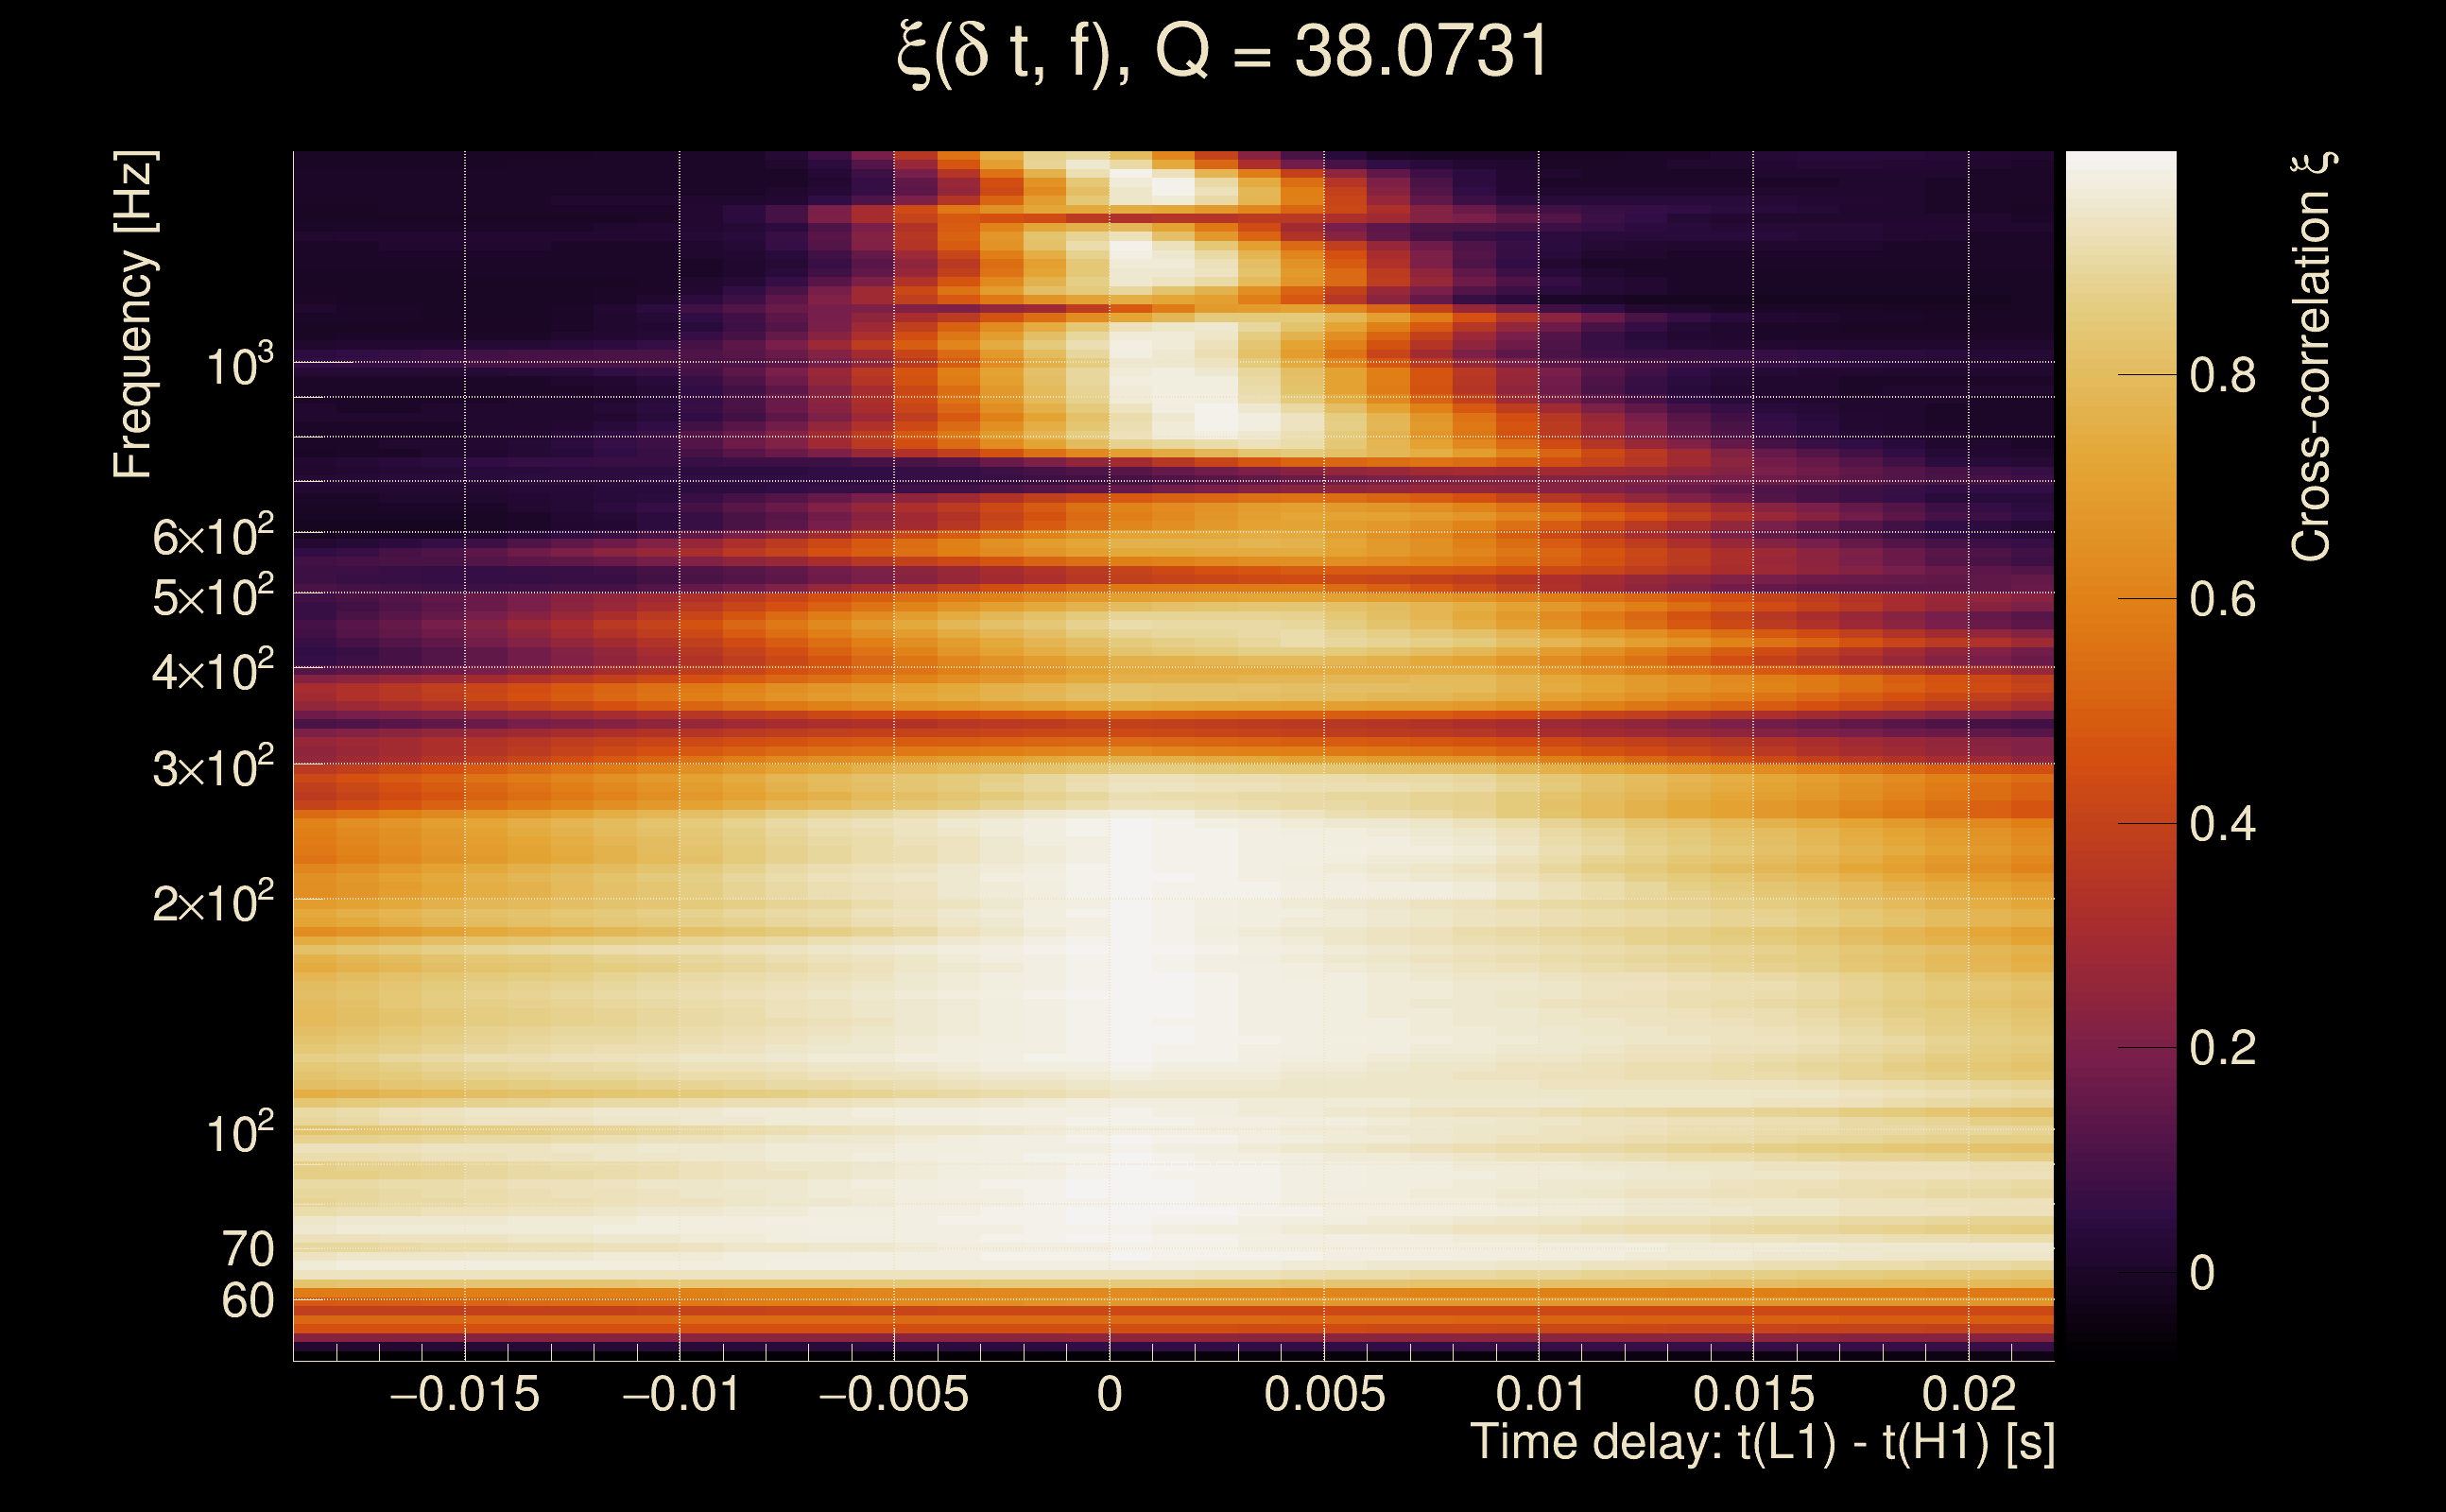
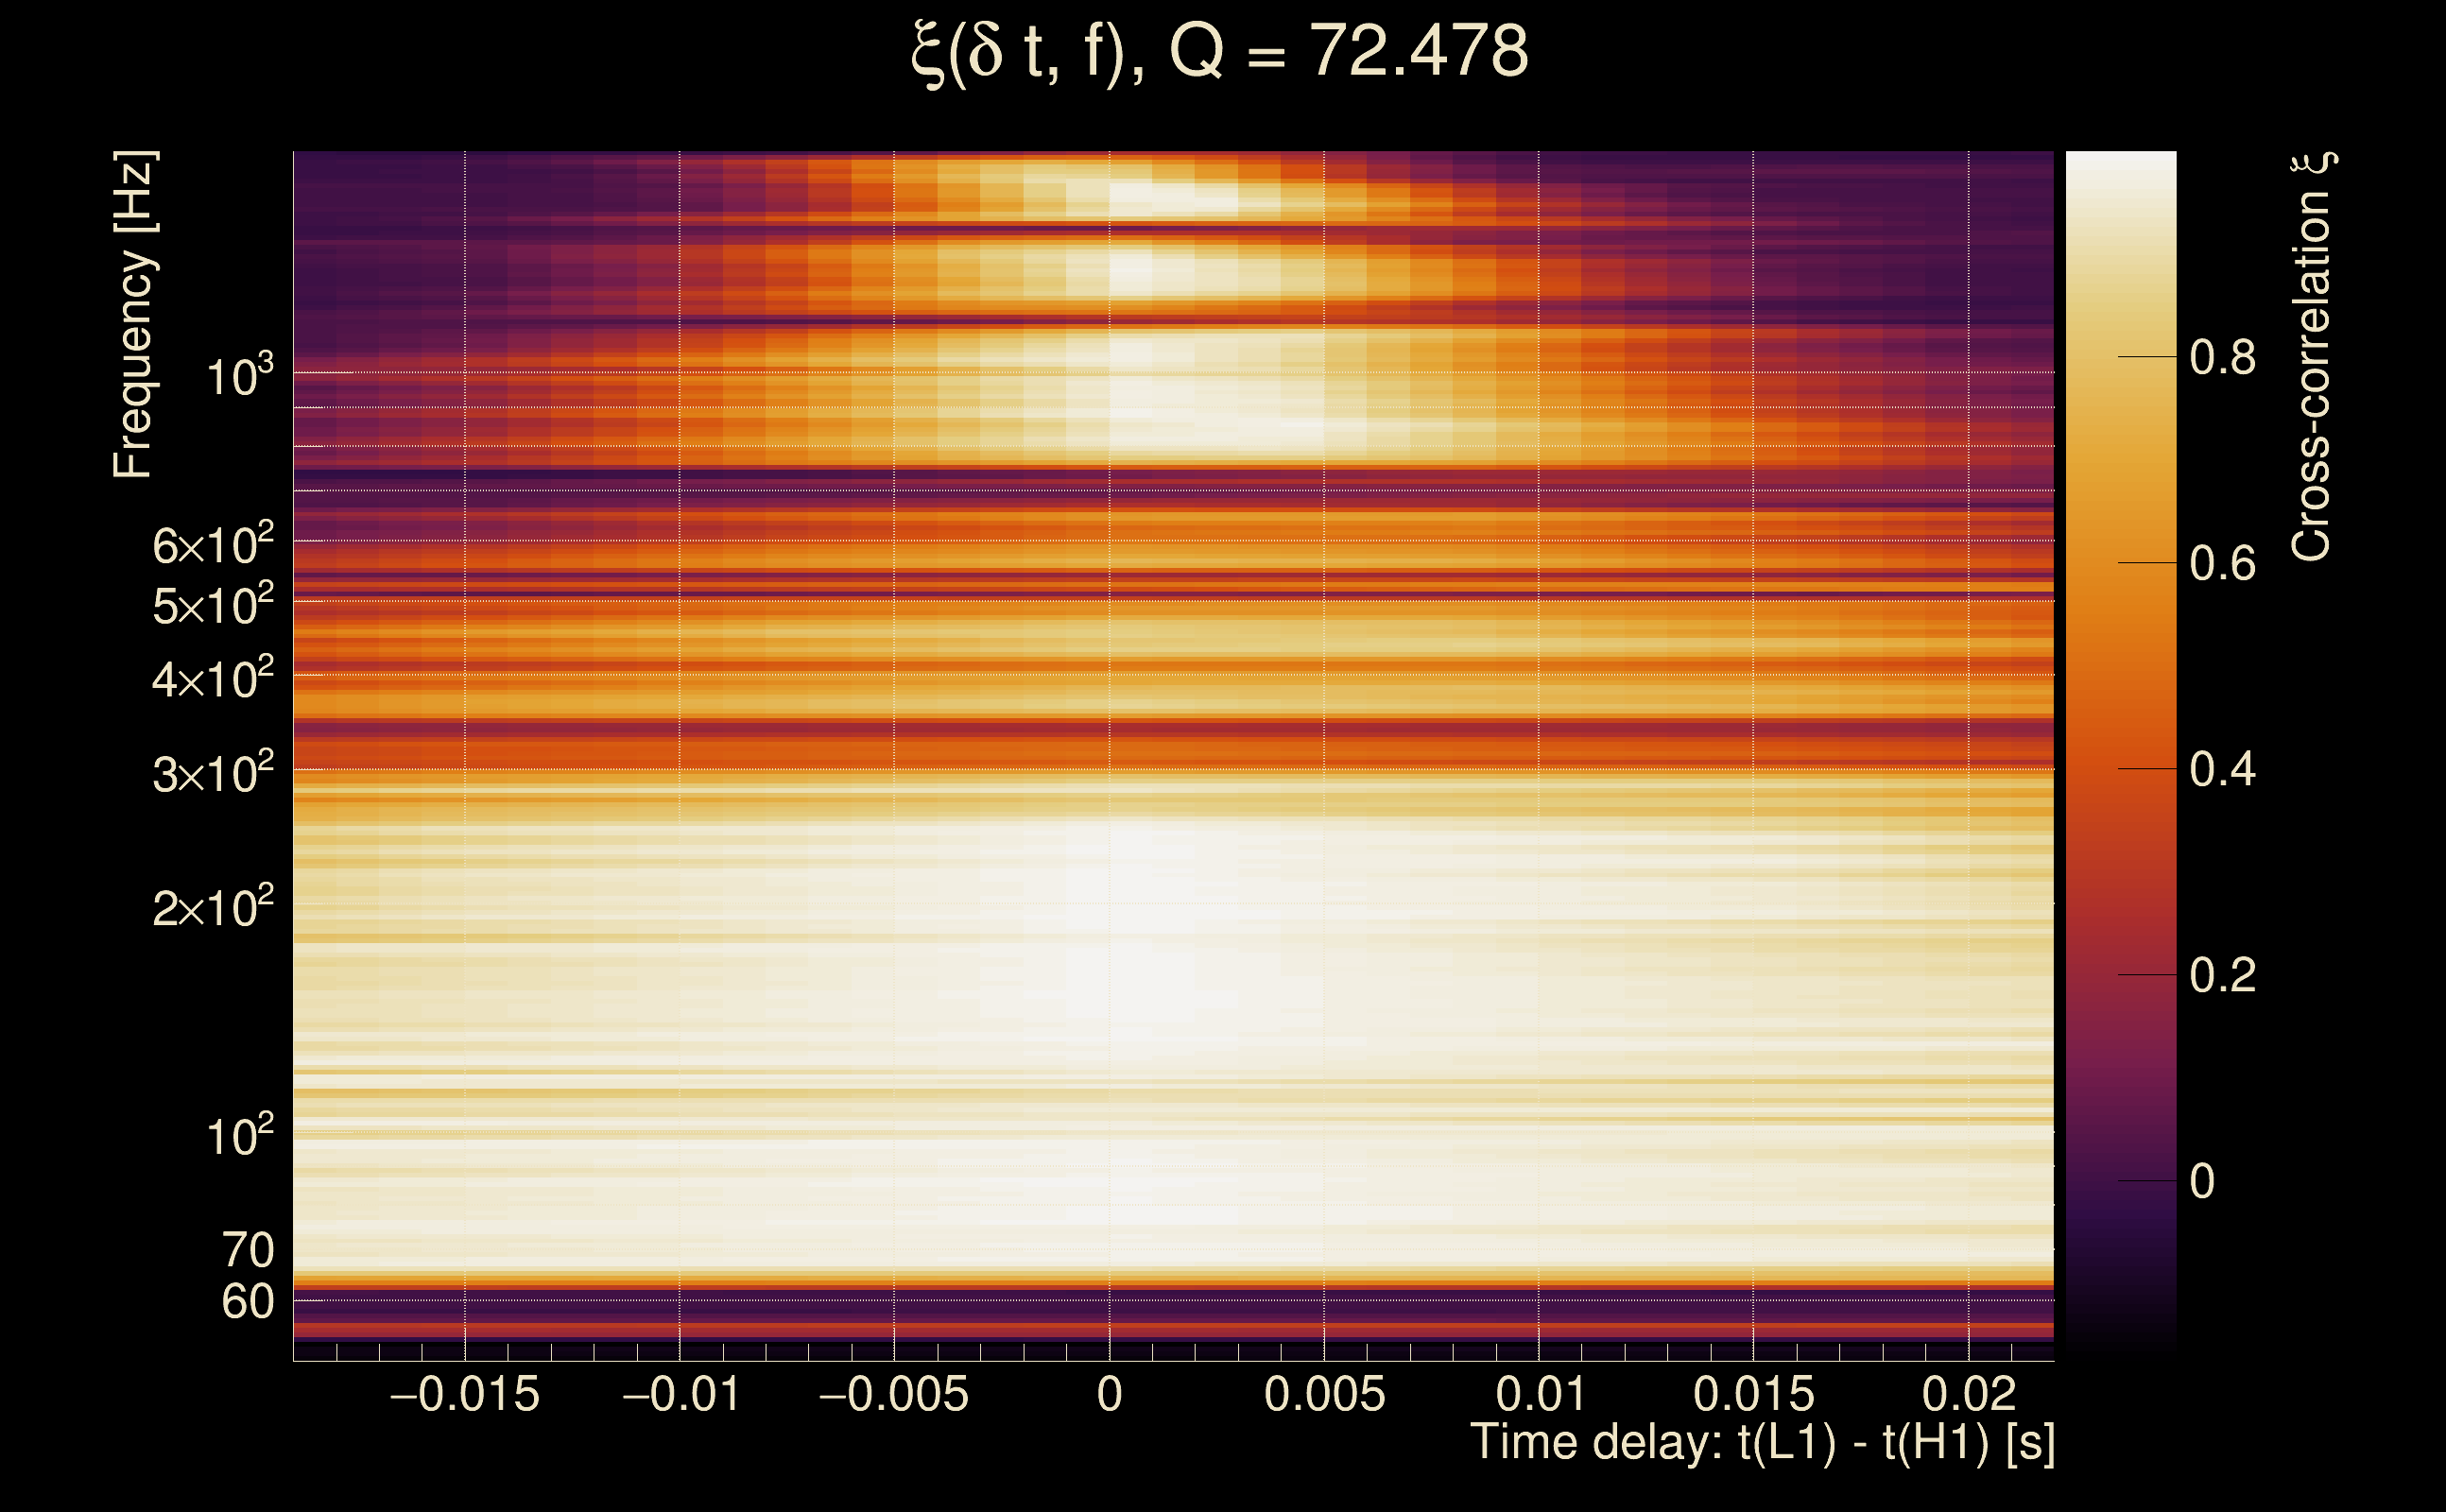
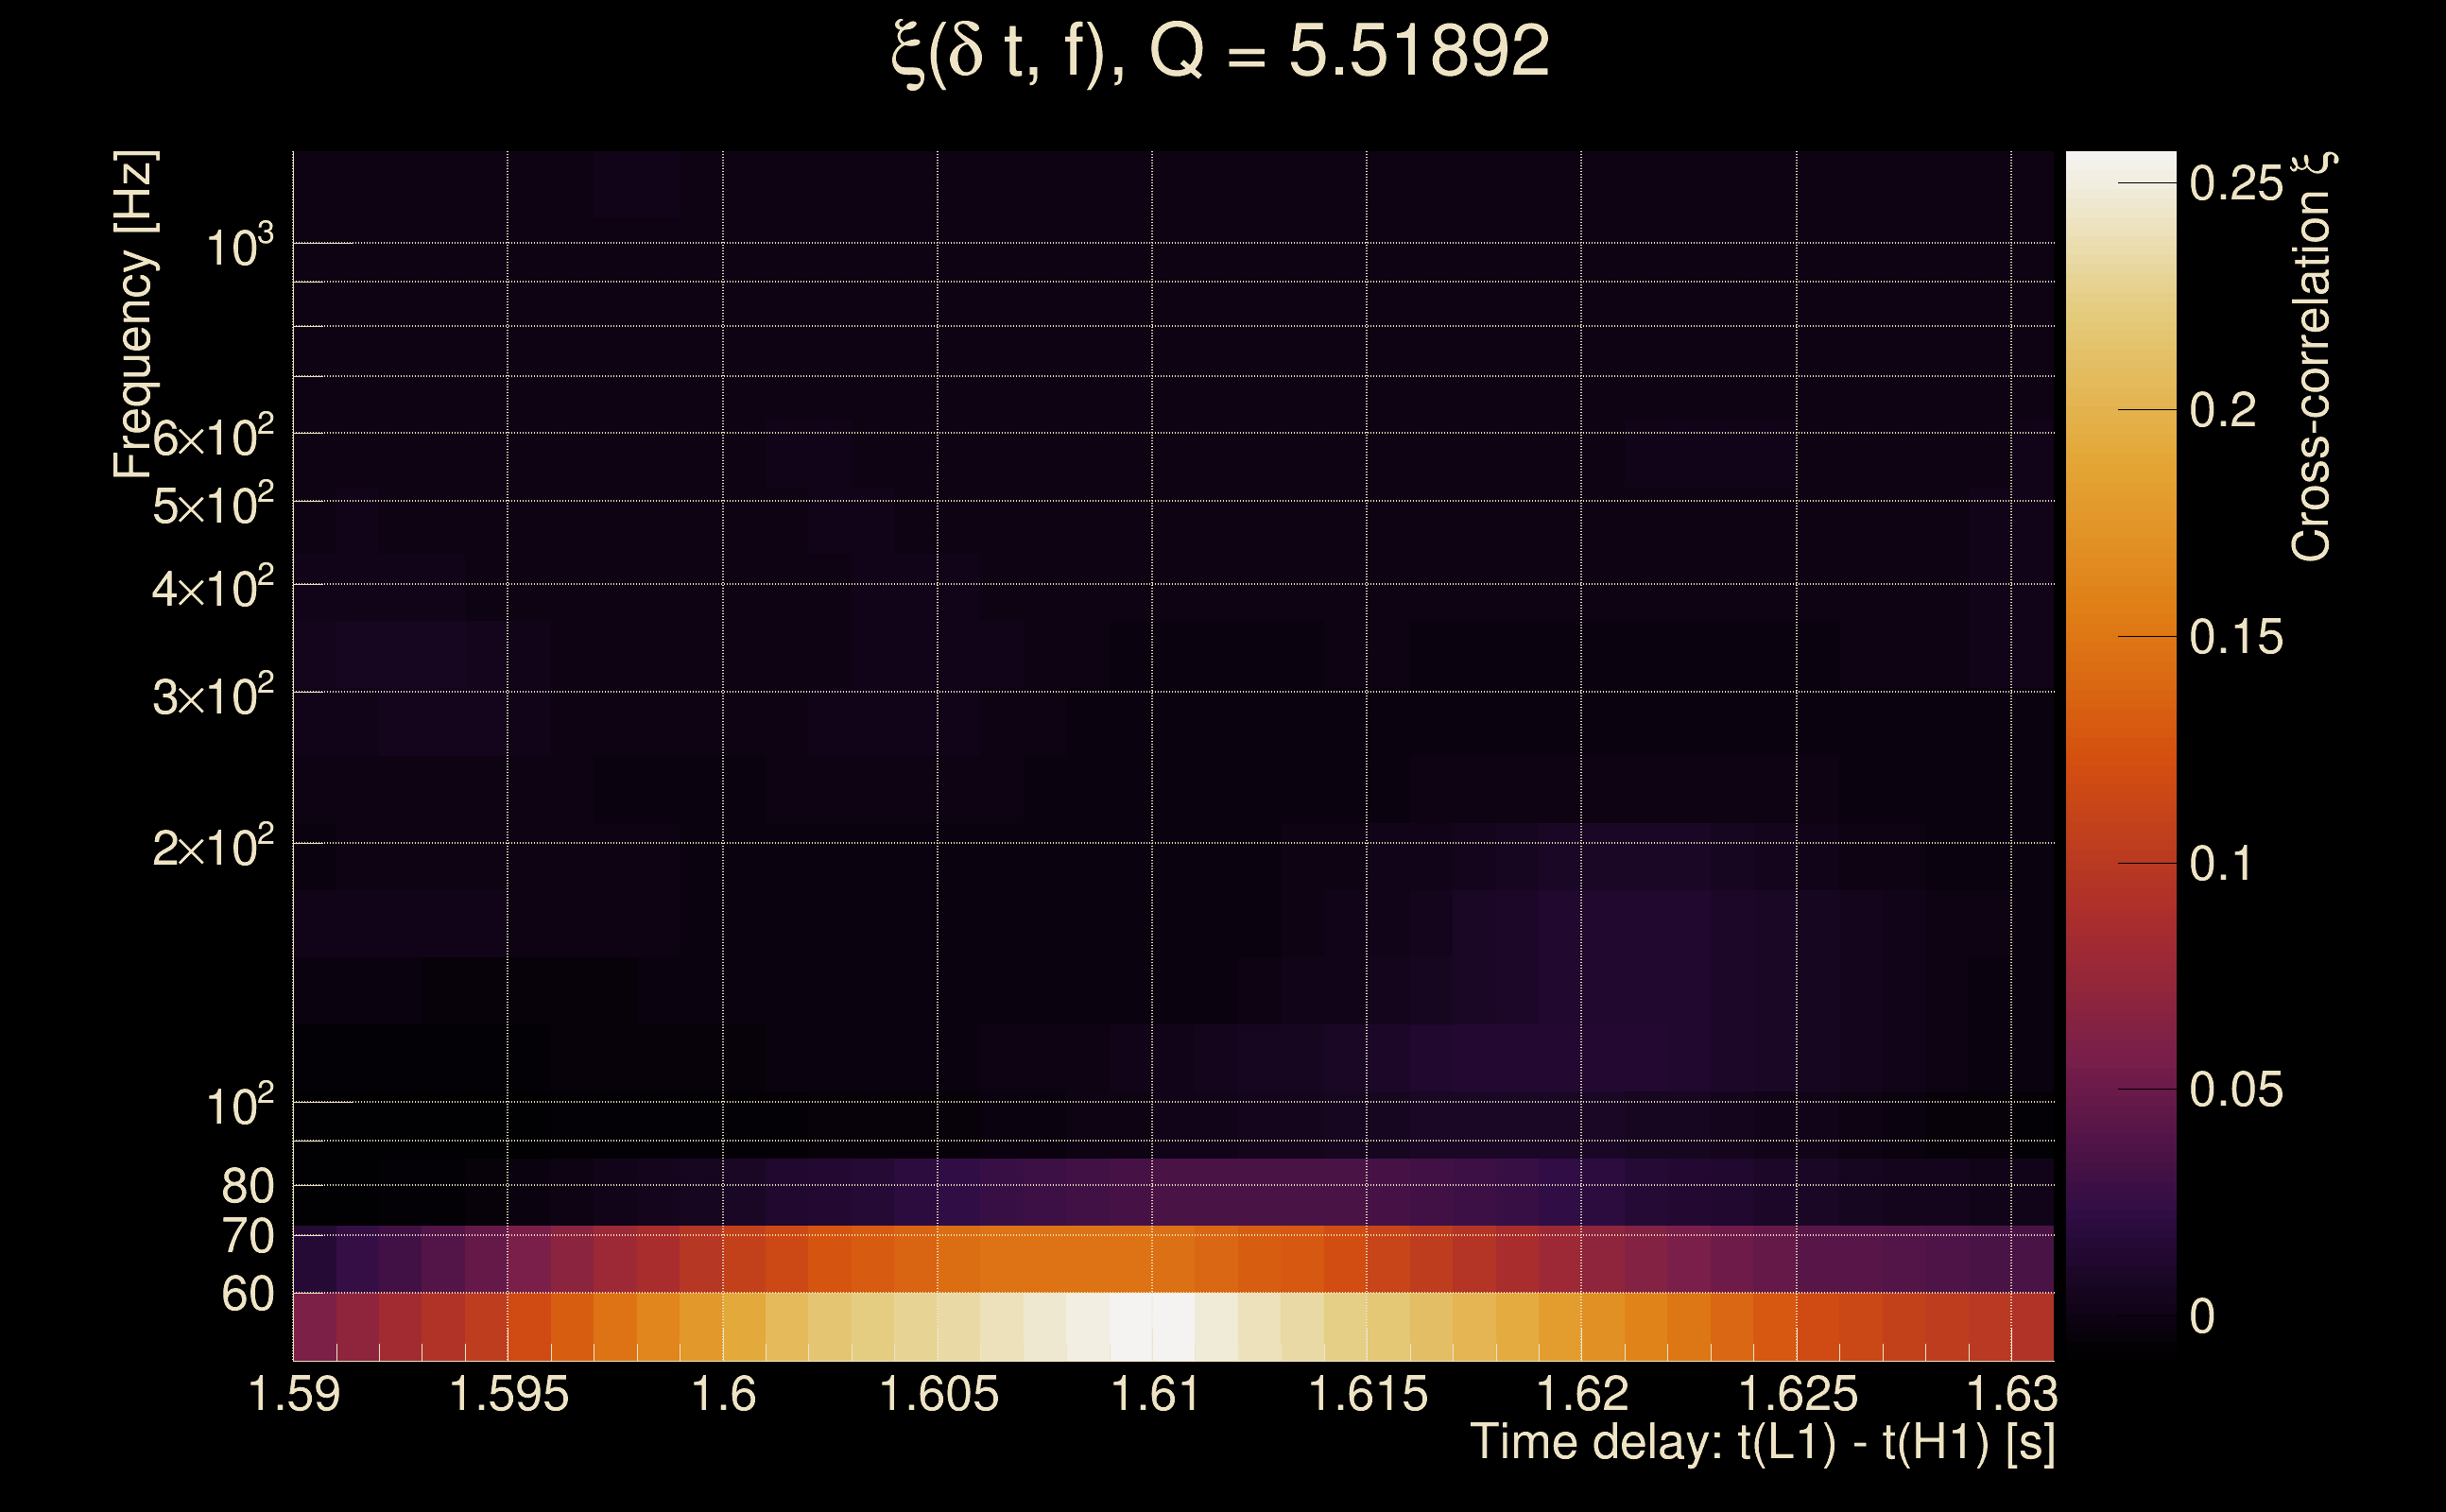
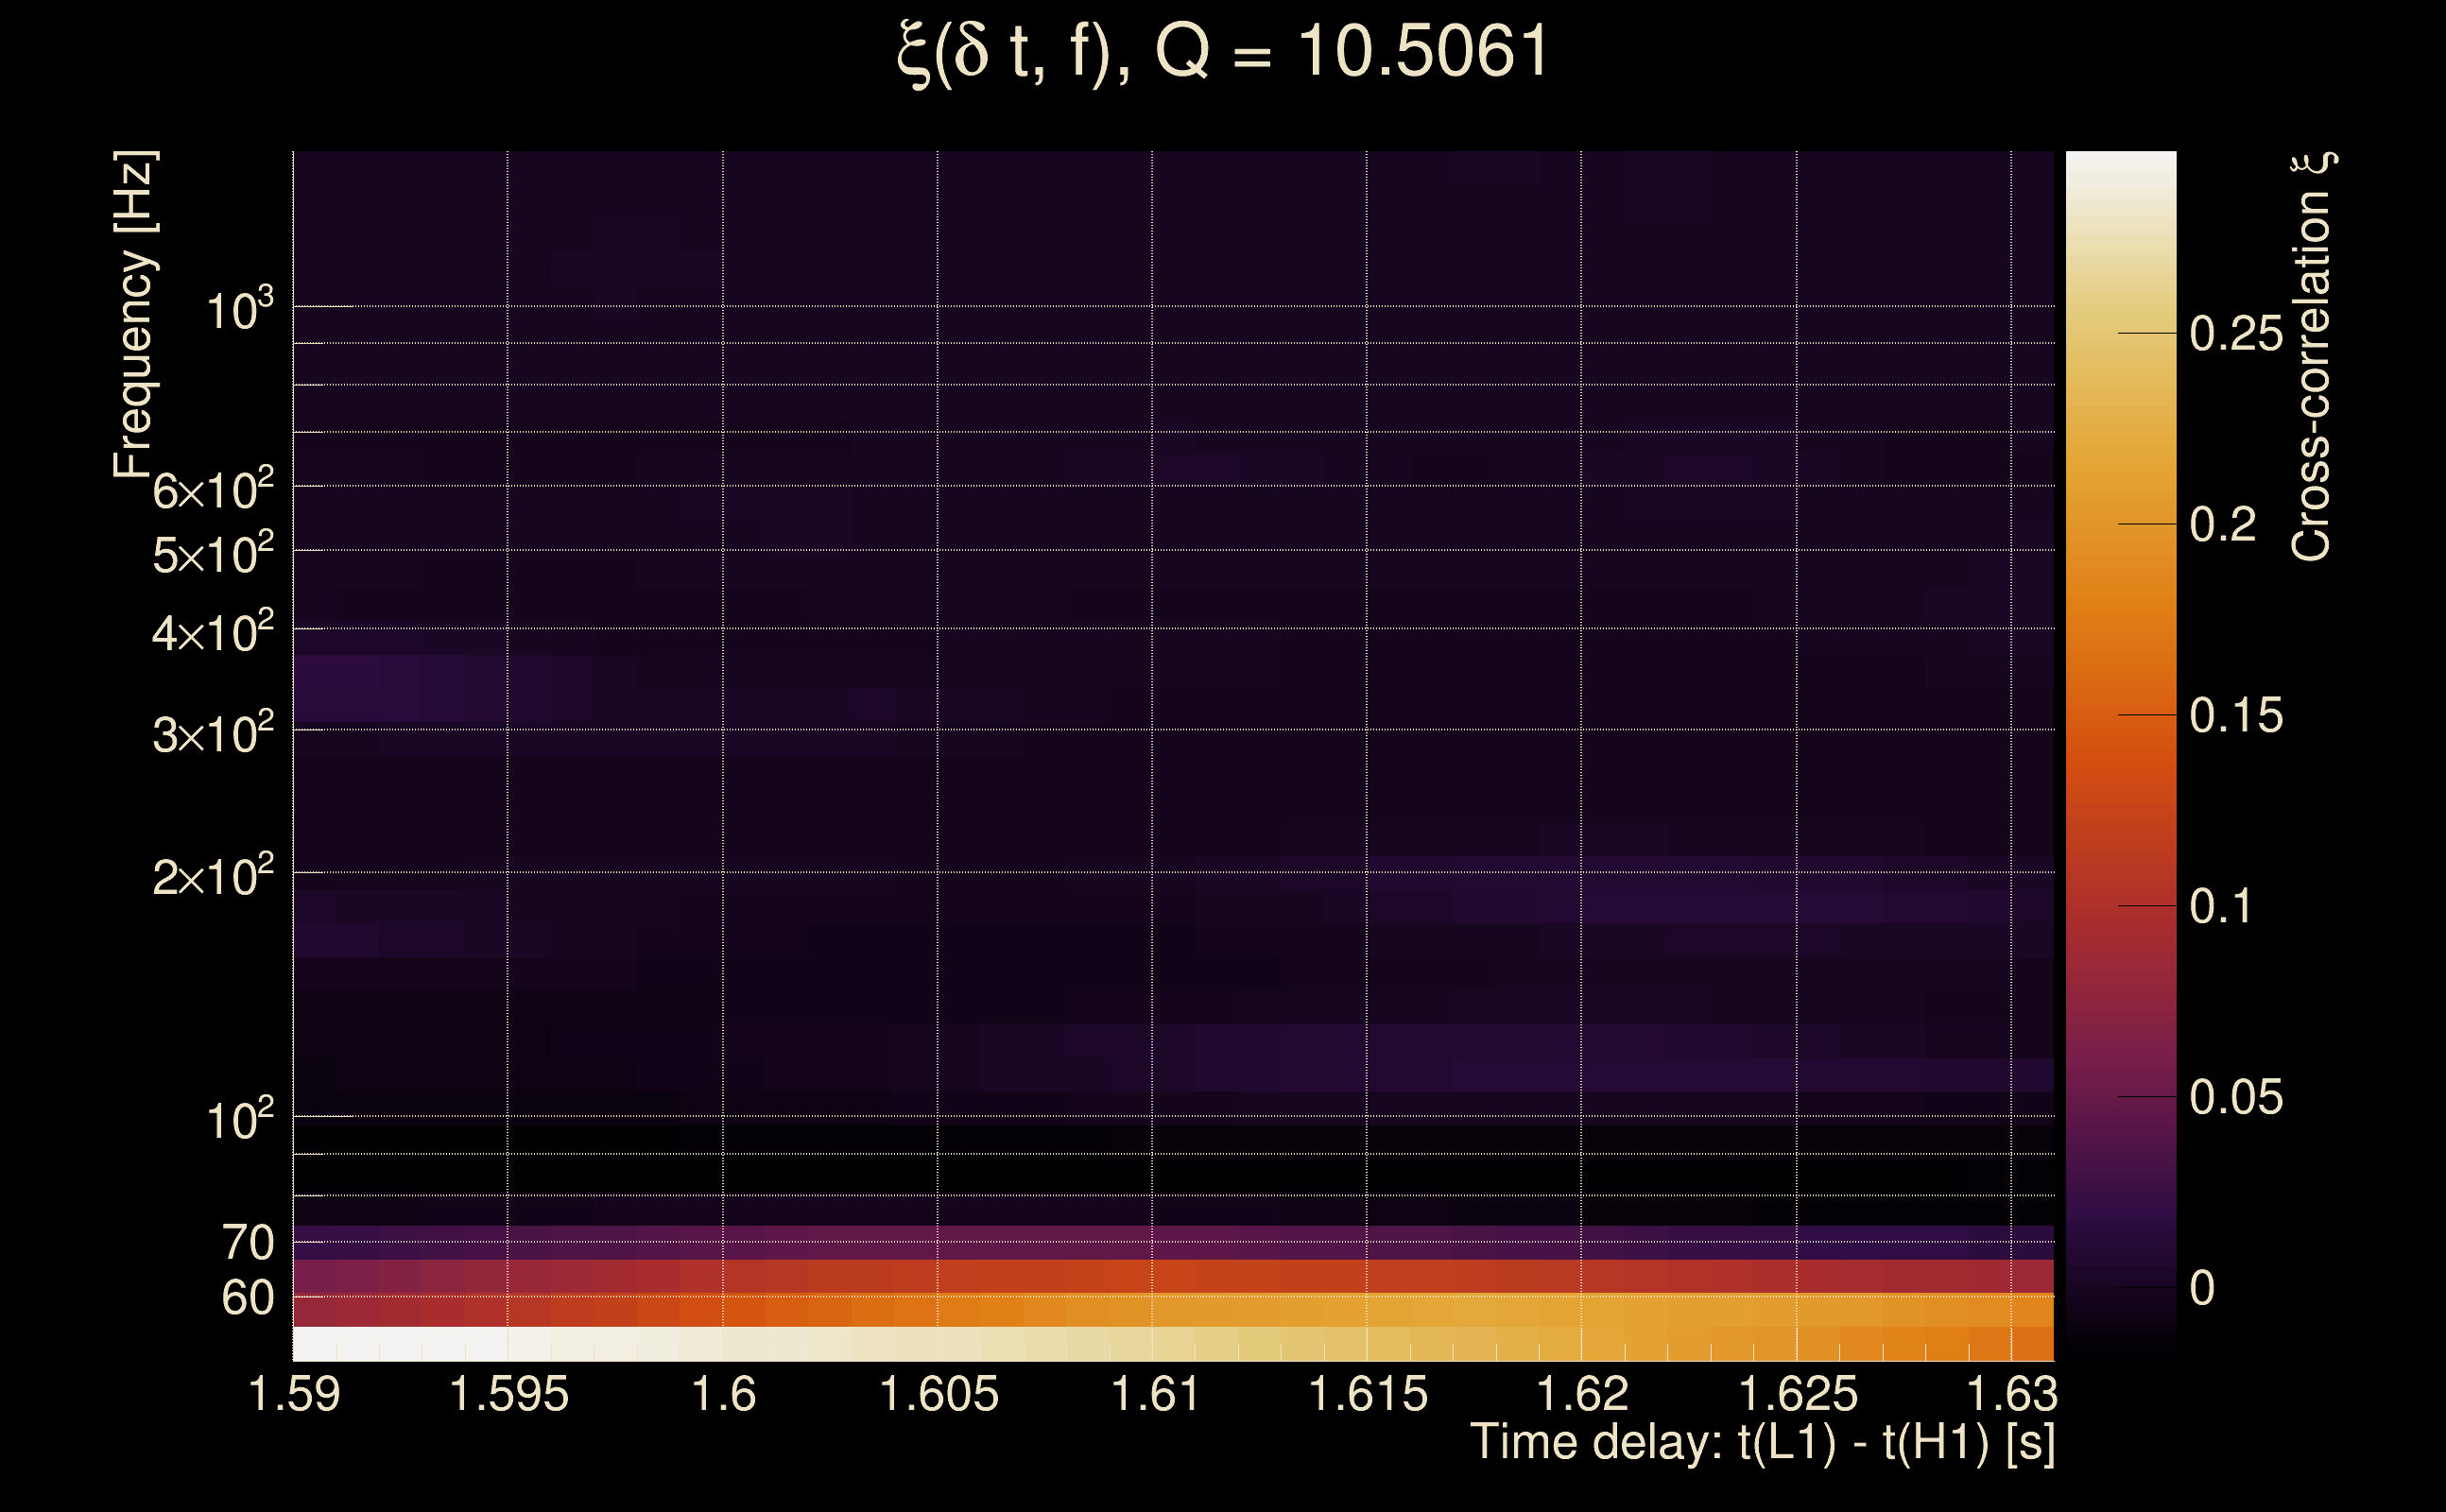
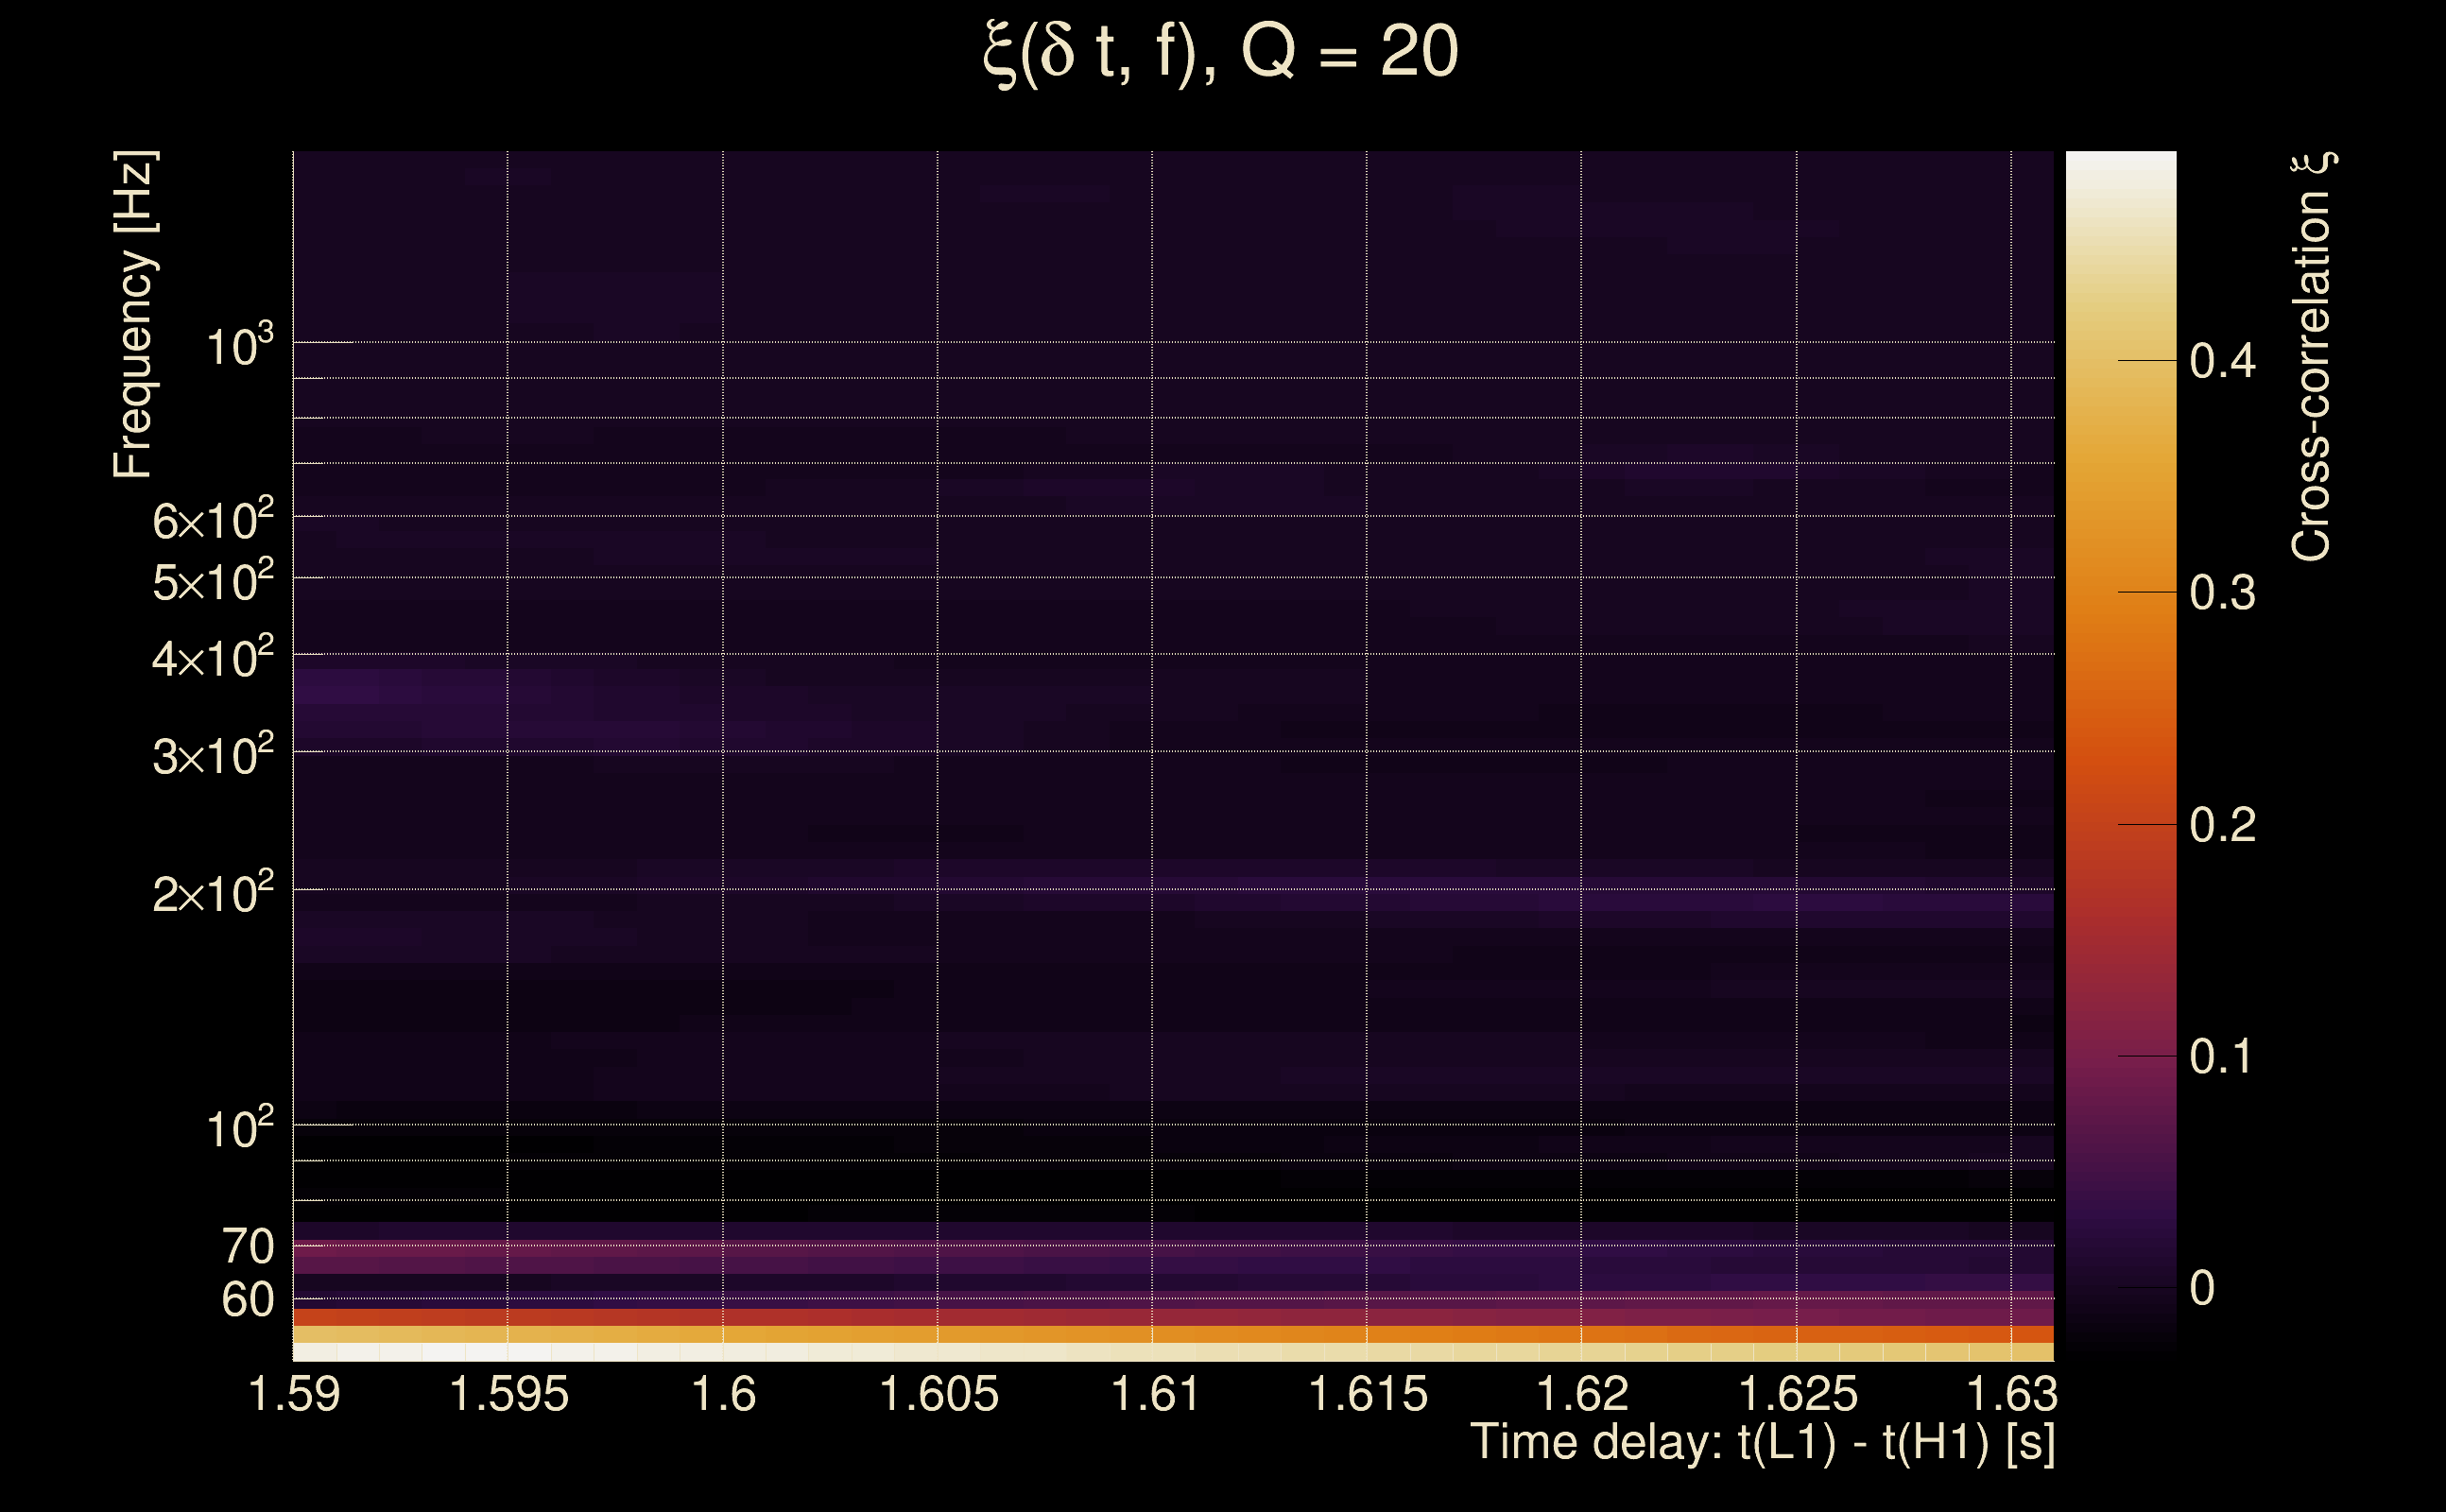
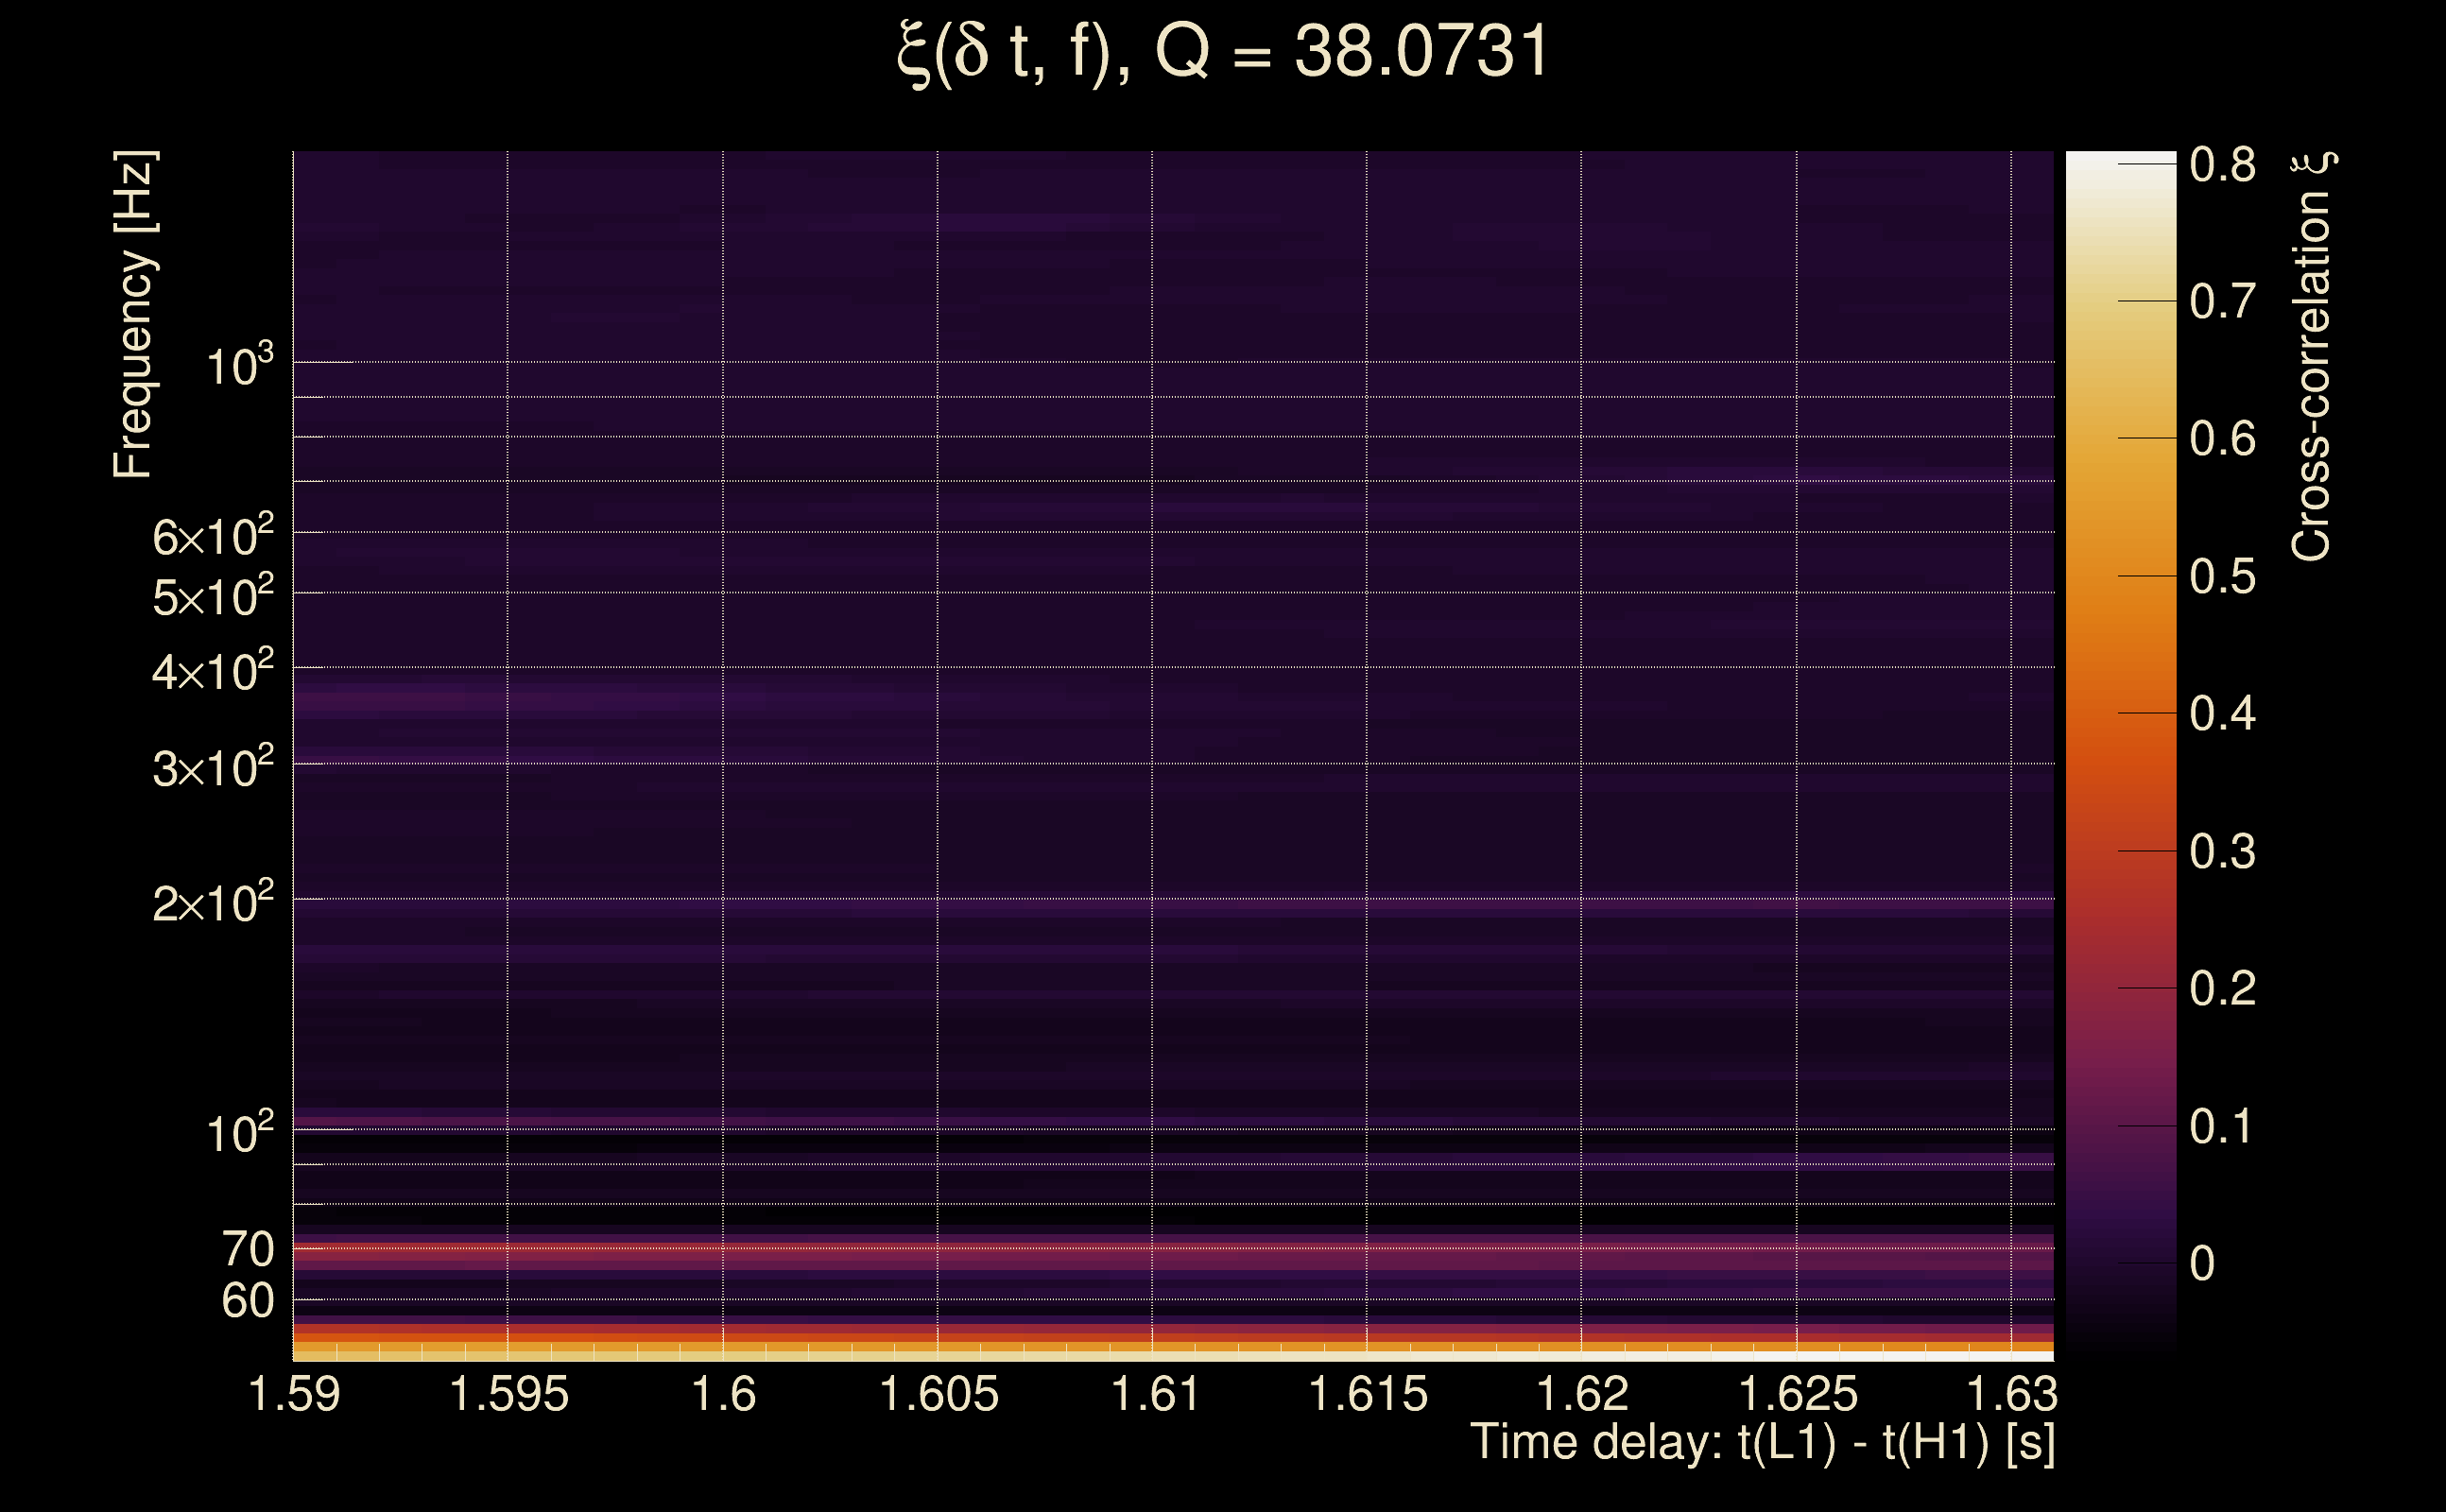
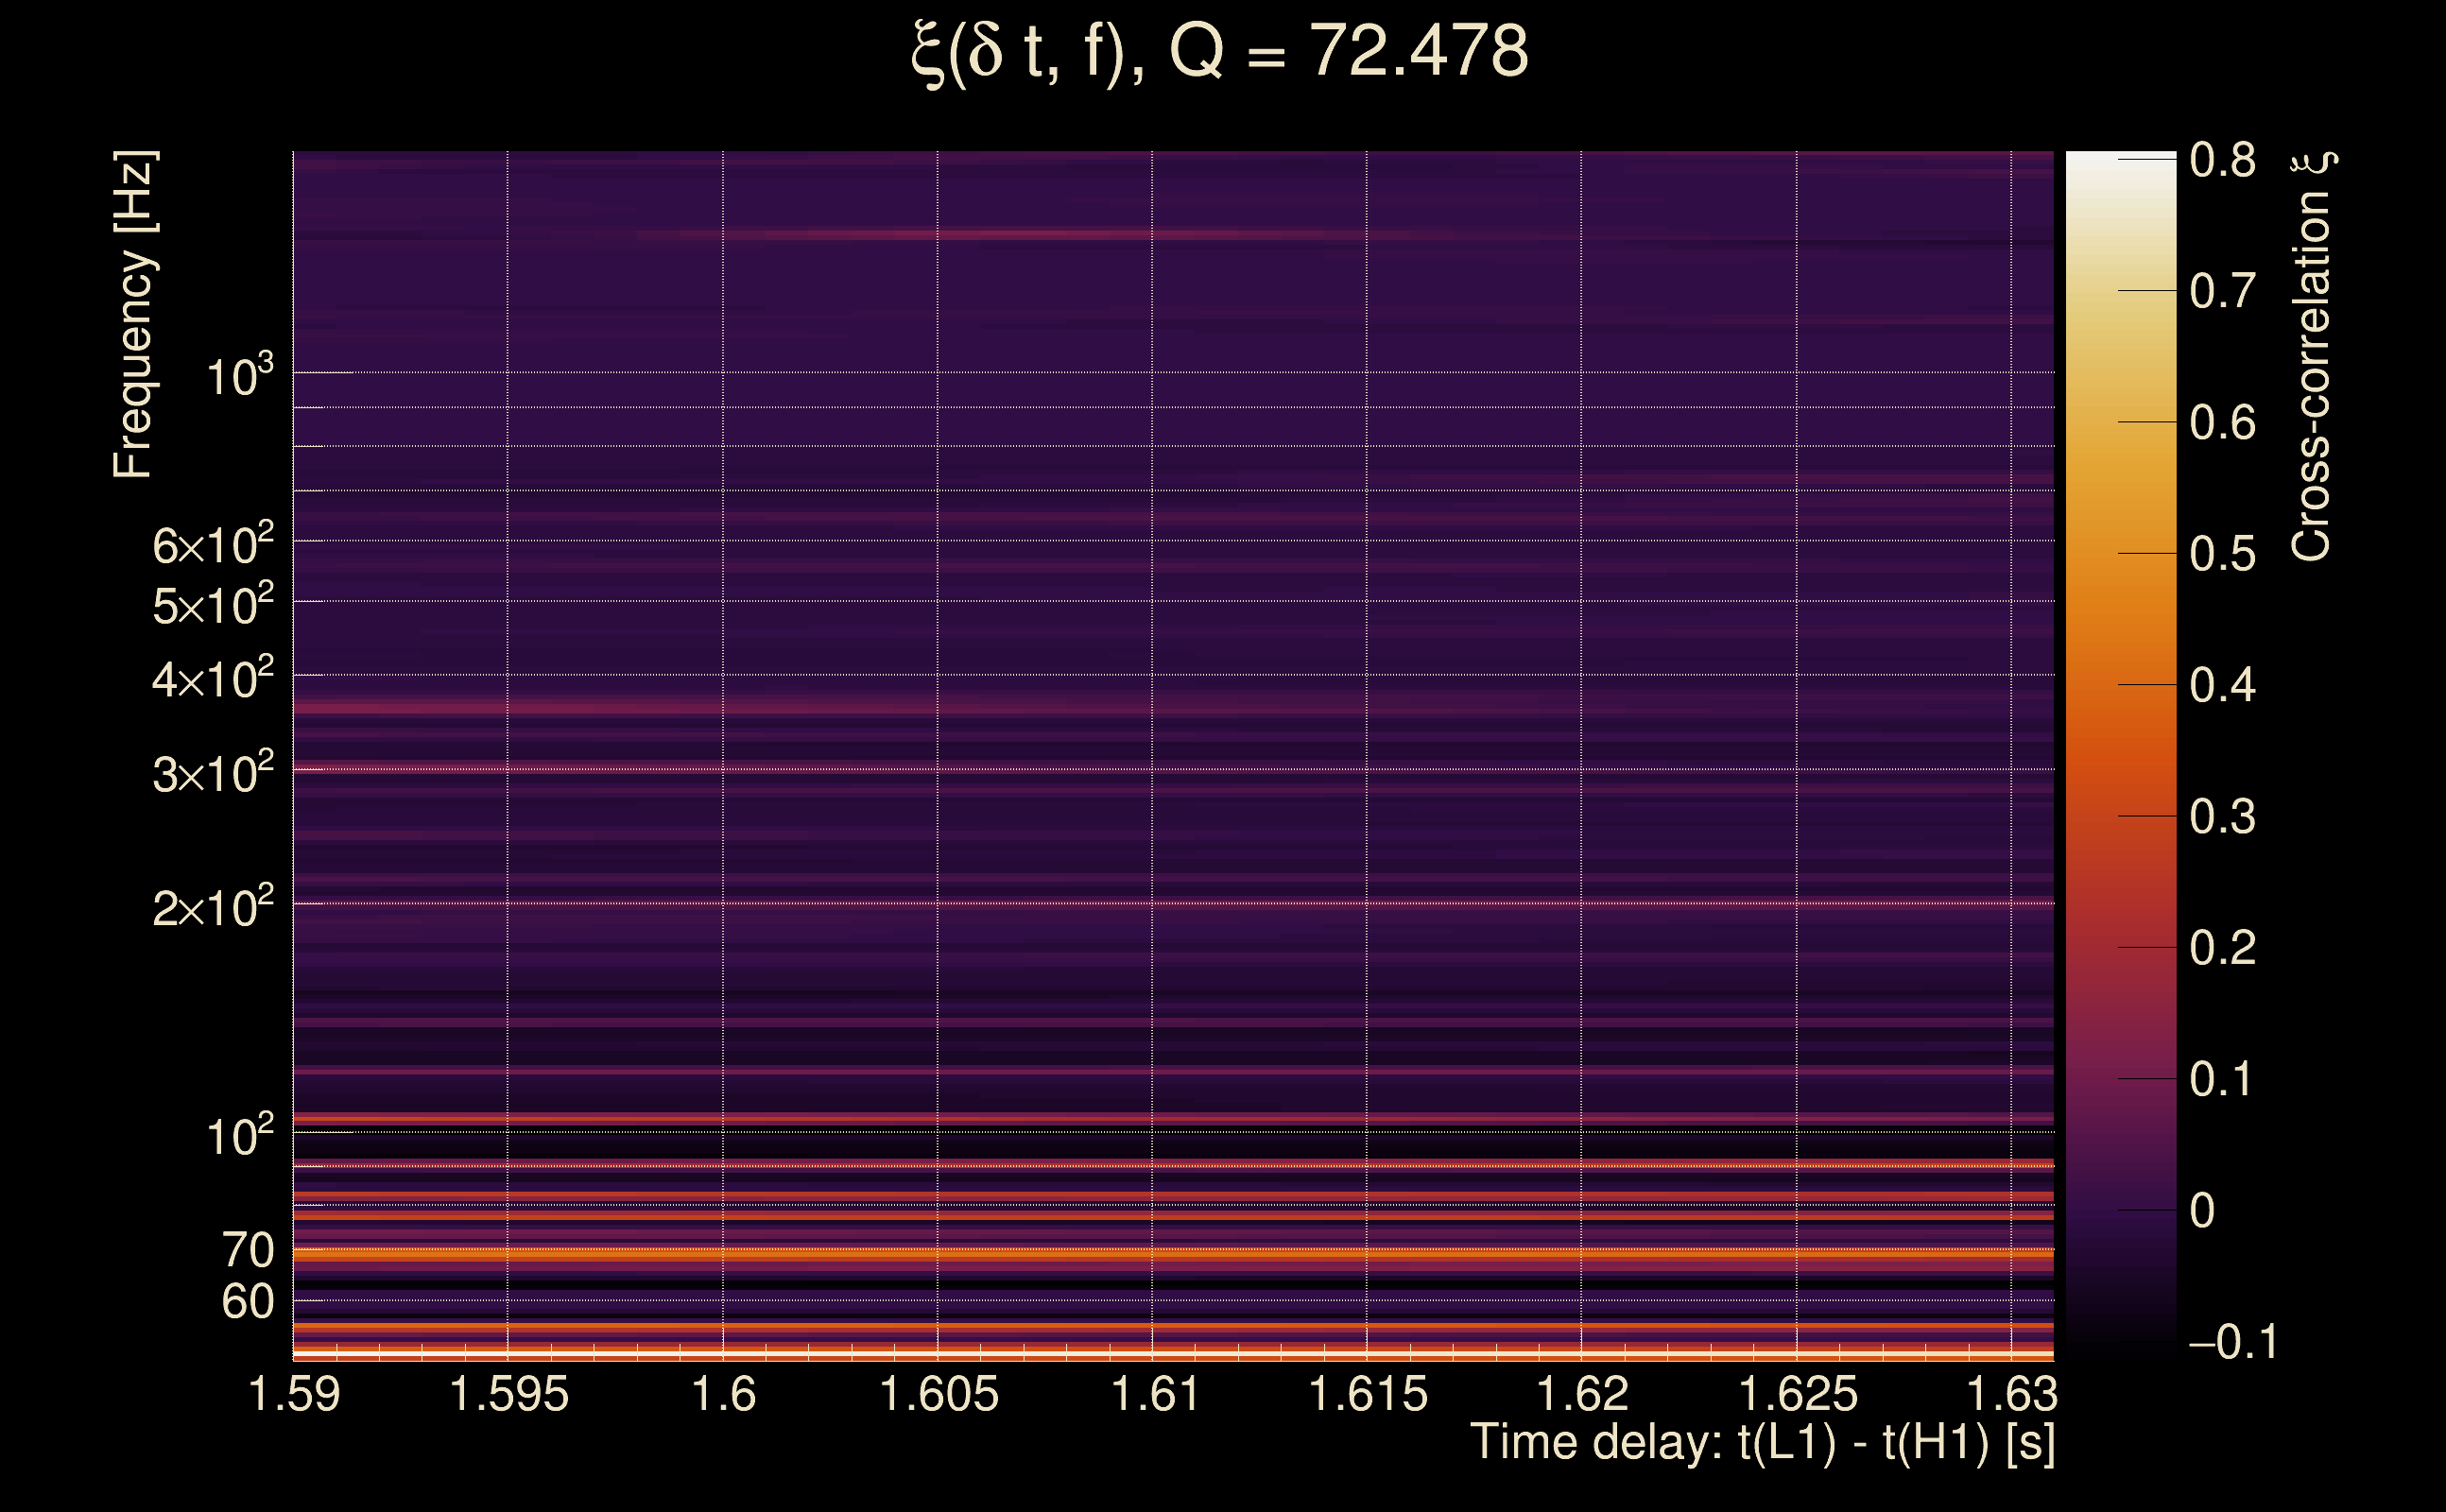
| Number of Q planes: | 5 (Q = 5.51892 → Q = 72.478) |
| Omicron frequency range: | 50 Hz → 1958.38 Hz |
| Light travel time between detectors: | 0.0100128 s |
| Slice extra-time (calibration uncertainty + slice veto): | 0.0129872 s |
| Number of time-delay bins in a cross-correlation map: | 10000 |
| Number of slices in a cross-correlation map: | 217 |
| Number of time-delay bins in a slice: | 46 |
| SNR gating: | < 100 (detector 0), < 100 (detector 1) |
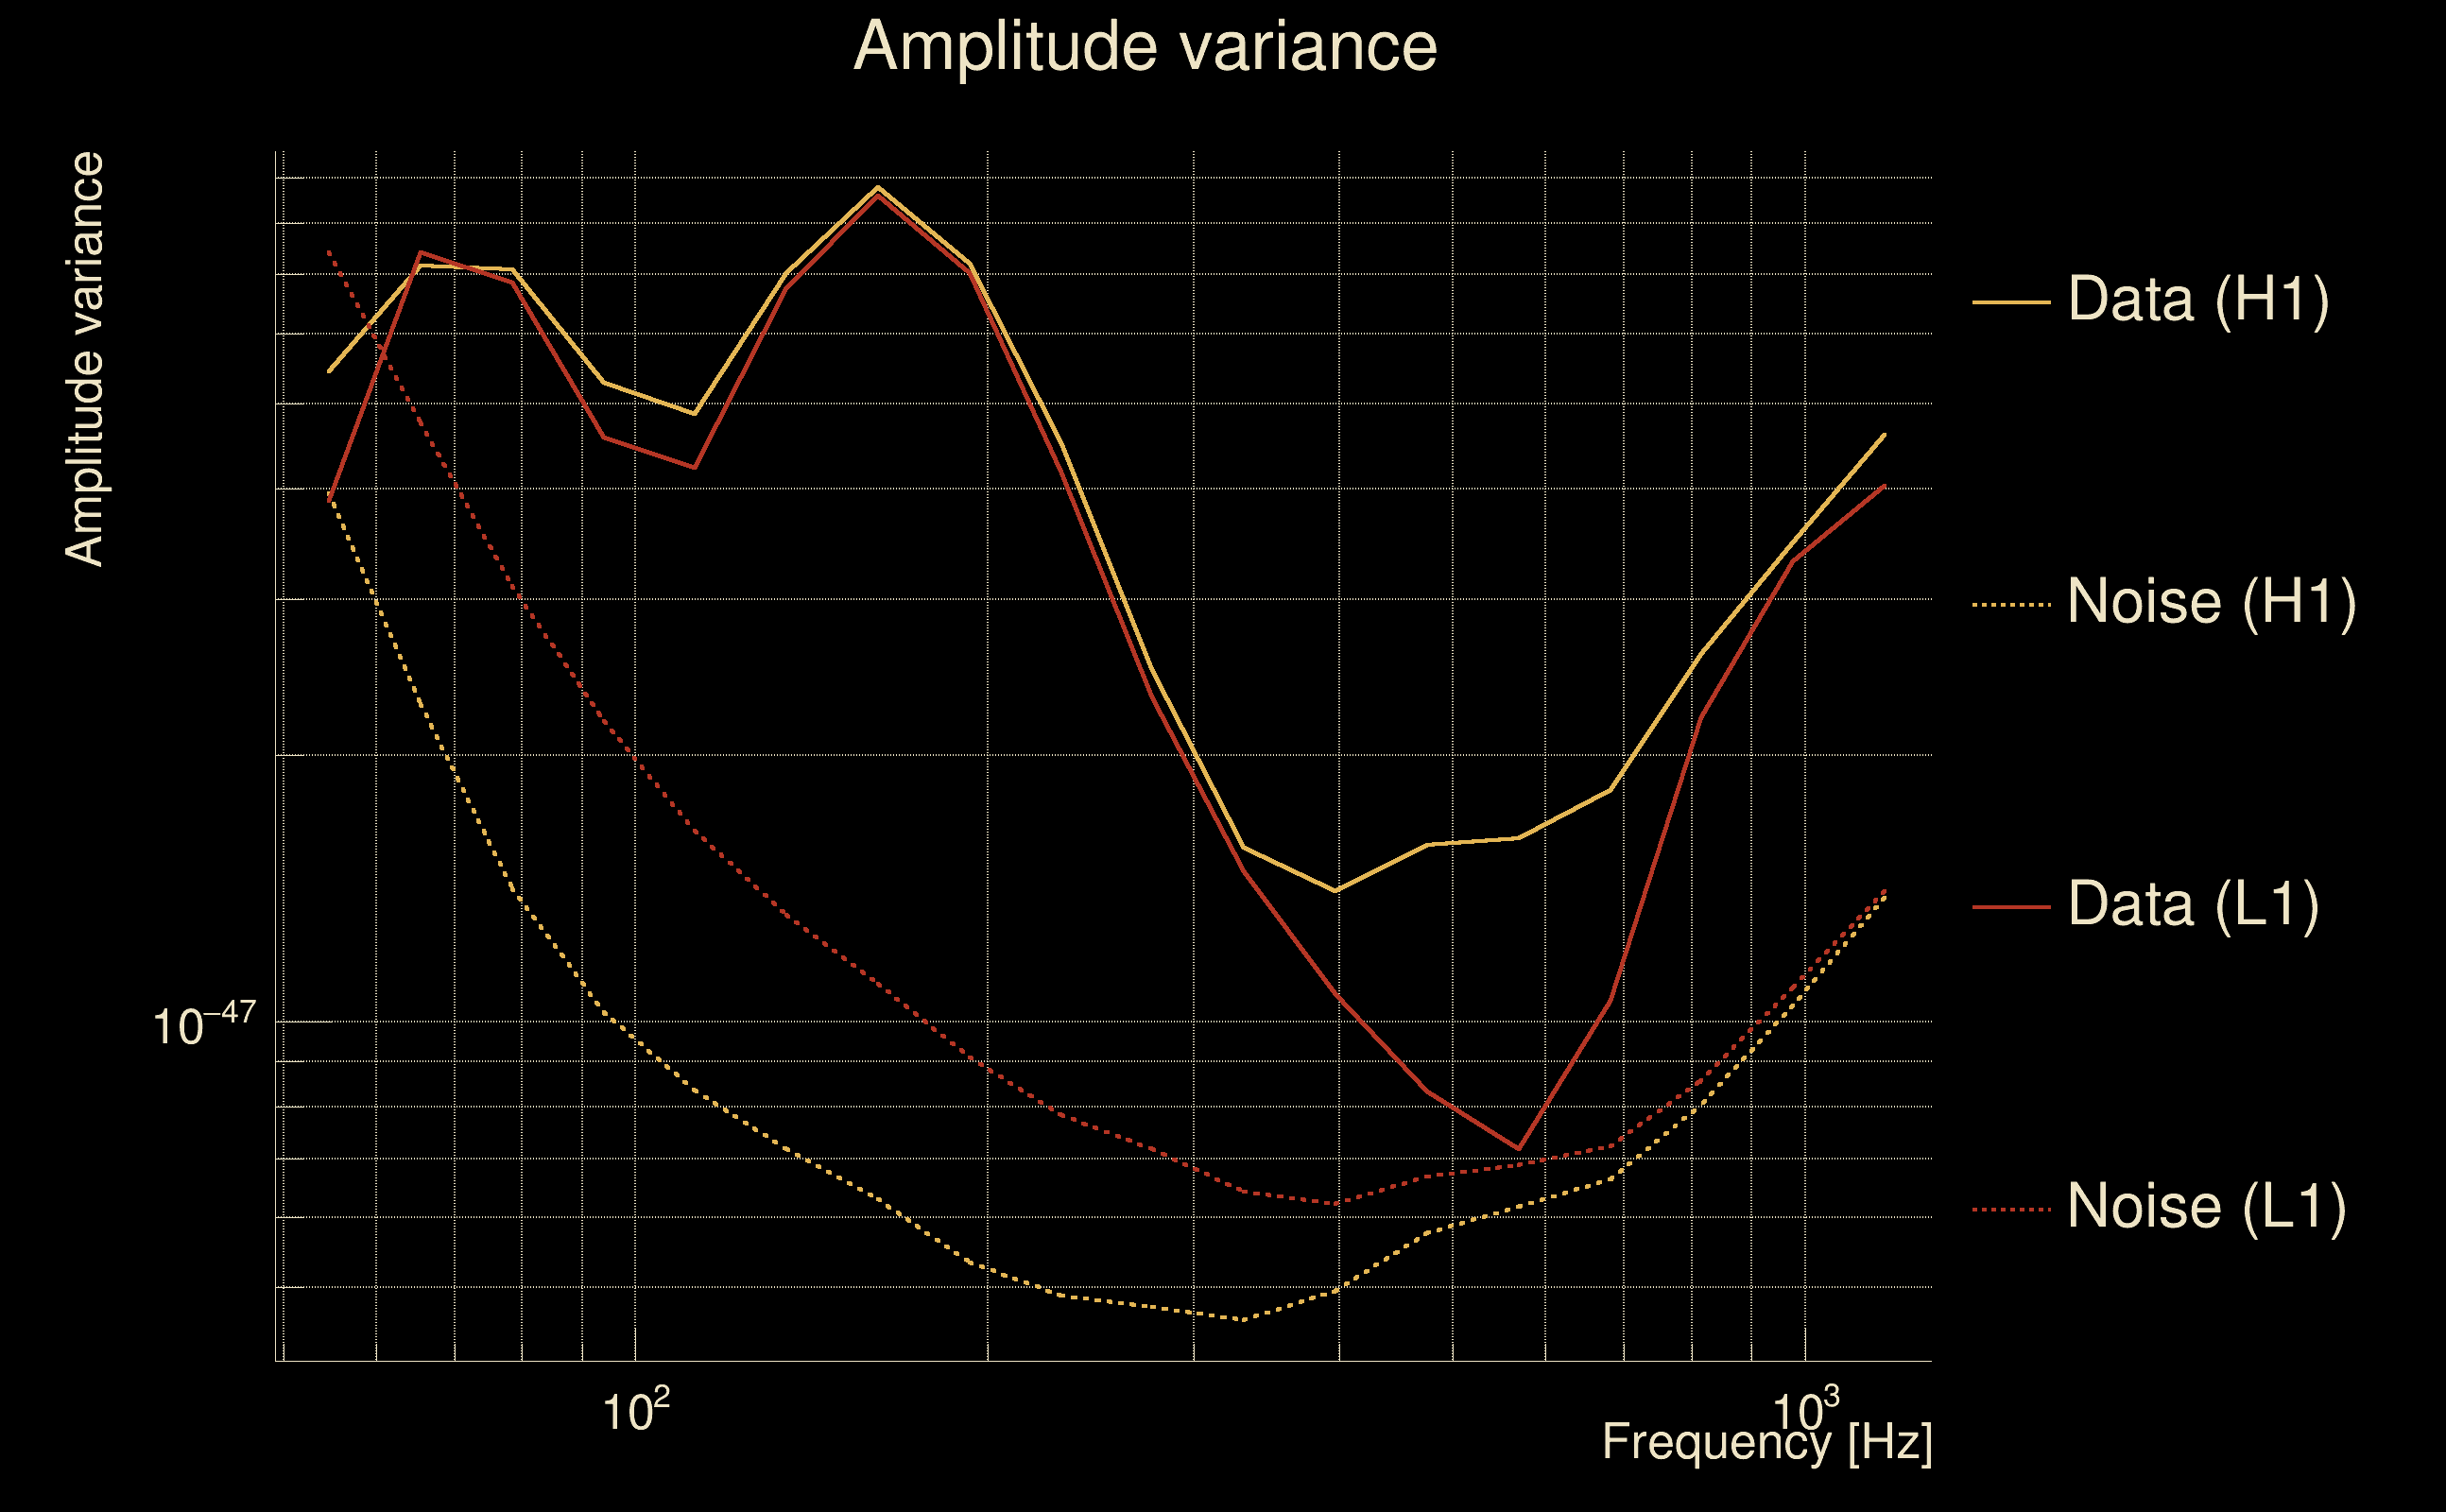
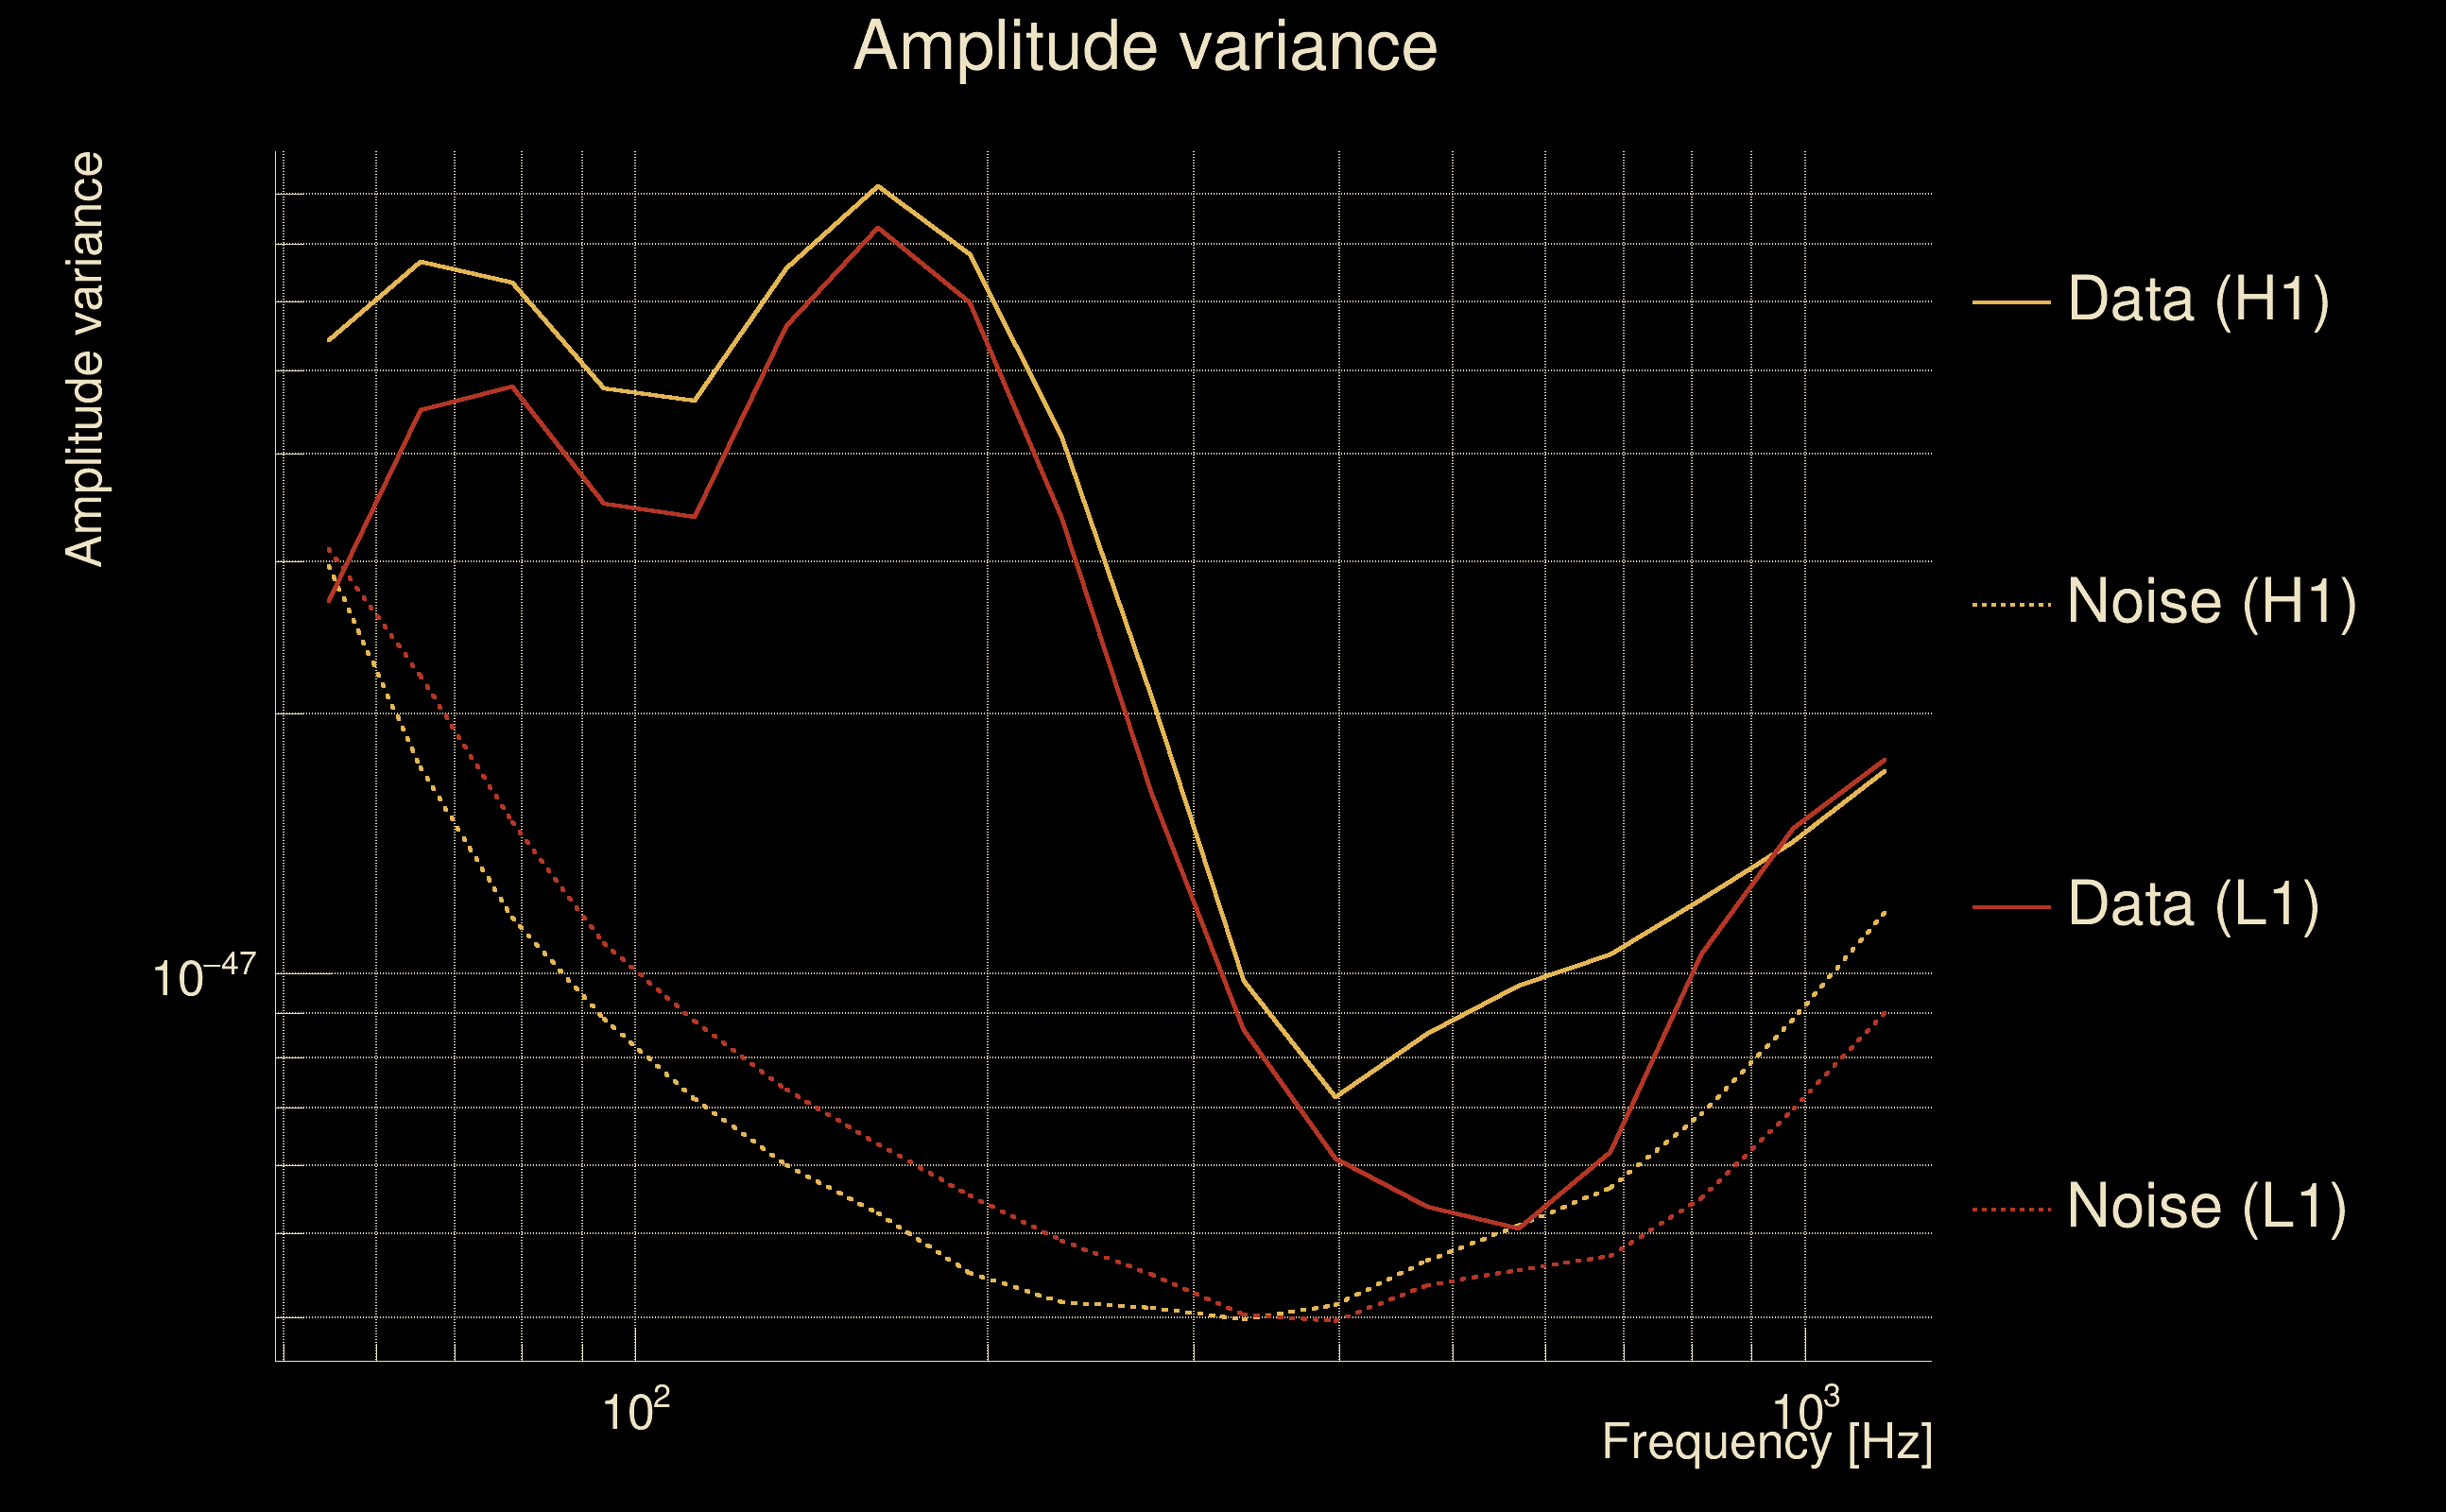
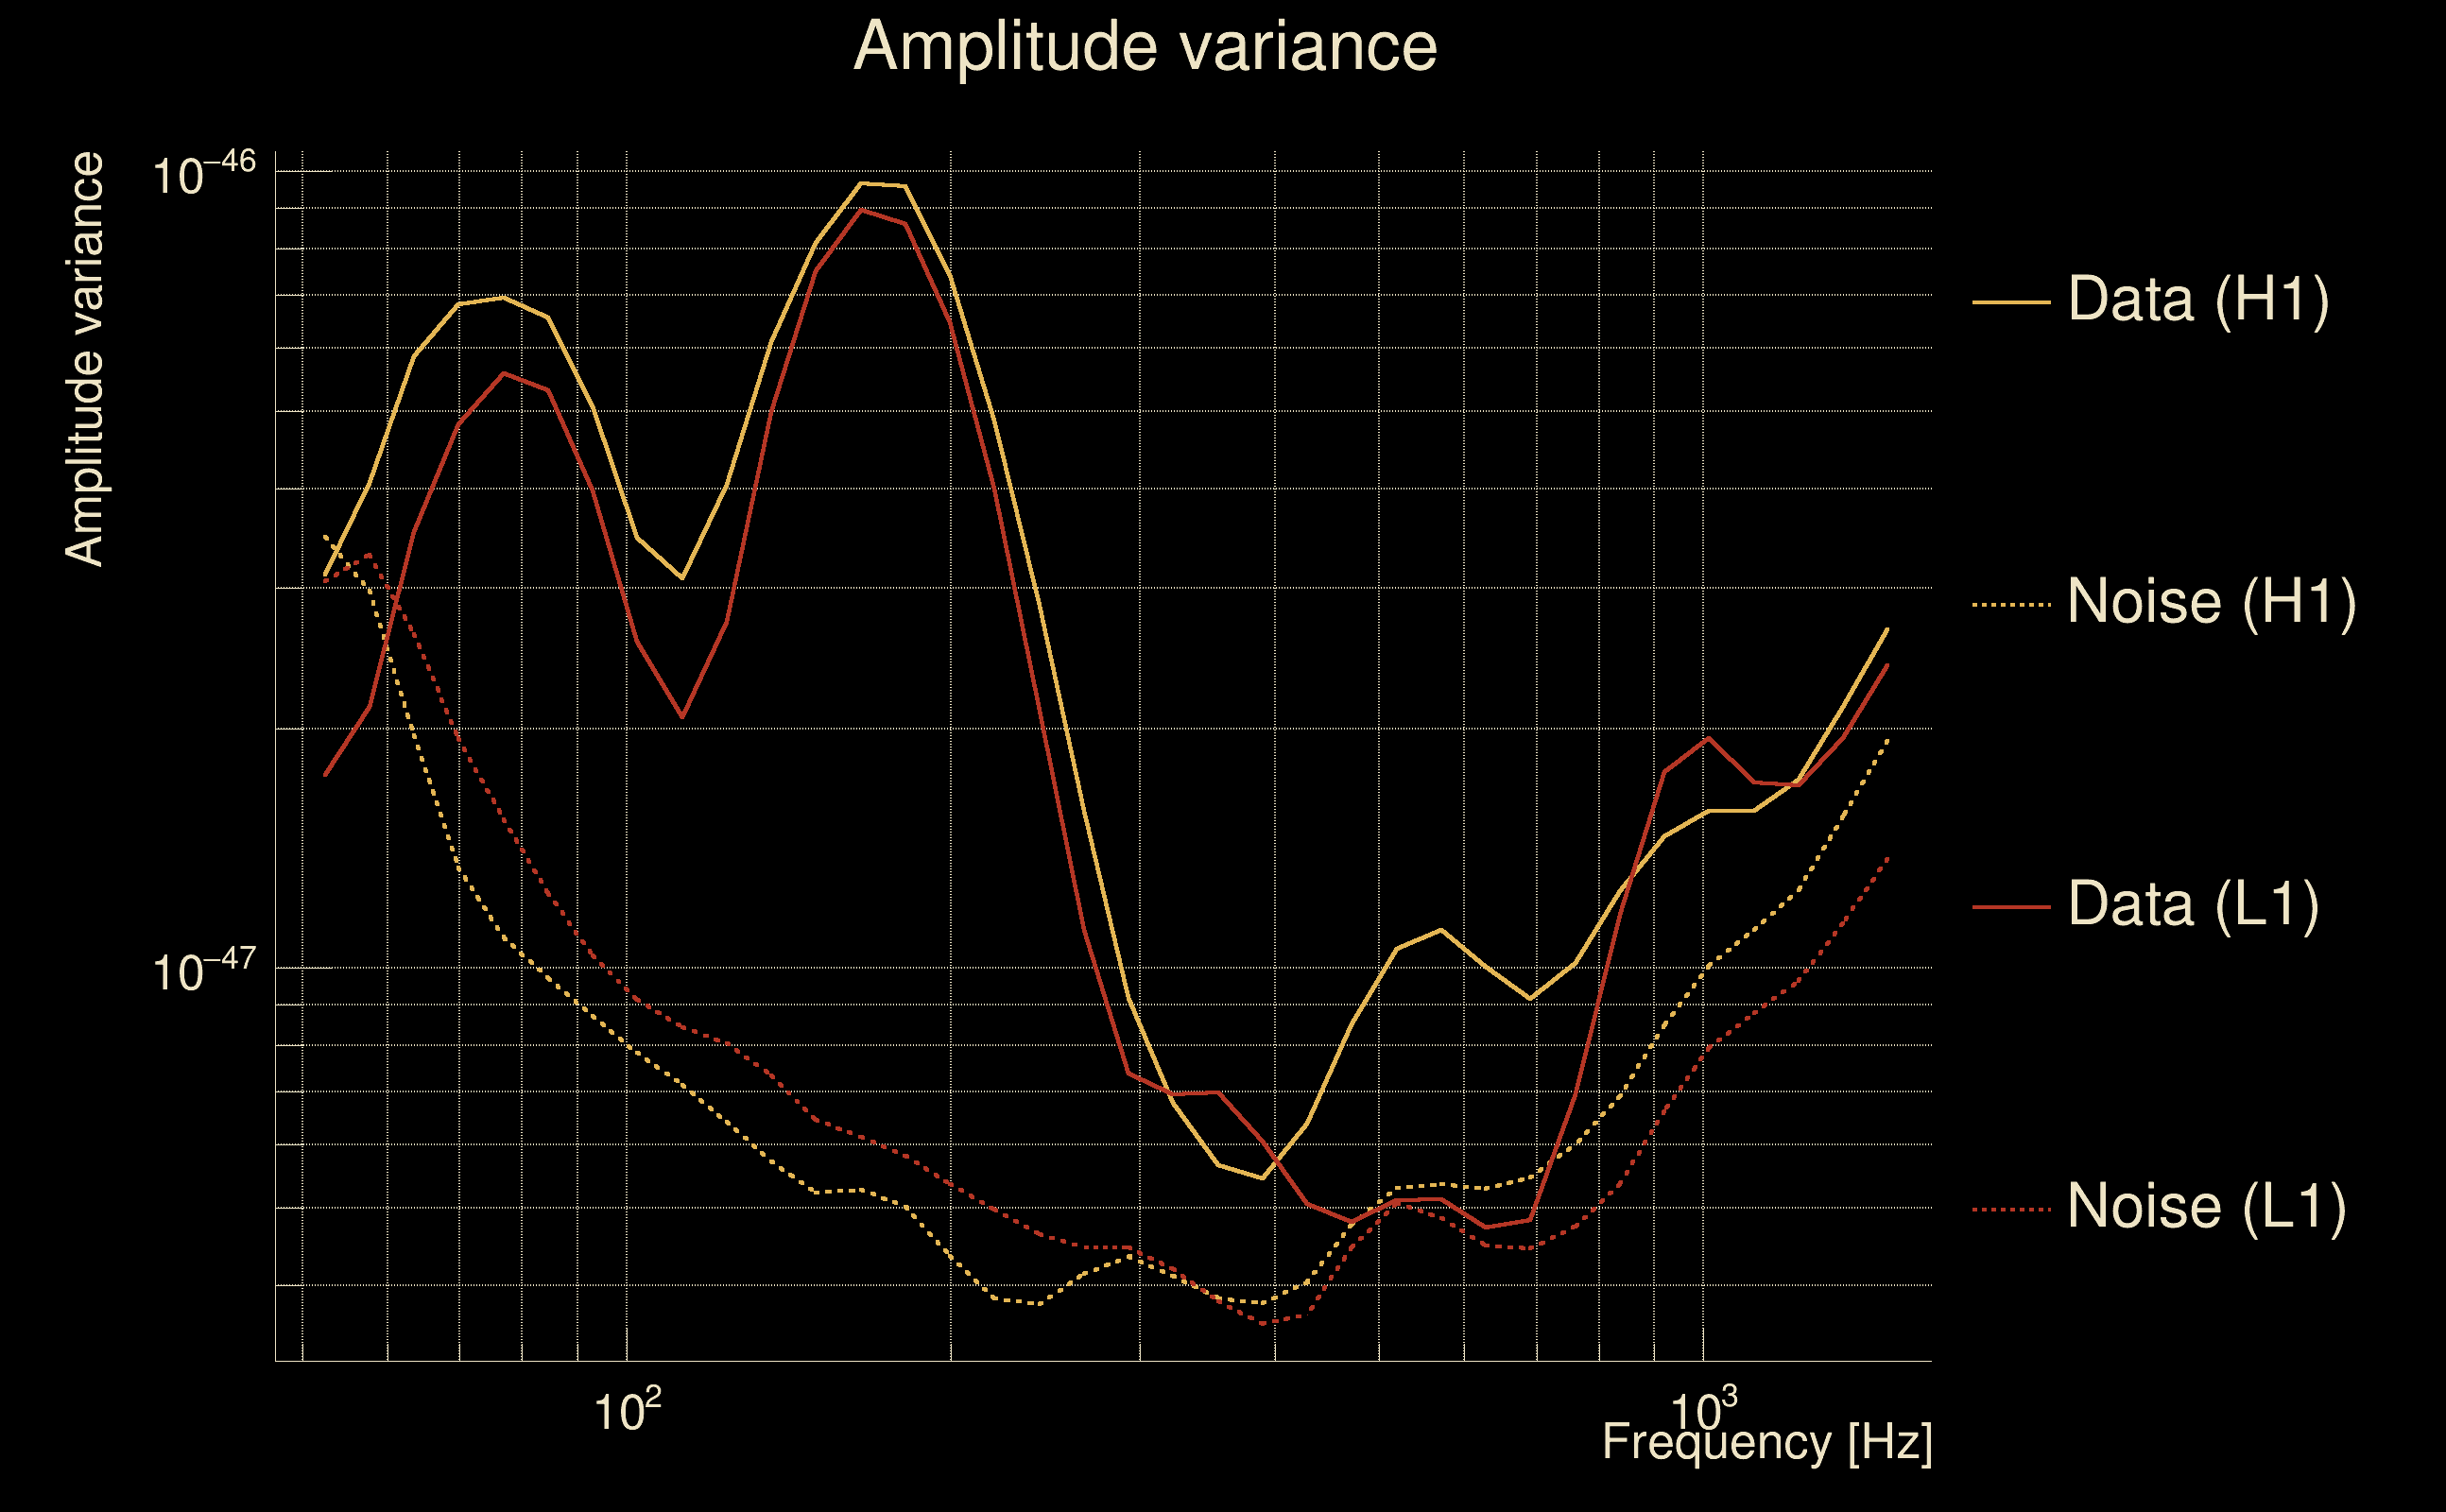
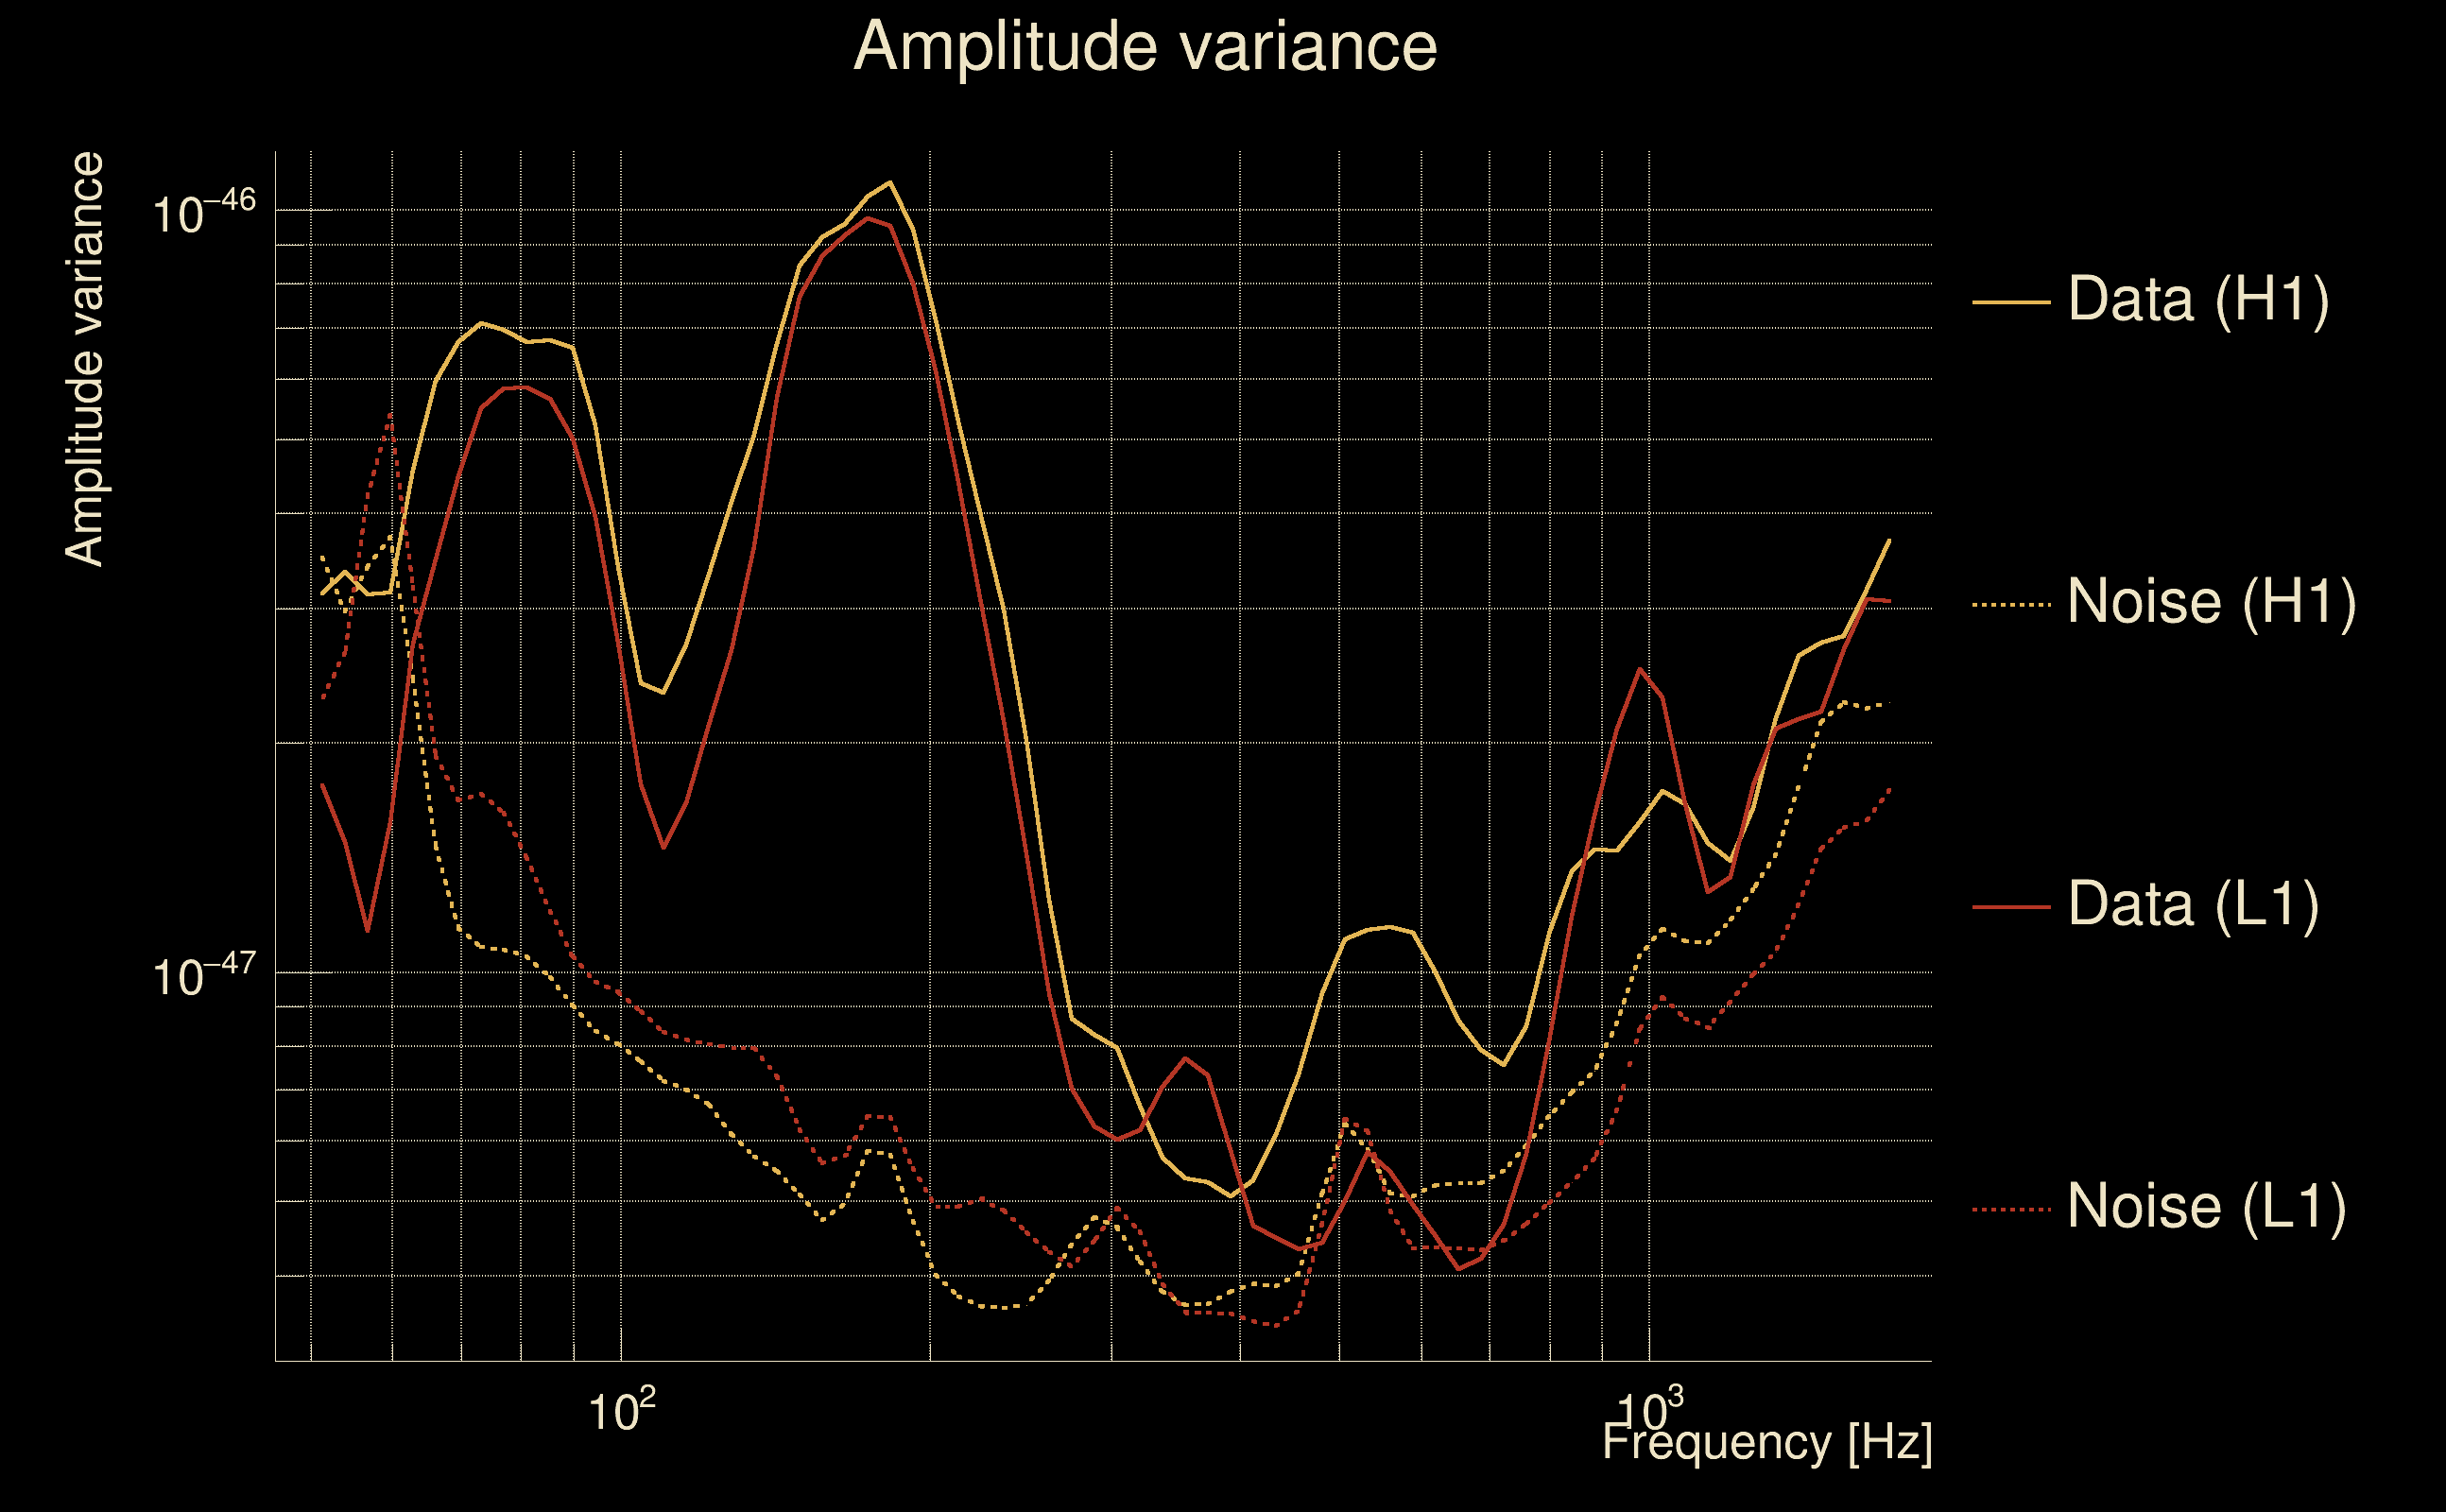
| Amplitude spectrograms: | normalization = 1e-22, power index = 2 |
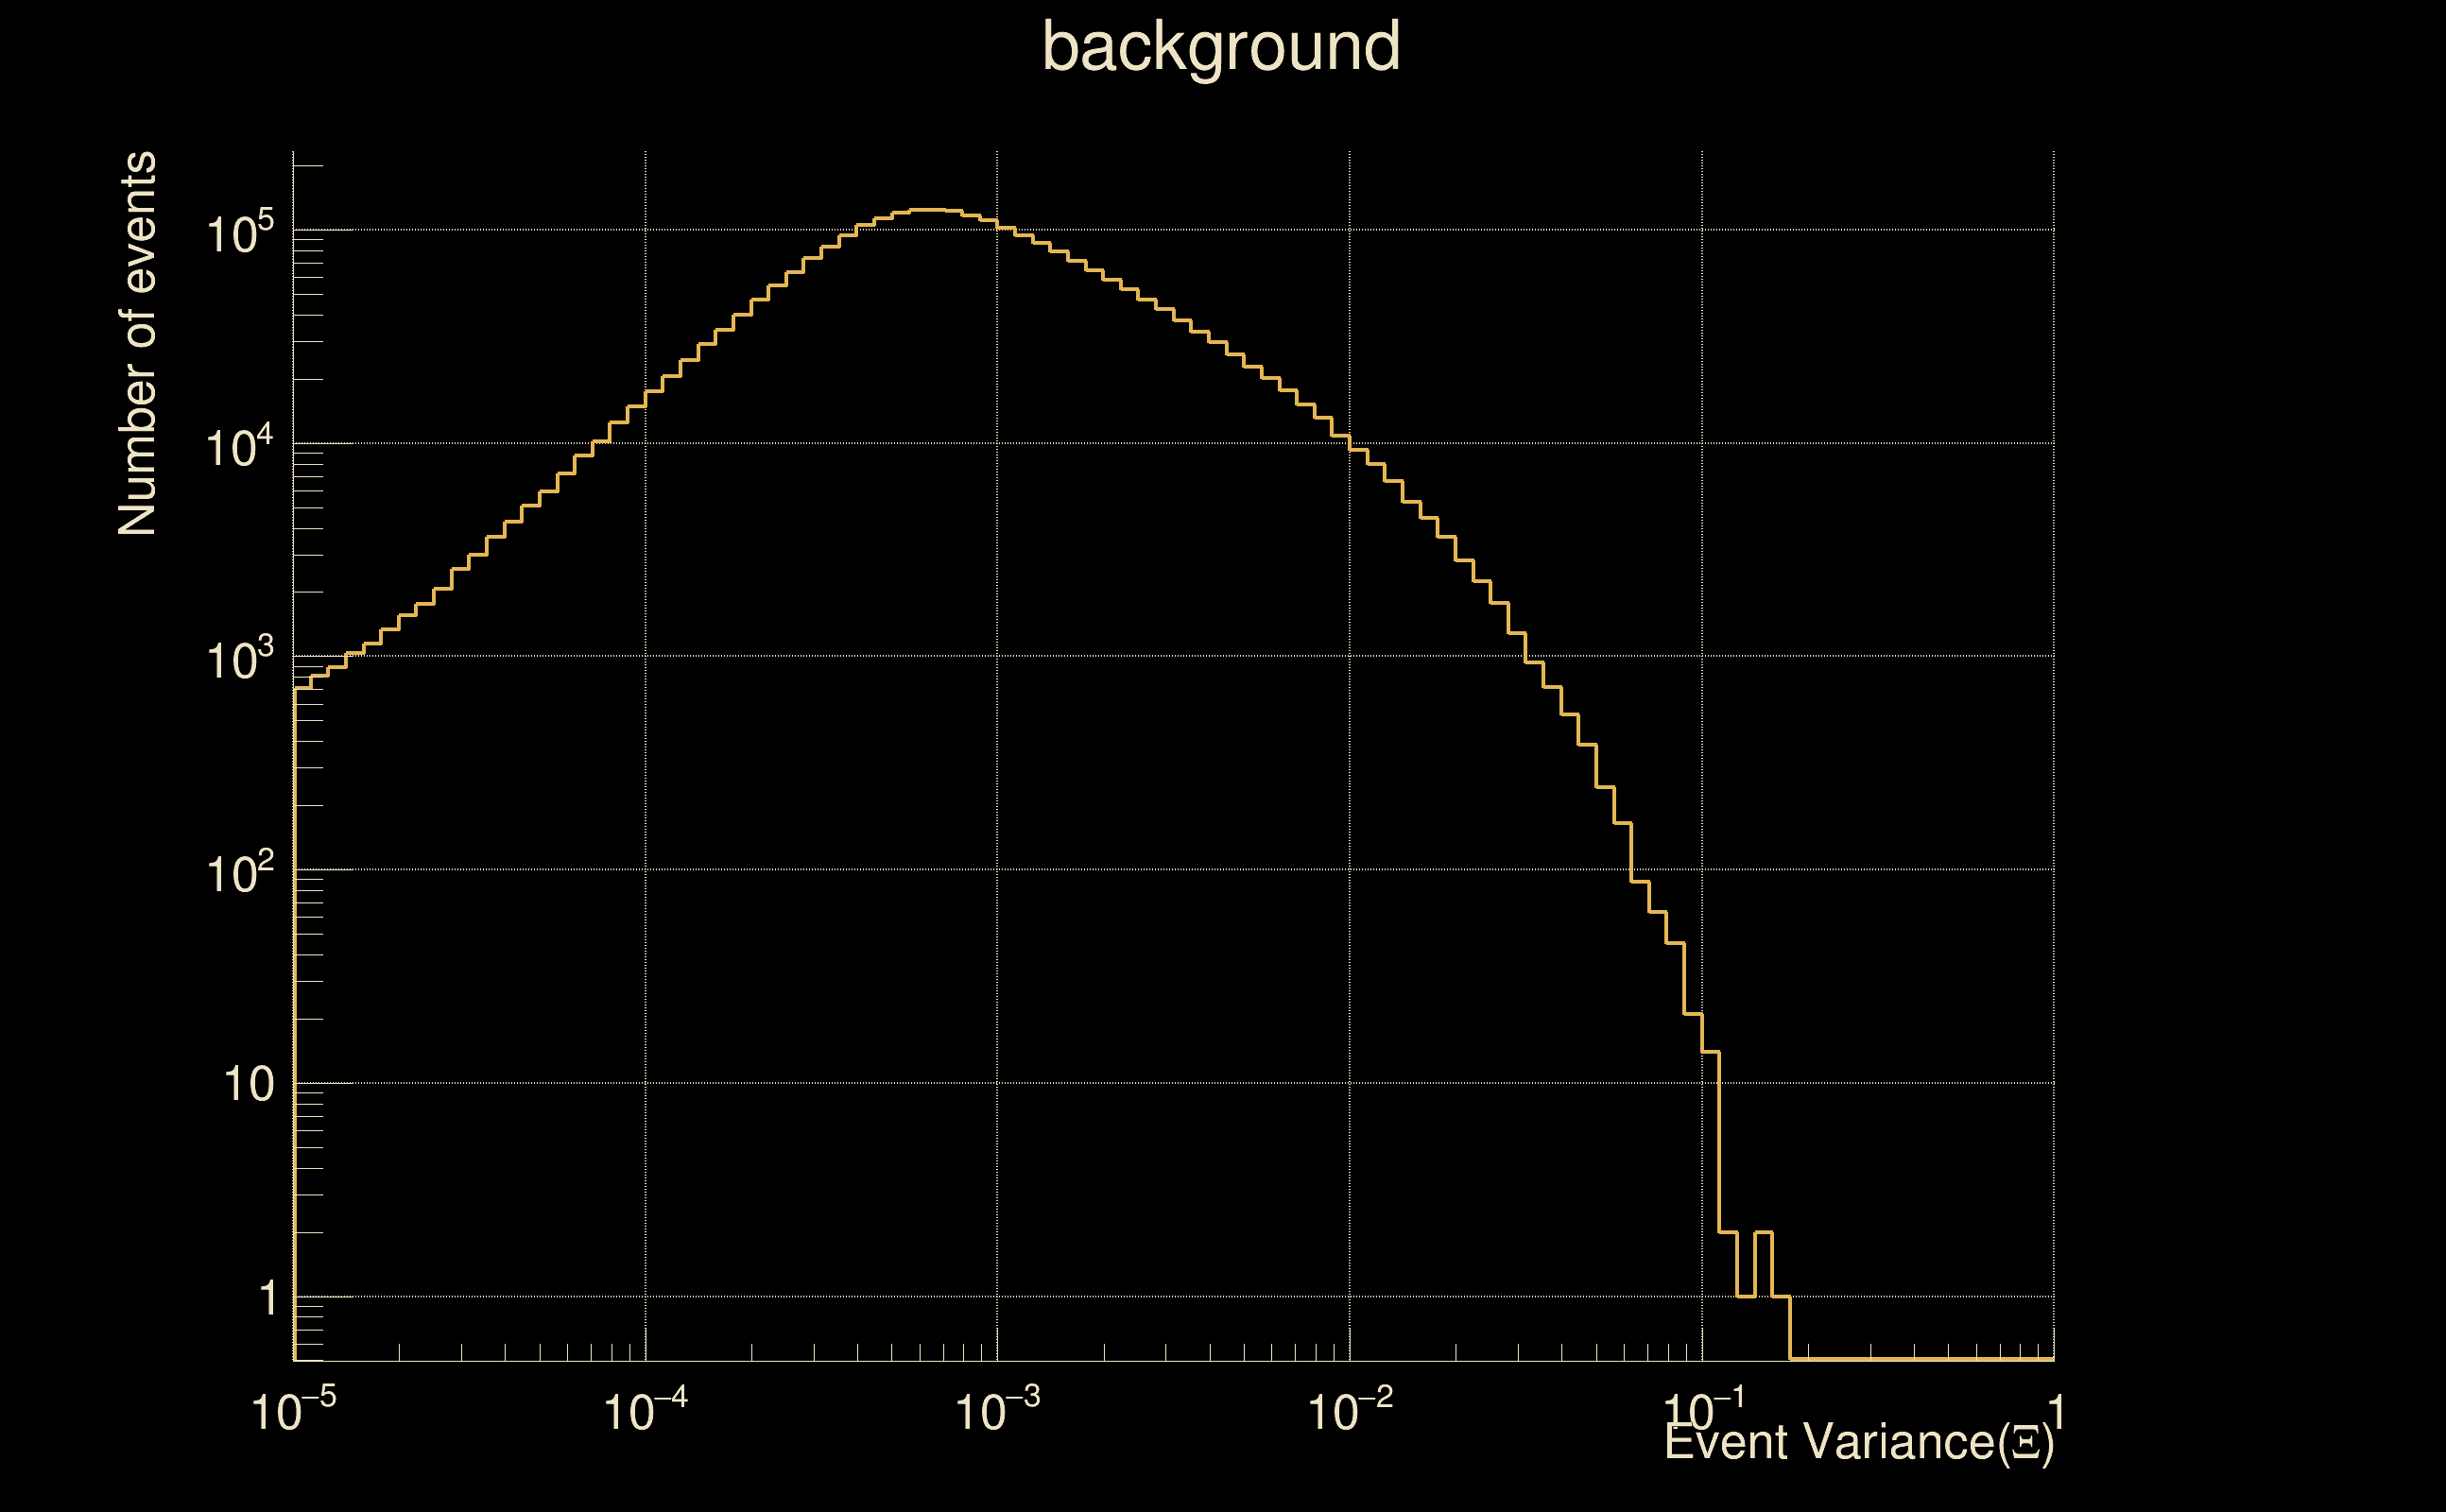
| White noise SNR variance: | 0.523175 (after applying a correction factor = 1) |
| Amplitude ratio confidence level: | 3 sigma |
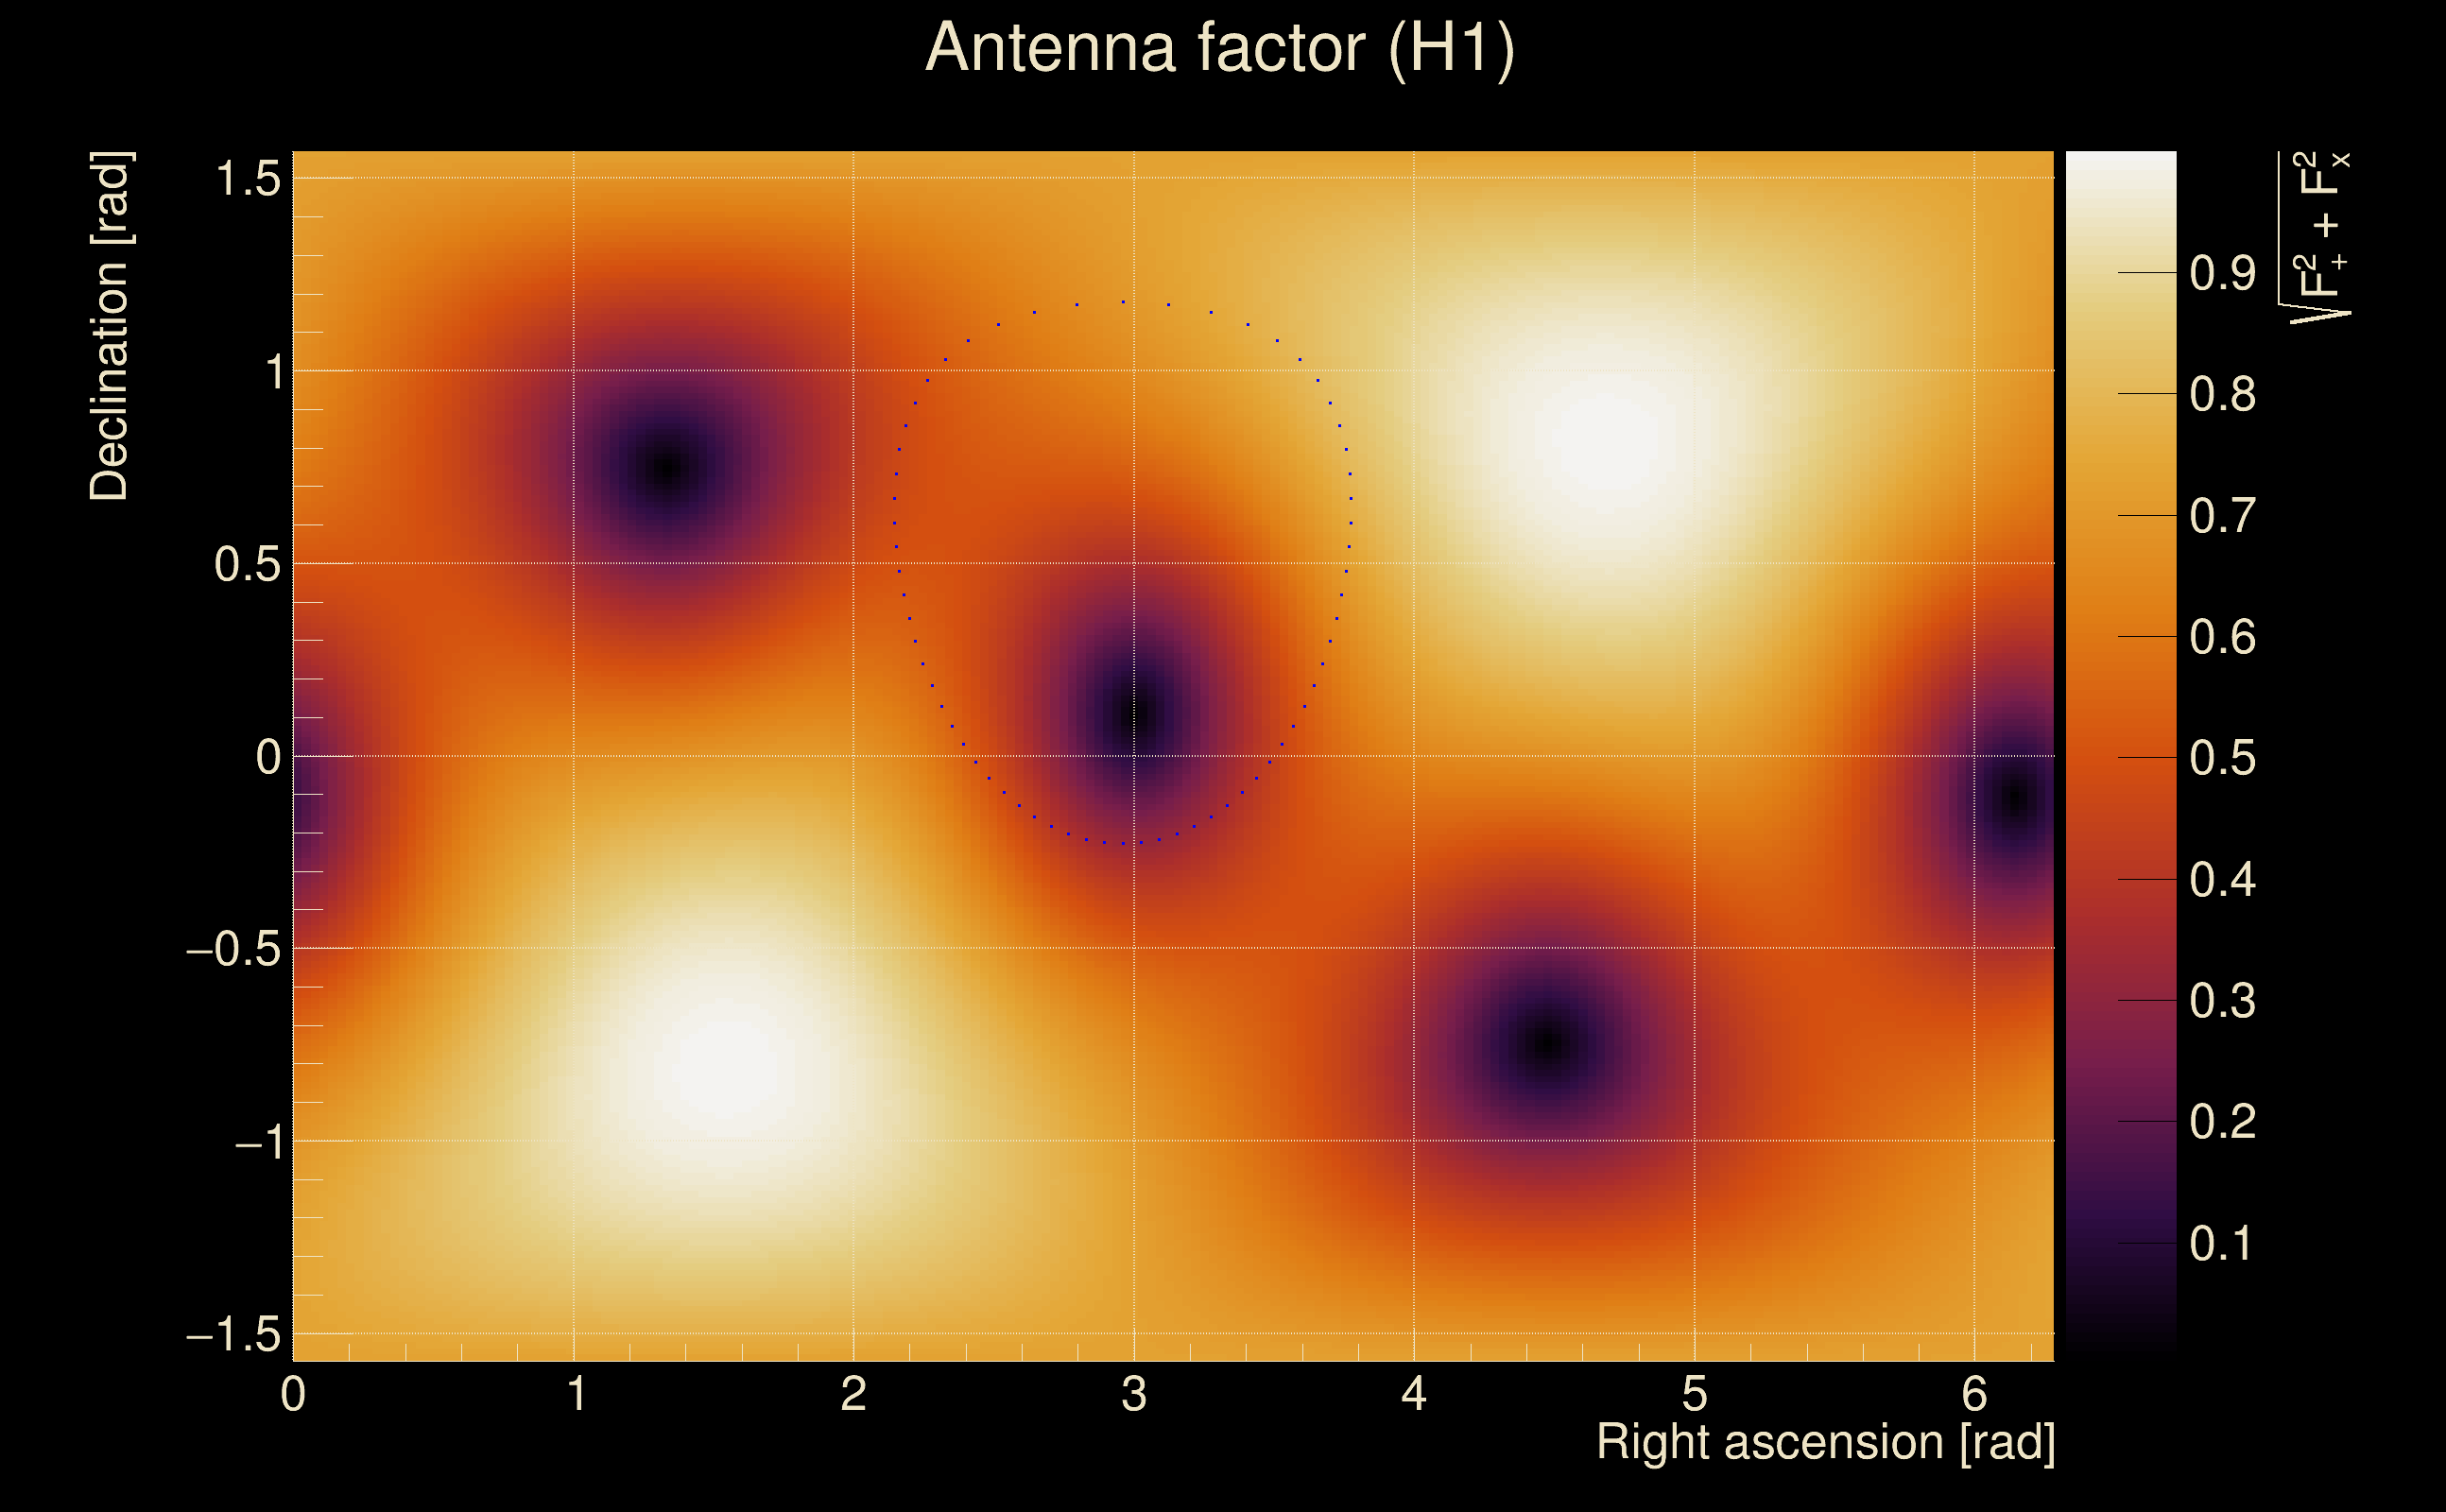
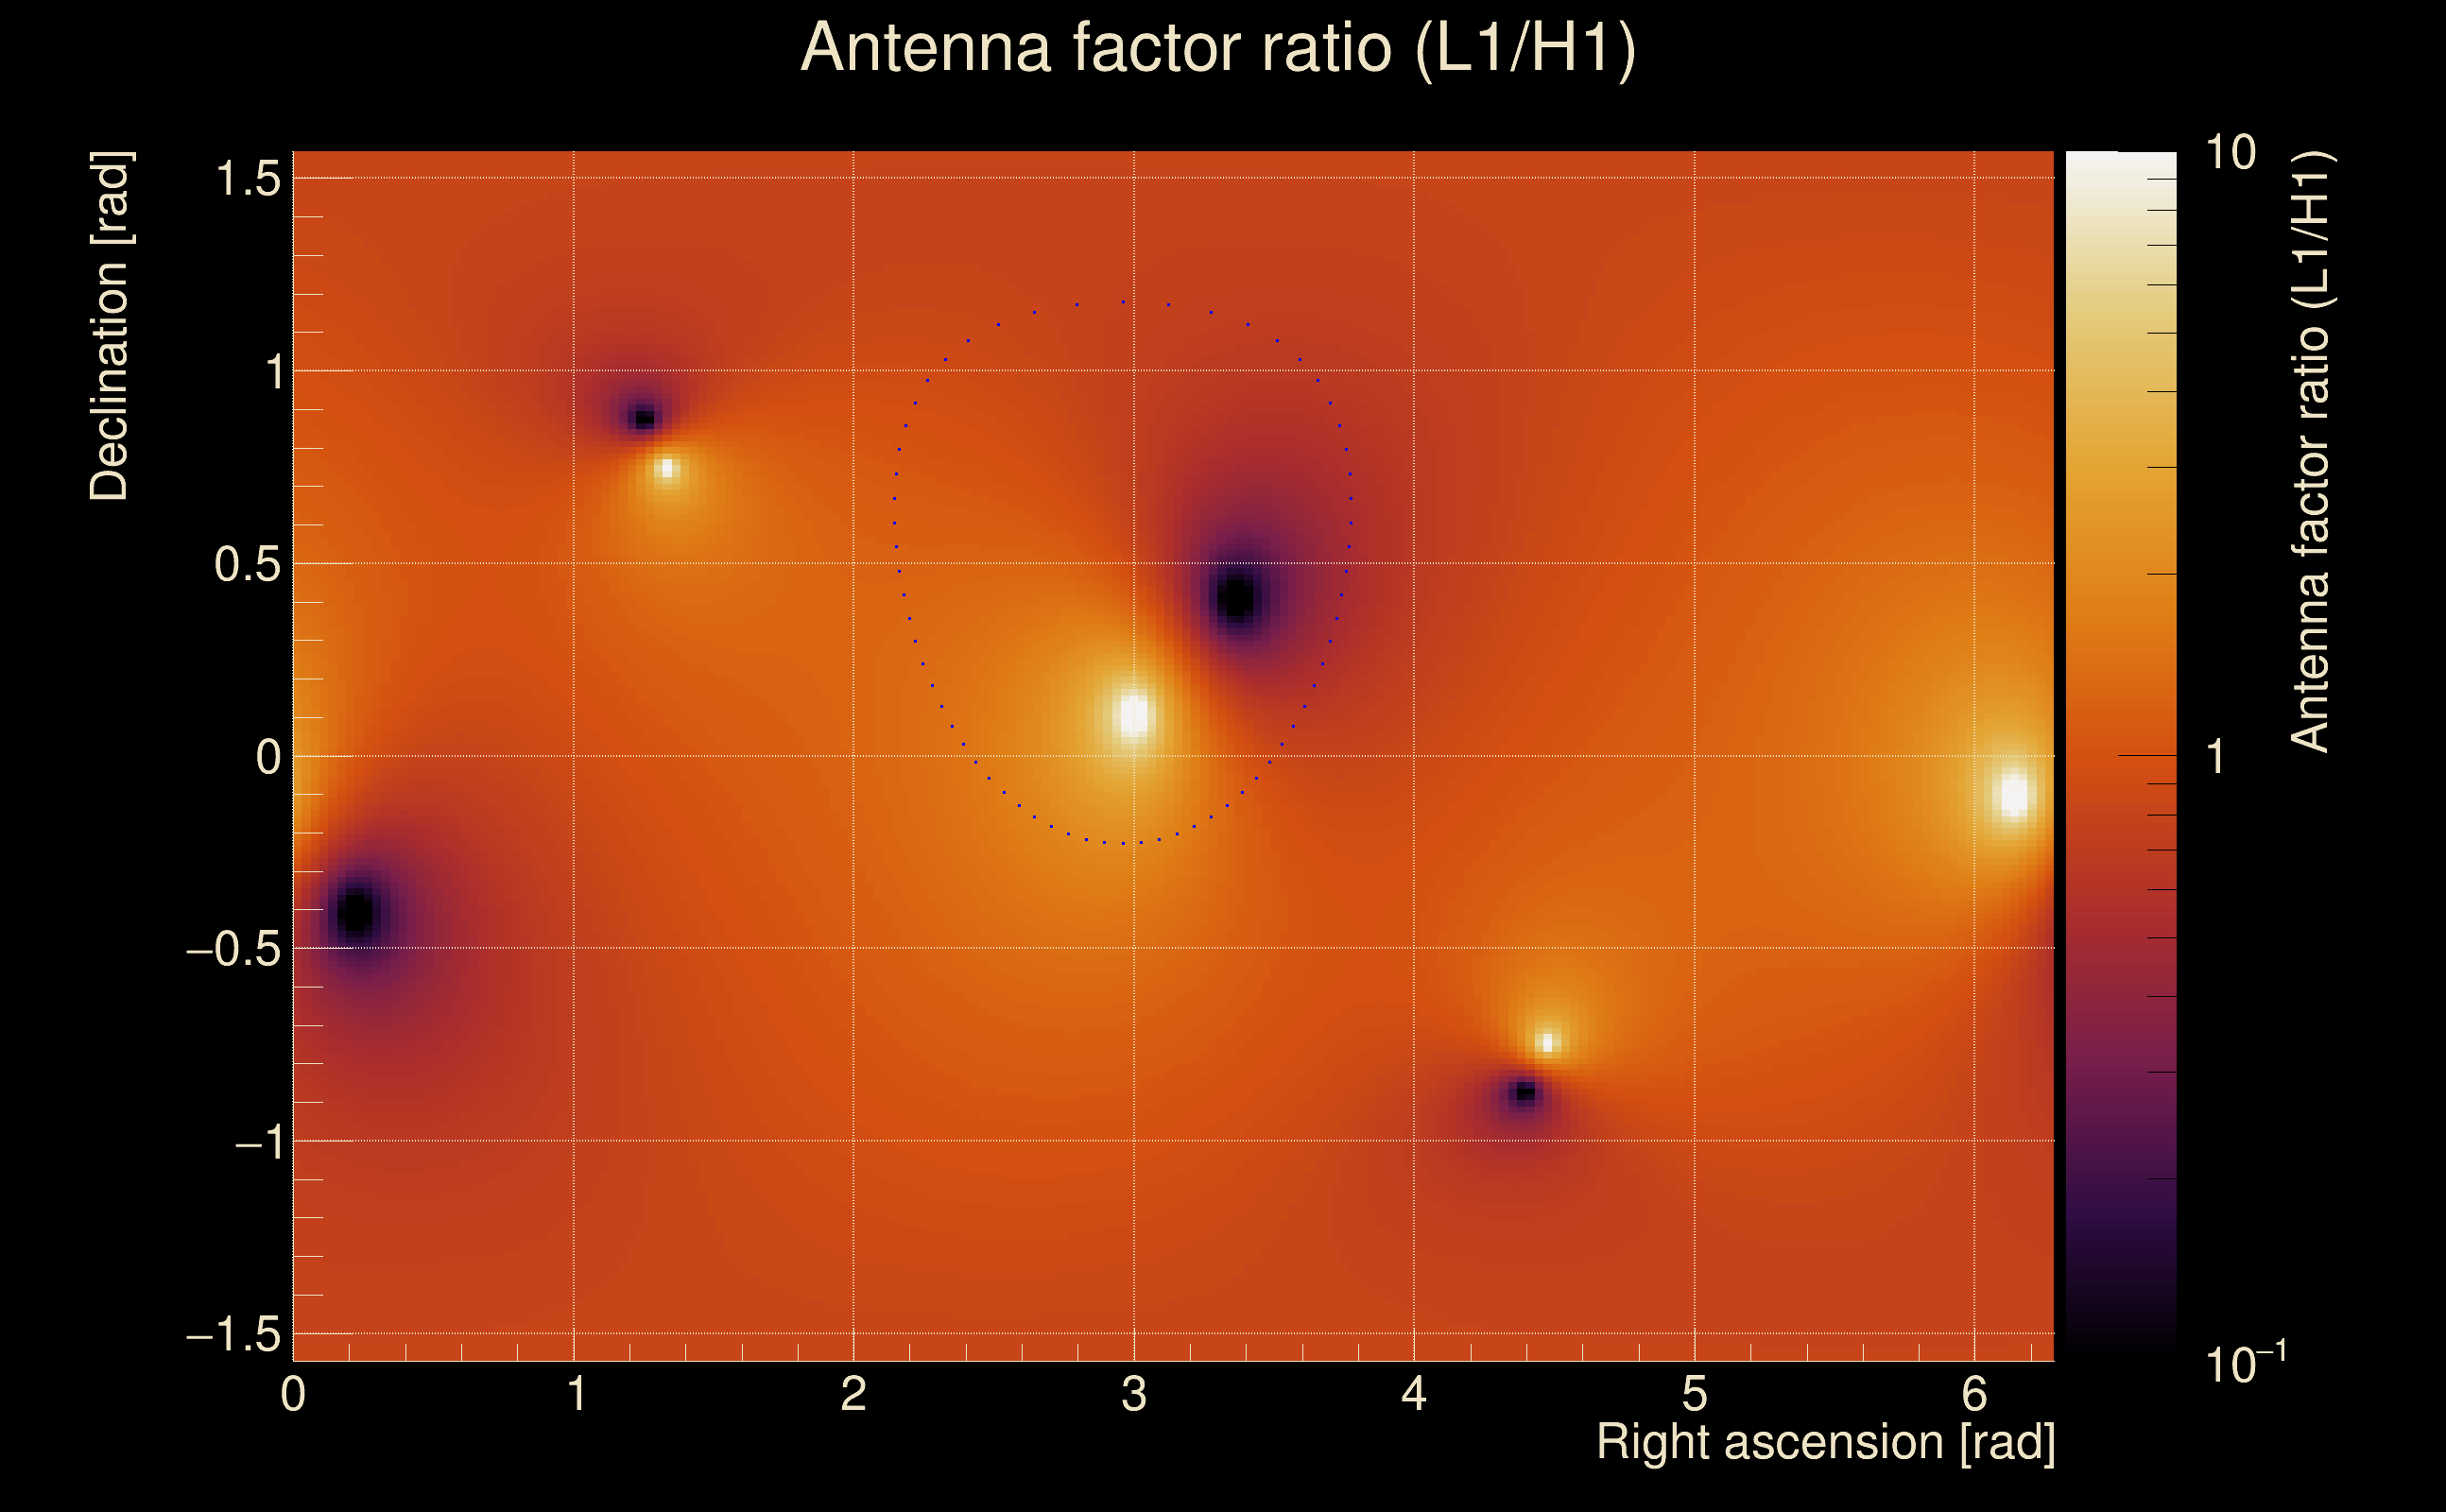
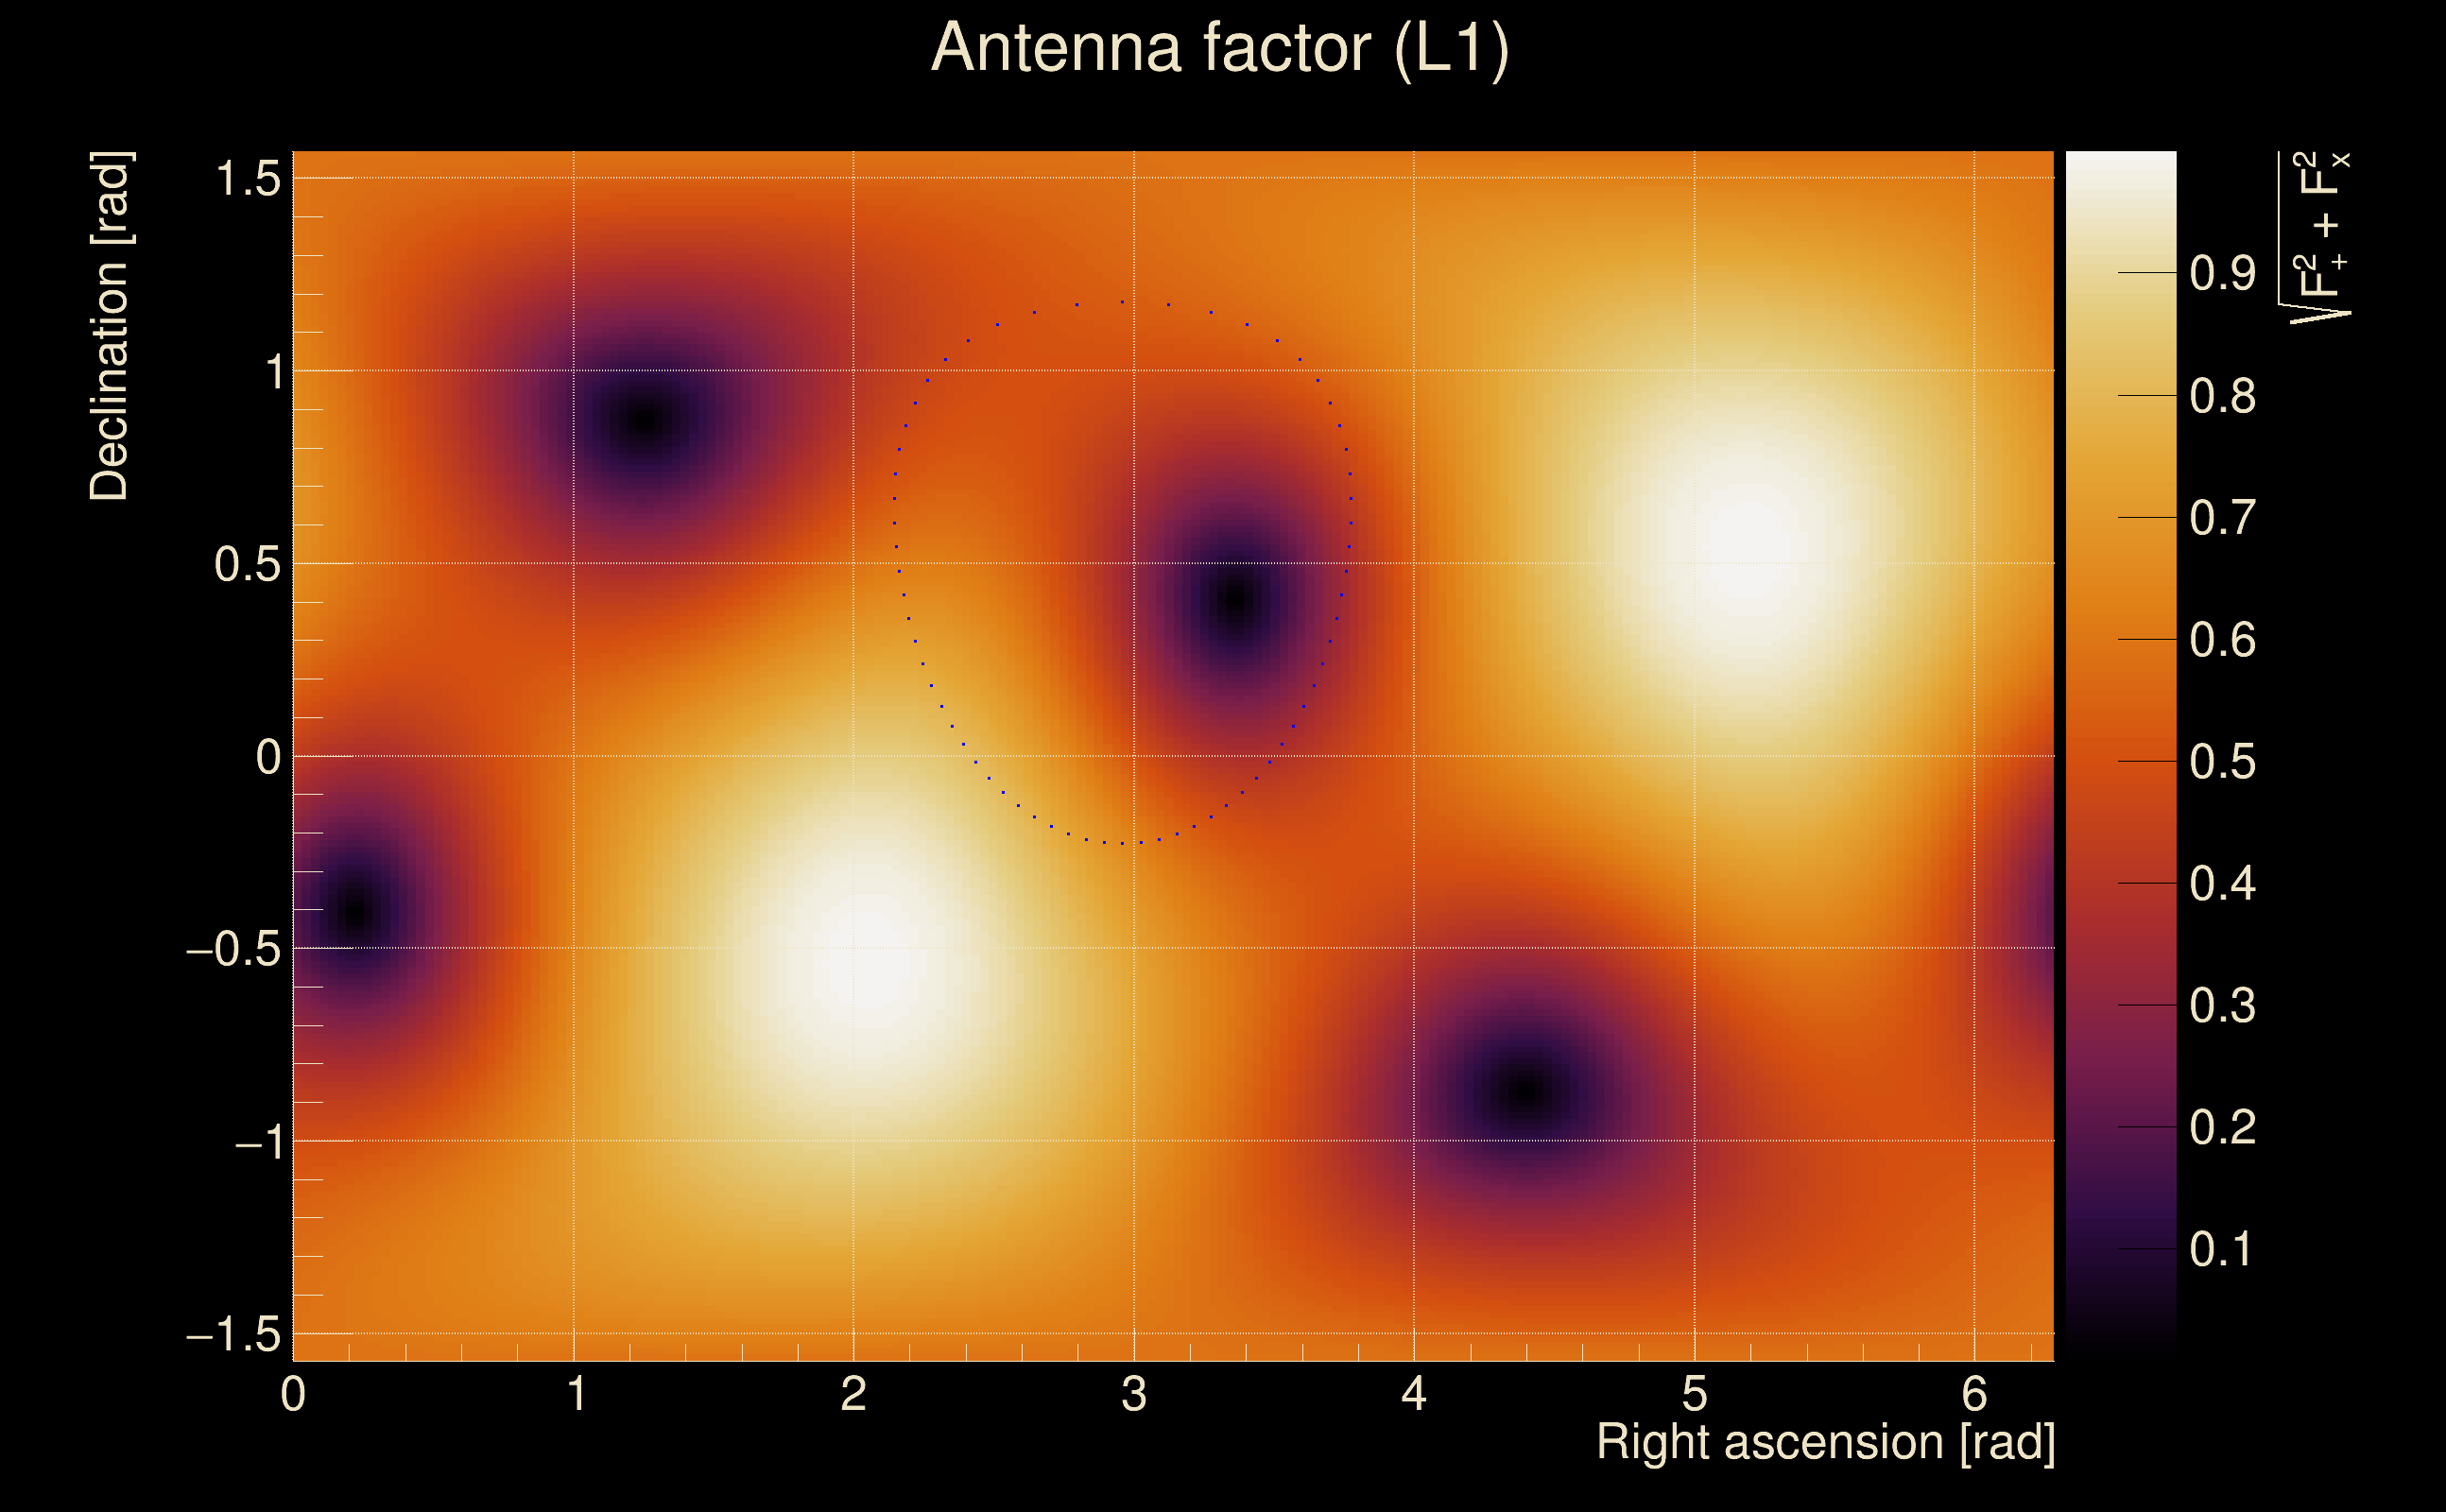
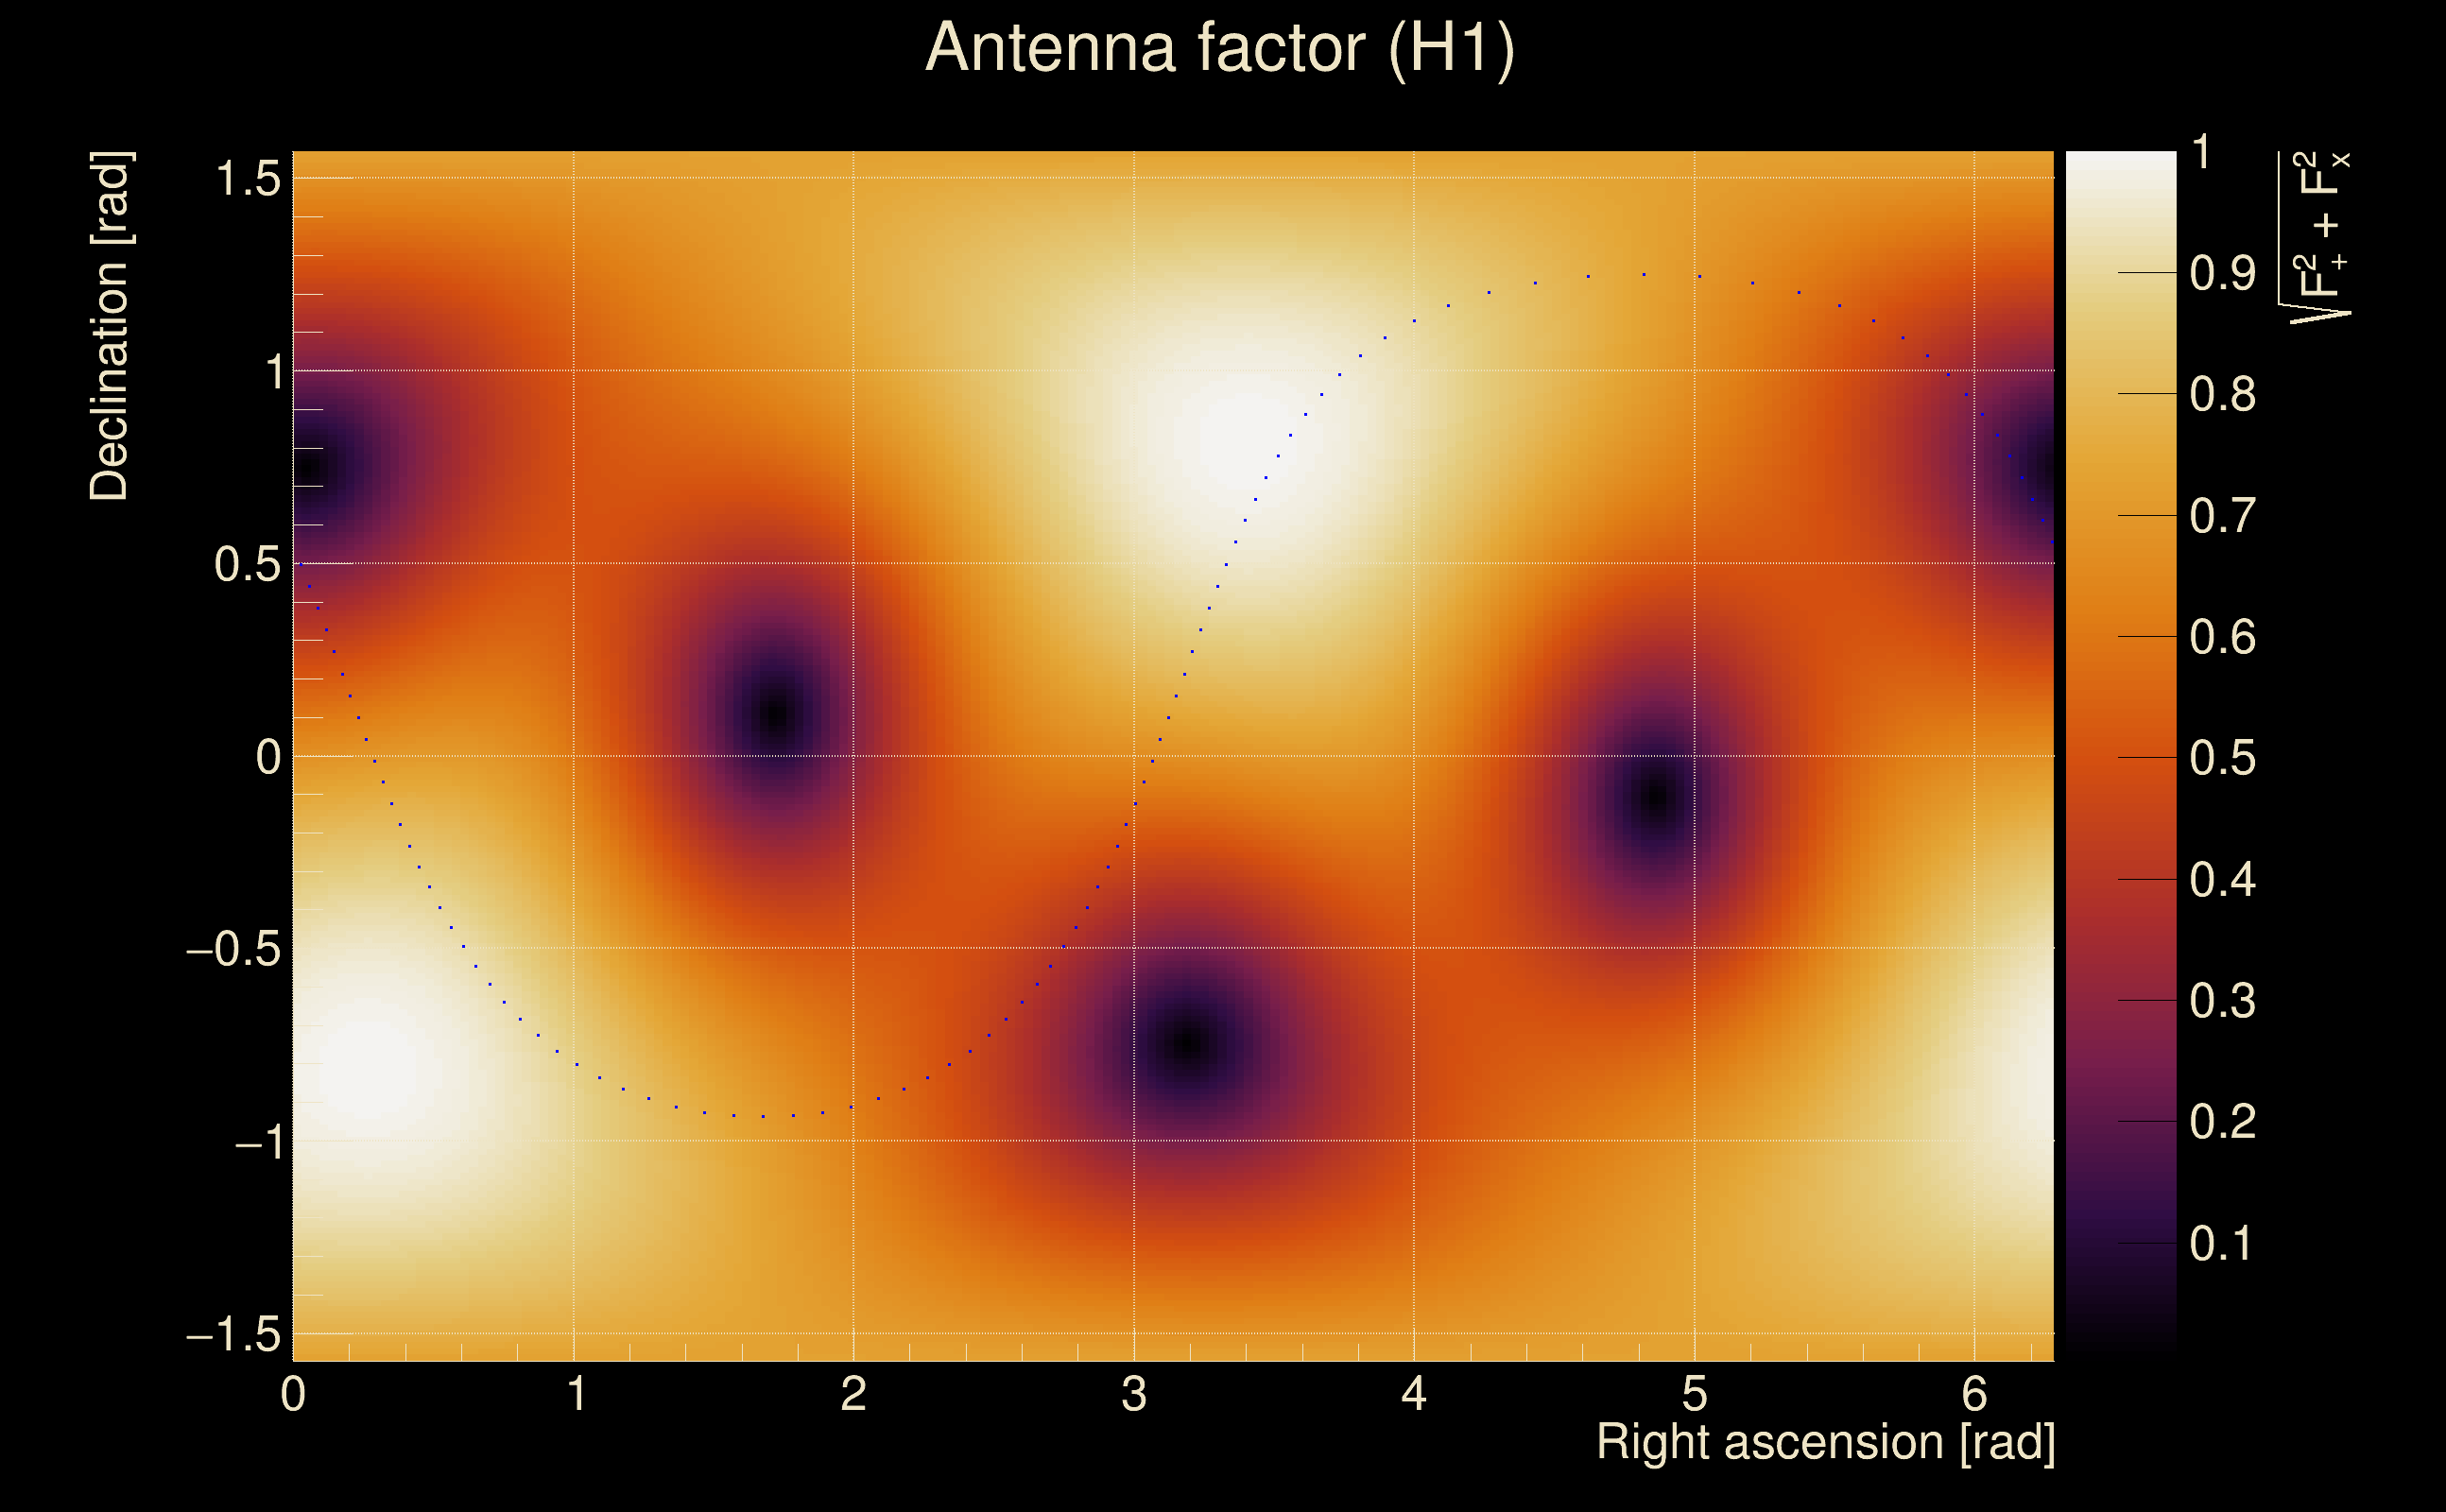
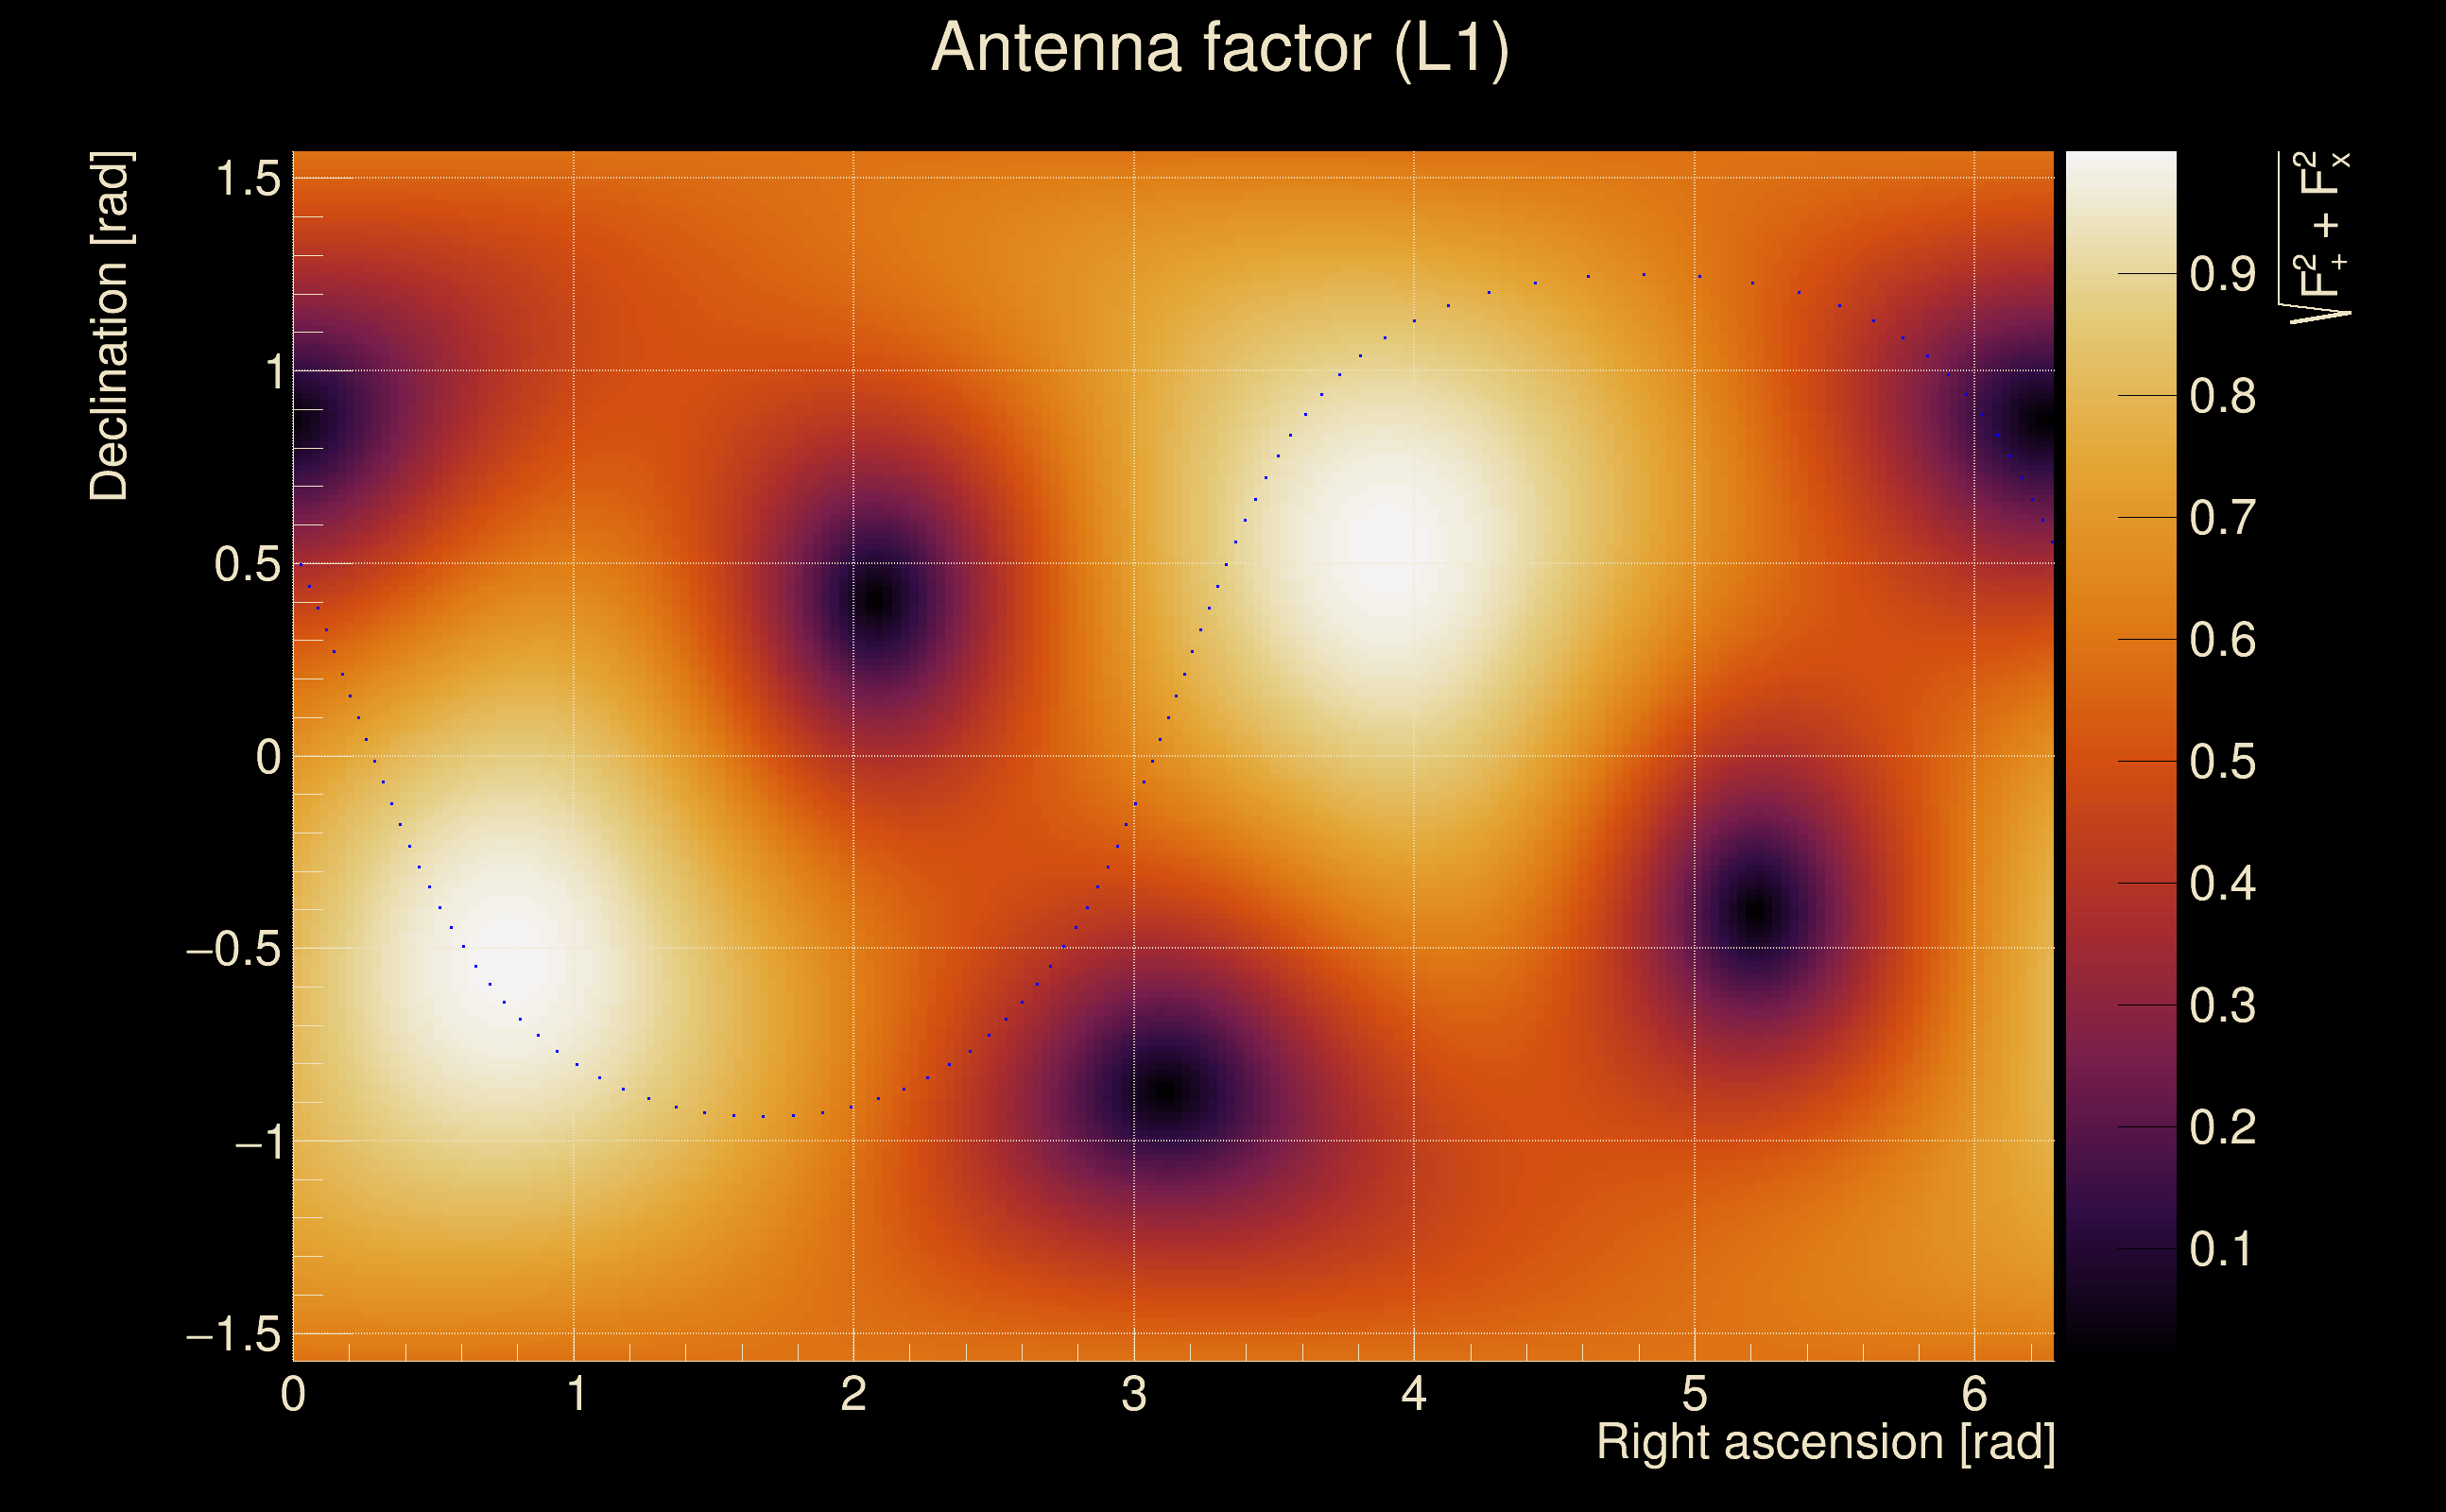
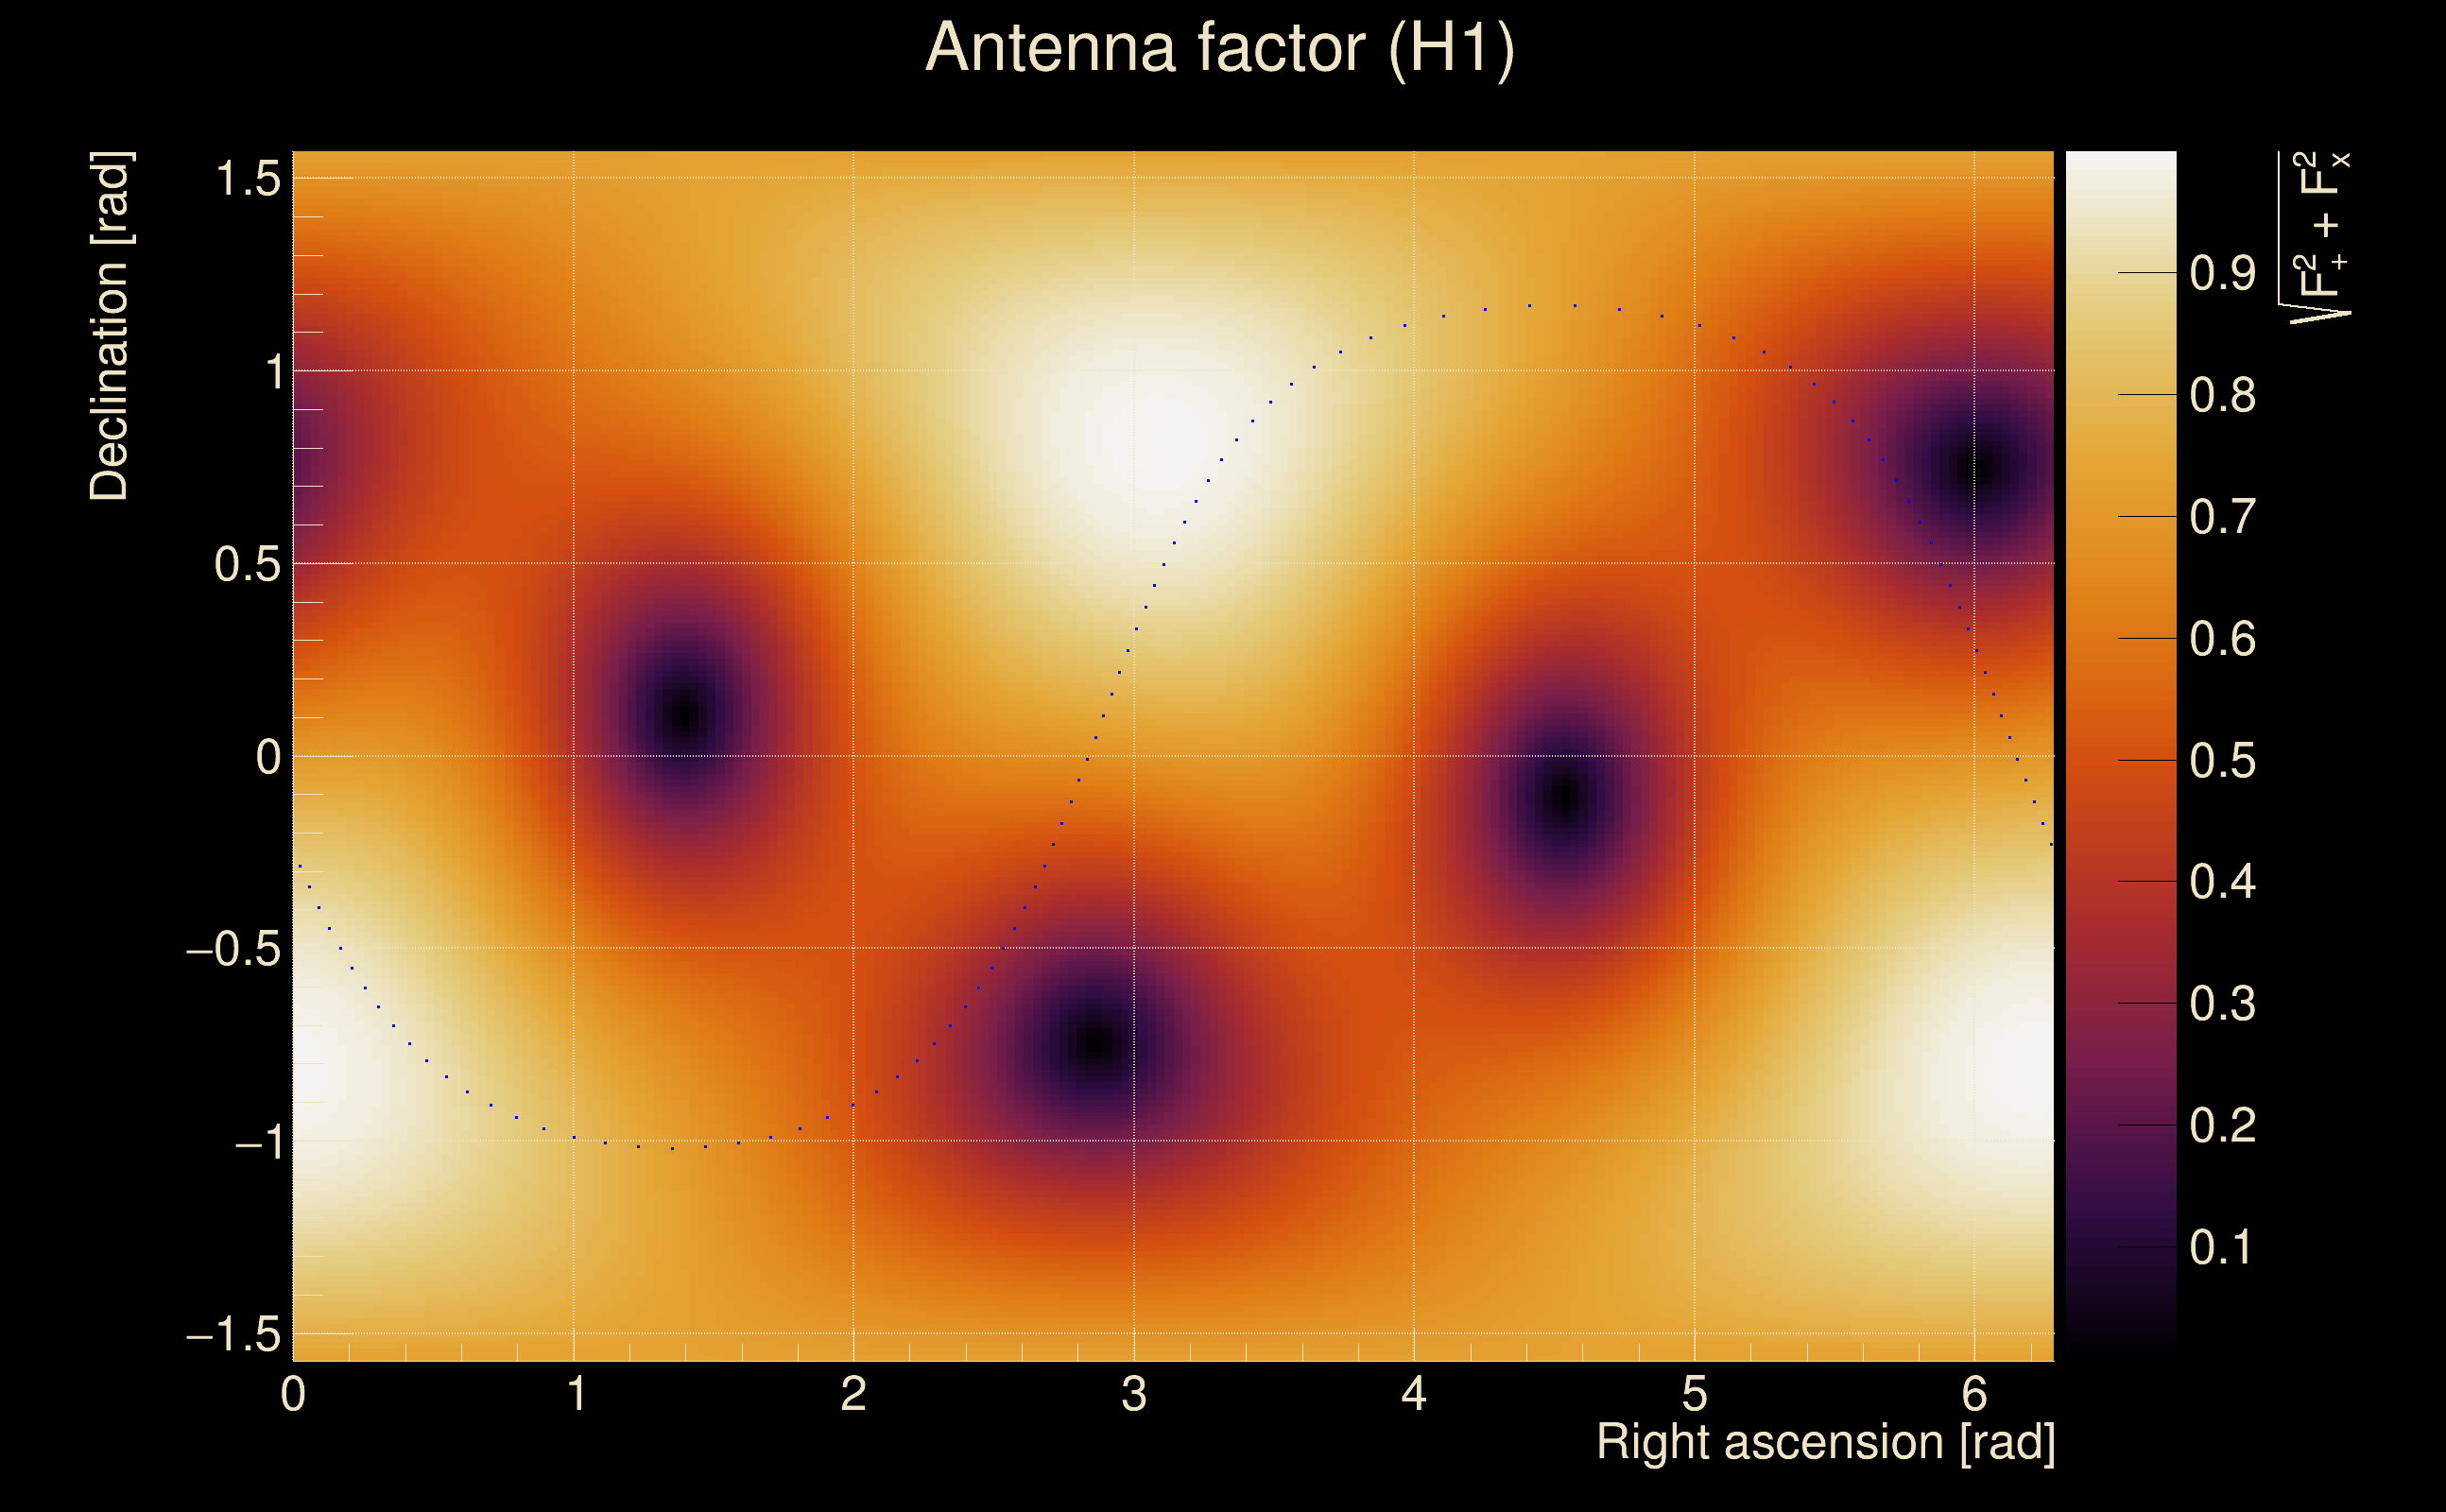
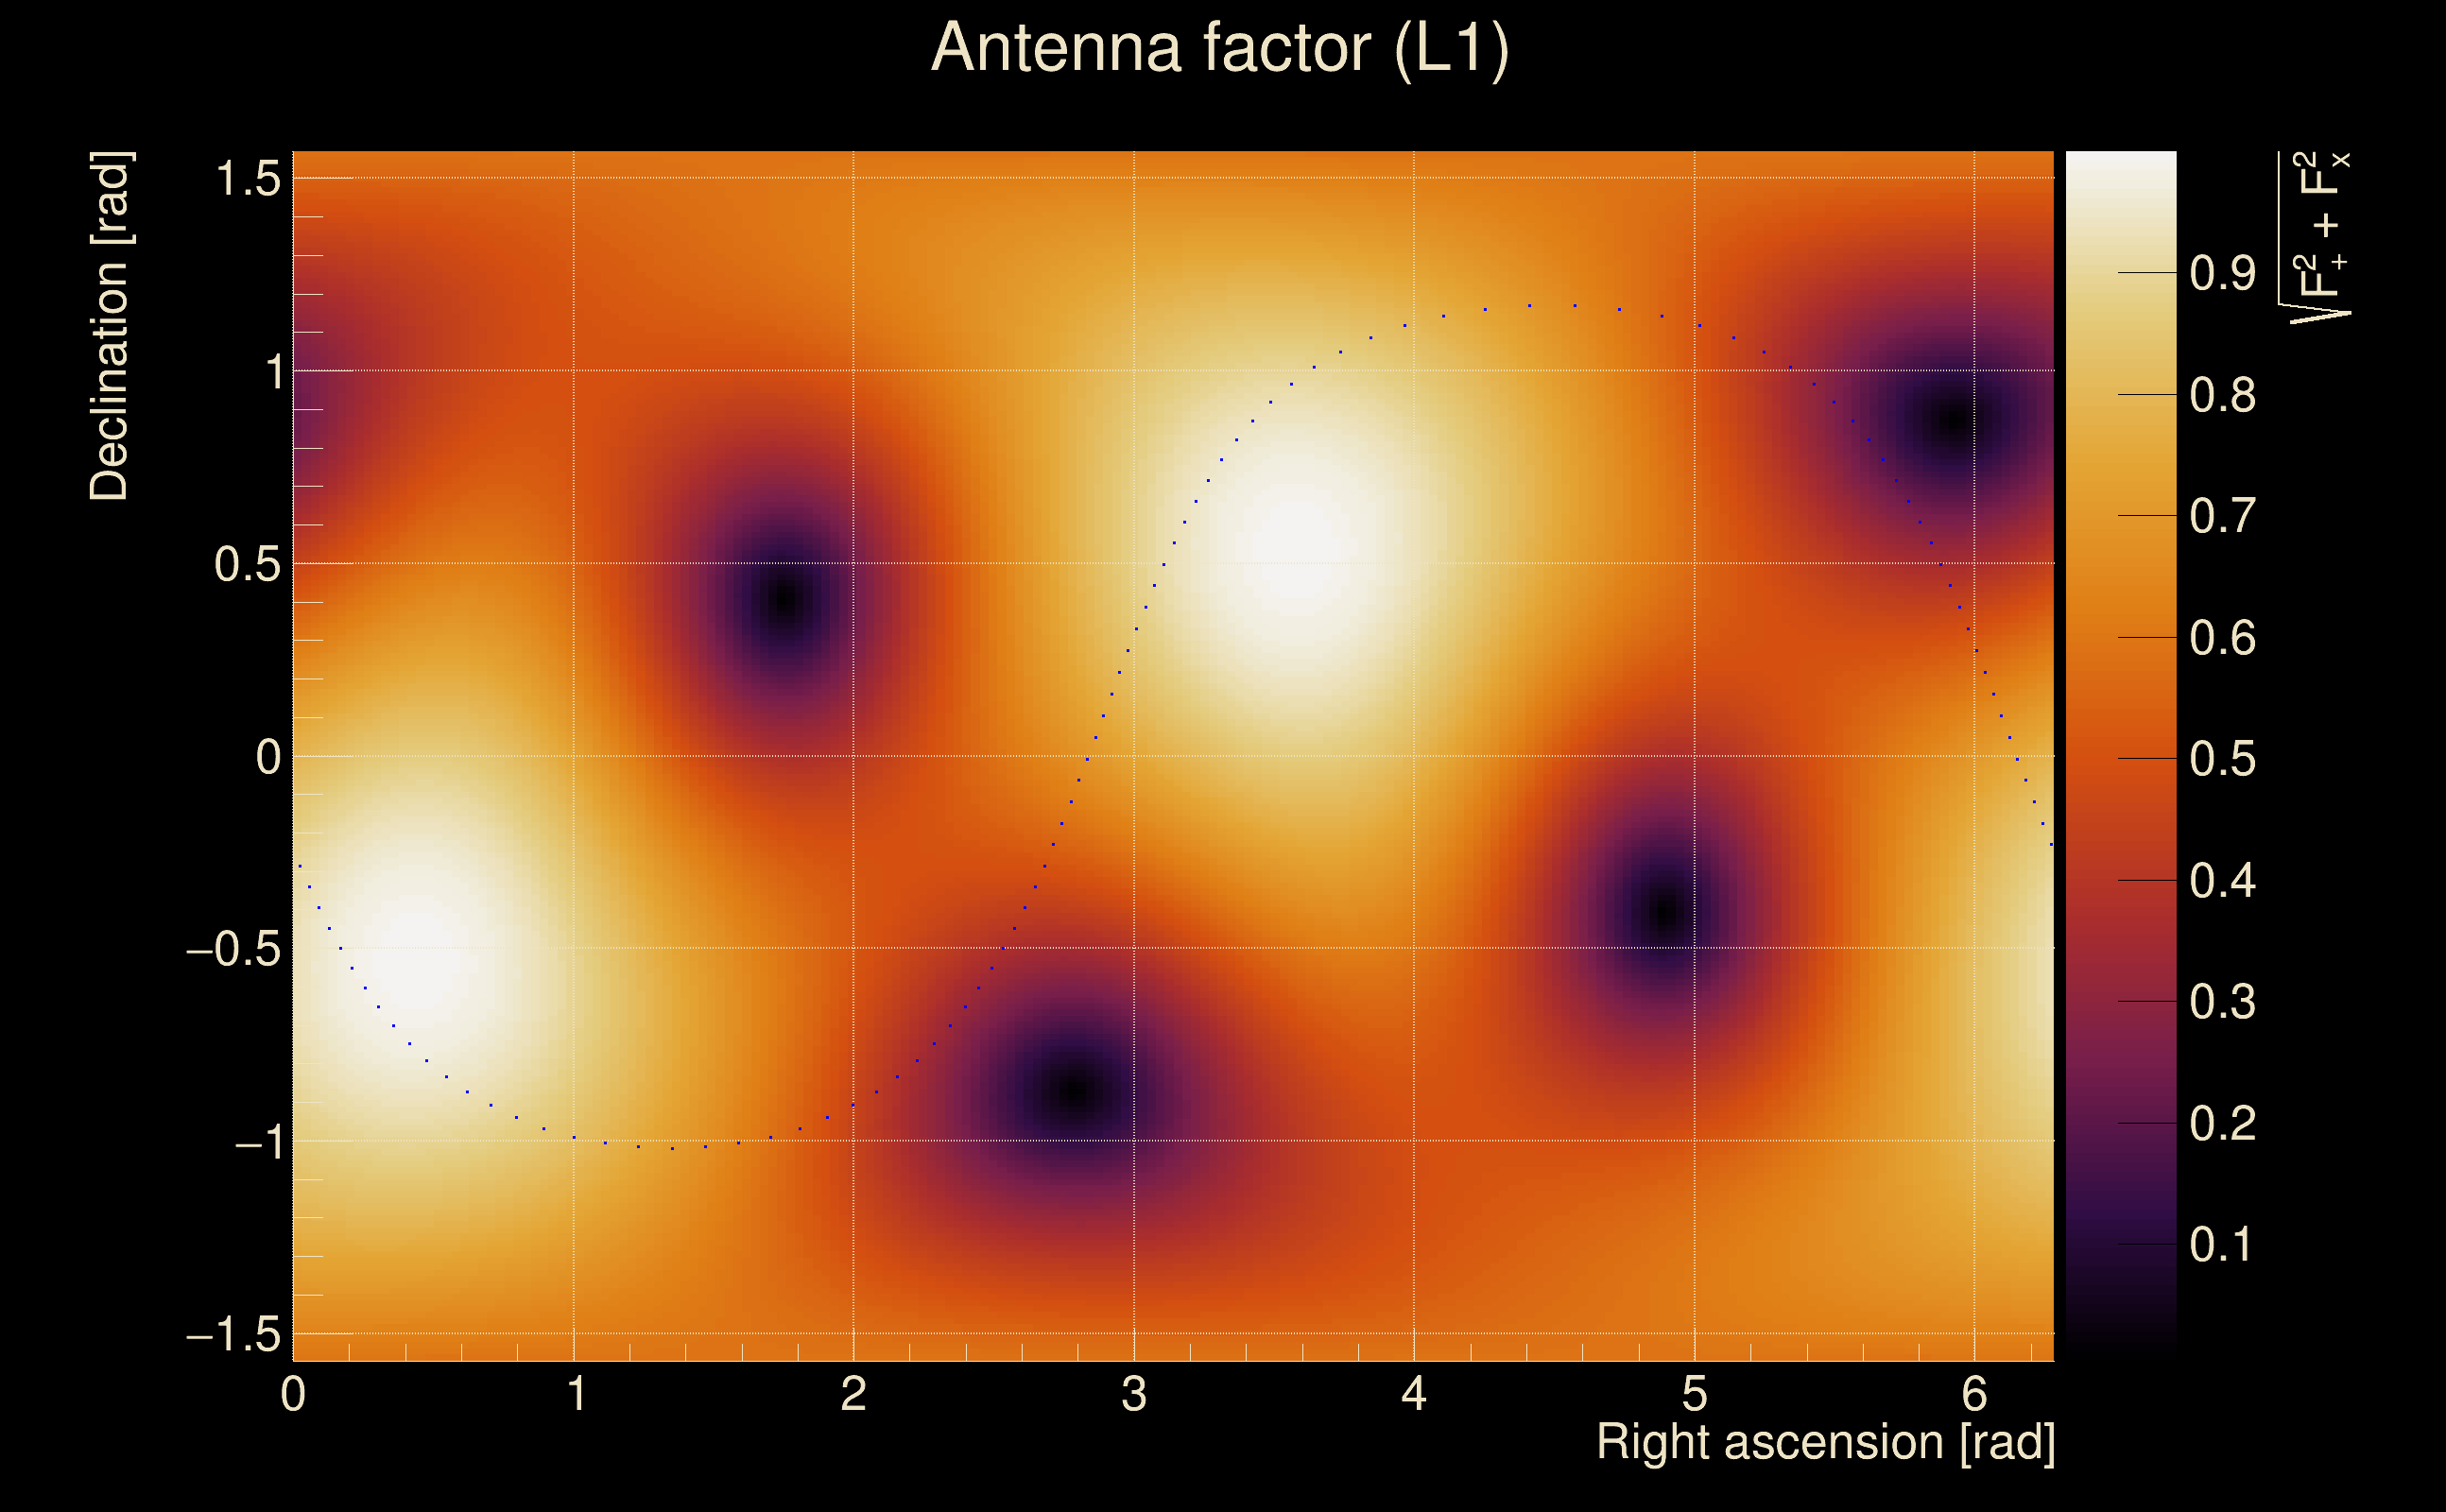
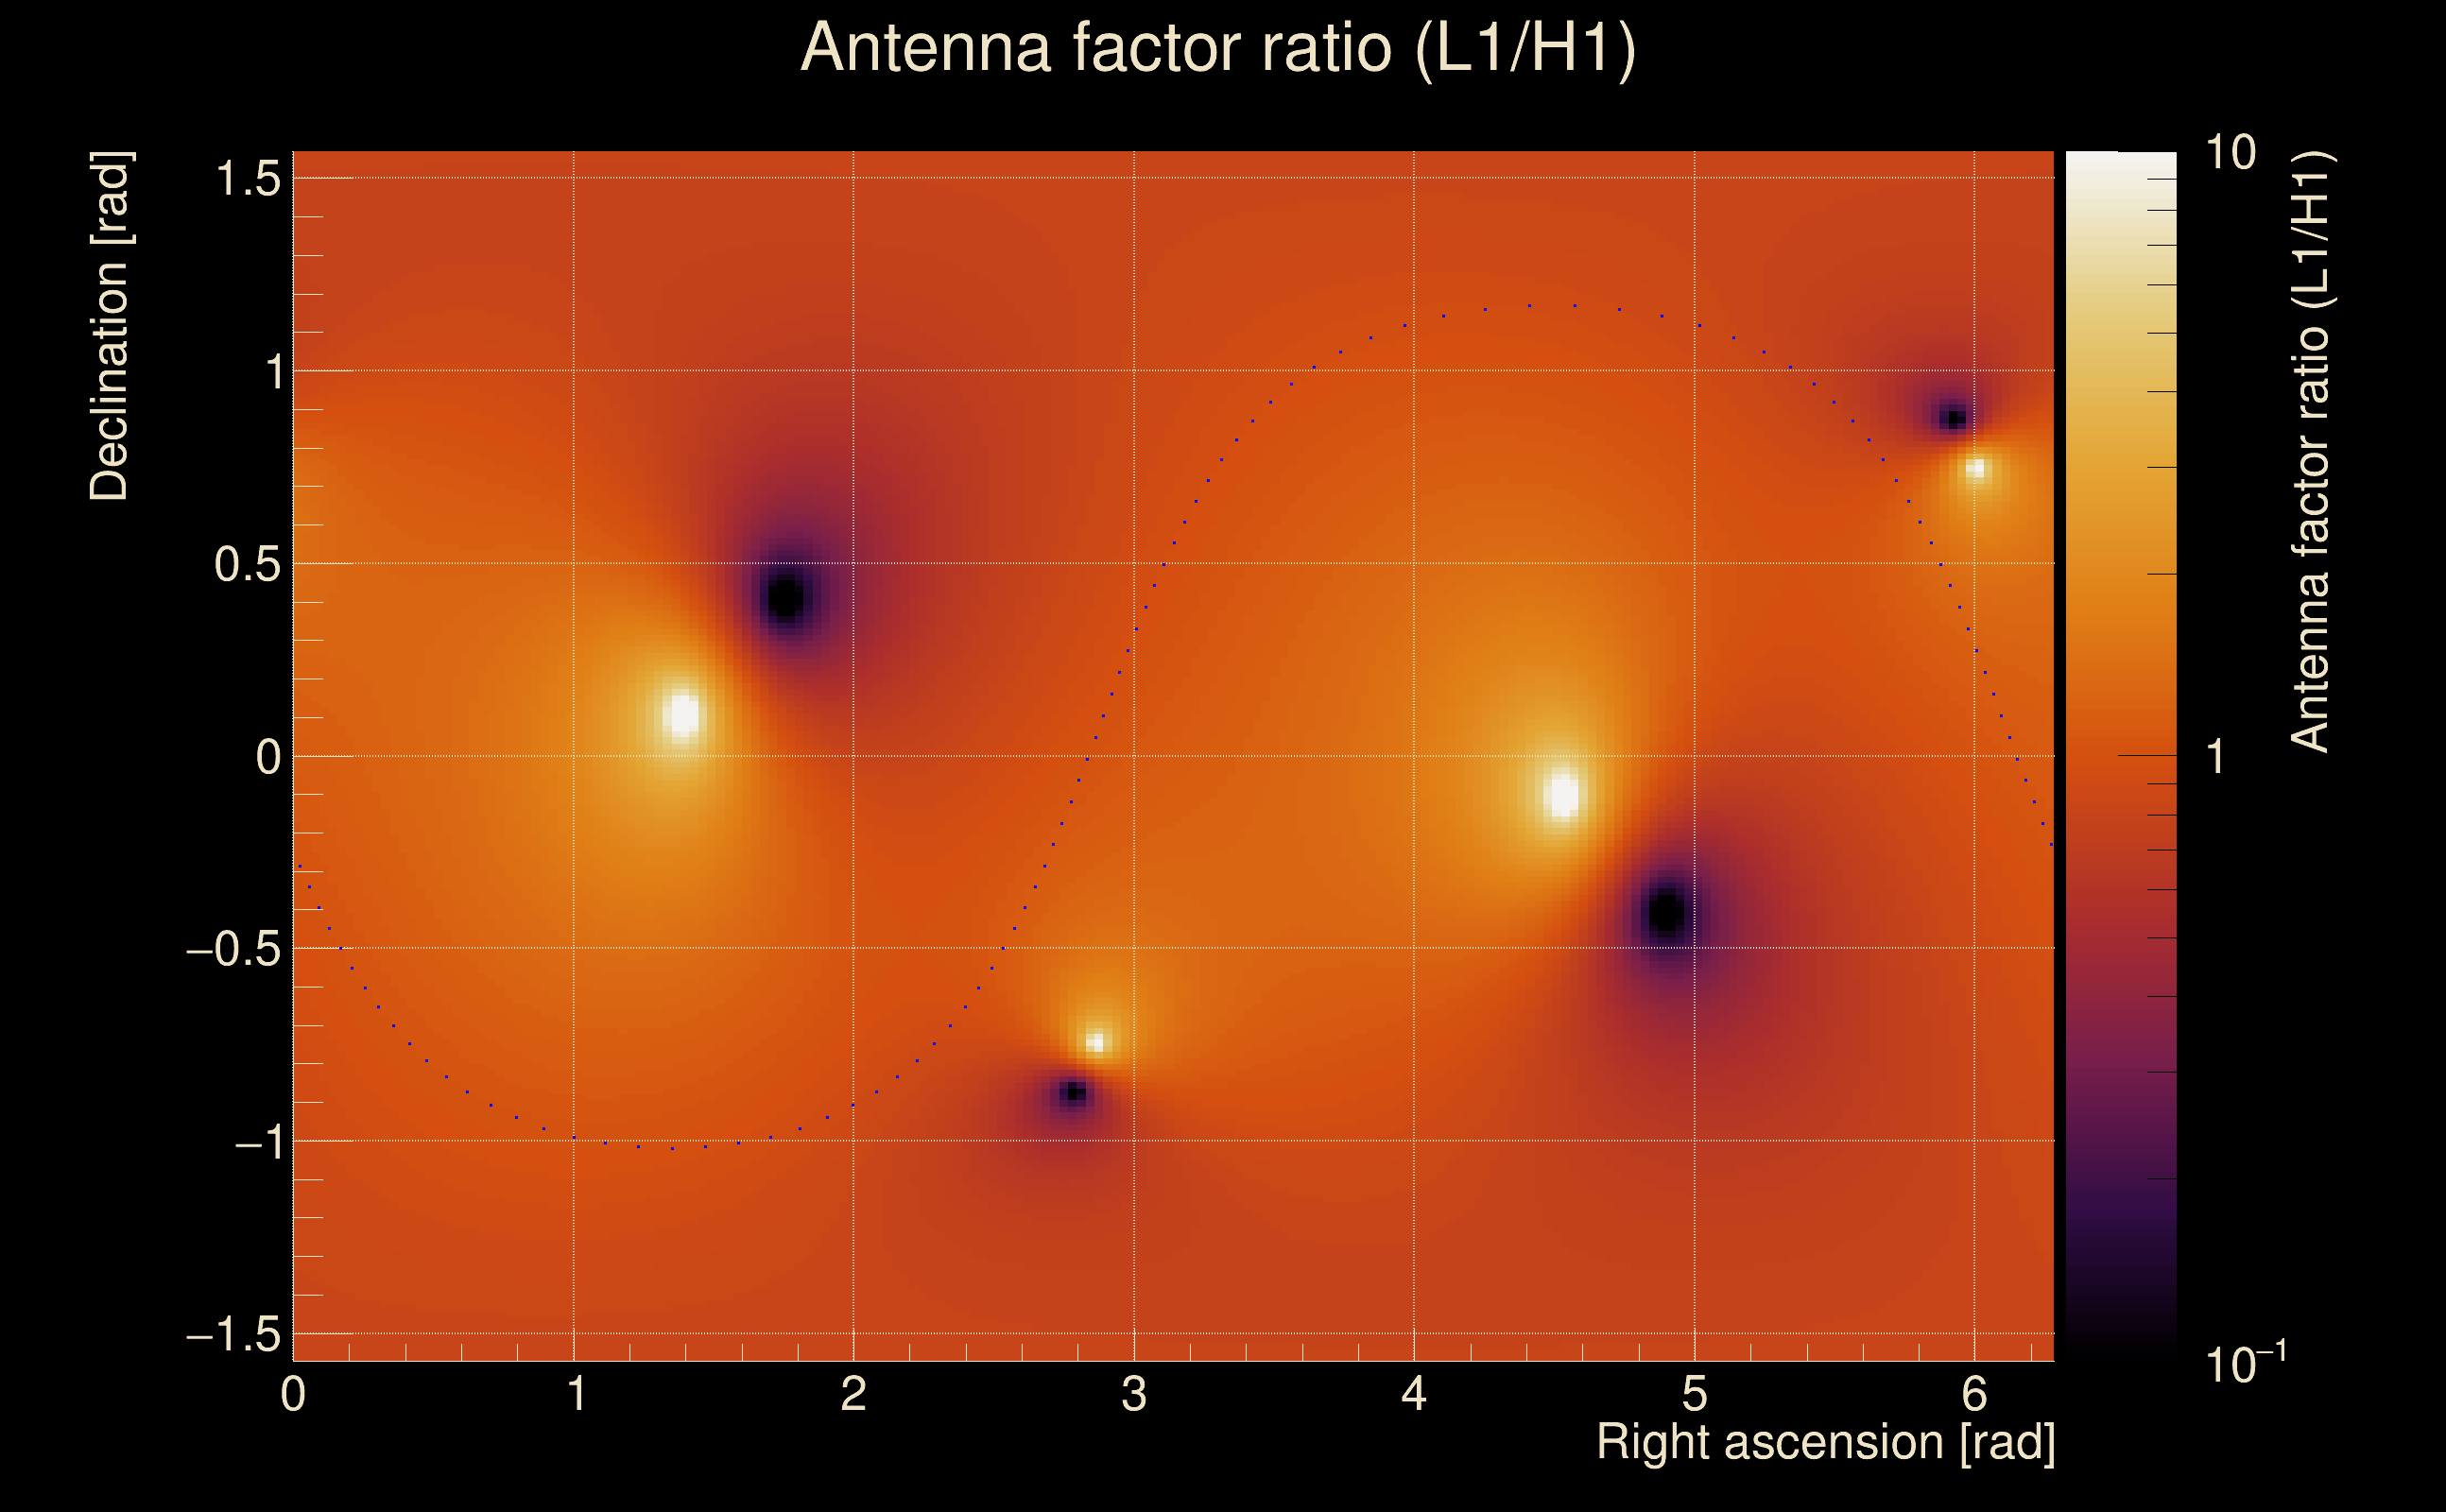
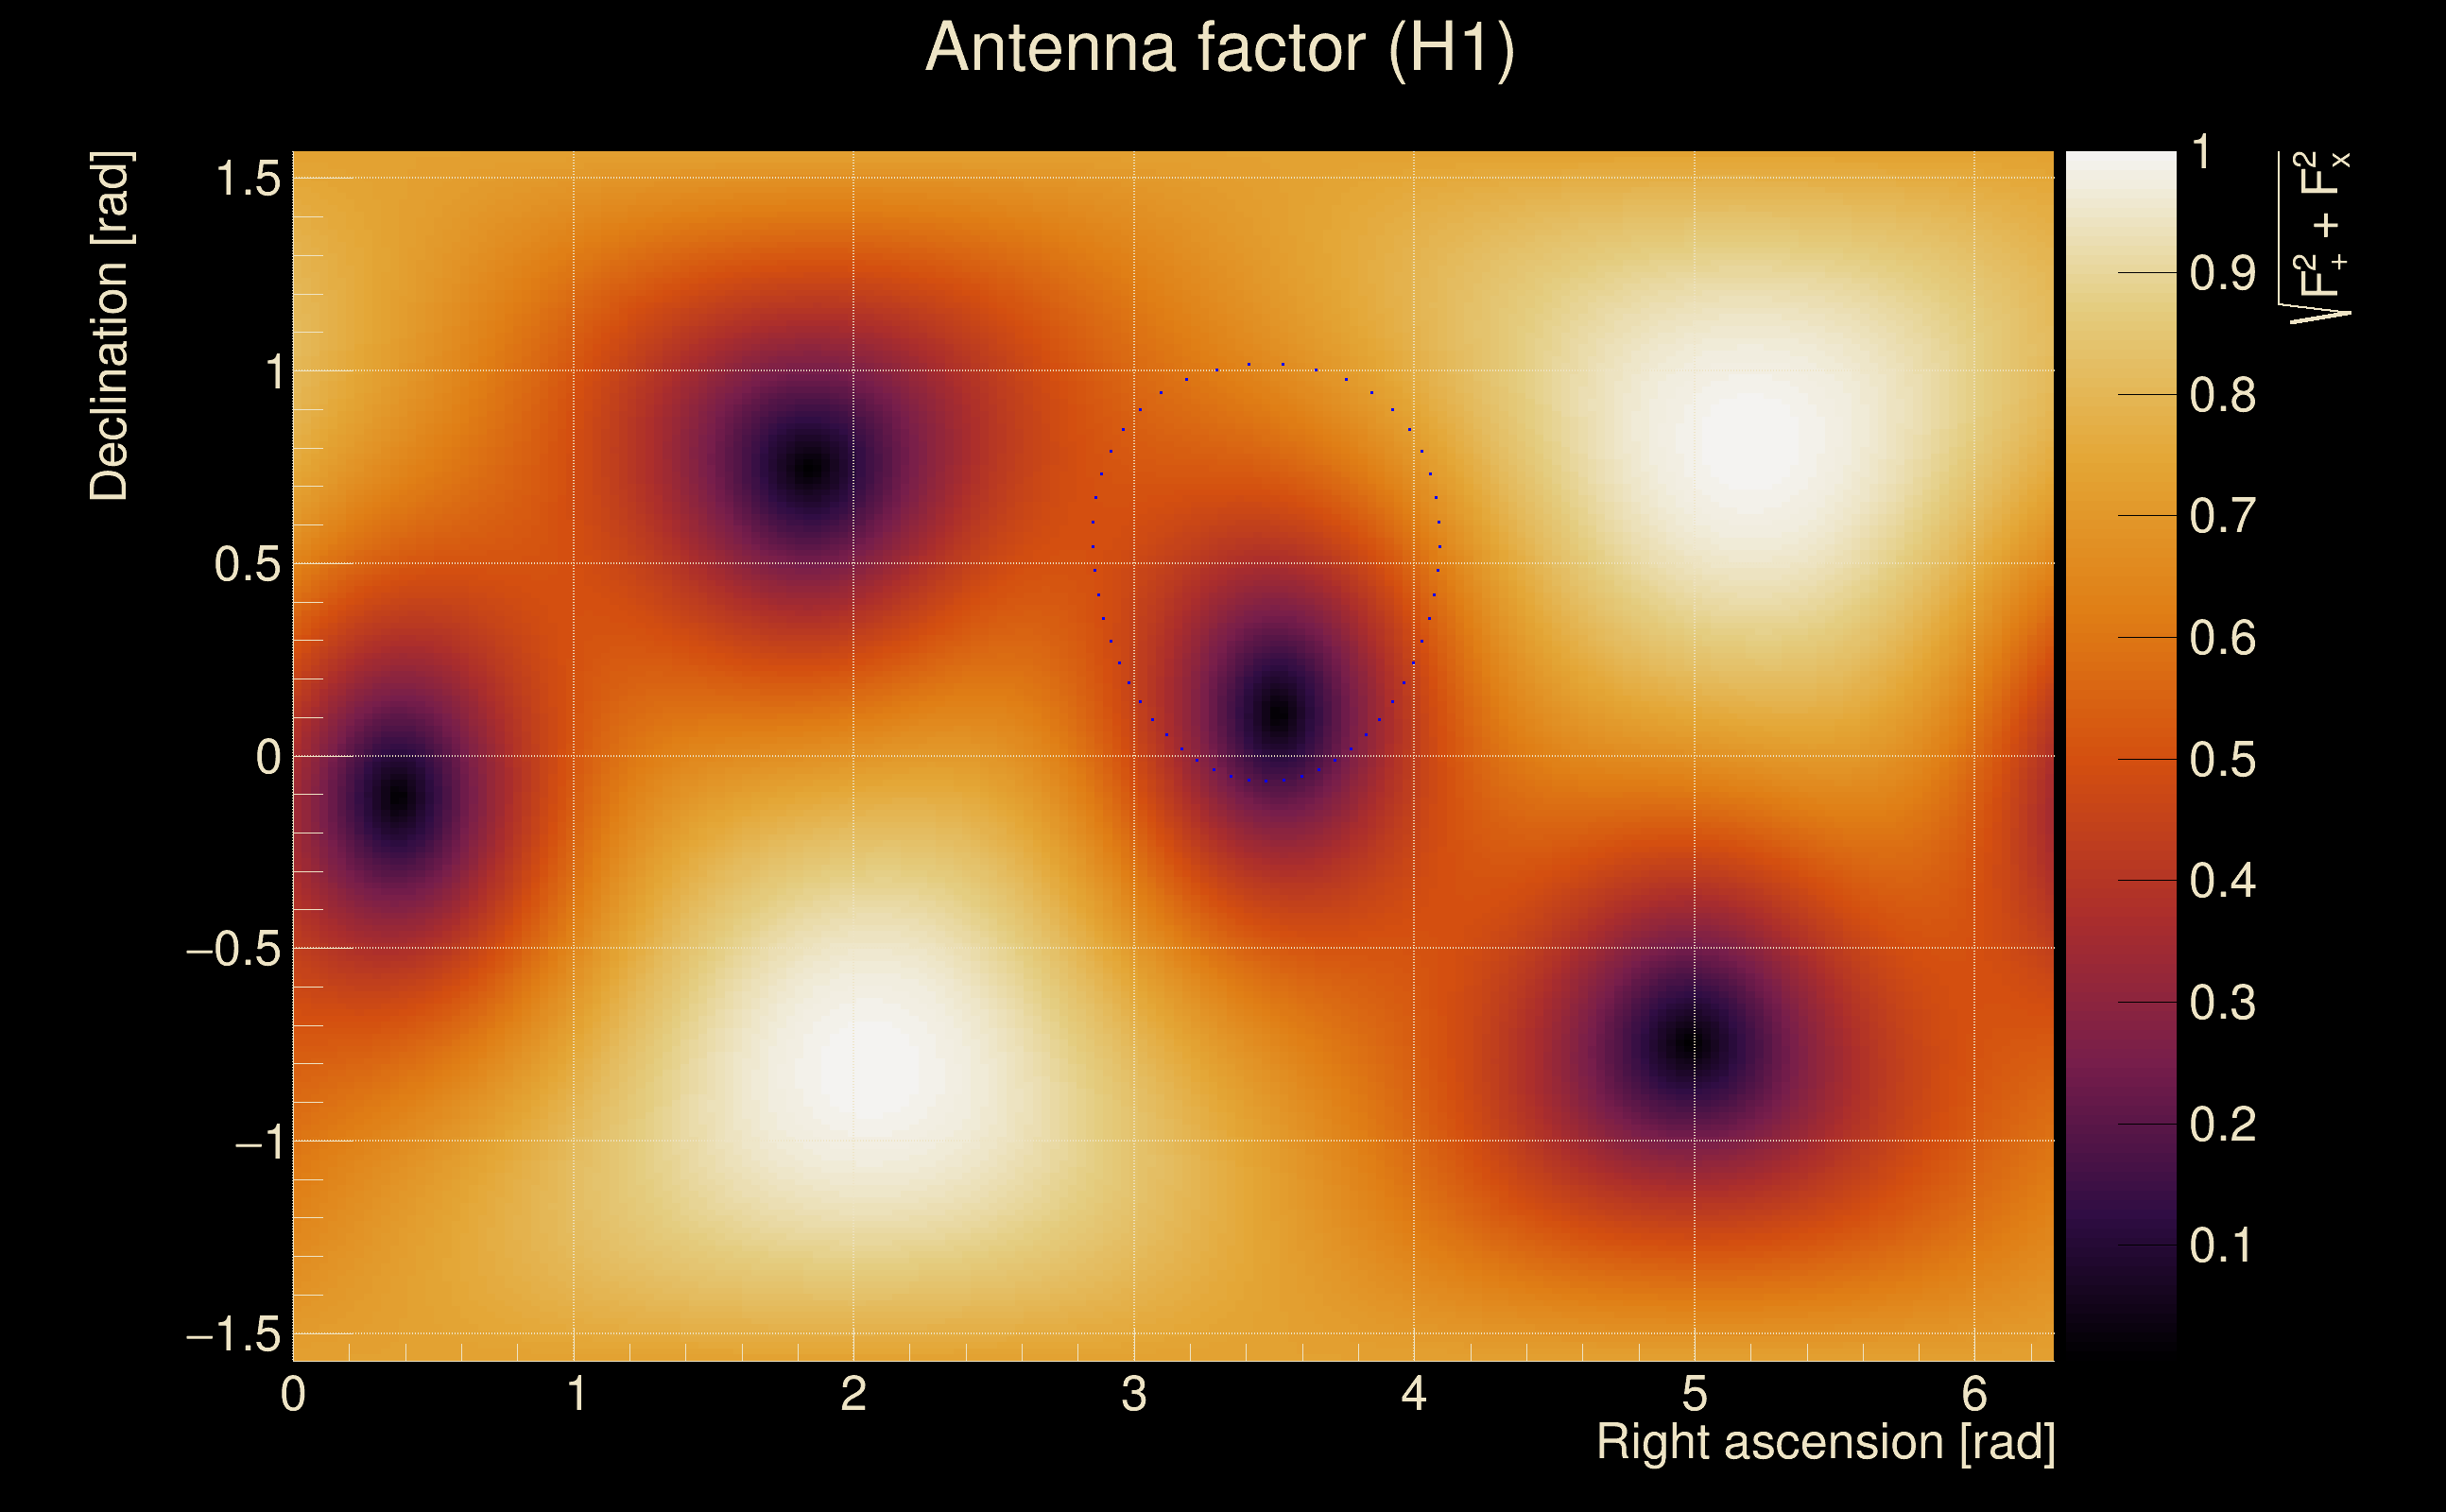
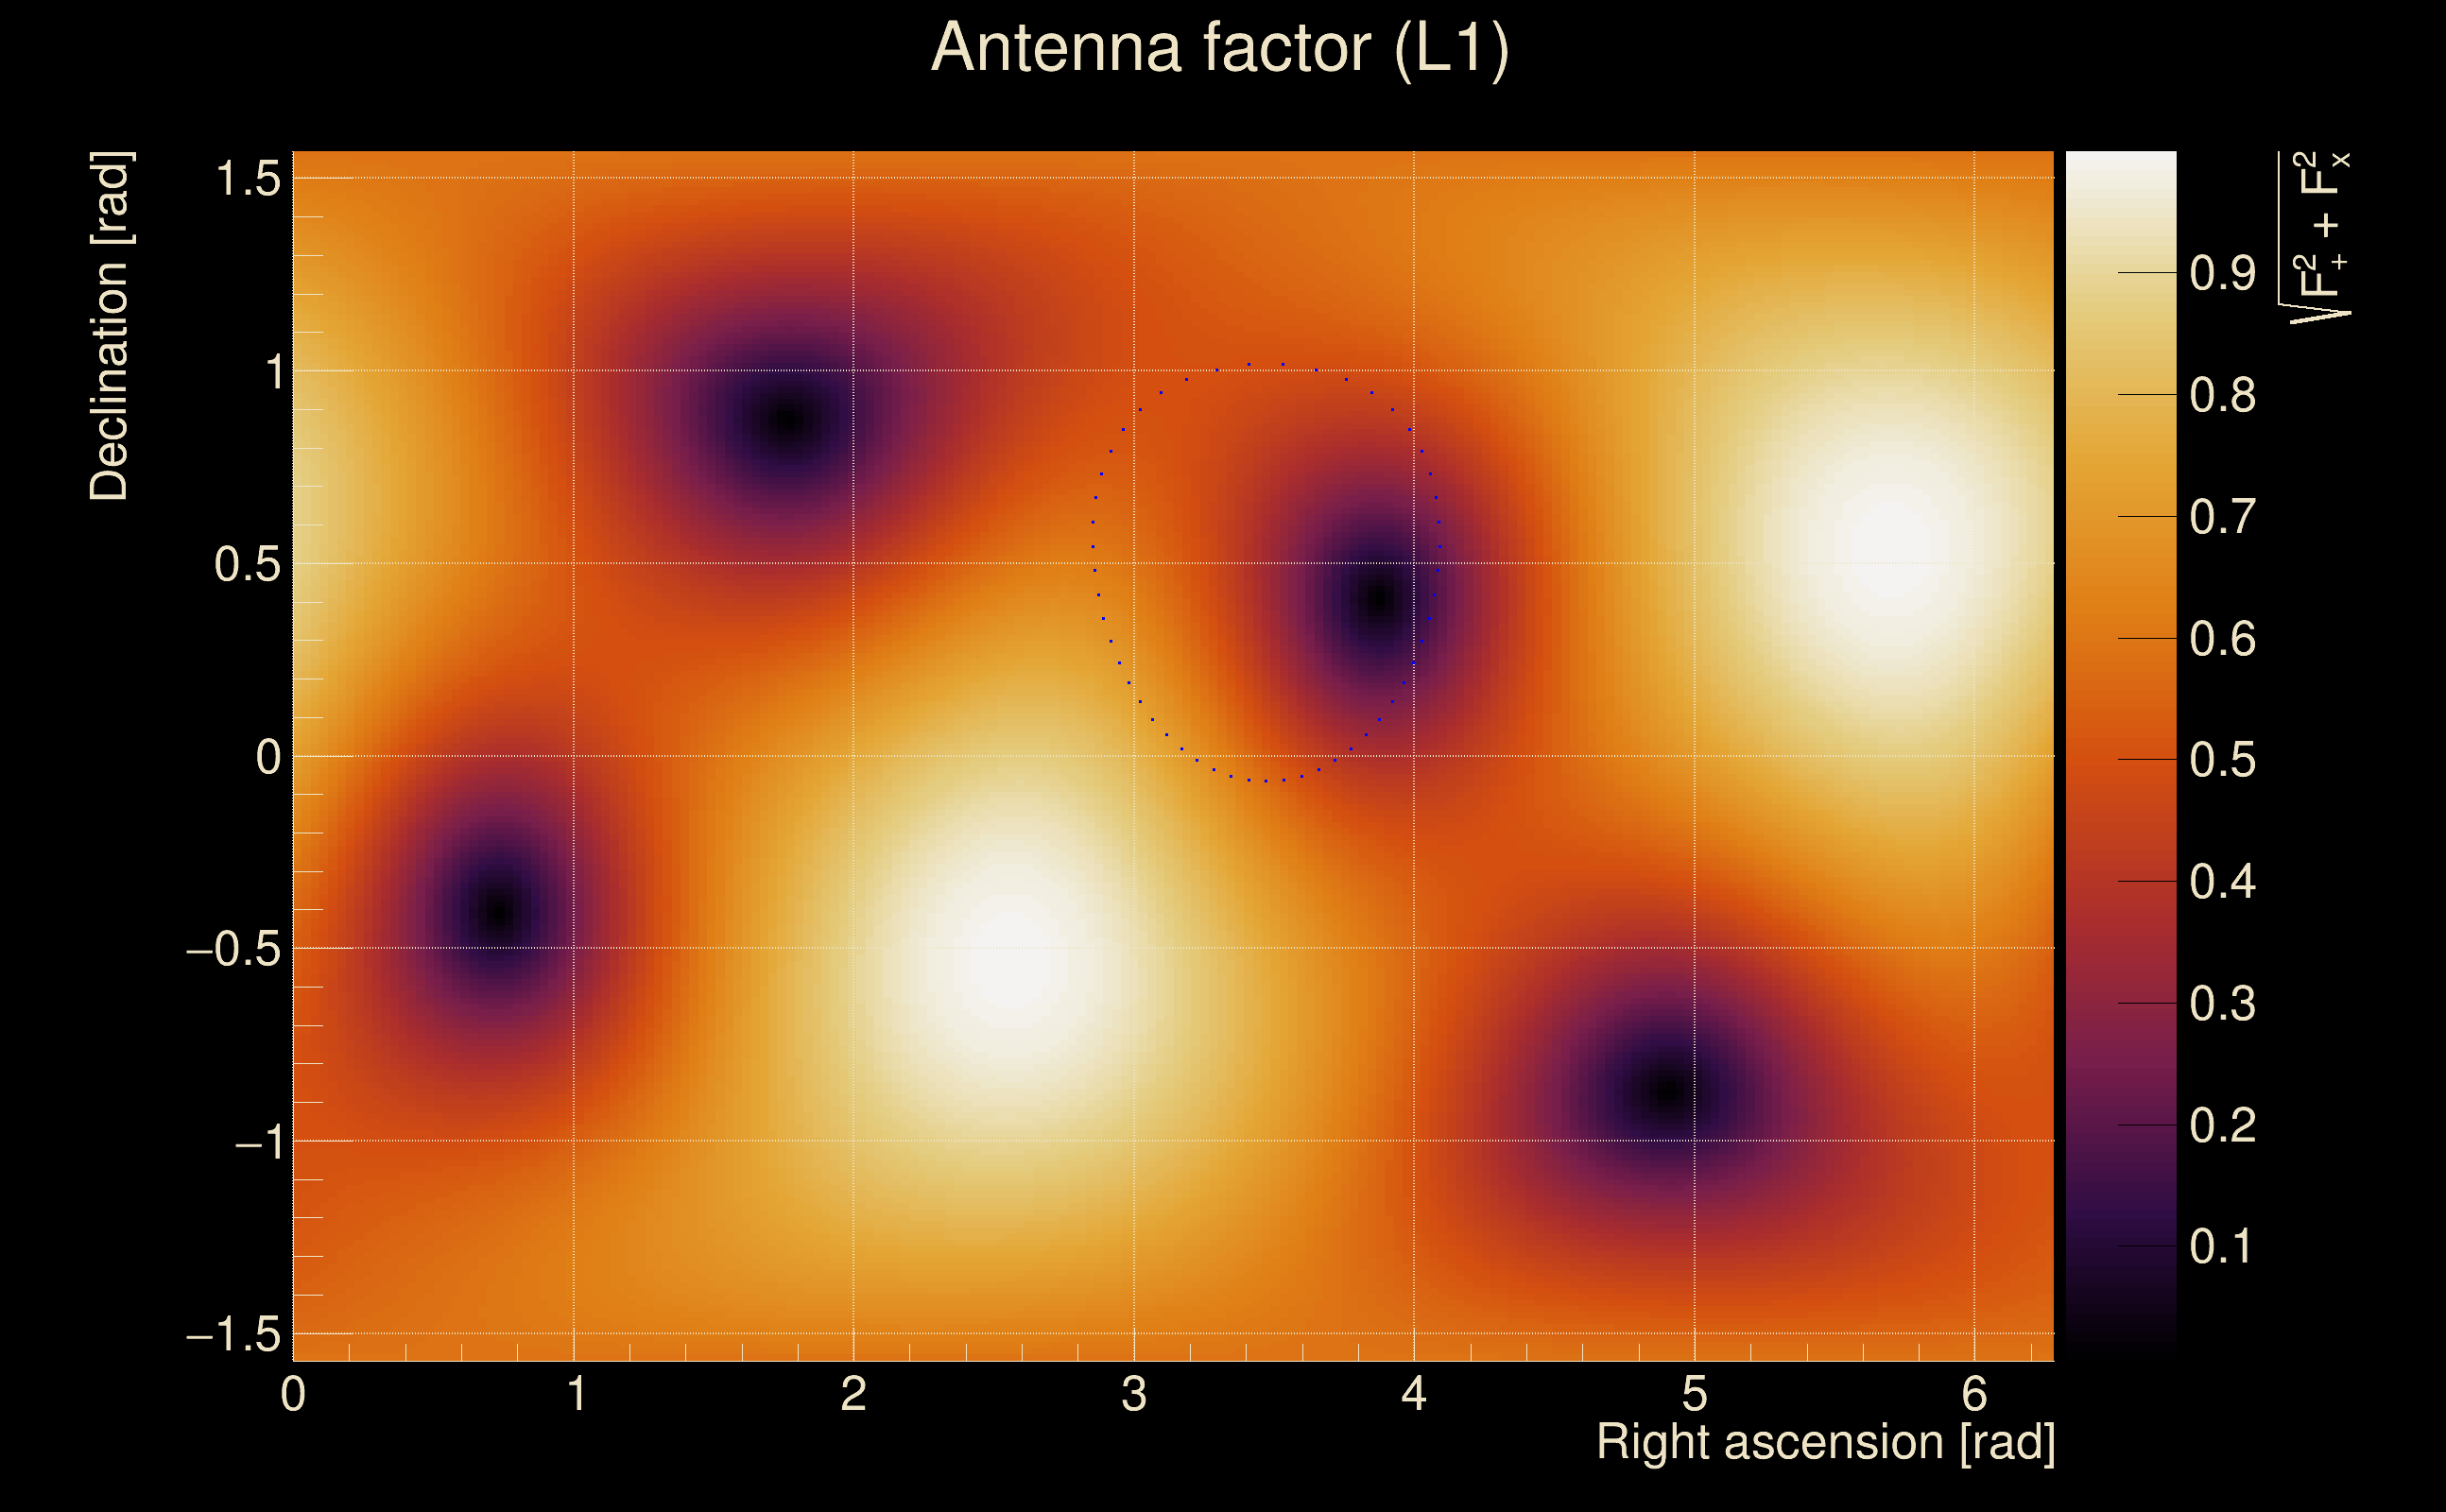
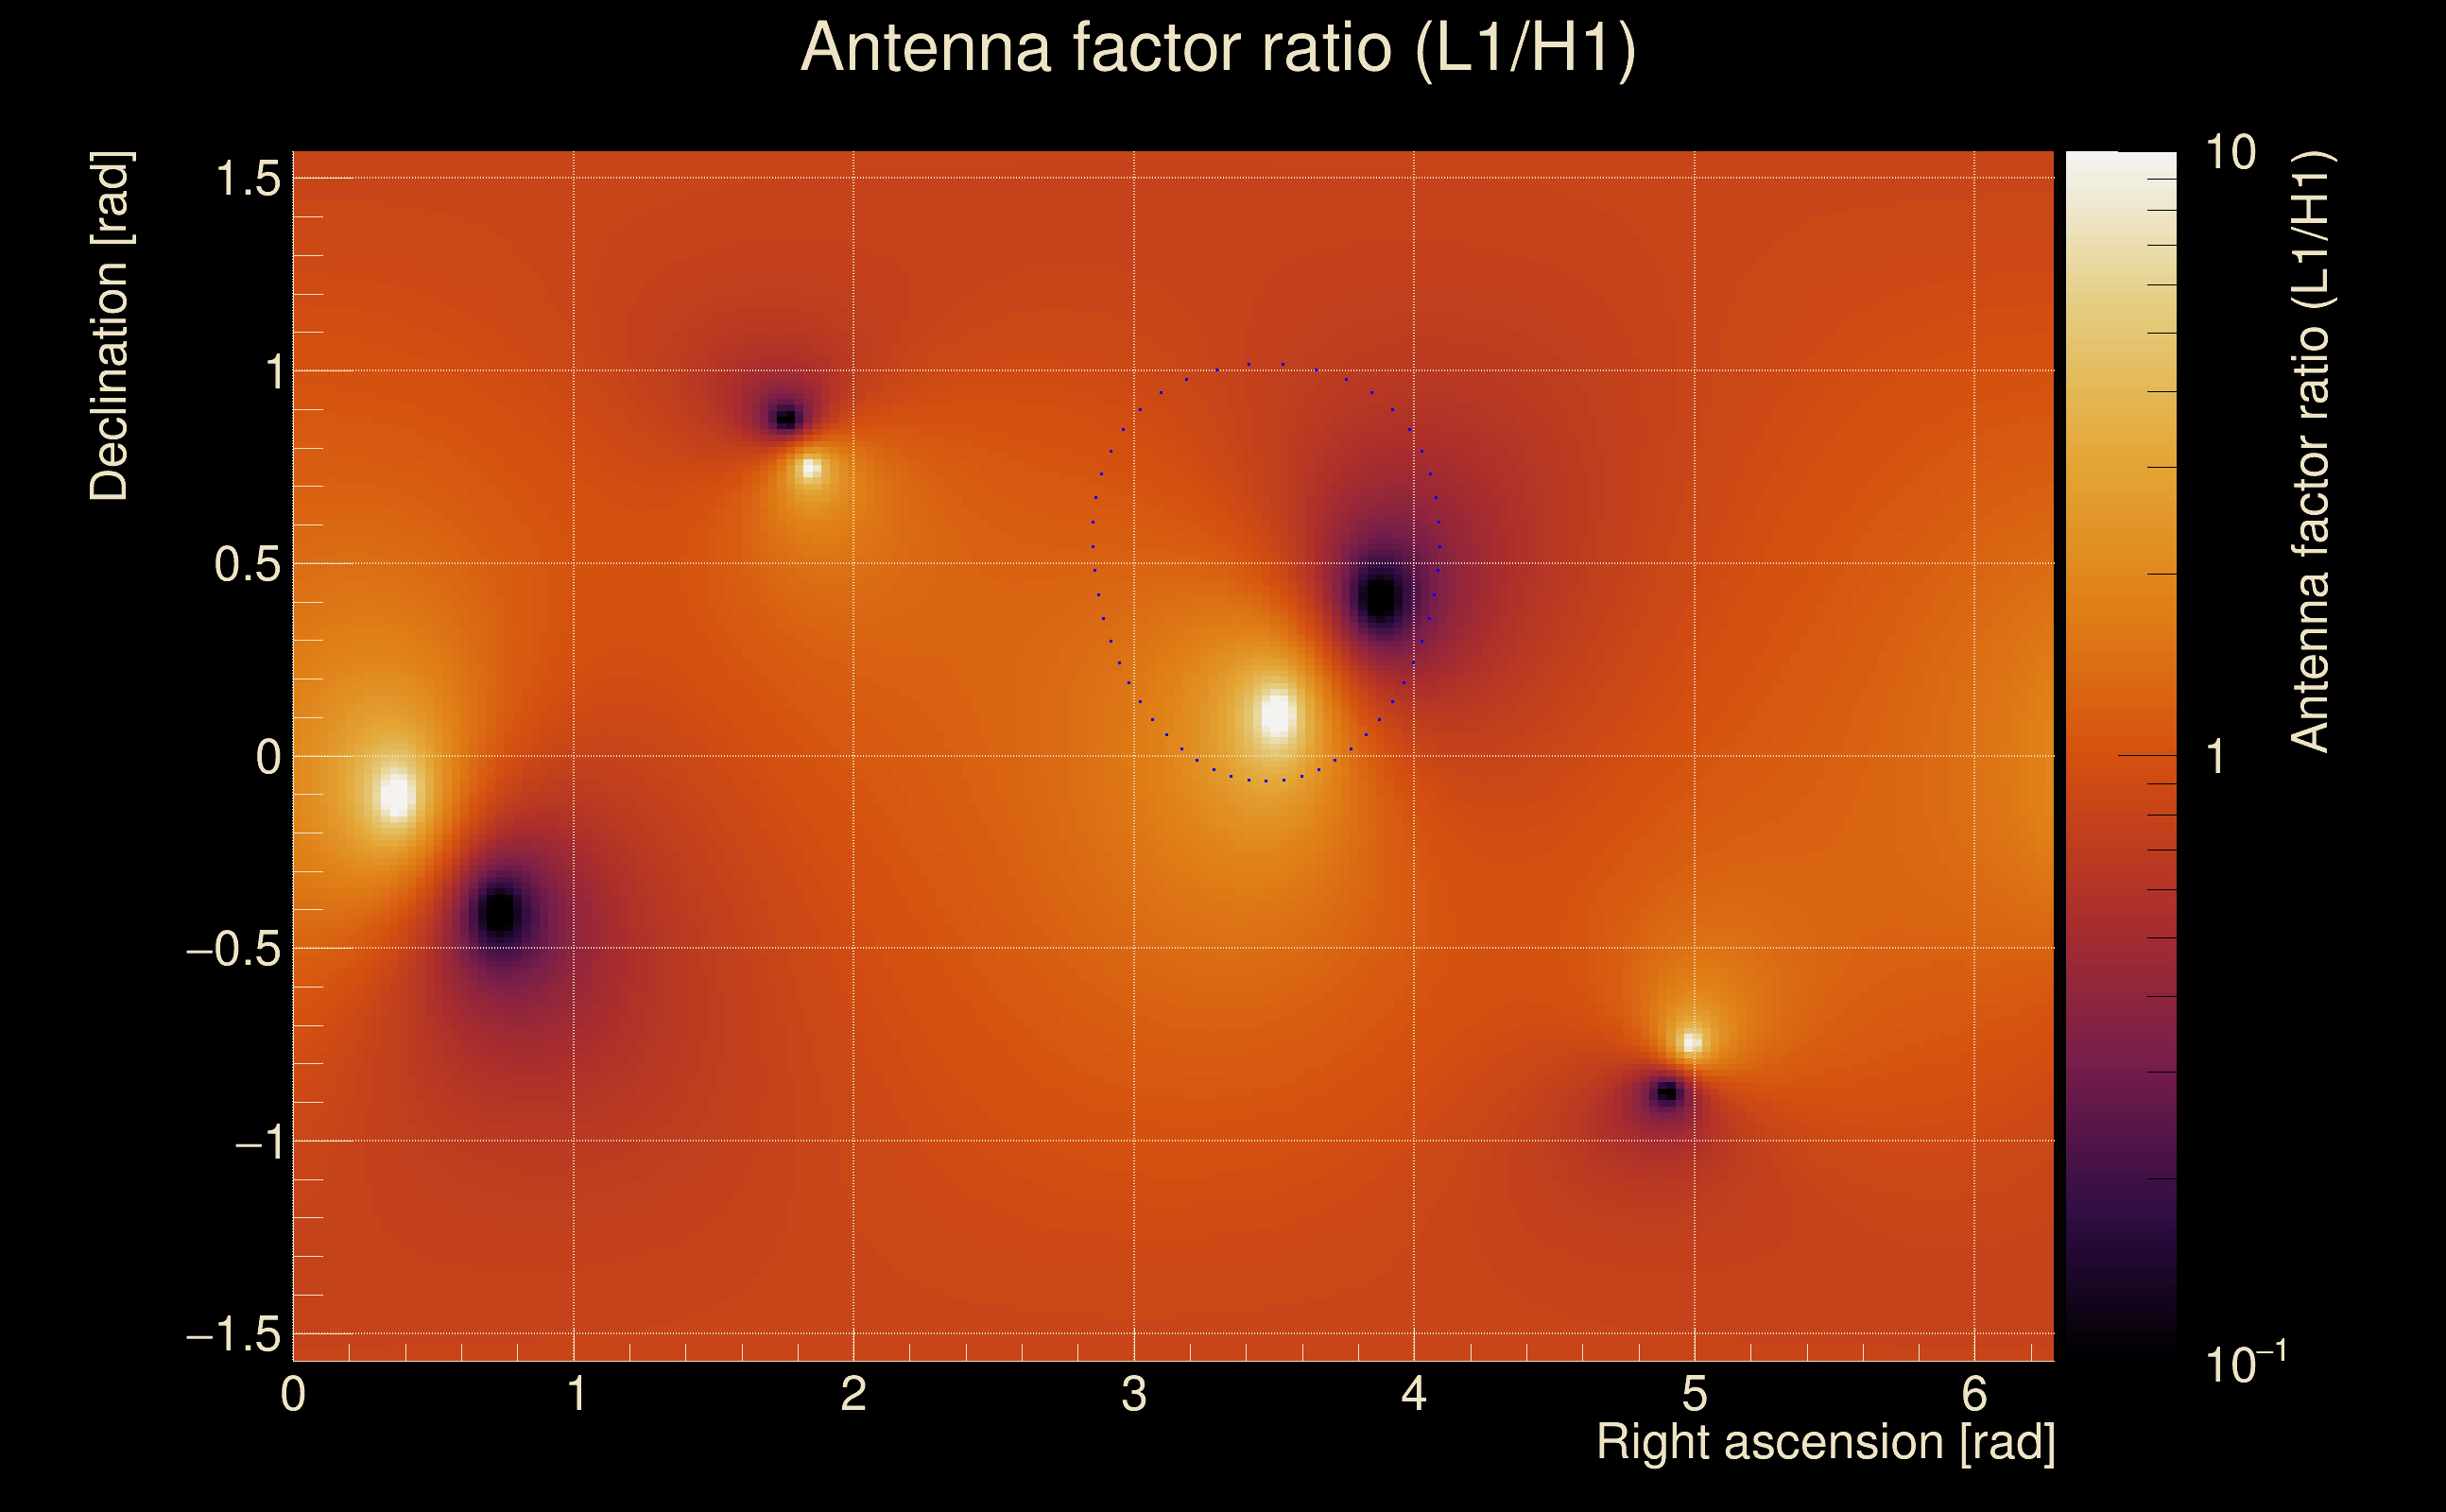
| Target sky positon: | Ra: 3.68109, Dec: 0.94792 [rad] |
| List of input Ox files: | TargIxfw_injpt3_file_list.txt (71 files) |
| Analysis result file: | TargIxfw_injpt3_results-0.root |
| Slice selected for the the fakeground: | slice index=73 (1.61 s), time lag = 0 s |
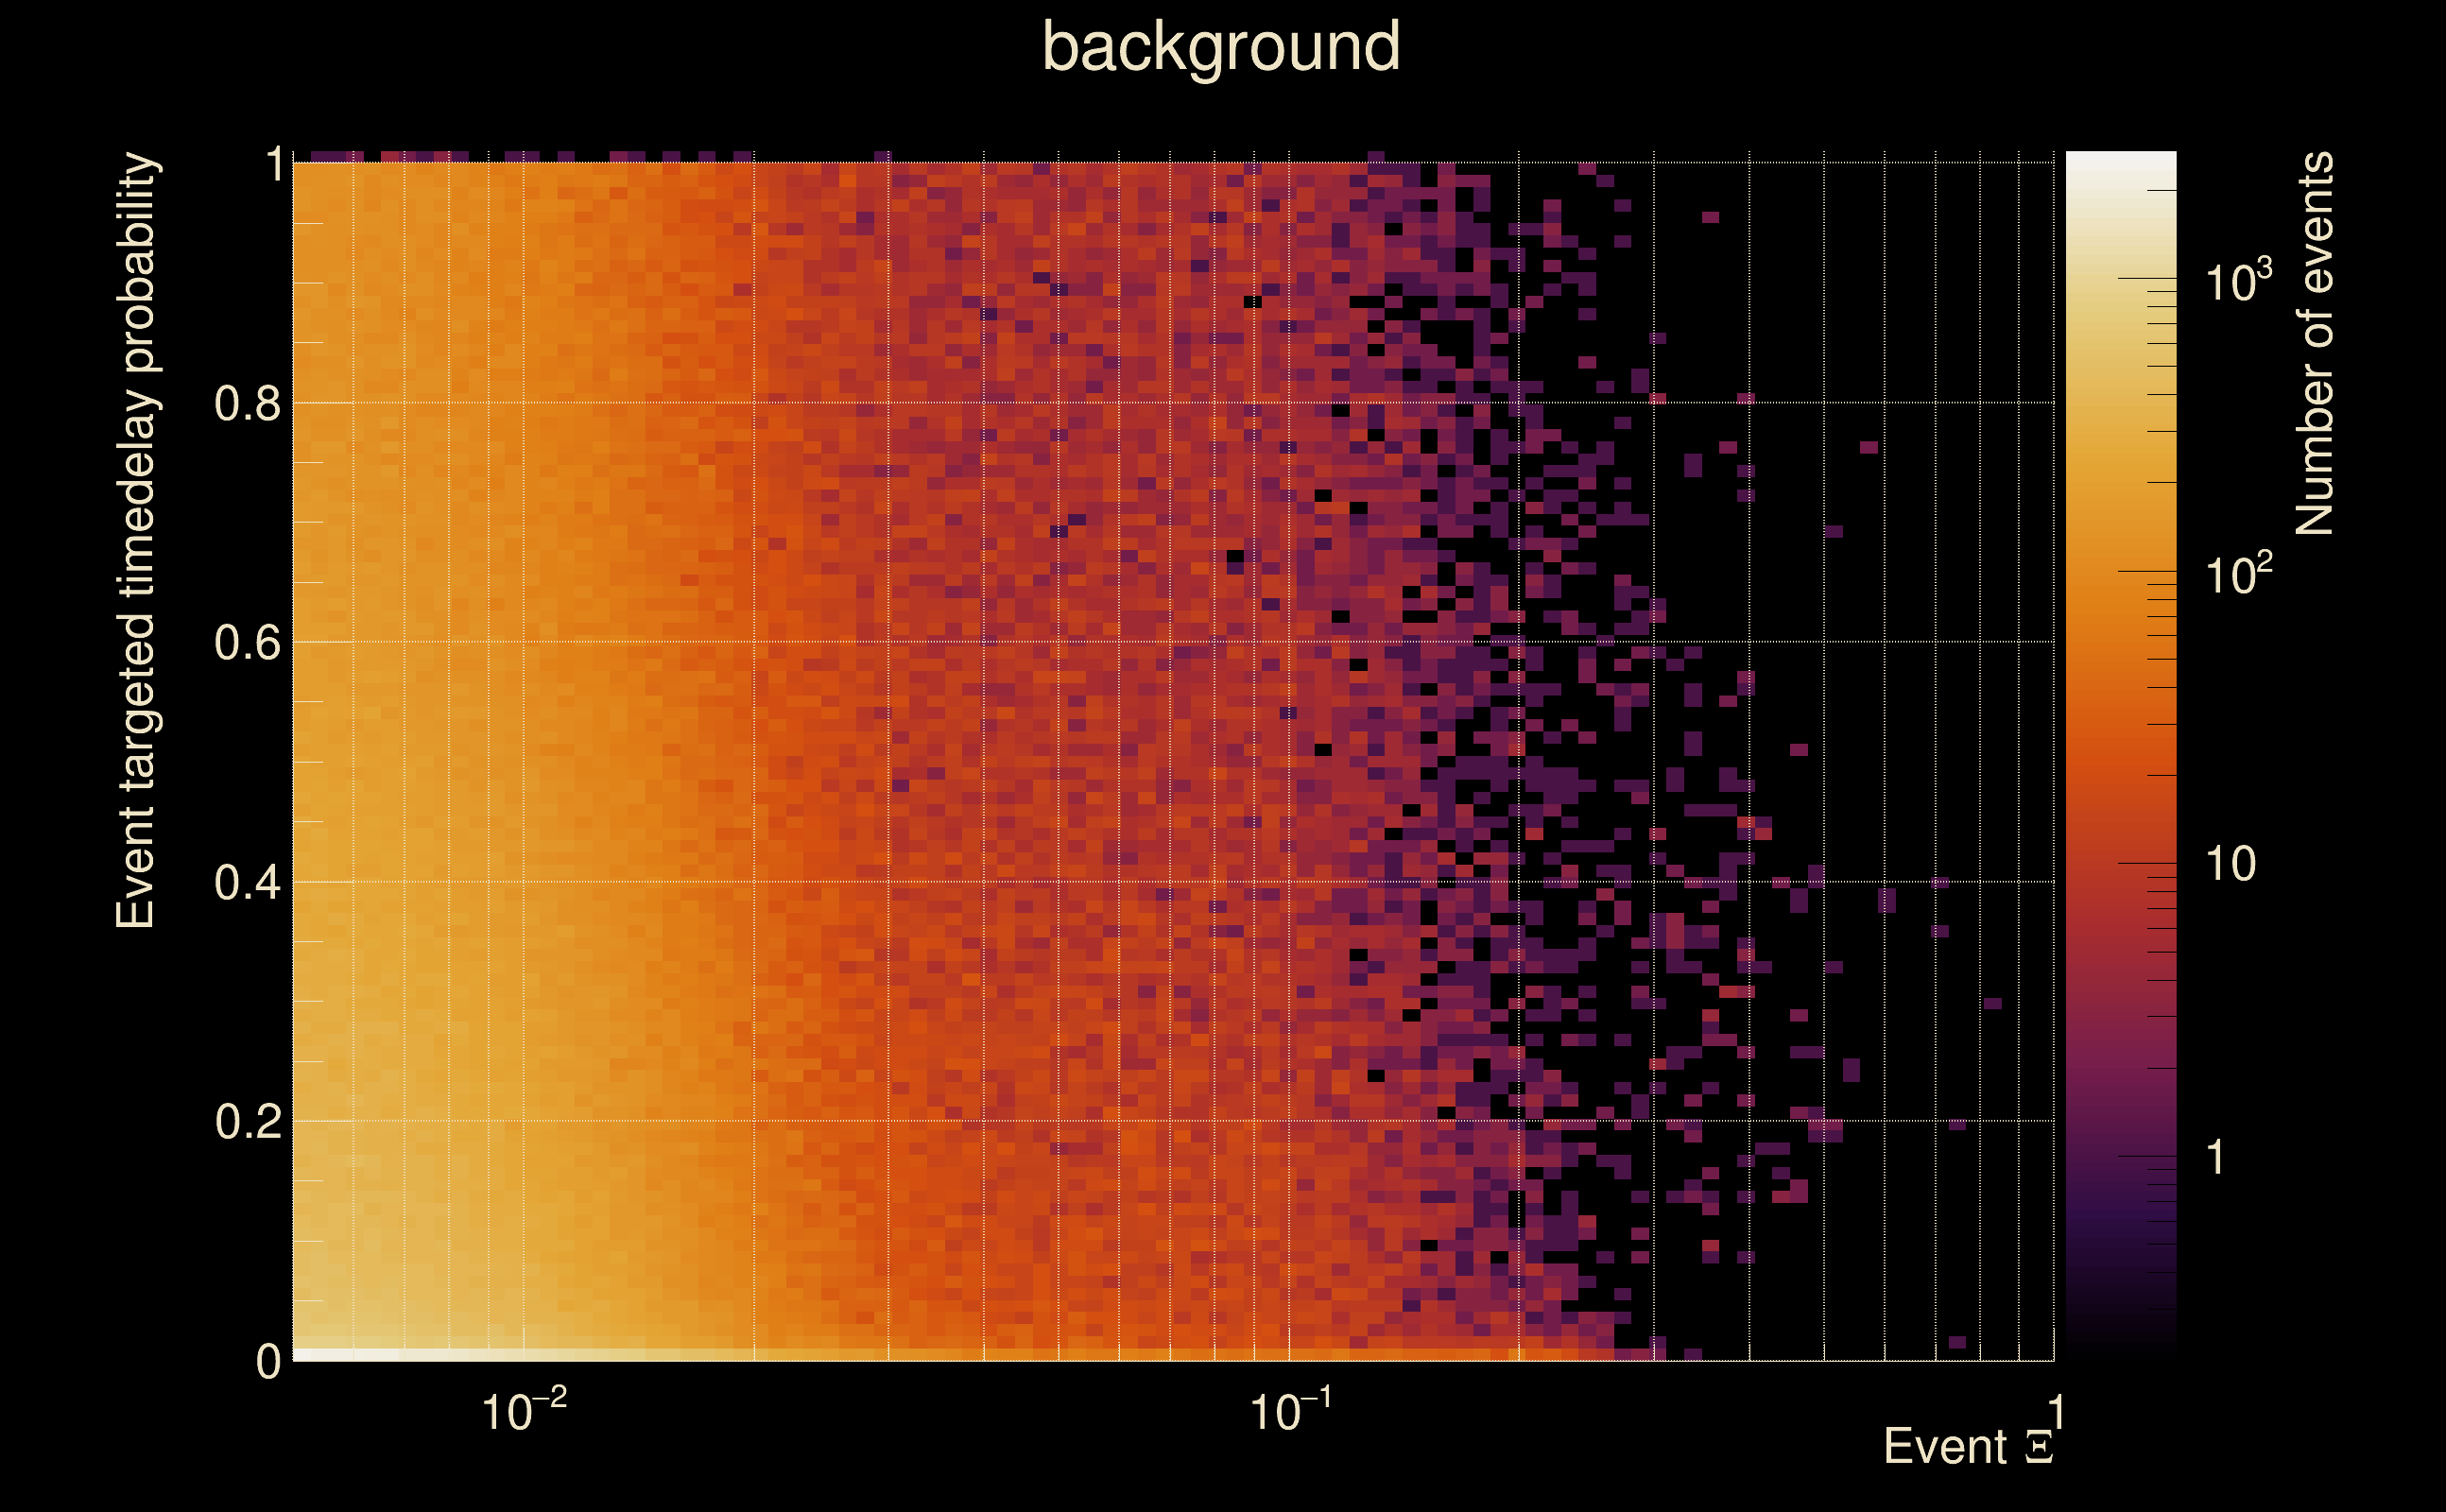
| Foreground | Fakeground | Background | ||
|---|---|---|---|---|
| Number of processed ox events | 12111 | 12111 | 2603865 | |
| Start Date (detector 0) | Mon May 15 14:13:25 2023 UTC | Mon May 15 14:13:25 2023 UTC | Mon May 15 14:13:25 2023 UTC | |
| End Date (detector 0) | Thu May 18 15:54:40 2023 UTC | Thu May 18 15:54:40 2023 UTC | Thu May 18 15:54:40 2023 UTC | |
| Start GPS (detector 0) | 1368195223 | 1368195223 | 1368195223 | |
| End GPS (detector 0) | 1368460498 | 1368460498 | 1368460498 | |
| Used livetime (detector 0) | 60875 s | 60875 s | 60875 s | |
| Start Date (detector 1) | Mon May 15 14:13:25 2023 UTC | Mon May 15 14:13:25 2023 UTC | Mon May 15 14:13:25 2023 UTC | |
| End Date (detector 1) | Thu May 18 15:54:40 2023 UTC | Thu May 18 15:54:40 2023 UTC | Thu May 18 15:54:40 2023 UTC | |
| Start GPS (detector 1) | 1368195223 | 1368195223 | 1368195223 | |
| End GPS (detector 1) | 1368460498 | 1368460498 | 1368460498 | |
| Used livetime (detector 1) | 60875 s | 60875 s | 60875 s | |
| Cumulative livetime | 121110 s | 121110 s | 26038650 s | |
| 0 years, 1 days, 9 hours, 38 min, 30 s | 0 years, 1 days, 9 hours, 38 min, 30 s | 0 years, 301 days, 8 hours, 57 min, 30 s |
|
|
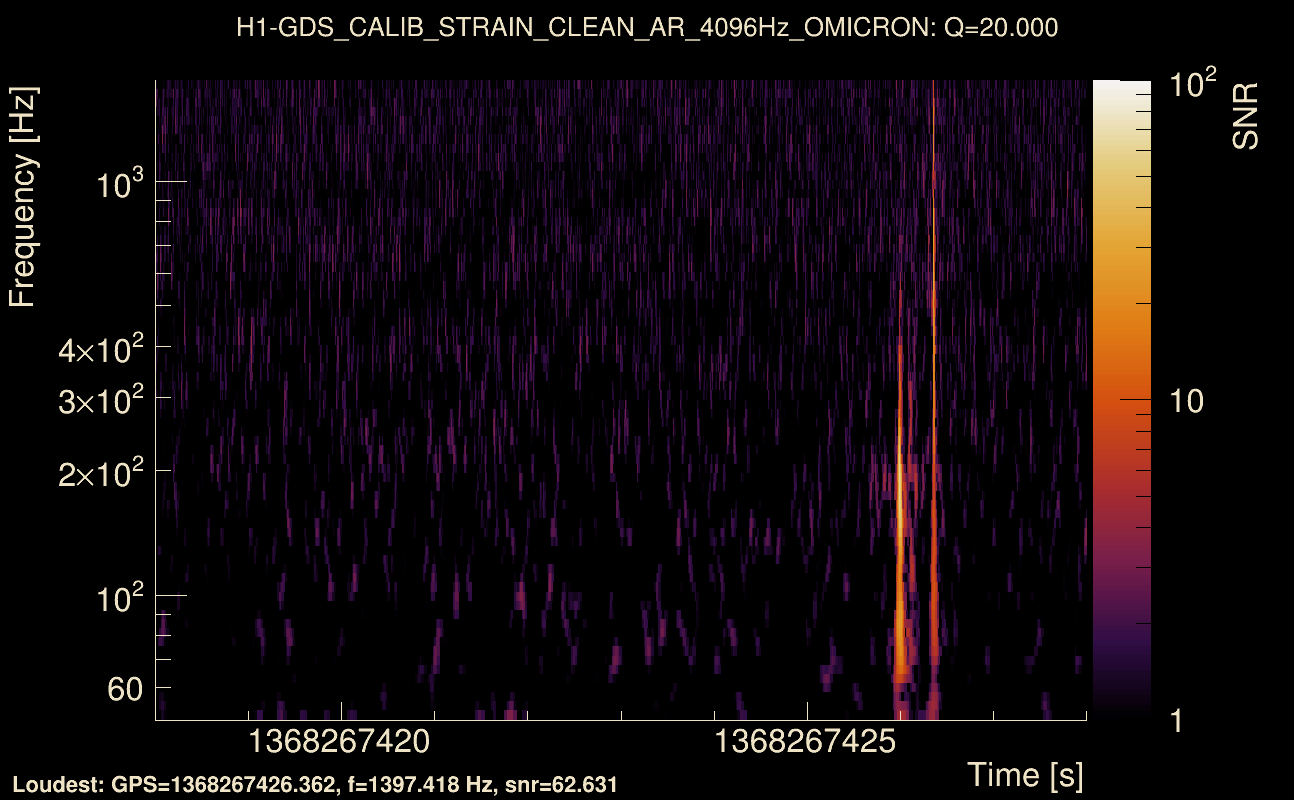
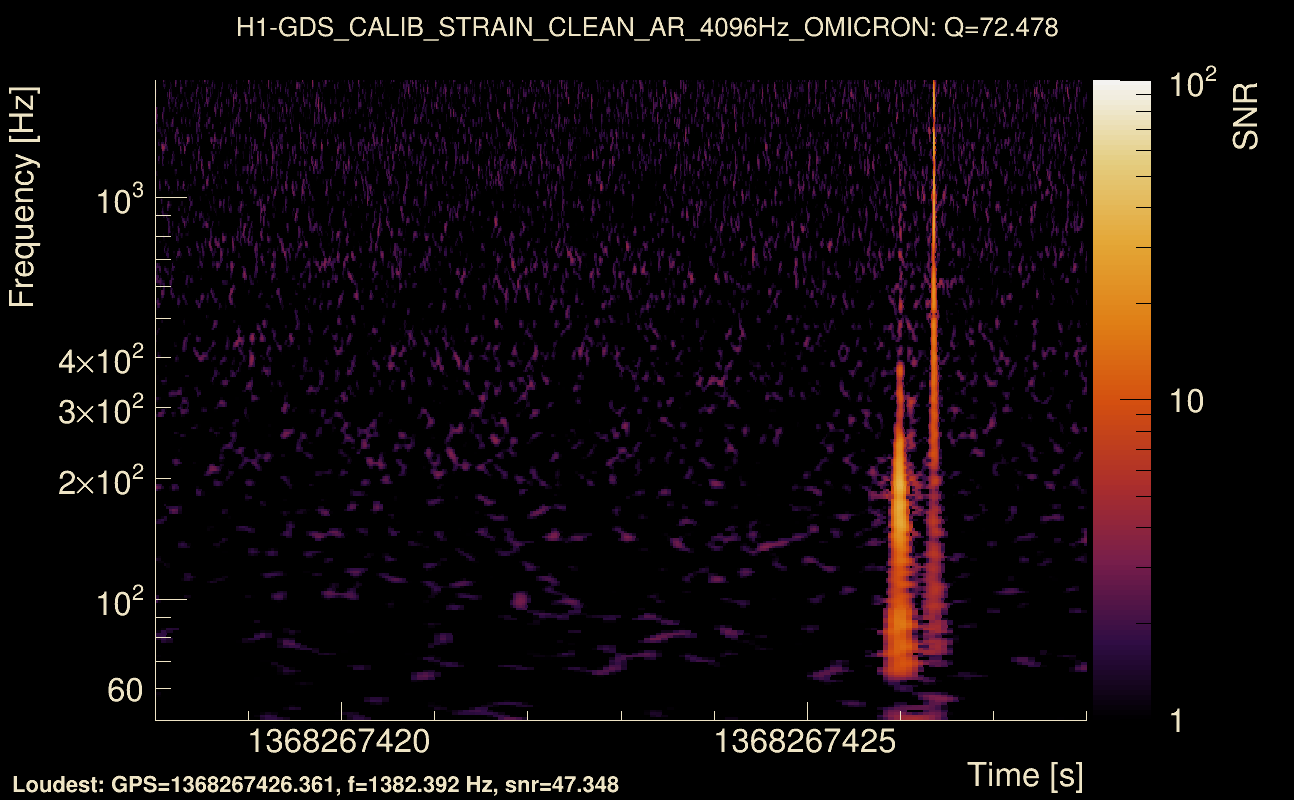
| Event time t(H1): | GPS = 1368267423 (Tue May 16 10:16:45 2023 ) → GPS = 1368267433 (Tue May 16 10:16:55 2023 ) |
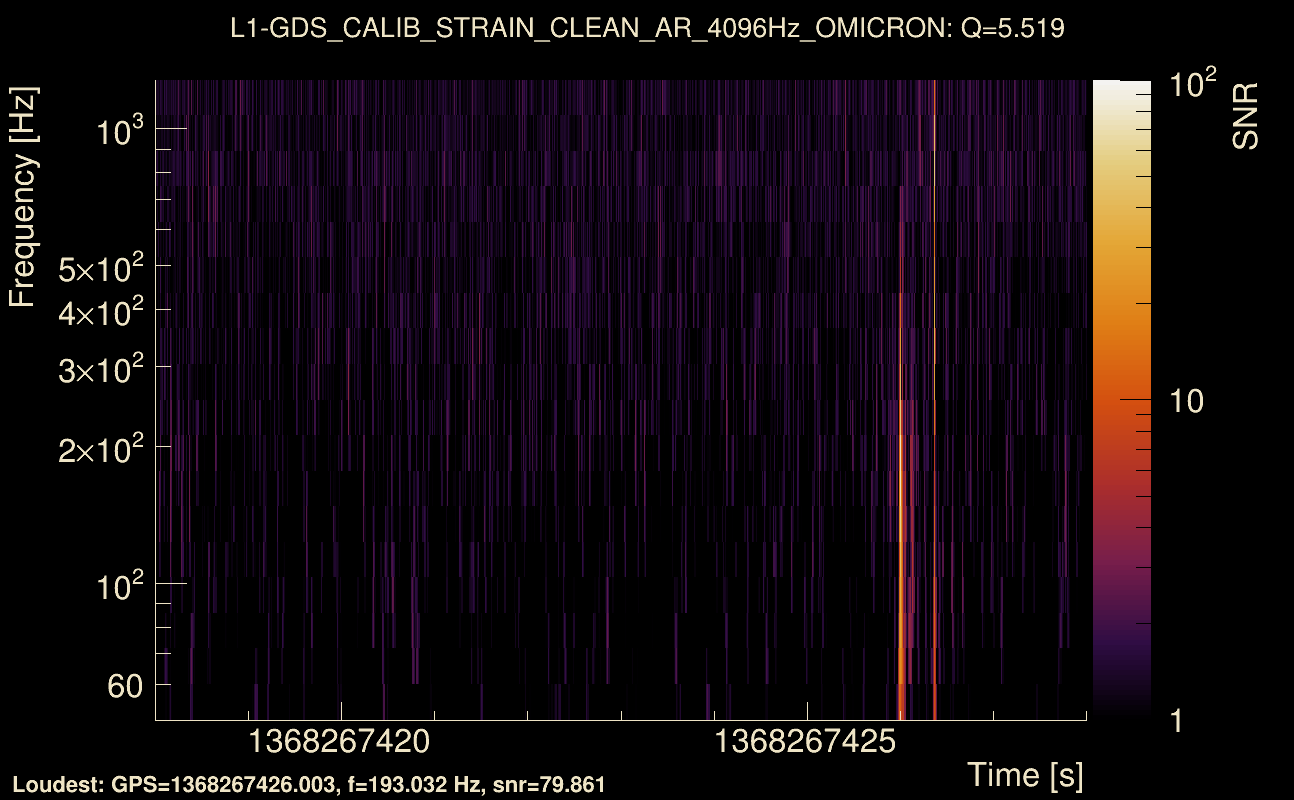
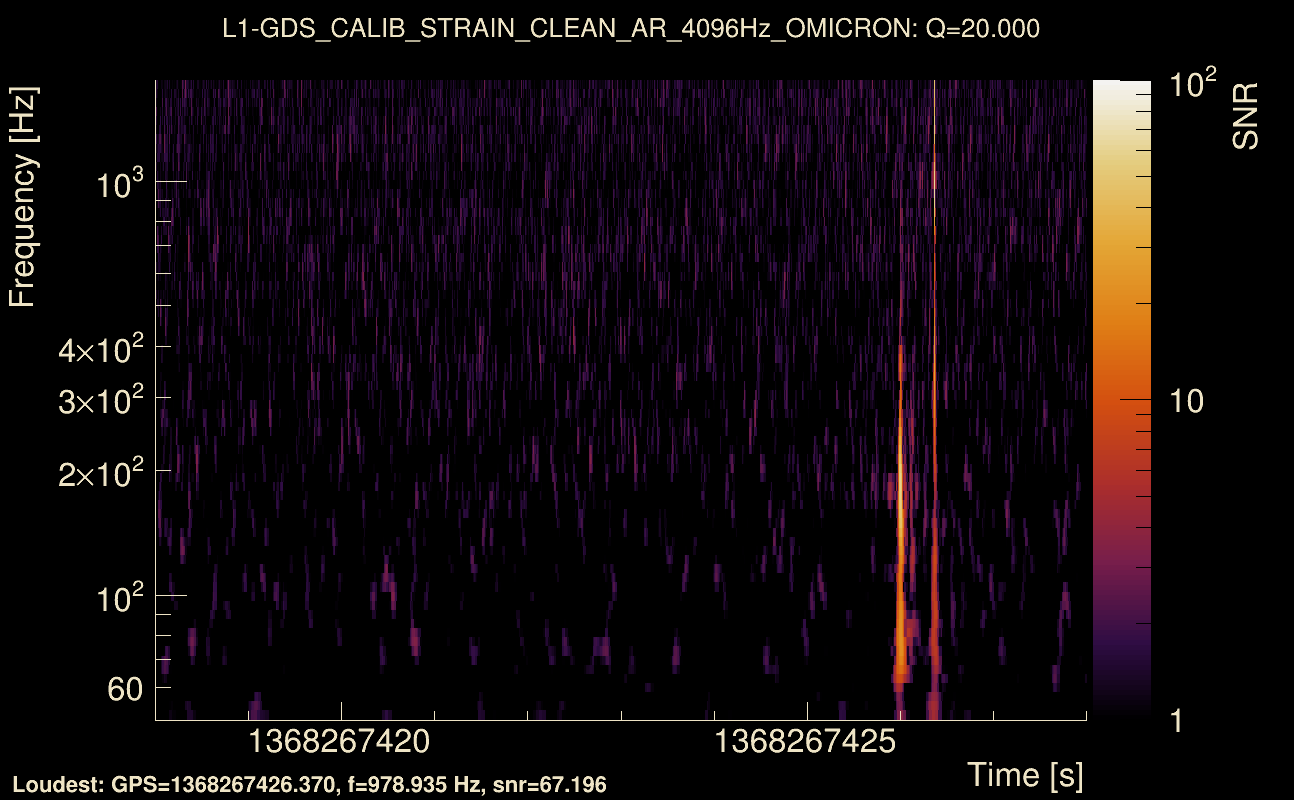
| Event time t(L1): | GPS = 1368267423 (Tue May 16 10:16:55 2023 ) → GPS = 1368267433 (Tue May 16 10:16:55 2023 ) |
| Omicron analysis time window (H1): | GPS = 1368267420 → GPS = 1368267436 |
| Omicron analysis time window (L1): | GPS = 1368267420 → GPS = 1368267436 |
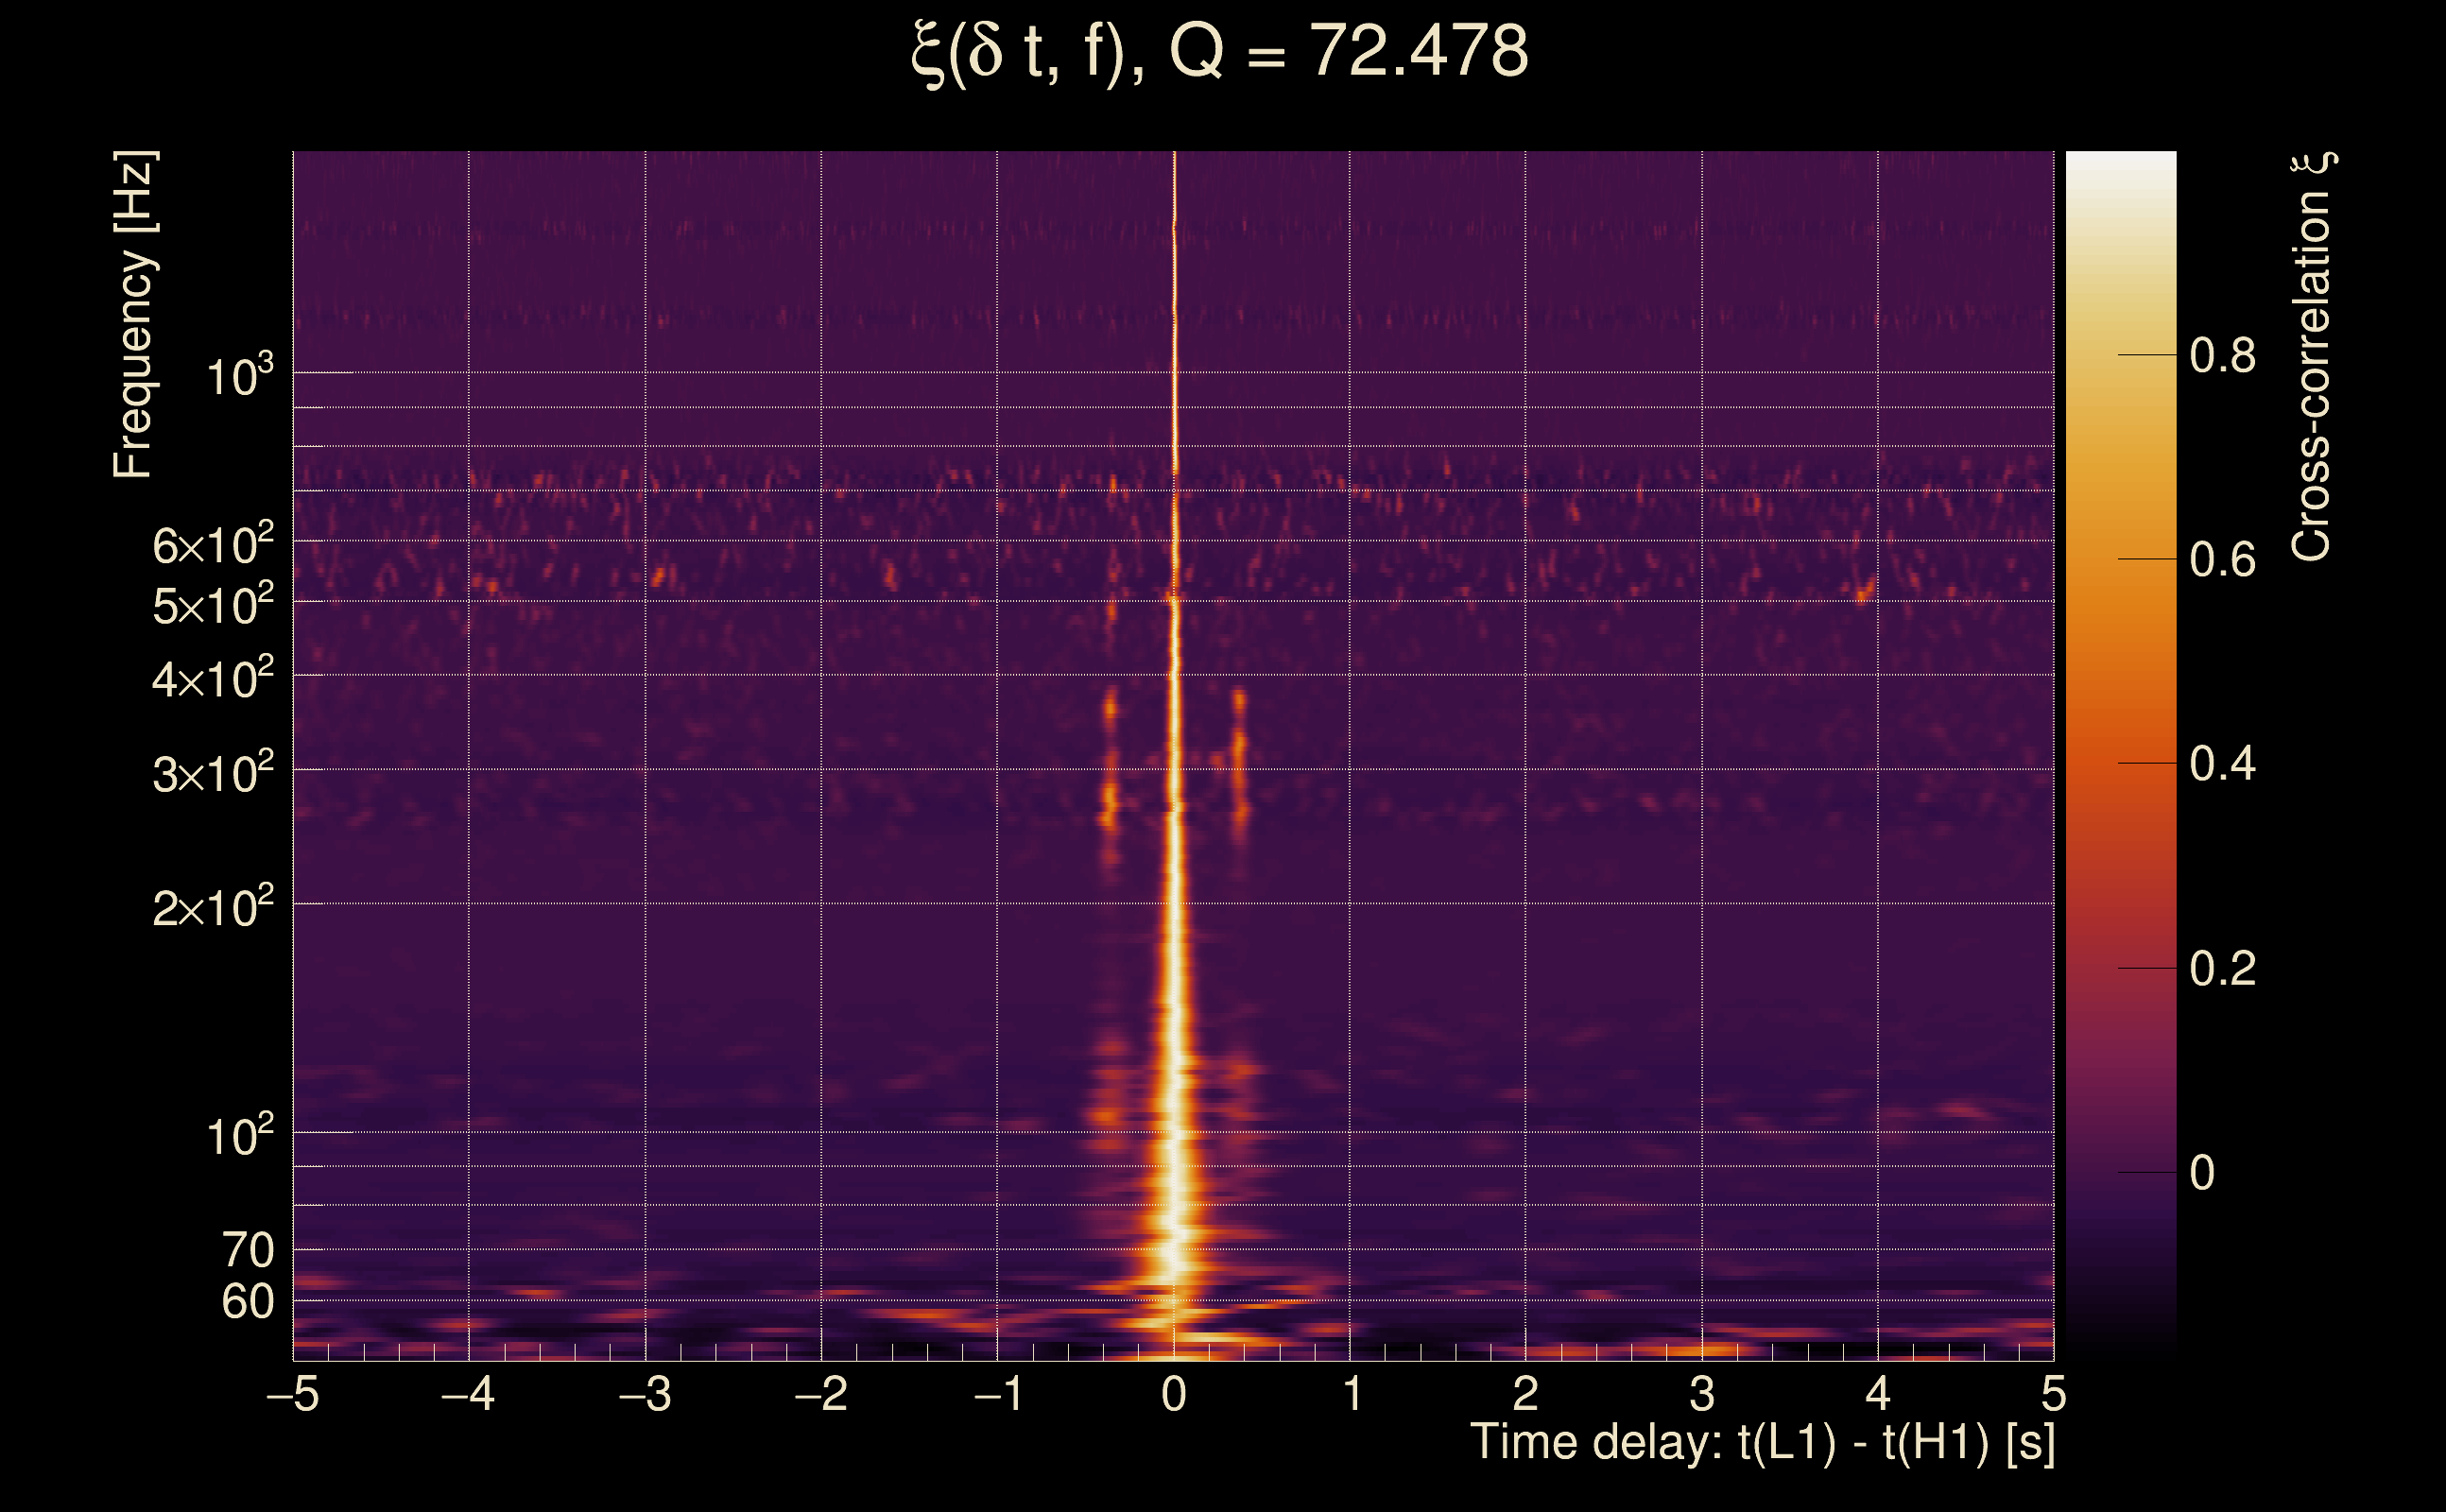
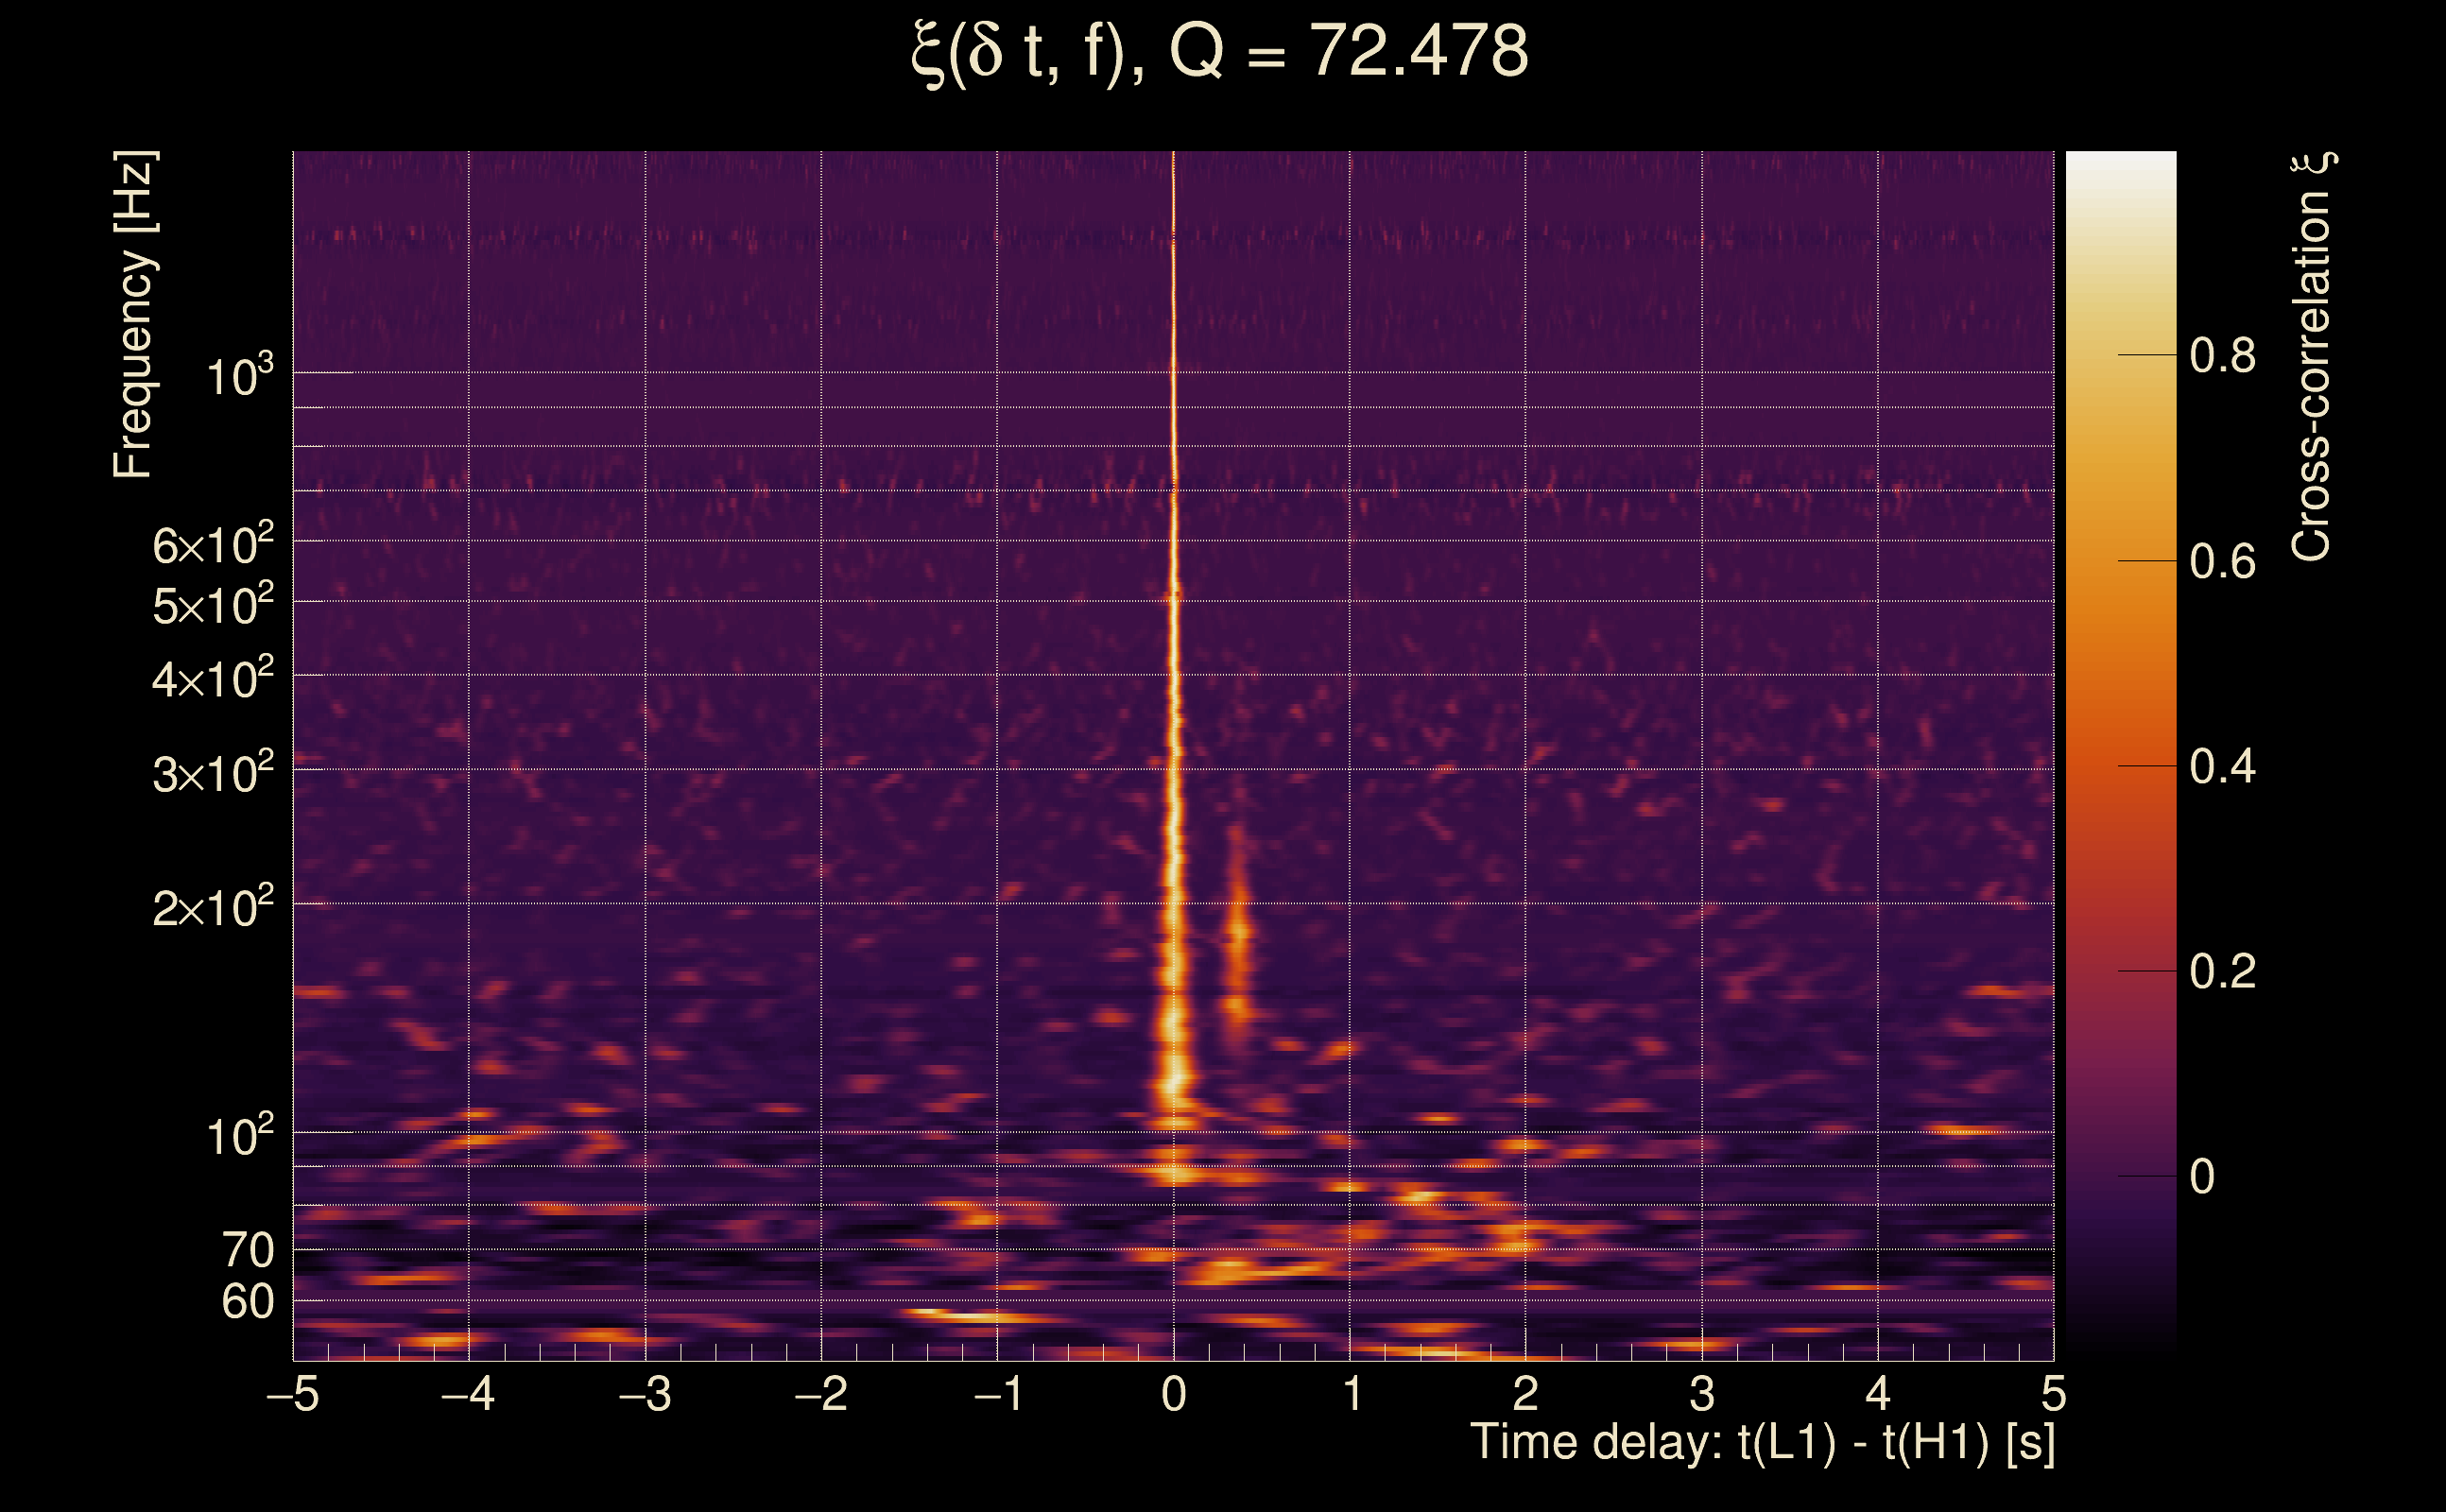
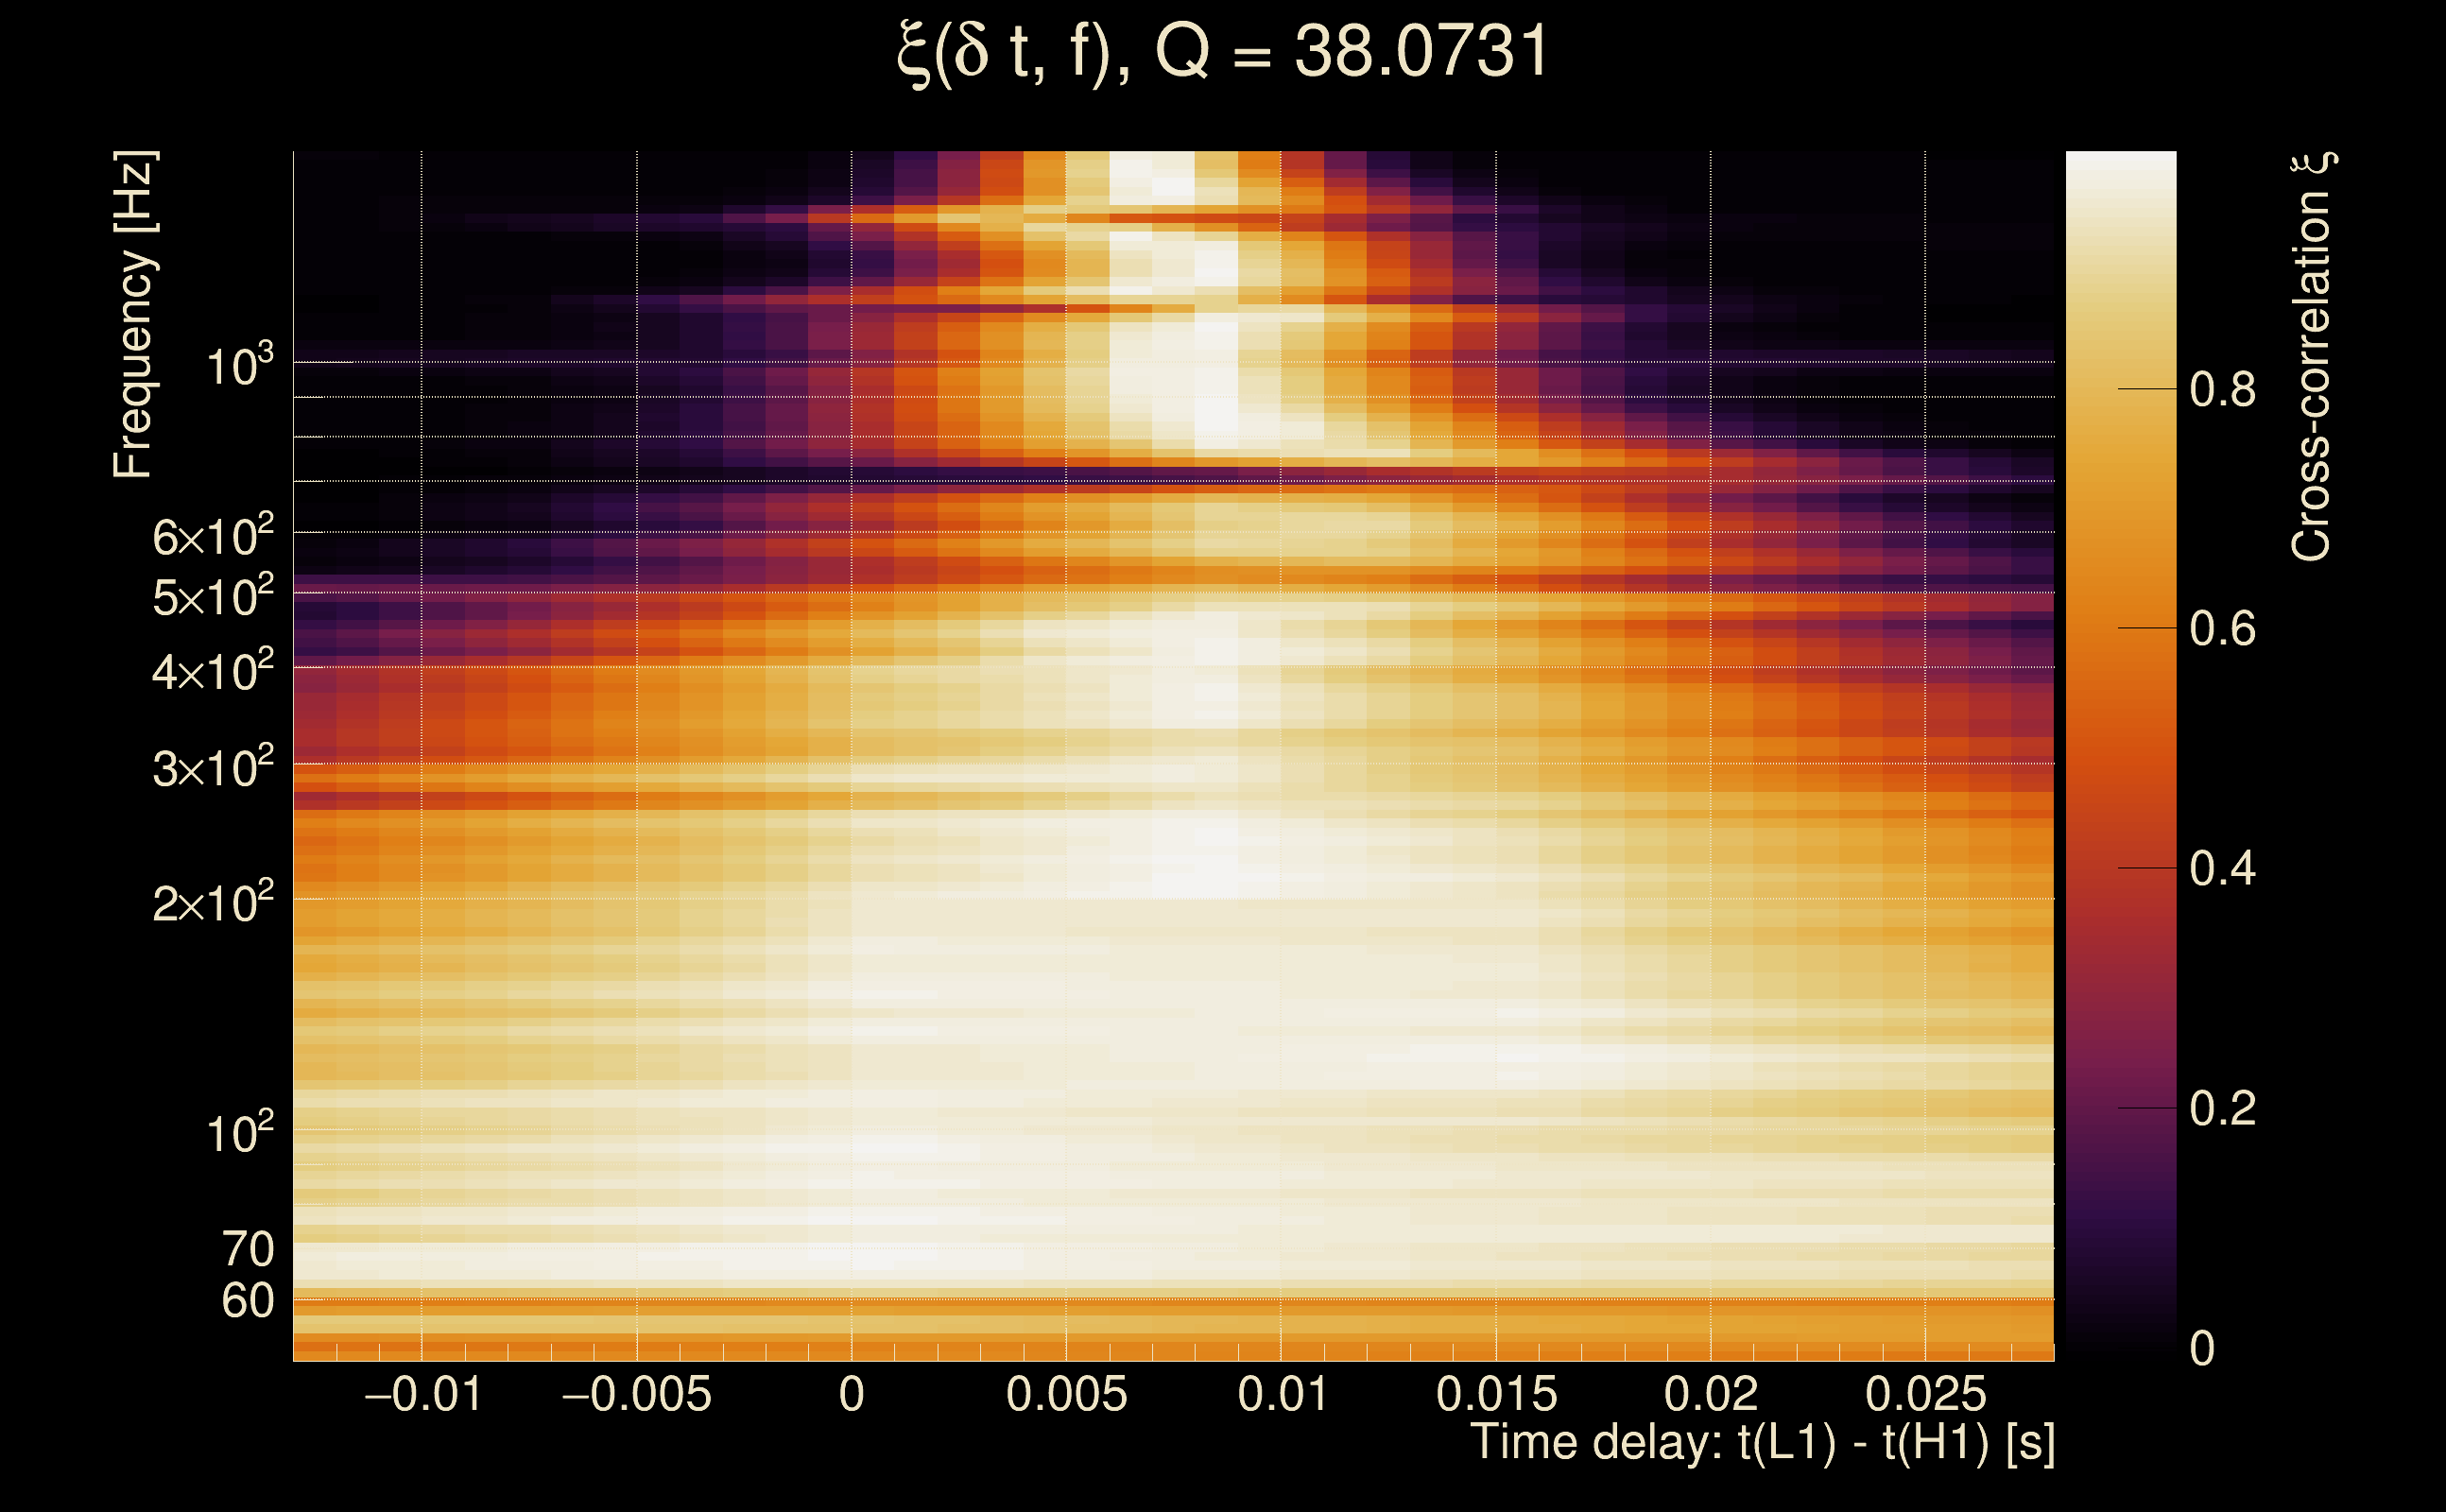
| Time delay between detectors t(L1) - t(H1): | 0.00762958 s (slice index = 108 / 217), δt_gw = 0.00762958 s |
| Time delay standard deviation: | 0.0360554 s |
| [targeted mode] Time delay probability: | 0.996082 (0.00491066 sigmas), δt_target = 1.72247e+45 s |
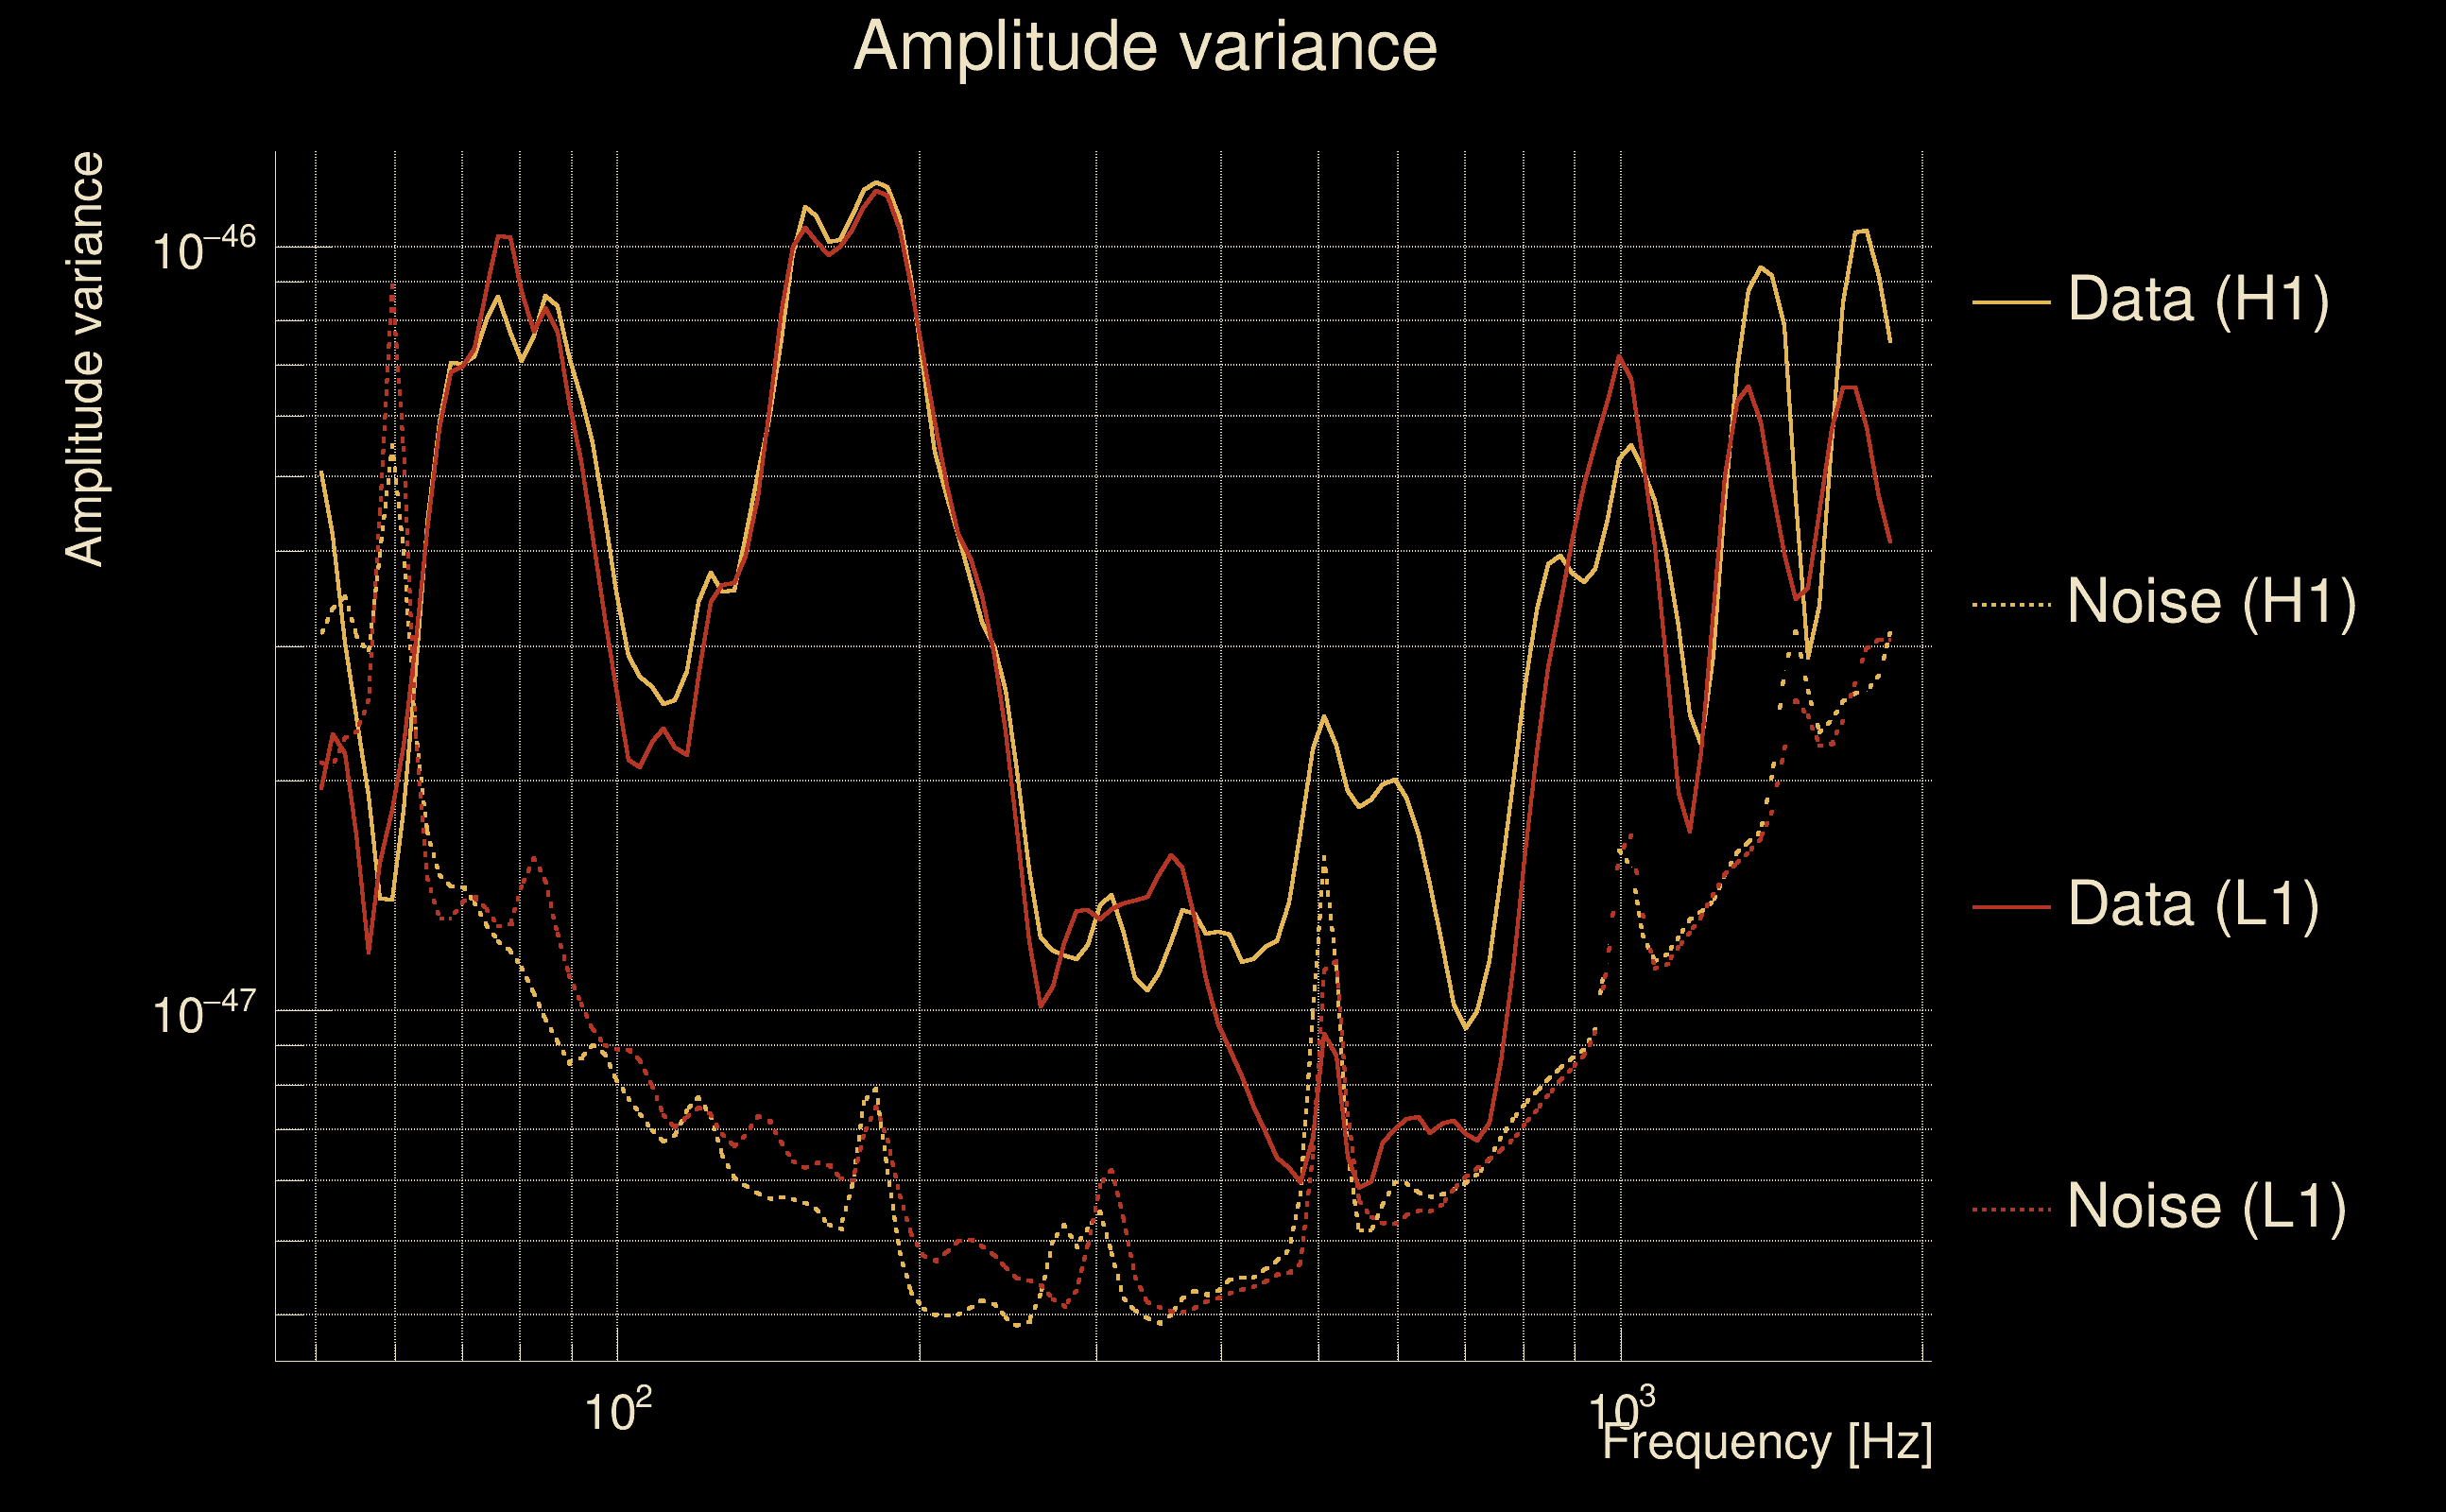
| Frequency: | 301.807 Hz |
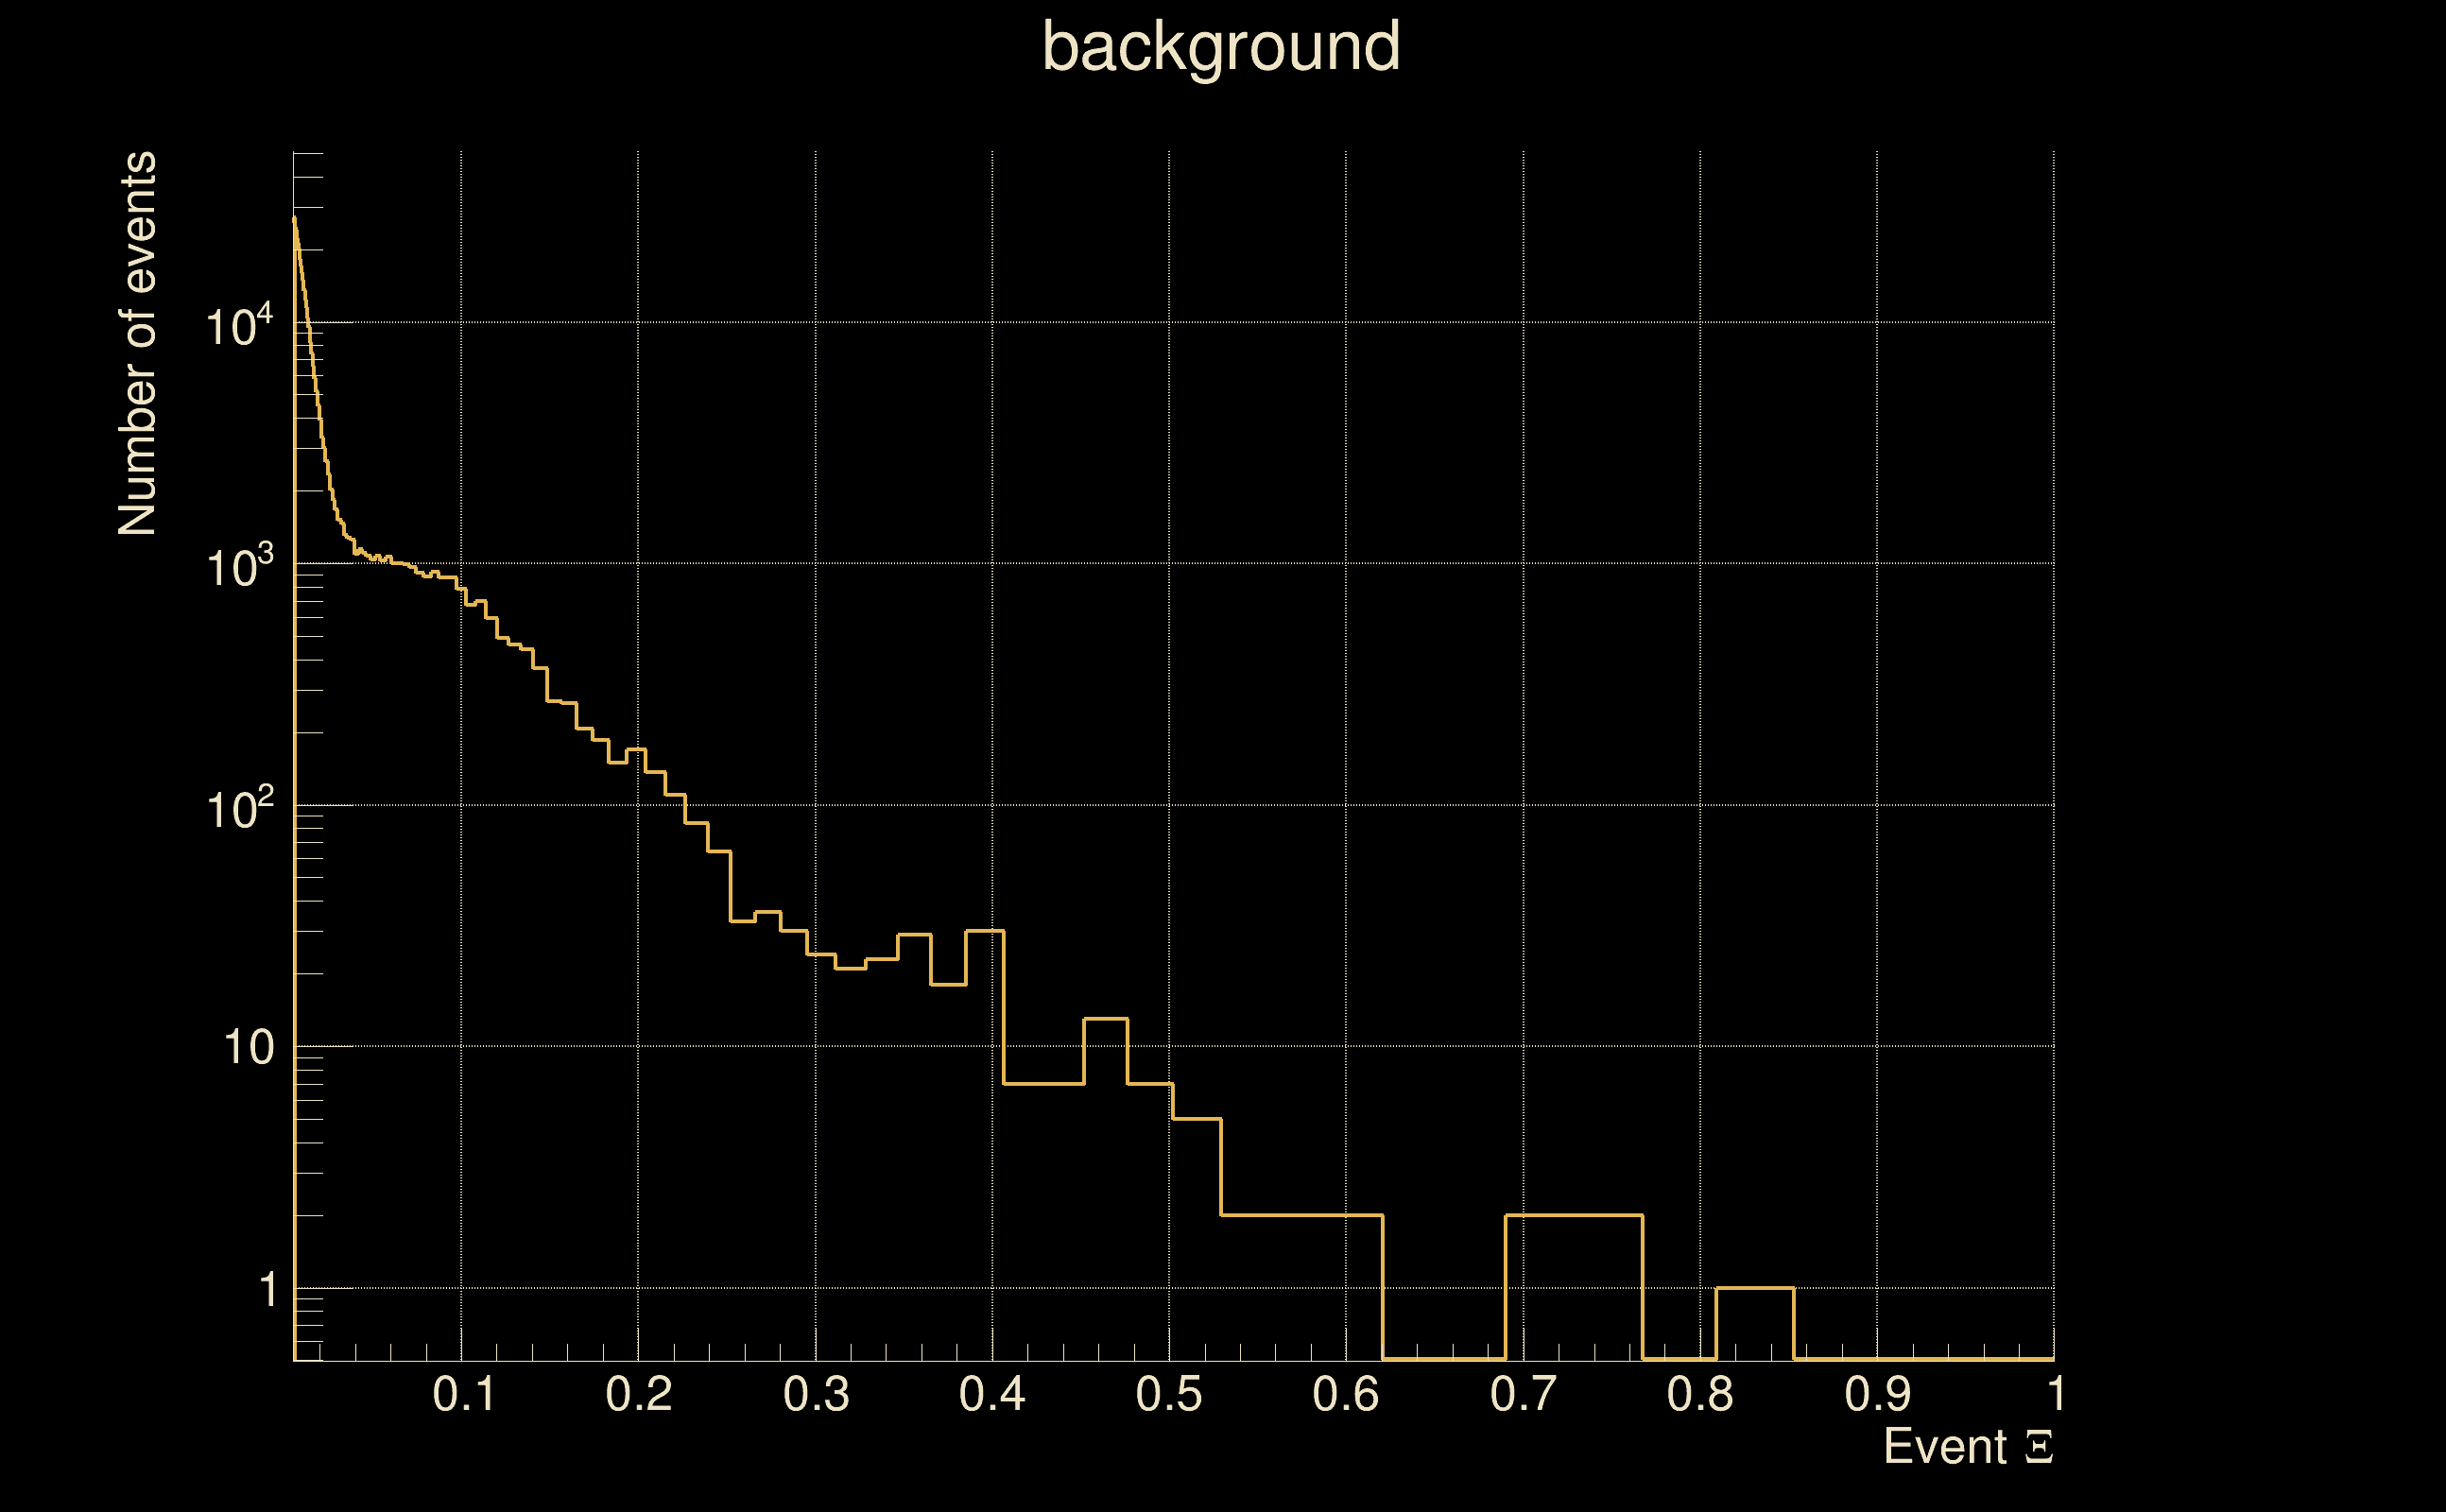
| Ξ: | 0.929286 ± 0.00384762 (variance = 1.48042e-05): Q0: 0.956905, Q1: 0.958785, Q2: 0.961129, Q3: 0.953613, Q4: 0.95021 |
| Rank: | R_A = 0.925645 |
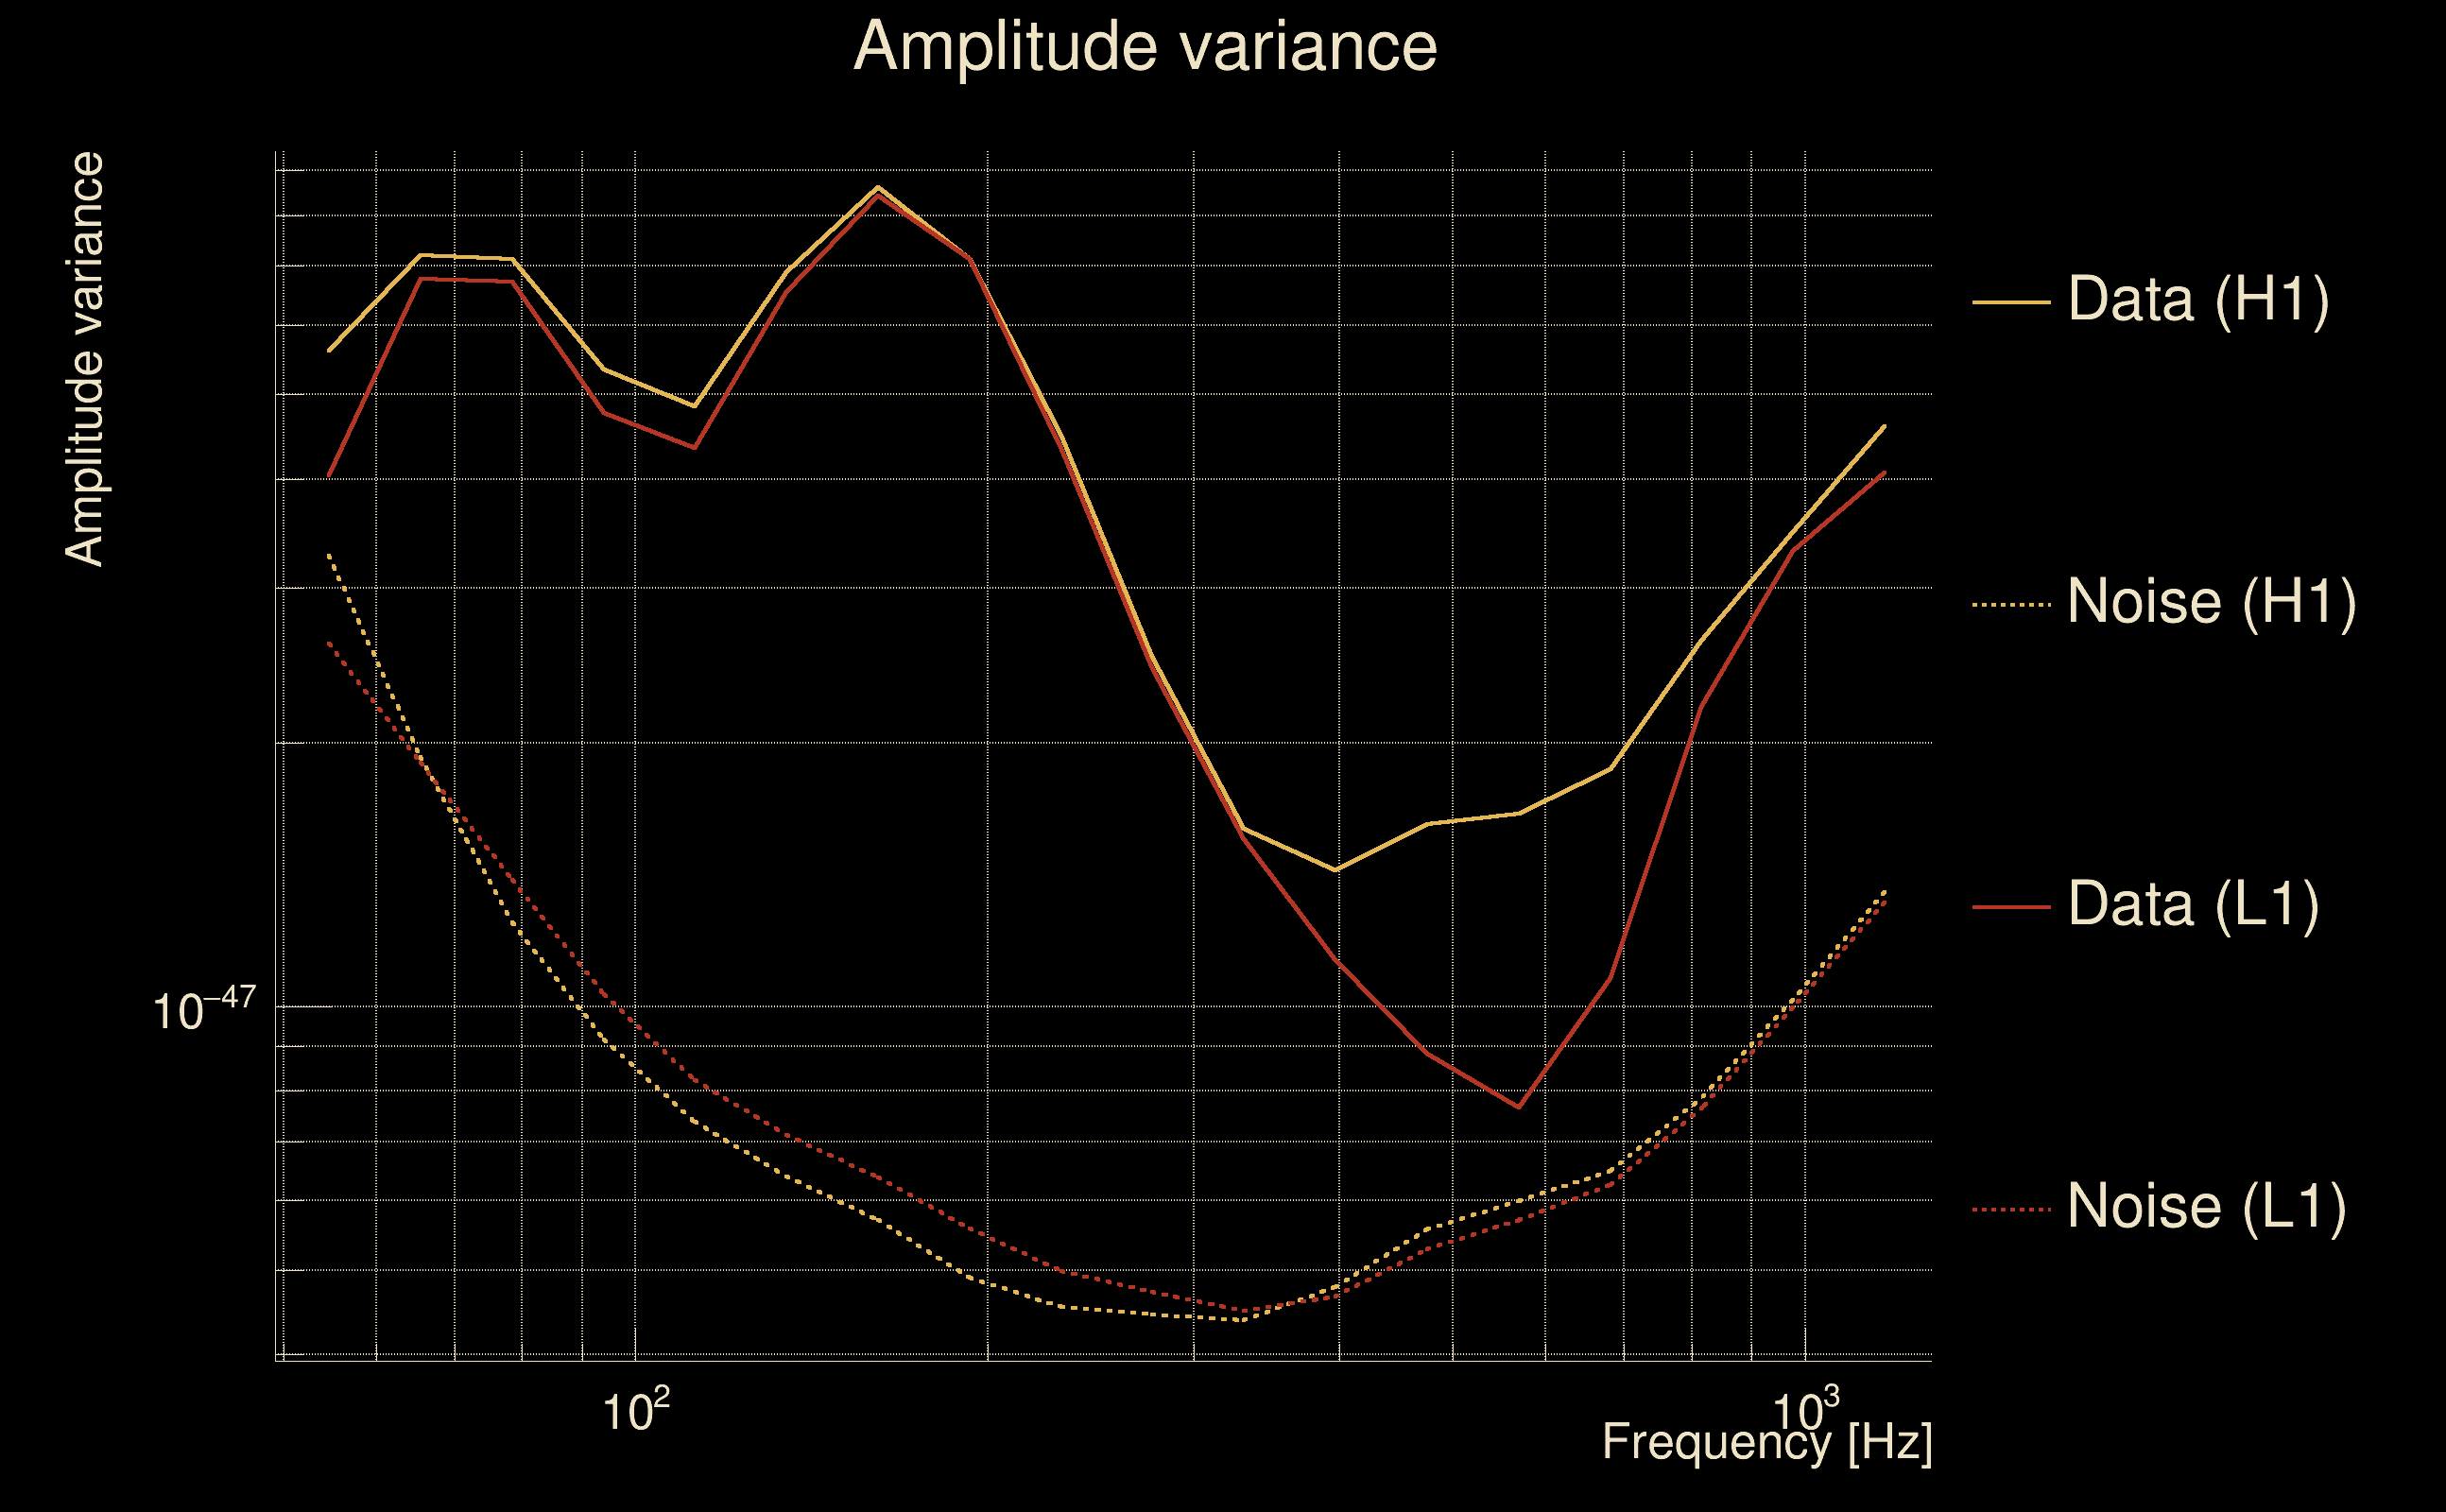
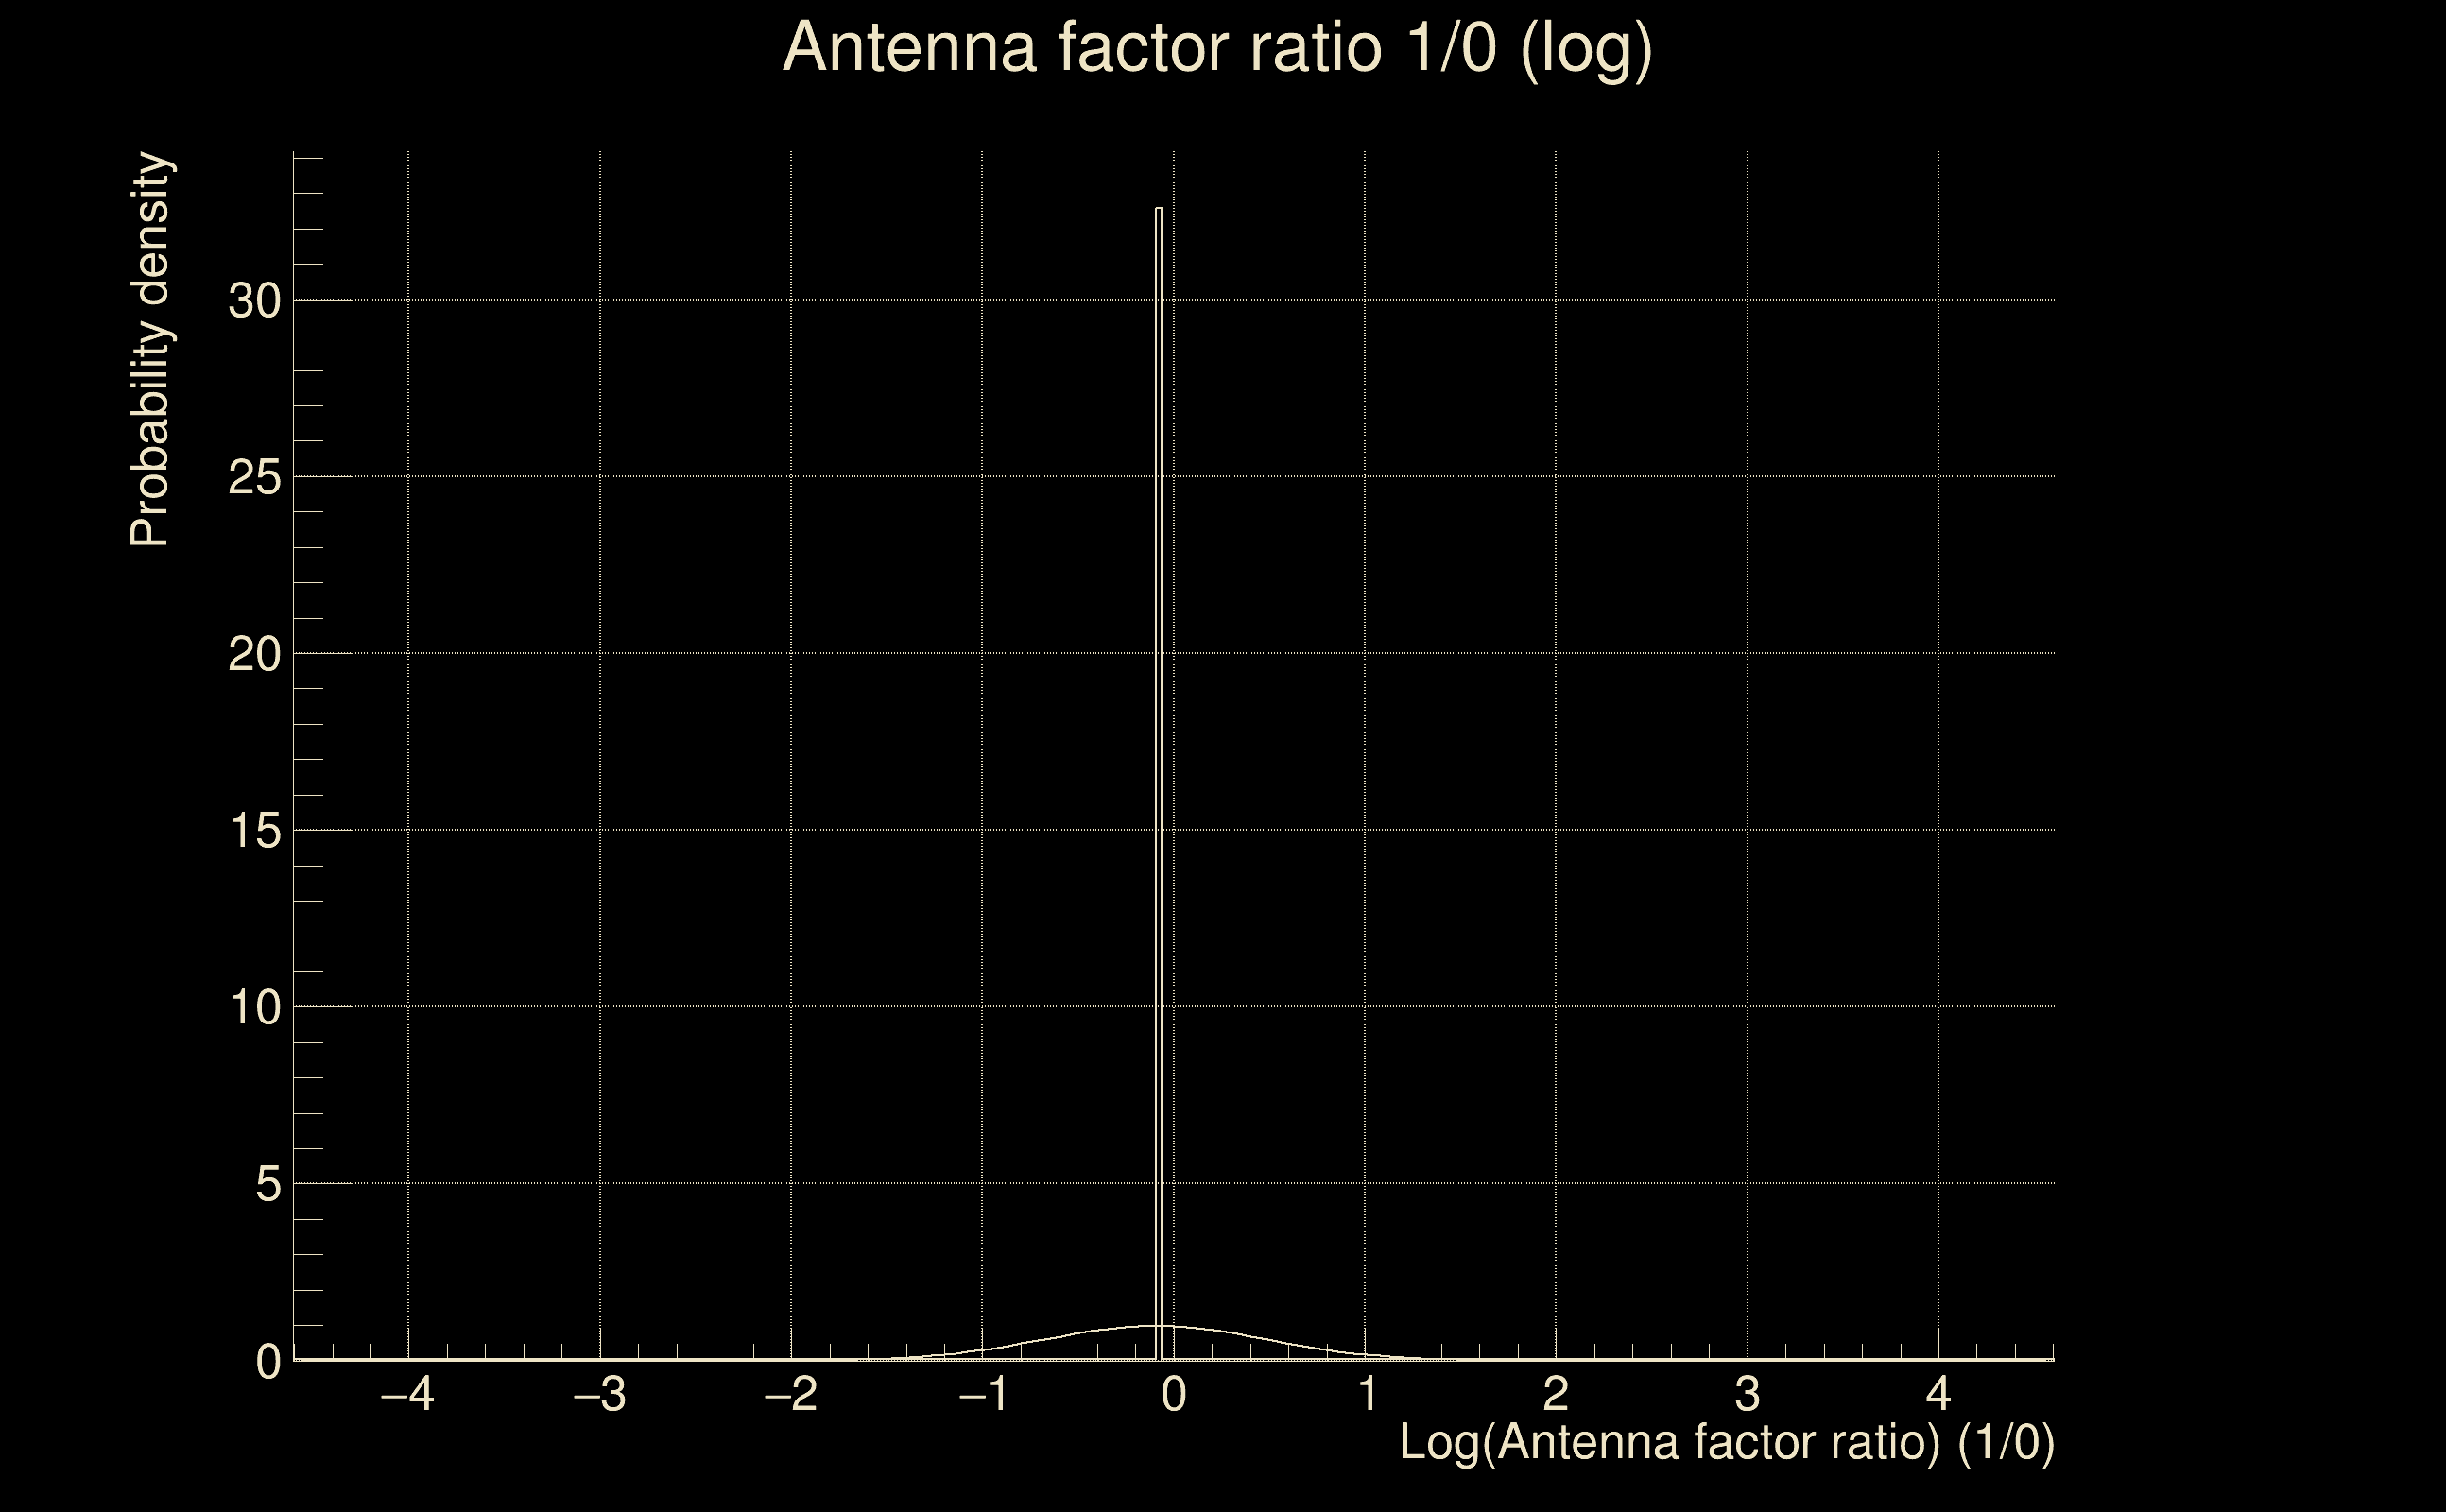
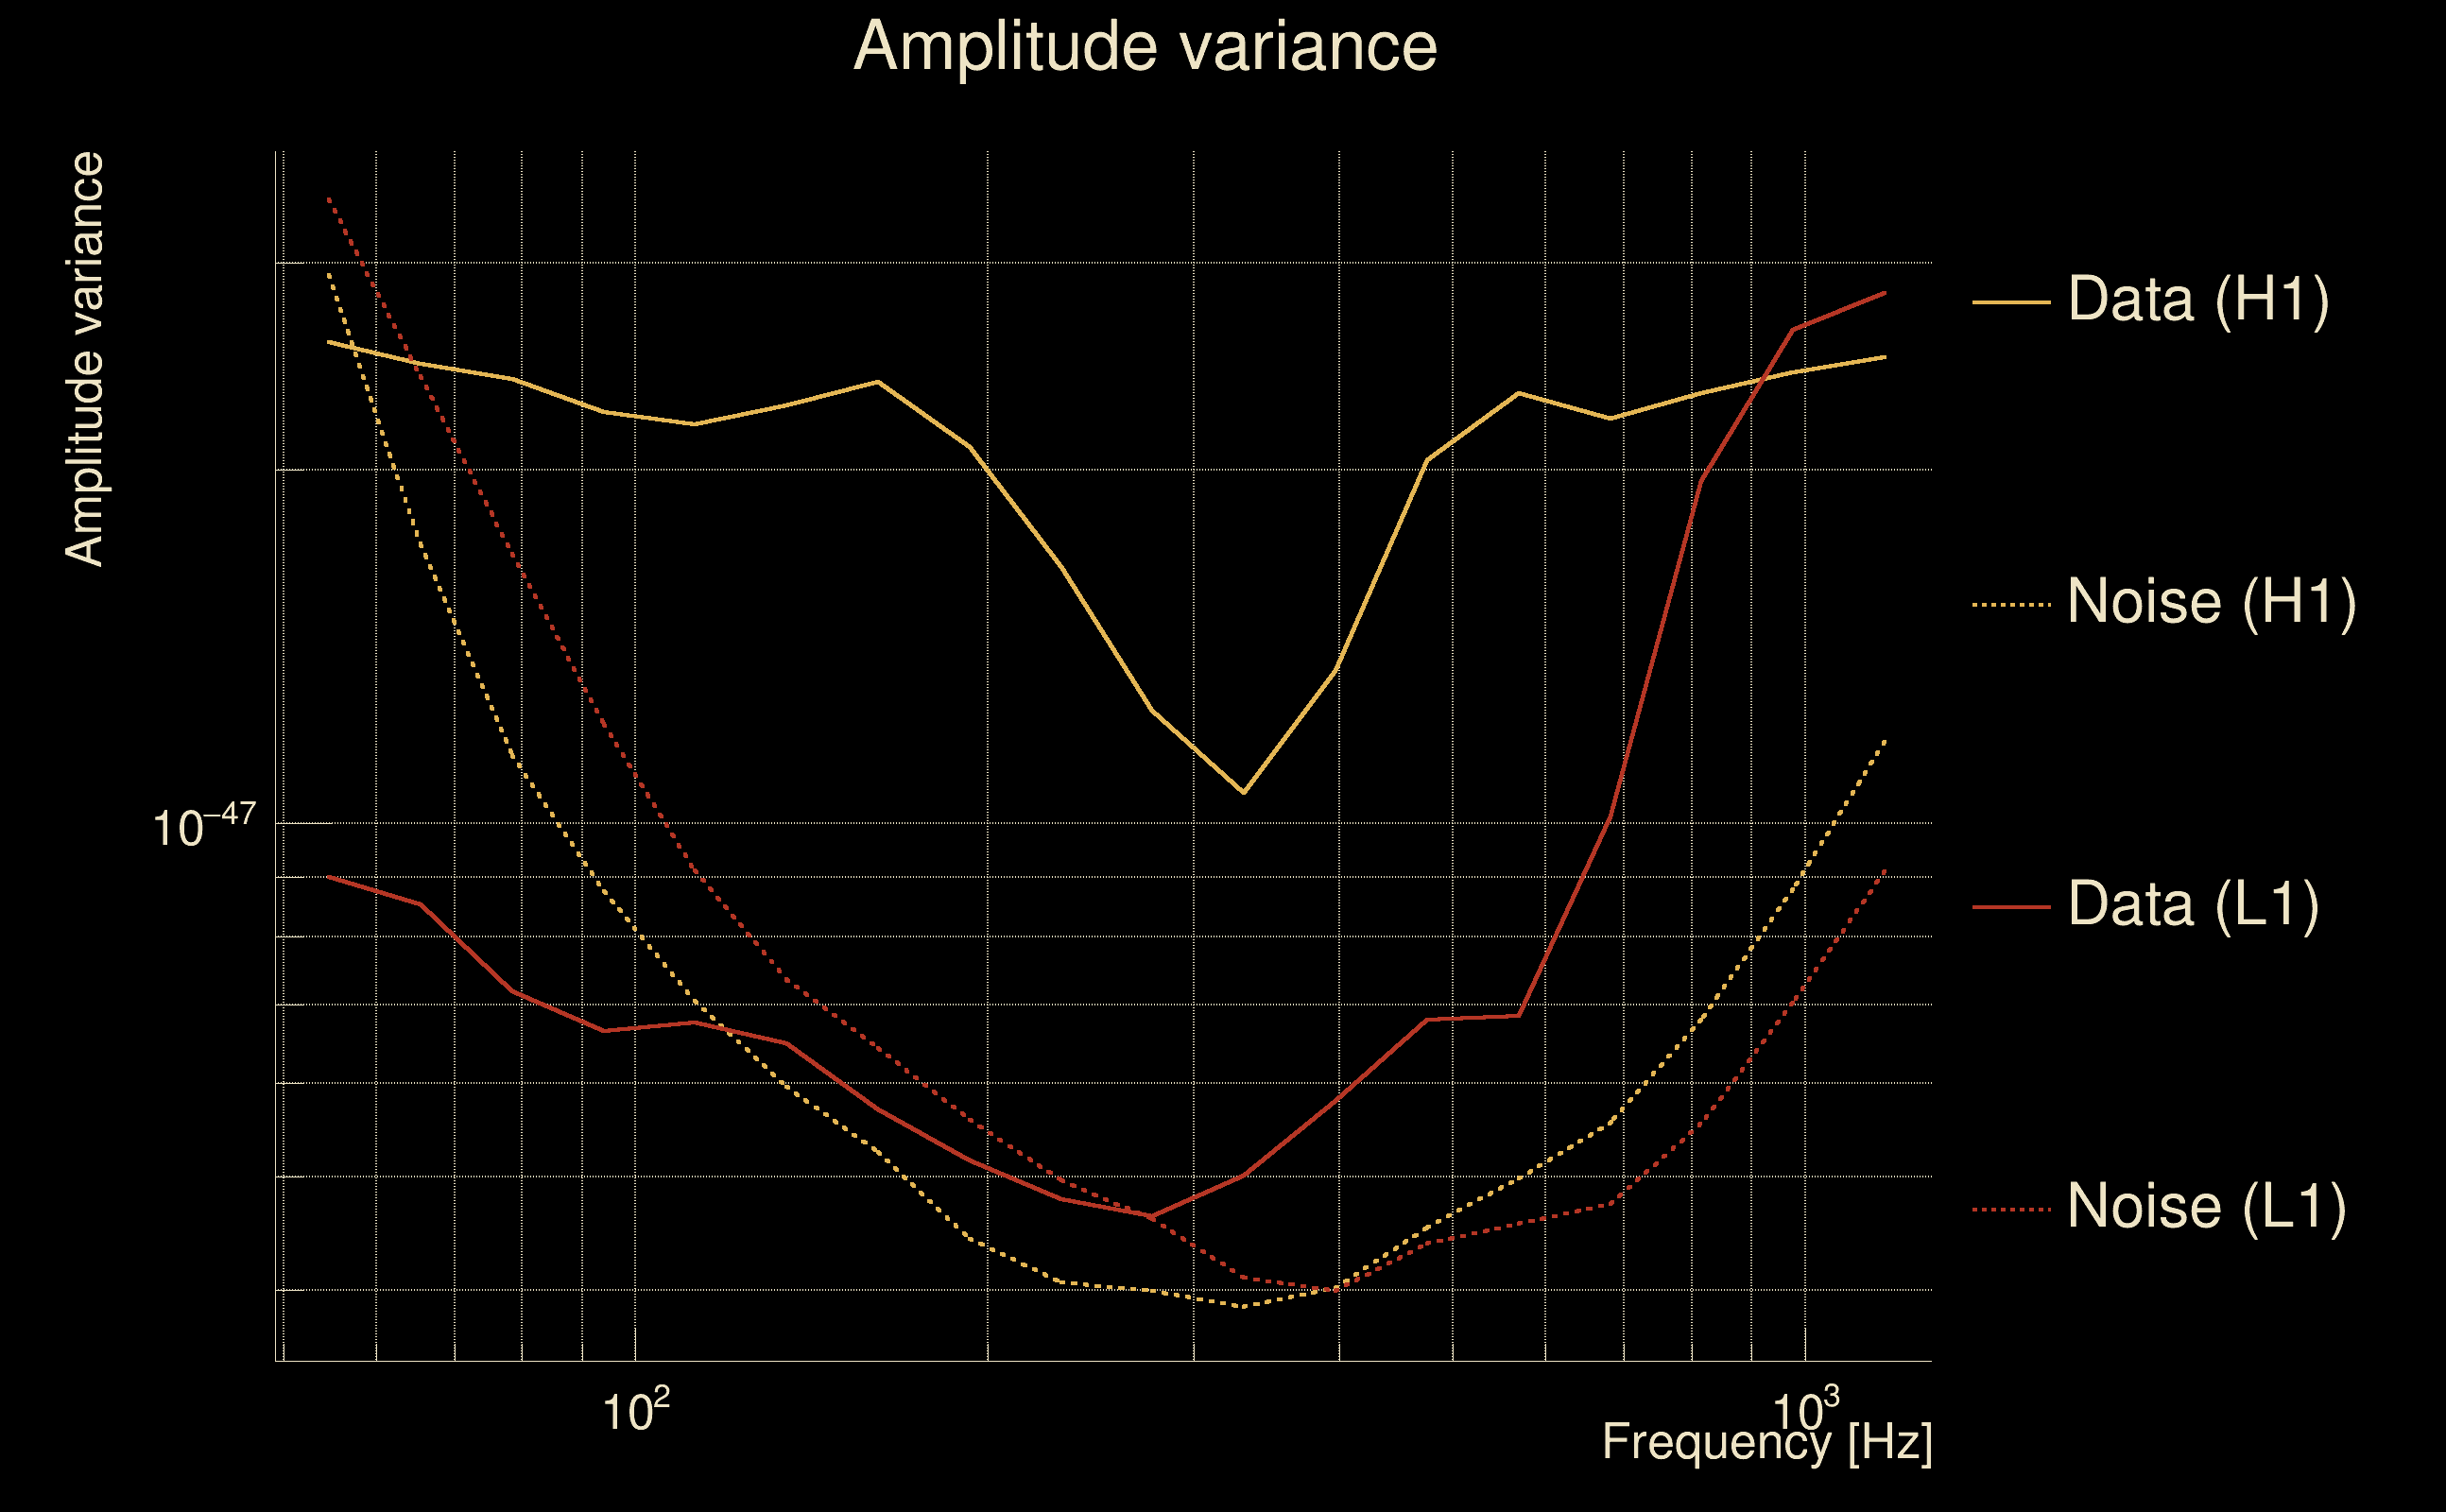
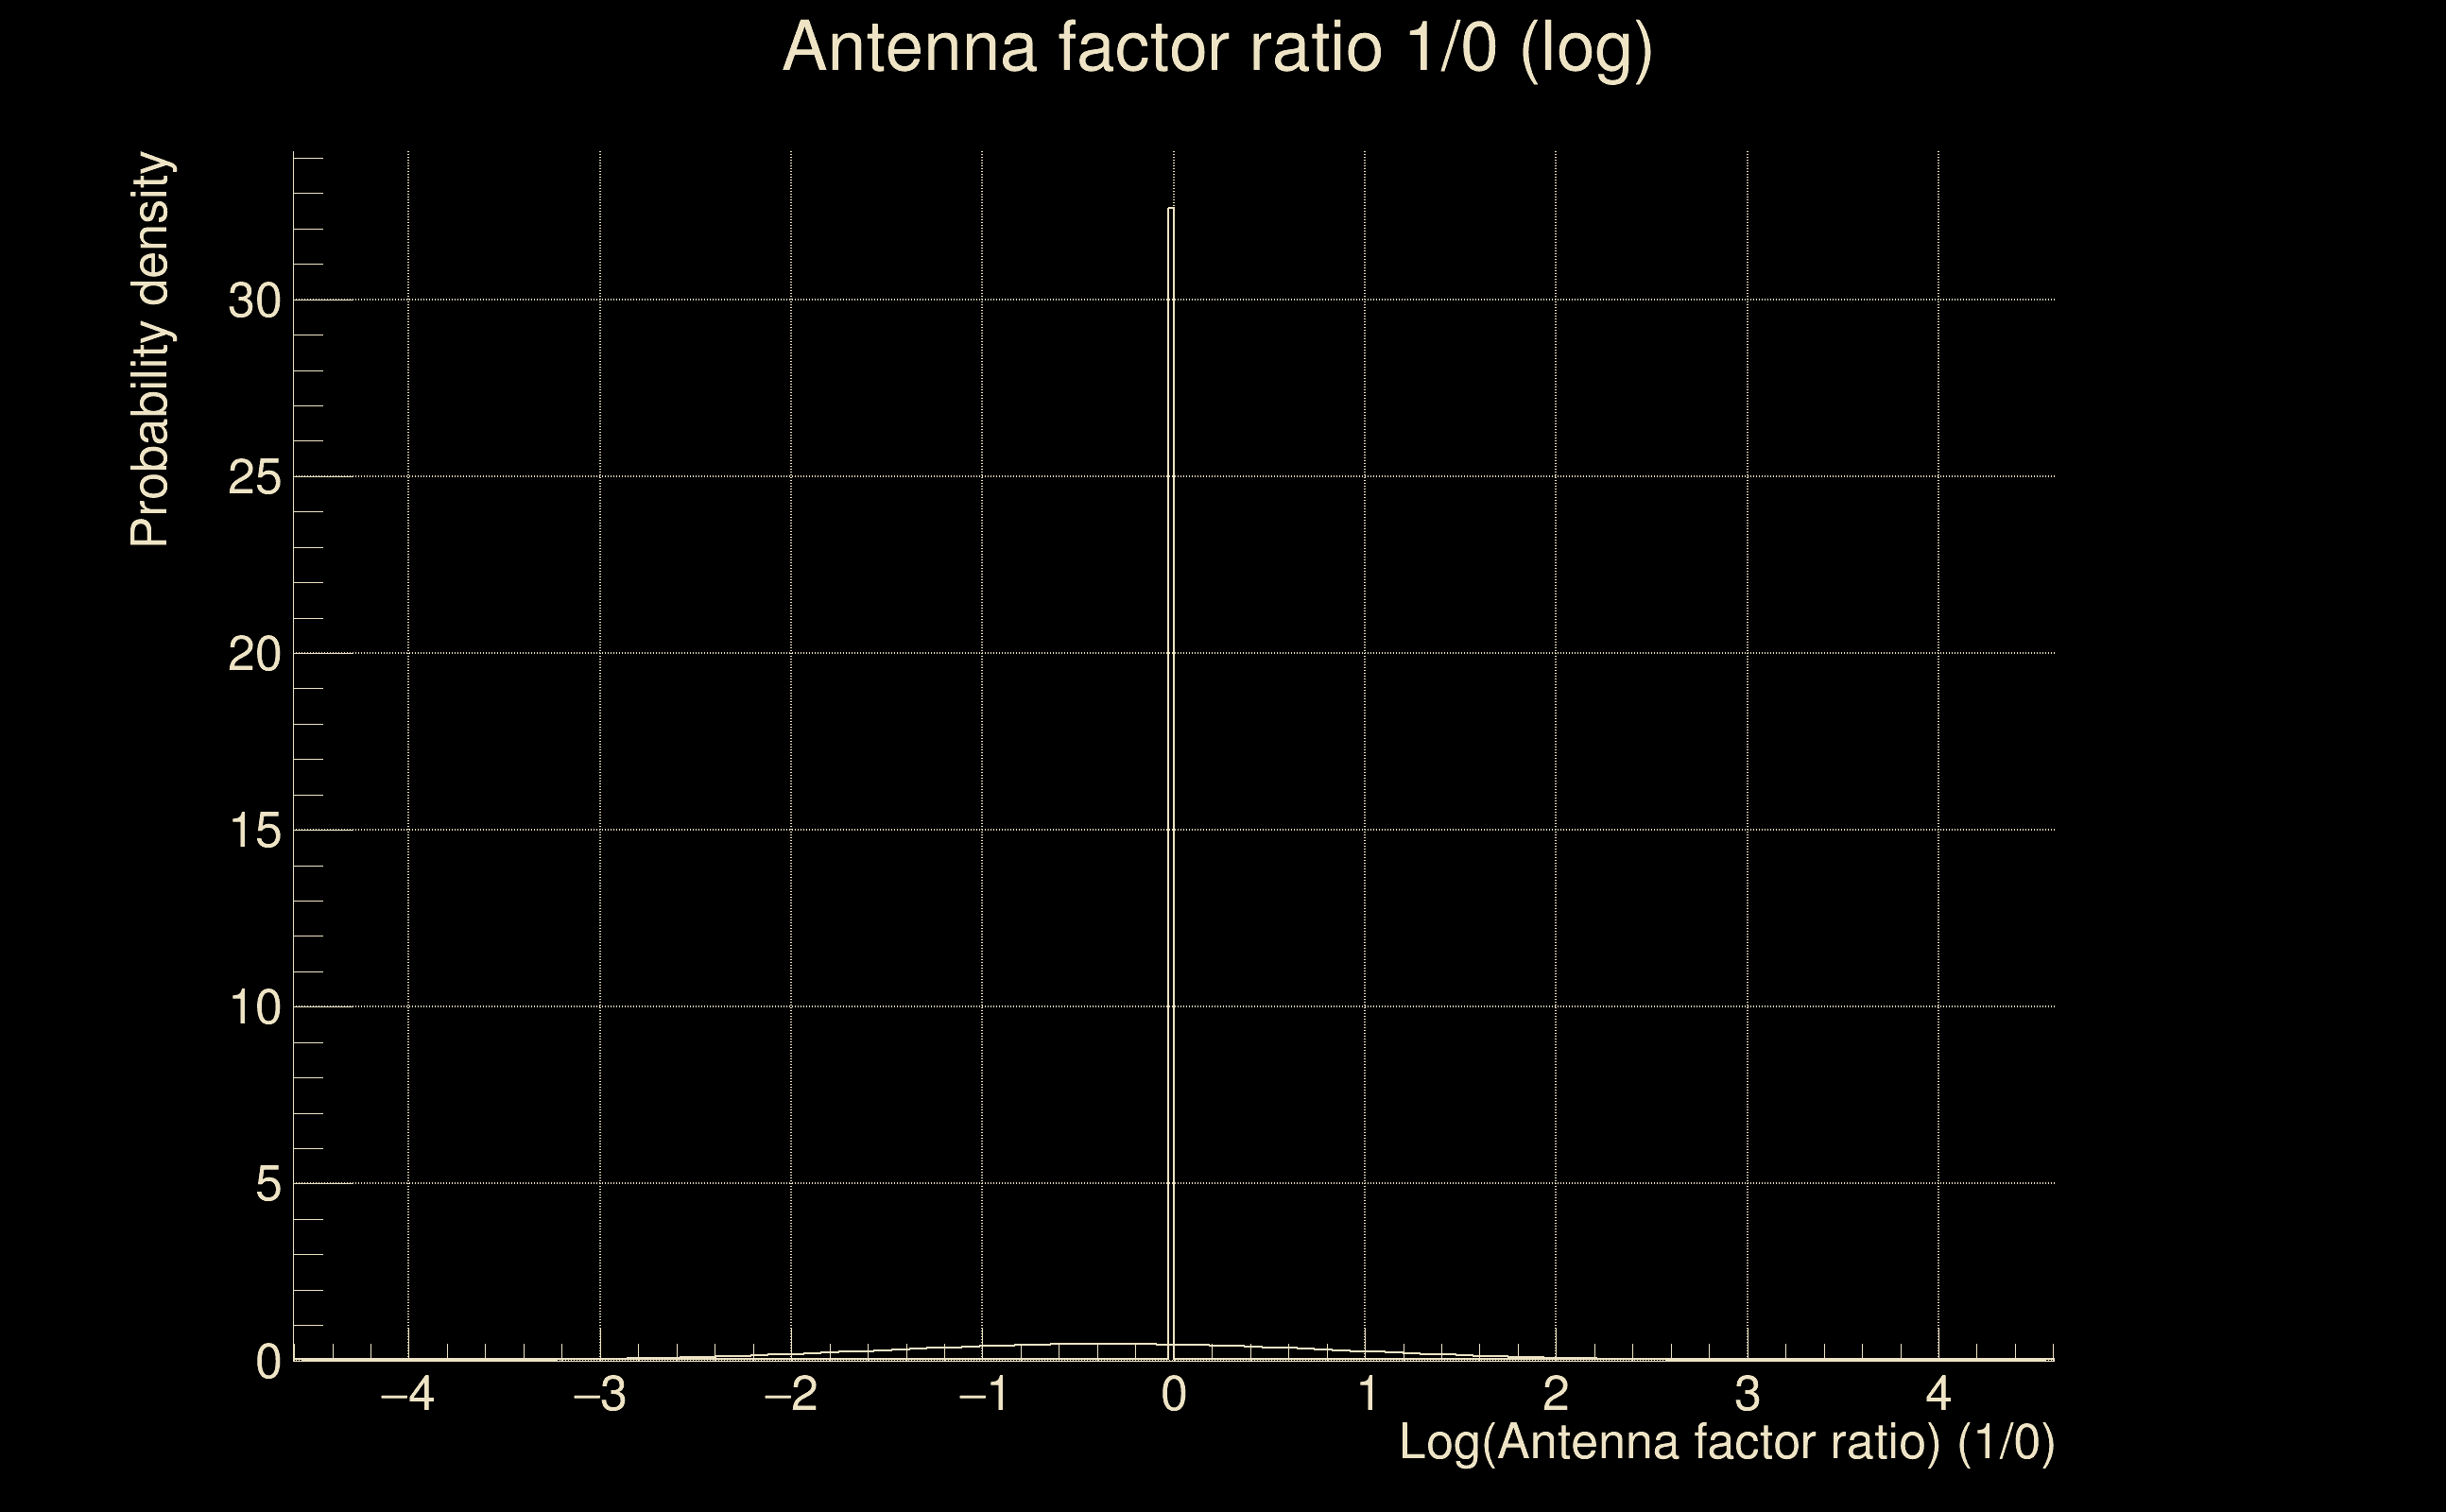
| Log of amplitude ratio (L1/H1): | -0.0563795, variance = 0.167885 (L1/H1: -0.0892926, variance = 0.355018, H1/L1: 0.0227069, variance = 0.315534) |
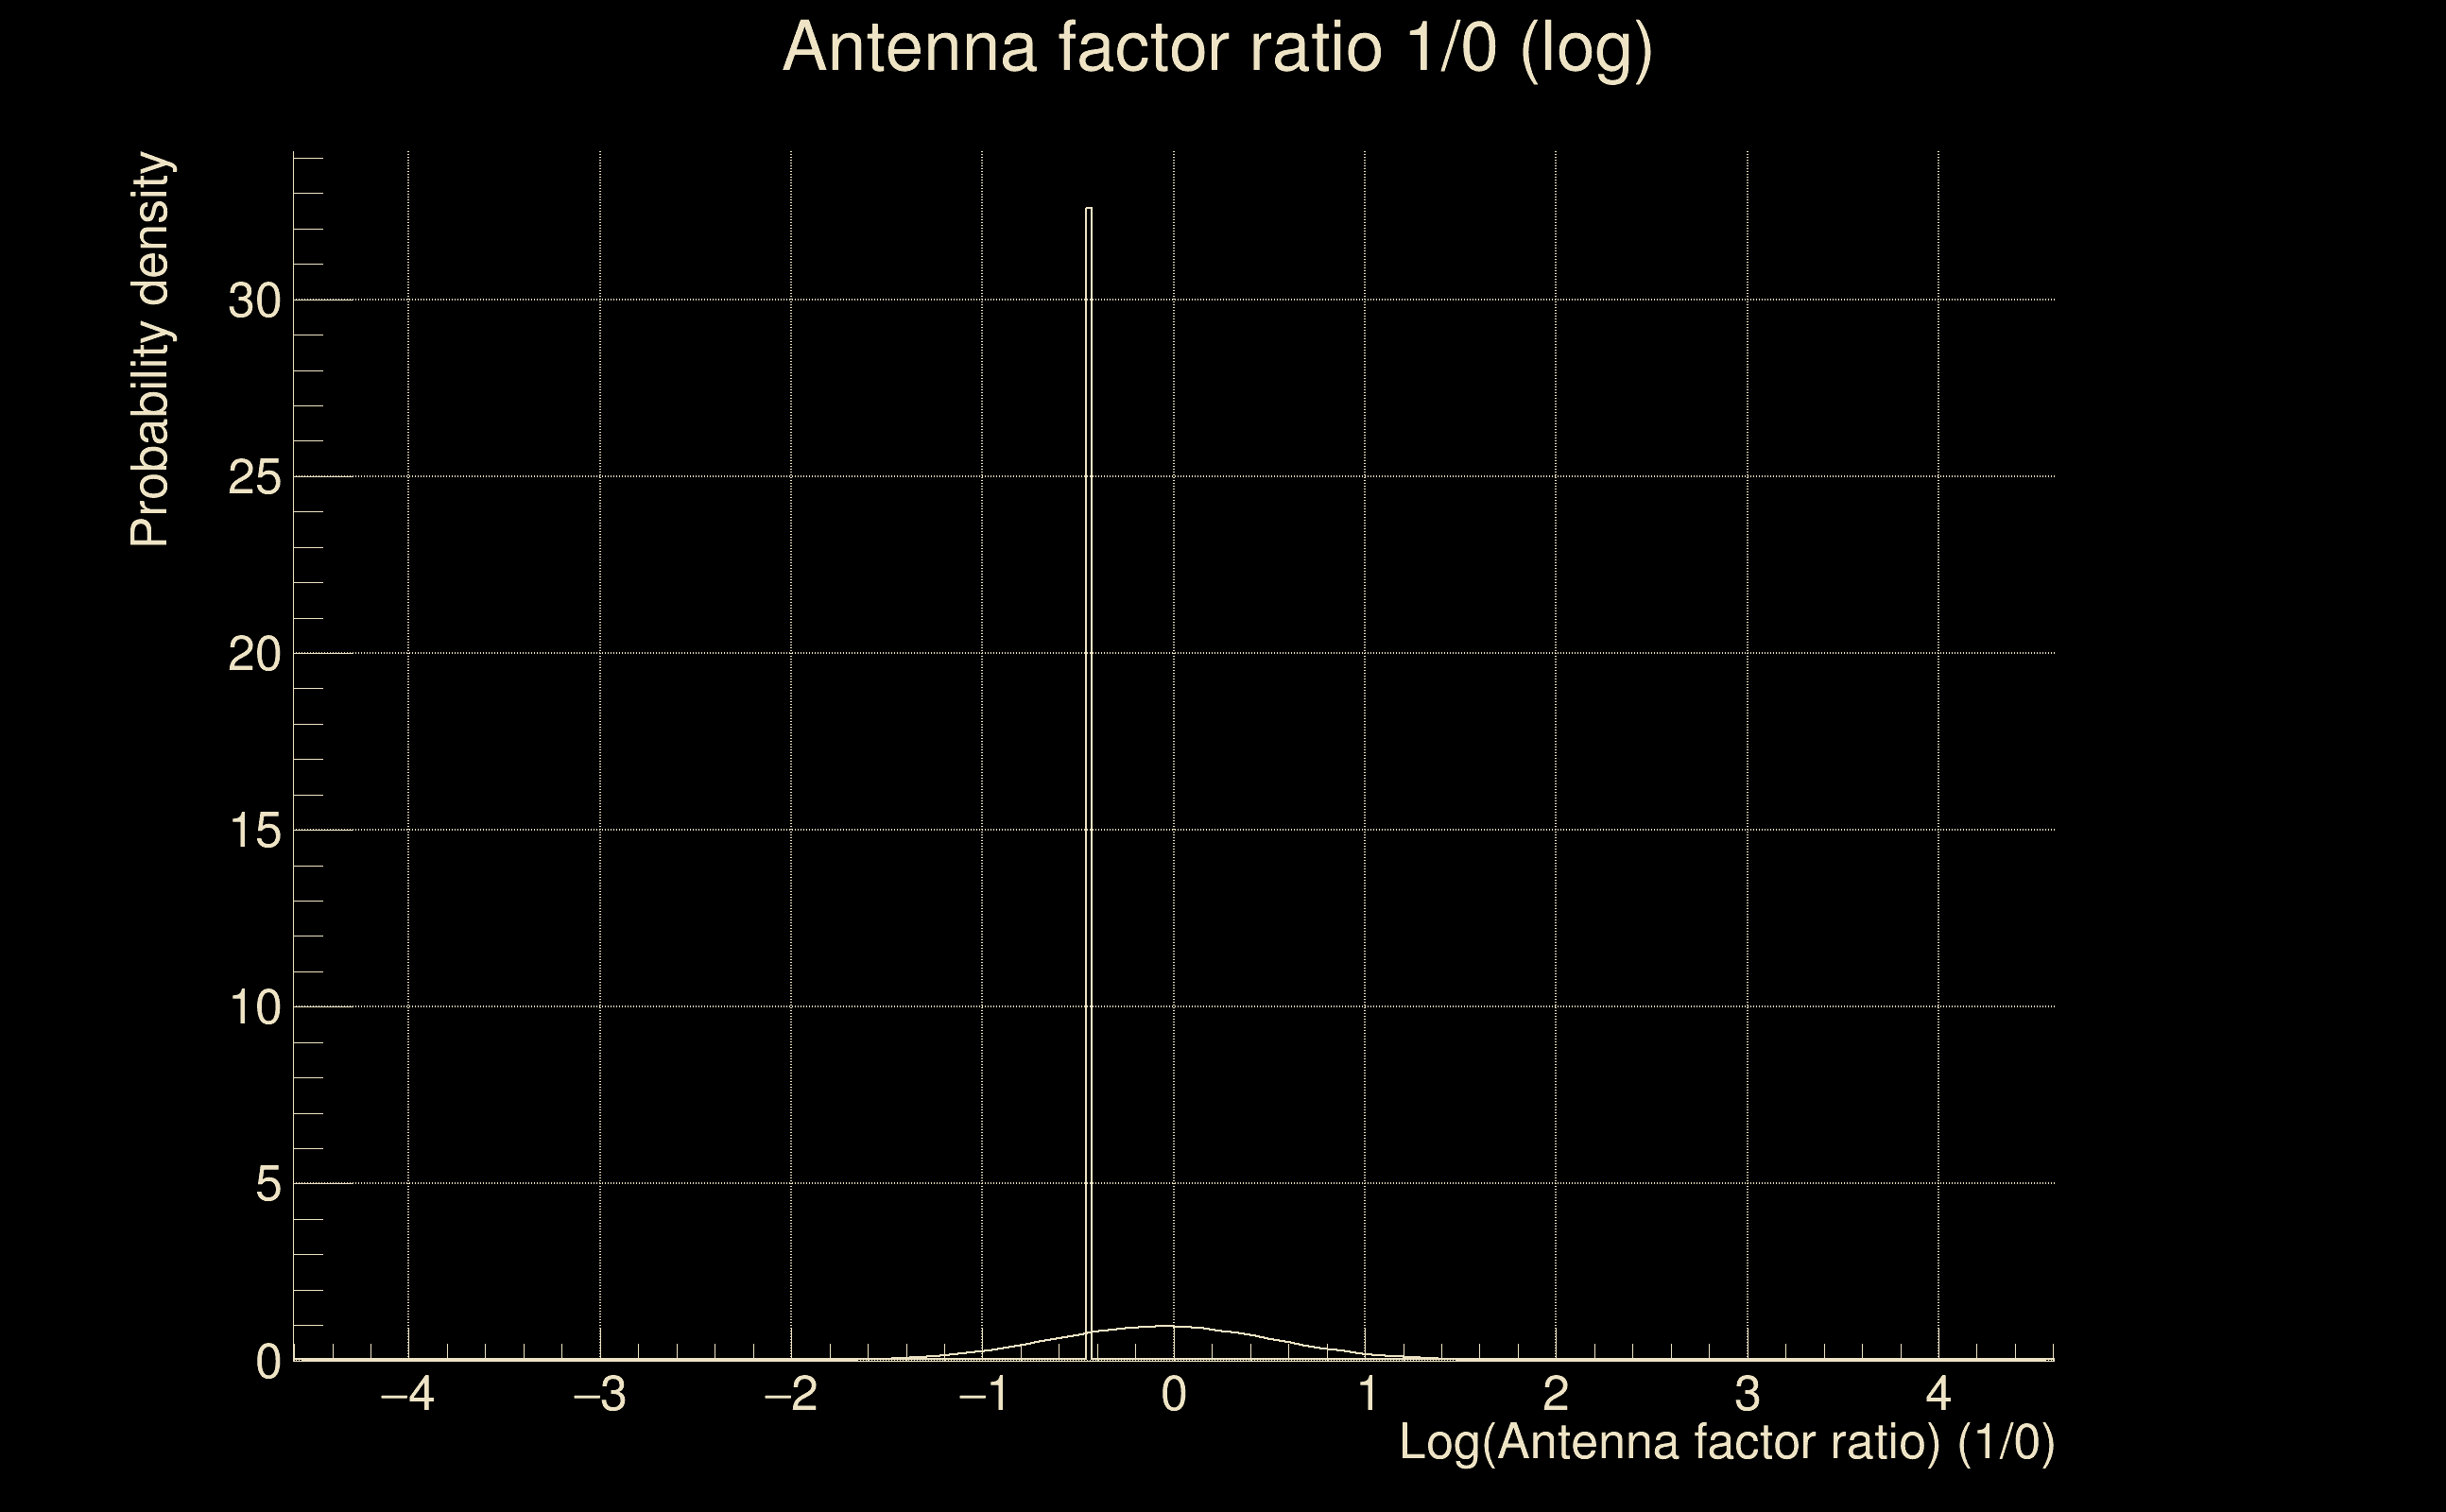
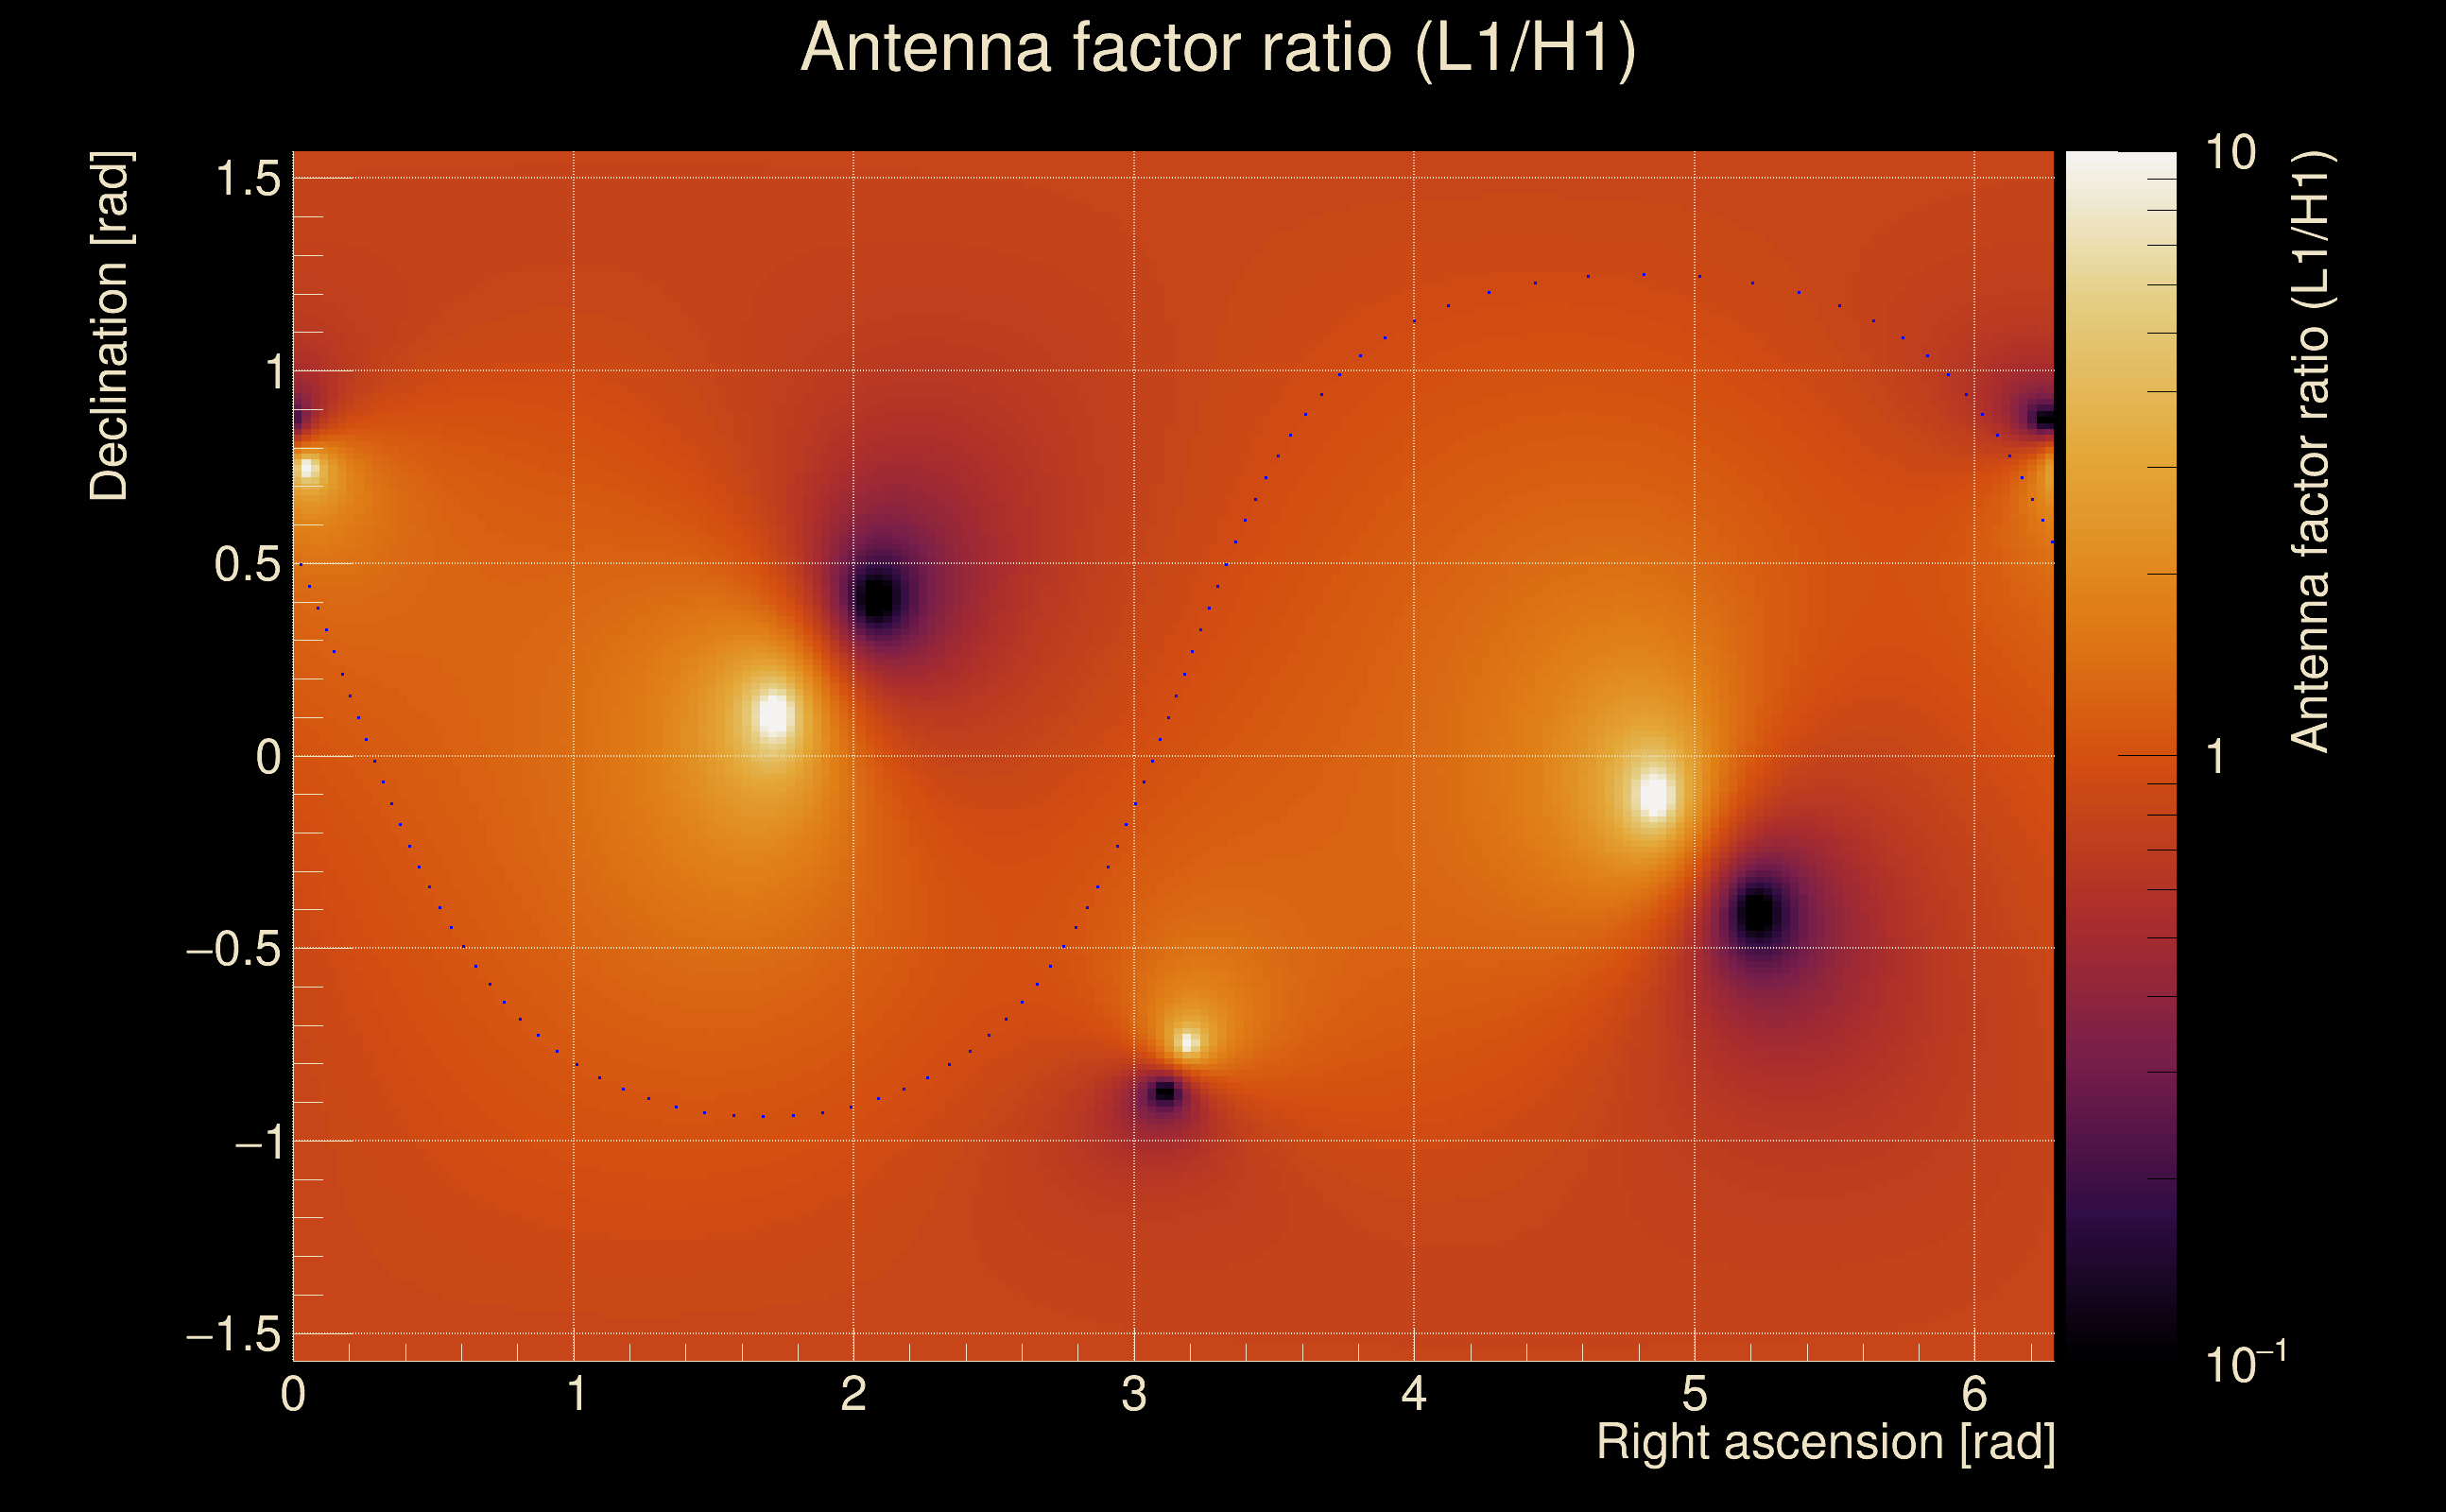
| Amplitude ratio (L1/H1): | 0.94518 ⋇ 1.50642 (L1/H1: 0.914578 ⋇ 1.81454, H1/L1: 1.02297 ⋇ 1.75369) |
| Amplitude ratio H1|L1 compatibility (probability): | 0.935192 |
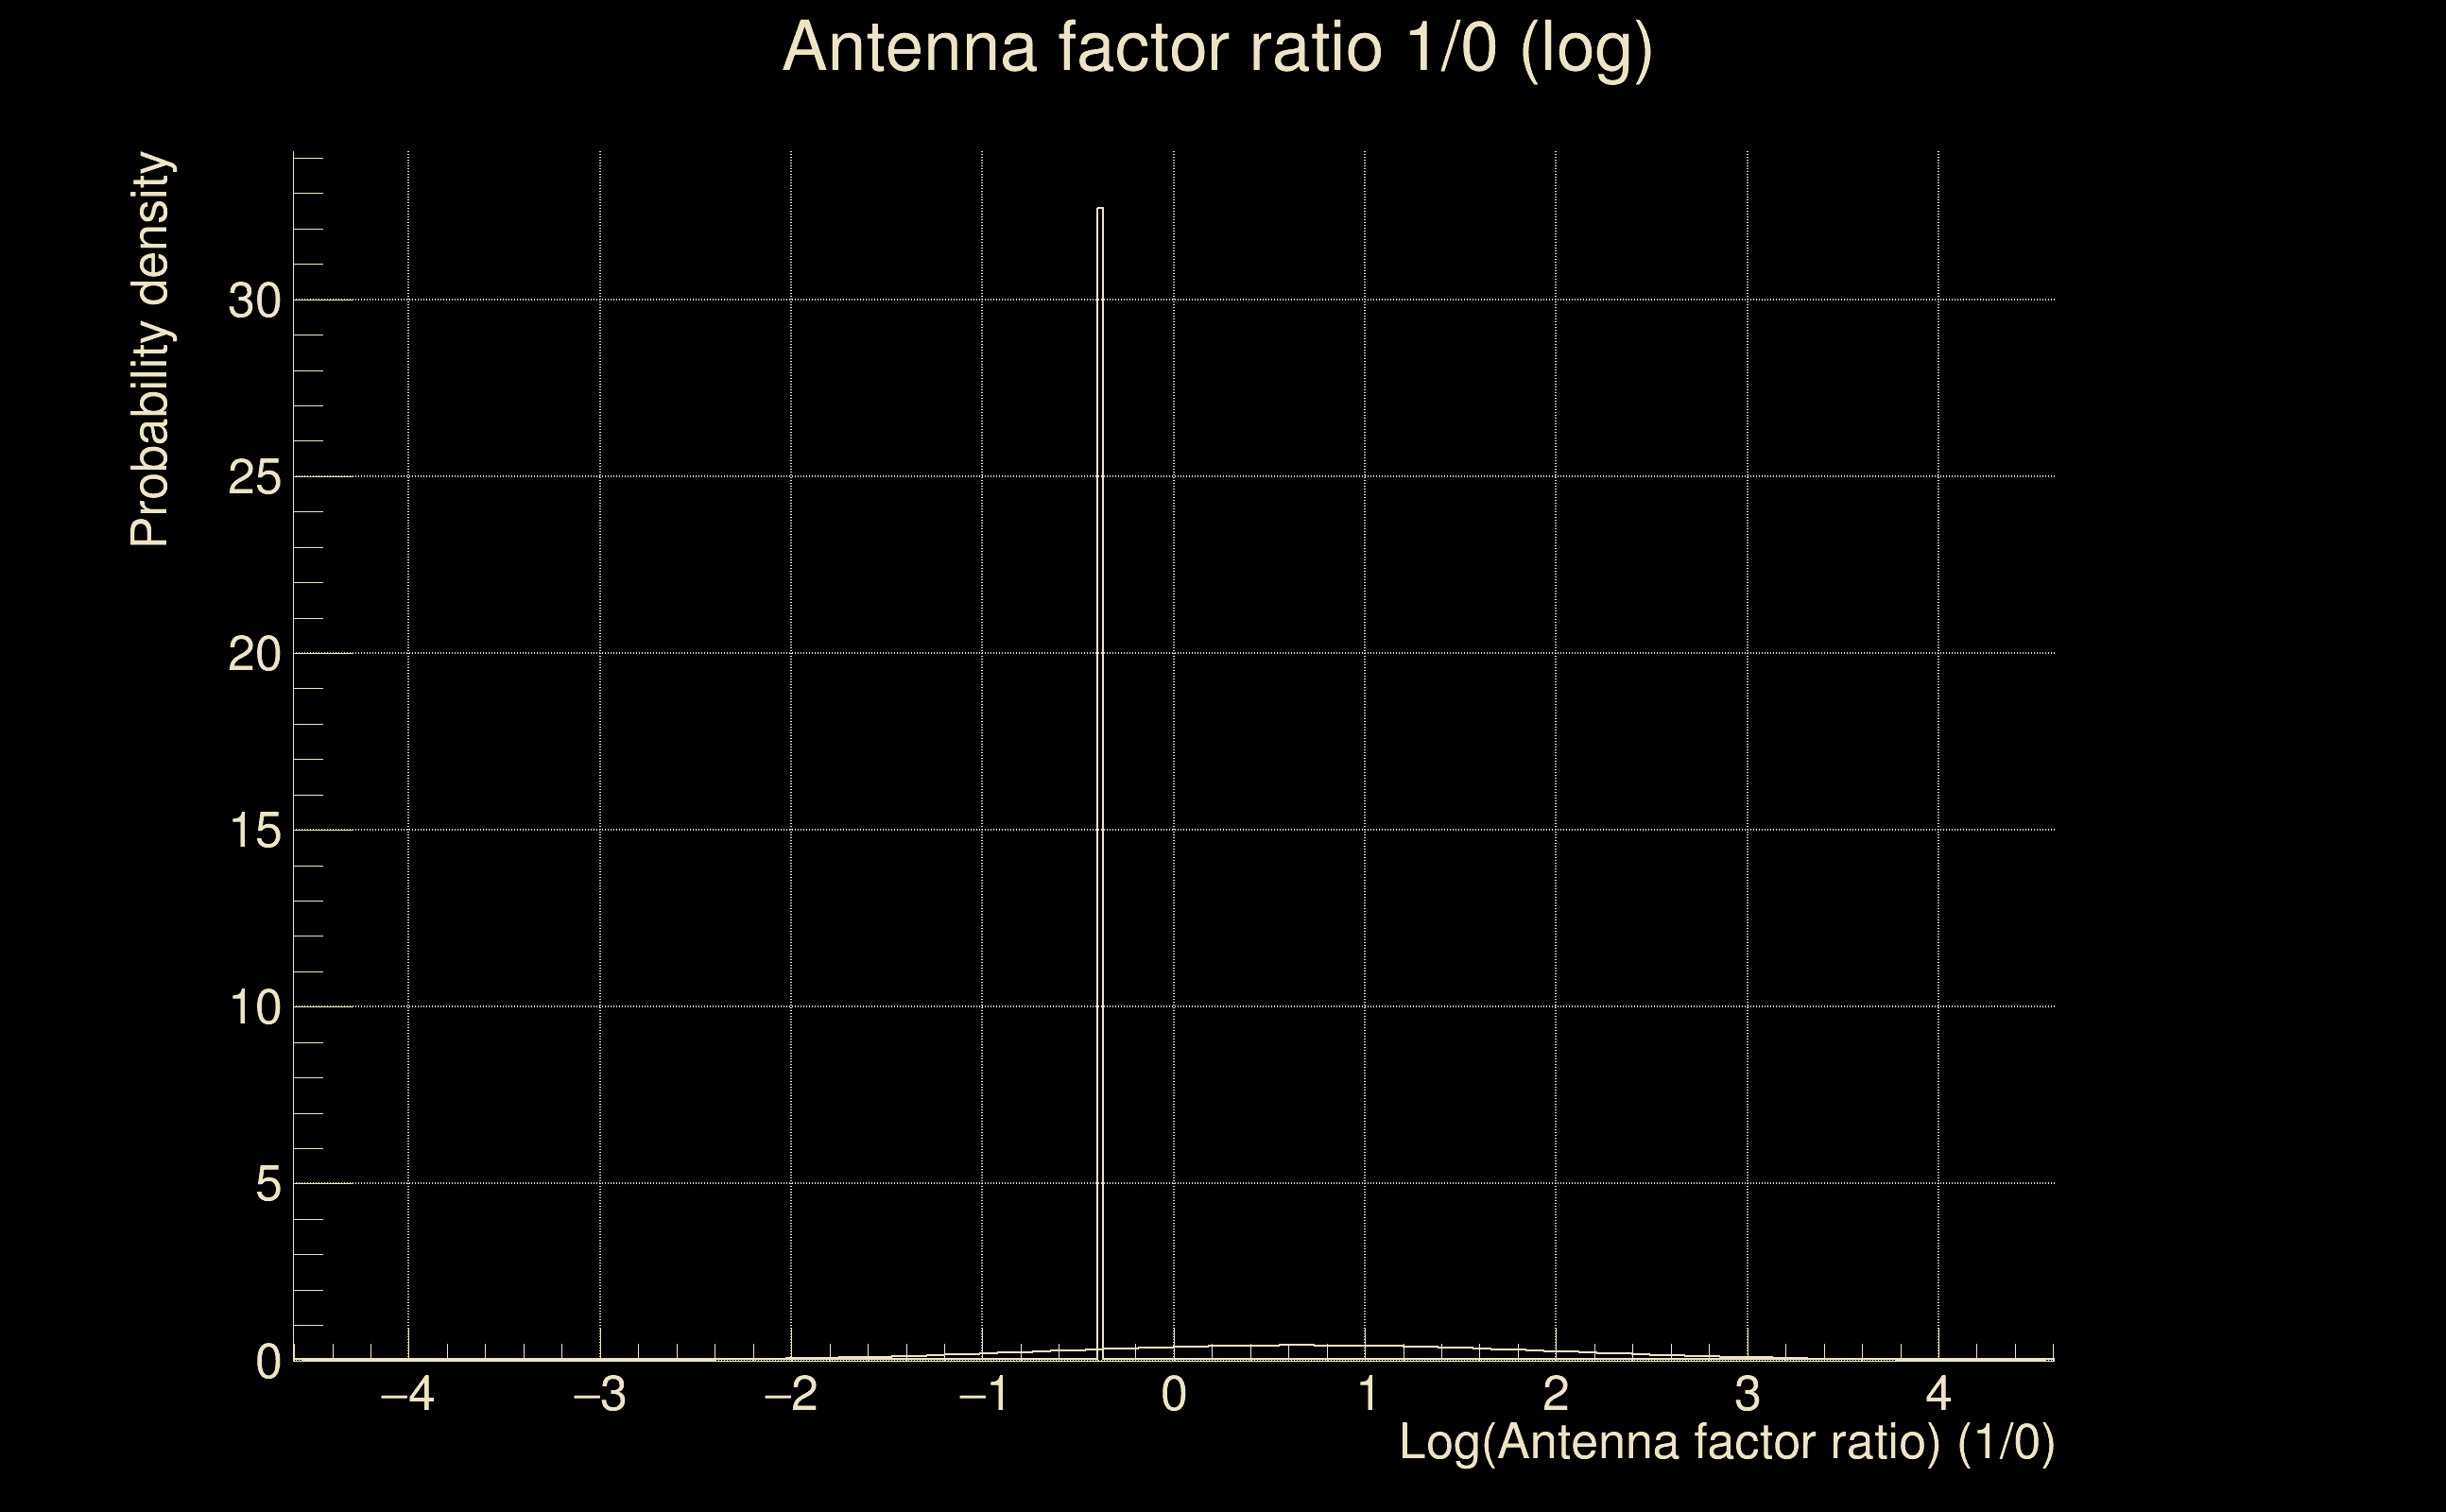
| Antenna factor probability: | 0.350728 |
| Number of rejected frequency rows: | Q0: 0 / 18, Q1: 0 / 36, Q2: 7 / 70, Q3: 18 / 134, Q4: 52 / 258 |
| Maximum signal-to-noise ratio: | H1: 89.9475, L1: 88.9272 |
| SNR variance: | H1: 3.24706, L1: 2.94999 |
| Click here for a zoomed plot | Click here for a zoomed plot | Click here for a zoomed plot | Click here for a zoomed plot | Click here for a zoomed plot |
 |
 |
 |
 |
 |
 |
 |
 |
 |
 |
 |
 |
 |
 |
 |
 |
 |
 |
 |
 |
 |
 |
 |
 |
 |
 |
 |
 |
 |
| Event time t(H1): | GPS = 1368267418 (Tue May 16 10:16:40 2023 ) → GPS = 1368267428 (Tue May 16 10:16:50 2023 ) |
| Event time t(L1): | GPS = 1368267418 (Tue May 16 10:16:50 2023 ) → GPS = 1368267428 (Tue May 16 10:16:50 2023 ) |
| Omicron analysis time window (H1): | GPS = 1368267415 → GPS = 1368267431 |
| Omicron analysis time window (L1): | GPS = 1368267415 → GPS = 1368267431 |
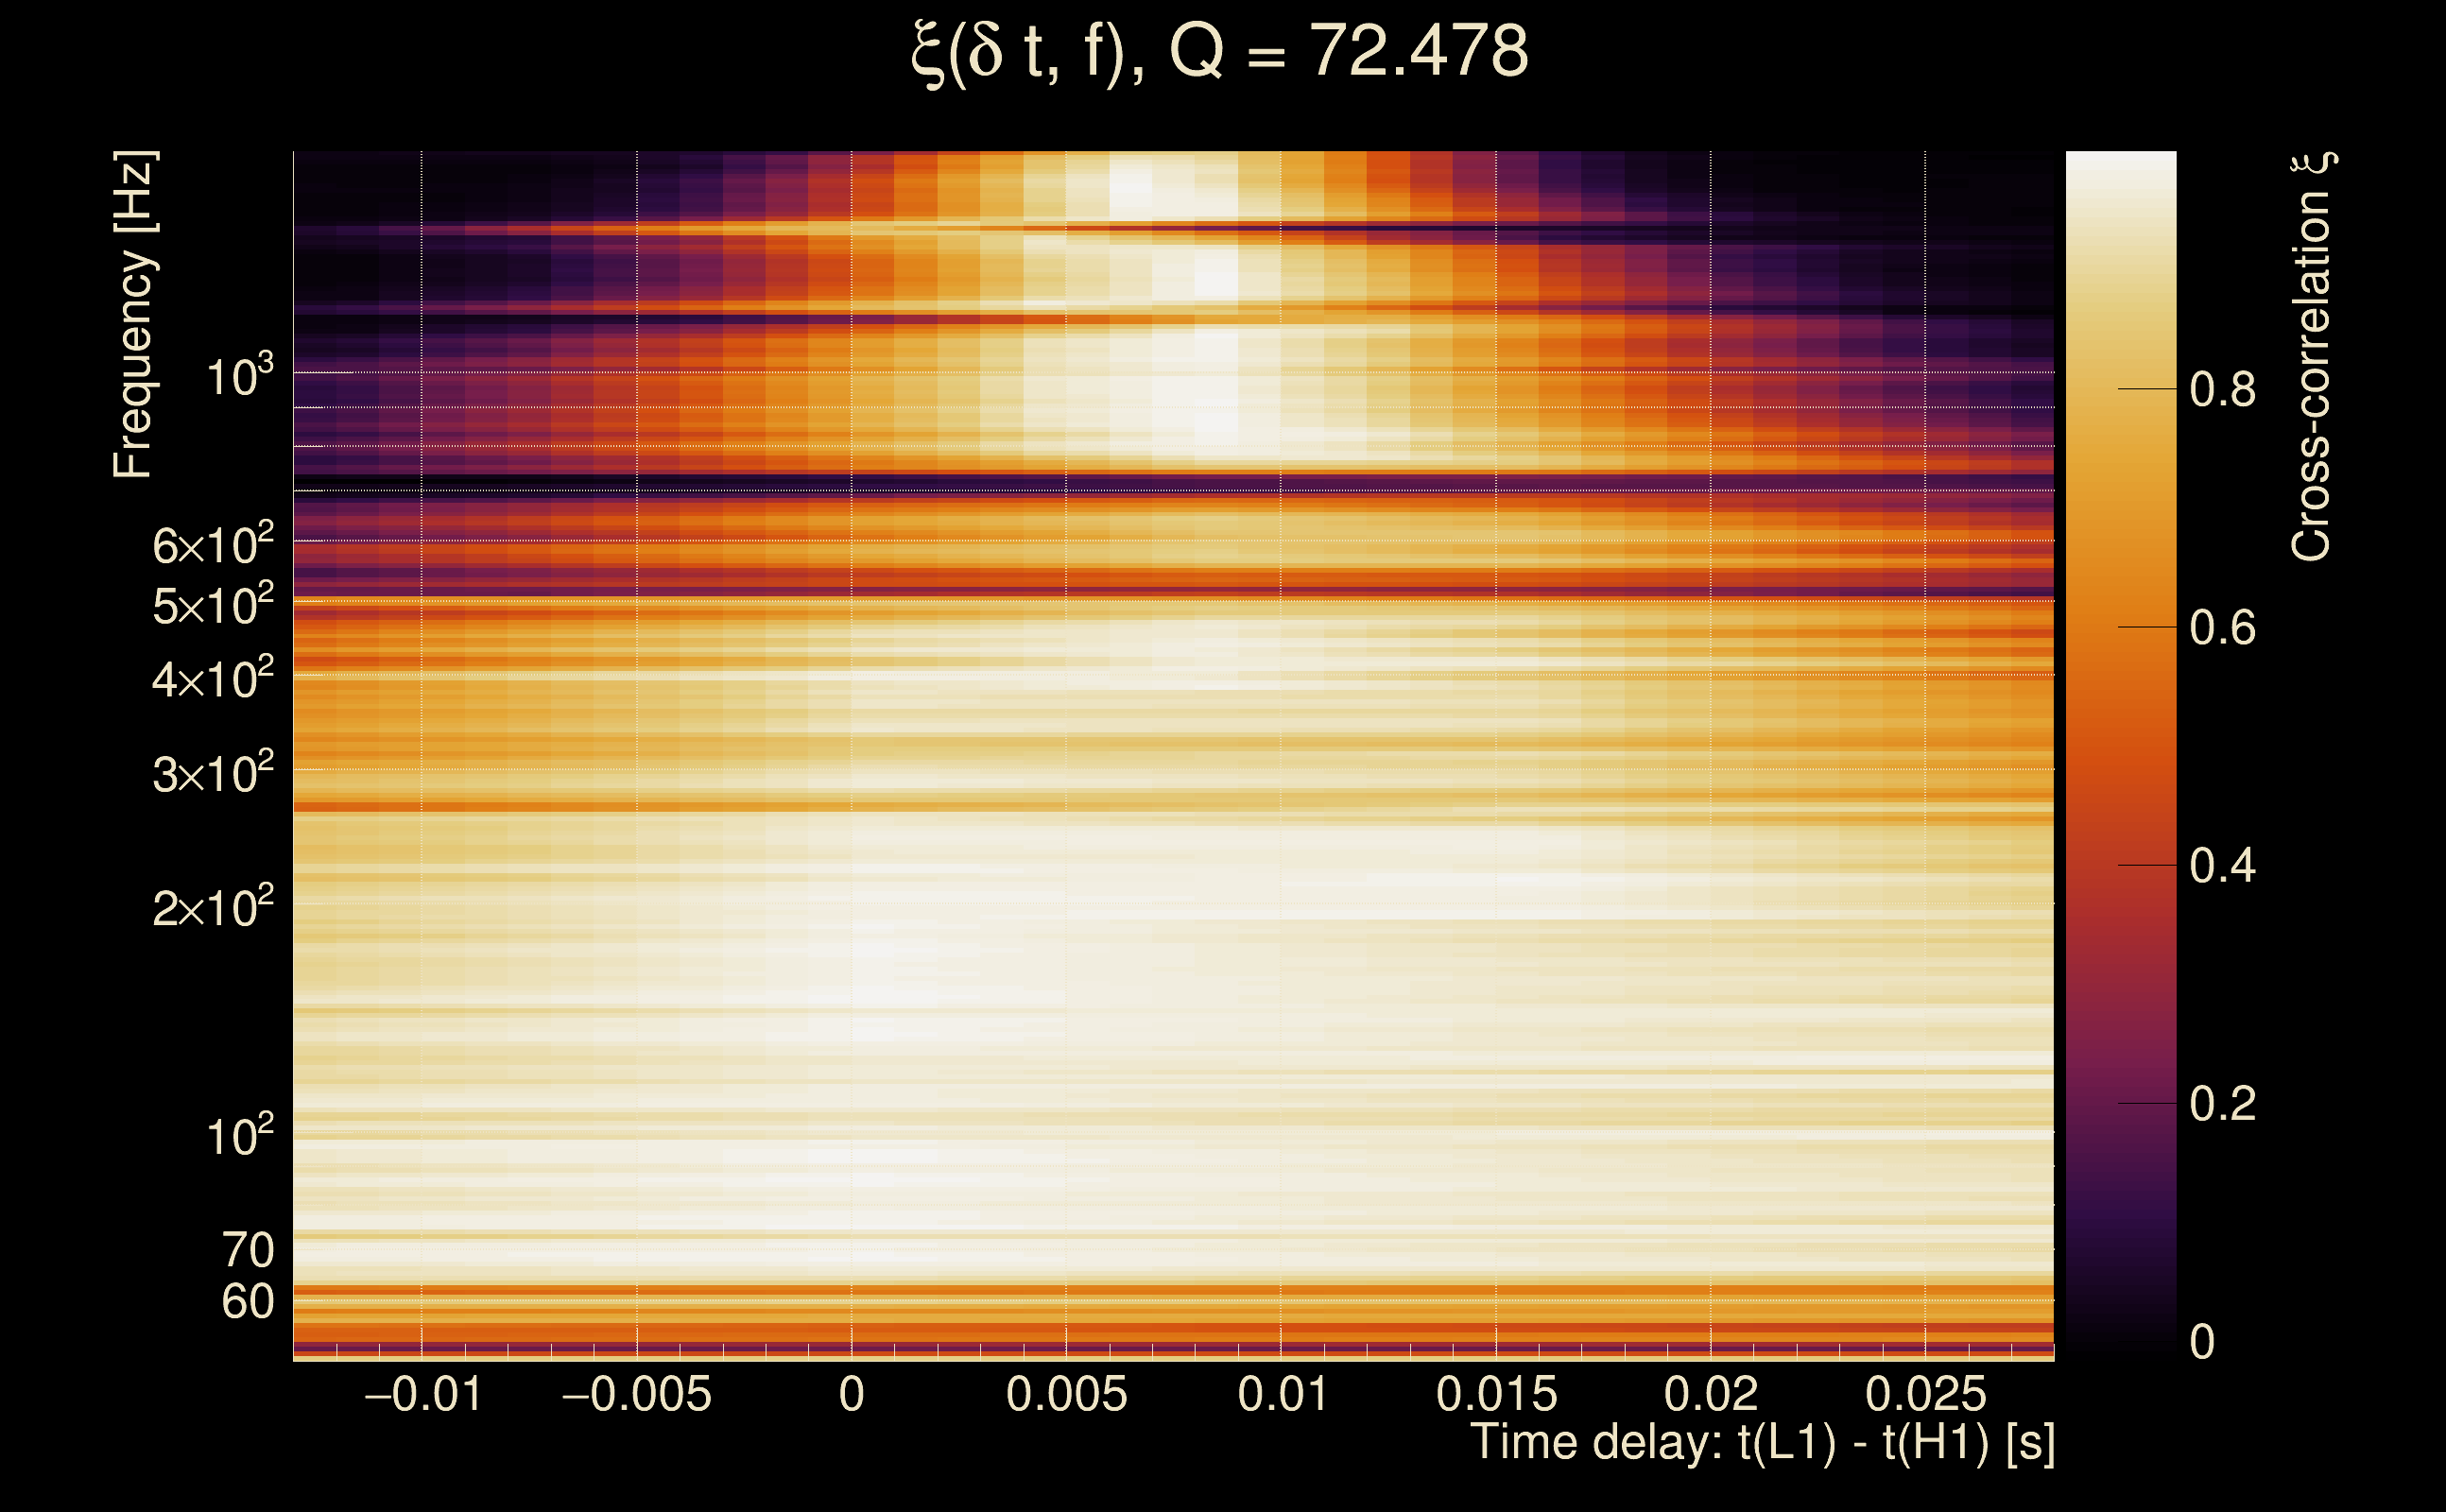
| Time delay between detectors t(L1) - t(H1): | 0.00762995 s (slice index = 108 / 217), δt_gw = 0.00762995 s |
| Time delay standard deviation: | 0.0360599 s |
| [targeted mode] Time delay probability: | 0.995126 (0.00610894 sigmas), δt_target = 0.0076232 s |
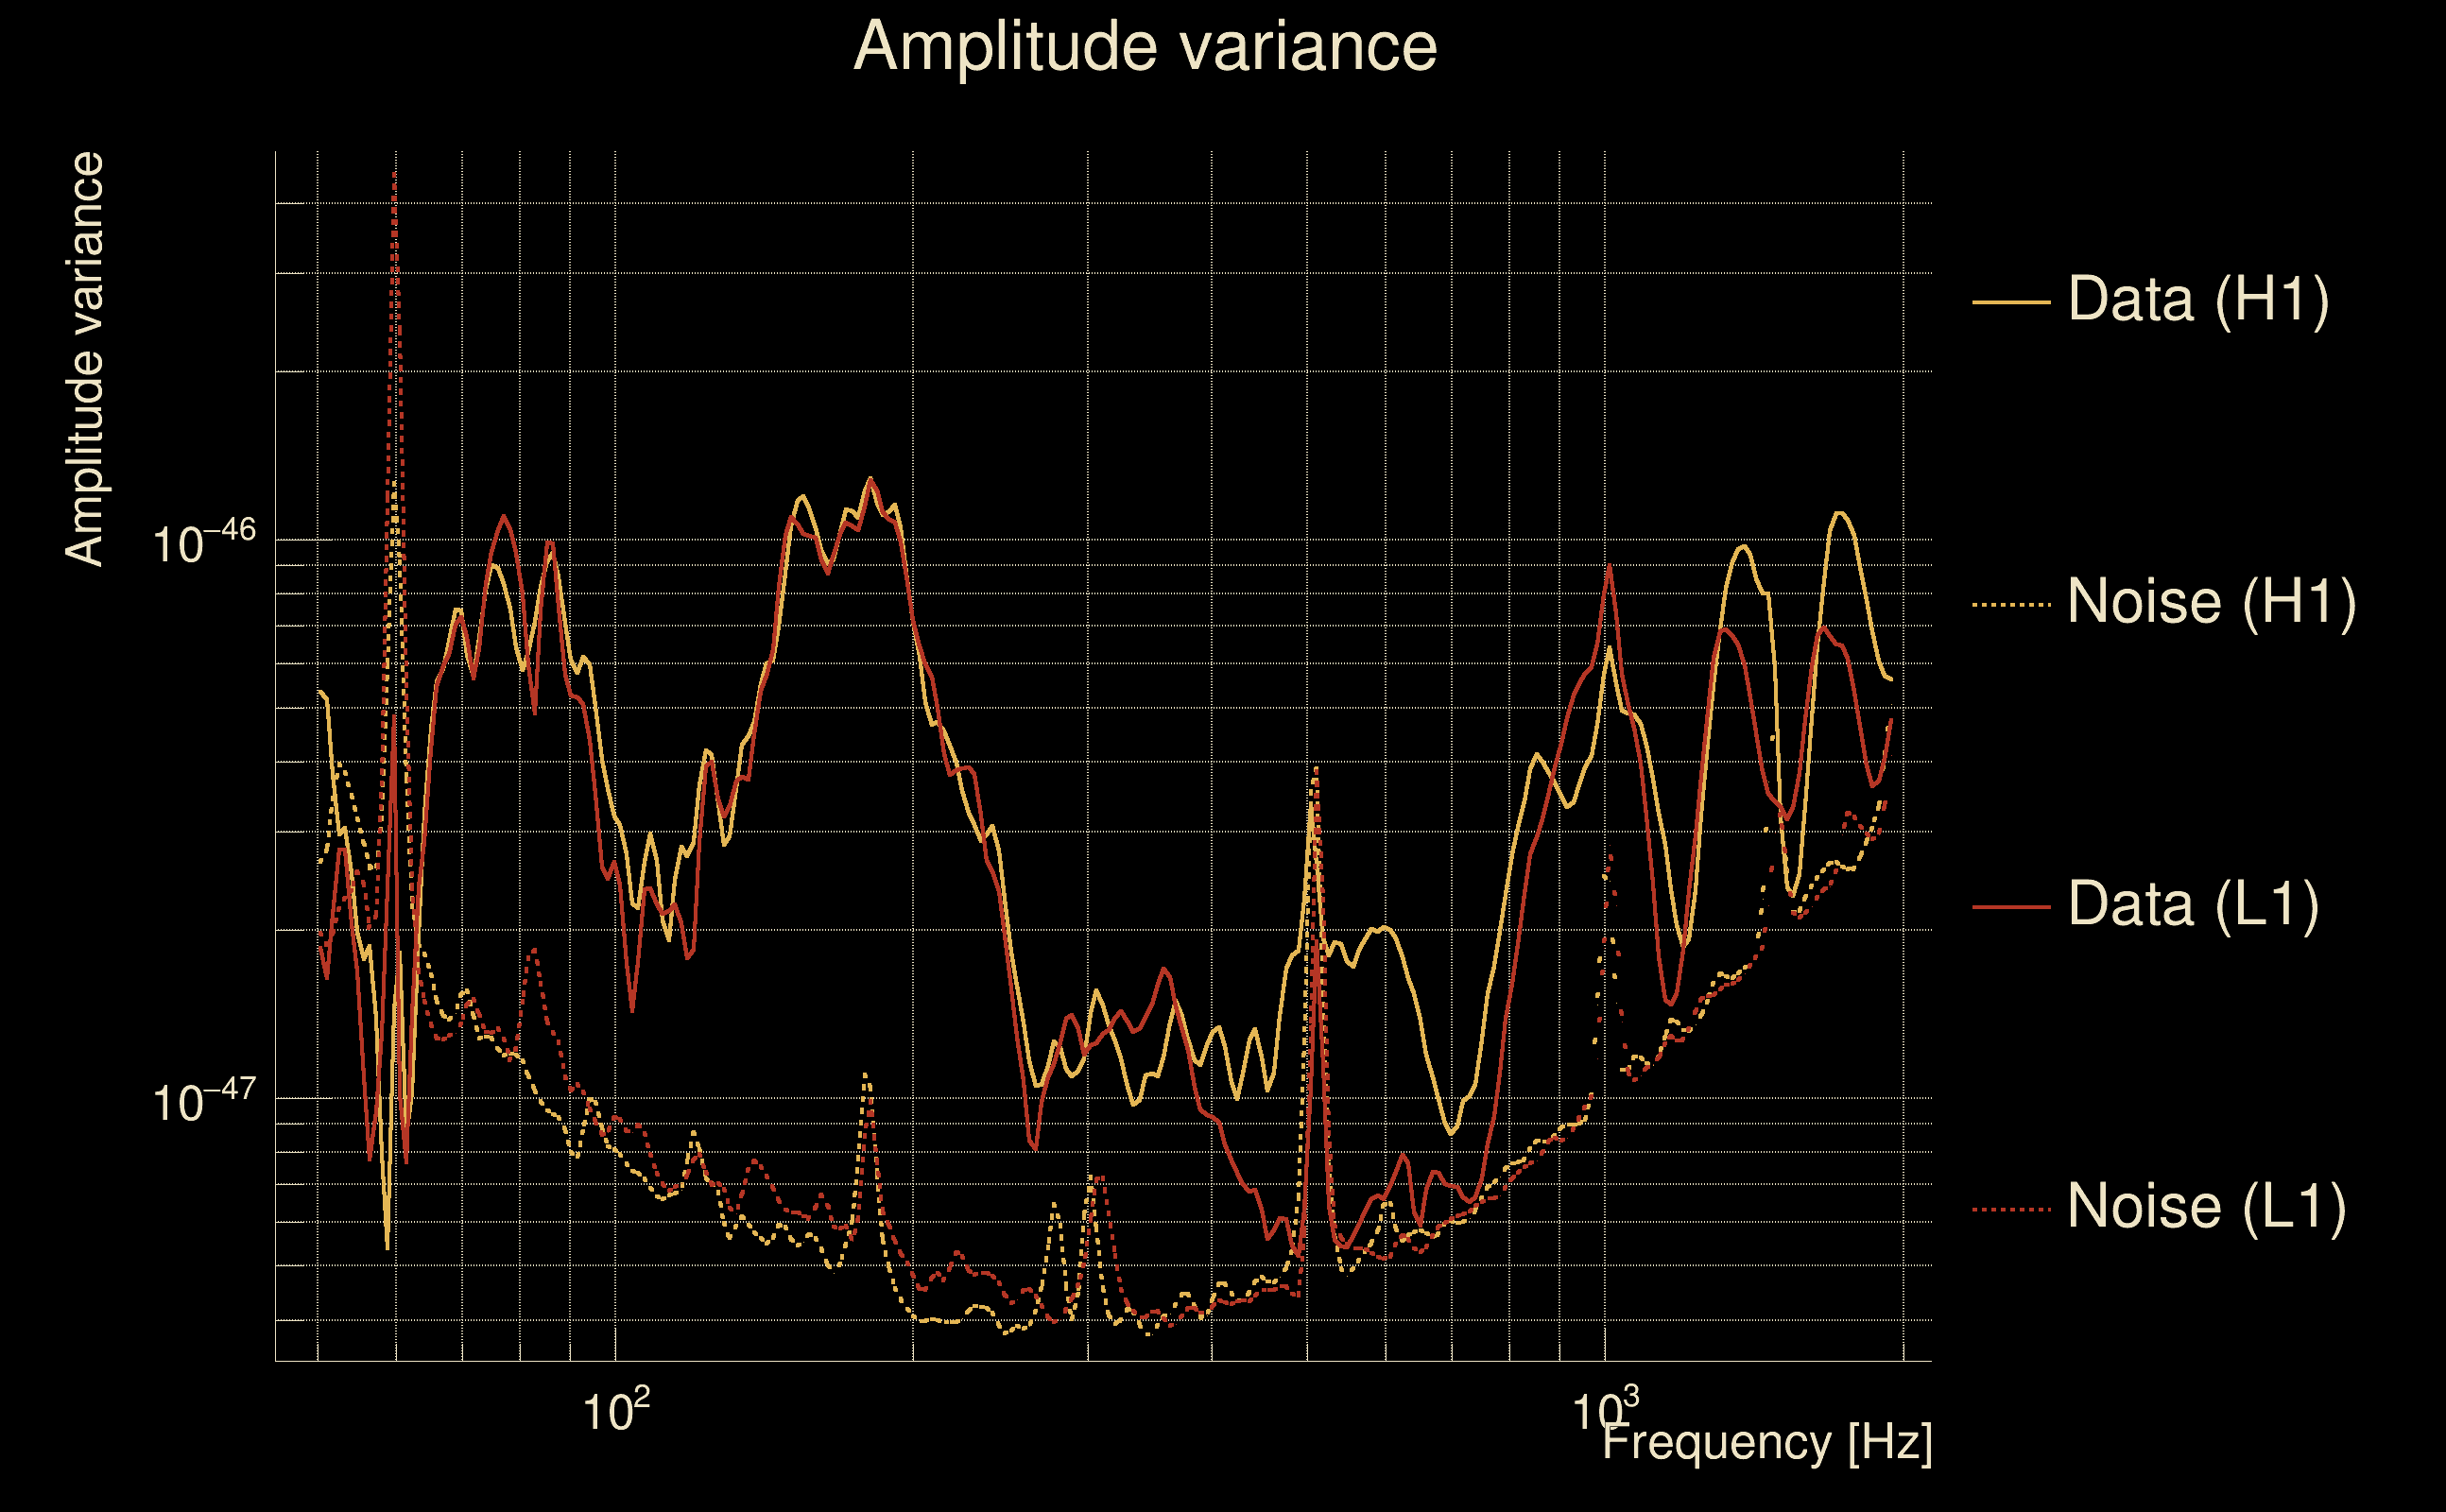
| Frequency: | 302.376 Hz |
| Ξ: | 0.929254 ± 0.00419167 (variance = 1.75701e-05): Q0: 0.95739, Q1: 0.959657, Q2: 0.962903, Q3: 0.958155, Q4: 0.950173 |
| Rank: | R_A = 0.924725 |
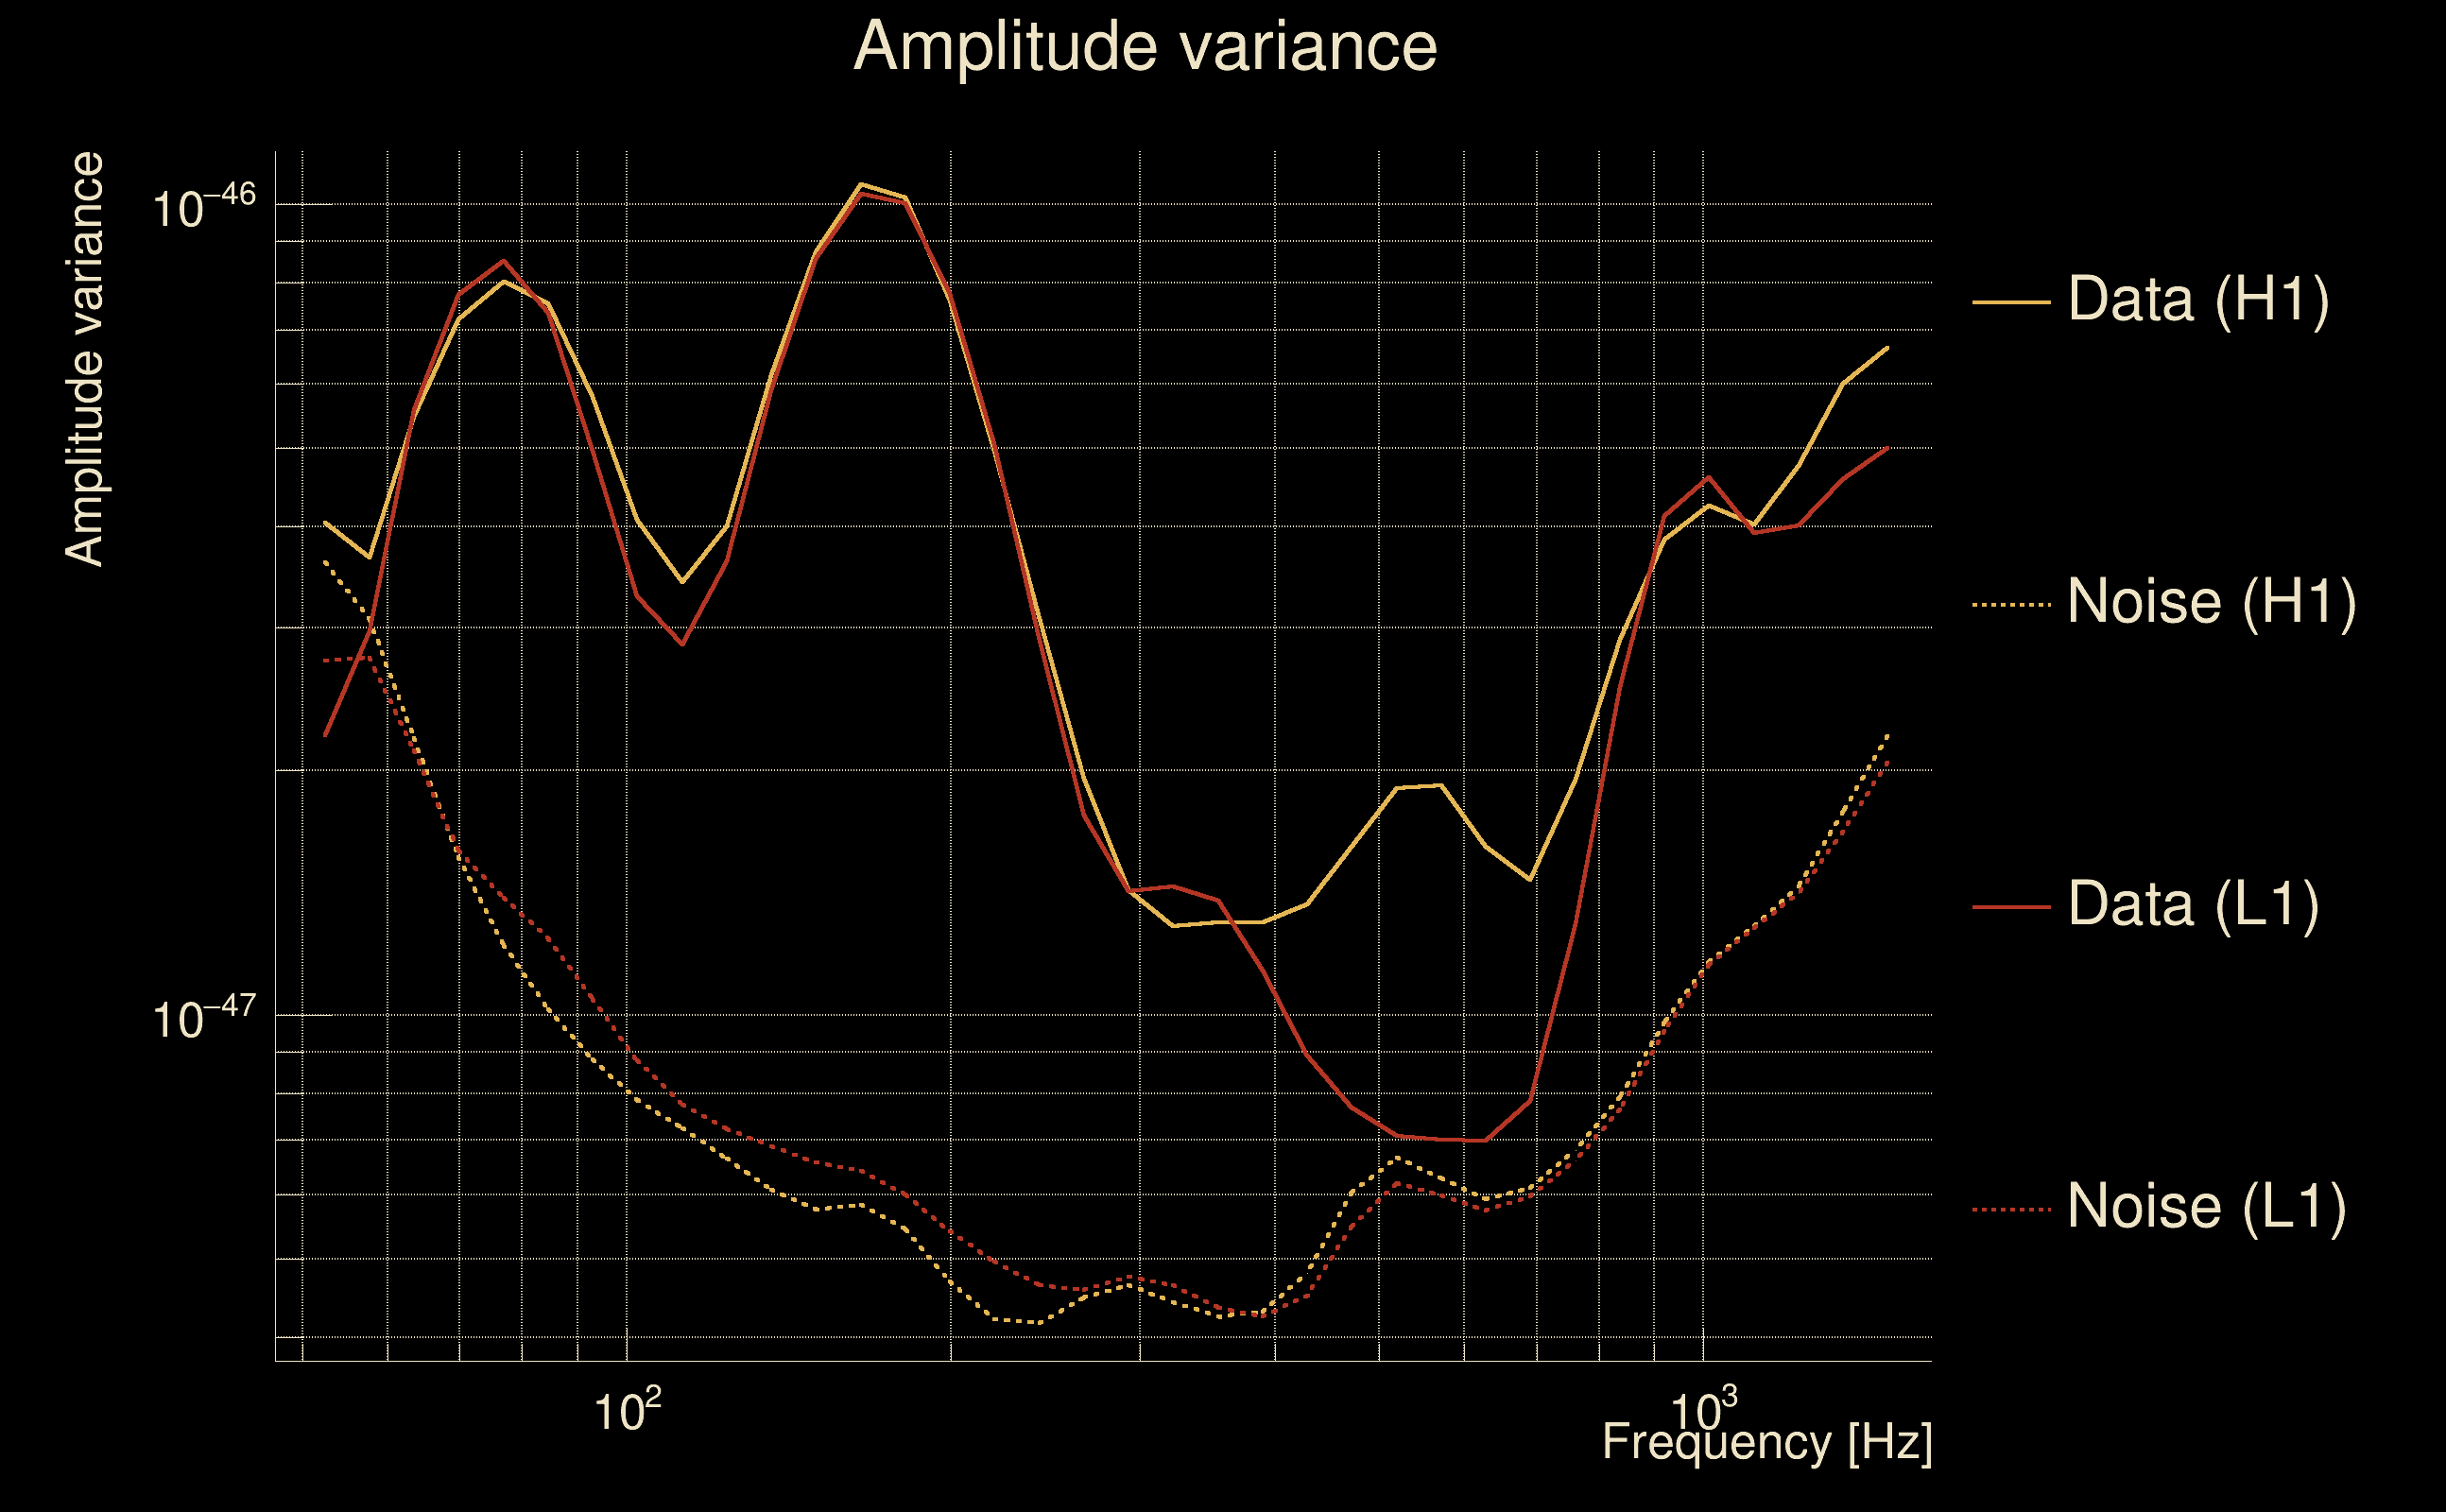
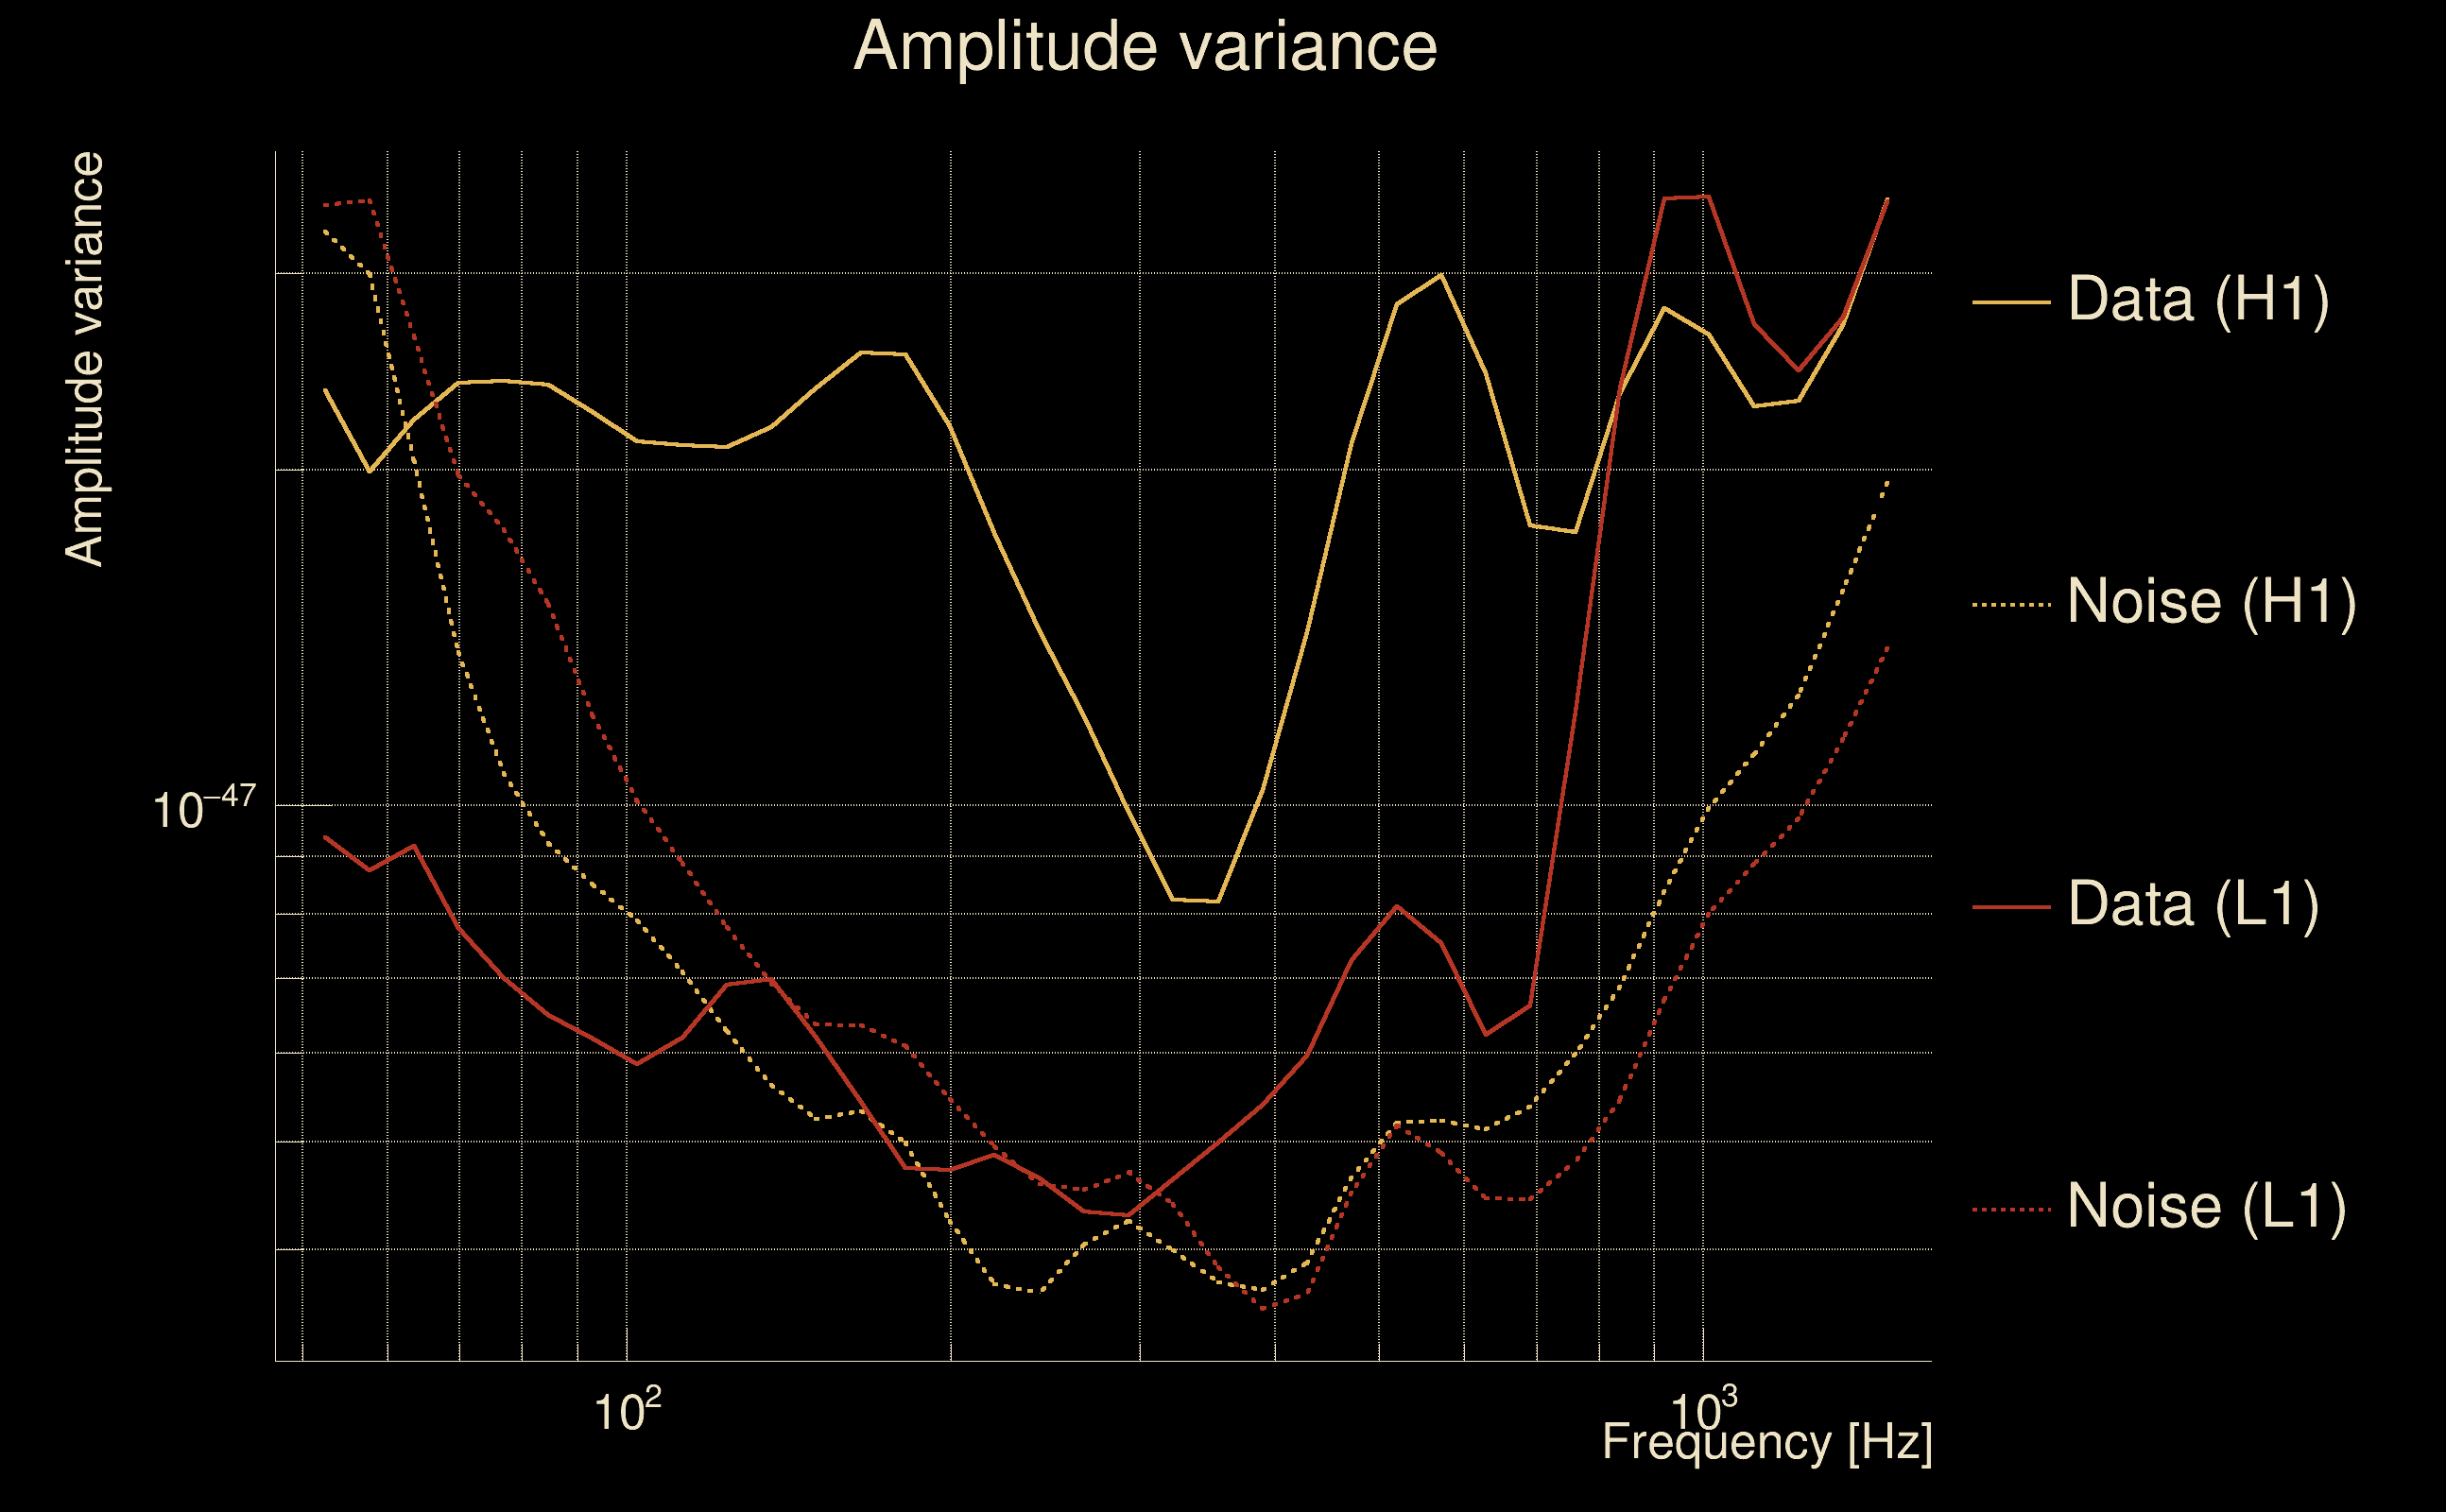
| Log of amplitude ratio (L1/H1): | -0.0566489, variance = 0.167937 (L1/H1: -0.0866714, variance = 0.355126, H1/L1: 0.0263555, variance = 0.316258) |
| Amplitude ratio (L1/H1): | 0.944926 ⋇ 1.50652 (L1/H1: 0.916978 ⋇ 1.81471, H1/L1: 1.02671 ⋇ 1.75482) |
| Amplitude ratio H1|L1 compatibility (probability): | 0.941319 |
| Antenna factor probability: | 0.351226 |
| Number of rejected frequency rows: | Q0: 0 / 18, Q1: 0 / 36, Q2: 7 / 70, Q3: 20 / 134, Q4: 52 / 258 |
| Maximum signal-to-noise ratio: | H1: 89.4668, L1: 89.0661 |
| SNR variance: | H1: 0.468229, L1: 0.485926 |
| Click here for a zoomed plot | Click here for a zoomed plot | Click here for a zoomed plot | Click here for a zoomed plot | Click here for a zoomed plot |
 |
 |
 |
 |
 |
 |
 |
 |
 |
 |
 |
 |
 |
 |
 |
 |
 |
 |
 |
 |
 |
 |
 |
 |
 |
 |
 |
 |
 |
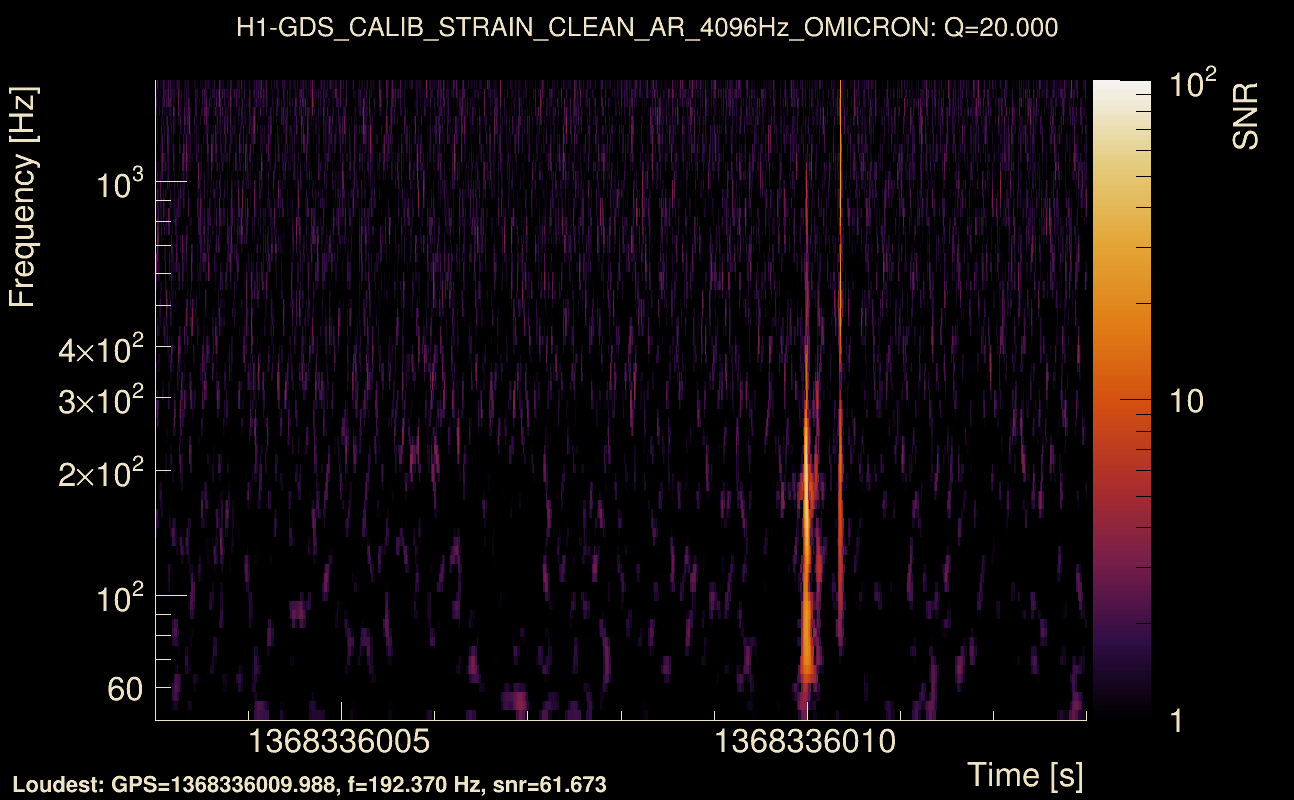
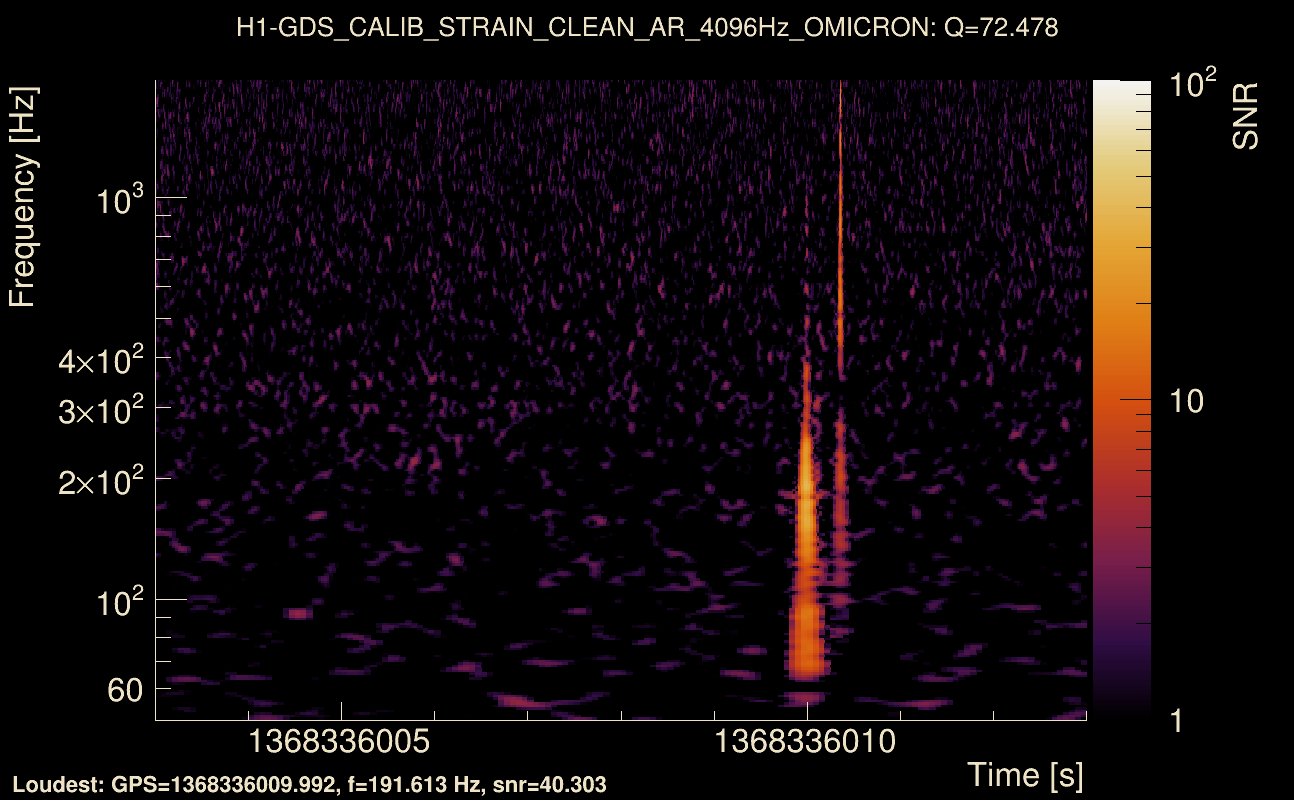
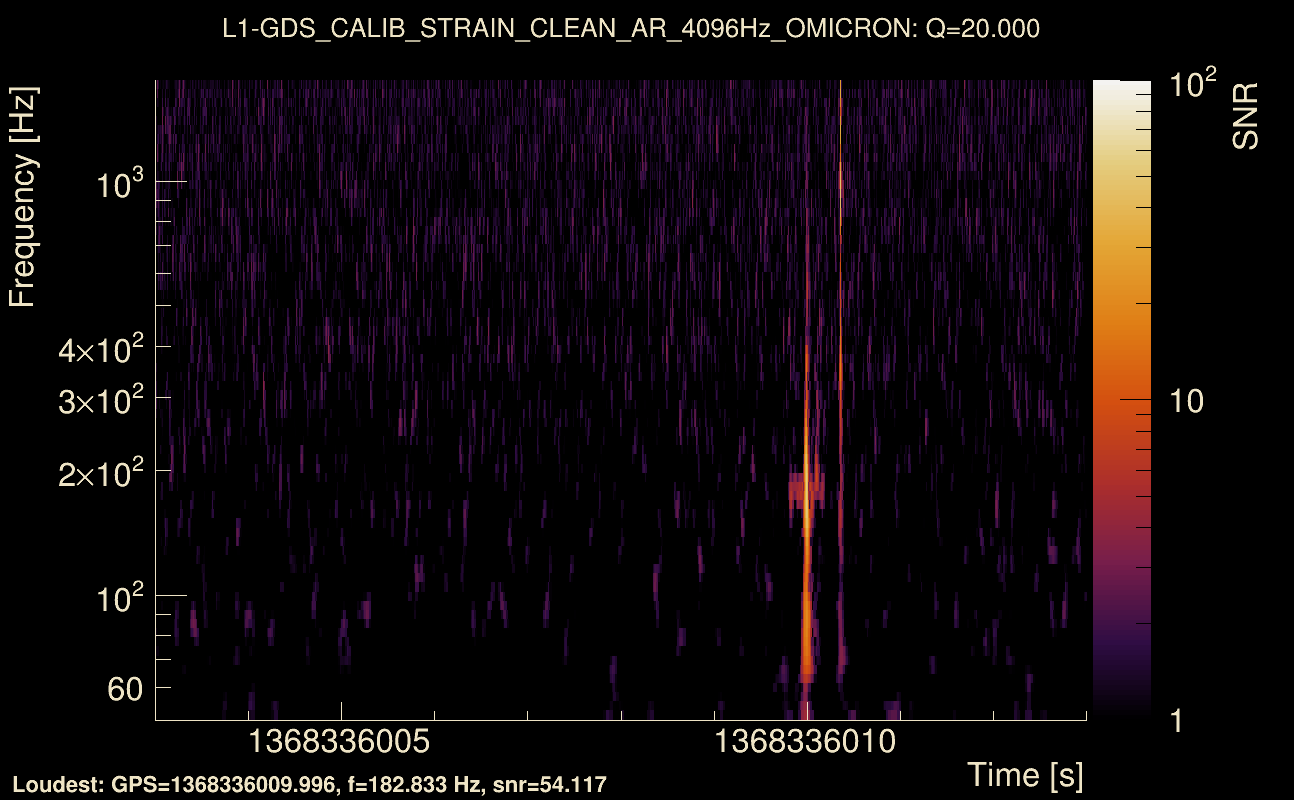
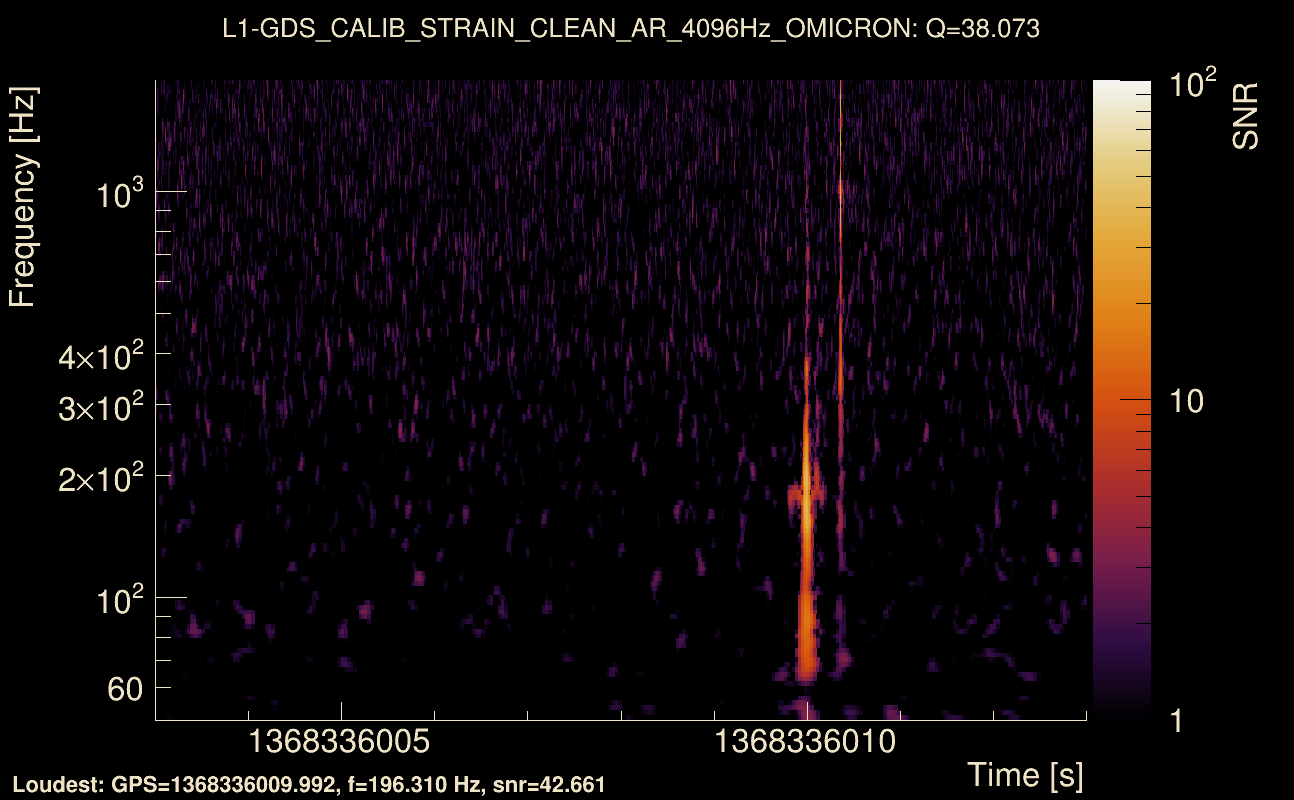
| Event time t(H1): | GPS = 1368336003 (Wed May 17 05:19:45 2023 ) → GPS = 1368336013 (Wed May 17 05:19:55 2023 ) |
| Event time t(L1): | GPS = 1368336003 (Wed May 17 05:19:55 2023 ) → GPS = 1368336013 (Wed May 17 05:19:55 2023 ) |
| Omicron analysis time window (H1): | GPS = 1368336000 → GPS = 1368336016 |
| Omicron analysis time window (L1): | GPS = 1368336000 → GPS = 1368336016 |
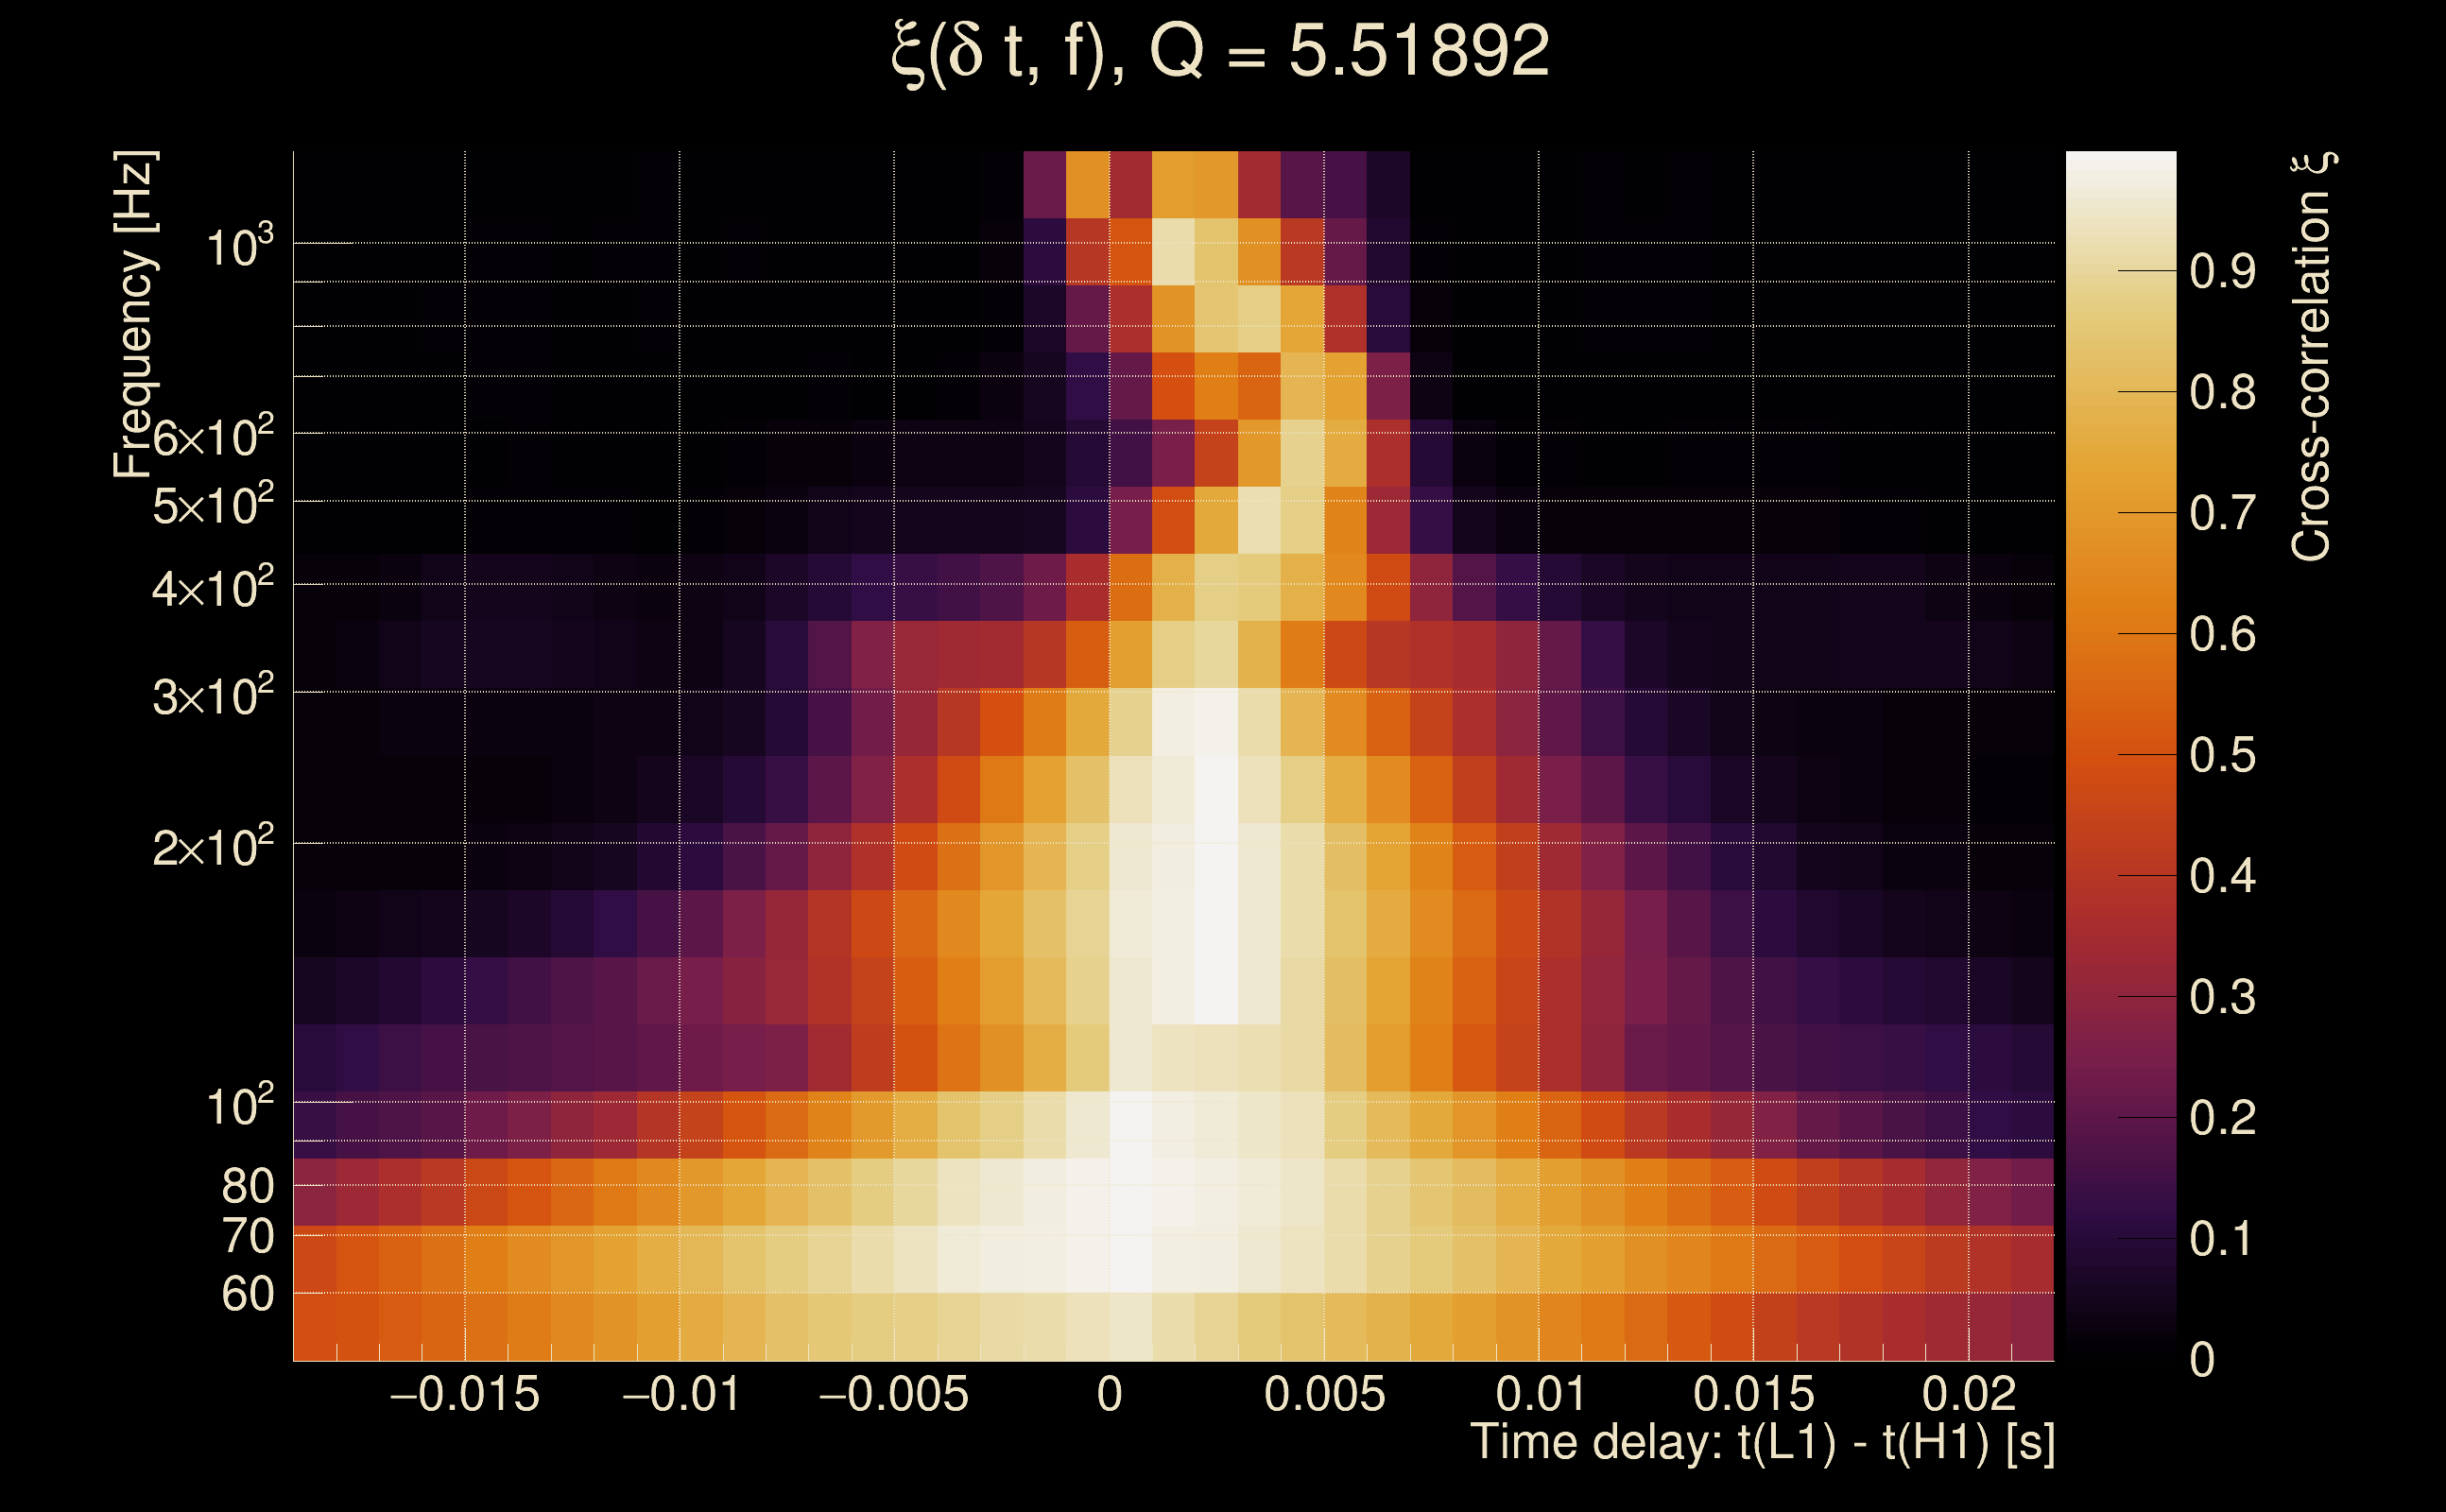
| Time delay between detectors t(L1) - t(H1): | 0.0015599 s (slice index = 108 / 217), δt_gw = 0.0015599 s |
| Time delay standard deviation: | 0.0374409 s |
| [targeted mode] Time delay probability: | 0.992305 (0.00964428 sigmas), δt_target = 0.007622 s |
| Frequency: | 286.096 Hz |
| Ξ: | 0.911353 ± 0.0121939 (variance = 0.000148691): Q0: 0.936588, Q1: 0.917355, Q2: 0.922348, Q3: 0.913078, Q4: 0.899163 |
| Rank: | R_A = 0.90434 |
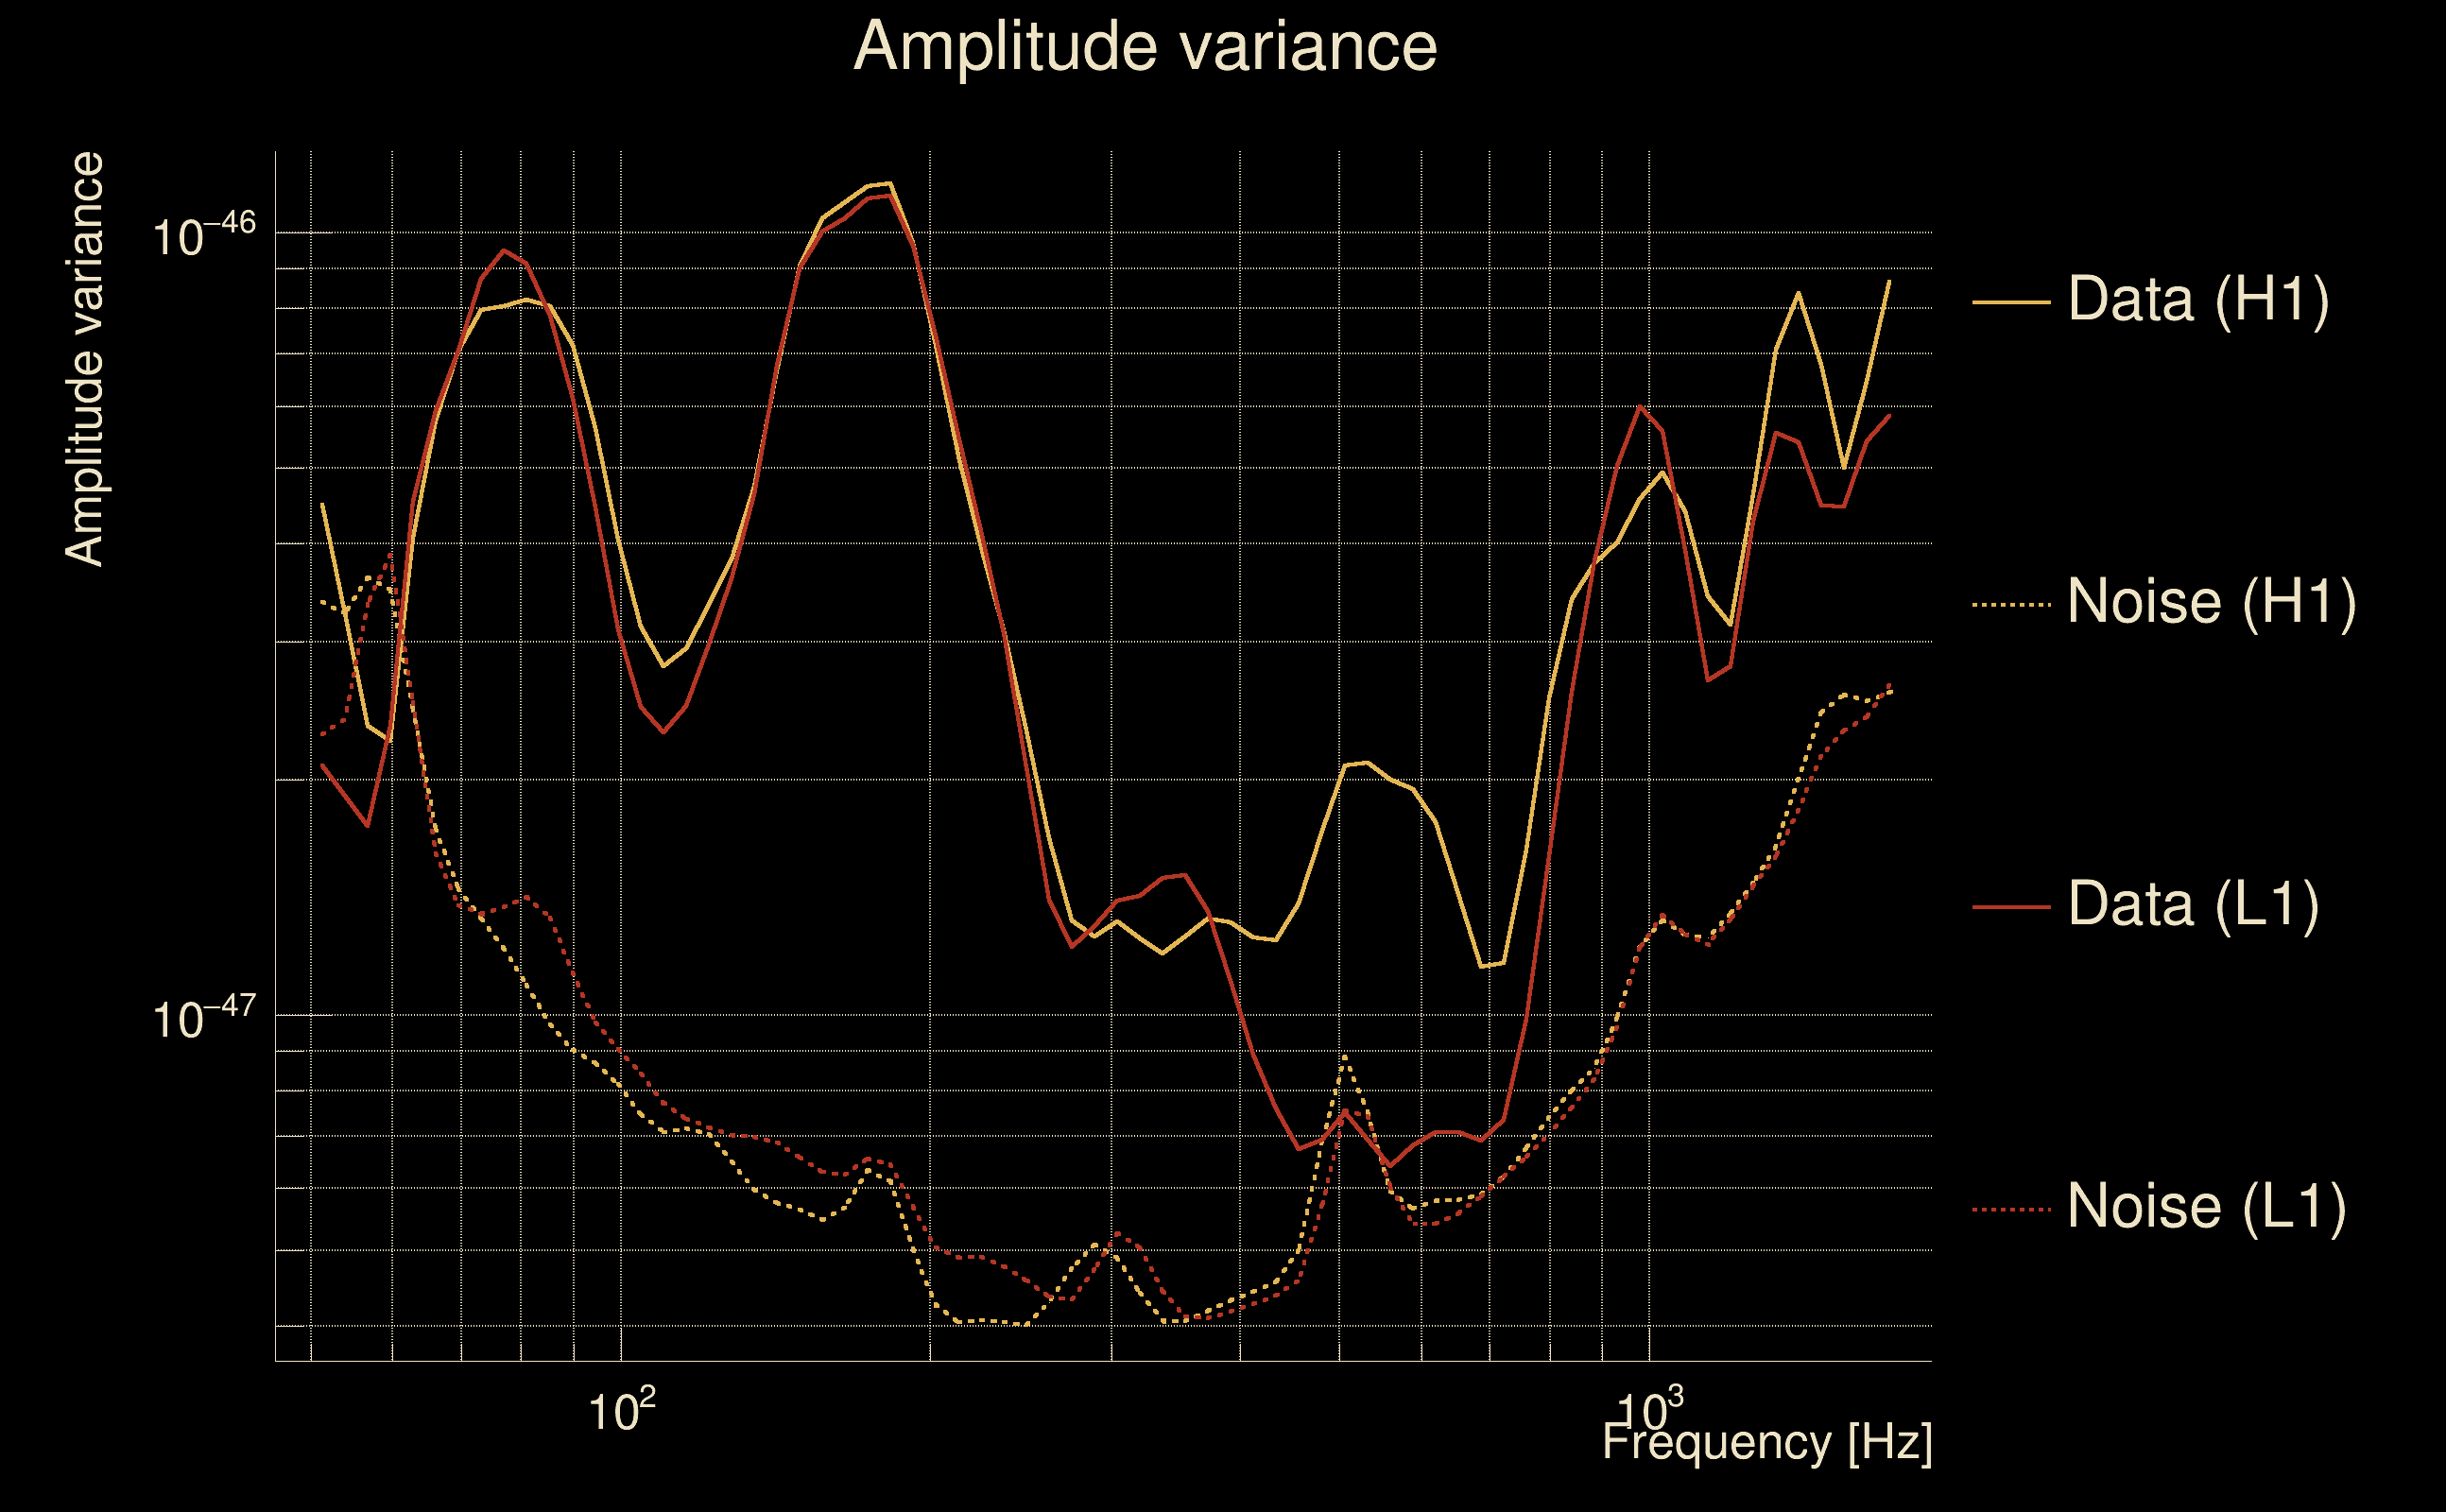
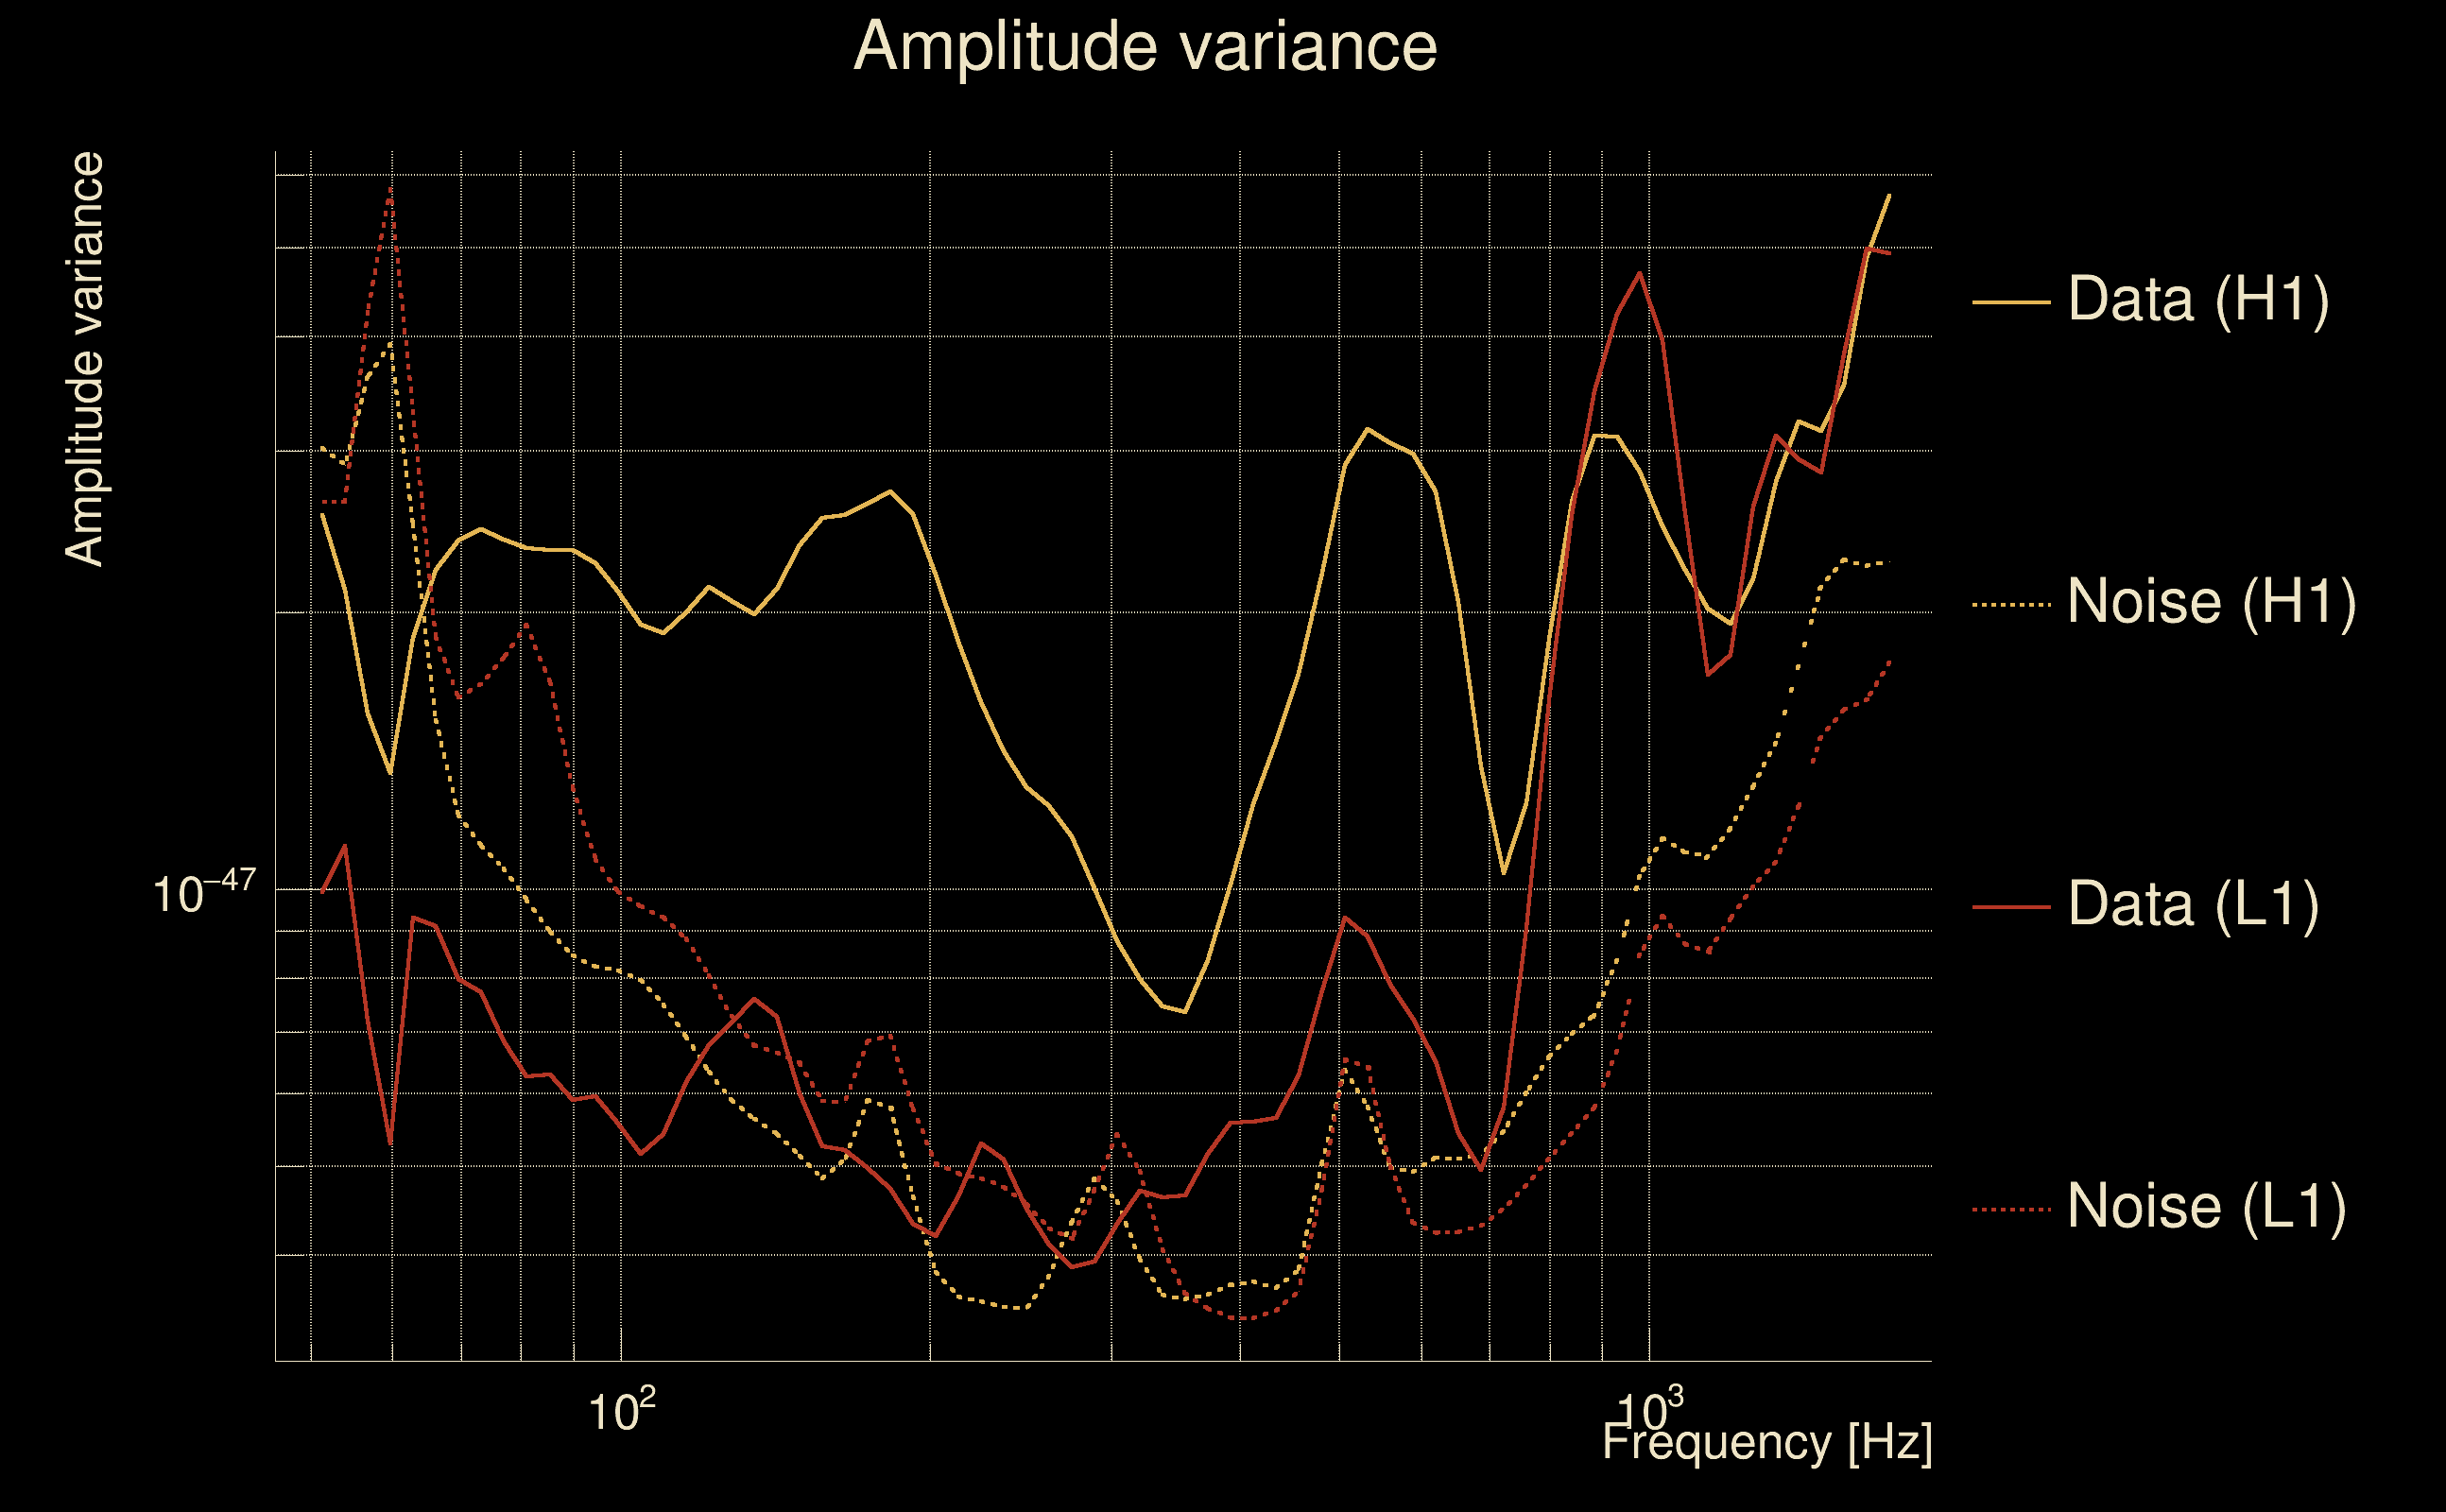
| Log of amplitude ratio (L1/H1): | -0.0913246, variance = 0.163666 (L1/H1: -0.121949, variance = 0.329442, H1/L1: 0.059324, variance = 0.324695) |
| Amplitude ratio (L1/H1): | 0.912721 ⋇ 1.49864 (L1/H1: 0.885194 ⋇ 1.7753, H1/L1: 1.06112 ⋇ 1.76795) |
| Amplitude ratio H1|L1 compatibility (probability): | 0.938281 |
| Antenna factor probability: | 0.963977 |
| Number of rejected frequency rows: | Q0: 0 / 18, Q1: 0 / 36, Q2: 3 / 70, Q3: 11 / 134, Q4: 42 / 258 |
| Maximum signal-to-noise ratio: | H1: 89.4752, L1: 87.5299 |
| SNR variance: | H1: 0.494269, L1: 0.49928 |
| Click here for a zoomed plot | Click here for a zoomed plot | Click here for a zoomed plot | Click here for a zoomed plot | Click here for a zoomed plot |
 |
 |
 |
 |
 |
 |
 |
 |
 |
 |
 |
 |
 |
 |
 |
 |
 |
 |
 |
 |
 |
 |
 |
 |
 |
 |
 |
 |
 |
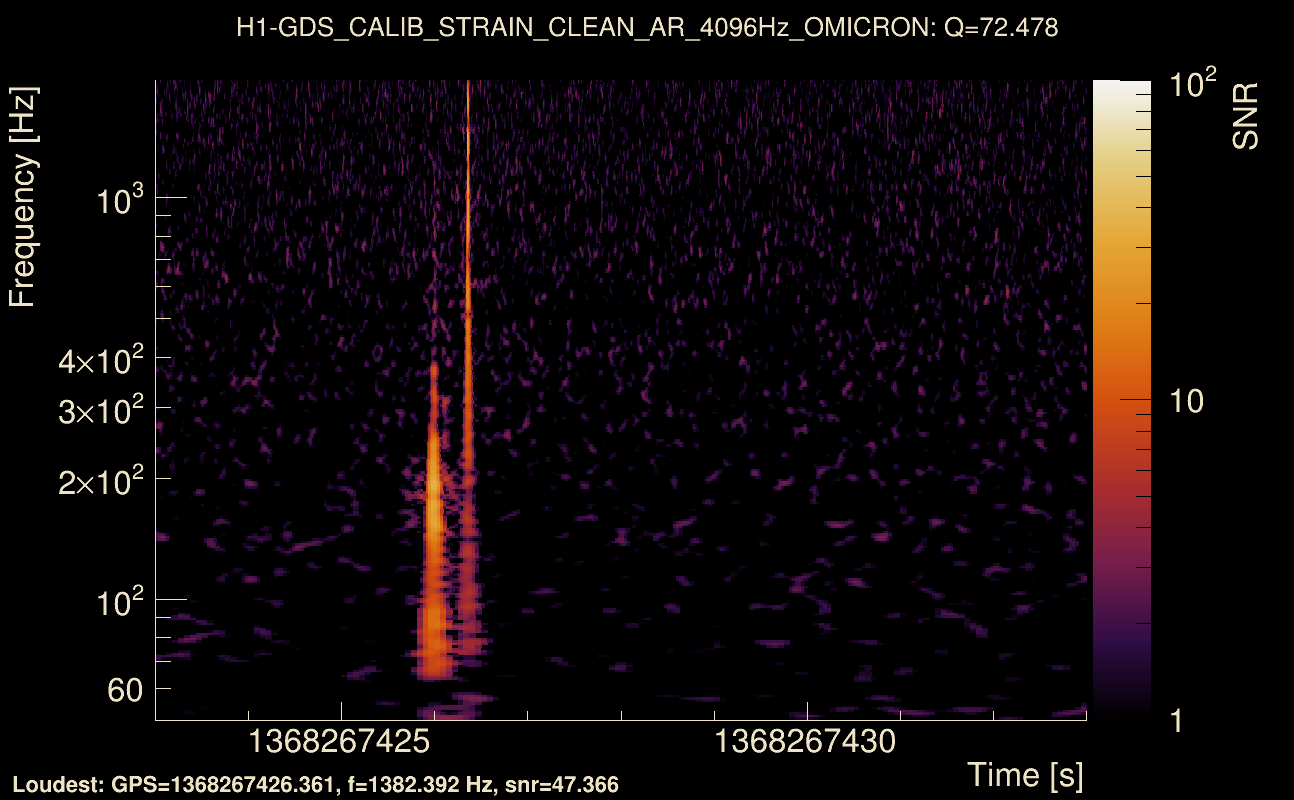
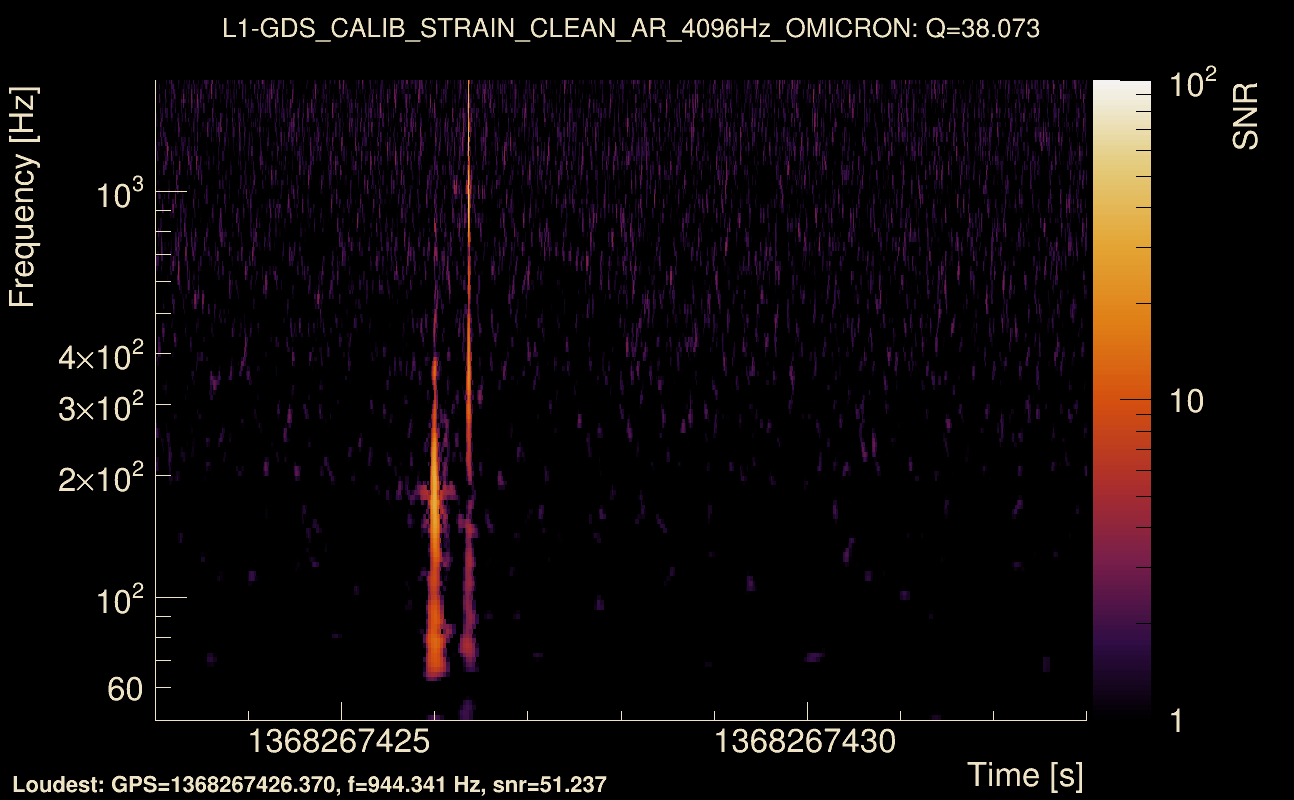
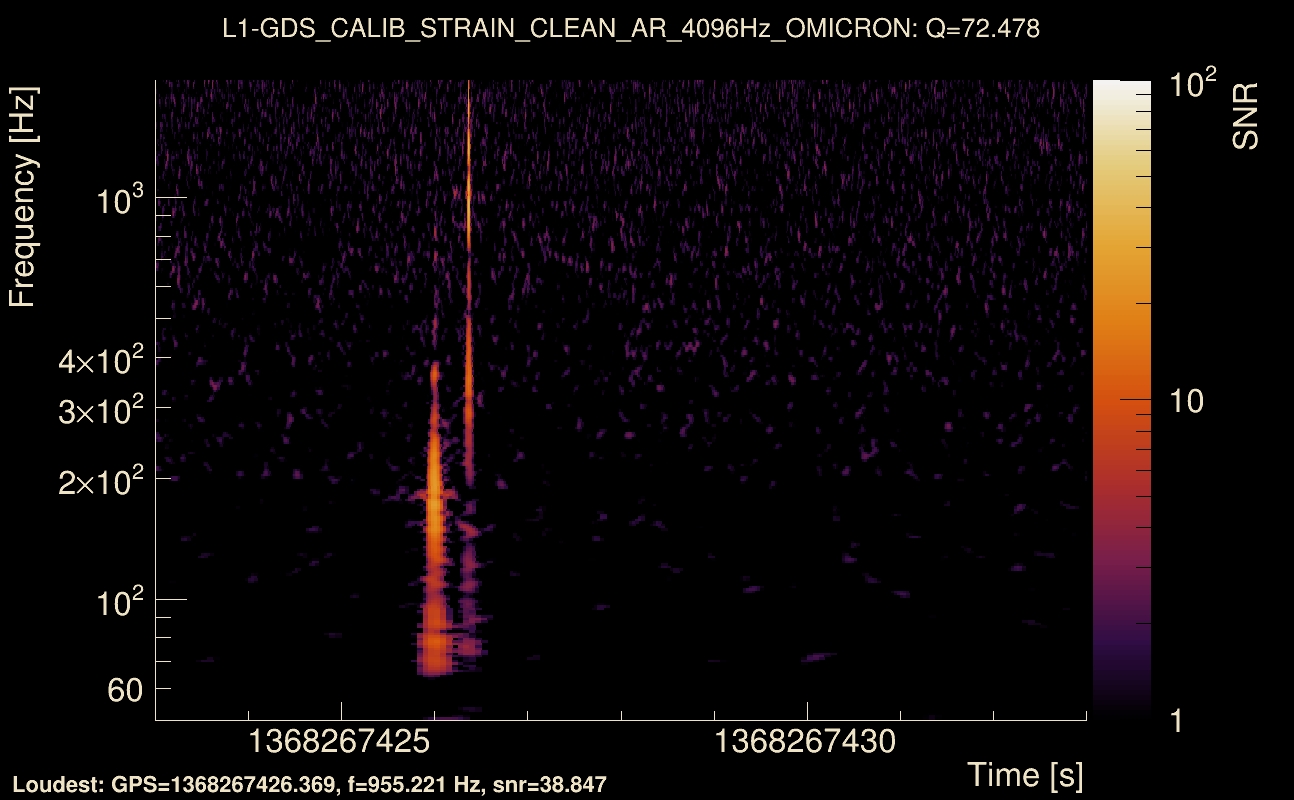
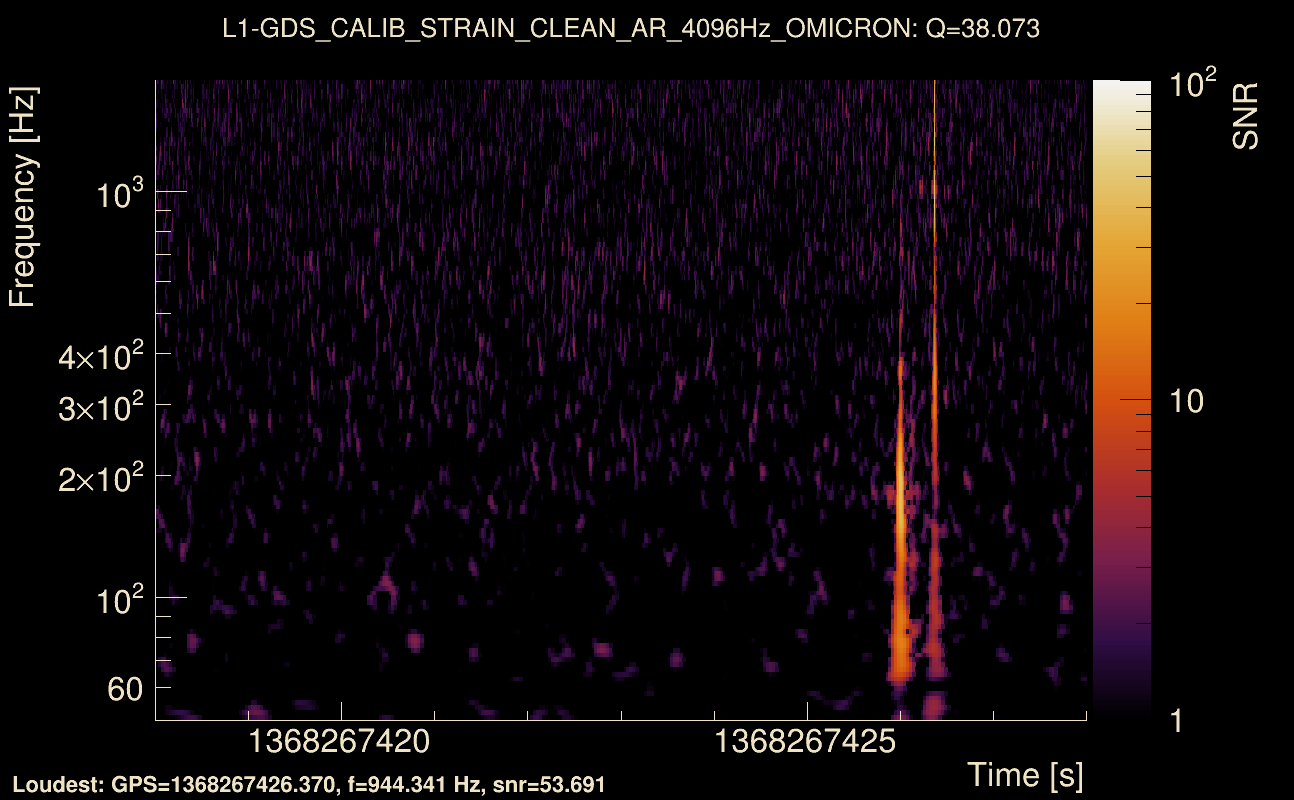
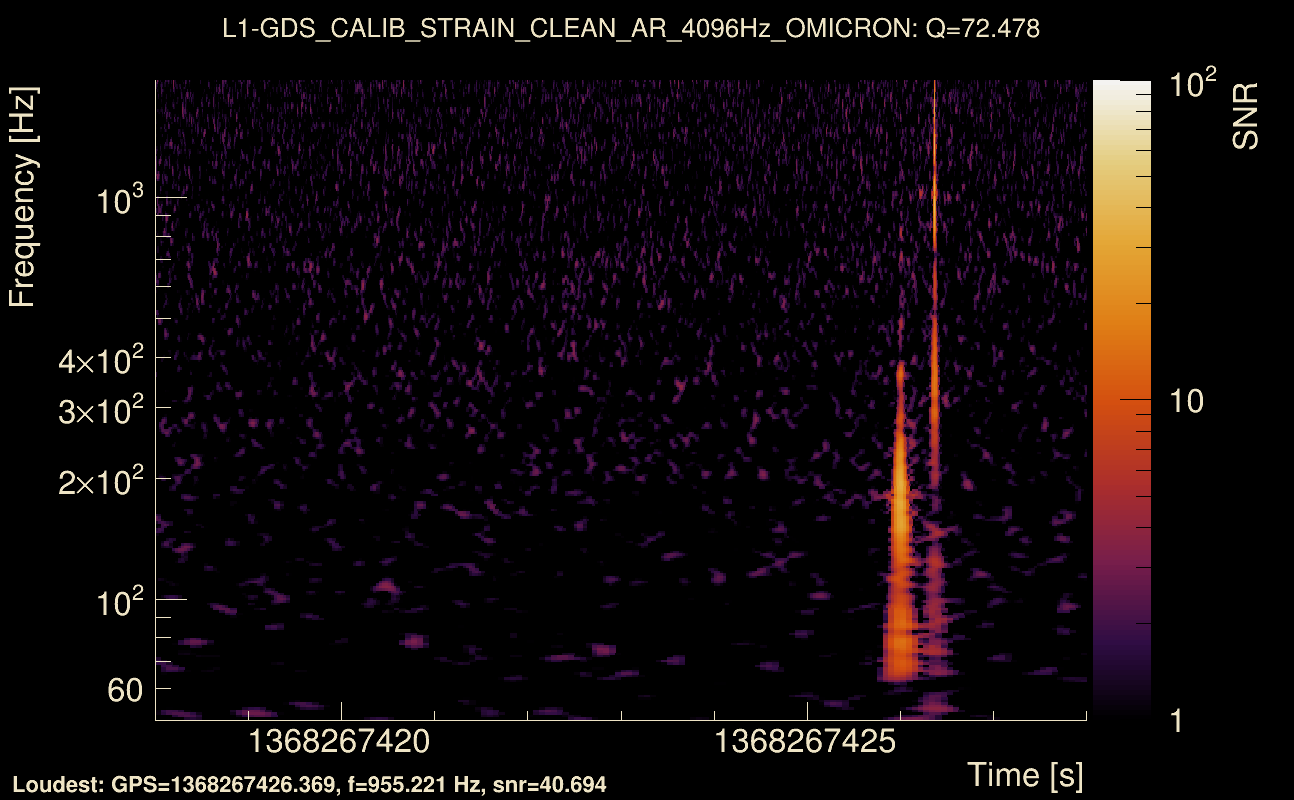
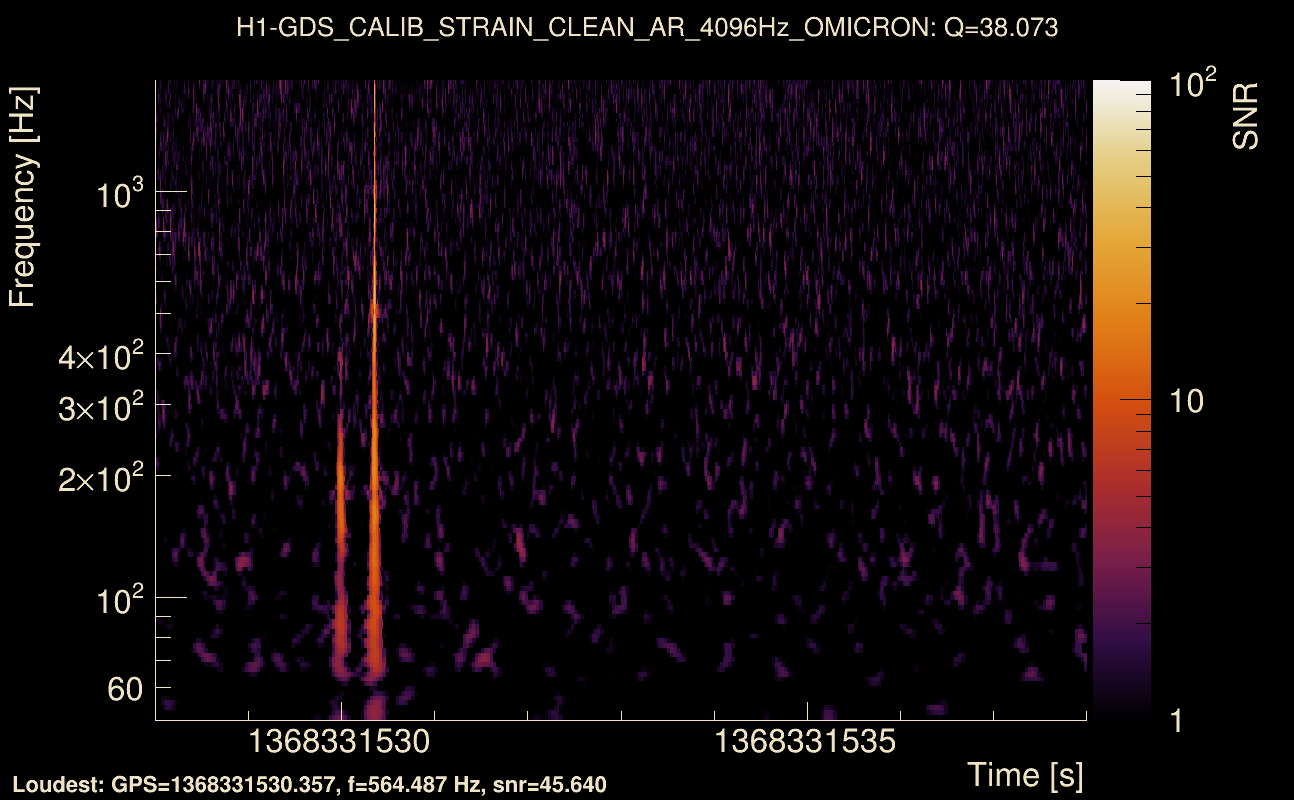
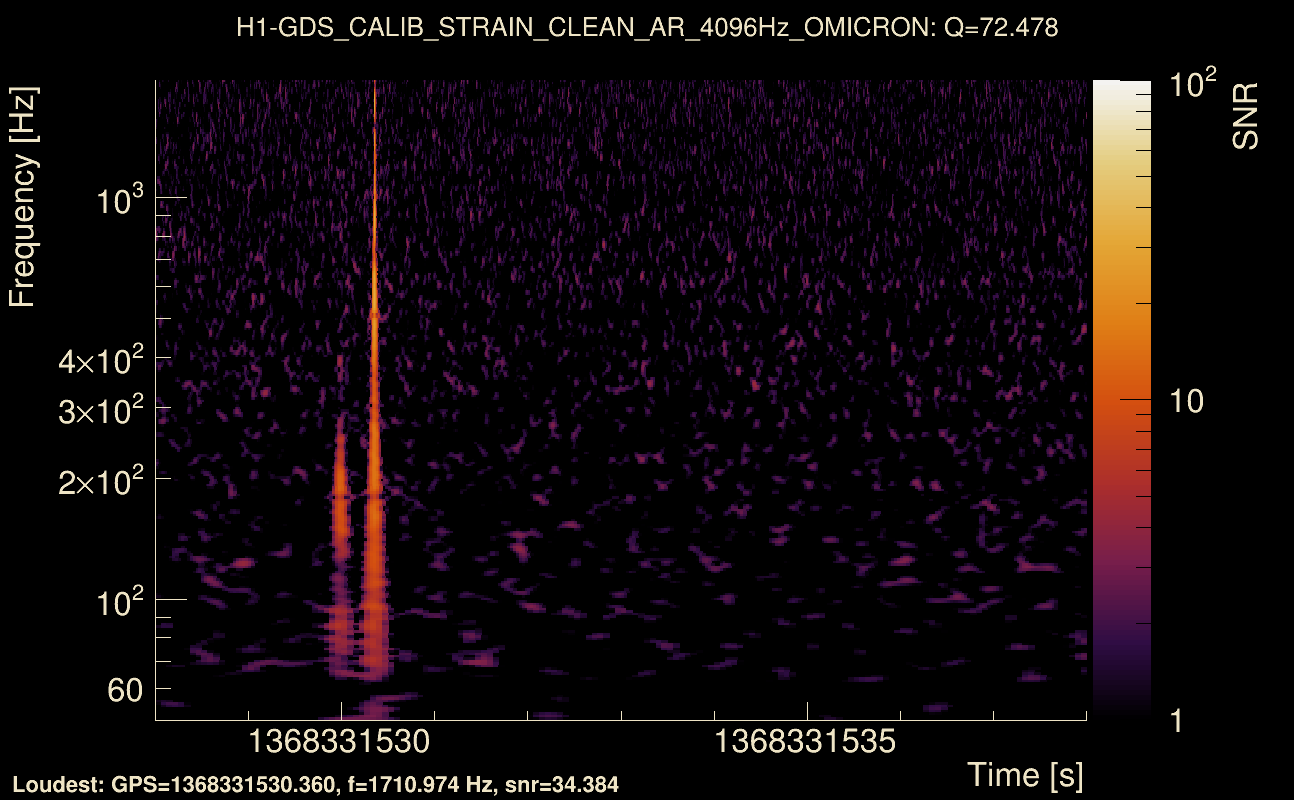
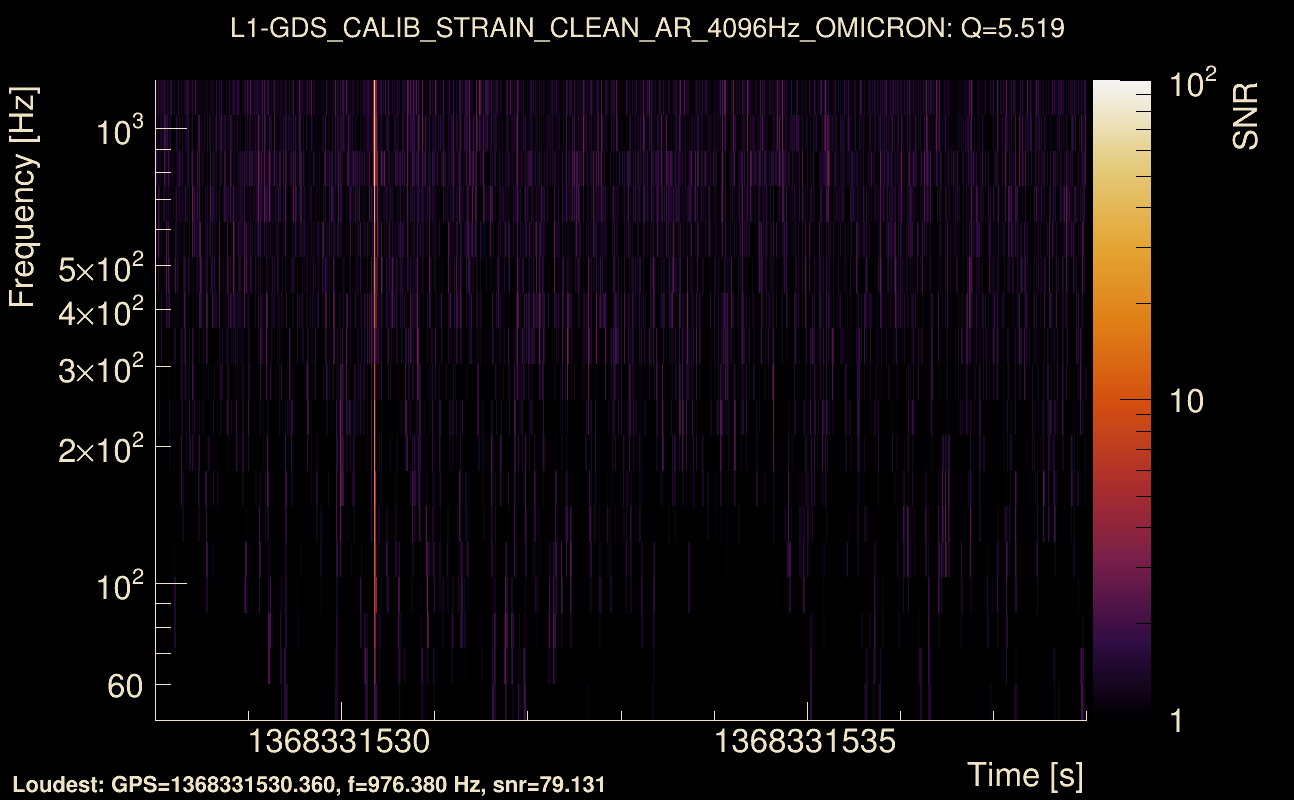
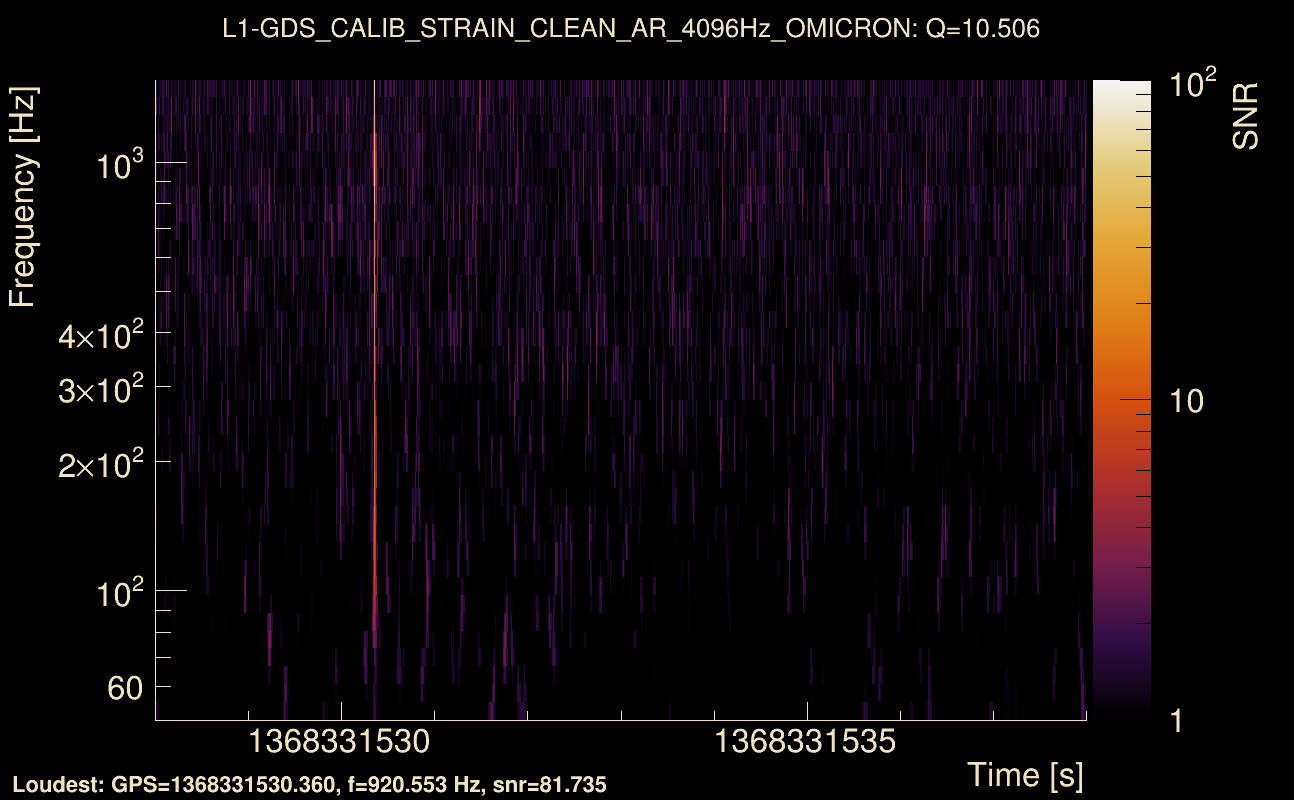
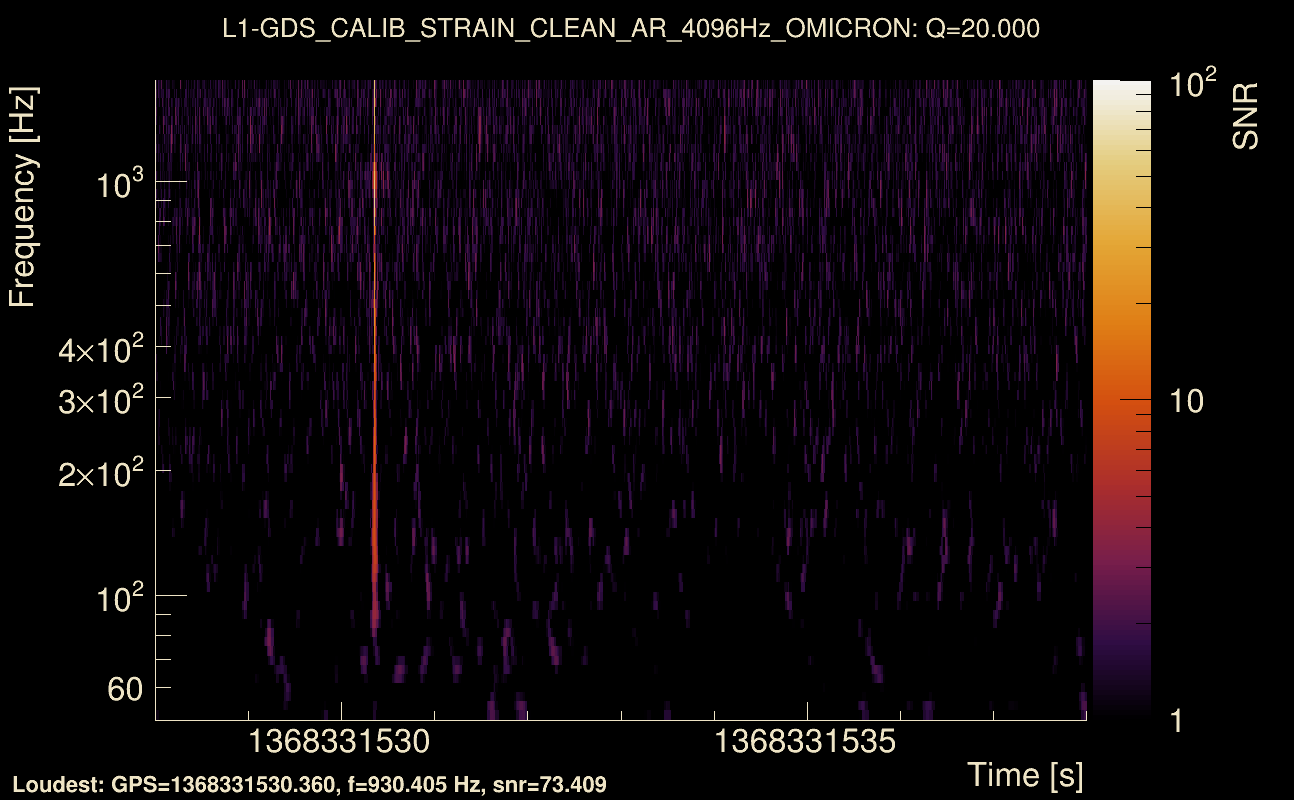
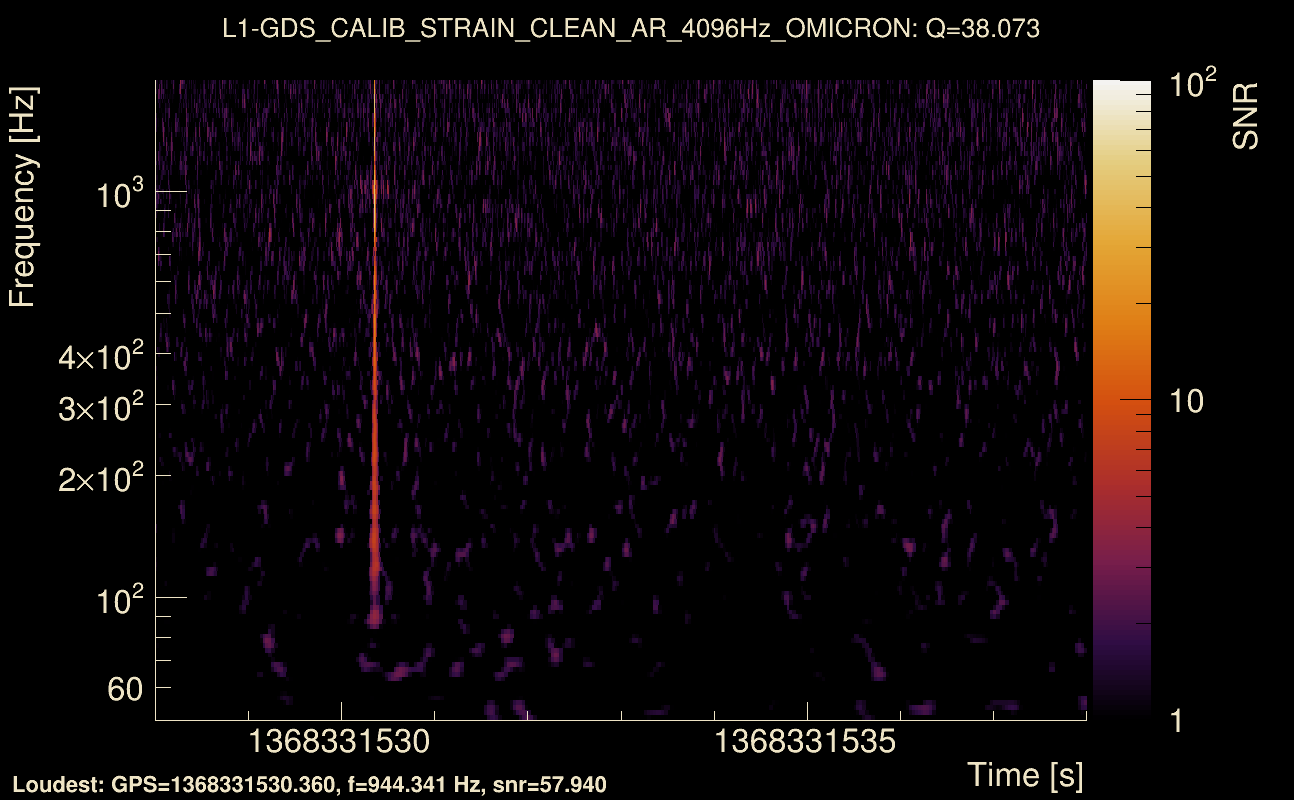
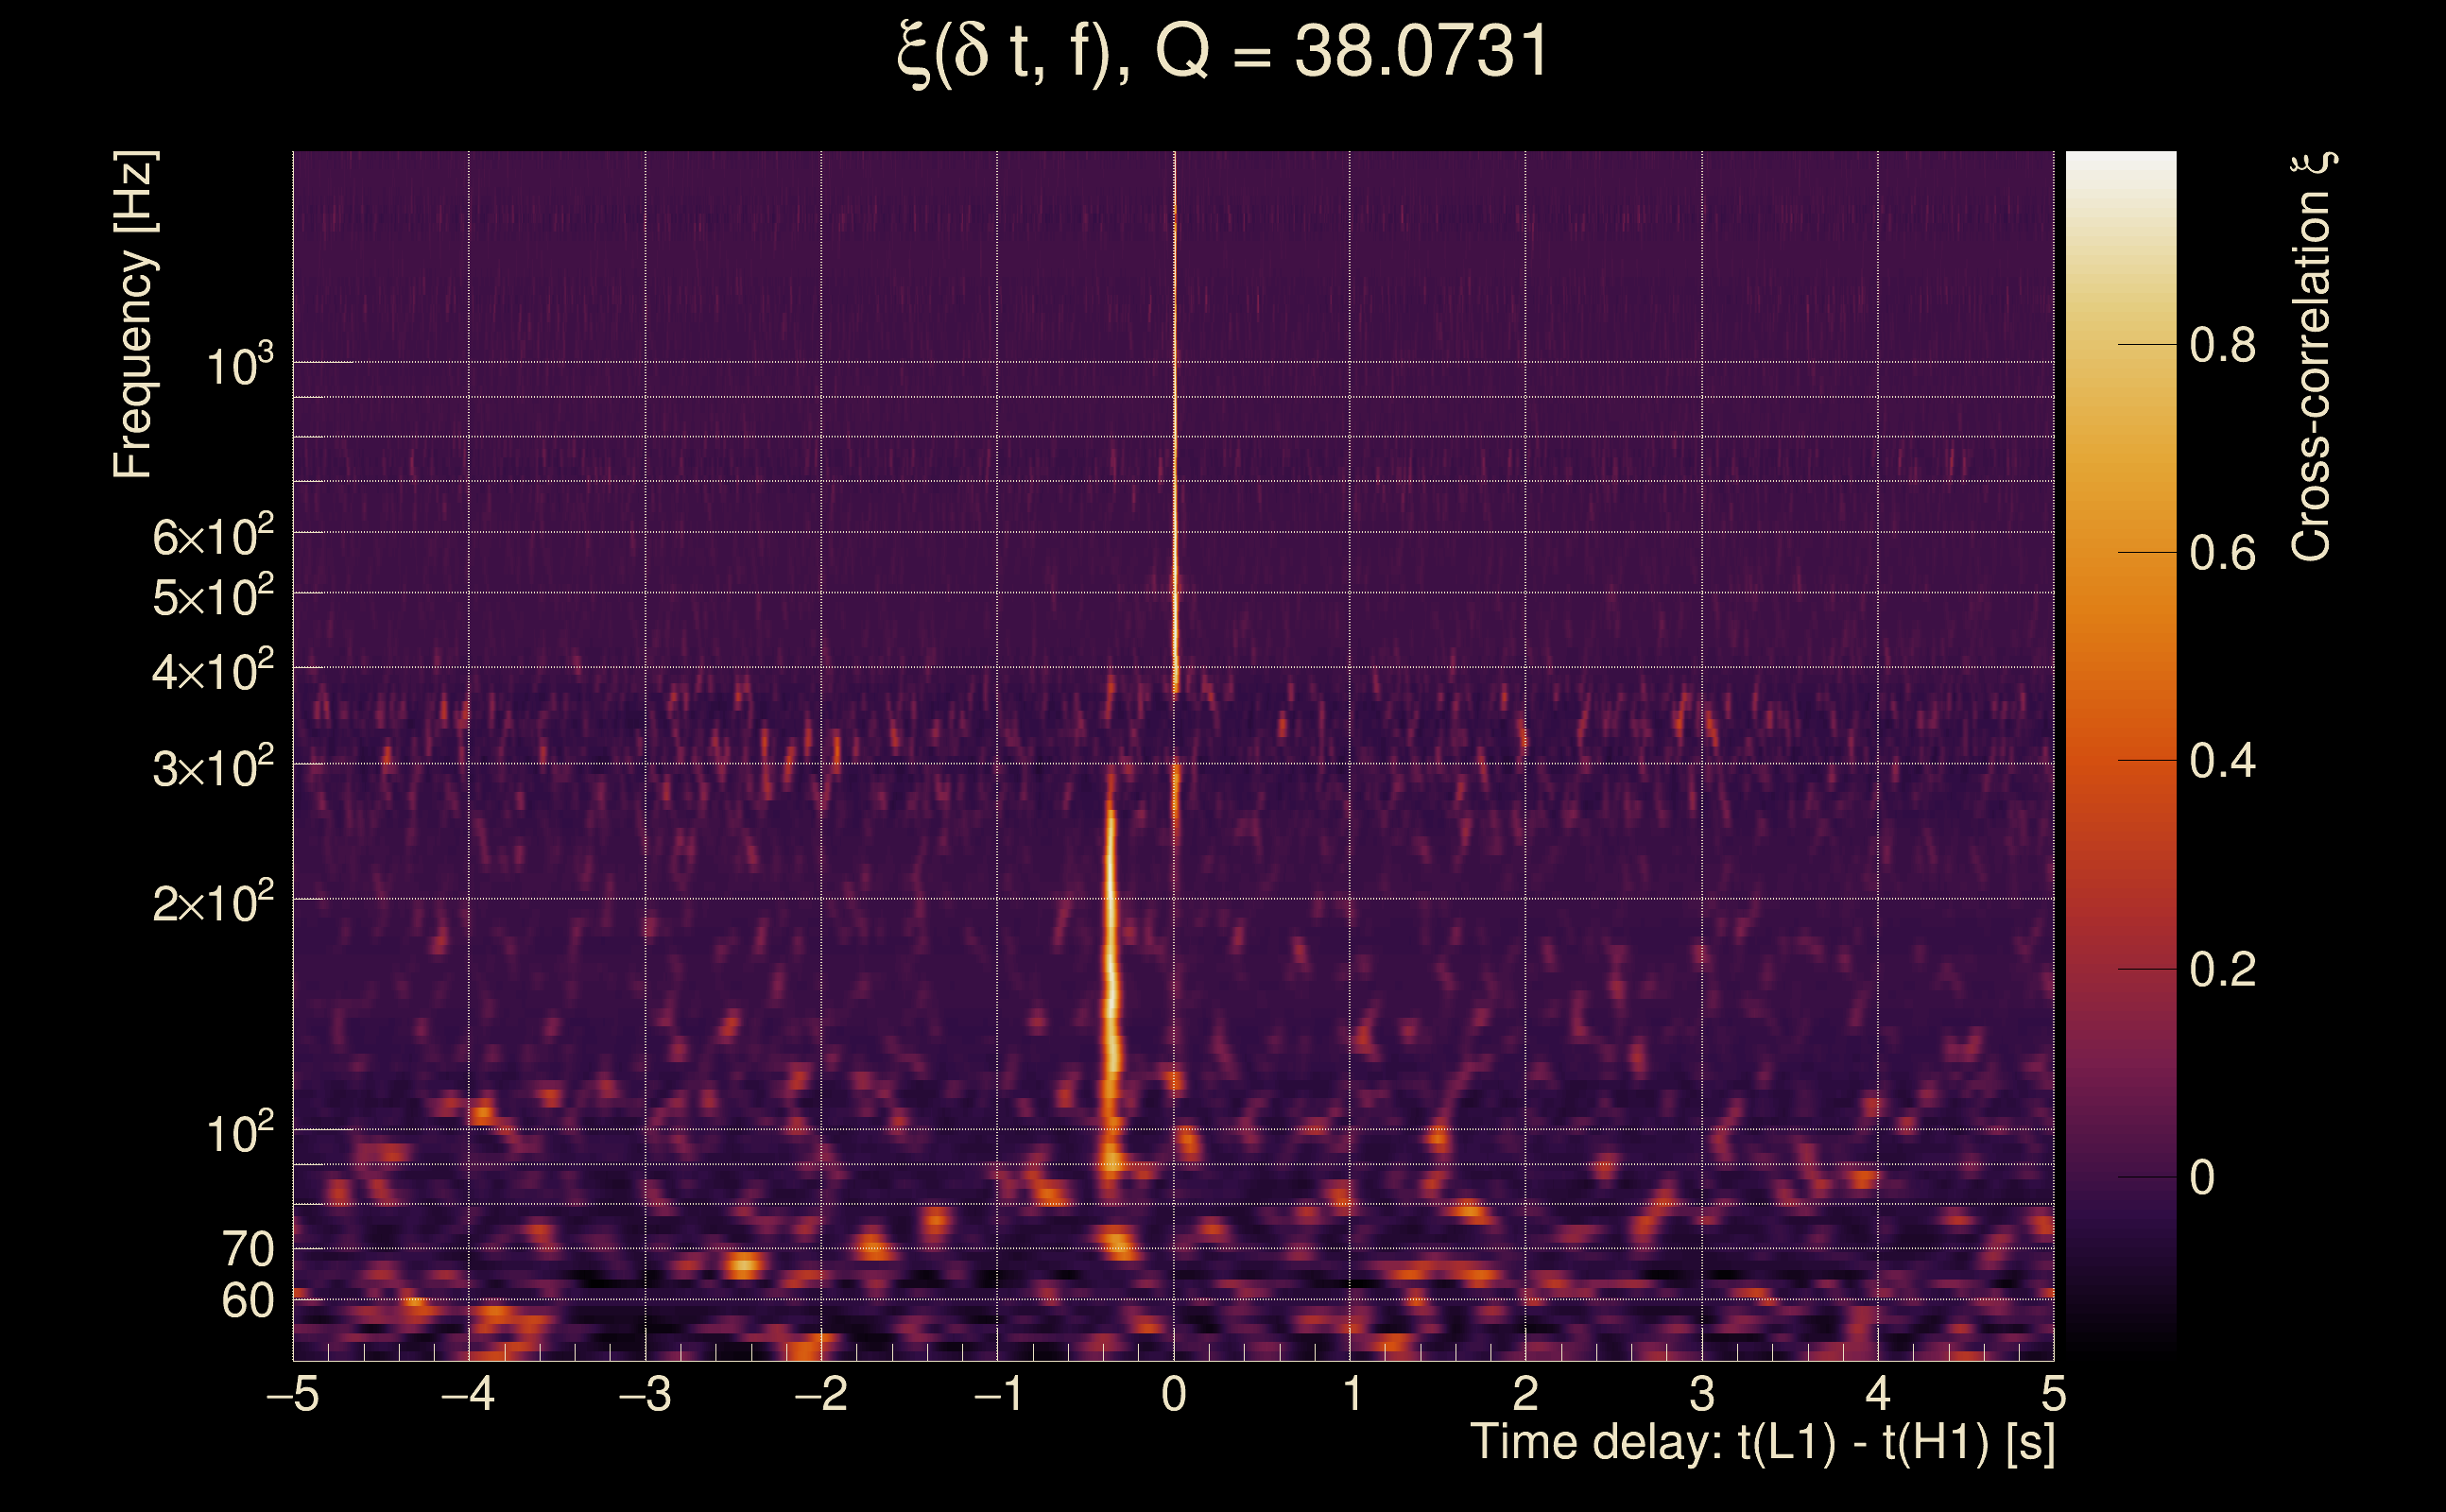
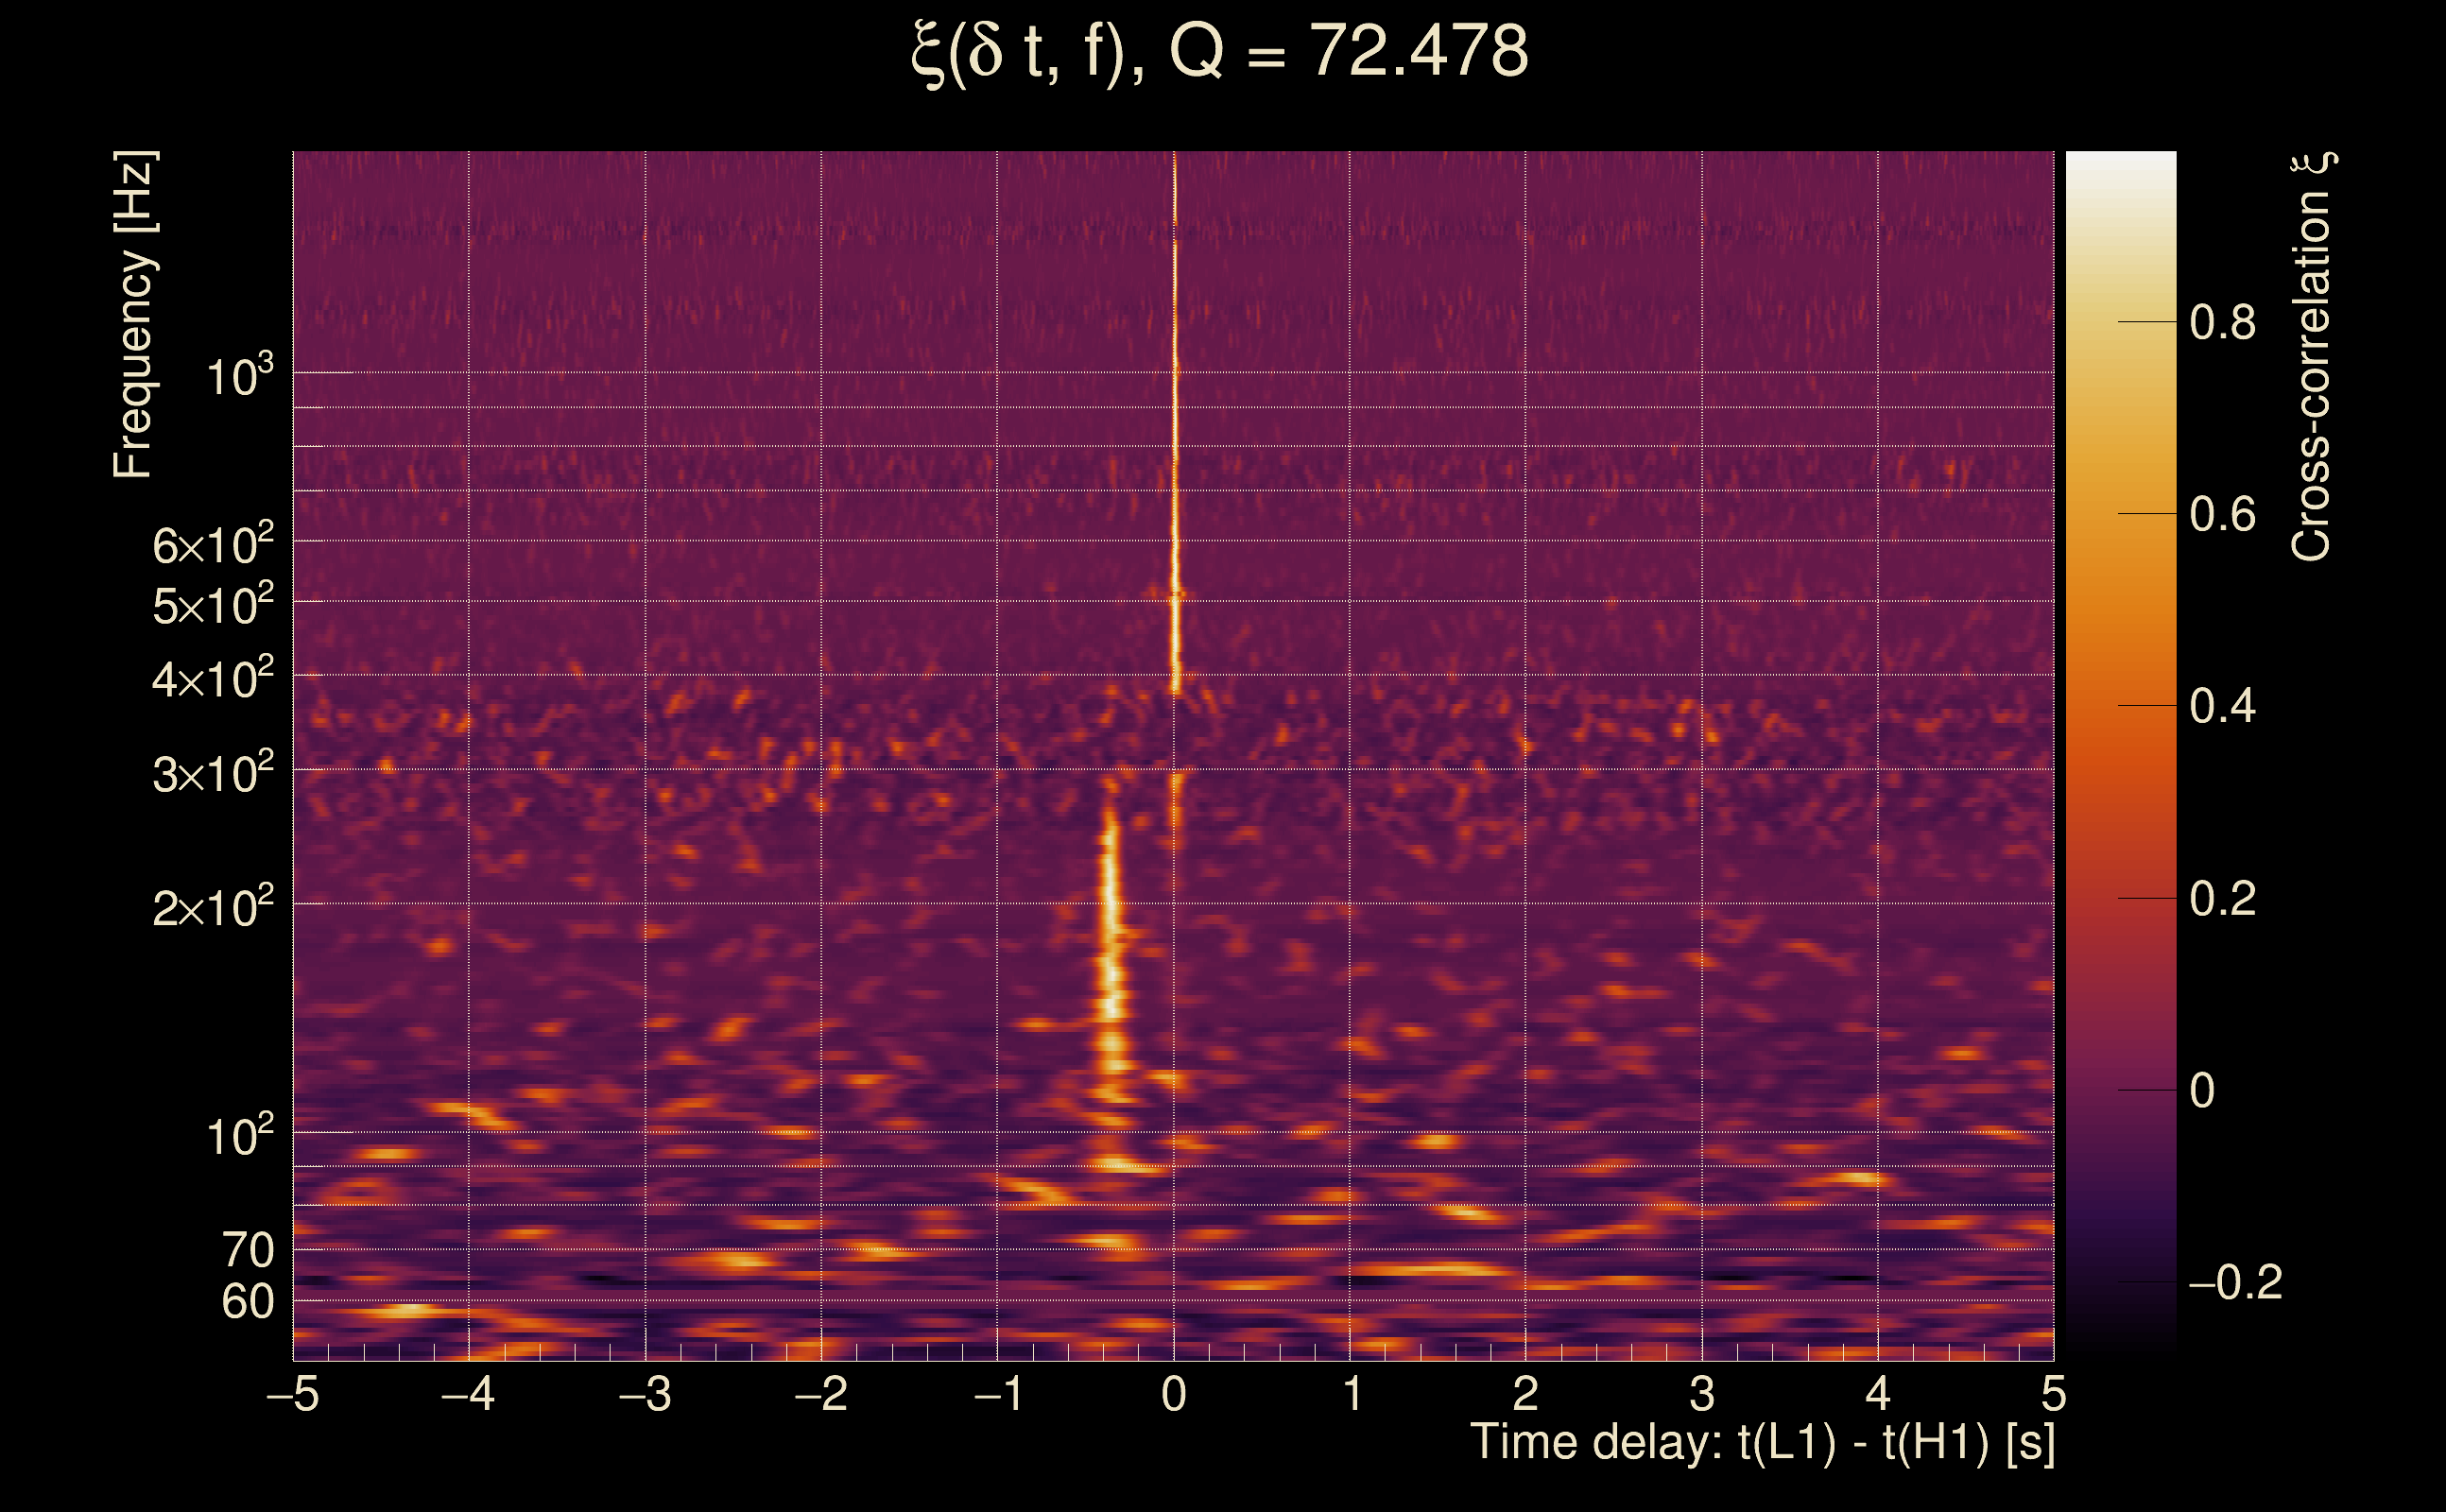
| Event time t(H1): | GPS = 1368331528 (Wed May 17 04:05:10 2023 ) → GPS = 1368331538 (Wed May 17 04:05:20 2023 ) |
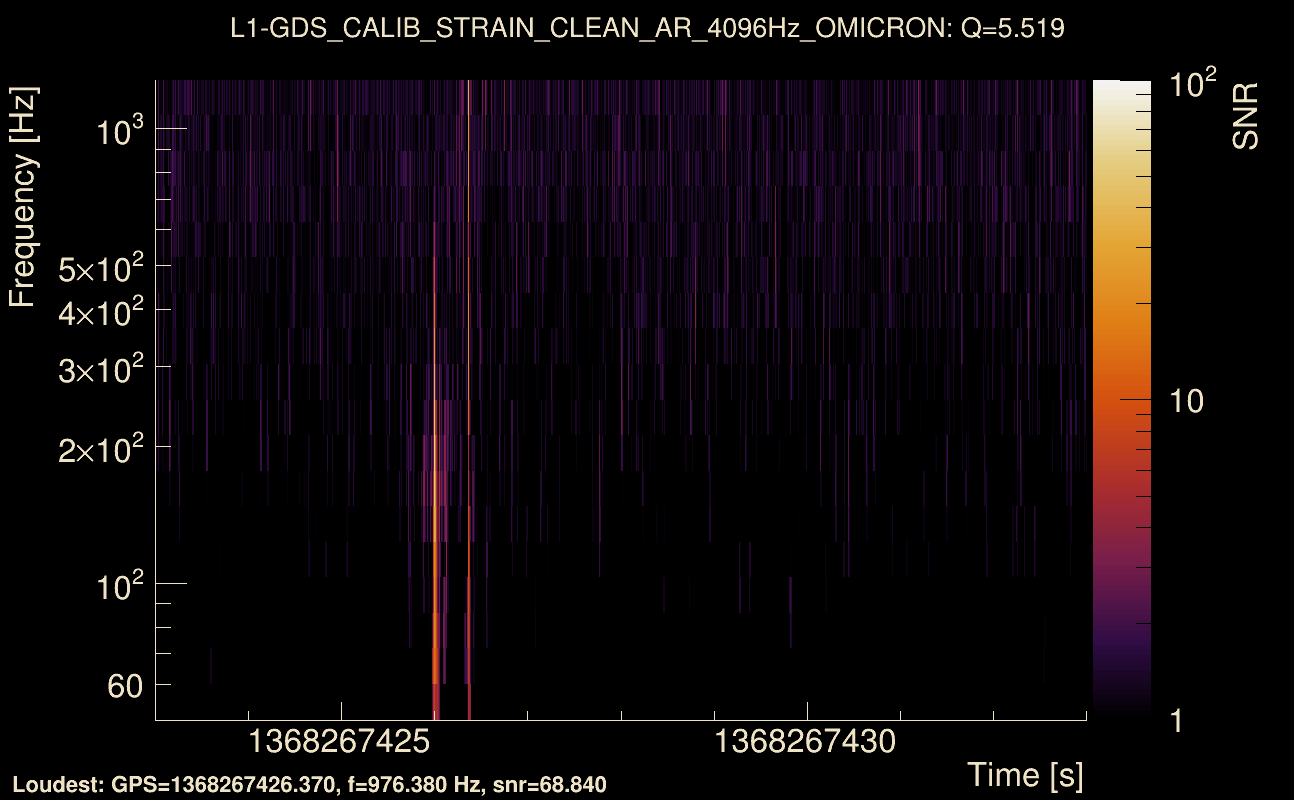
| Event time t(L1): | GPS = 1368331528 (Wed May 17 04:05:20 2023 ) → GPS = 1368331538 (Wed May 17 04:05:20 2023 ) |
| Omicron analysis time window (H1): | GPS = 1368331525 → GPS = 1368331541 |
| Omicron analysis time window (L1): | GPS = 1368331525 → GPS = 1368331541 |
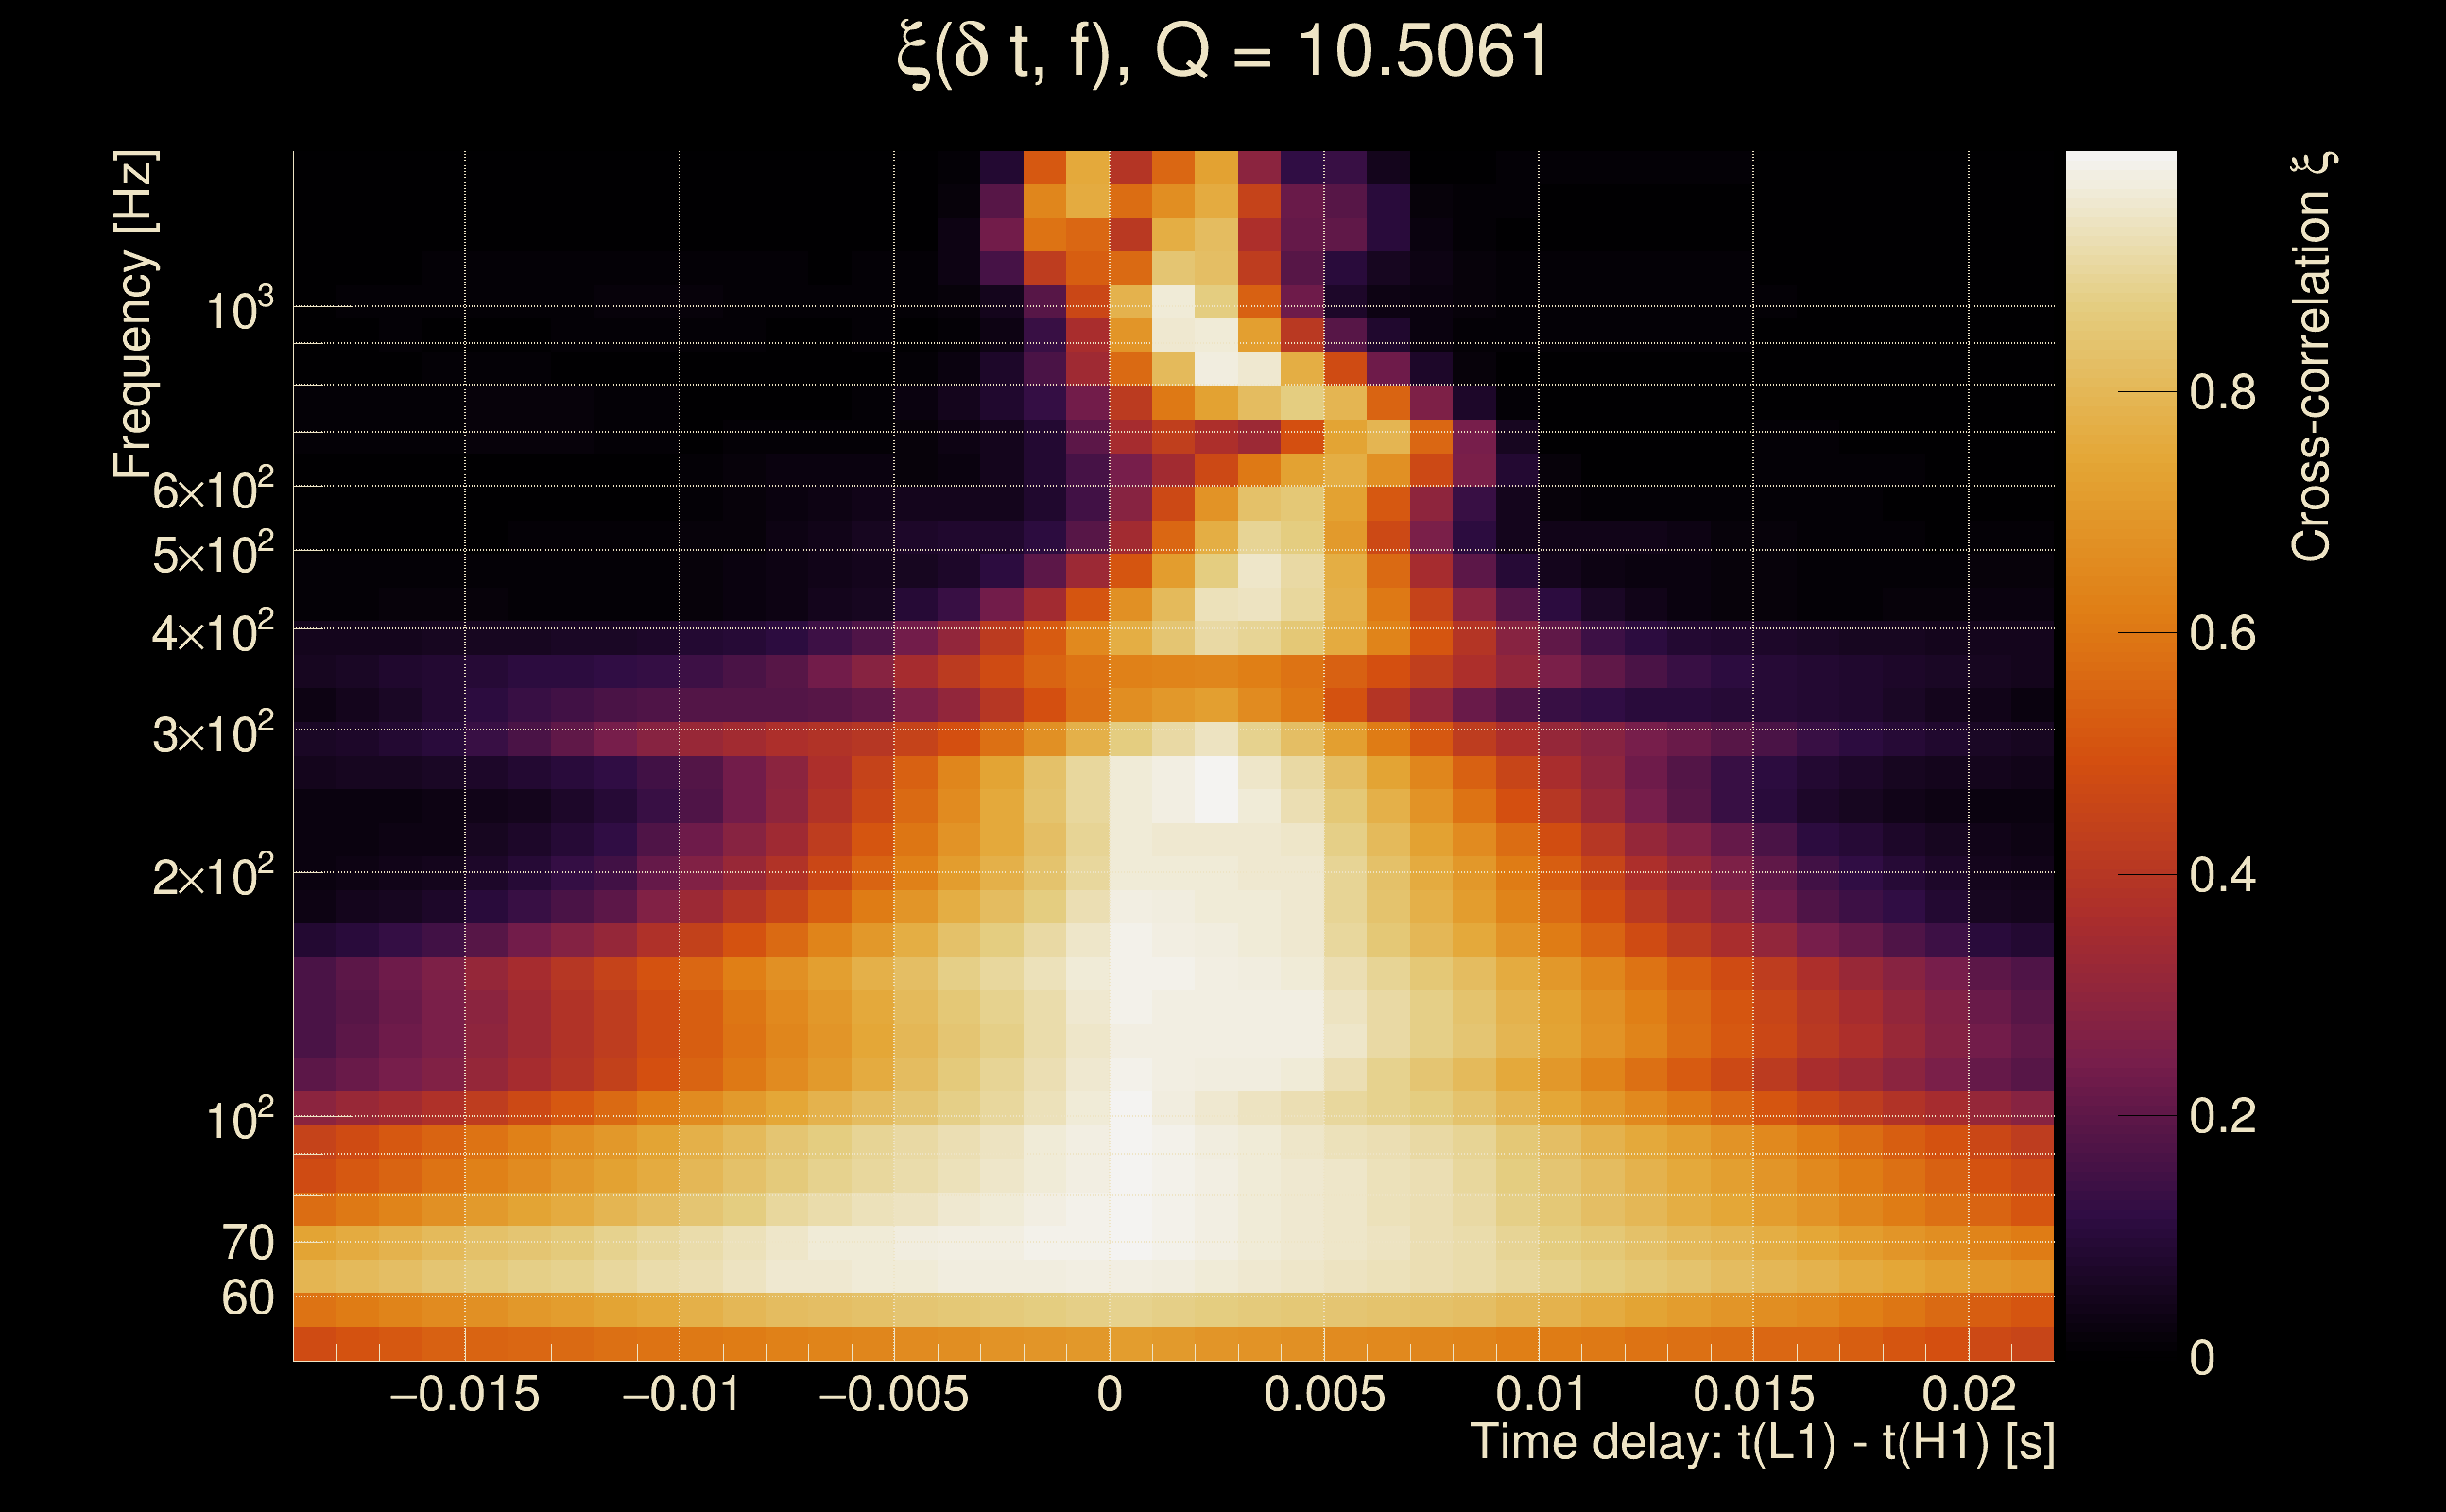
| Time delay between detectors t(L1) - t(H1): | 1.61075 s (slice index = 73 / 217), δt_gw = 0.000753855 s |
| Time delay standard deviation: | 0.0955506 s |
| [targeted mode] Time delay probability: | 0.947409 (0.0659613 sigmas), δt_target = 0.00154638 s |
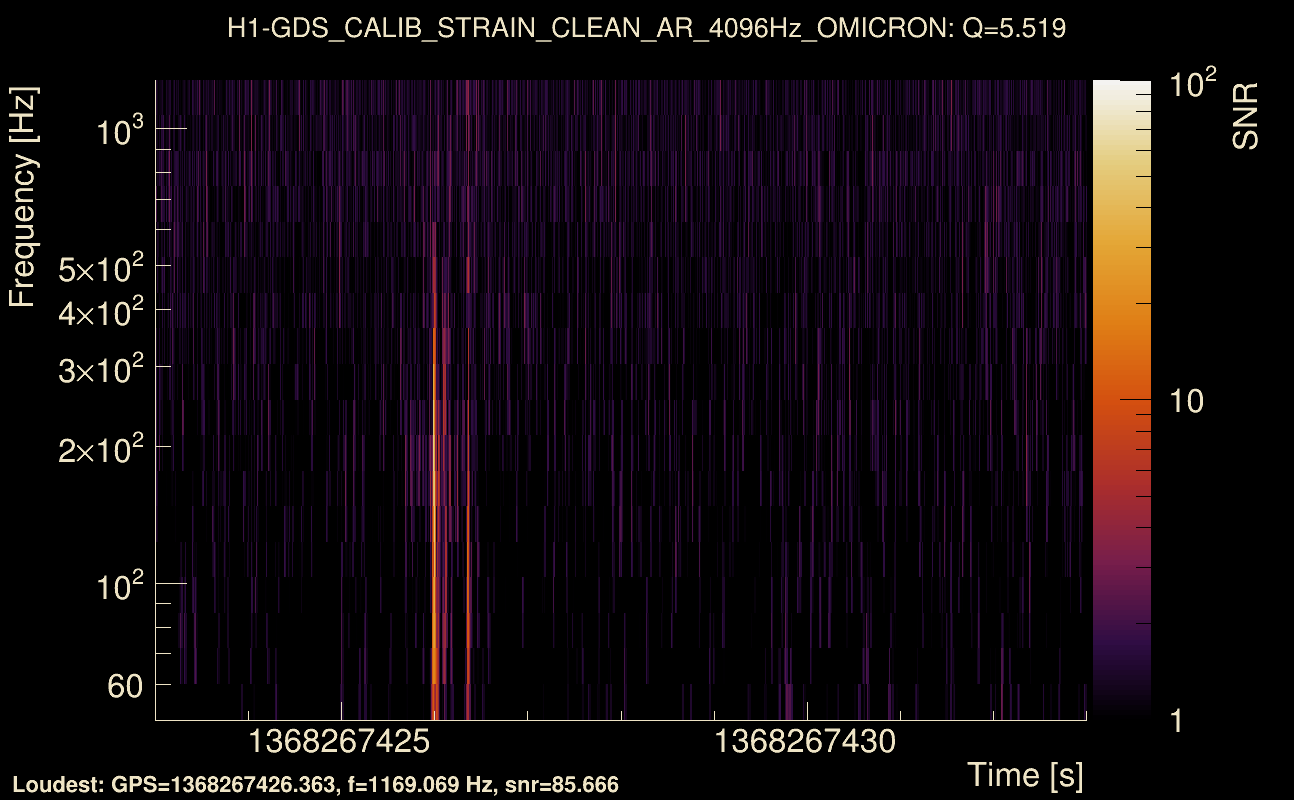
| Frequency: | 81.8961 Hz |
| Ξ: | 0.0658959 ± 0.0576749 (variance = 0.00332639): Q0: 0.147436, Q1: 0.134613, Q2: 0.0212779, Q3: 0.0163346, Q4: 0.035192 |
| Rank: | R_A = 0.0624303 |
| Log of amplitude ratio (L1/H1): | -0.319192, variance = 0.736005 (L1/H1: -3.38787, variance = 0.812043, H1/L1: -2.7089, variance = 2.1145) |
| Amplitude ratio (L1/H1): | 0.726736 ⋇ 2.35822 (L1/H1: 0.0337805 ⋇ 2.46239, H1/L1: 0.0666103 ⋇ 4.28077) |
| Amplitude ratio H1|L1 compatibility (probability): | 0.000365426 |
| Antenna factor probability: | 0.718785 |
| Number of rejected frequency rows: | Q0: 6 / 18, Q1: 20 / 36, Q2: 62 / 70, Q3: 119 / 134, Q4: 241 / 258 |
| Maximum signal-to-noise ratio: | H1: 81.6188, L1: 82.164 |
| SNR variance: | H1: 1.68185, L1: 0.98935 |
| Click here for a zoomed plot | Click here for a zoomed plot | Click here for a zoomed plot | Click here for a zoomed plot | Click here for a zoomed plot |
 |
 |
 |
 |
 |
 |
 |
 |
 |
 |
 |
 |
 |
 |
 |
 |
 |
 |
 |
 |
 |
 |
 |
 |
 |
 |
 |
 |
 |
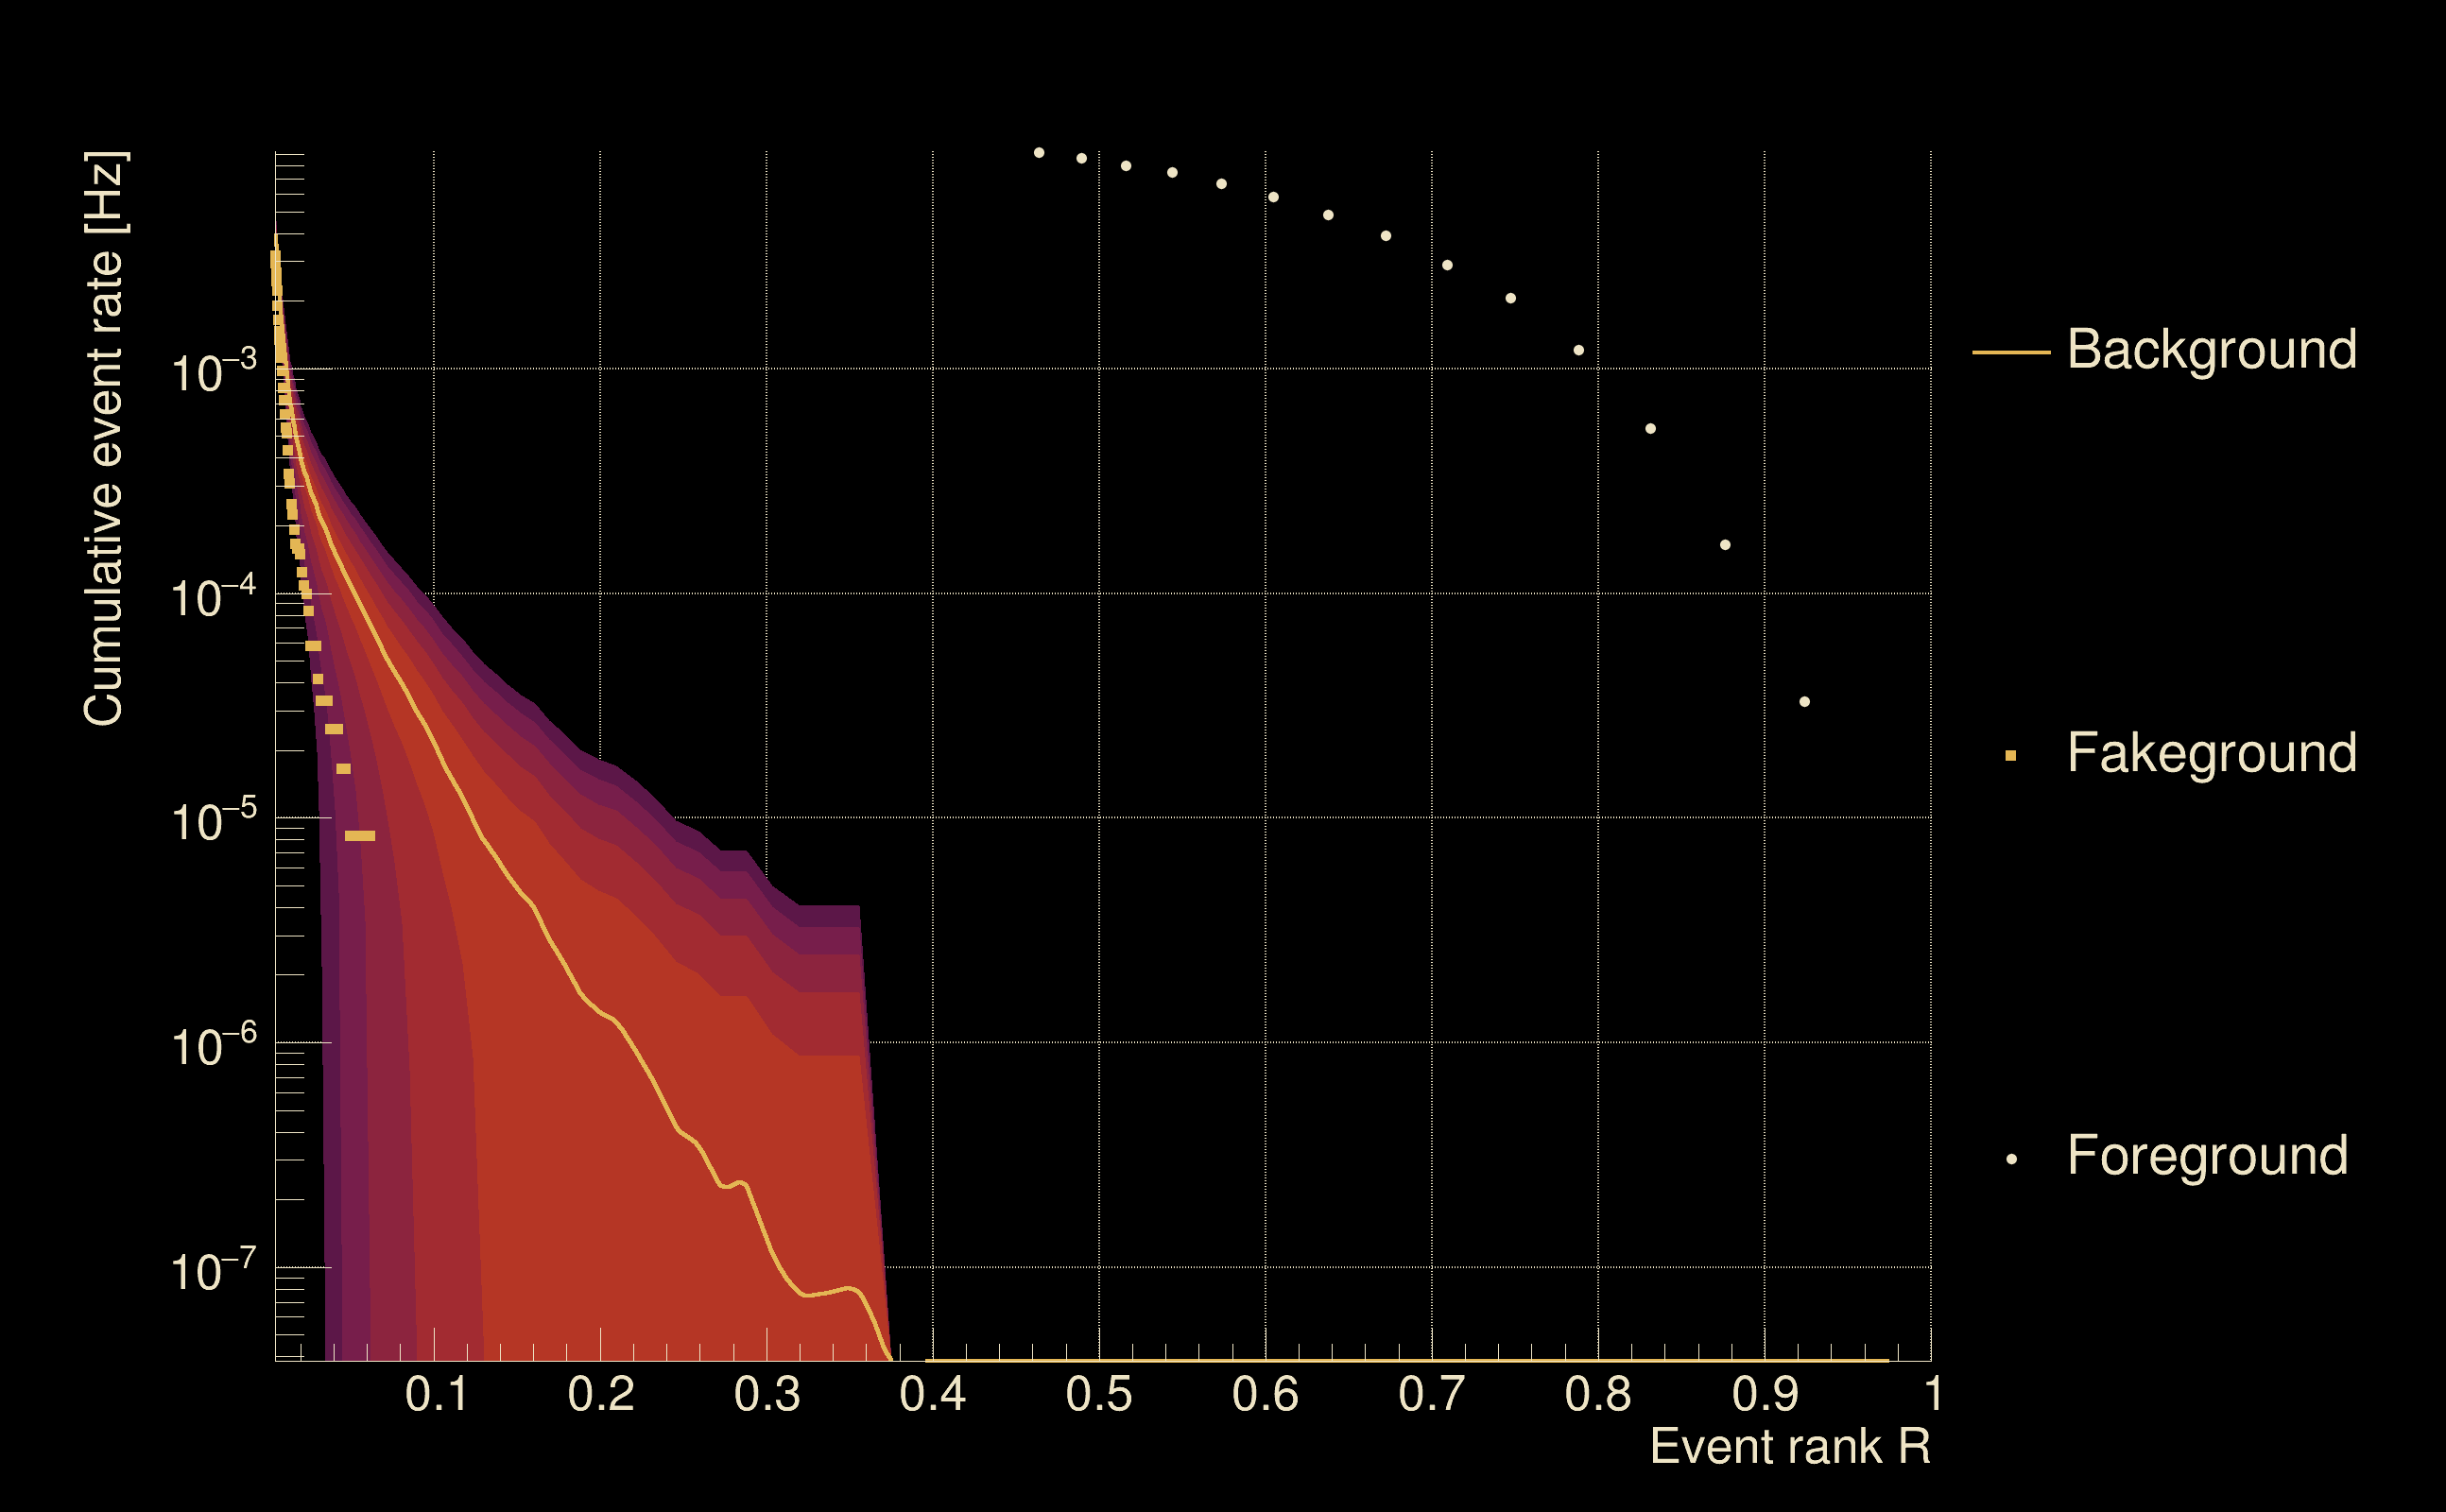
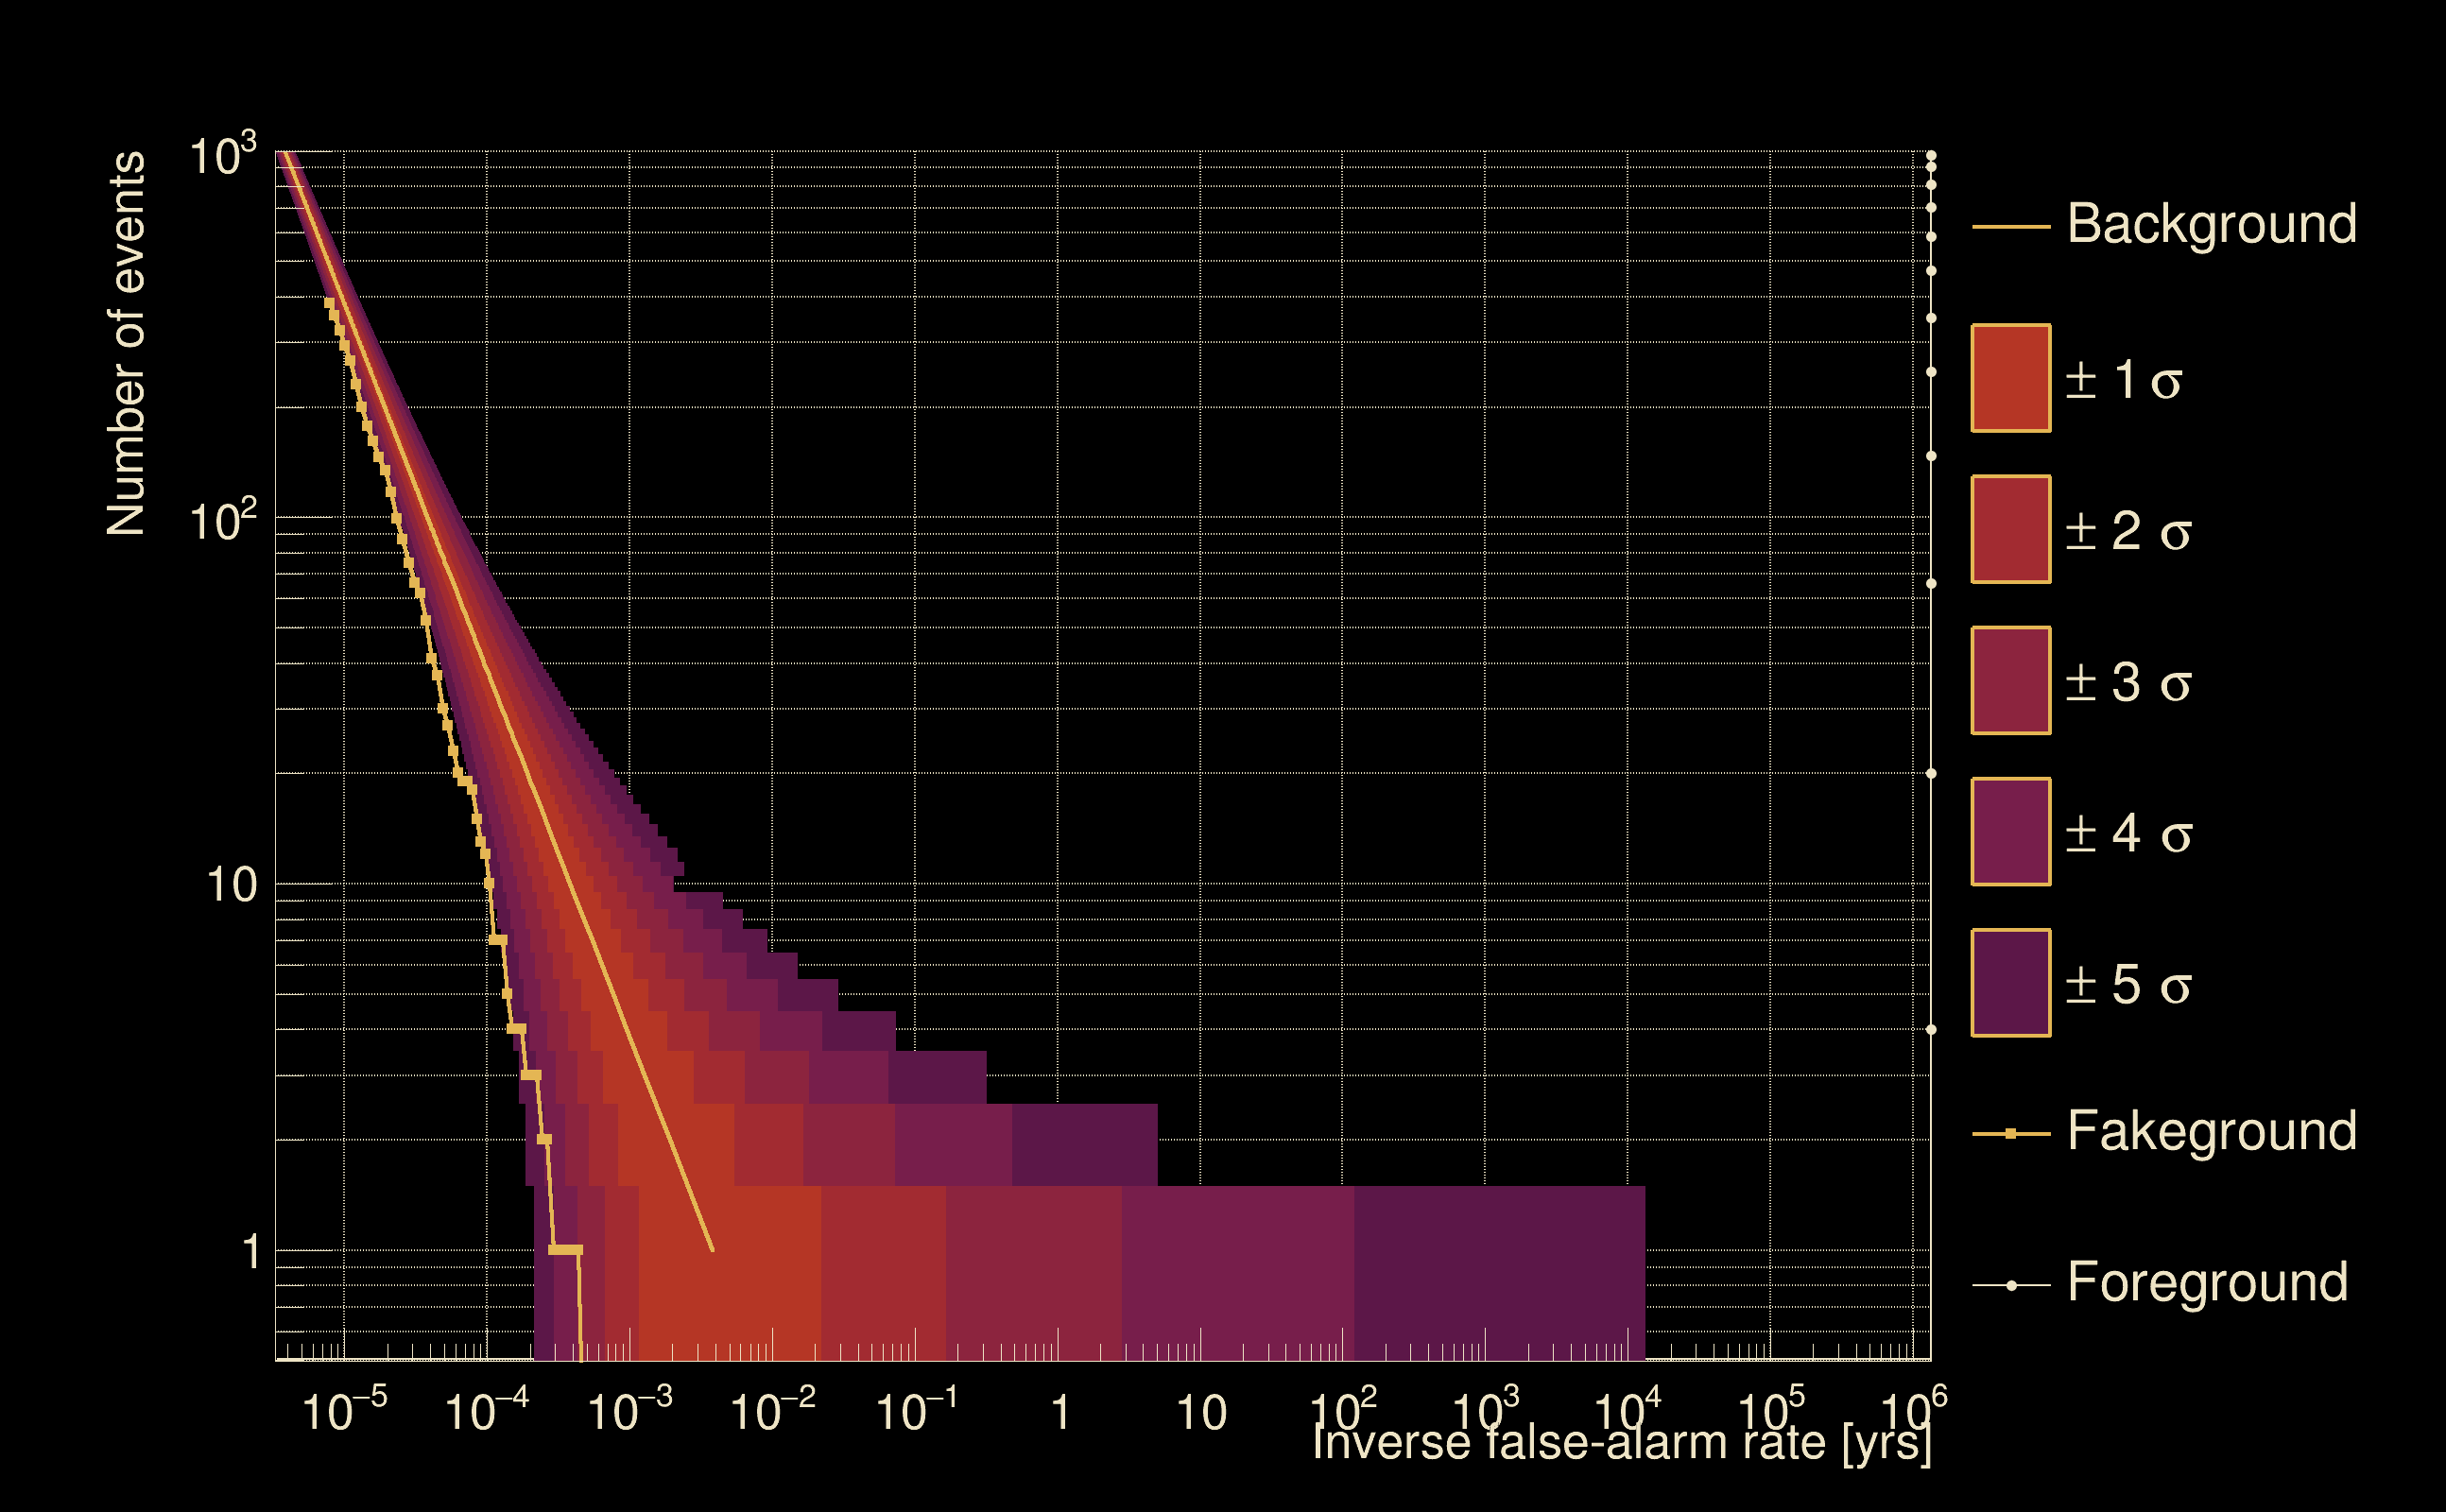
| Detection threshold: | R > 0.117856 |
| False-alarm rate above that detection threshold: | 1.08031e-05 |
| Alternative threshold at 1/1000 yrs: | R > 0.356001 |
| Alternative threshold at 1/100 yrs: | R > 0.356001 |
| Alternative threshold at 1/10 yrs: | R > 0.356001 |
| Alternative threshold at 1/1 yr: | R > 0.356001 |
| Alternative threshold at 1/1 d: | R > 0.117115 |
 |
|
 |
 |
 |
 |
 |
 |
 |
 |
 |
 |
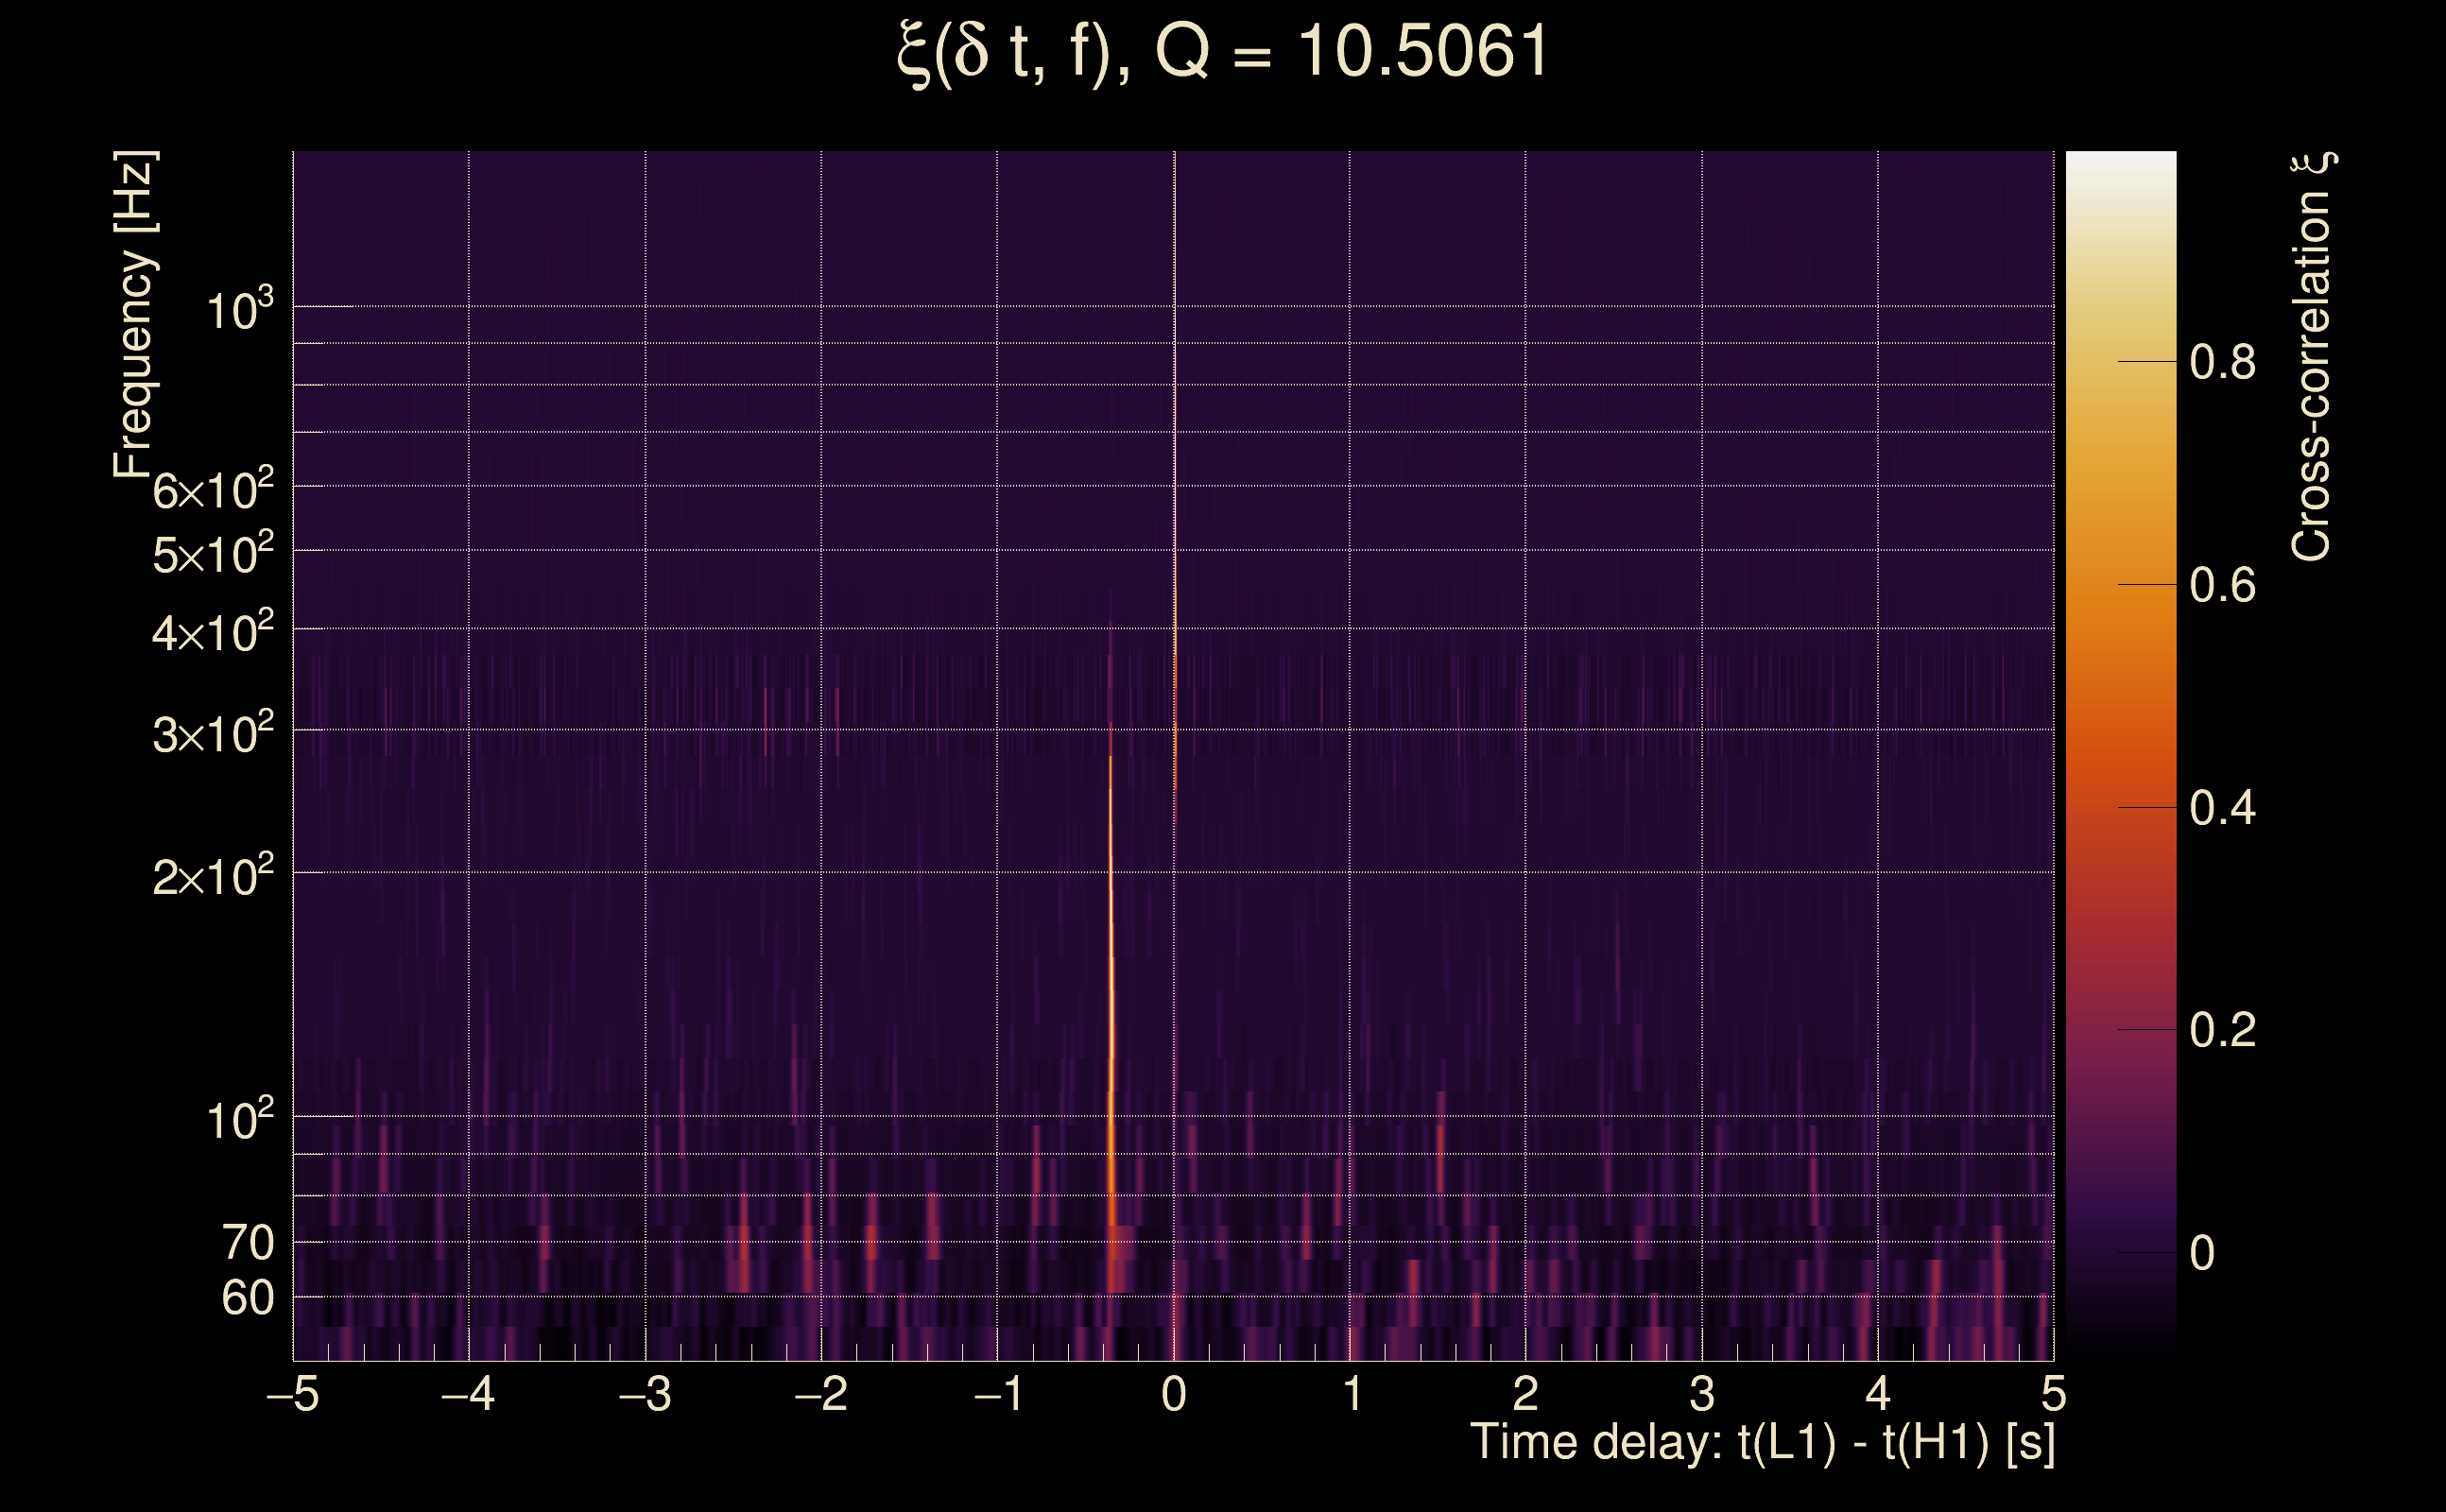
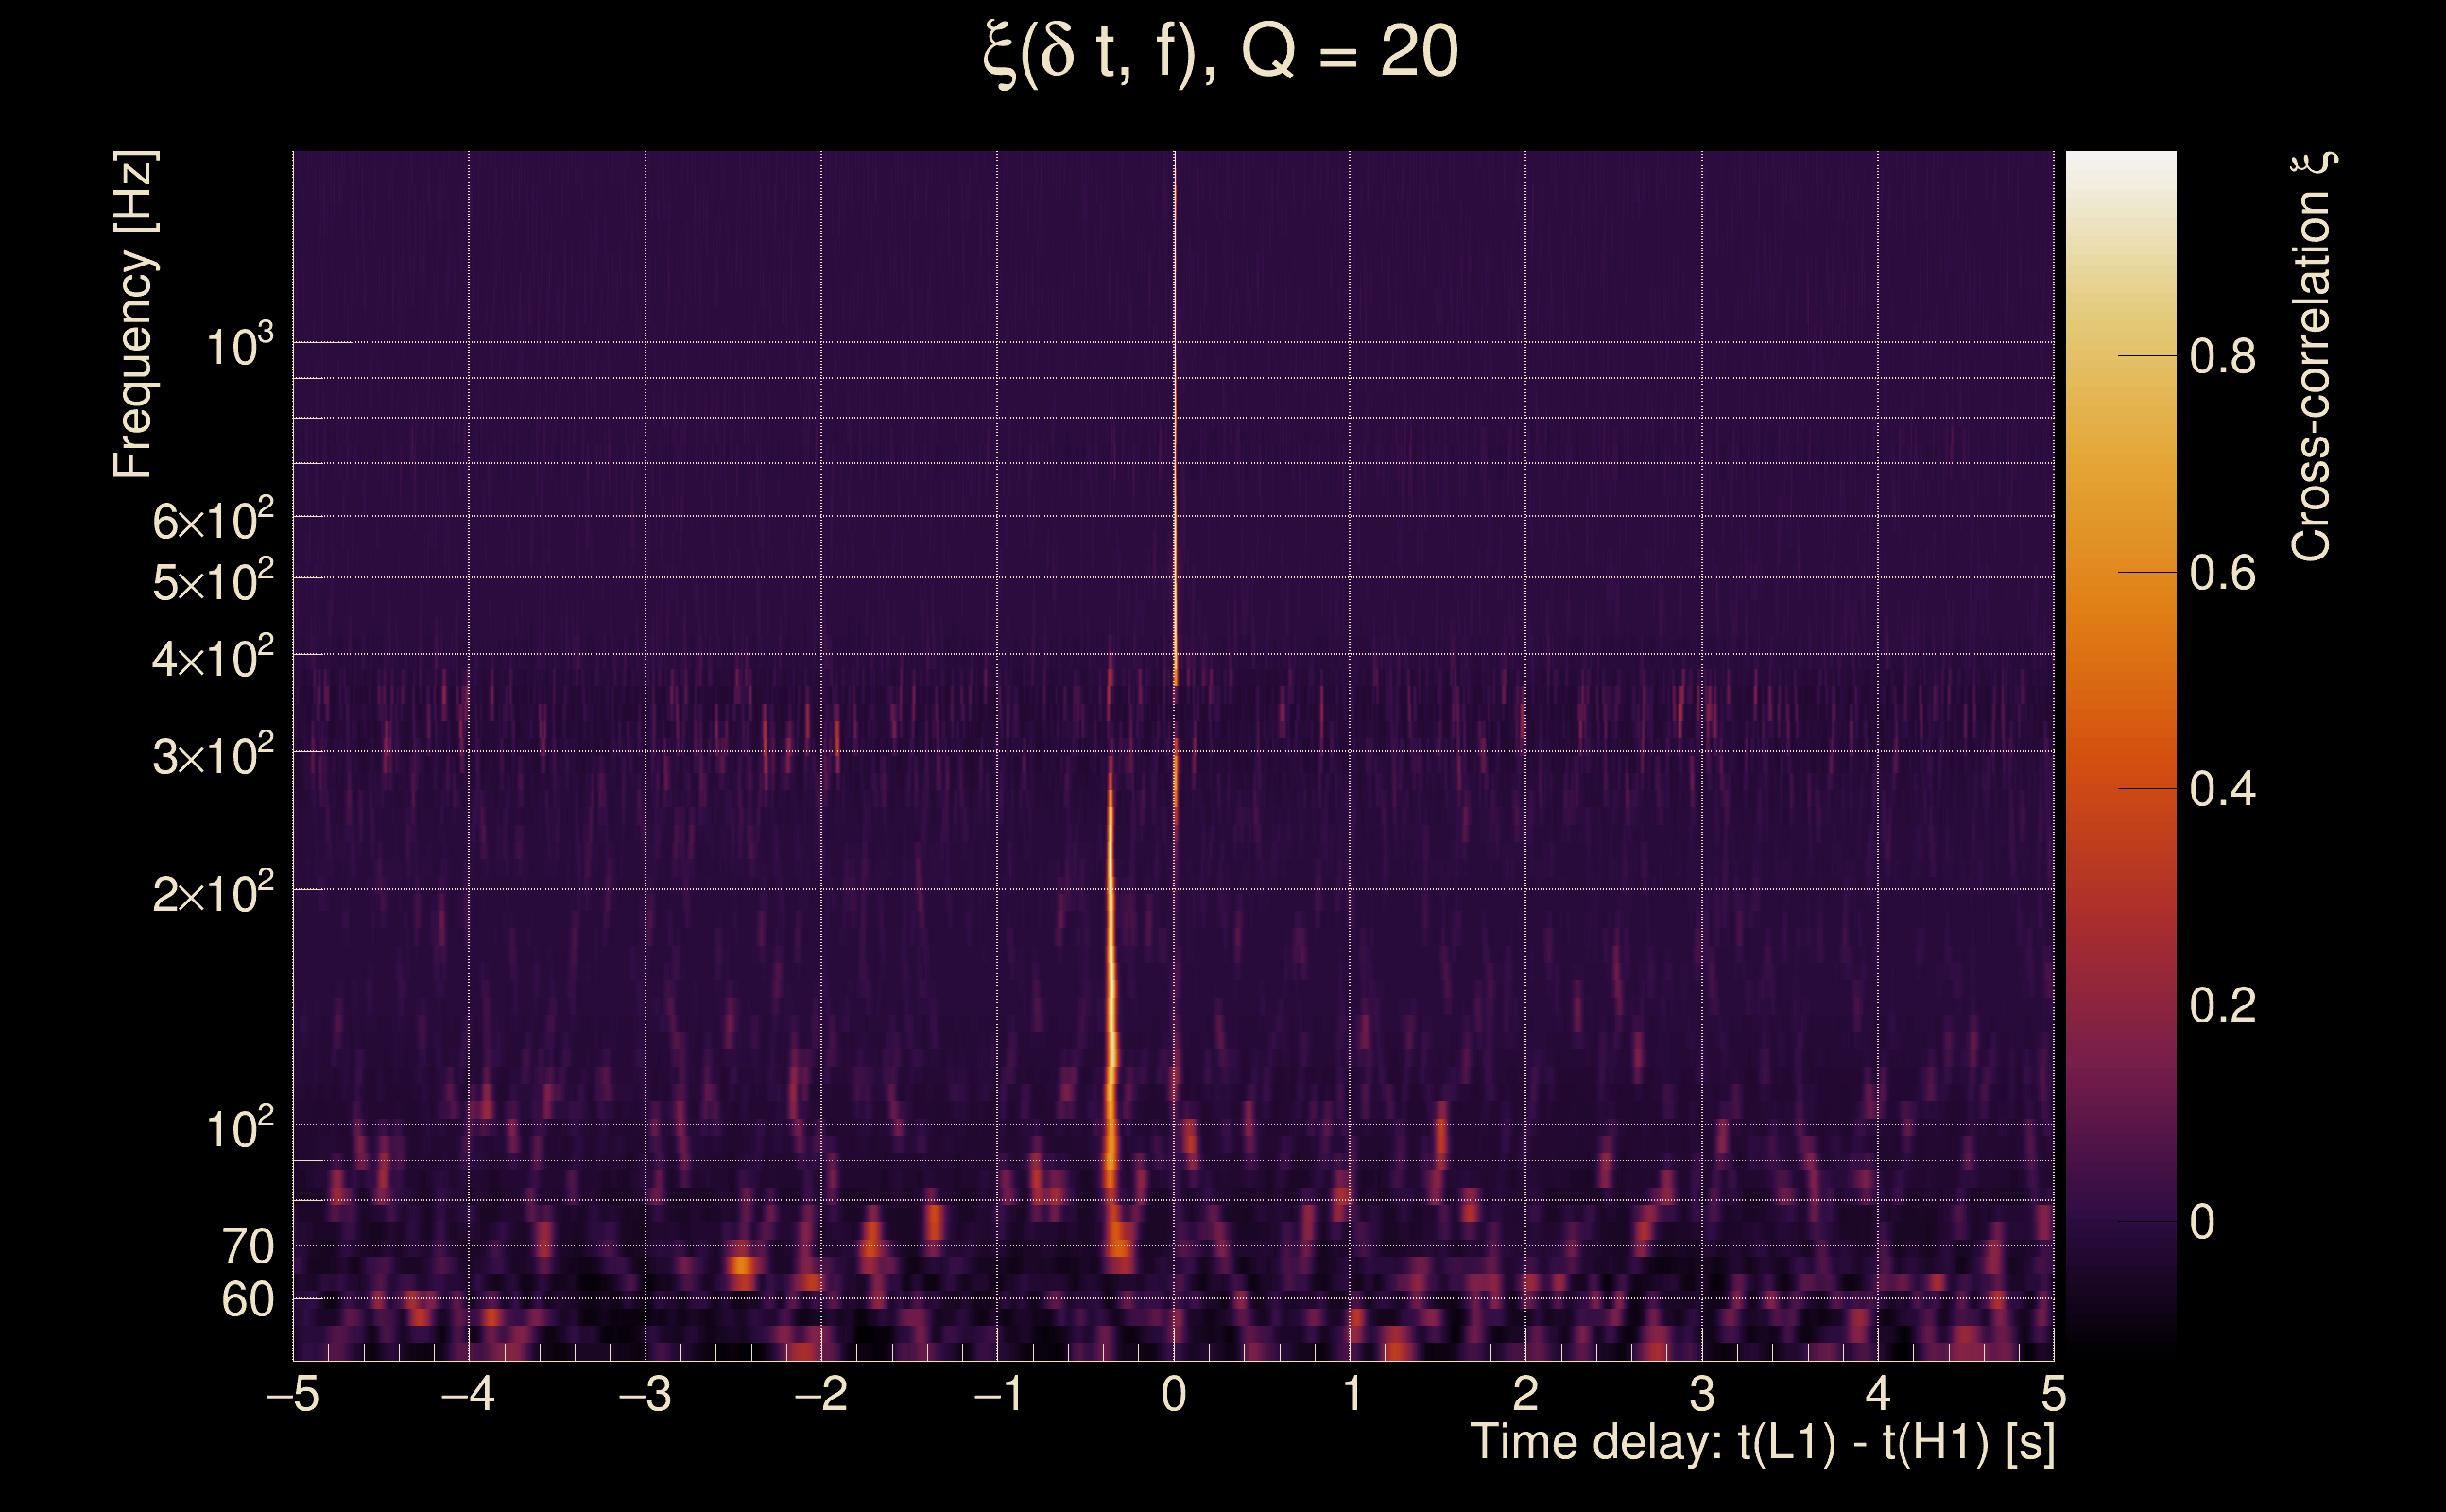
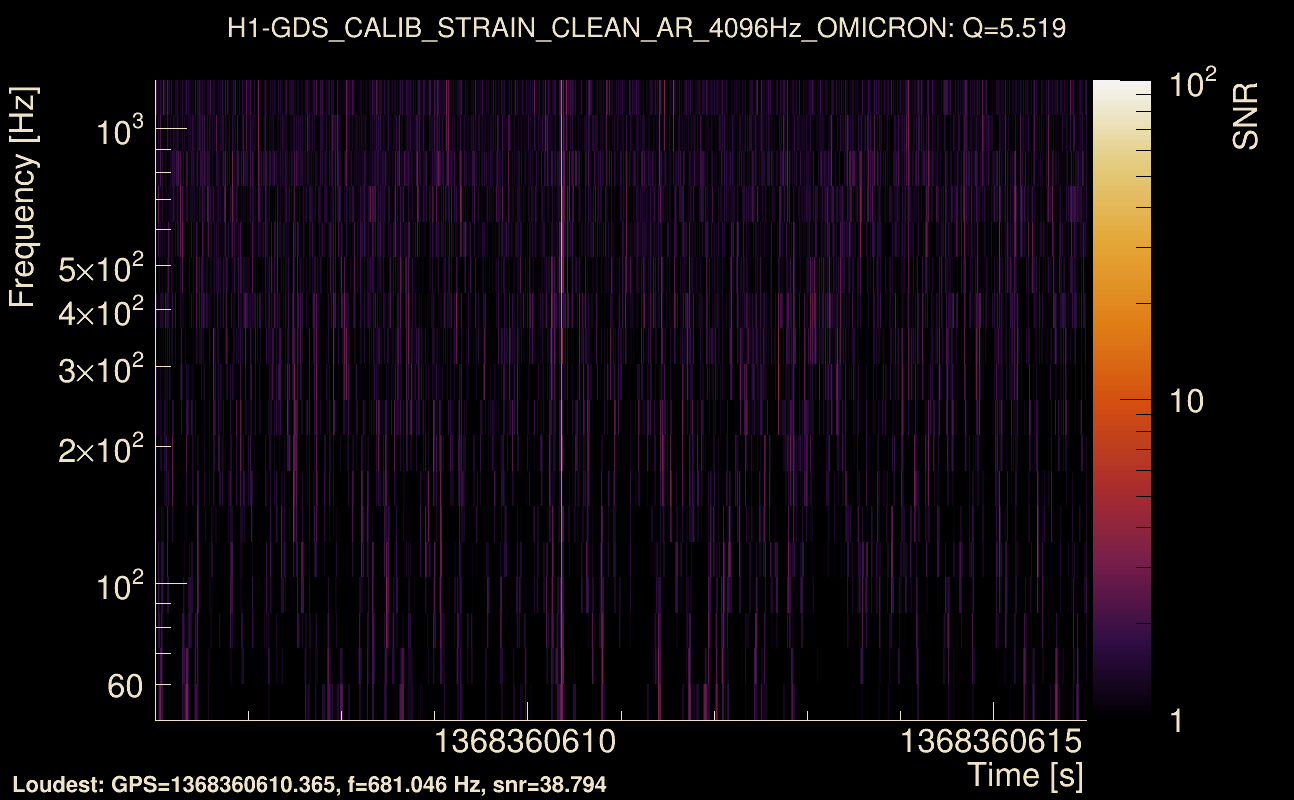
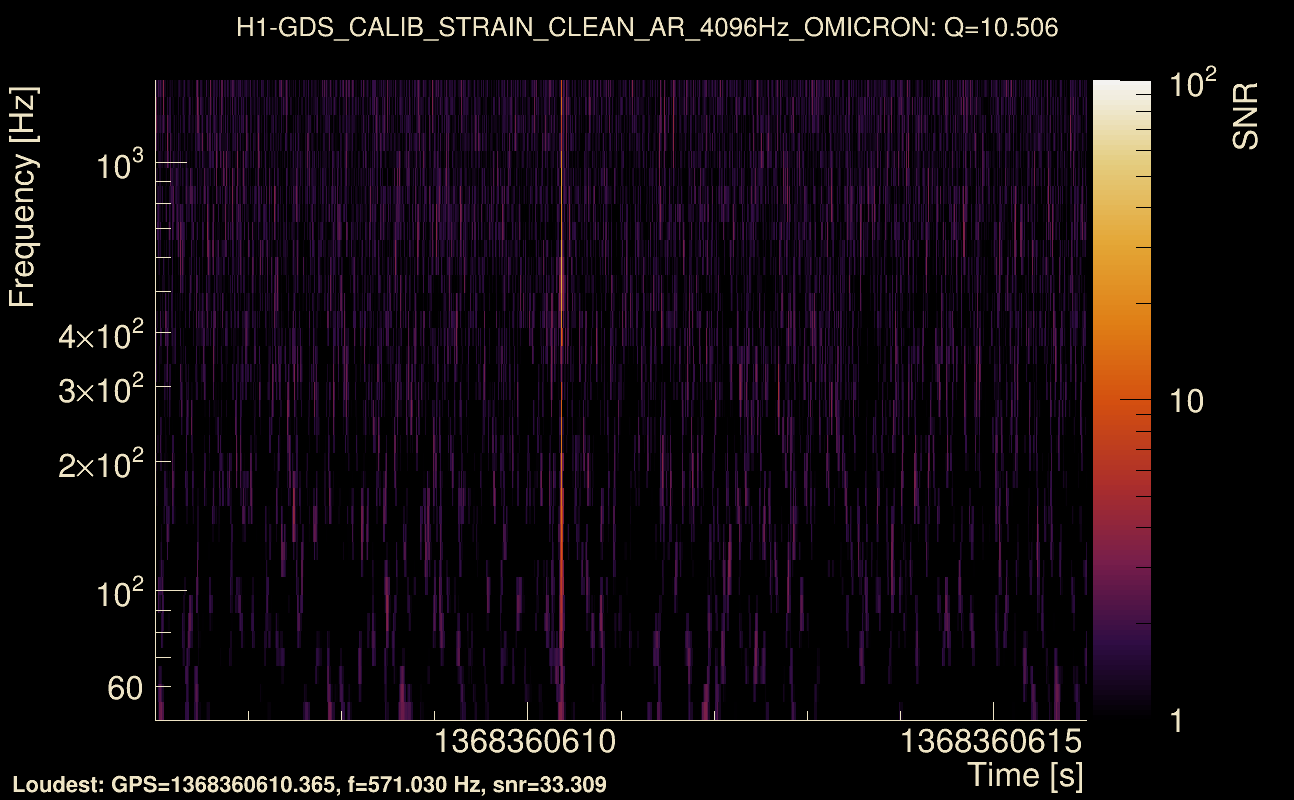
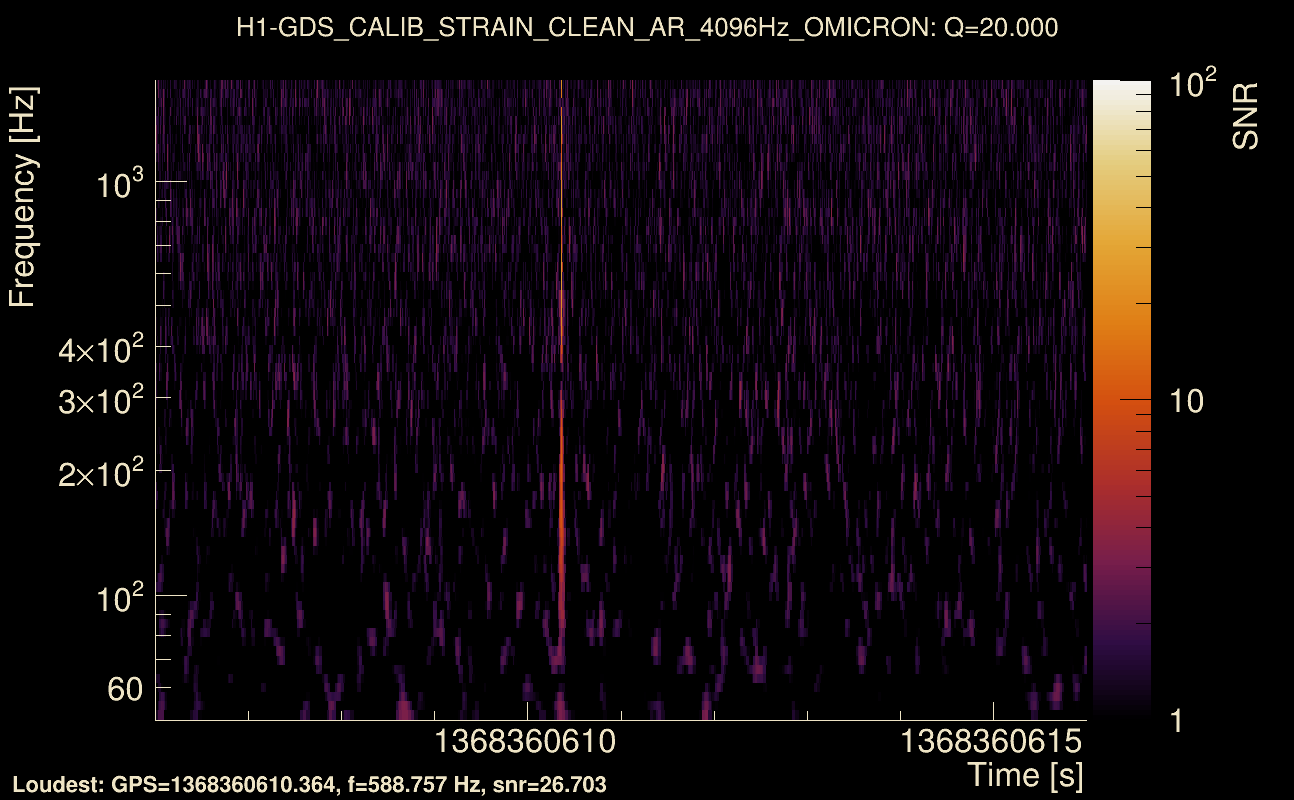
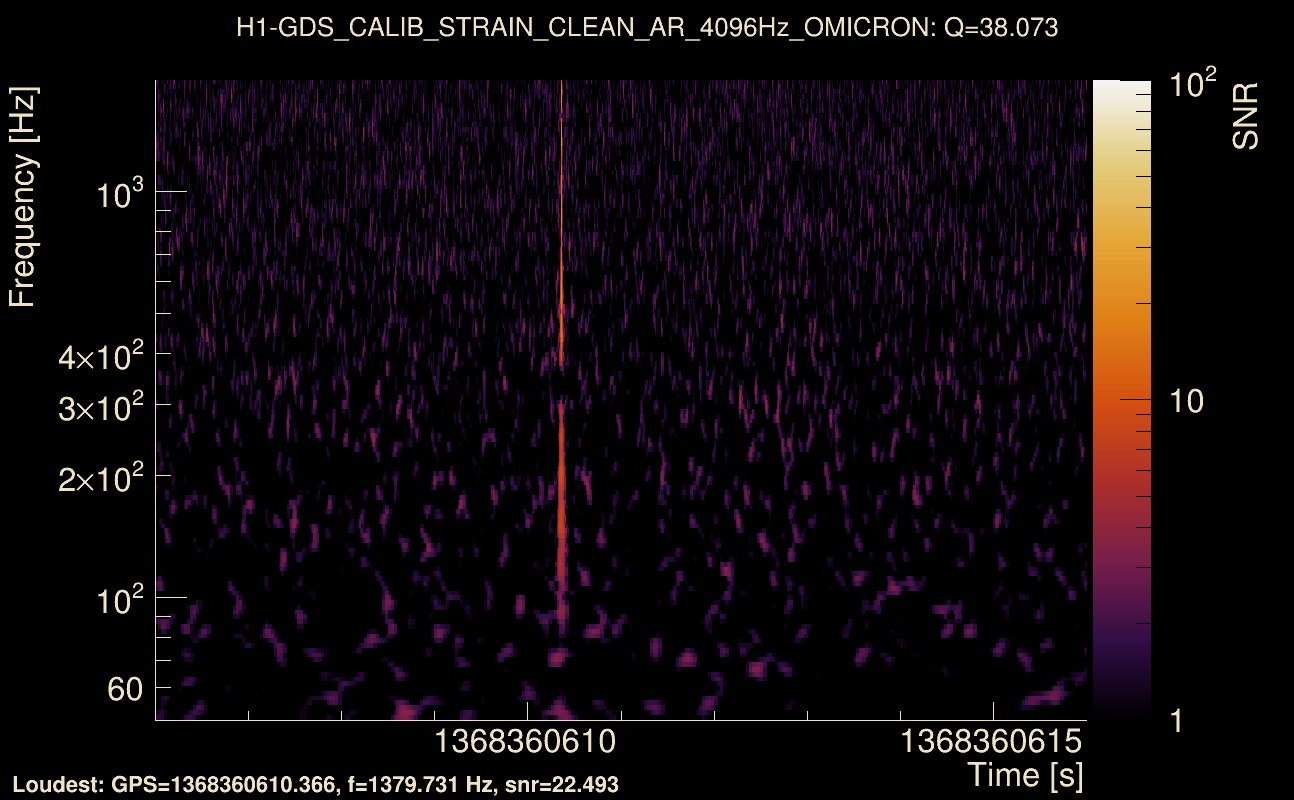
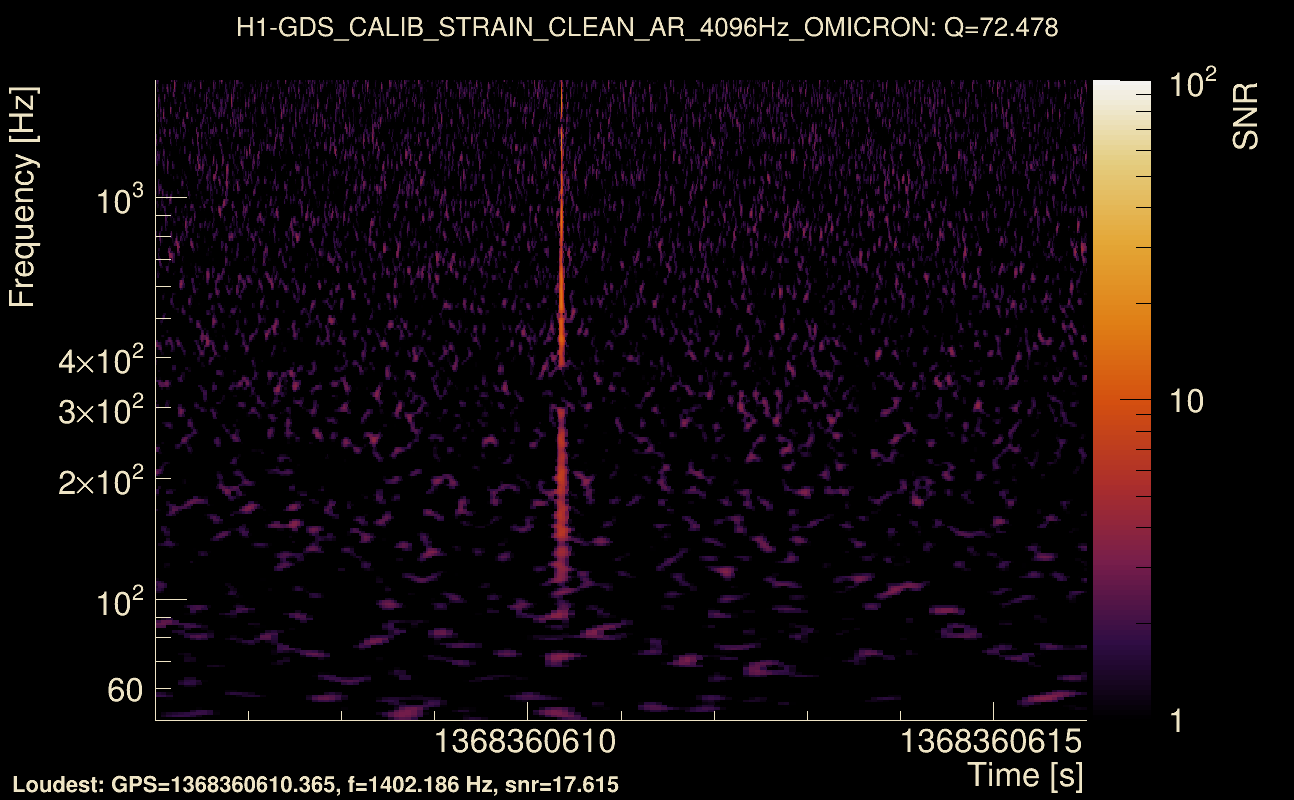
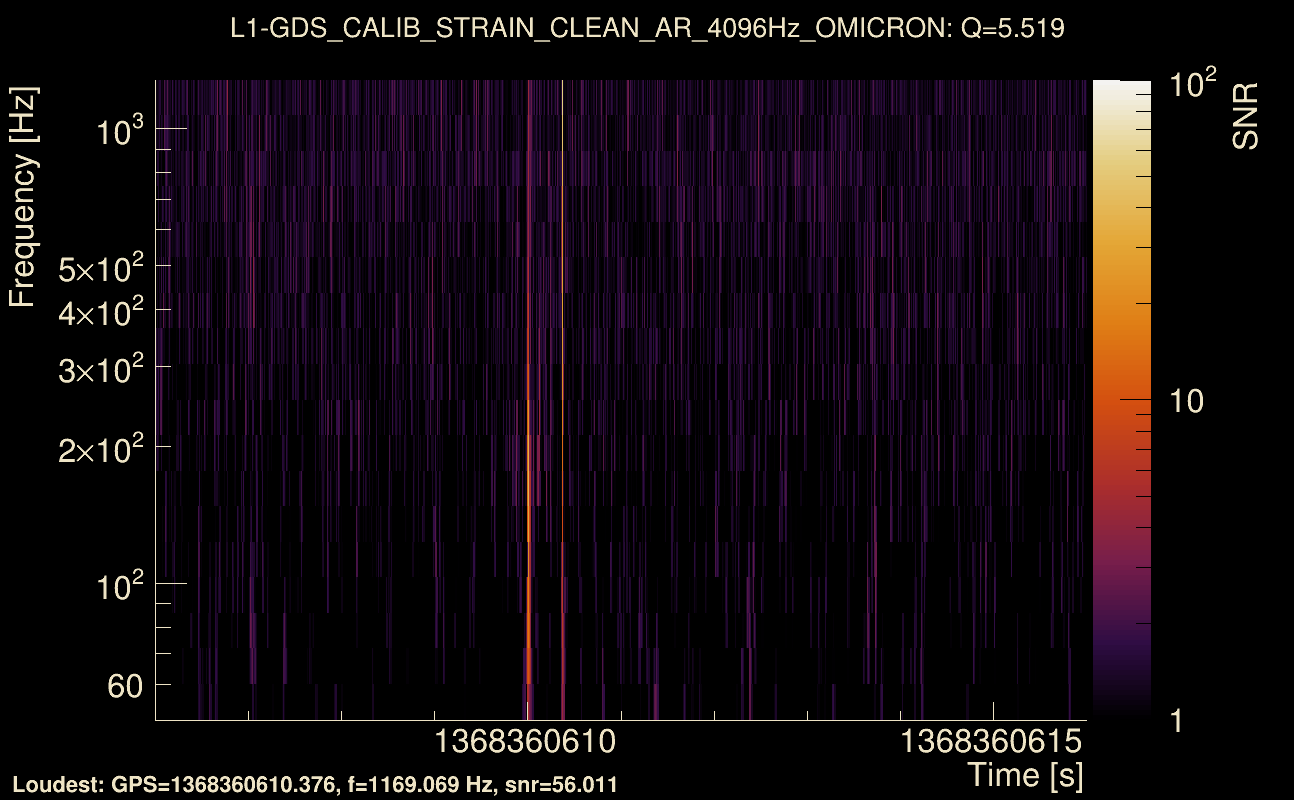
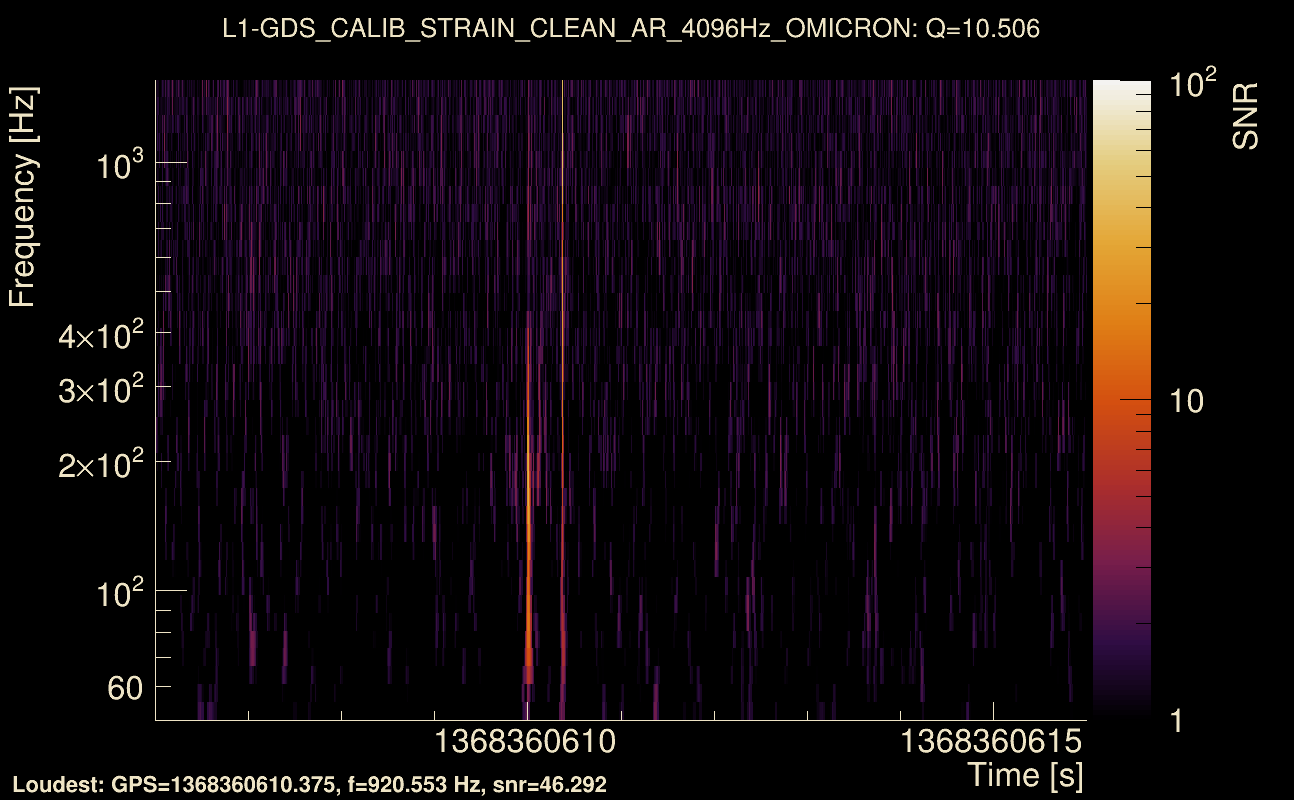
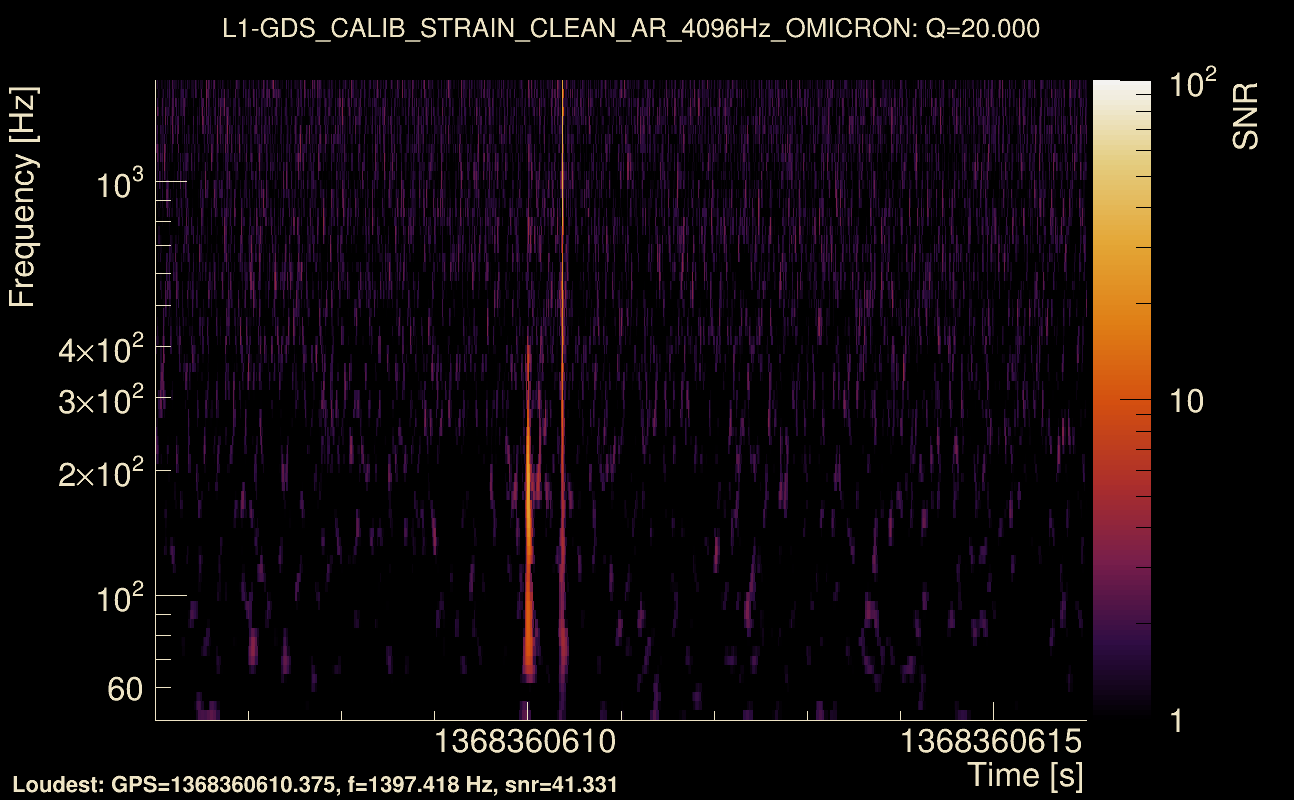
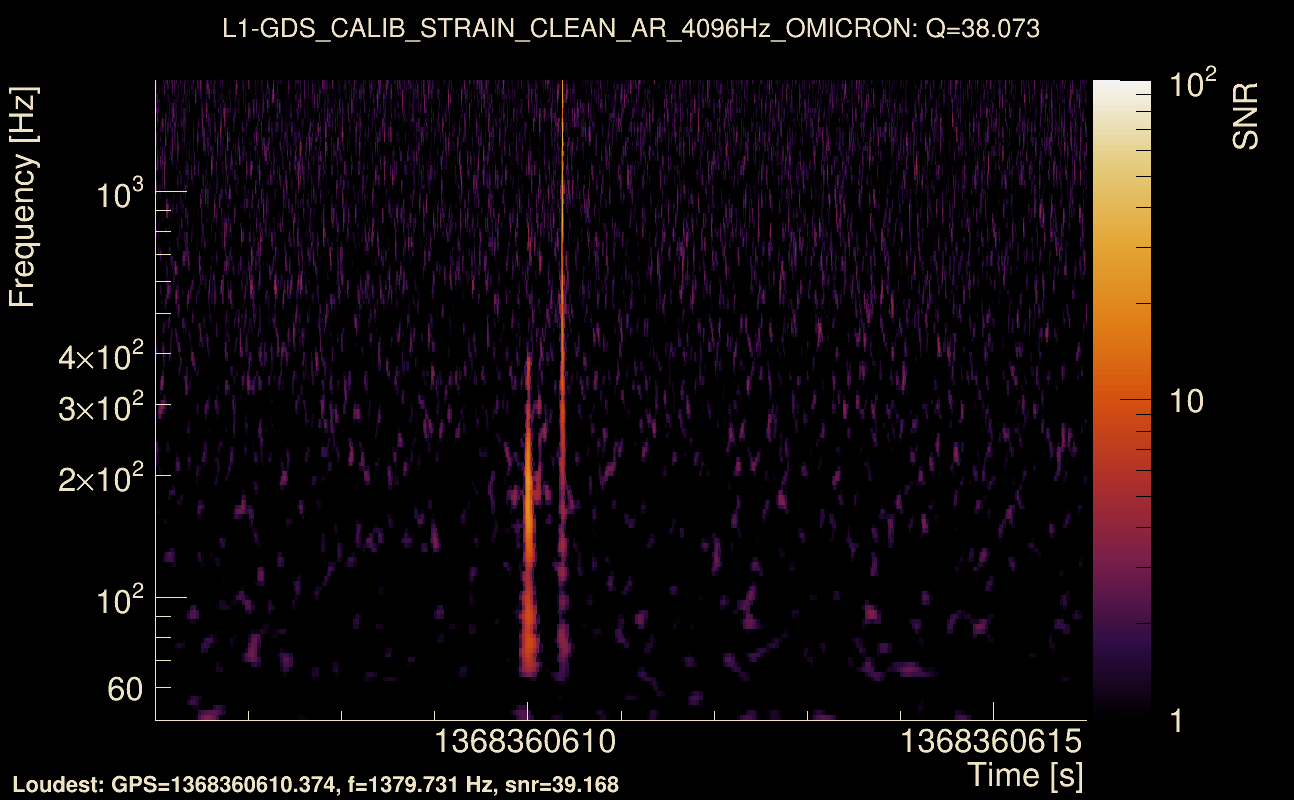
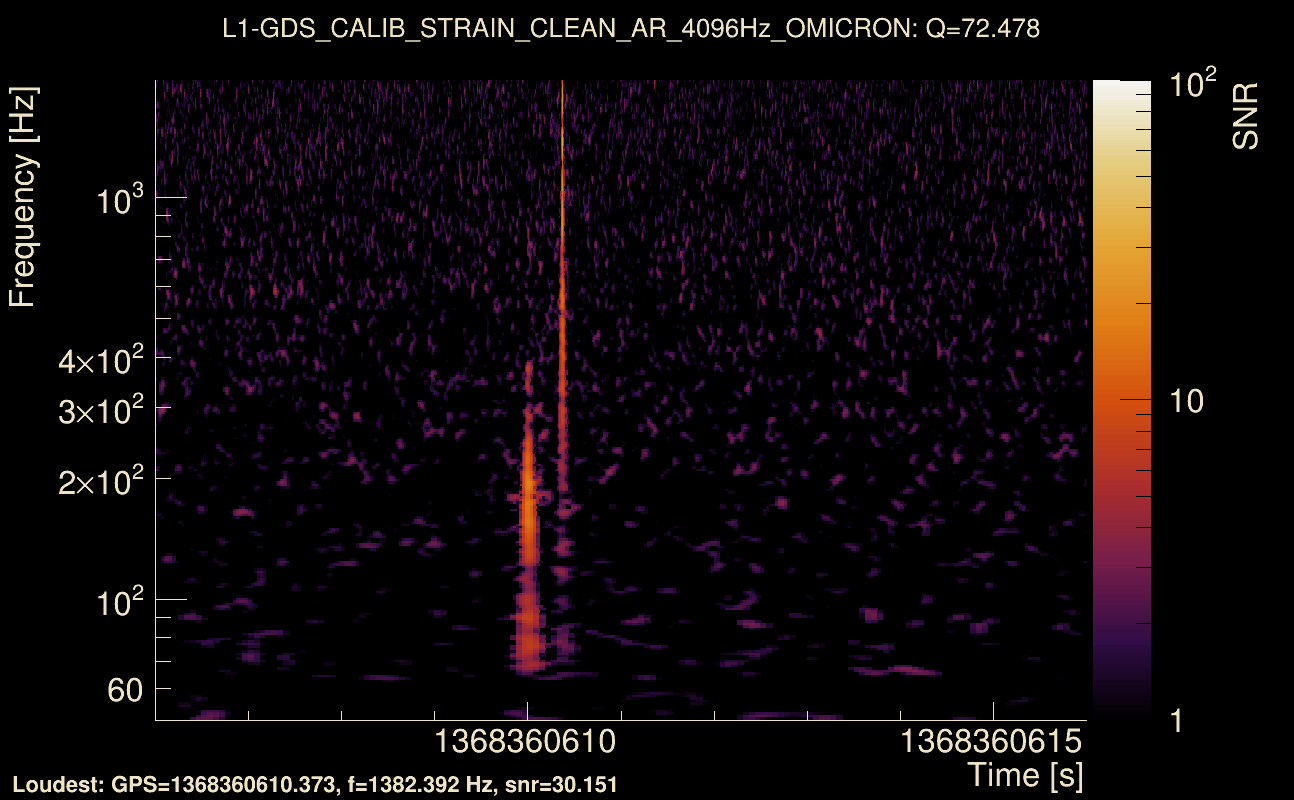
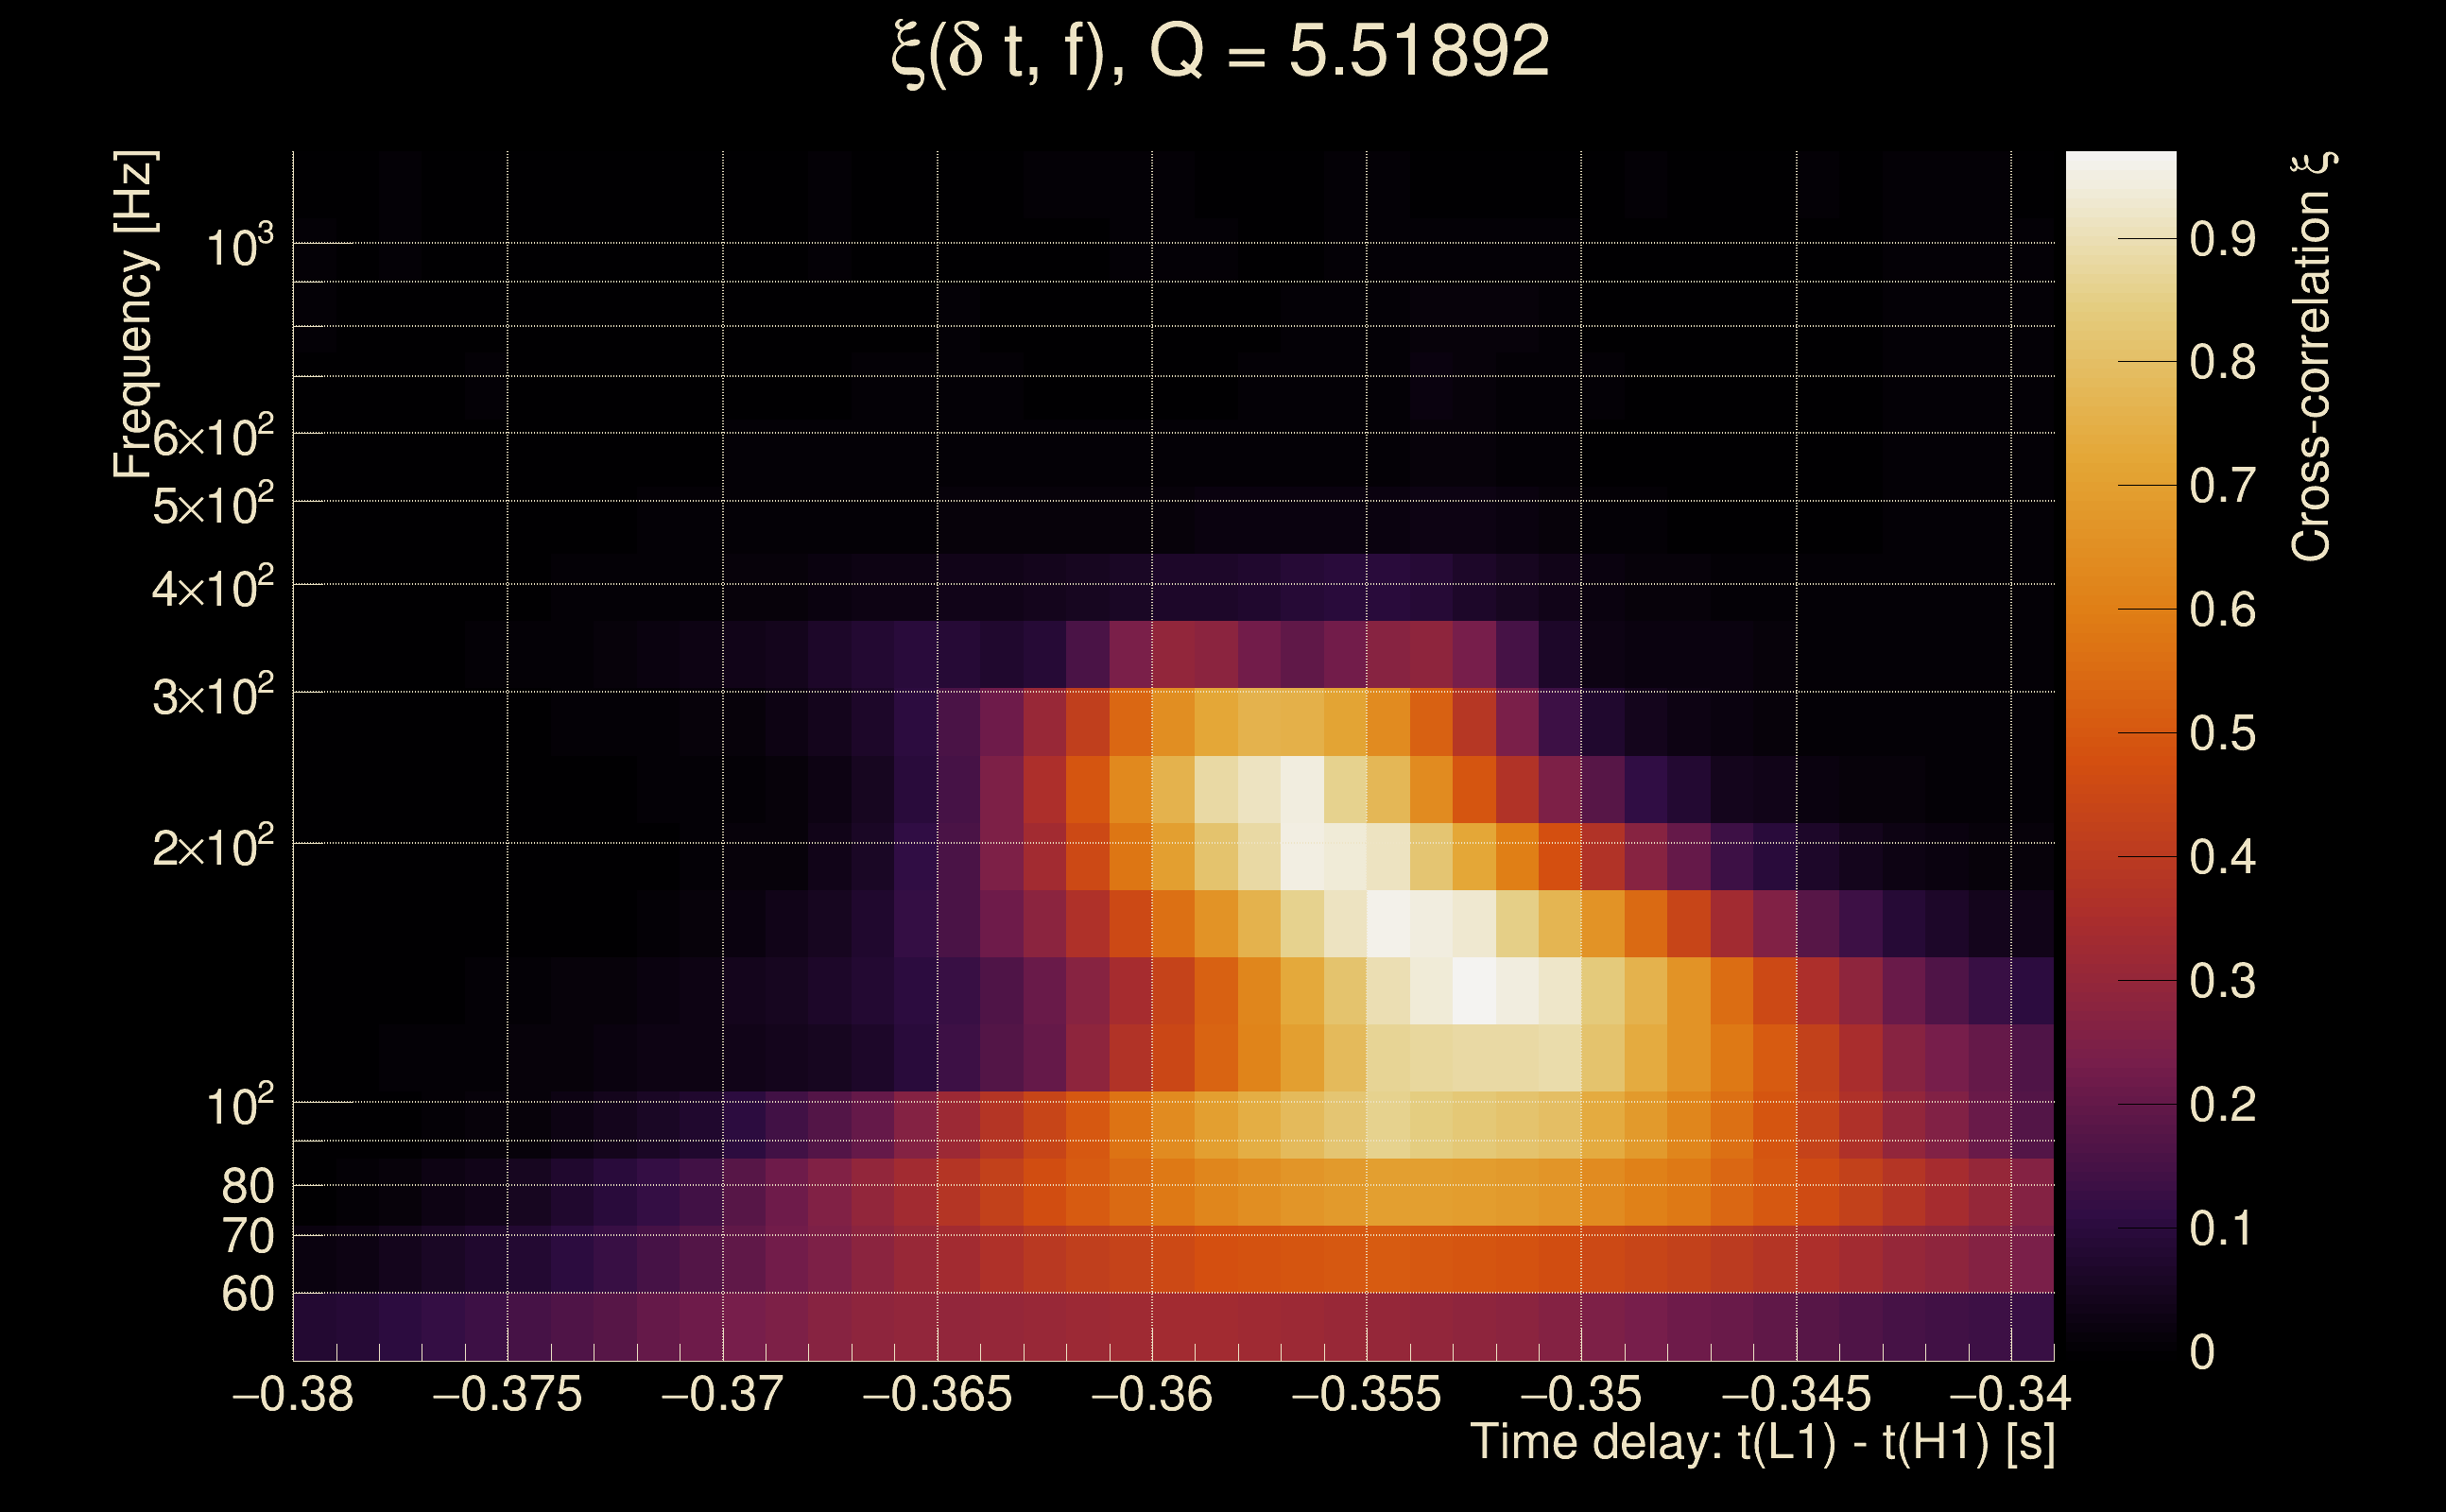
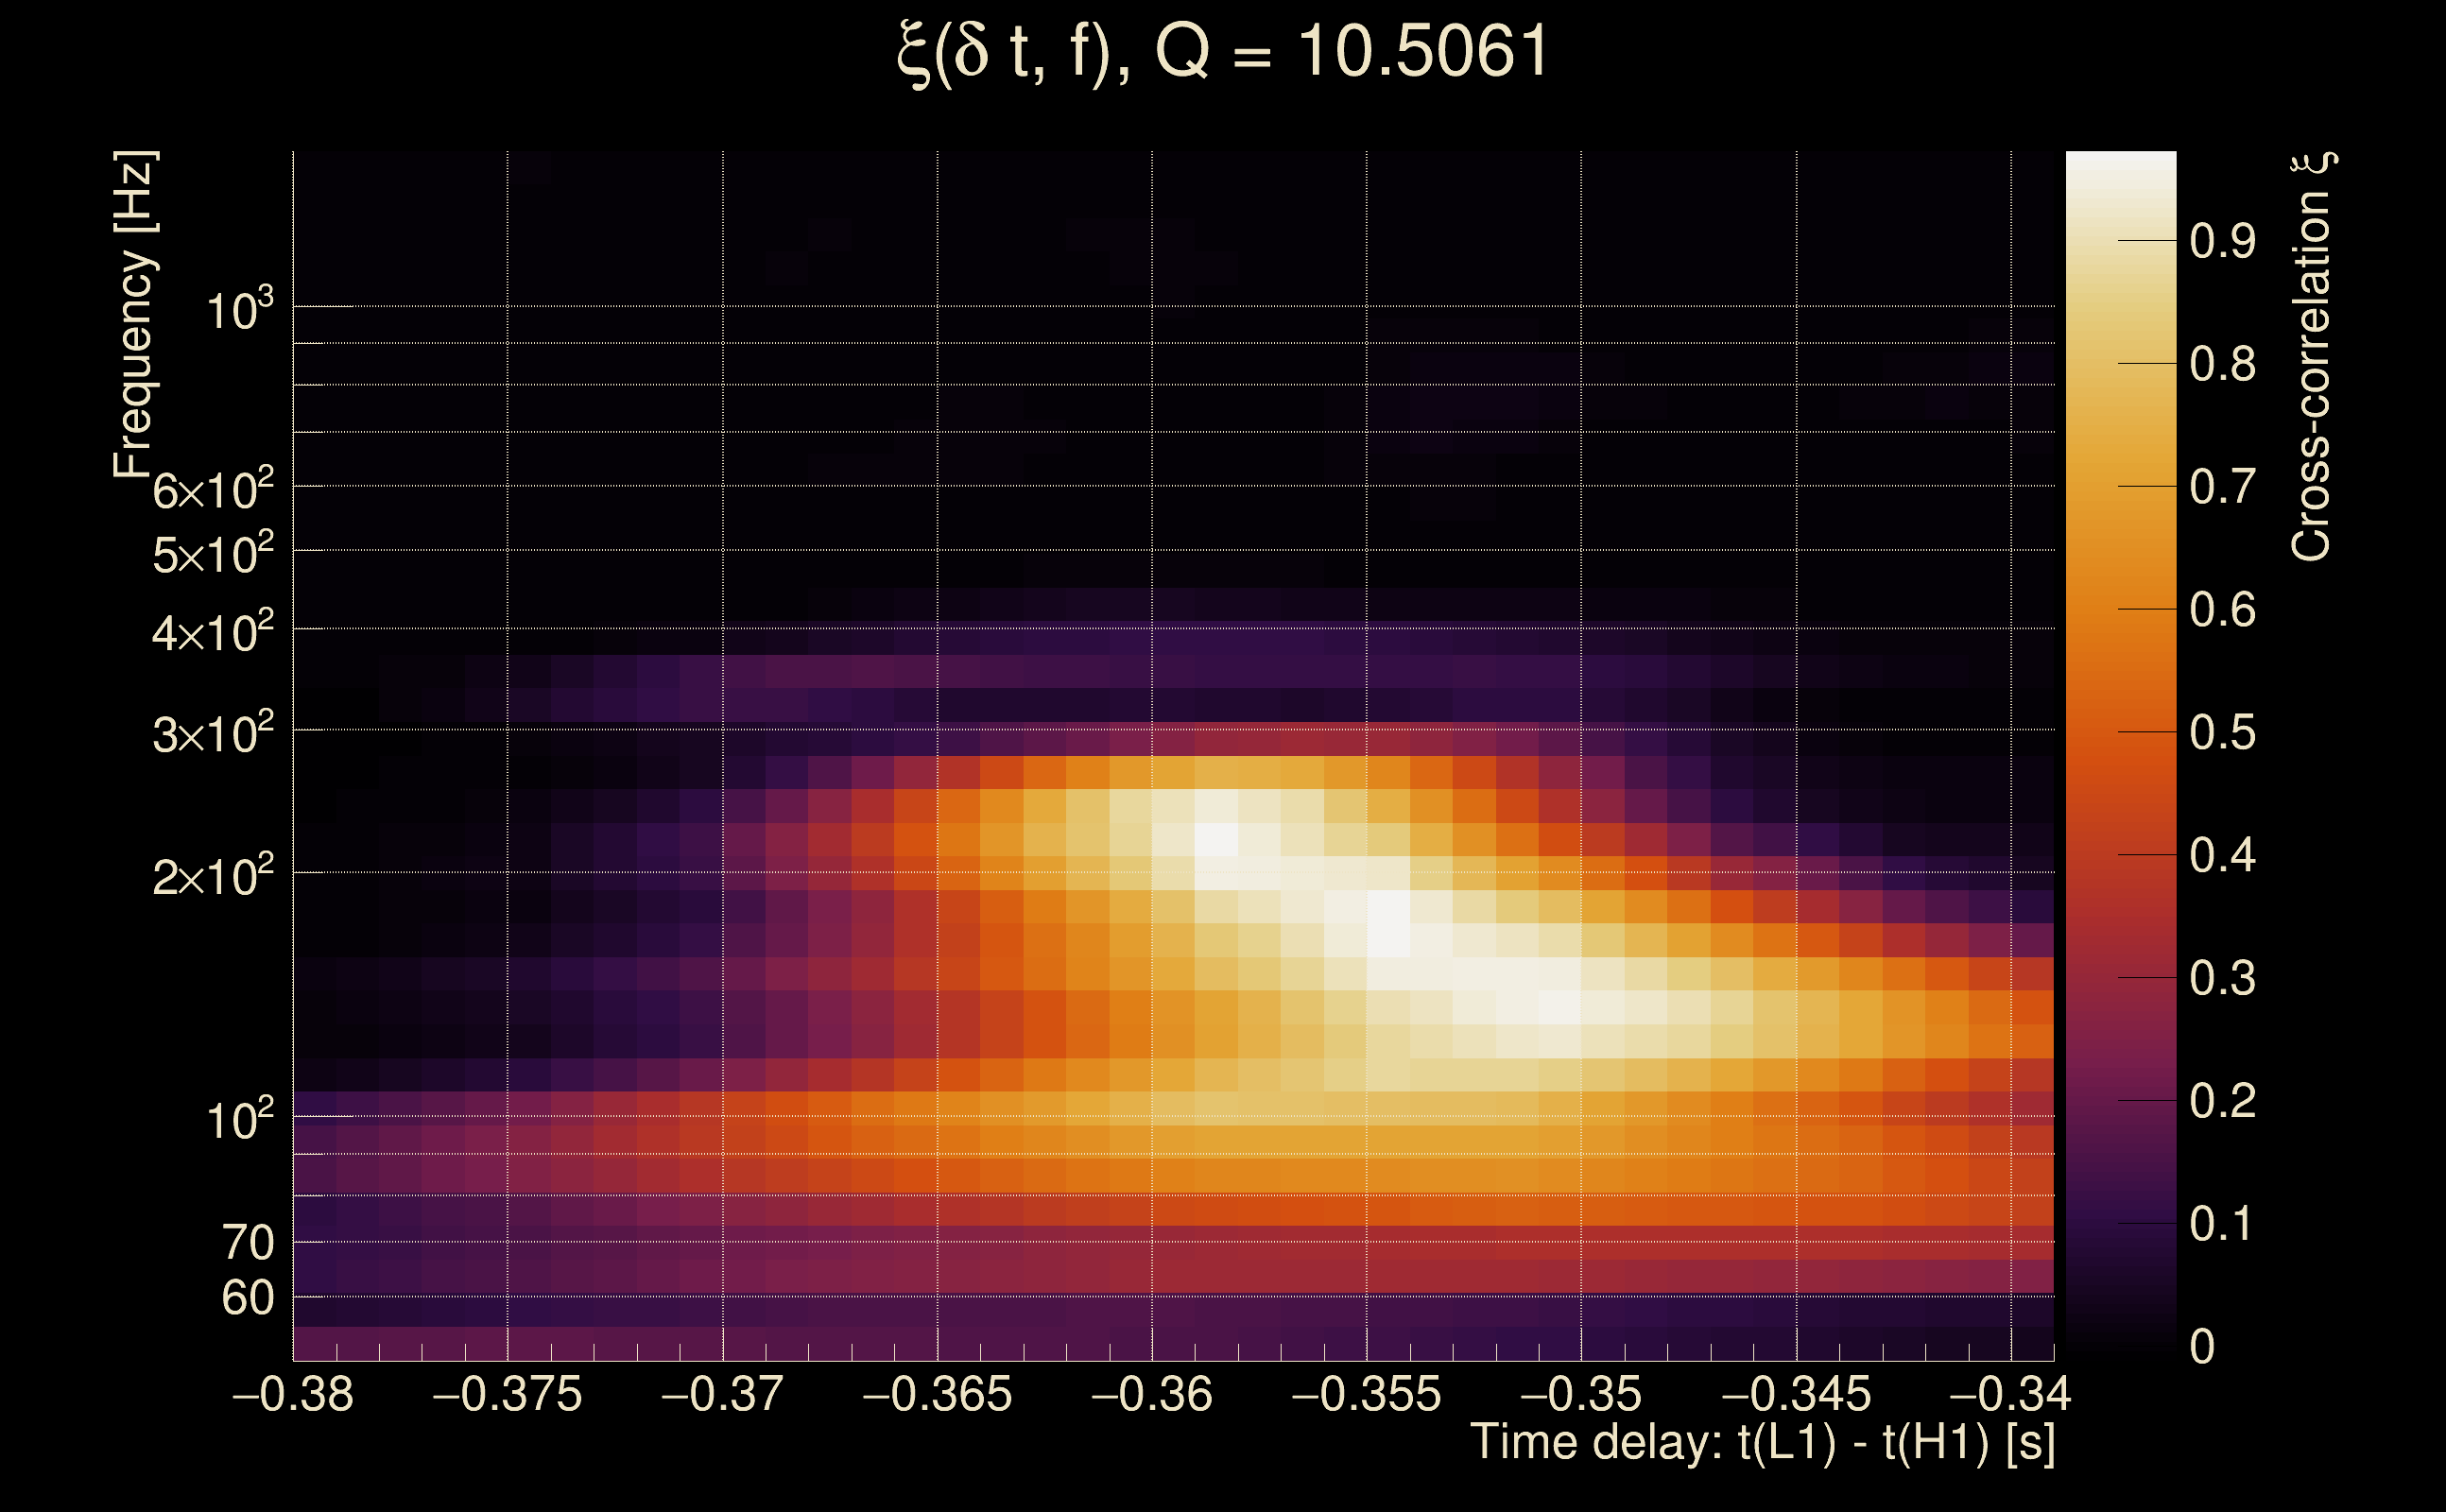
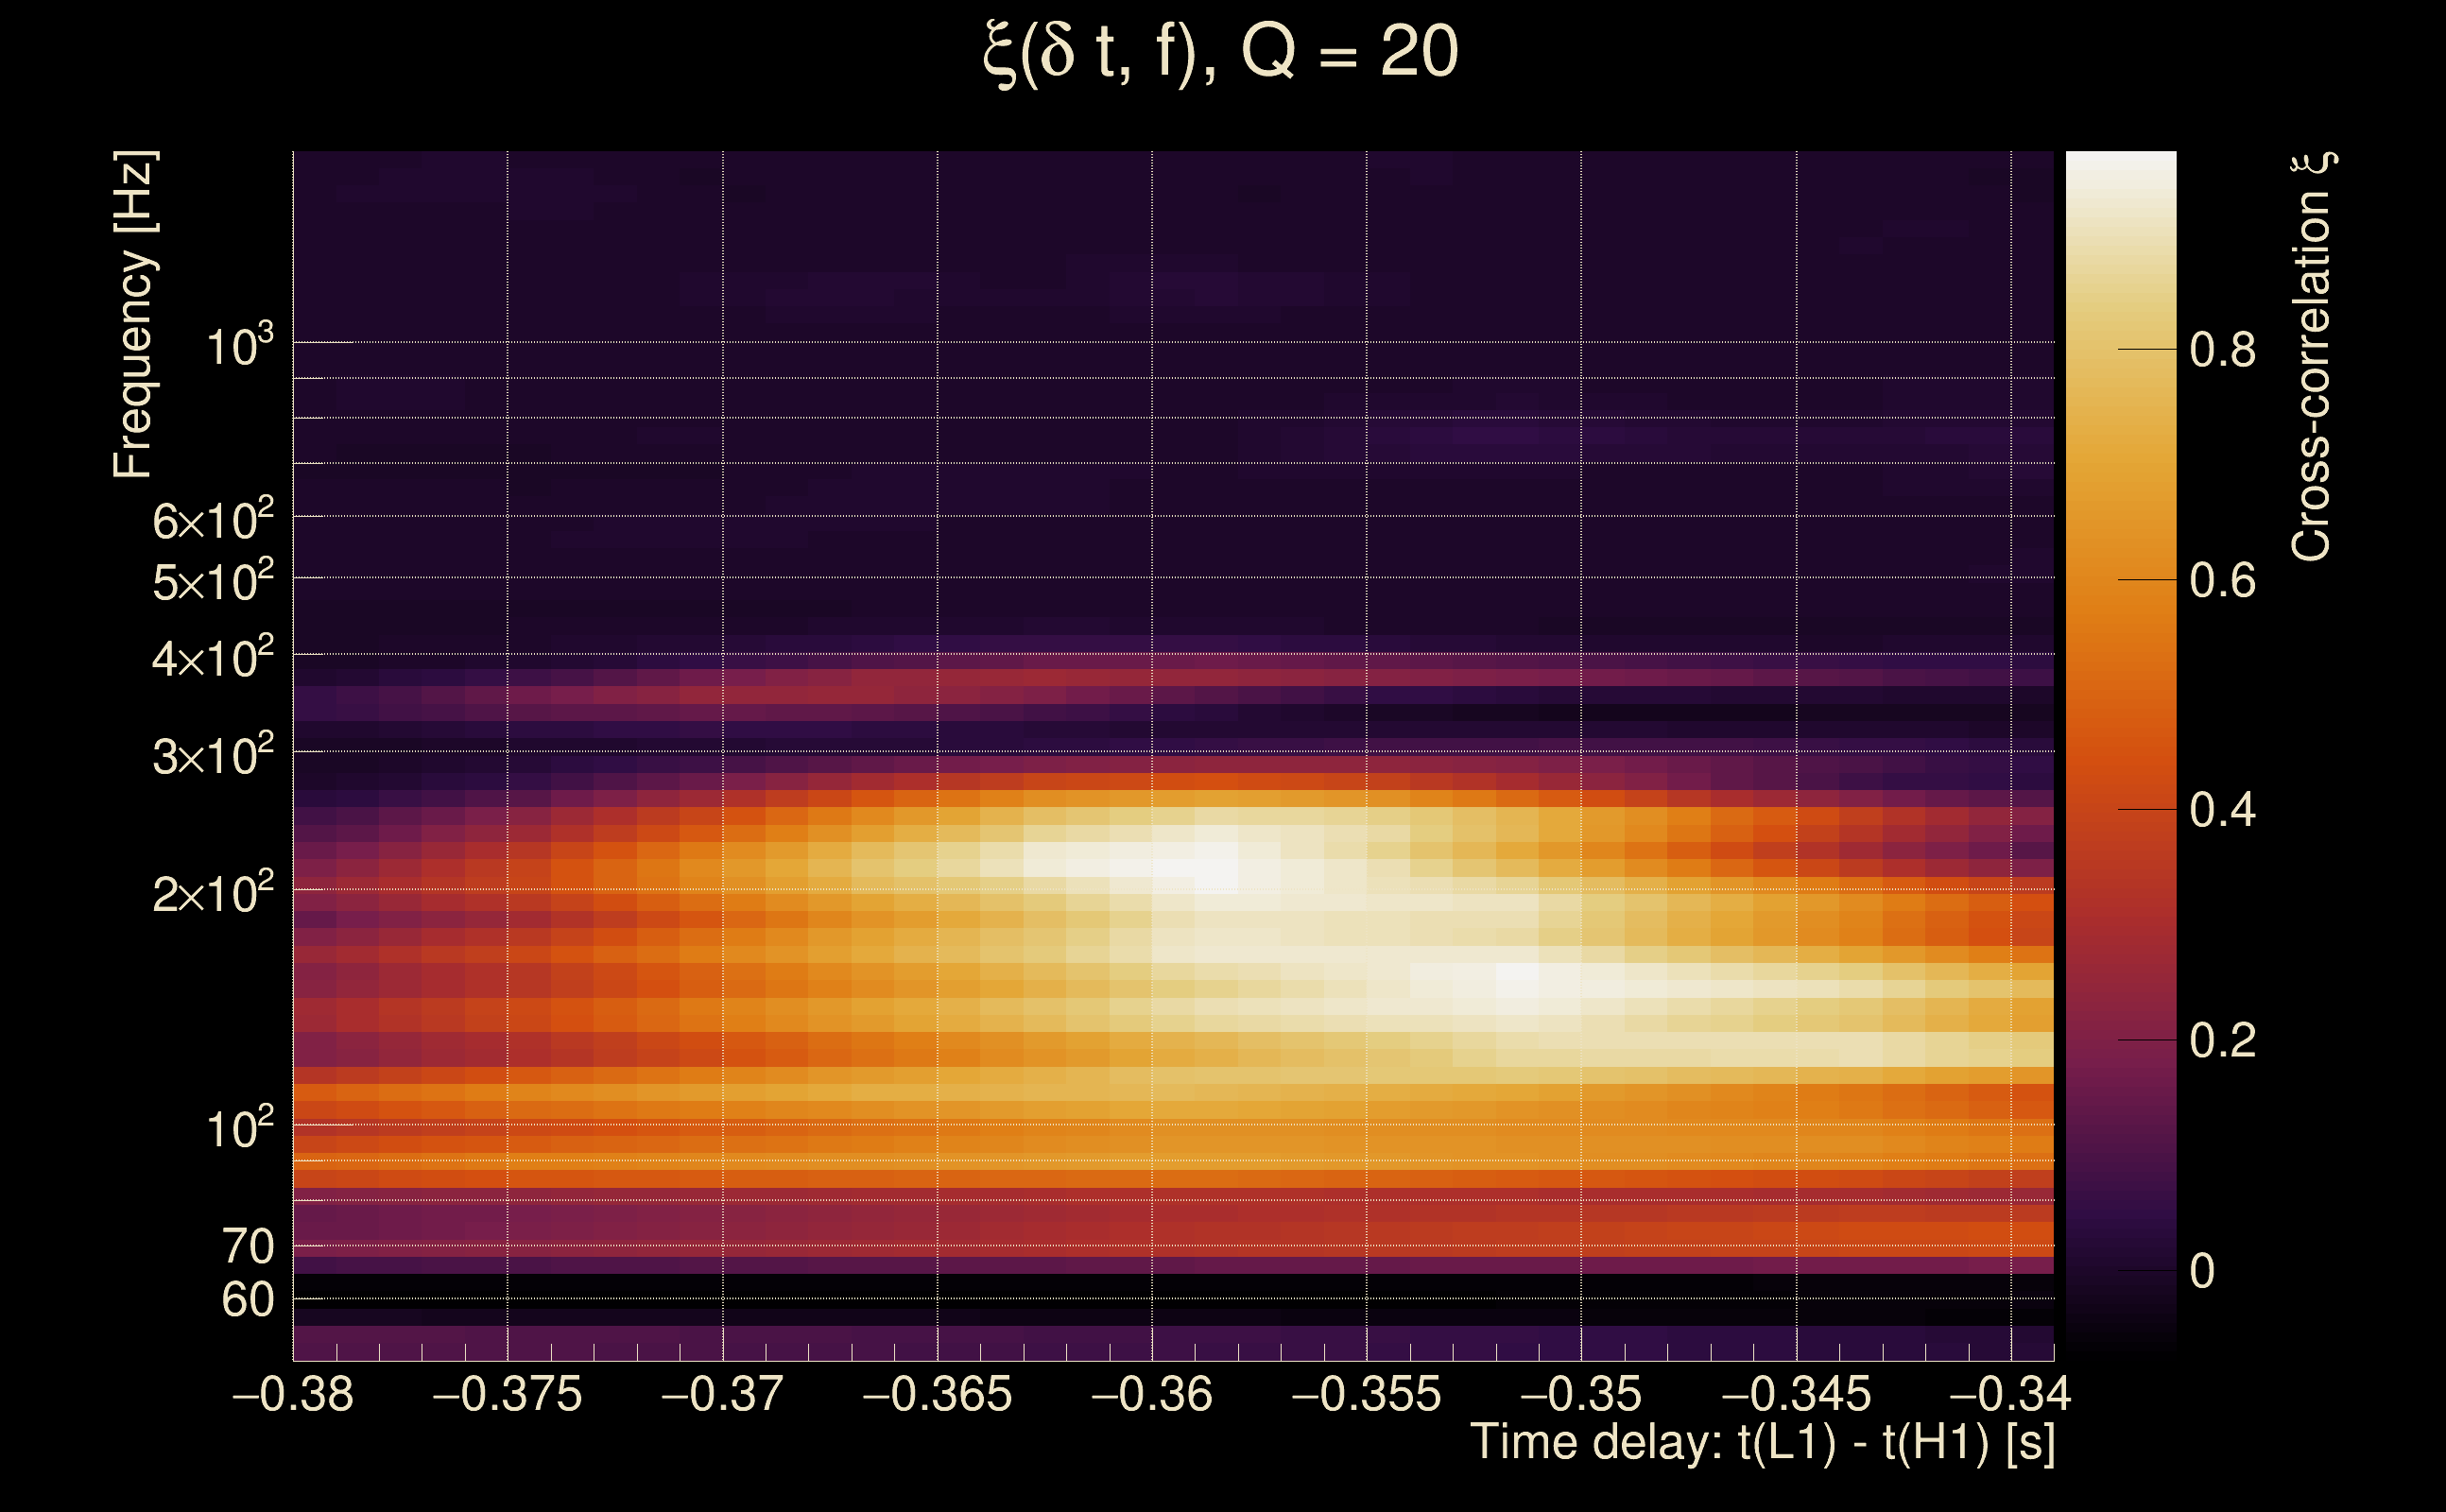
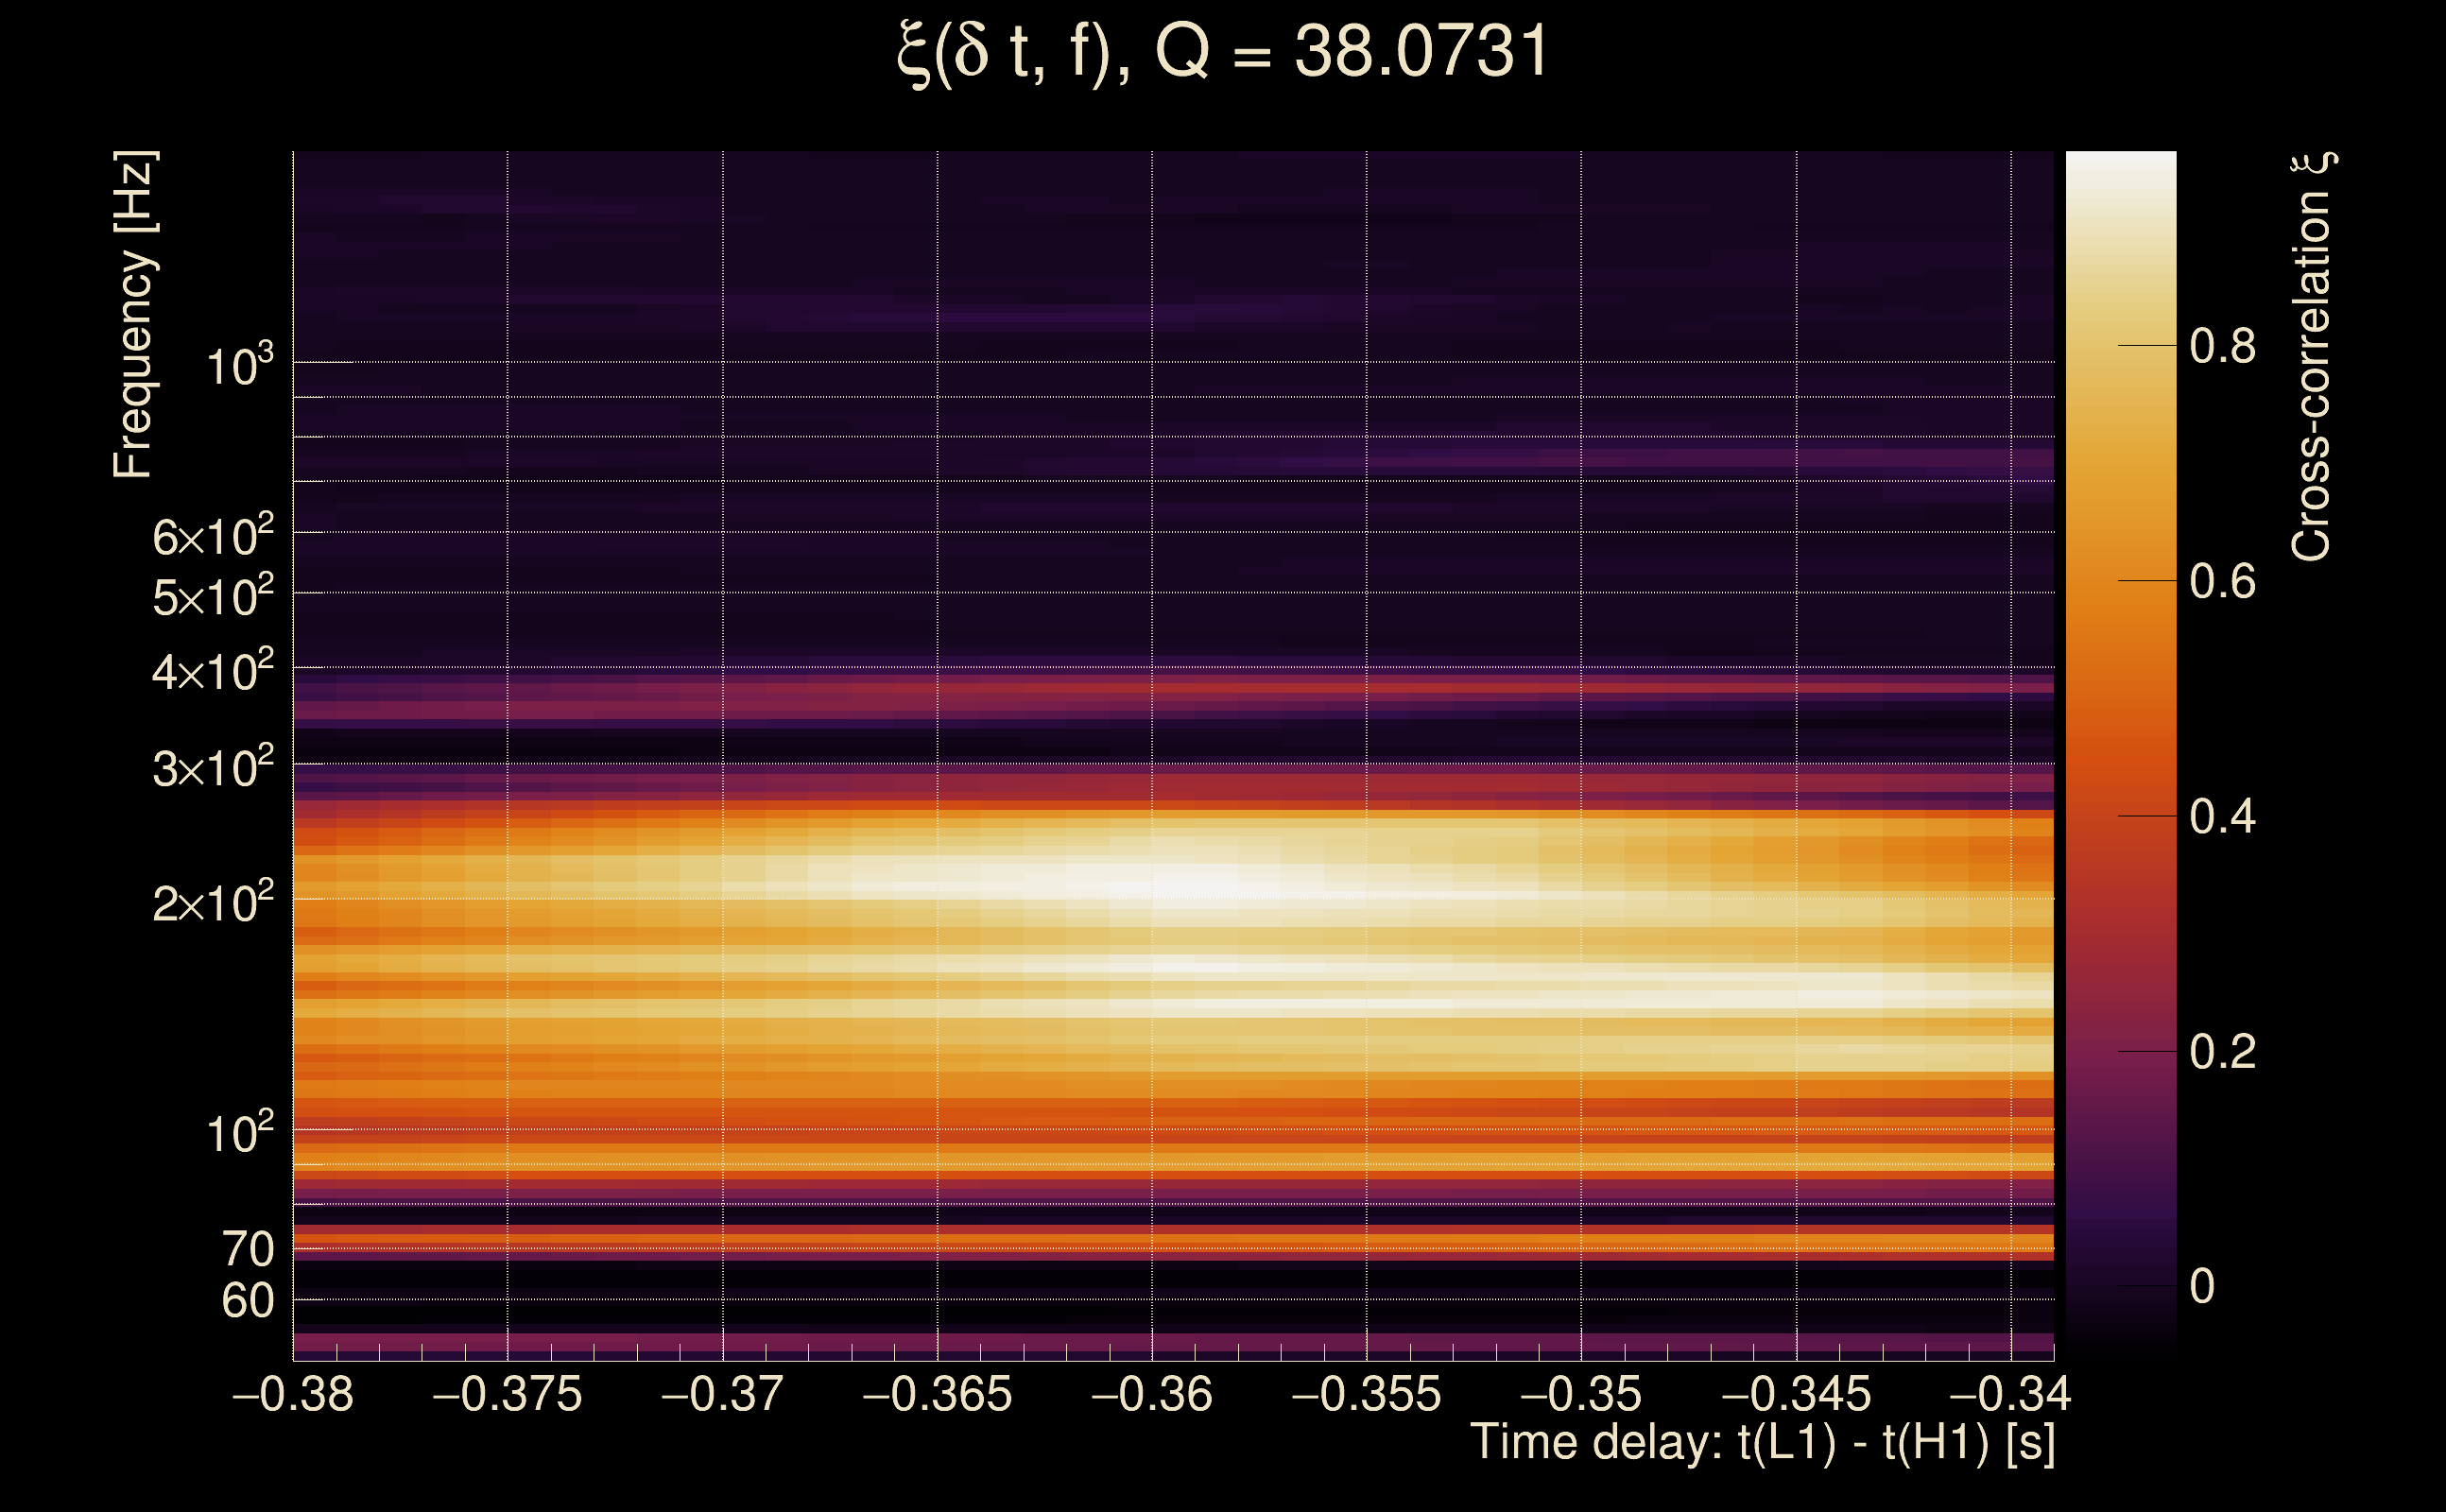
| Event time t(H1): | GPS = 1368360606 (Wed May 17 12:09:48 2023 ) → GPS = 1368360616 (Wed May 17 12:09:58 2023 ) |
| Event time t(L1): | GPS = 1368360606 (Wed May 17 12:09:58 2023 ) → GPS = 1368360616 (Wed May 17 12:09:58 2023 ) |
| Omicron analysis time window (H1): | GPS = 1368360603 → GPS = 1368360619 |
| Omicron analysis time window (L1): | GPS = 1368360603 → GPS = 1368360619 |
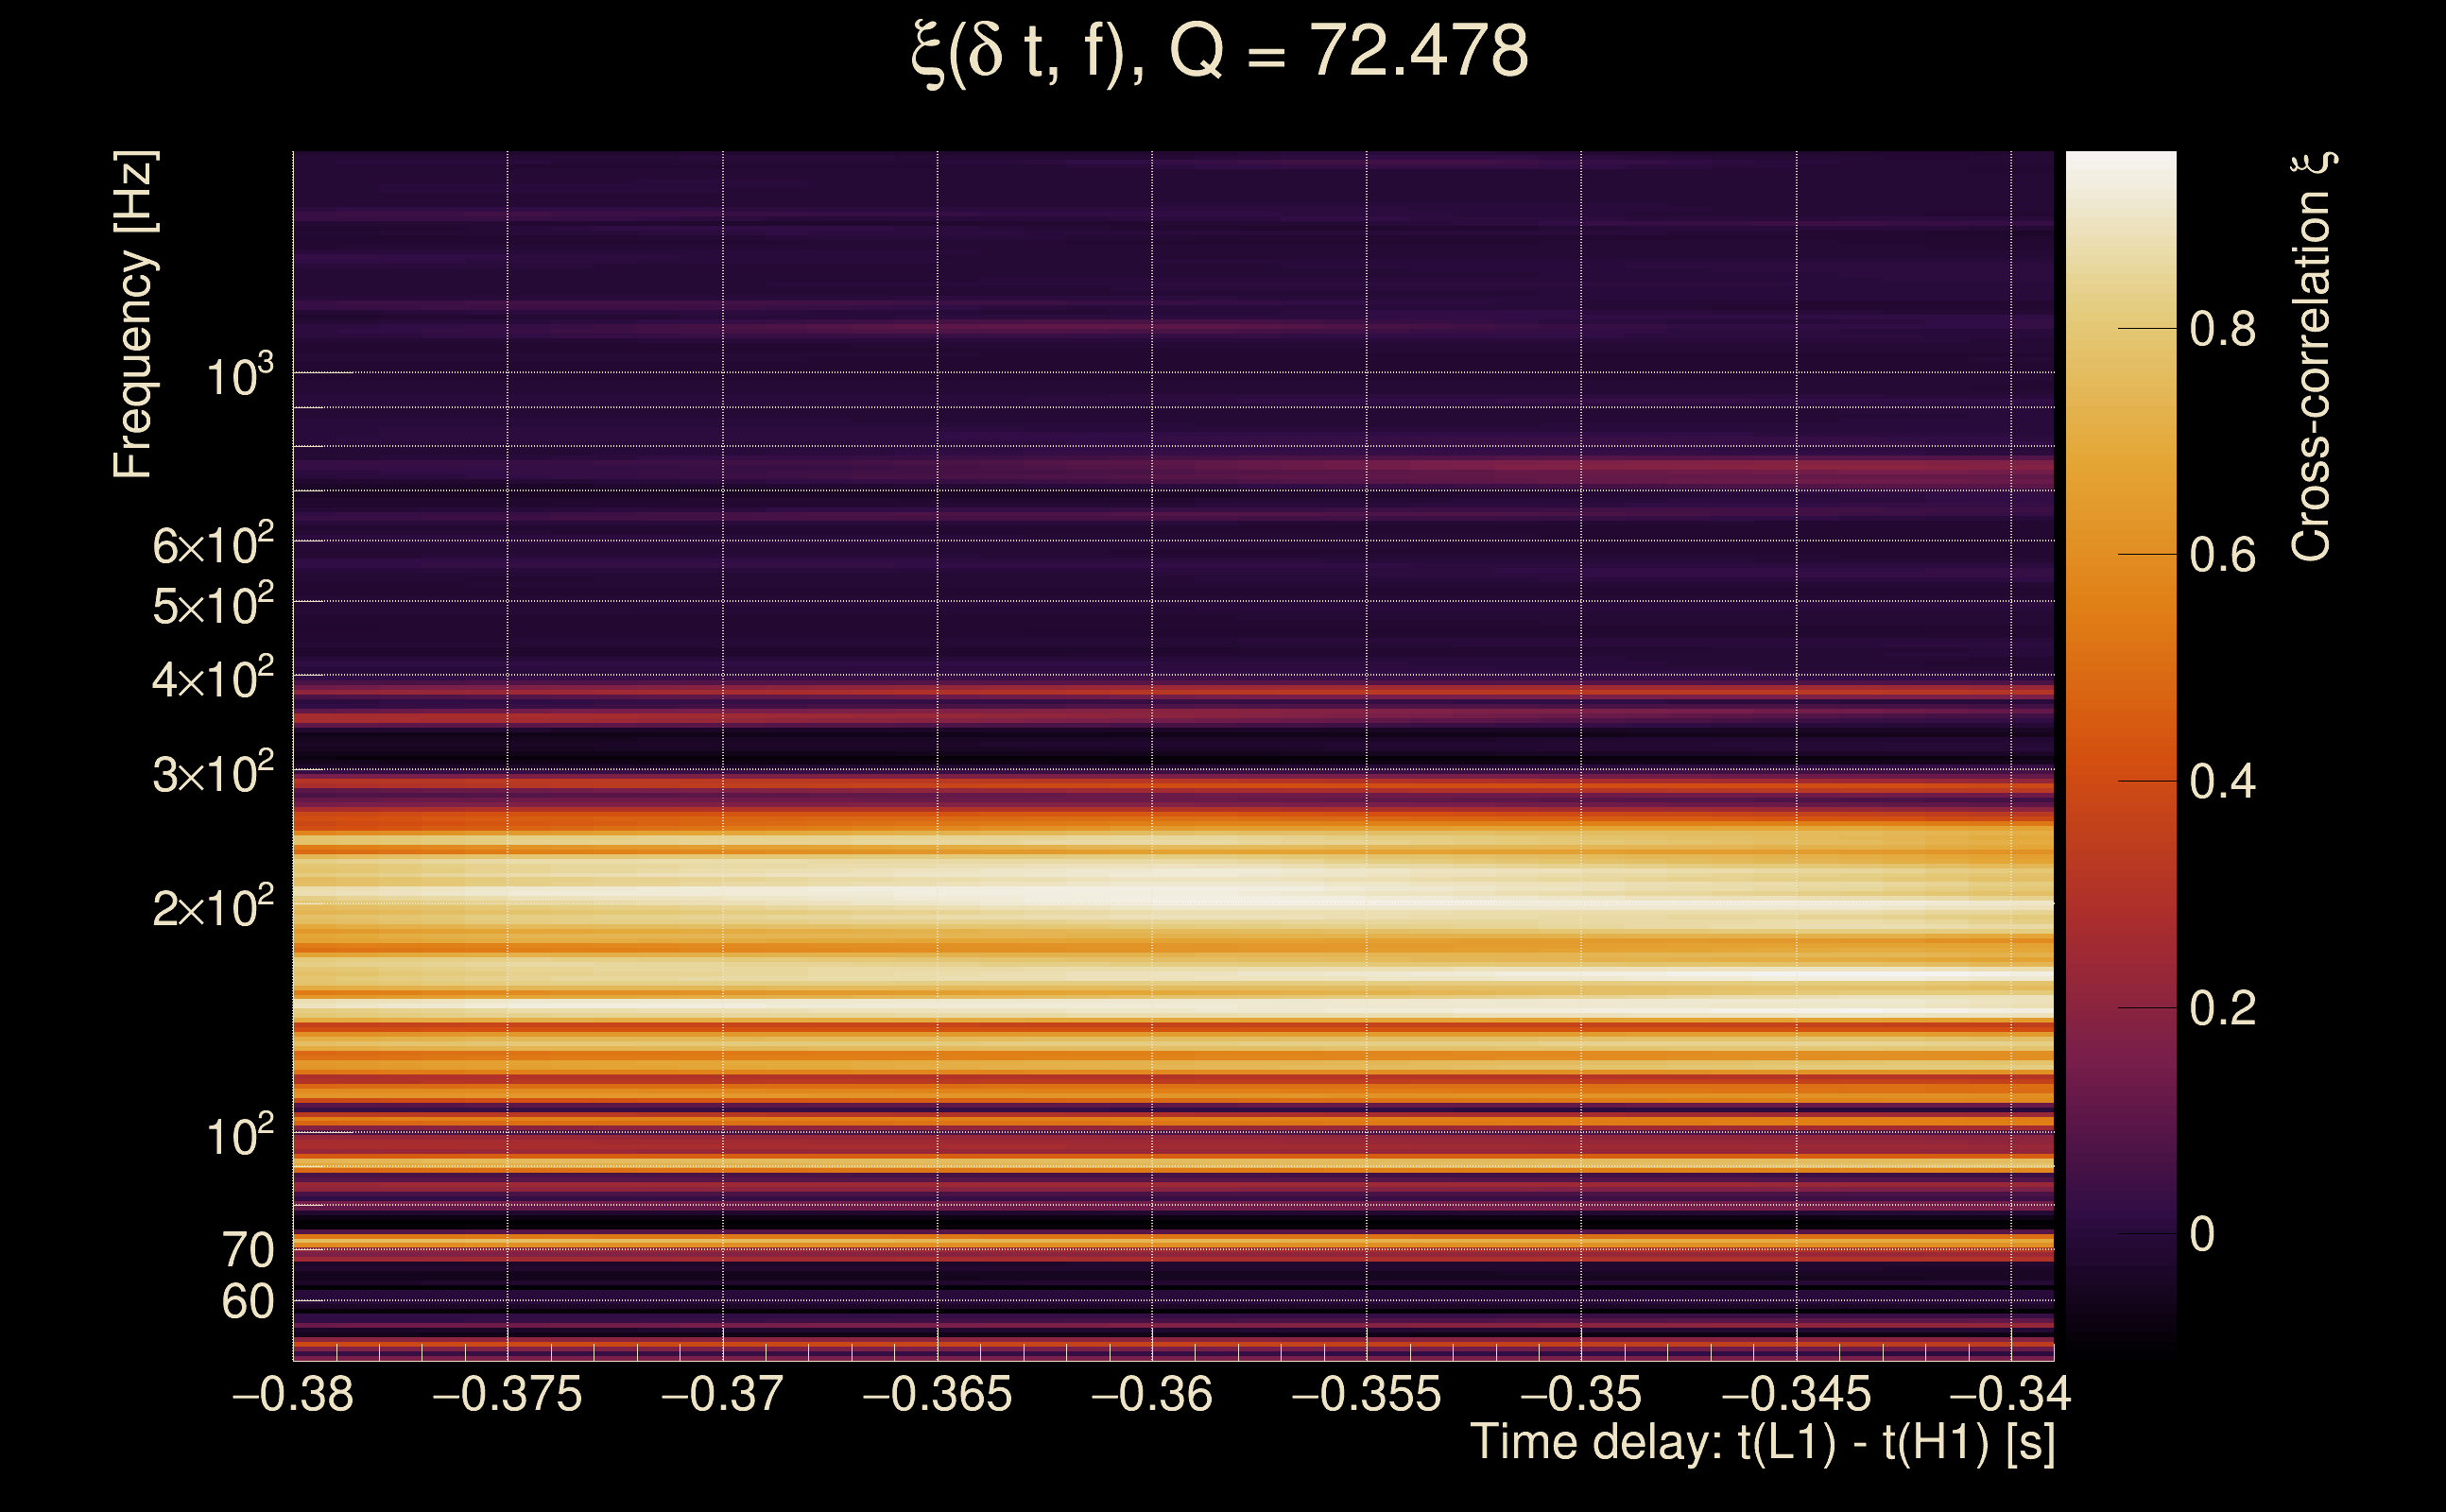
| Time delay between detectors t(L1) - t(H1): | -0.359425 s (slice index = 116 / 217), δt_gw = 0.00857488 s |
| Time delay standard deviation: | 0.0619222 s |
| [targeted mode] Time delay probability: | 0.952185 (0.059963 sigmas), δt_target = 0.000151634 s |
| Frequency: | 189.01 Hz |
| Ξ: | 0.364559 ± 0.0262368 (variance = 0.00068837): Q0: 0.762794, Q1: 0.742473, Q2: 0.765363, Q3: 0.795569, Q4: 0.716494 |
| Rank: | R_A = 0.347128 |
| Log of amplitude ratio (L1/H1): | 0.683171, variance = 0.863212 (L1/H1: -1.09479, variance = 3.58497, H1/L1: -1.52599, variance = 1.06999) |
| Amplitude ratio (L1/H1): | 1.98015 ⋇ 2.53221 (L1/H1: 0.334609 ⋇ 6.64192, H1/L1: 0.217407 ⋇ 2.81343) |
| Amplitude ratio H1|L1 compatibility (probability): | 0.224477 |
| Antenna factor probability: | 0.252927 |
| Number of rejected frequency rows: | Q0: 10 / 18, Q1: 16 / 36, Q2: 29 / 70, Q3: 82 / 134, Q4: 191 / 258 |
| Maximum signal-to-noise ratio: | H1: 38.4139, L1: 55.7935 |
| SNR variance: | H1: 0.687452, L1: 1.25232 |
| Click here for a zoomed plot | Click here for a zoomed plot | Click here for a zoomed plot | Click here for a zoomed plot | Click here for a zoomed plot |
 |
 |
 |
 |
 |
 |
 |
 |
 |
 |
 |
 |
 |
 |
 |
 |
 |
 |
 |
 |
 |
 |
 |
 |
 |
 |
 |
 |
 |
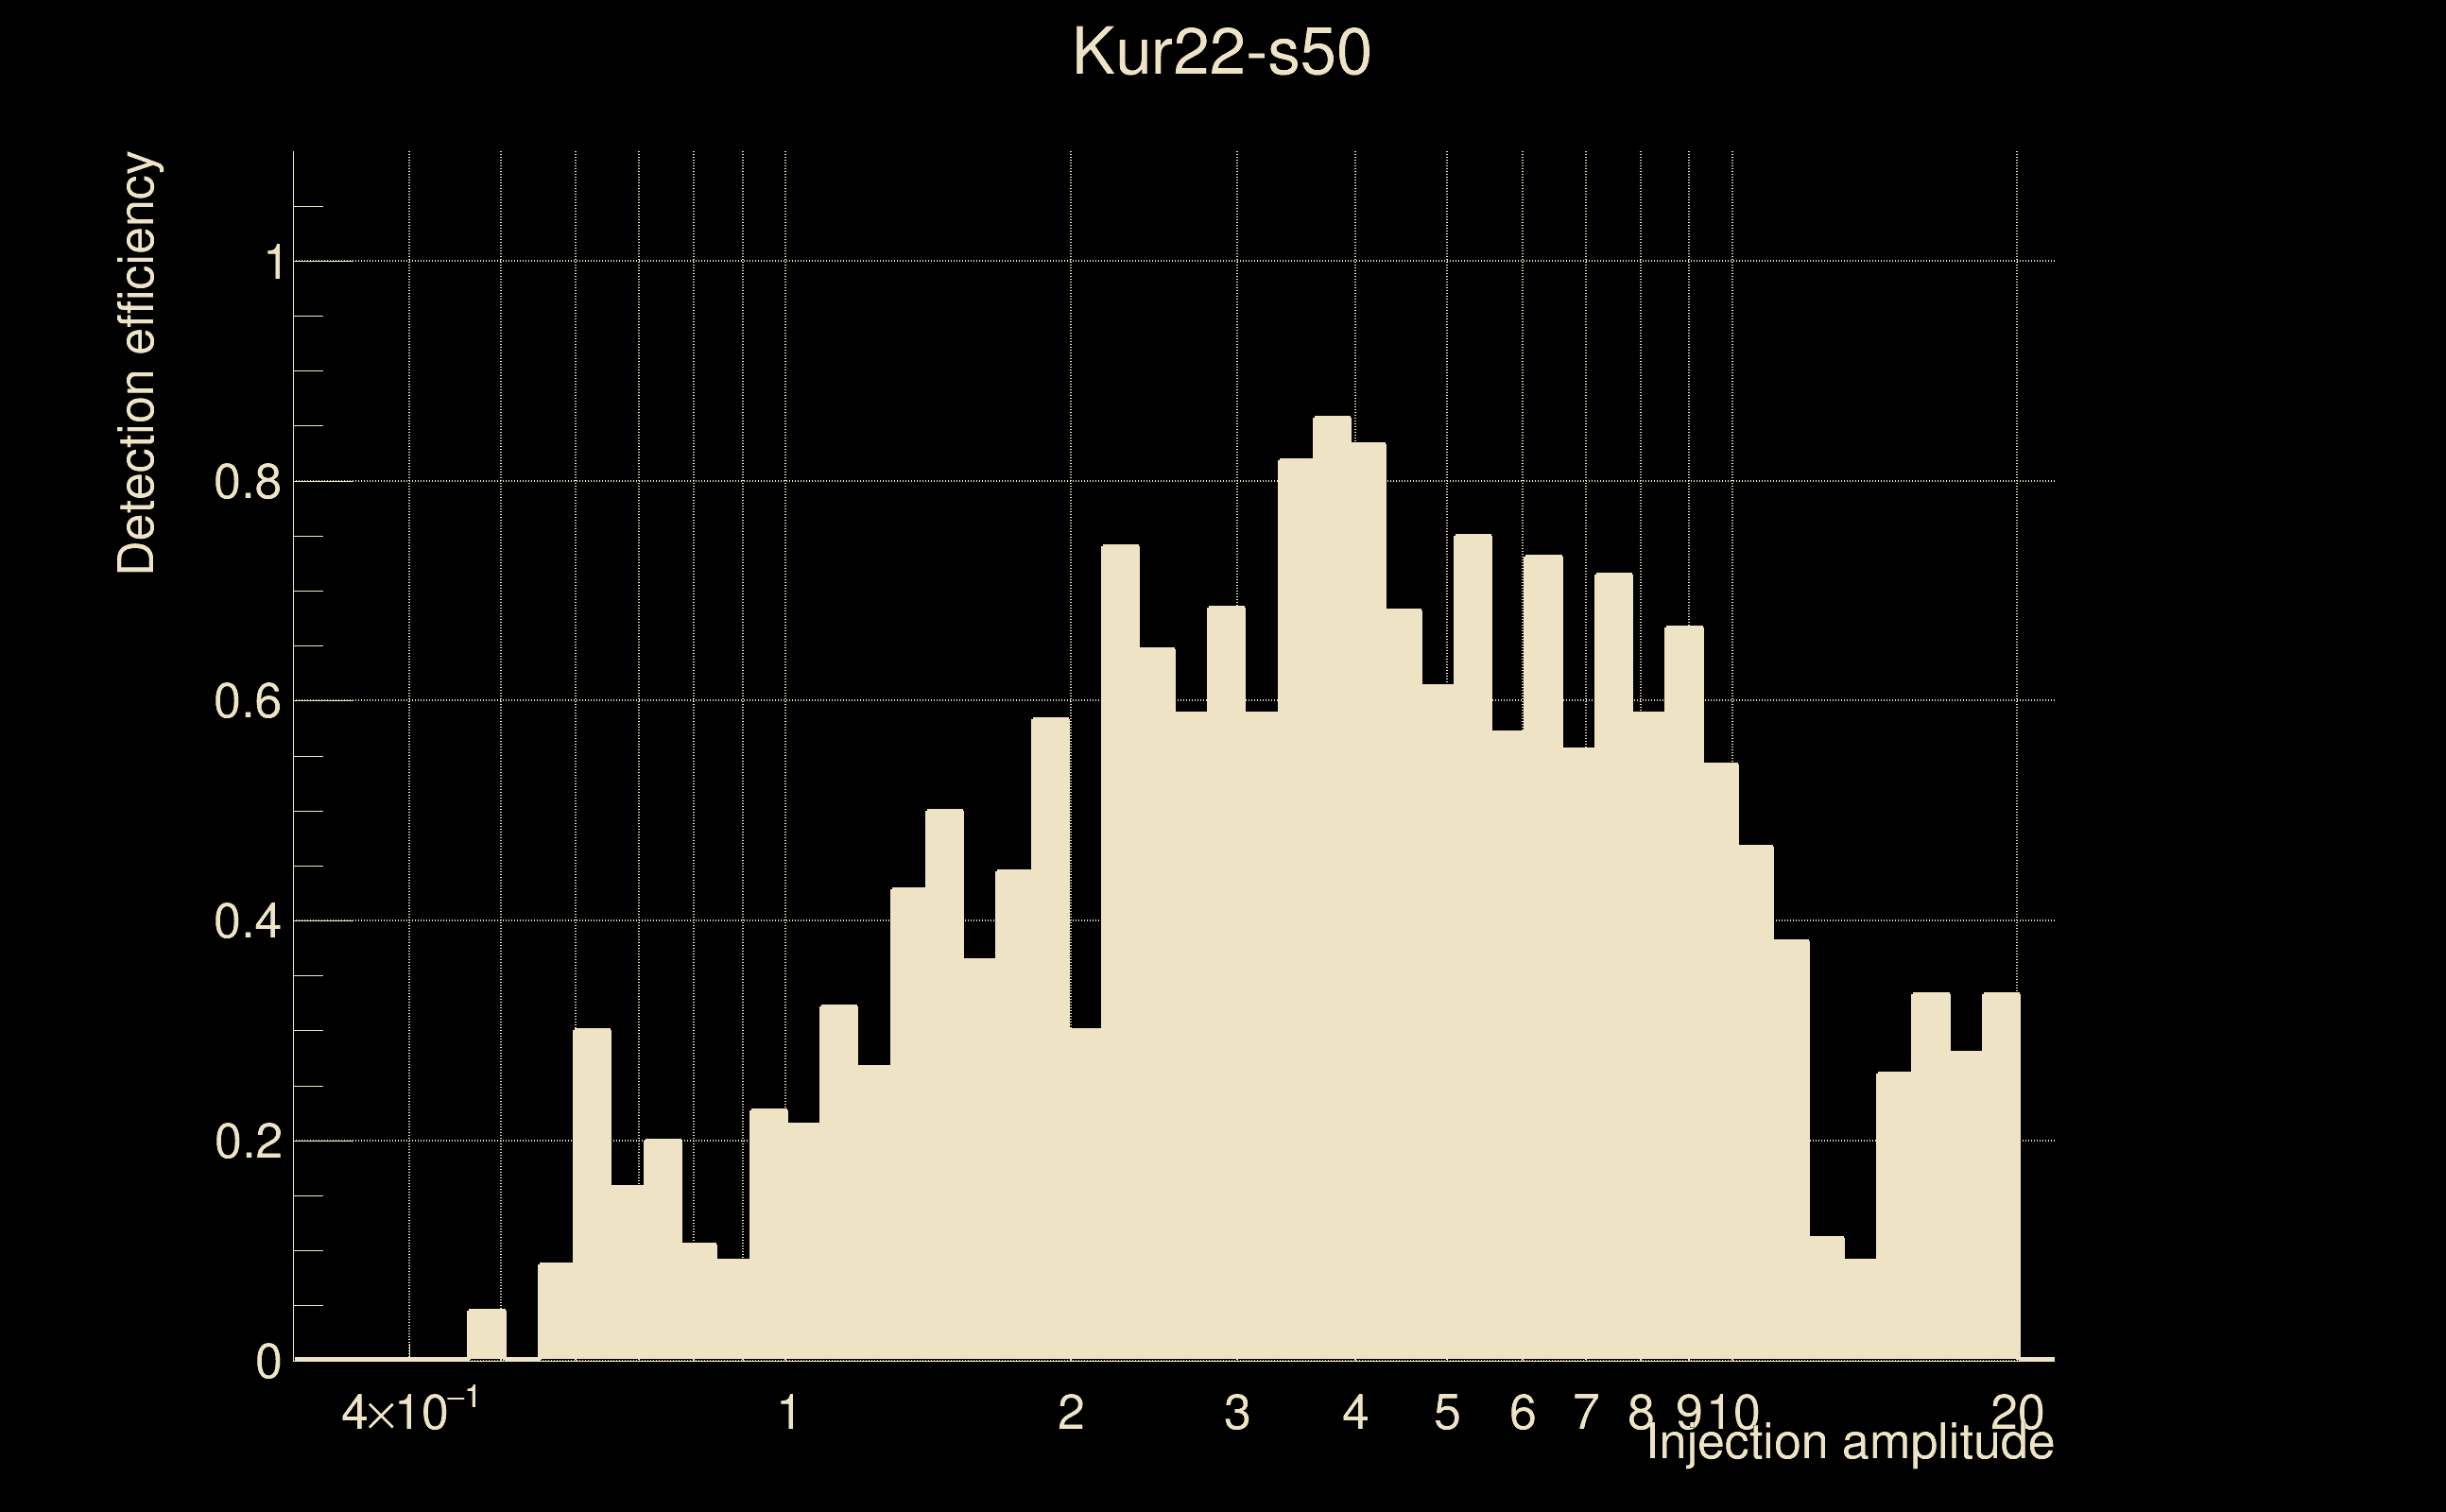
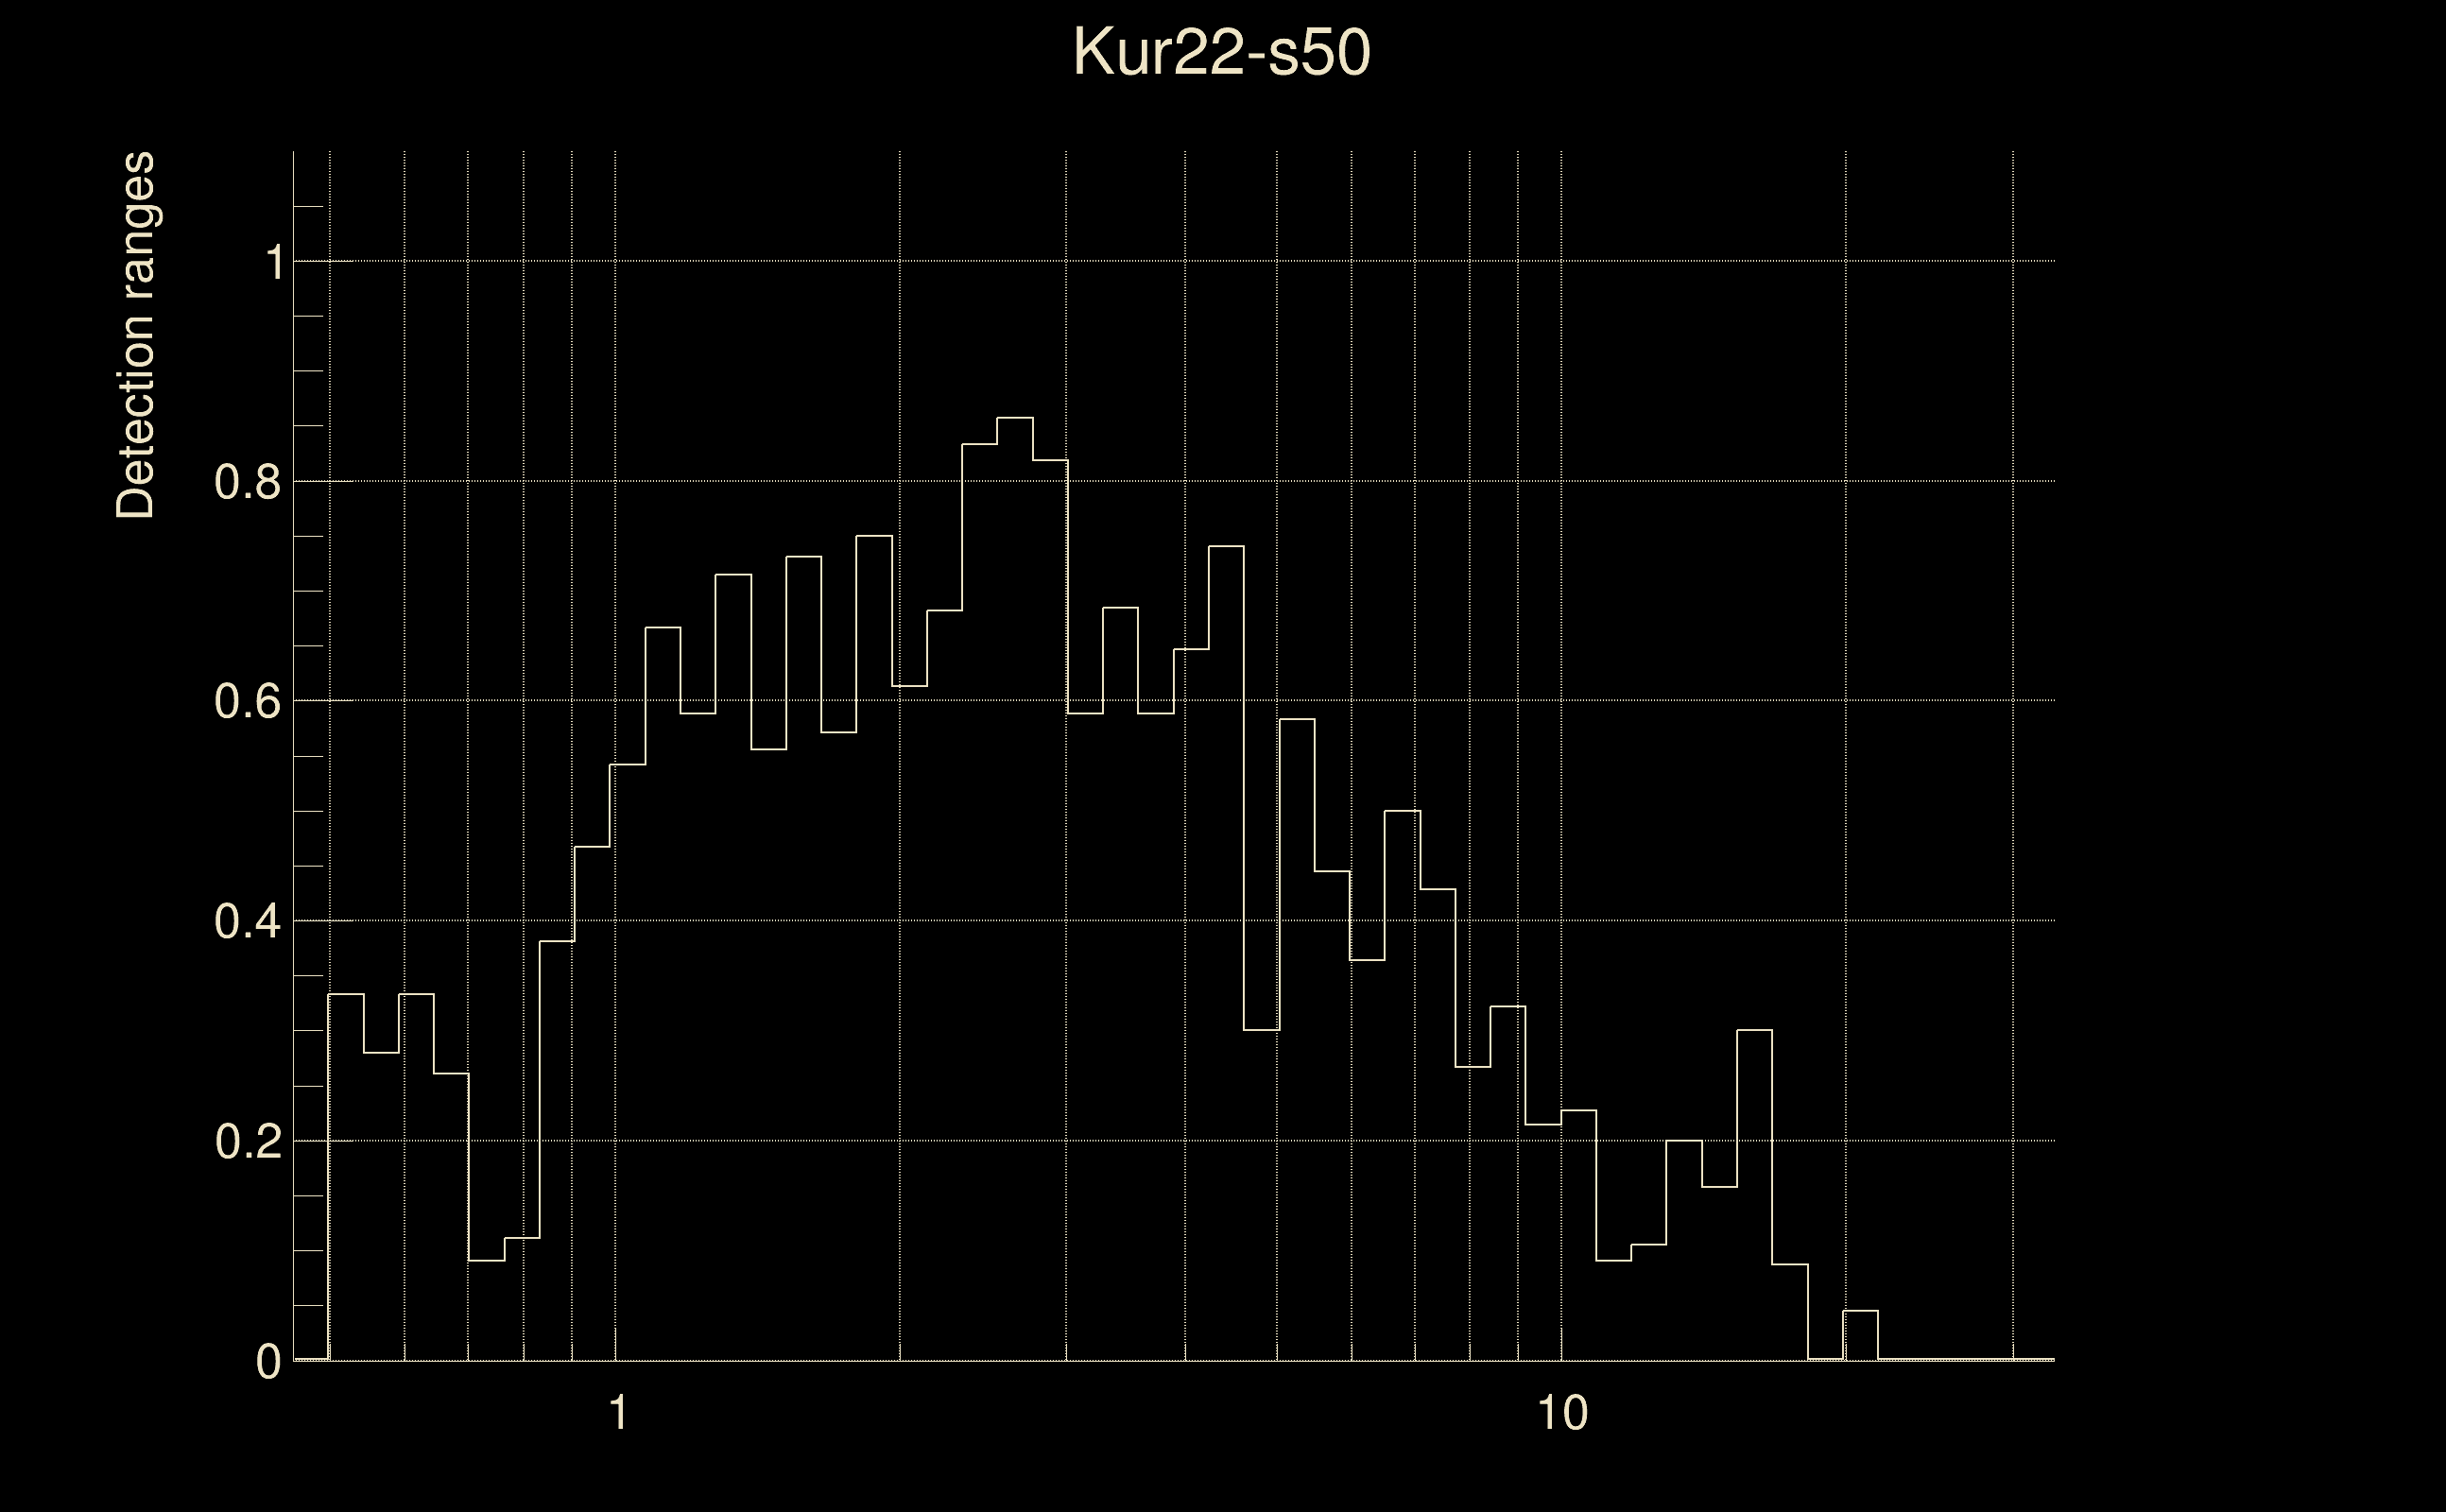
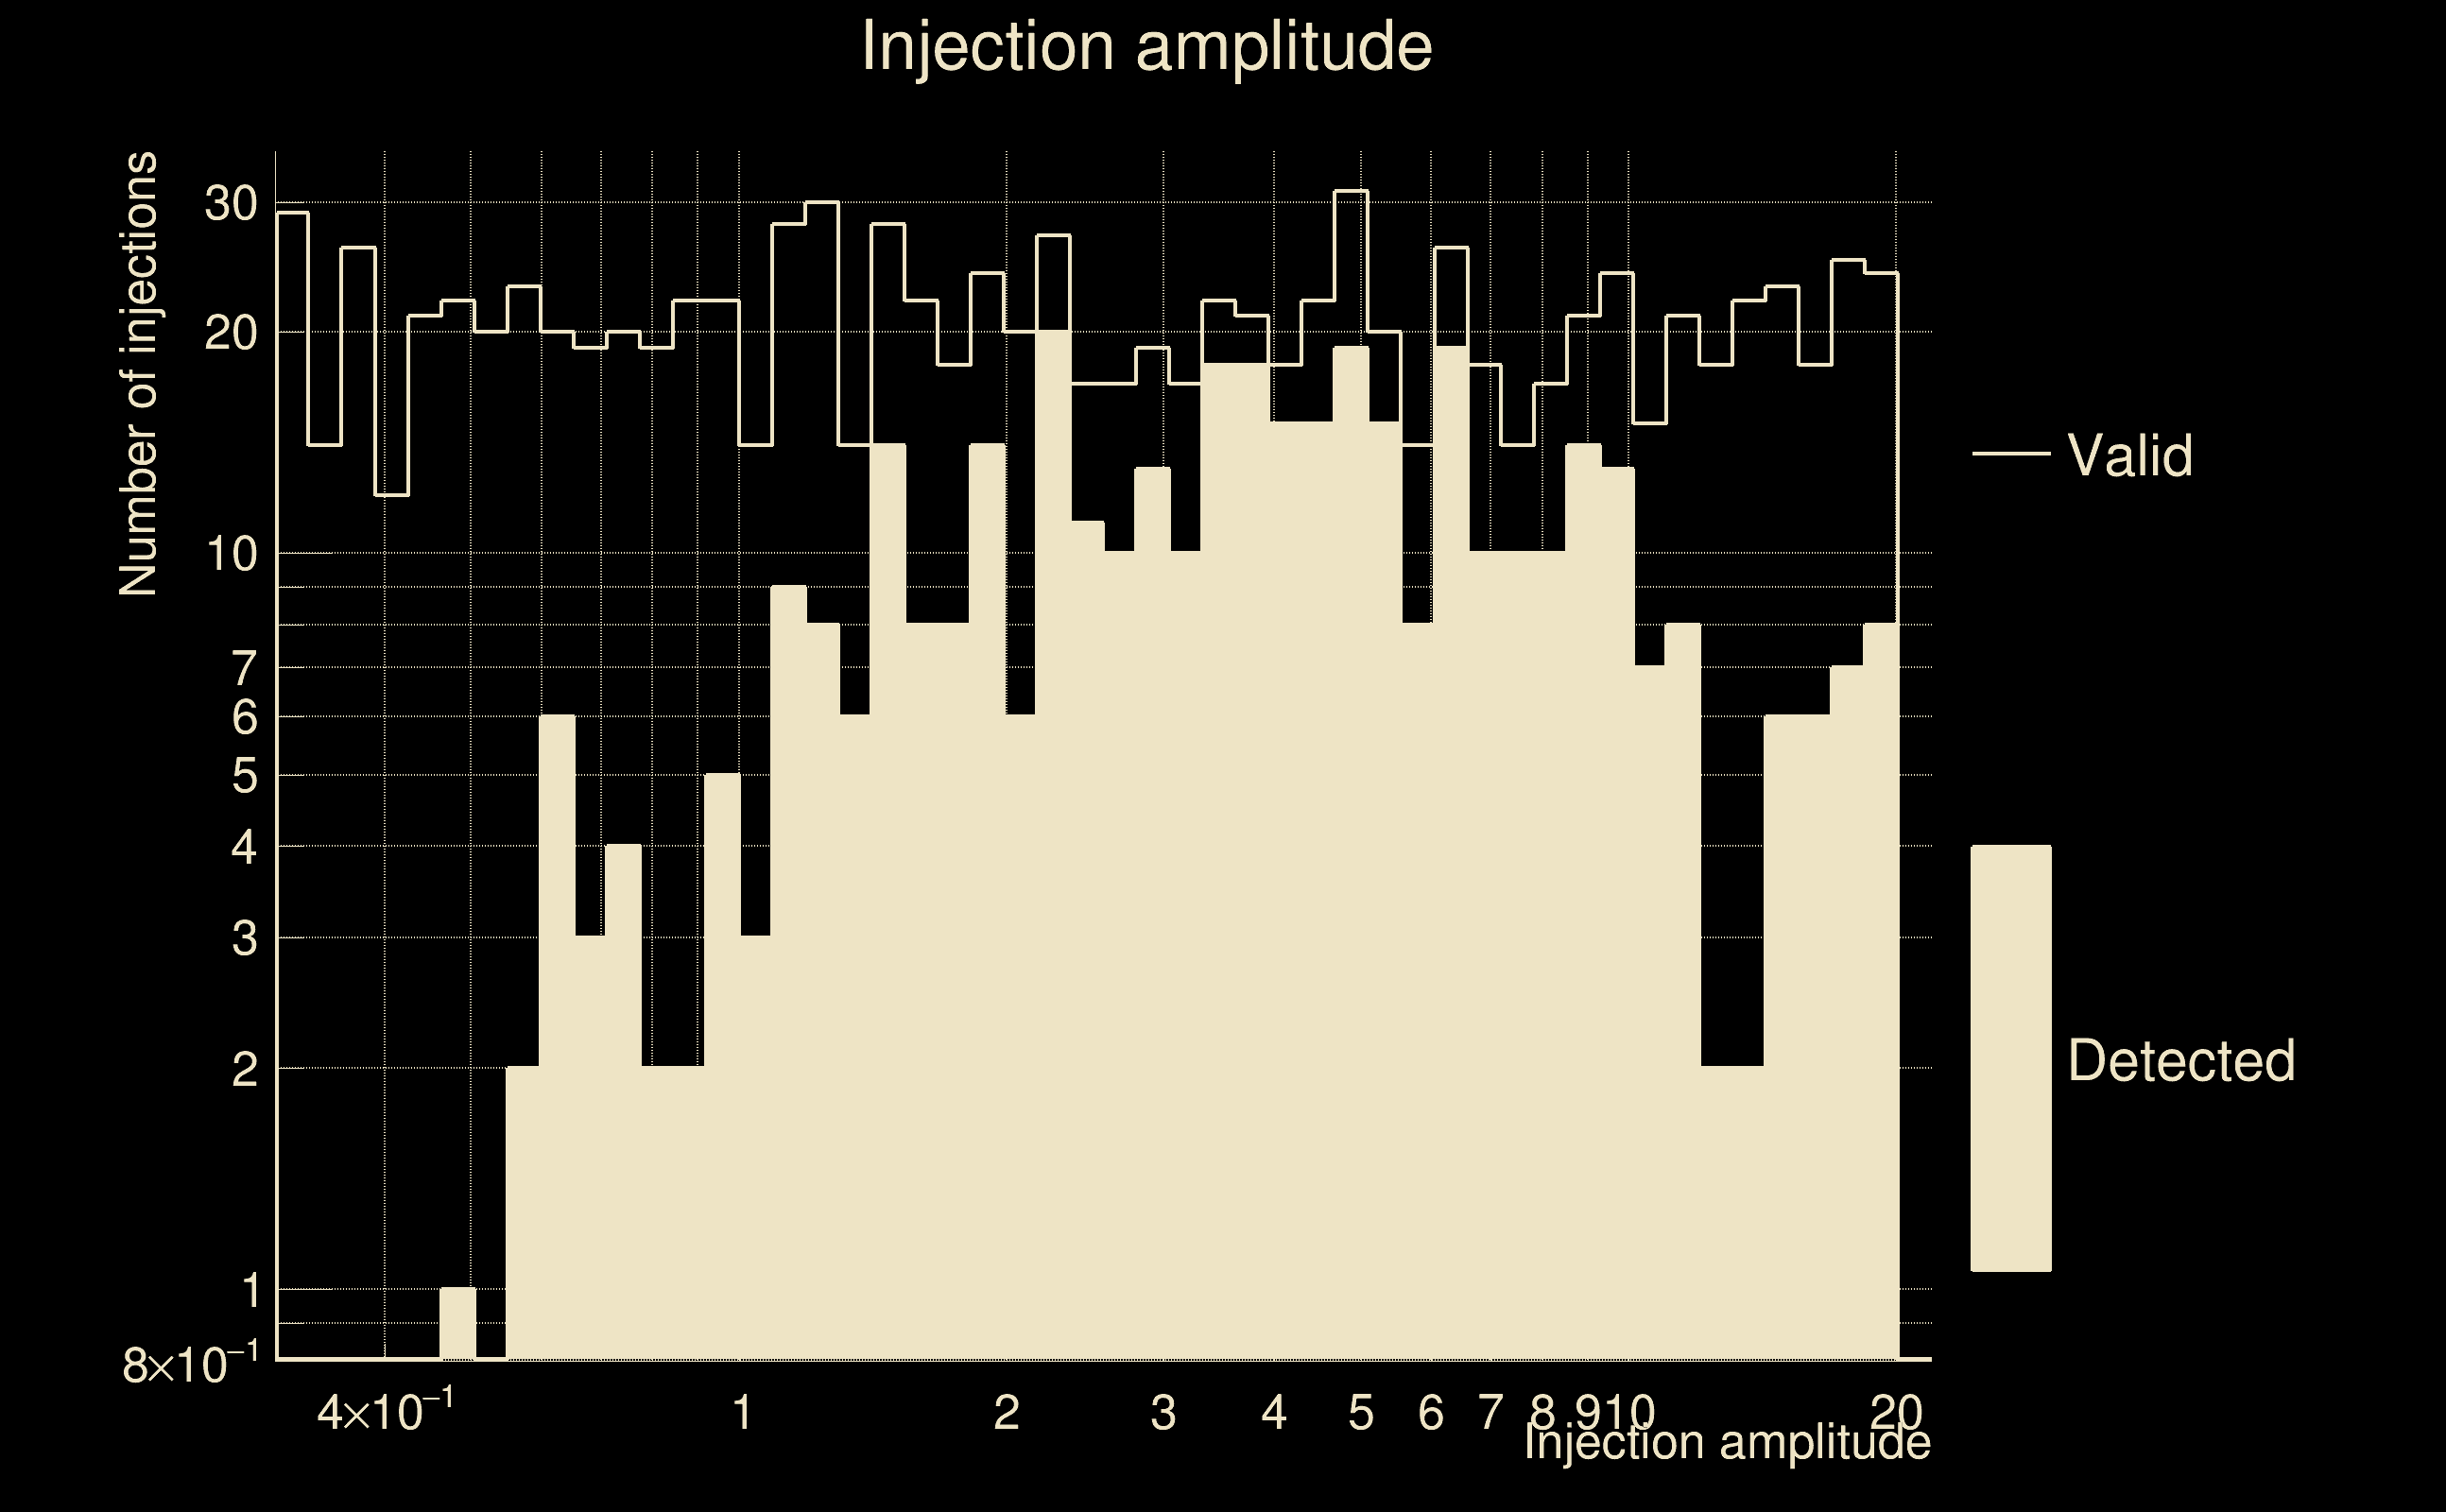
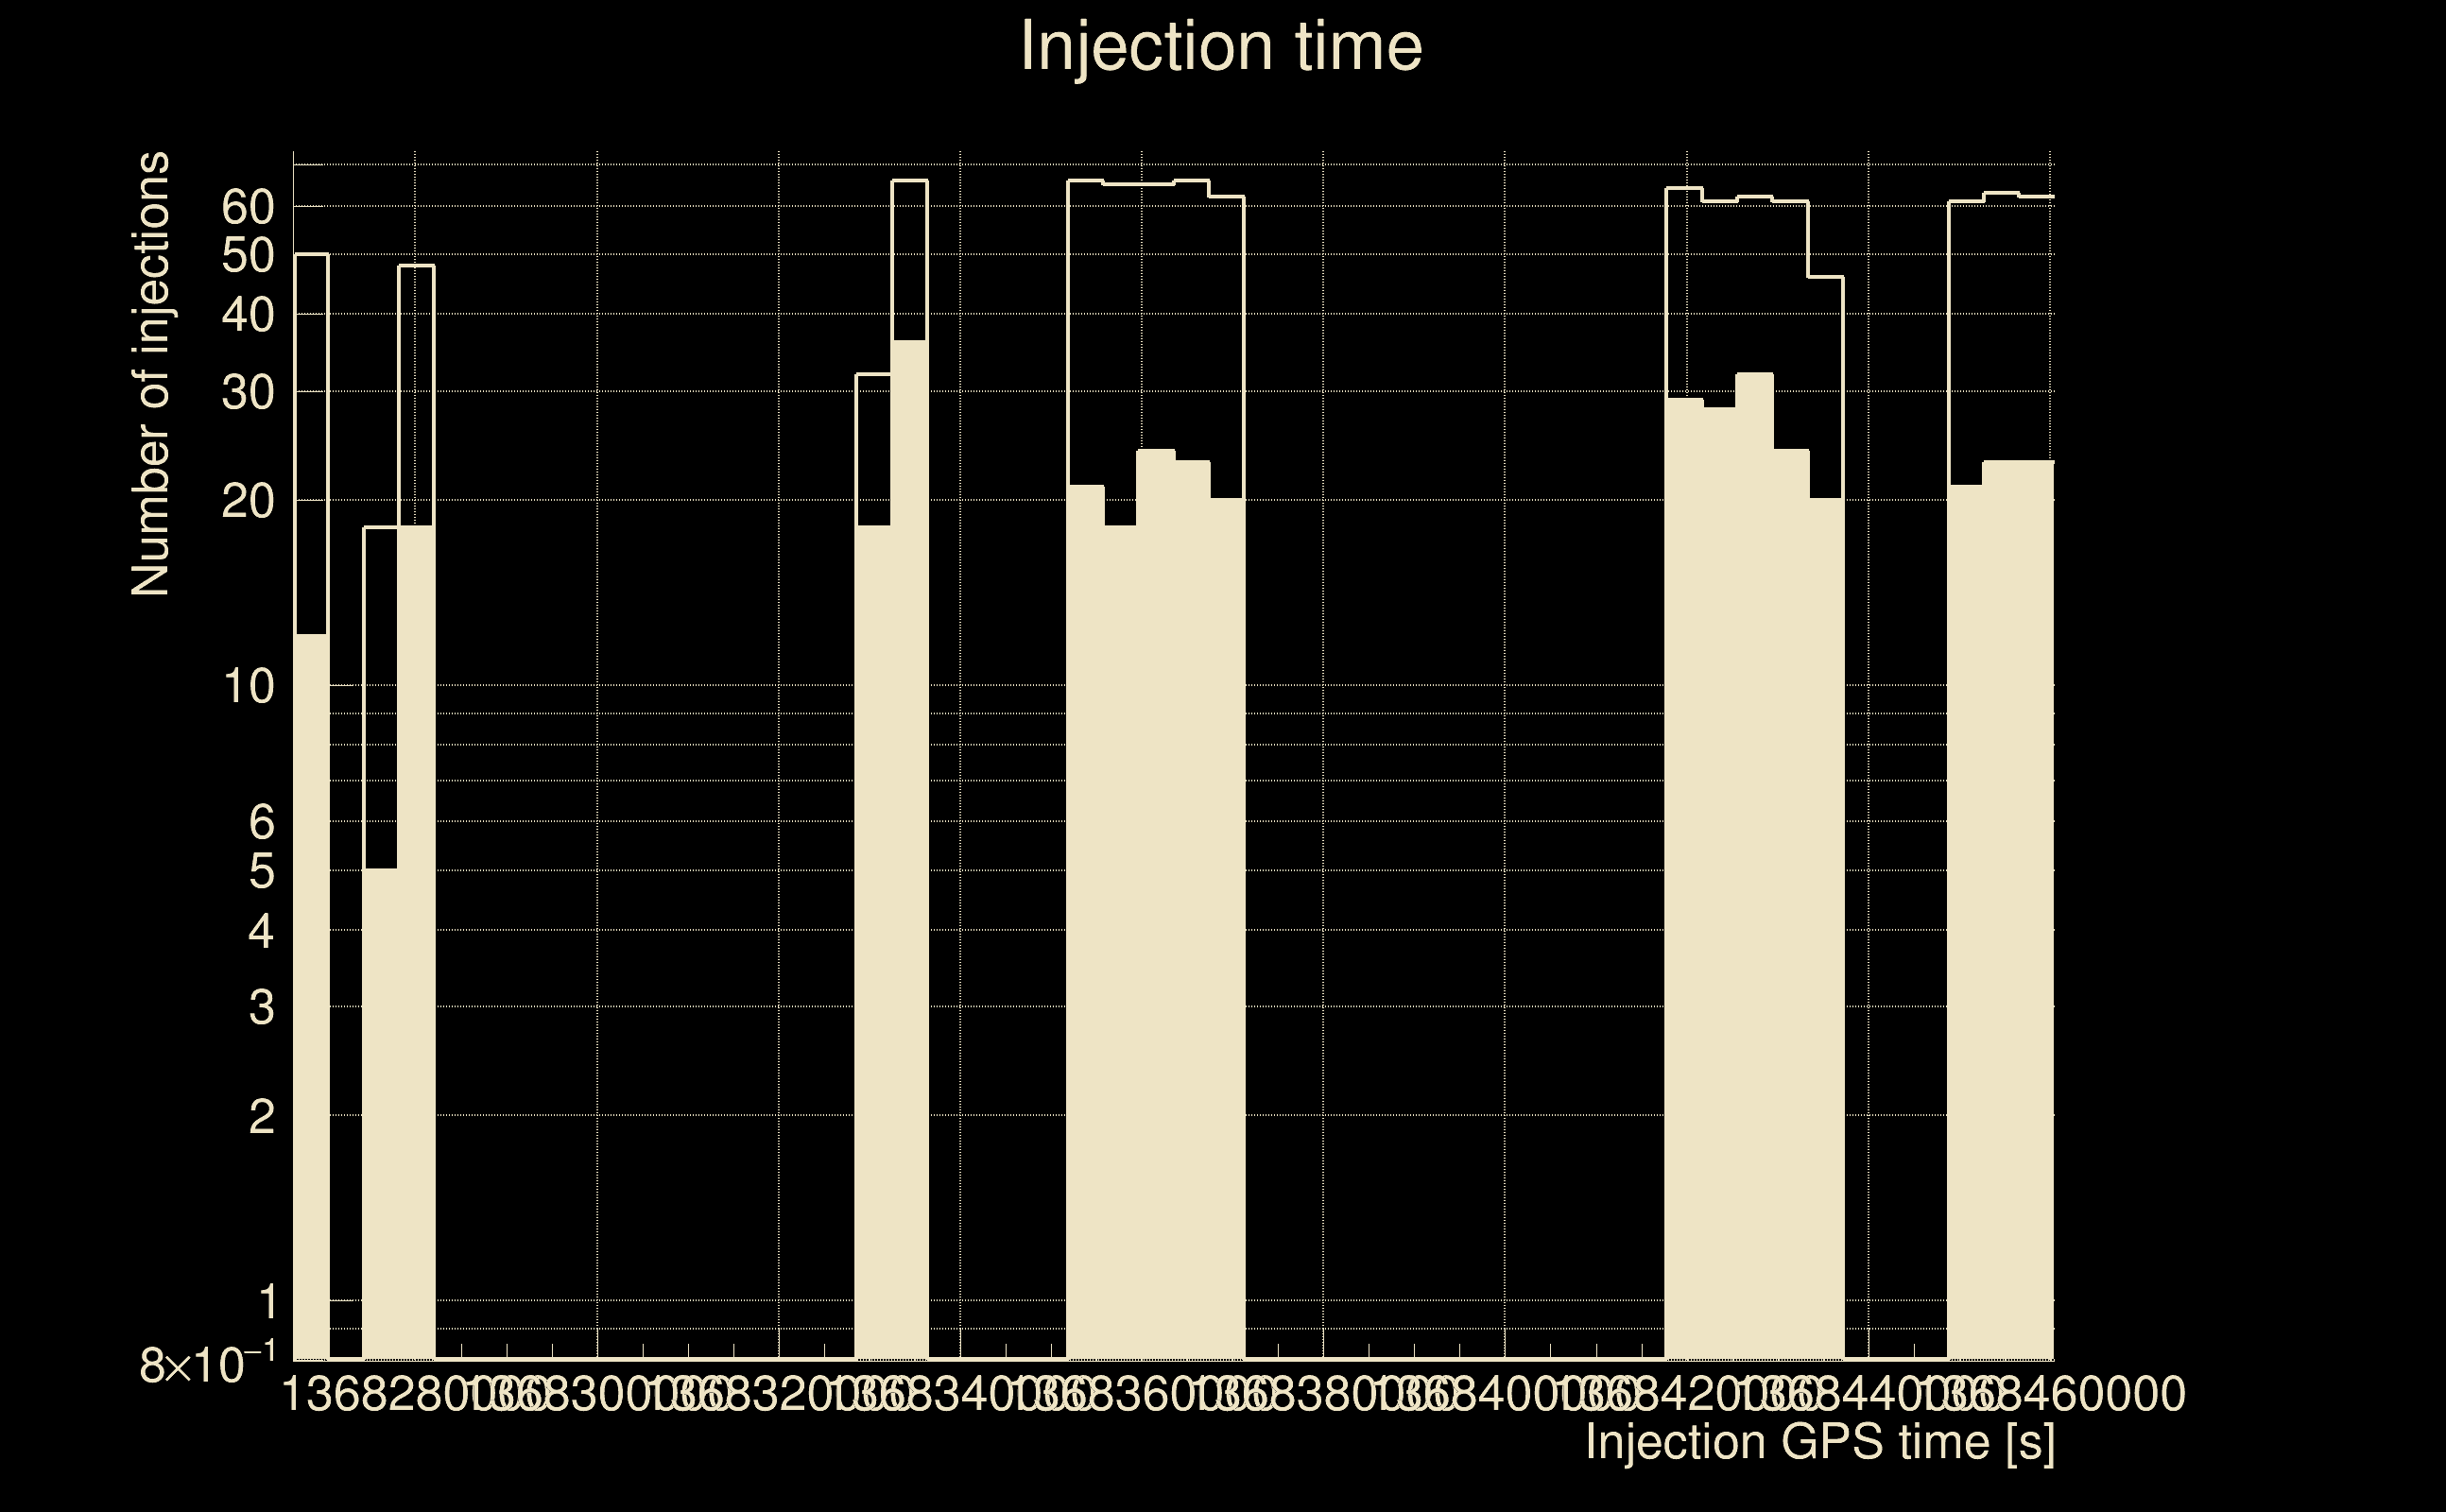
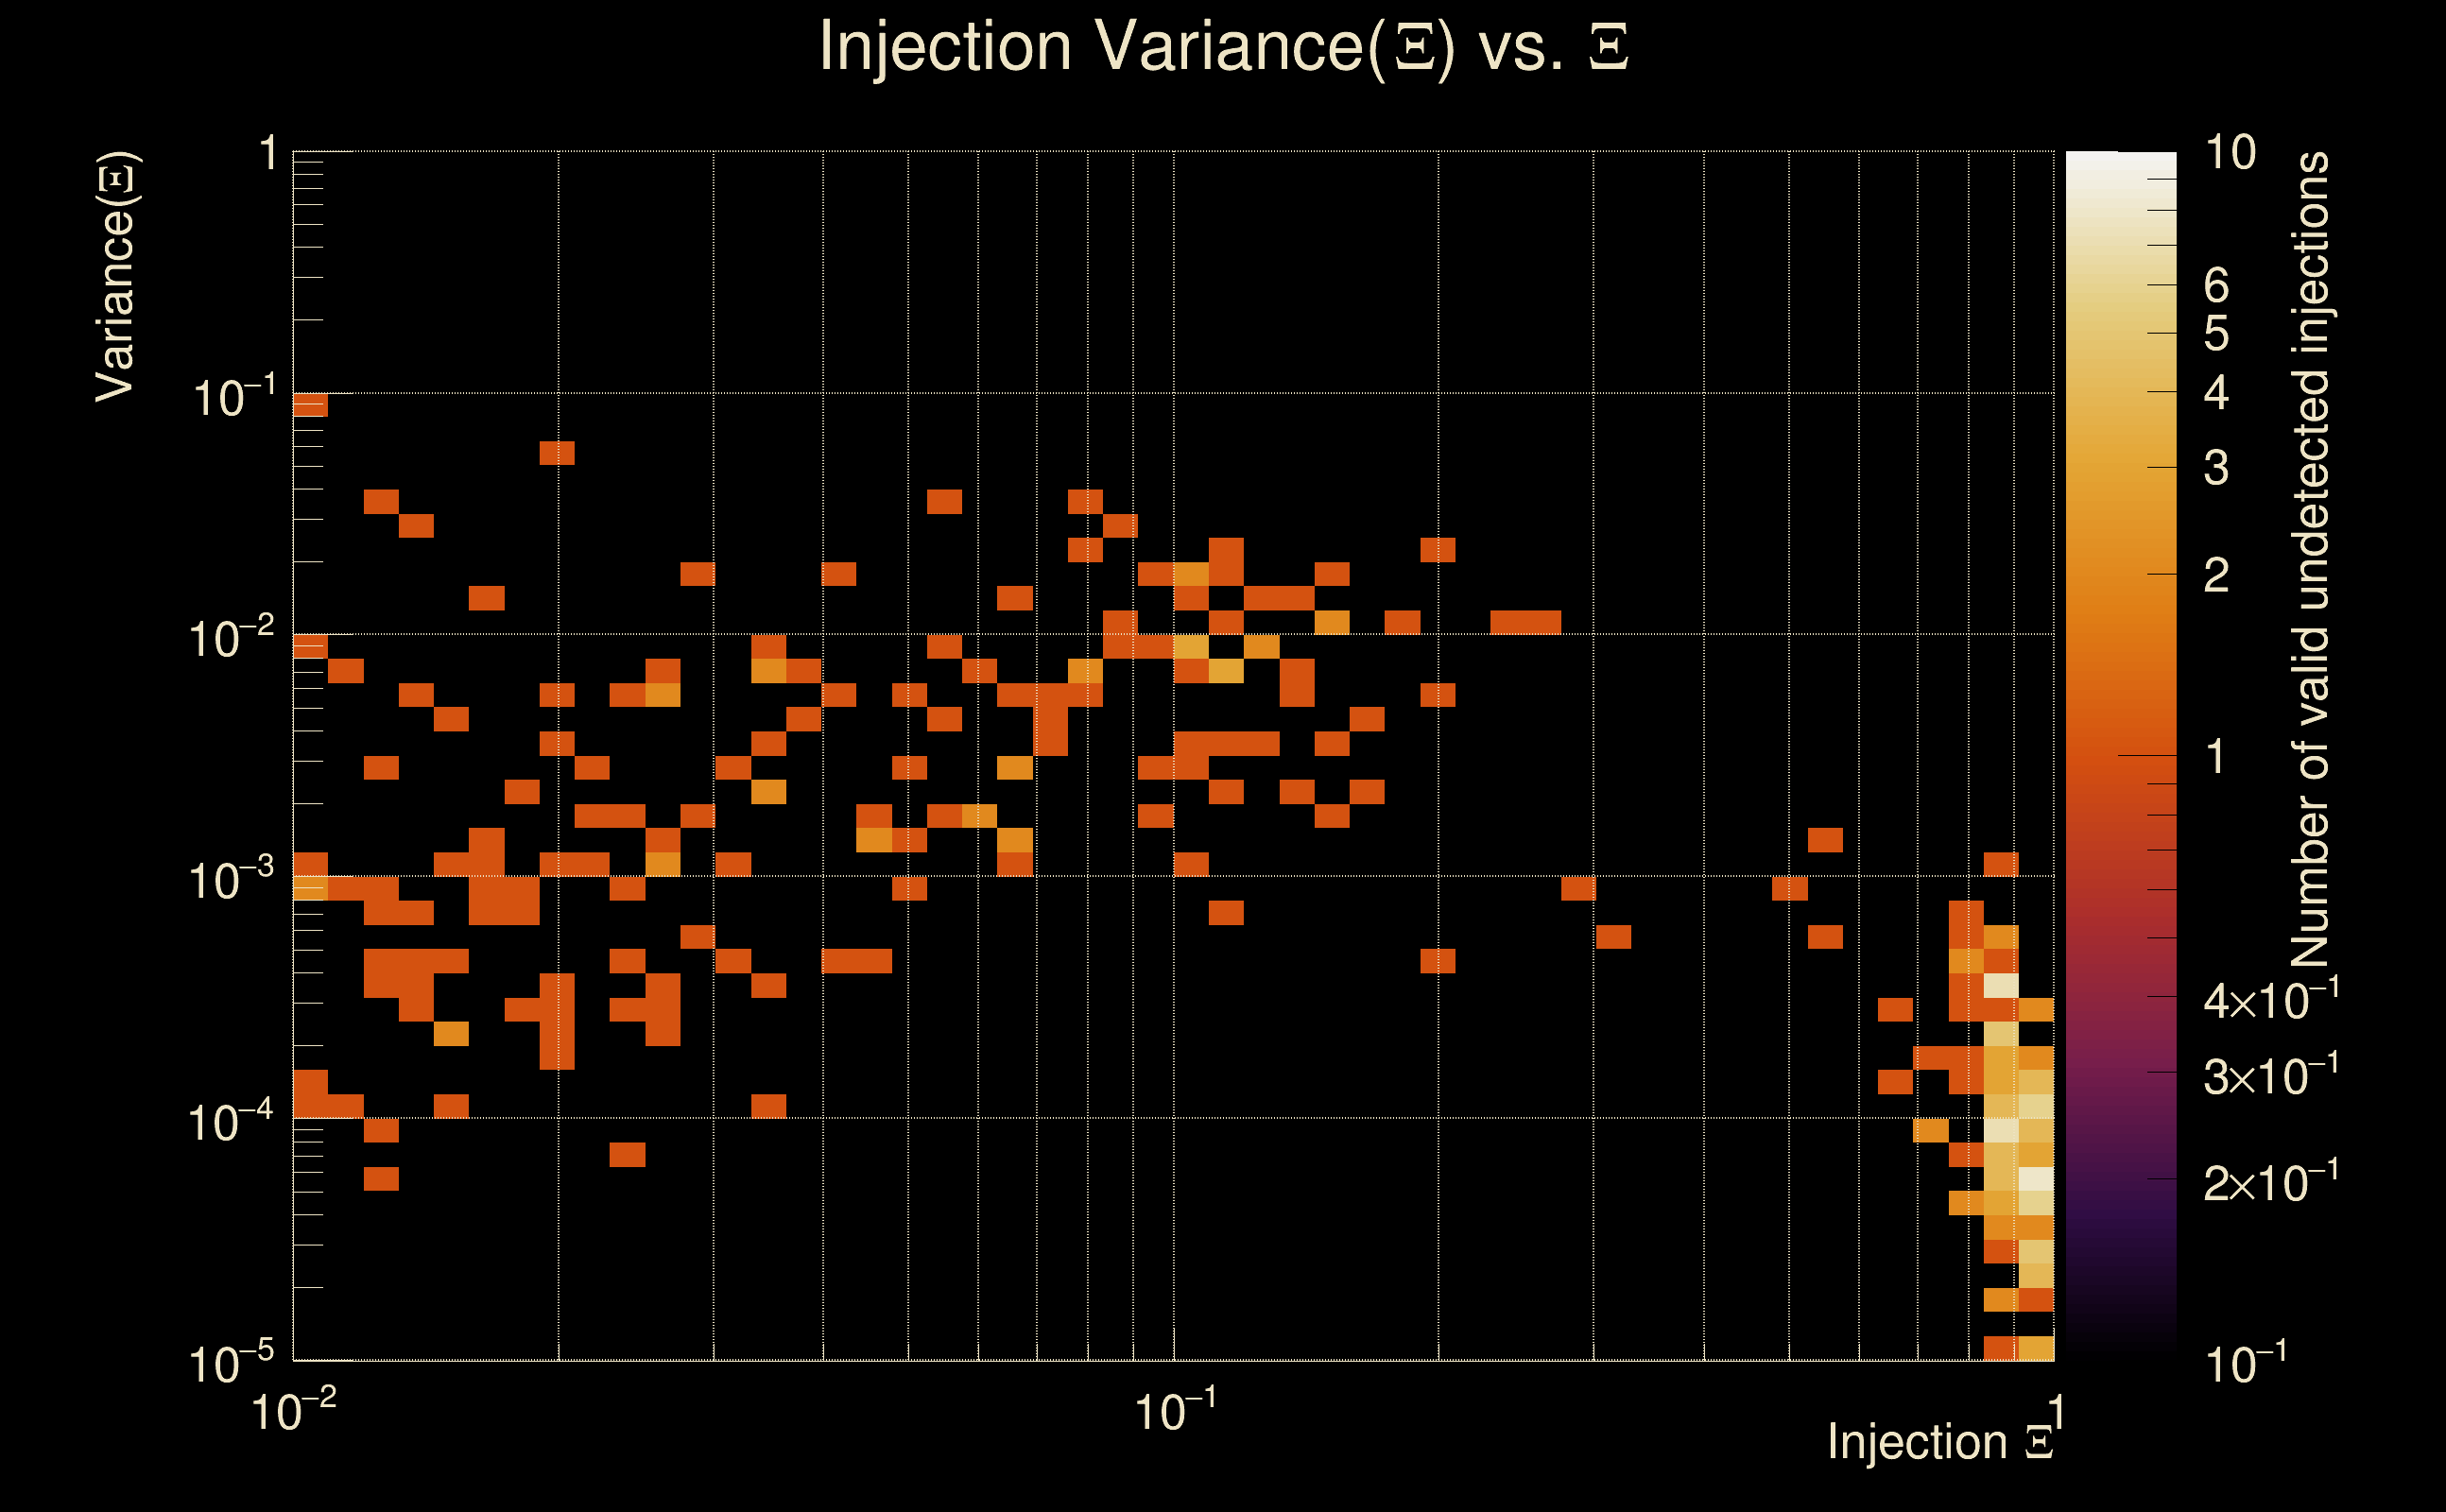
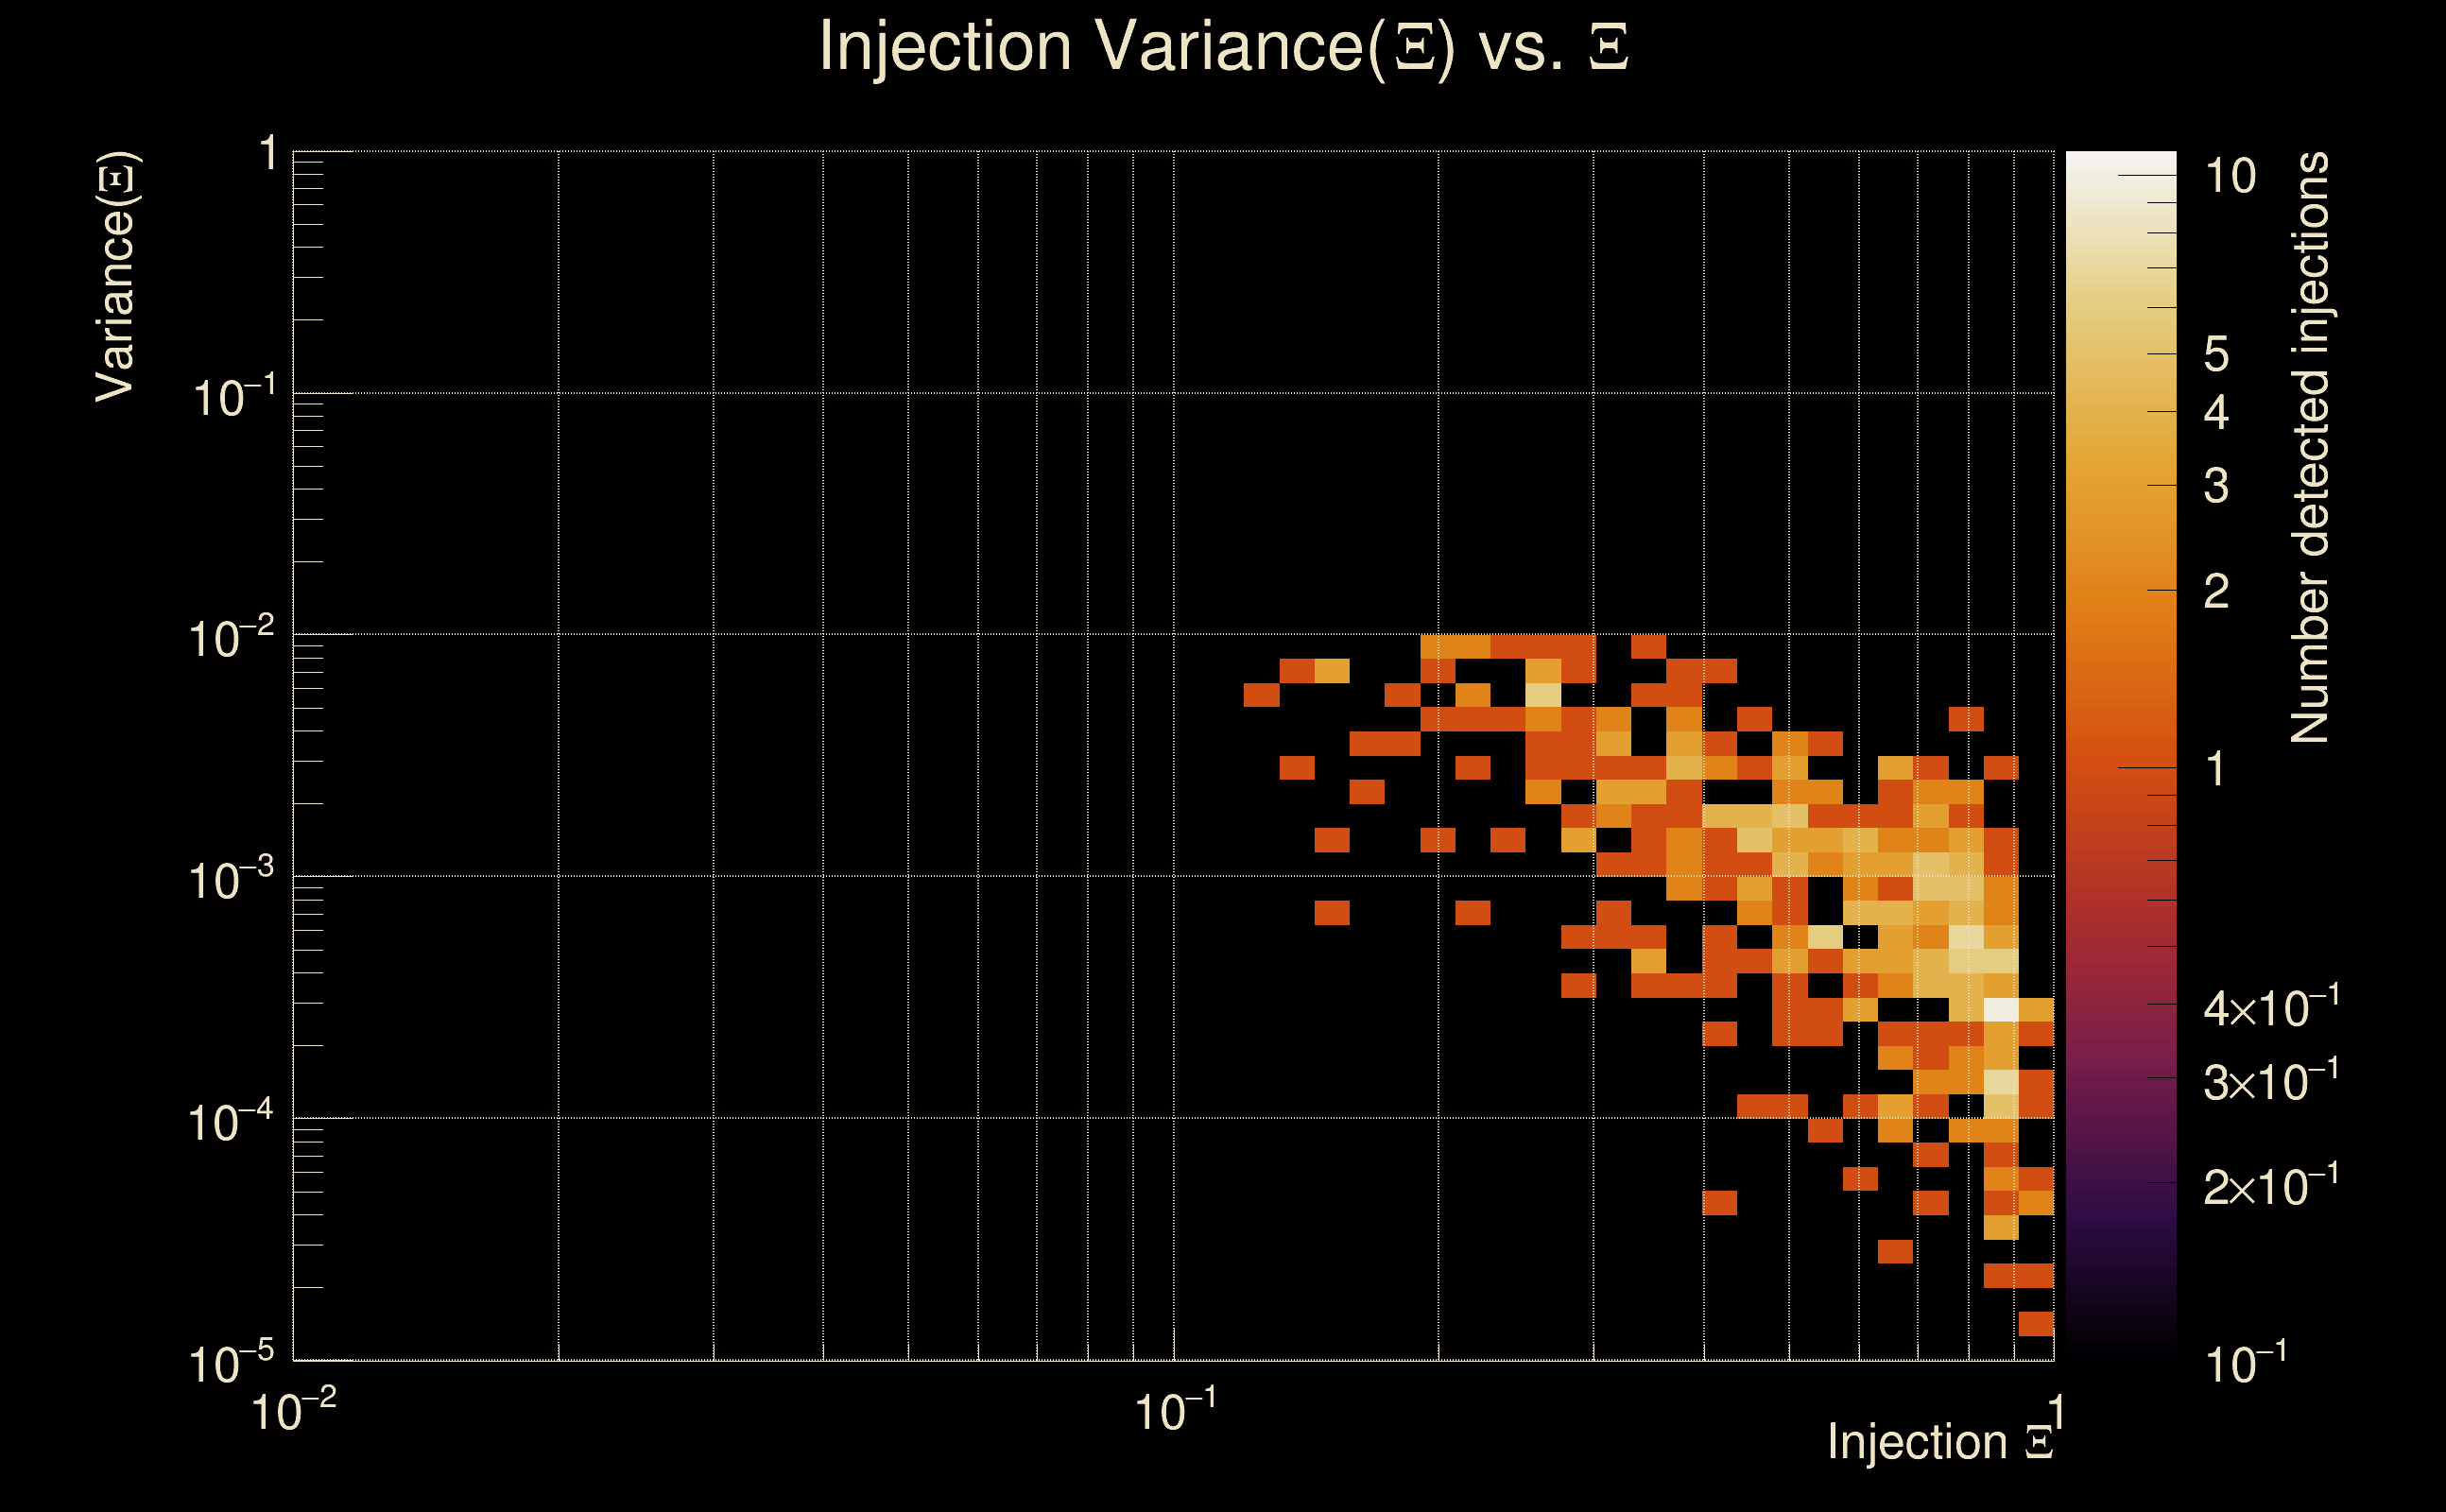
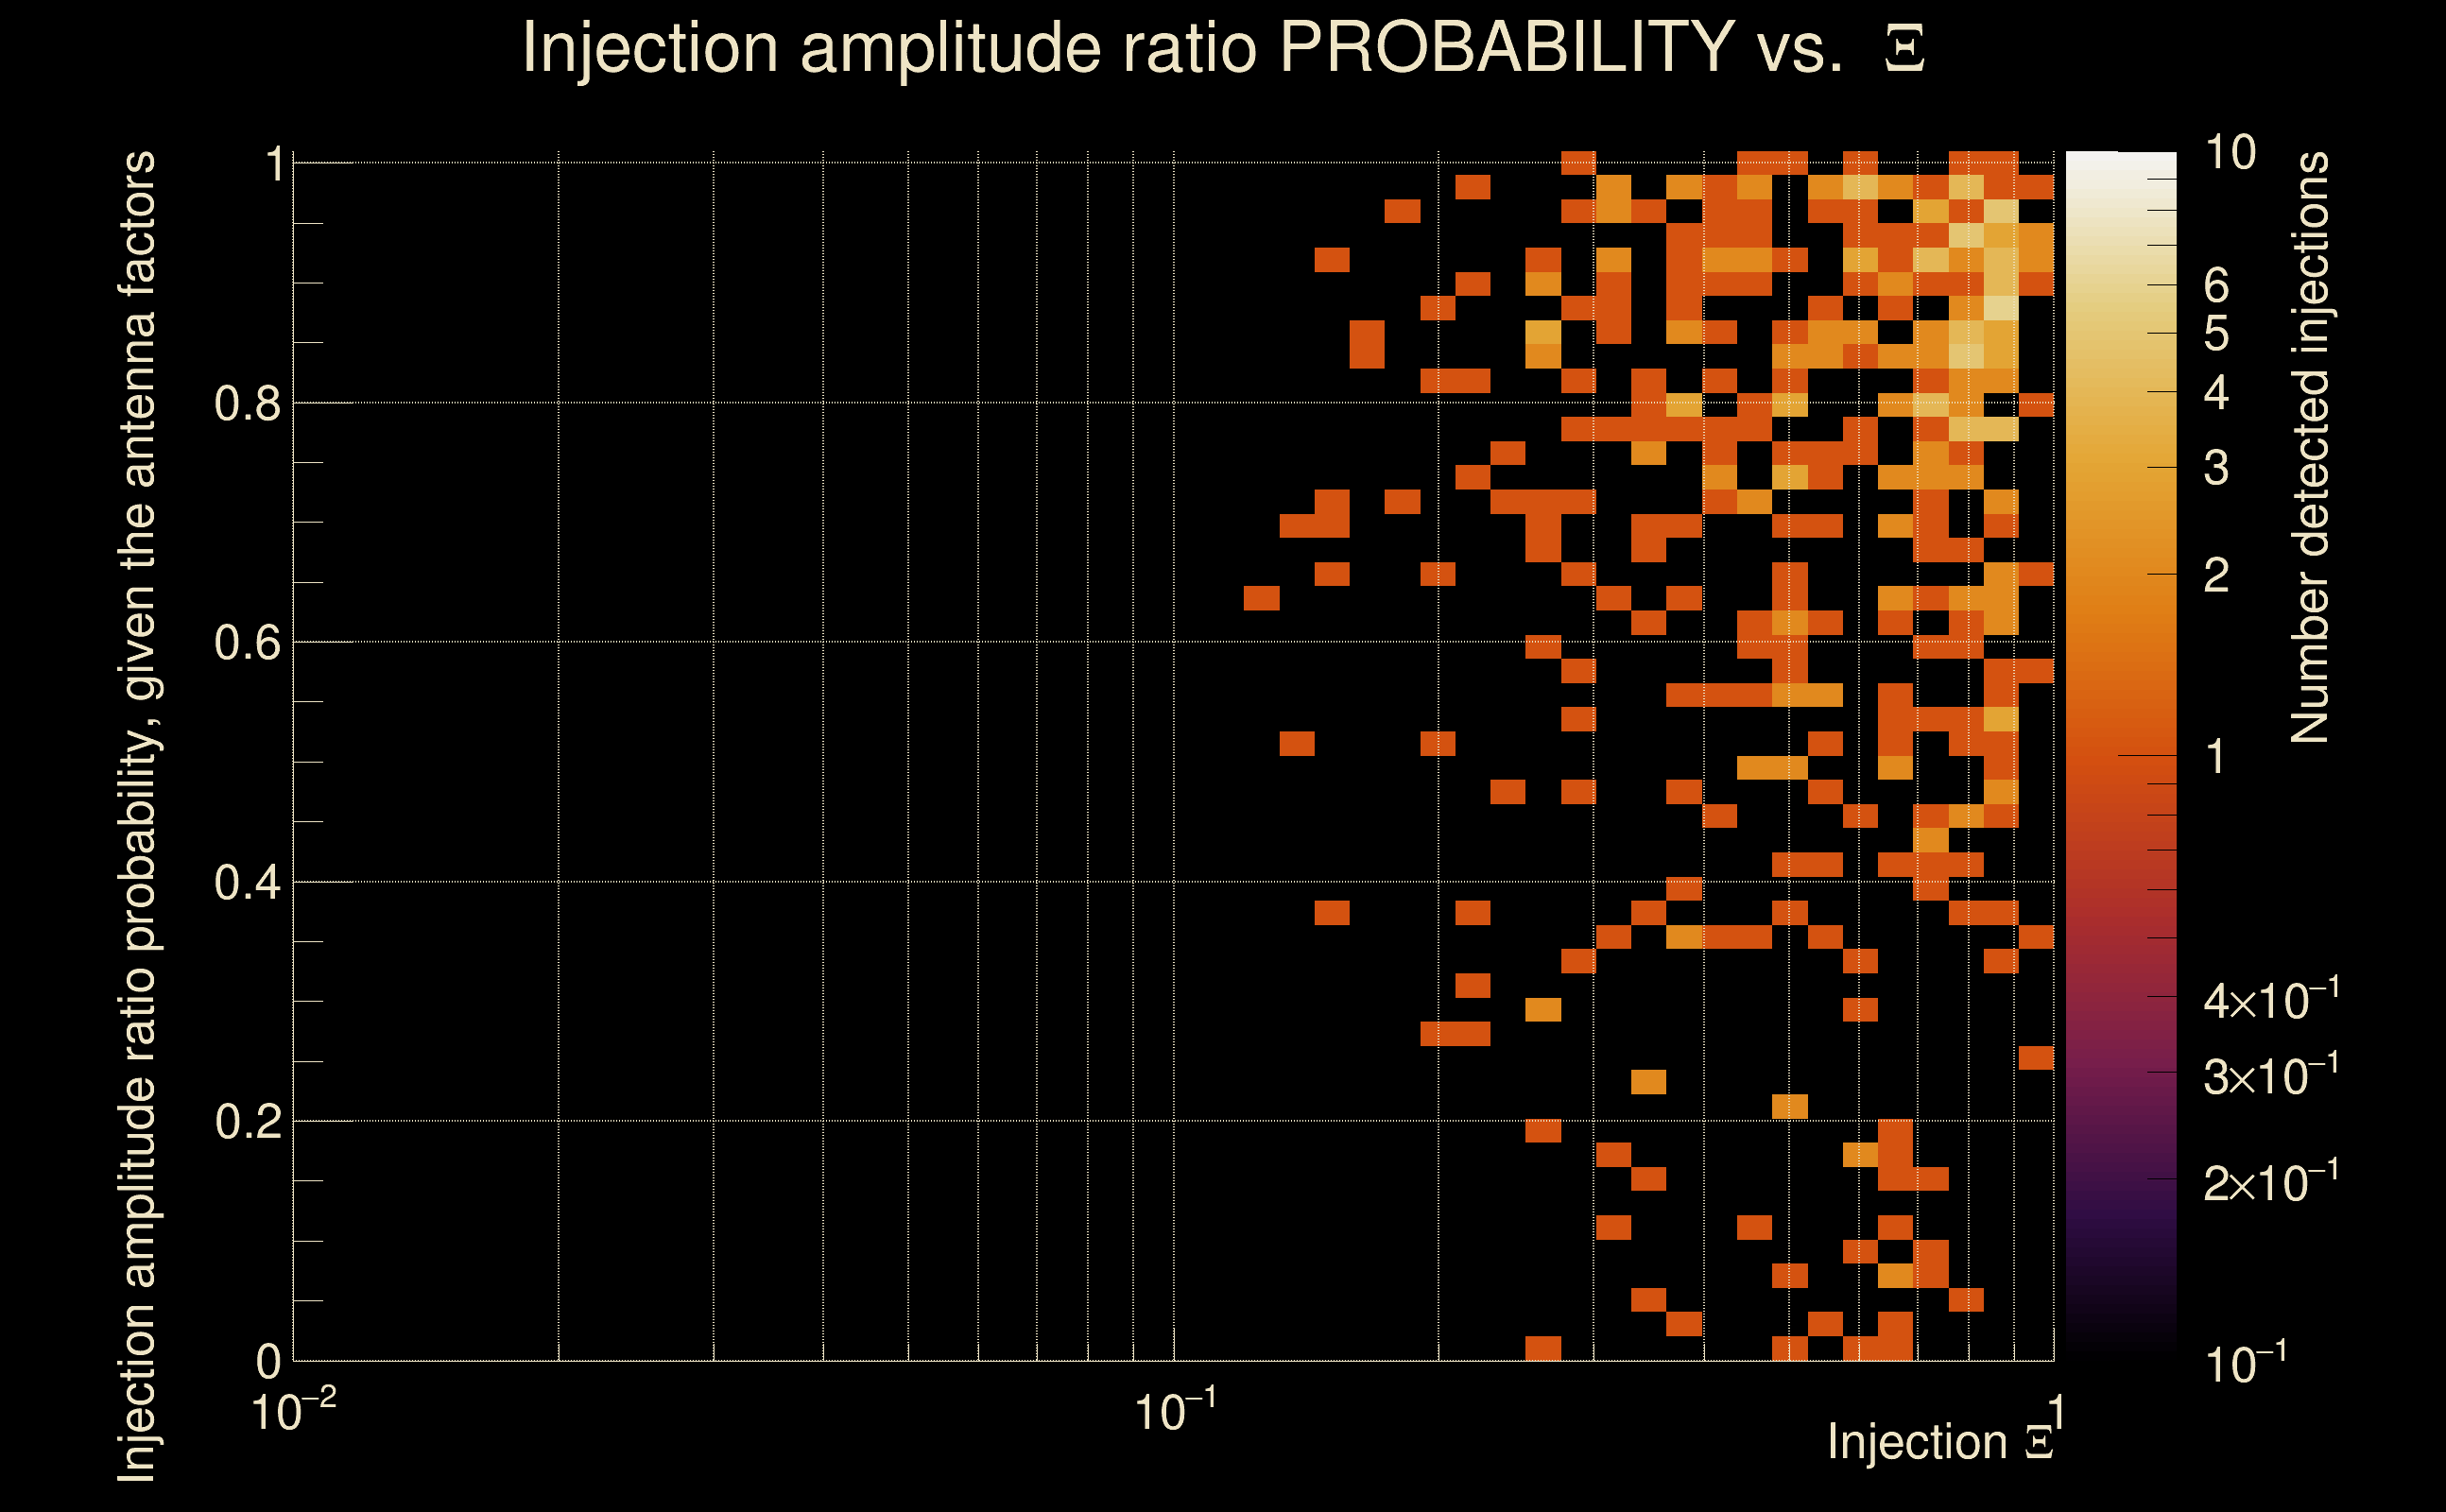
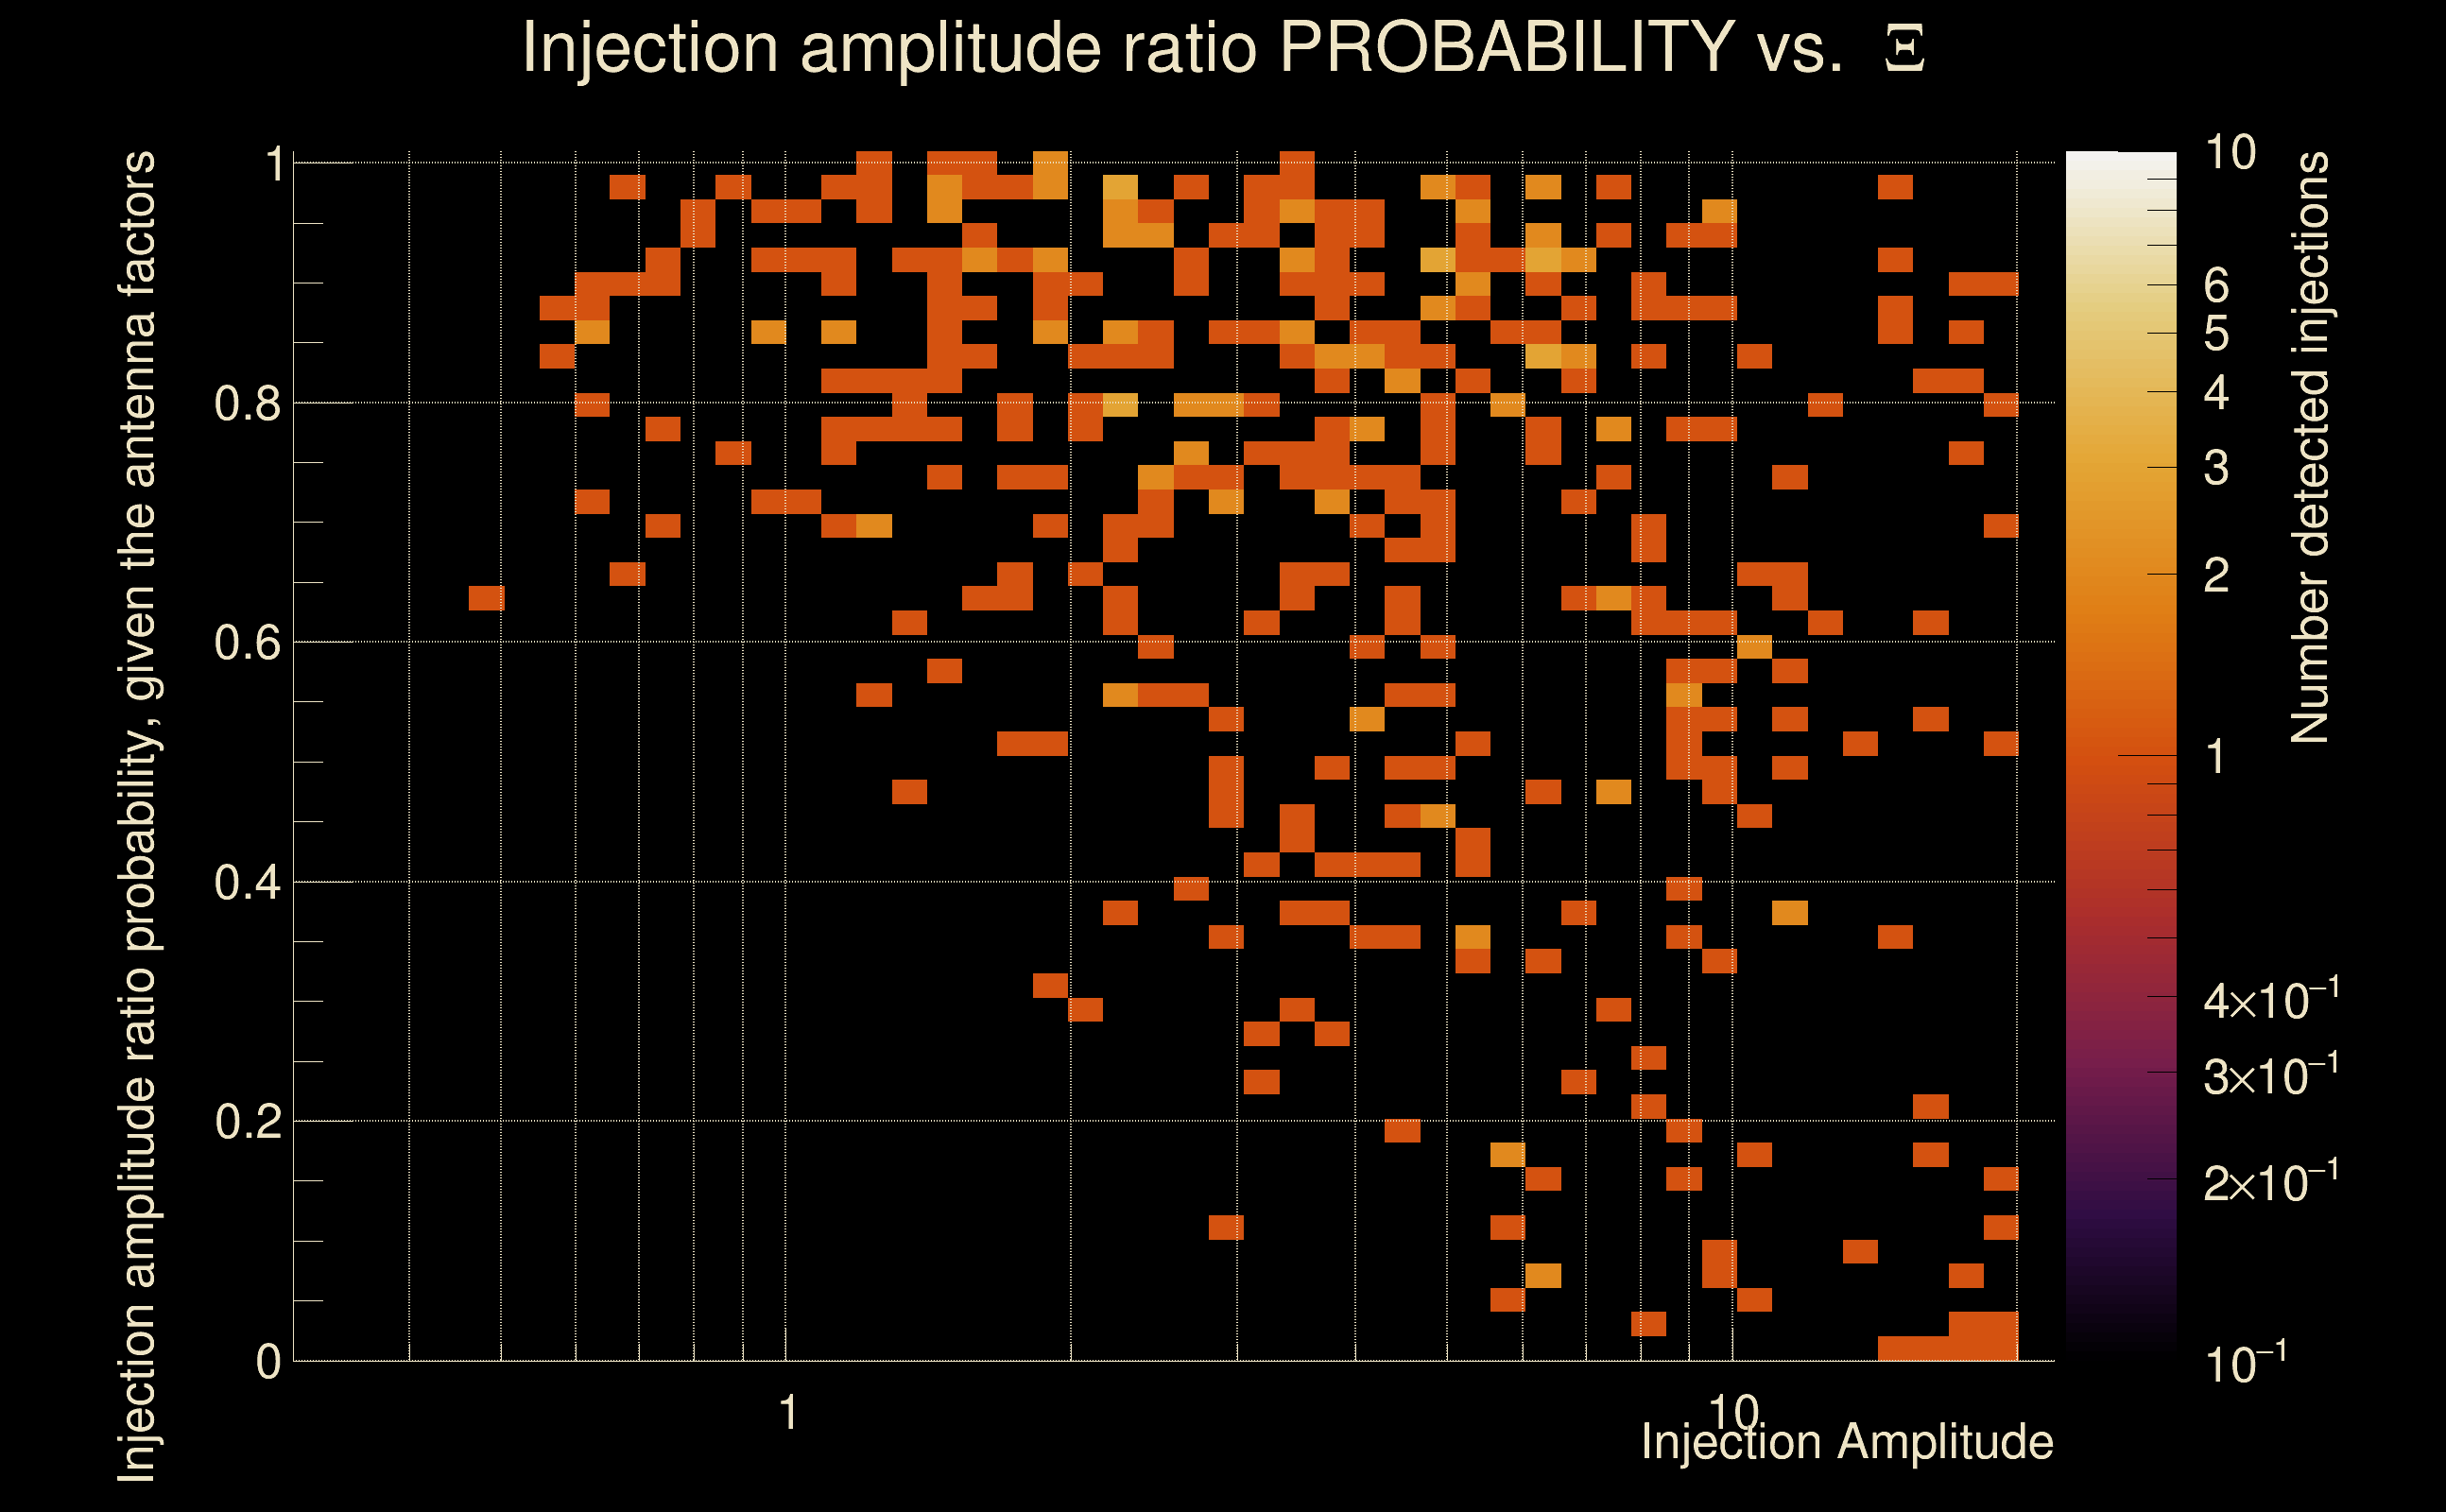
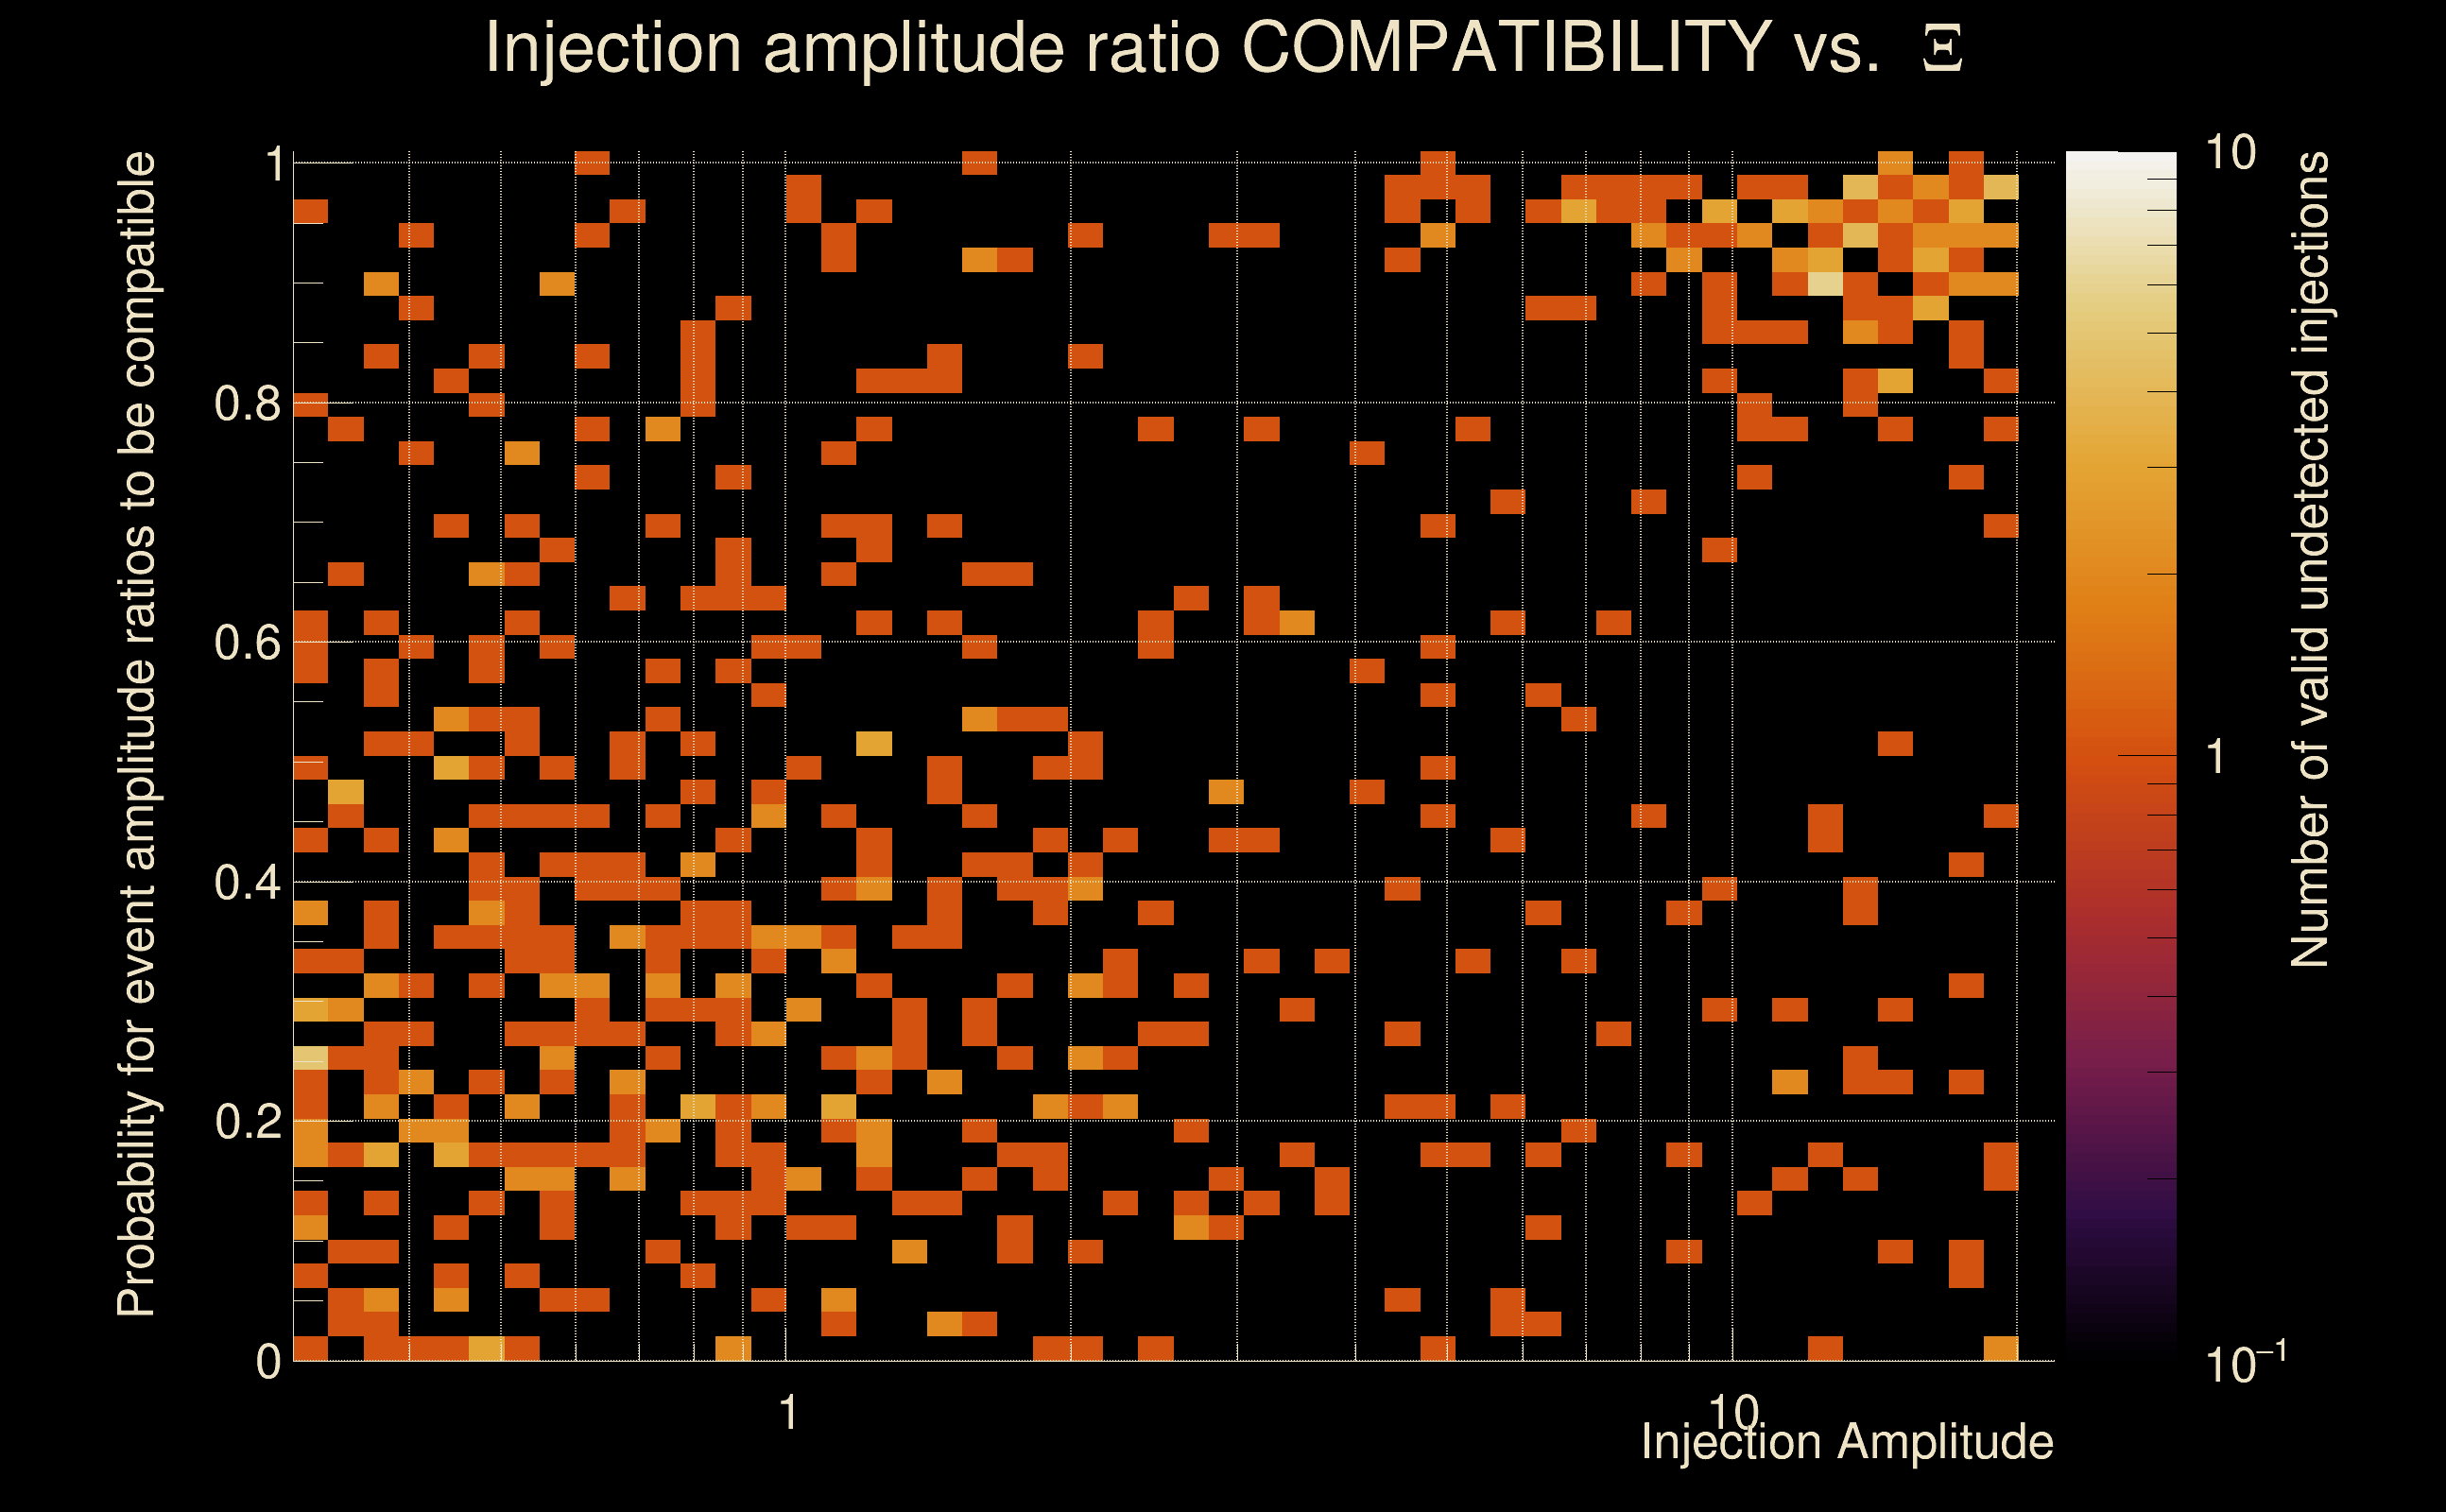
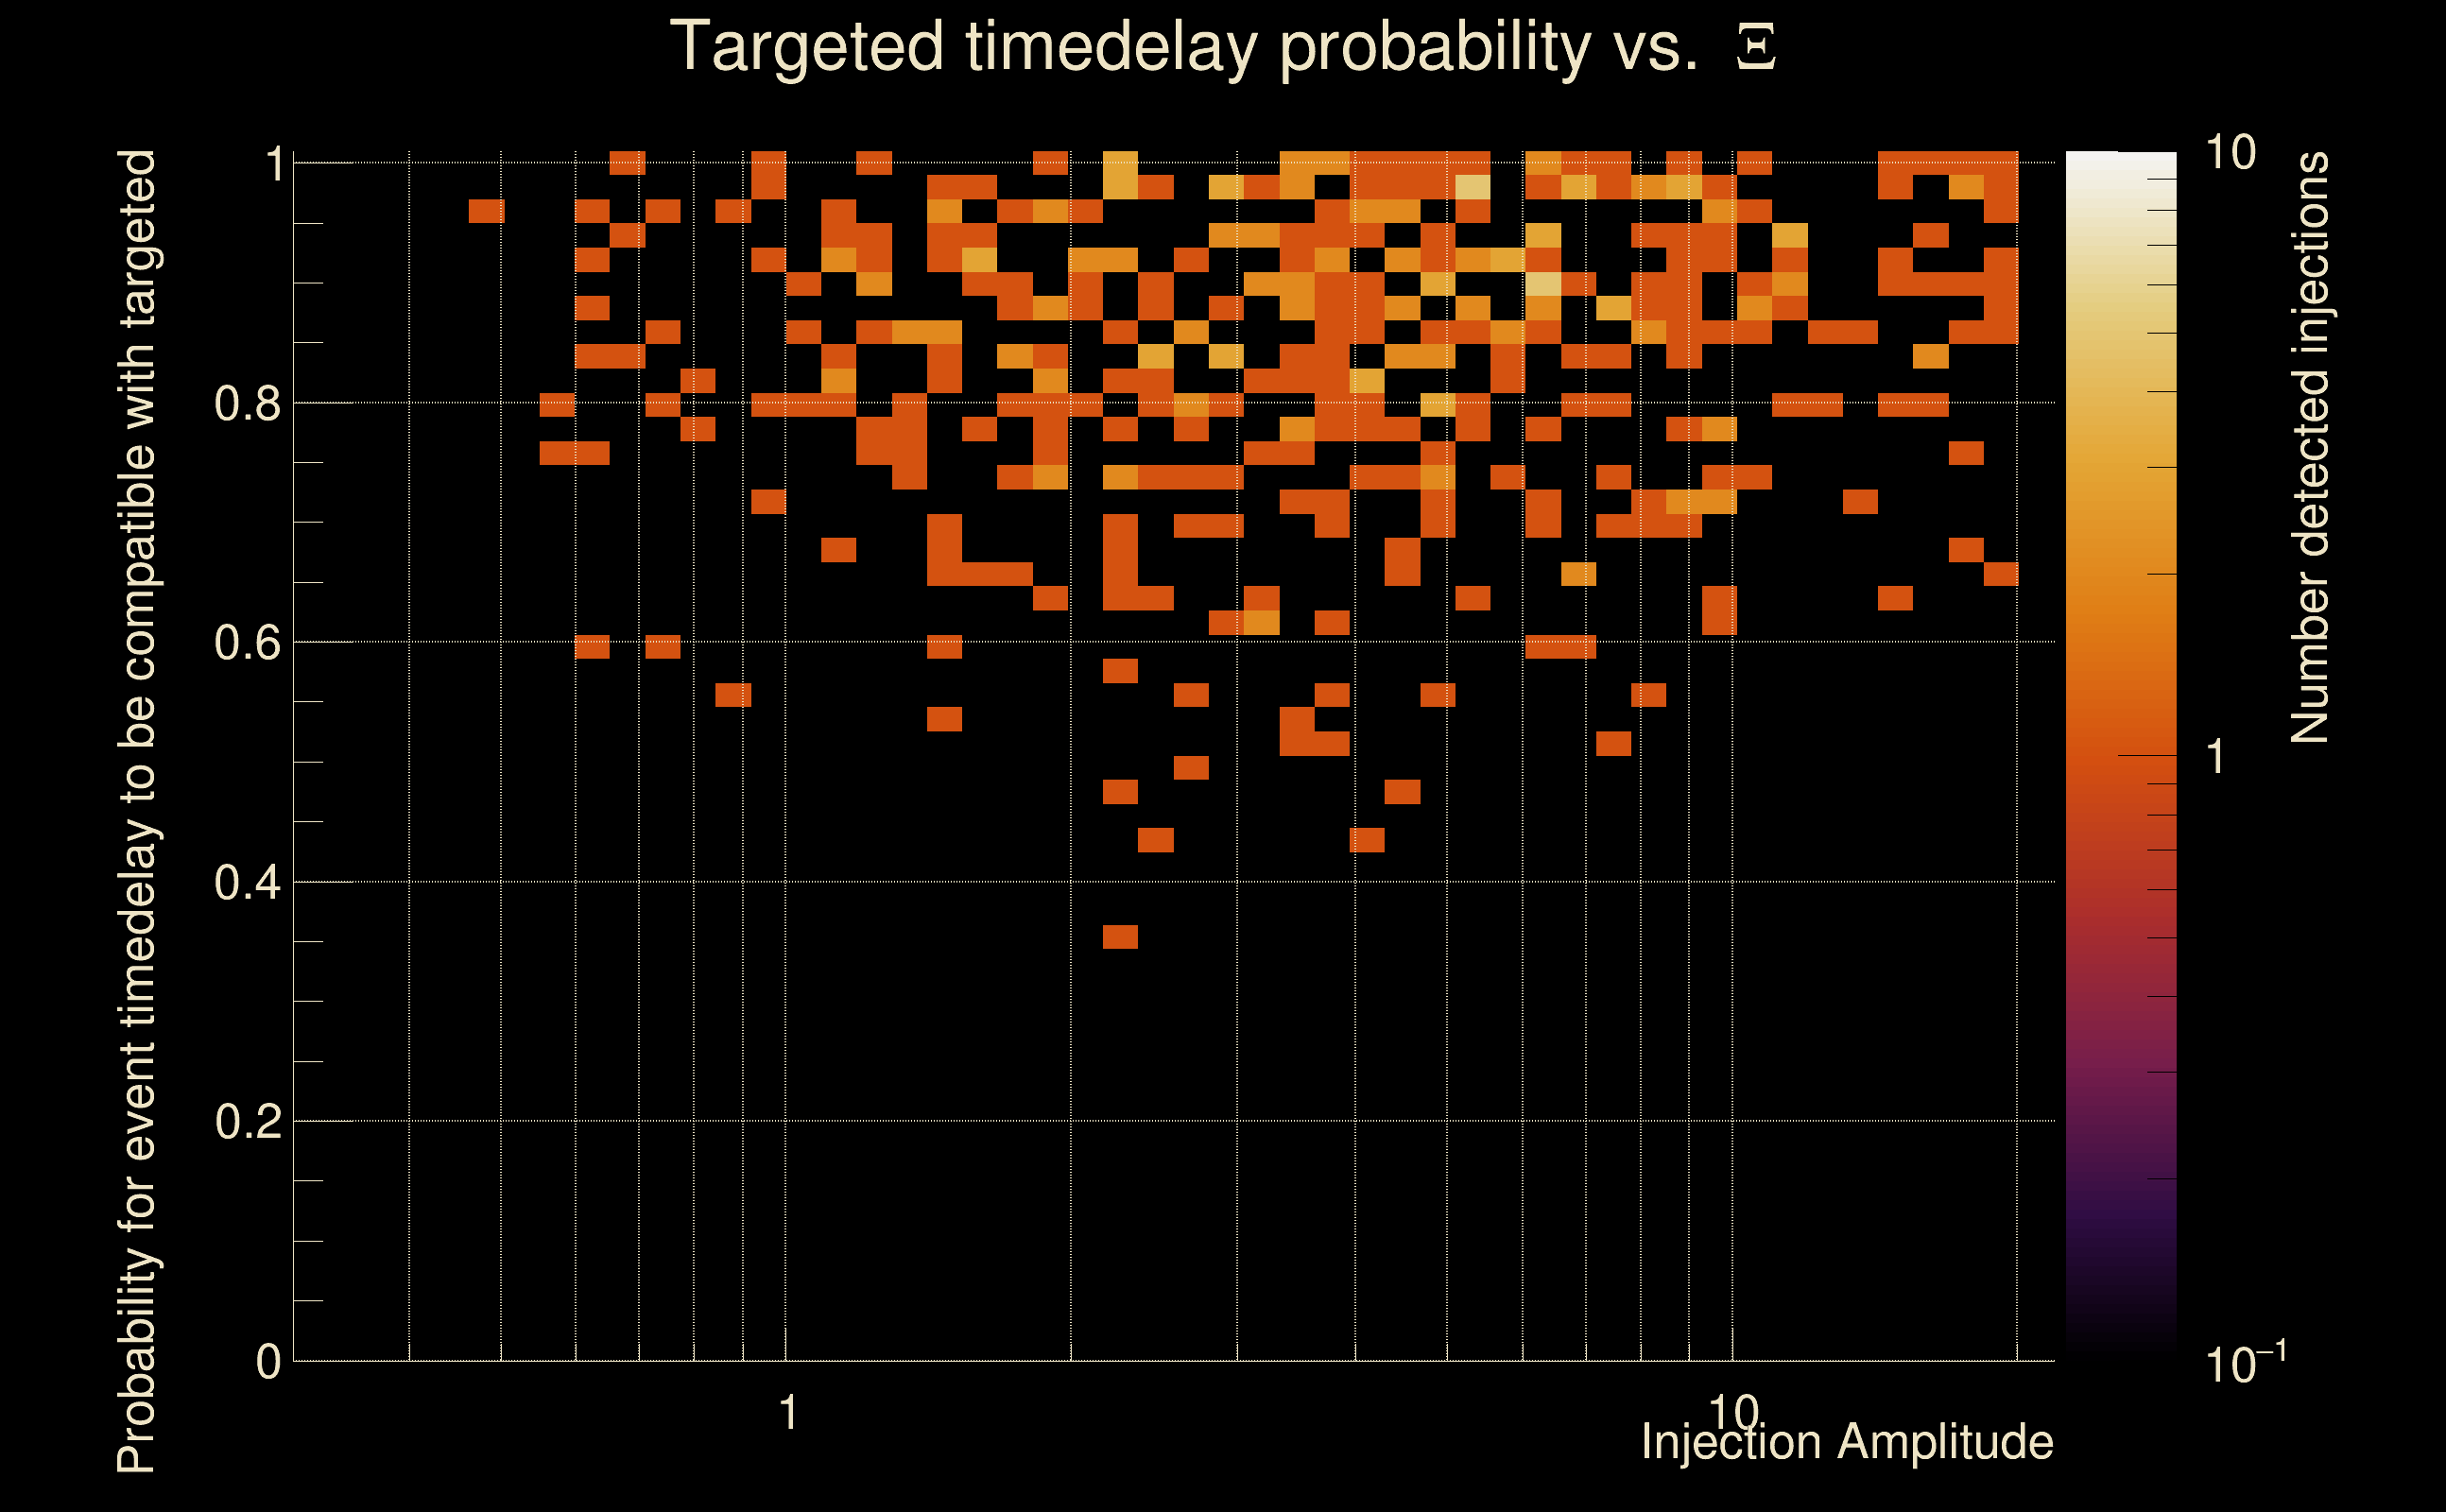
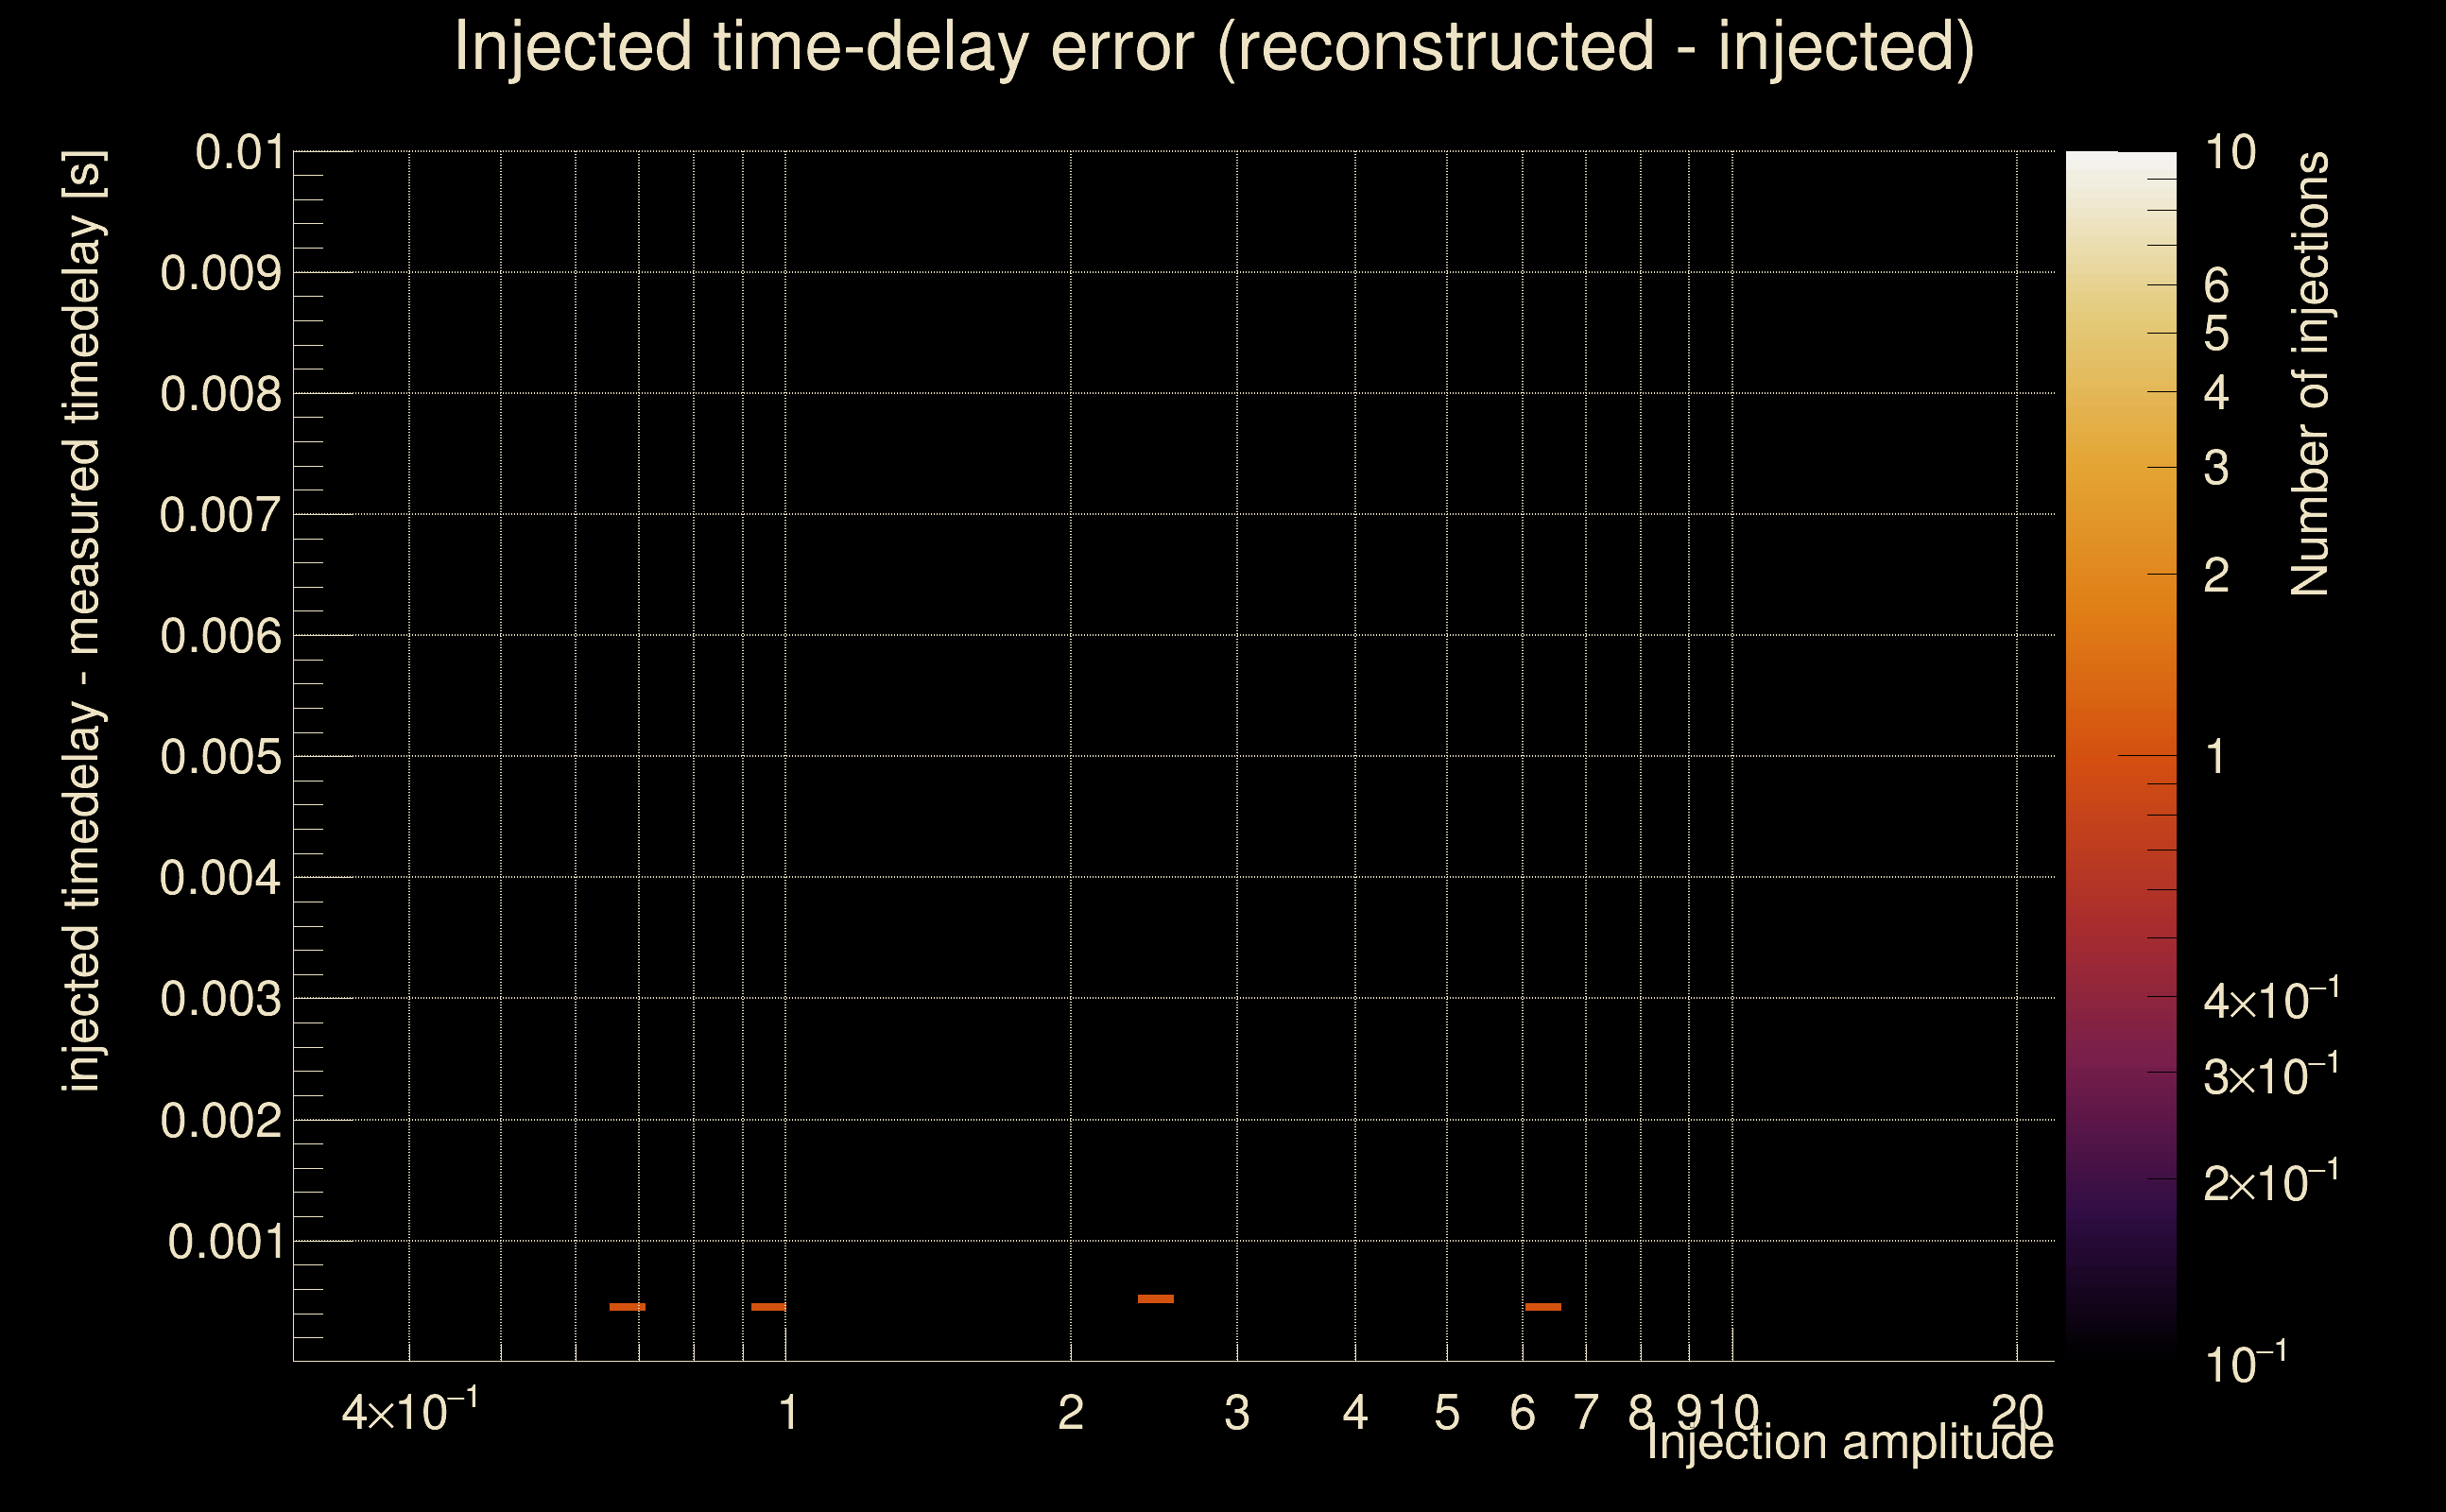
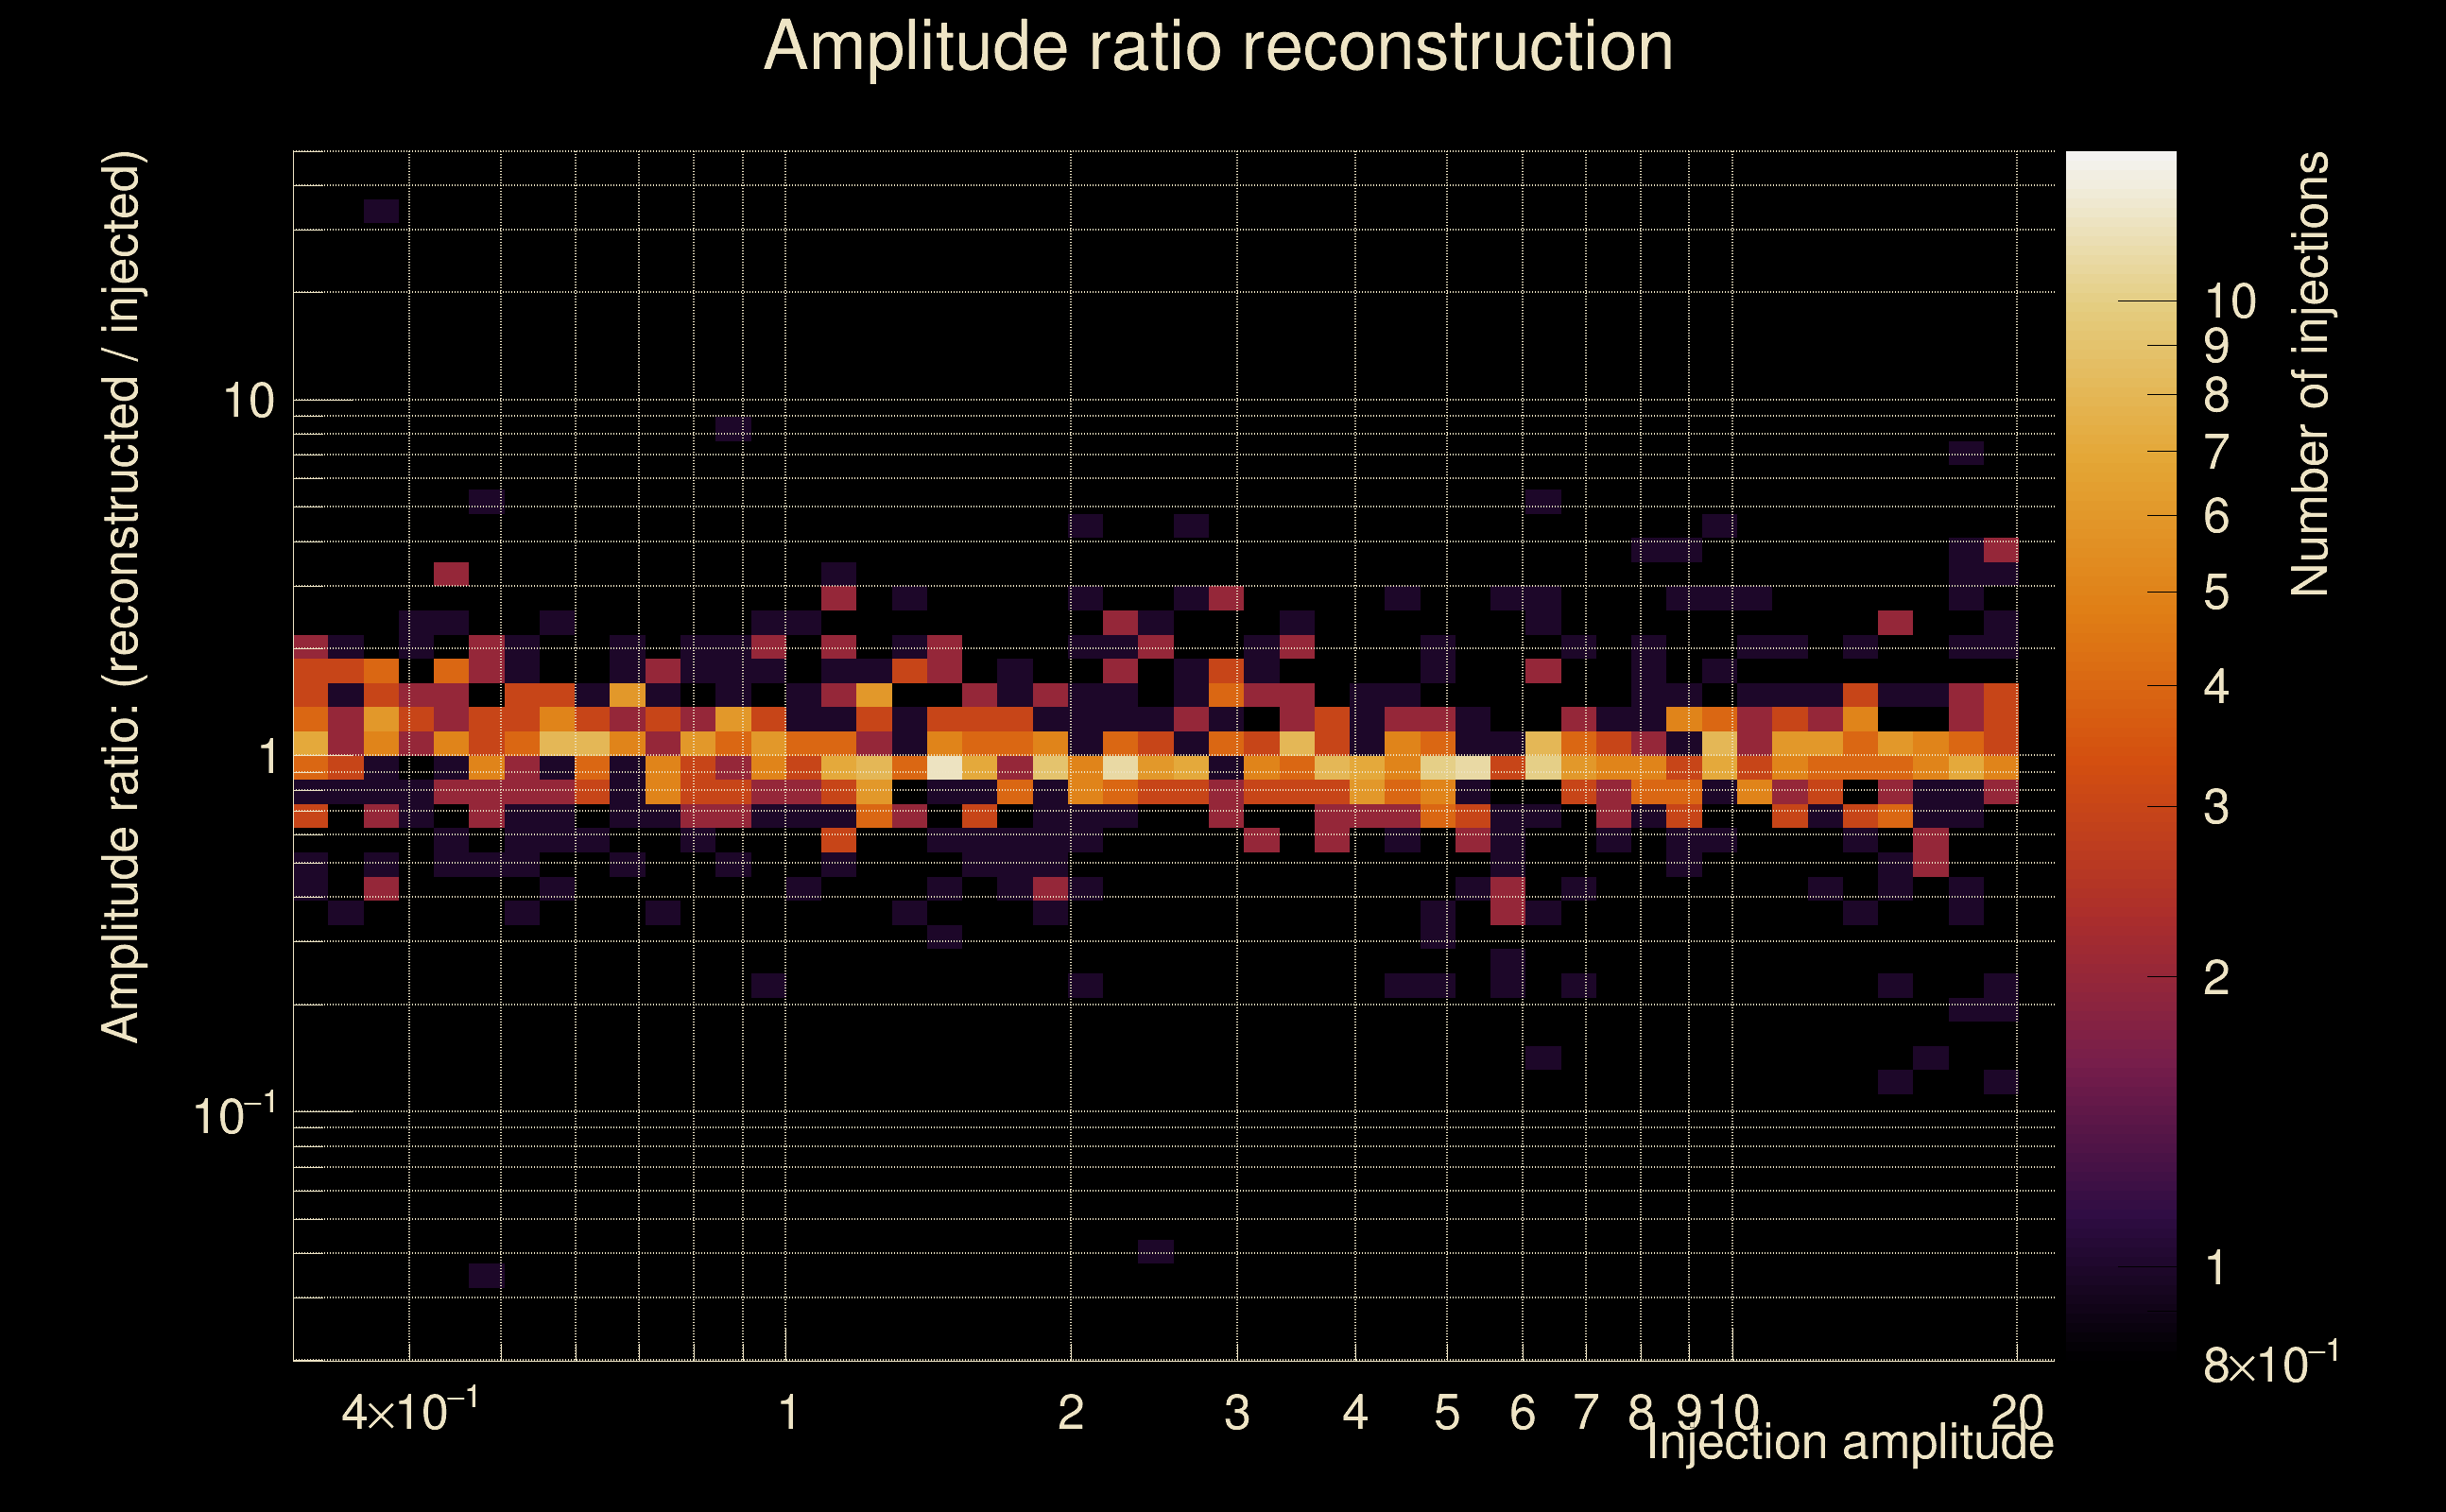
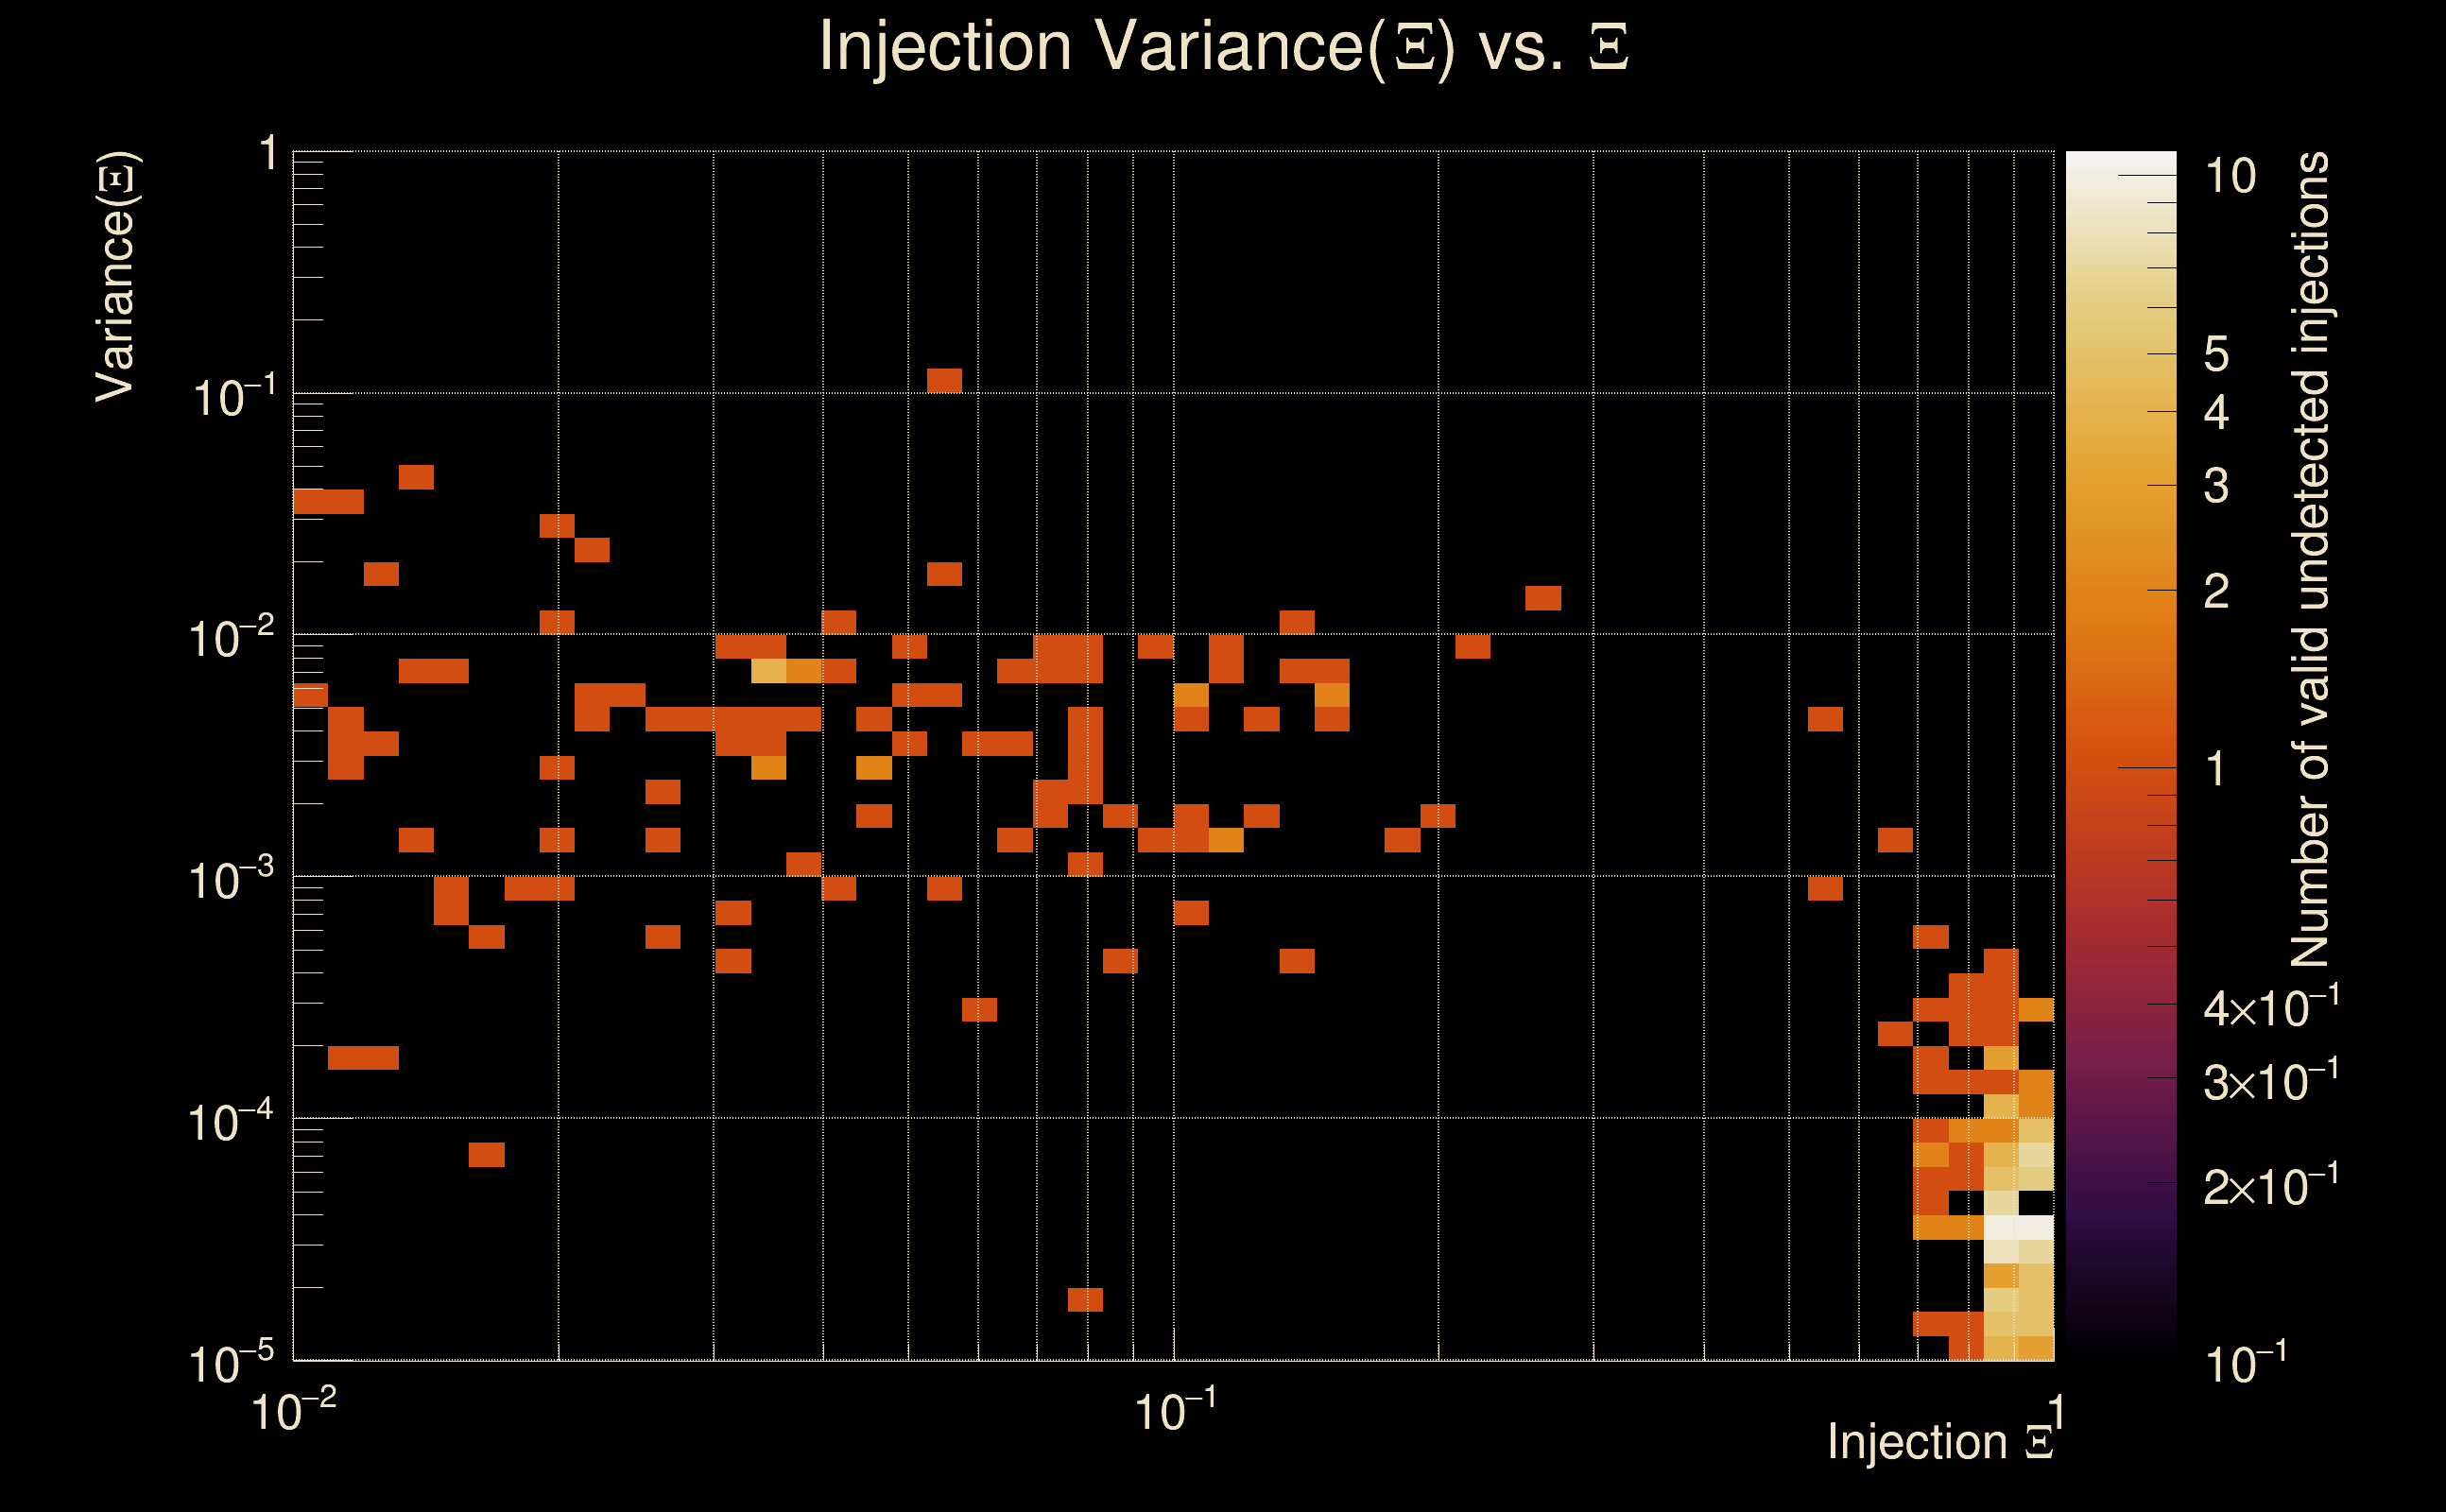
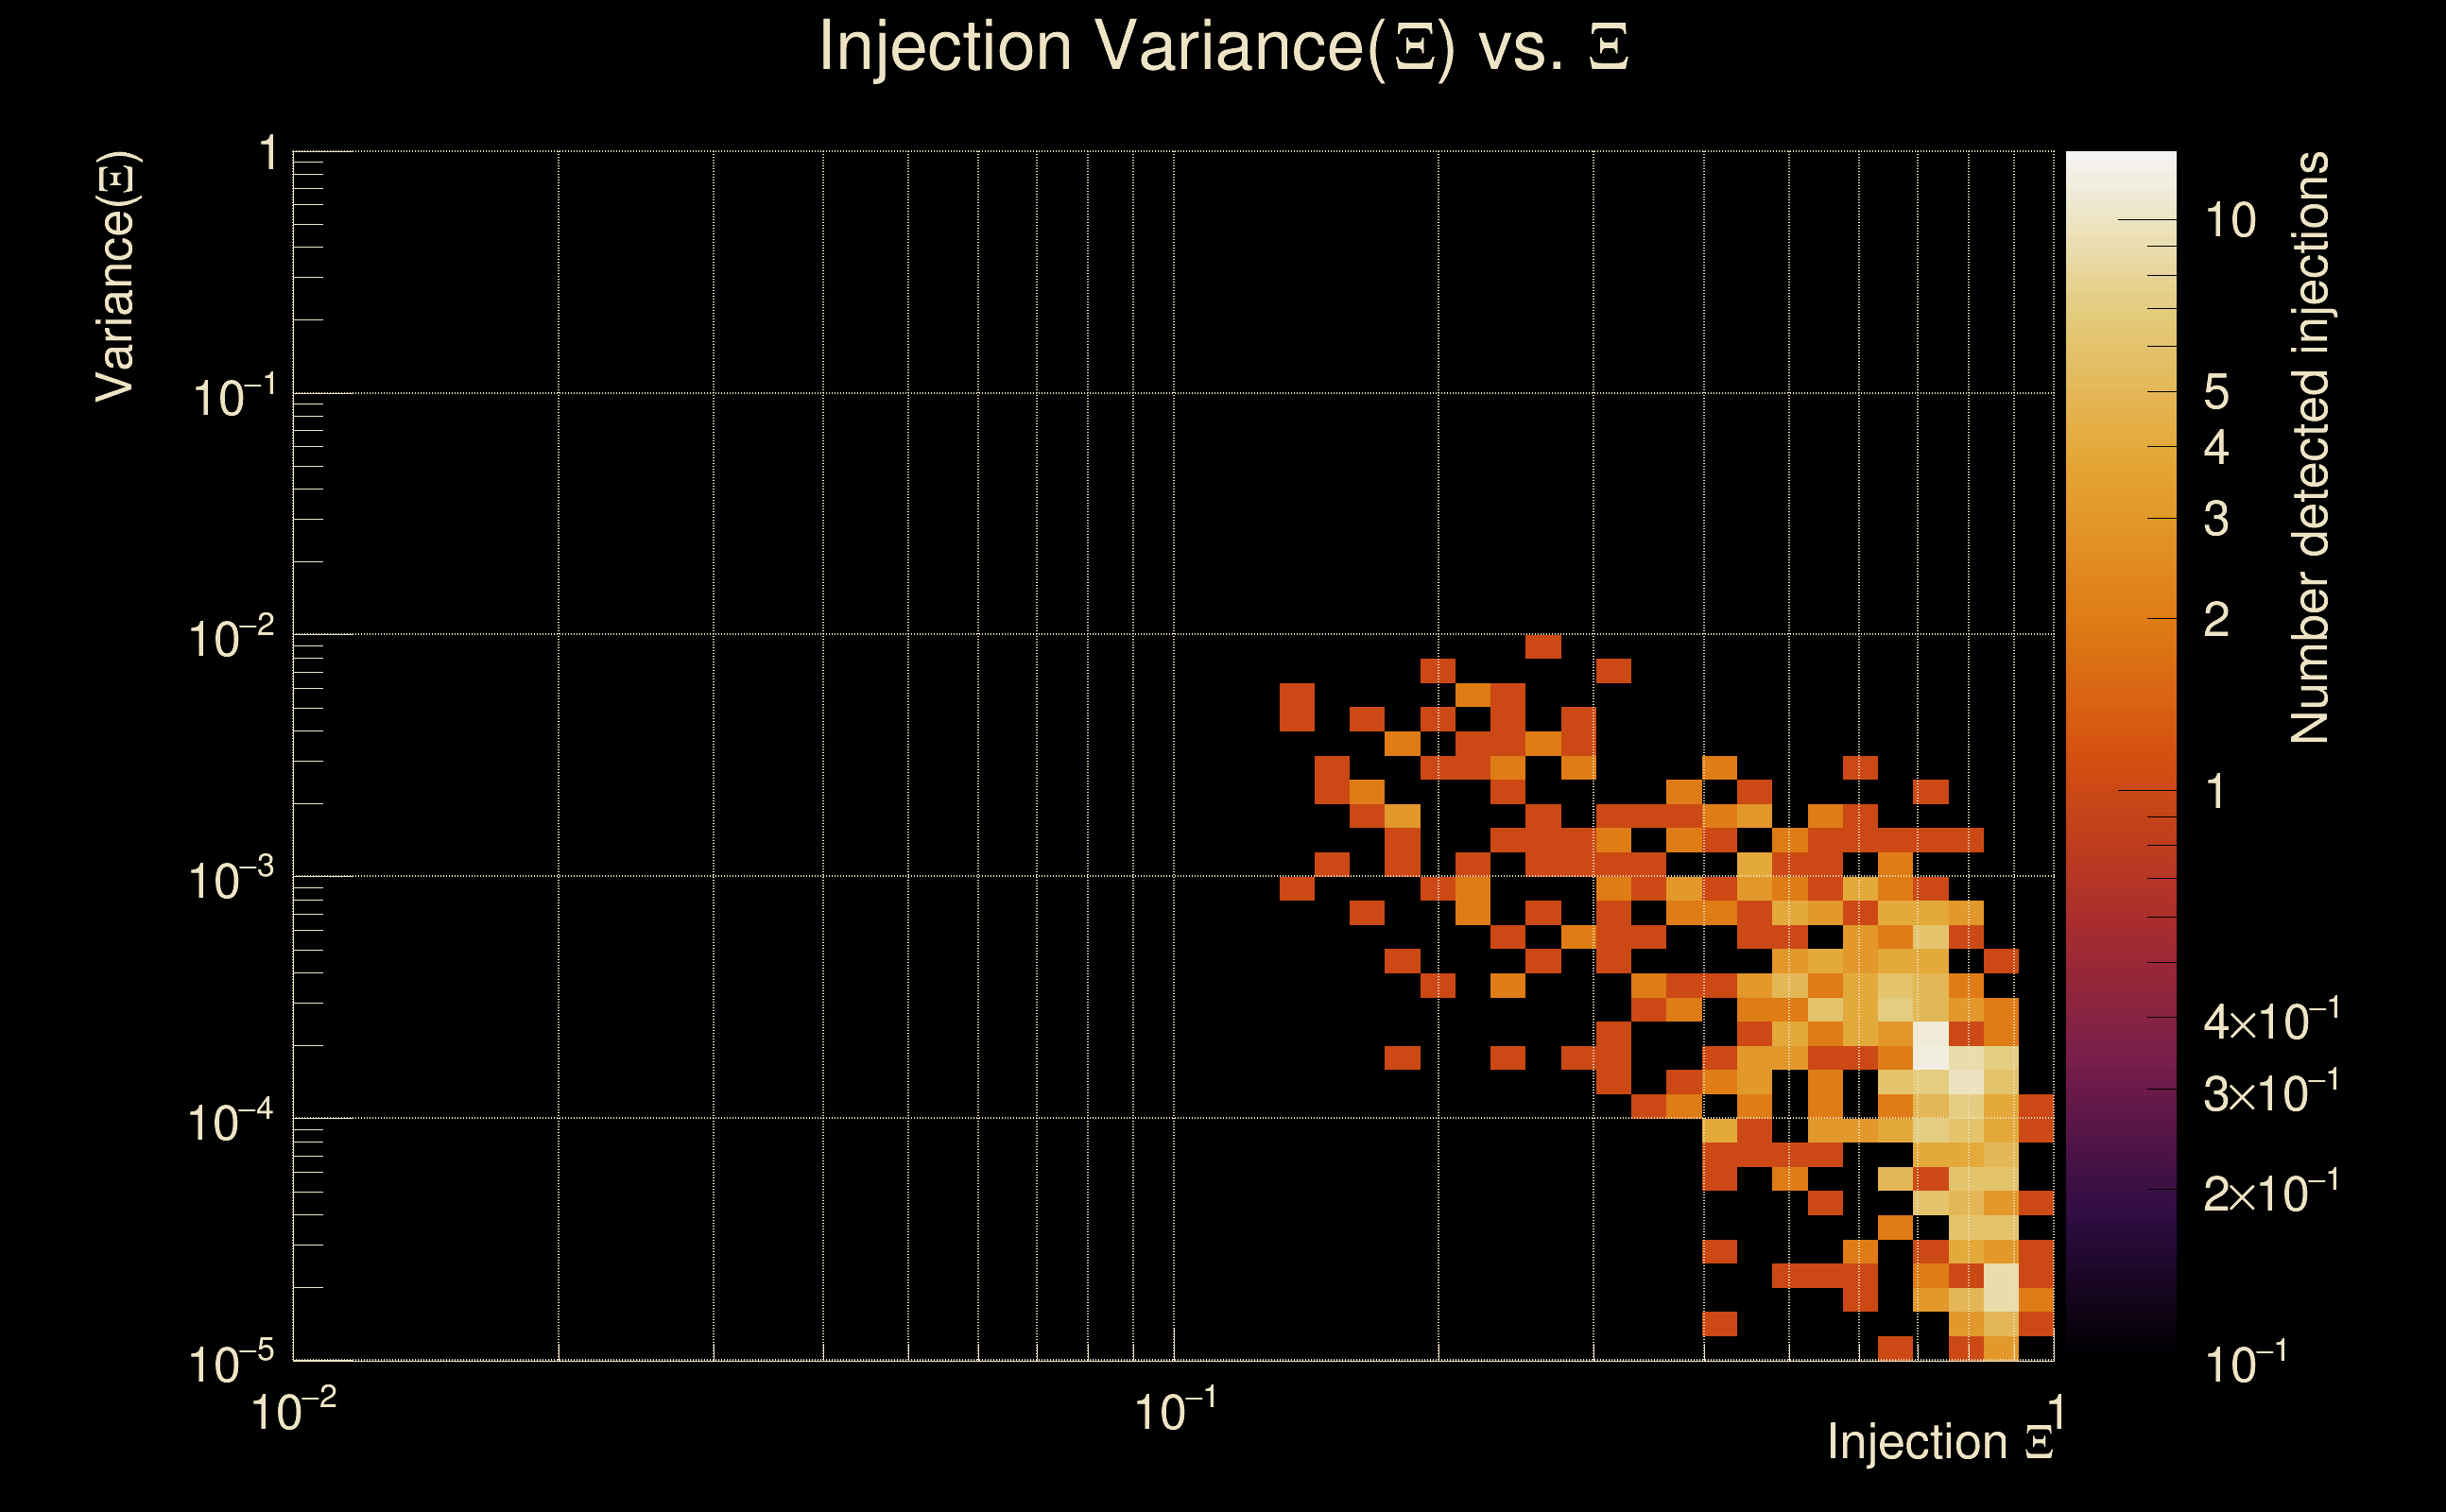
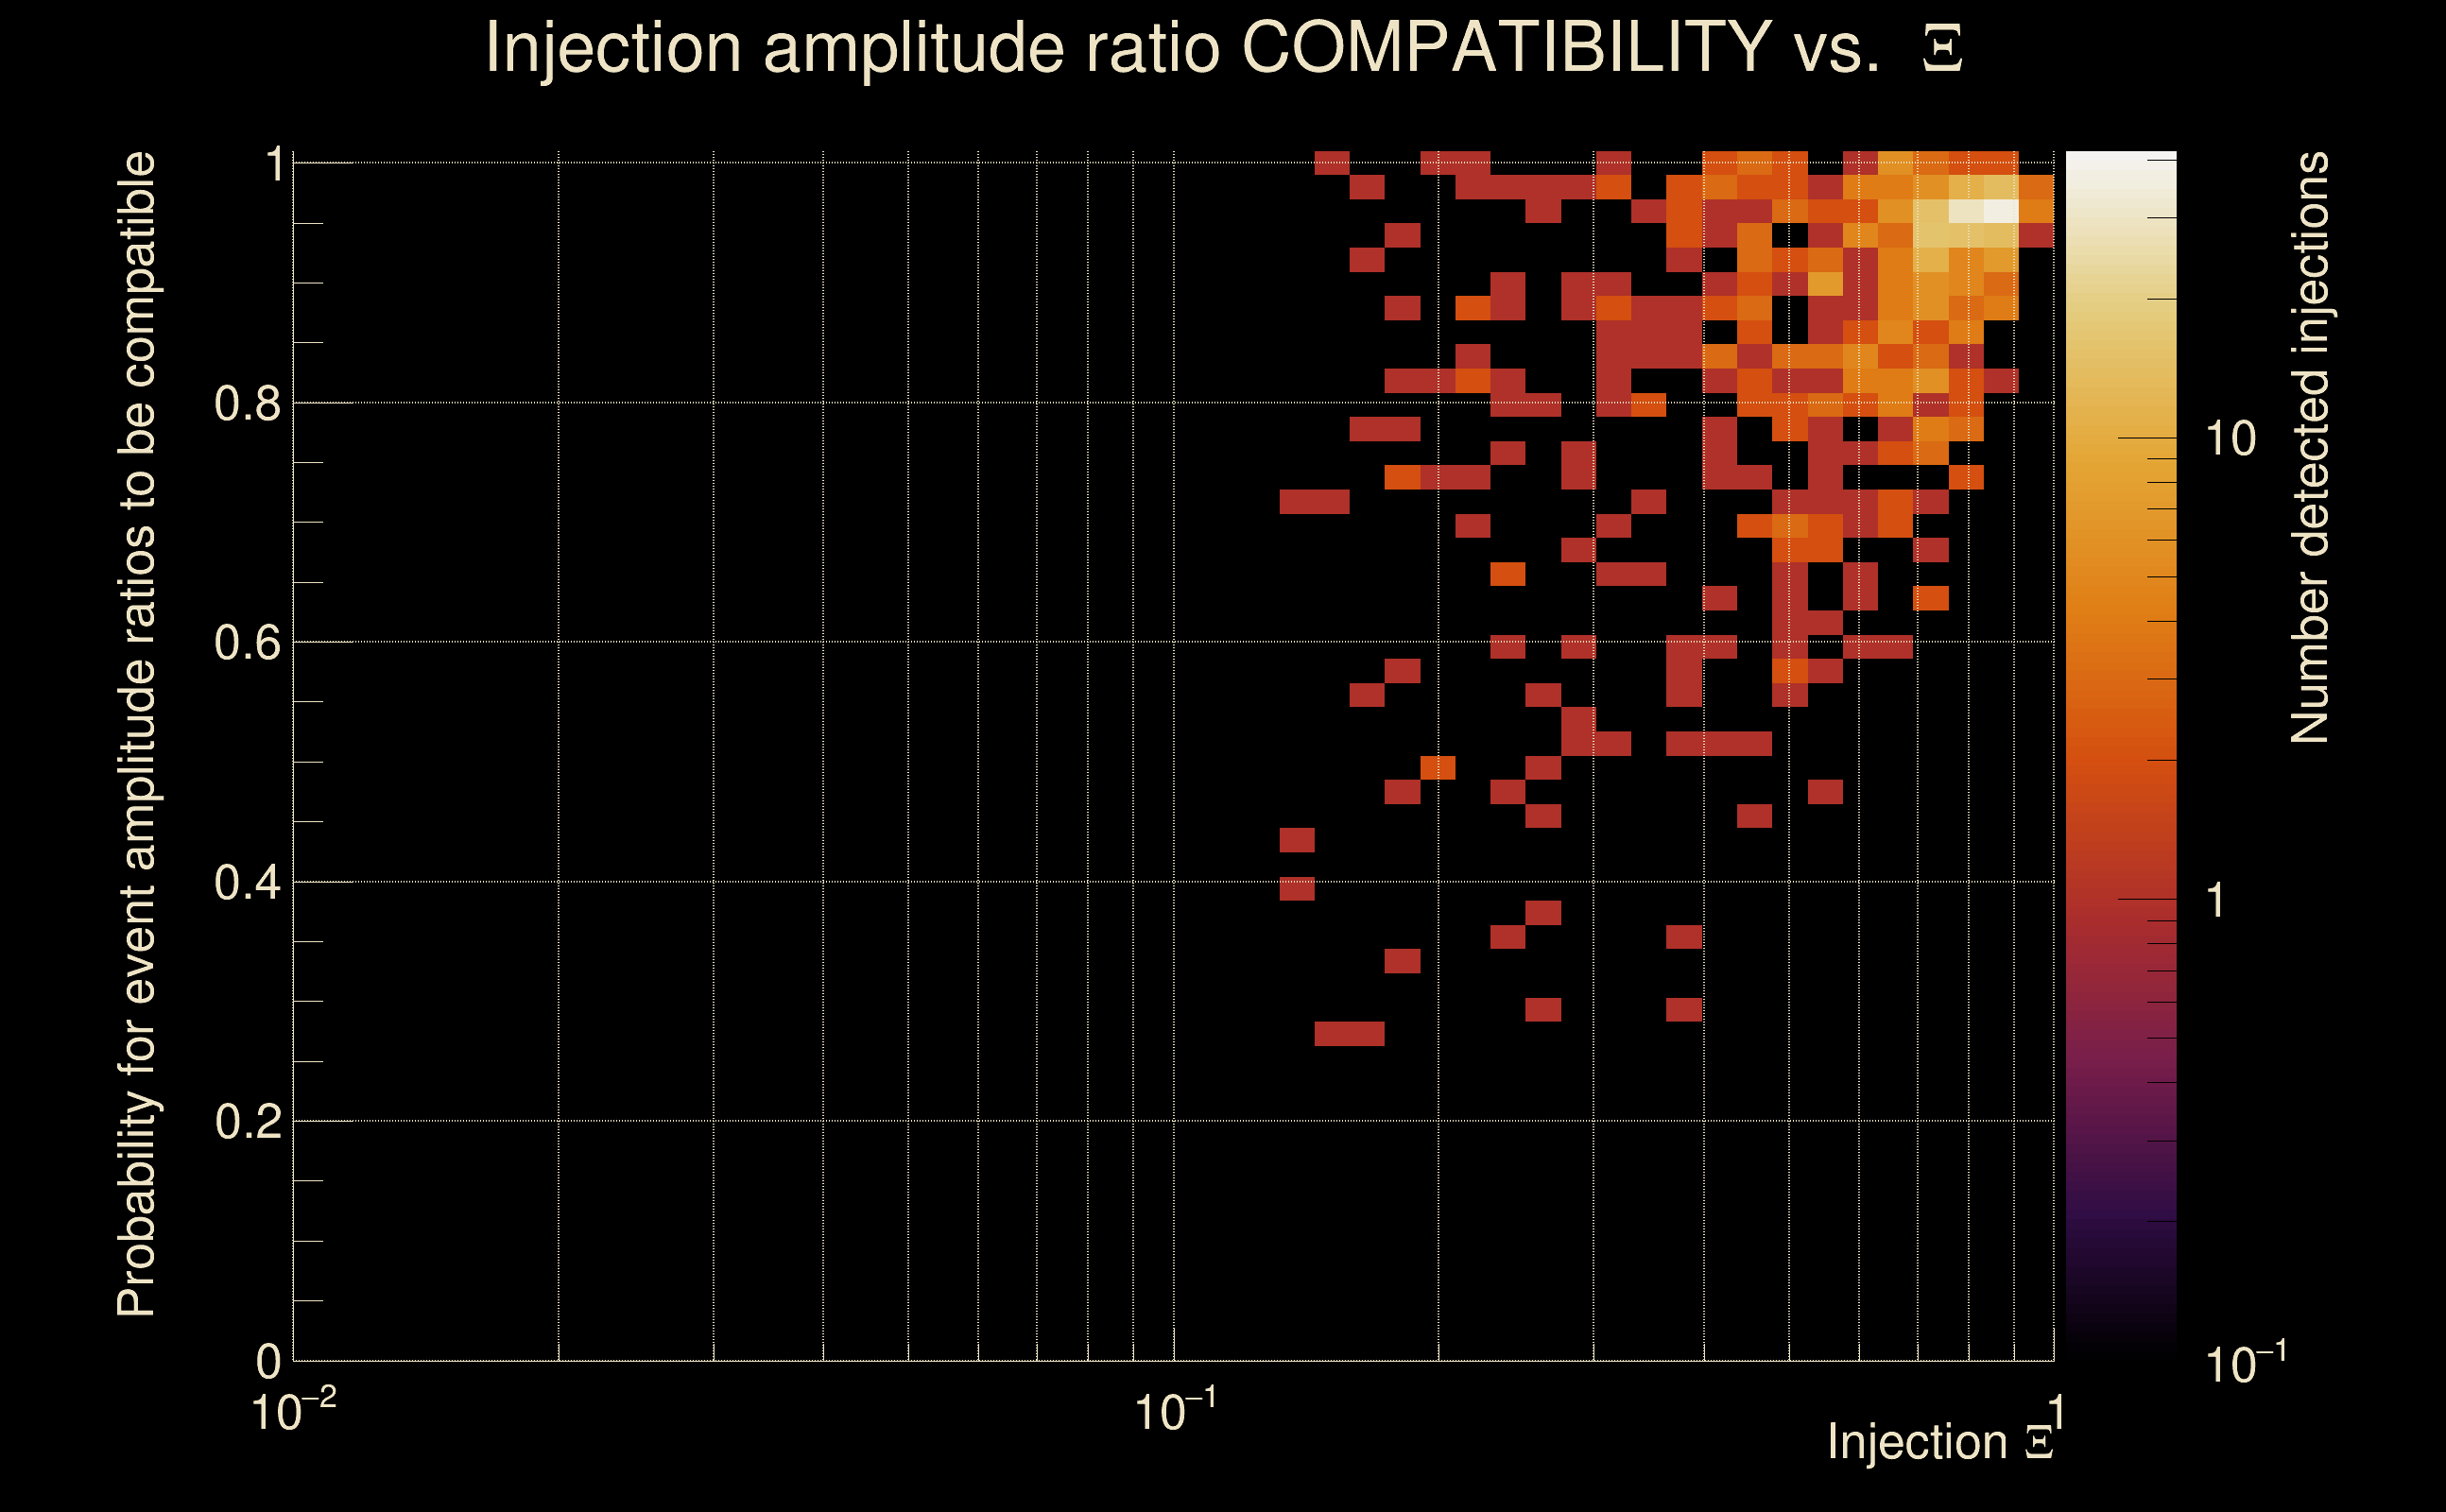
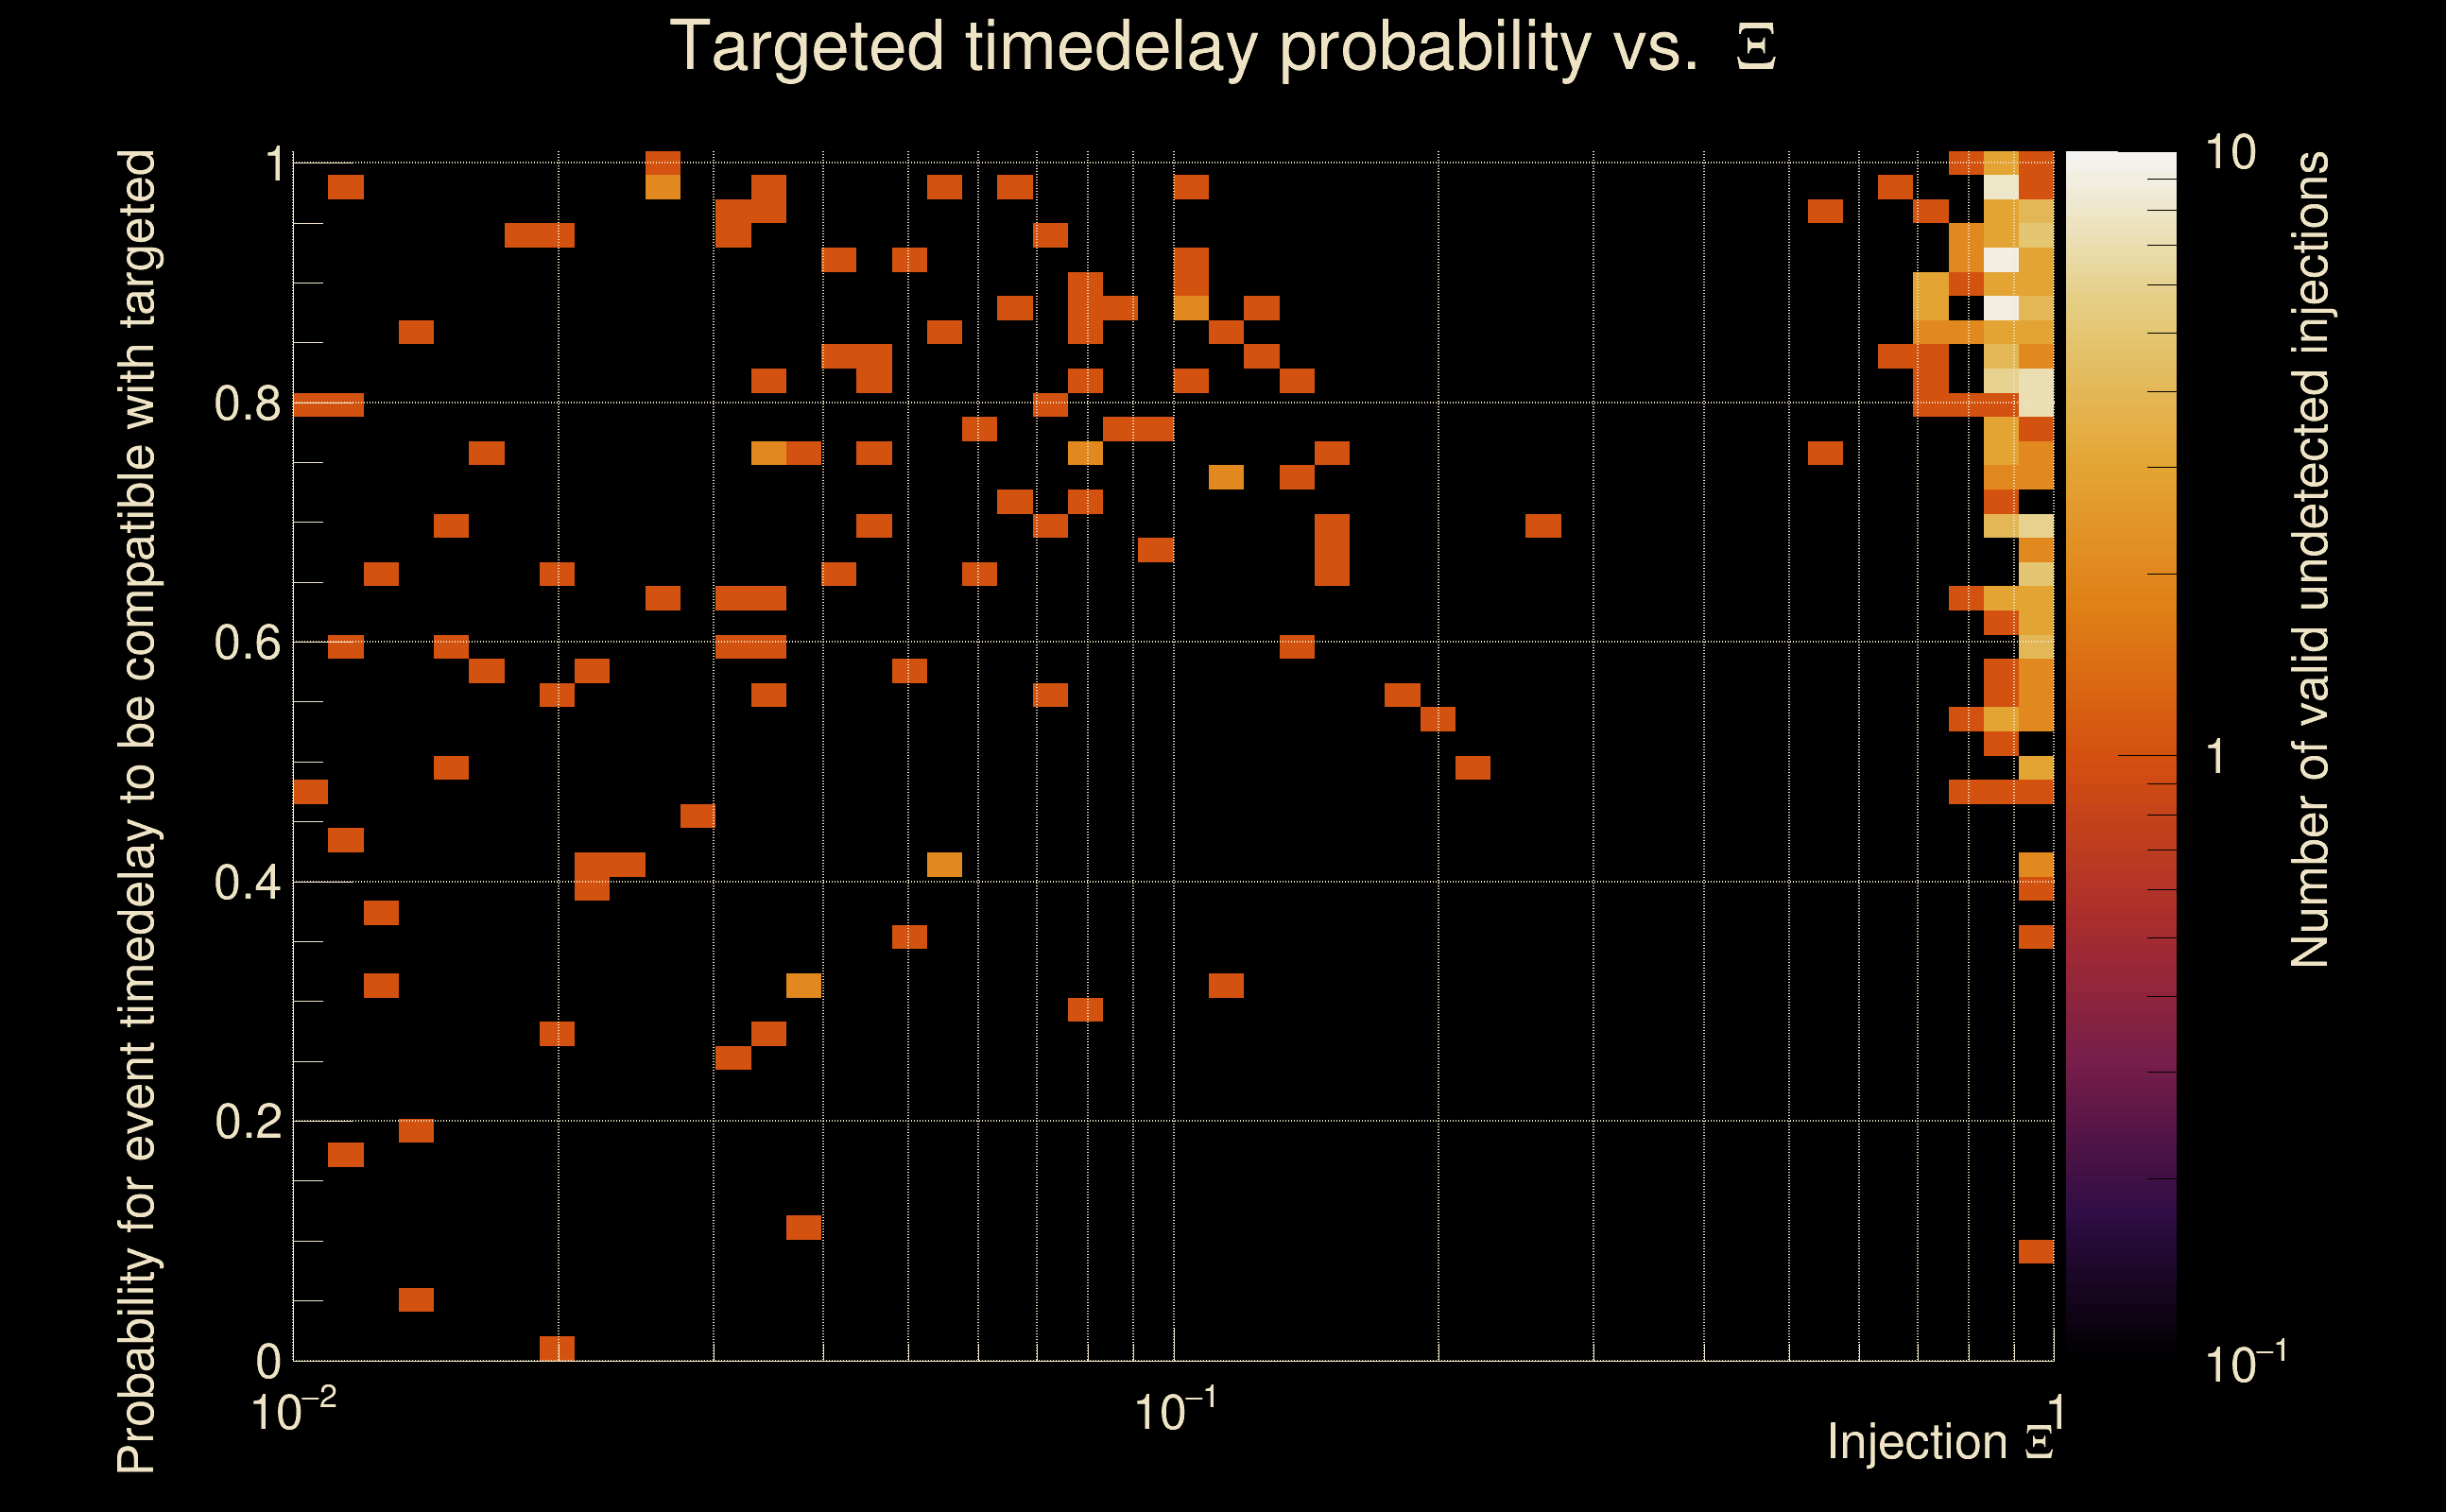
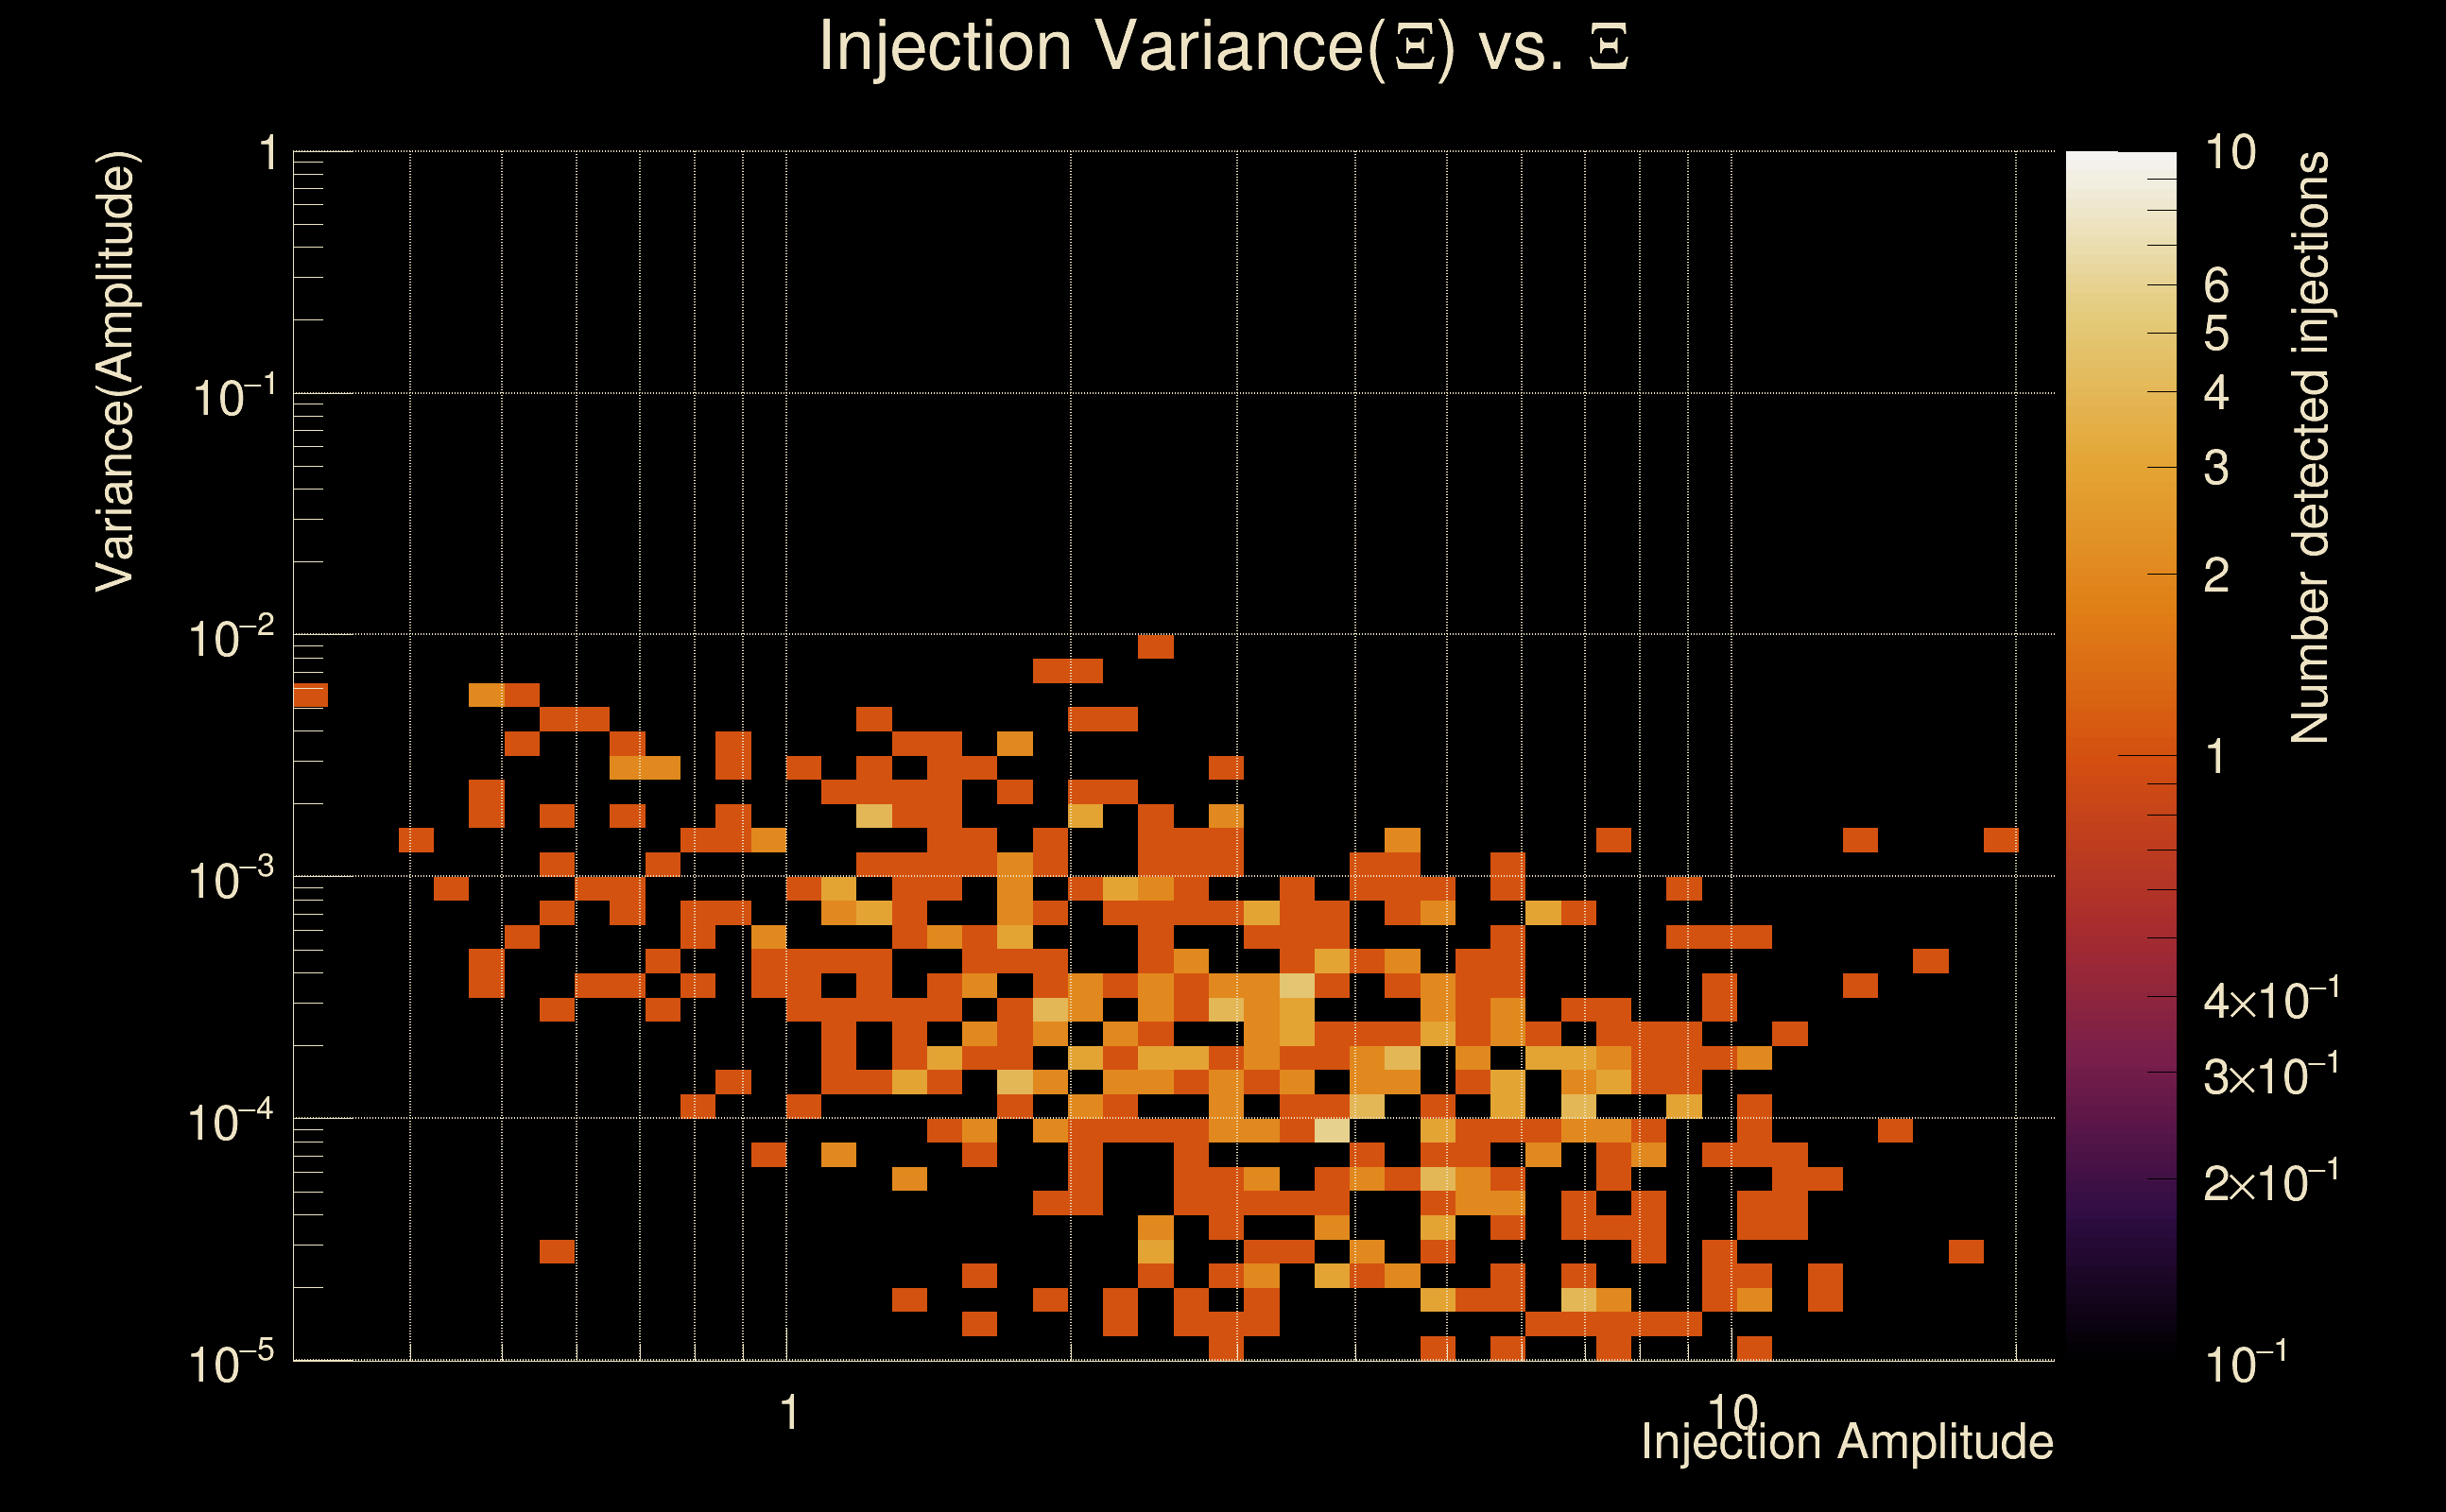
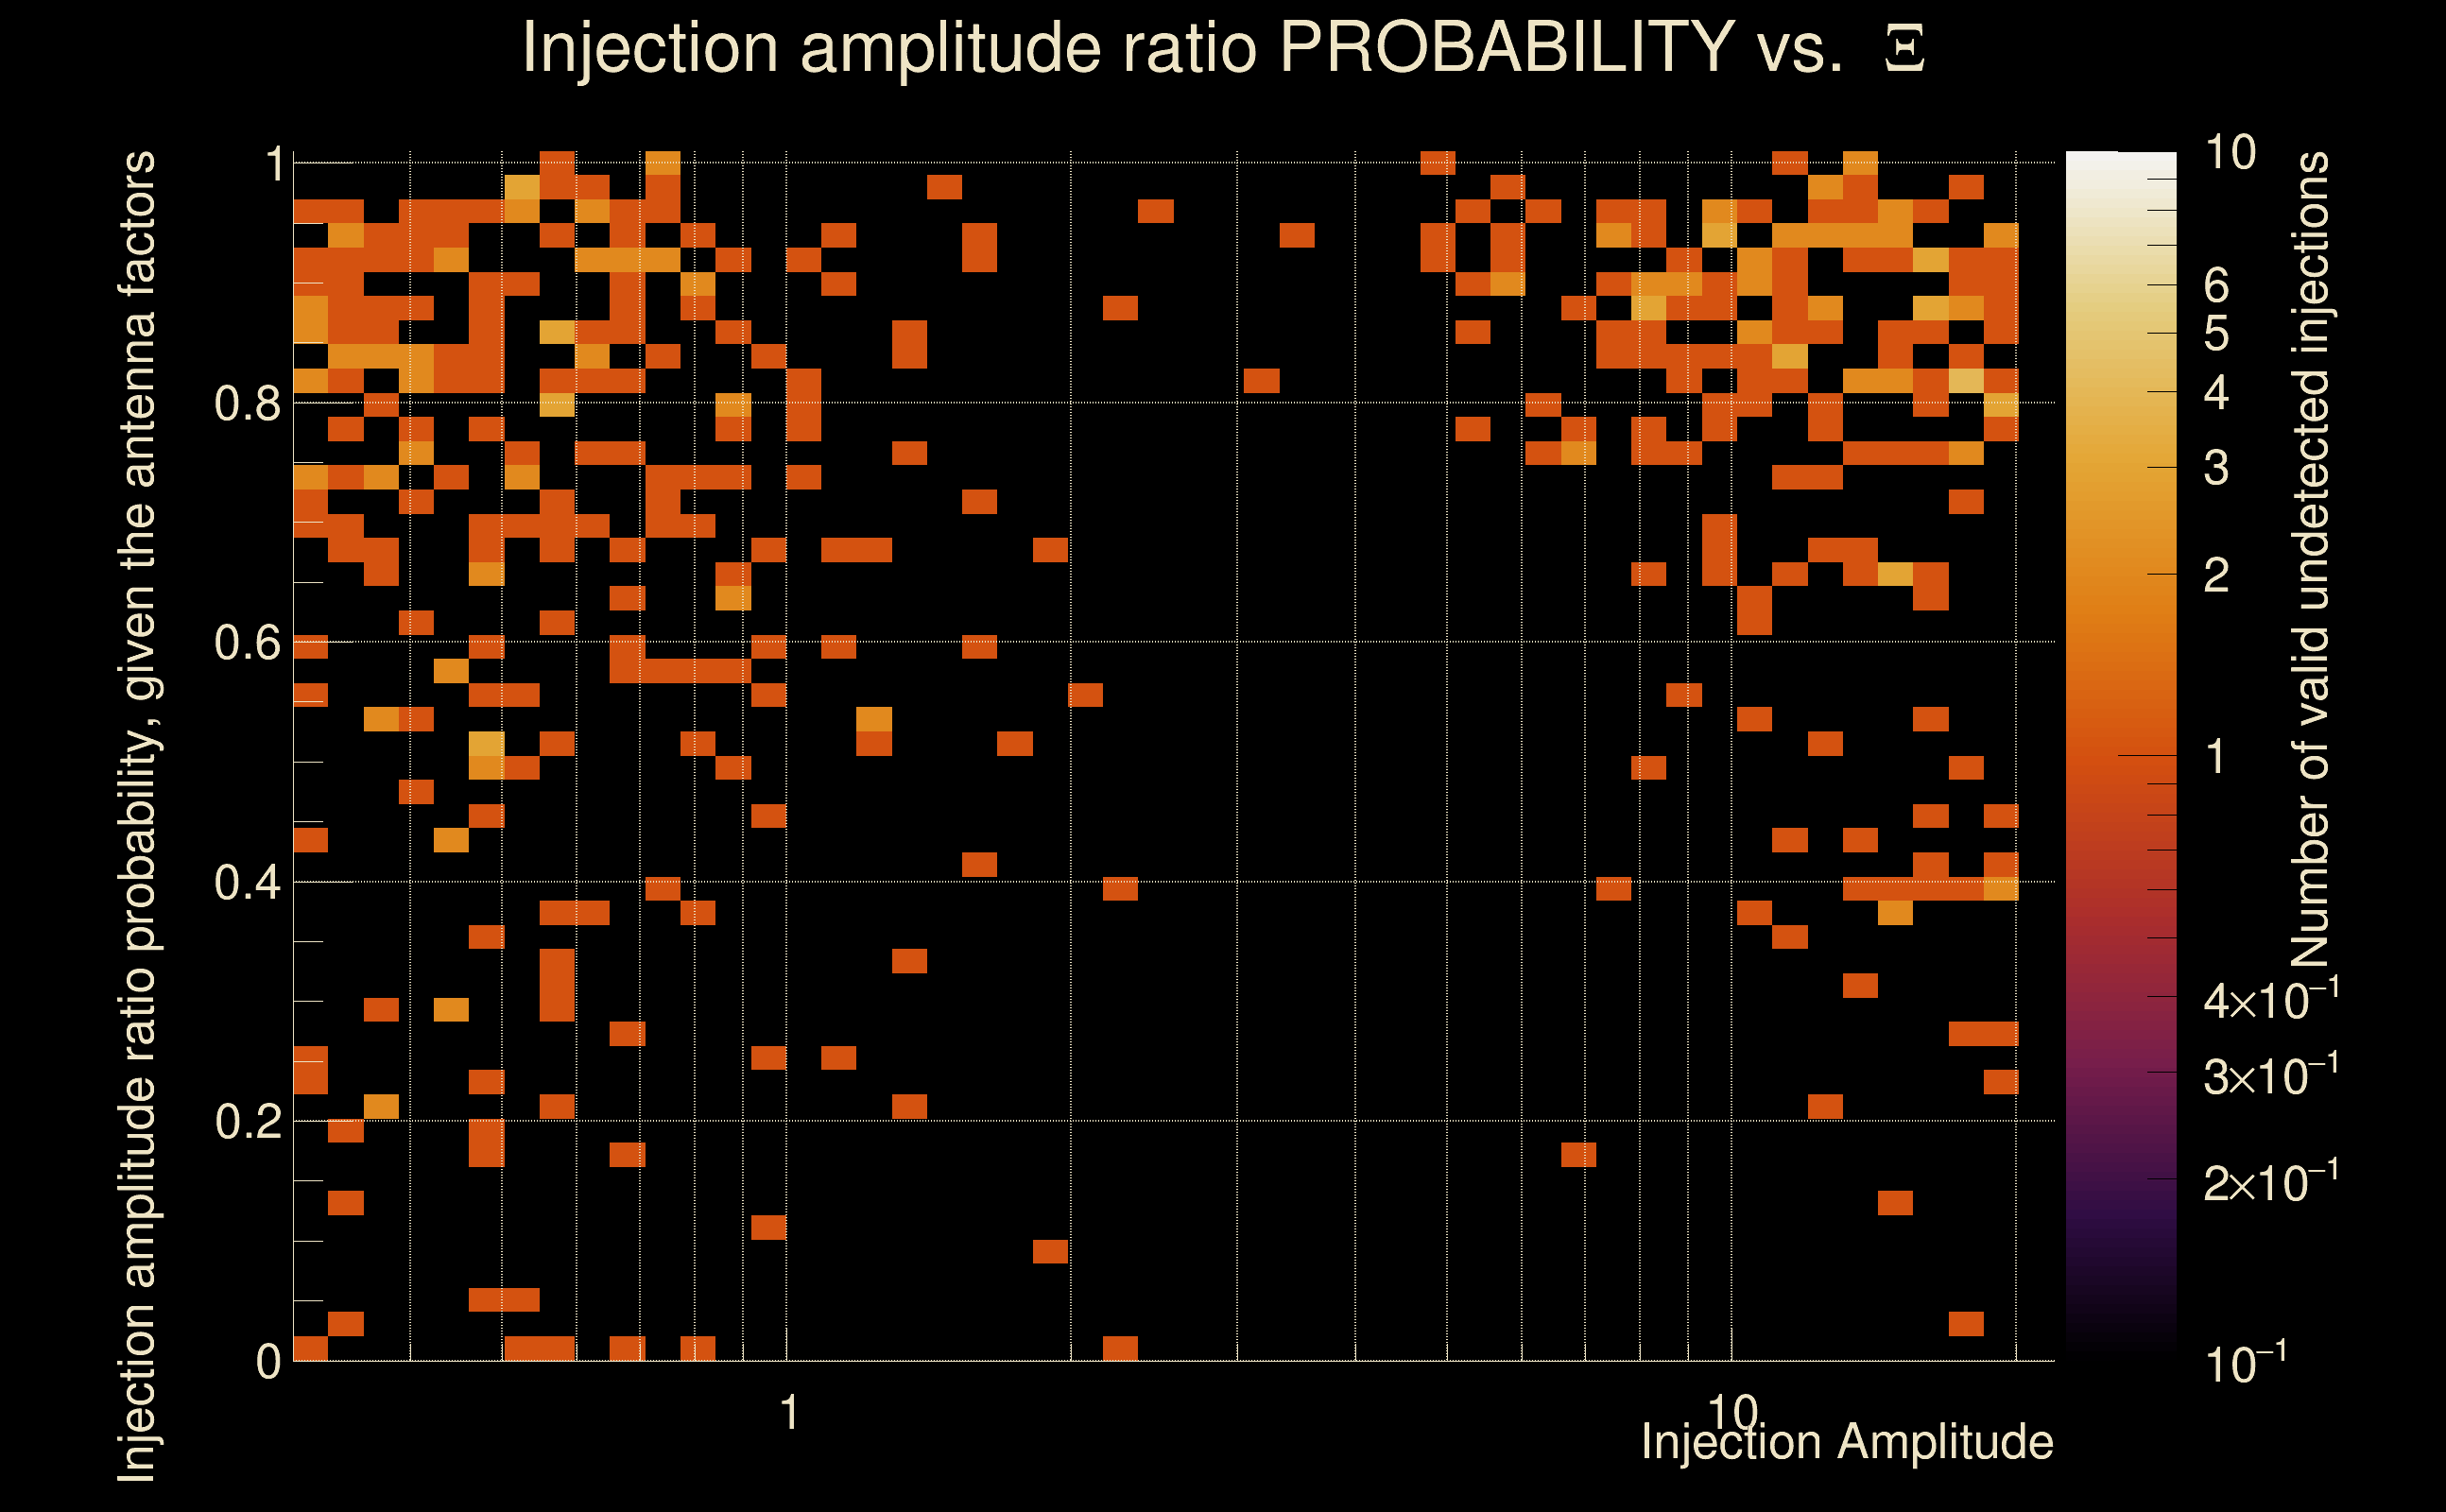
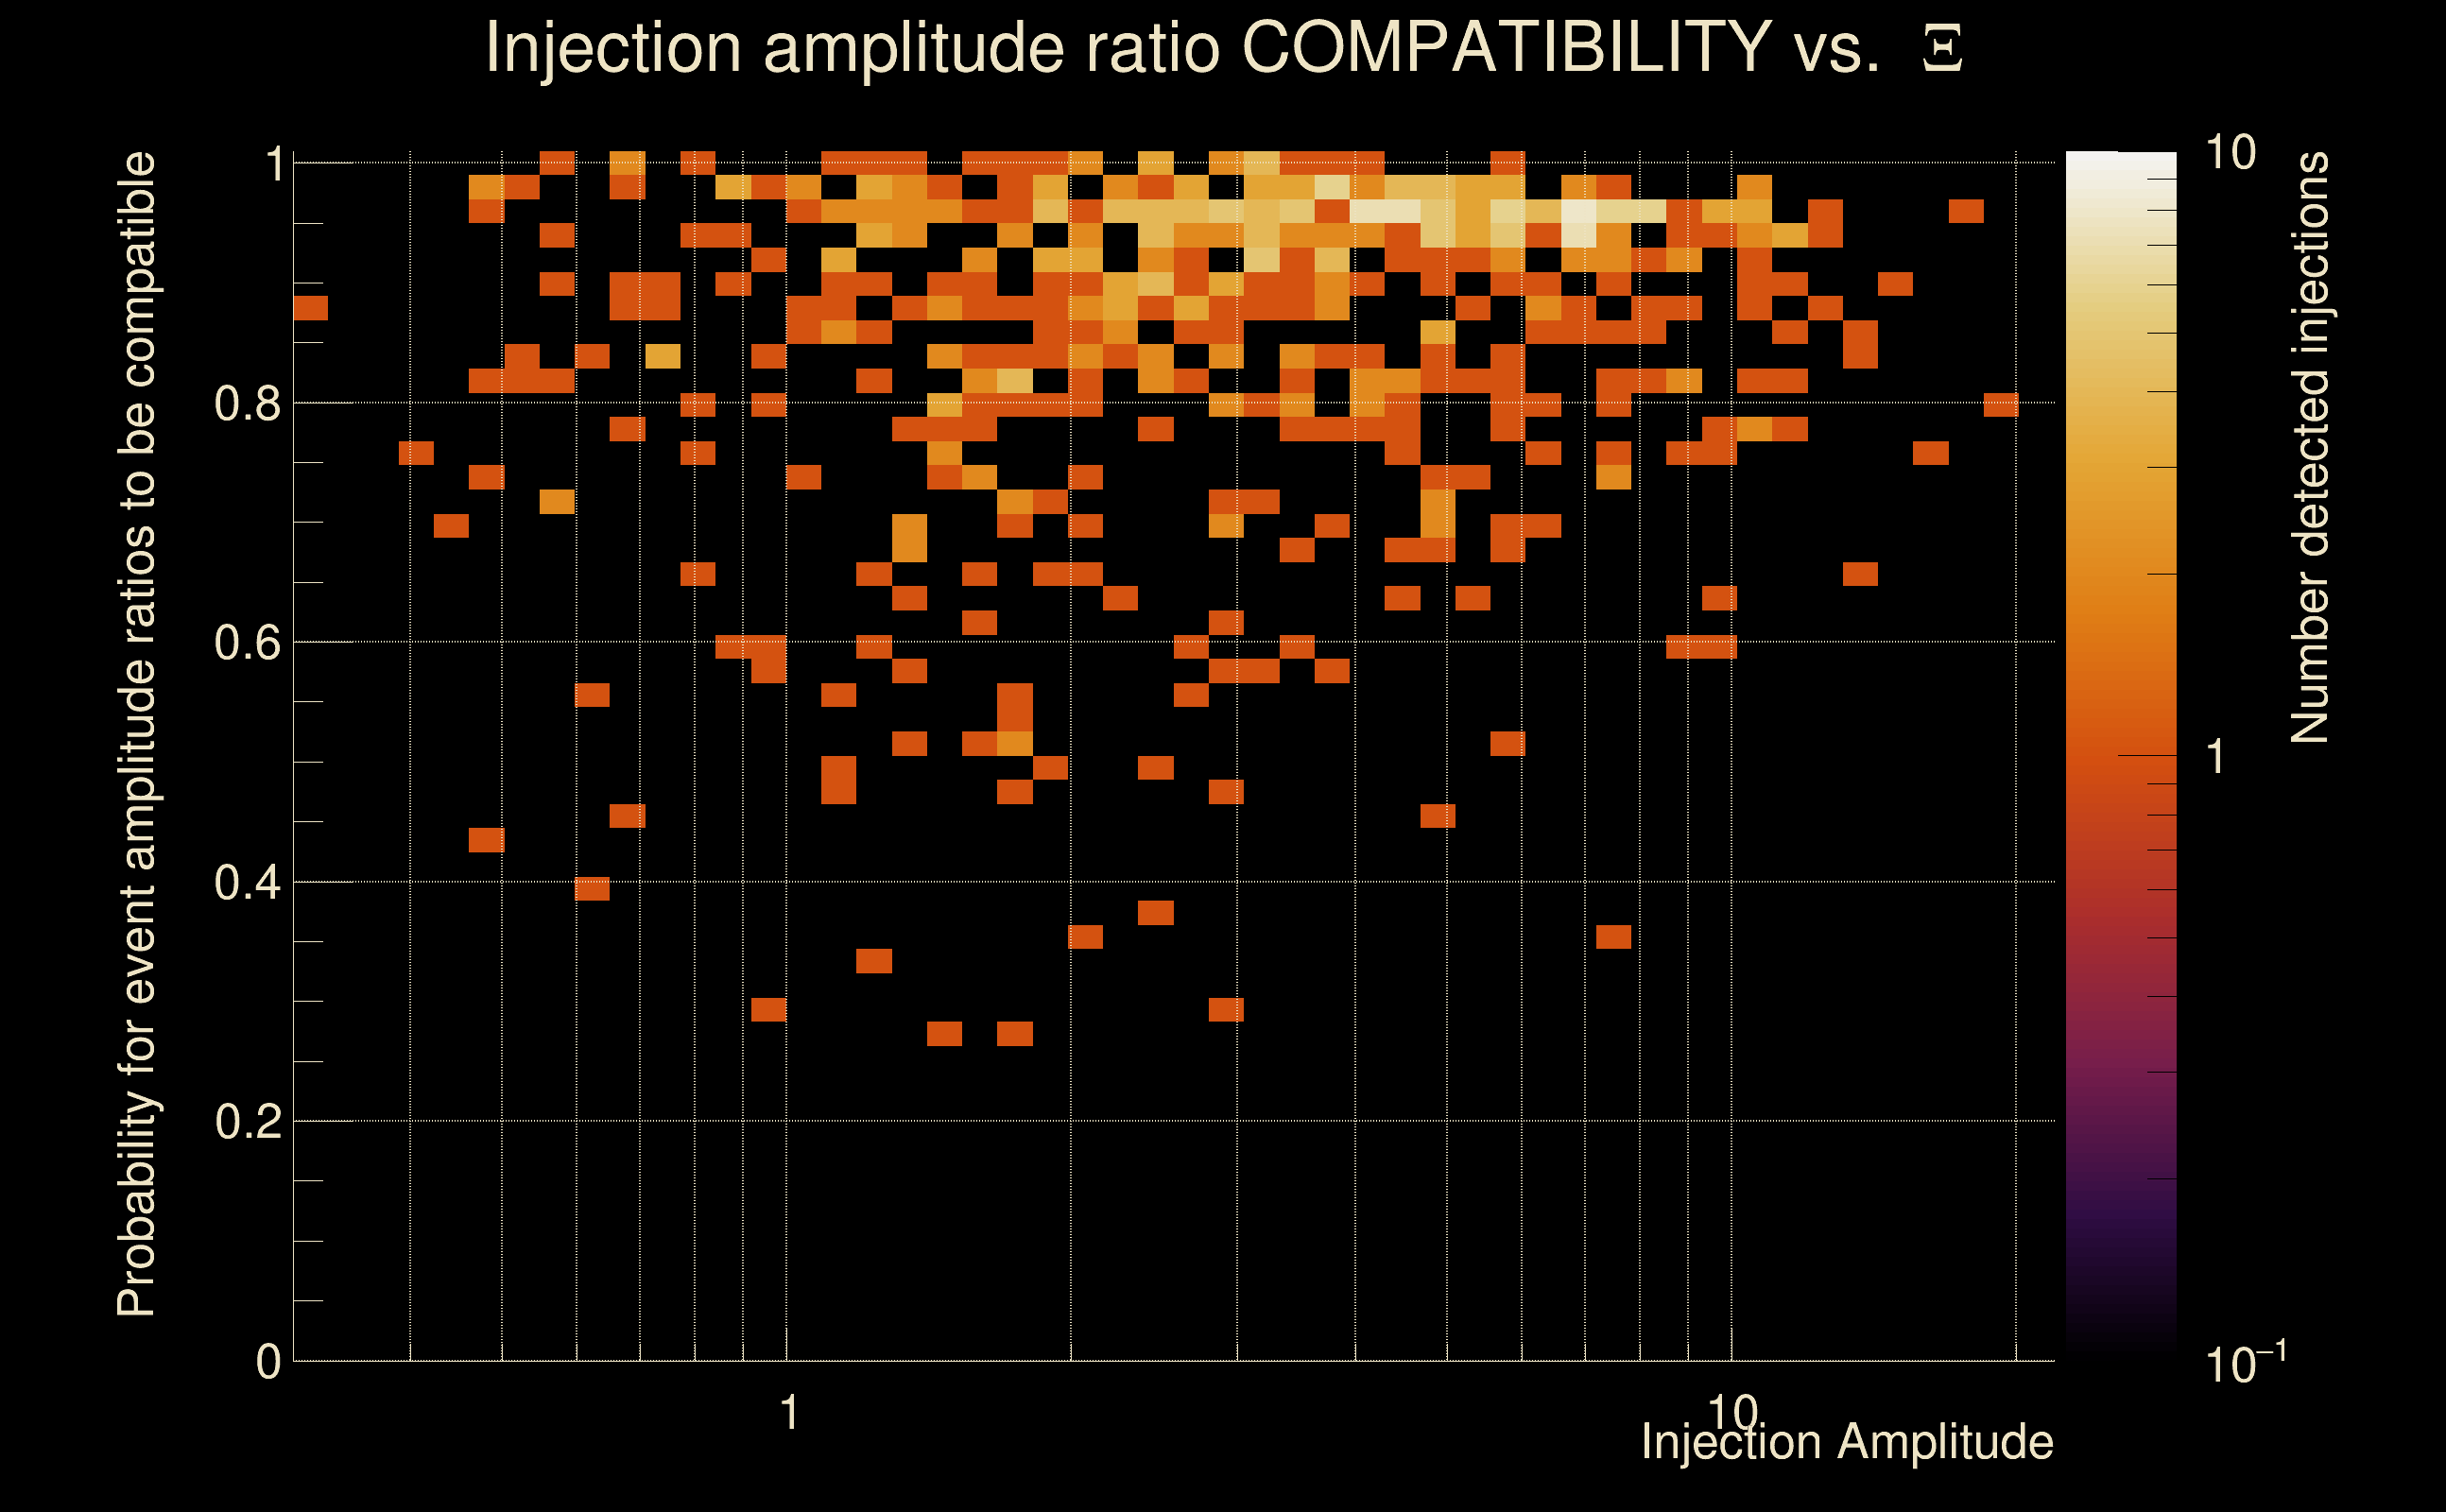
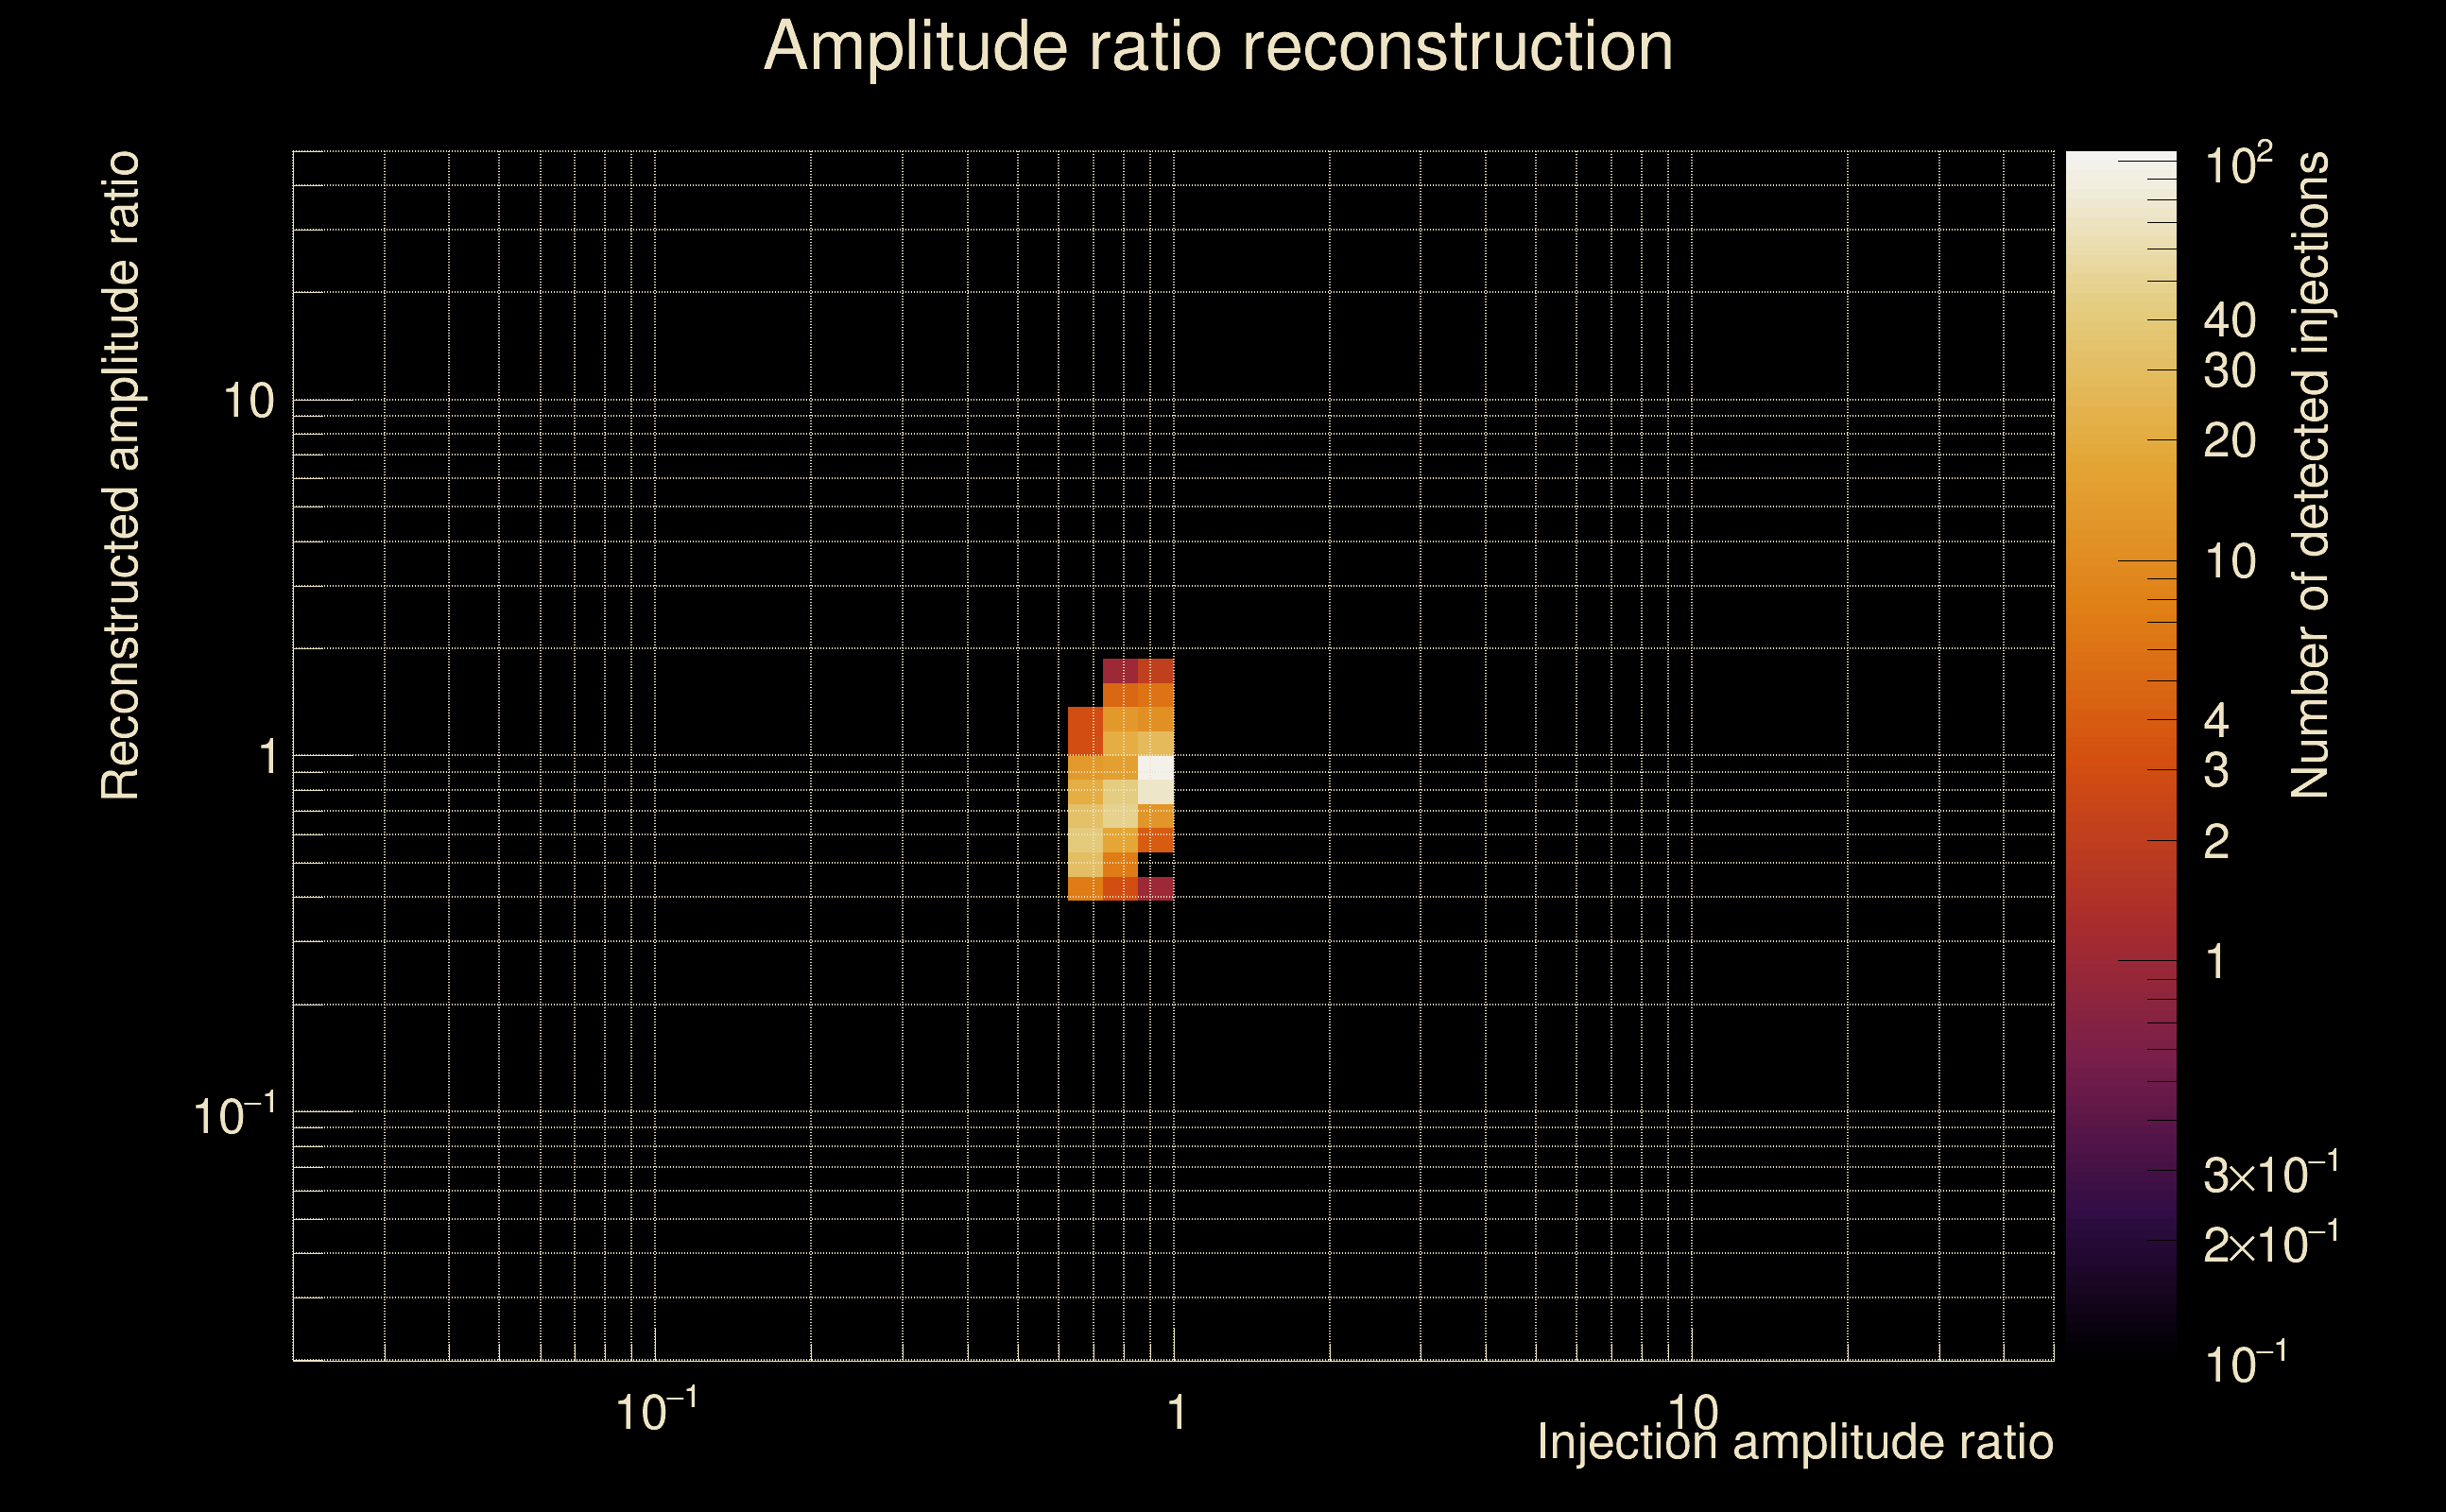
| Number of injections (total/valid/detected): | 1162 / 1018 / 395 |
| List of missed injections: | ./Kur22-s50_missed.txt |
| Injection amplitude at 90% detection efficiency: | -1 |
| Injection amplitude at 50% detection efficiency: | 2.15744 |
| Injection amplitude at 10% detection efficiency: | 0.885339 |
 |
 |
 |
 |
 |
 |
 |
|
 |
 |
|
 |
 |
|
 |
 |
|
 |
 |
|
 |
 |
|
 |
 |
|
 |
 |
|
 |
 |
 |
 |
 |
 |
 |
 |
 |
 |
 |
 |
 |
 |
 |
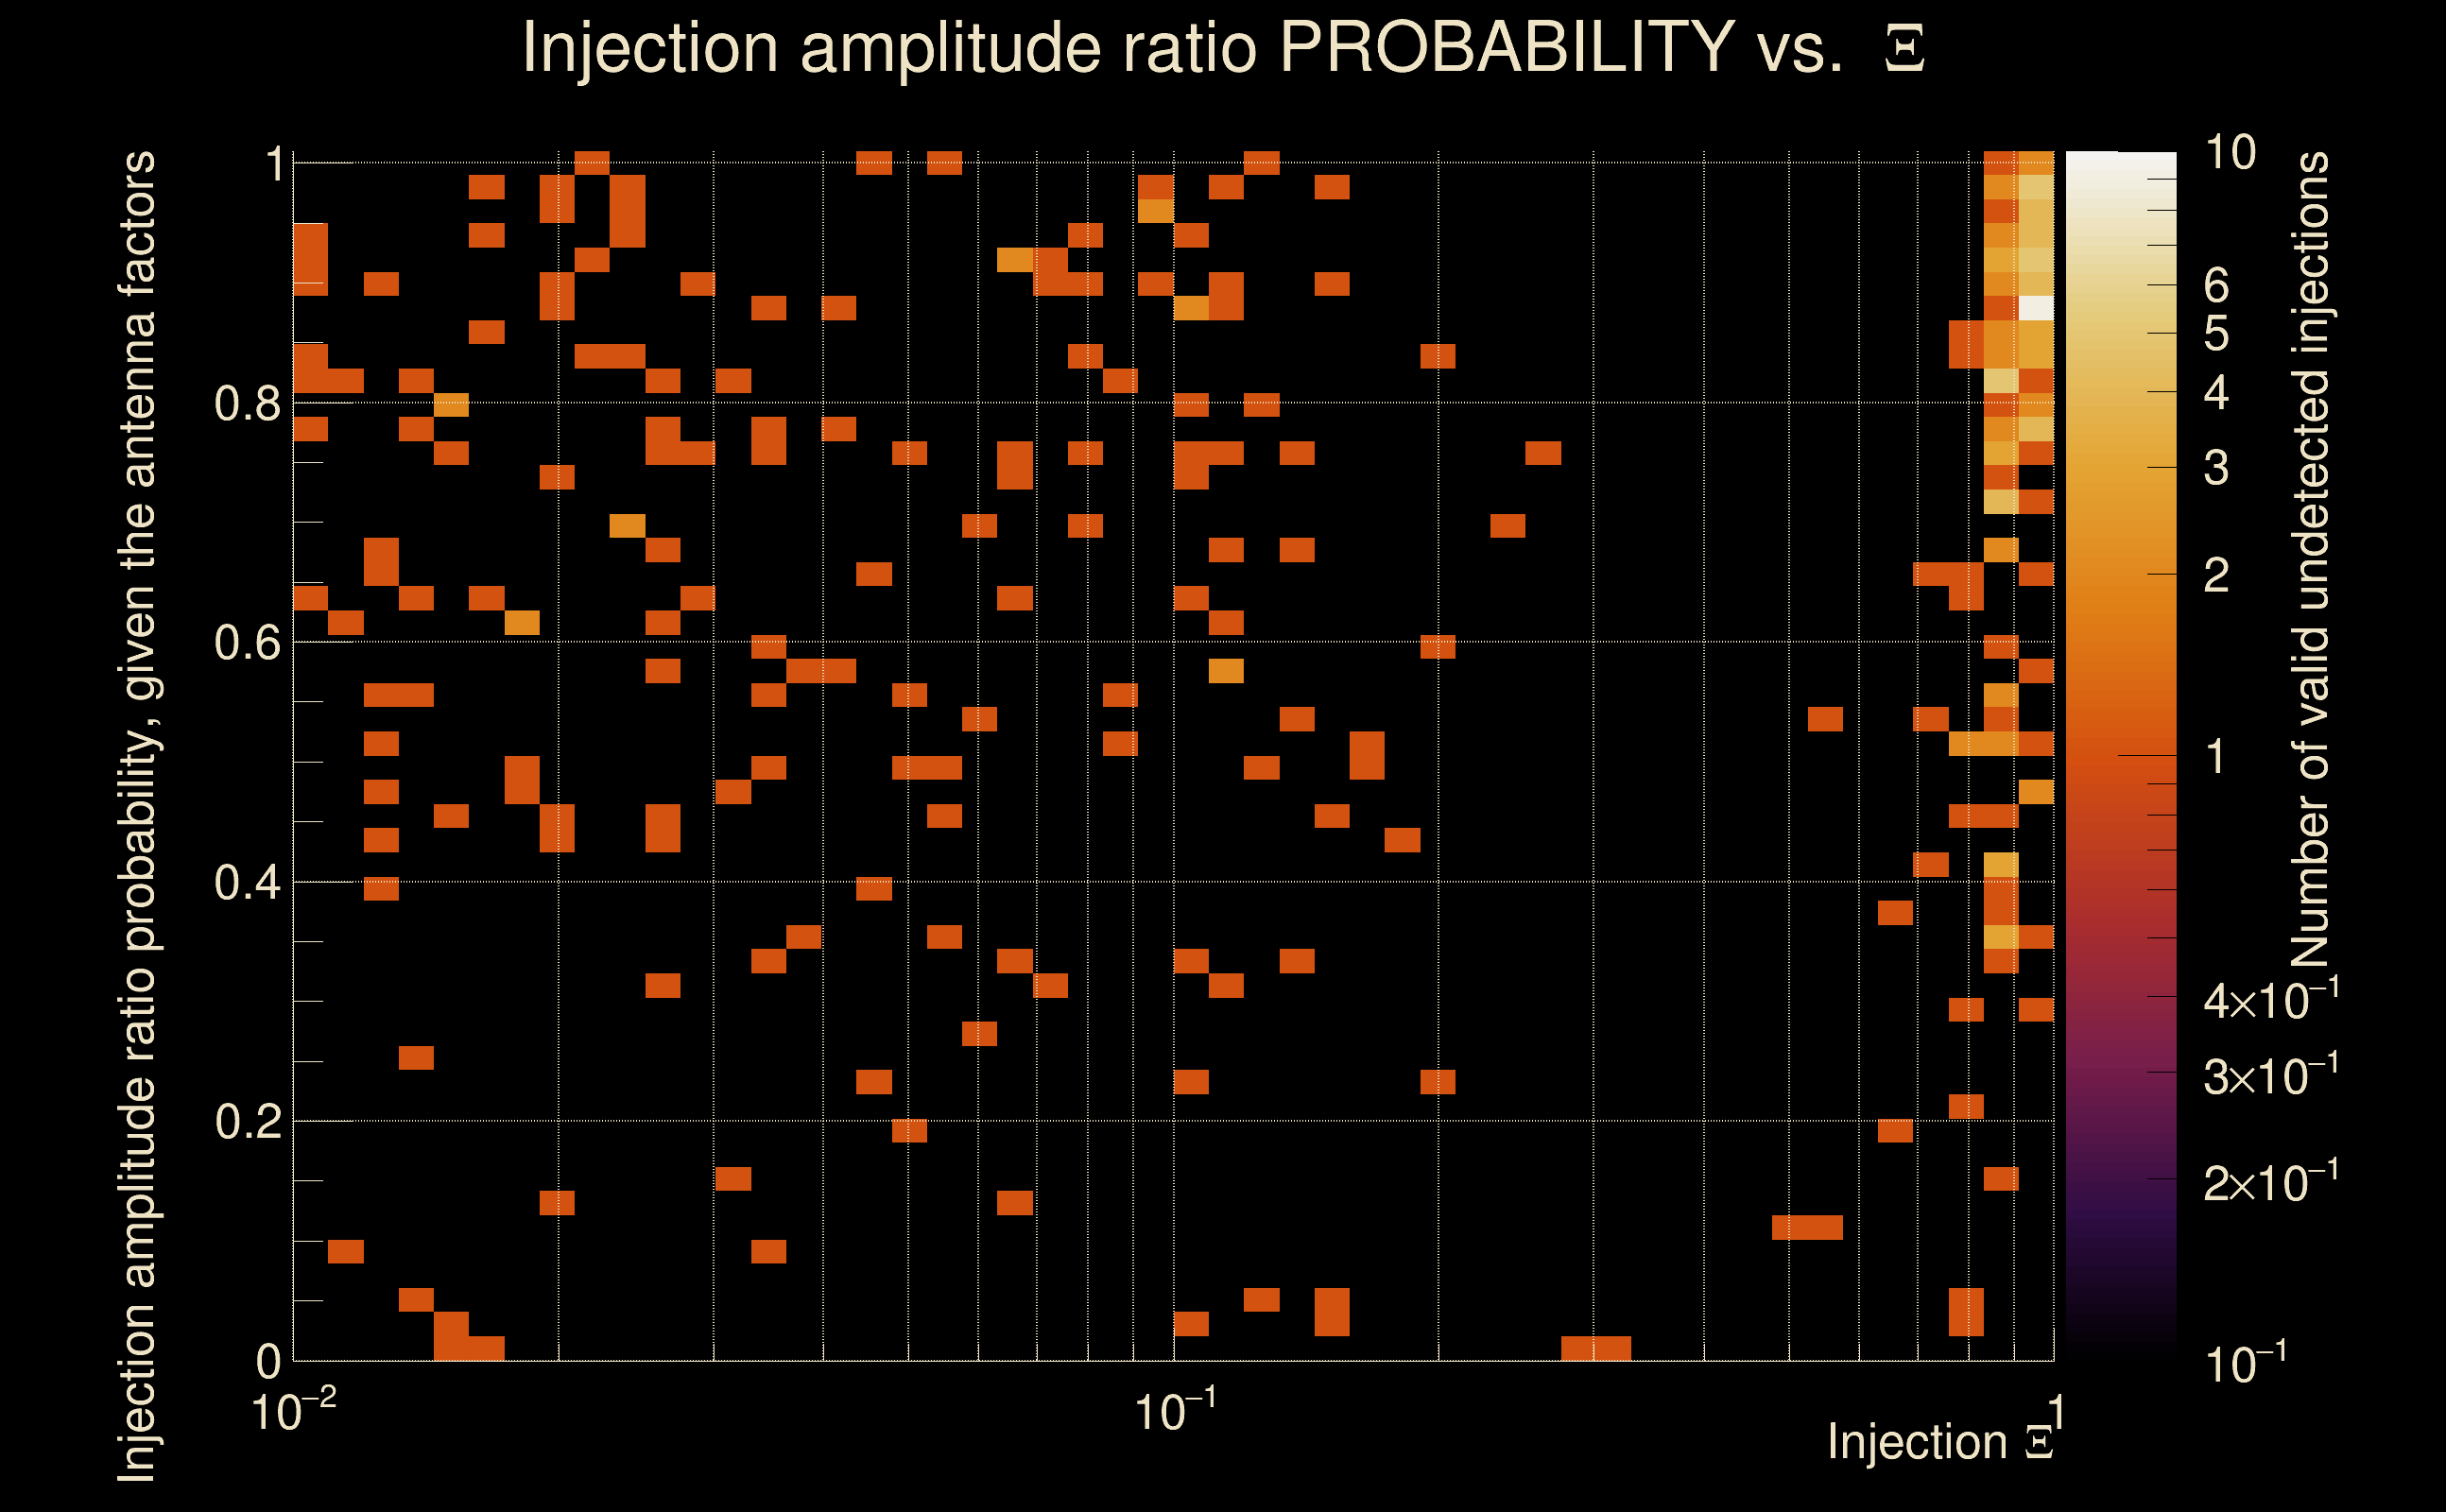
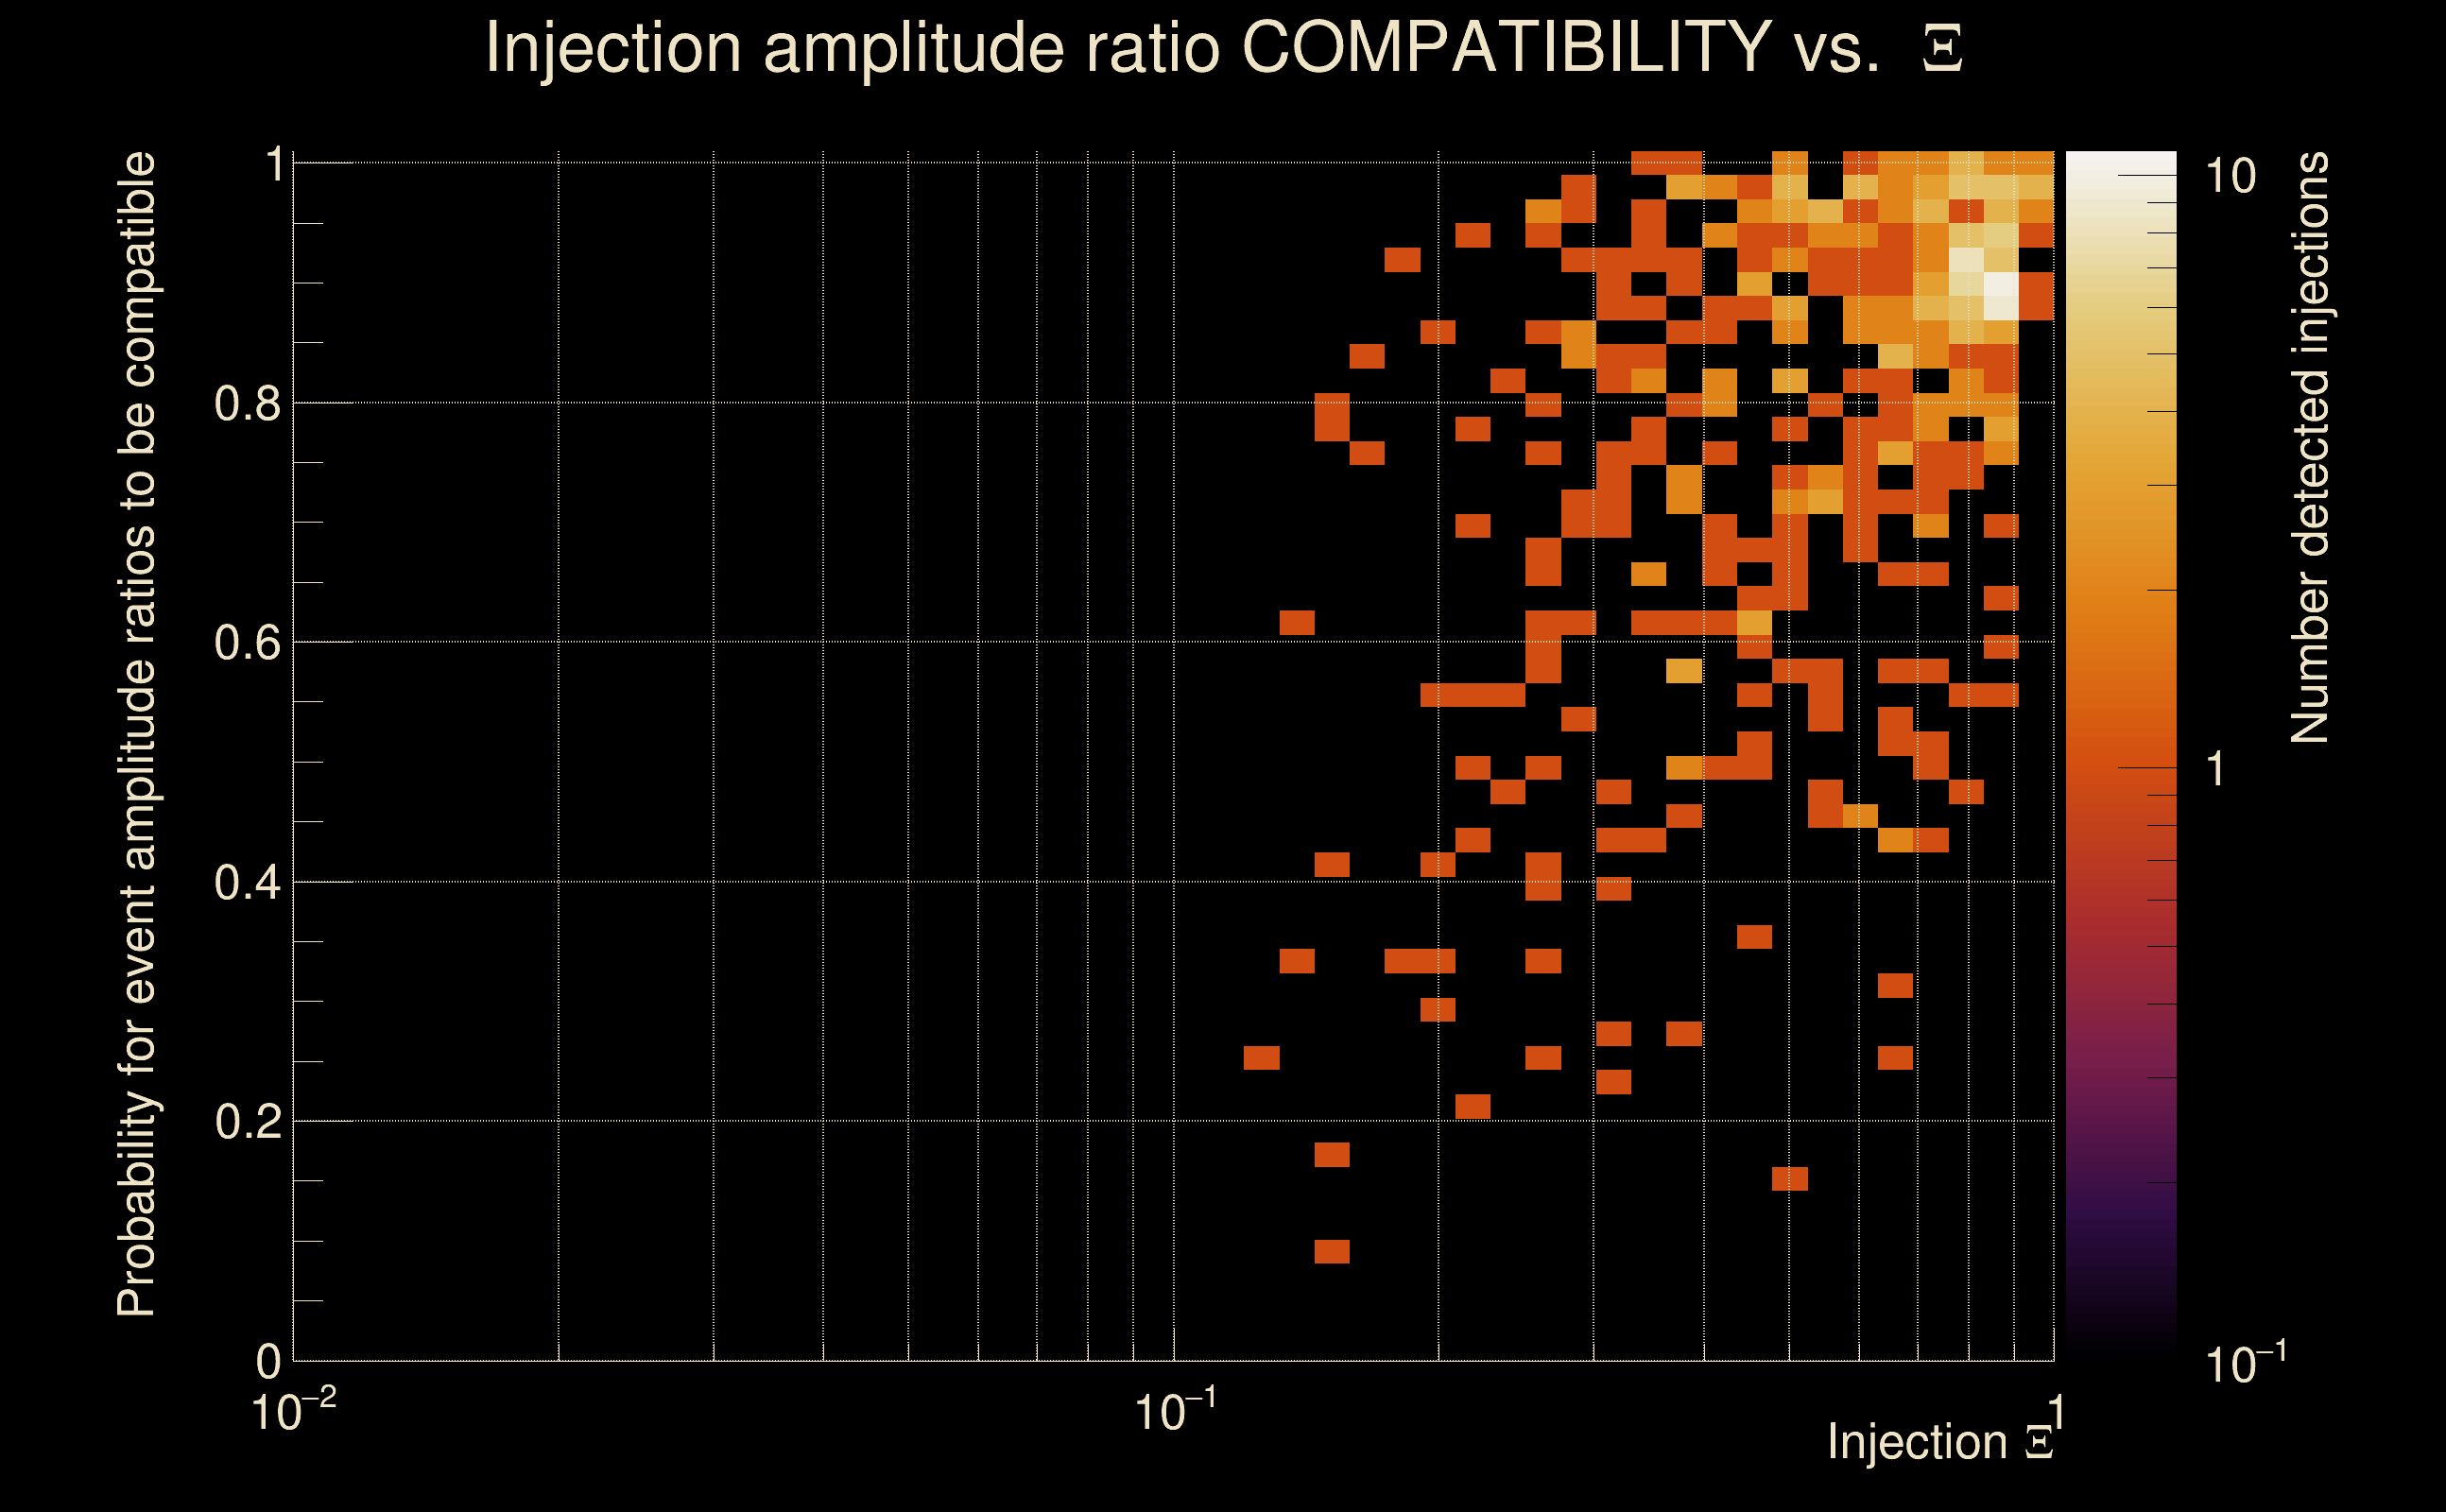
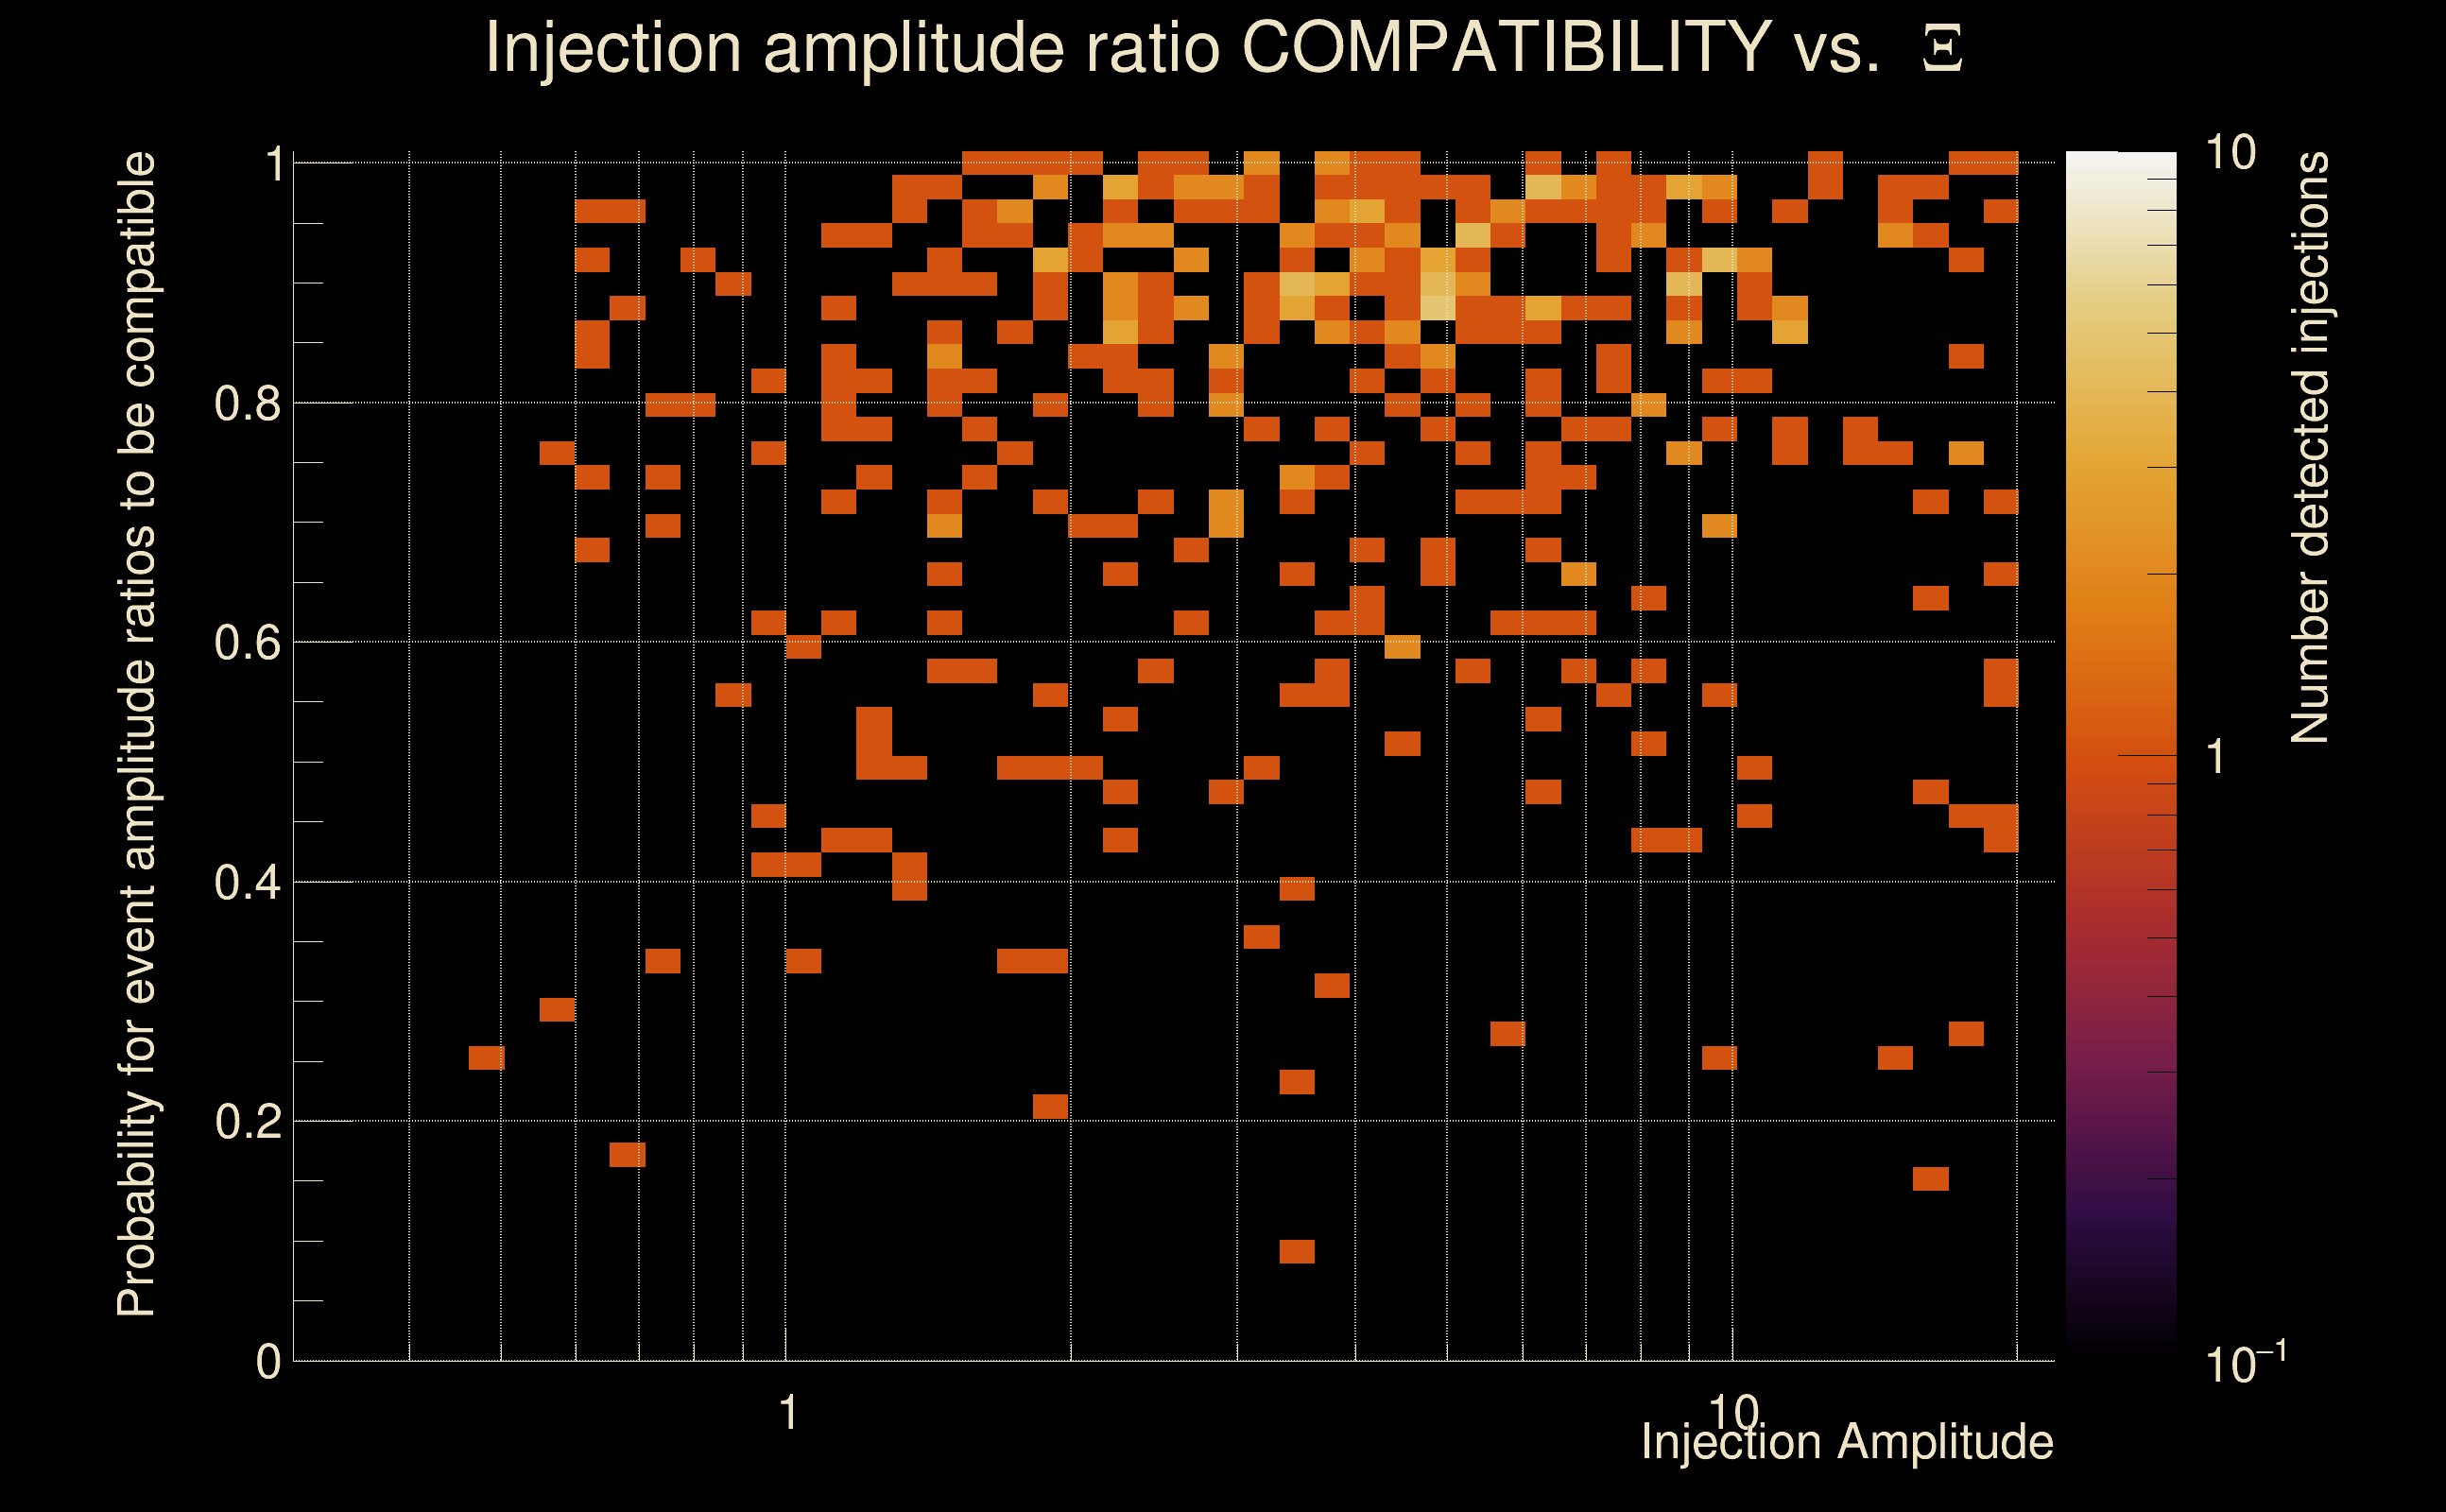
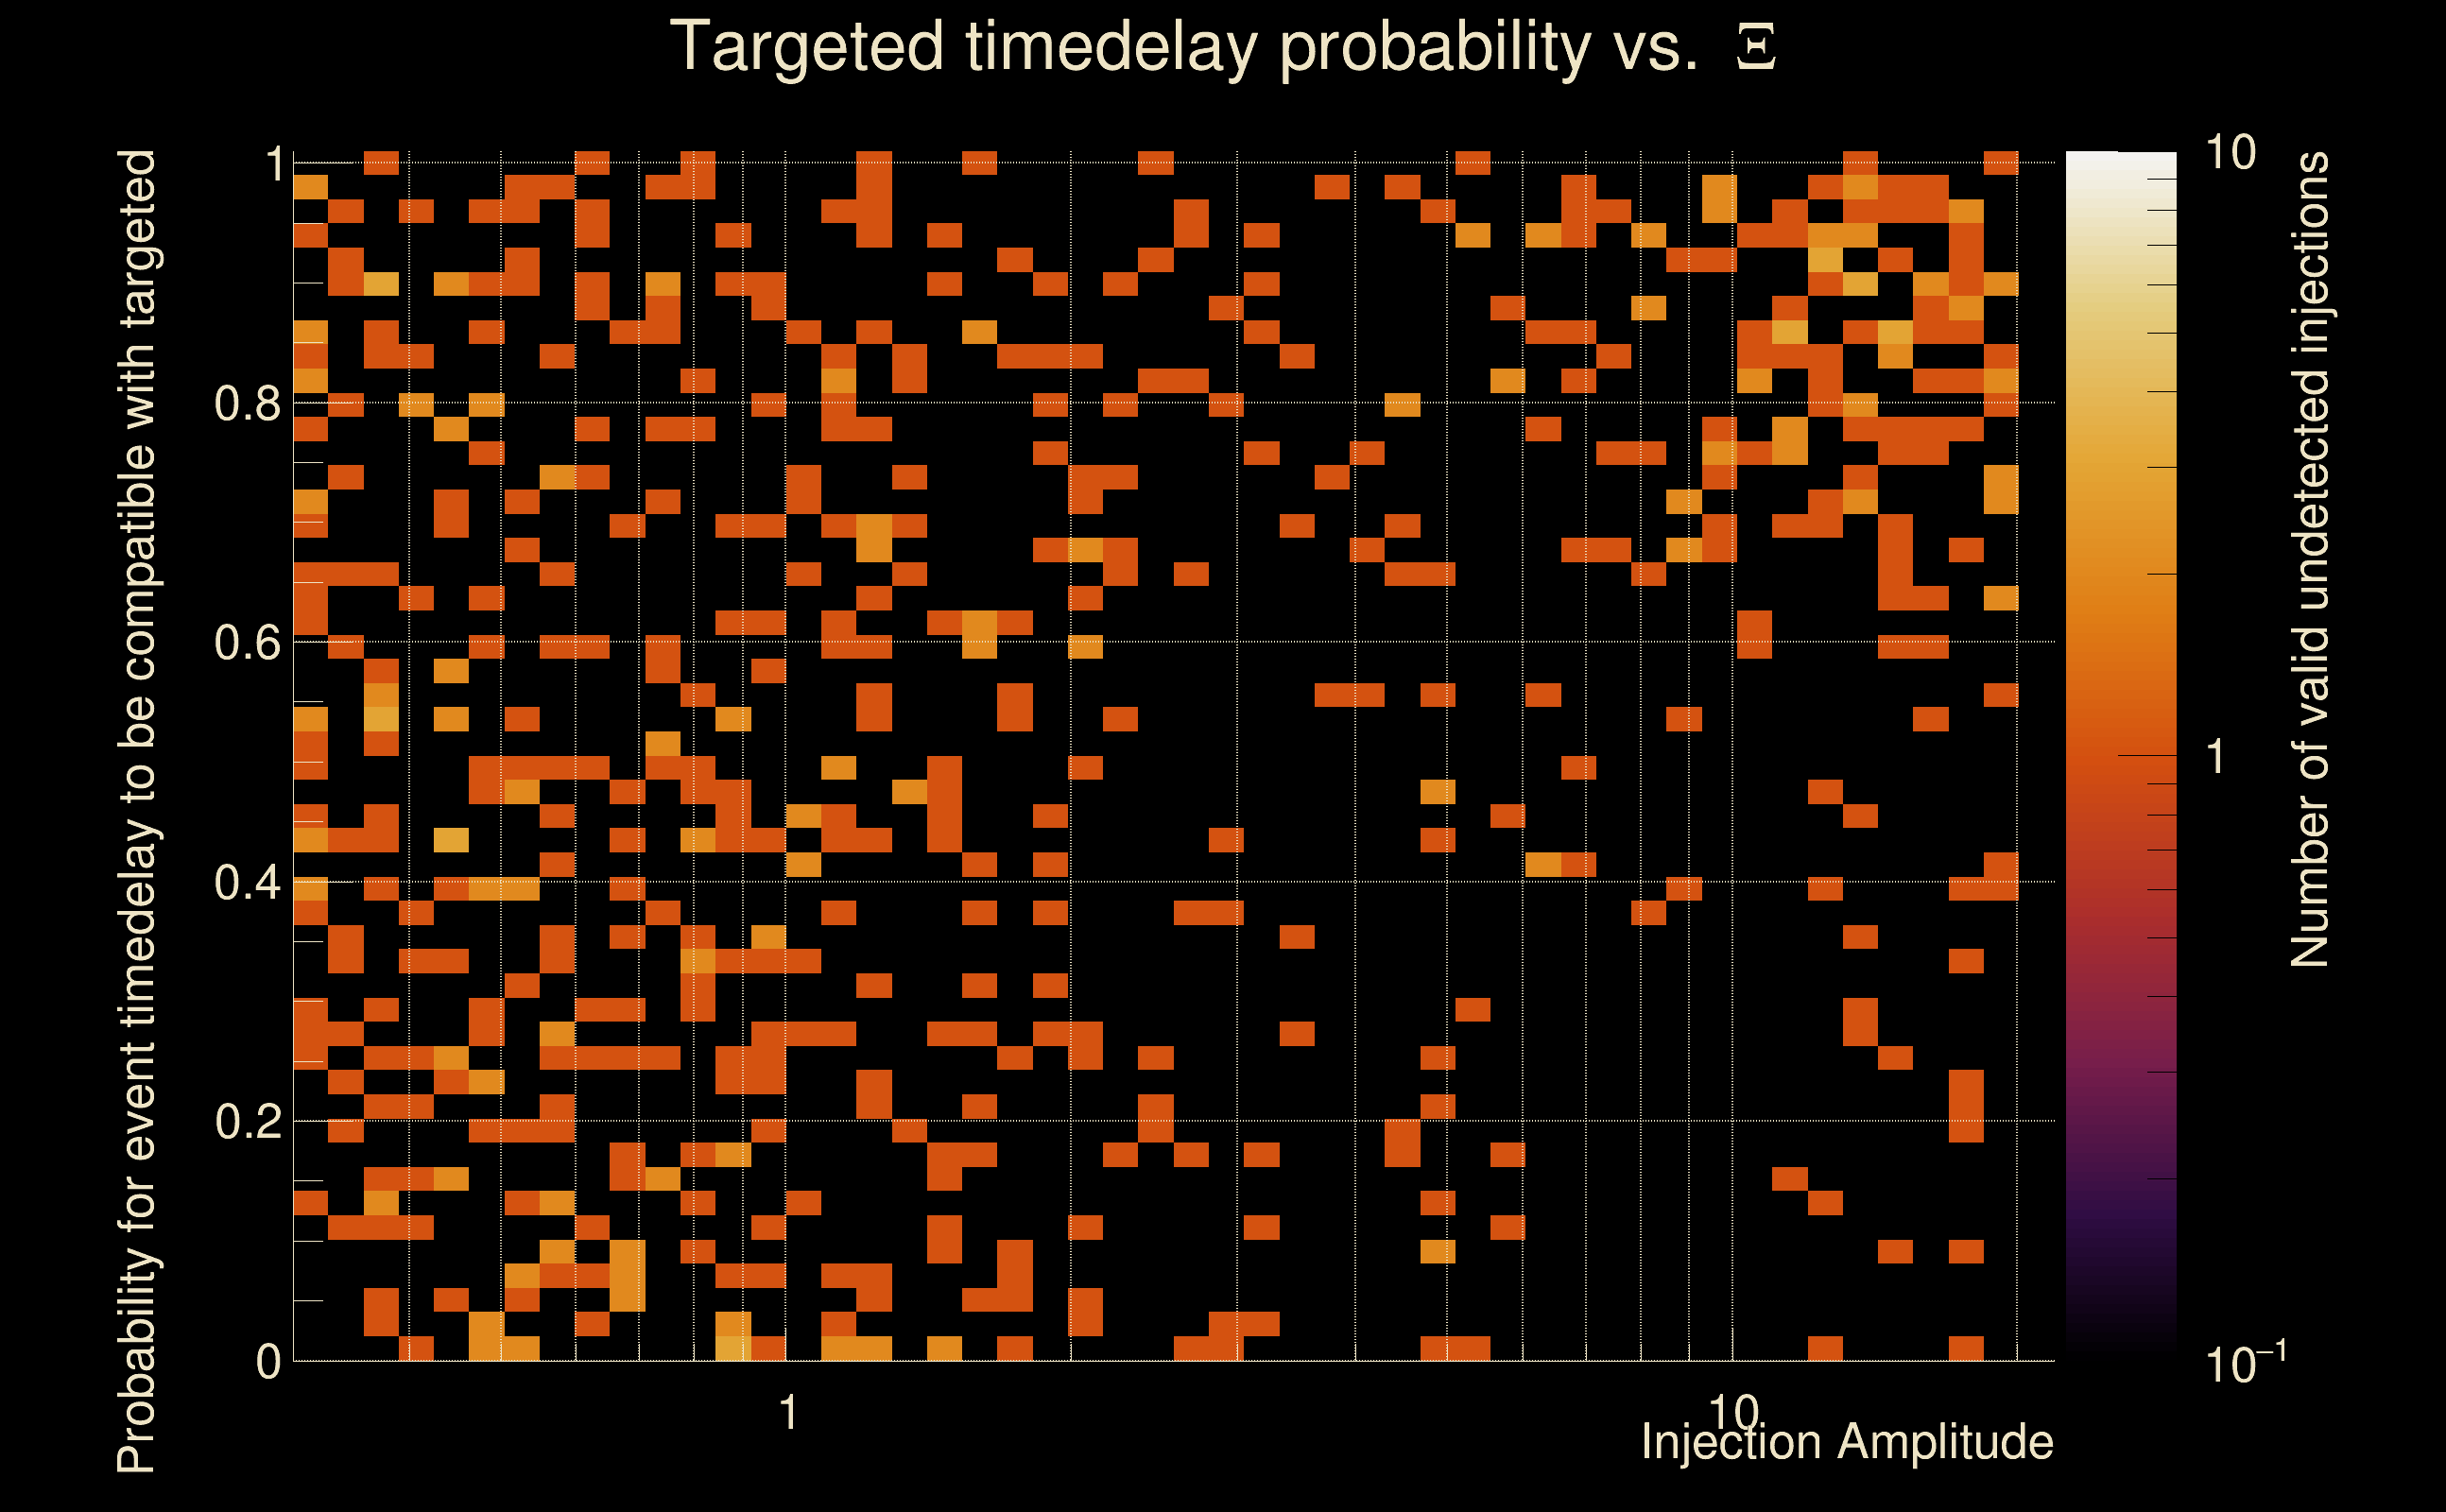
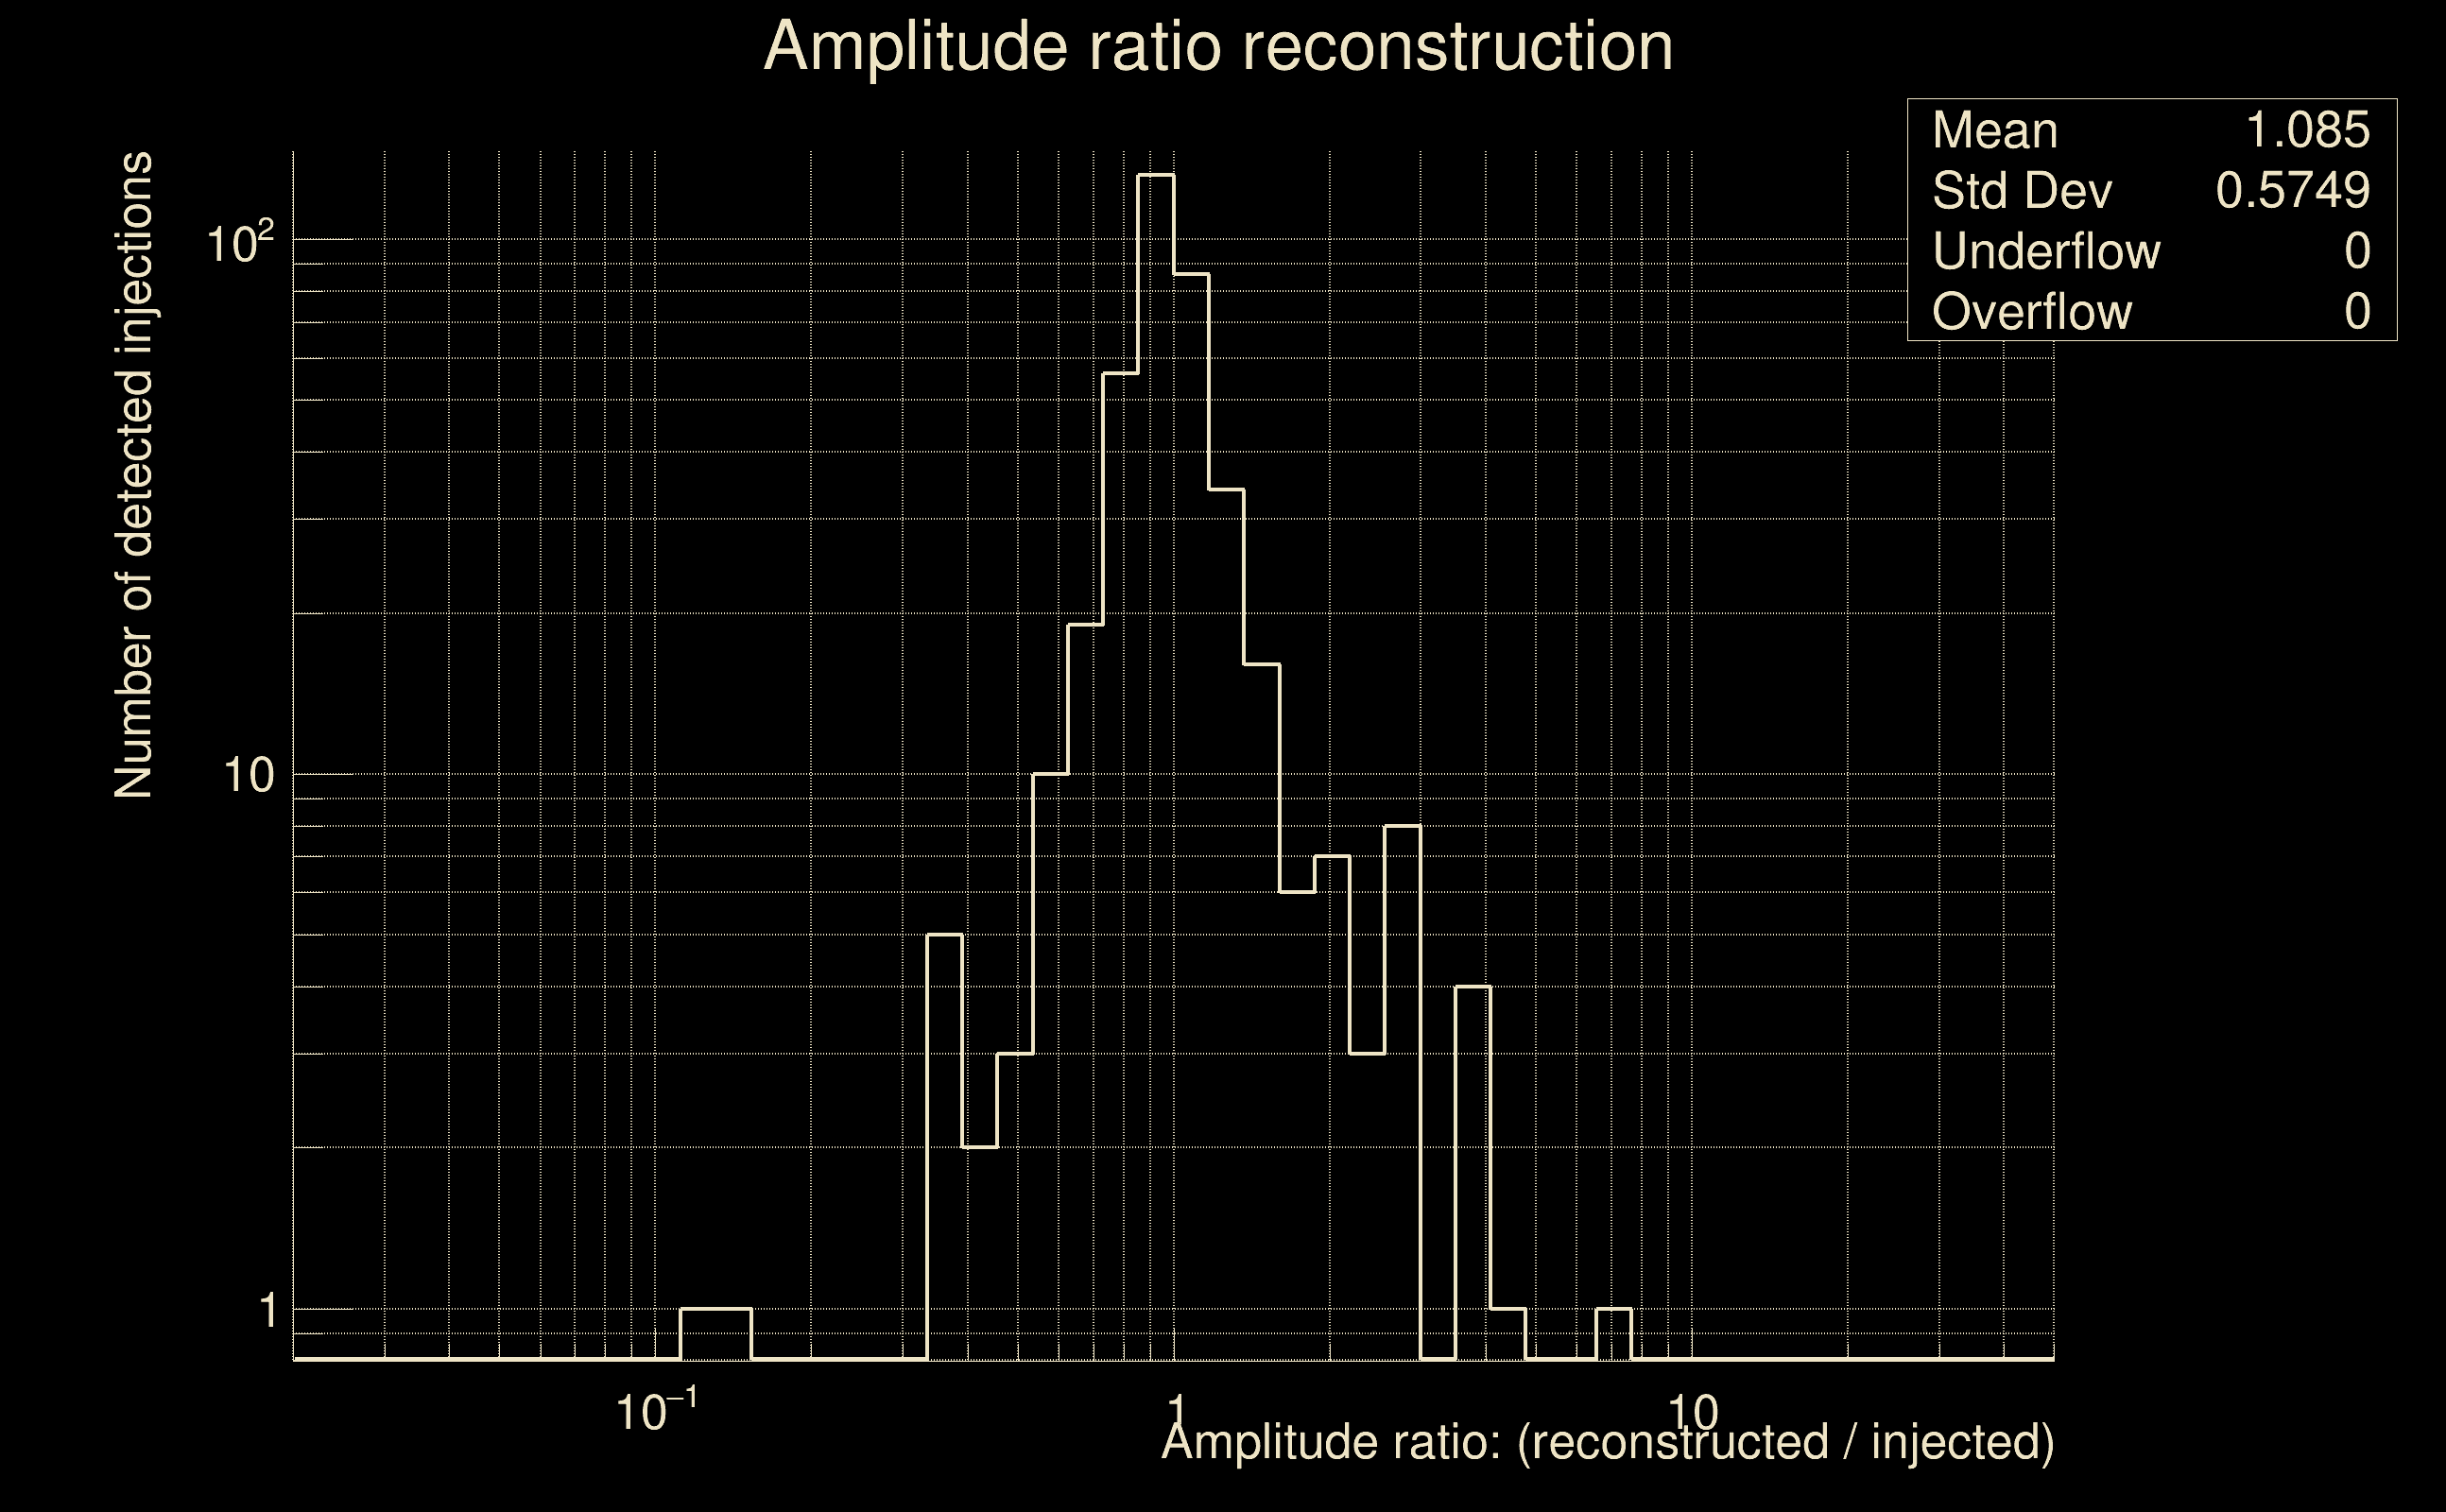
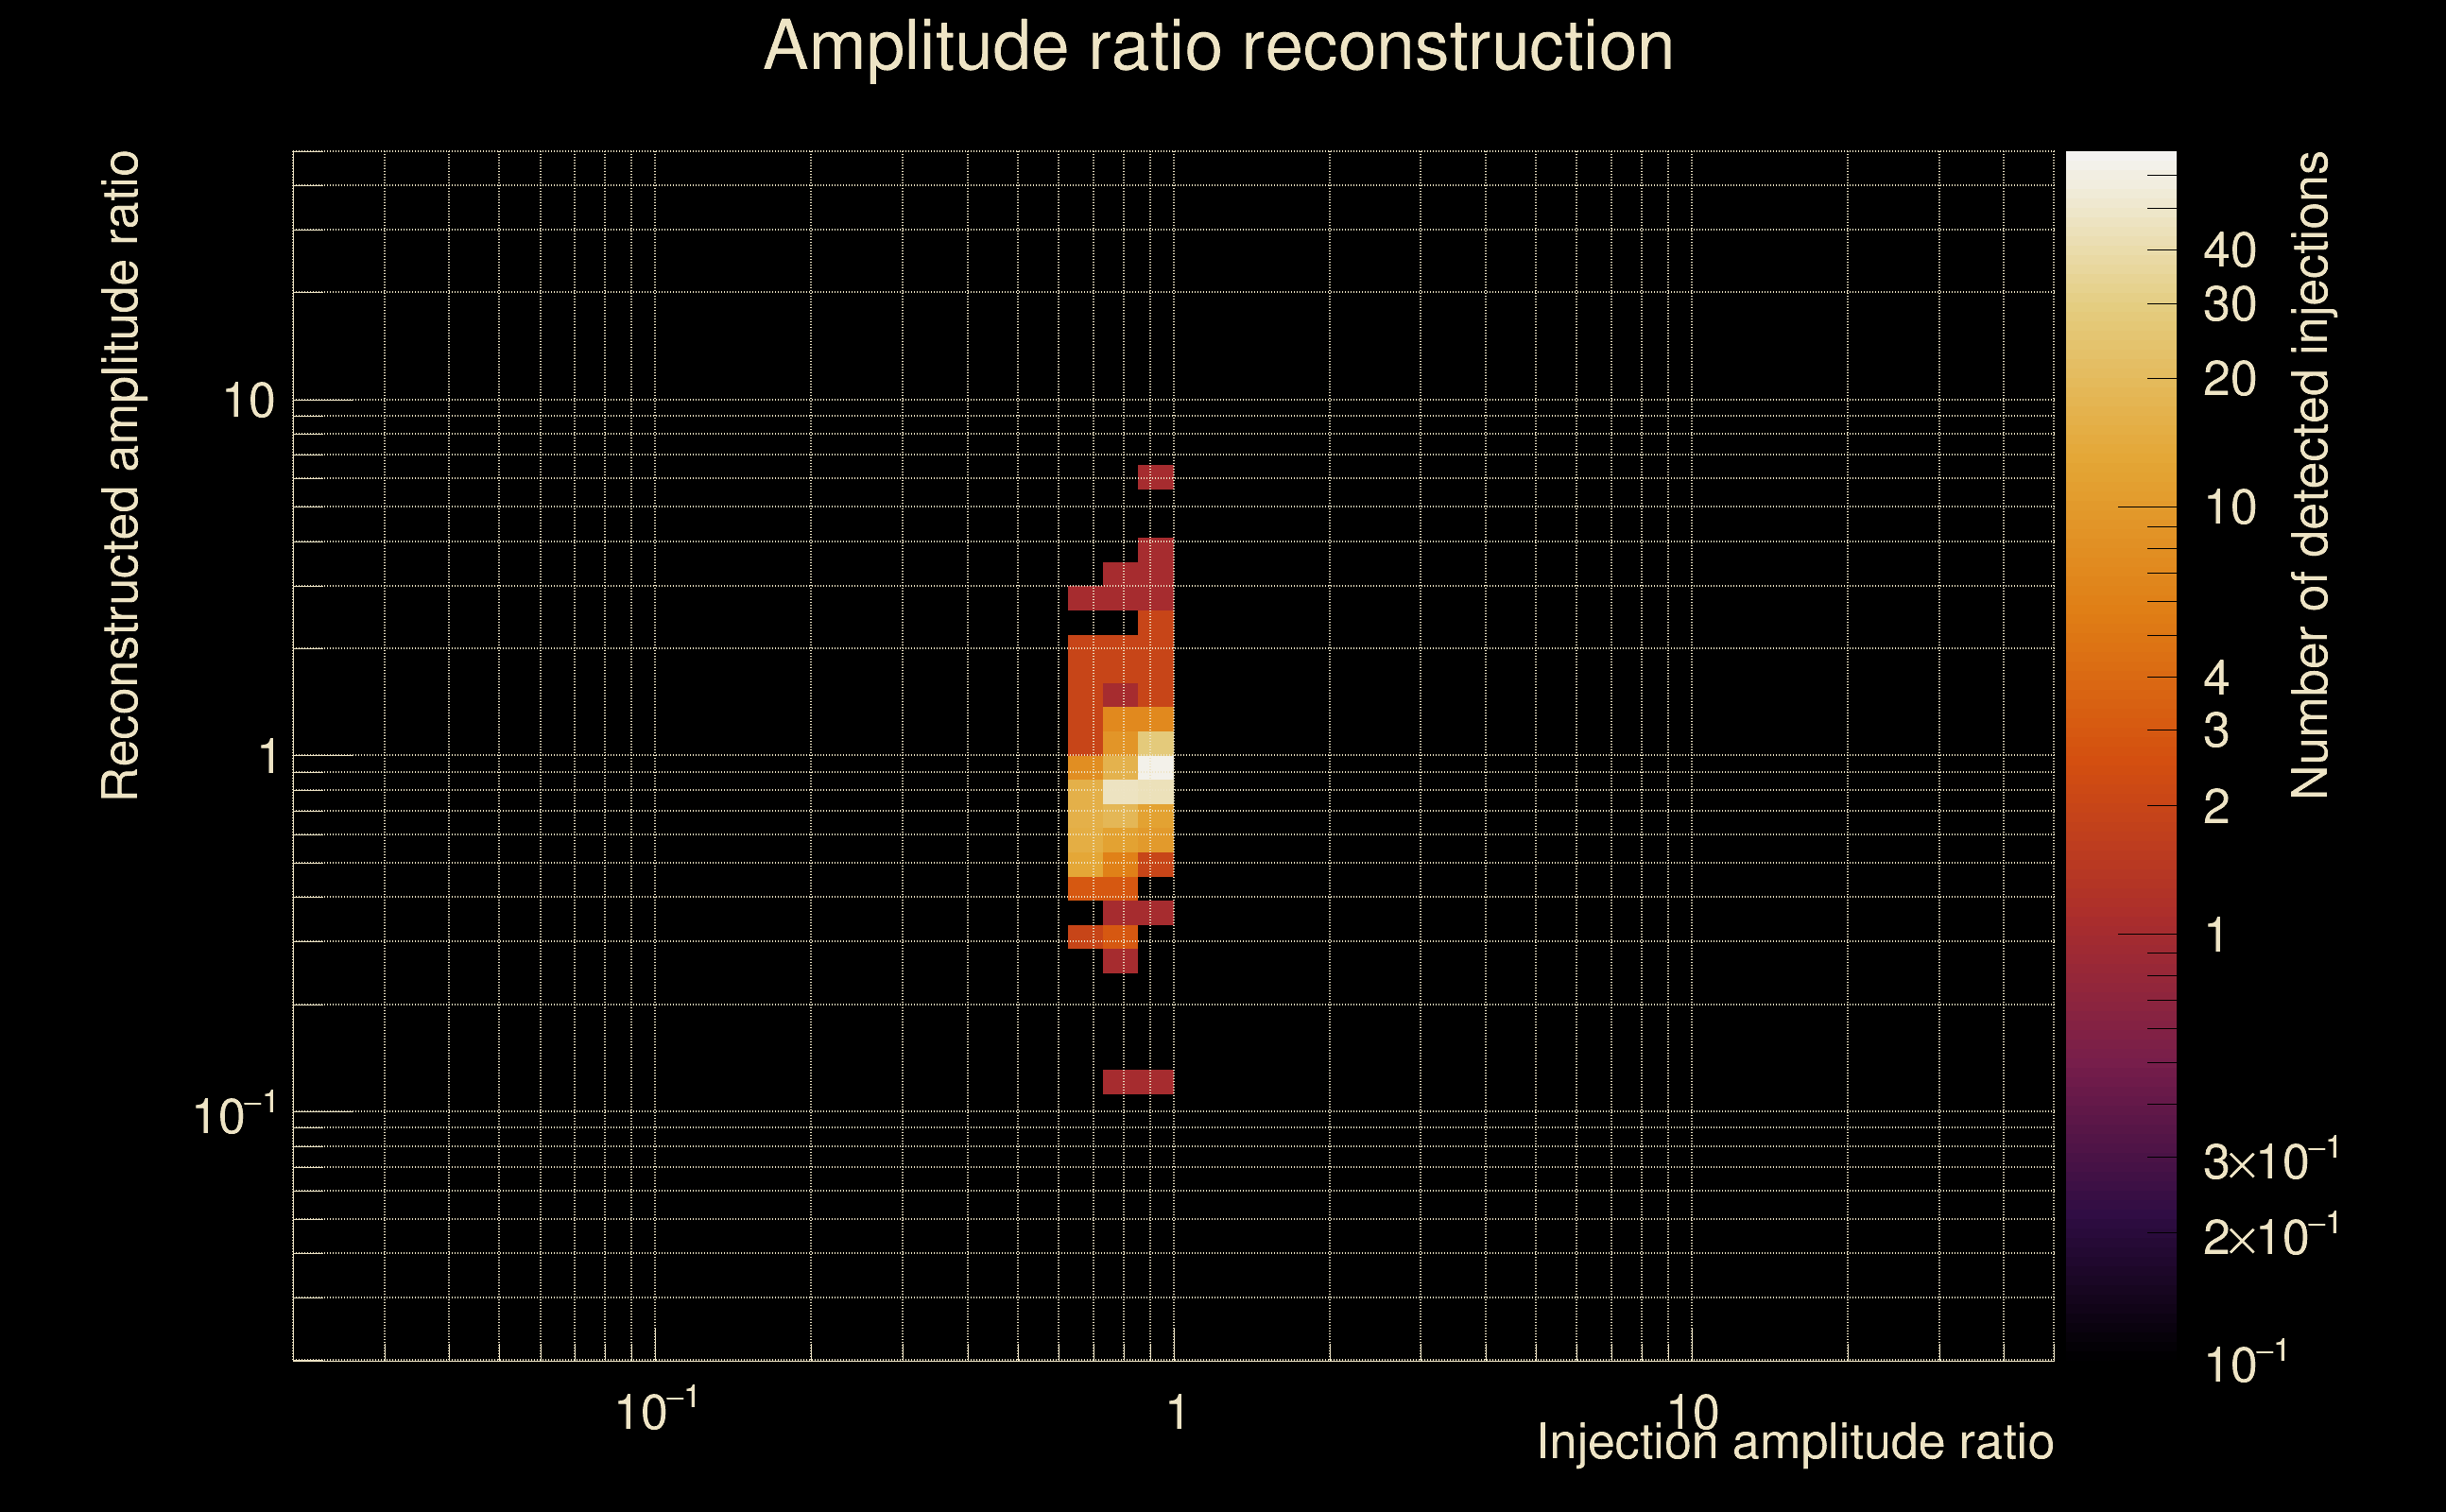
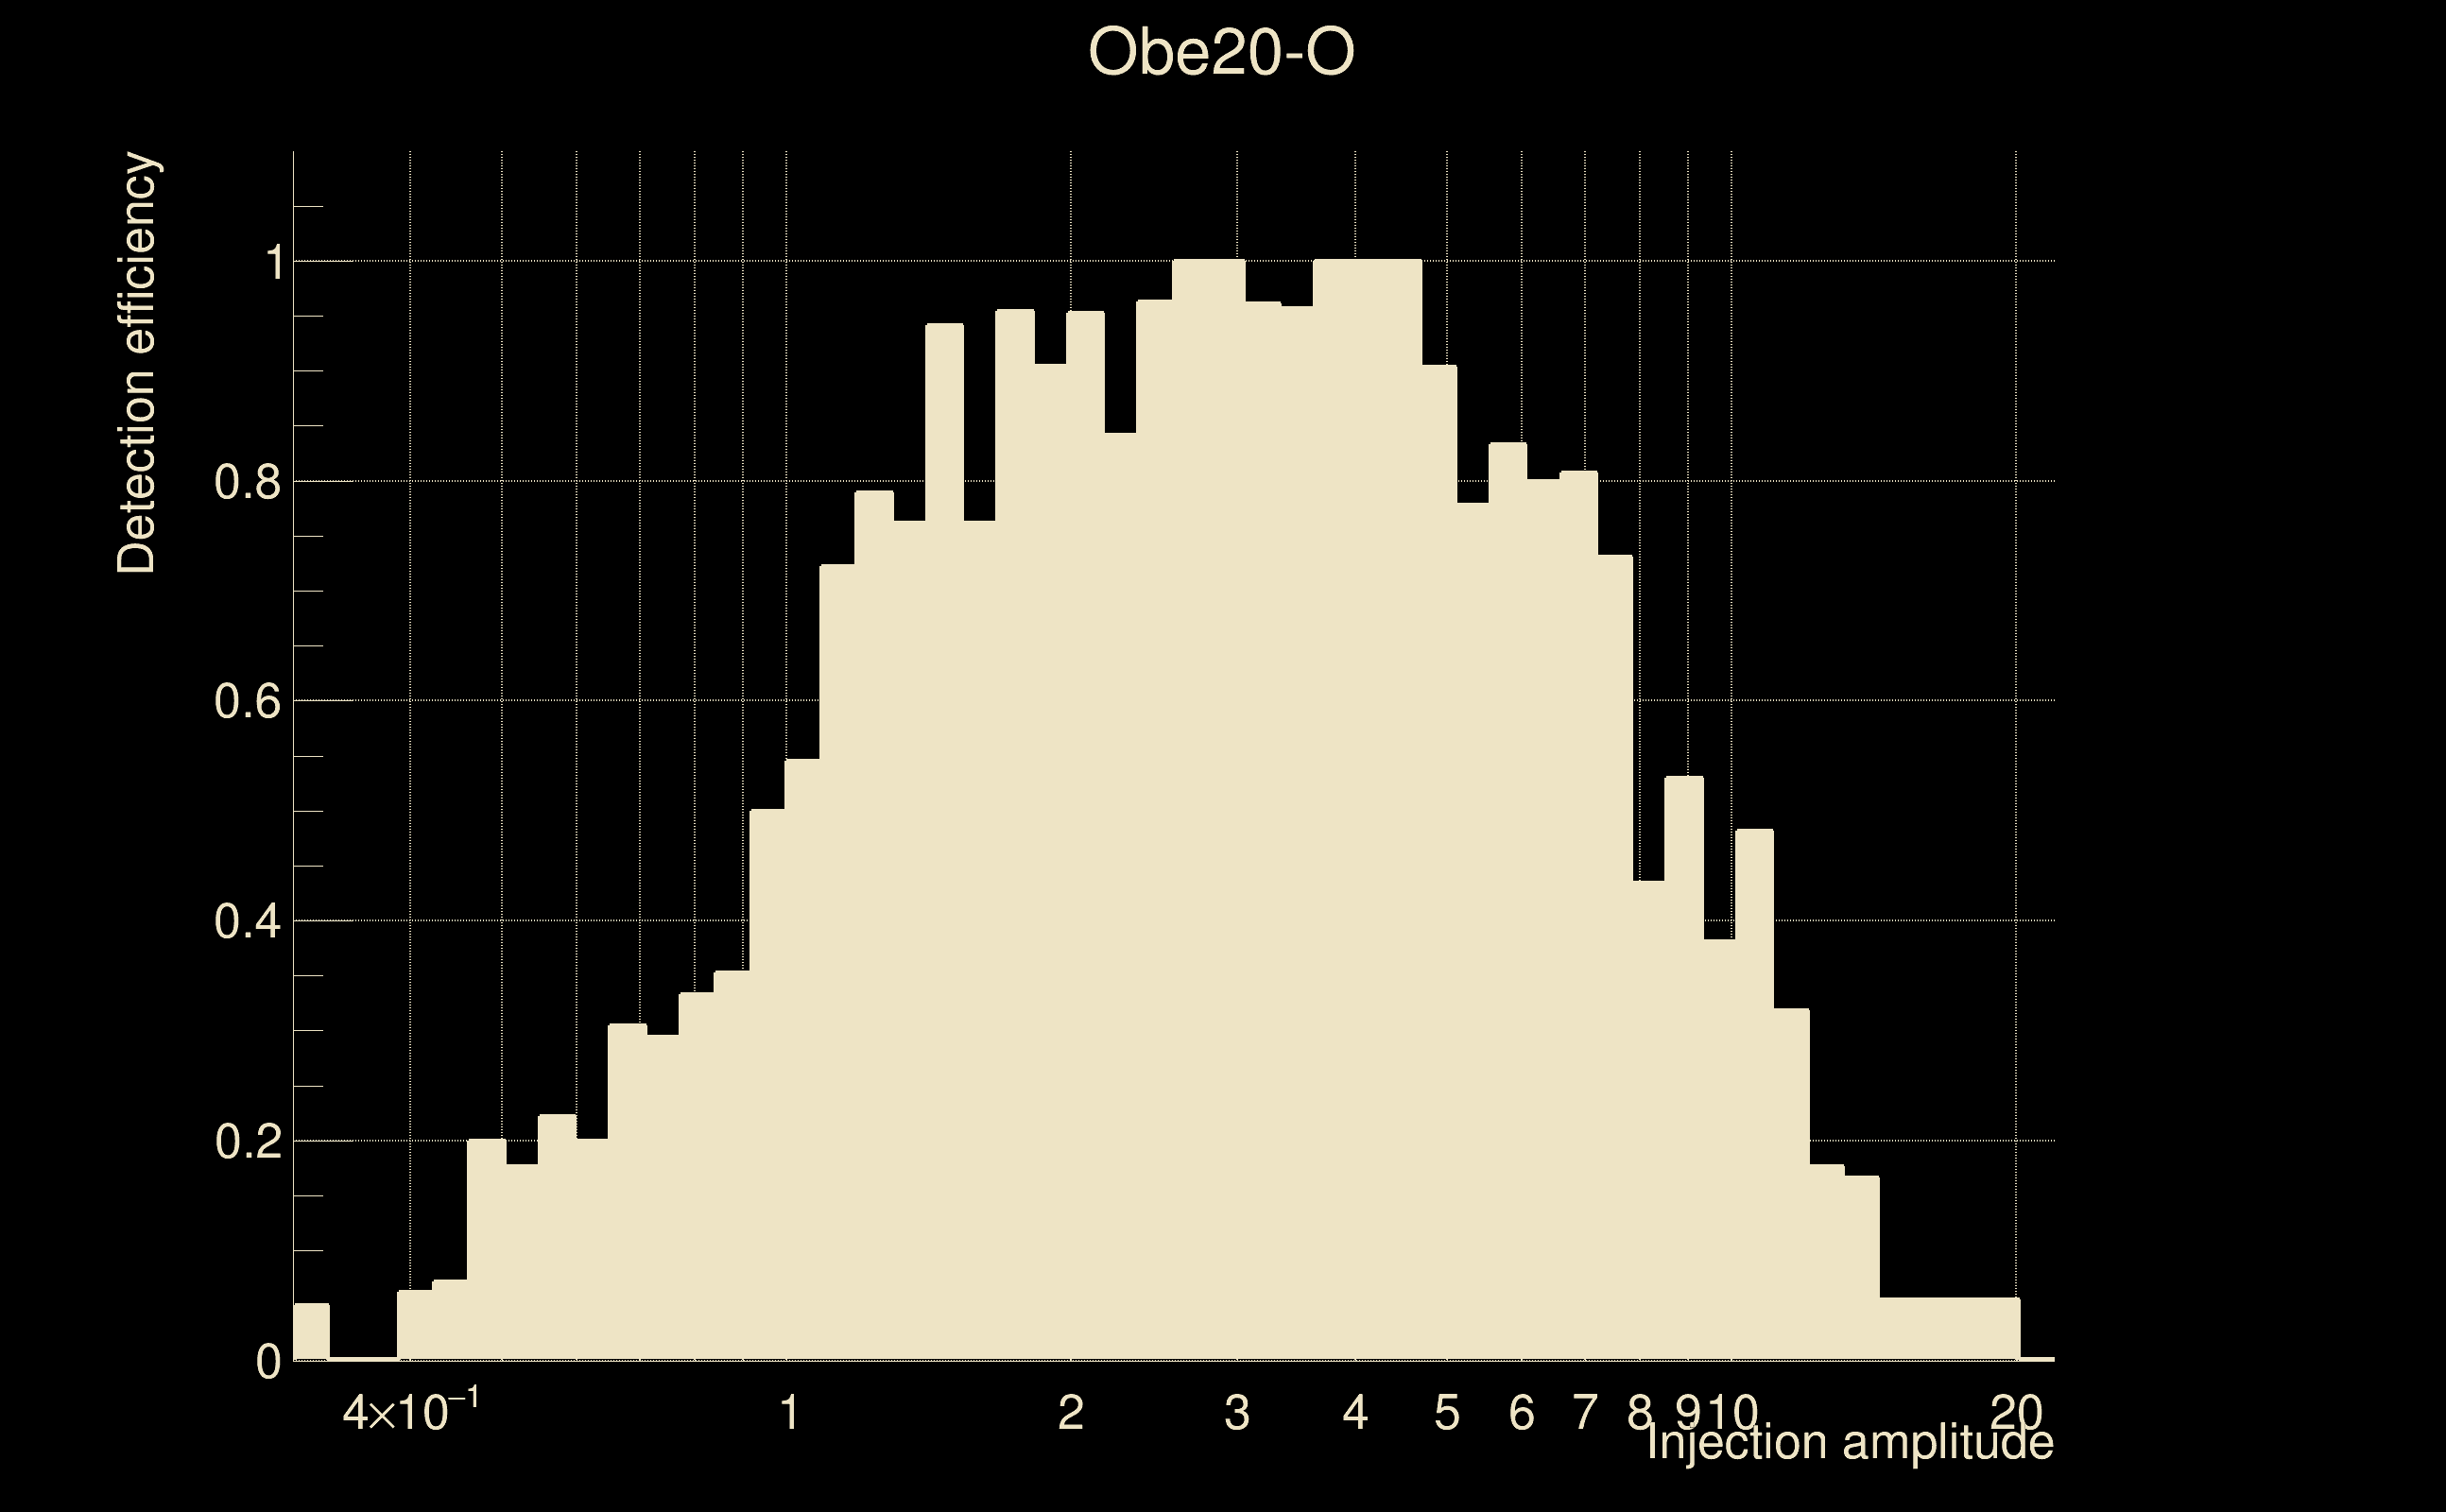
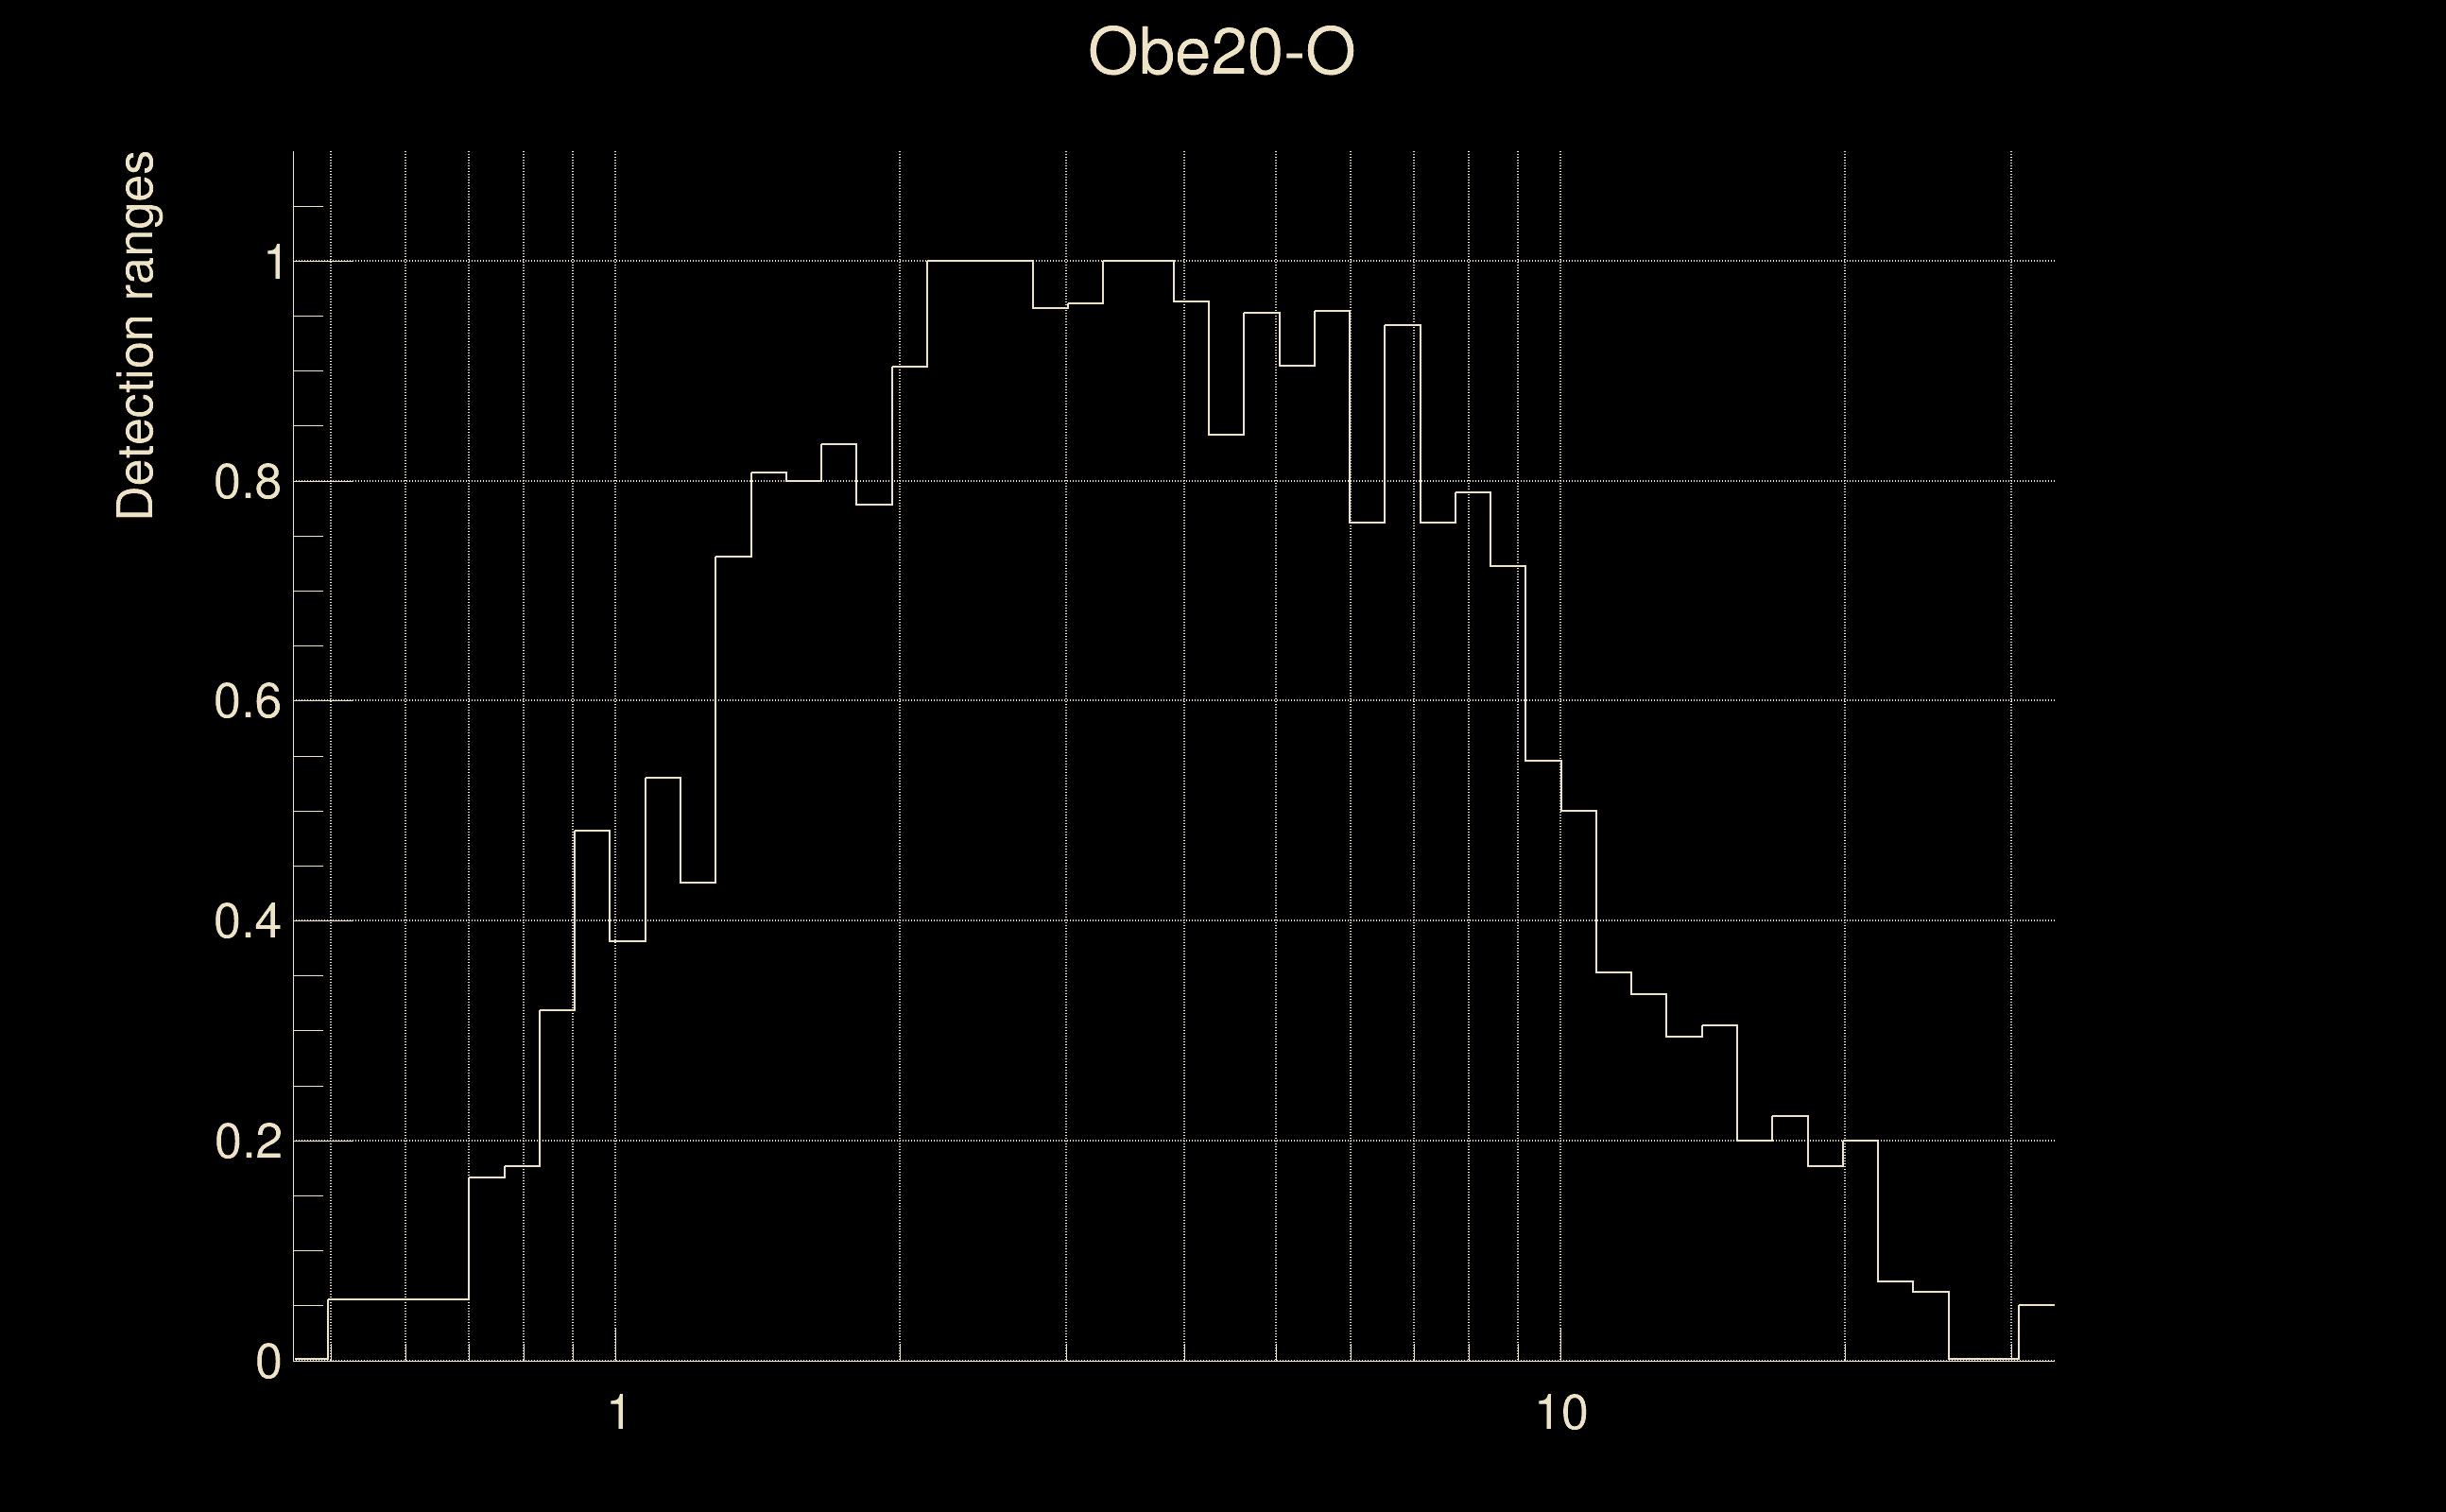
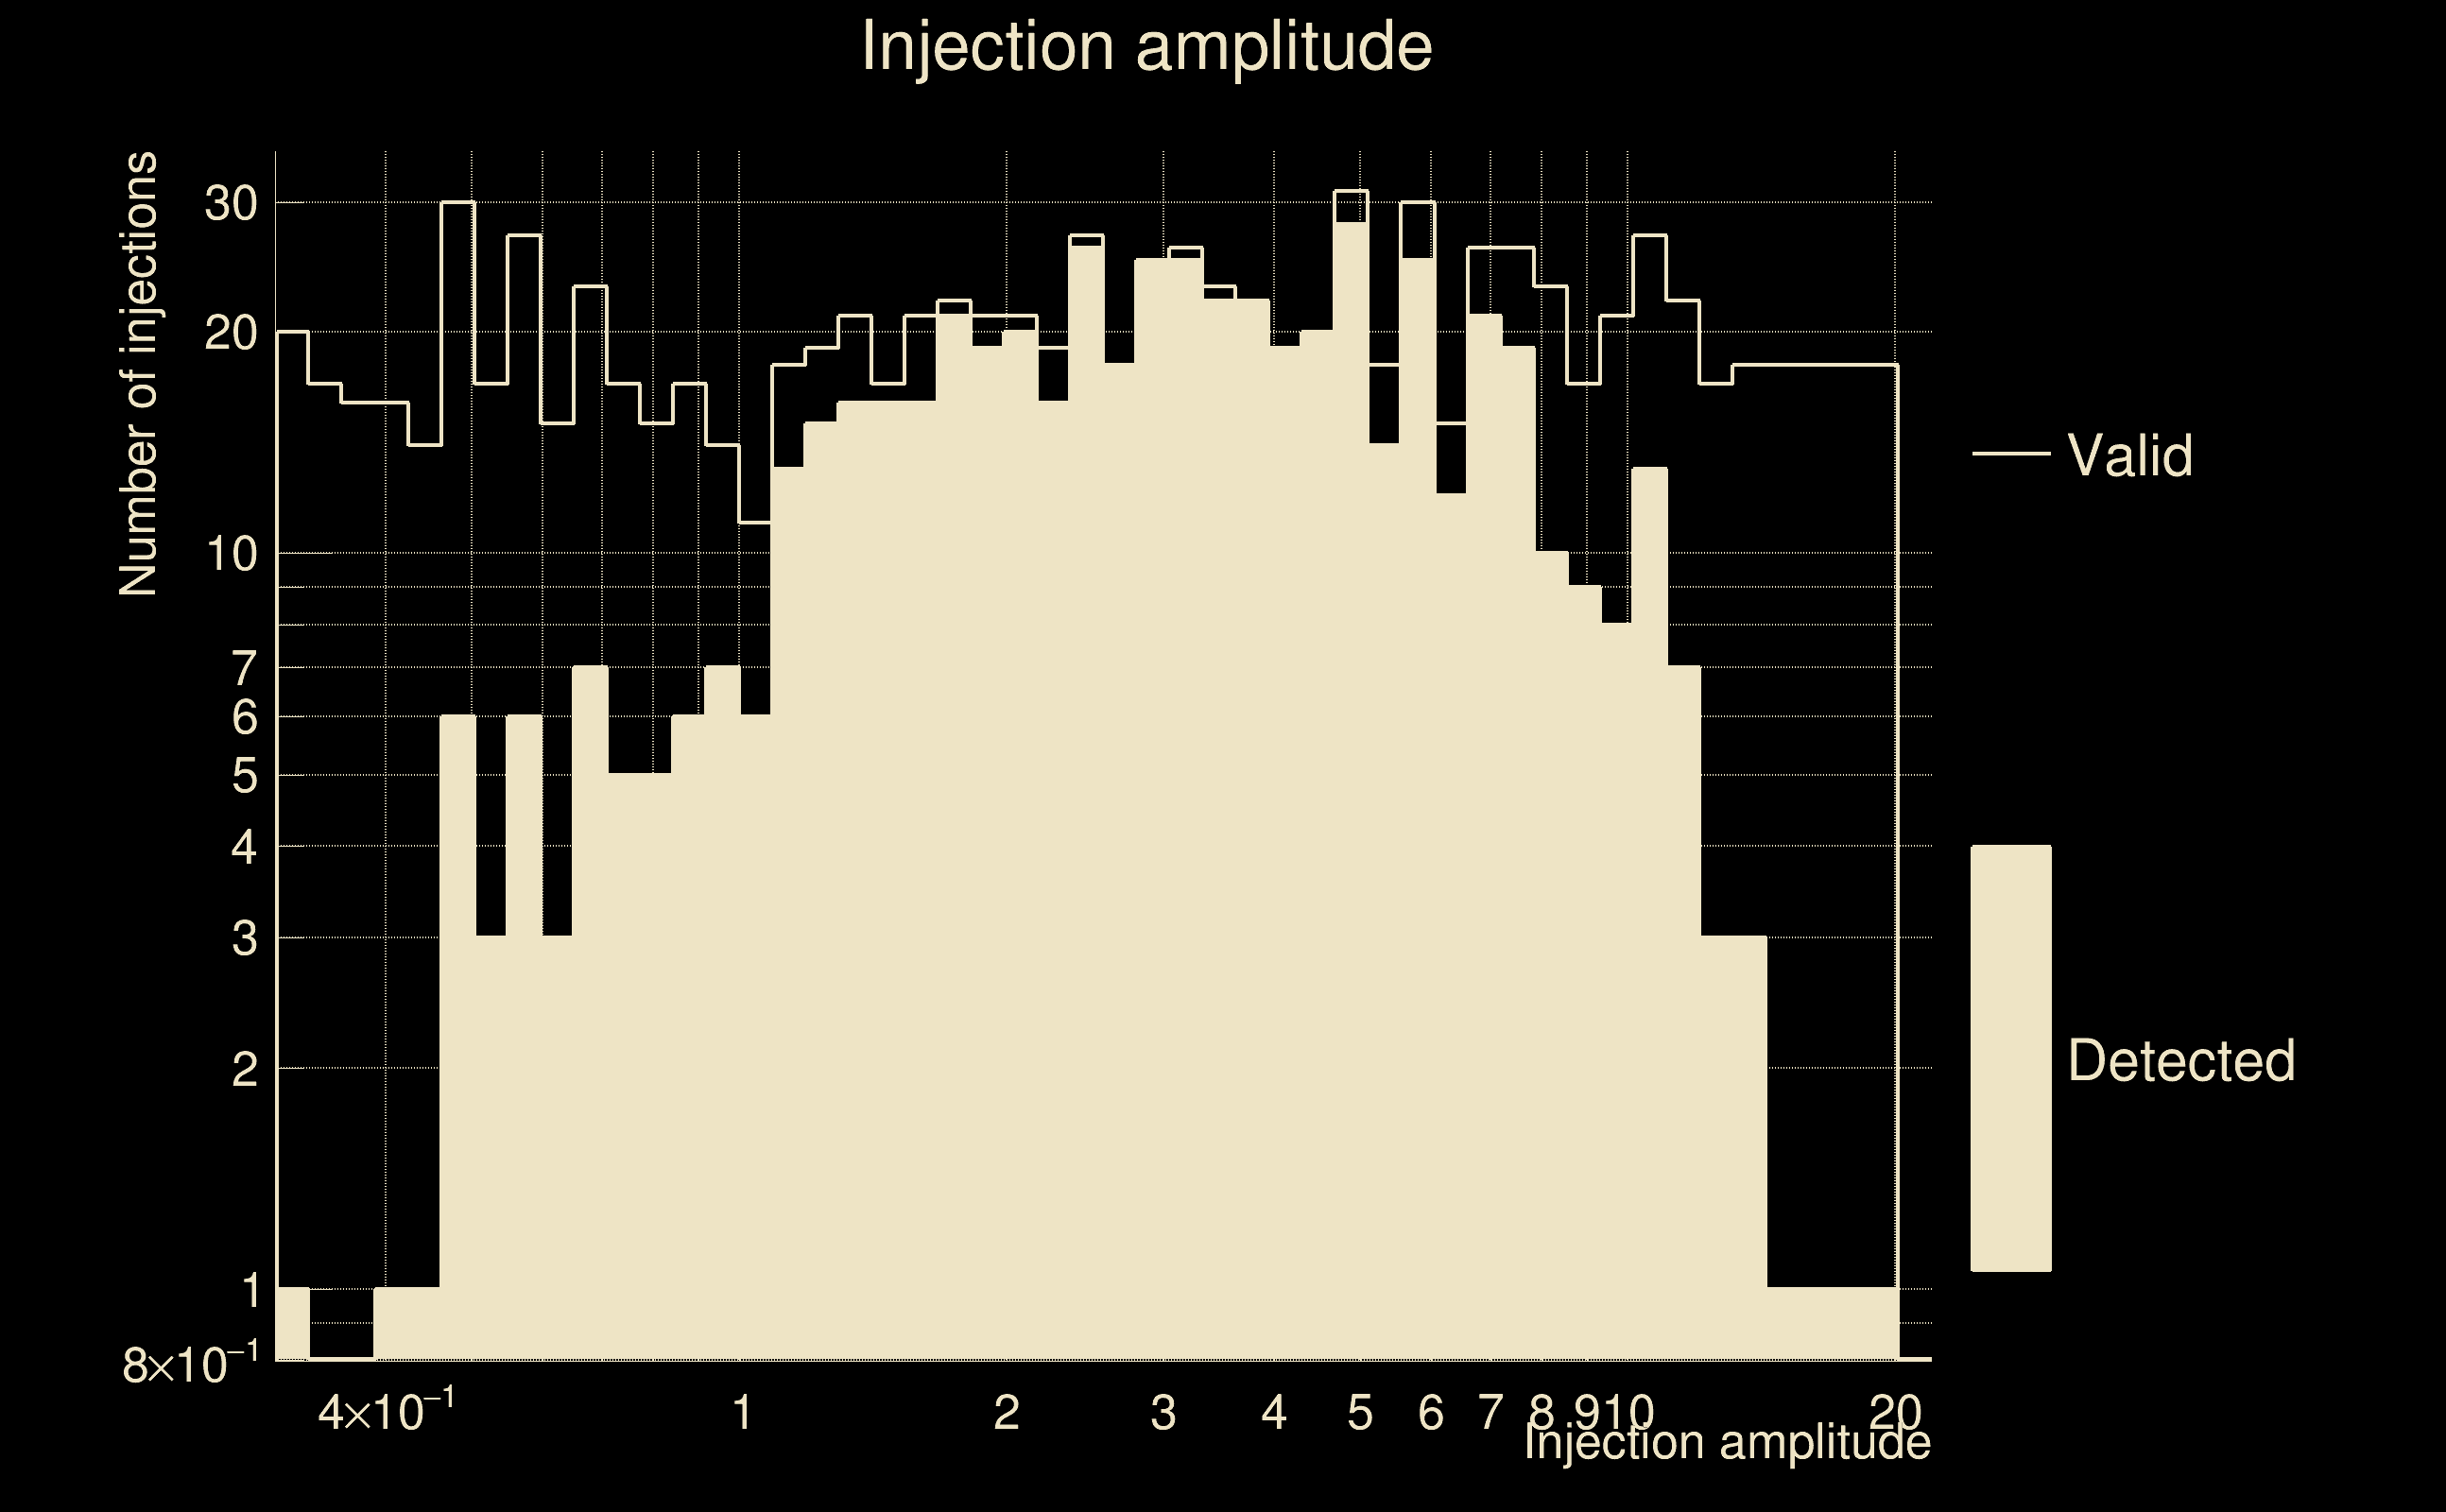
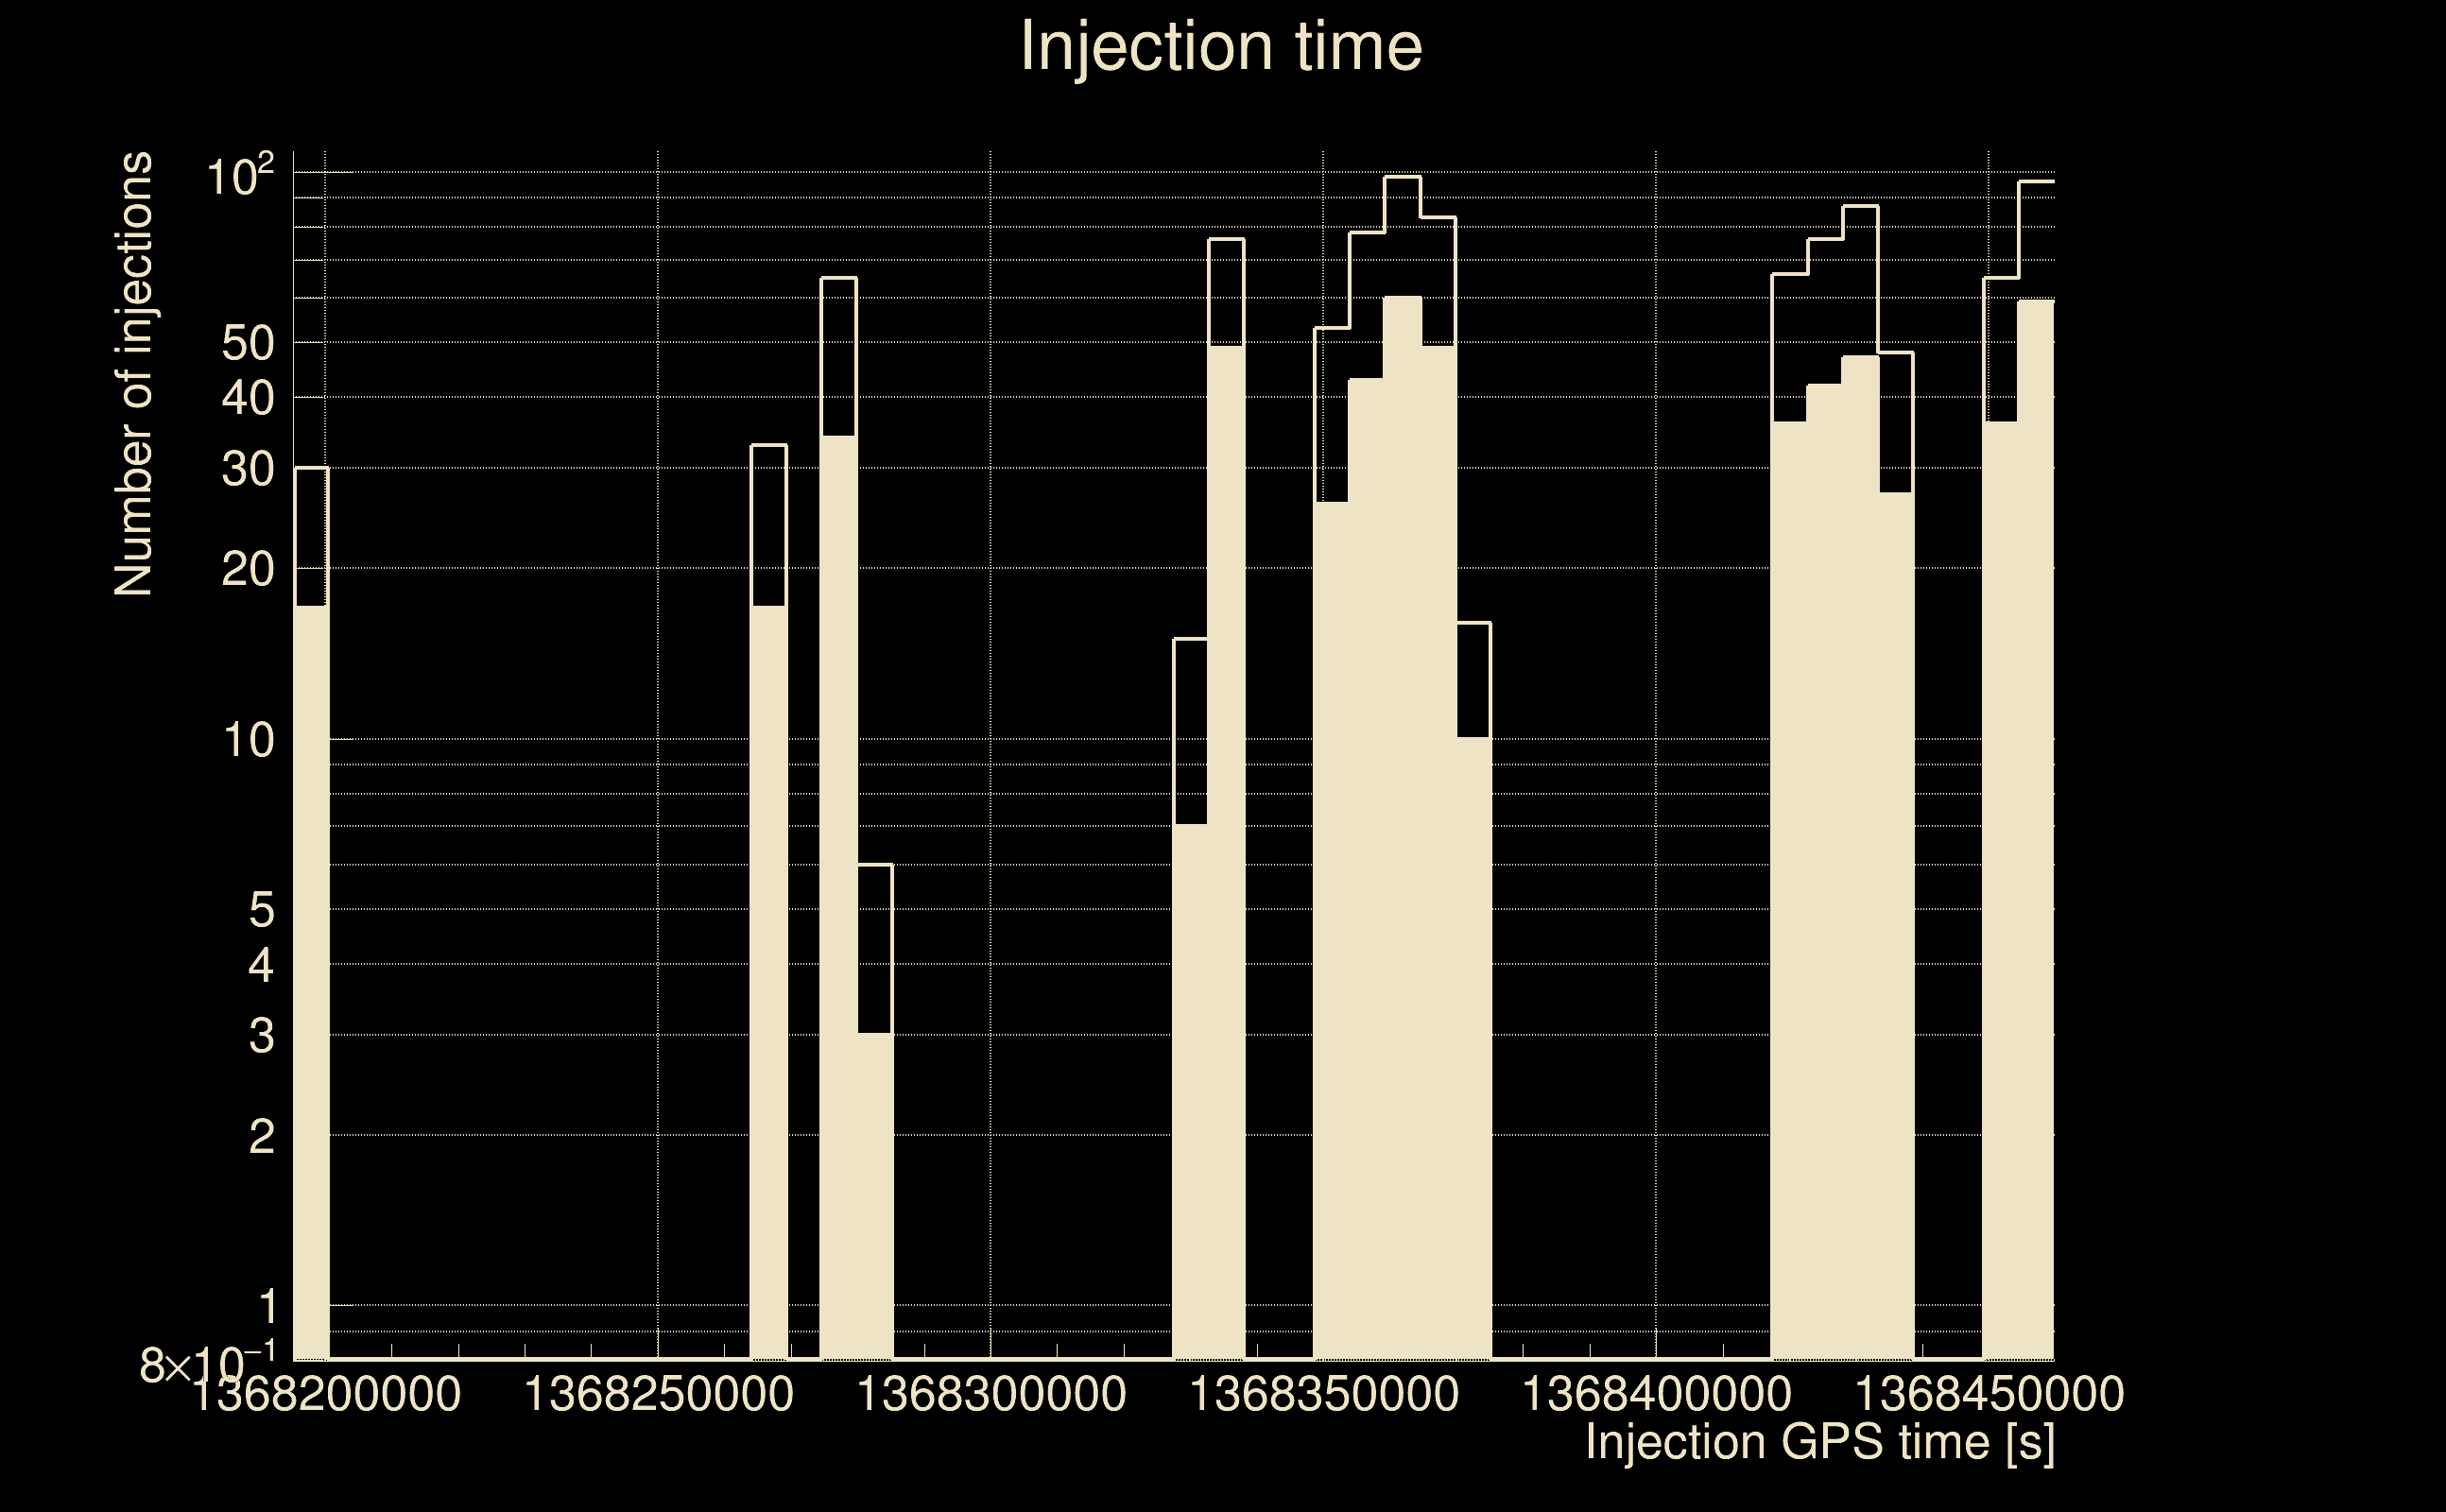
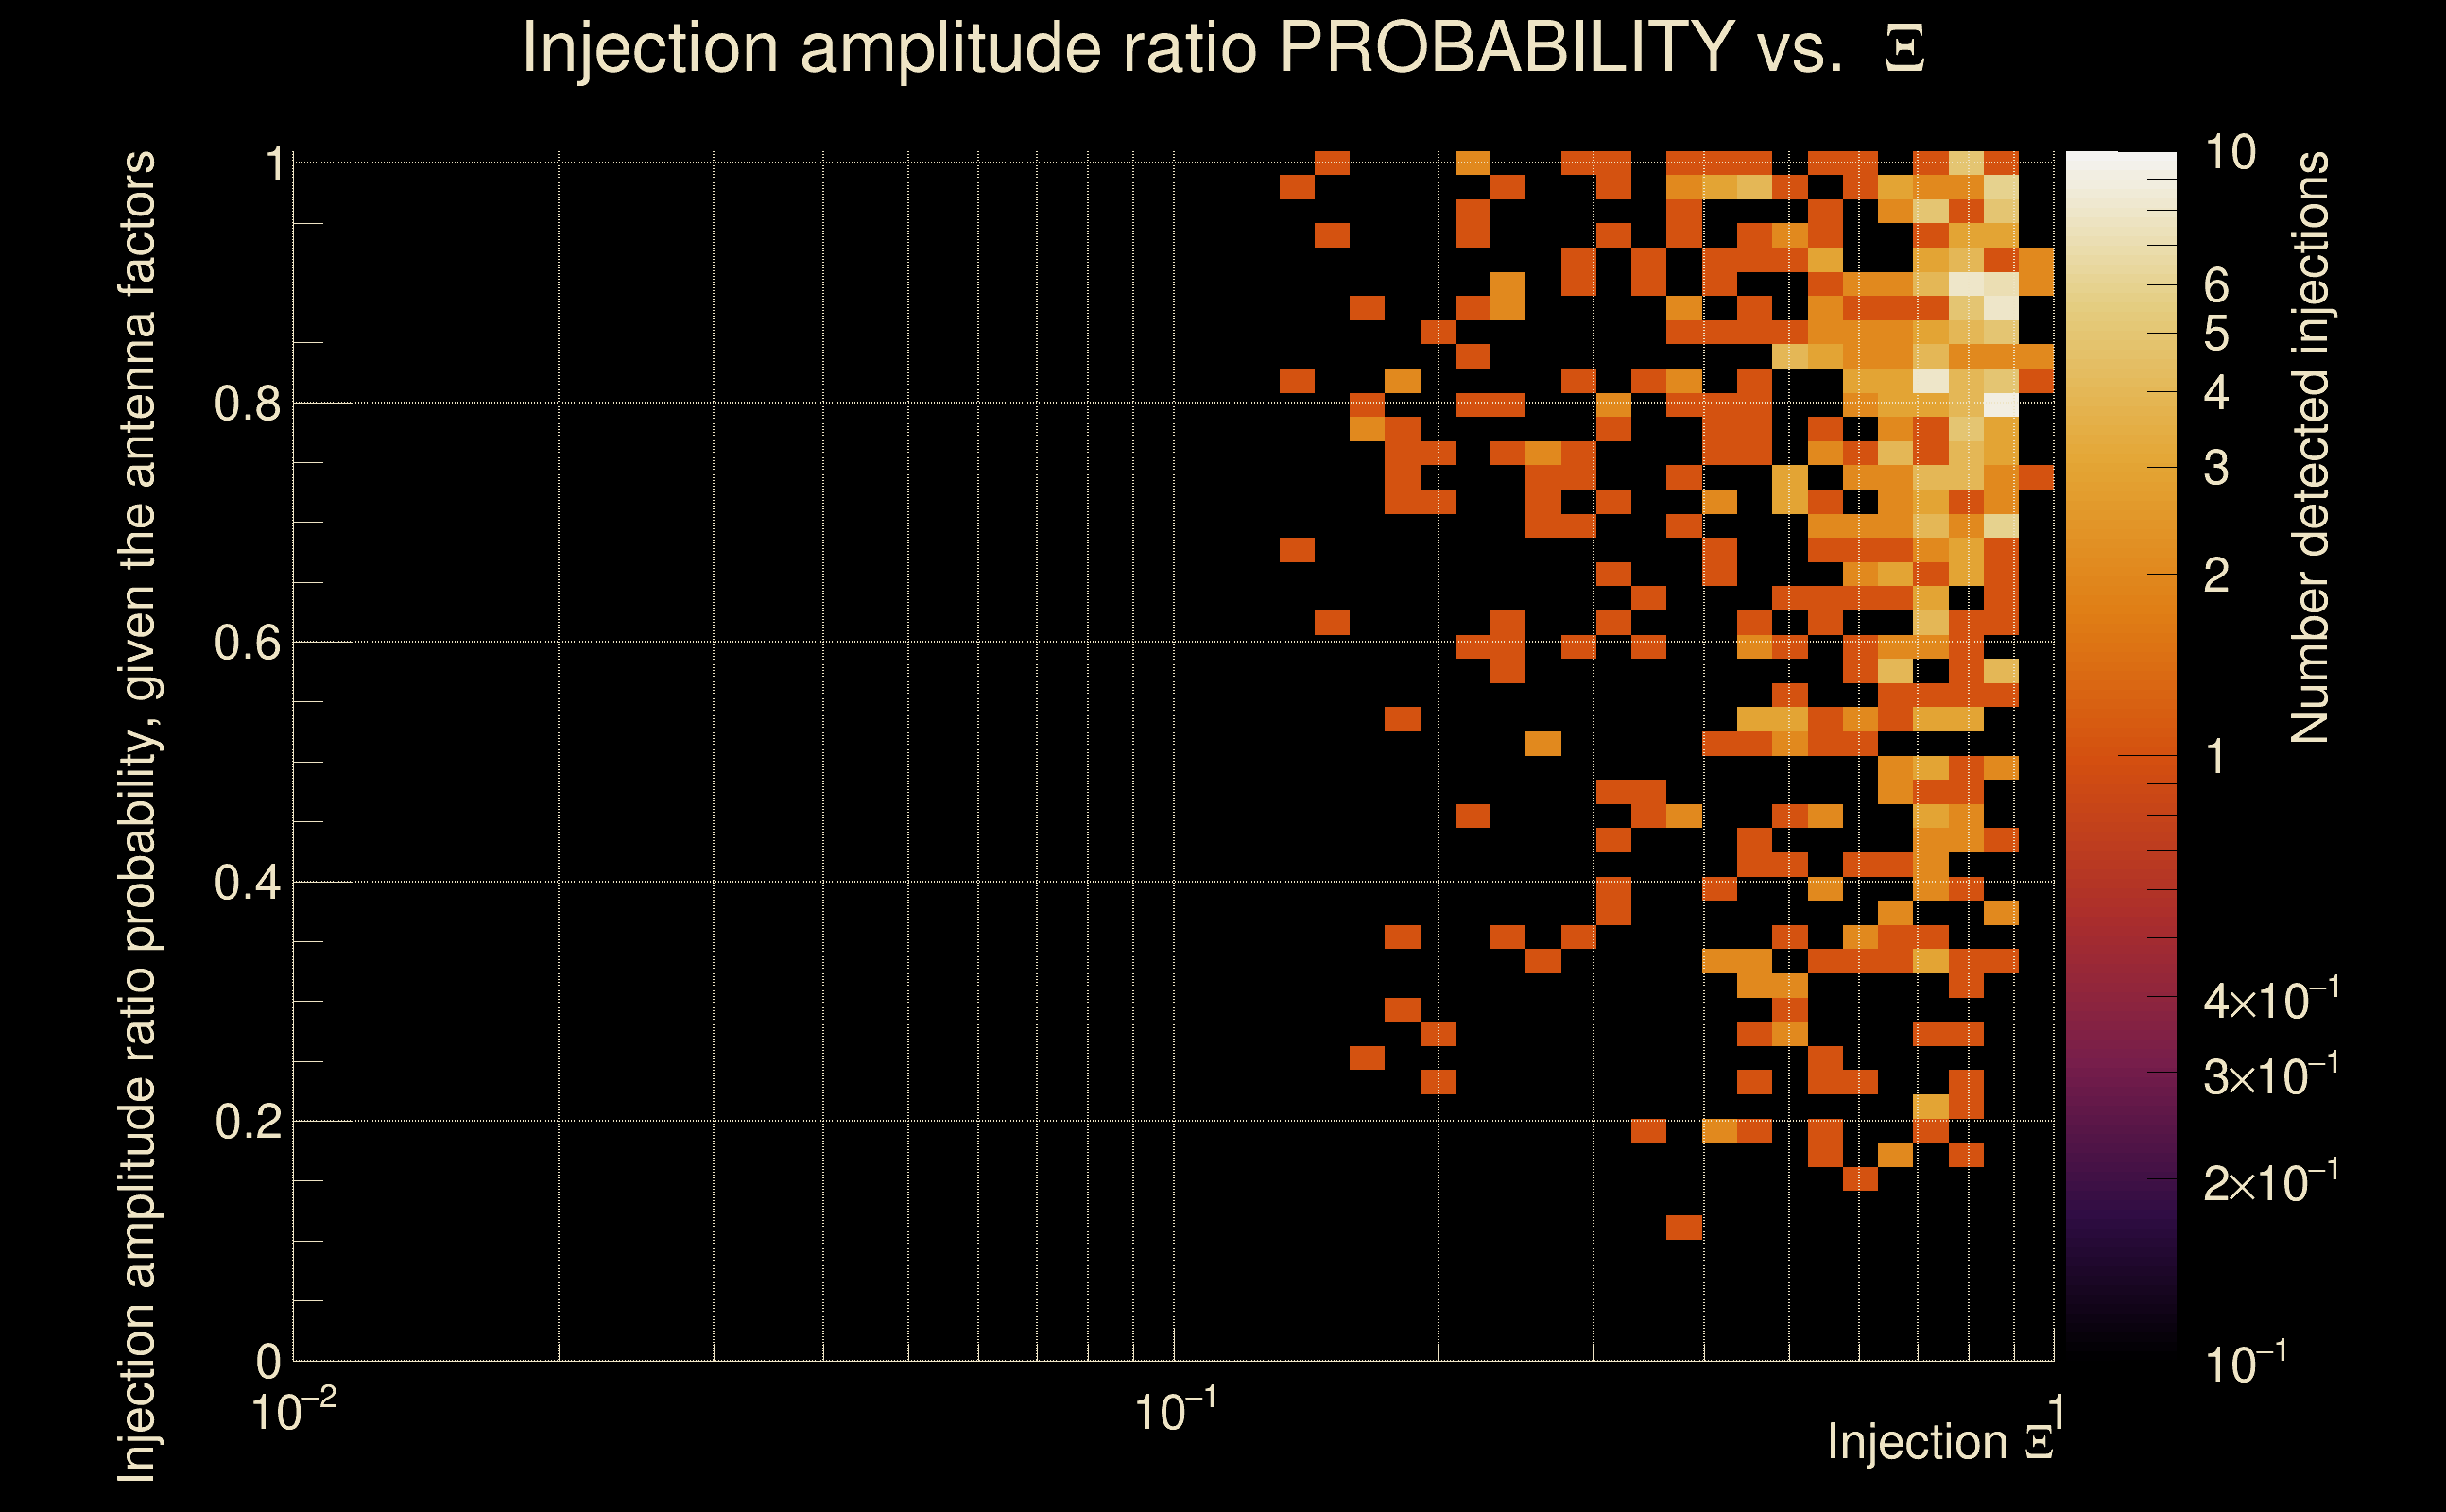
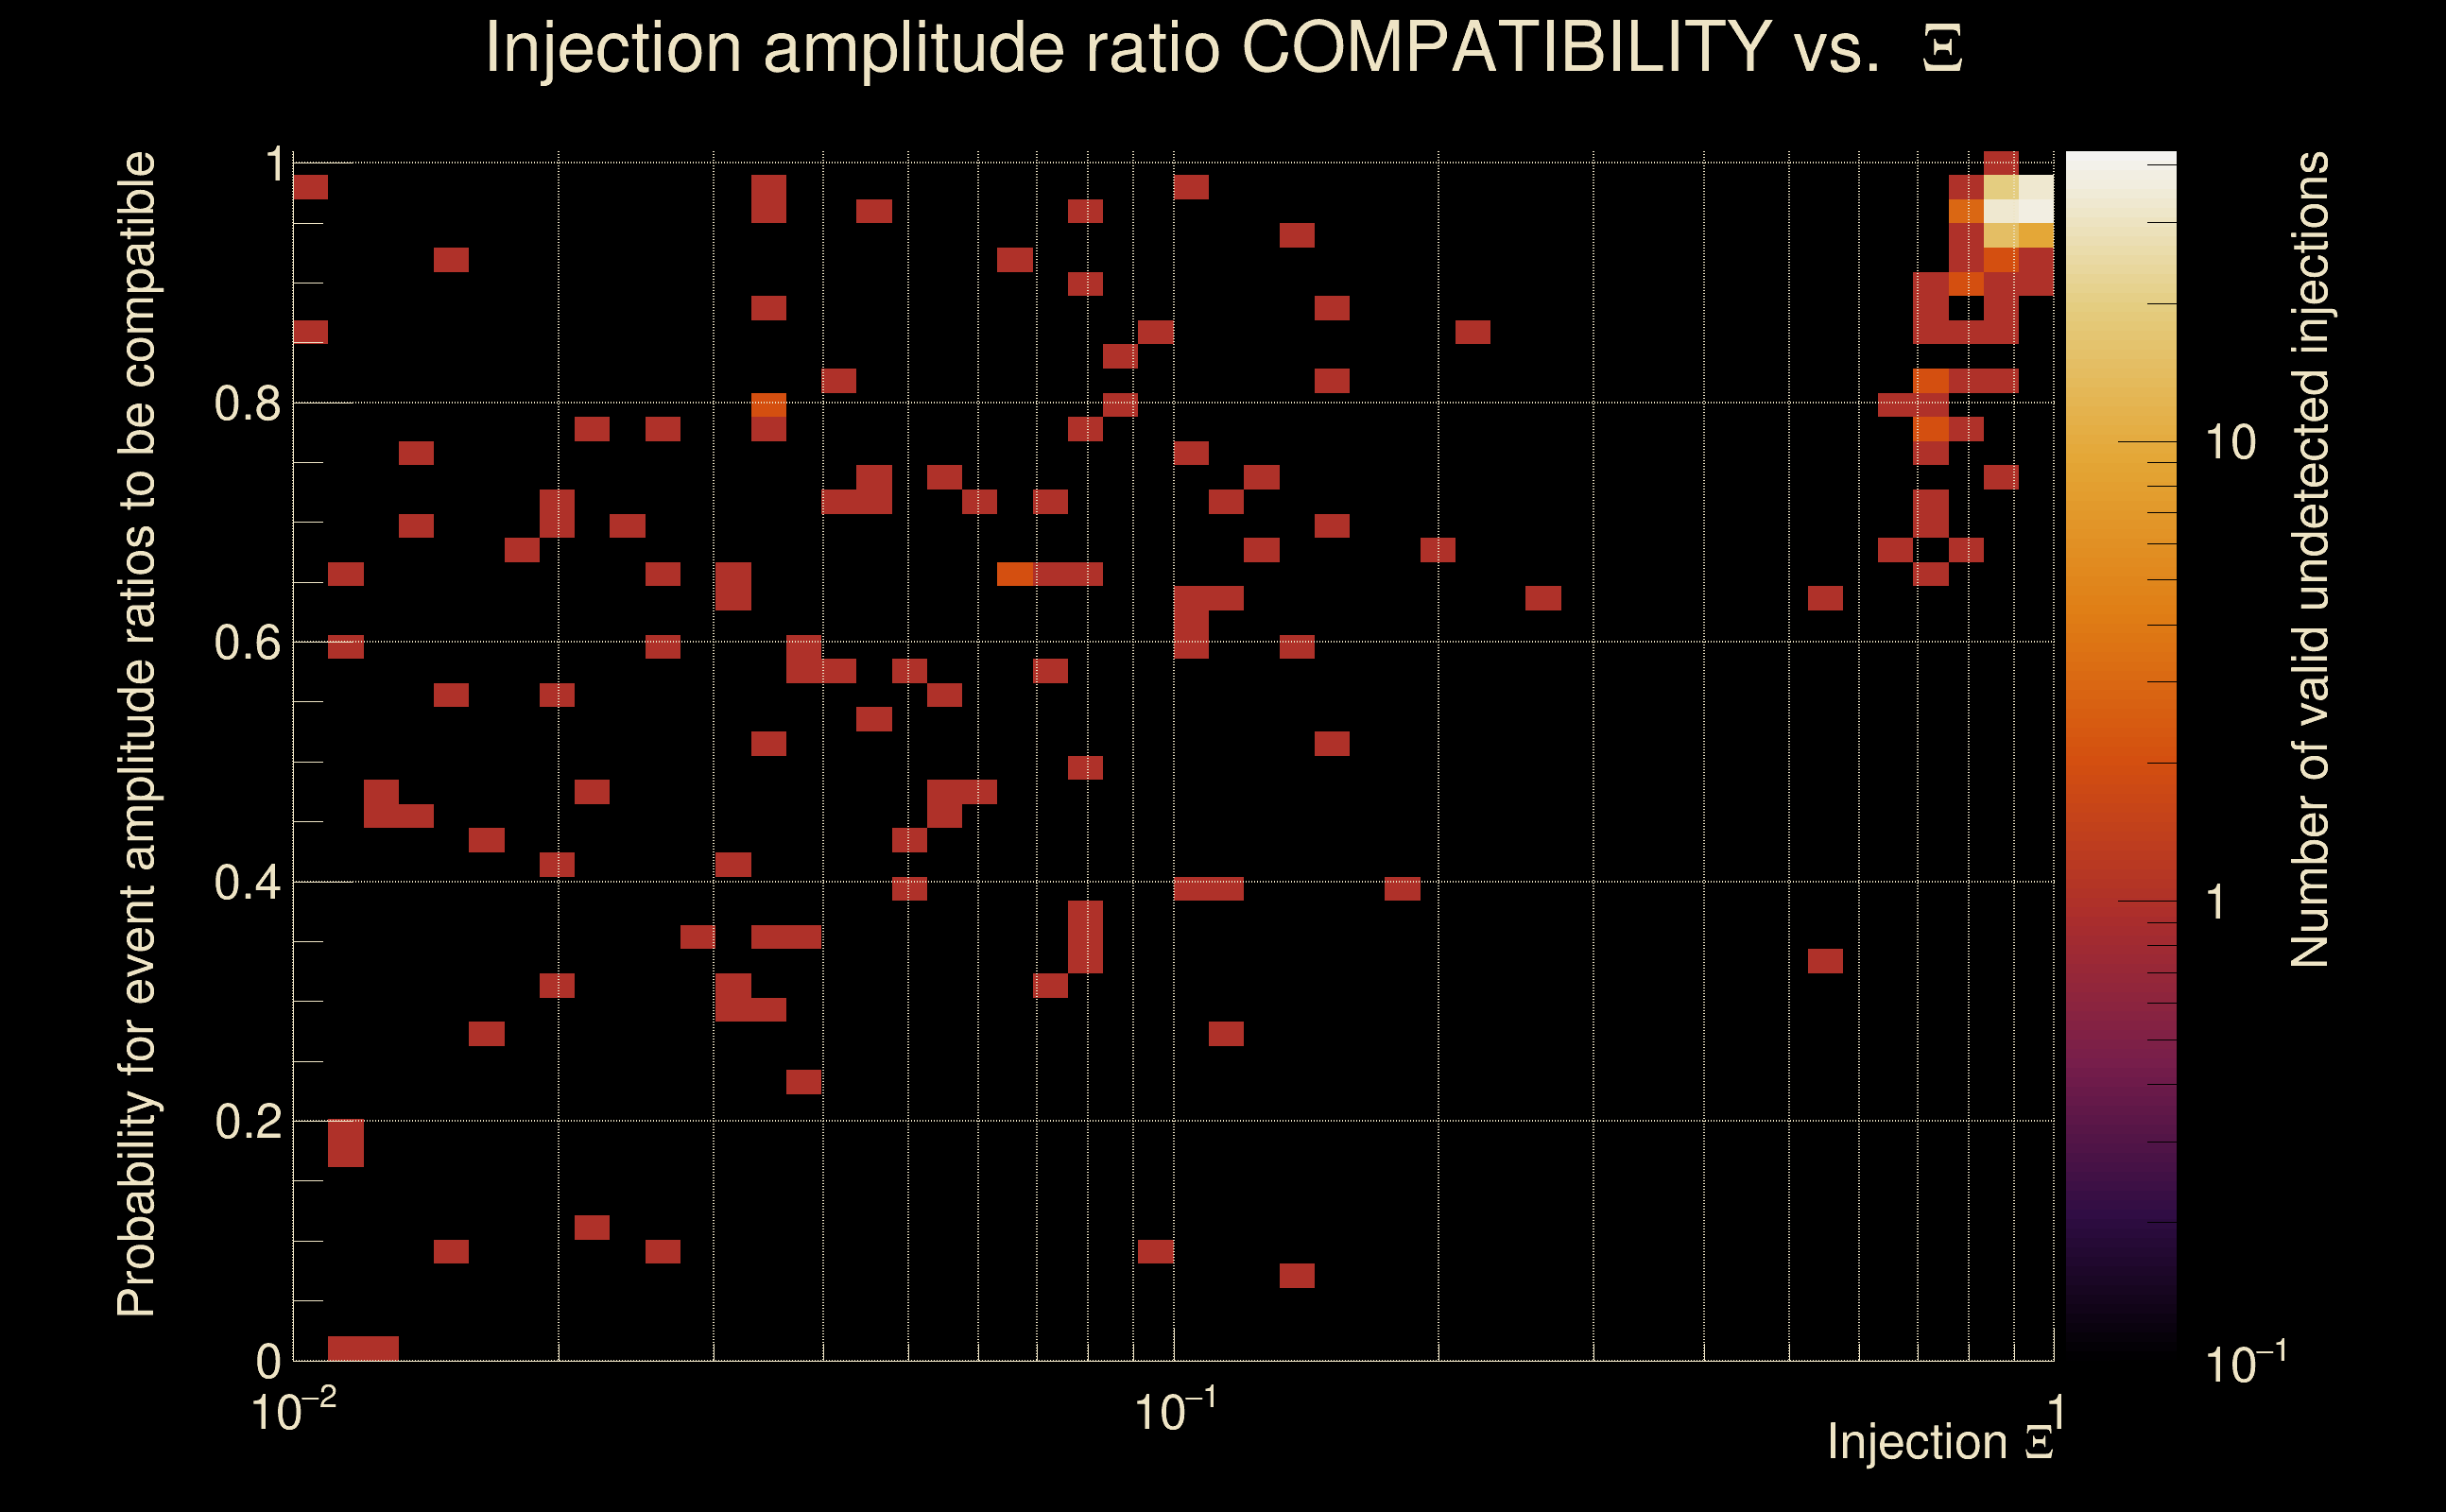
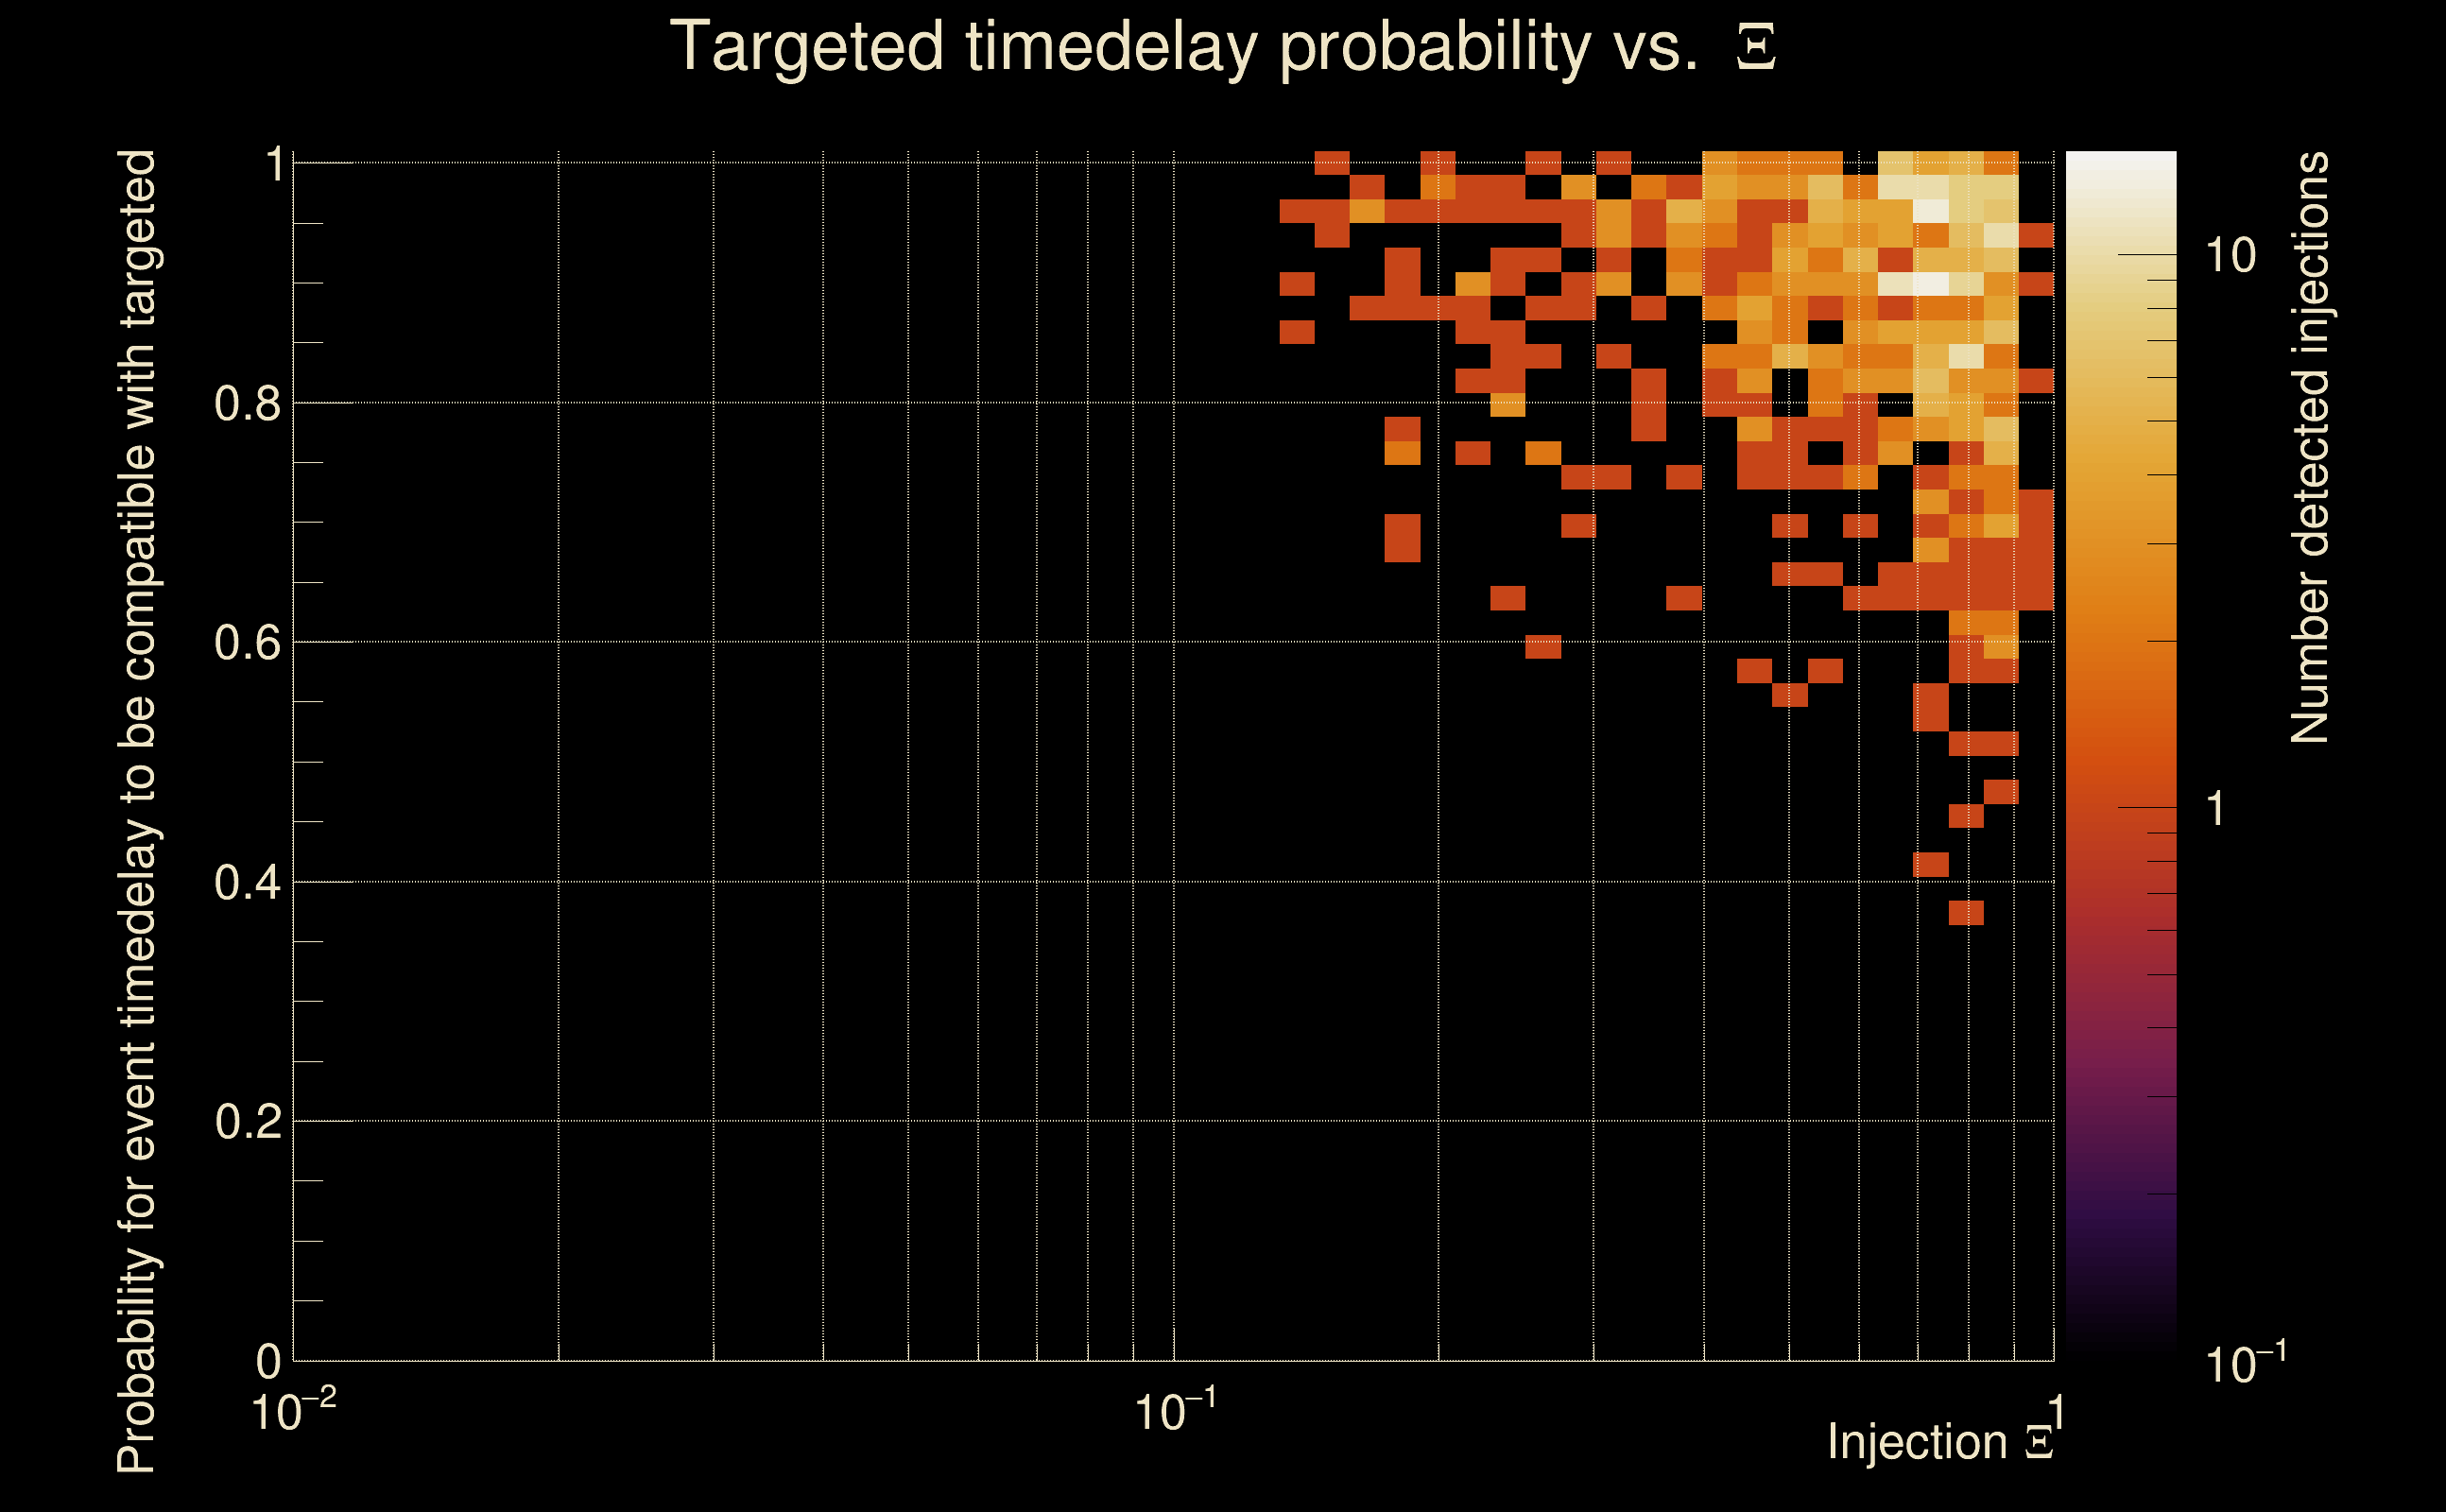
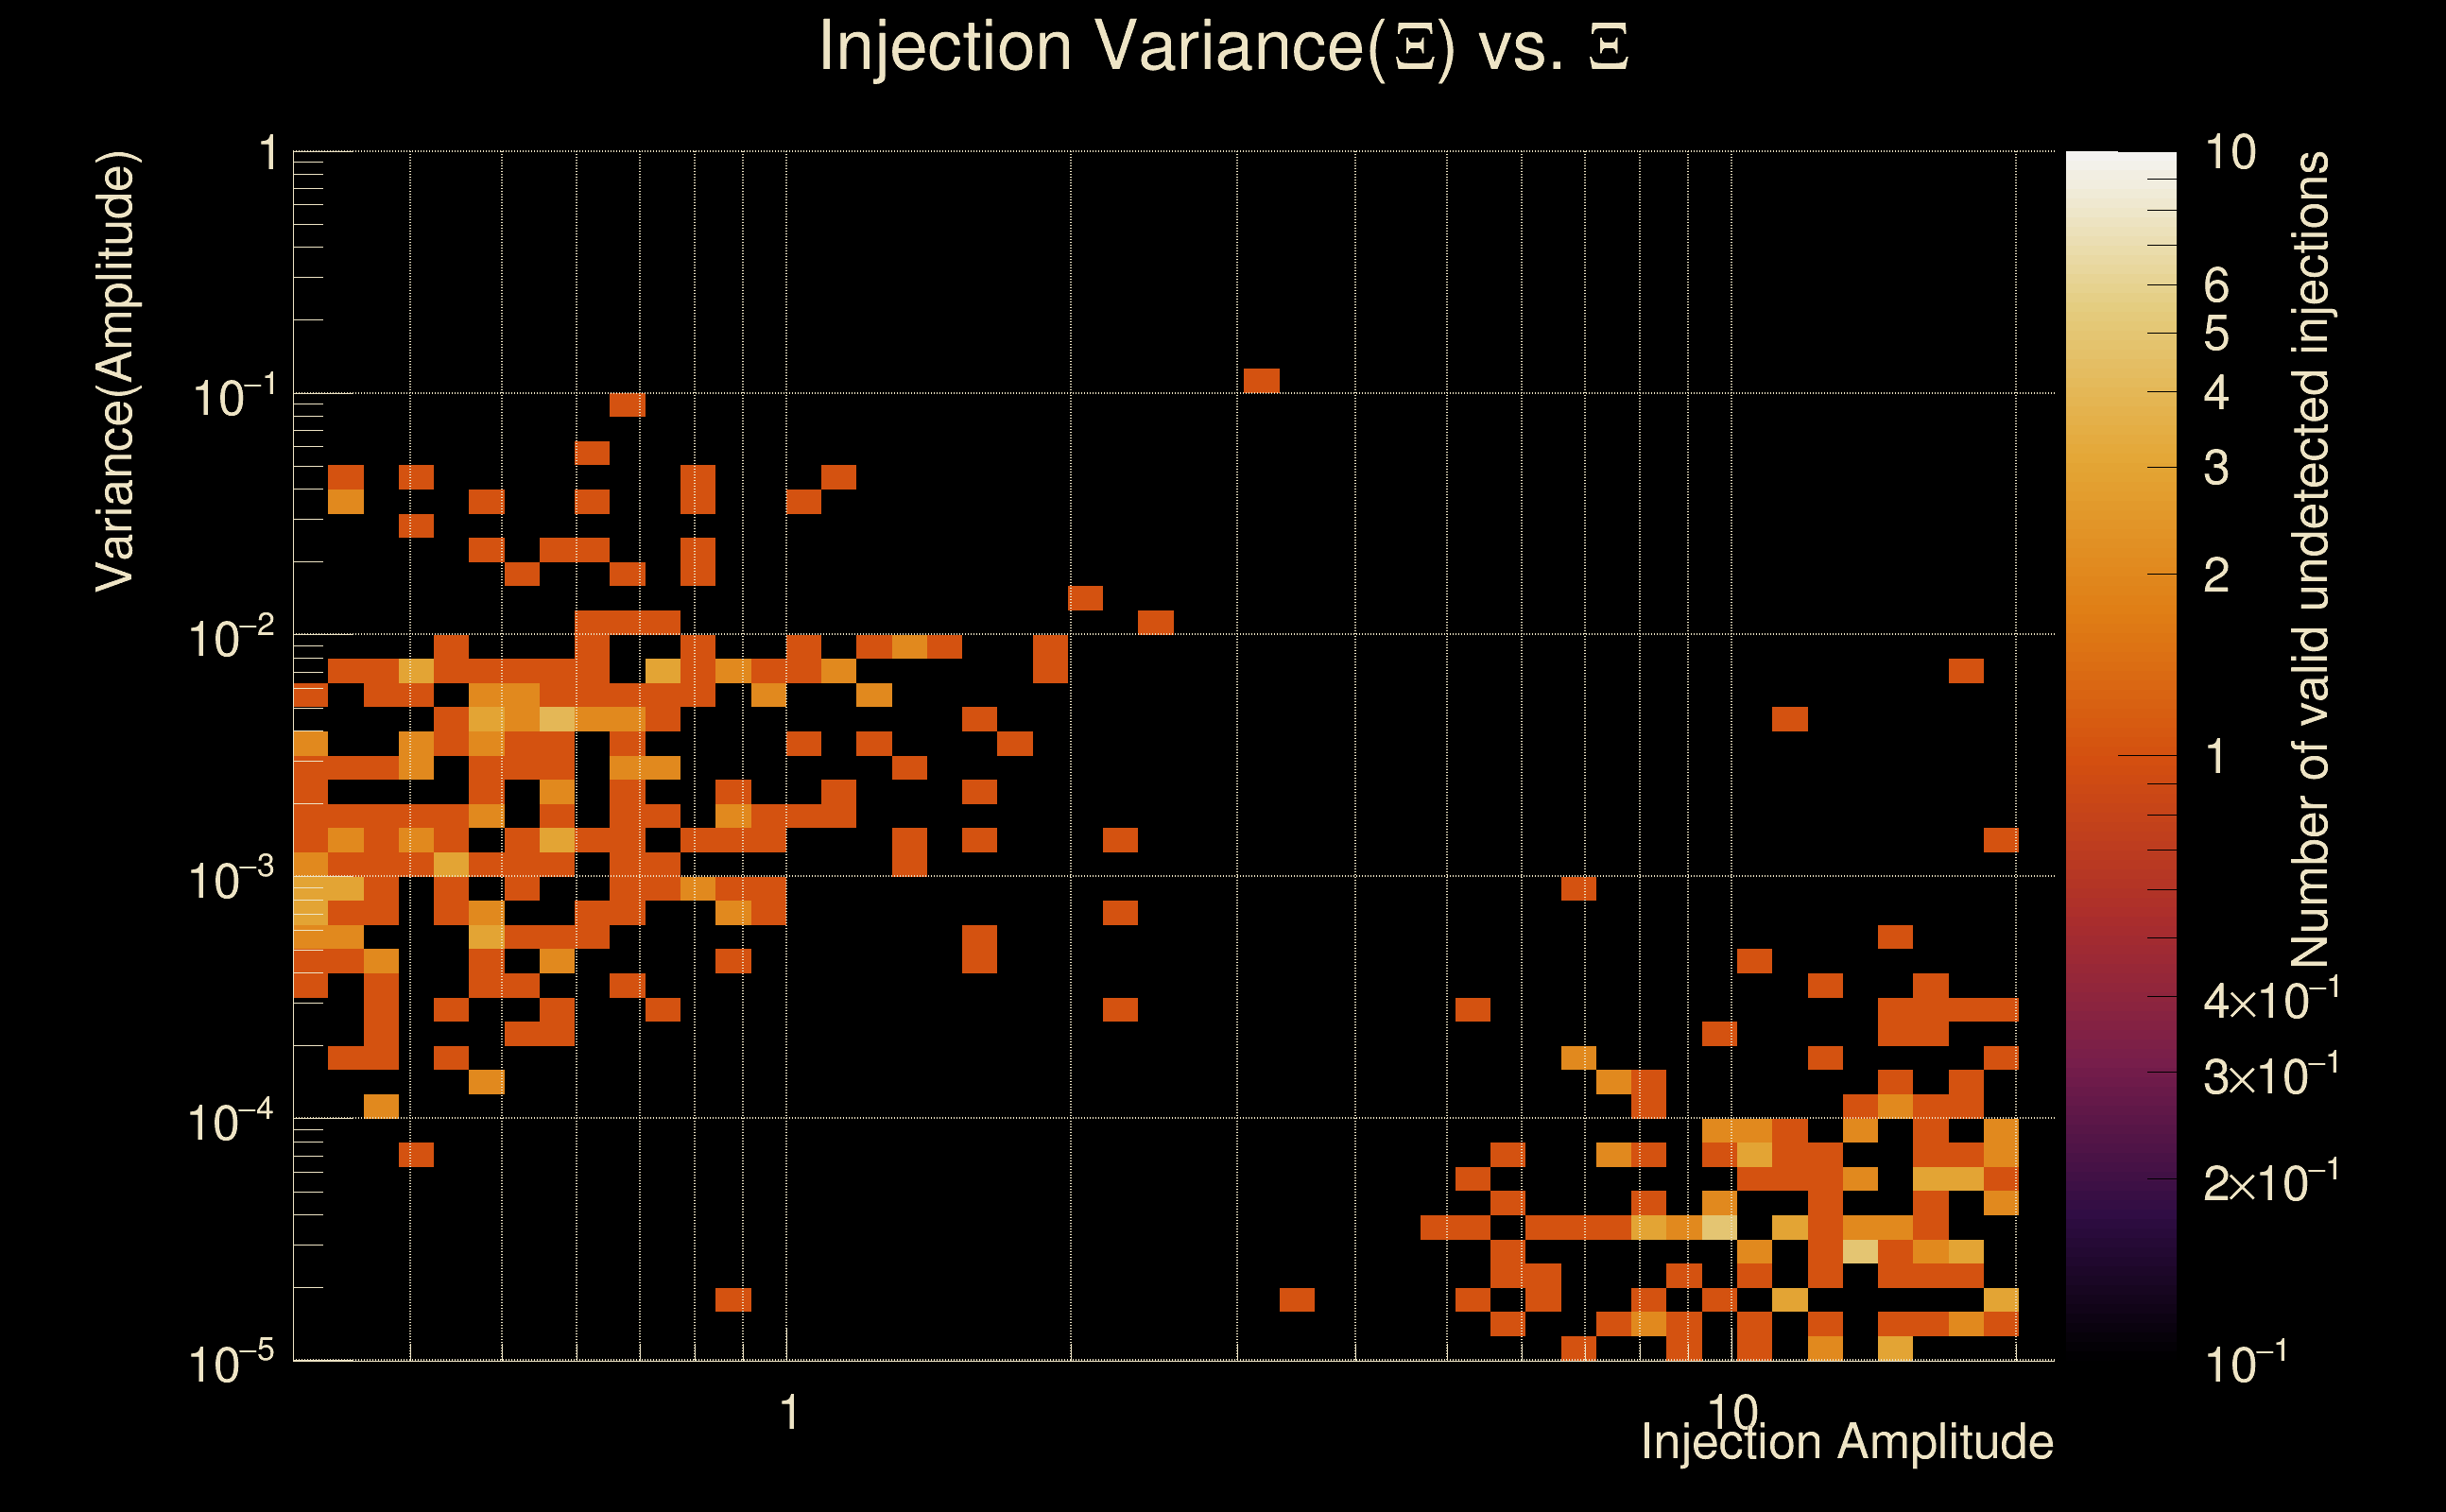
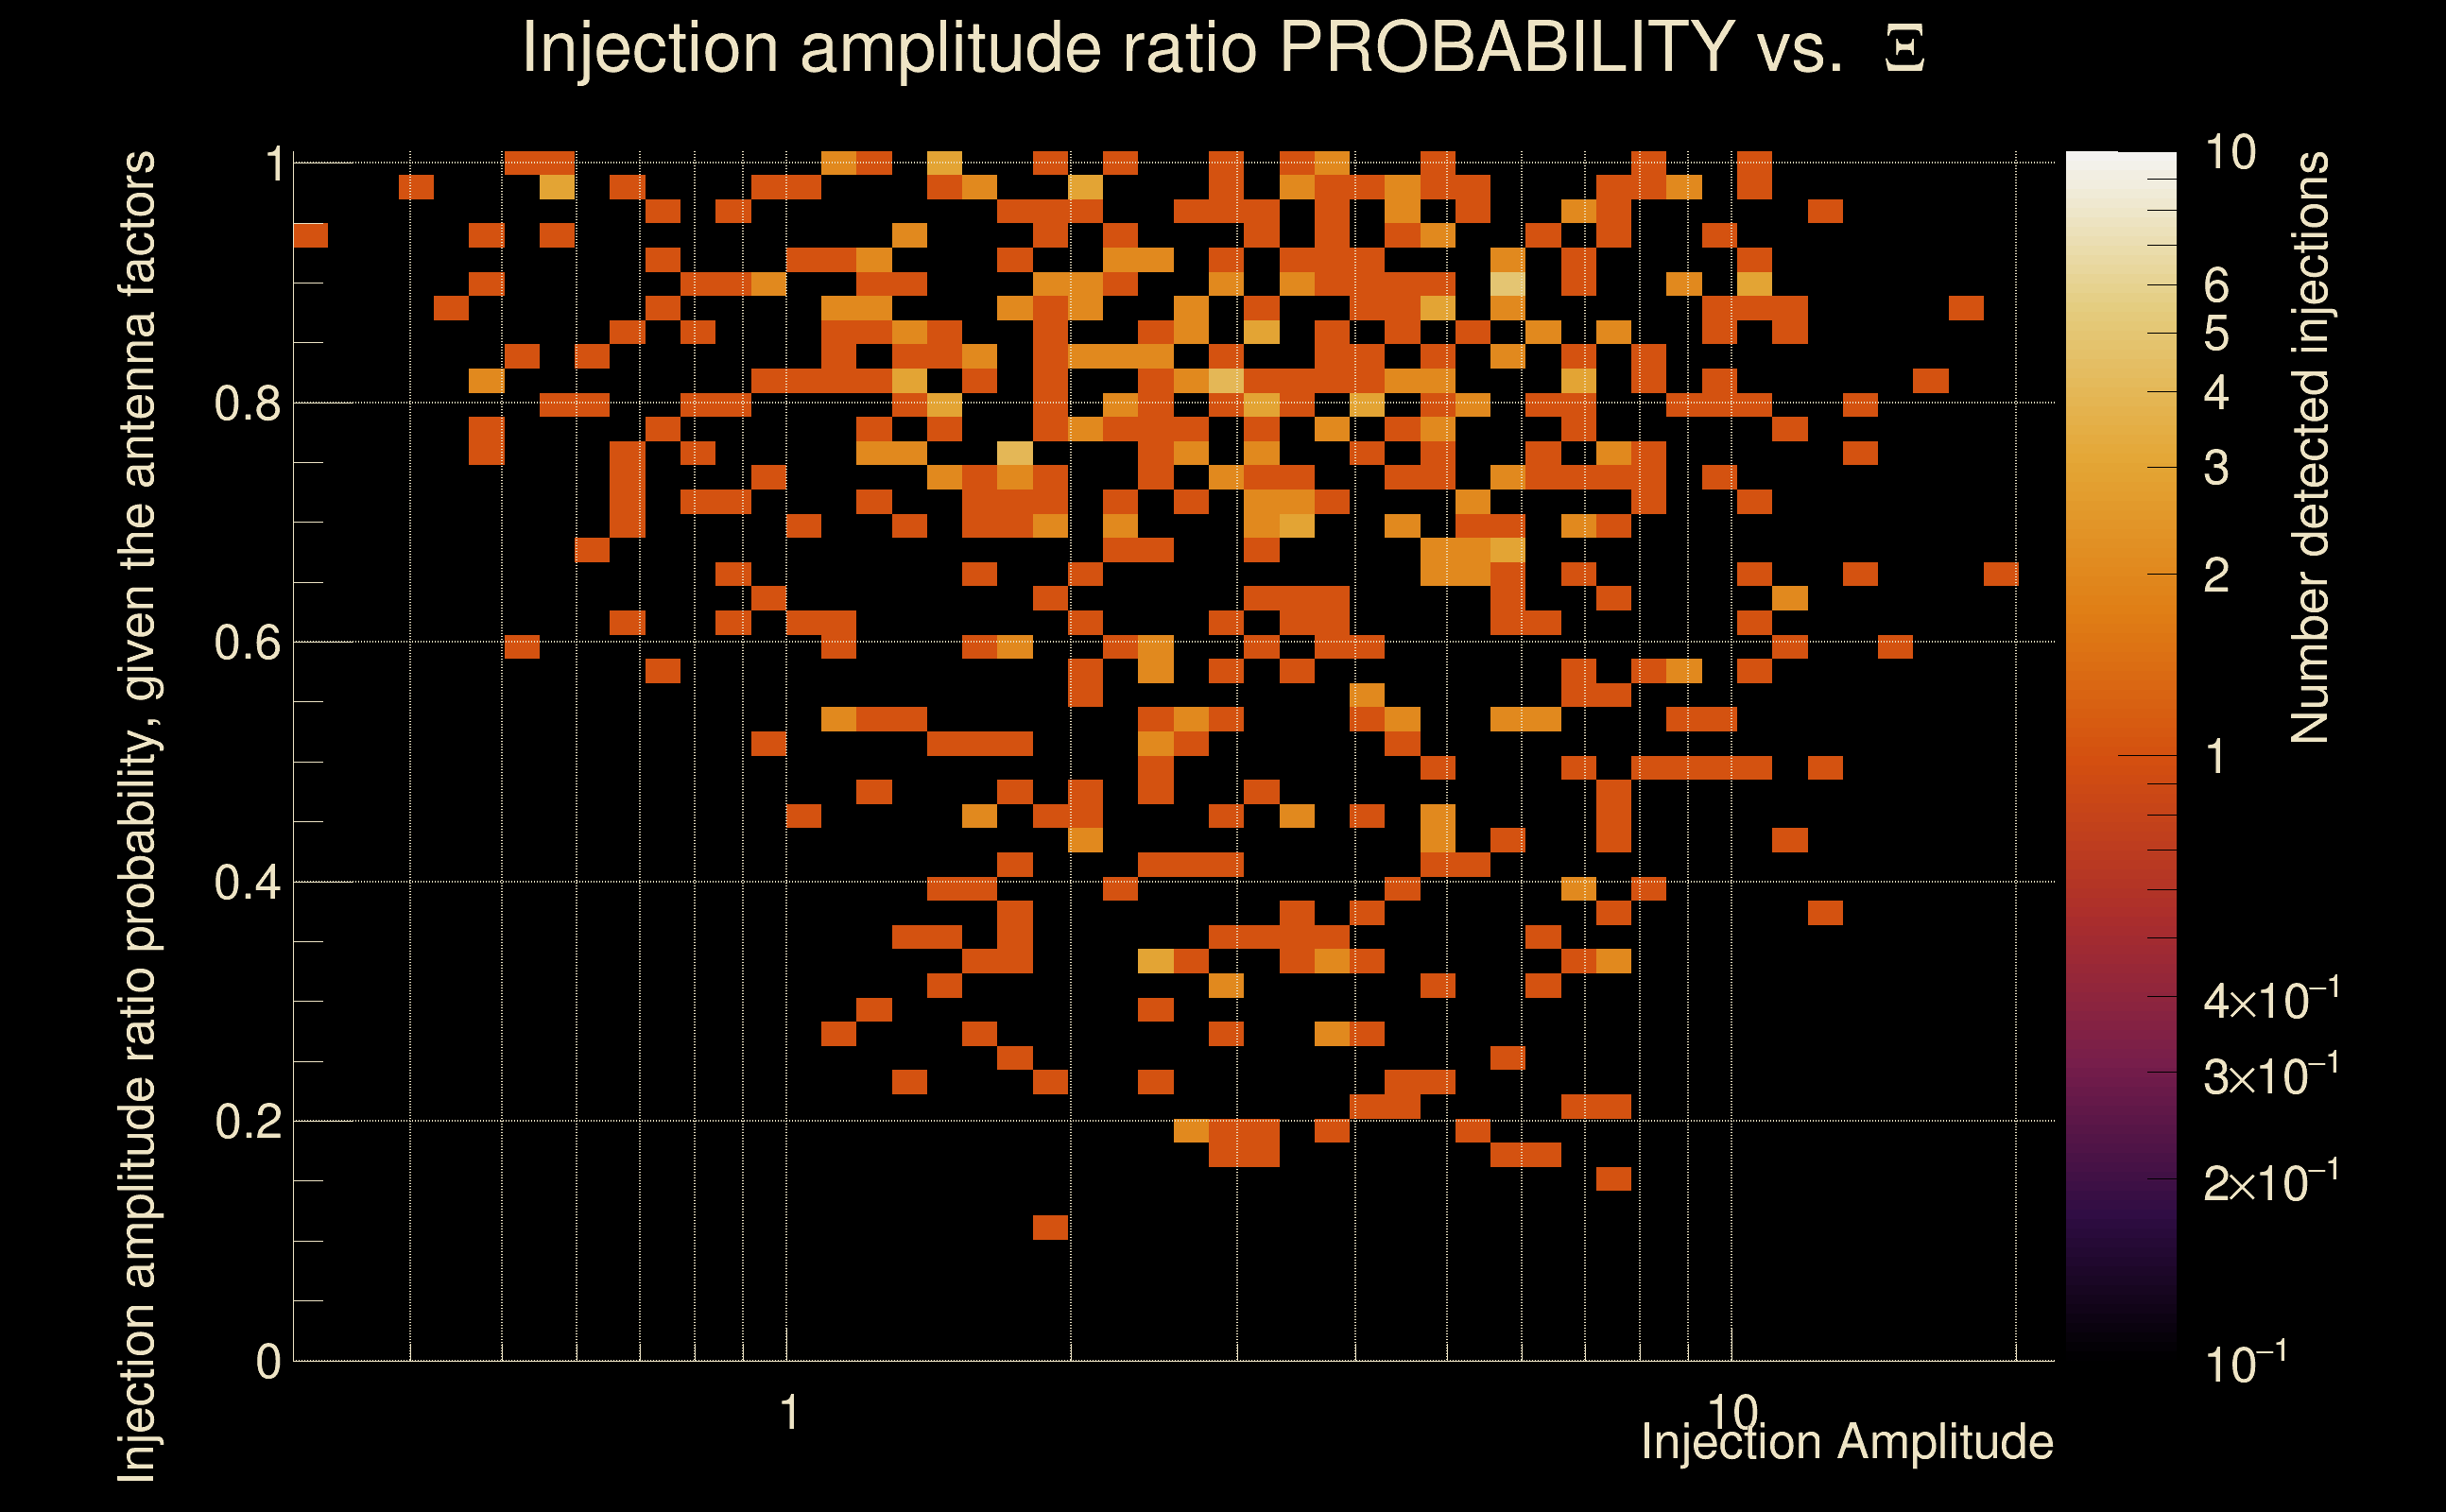
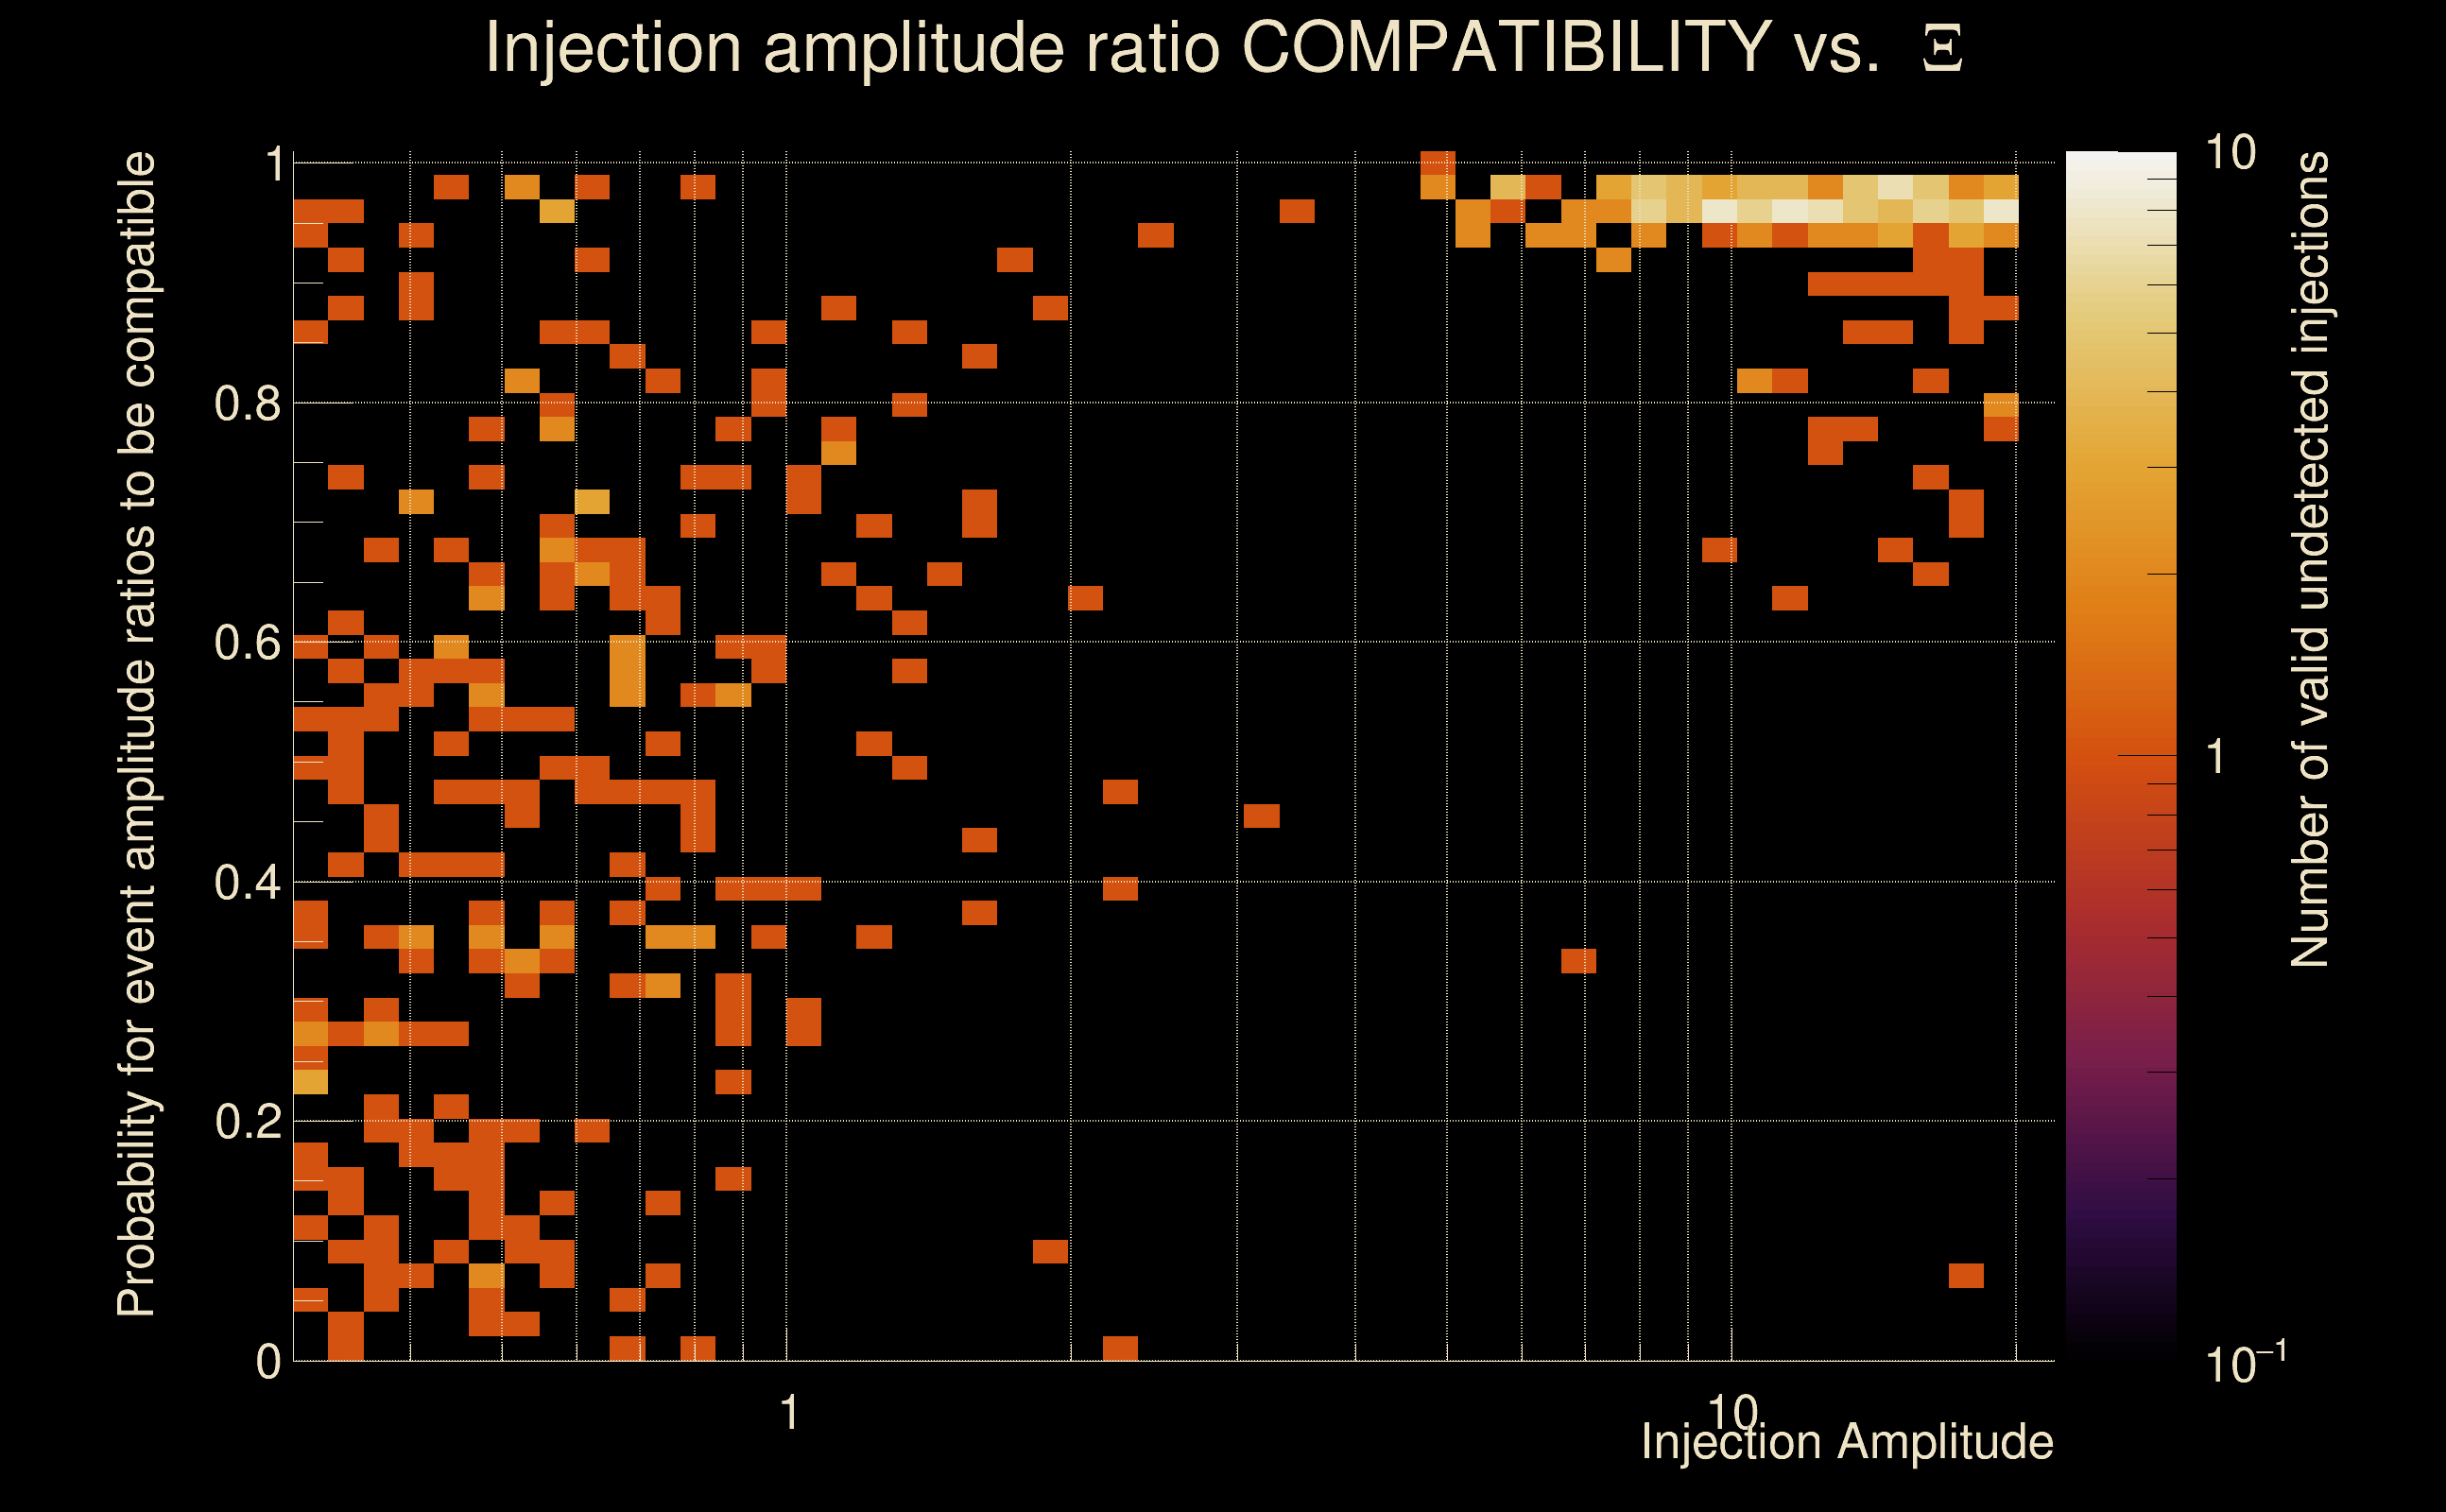
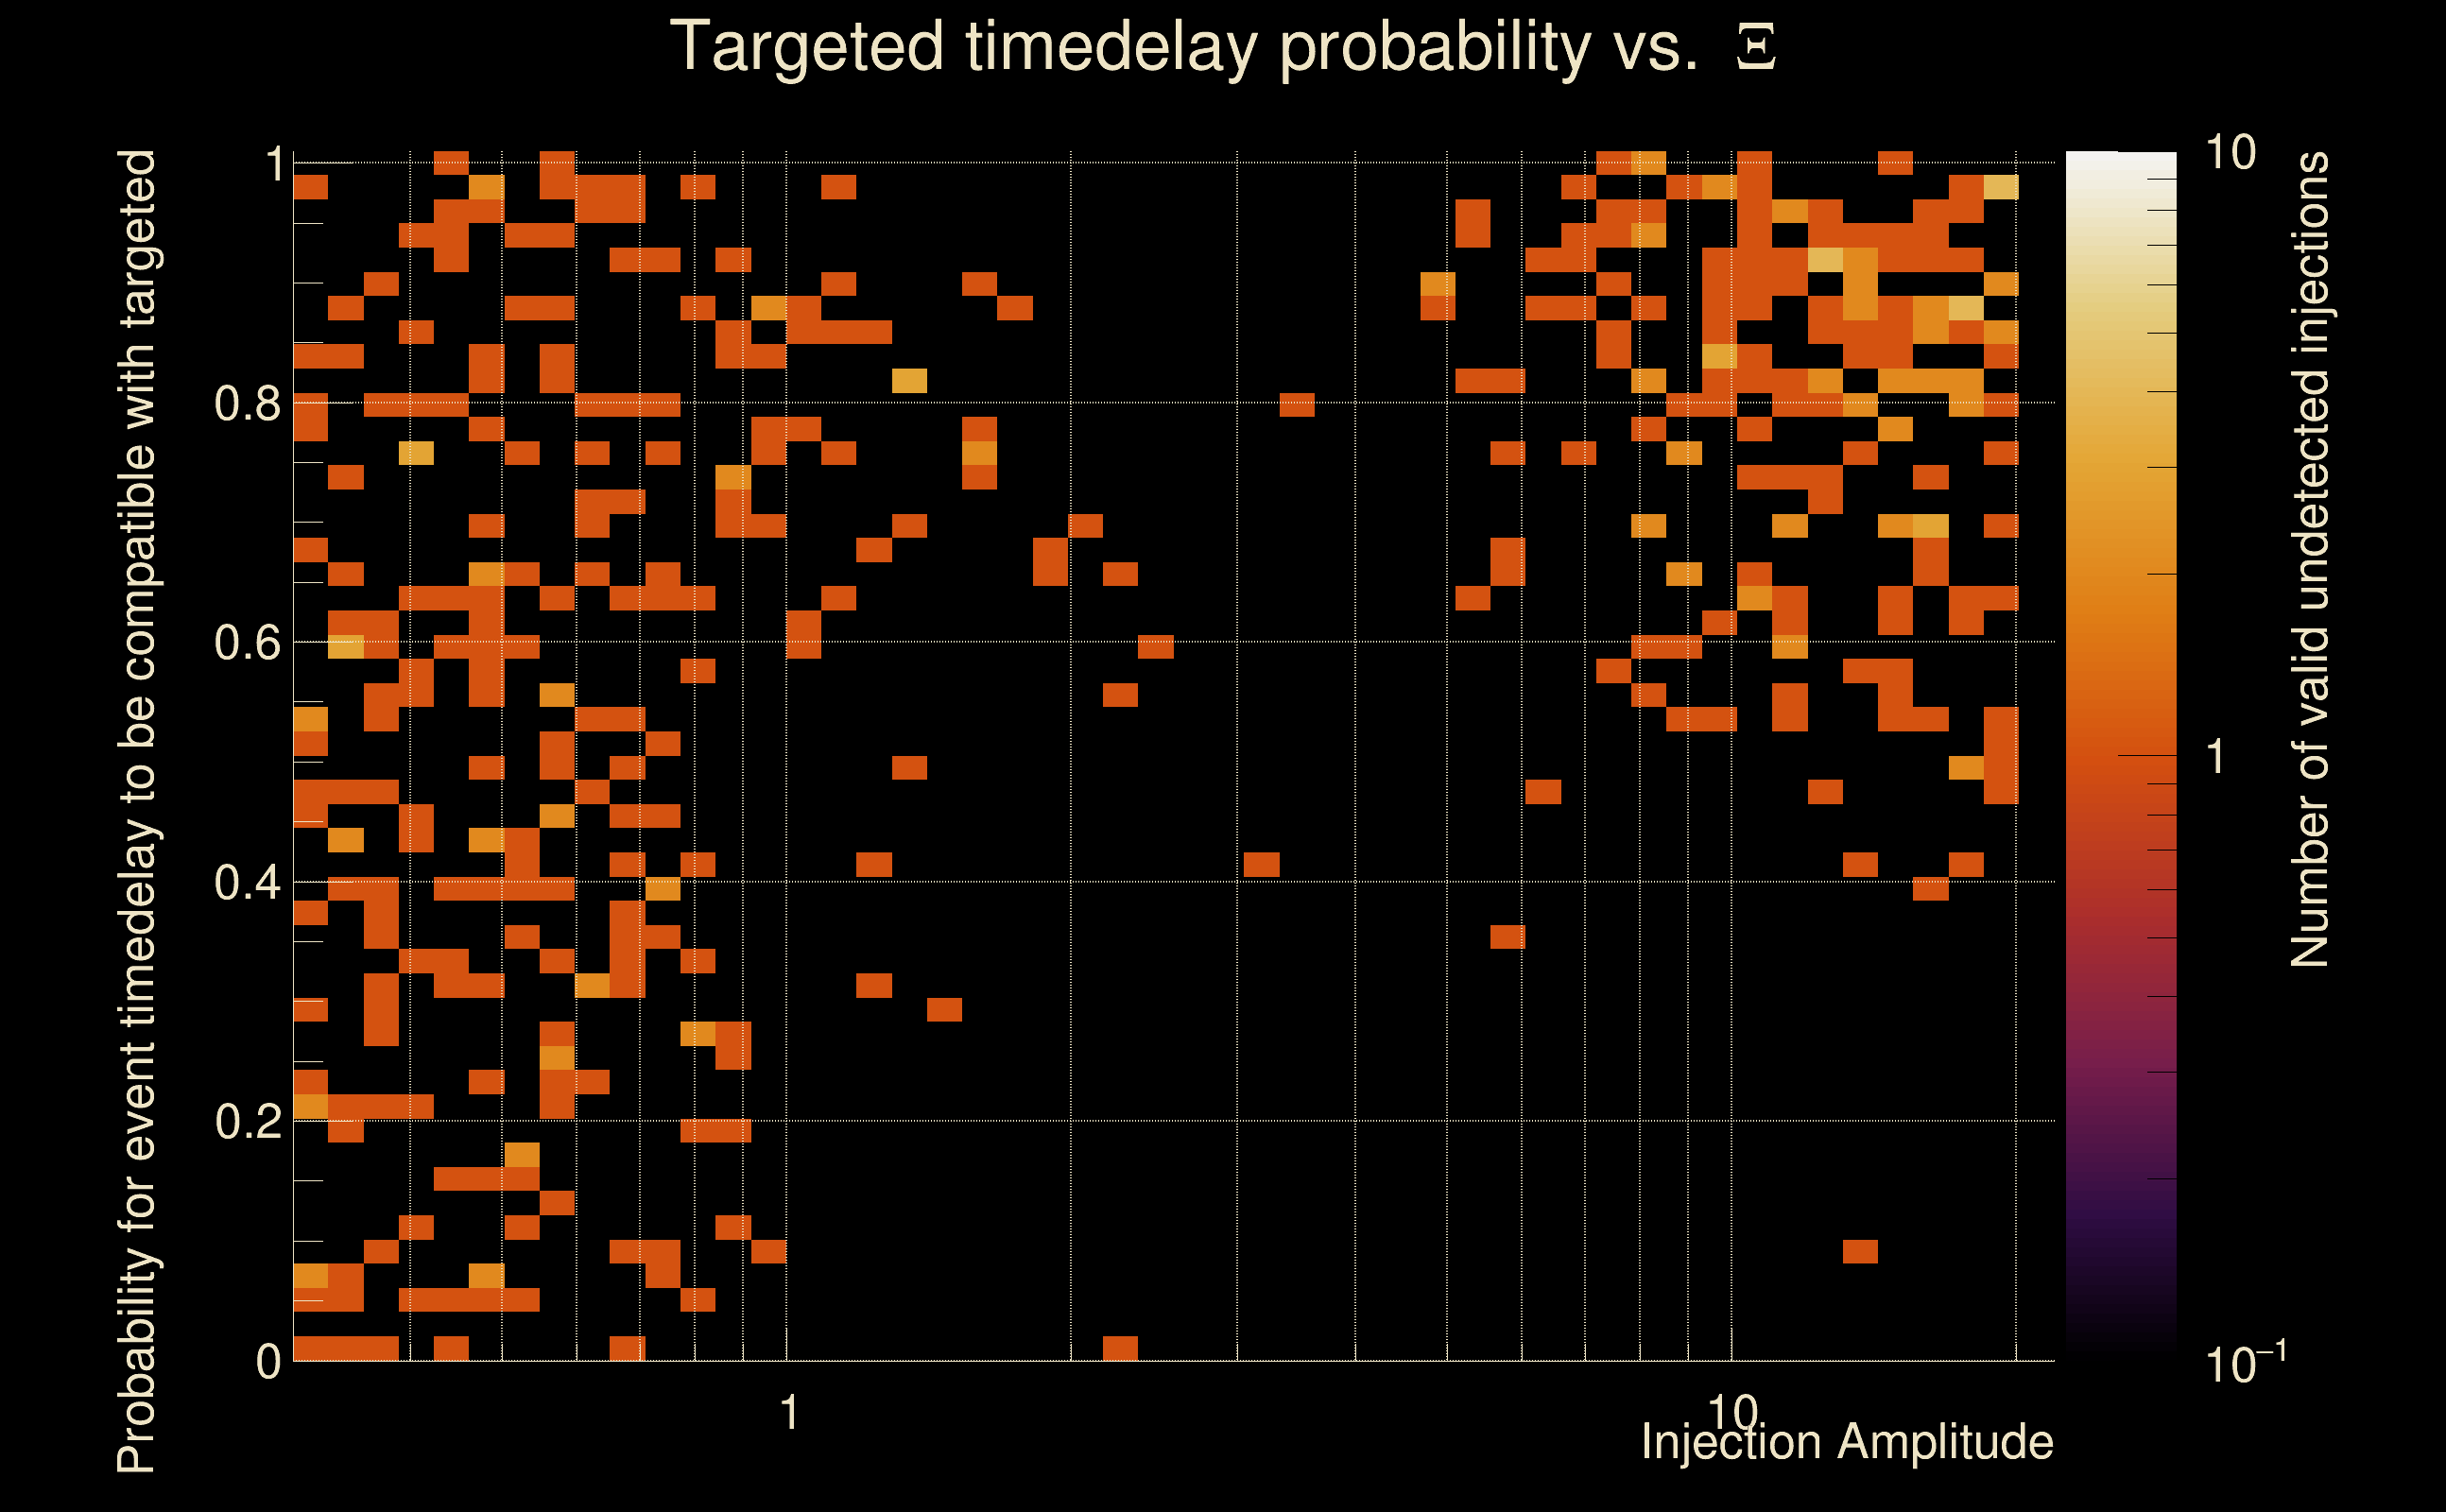
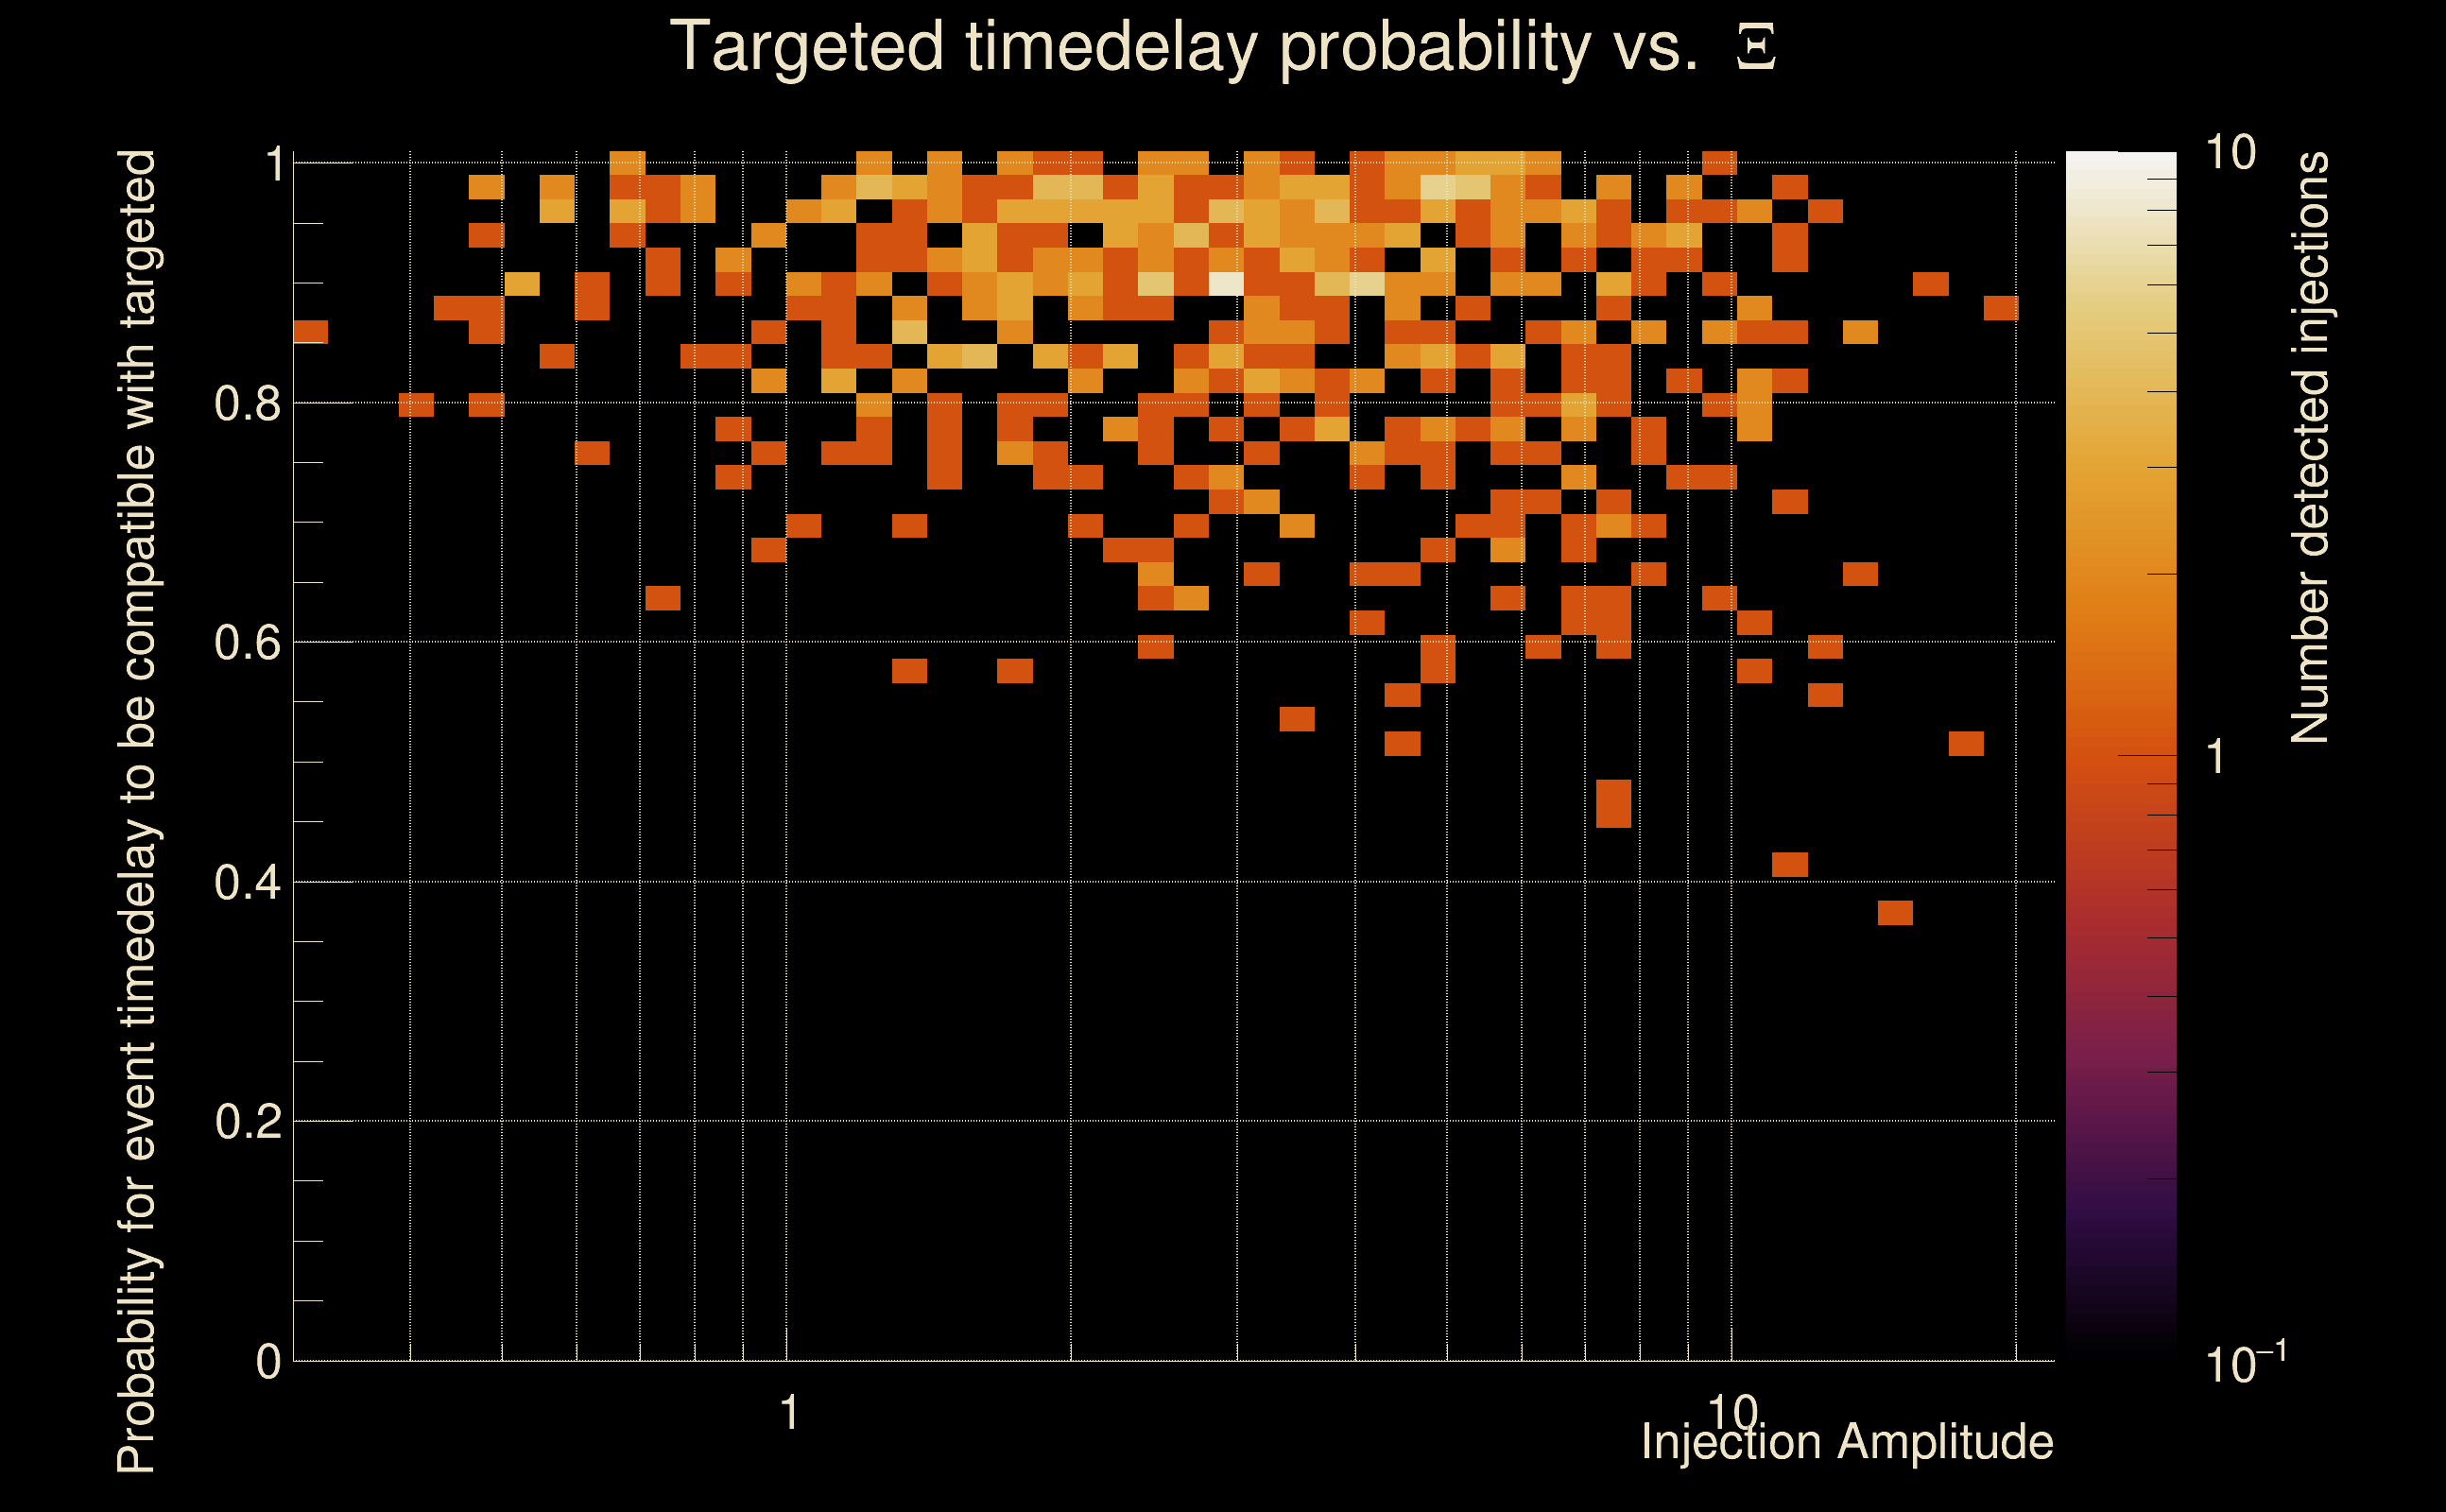
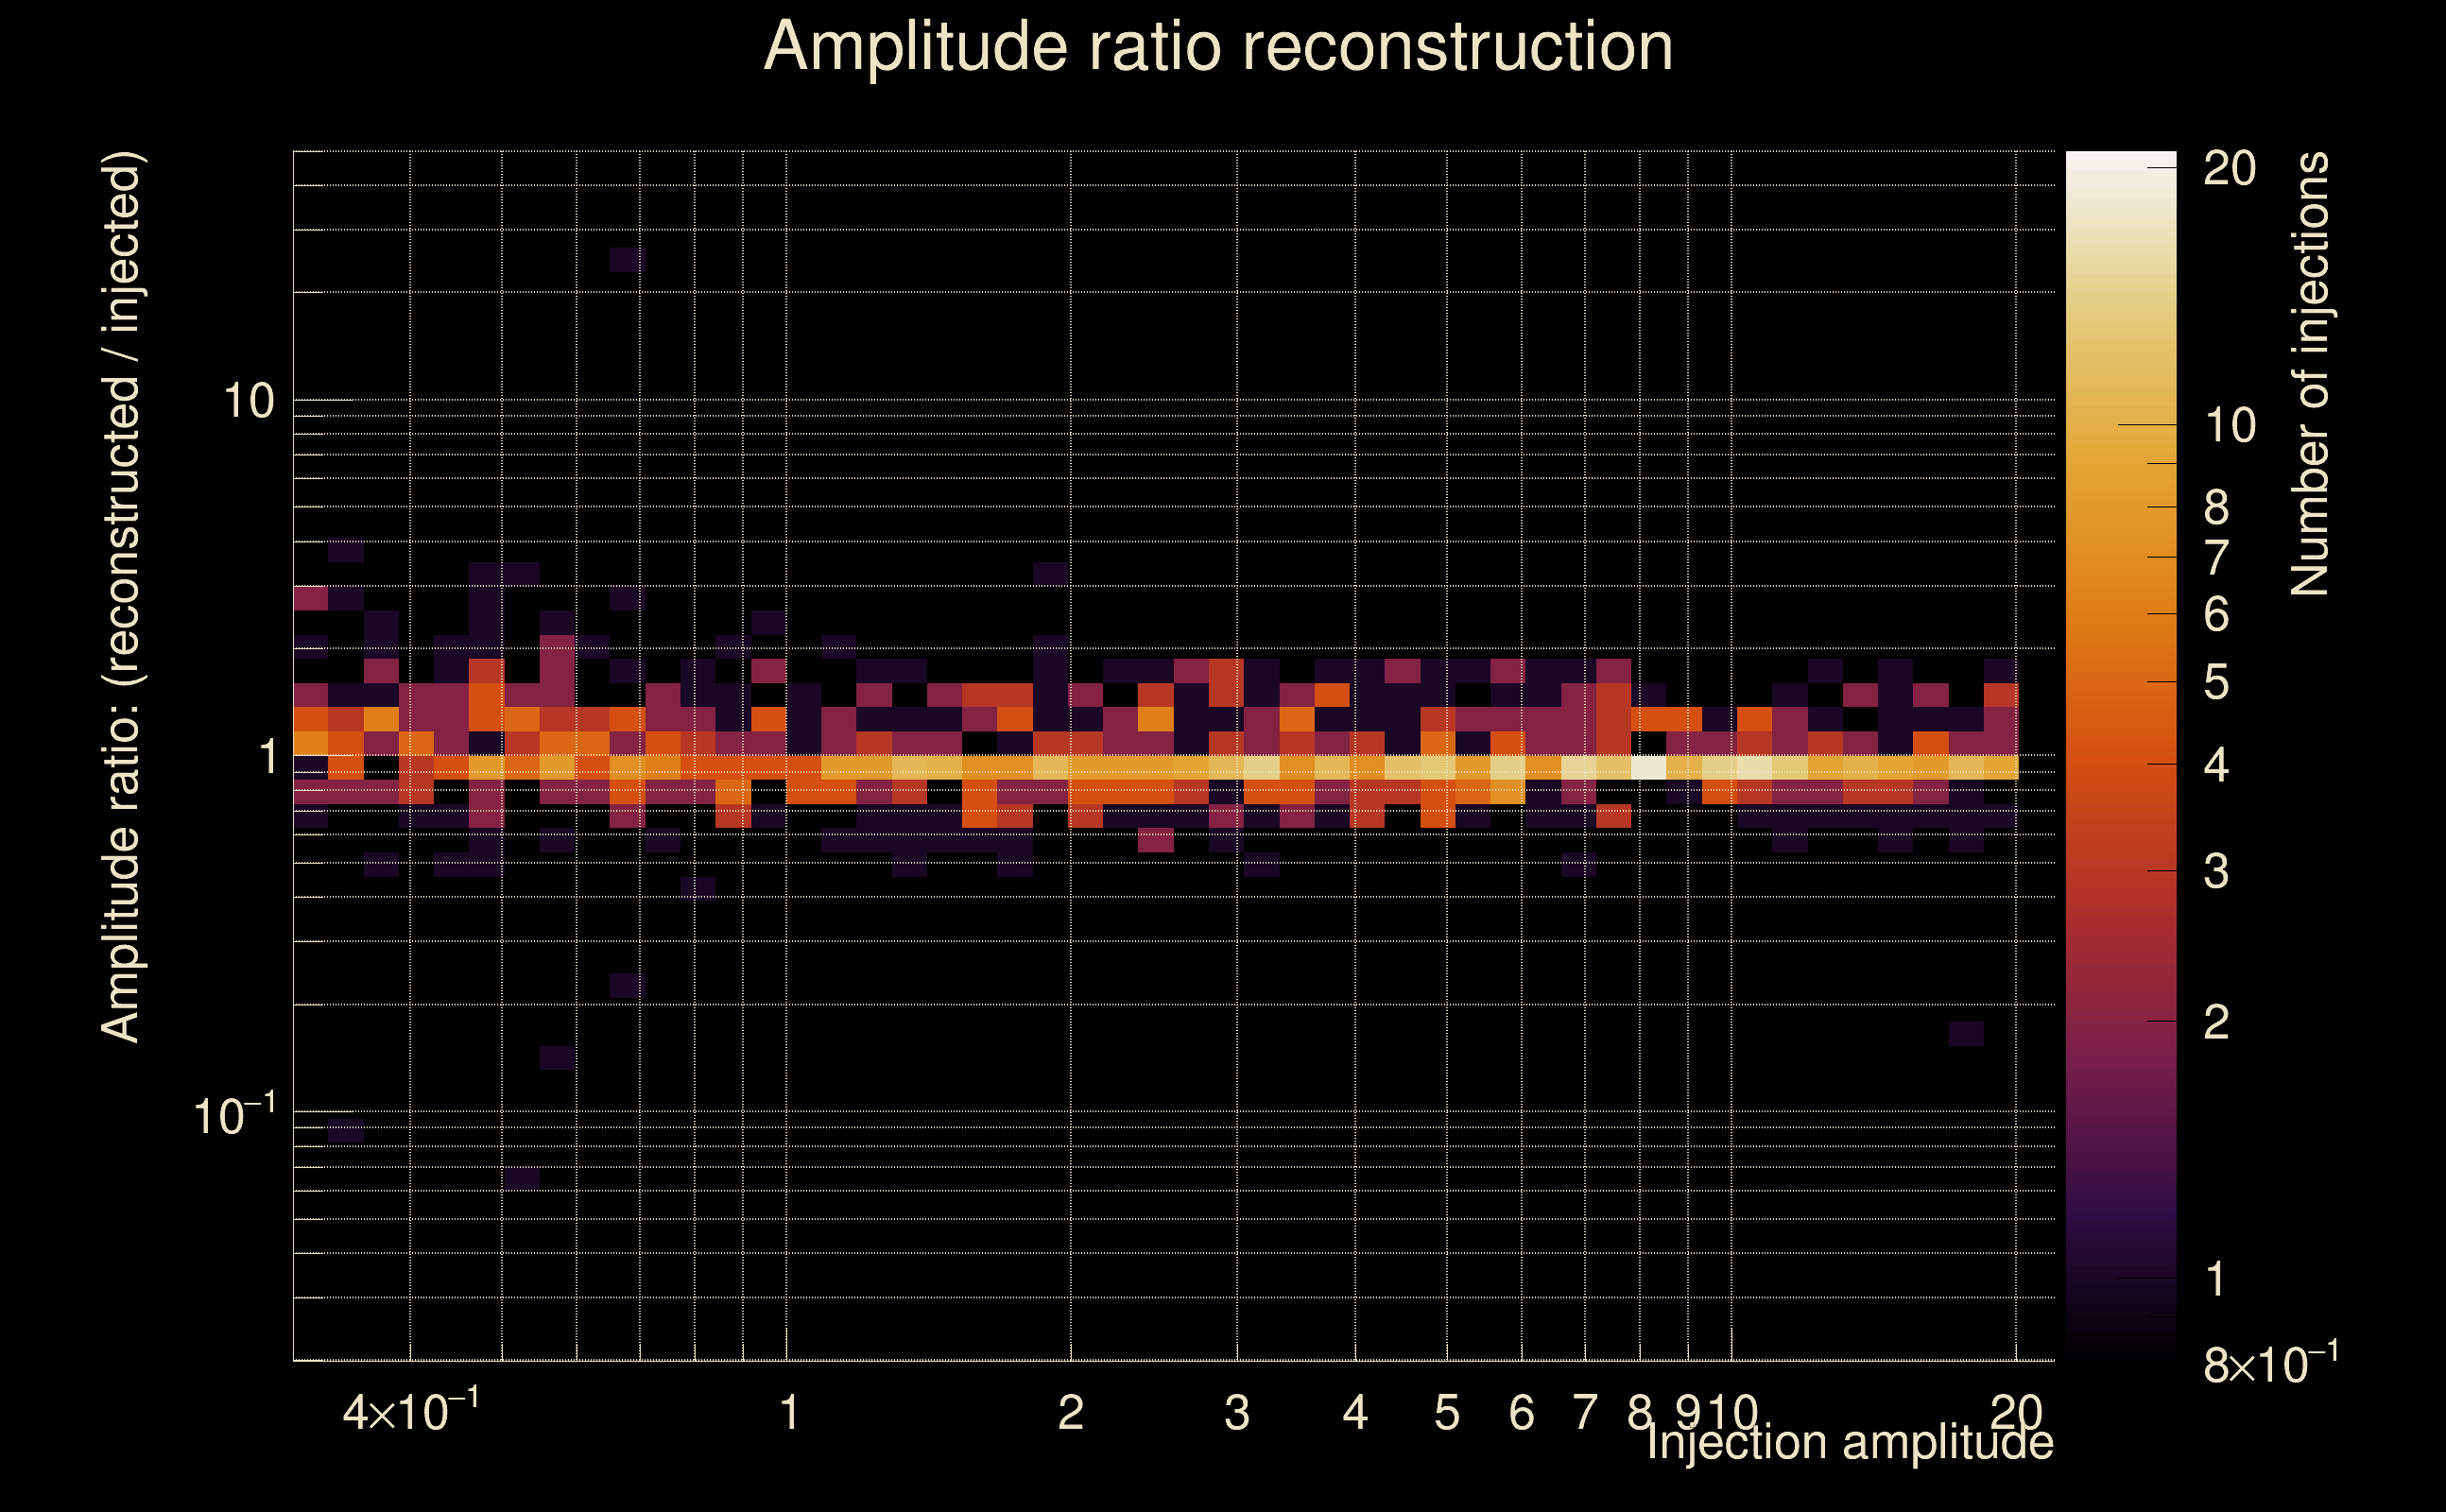
| Number of injections (total/valid/detected): | 1116 / 991 / 562 |
| List of missed injections: | ./Obe20-O_missed.txt |
| Injection amplitude at 90% detection efficiency: | 2.35468 |
| Injection amplitude at 50% detection efficiency: | 0.957201 |
| Injection amplitude at 10% detection efficiency: | 0.450979 |
 |
 |
 |
 |
 |
 |
 |
|
 |
 |
|
 |
 |
|
 |
 |
|
 |
 |
|
 |
 |
|
 |
 |
|
 |
 |
|
 |
 |
 |
 |
 |
 |
 |
 |
 |
 |
 |
 |
 |
 |
 |
| florent.robinet@ijclab.in2p3.fr |