| Omicron version: | 4.2.0: documentation gitlab repository |
| Omicron run by: | unknown |
| Report produced on: | Wed Dec 17 09:46:18 2025 UTC |
| Ox option file: | TargIxfw_injpt3_options.txt |
| Omicron option files: | detector 0, detector 1 |
| Detector channel names: | H1:GDS-CALIB_STRAIN_CLEAN_AR_4096Hz, L1:GDS-CALIB_STRAIN_CLEAN_AR_4096Hz |
| Omicron analysis time window and overlap: | 16 s, 6 s |
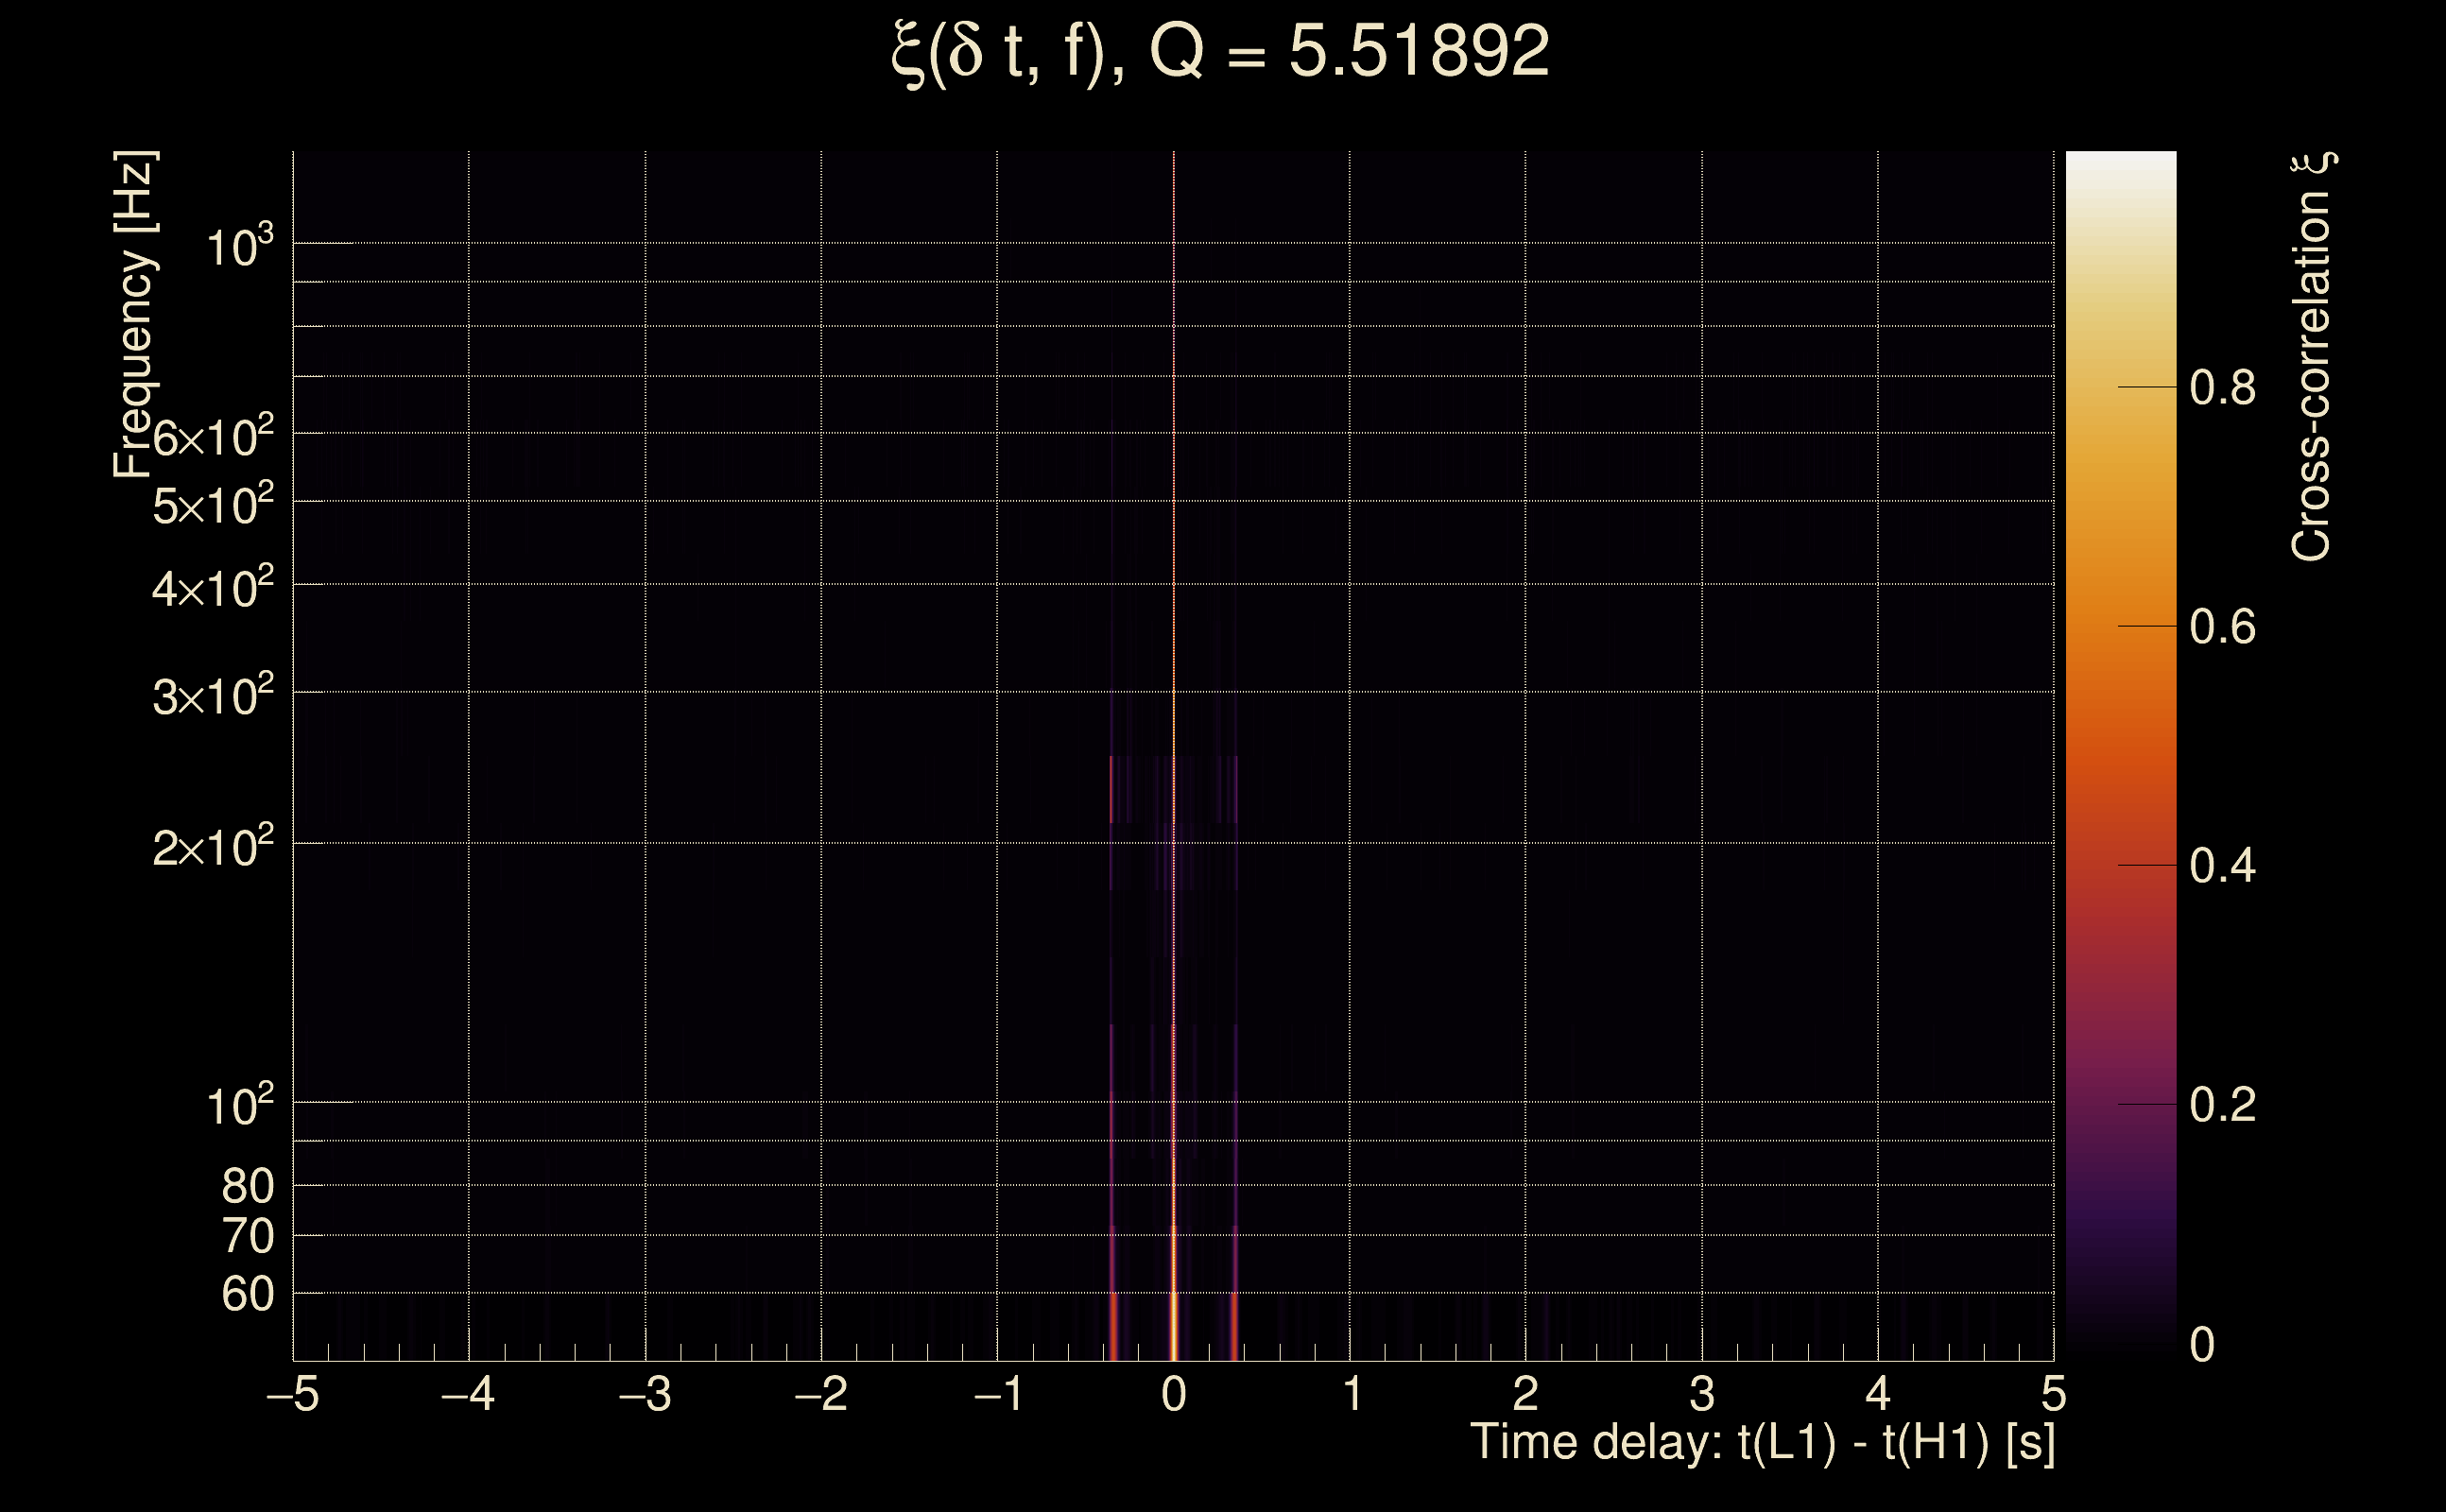
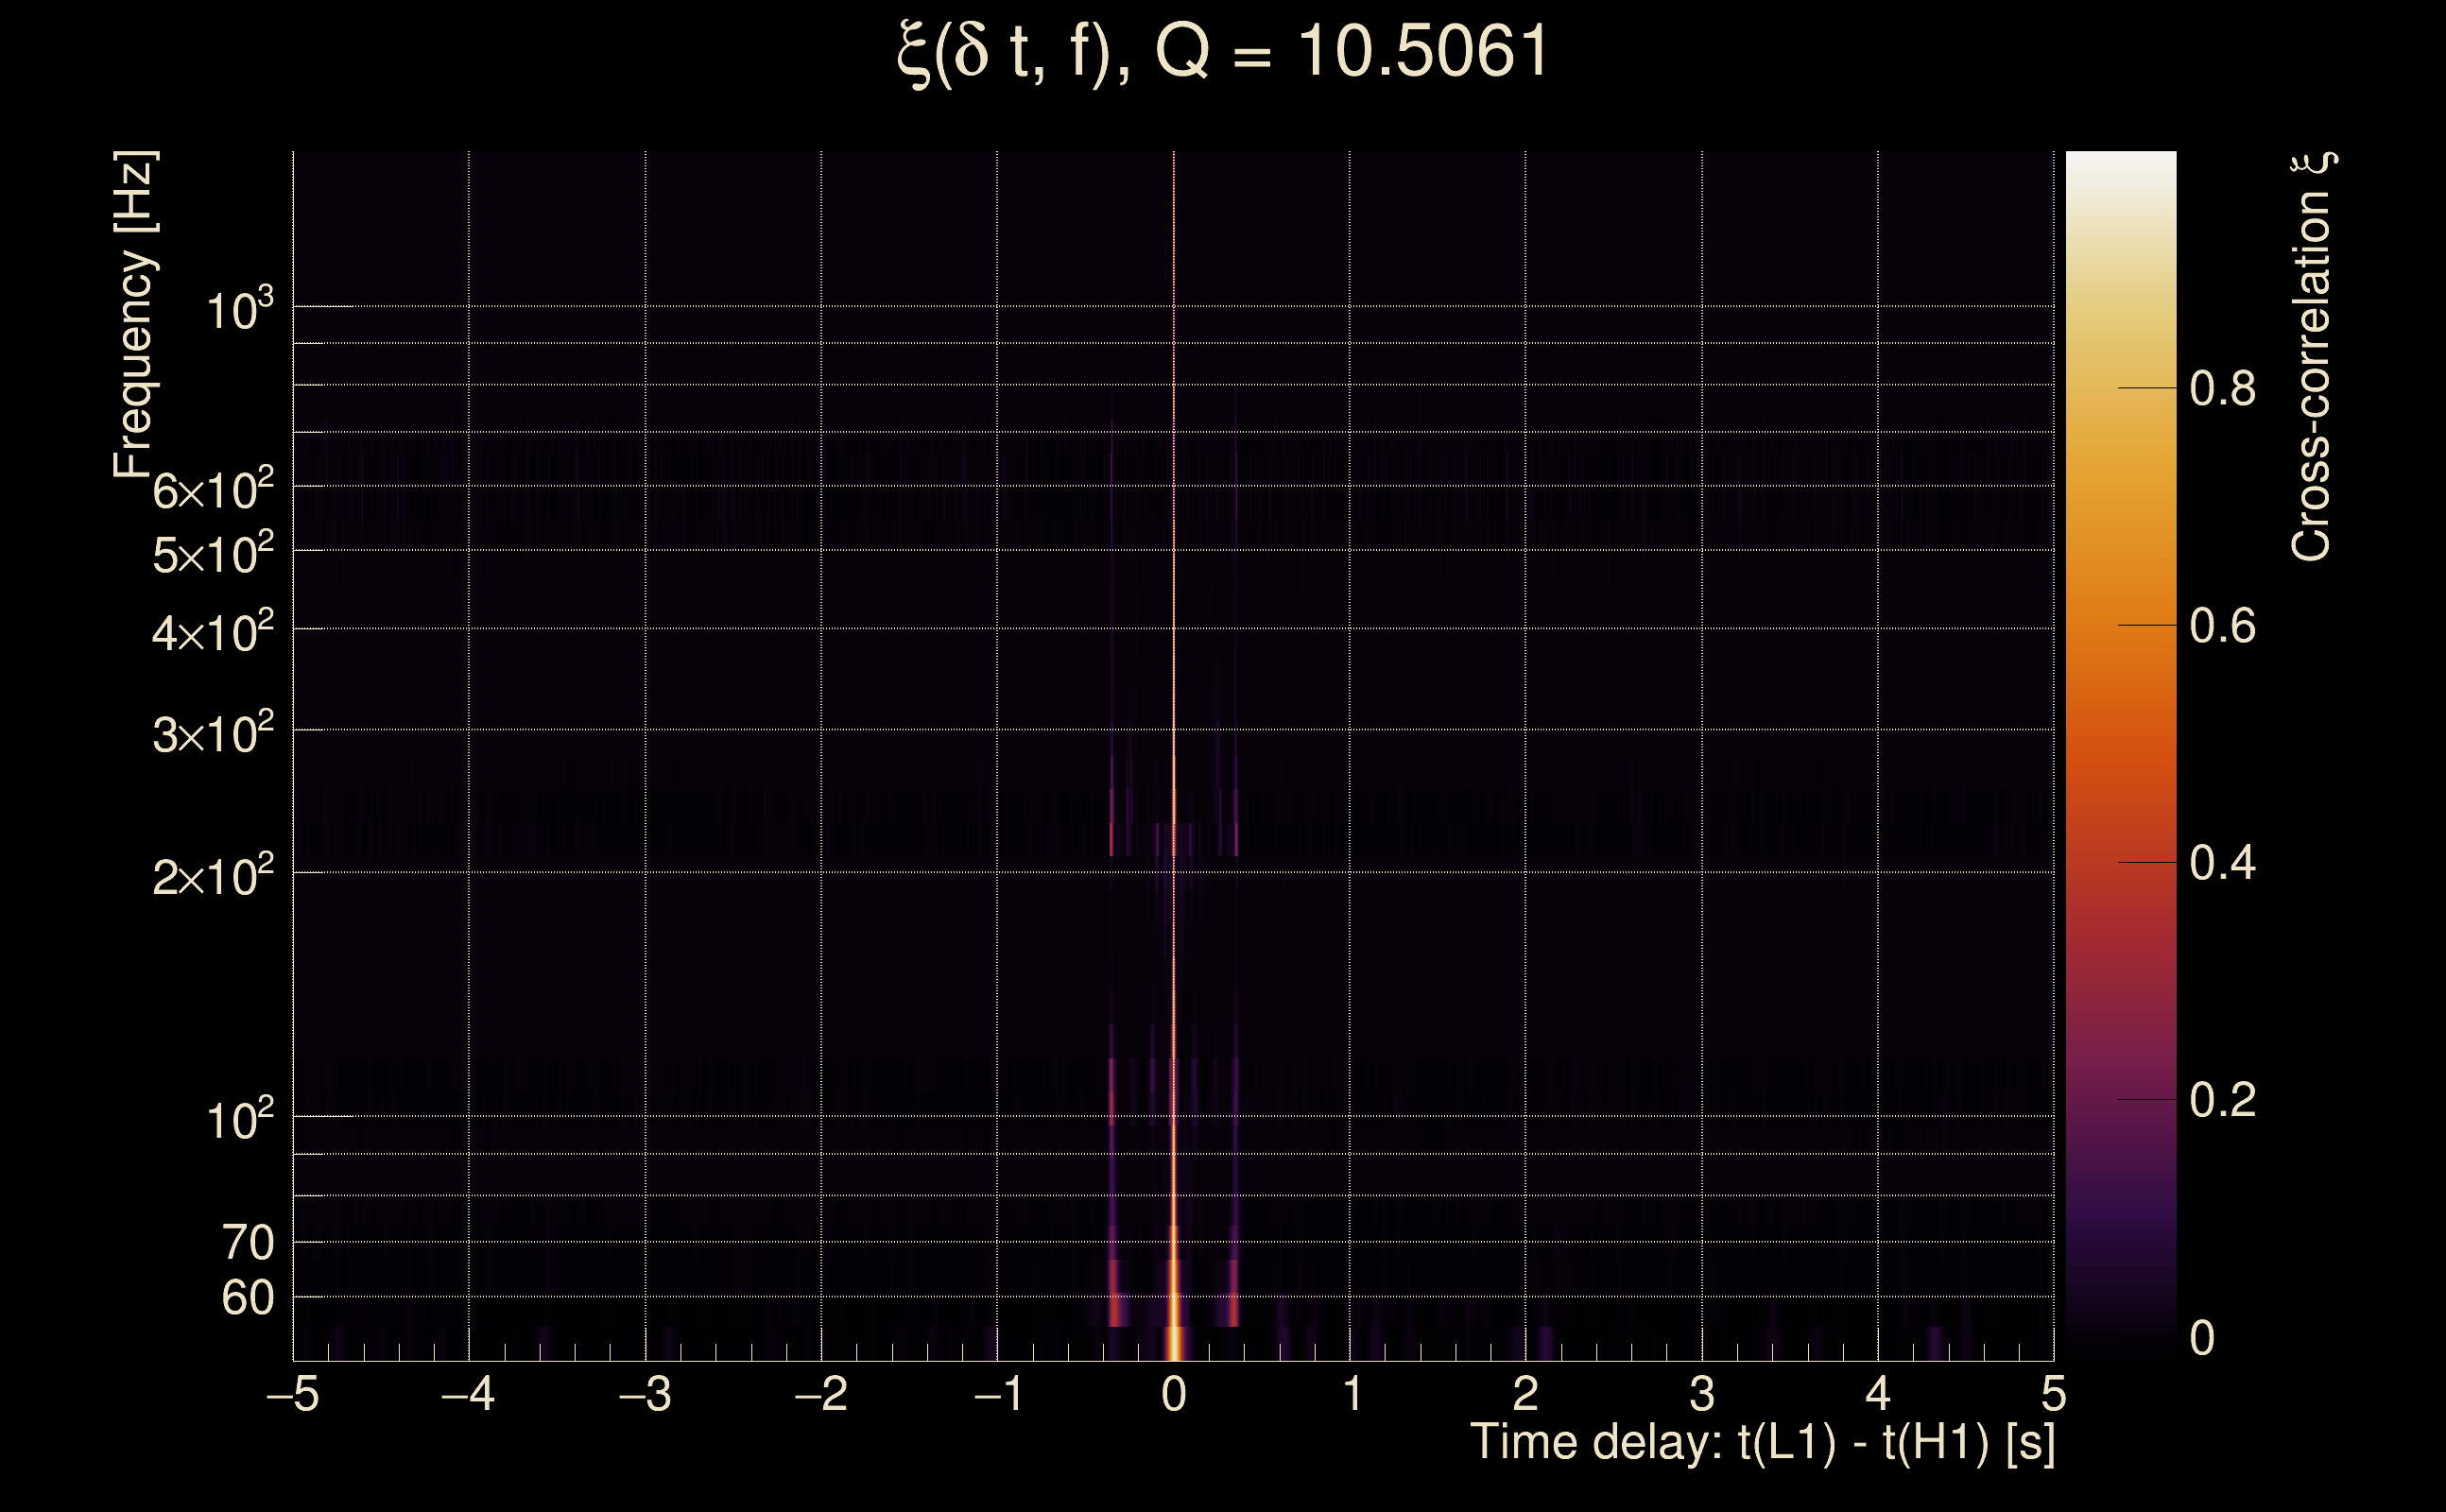
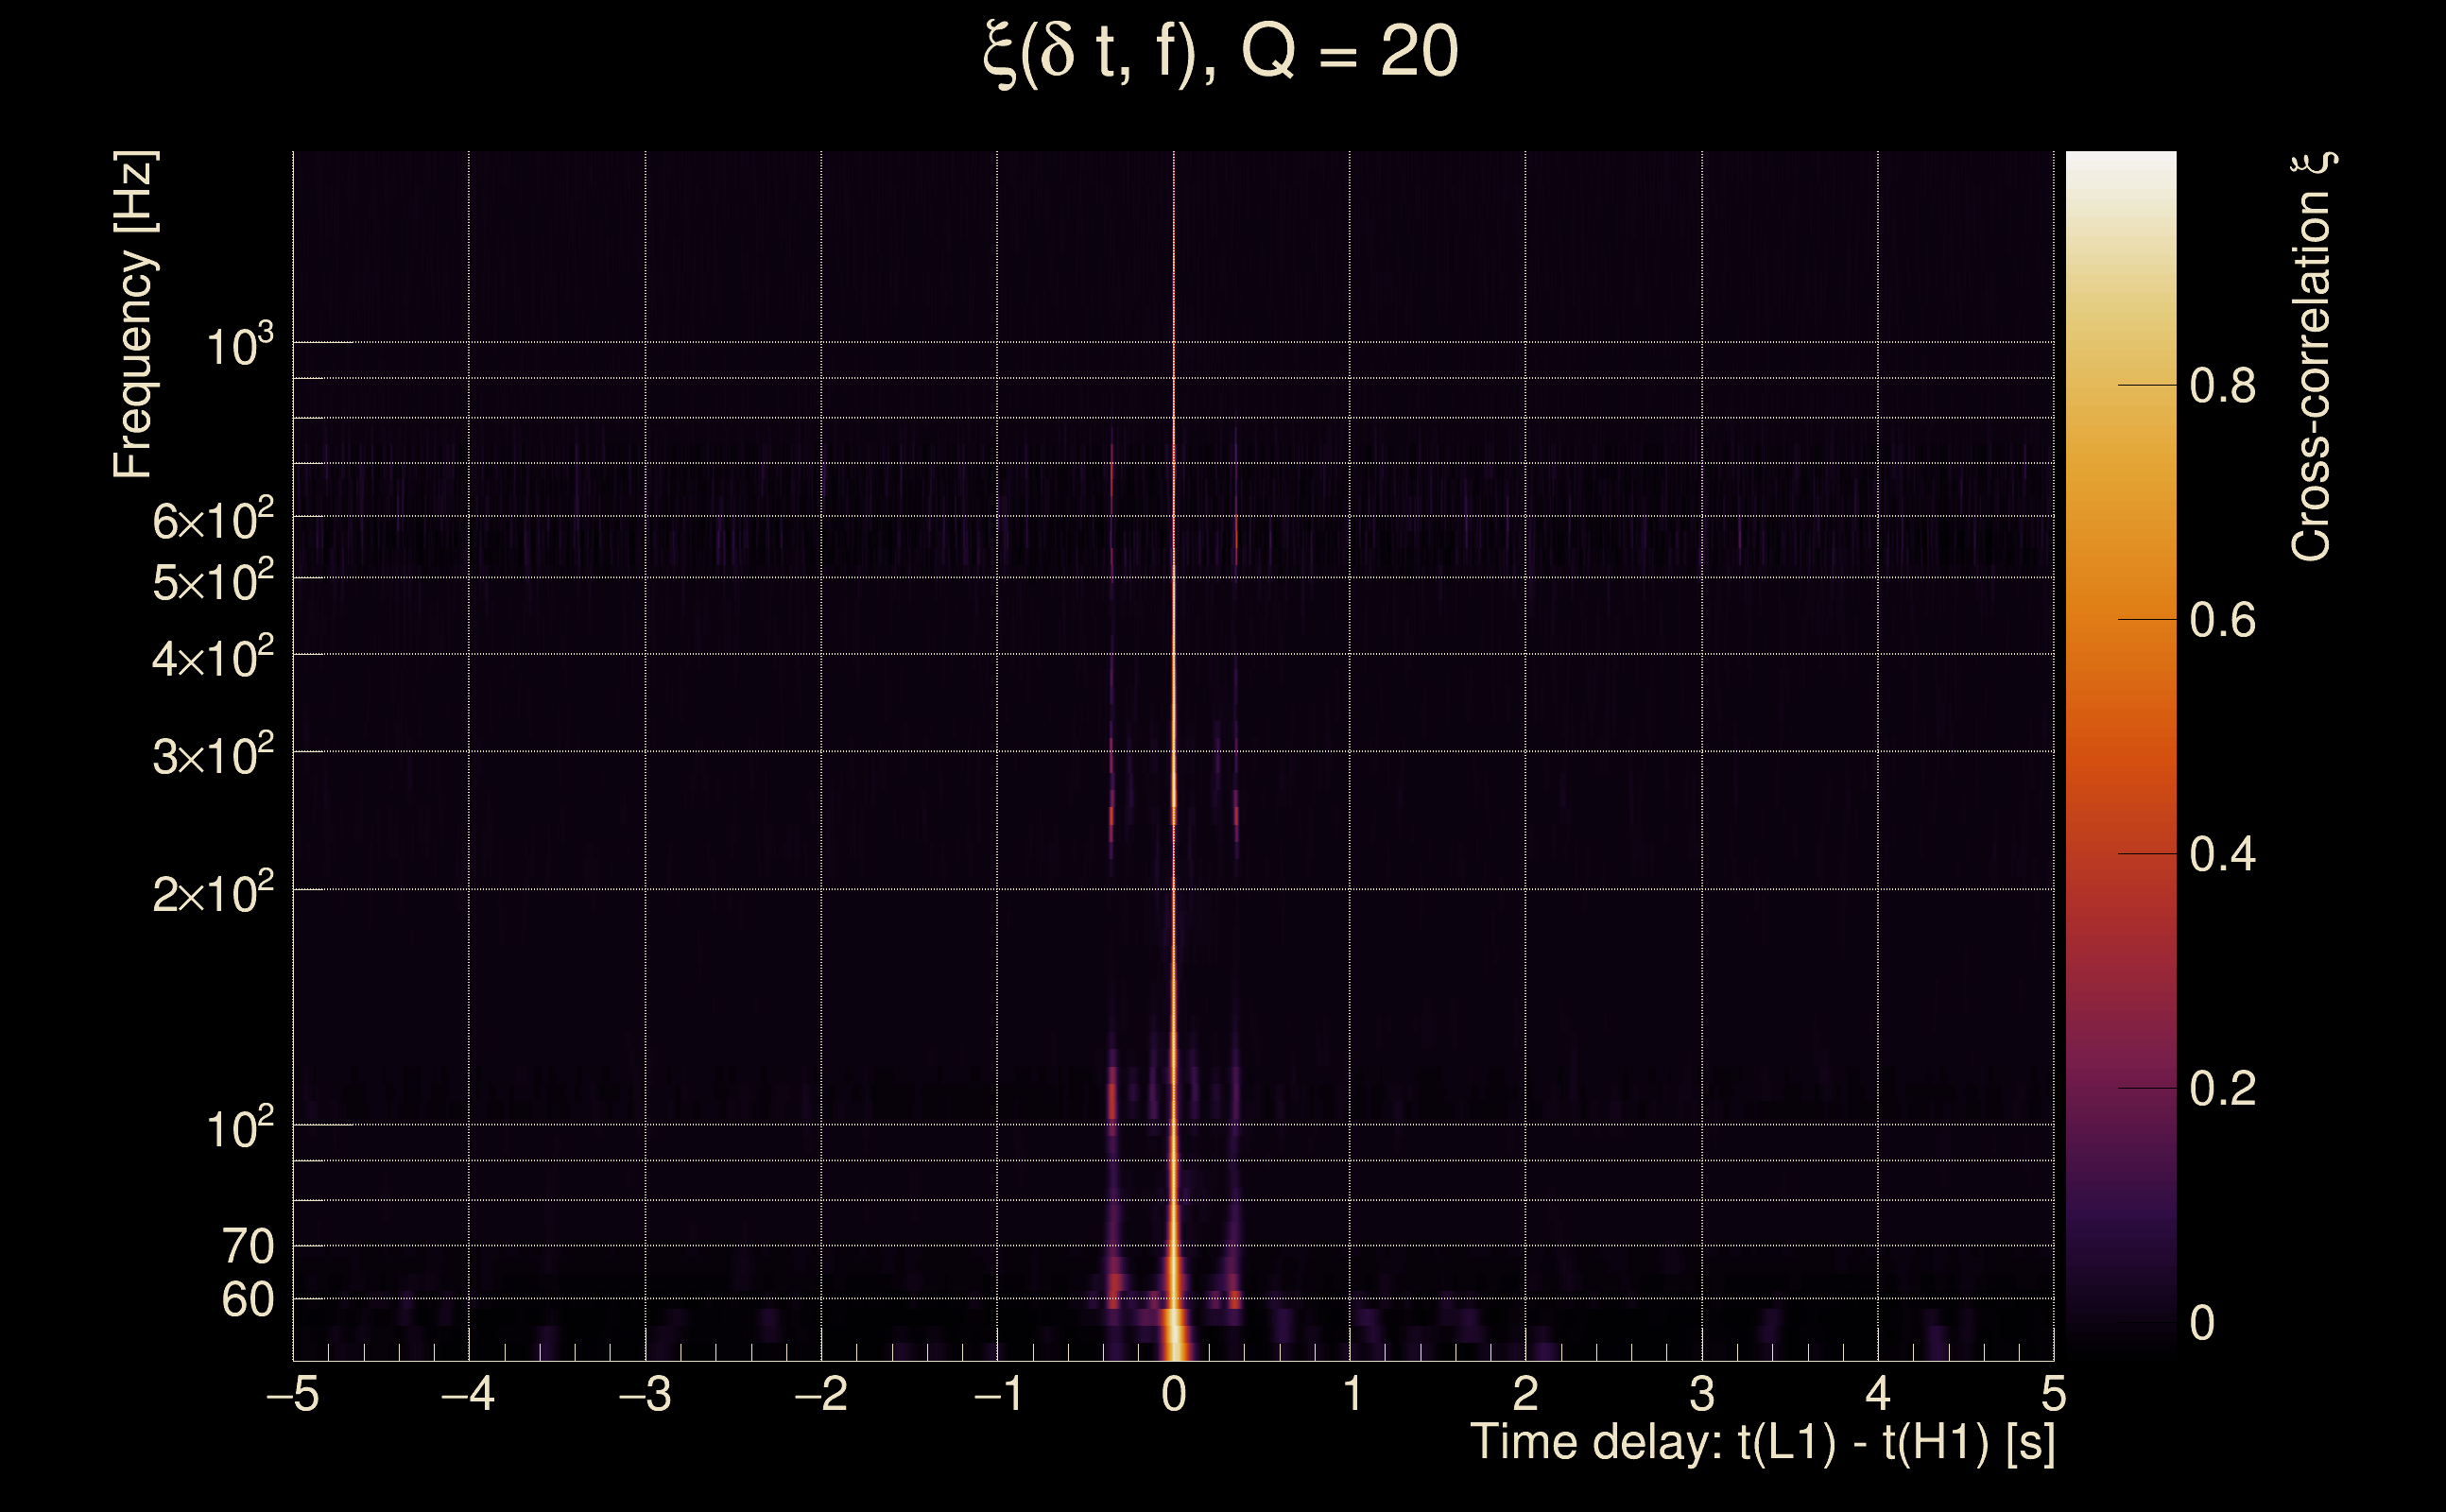
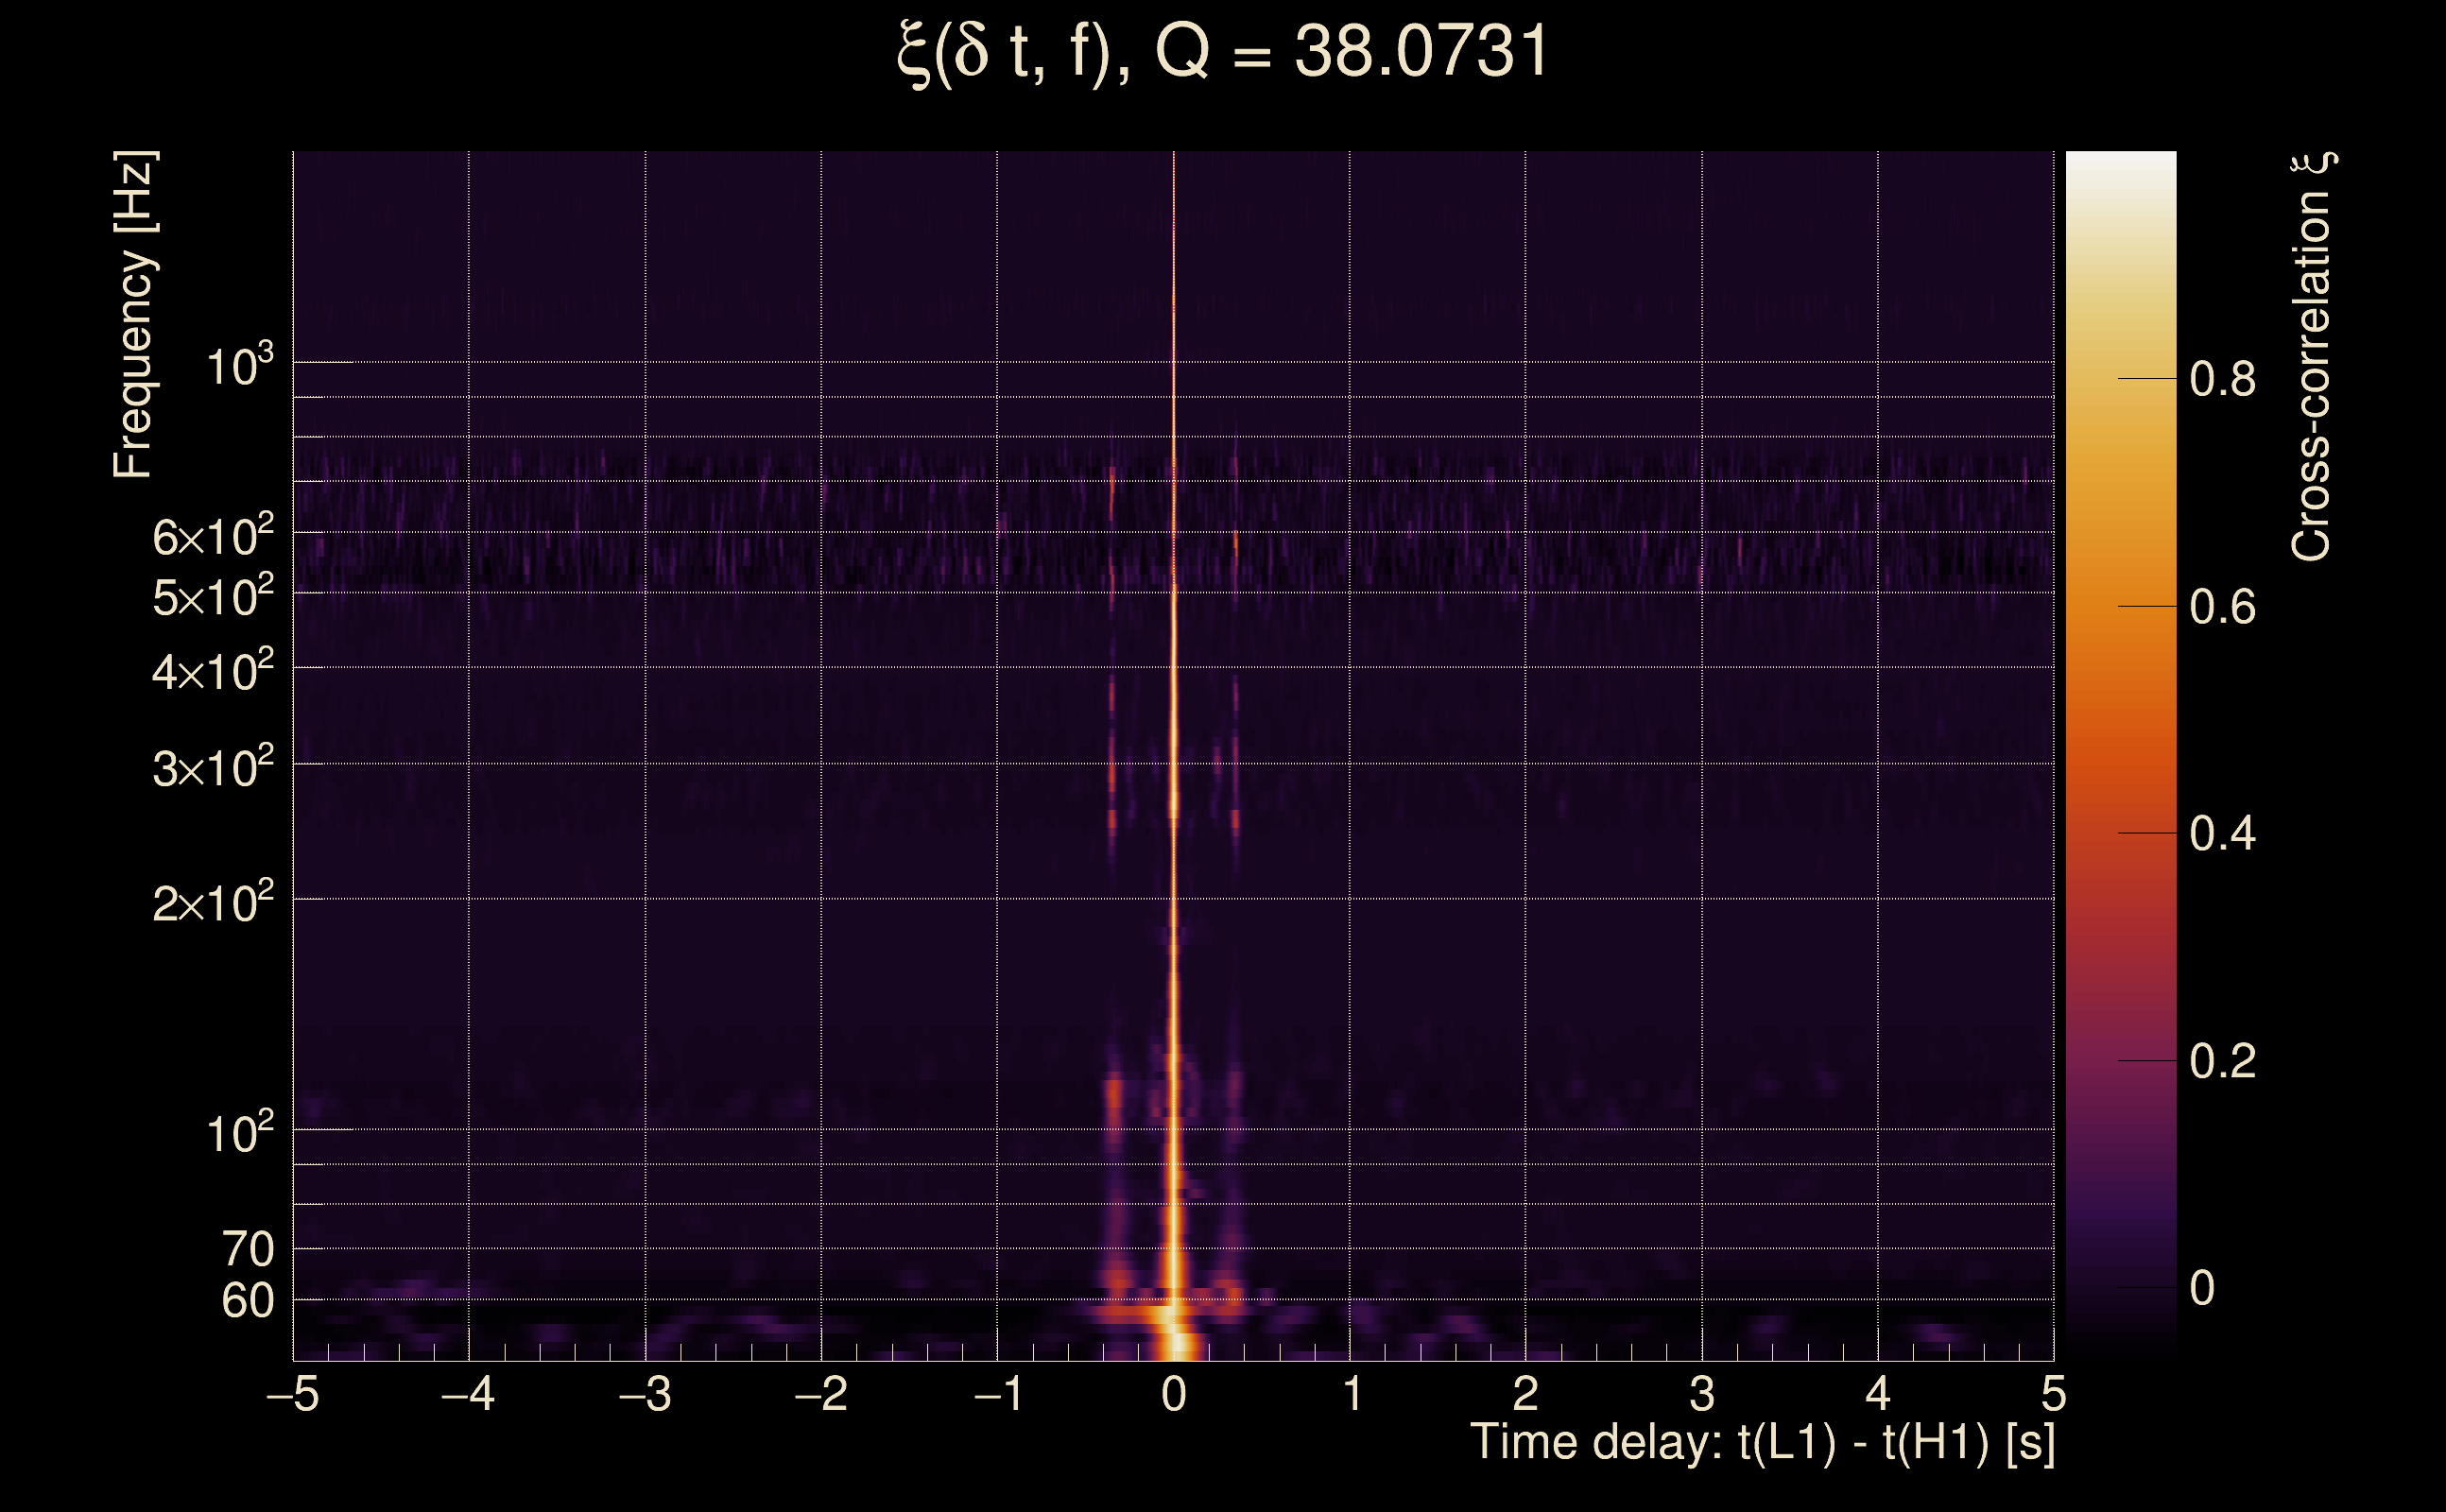
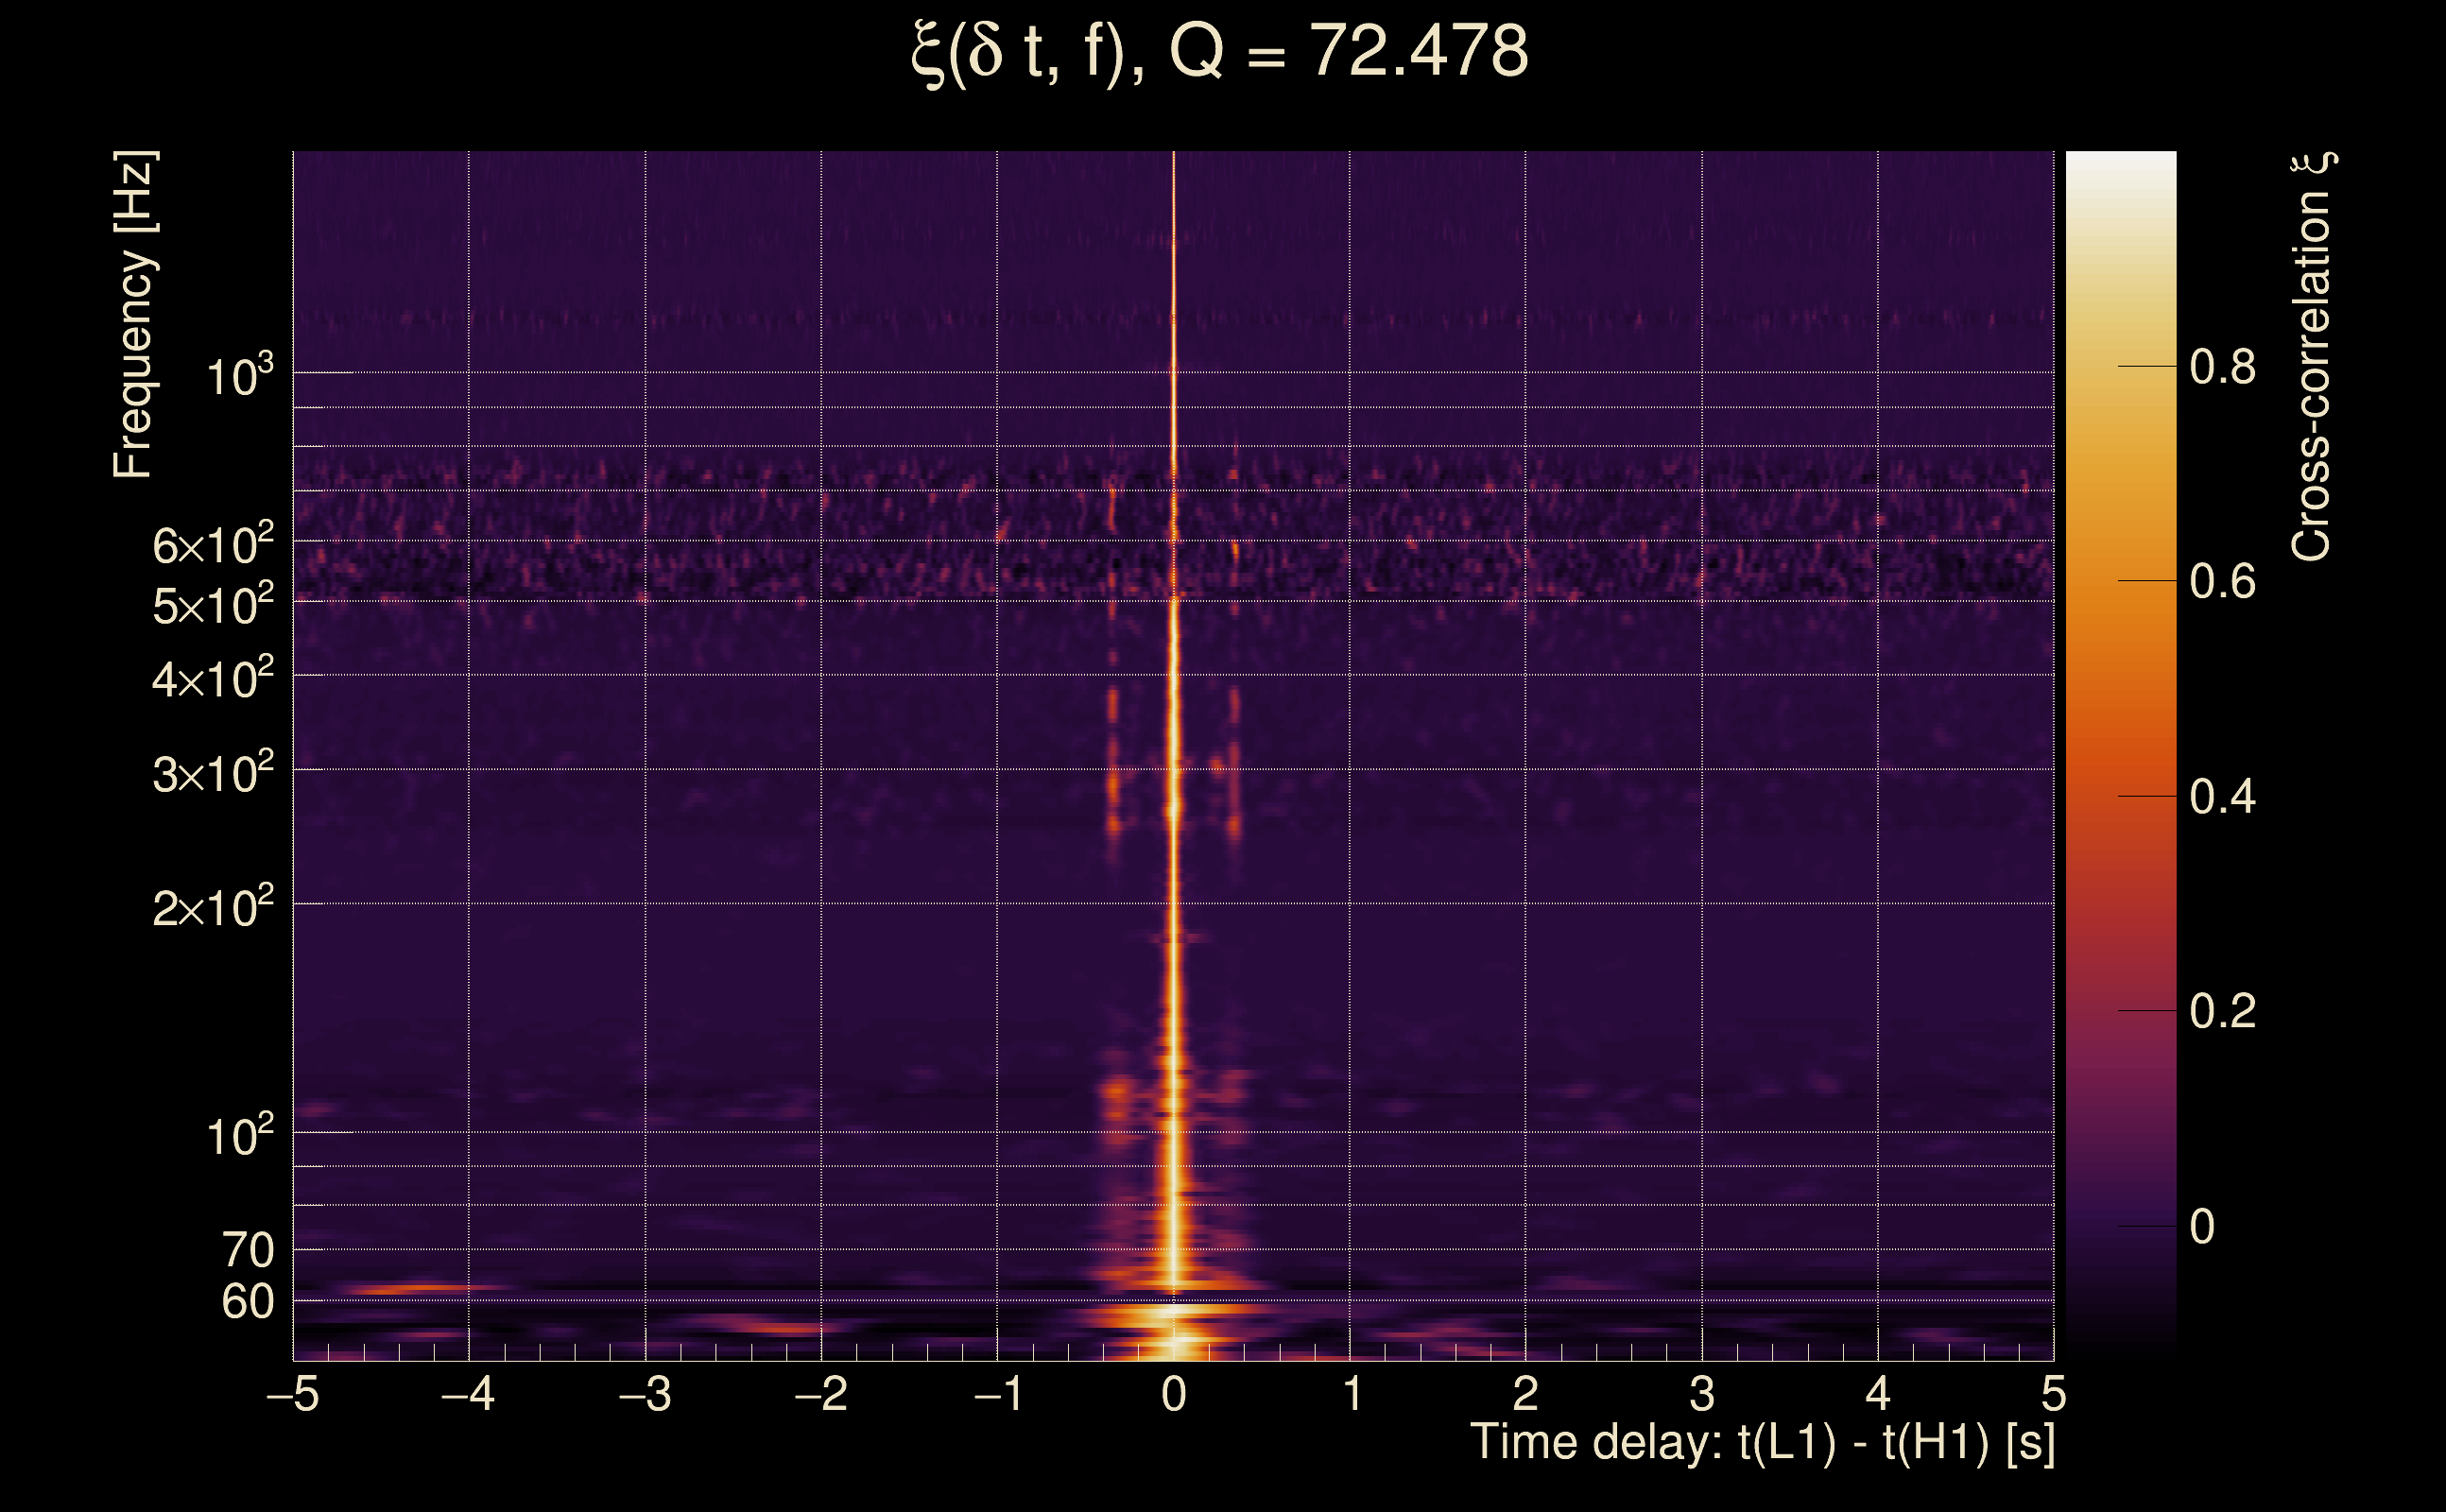
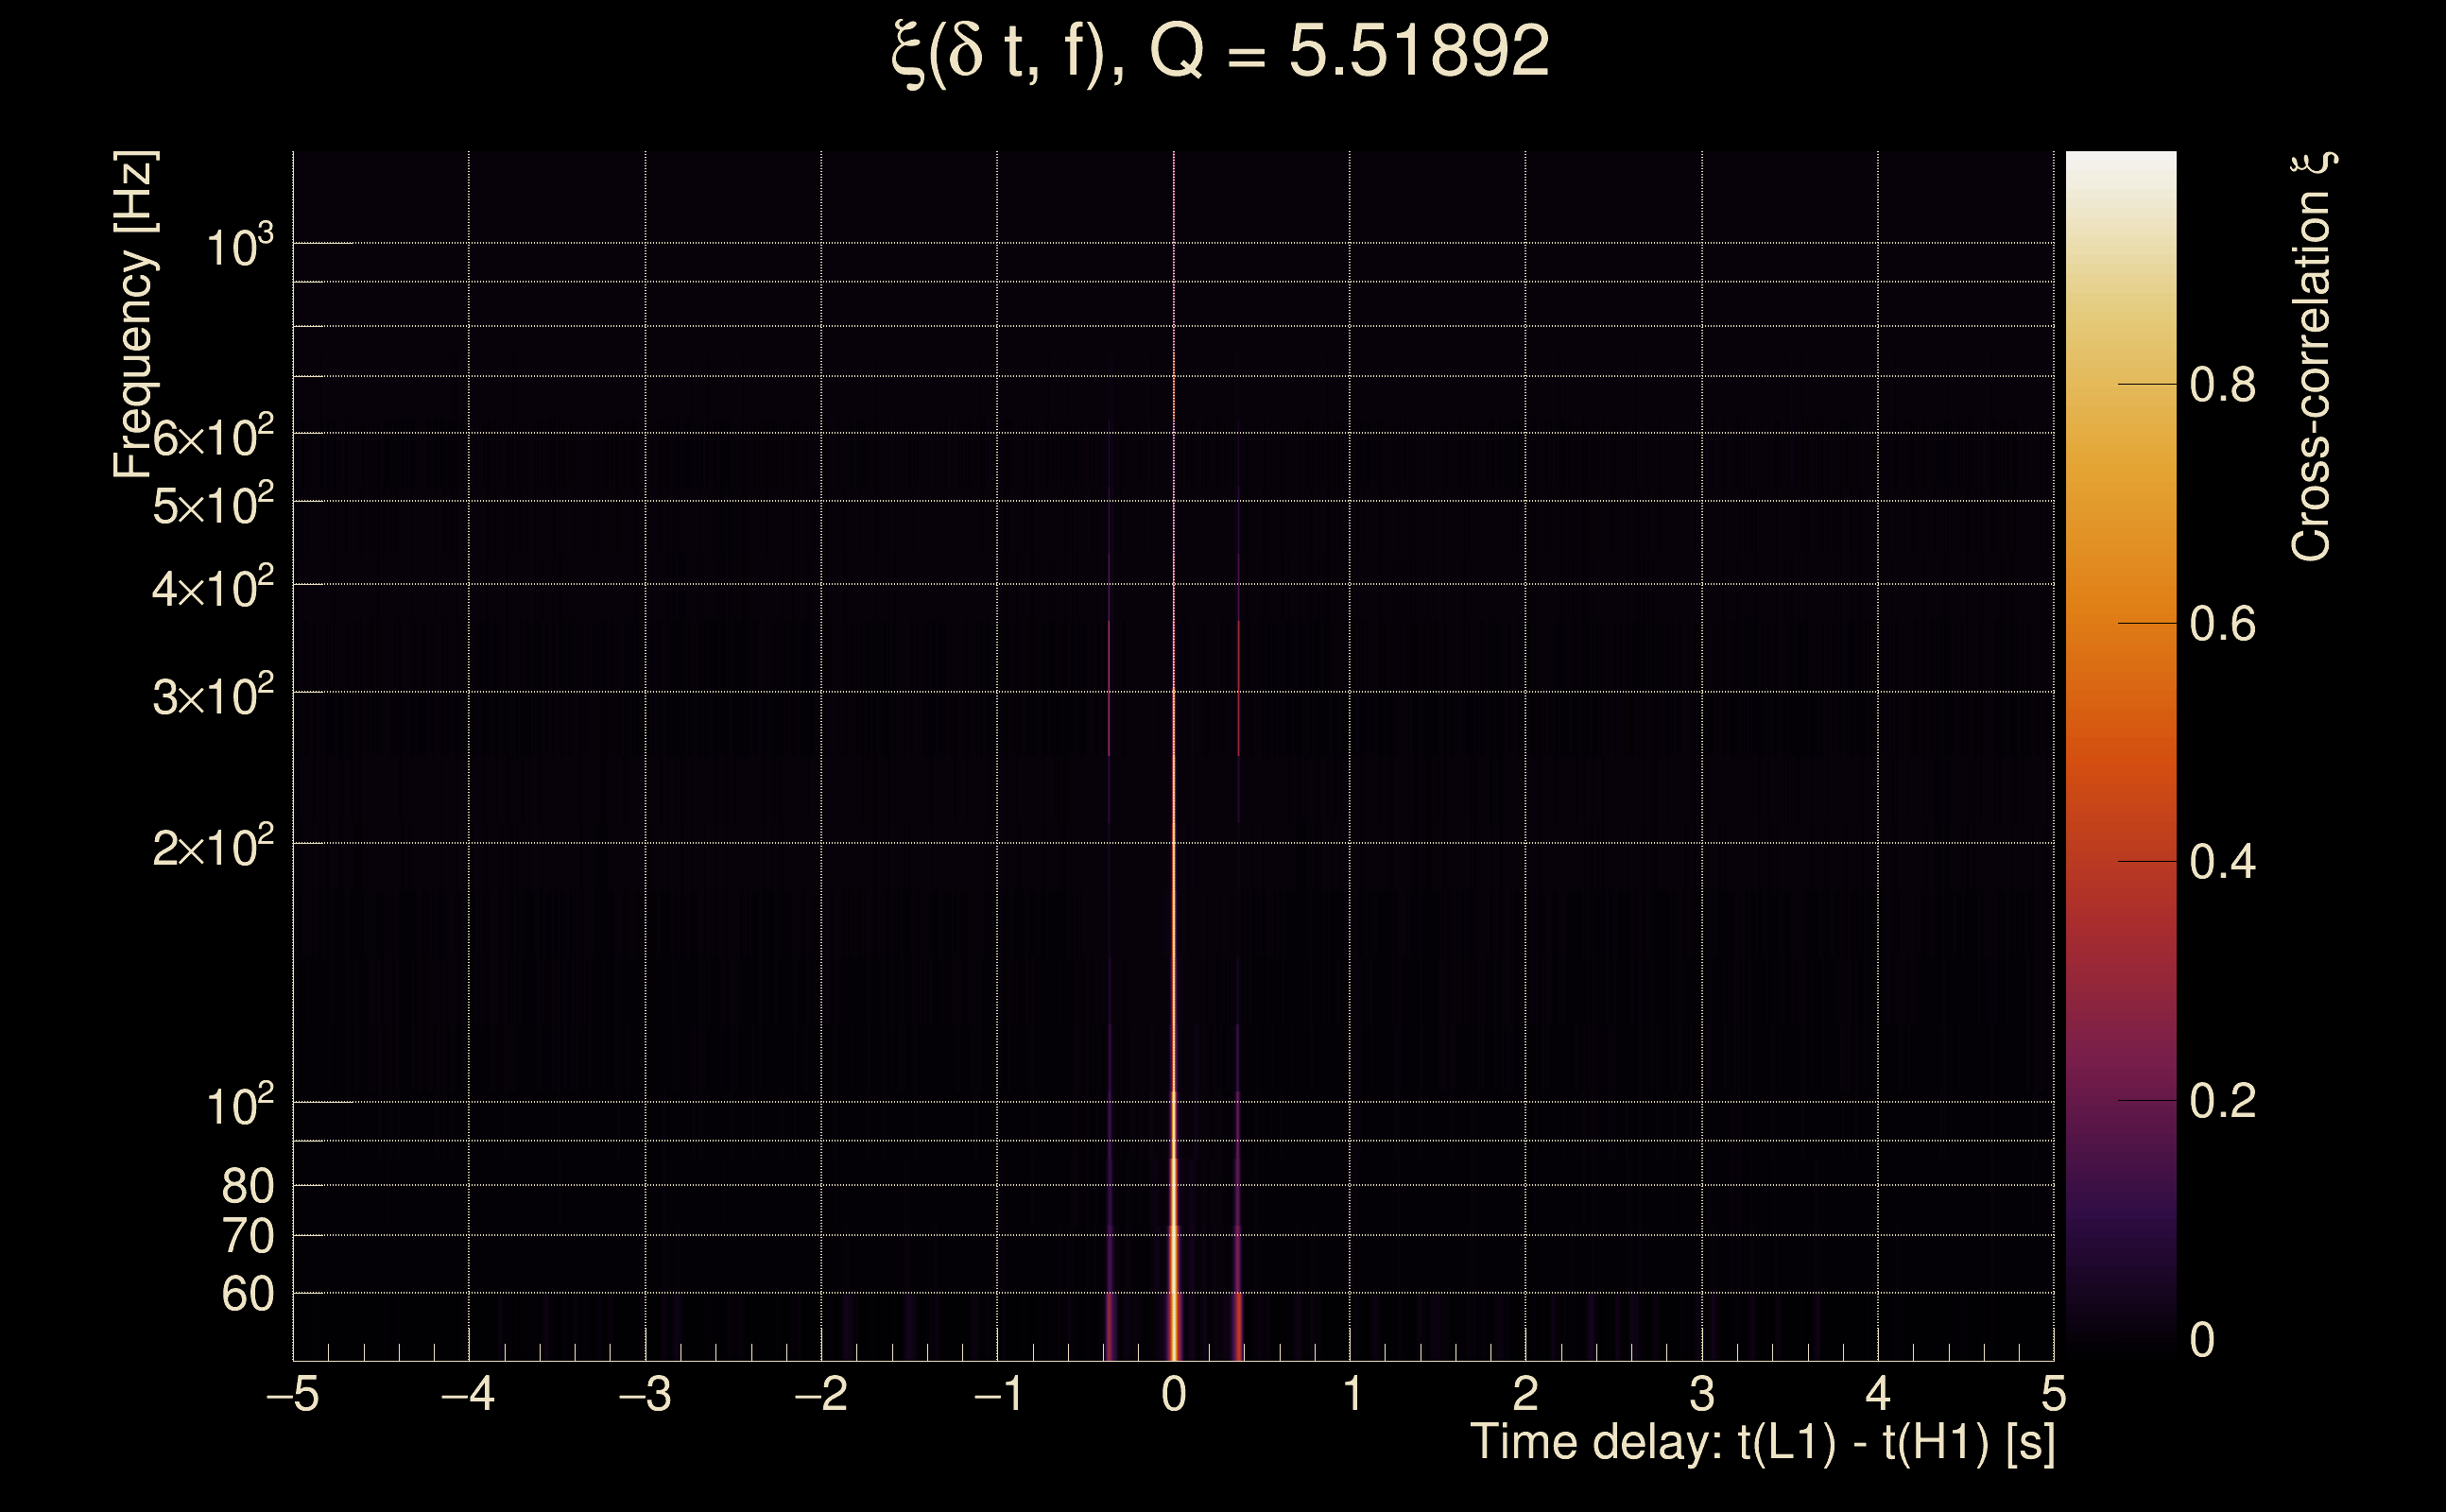
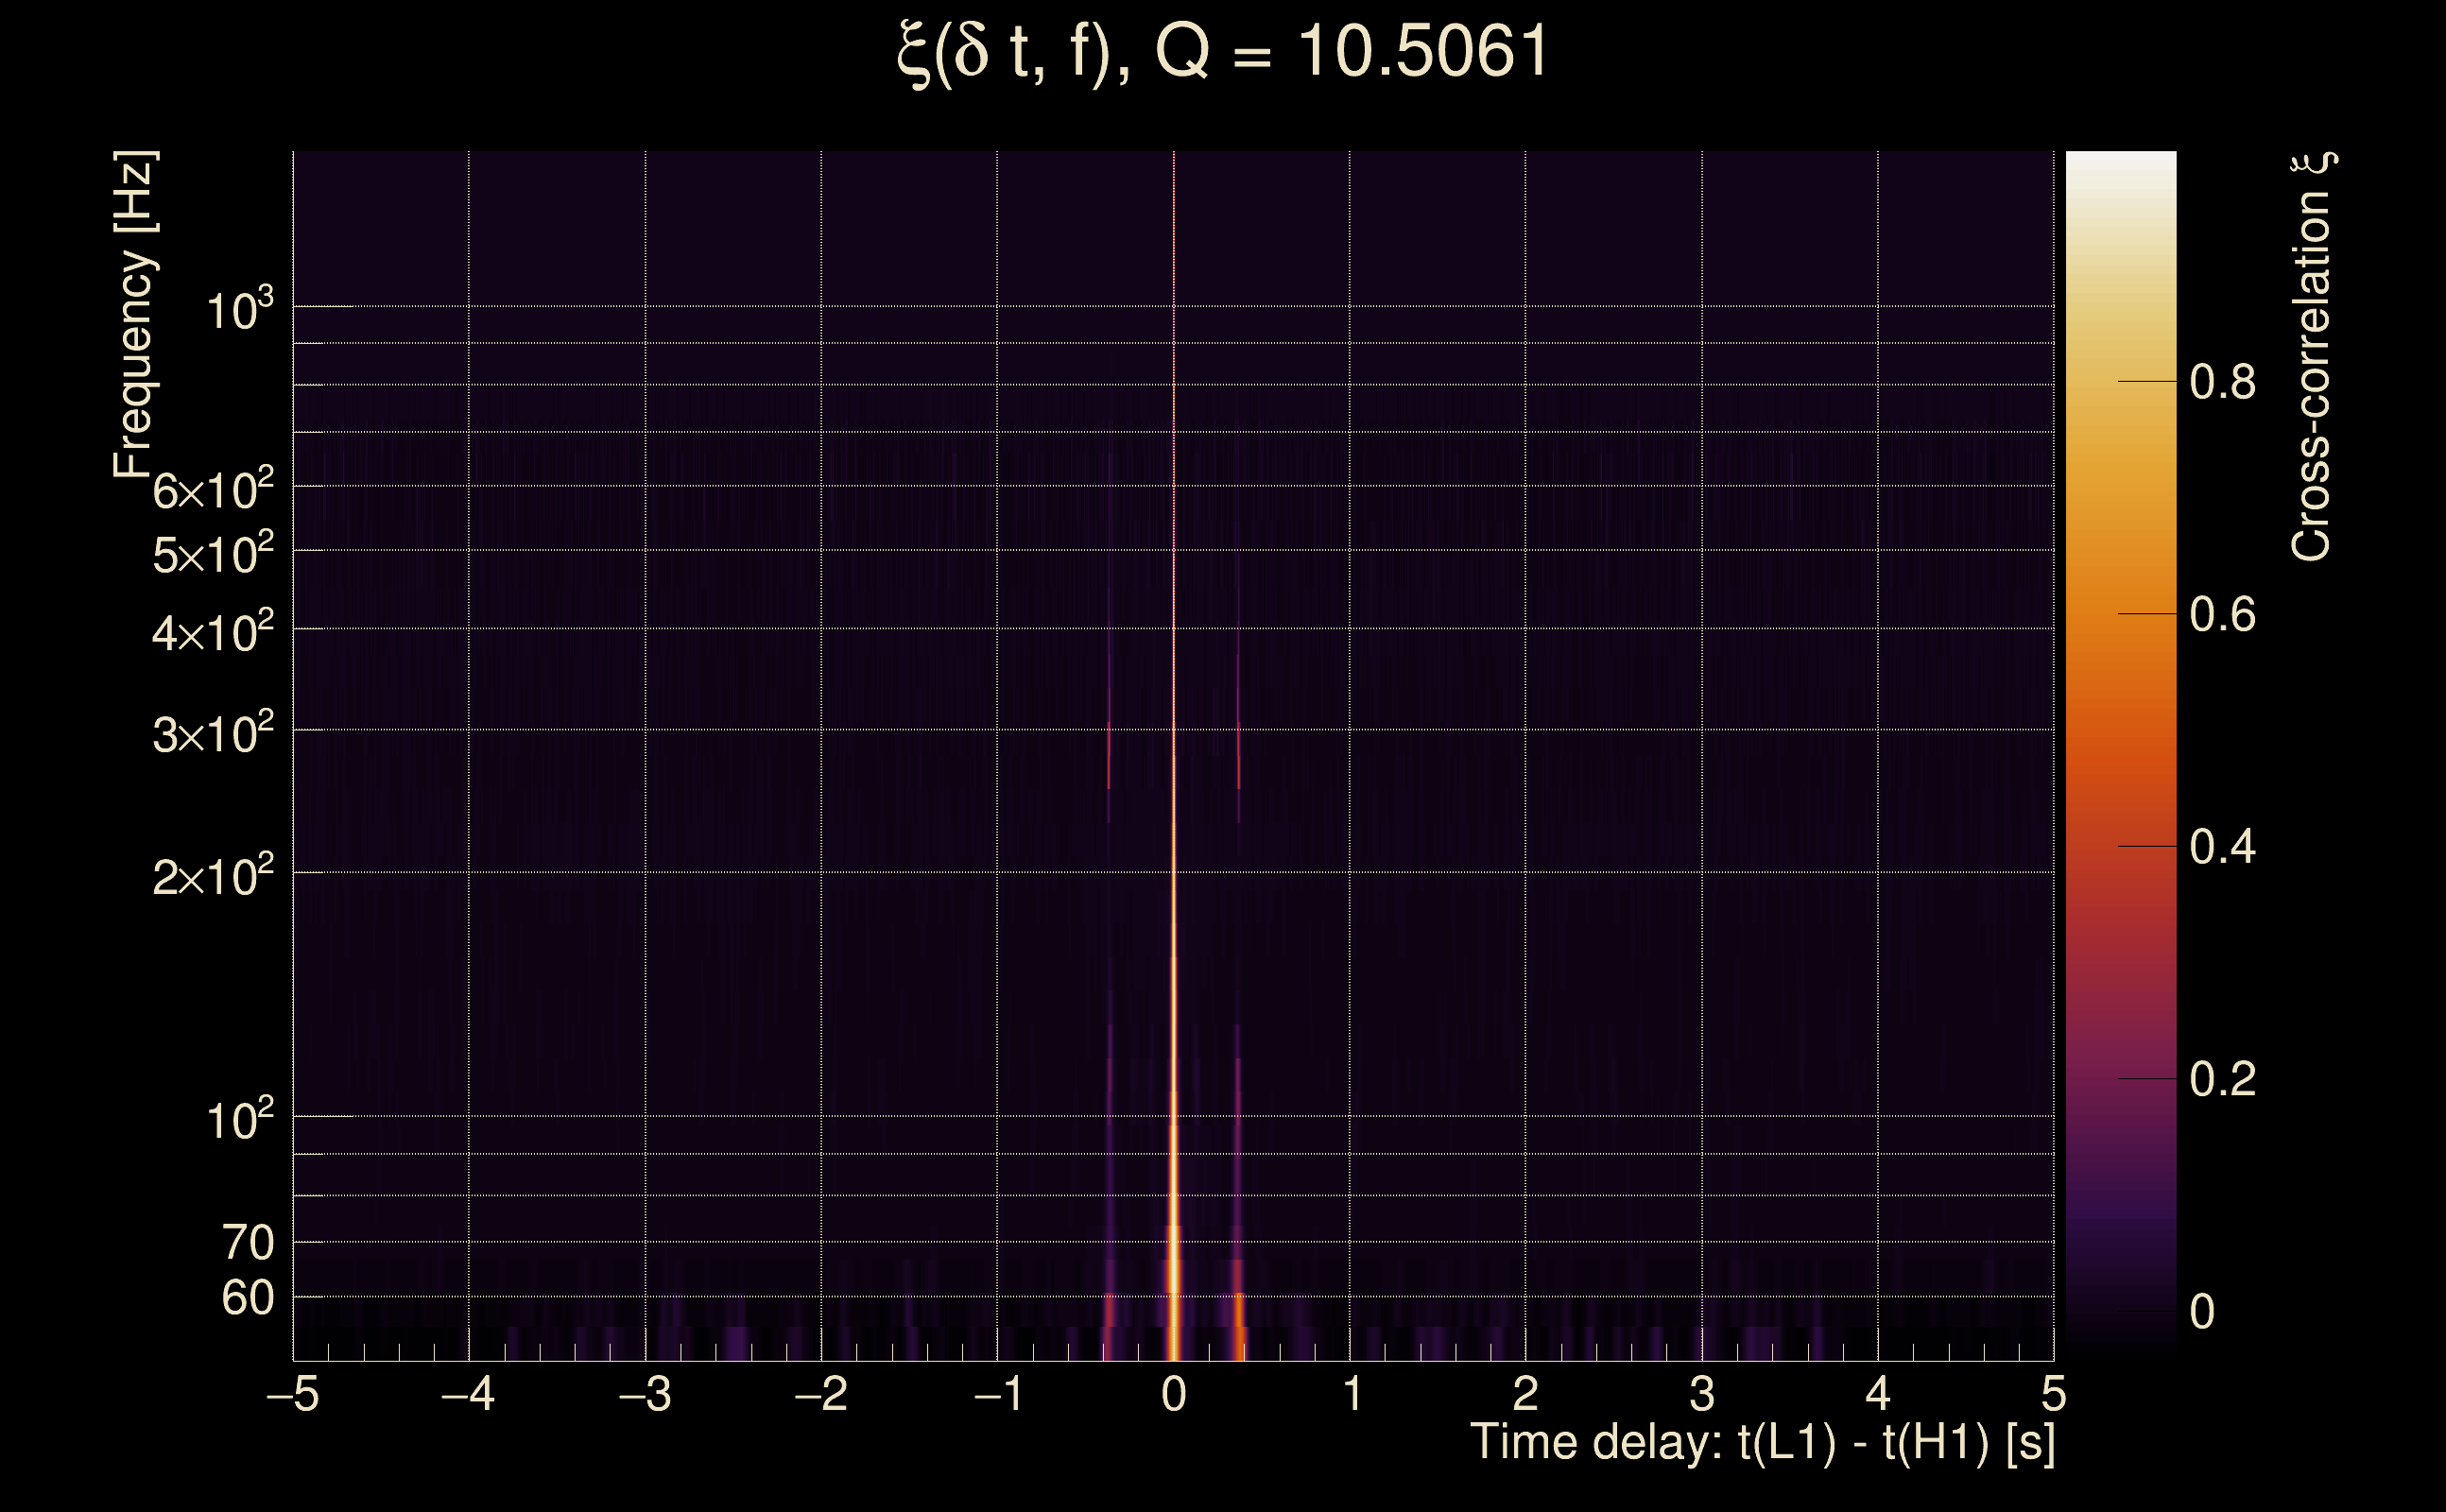
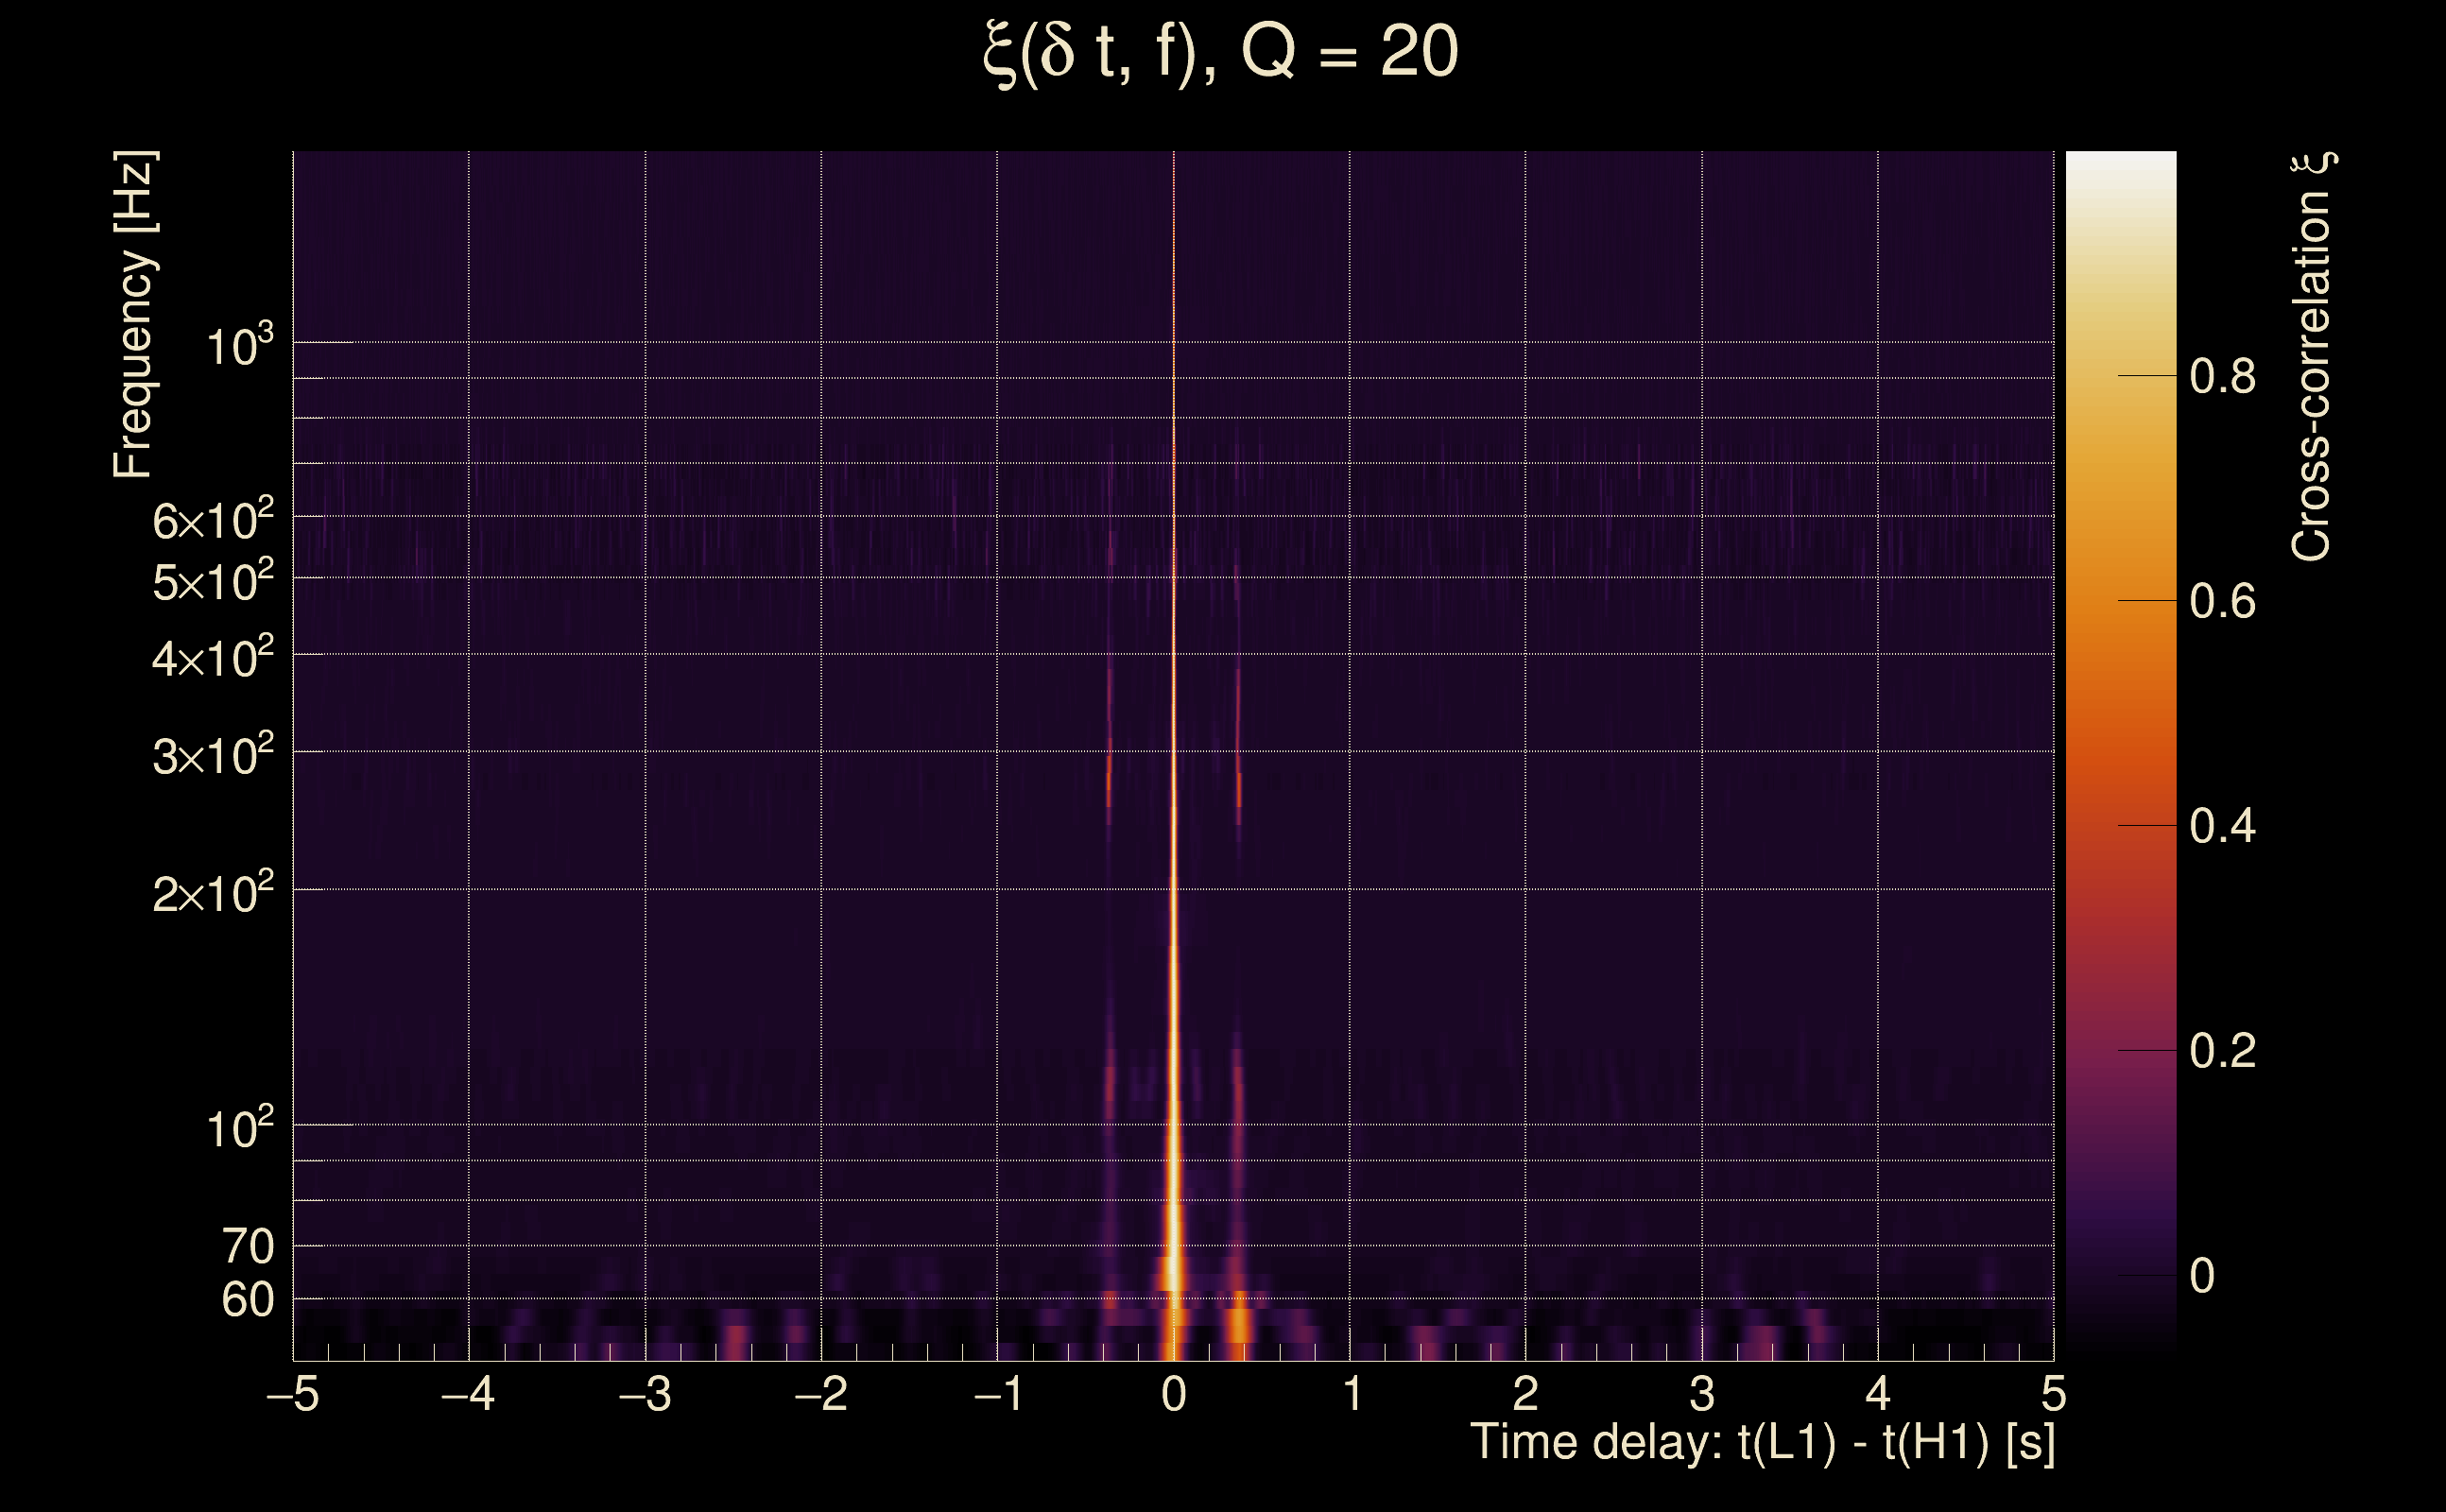
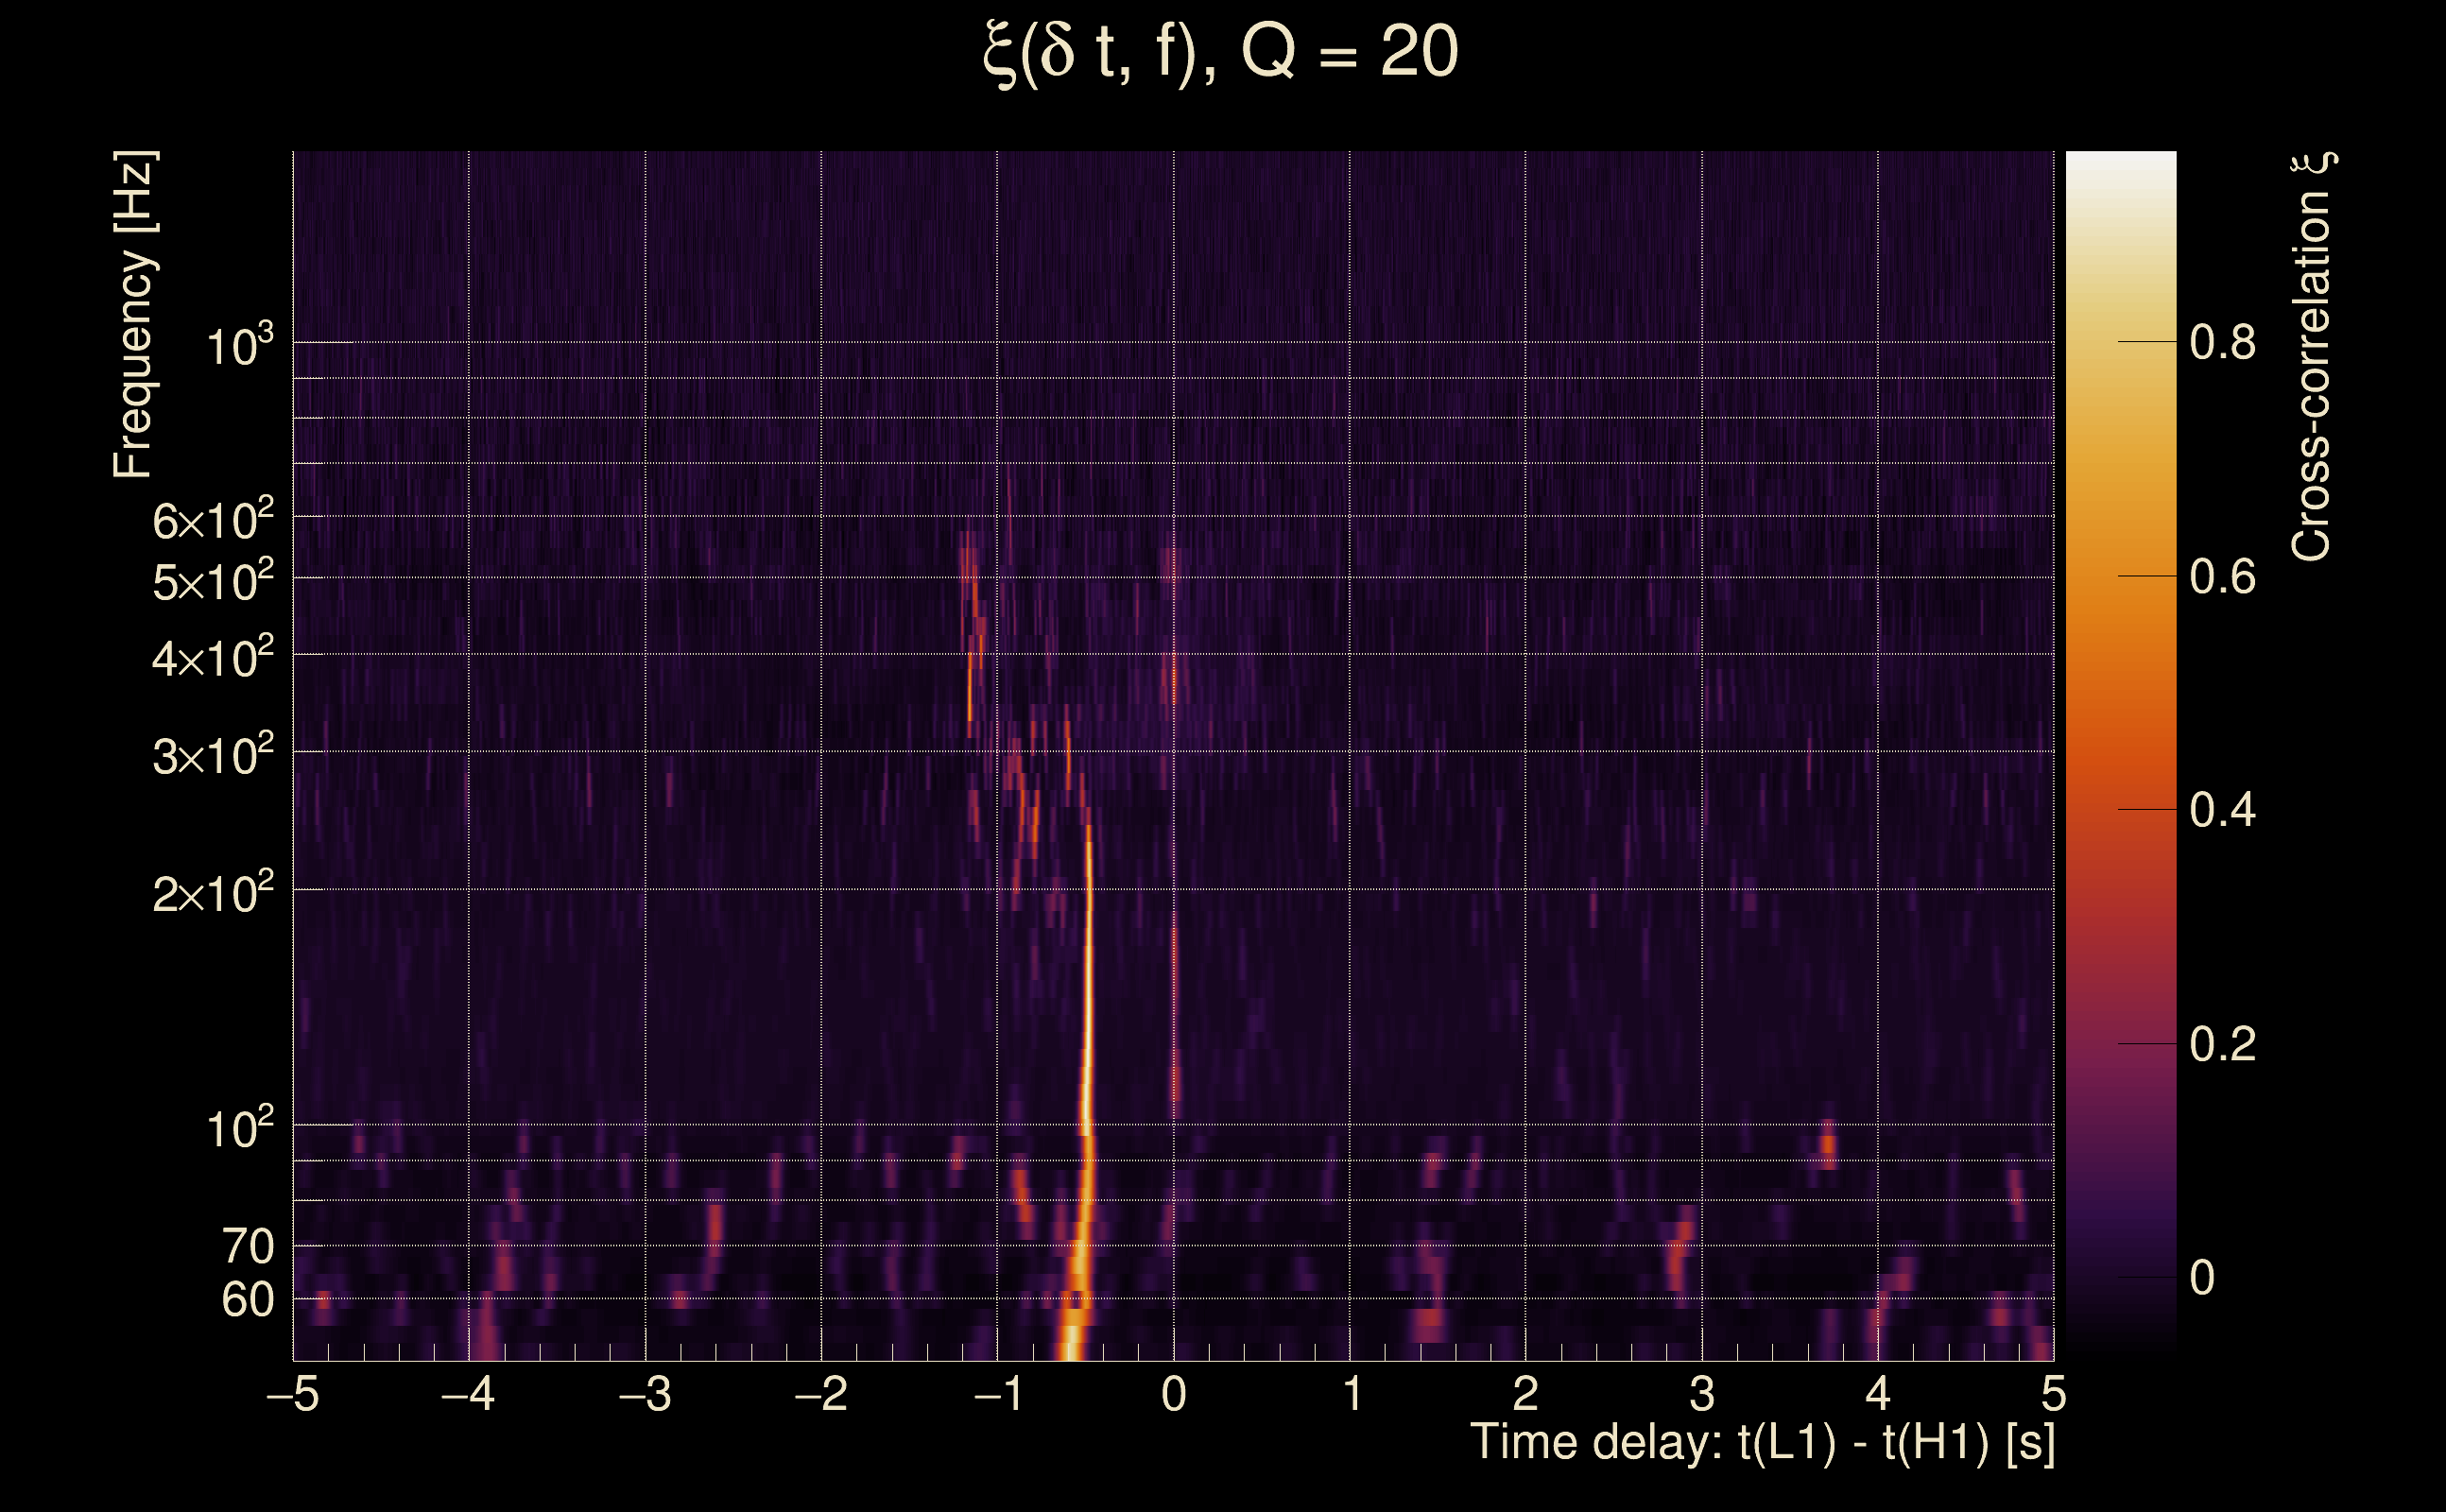
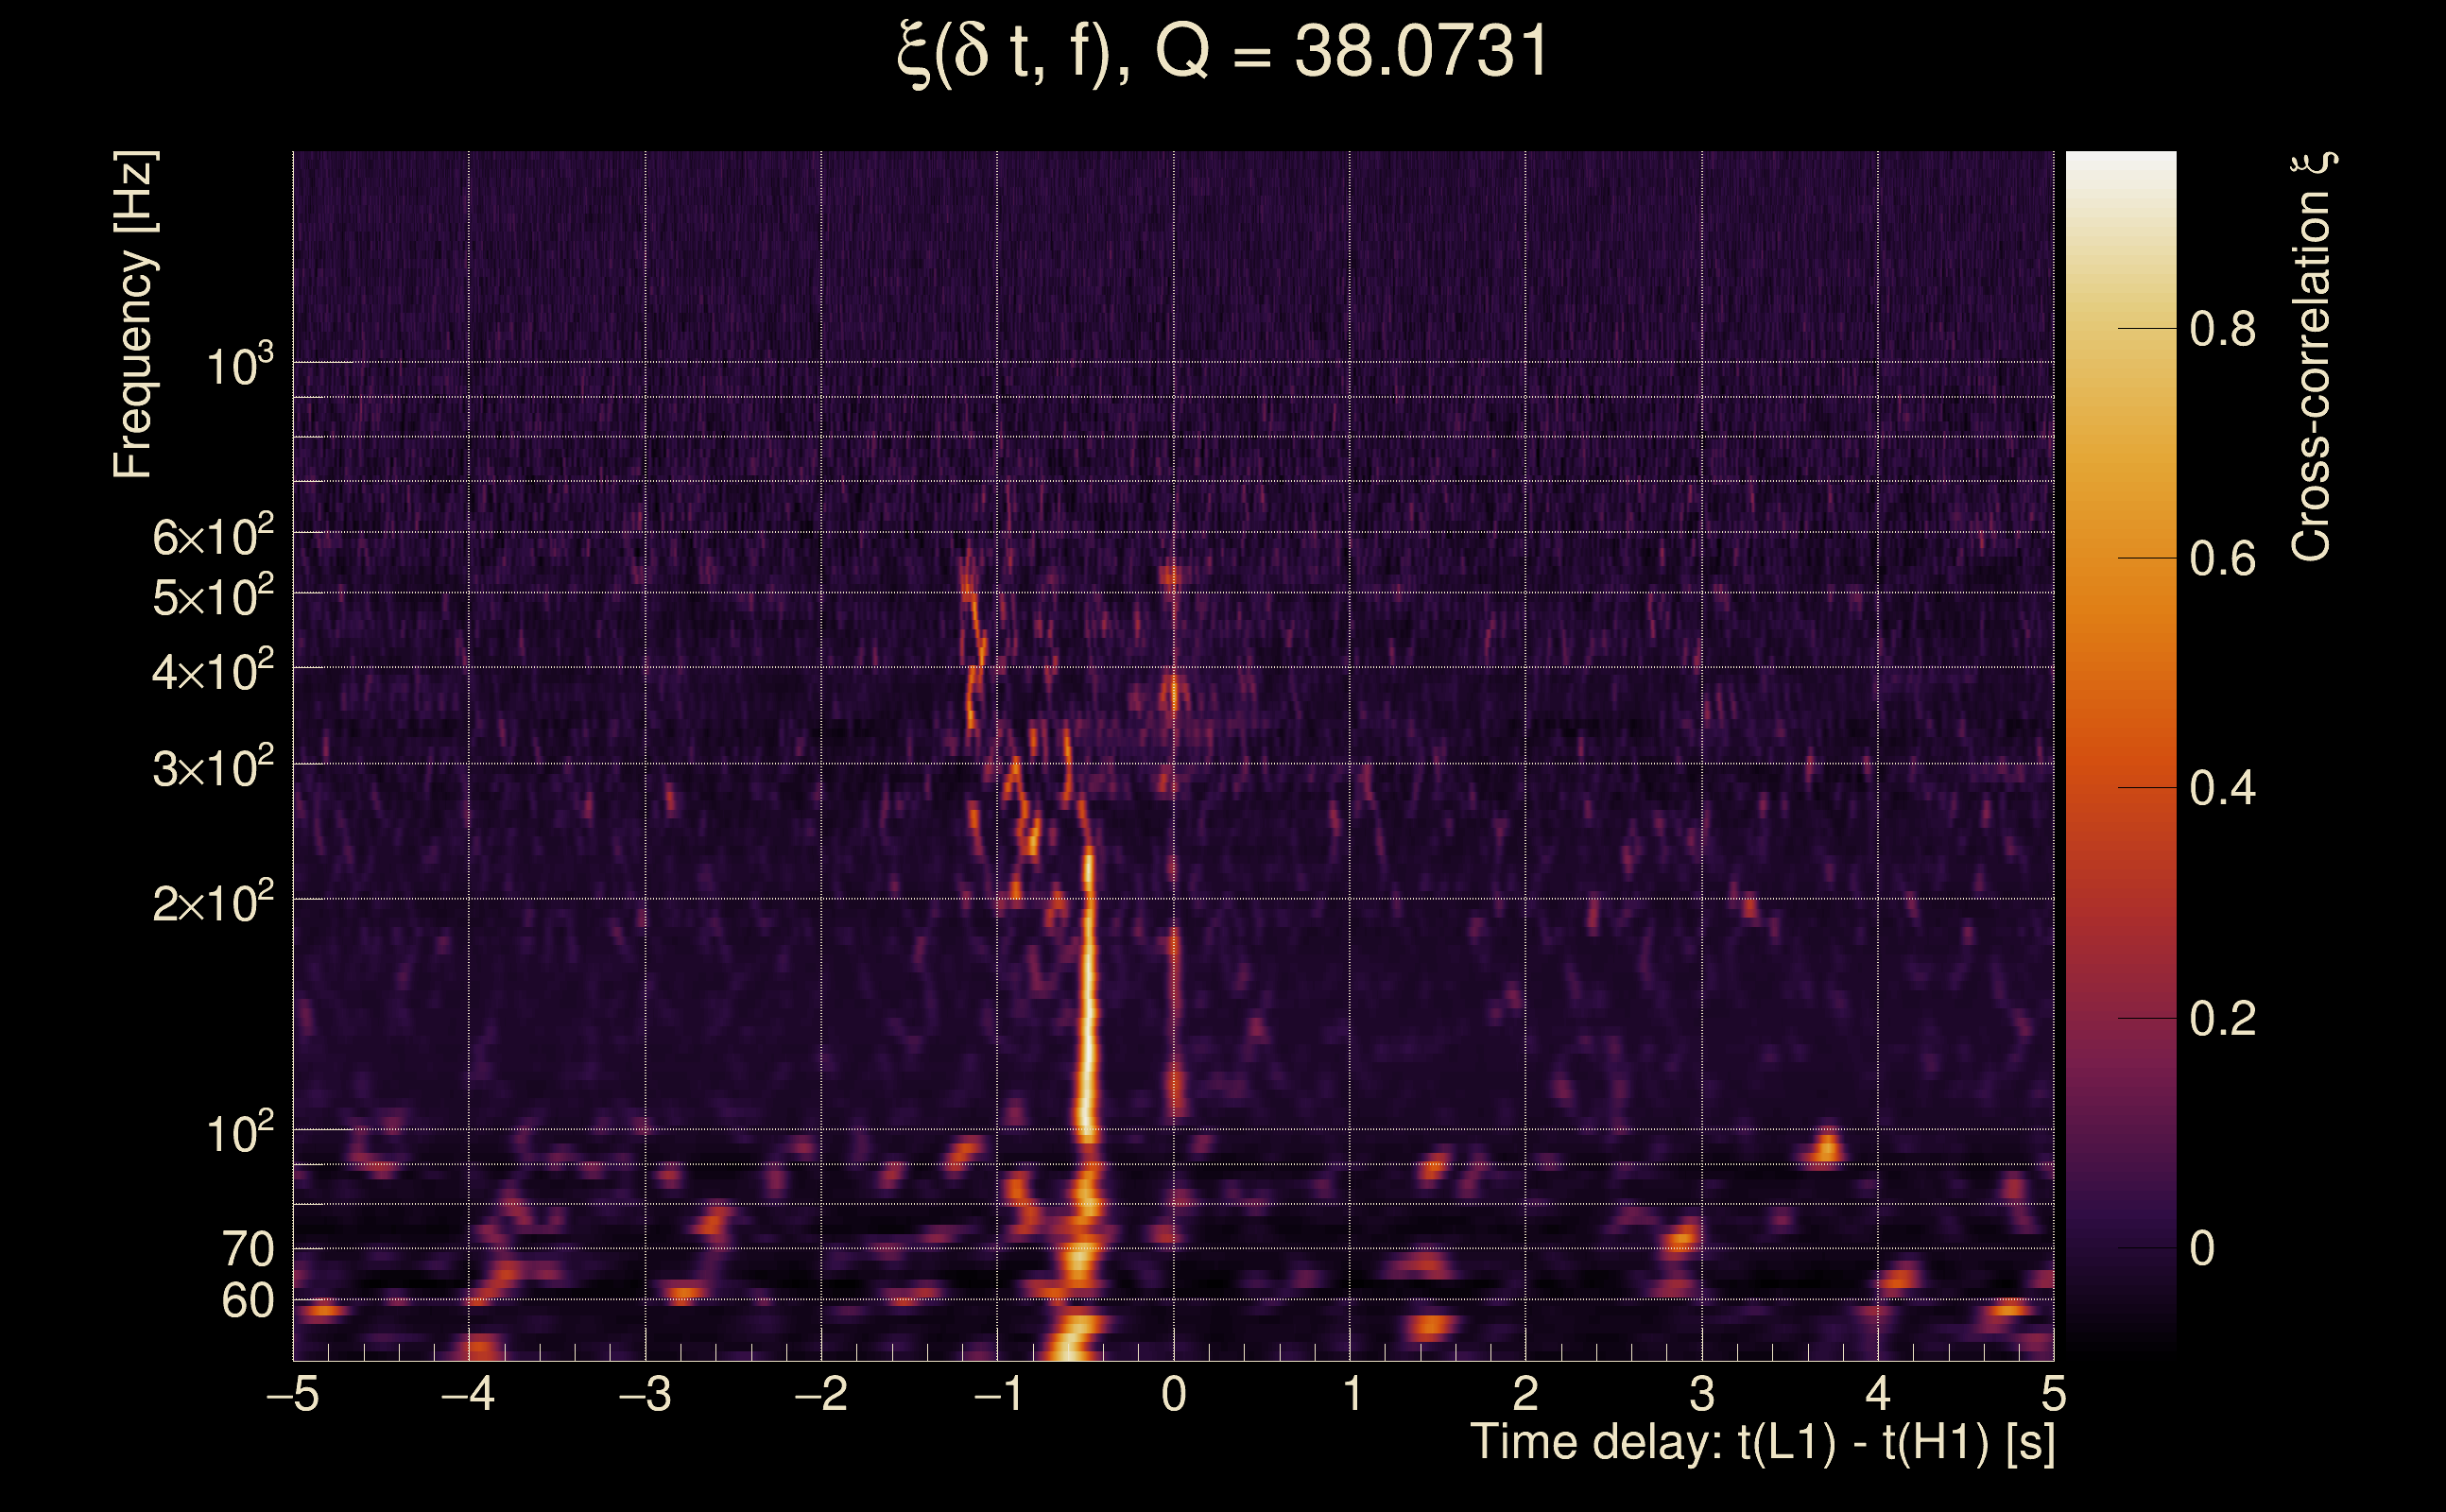
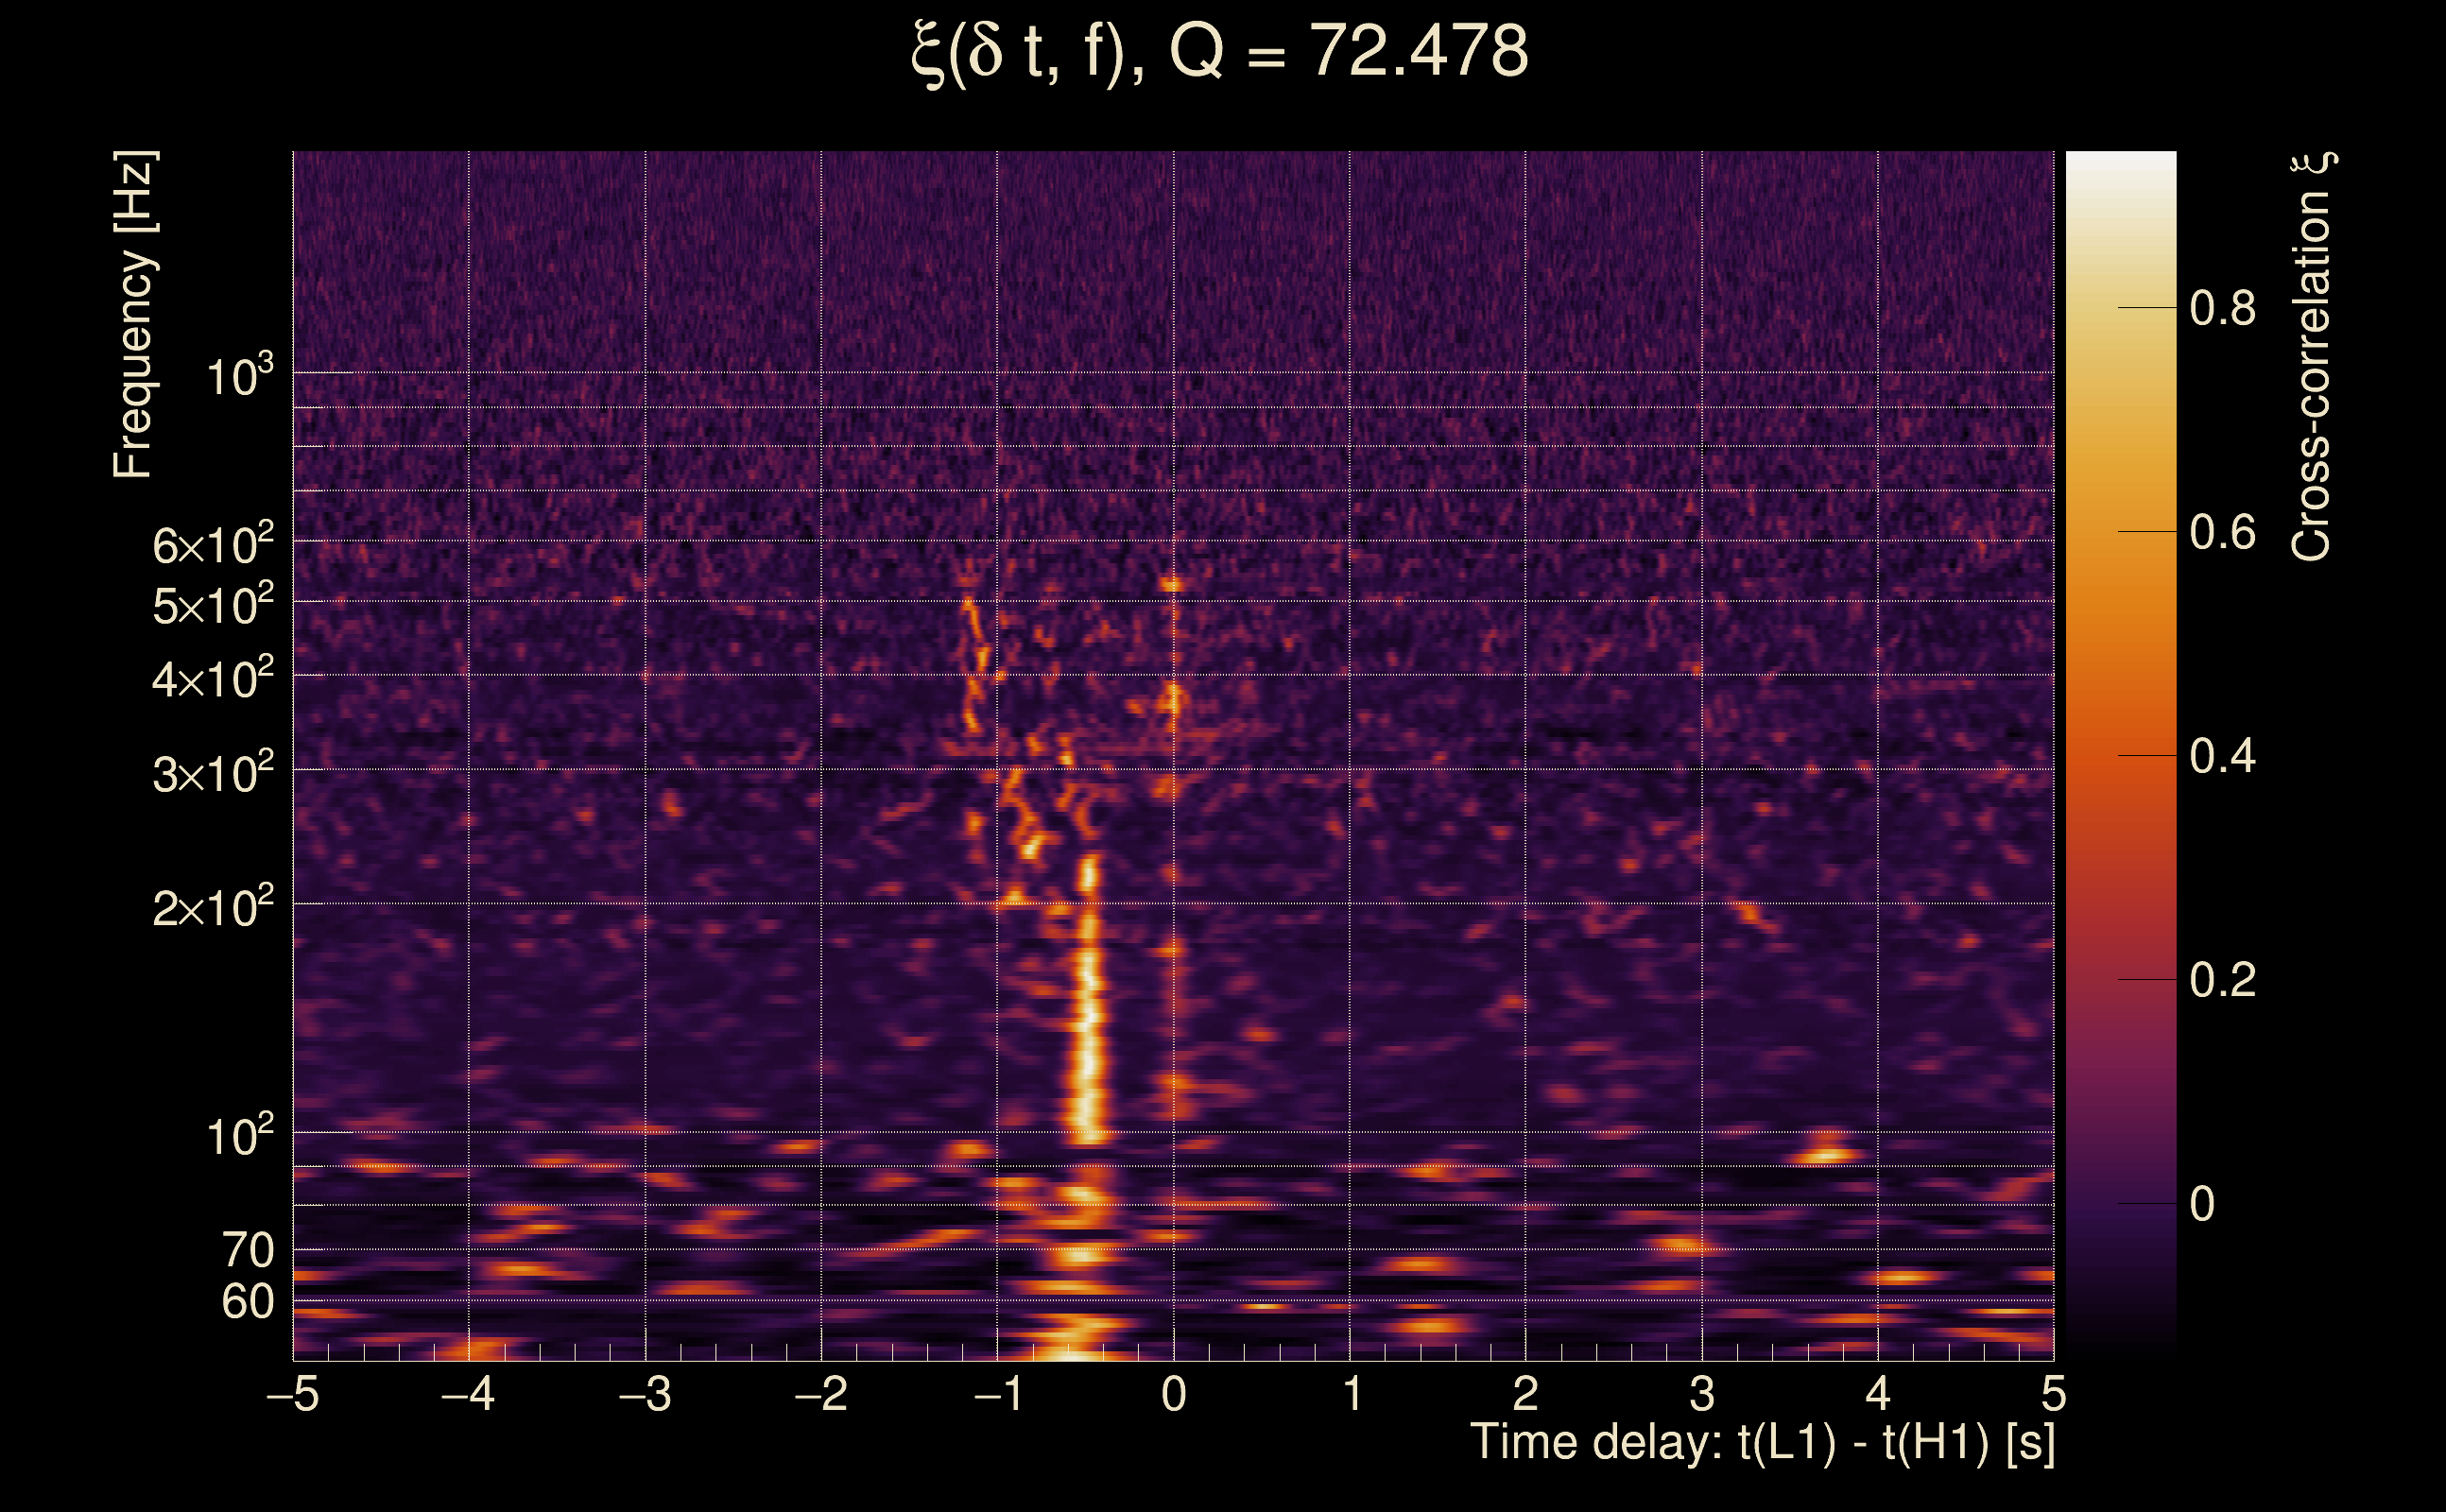
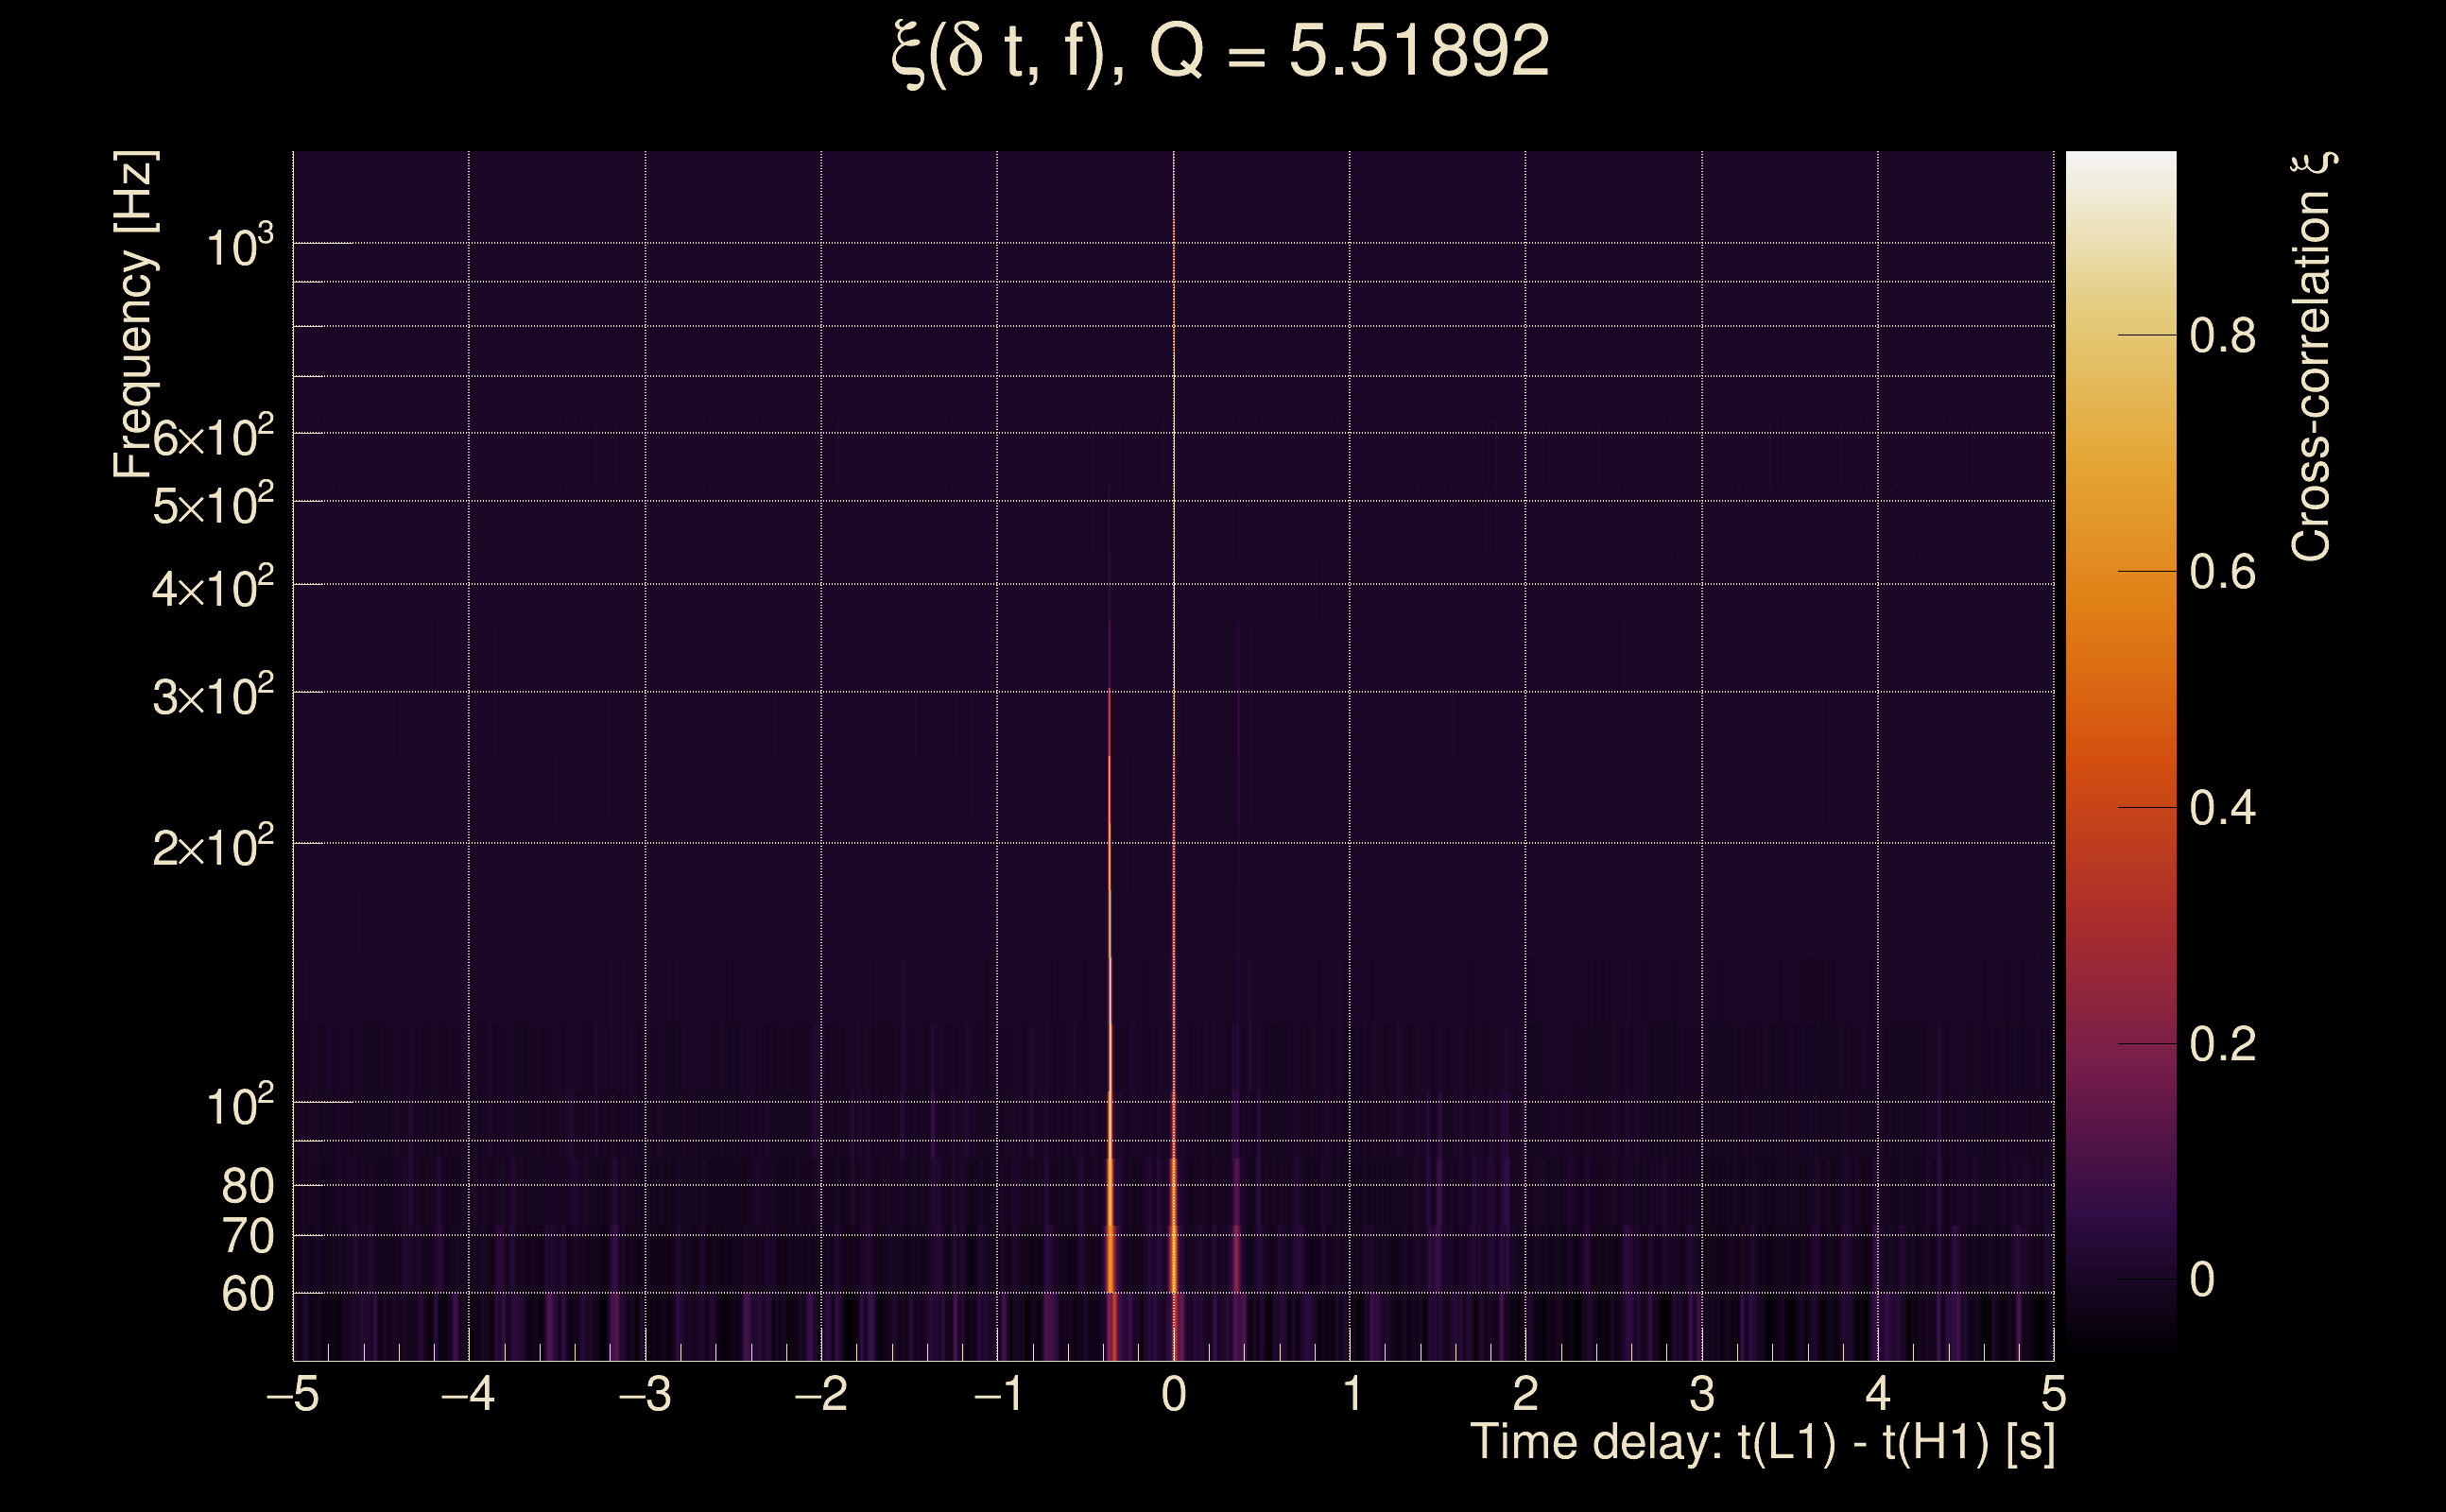
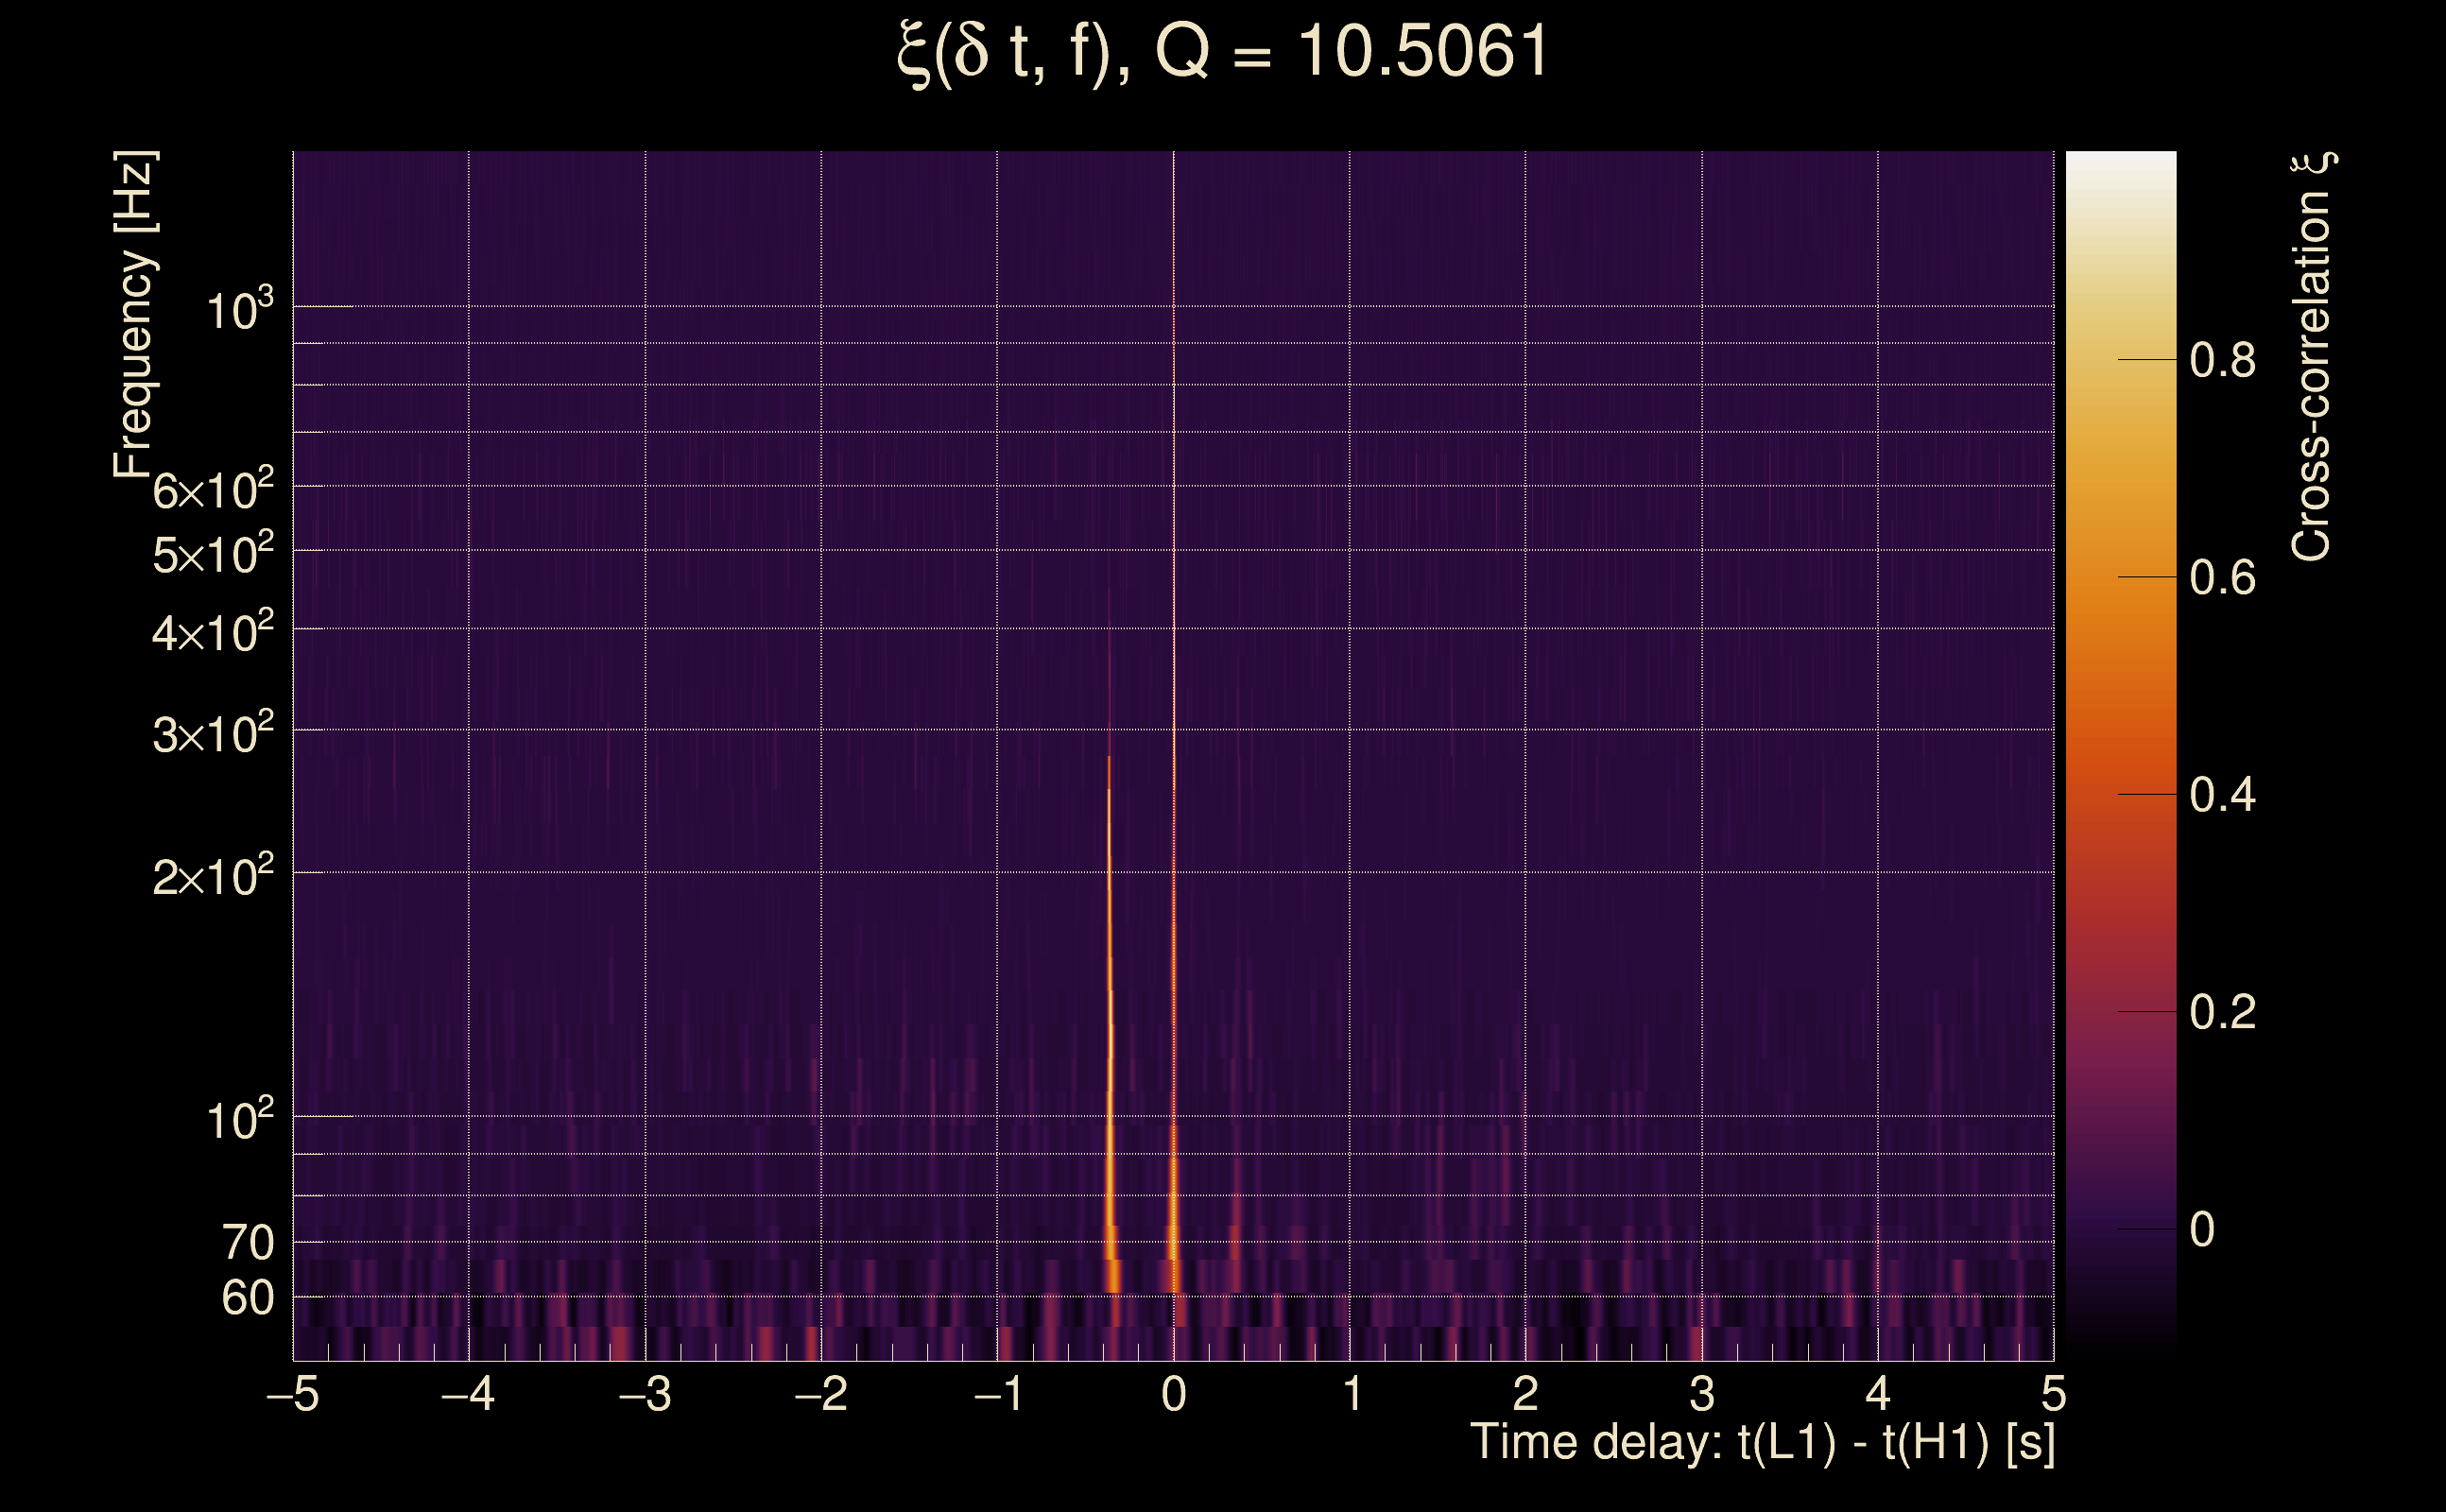
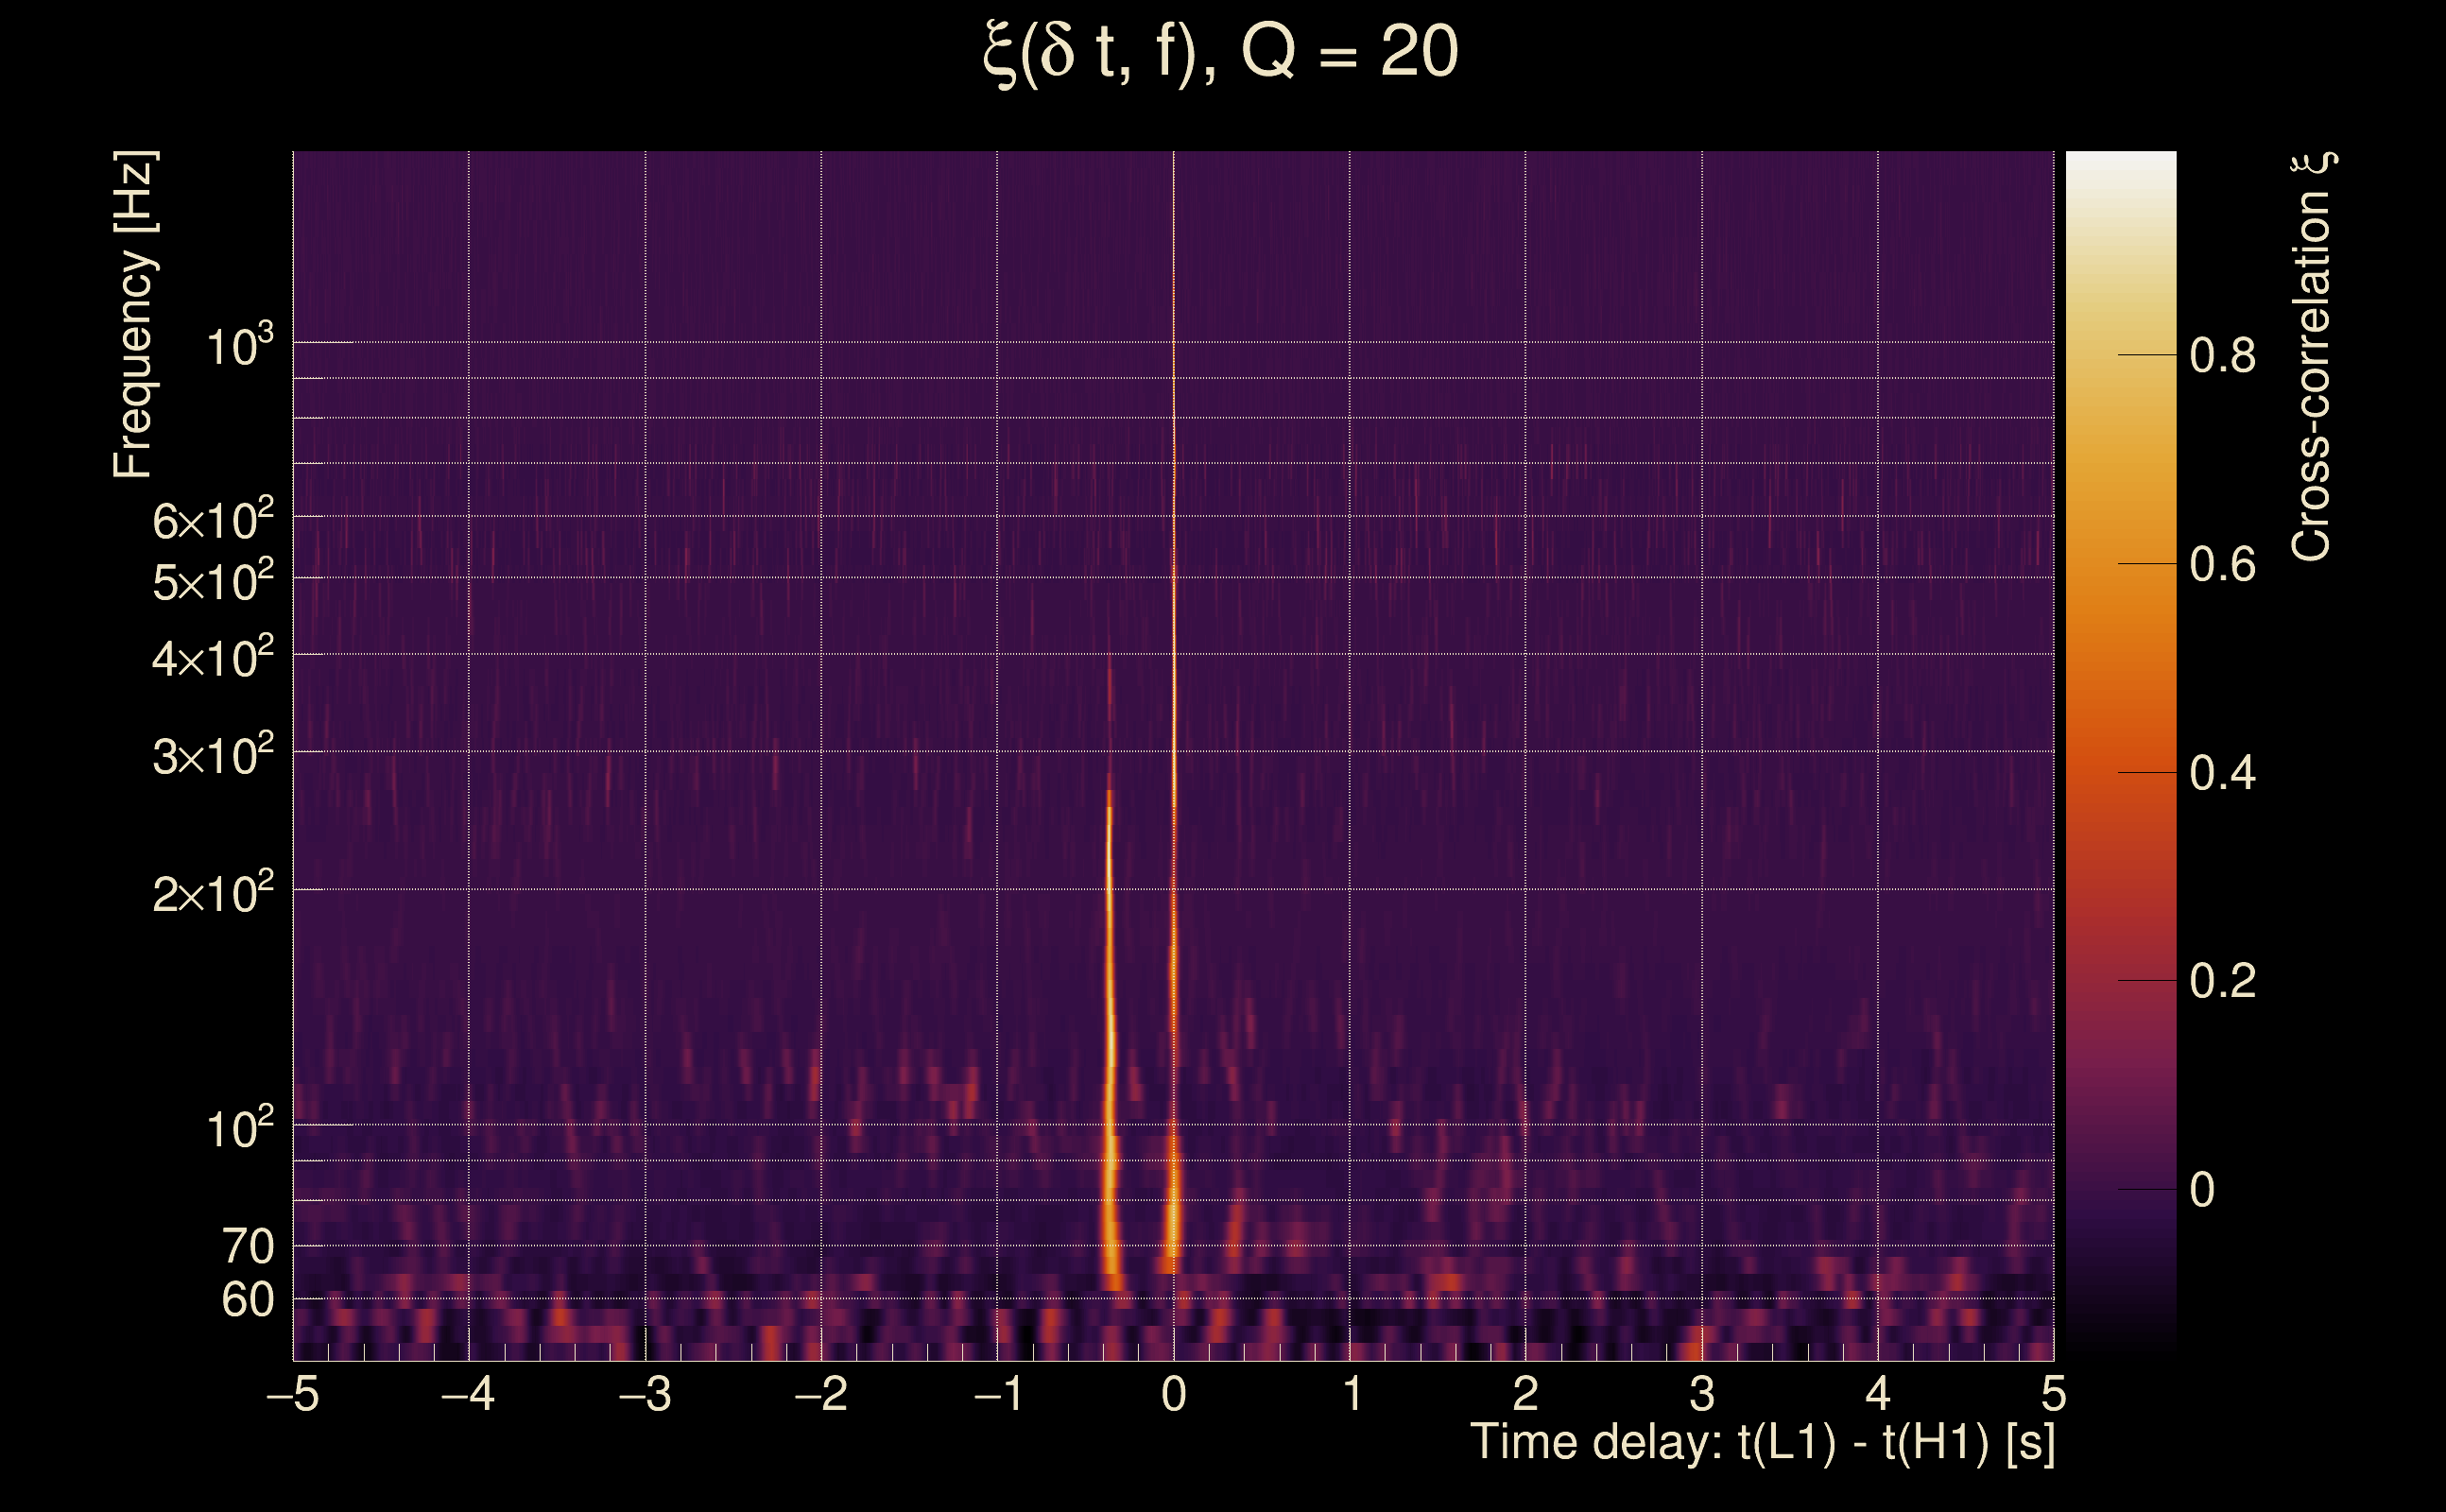
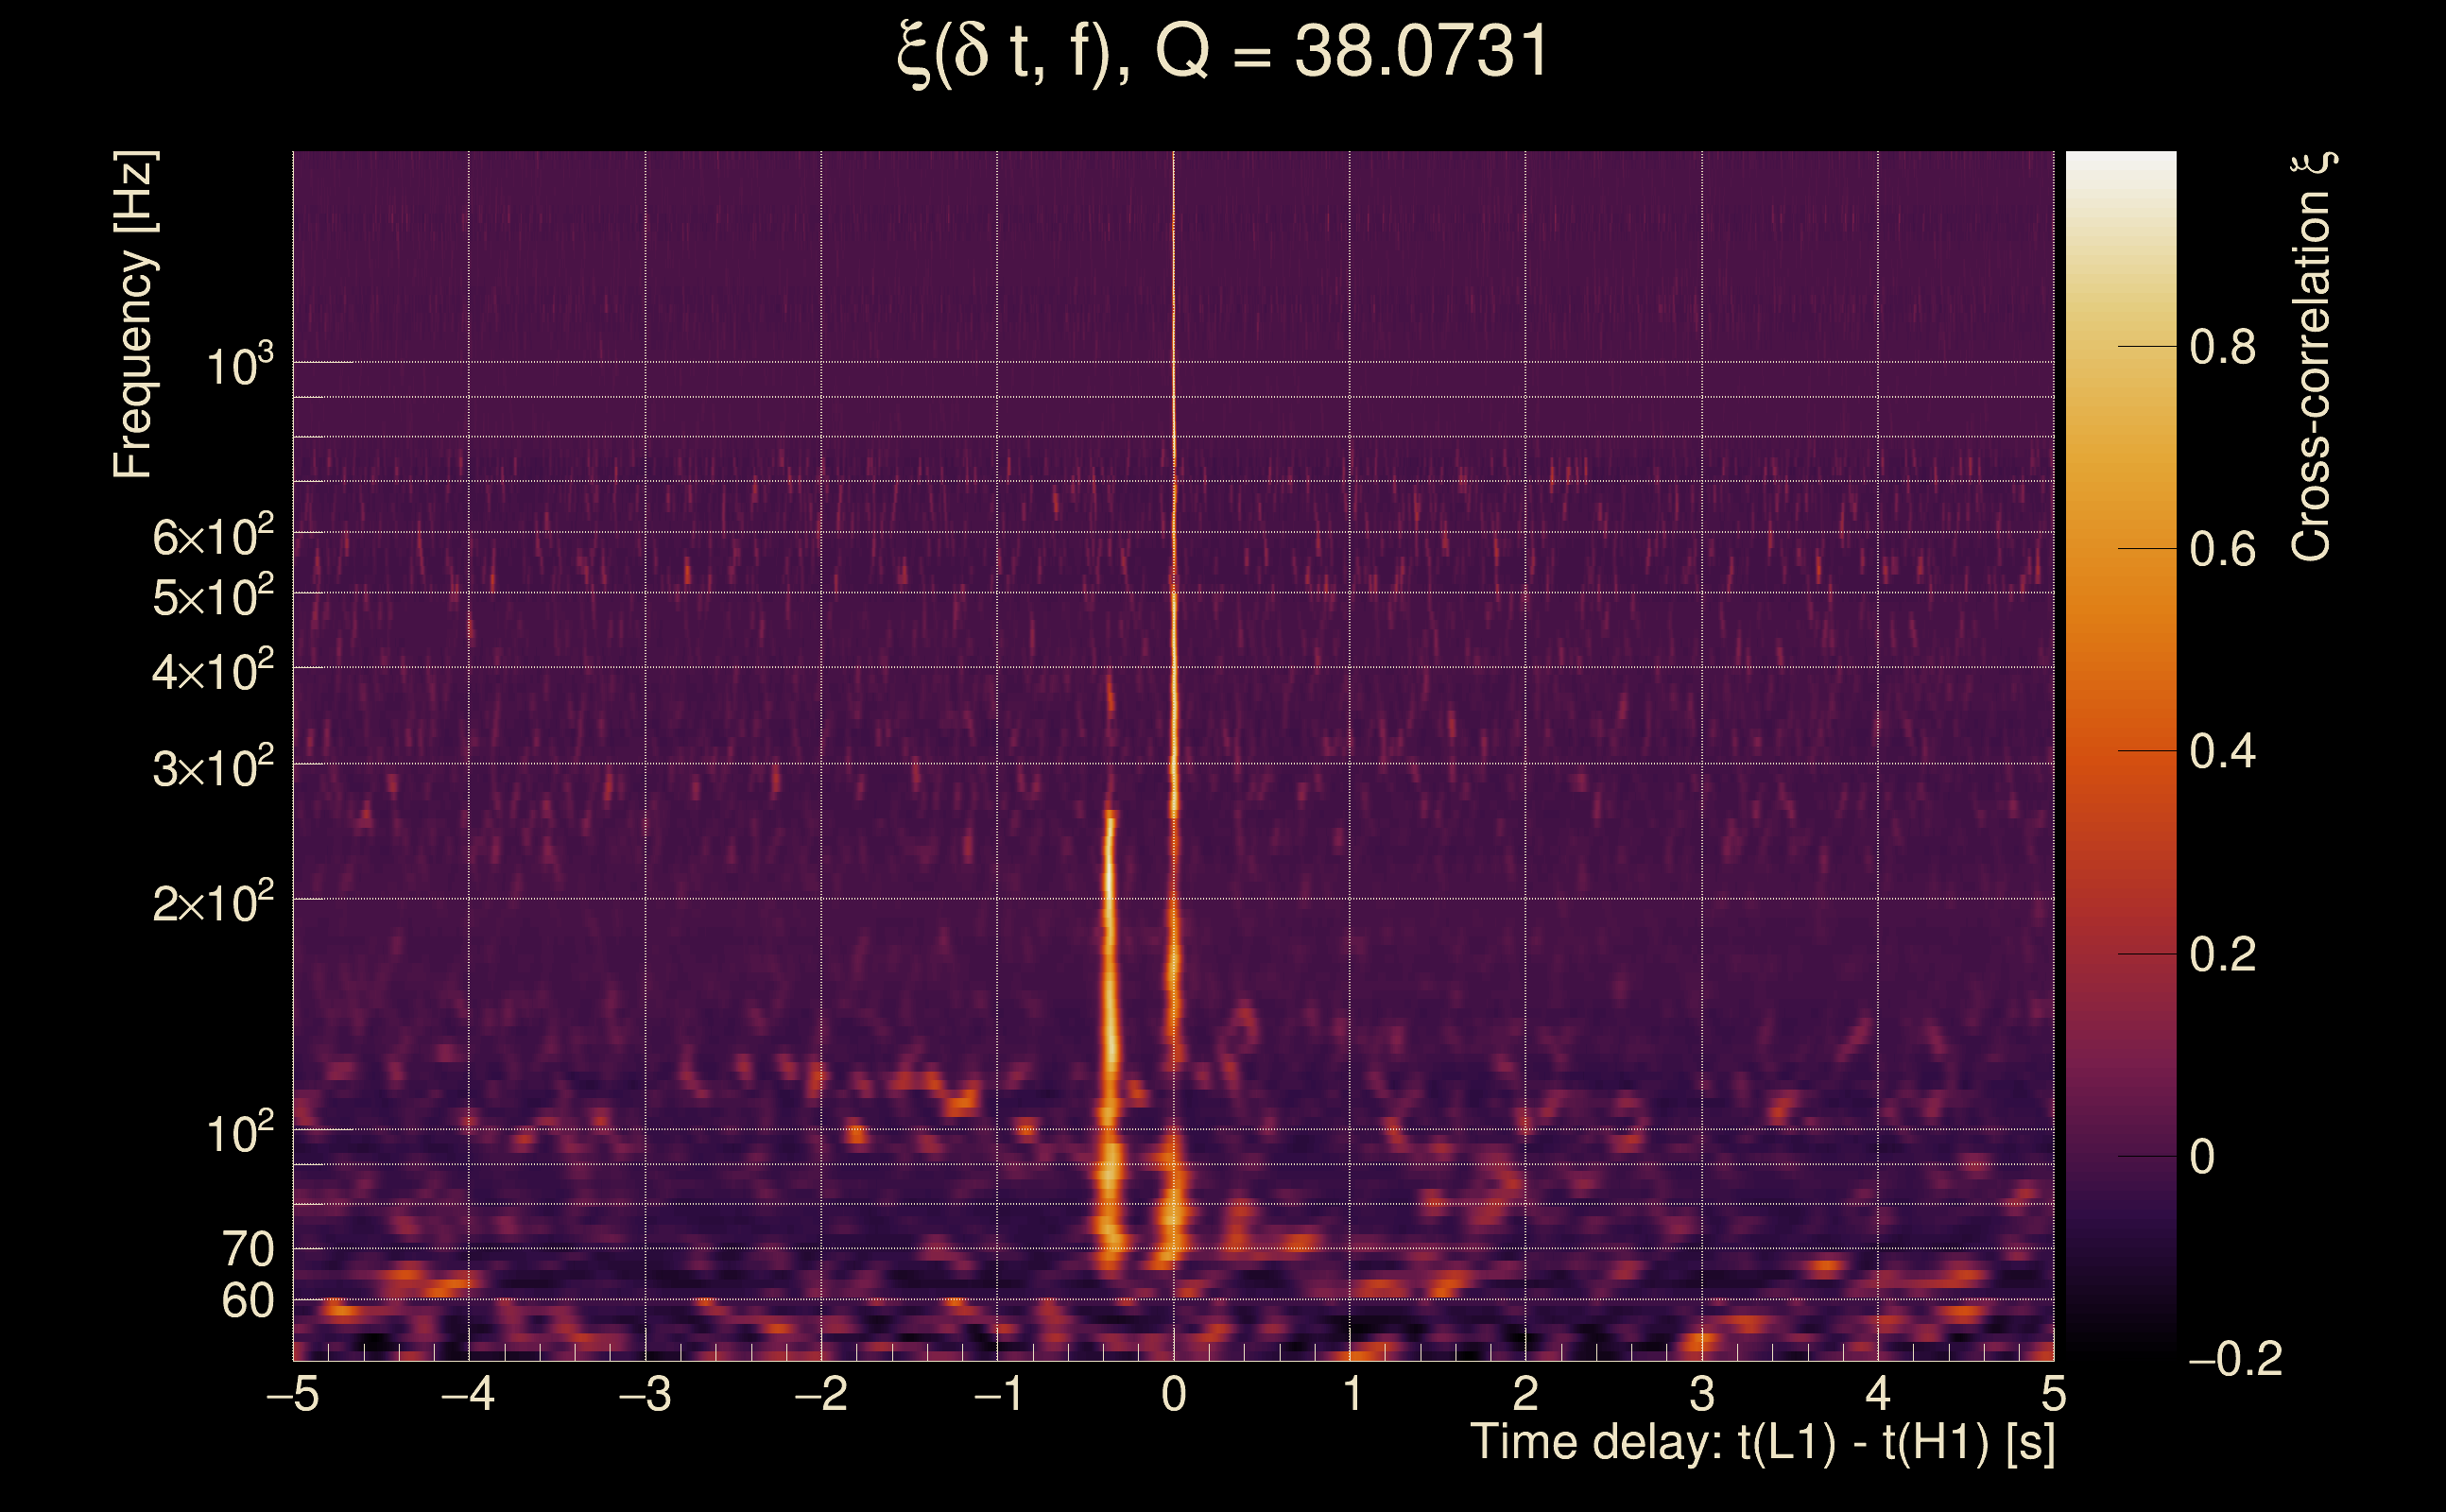
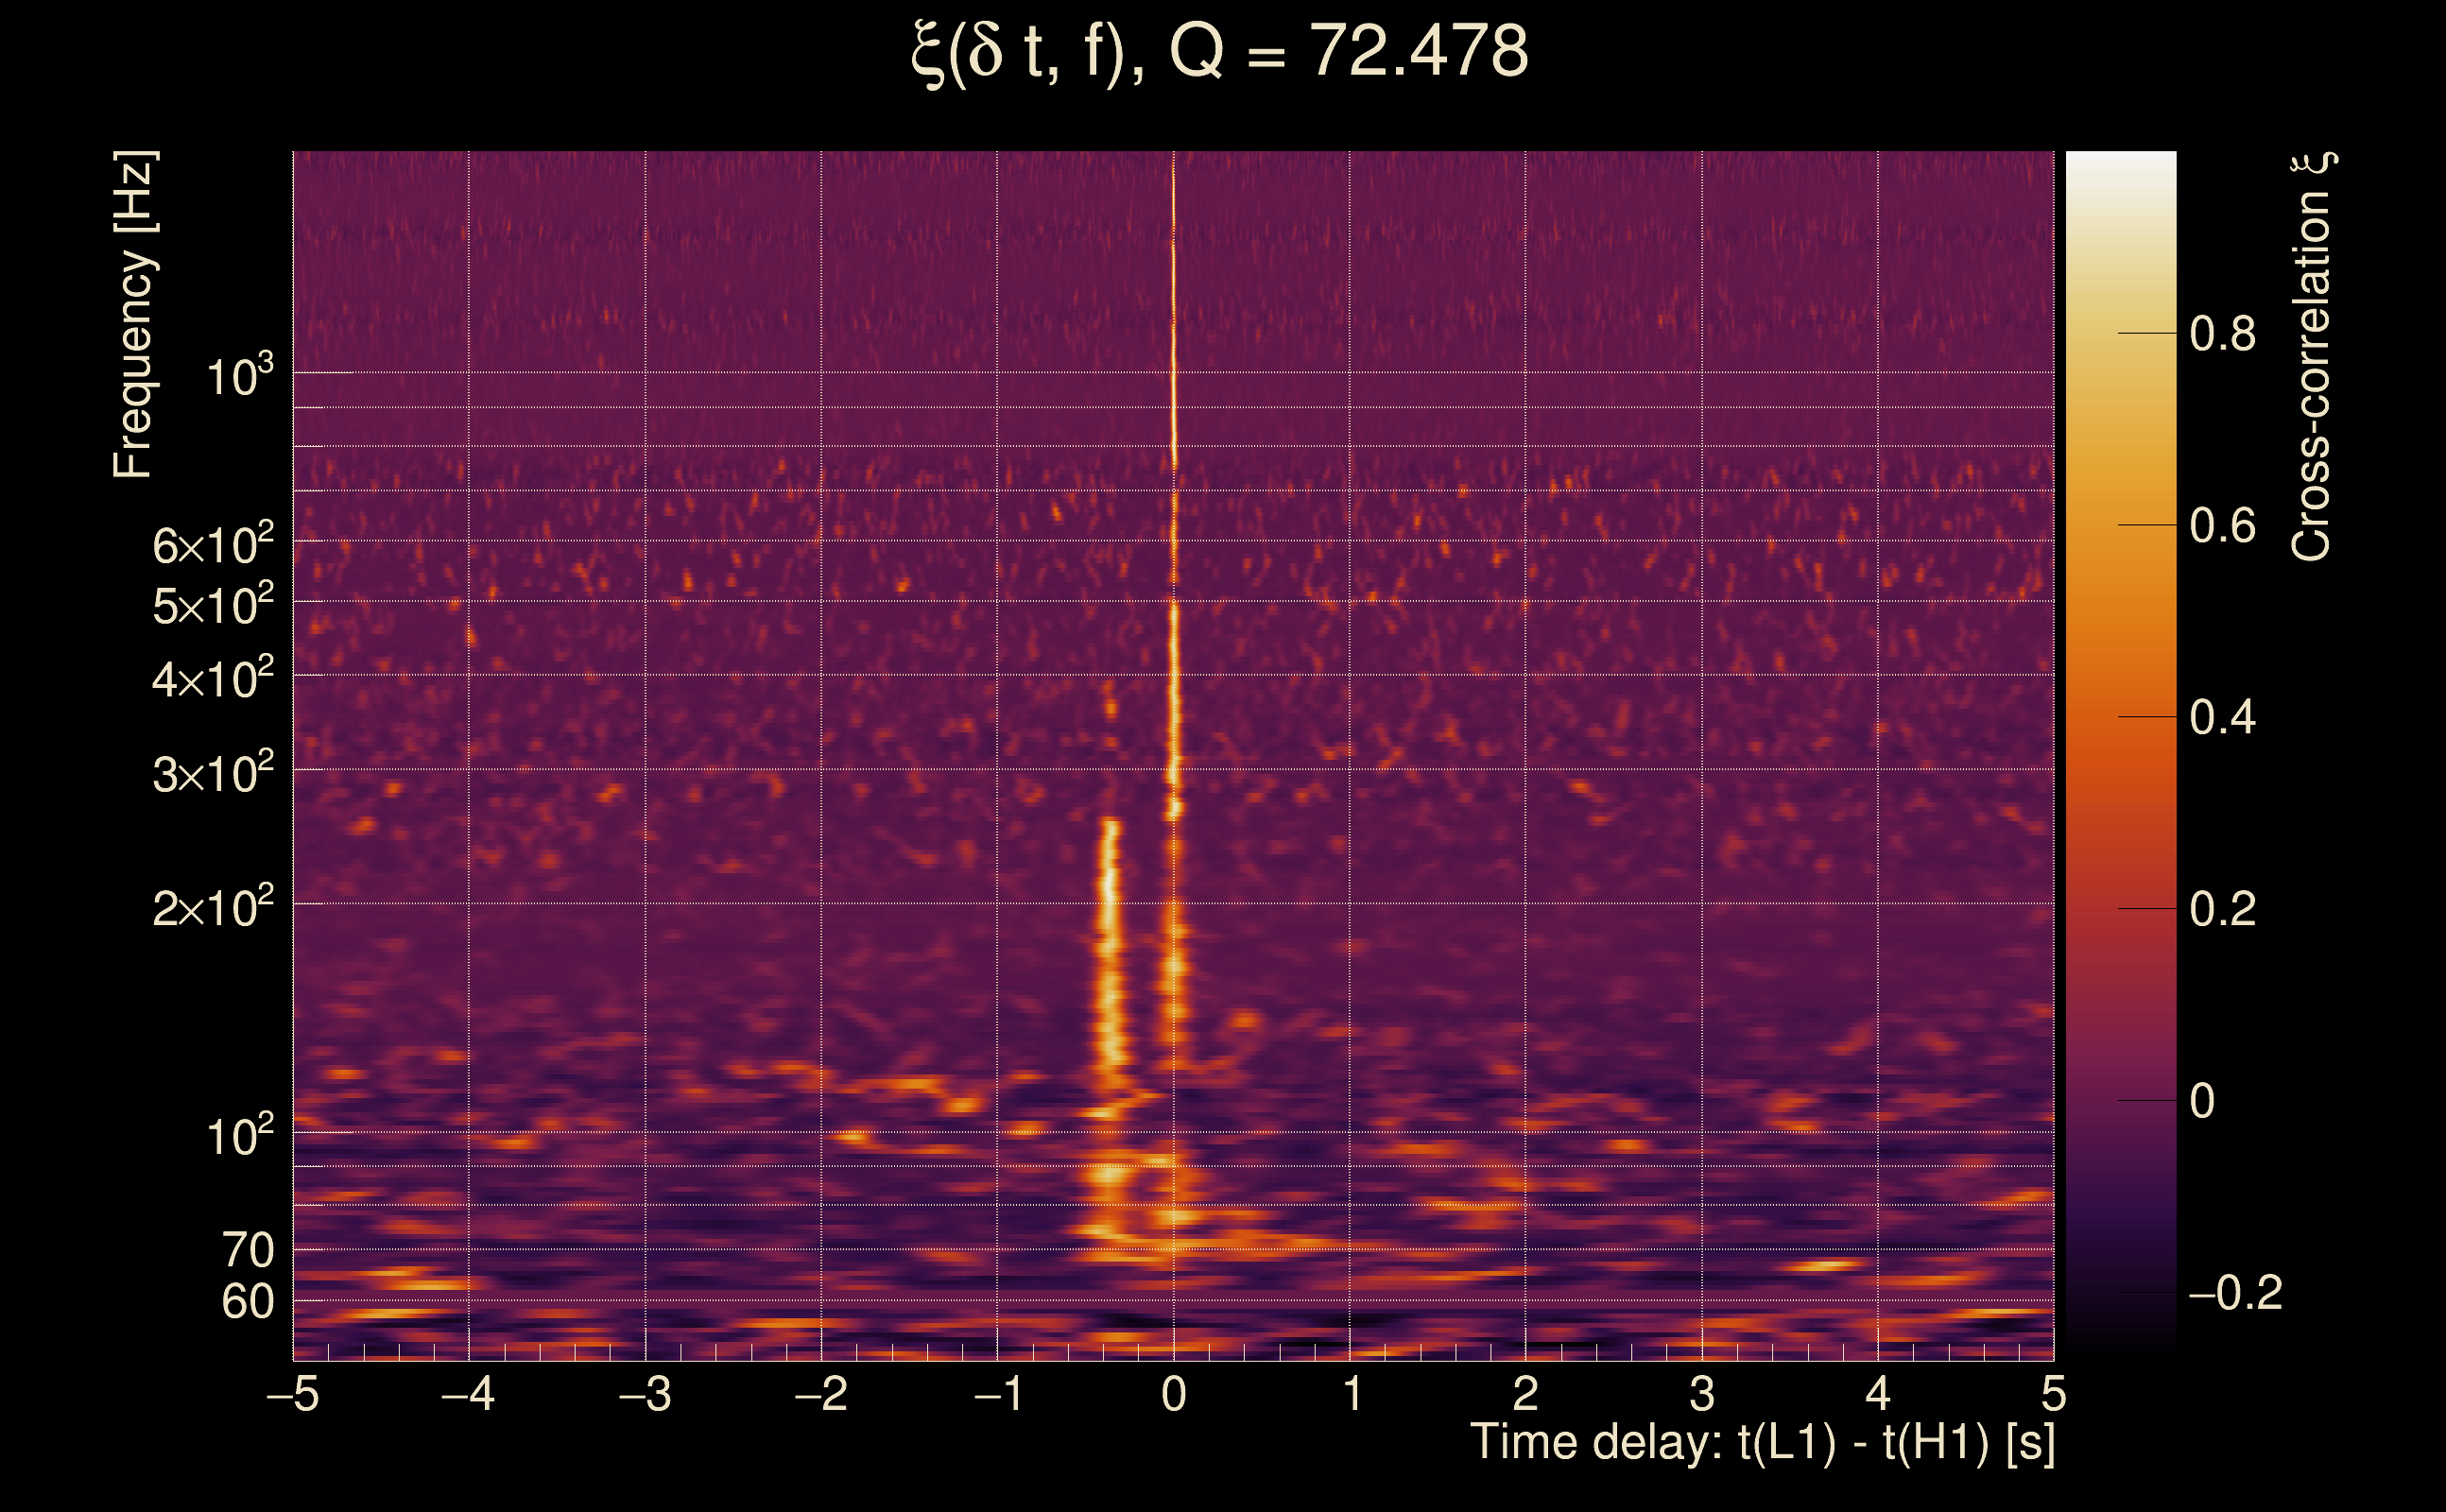
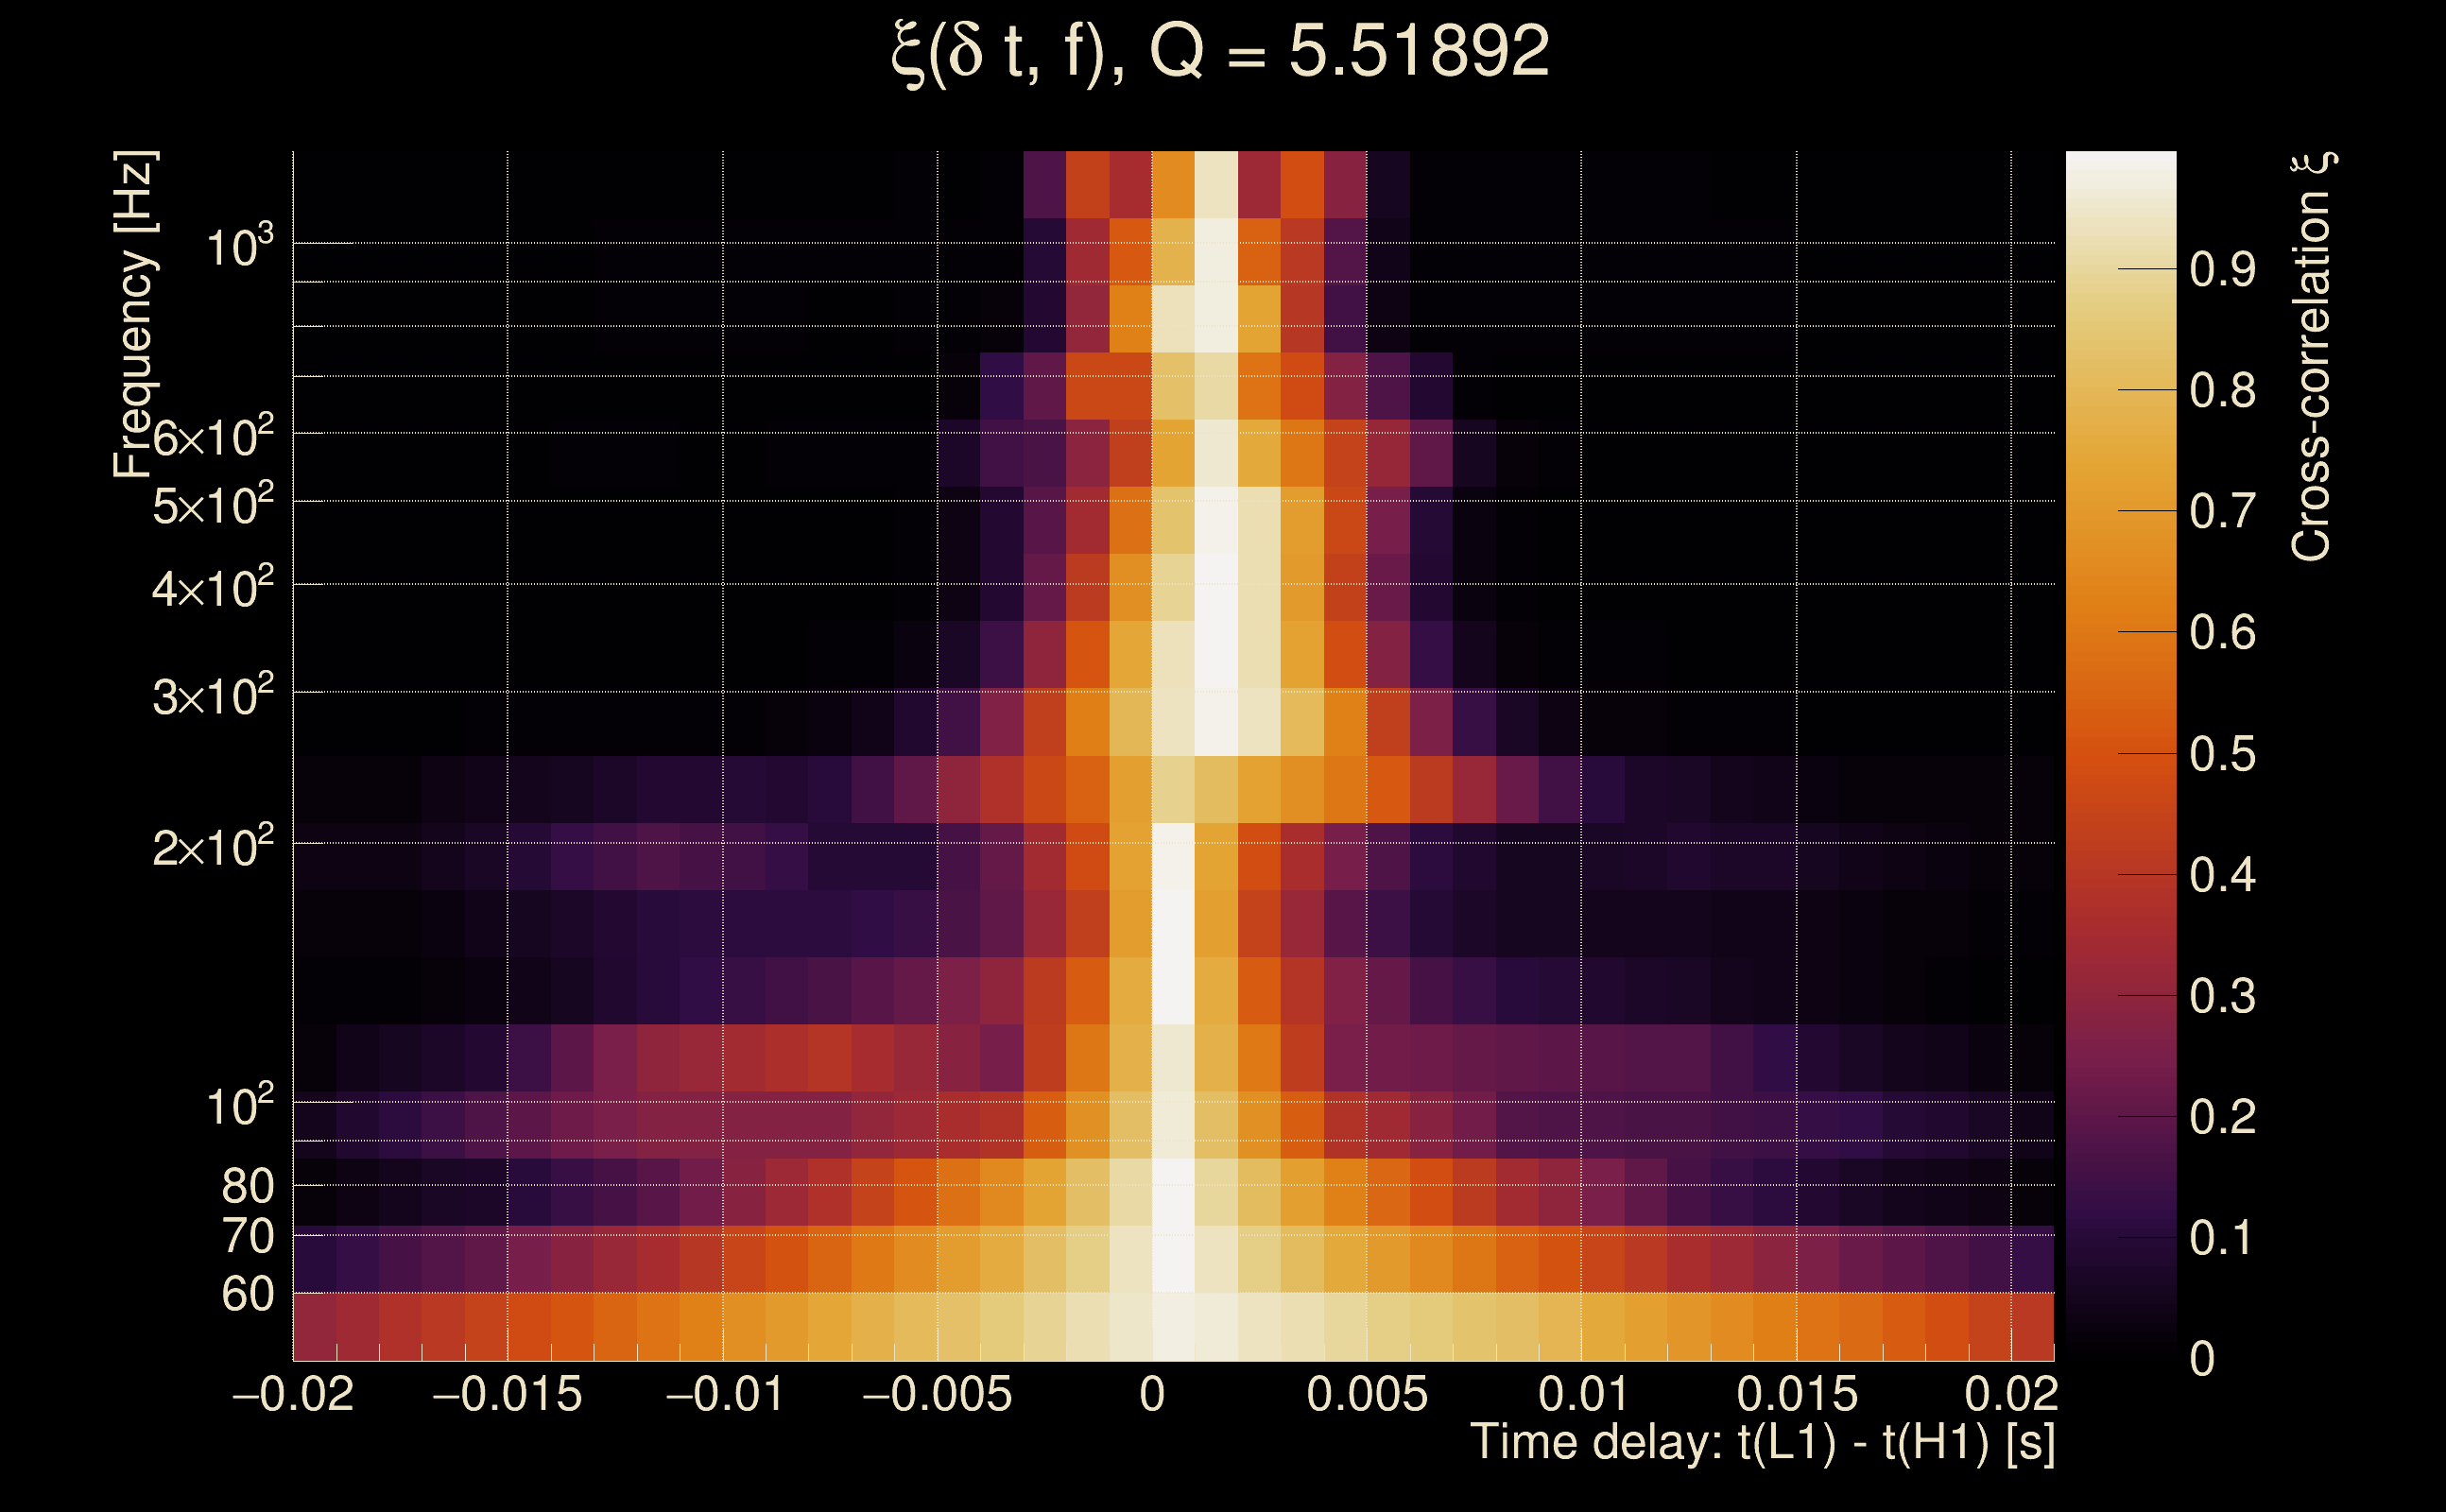
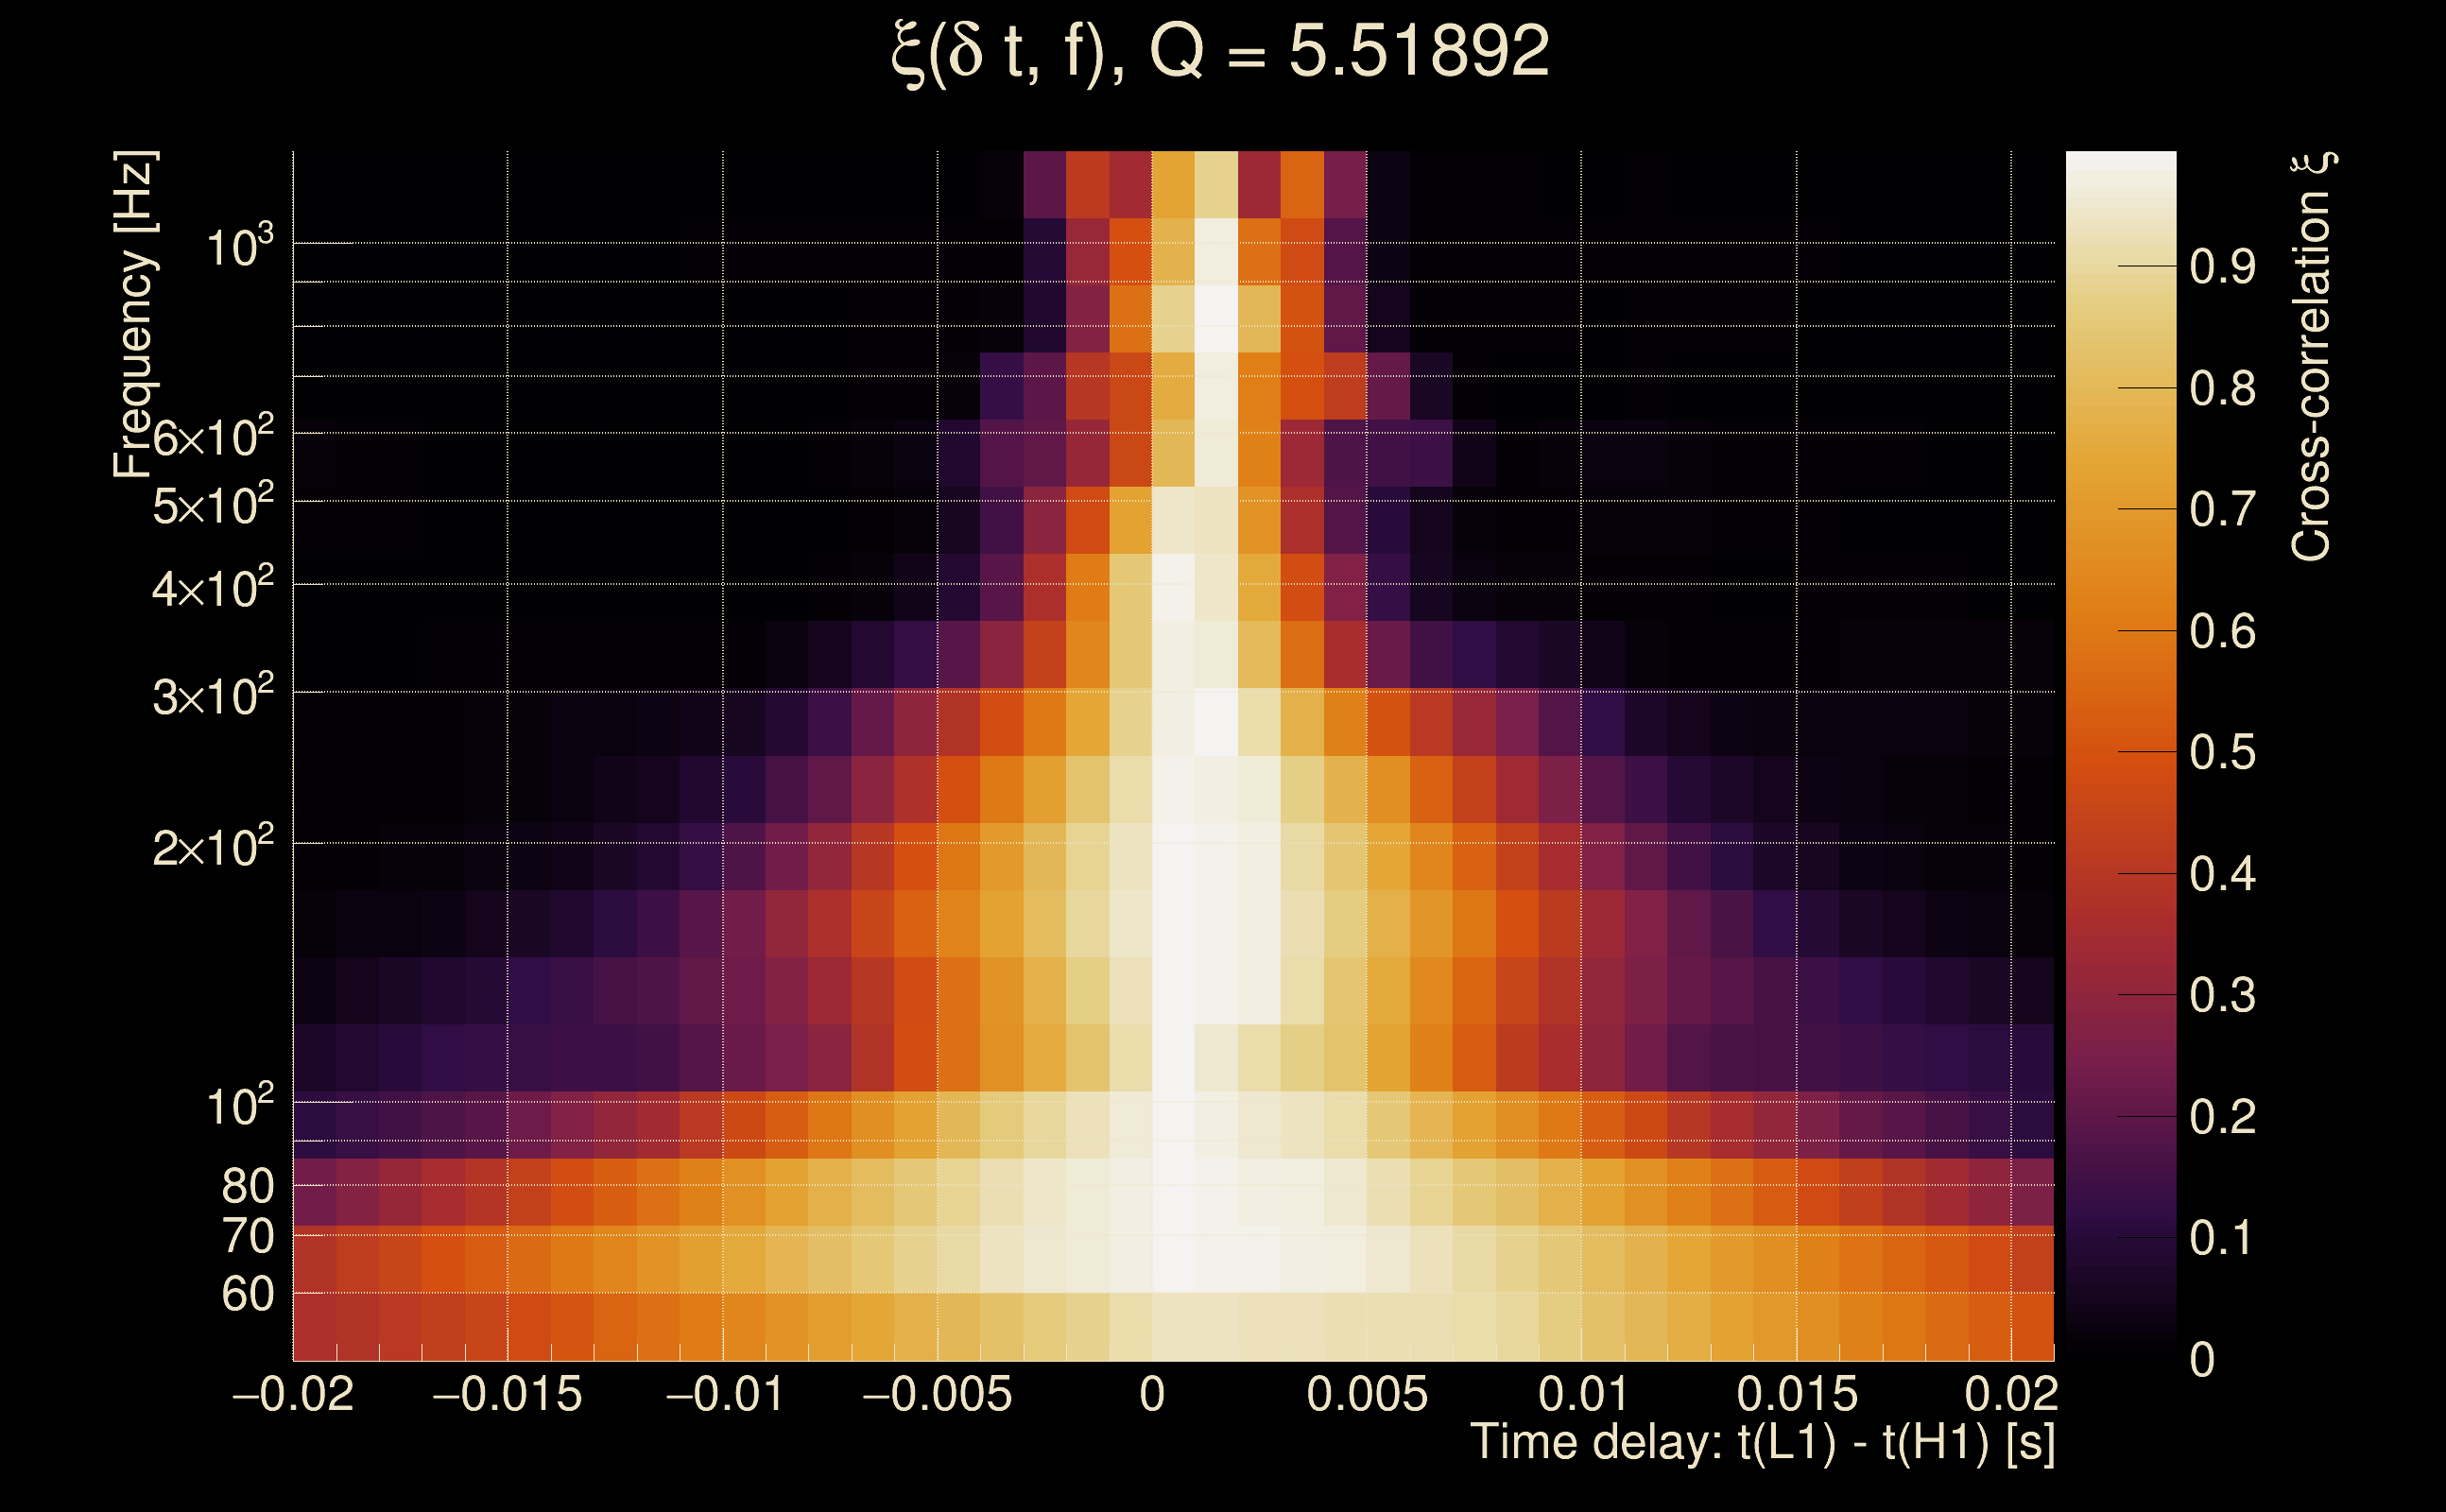
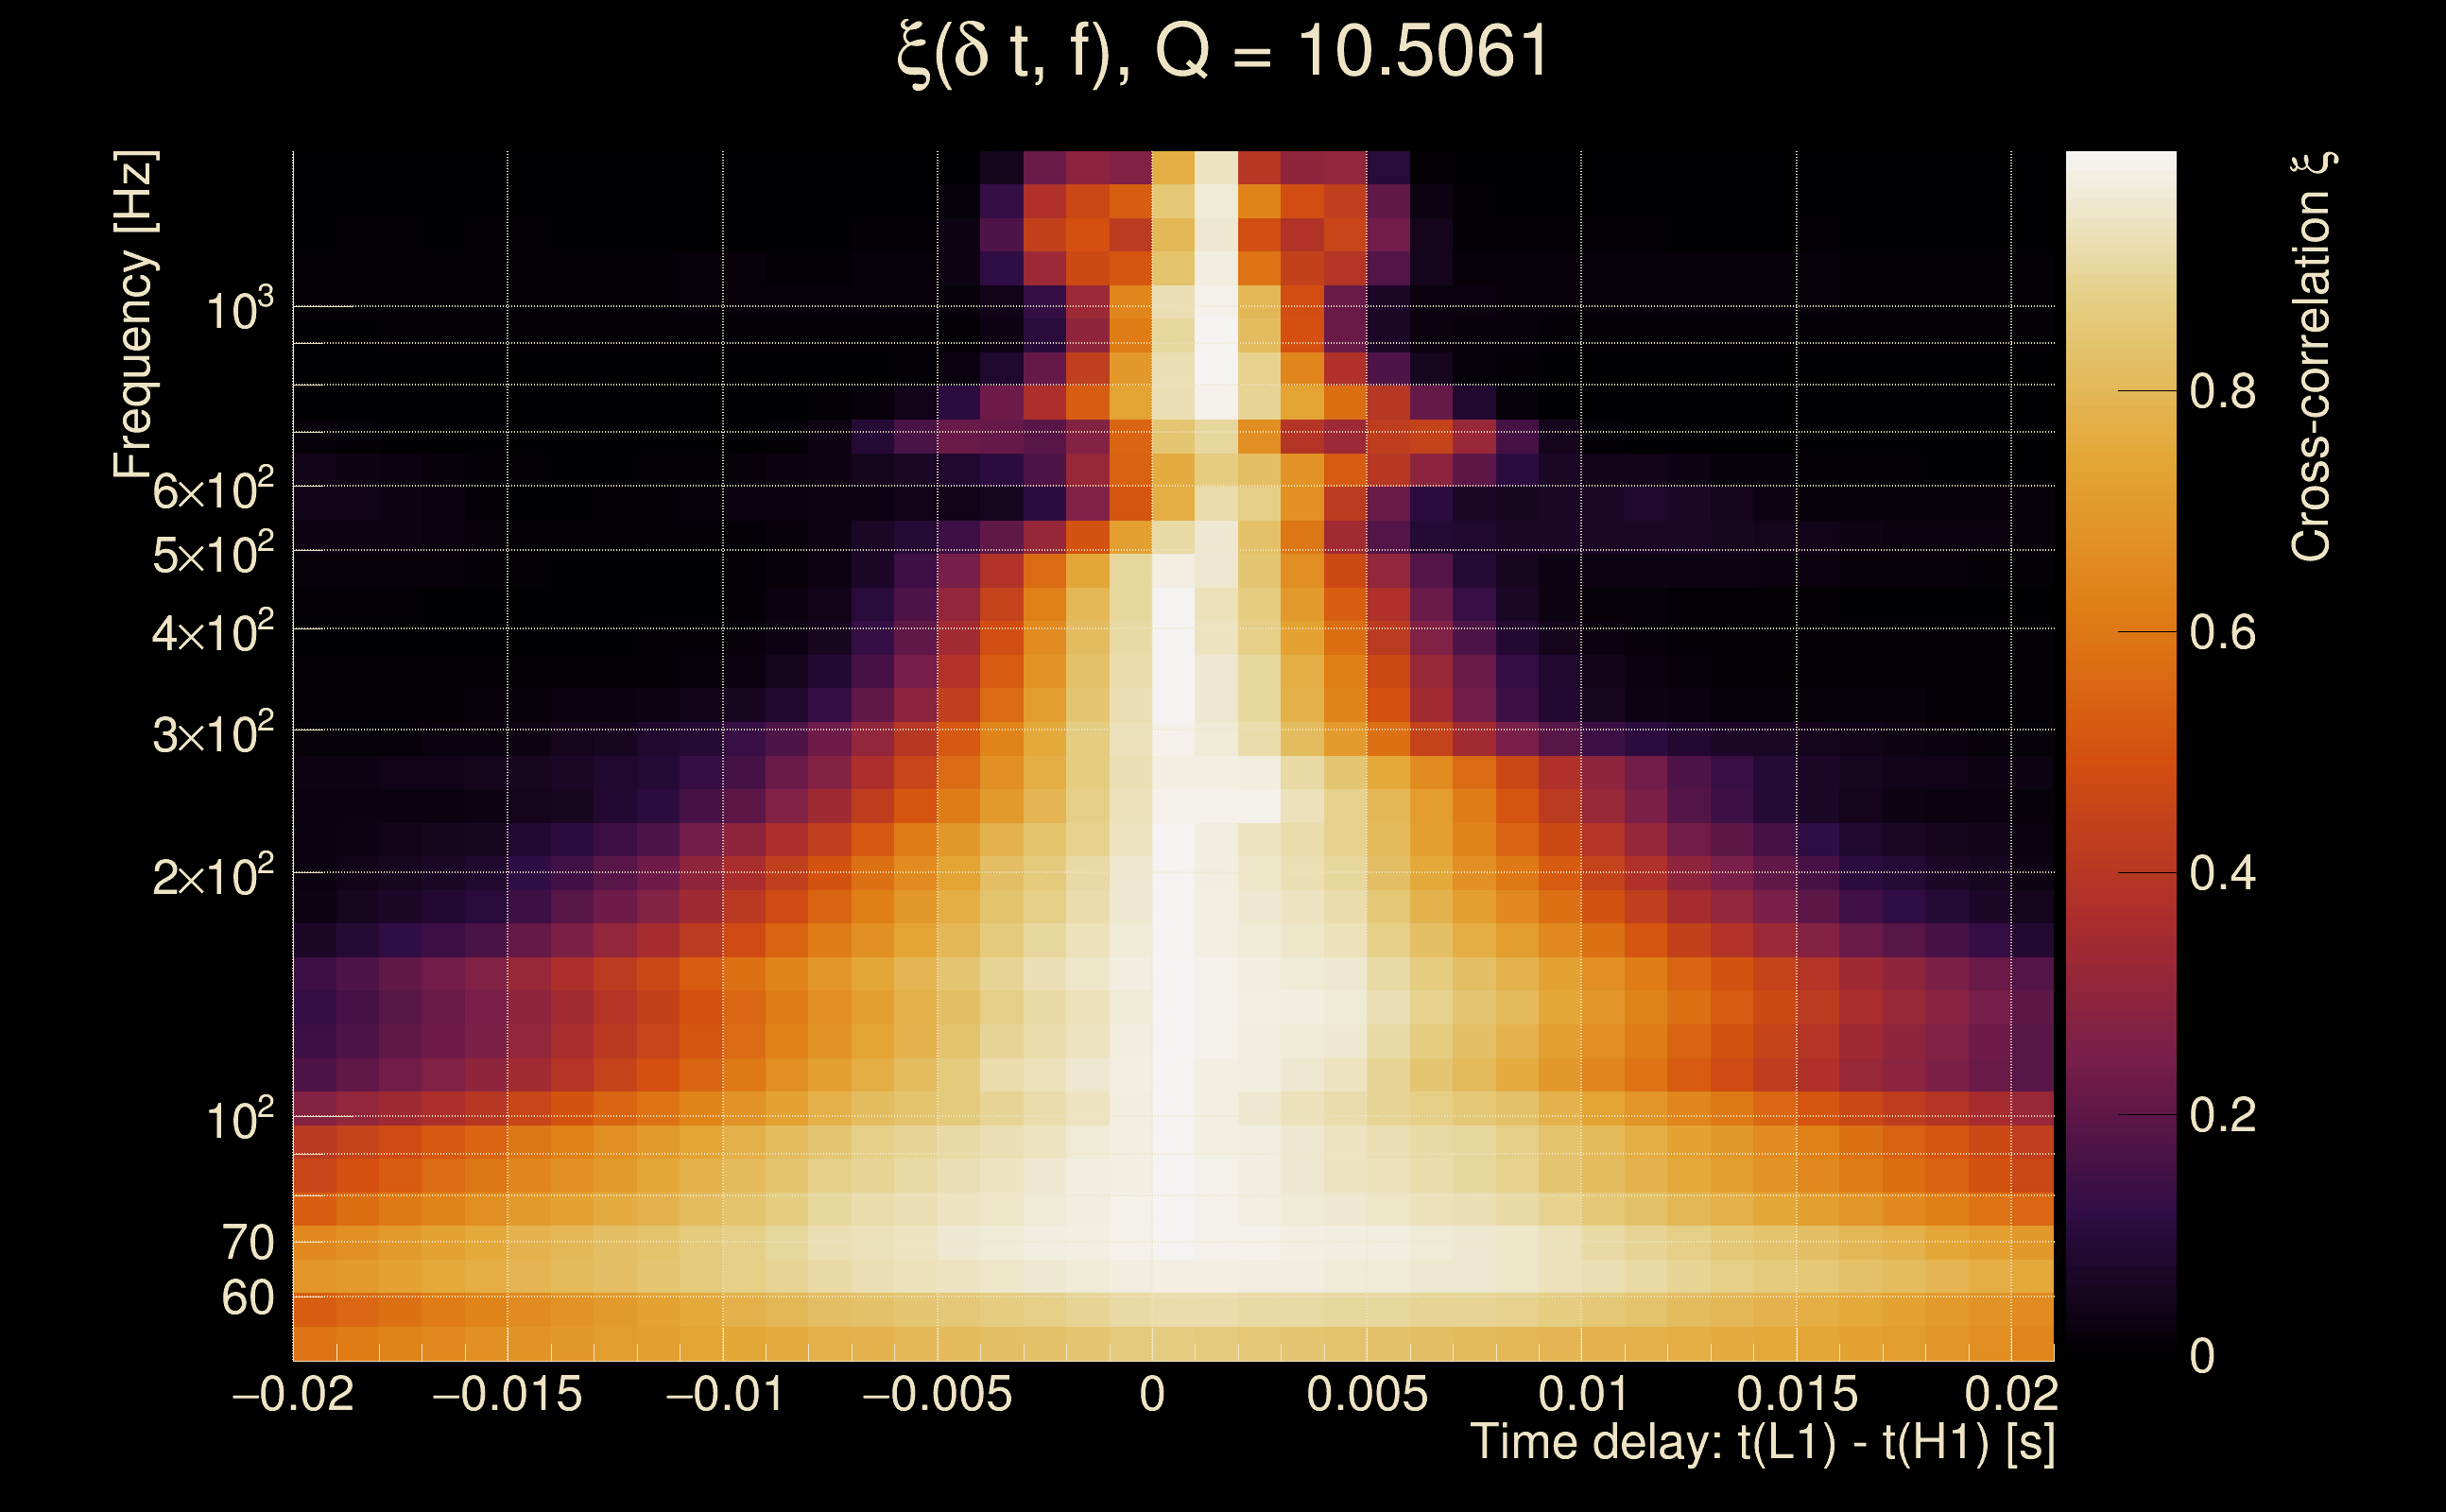
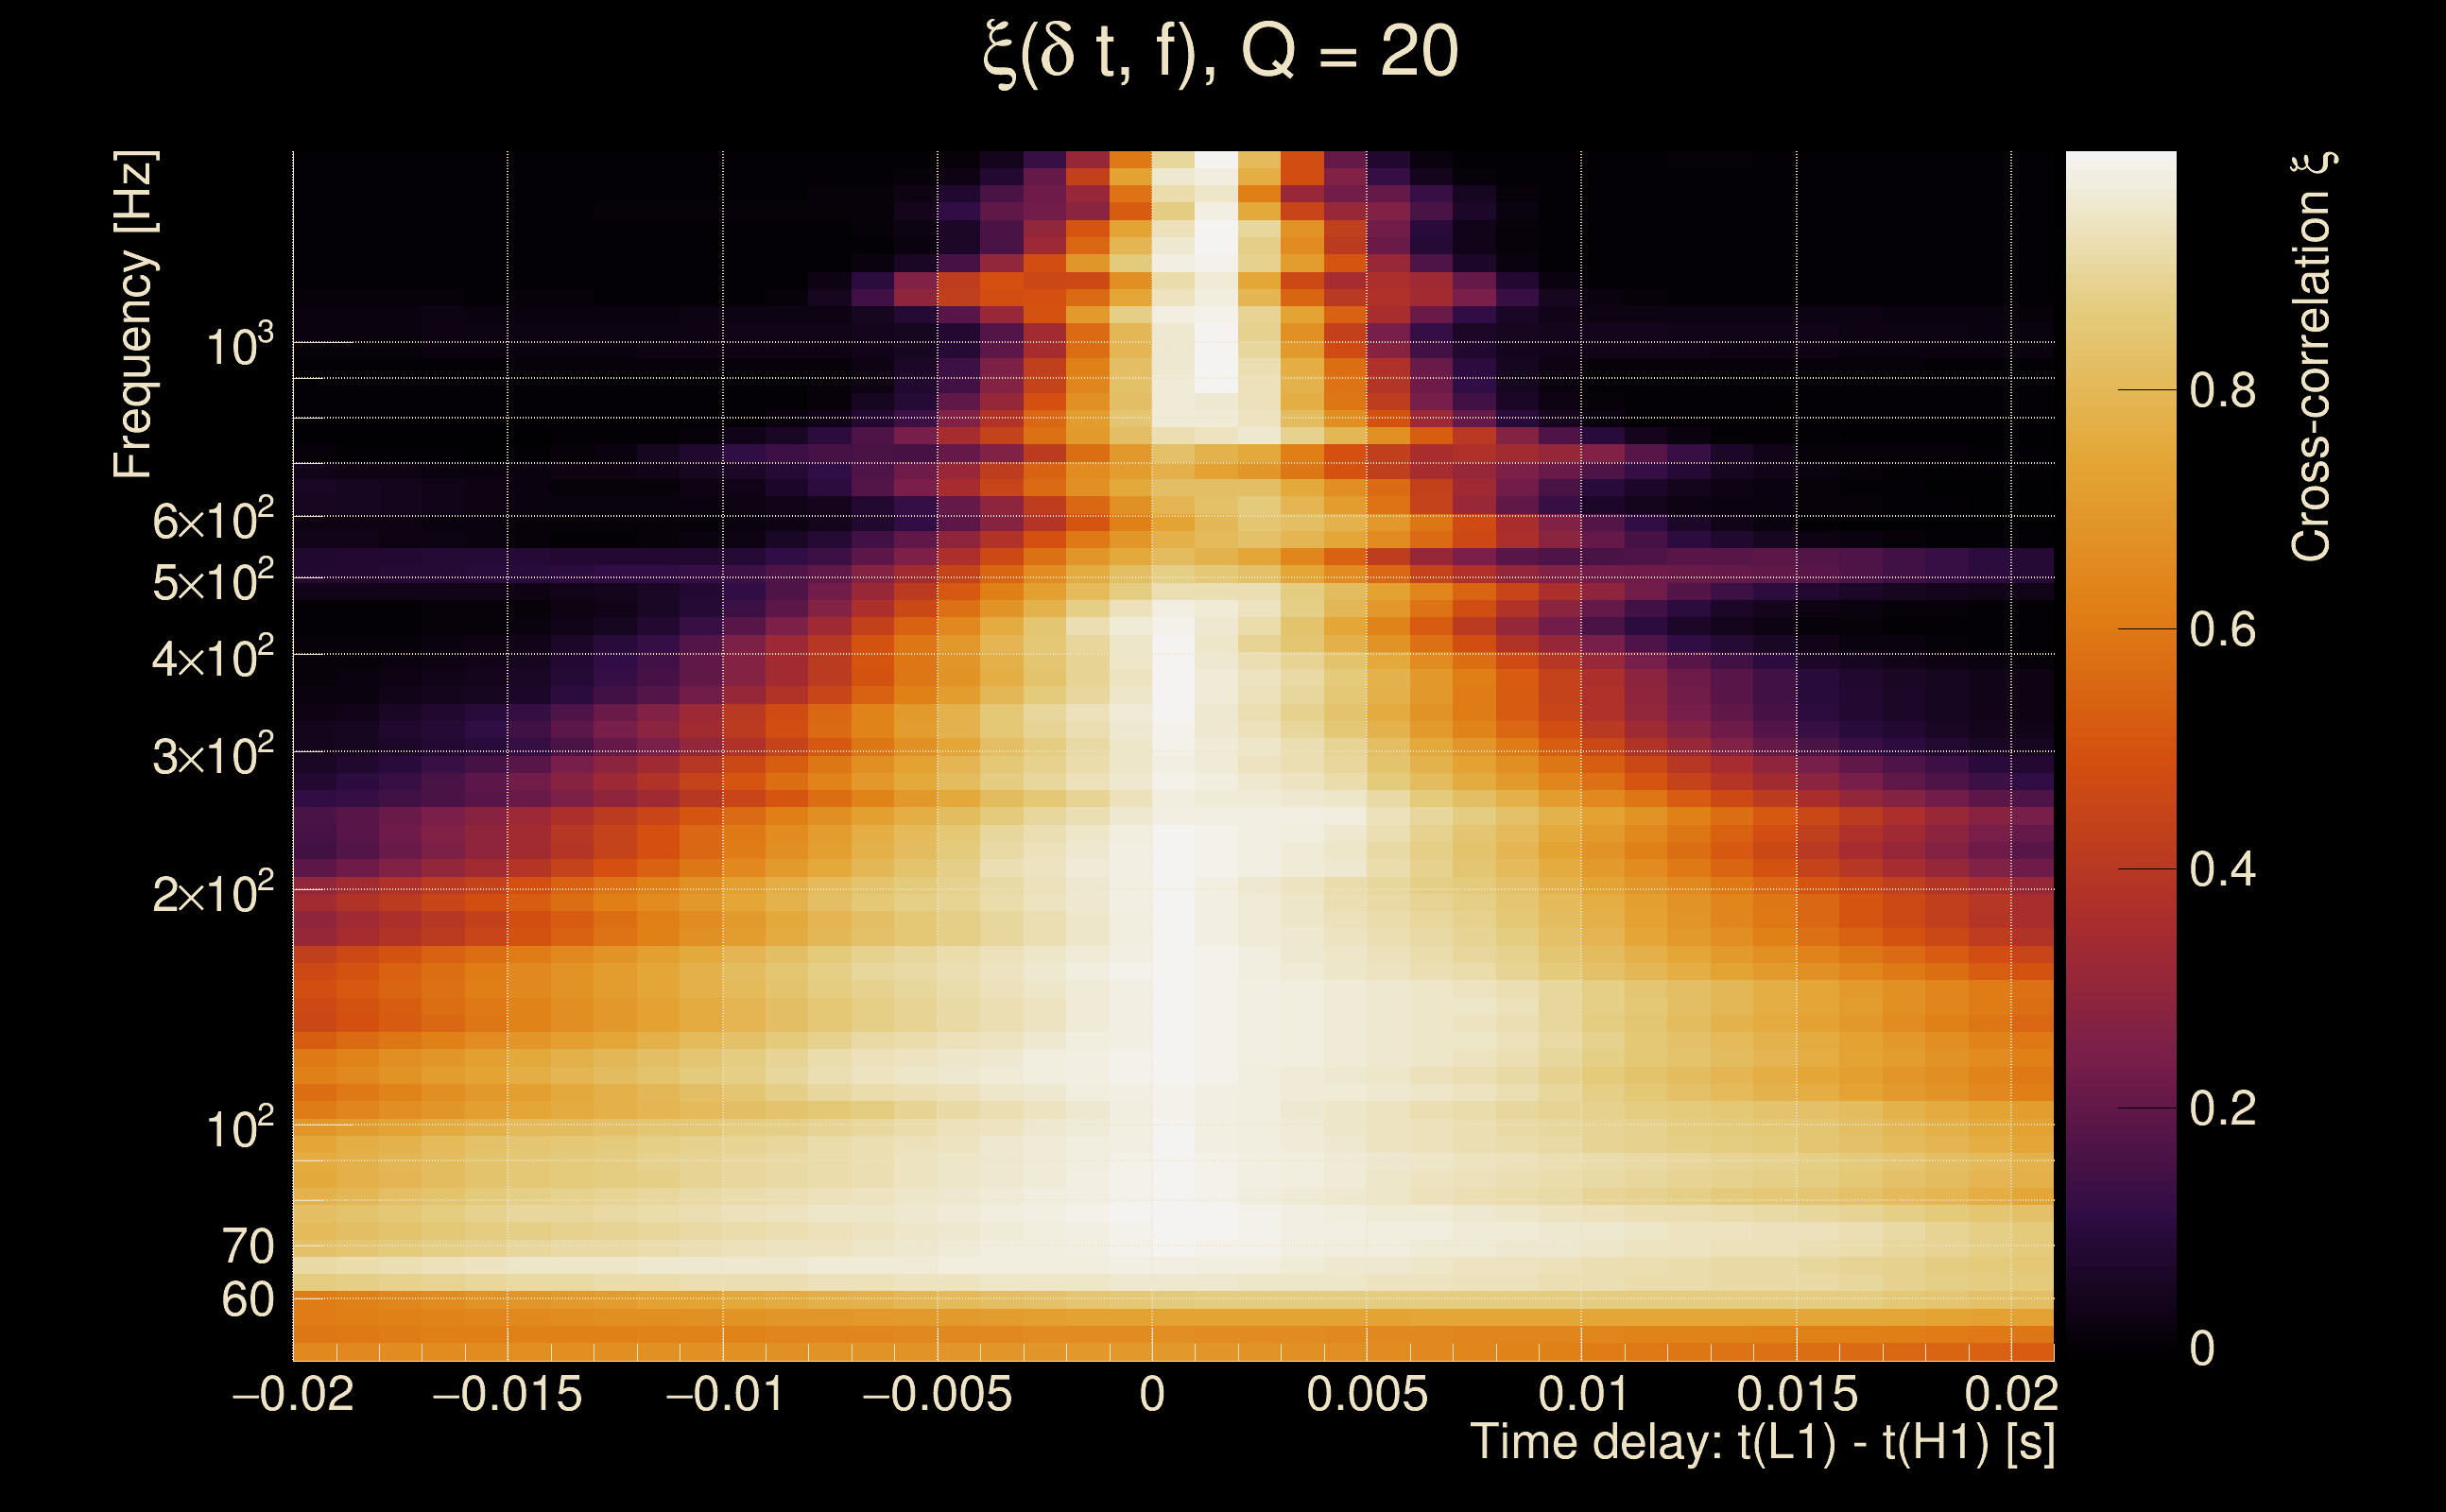
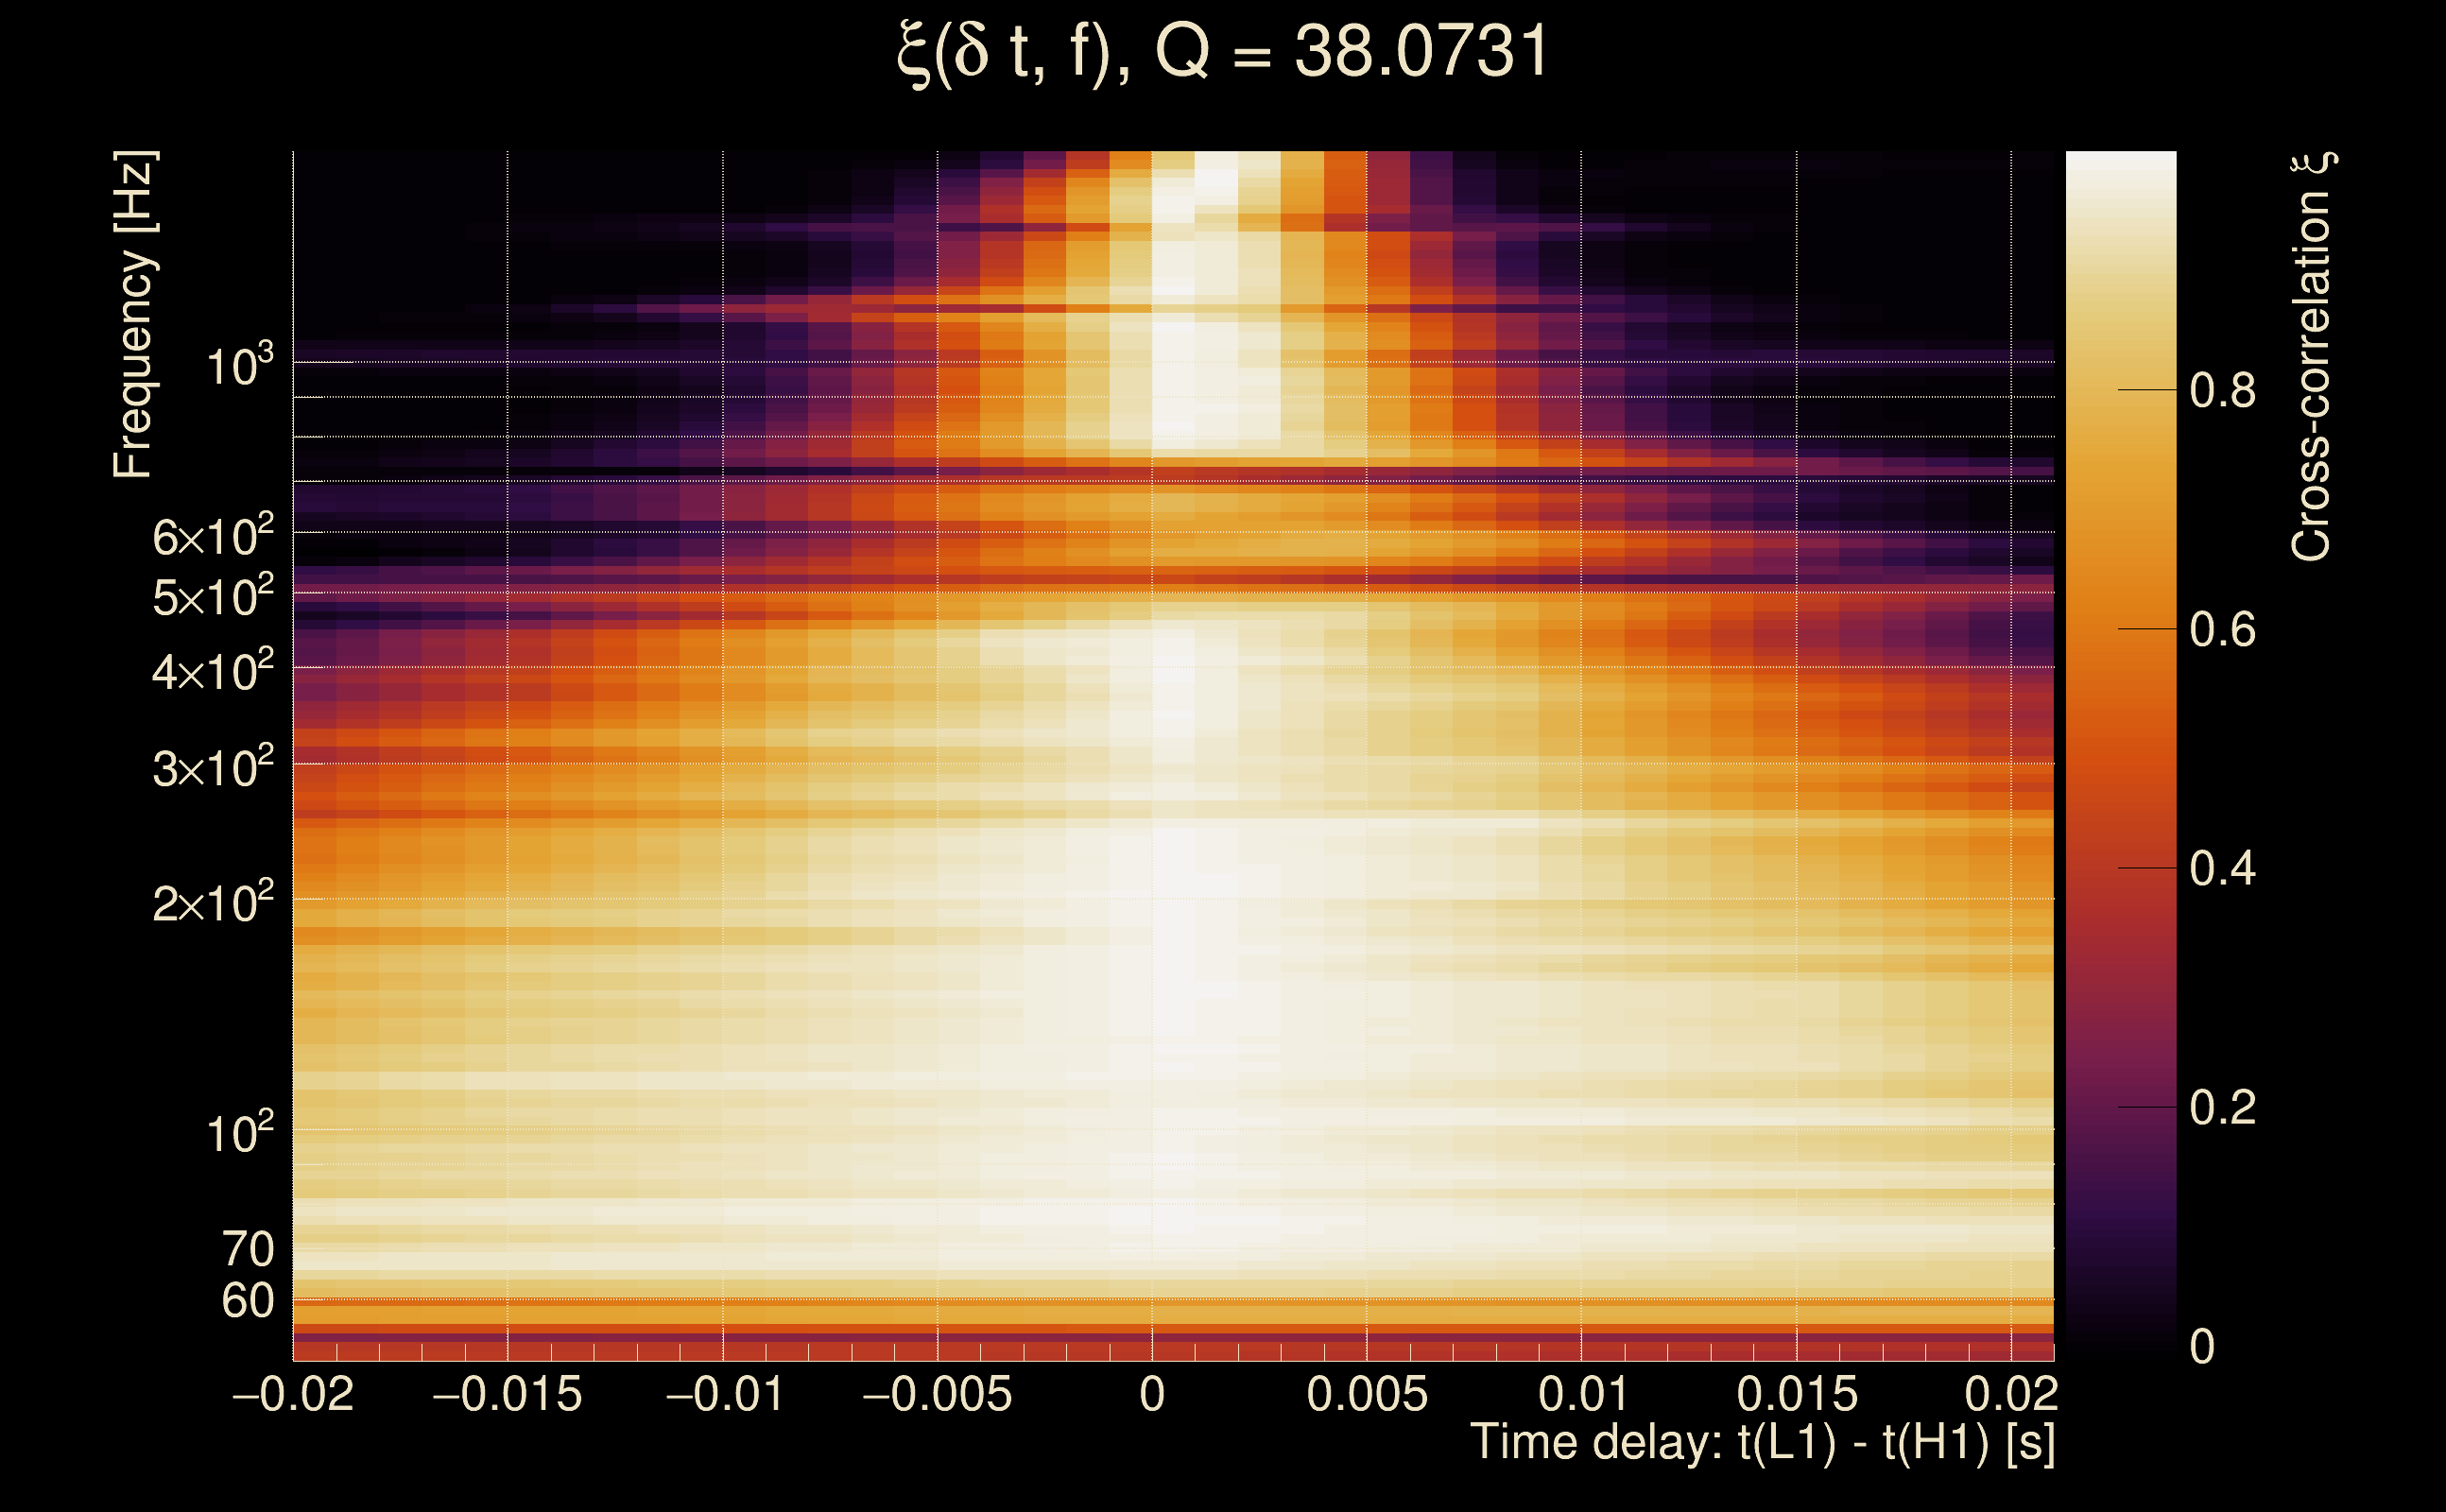
| Number of Q planes: | 5 (Q = 5.51892 → Q = 72.478) |
| Omicron frequency range: | 50 Hz → 1958.38 Hz |
| Light travel time between detectors: | 0.0100128 s |
| Slice extra-time (calibration uncertainty + slice veto): | 0.0129872 s |
| Number of time-delay bins in a cross-correlation map: | 10000 |
| Number of slices in a cross-correlation map: | 217 |
| Number of time-delay bins in a slice: | 46 |
| SNR gating: | < 100 (detector 0), < 100 (detector 1) |
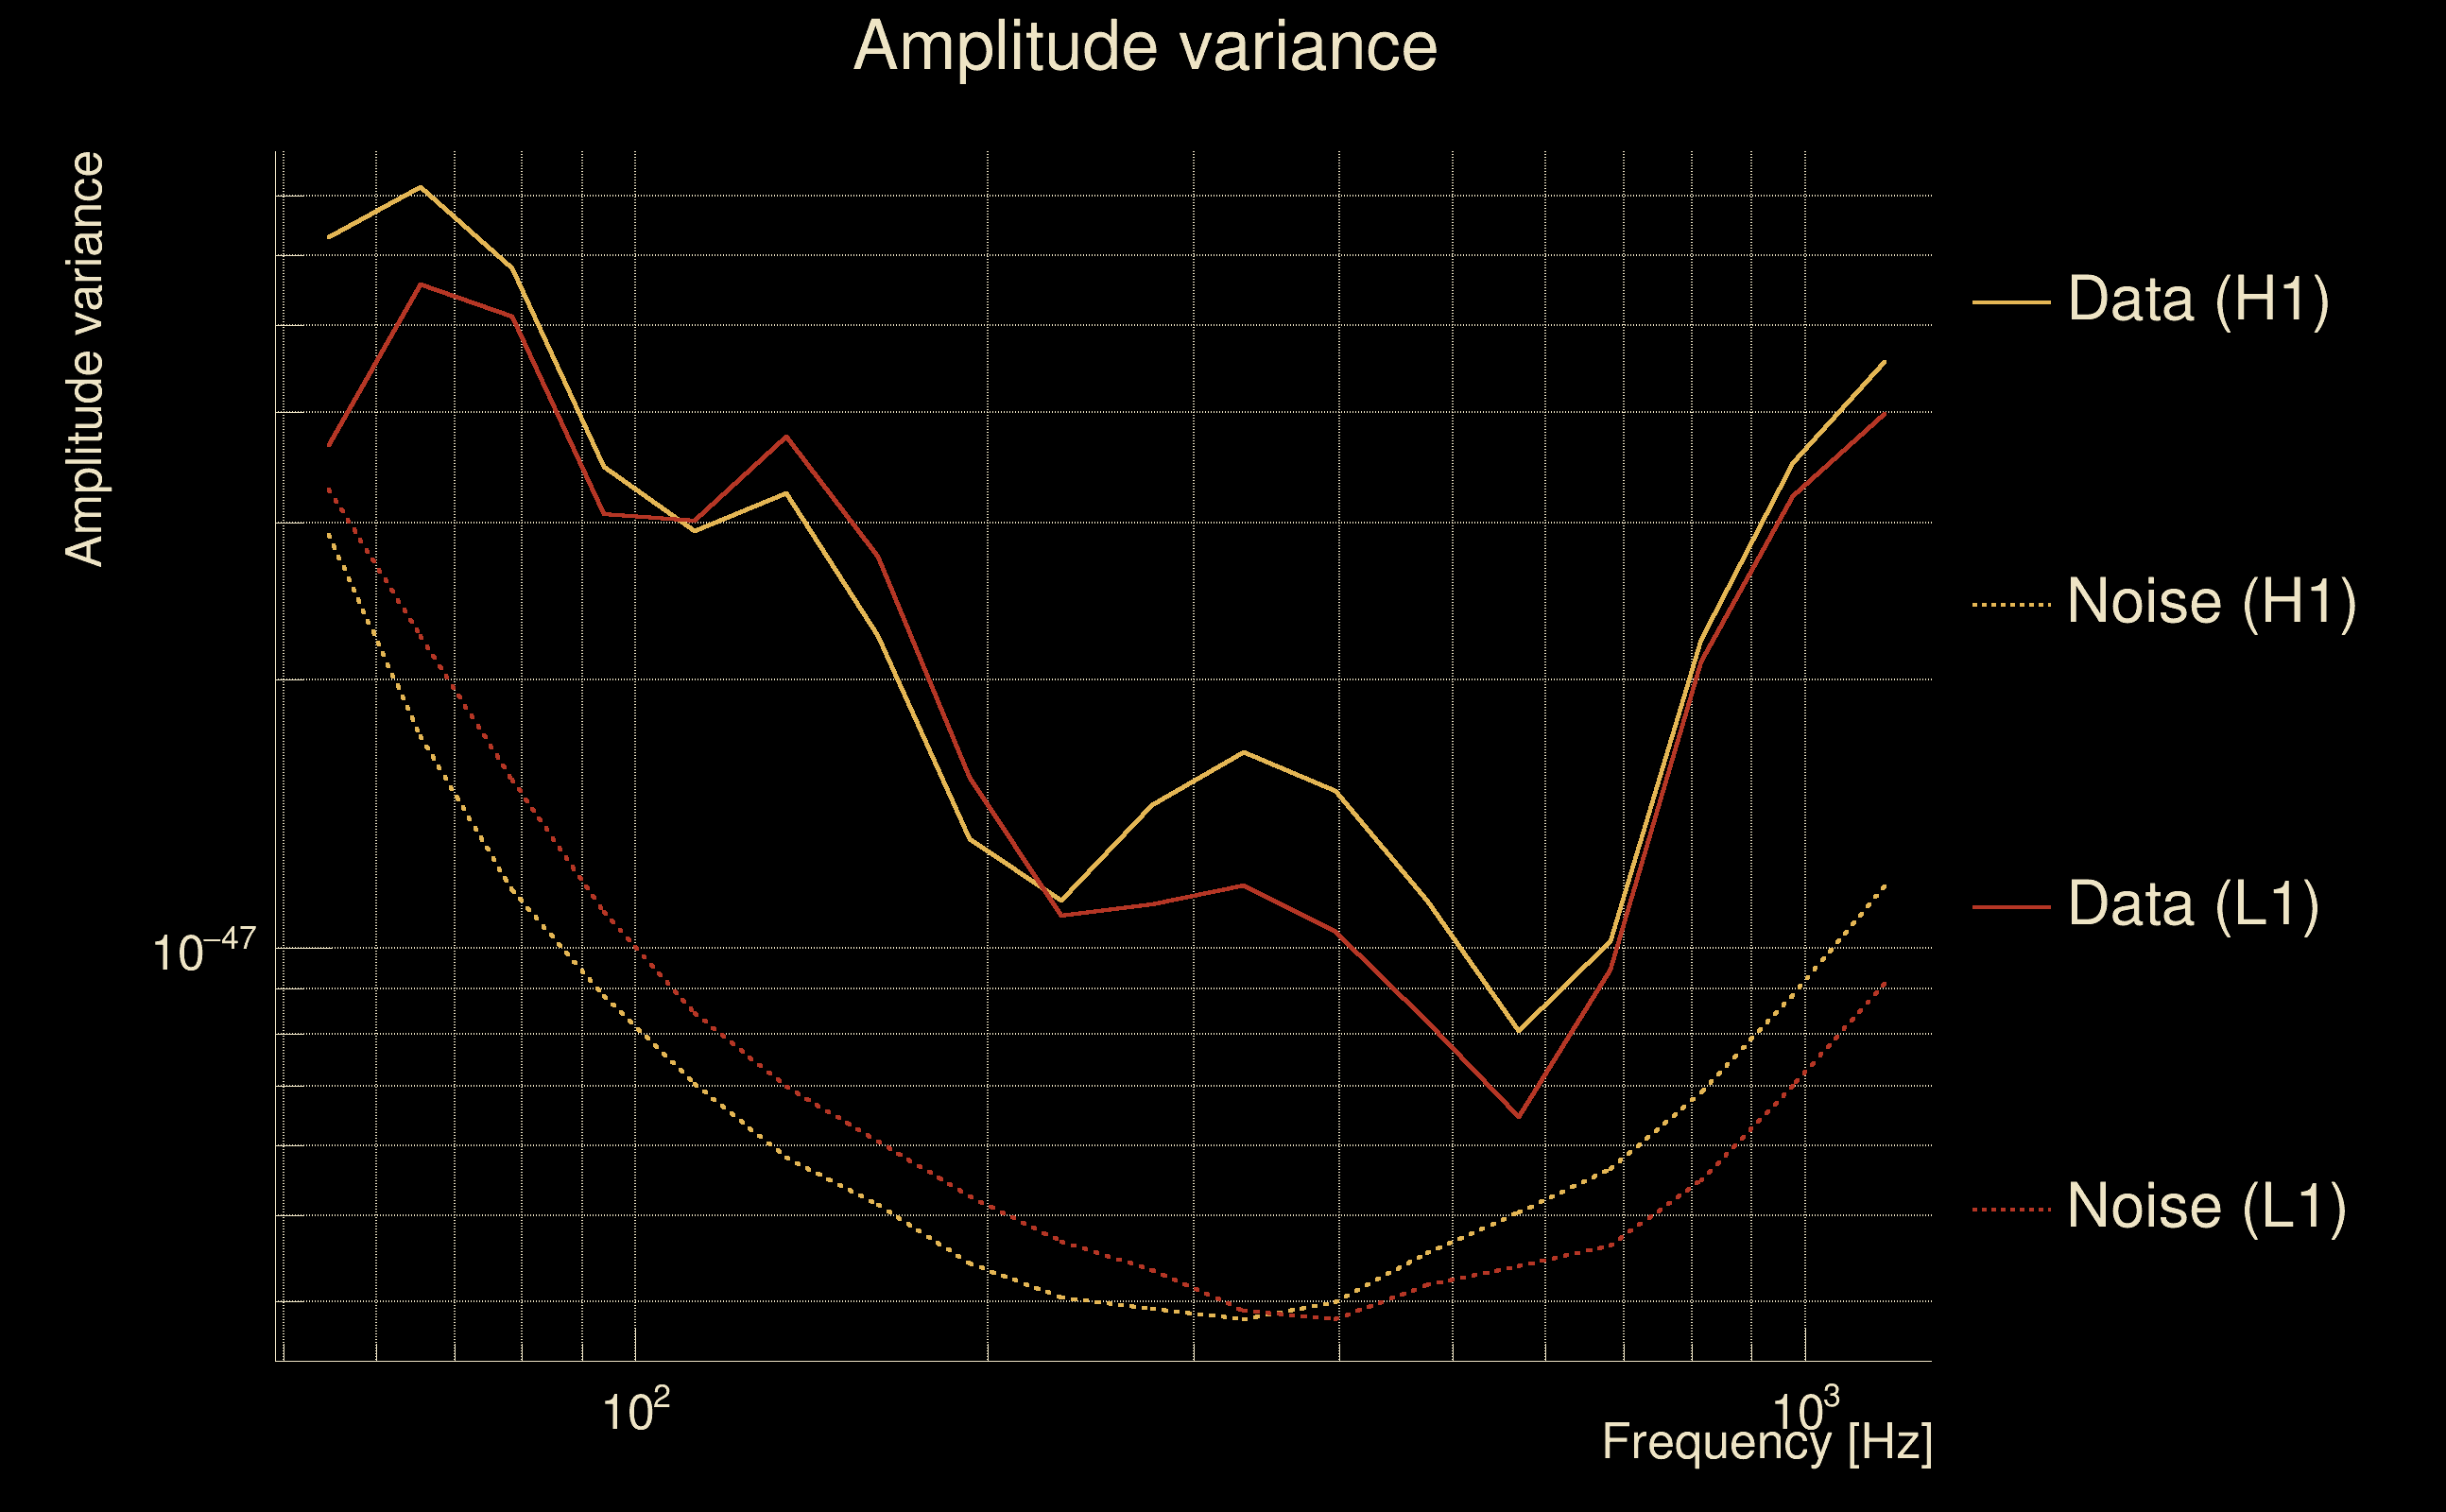
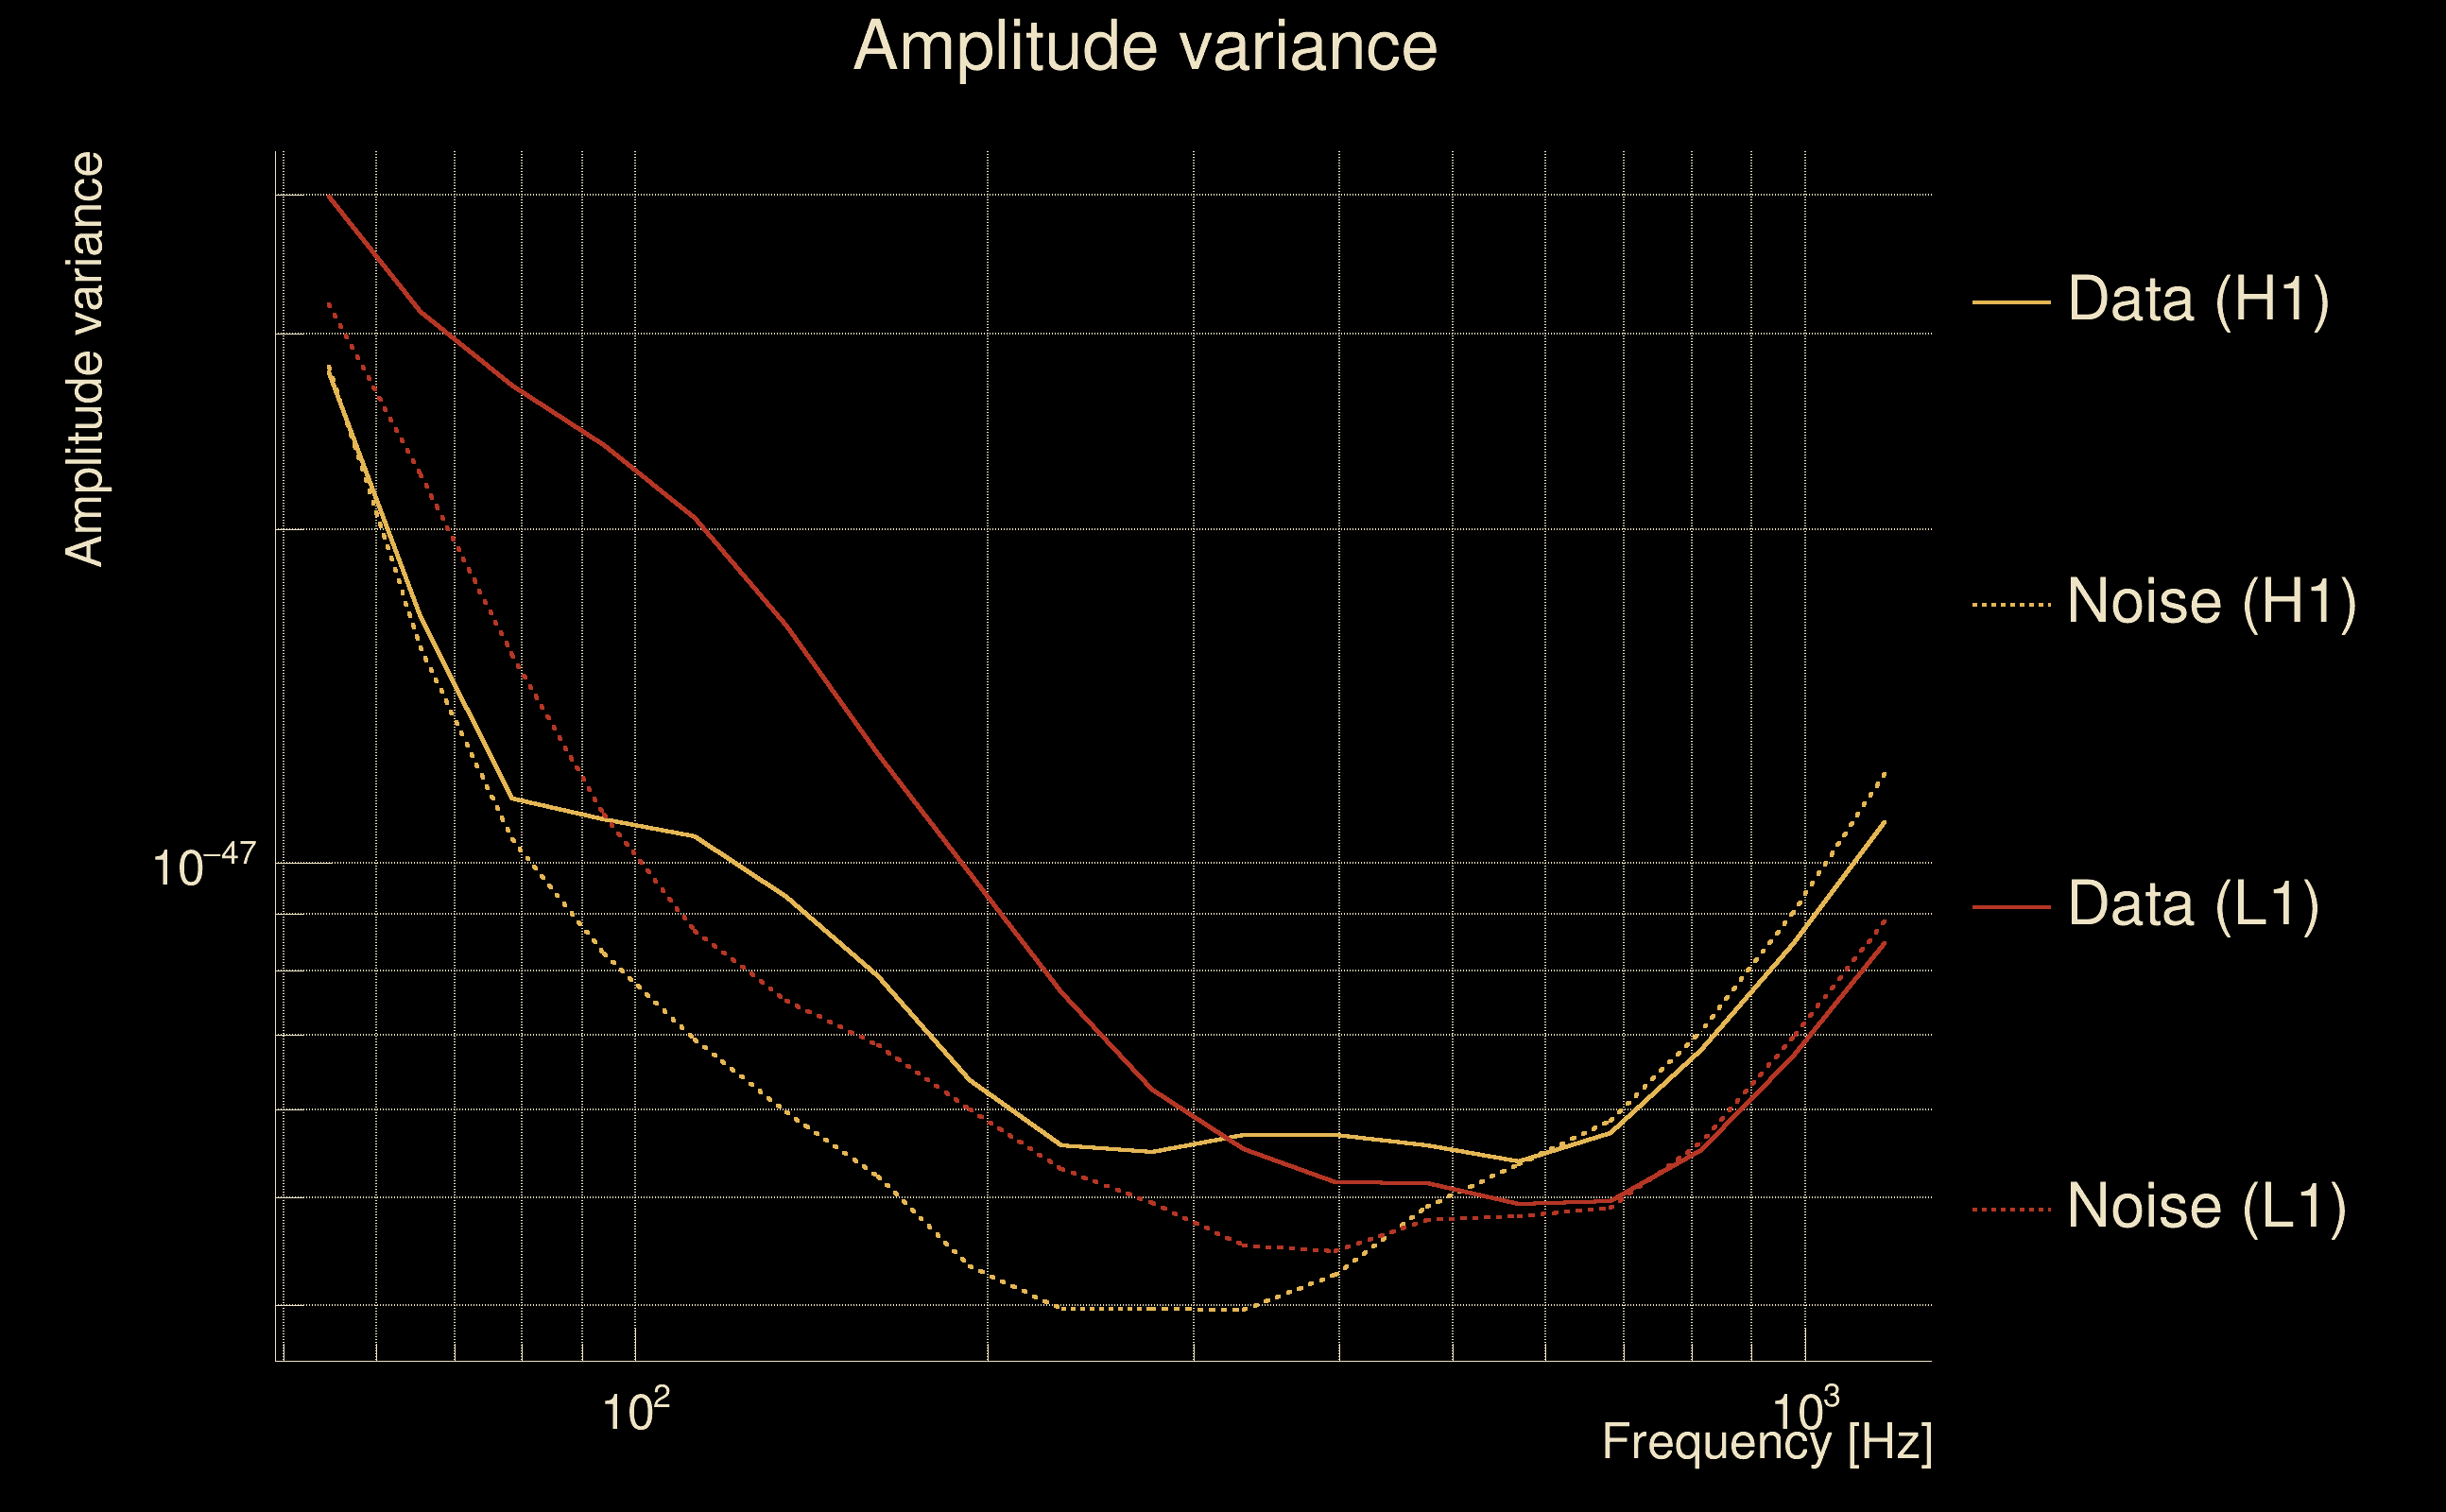
| Amplitude spectrograms: | normalization = 1e-22, power index = 2 |
| White noise SNR variance: | 0.523175 (after applying a correction factor = 1) |
| Amplitude ratio confidence level: | 3 sigma |
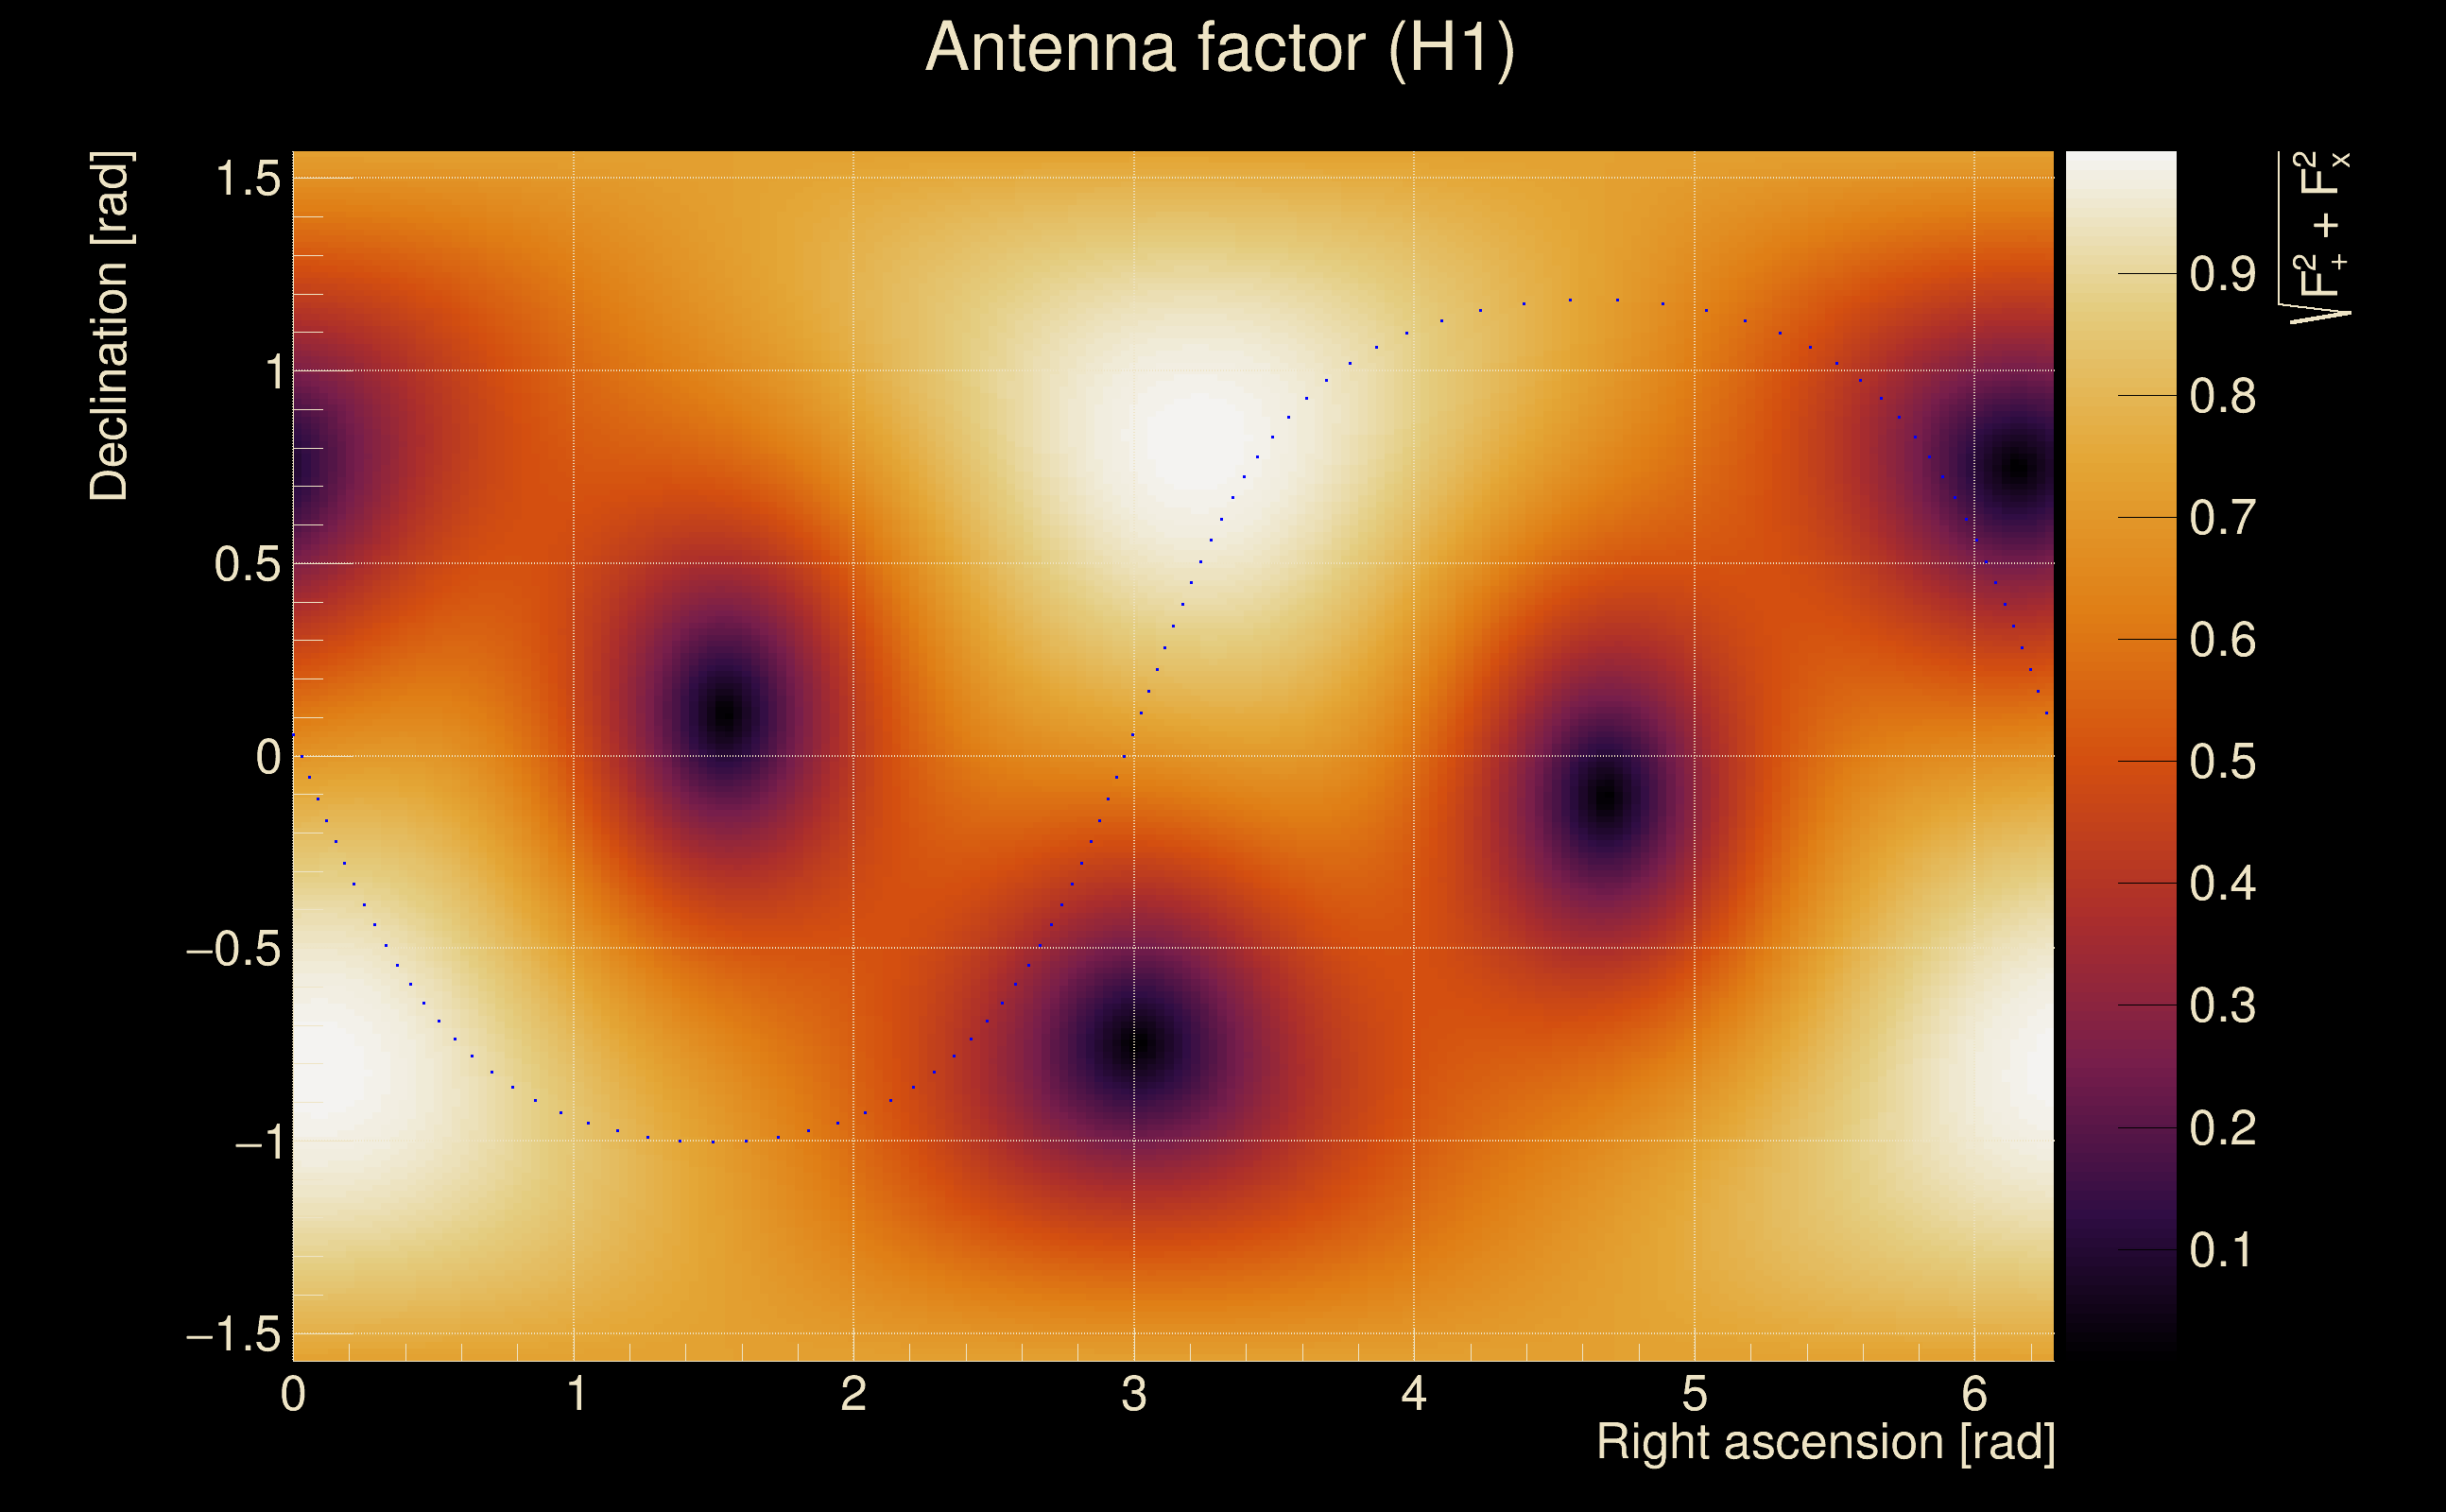
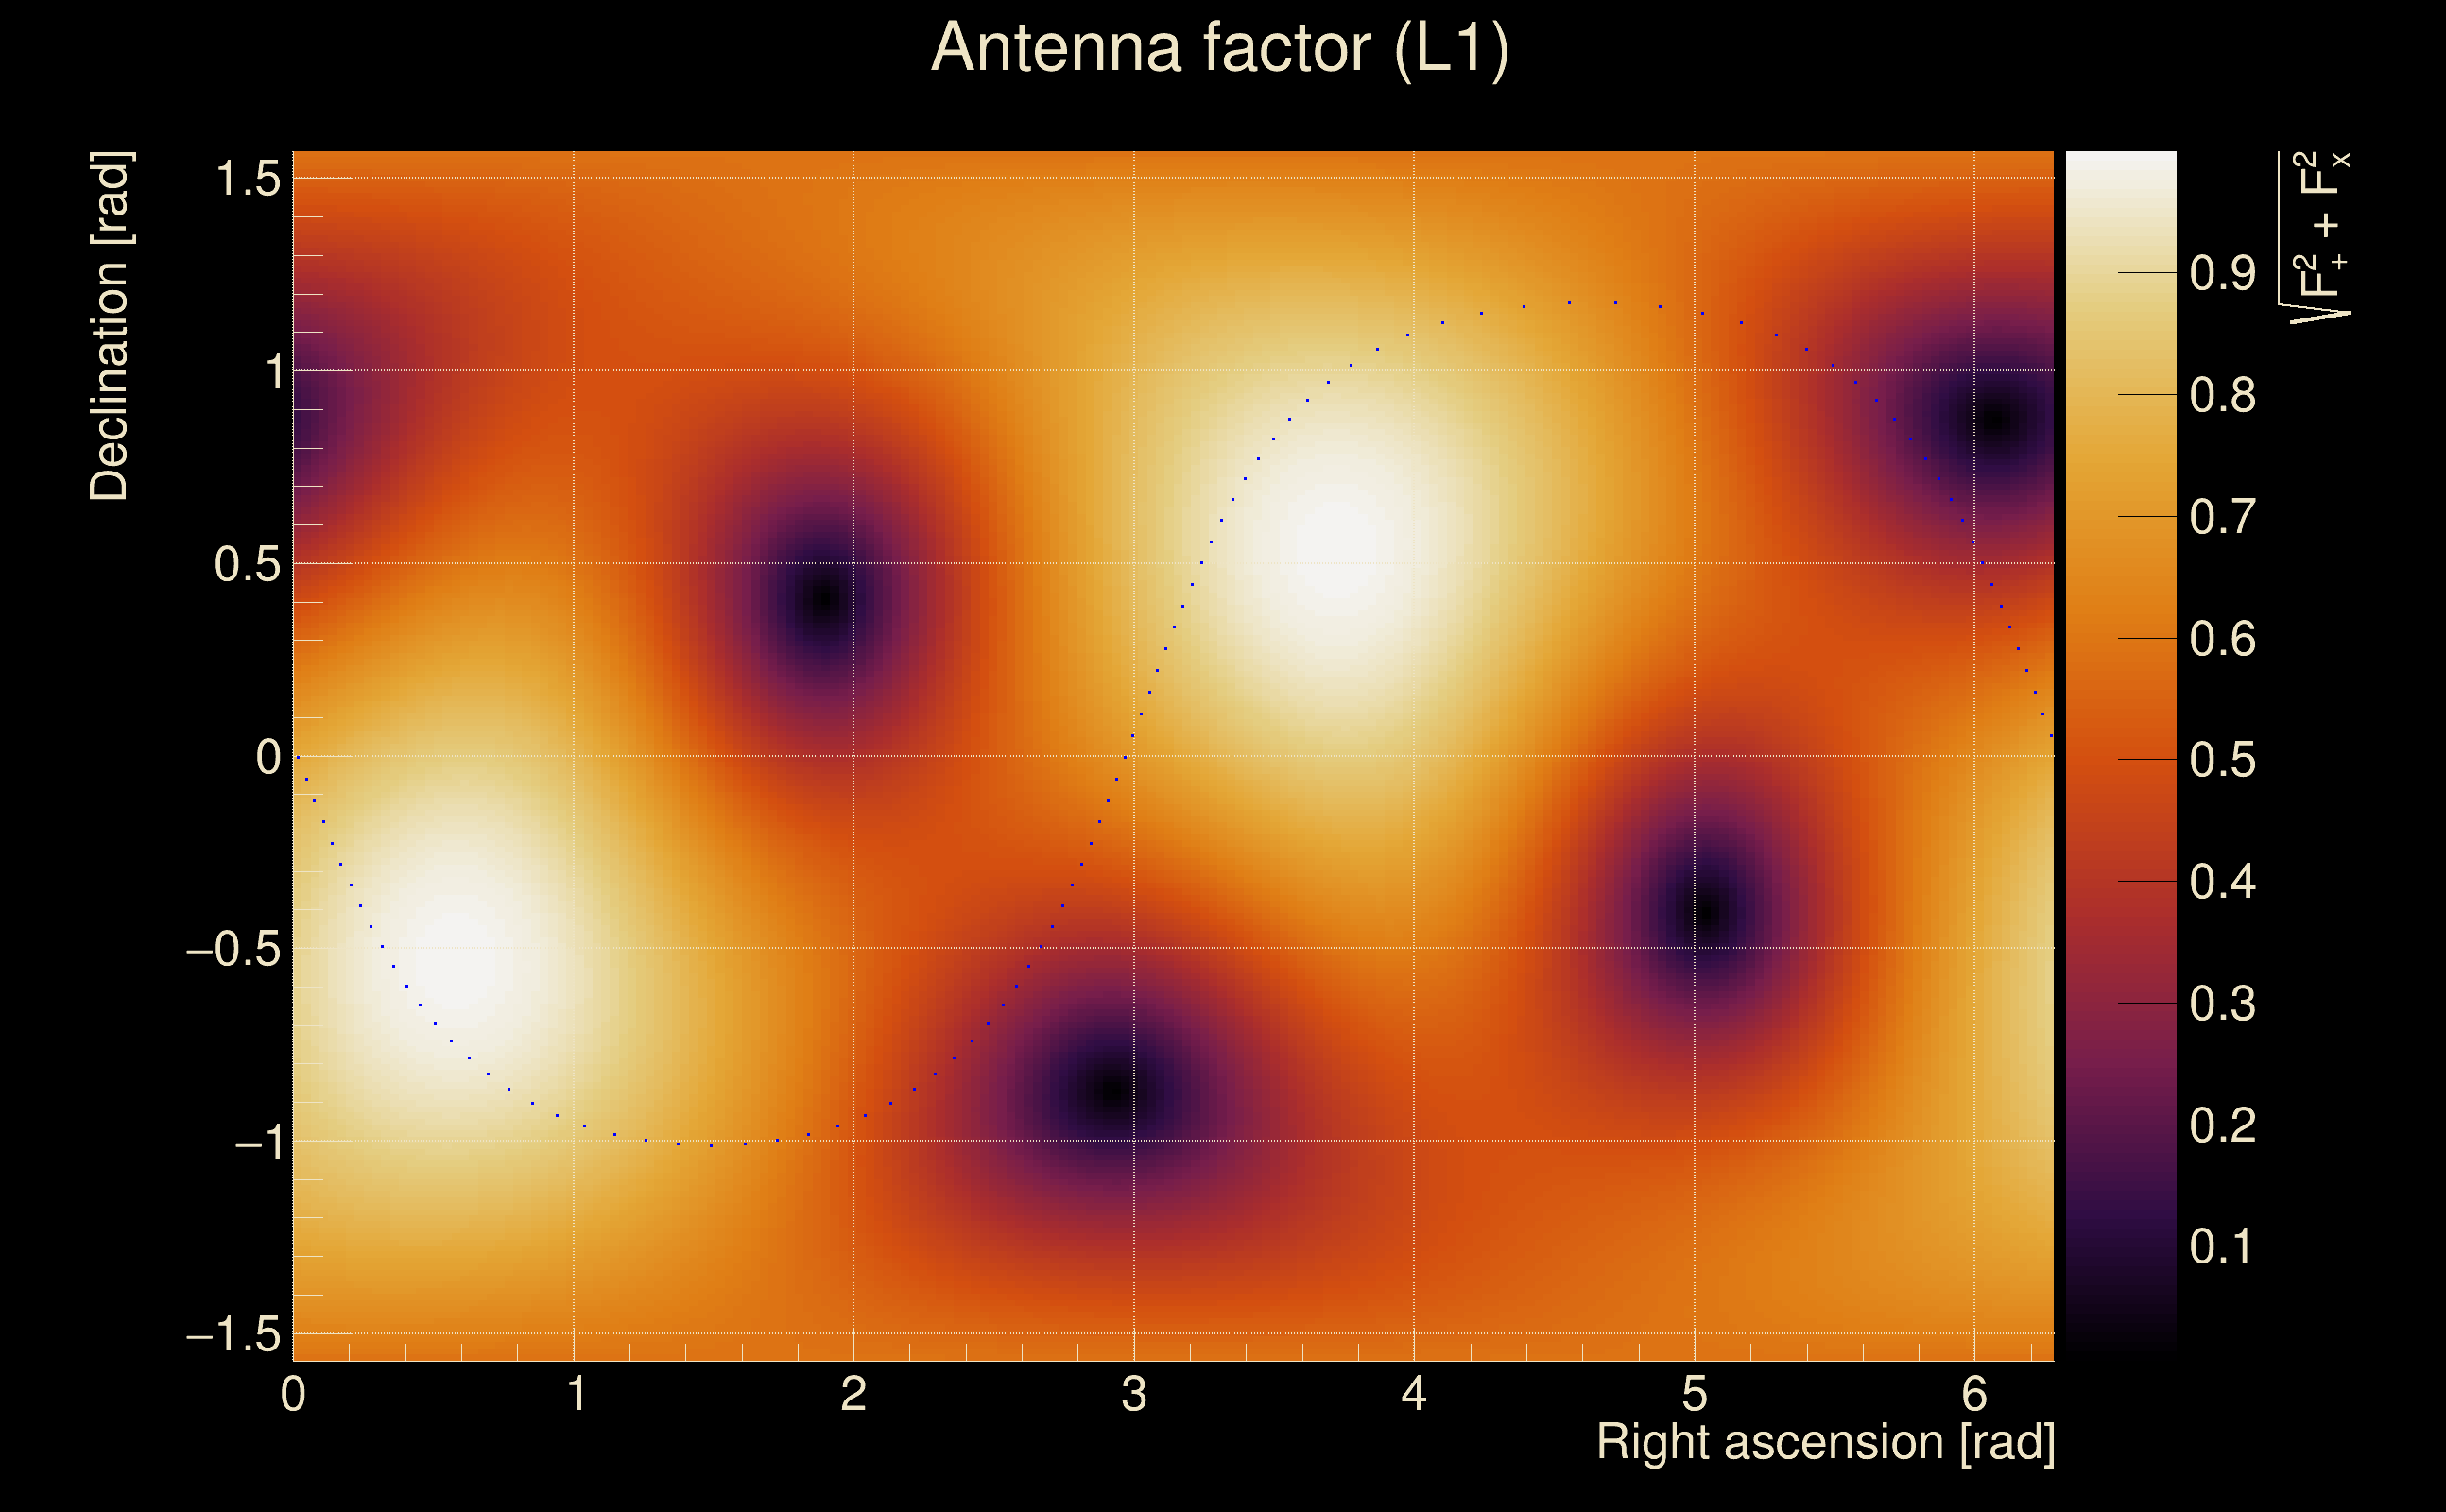
| Target sky positon: | Ra: 10, Dec: 10 [rad] |
| List of input Ox files: | TargIxfw_injpt3_file_list.txt (71 files) |
| Analysis result file: | TargIxfw_injpt3_results-0.root |
| Slice selected for the the fakeground: | slice index=134 (-1.196 s), time lag = 0 s |
| Foreground | Fakeground | Background | ||
|---|---|---|---|---|
| Number of processed ox events | 12111 | 12111 | 2603865 | |
| Start Date (detector 0) | Mon May 15 14:13:25 2023 UTC | Mon May 15 14:13:25 2023 UTC | Mon May 15 14:13:25 2023 UTC | |
| End Date (detector 0) | Thu May 18 15:54:40 2023 UTC | Thu May 18 15:54:40 2023 UTC | Thu May 18 15:54:40 2023 UTC | |
| Start GPS (detector 0) | 1368195223 | 1368195223 | 1368195223 | |
| End GPS (detector 0) | 1368460498 | 1368460498 | 1368460498 | |
| Used livetime (detector 0) | 60875 s | 60875 s | 60875 s | |
| Start Date (detector 1) | Mon May 15 14:13:25 2023 UTC | Mon May 15 14:13:25 2023 UTC | Mon May 15 14:13:25 2023 UTC | |
| End Date (detector 1) | Thu May 18 15:54:40 2023 UTC | Thu May 18 15:54:40 2023 UTC | Thu May 18 15:54:40 2023 UTC | |
| Start GPS (detector 1) | 1368195223 | 1368195223 | 1368195223 | |
| End GPS (detector 1) | 1368460498 | 1368460498 | 1368460498 | |
| Used livetime (detector 1) | 60875 s | 60875 s | 60875 s | |
| Cumulative livetime | 121110 s | 121110 s | 26038650 s | |
| 0 years, 1 days, 9 hours, 38 min, 30 s | 0 years, 1 days, 9 hours, 38 min, 30 s | 0 years, 301 days, 8 hours, 57 min, 30 s |
|
|
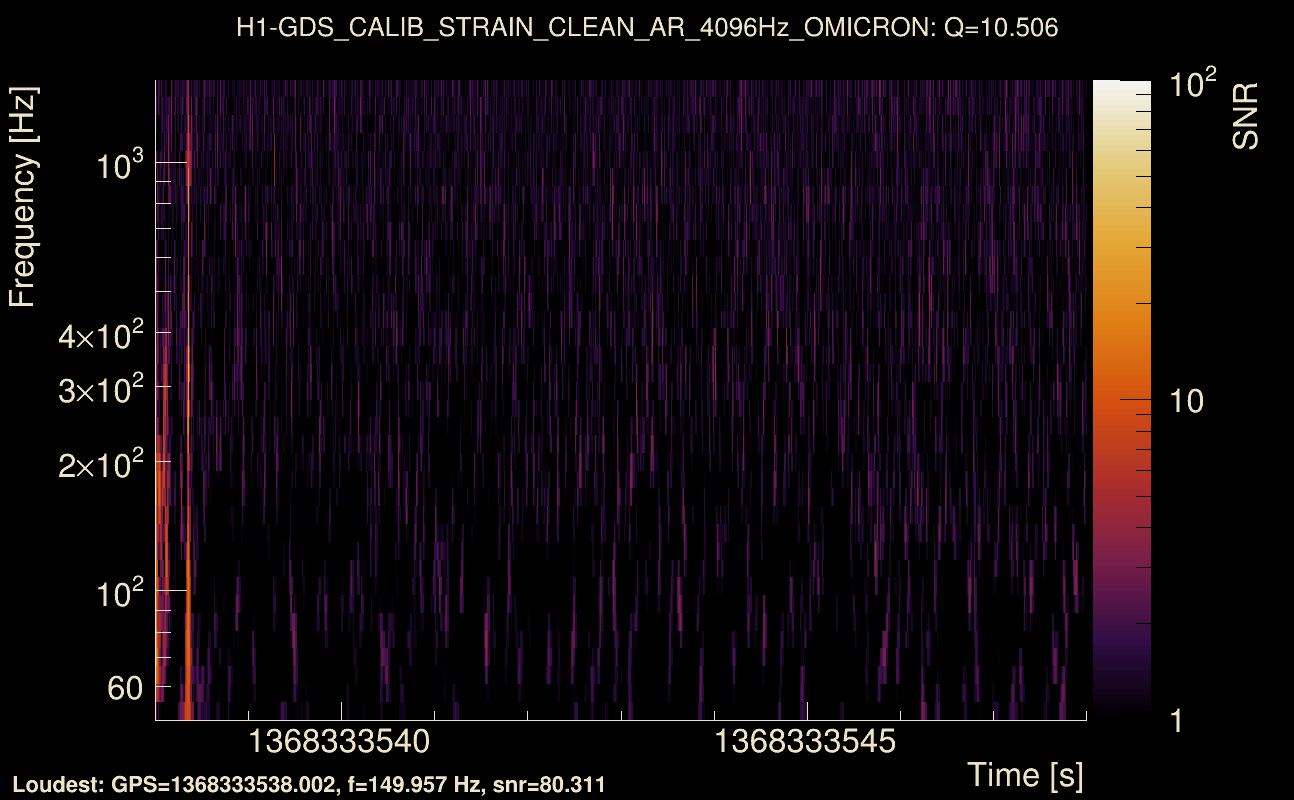
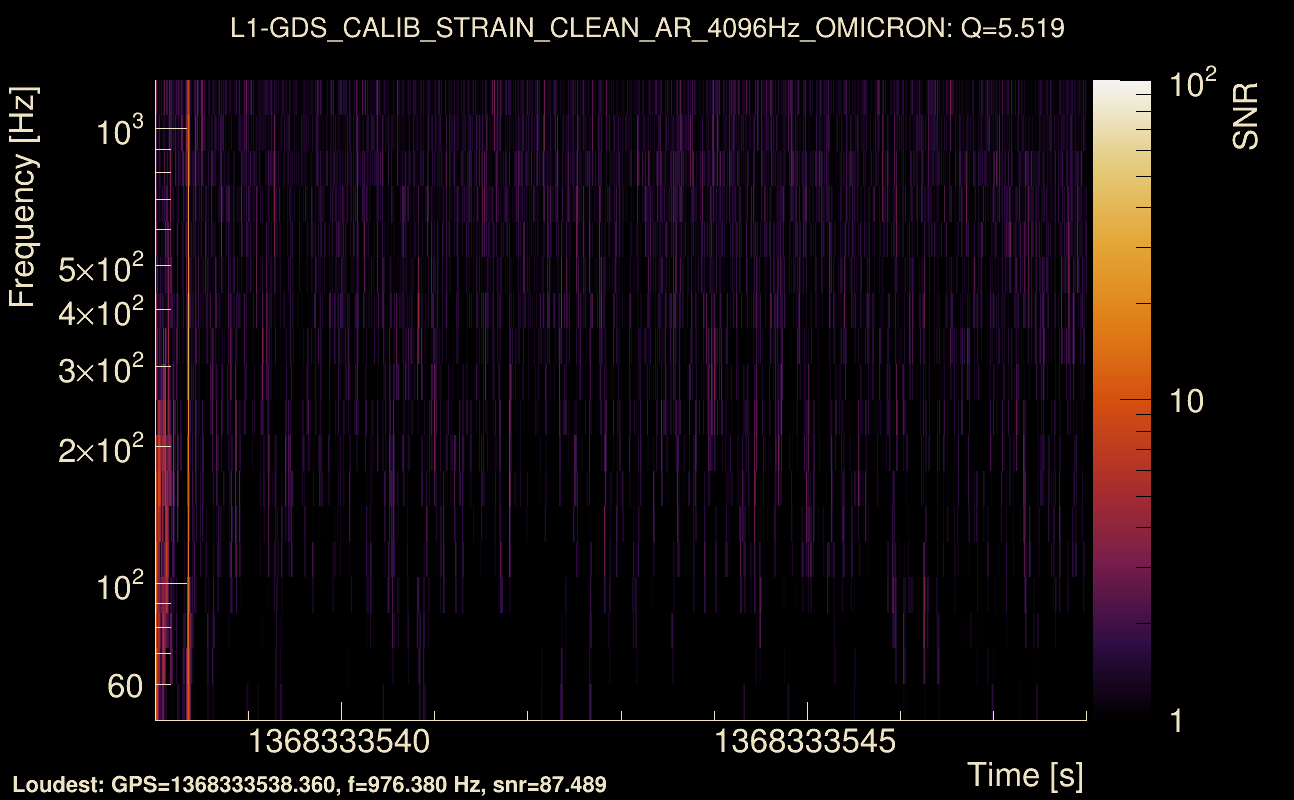
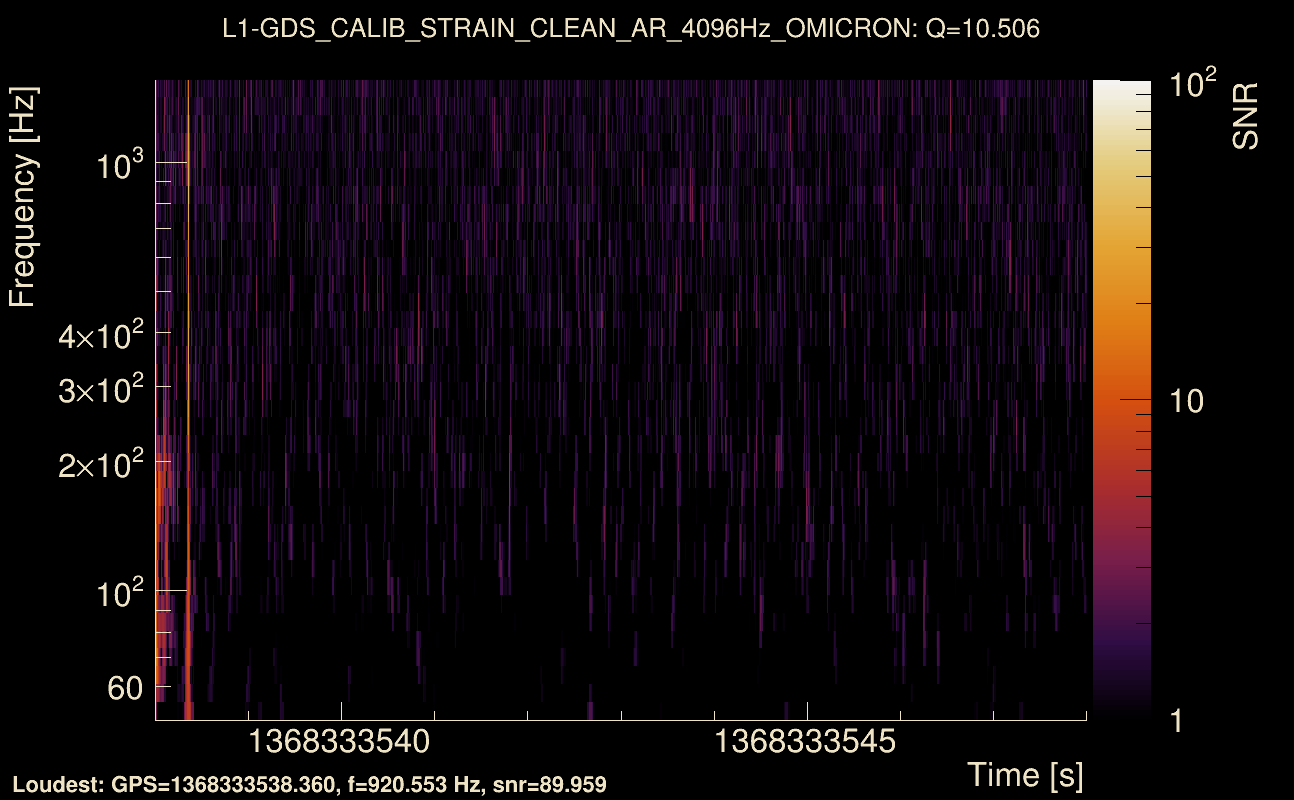
| Event time t(H1): | GPS = 1368333538 (Wed May 17 04:38:40 2023 ) → GPS = 1368333548 (Wed May 17 04:38:50 2023 ) |
| Event time t(L1): | GPS = 1368333538 (Wed May 17 04:38:50 2023 ) → GPS = 1368333548 (Wed May 17 04:38:50 2023 ) |
| Omicron analysis time window (H1): | GPS = 1368333535 → GPS = 1368333551 |
| Omicron analysis time window (L1): | GPS = 1368333535 → GPS = 1368333551 |
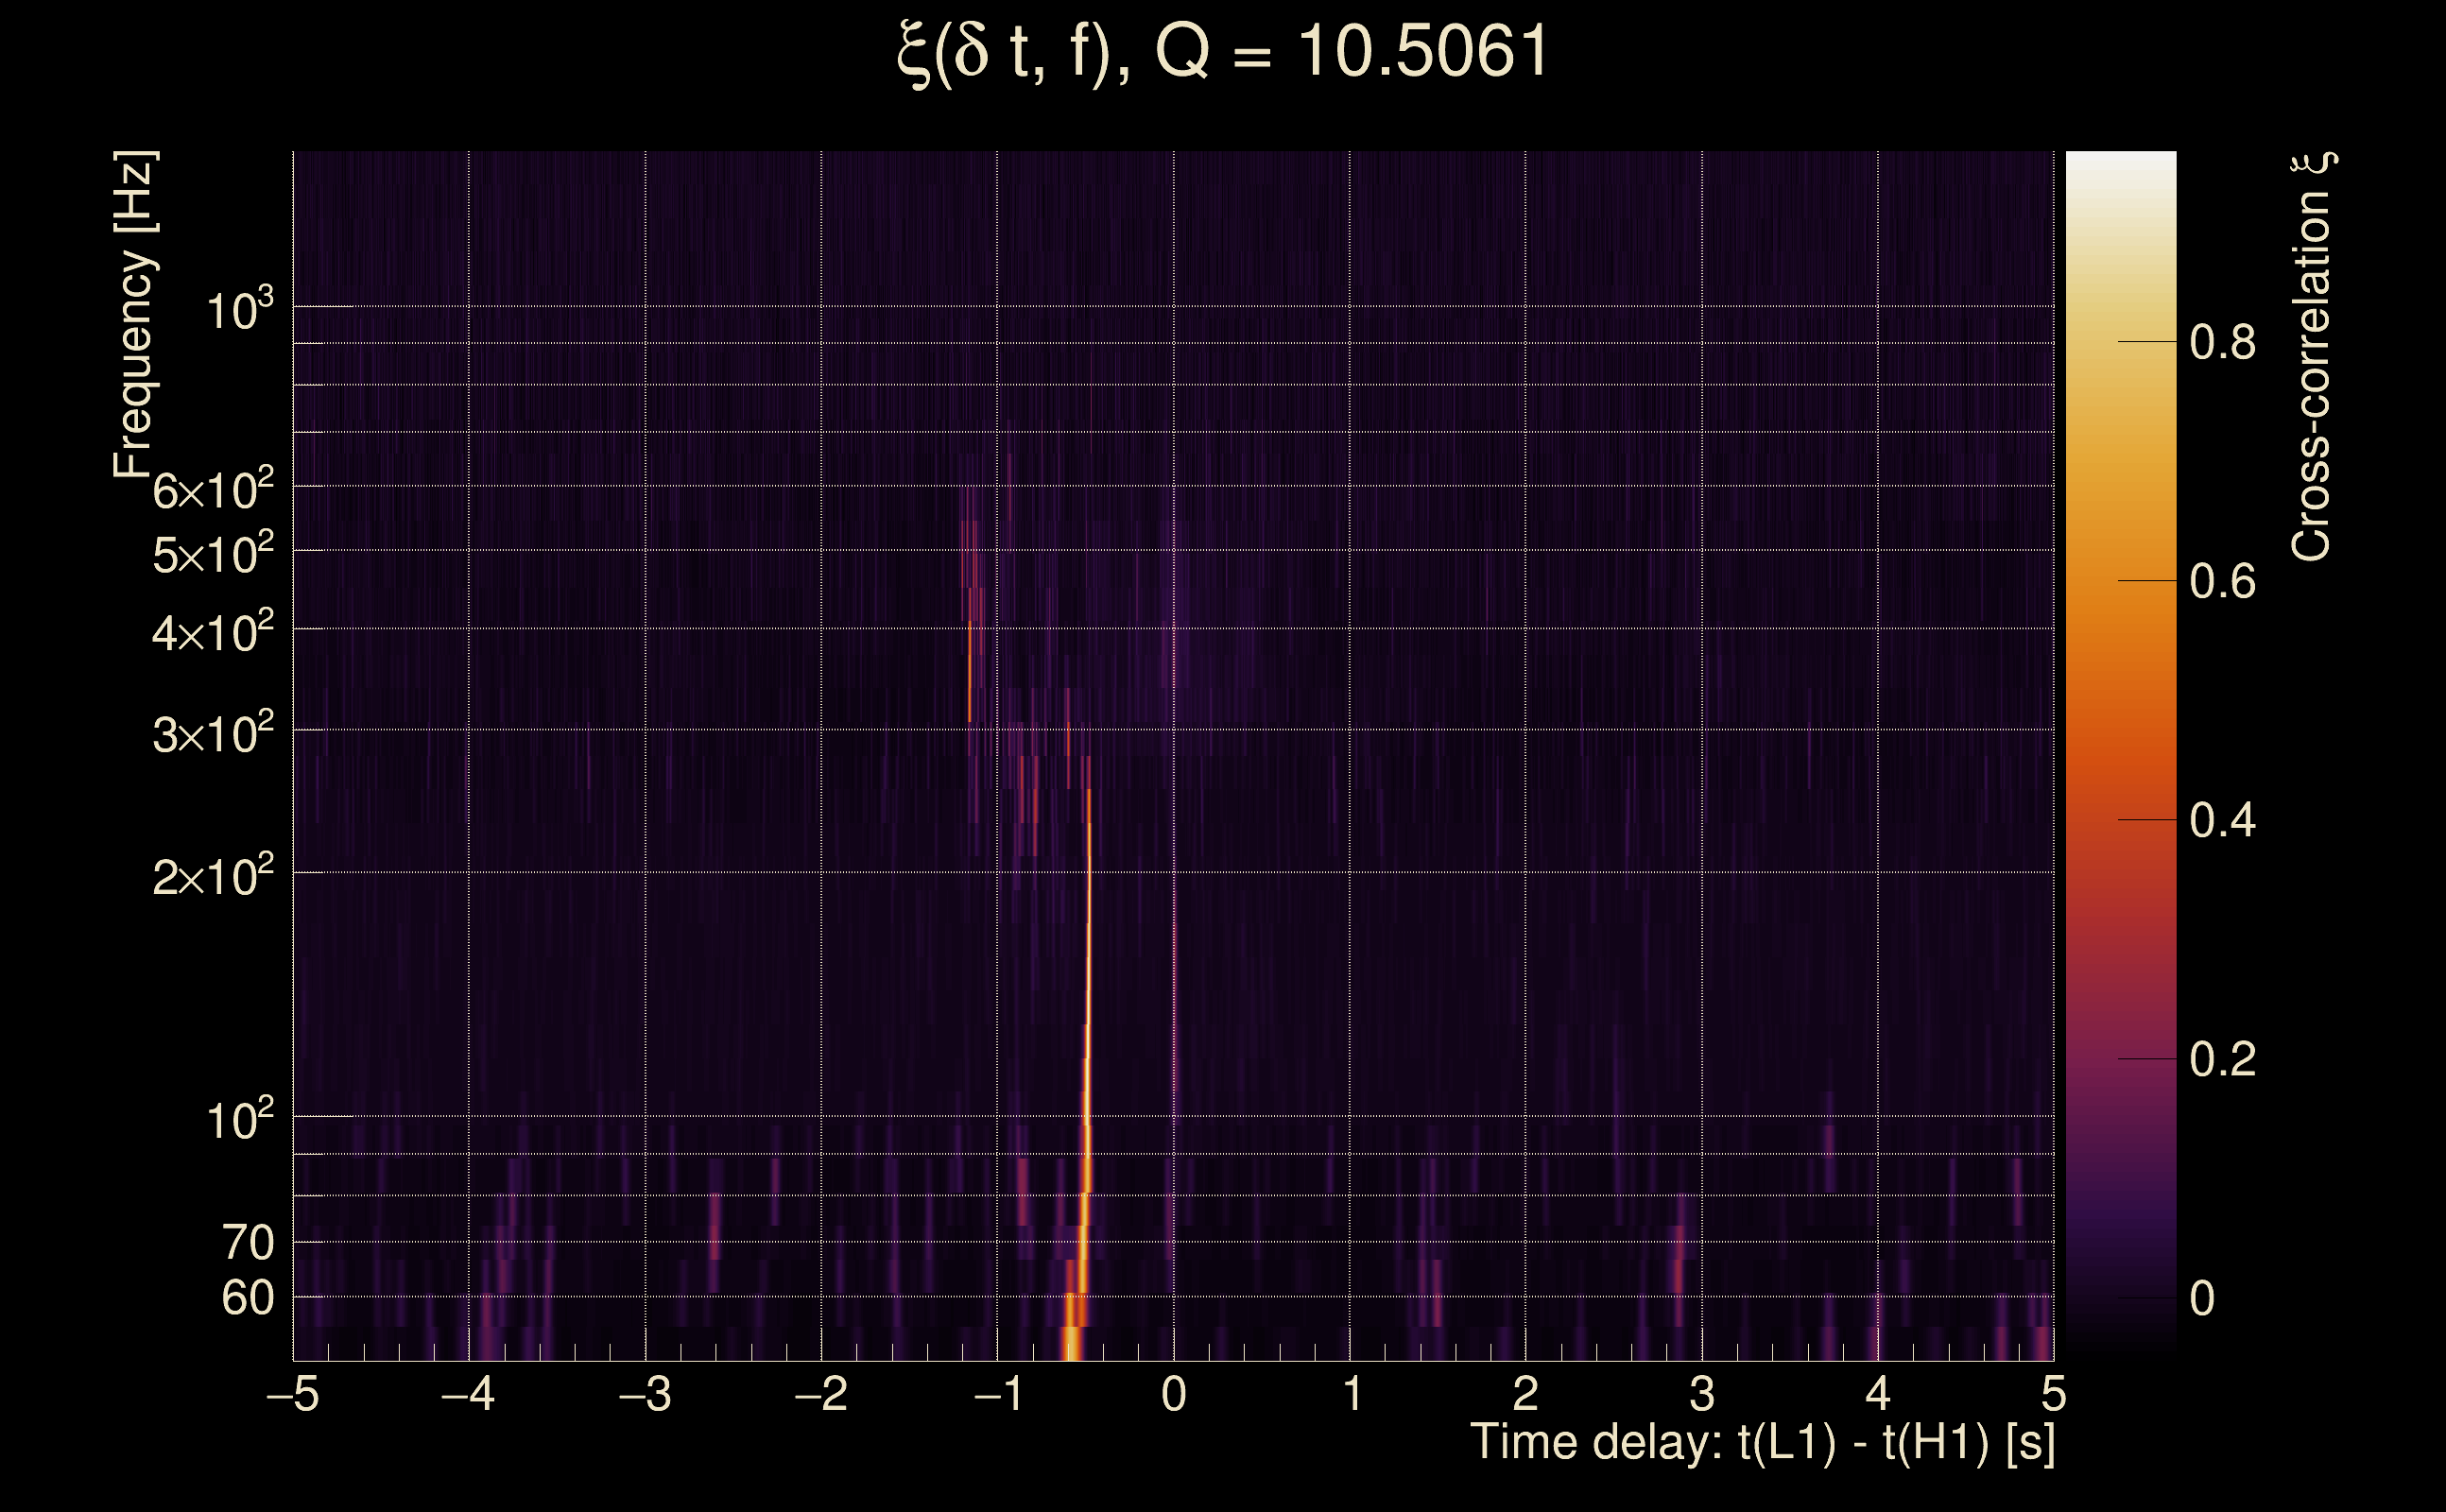
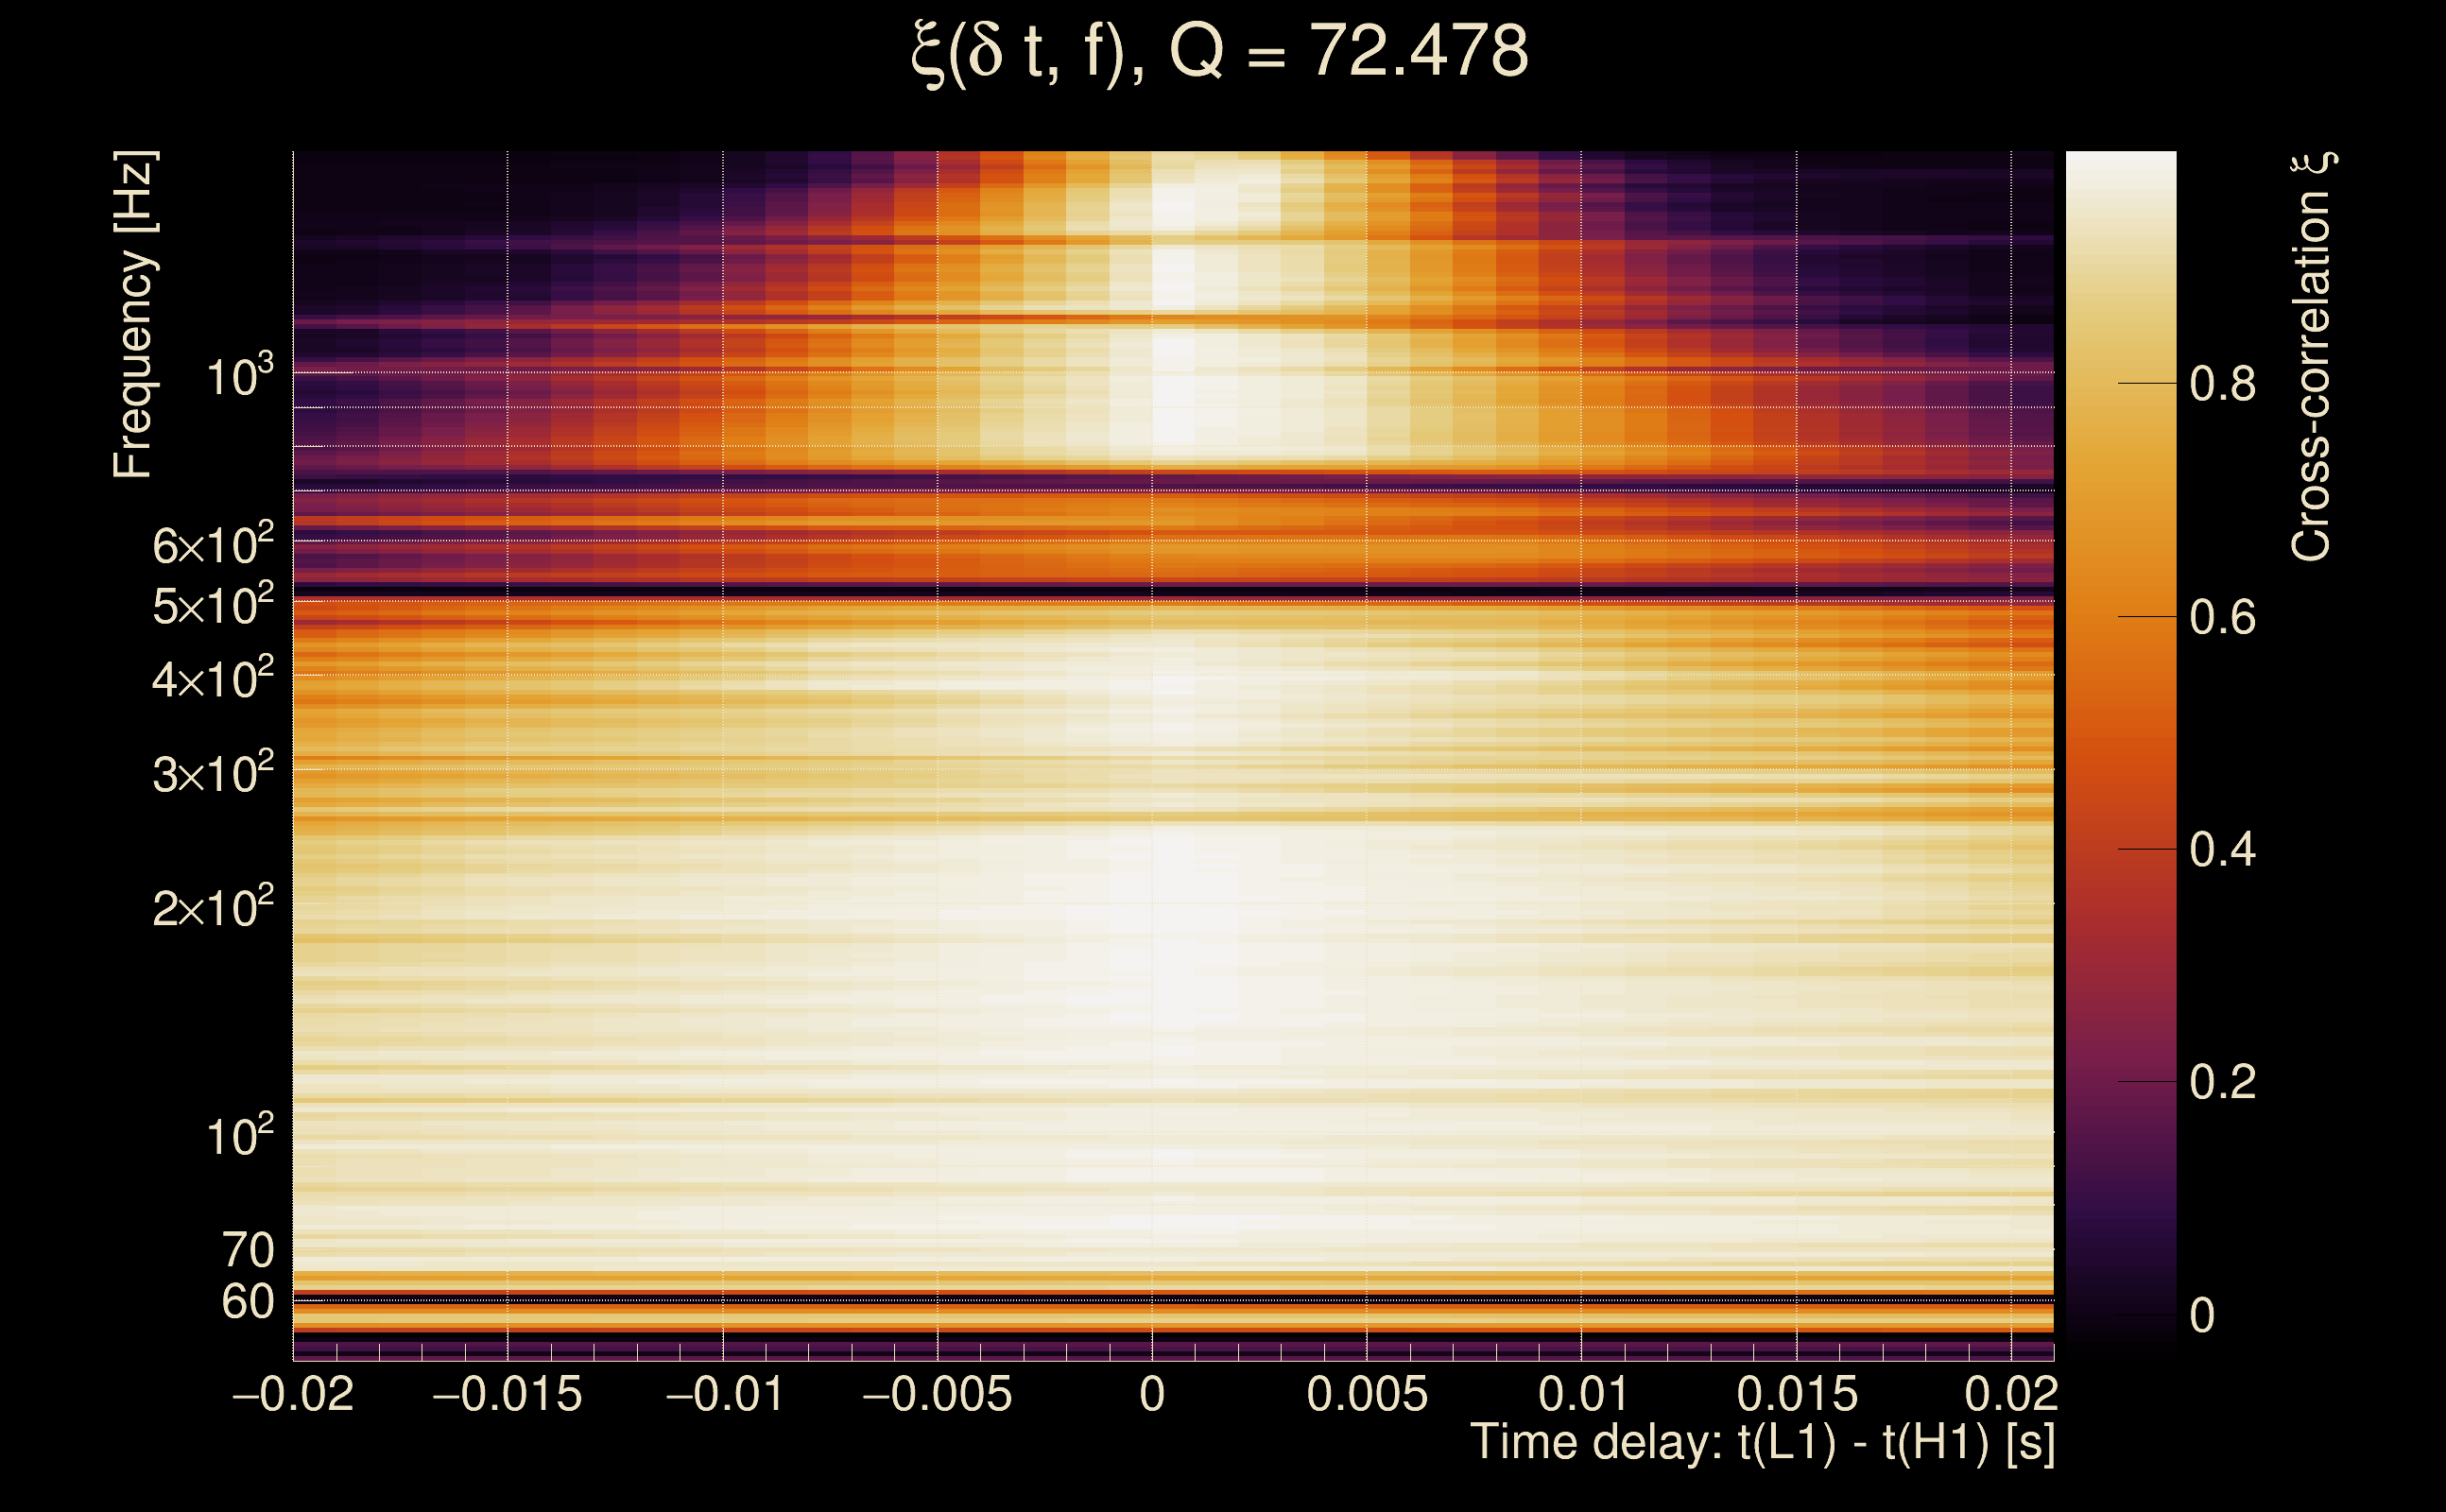
| Time delay between detectors t(L1) - t(H1): | 0.000911576 s (slice index = 108 / 217), δt_gw = 0.000911576 s |
| Time delay standard deviation: | 0.0191273 s |
| [targeted mode] Time delay probability: | 0.637792 (0.470788 sigmas), δt_target = 1.72247e+45 s |
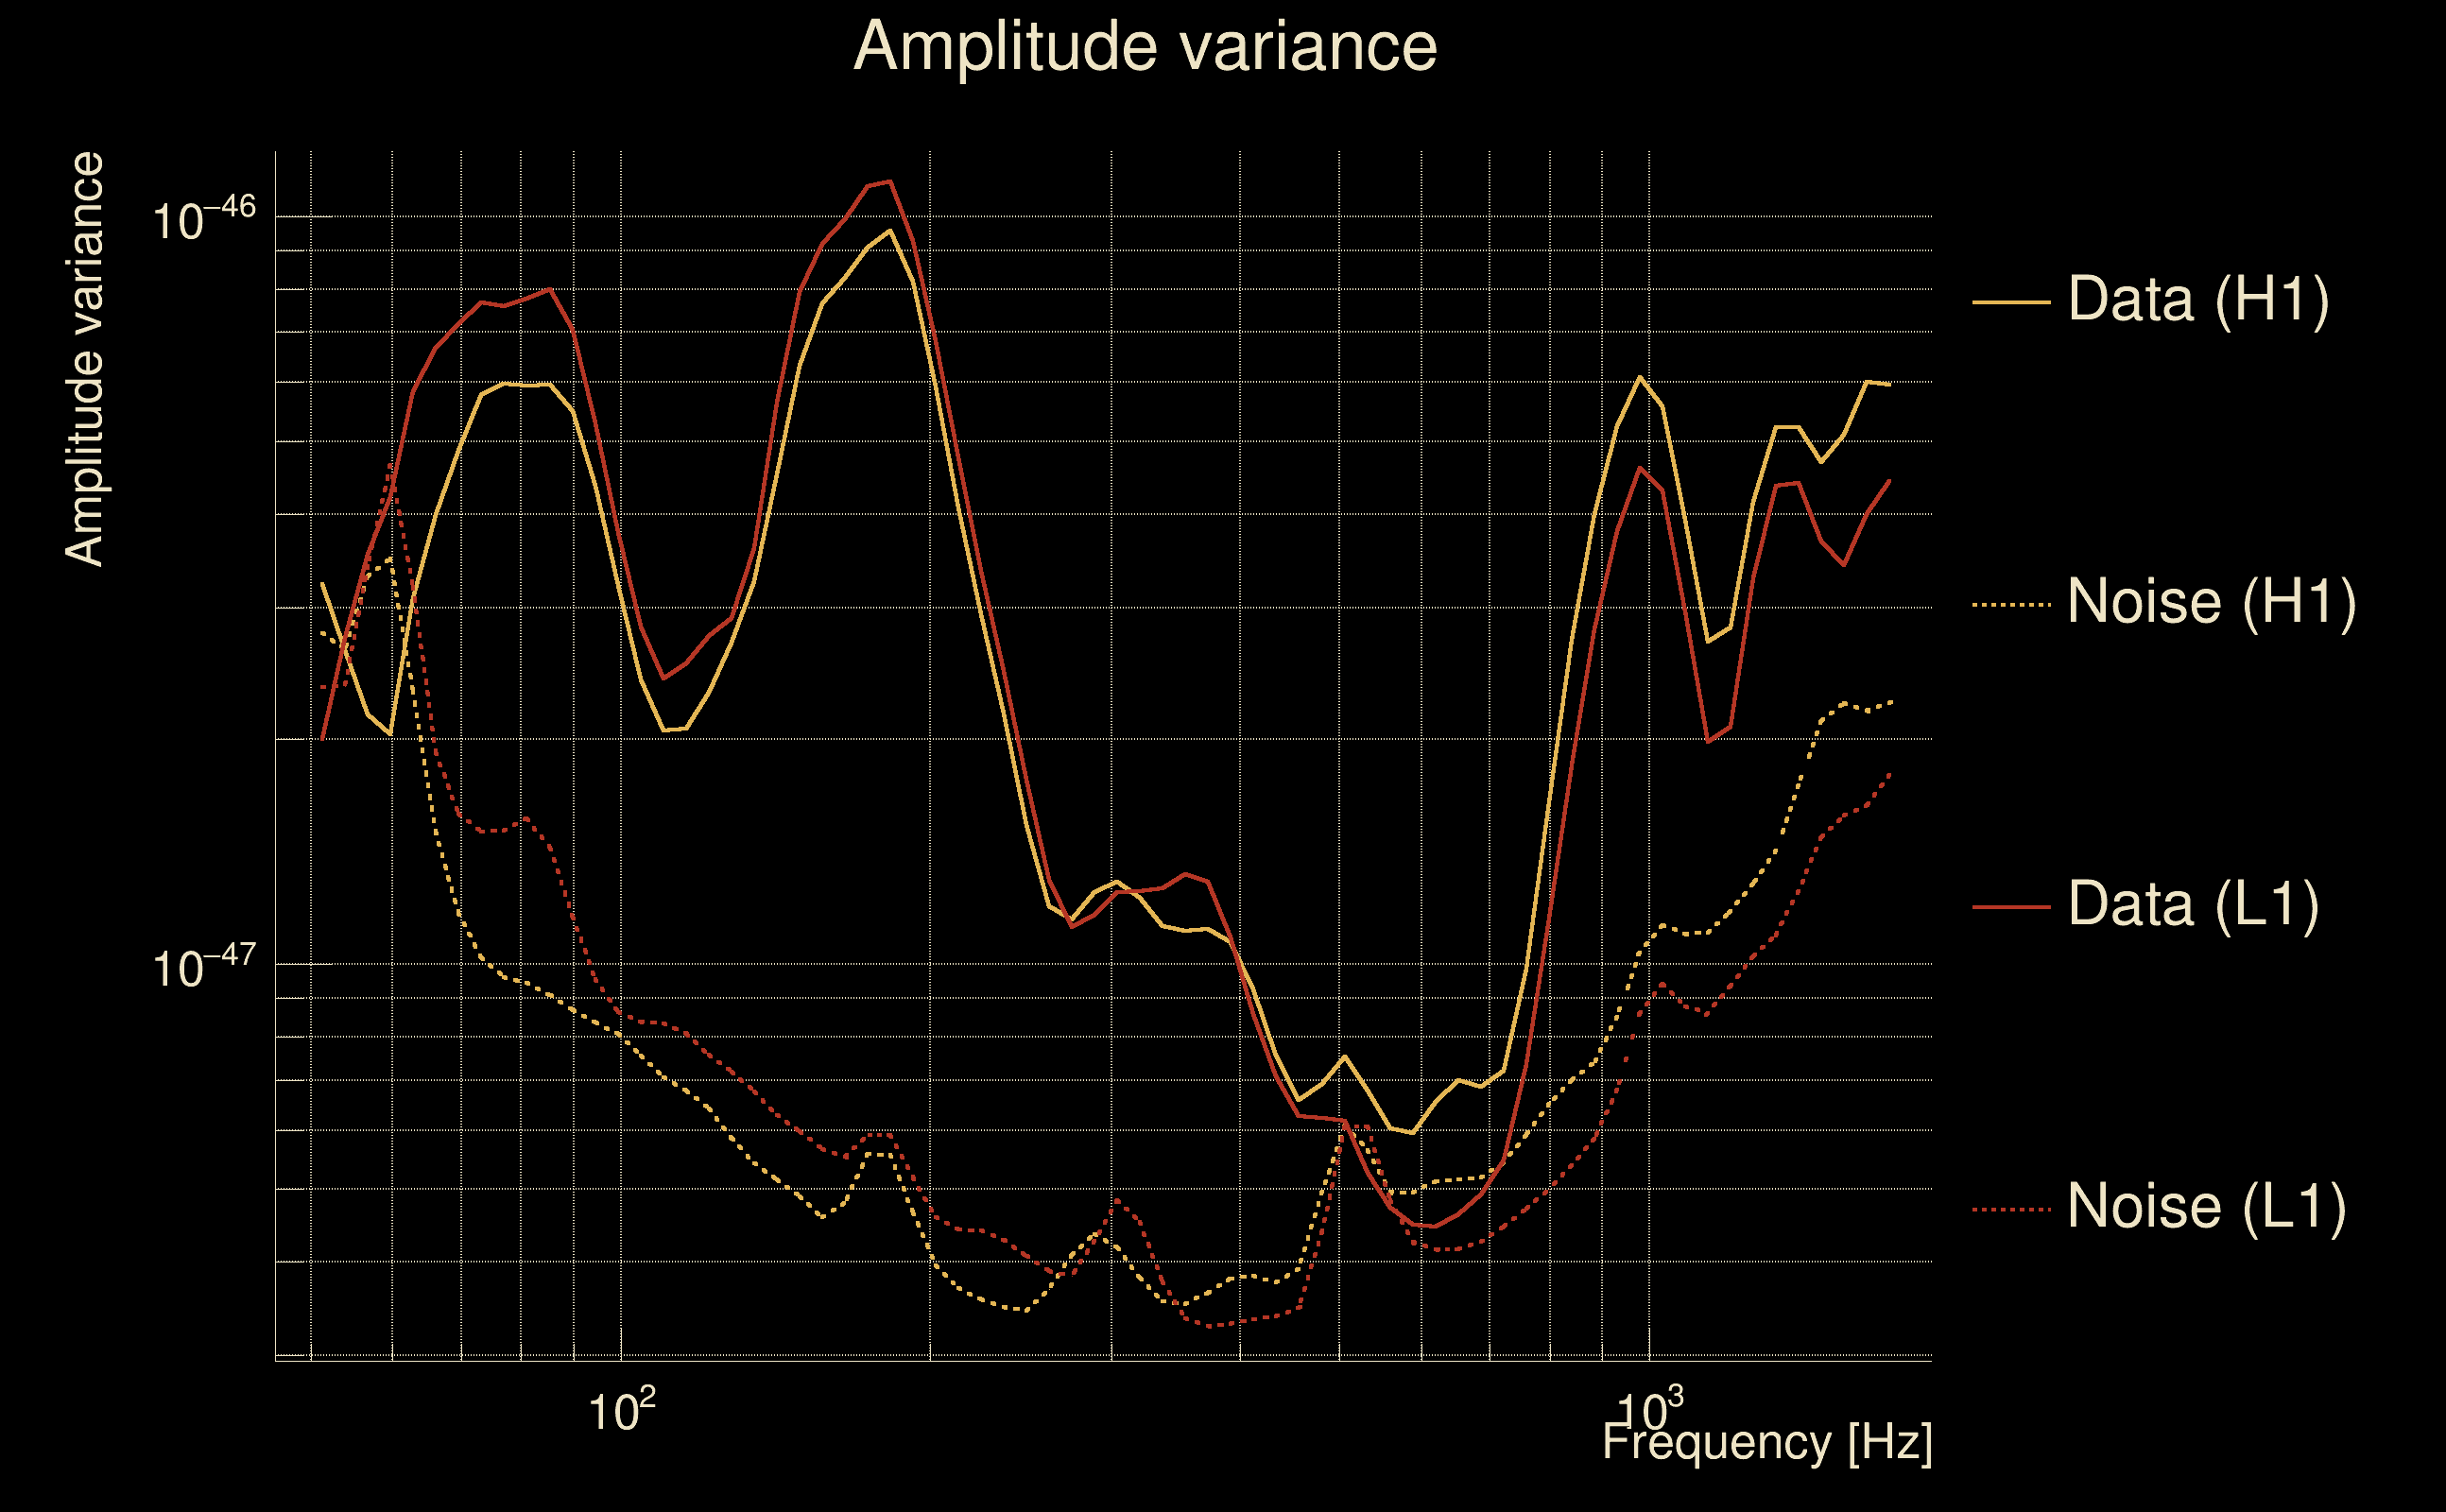
| Frequency: | 289.649 Hz |
| Ξ: | 0.964007 ± 0.00690558 (variance = 4.7687e-05): Q0: 0.968059, Q1: 0.97246, Q2: 0.968695, Q3: 0.959619, Q4: 0.953501 |
| Rank: | R_A = 0.964007 |
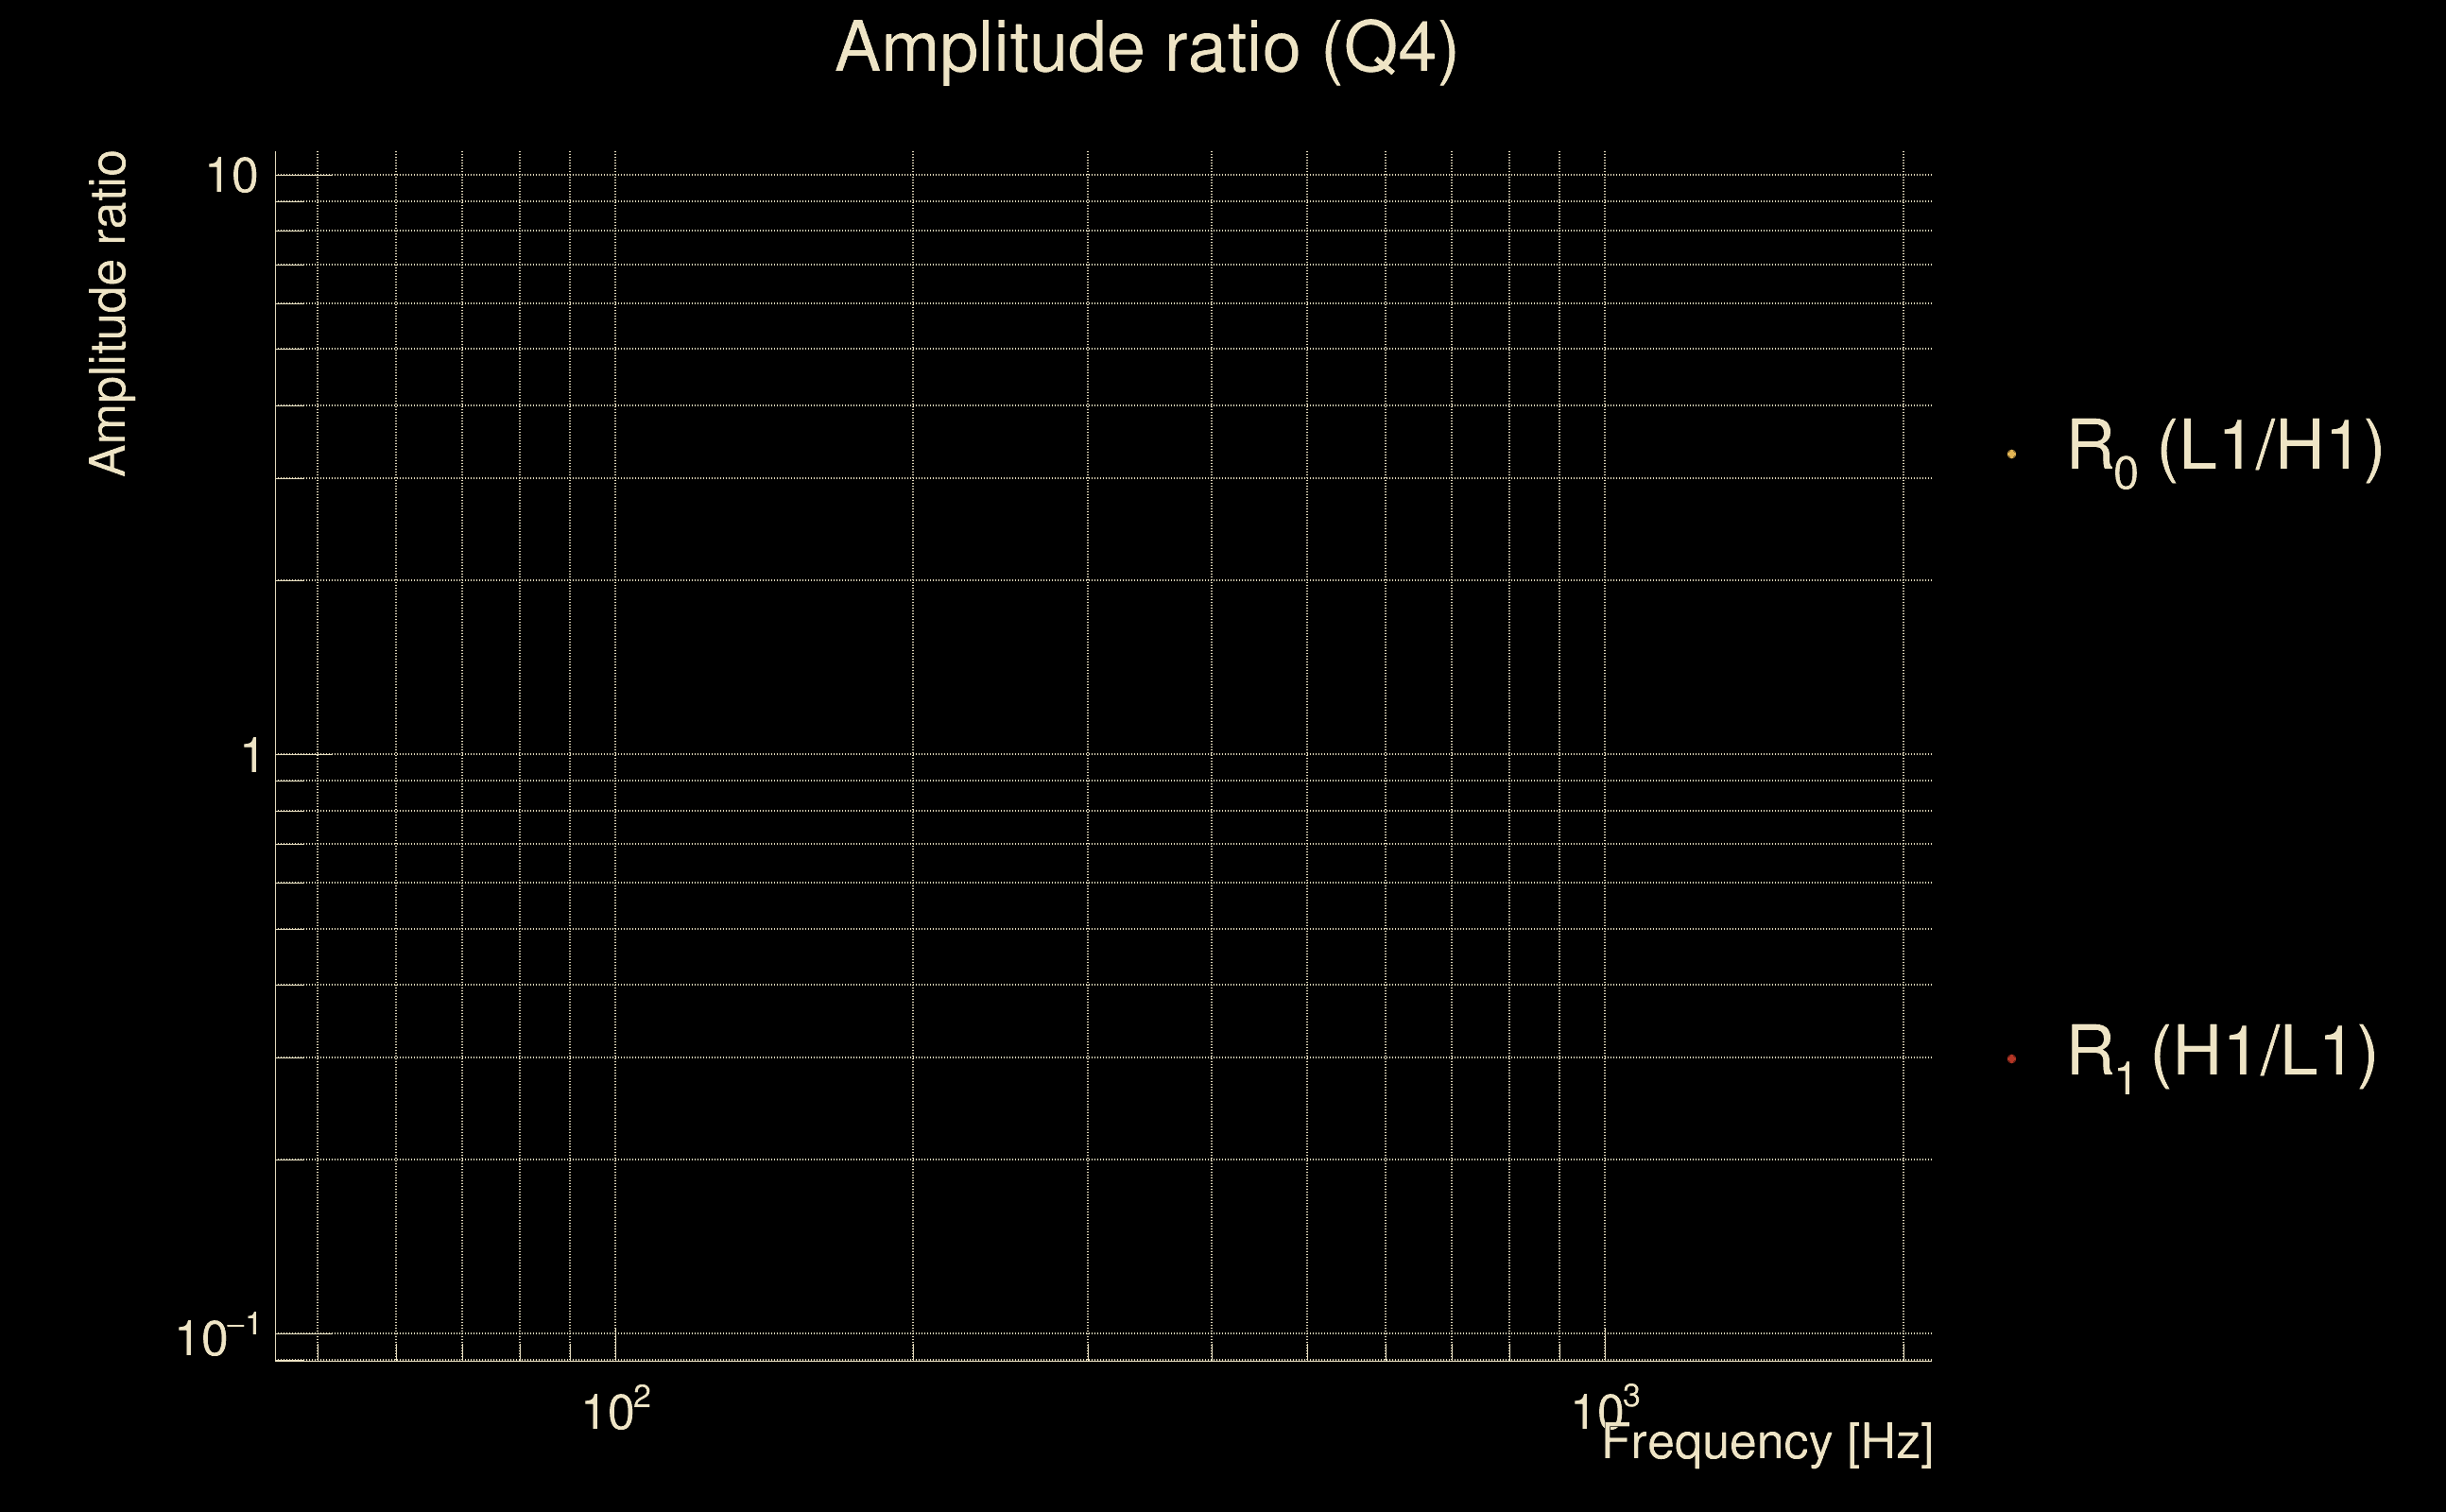
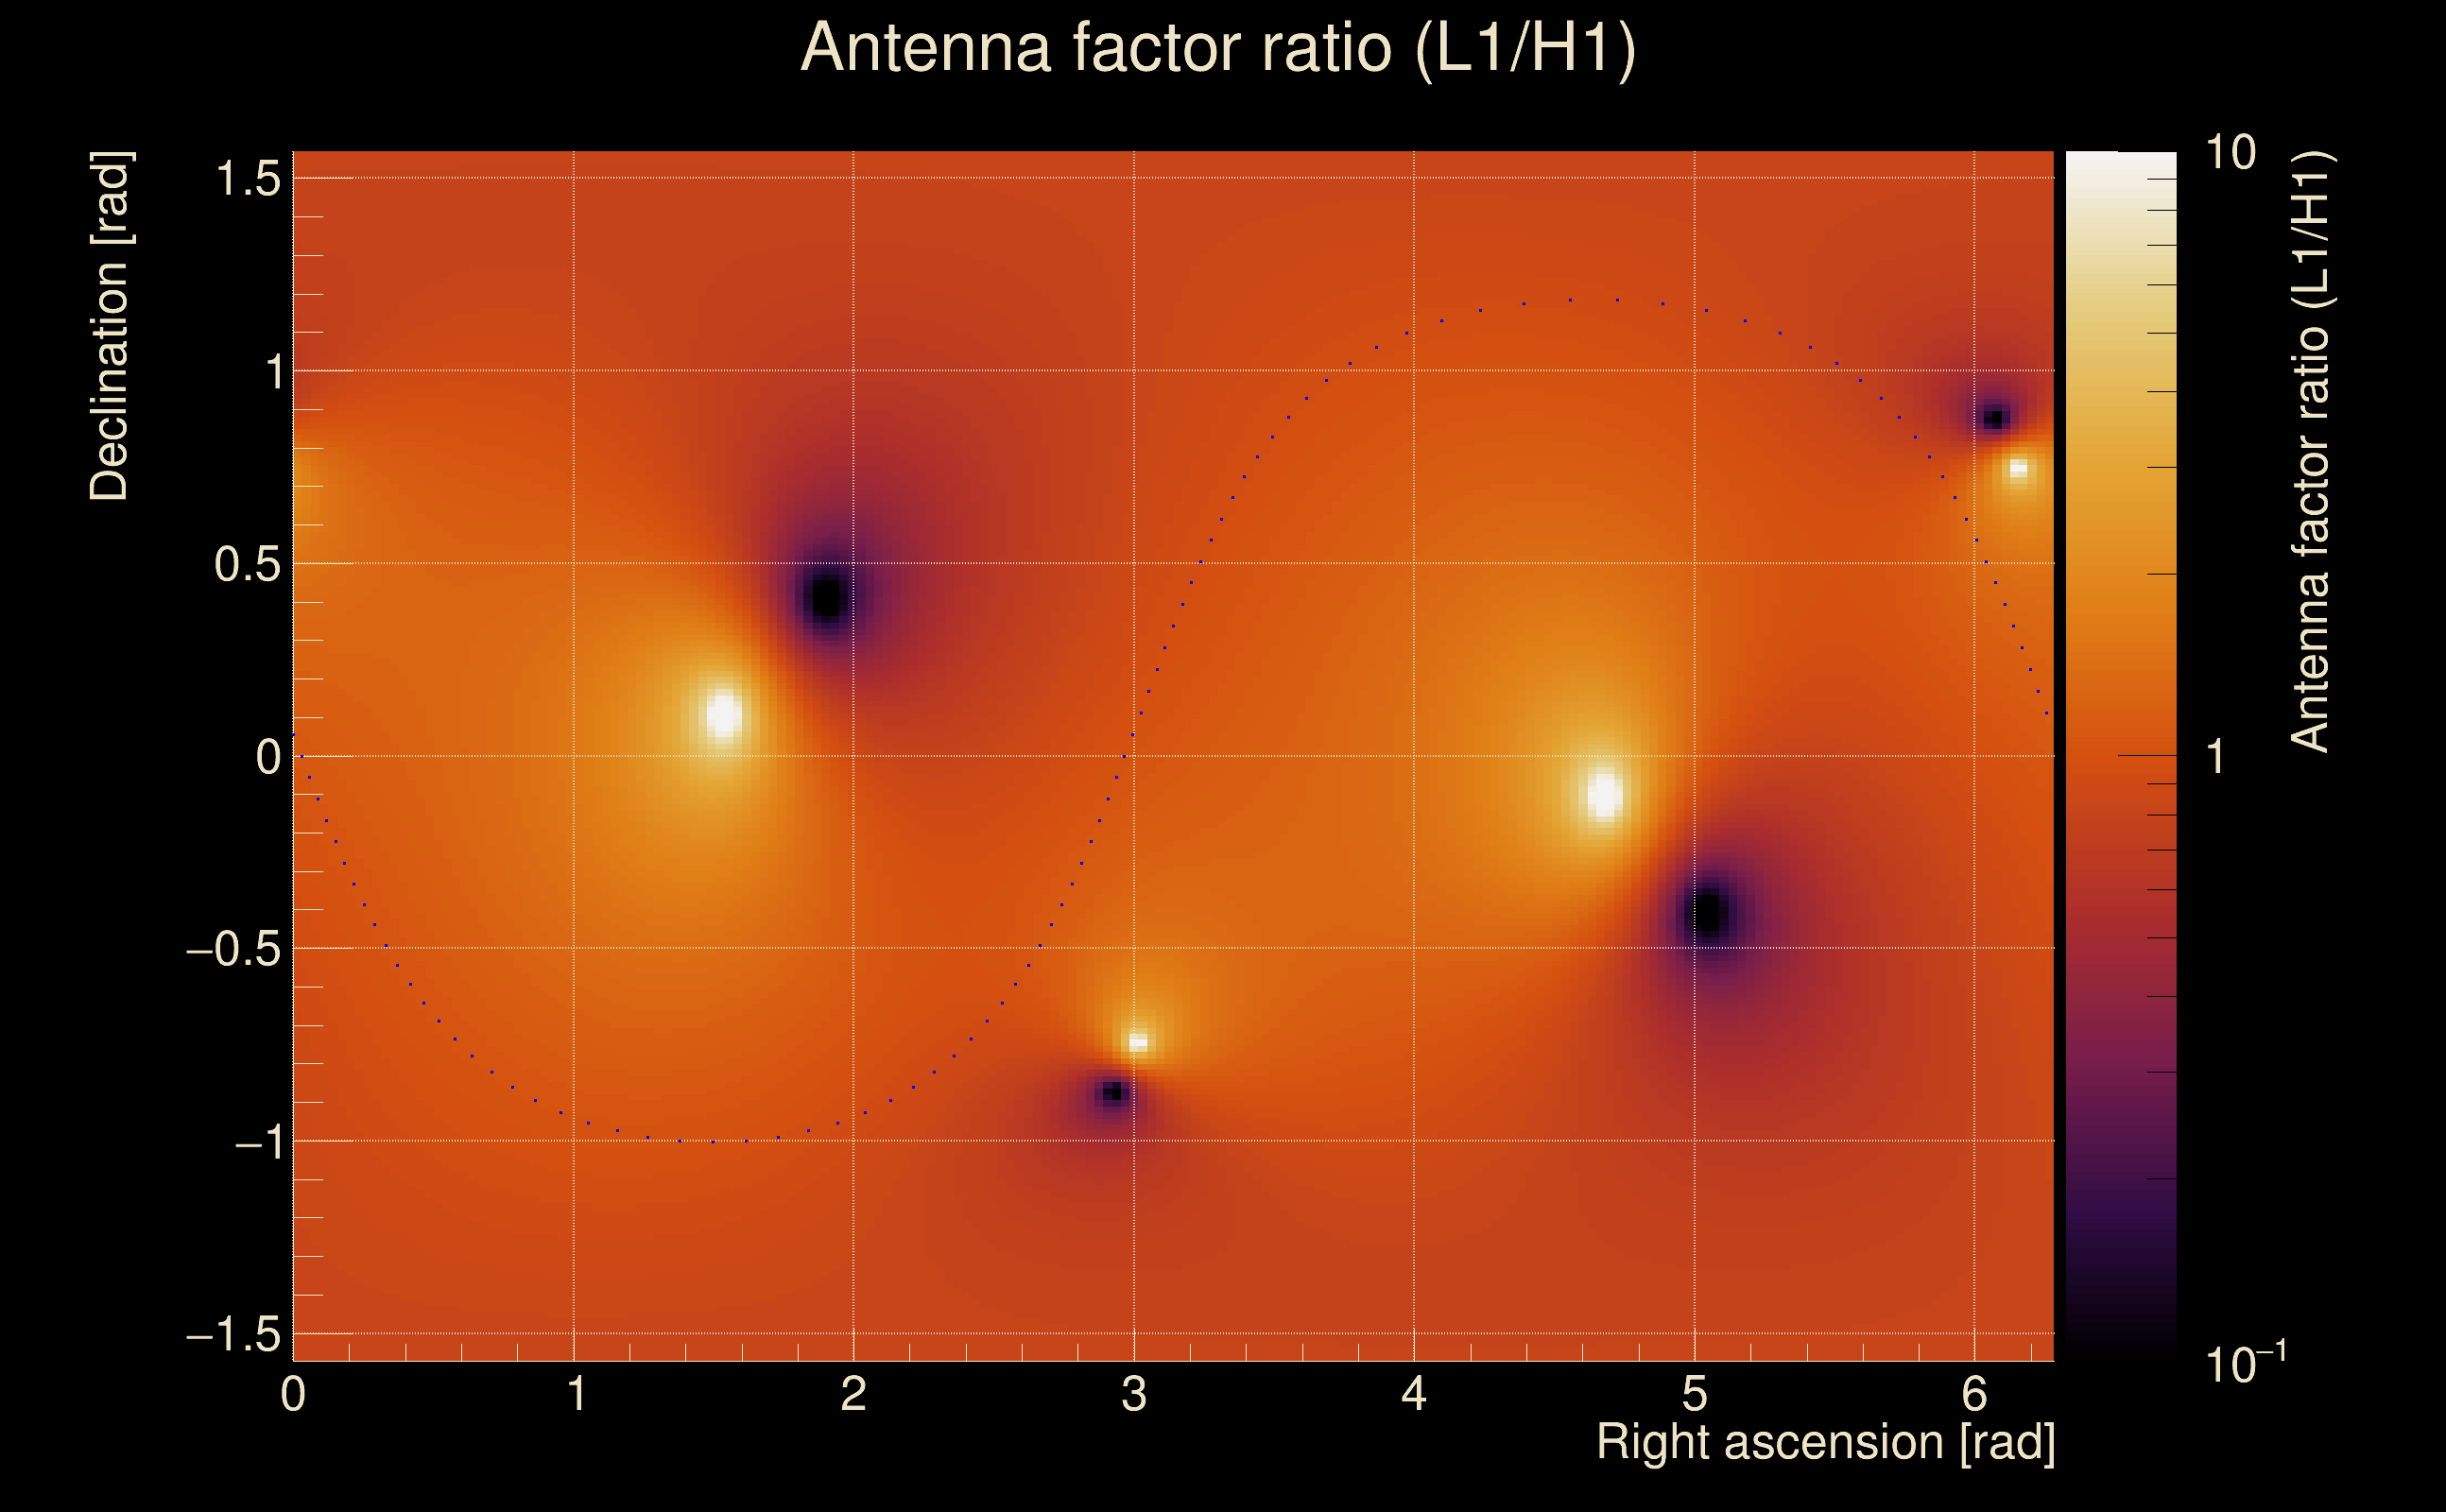
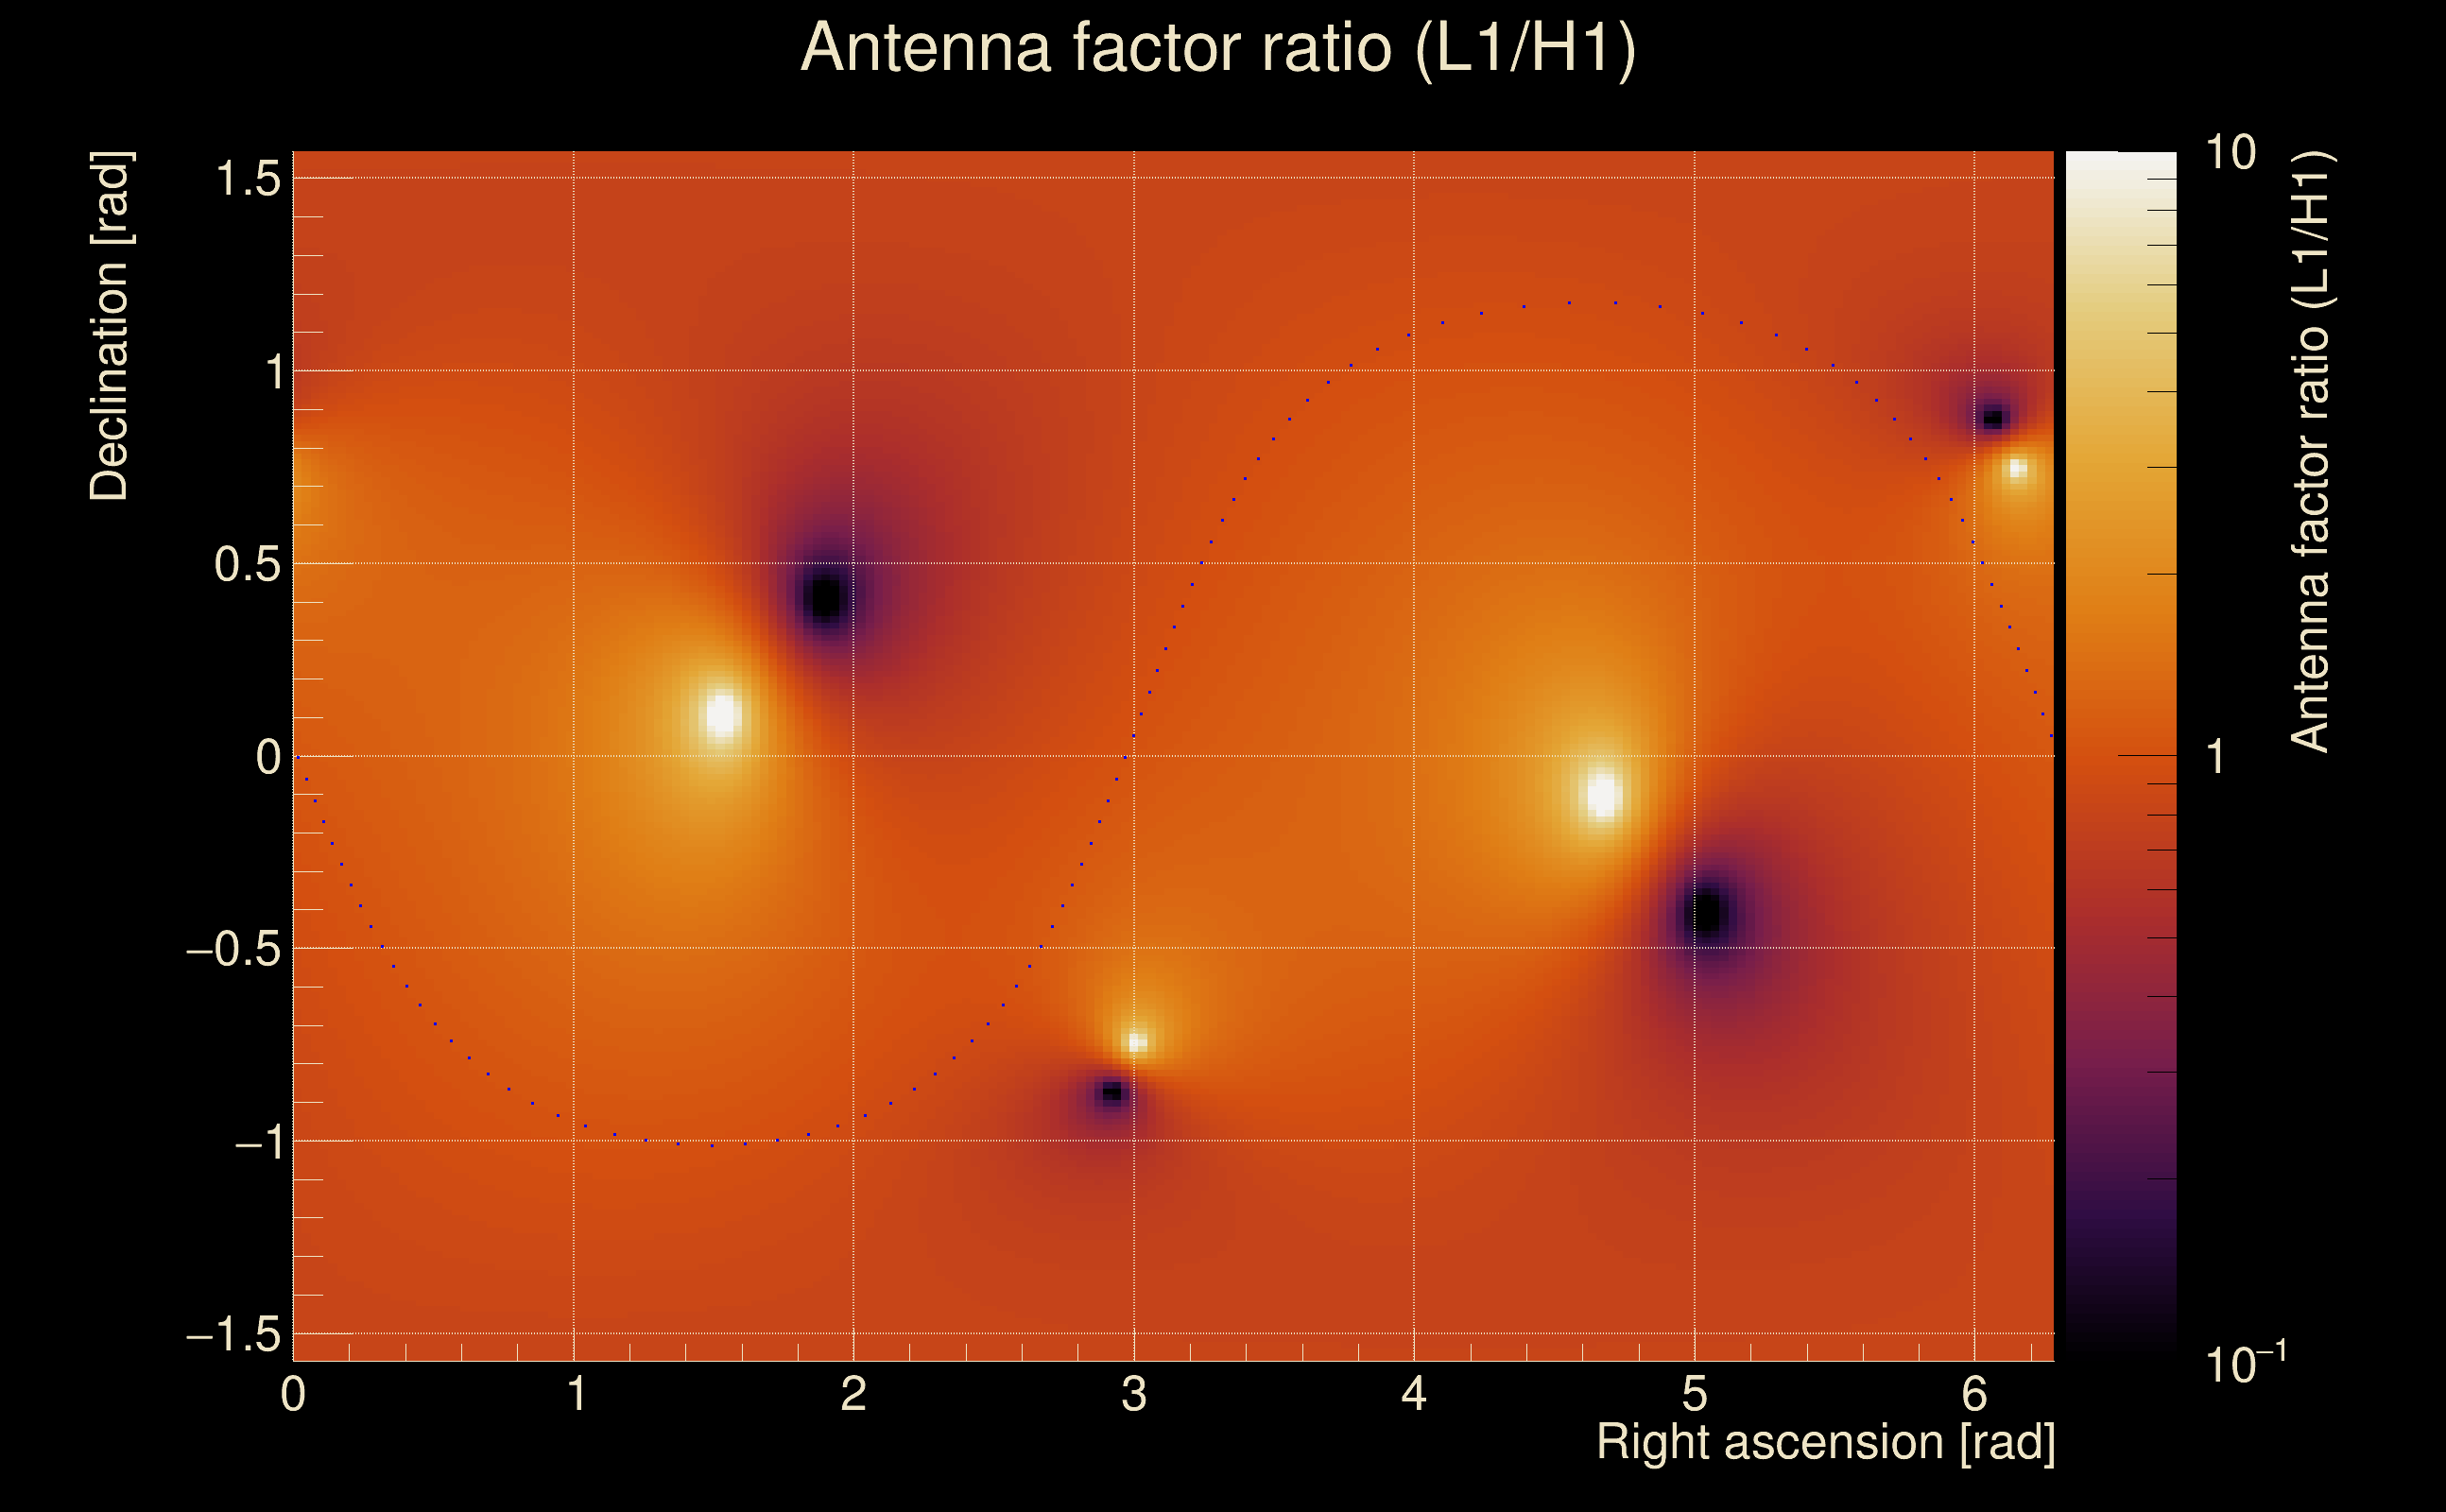
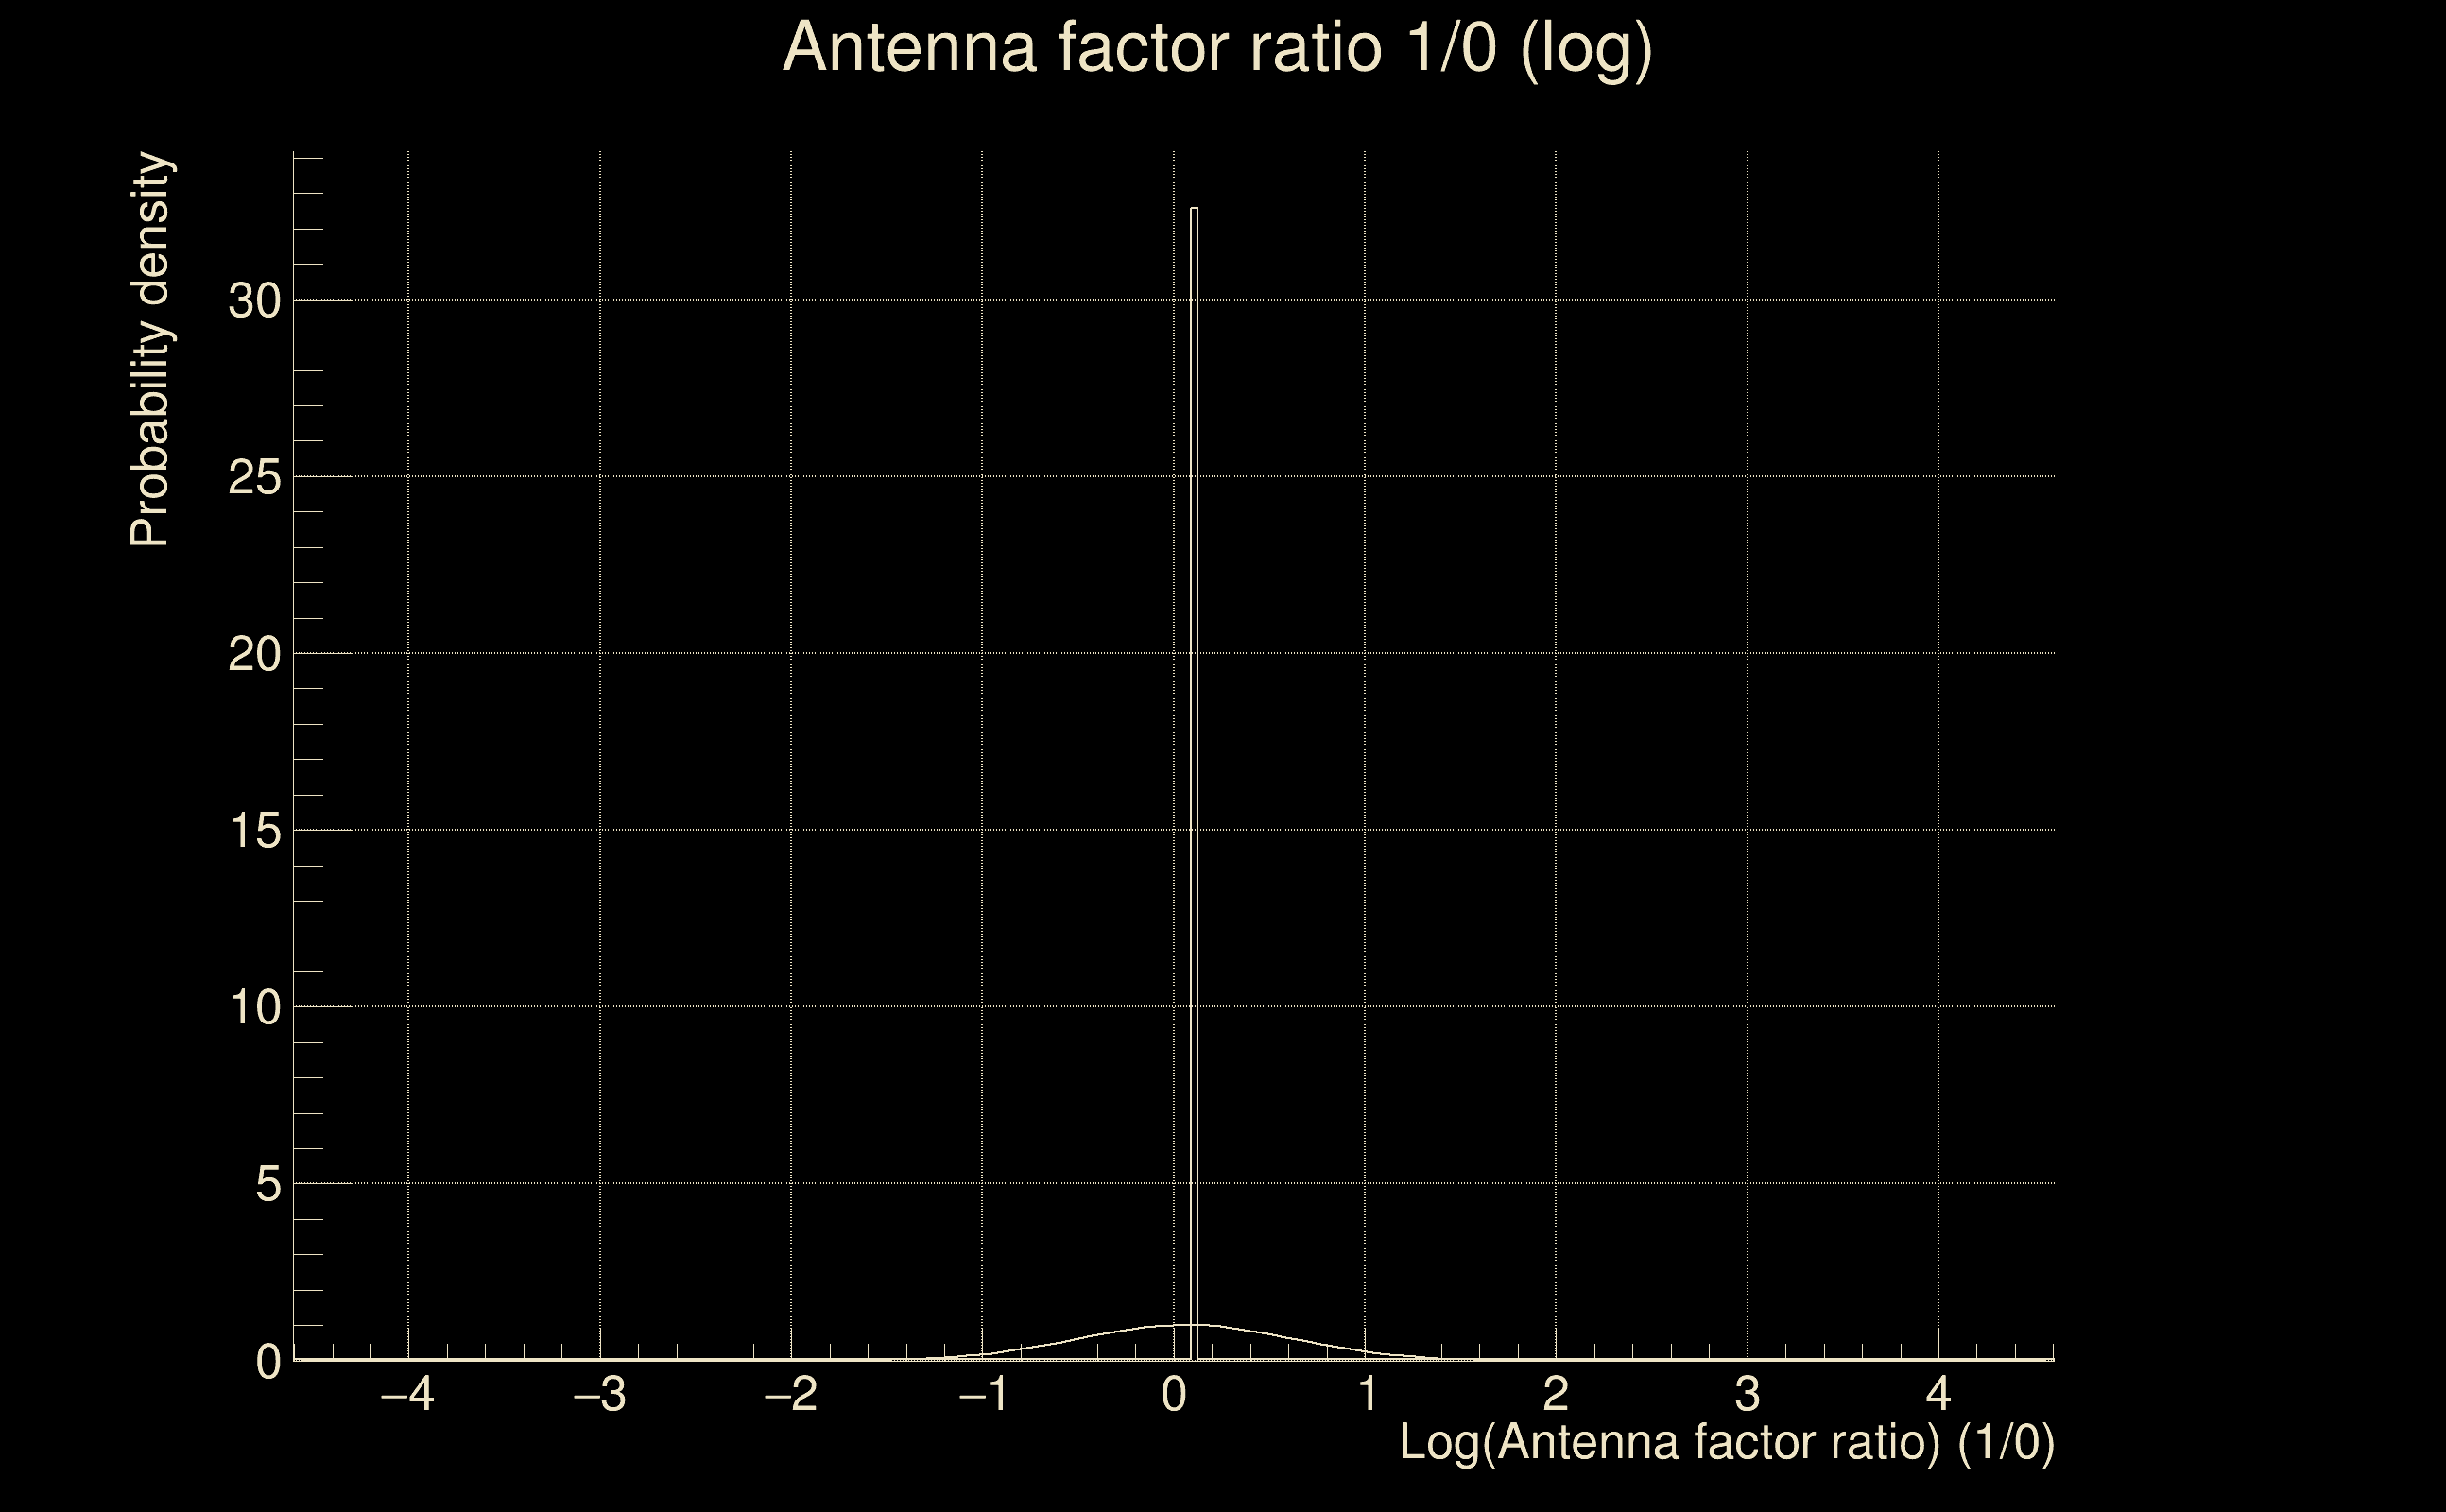
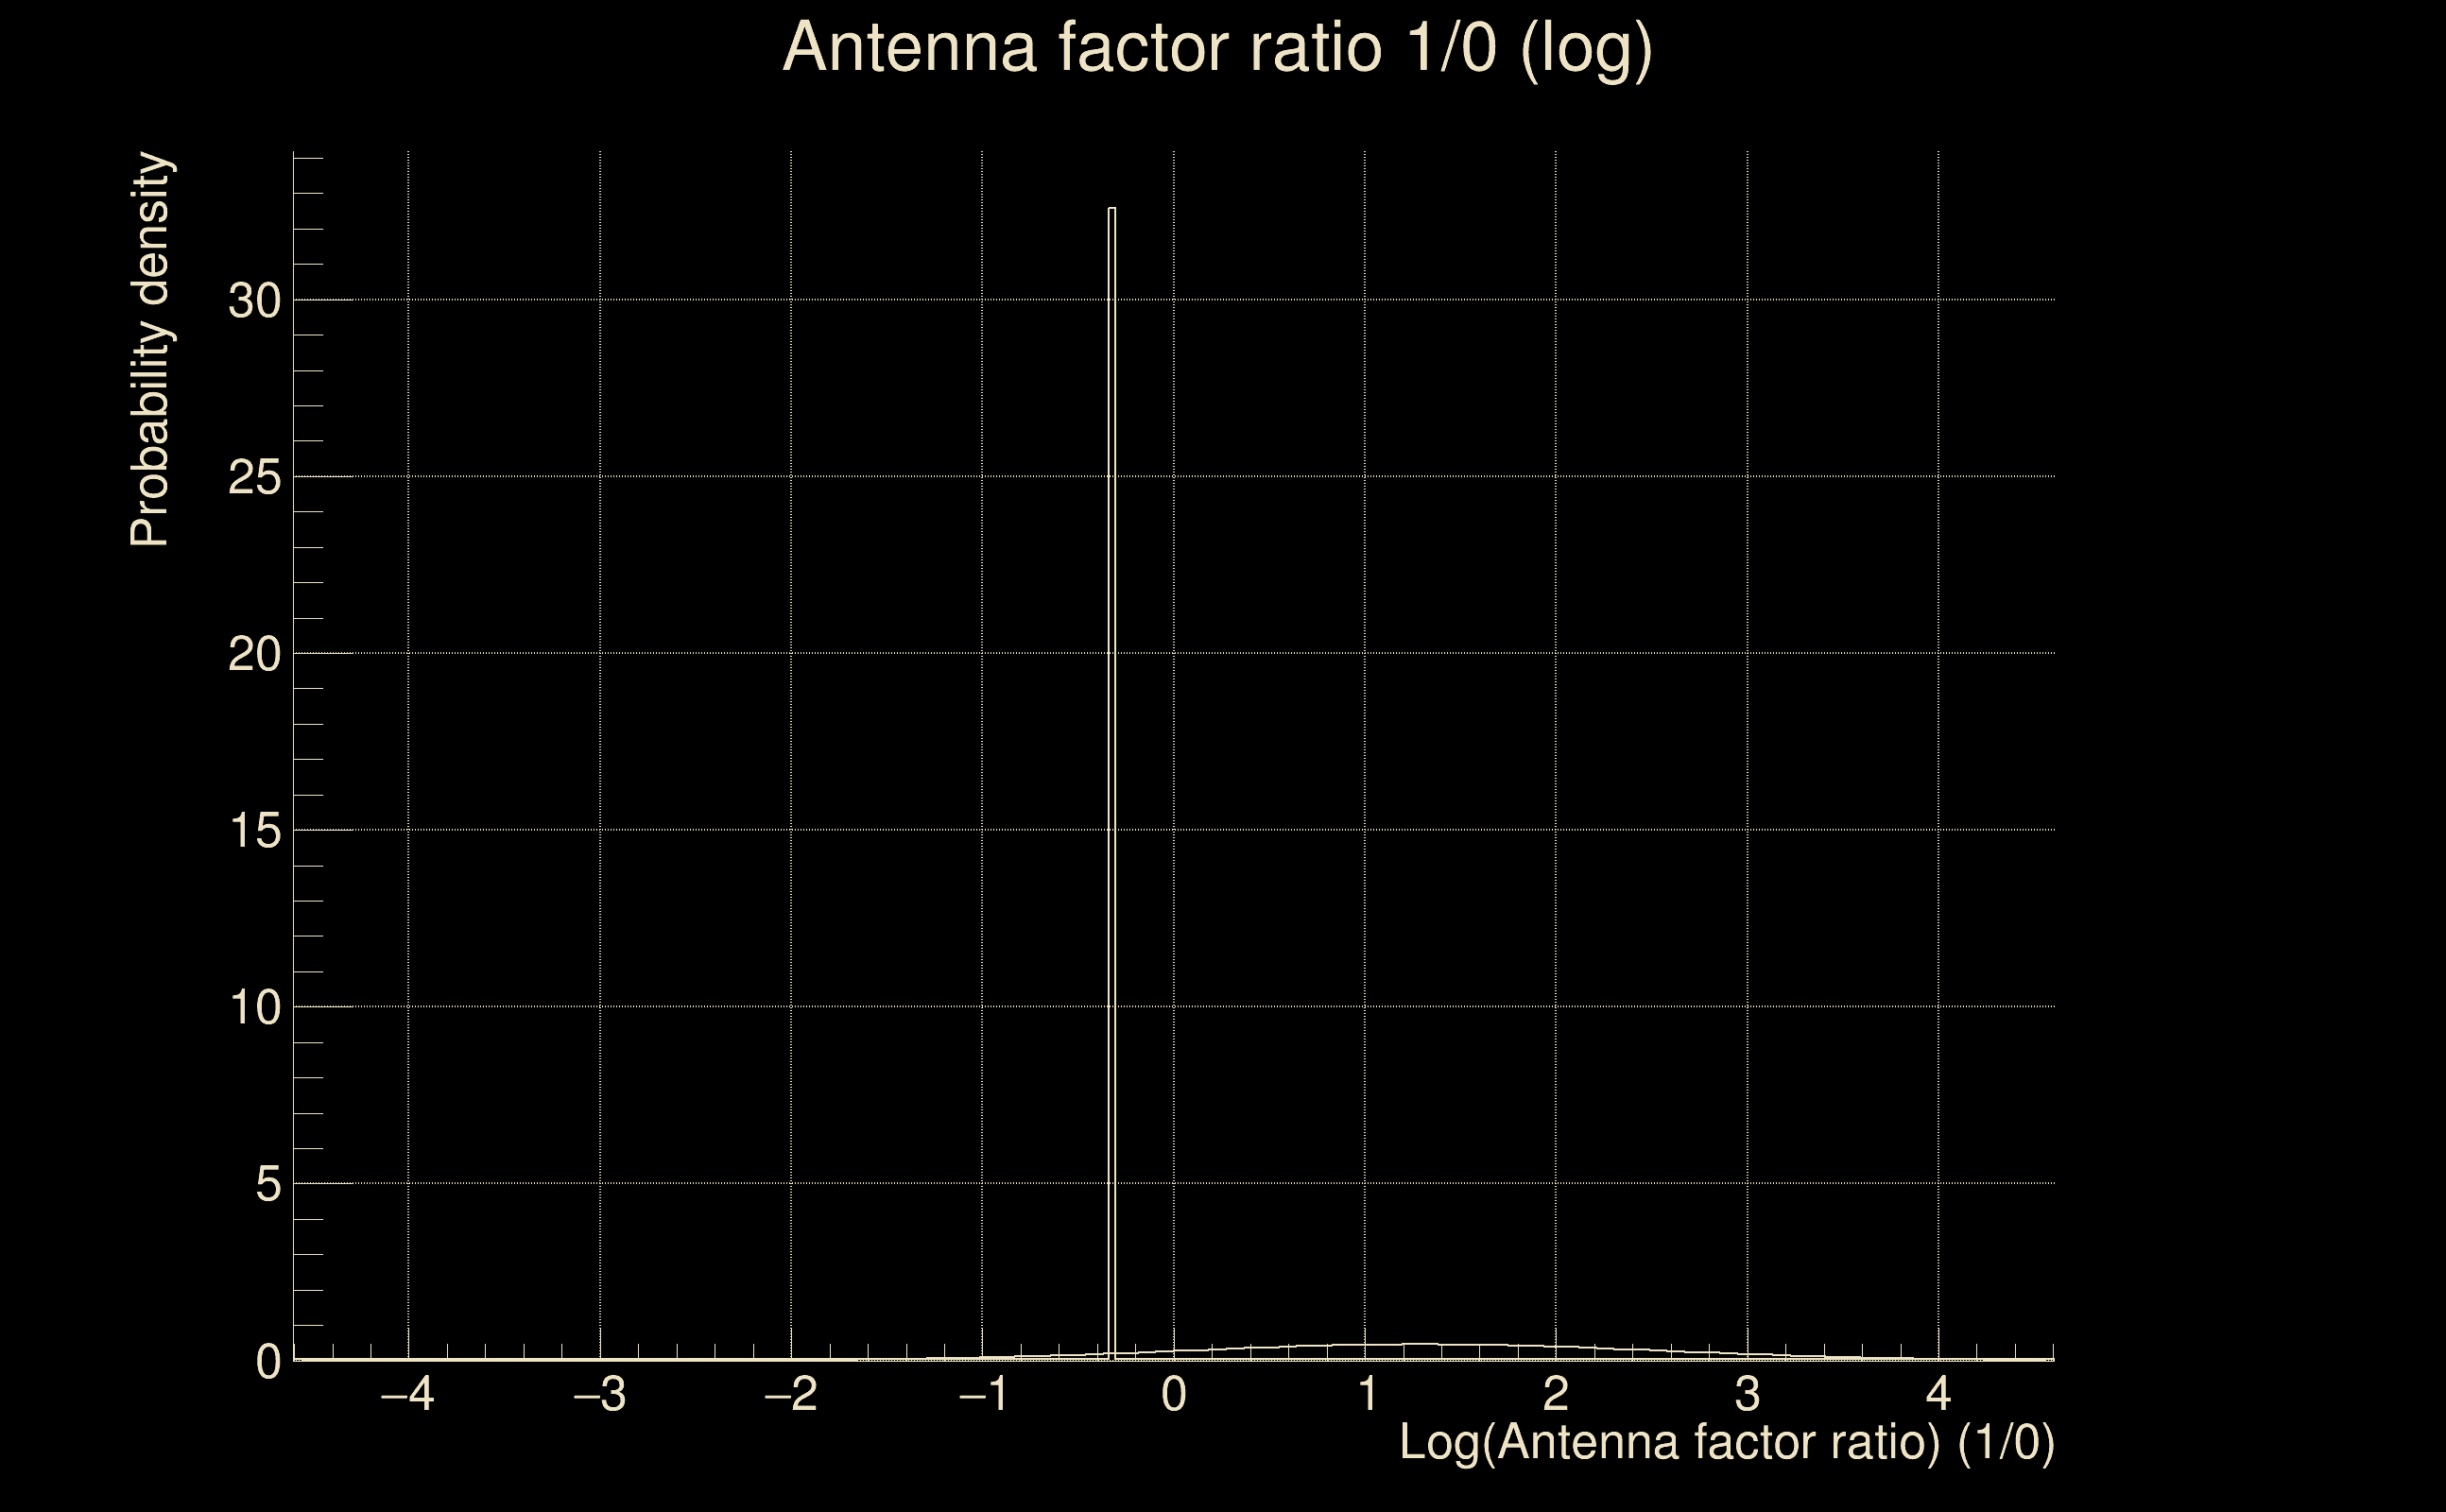
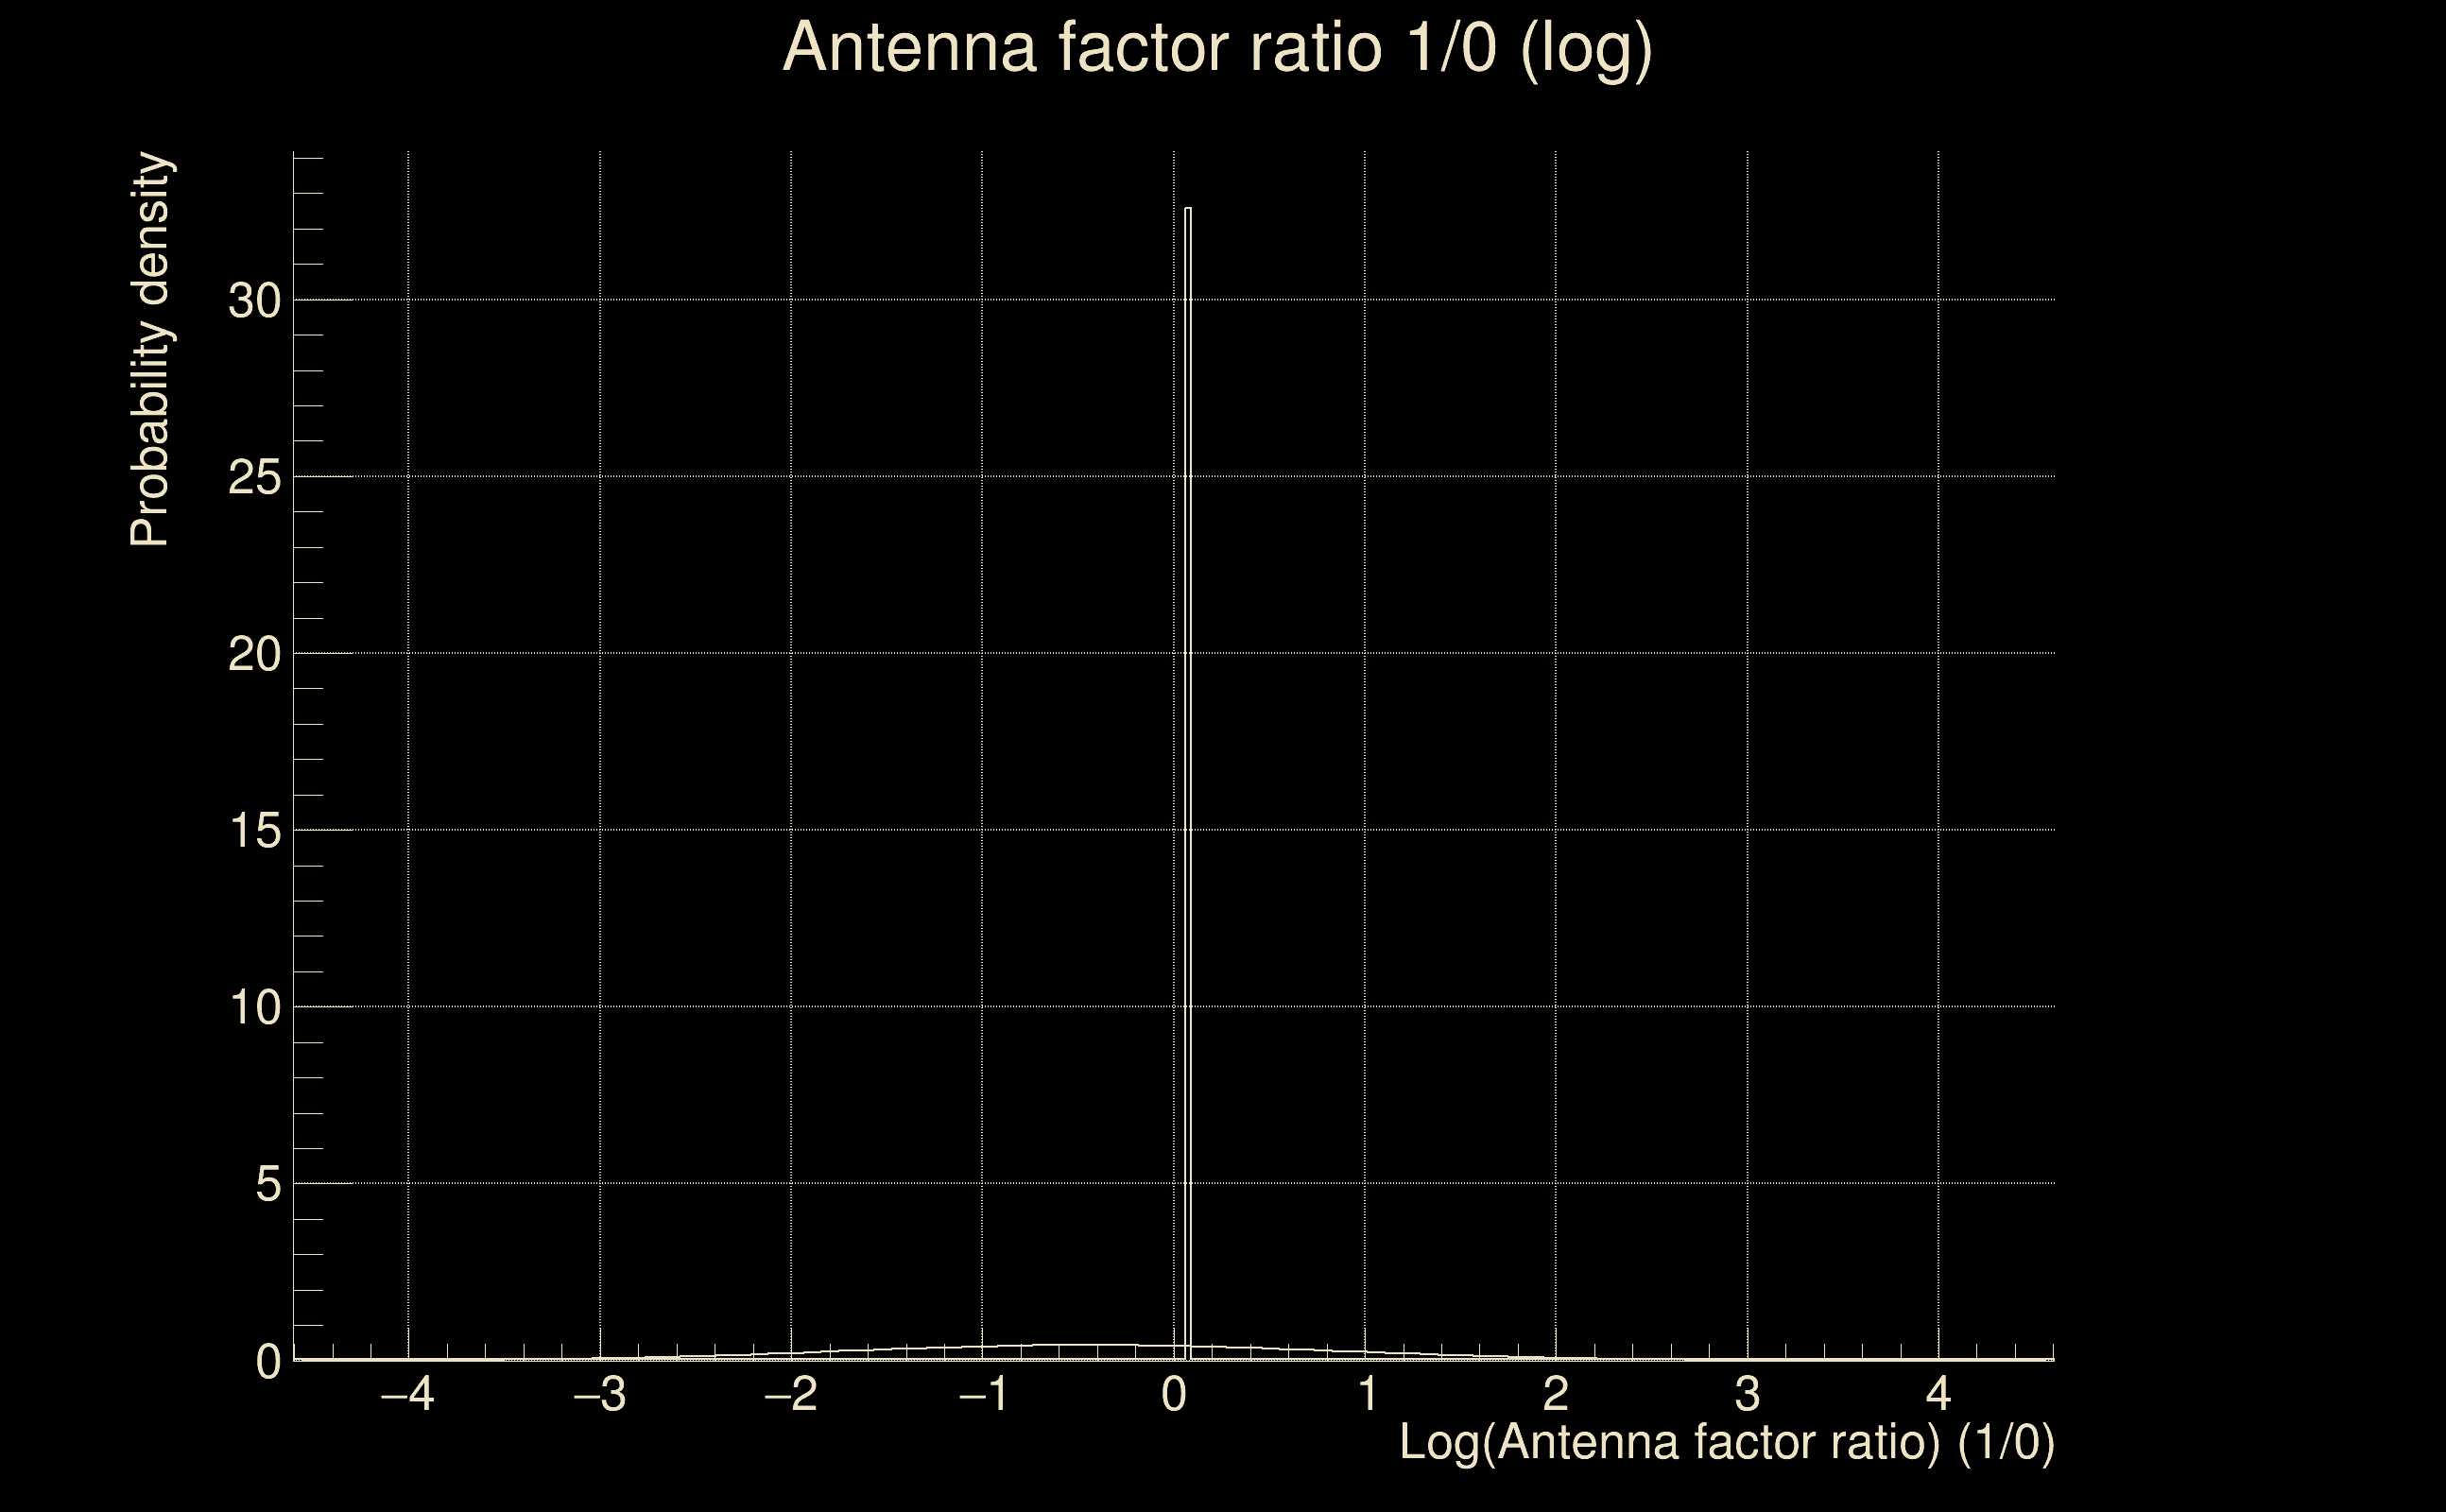
| Log of amplitude ratio (L1/H1): | -0.0293481, variance = 0.158657 (L1/H1: -0.0475872, variance = 0.31273, H1/L1: 0.0146319, variance = 0.31438) |
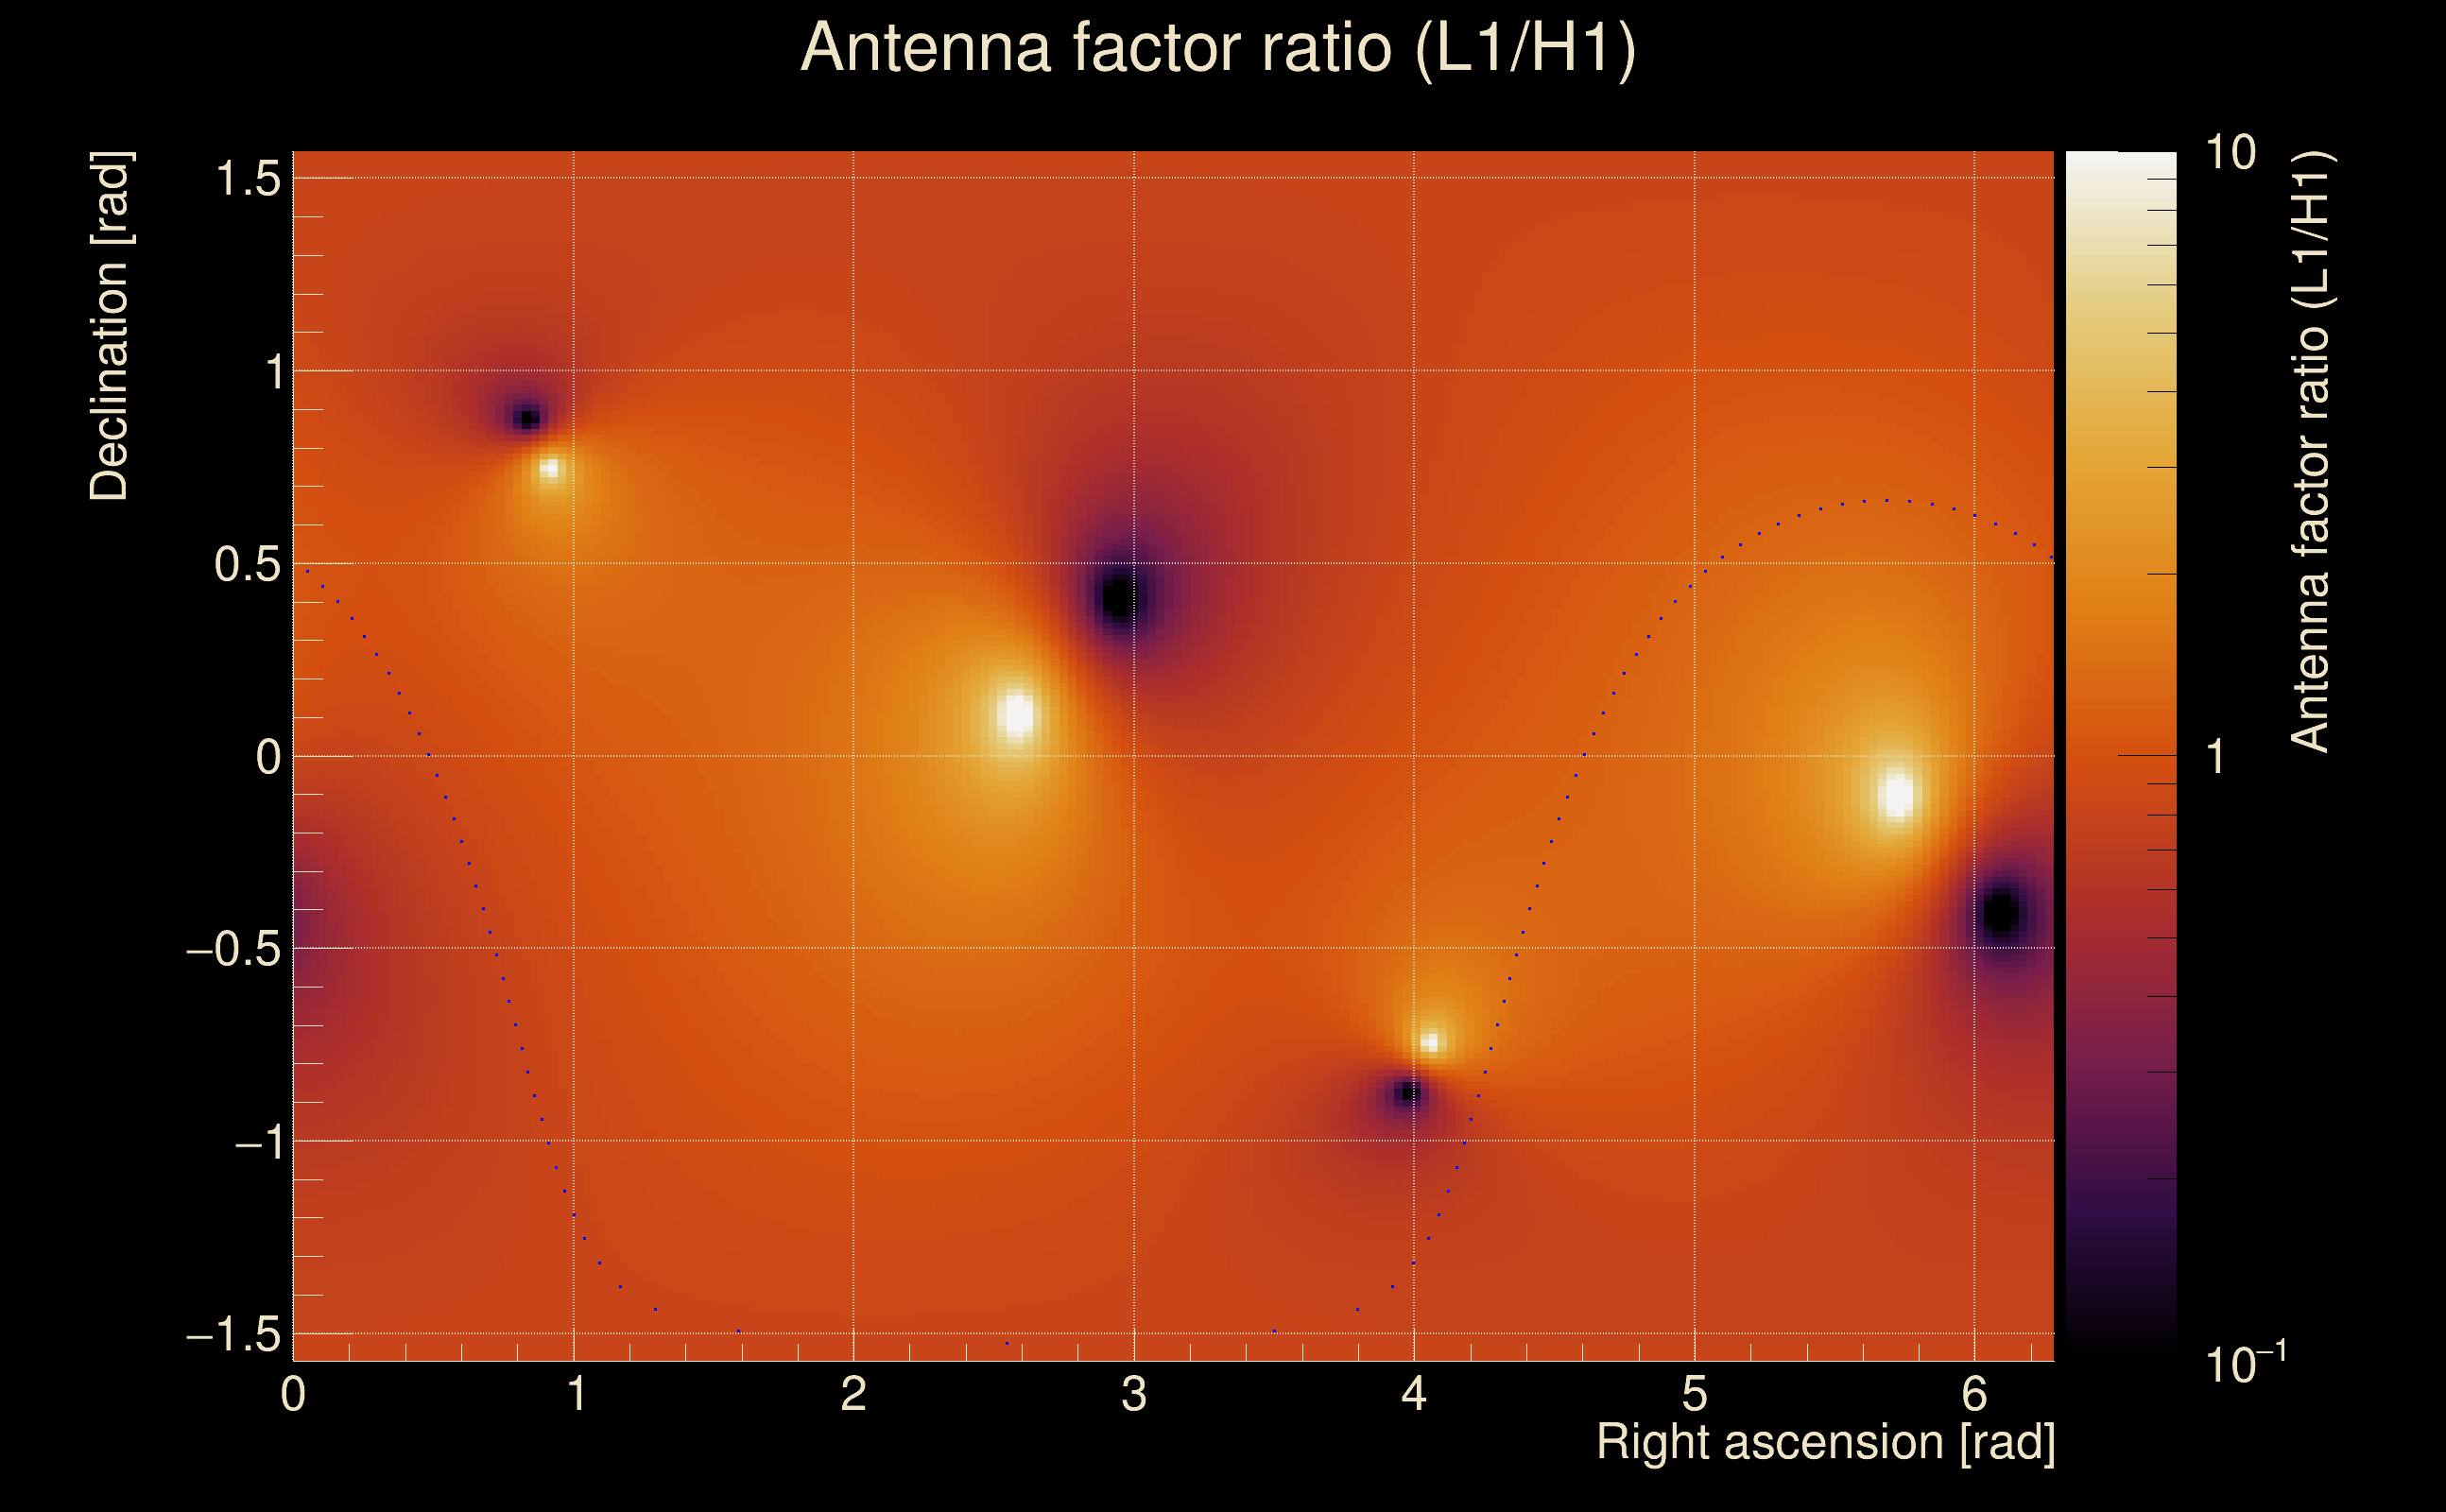
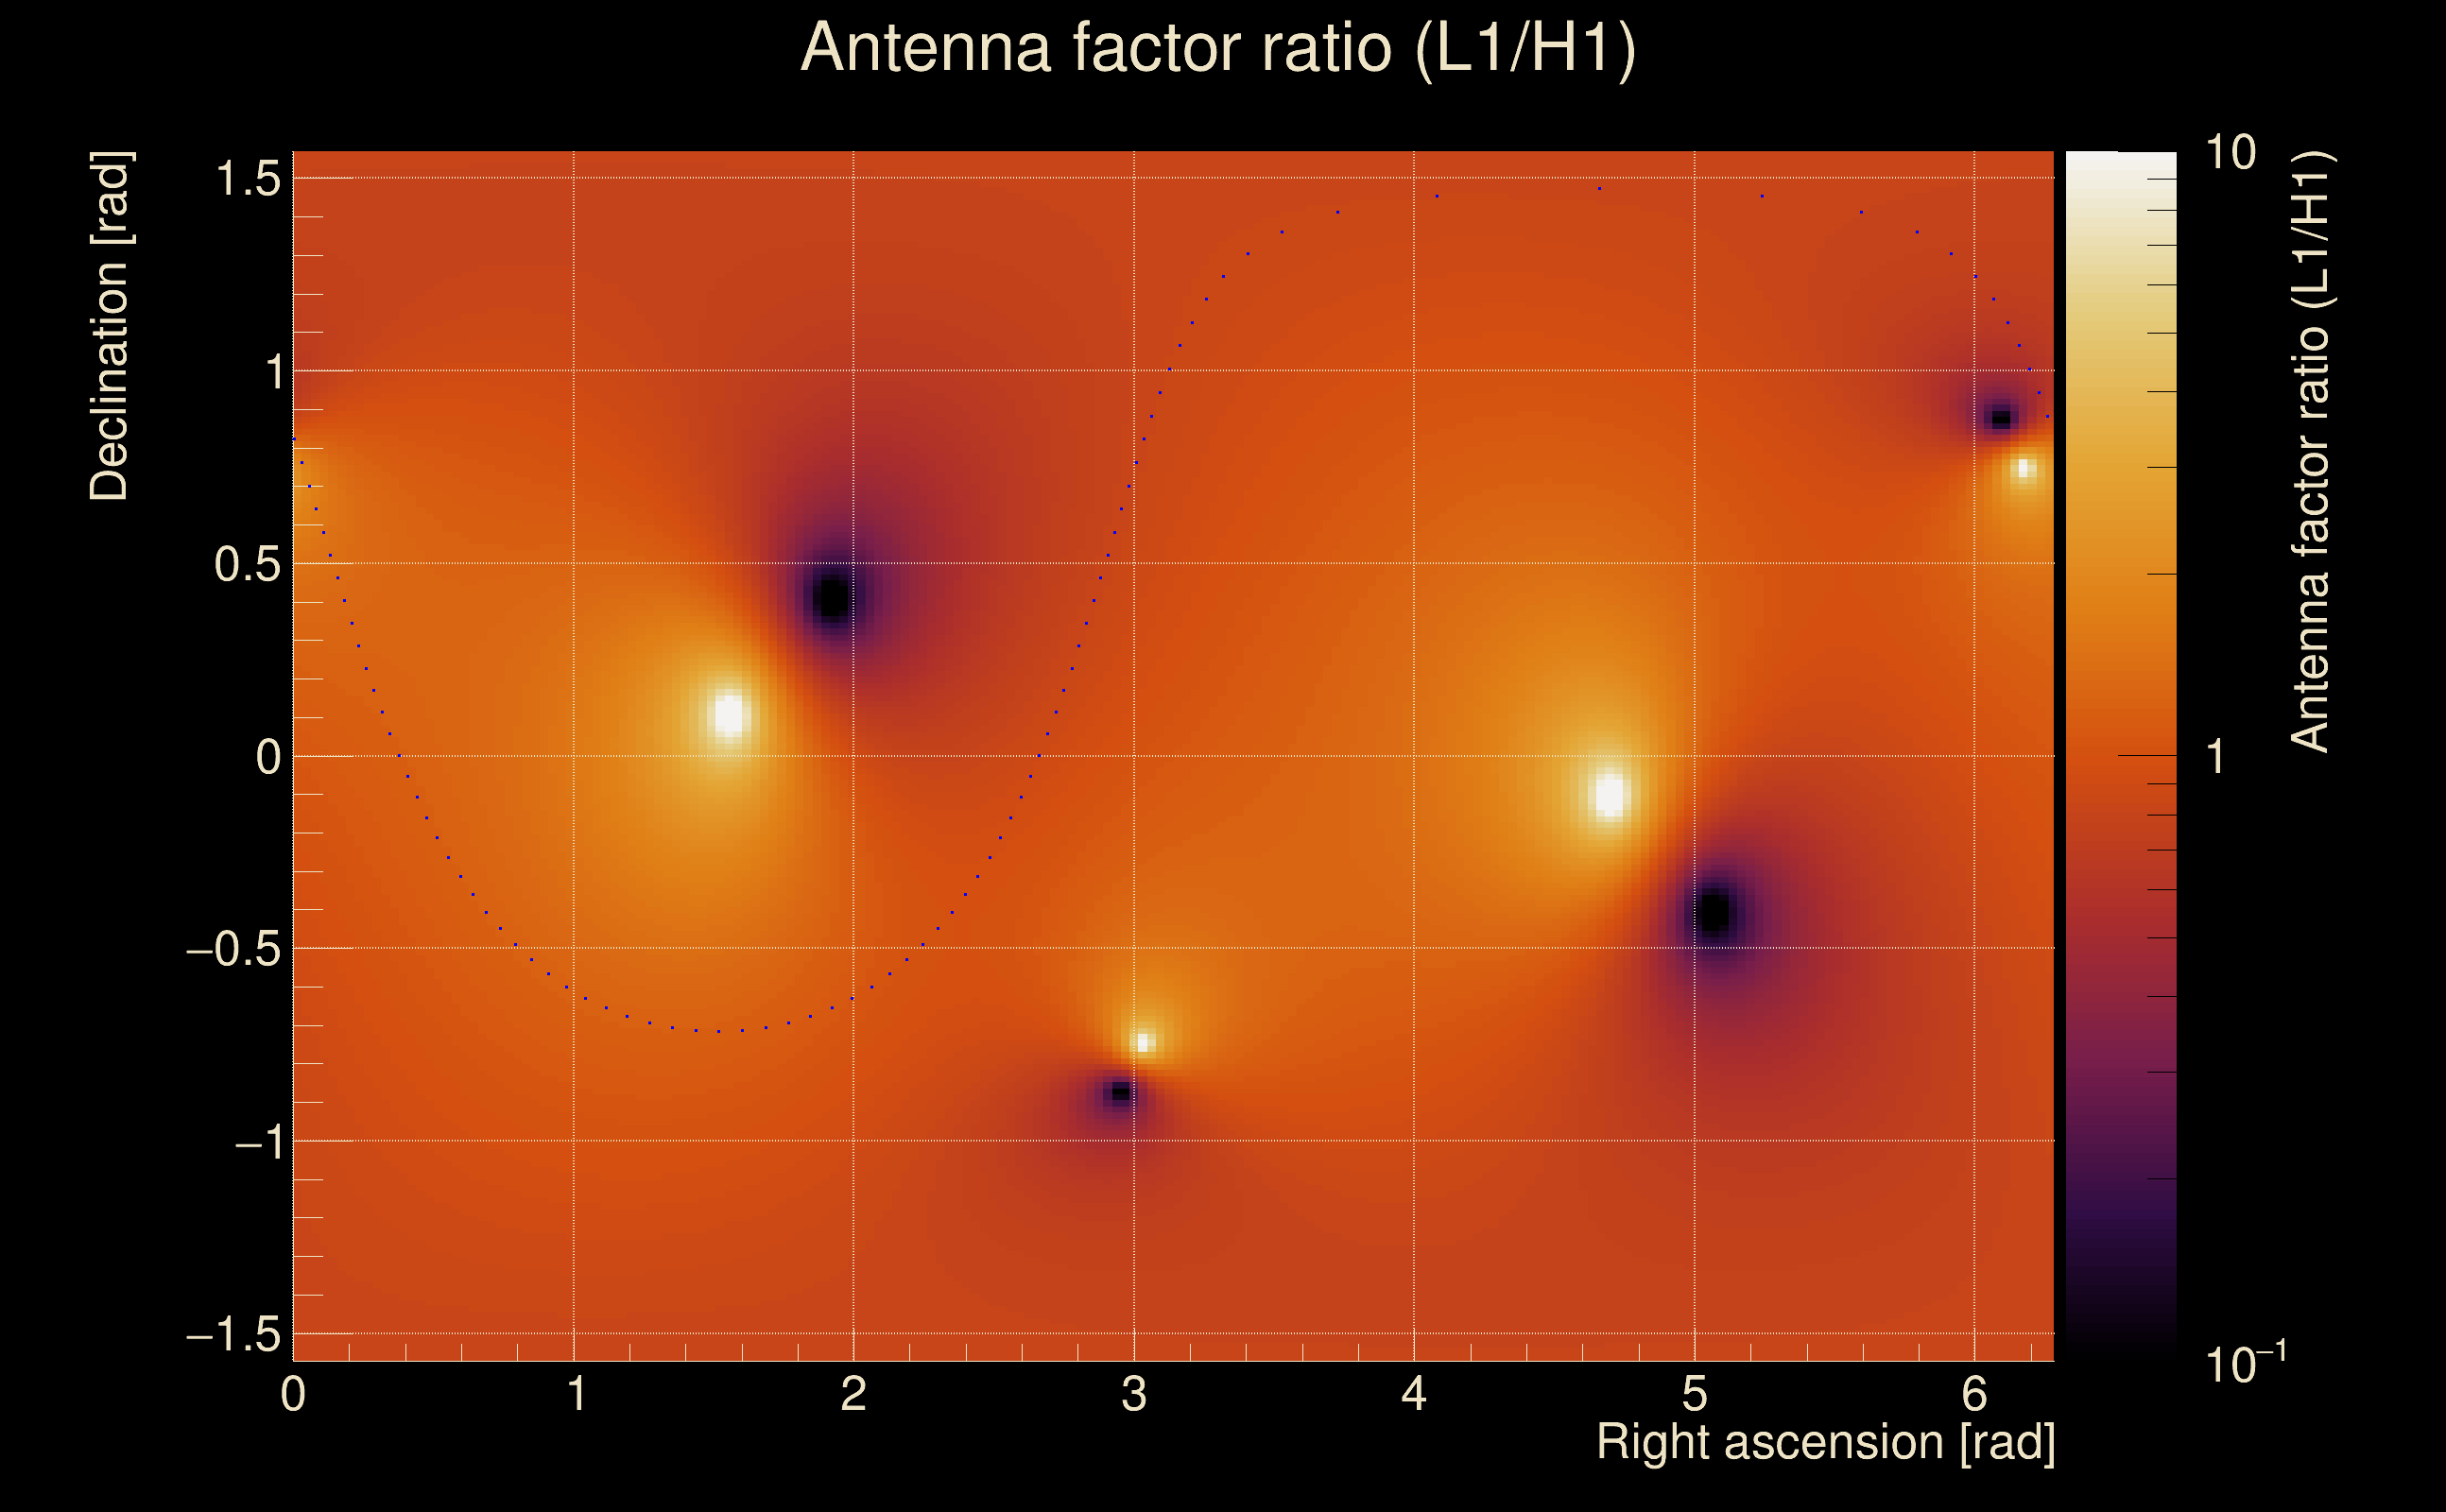
| Amplitude ratio (L1/H1): | 0.971078 ⋇ 1.48932 (L1/H1: 0.953527 ⋇ 1.74931, H1/L1: 1.01474 ⋇ 1.75189) |
| Amplitude ratio H1|L1 compatibility (probability): | 0.966805 |
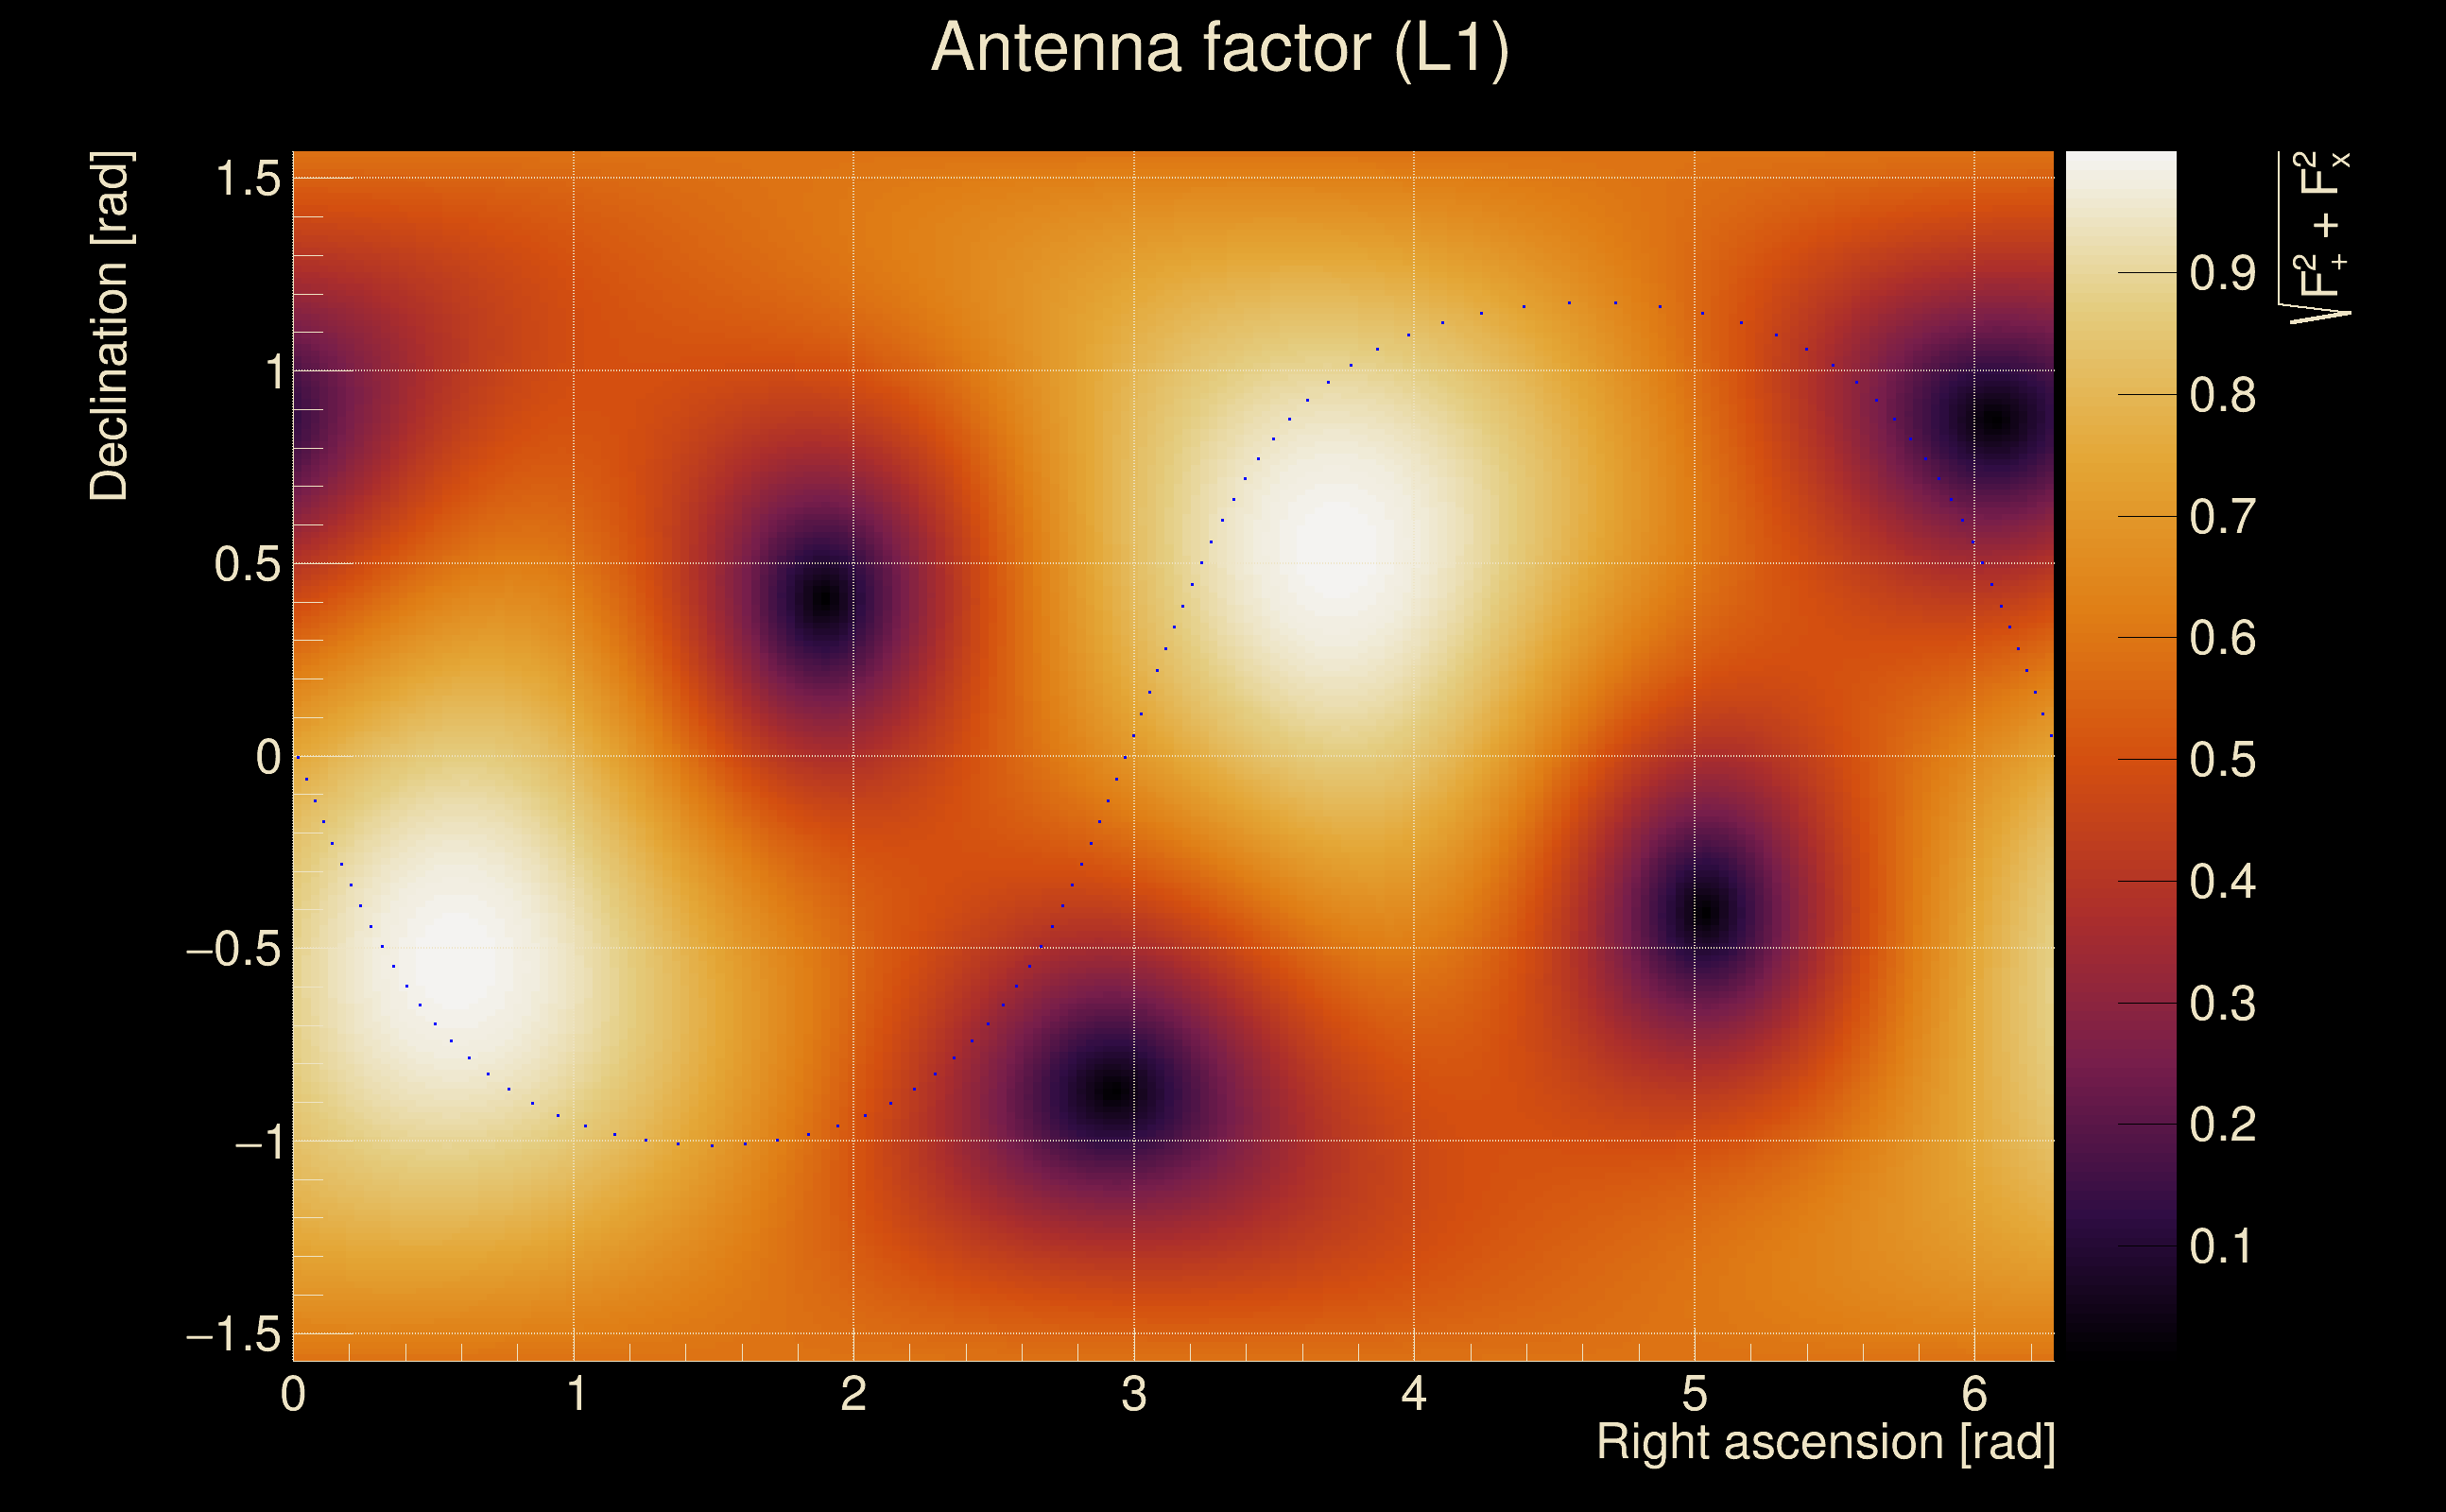
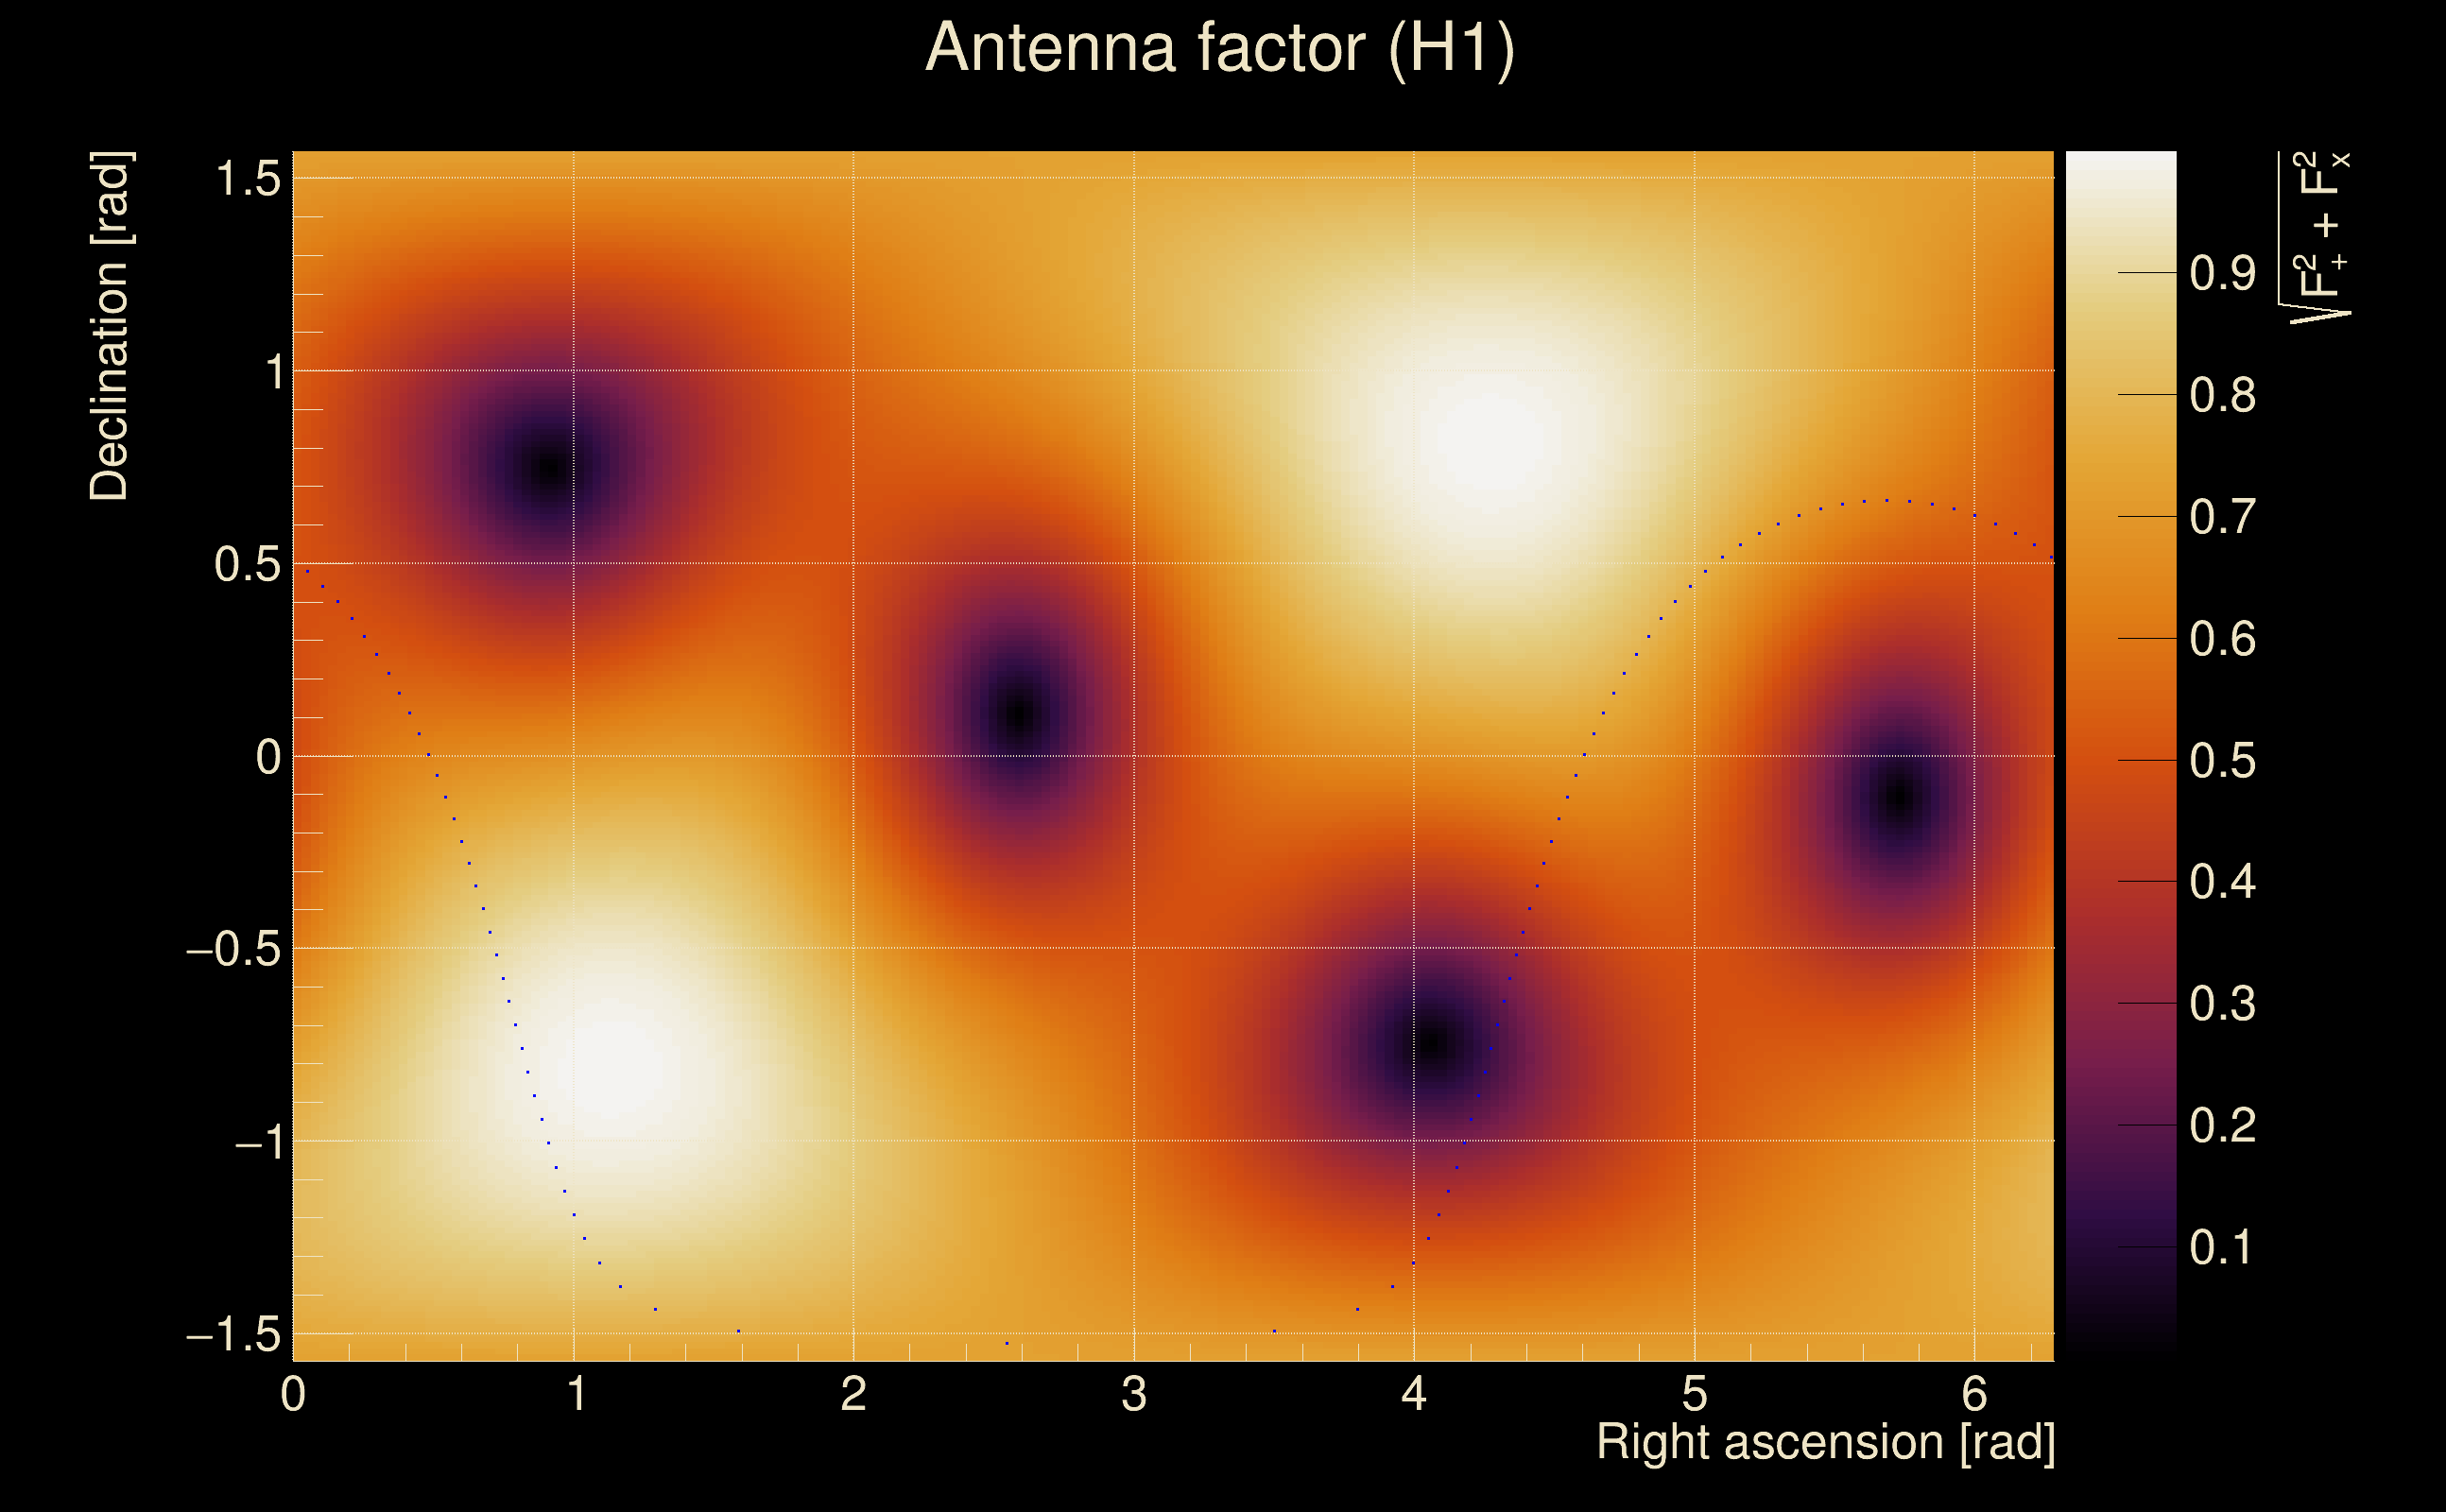
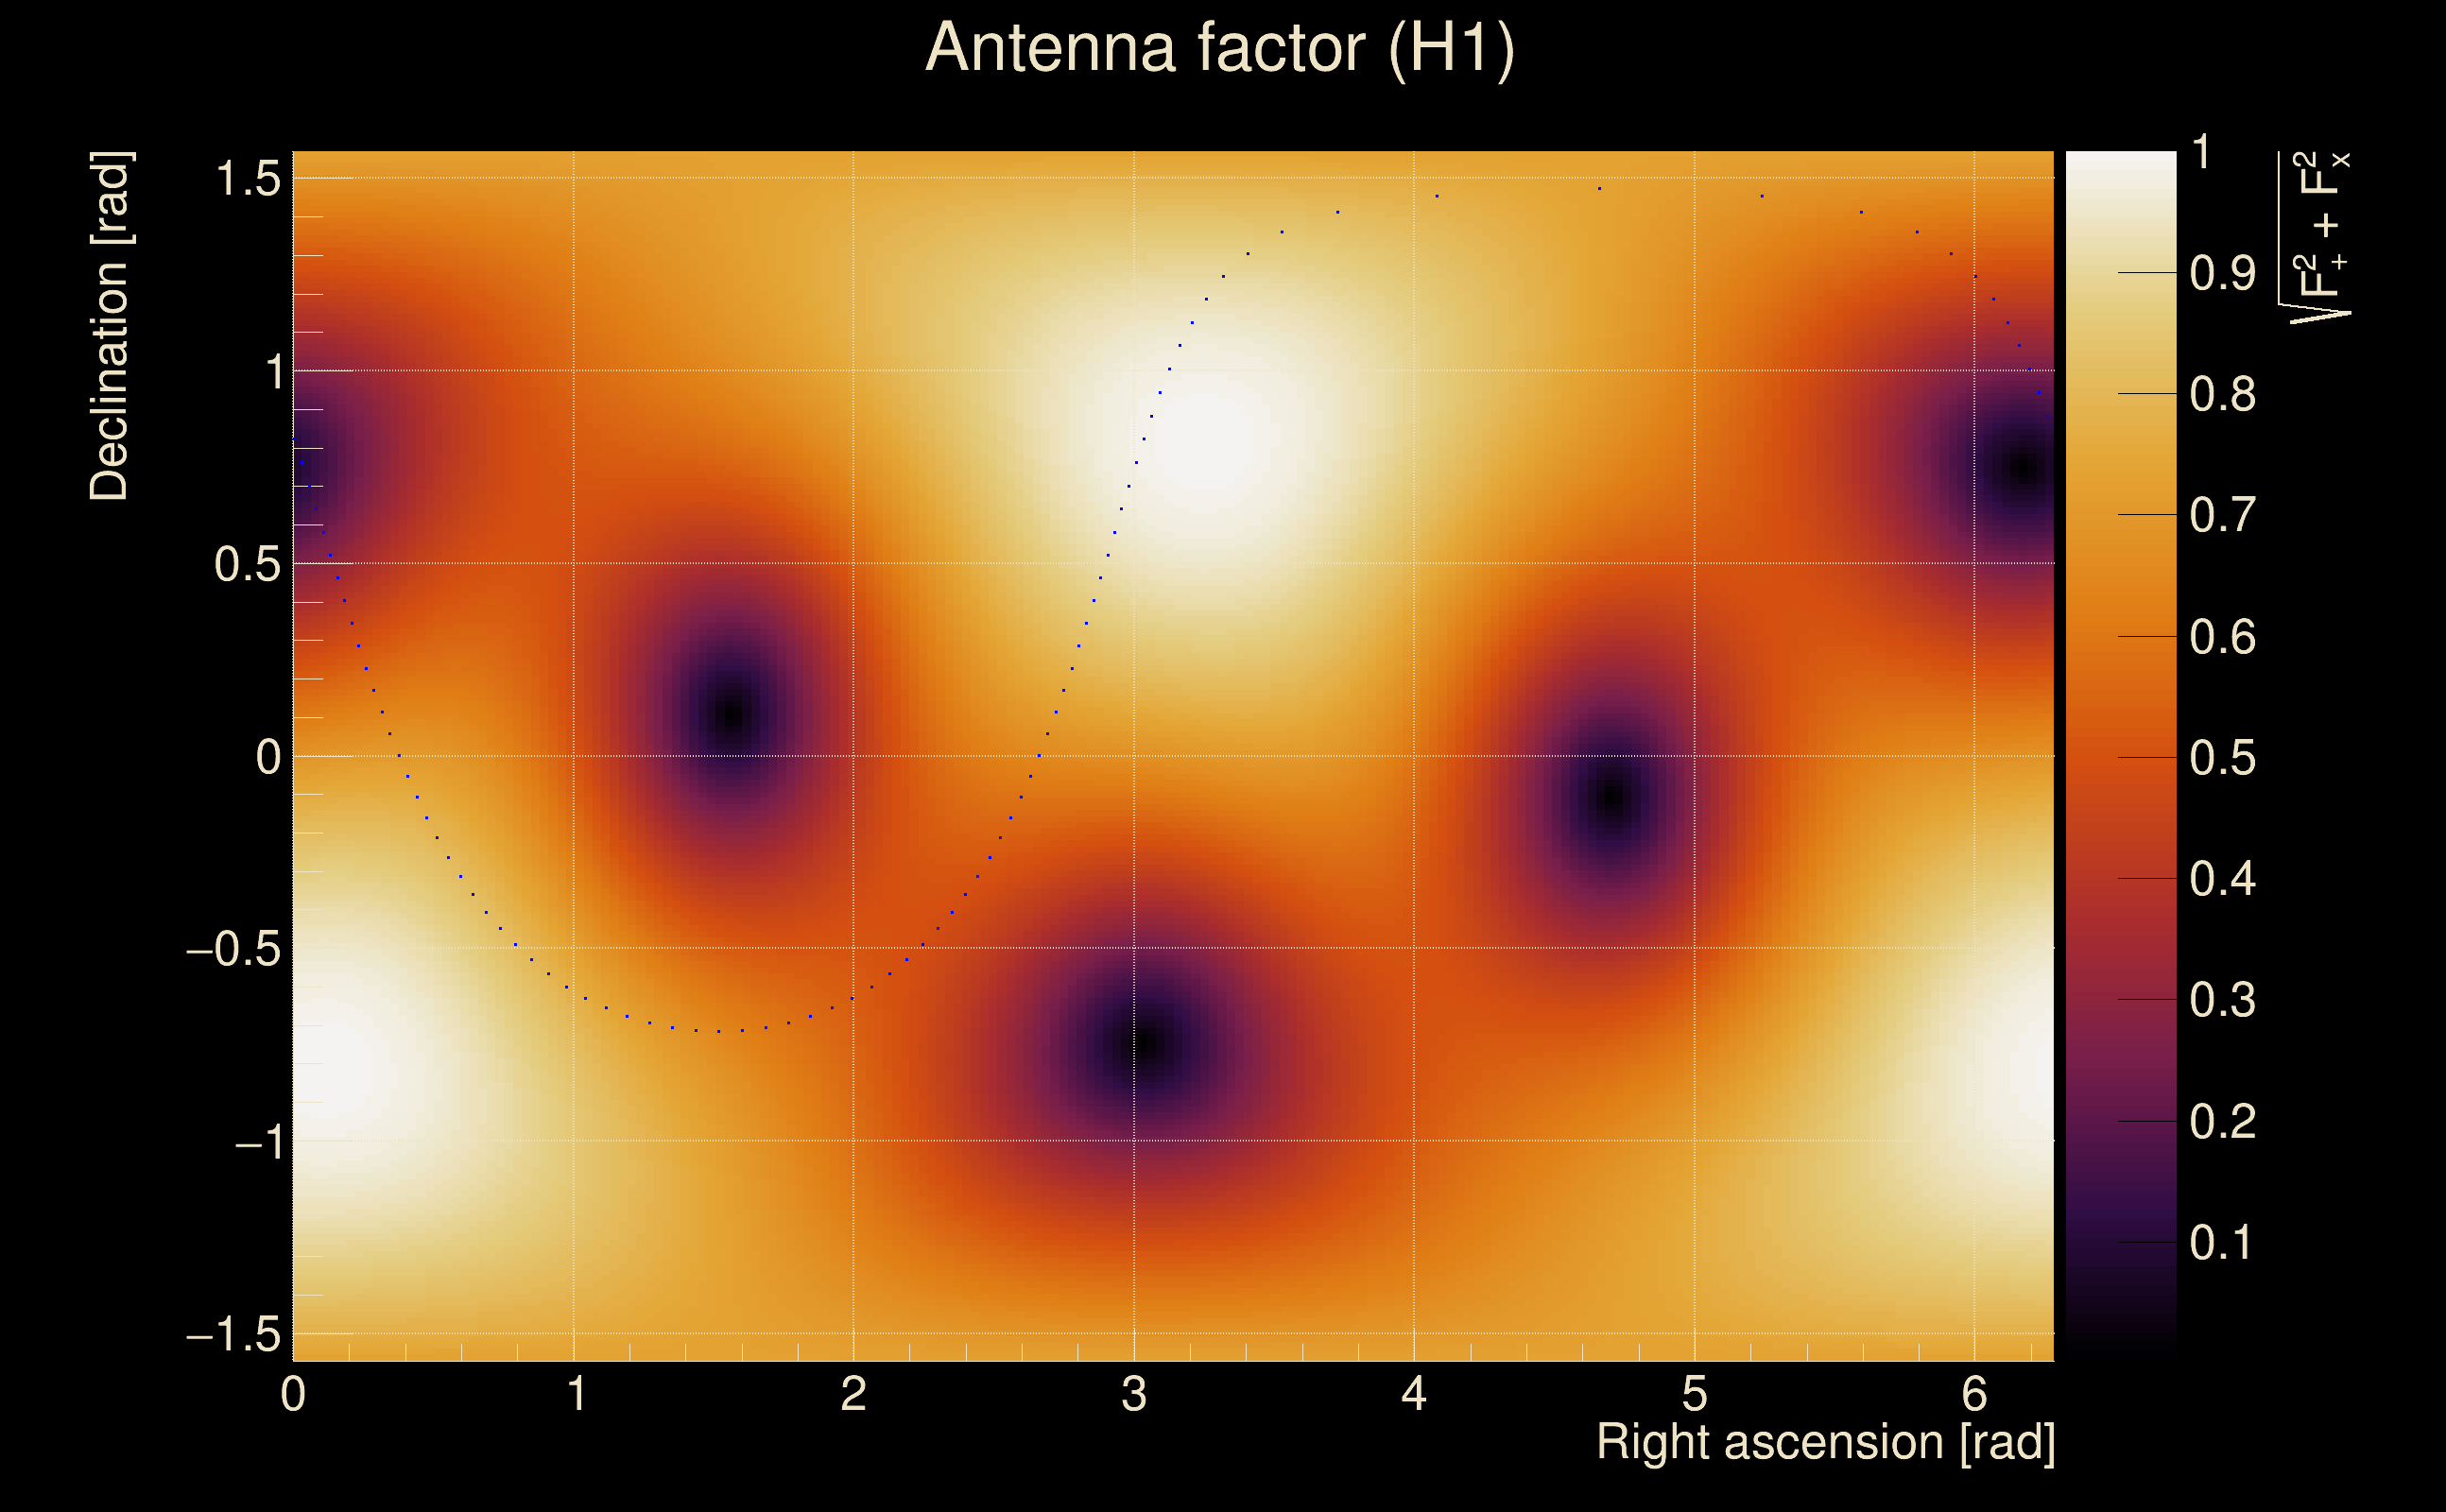
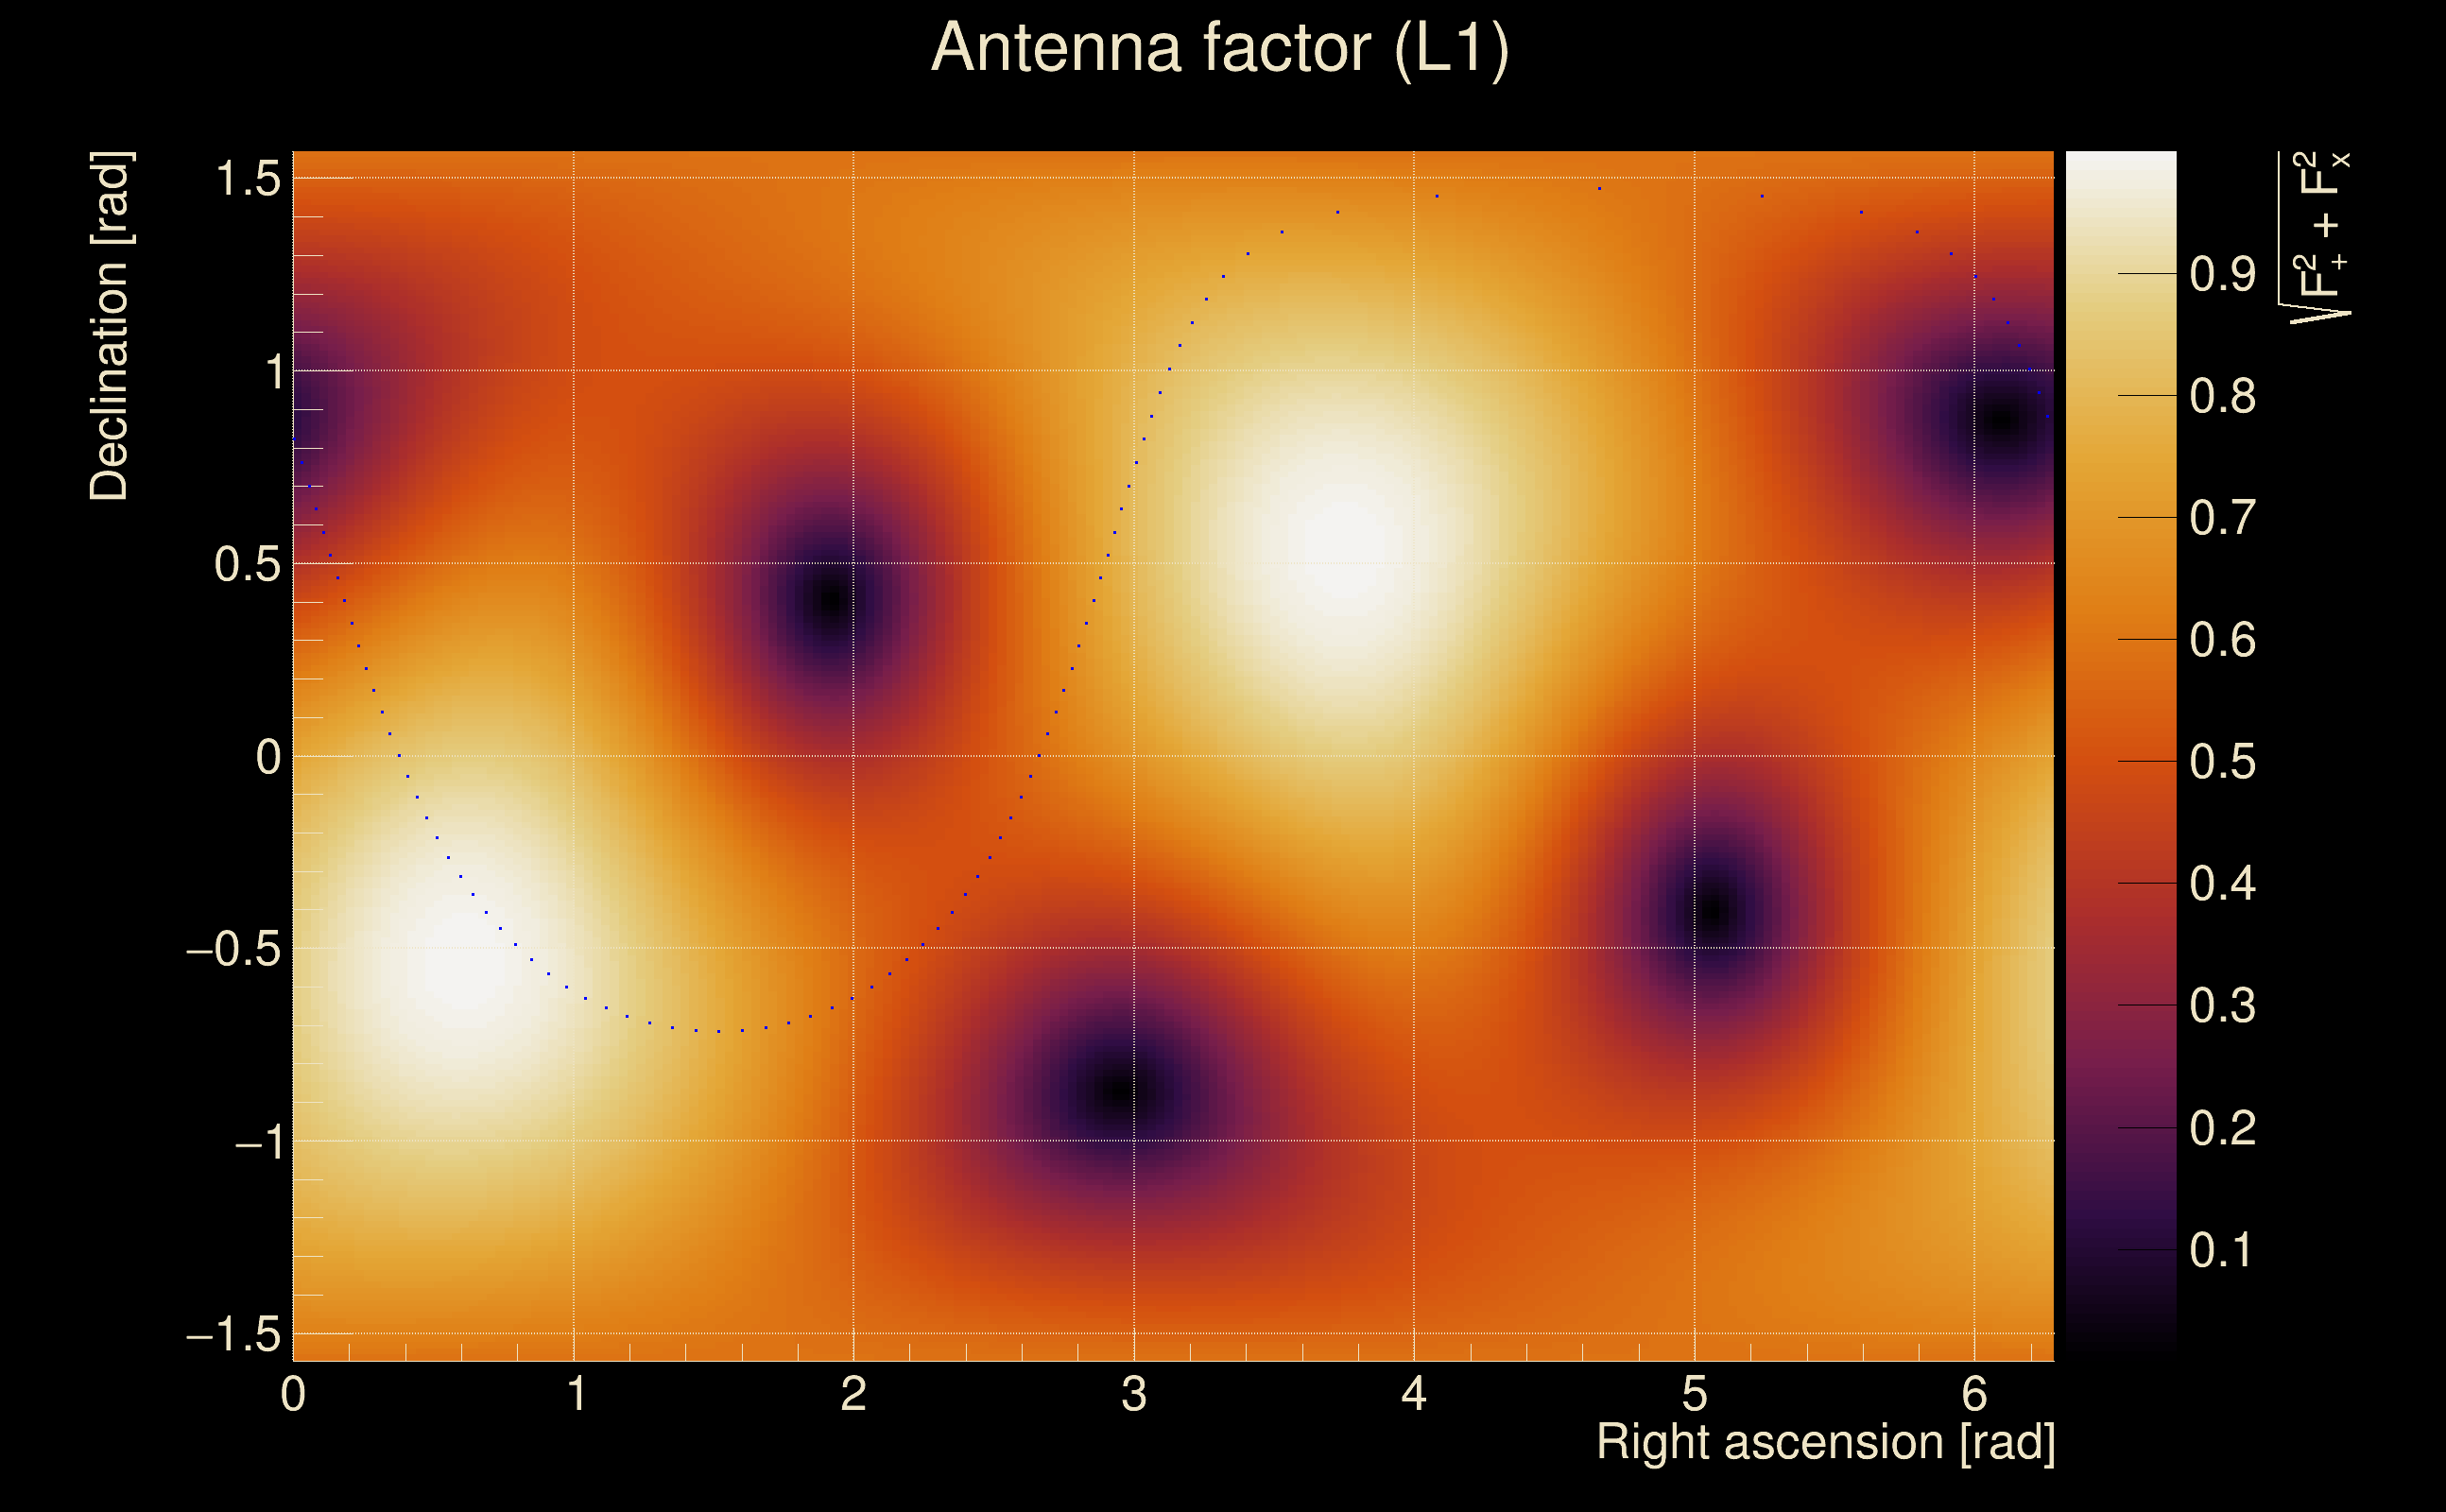
| Antenna factor probability: | 0.986425 |
| Number of rejected frequency rows: | Q0: 0 / 18, Q1: 0 / 36, Q2: 0 / 70, Q3: 5 / 134, Q4: 13 / 258 |
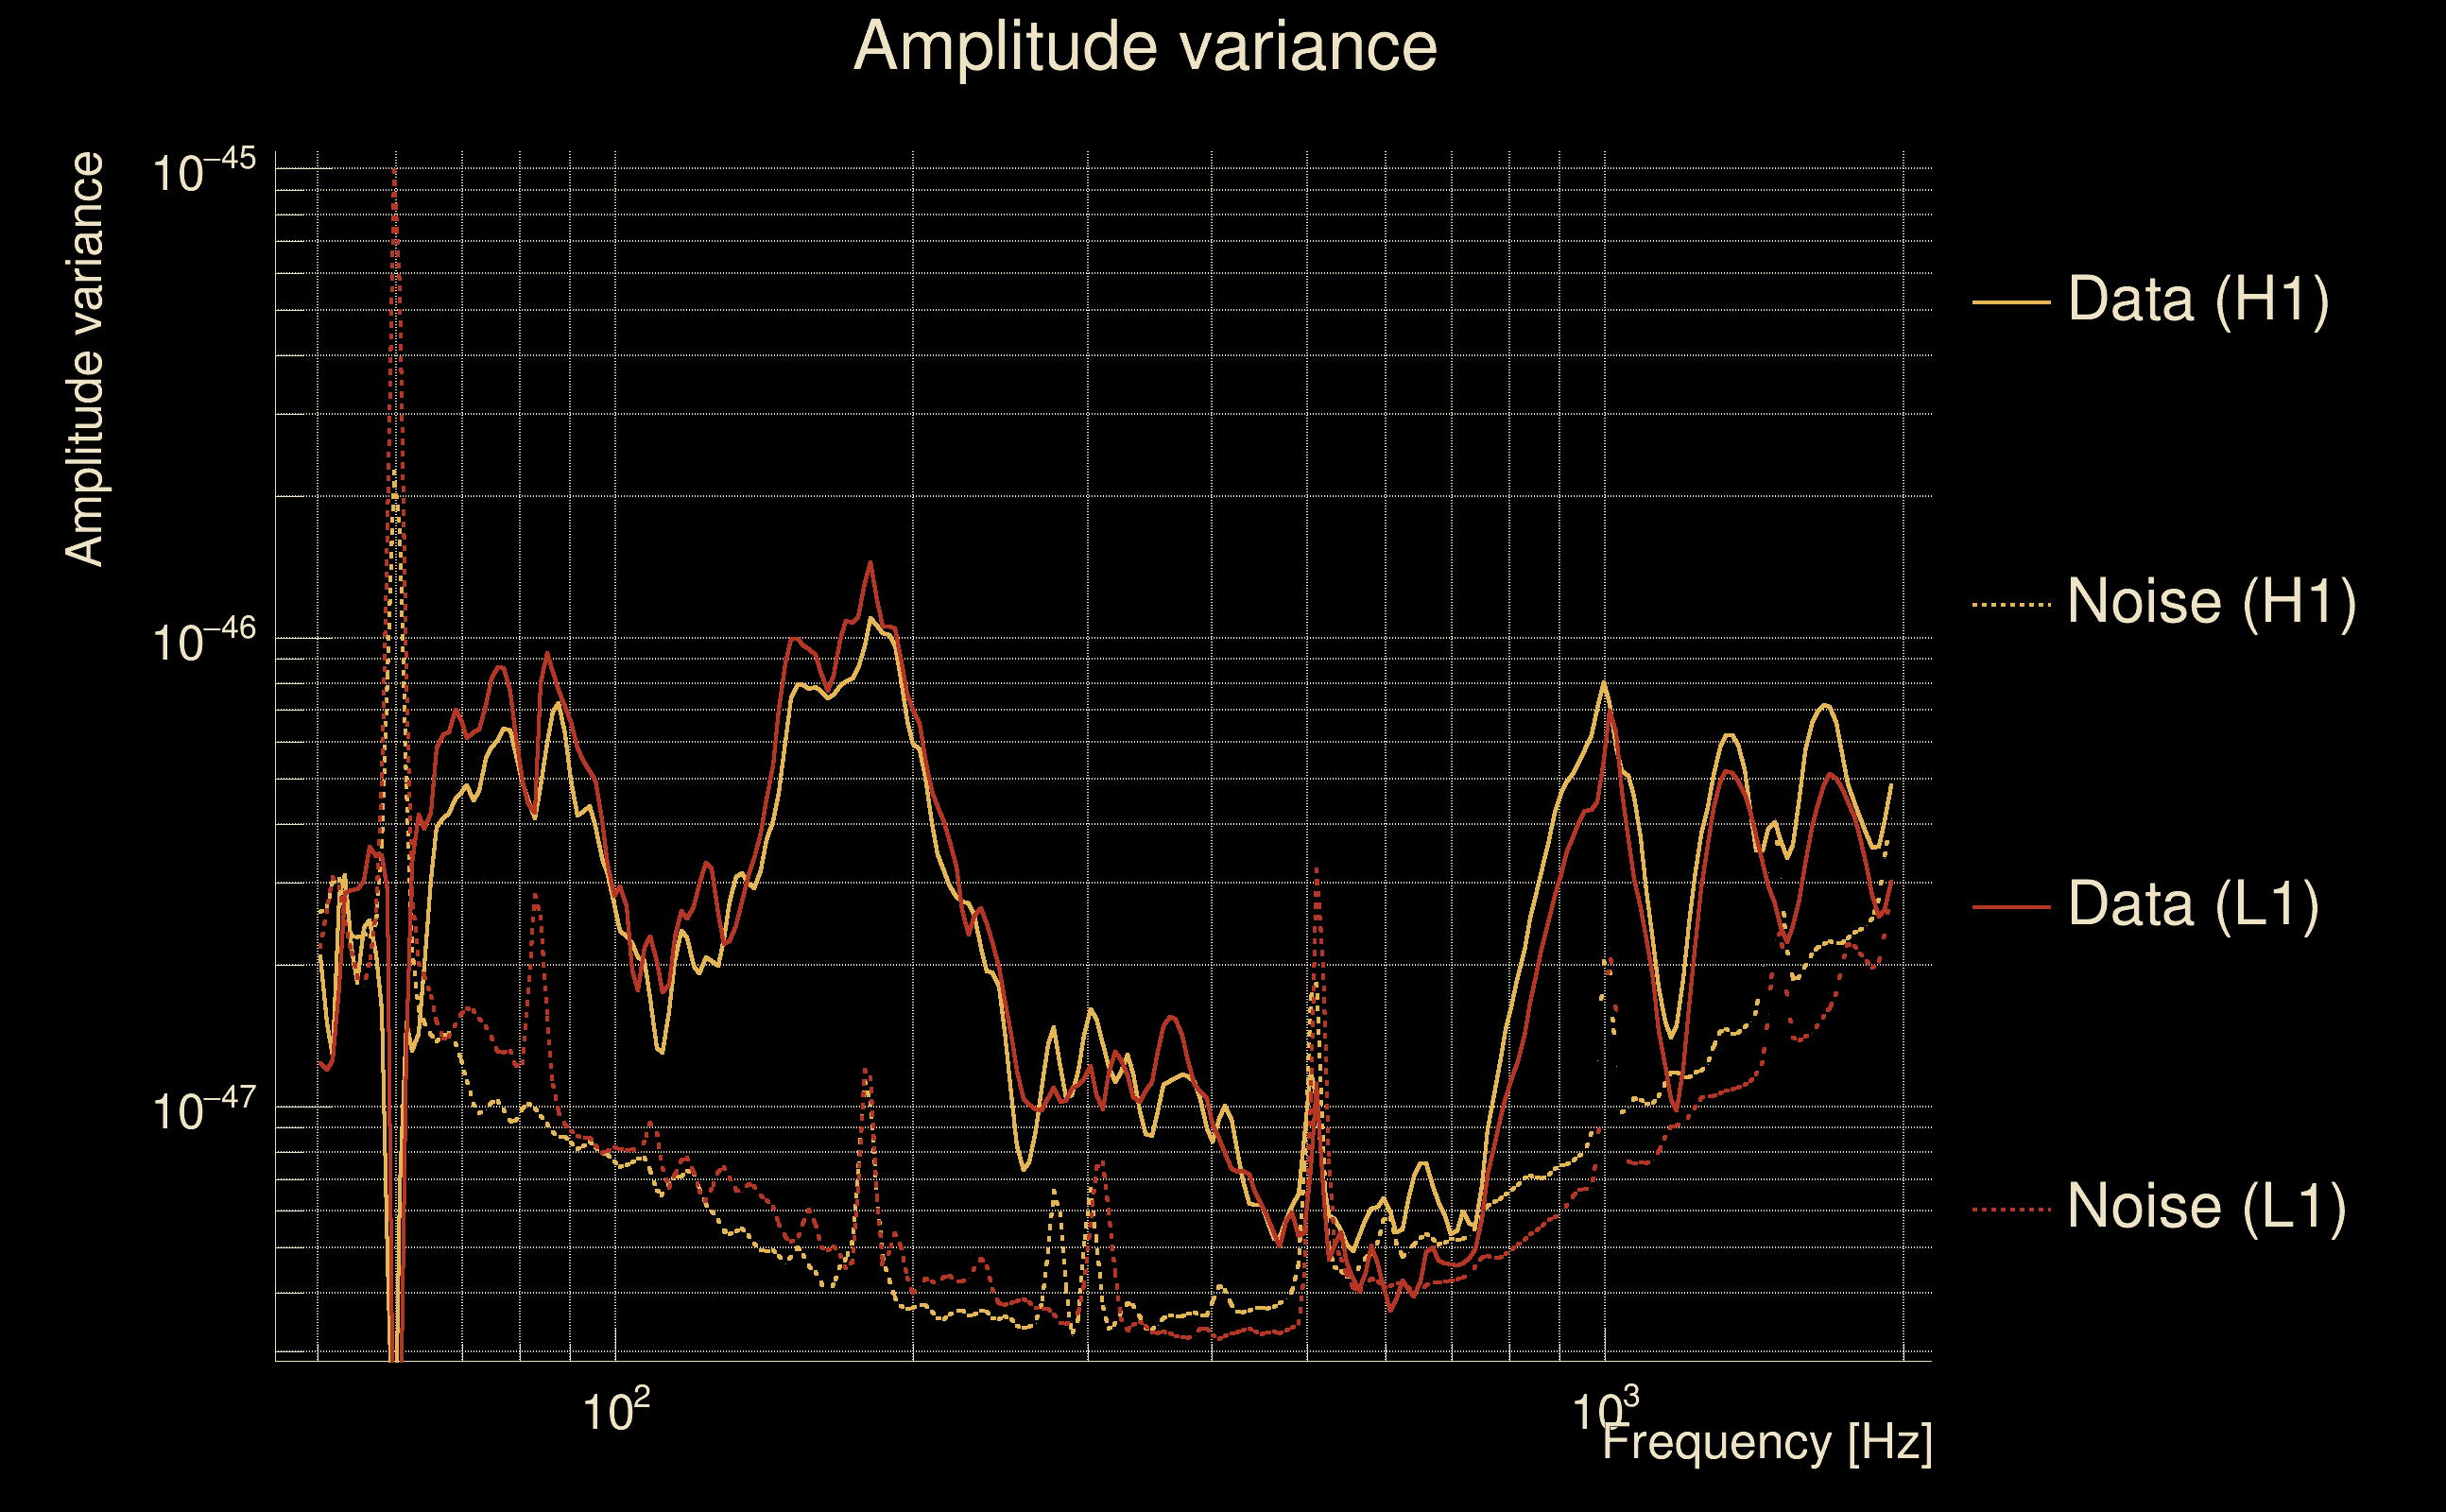
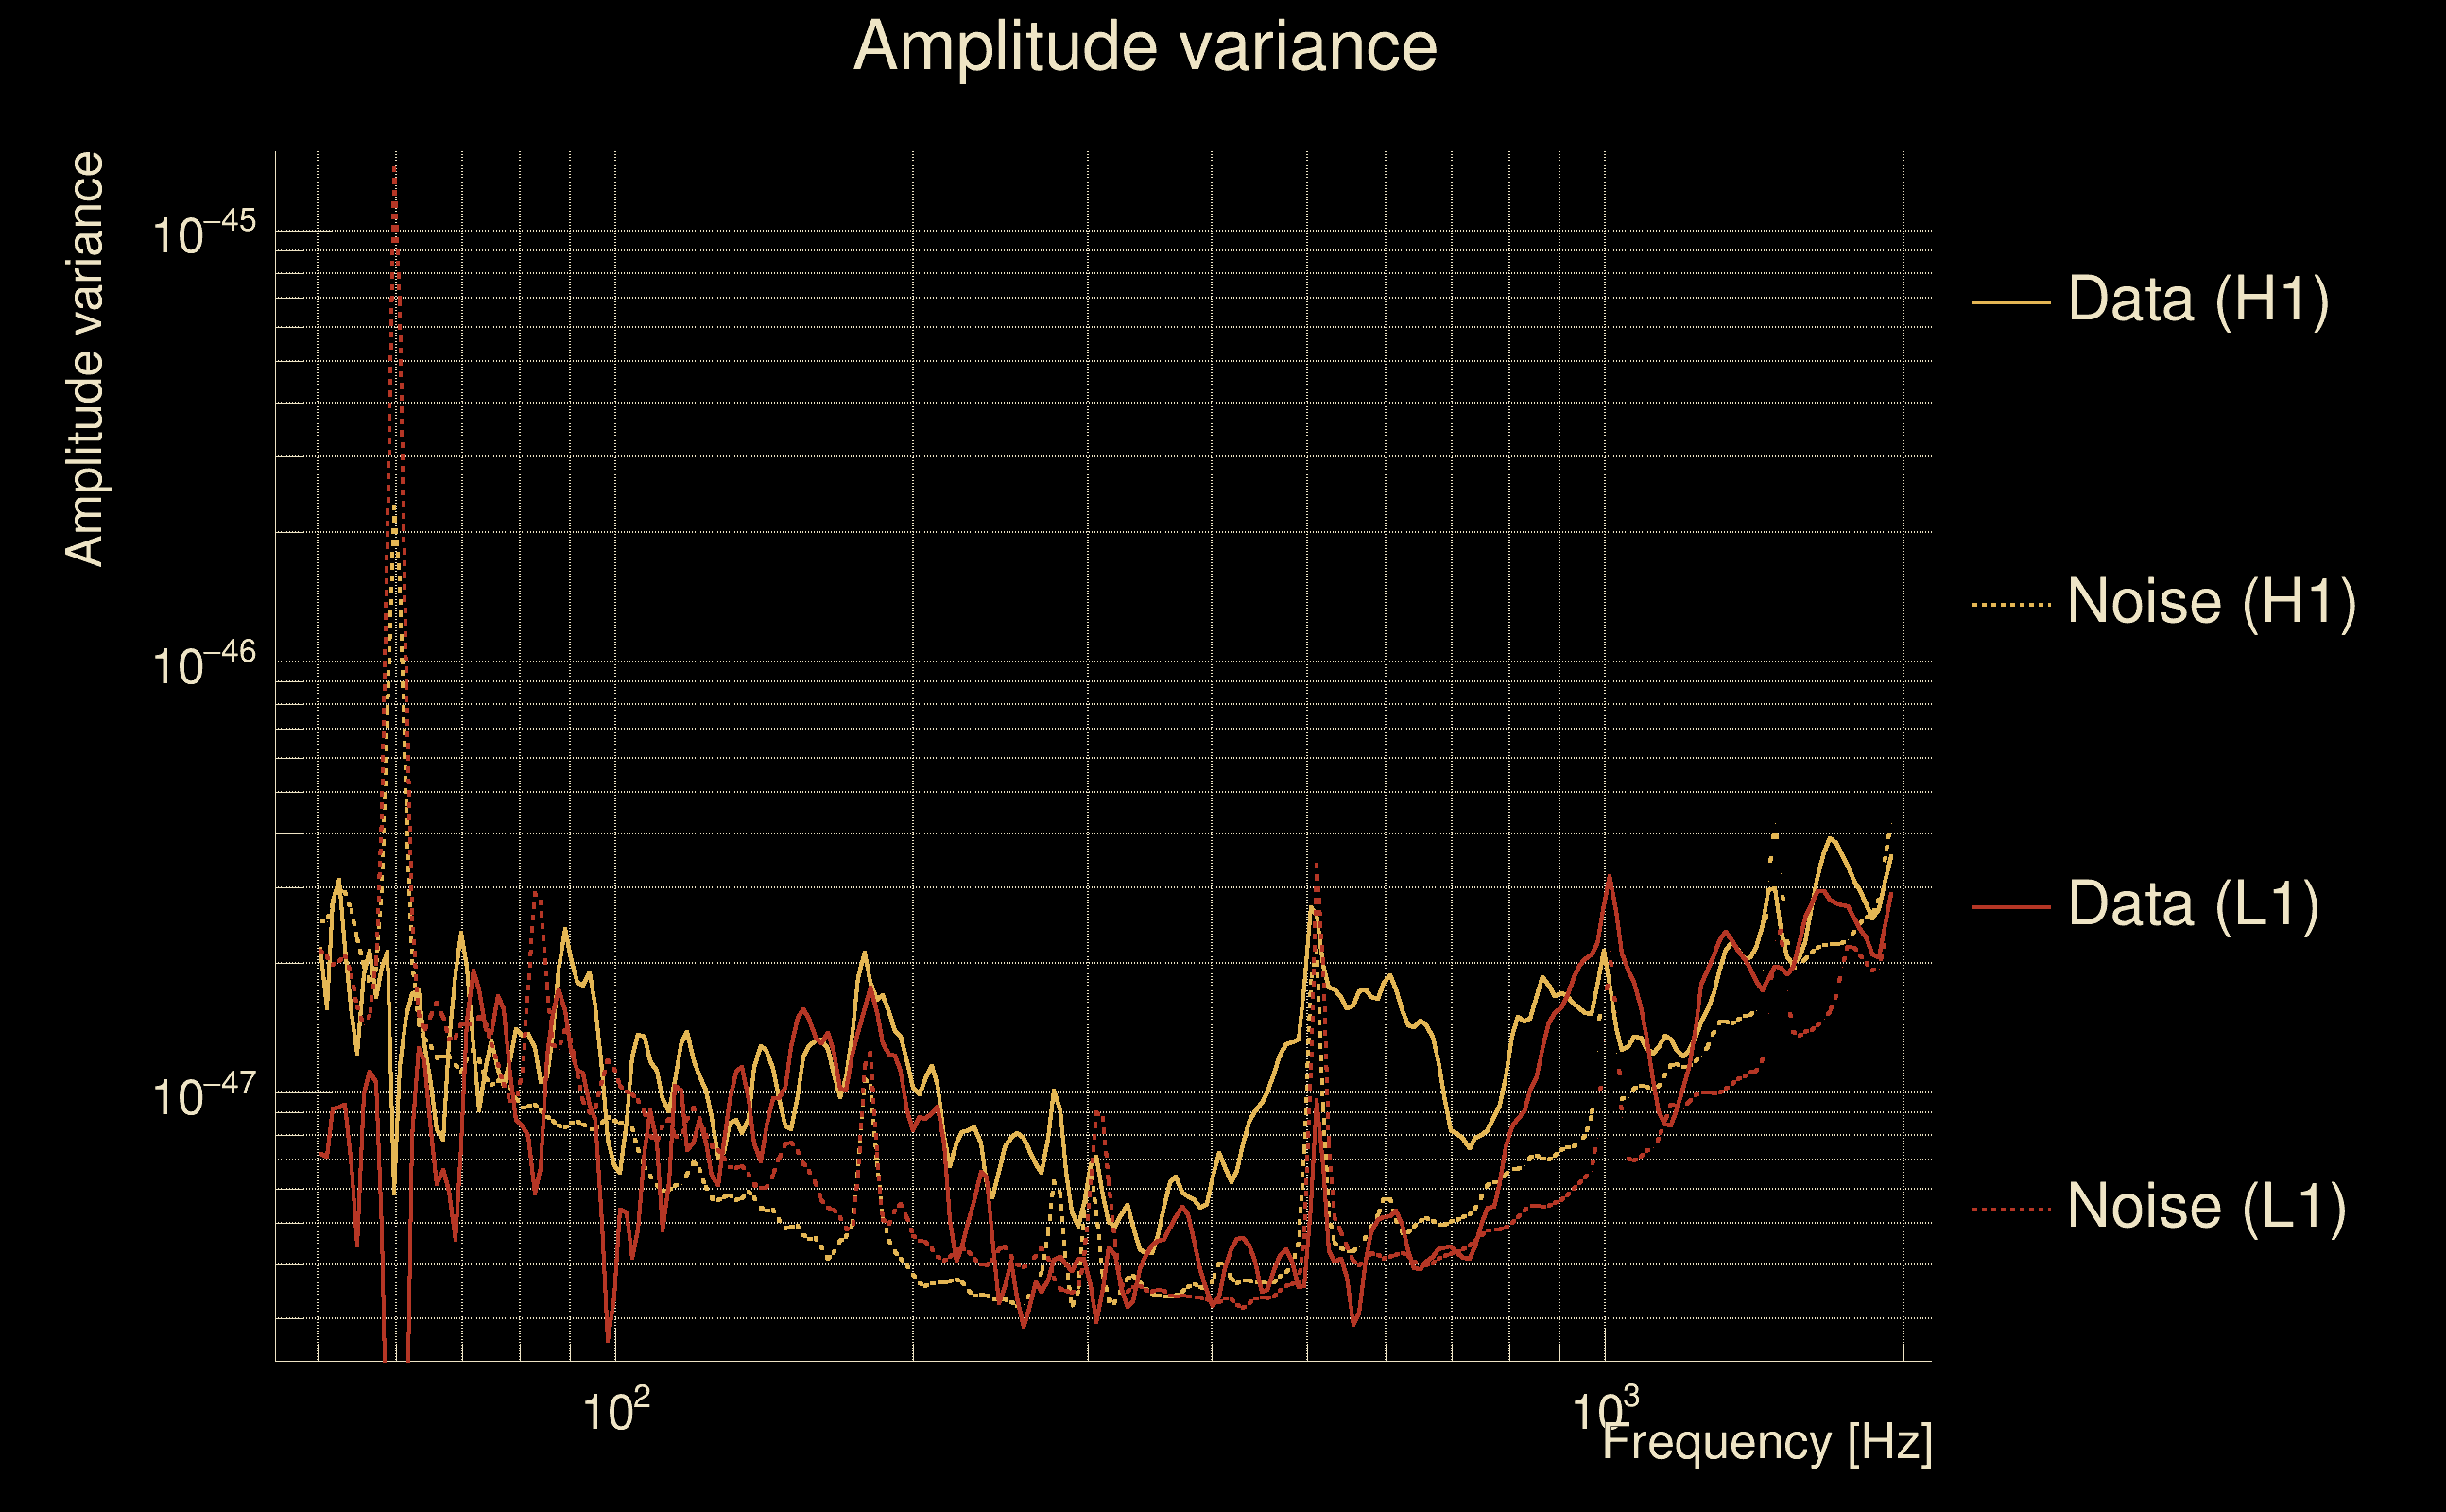
| Maximum signal-to-noise ratio: | H1: 82.9071, L1: 92.2983 |
| SNR variance: | H1: 5.37913, L1: 5.4097 |
| Click here for a zoomed plot | Click here for a zoomed plot | Click here for a zoomed plot | Click here for a zoomed plot | Click here for a zoomed plot |
 |
 |
 |
 |
 |
 |
 |
 |
 |
 |
 |
 |
 |
 |
 |
 |
 |
 |
 |
 |
 |
 |
 |
 |
 |
 |
 |
 |
 |
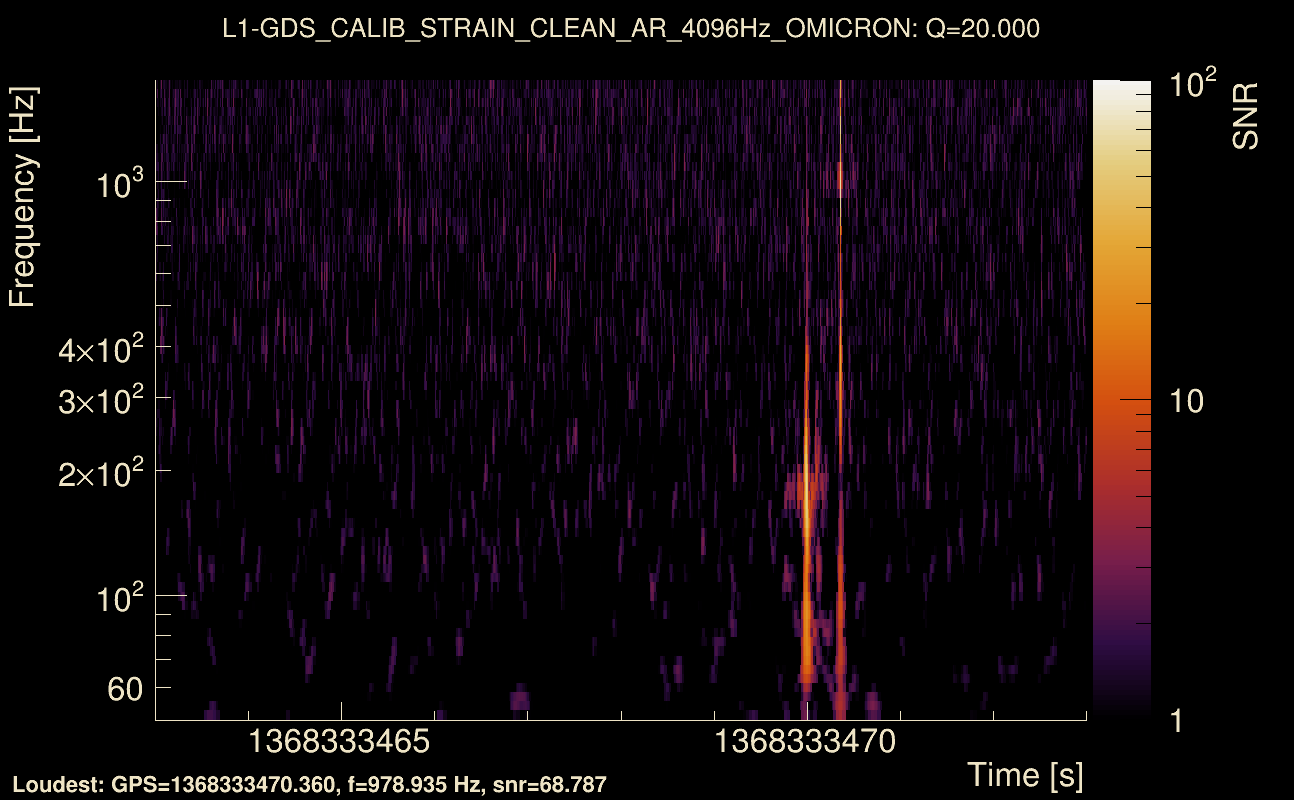
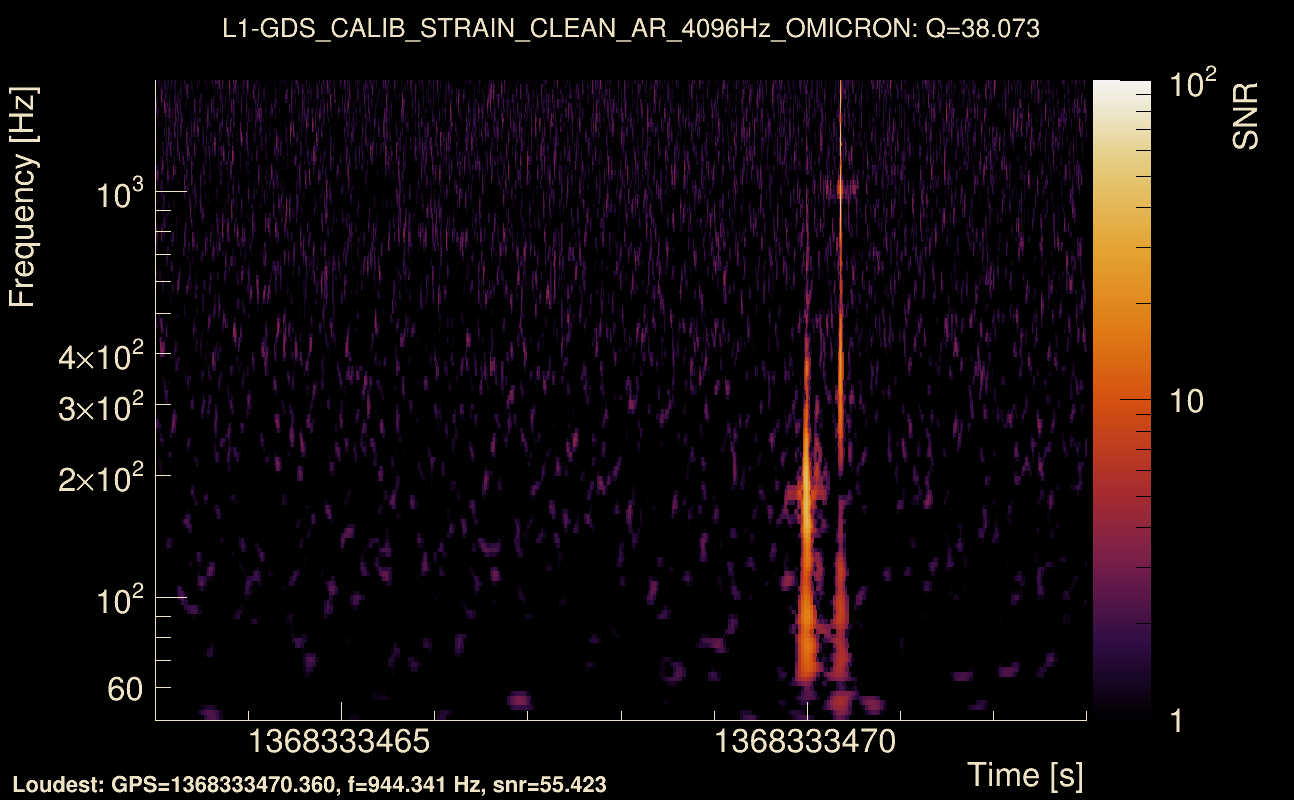
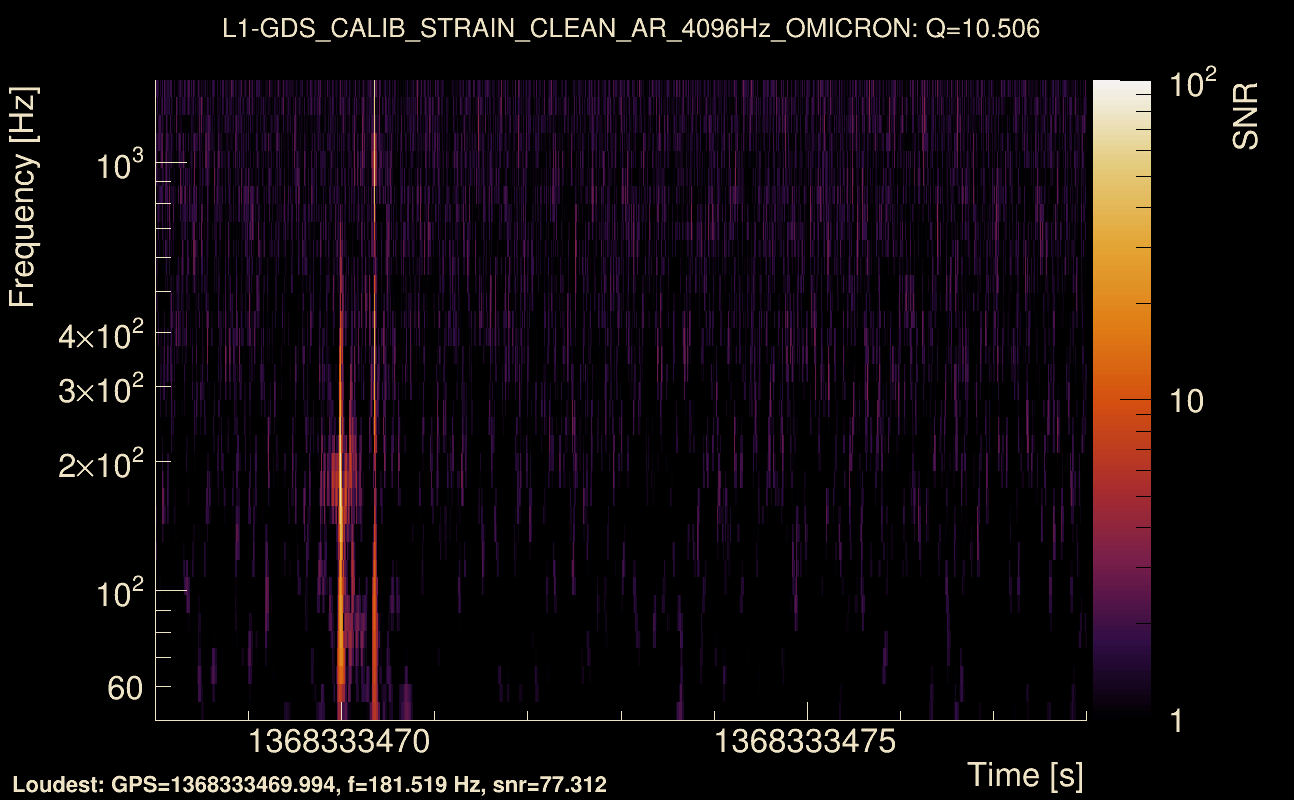
| Event time t(H1): | GPS = 1368333463 (Wed May 17 04:37:25 2023 ) → GPS = 1368333473 (Wed May 17 04:37:35 2023 ) |
| Event time t(L1): | GPS = 1368333463 (Wed May 17 04:37:35 2023 ) → GPS = 1368333473 (Wed May 17 04:37:35 2023 ) |
| Omicron analysis time window (H1): | GPS = 1368333460 → GPS = 1368333476 |
| Omicron analysis time window (L1): | GPS = 1368333460 → GPS = 1368333476 |
| Time delay between detectors t(L1) - t(H1): | 0.000830036 s (slice index = 108 / 217), δt_gw = 0.000830036 s |
| Time delay standard deviation: | 0.020657 s |
| [targeted mode] Time delay probability: | 0.789661 (0.266751 sigmas), δt_target = 0.00201678 s |
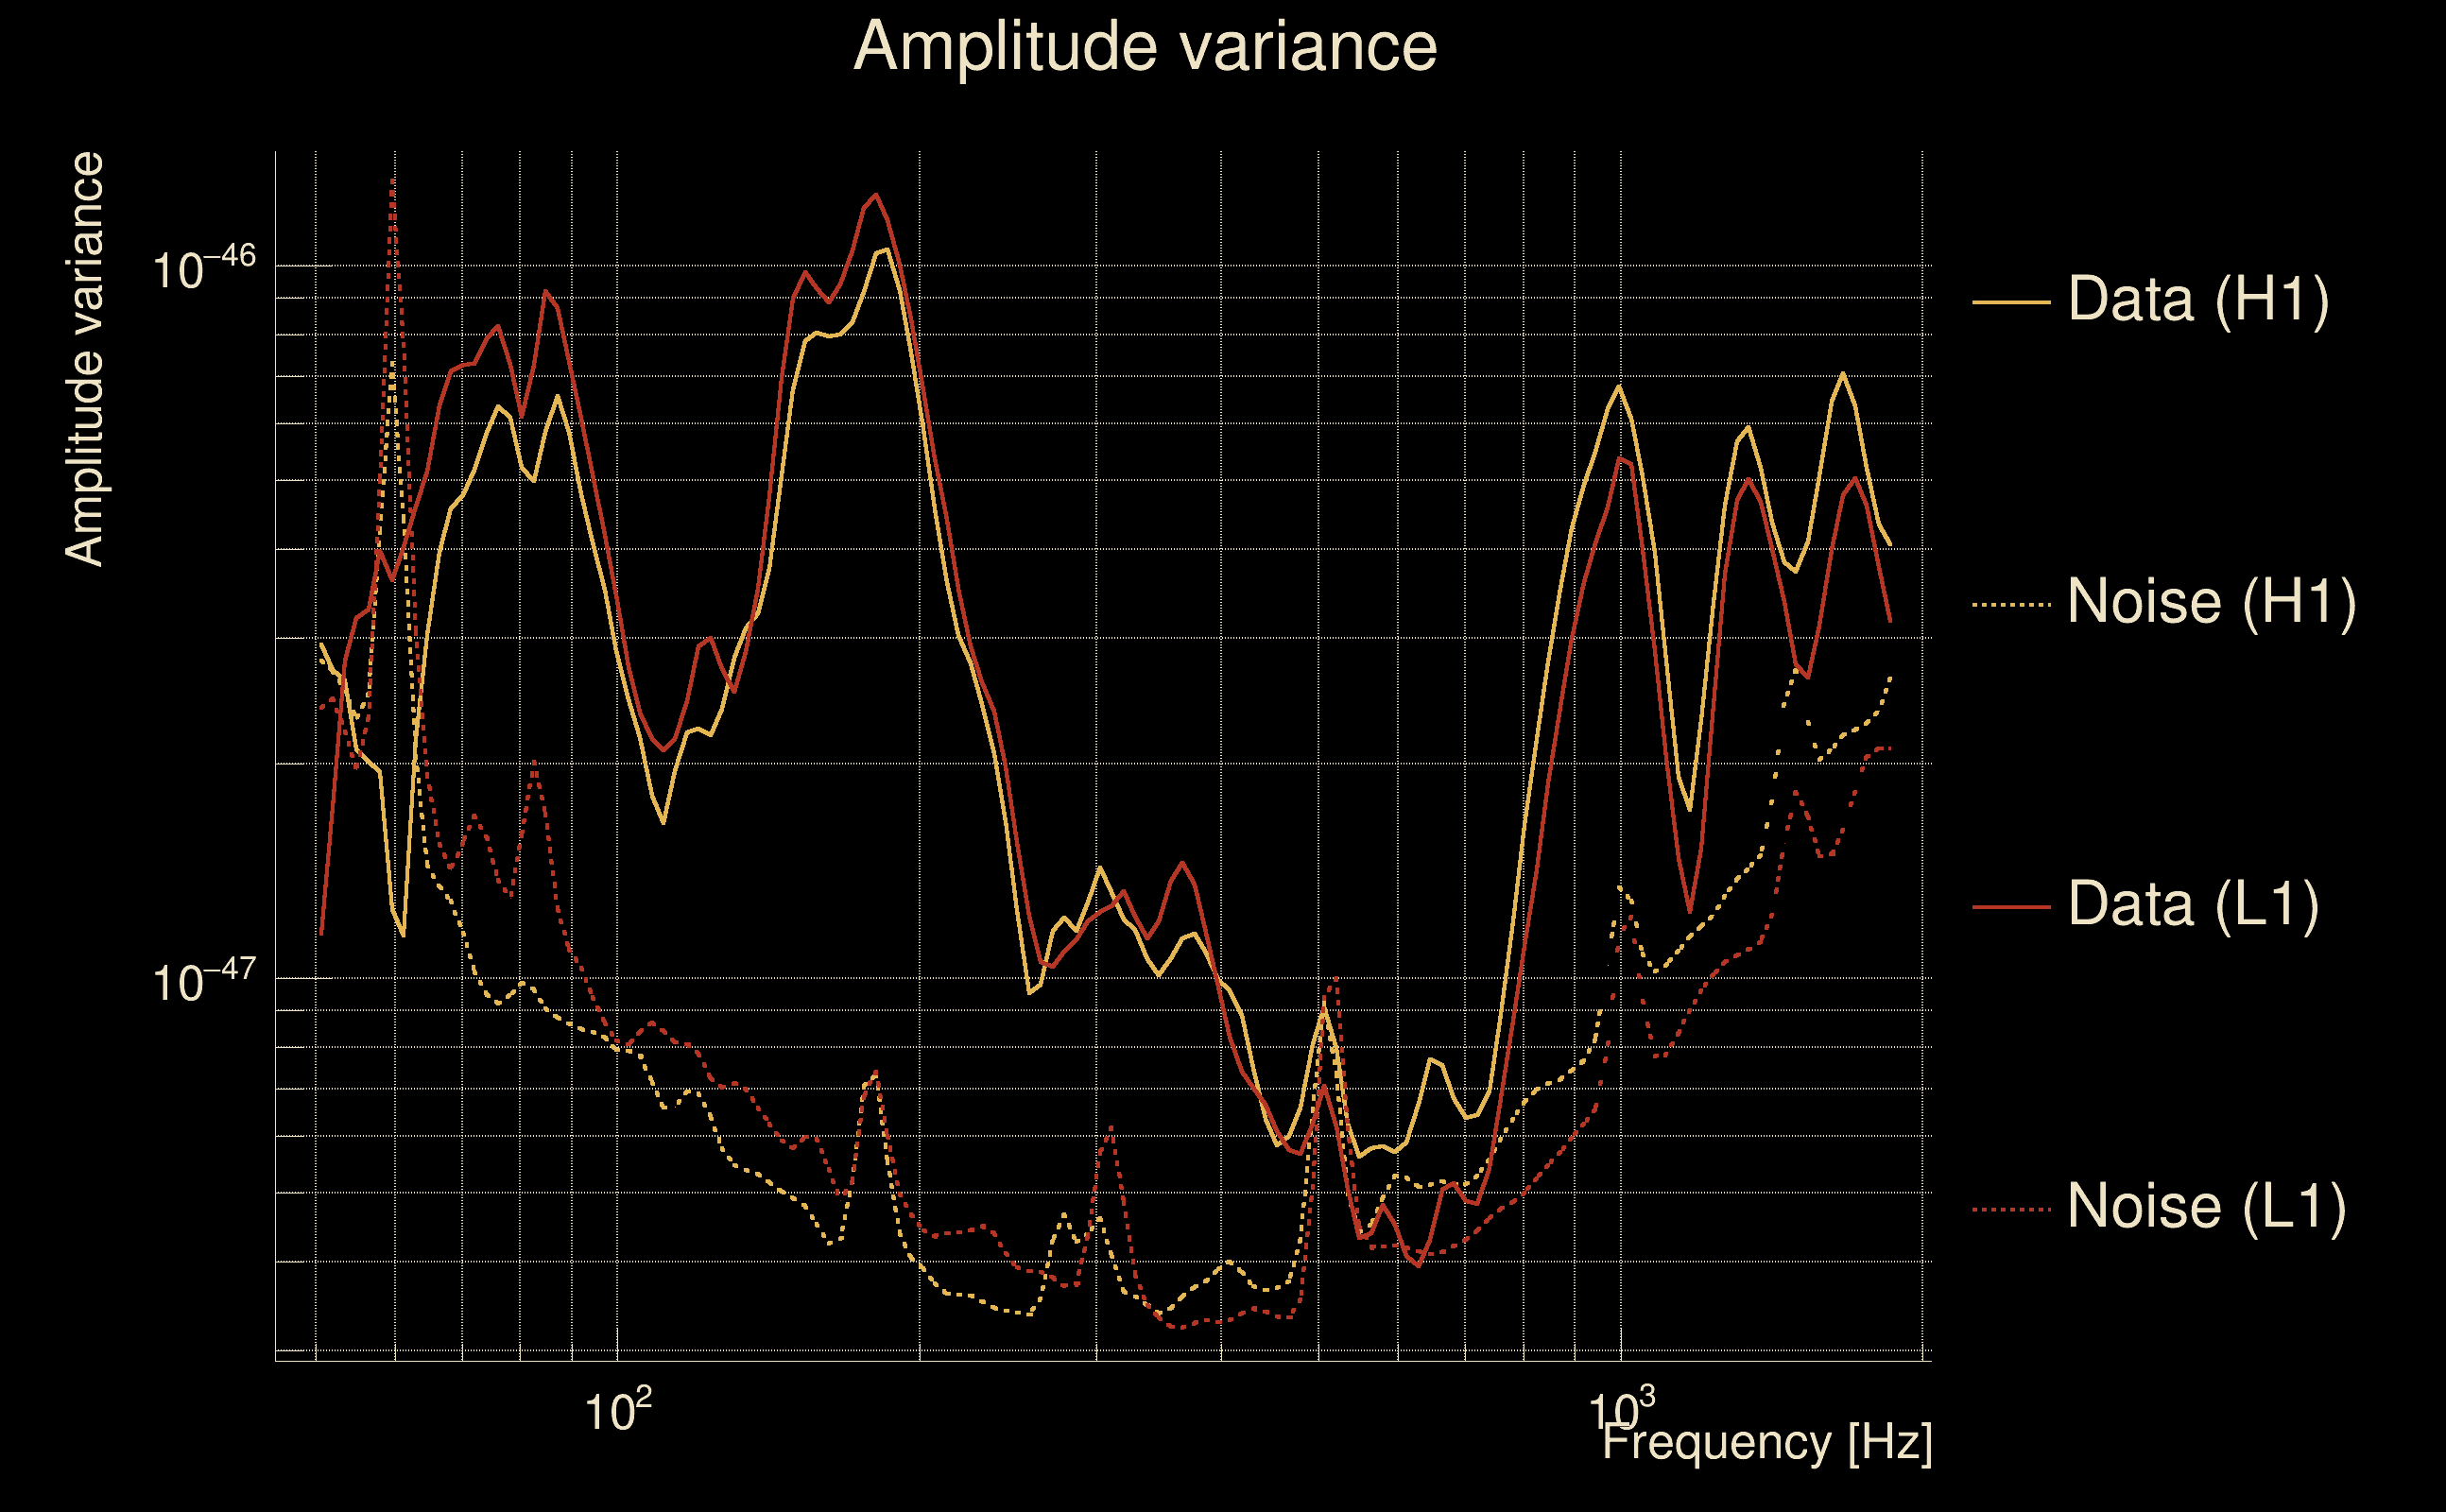
| Frequency: | 294.302 Hz |
| Ξ: | 0.963603 ± 0.0115111 (variance = 0.000132506): Q0: 0.973922, Q1: 0.973587, Q2: 0.959533, Q3: 0.951285, Q4: 0.94548 |
| Rank: | R_A = 0.963603 |
| Log of amplitude ratio (L1/H1): | 0.0630884, variance = 0.157928 (L1/H1: 0.0542992, variance = 0.314633, H1/L1: -0.0704571, variance = 0.31259) |
| Amplitude ratio (L1/H1): | 1.06512 ⋇ 1.48795 (L1/H1: 1.0558 ⋇ 1.75229, H1/L1: 0.931968 ⋇ 1.74909) |
| Amplitude ratio H1|L1 compatibility (probability): | 0.983723 |
| Antenna factor probability: | 0.804871 |
| Number of rejected frequency rows: | Q0: 0 / 18, Q1: 0 / 36, Q2: 0 / 70, Q3: 6 / 134, Q4: 22 / 258 |
| Maximum signal-to-noise ratio: | H1: 81.1292, L1: 88.6047 |
| SNR variance: | H1: 0.501195, L1: 0.463422 |
| Click here for a zoomed plot | Click here for a zoomed plot | Click here for a zoomed plot | Click here for a zoomed plot | Click here for a zoomed plot |
 |
 |
 |
 |
 |
 |
 |
 |
 |
 |
 |
 |
 |
 |
 |
 |
 |
 |
 |
 |
 |
 |
 |
 |
 |
 |
 |
 |
 |
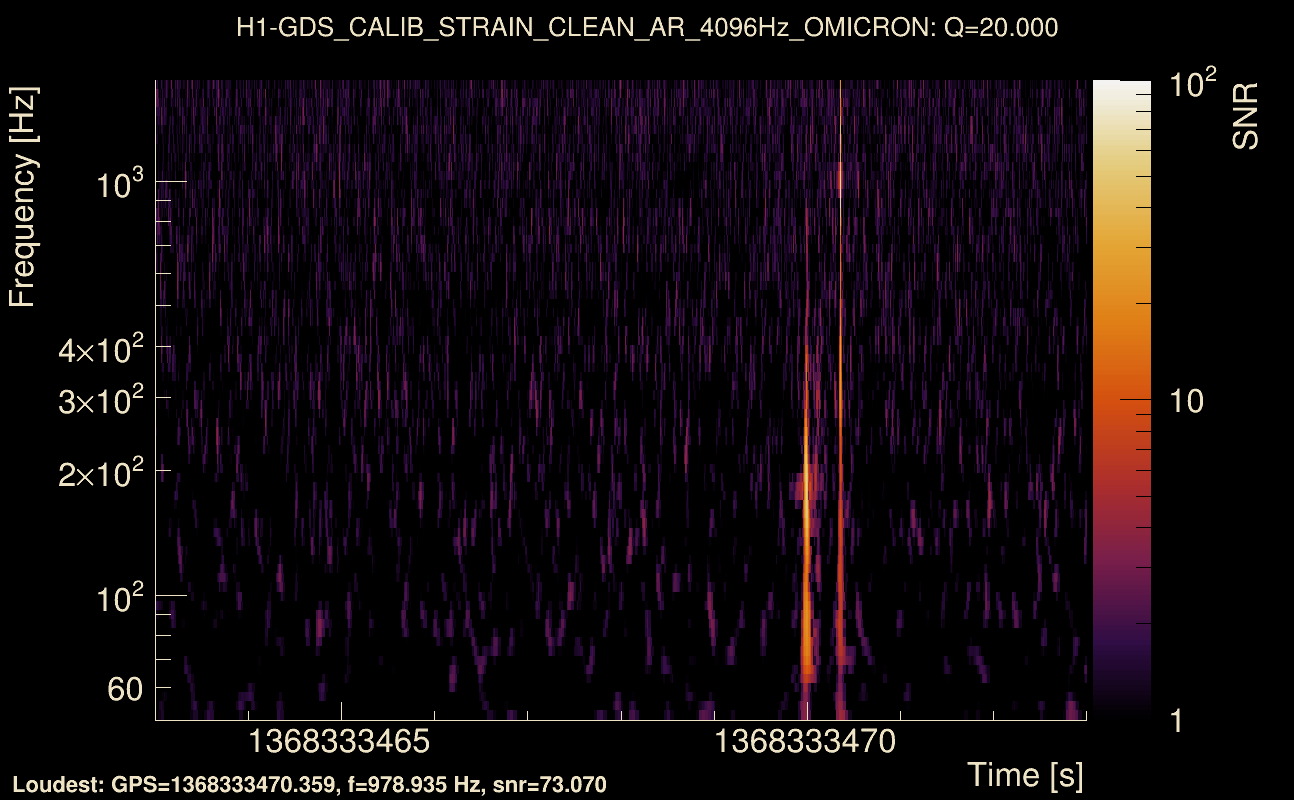
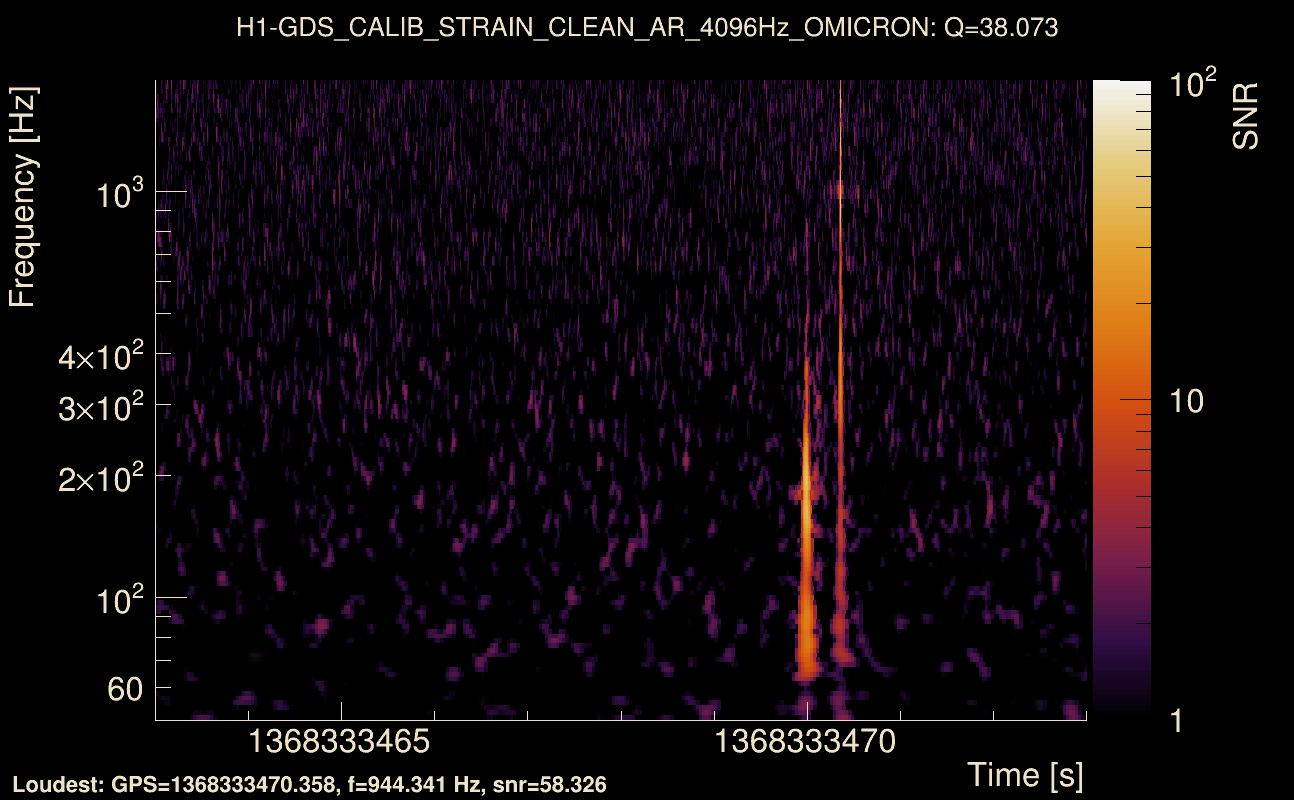
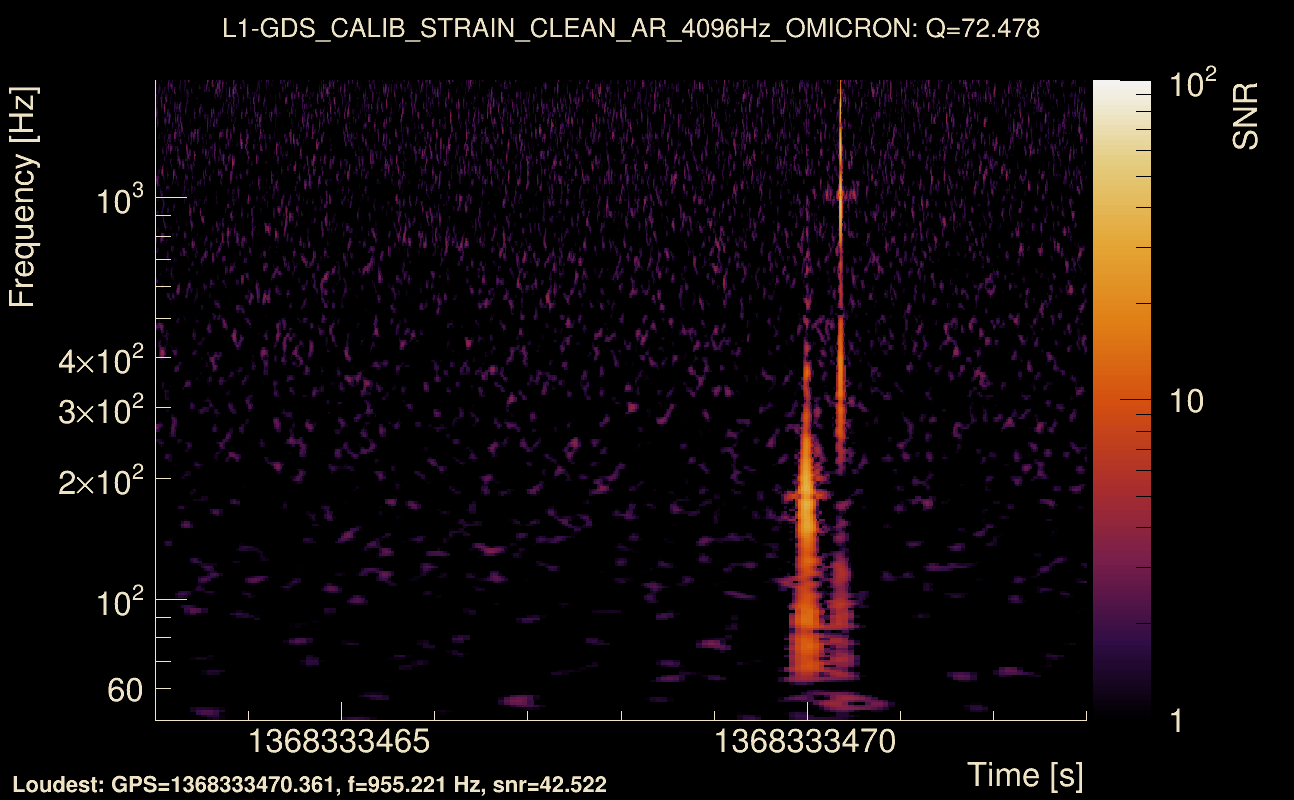
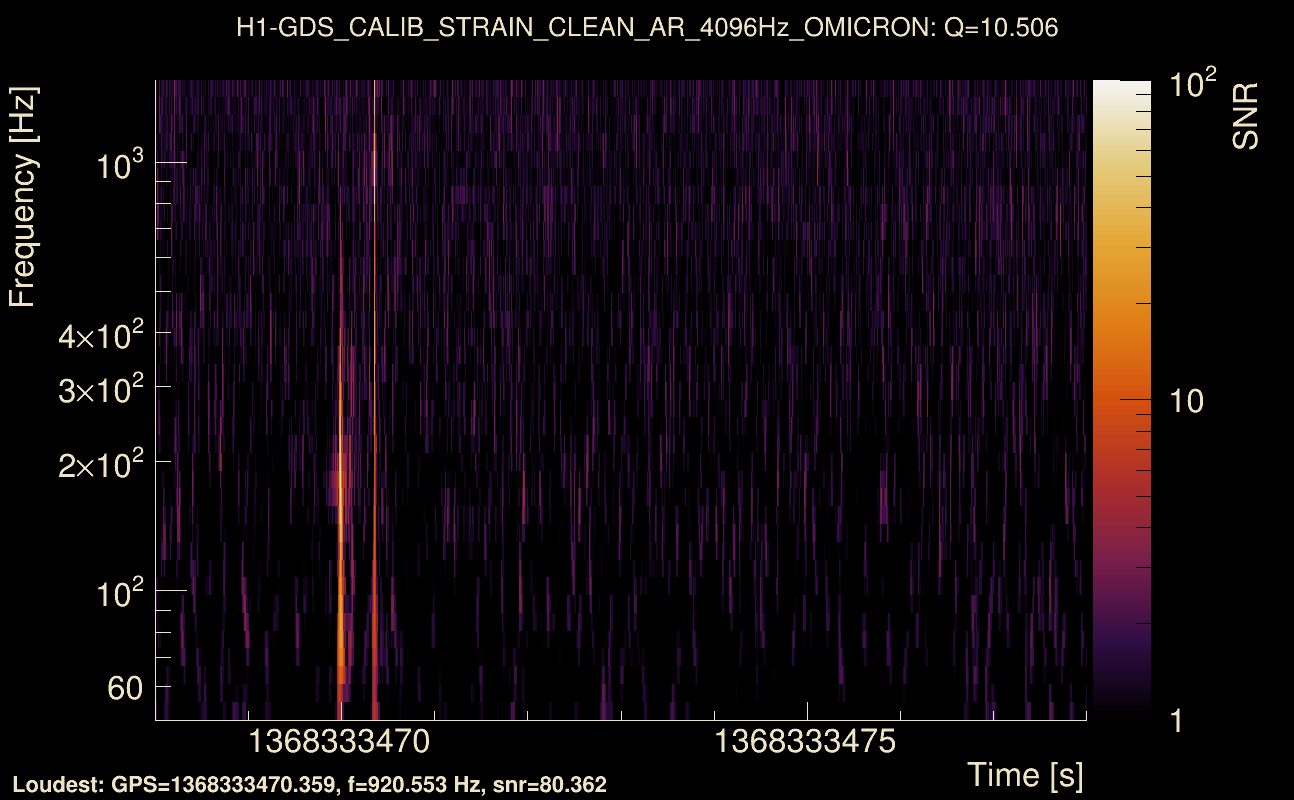
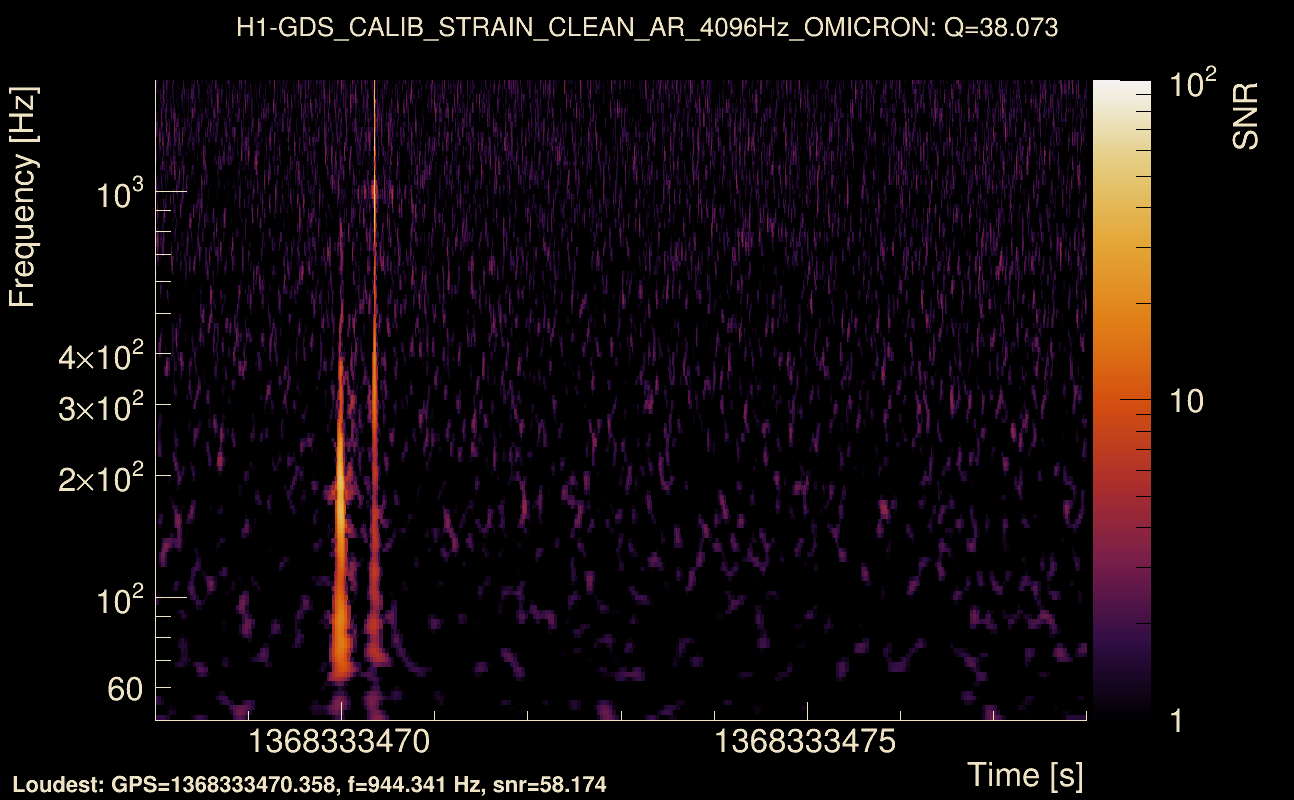
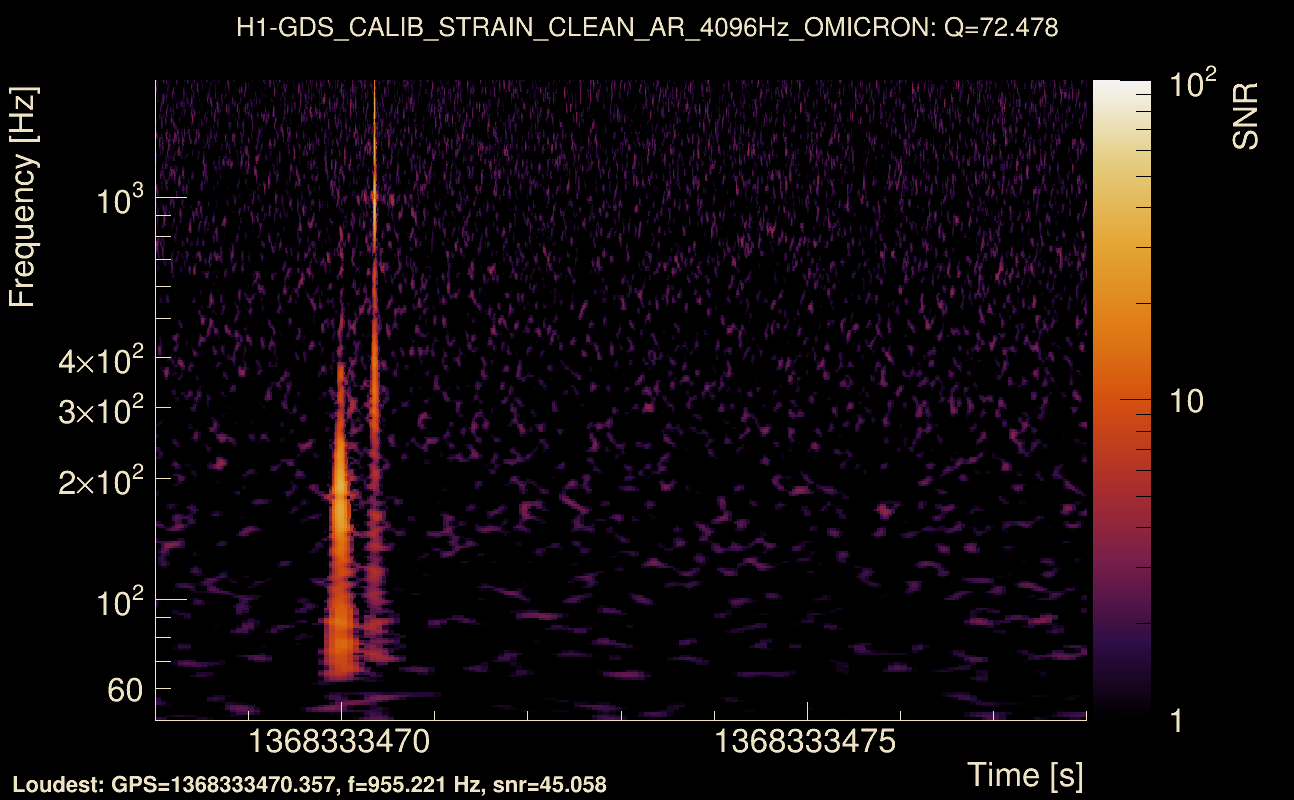
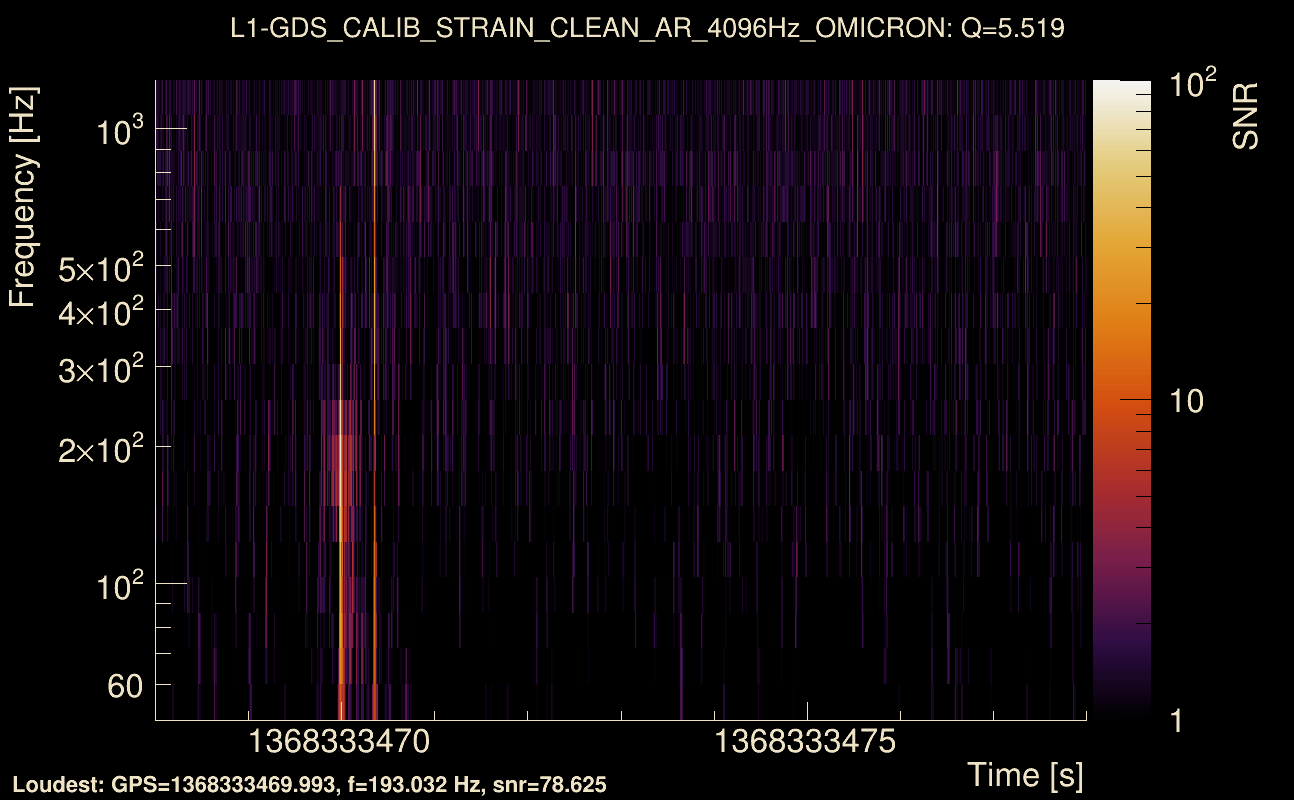
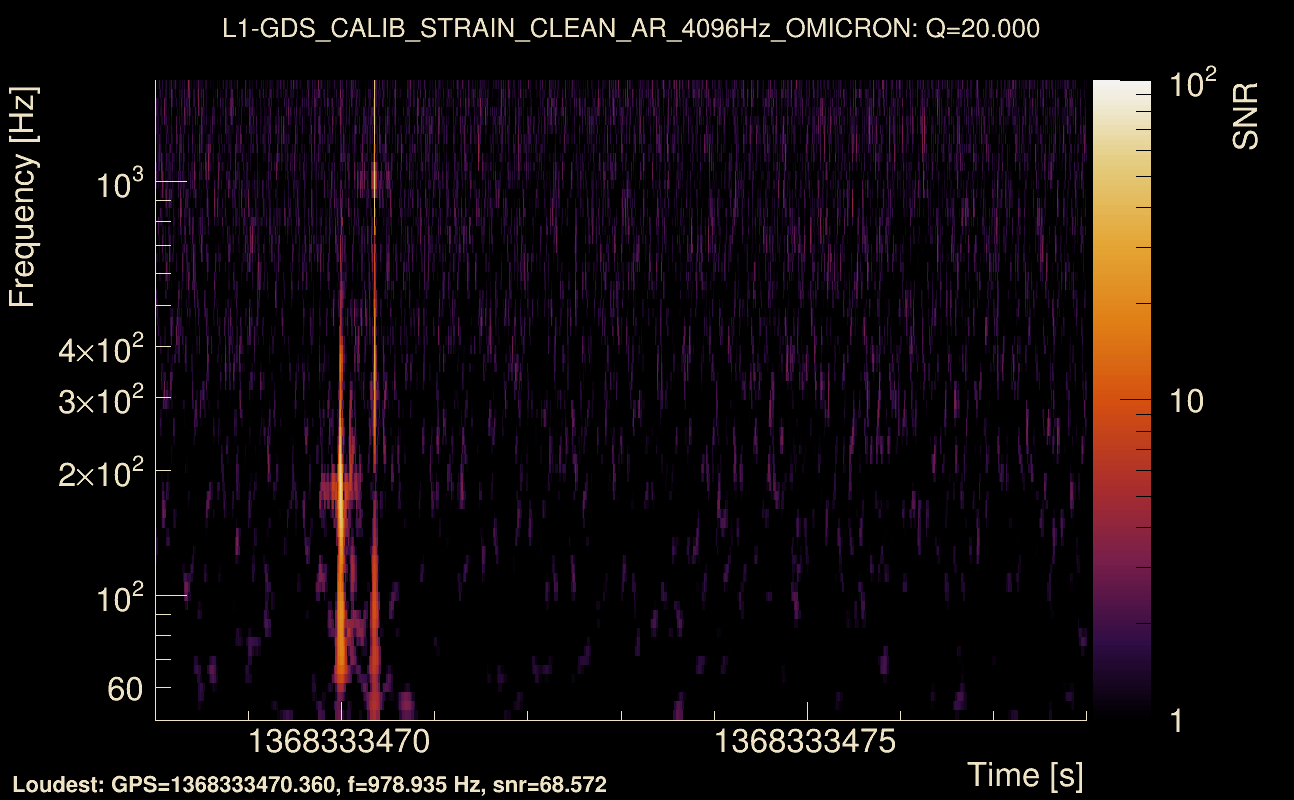
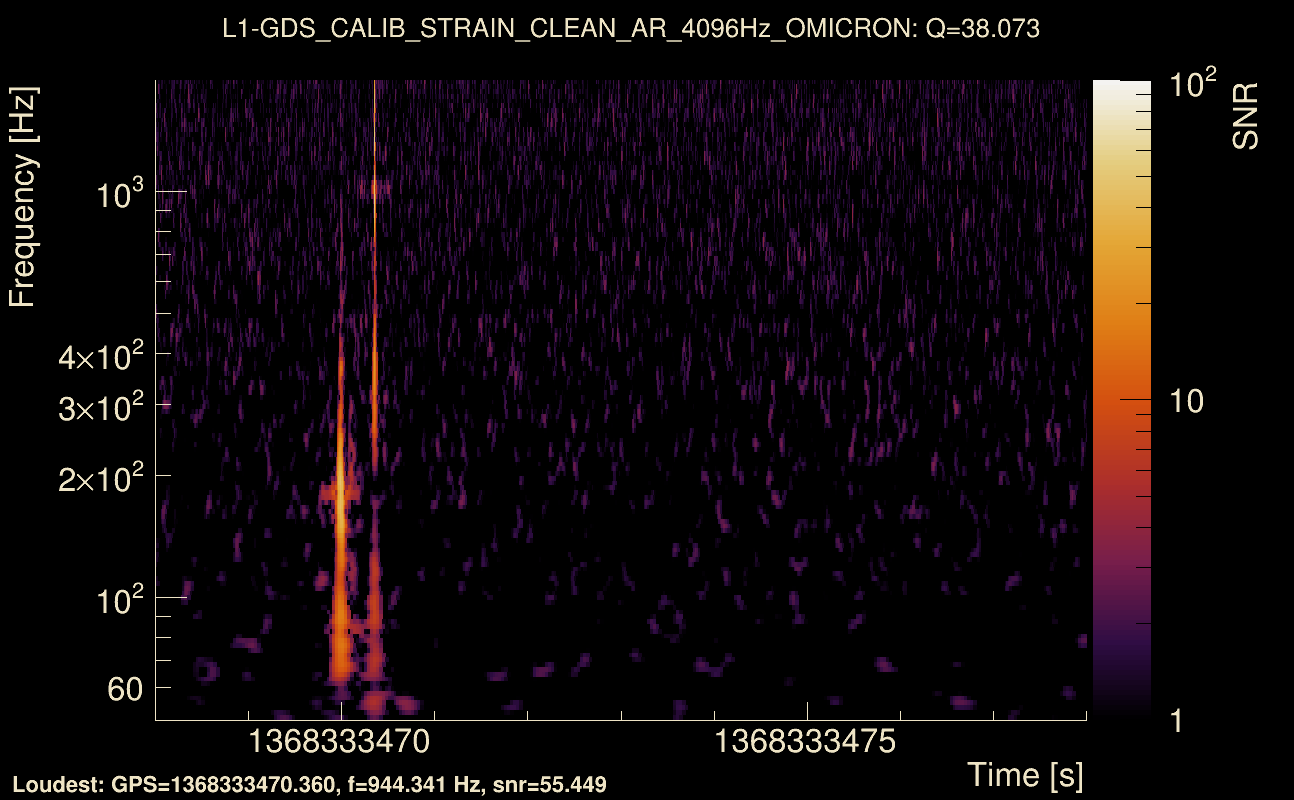
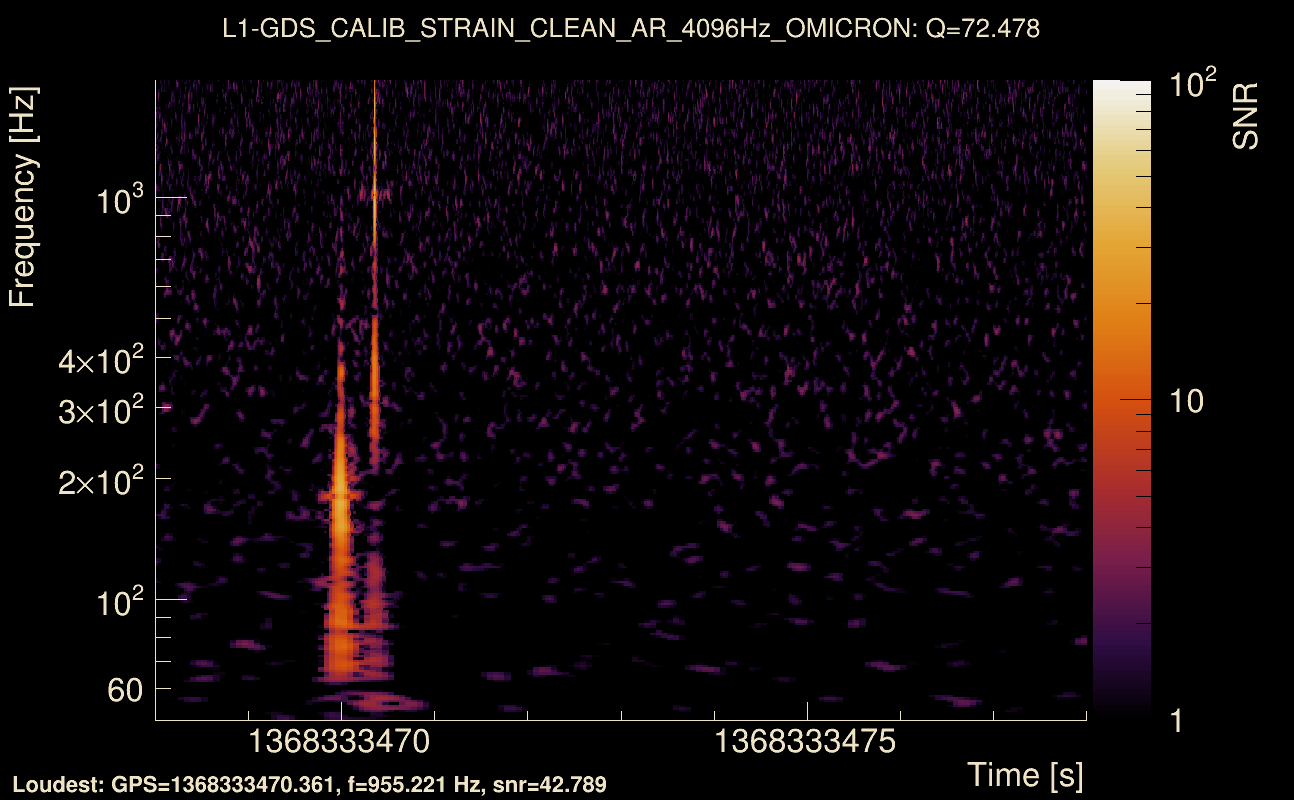
| Event time t(H1): | GPS = 1368333468 (Wed May 17 04:37:30 2023 ) → GPS = 1368333478 (Wed May 17 04:37:40 2023 ) |
| Event time t(L1): | GPS = 1368333468 (Wed May 17 04:37:40 2023 ) → GPS = 1368333478 (Wed May 17 04:37:40 2023 ) |
| Omicron analysis time window (H1): | GPS = 1368333465 → GPS = 1368333481 |
| Omicron analysis time window (L1): | GPS = 1368333465 → GPS = 1368333481 |
| Time delay between detectors t(L1) - t(H1): | 0.000830367 s (slice index = 108 / 217), δt_gw = 0.000830367 s |
| Time delay standard deviation: | 0.0206413 s |
| [targeted mode] Time delay probability: | 0.791335 (0.264577 sigmas), δt_target = 0.00204945 s |
| Frequency: | 294.564 Hz |
| Ξ: | 0.962668 ± 0.0112303 (variance = 0.000126119): Q0: 0.973783, Q1: 0.973707, Q2: 0.959854, Q3: 0.956011, Q4: 0.944241 |
| Rank: | R_A = 0.962668 |
| Log of amplitude ratio (L1/H1): | 0.0644201, variance = 0.158414 (L1/H1: 0.0542326, variance = 0.316478, H1/L1: -0.0728285, variance = 0.312235) |
| Amplitude ratio (L1/H1): | 1.06654 ⋇ 1.48886 (L1/H1: 1.05573 ⋇ 1.75517, H1/L1: 0.92976 ⋇ 1.74854) |
| Amplitude ratio H1|L1 compatibility (probability): | 0.981289 |
| Antenna factor probability: | 0.802443 |
| Number of rejected frequency rows: | Q0: 0 / 18, Q1: 0 / 36, Q2: 0 / 70, Q3: 9 / 134, Q4: 20 / 258 |
| Maximum signal-to-noise ratio: | H1: 80.5241, L1: 88.6346 |
| SNR variance: | H1: 2.5874, L1: 3.02422 |
| Click here for a zoomed plot | Click here for a zoomed plot | Click here for a zoomed plot | Click here for a zoomed plot | Click here for a zoomed plot |
 |
 |
 |
 |
 |
 |
 |
 |
 |
 |
 |
 |
 |
 |
 |
 |
 |
 |
 |
 |
 |
 |
 |
 |
 |
 |
 |
 |
 |
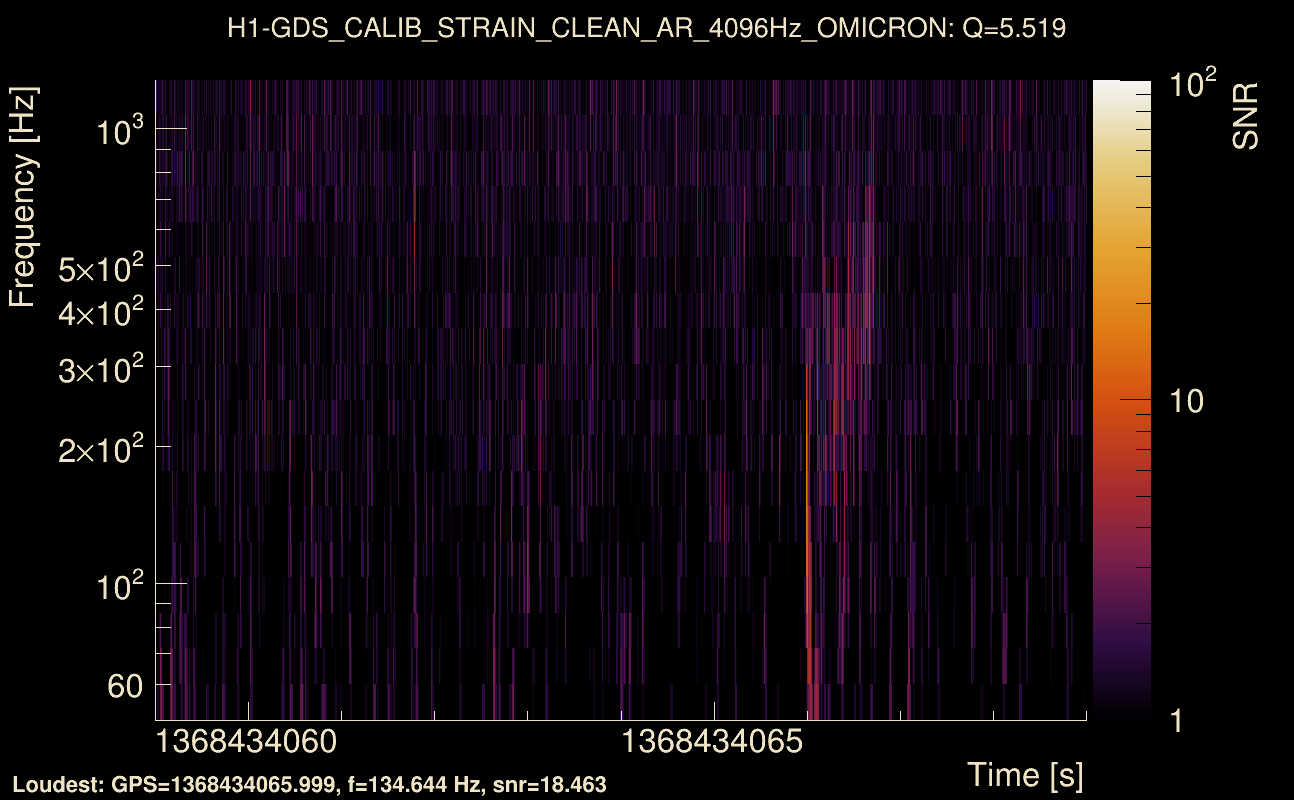
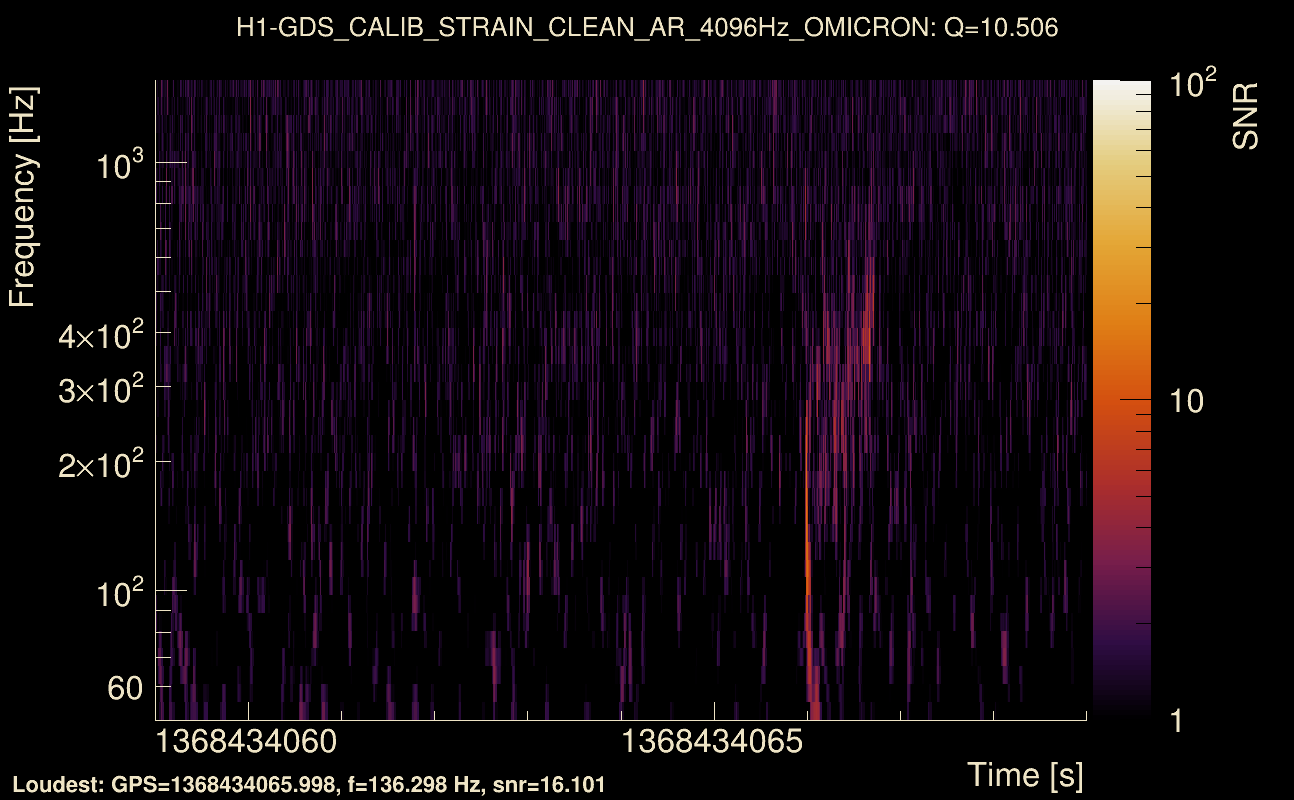
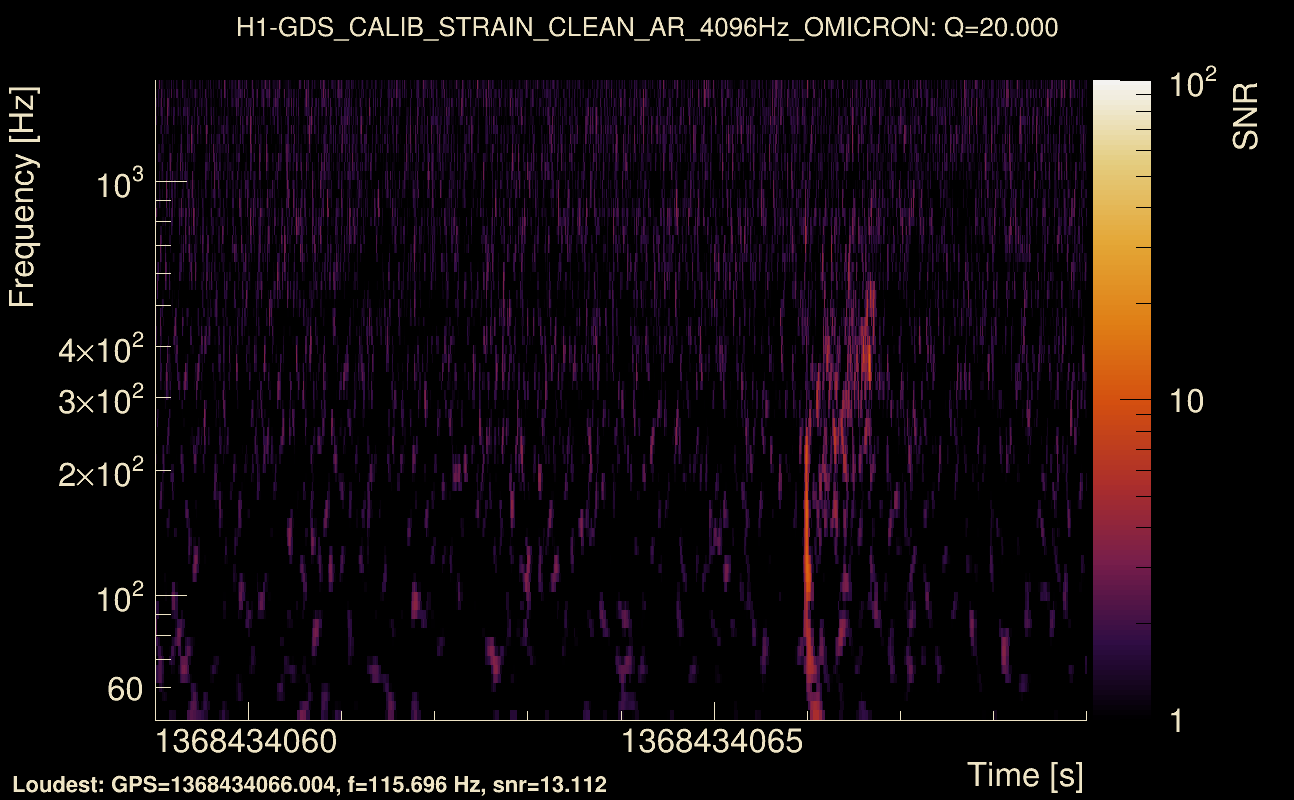
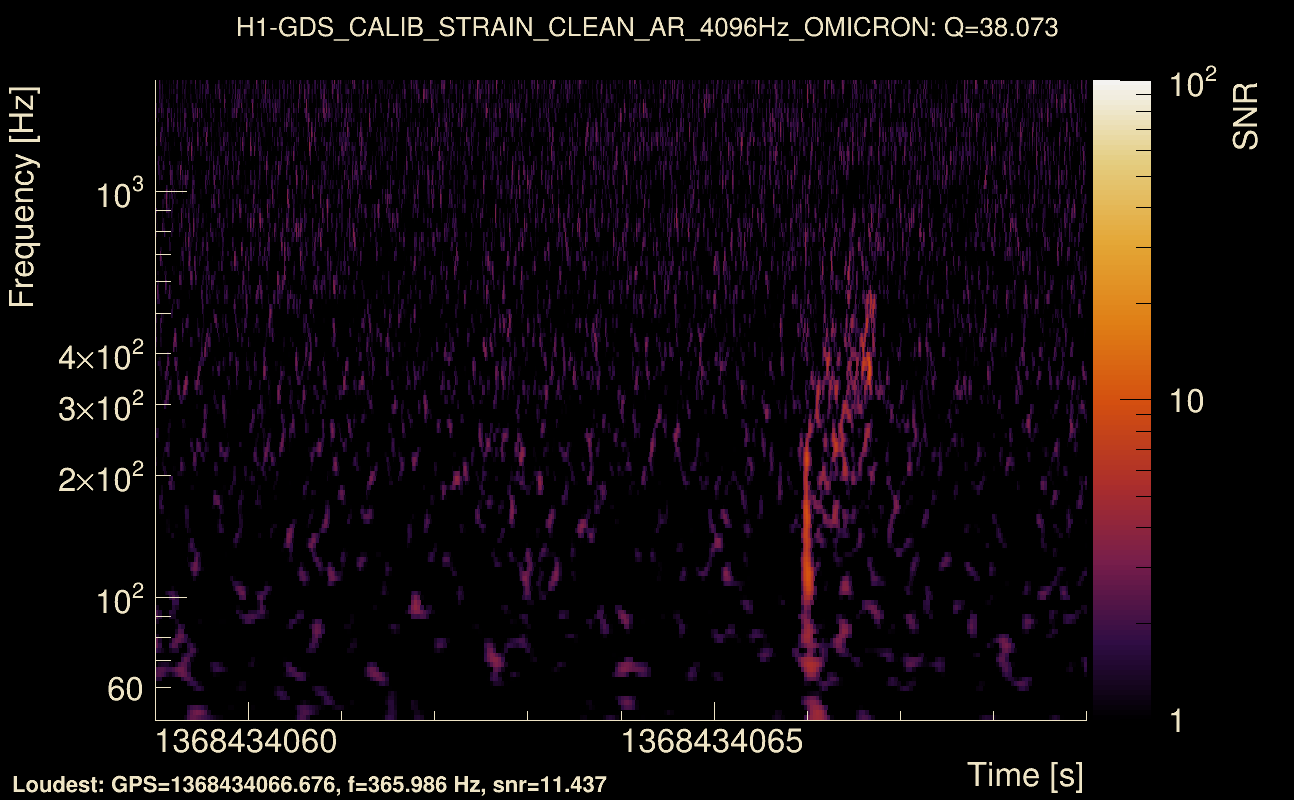
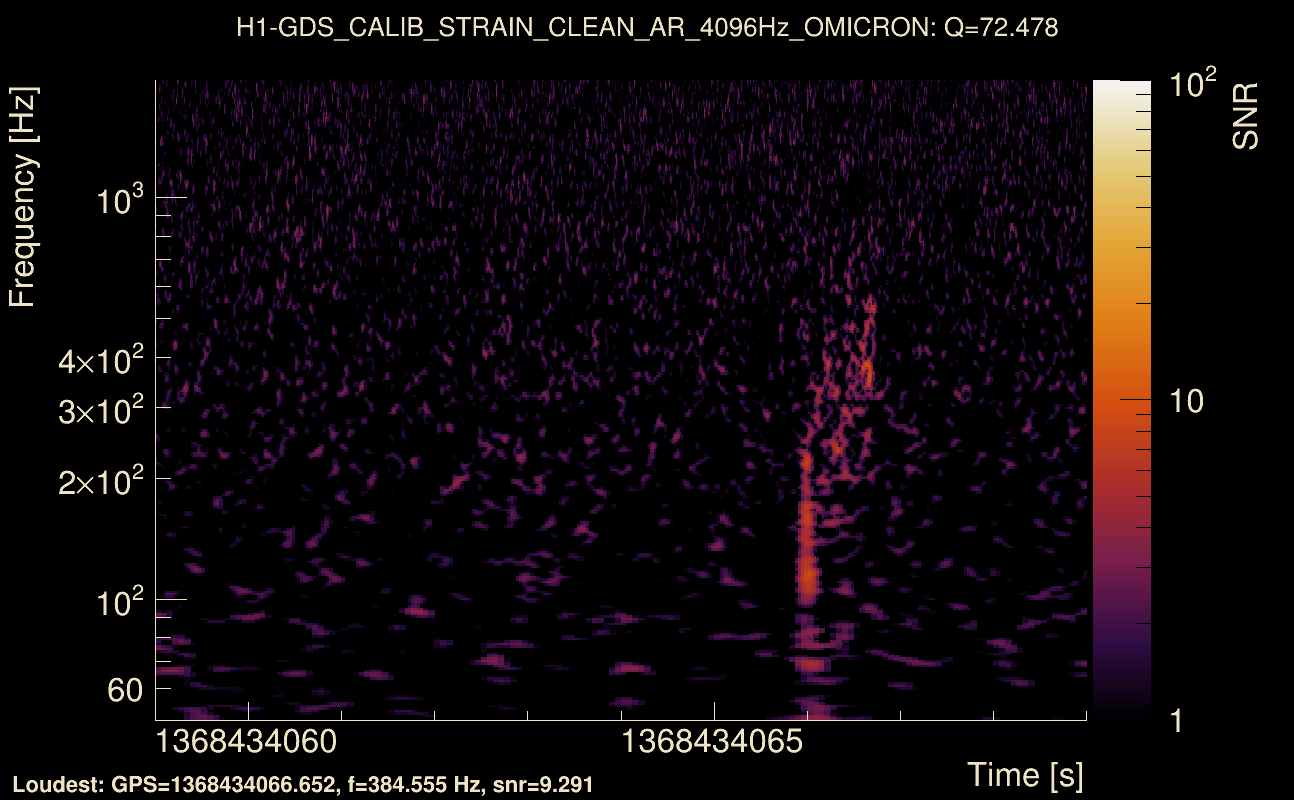
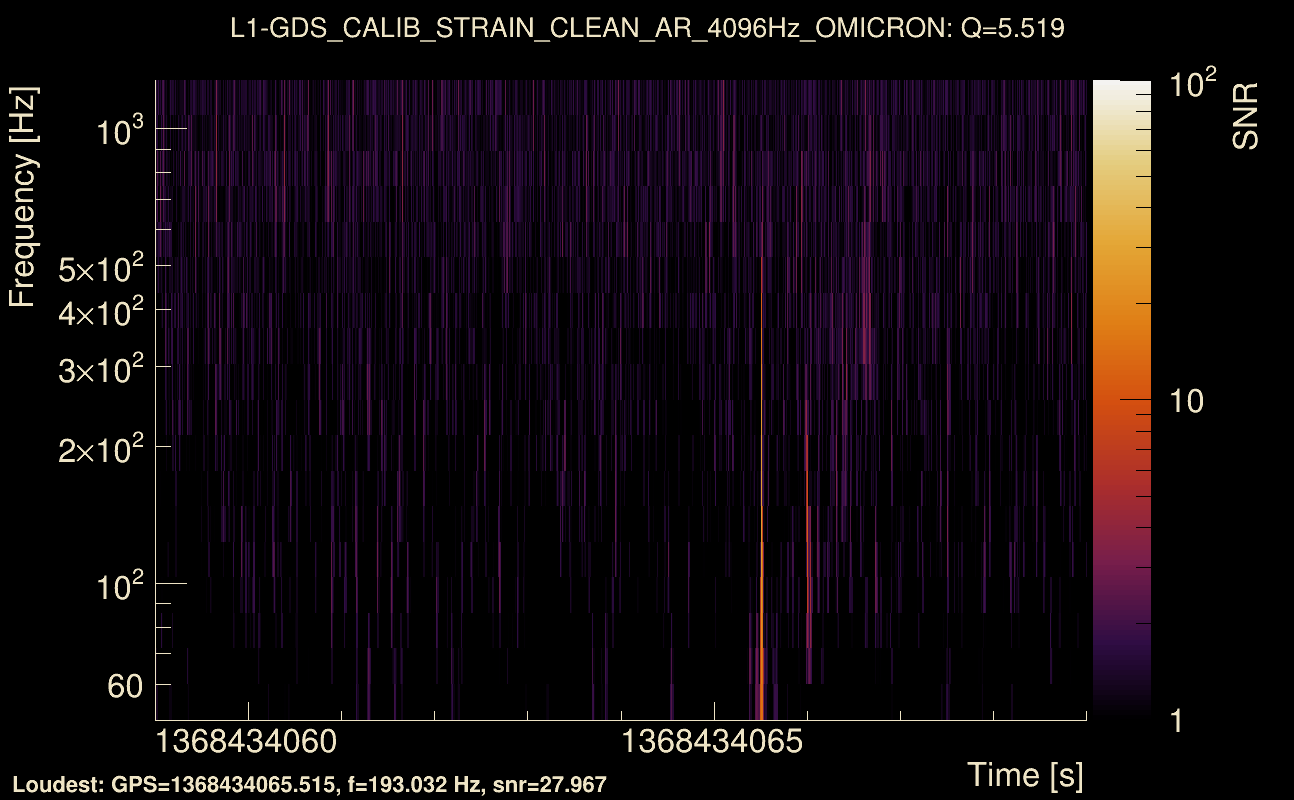
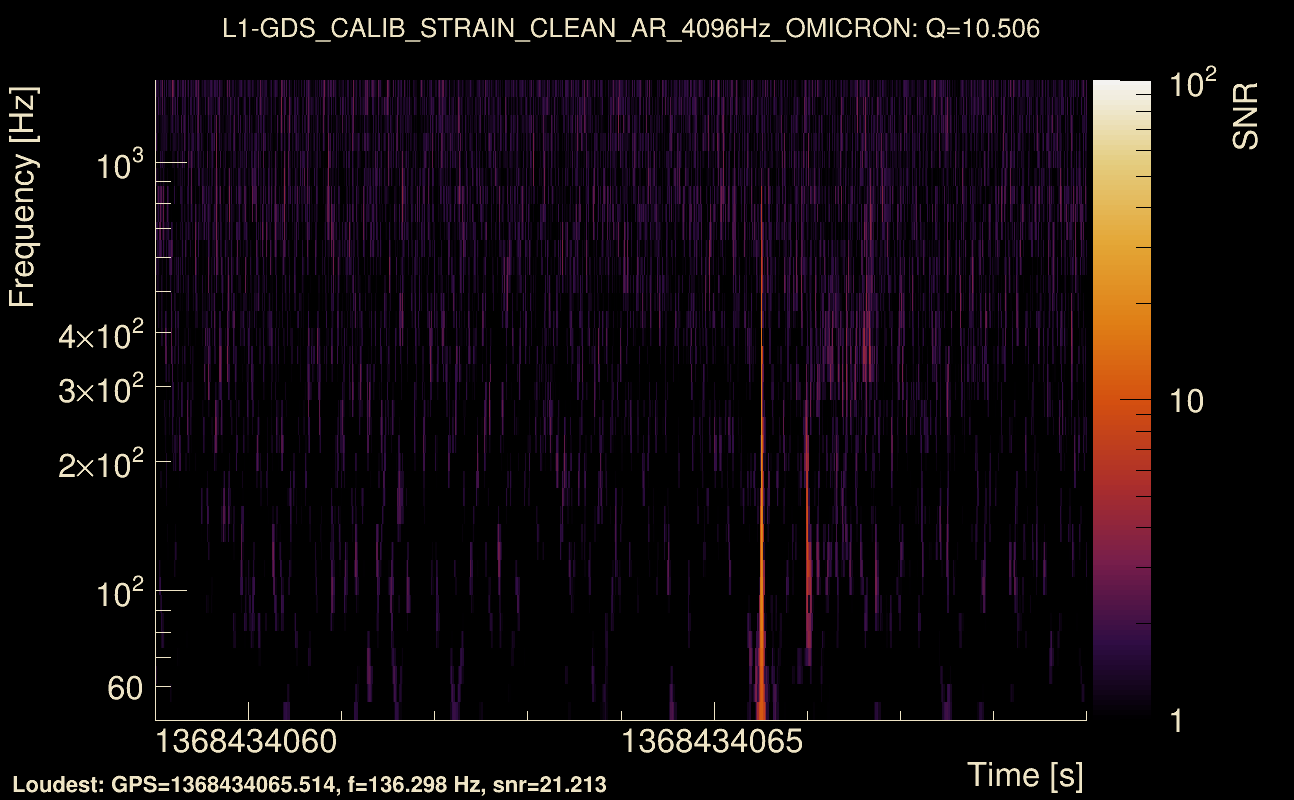
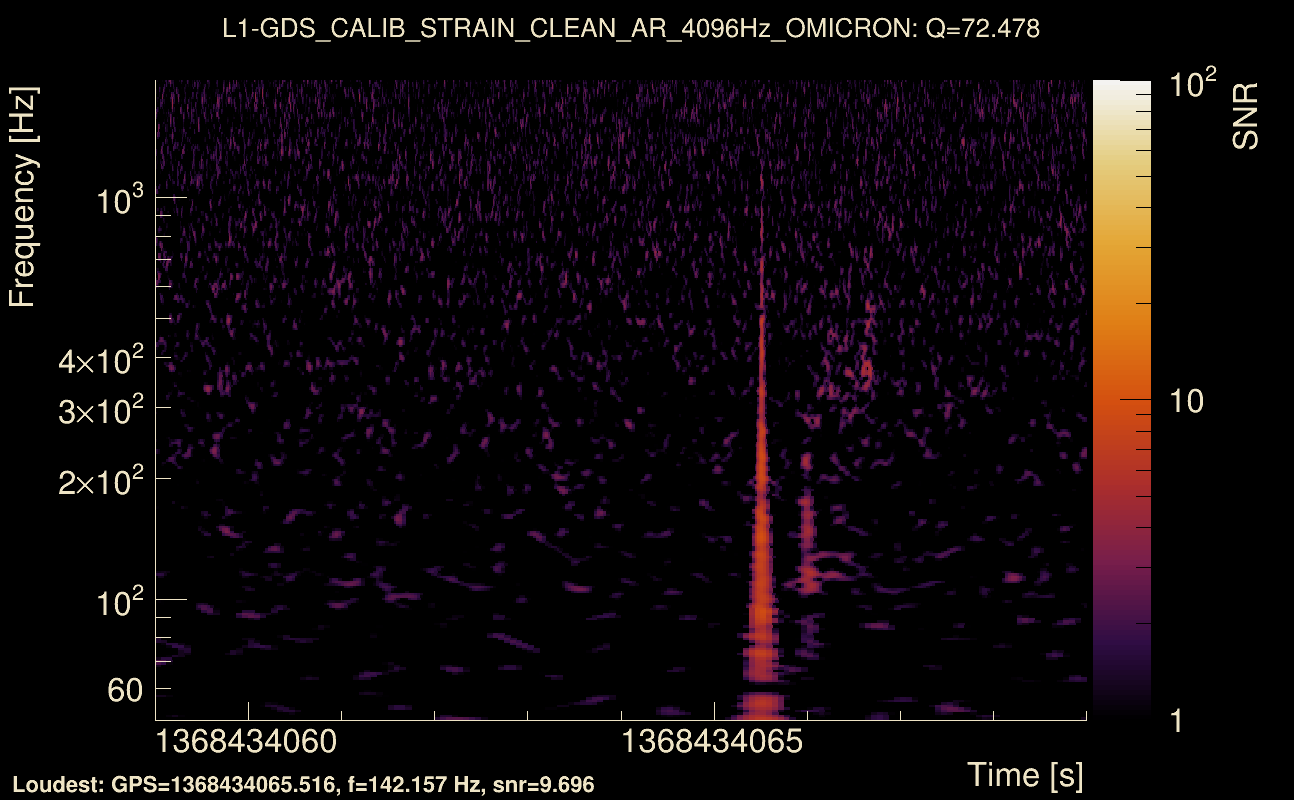
| Event time t(H1): | GPS = 1368434059 (Thu May 18 08:34:01 2023 ) → GPS = 1368434069 (Thu May 18 08:34:11 2023 ) |
| Event time t(L1): | GPS = 1368434059 (Thu May 18 08:34:11 2023 ) → GPS = 1368434069 (Thu May 18 08:34:11 2023 ) |
| Omicron analysis time window (H1): | GPS = 1368434056 → GPS = 1368434072 |
| Omicron analysis time window (L1): | GPS = 1368434056 → GPS = 1368434072 |
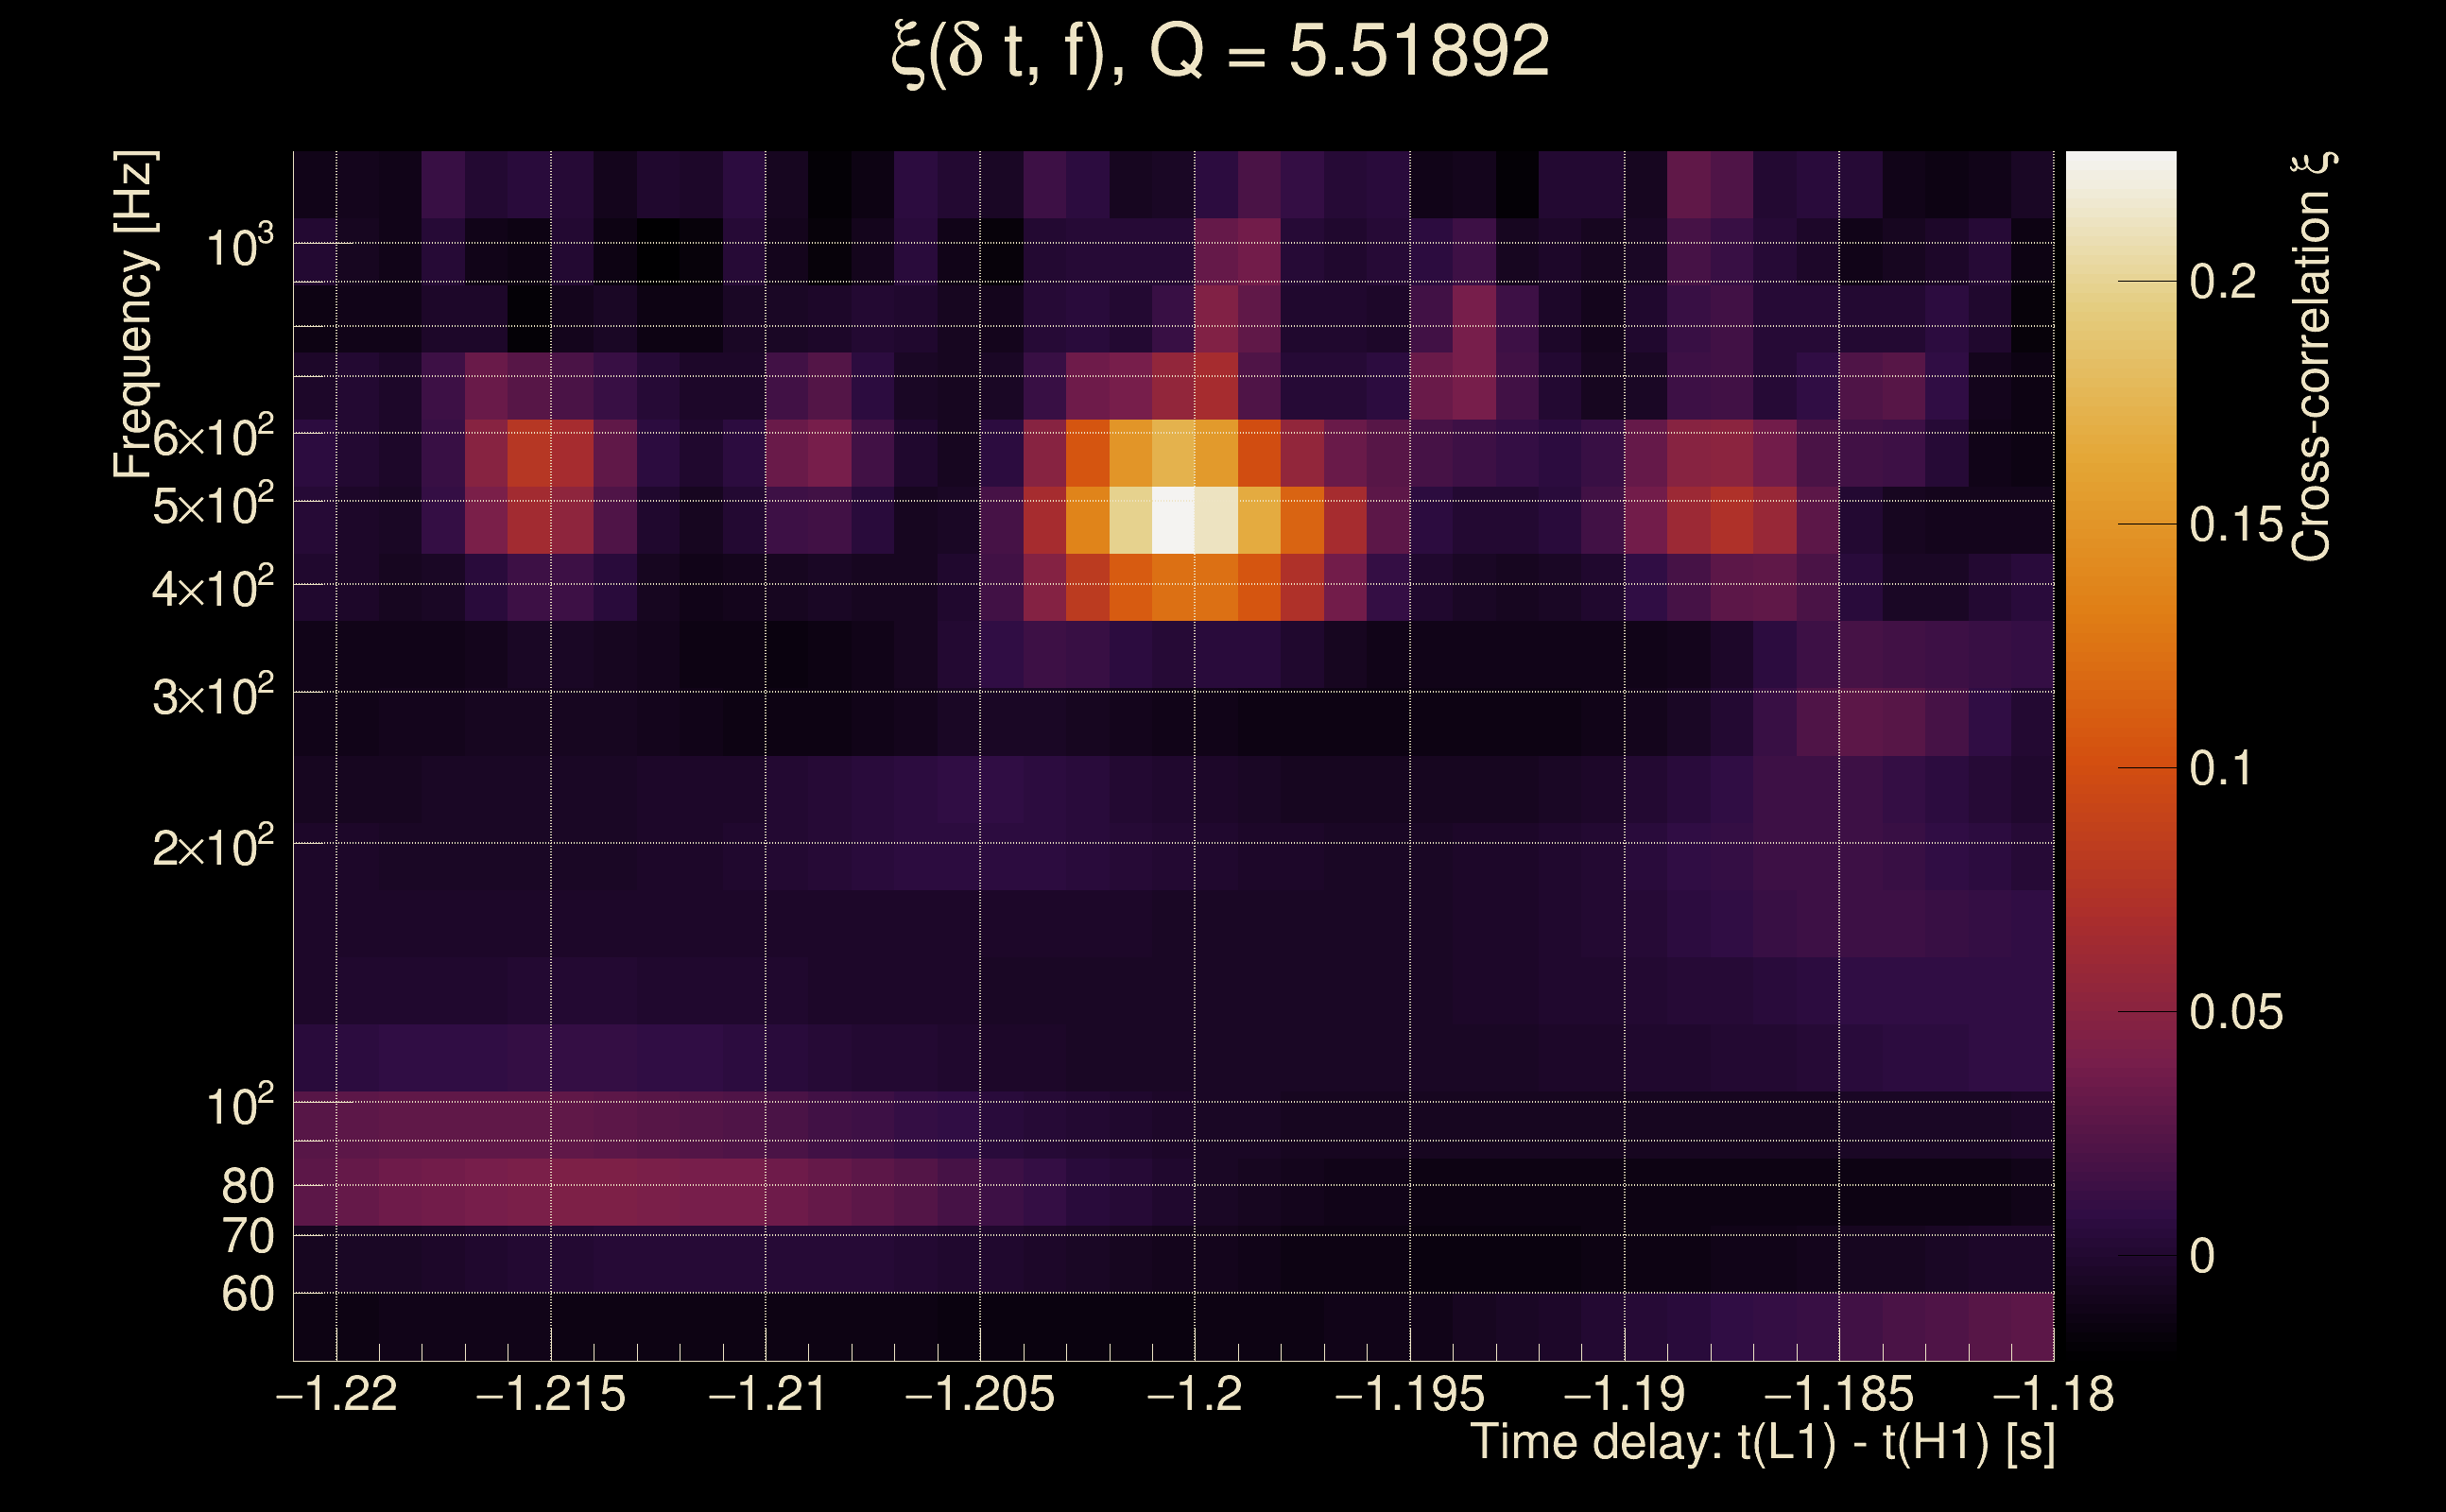
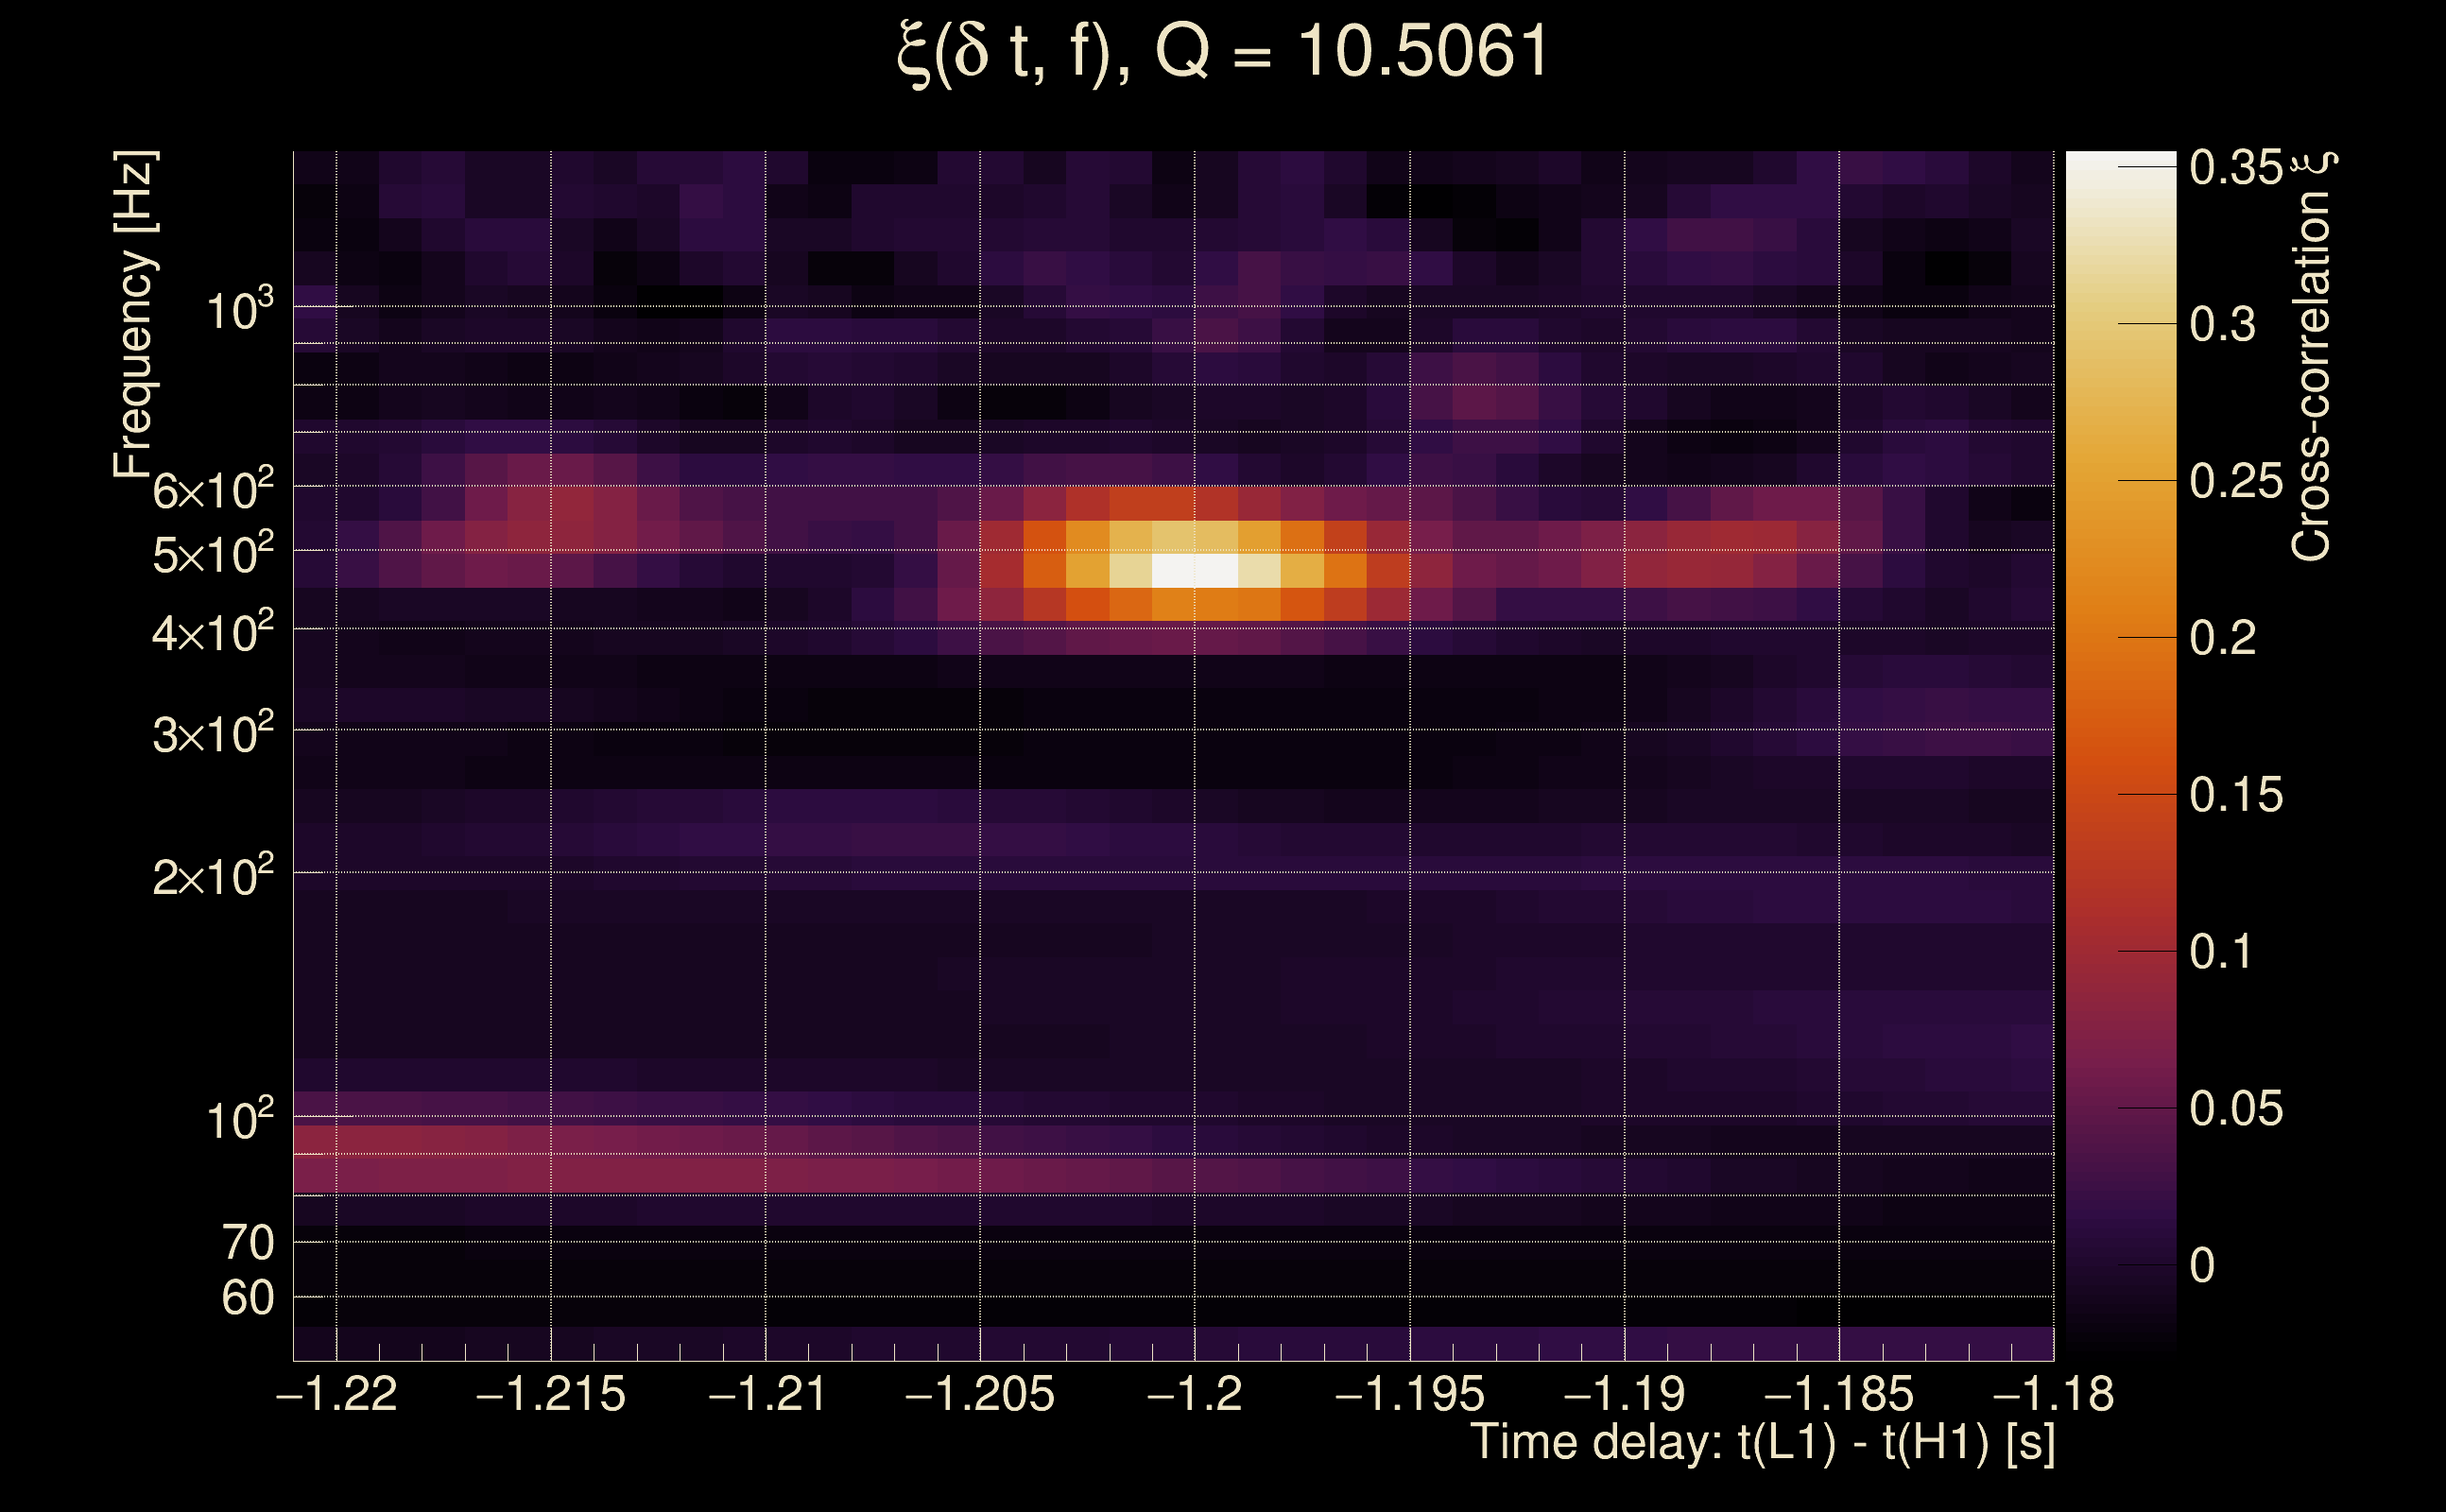
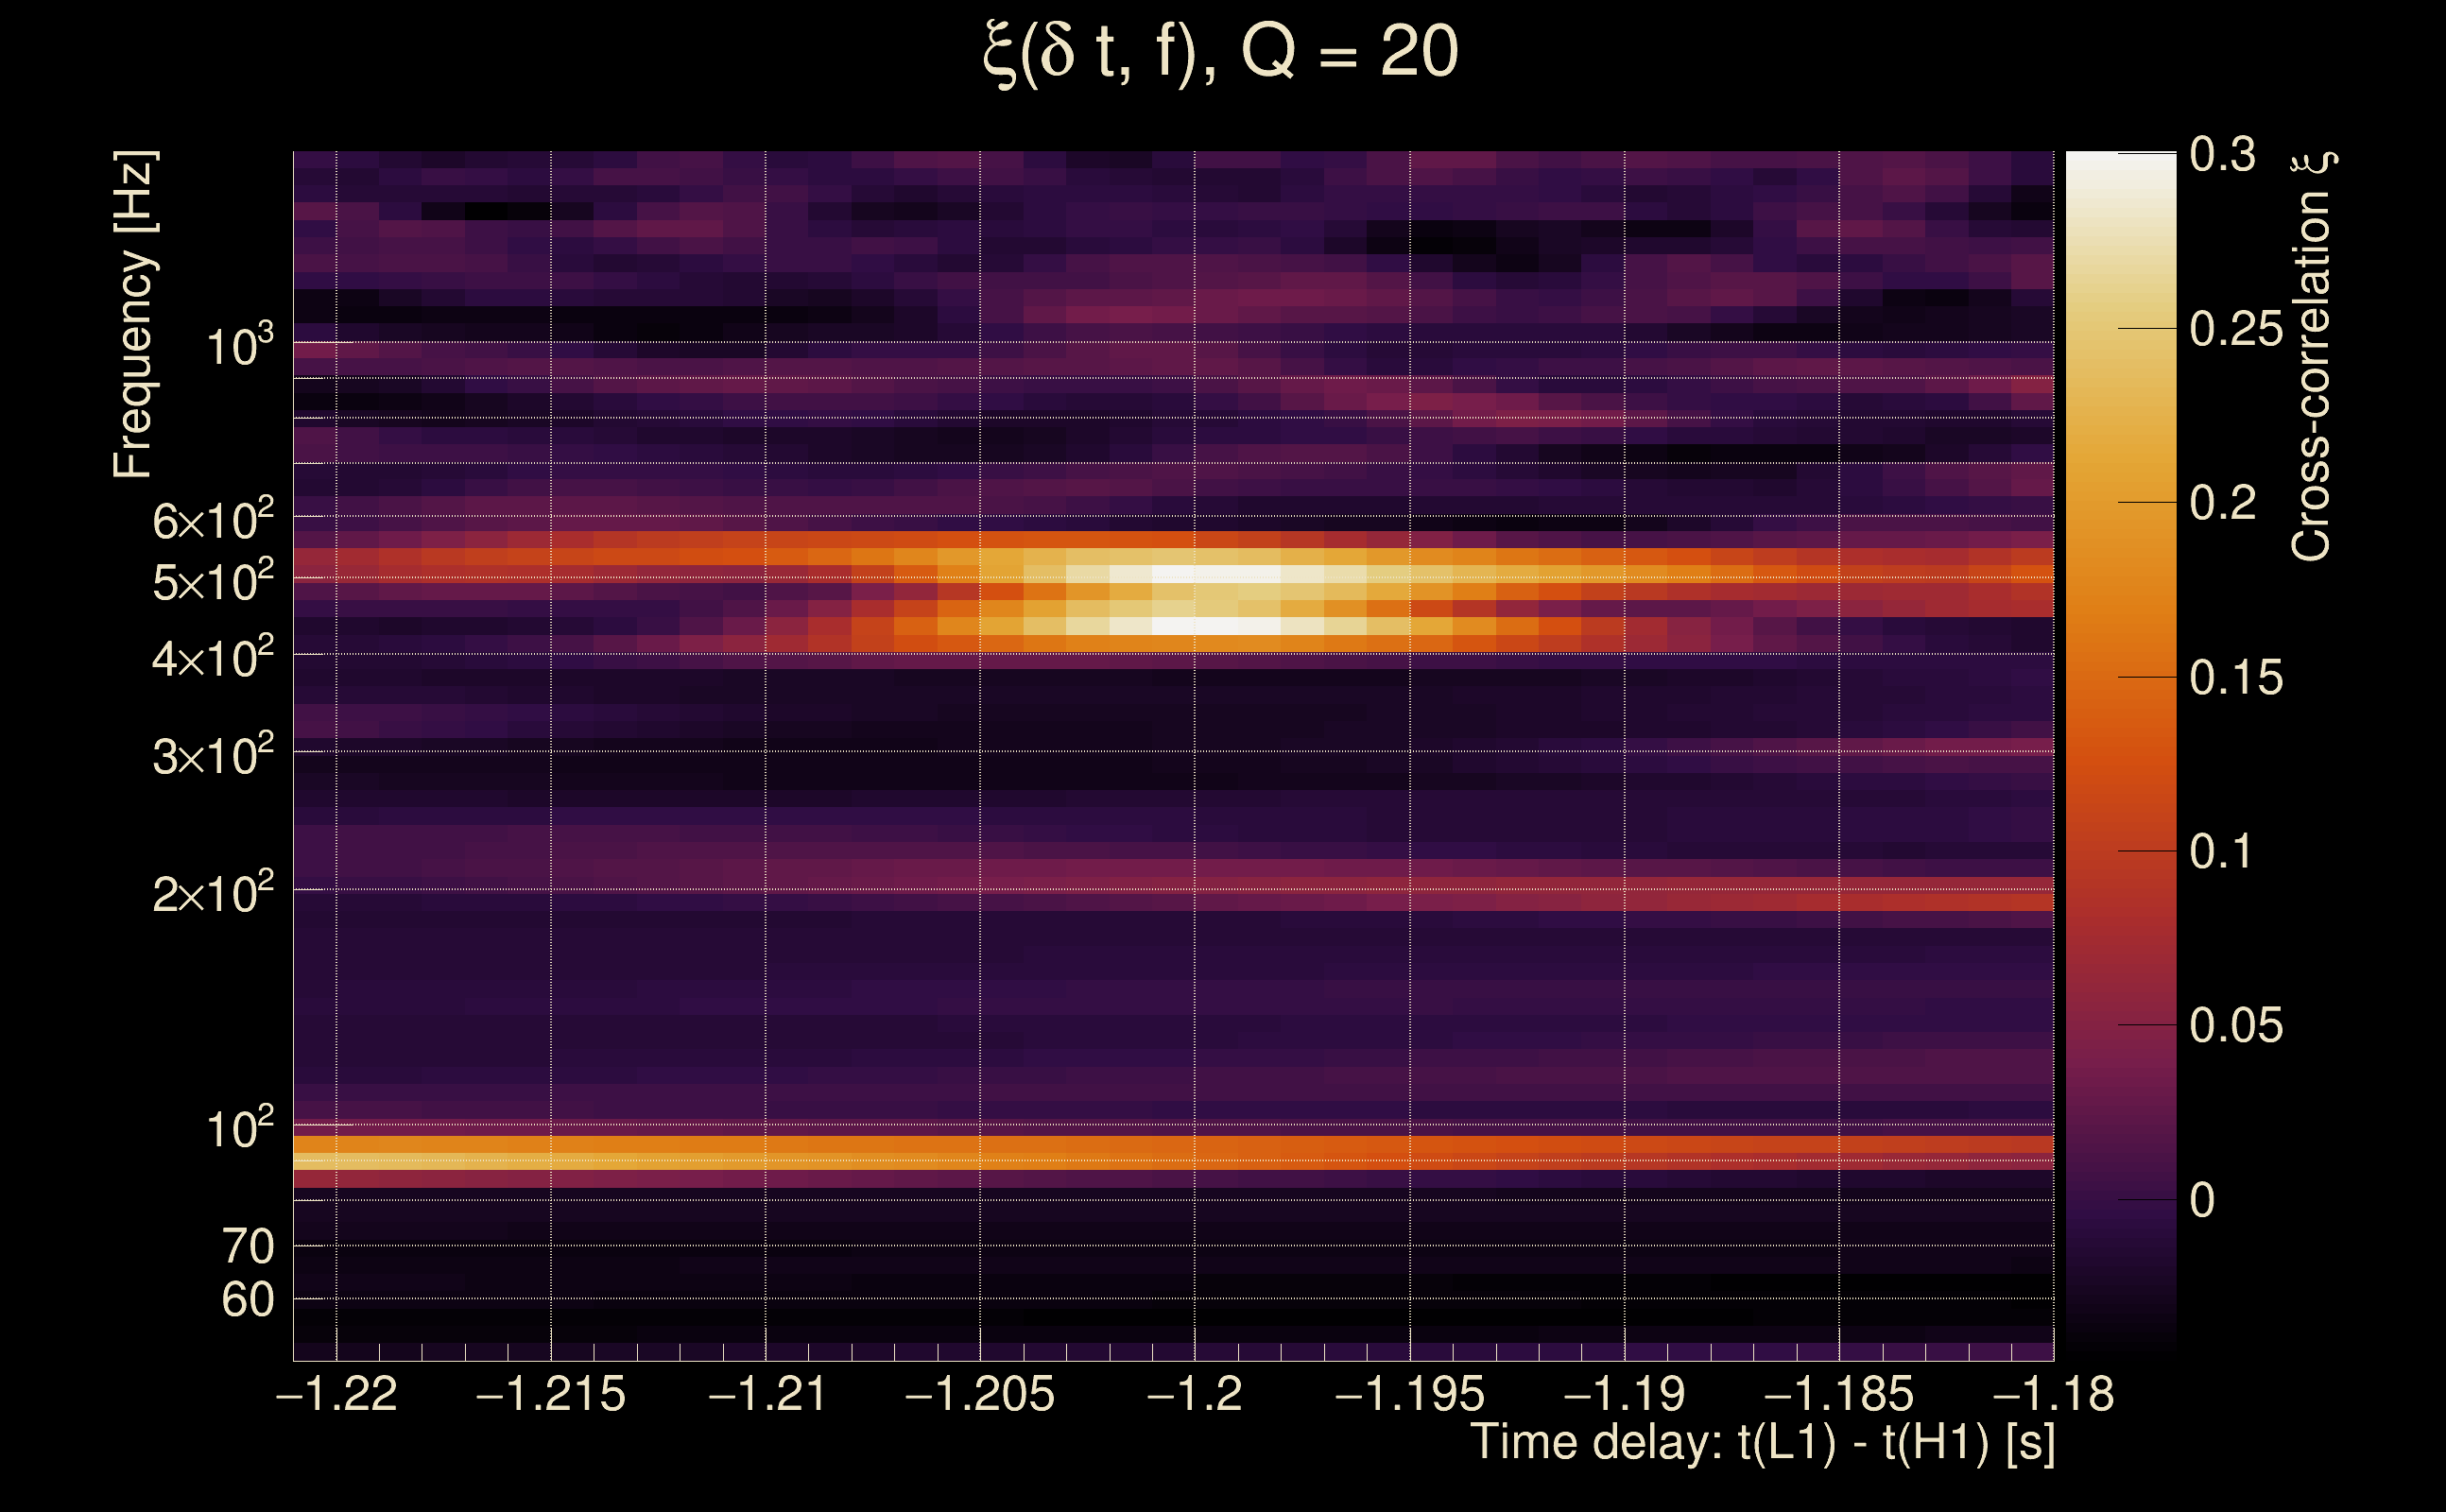
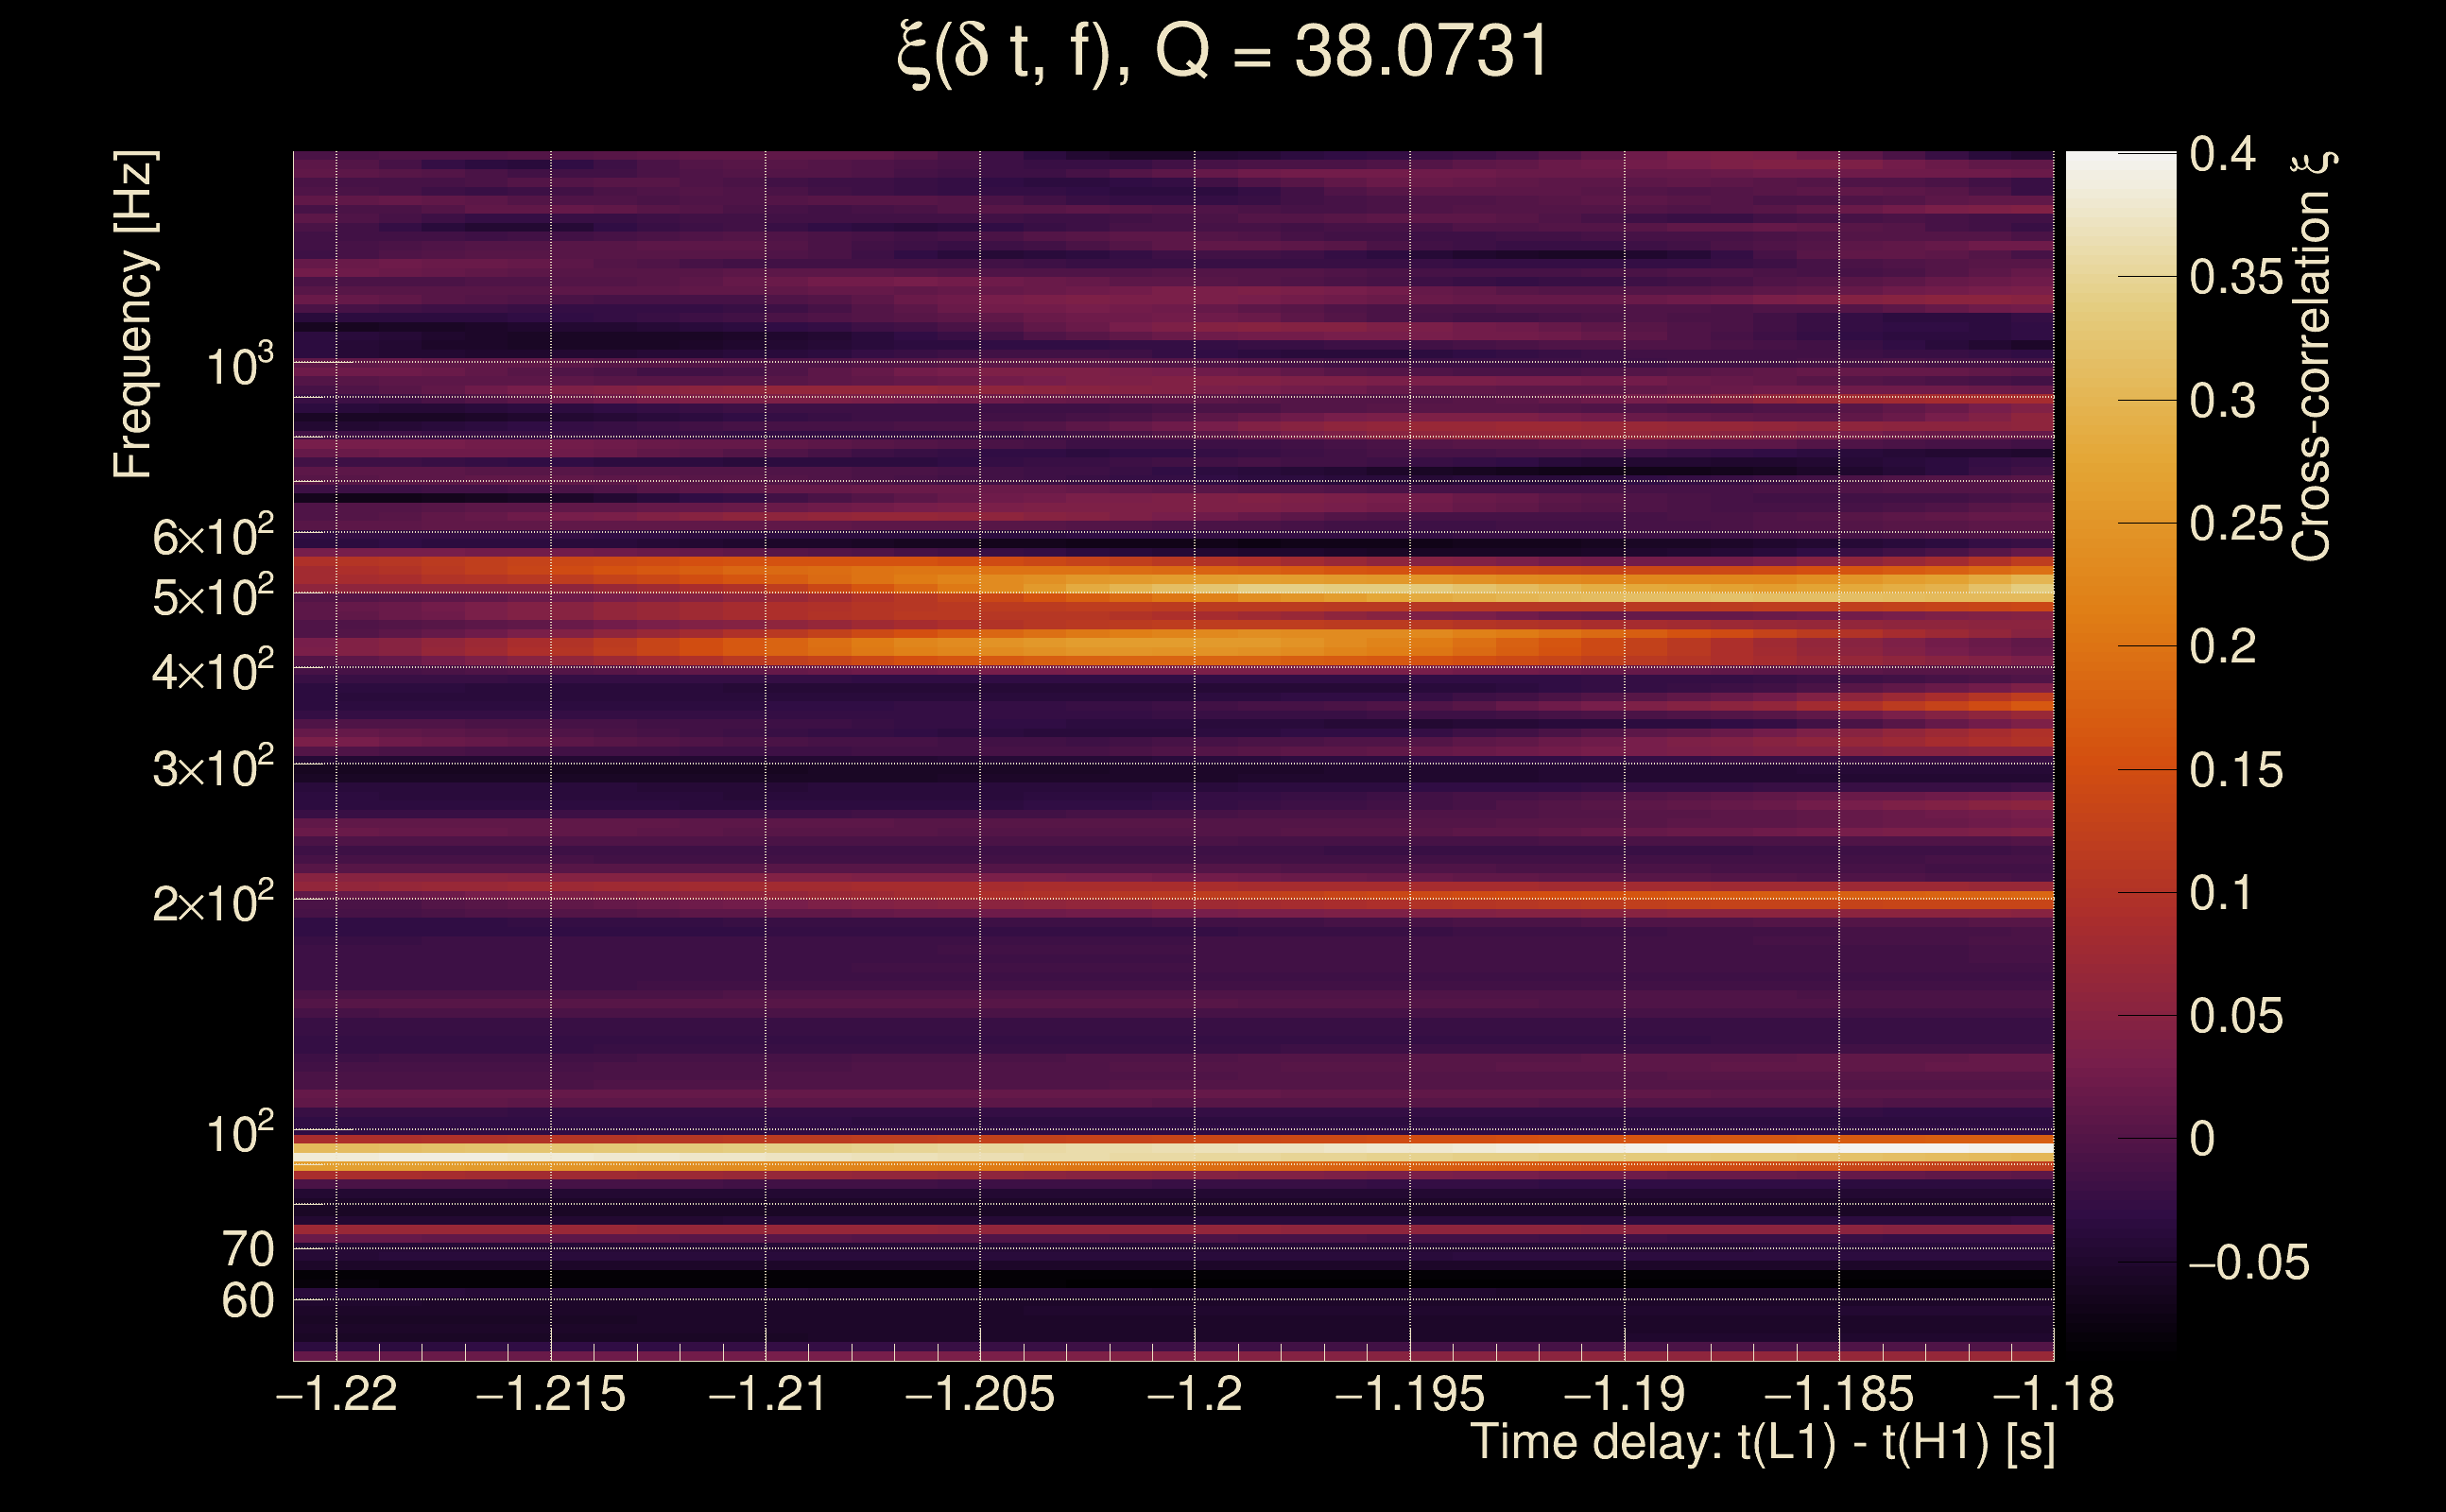
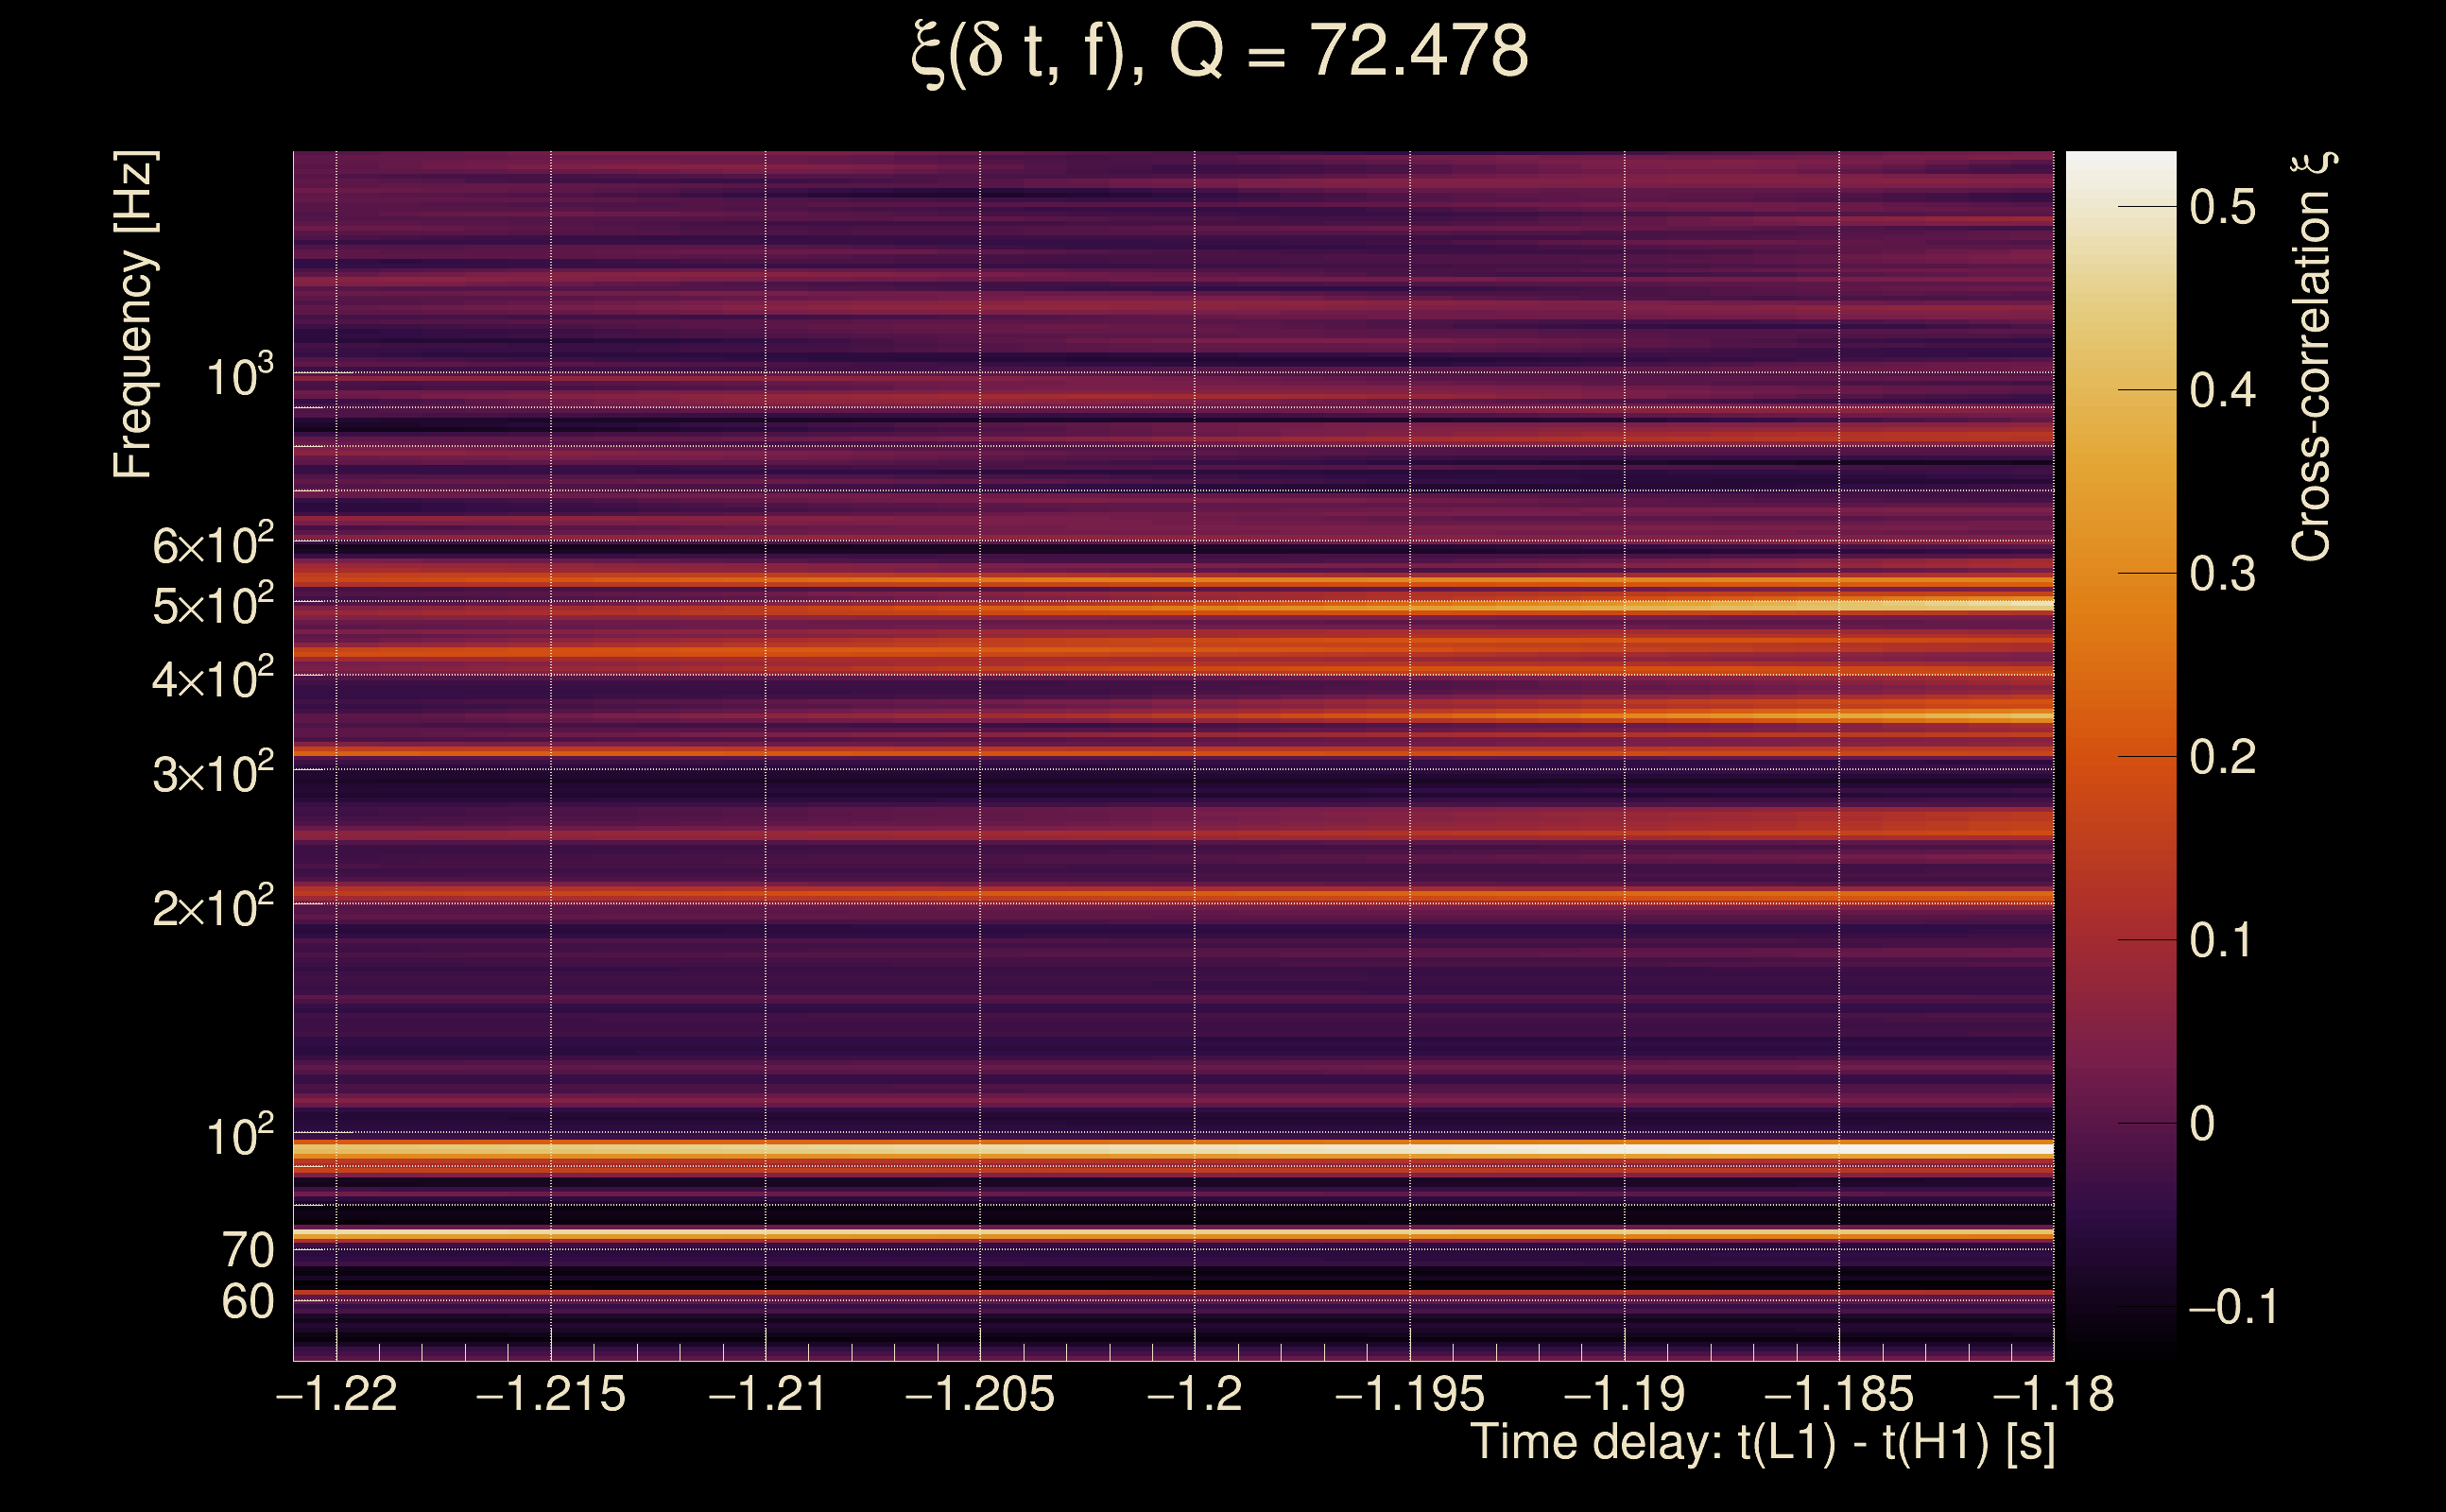
| Time delay between detectors t(L1) - t(H1): | -1.20018 s (slice index = 134 / 217), δt_gw = -0.00417709 s |
| Time delay standard deviation: | 0.0518427 s |
| [targeted mode] Time delay probability: | 0.000175048 (3.75255 sigmas), δt_target = 0.0020473 s |
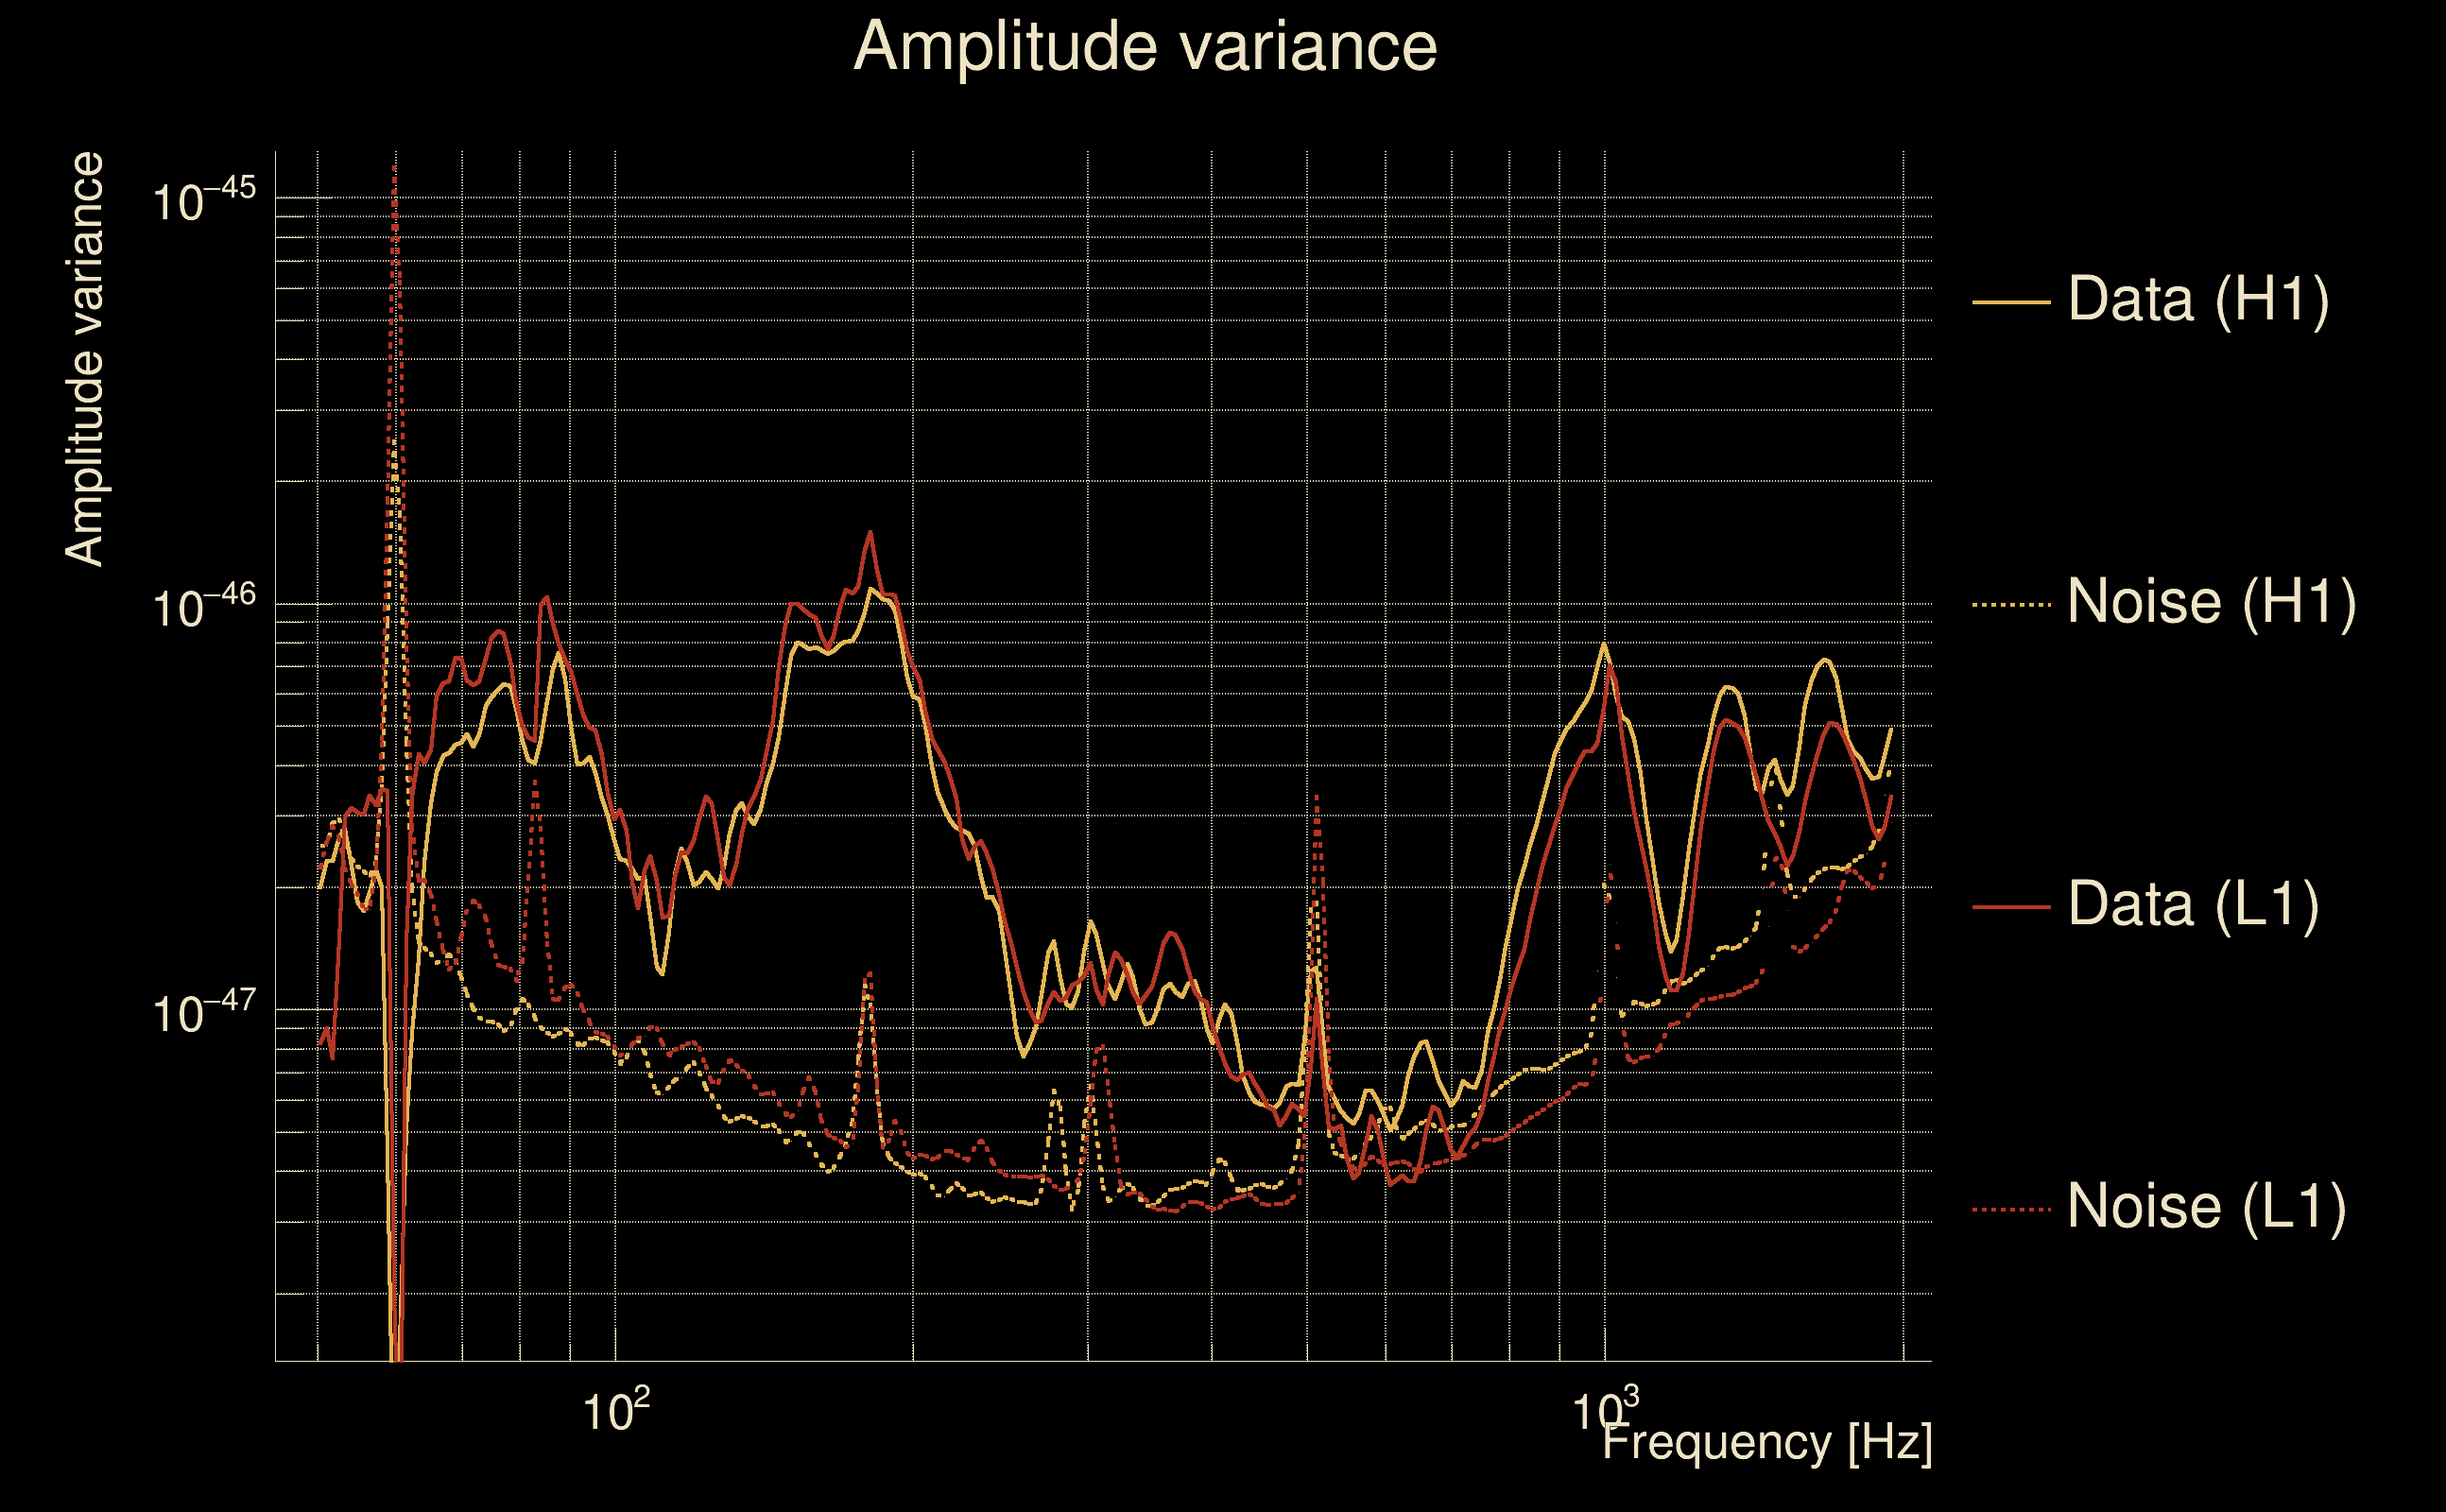
| Frequency: | 453.504 Hz |
| Ξ: | 0.0671829 ± 0.0440478 (variance = 0.00194021): Q0: 0.165918, Q1: 0.284405, Q2: 0.257969, Q3: 0.19797, Q4: 0.193521 |
| Rank: | R_A = 0.0671829 |
| Log of amplitude ratio (L1/H1): | 1.48762, variance = 0.799079 (L1/H1: -2.45969, variance = 1.54594, H1/L1: -2.94719, variance = 1.2879) |
| Amplitude ratio (L1/H1): | 4.42654 ⋇ 2.44467 (L1/H1: 0.0854617 ⋇ 3.46724, H1/L1: 0.0524871 ⋇ 3.11073) |
| Amplitude ratio H1|L1 compatibility (probability): | 0.00131874 |
| Antenna factor probability: | 0.0431927 |
| Number of rejected frequency rows: | Q0: 9 / 18, Q1: 27 / 36, Q2: 61 / 70, Q3: 116 / 134, Q4: 236 / 258 |
| Maximum signal-to-noise ratio: | H1: 19.7446, L1: 32.4703 |
| SNR variance: | H1: 0.508318, L1: 0.515178 |
| Click here for a zoomed plot | Click here for a zoomed plot | Click here for a zoomed plot | Click here for a zoomed plot | Click here for a zoomed plot |
 |
 |
 |
 |
 |
 |
 |
 |
 |
 |
 |
 |
 |
 |
 |
 |
 |
 |
 |
 |
 |
 |
 |
 |
 |
 |
 |
 |
 |
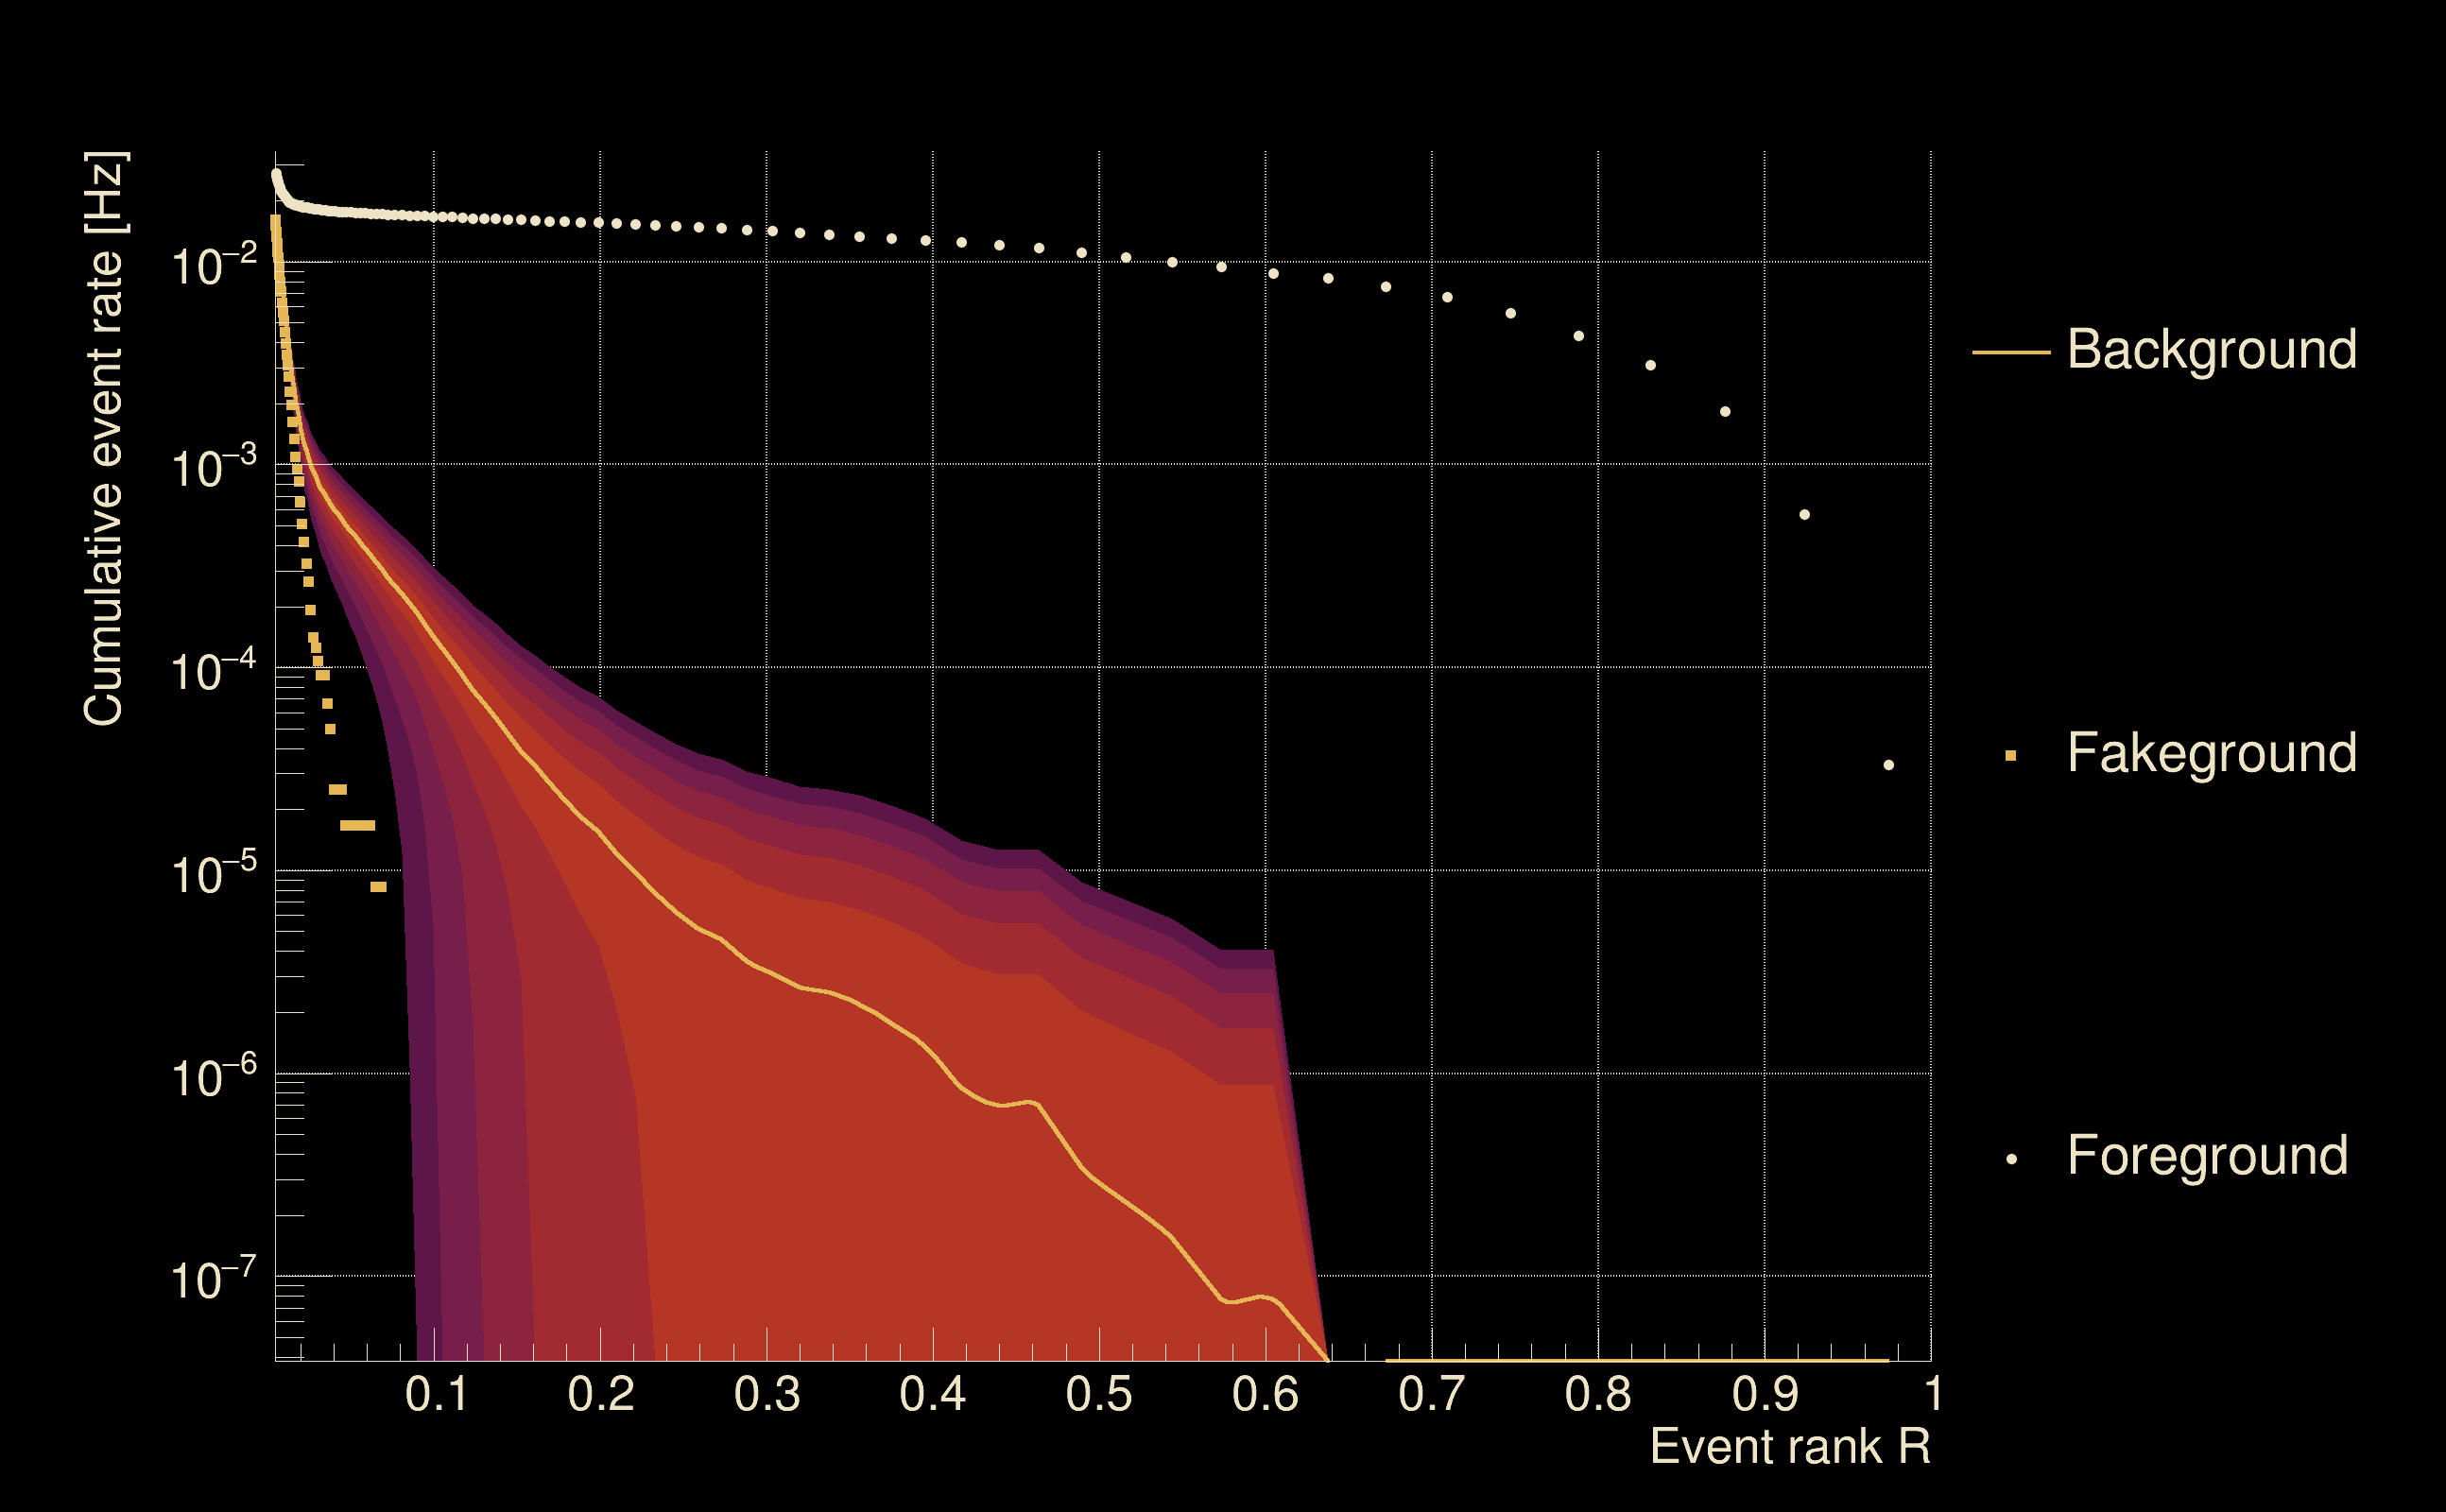
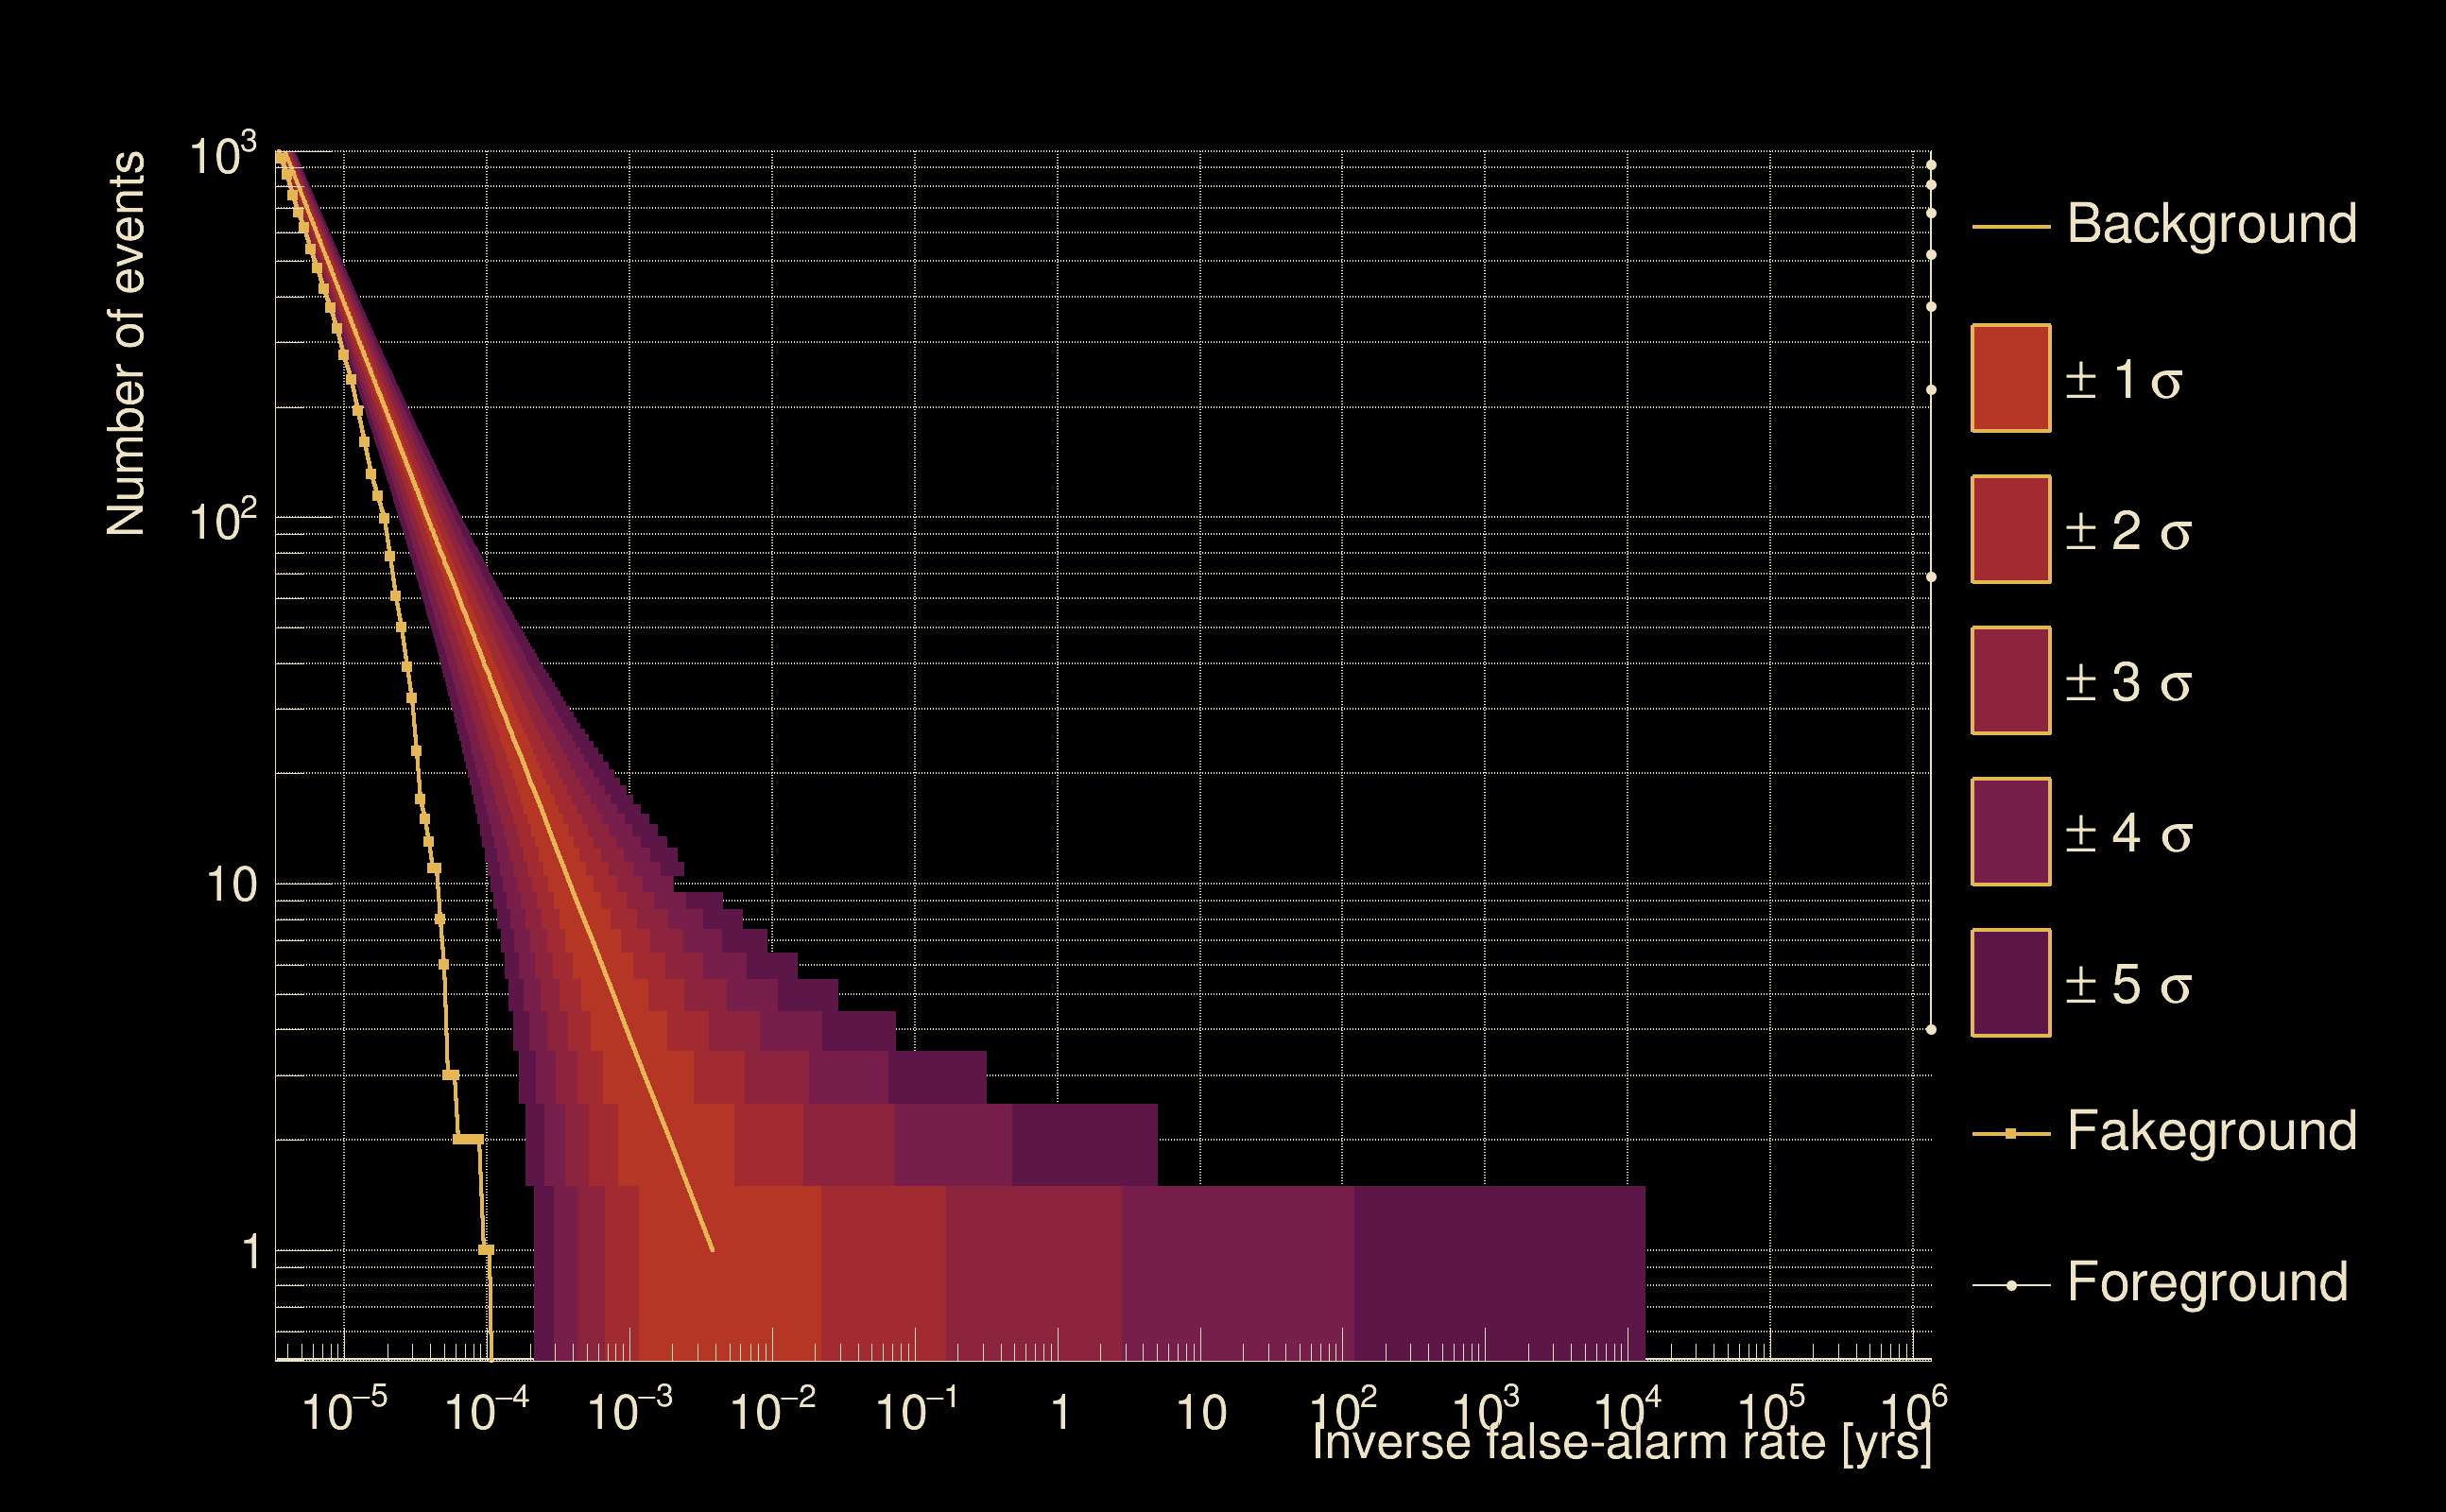
| Detection threshold: | R > 0.172388 |
| False-alarm rate above that detection threshold: | 2.31771e-05 |
| Alternative threshold at 1/1000 yrs: | R > 0.60472 |
| Alternative threshold at 1/100 yrs: | R > 0.60472 |
| Alternative threshold at 1/10 yrs: | R > 0.60472 |
| Alternative threshold at 1/1 yr: | R > 0.60472 |
| Alternative threshold at 1/1 d: | R > 0.209694 |
 |
|
 |
 |
 |
 |
 |
 |
 |
 |
 |
 |
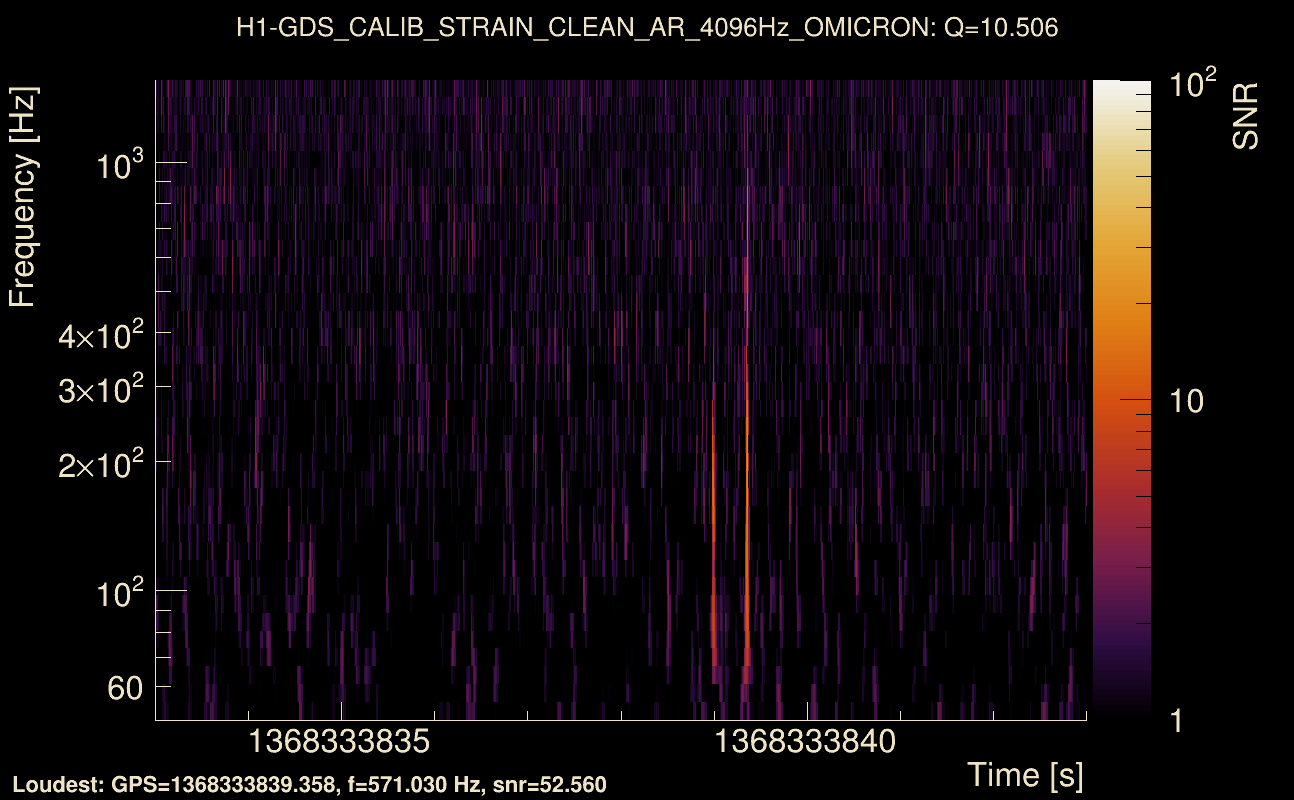
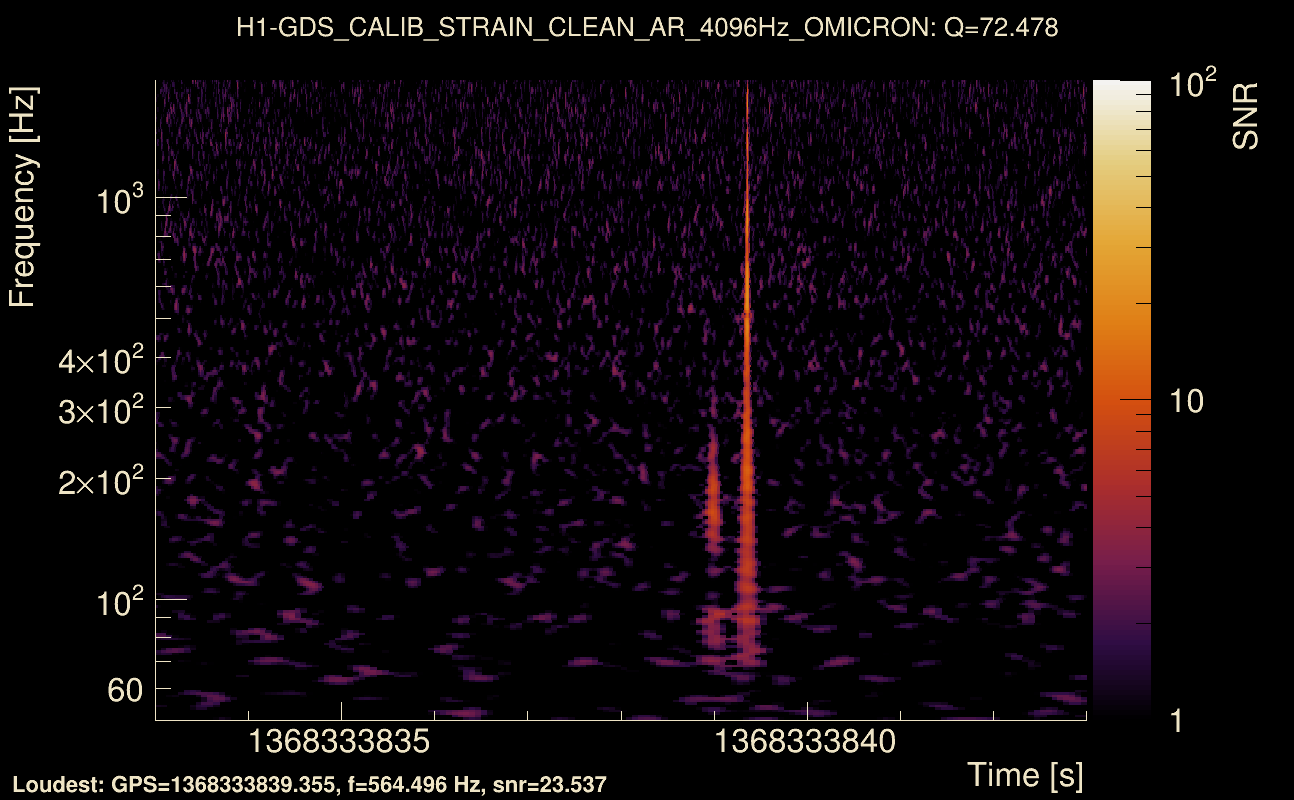
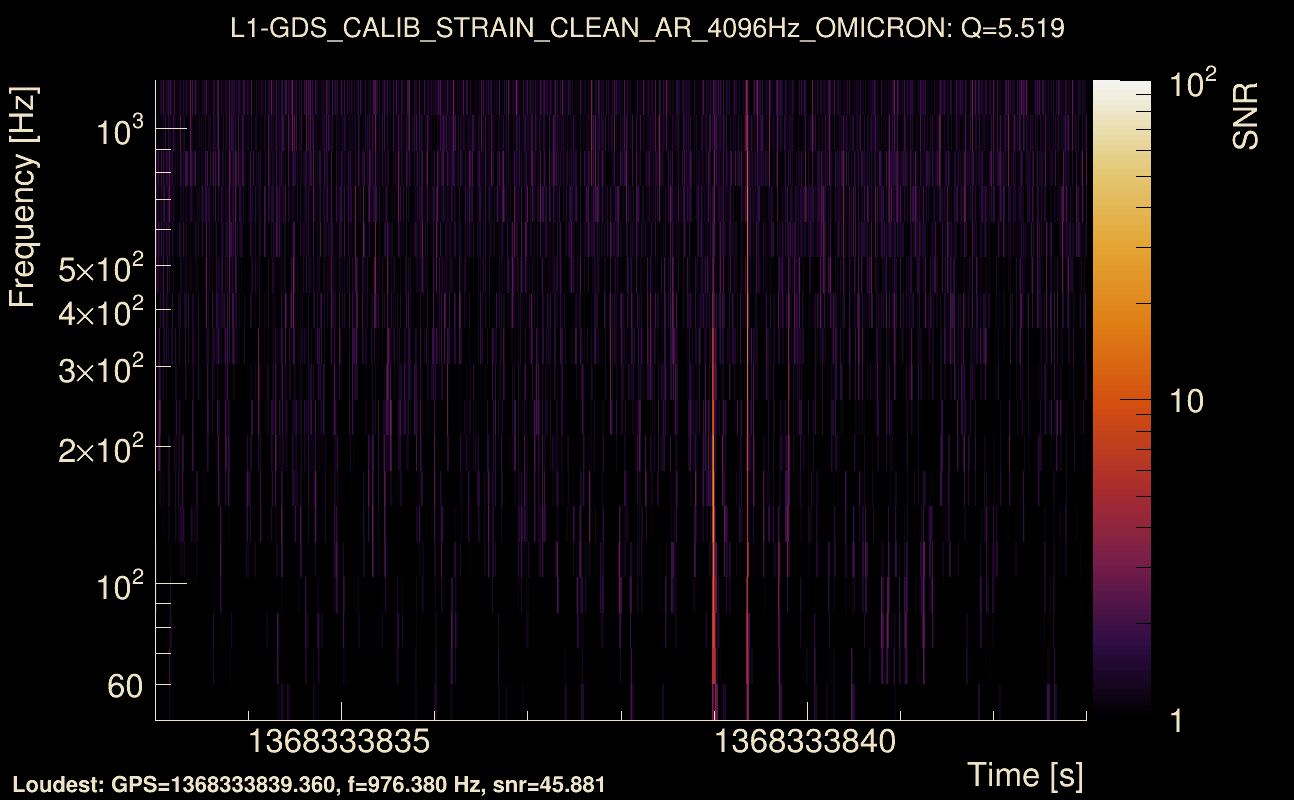
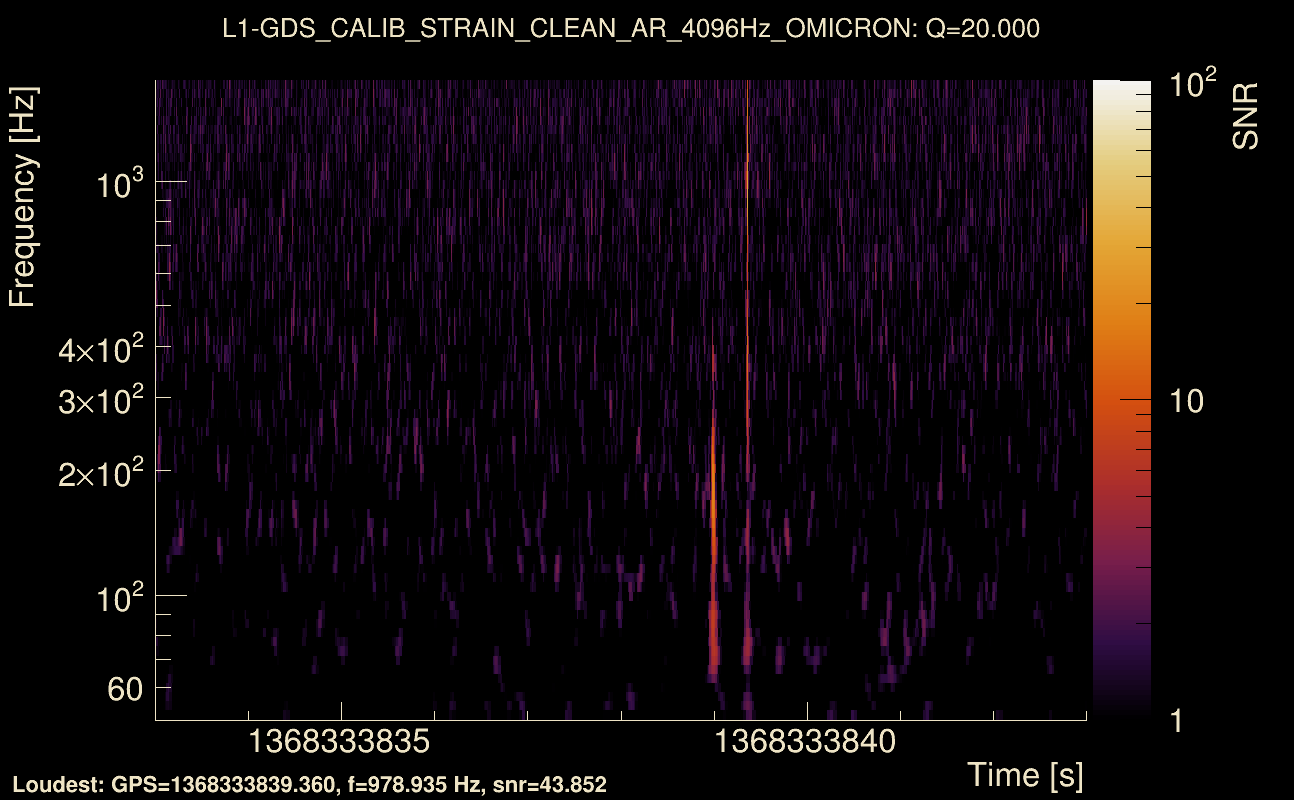
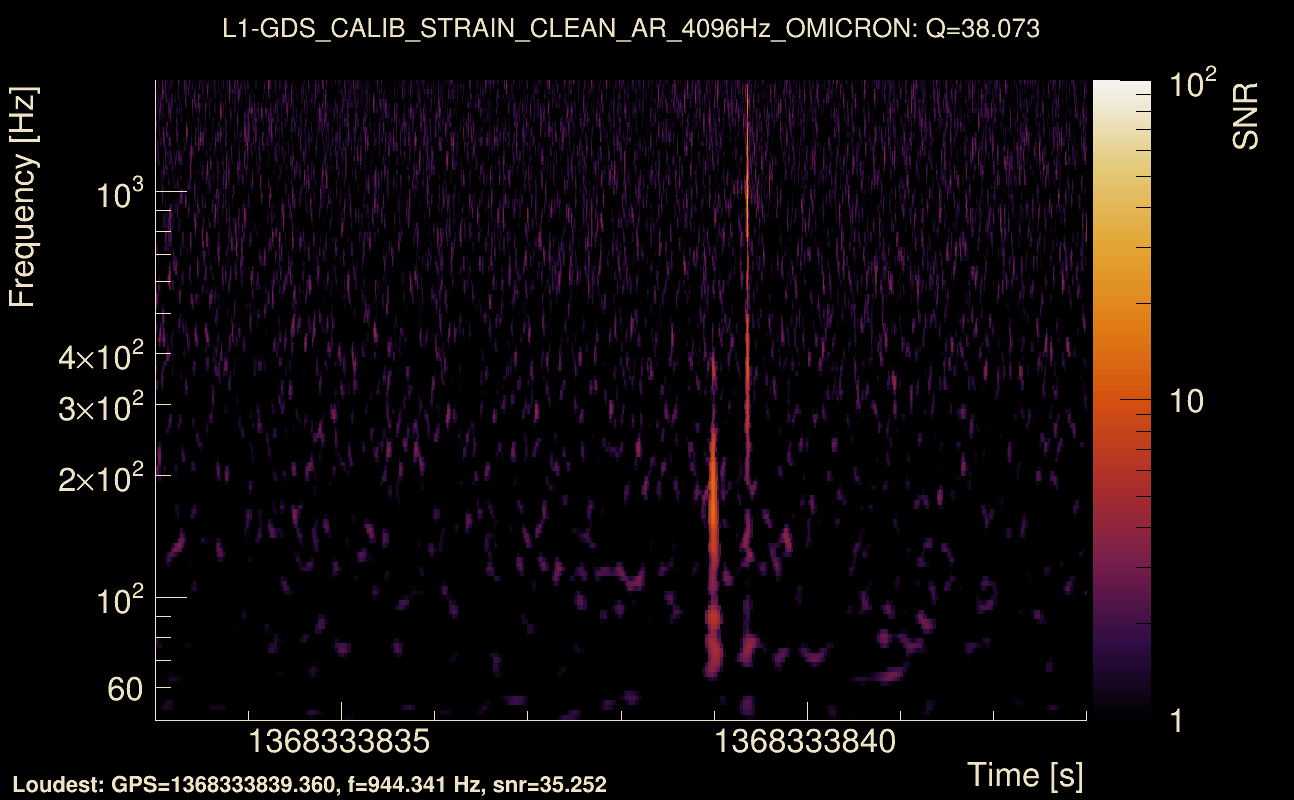
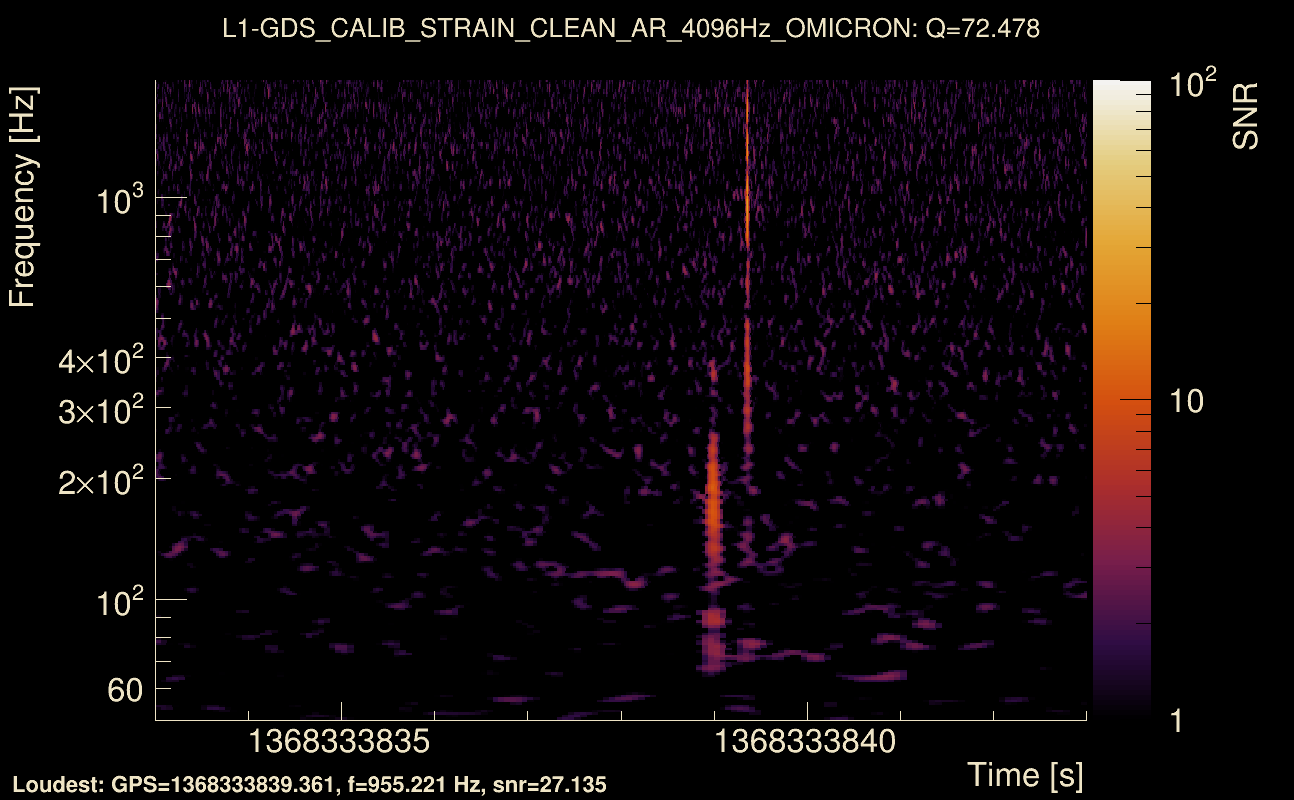
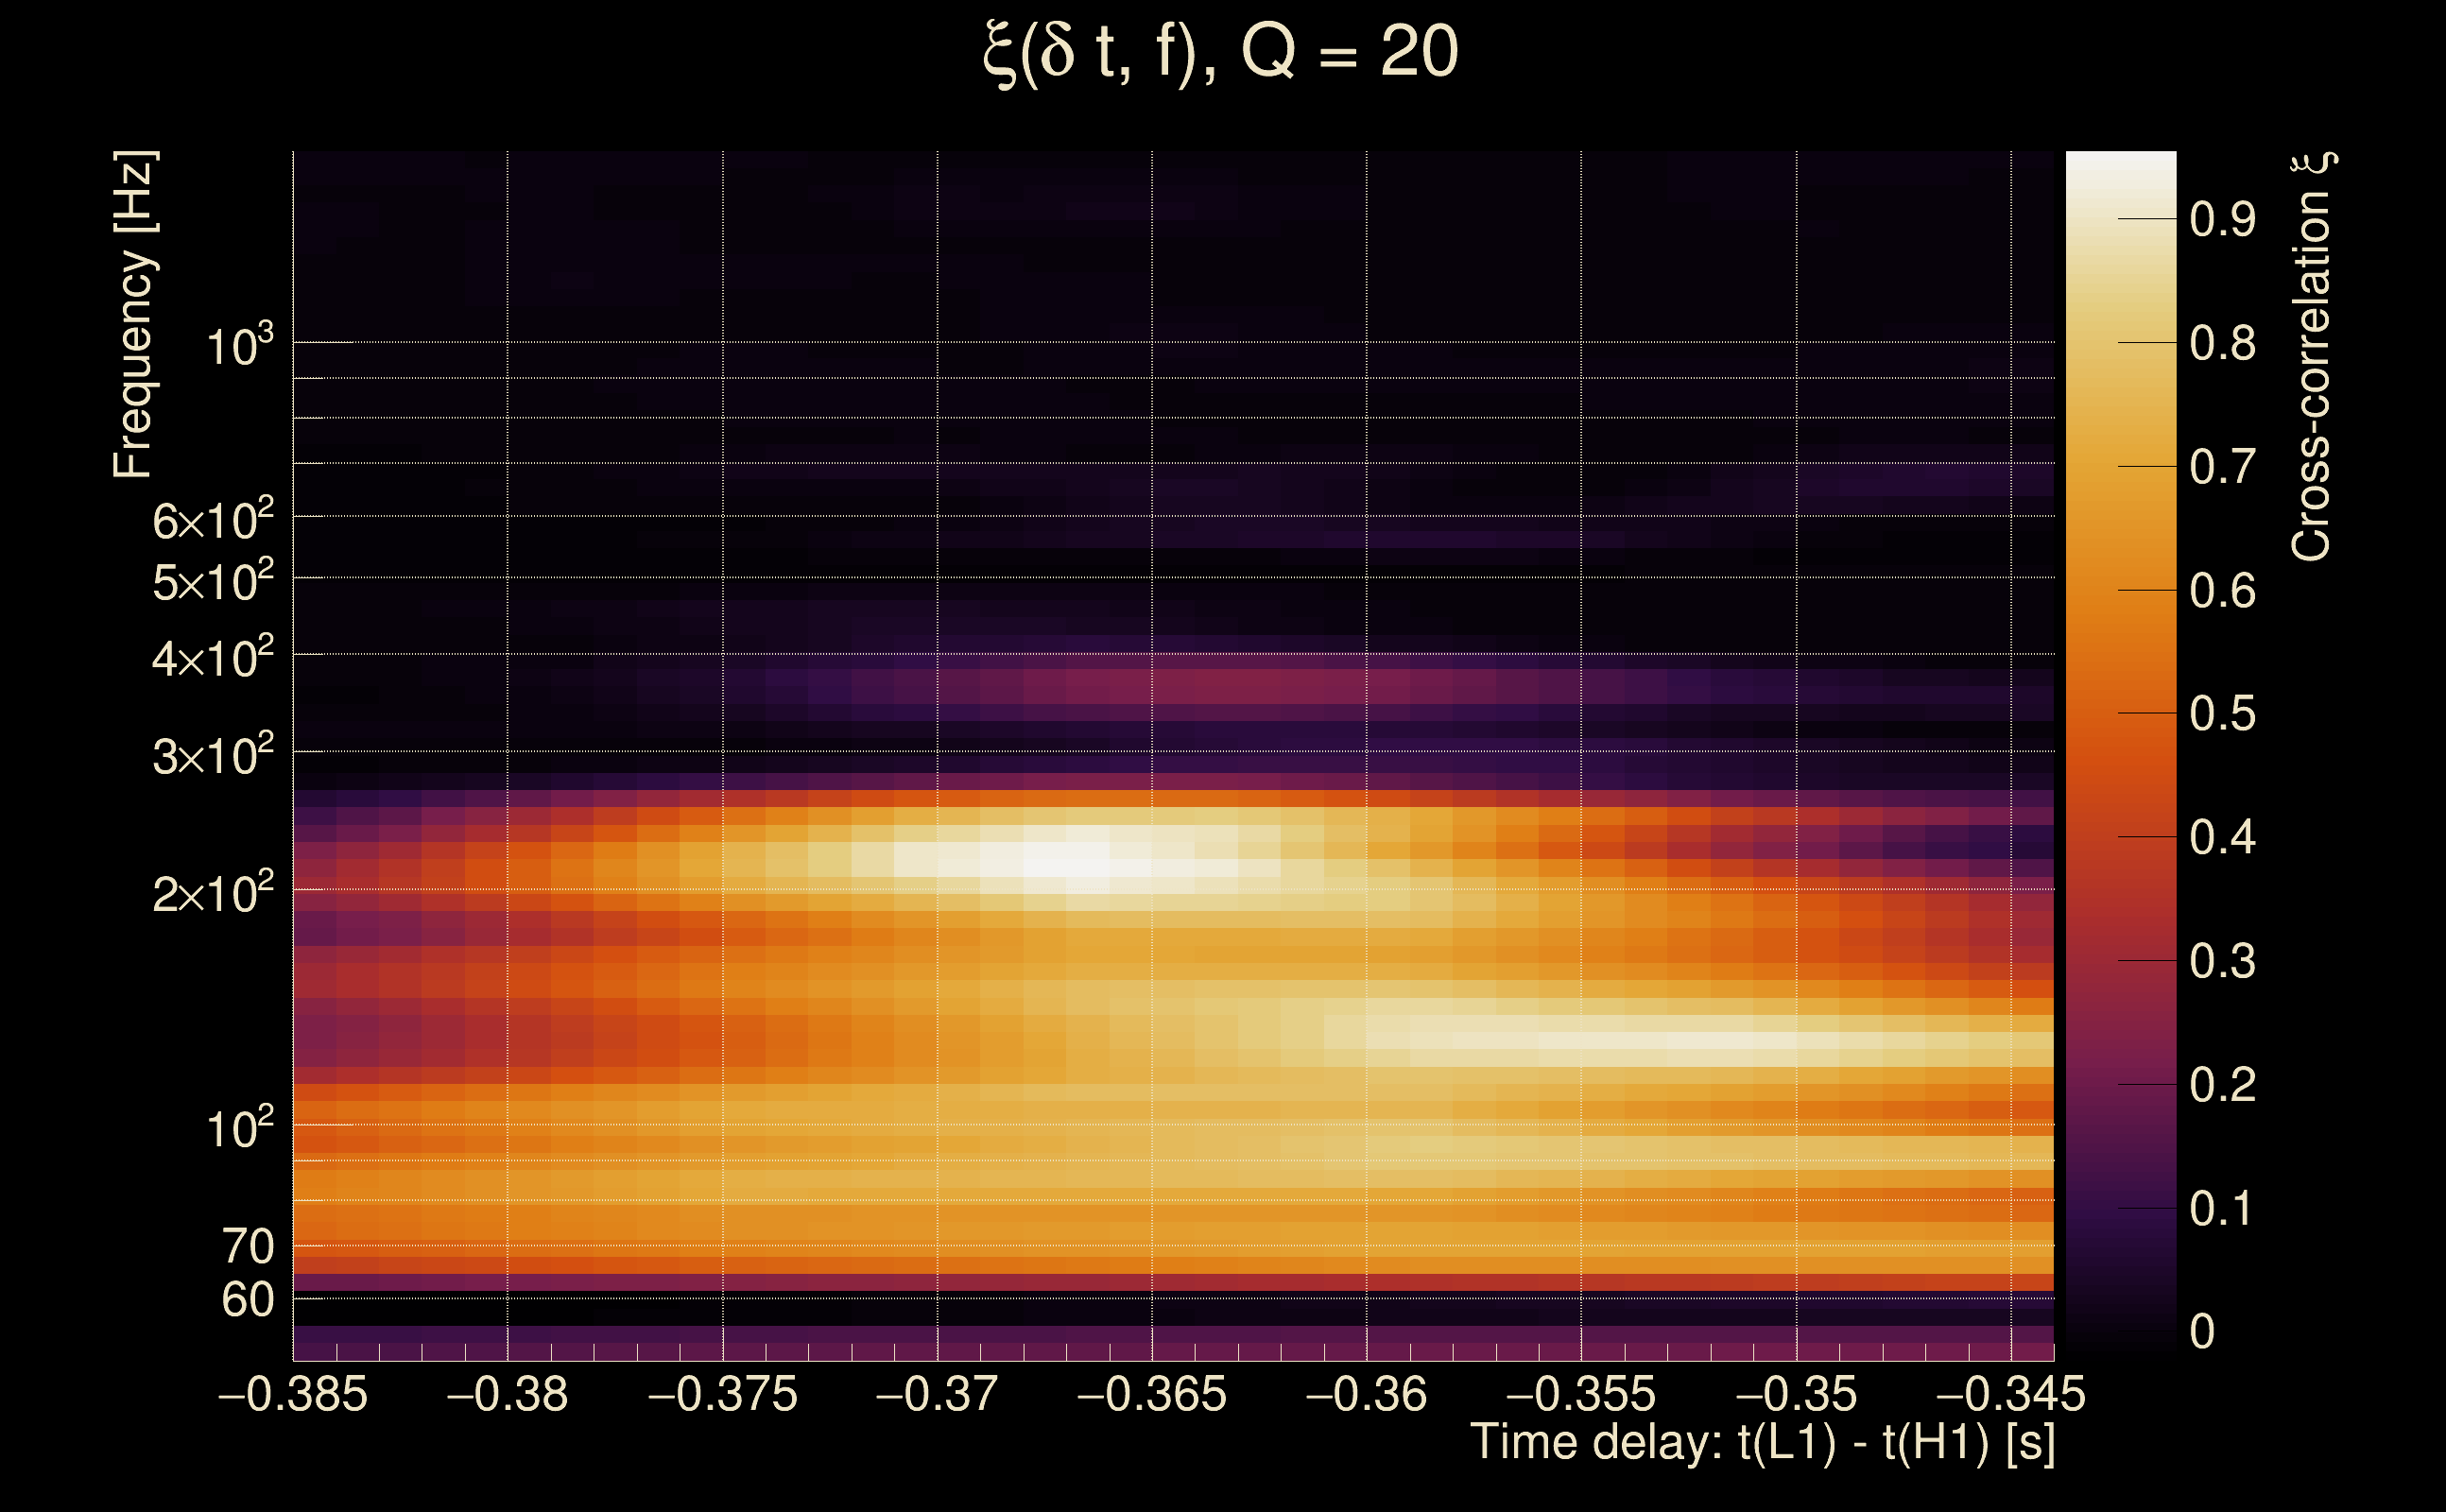
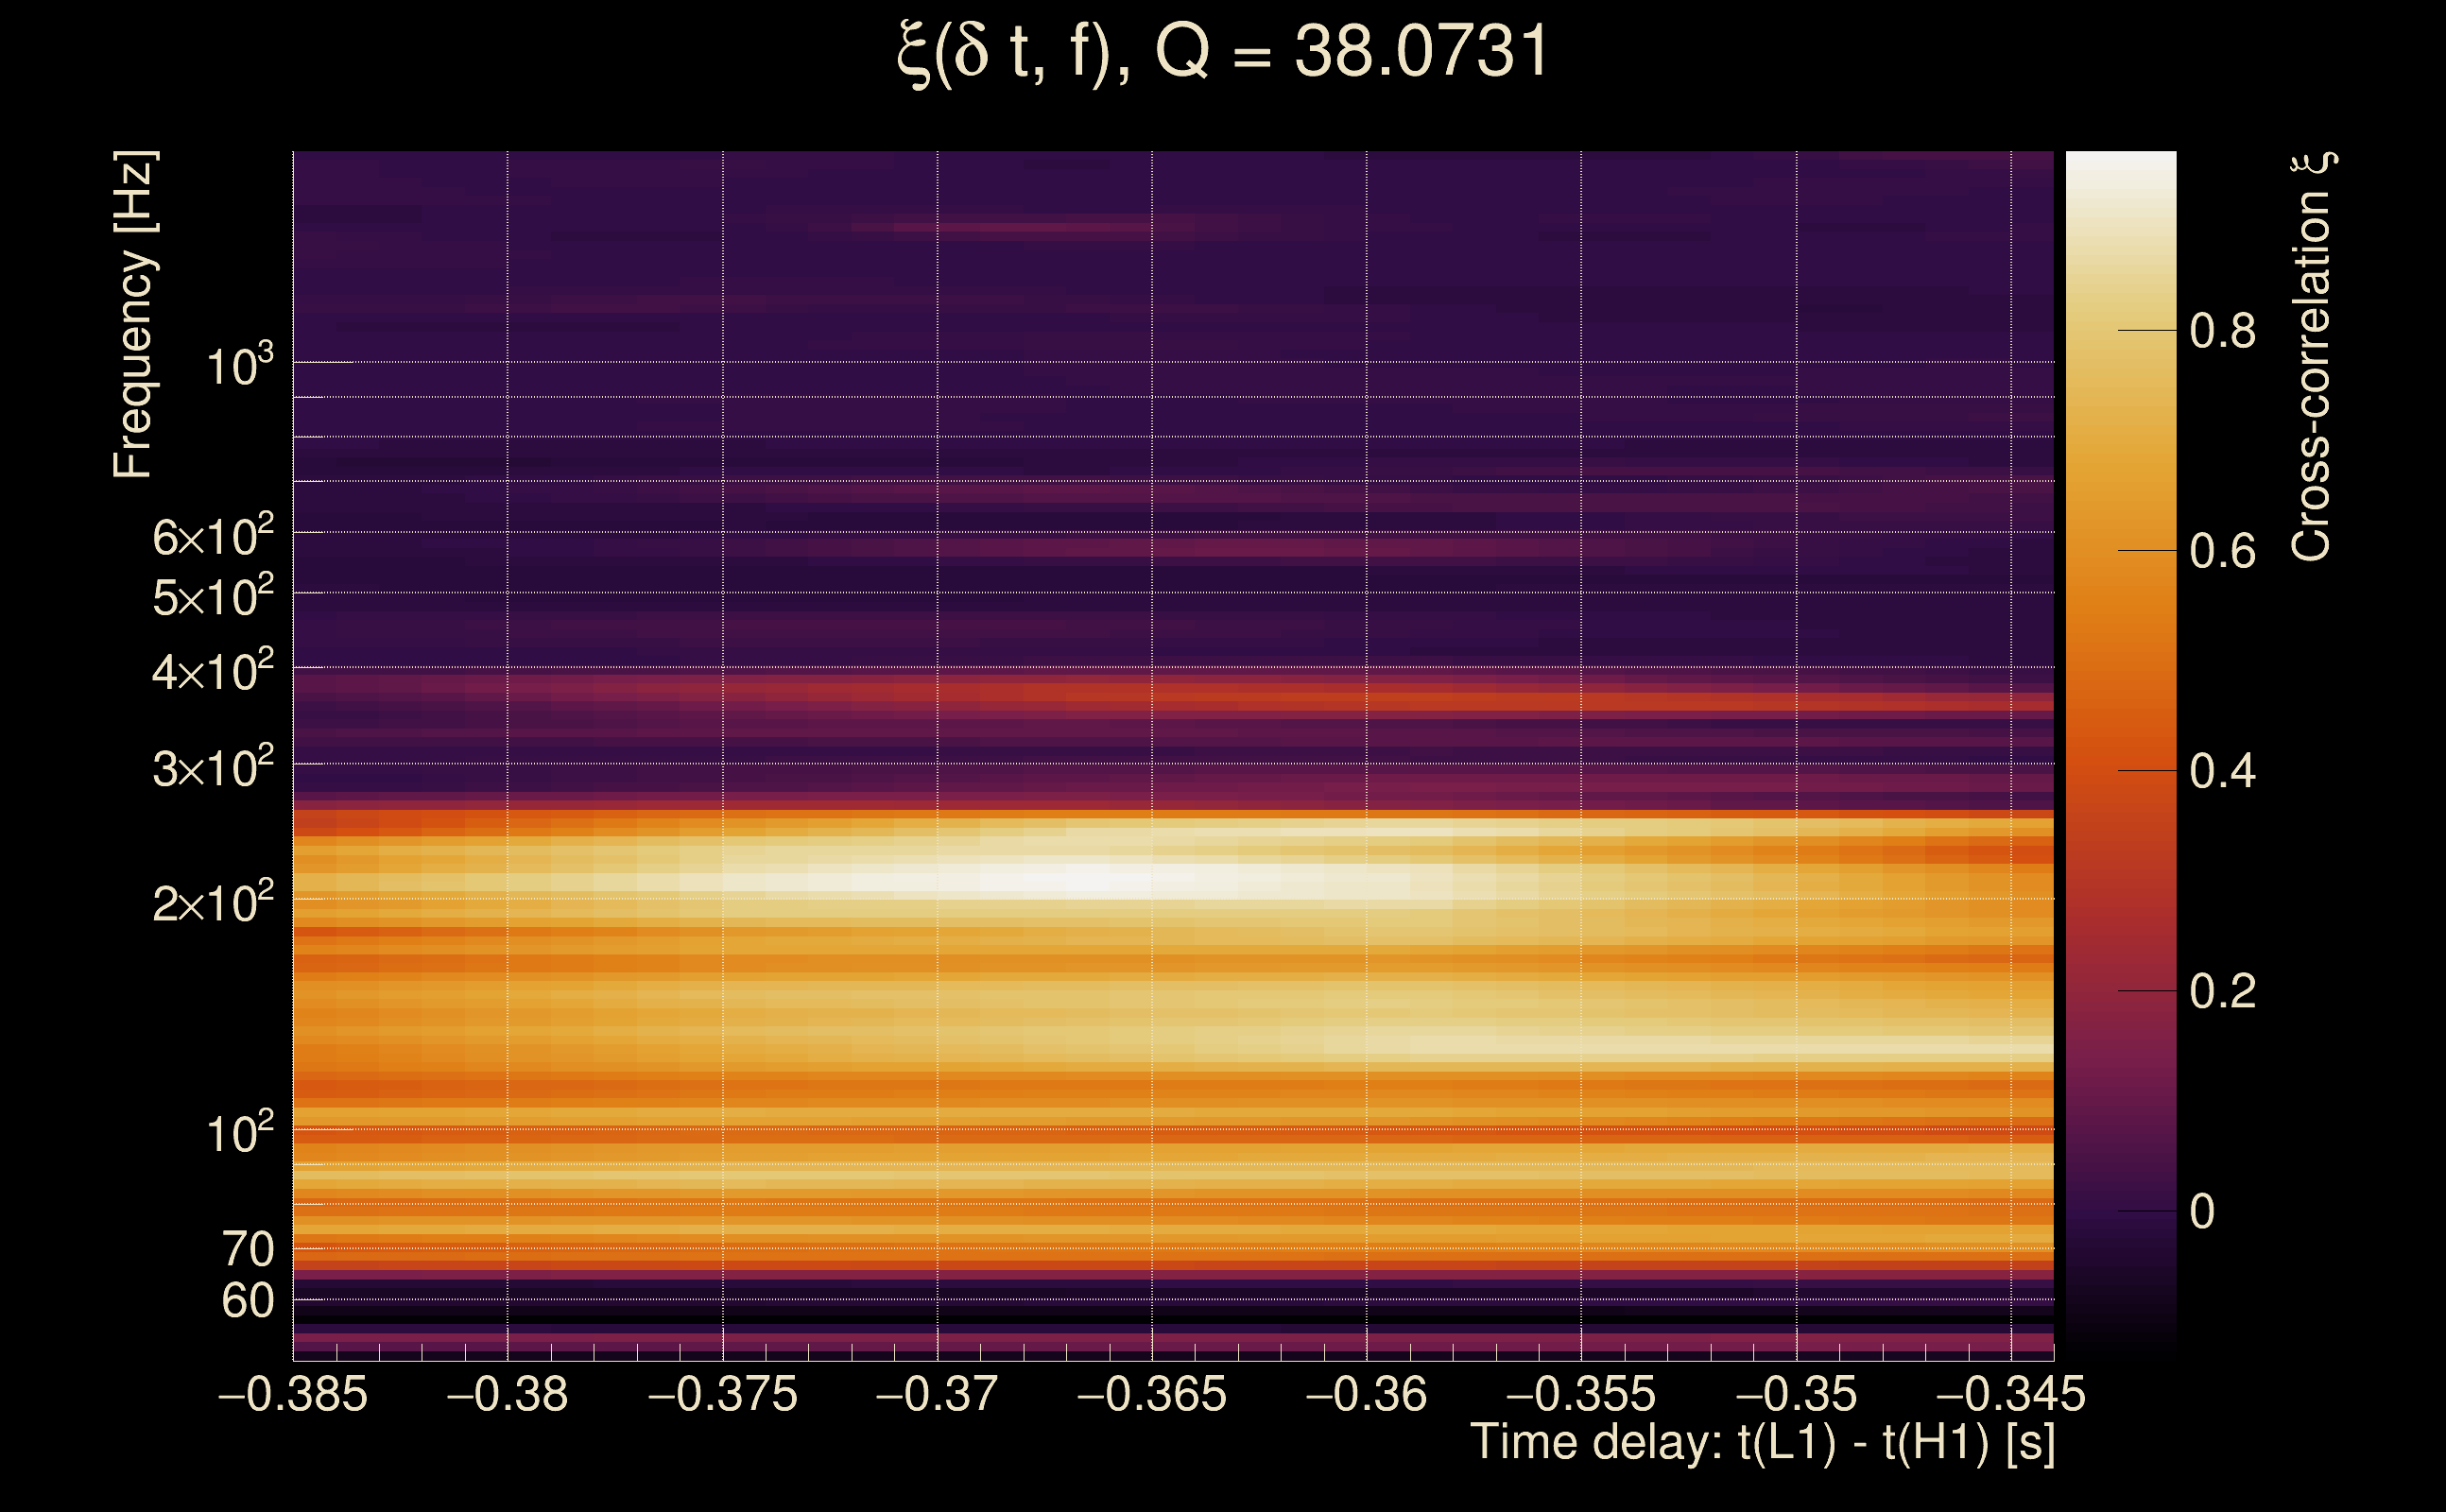
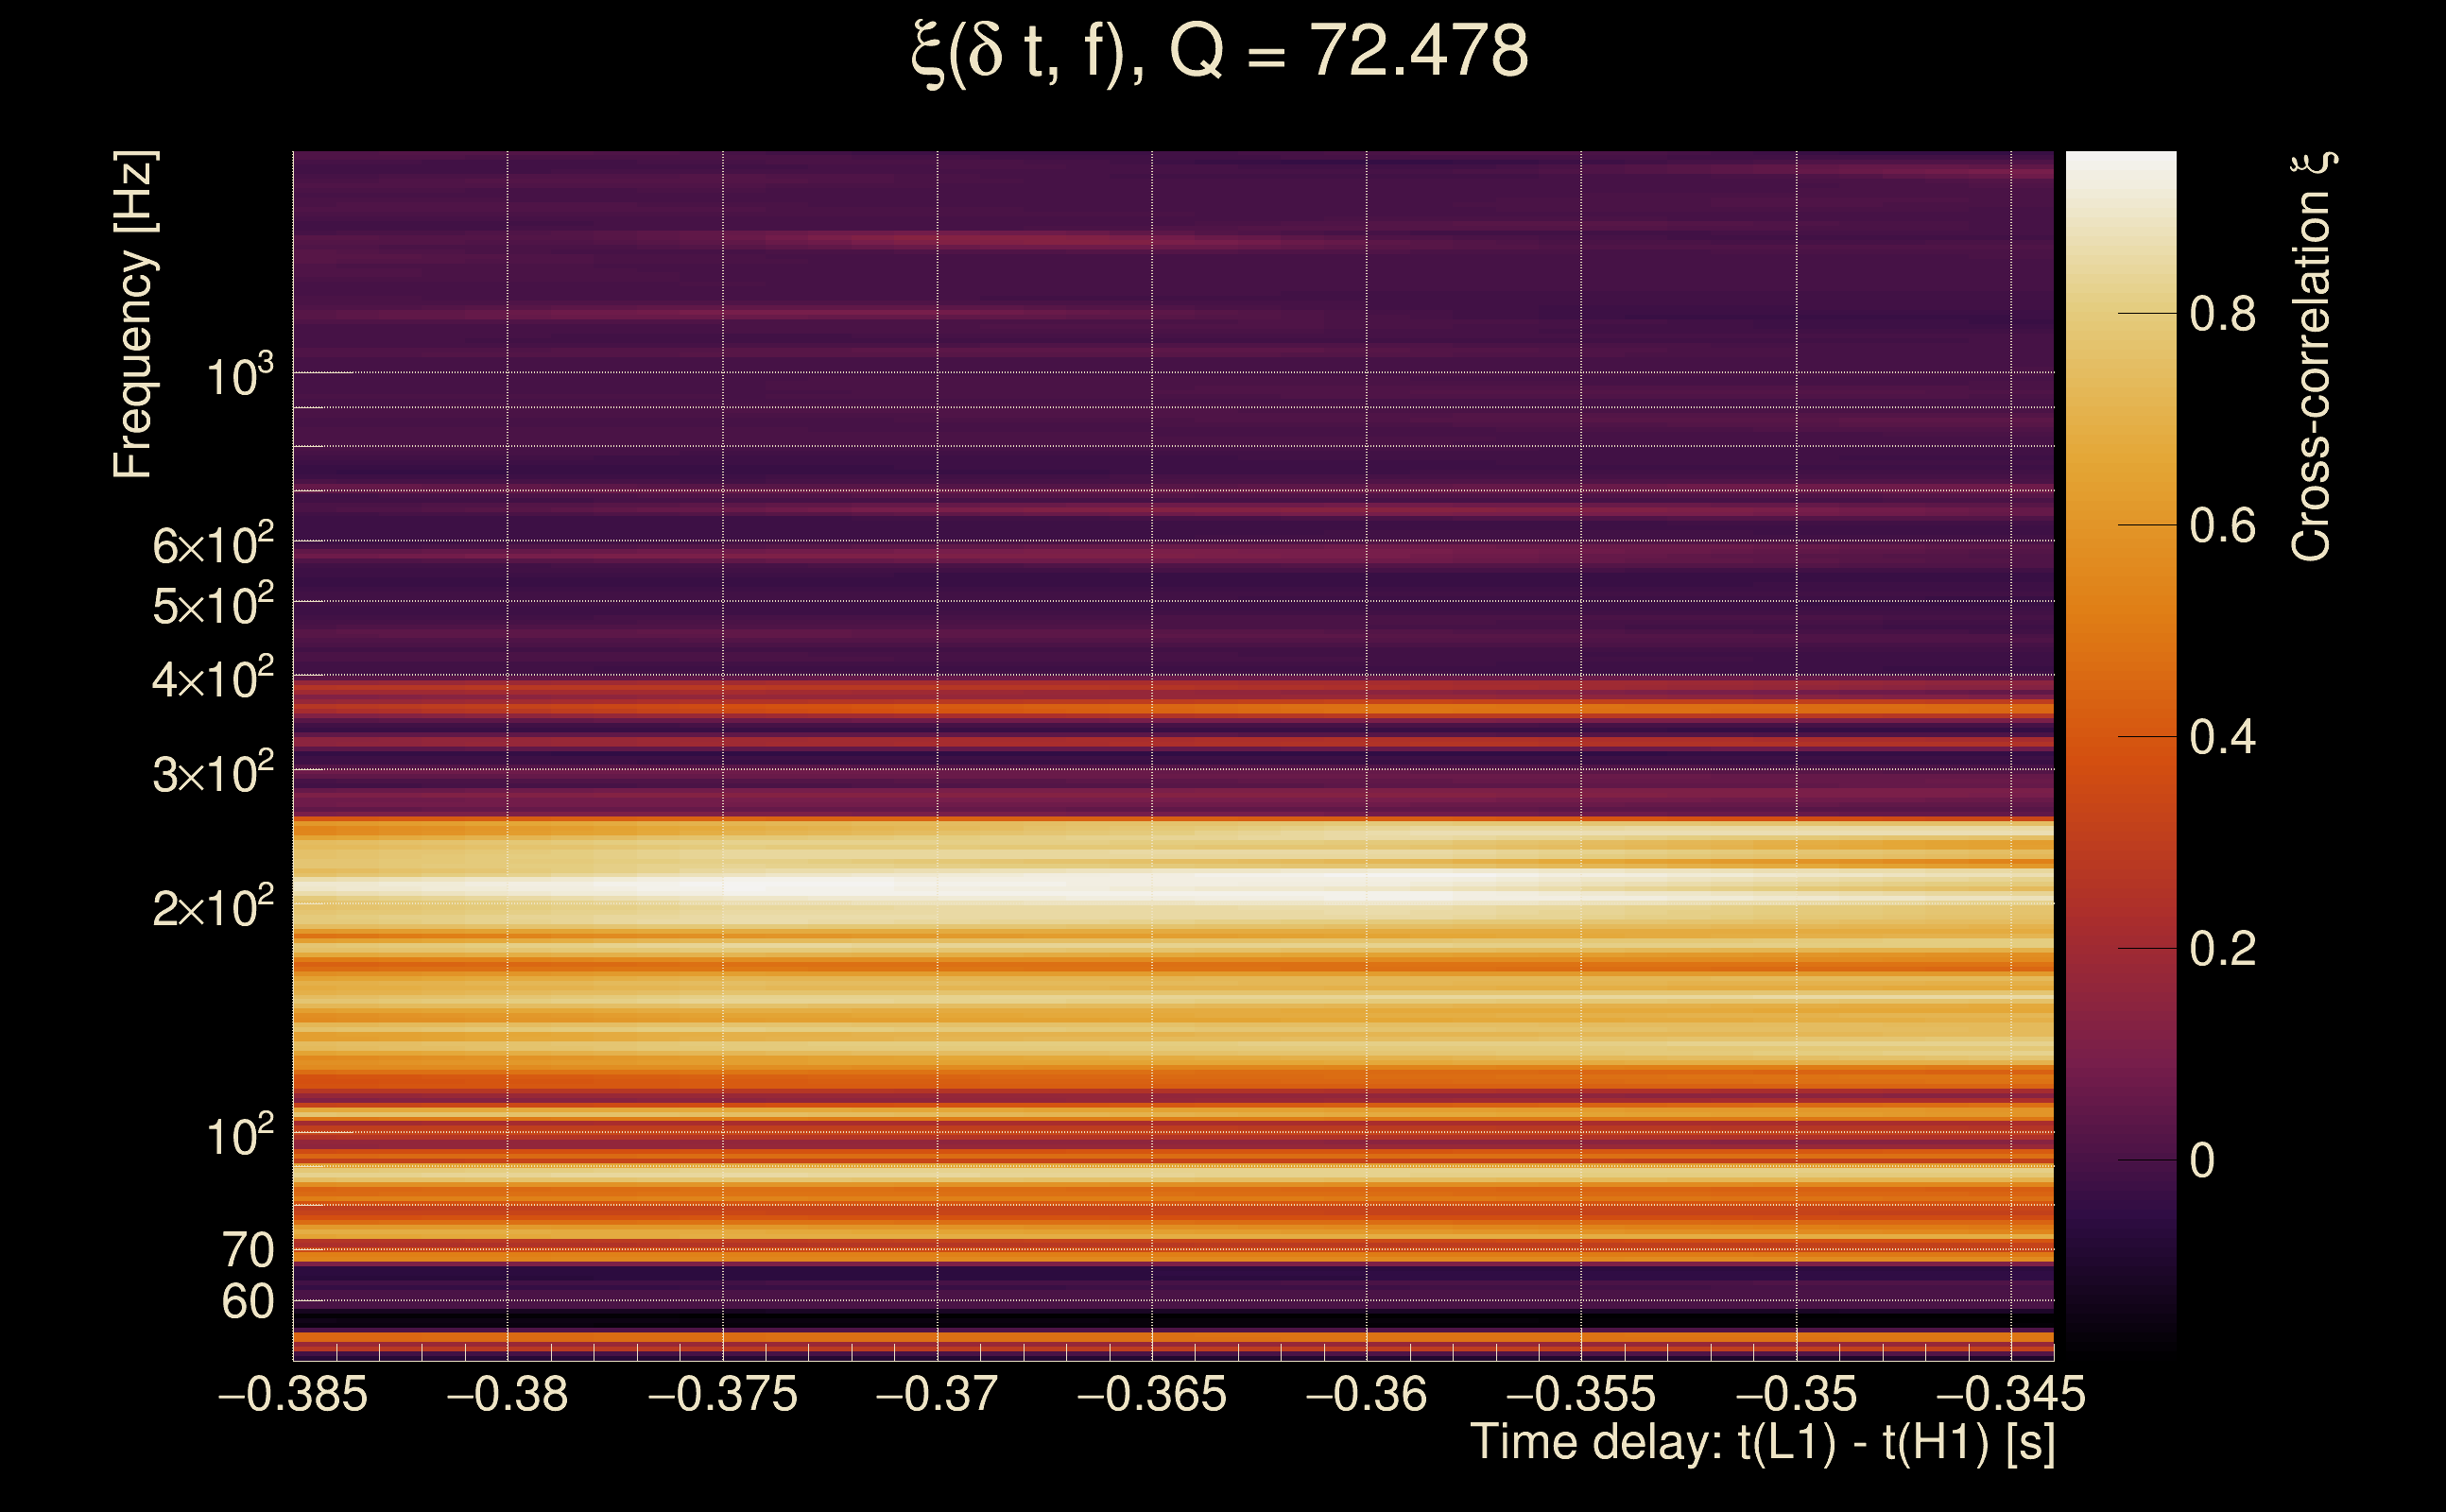
| Event time t(H1): | GPS = 1368333833 (Wed May 17 04:43:35 2023 ) → GPS = 1368333843 (Wed May 17 04:43:45 2023 ) |
| Event time t(L1): | GPS = 1368333833 (Wed May 17 04:43:45 2023 ) → GPS = 1368333843 (Wed May 17 04:43:45 2023 ) |
| Omicron analysis time window (H1): | GPS = 1368333830 → GPS = 1368333846 |
| Omicron analysis time window (L1): | GPS = 1368333830 → GPS = 1368333846 |
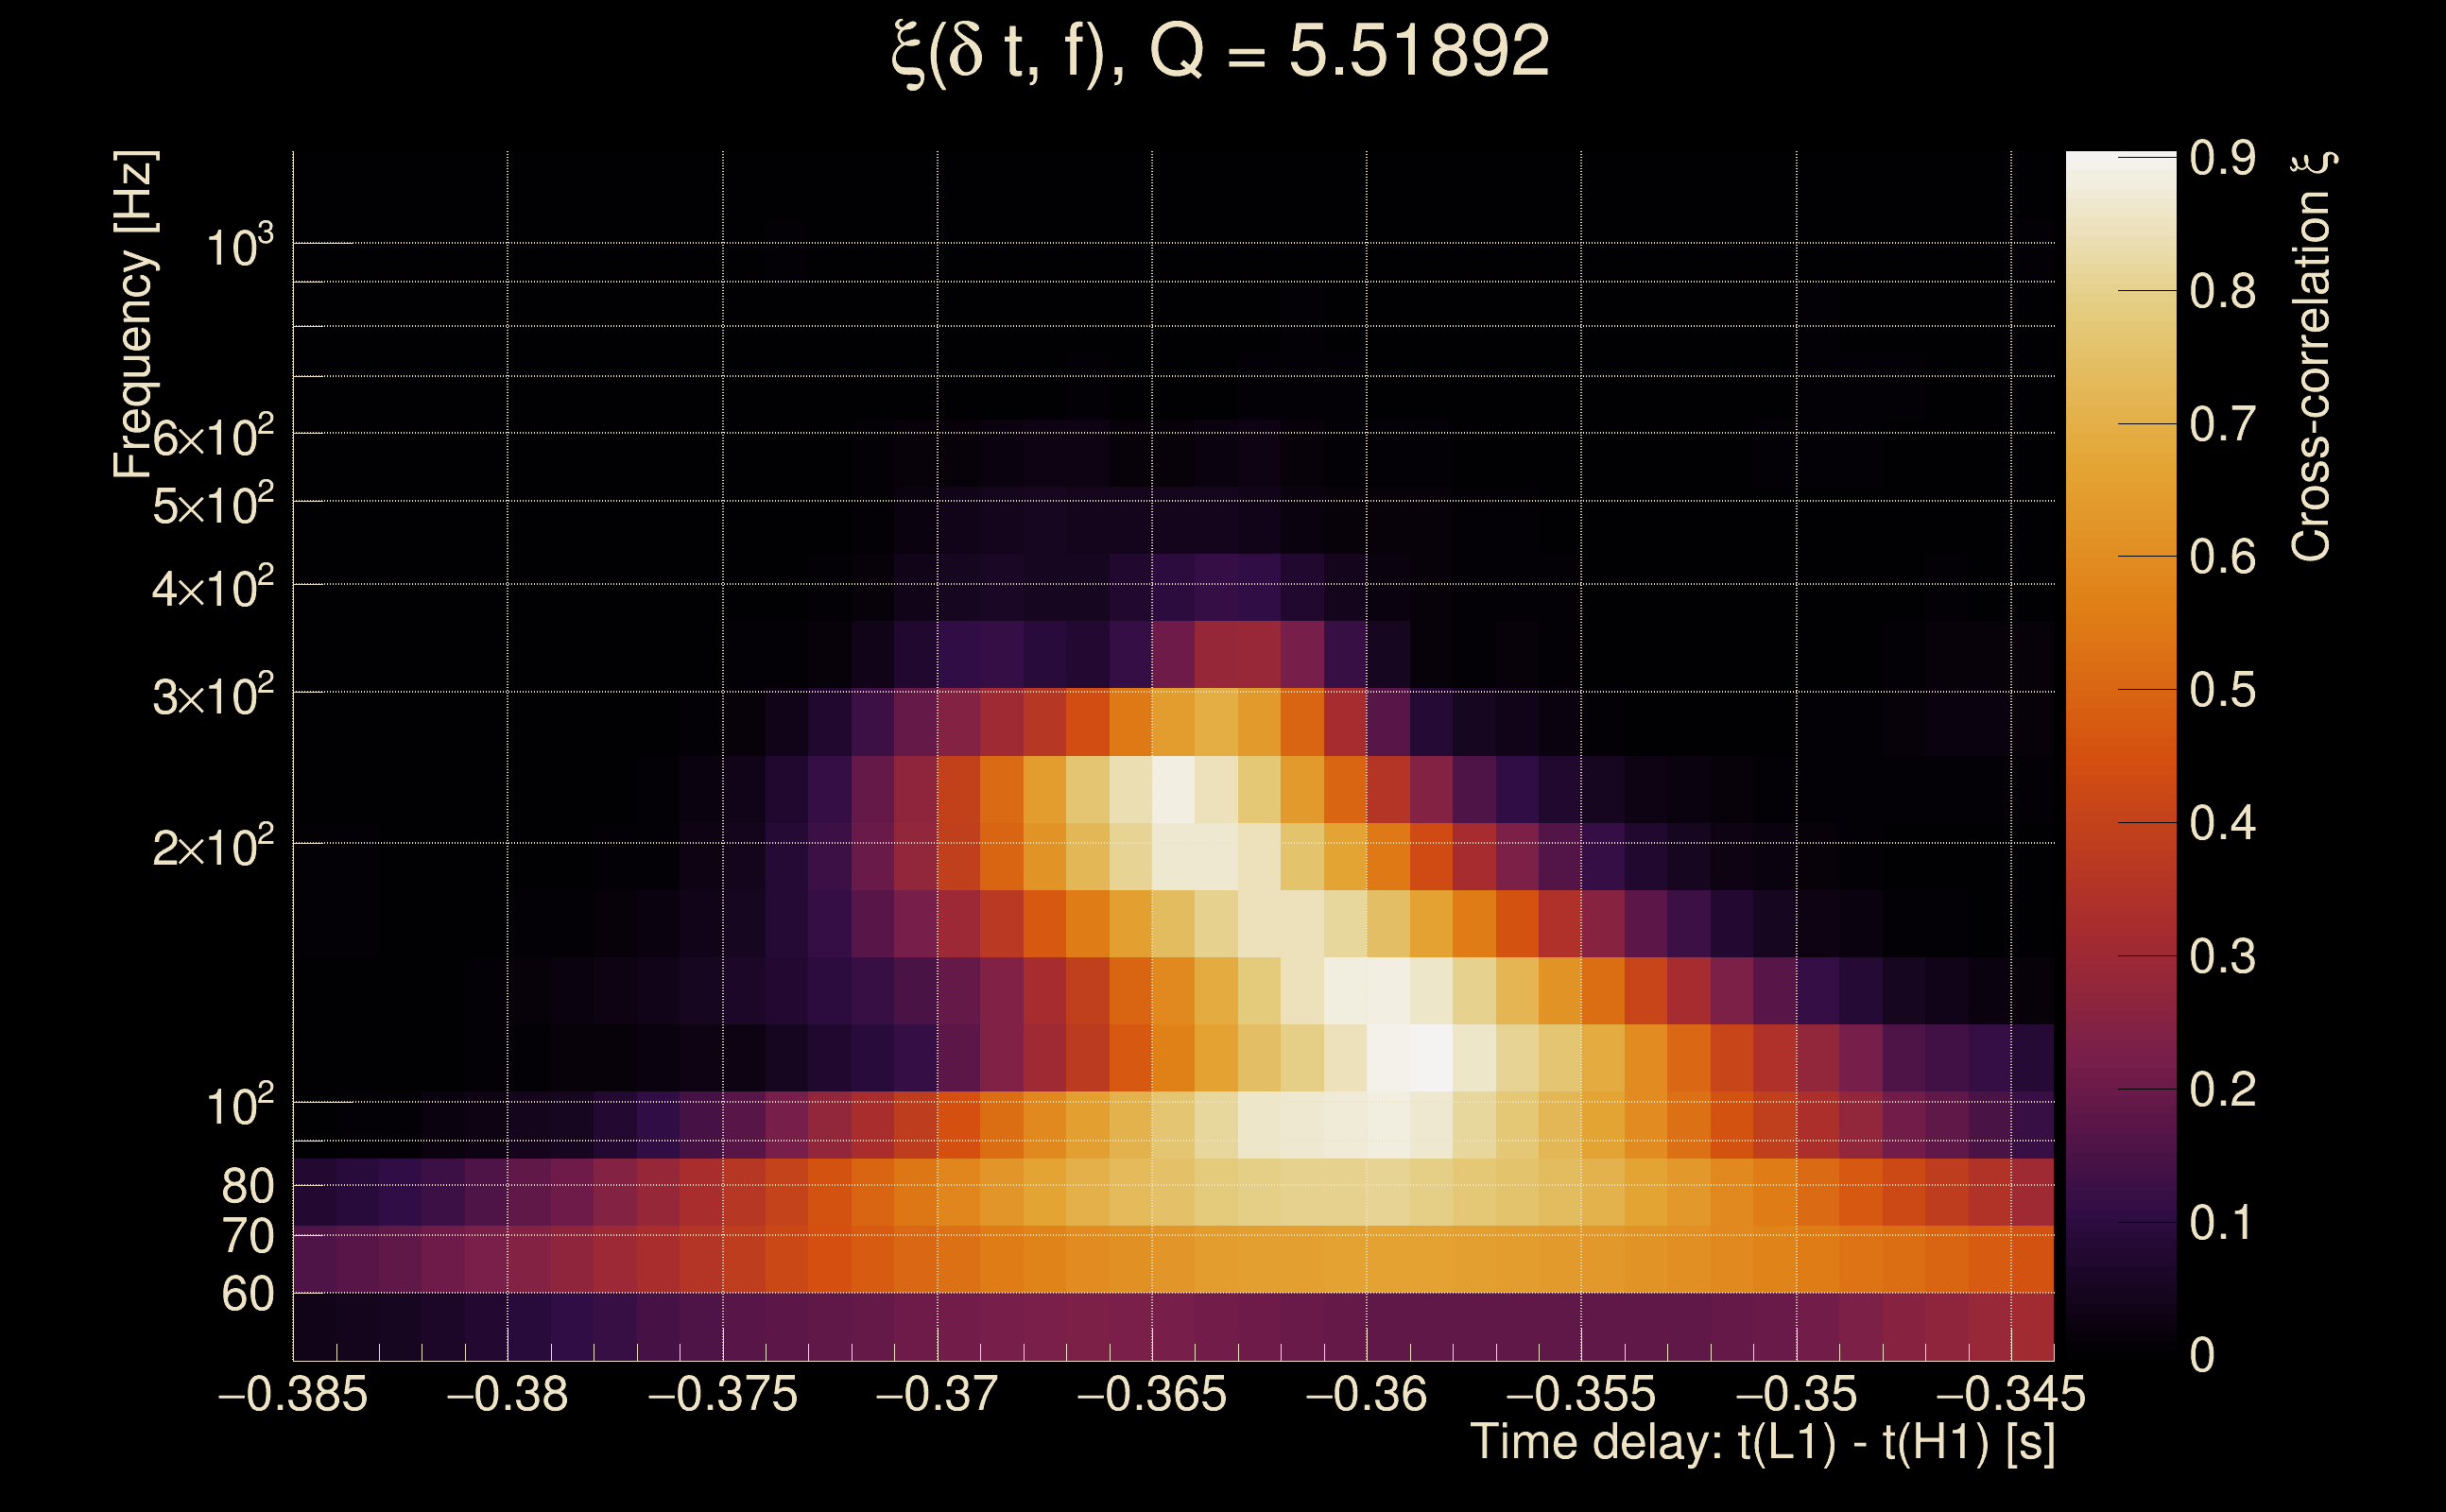
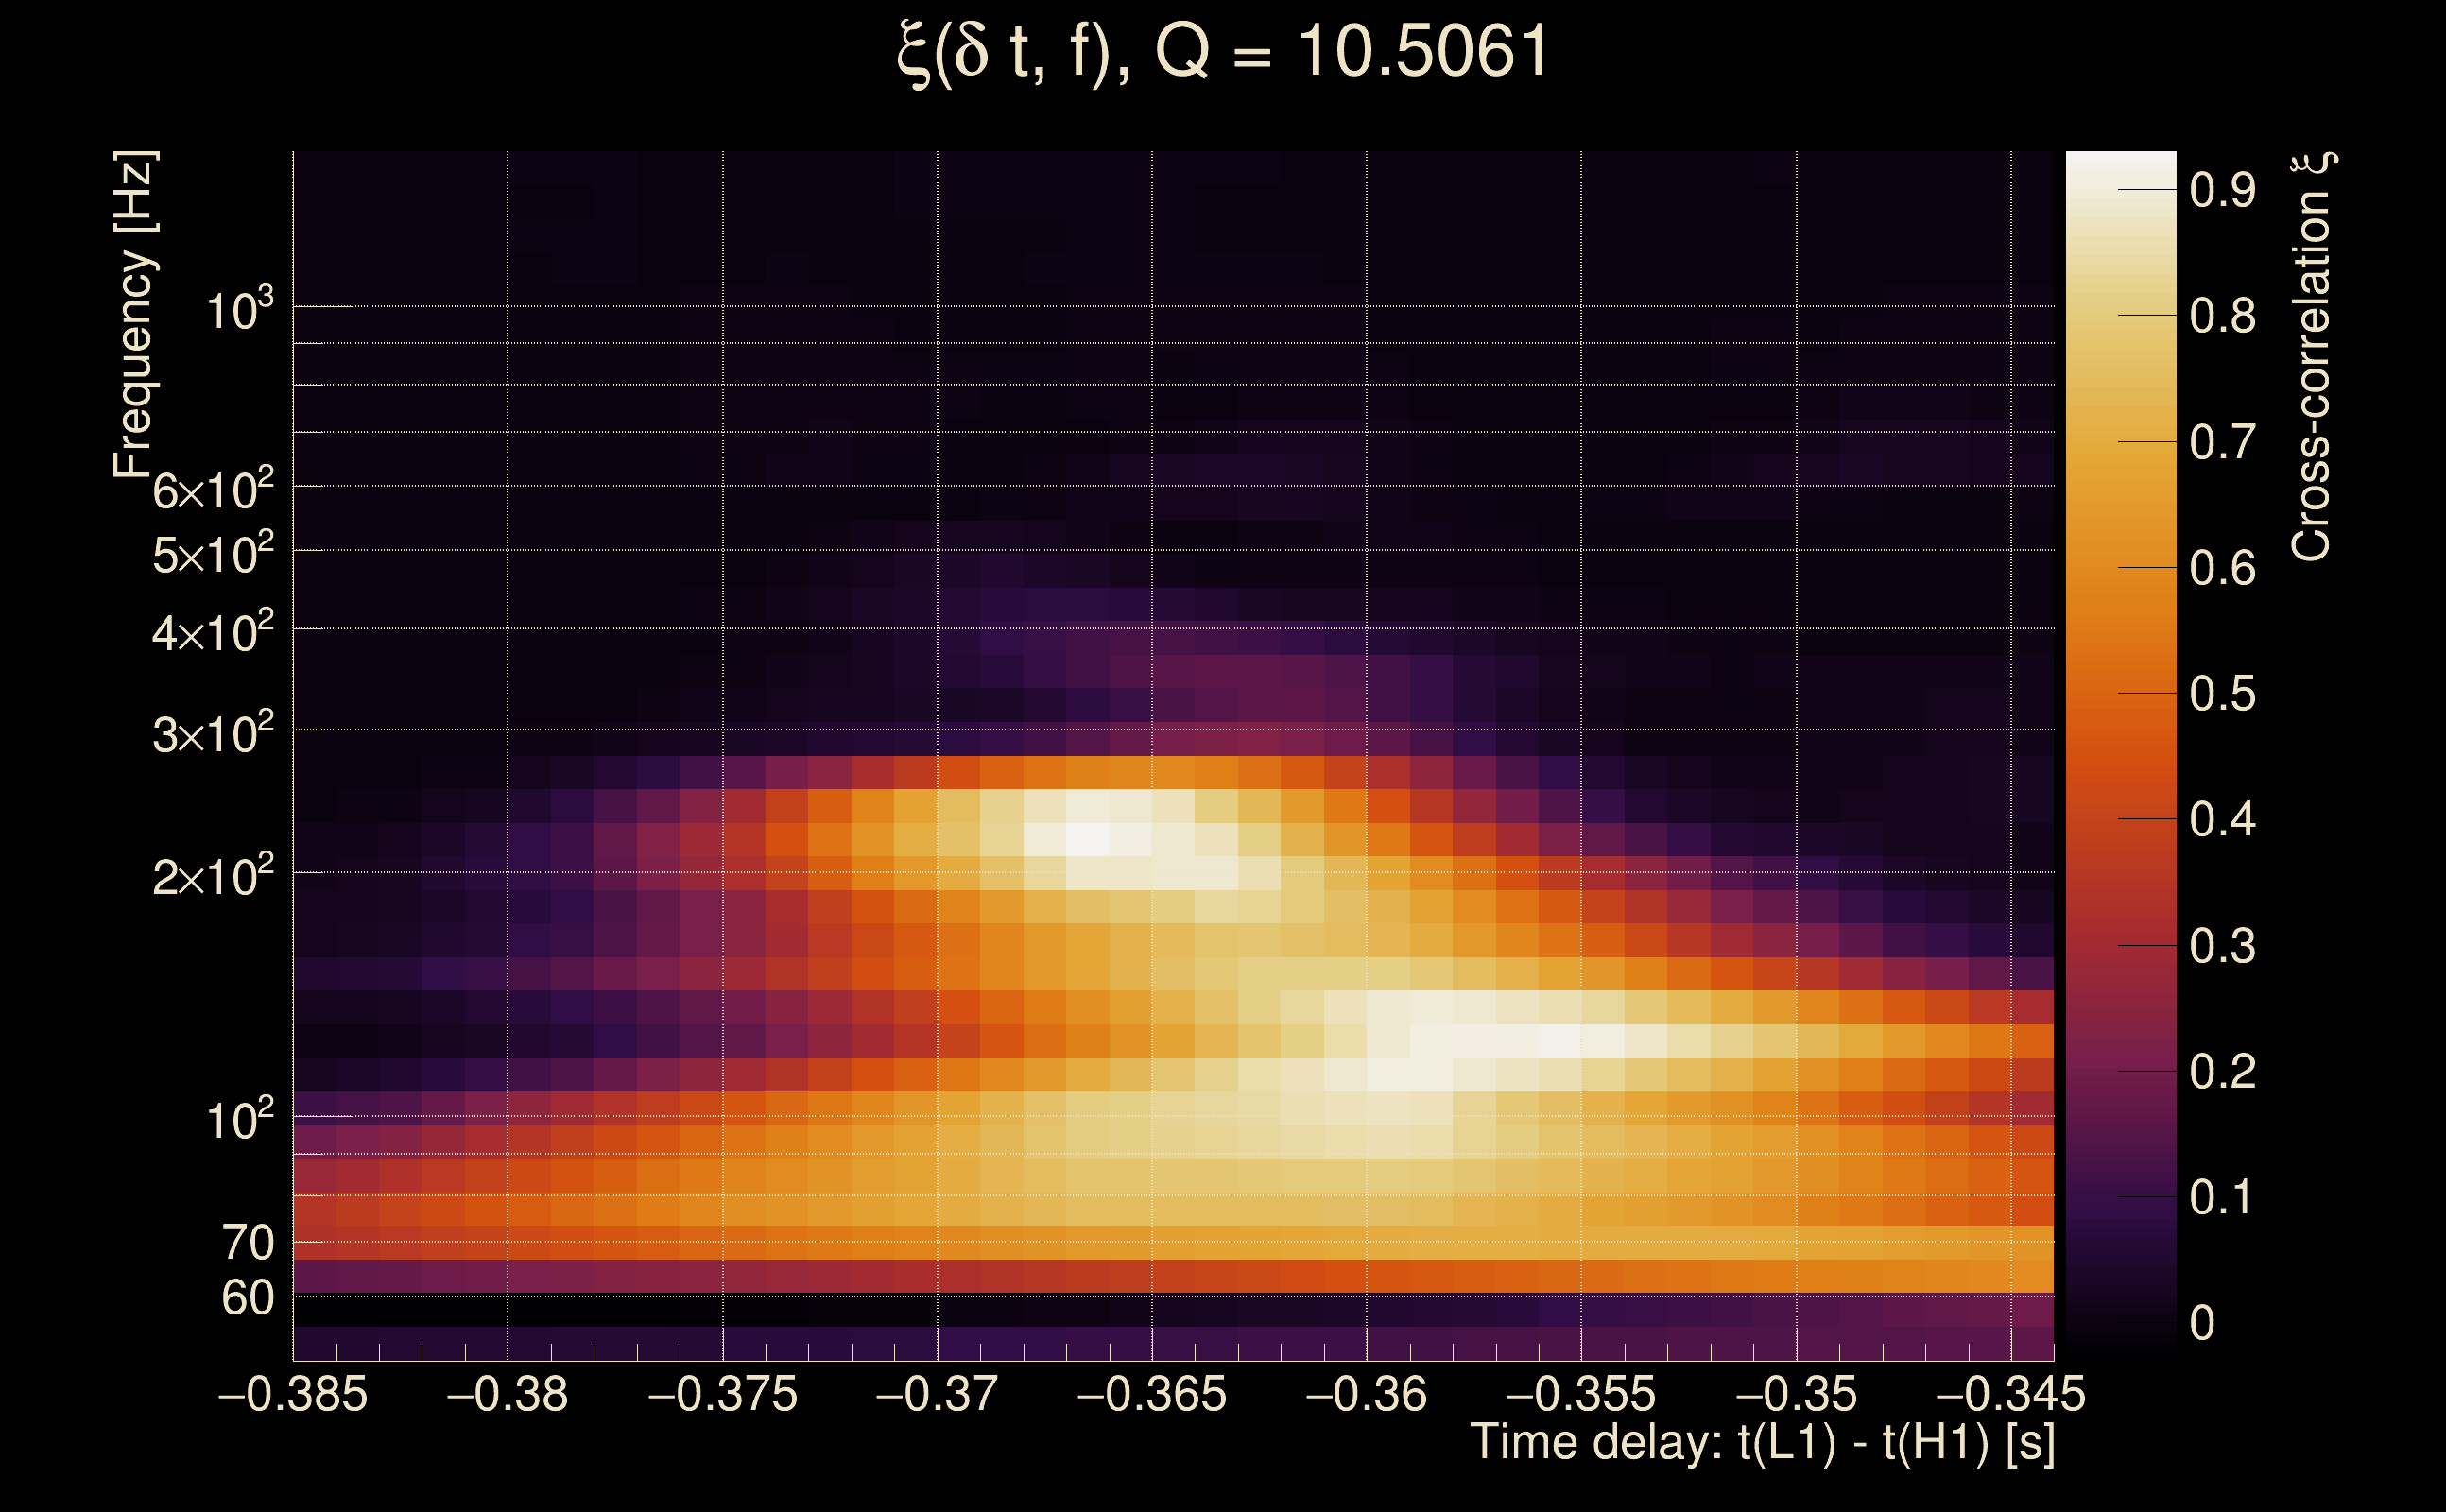
| Time delay between detectors t(L1) - t(H1): | -0.364295 s (slice index = 116 / 217), δt_gw = 0.00370517 s |
| Time delay standard deviation: | 0.0576702 s |
| [targeted mode] Time delay probability: | 0.387543 (0.864082 sigmas), δt_target = -0.00538898 s |
| Frequency: | 150.508 Hz |
| Ξ: | 0.594577 ± 0.0380159 (variance = 0.00144521): Q0: 0.792227, Q1: 0.790429, Q2: 0.751504, Q3: 0.71946, Q4: 0.696395 |
| Rank: | R_A = 0.594577 |
| Log of amplitude ratio (L1/H1): | -0.420698, variance = 0.831671 (L1/H1: -1.17632, variance = 1.64468, H1/L1: -0.731442, variance = 1.47771) |
| Amplitude ratio (L1/H1): | 0.656588 ⋇ 2.4892 (L1/H1: 0.308413 ⋇ 3.60546, H1/L1: 0.481215 ⋇ 3.37235) |
| Amplitude ratio H1|L1 compatibility (probability): | 0.280302 |
| Antenna factor probability: | 0.676554 |
| Number of rejected frequency rows: | Q0: 3 / 18, Q1: 8 / 36, Q2: 27 / 70, Q3: 51 / 134, Q4: 152 / 258 |
| Maximum signal-to-noise ratio: | H1: 61.3209, L1: 49.6601 |
| SNR variance: | H1: 0.491175, L1: 0.496661 |
| Click here for a zoomed plot | Click here for a zoomed plot | Click here for a zoomed plot | Click here for a zoomed plot | Click here for a zoomed plot |
 |
 |
 |
 |
 |
 |
 |
 |
 |
 |
 |
 |
 |
 |
 |
 |
 |
 |
 |
 |
 |
 |
 |
 |
 |
 |
 |
 |
 |
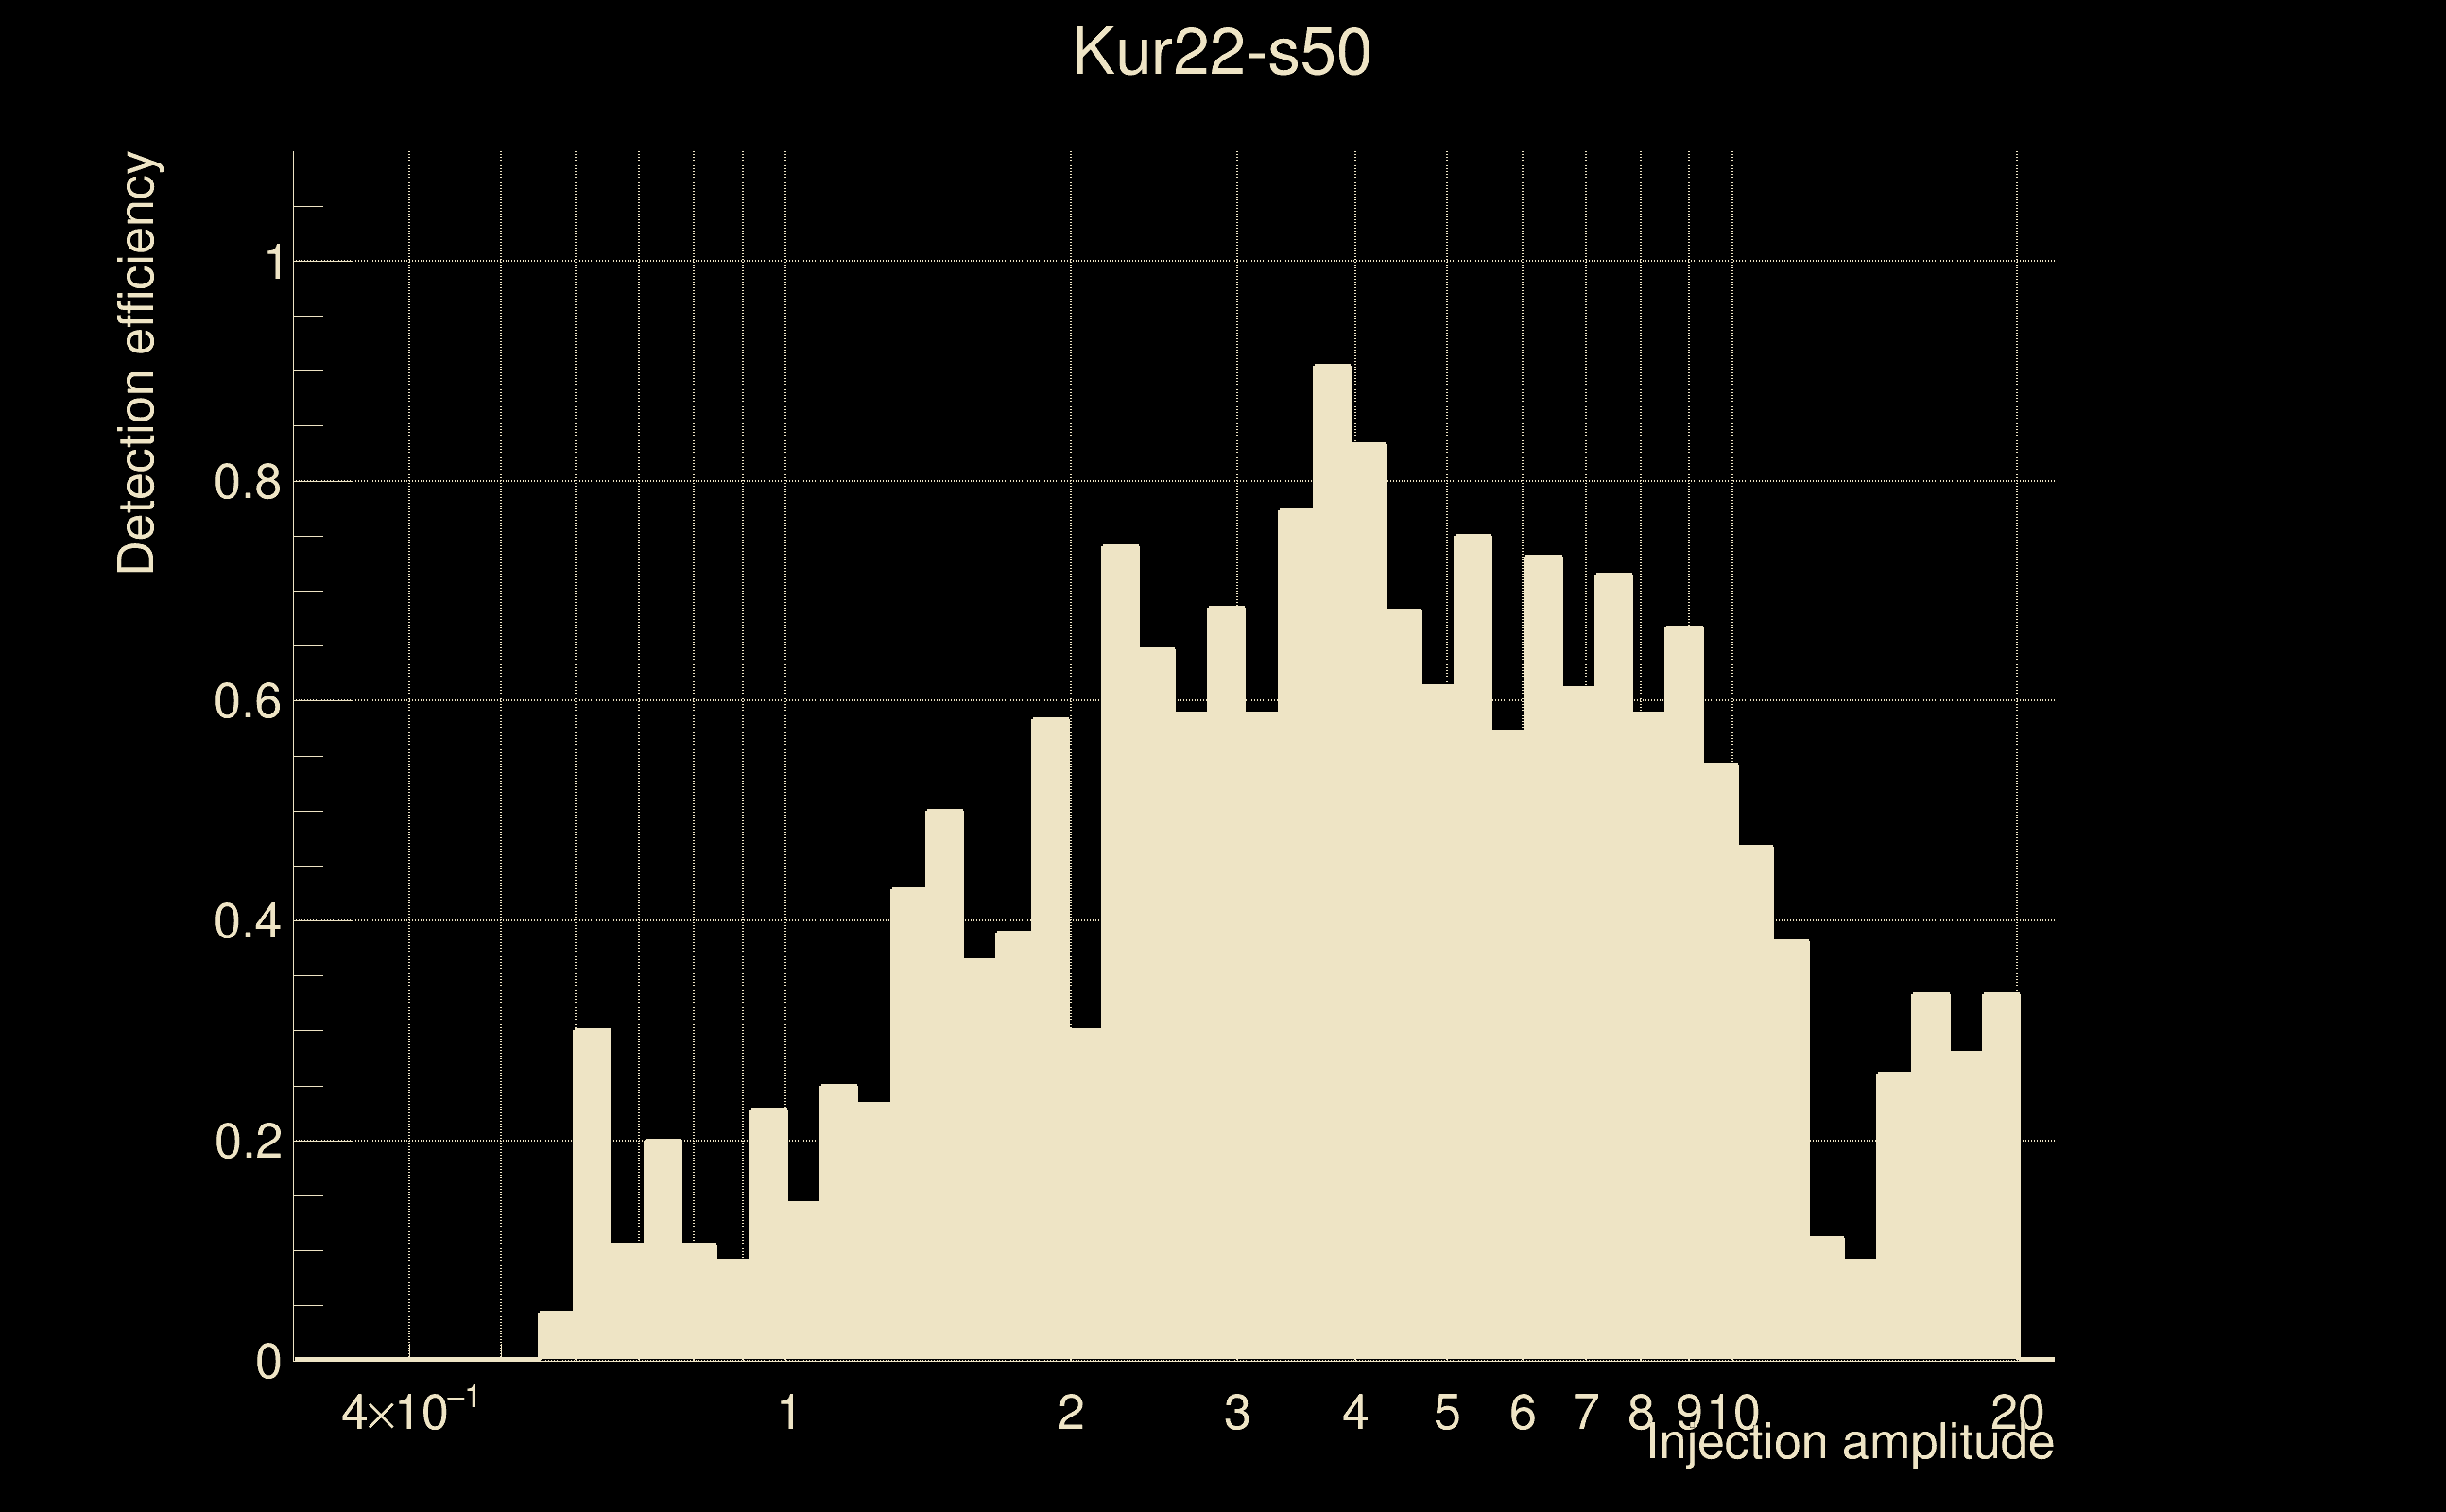
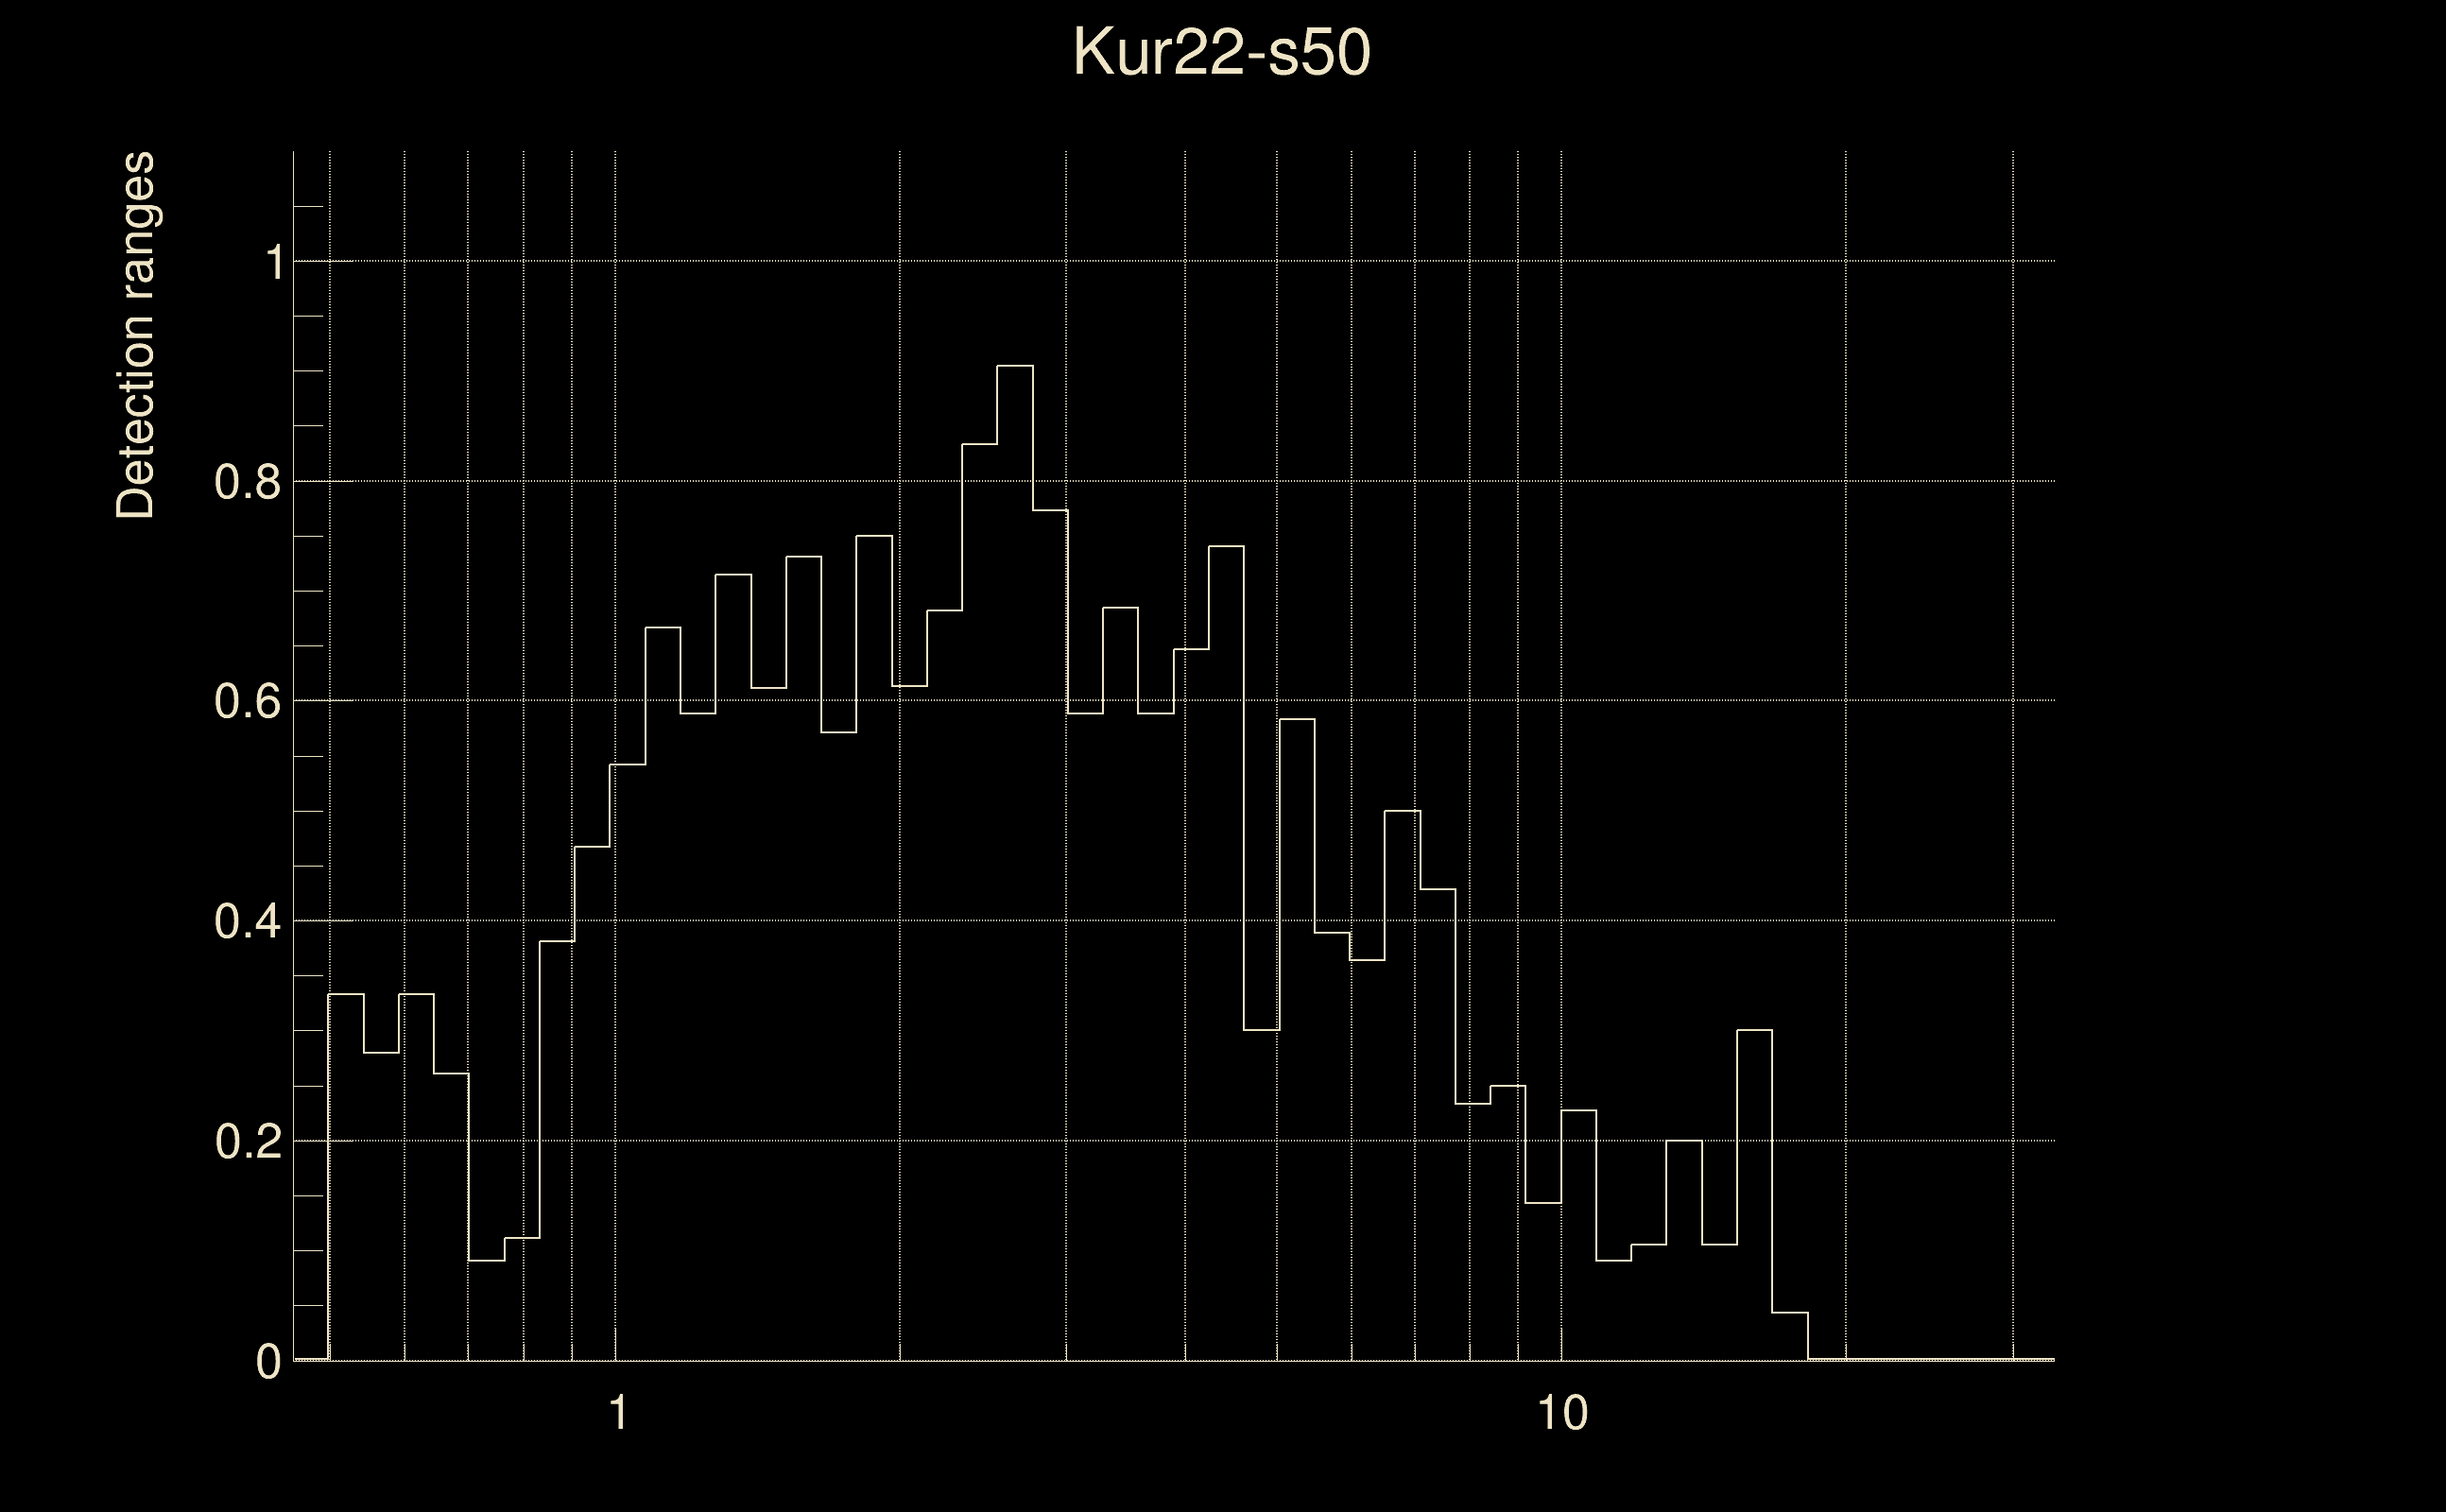
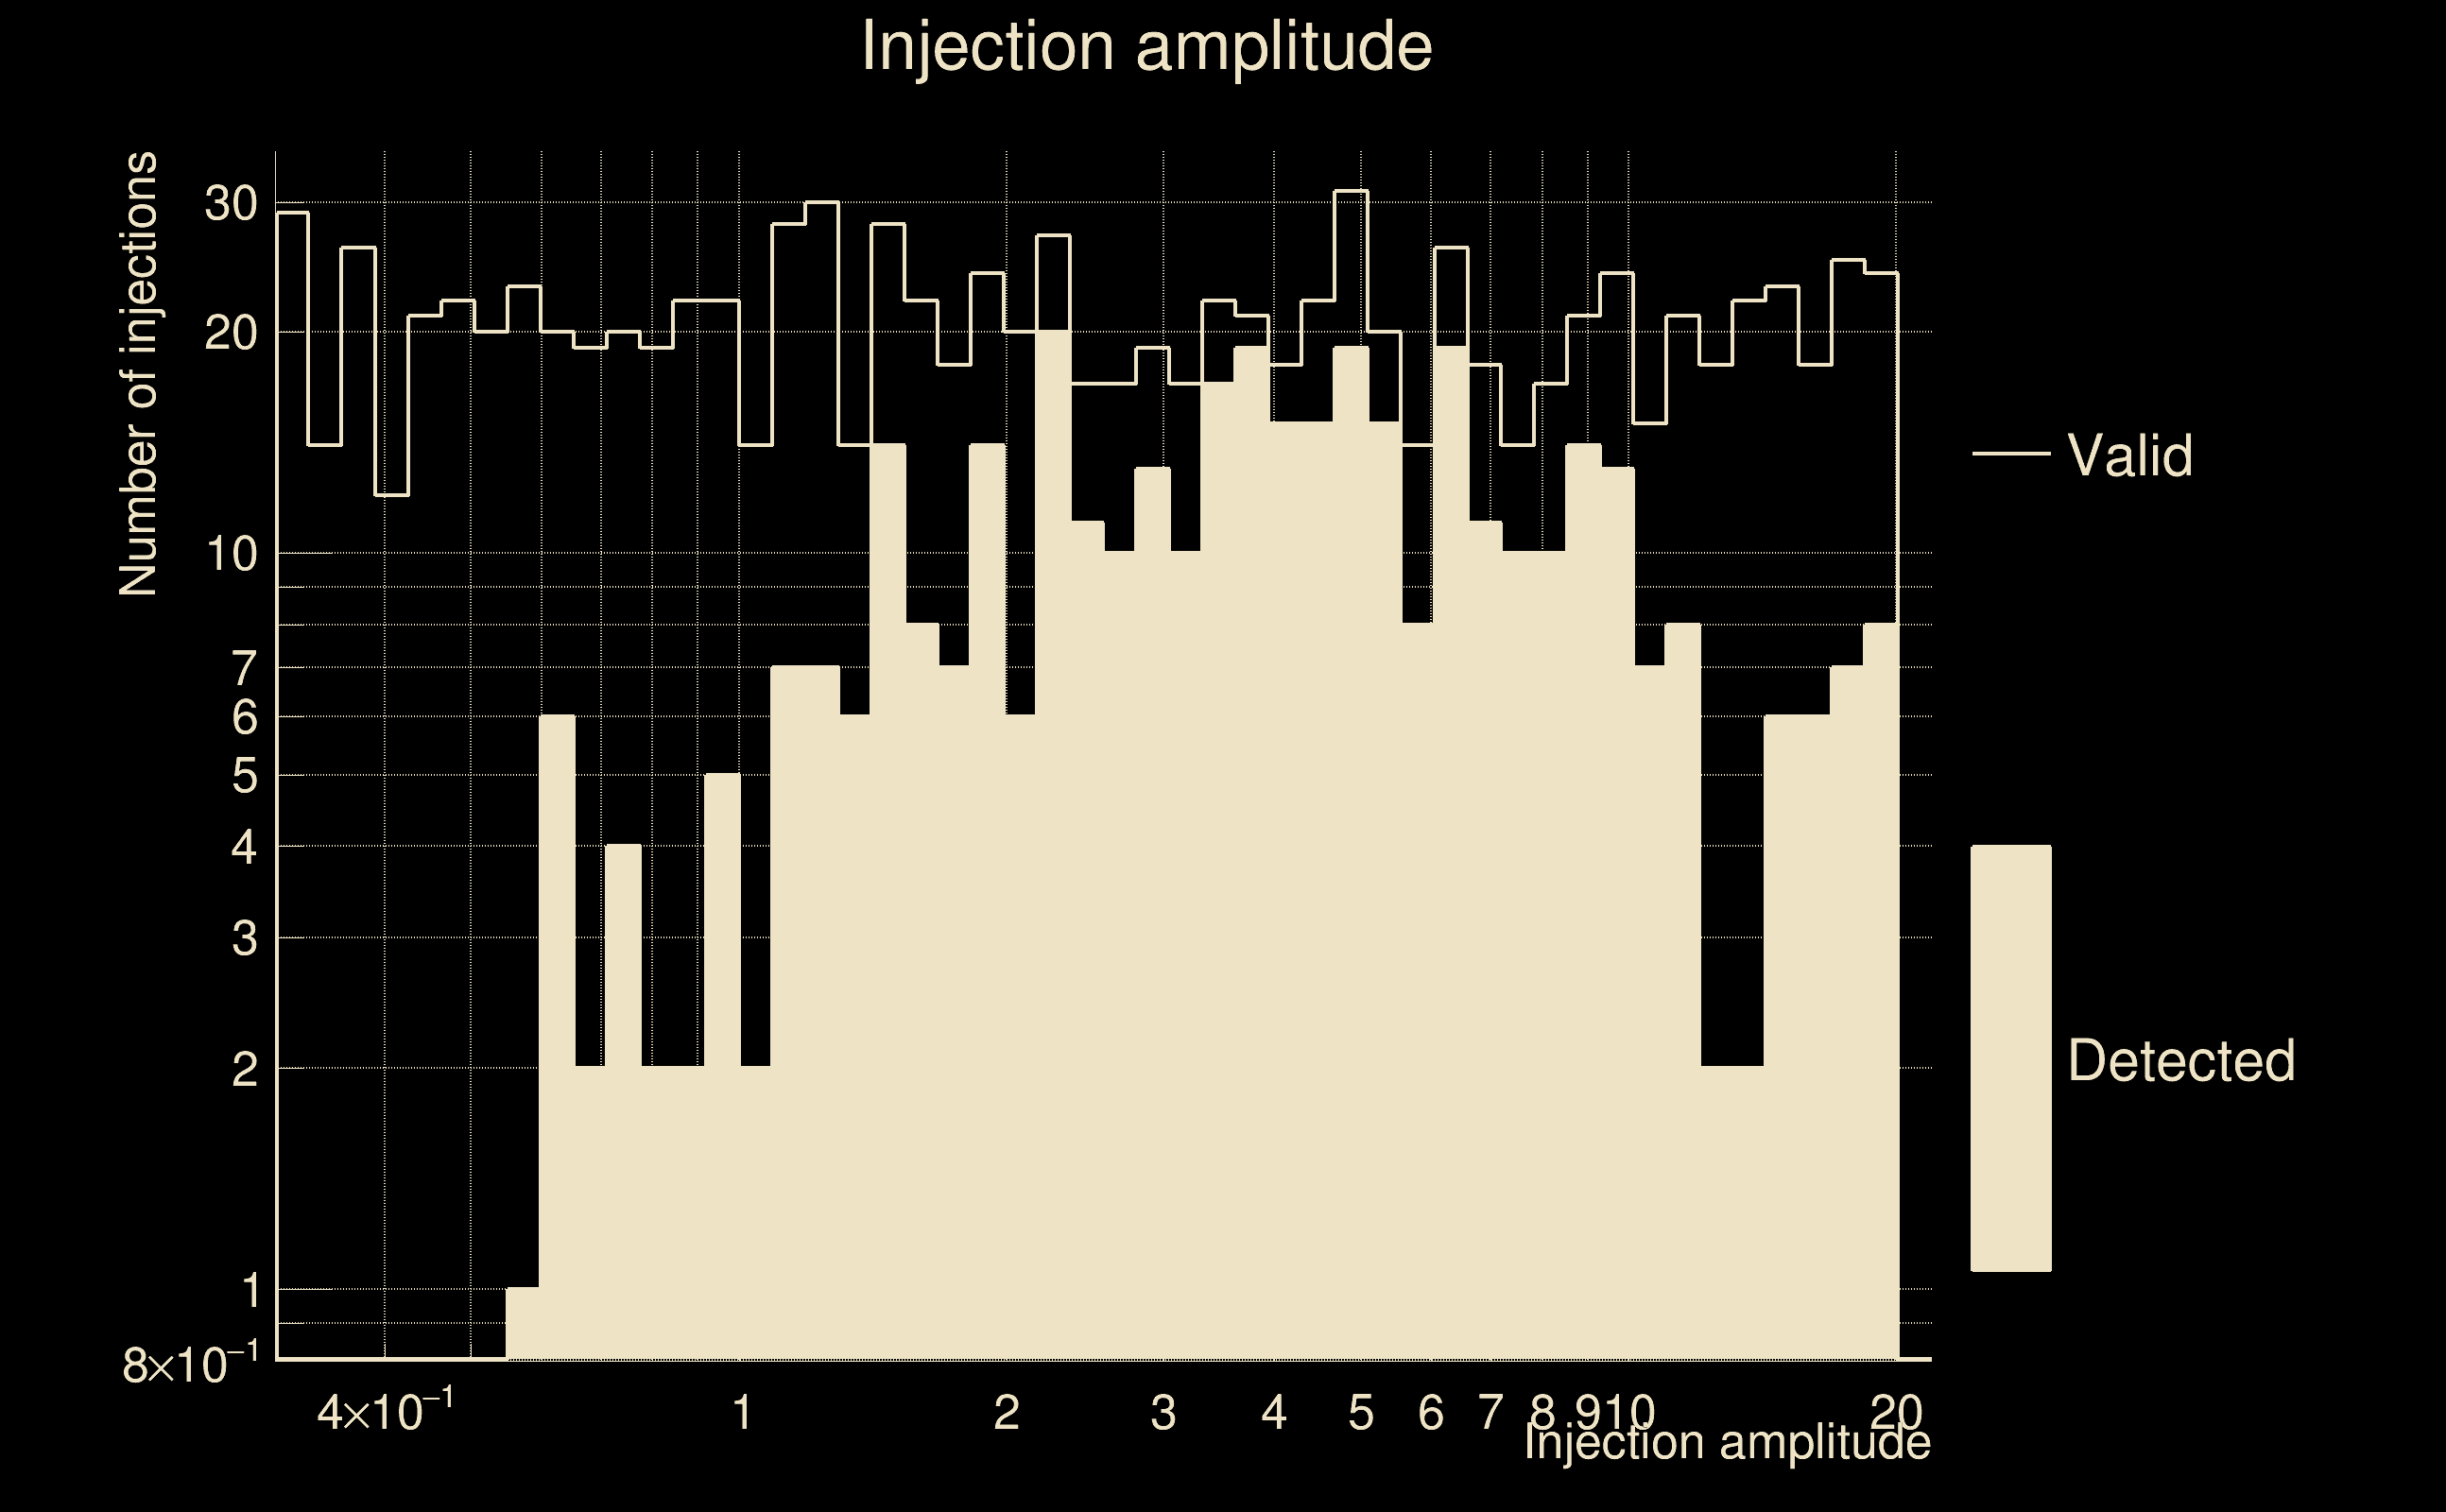
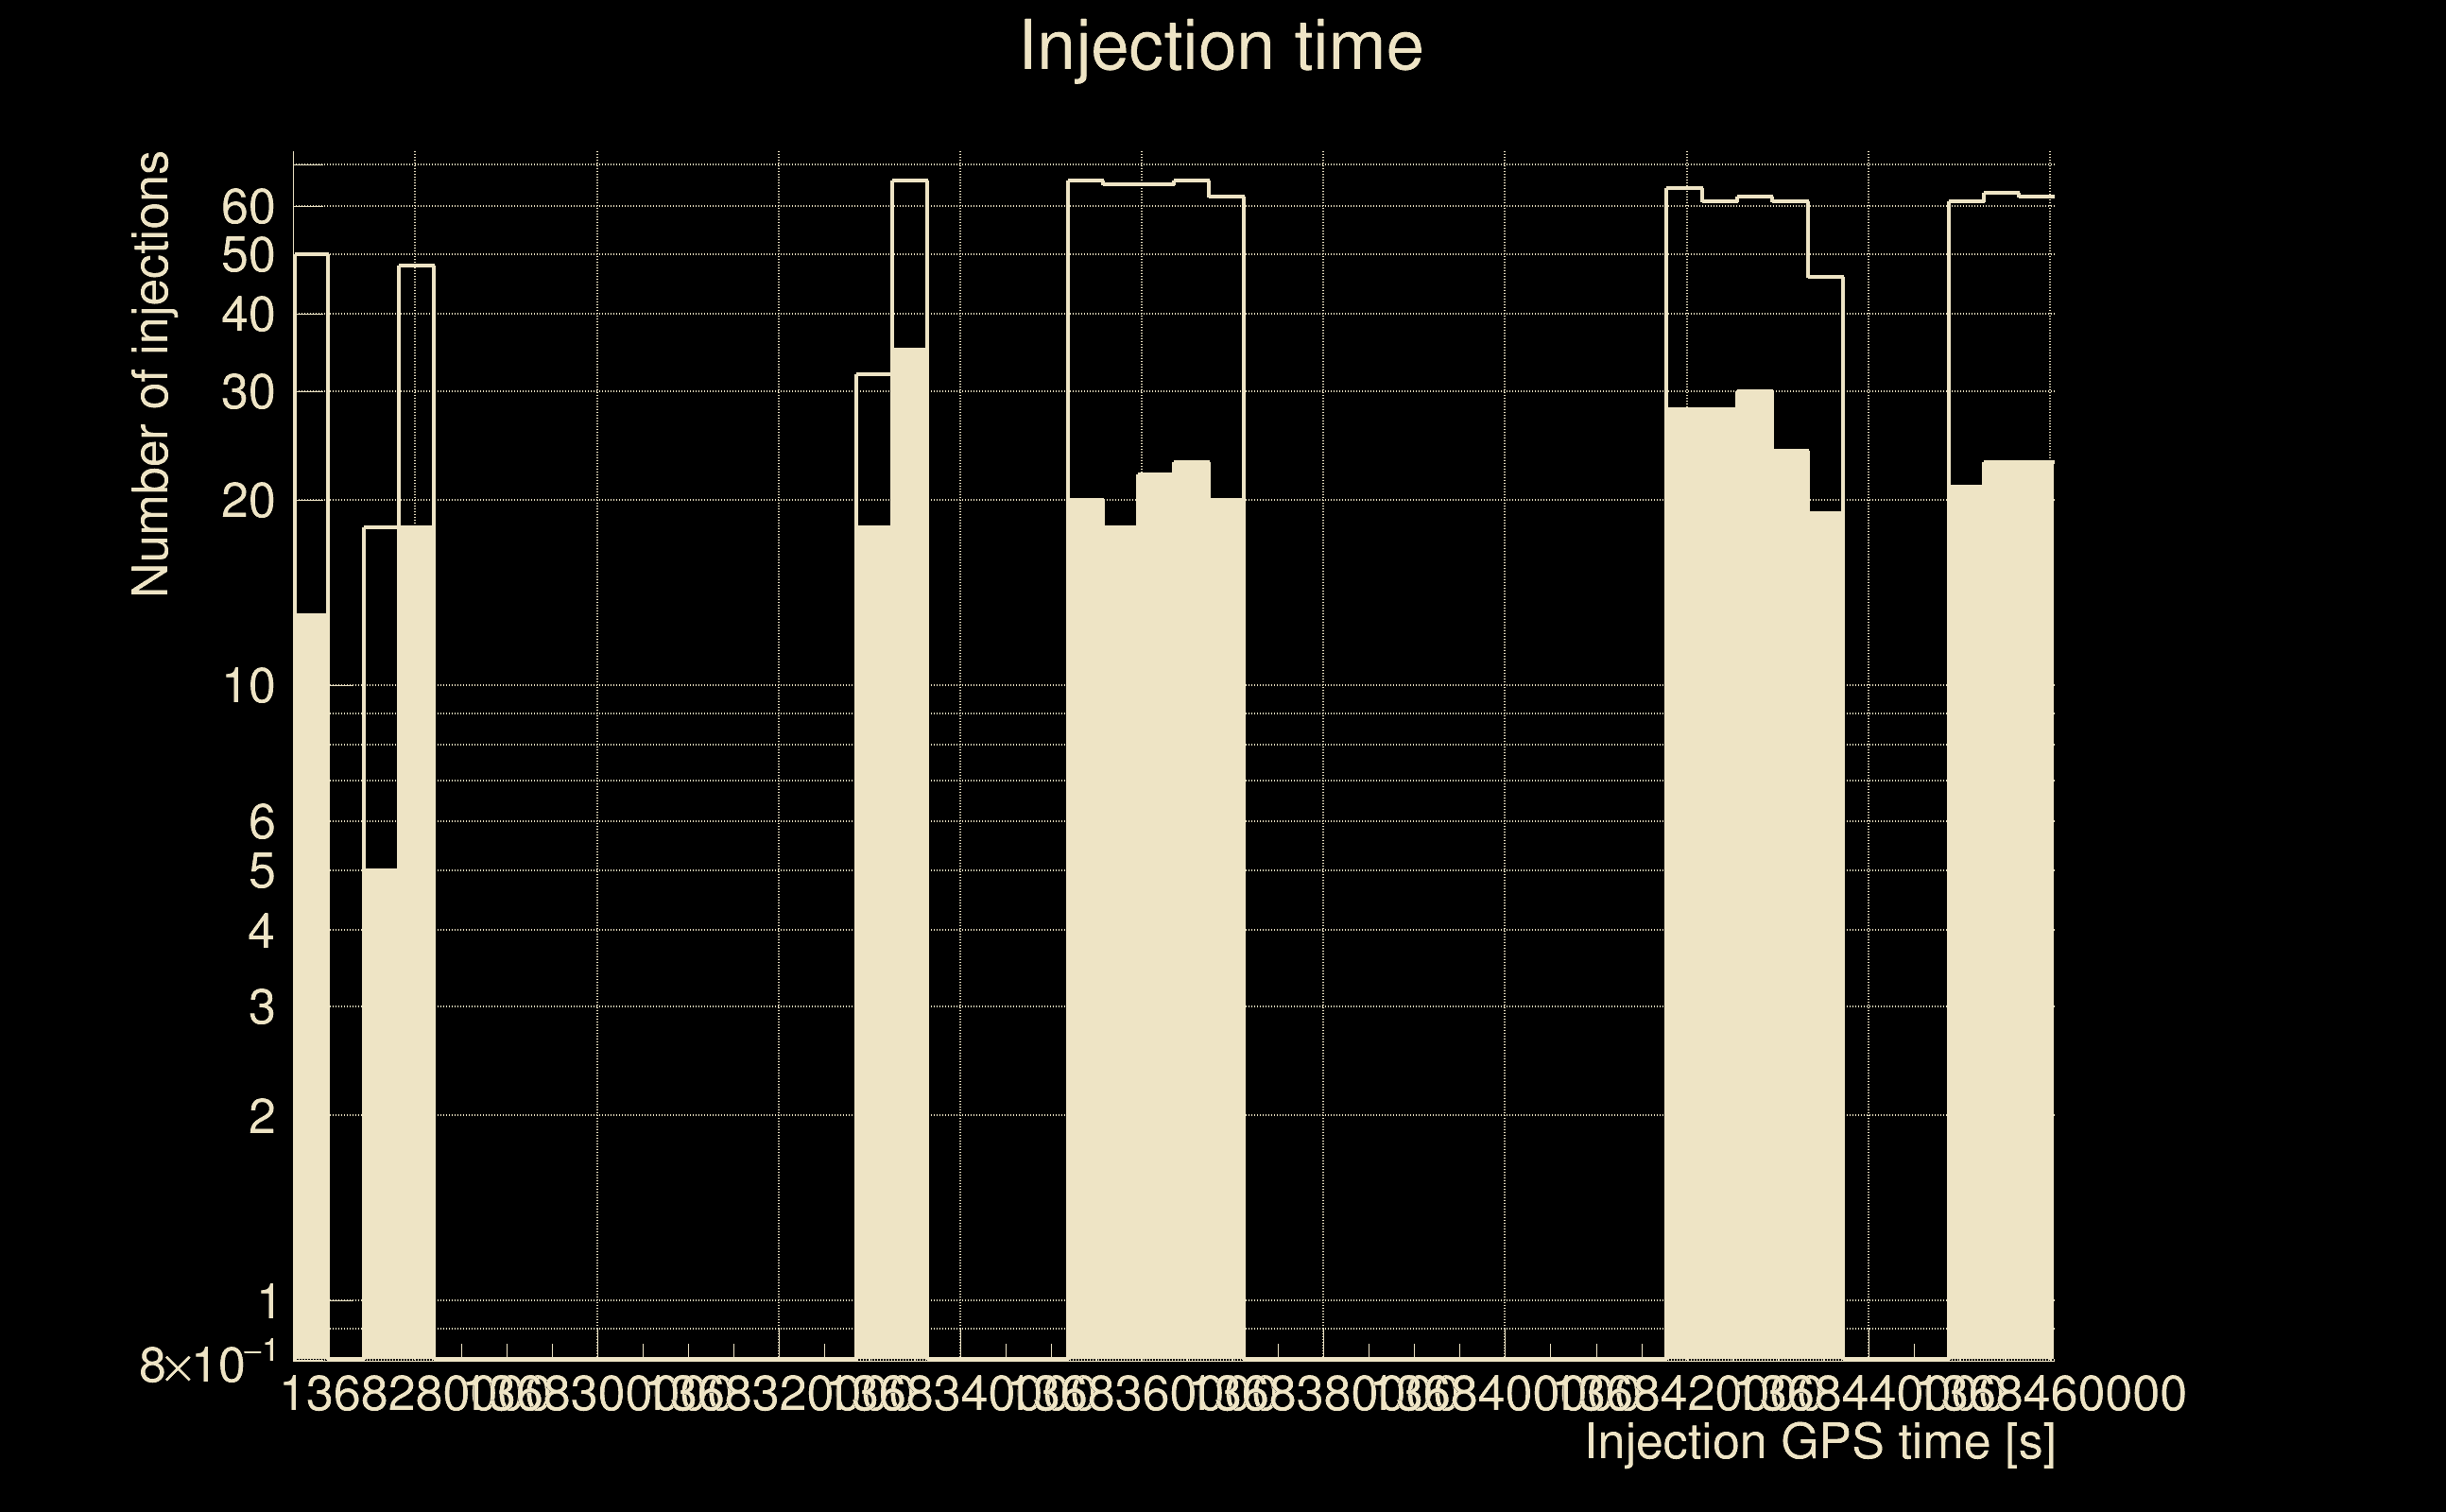
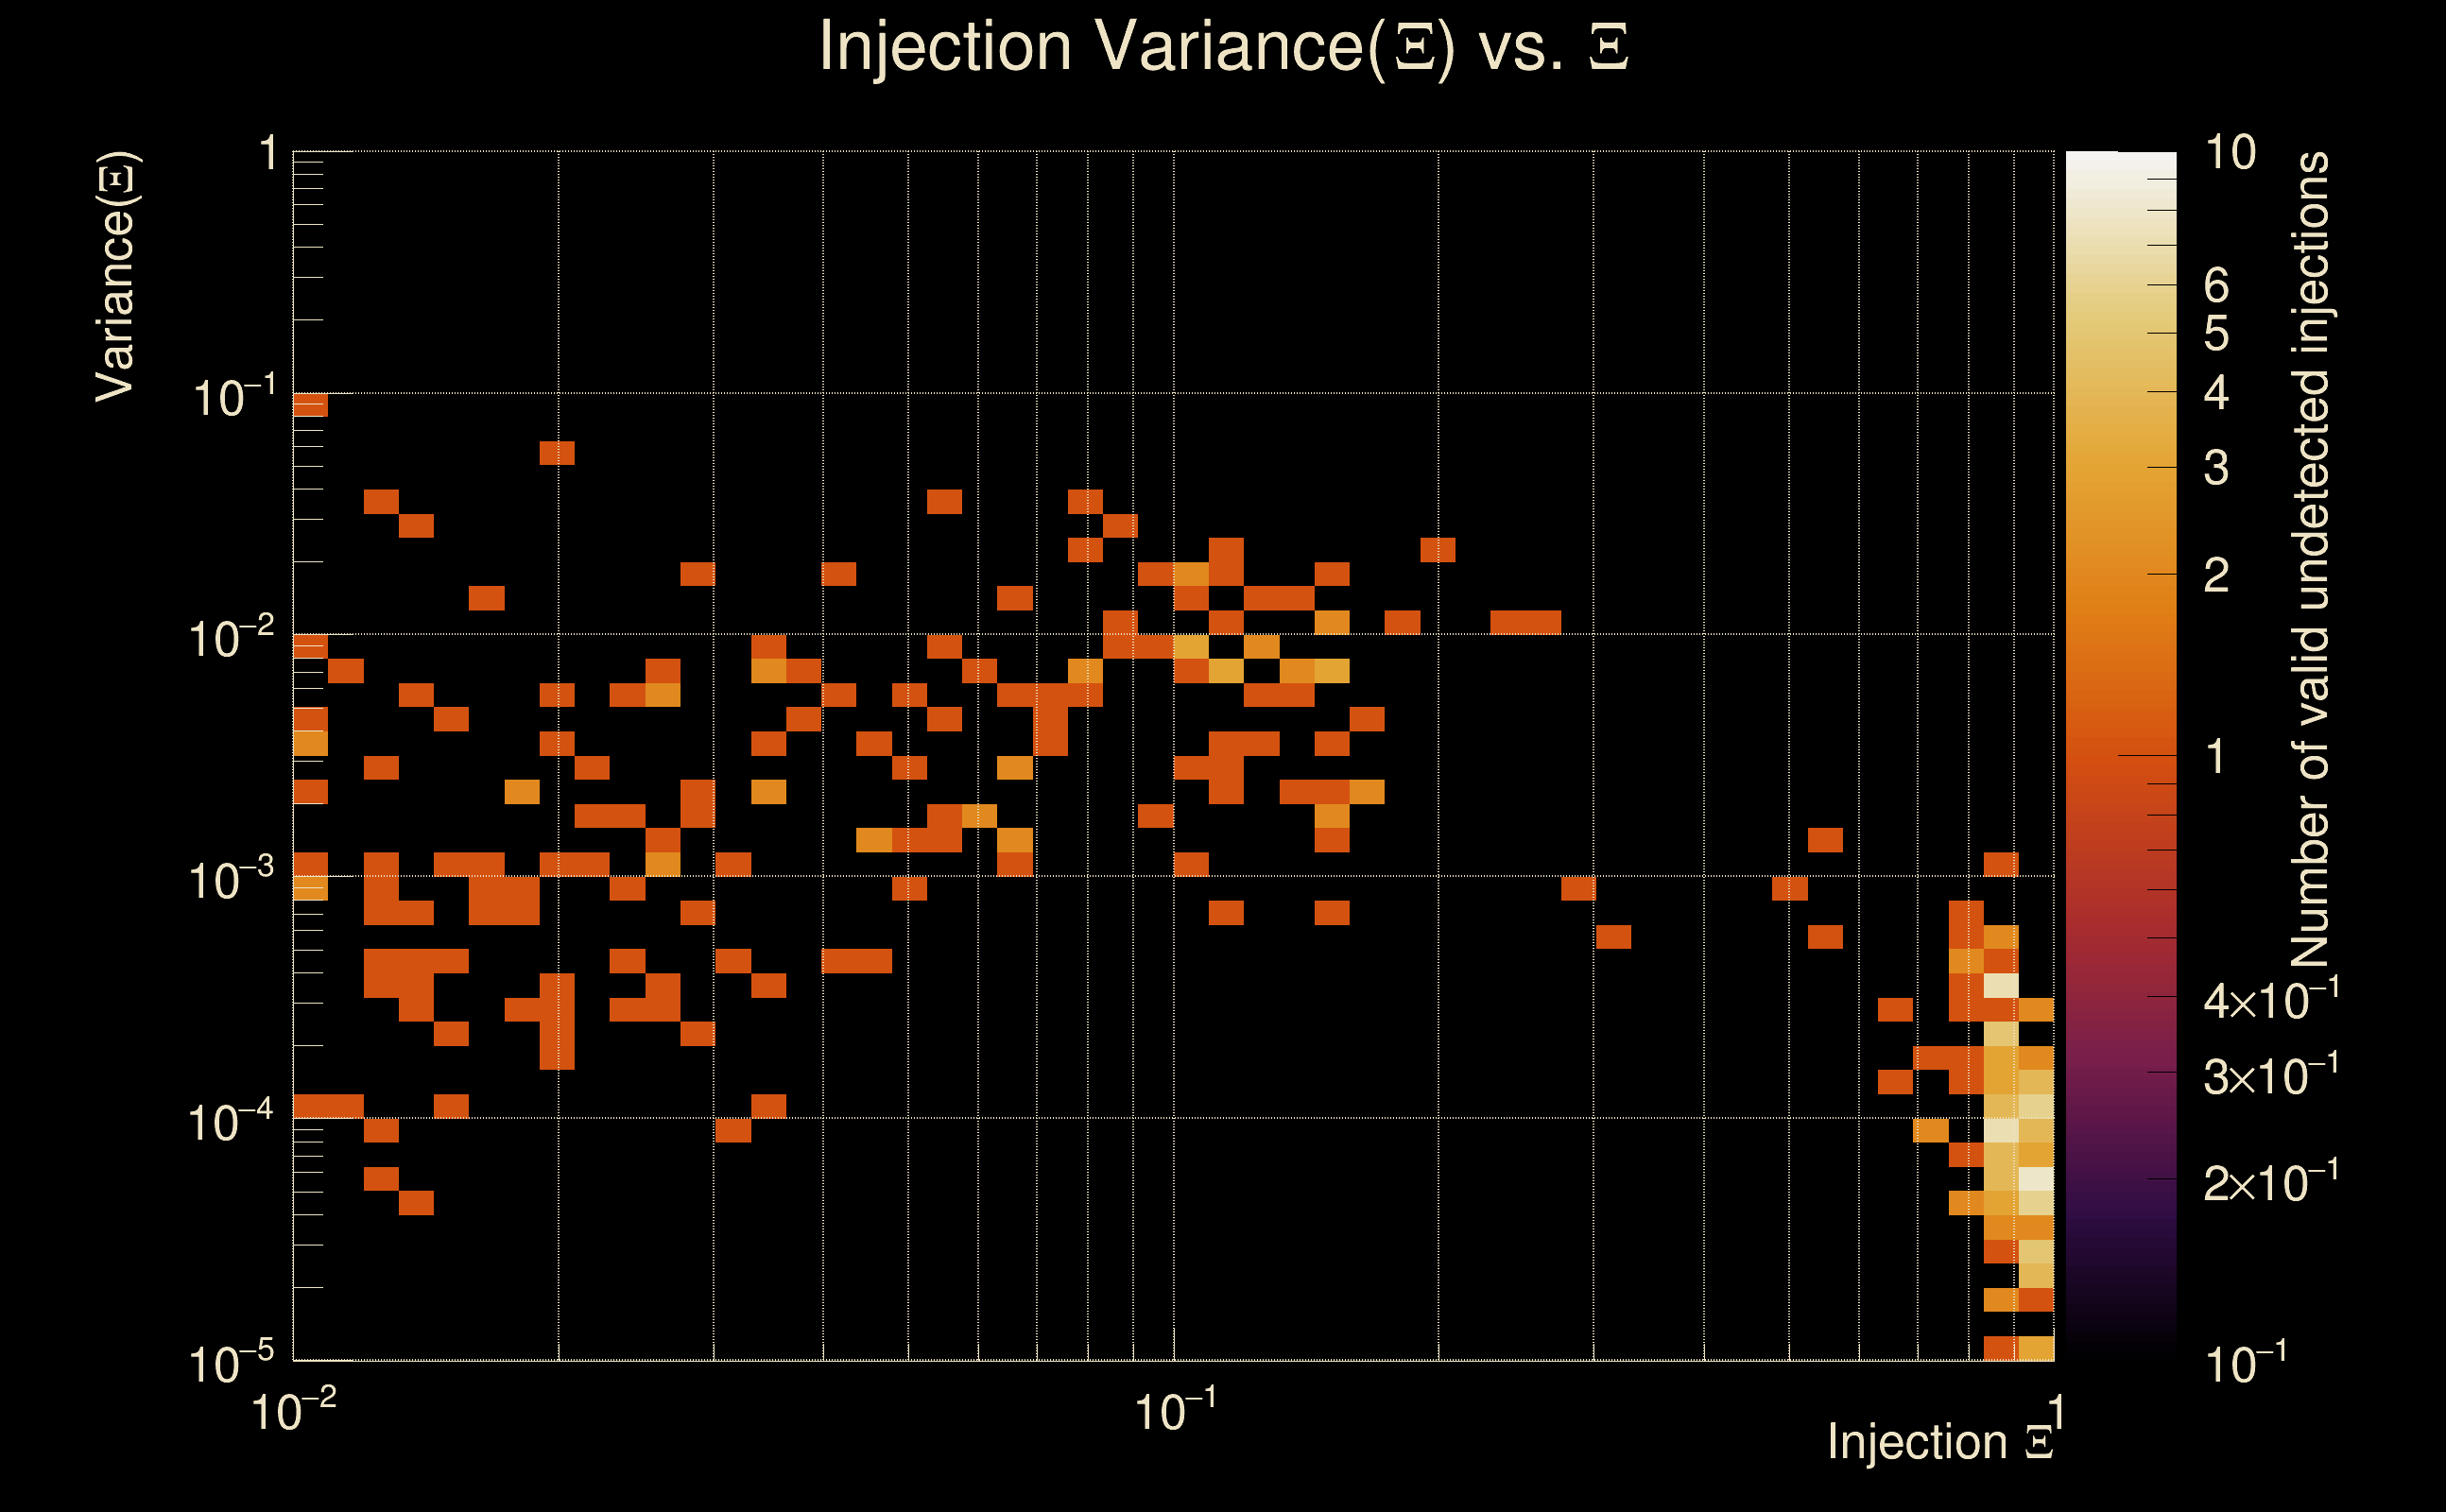
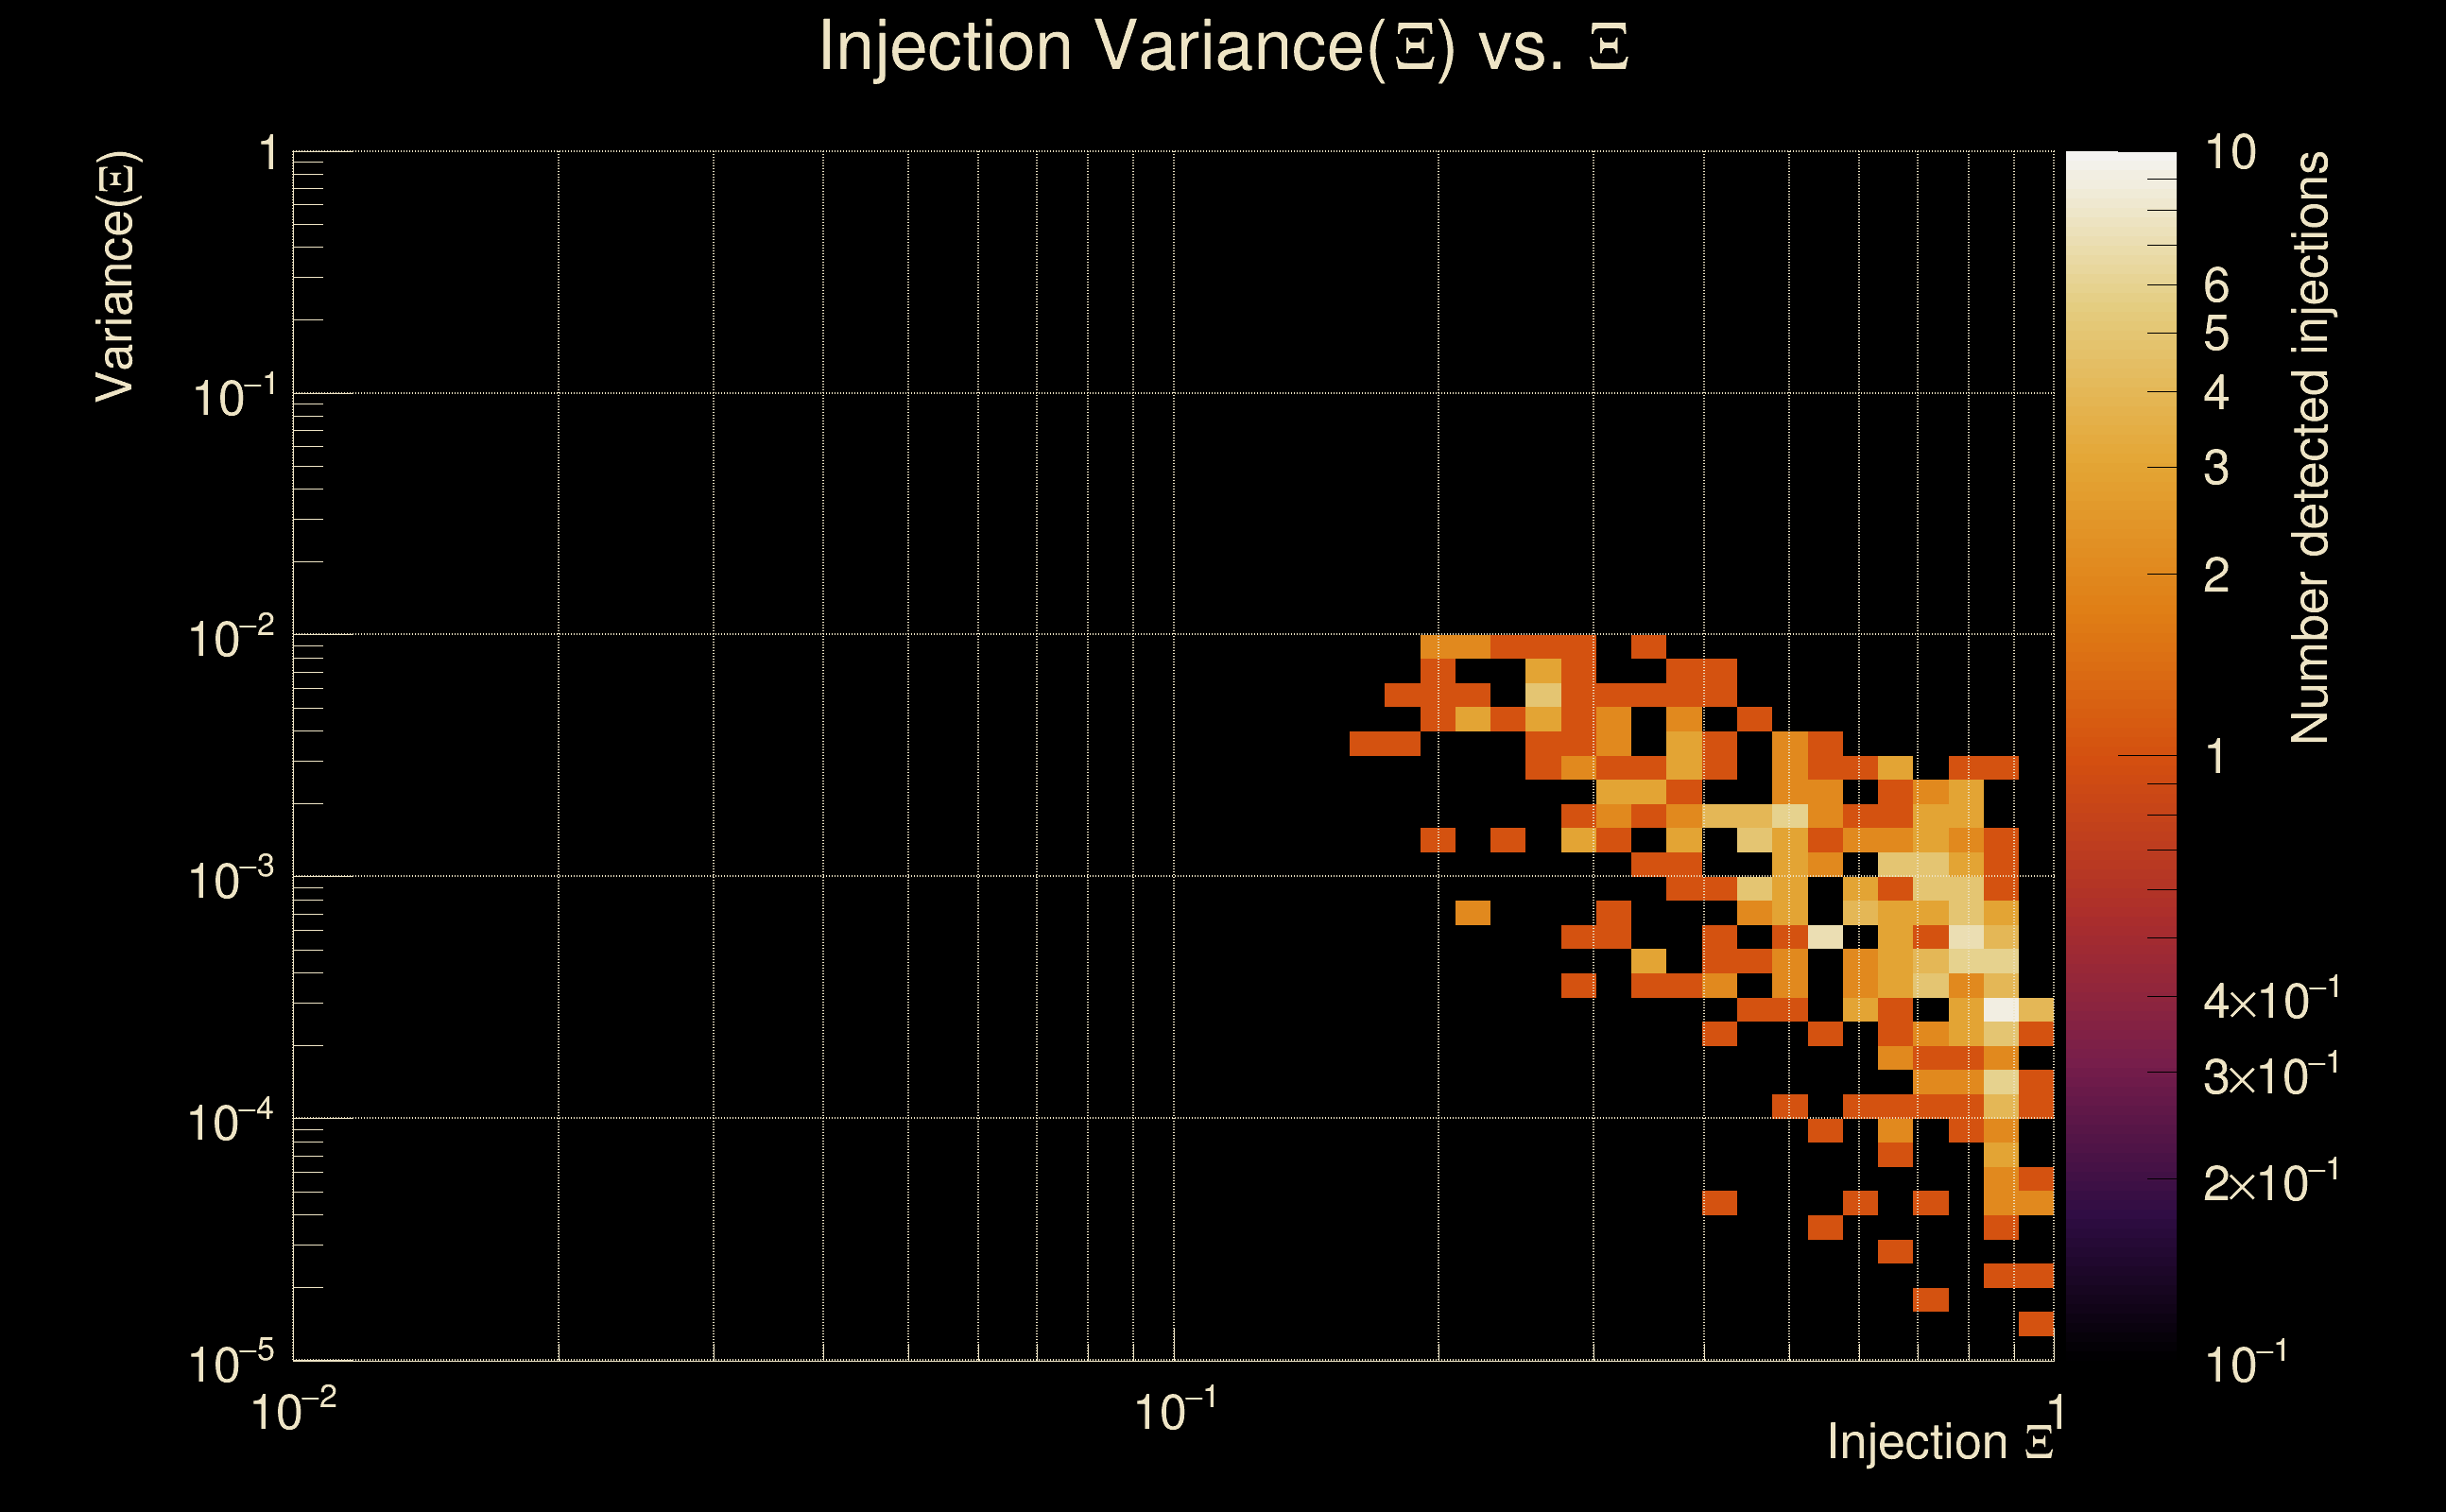
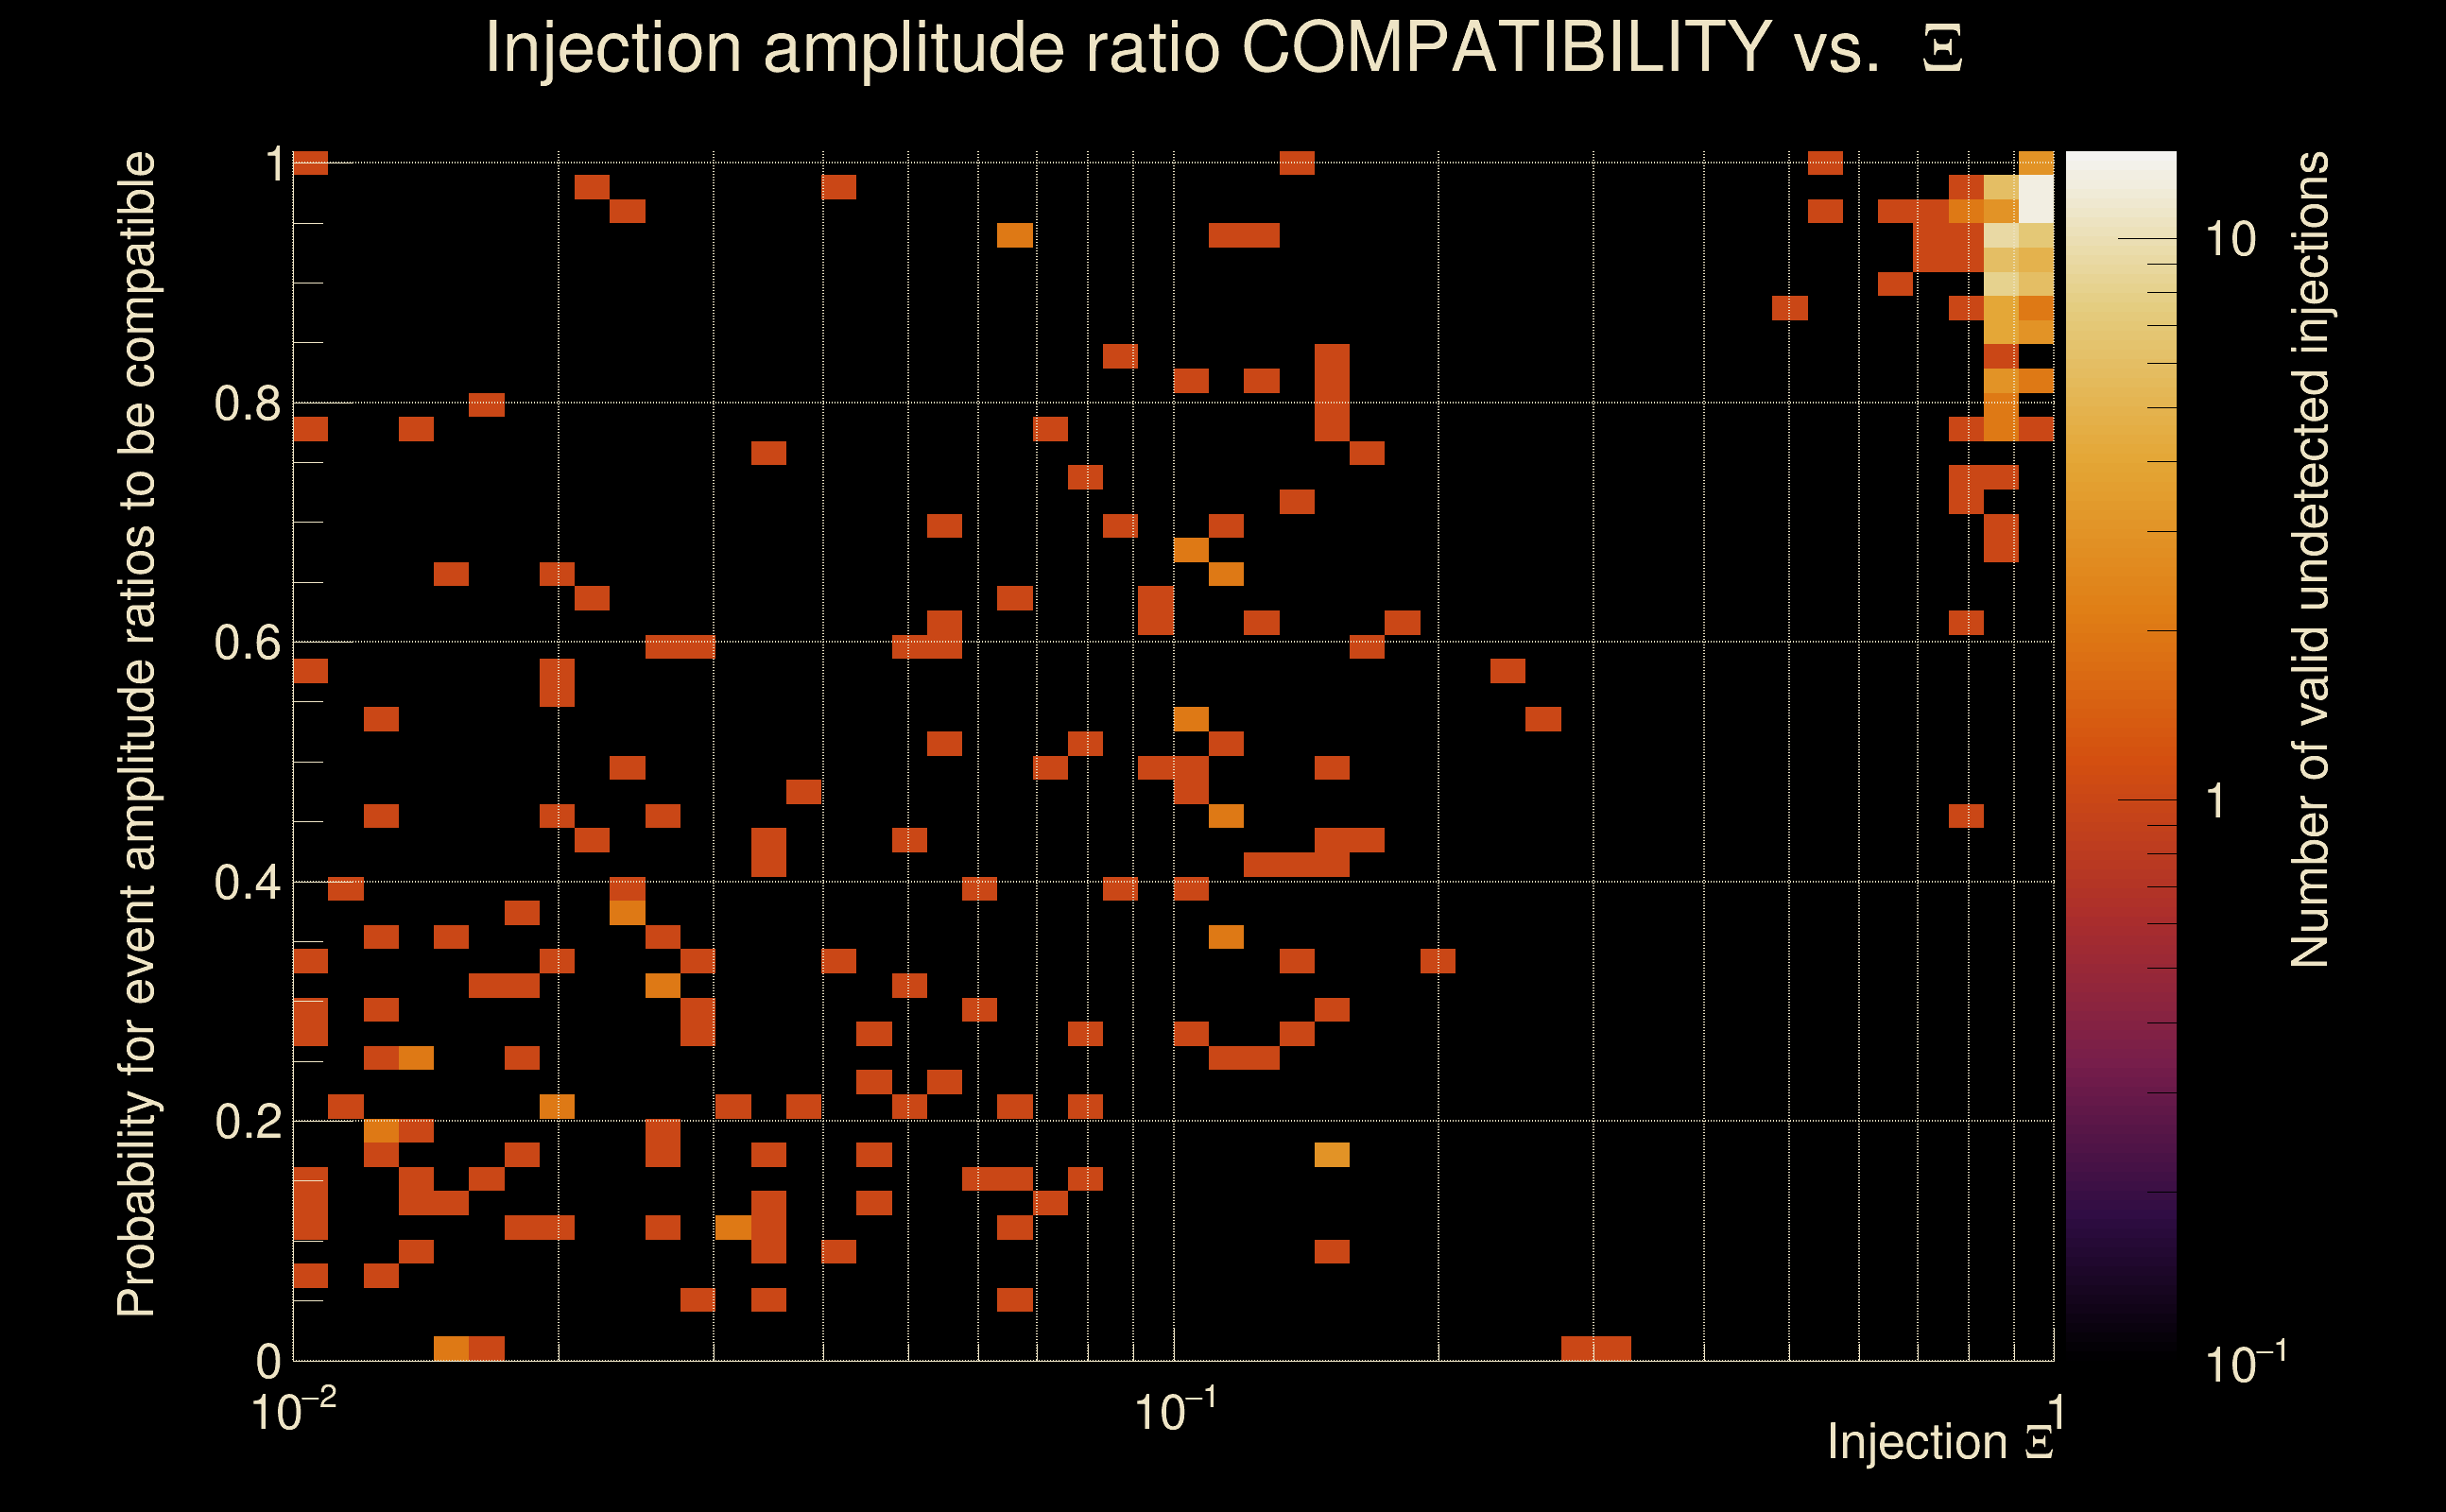
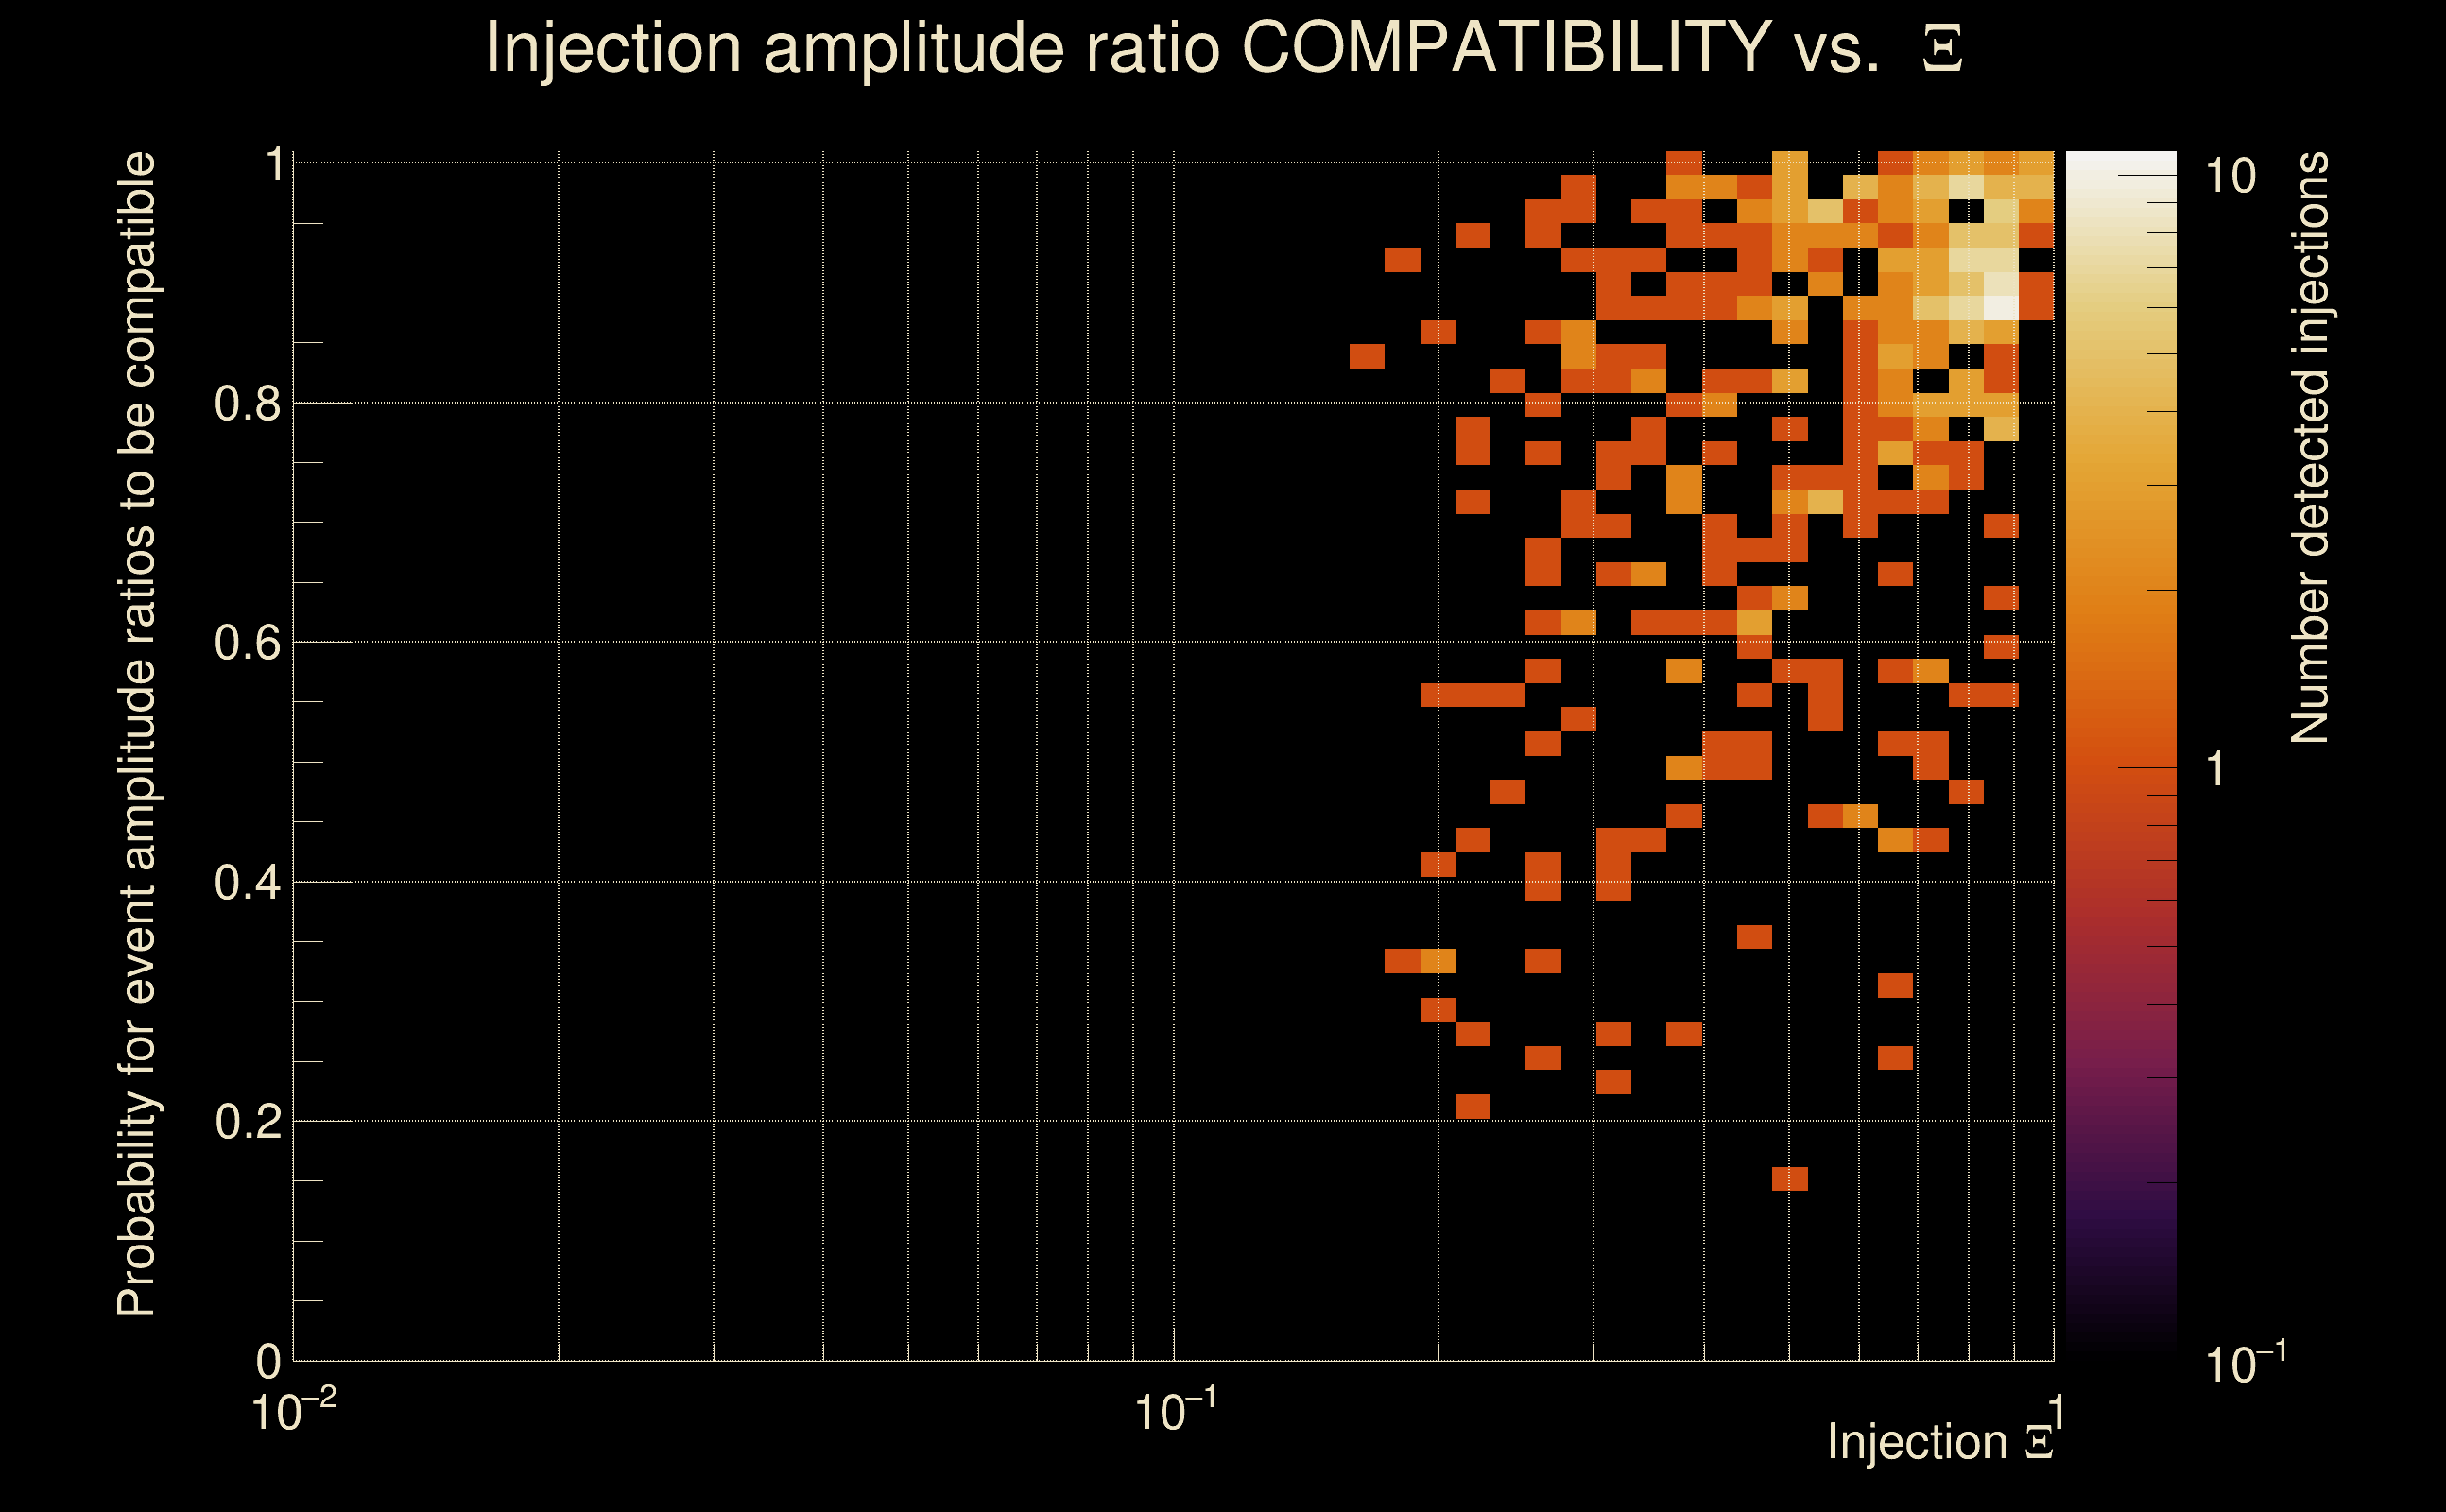
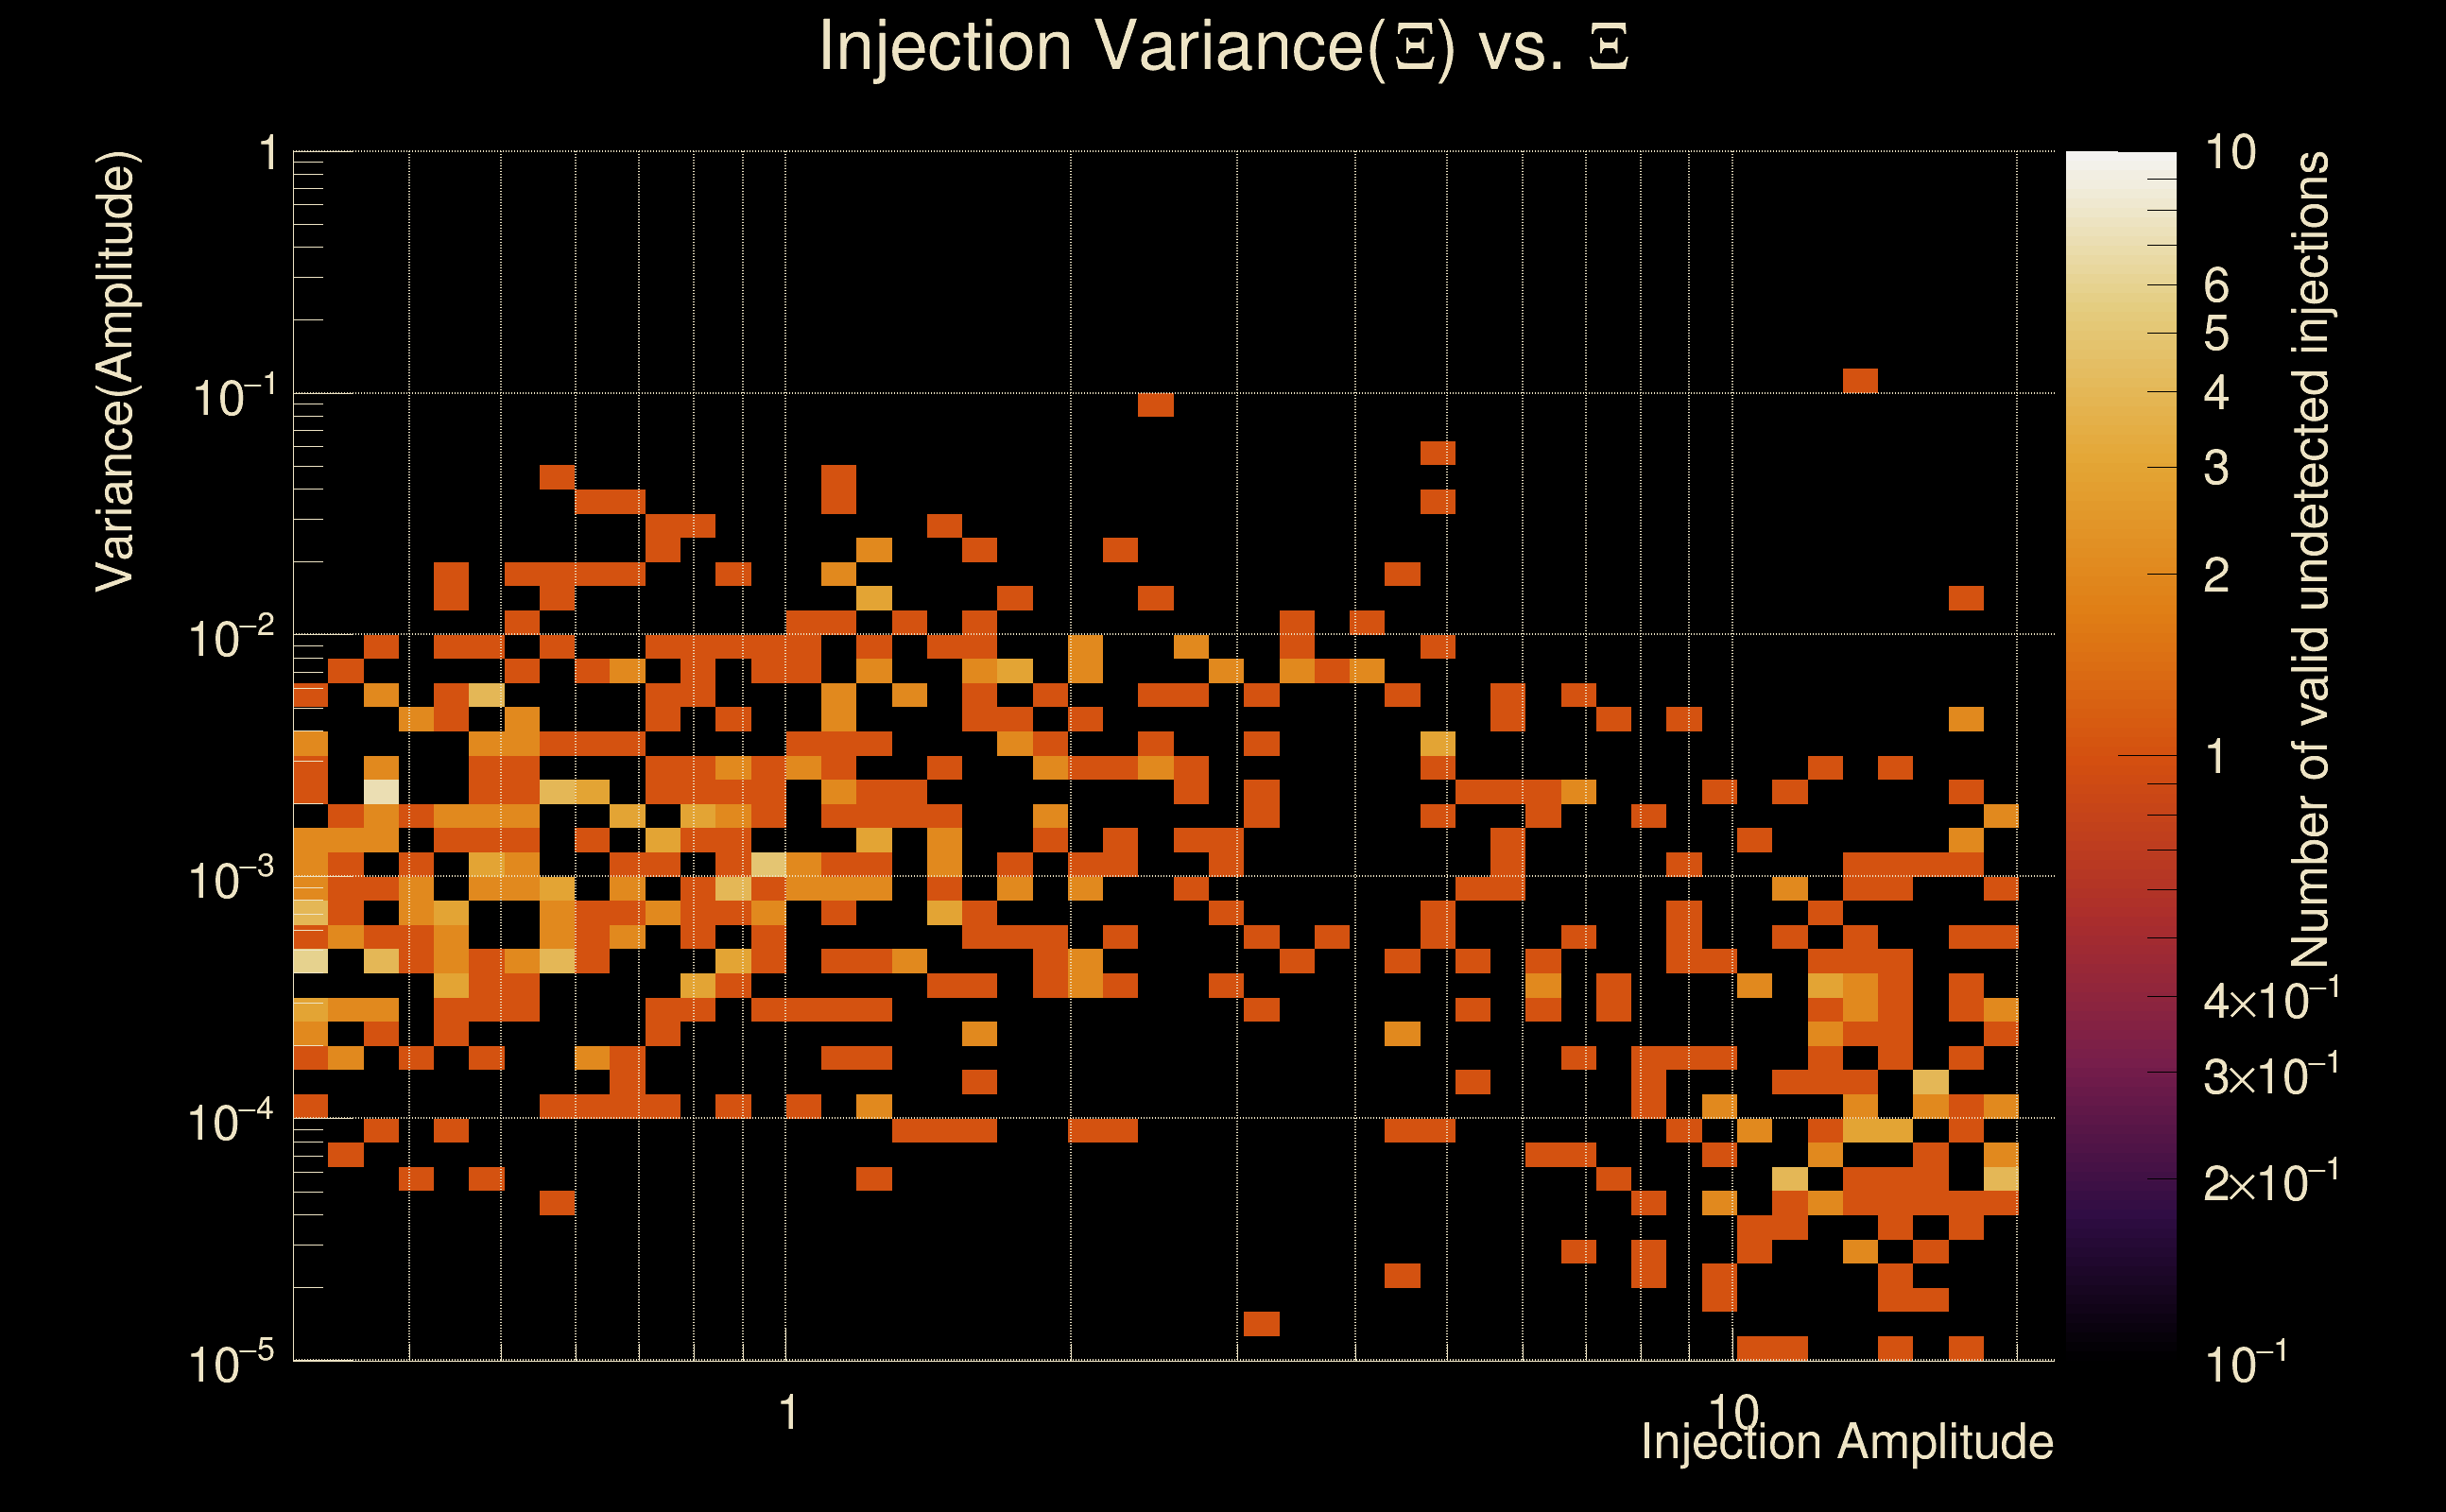
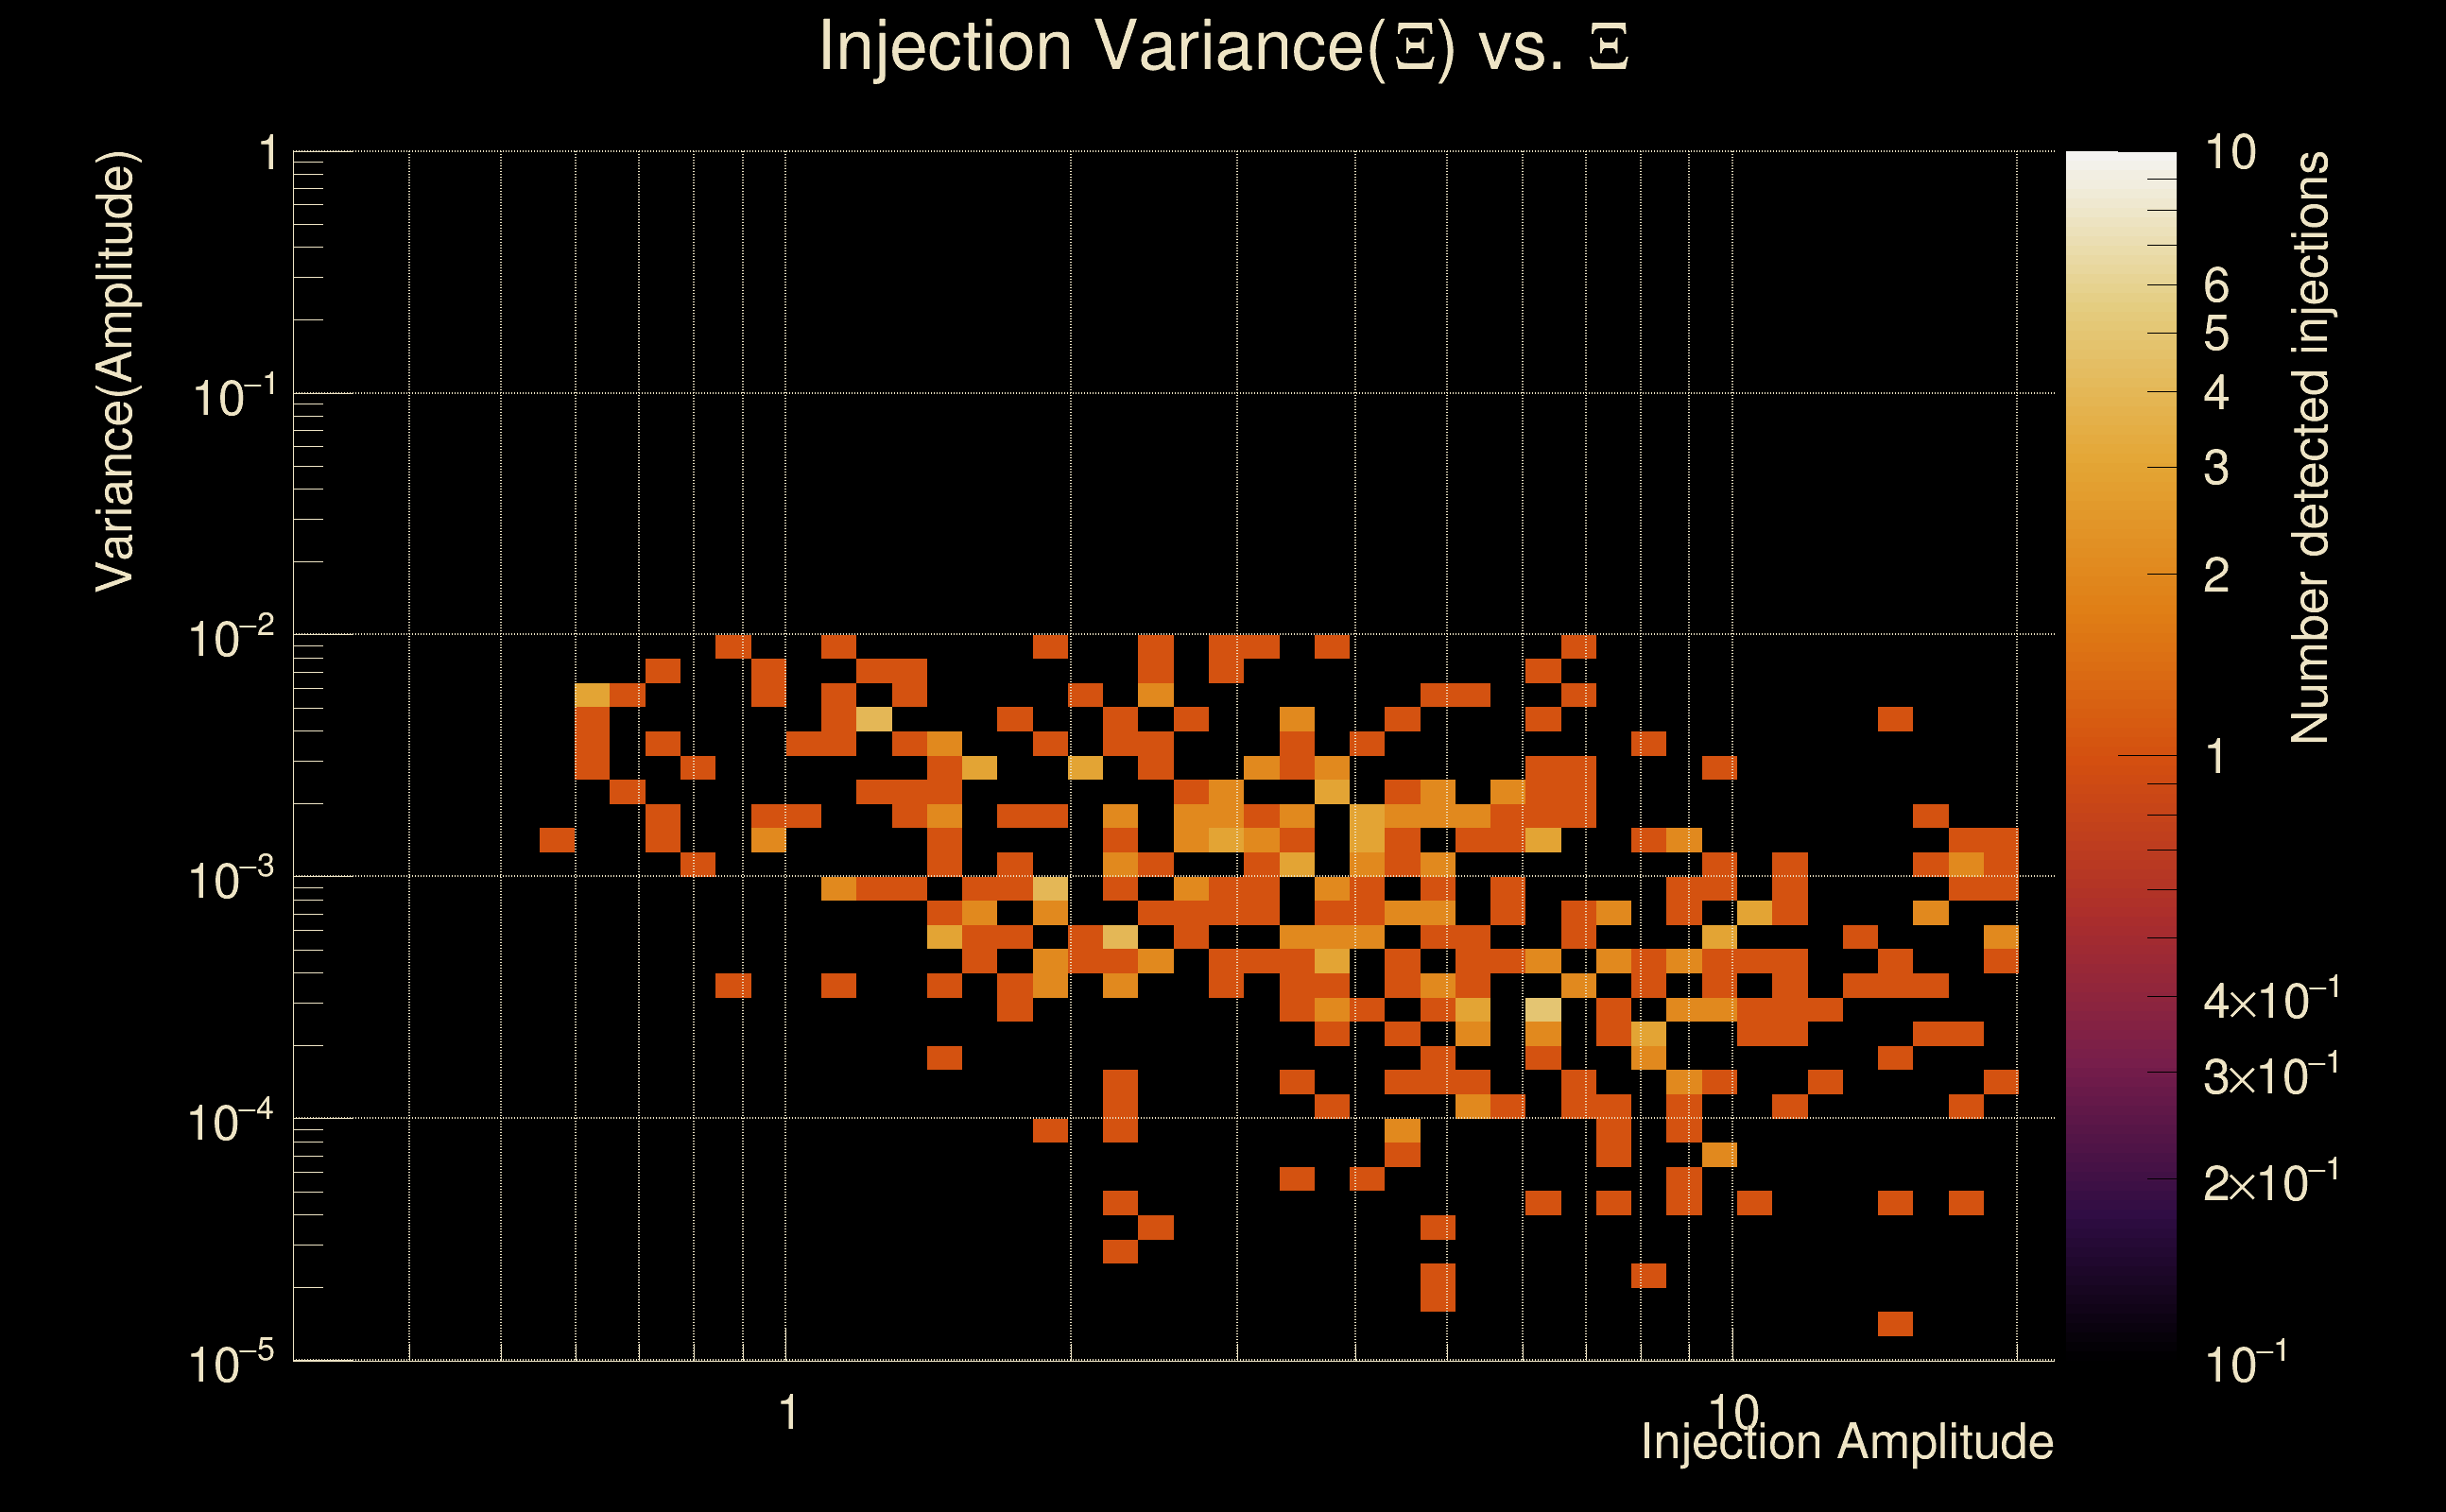
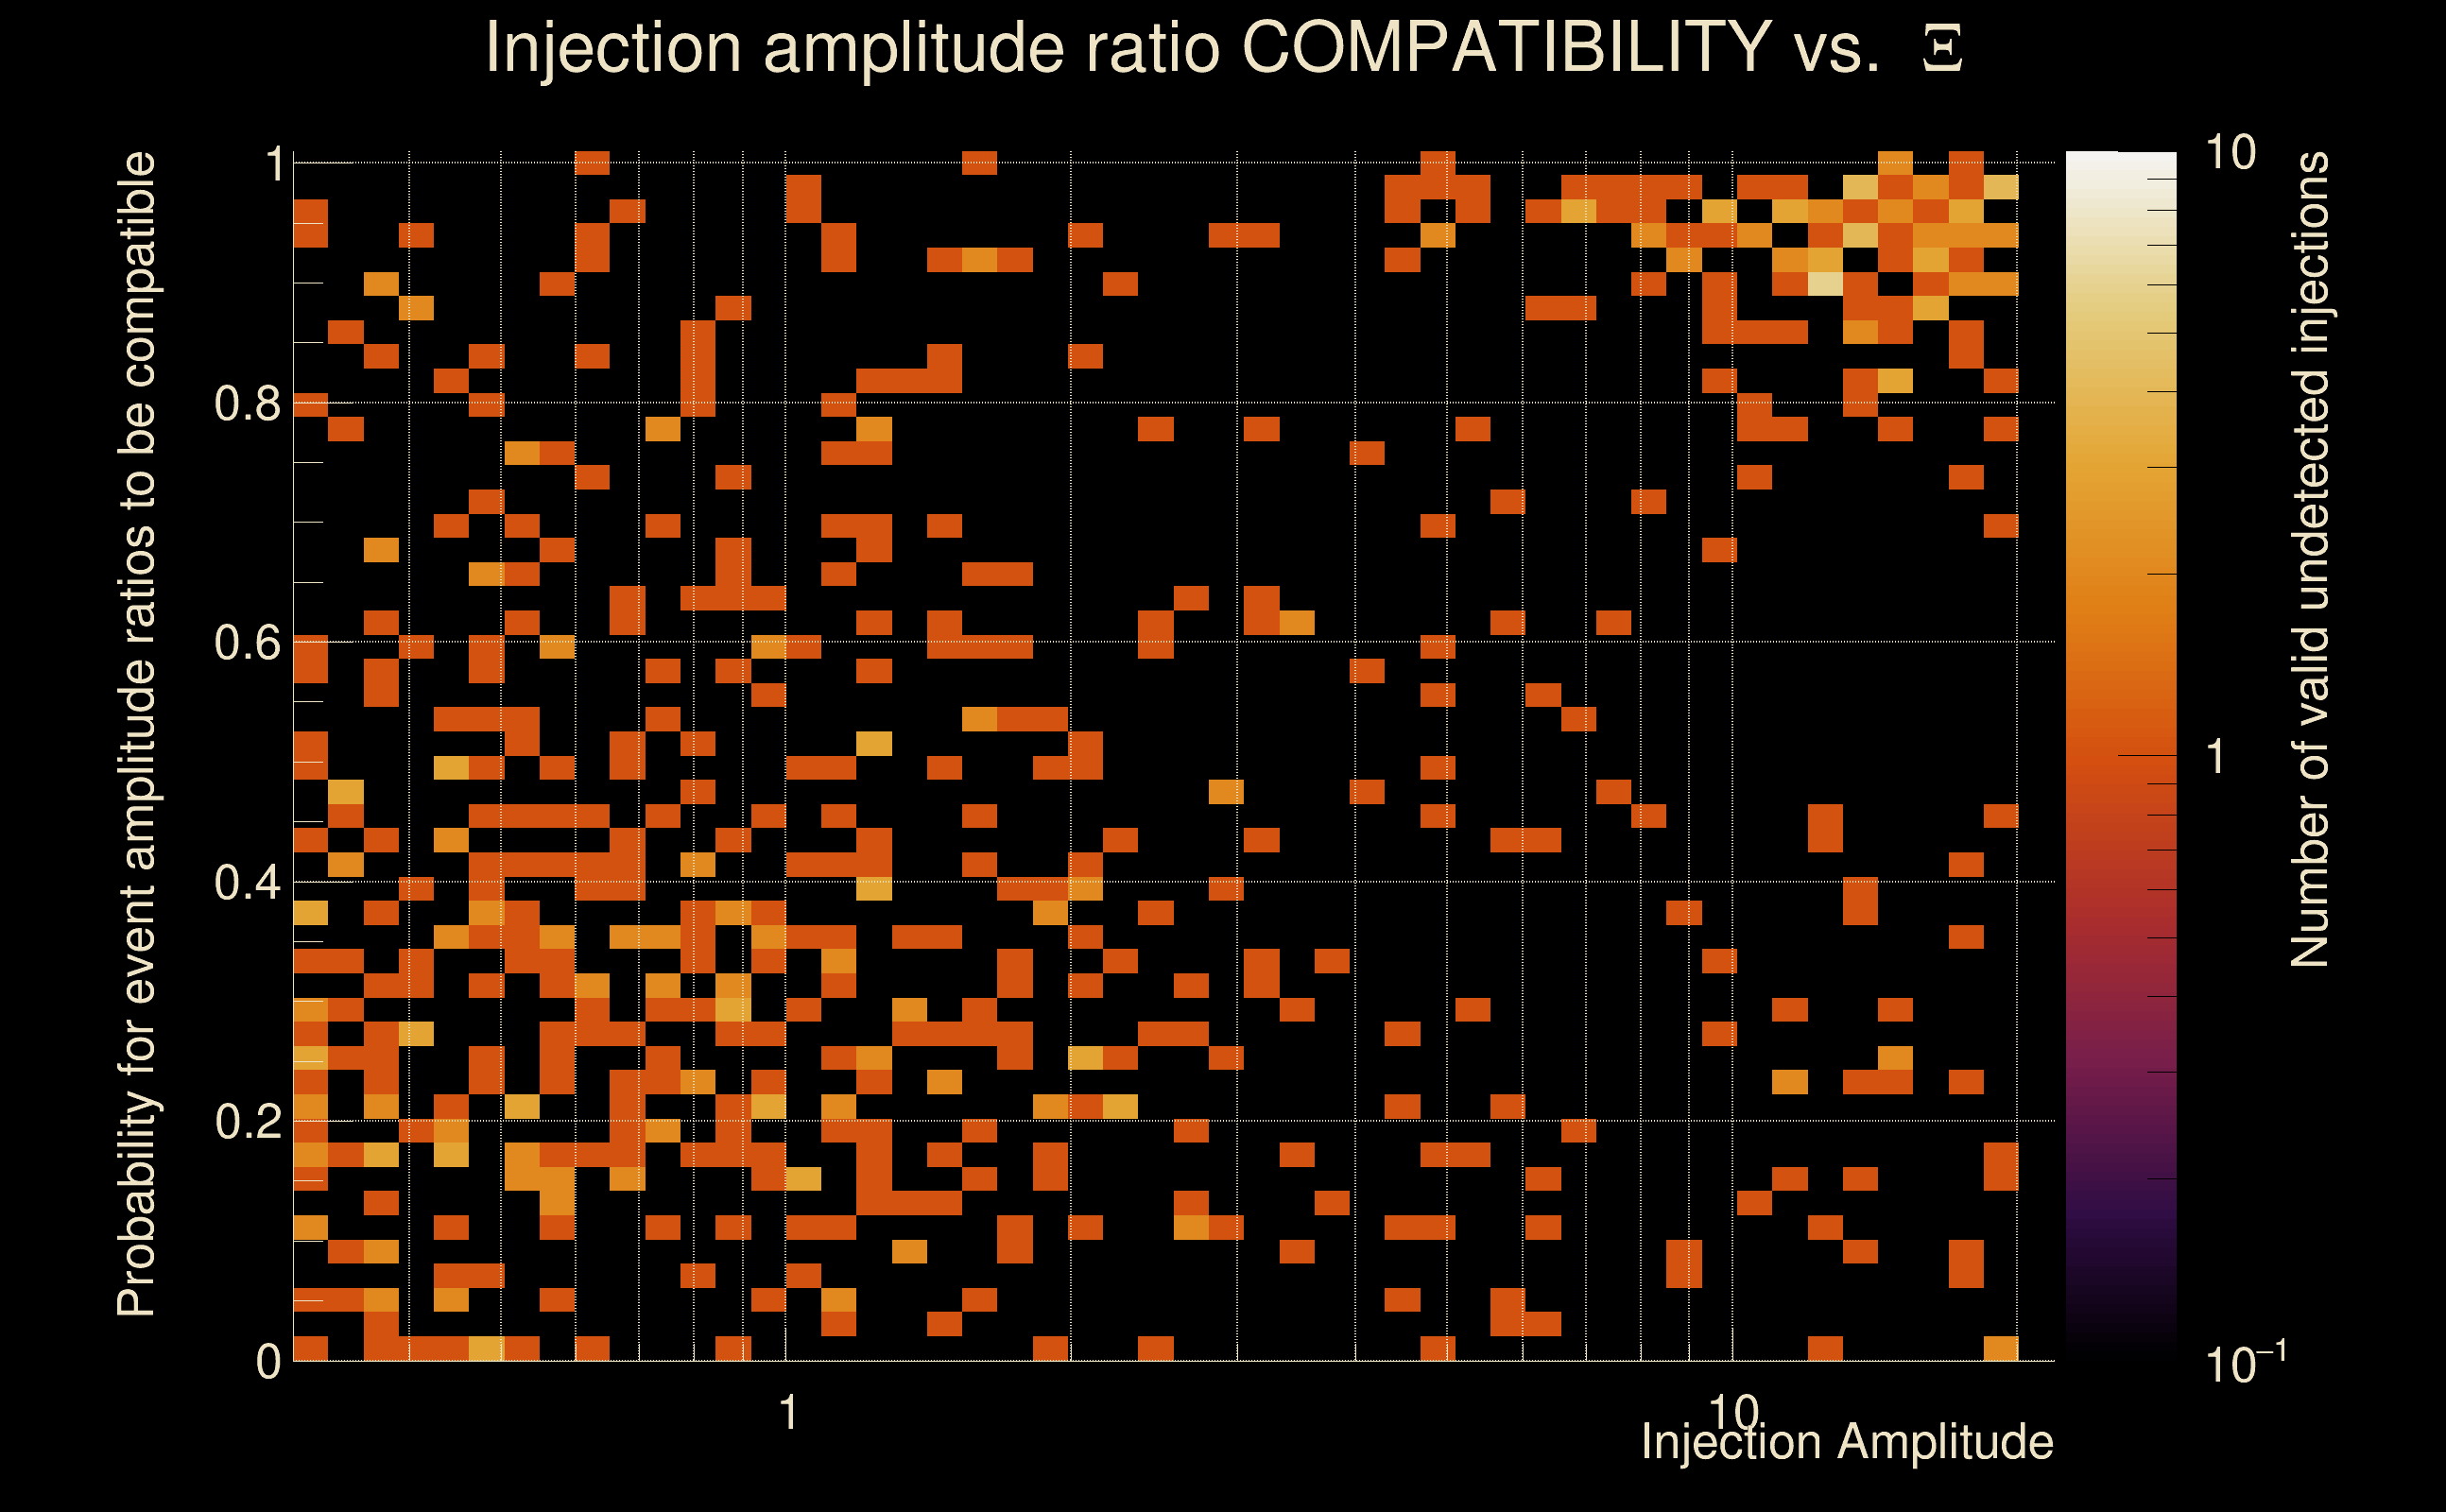
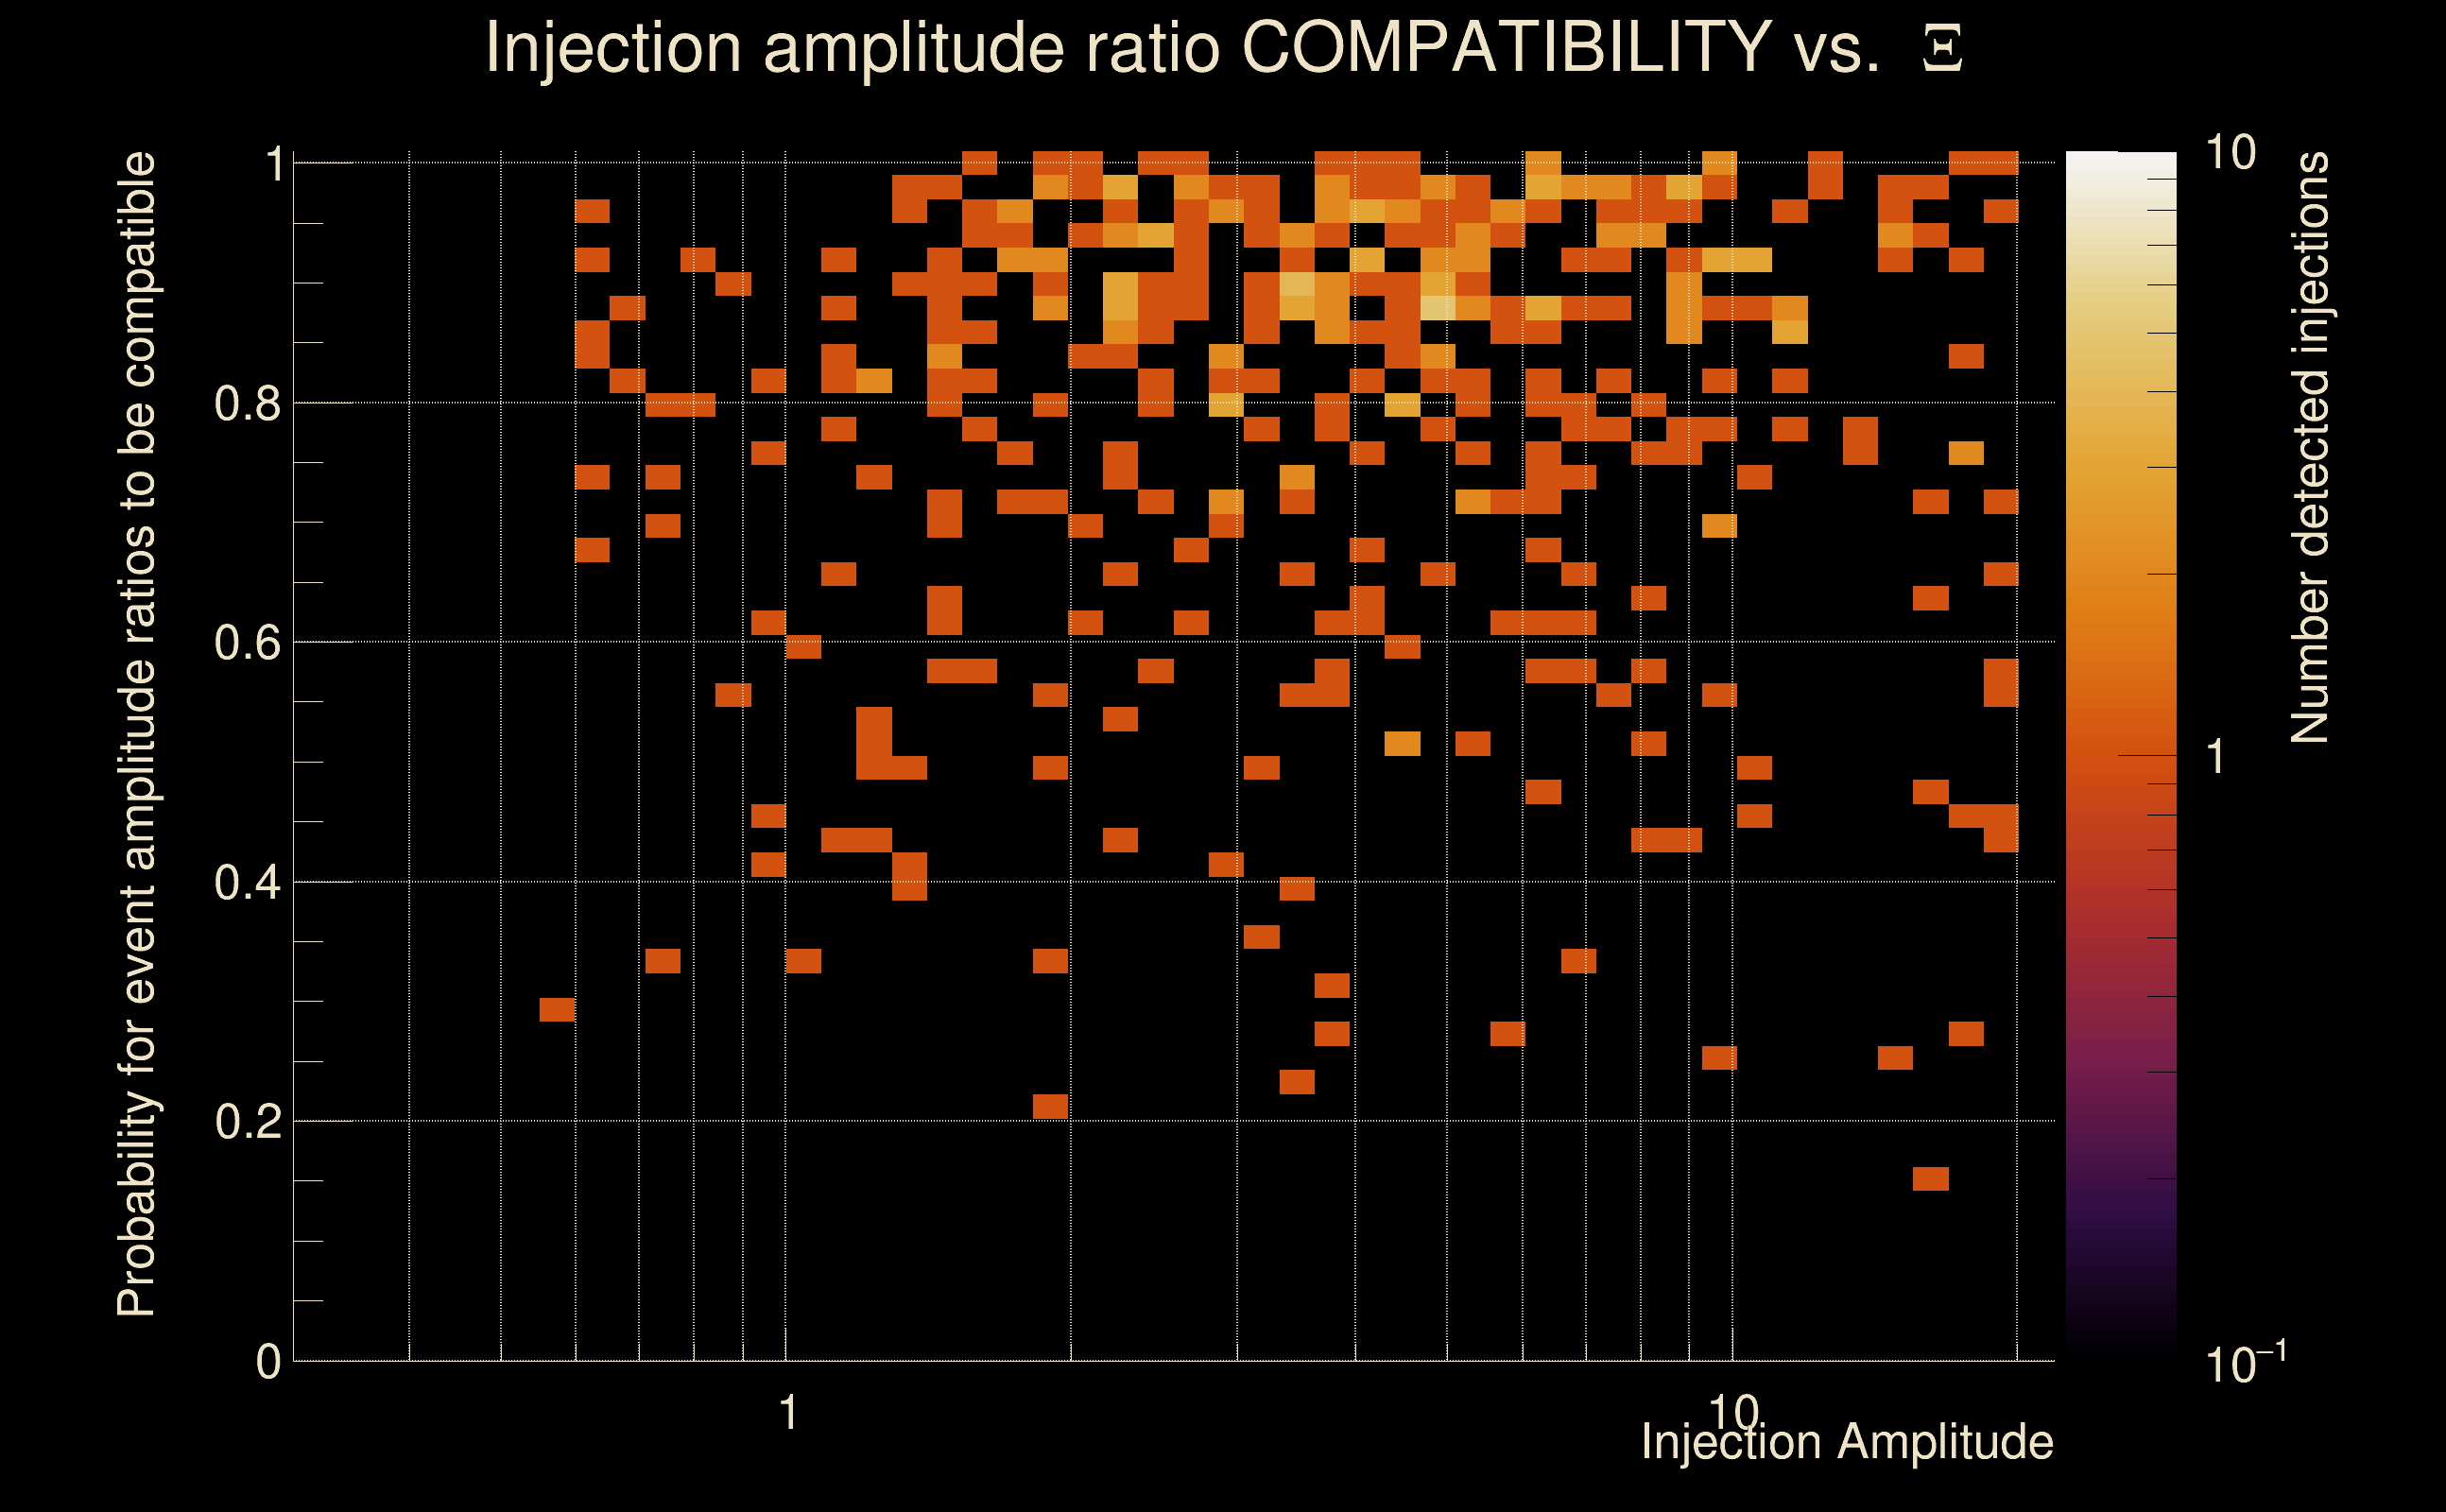
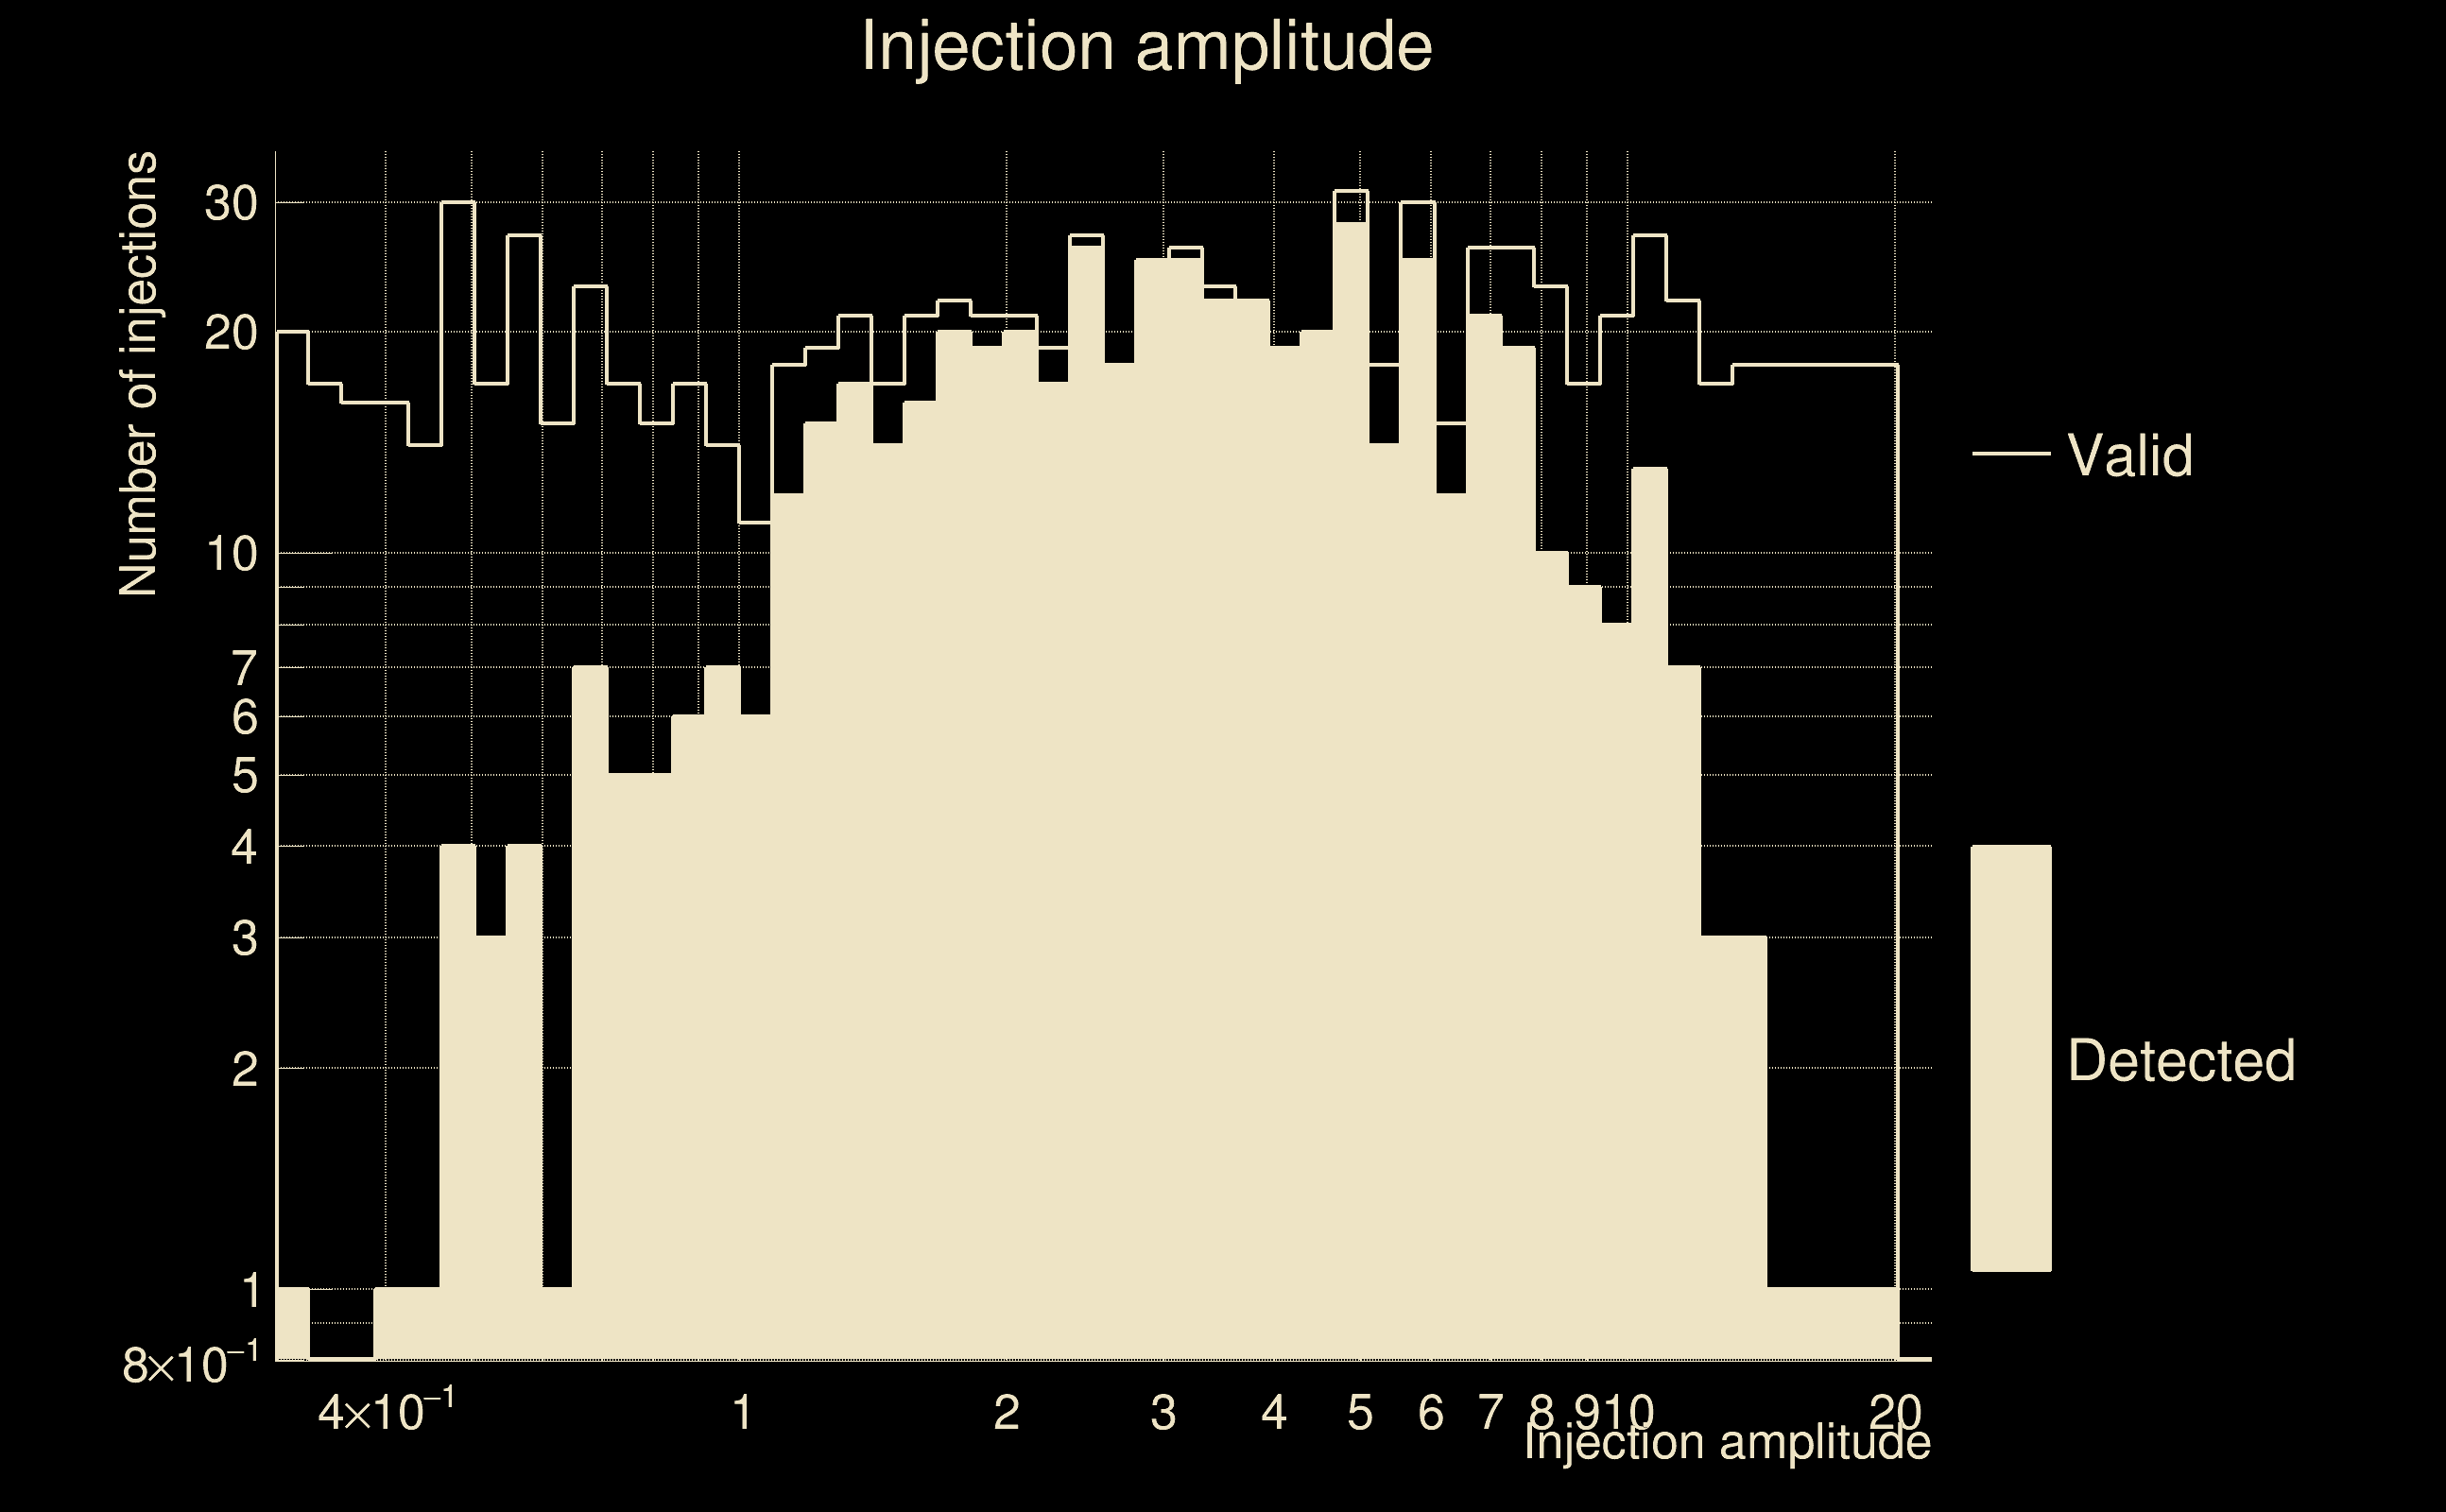
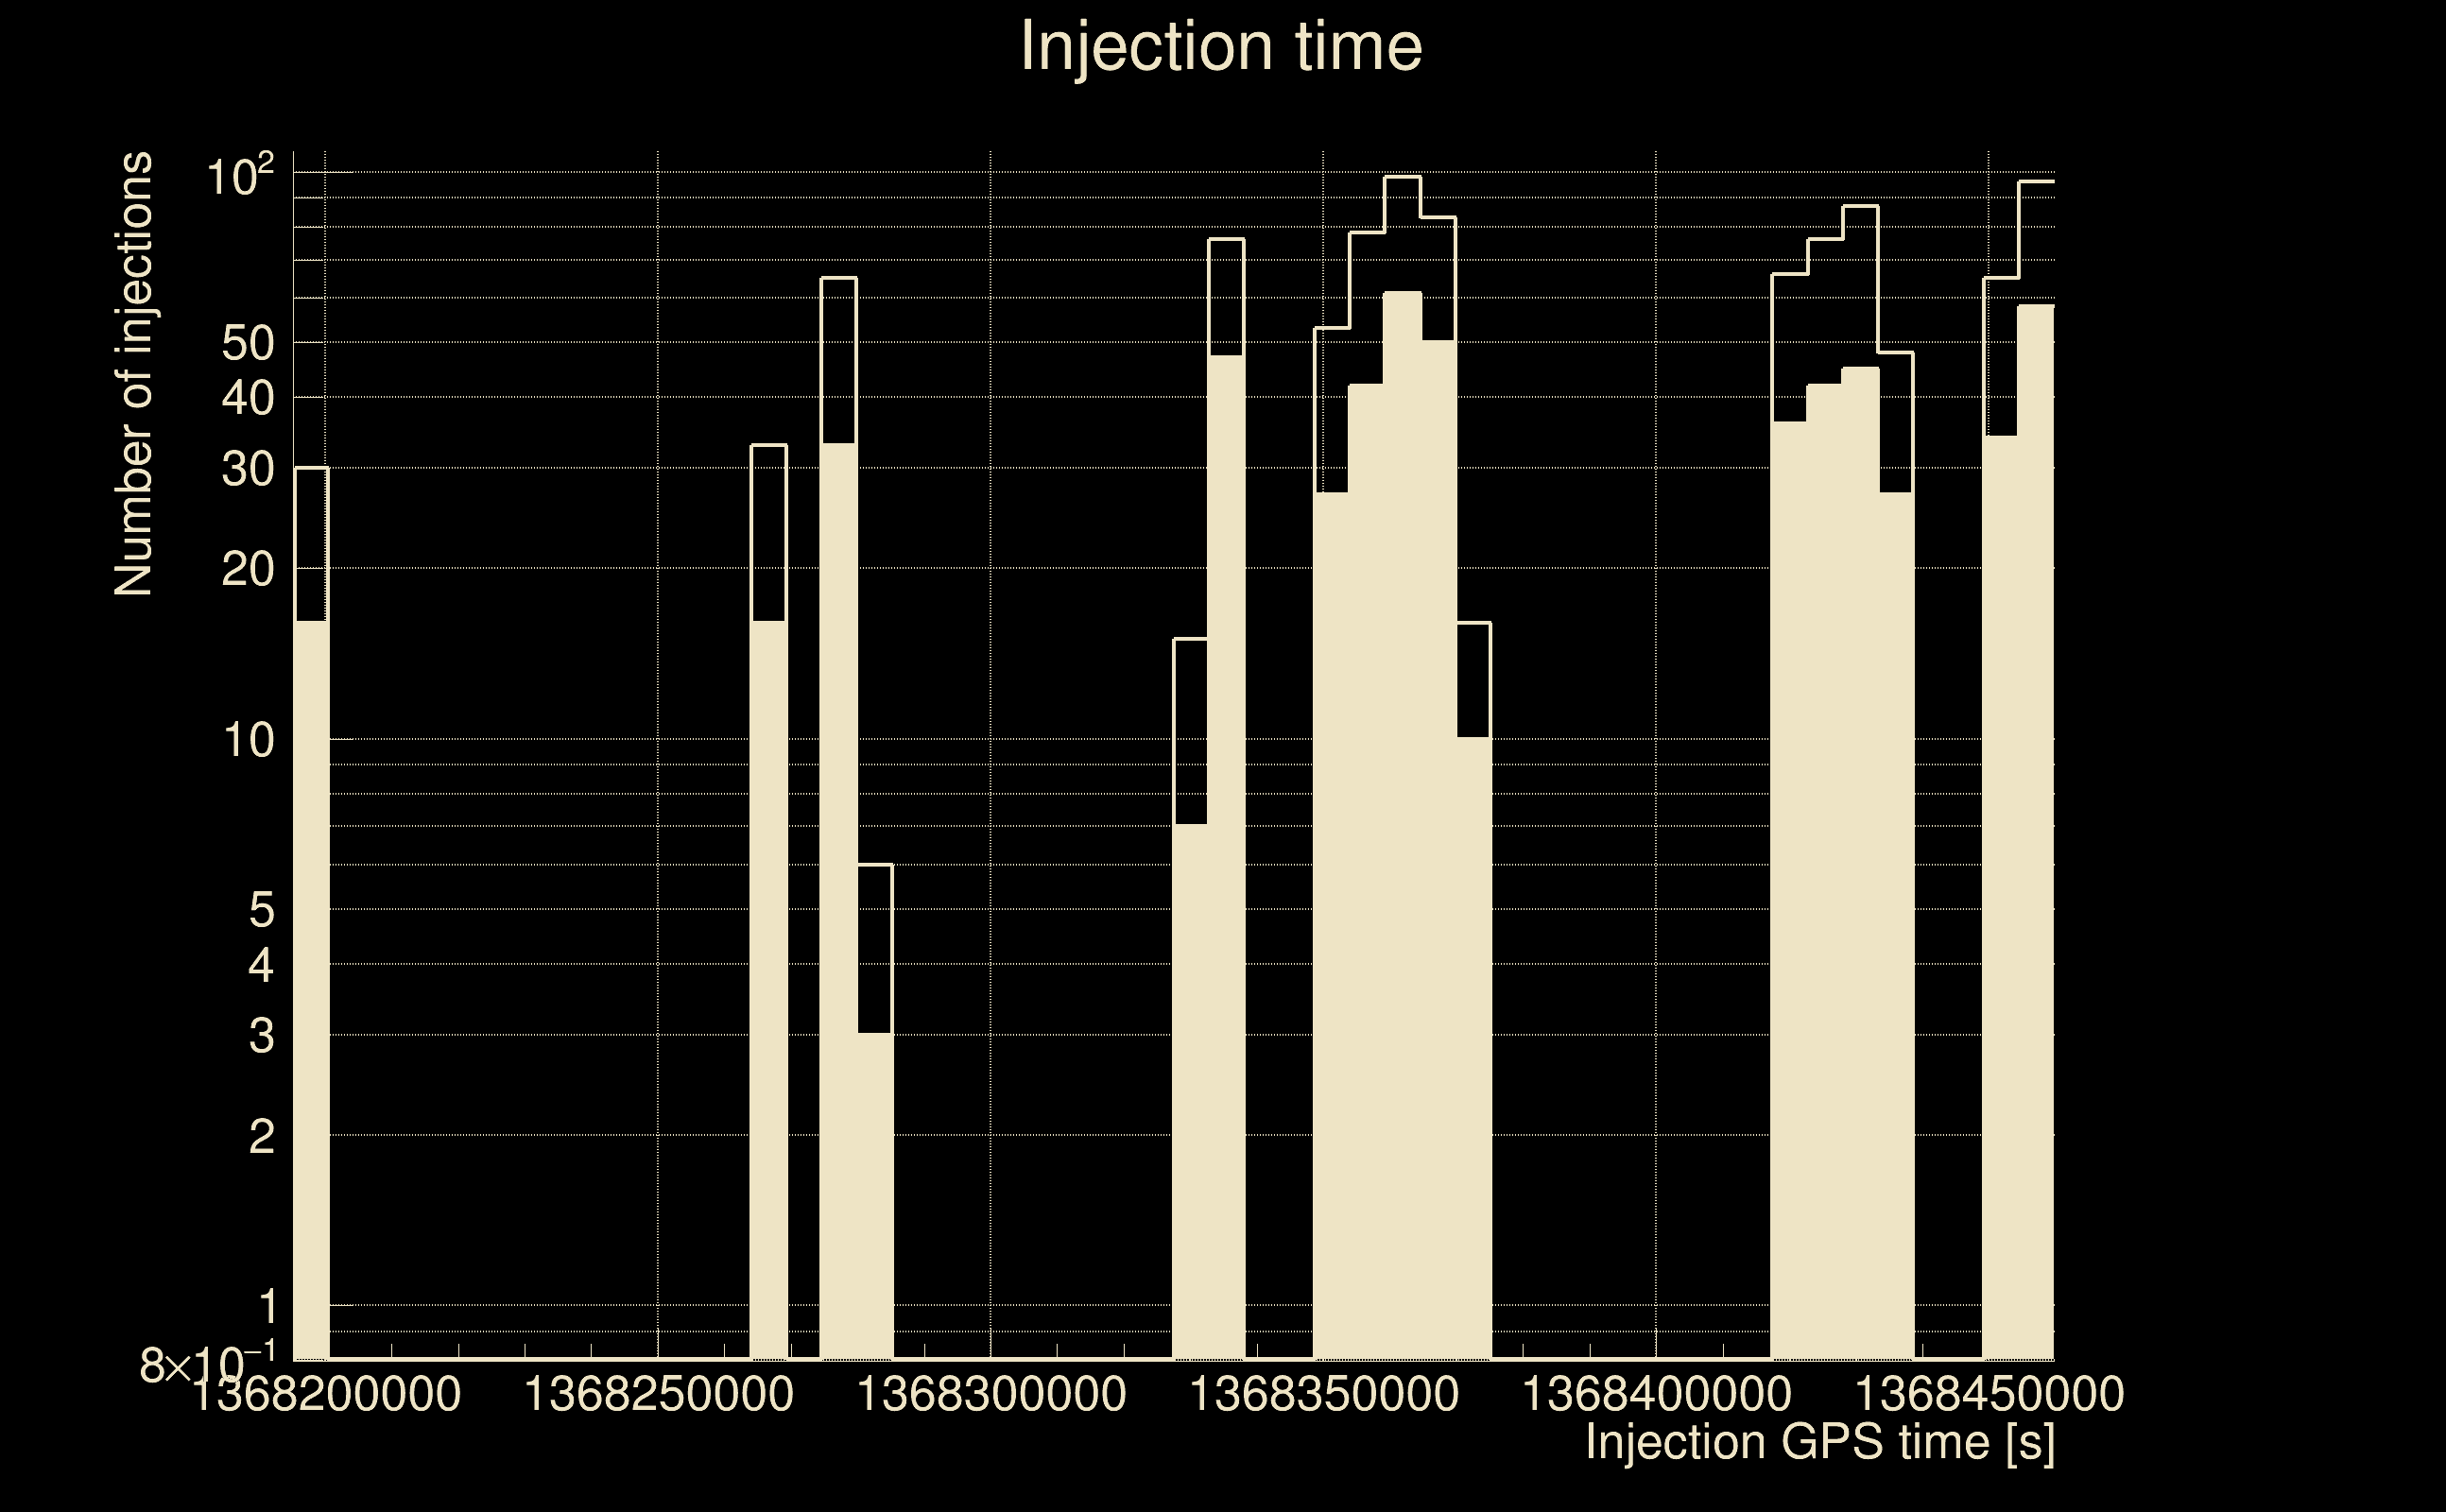
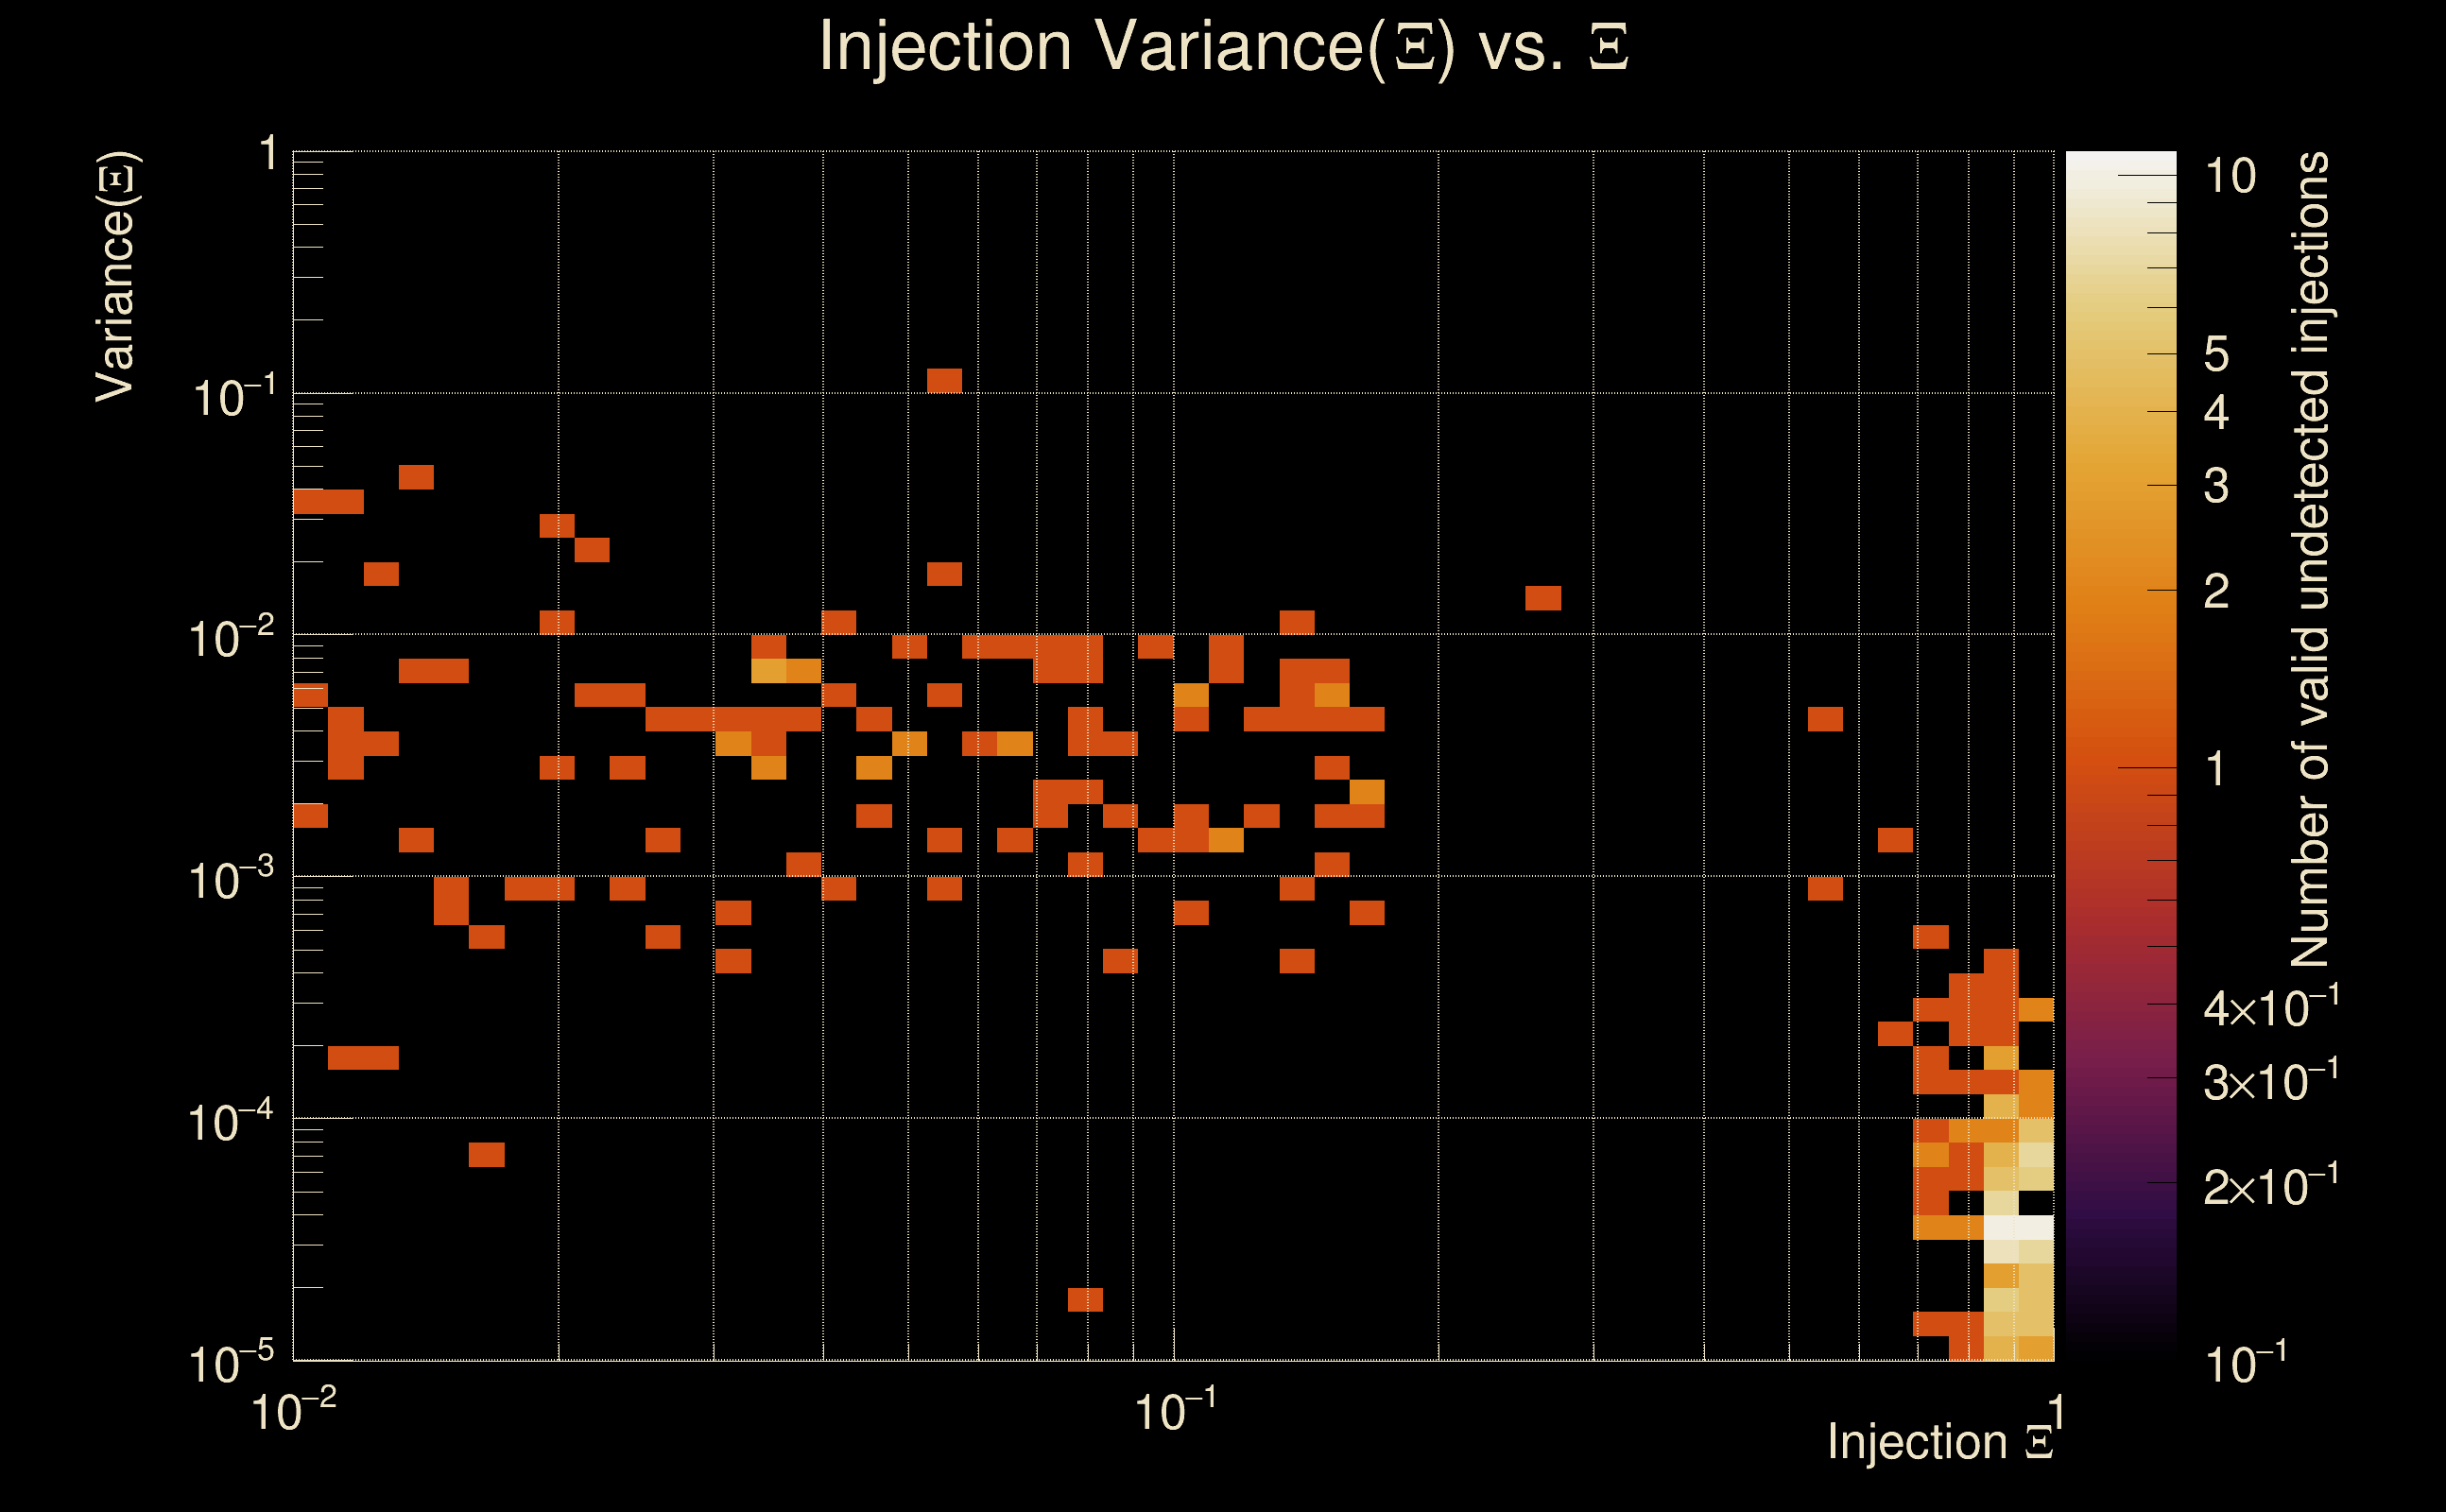
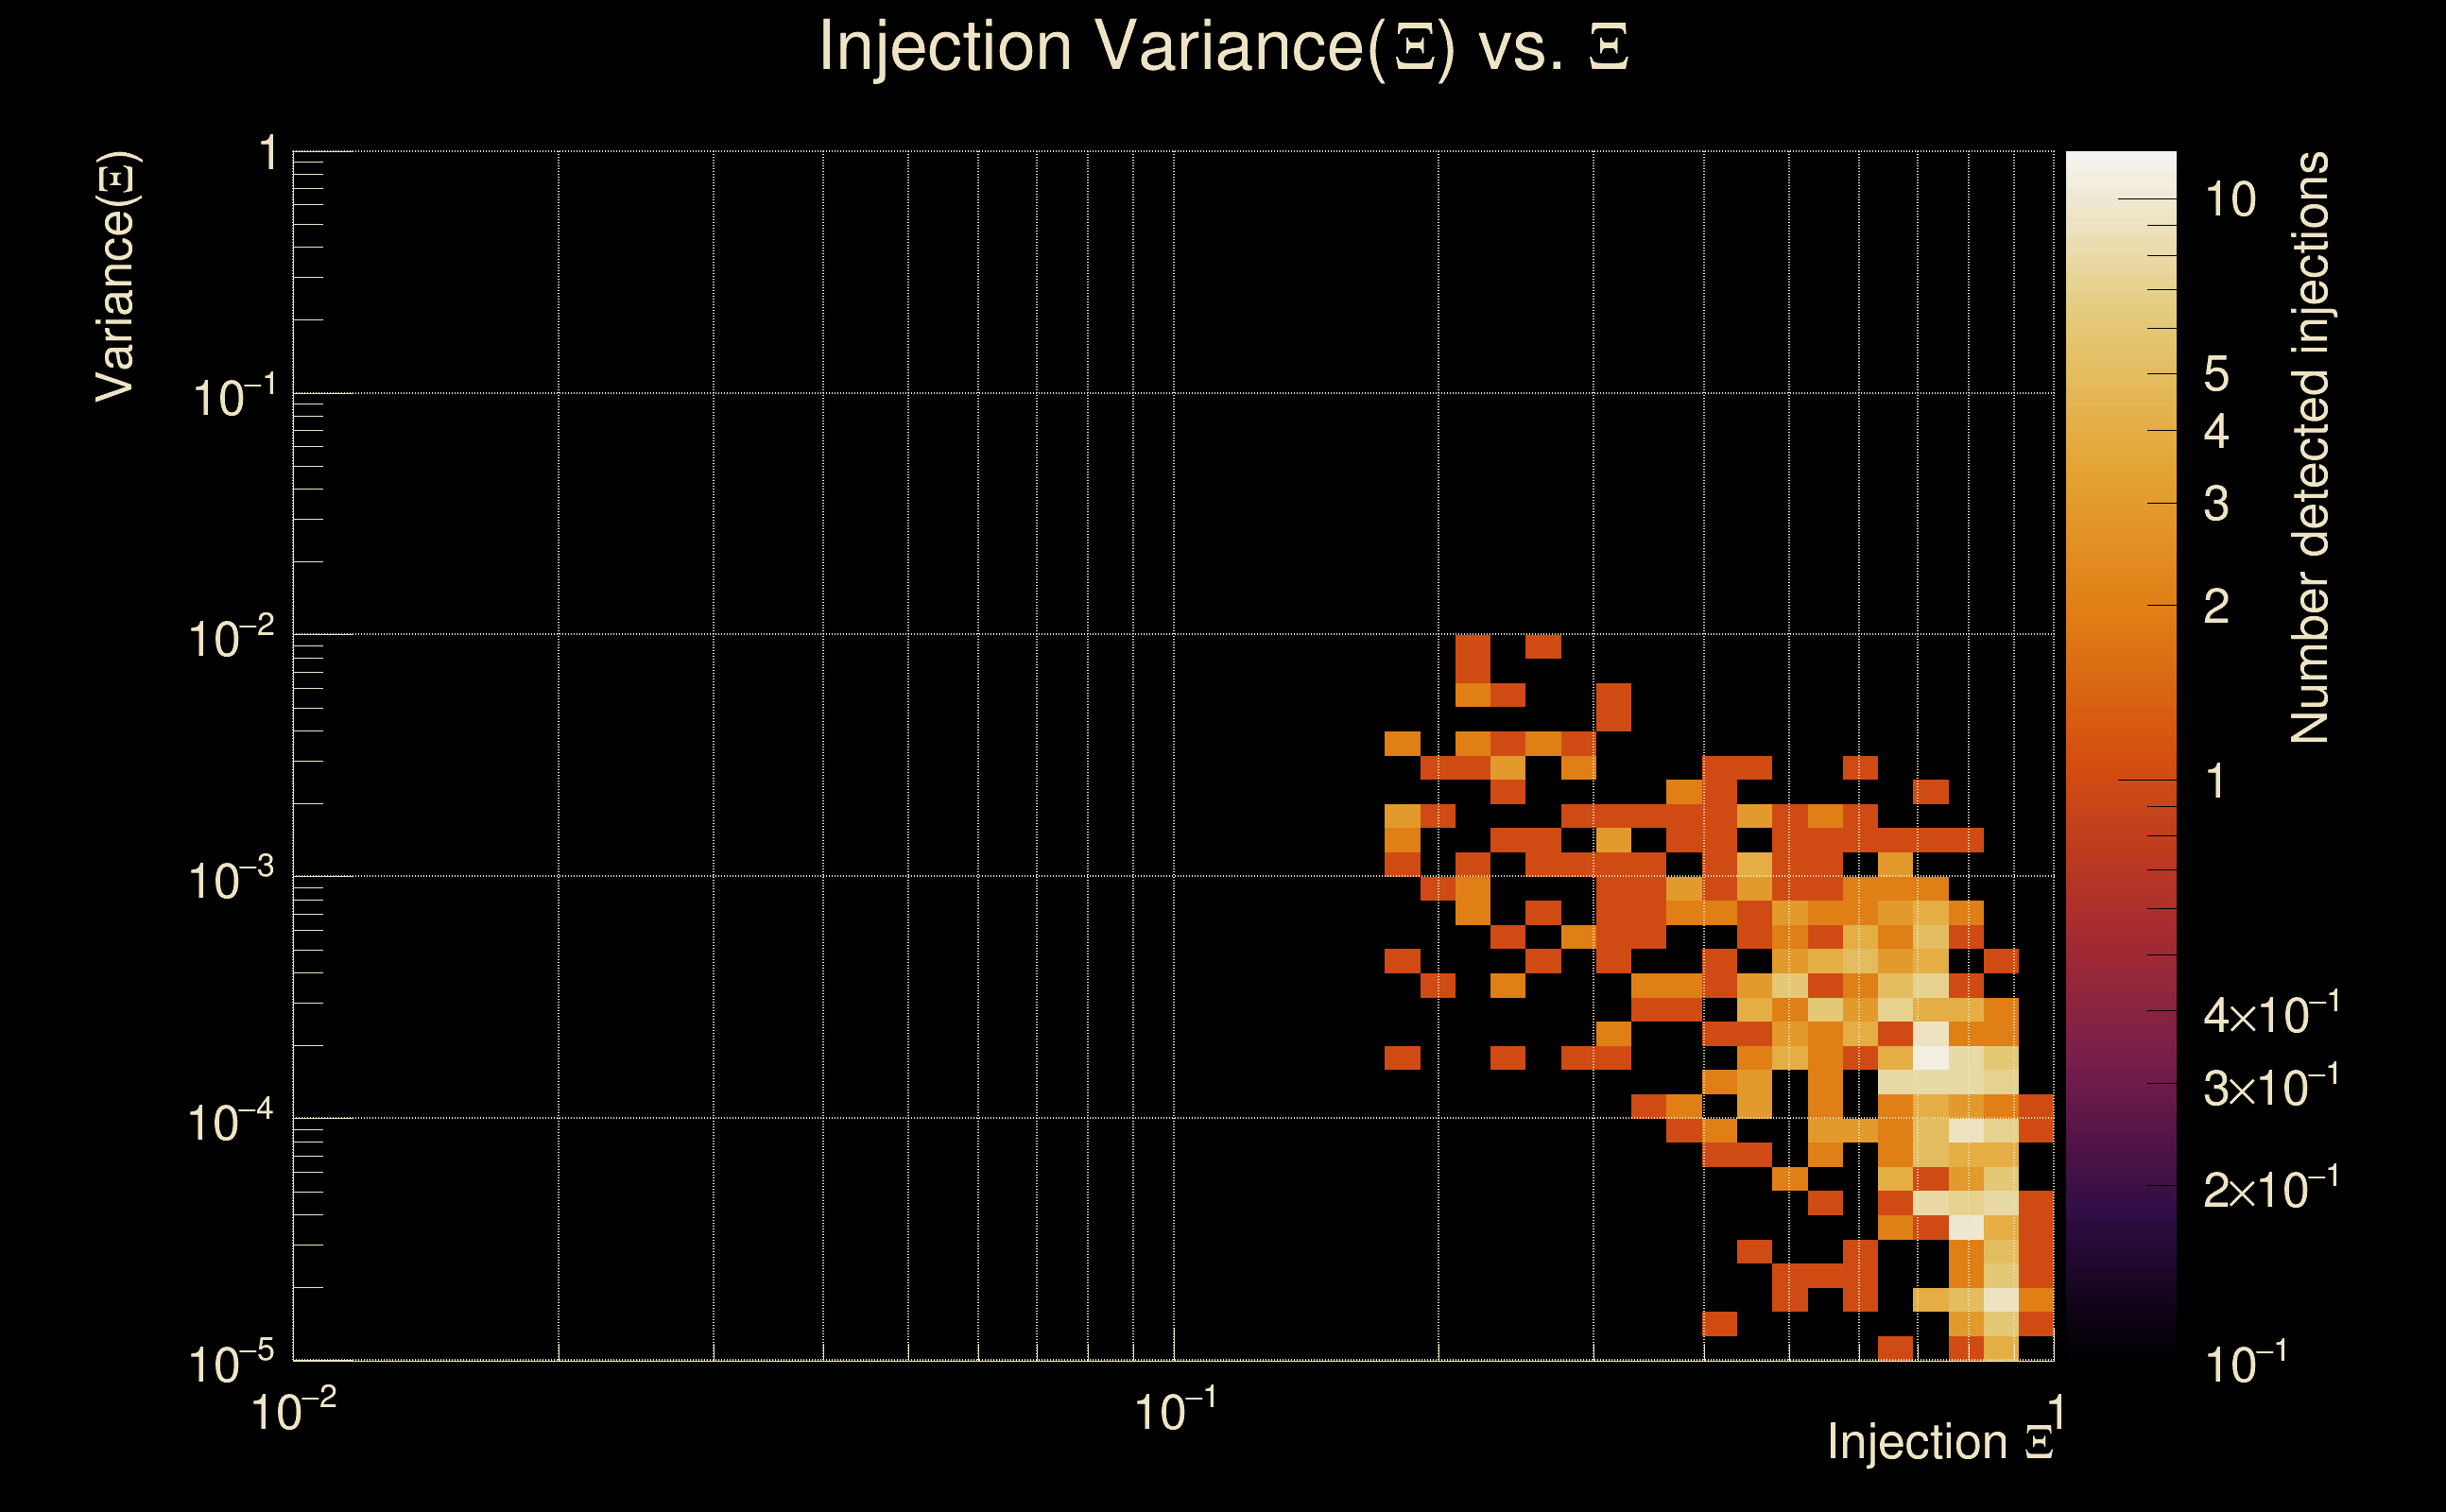
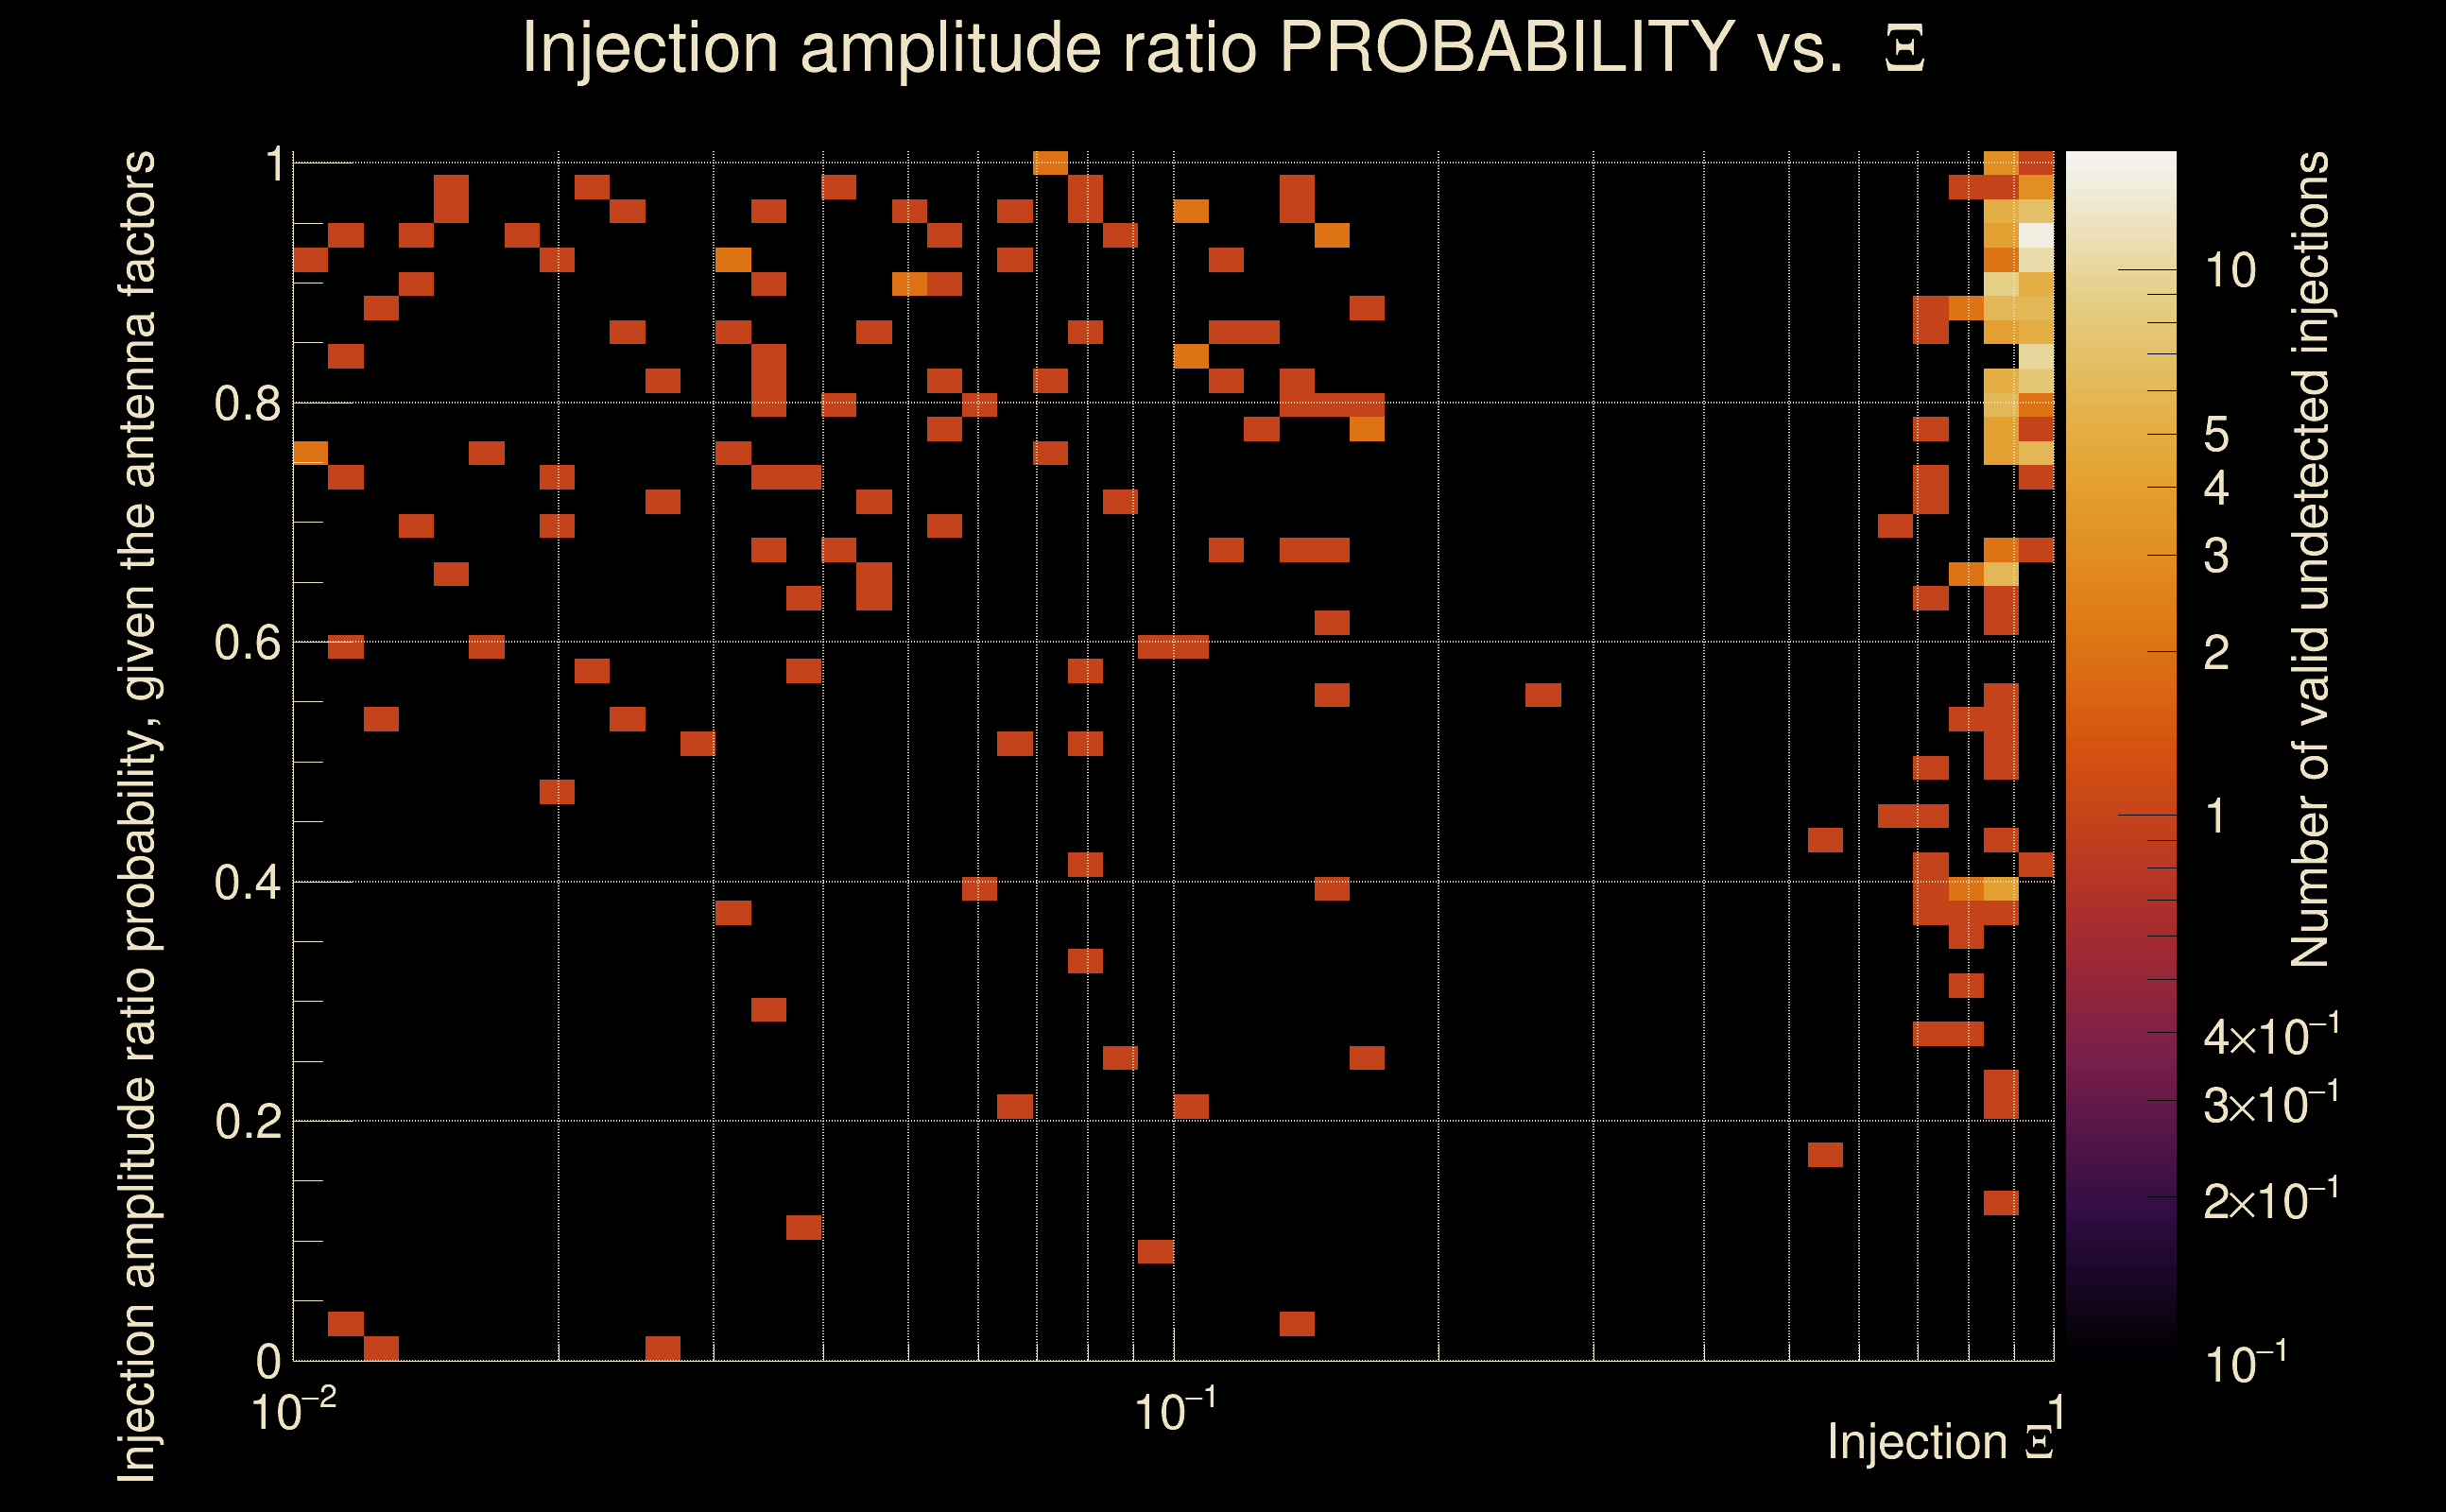
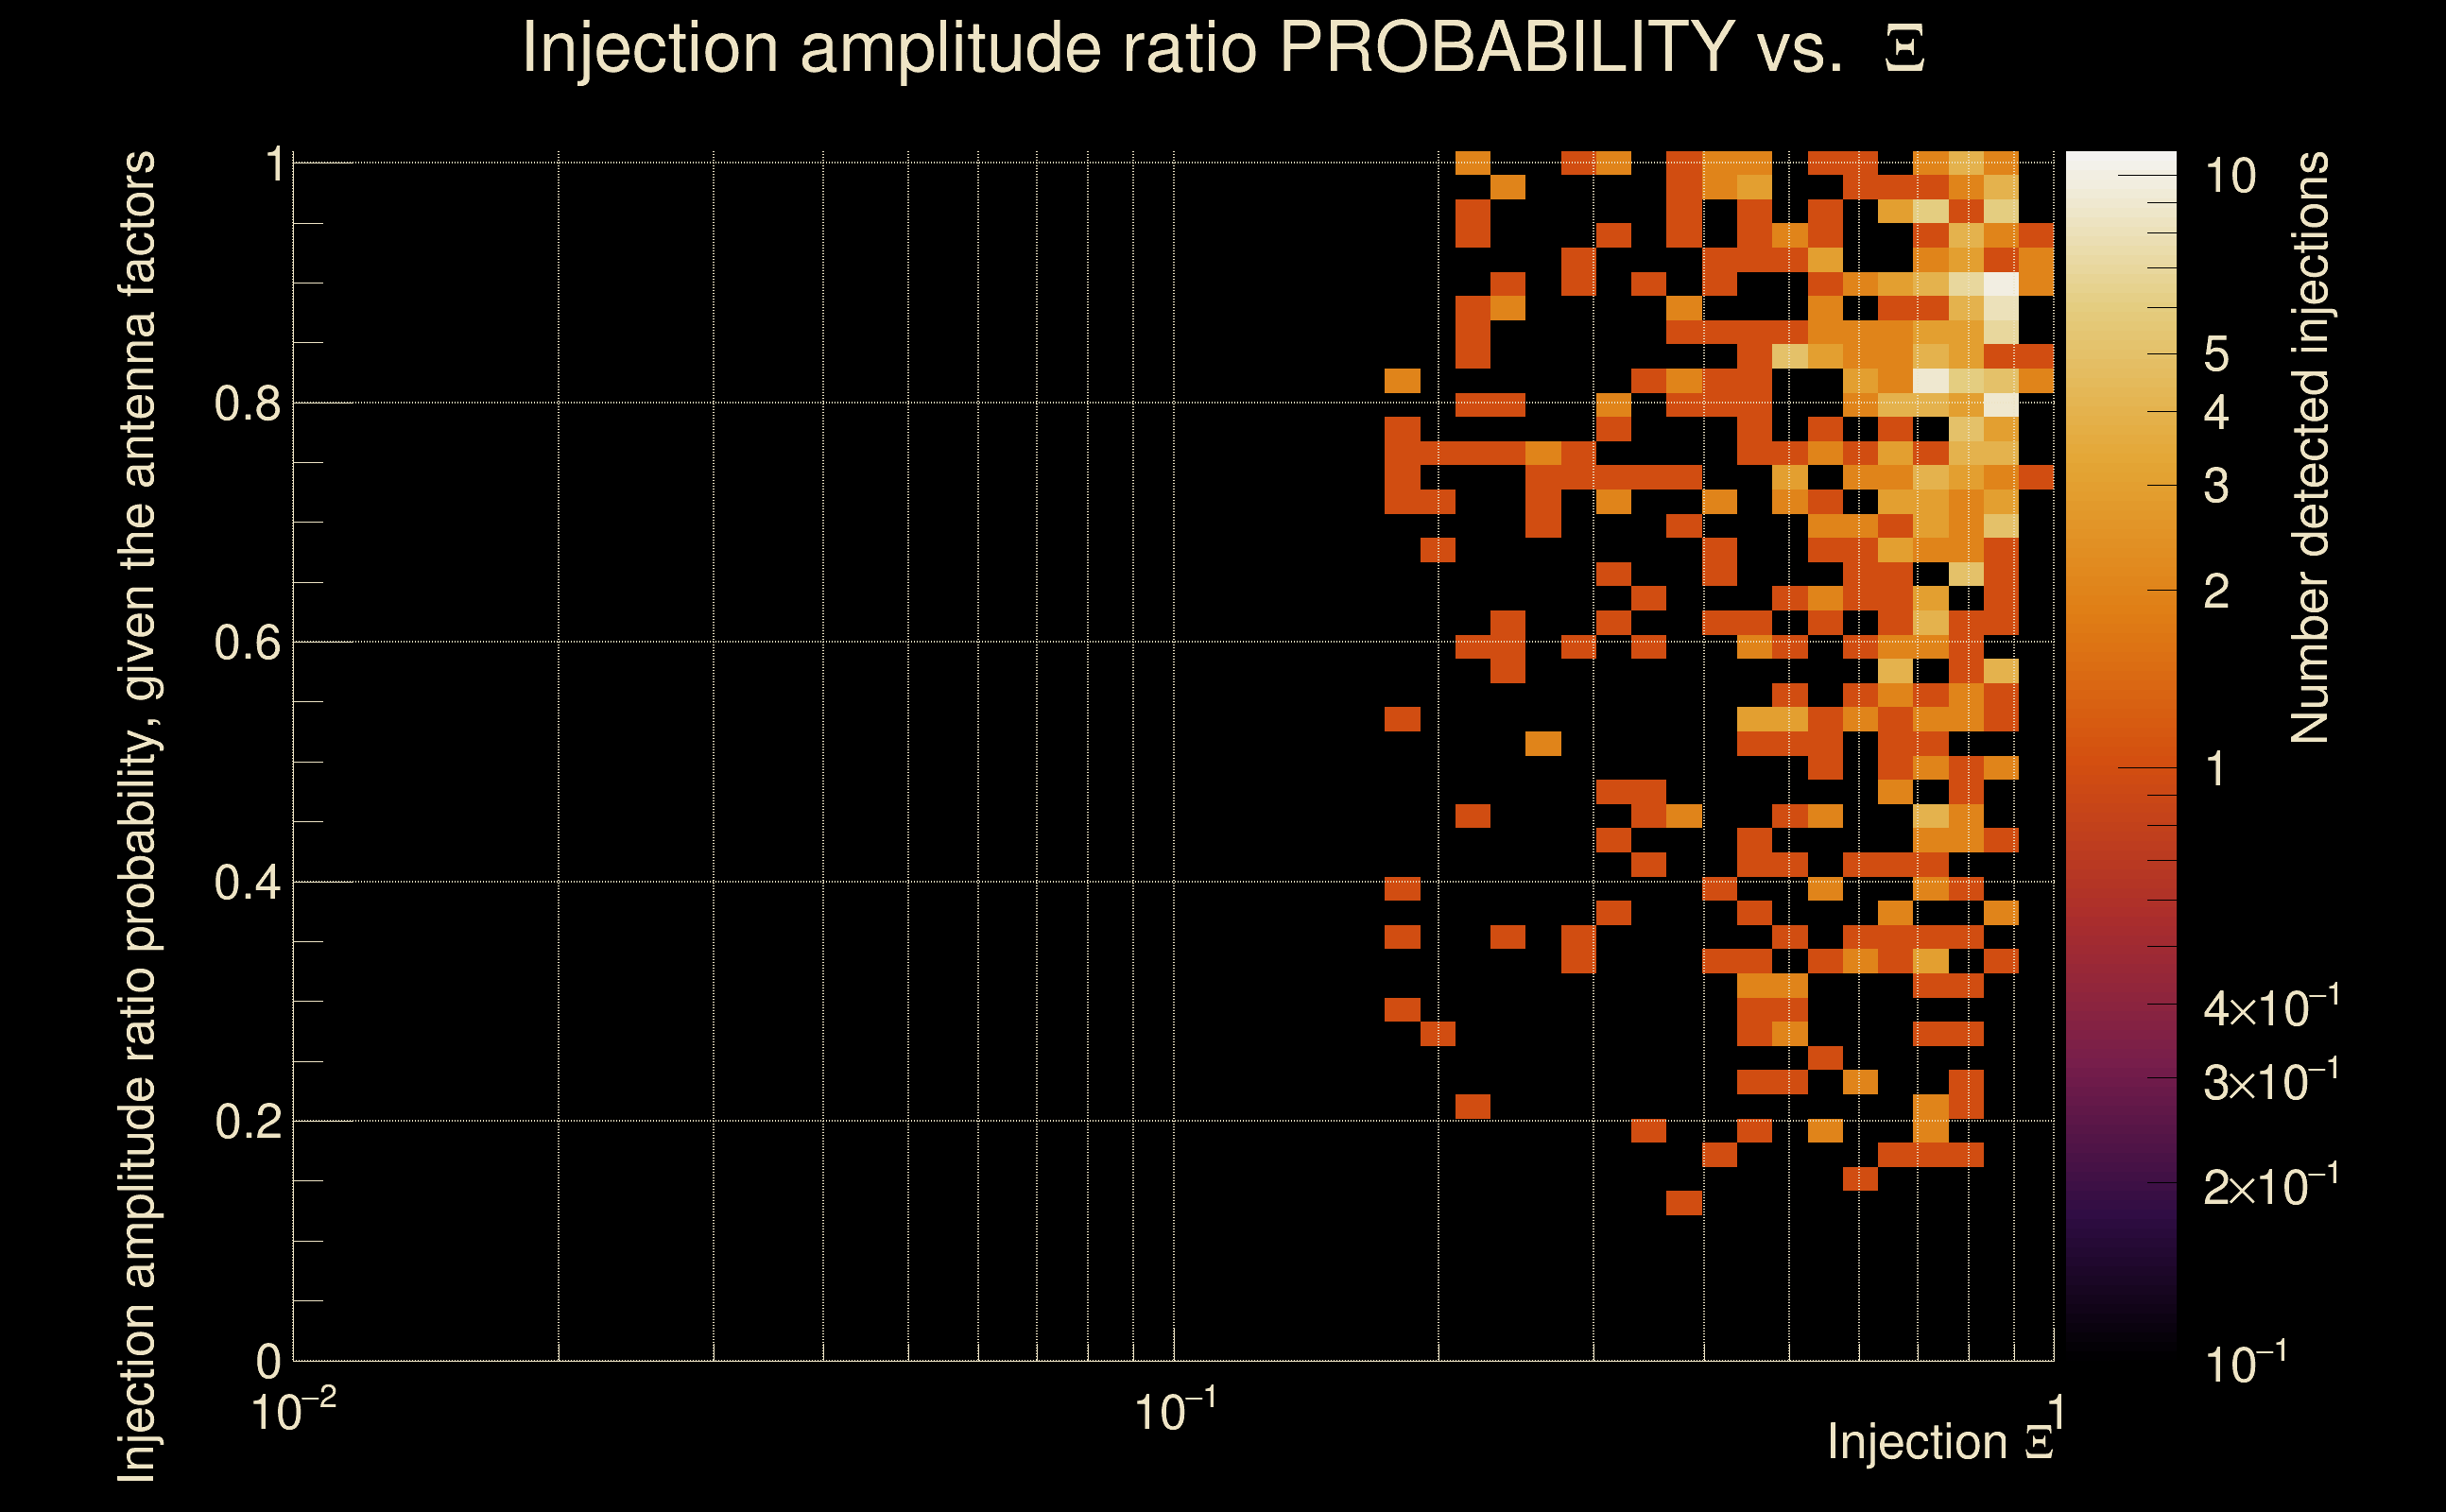
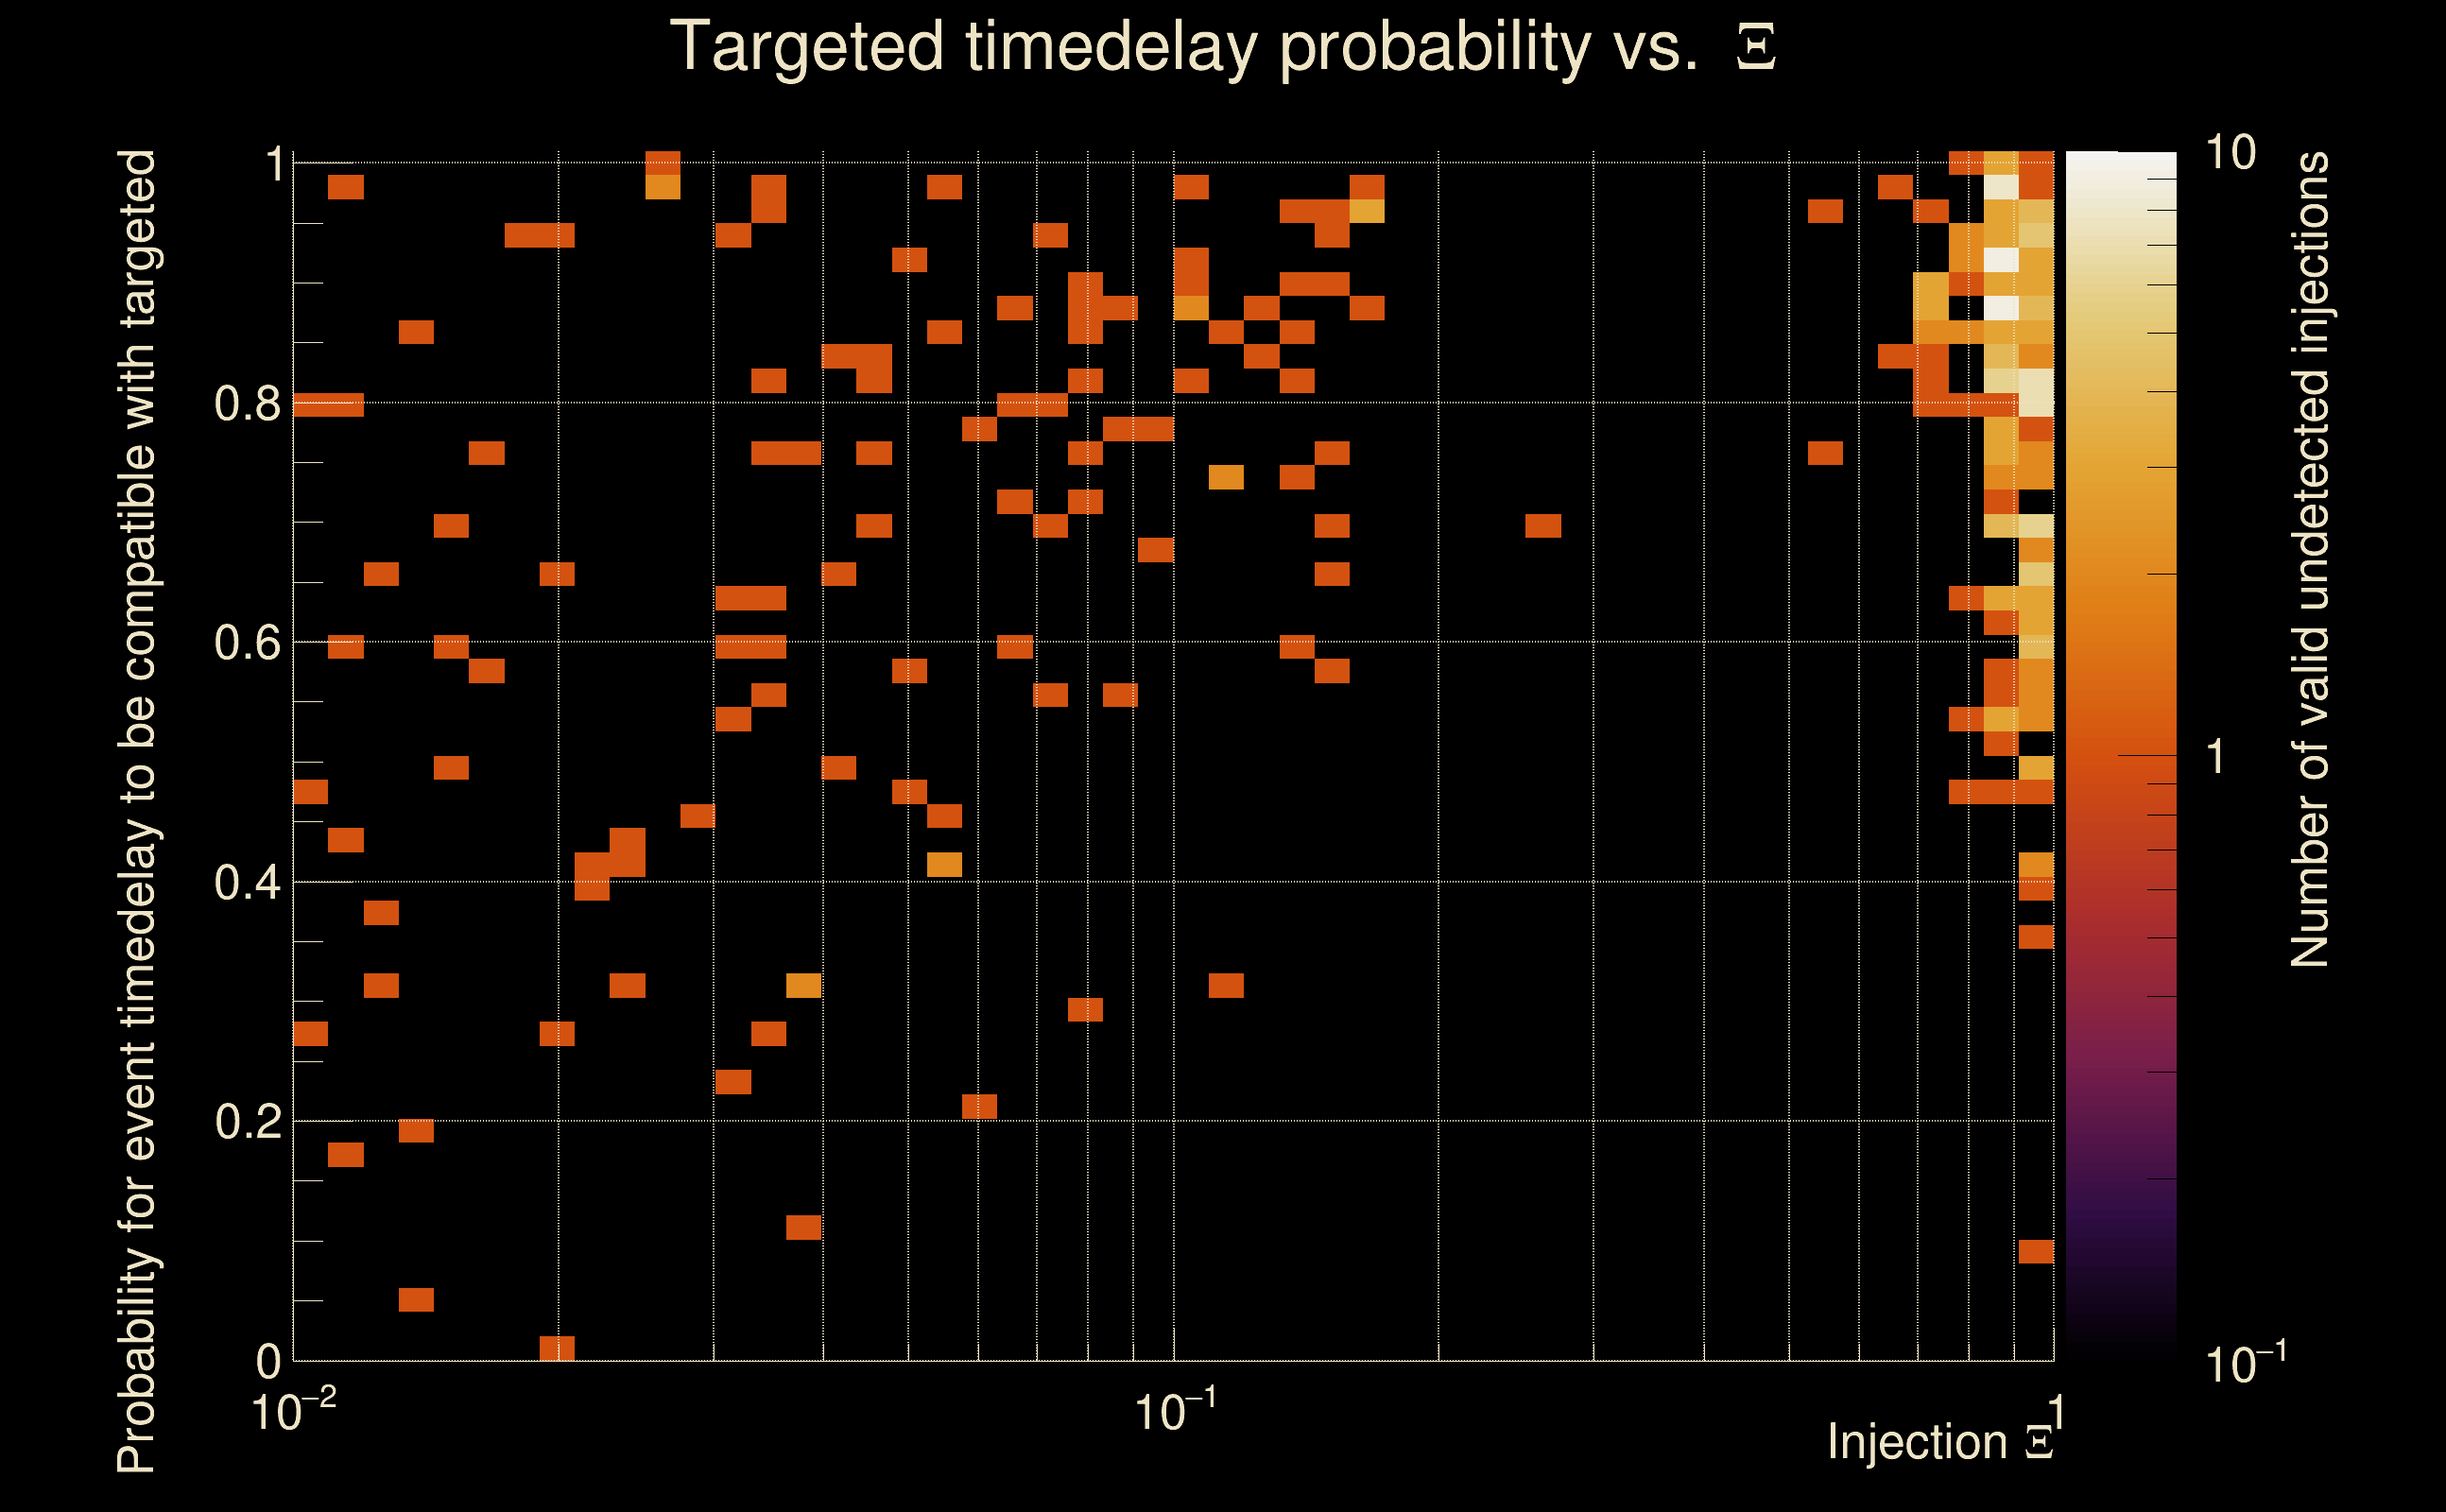
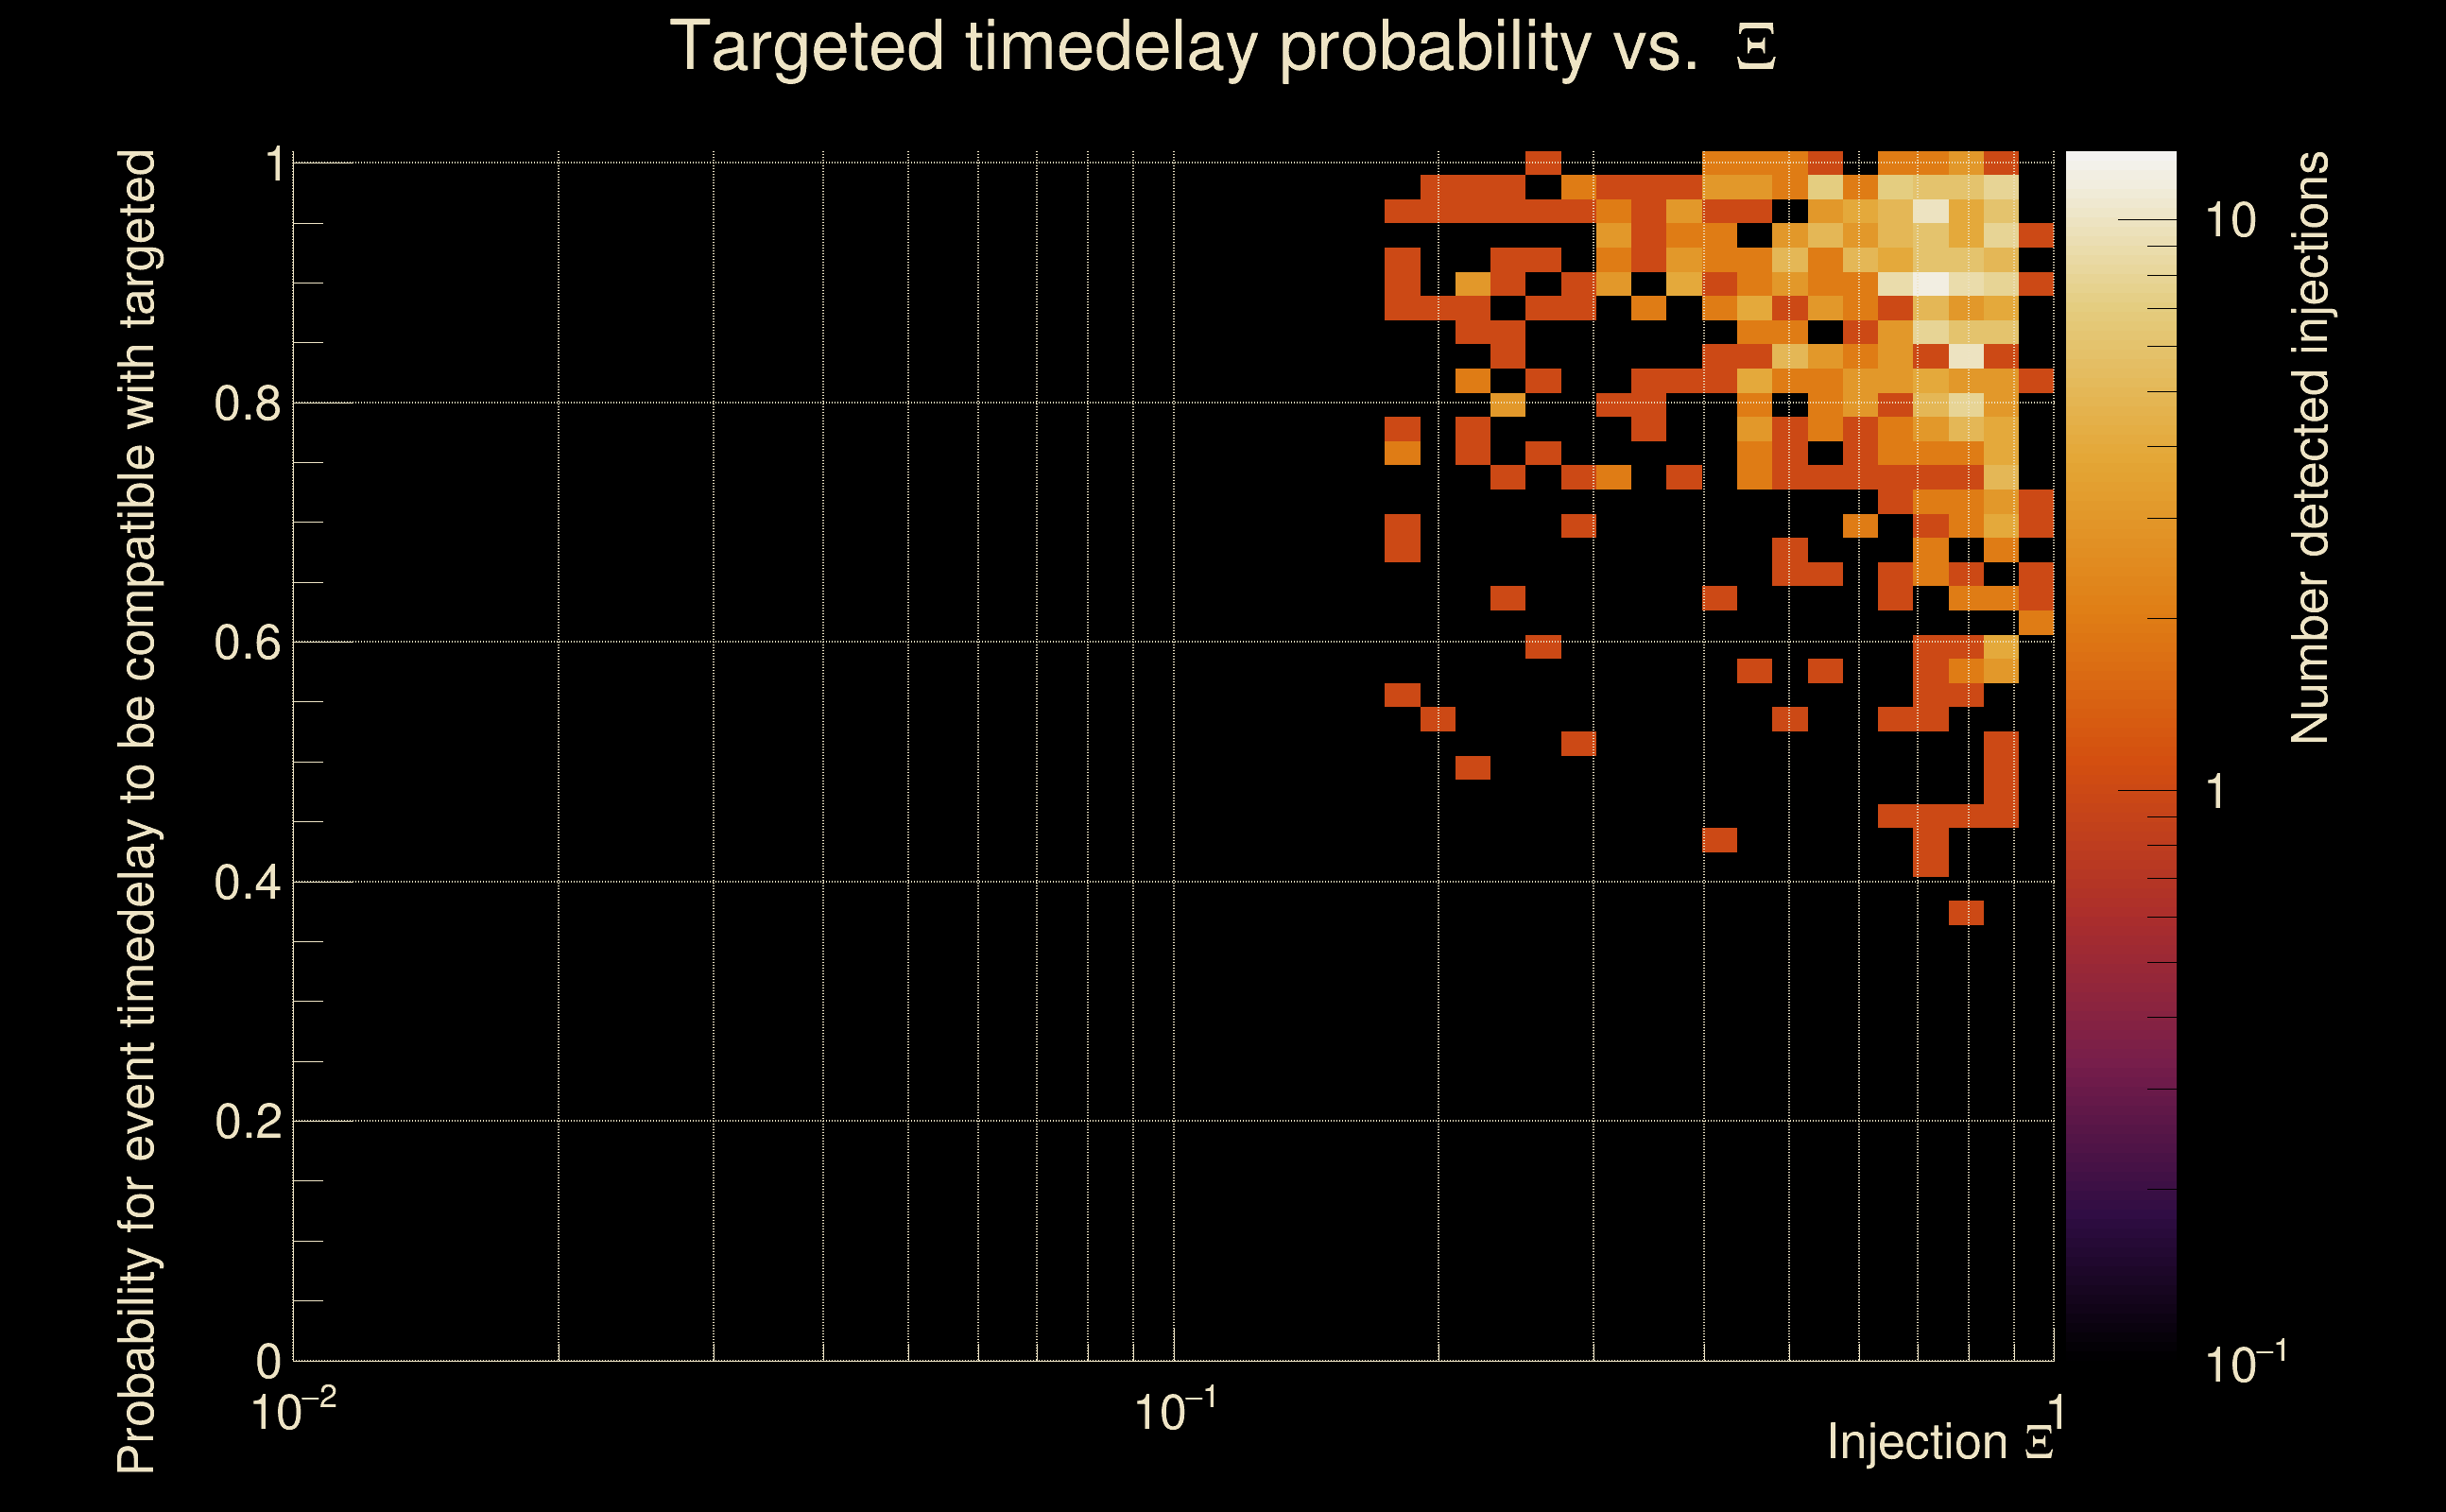
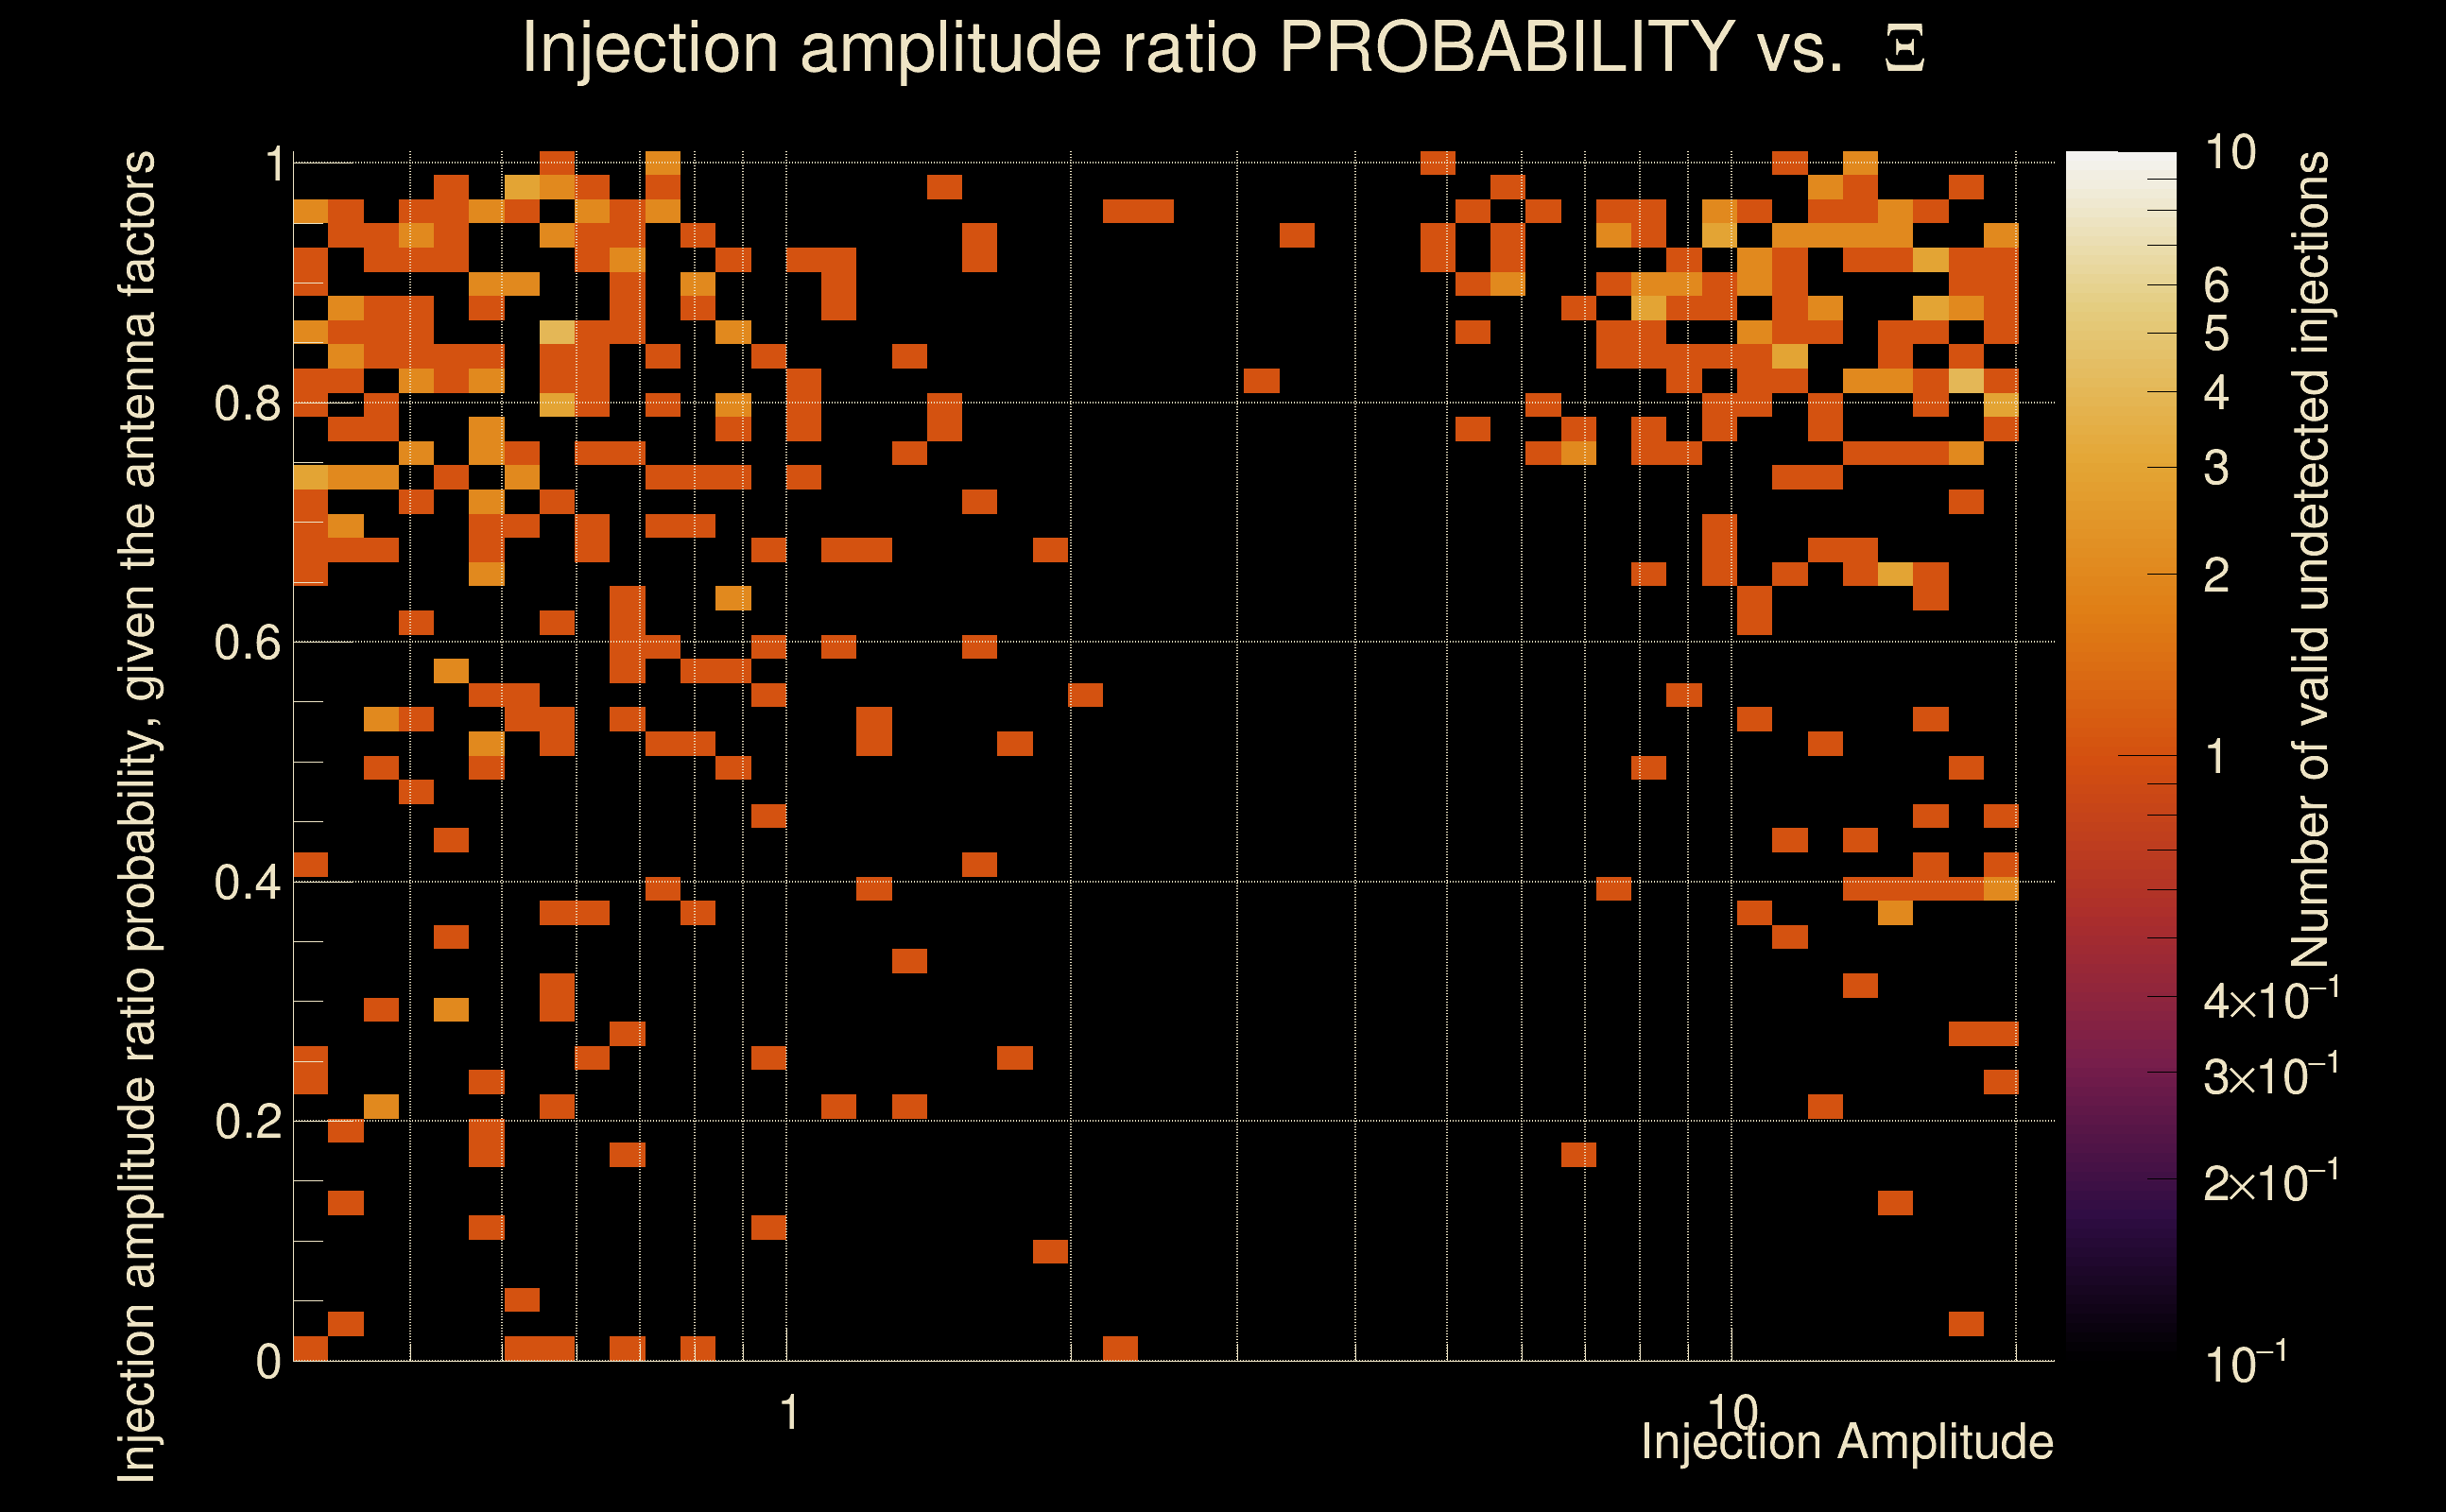
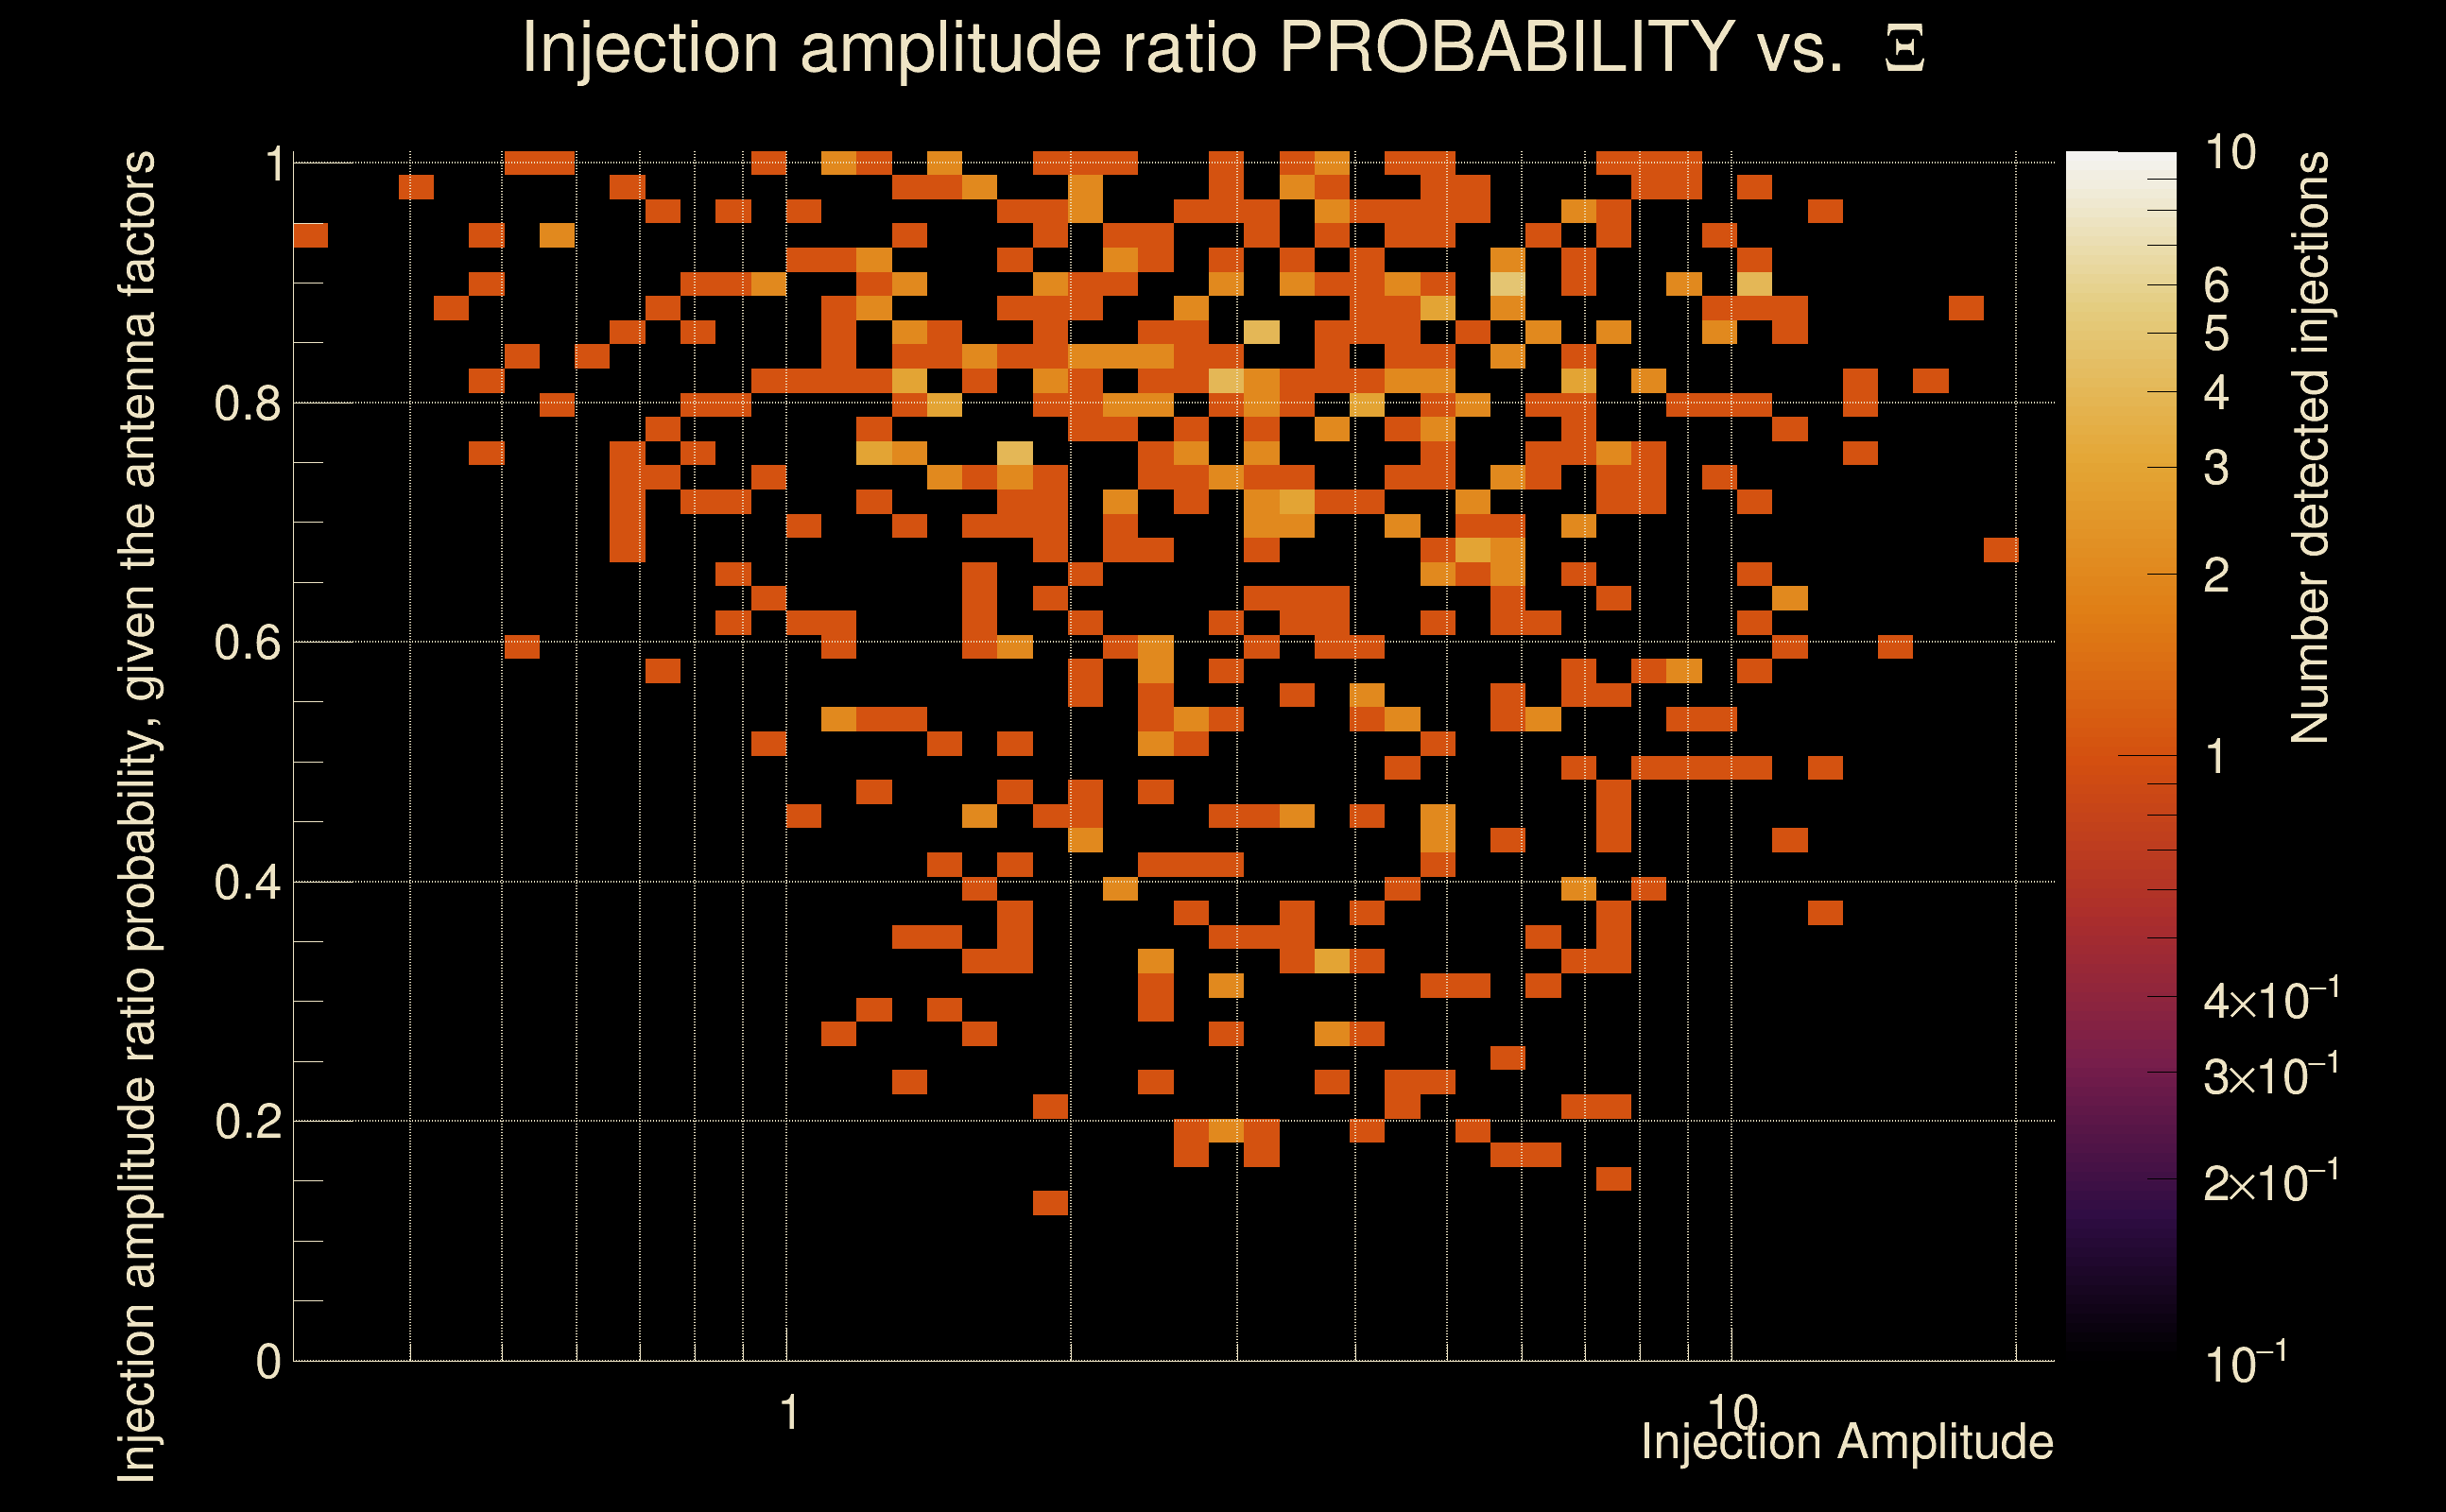
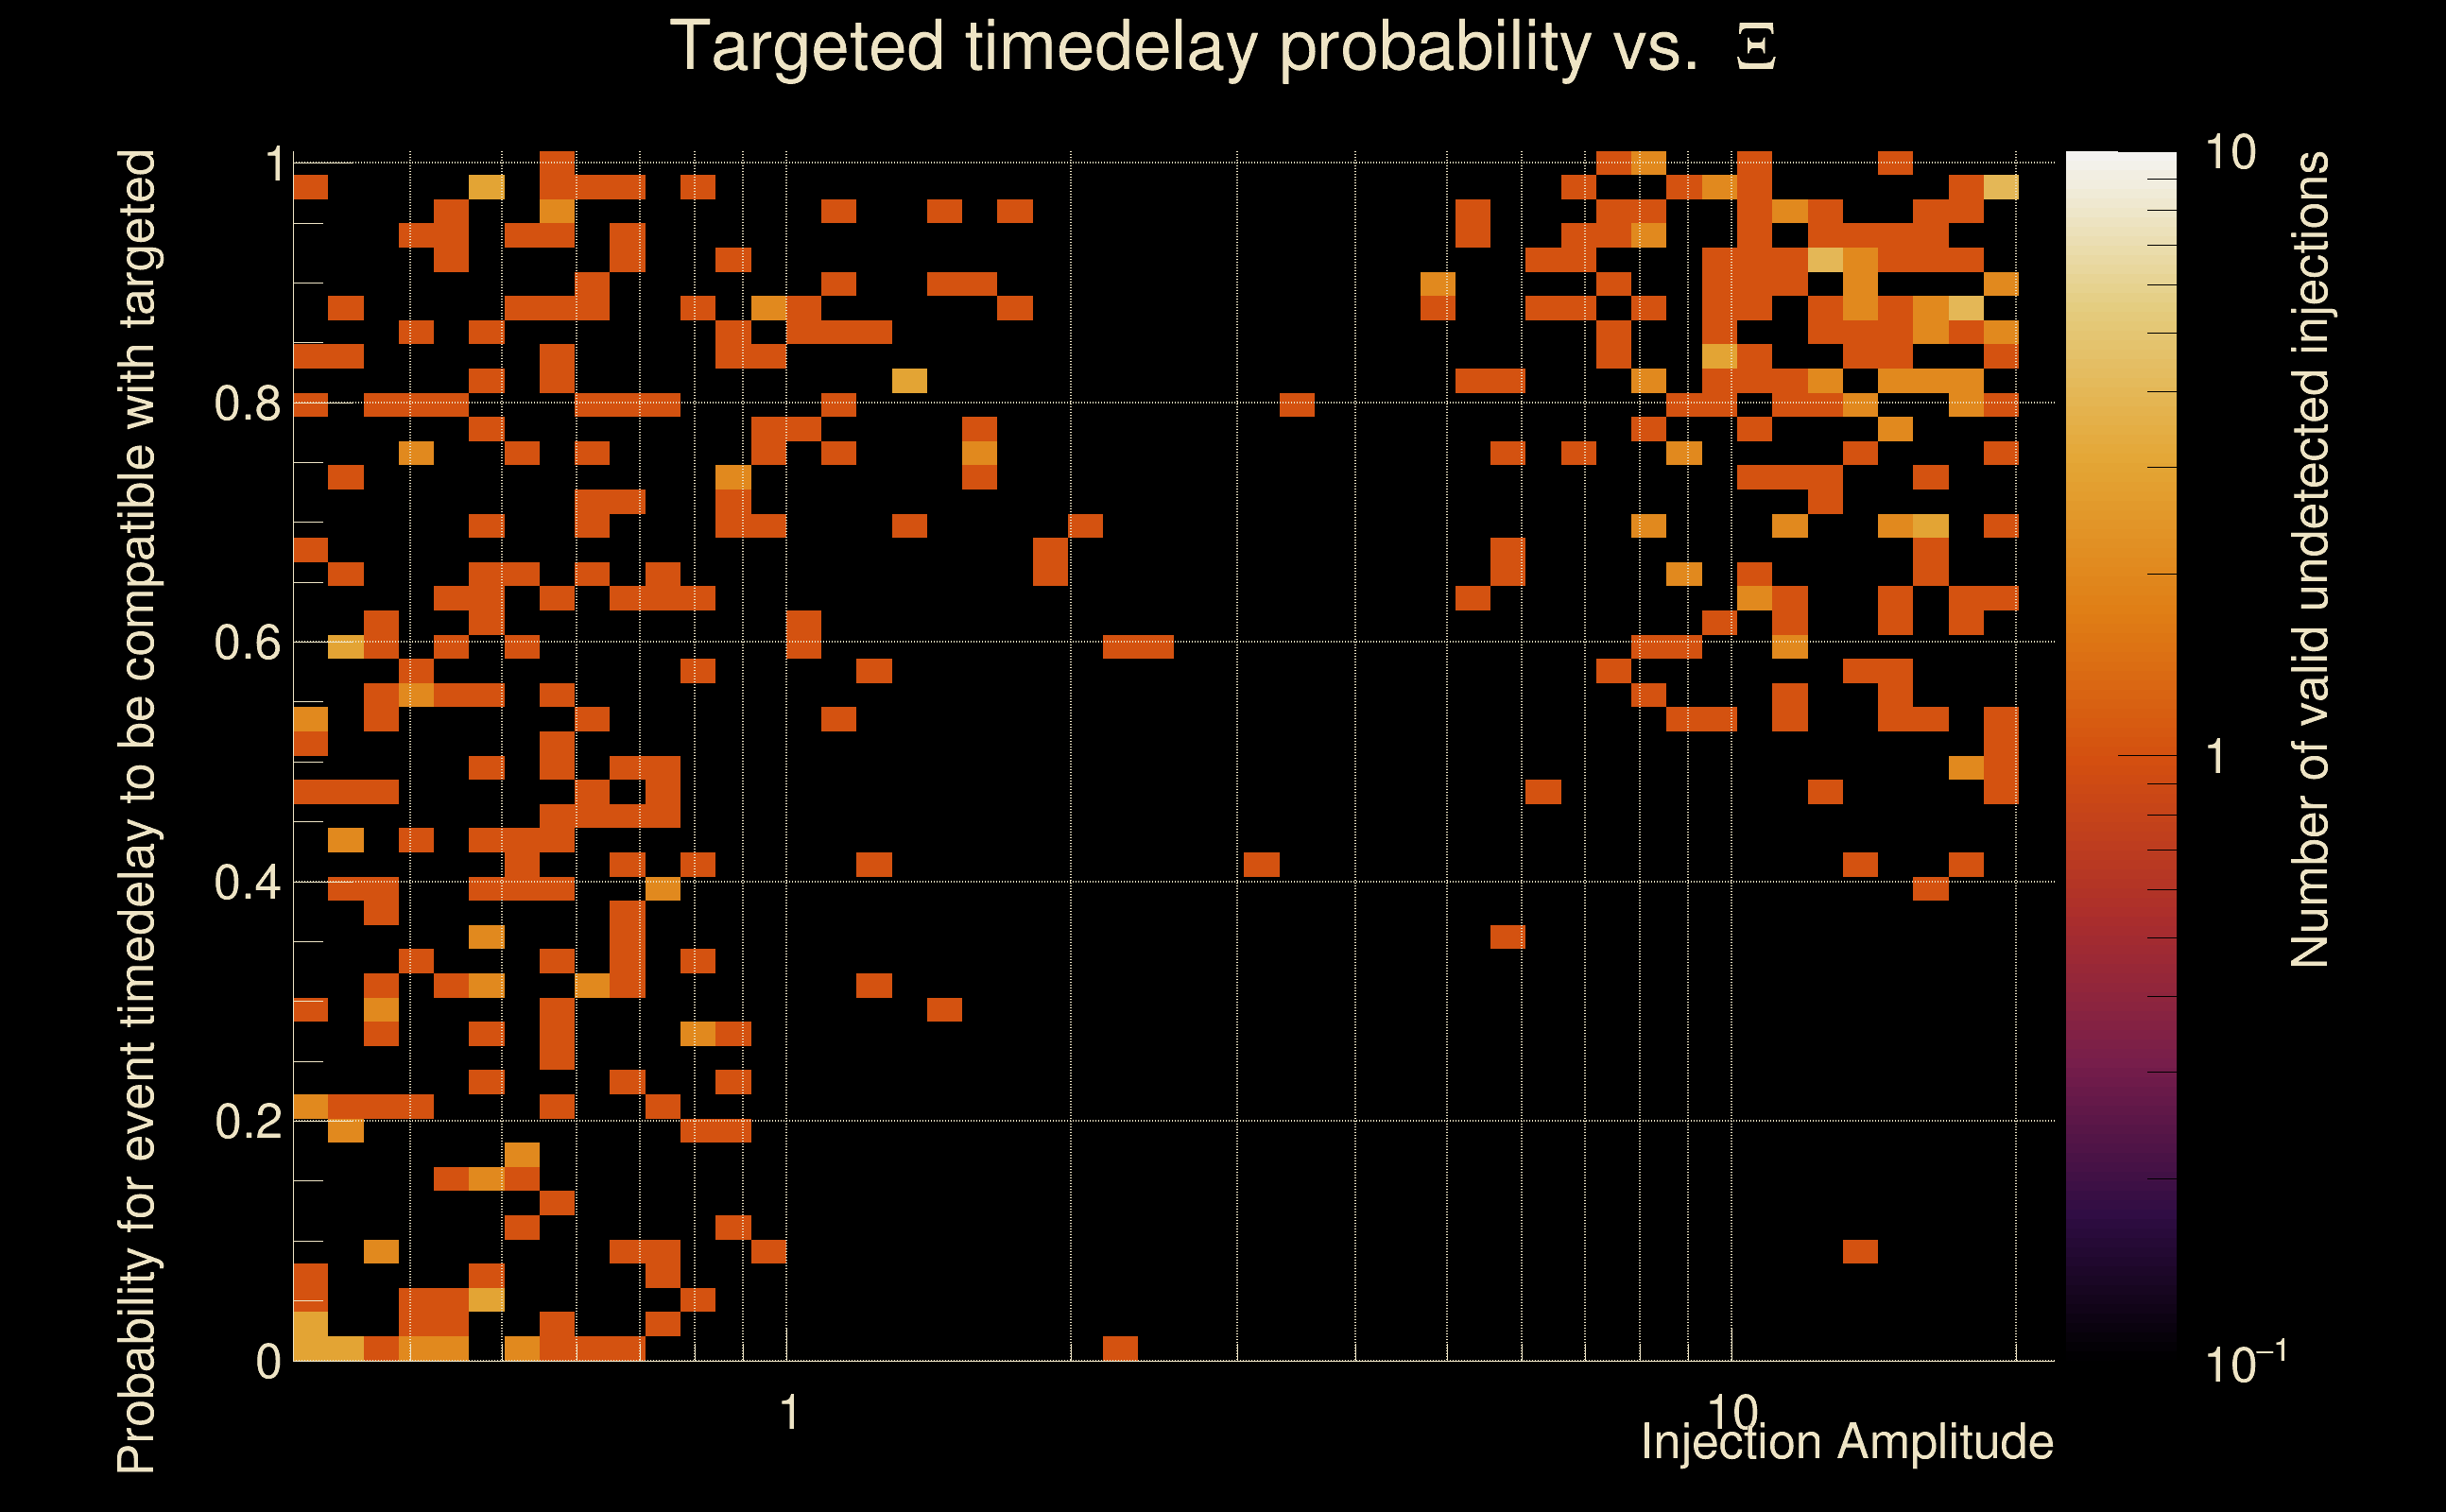
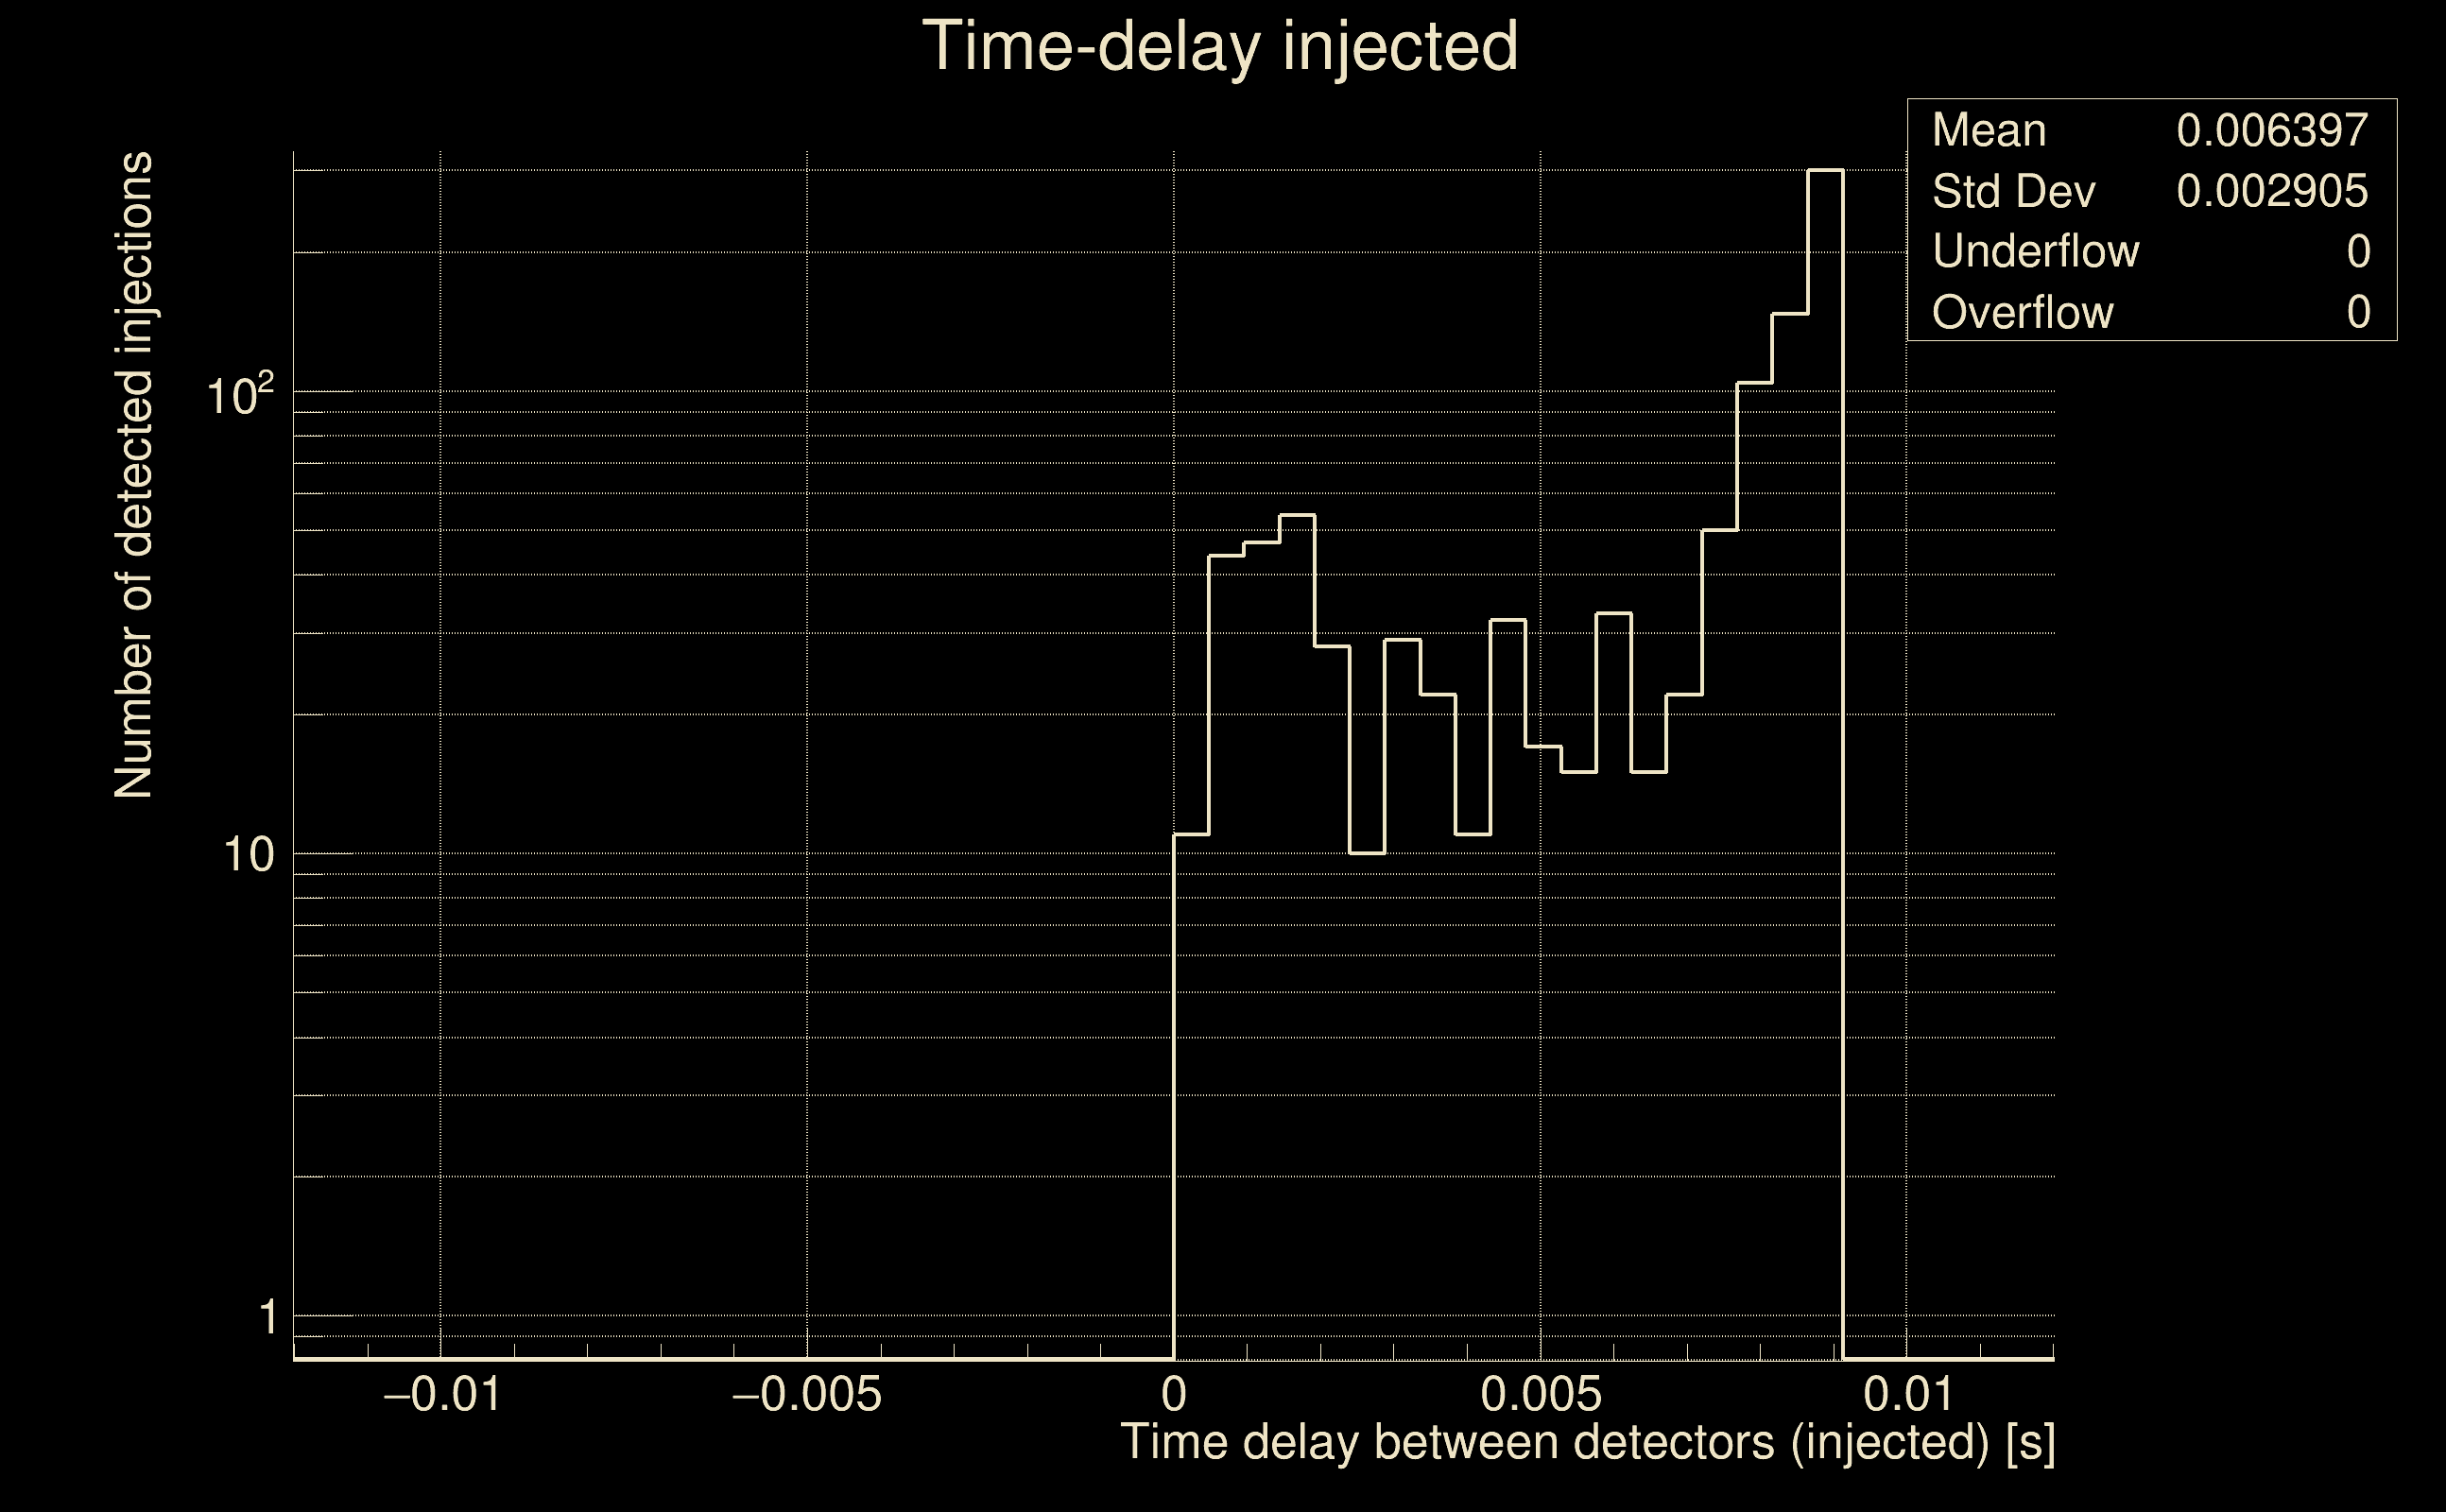
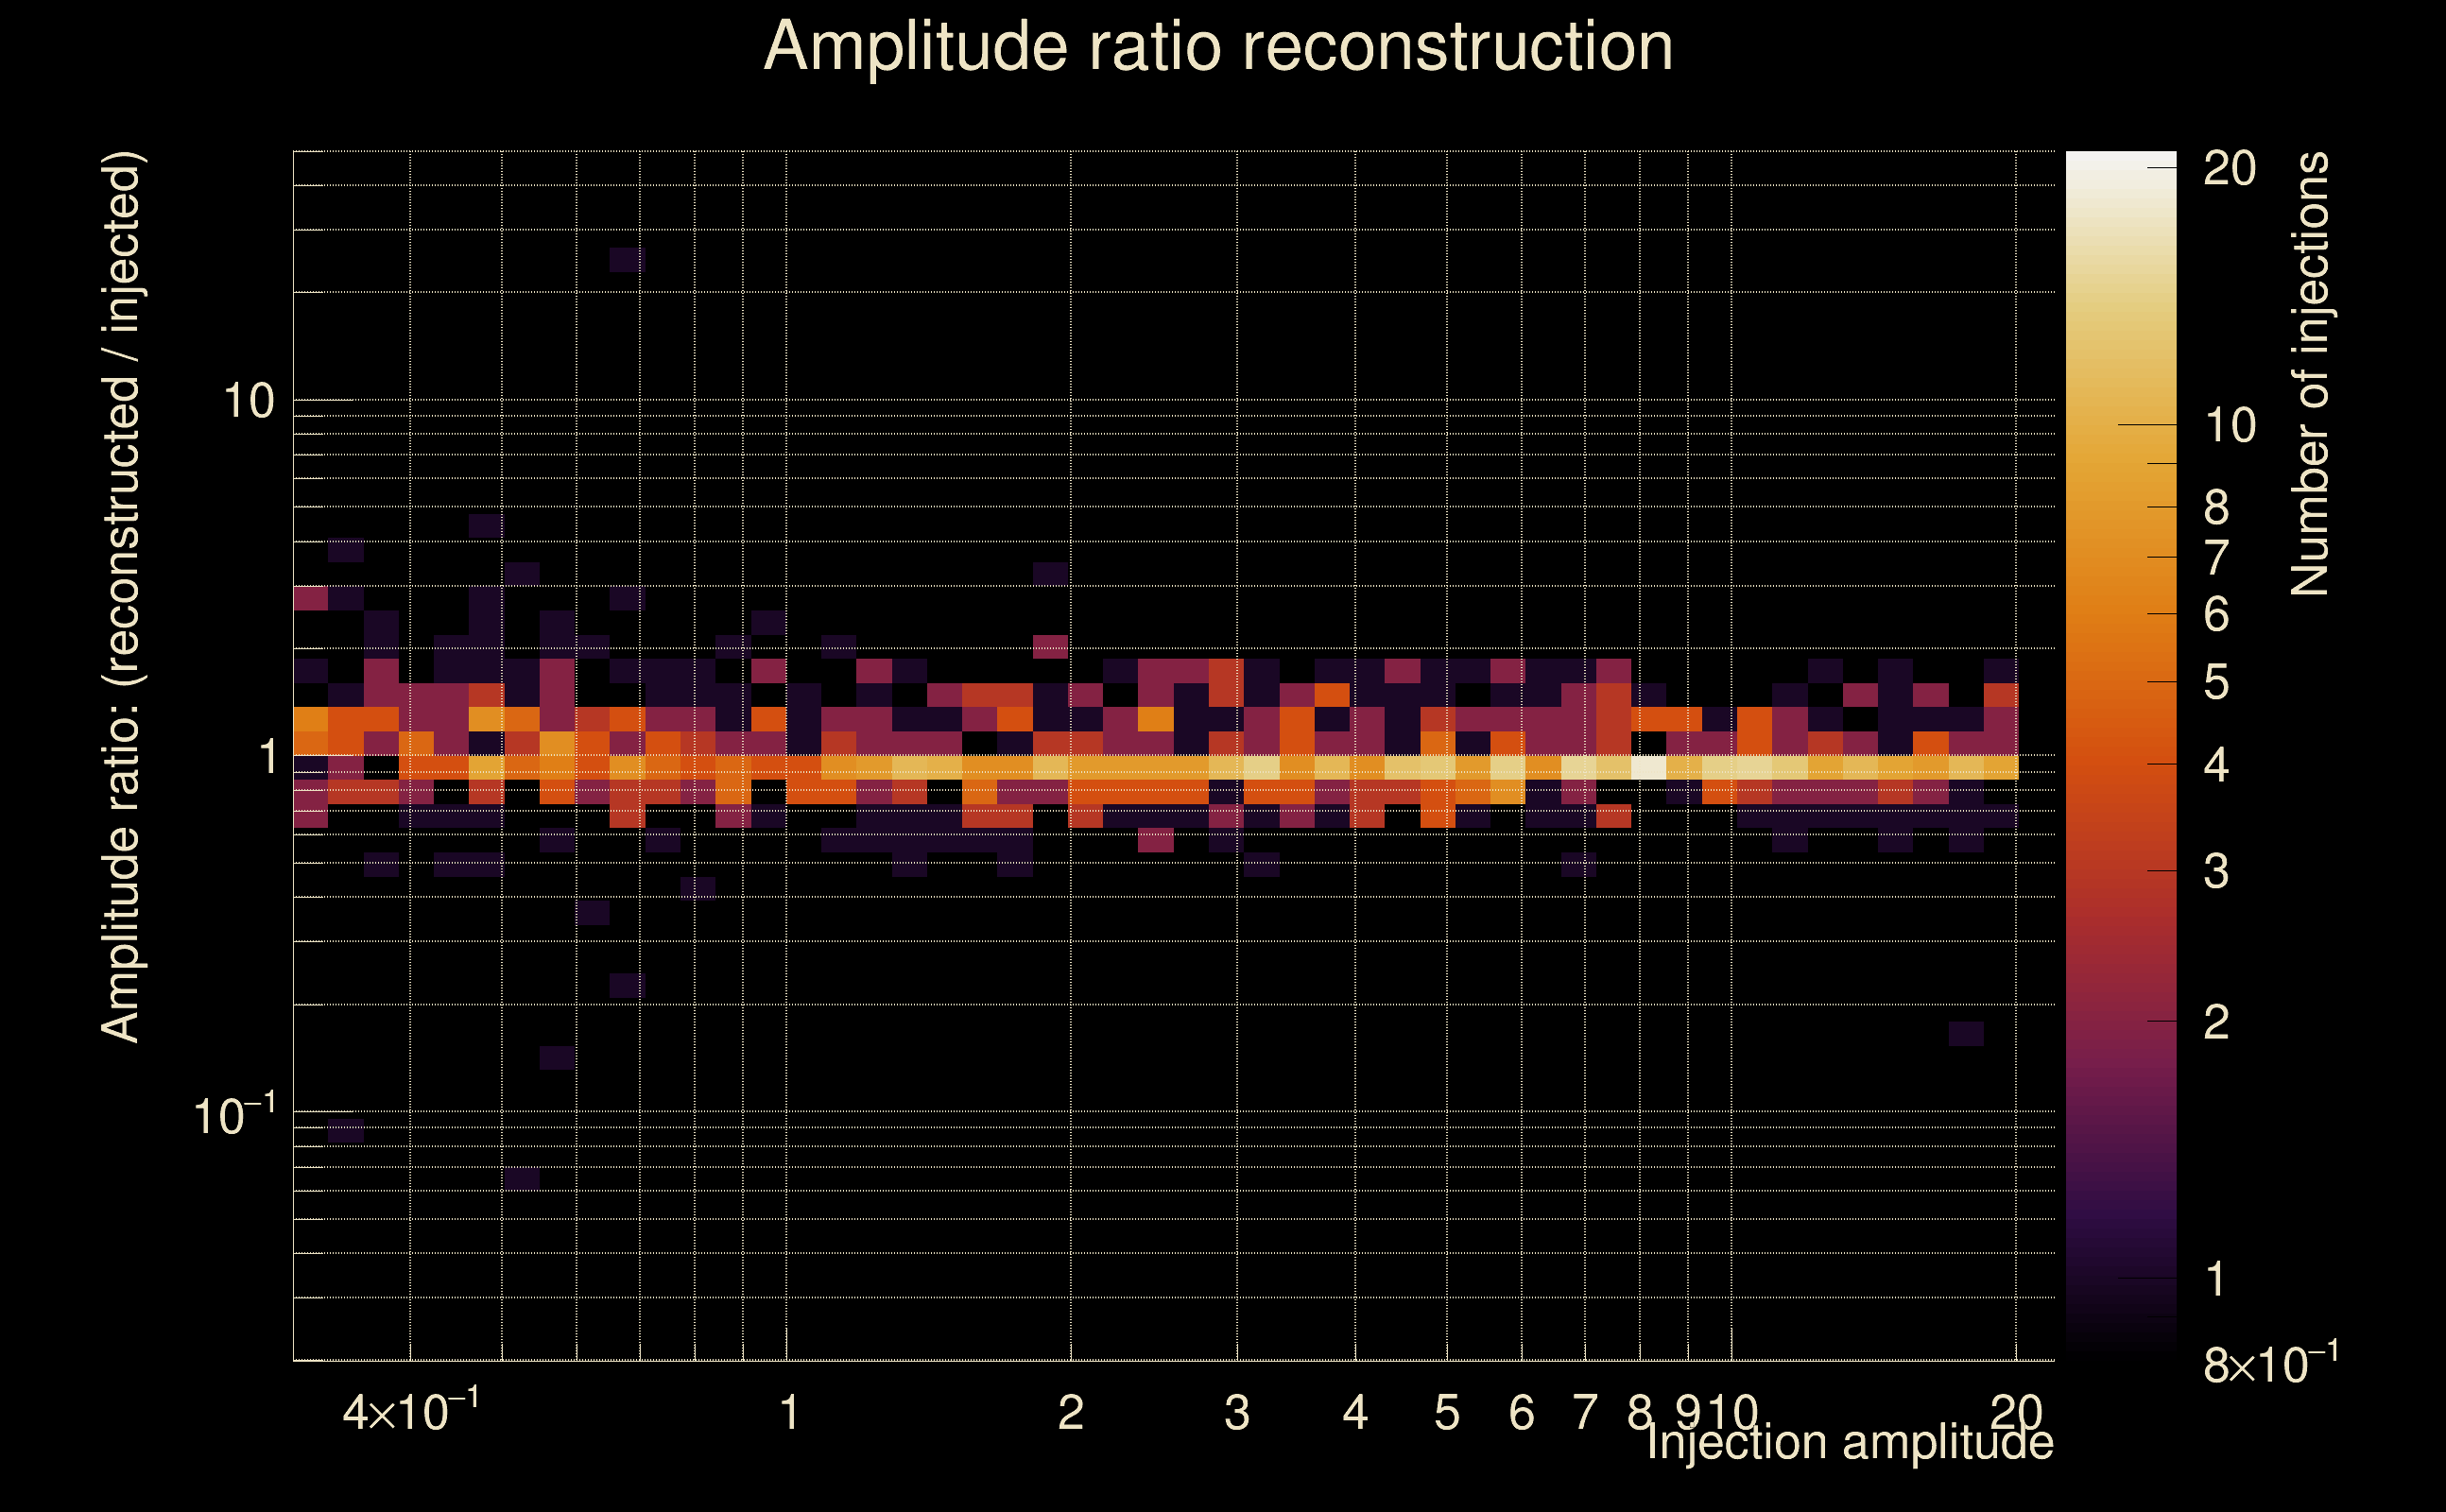
| Number of injections (total/valid/detected): | 1162 / 1018 / 388 |
| List of missed injections: | ./Kur22-s50_missed.txt |
| Injection amplitude at 90% detection efficiency: | 3.7658 |
| Injection amplitude at 50% detection efficiency: | 2.15744 |
| Injection amplitude at 10% detection efficiency: | 0.885339 |
 |
 |
 |
 |
 |
 |
 |
|
 |
 |
|
 |
 |
|
 |
 |
|
 |
 |
|
 |
 |
|
 |
 |
|
 |
 |
|
 |
 |
 |
 |
 |
 |
 |
 |
 |
 |
 |
 |
 |
 |
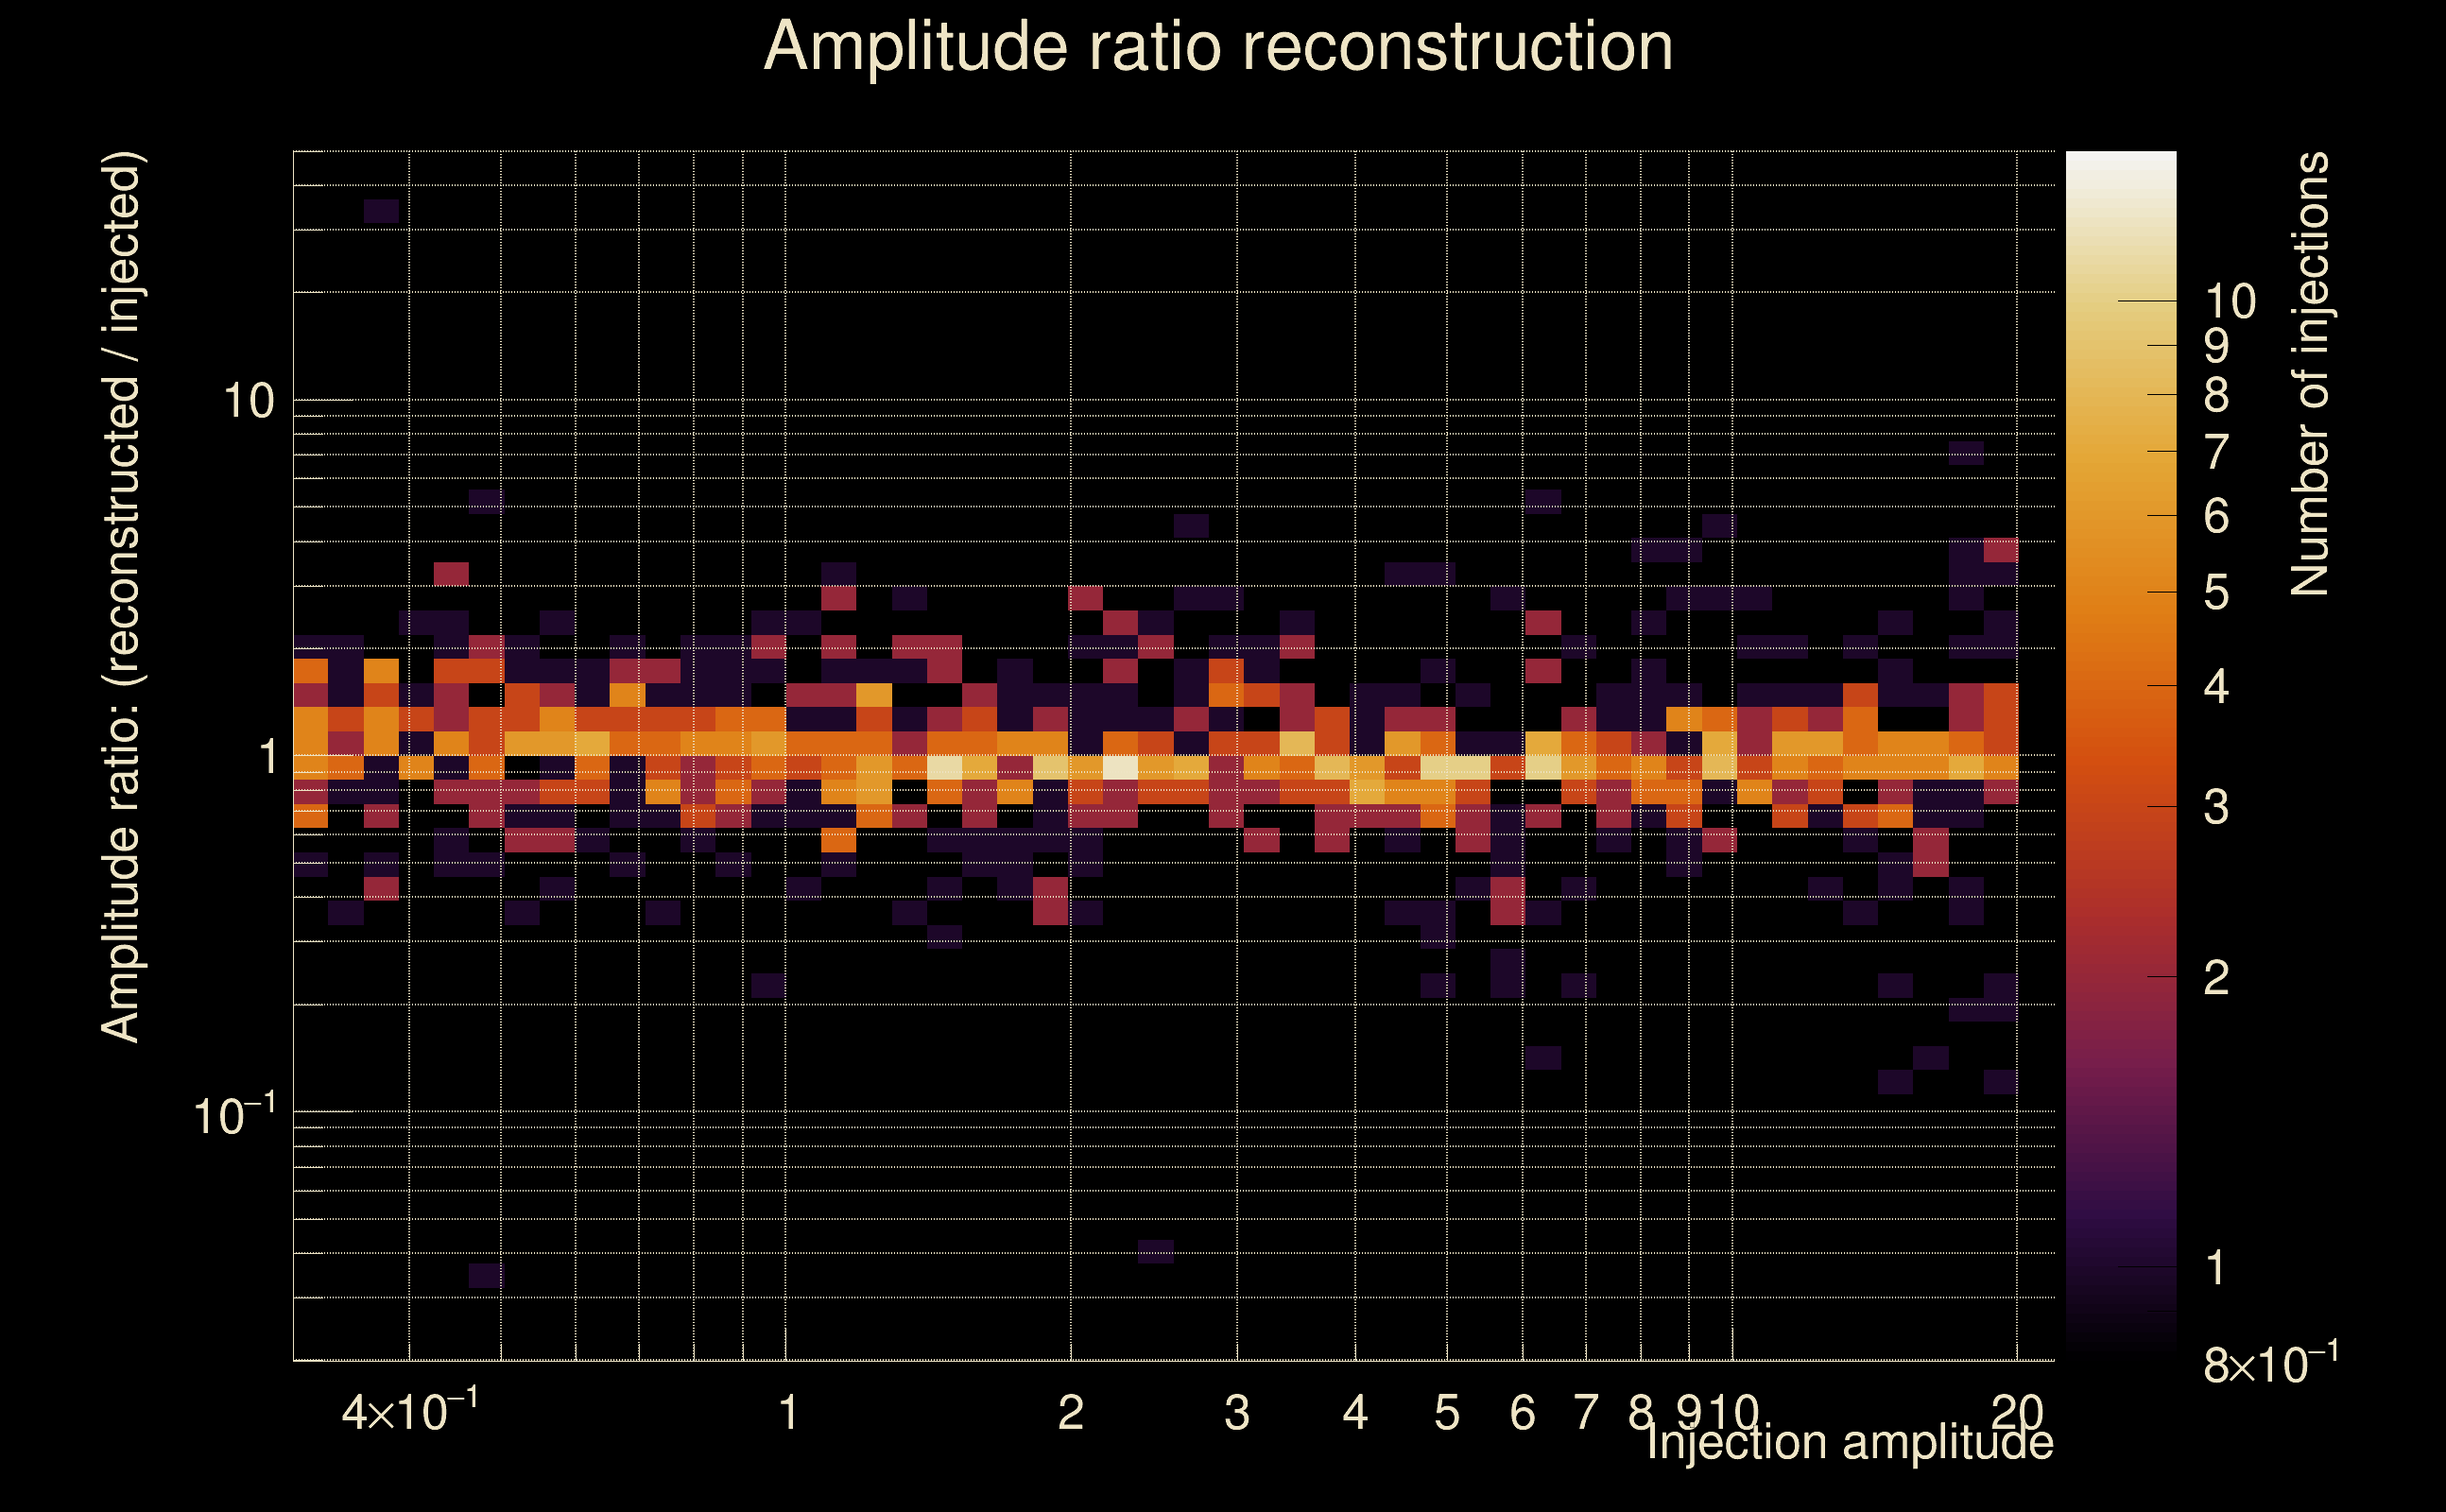 |
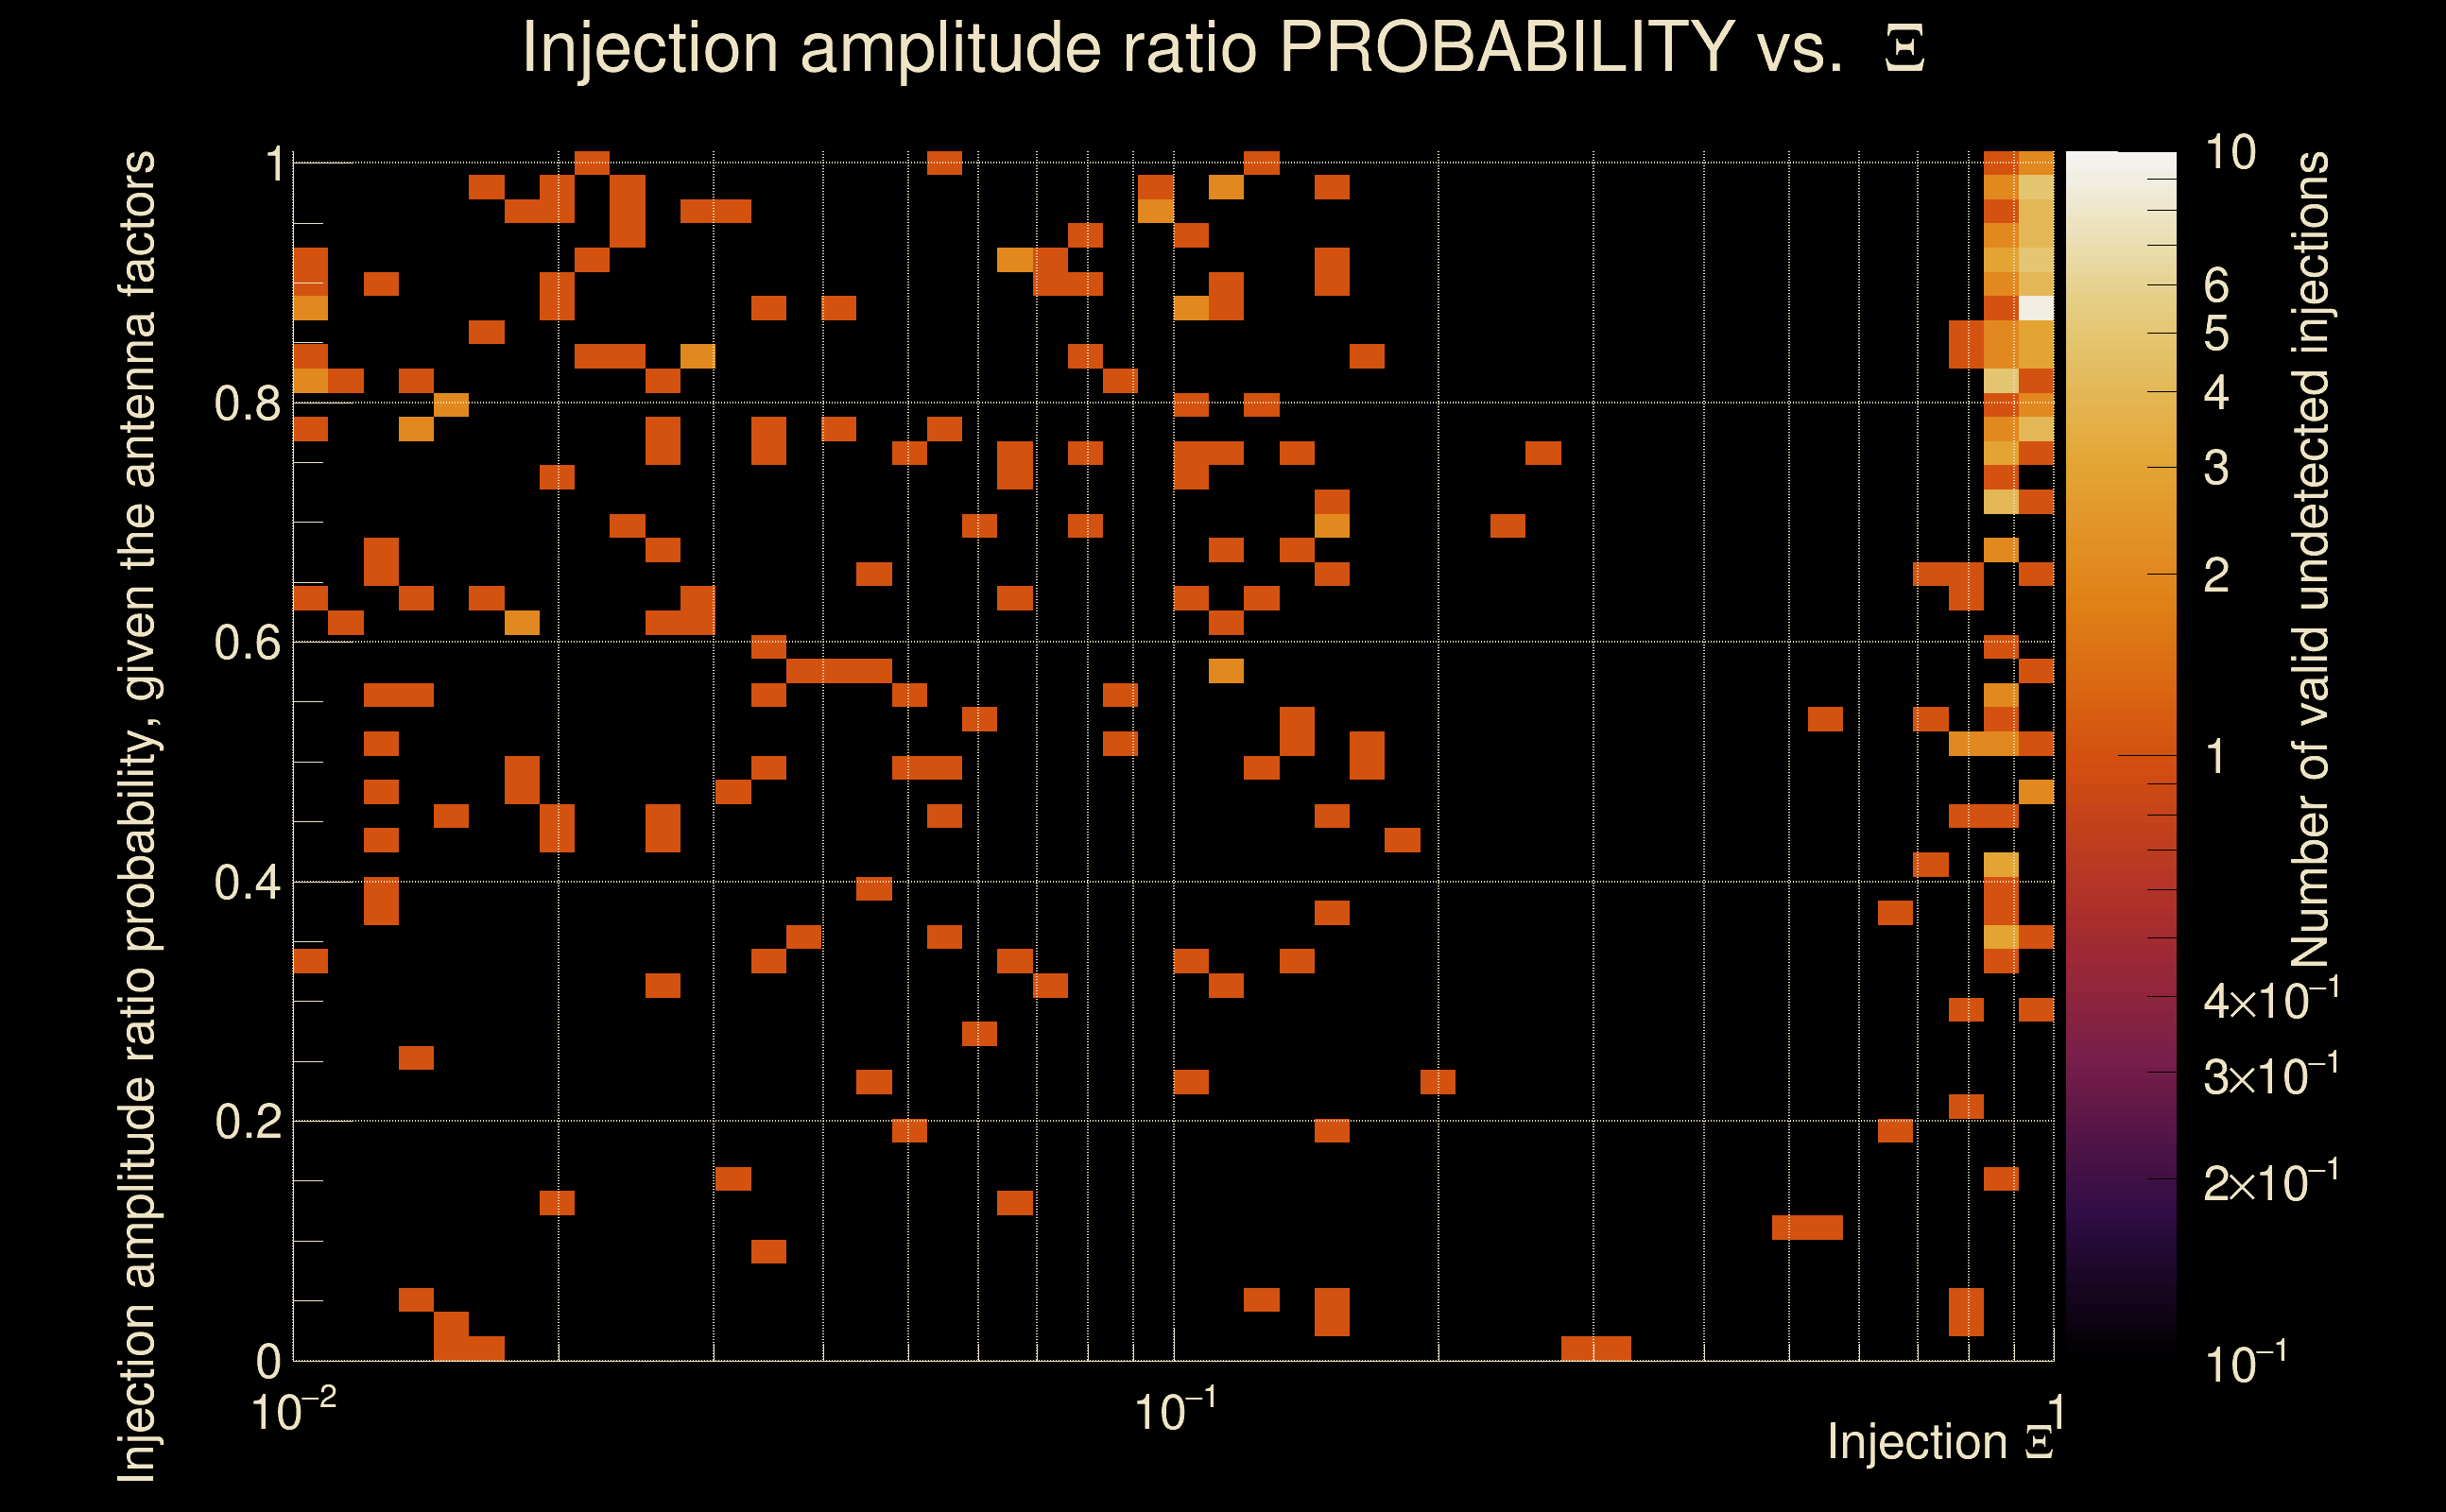
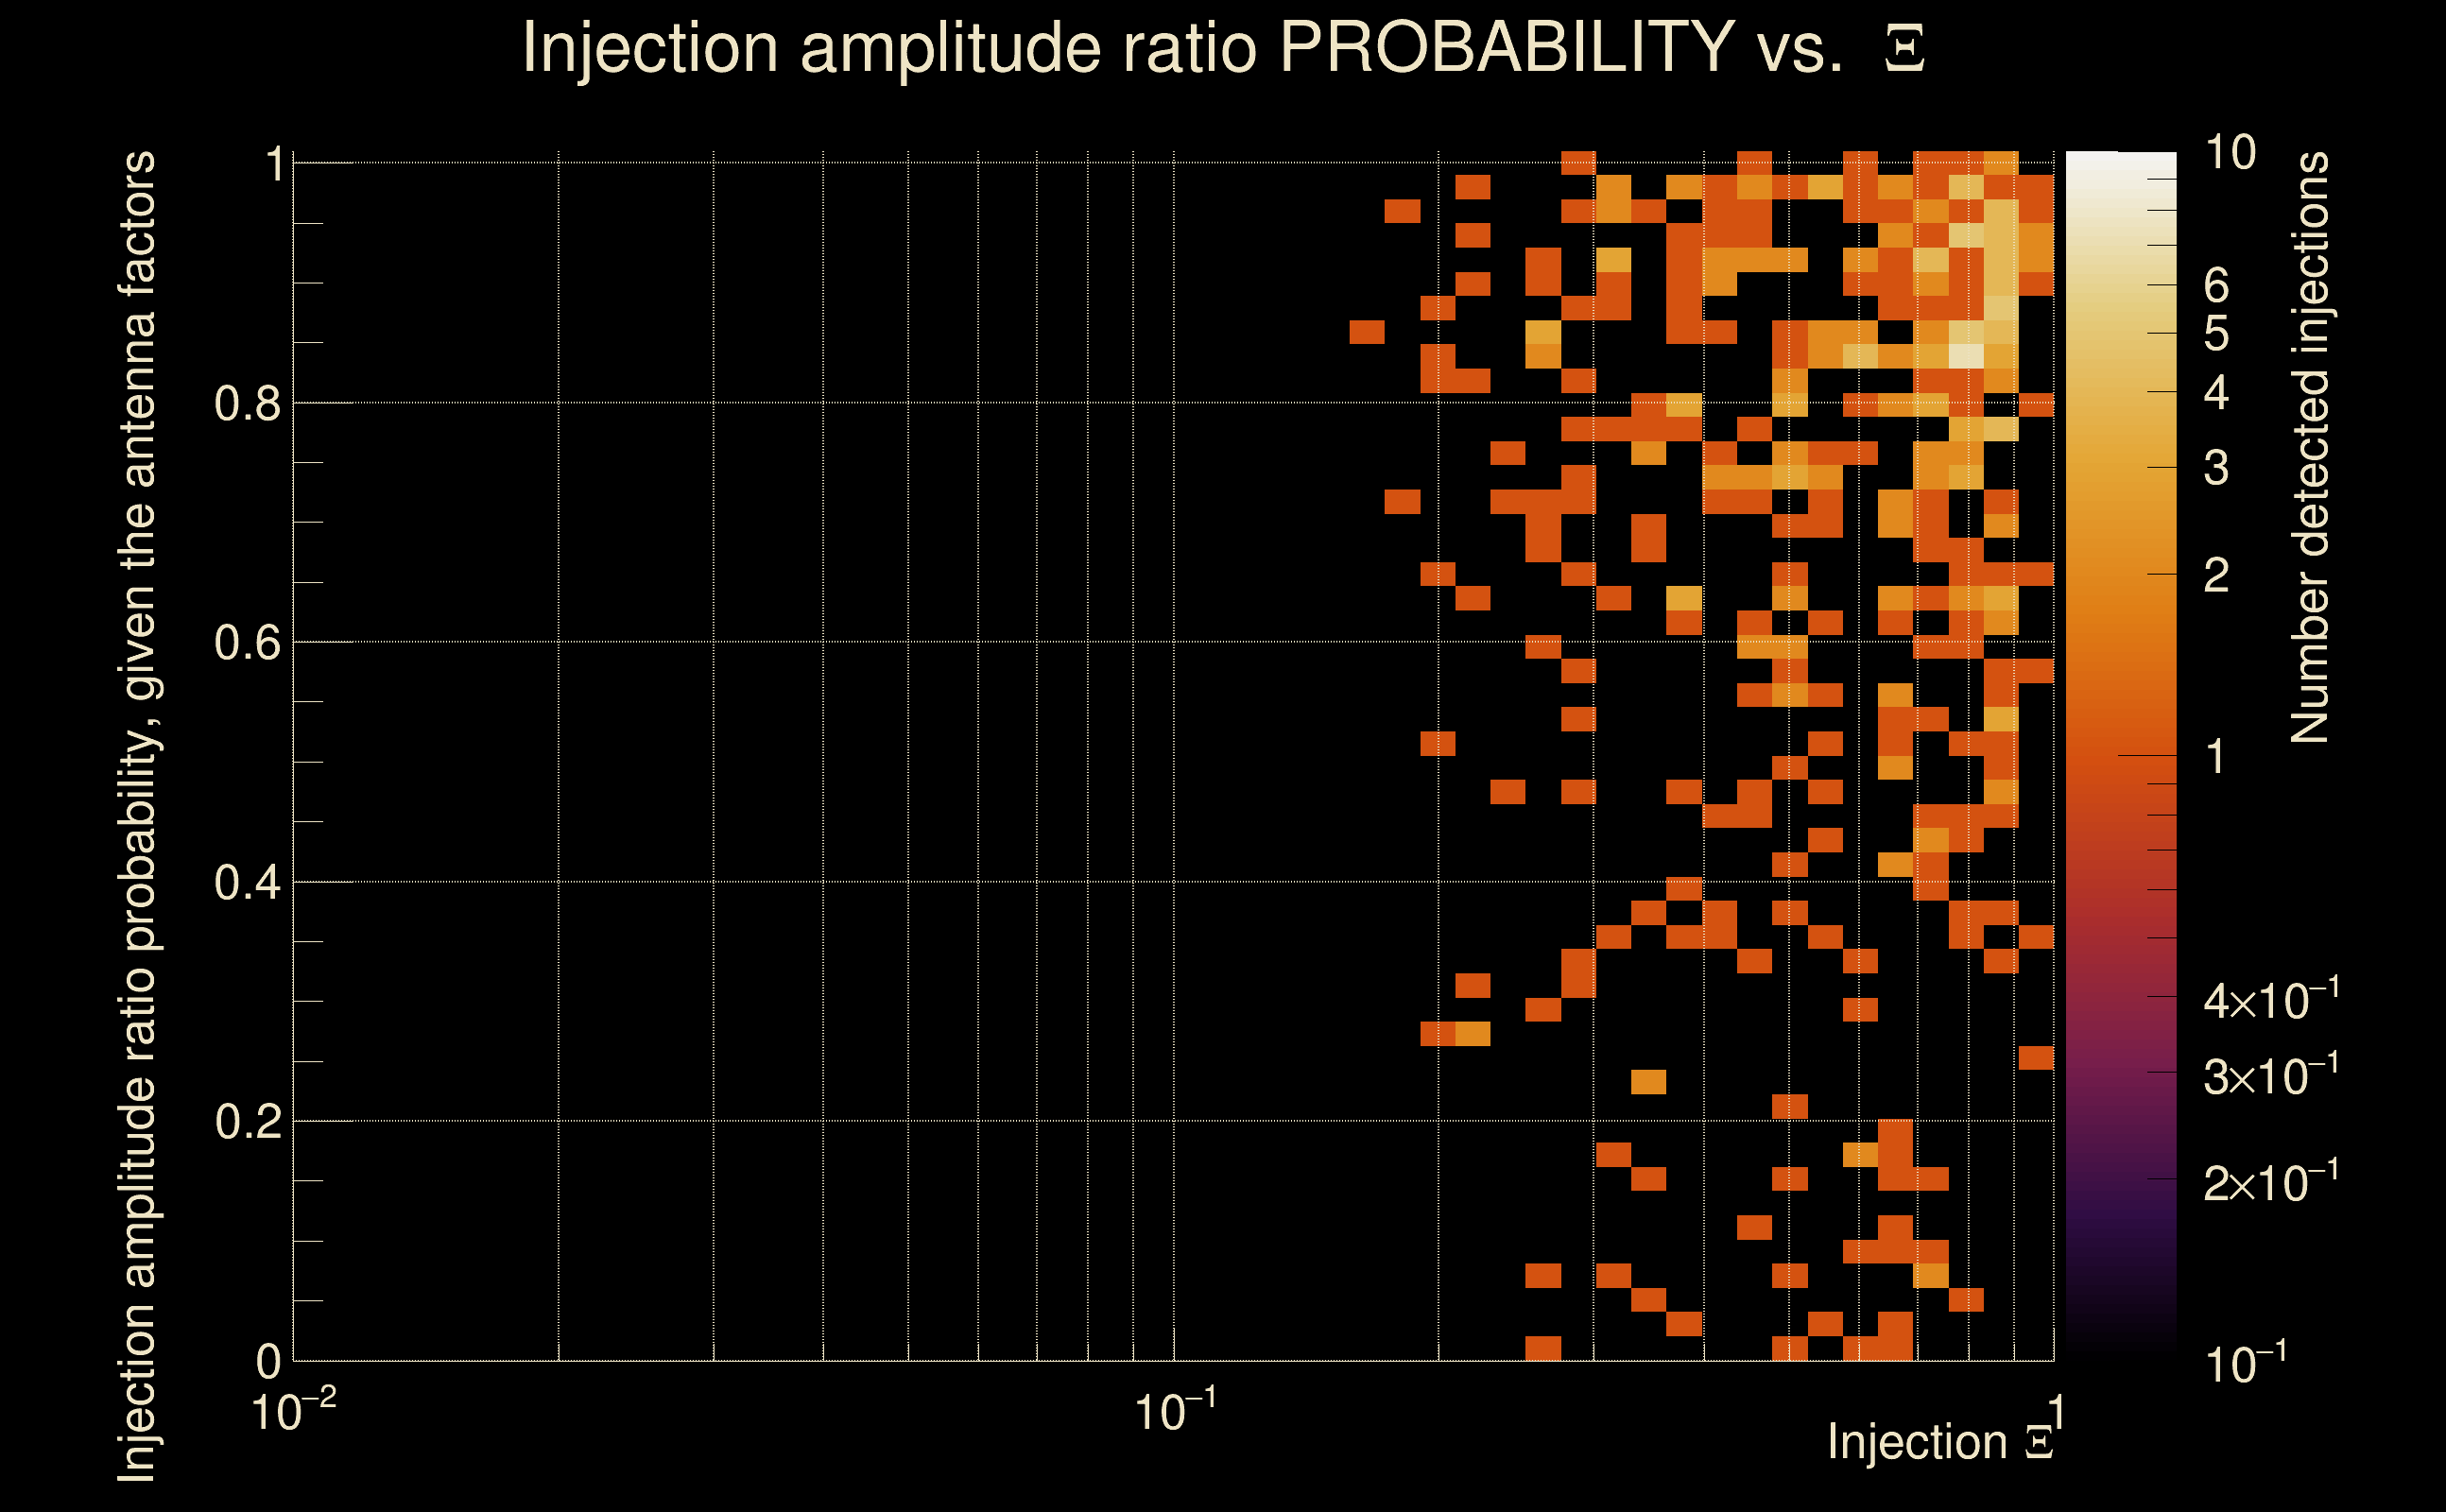
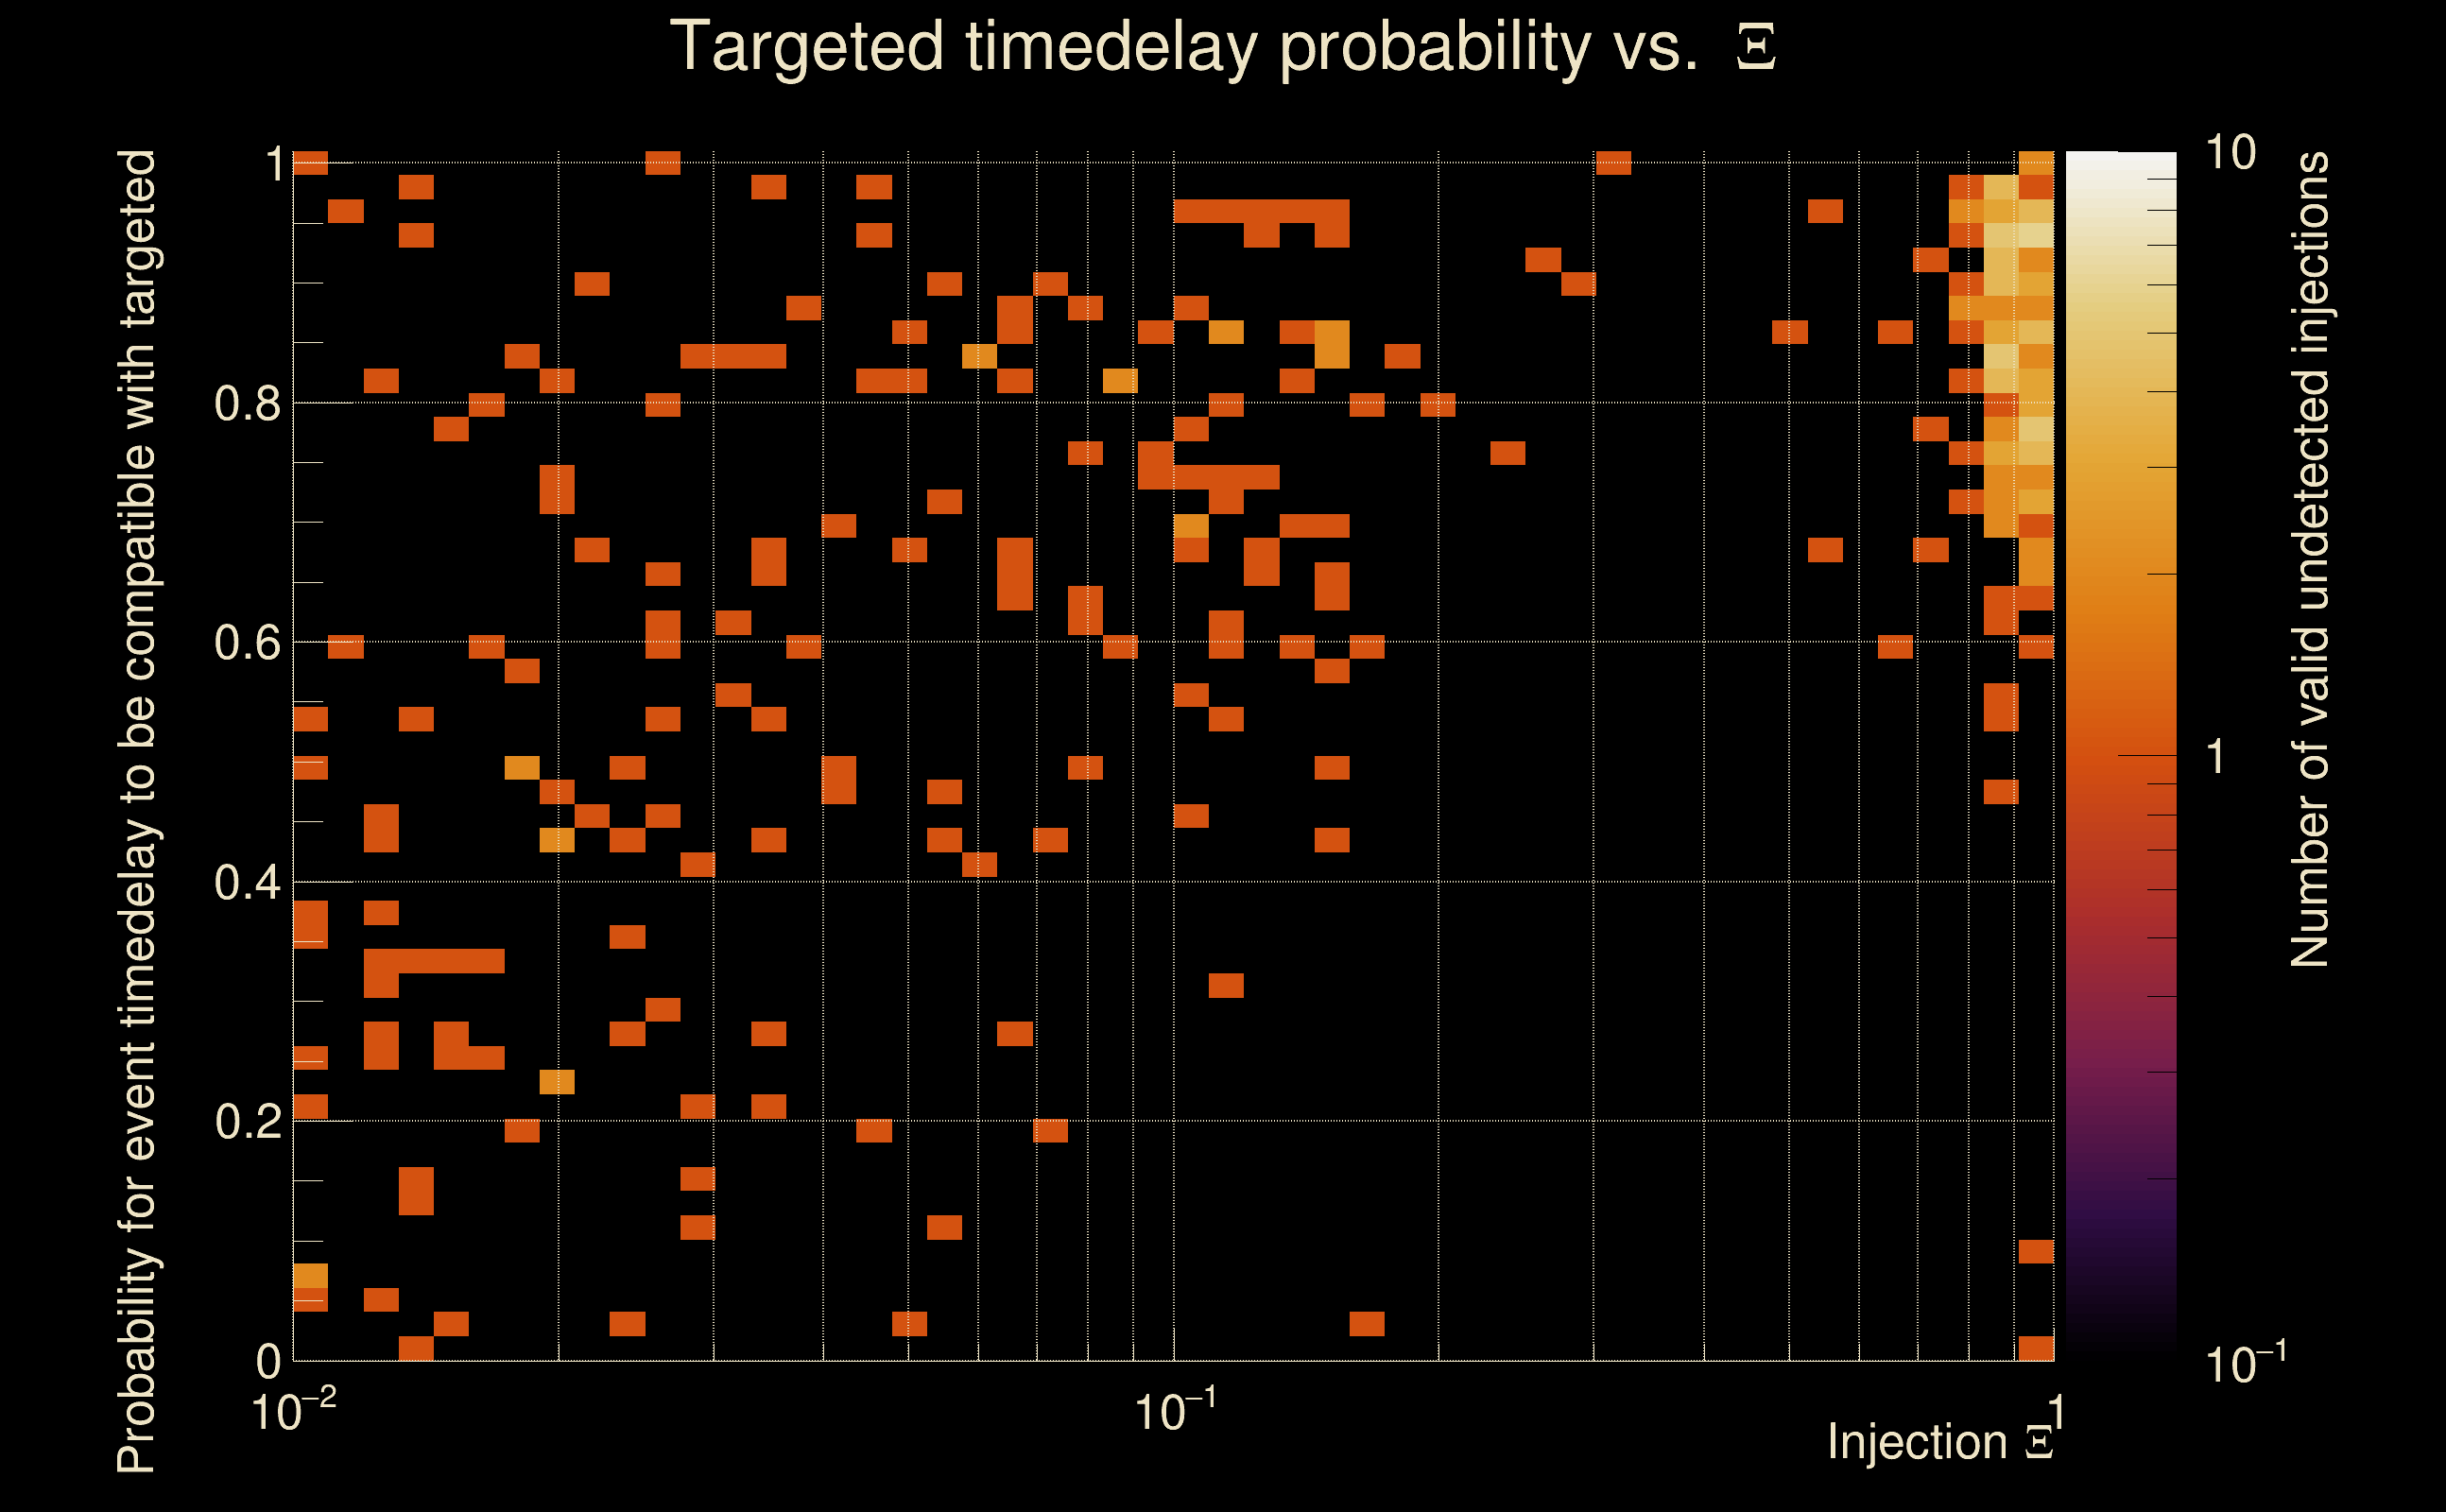
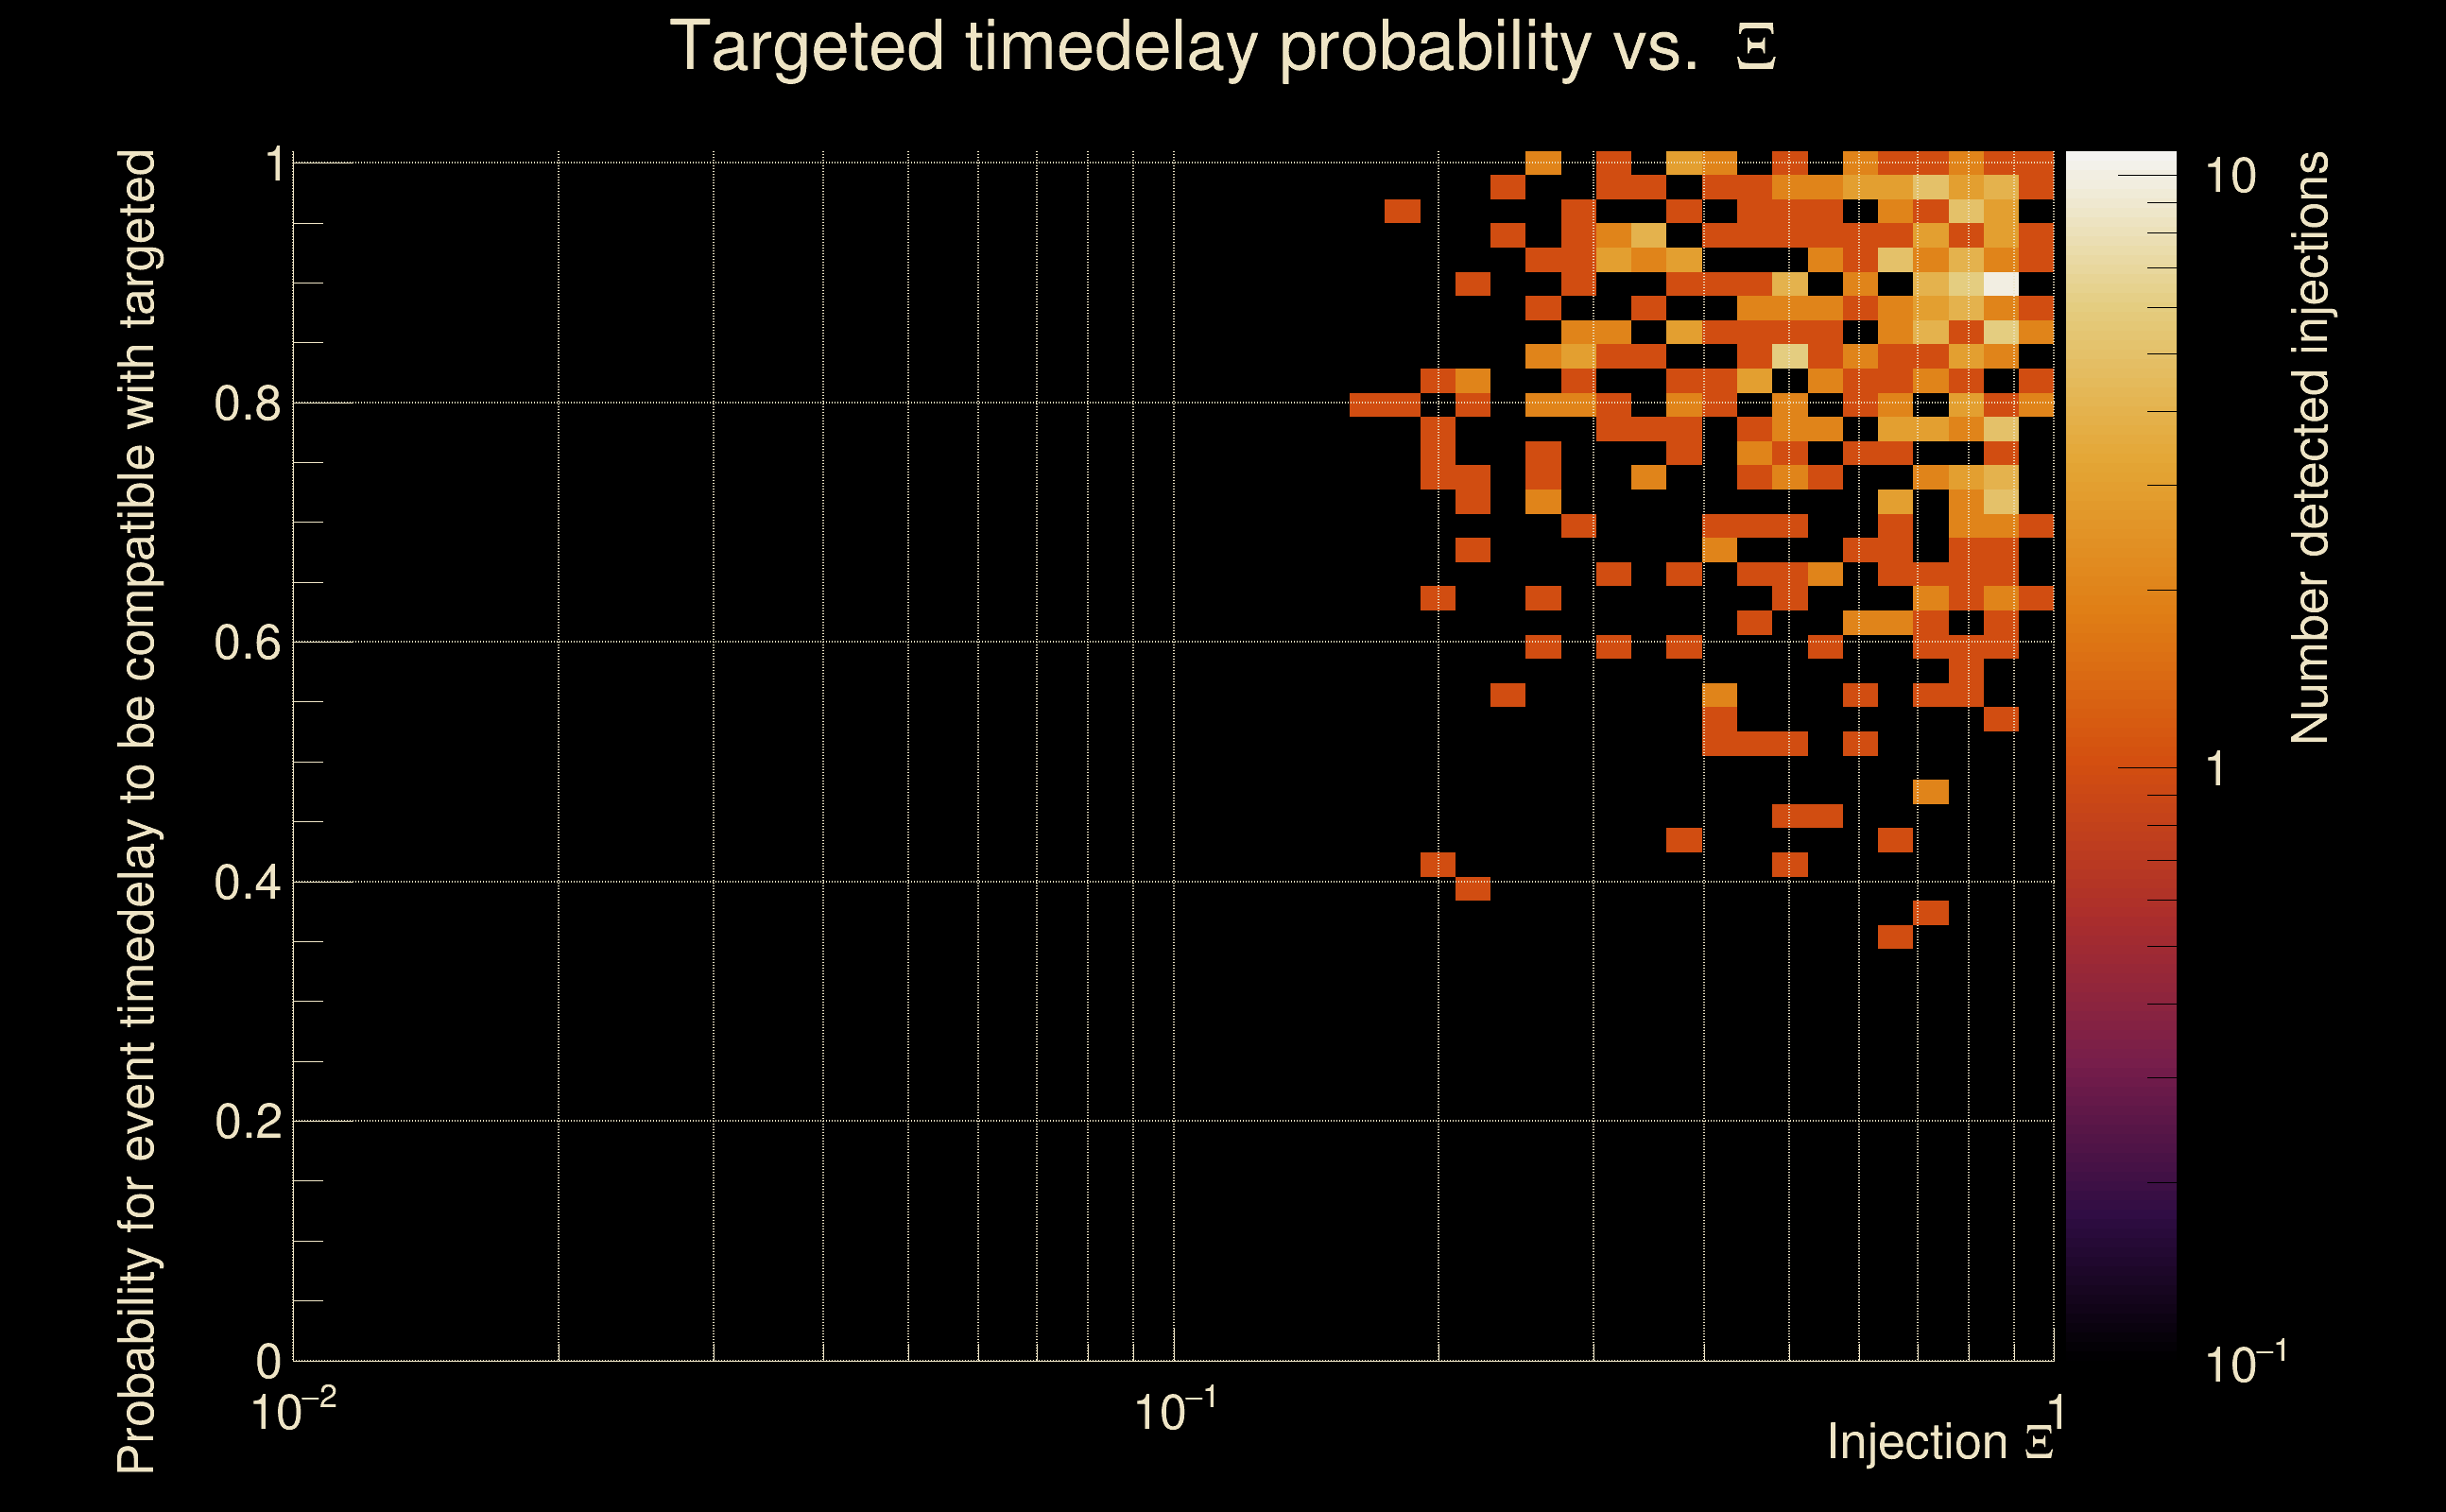
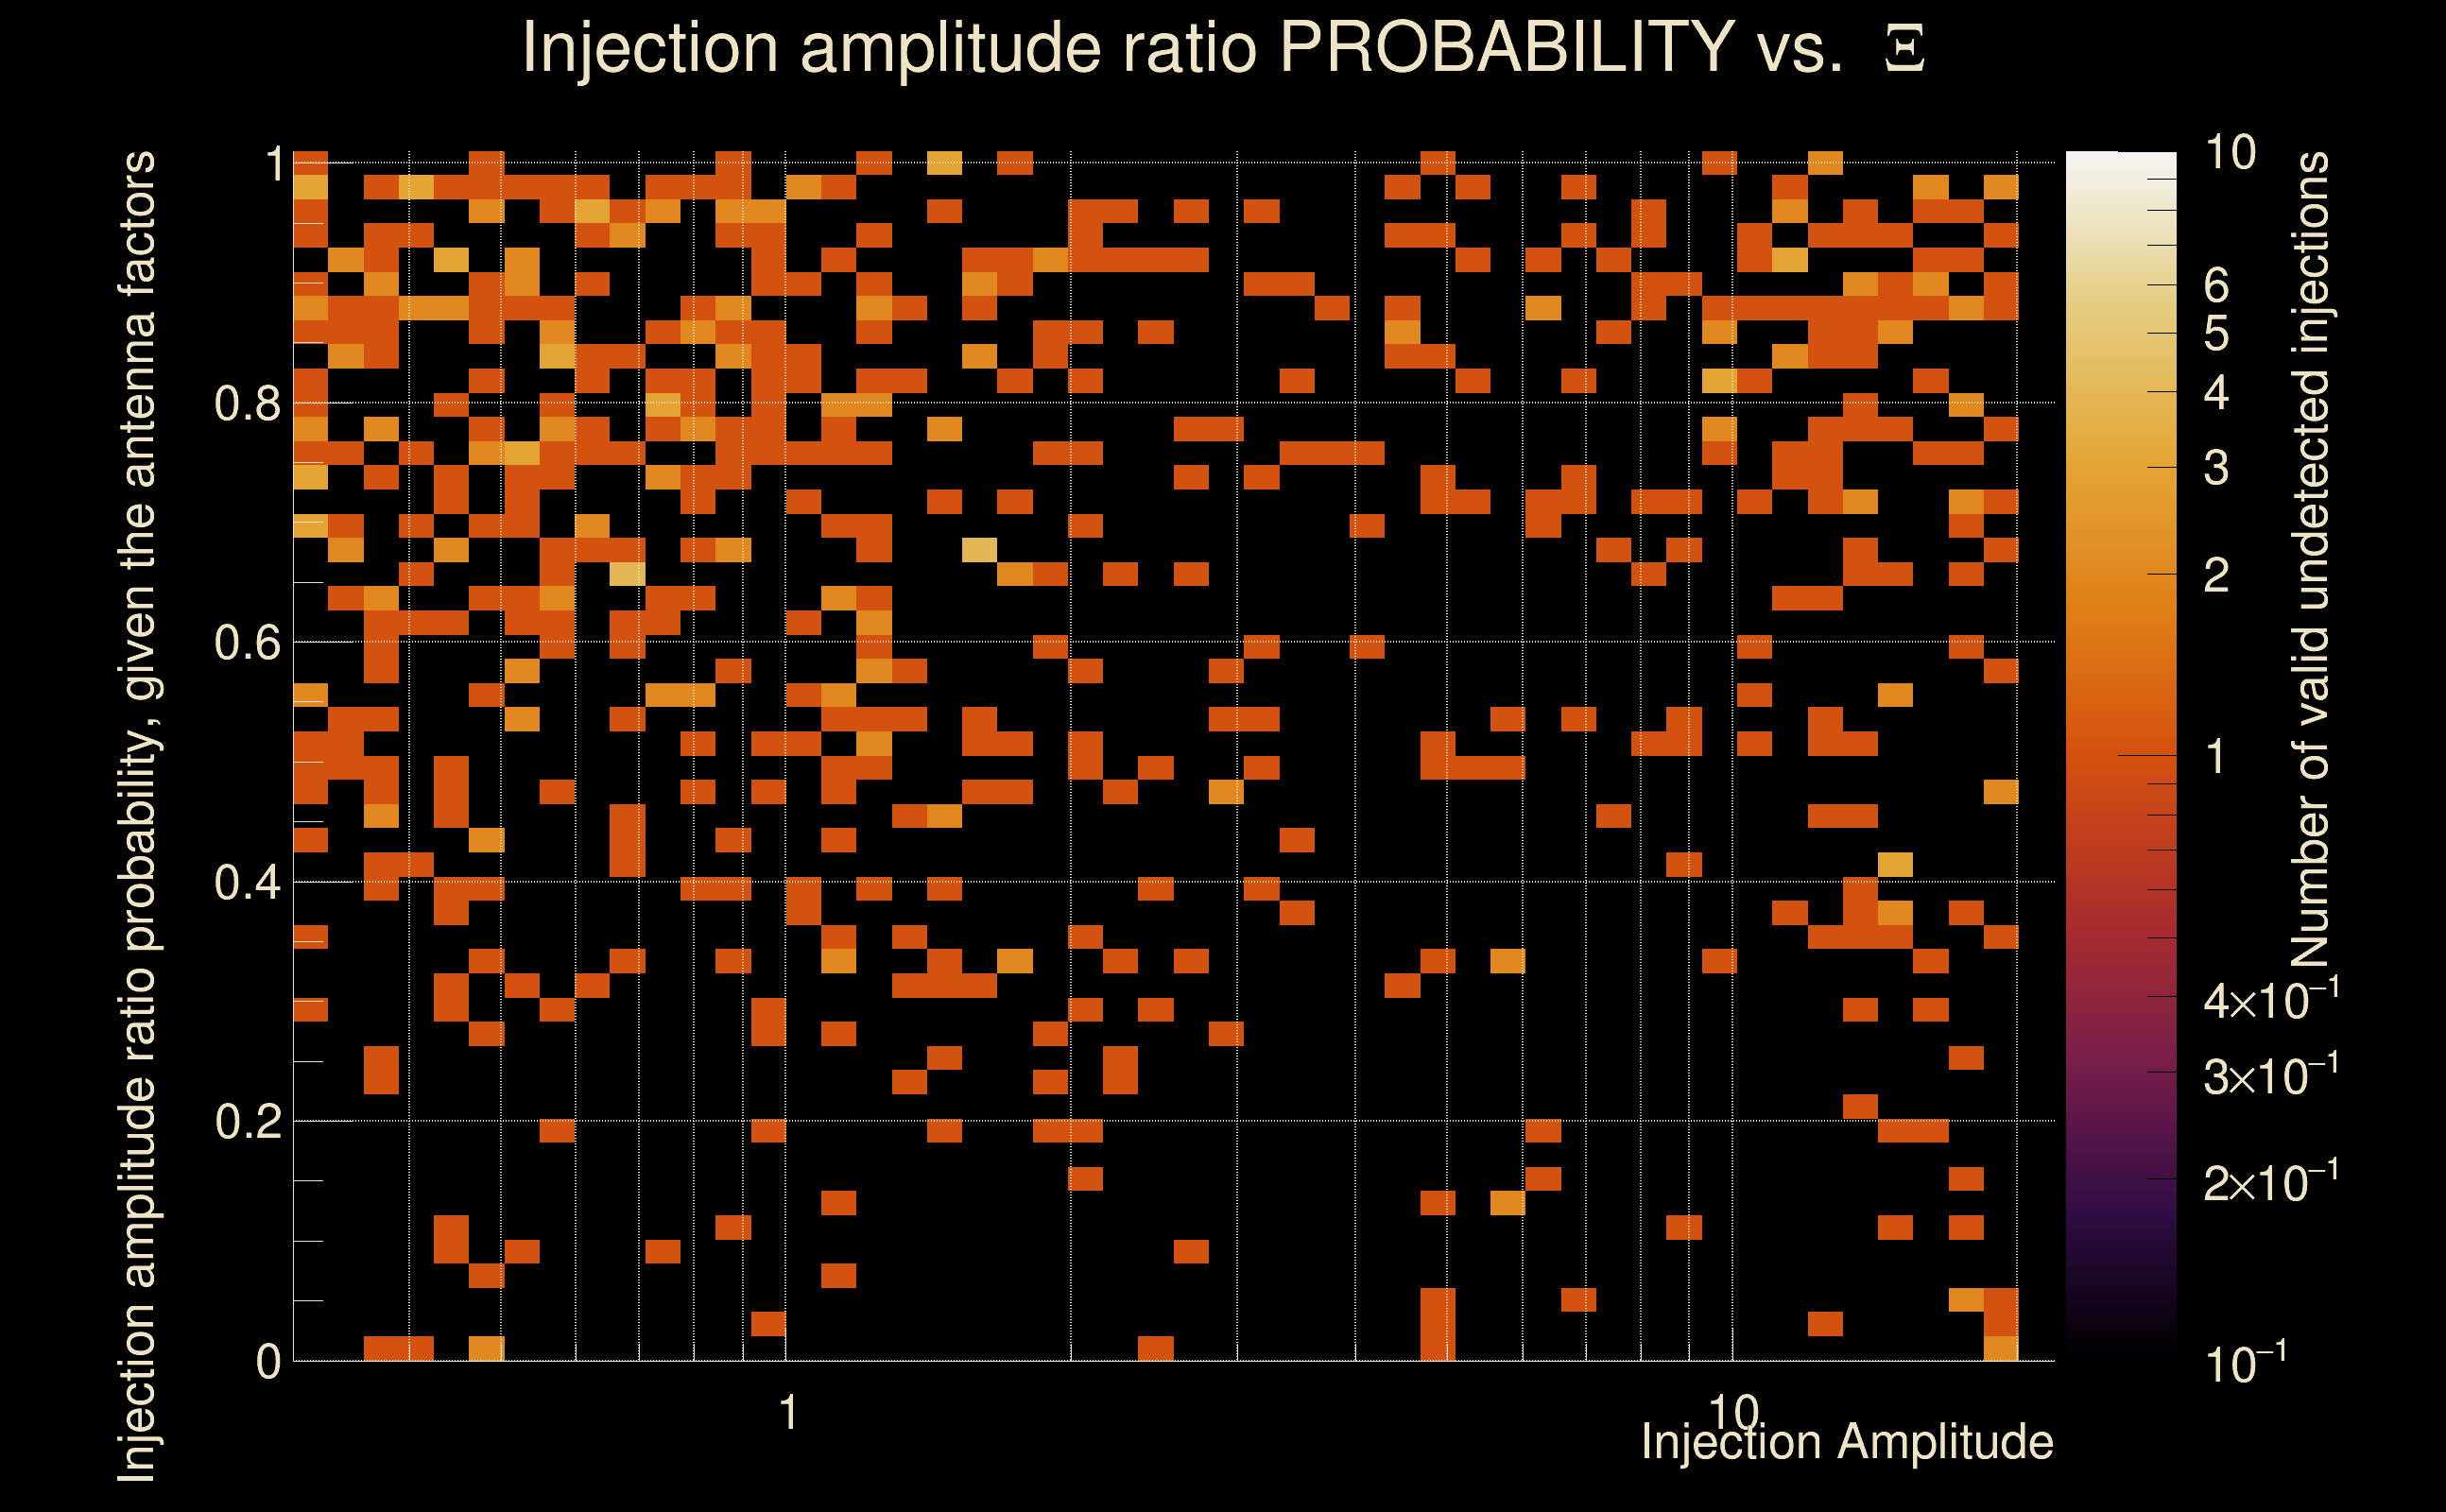
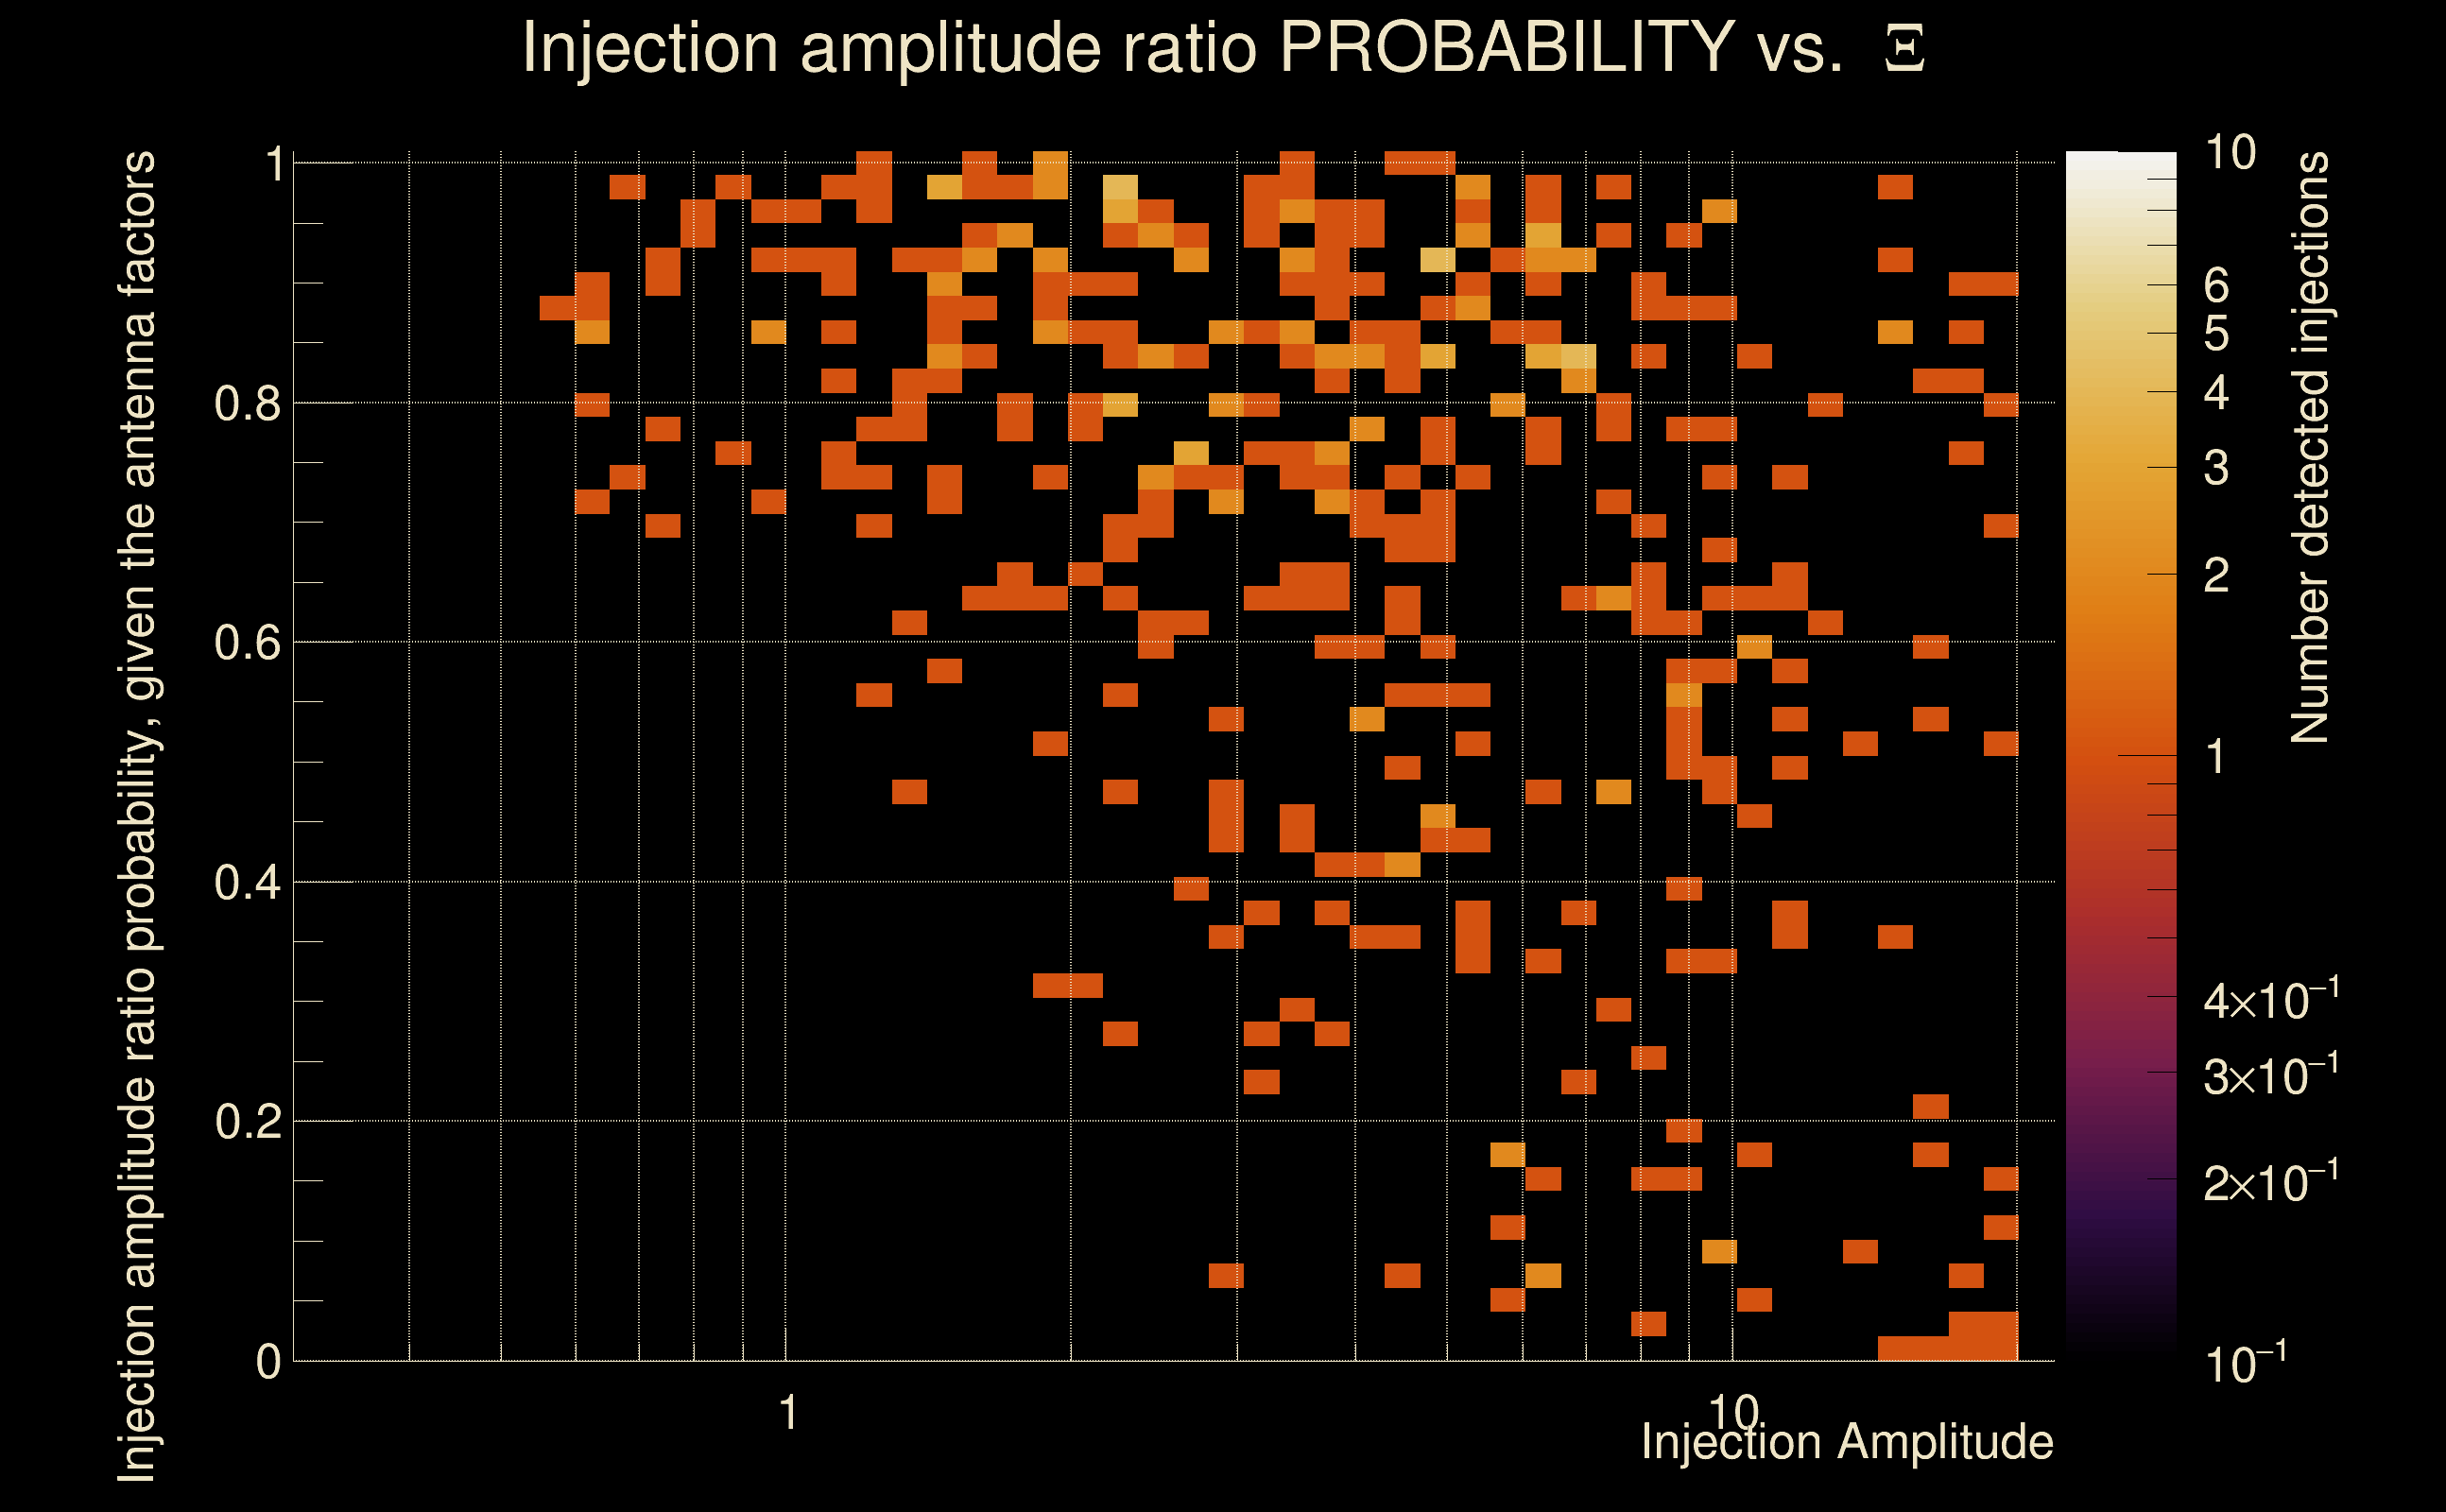
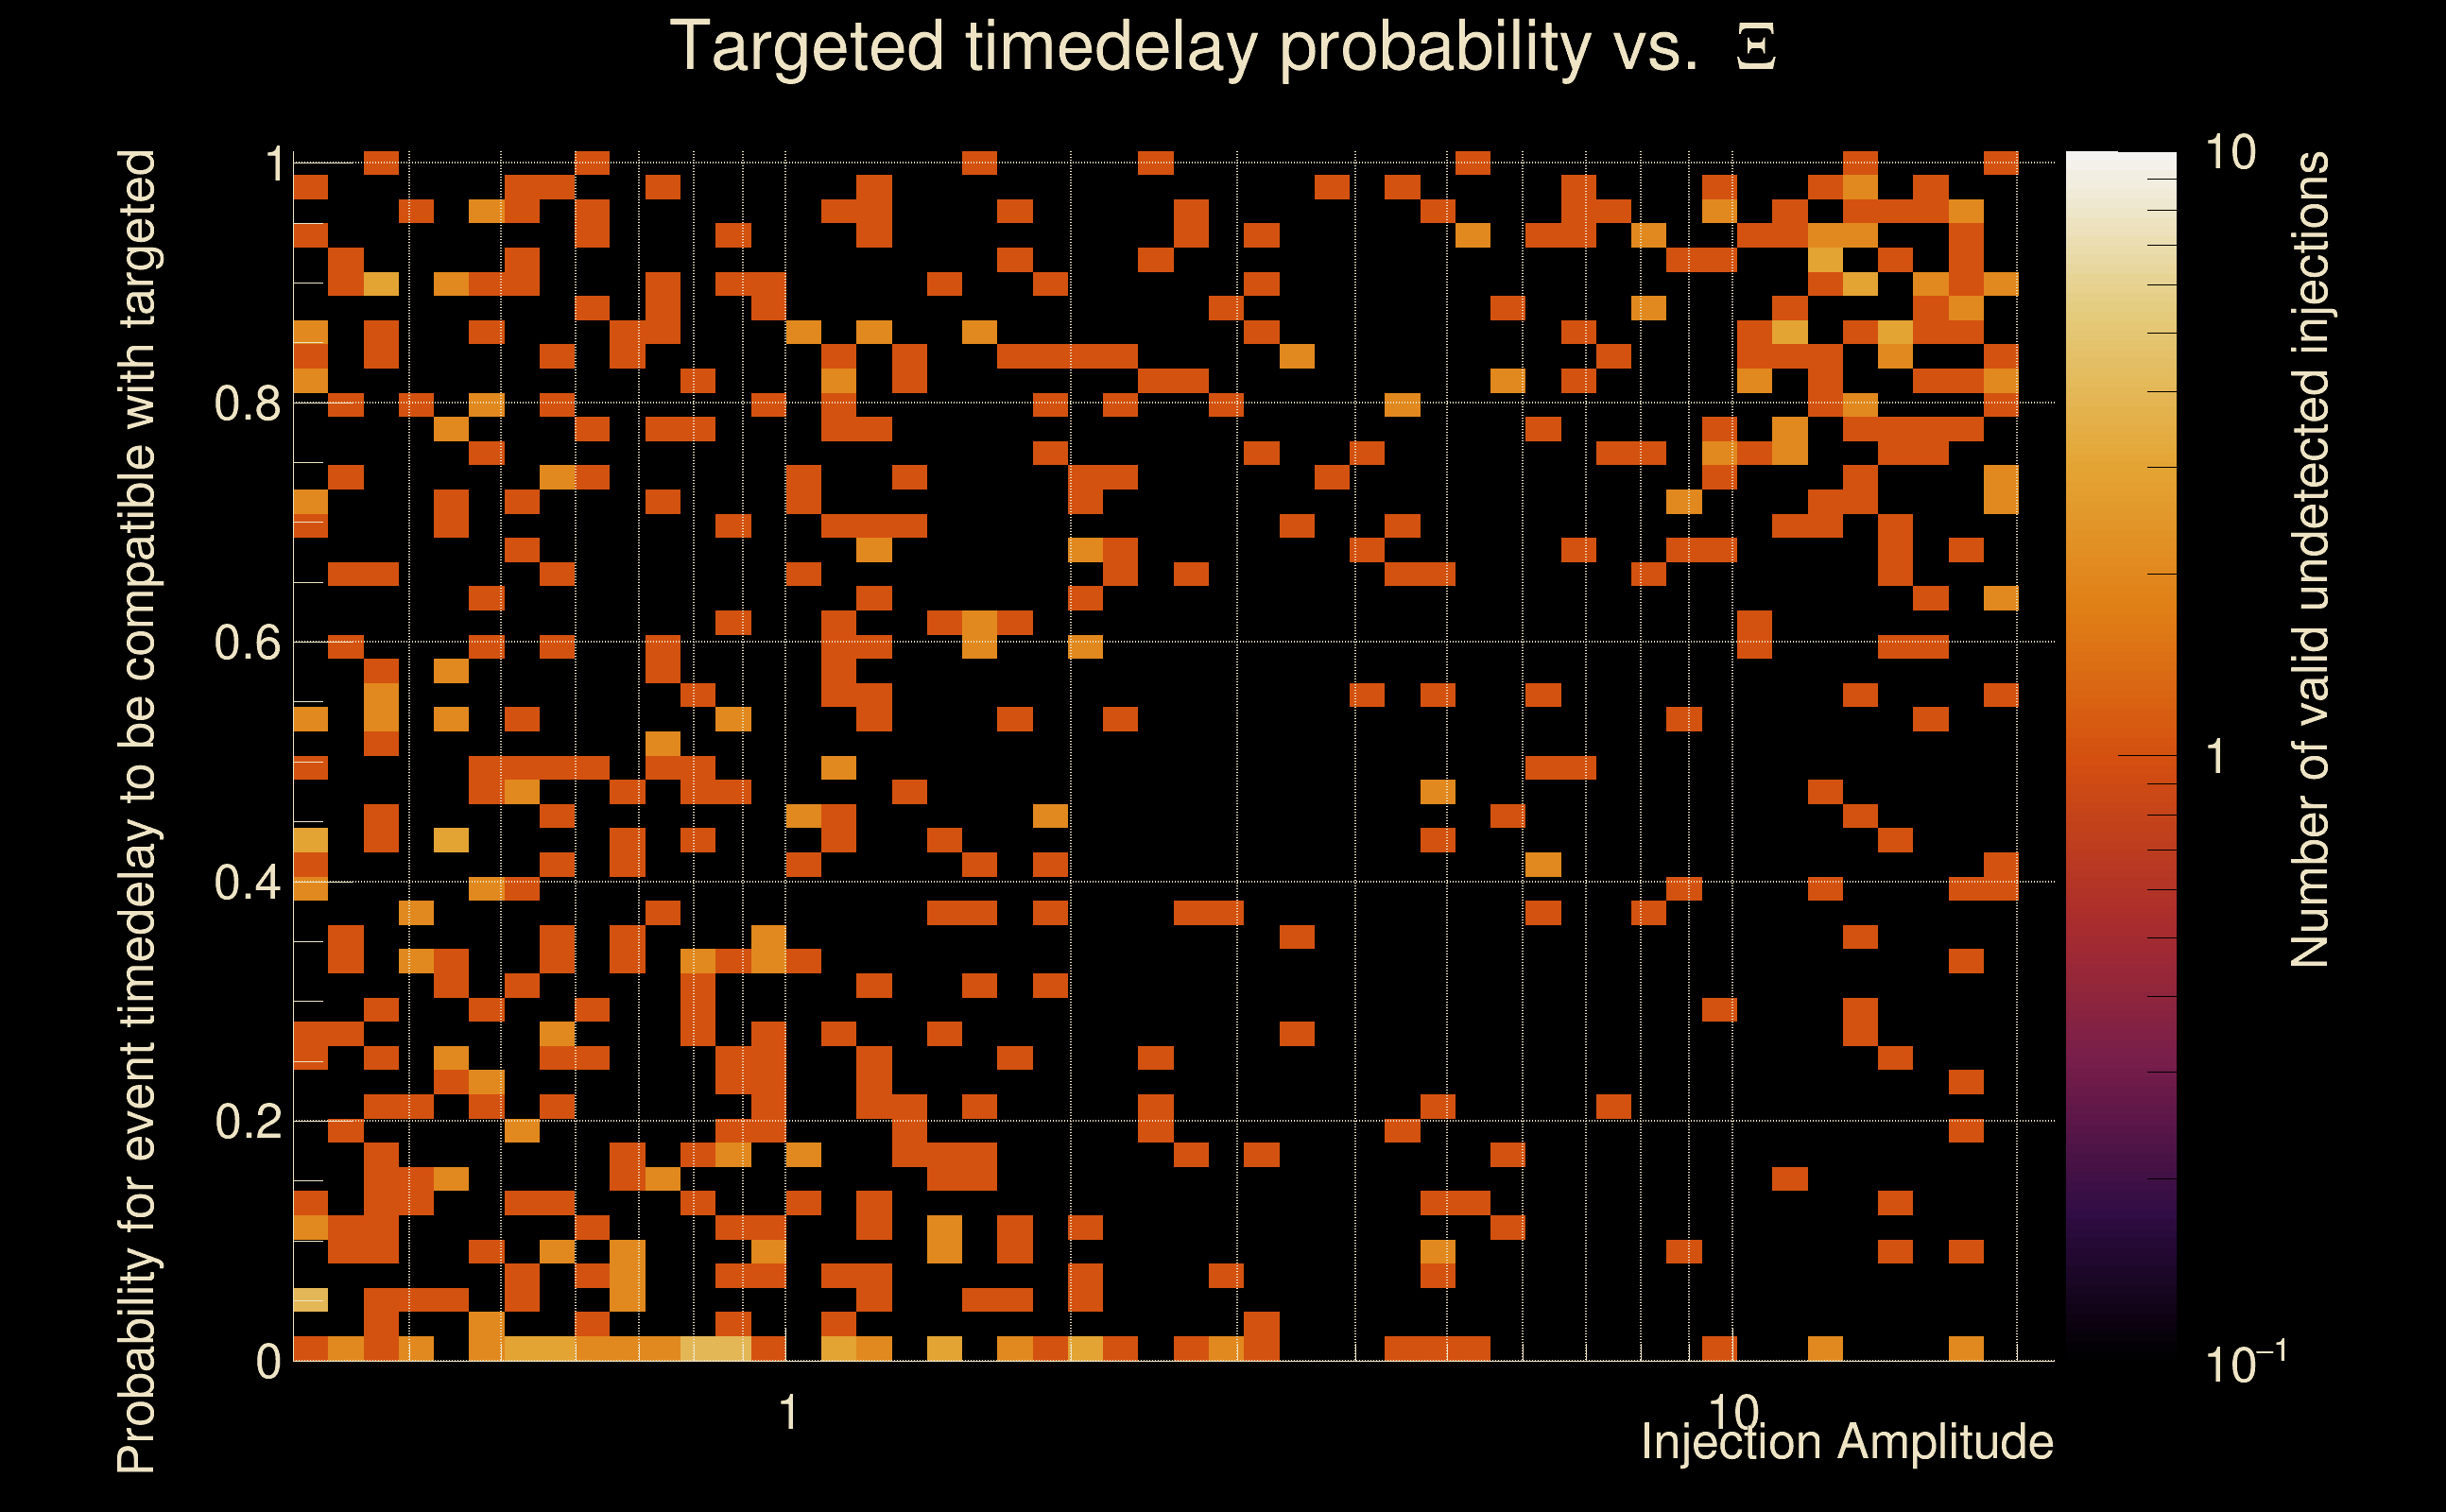
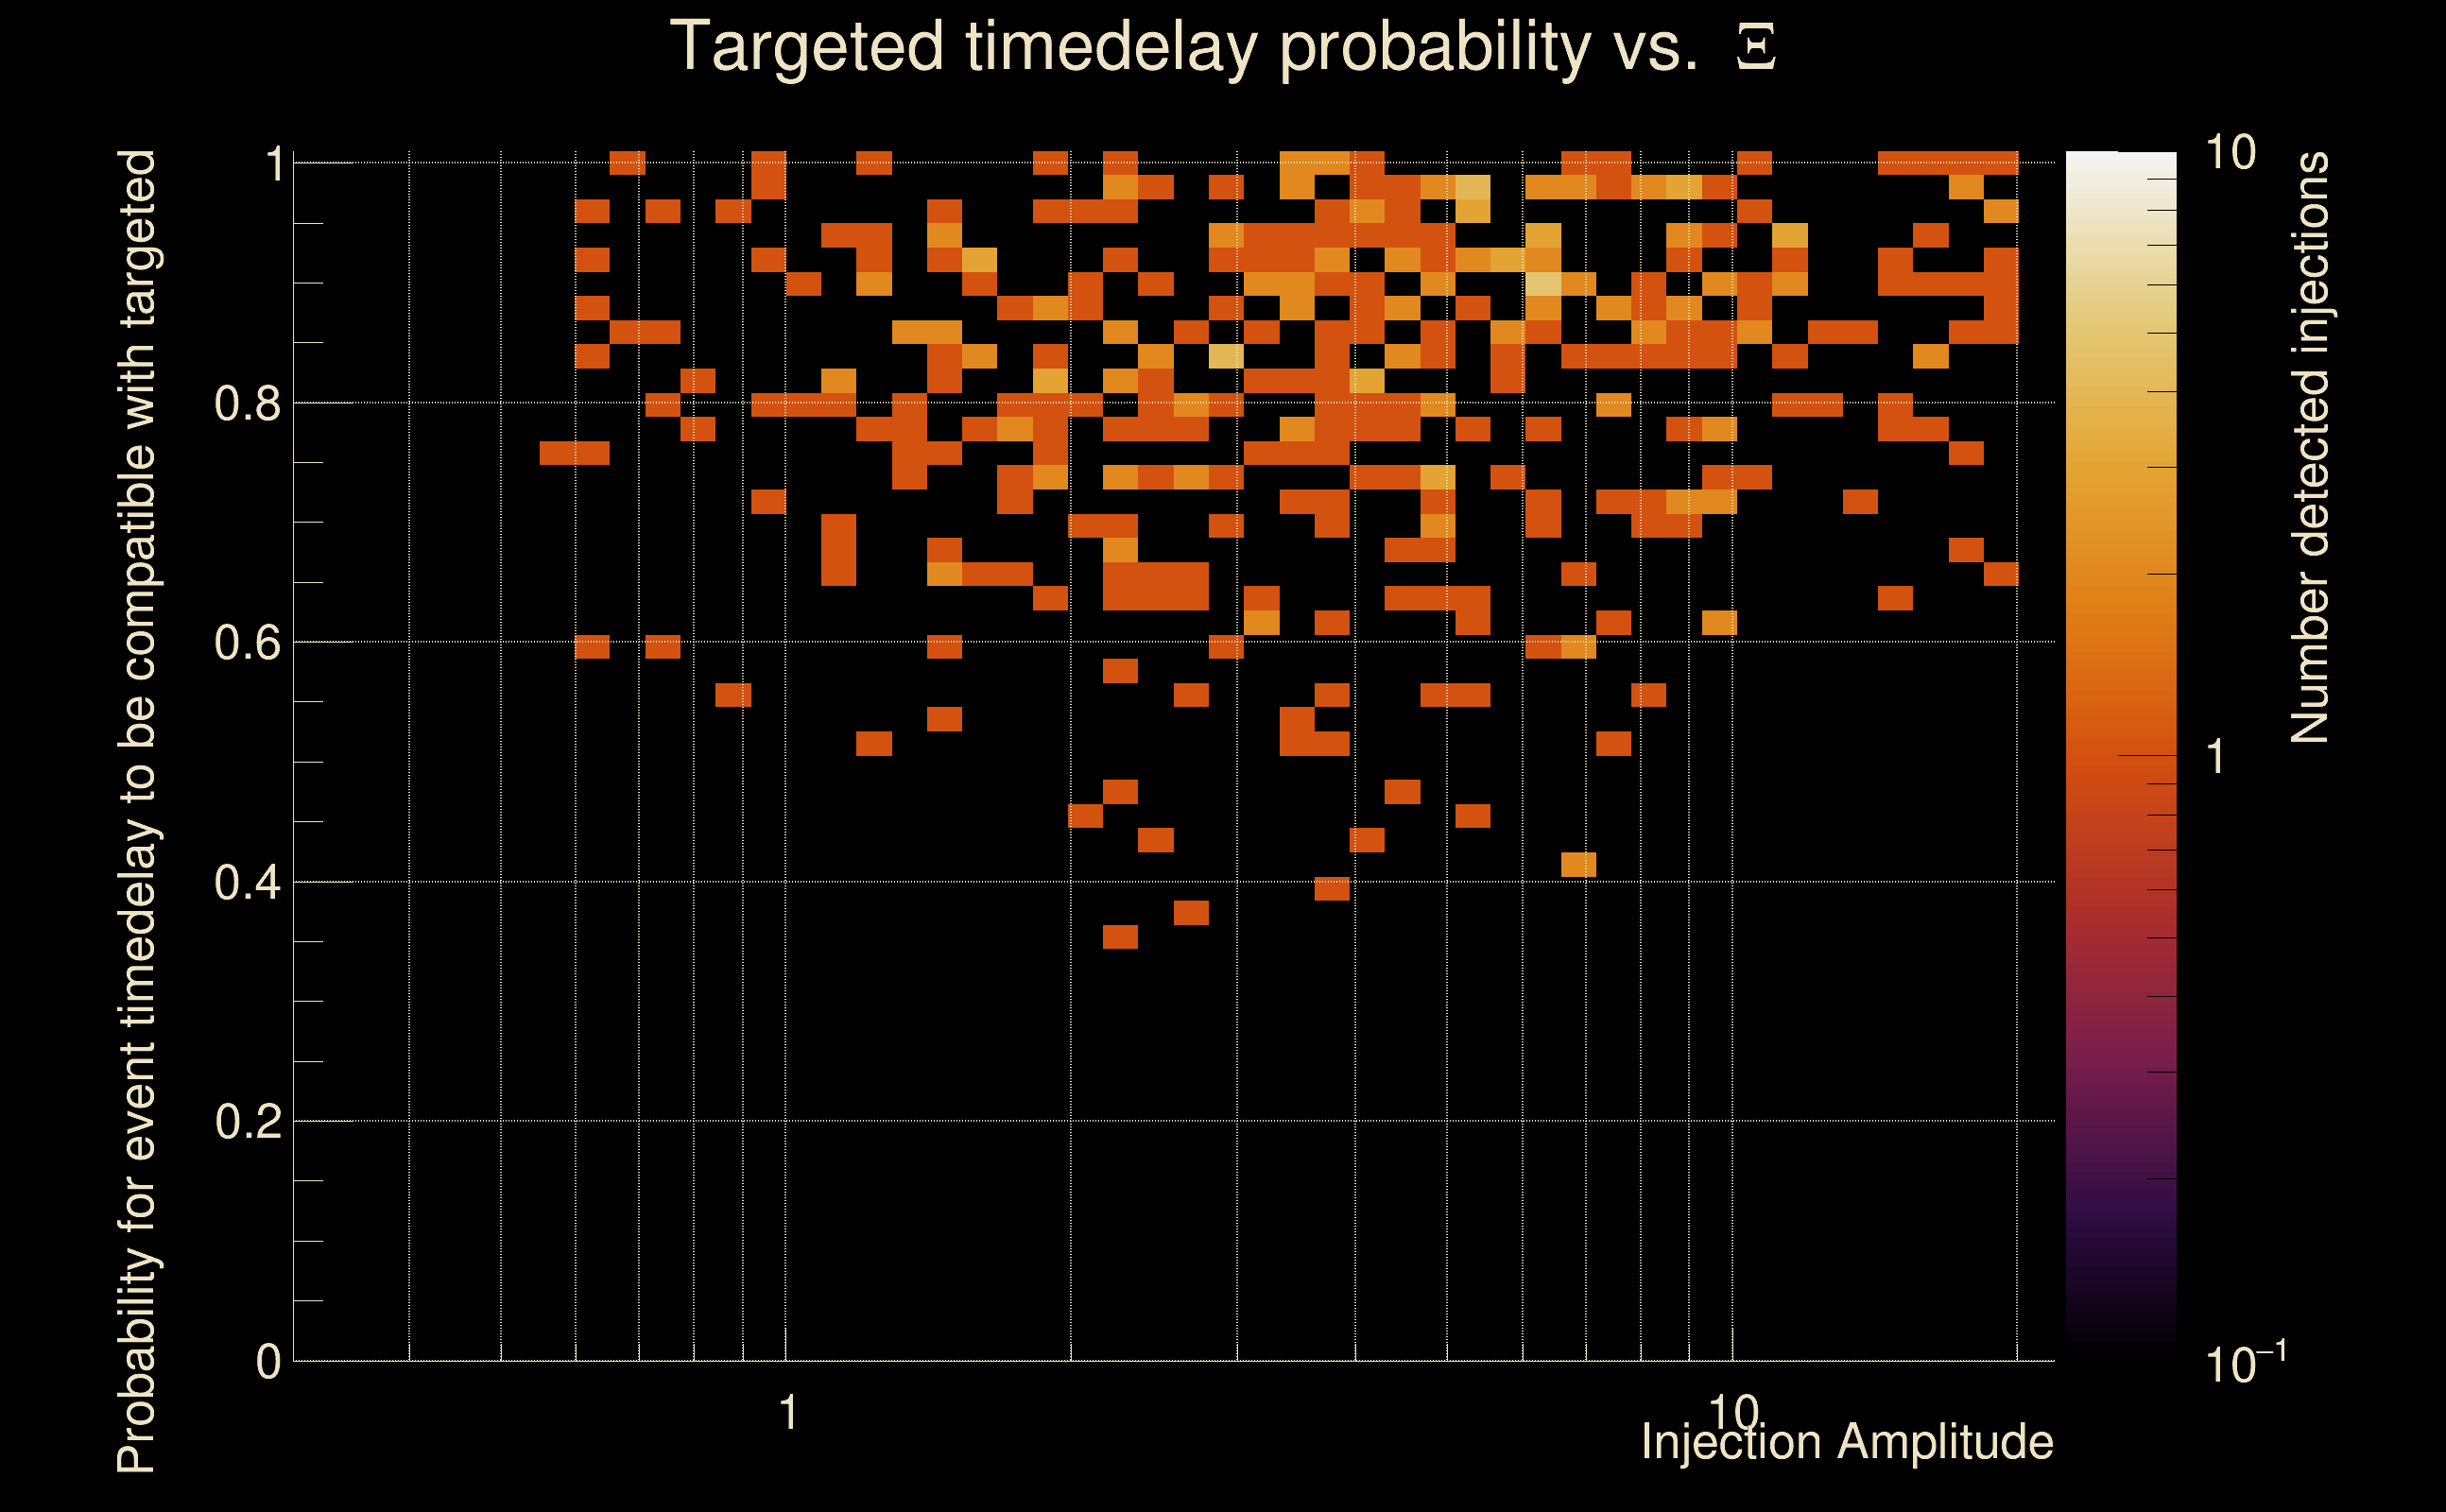
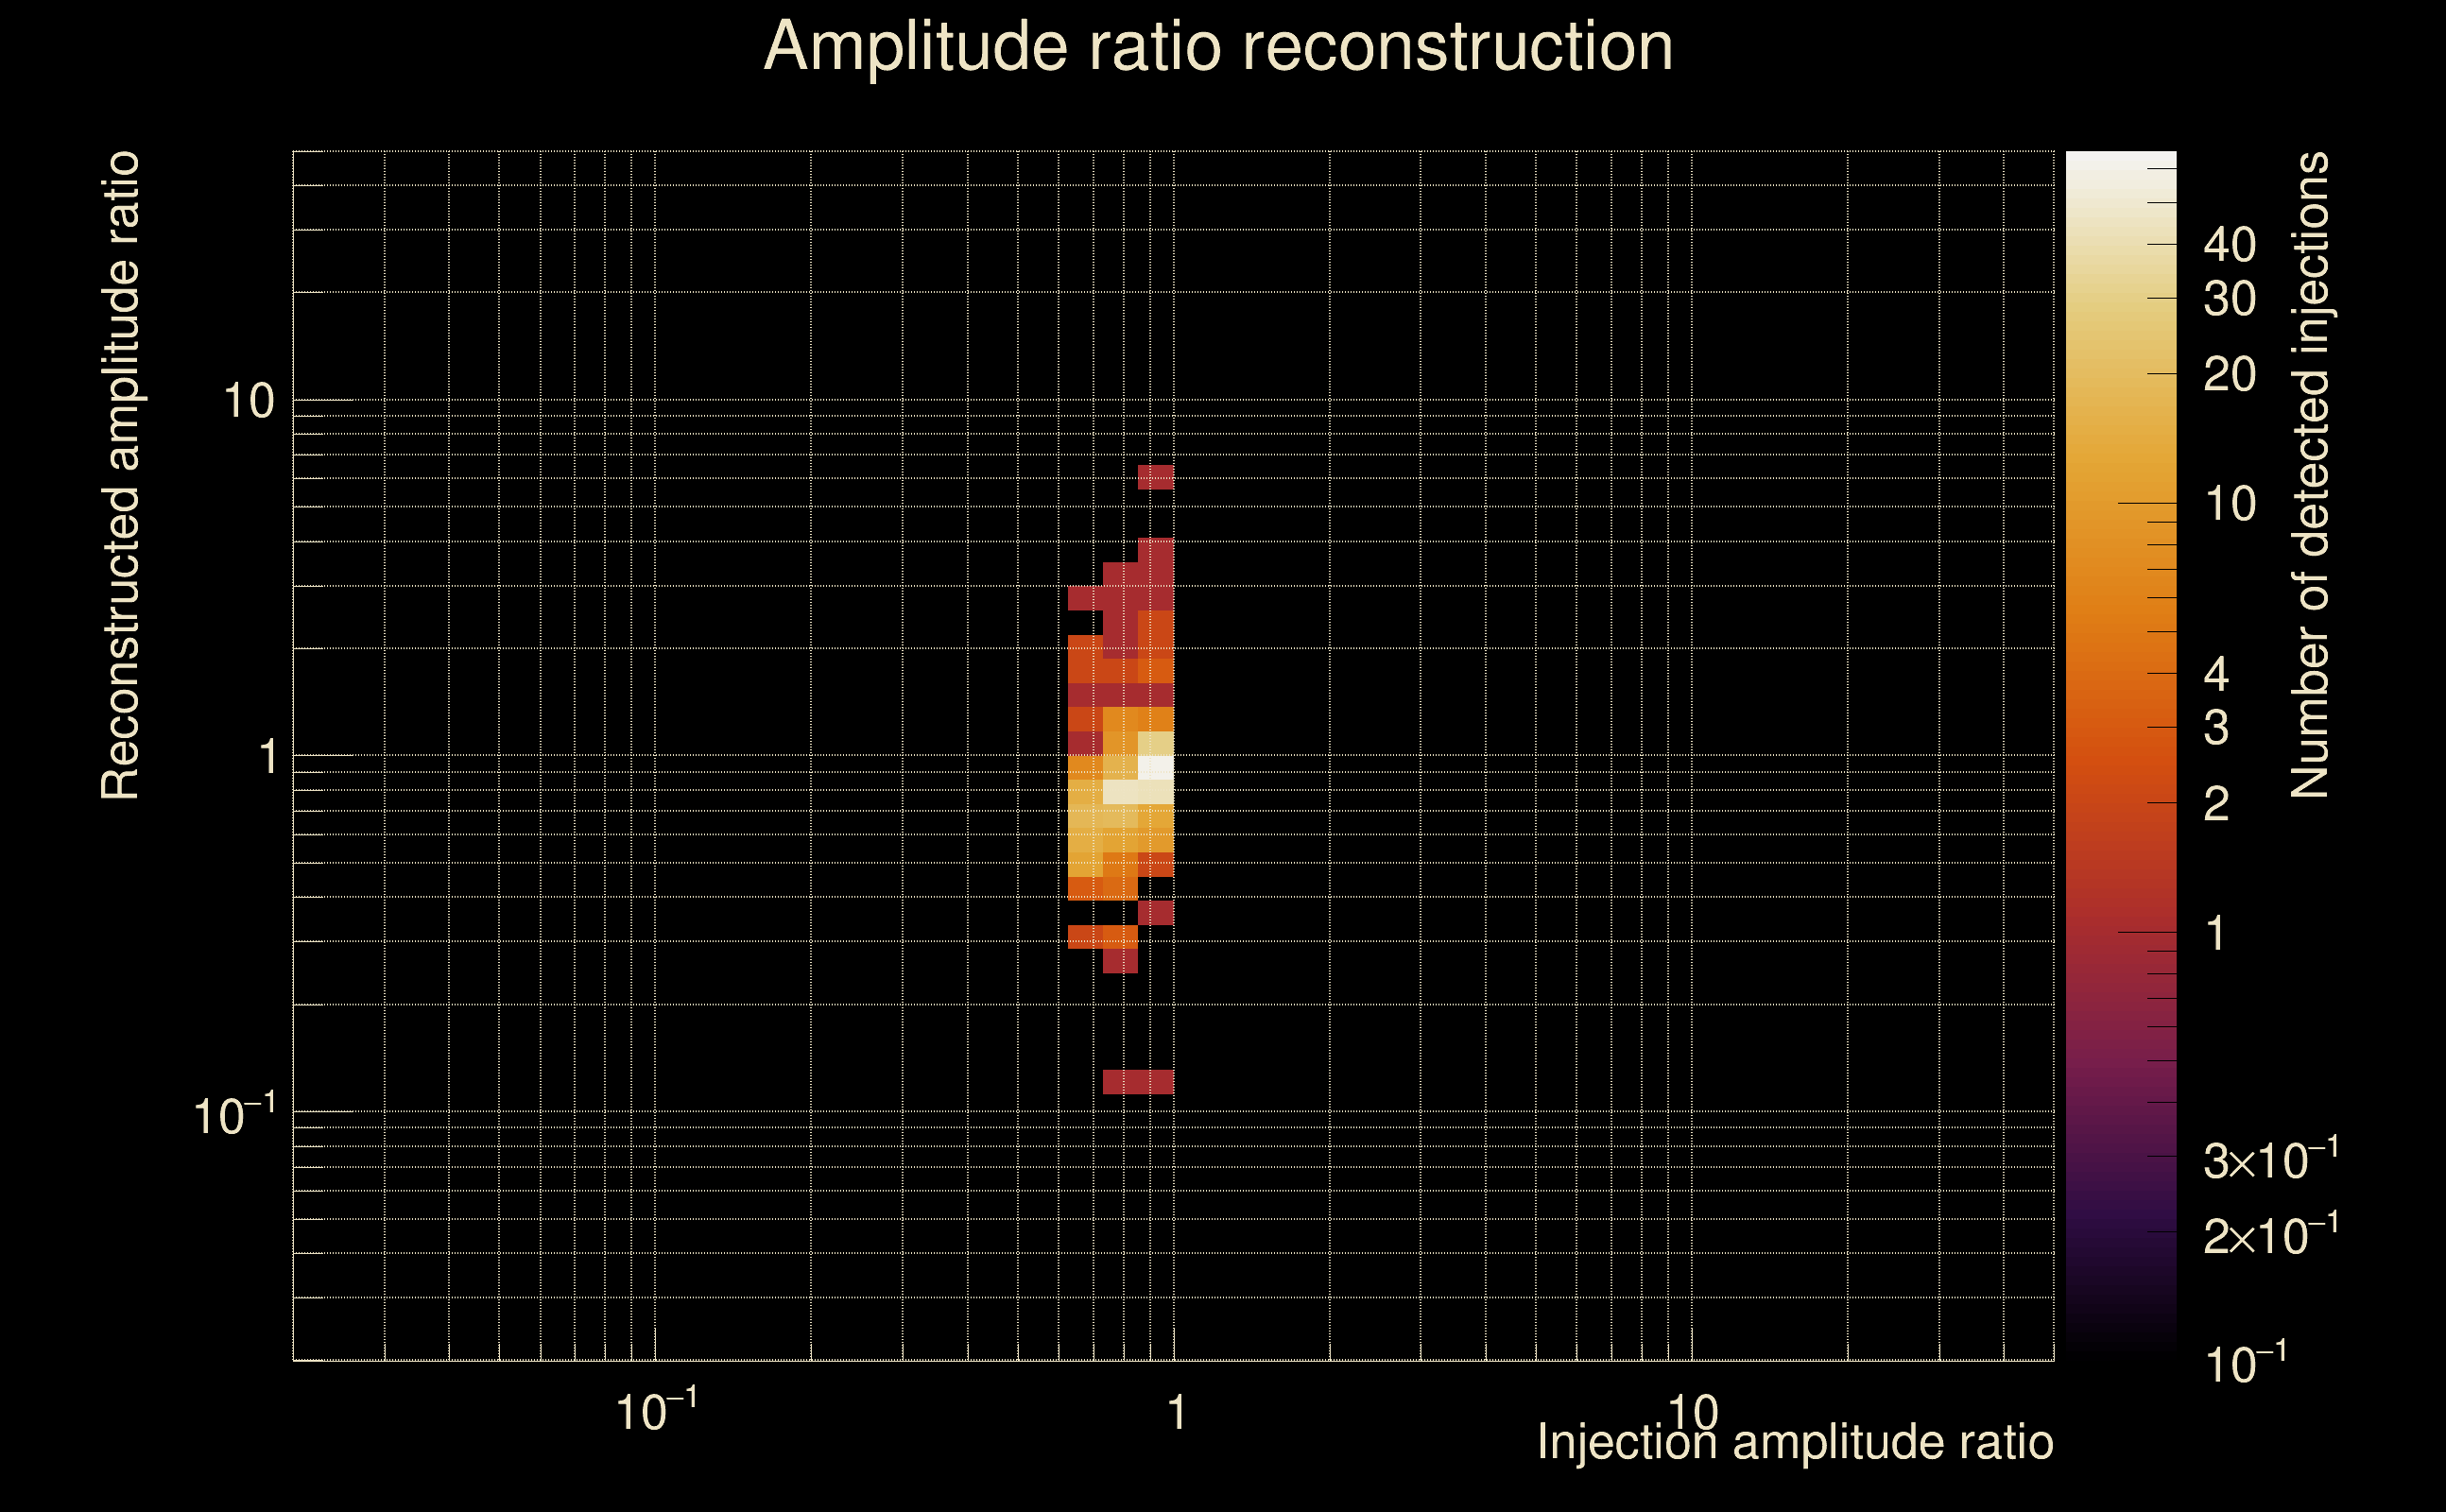
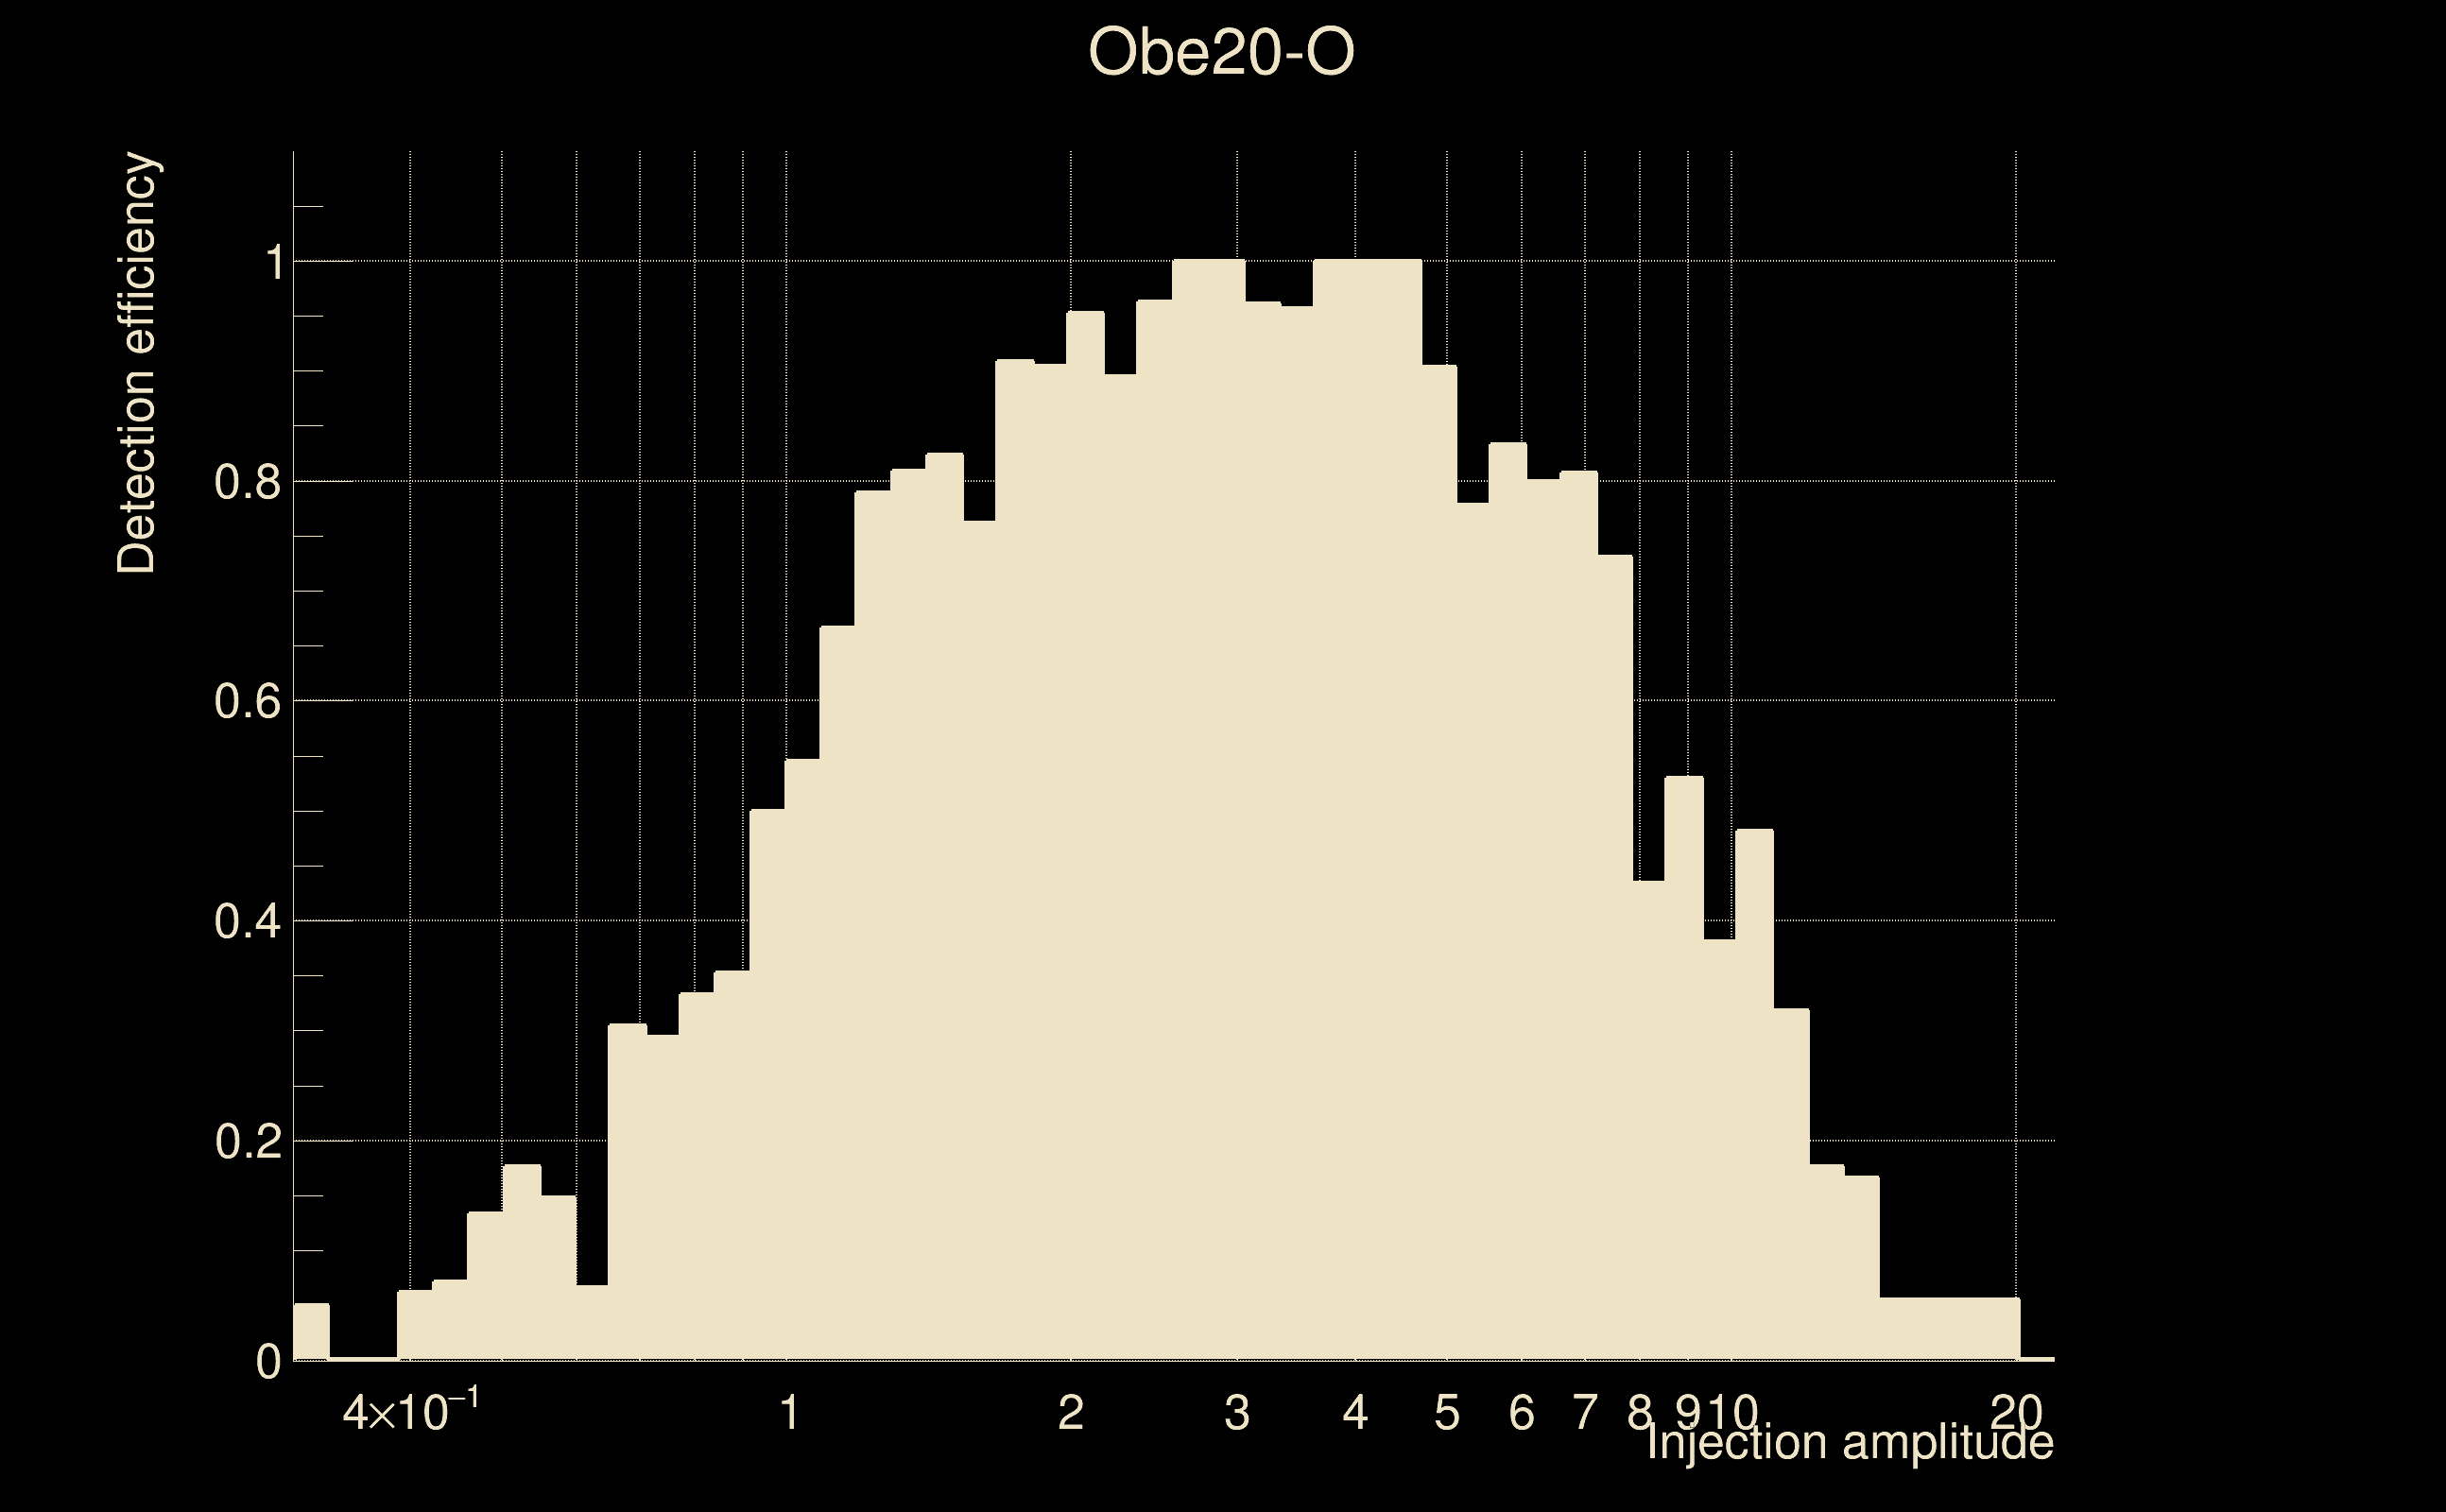
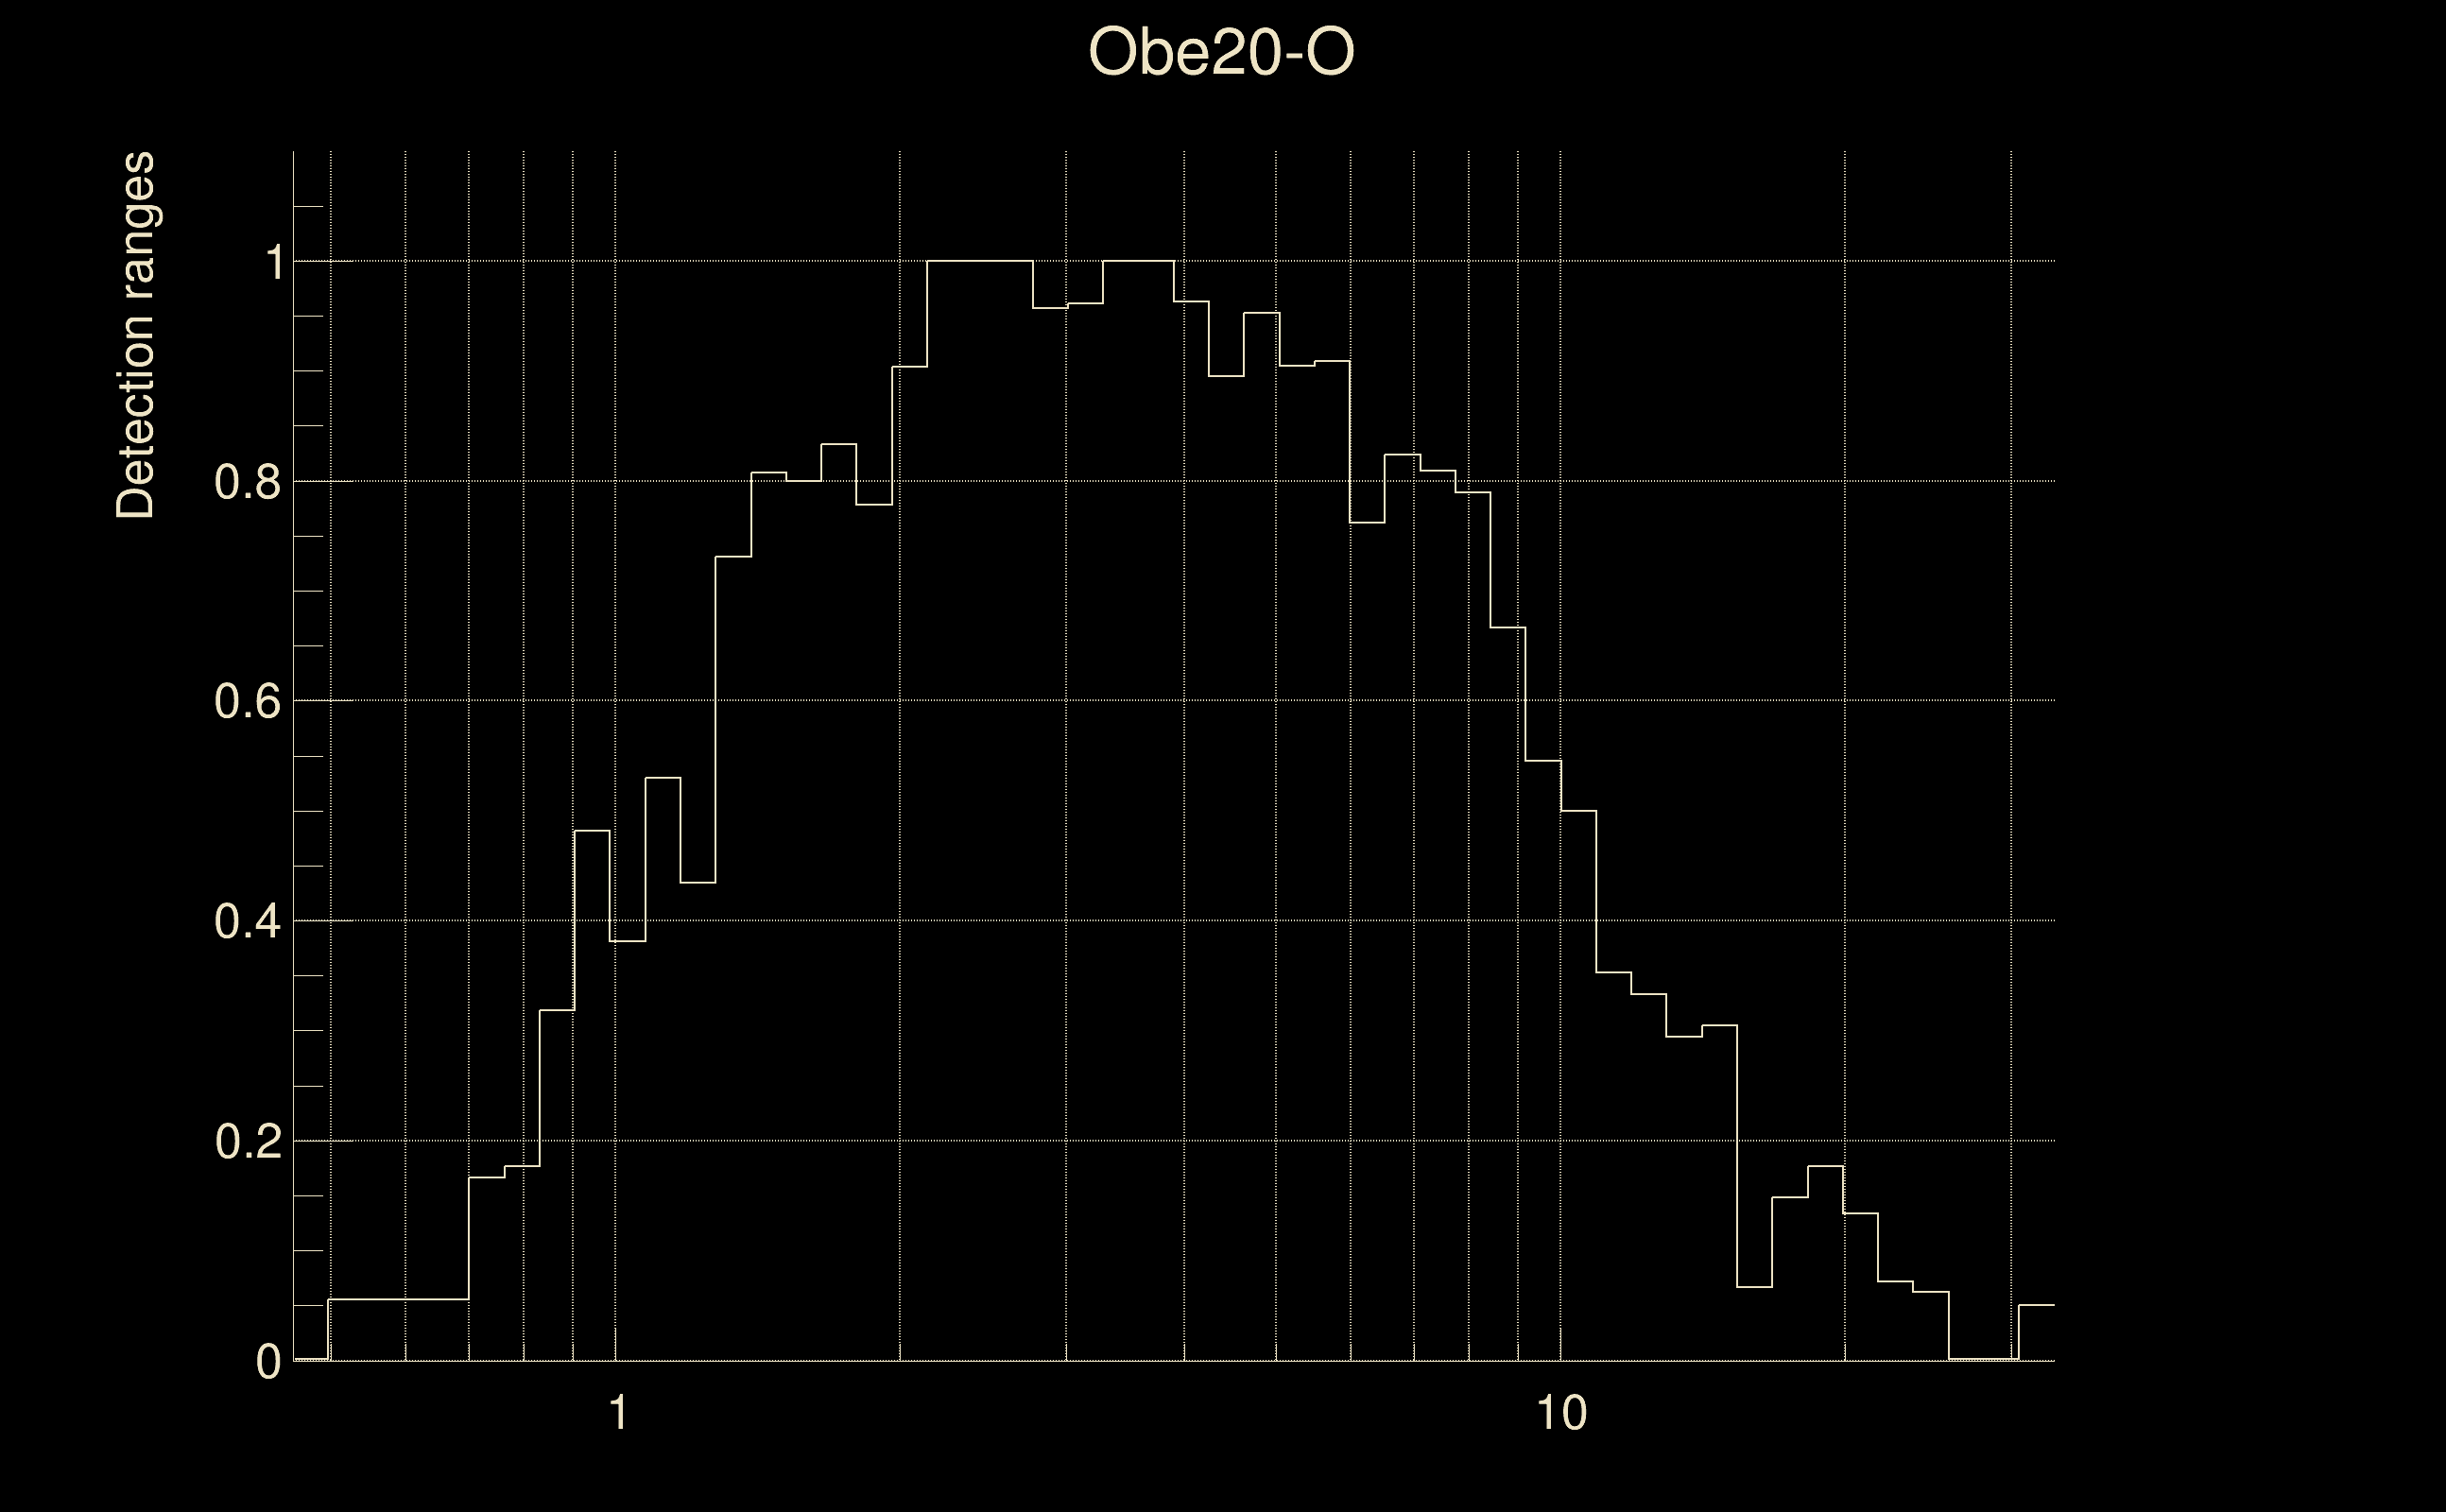
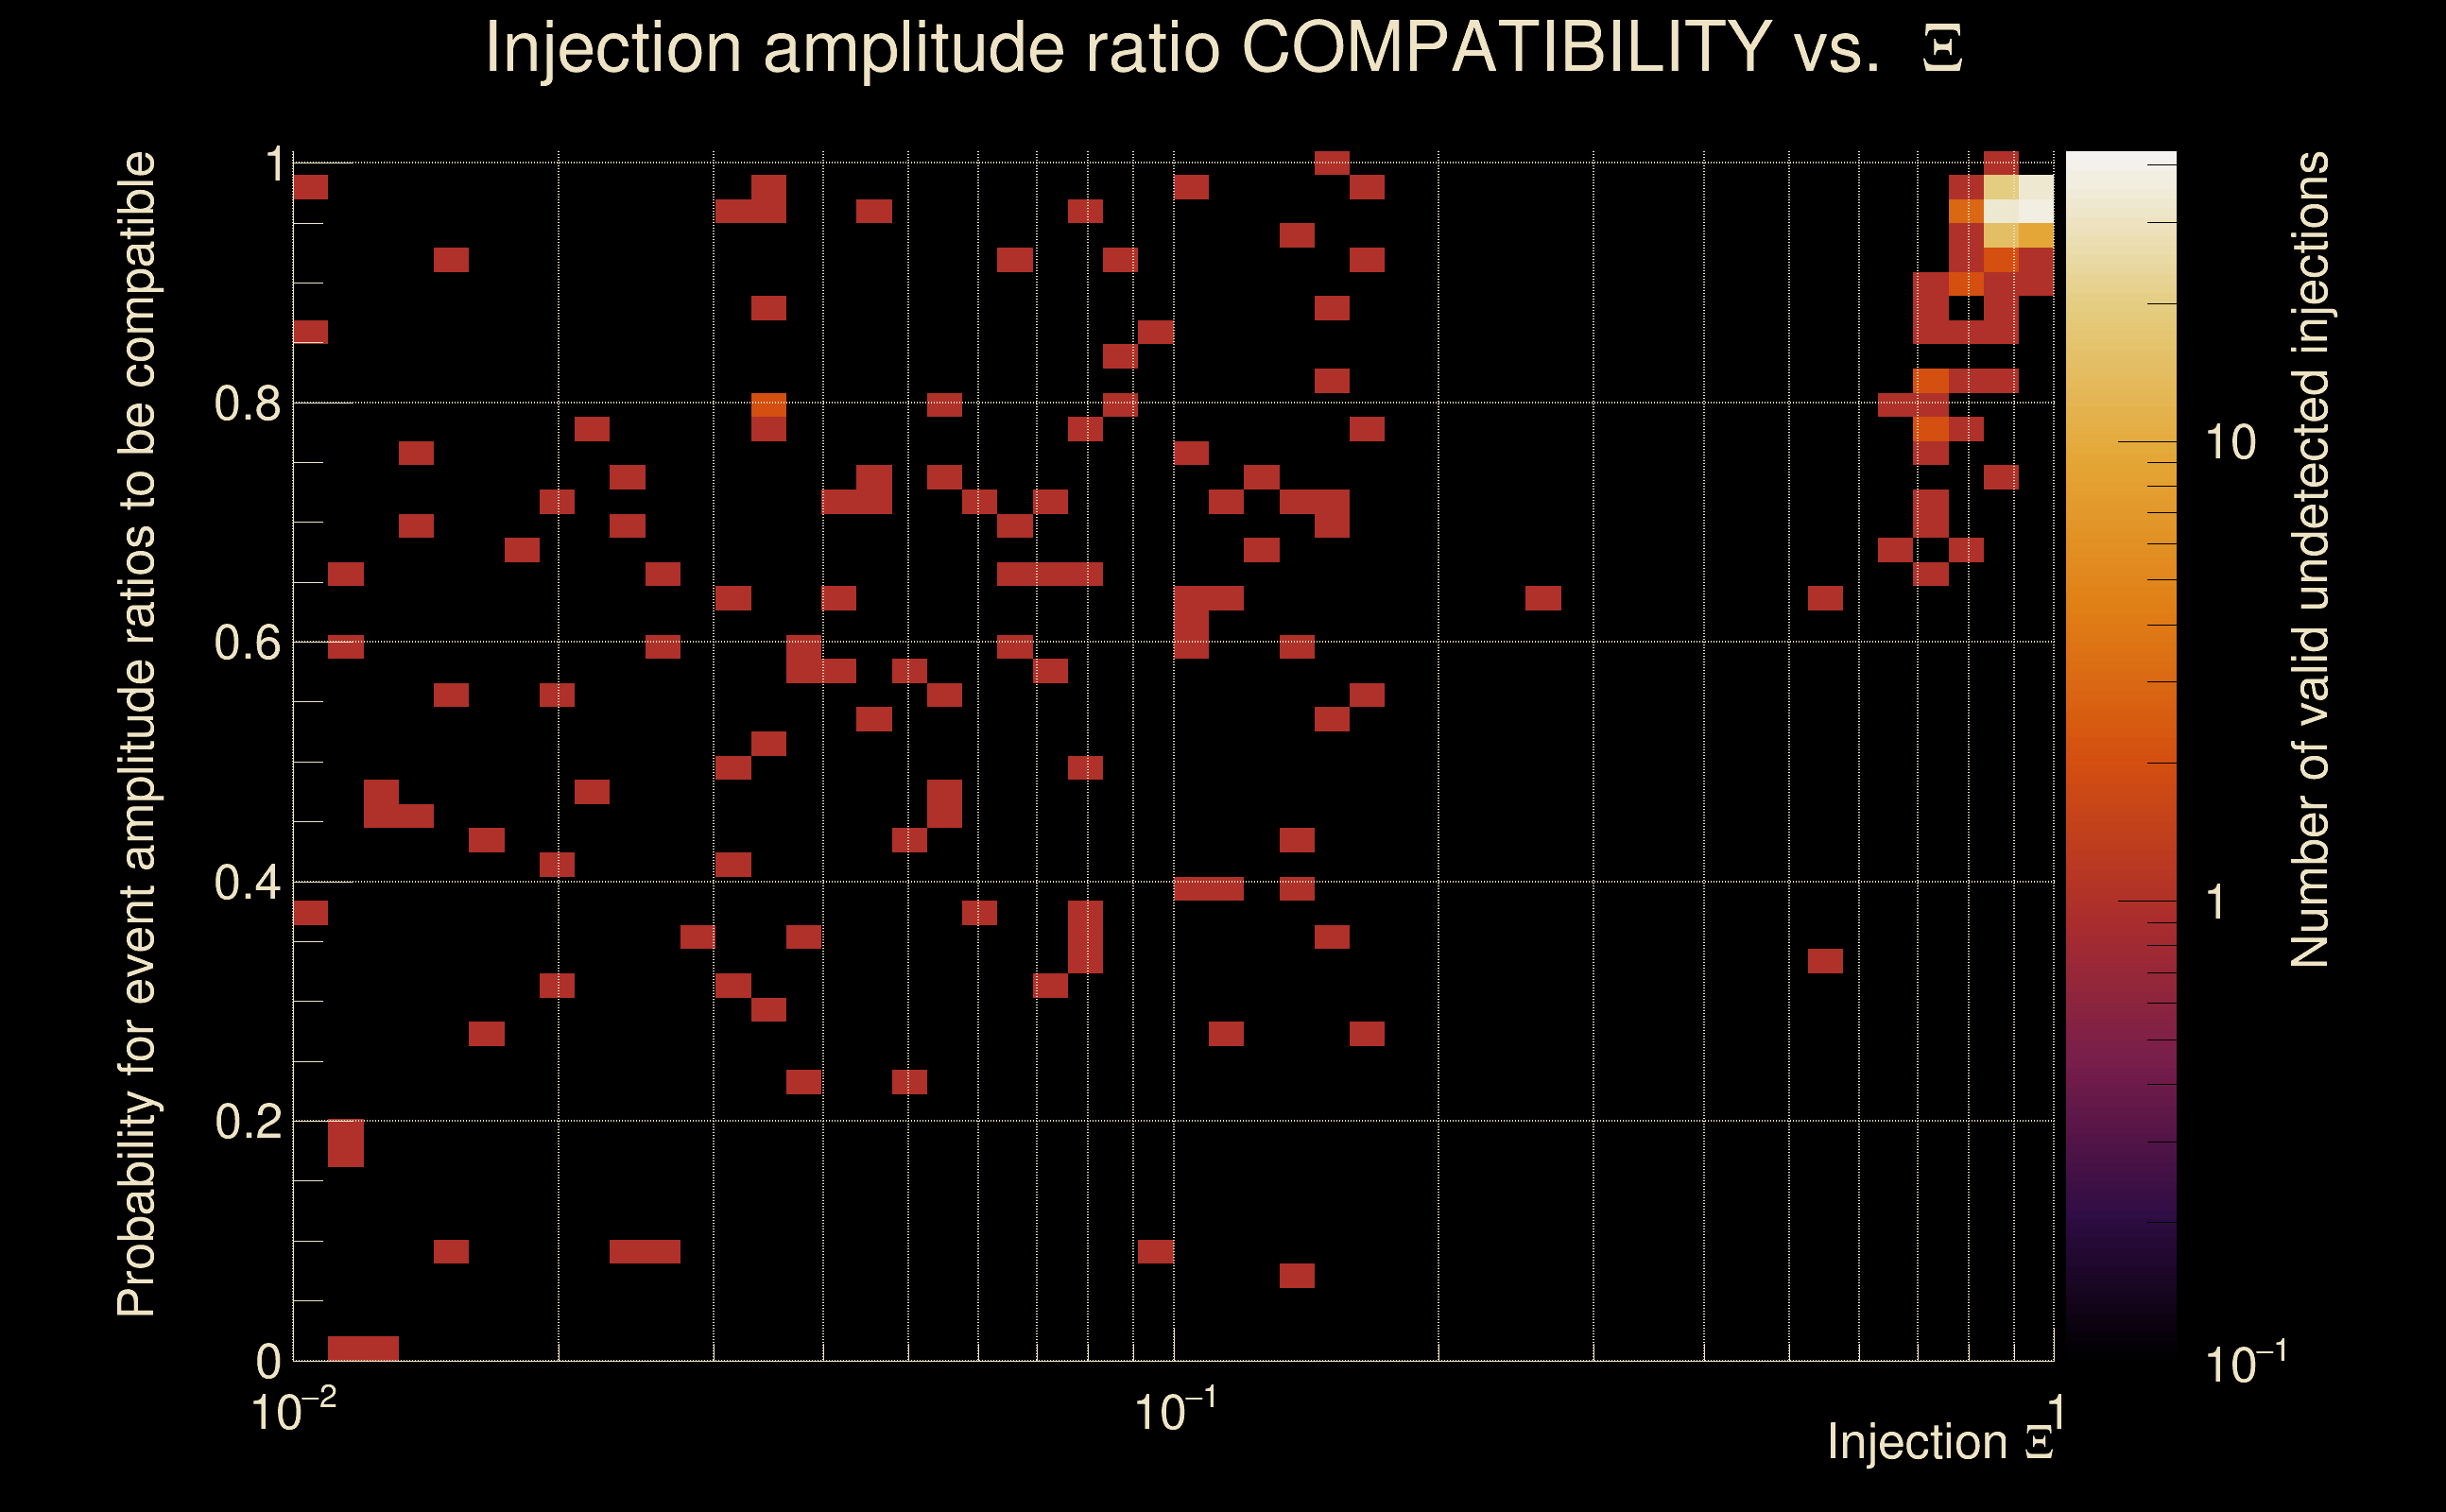
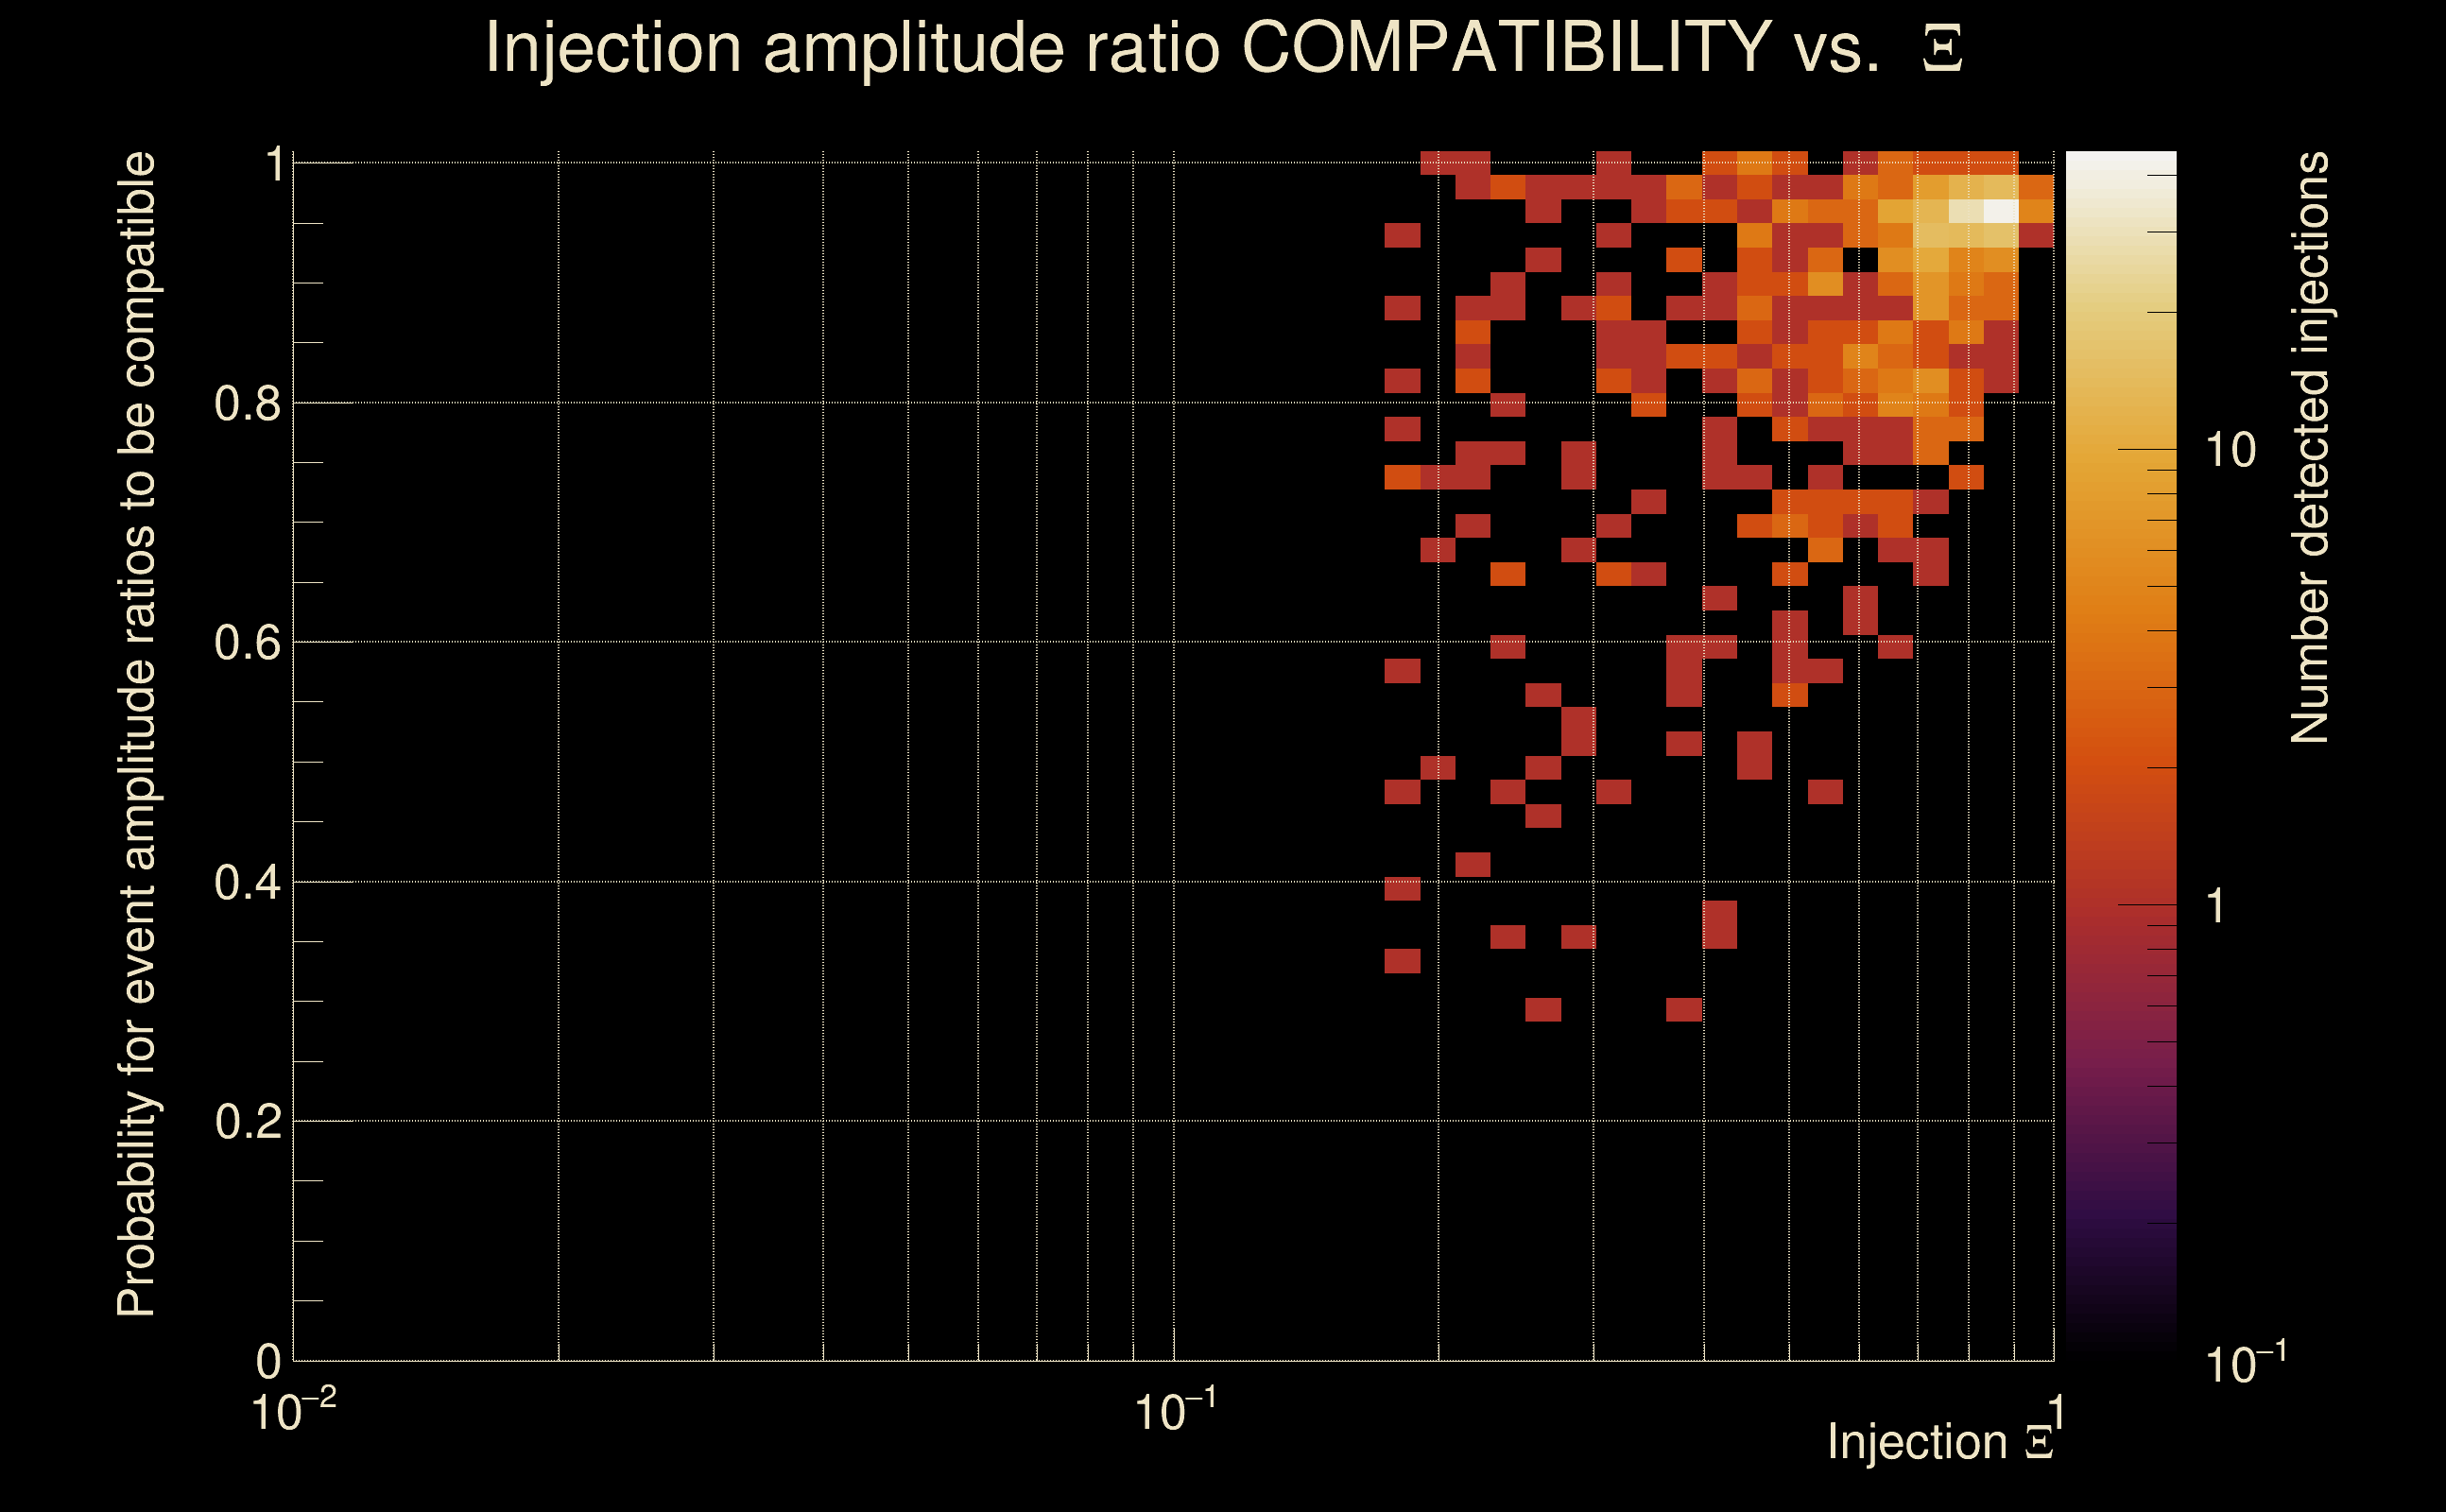
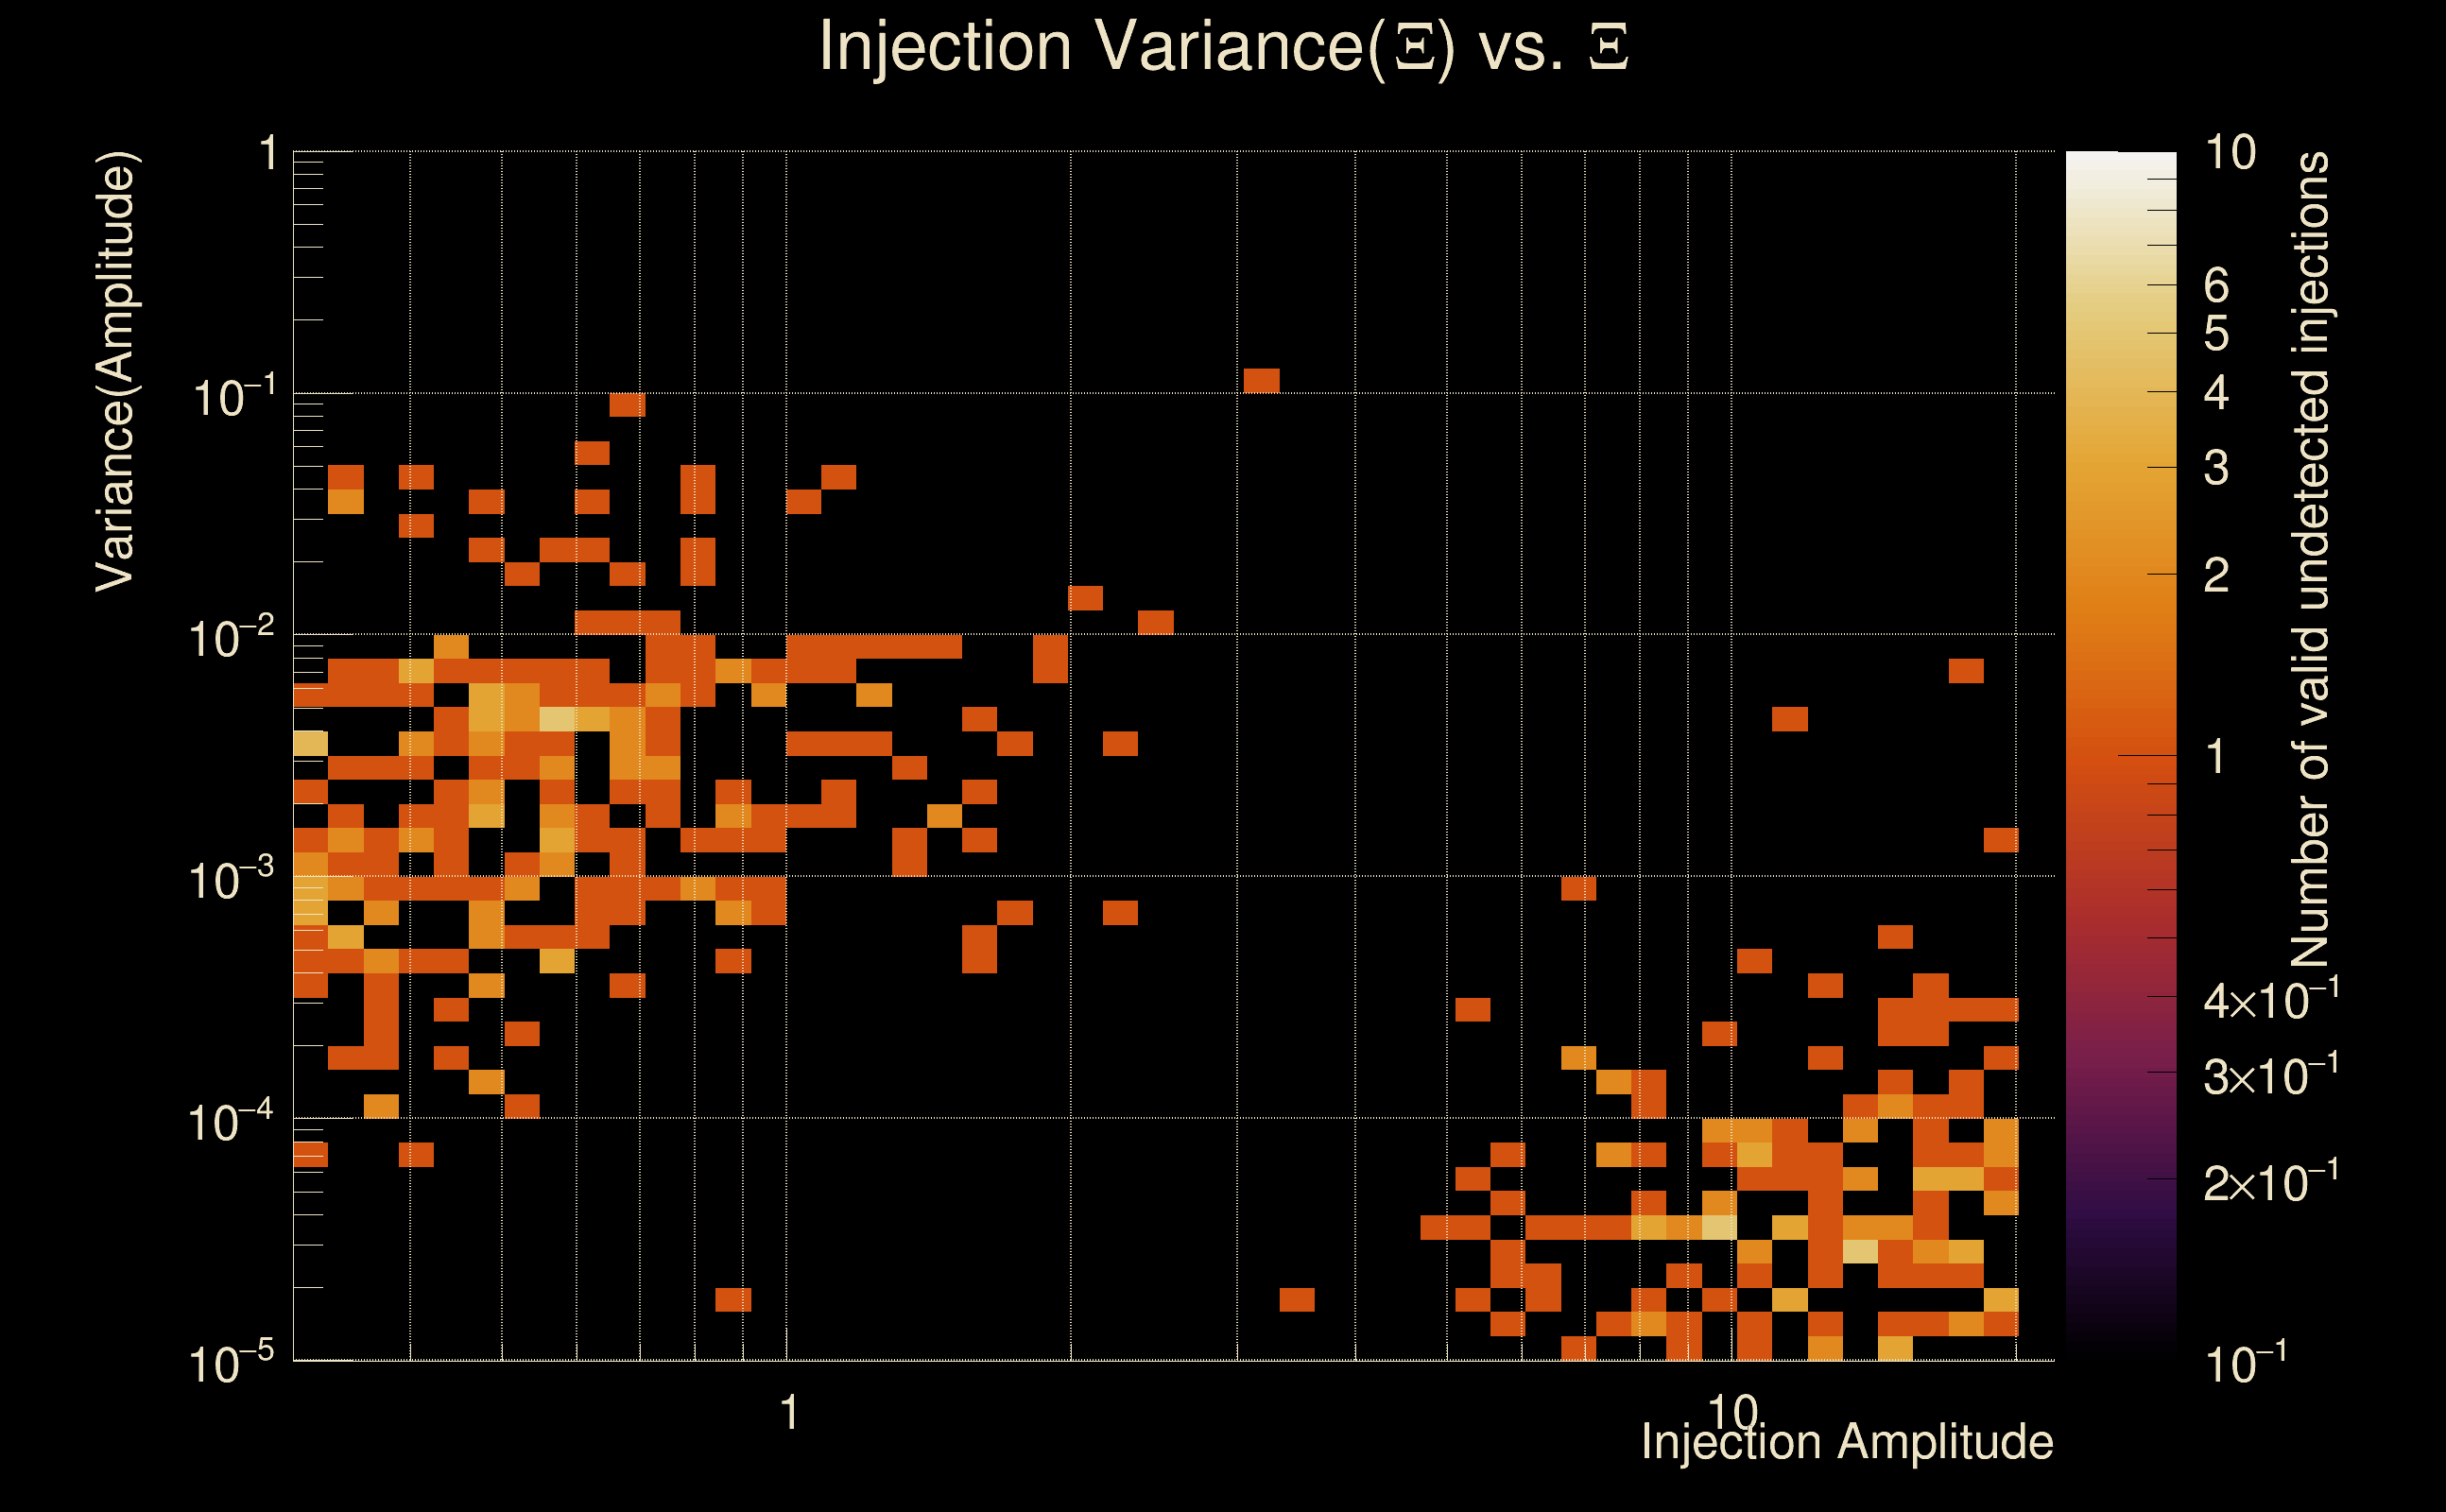
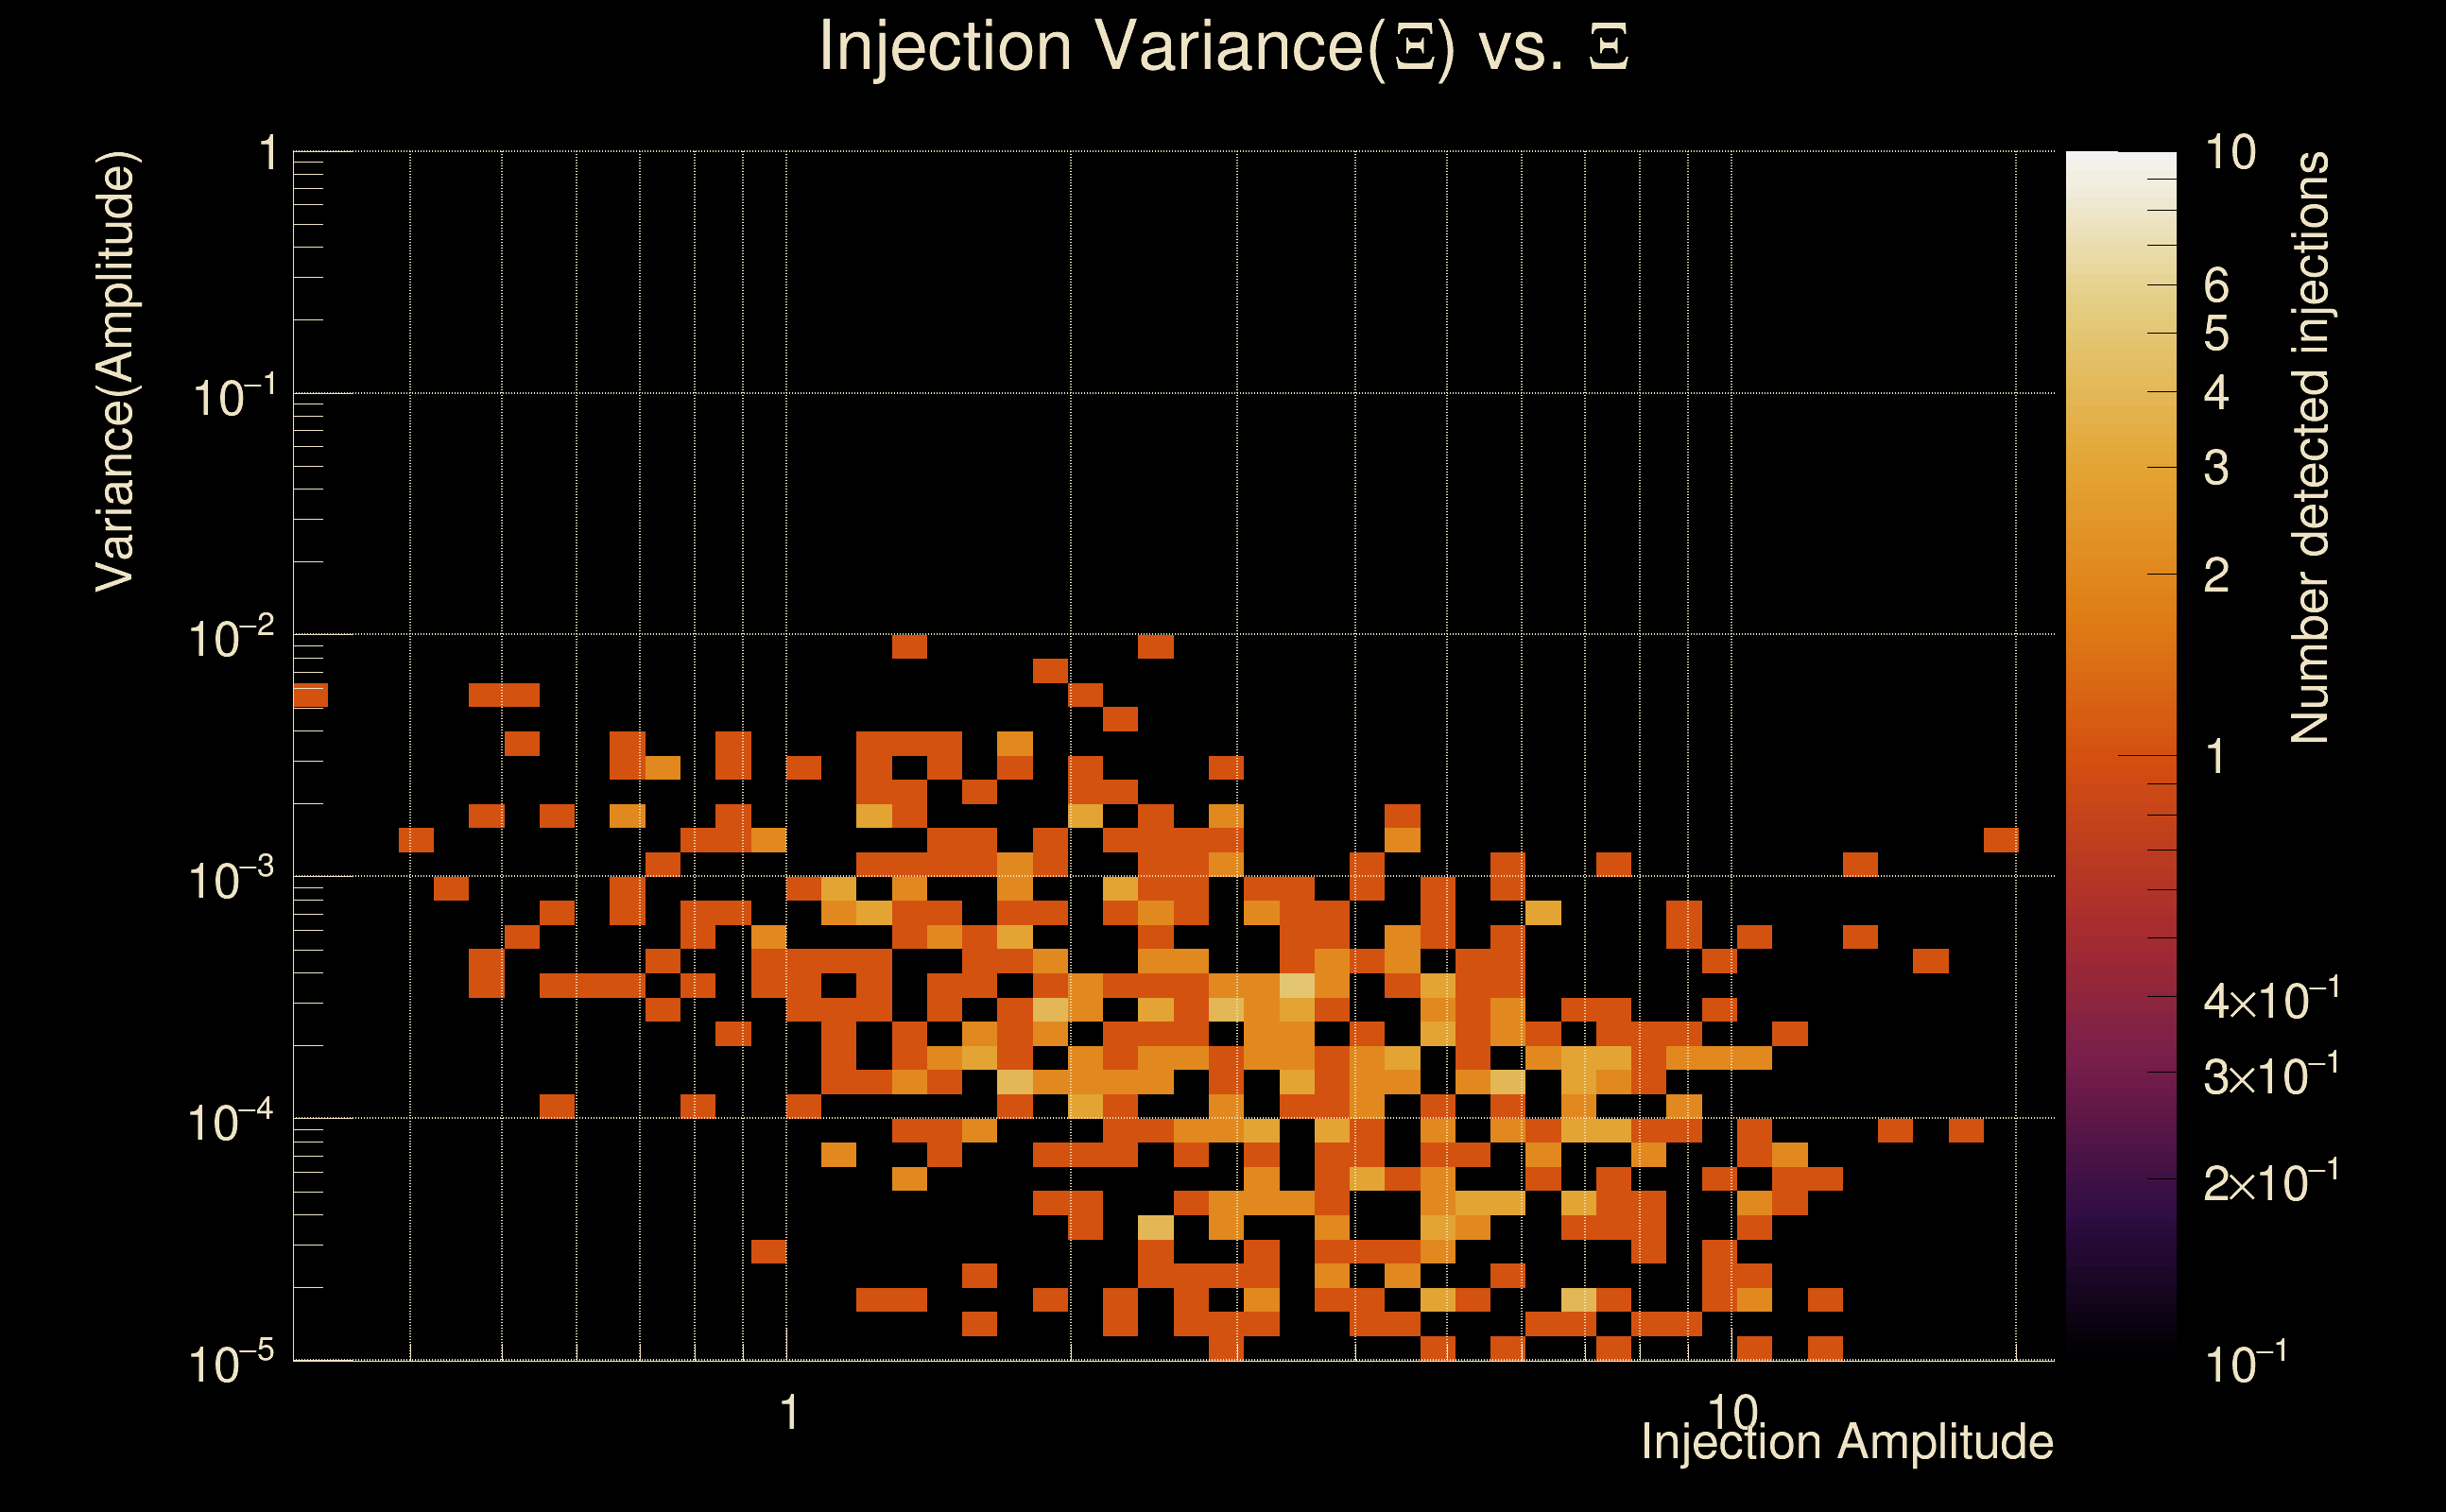
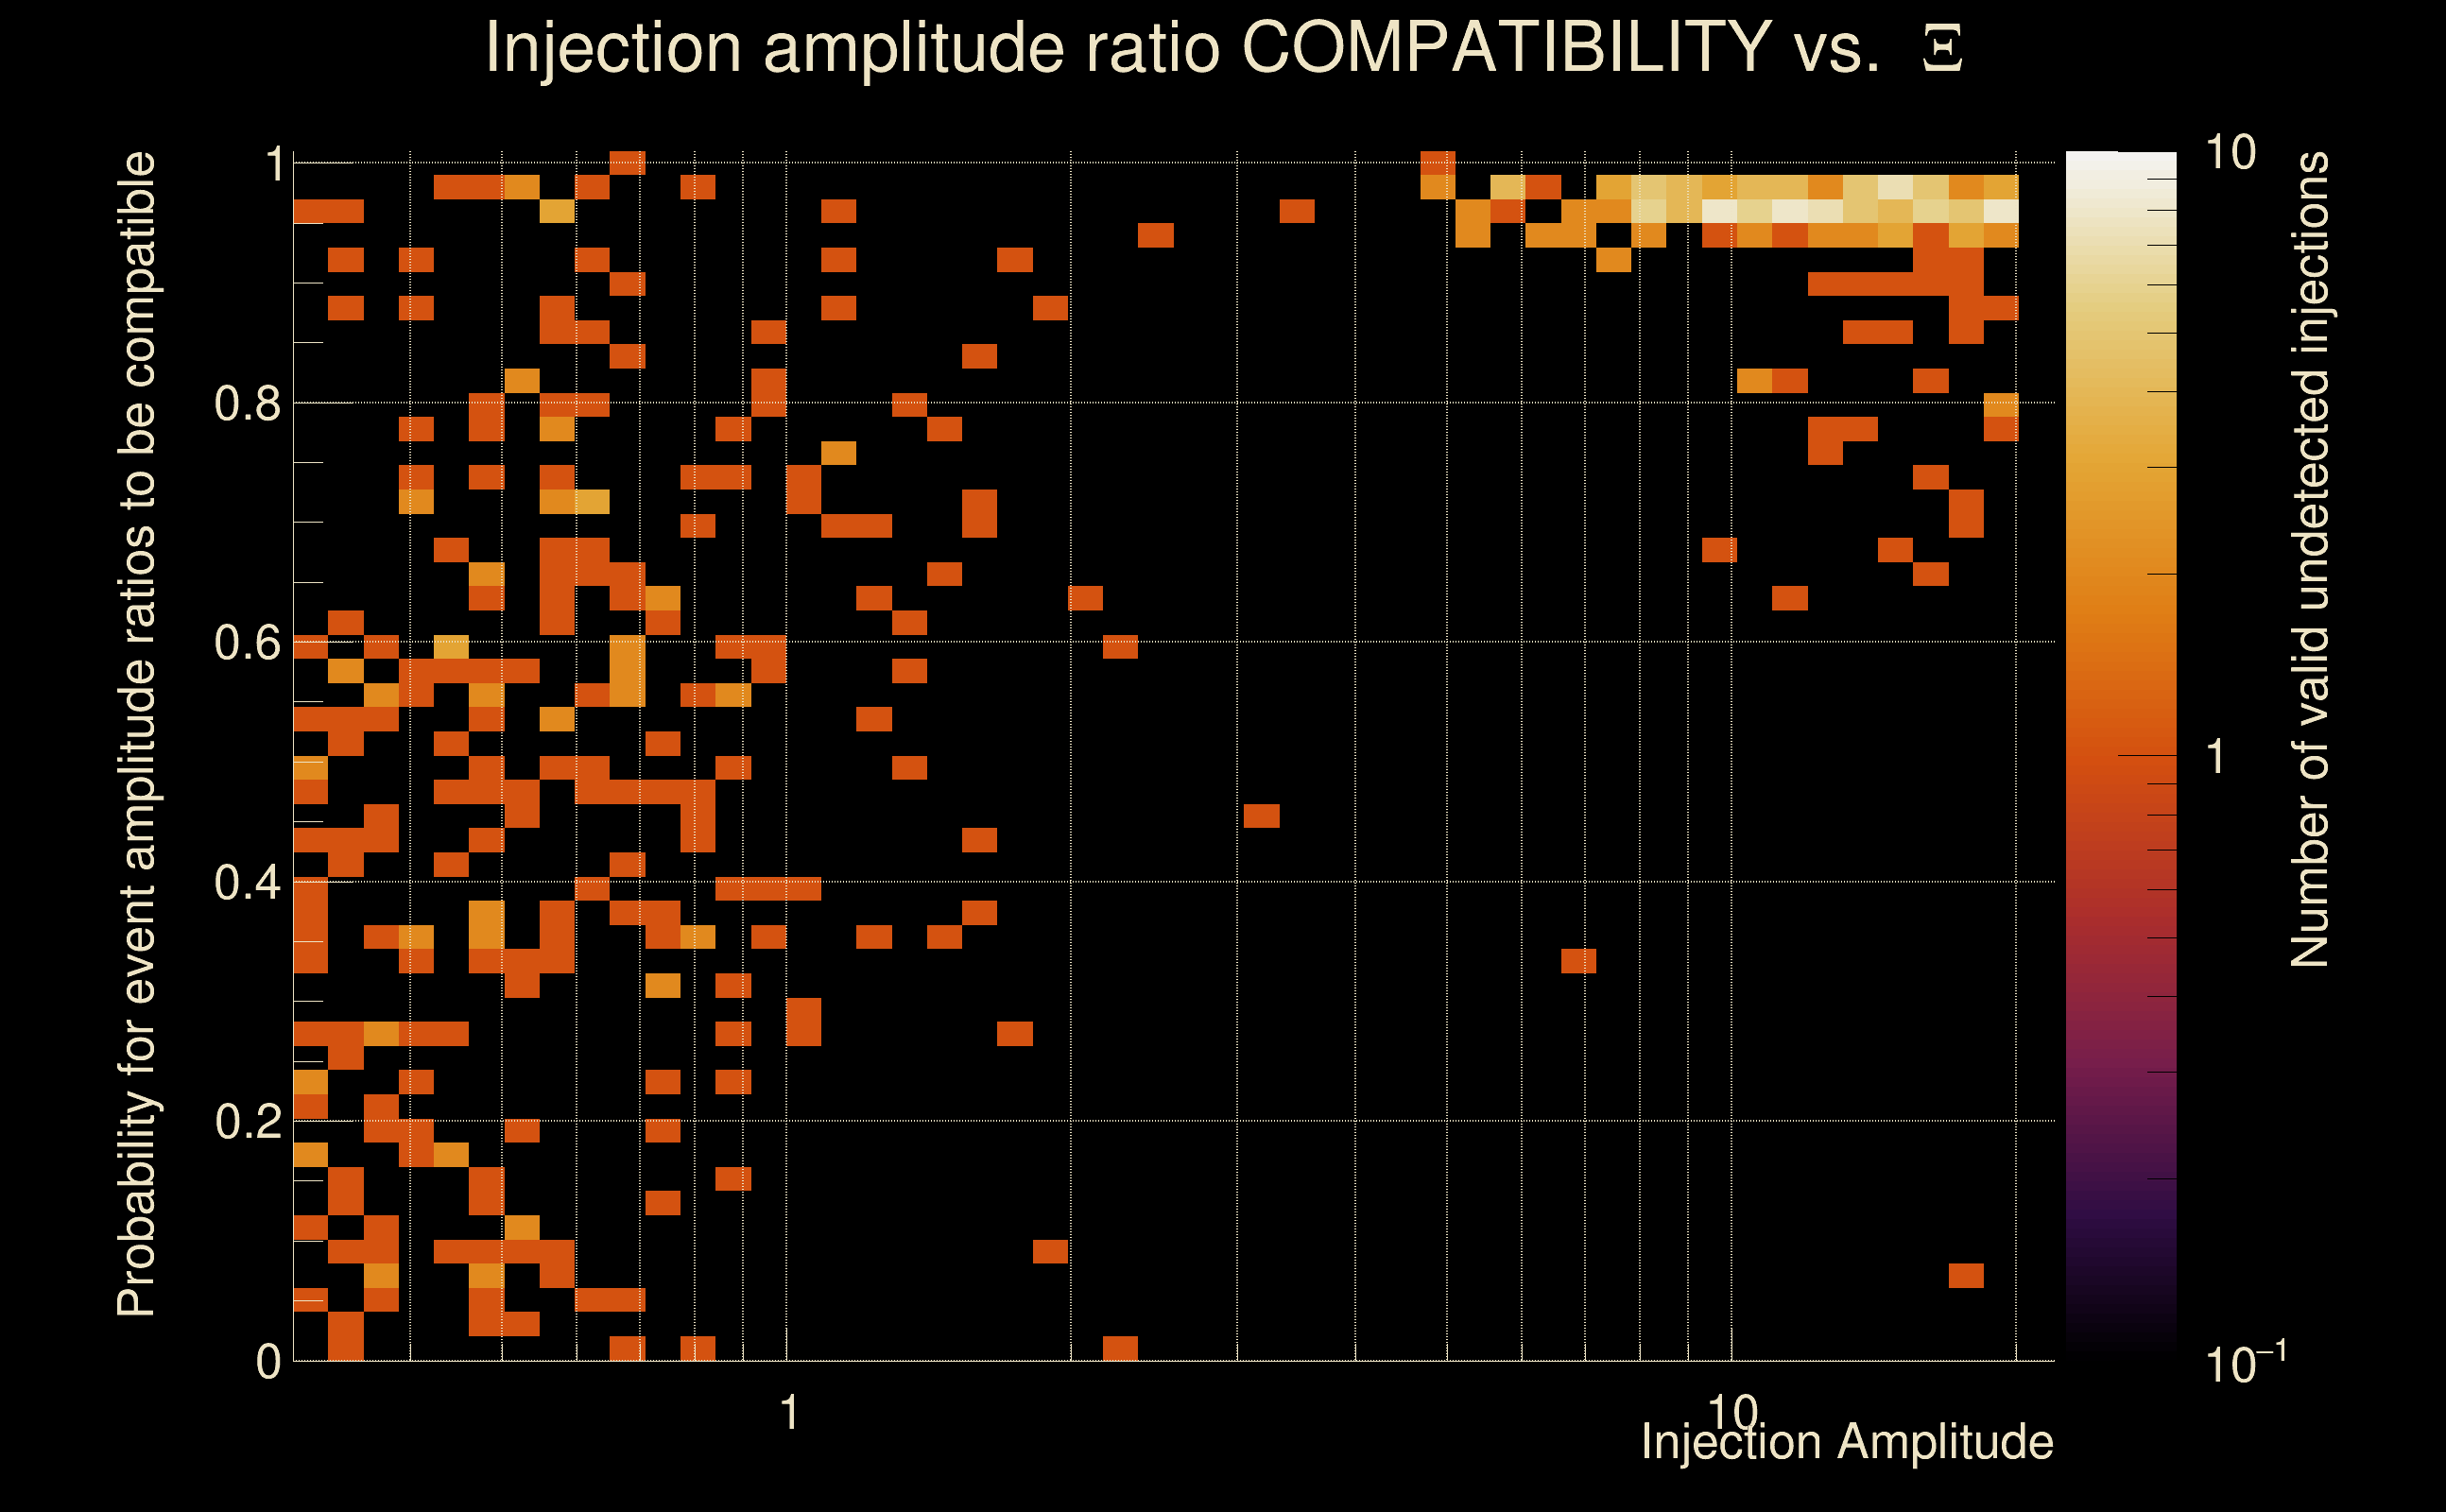
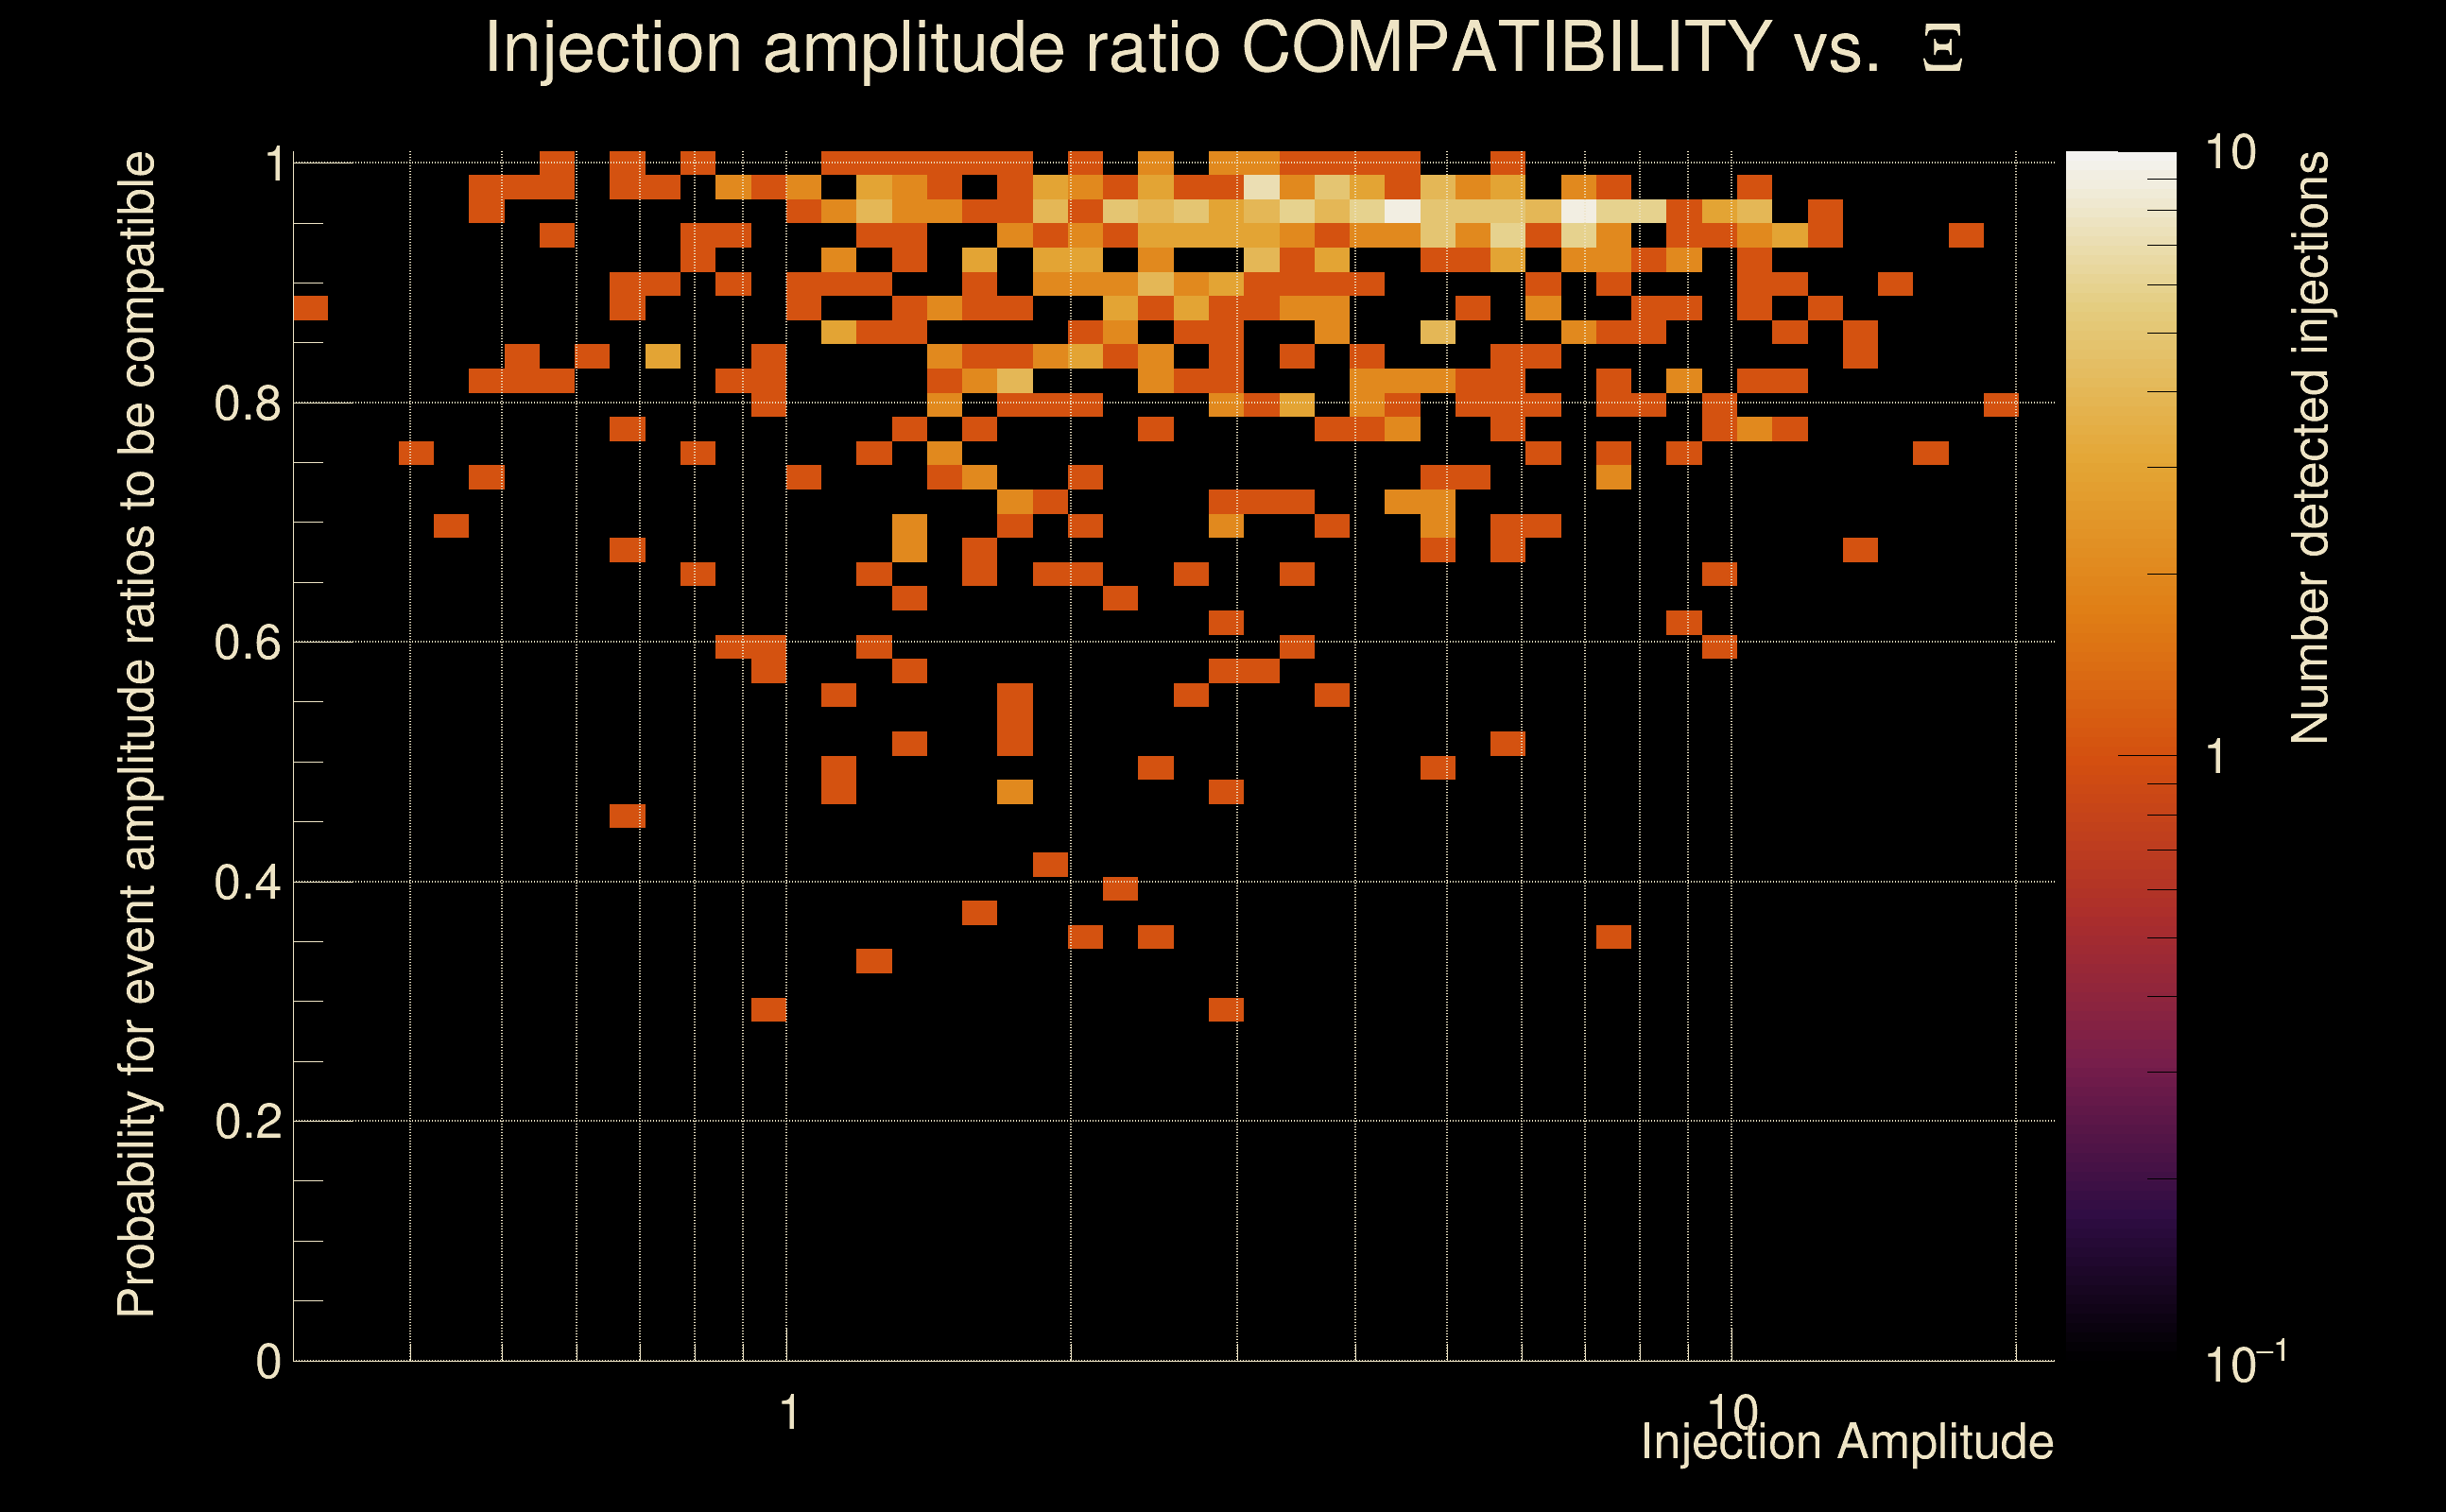
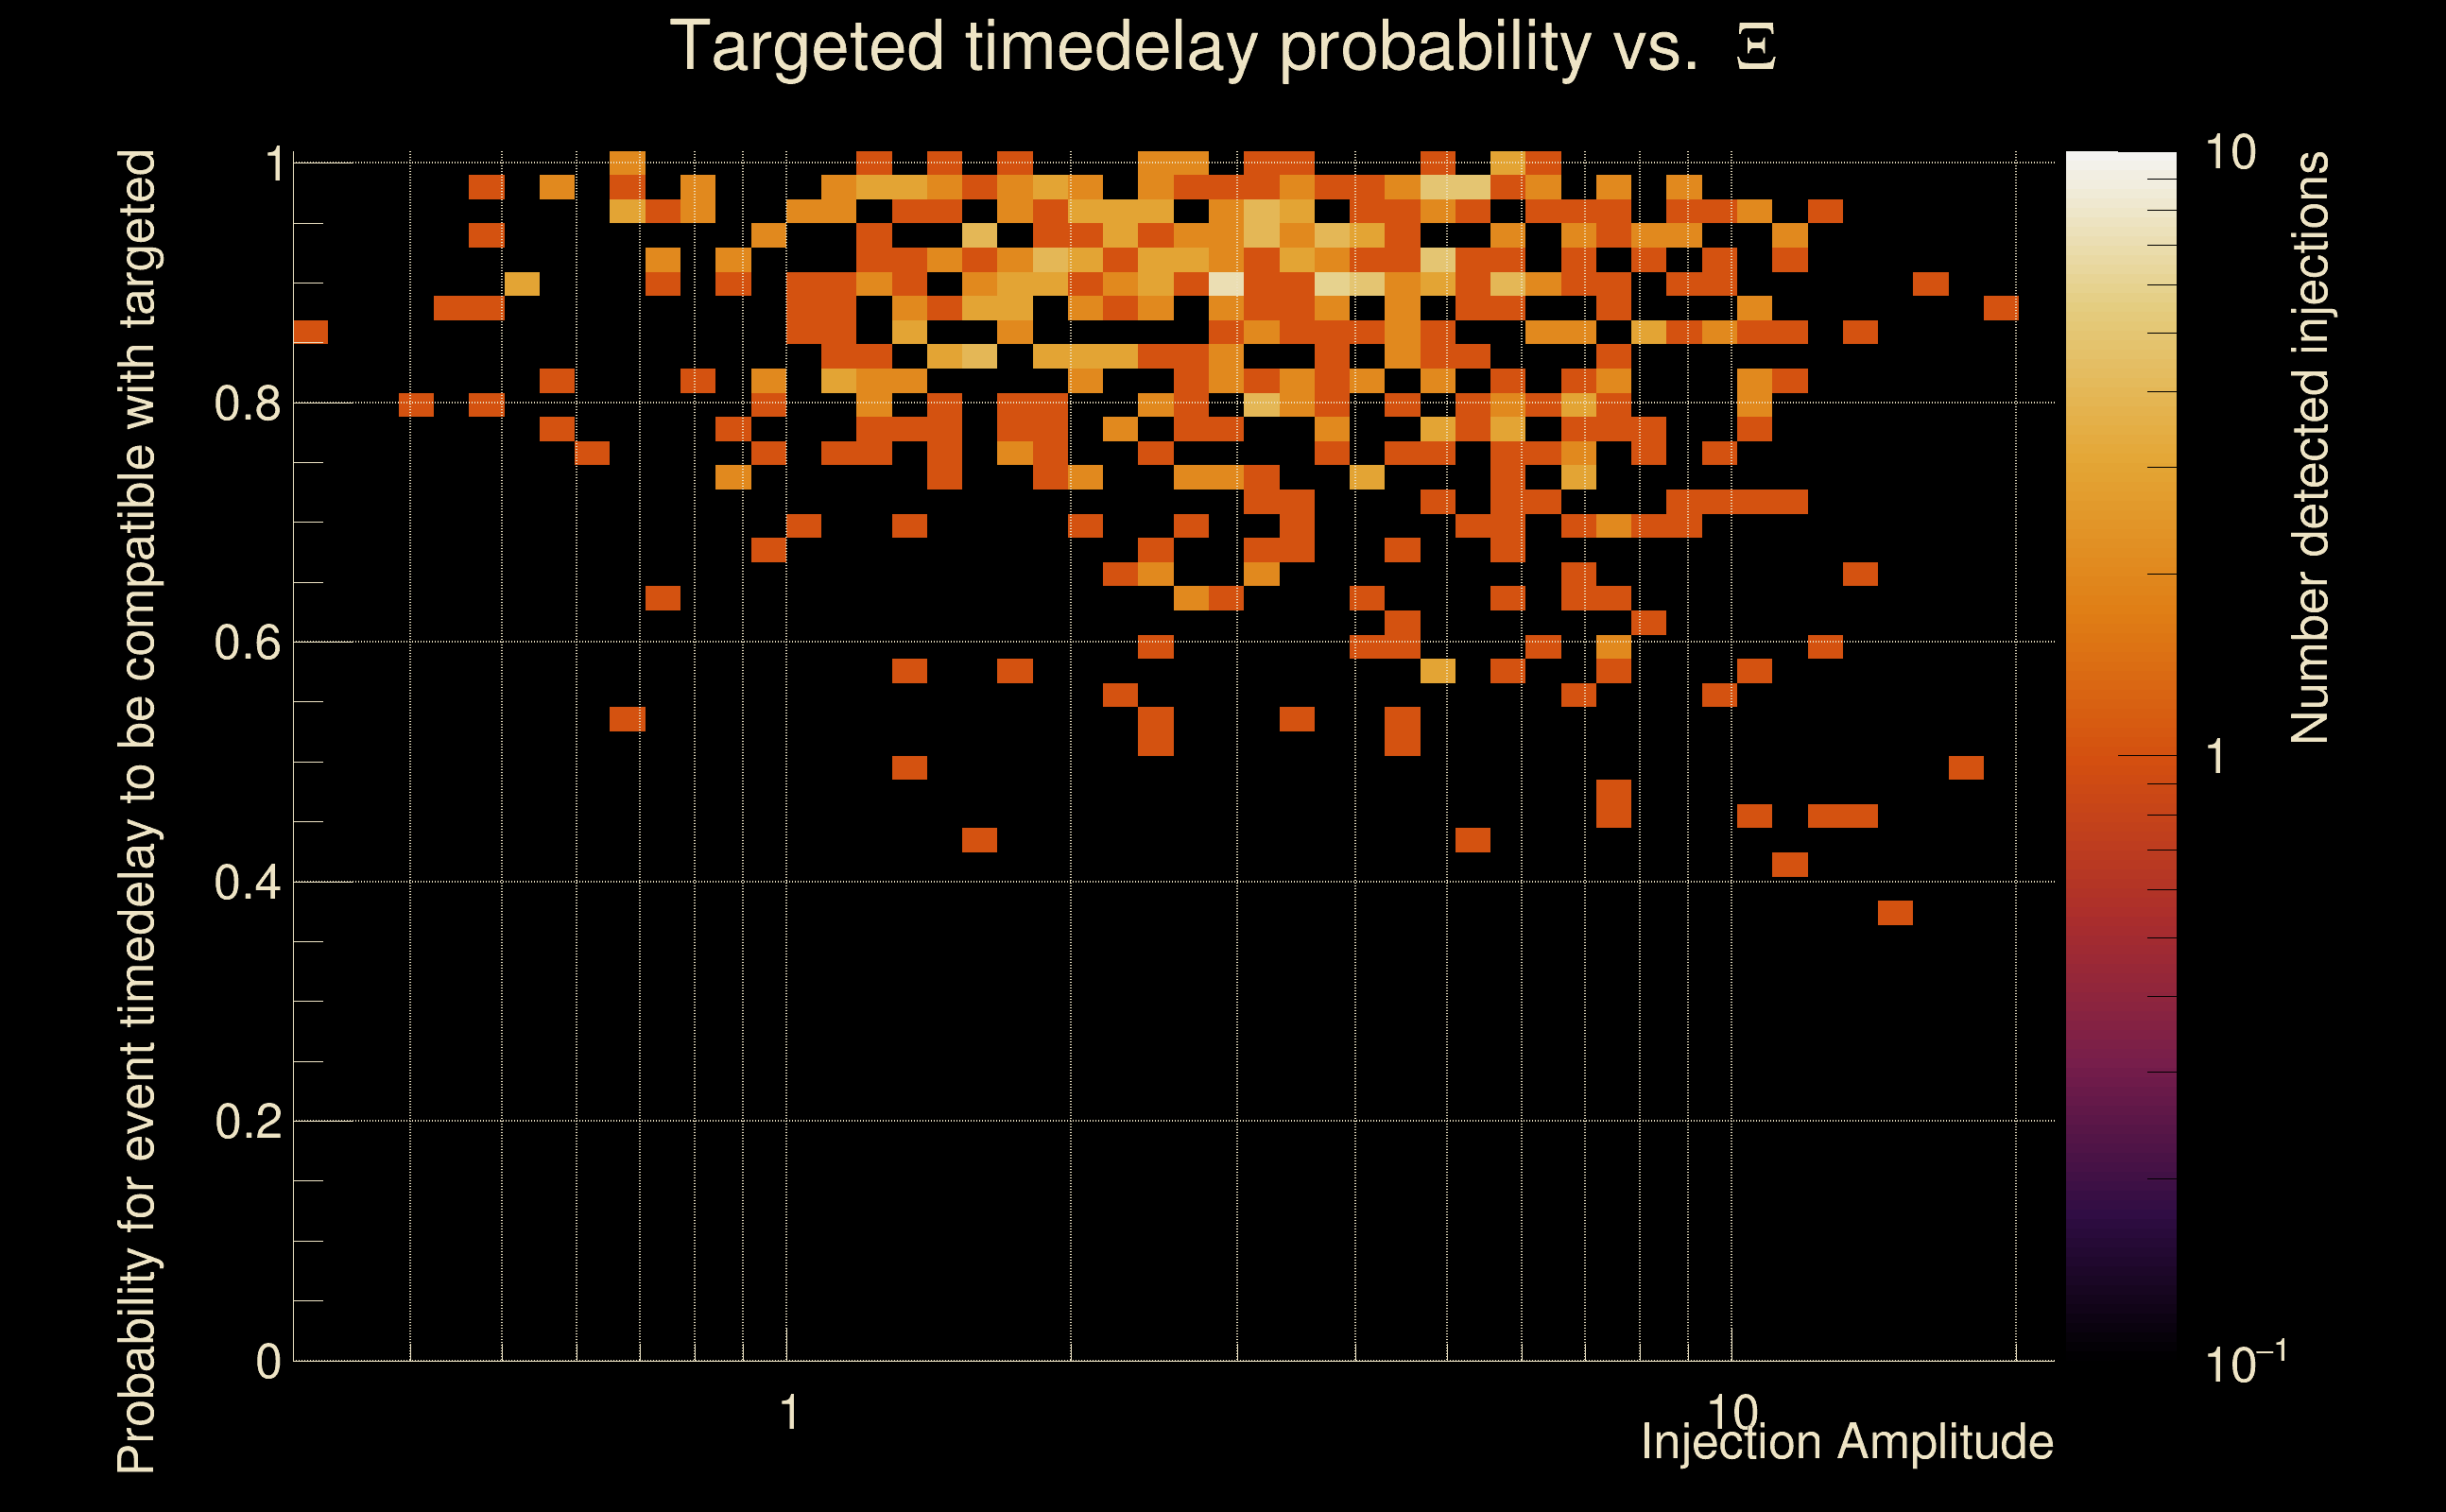
| Number of injections (total/valid/detected): | 1116 / 991 / 554 |
| List of missed injections: | ./Obe20-O_missed.txt |
| Injection amplitude at 90% detection efficiency: | 2.27337 |
| Injection amplitude at 50% detection efficiency: | 0.957201 |
| Injection amplitude at 10% detection efficiency: | 0.631085 |
 |
 |
 |
 |
 |
 |
 |
|
 |
 |
|
 |
 |
|
 |
 |
|
 |
 |
|
 |
 |
|
 |
 |
|
 |
 |
|
 |
 |
 |
 |
 |
 |
 |
 |
 |
 |
 |
 |
 |
 |
 |
| florent.robinet@ijclab.in2p3.fr |