| Omicron version: | 4.2.0: documentation gitlab repository |
| Omicron run by: | unknown |
| Report produced on: | Wed Dec 17 09:48:12 2025 UTC |
| Ox option file: | TargIxfw_injpt1_options.txt |
| Omicron option files: | detector 0, detector 1 |
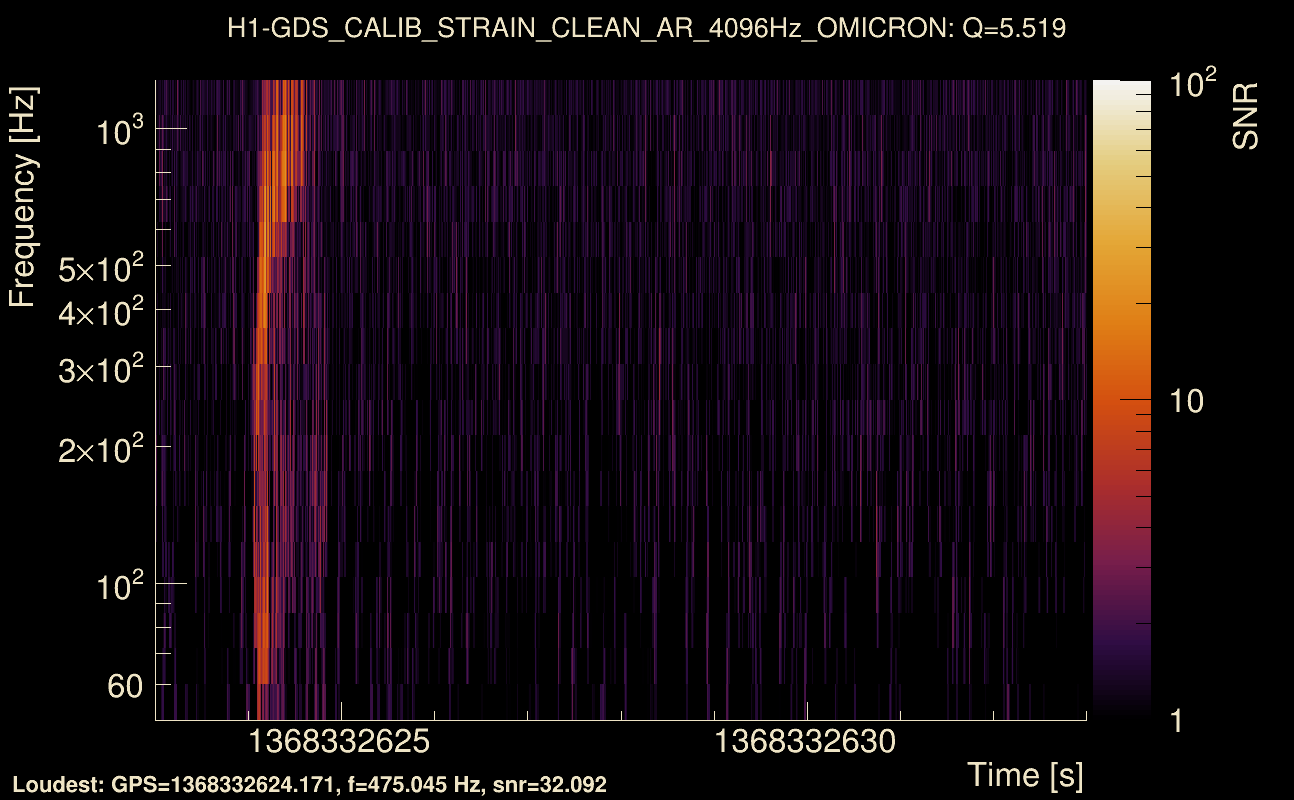
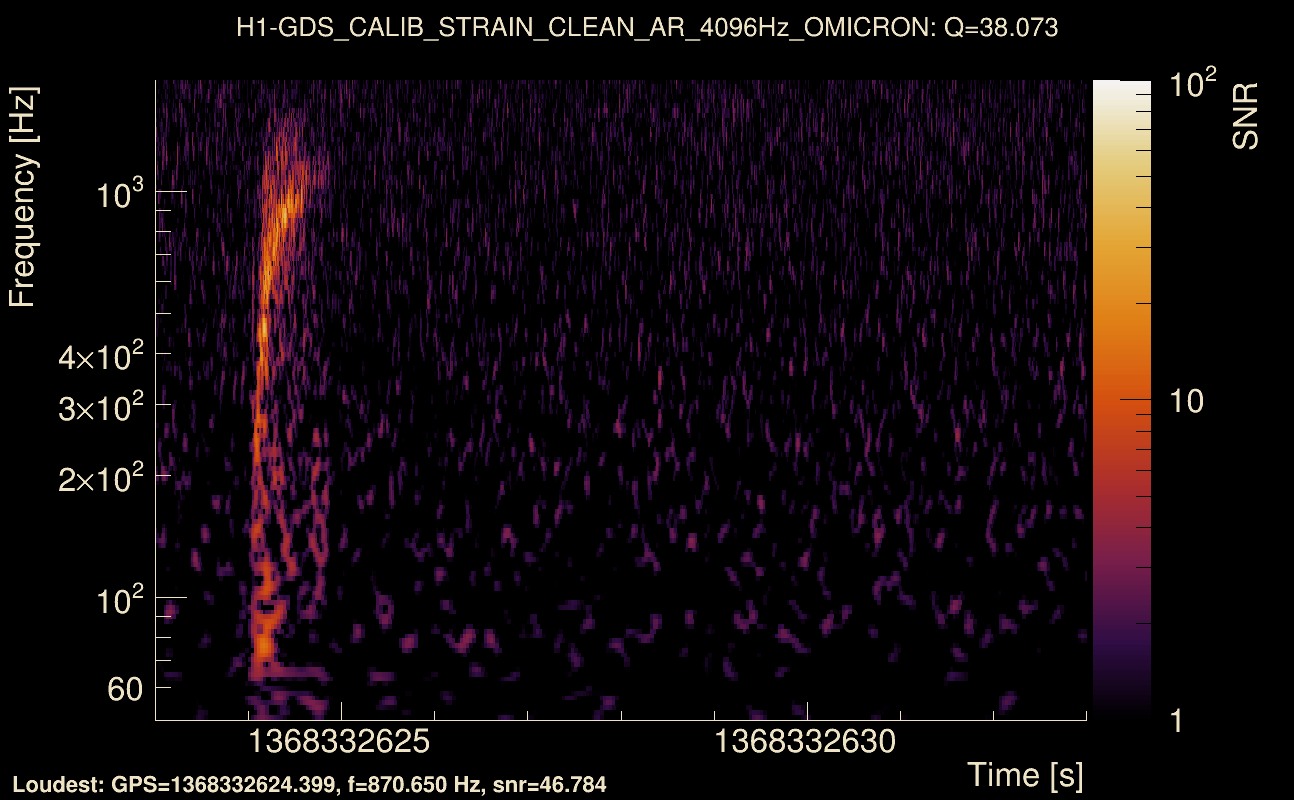
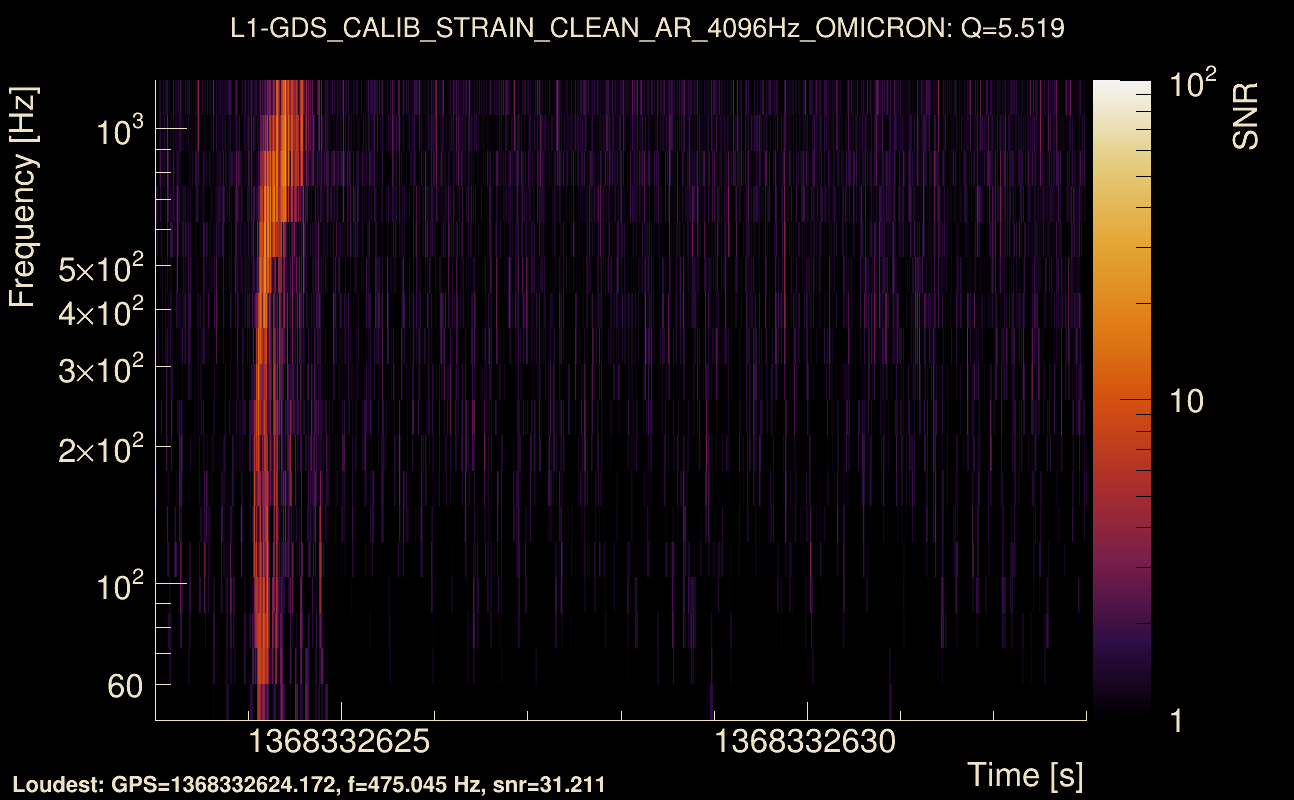
| Detector channel names: | H1:GDS-CALIB_STRAIN_CLEAN_AR_4096Hz, L1:GDS-CALIB_STRAIN_CLEAN_AR_4096Hz |
| Omicron analysis time window and overlap: | 16 s, 6 s |
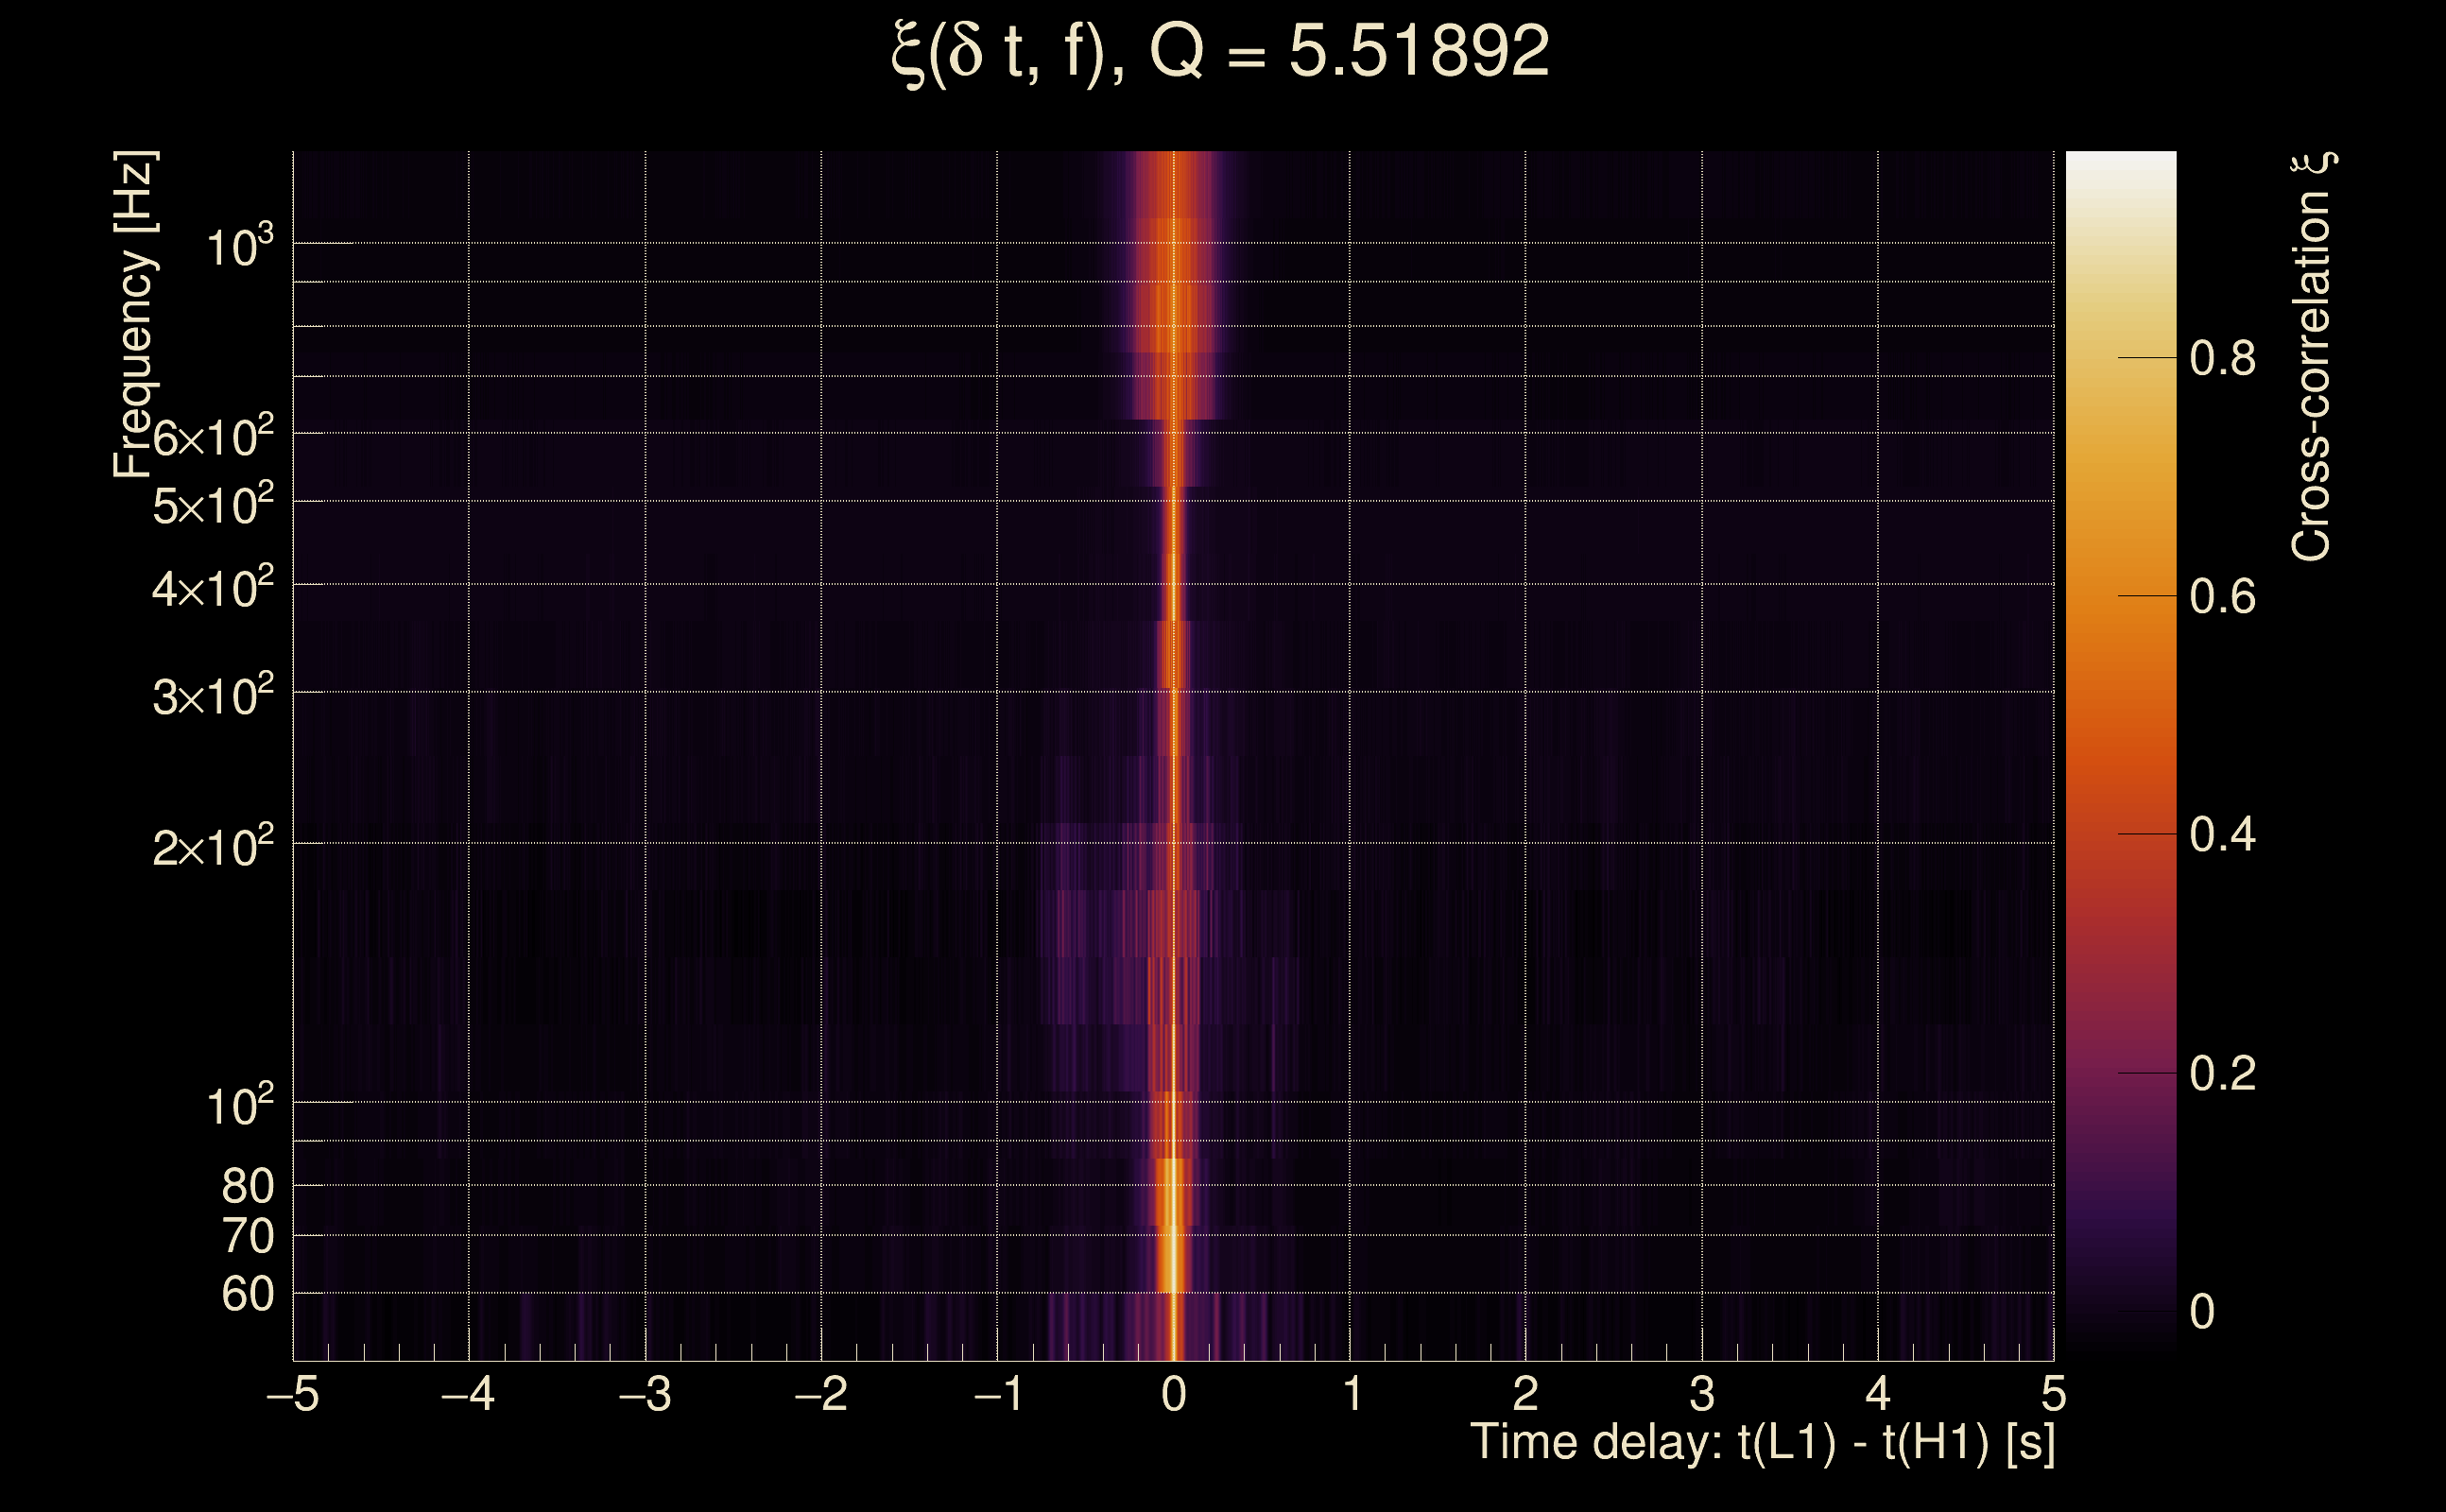
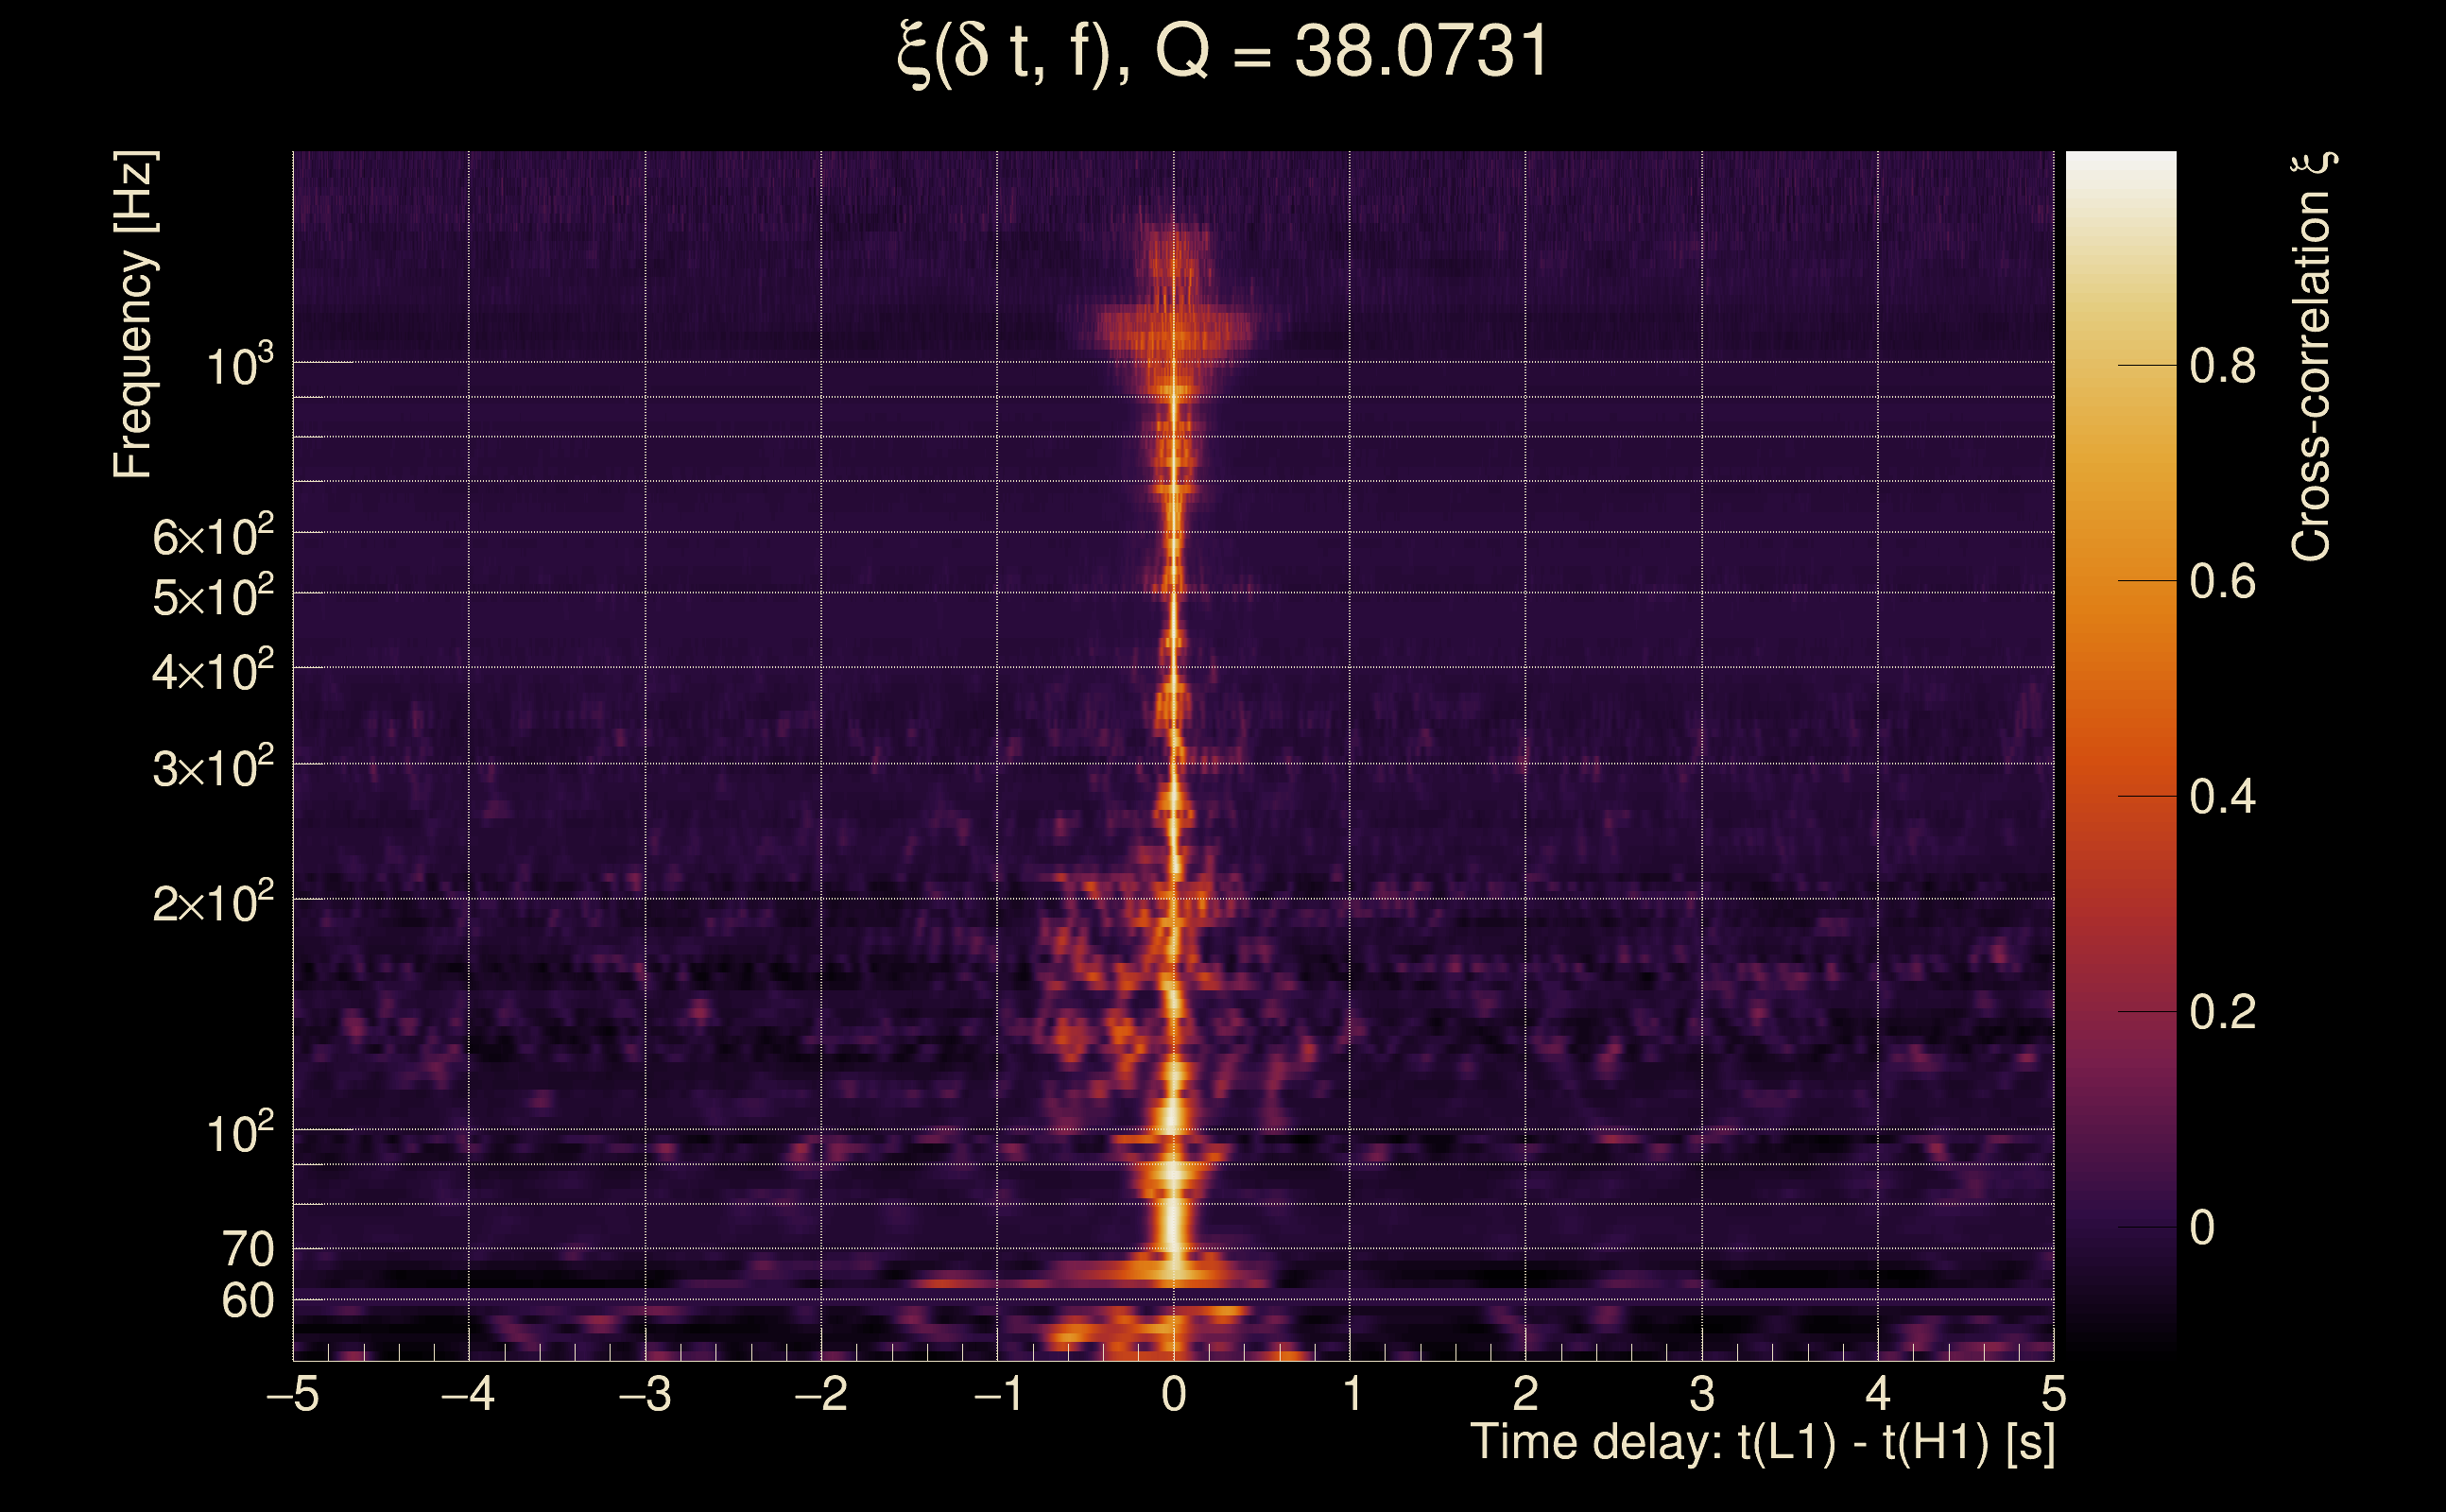
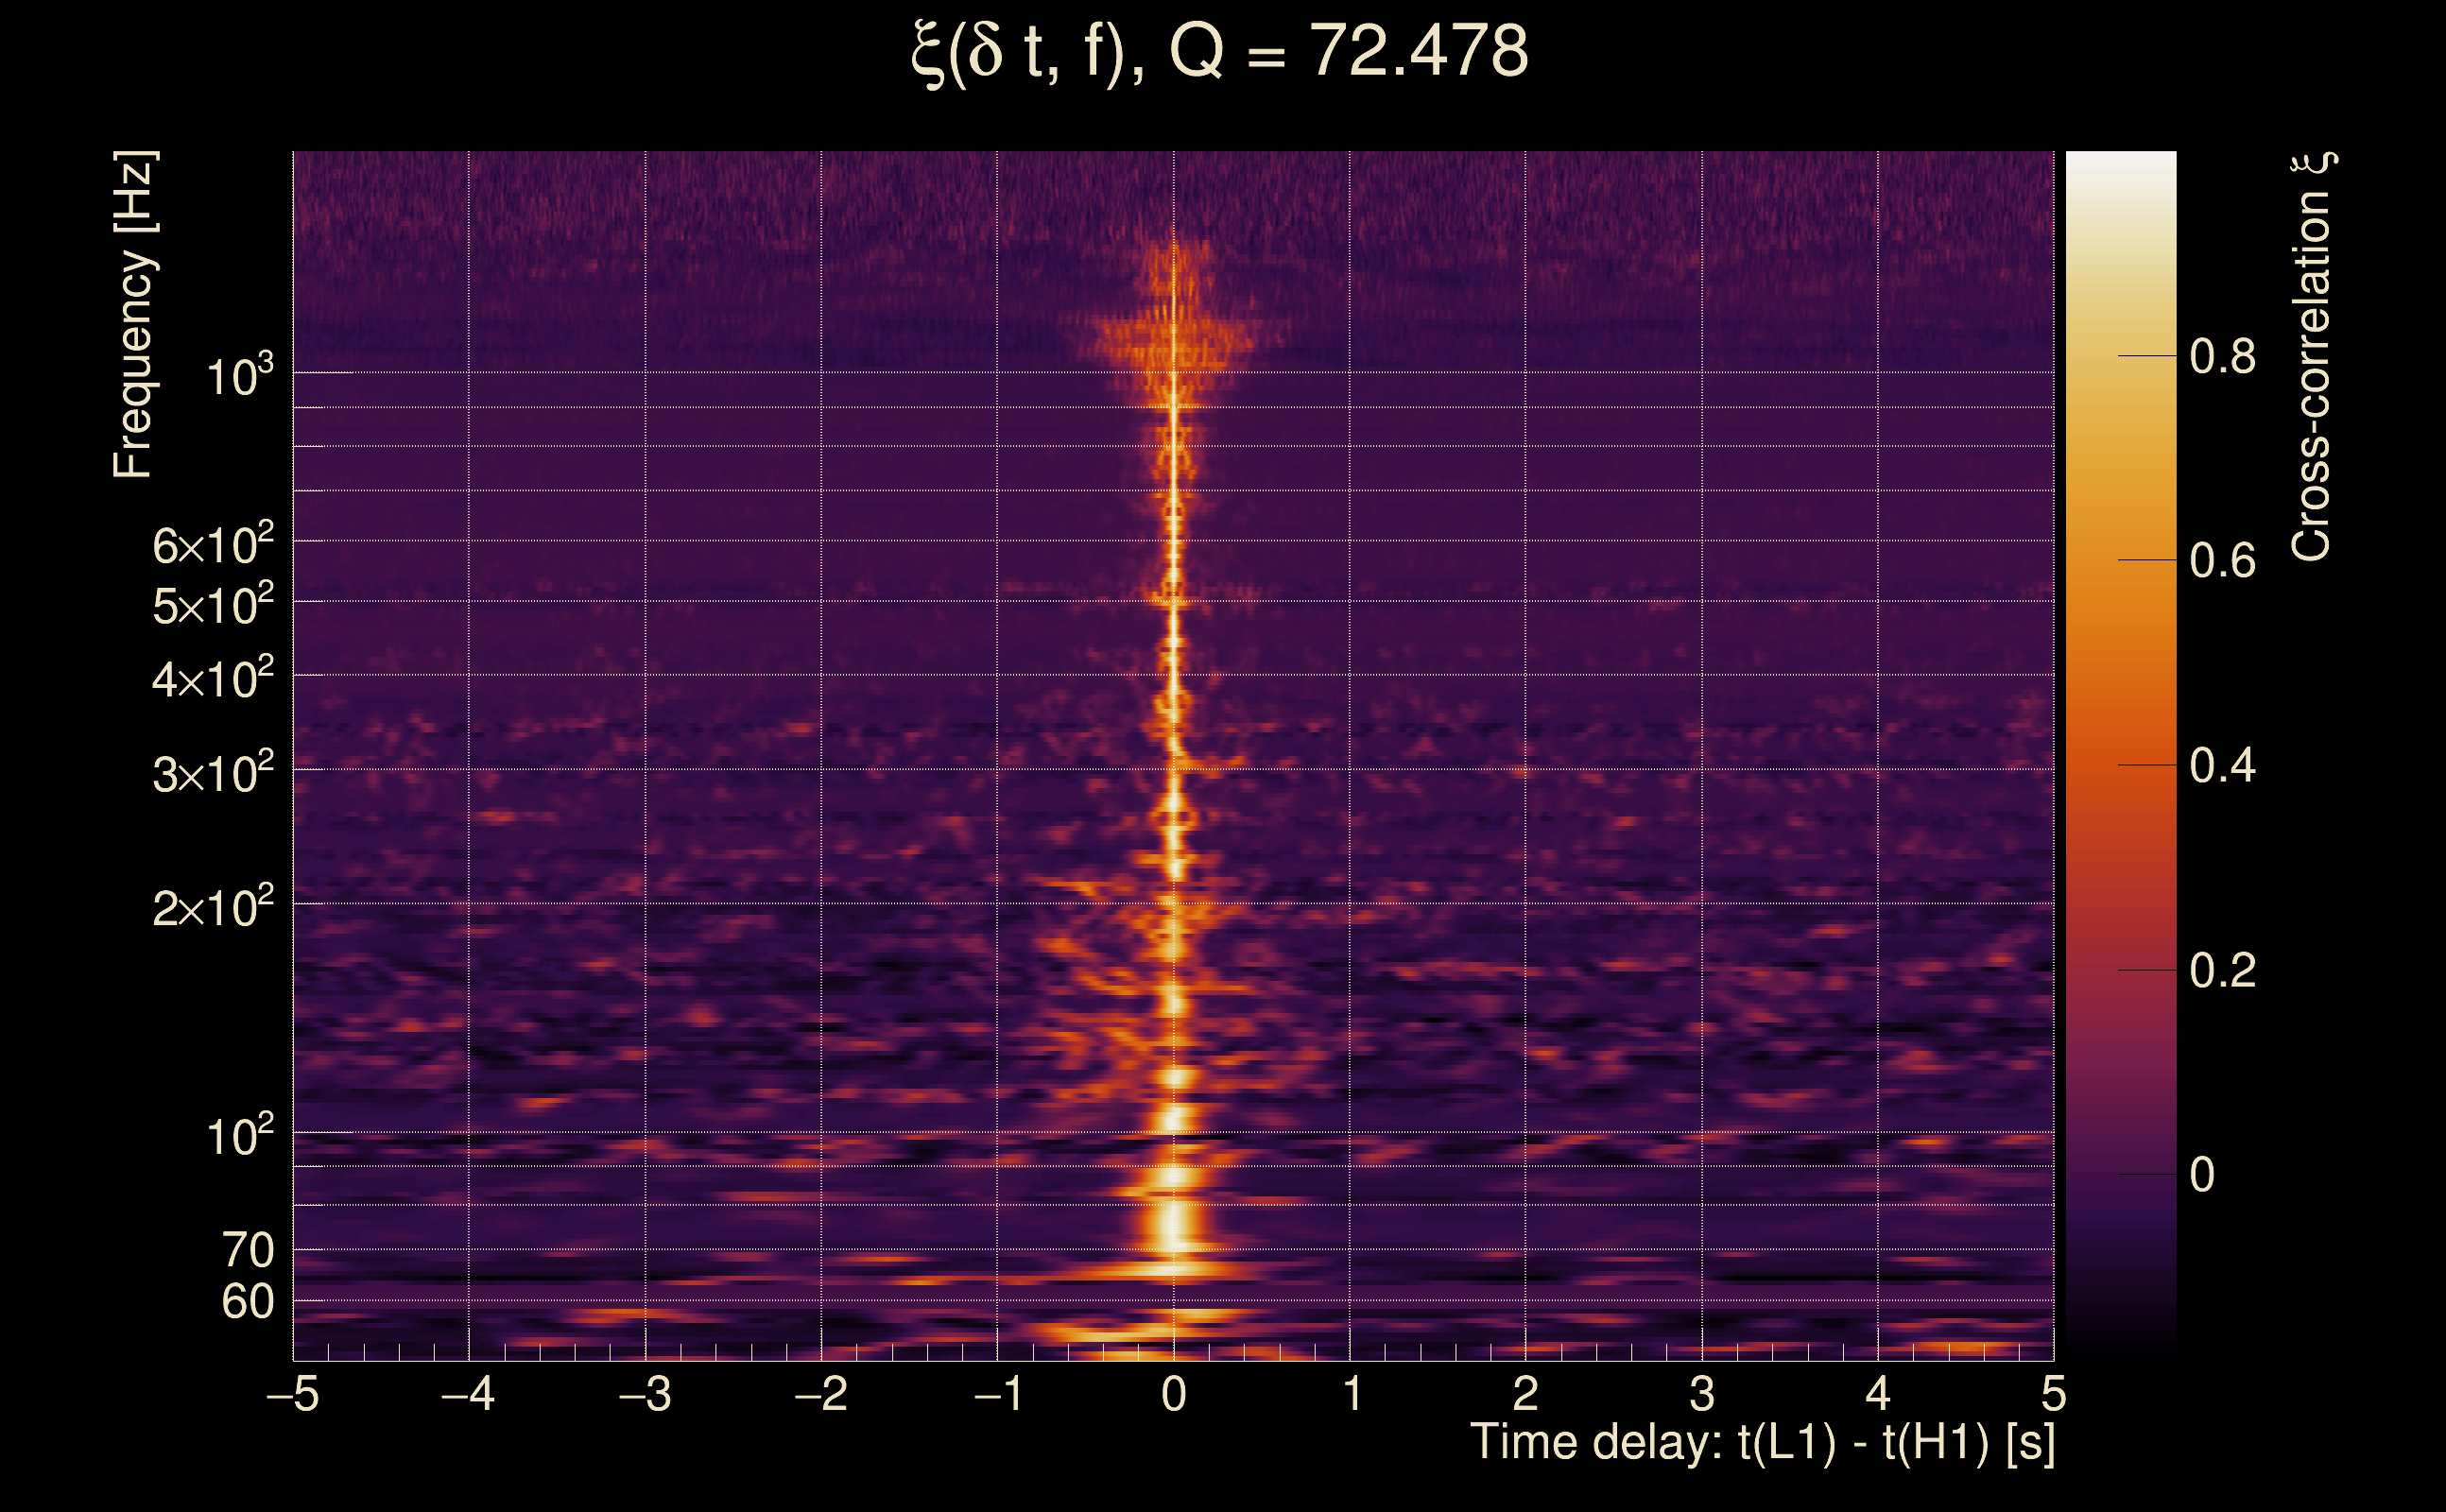
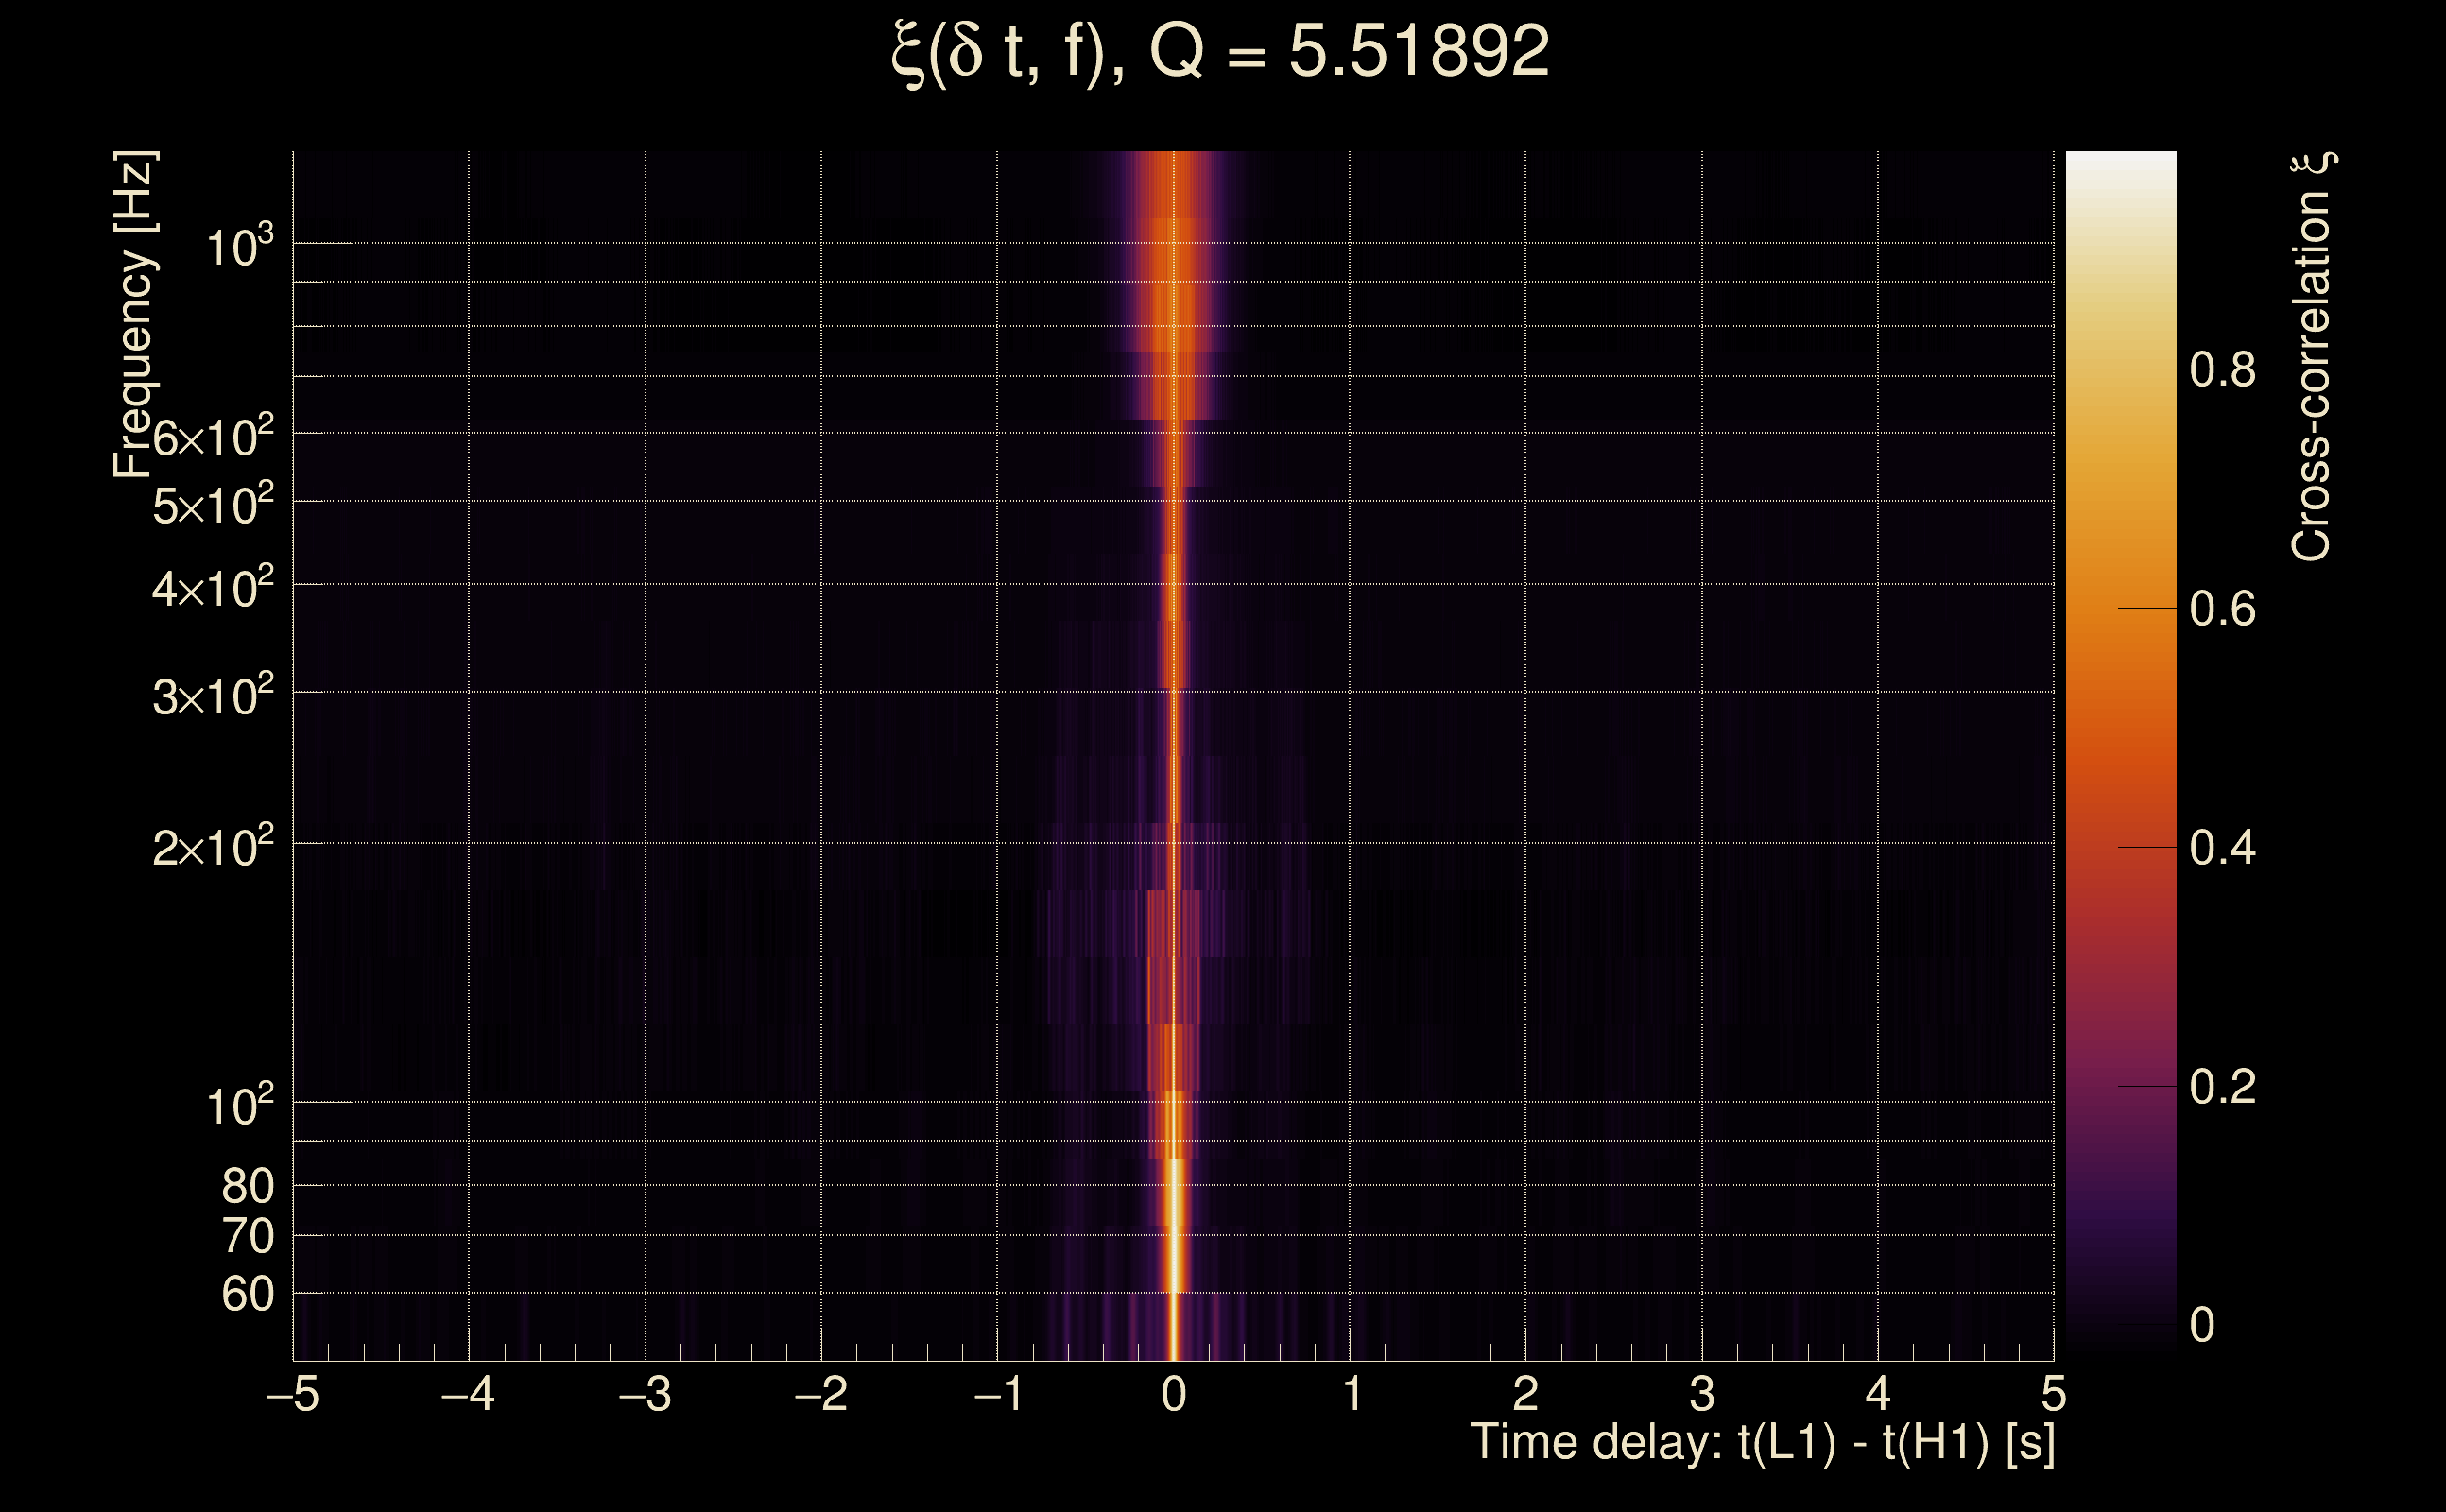
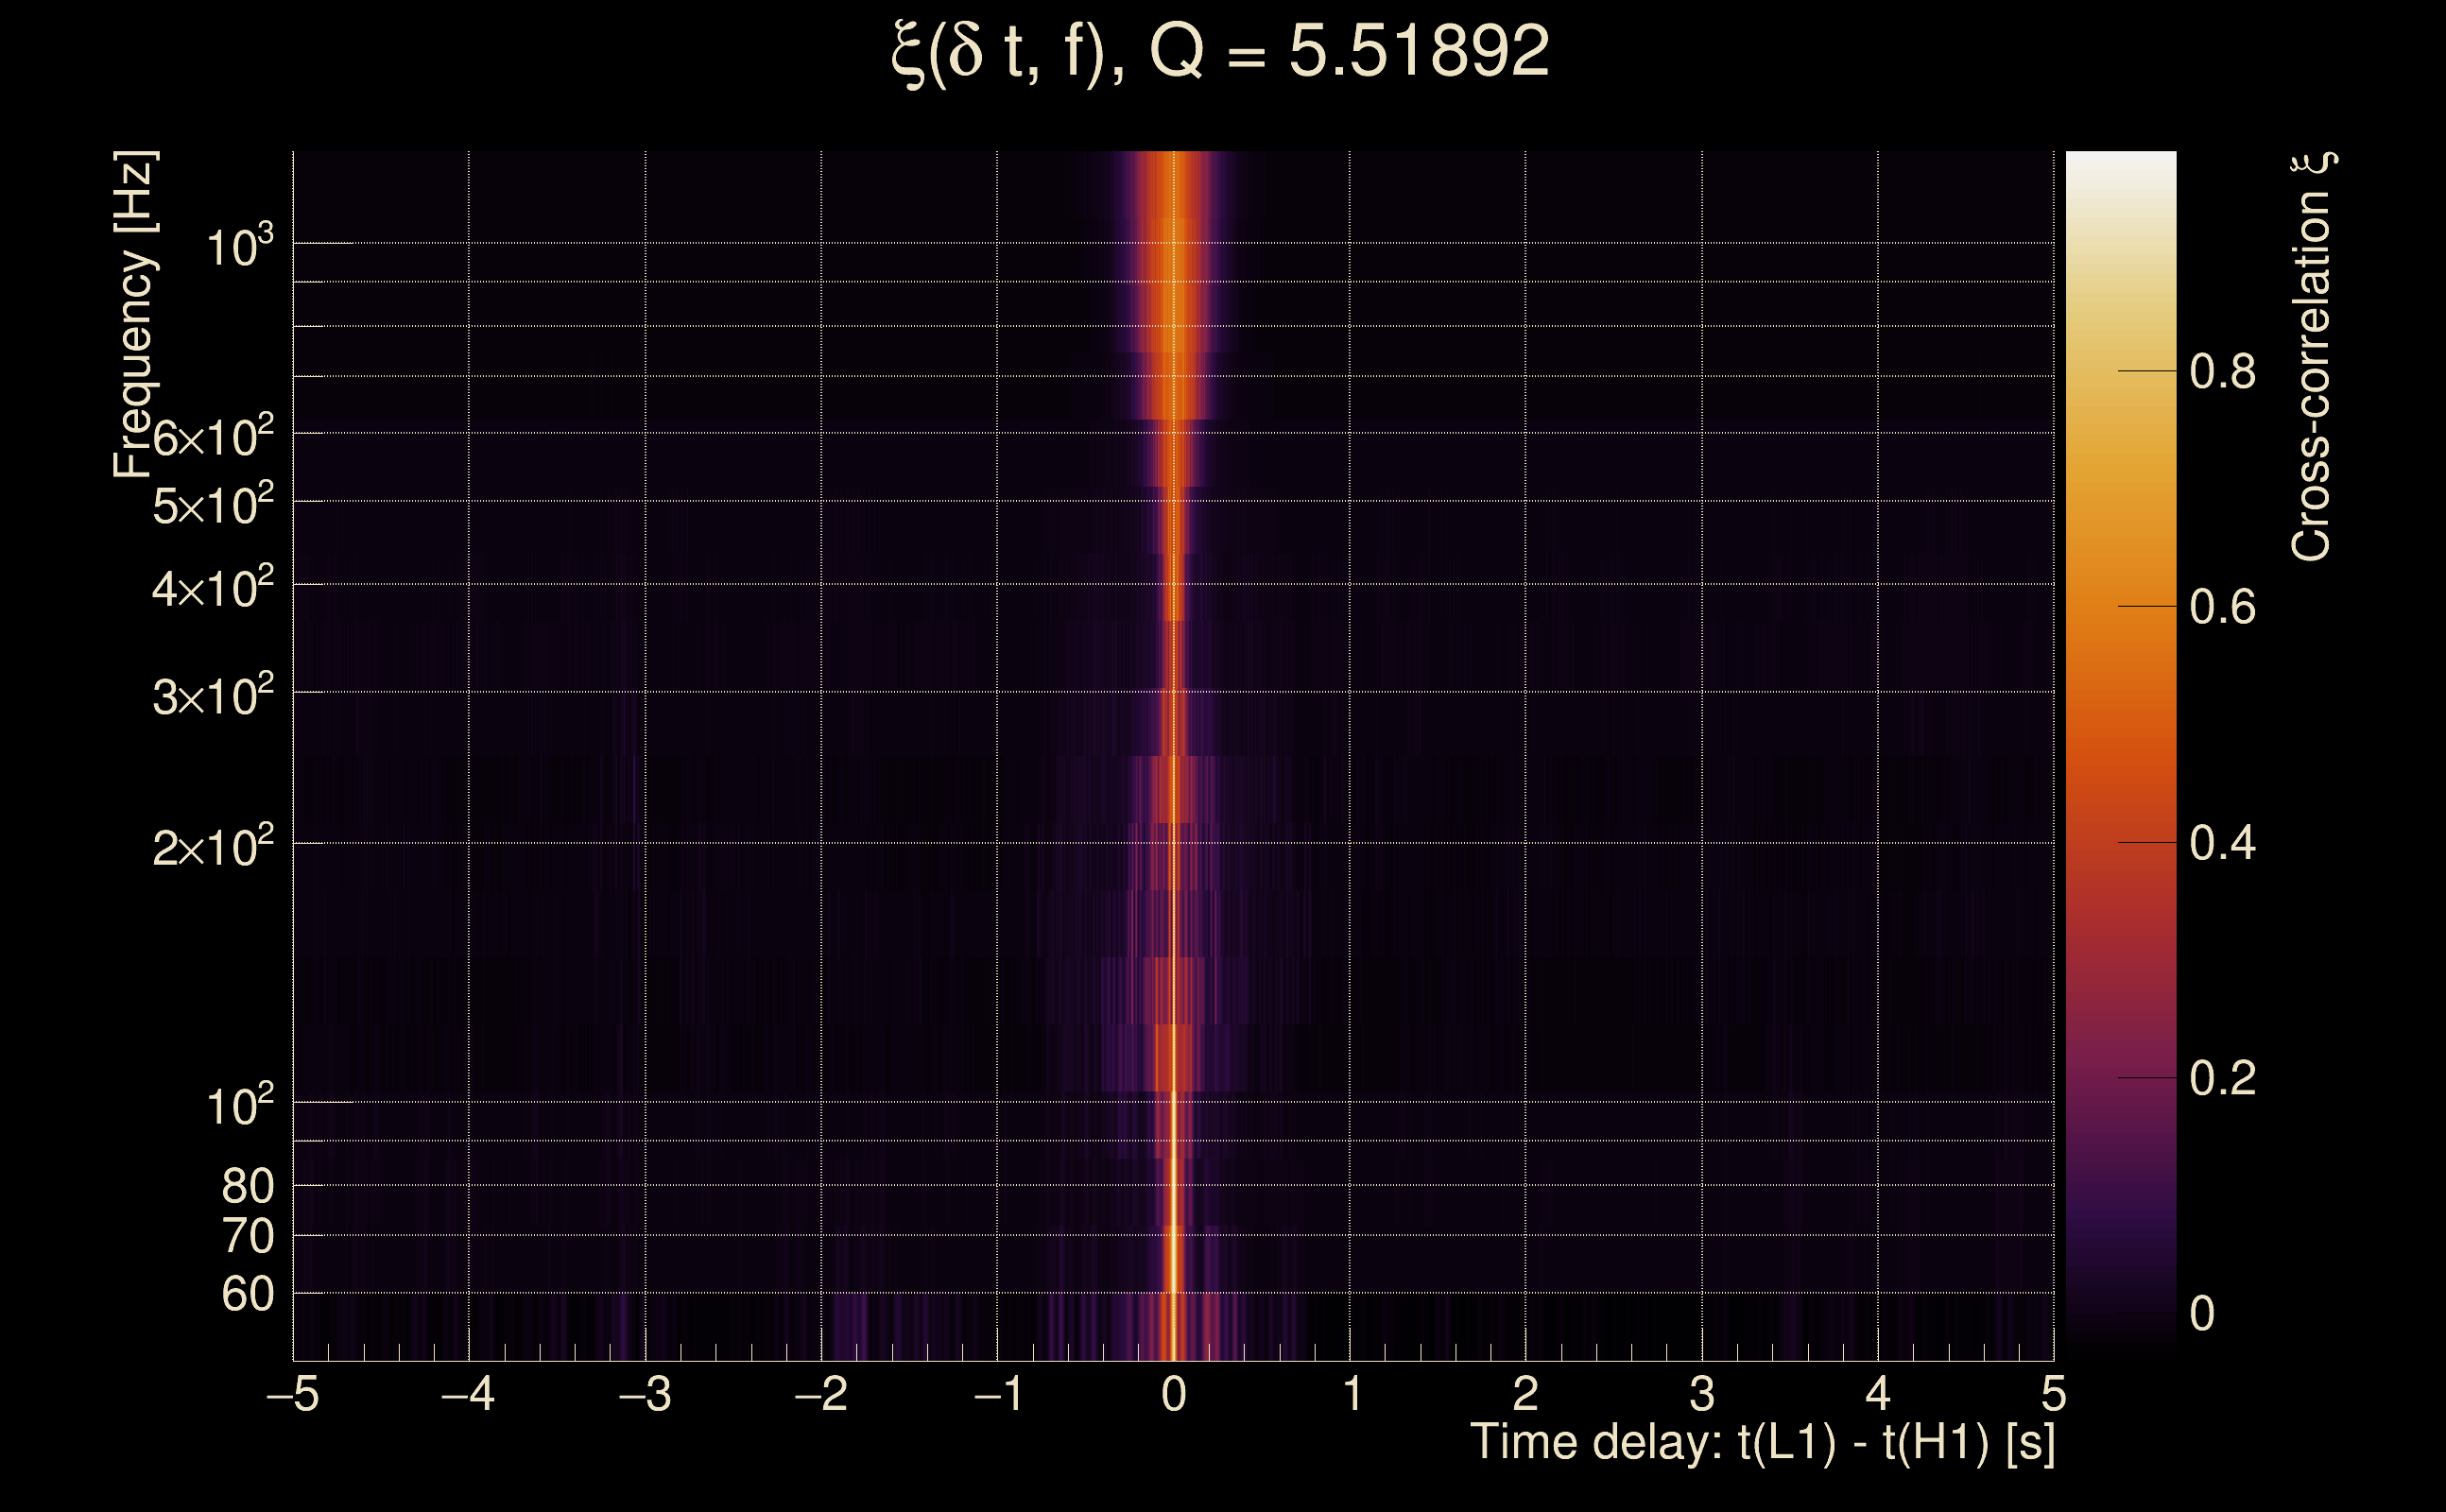
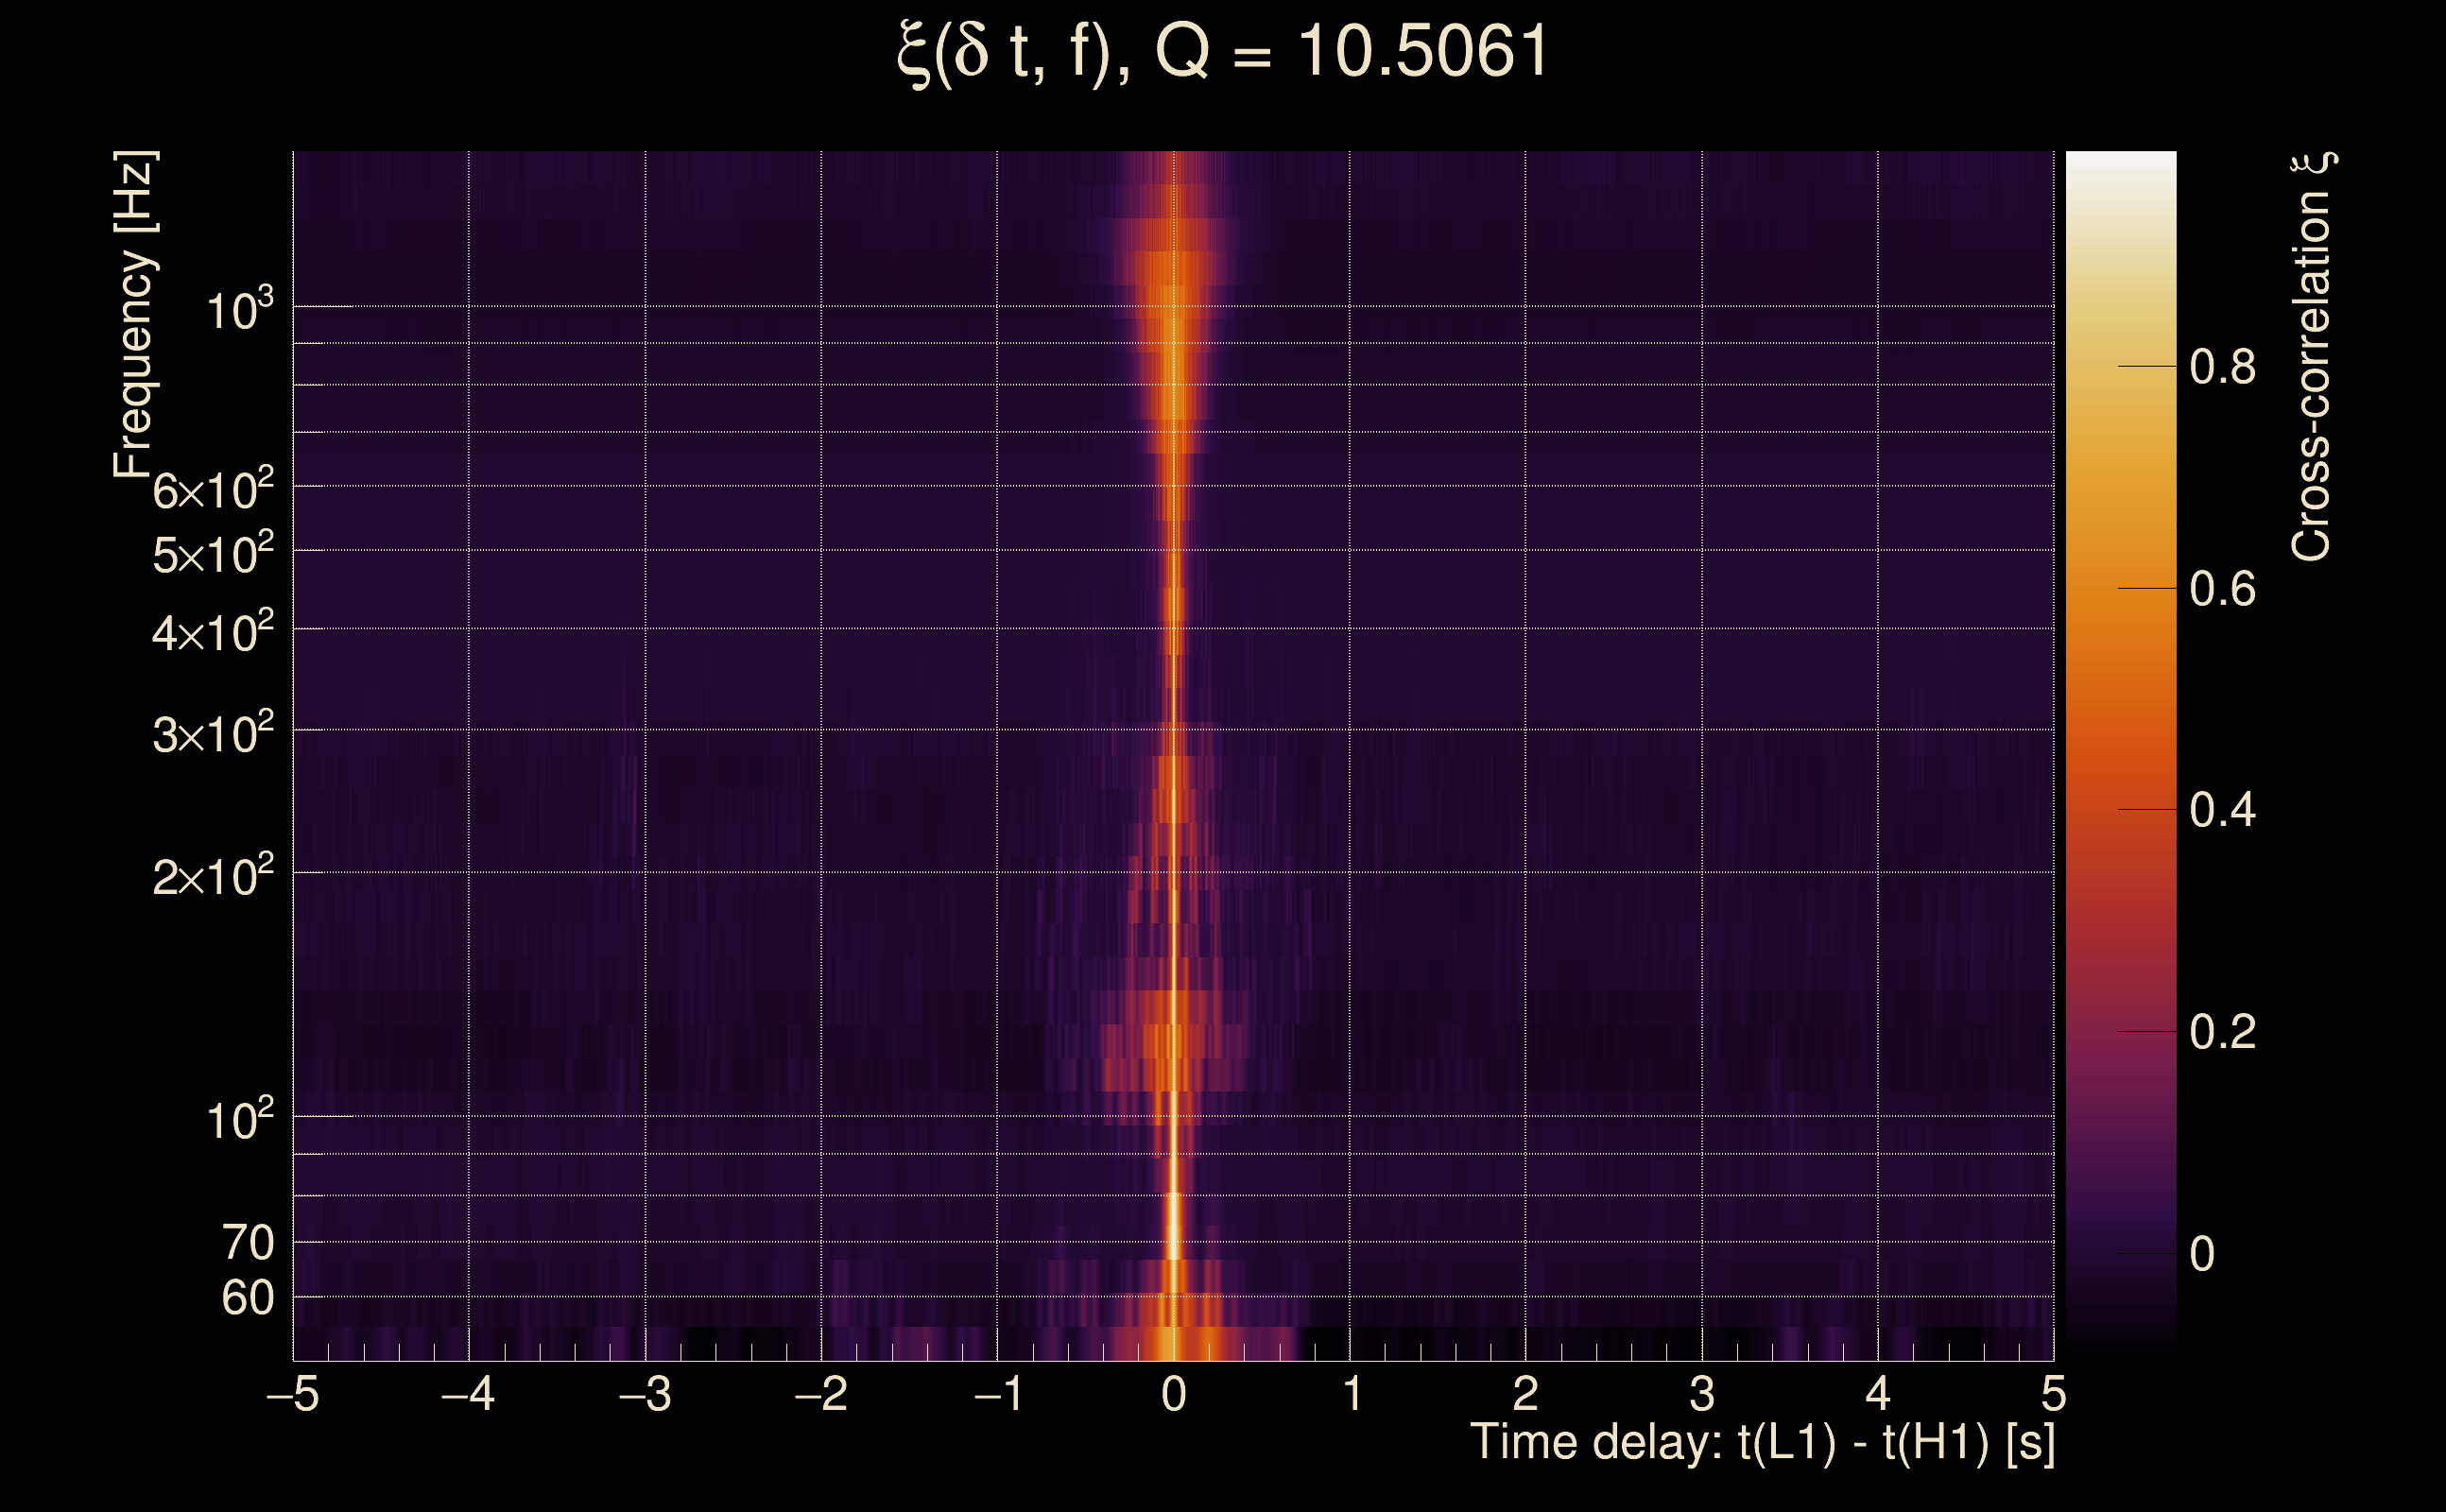
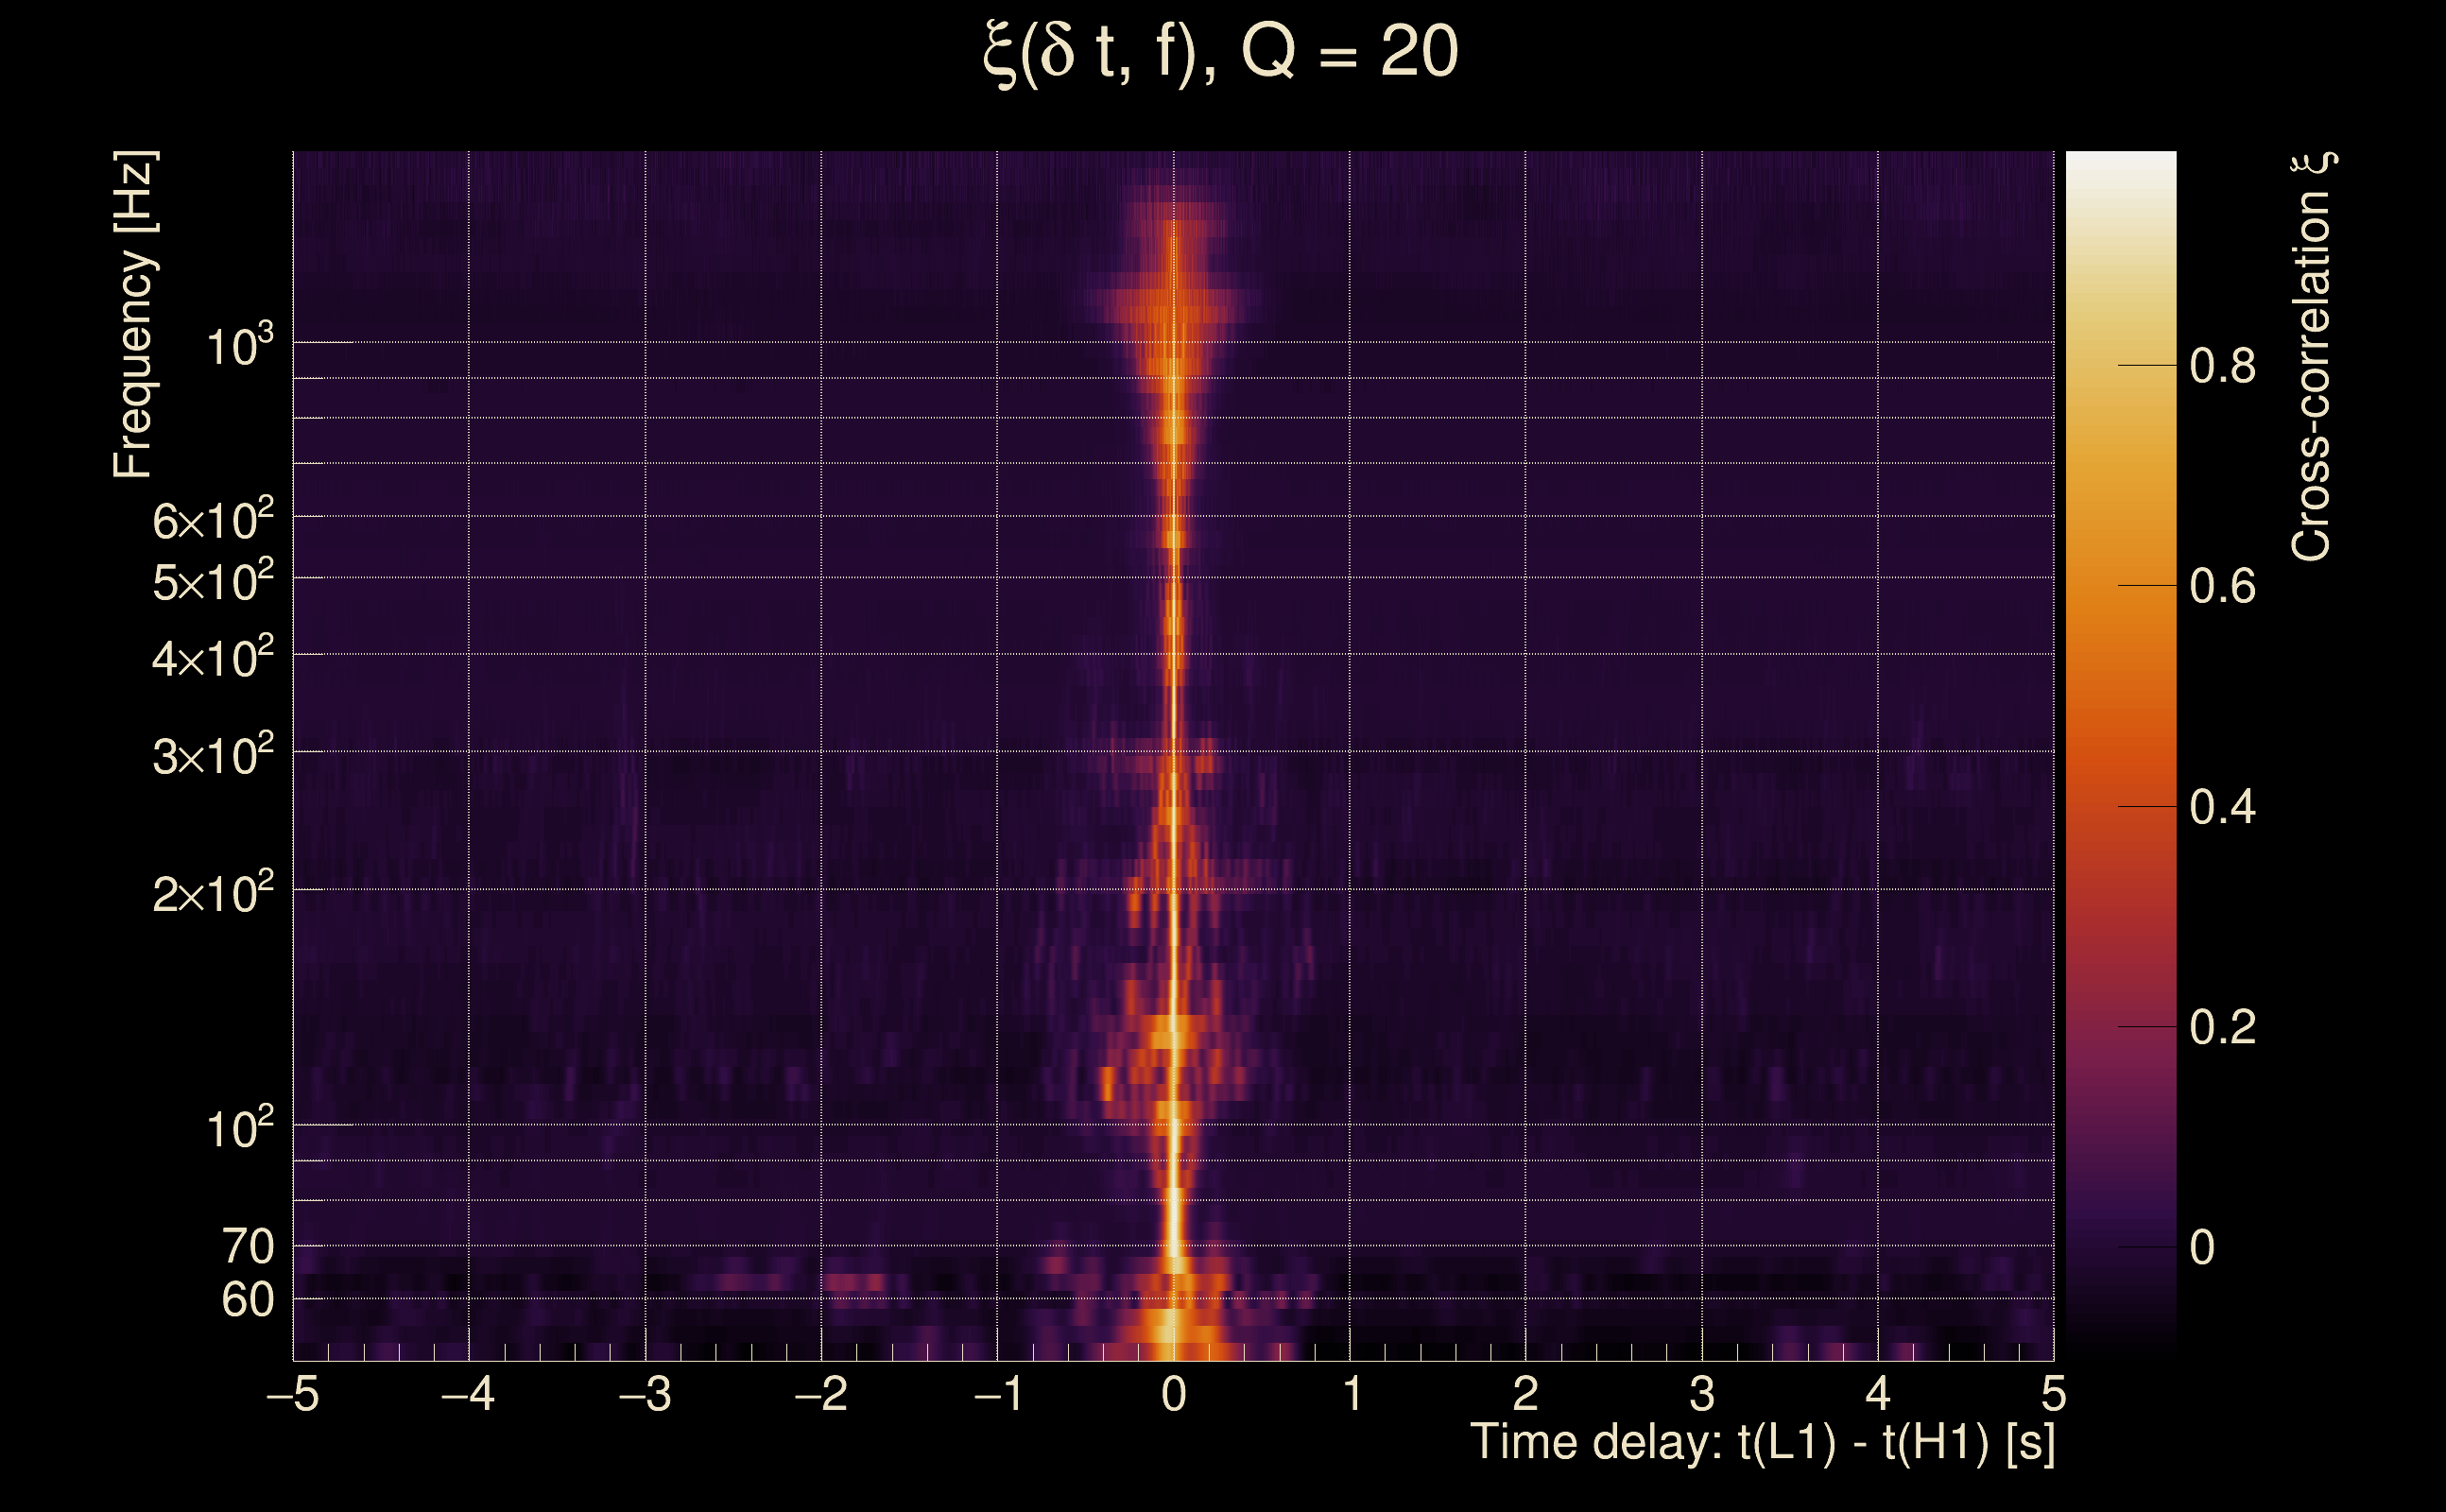
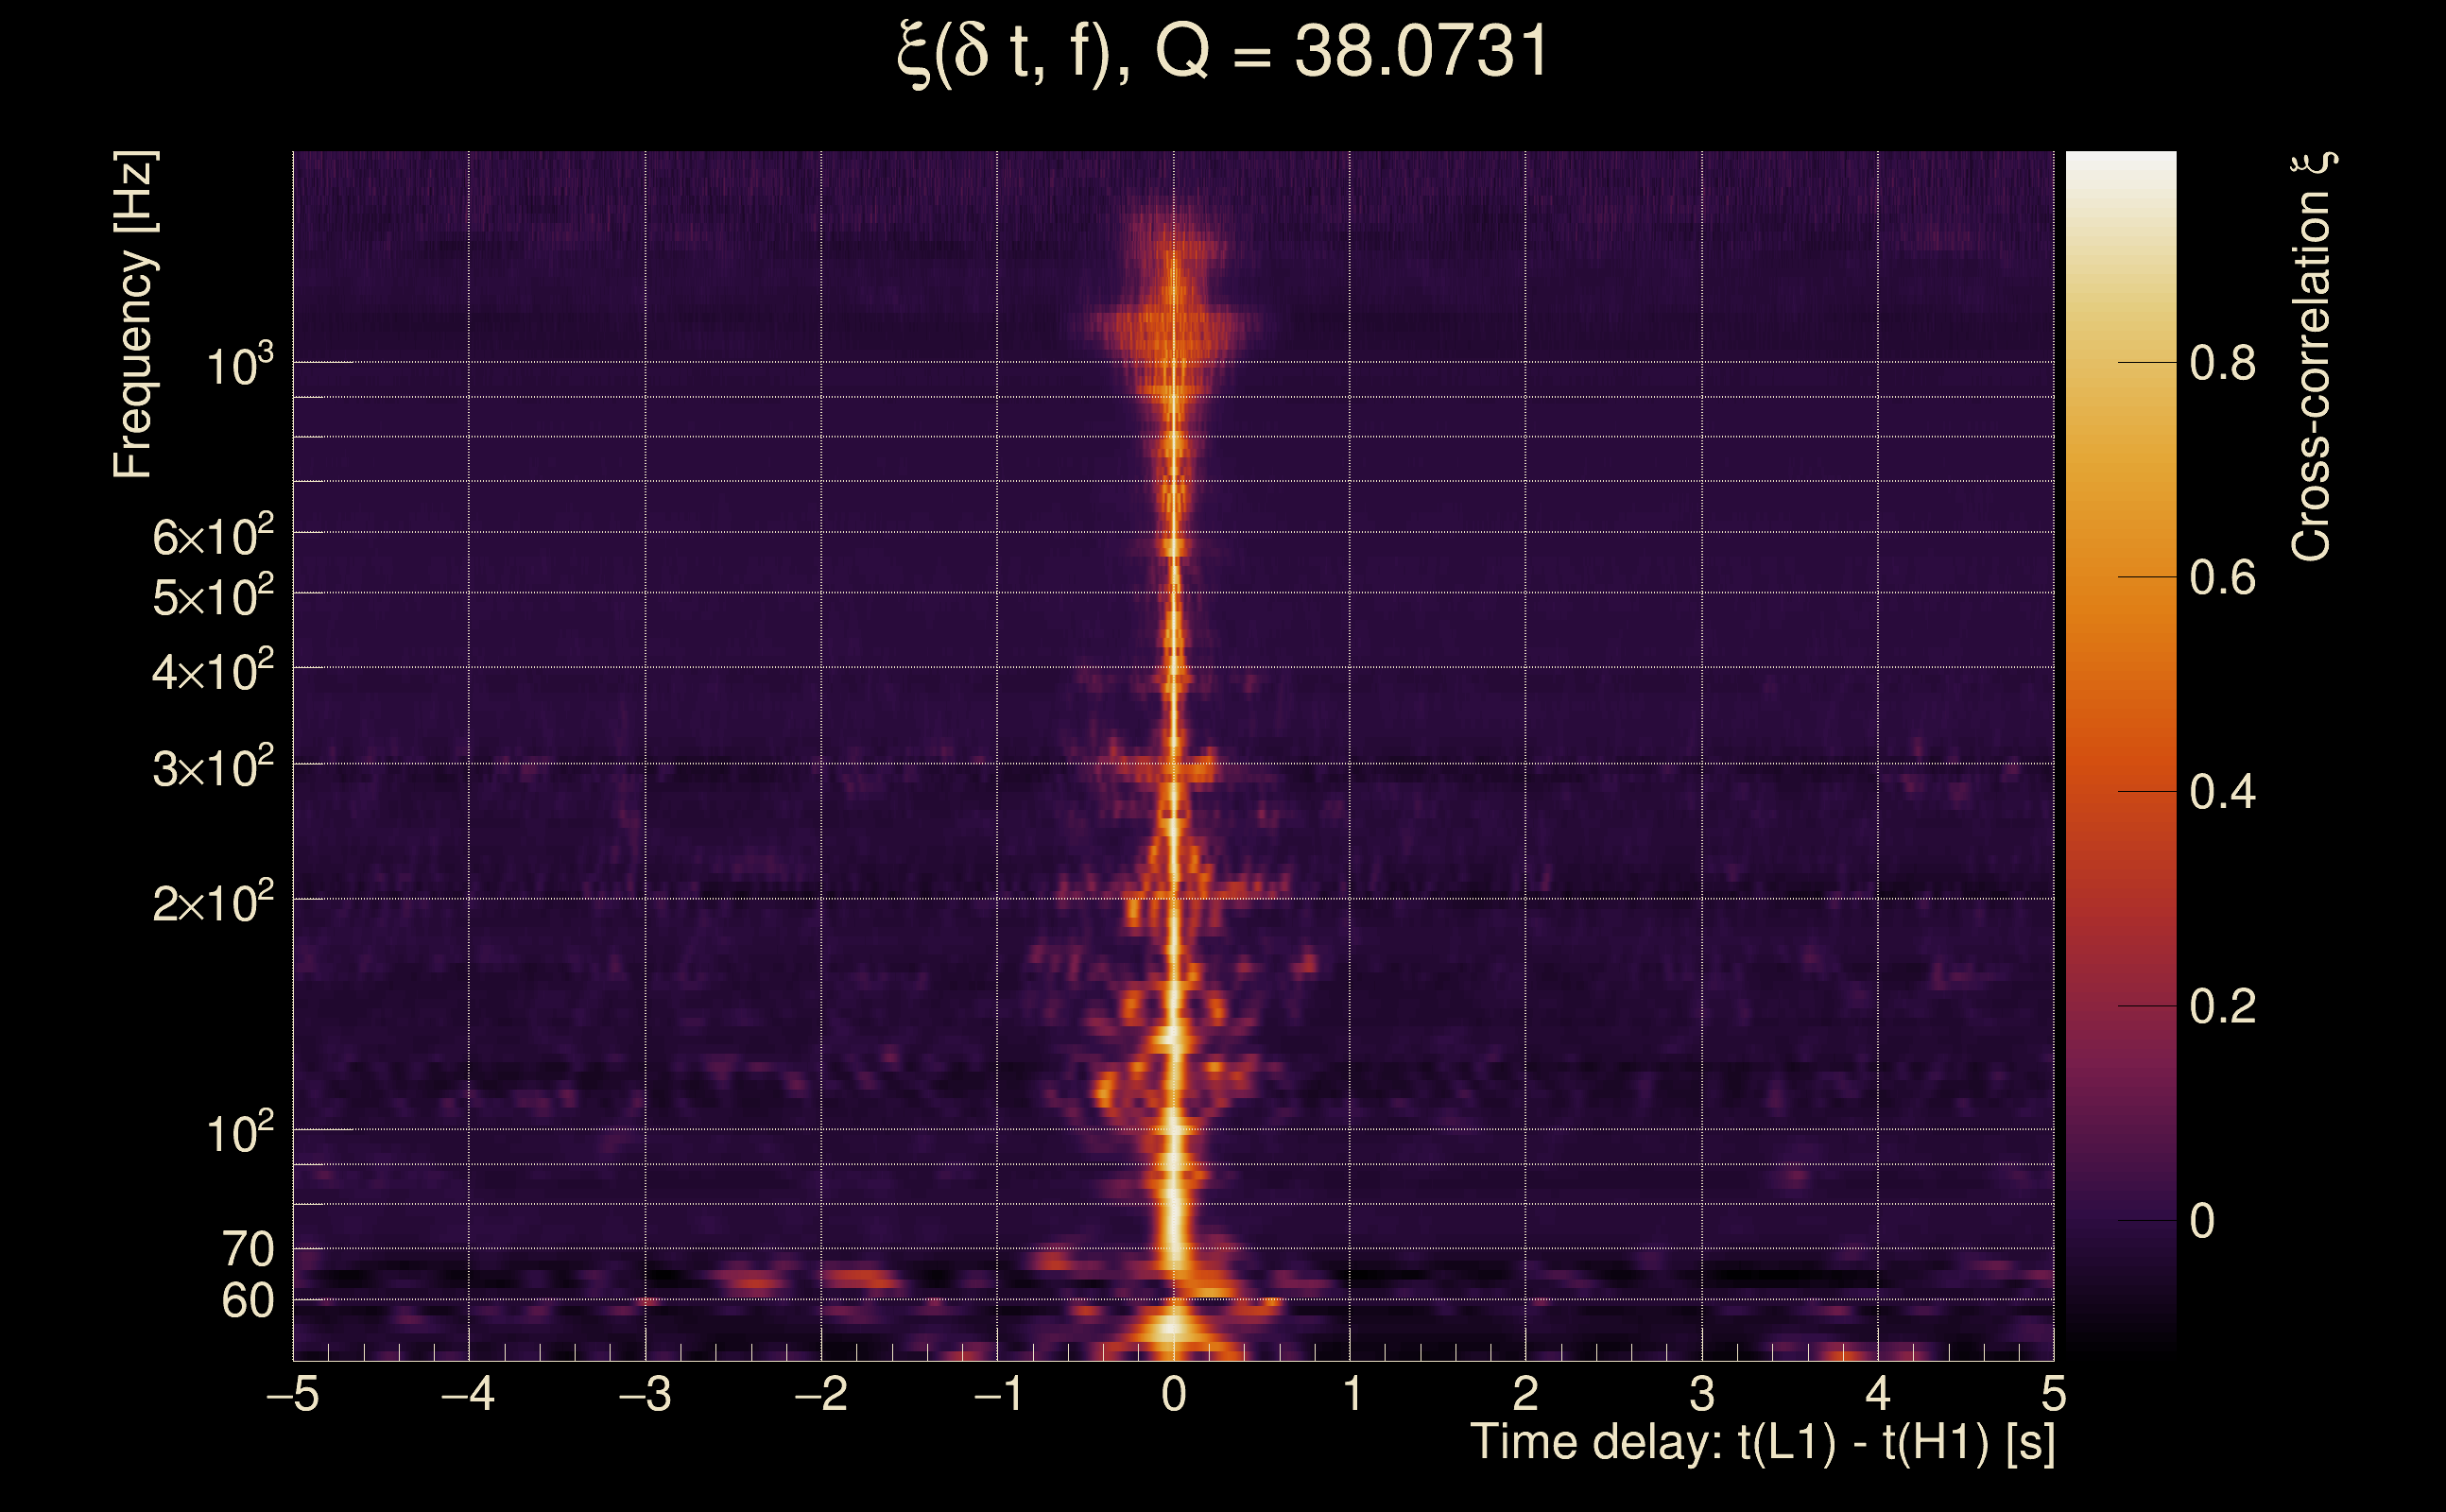
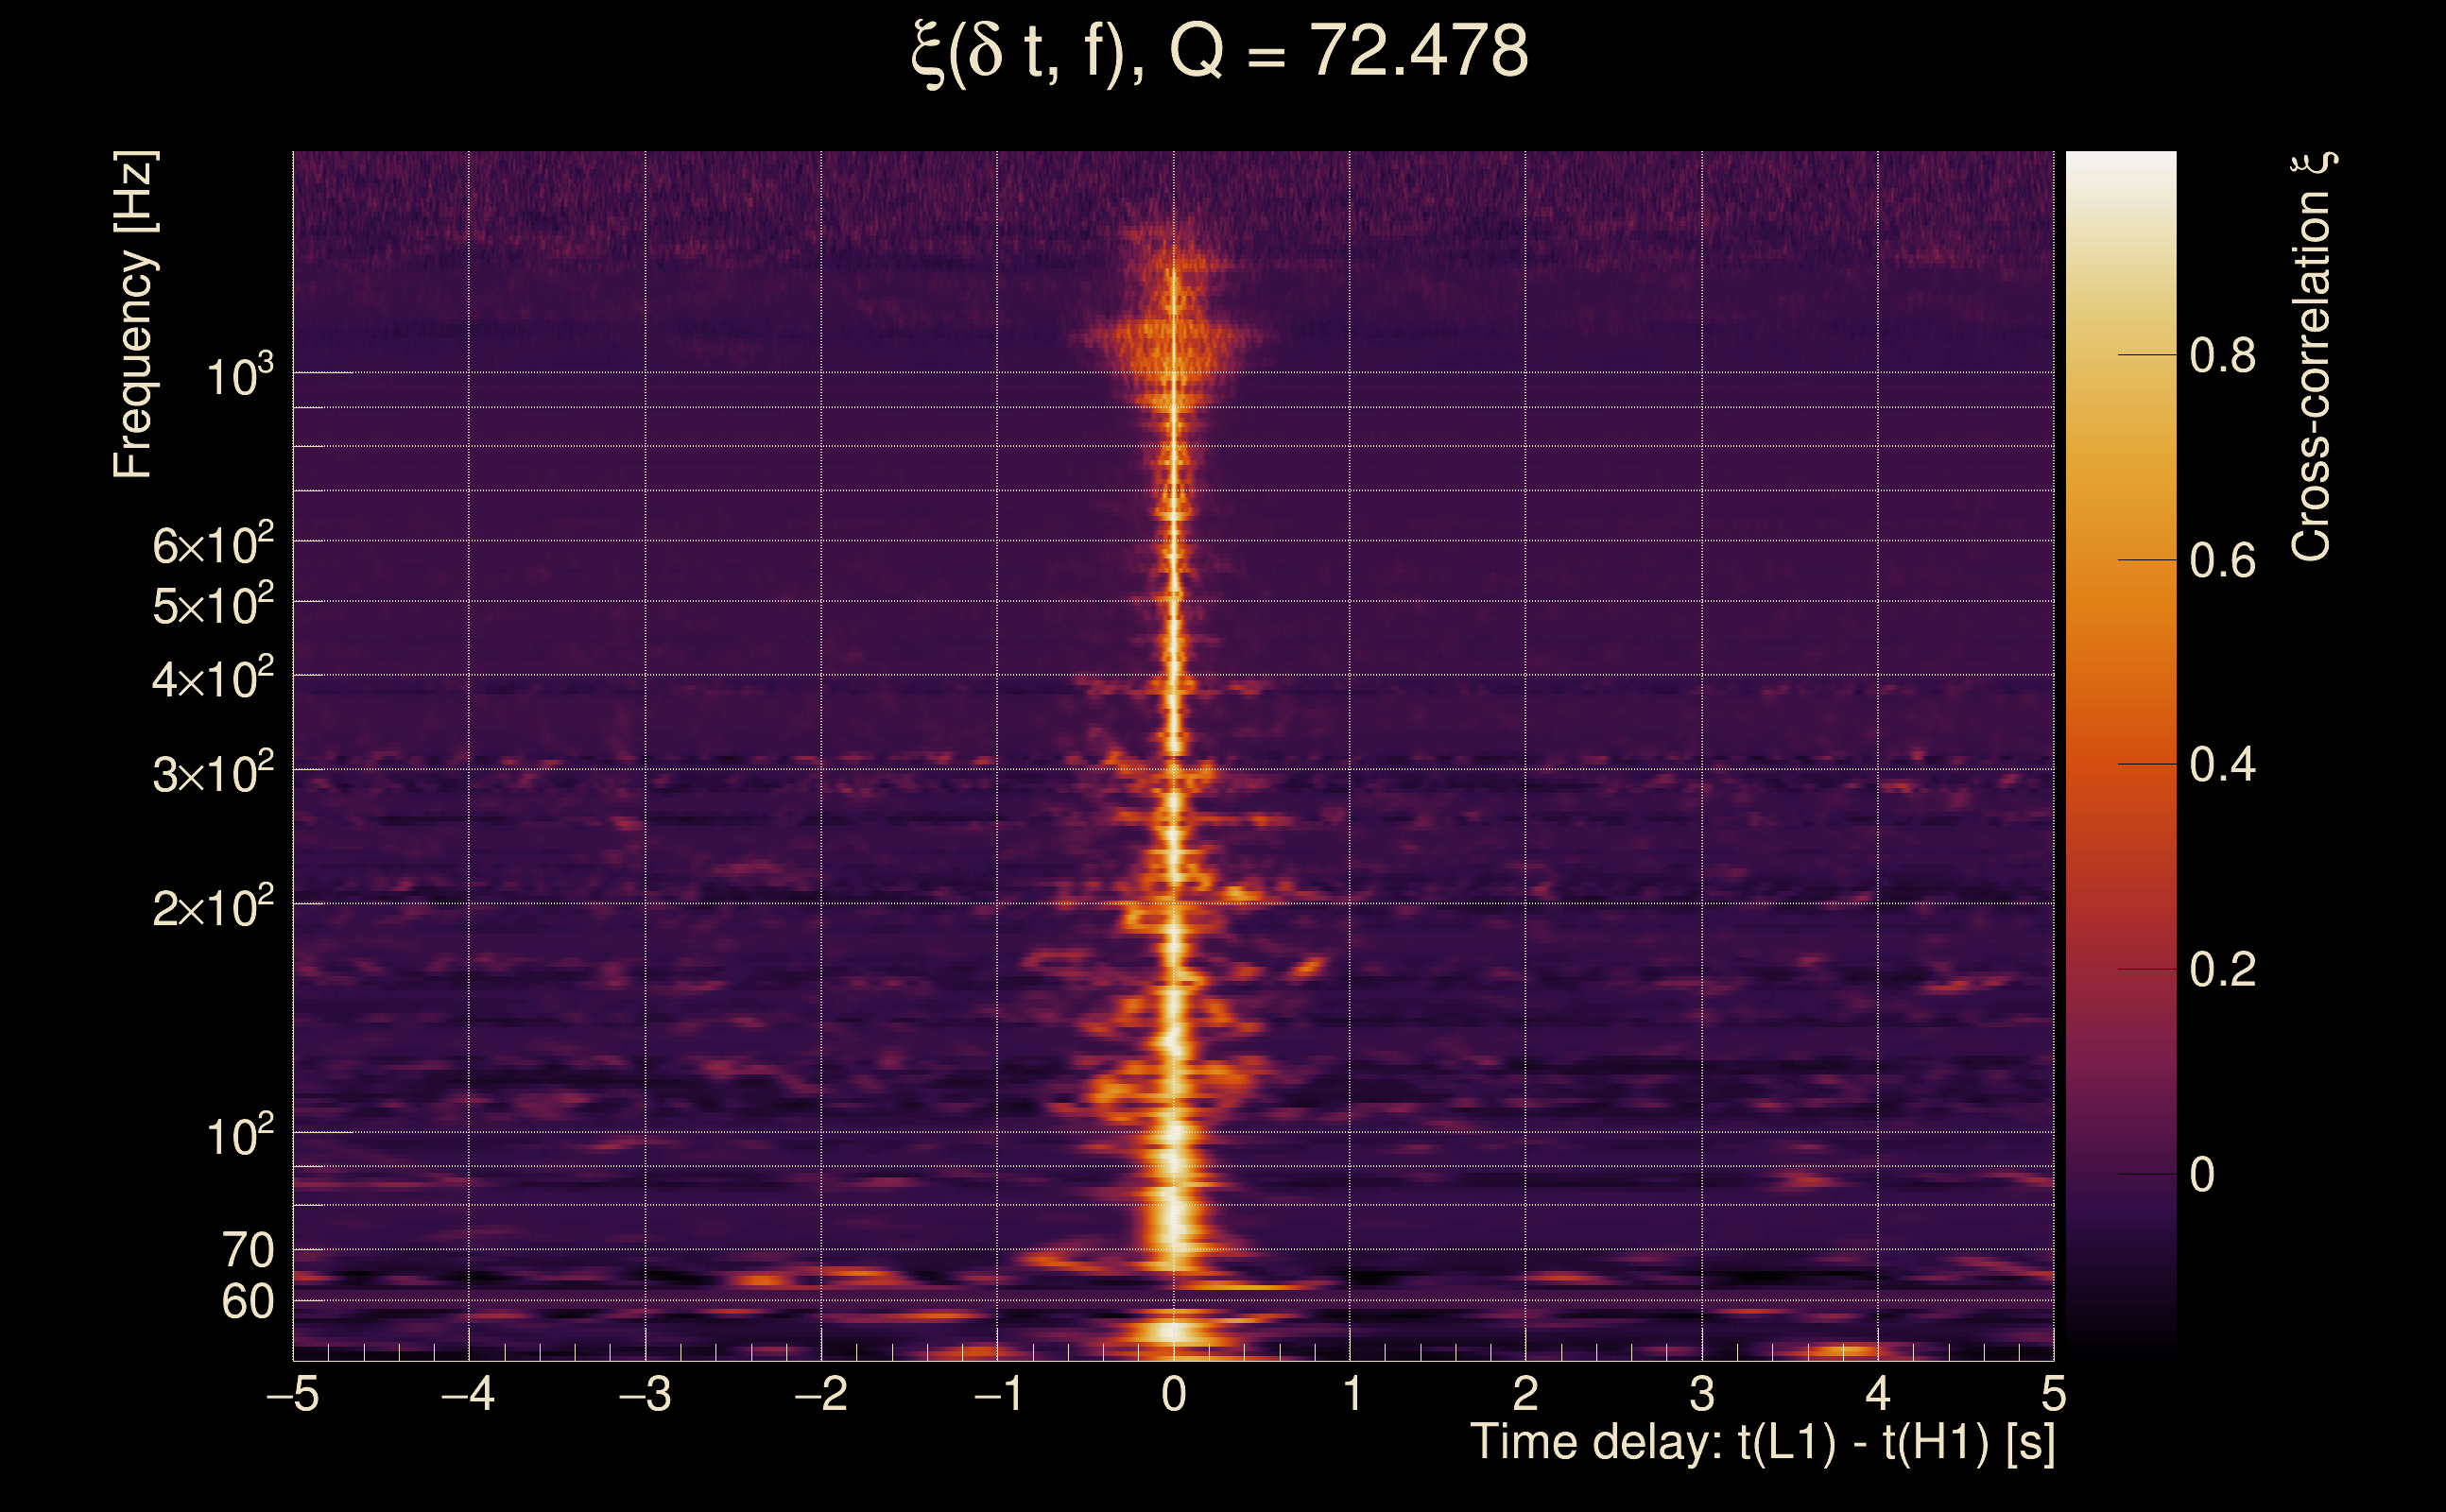
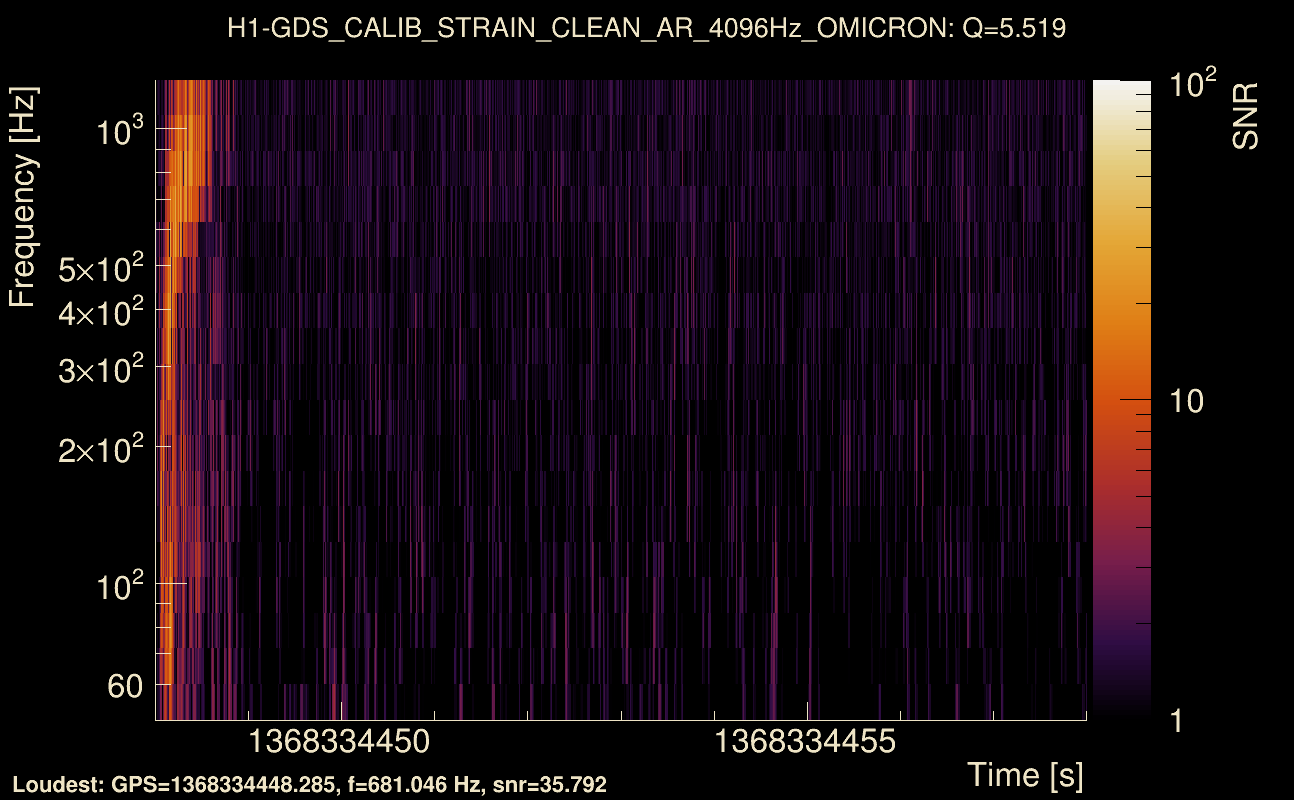
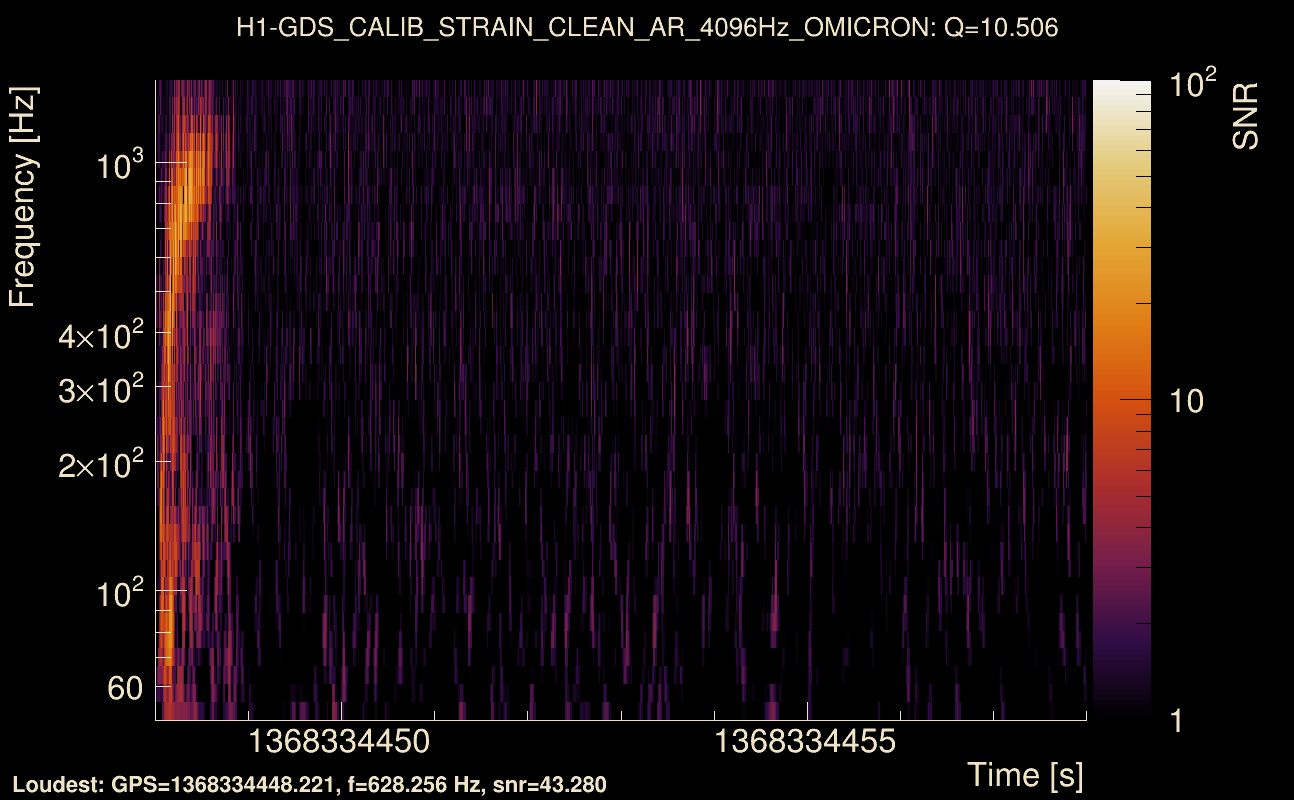
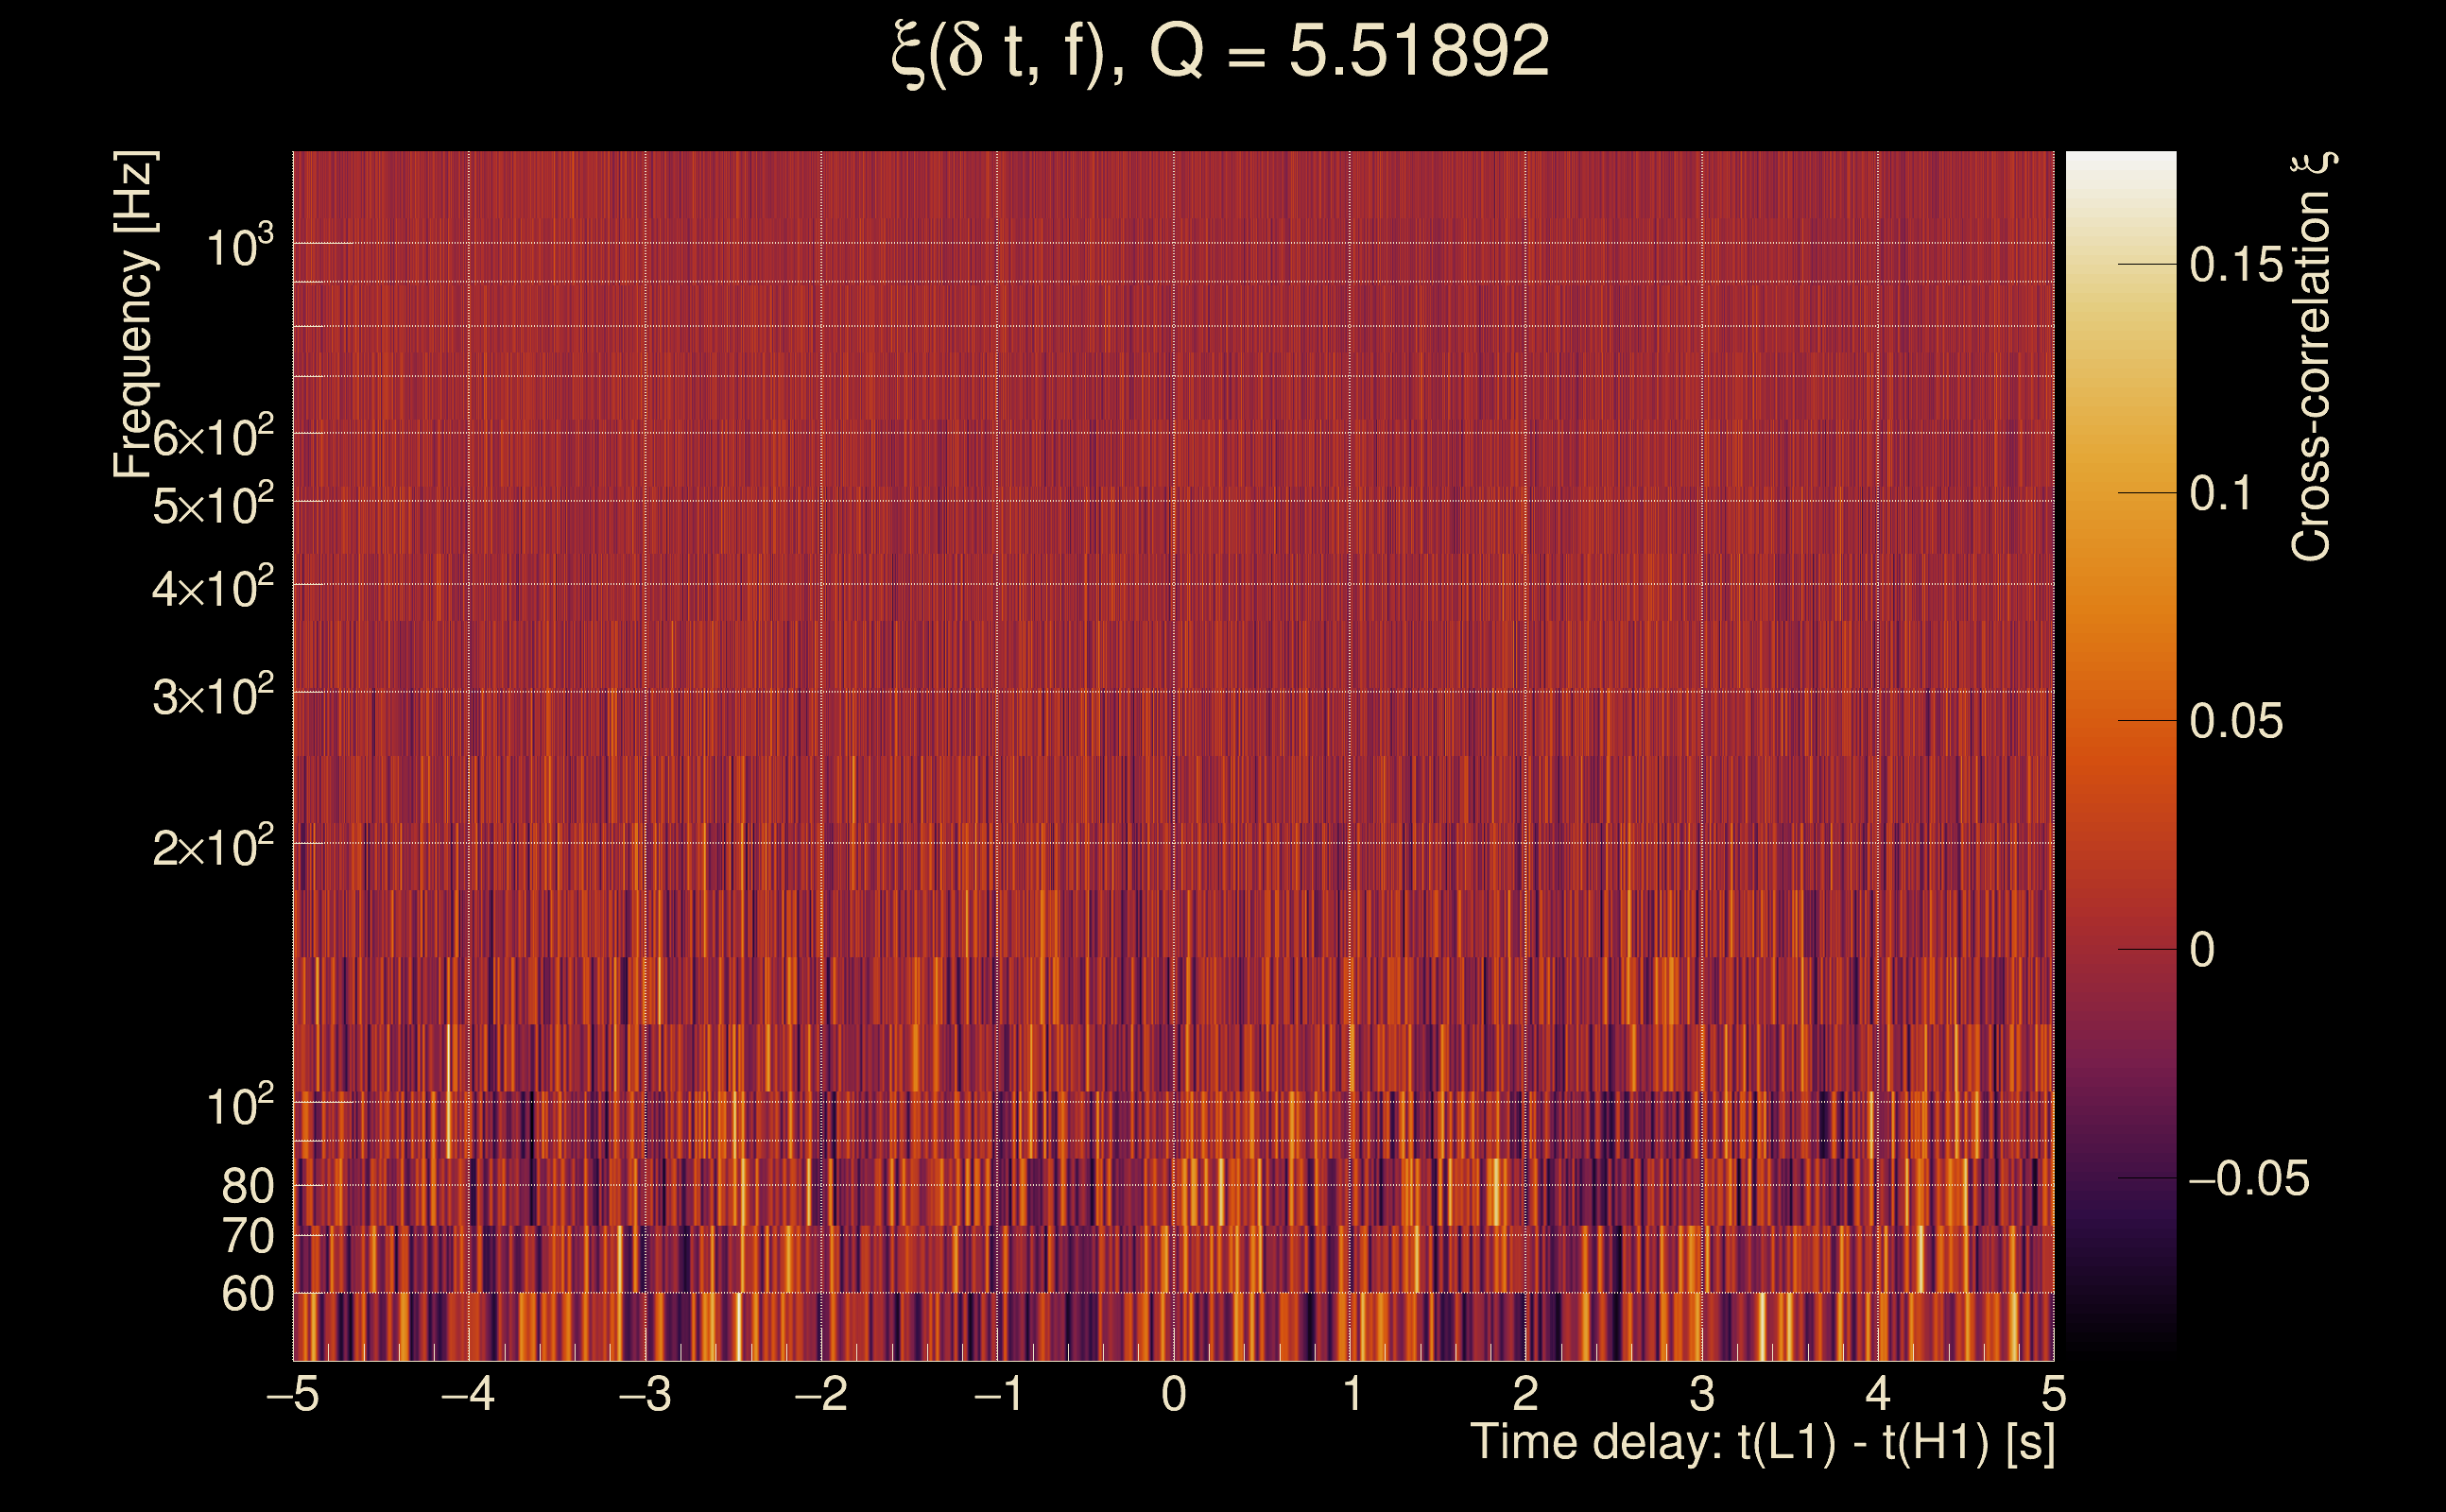
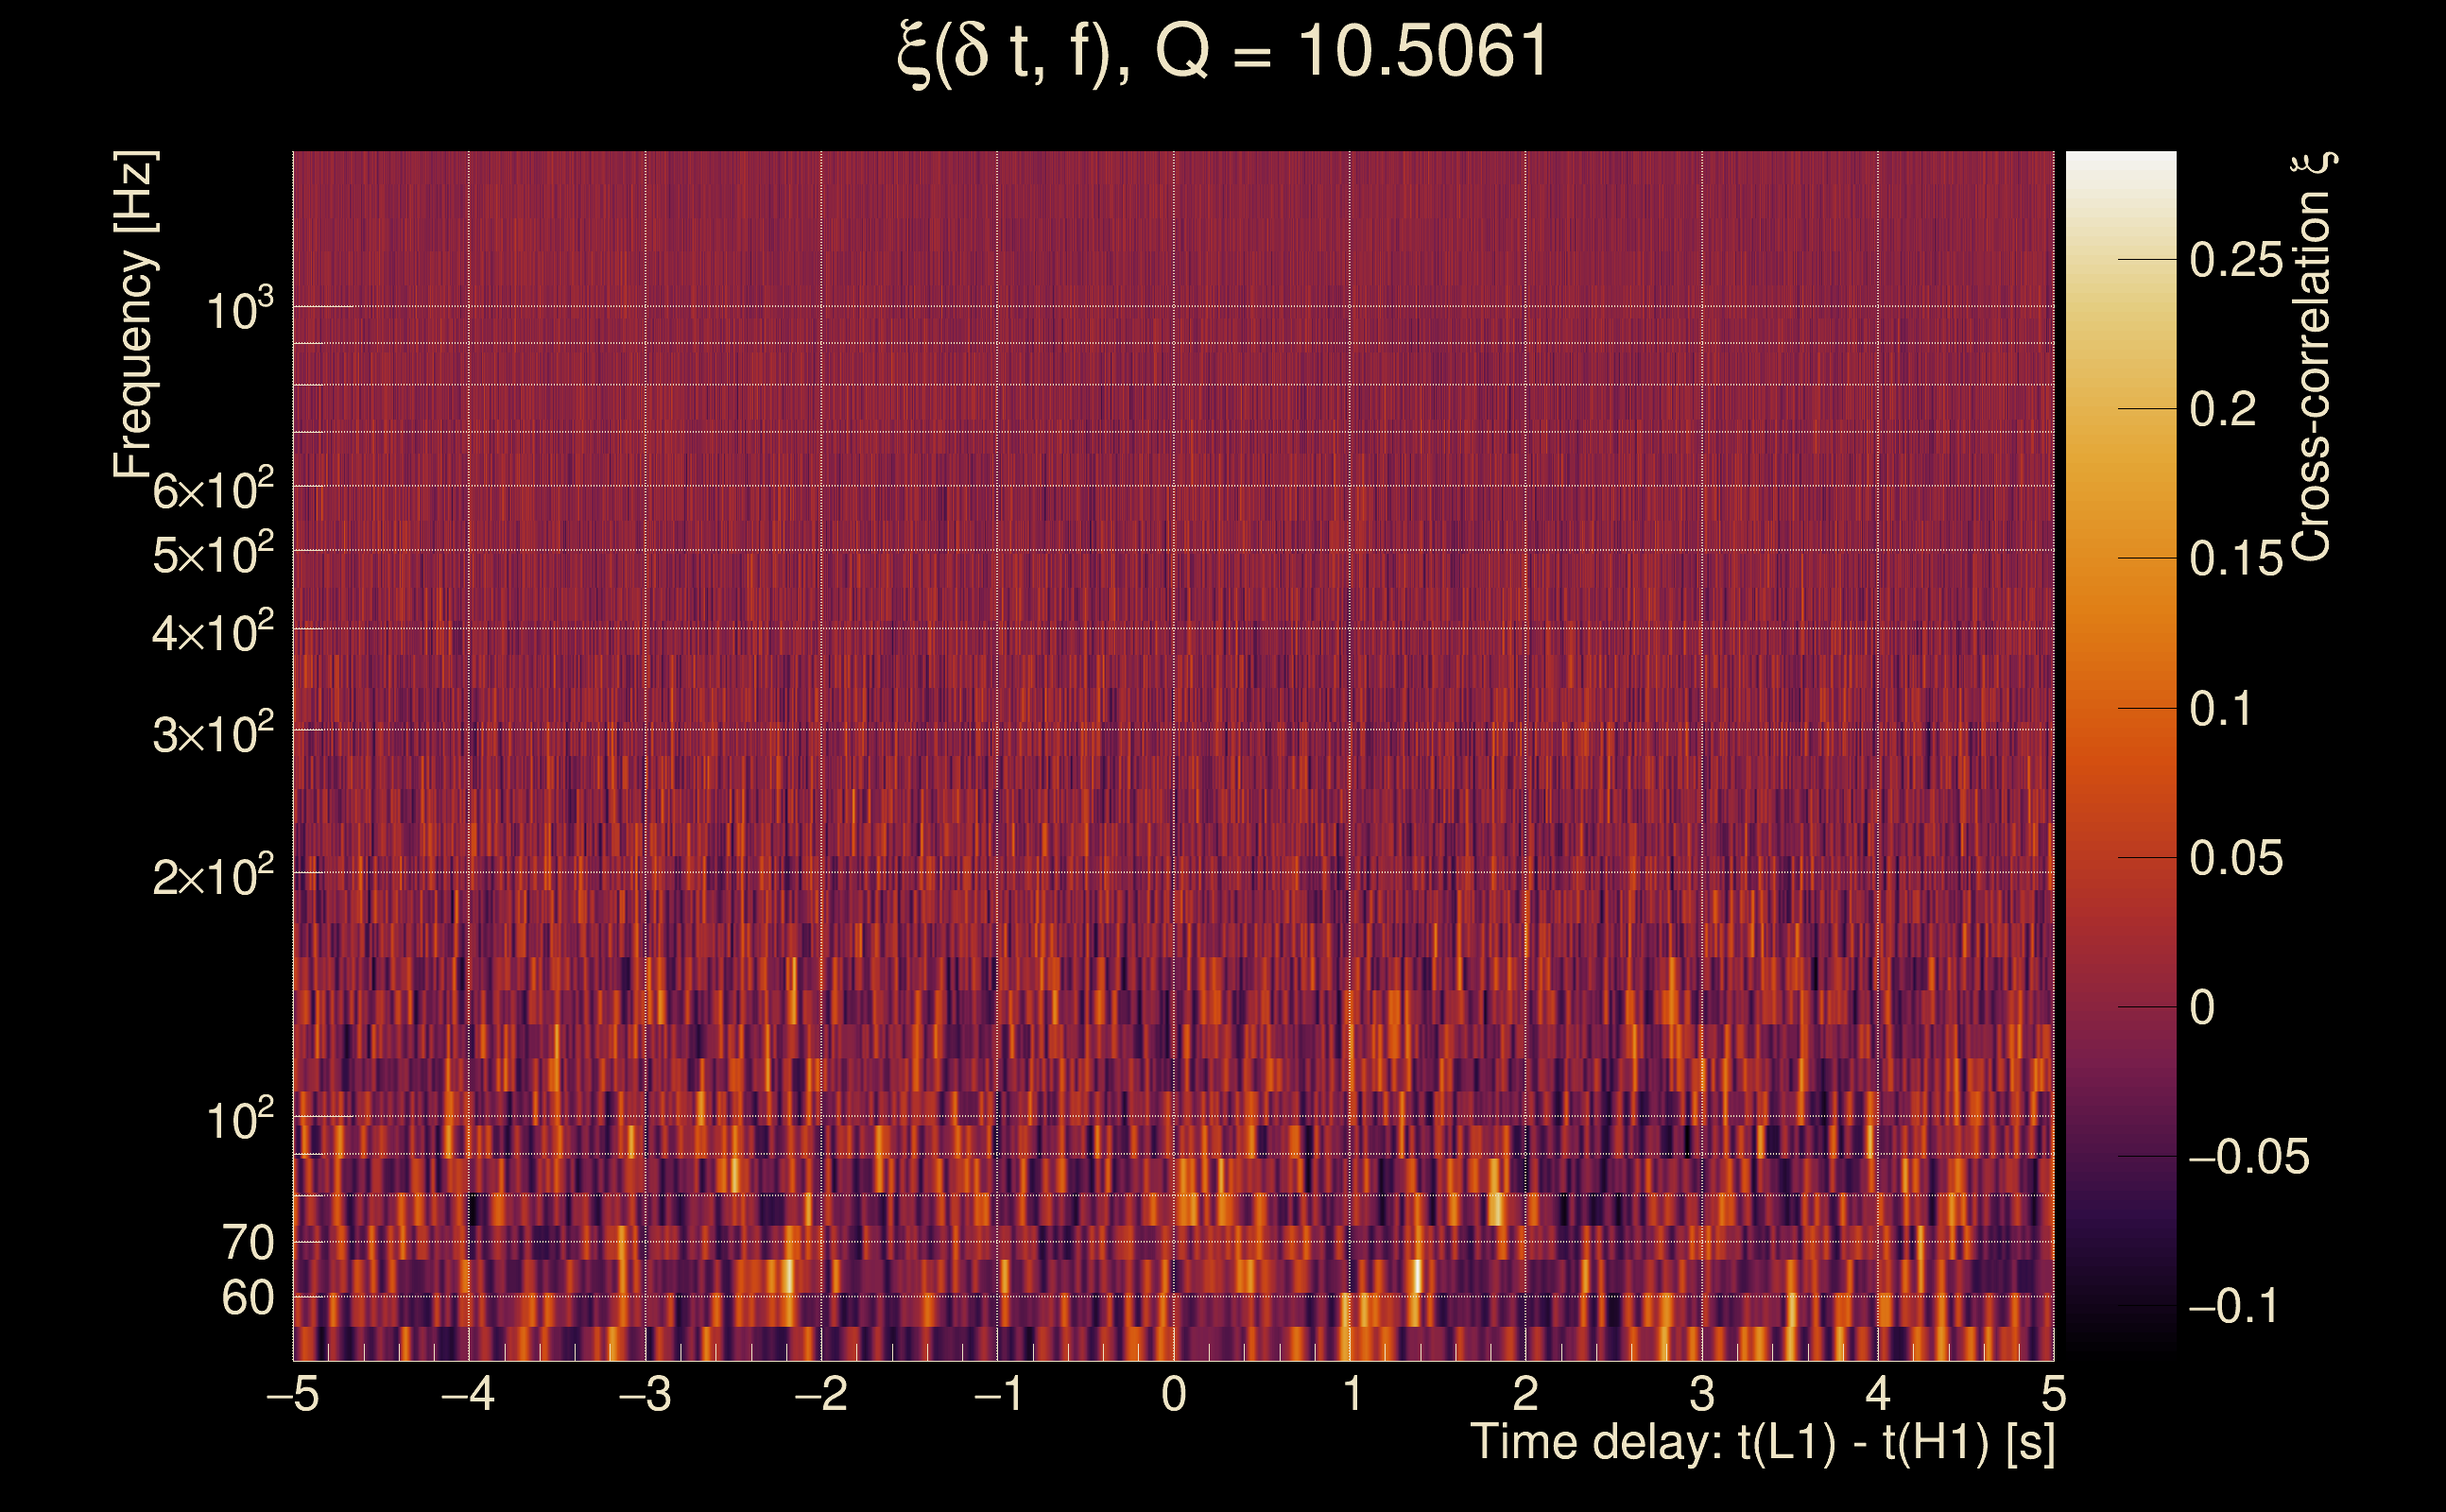
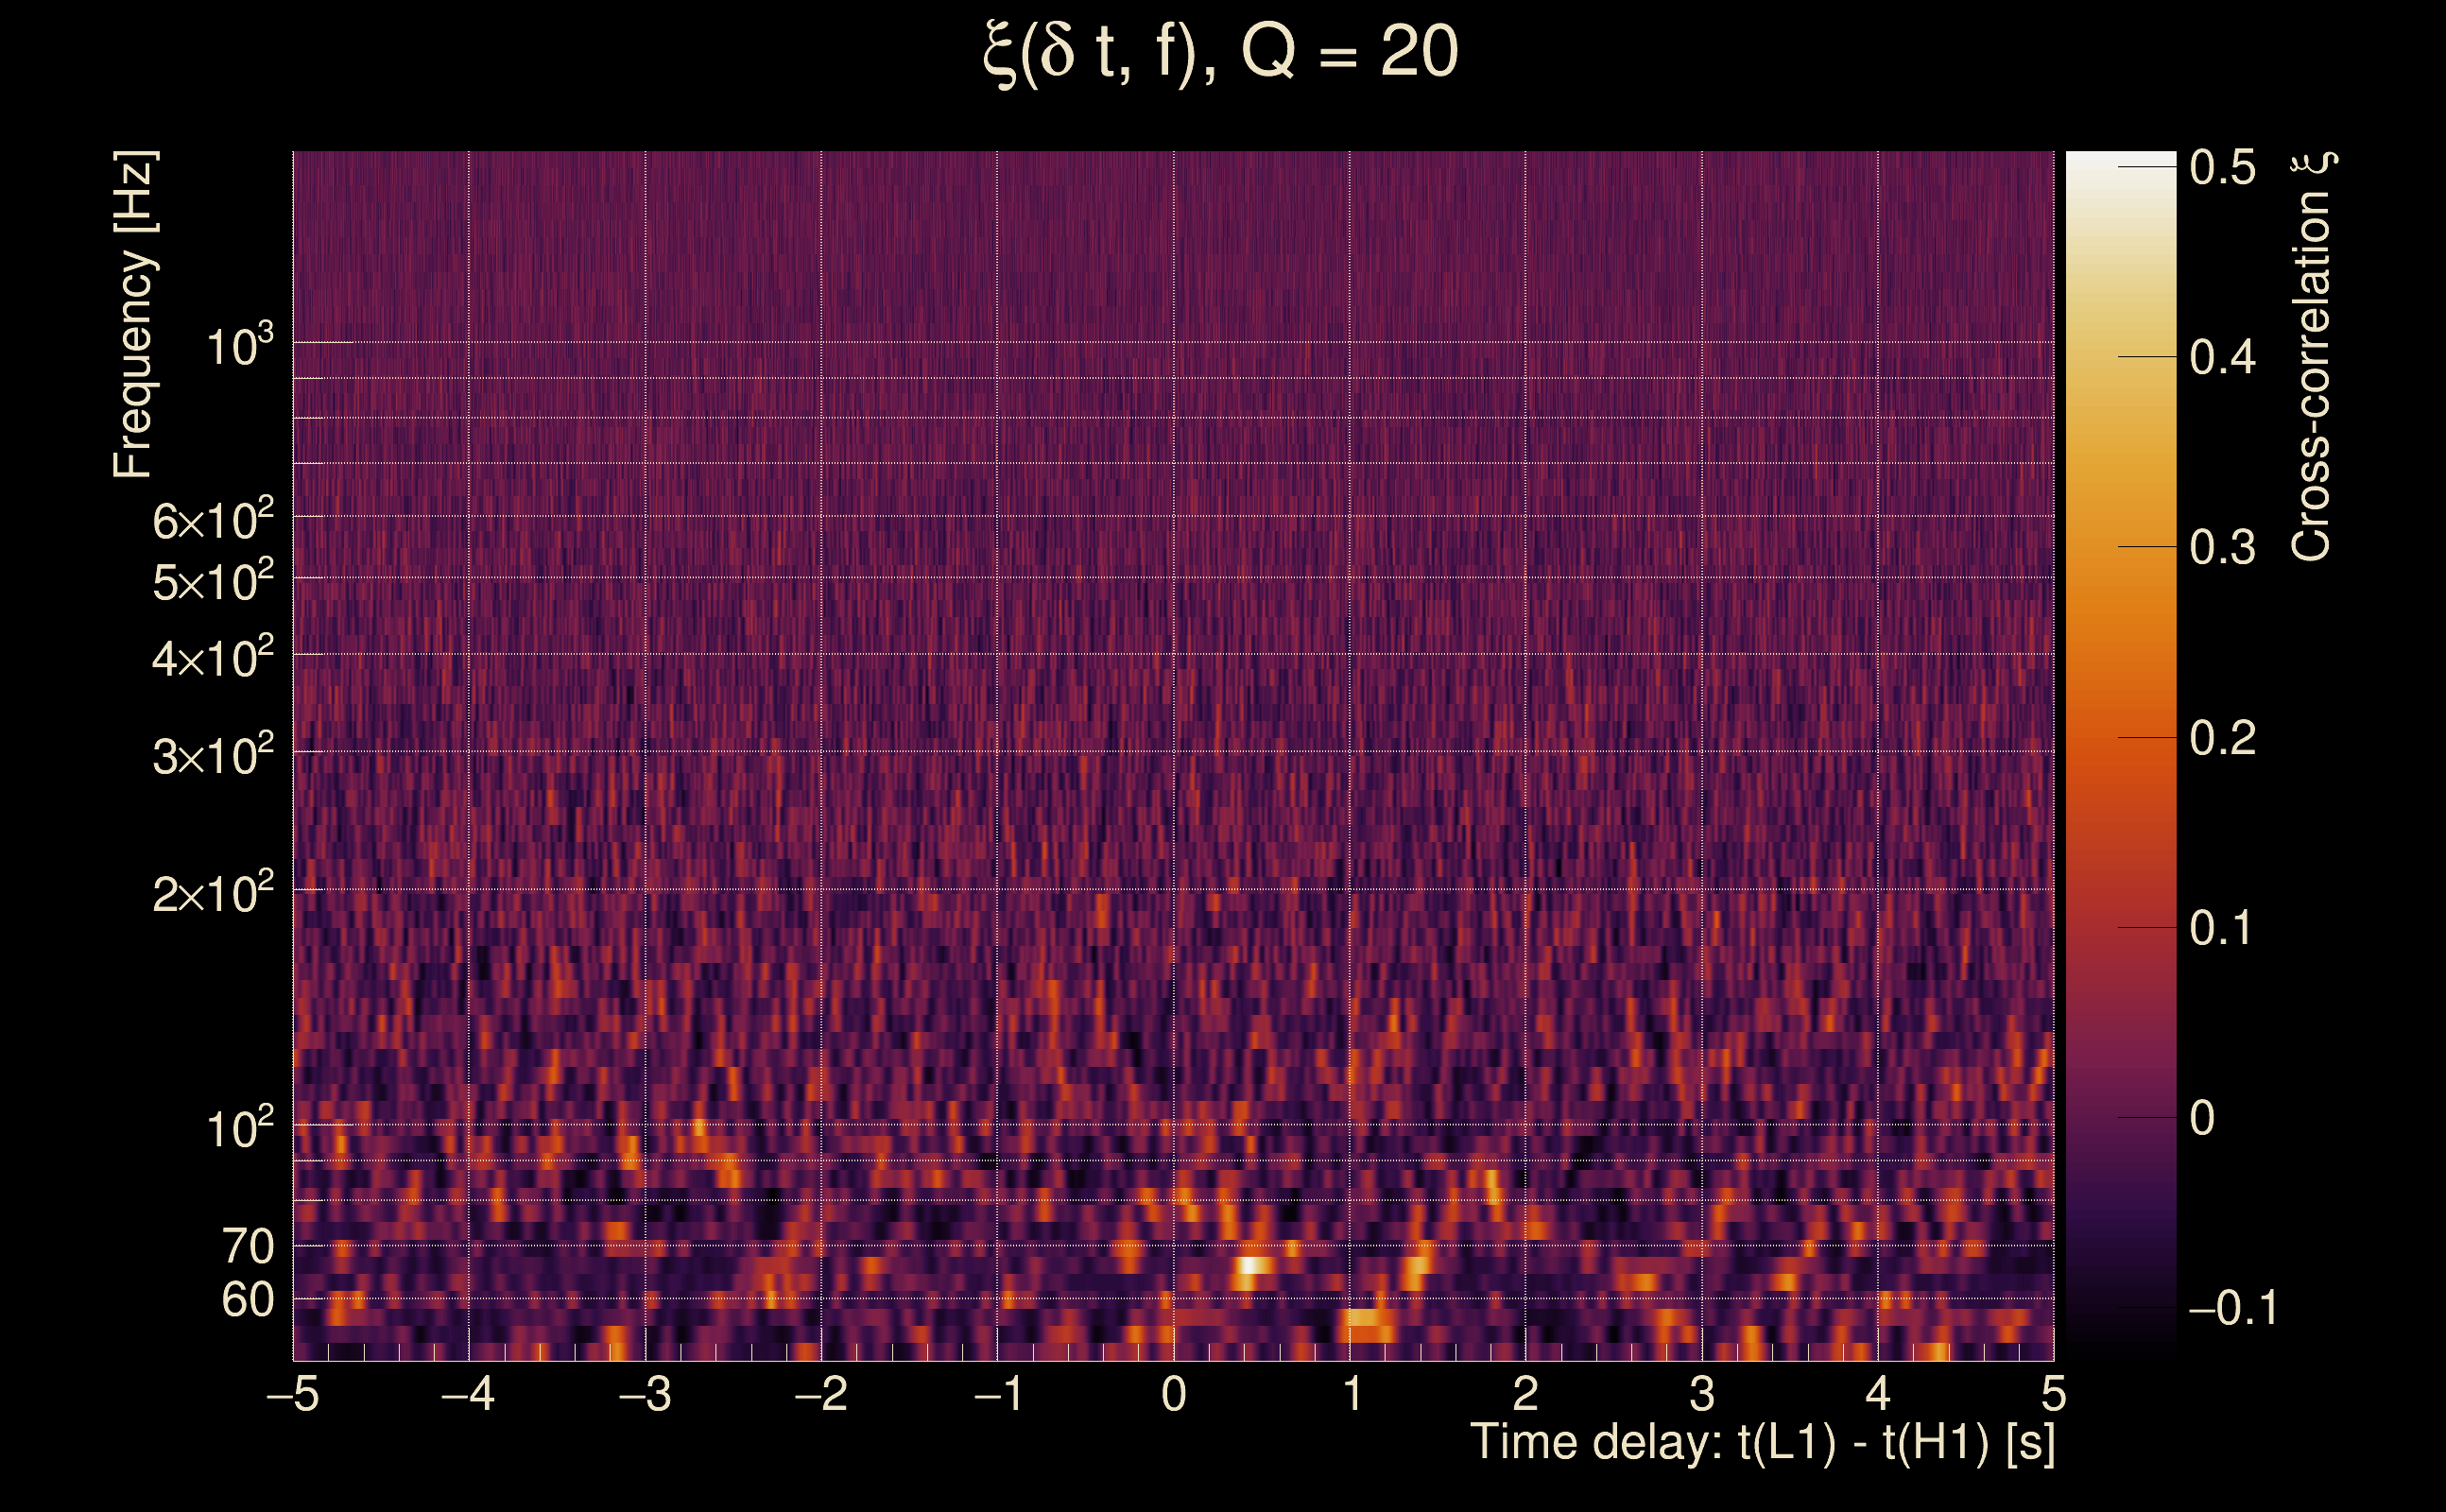
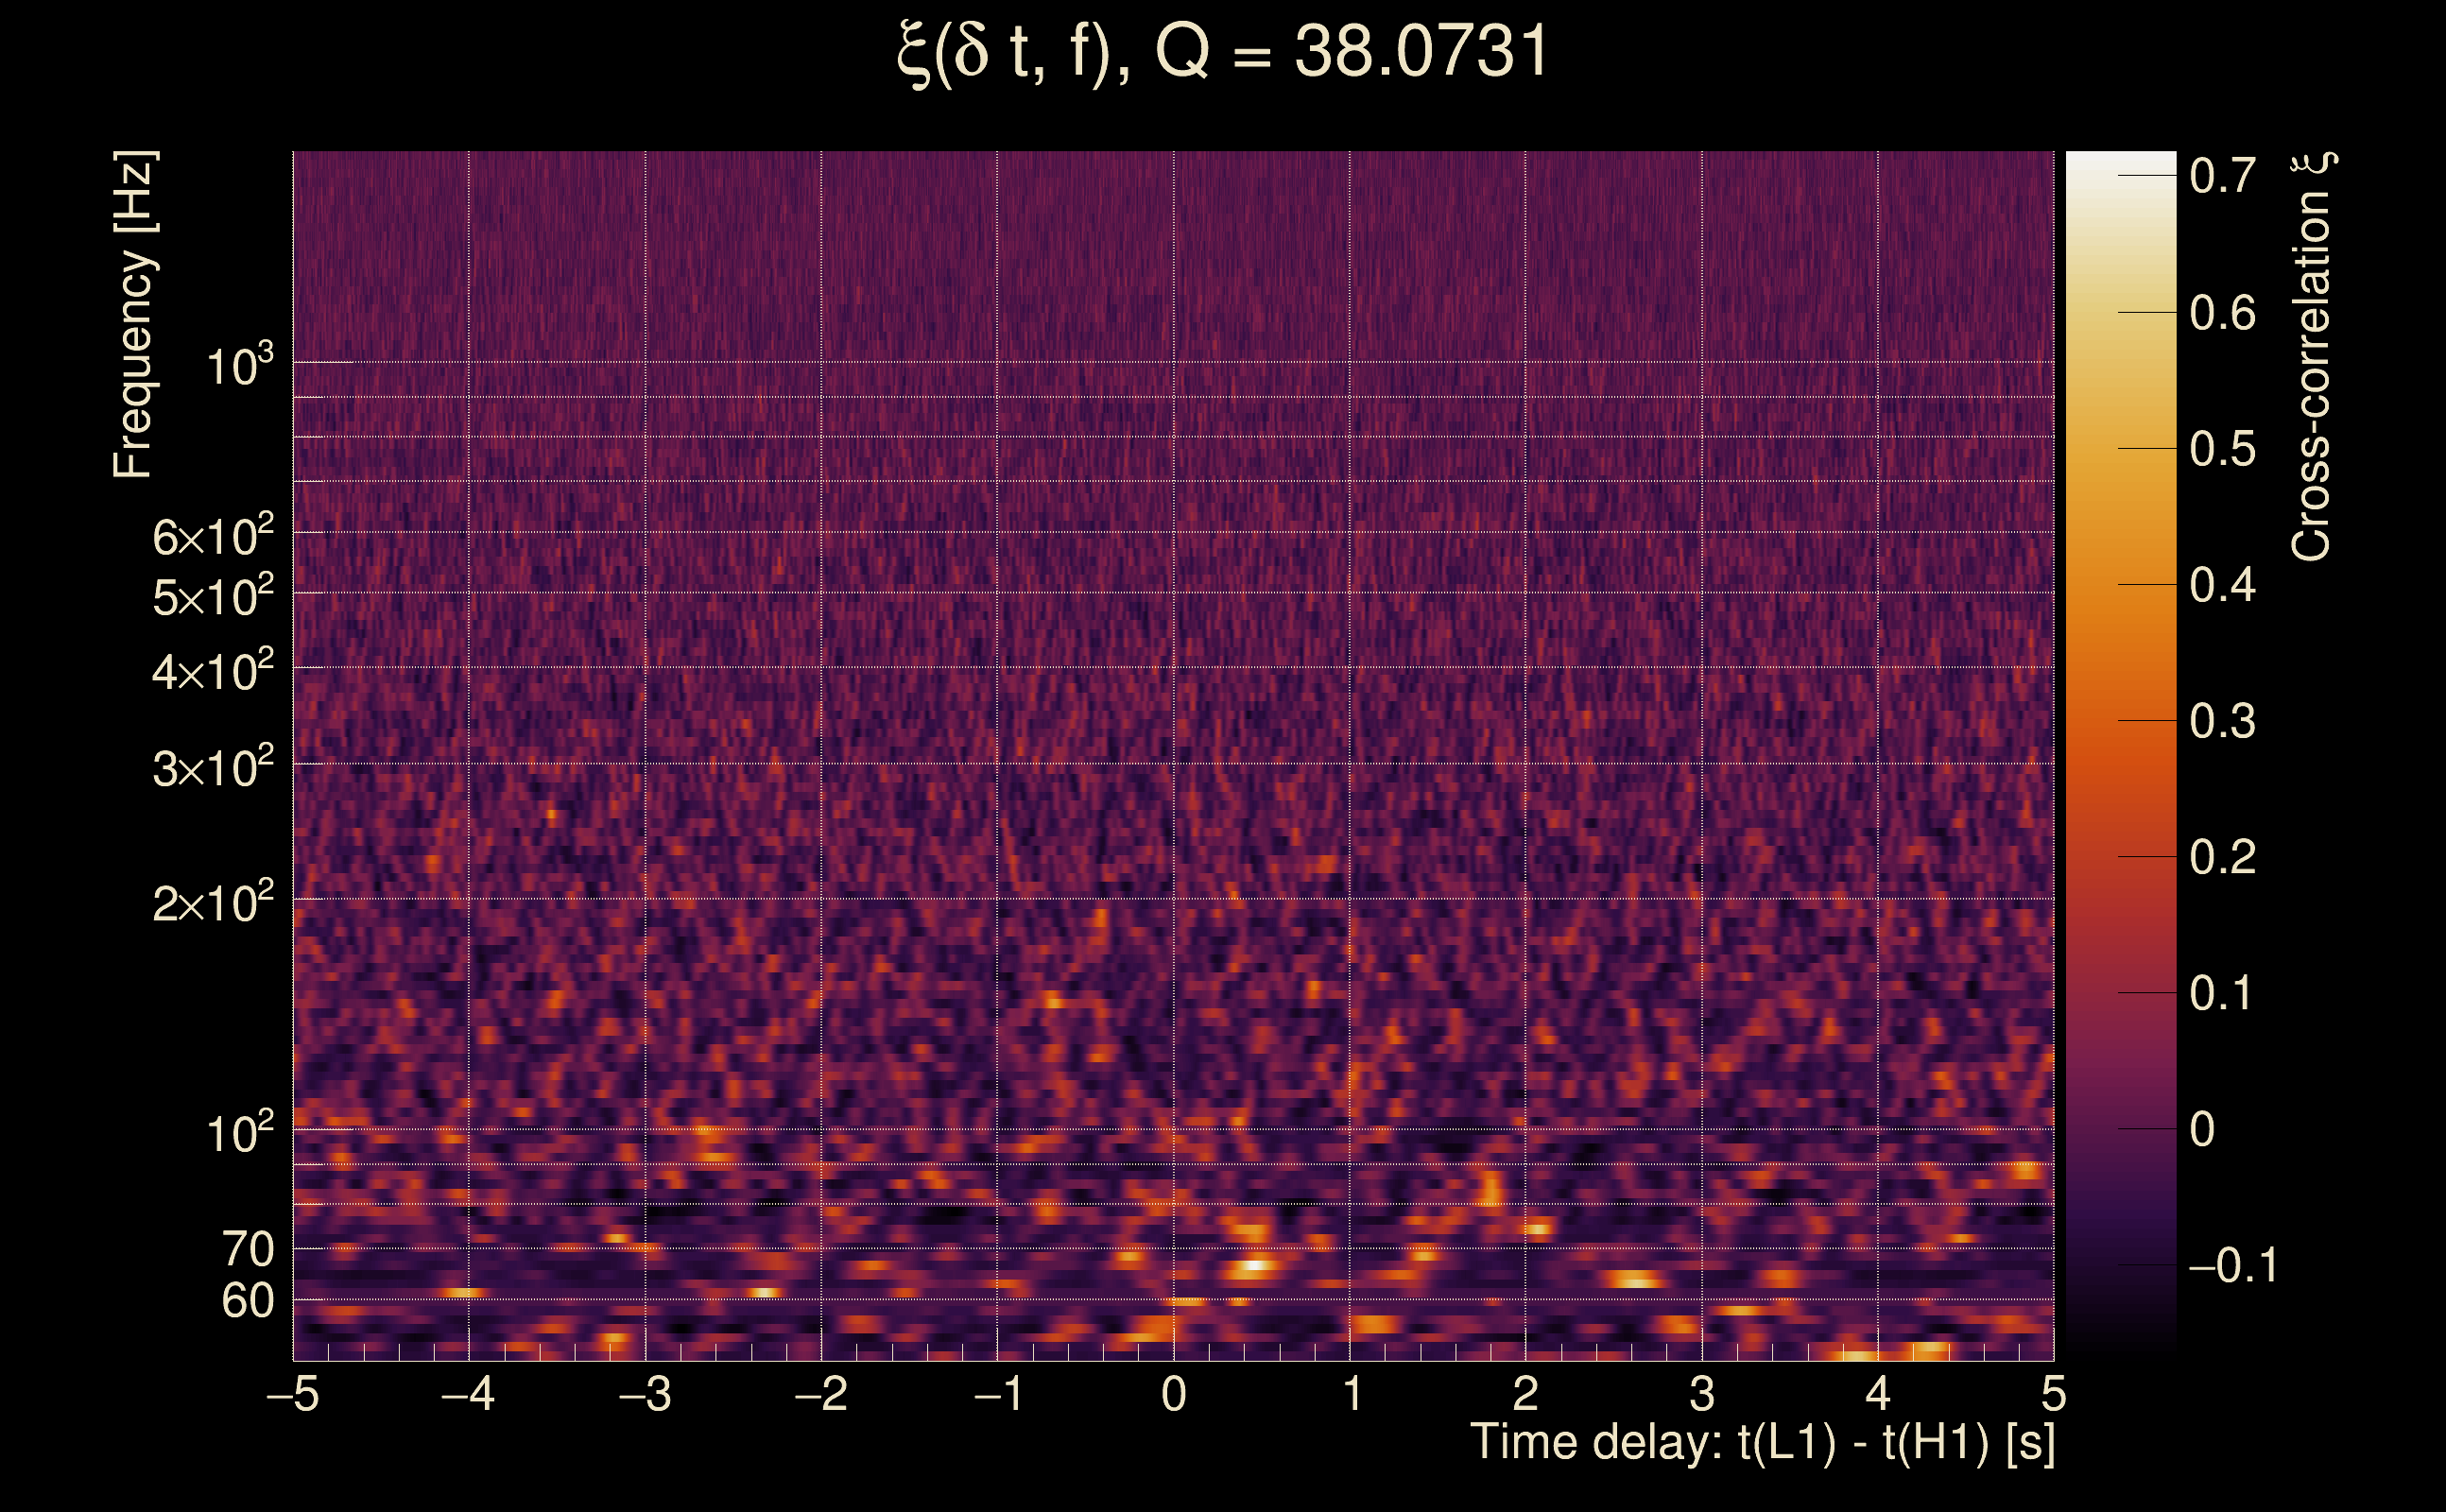
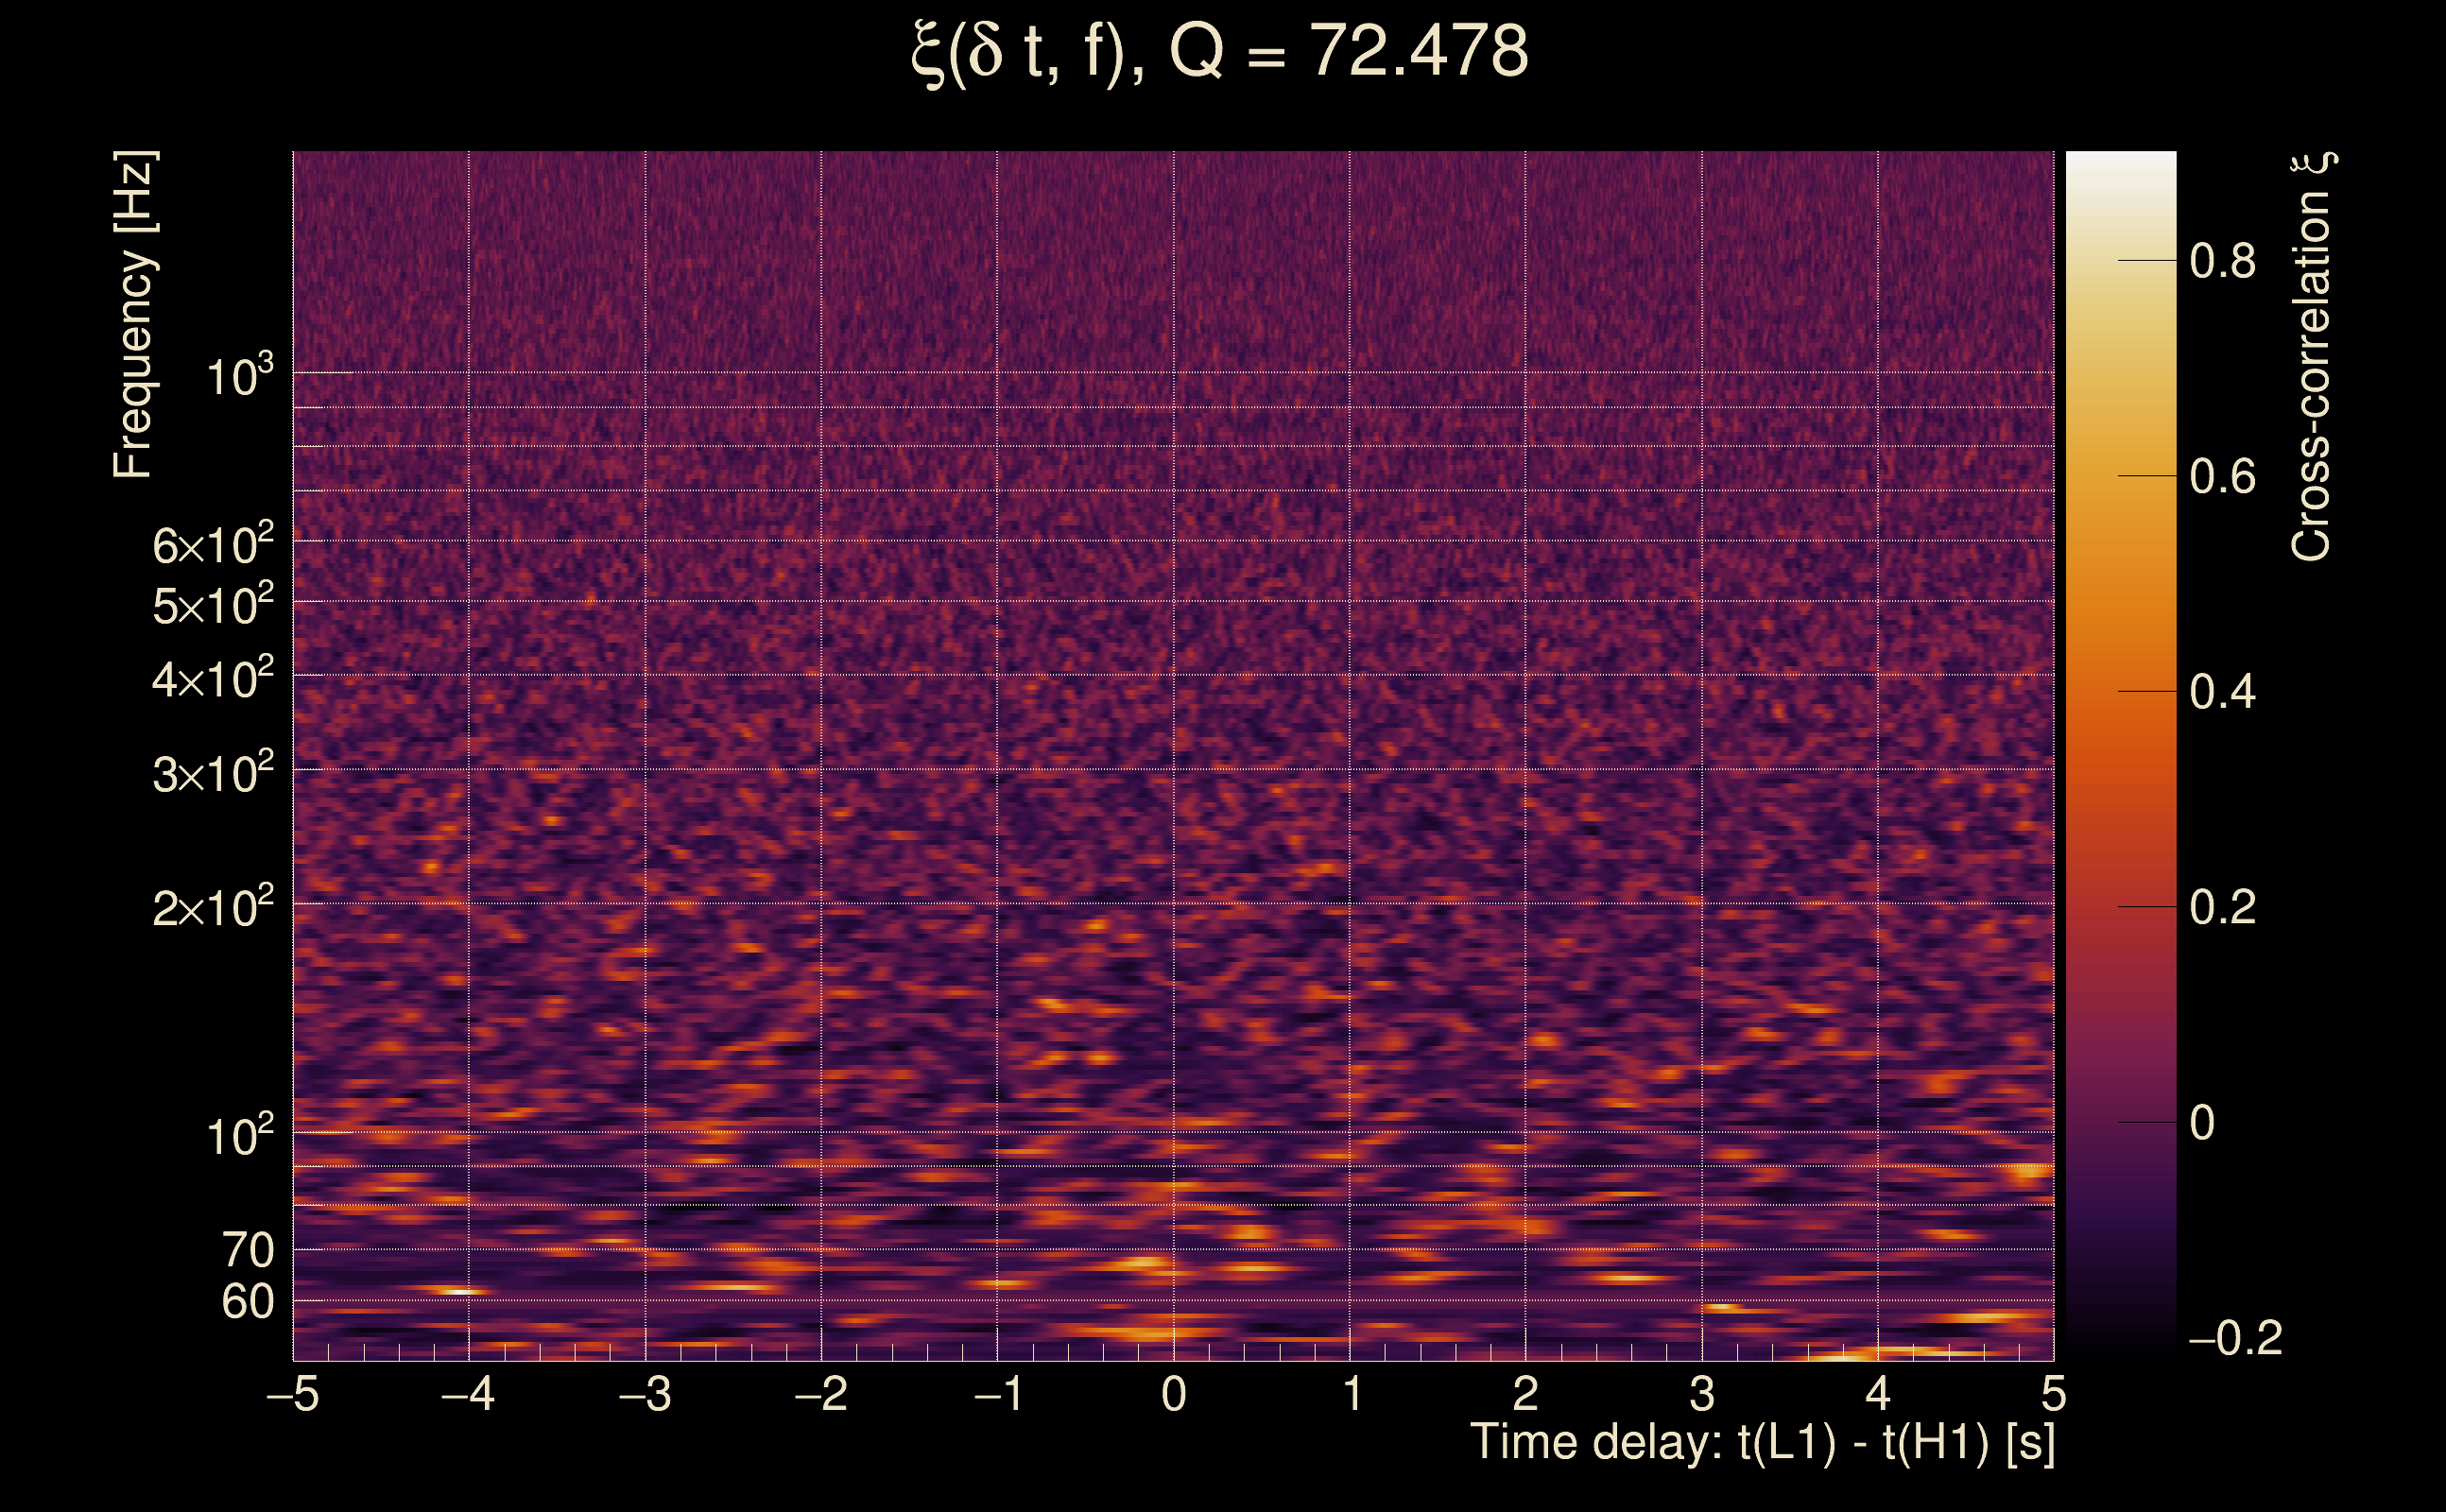
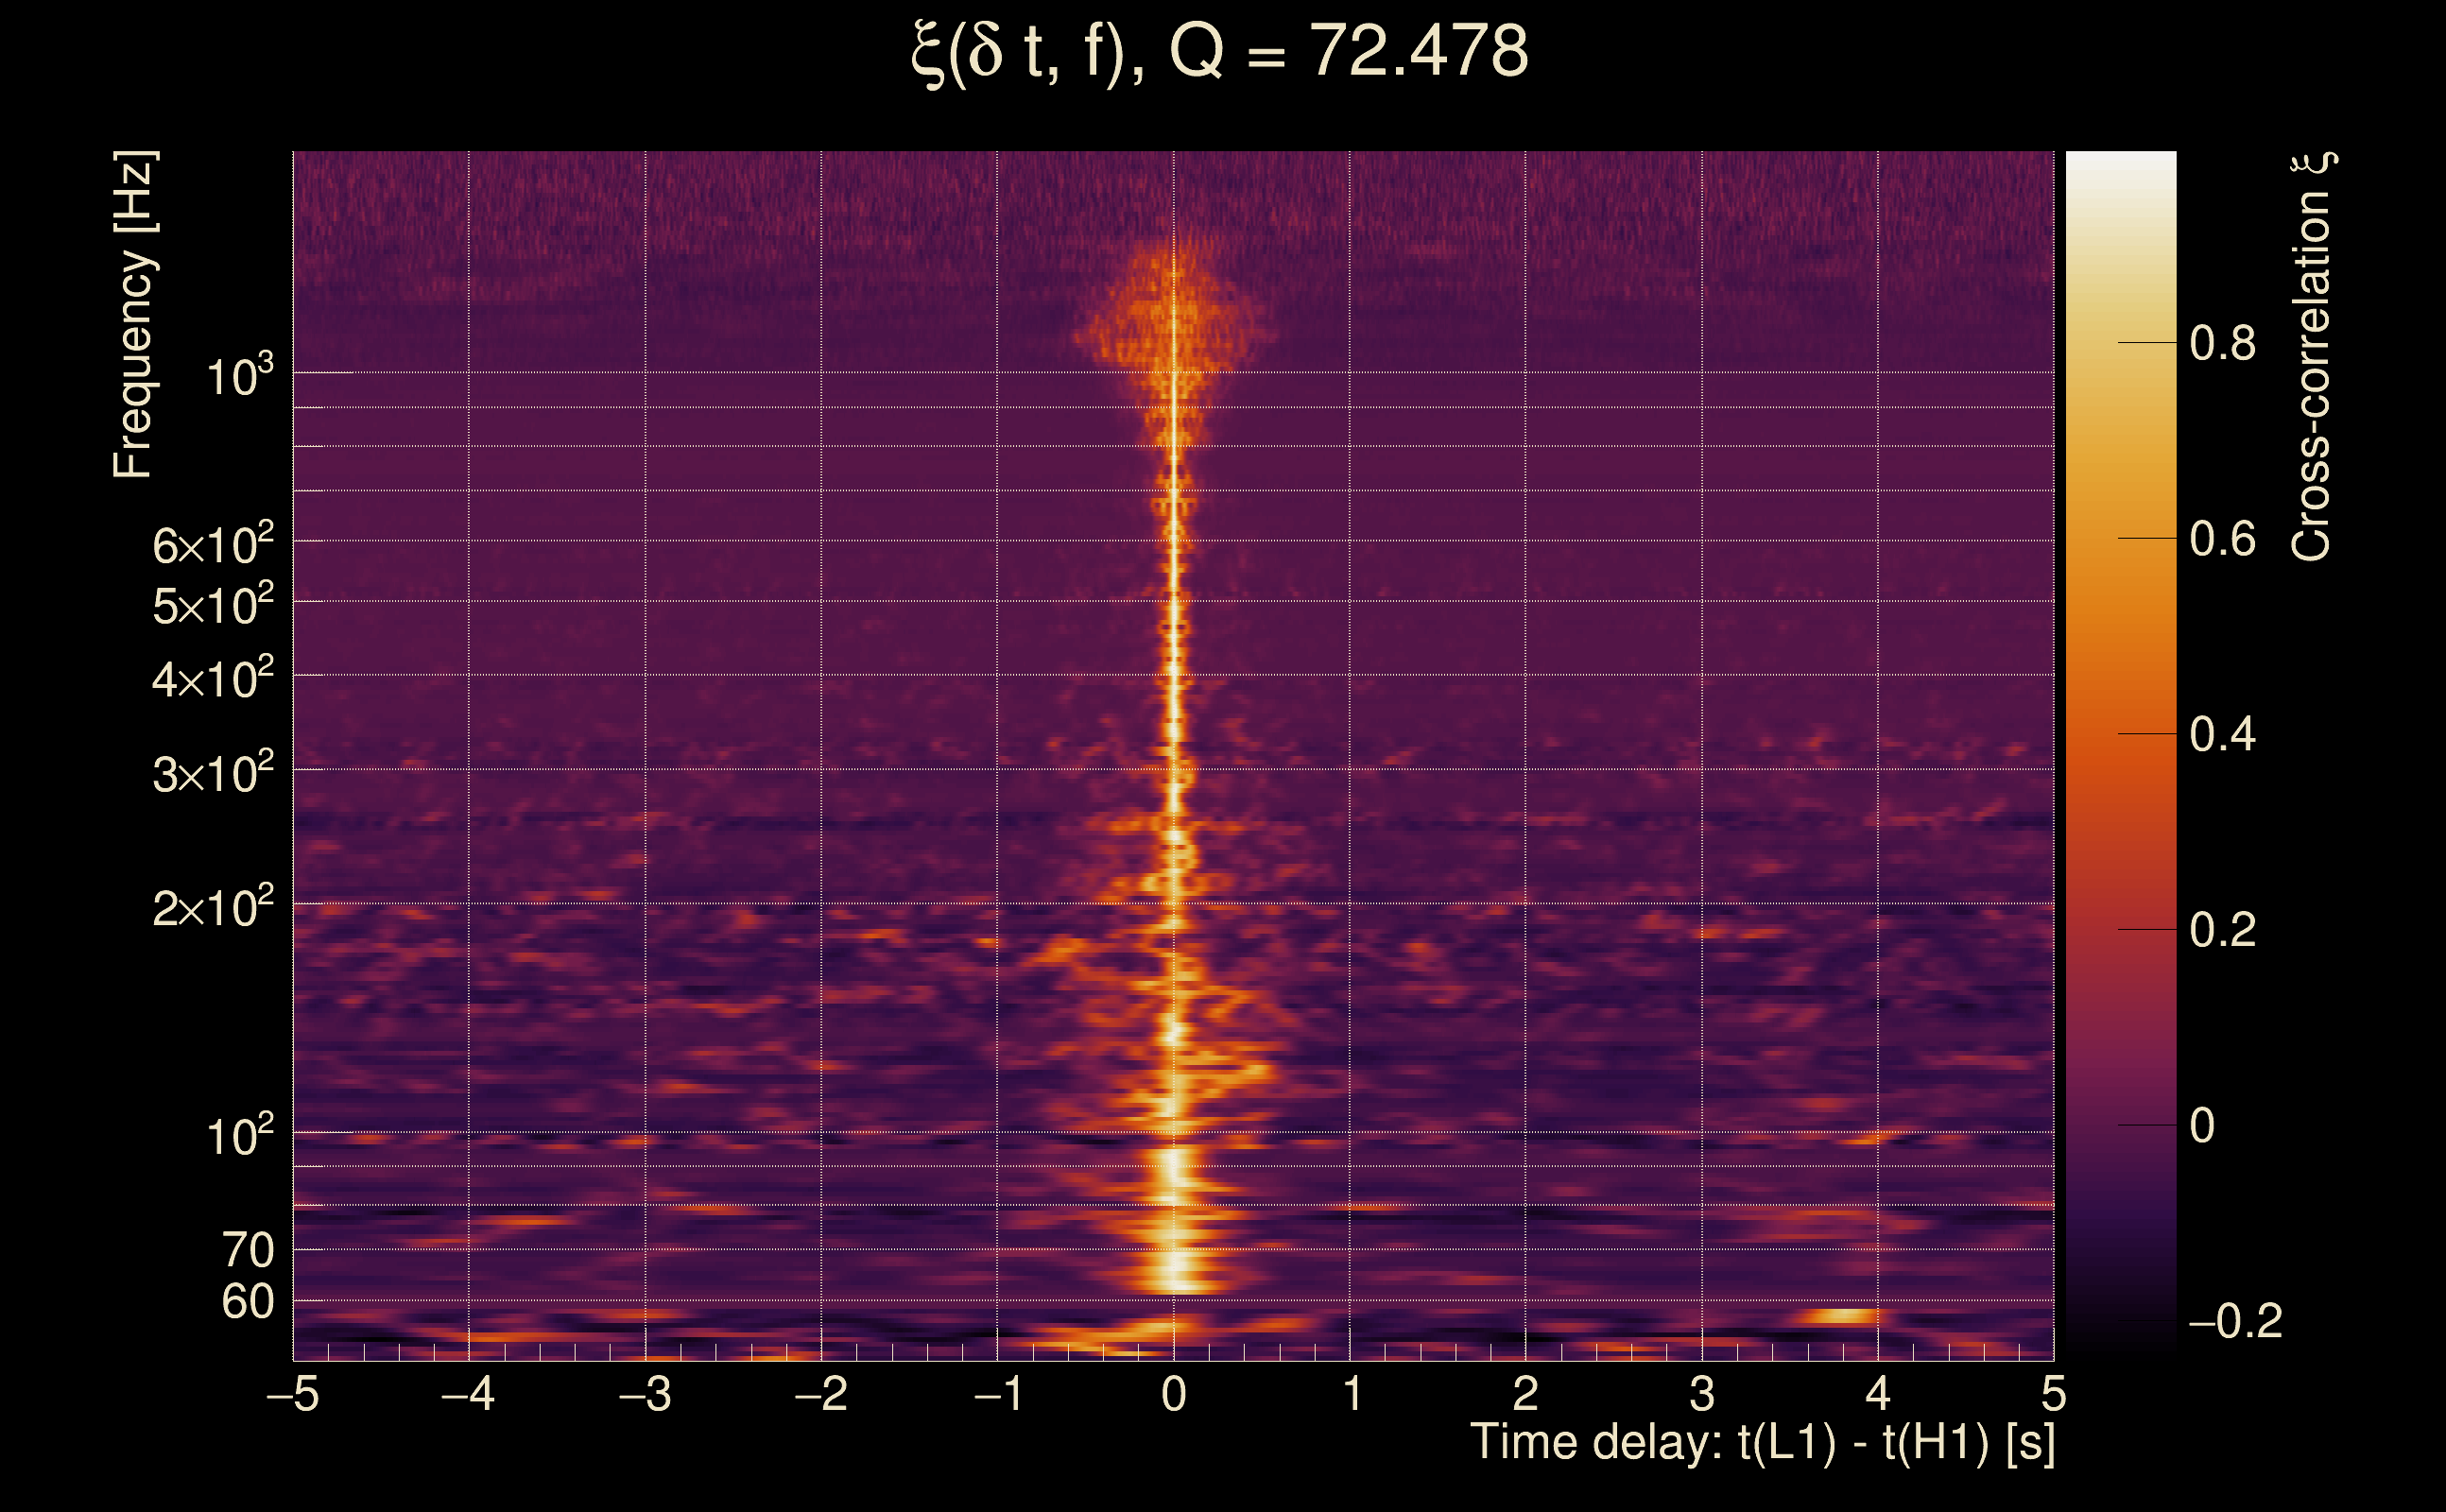
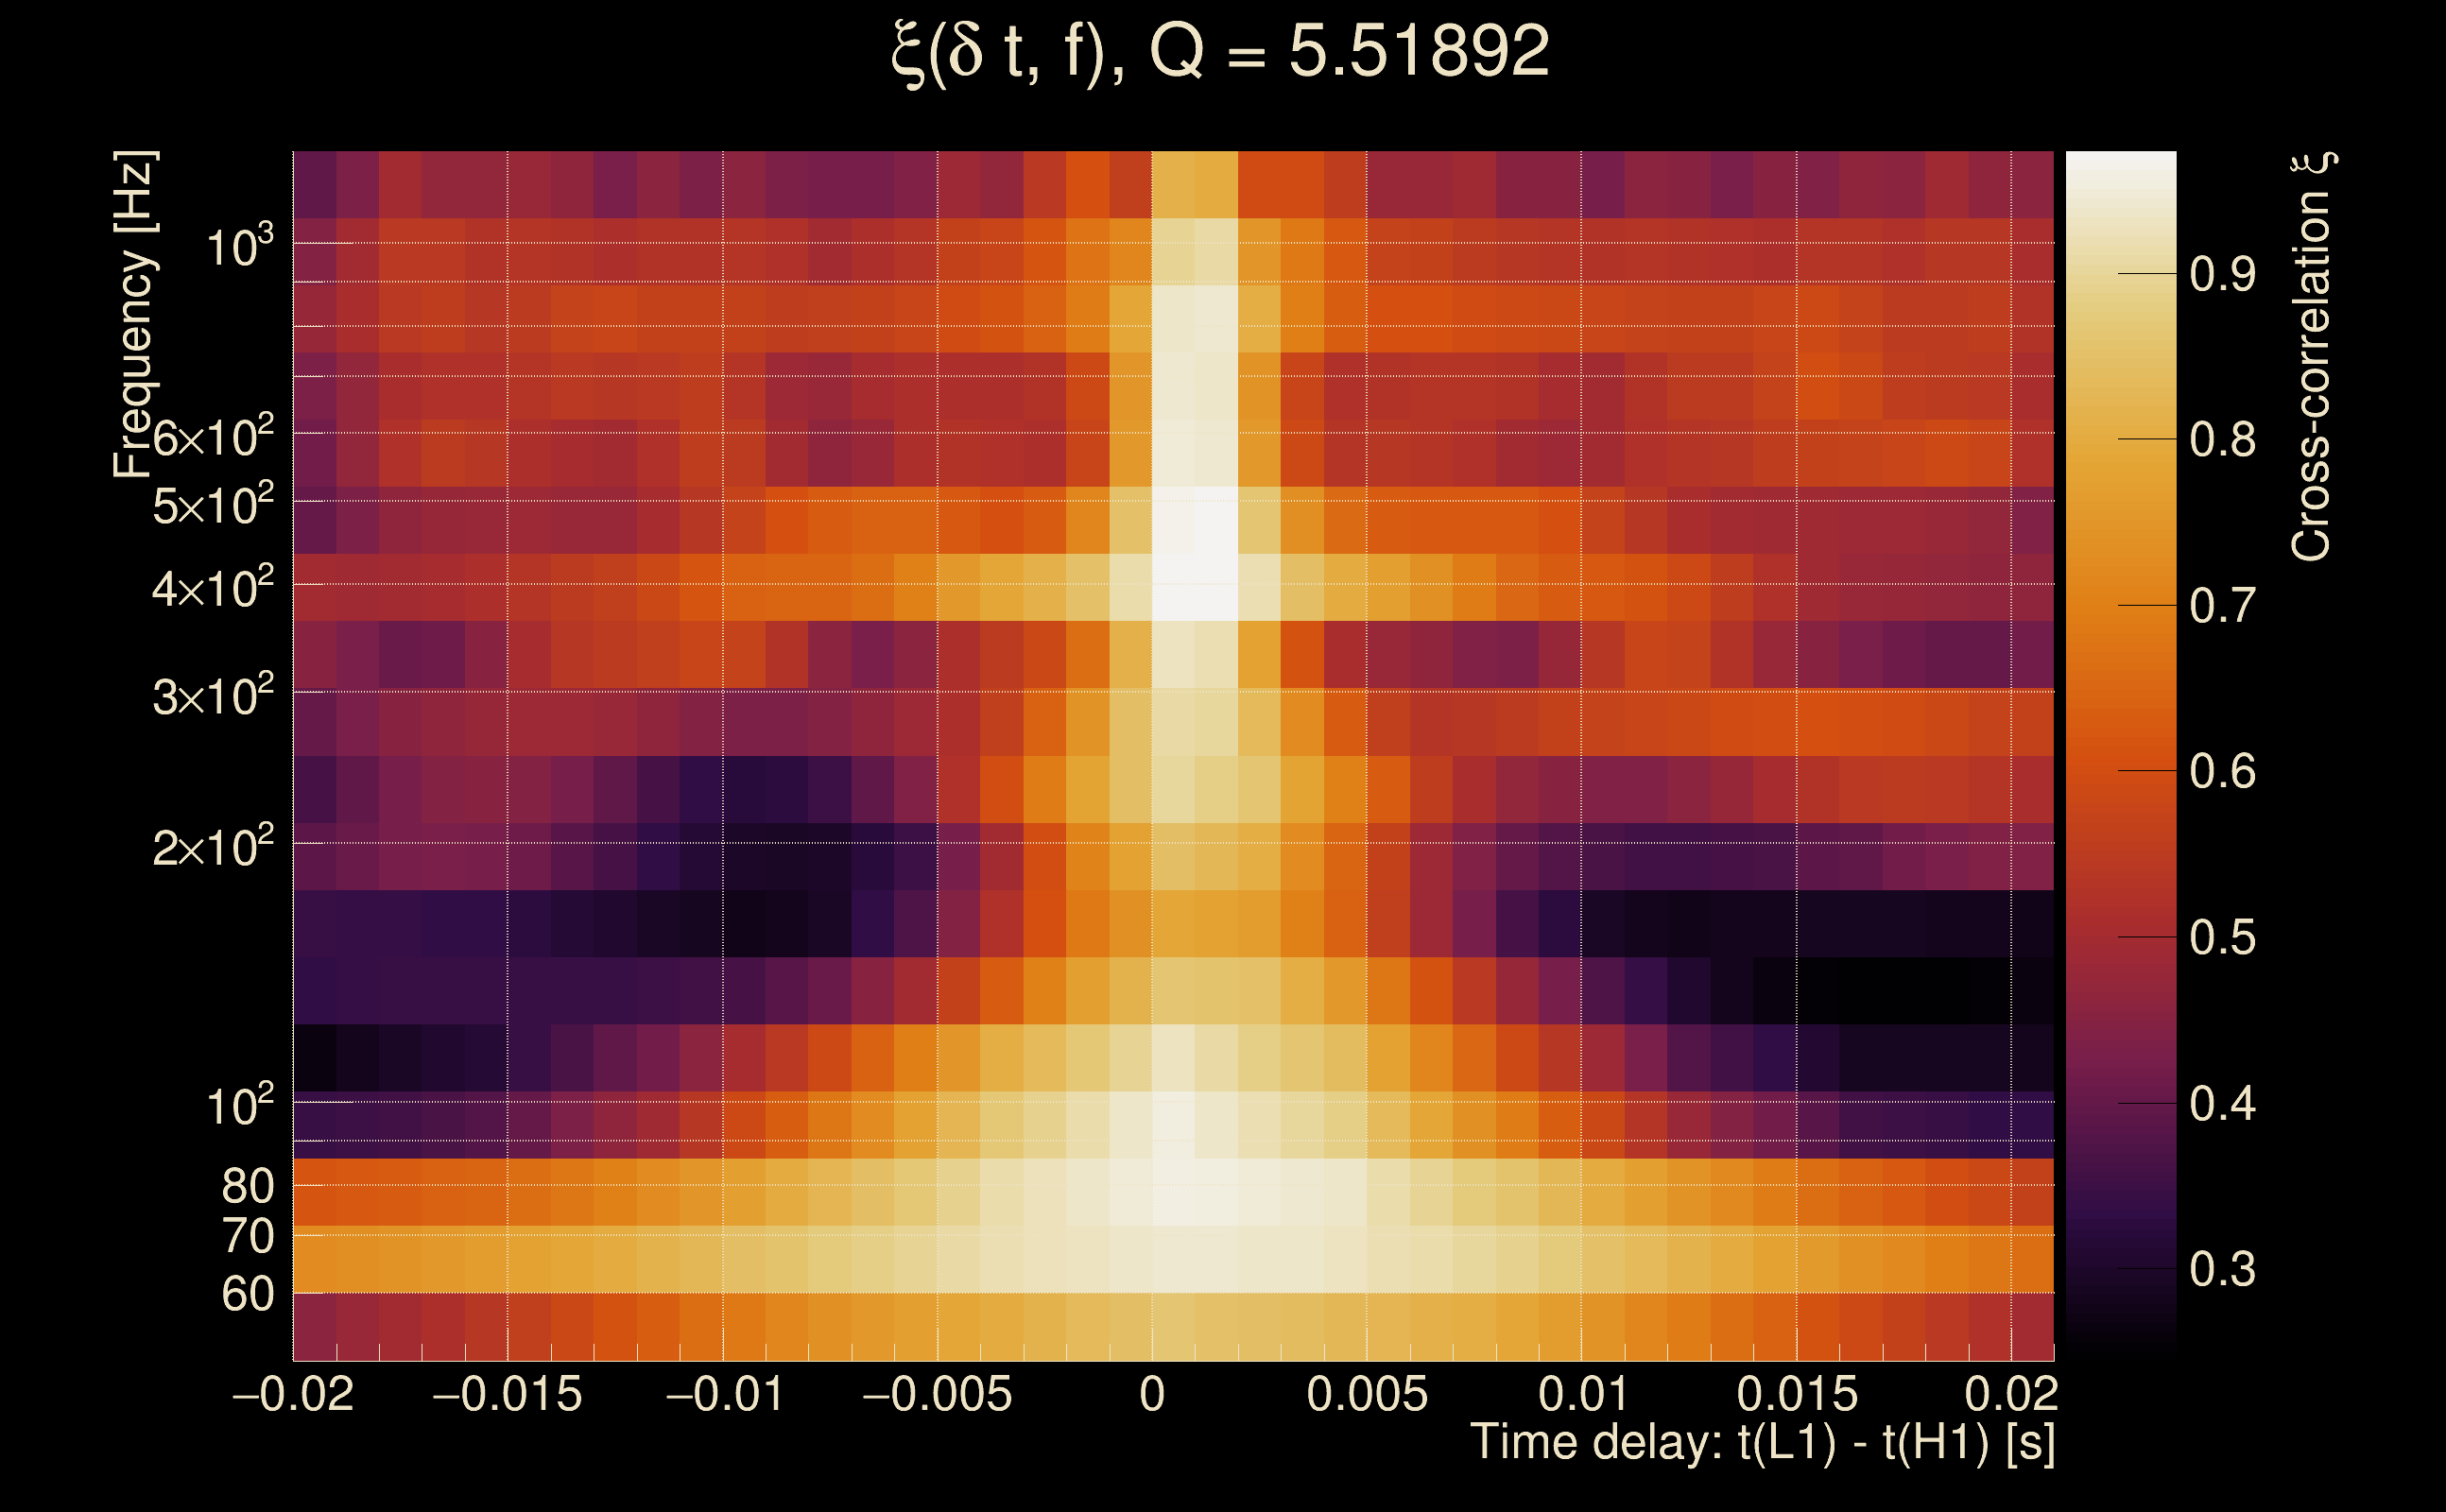
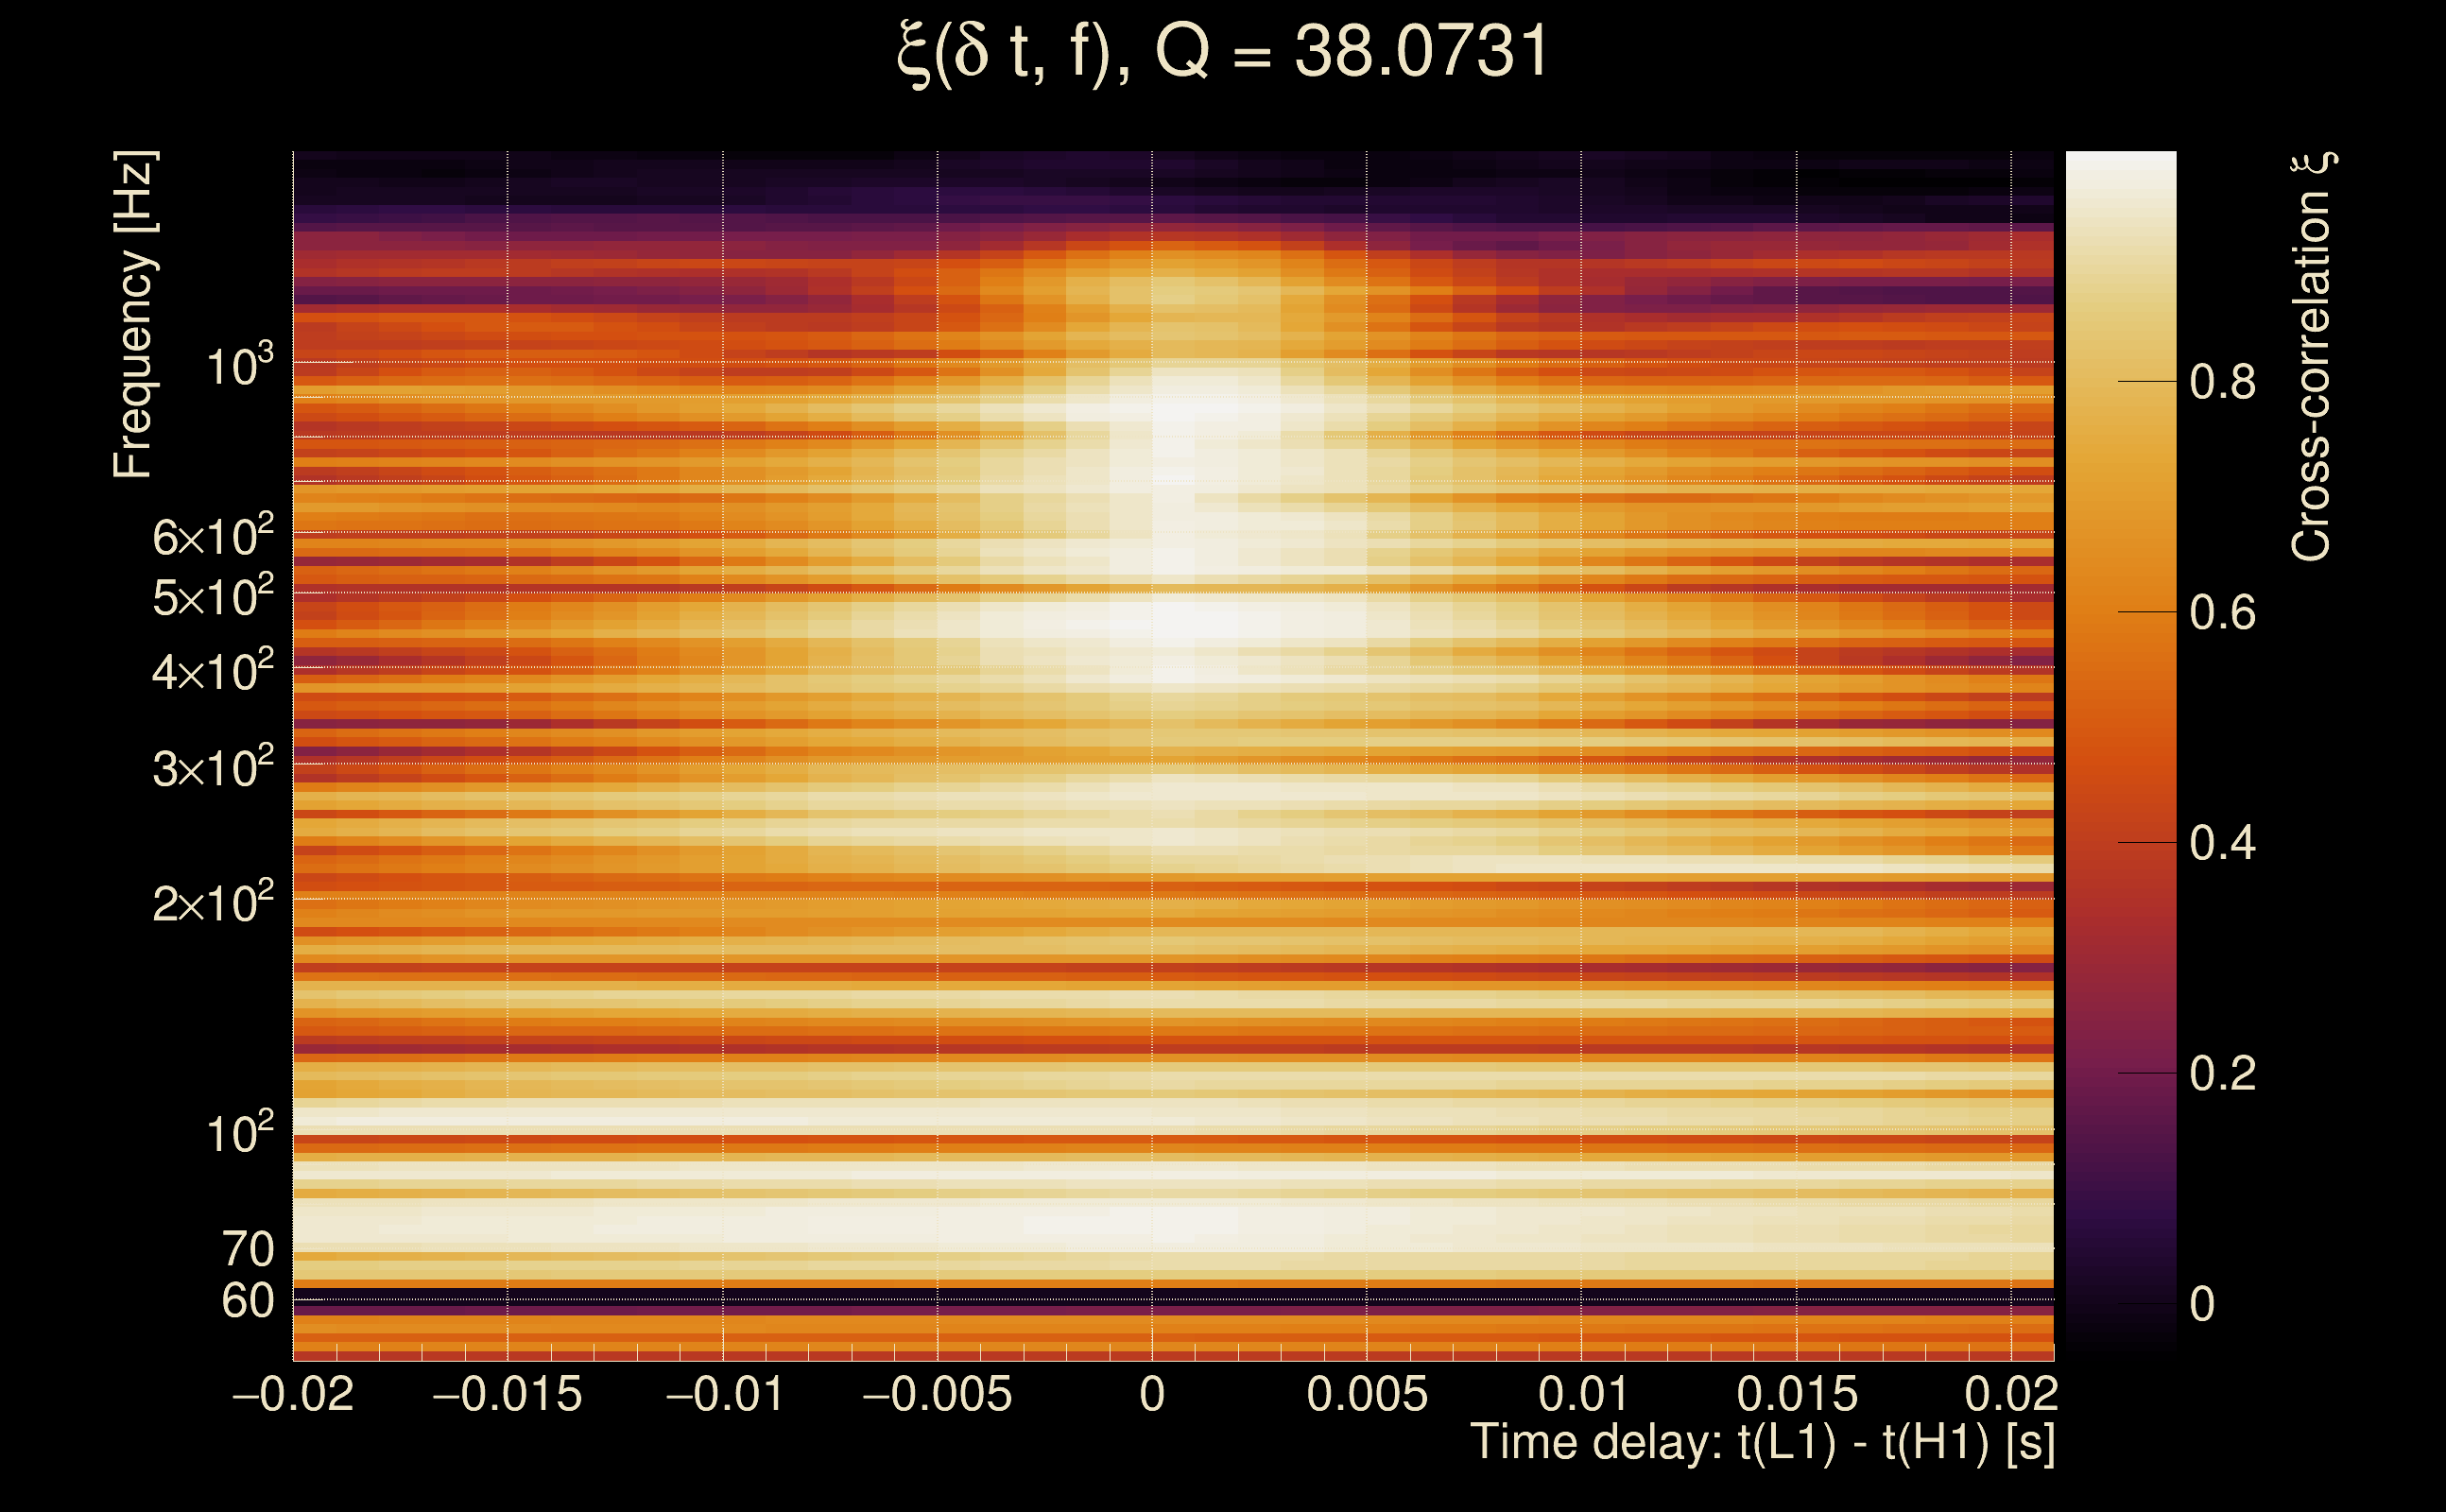
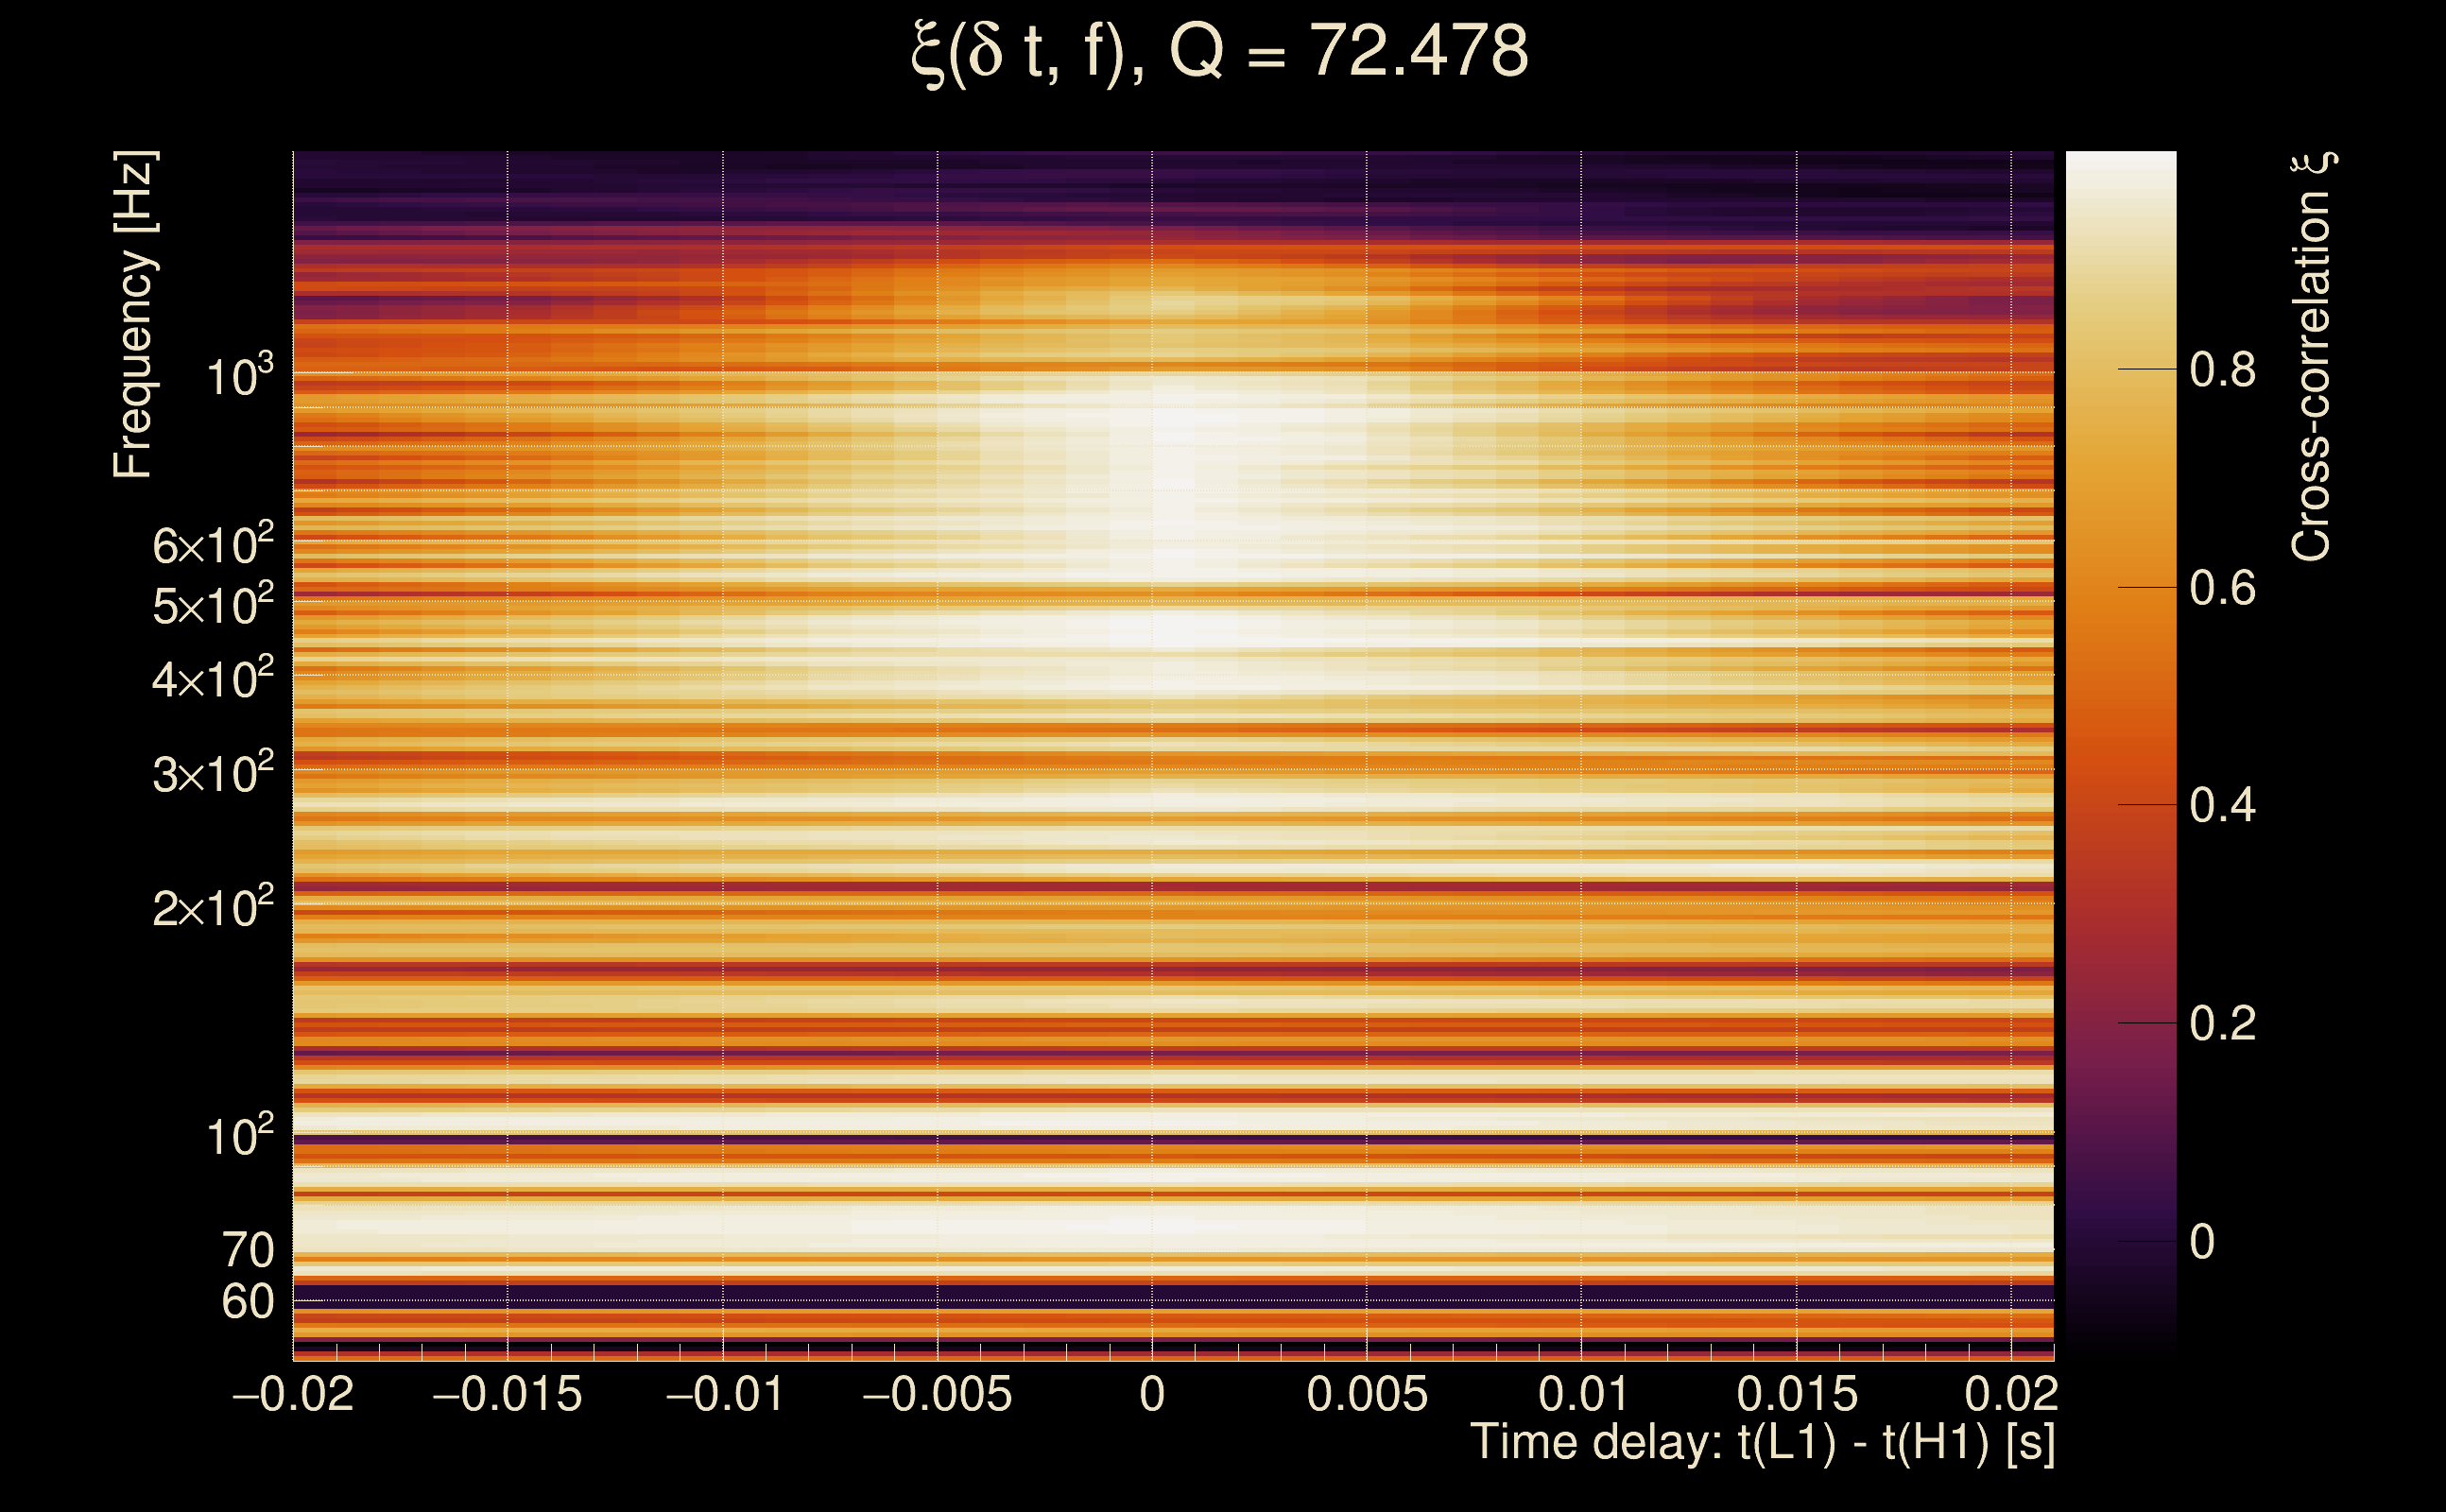
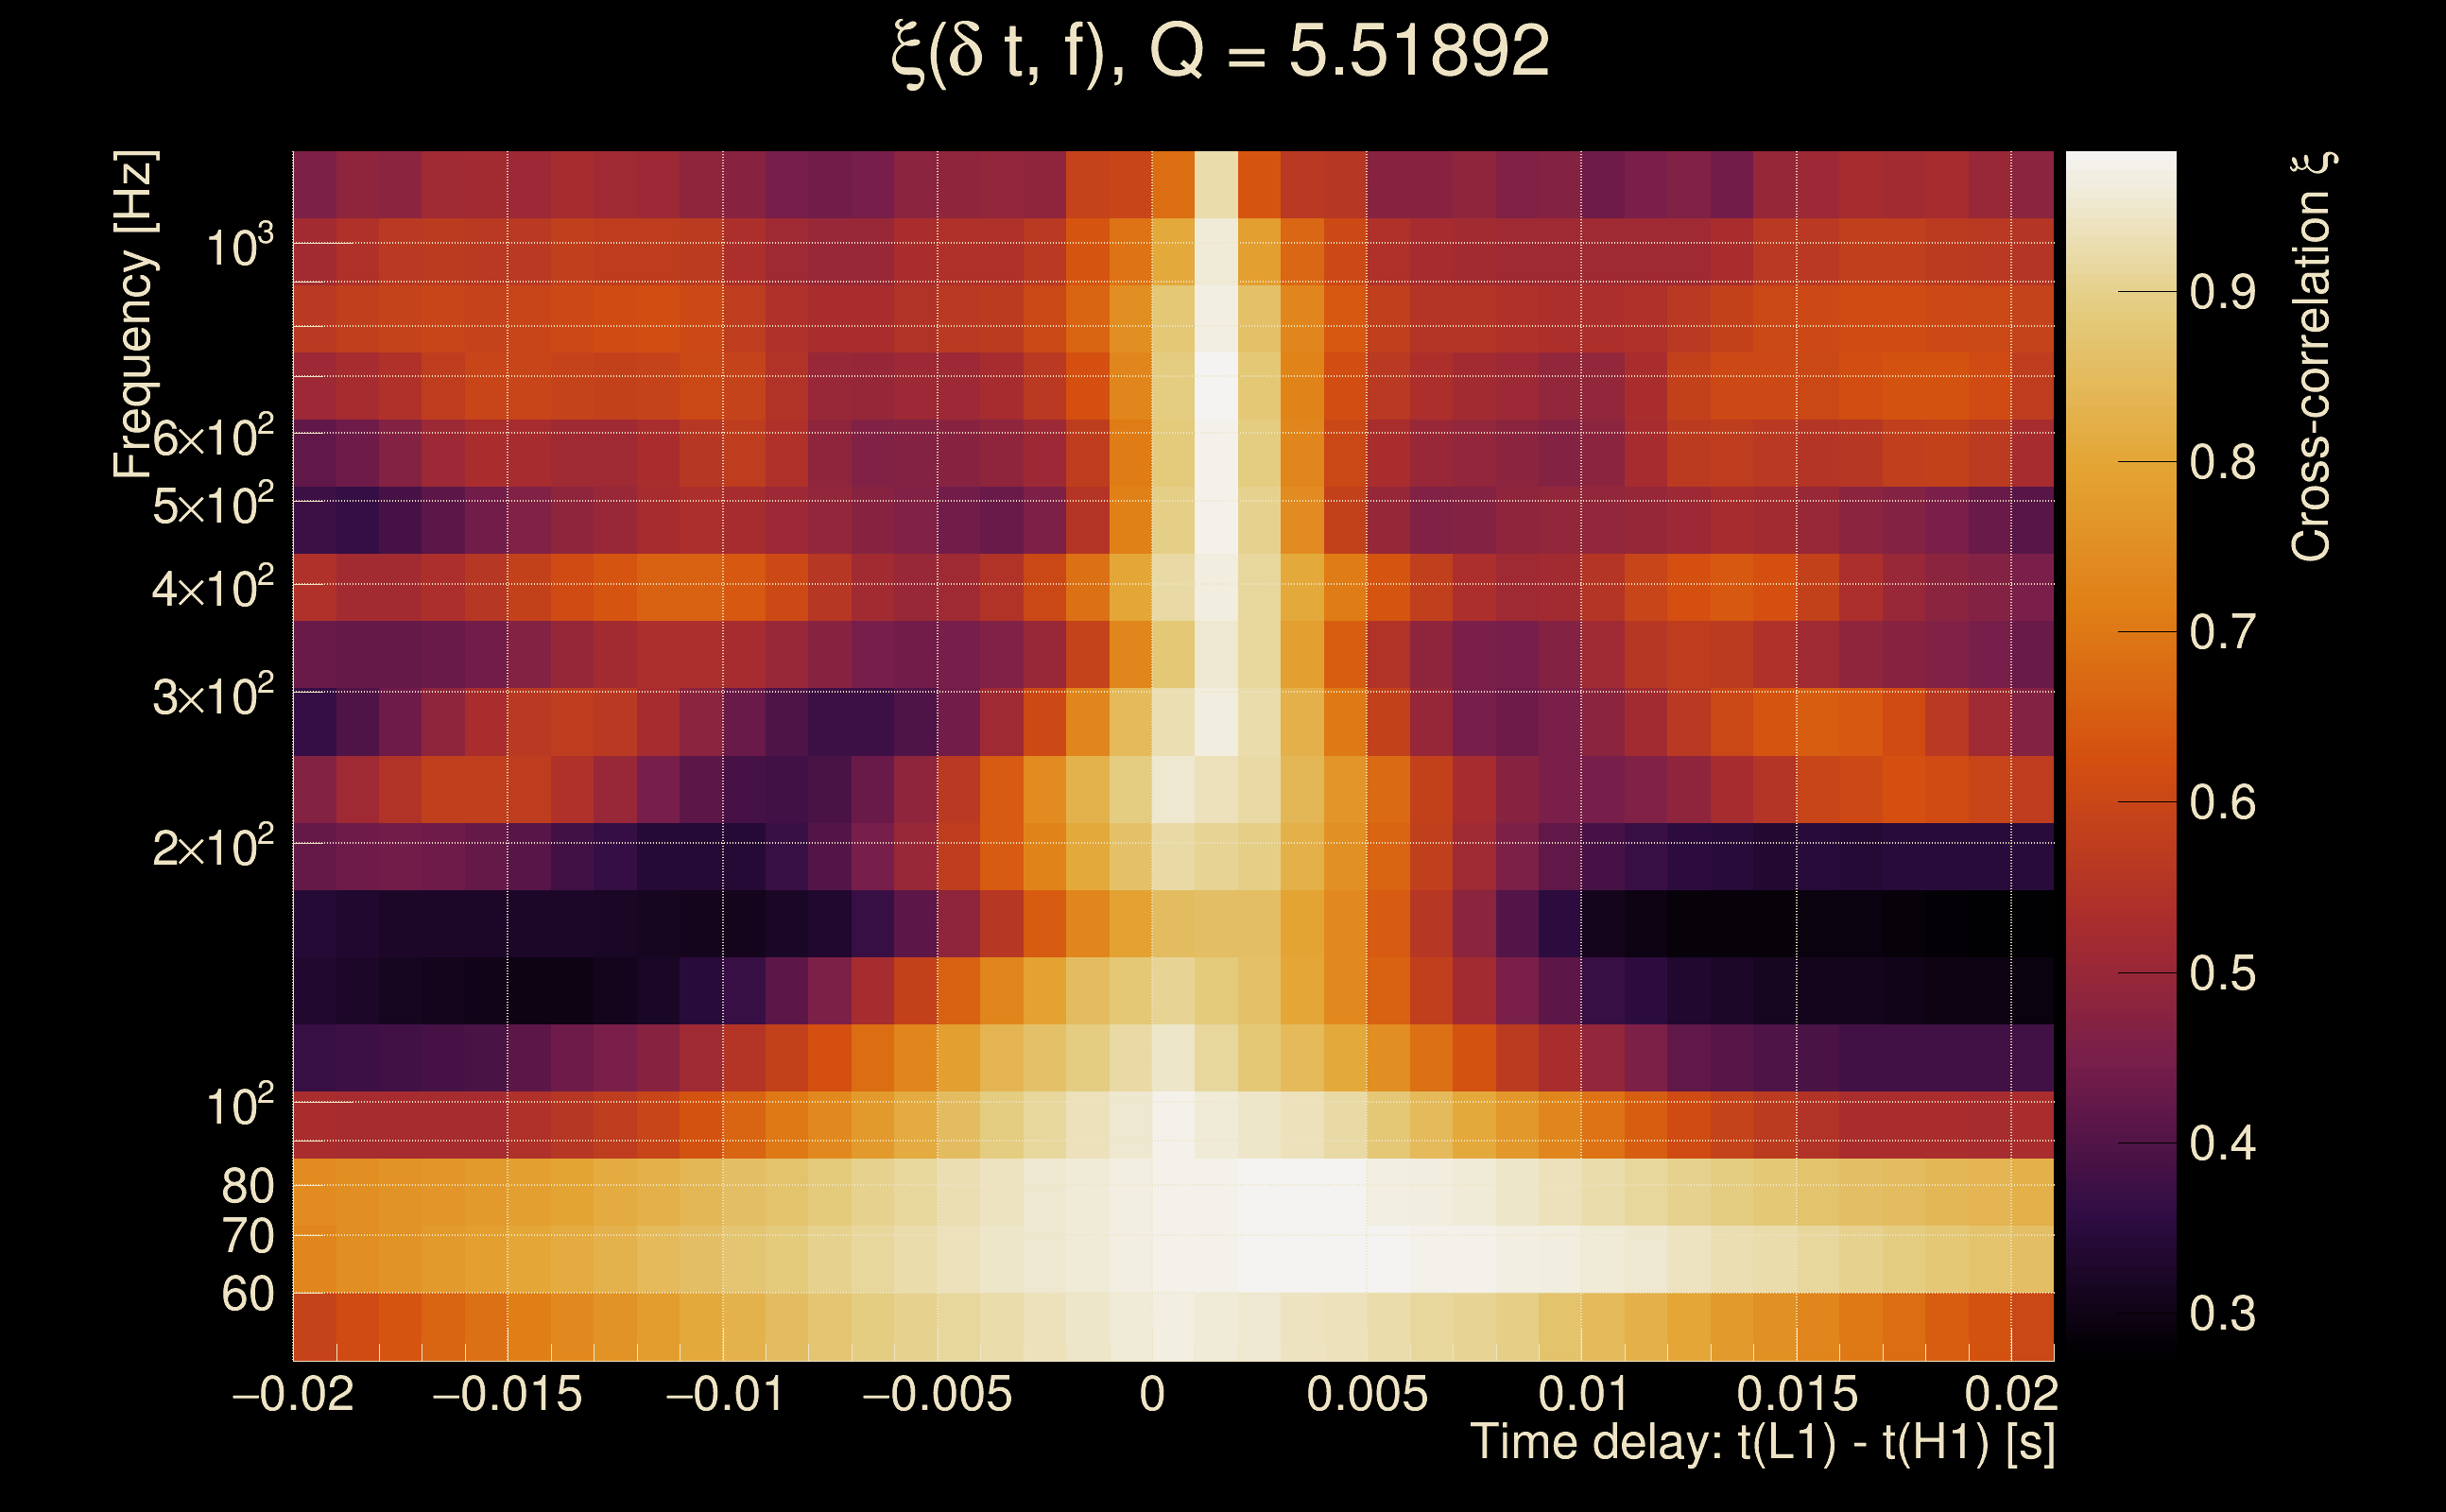
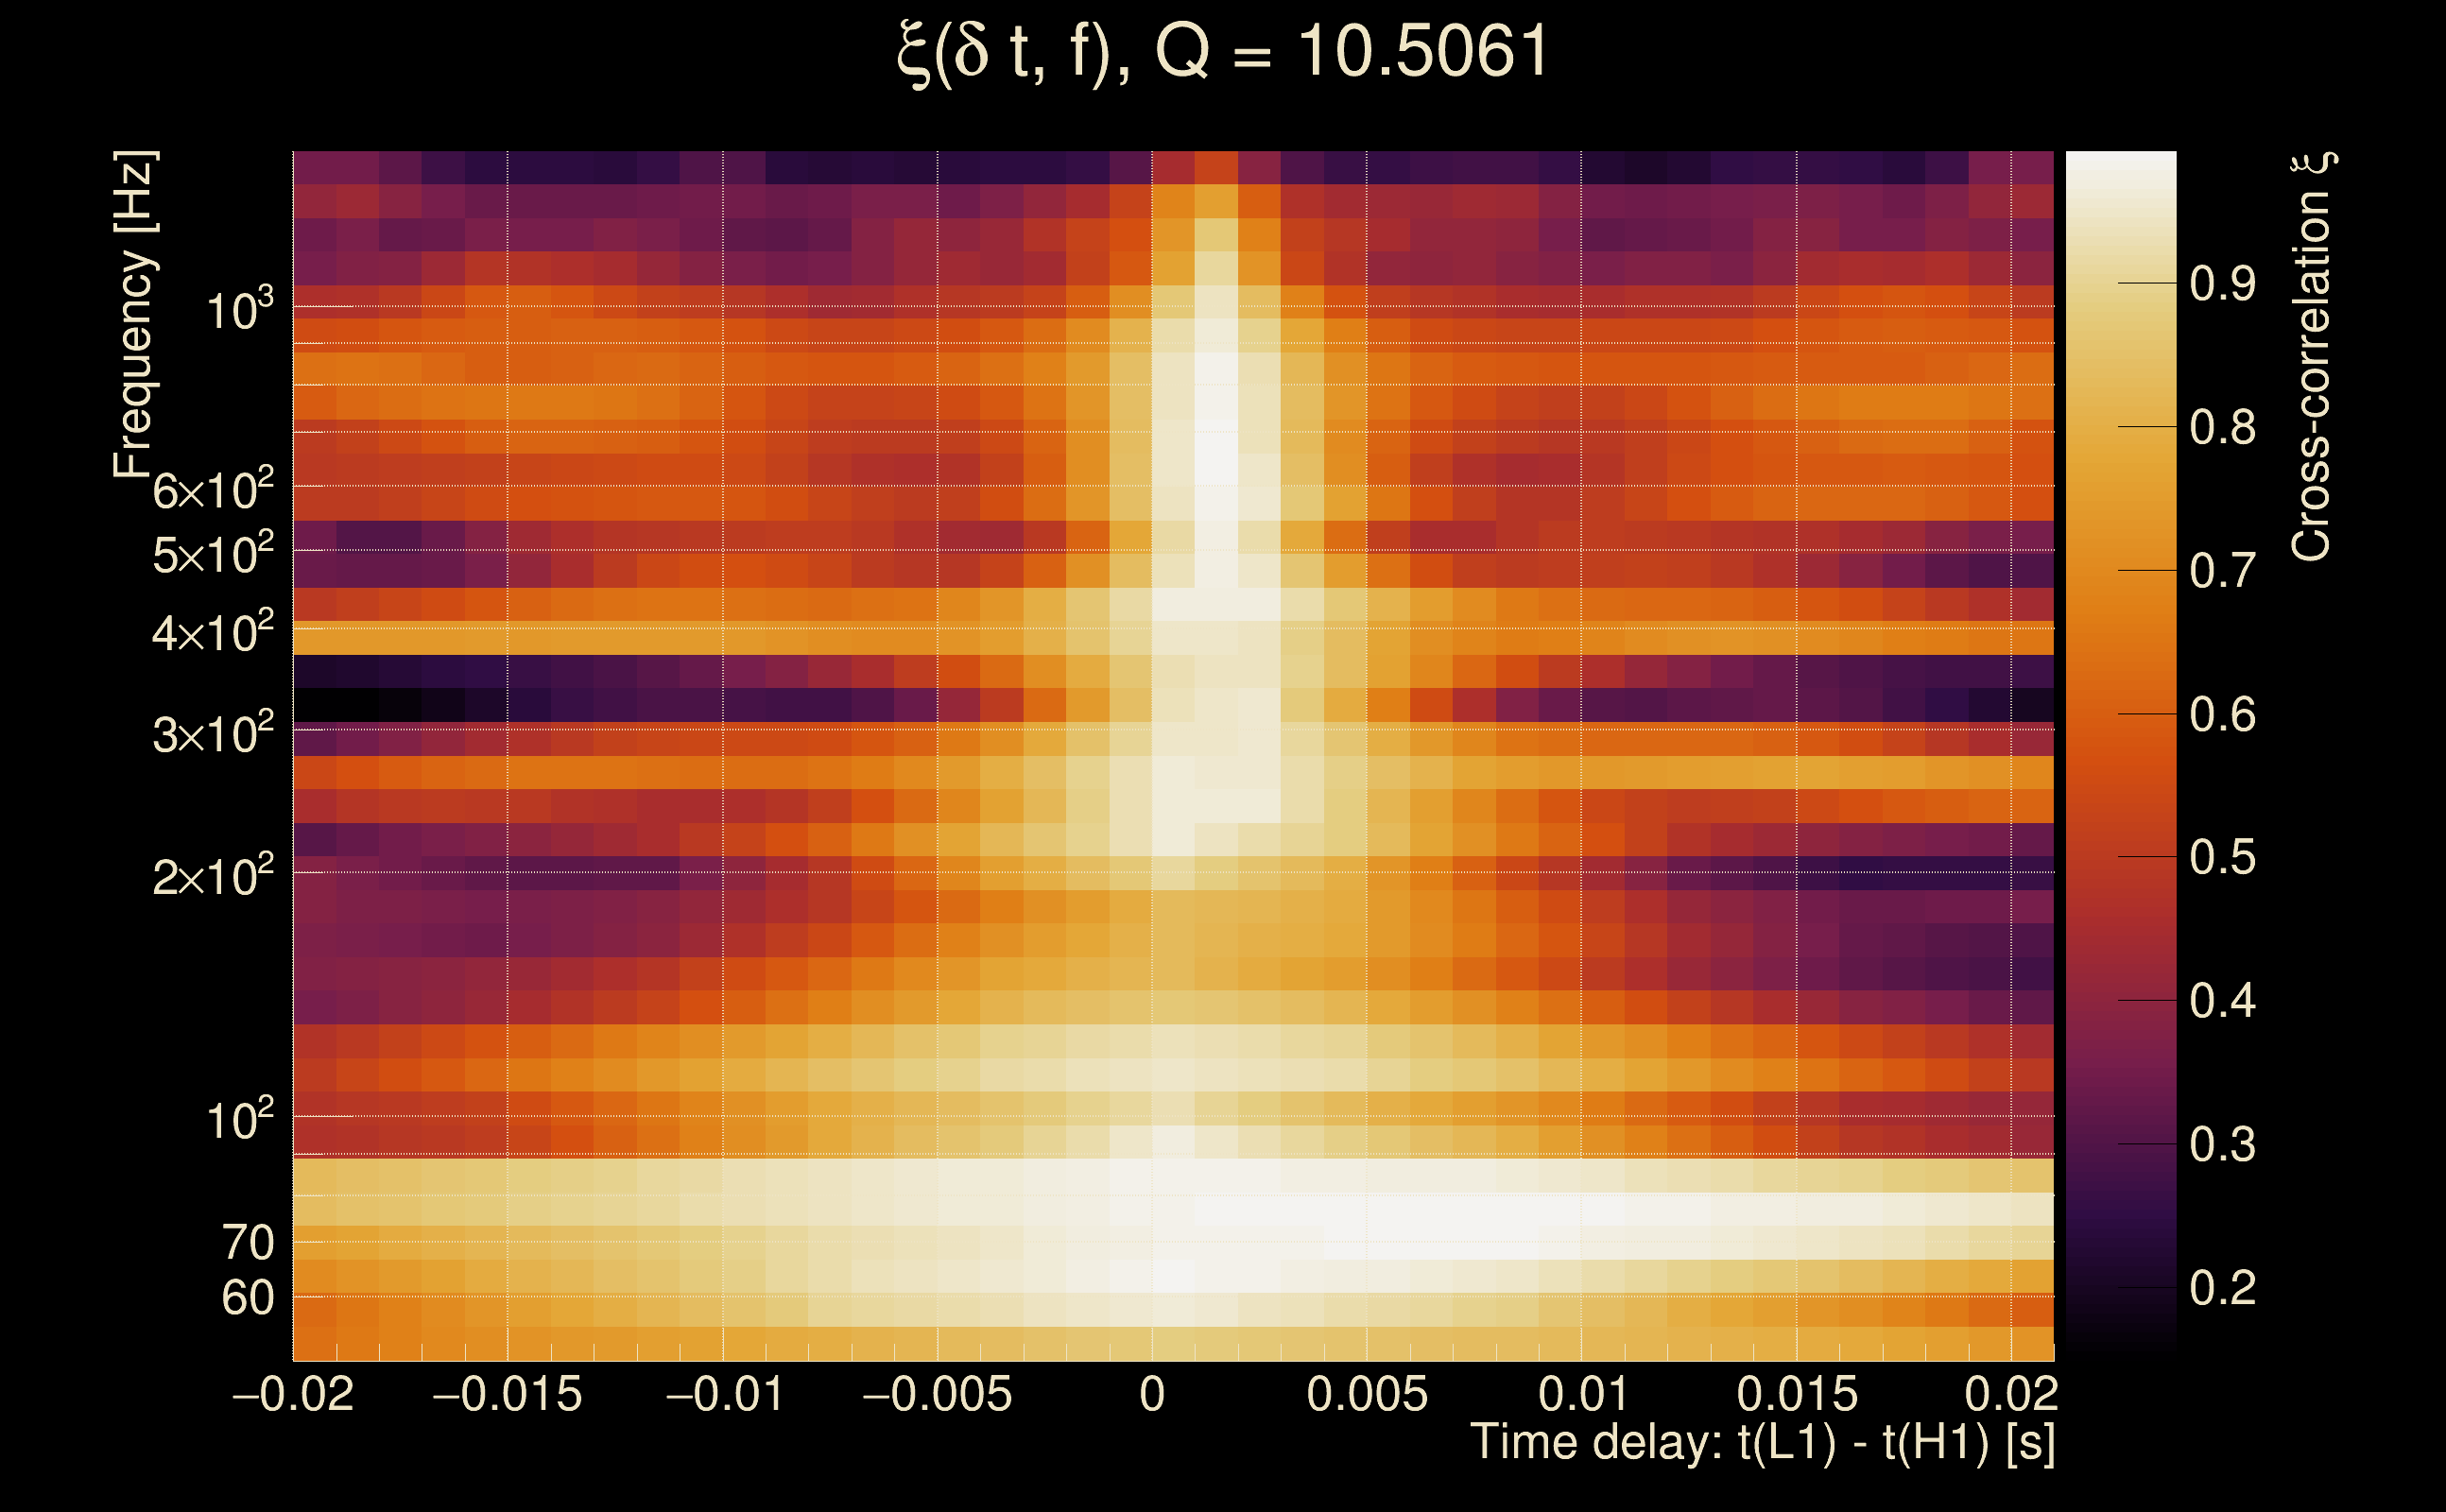
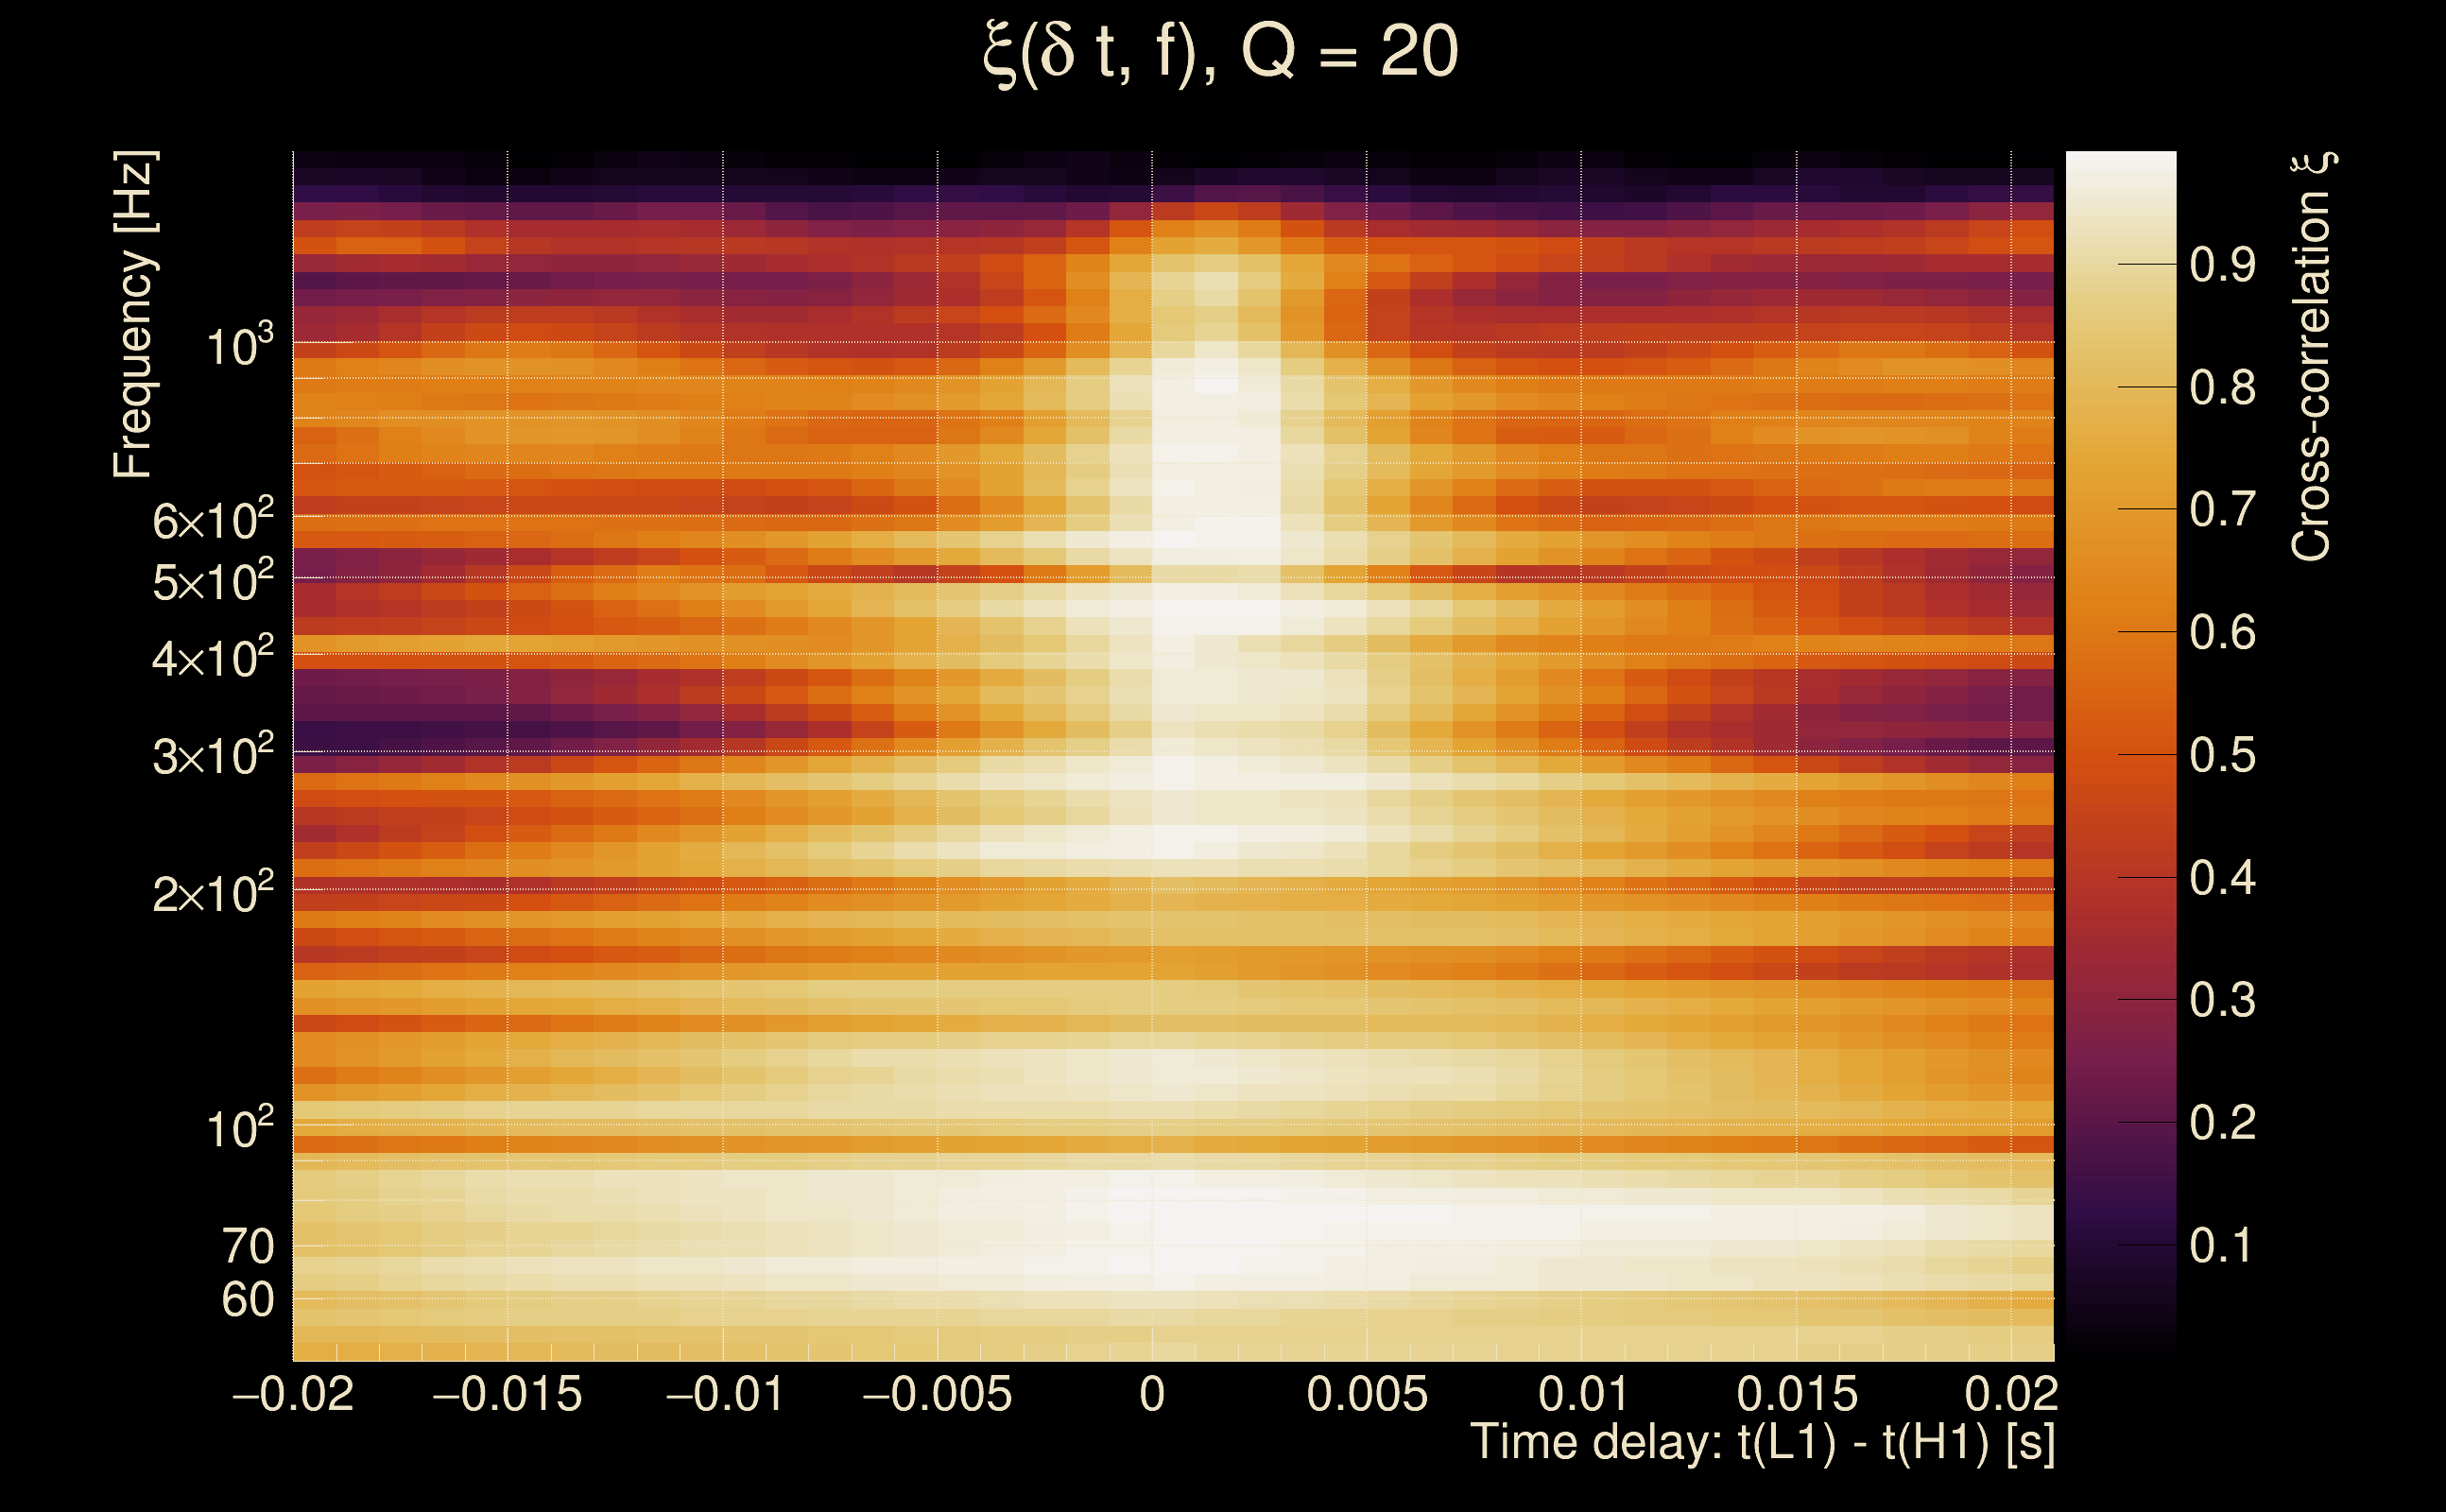
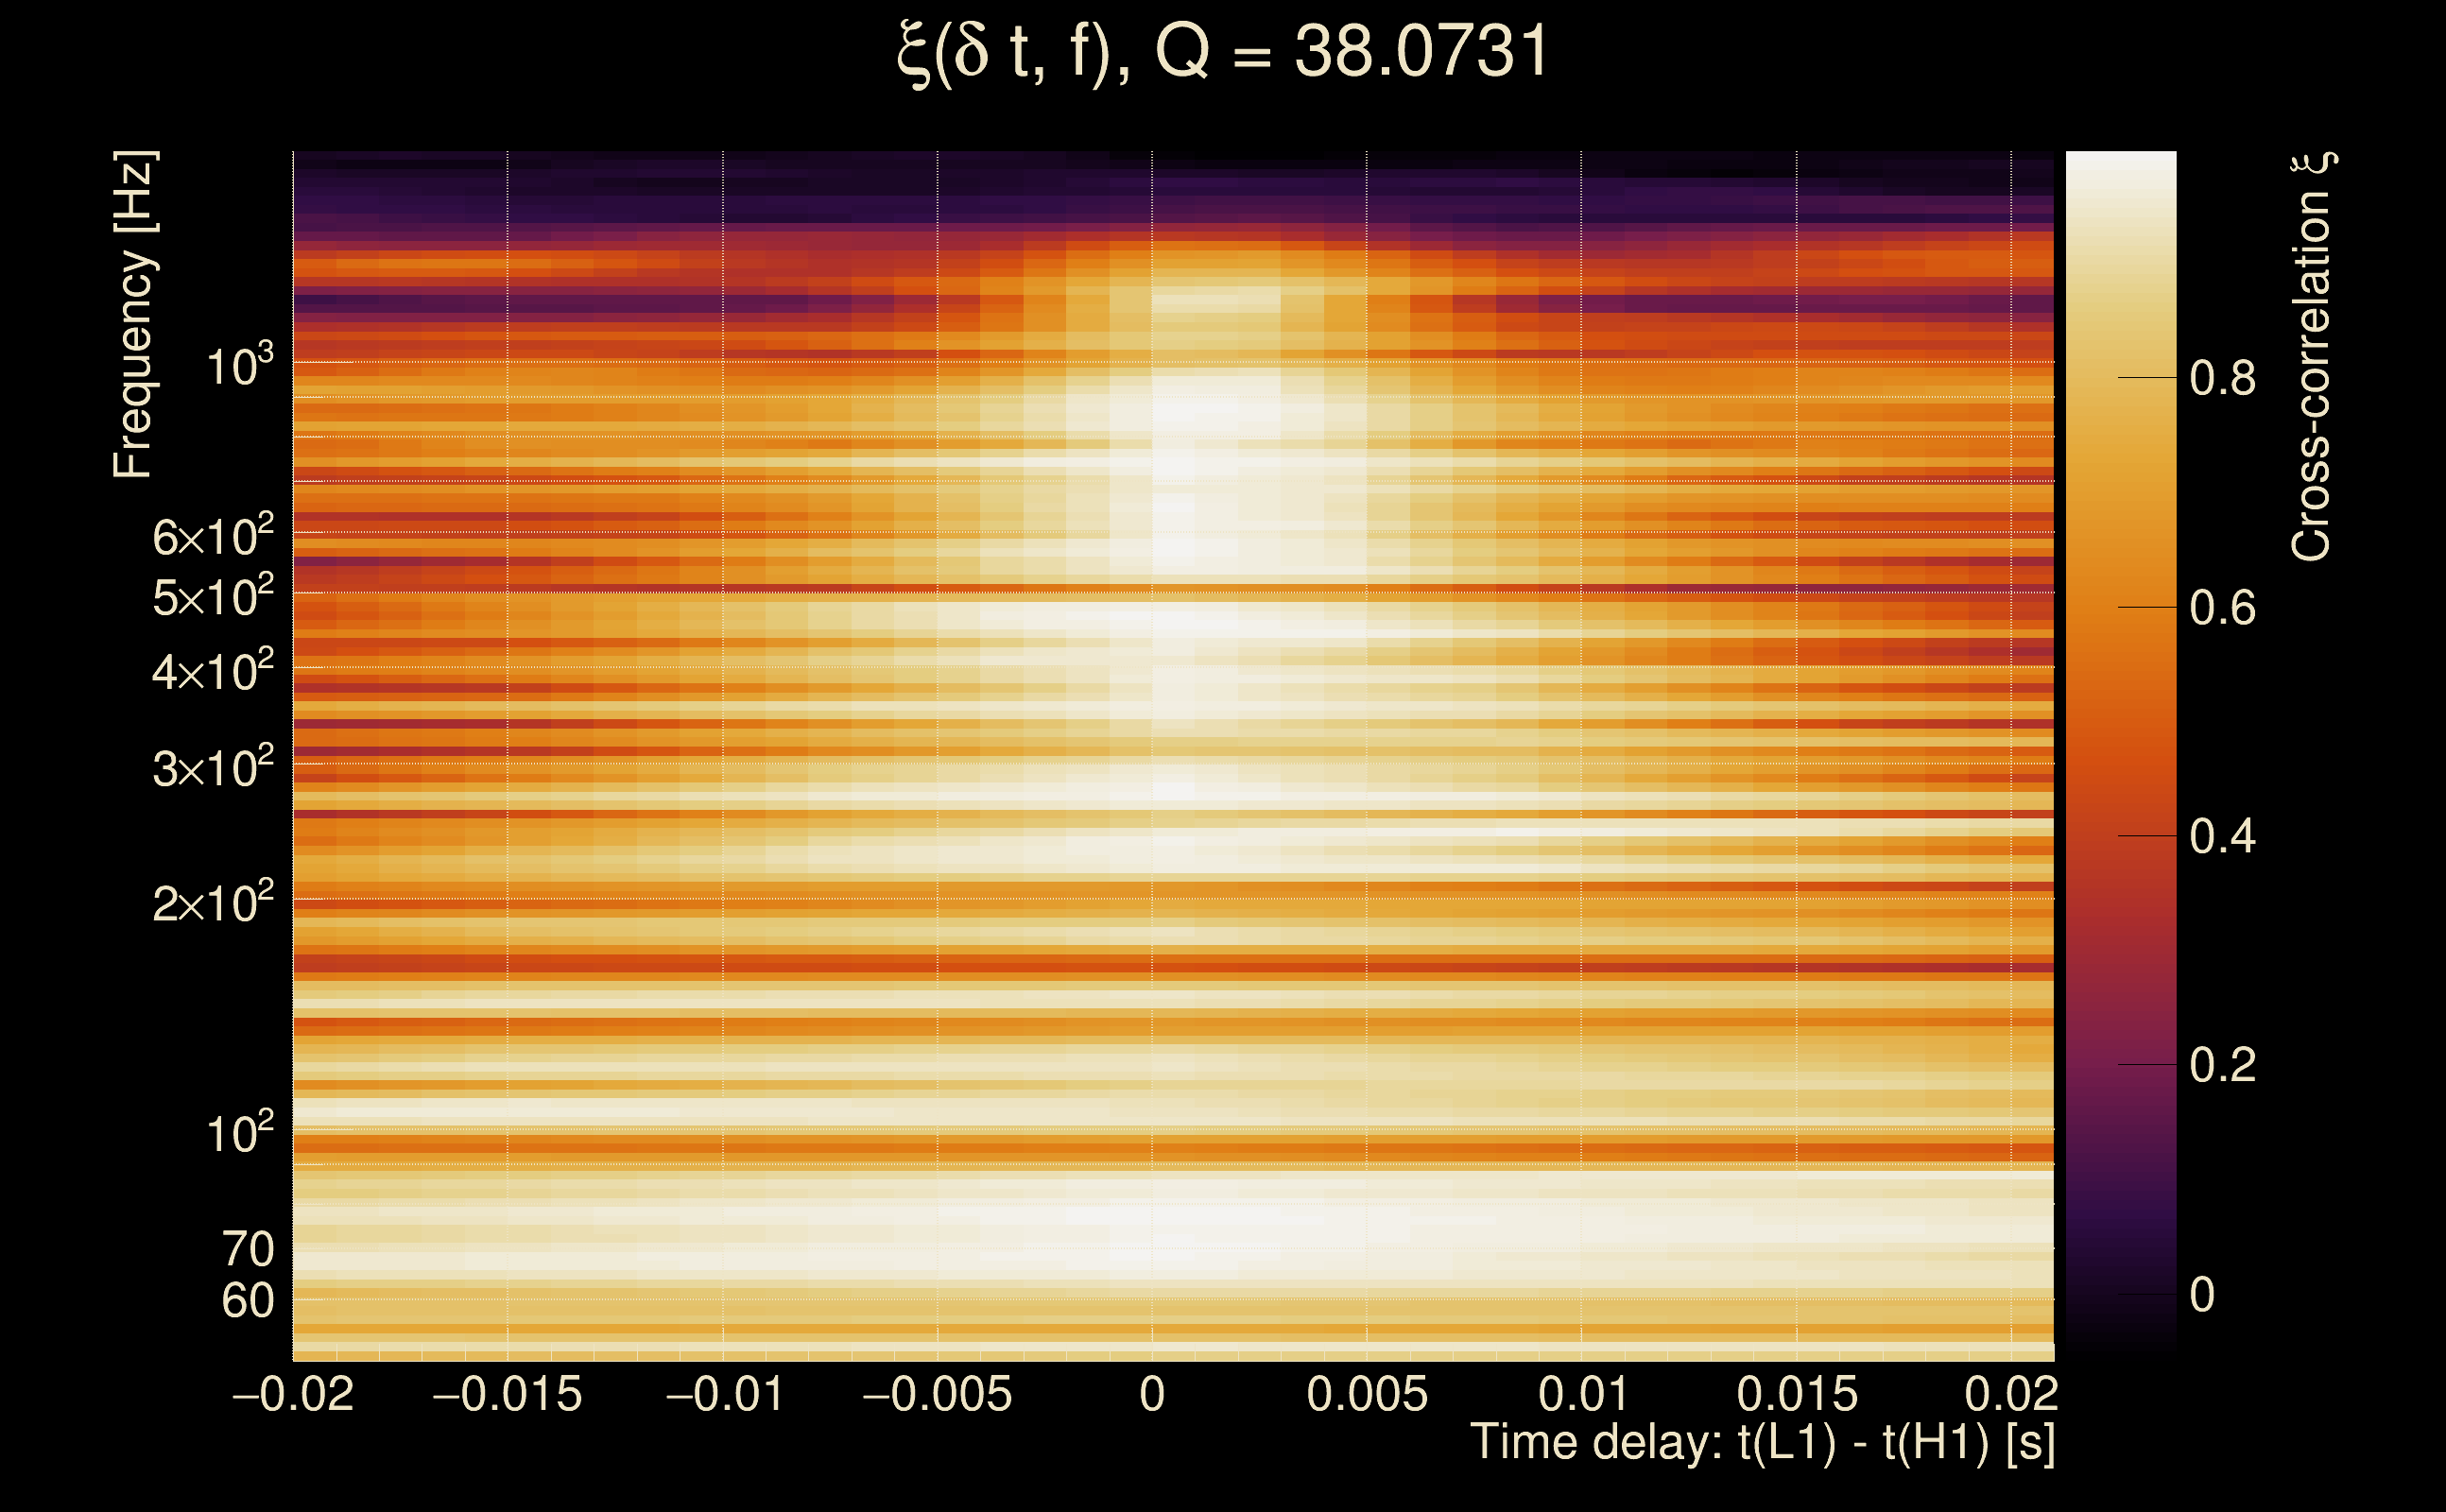
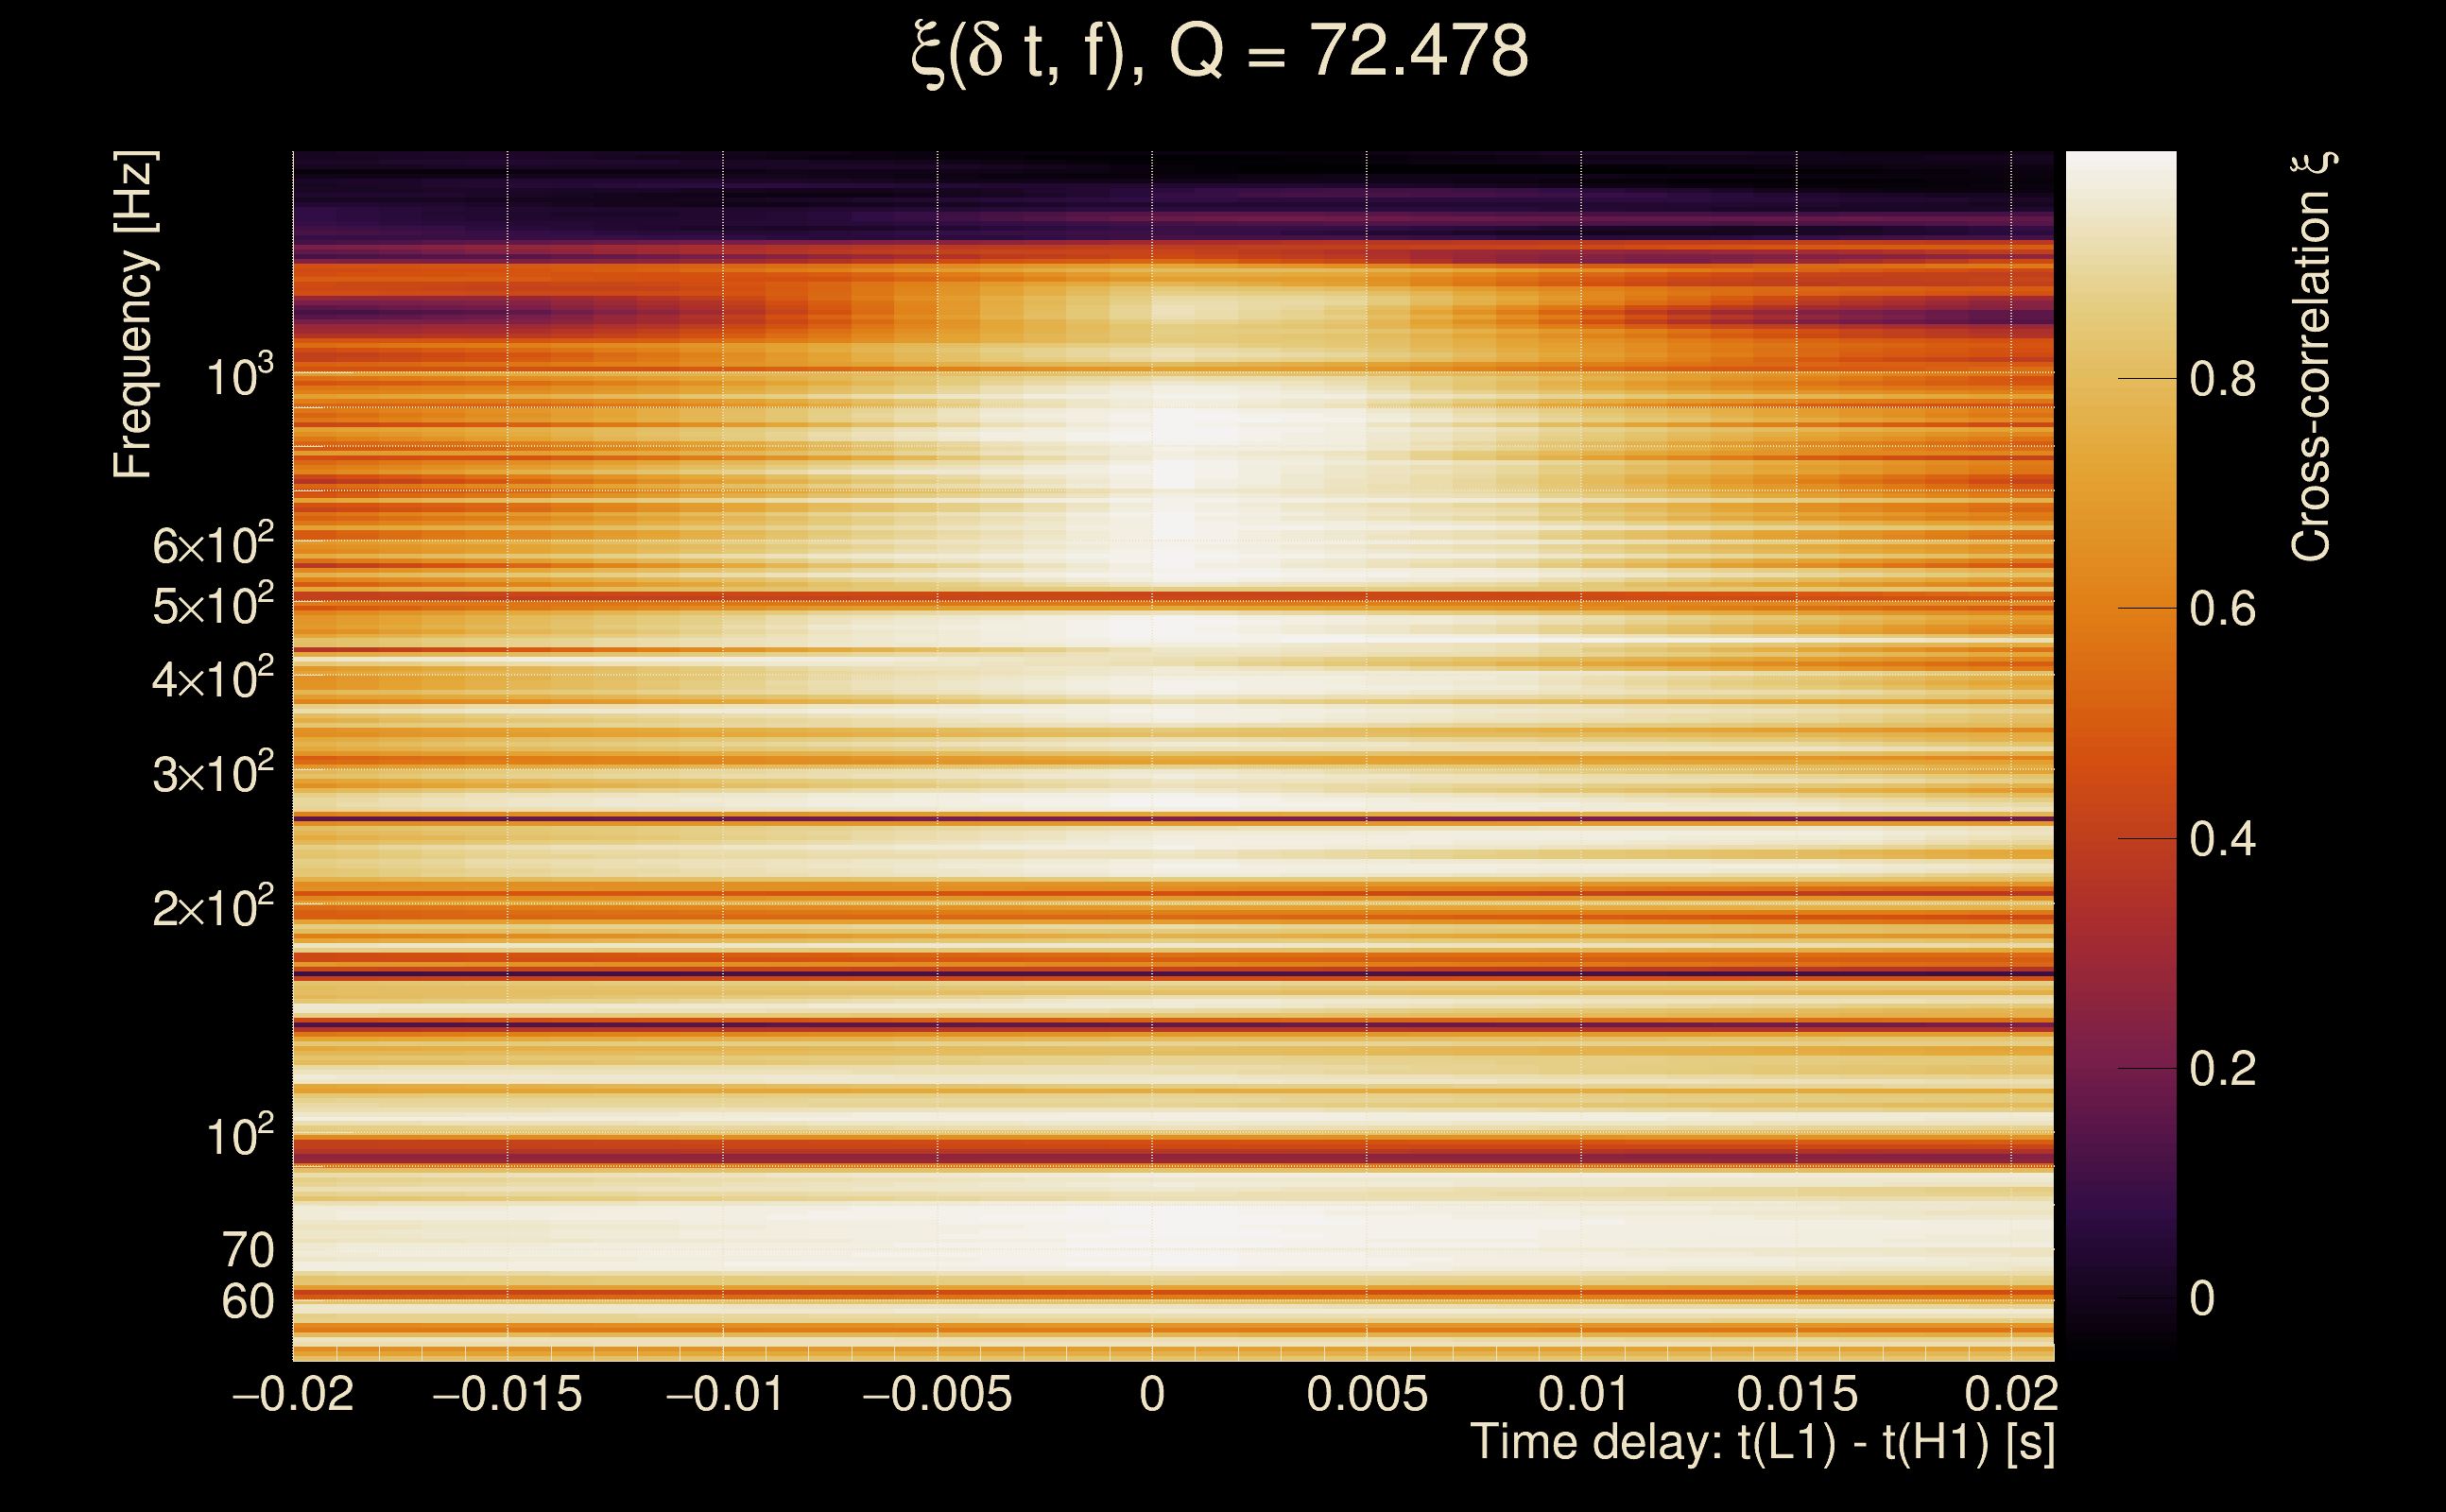
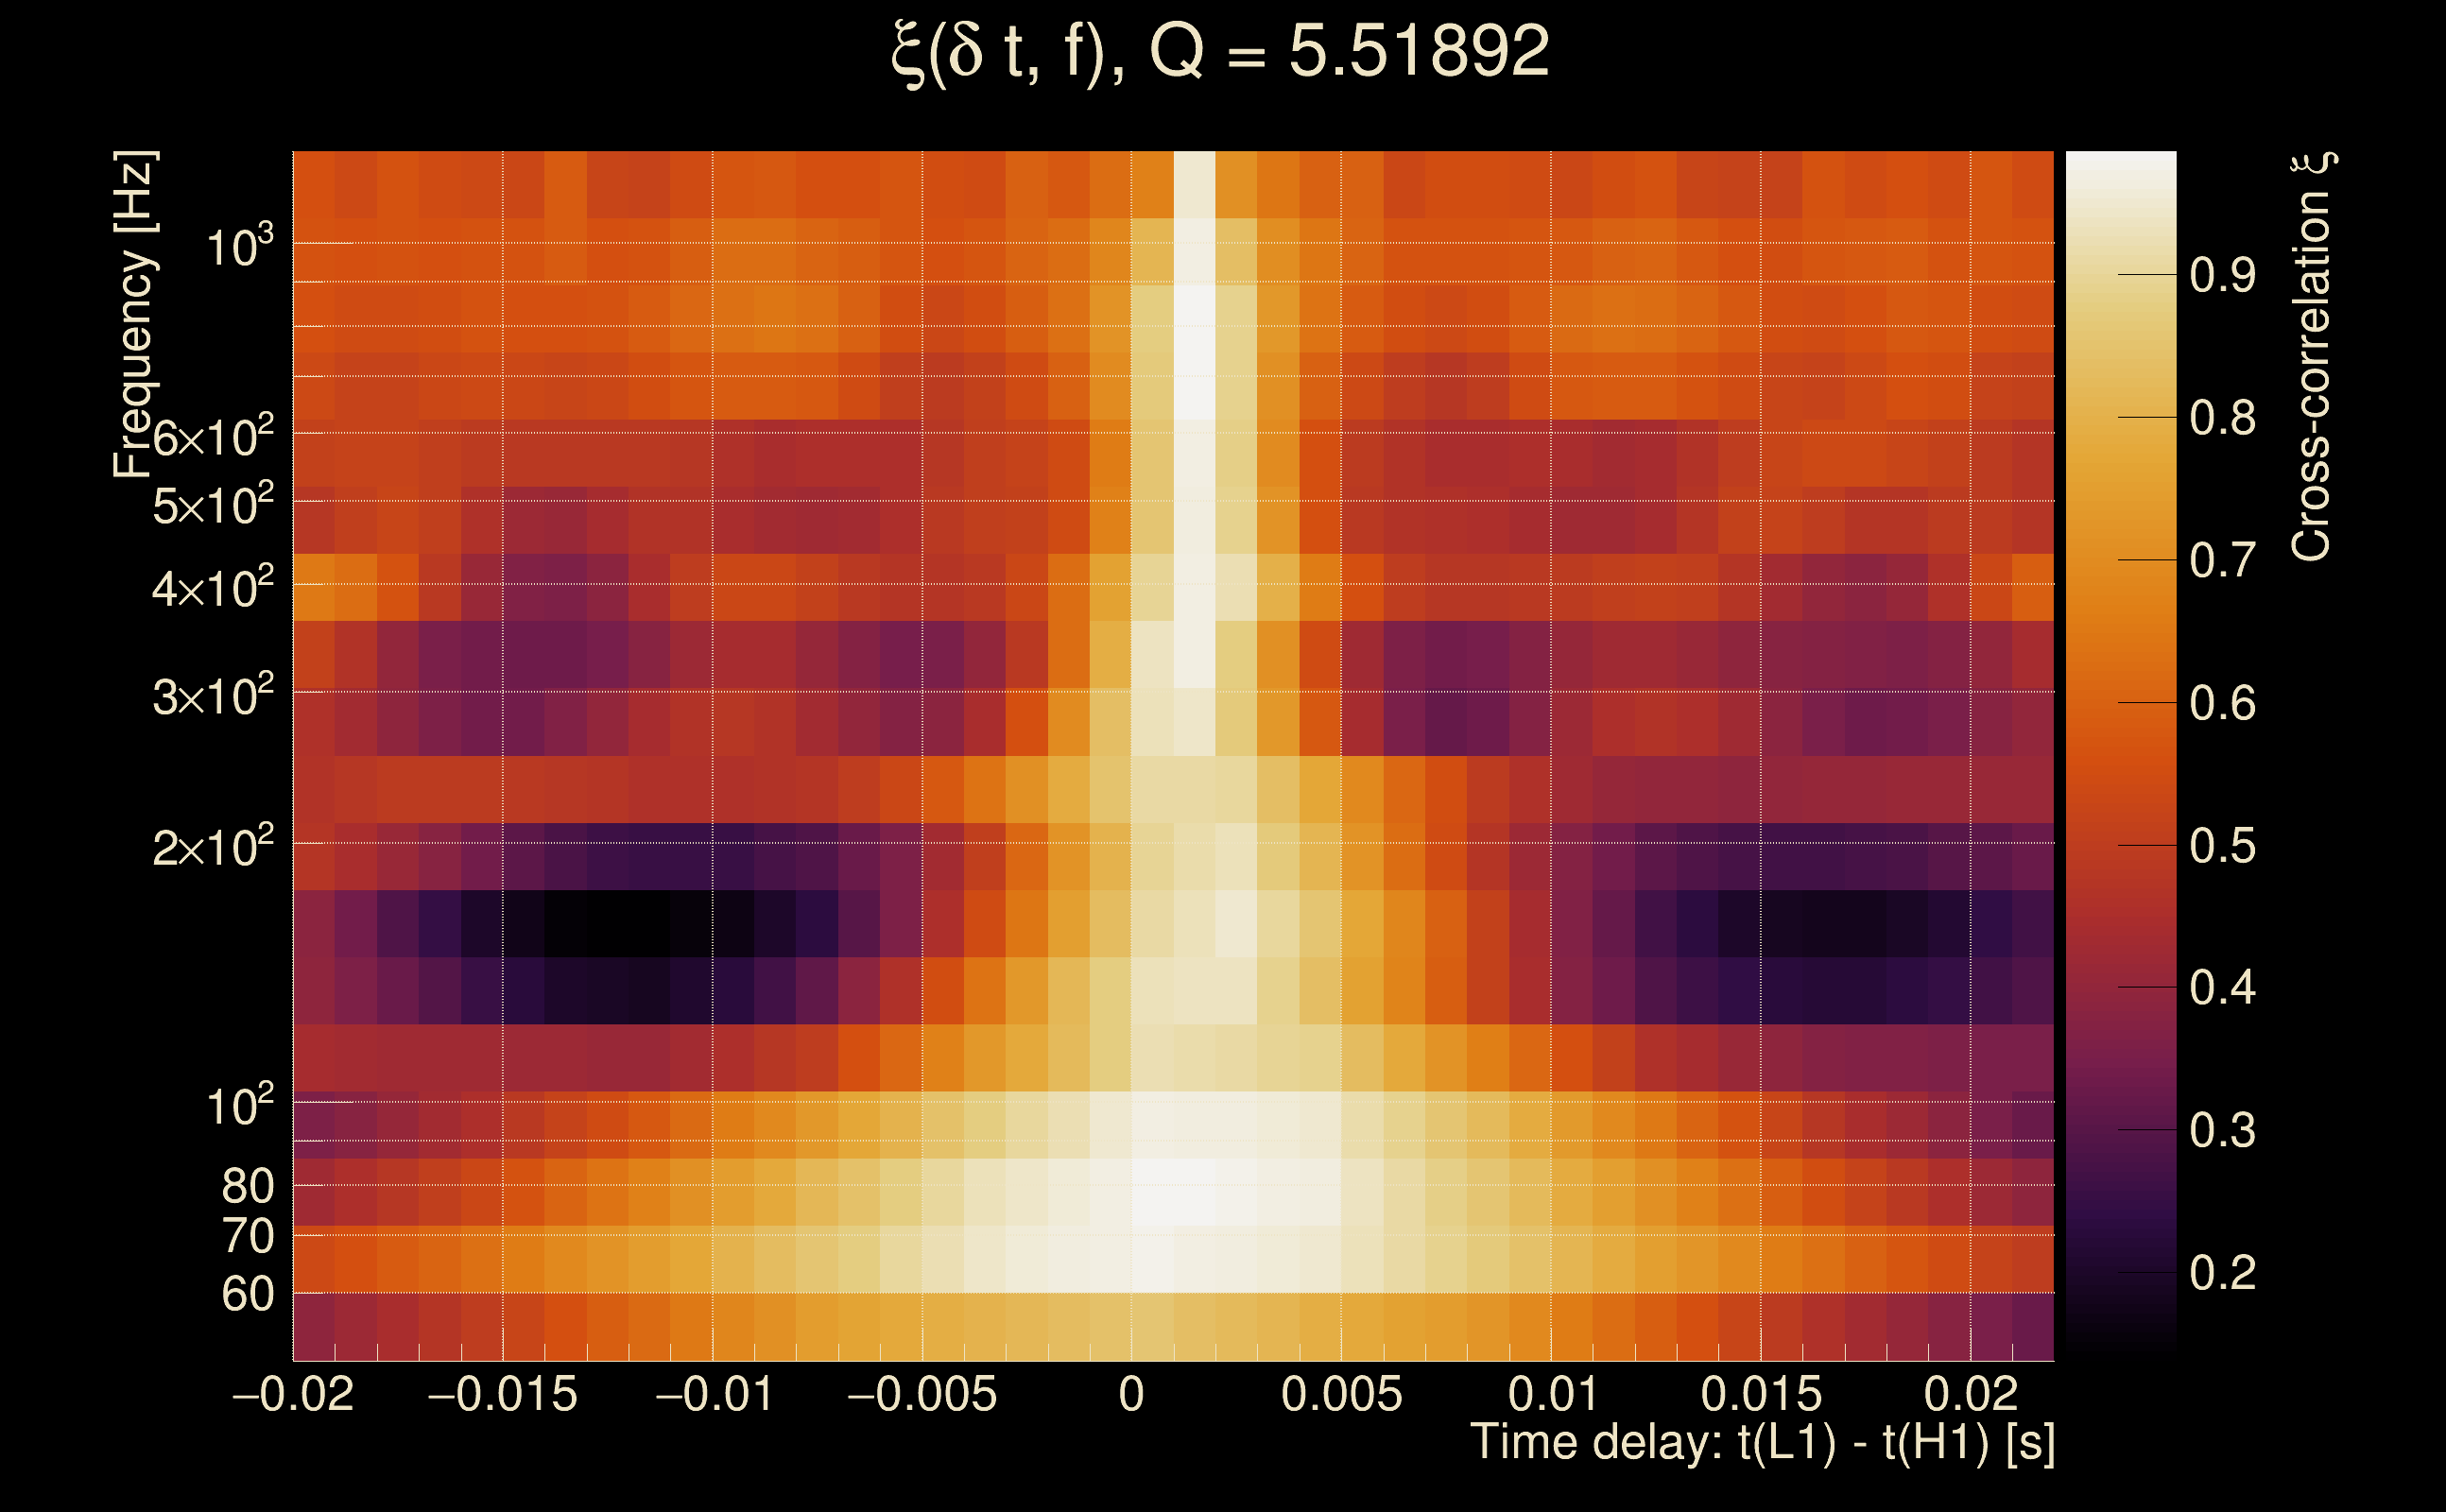
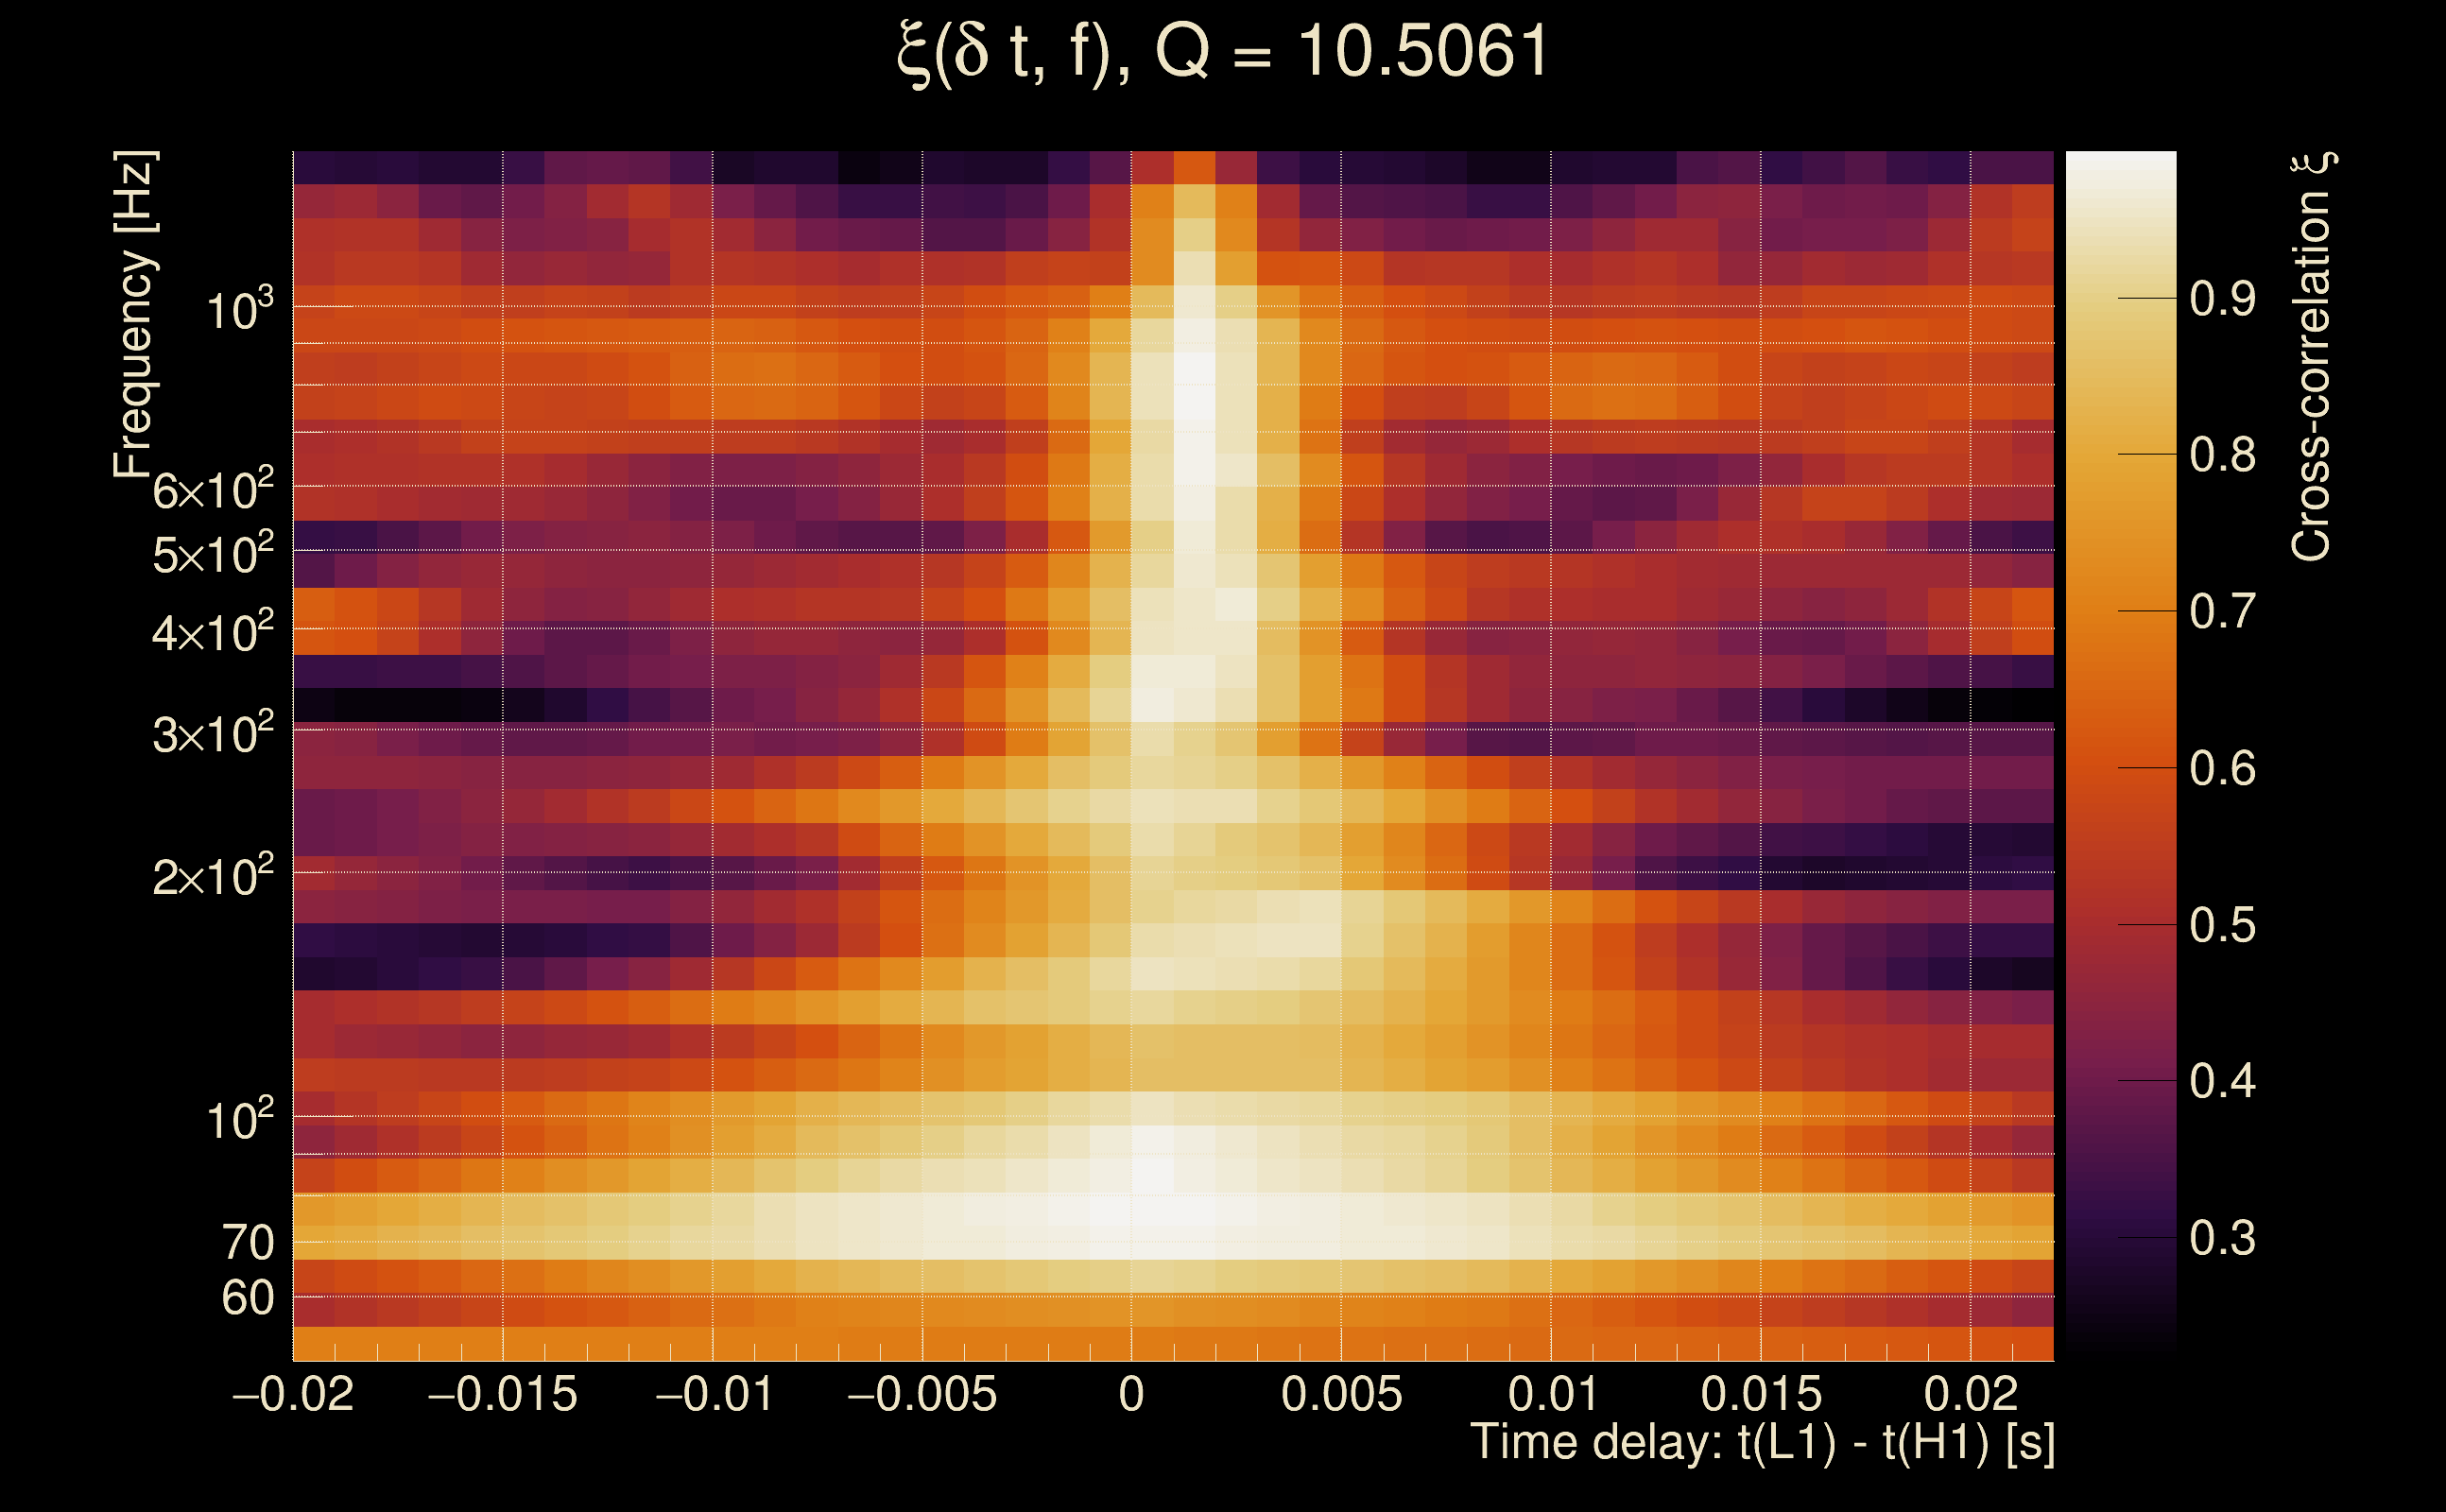
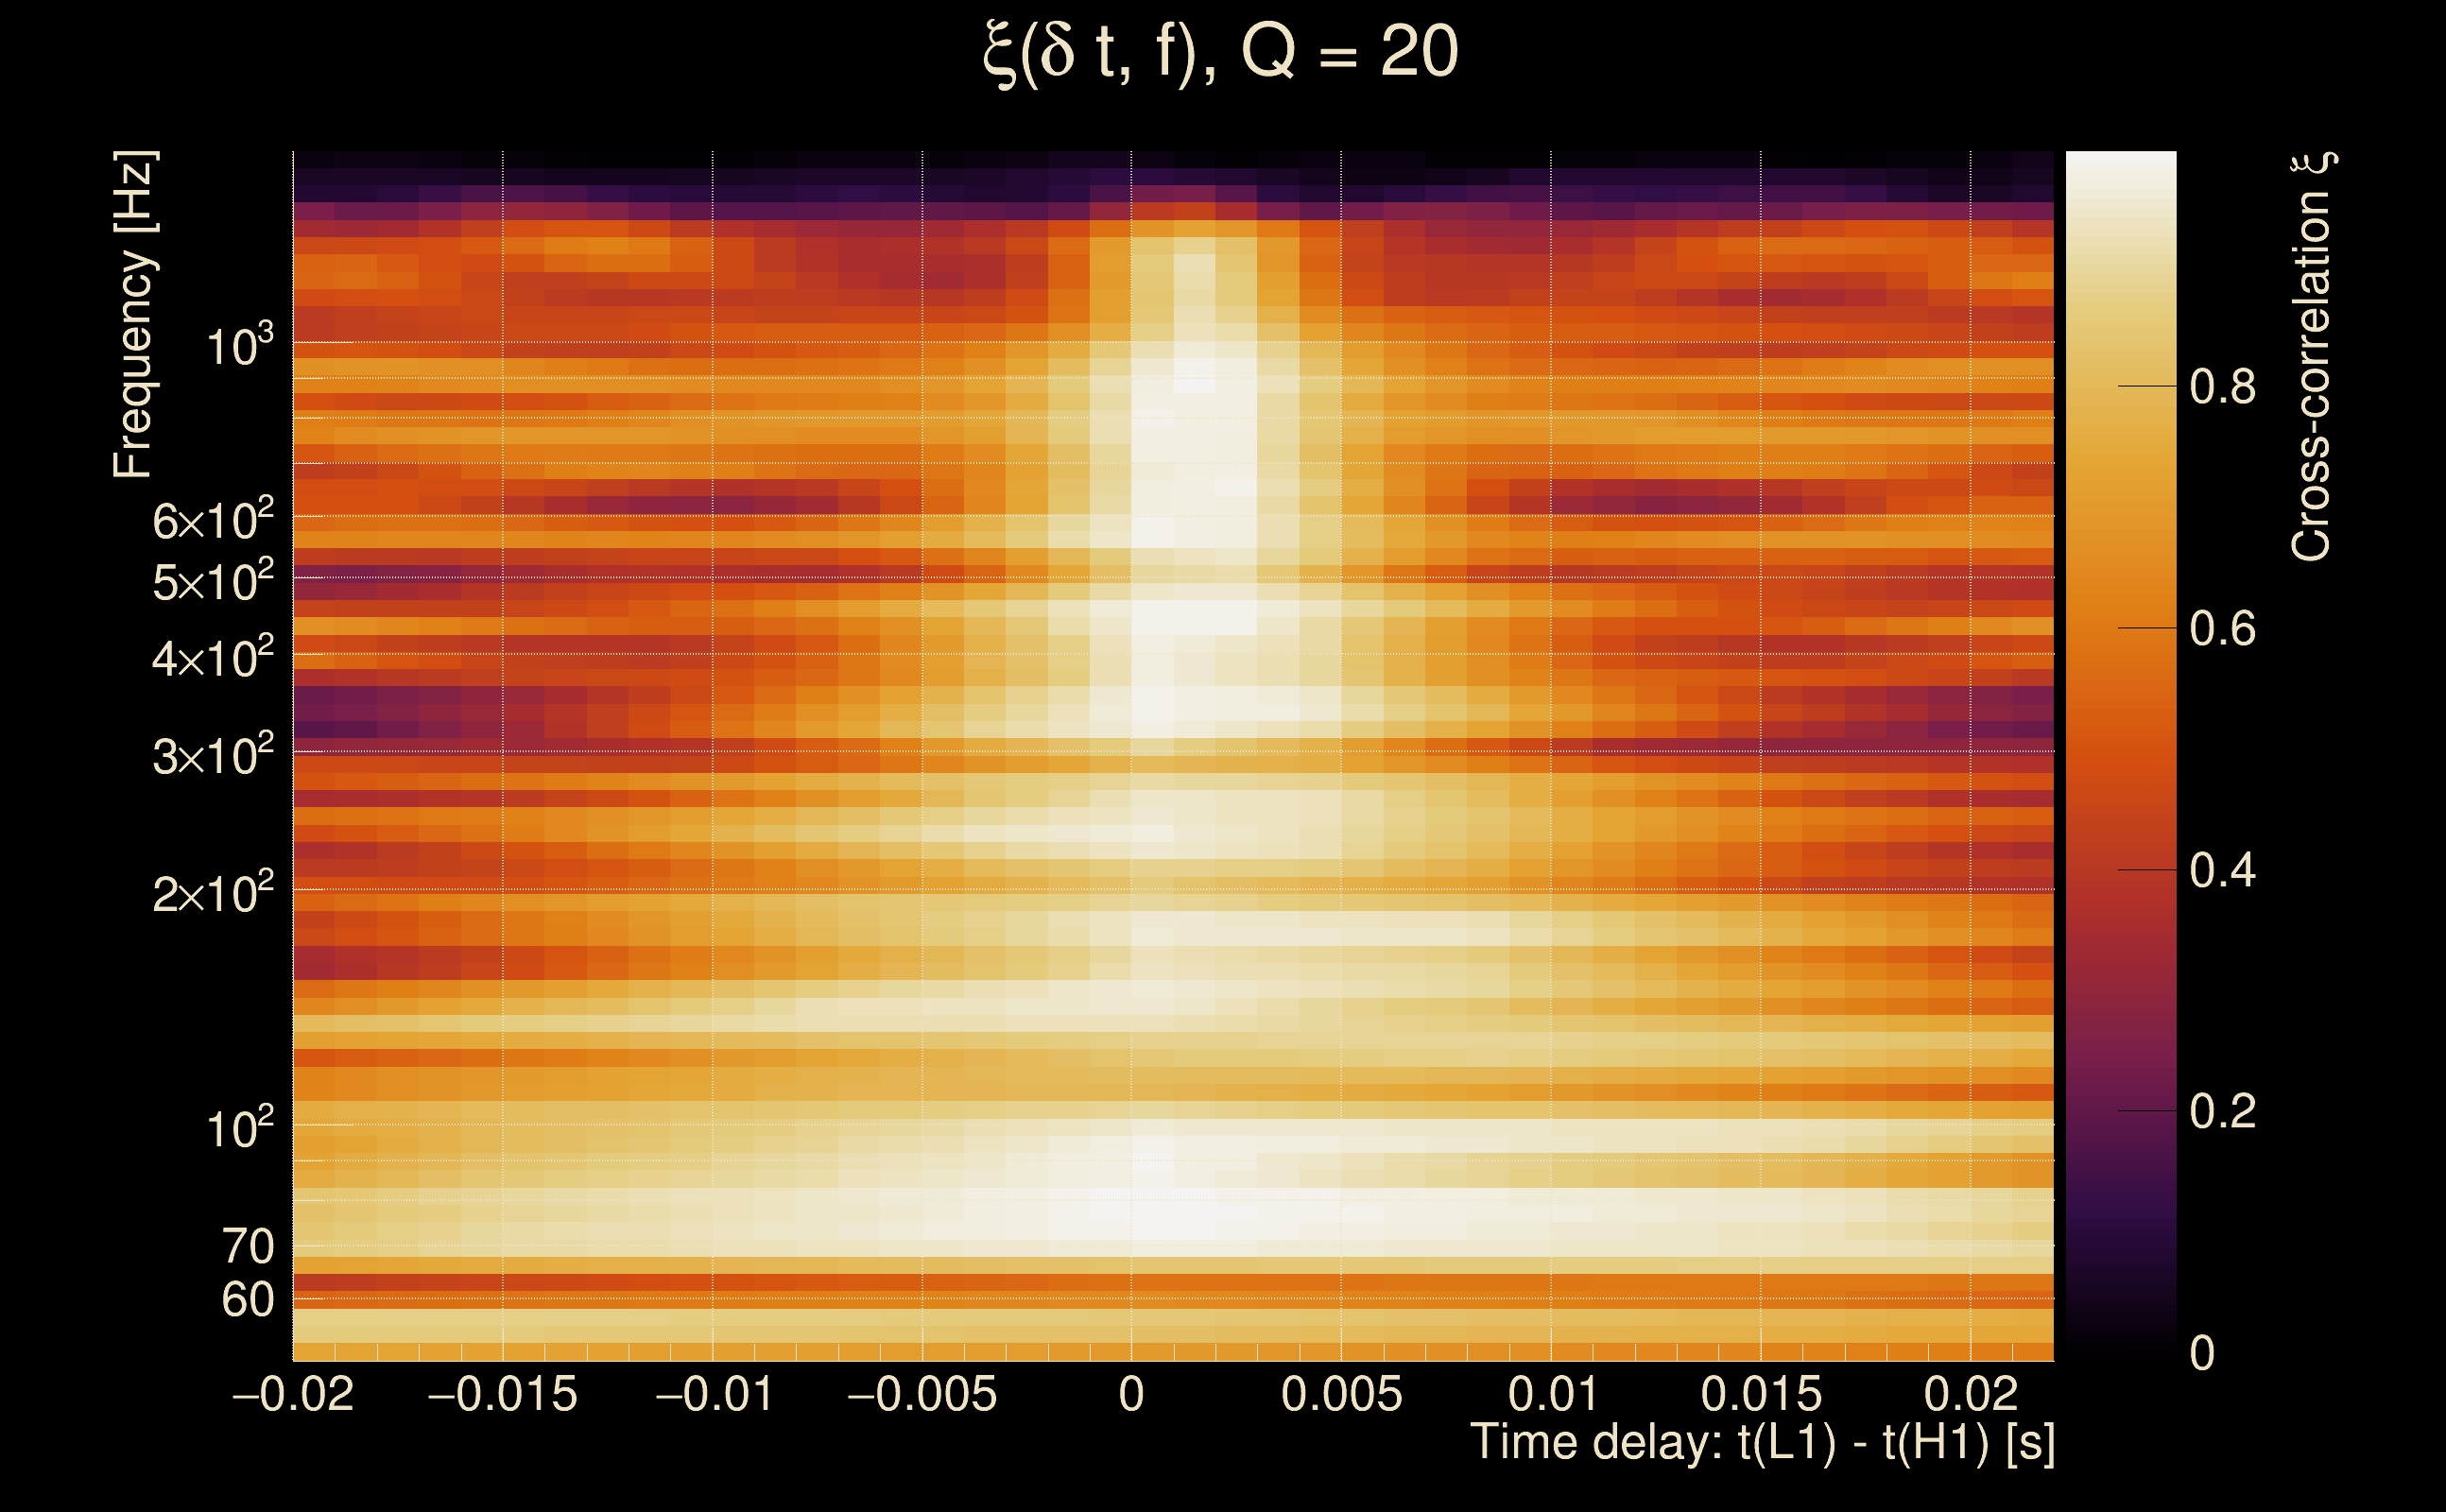
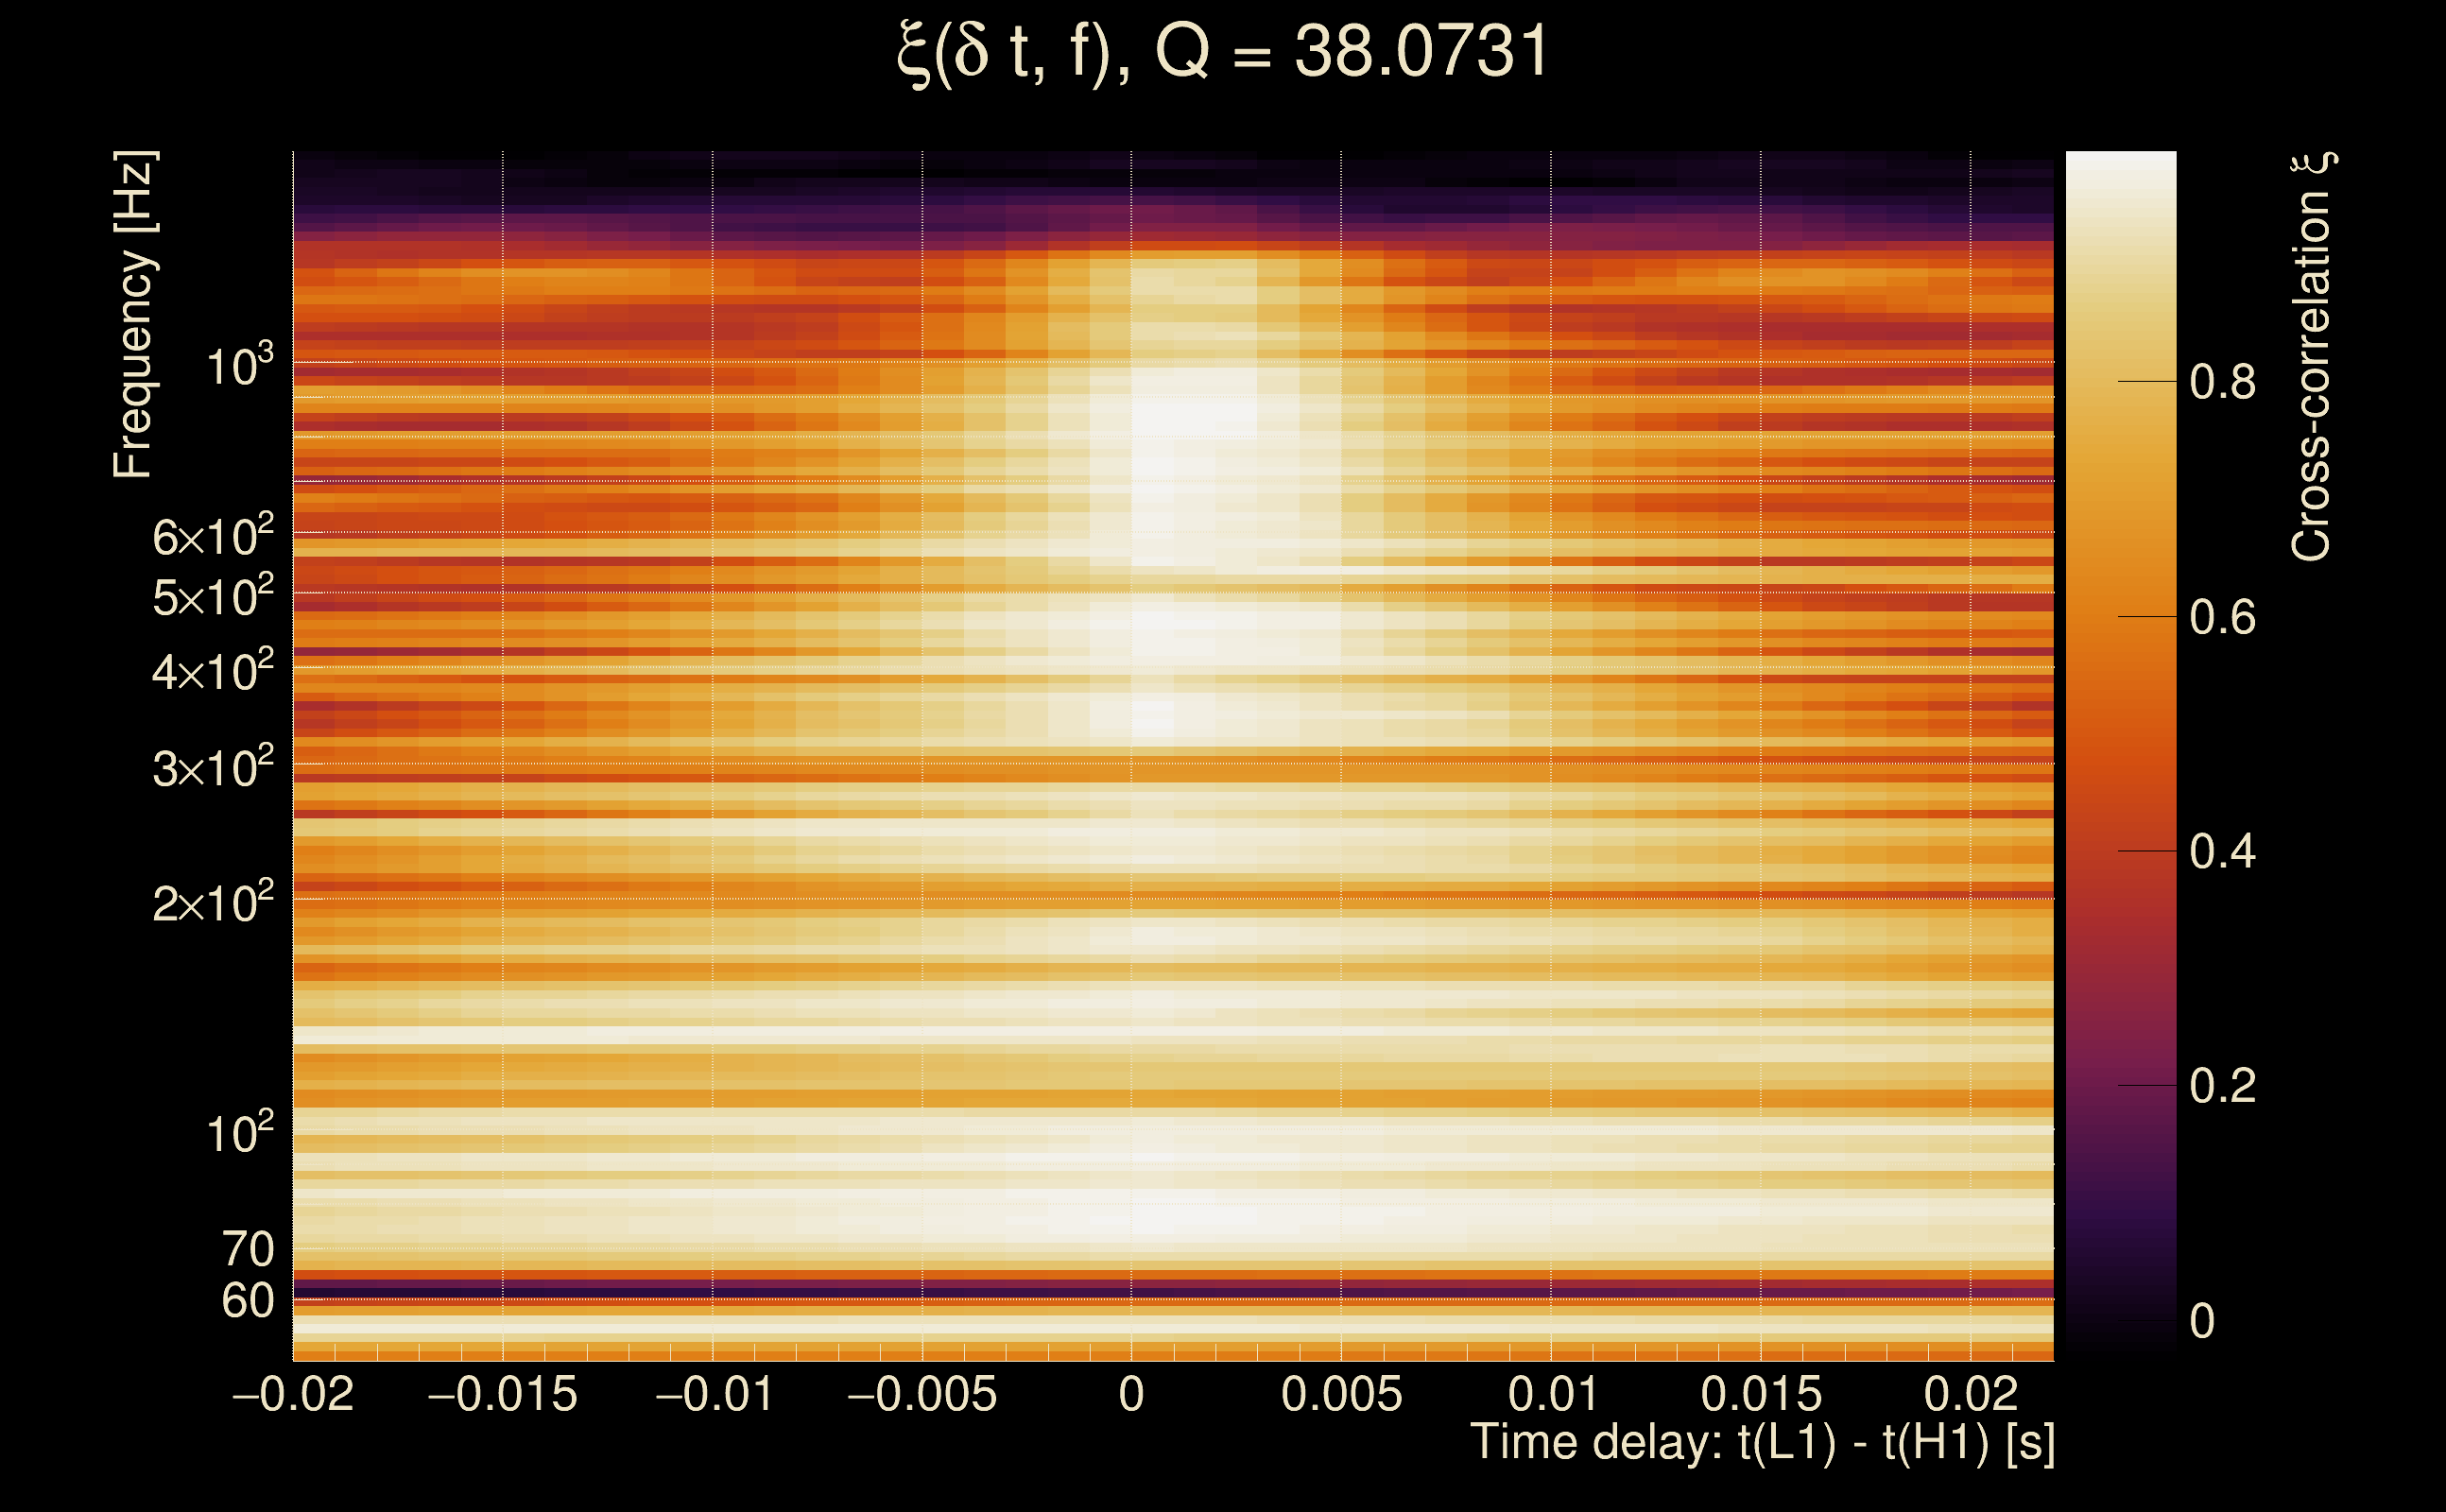
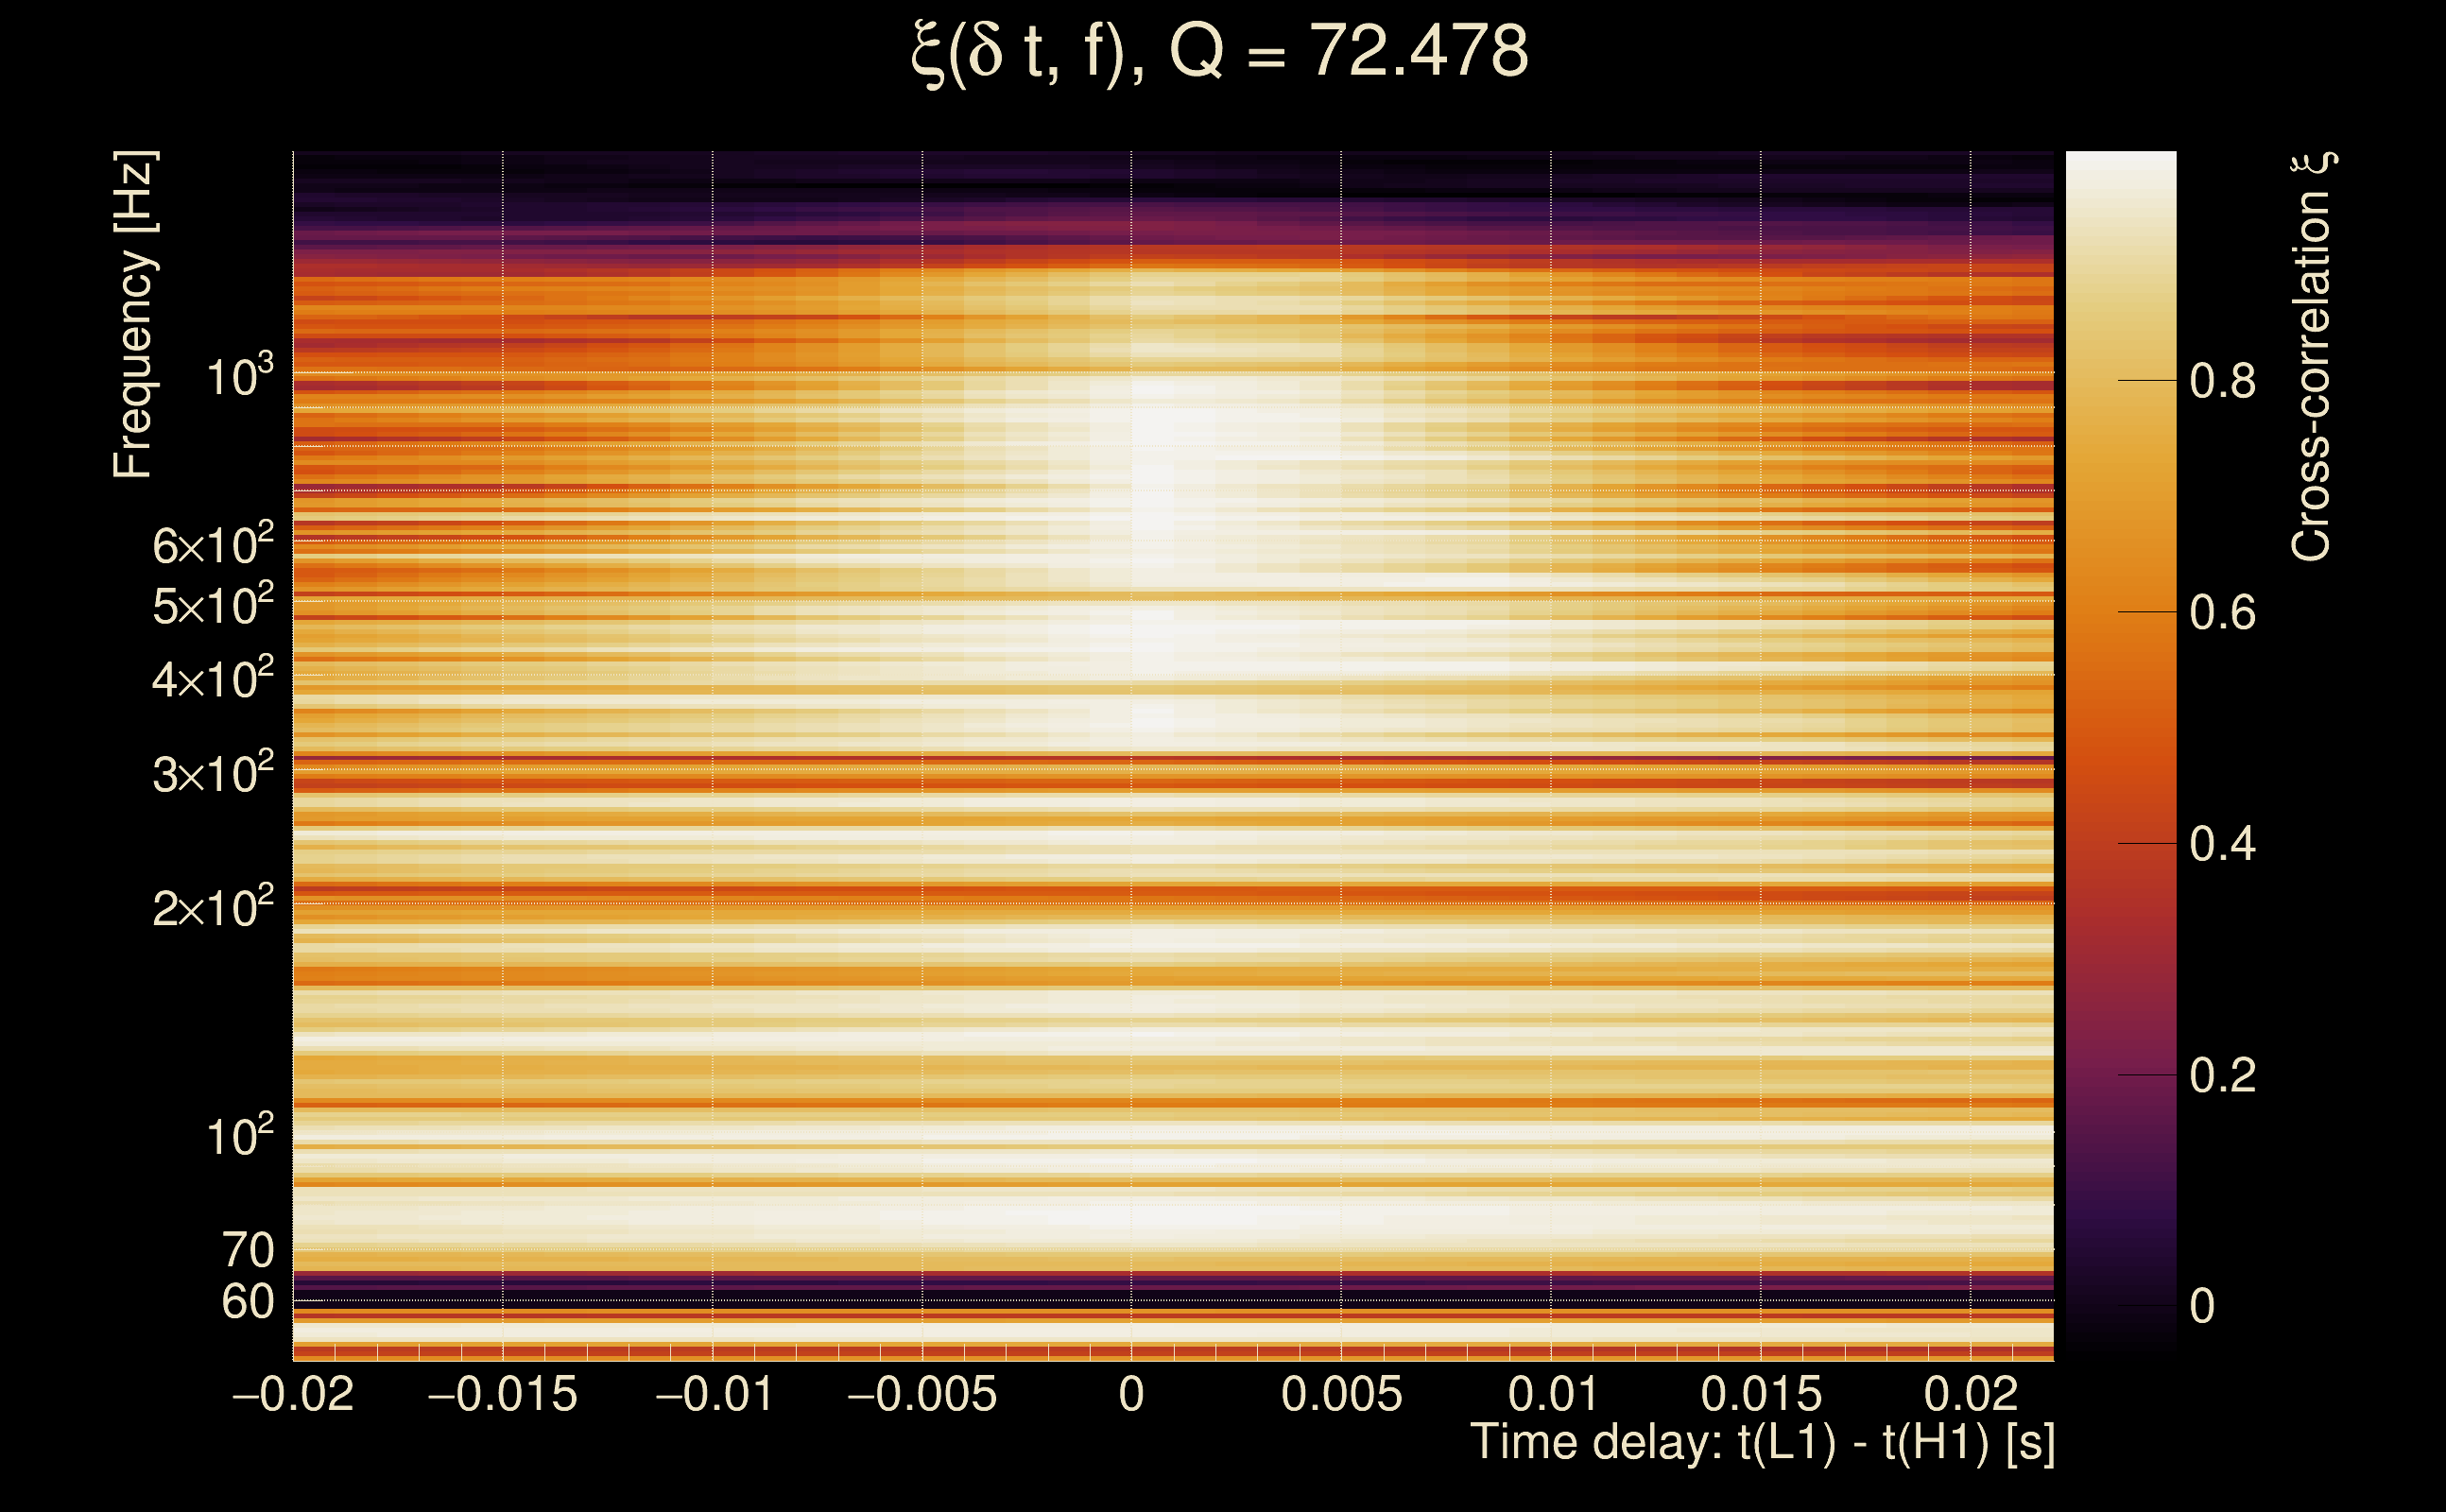
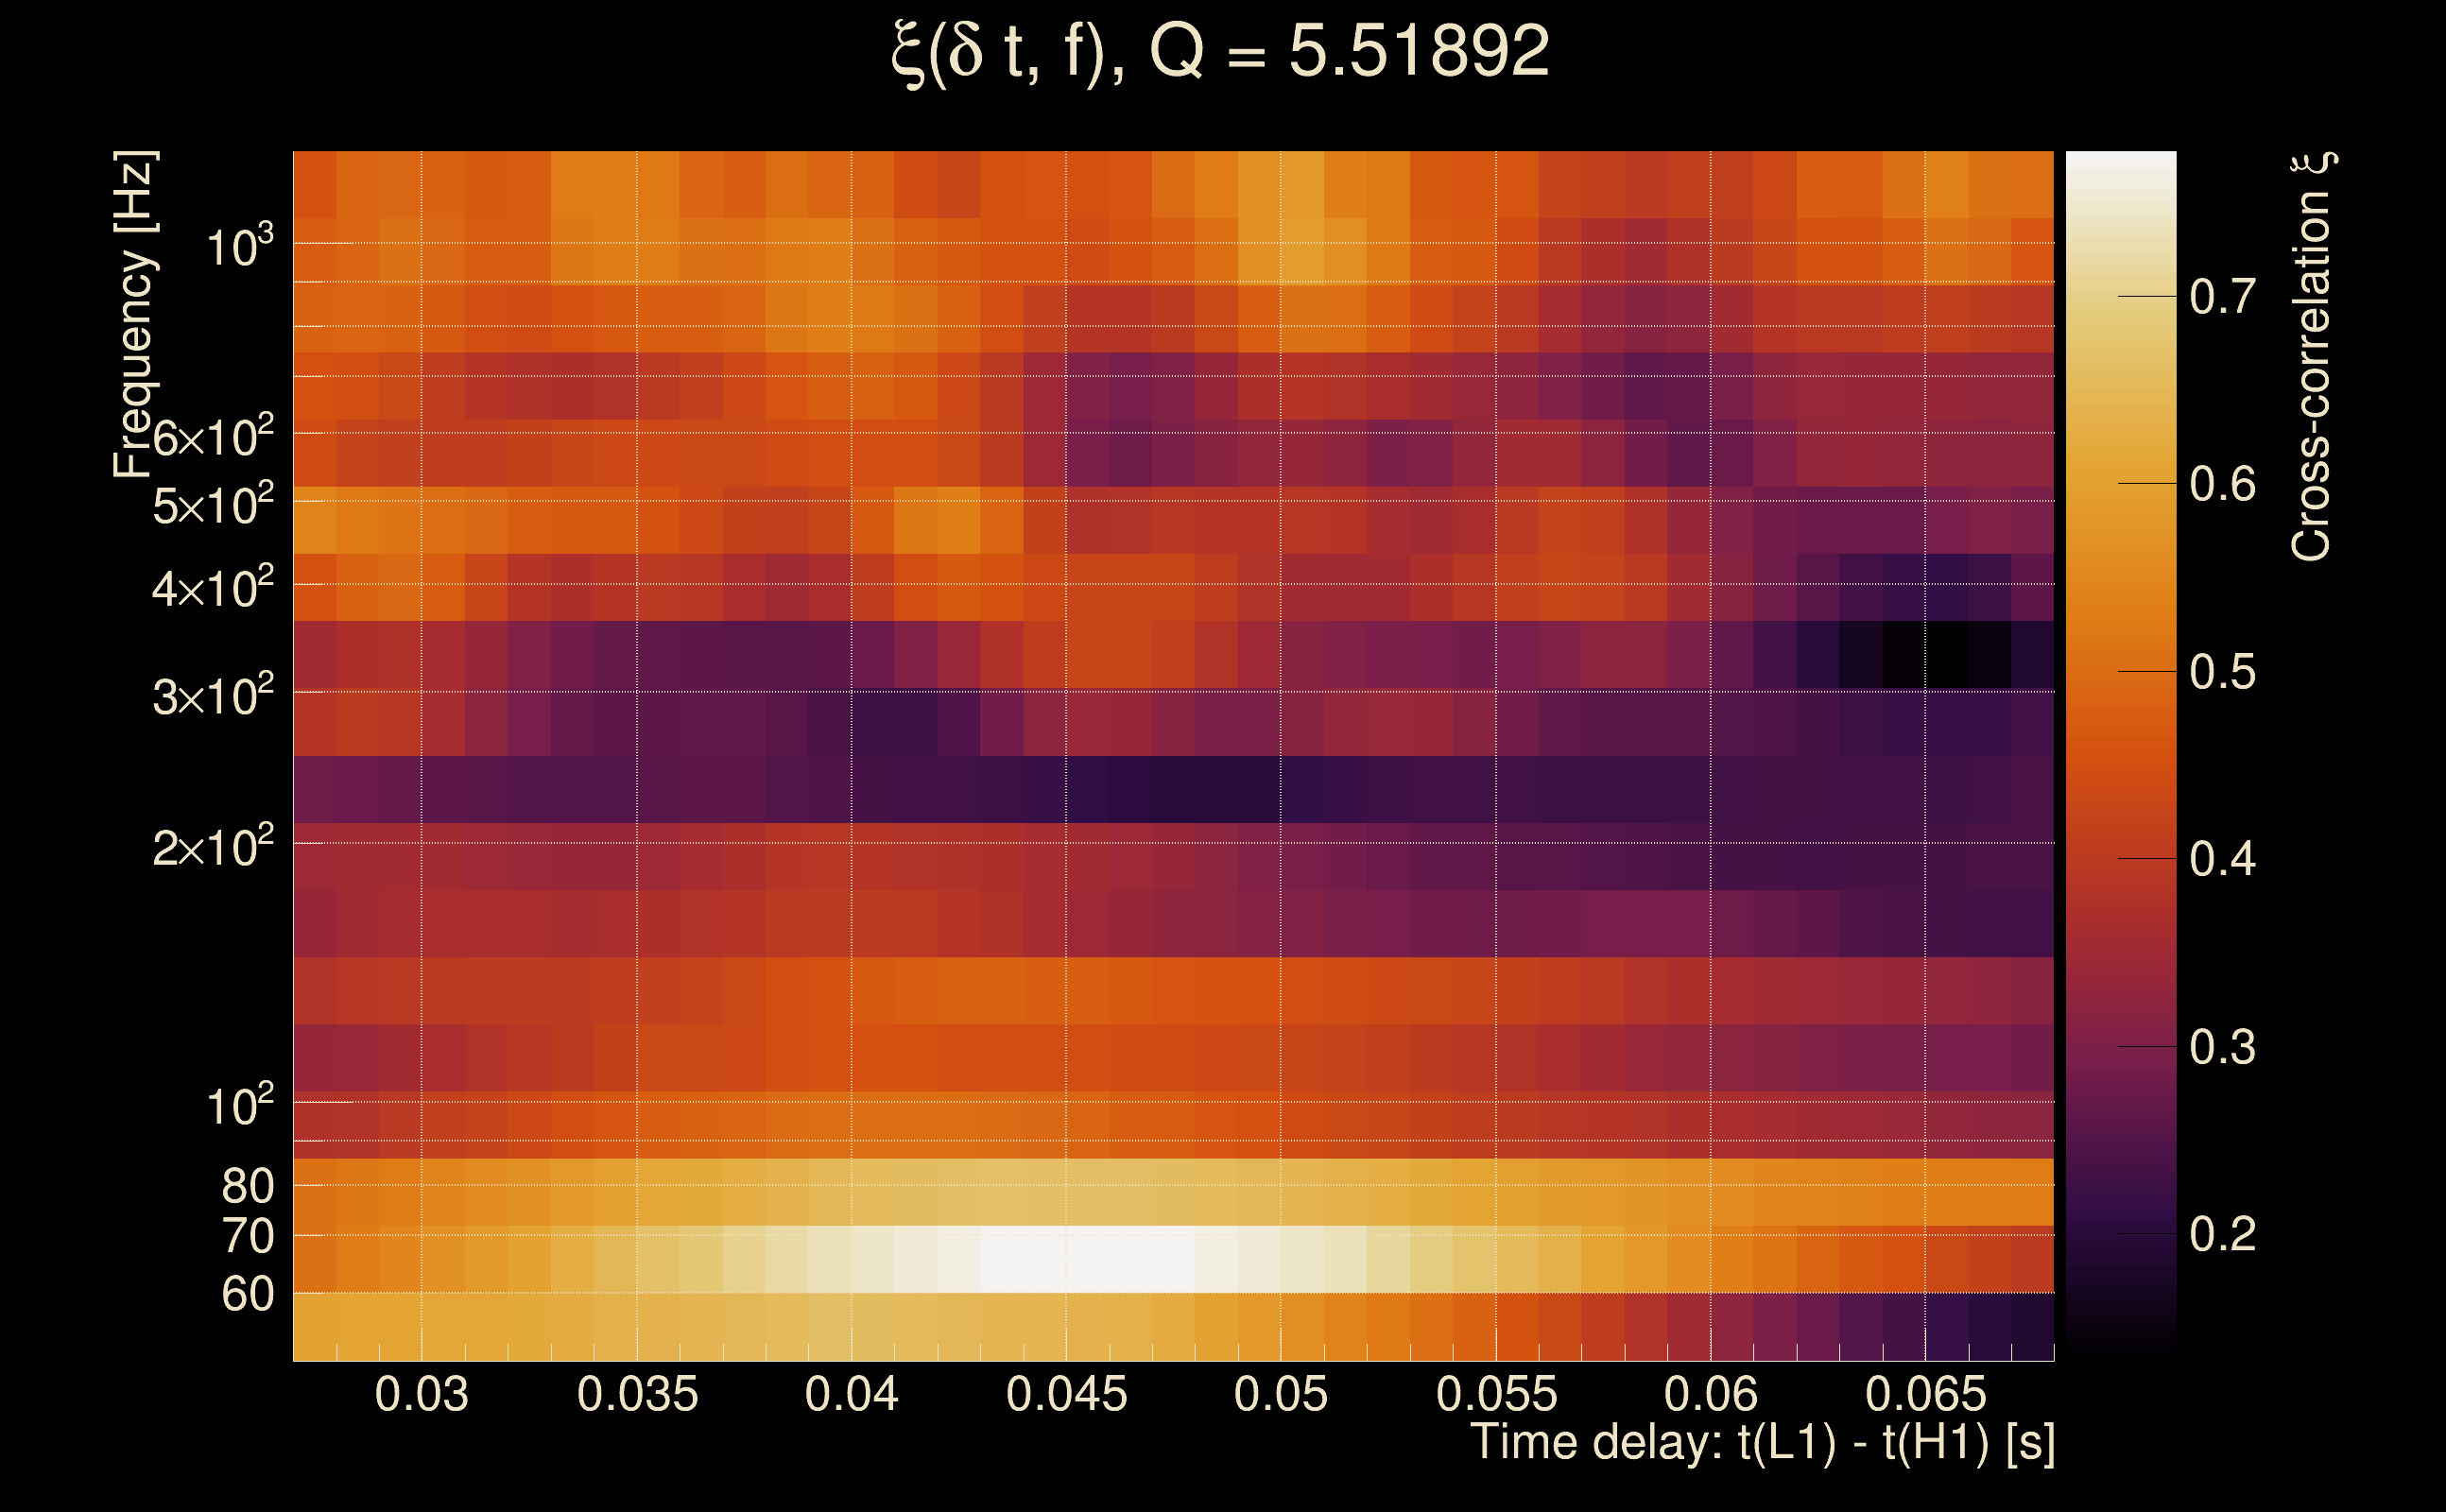
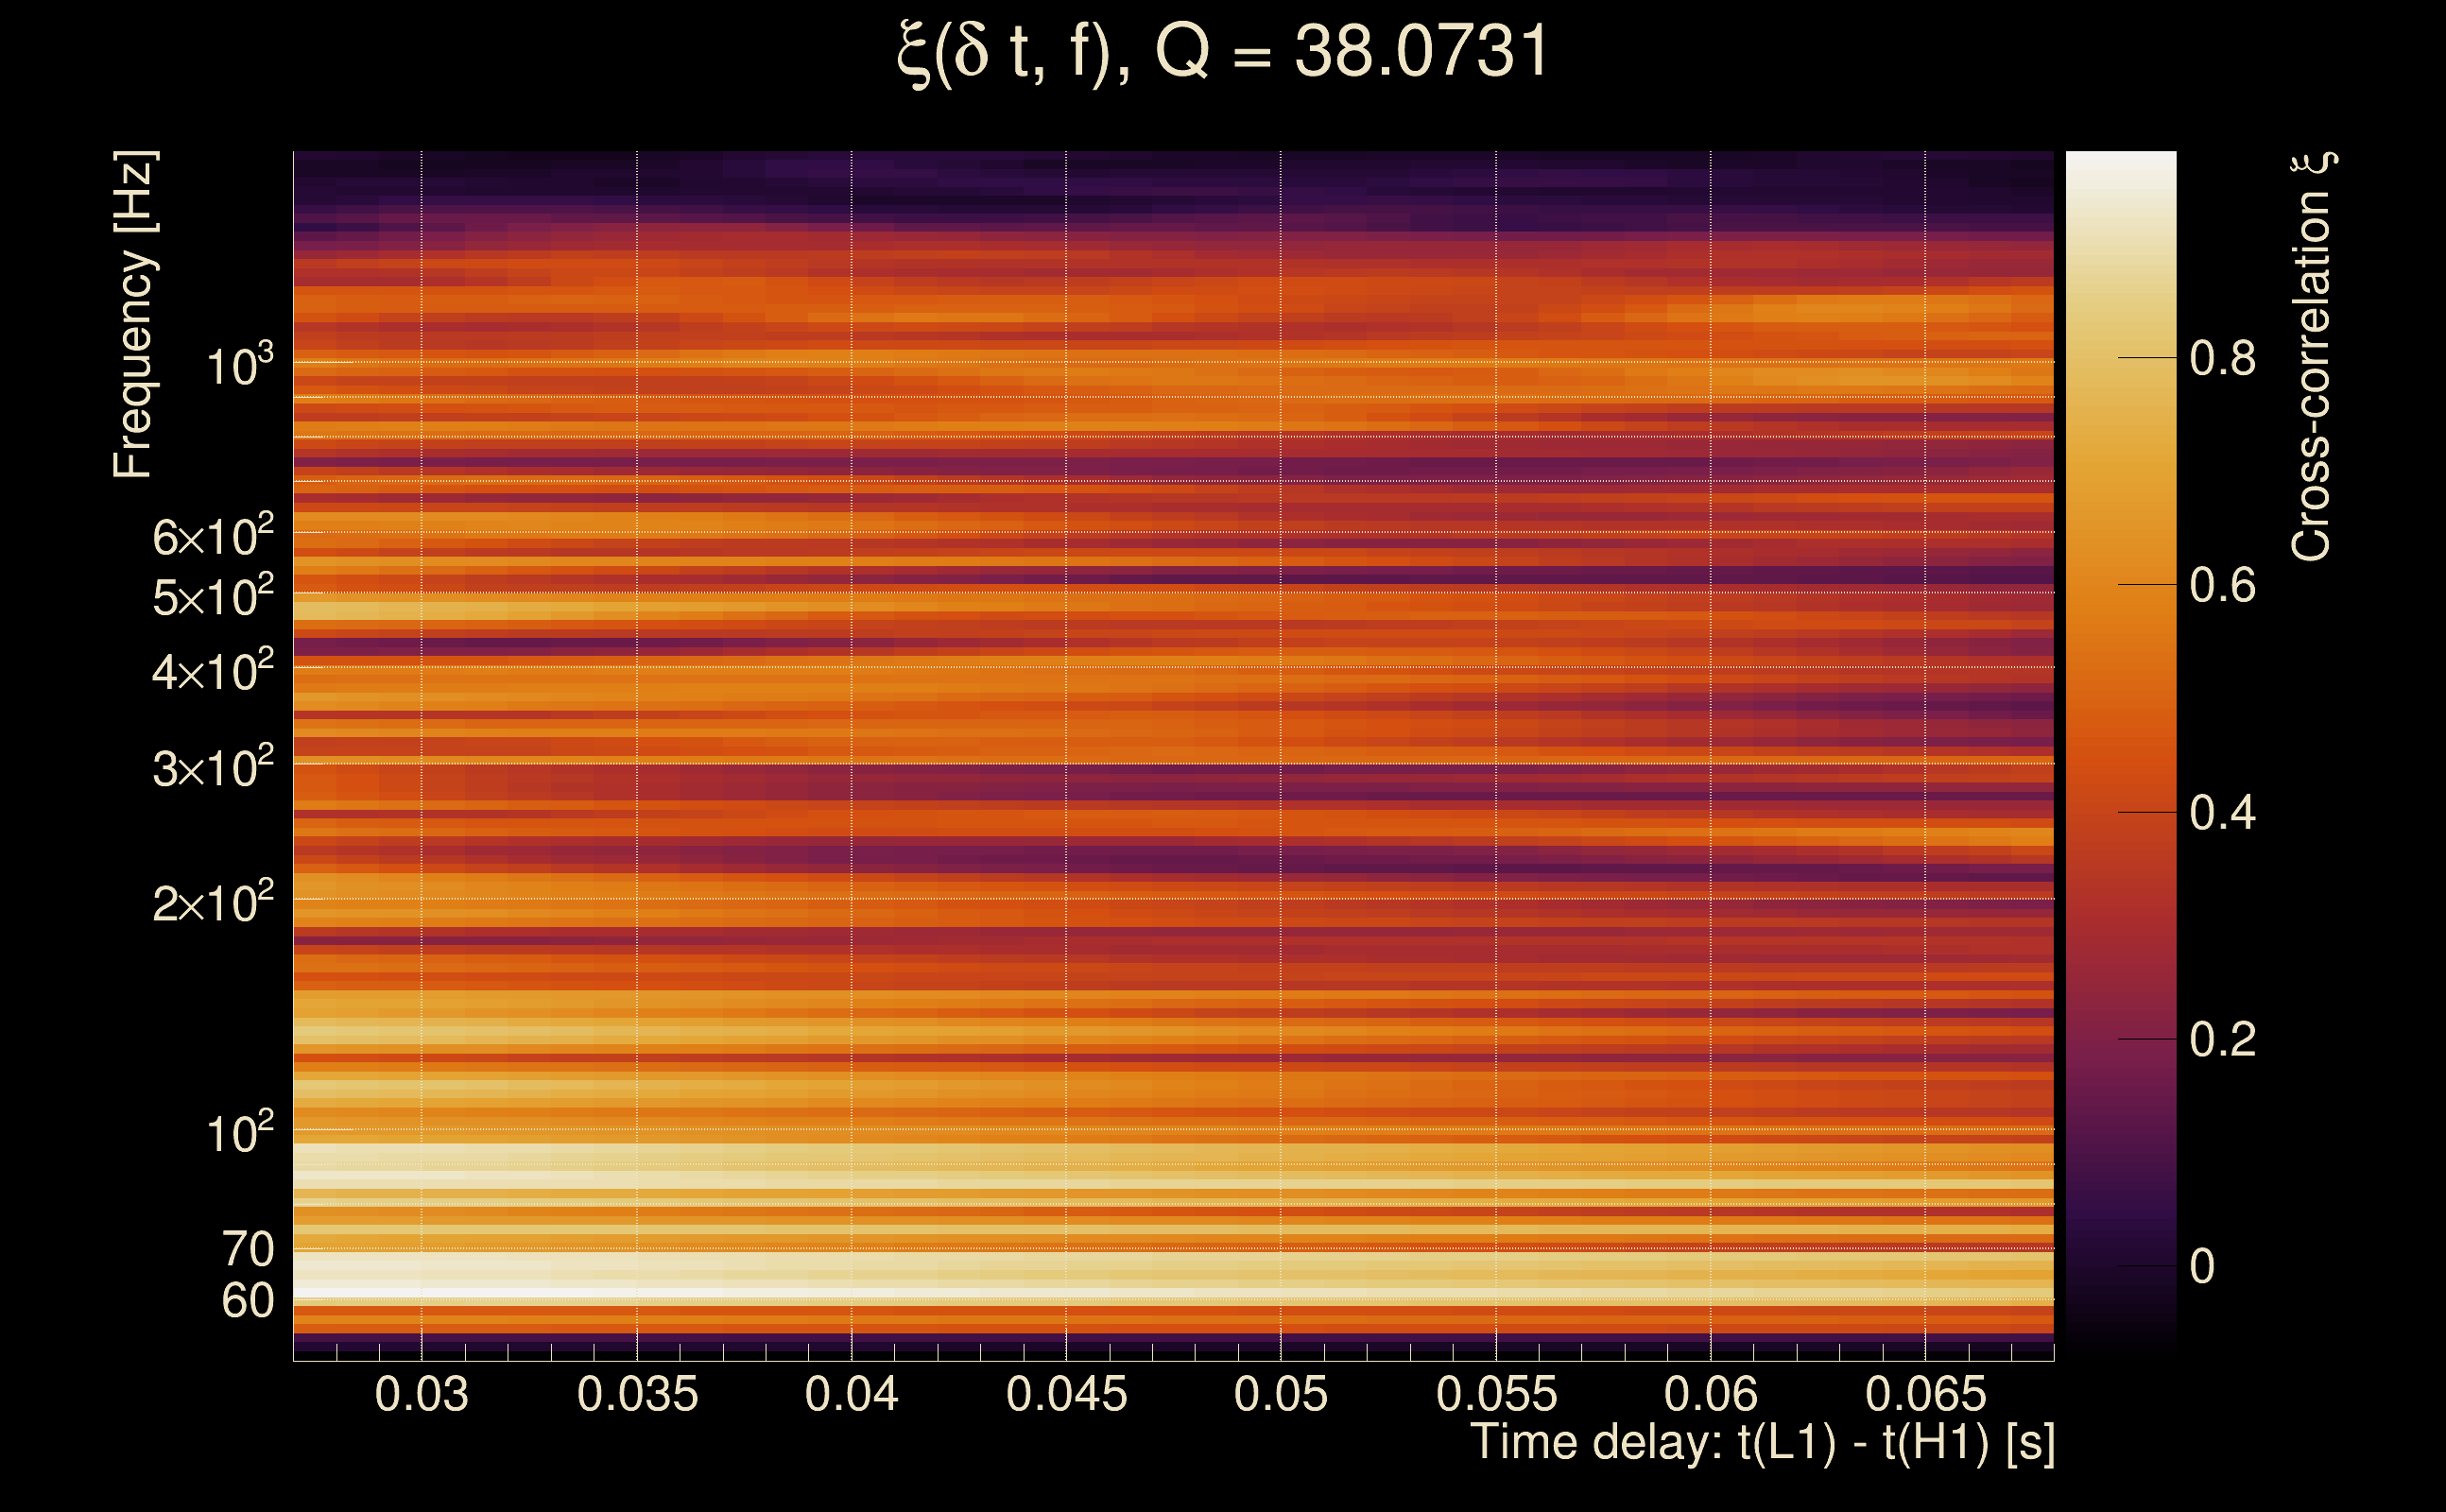
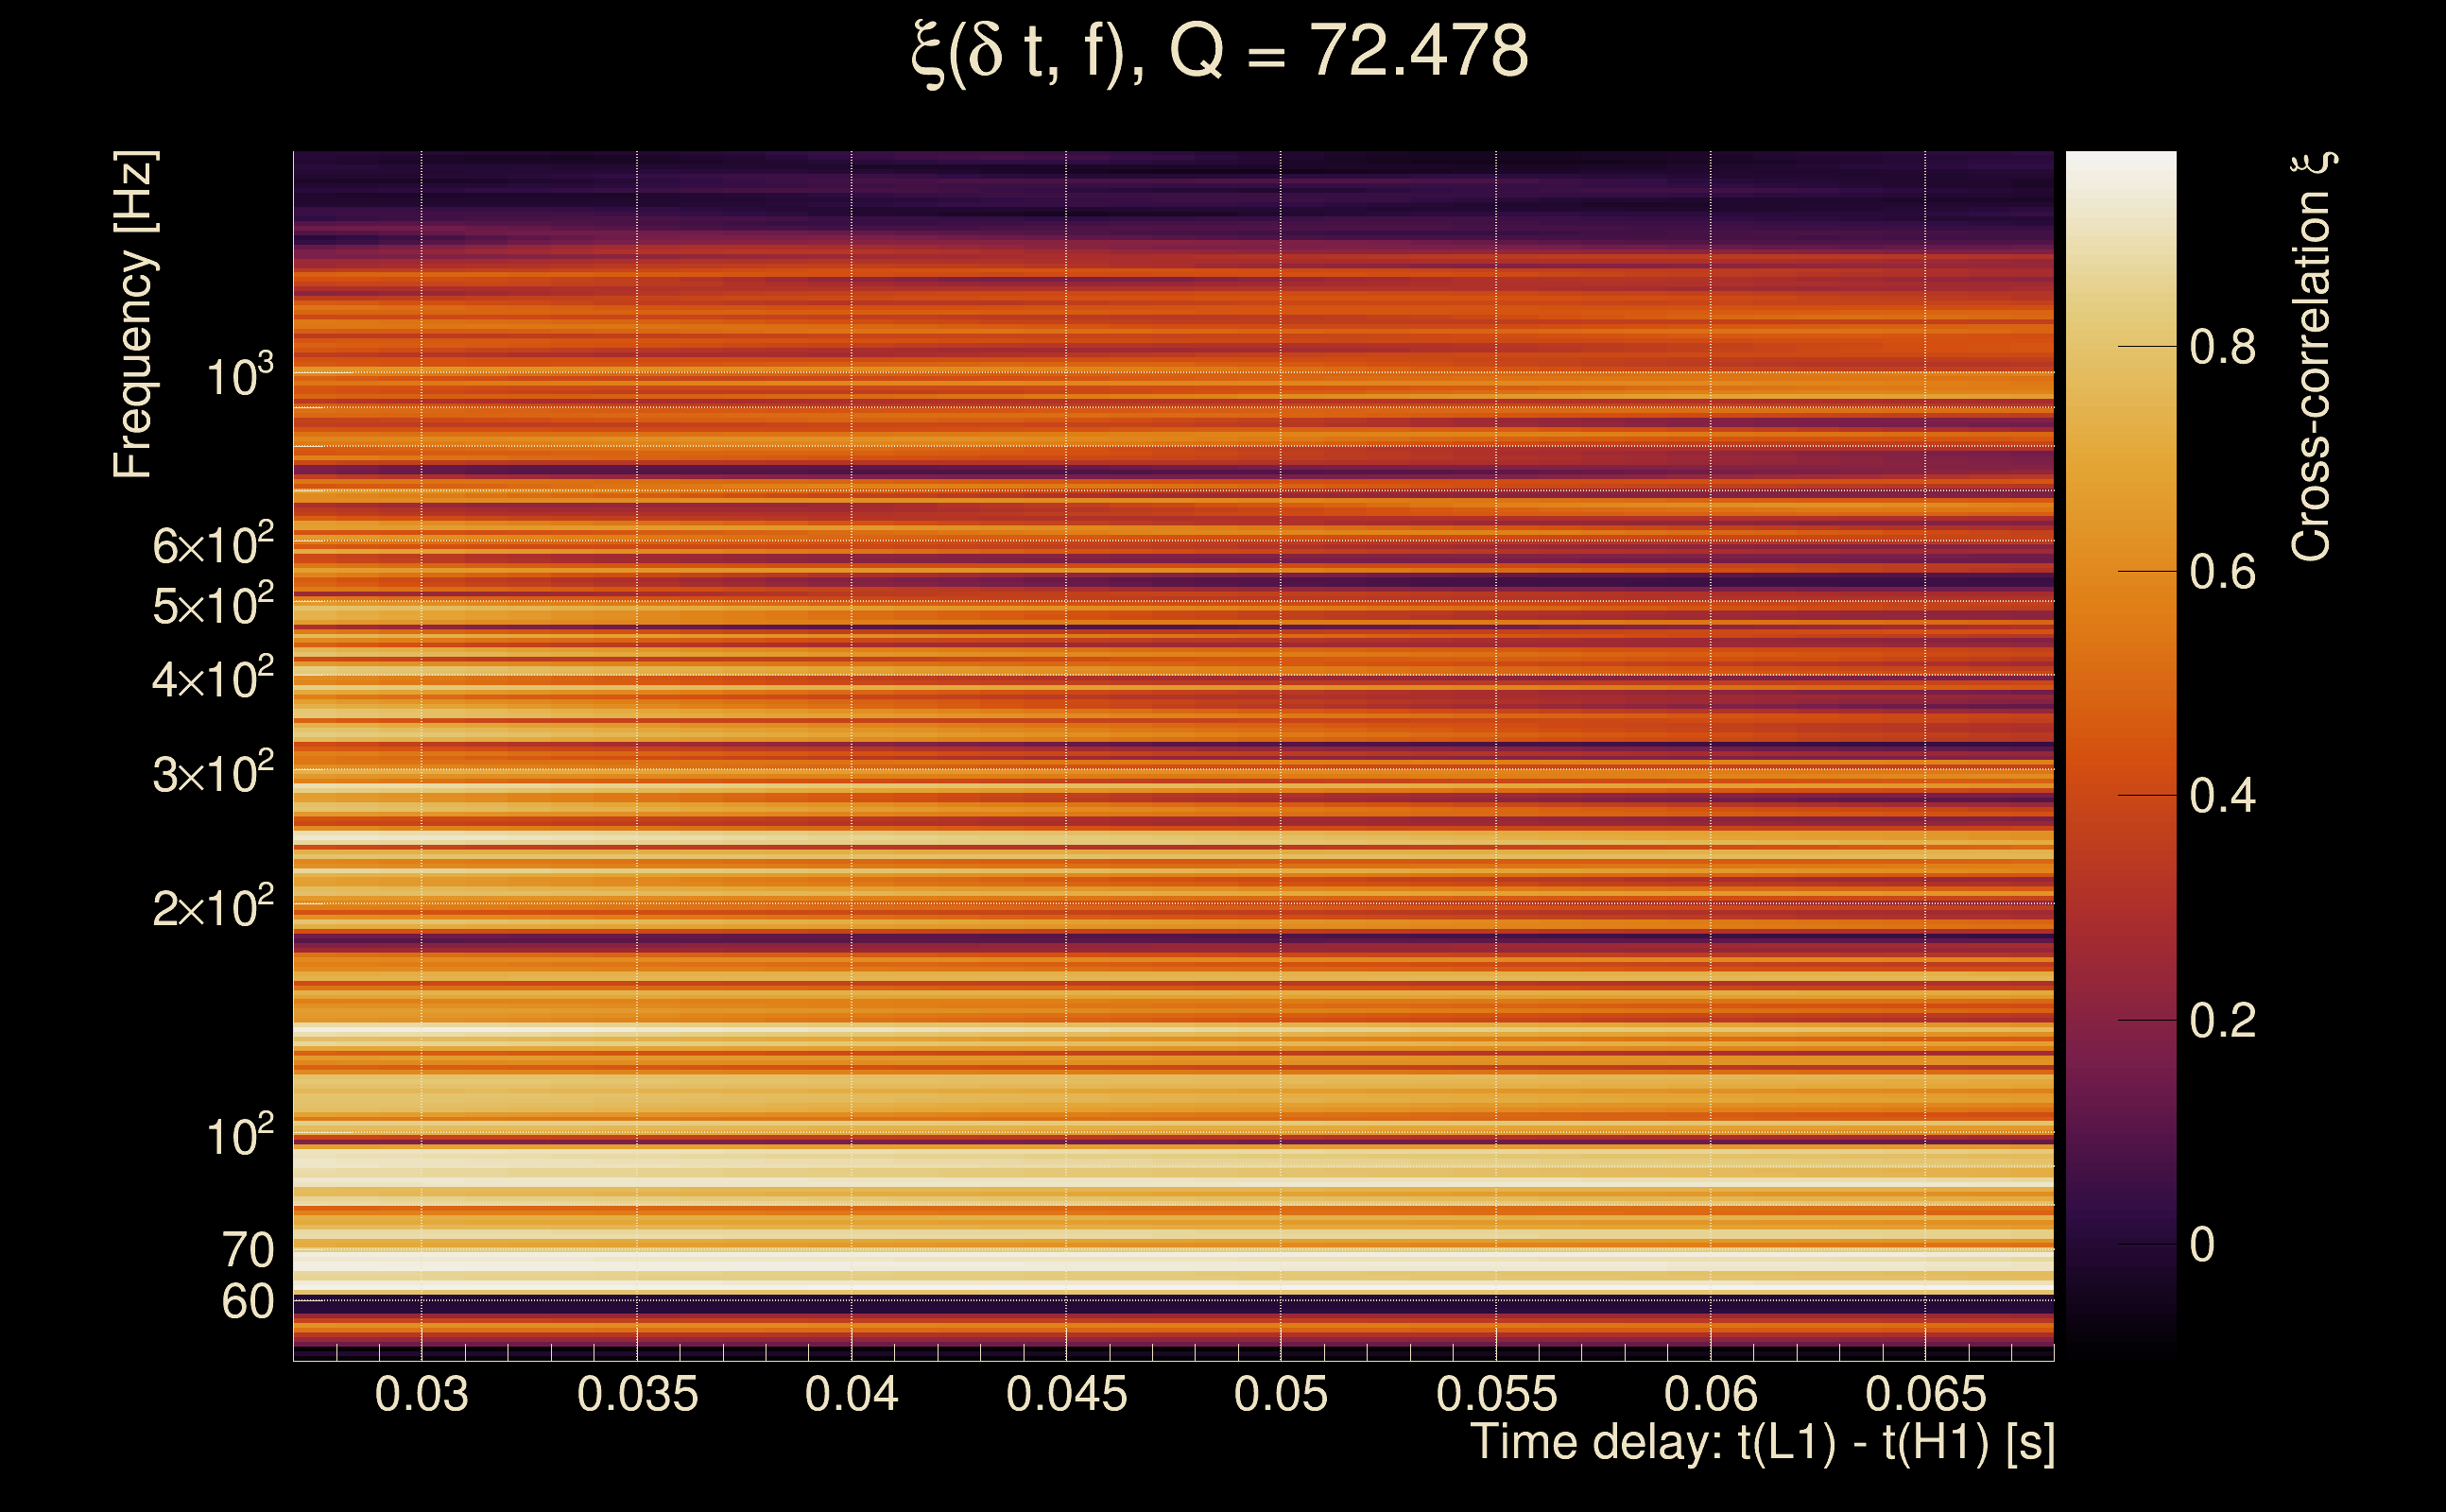
| Number of Q planes: | 5 (Q = 5.51892 → Q = 72.478) |
| Omicron frequency range: | 50 Hz → 1958.38 Hz |
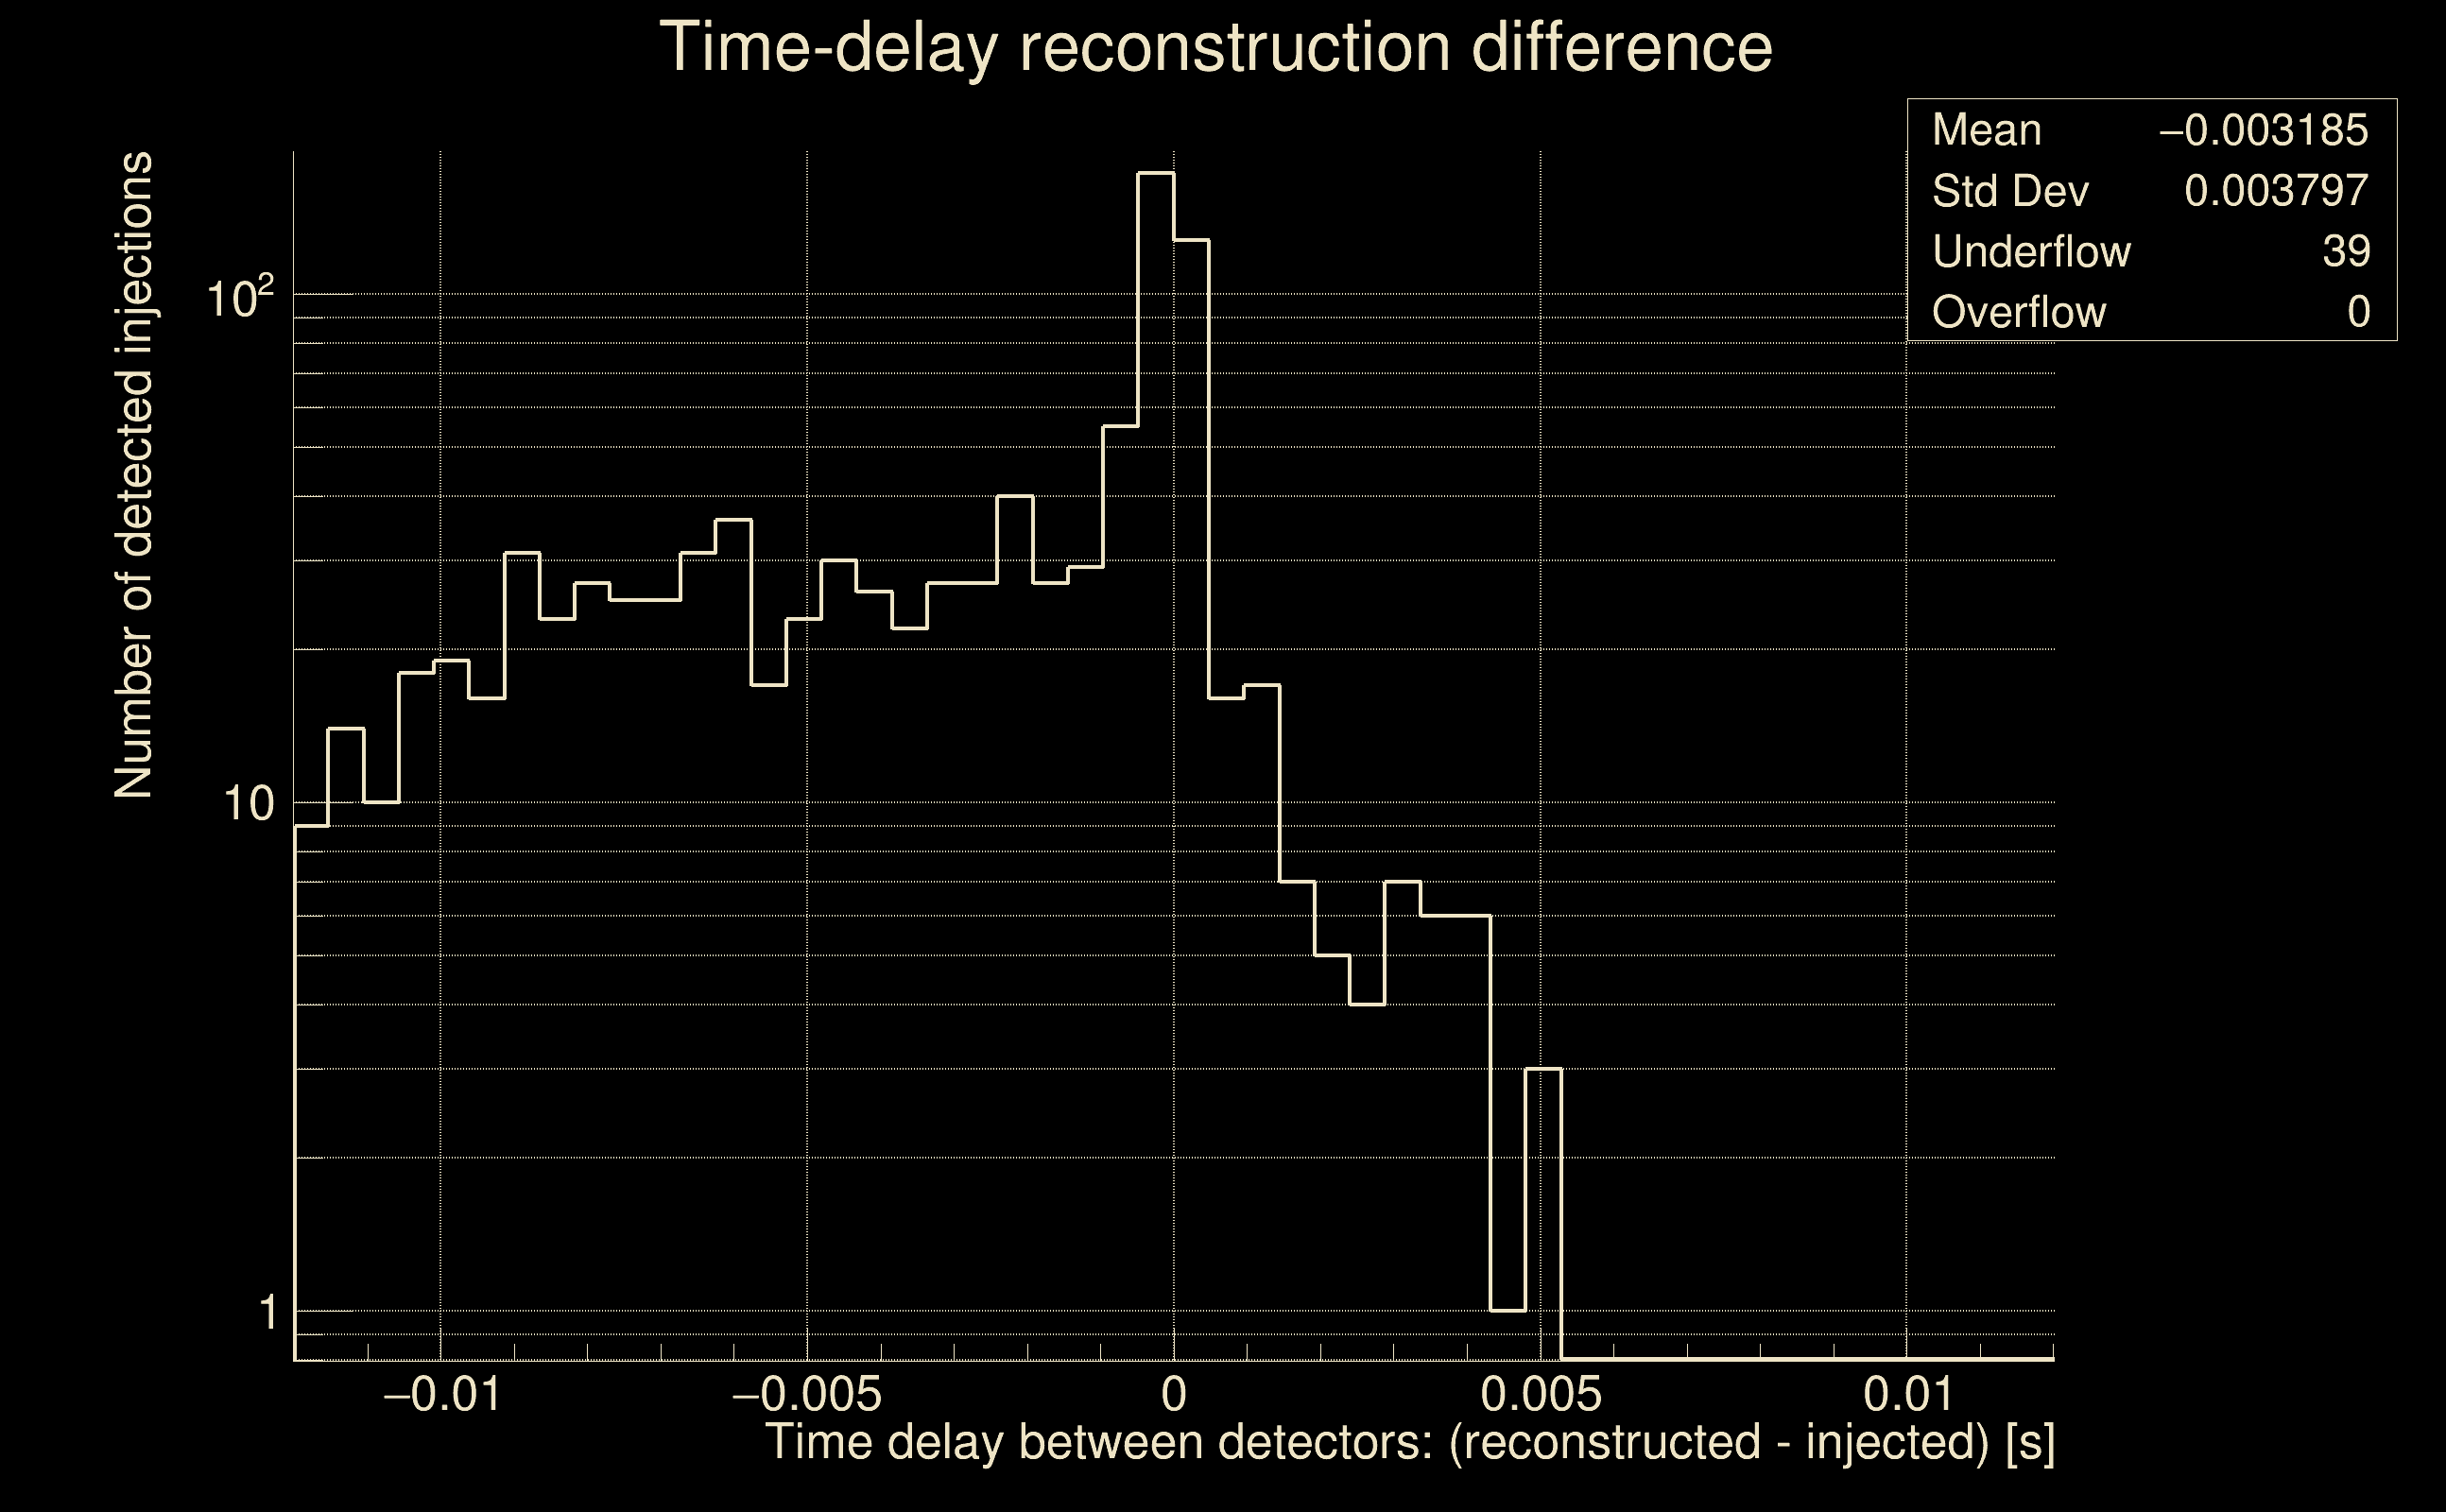
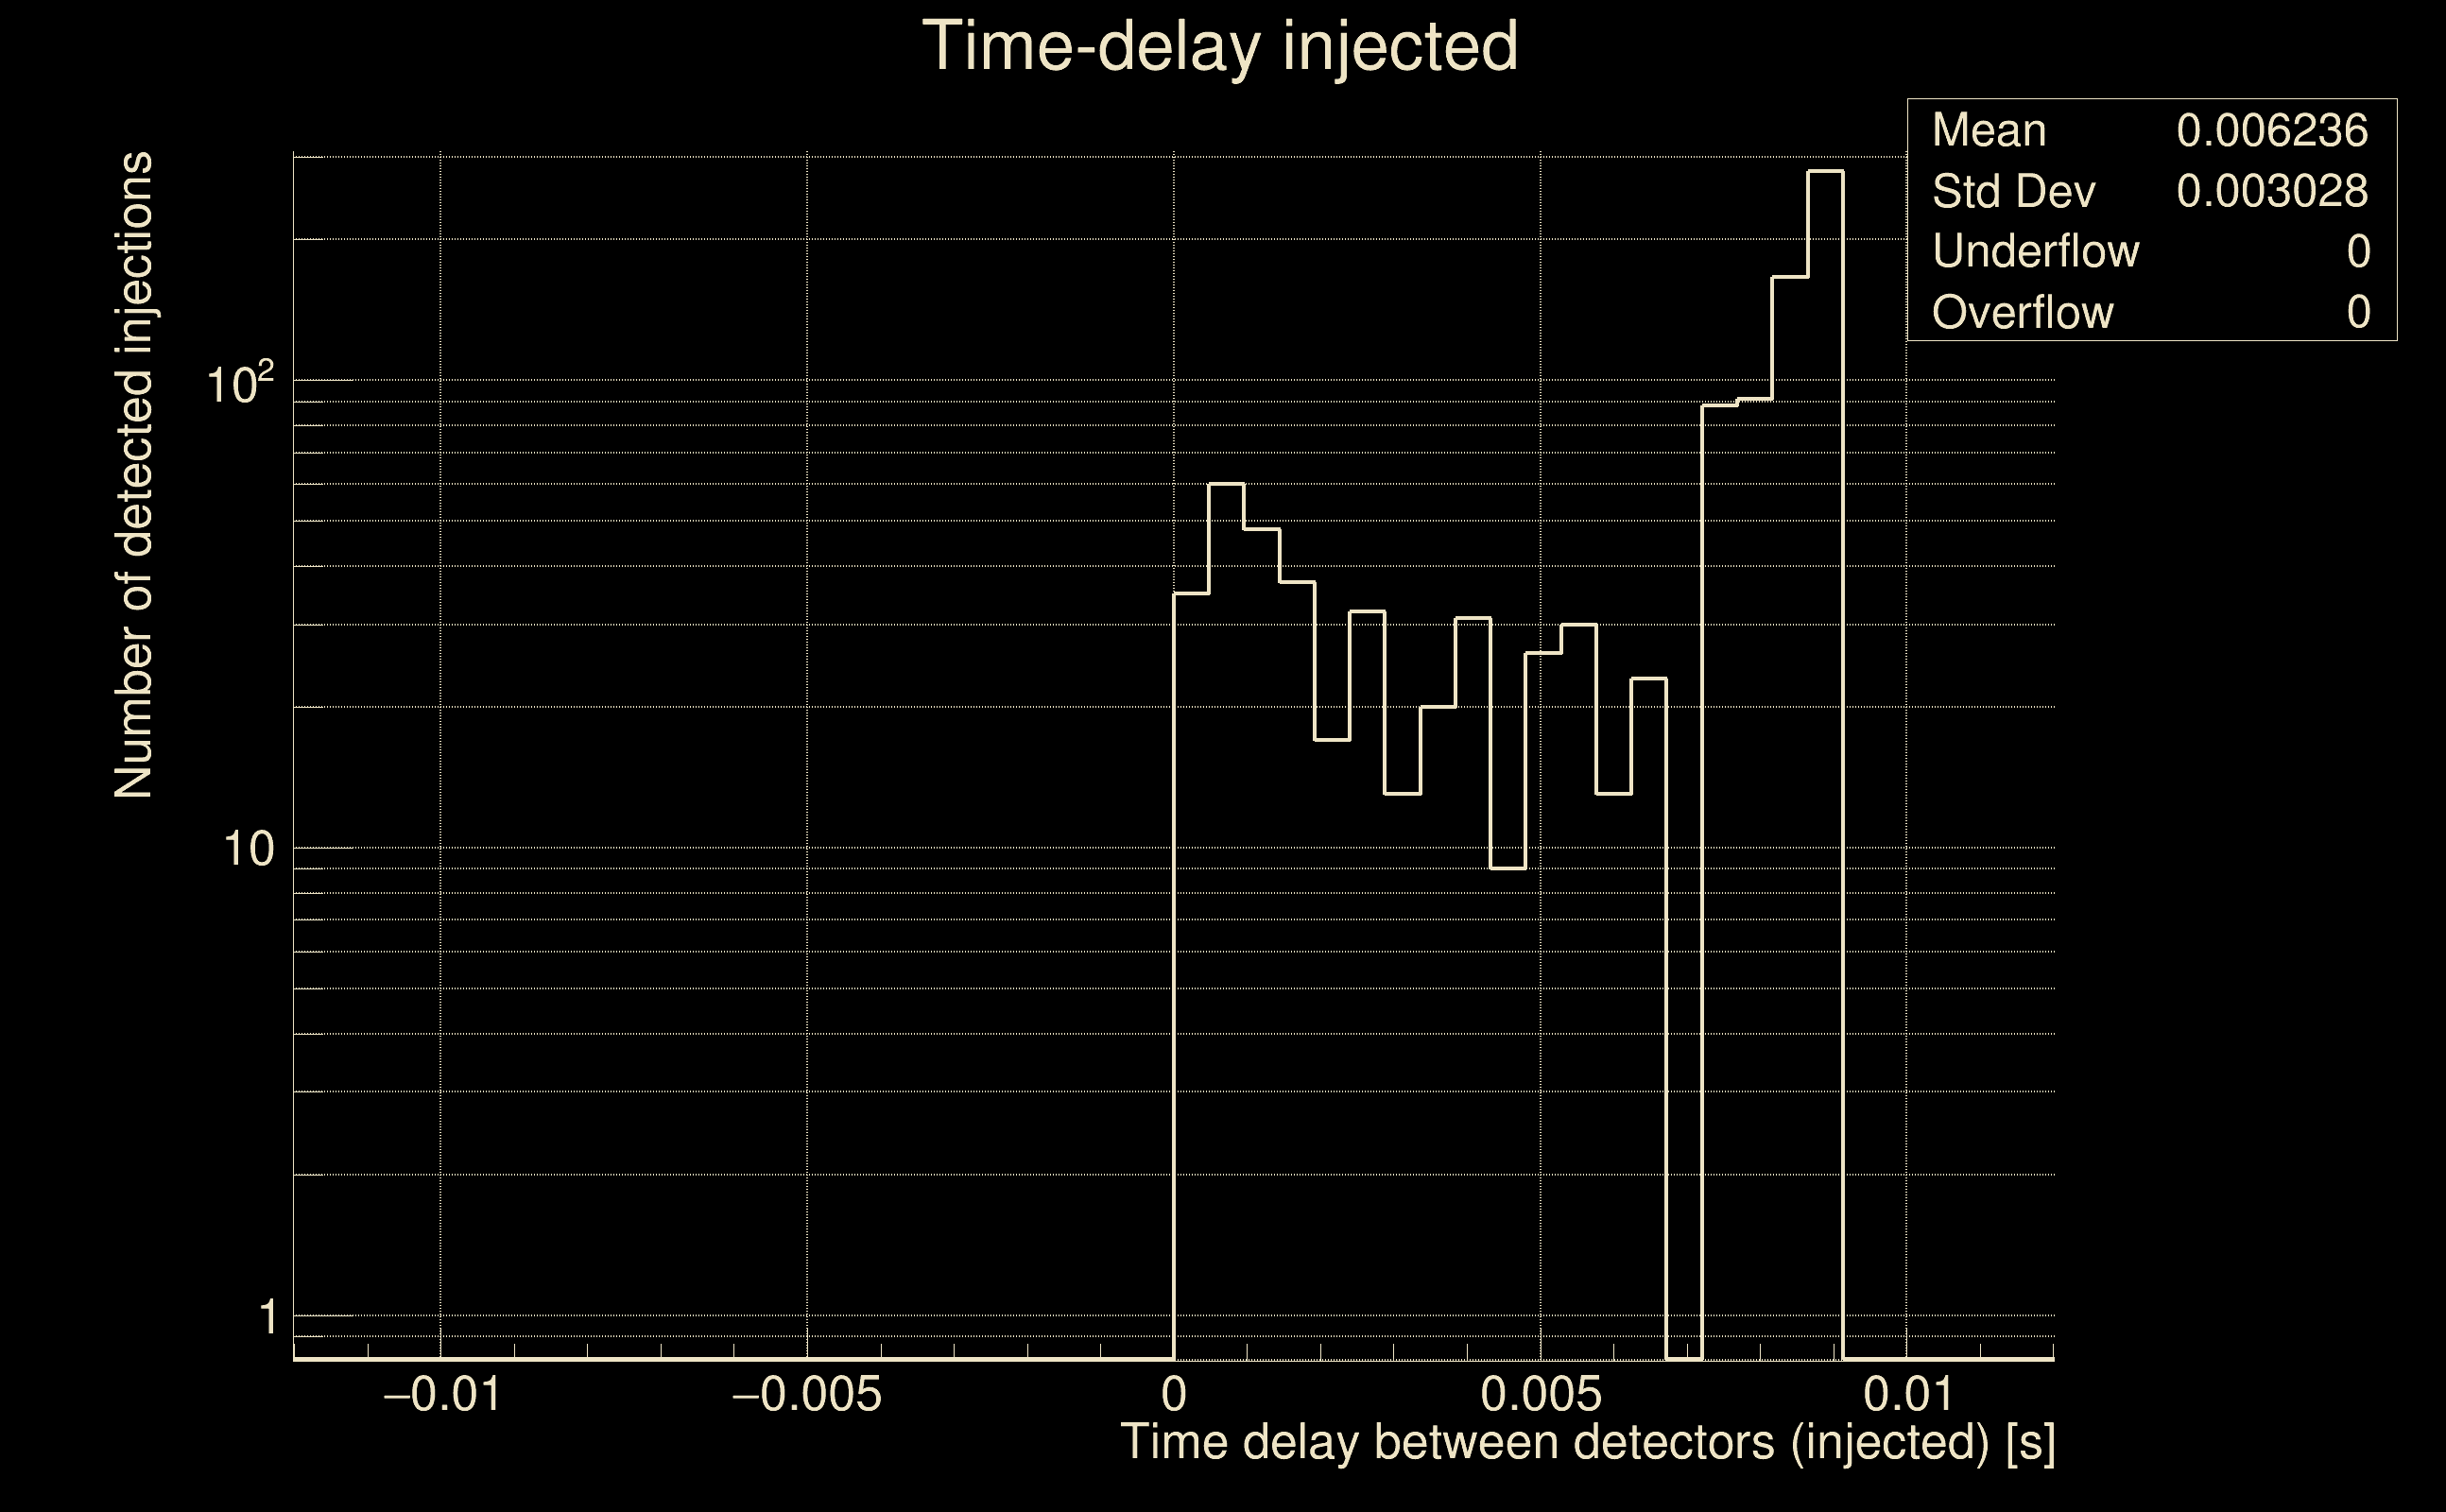
| Light travel time between detectors: | 0.0100128 s |
| Slice extra-time (calibration uncertainty + slice veto): | 0.0129872 s |
| Number of time-delay bins in a cross-correlation map: | 10000 |
| Number of slices in a cross-correlation map: | 217 |
| Number of time-delay bins in a slice: | 46 |
| SNR gating: | < 100 (detector 0), < 100 (detector 1) |
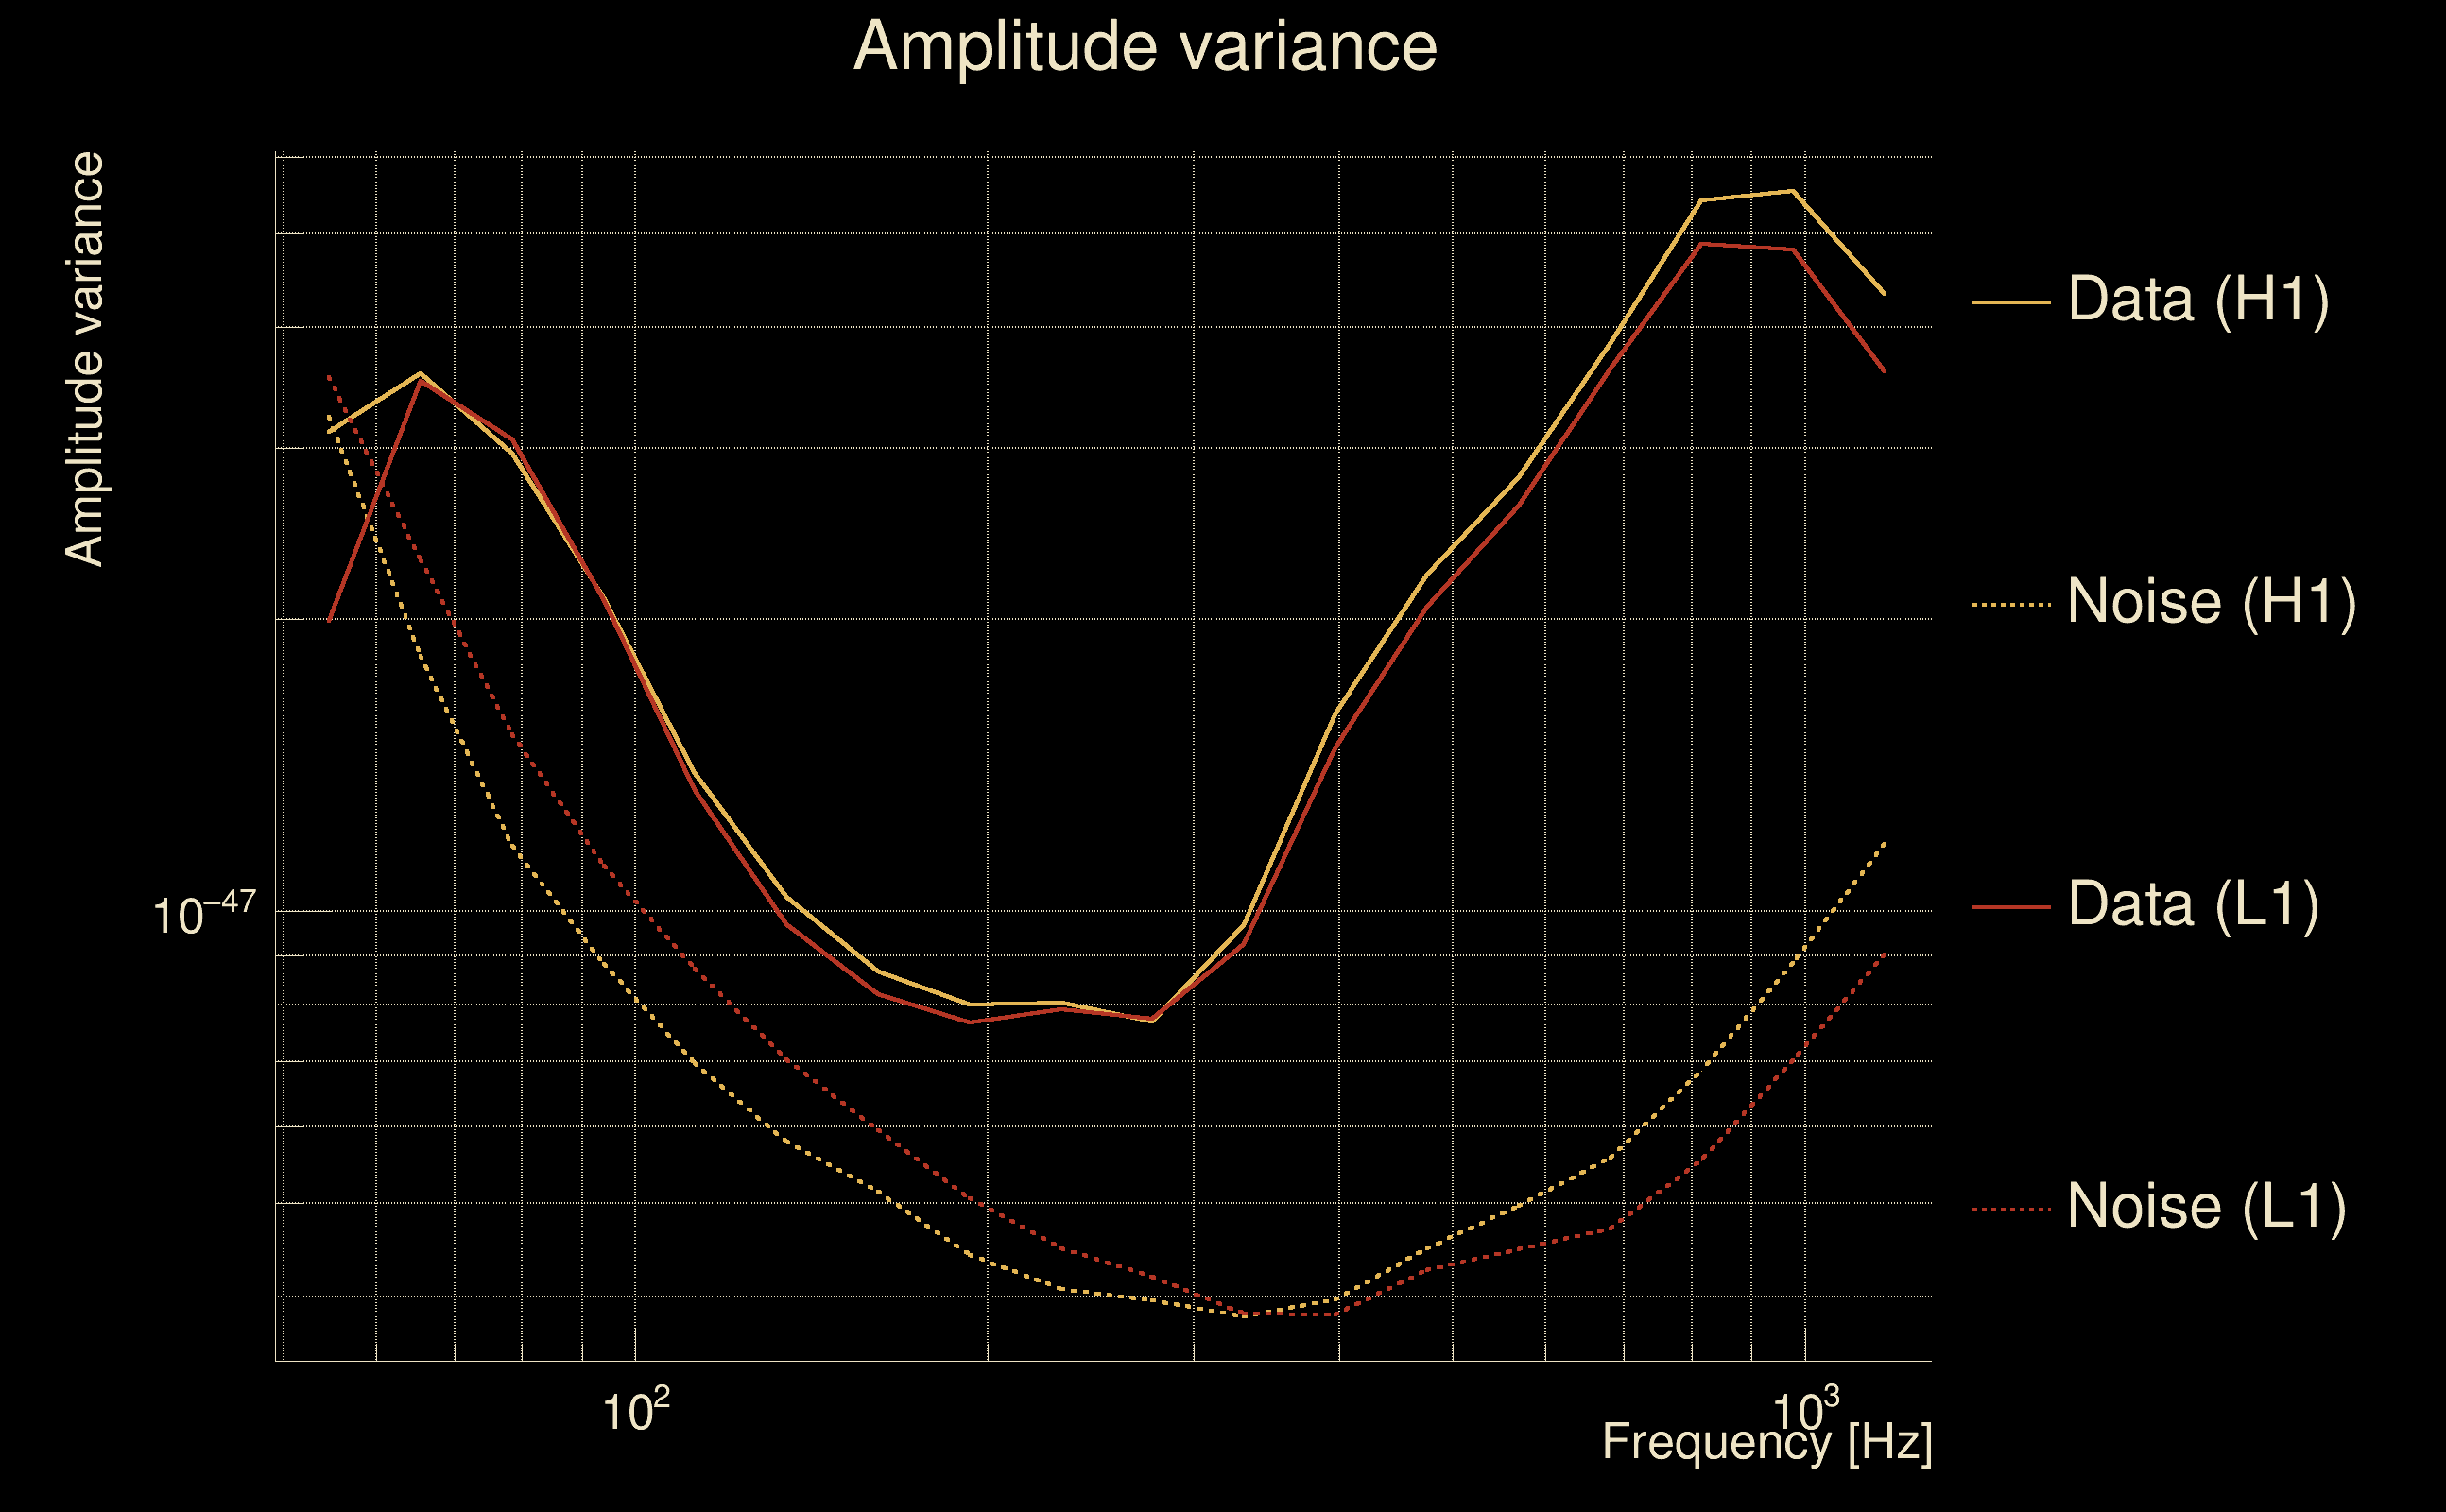
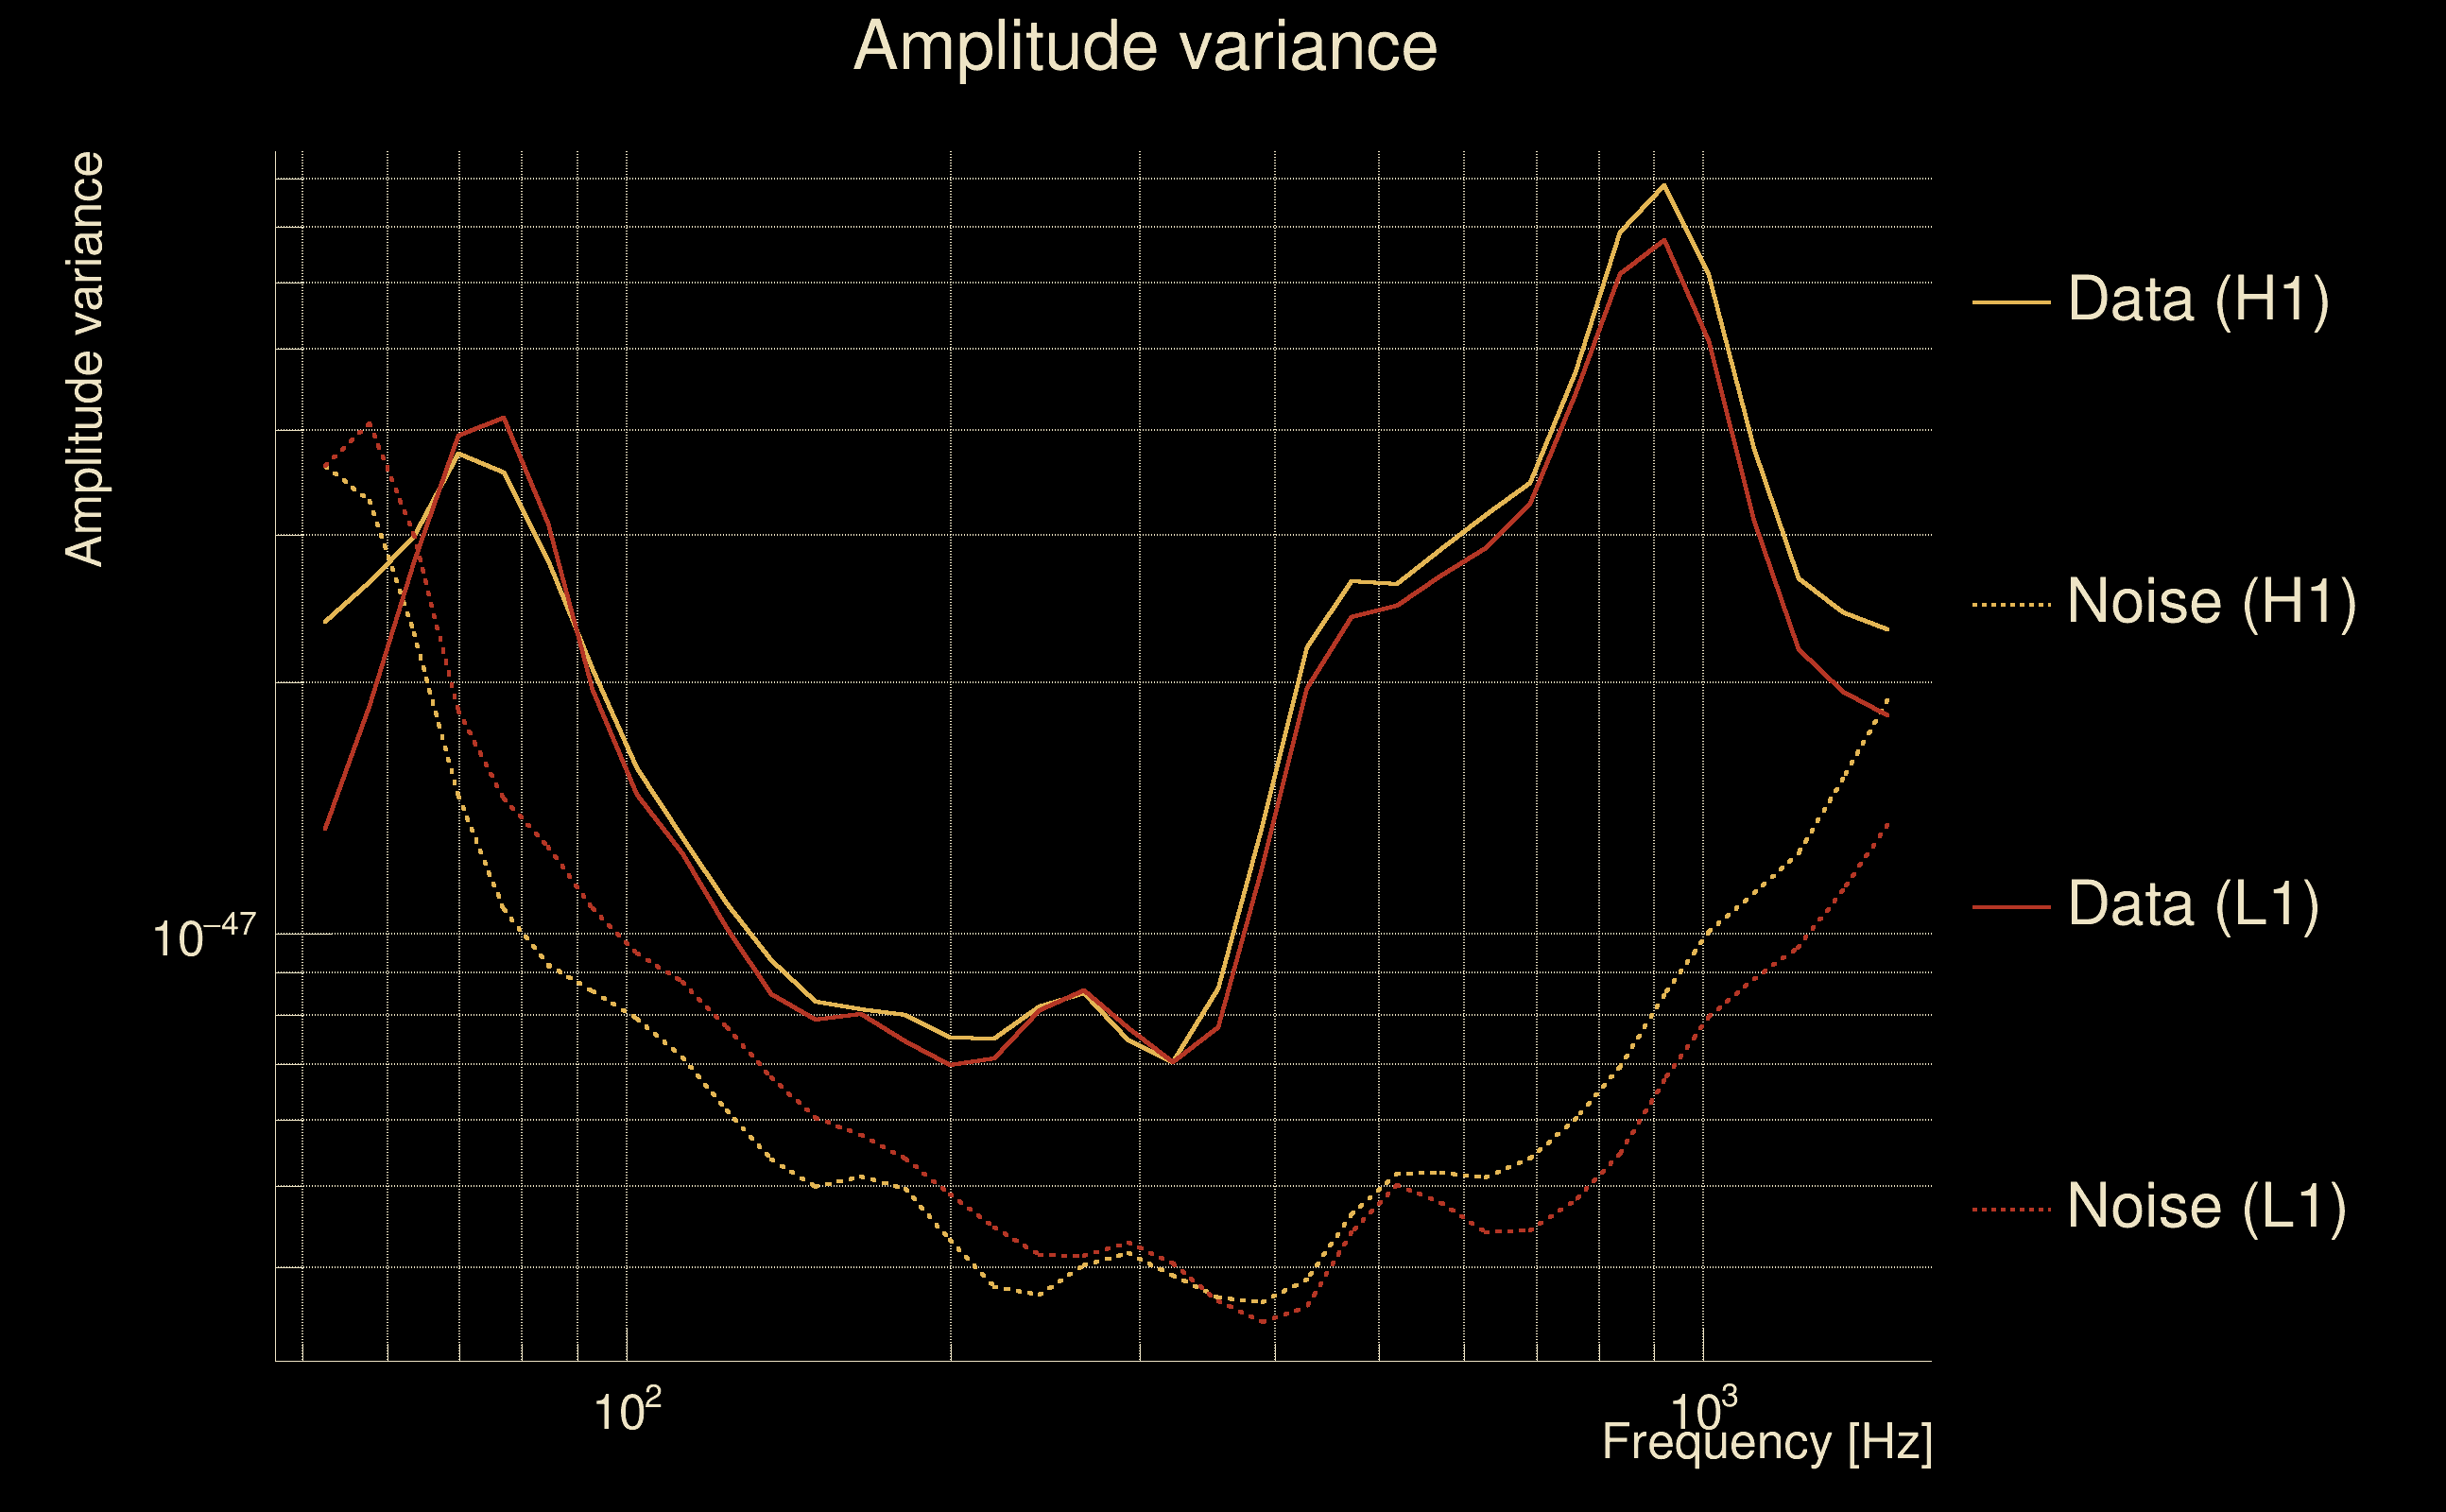
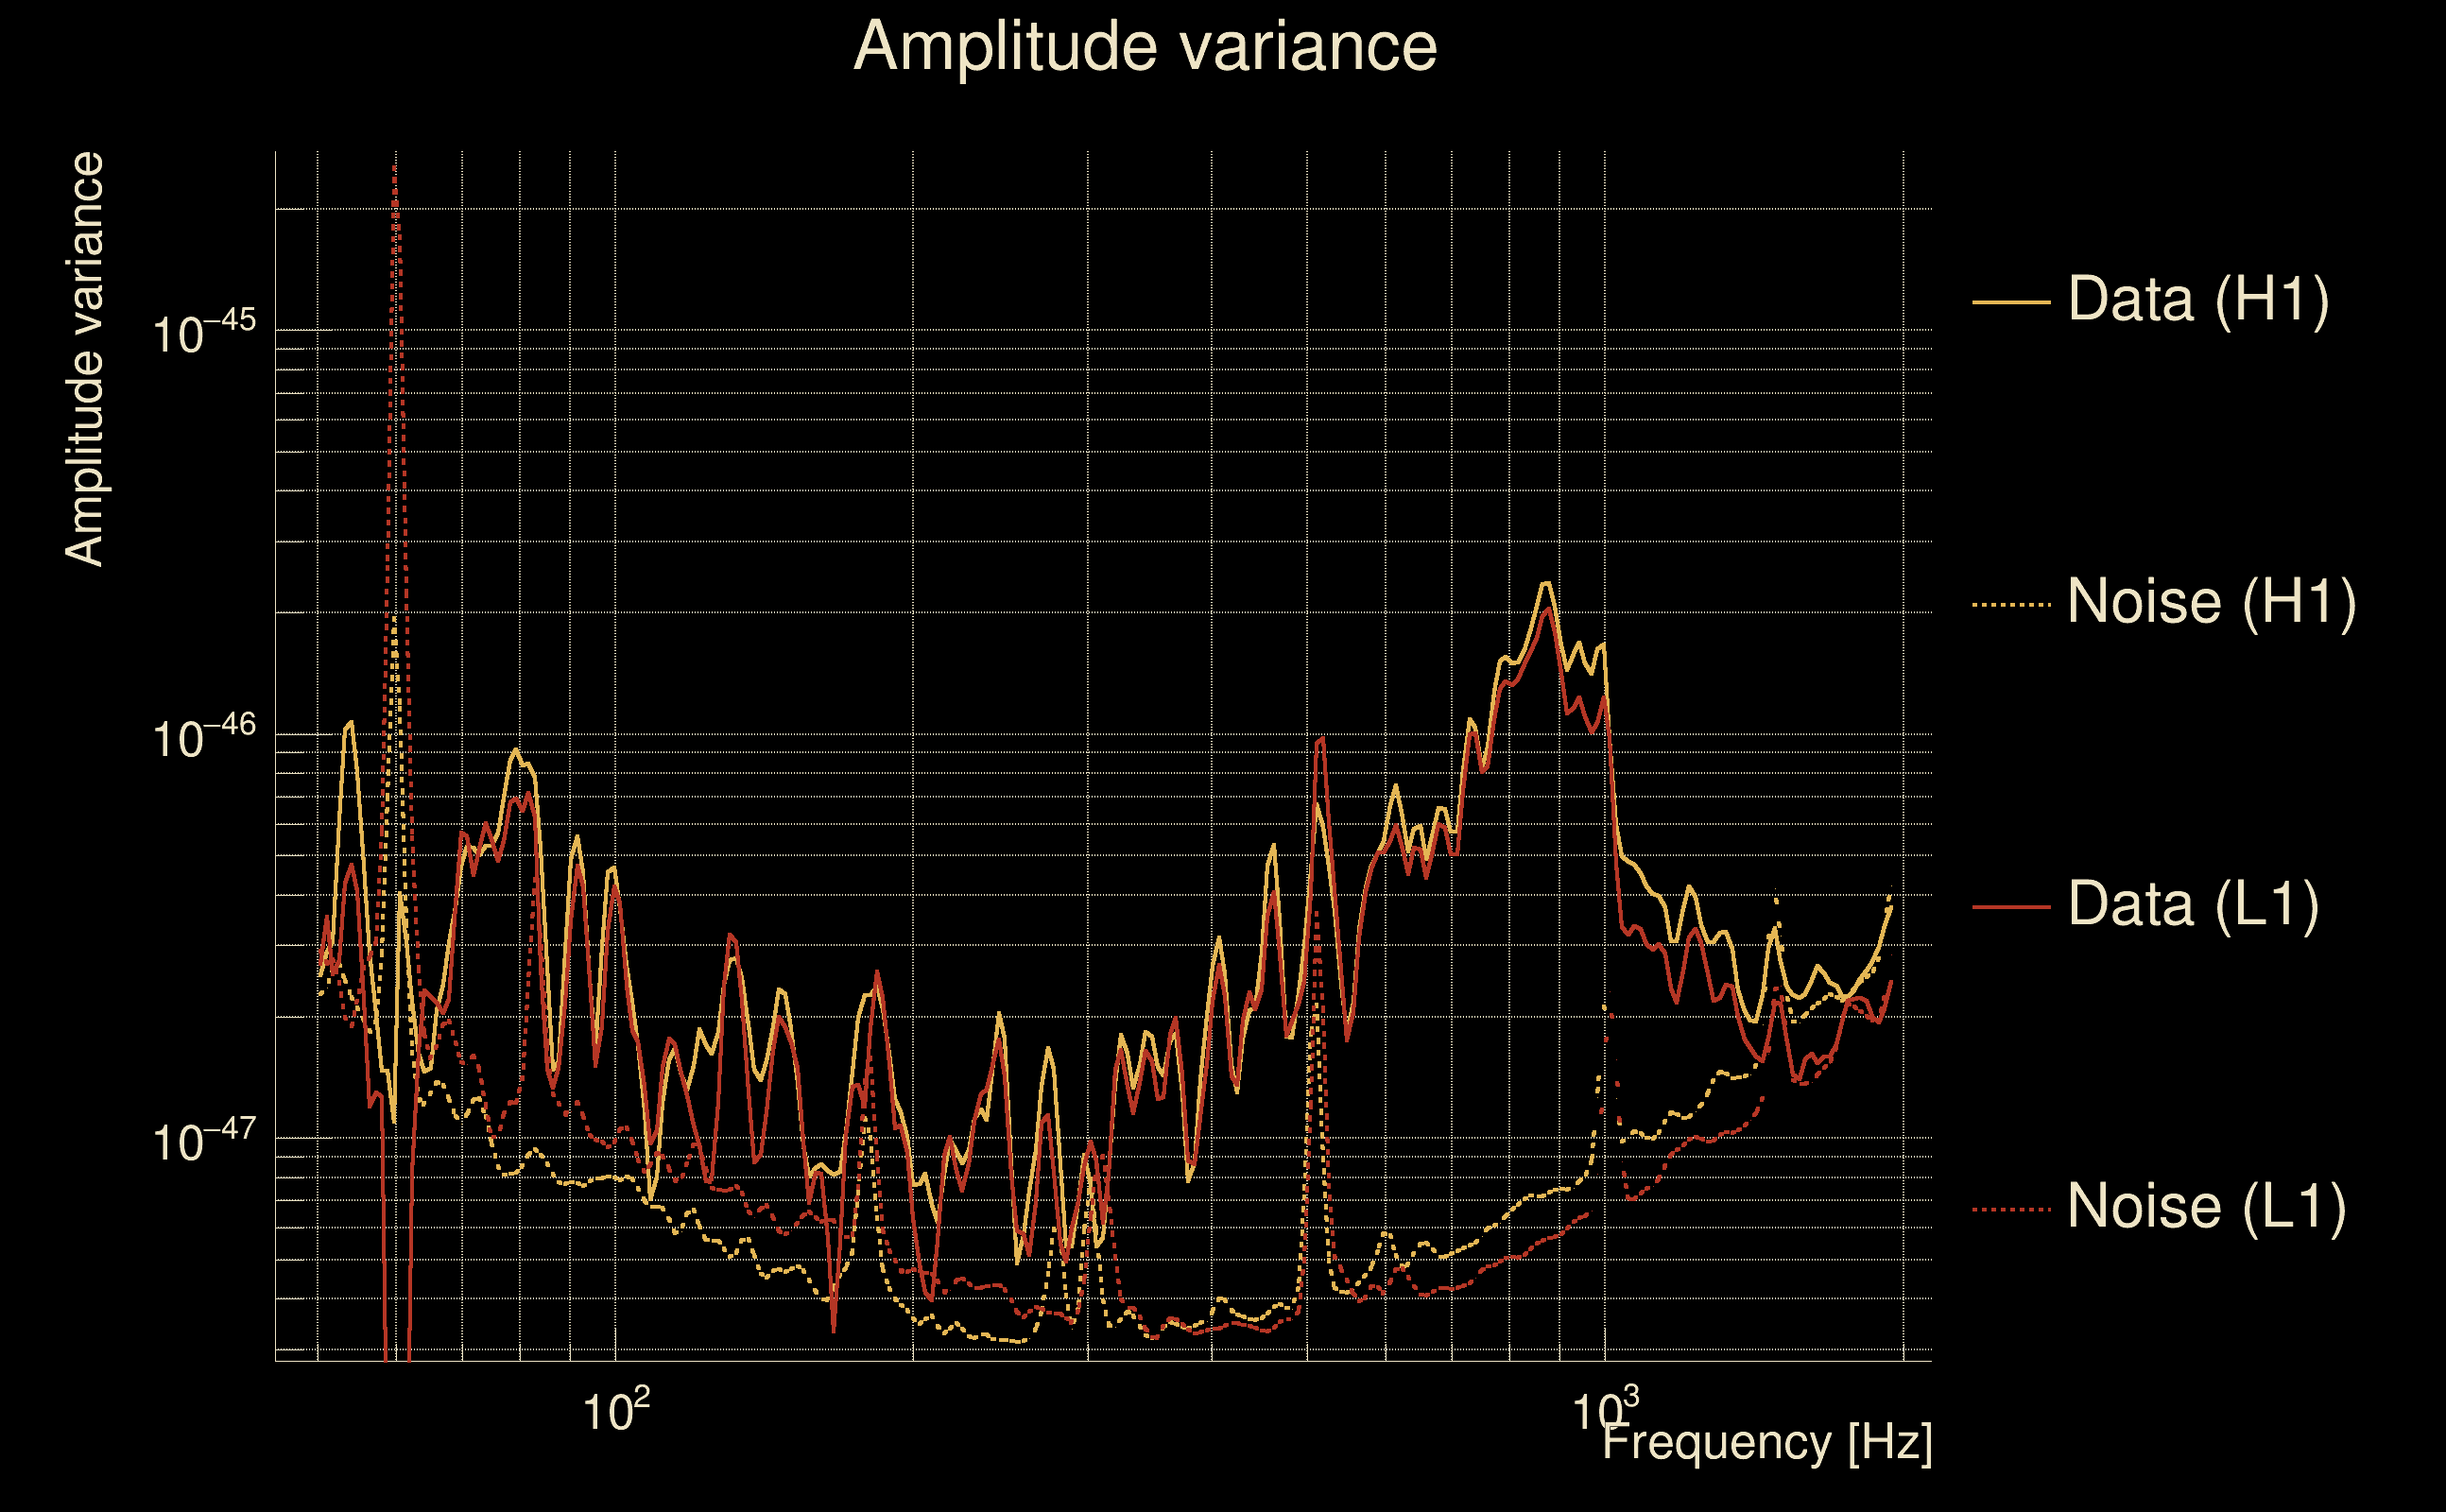
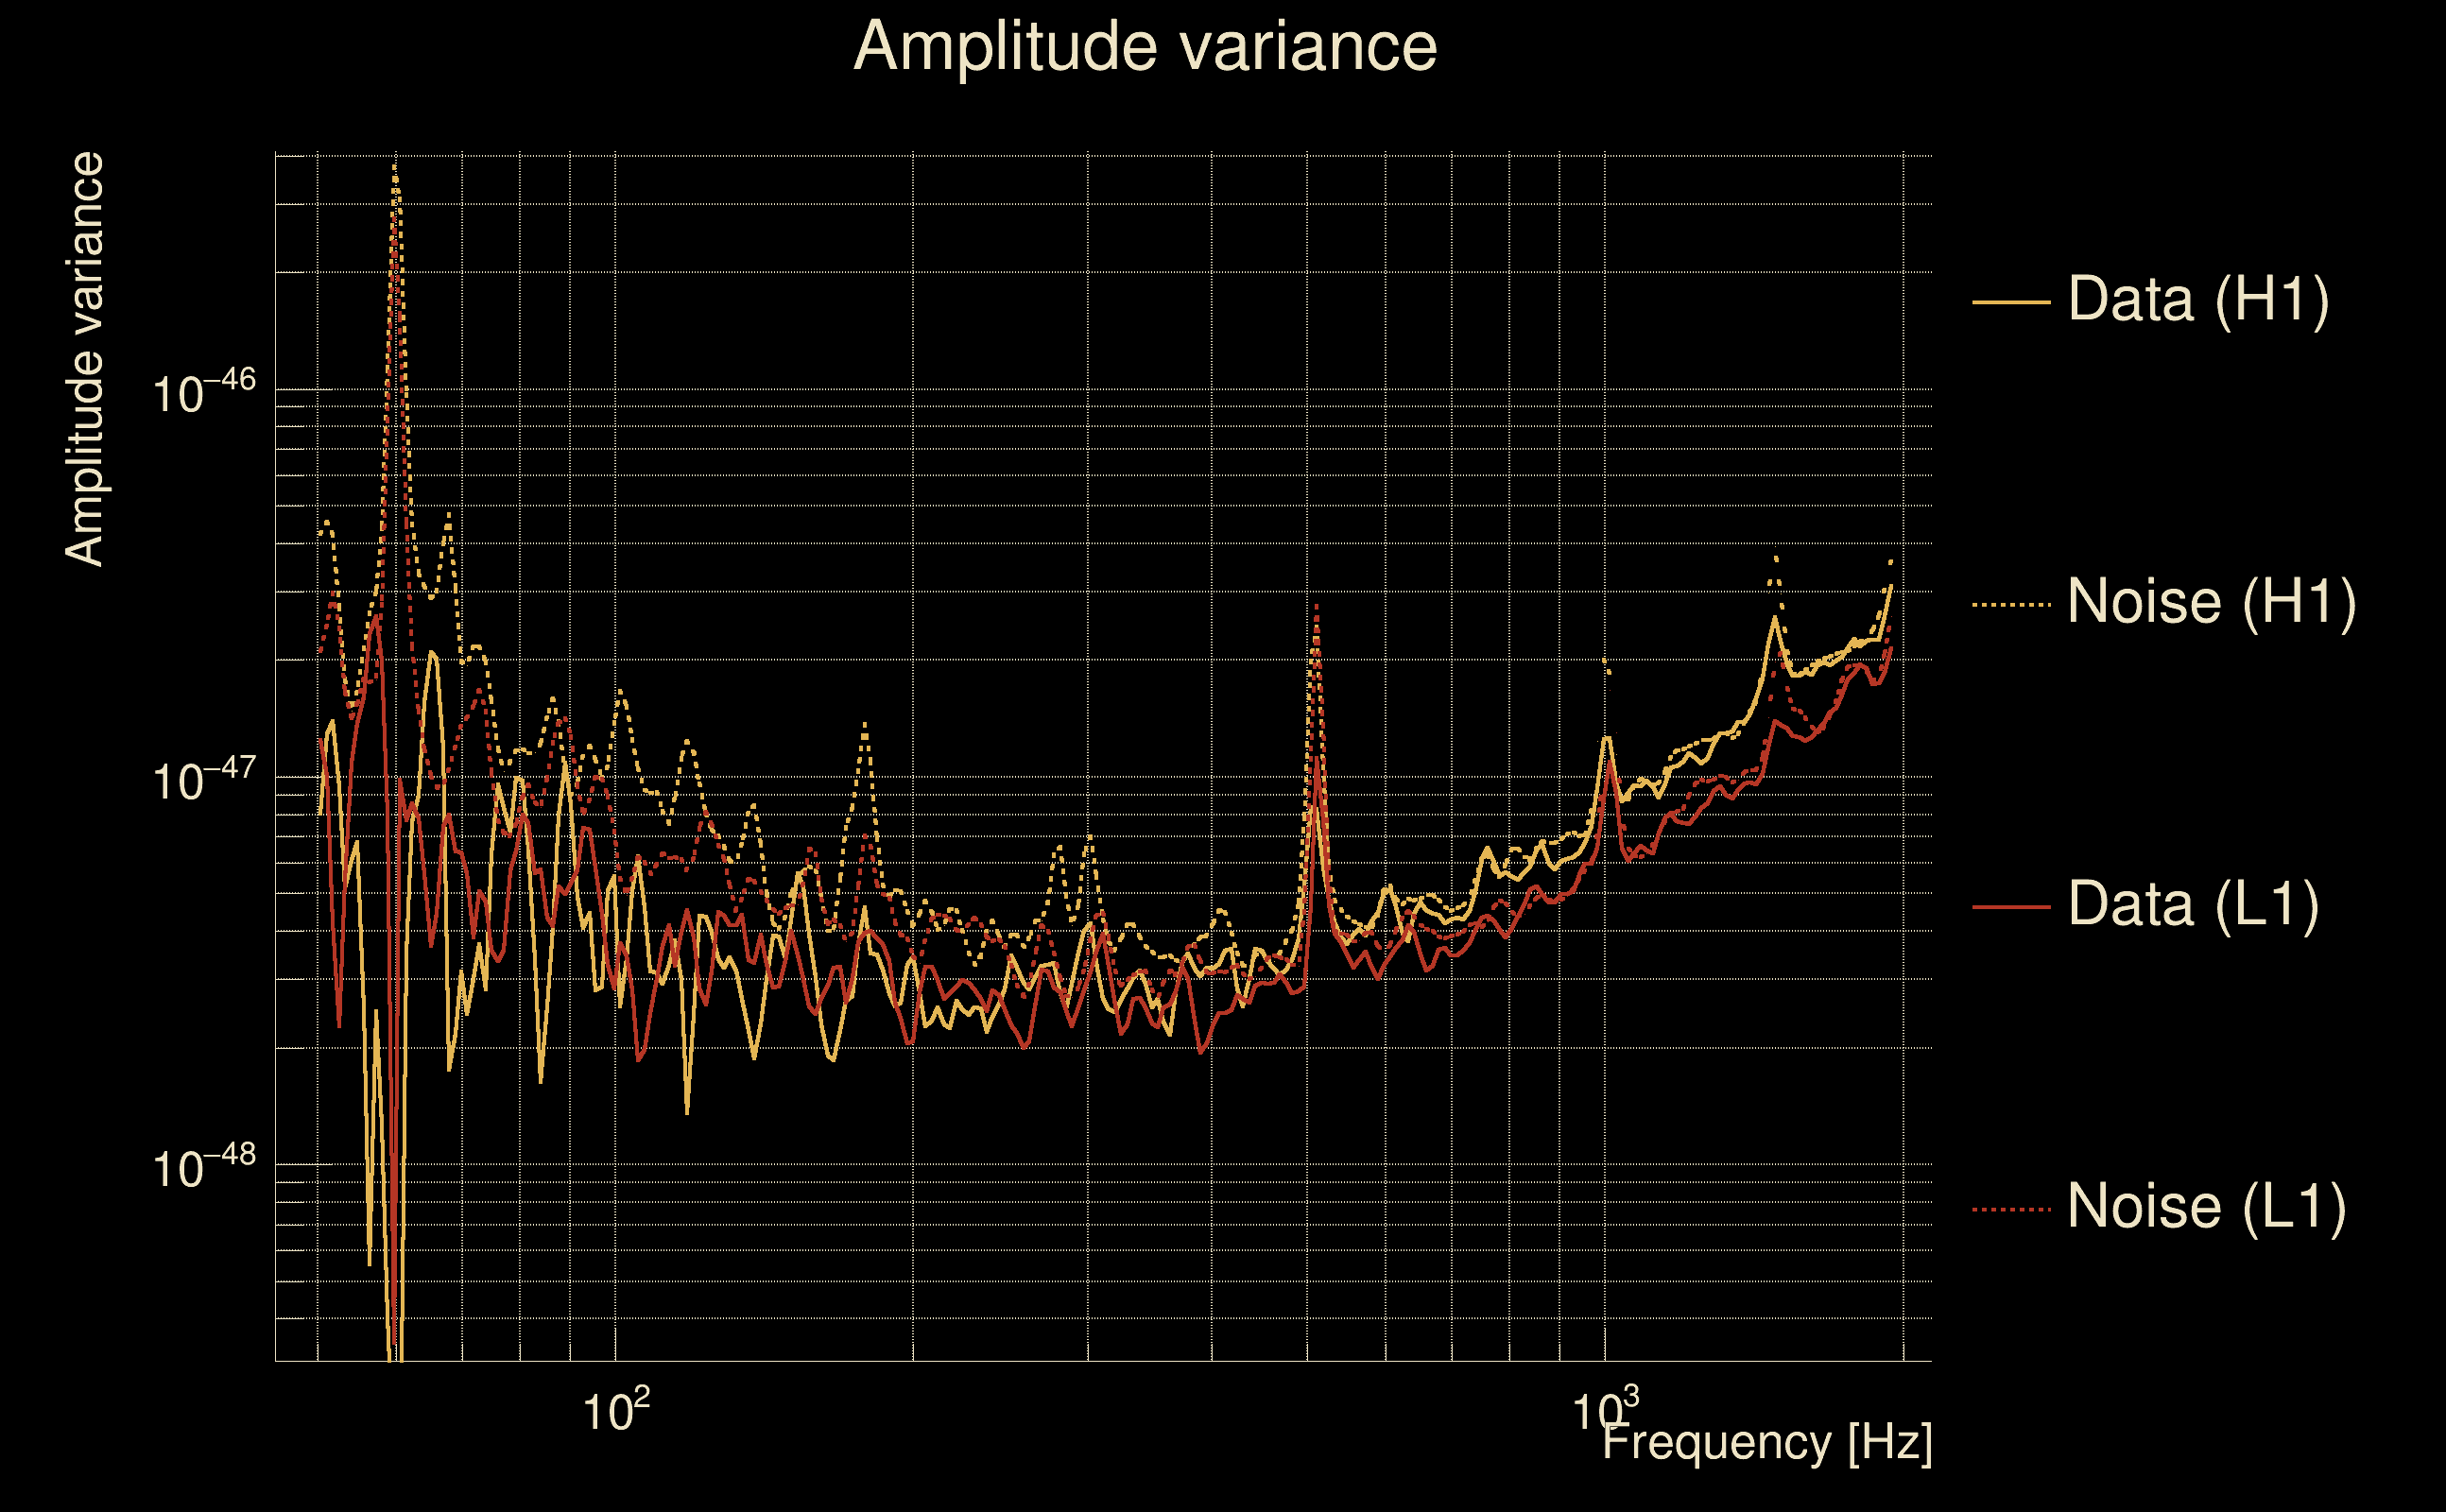
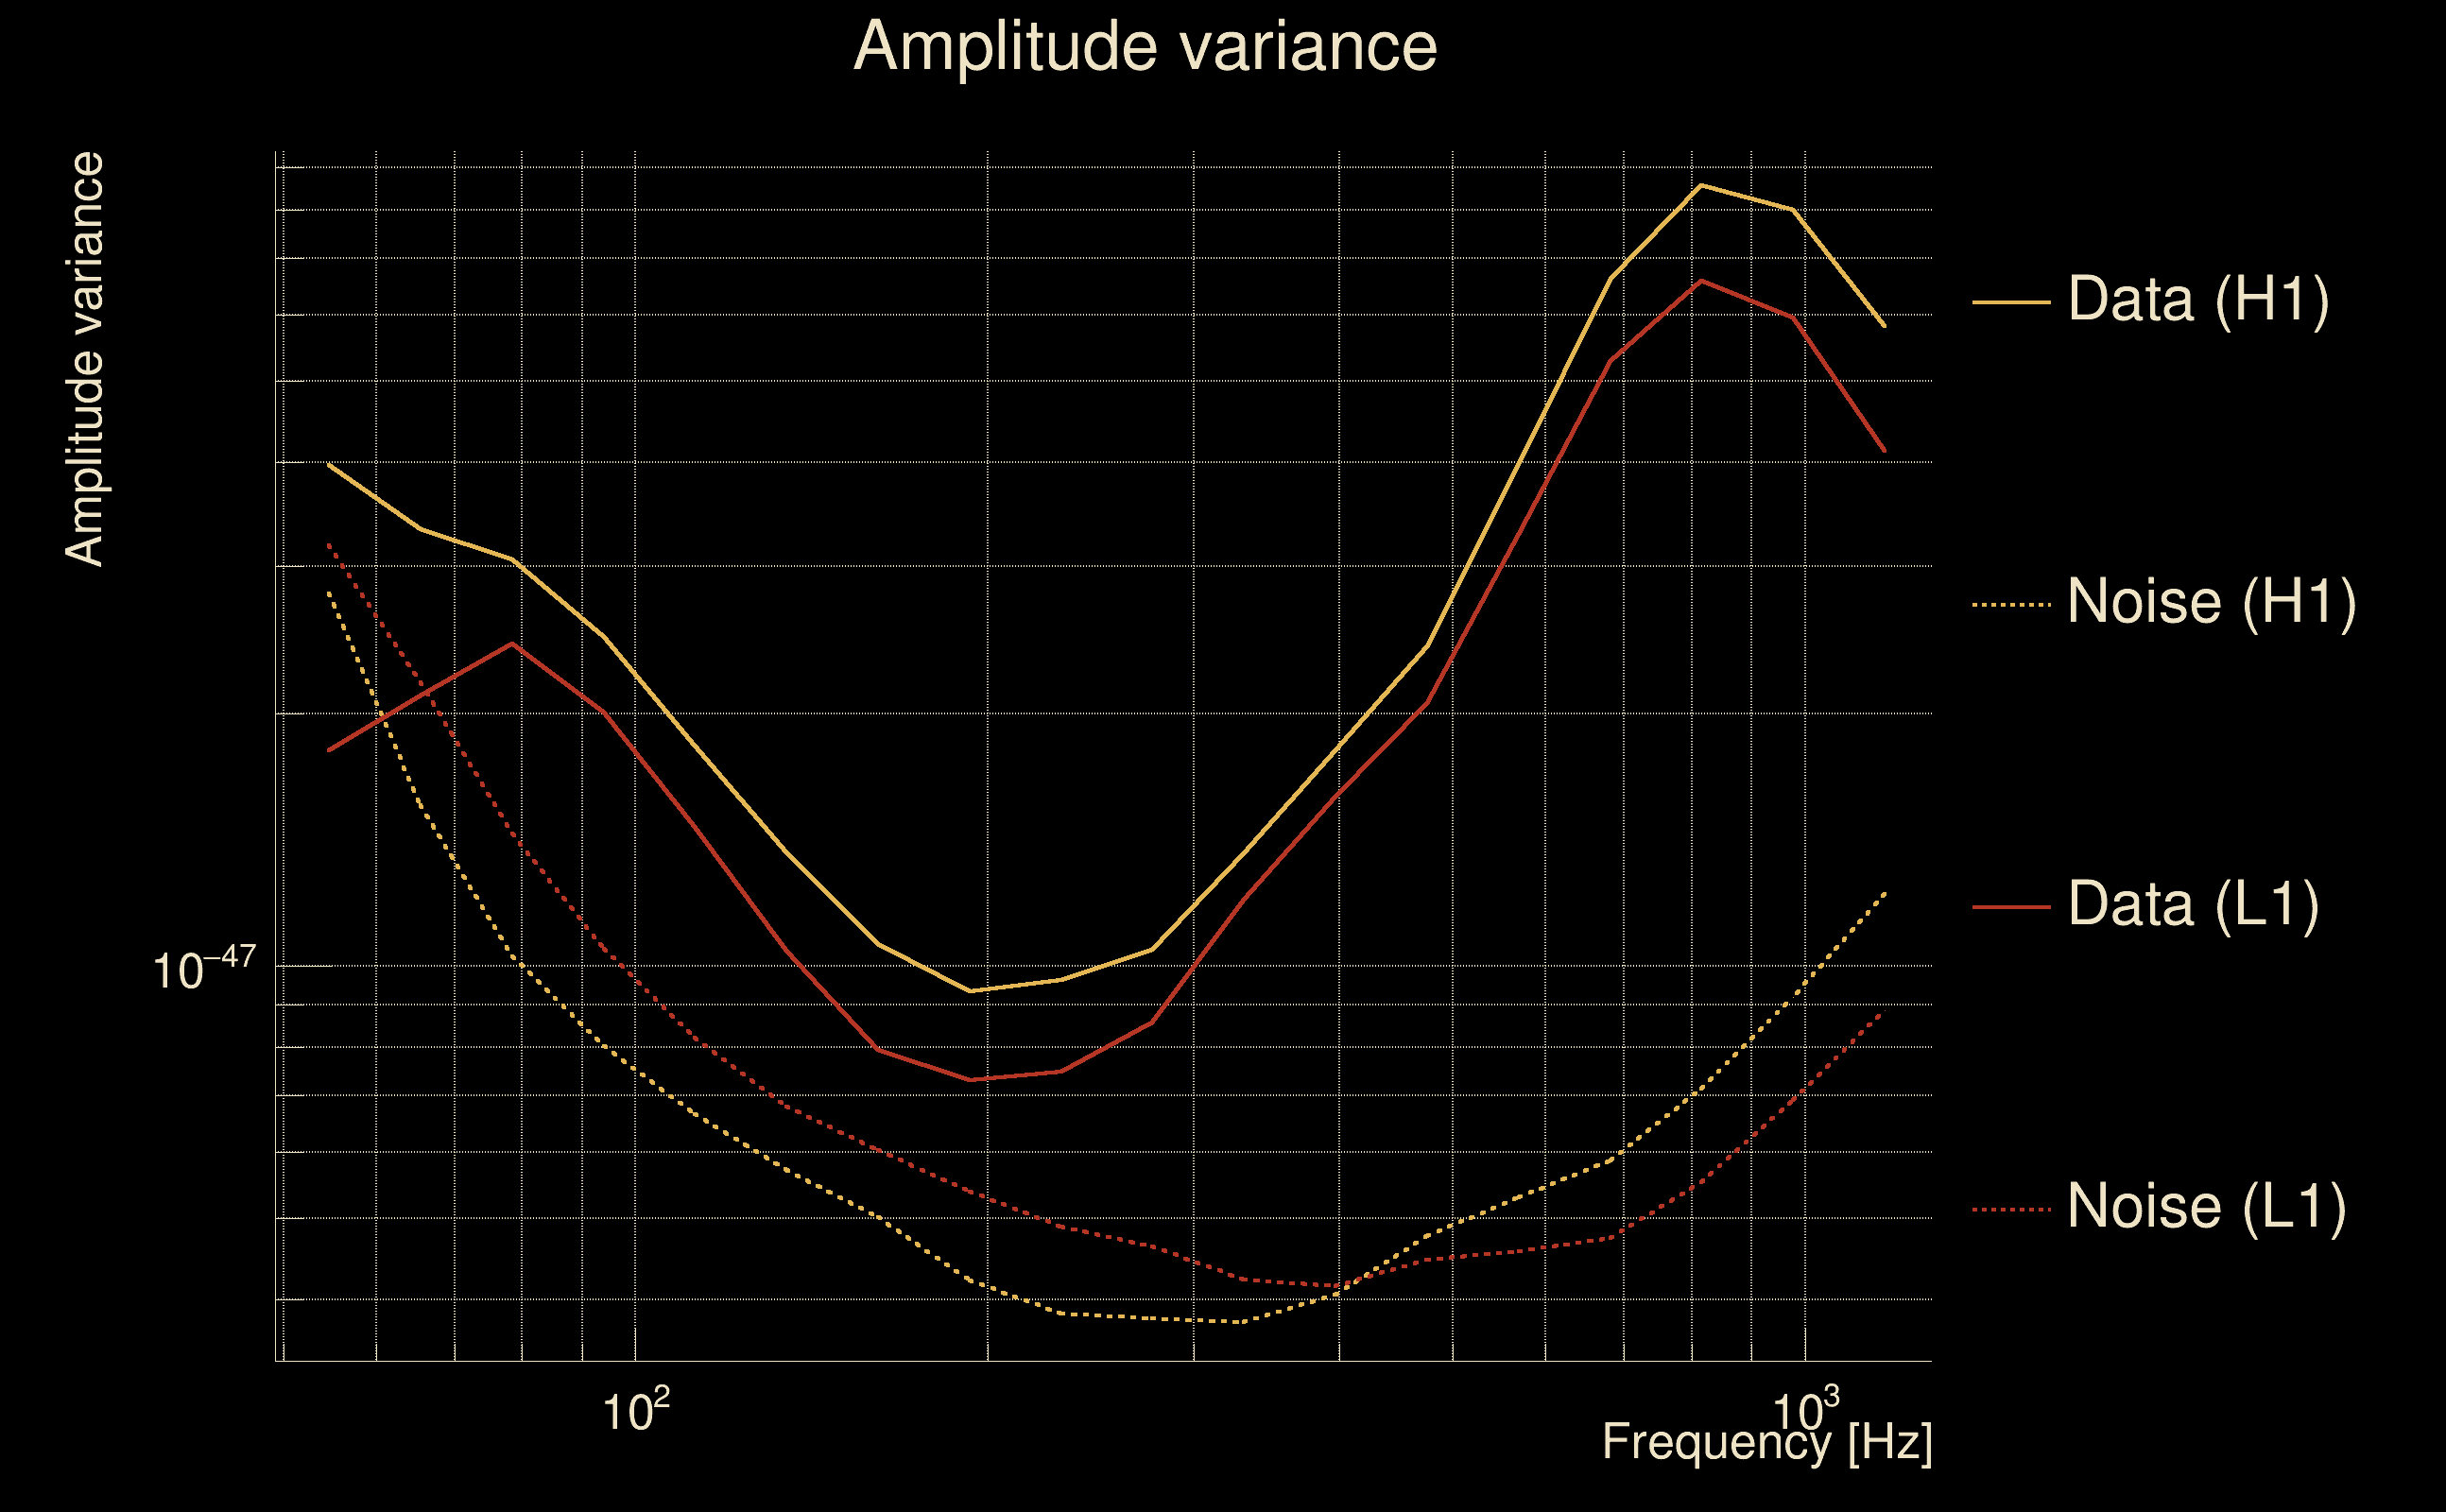
| Amplitude spectrograms: | normalization = 1e-22, power index = 2 |
| White noise SNR variance: | 0.523175 (after applying a correction factor = 1) |
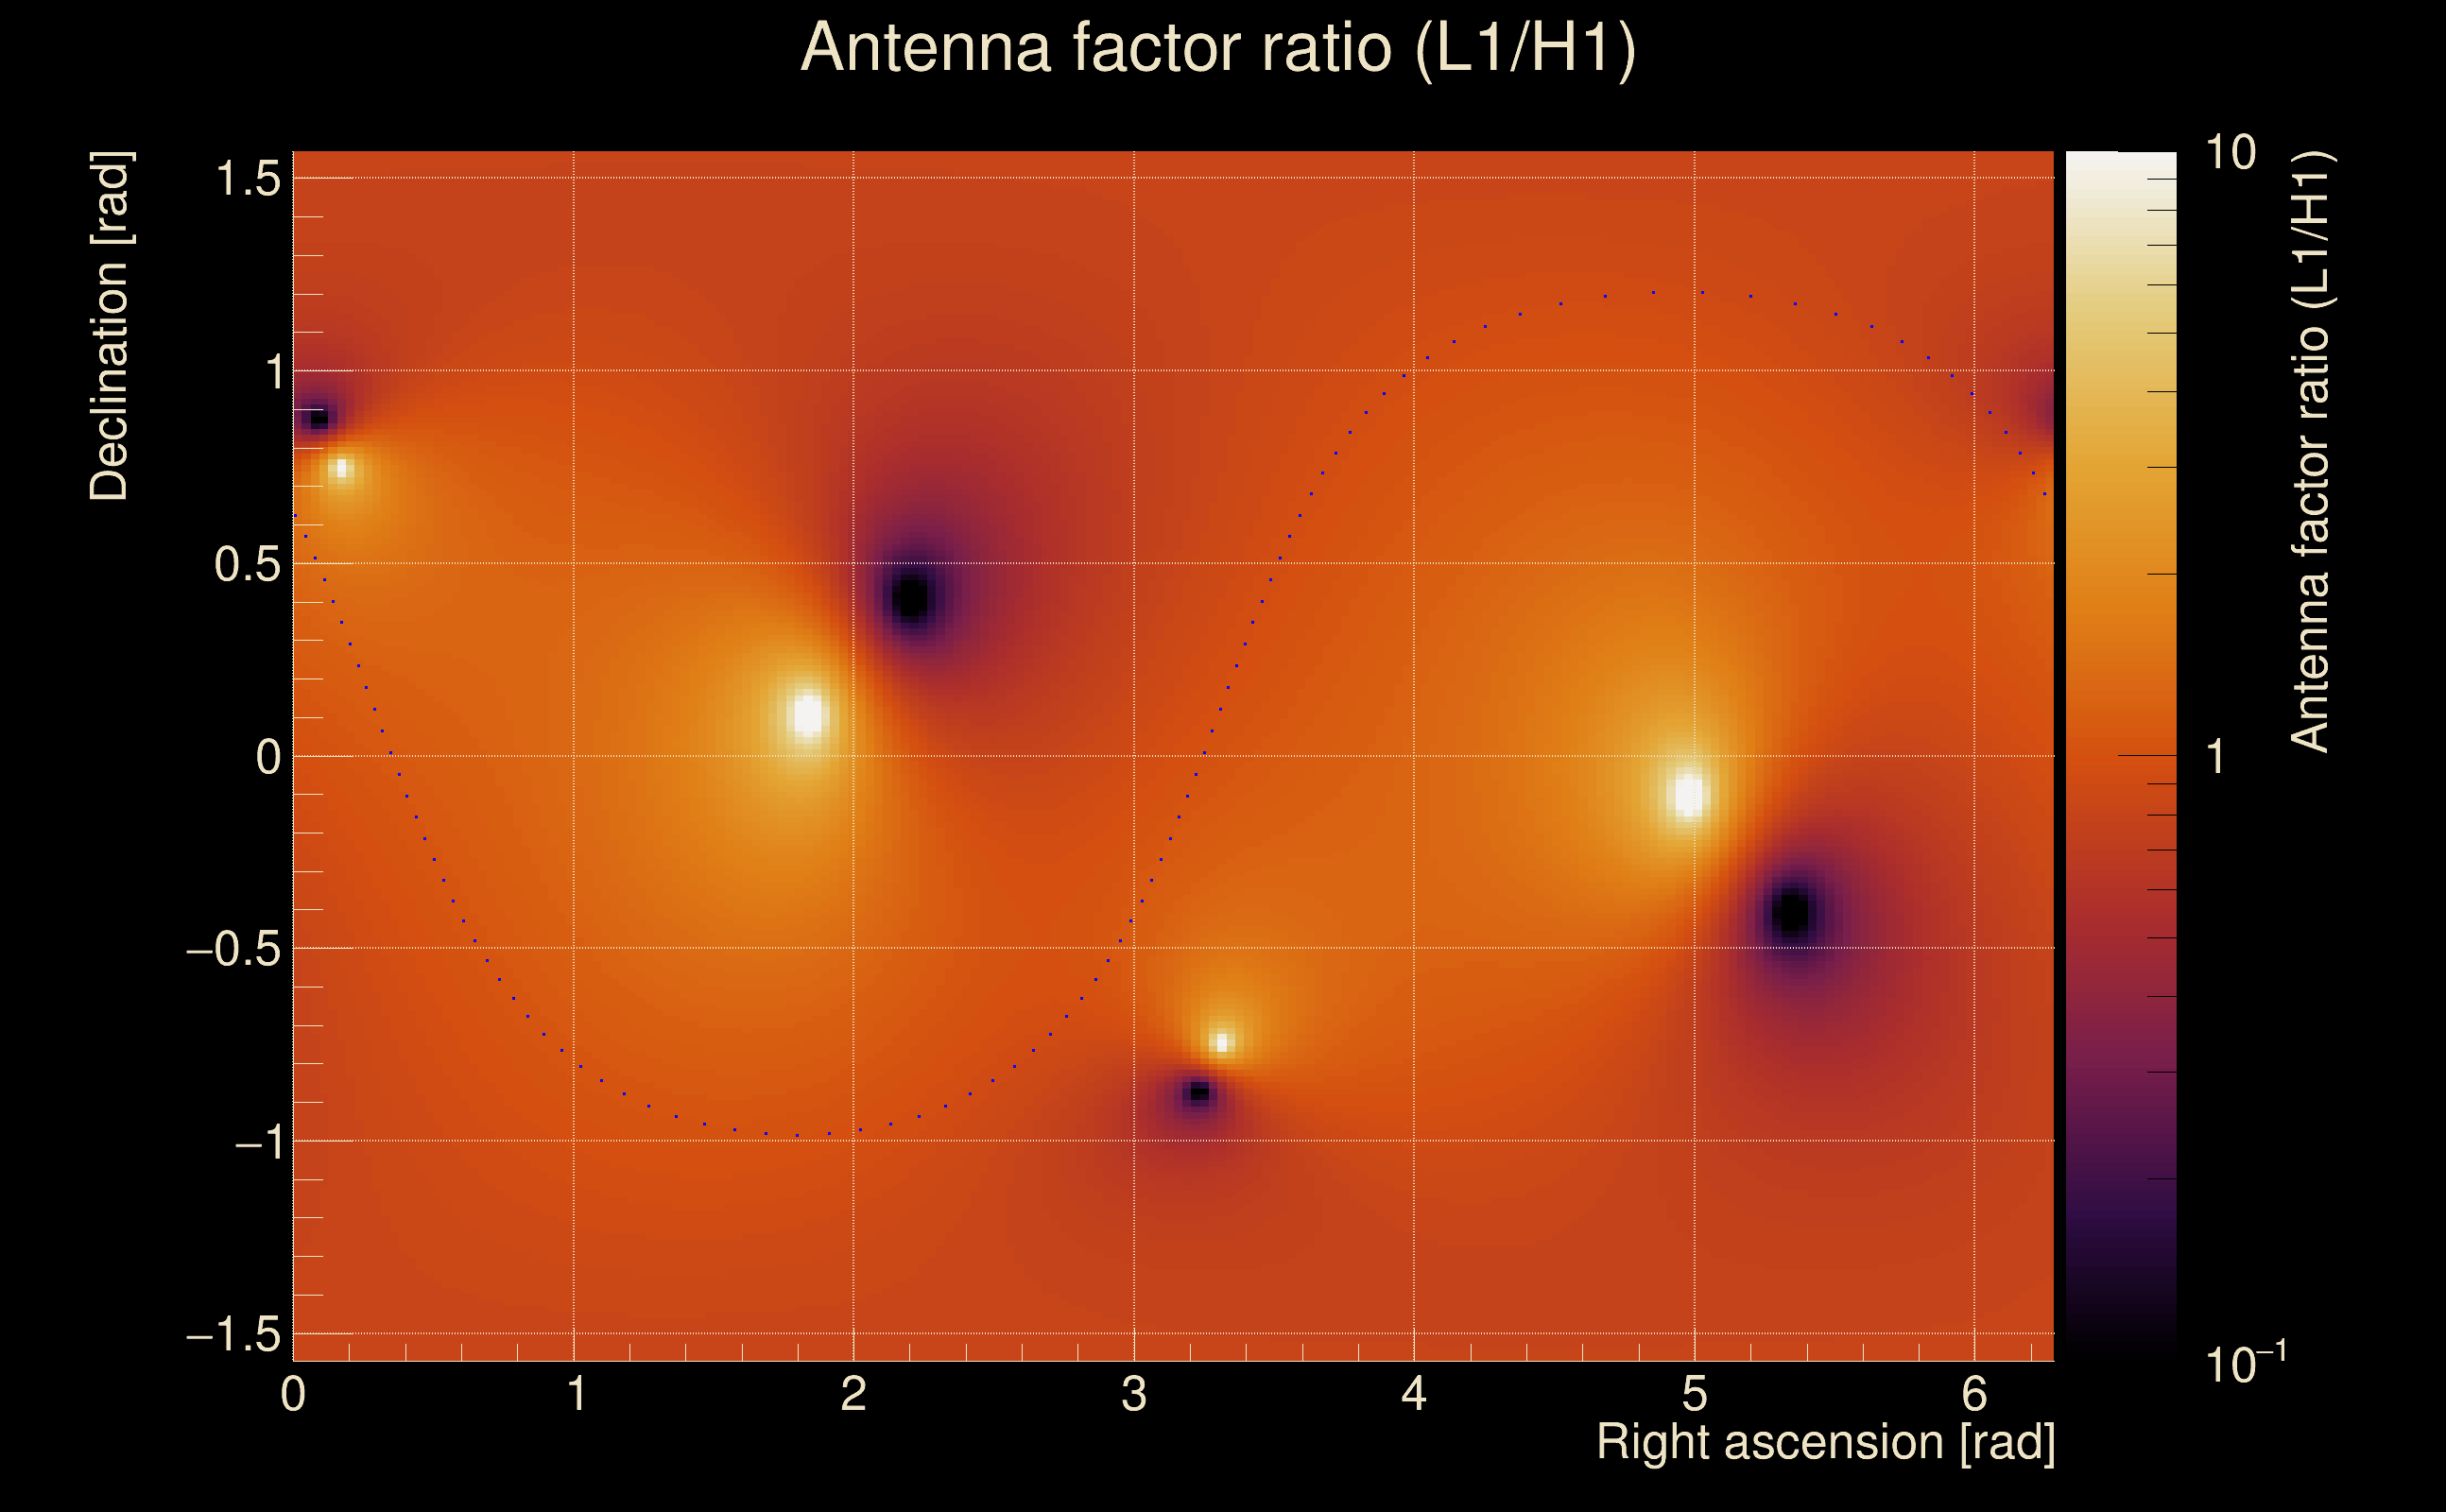
| Amplitude ratio confidence level: | 3 sigma |
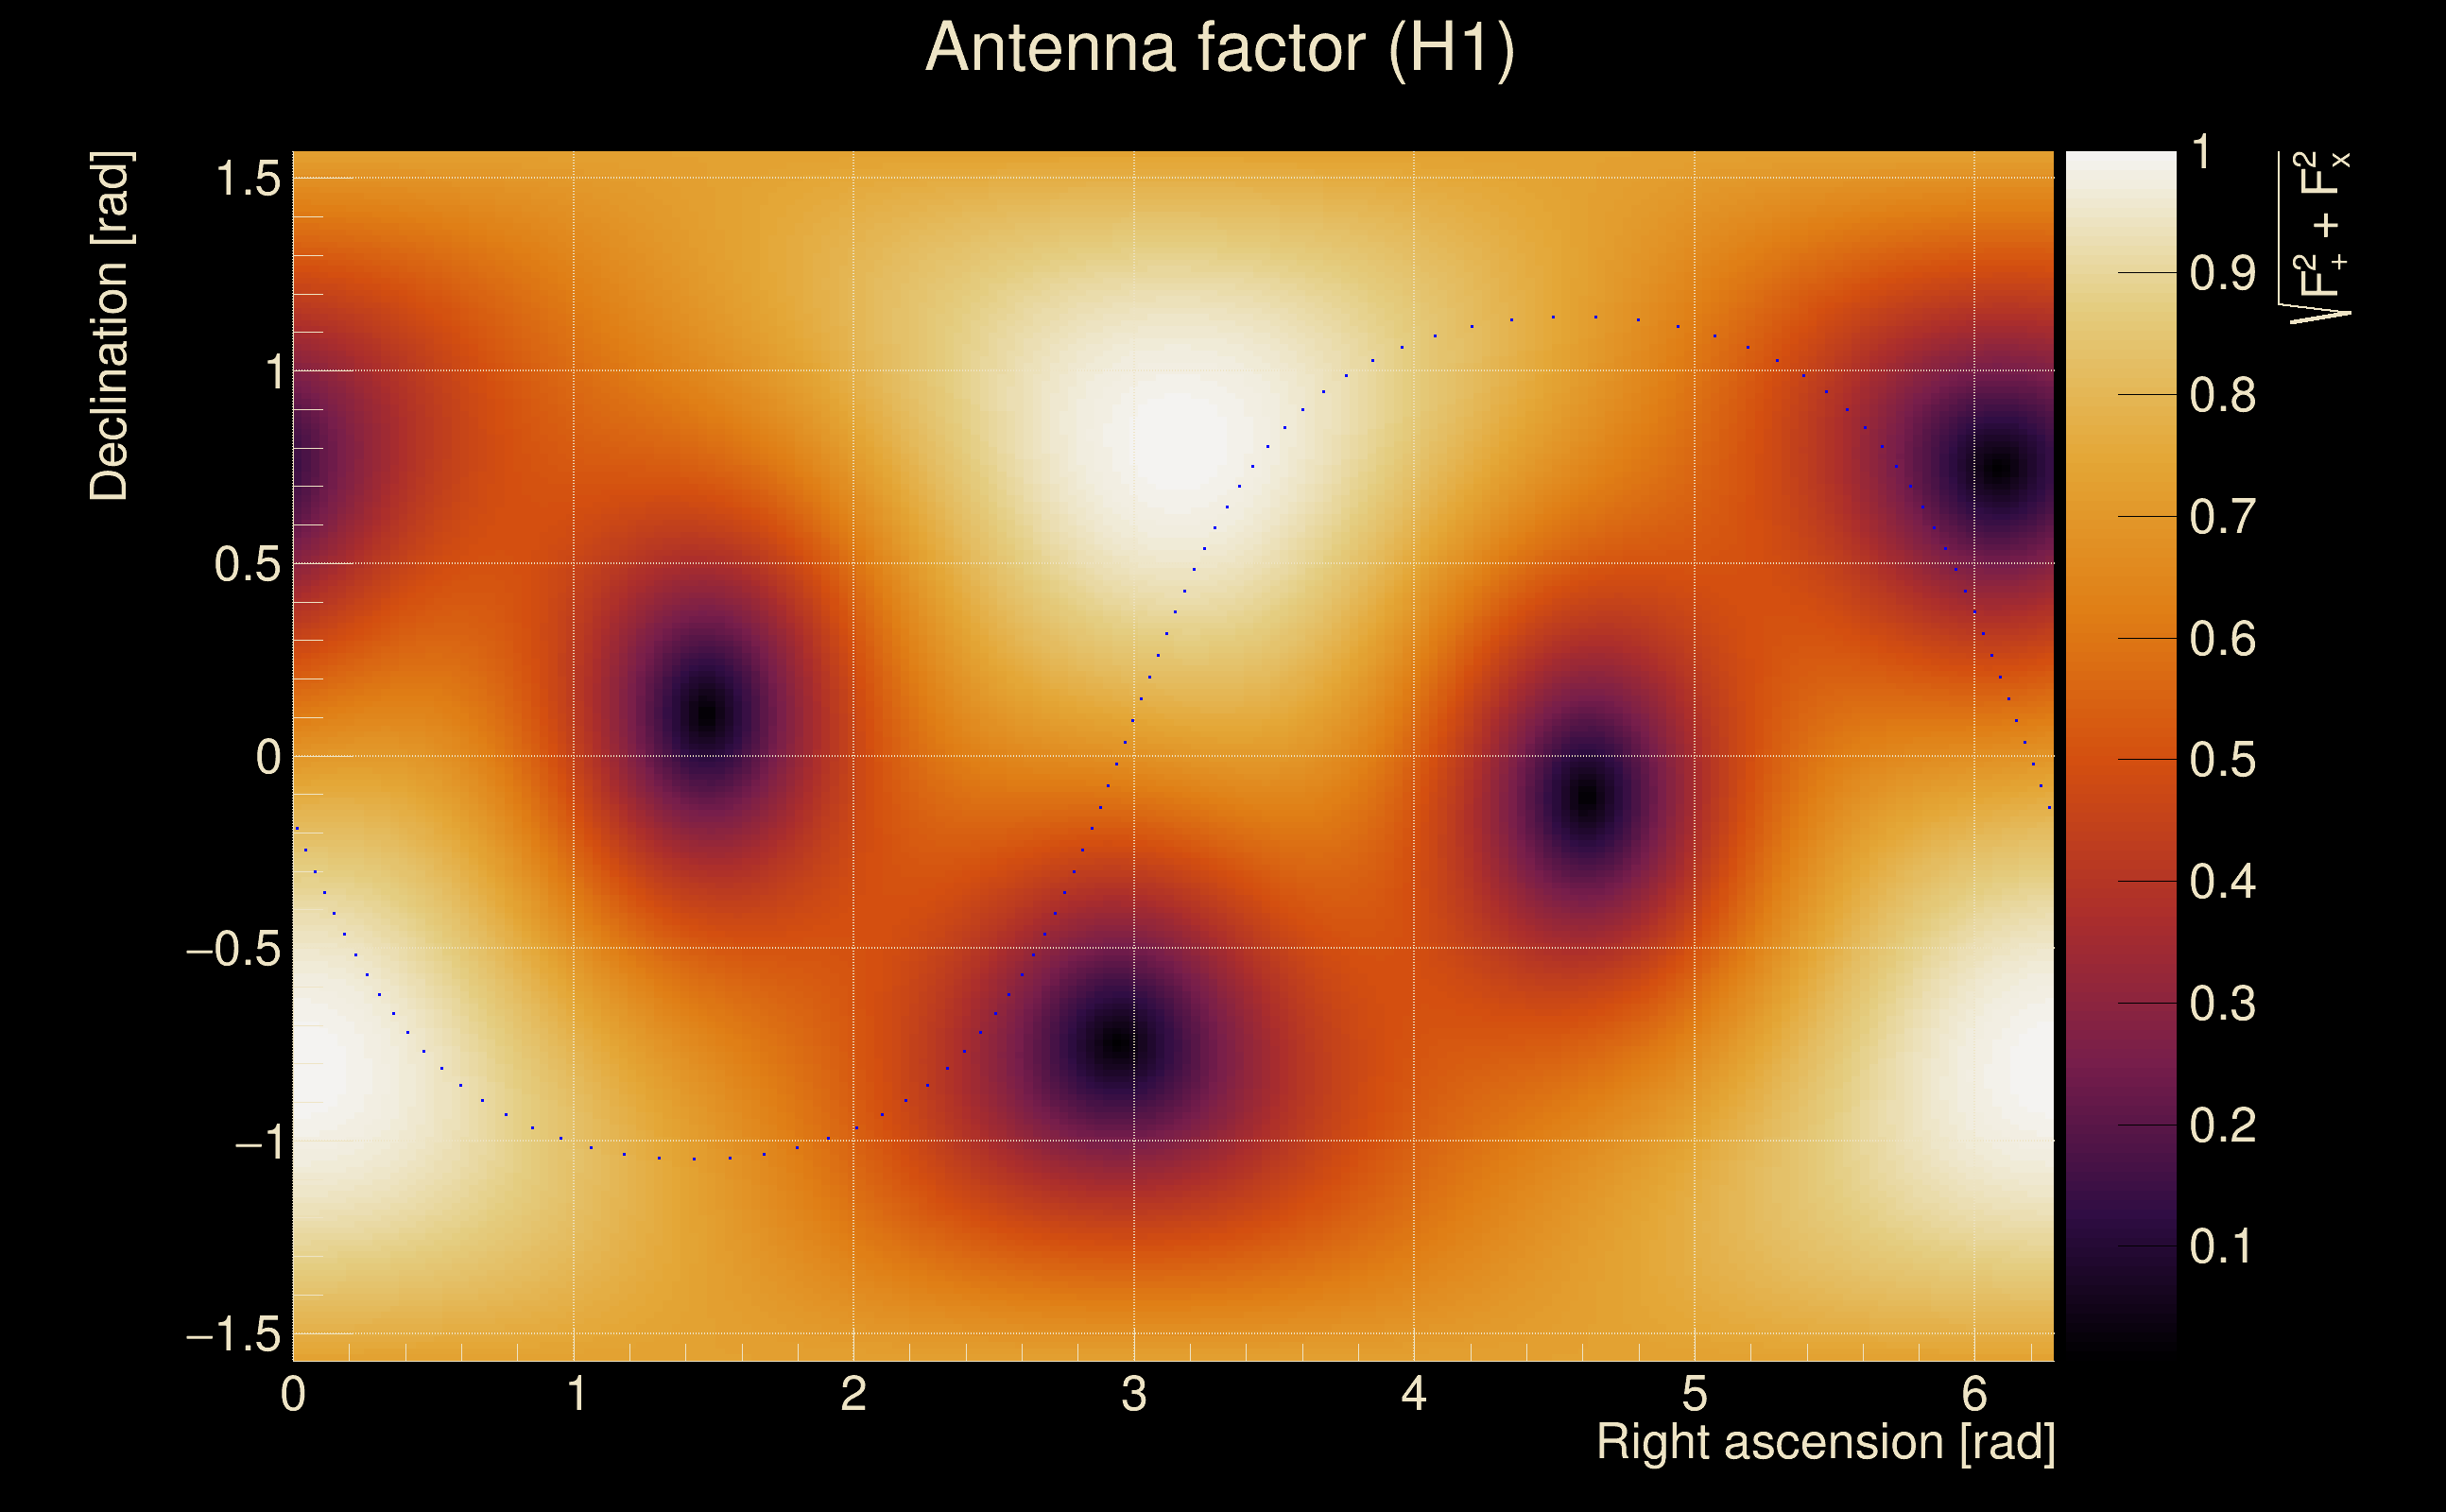
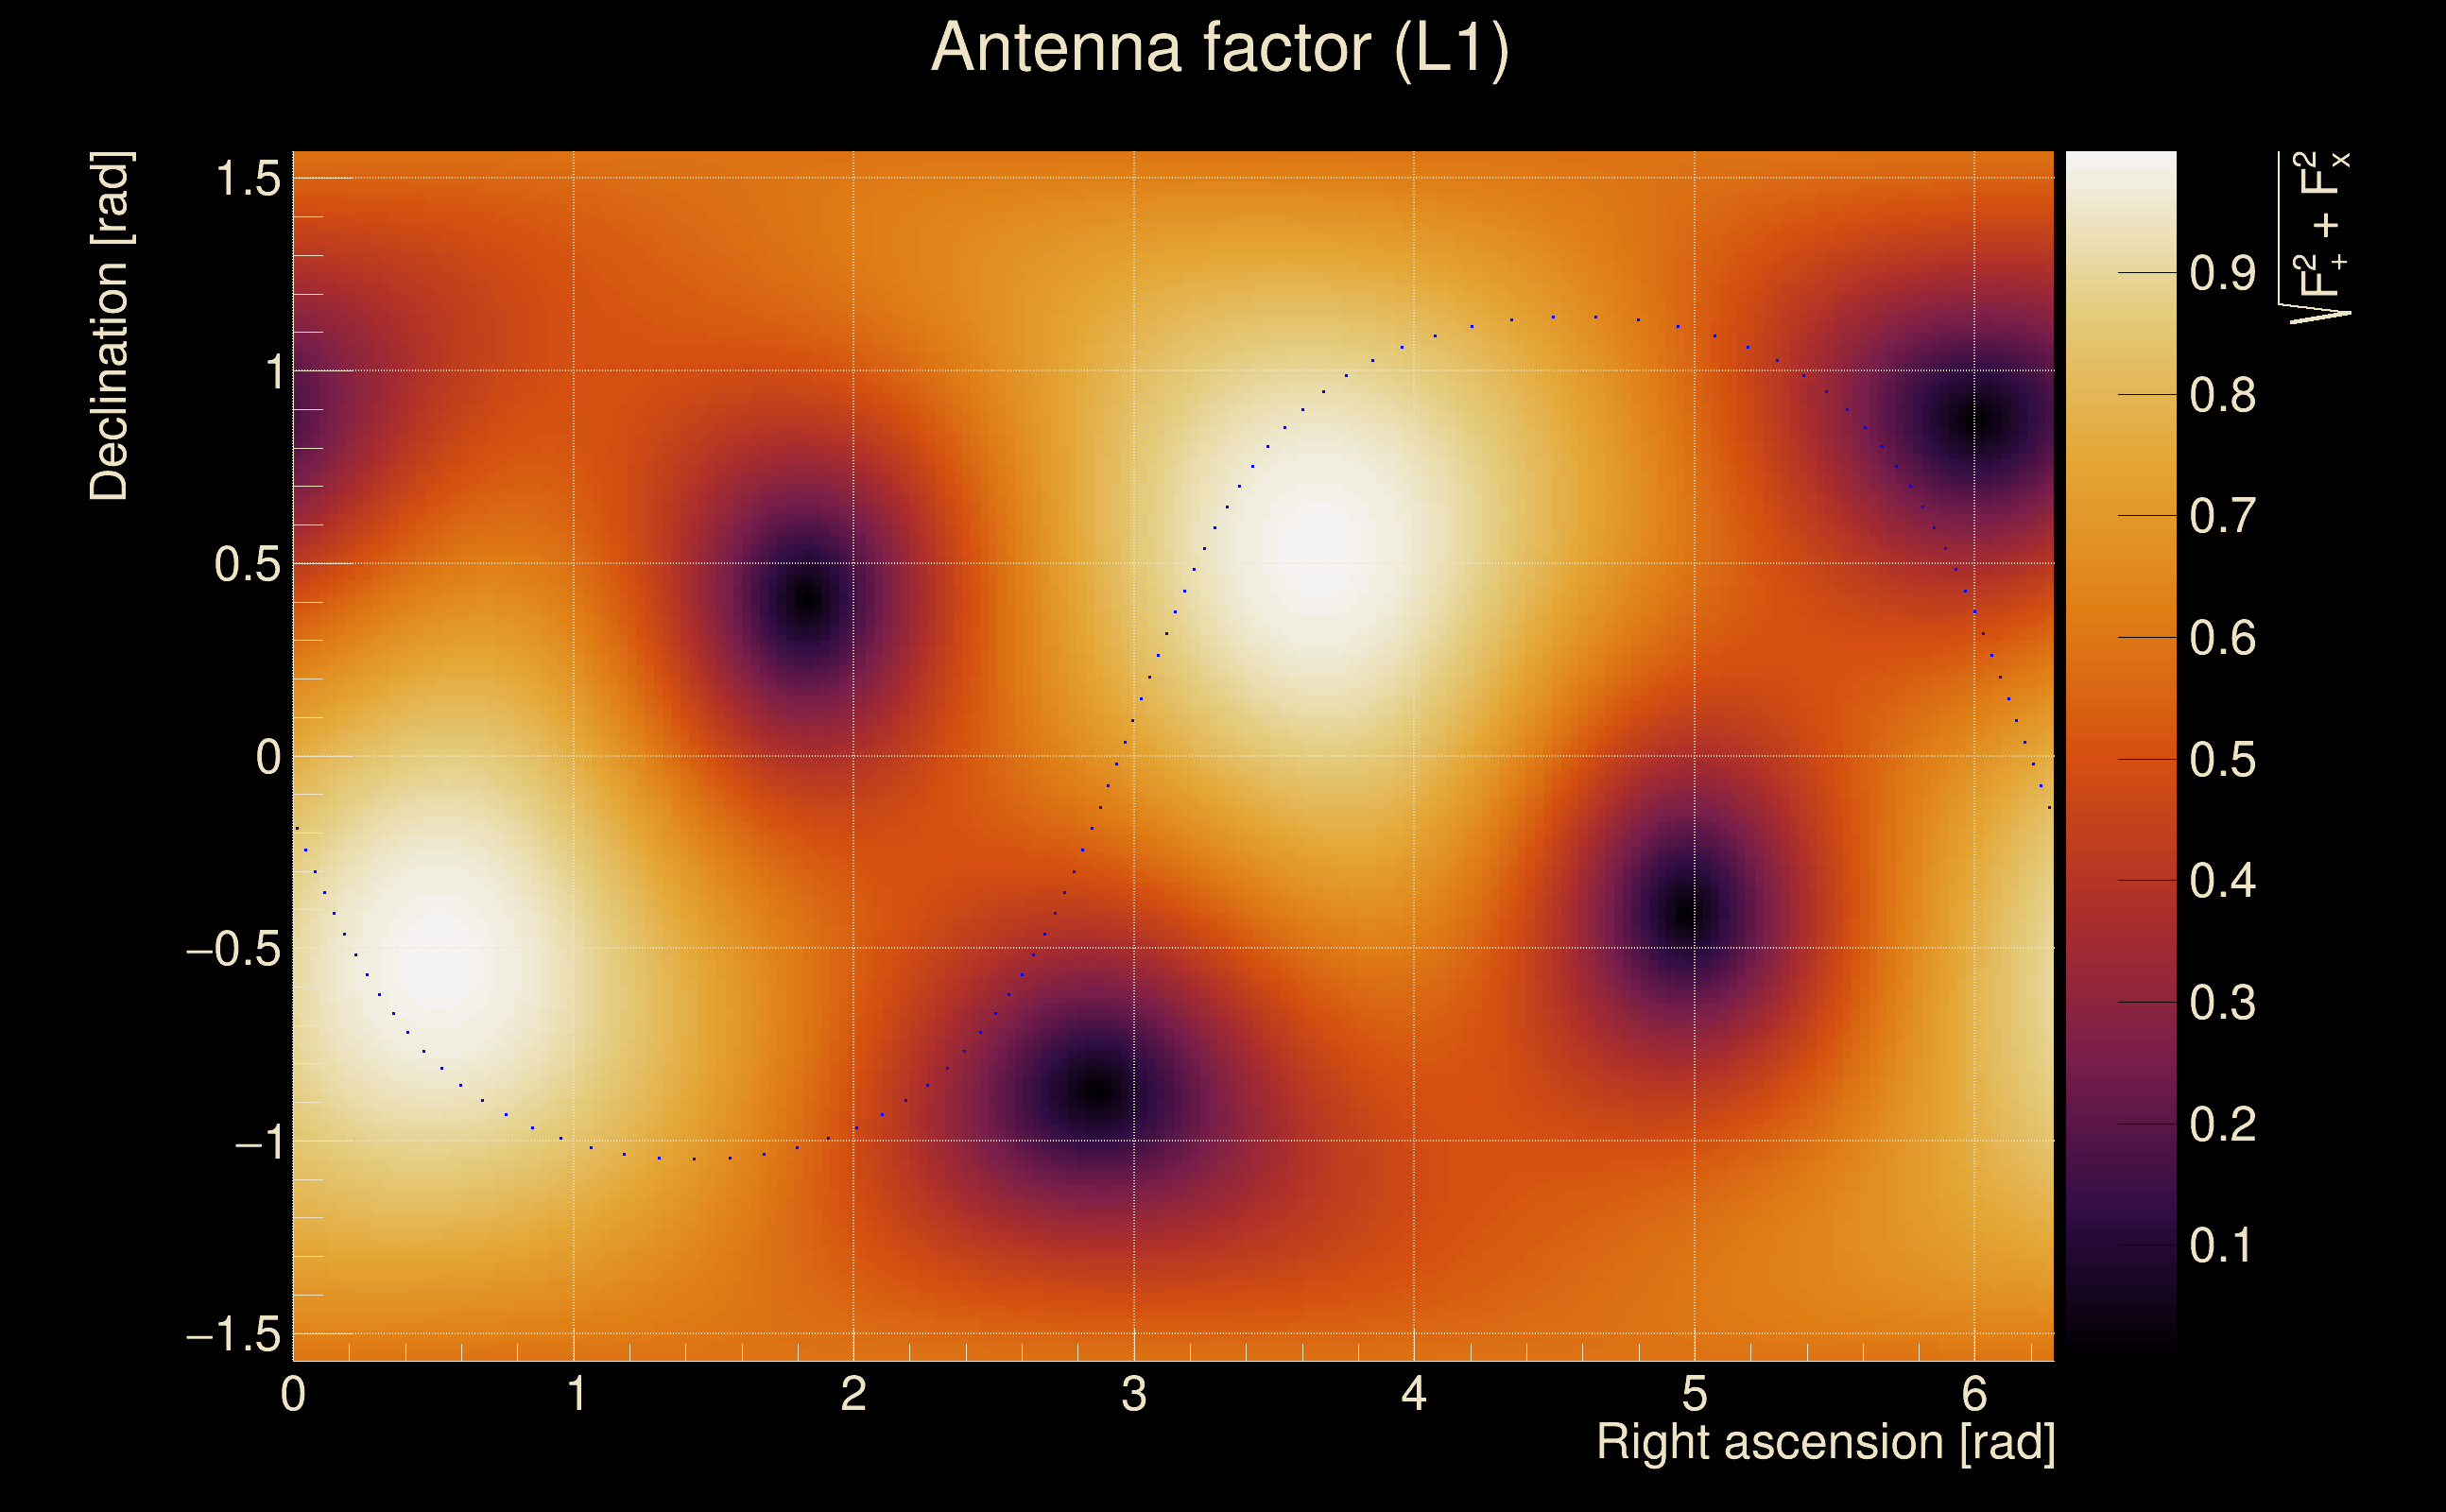
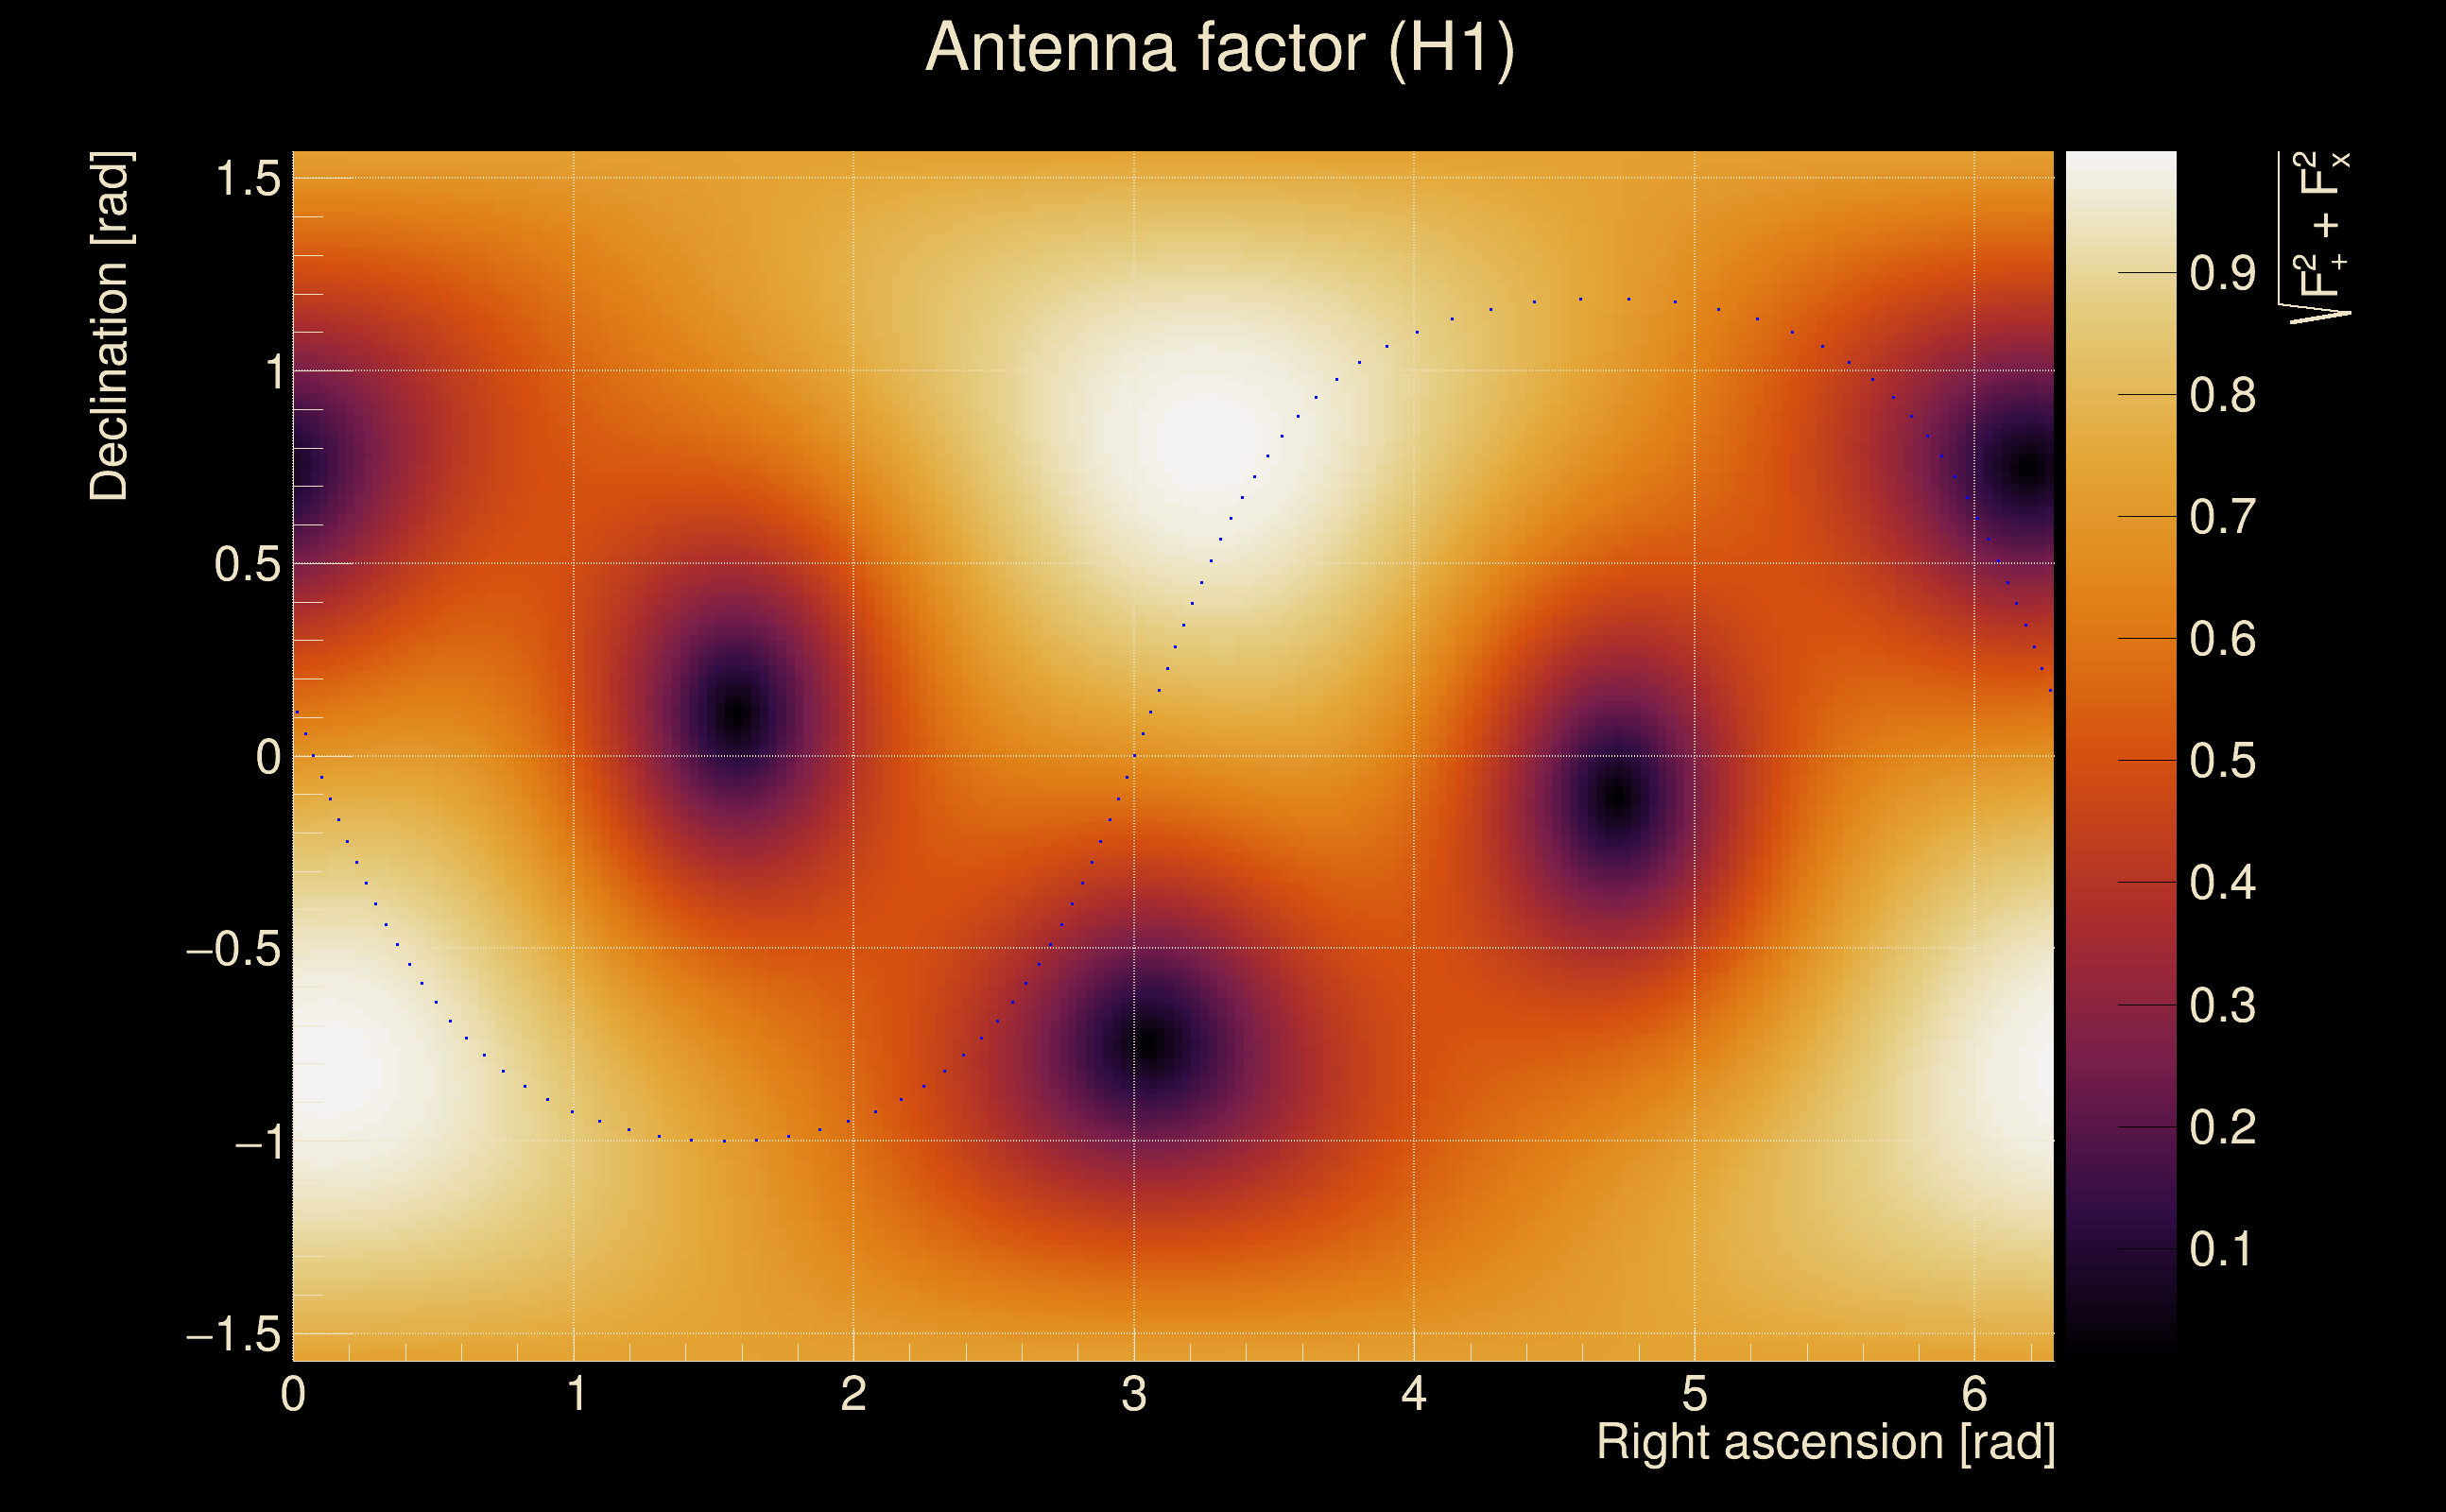
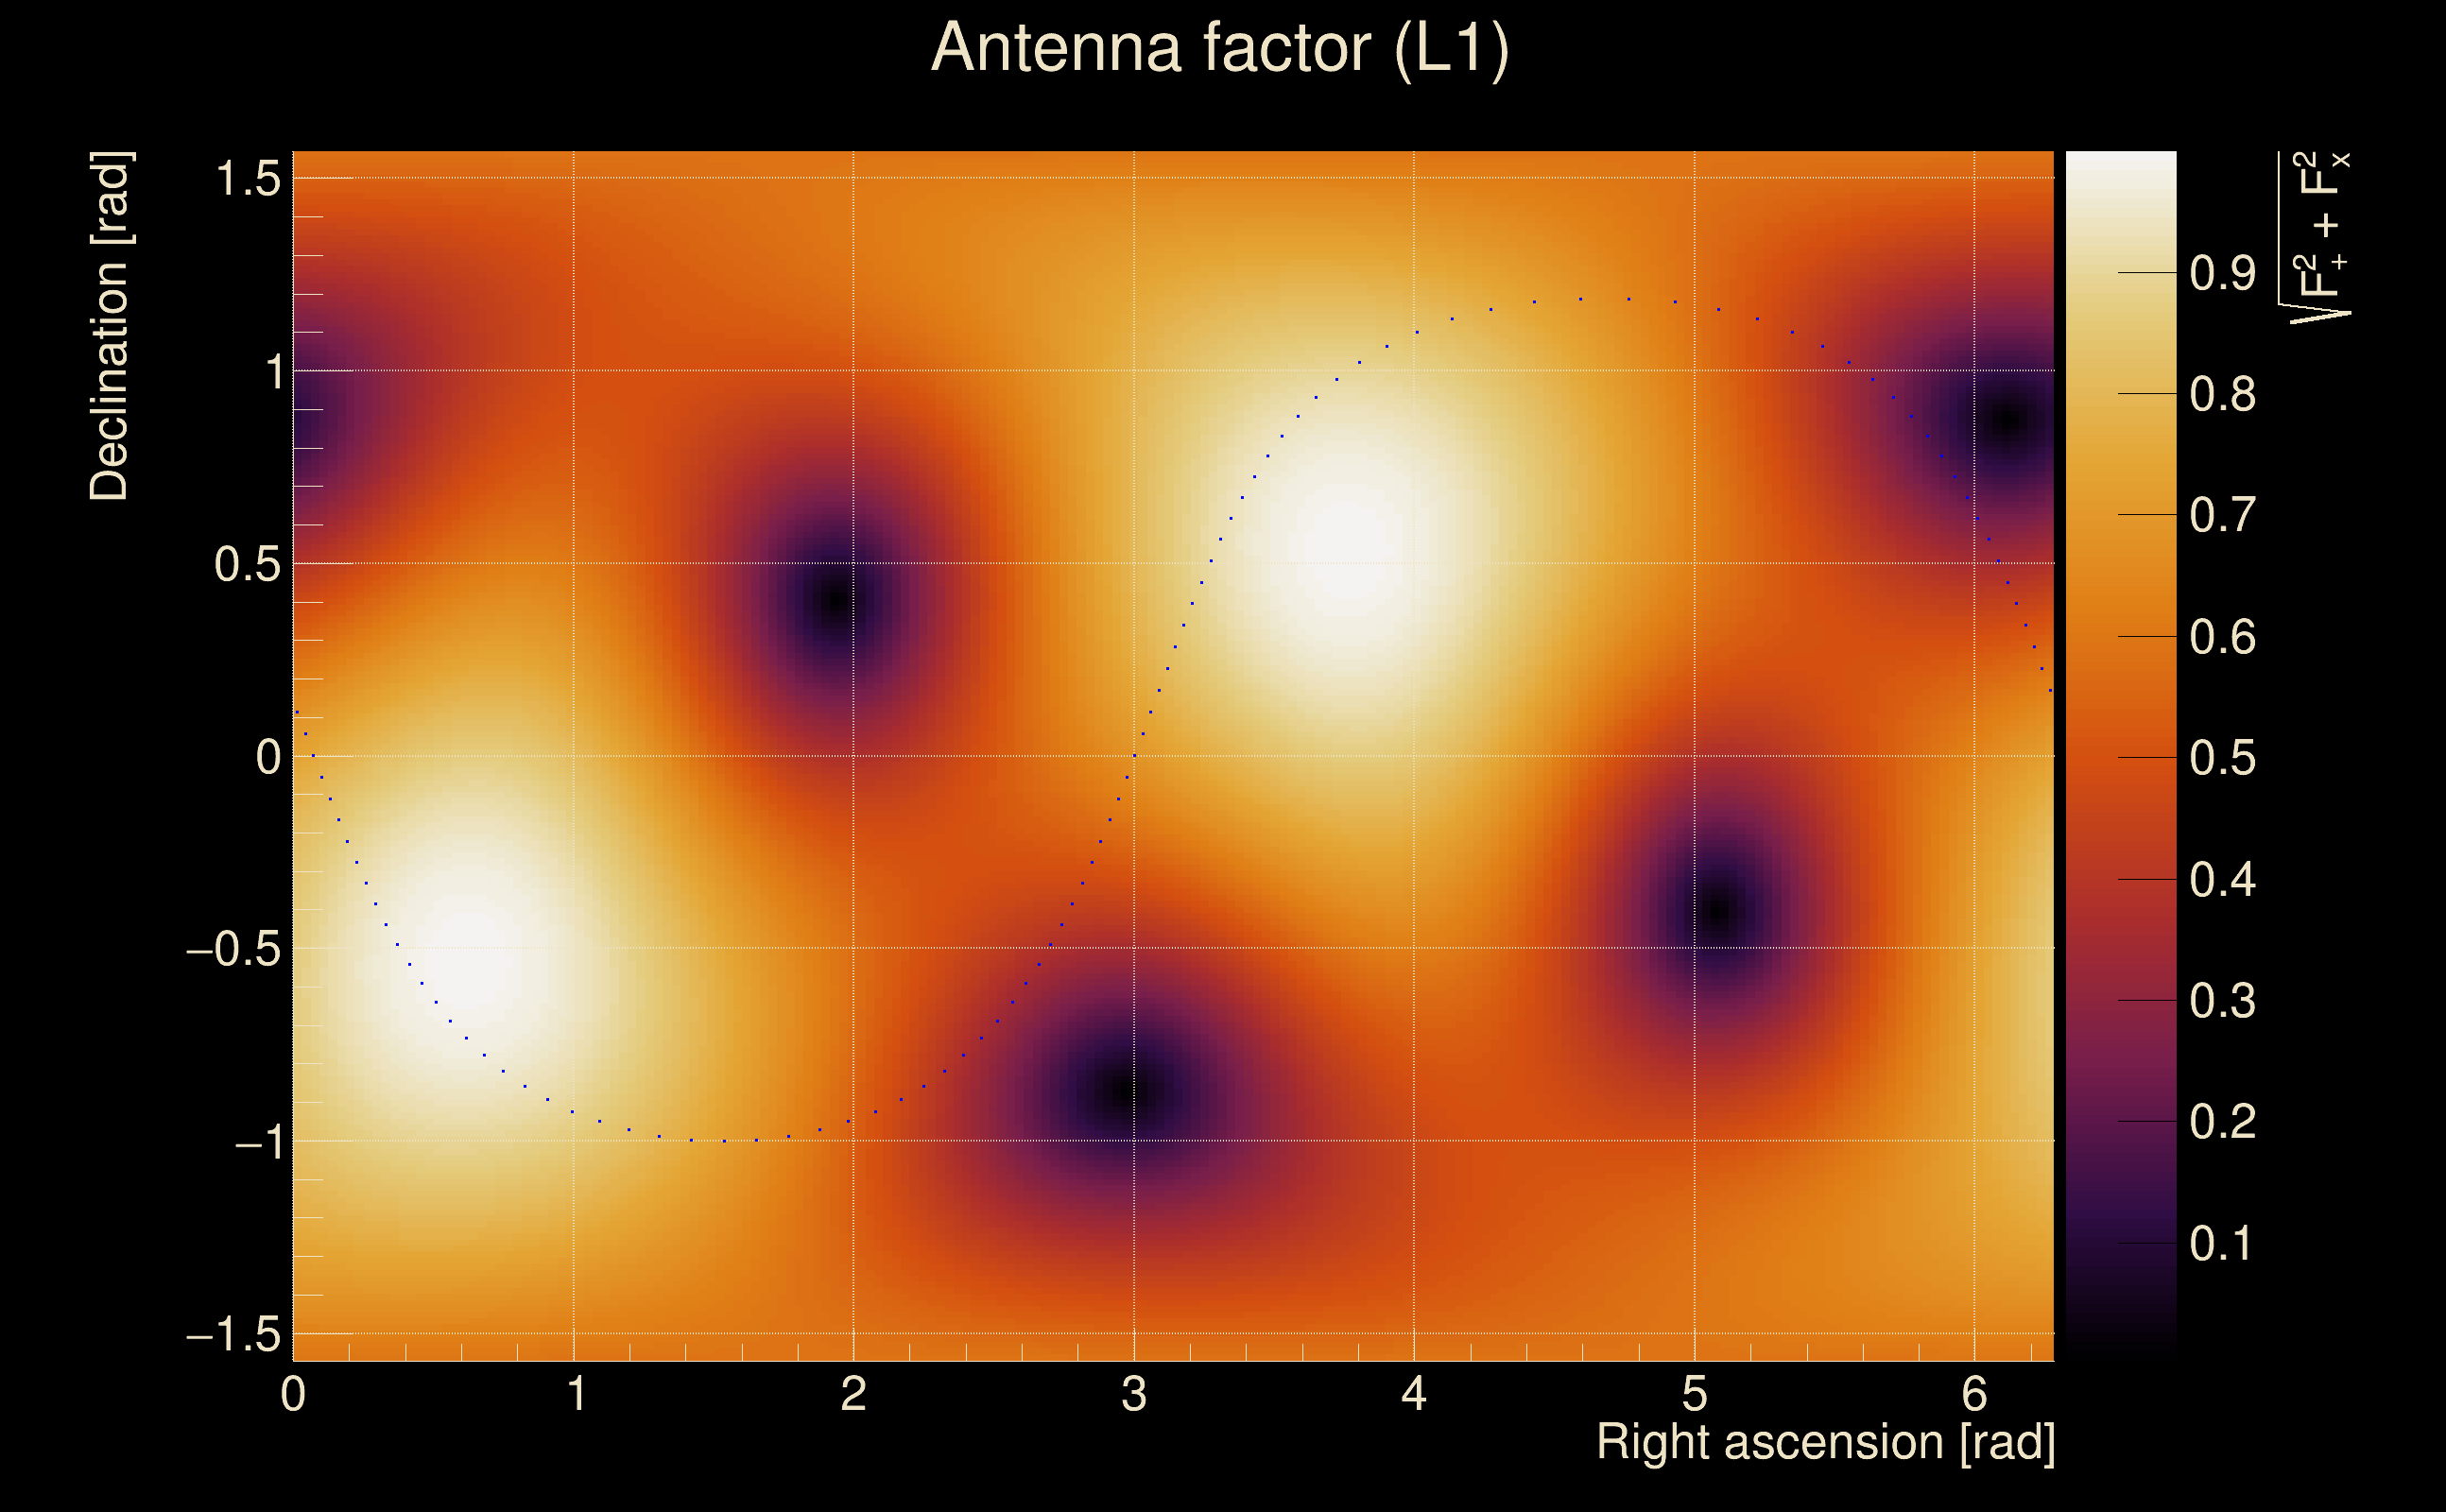
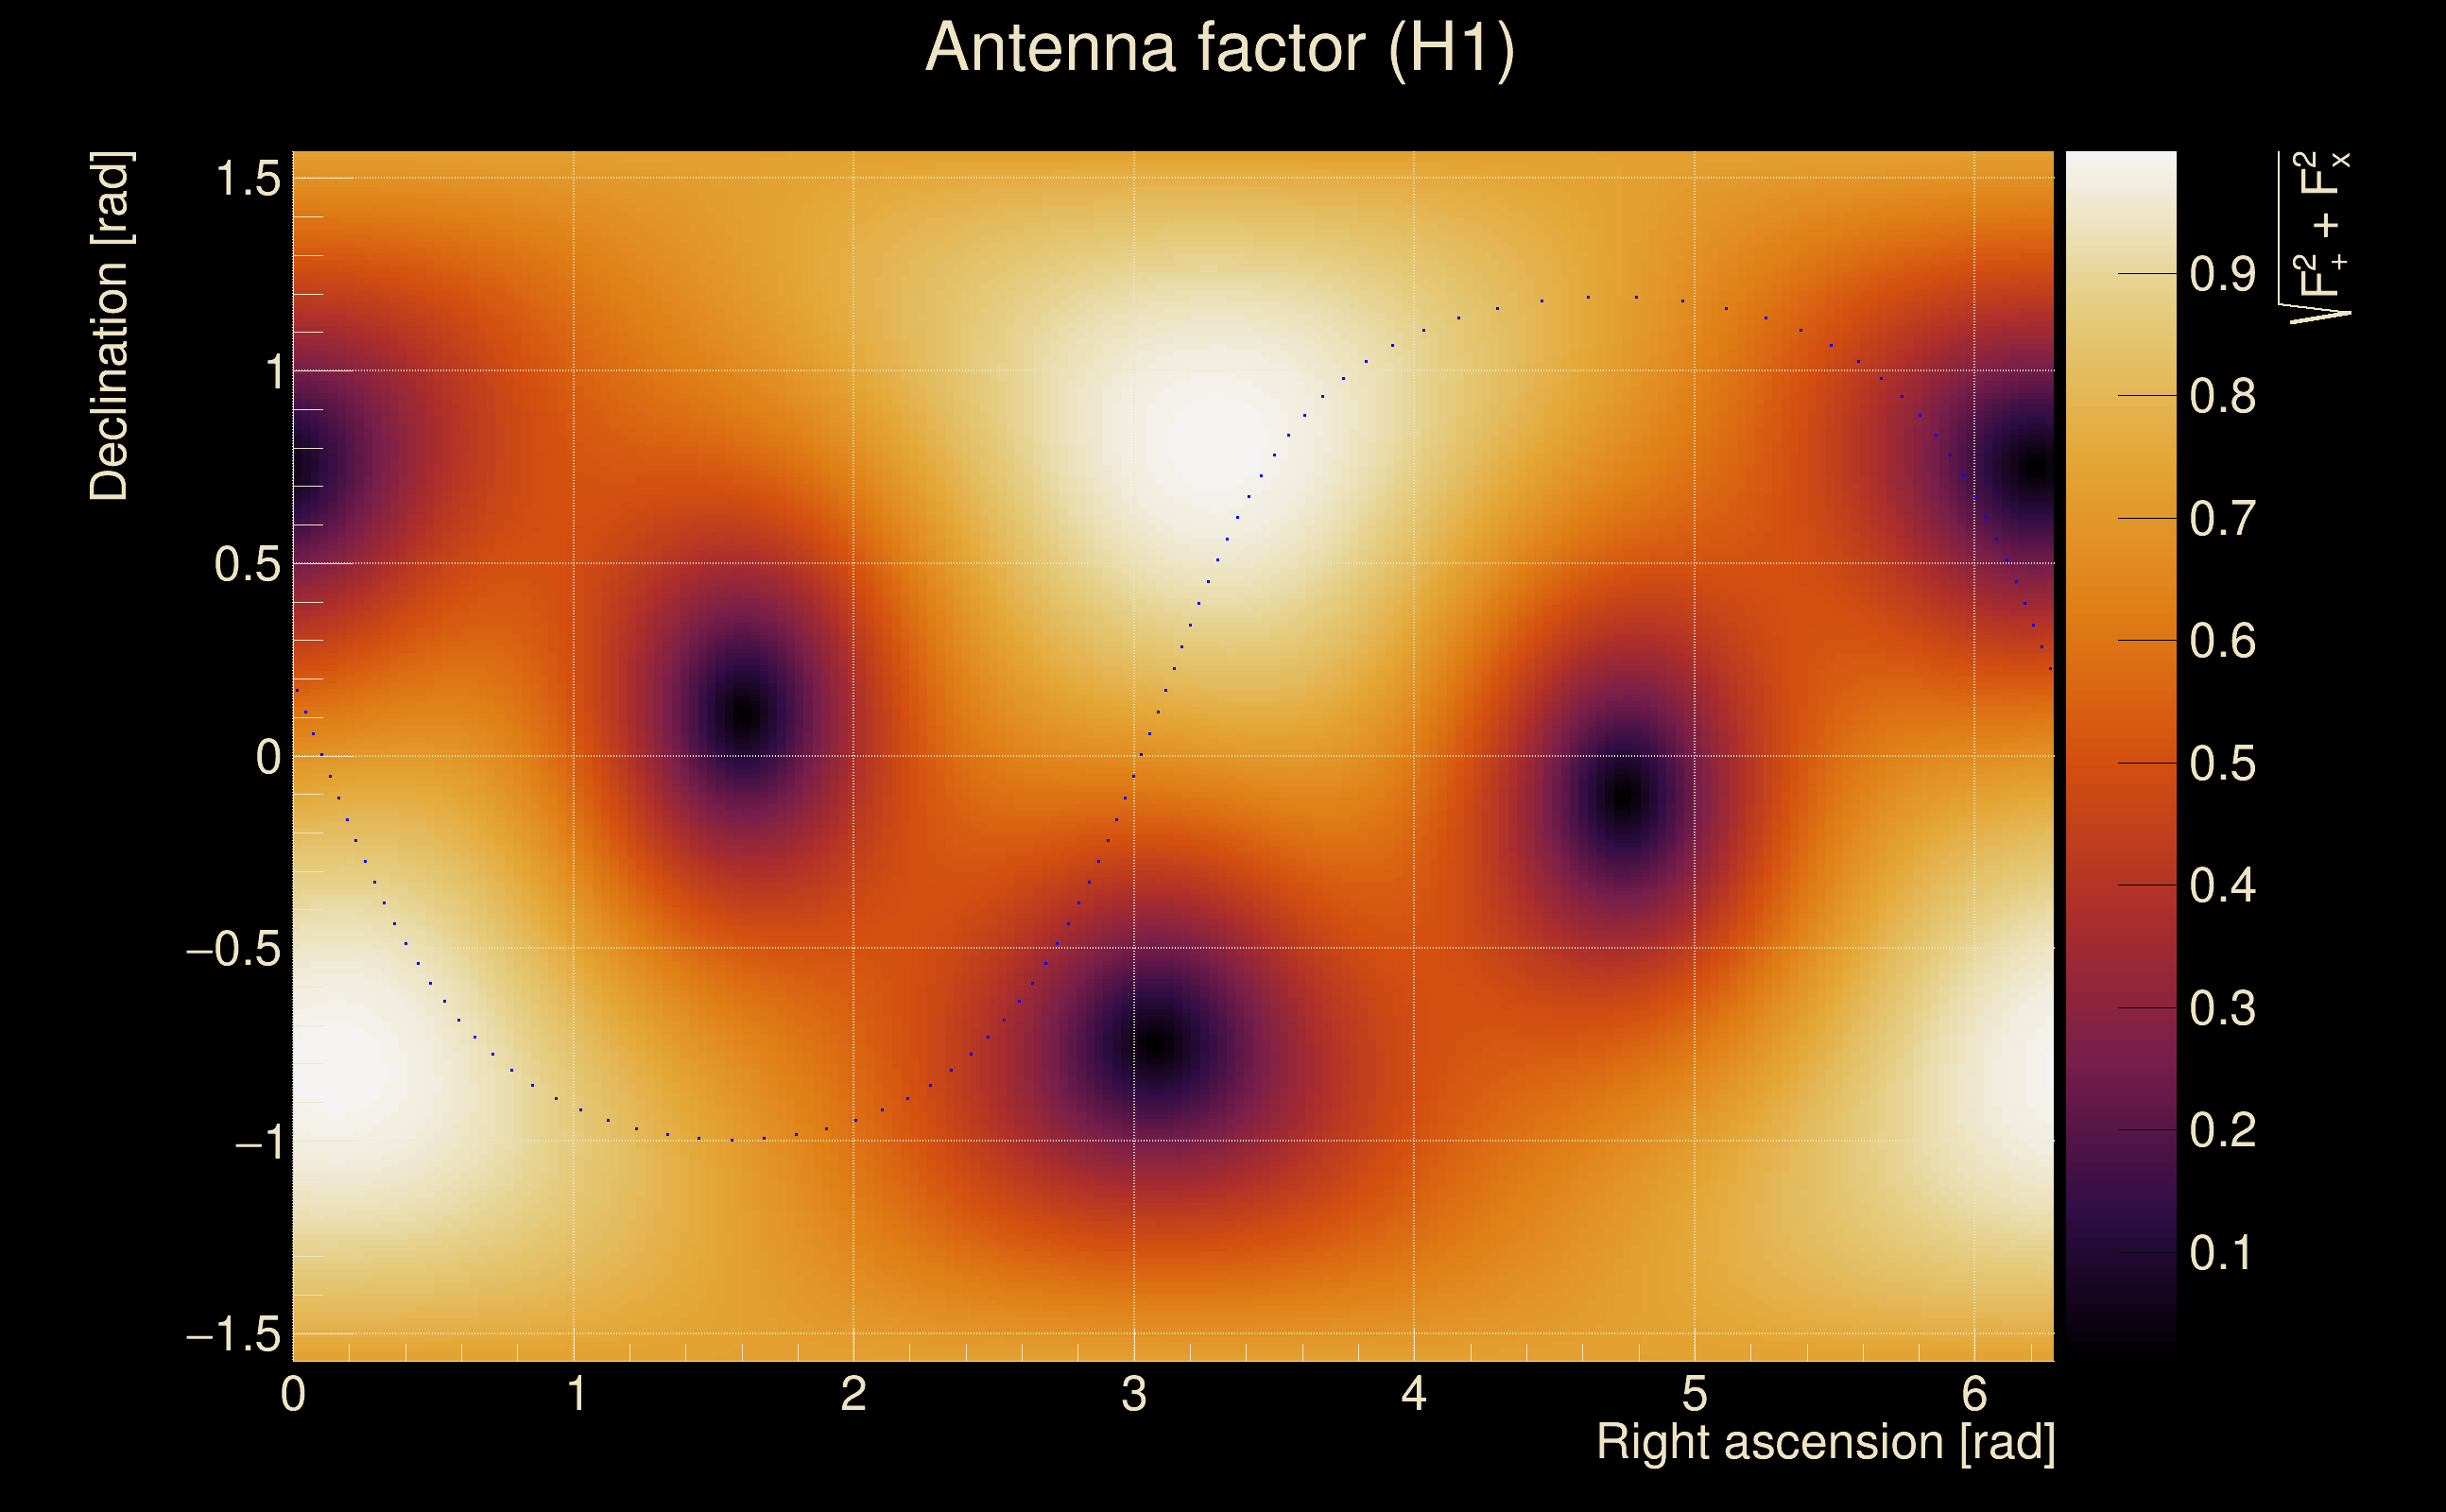
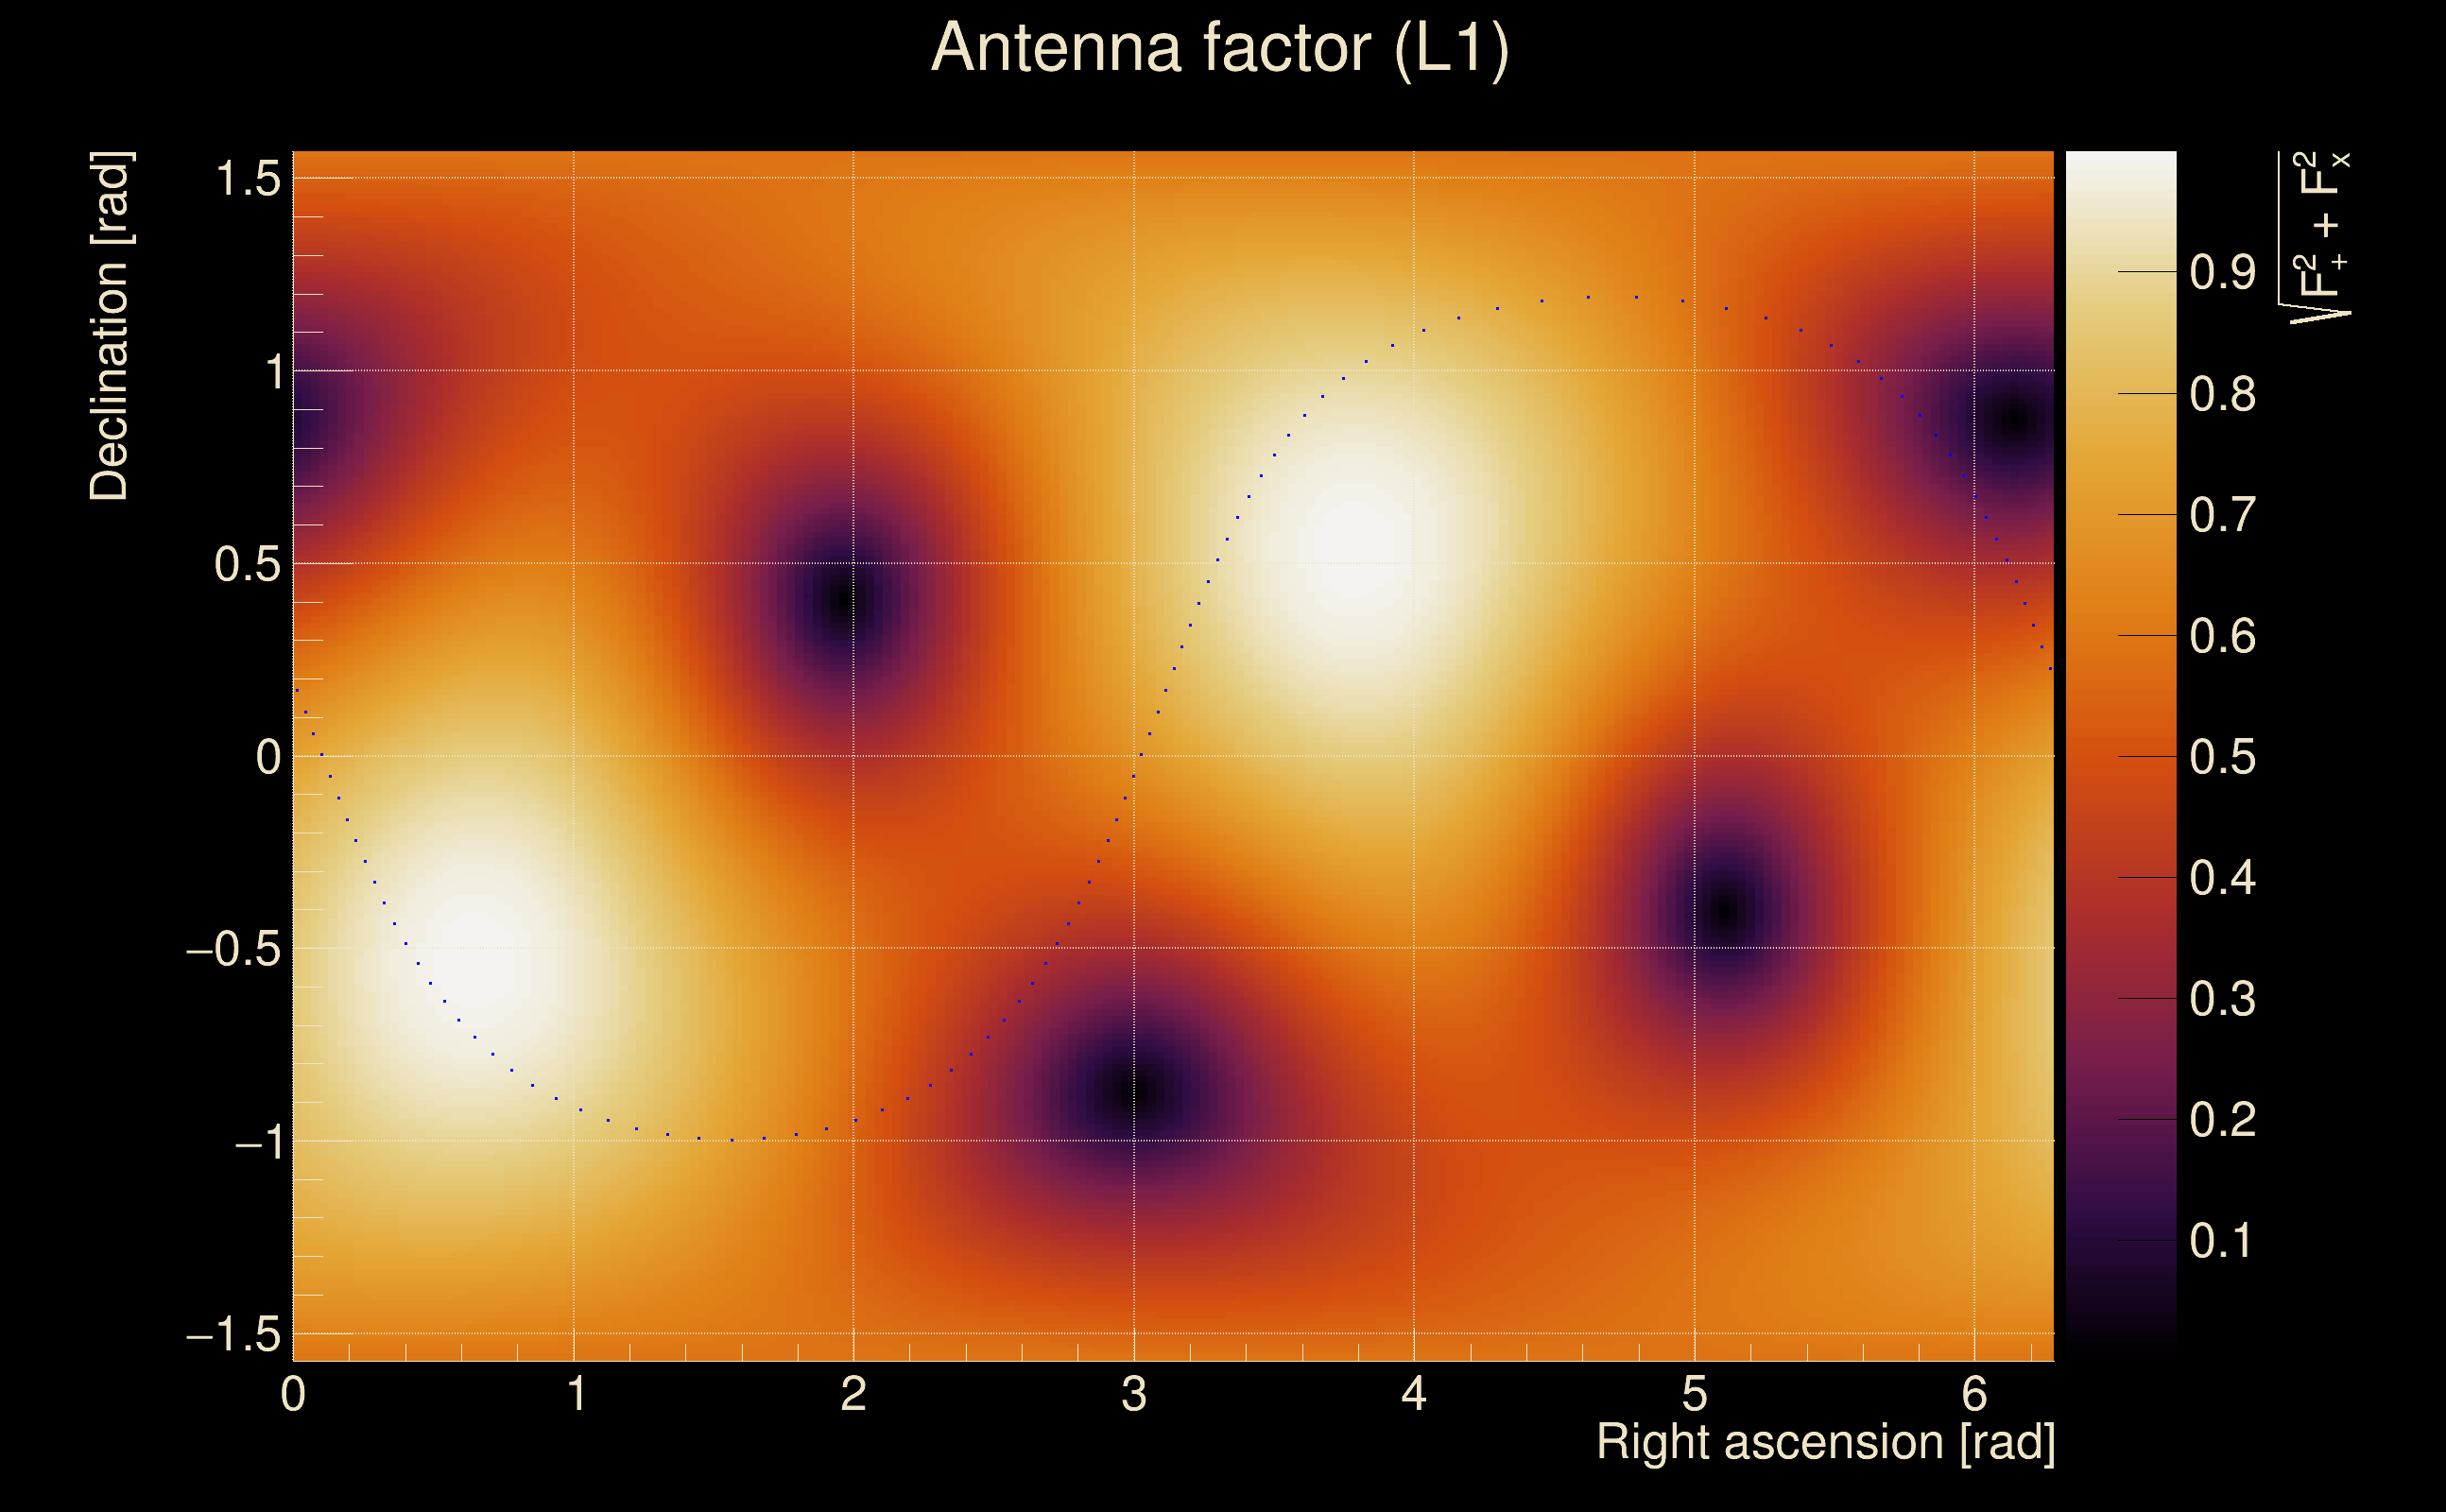
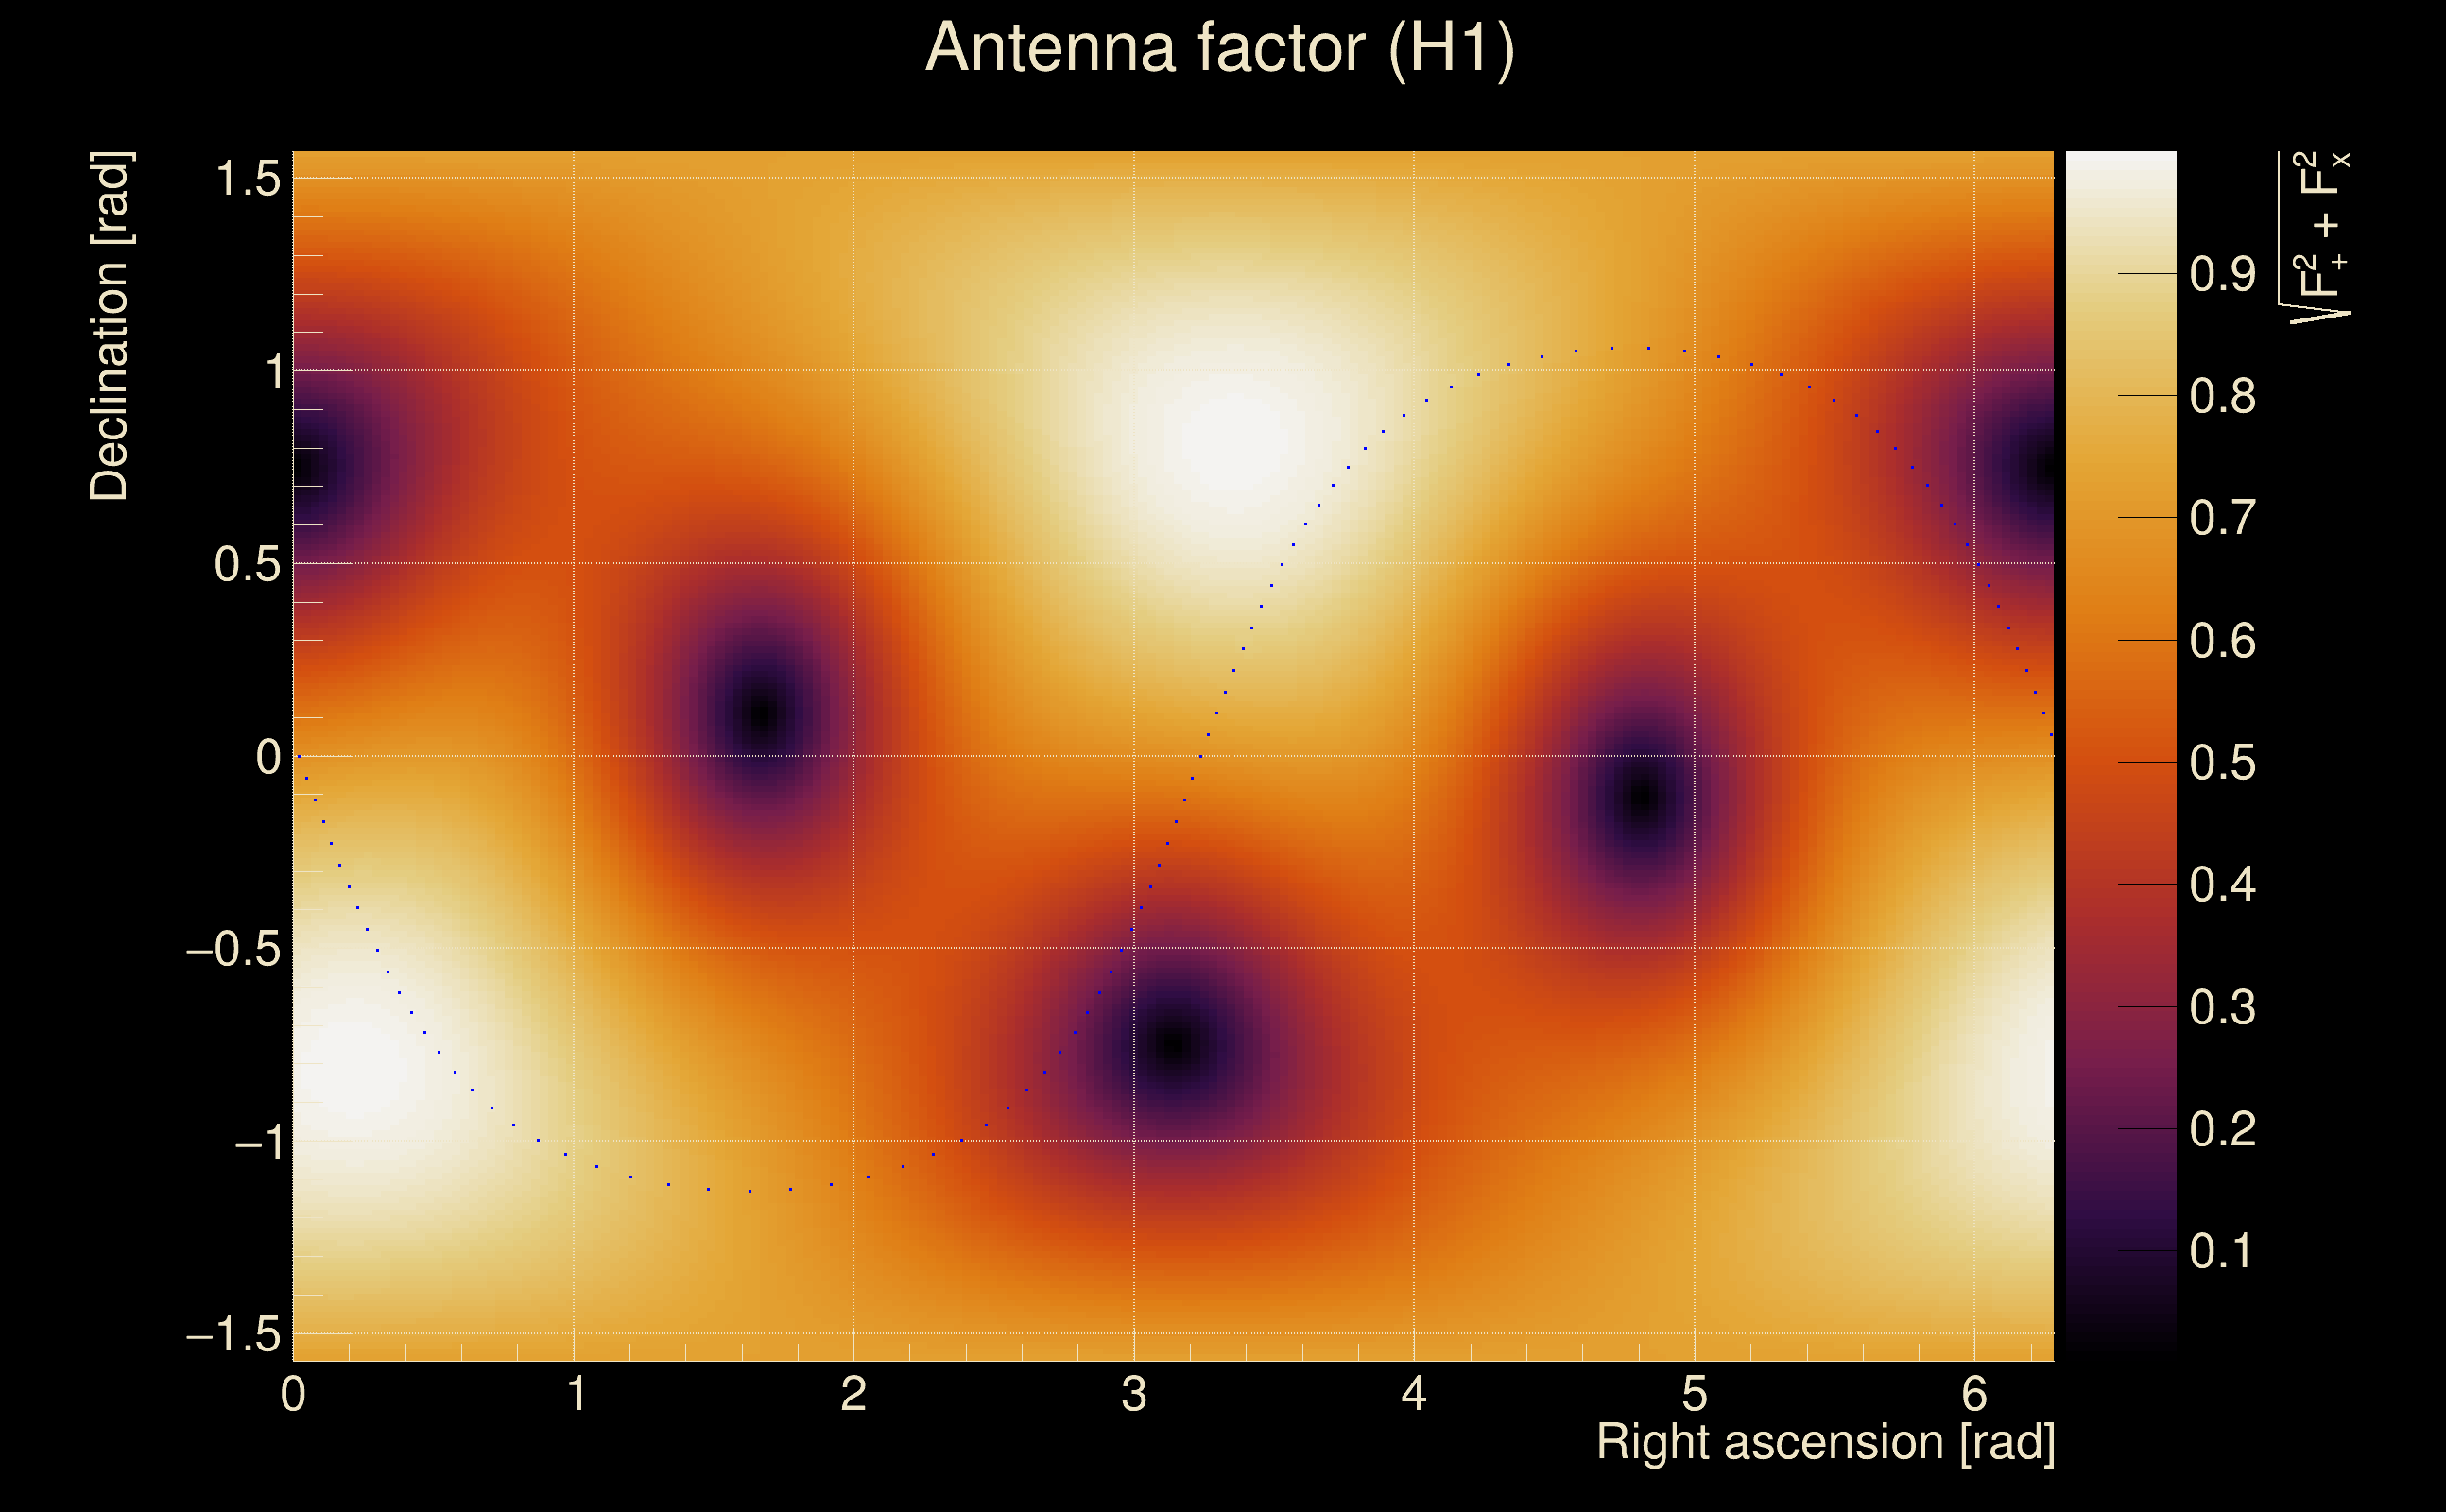
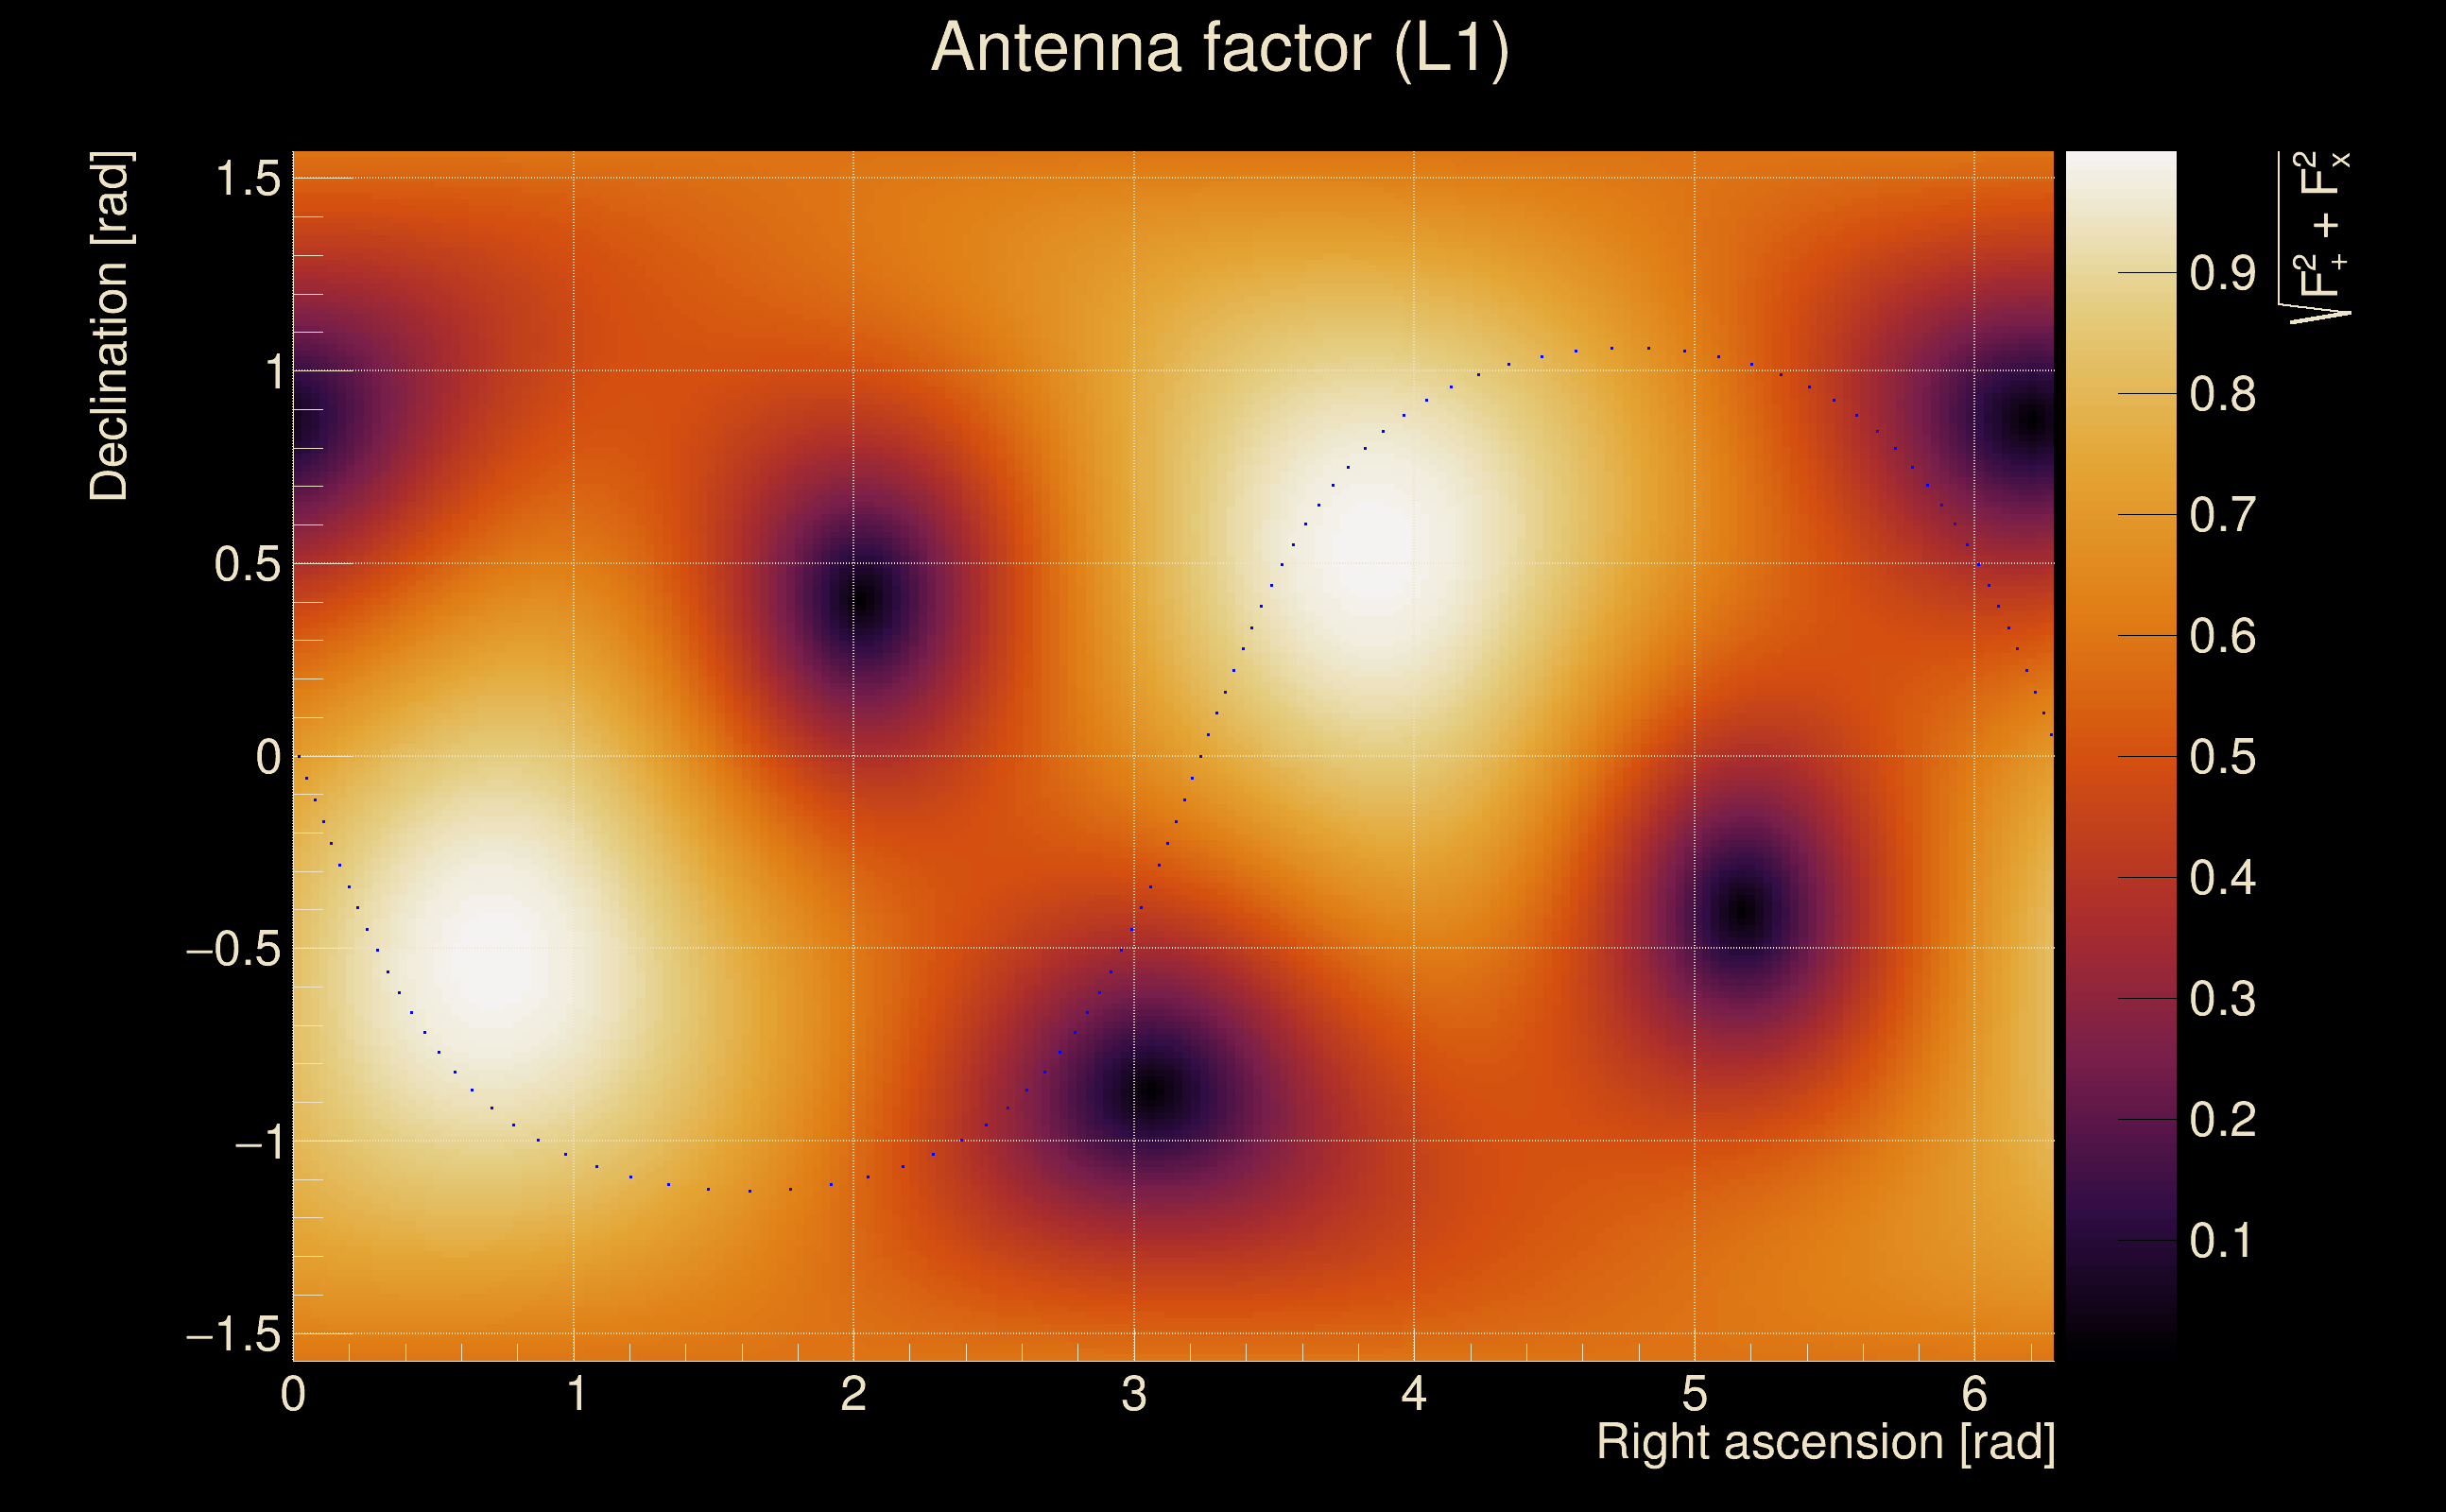
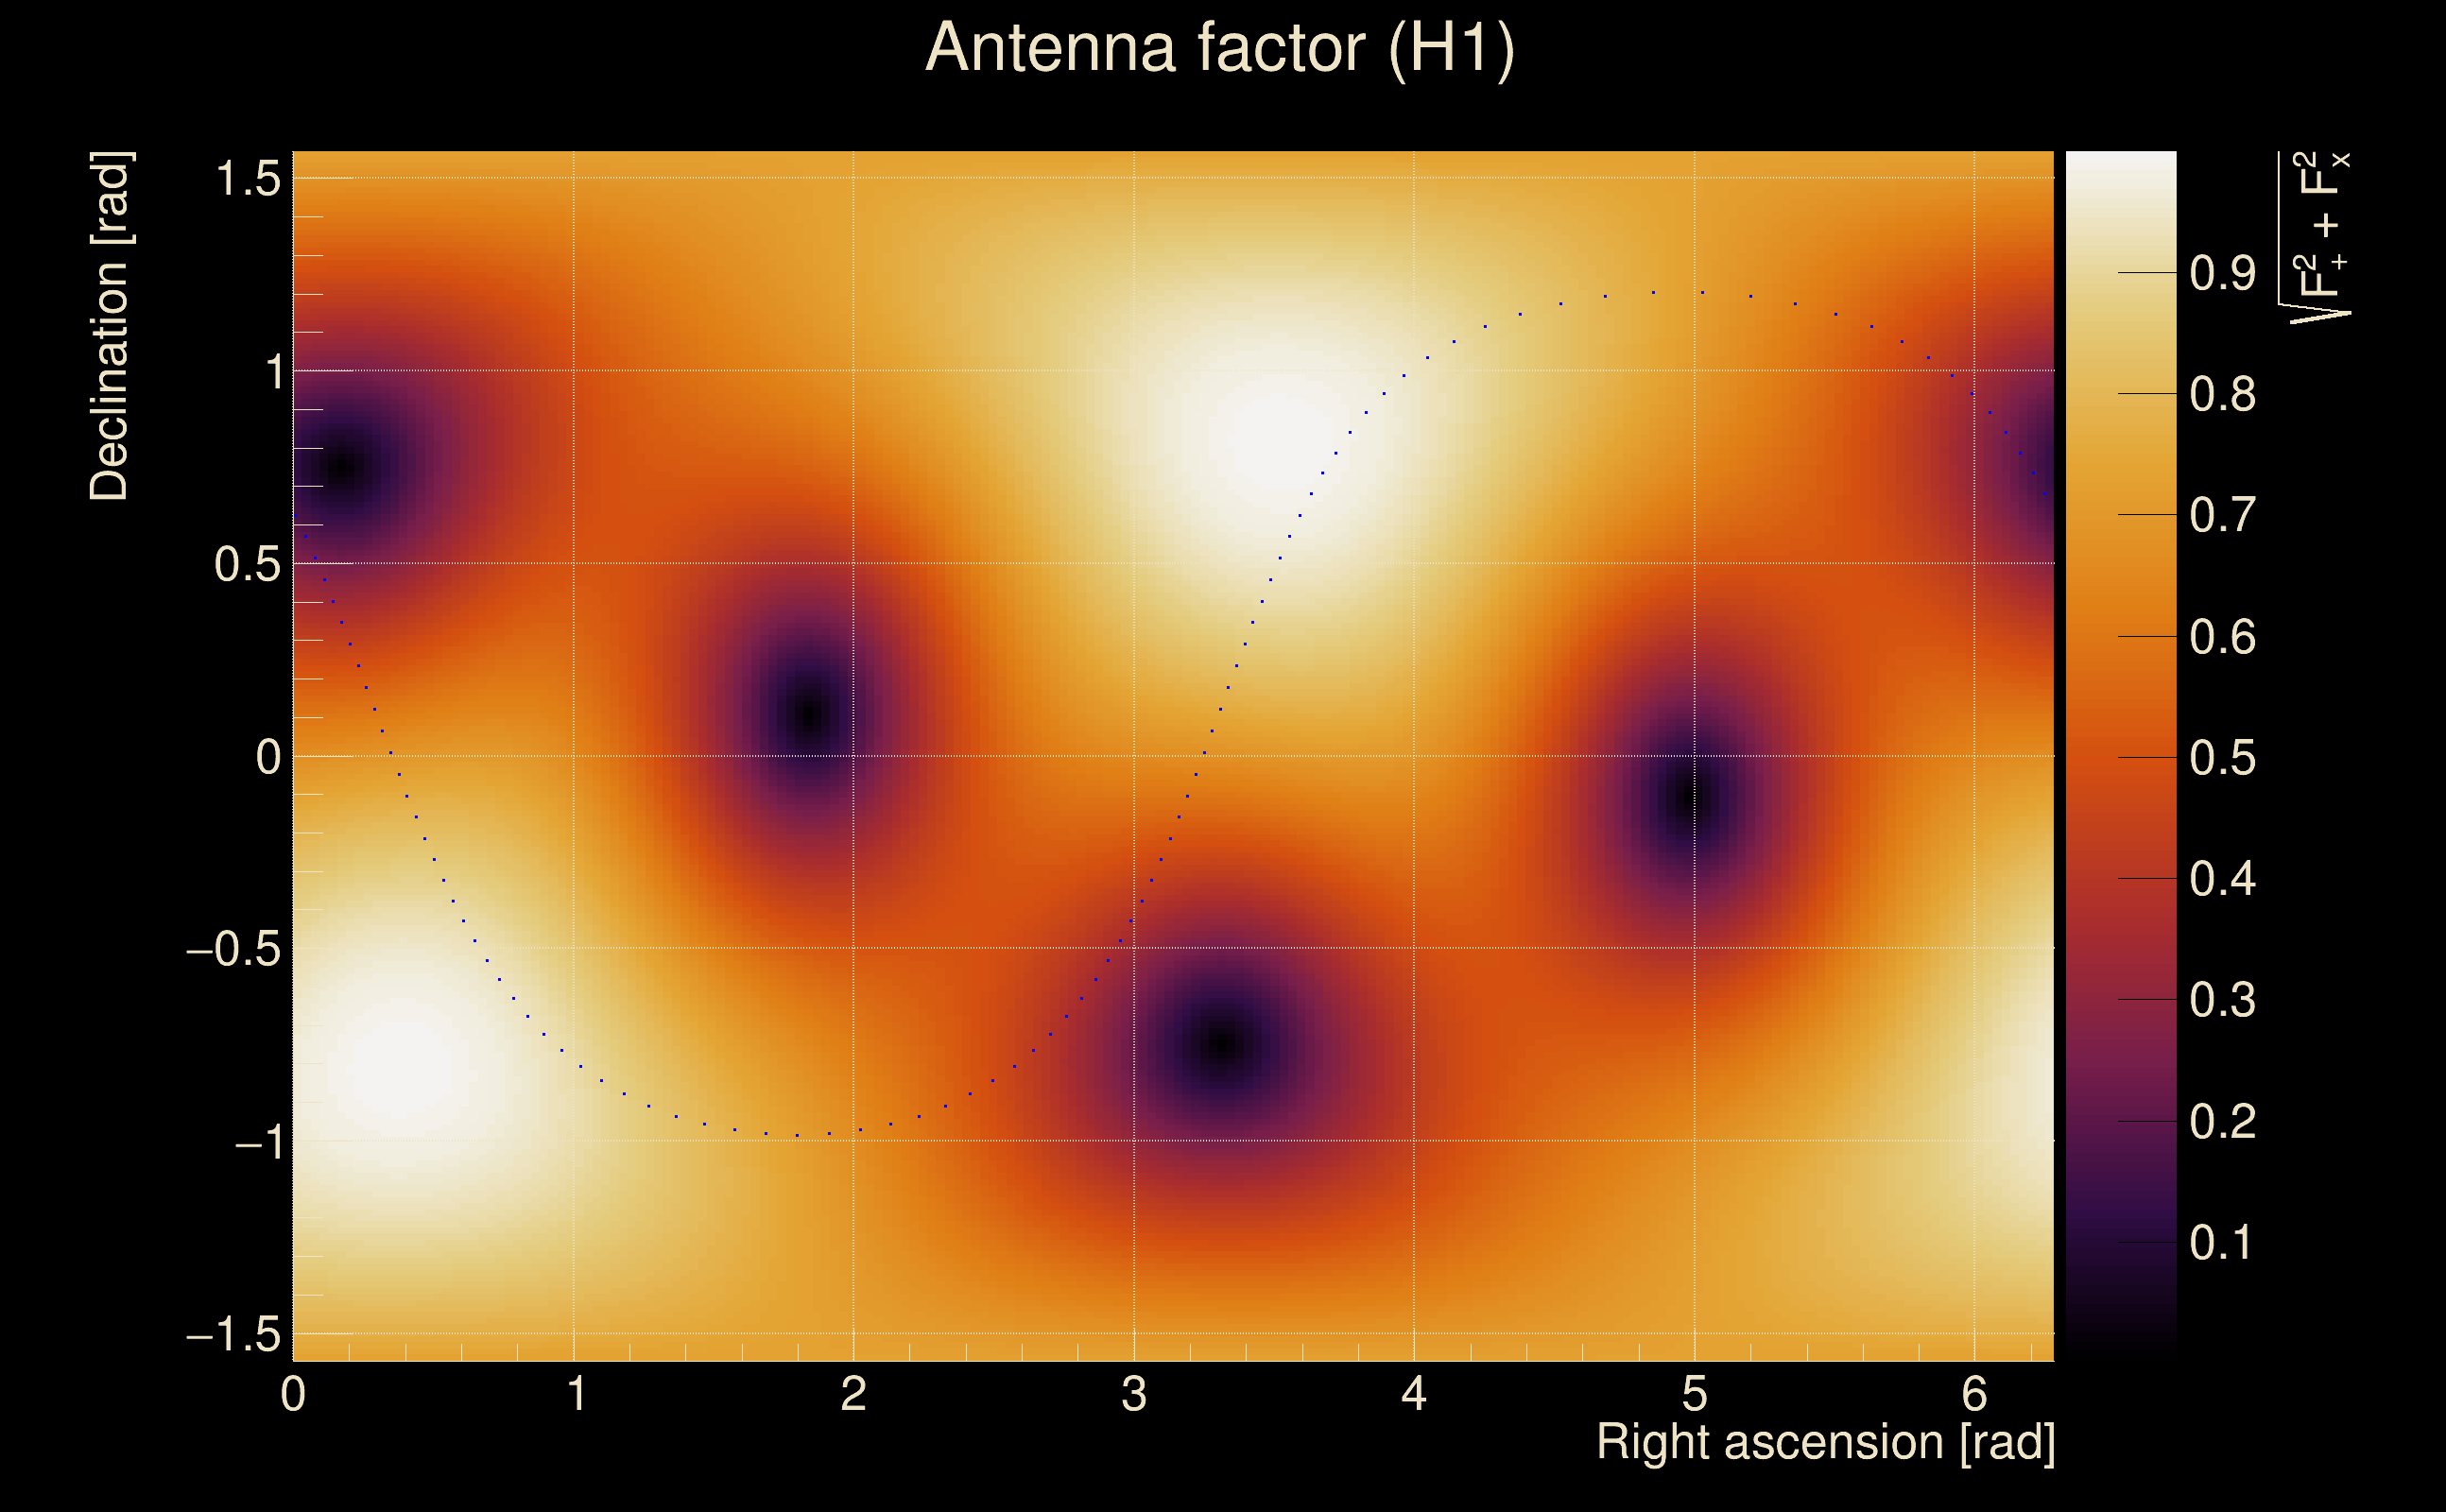
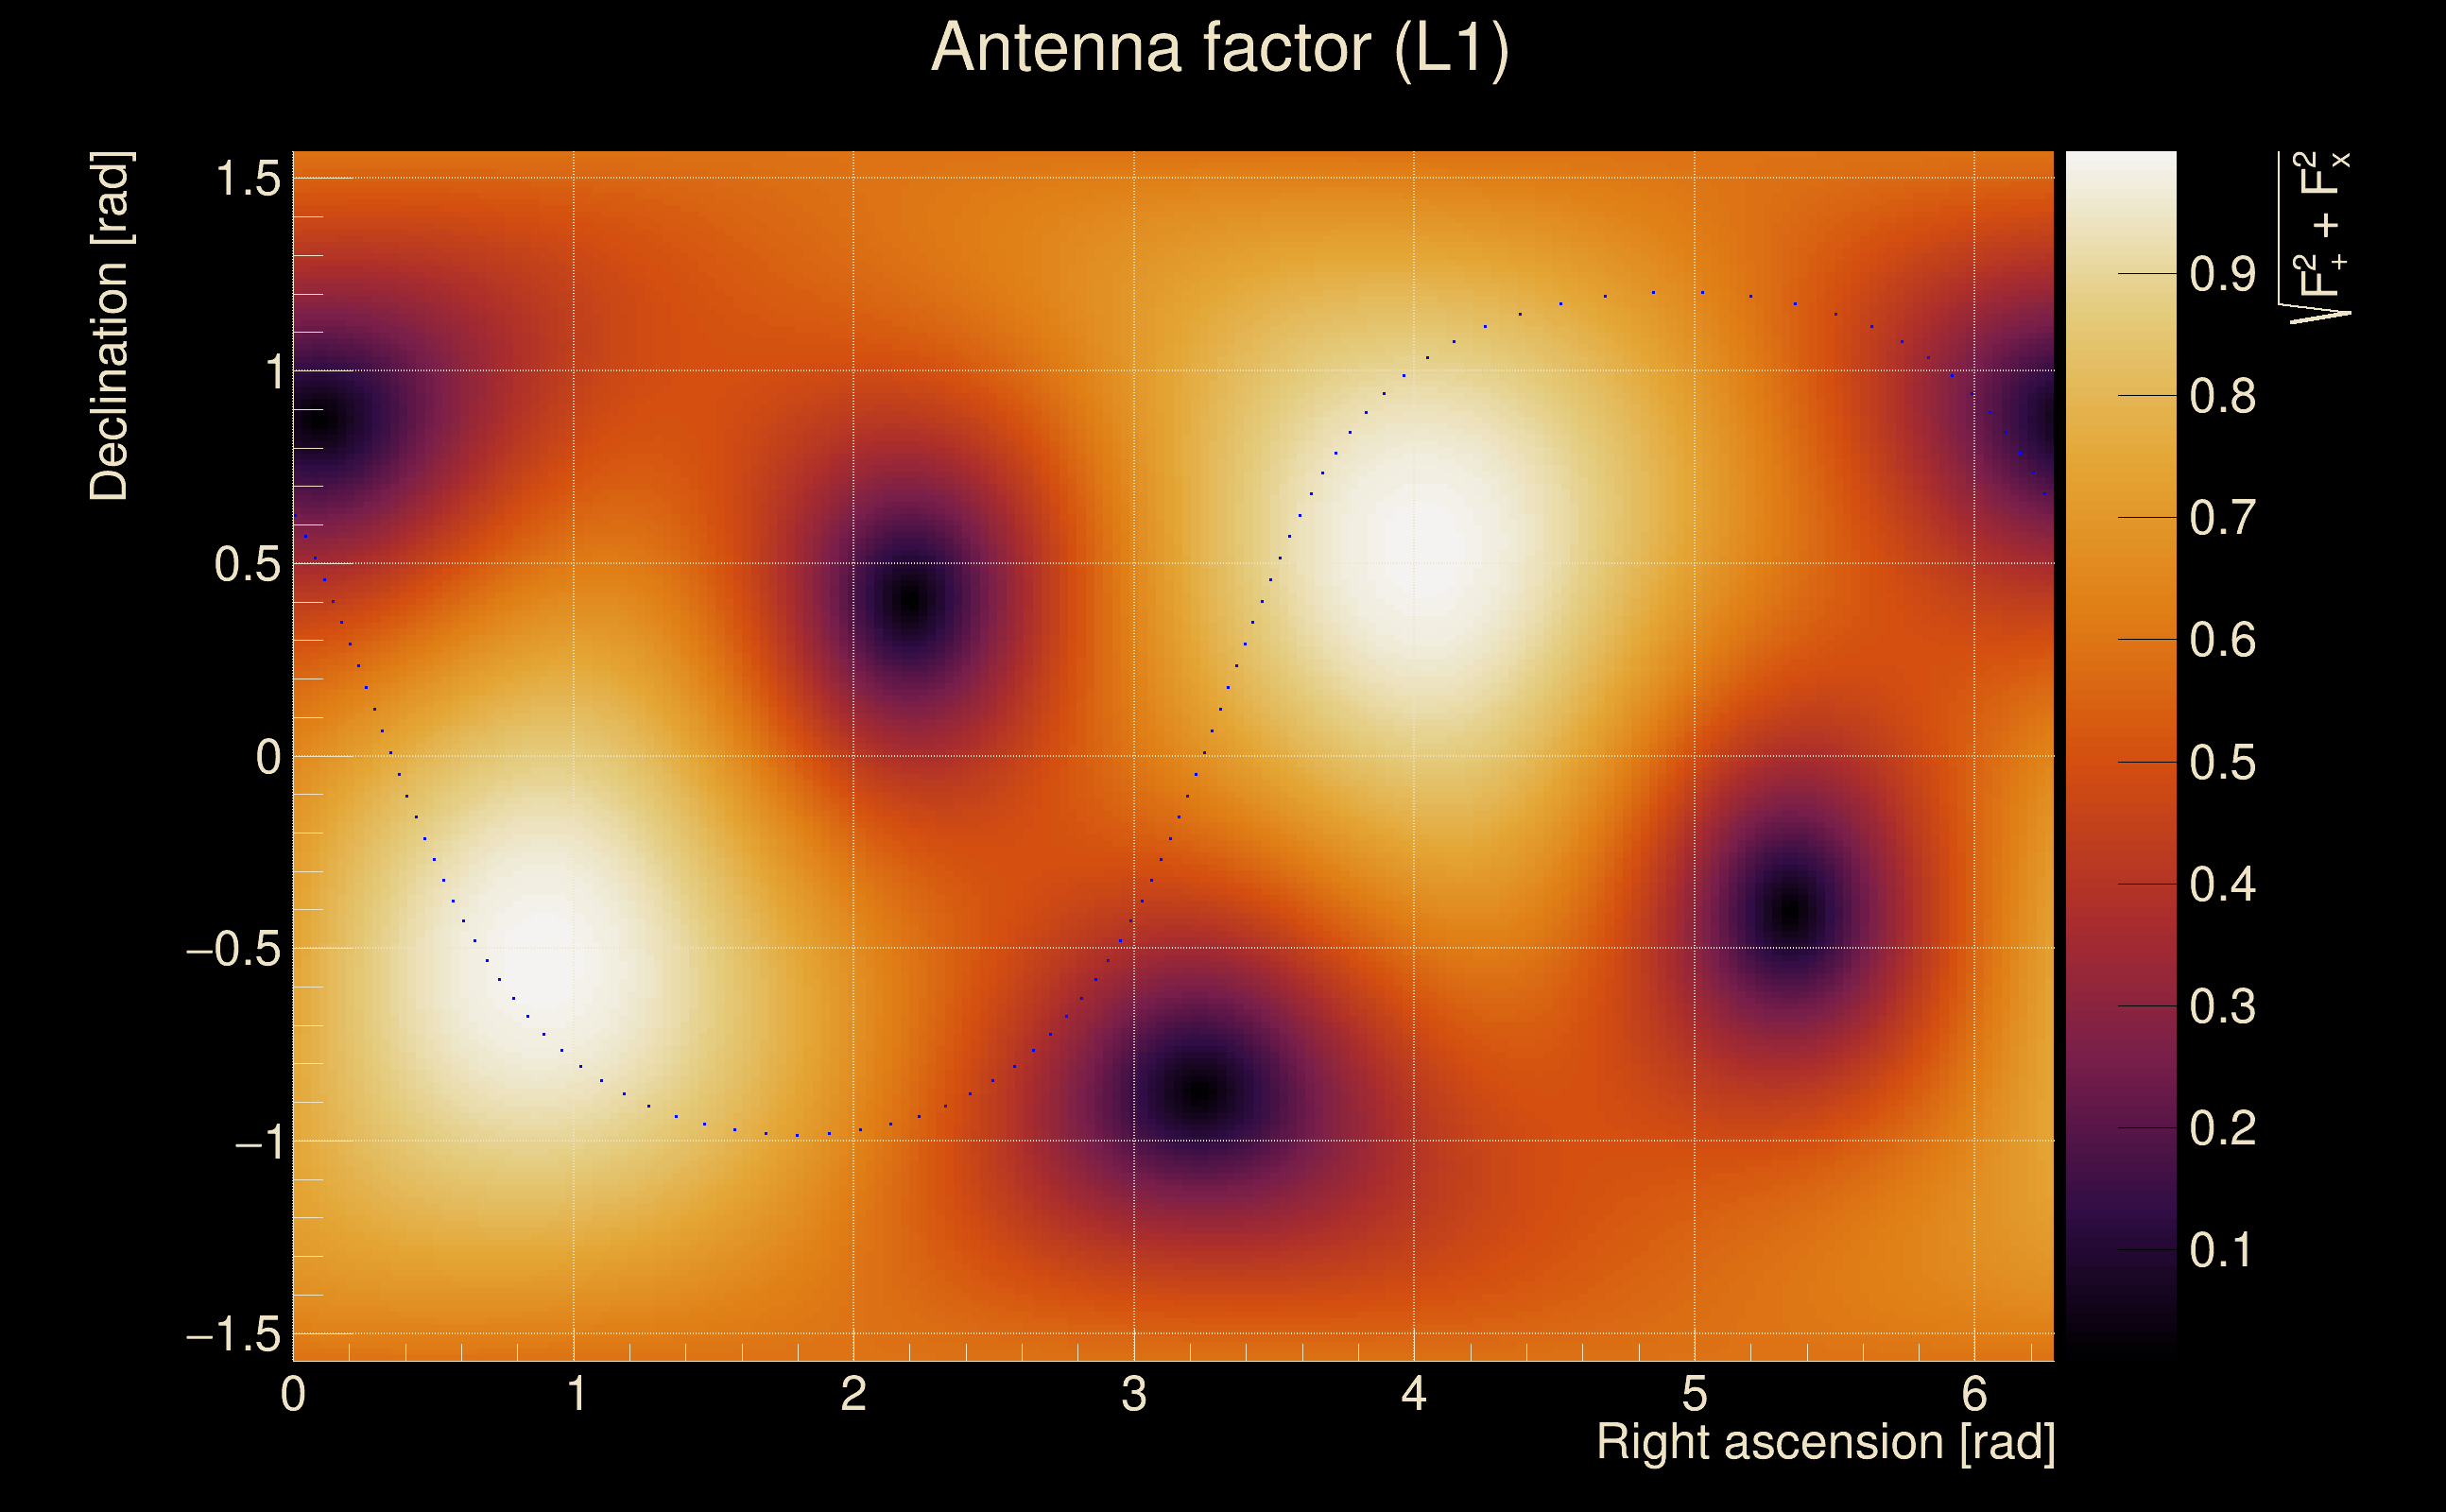
| Target sky positon: | Ra: 3.68109, Dec: 0.94792 [rad] |
| List of input Ox files: | TargIxfw_injpt1_file_list.txt (71 files) |
| Analysis result file: | TargIxfw_injpt1_results-0.root |
| Slice selected for the the fakeground: | slice index=161 (-2.438 s), time lag = 0 s |
| Foreground | Fakeground | Background | ||
|---|---|---|---|---|
| Number of processed ox events | 12111 | 12111 | 2603865 | |
| Start Date (detector 0) | Mon May 15 14:13:25 2023 UTC | Mon May 15 14:13:25 2023 UTC | Mon May 15 14:13:25 2023 UTC | |
| End Date (detector 0) | Thu May 18 15:54:40 2023 UTC | Thu May 18 15:54:40 2023 UTC | Thu May 18 15:54:40 2023 UTC | |
| Start GPS (detector 0) | 1368195223 | 1368195223 | 1368195223 | |
| End GPS (detector 0) | 1368460498 | 1368460498 | 1368460498 | |
| Used livetime (detector 0) | 60875 s | 60875 s | 60875 s | |
| Start Date (detector 1) | Mon May 15 14:13:25 2023 UTC | Mon May 15 14:13:25 2023 UTC | Mon May 15 14:13:25 2023 UTC | |
| End Date (detector 1) | Thu May 18 15:54:40 2023 UTC | Thu May 18 15:54:40 2023 UTC | Thu May 18 15:54:40 2023 UTC | |
| Start GPS (detector 1) | 1368195223 | 1368195223 | 1368195223 | |
| End GPS (detector 1) | 1368460498 | 1368460498 | 1368460498 | |
| Used livetime (detector 1) | 60875 s | 60875 s | 60875 s | |
| Cumulative livetime | 121110 s | 121110 s | 26038650 s | |
| 0 years, 1 days, 9 hours, 38 min, 30 s | 0 years, 1 days, 9 hours, 38 min, 30 s | 0 years, 301 days, 8 hours, 57 min, 30 s |
|
|
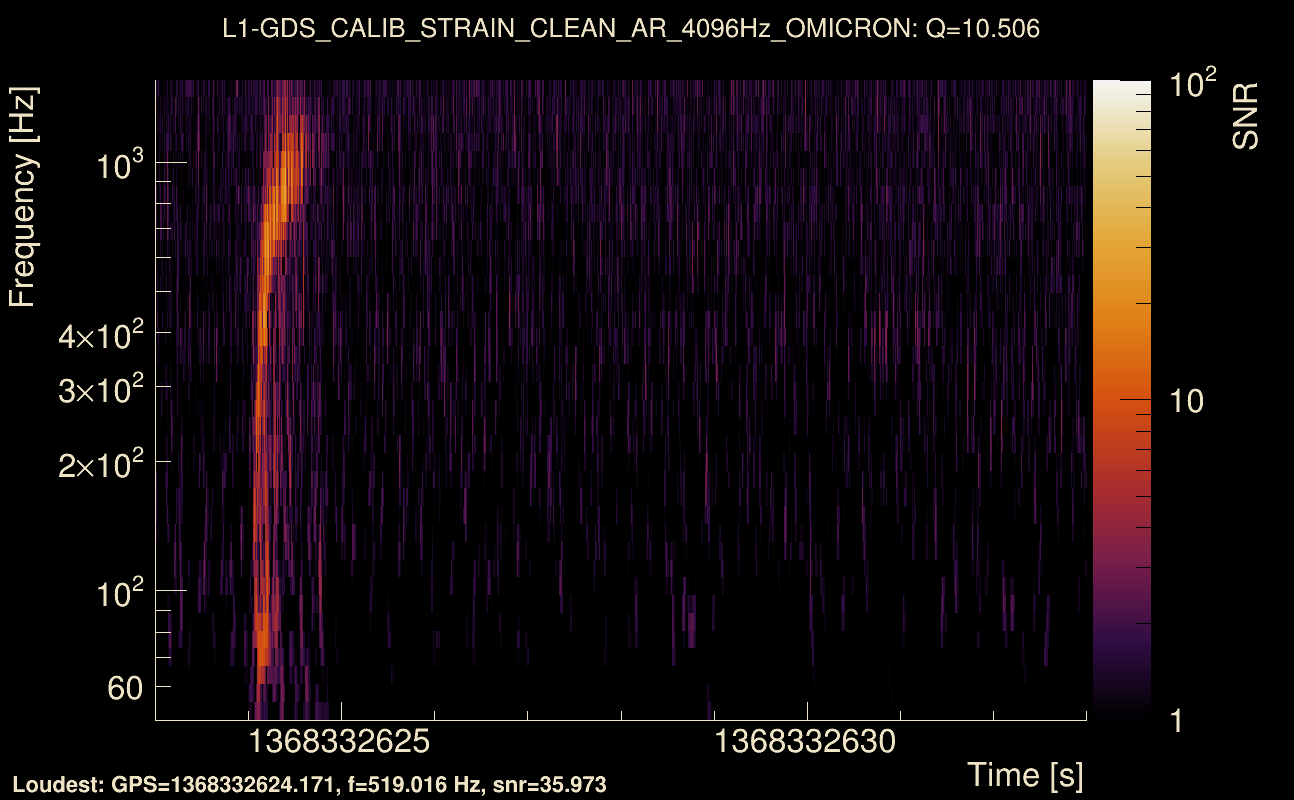
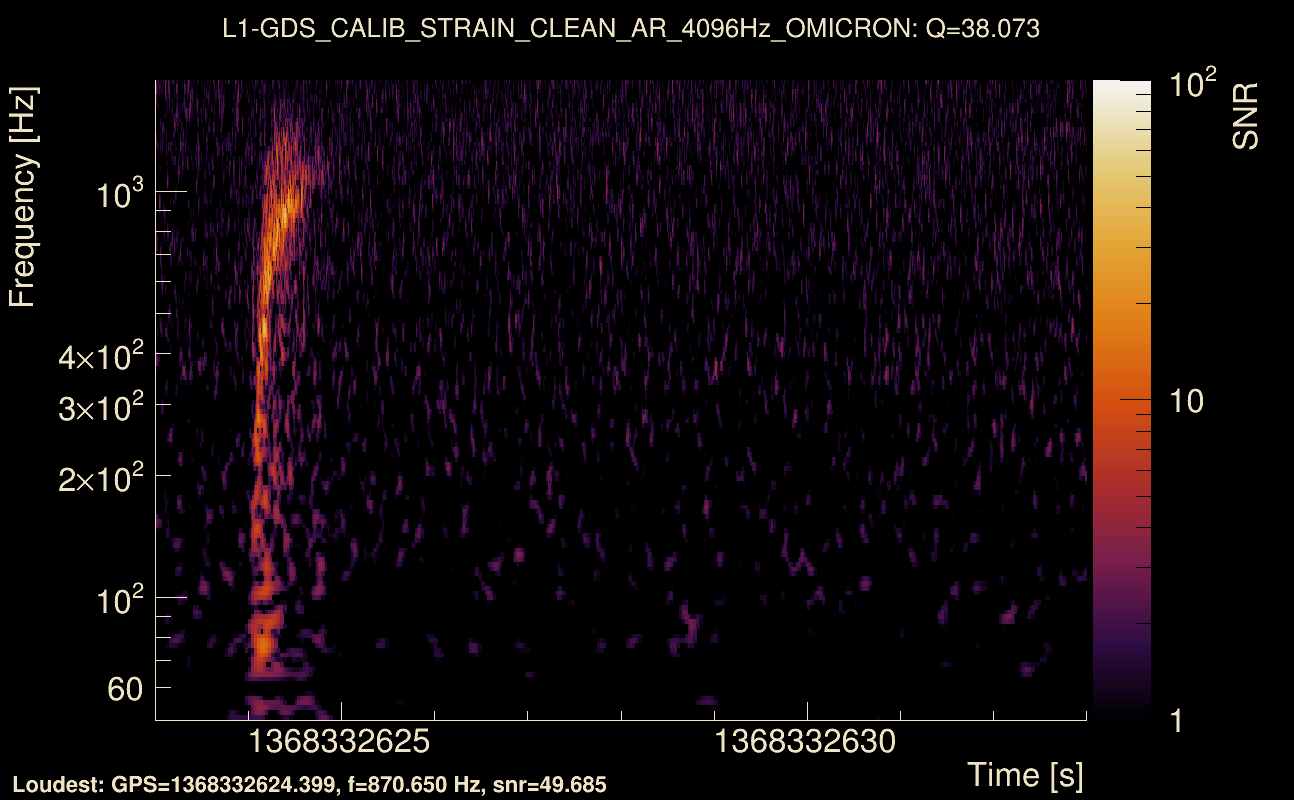
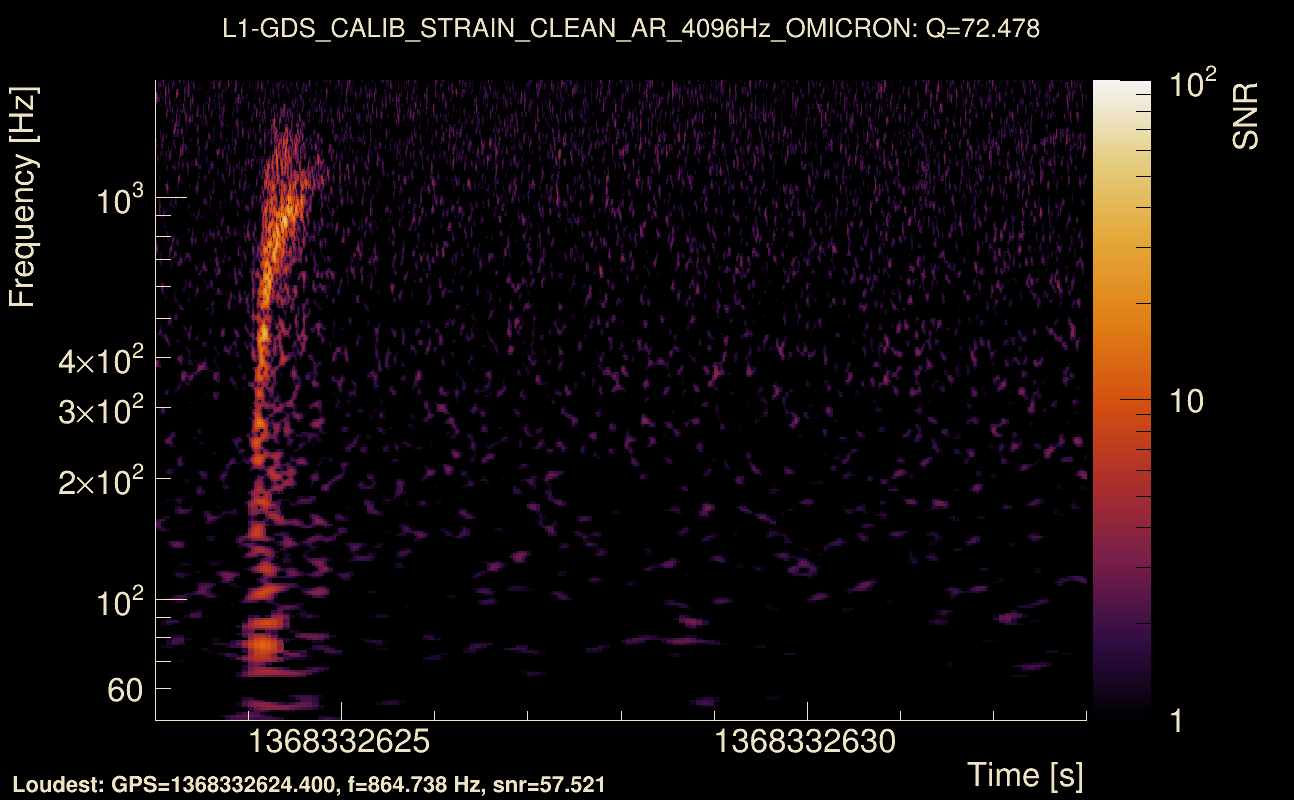
| Event time t(H1): | GPS = 1368332623 (Wed May 17 04:23:25 2023 ) → GPS = 1368332633 (Wed May 17 04:23:35 2023 ) |
| Event time t(L1): | GPS = 1368332623 (Wed May 17 04:23:35 2023 ) → GPS = 1368332633 (Wed May 17 04:23:35 2023 ) |
| Omicron analysis time window (H1): | GPS = 1368332620 → GPS = 1368332636 |
| Omicron analysis time window (L1): | GPS = 1368332620 → GPS = 1368332636 |
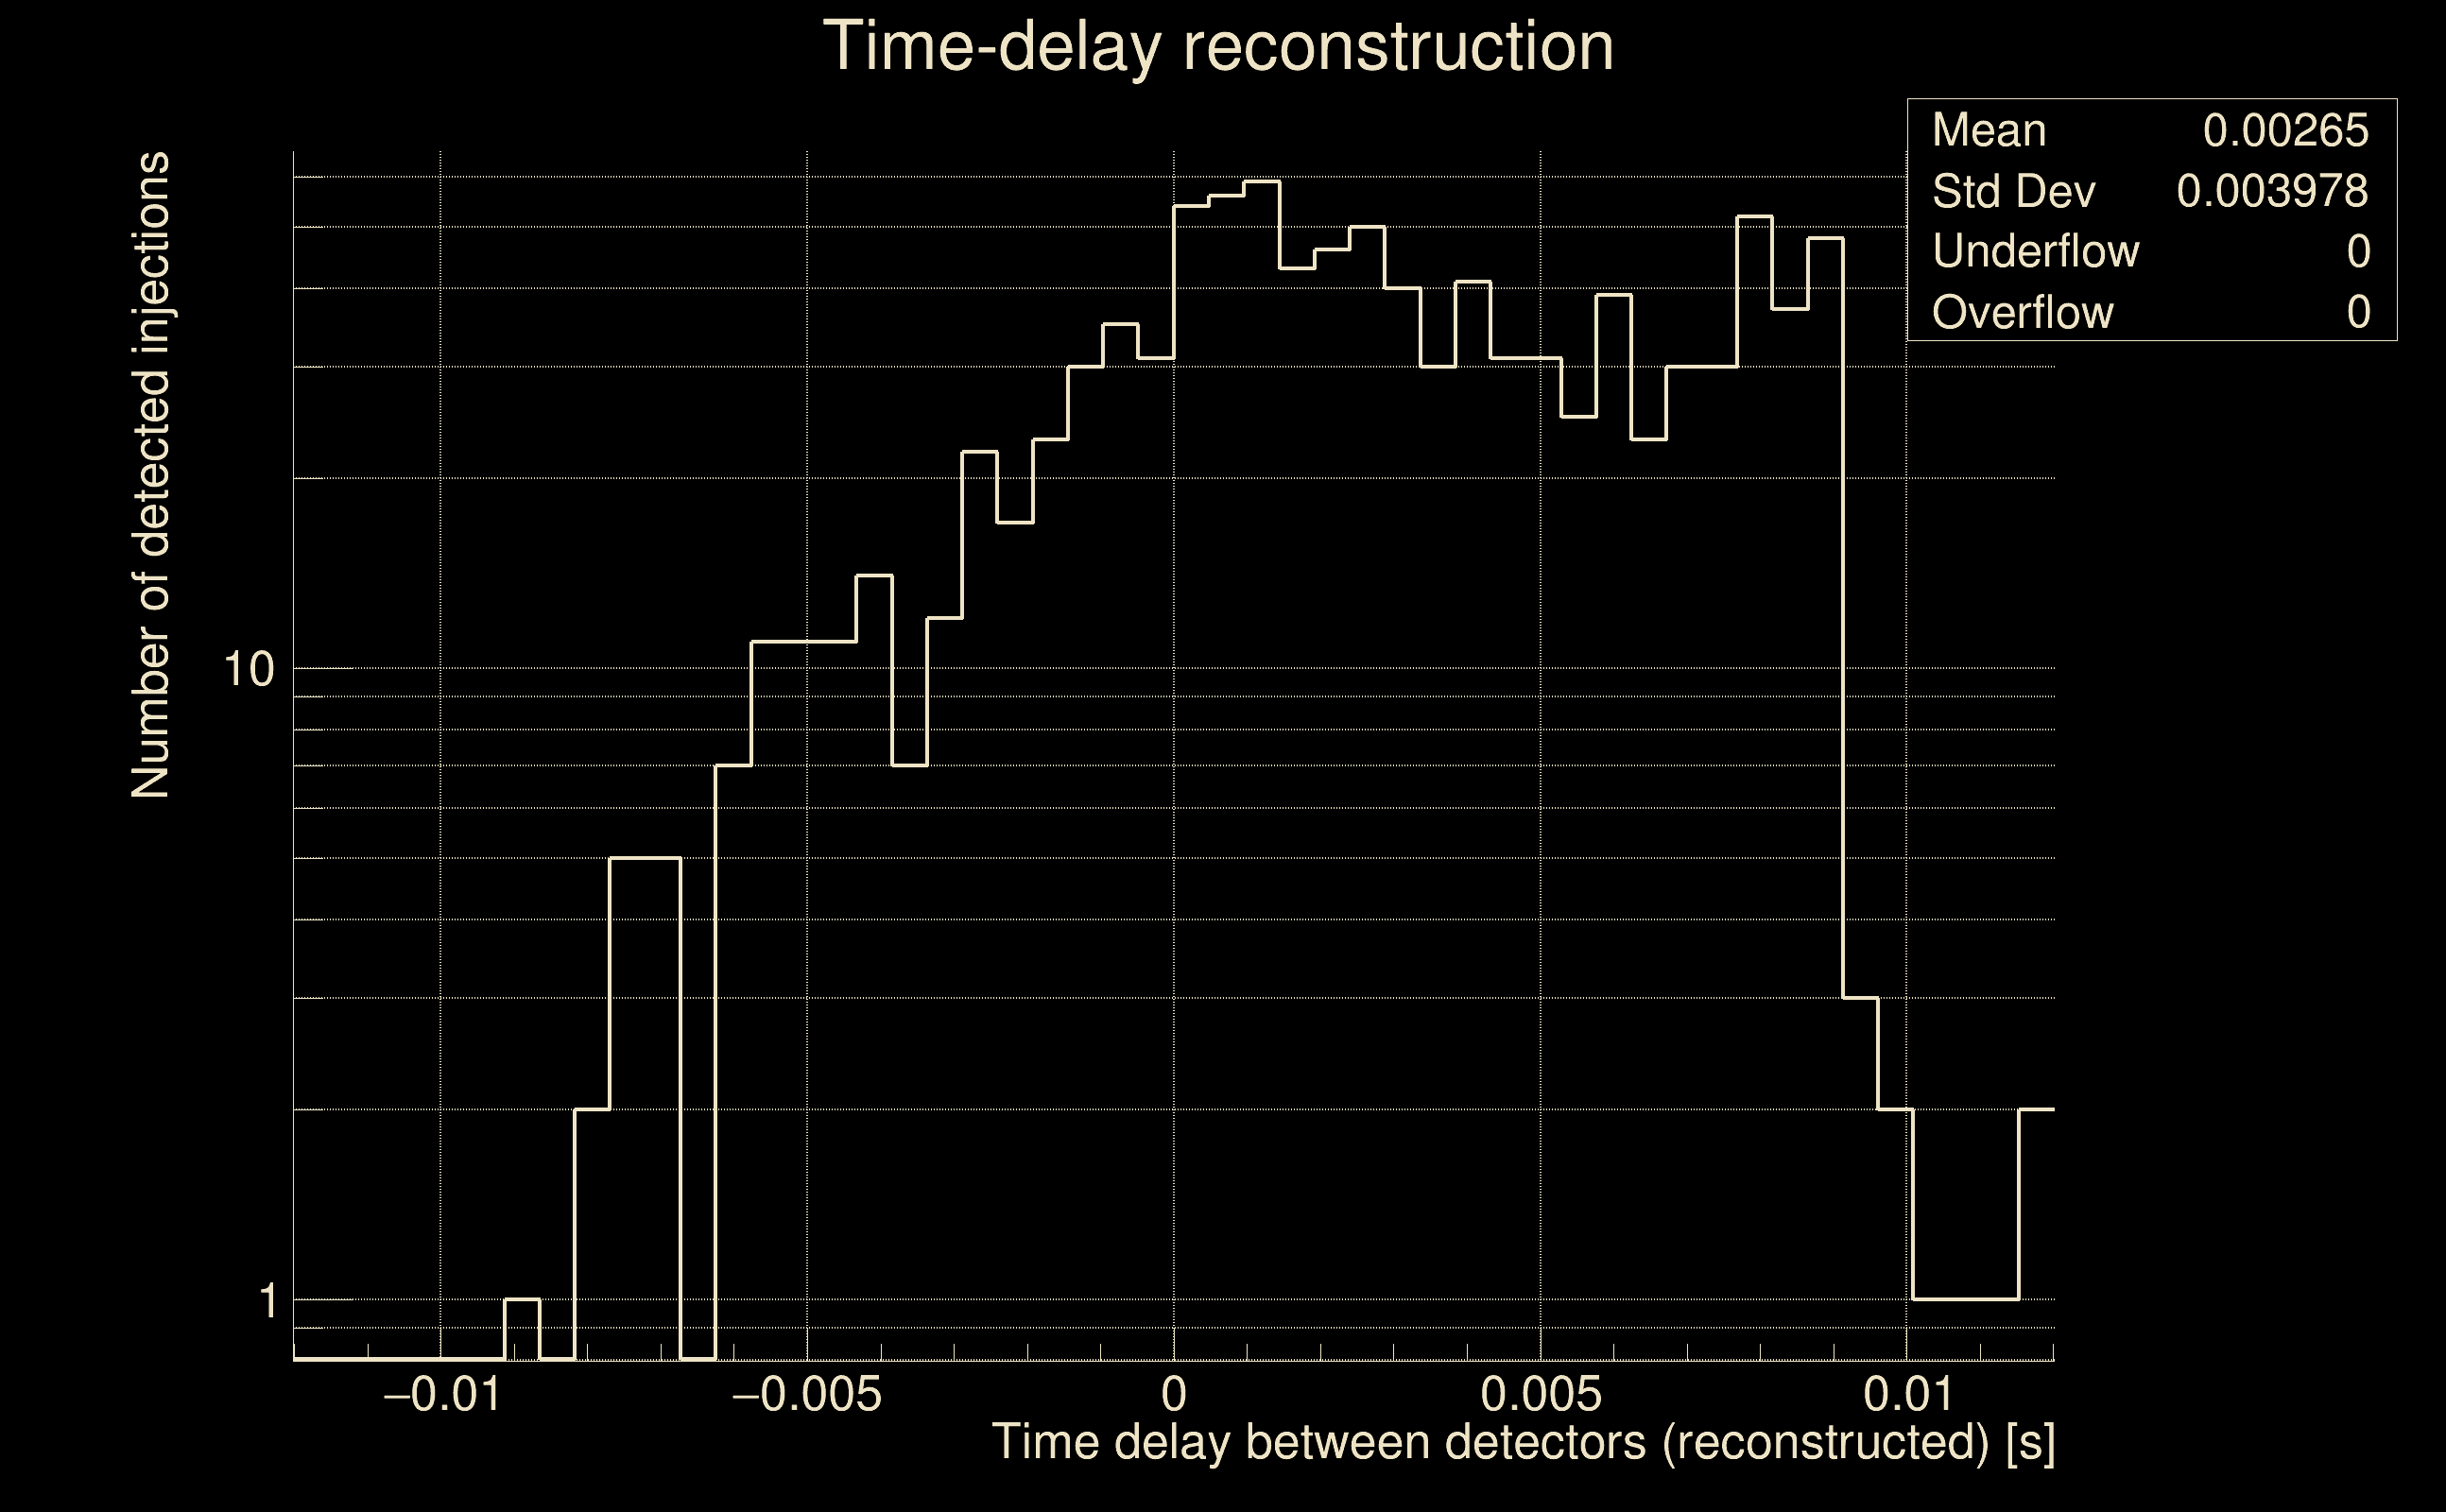
| Time delay between detectors t(L1) - t(H1): | 0.0004653 s (slice index = 108 / 217), δt_gw = 0.0004653 s |
| Time delay standard deviation: | 0.0252795 s |
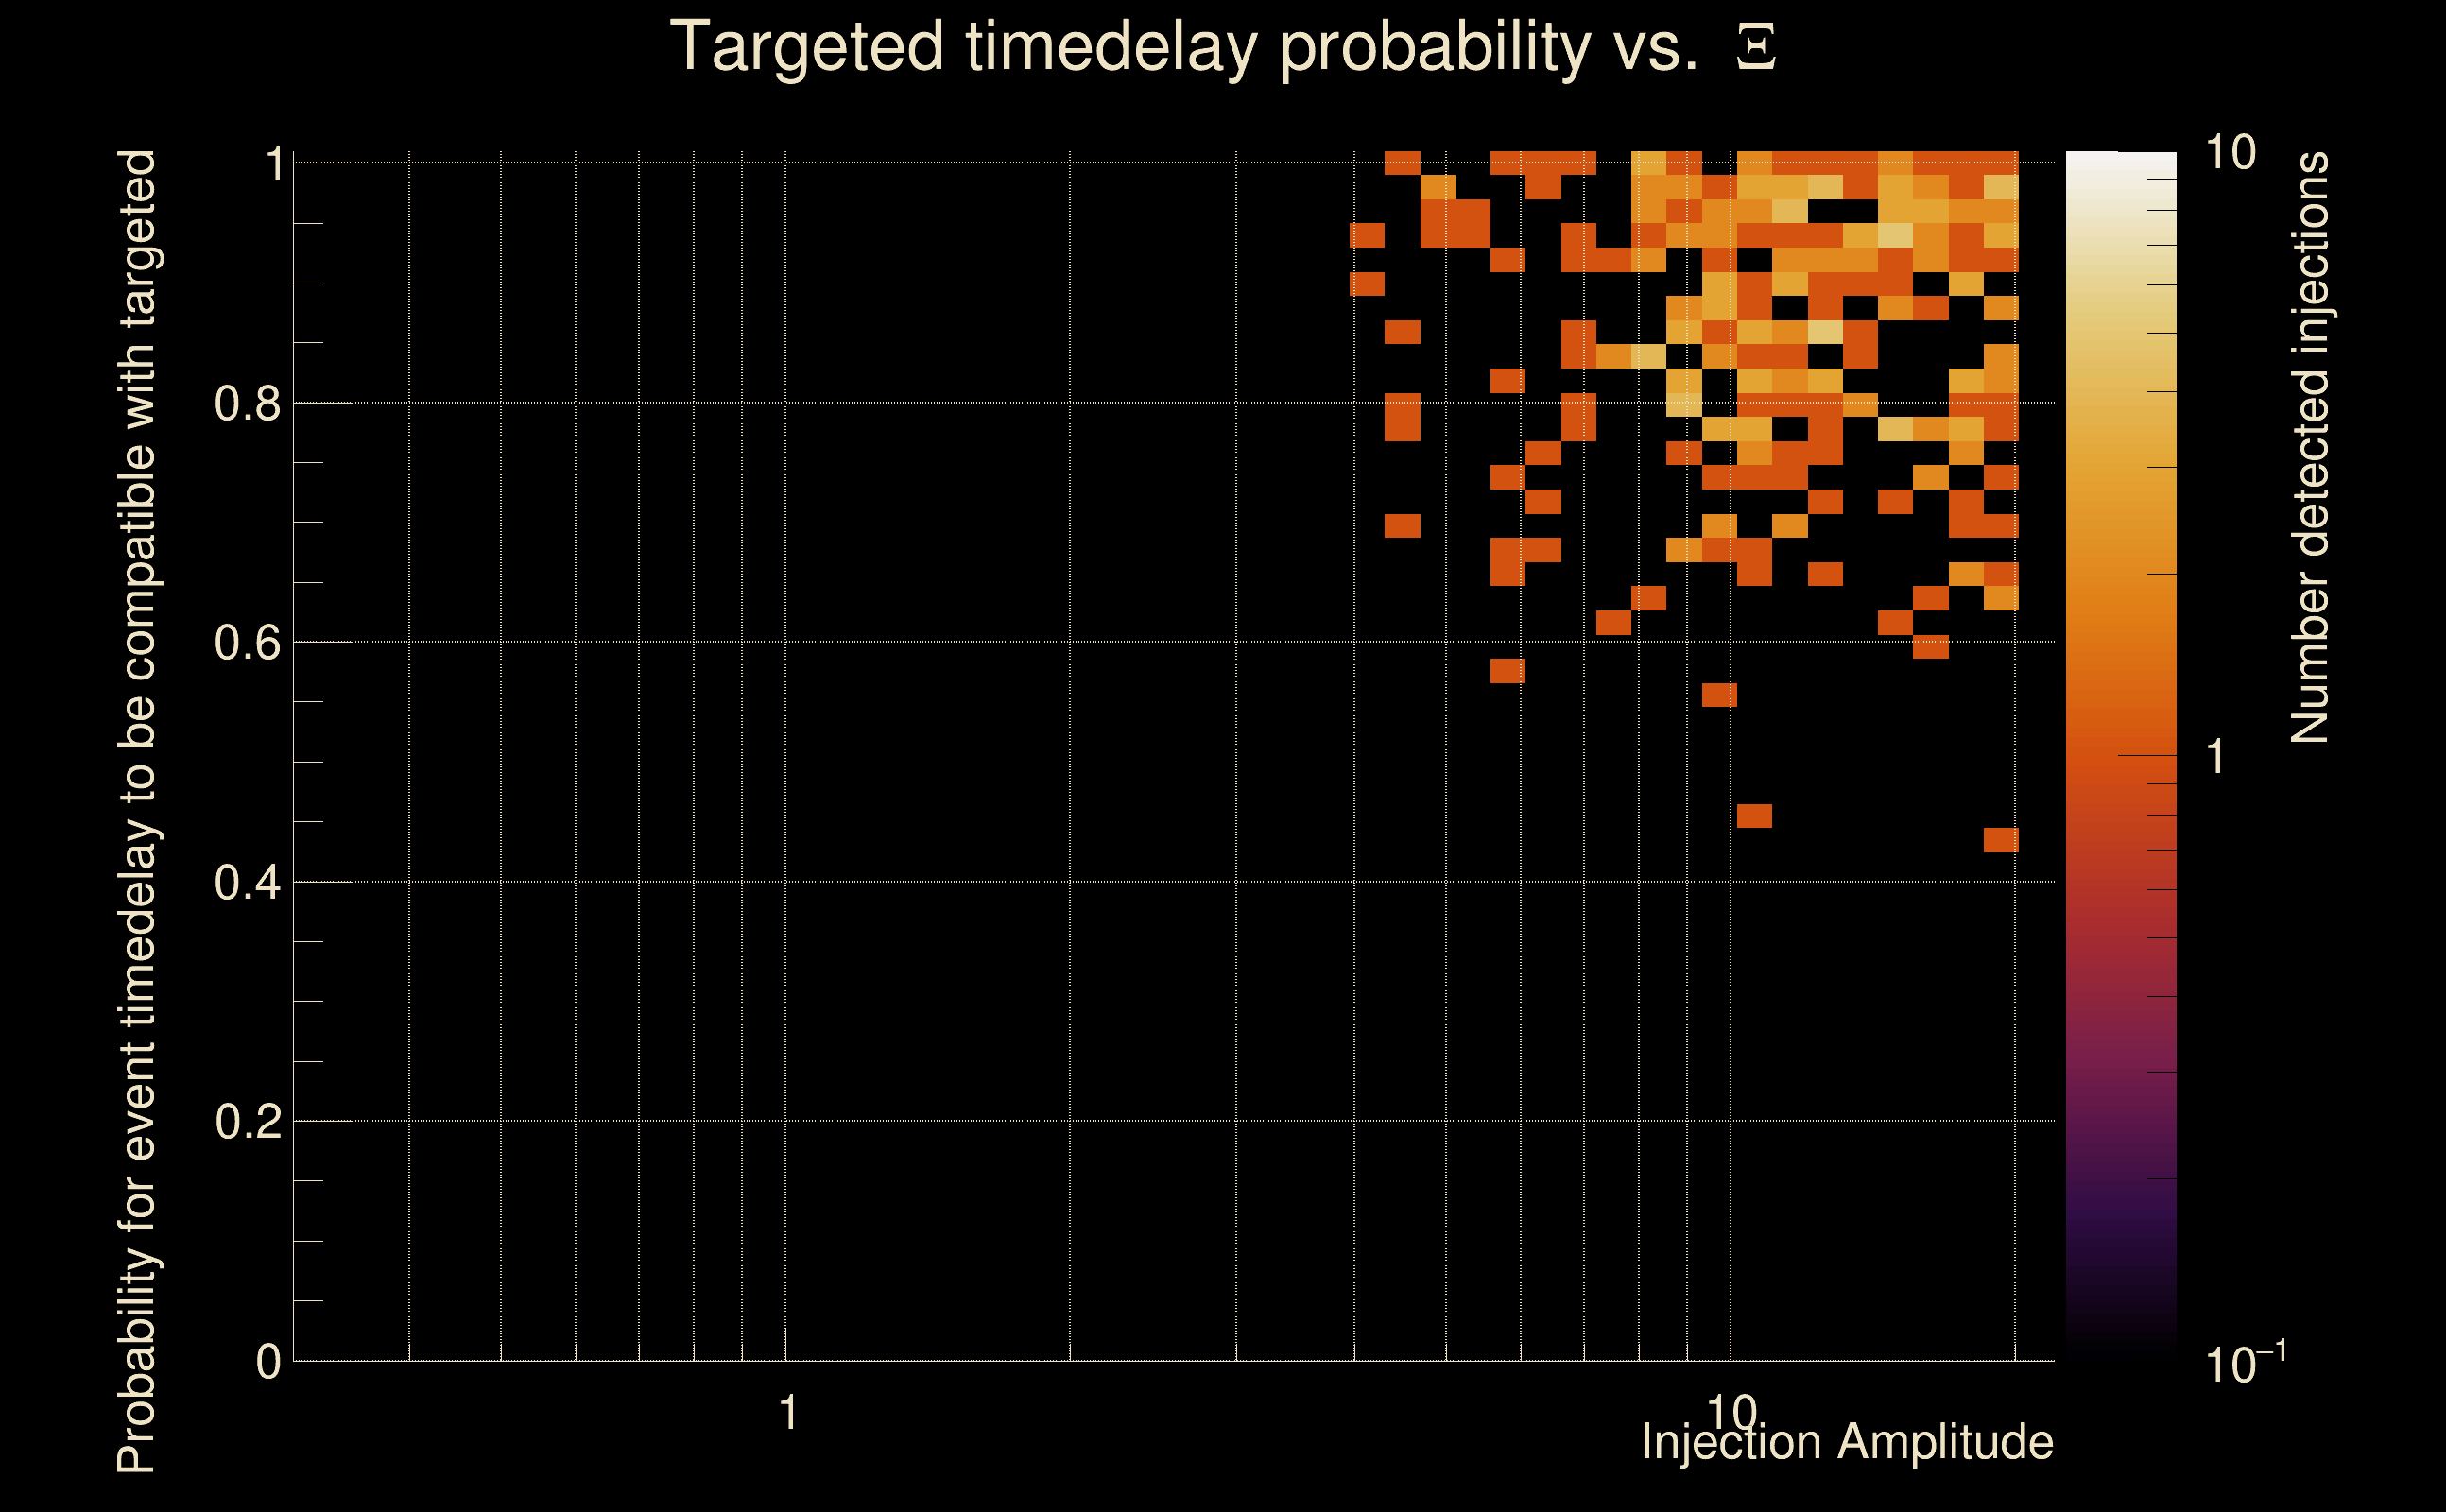
| [targeted mode] Time delay probability: | 0.997139 (0.00358514 sigmas), δt_target = 1.72247e+45 s |
| Frequency: | 294.515 Hz |
| Ξ: | 0.879783 ± 0.0105855 (variance = 0.000112053): Q0: 0.909687, Q1: 0.895697, Q2: 0.889725, Q3: 0.881227, Q4: 0.881341 |
| Rank: | R_A = 0.840153 |
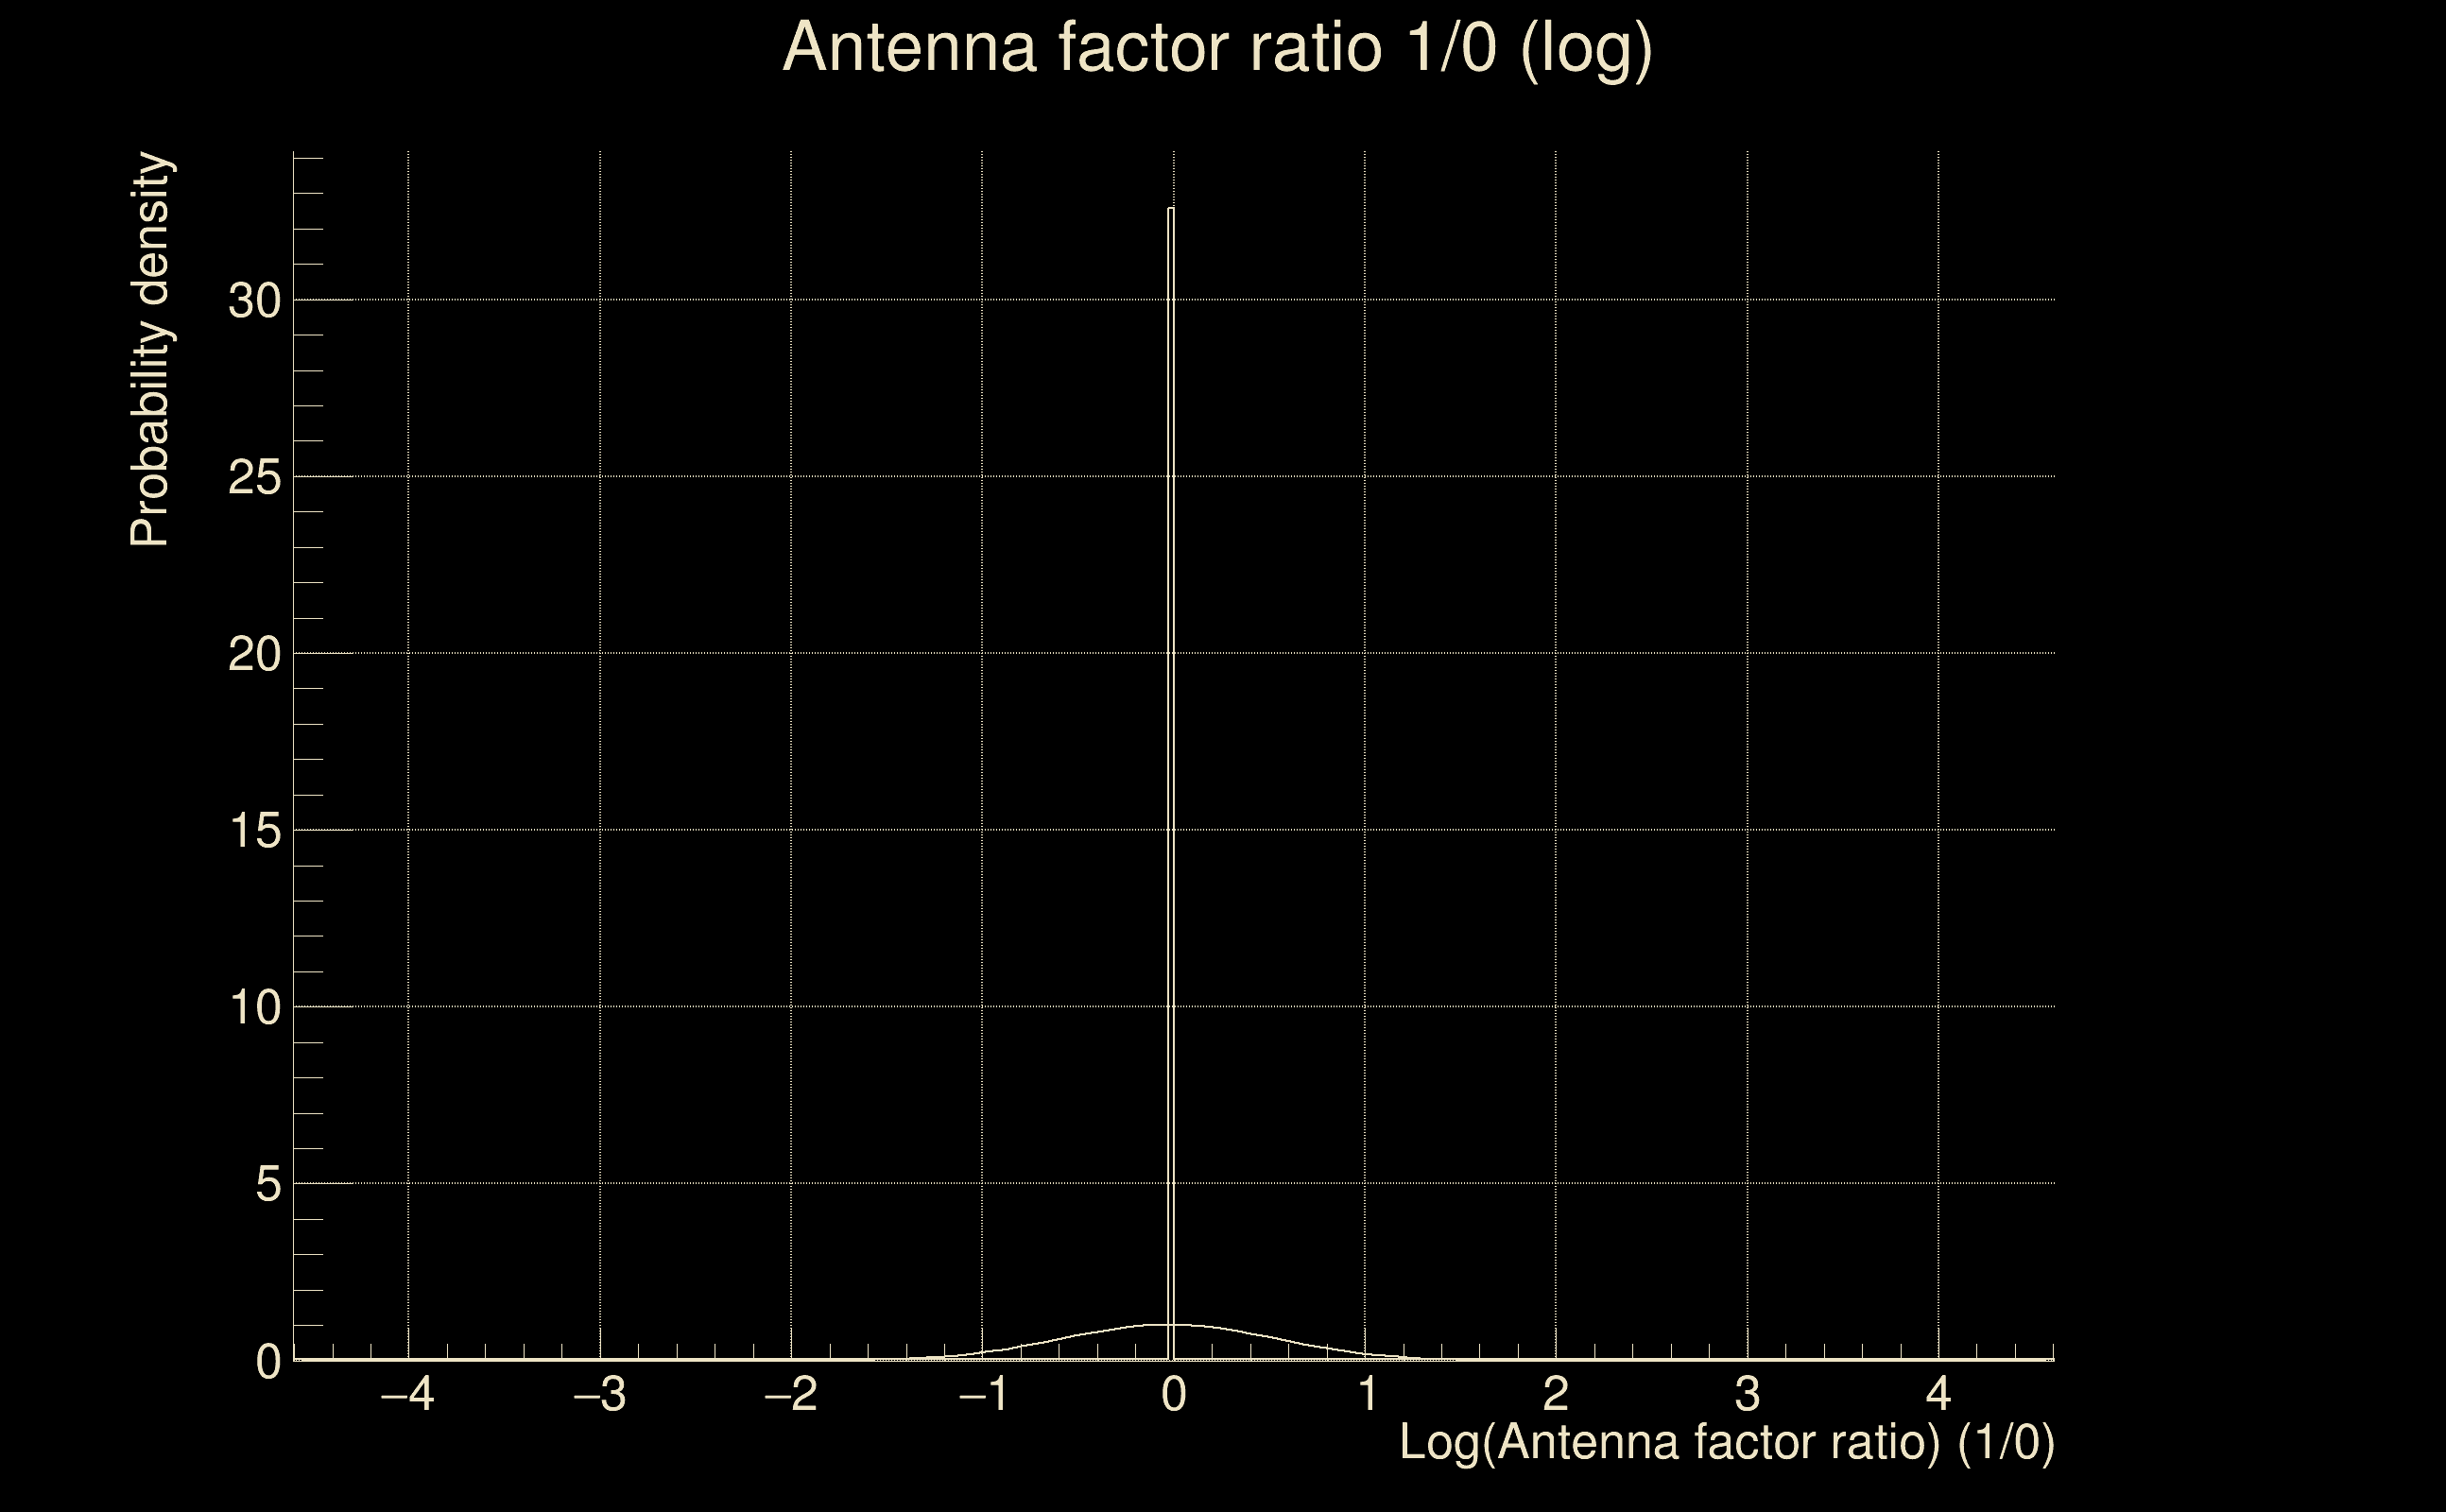
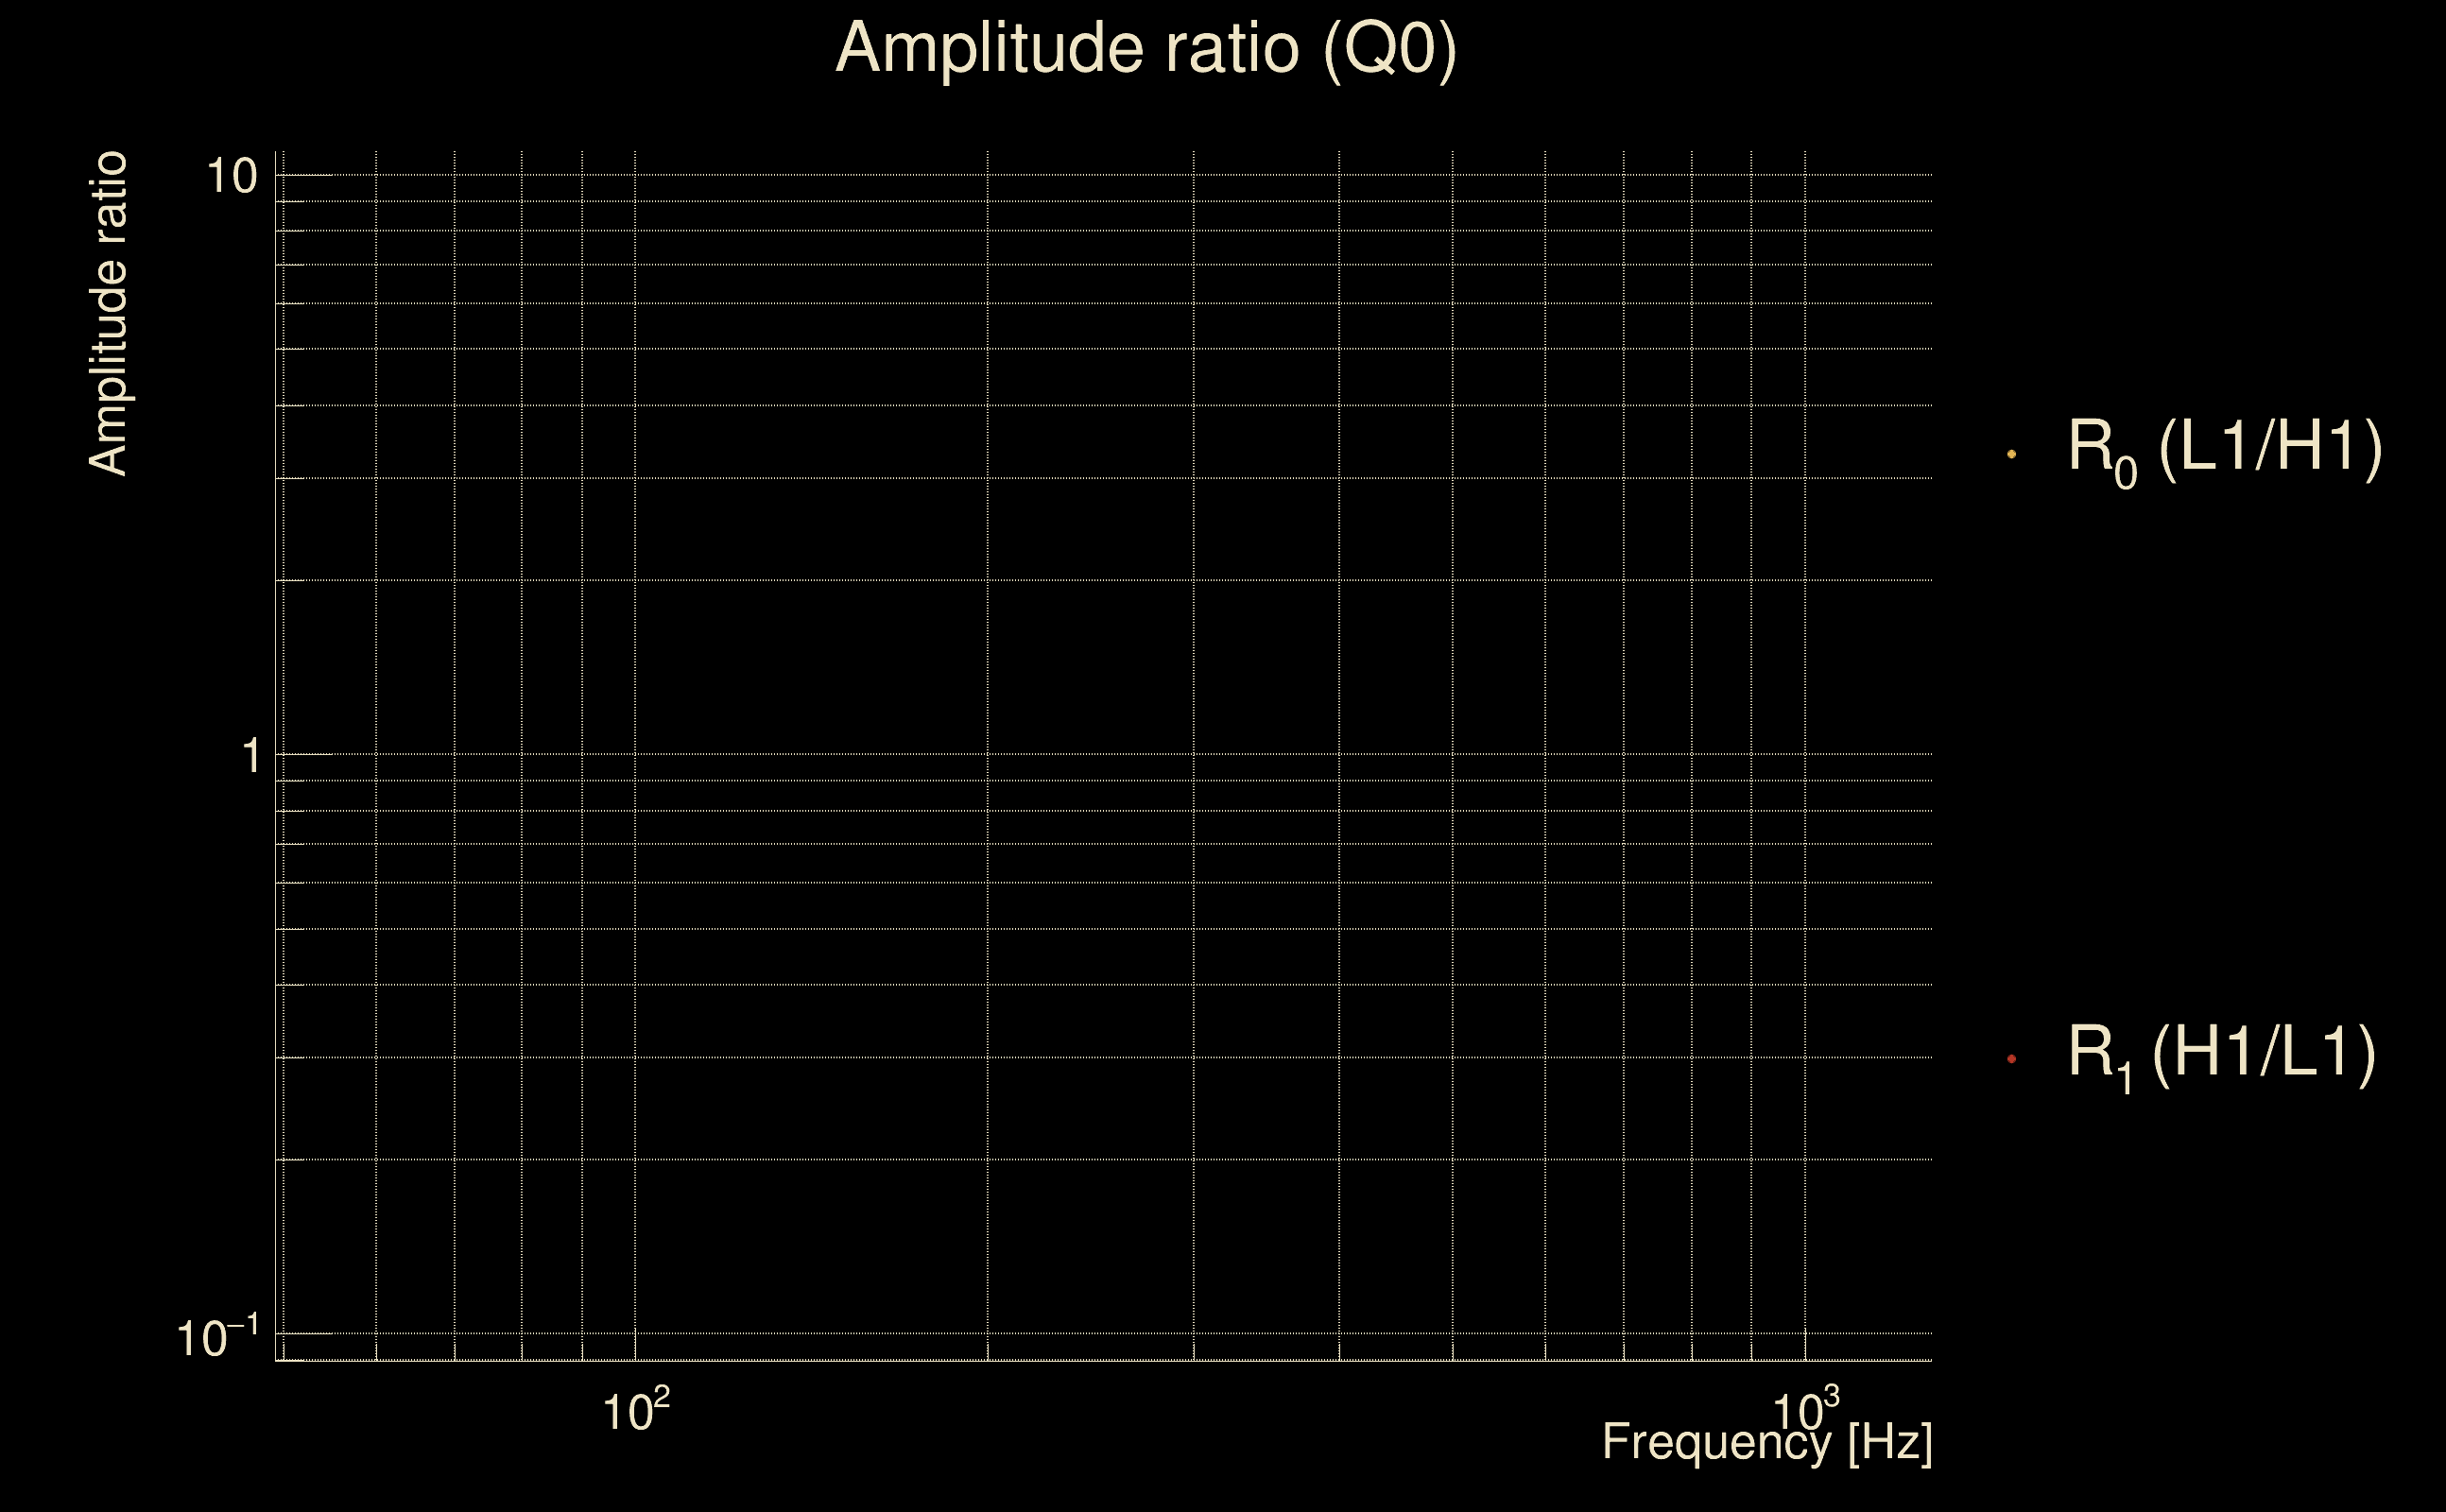
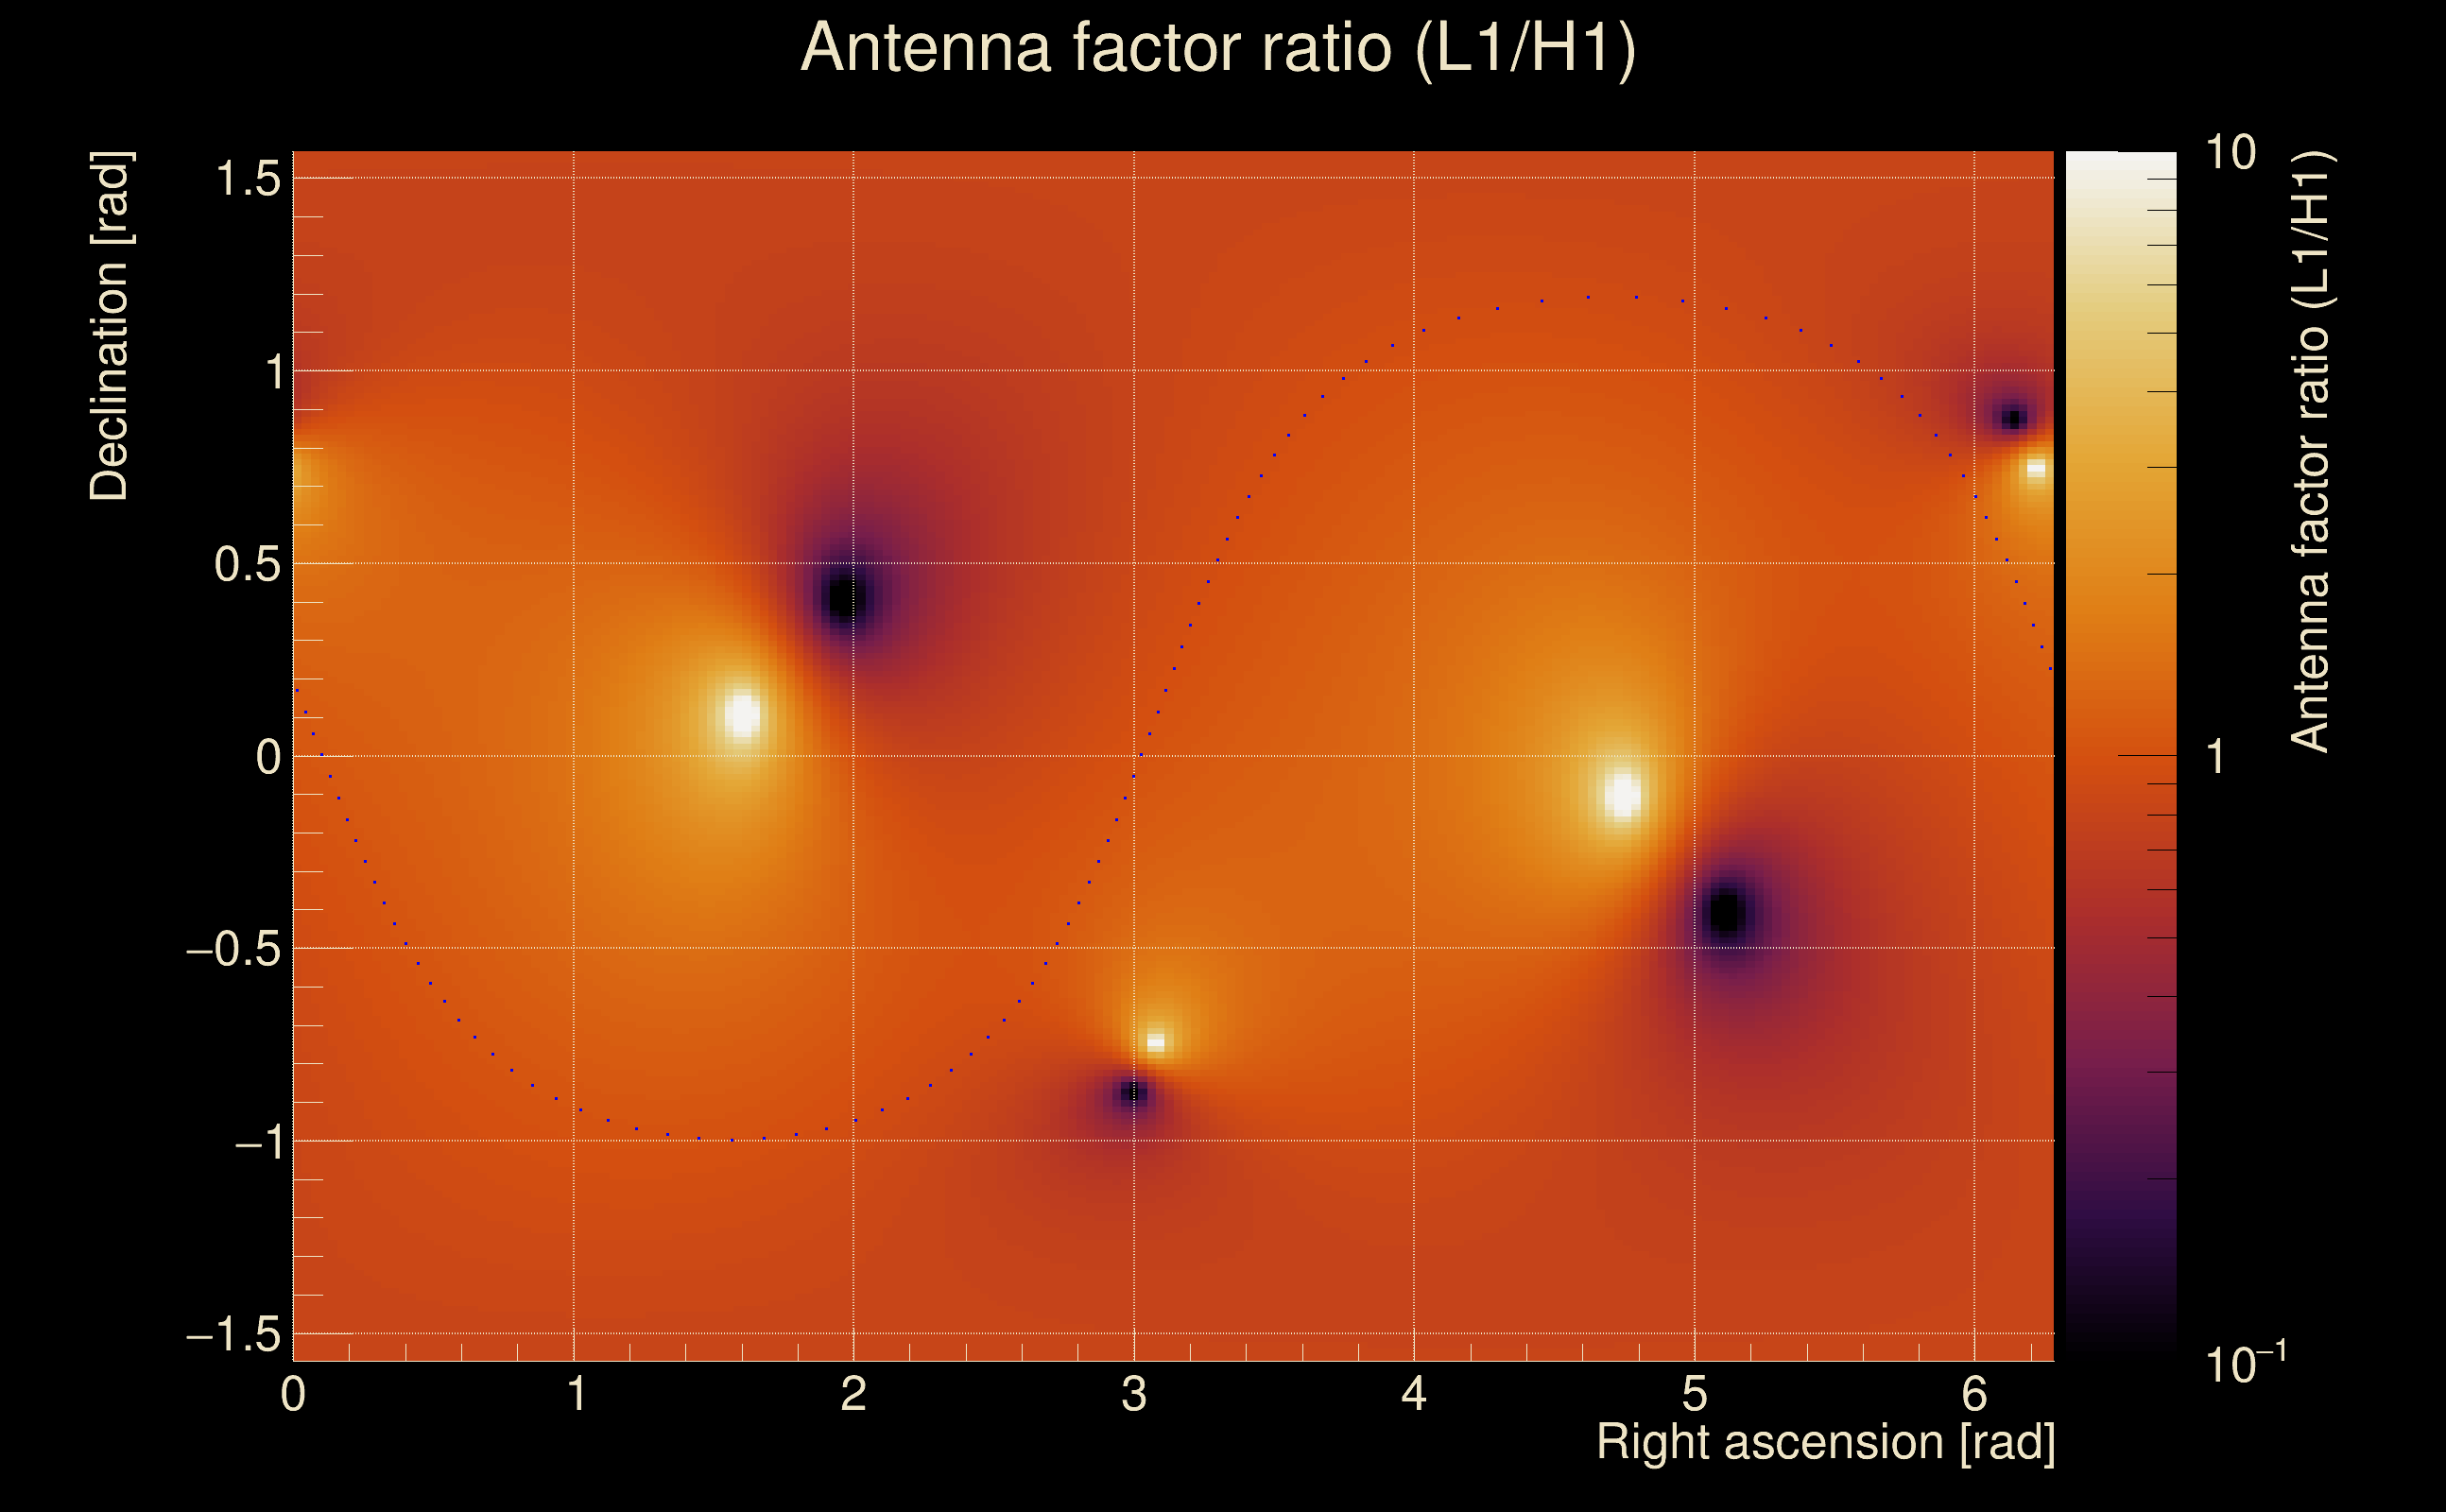
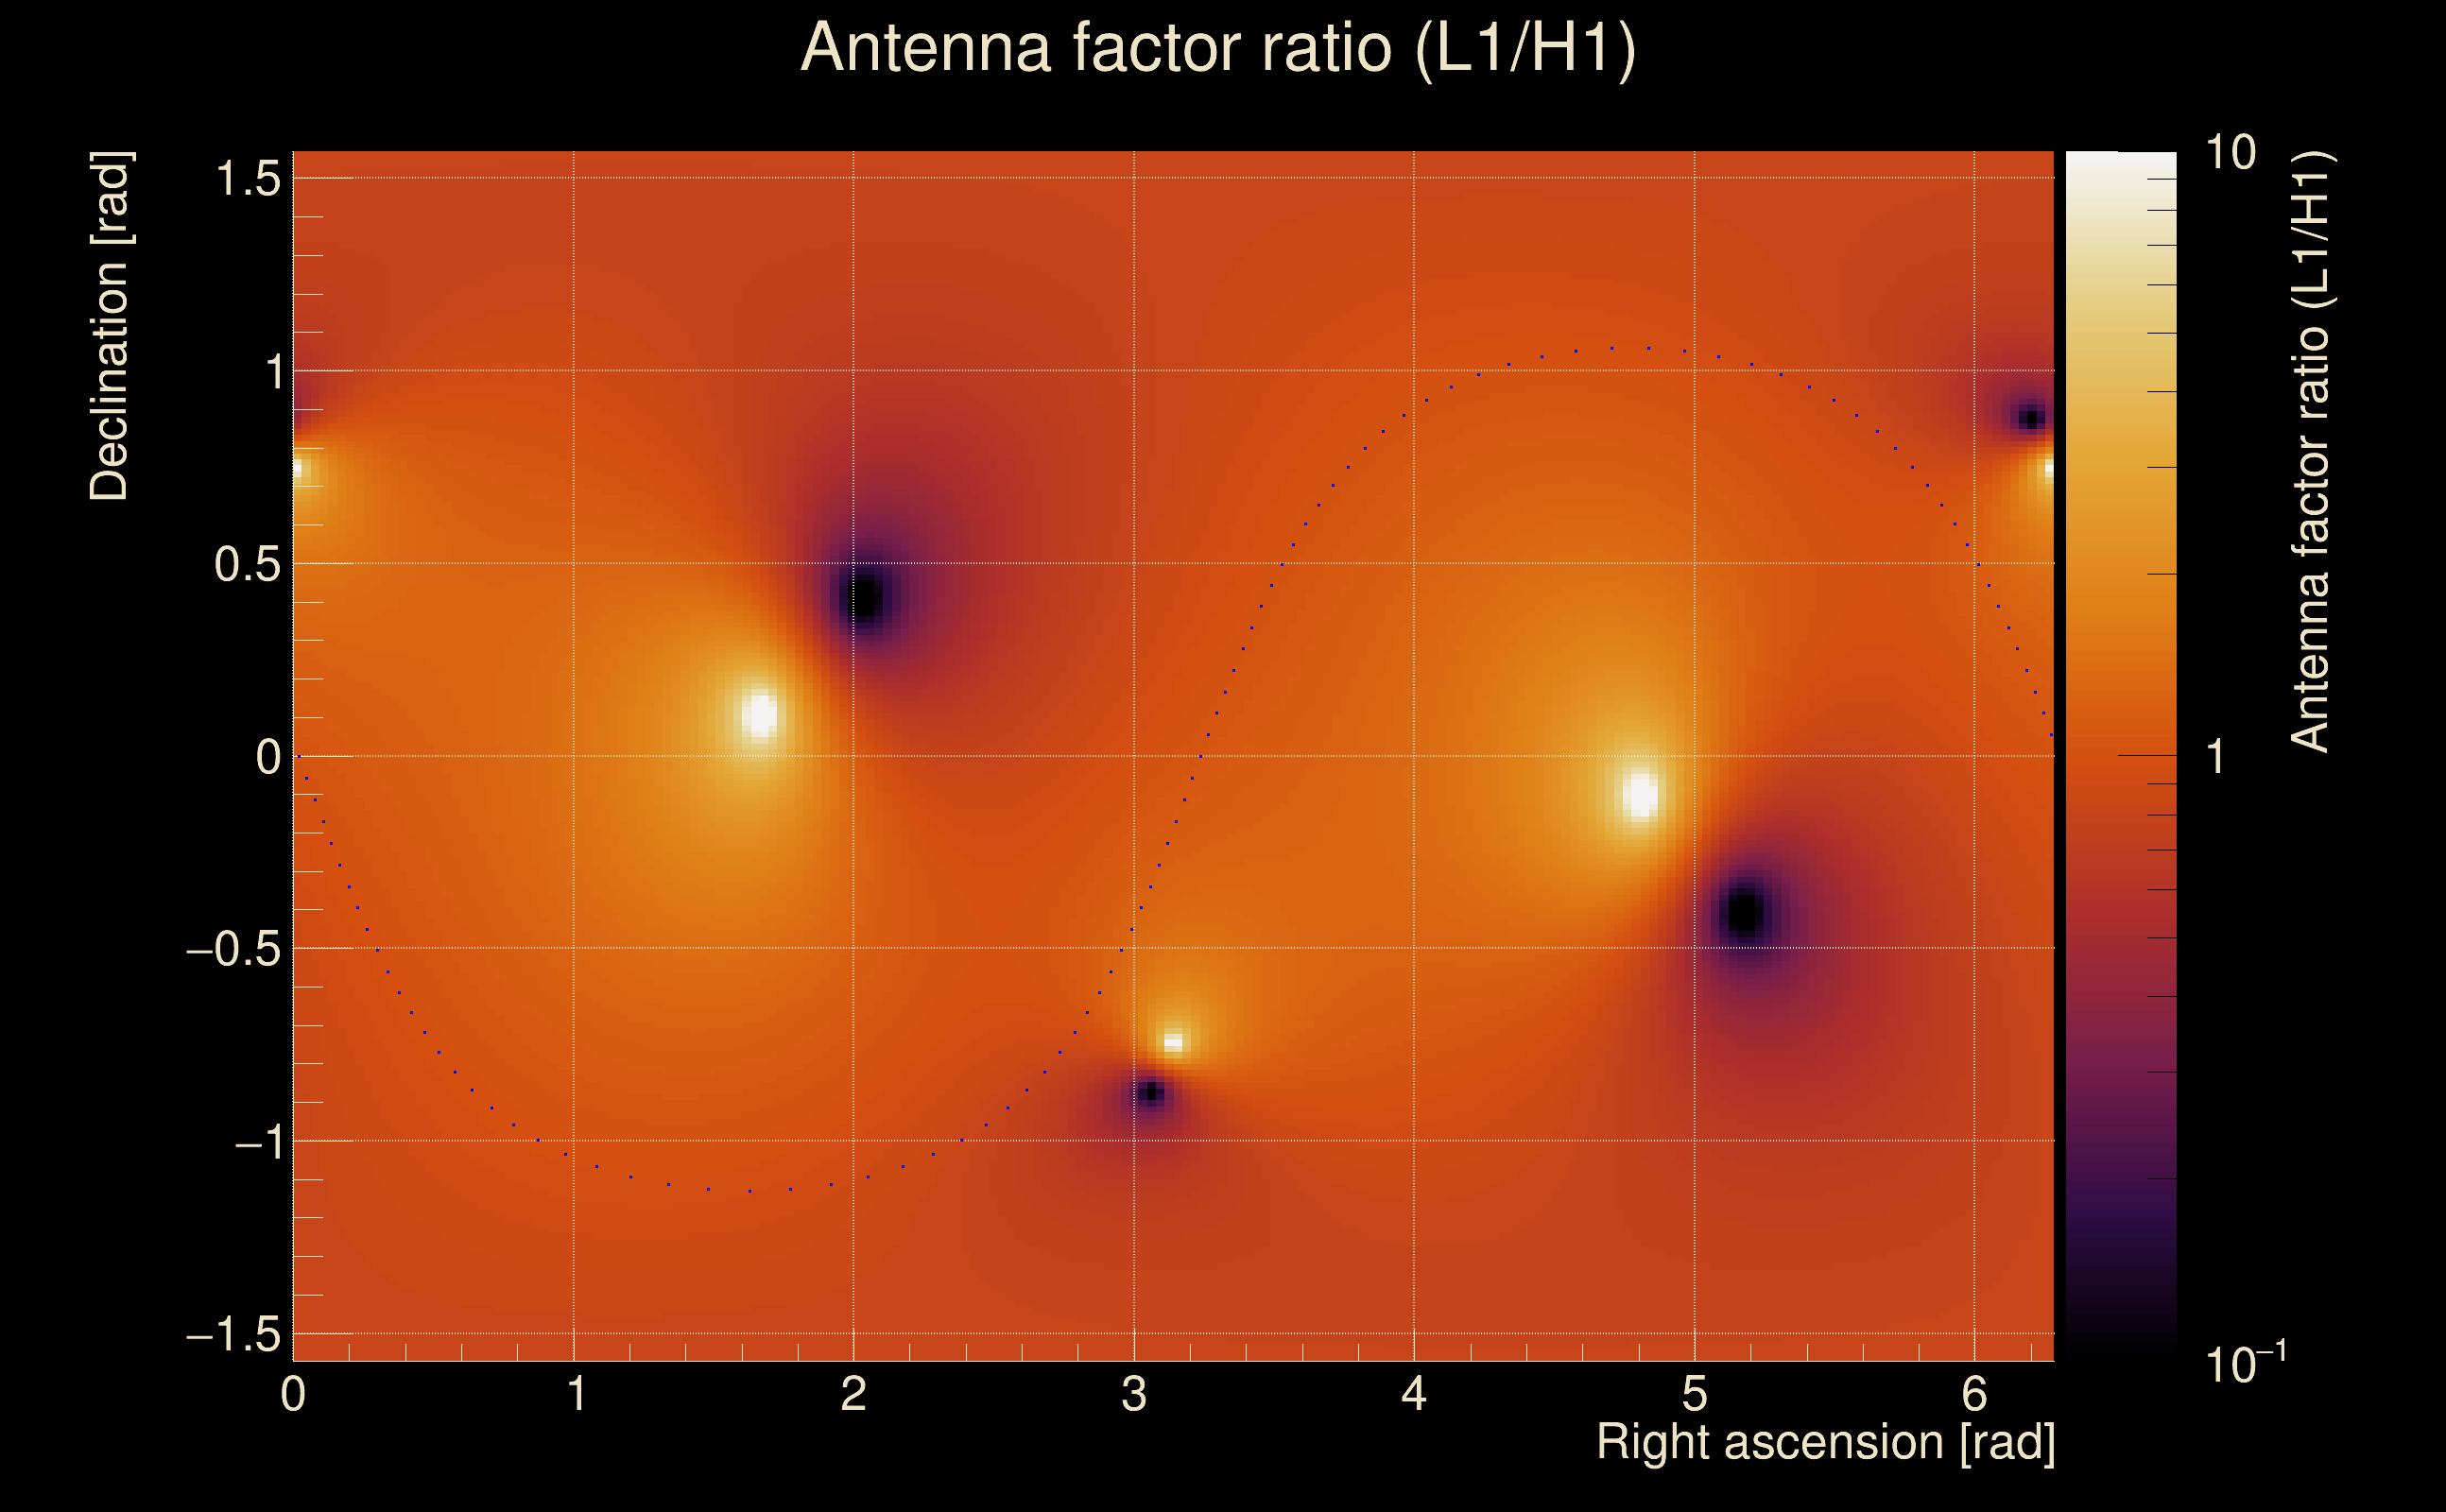
| Log of amplitude ratio (L1/H1): | -0.0241103, variance = 0.15568 (L1/H1: -0.0464861, variance = 0.310434, H1/L1: 0.00526445, variance = 0.308144) |
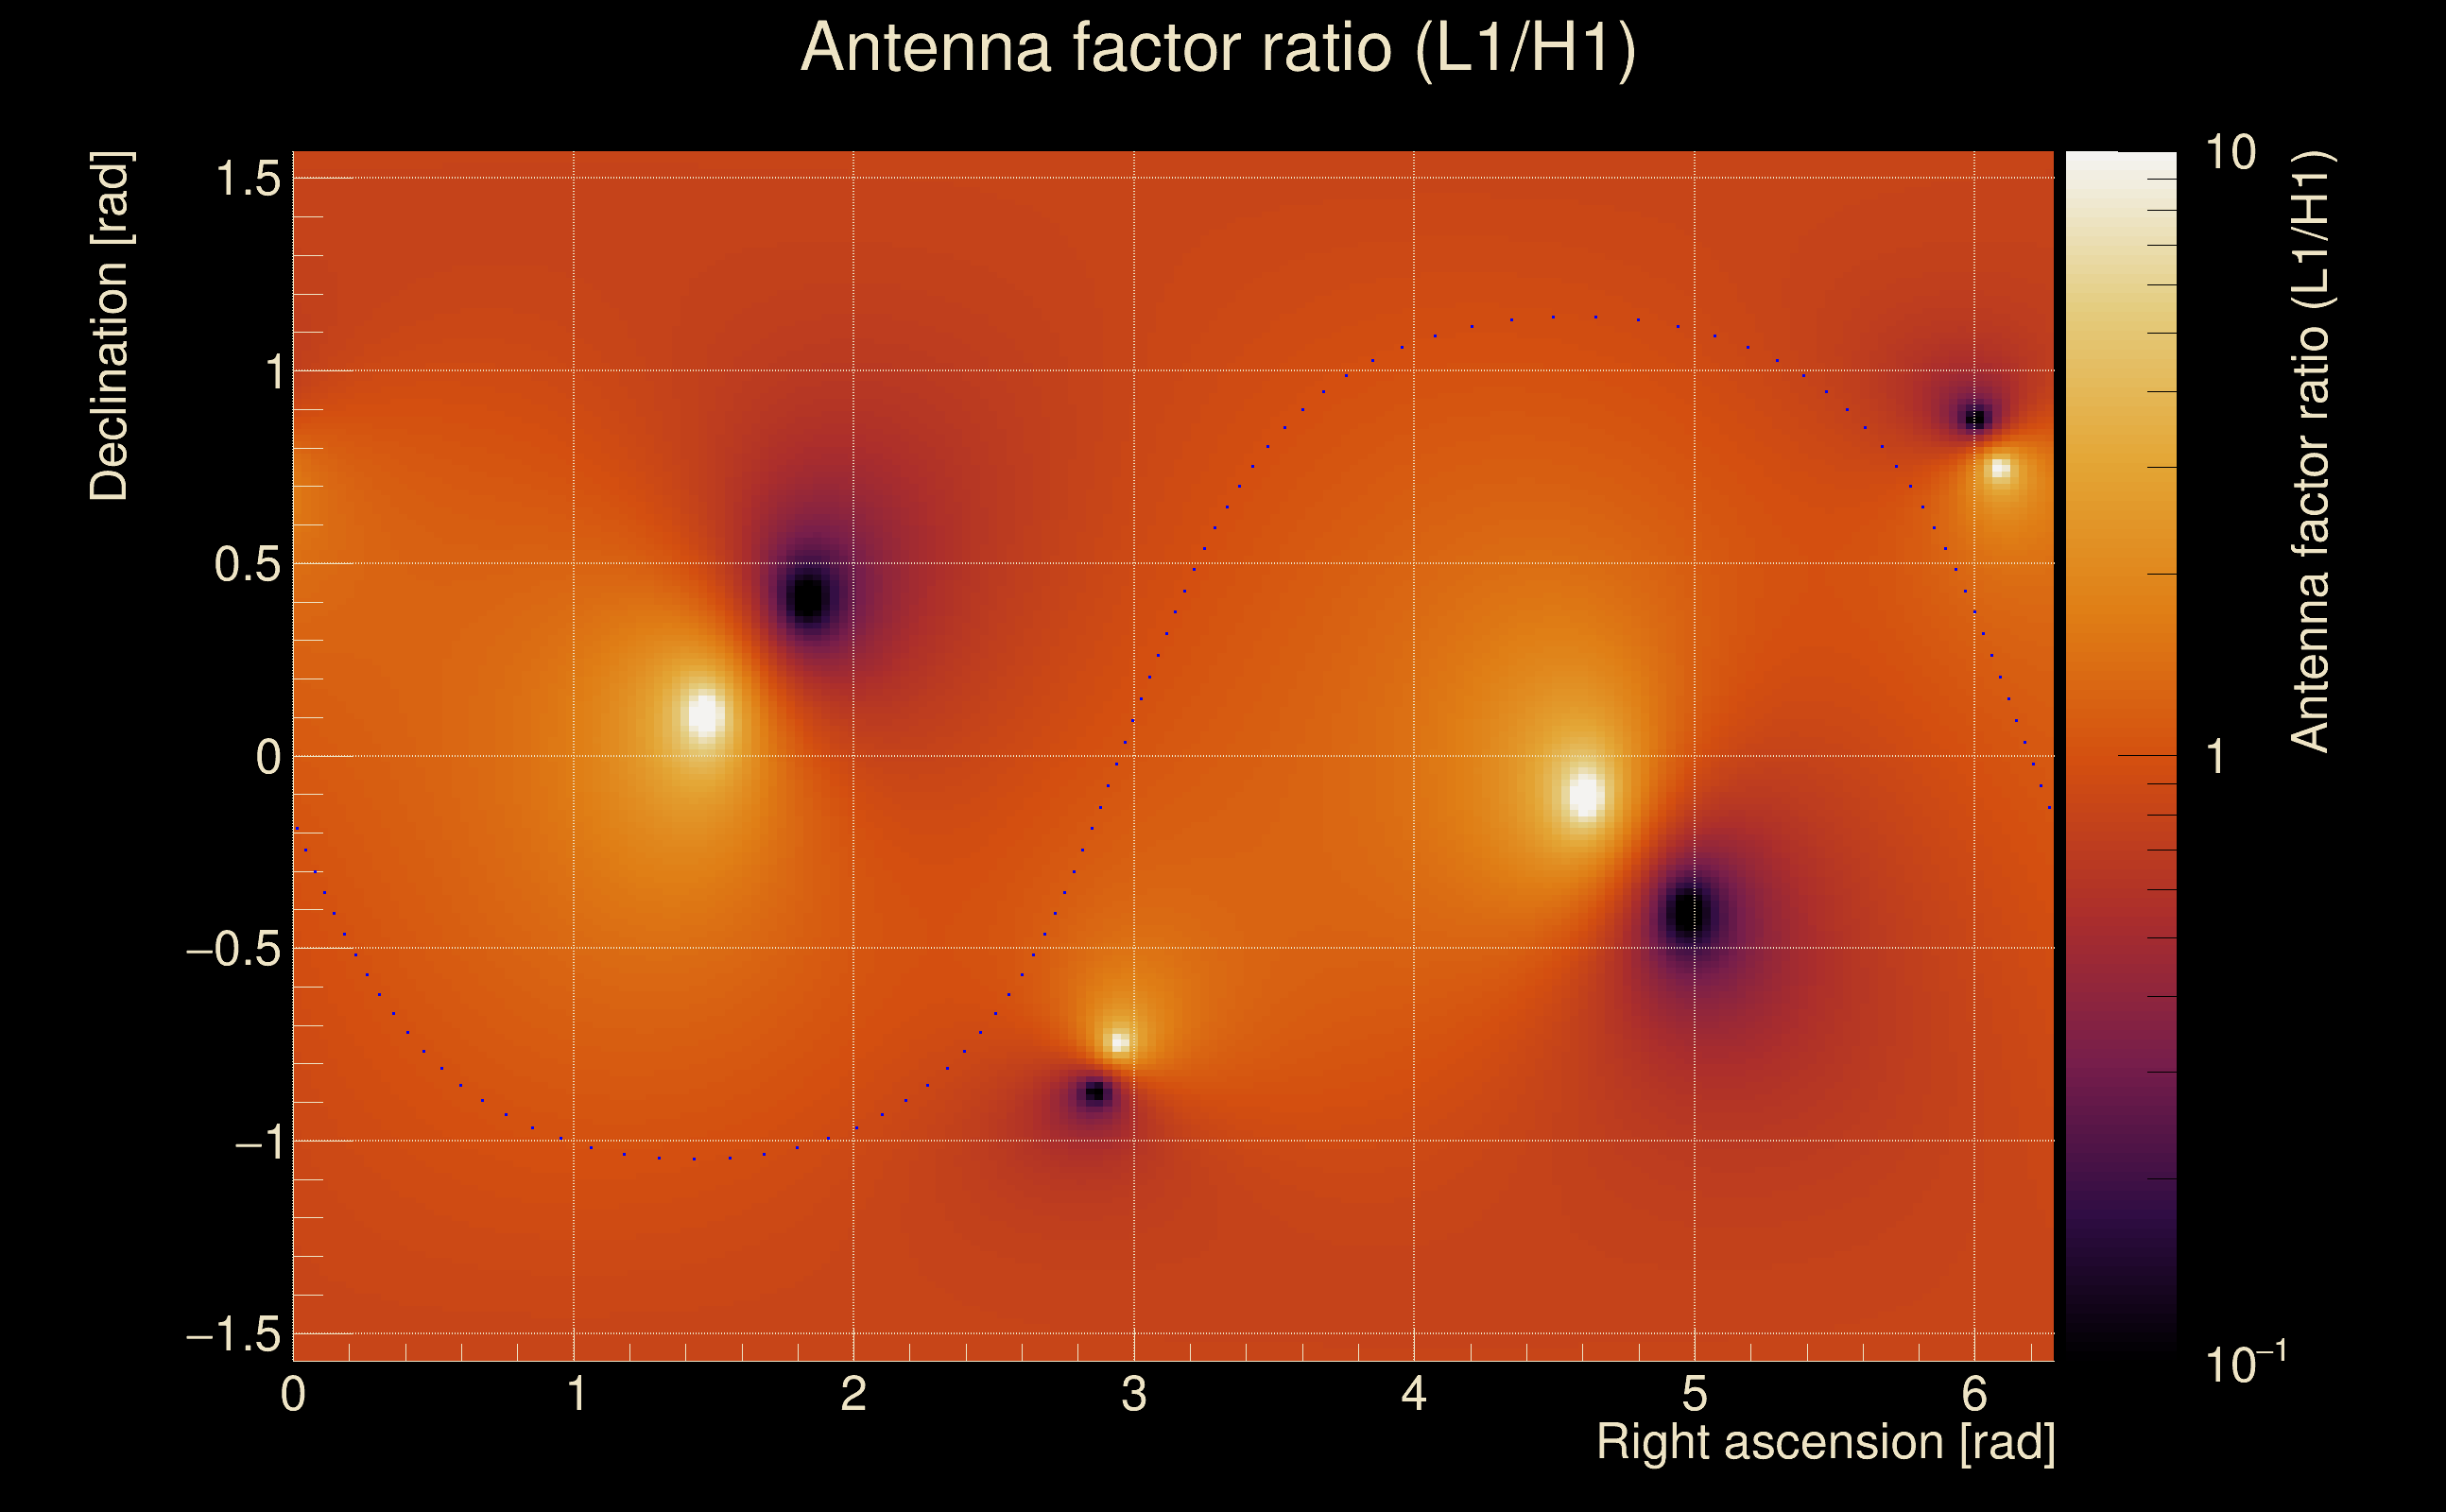
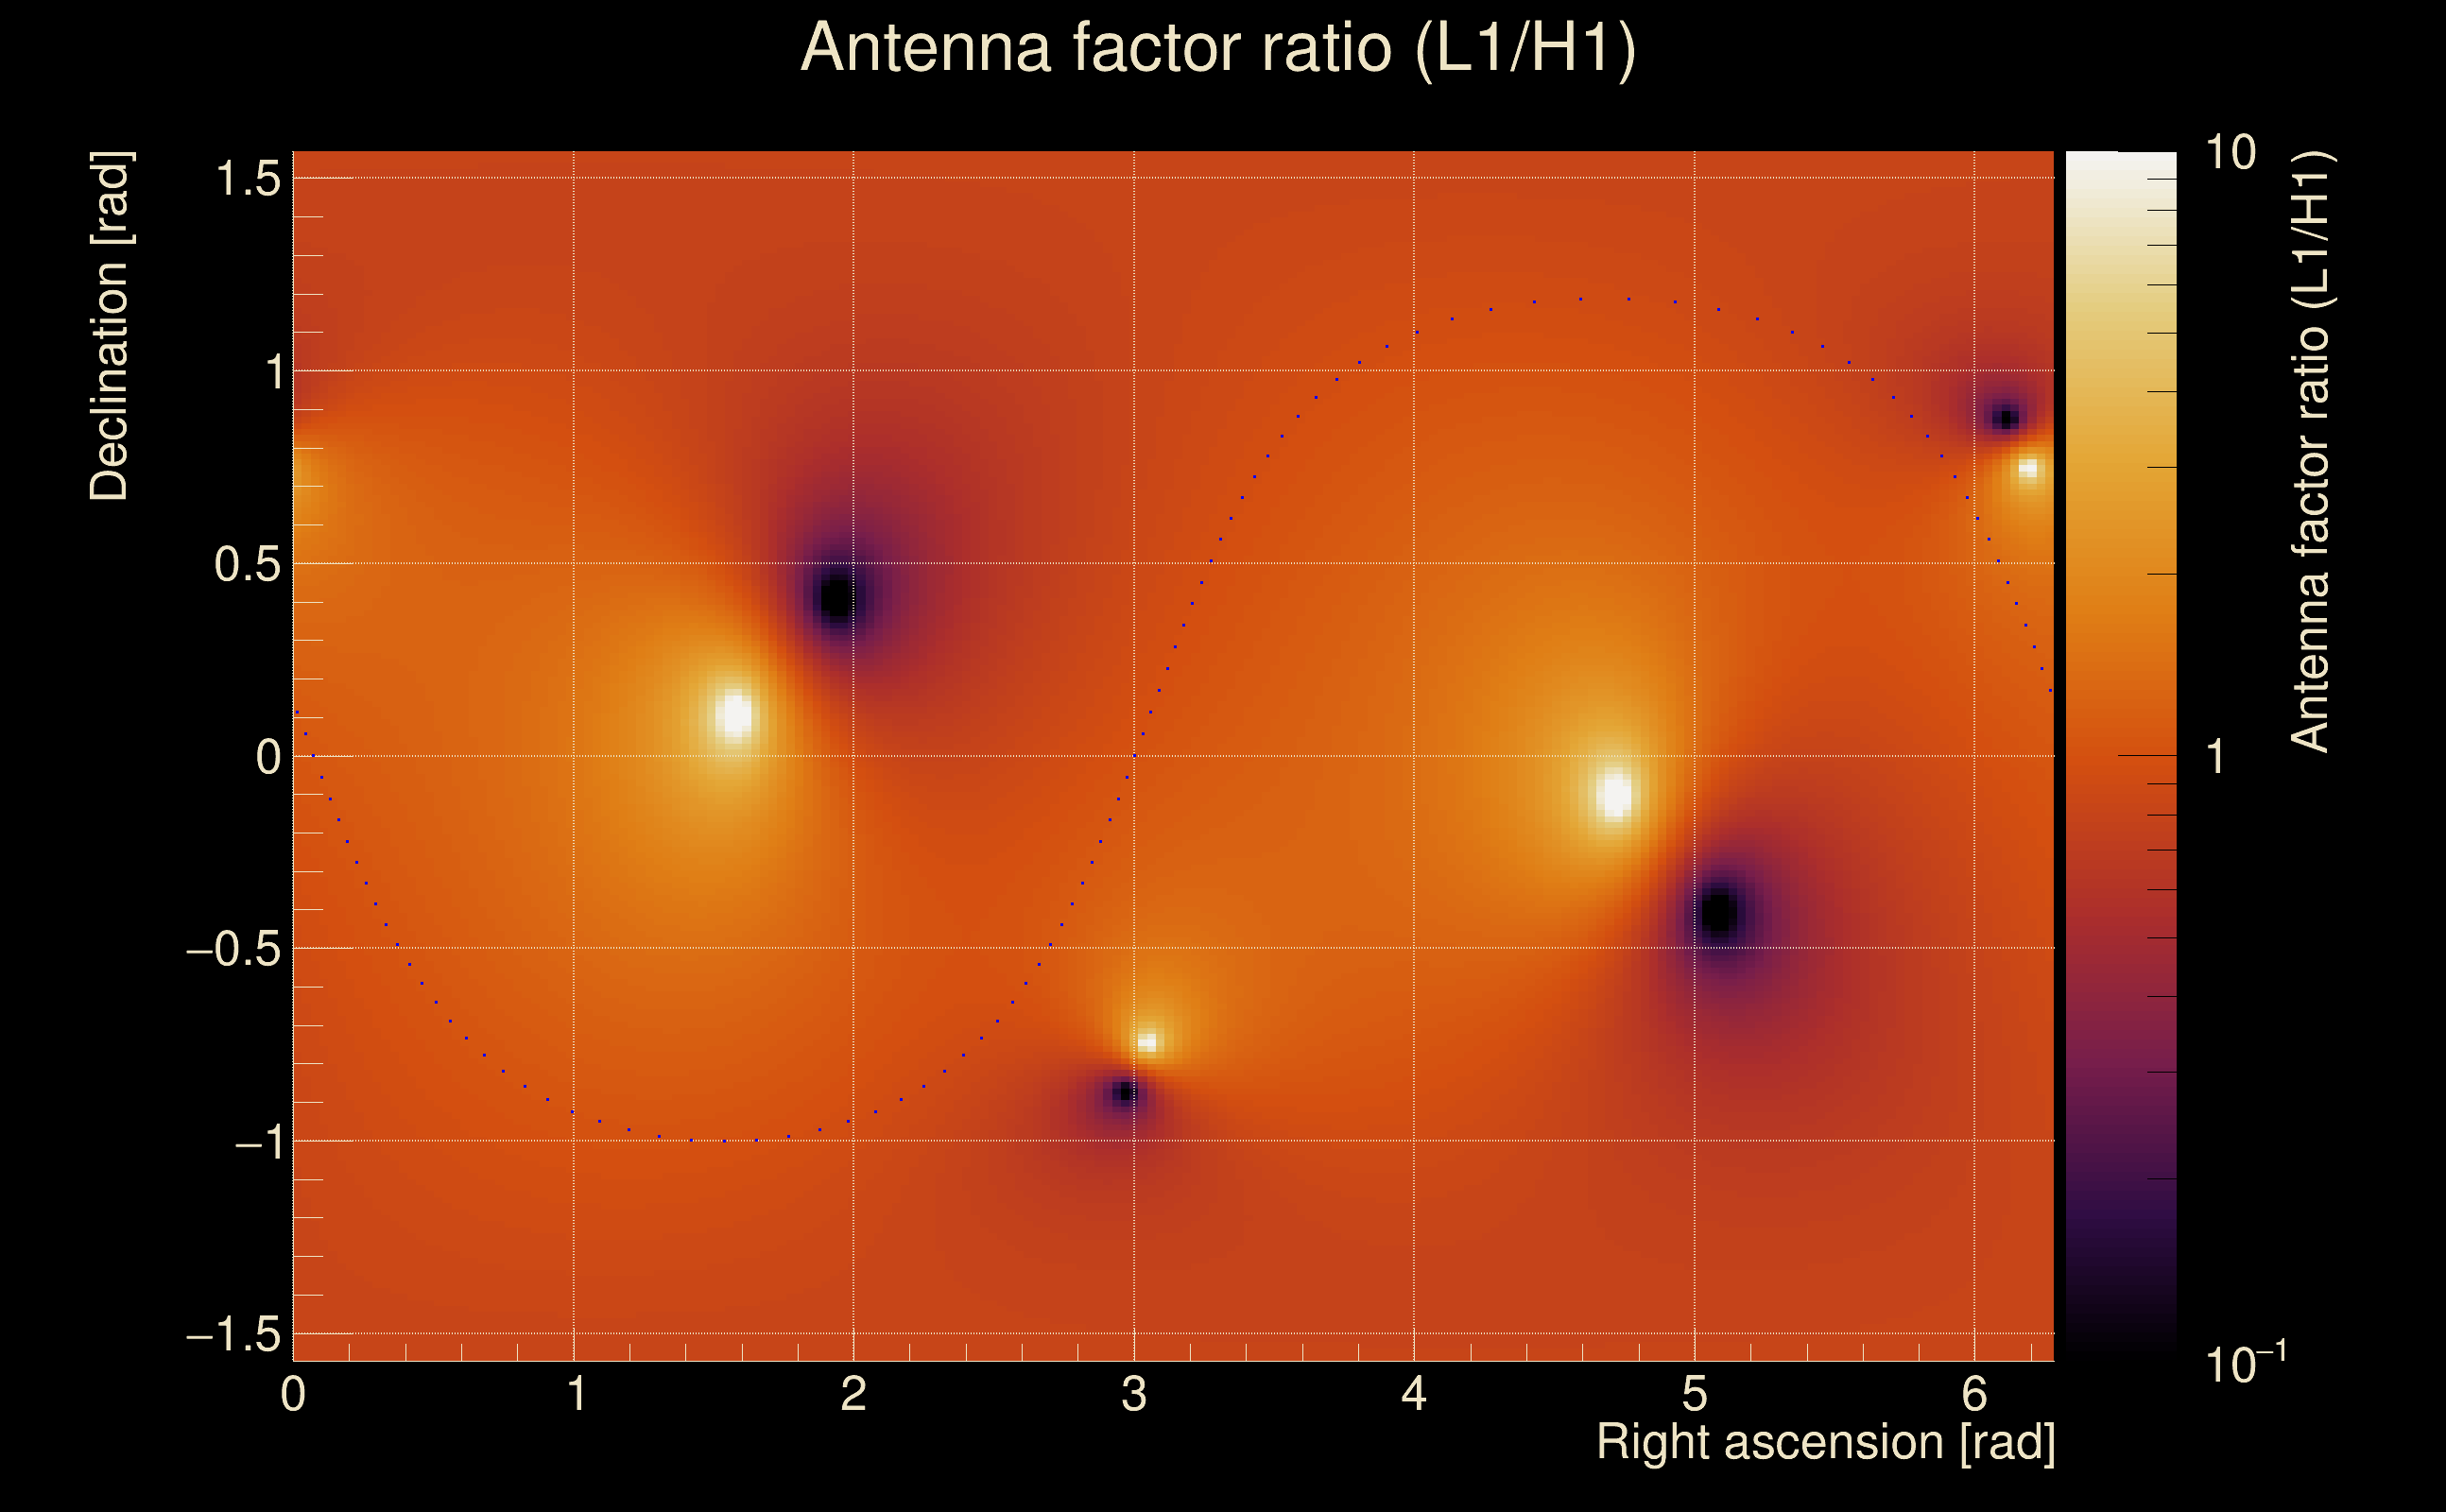
| Amplitude ratio (L1/H1): | 0.976178 ⋇ 1.48374 (L1/H1: 0.954578 ⋇ 1.74572, H1/L1: 1.00528 ⋇ 1.74213) |
| Amplitude ratio H1|L1 compatibility (probability): | 0.958201 |
| Antenna factor probability: | 0.999472 |
| Number of rejected frequency rows: | Q0: 0 / 18, Q1: 0 / 36, Q2: 3 / 70, Q3: 18 / 134, Q4: 63 / 258 |
| Maximum signal-to-noise ratio: | H1: 54.6996, L1: 59.6027 |
| SNR variance: | H1: 1.81471, L1: 2.01022 |
| Click here for a zoomed plot | Click here for a zoomed plot | Click here for a zoomed plot | Click here for a zoomed plot | Click here for a zoomed plot |
 |
 |
 |
 |
 |
 |
 |
 |
 |
 |
 |
 |
 |
 |
 |
 |
 |
 |
 |
 |
 |
 |
 |
 |
 |
 |
 |
 |
 |
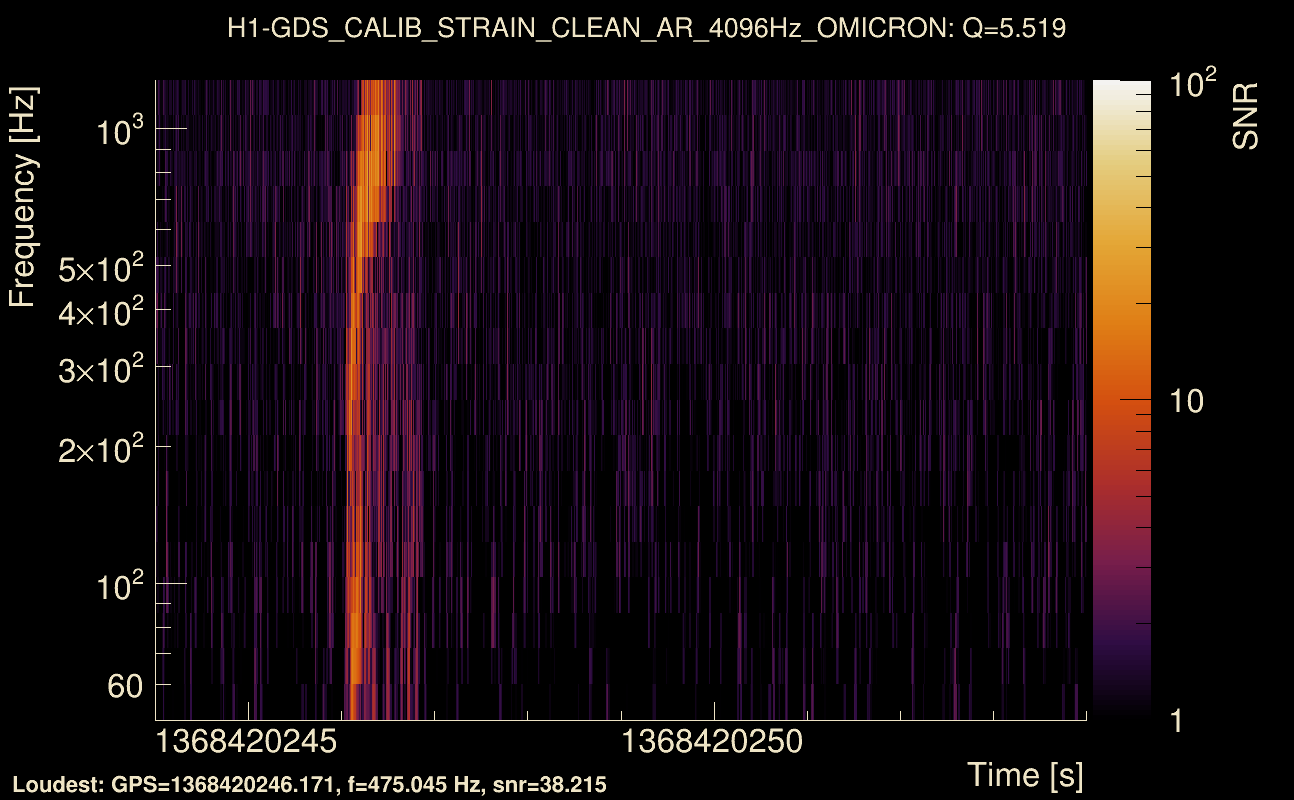
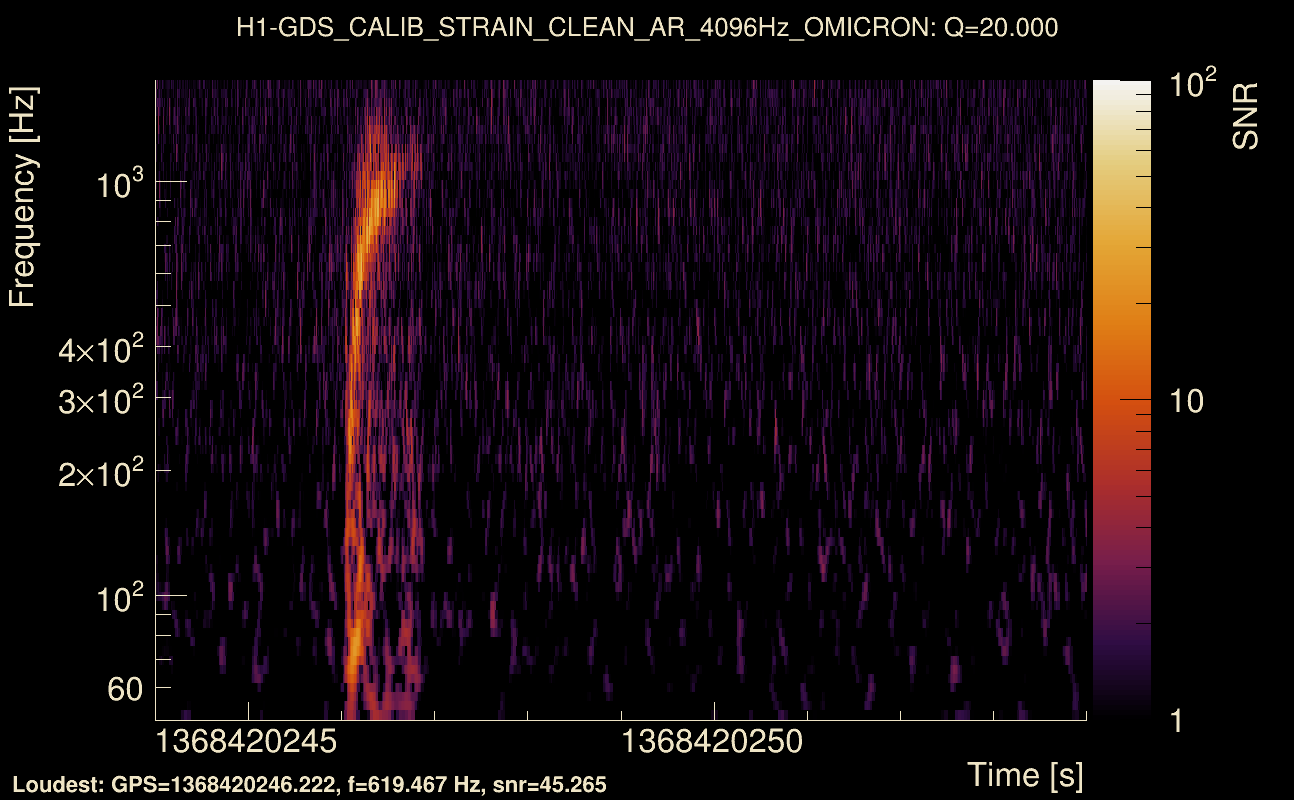
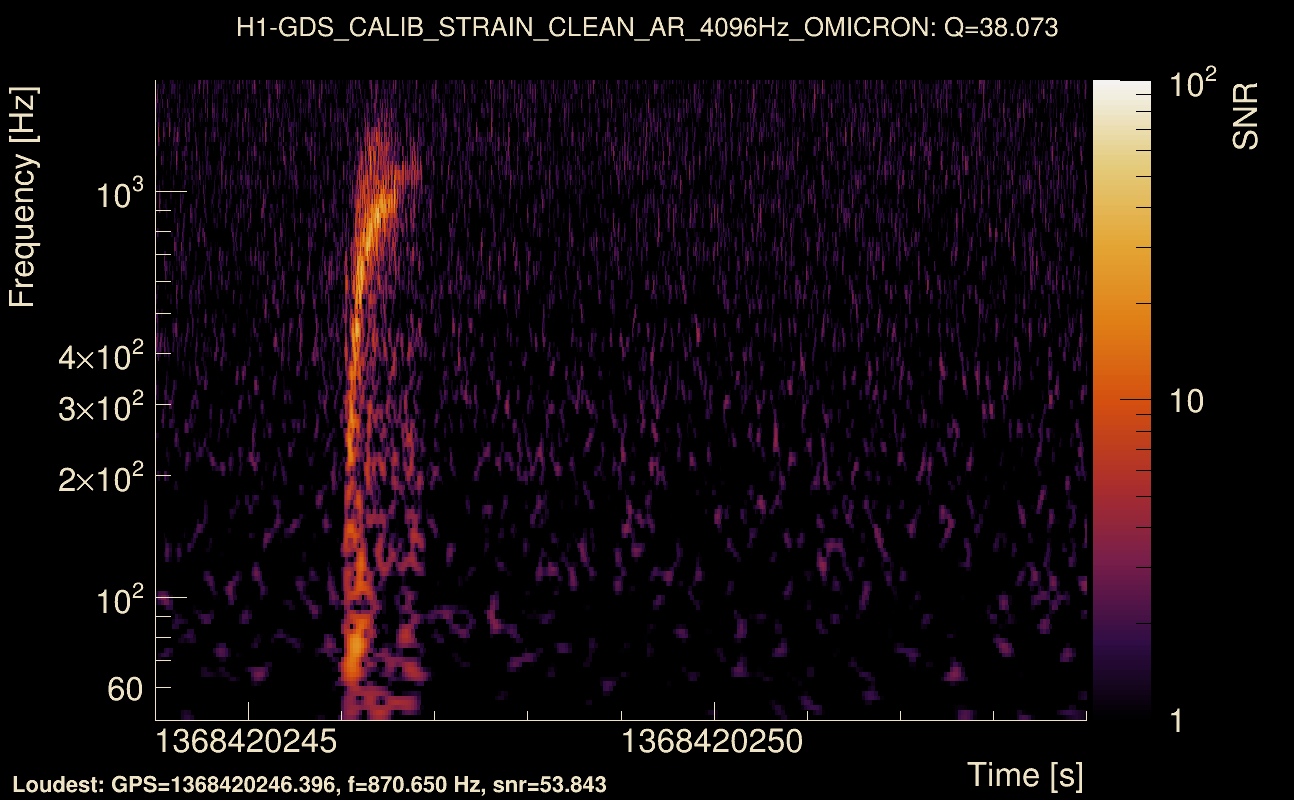
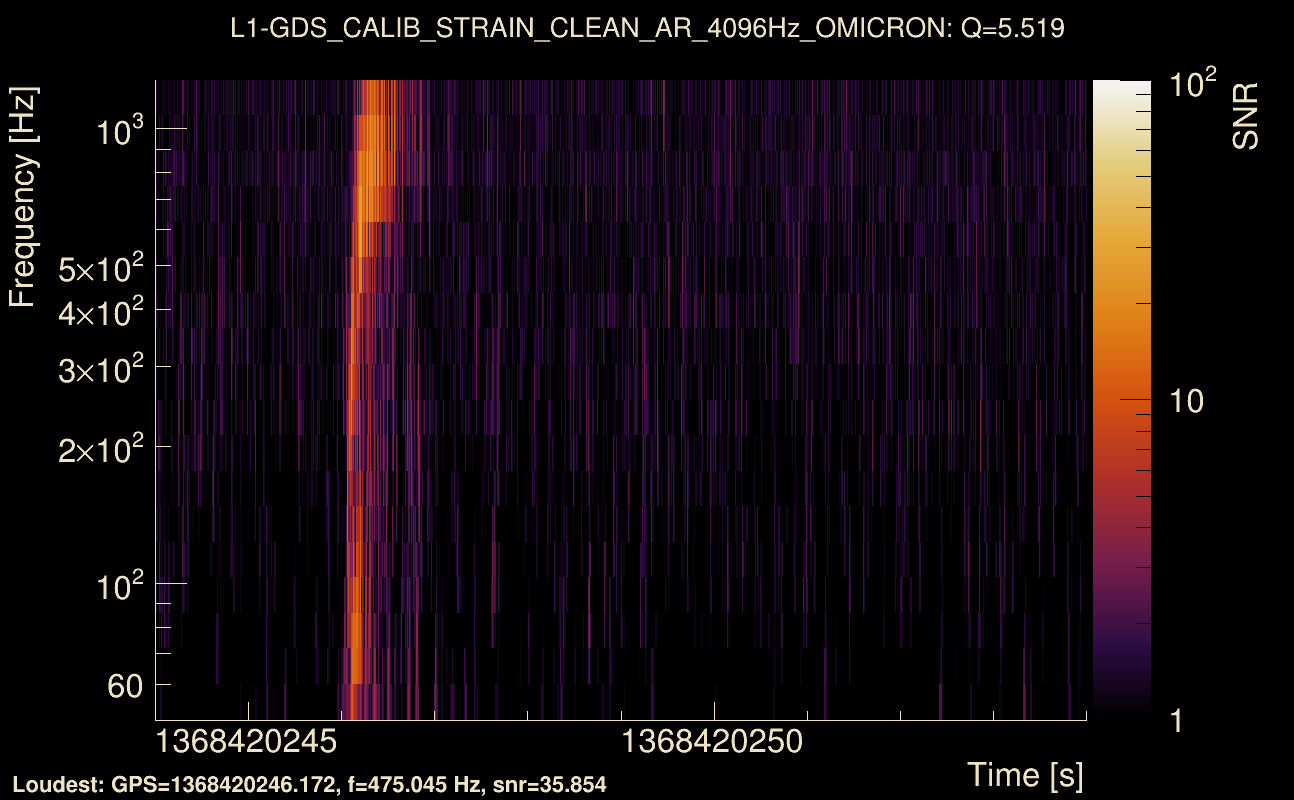
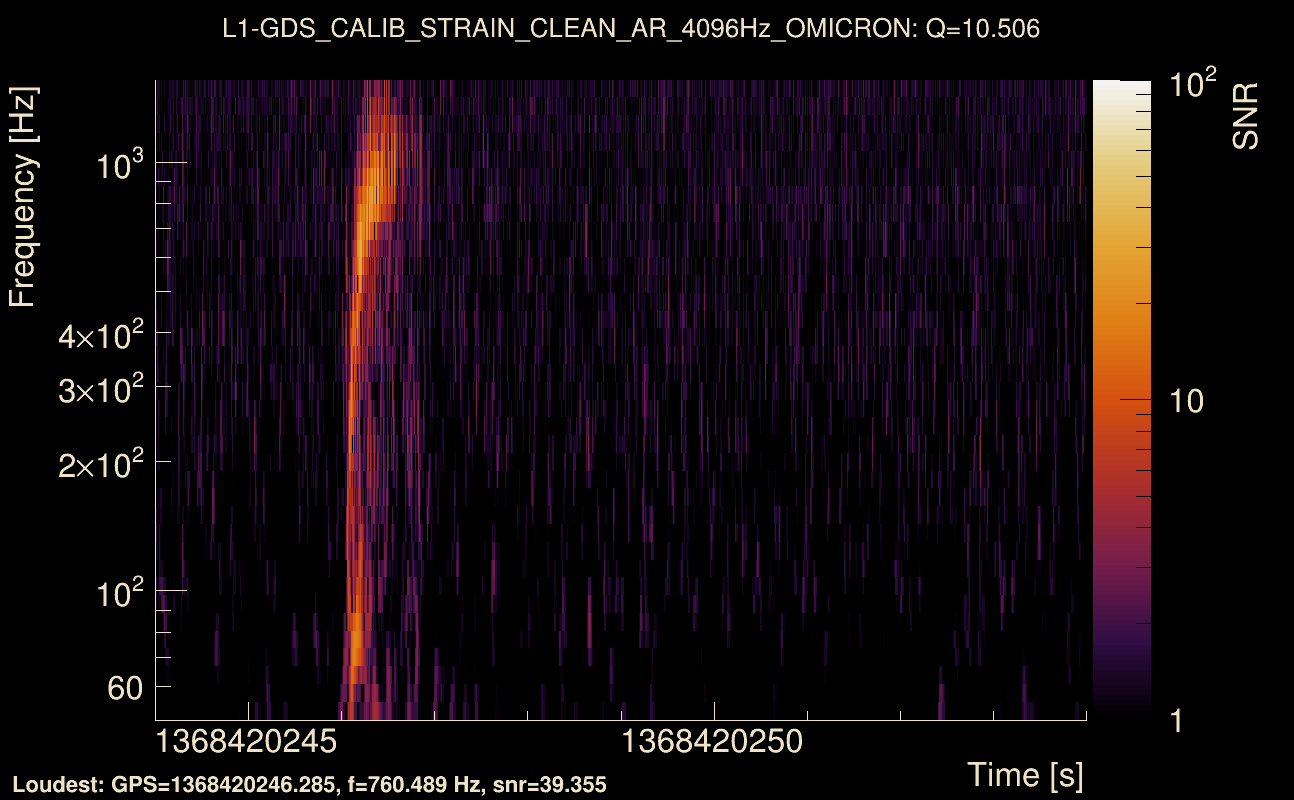
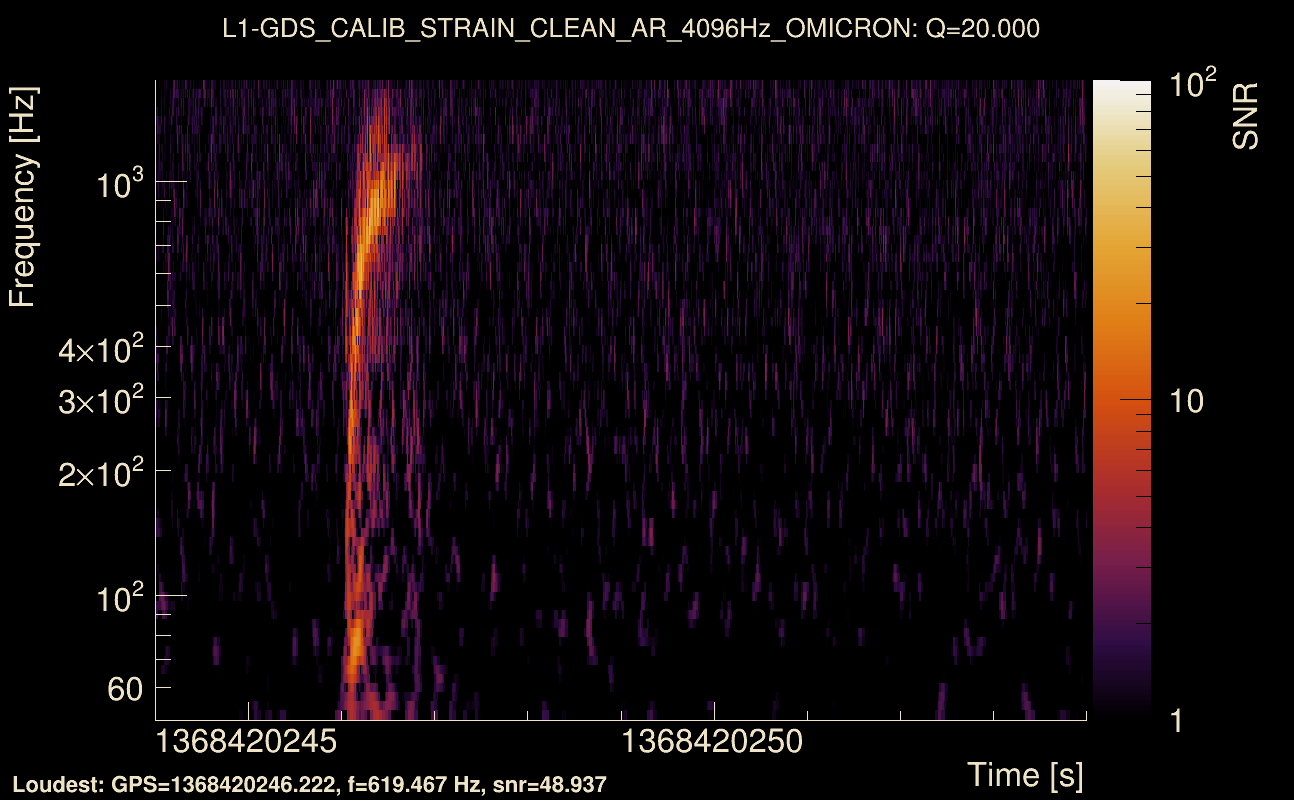
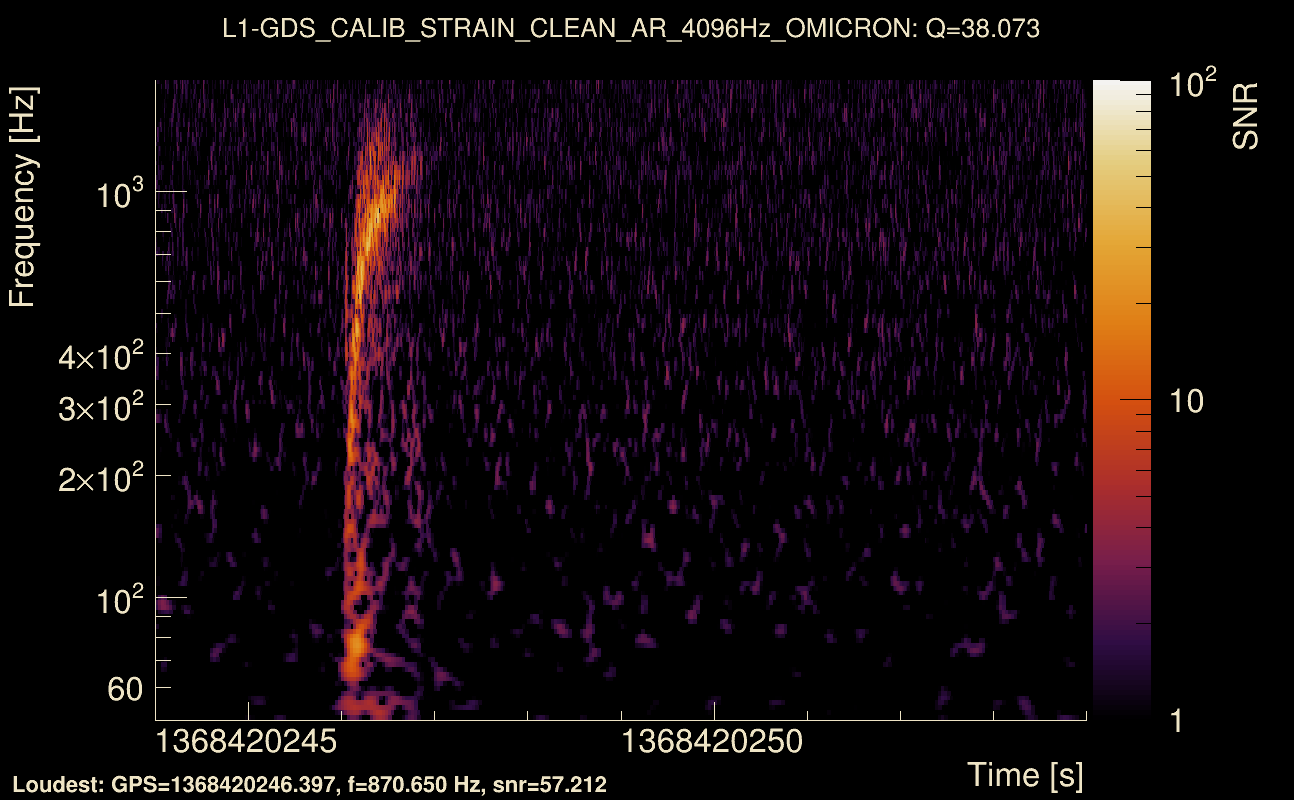
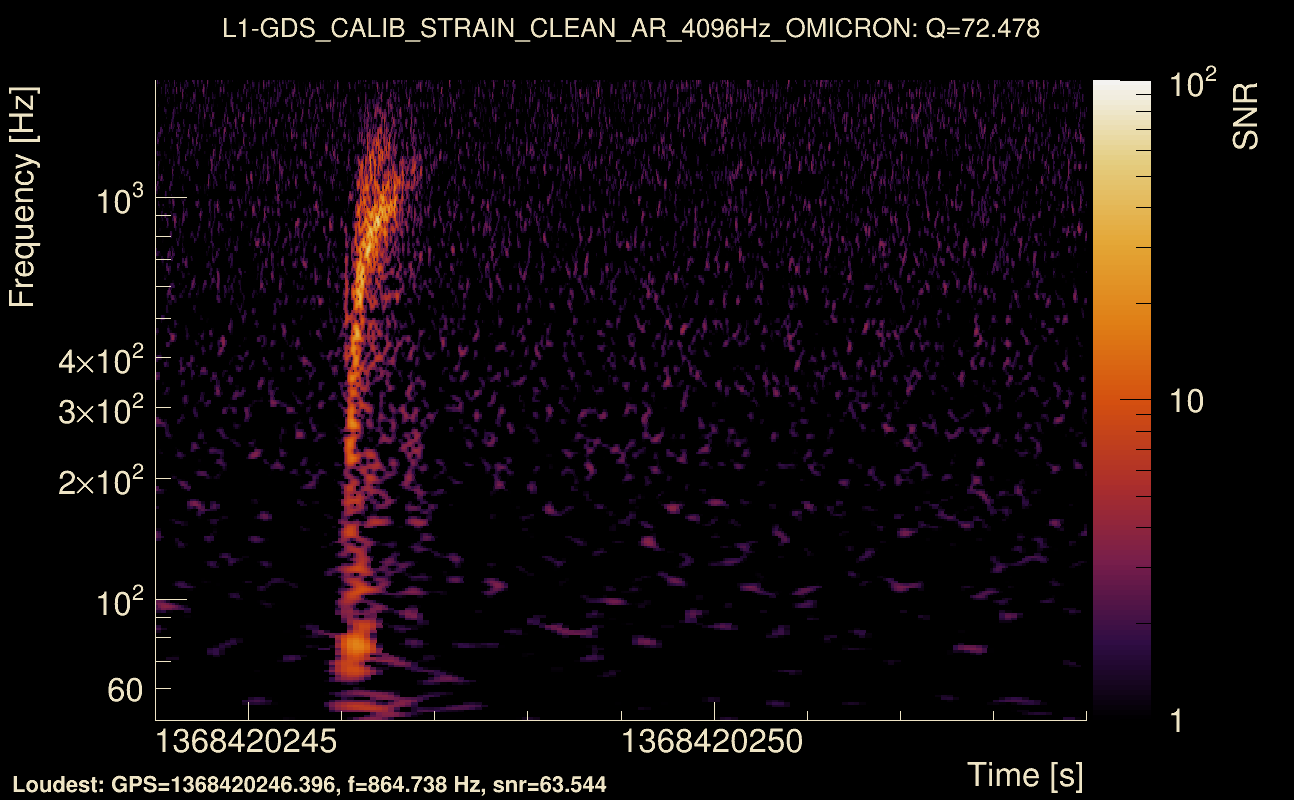
| Event time t(H1): | GPS = 1368420244 (Thu May 18 04:43:46 2023 ) → GPS = 1368420254 (Thu May 18 04:43:56 2023 ) |
| Event time t(L1): | GPS = 1368420244 (Thu May 18 04:43:56 2023 ) → GPS = 1368420254 (Thu May 18 04:43:56 2023 ) |
| Omicron analysis time window (H1): | GPS = 1368420241 → GPS = 1368420257 |
| Omicron analysis time window (L1): | GPS = 1368420241 → GPS = 1368420257 |
| Time delay between detectors t(L1) - t(H1): | 0.000935199 s (slice index = 108 / 217), δt_gw = 0.000935199 s |
| Time delay standard deviation: | 0.0214054 s |
| [targeted mode] Time delay probability: | 0.955388 (0.0559423 sigmas), δt_target = 0.000463009 s |
| Frequency: | 278.289 Hz |
| Ξ: | 0.920637 ± 0.0136218 (variance = 0.000185553): Q0: 0.952089, Q1: 0.934334, Q2: 0.921956, Q3: 0.914794, Q4: 0.91816 |
| Rank: | R_A = 0.816104 |
| Log of amplitude ratio (L1/H1): | -0.0450964, variance = 0.153941 (L1/H1: -0.0813774, variance = 0.306857, H1/L1: 0.0129135, variance = 0.306723) |
| Amplitude ratio (L1/H1): | 0.955905 ⋇ 1.48046 (L1/H1: 0.921846 ⋇ 1.74011, H1/L1: 1.013 ⋇ 1.7399) |
| Amplitude ratio H1|L1 compatibility (probability): | 0.930351 |
| Antenna factor probability: | 0.99731 |
| Number of rejected frequency rows: | Q0: 0 / 18, Q1: 0 / 36, Q2: 2 / 70, Q3: 18 / 134, Q4: 58 / 258 |
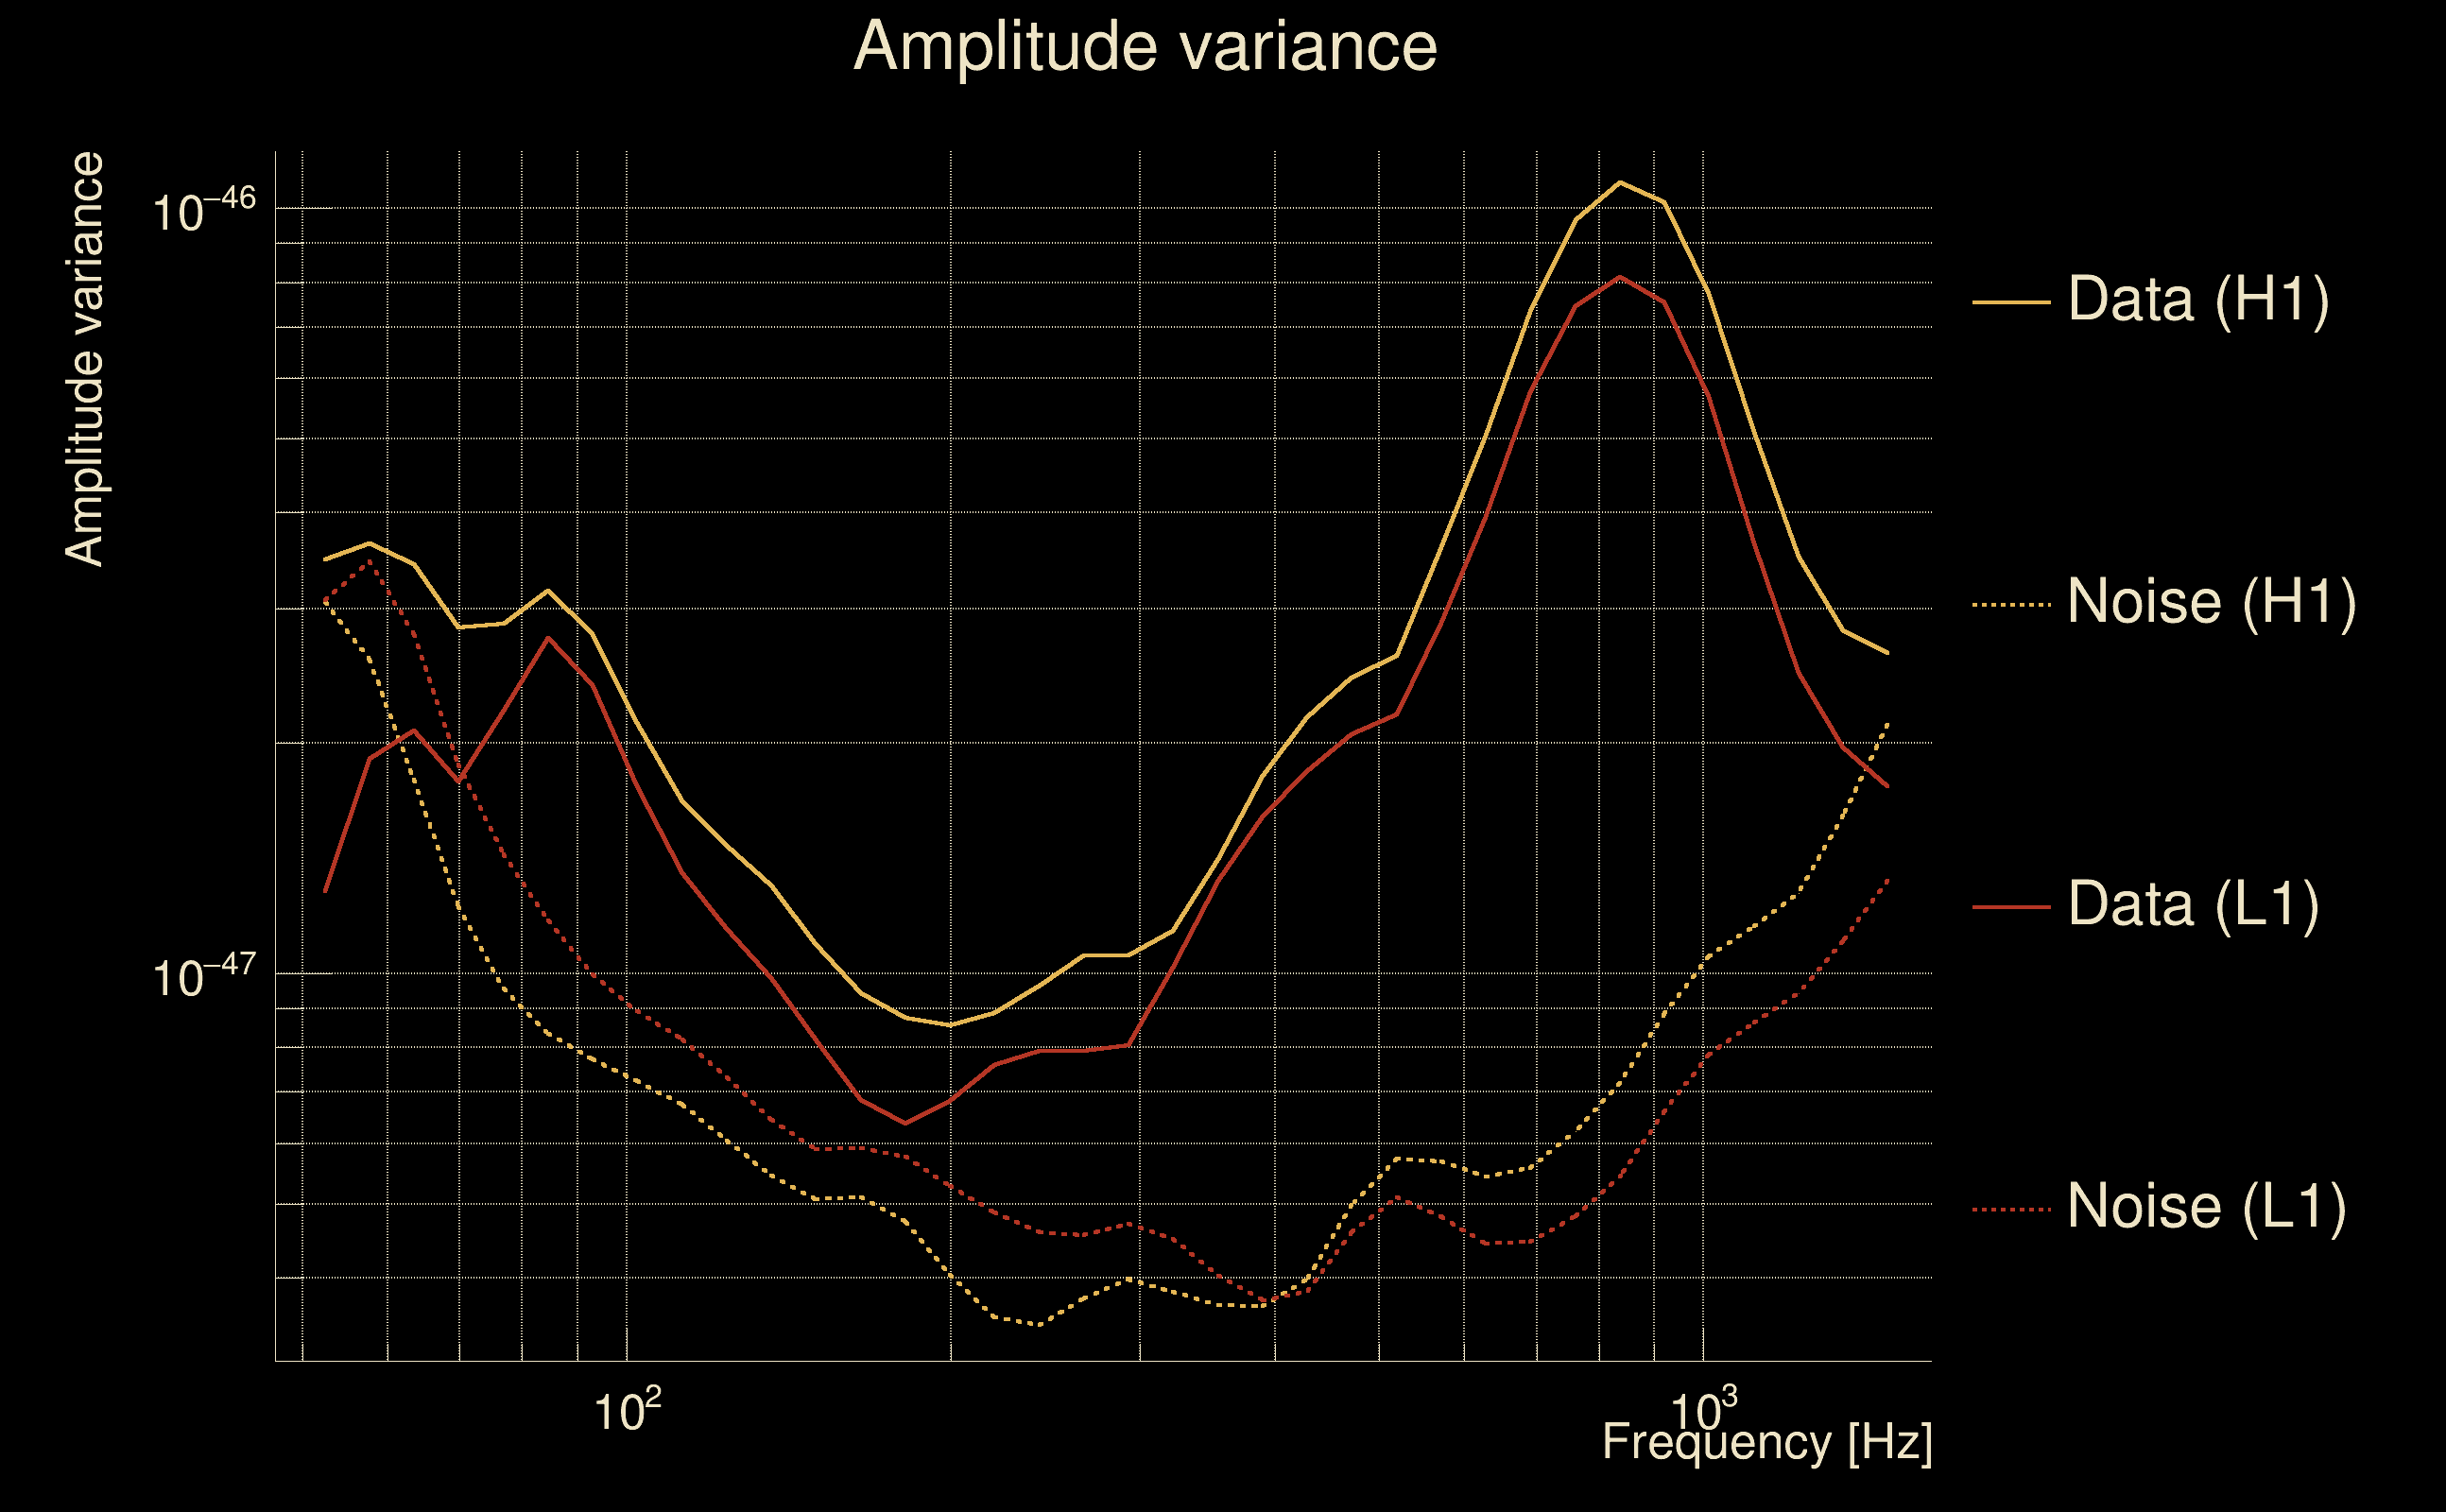
| Maximum signal-to-noise ratio: | H1: 59.4945, L1: 63.1689 |
| SNR variance: | H1: 2.79627, L1: 2.89062 |
| Click here for a zoomed plot | Click here for a zoomed plot | Click here for a zoomed plot | Click here for a zoomed plot | Click here for a zoomed plot |
 |
 |
 |
 |
 |
 |
 |
 |
 |
 |
 |
 |
 |
 |
 |
 |
 |
 |
 |
 |
 |
 |
 |
 |
 |
 |
 |
 |
 |
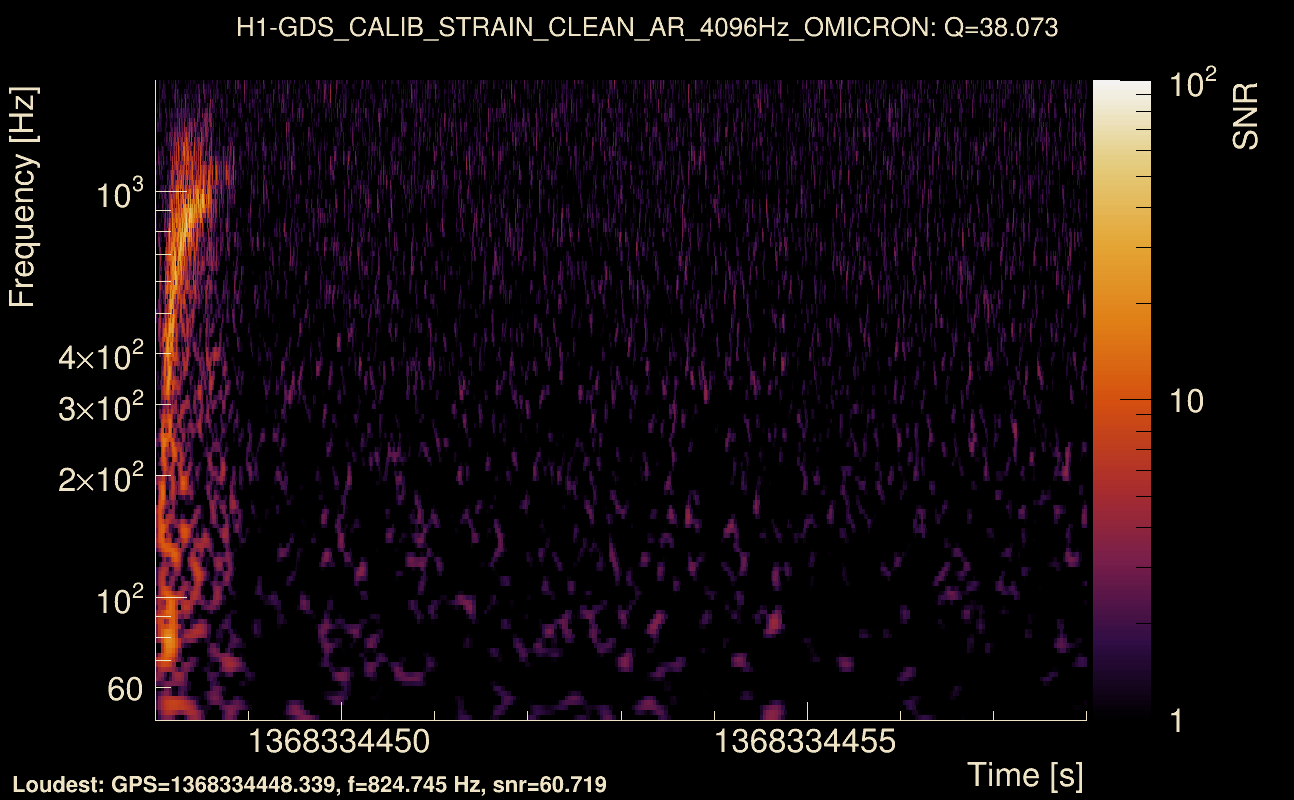
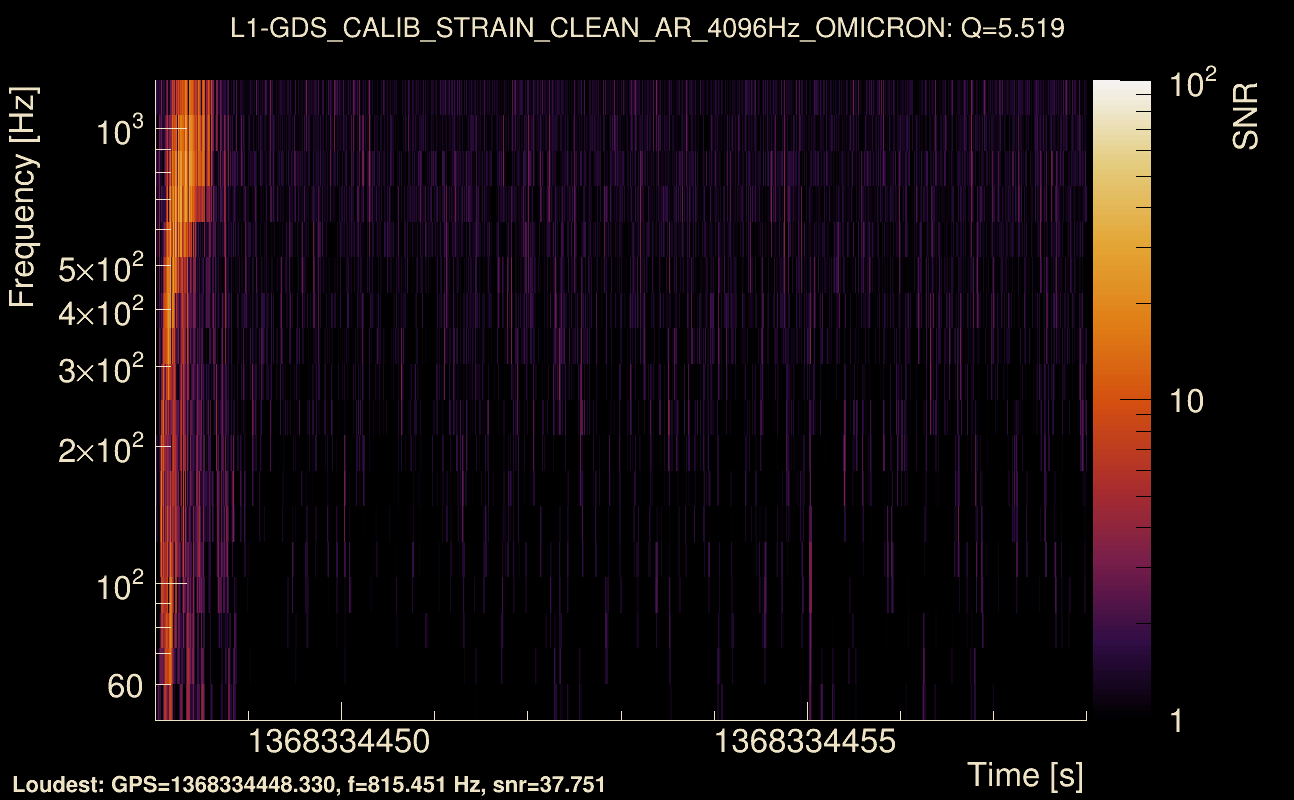
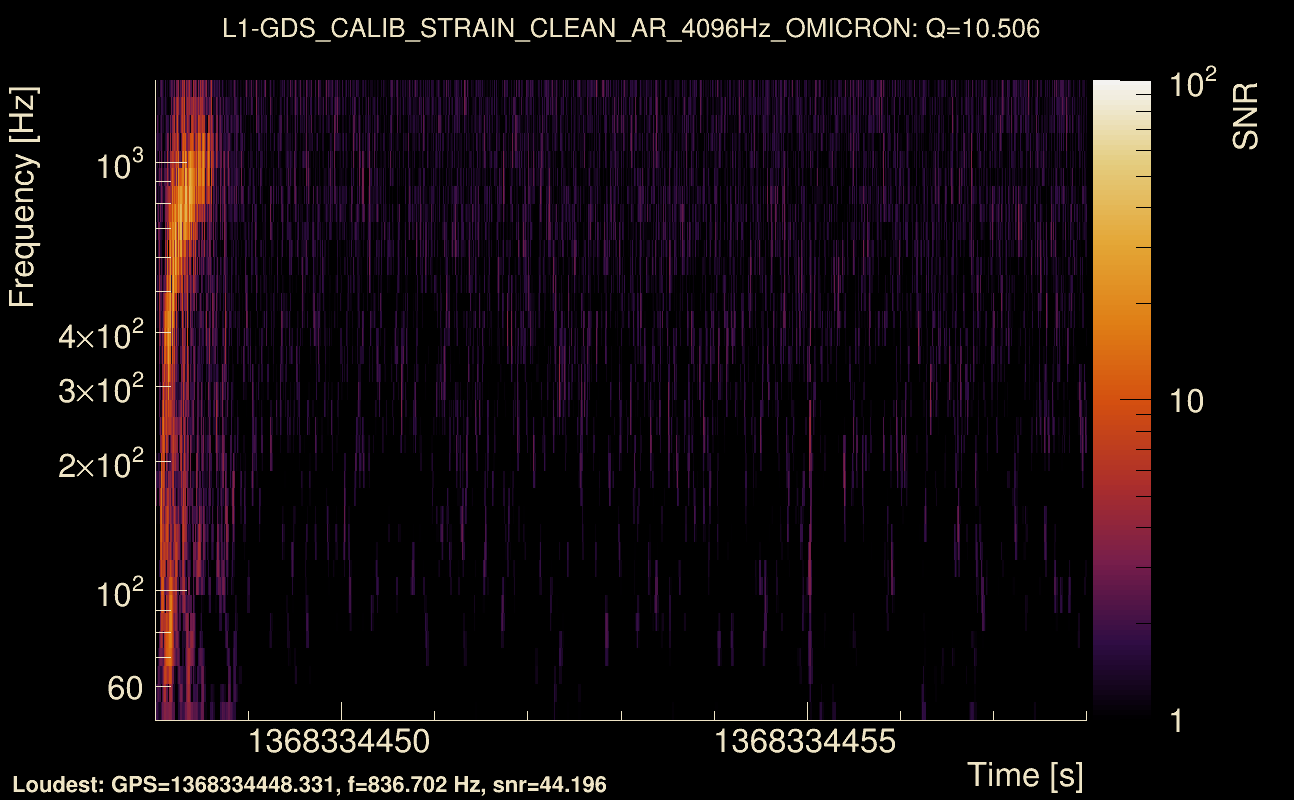
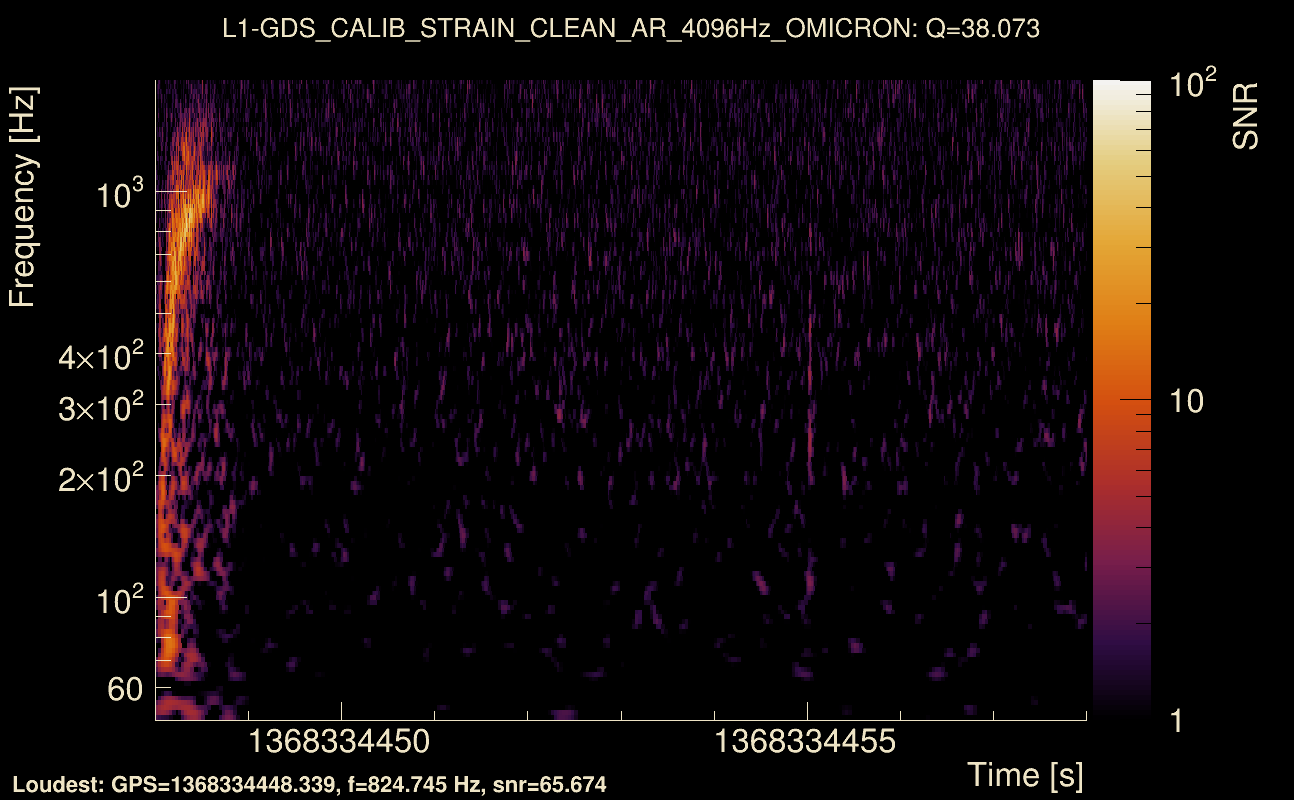
| Event time t(H1): | GPS = 1368334448 (Wed May 17 04:53:50 2023 ) → GPS = 1368334458 (Wed May 17 04:54:00 2023 ) |
| Event time t(L1): | GPS = 1368334448 (Wed May 17 04:54:00 2023 ) → GPS = 1368334458 (Wed May 17 04:54:00 2023 ) |
| Omicron analysis time window (H1): | GPS = 1368334445 → GPS = 1368334461 |
| Omicron analysis time window (L1): | GPS = 1368334445 → GPS = 1368334461 |
| Time delay between detectors t(L1) - t(H1): | 0.000979719 s (slice index = 108 / 217), δt_gw = 0.000979719 s |
| Time delay standard deviation: | 0.0211756 s |
| [targeted mode] Time delay probability: | 0.914991 (0.106745 sigmas), δt_target = 0.000909567 s |
| Frequency: | 290.604 Hz |
| Ξ: | 0.922245 ± 0.0115474 (variance = 0.000133342): Q0: 0.953586, Q1: 0.932339, Q2: 0.926196, Q3: 0.92542, Q4: 0.920857 |
| Rank: | R_A = 0.798017 |
| Log of amplitude ratio (L1/H1): | -0.068774, variance = 0.153006 (L1/H1: -0.0765275, variance = 0.304038, H1/L1: 0.0620126, variance = 0.305009) |
| Amplitude ratio (L1/H1): | 0.933538 ⋇ 1.4787 (L1/H1: 0.926327 ⋇ 1.73567, H1/L1: 1.06398 ⋇ 1.7372) |
| Amplitude ratio H1|L1 compatibility (probability): | 0.985161 |
| Antenna factor probability: | 0.959934 |
| Number of rejected frequency rows: | Q0: 0 / 18, Q1: 0 / 36, Q2: 4 / 70, Q3: 15 / 134, Q4: 41 / 258 |
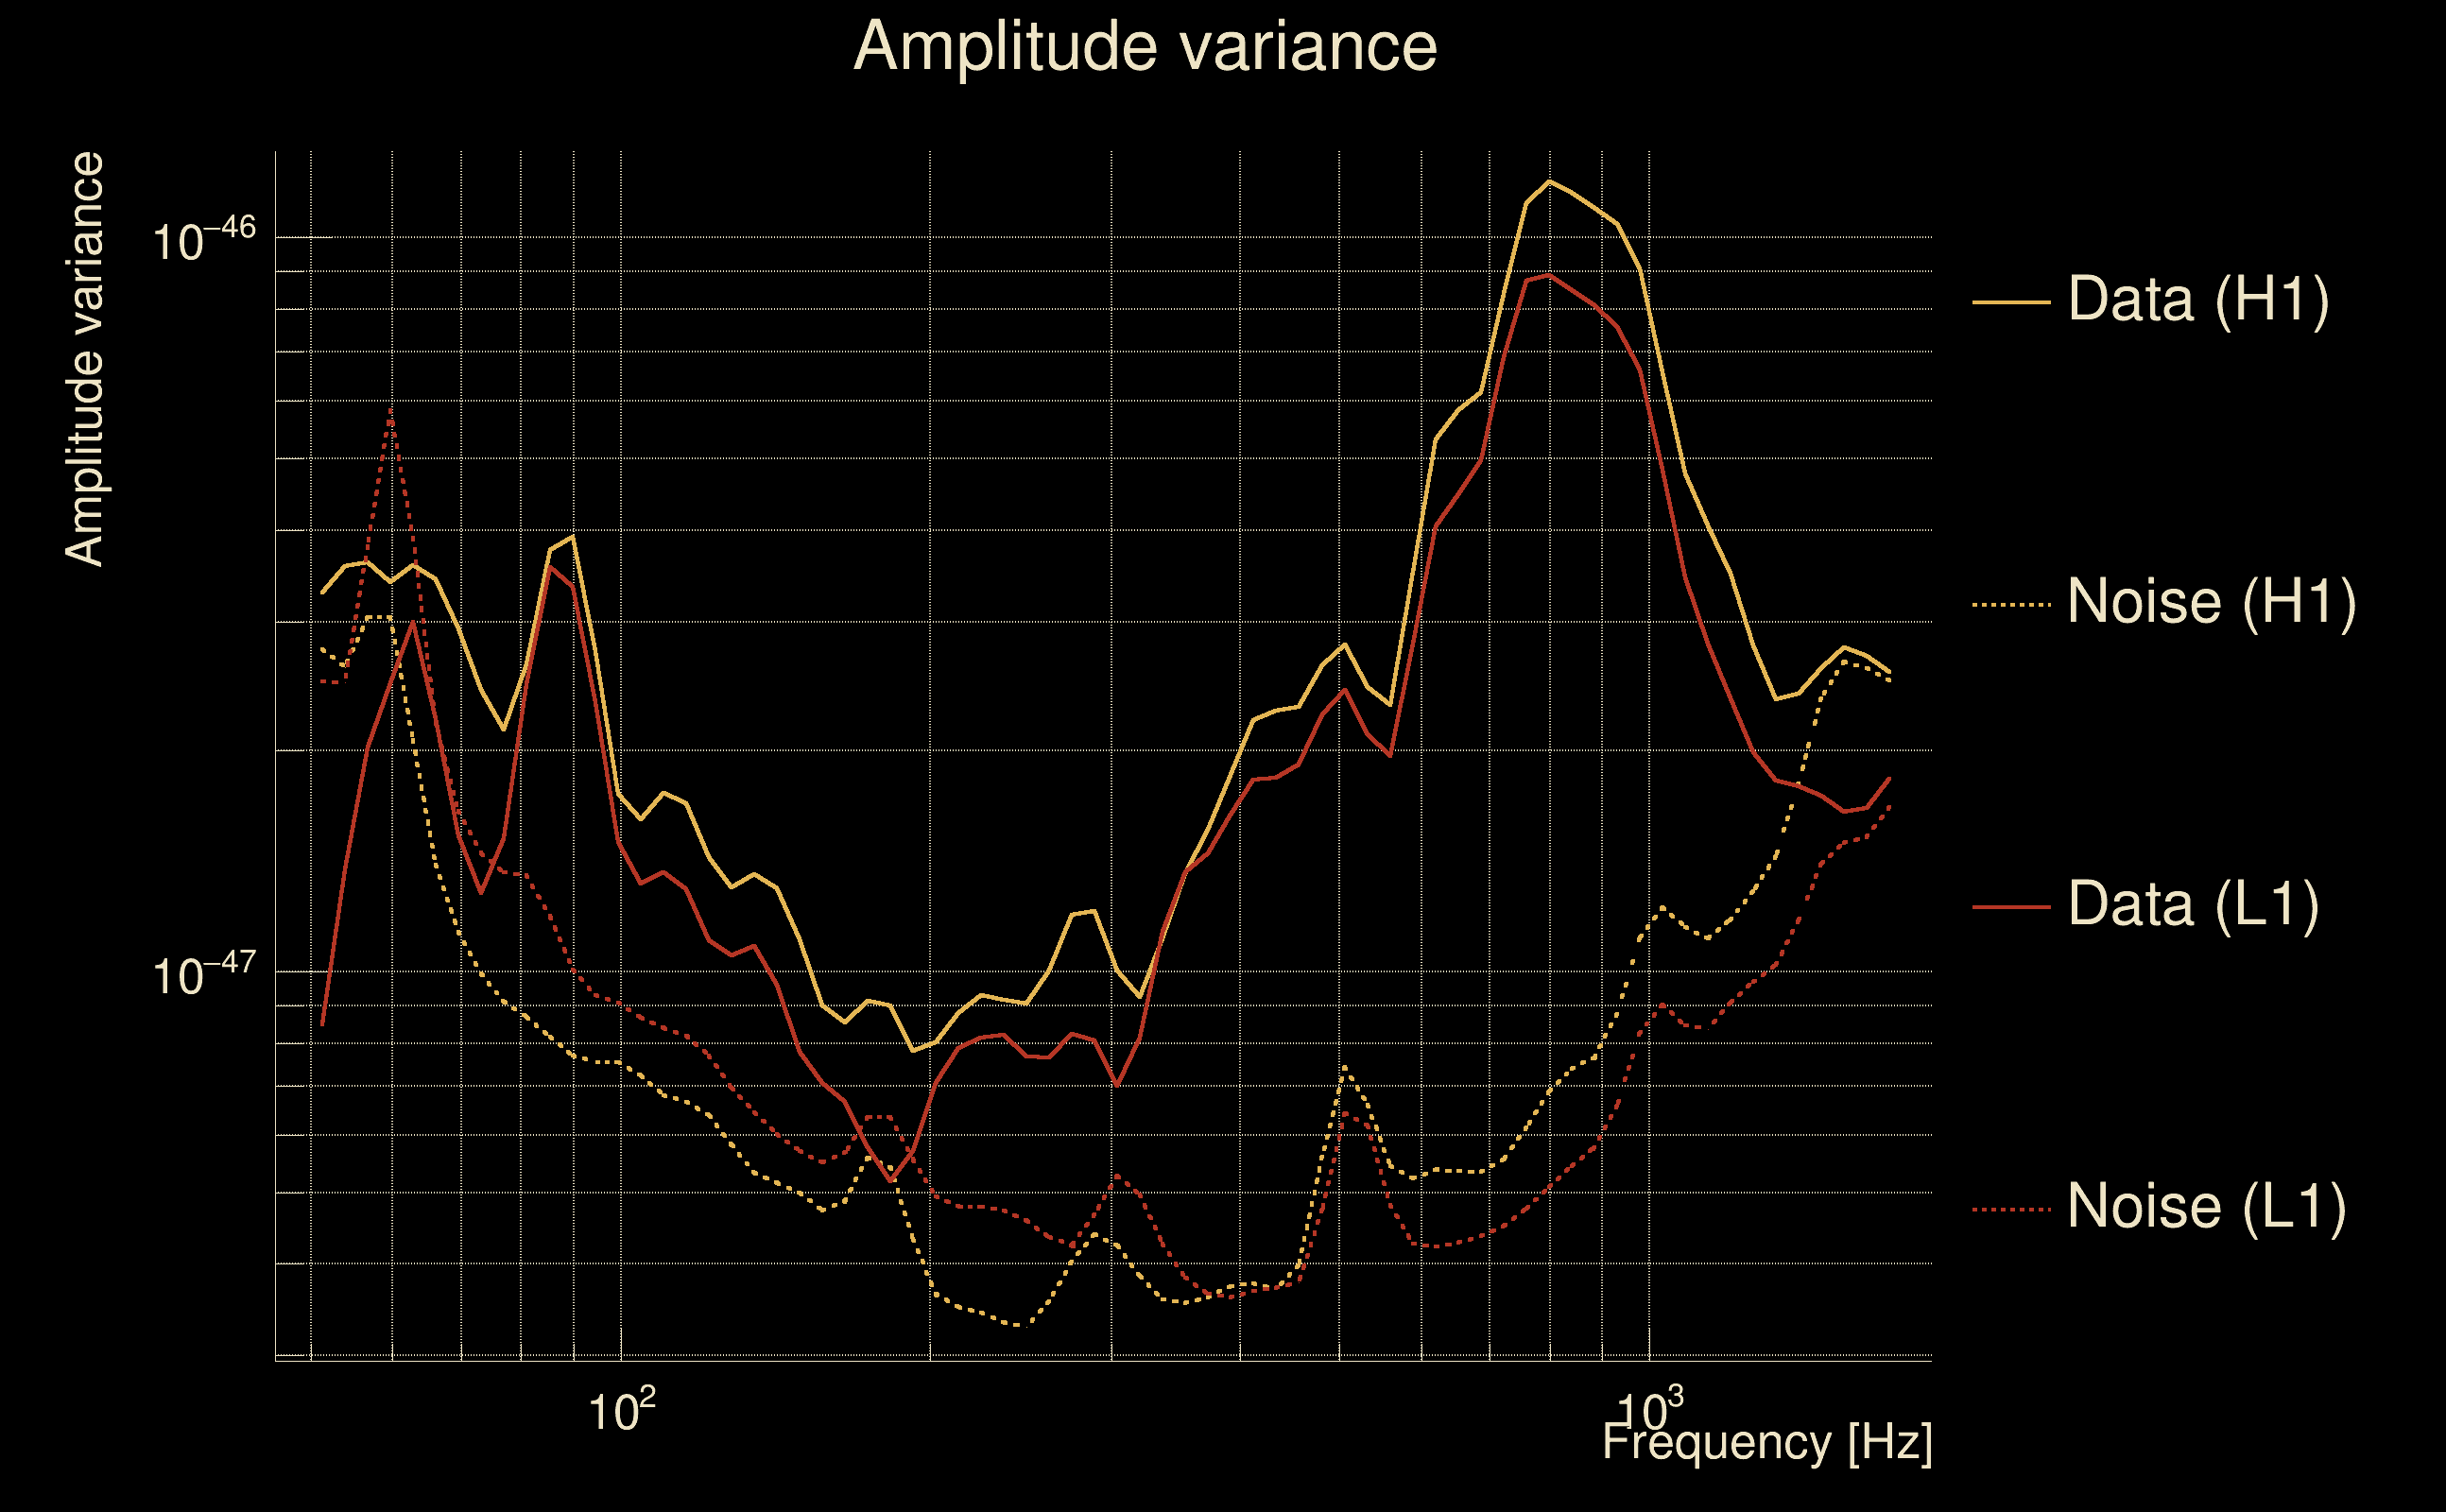
| Maximum signal-to-noise ratio: | H1: 60.7755, L1: 65.0813 |
| SNR variance: | H1: 3.06121, L1: 3.09679 |
| Click here for a zoomed plot | Click here for a zoomed plot | Click here for a zoomed plot | Click here for a zoomed plot | Click here for a zoomed plot |
 |
 |
 |
 |
 |
 |
 |
 |
 |
 |
 |
 |
 |
 |
 |
 |
 |
 |
 |
 |
 |
 |
 |
 |
 |
 |
 |
 |
 |
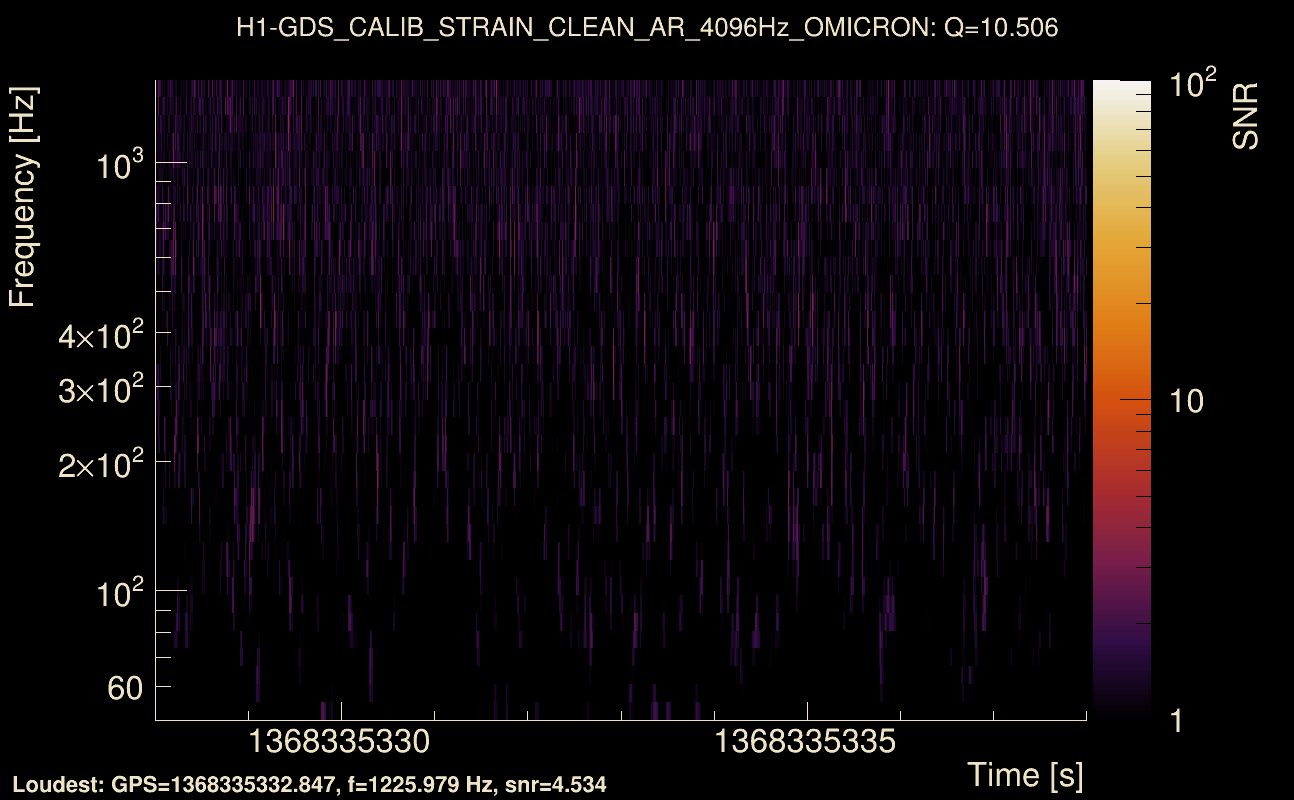
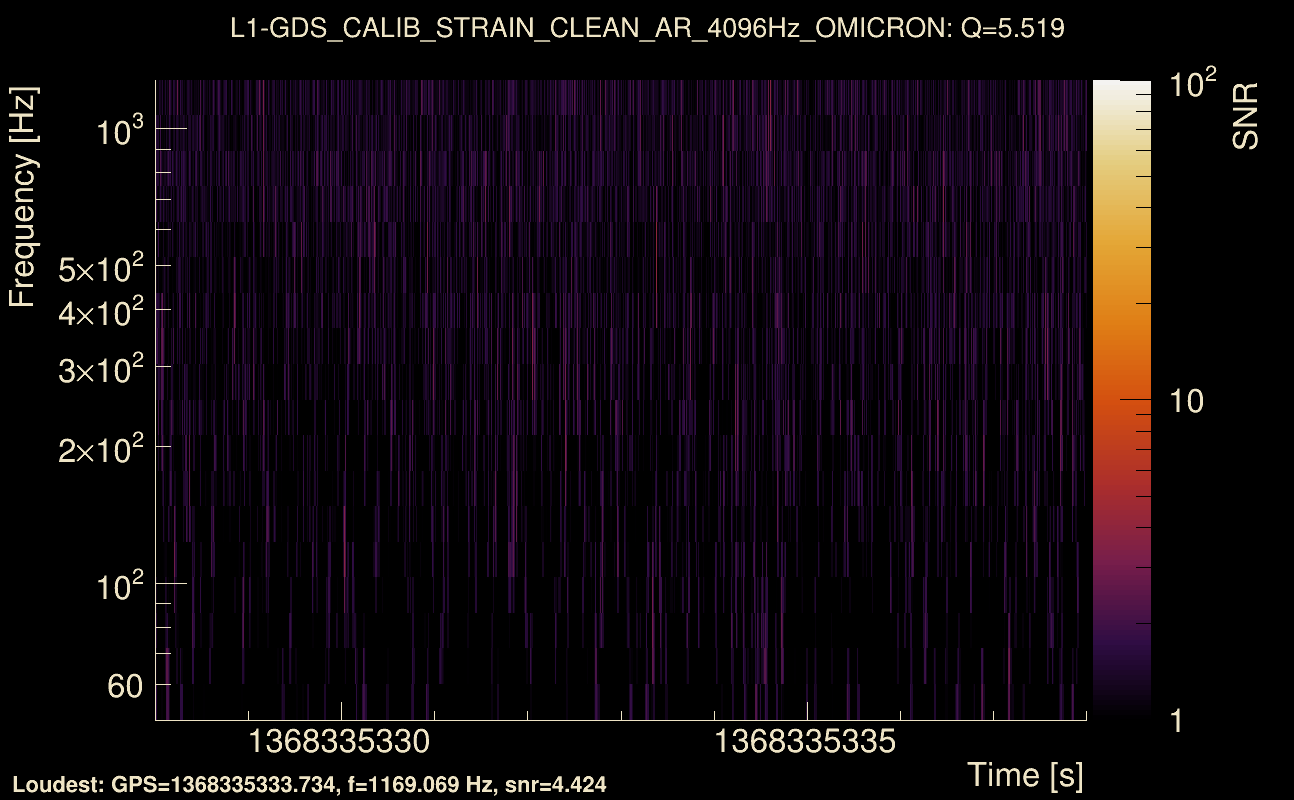
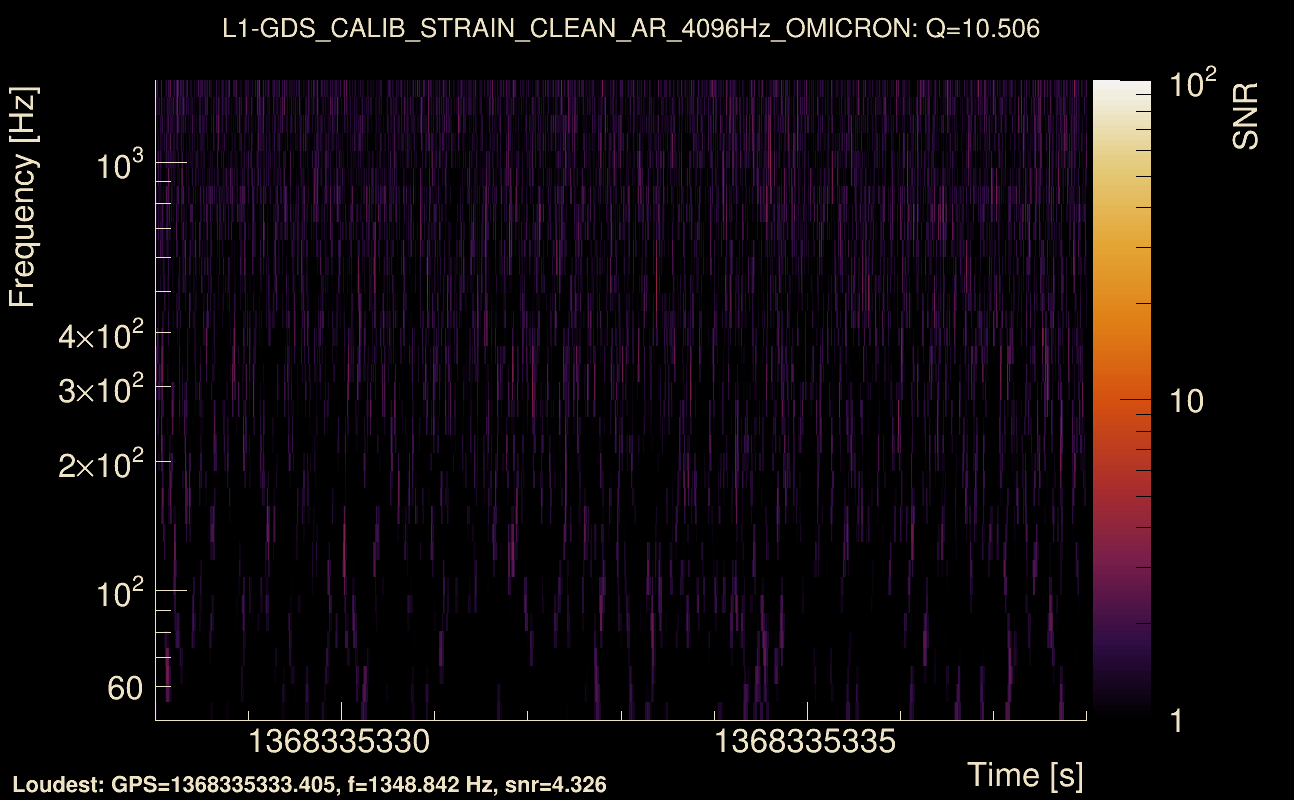
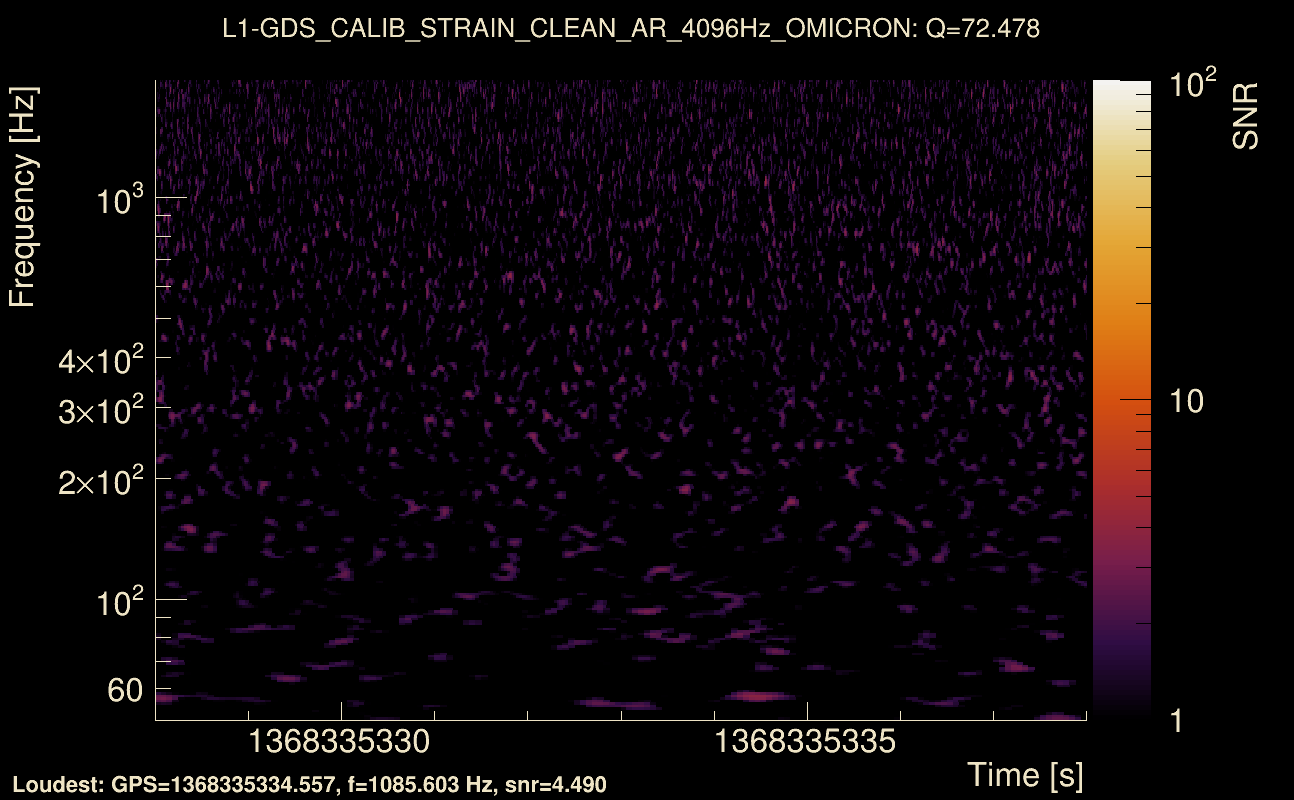
| Event time t(H1): | GPS = 1368335328 (Wed May 17 05:08:30 2023 ) → GPS = 1368335338 (Wed May 17 05:08:40 2023 ) |
| Event time t(L1): | GPS = 1368335328 (Wed May 17 05:08:40 2023 ) → GPS = 1368335338 (Wed May 17 05:08:40 2023 ) |
| Omicron analysis time window (H1): | GPS = 1368335325 → GPS = 1368335341 |
| Omicron analysis time window (L1): | GPS = 1368335325 → GPS = 1368335341 |
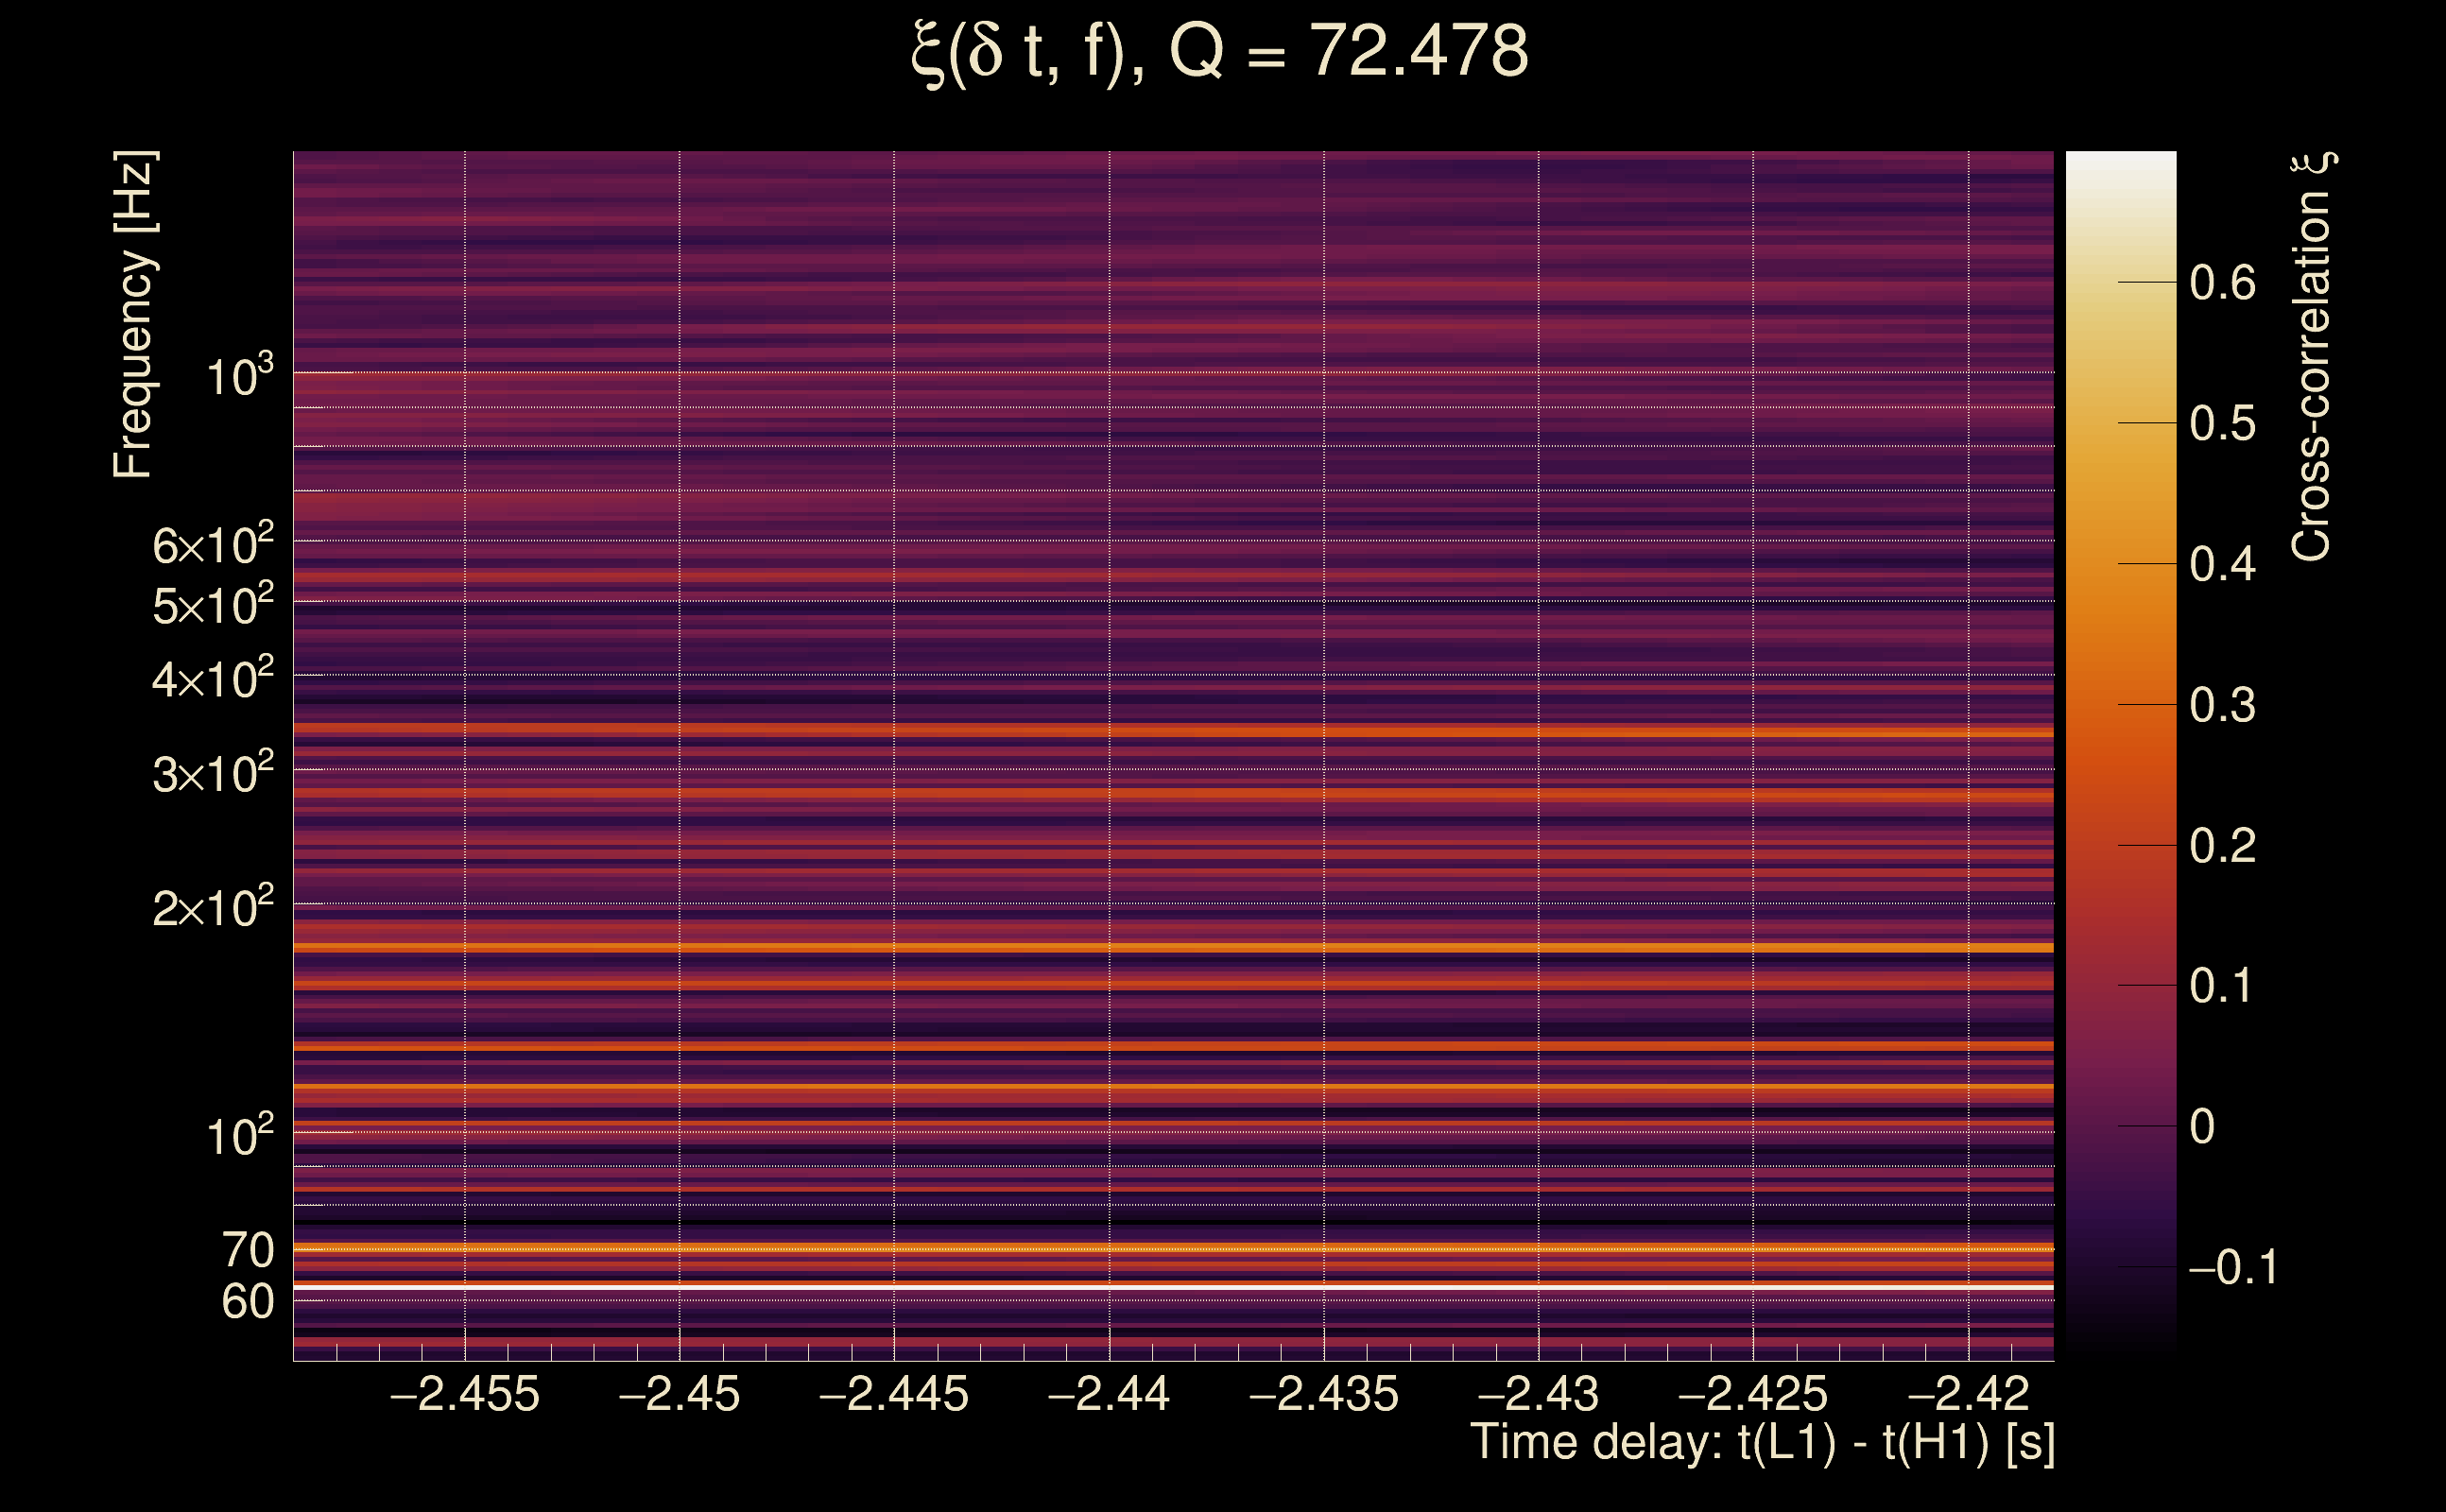
| Time delay between detectors t(L1) - t(H1): | -2.43834 s (slice index = 161 / 217), δt_gw = -0.000338865 s |
| Time delay standard deviation: | 0.0780547 s |
| [targeted mode] Time delay probability: | 0.785754 (0.271829 sigmas), δt_target = 0.00102758 s |
| Frequency: | 253.705 Hz |
| Ξ: | 0.013762 ± 0.0488129 (variance = 0.00238269): Q0: 0.0792852, Q1: 0.0846885, Q2: 0.0384974, Q3: 0.101014, Q4: 0.186523 |
| Rank: | R_A = 0.00952517 |
| Log of amplitude ratio (L1/H1): | -0.155952, variance = 0.724225 (L1/H1: -0.191925, variance = 1.37754, H1/L1: 0.117913, variance = 1.52535) |
| Amplitude ratio (L1/H1): | 0.8556 ⋇ 2.34202 (L1/H1: 0.825368 ⋇ 3.23389, H1/L1: 1.12515 ⋇ 3.43855) |
| Amplitude ratio H1|L1 compatibility (probability): | 0.965351 |
| Antenna factor probability: | 0.912471 |
| Number of rejected frequency rows: | Q0: 14 / 18, Q1: 30 / 36, Q2: 64 / 70, Q3: 126 / 134, Q4: 245 / 258 |
| Maximum signal-to-noise ratio: | H1: 4.98938, L1: 4.85206 |
| SNR variance: | H1: 0.534659, L1: 0.502001 |
| Click here for a zoomed plot | Click here for a zoomed plot | Click here for a zoomed plot | Click here for a zoomed plot | Click here for a zoomed plot |
 |
 |
 |
 |
 |
 |
 |
 |
 |
 |
 |
 |
 |
 |
 |
 |
 |
 |
 |
 |
 |
 |
 |
 |
 |
 |
 |
 |
 |
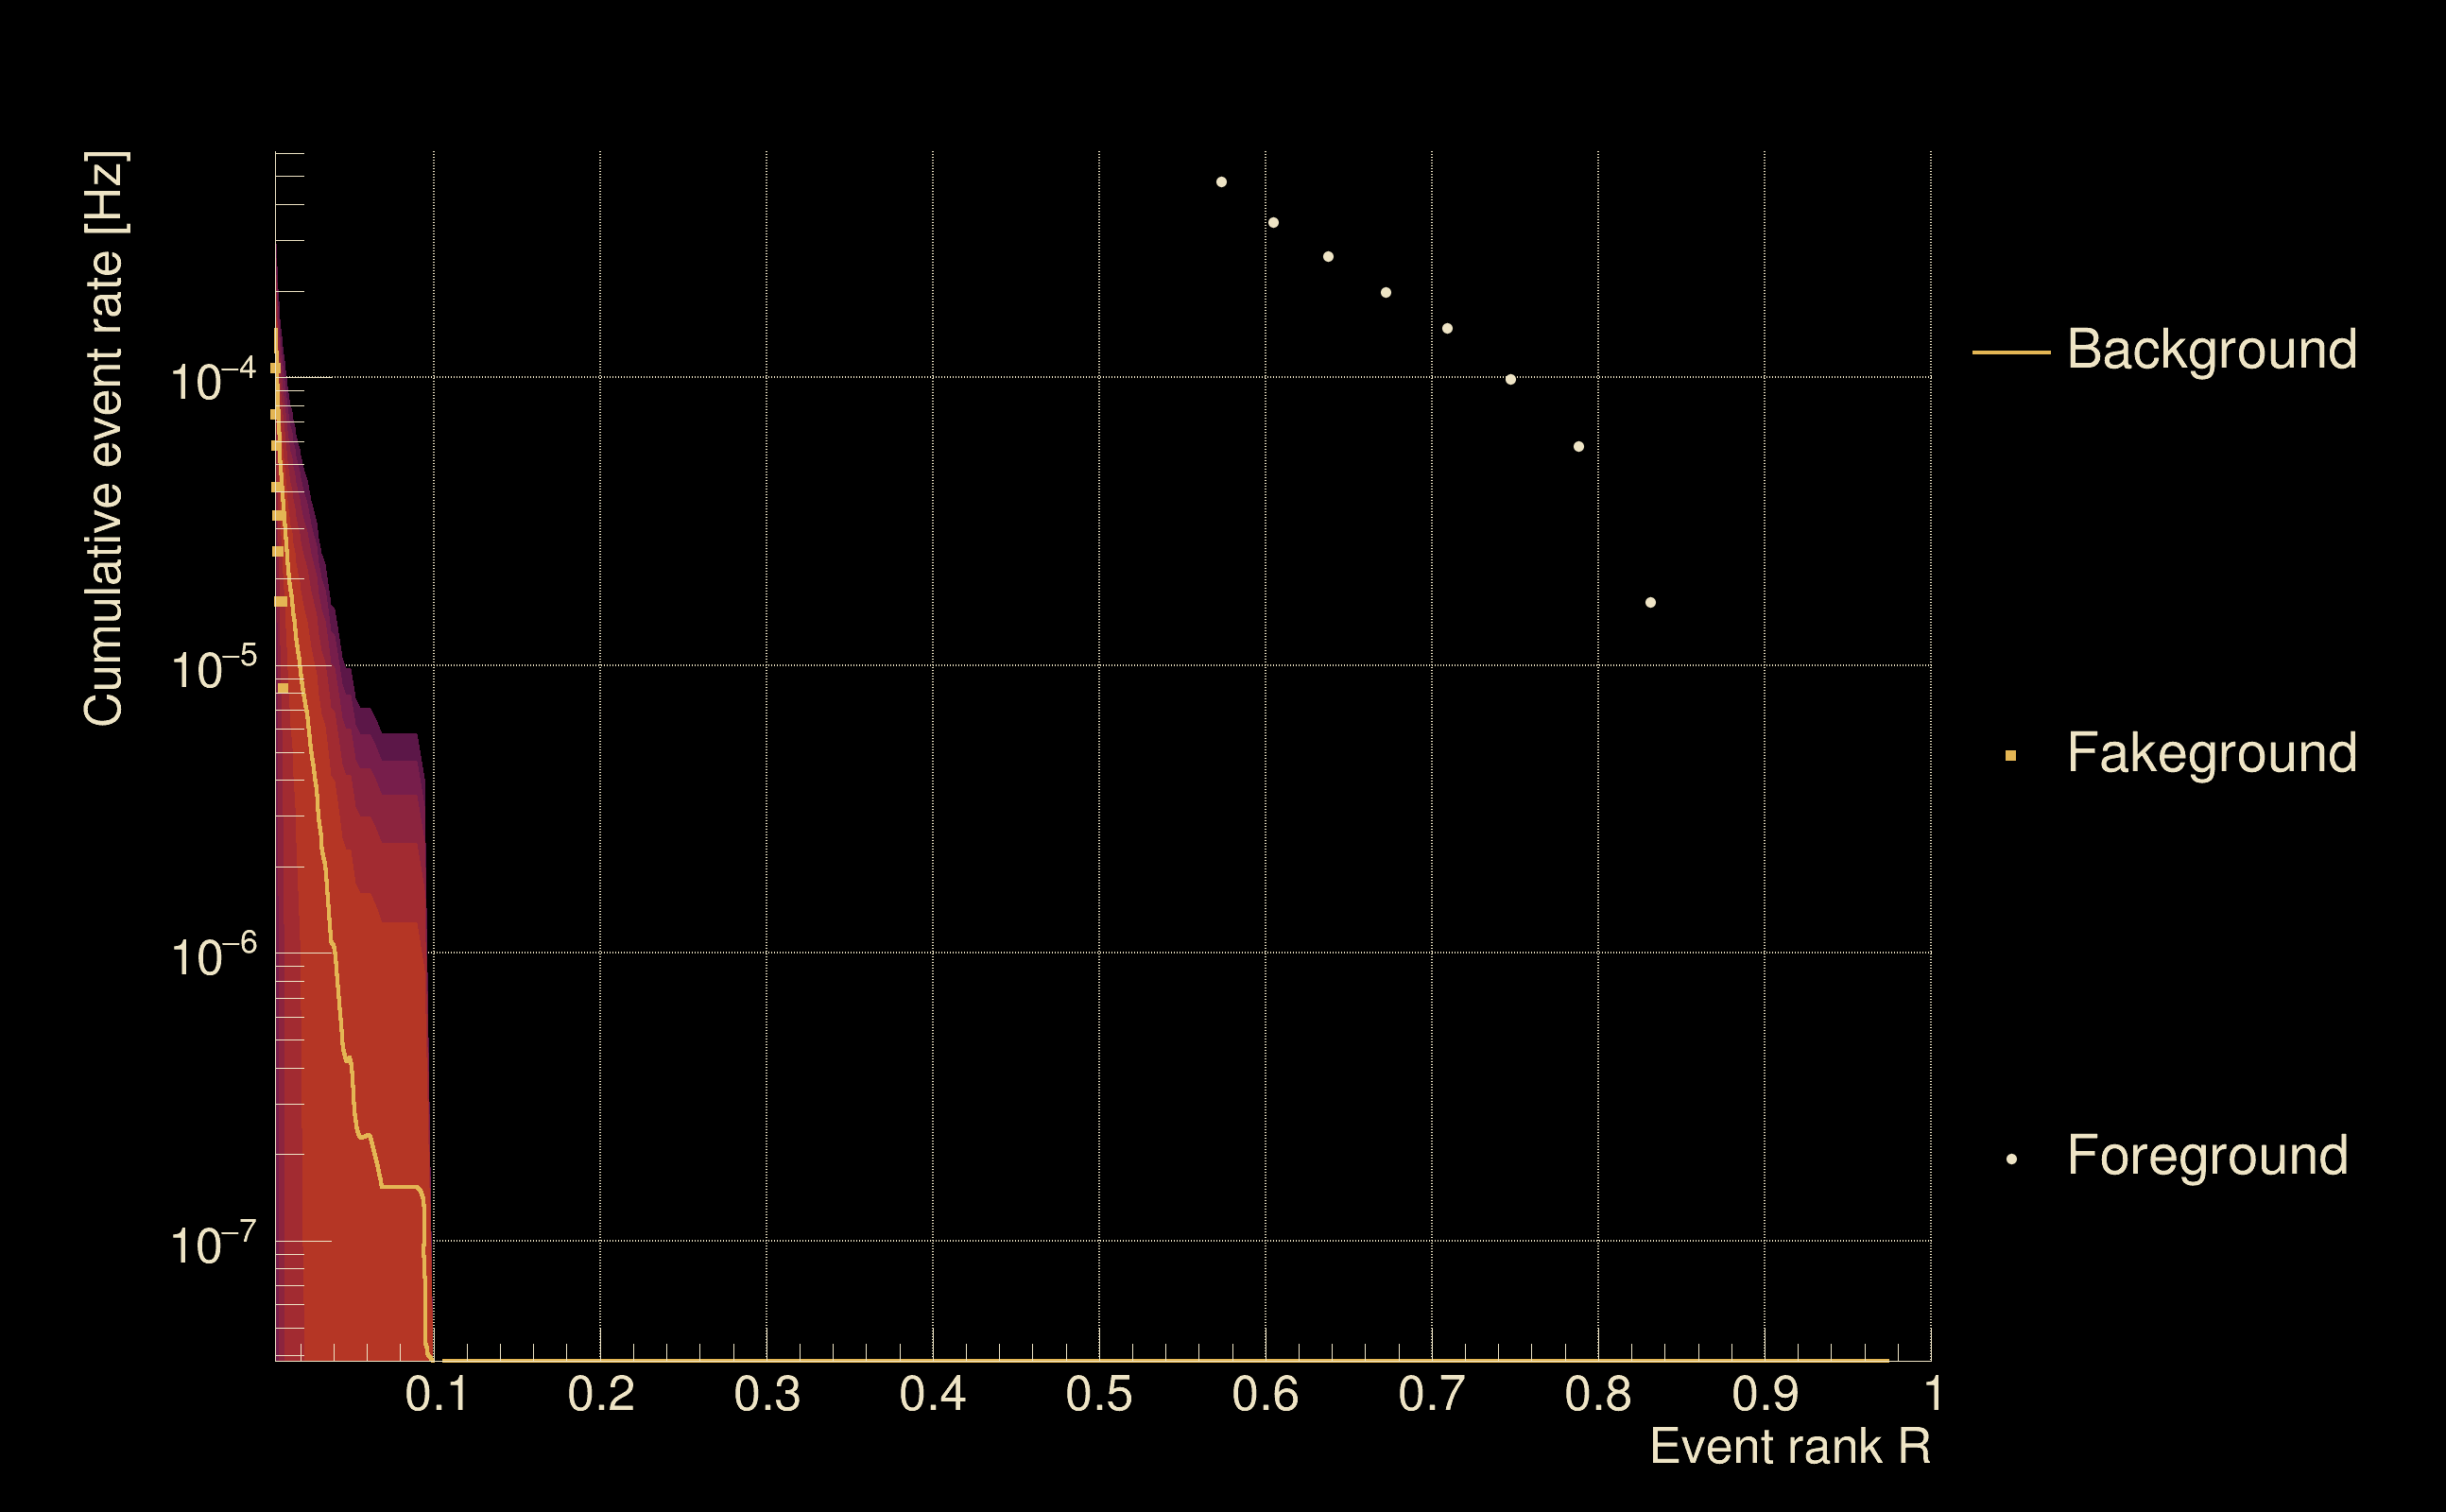
| Detection threshold: | R > 0.0314201 |
| False-alarm rate above that detection threshold: | 2.56267e-06 |
| Alternative threshold at 1/1000 yrs: | R > 0.094666 |
| Alternative threshold at 1/100 yrs: | R > 0.094666 |
| Alternative threshold at 1/10 yrs: | R > 0.094666 |
| Alternative threshold at 1/1 yr: | R > 0.094666 |
| Alternative threshold at 1/1 d: | R > 0.0173961 |
 |
|
 |
 |
 |
 |
 |
 |
 |
 |
 |
 |
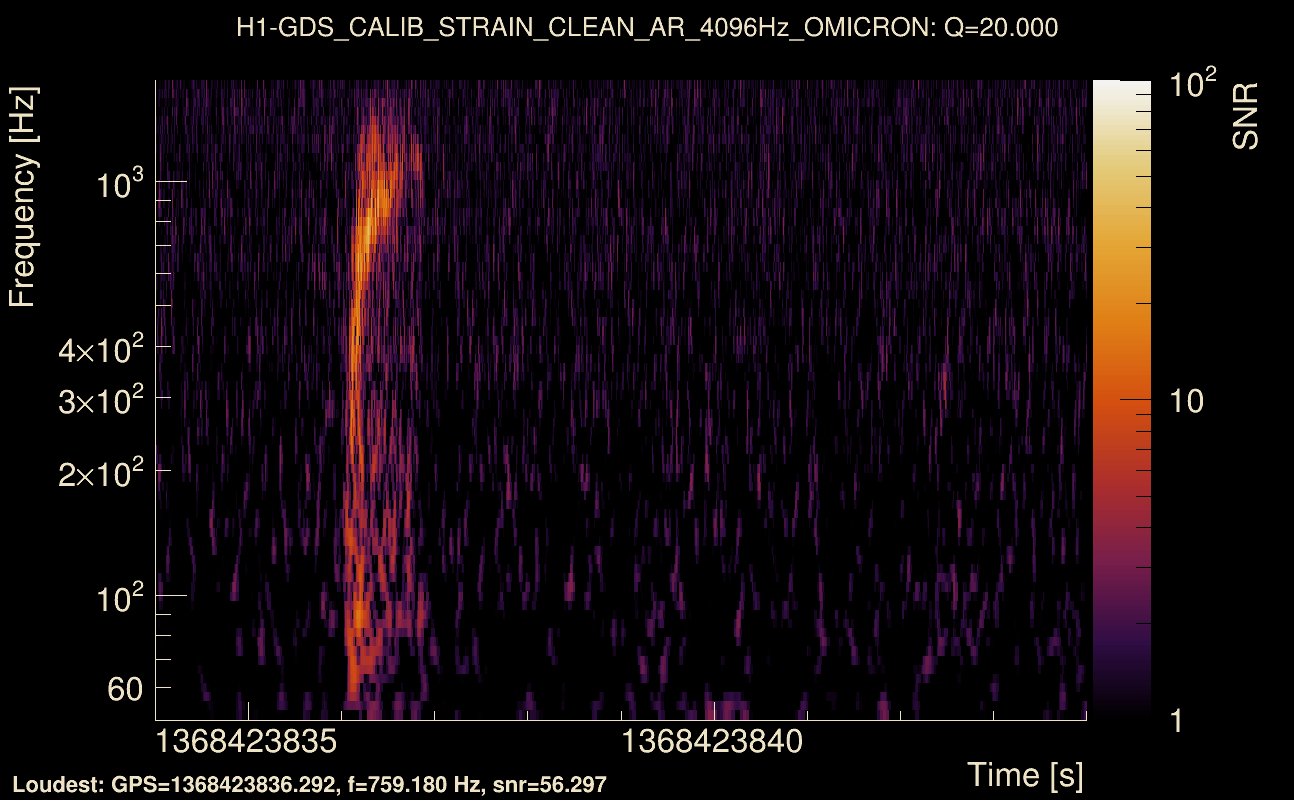
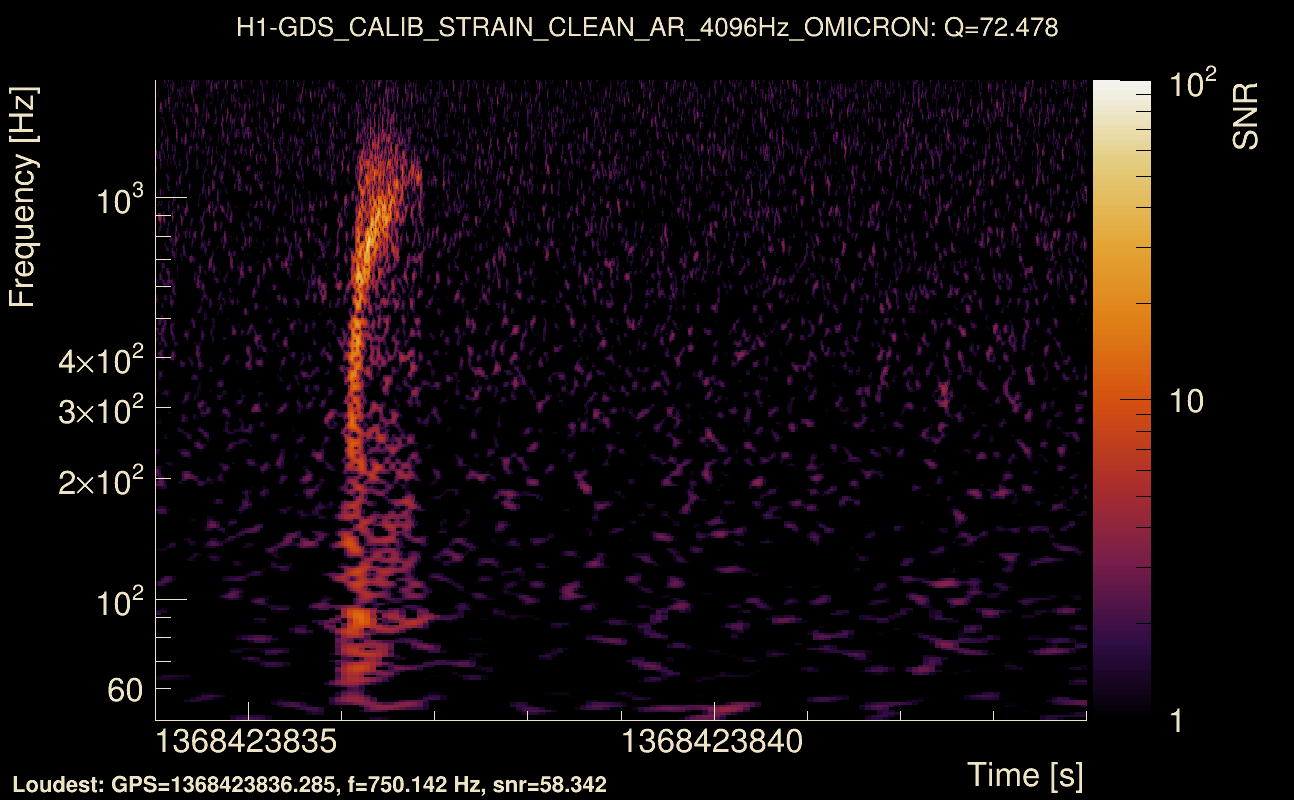
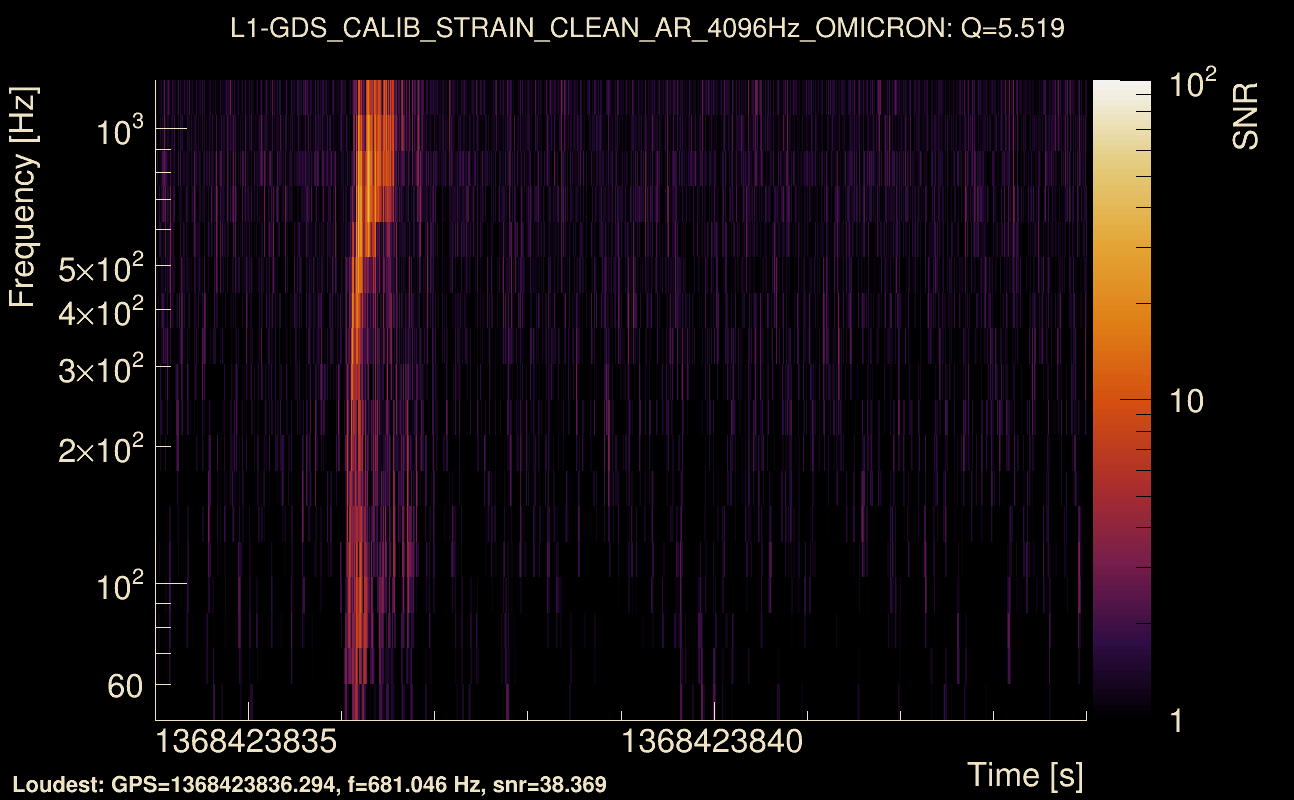
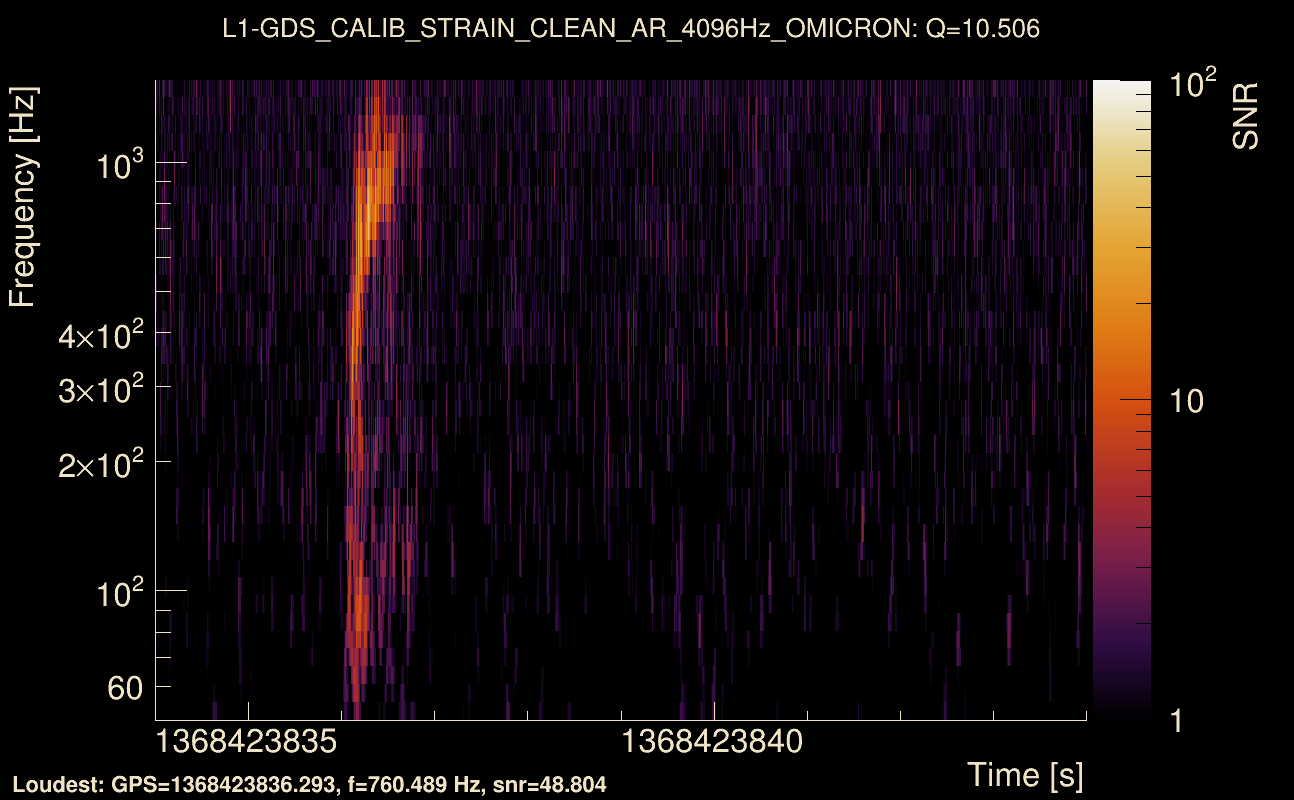
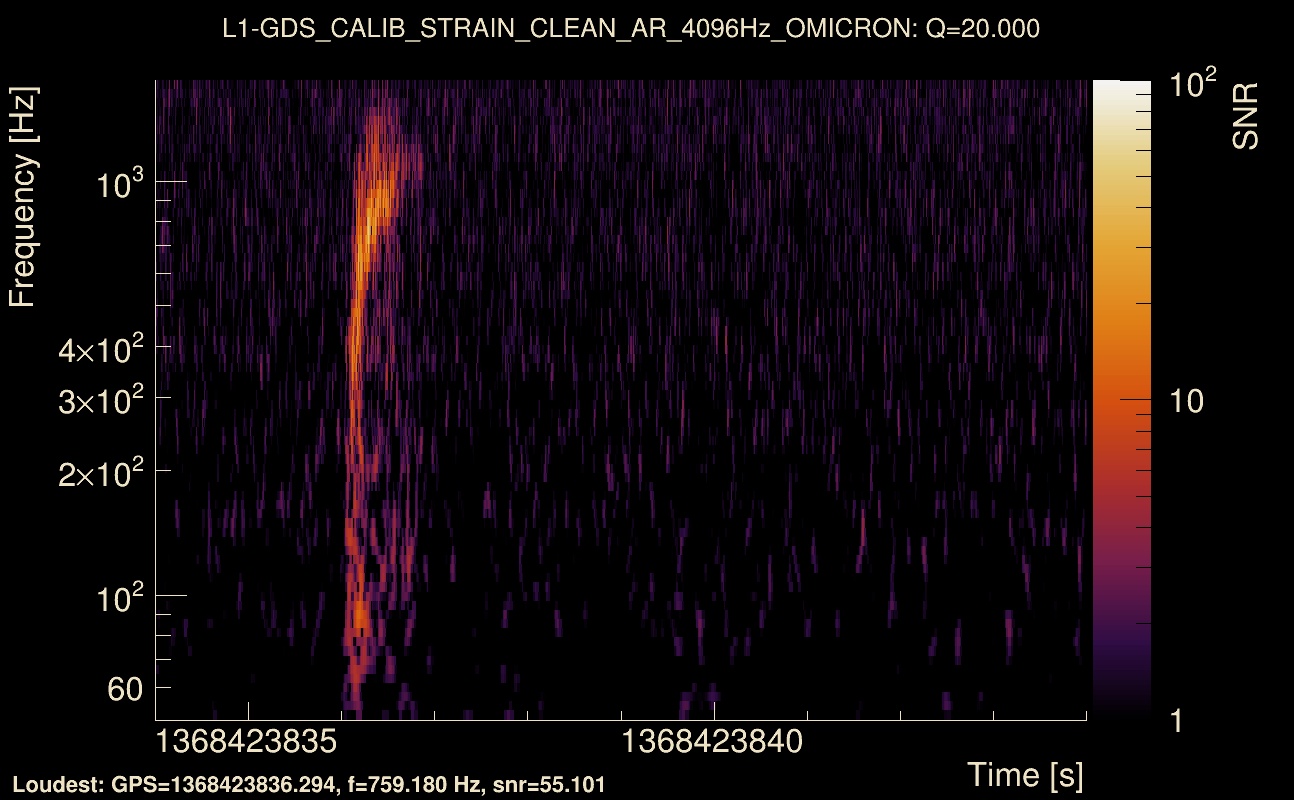
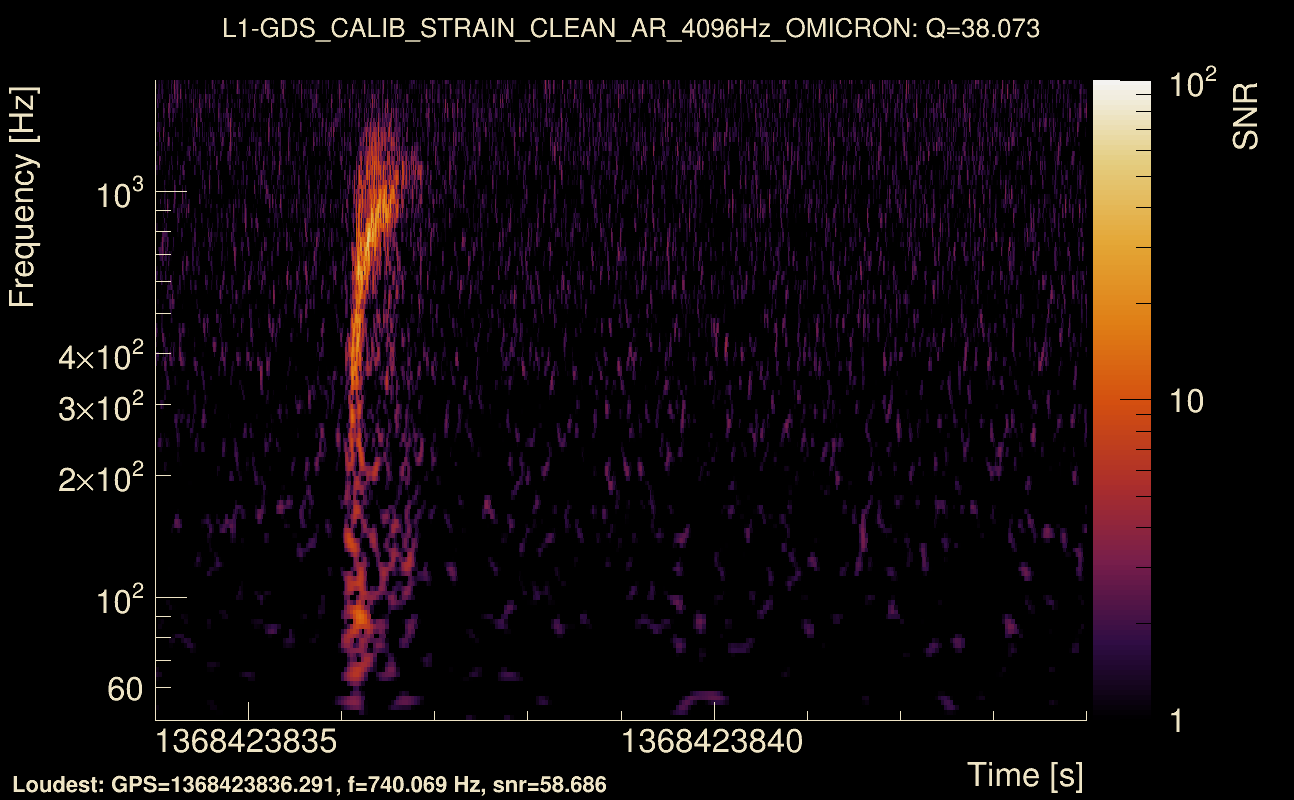
| Event time t(H1): | GPS = 1368423834 (Thu May 18 05:43:36 2023 ) → GPS = 1368423844 (Thu May 18 05:43:46 2023 ) |
| Event time t(L1): | GPS = 1368423834 (Thu May 18 05:43:46 2023 ) → GPS = 1368423844 (Thu May 18 05:43:46 2023 ) |
| Omicron analysis time window (H1): | GPS = 1368423831 → GPS = 1368423847 |
| Omicron analysis time window (L1): | GPS = 1368423831 → GPS = 1368423847 |
| Time delay between detectors t(L1) - t(H1): | 0.0470981 s (slice index = 107 / 217), δt_gw = 0.00109811 s |
| Time delay standard deviation: | 0.069012 s |
| [targeted mode] Time delay probability: | 0.827881 (0.21742 sigmas), δt_target = 0.00131726 s |
| Frequency: | 333.156 Hz |
| Ξ: | 0.289597 ± 0.0263449 (variance = 0.000694053): Q0: 0.557235, Q1: 0.526444, Q2: 0.489489, Q3: 0.496056, Q4: 0.490683 |
| Rank: | R_A = 0.0933971 |
| Log of amplitude ratio (L1/H1): | -0.141419, variance = 0.155364 (L1/H1: -0.45339, variance = 0.304729, H1/L1: -0.176692, variance = 0.316903) |
| Amplitude ratio (L1/H1): | 0.868125 ⋇ 1.48314 (L1/H1: 0.63547 ⋇ 1.73676, H1/L1: 0.838038 ⋇ 1.75583) |
| Amplitude ratio H1|L1 compatibility (probability): | 0.424202 |
| Antenna factor probability: | 0.91833 |
| Number of rejected frequency rows: | Q0: 5 / 18, Q1: 21 / 36, Q2: 47 / 70, Q3: 111 / 134, Q4: 235 / 258 |
| Maximum signal-to-noise ratio: | H1: 59.9591, L1: 59.3776 |
| SNR variance: | H1: 2.28823, L1: 2.1284 |
| Click here for a zoomed plot | Click here for a zoomed plot | Click here for a zoomed plot | Click here for a zoomed plot | Click here for a zoomed plot |
 |
 |
 |
 |
 |
 |
 |
 |
 |
 |
 |
 |
 |
 |
 |
 |
 |
 |
 |
 |
 |
 |
 |
 |
 |
 |
 |
 |
 |
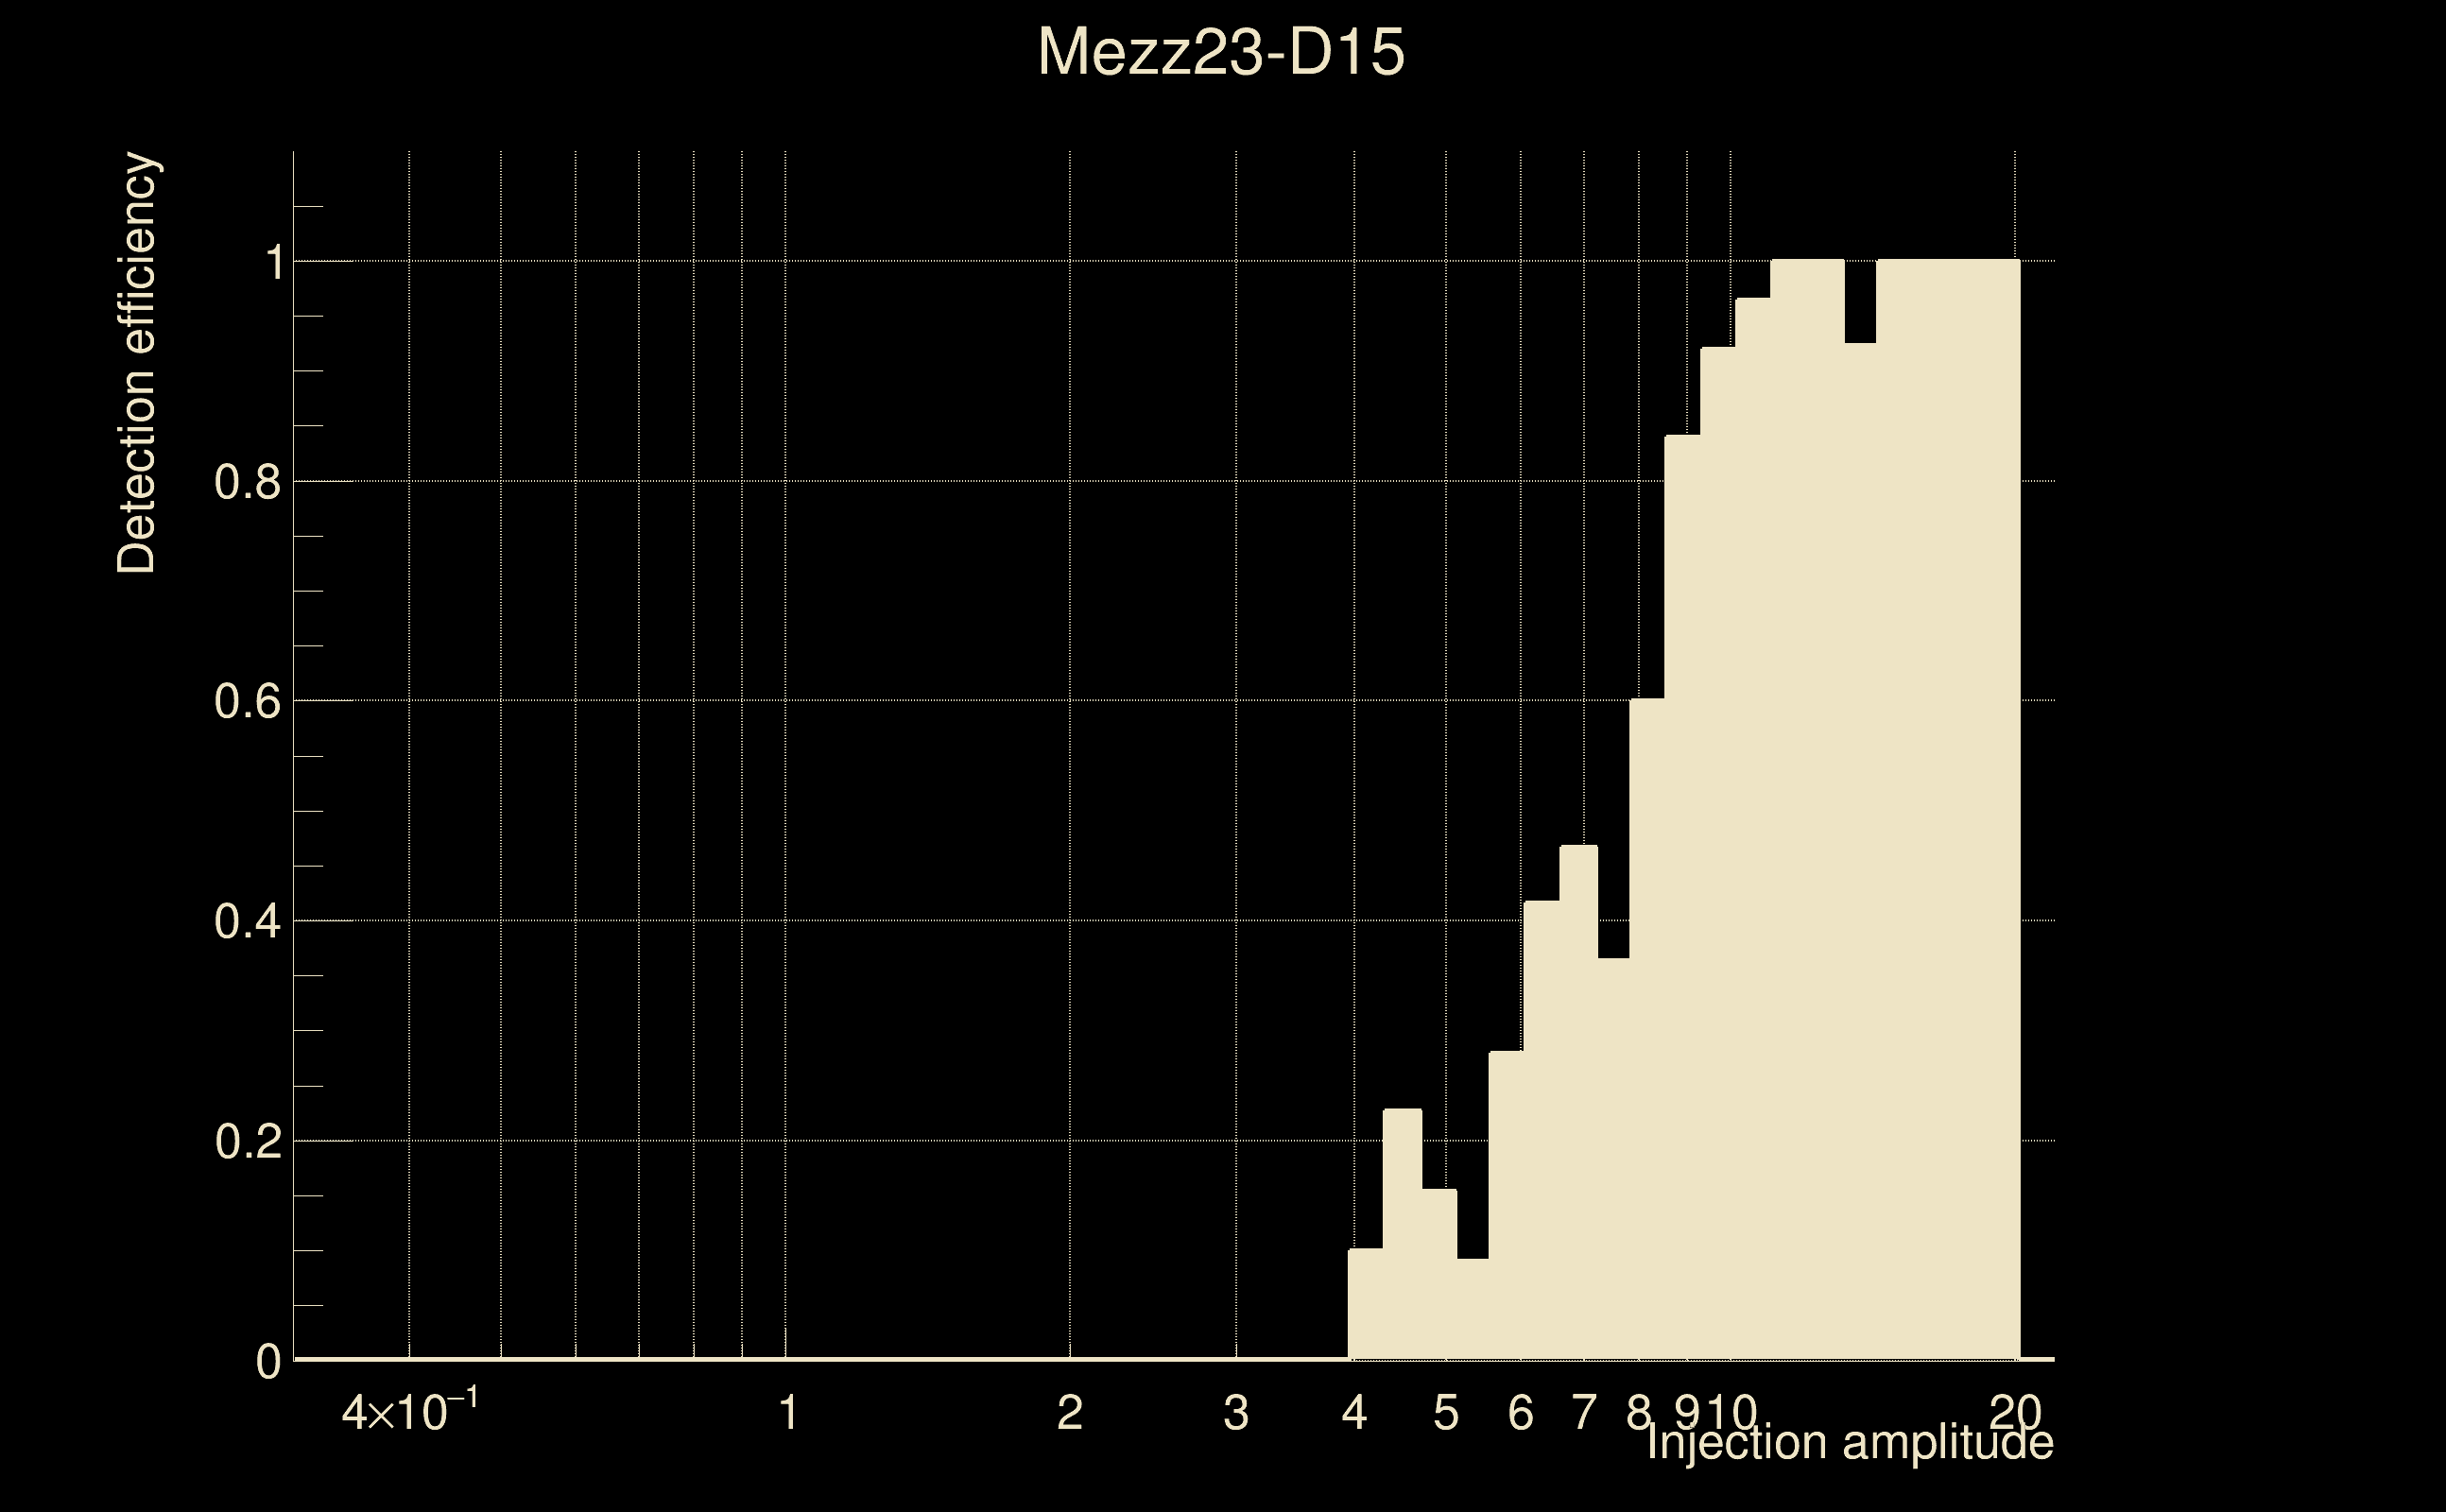
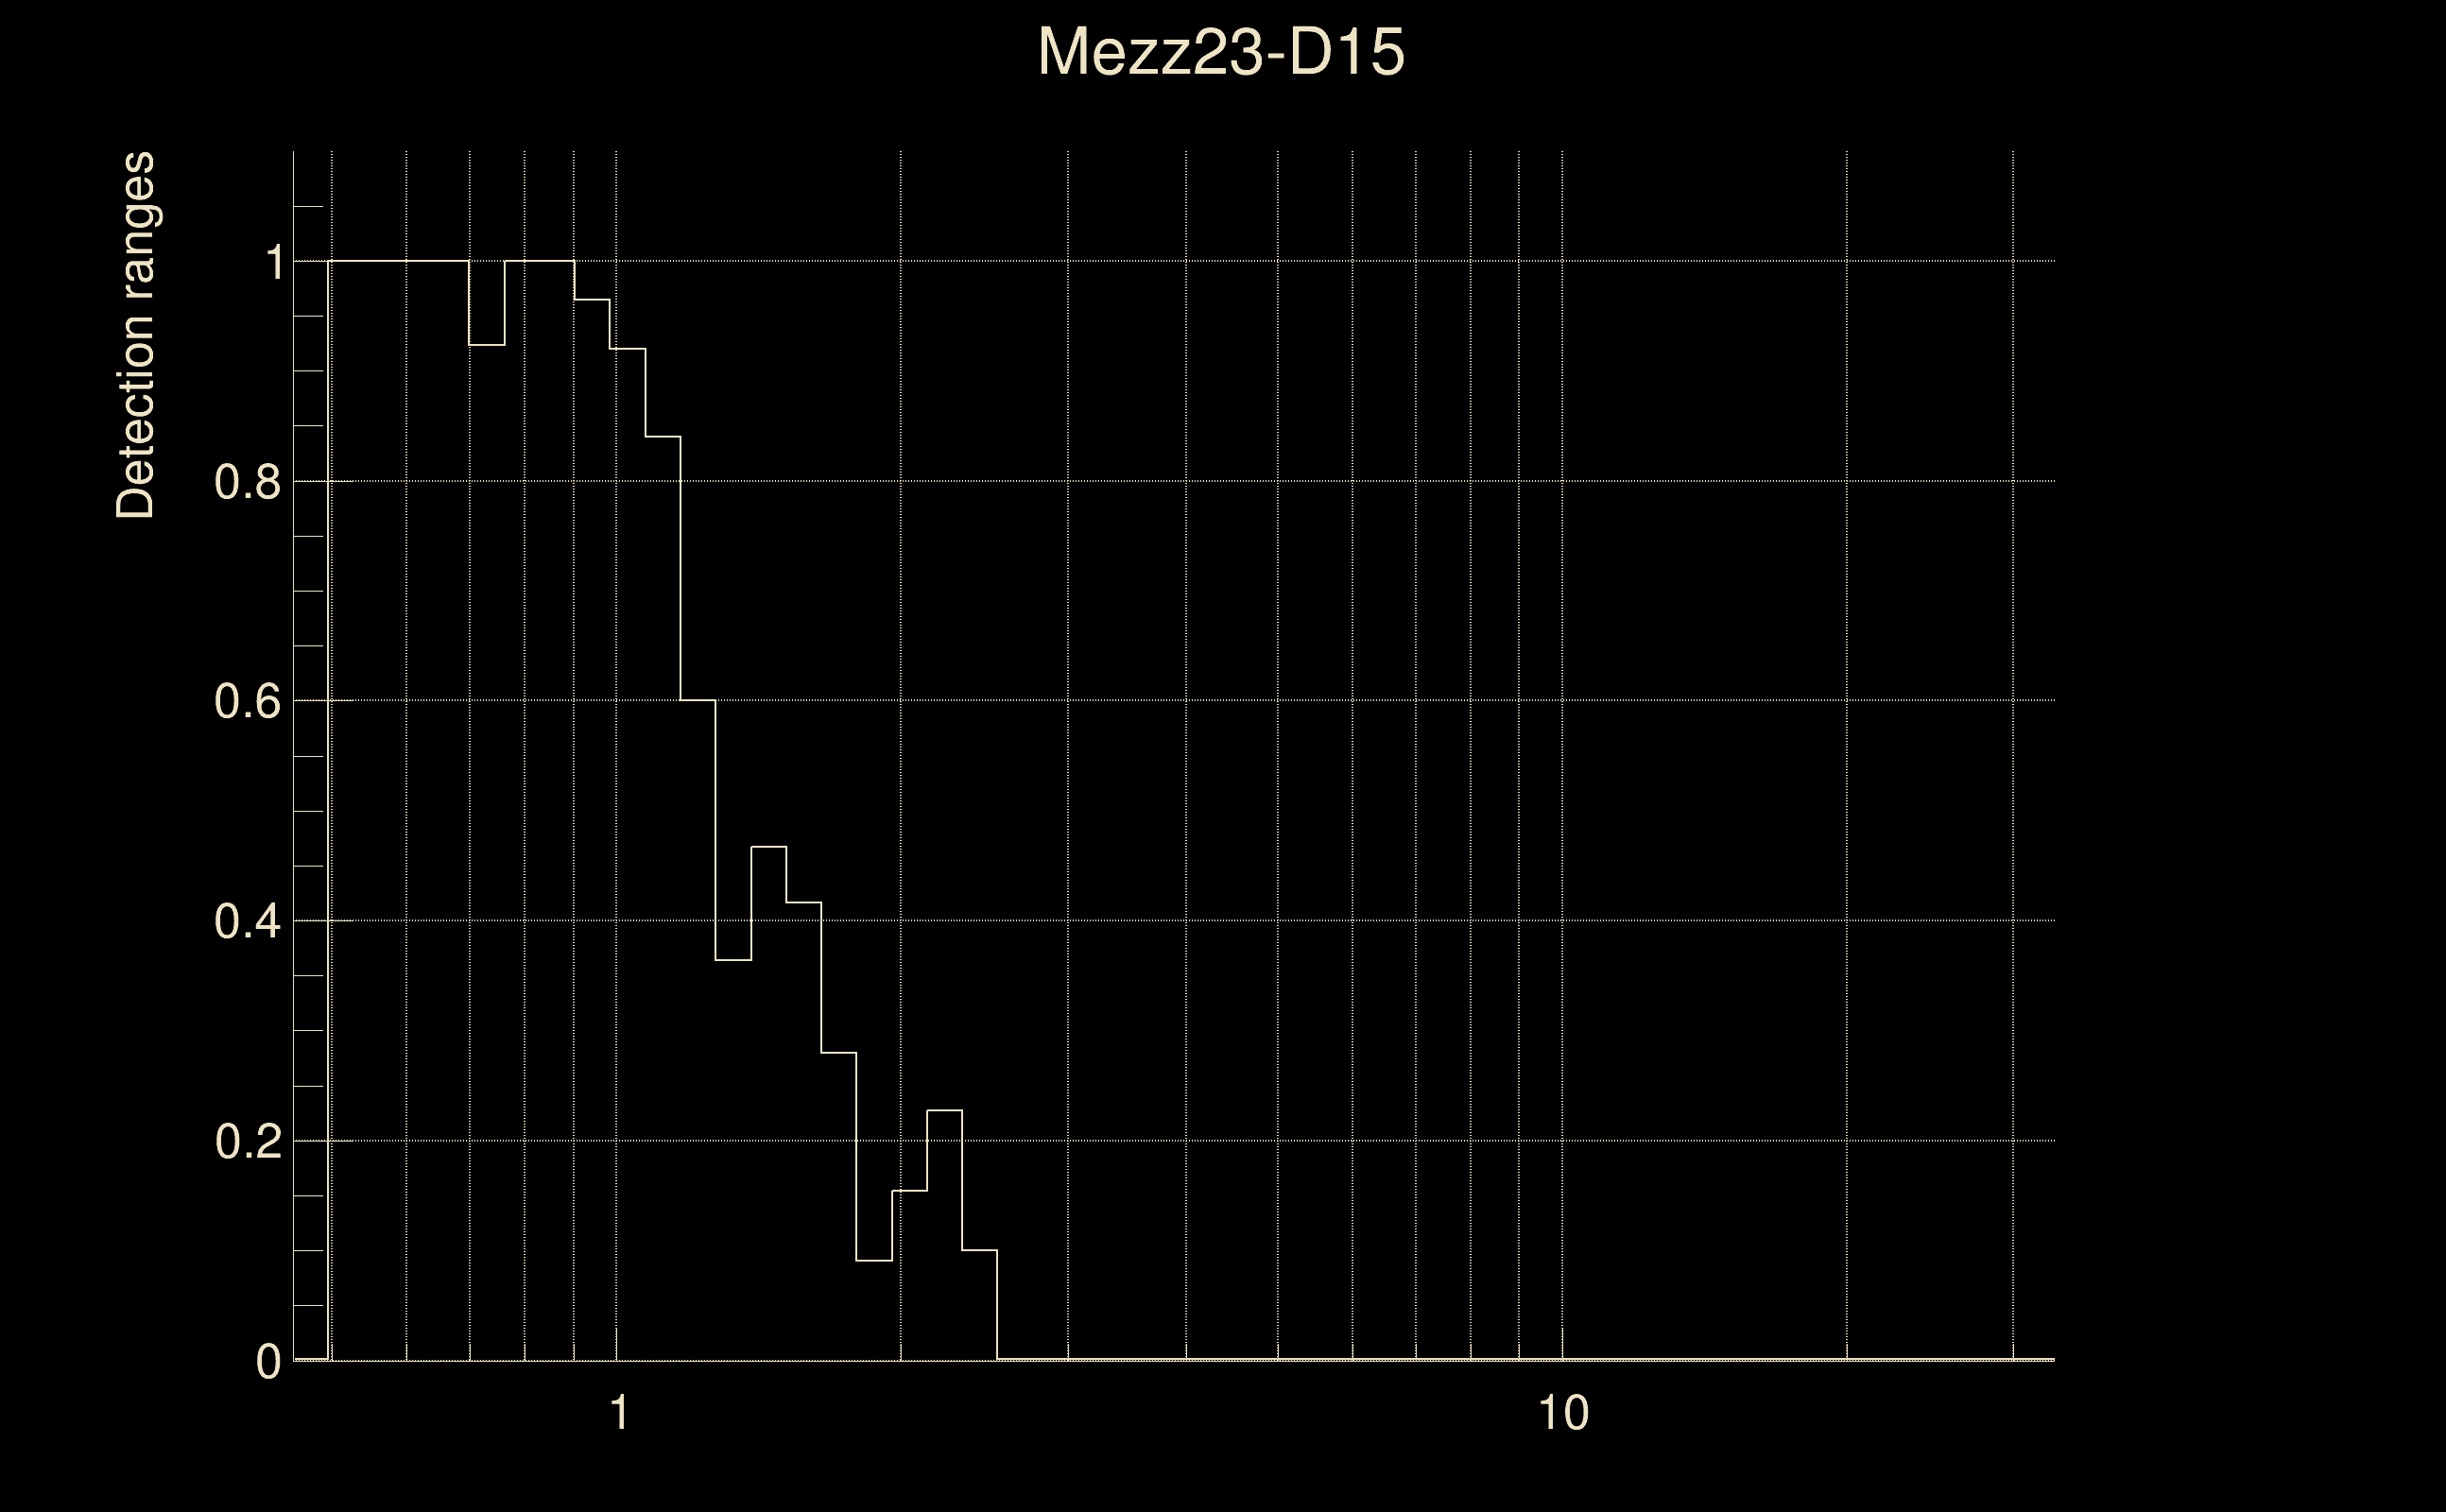
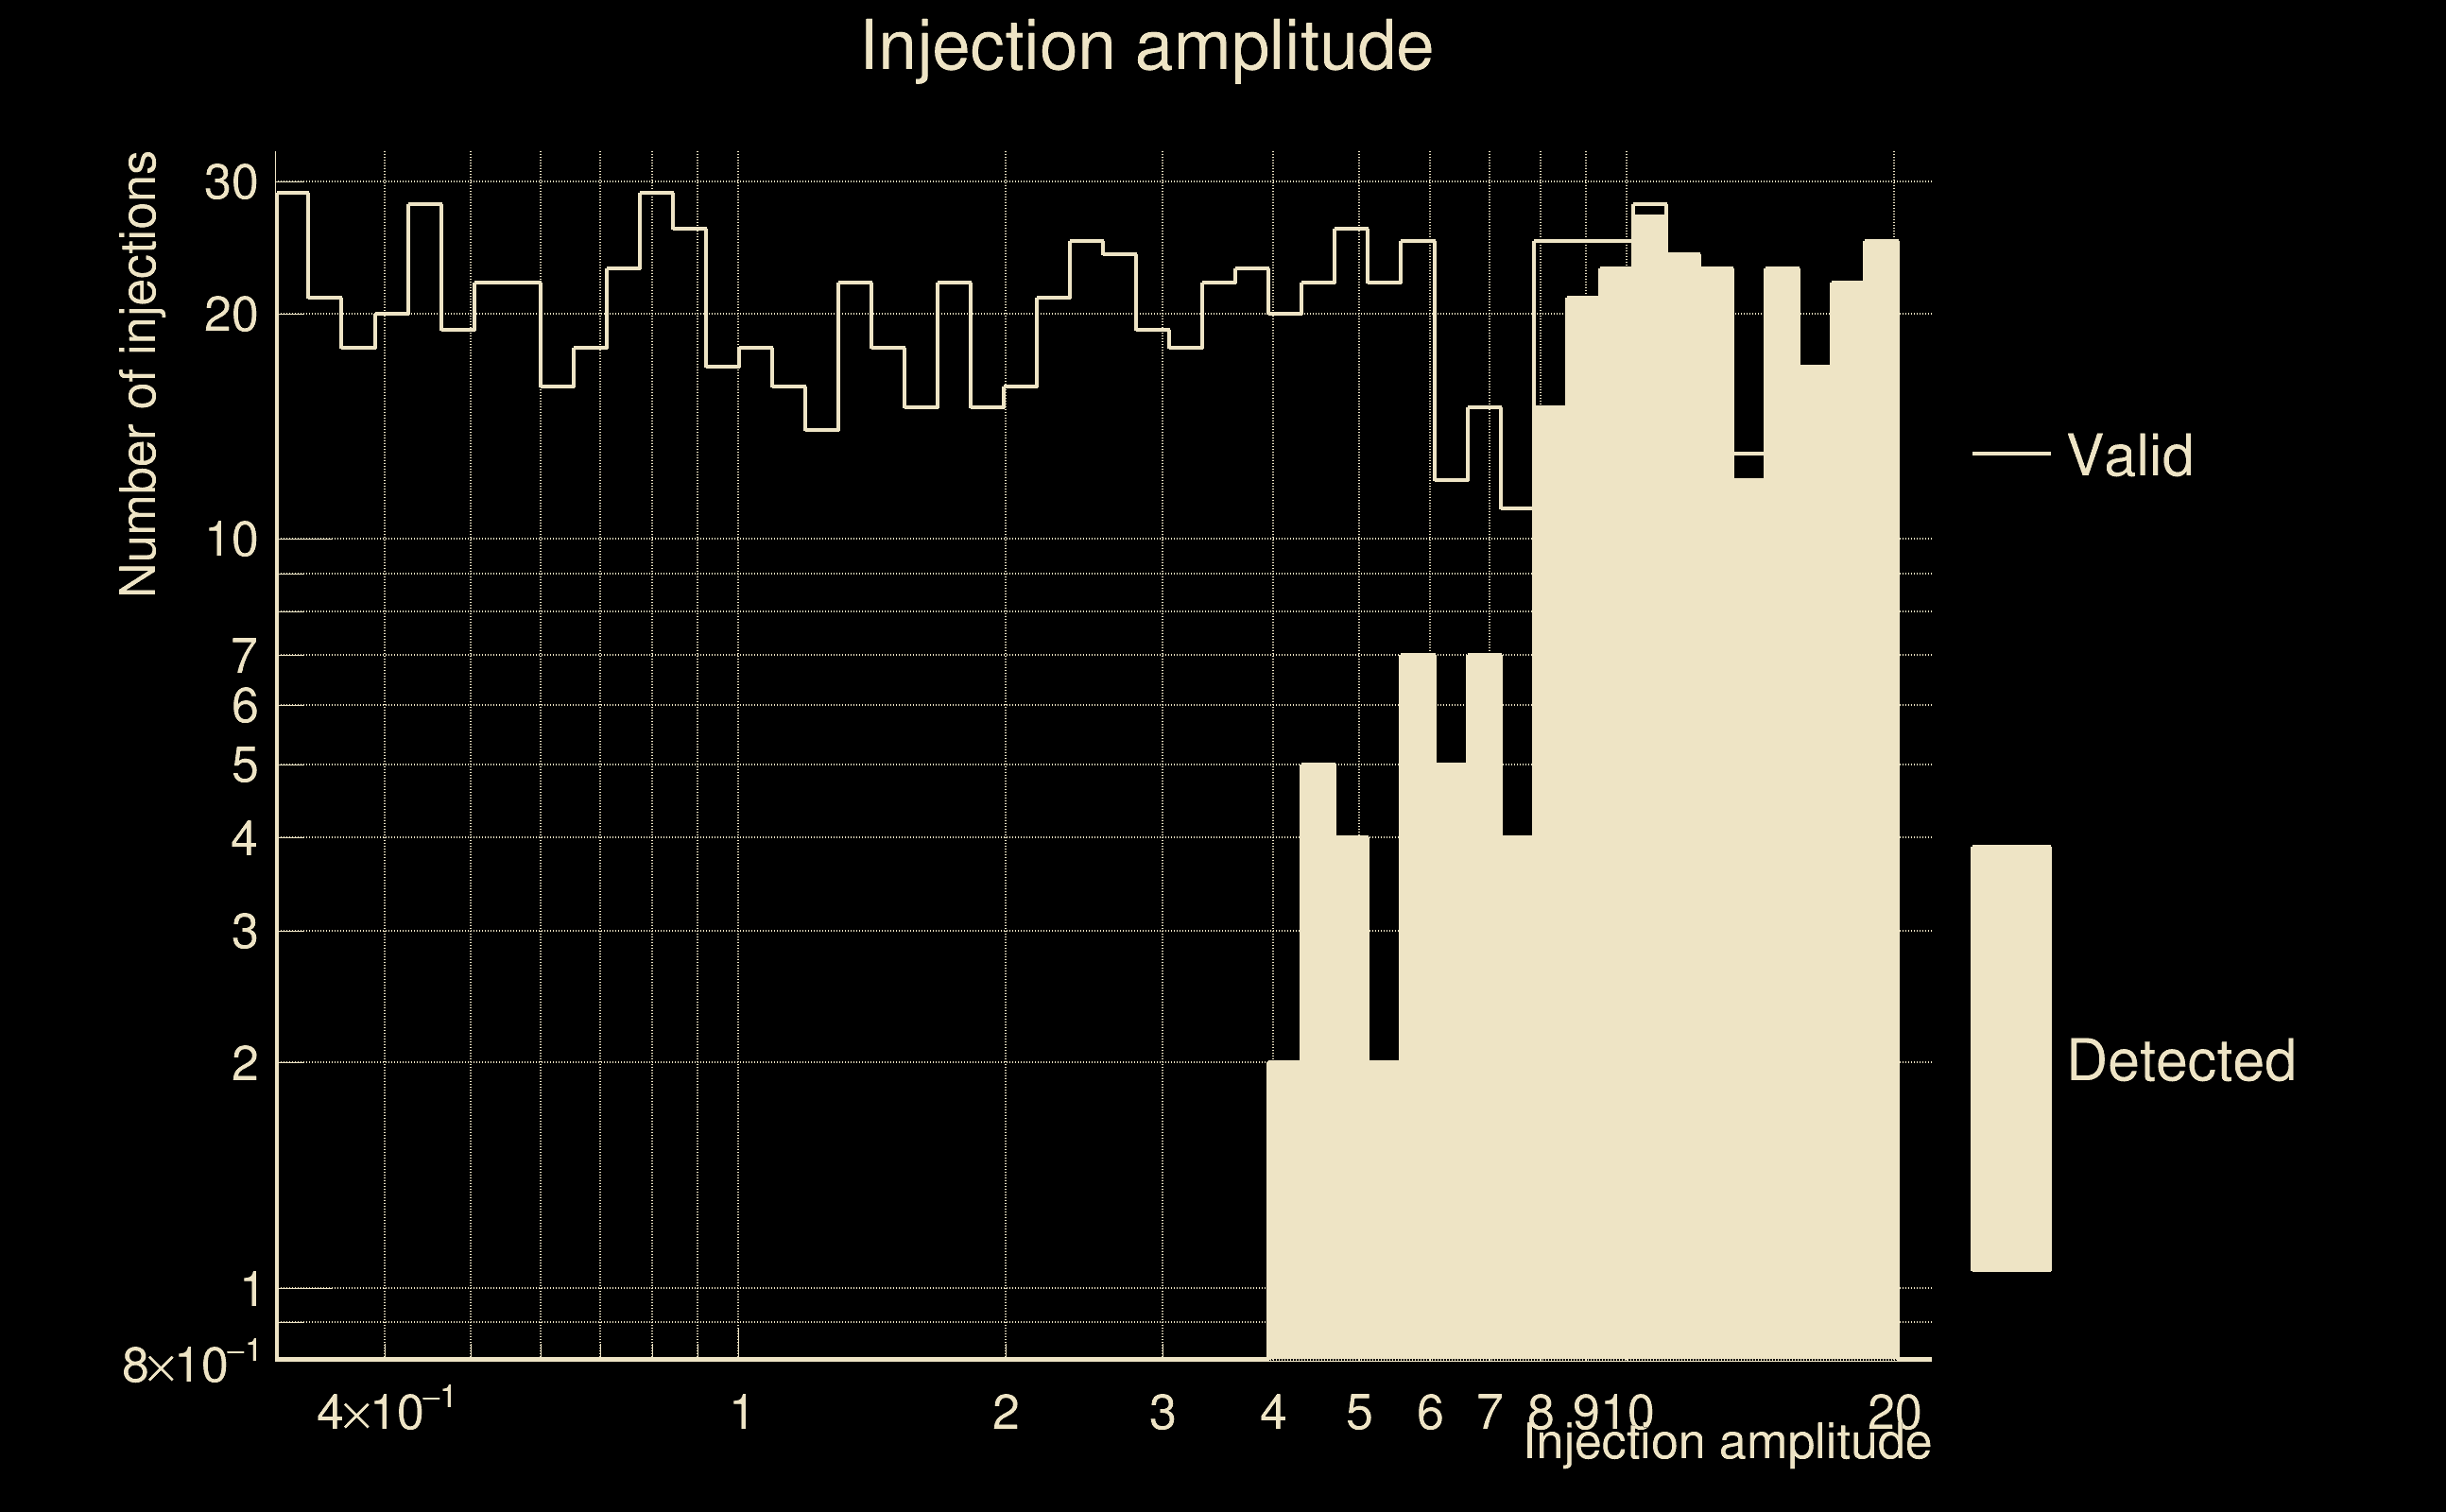
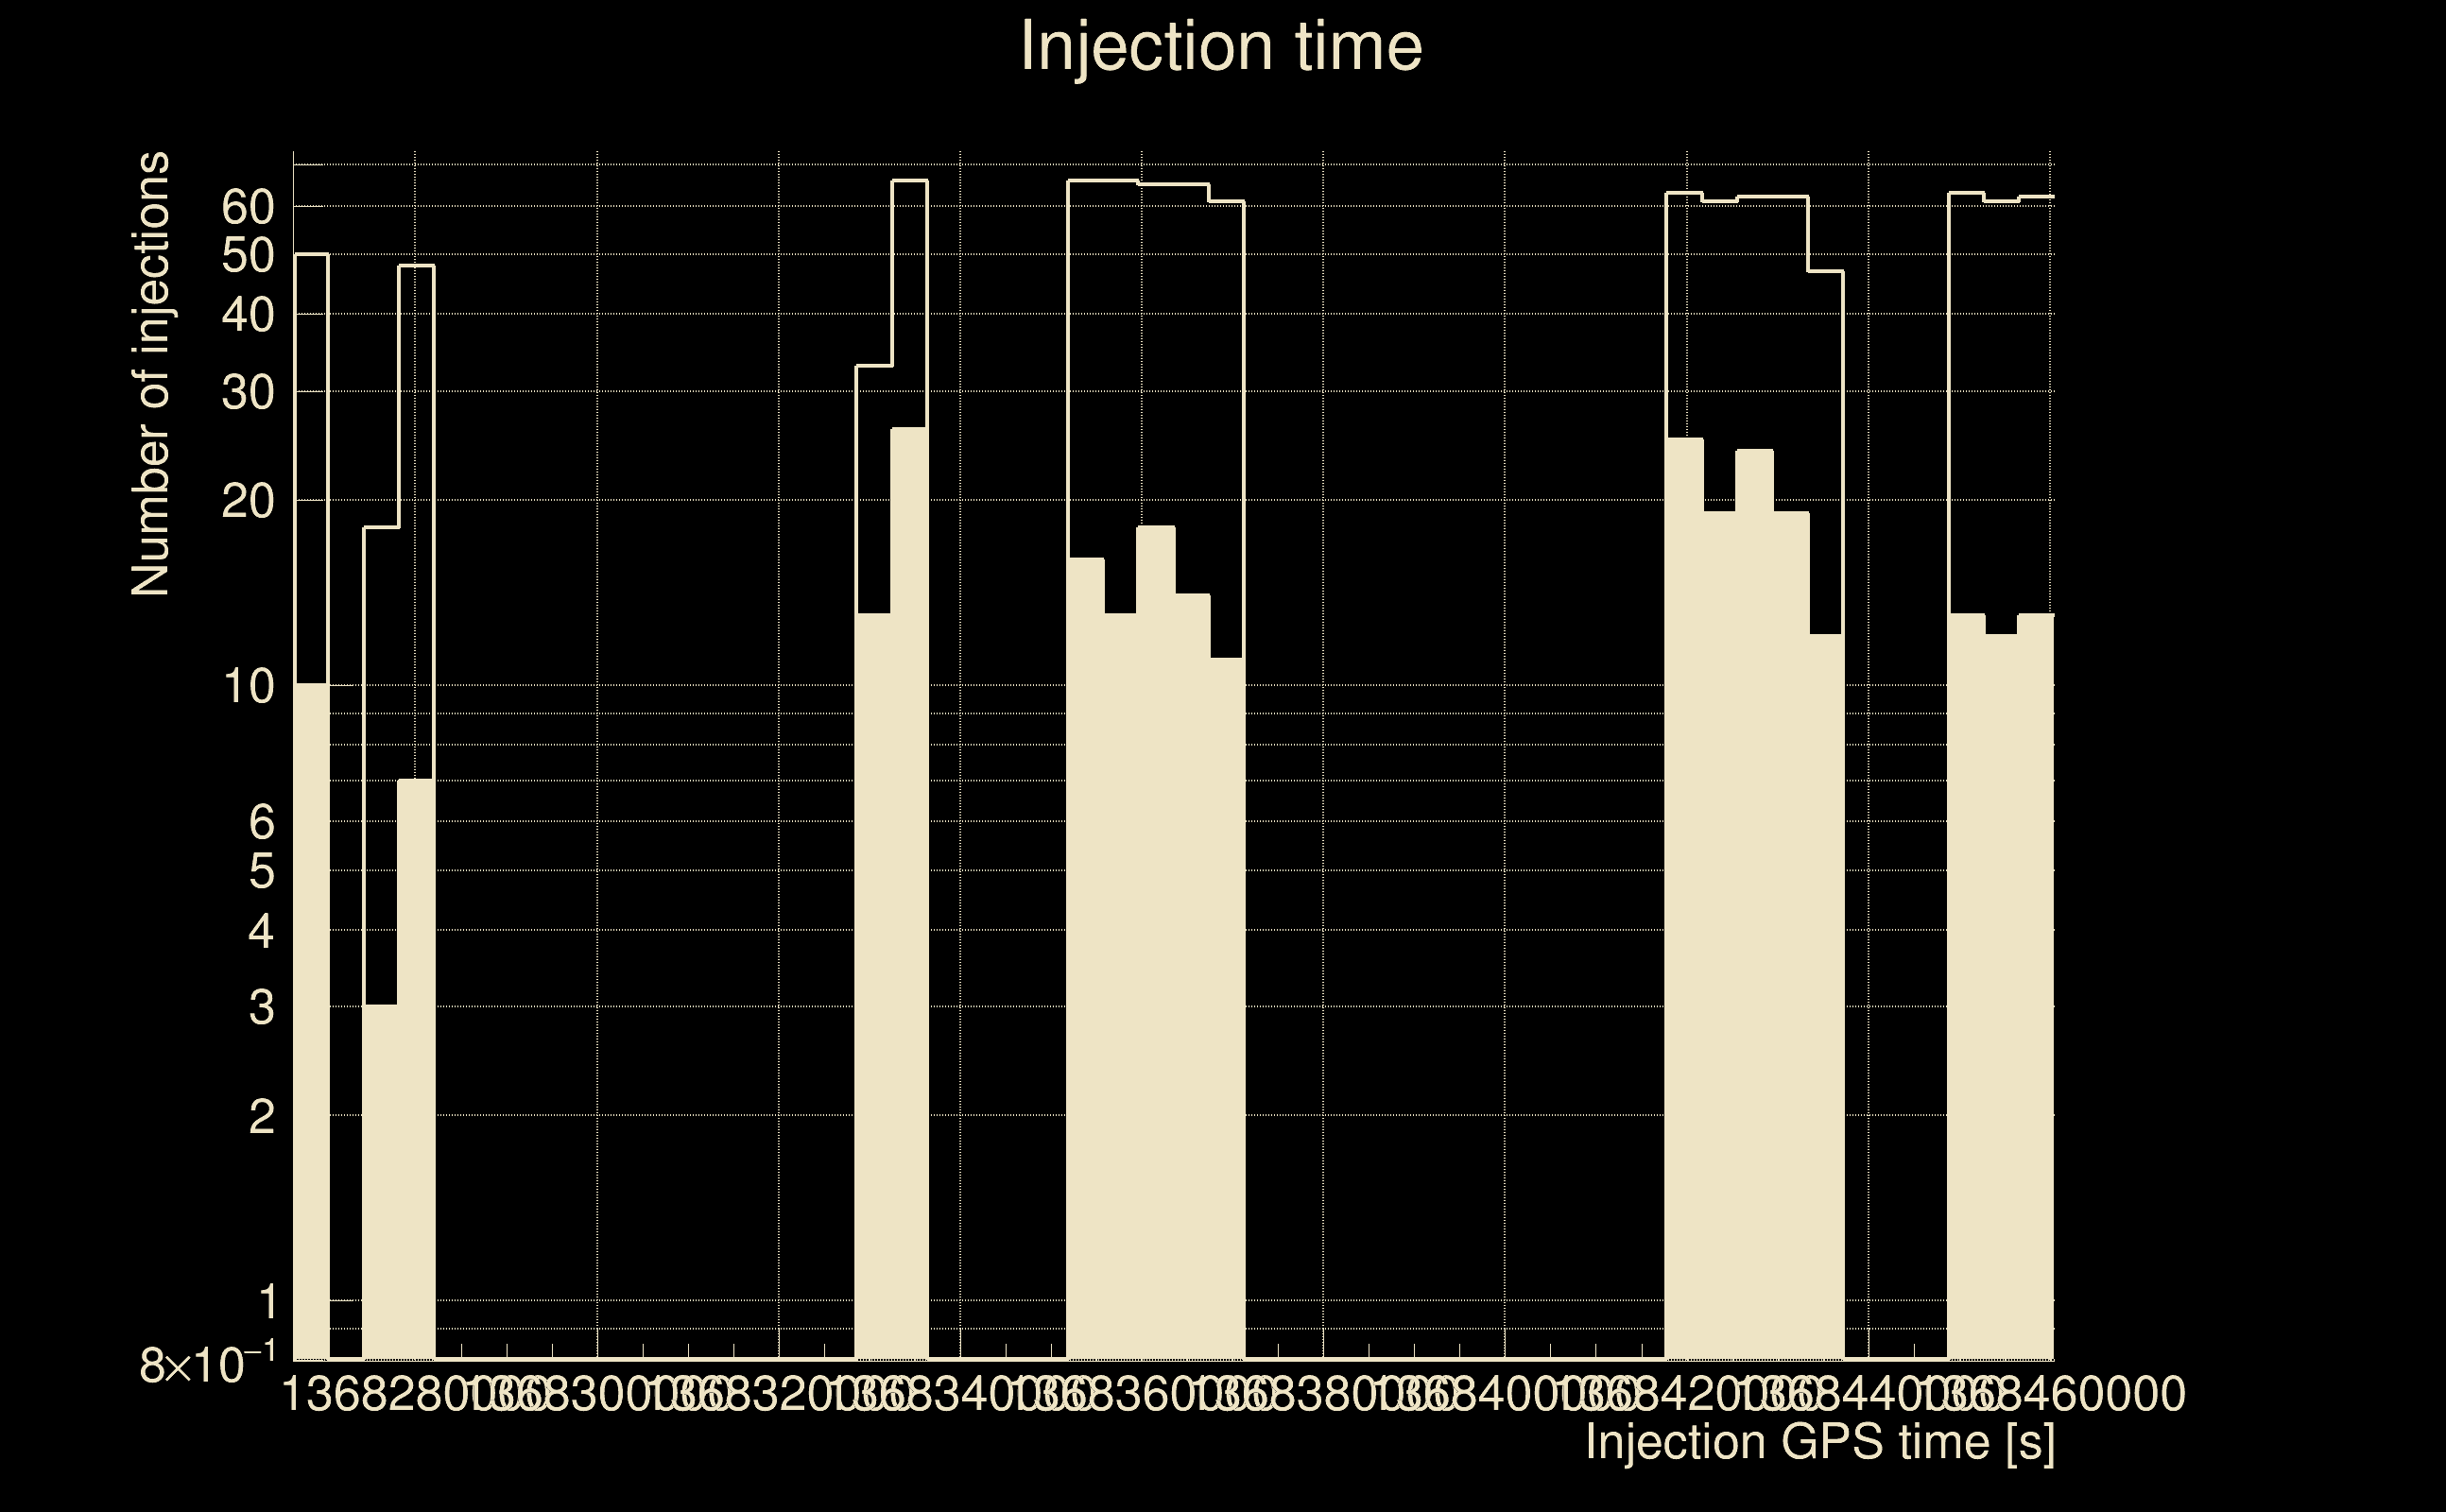
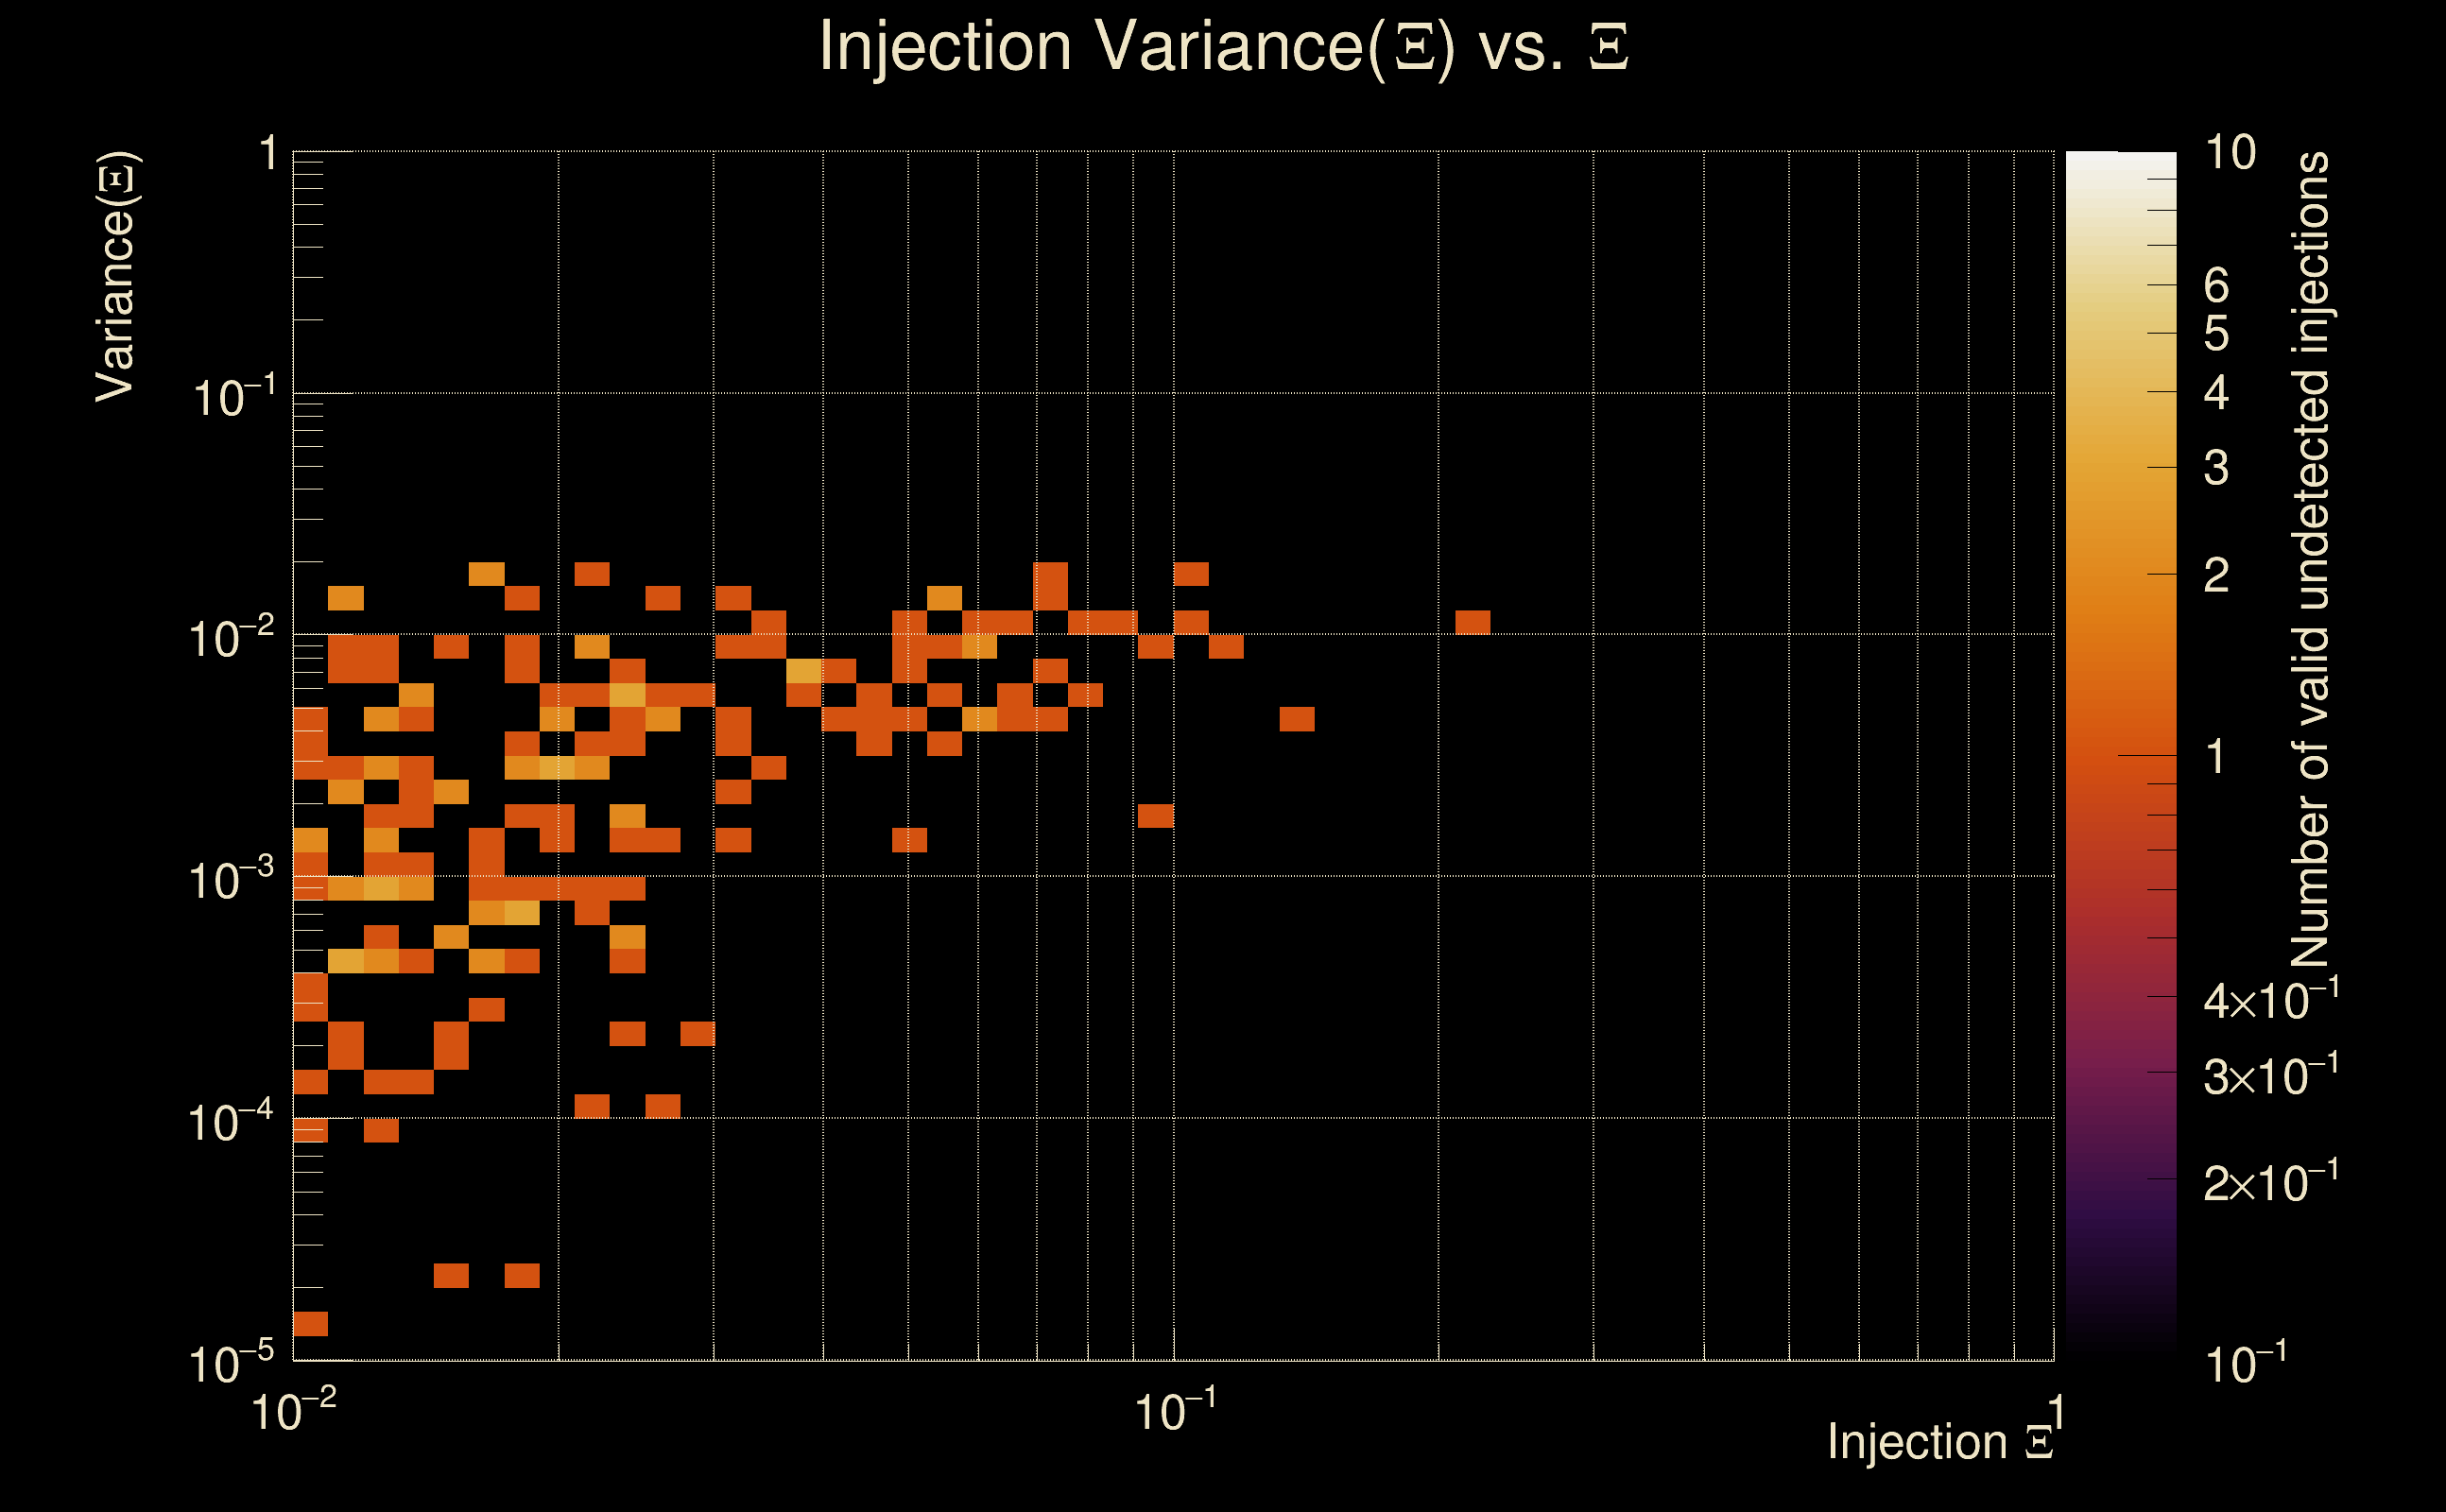
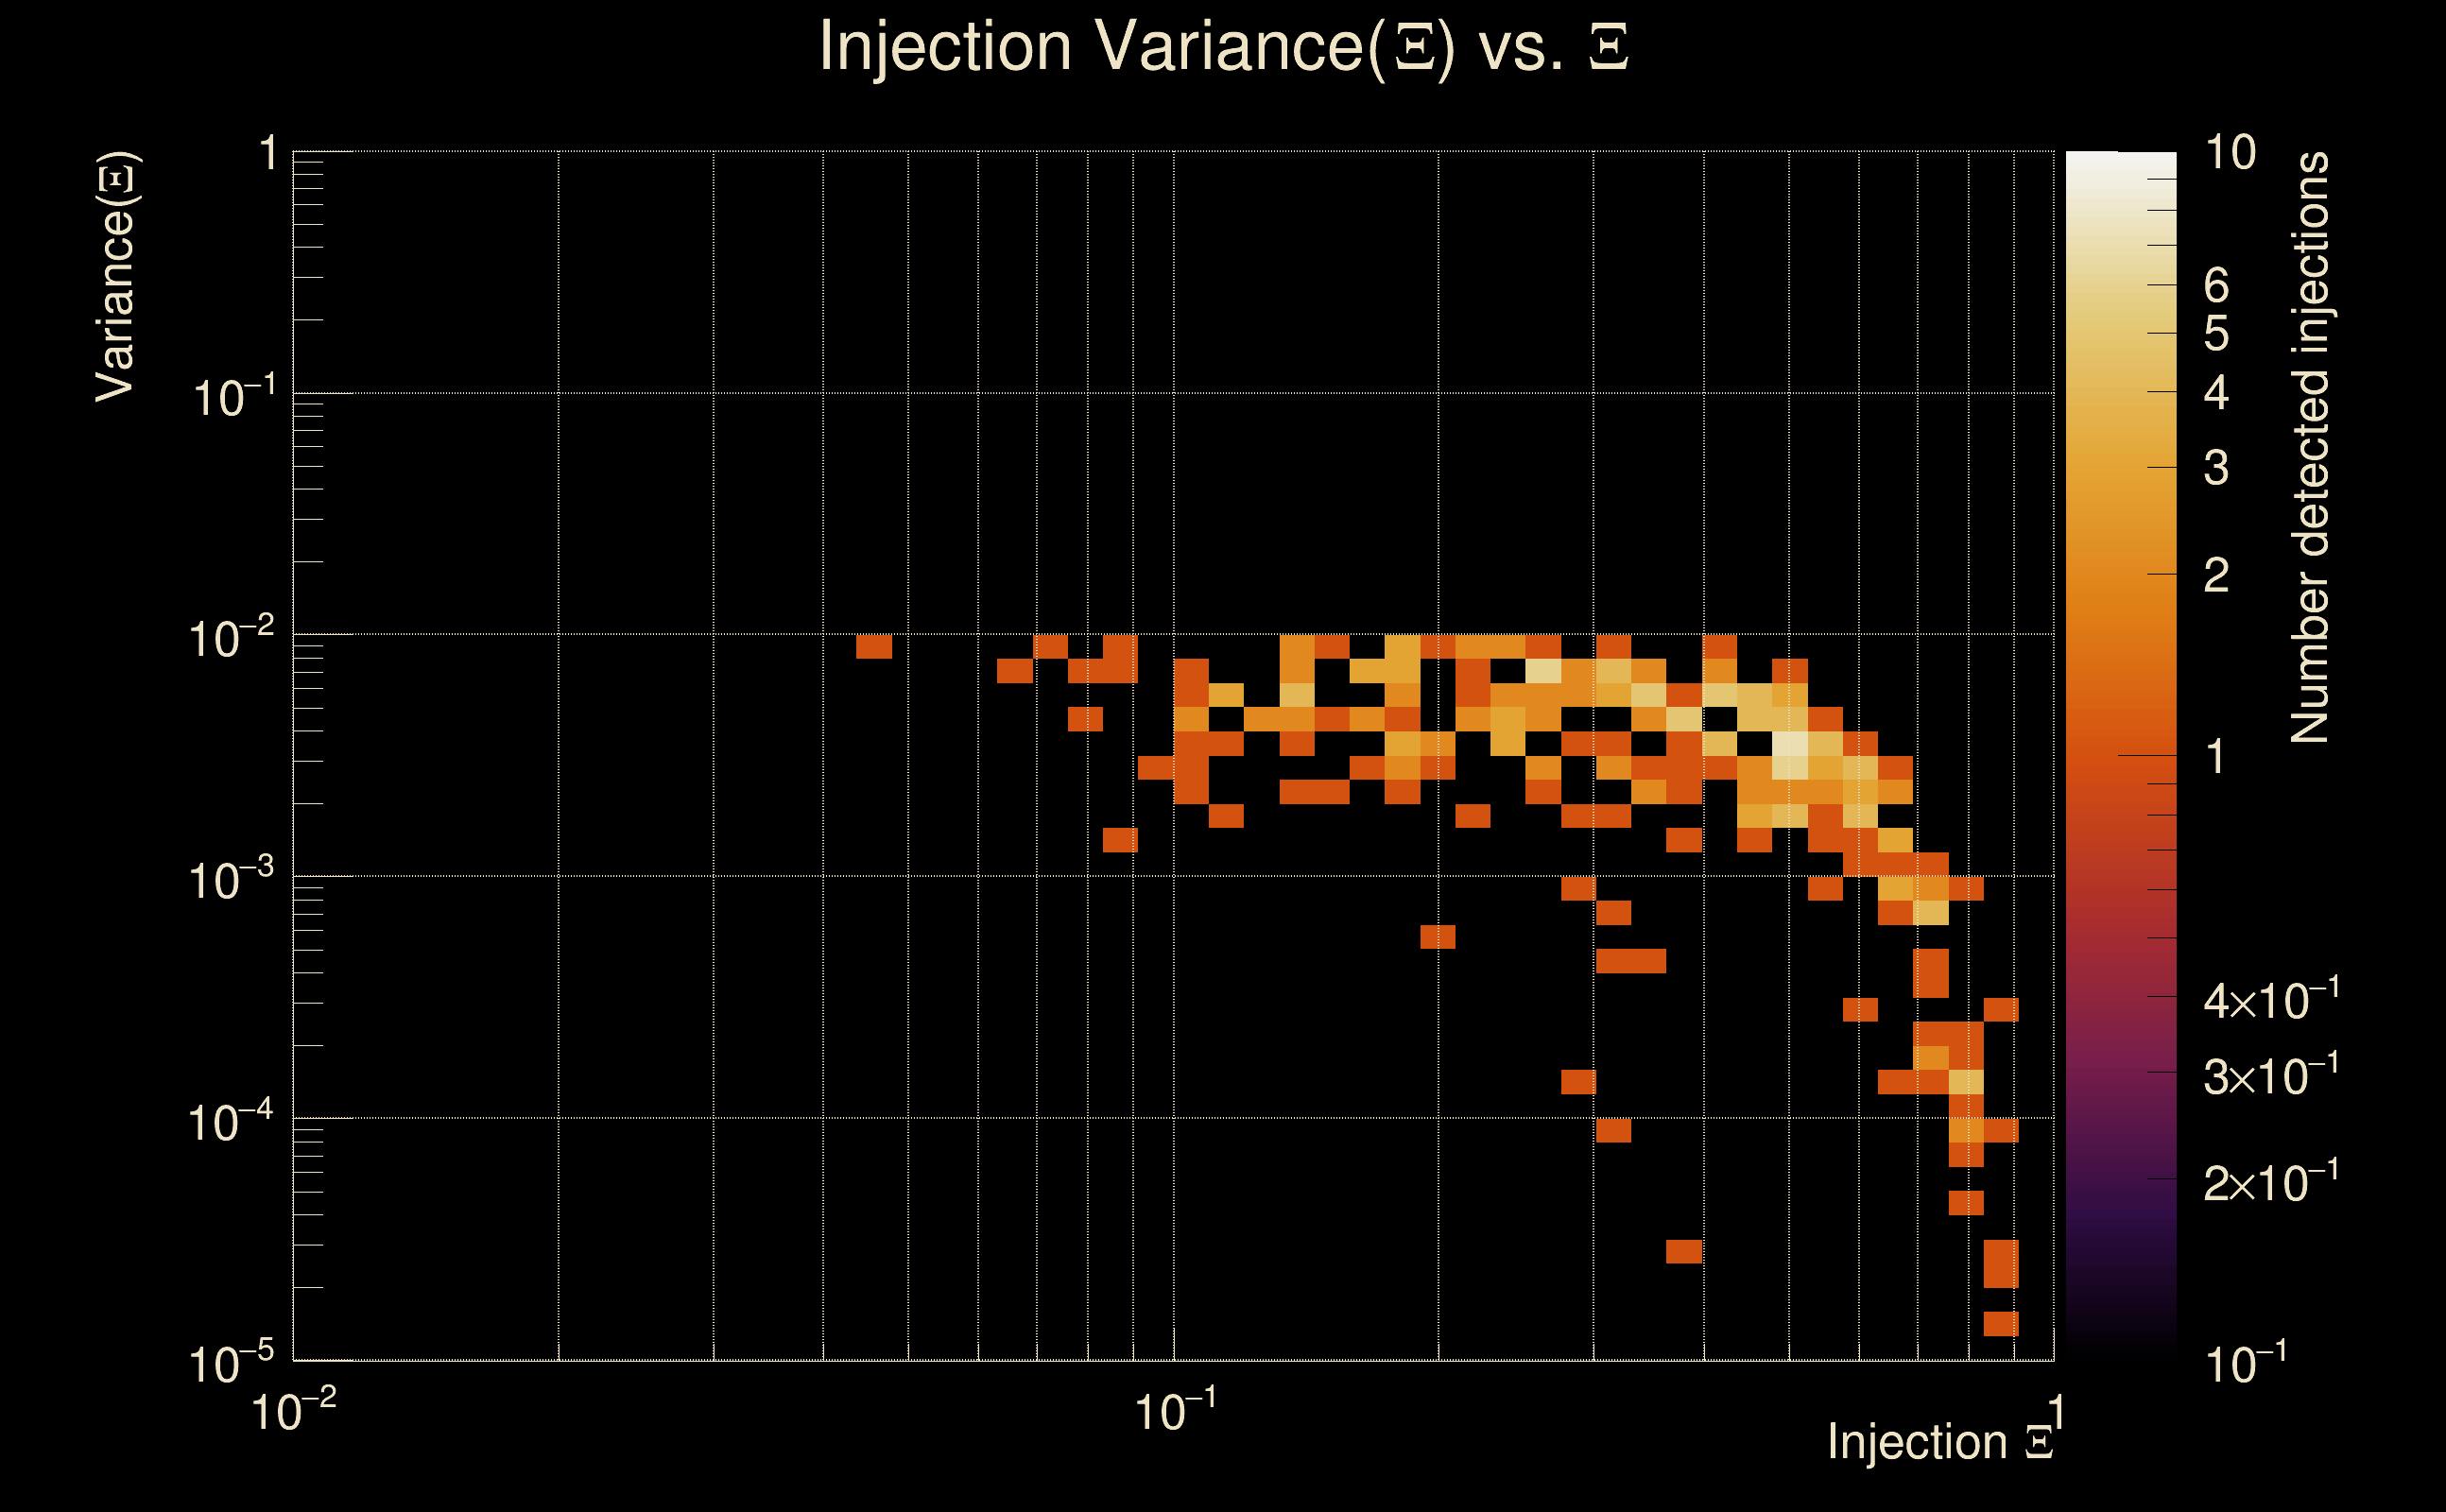
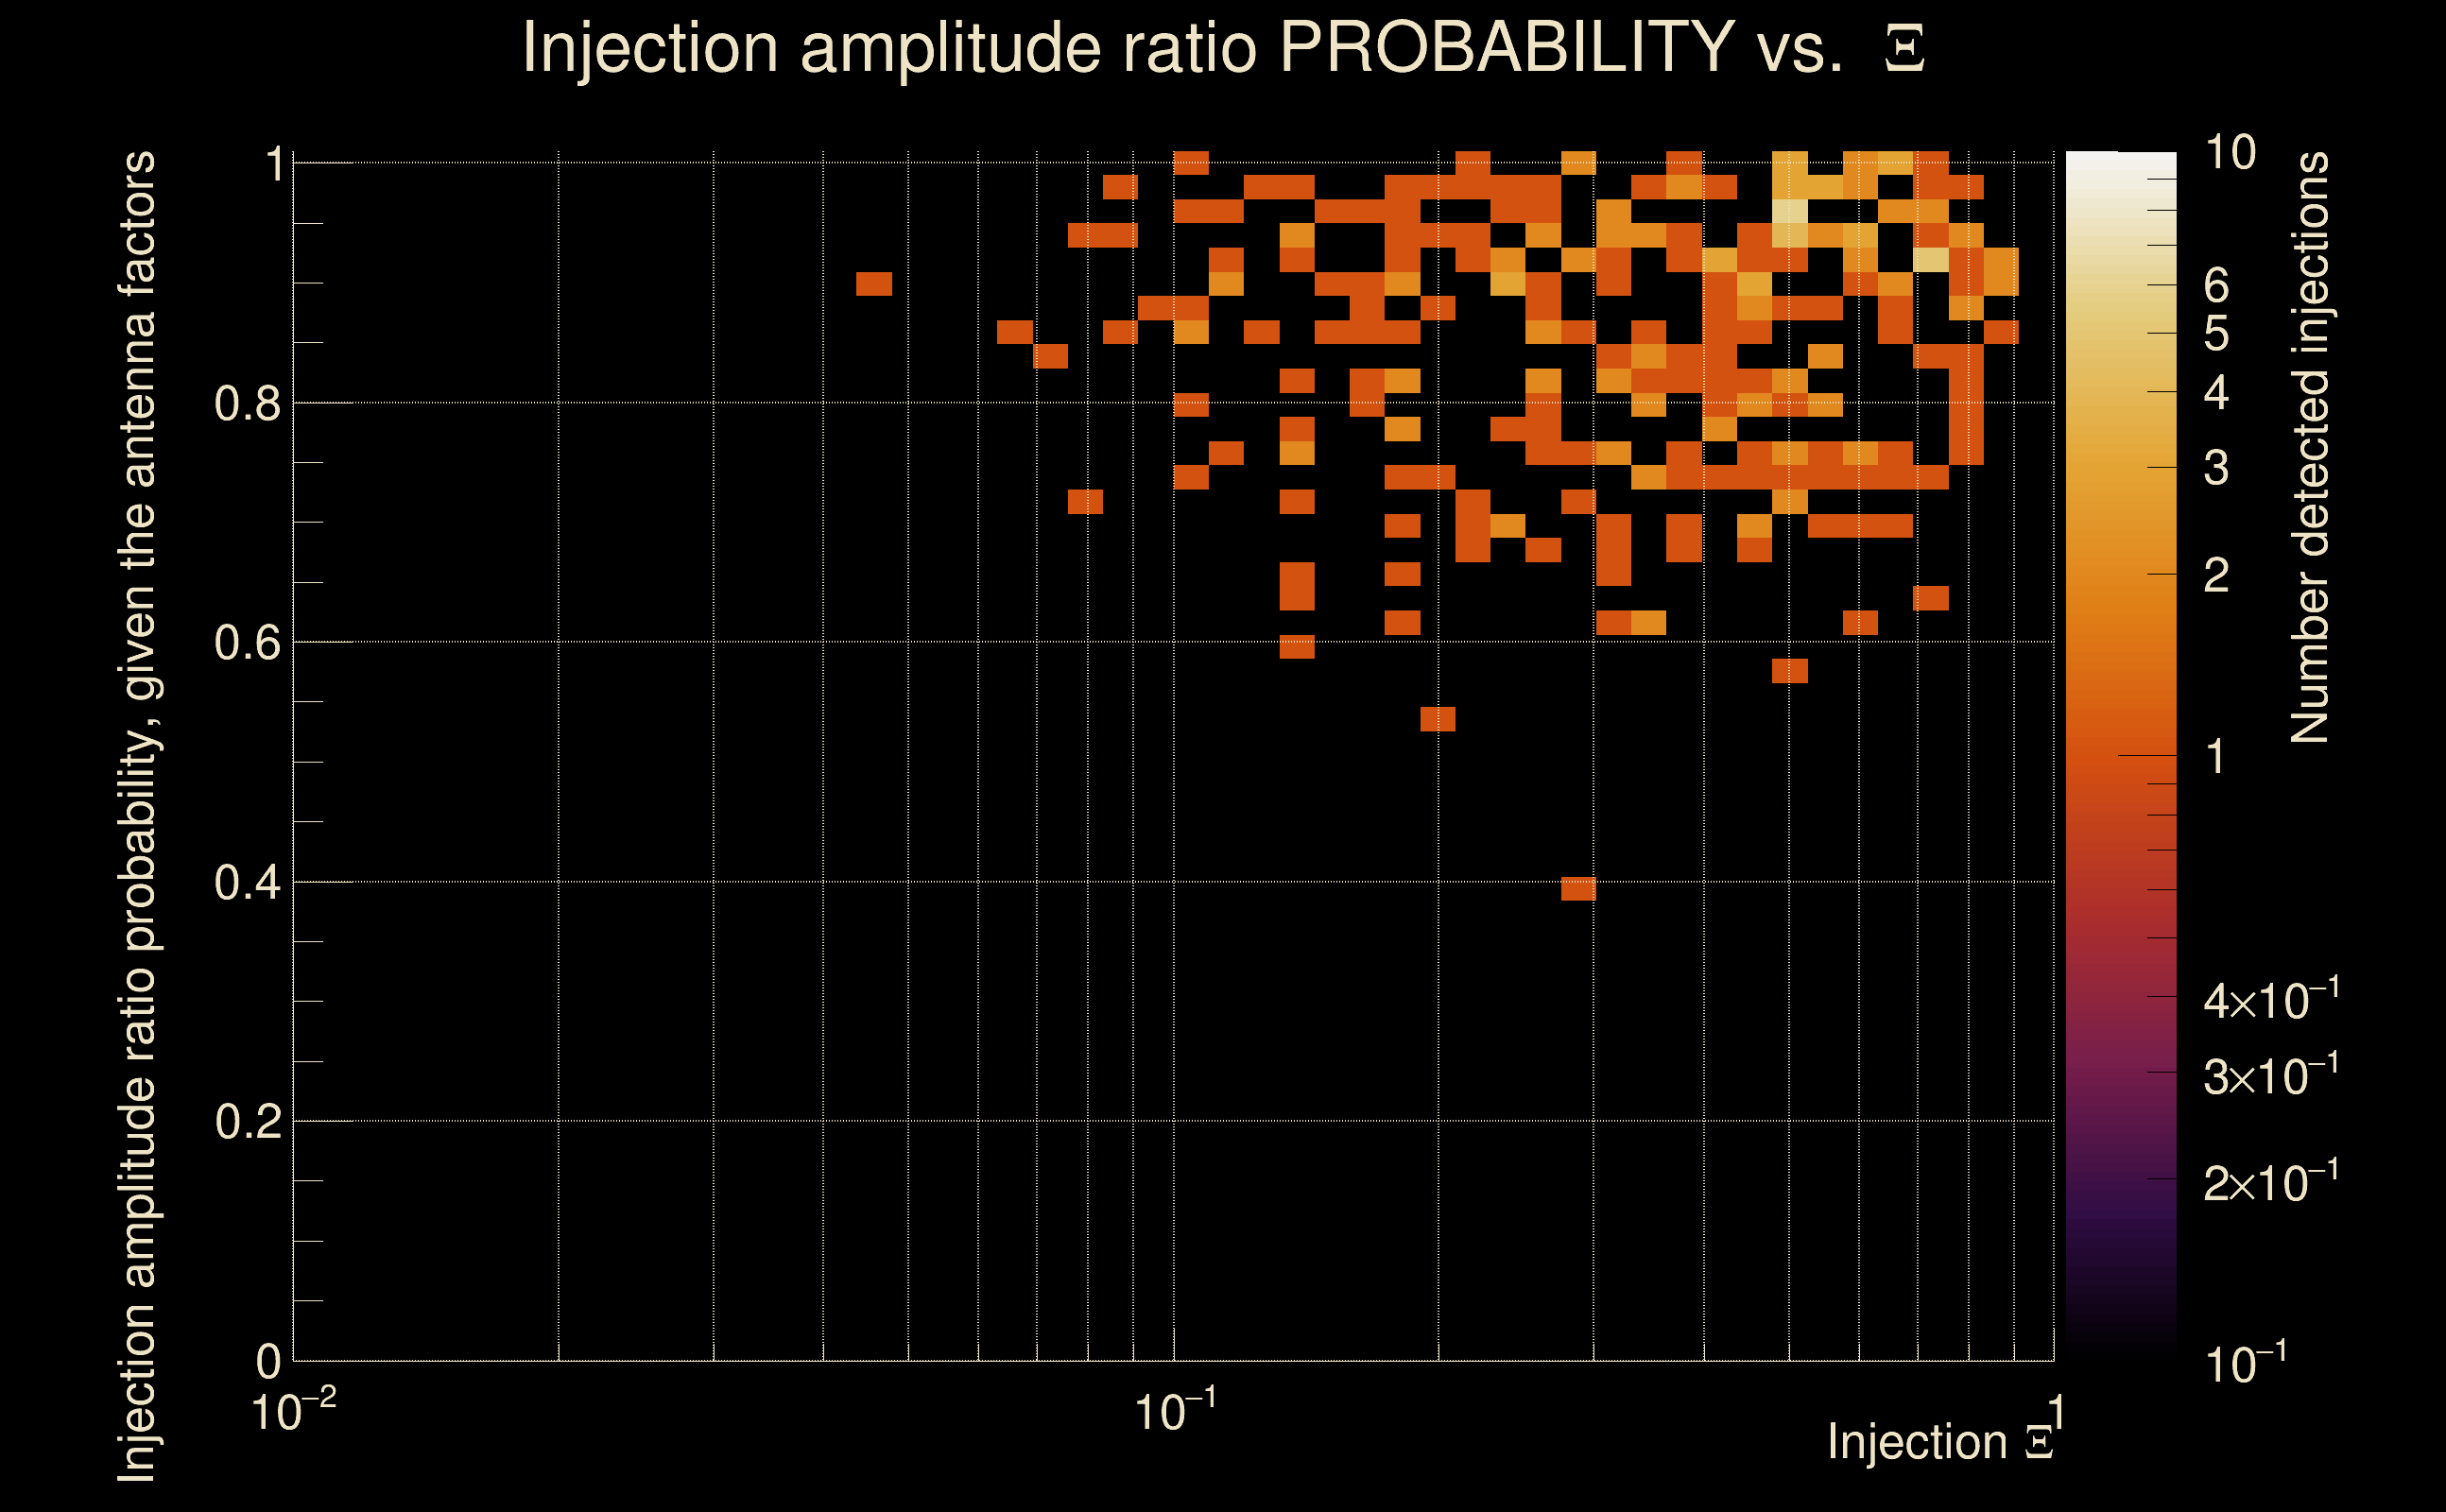
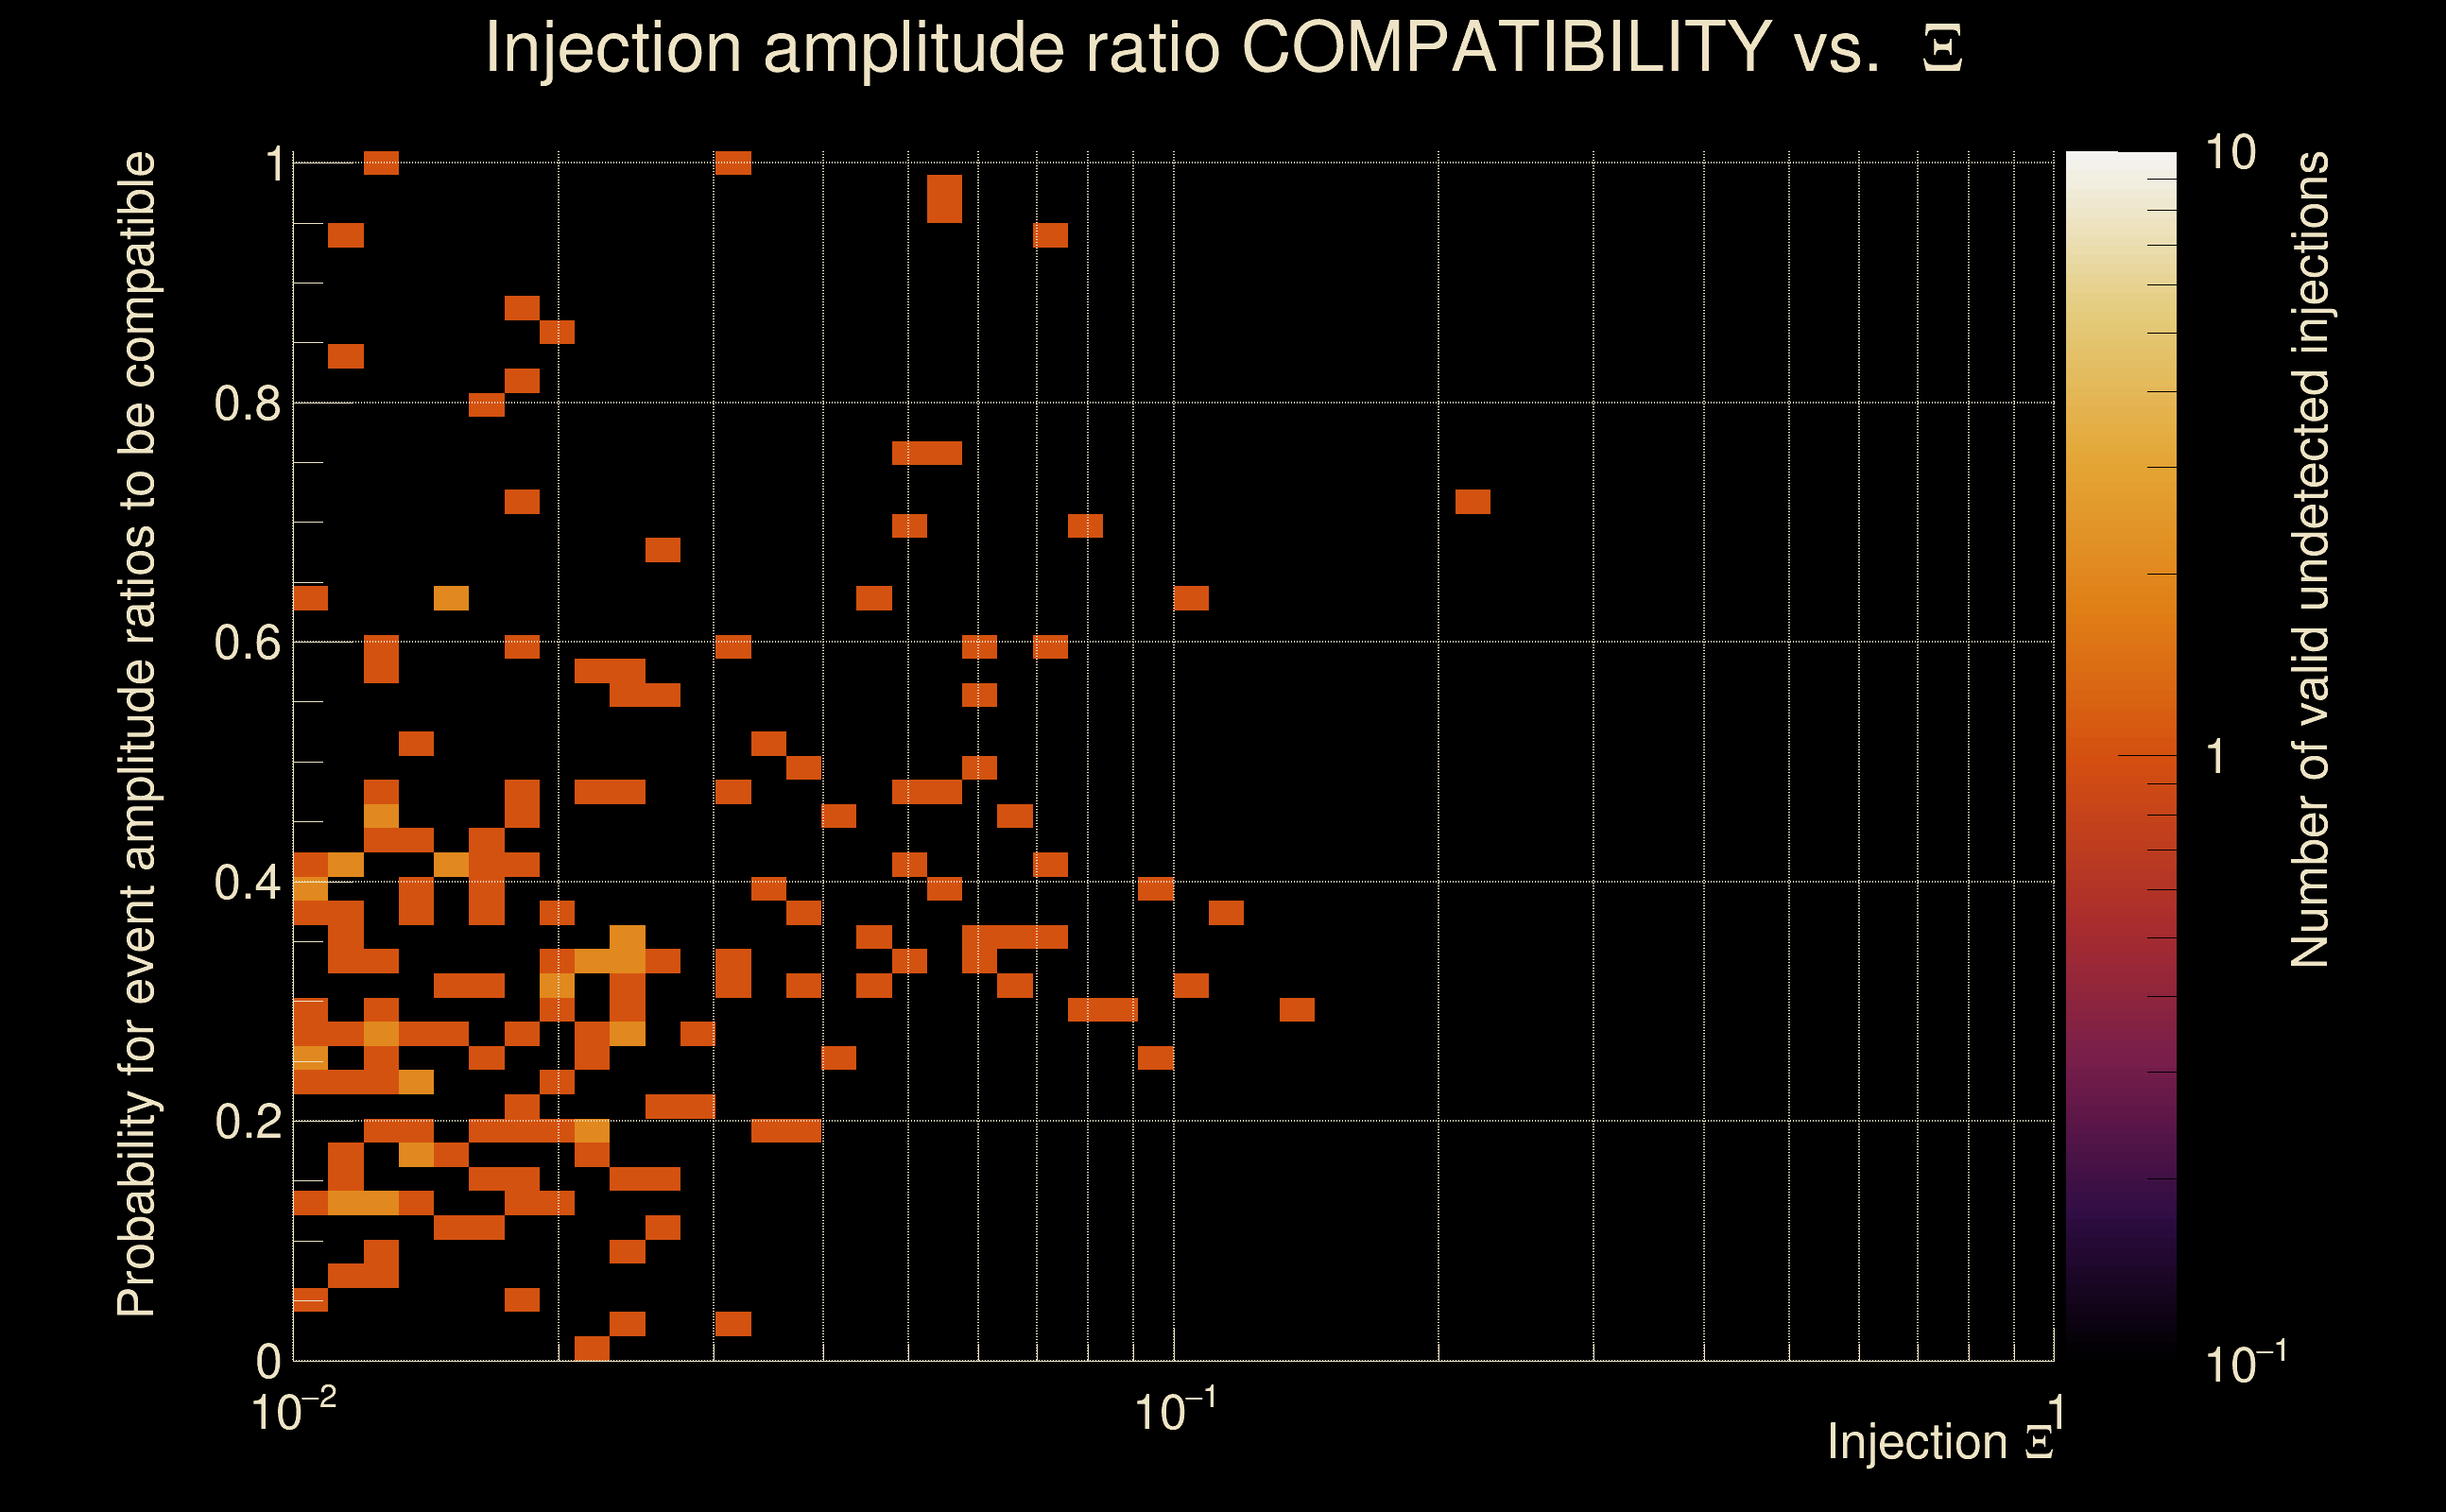
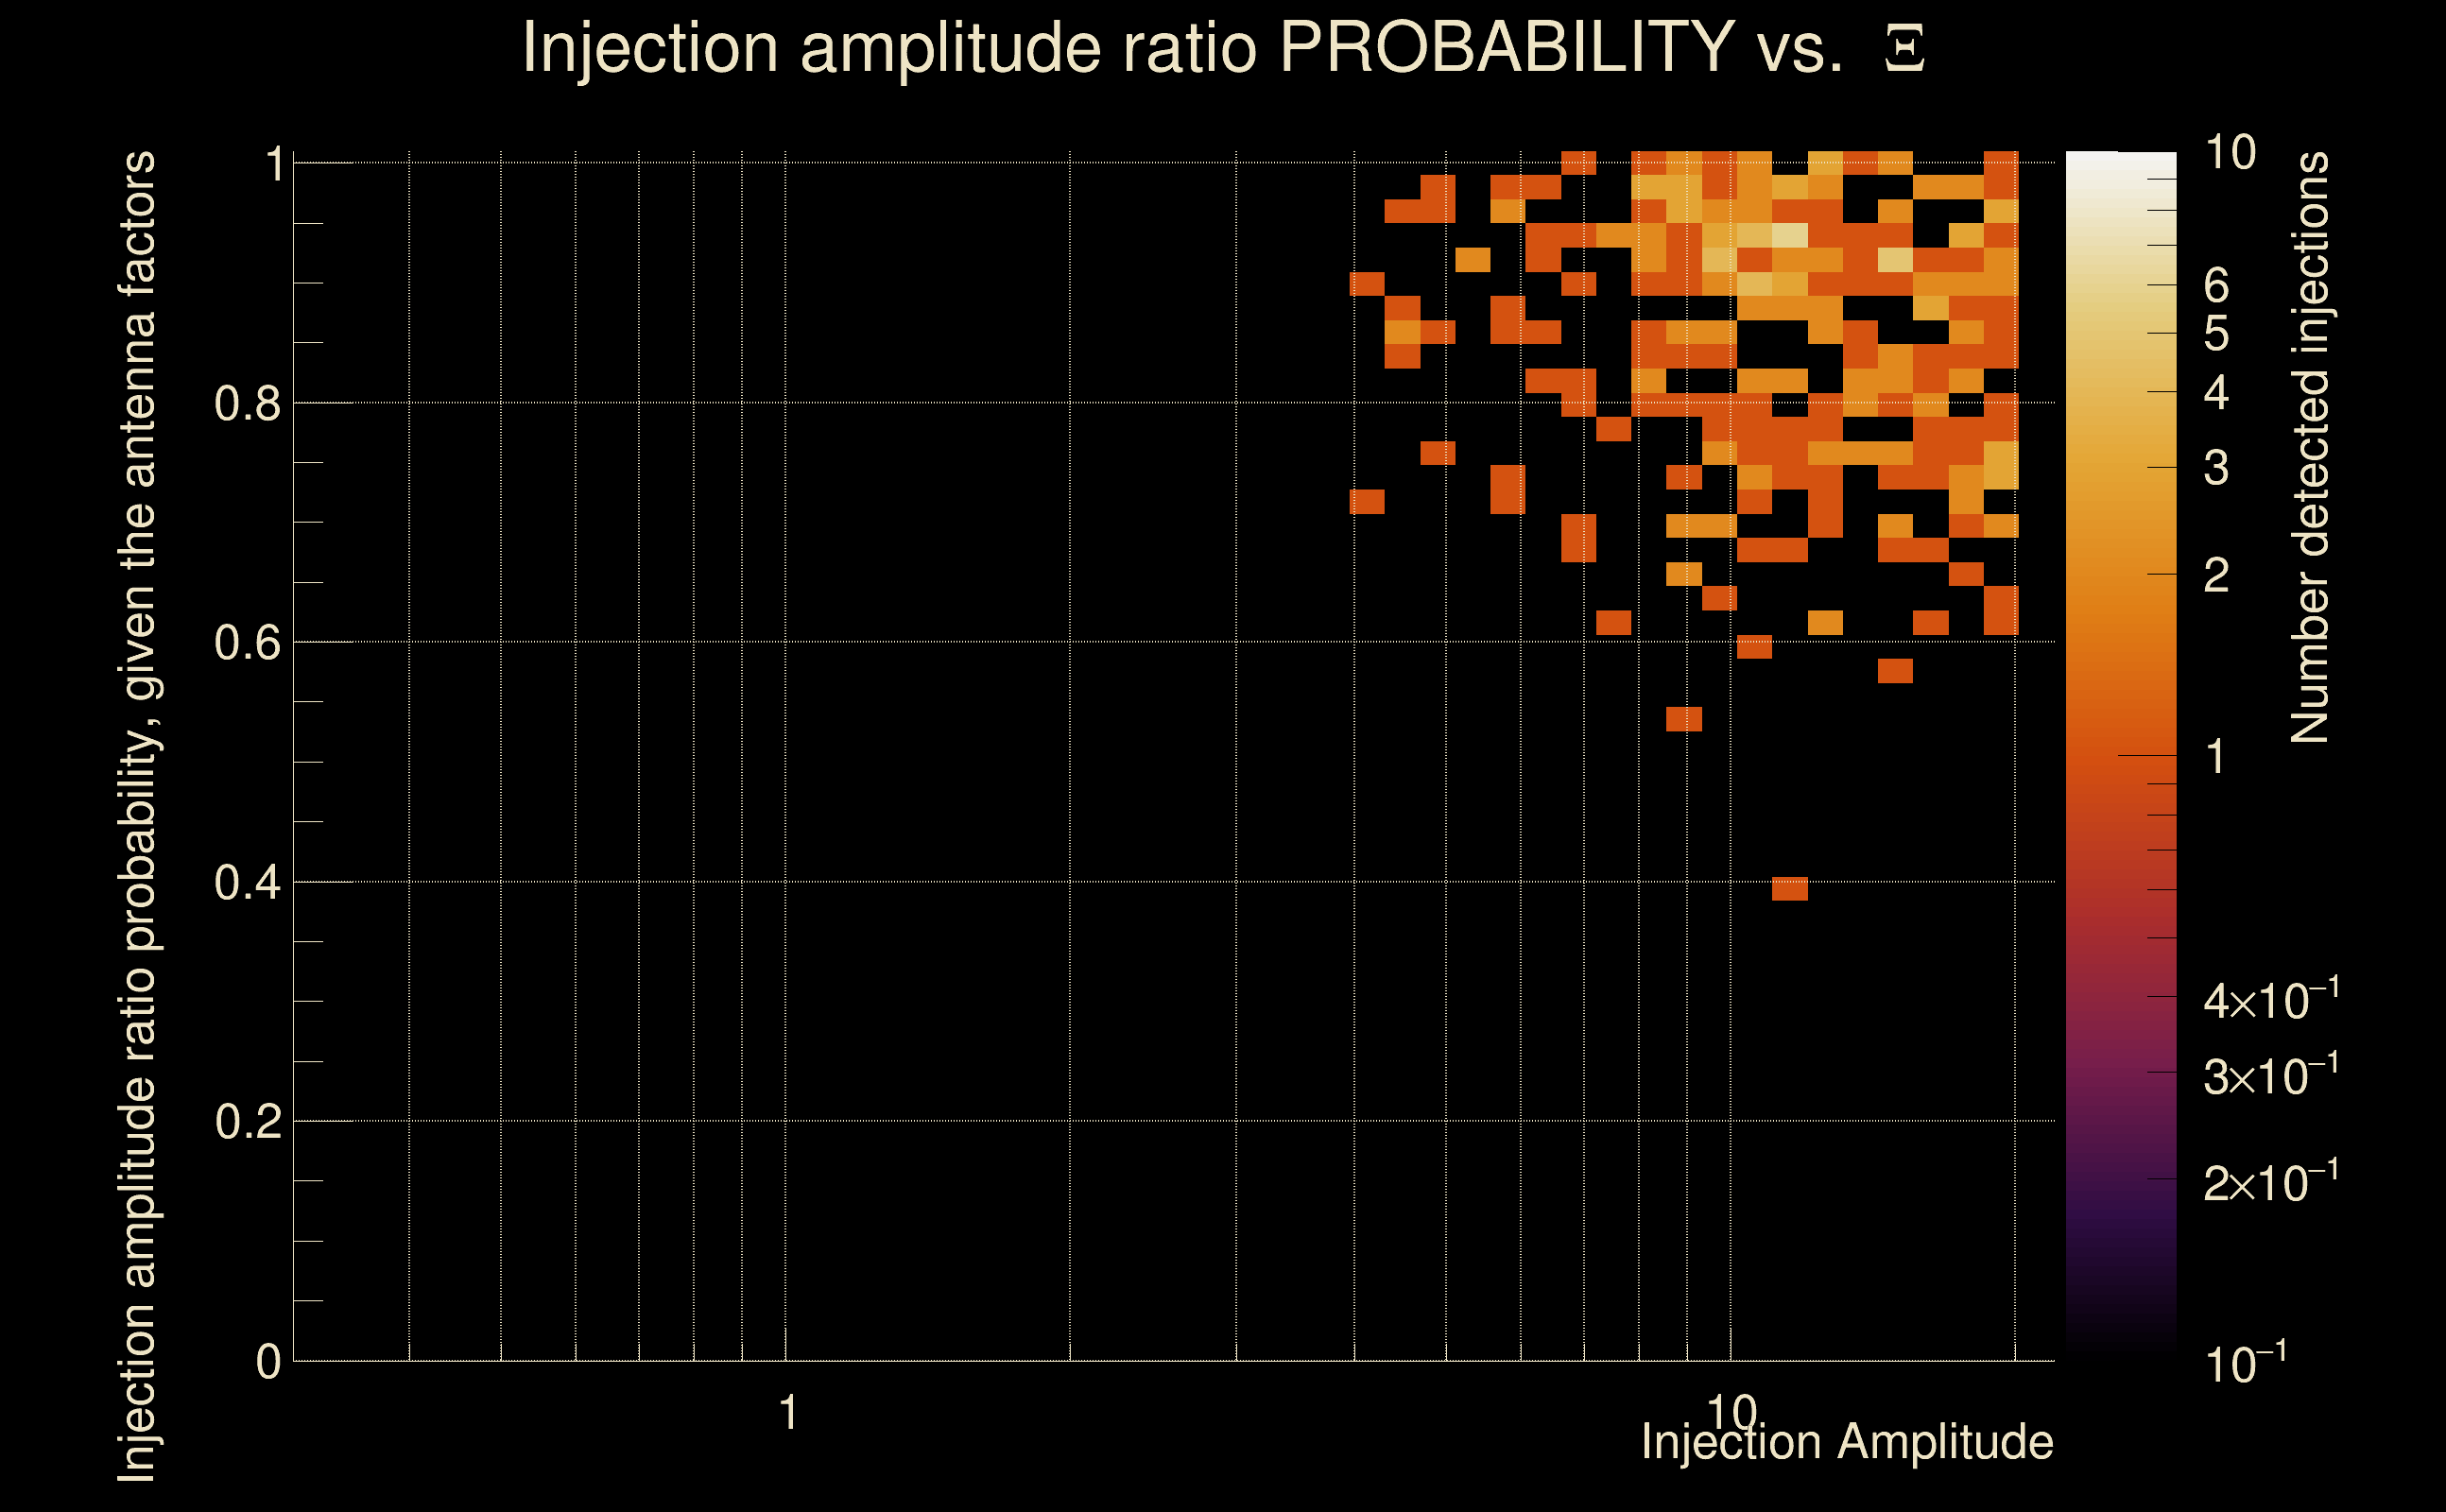
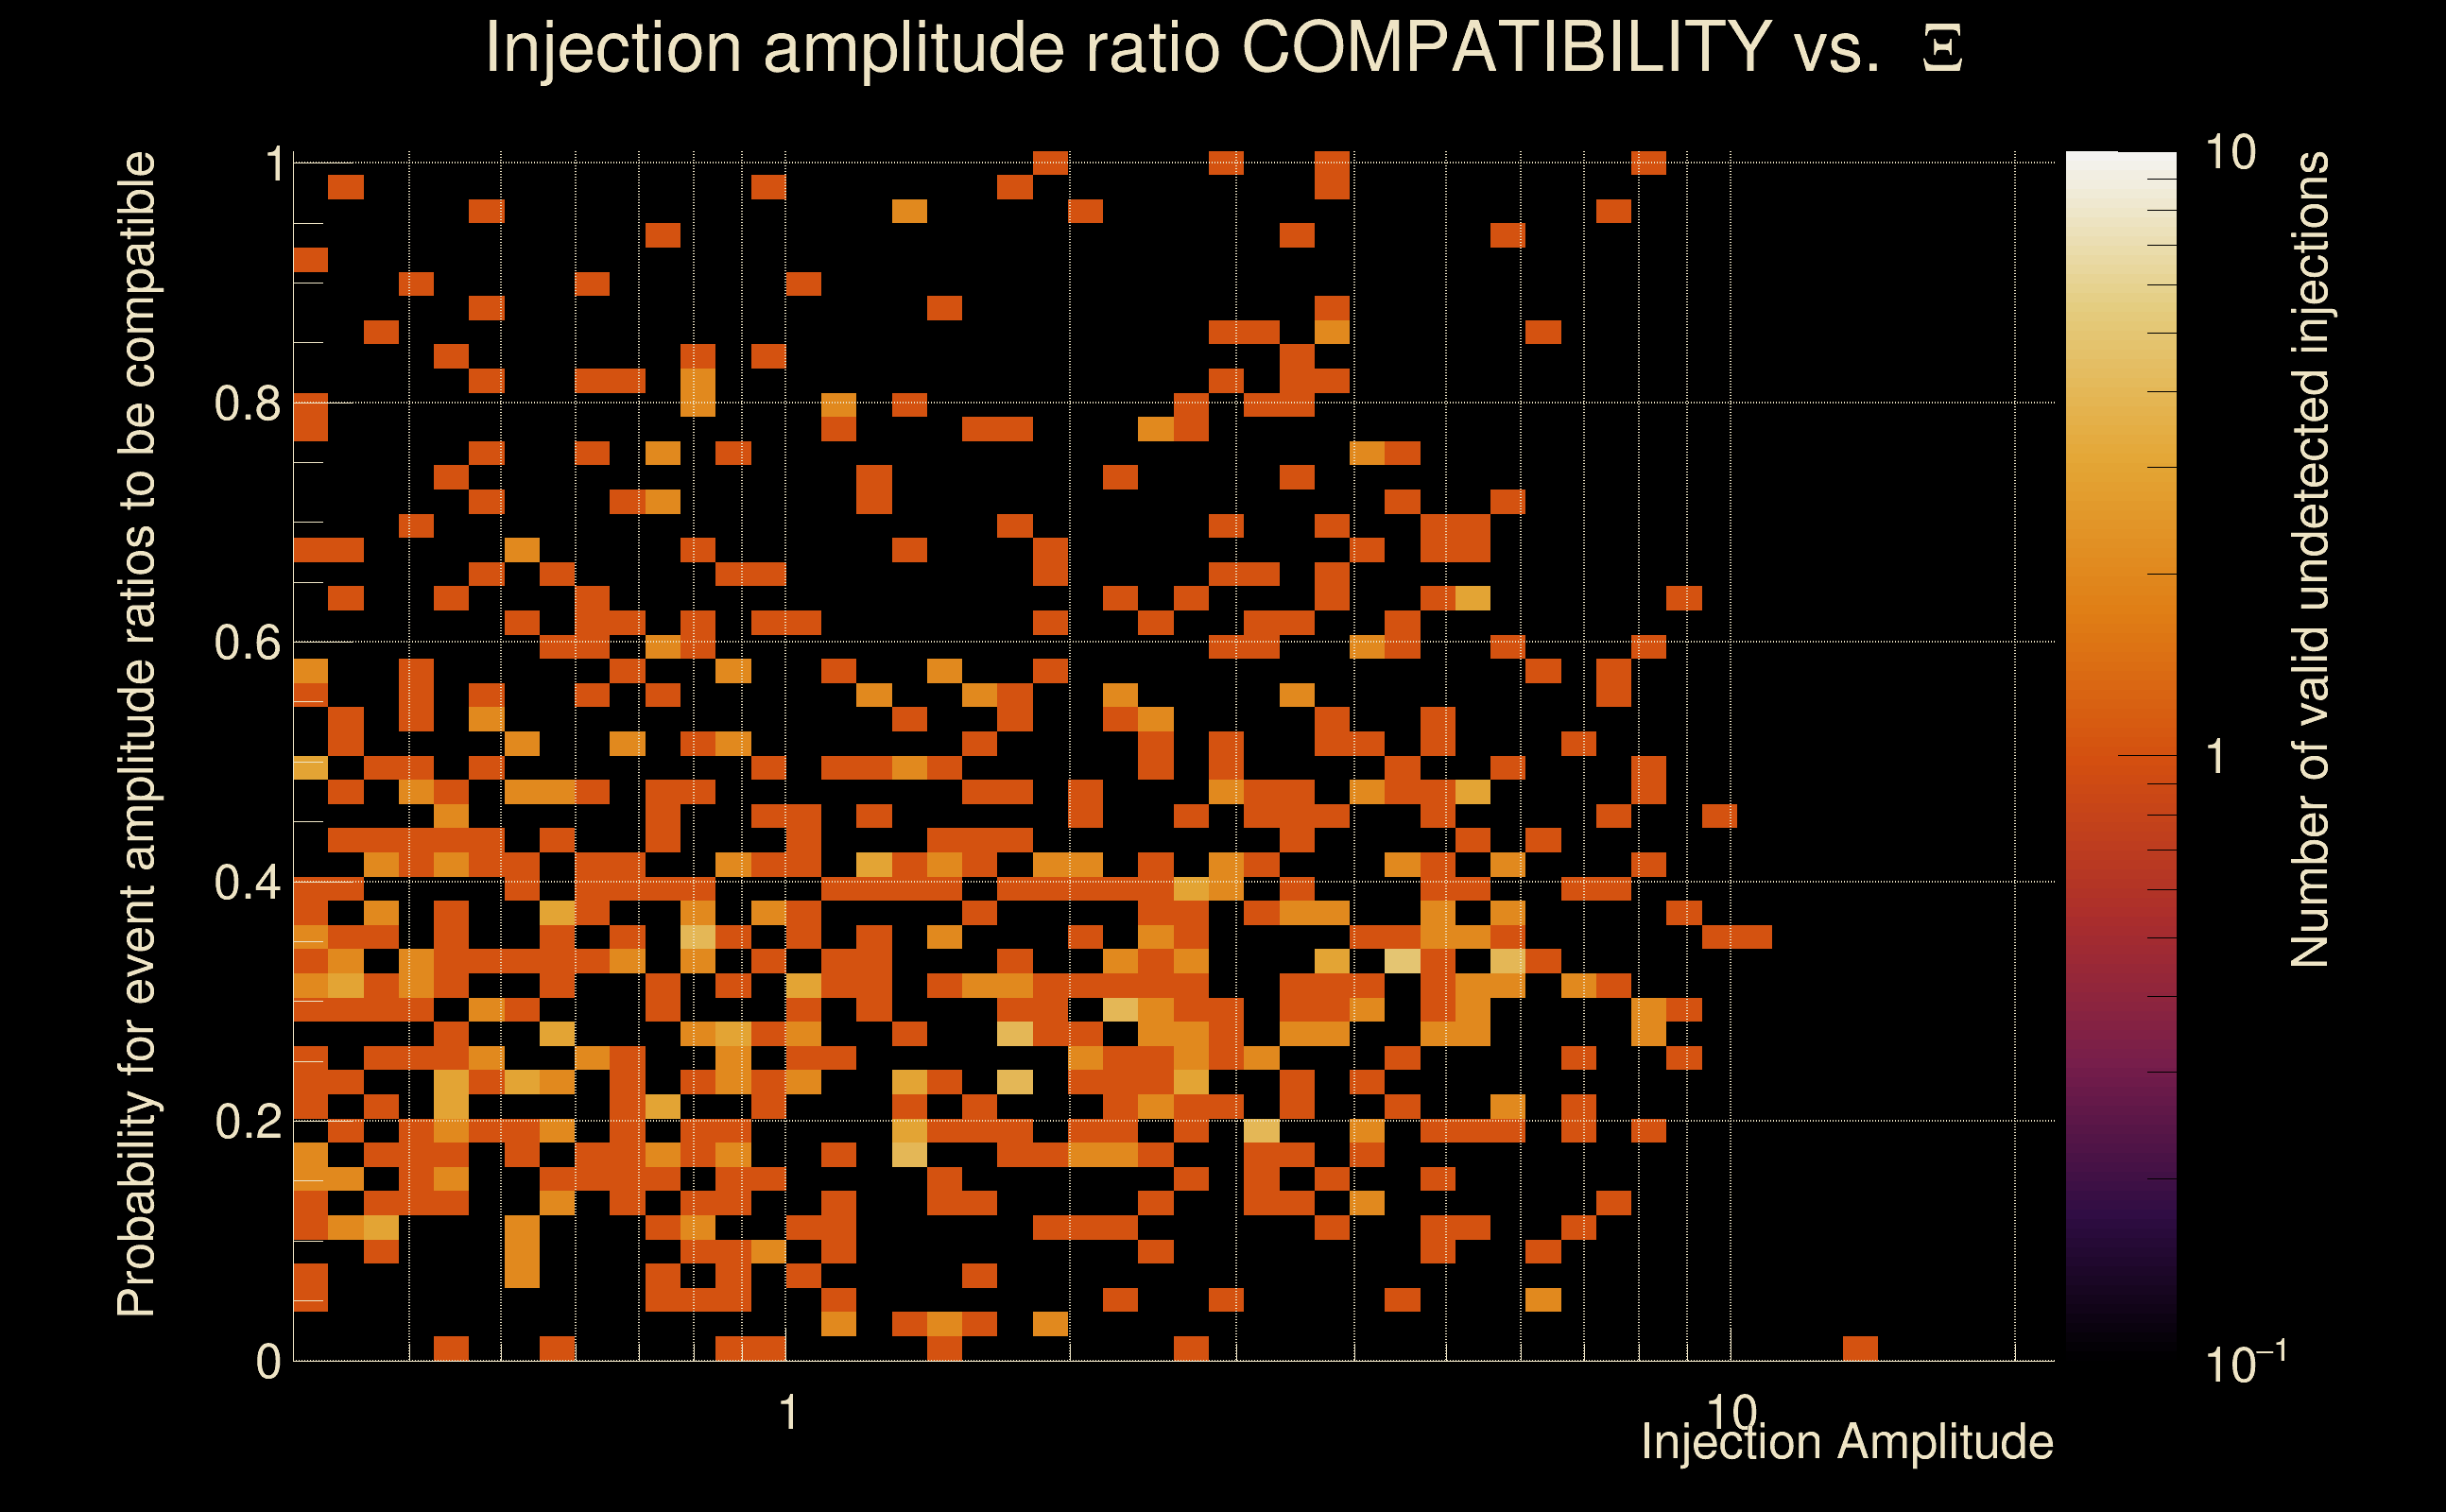
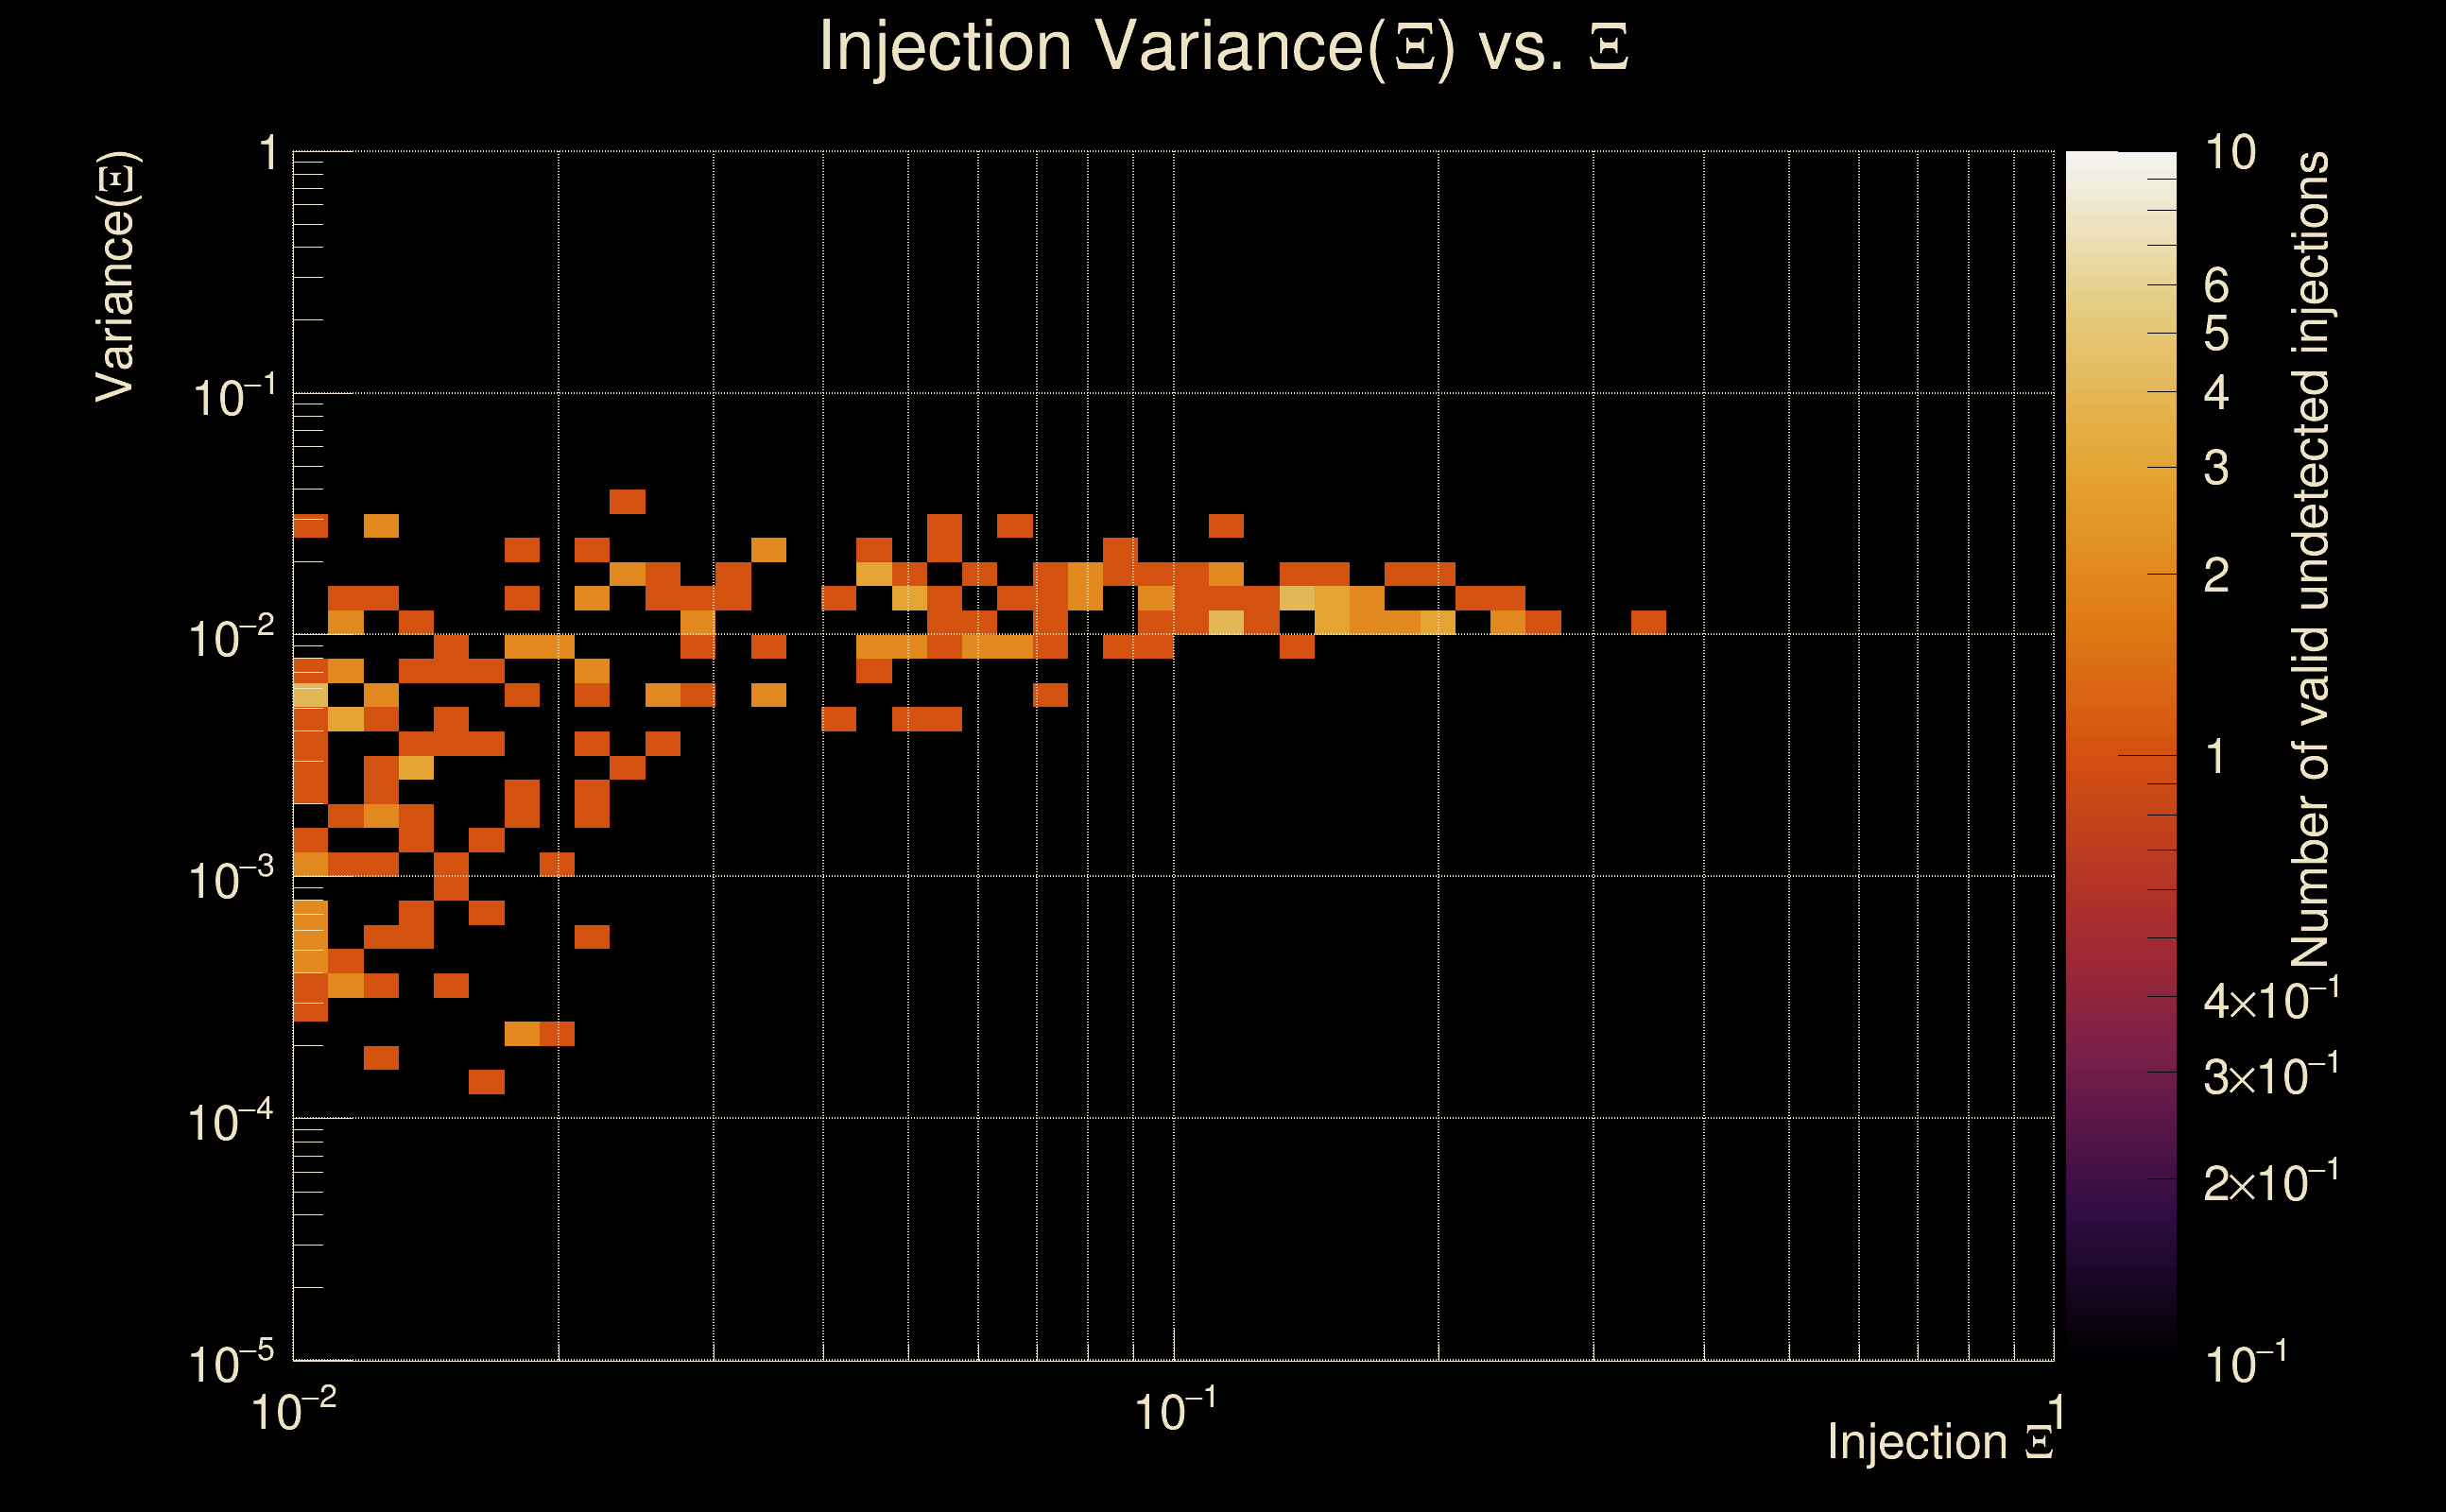
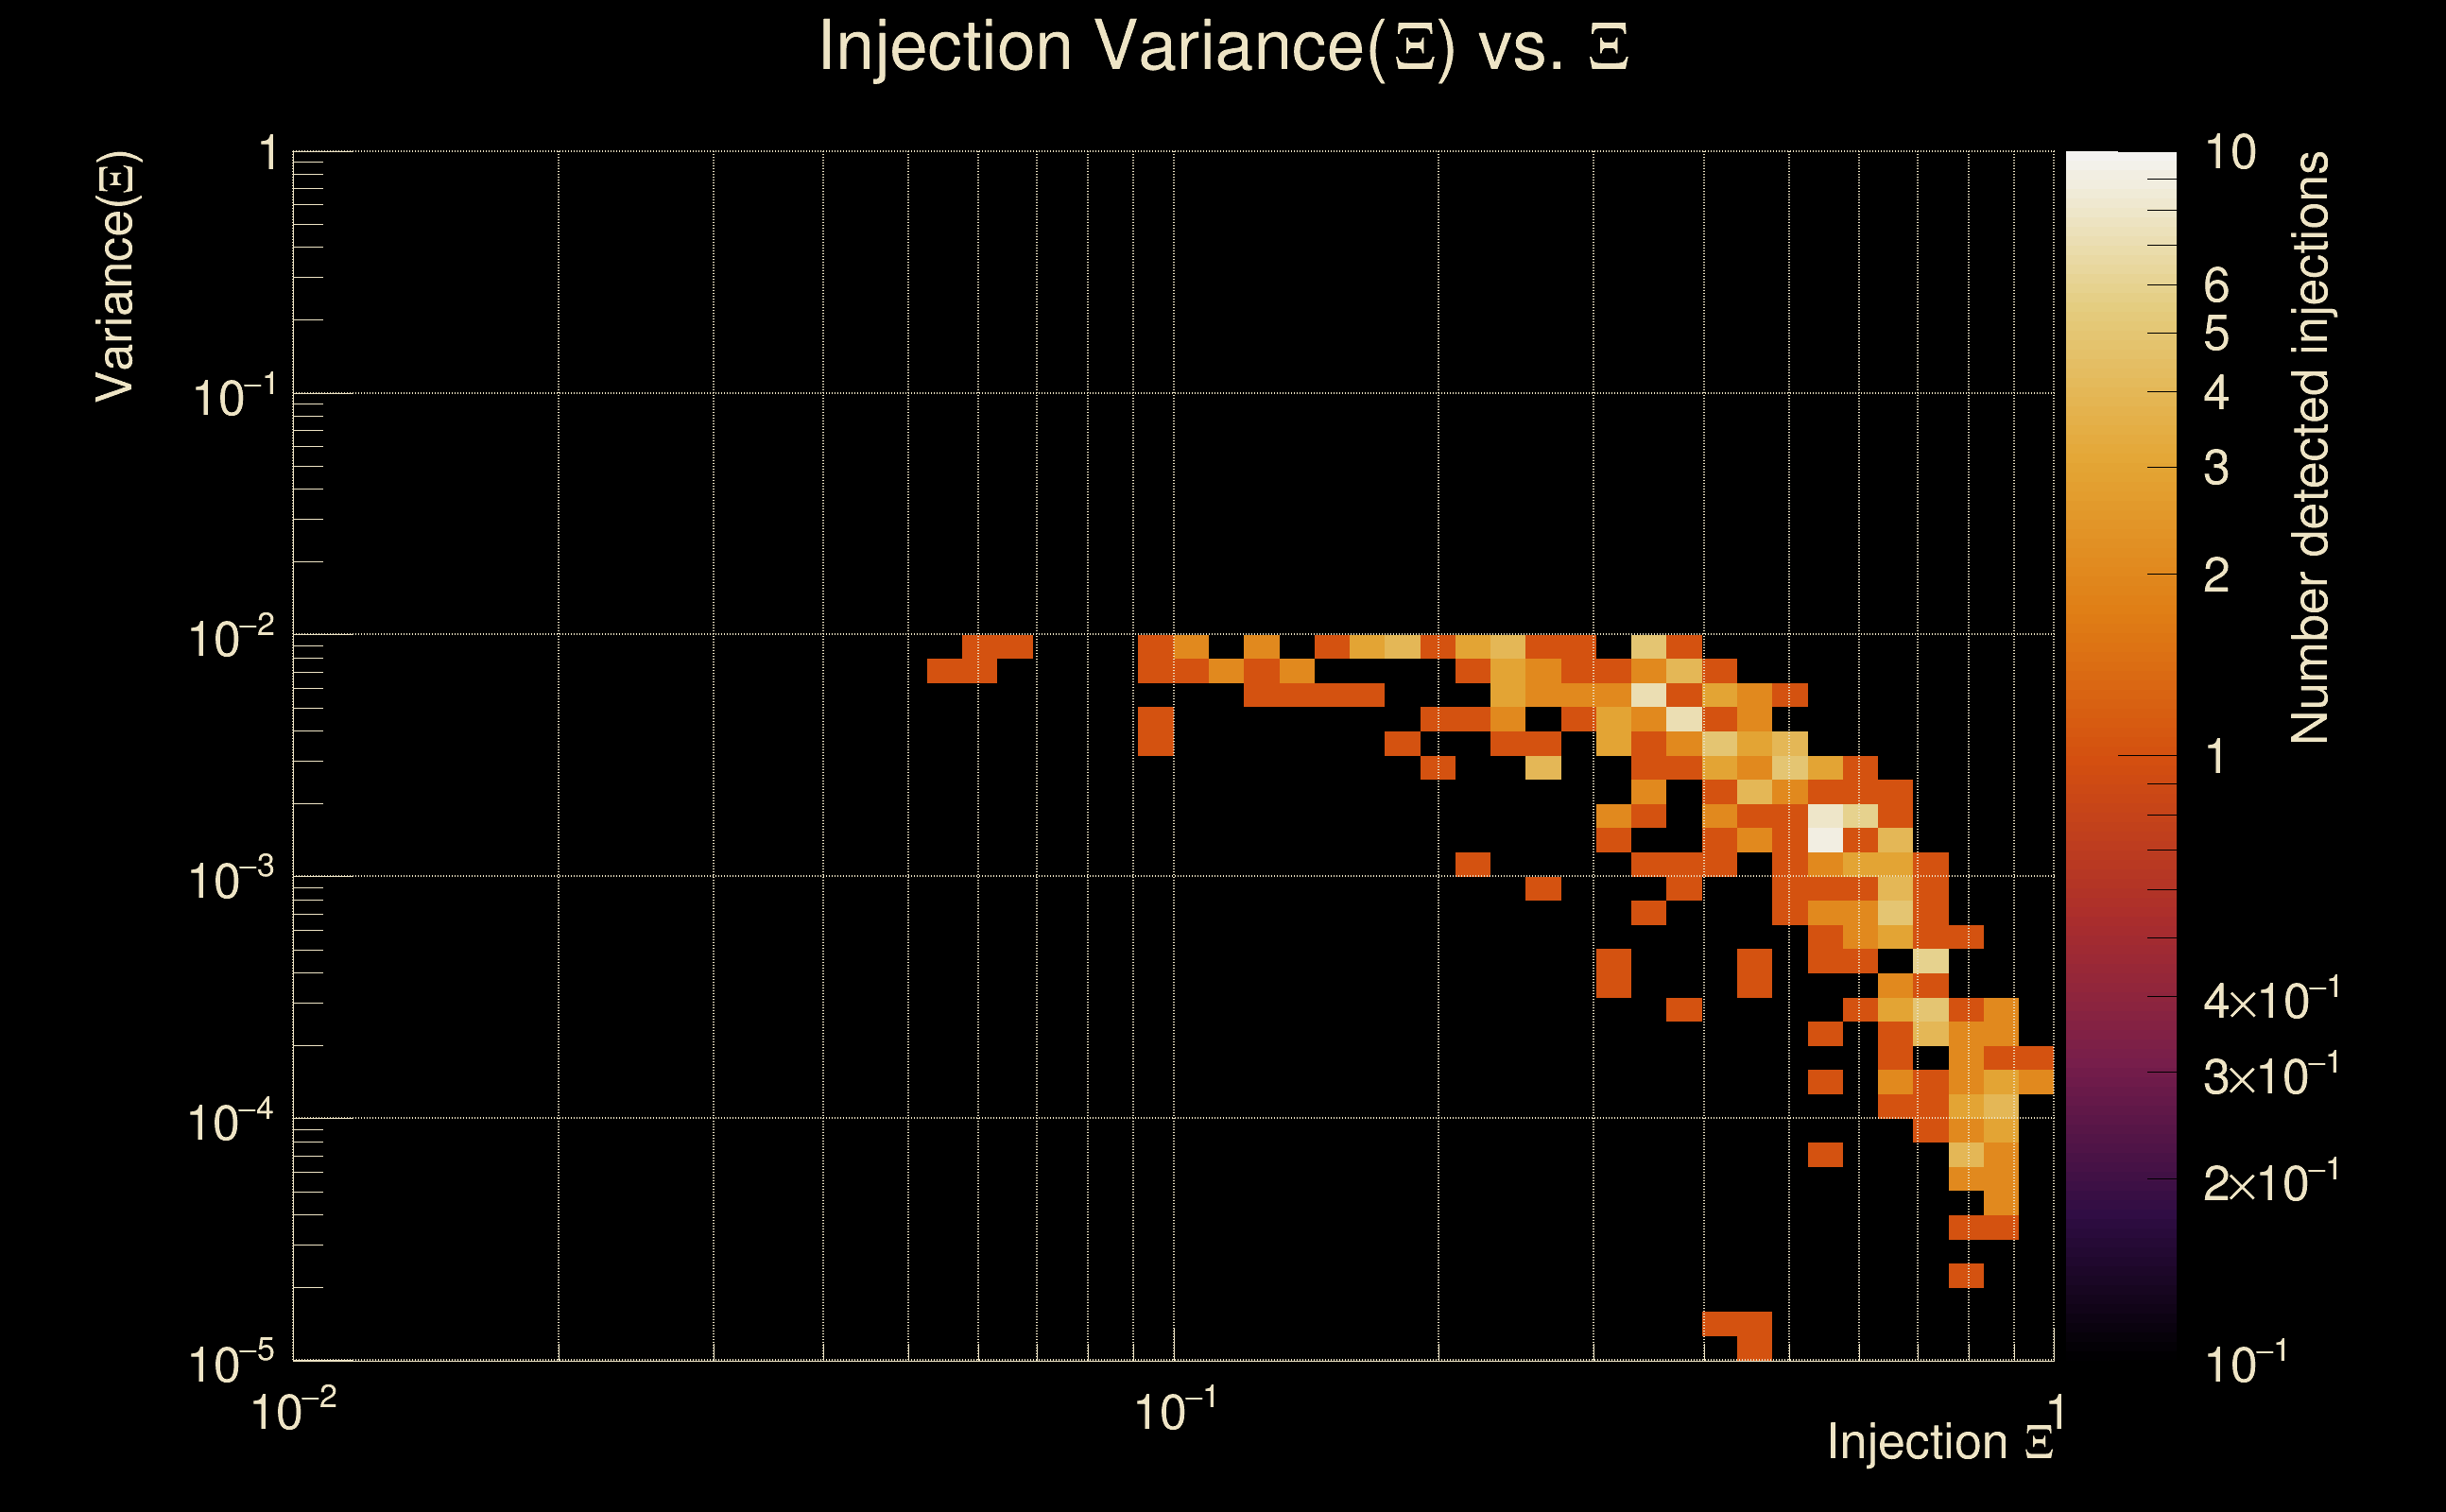
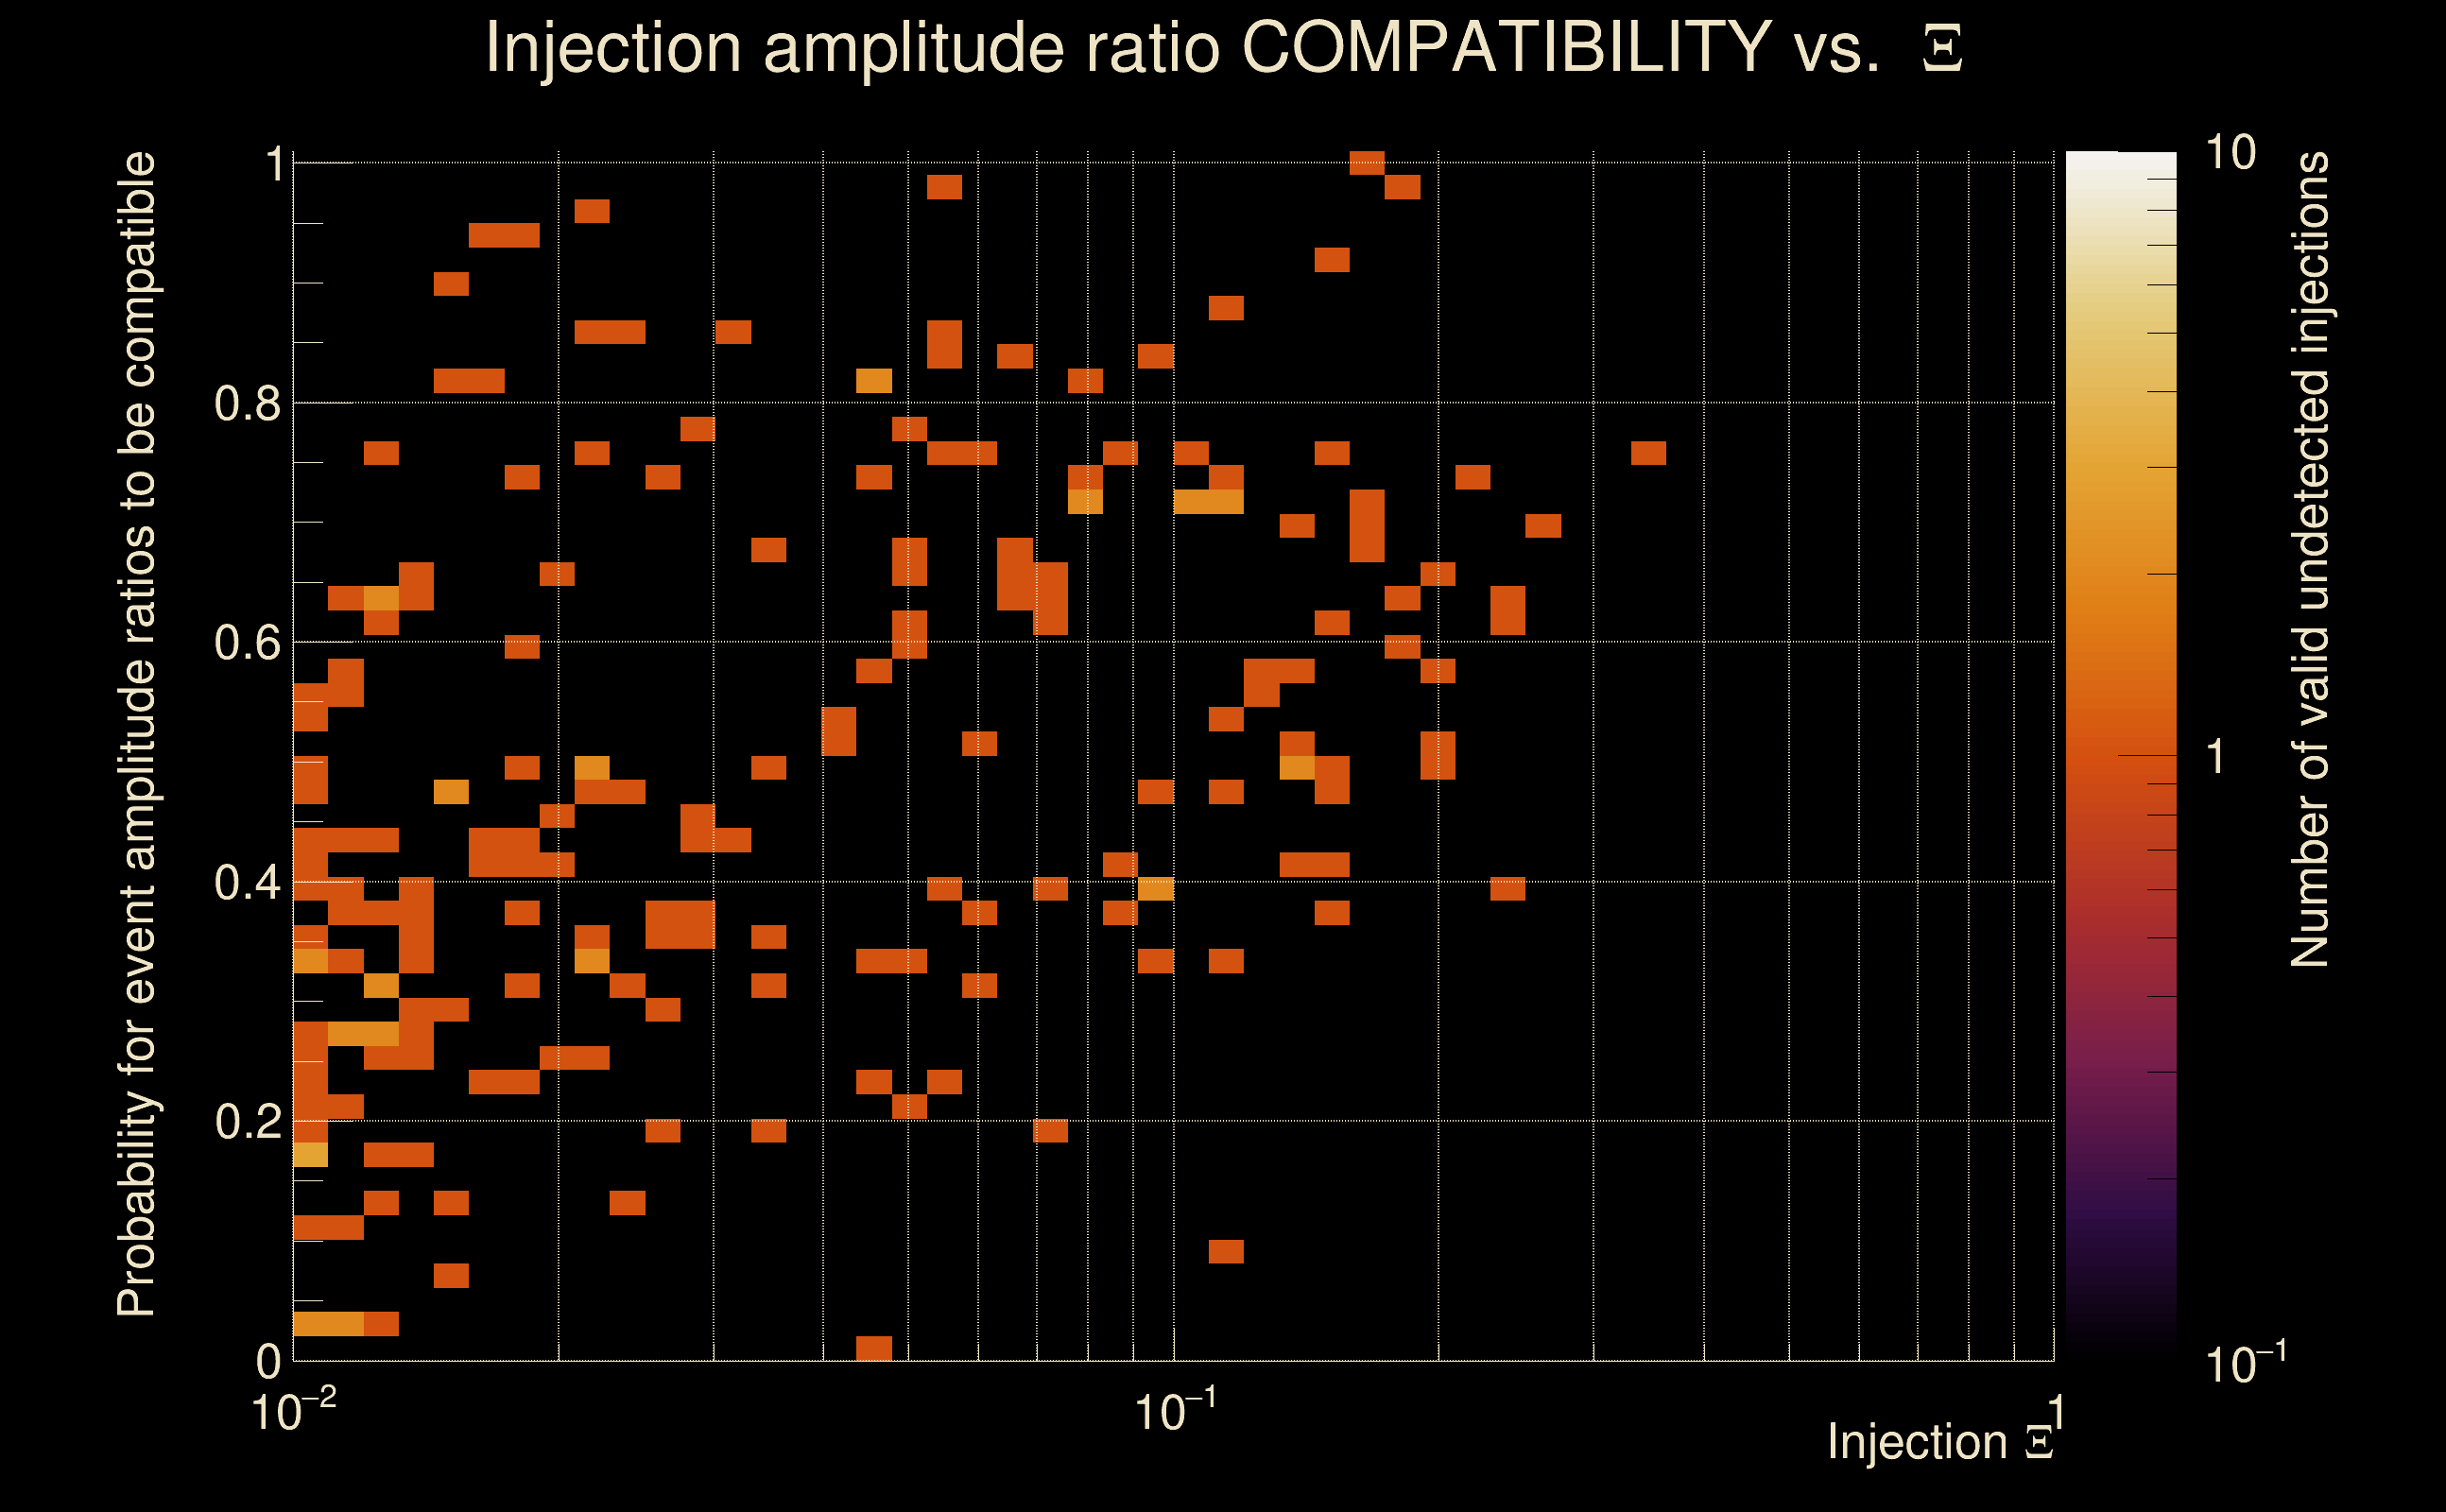
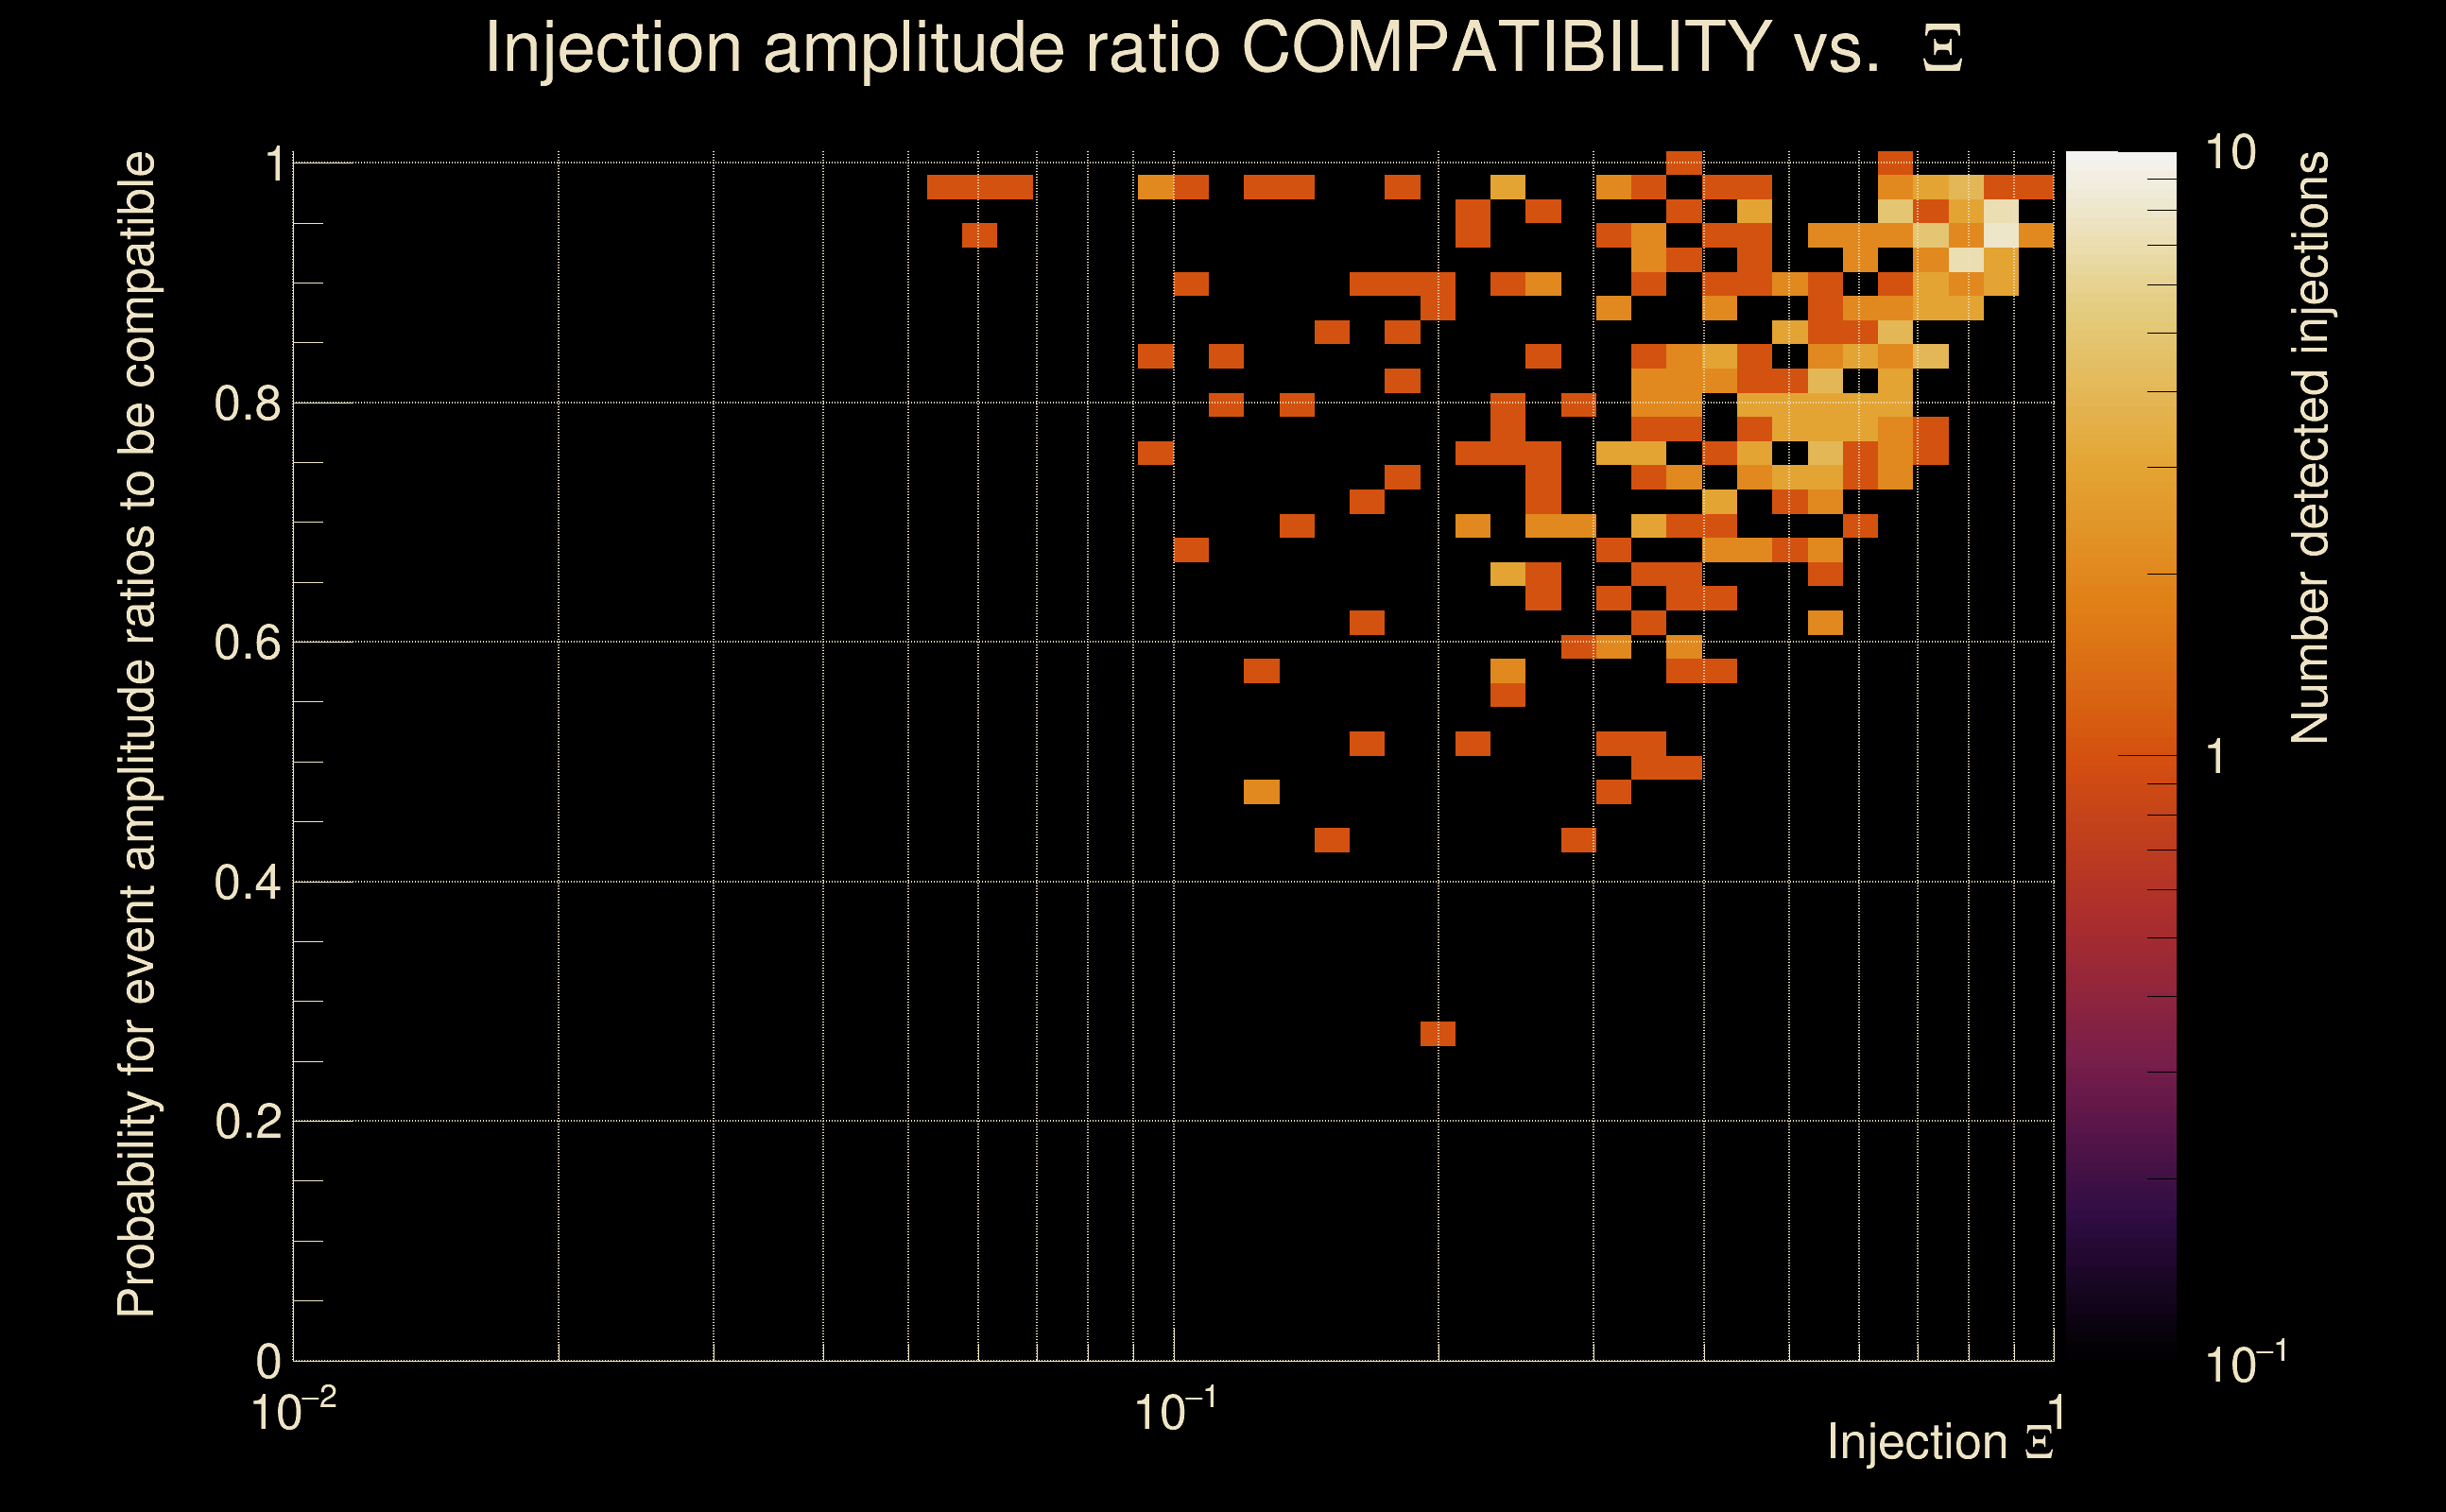
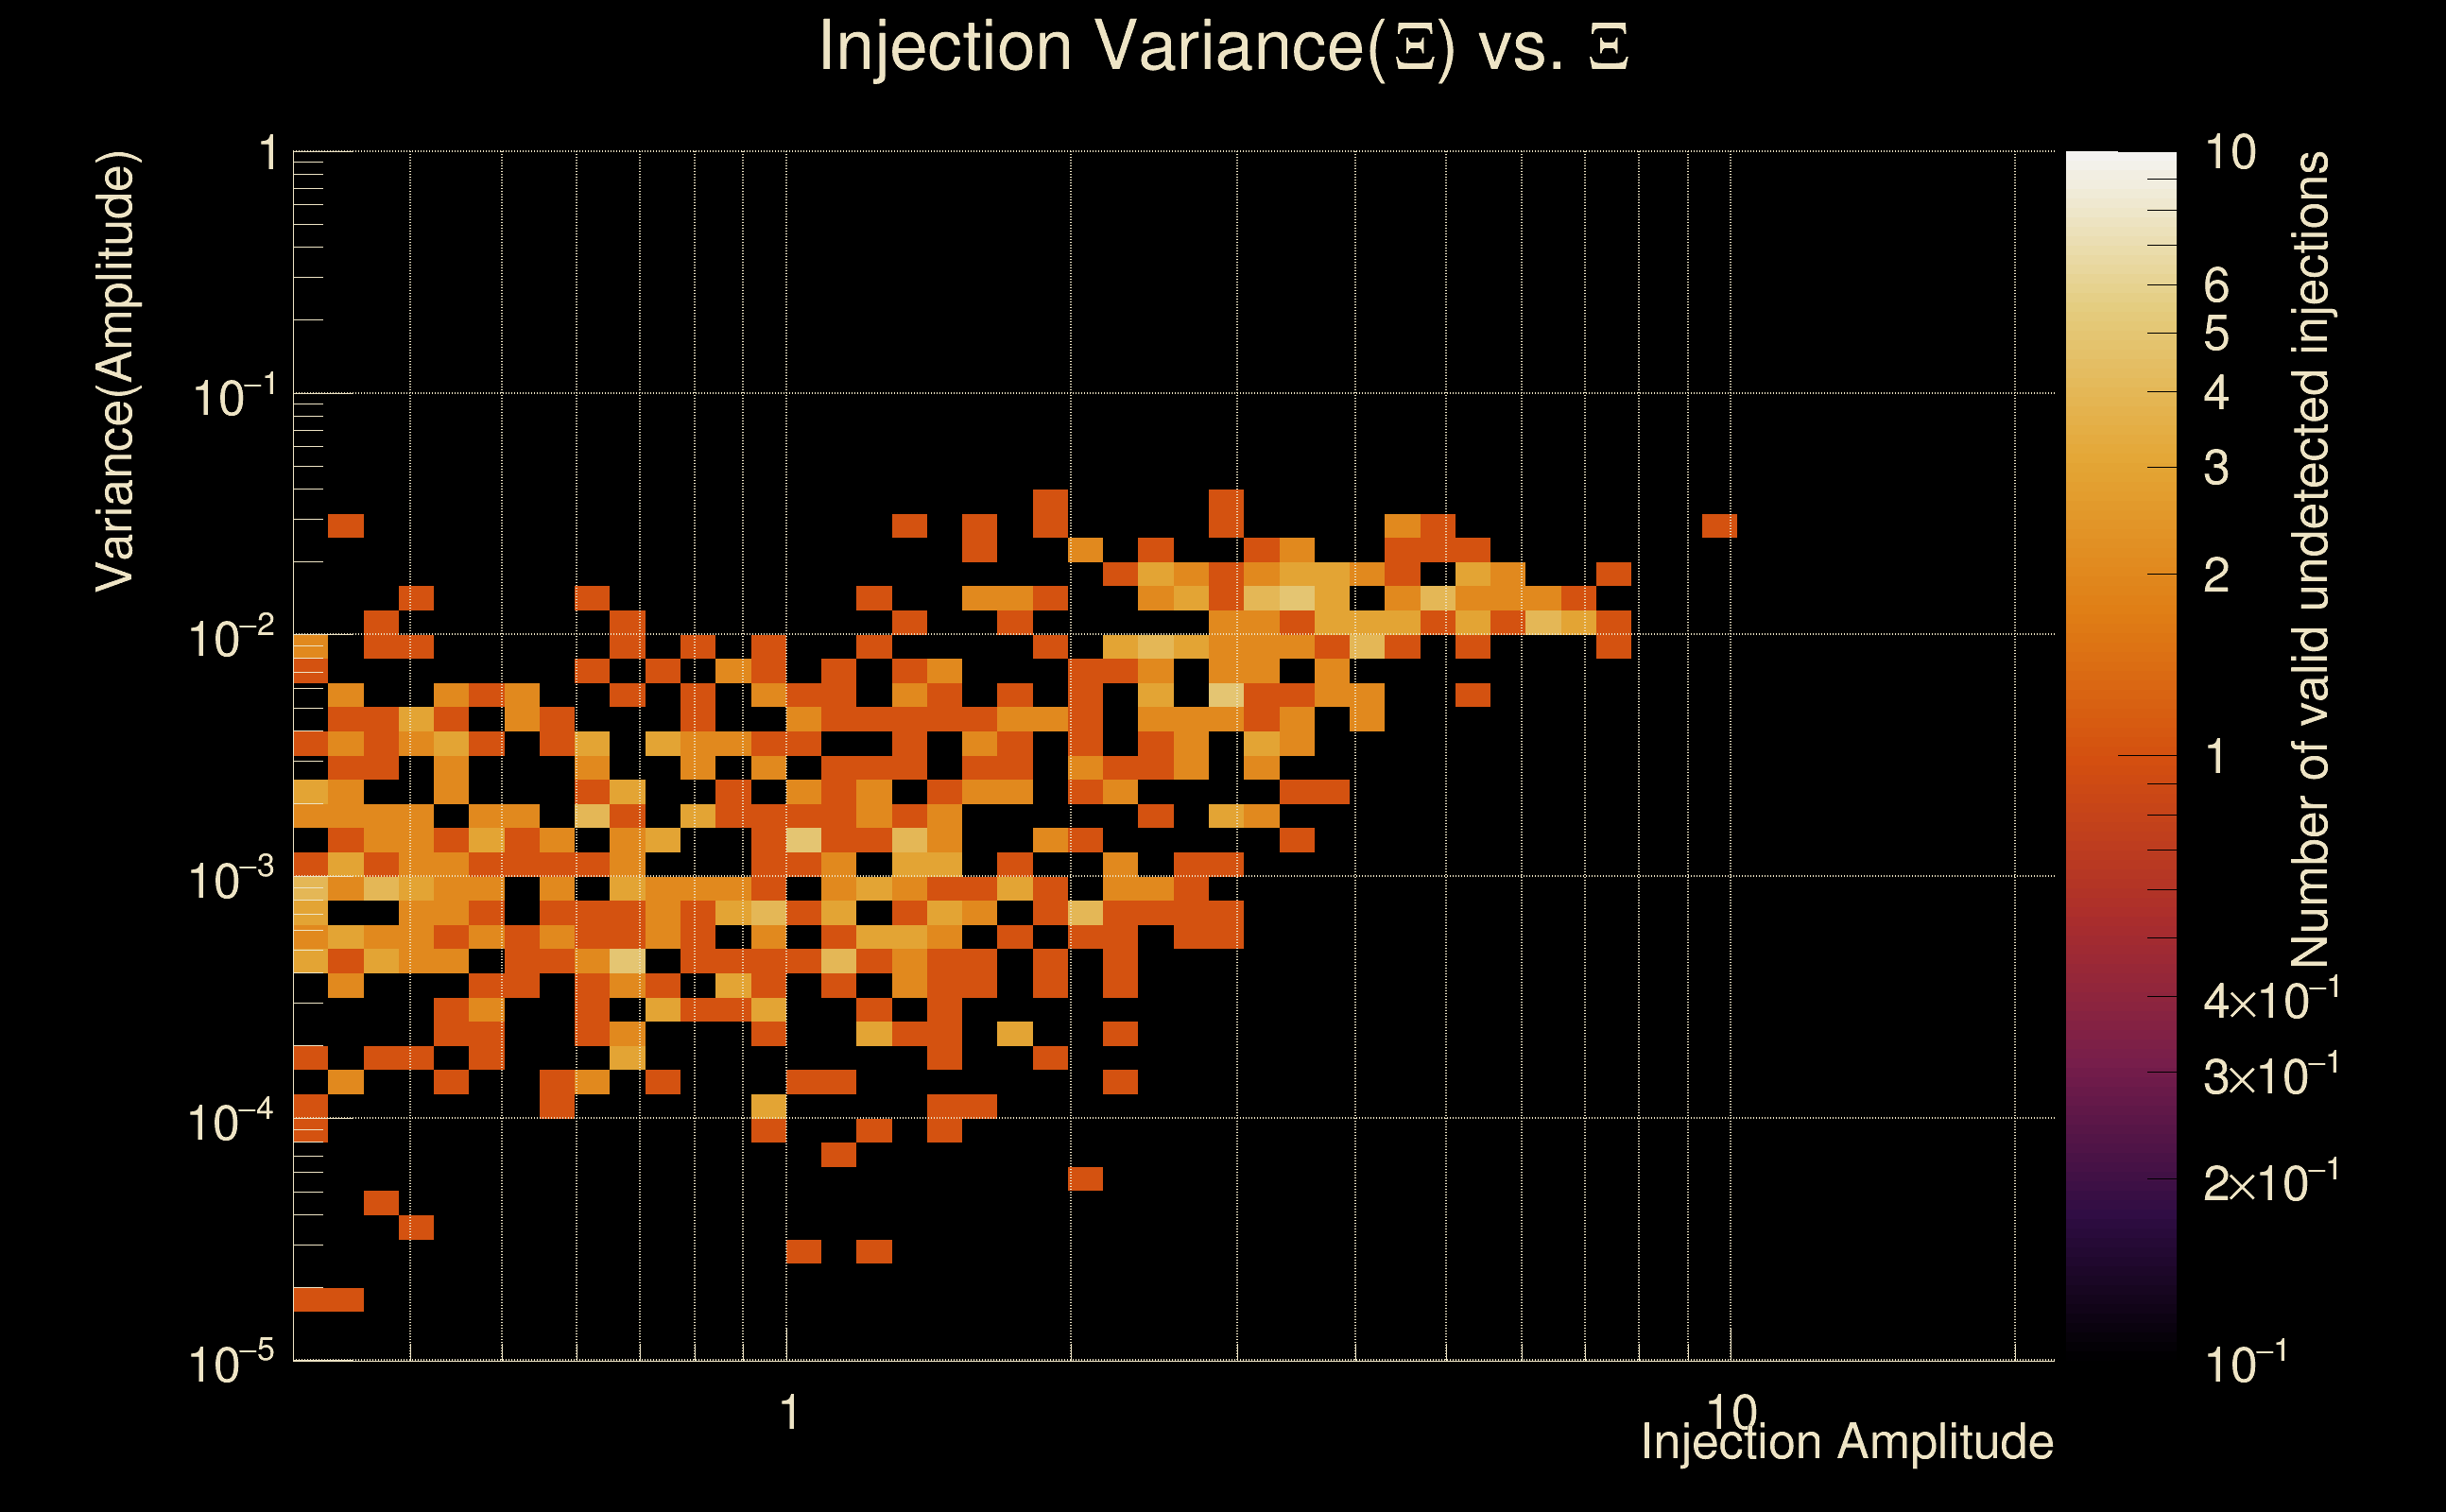
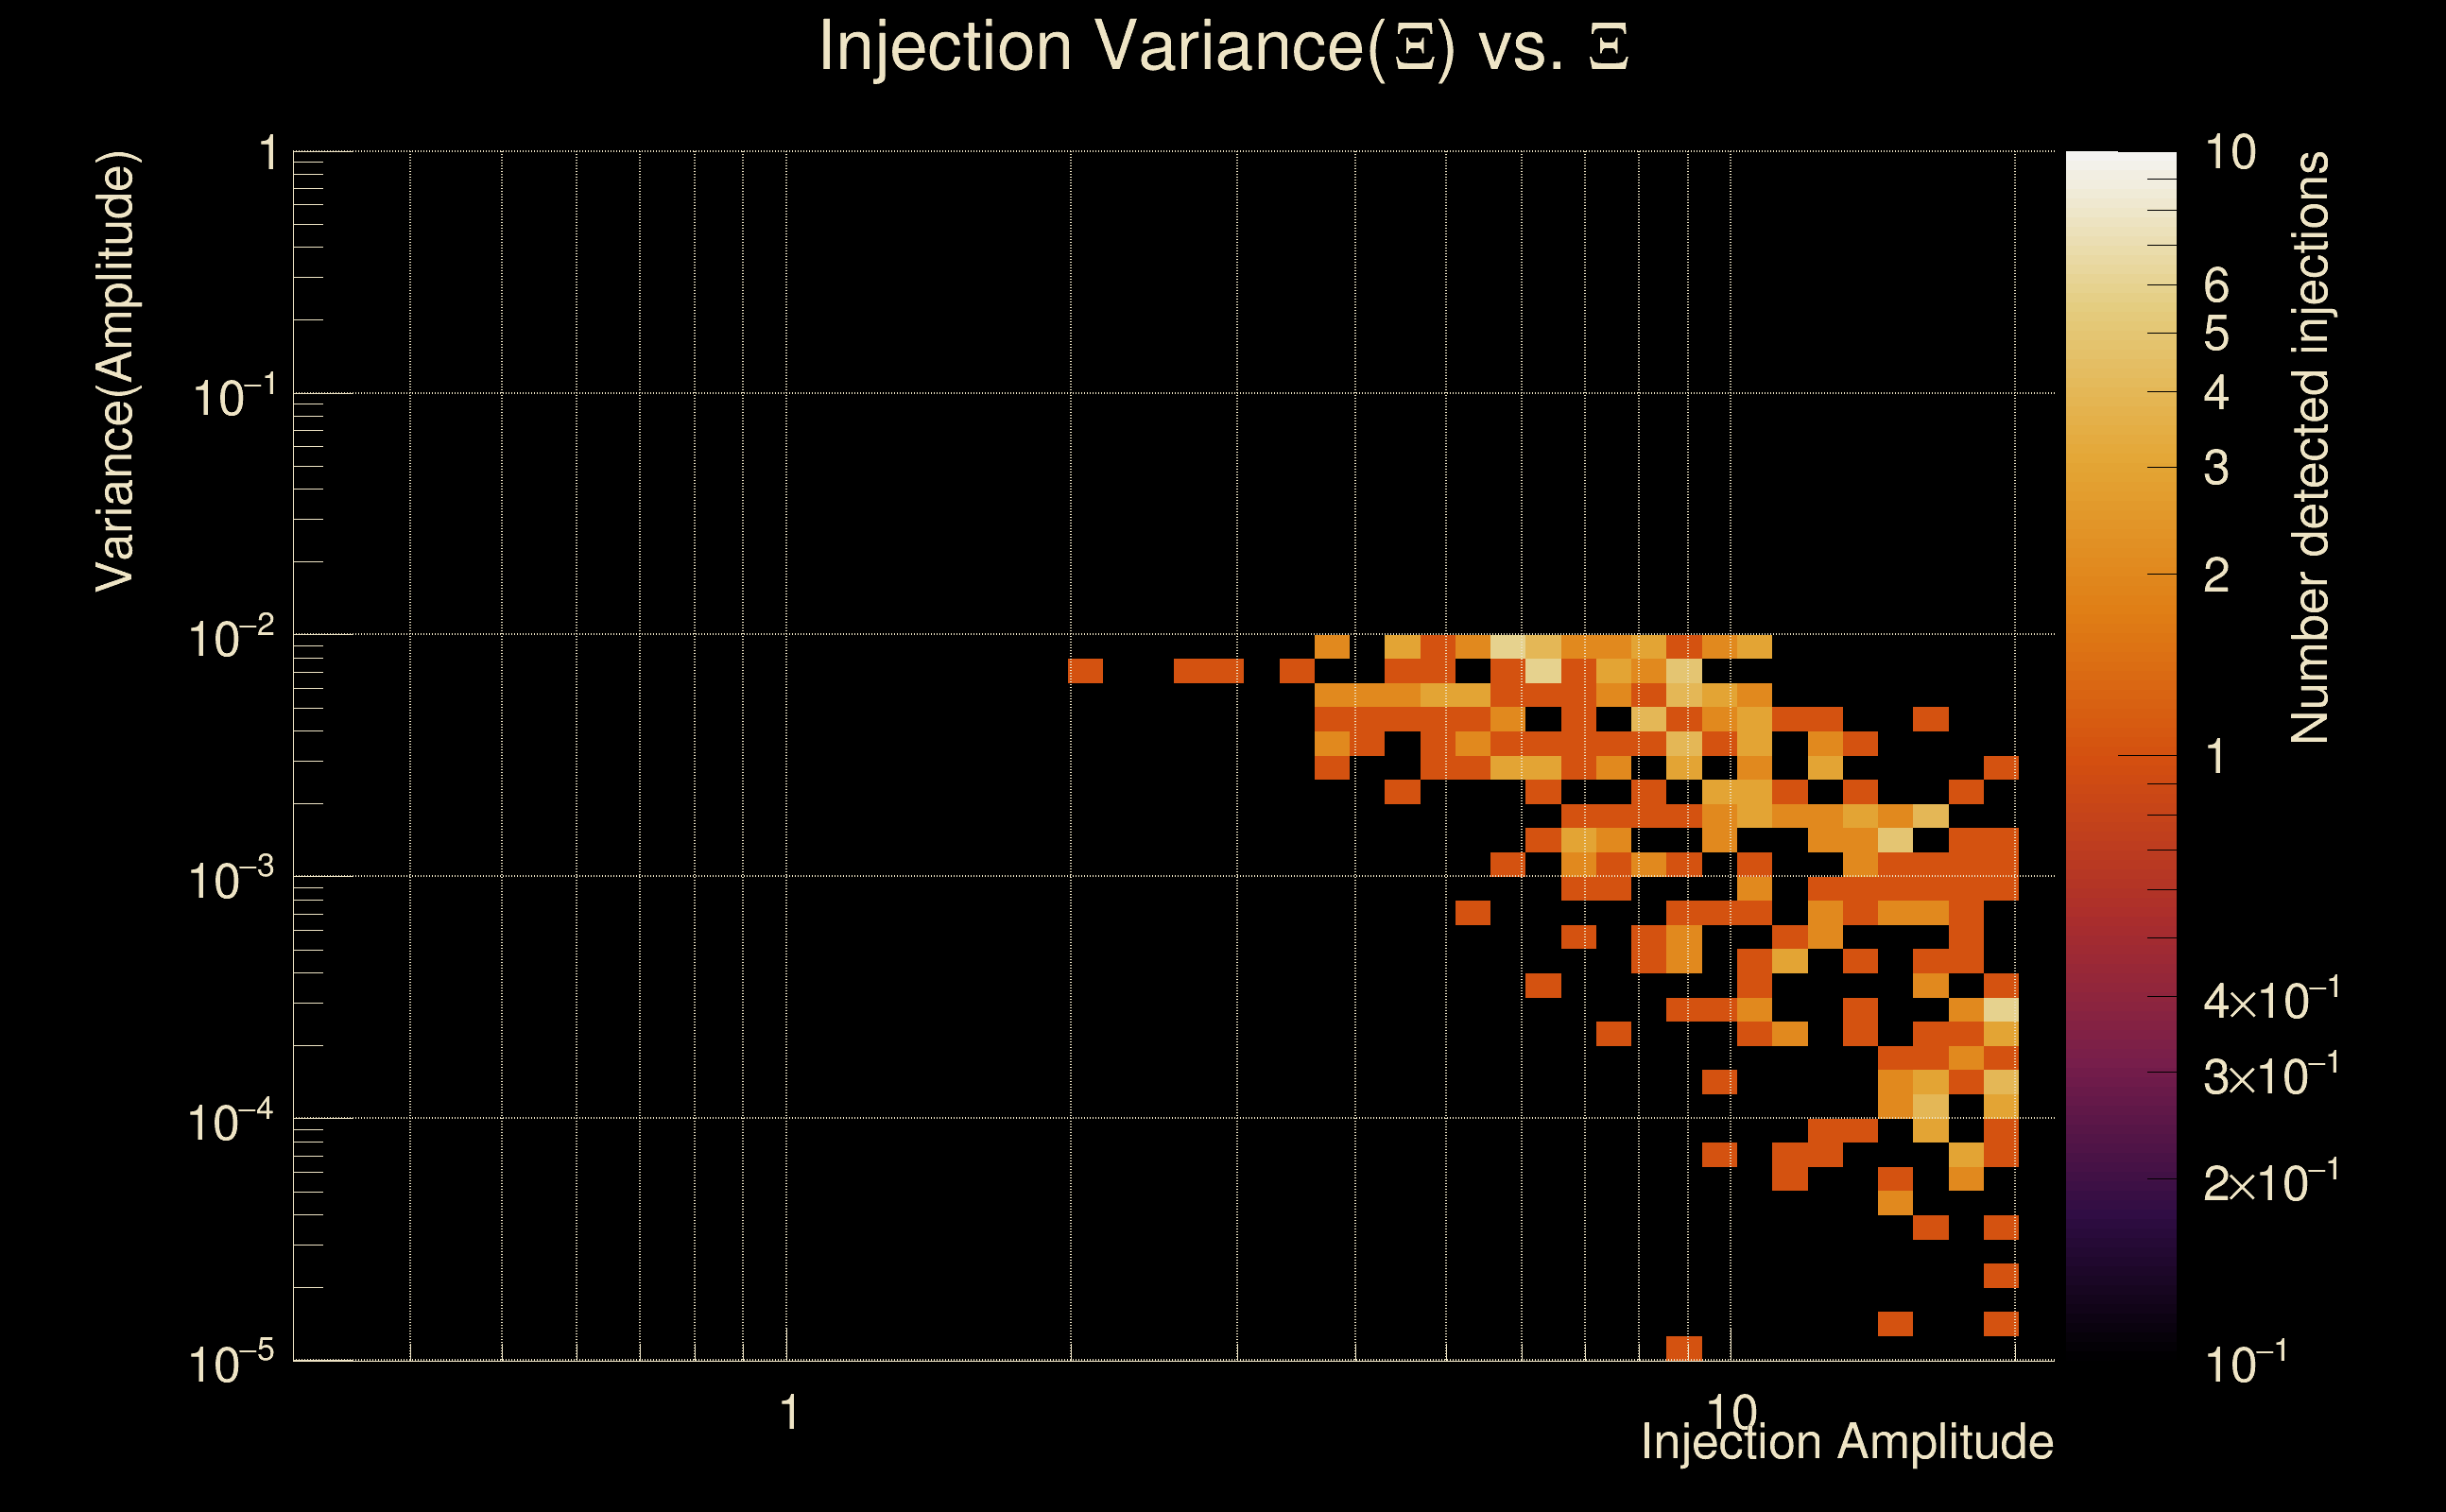
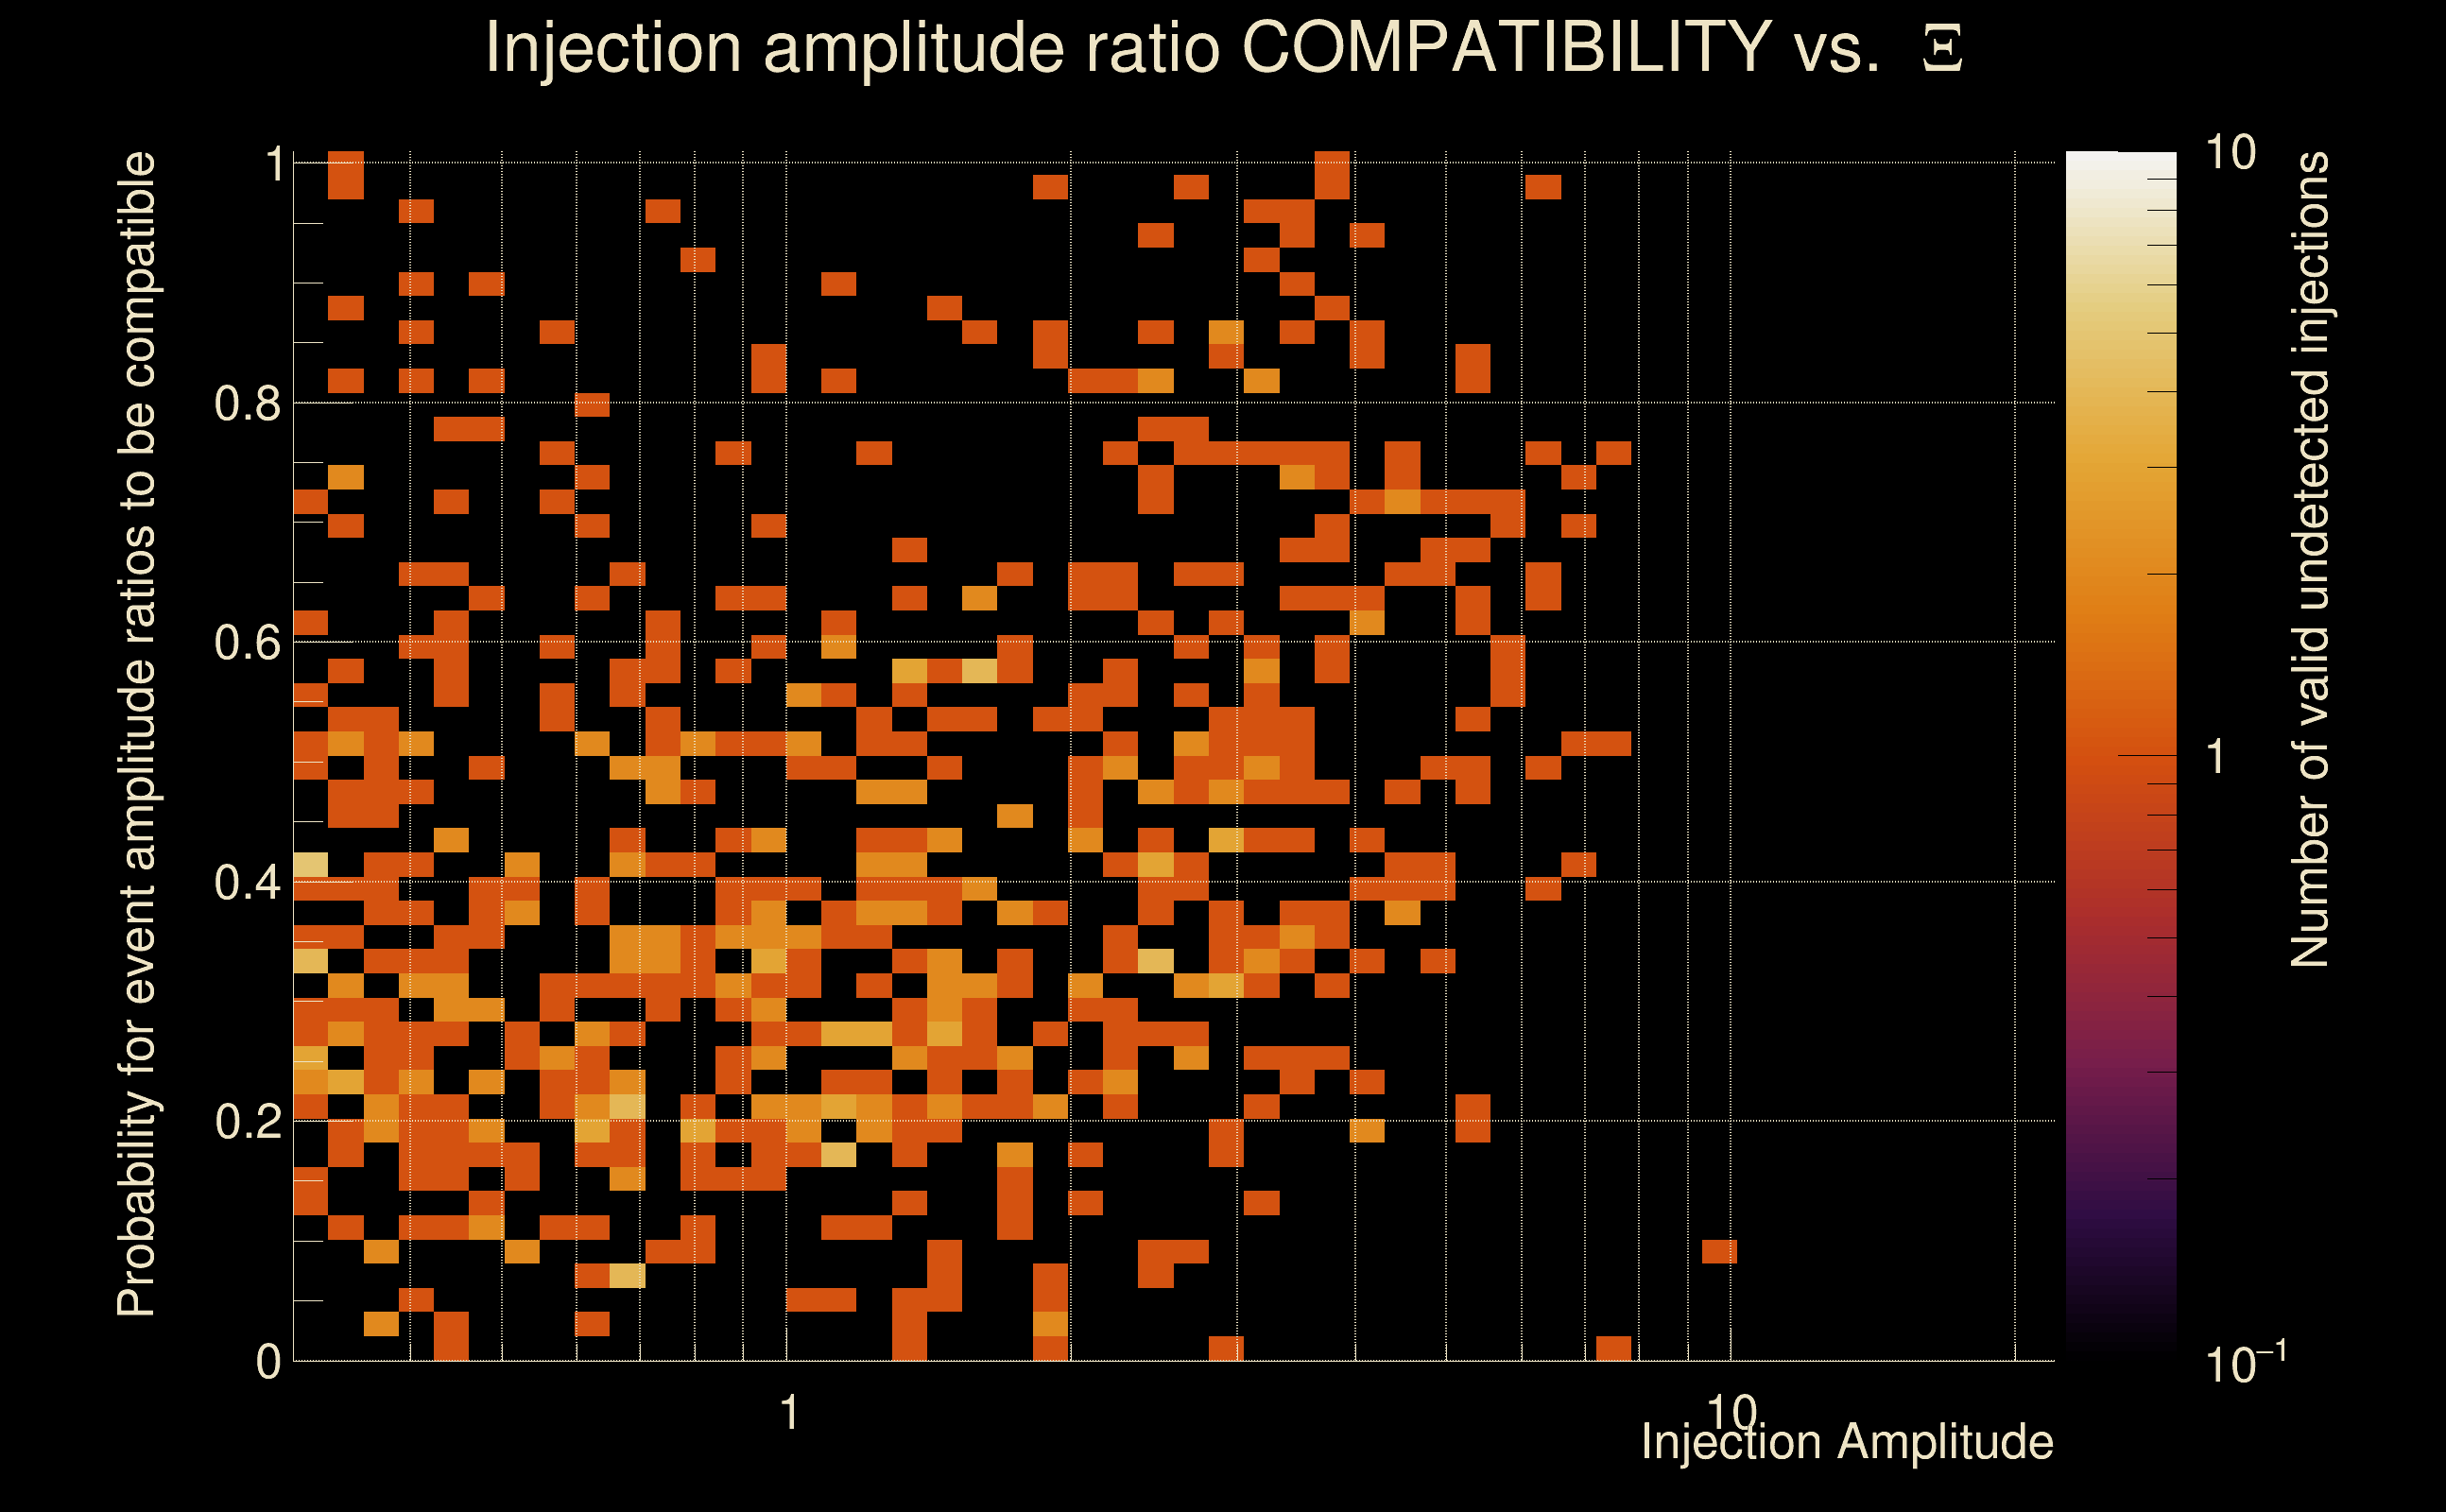
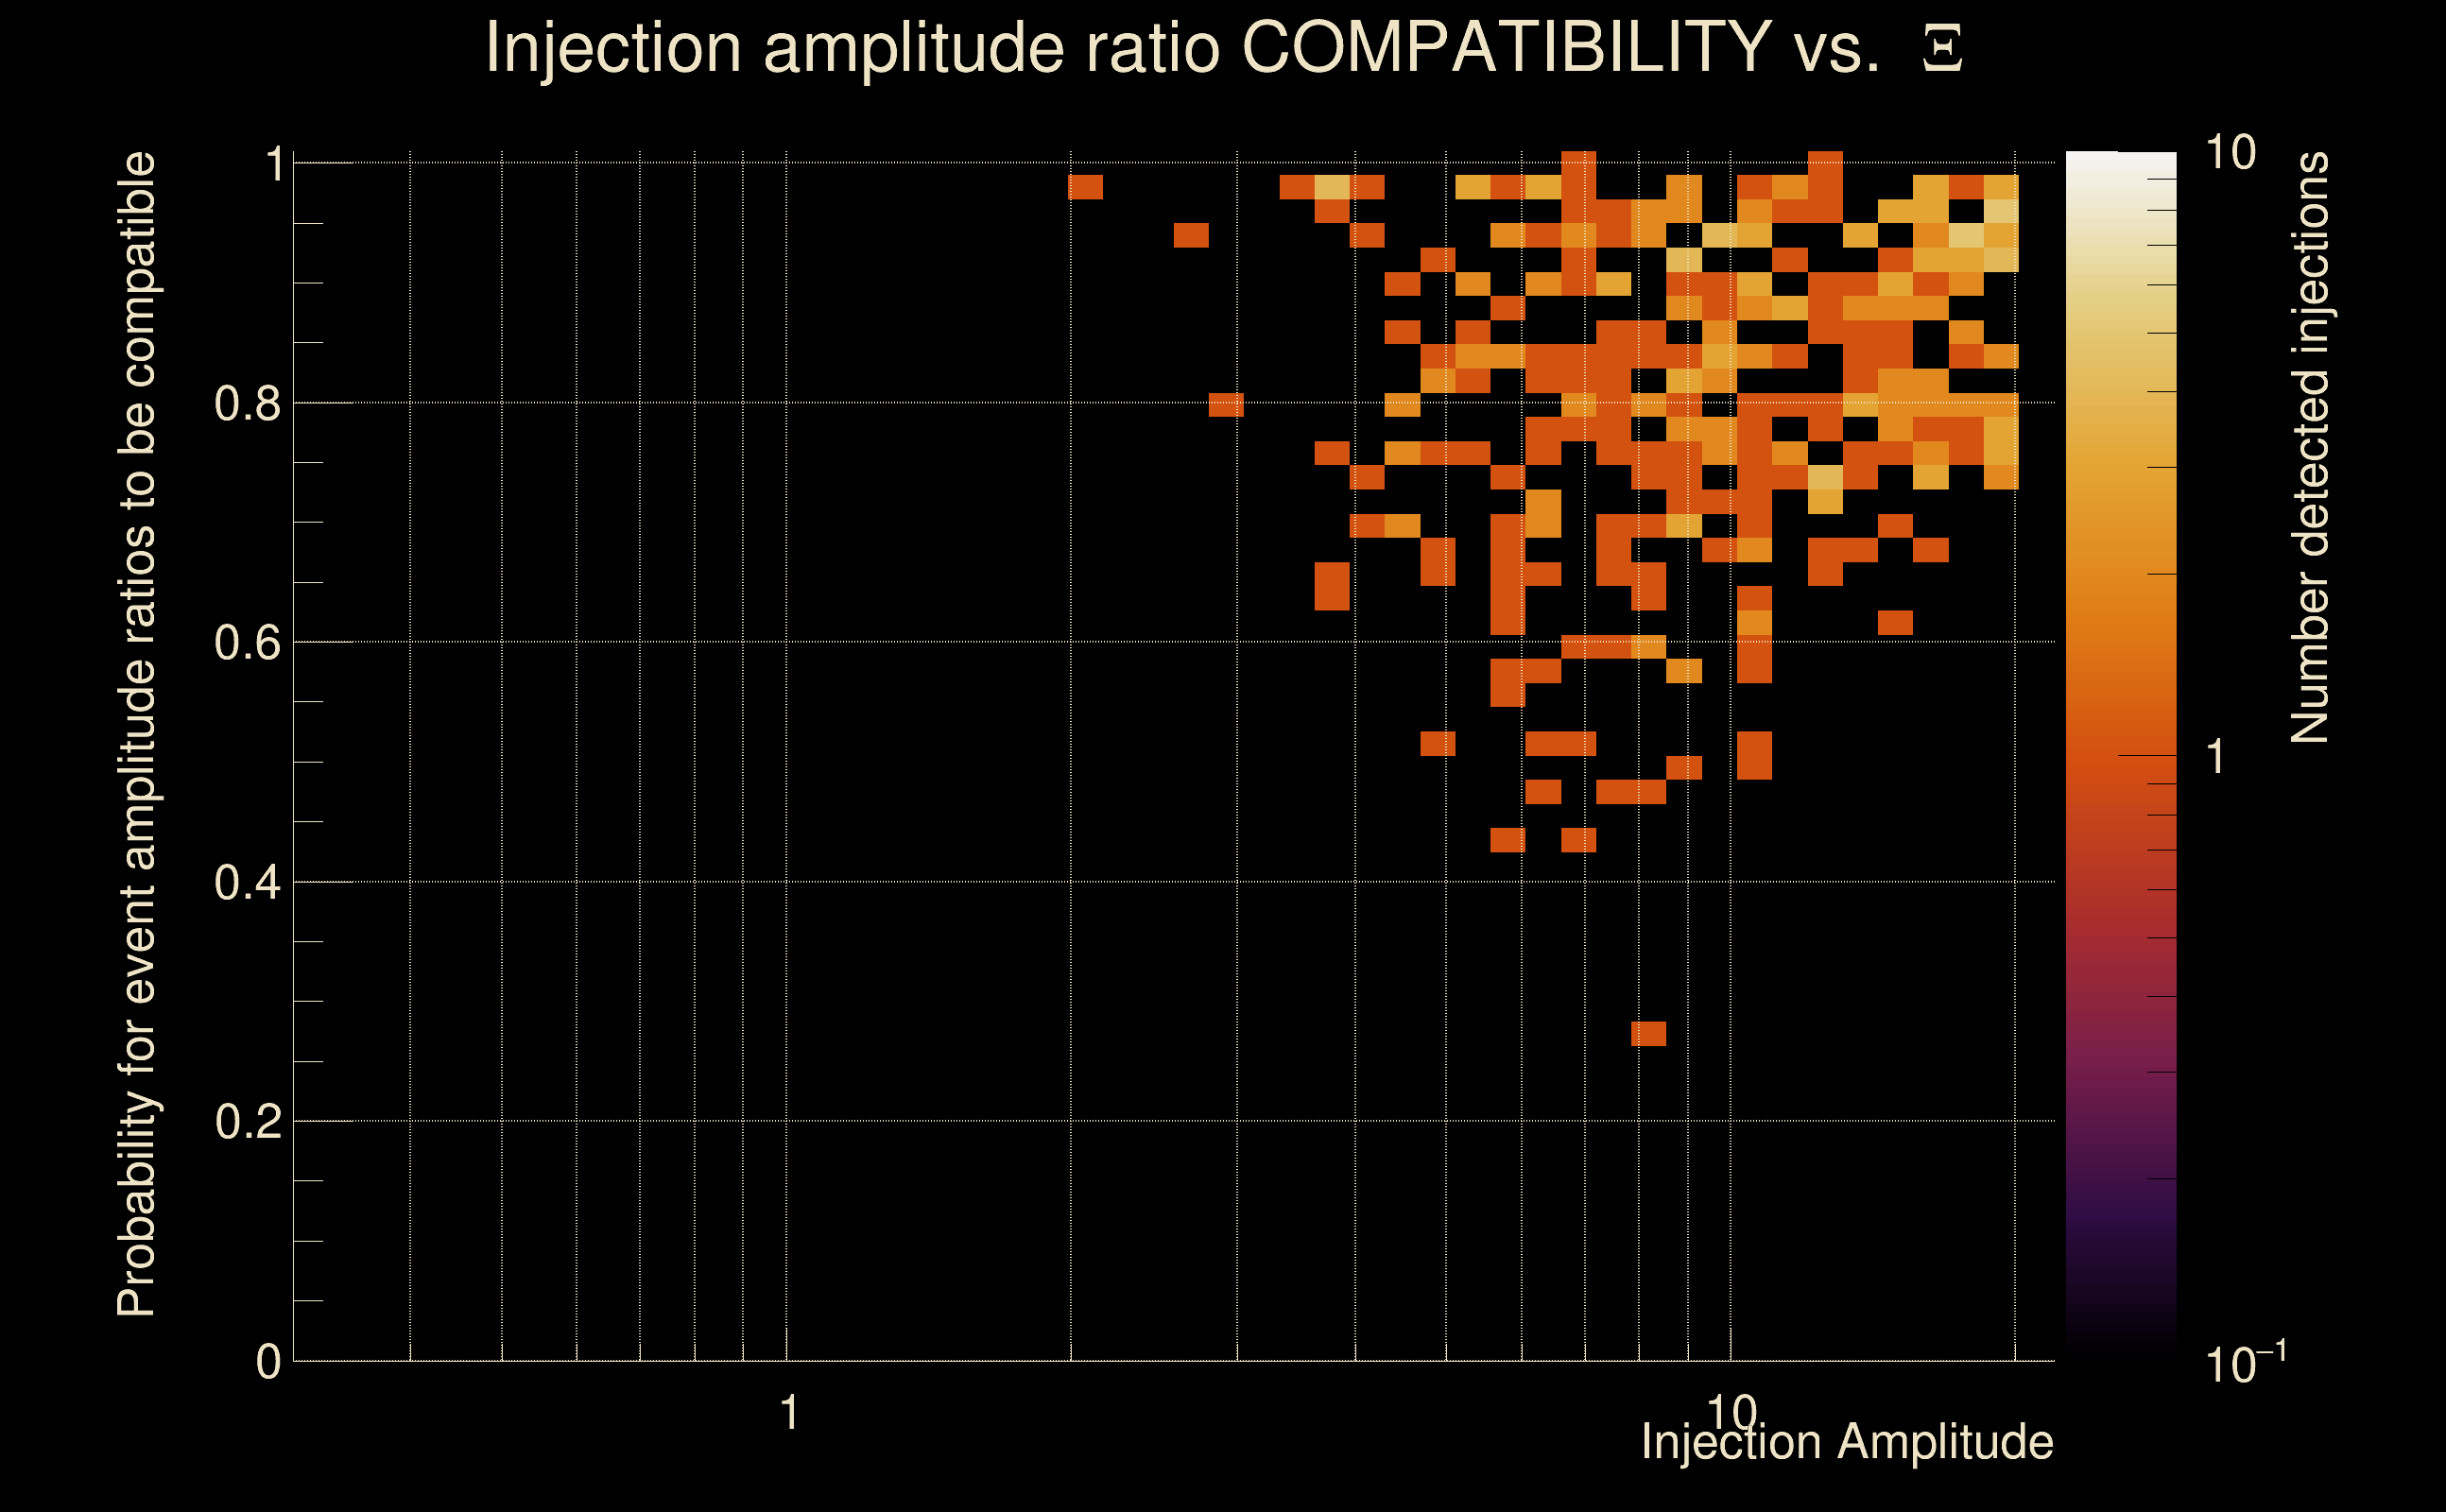
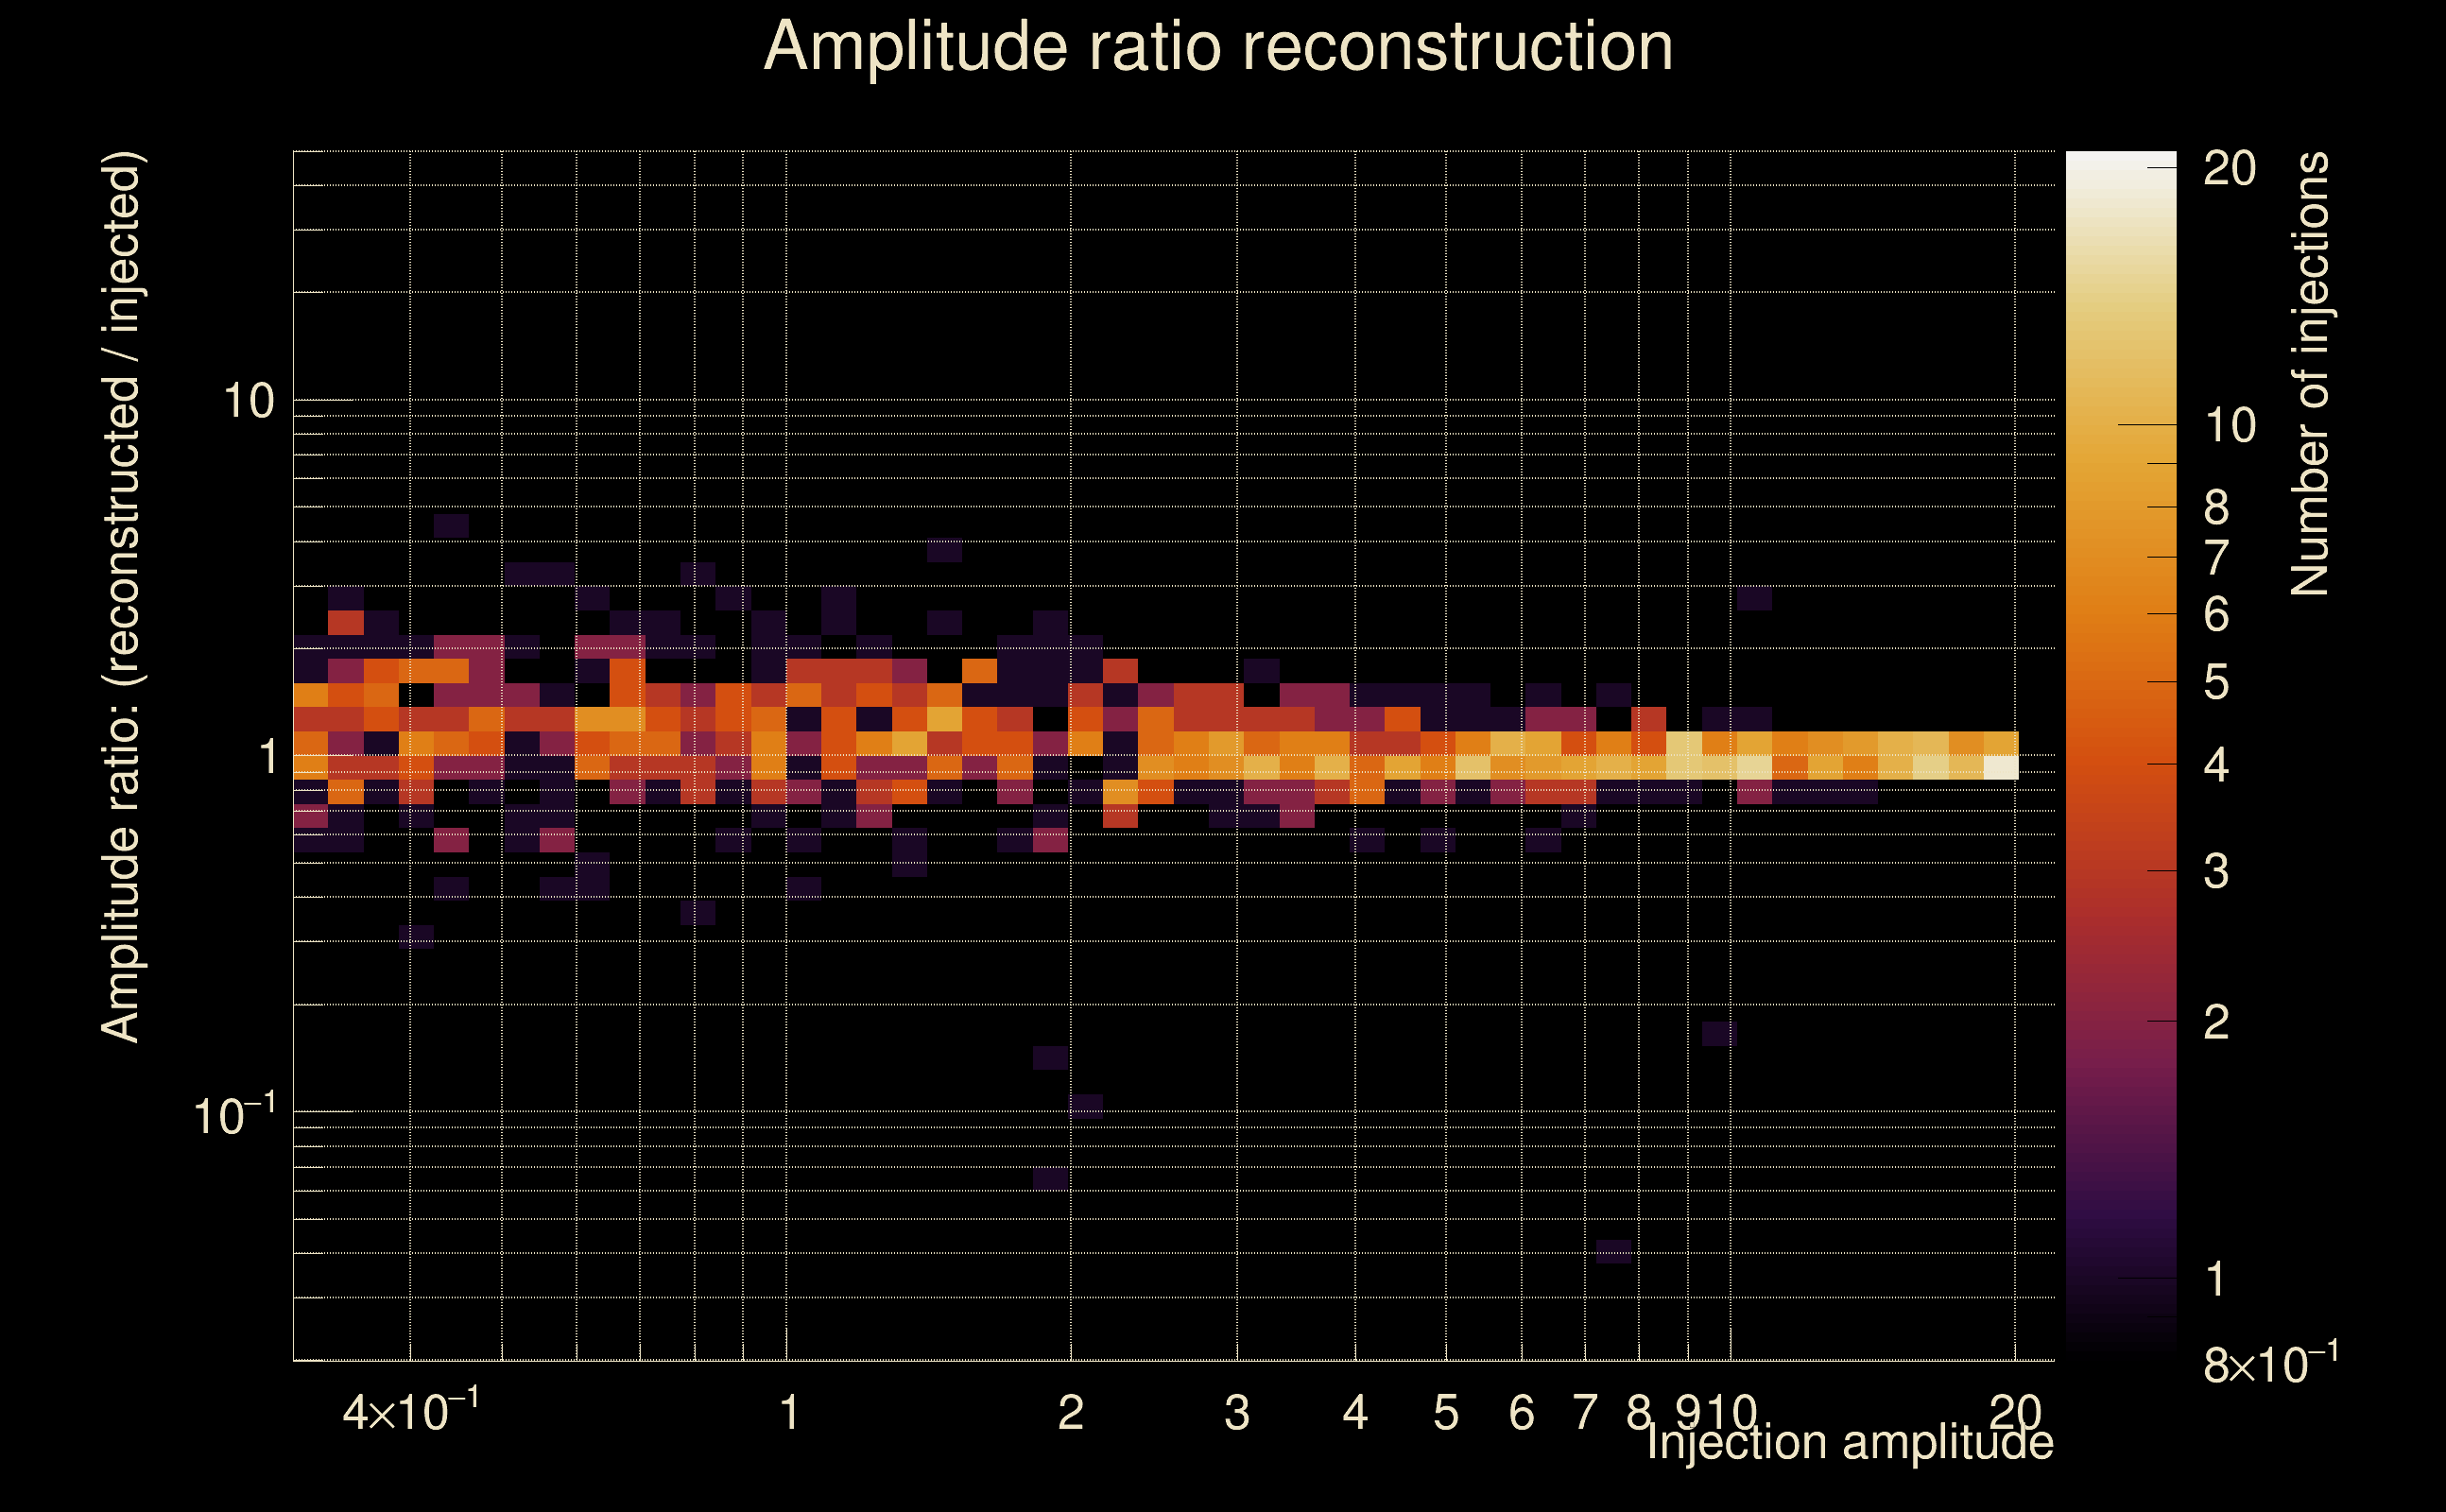
| Number of injections (total/valid/detected): | 1162 / 1019 / 268 |
| List of missed injections: | ./Mezz23-D15_missed.txt |
| Injection amplitude at 90% detection efficiency: | 9.53324 |
| Injection amplitude at 50% detection efficiency: | 7.91356 |
| Injection amplitude at 10% detection efficiency: | 5.36203 |
 |
 |
 |
 |
 |
 |
 |
|
 |
 |
|
 |
 |
|
 |
 |
|
 |
 |
|
 |
 |
|
 |
 |
|
 |
 |
|
 |
 |
 |
 |
 |
 |
 |
 |
 |
 |
 |
 |
 |
 |
 |
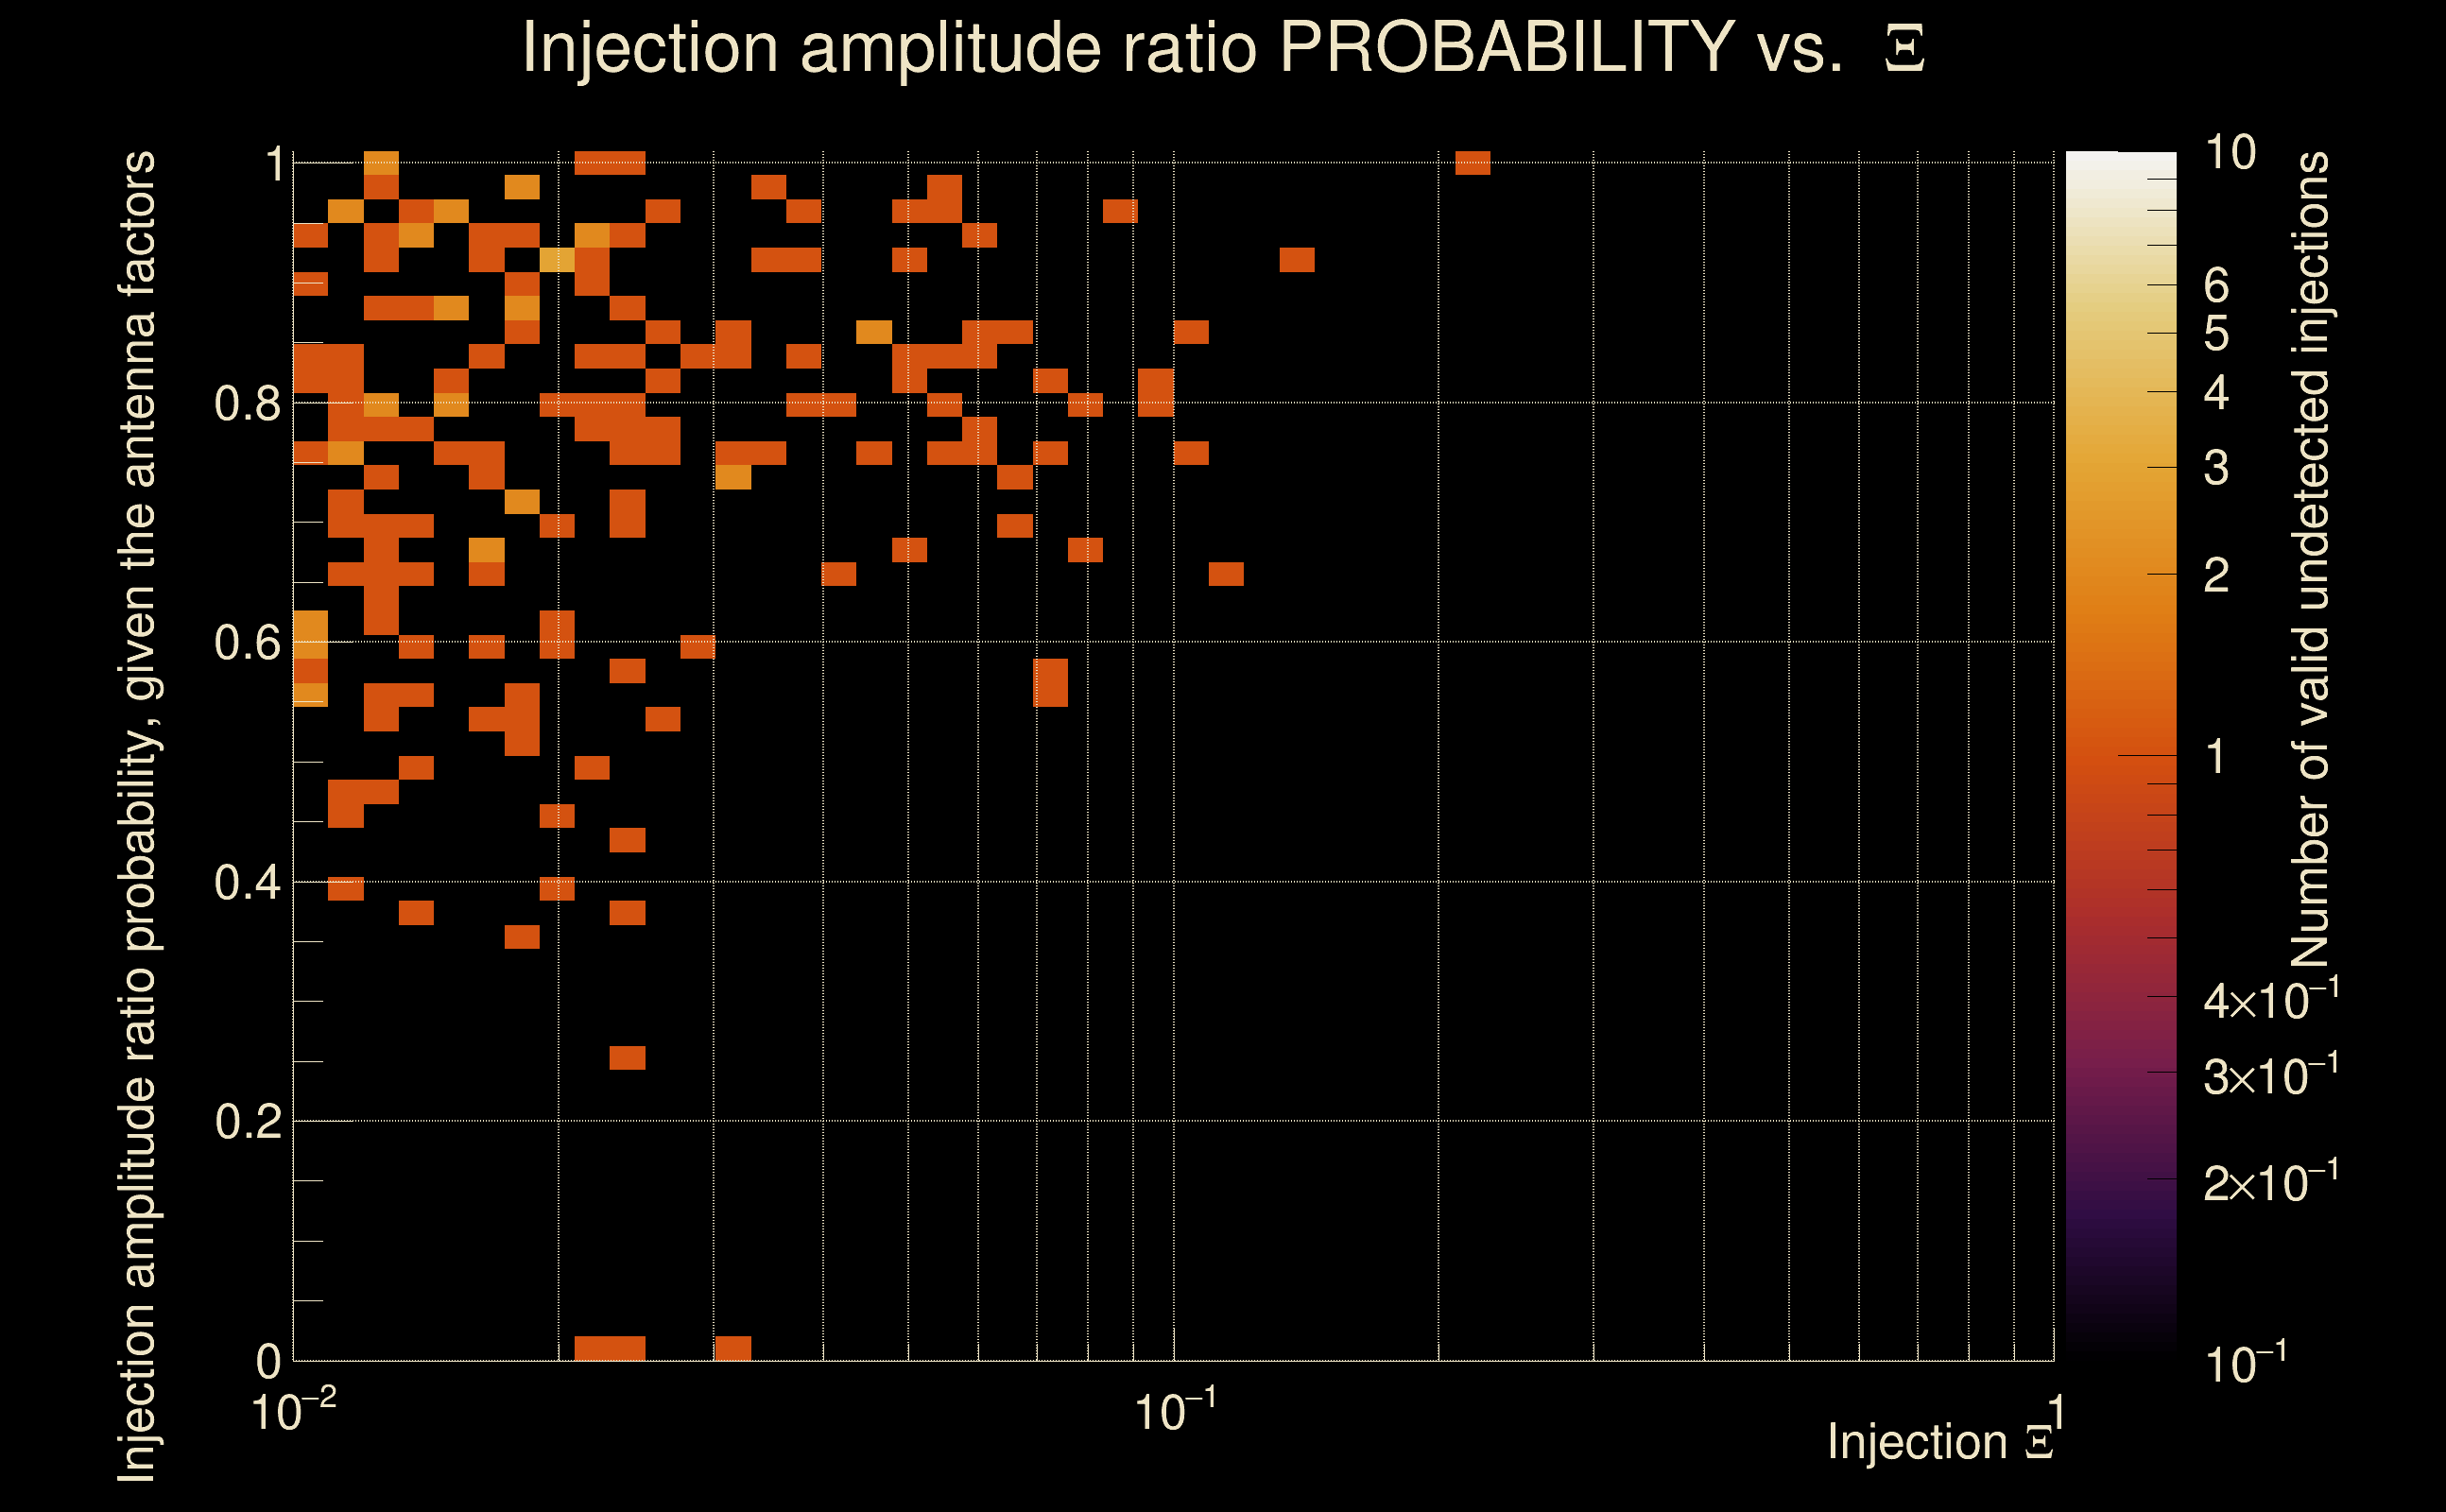
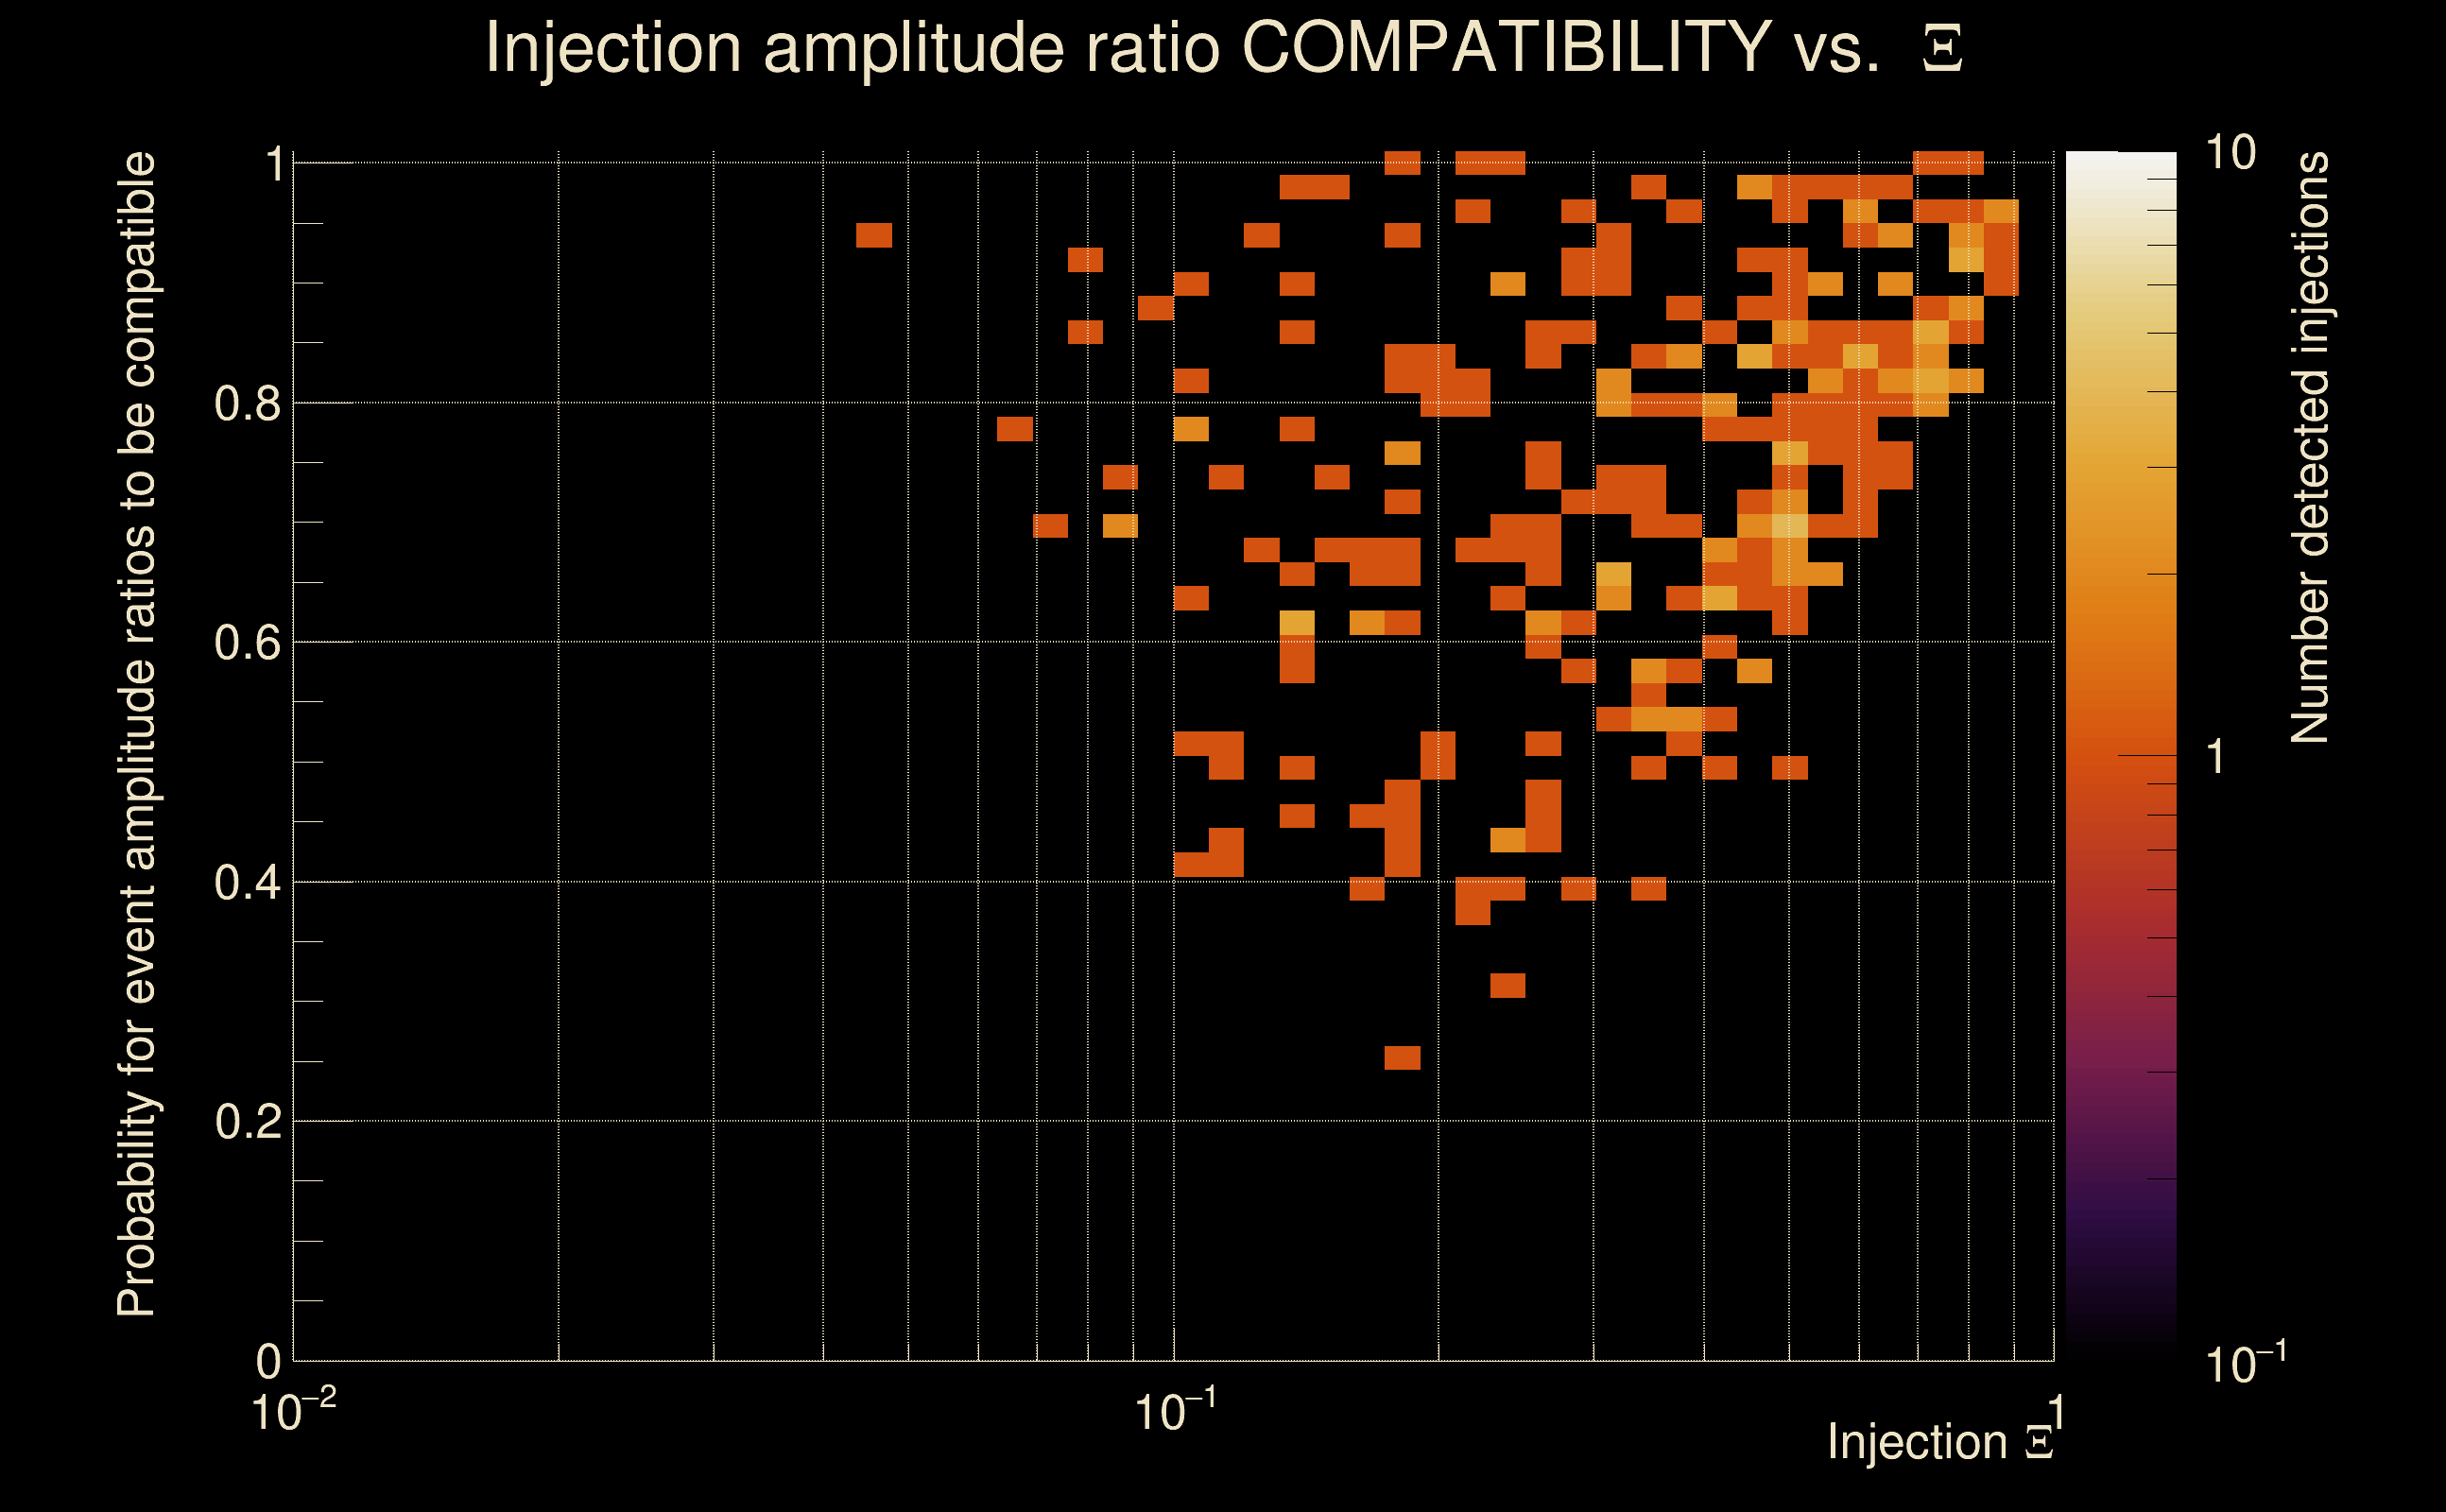
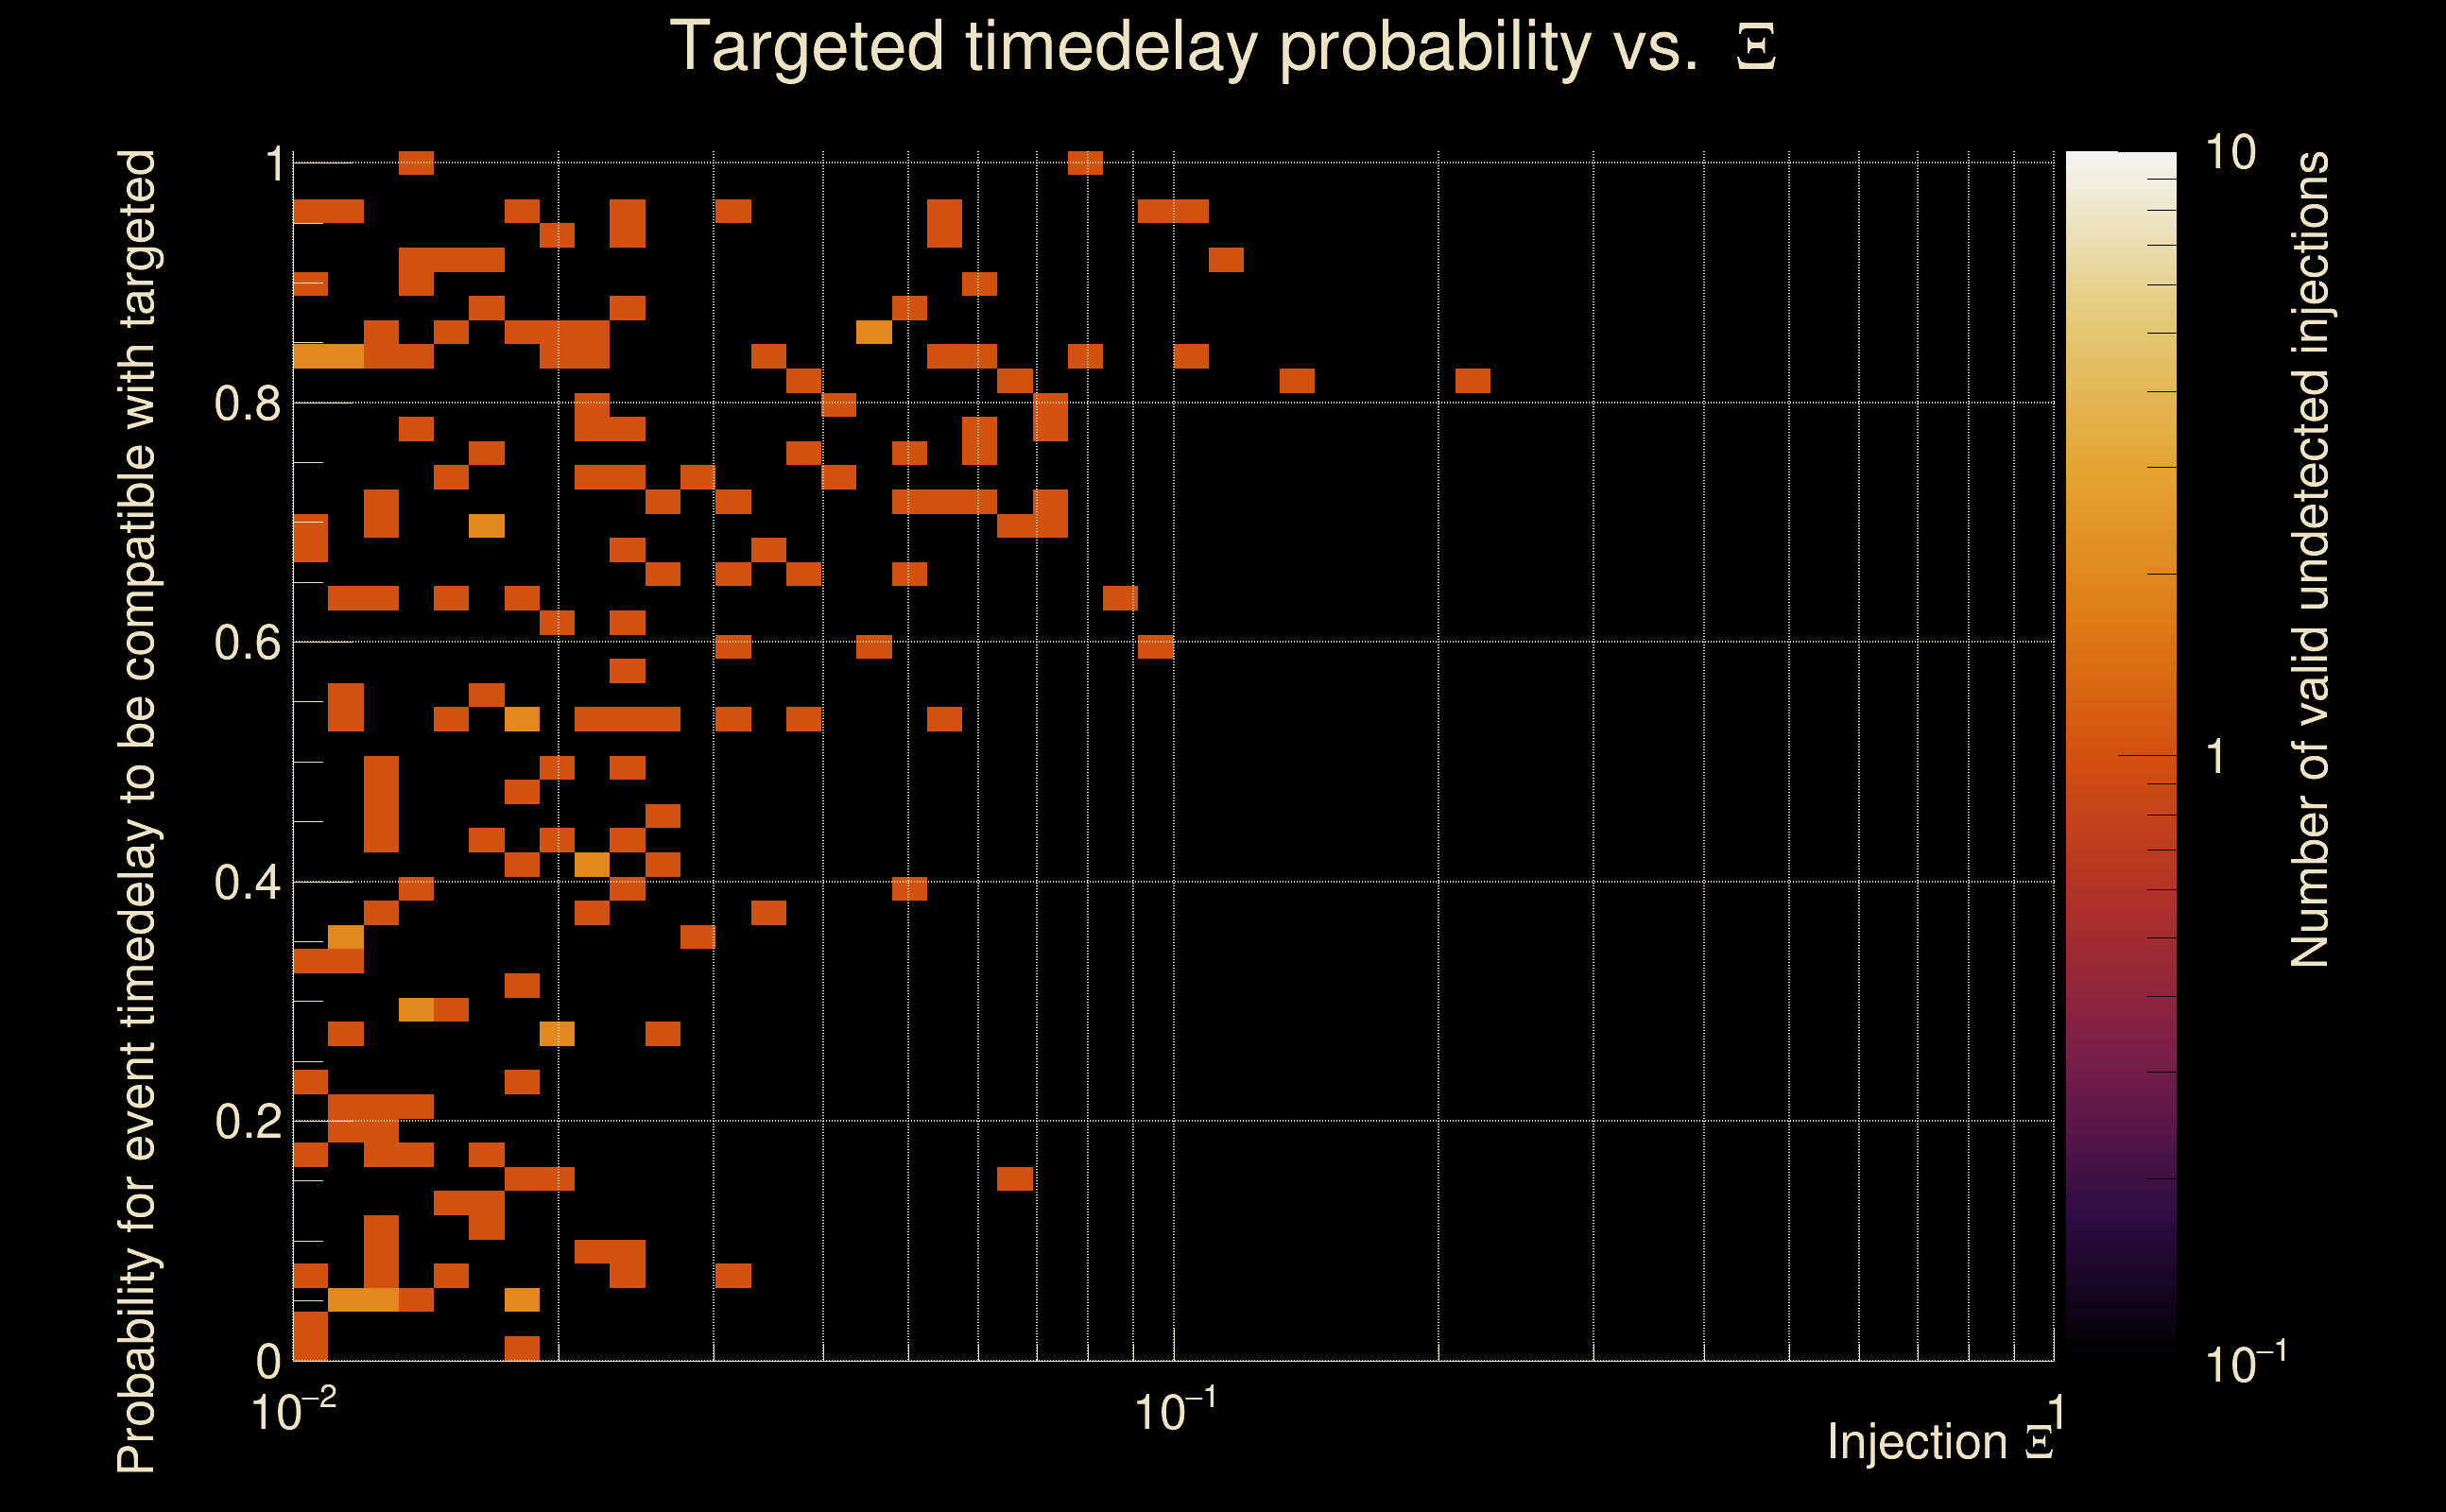
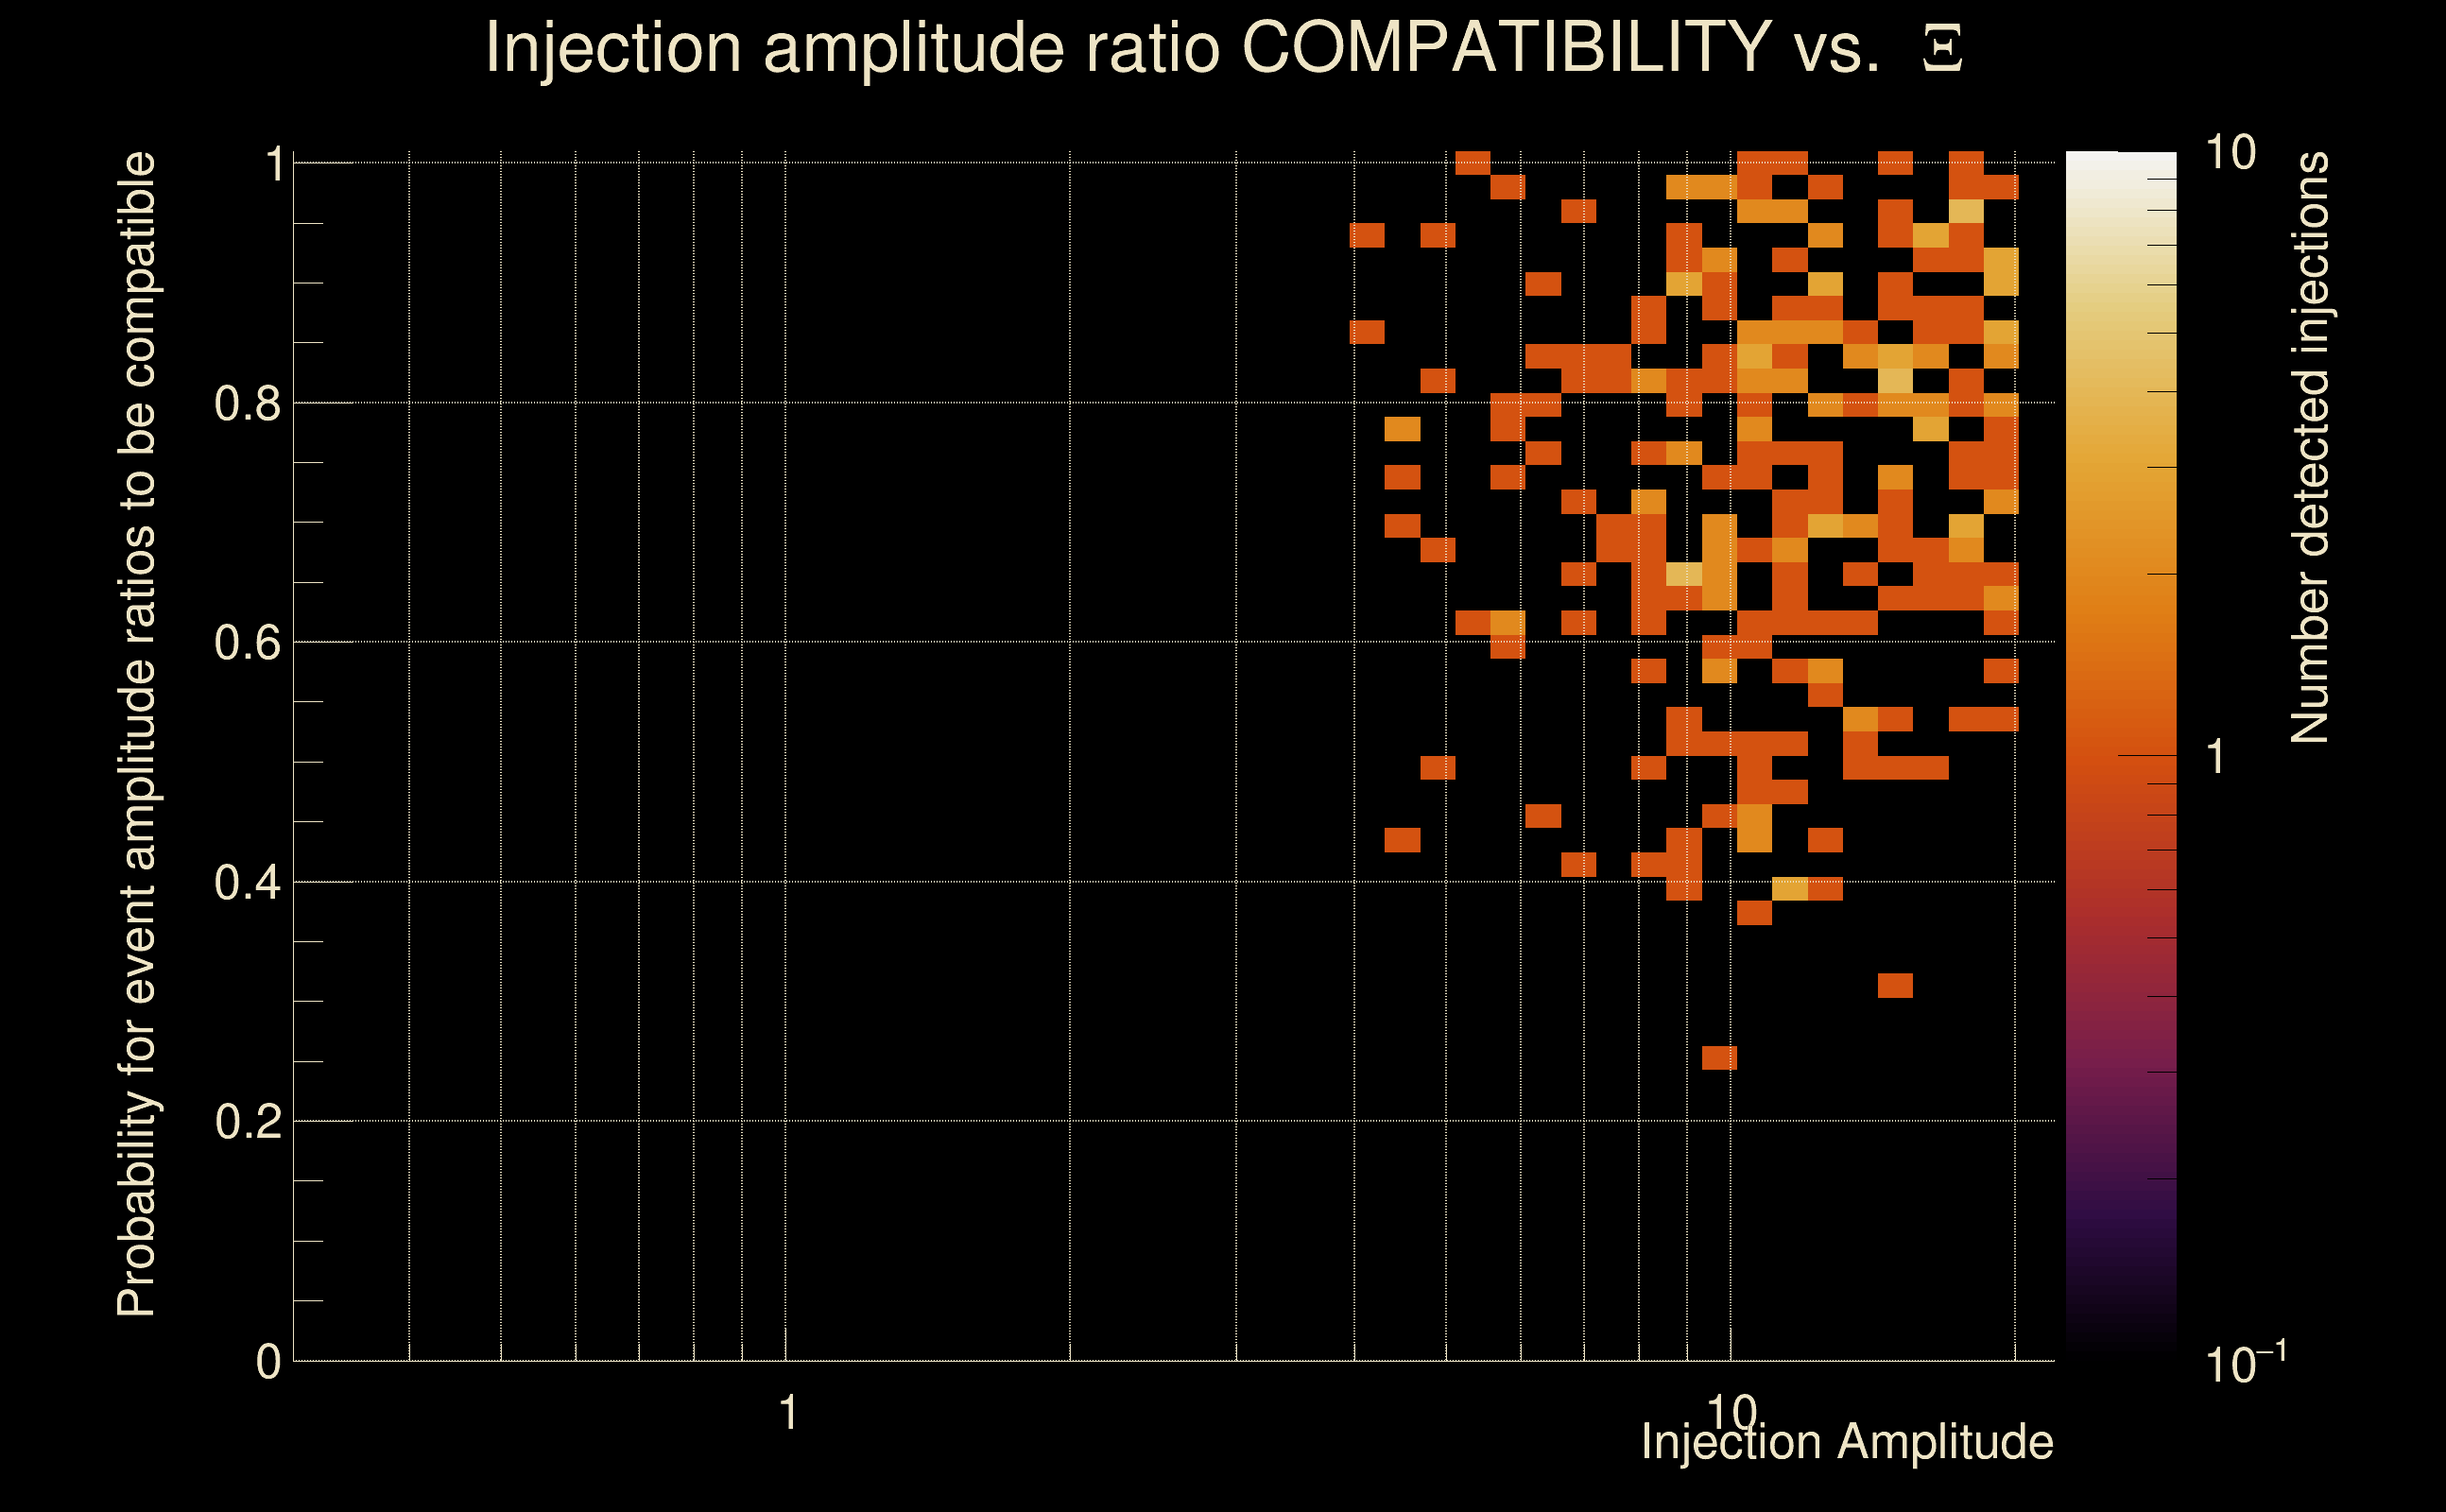
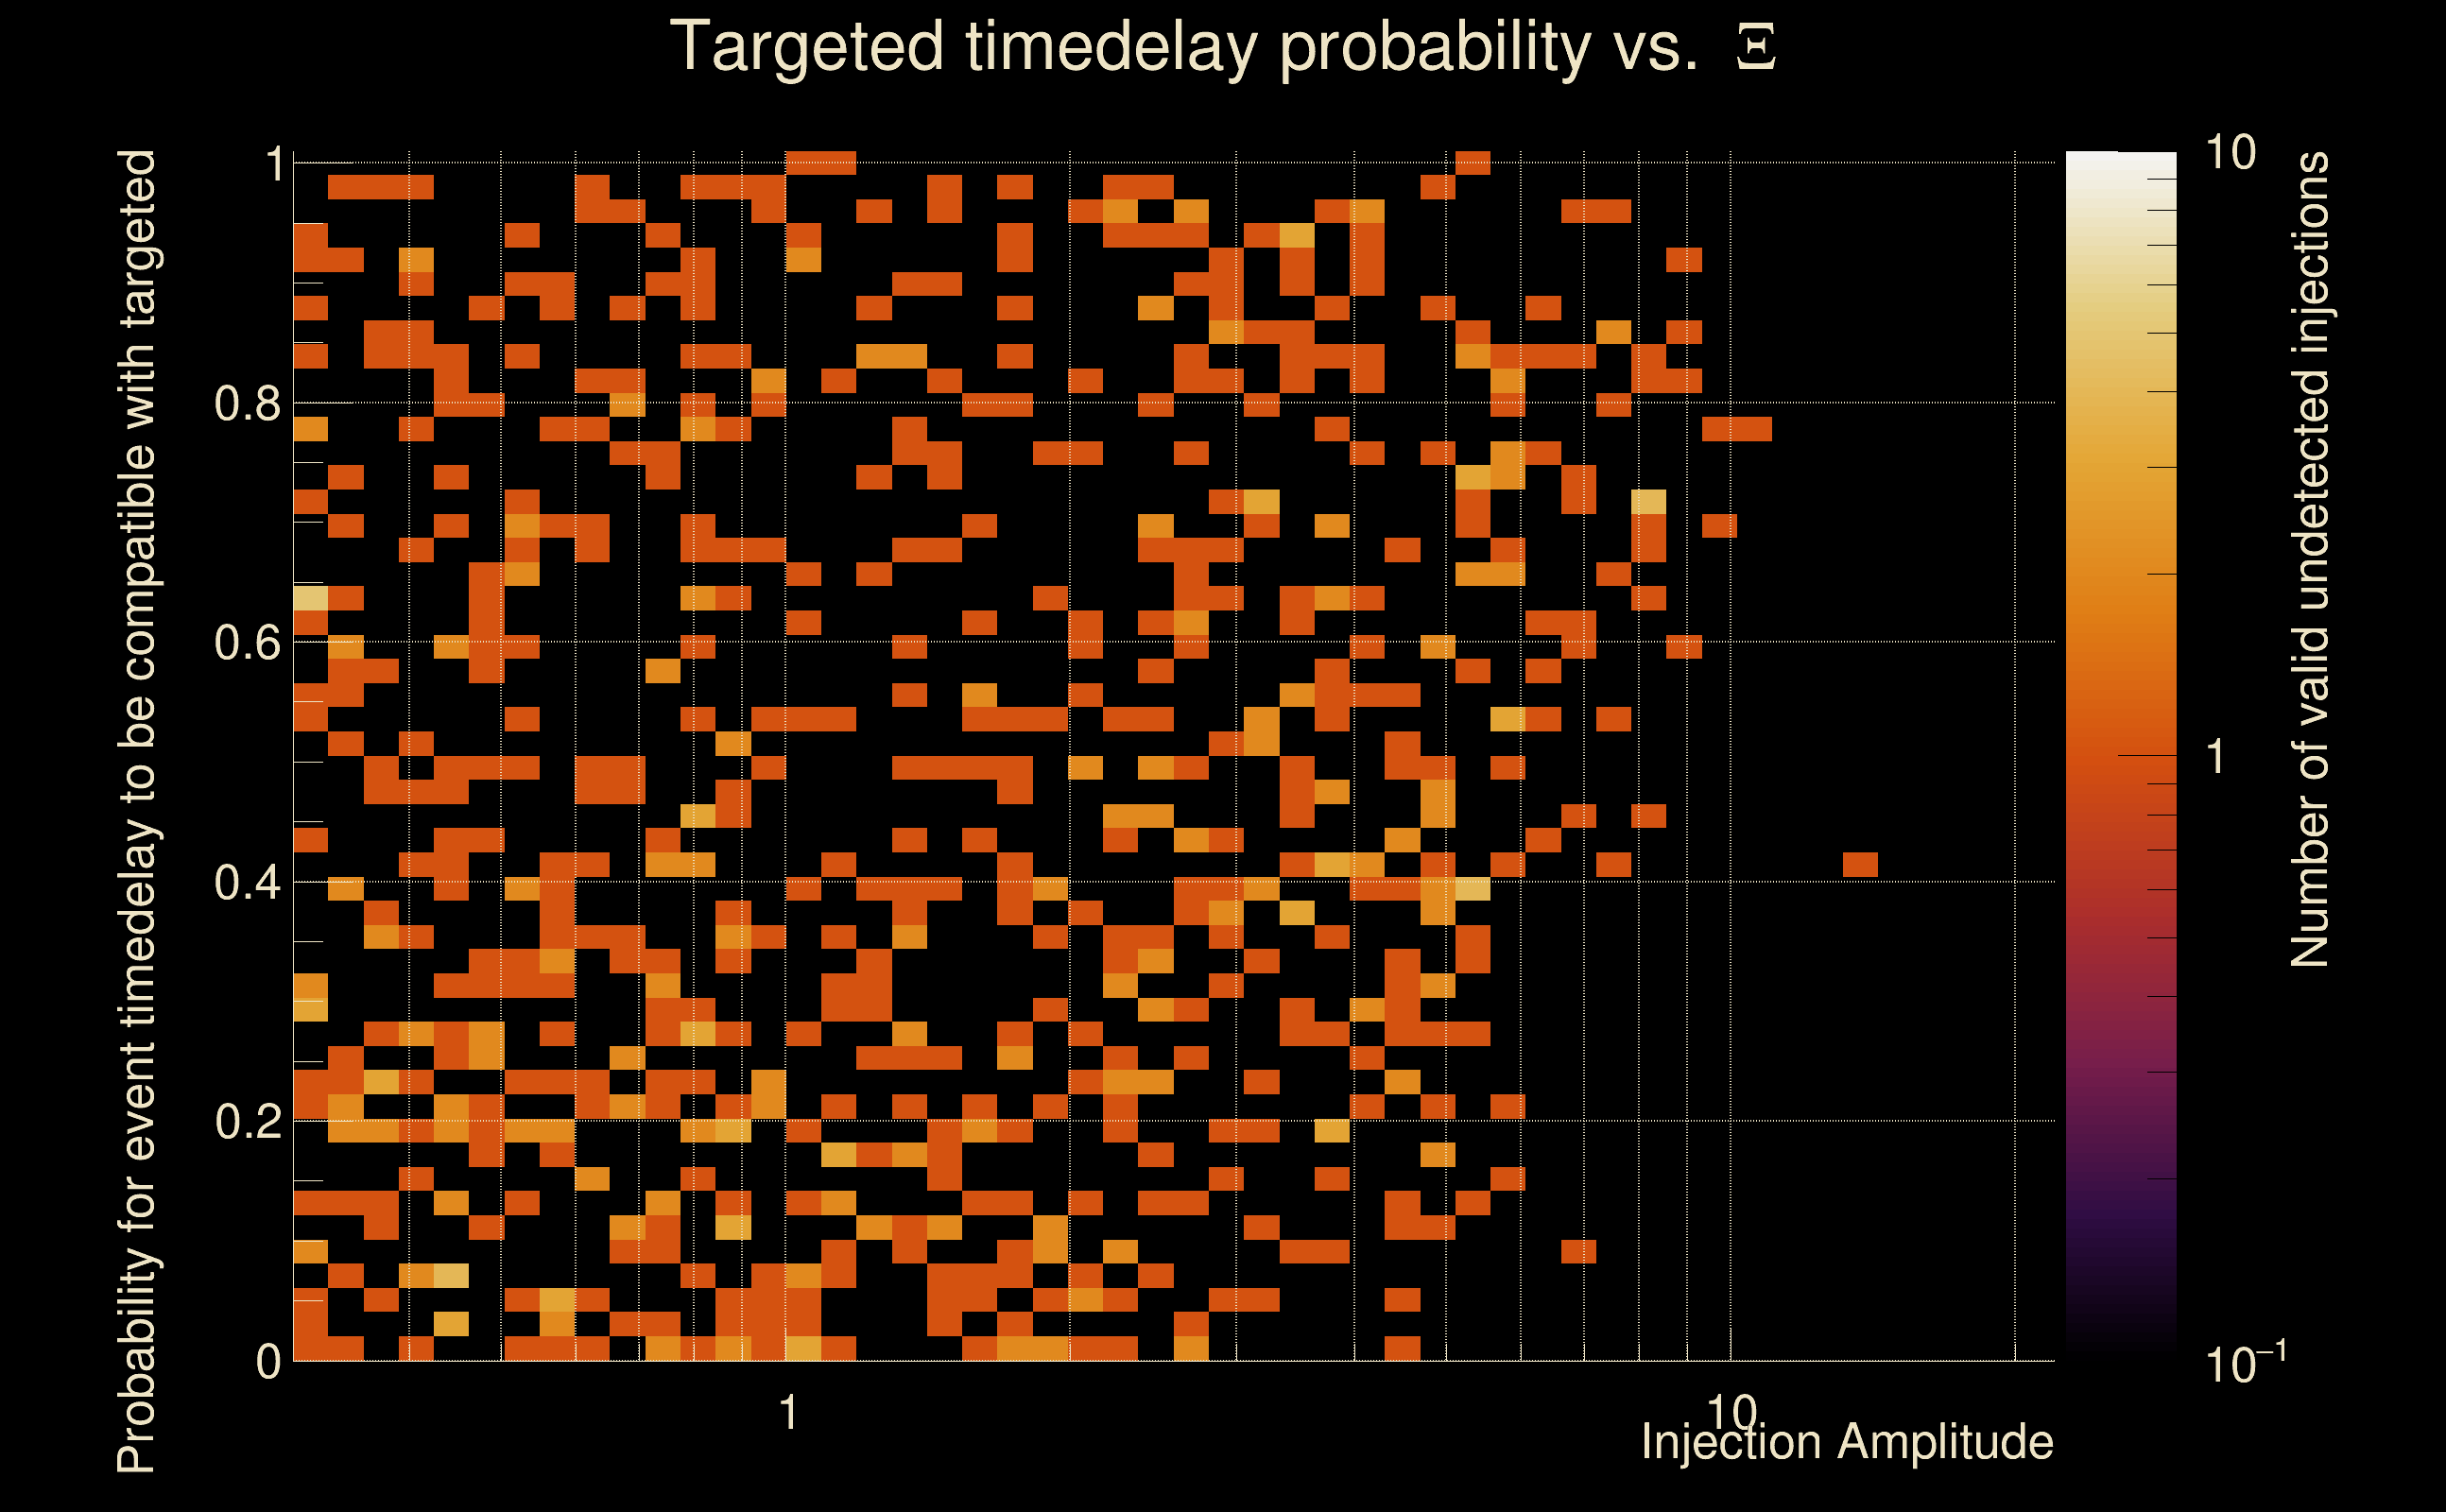
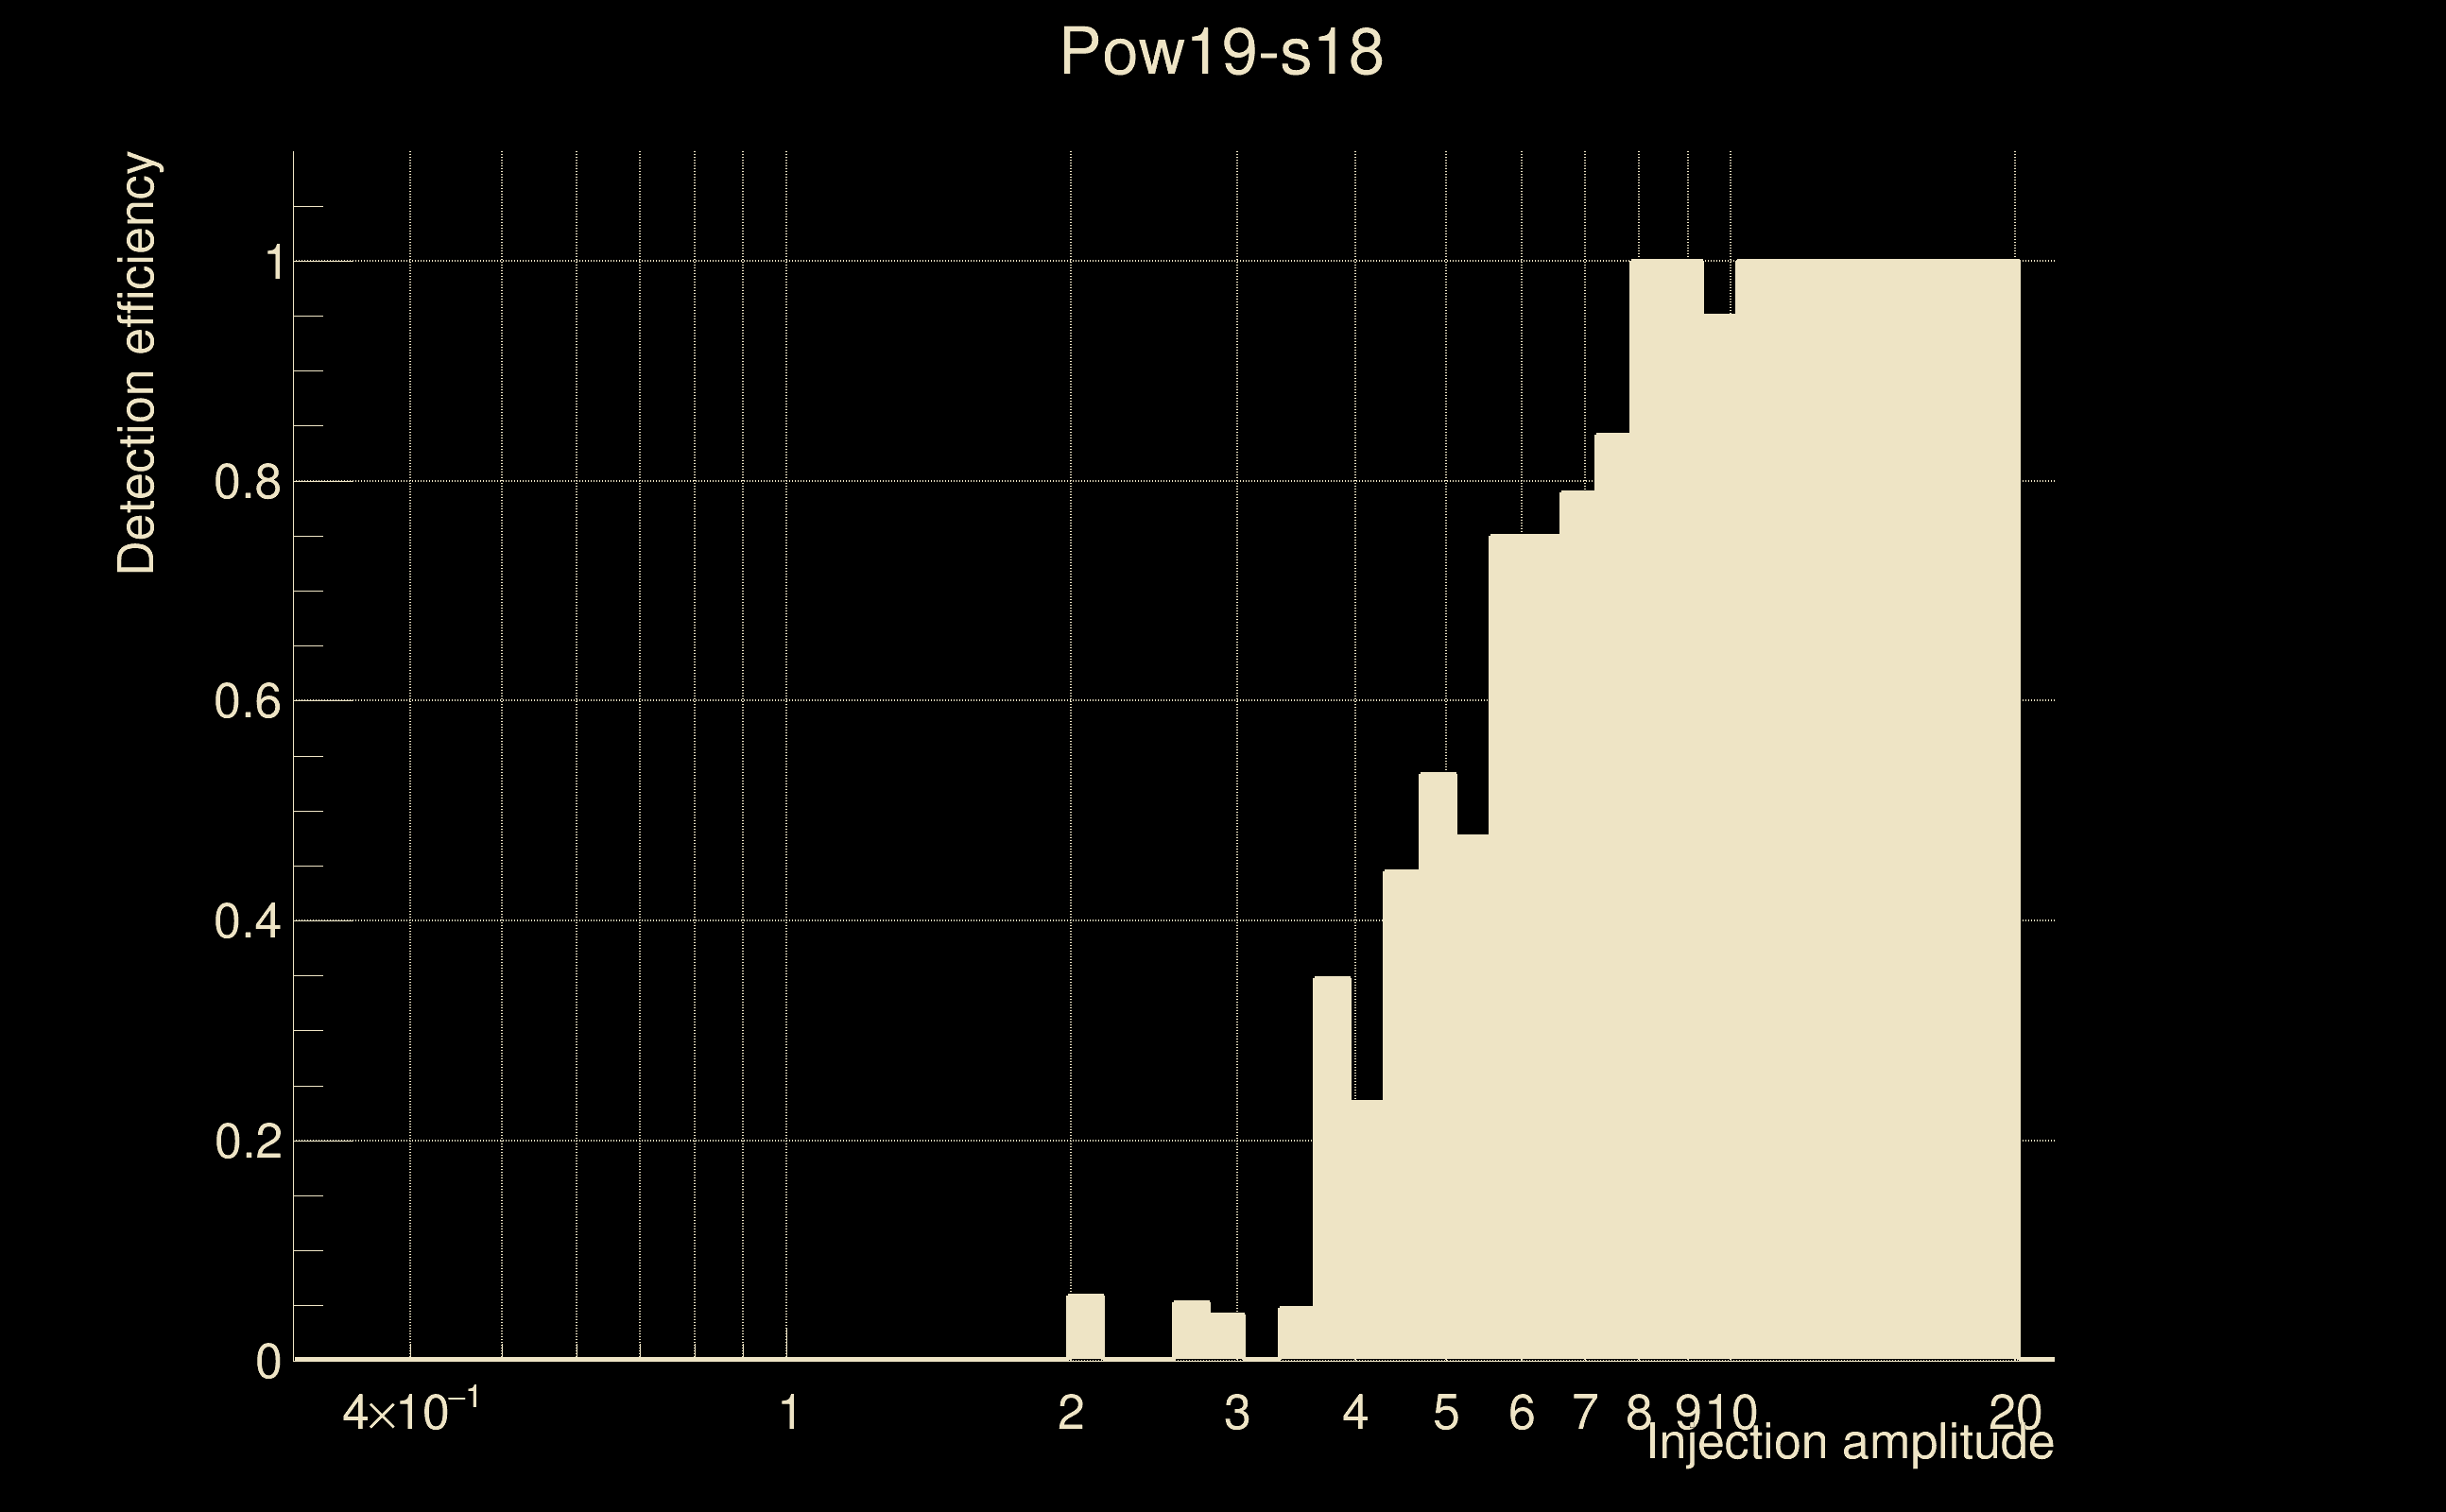
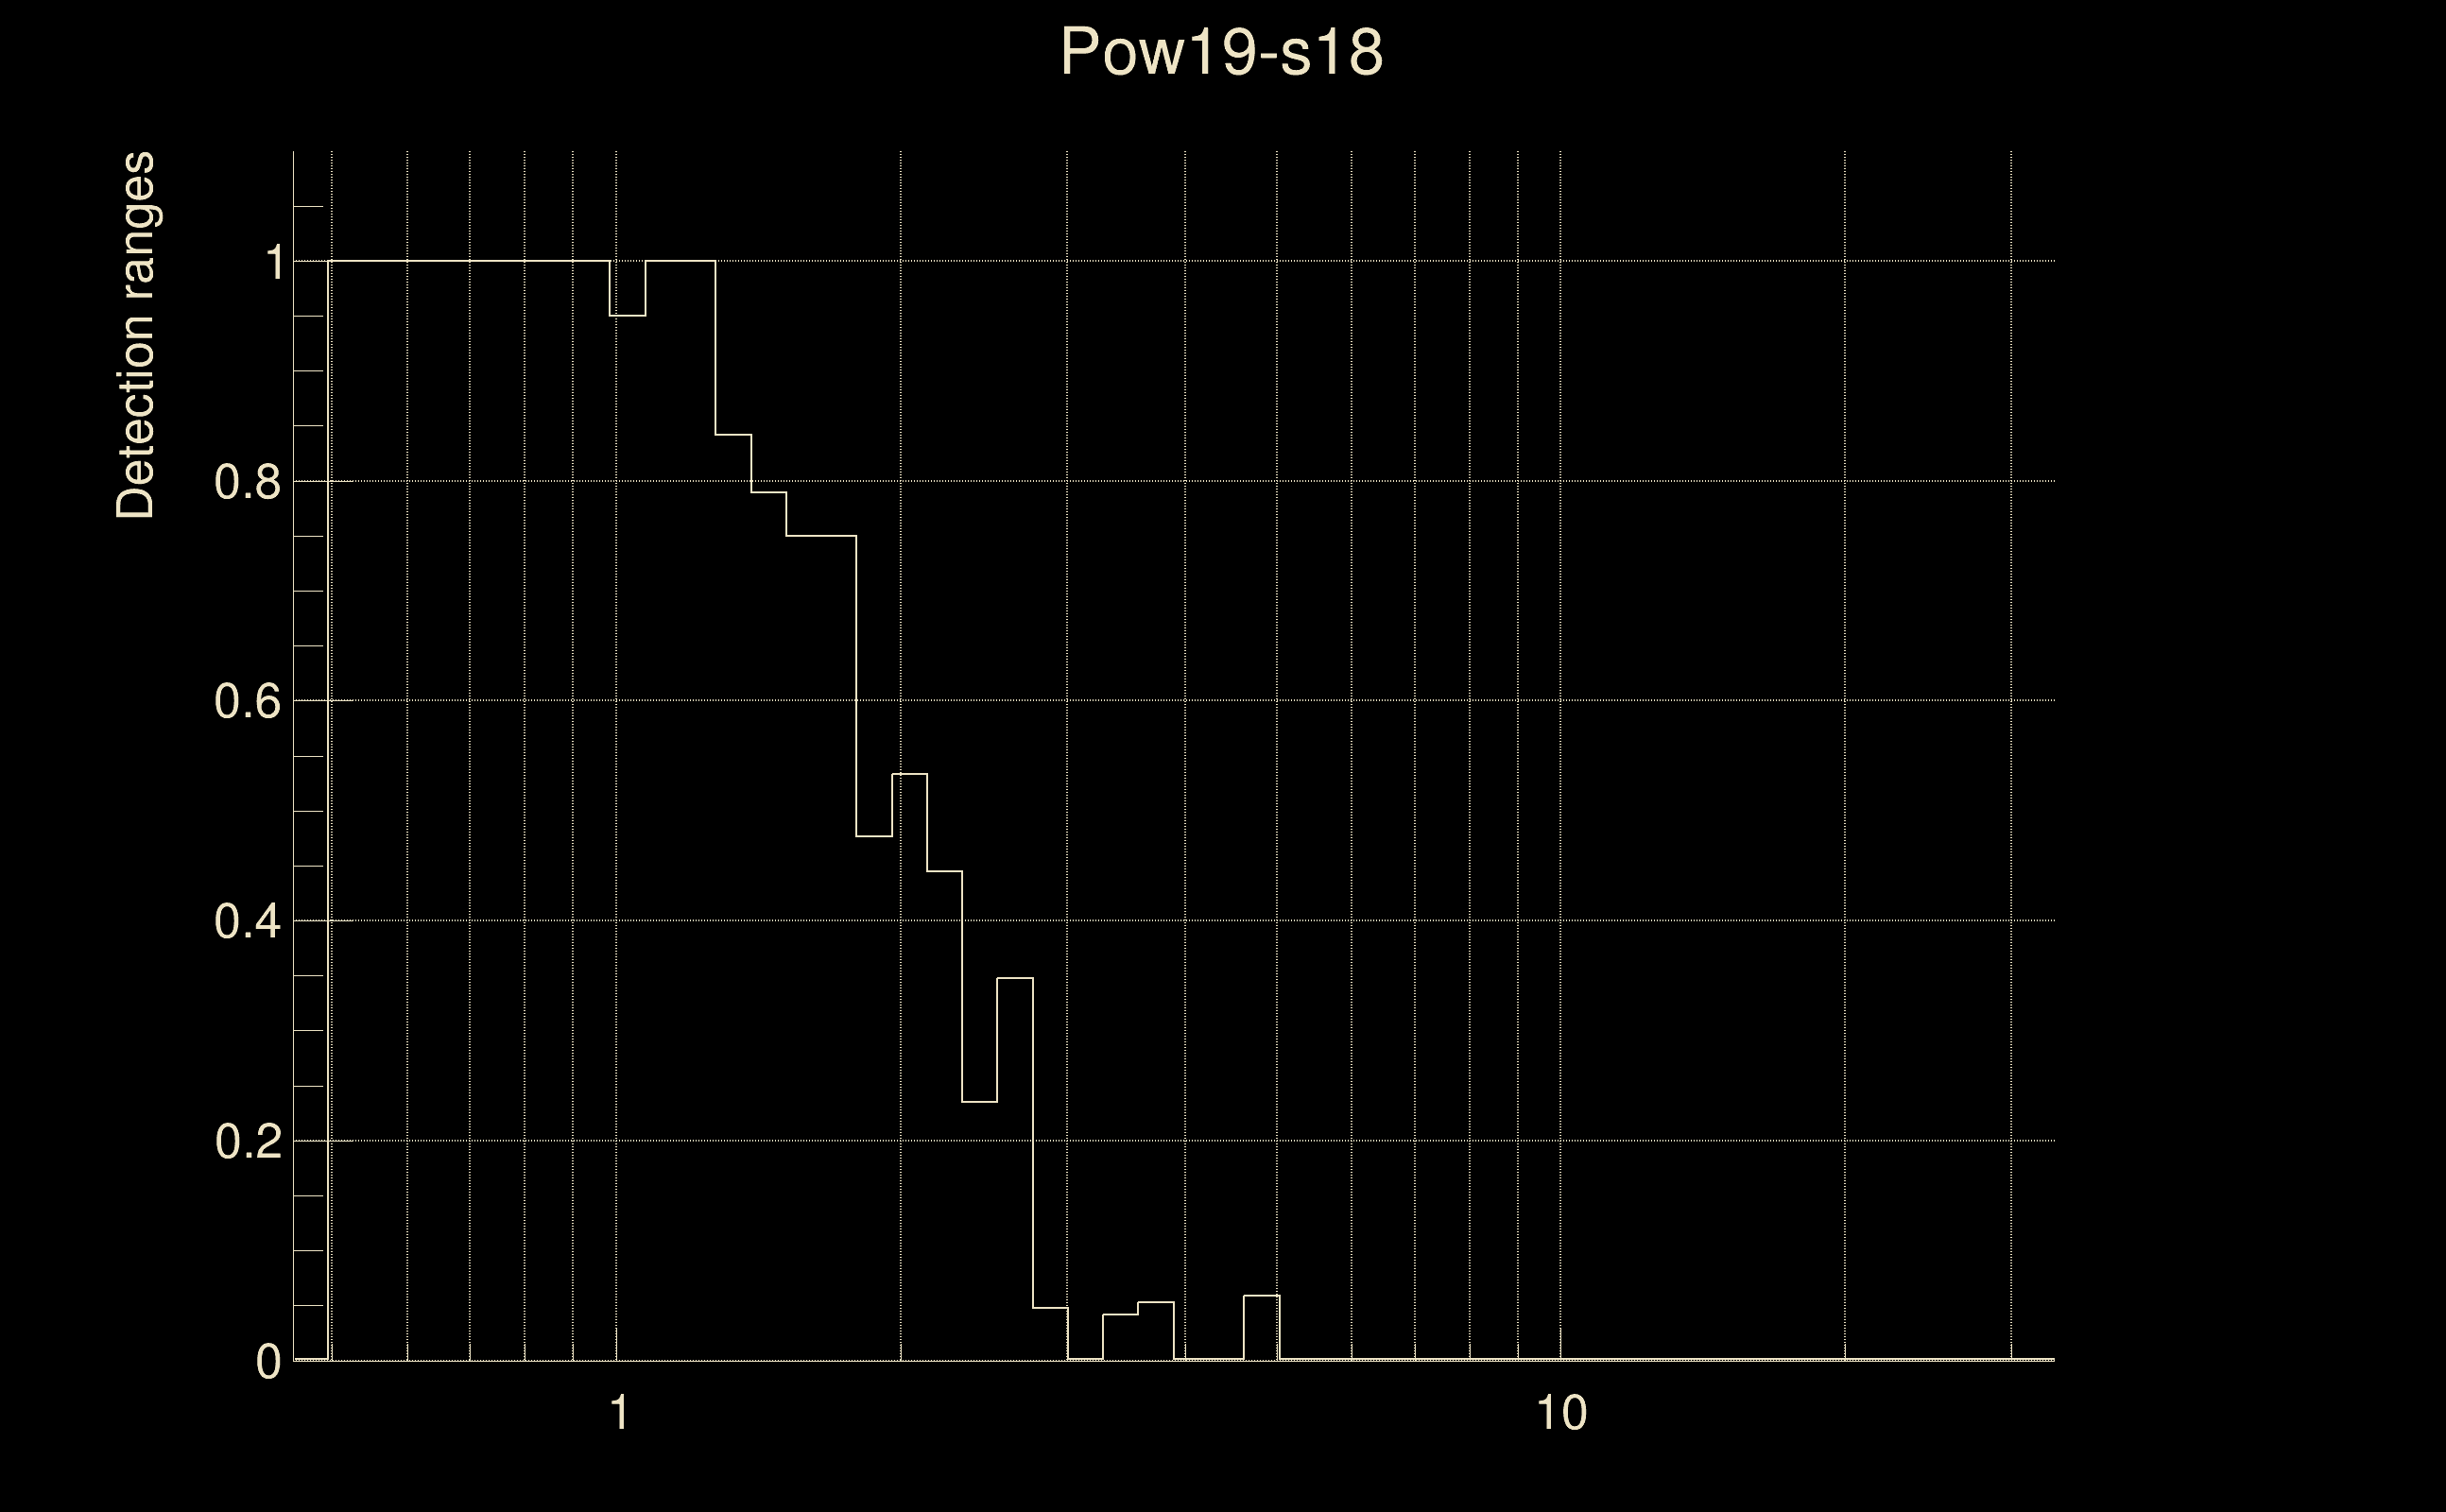
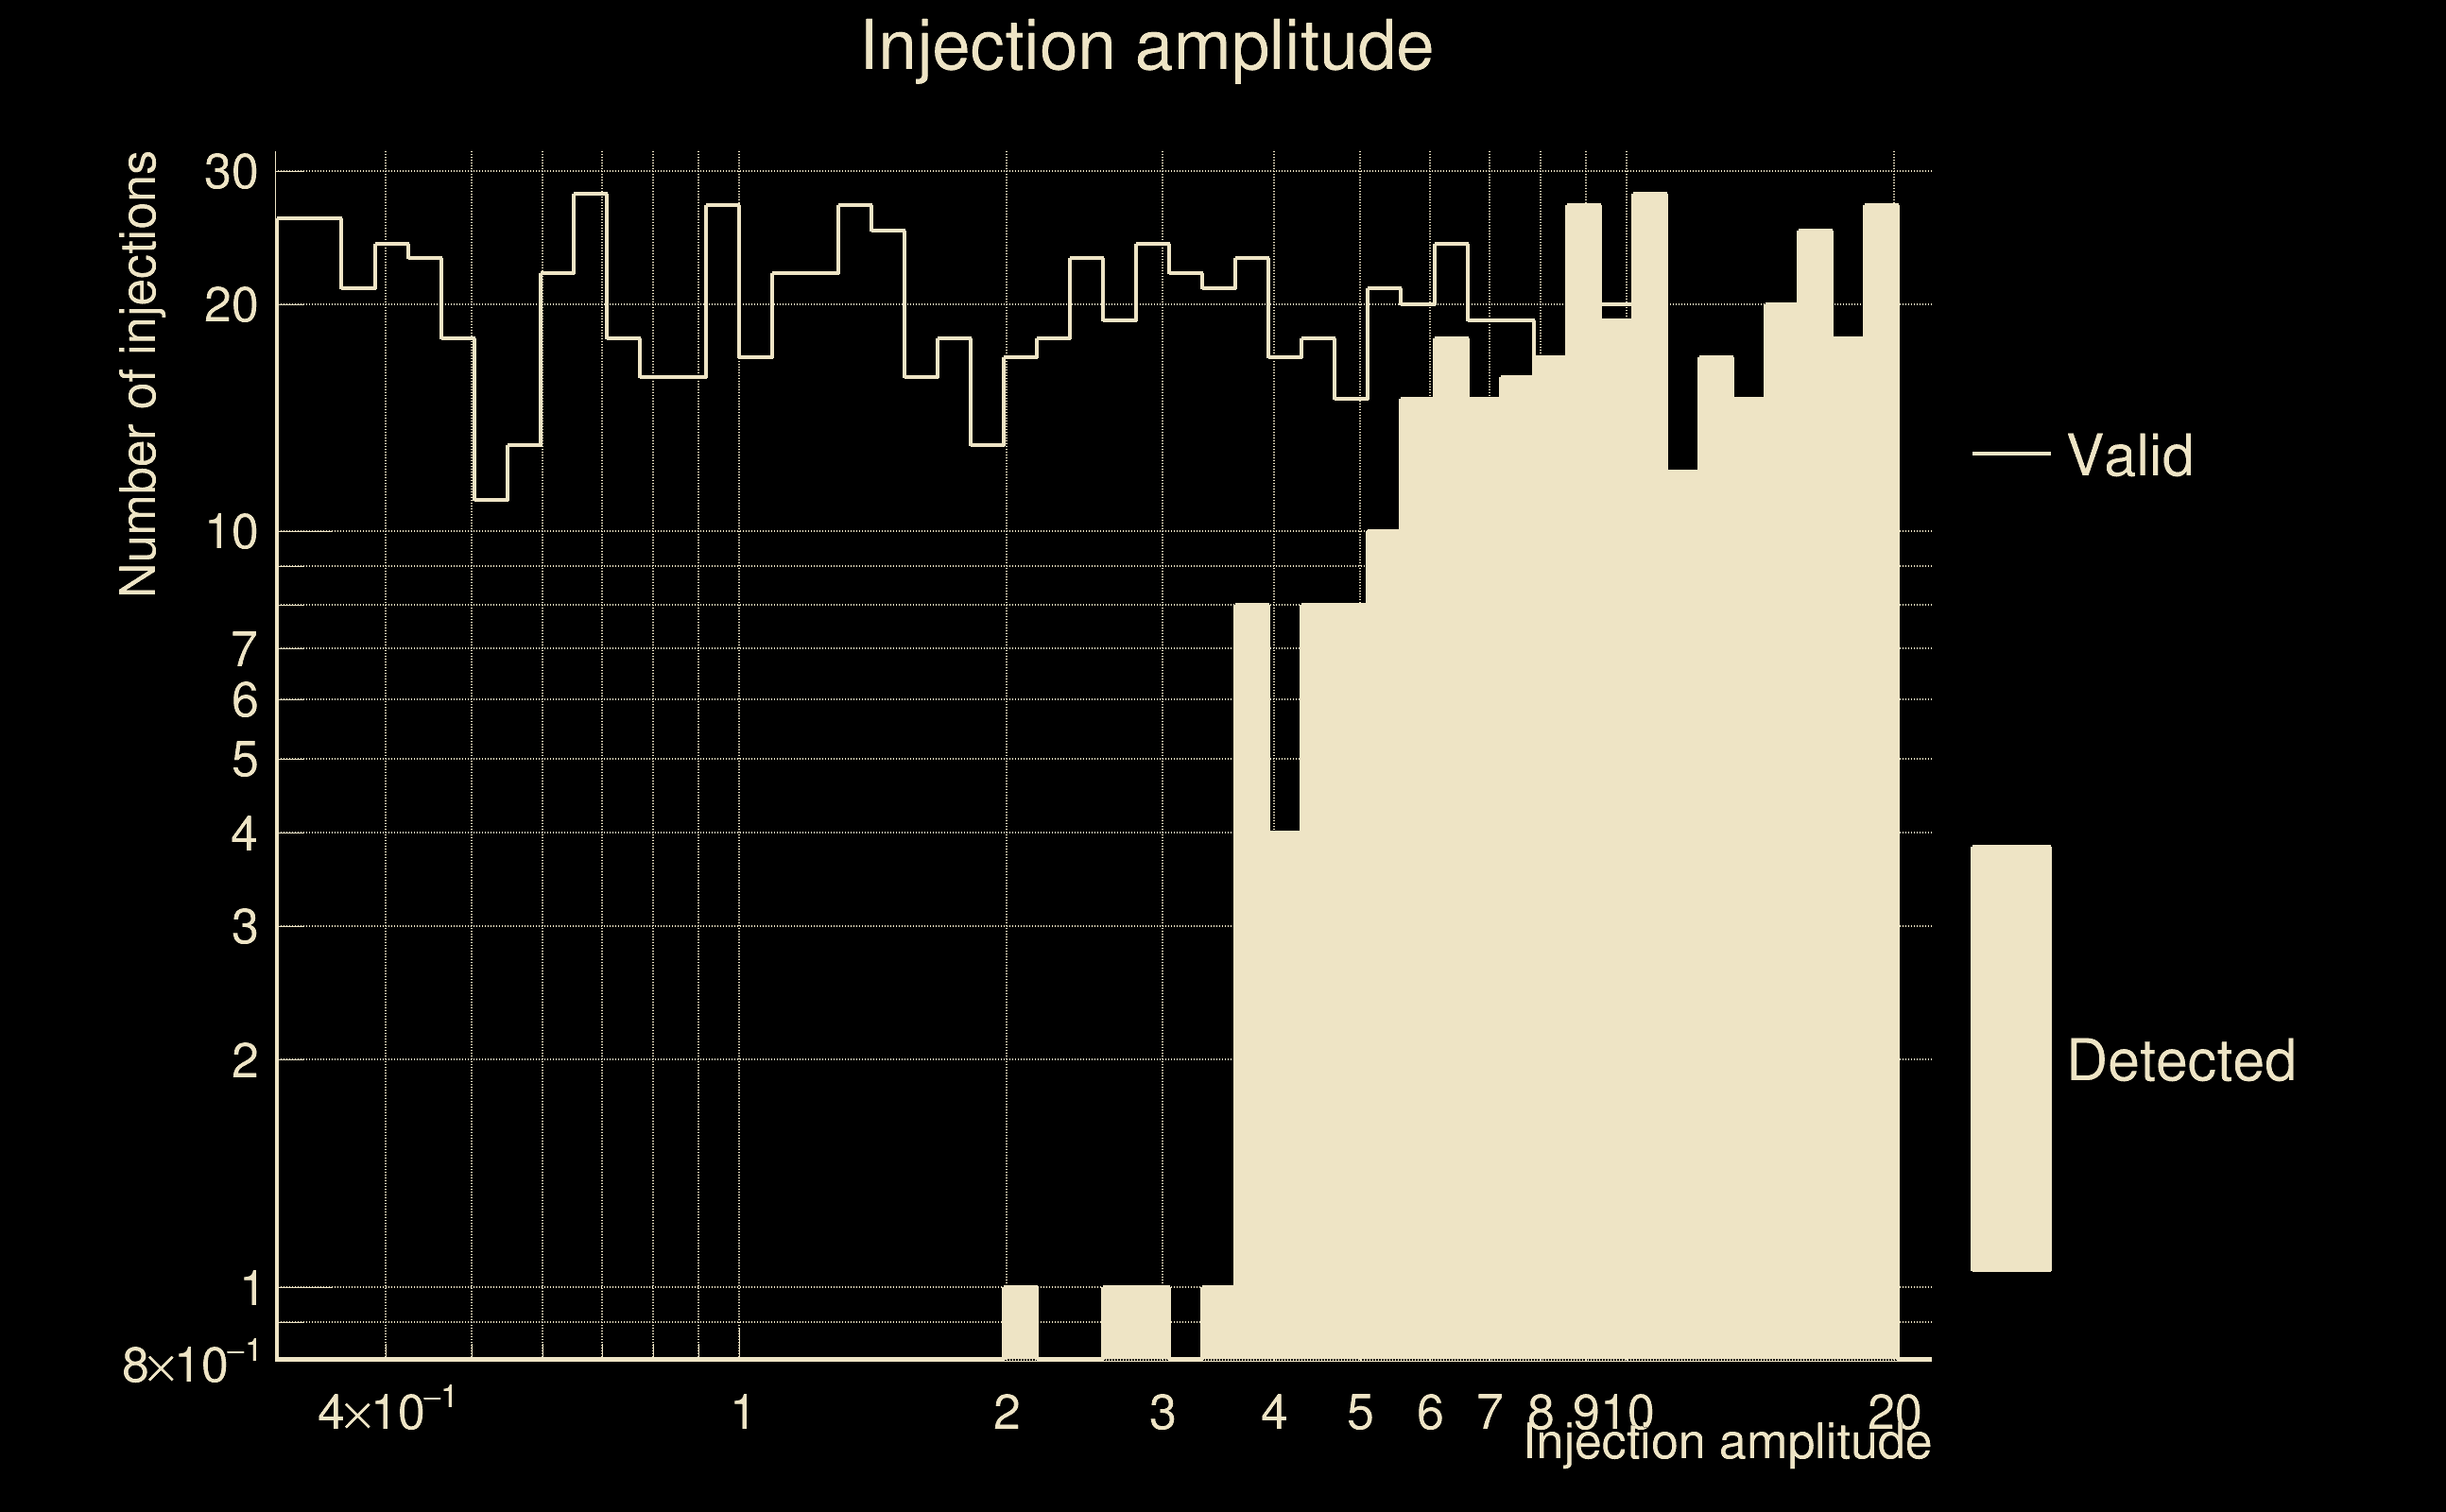
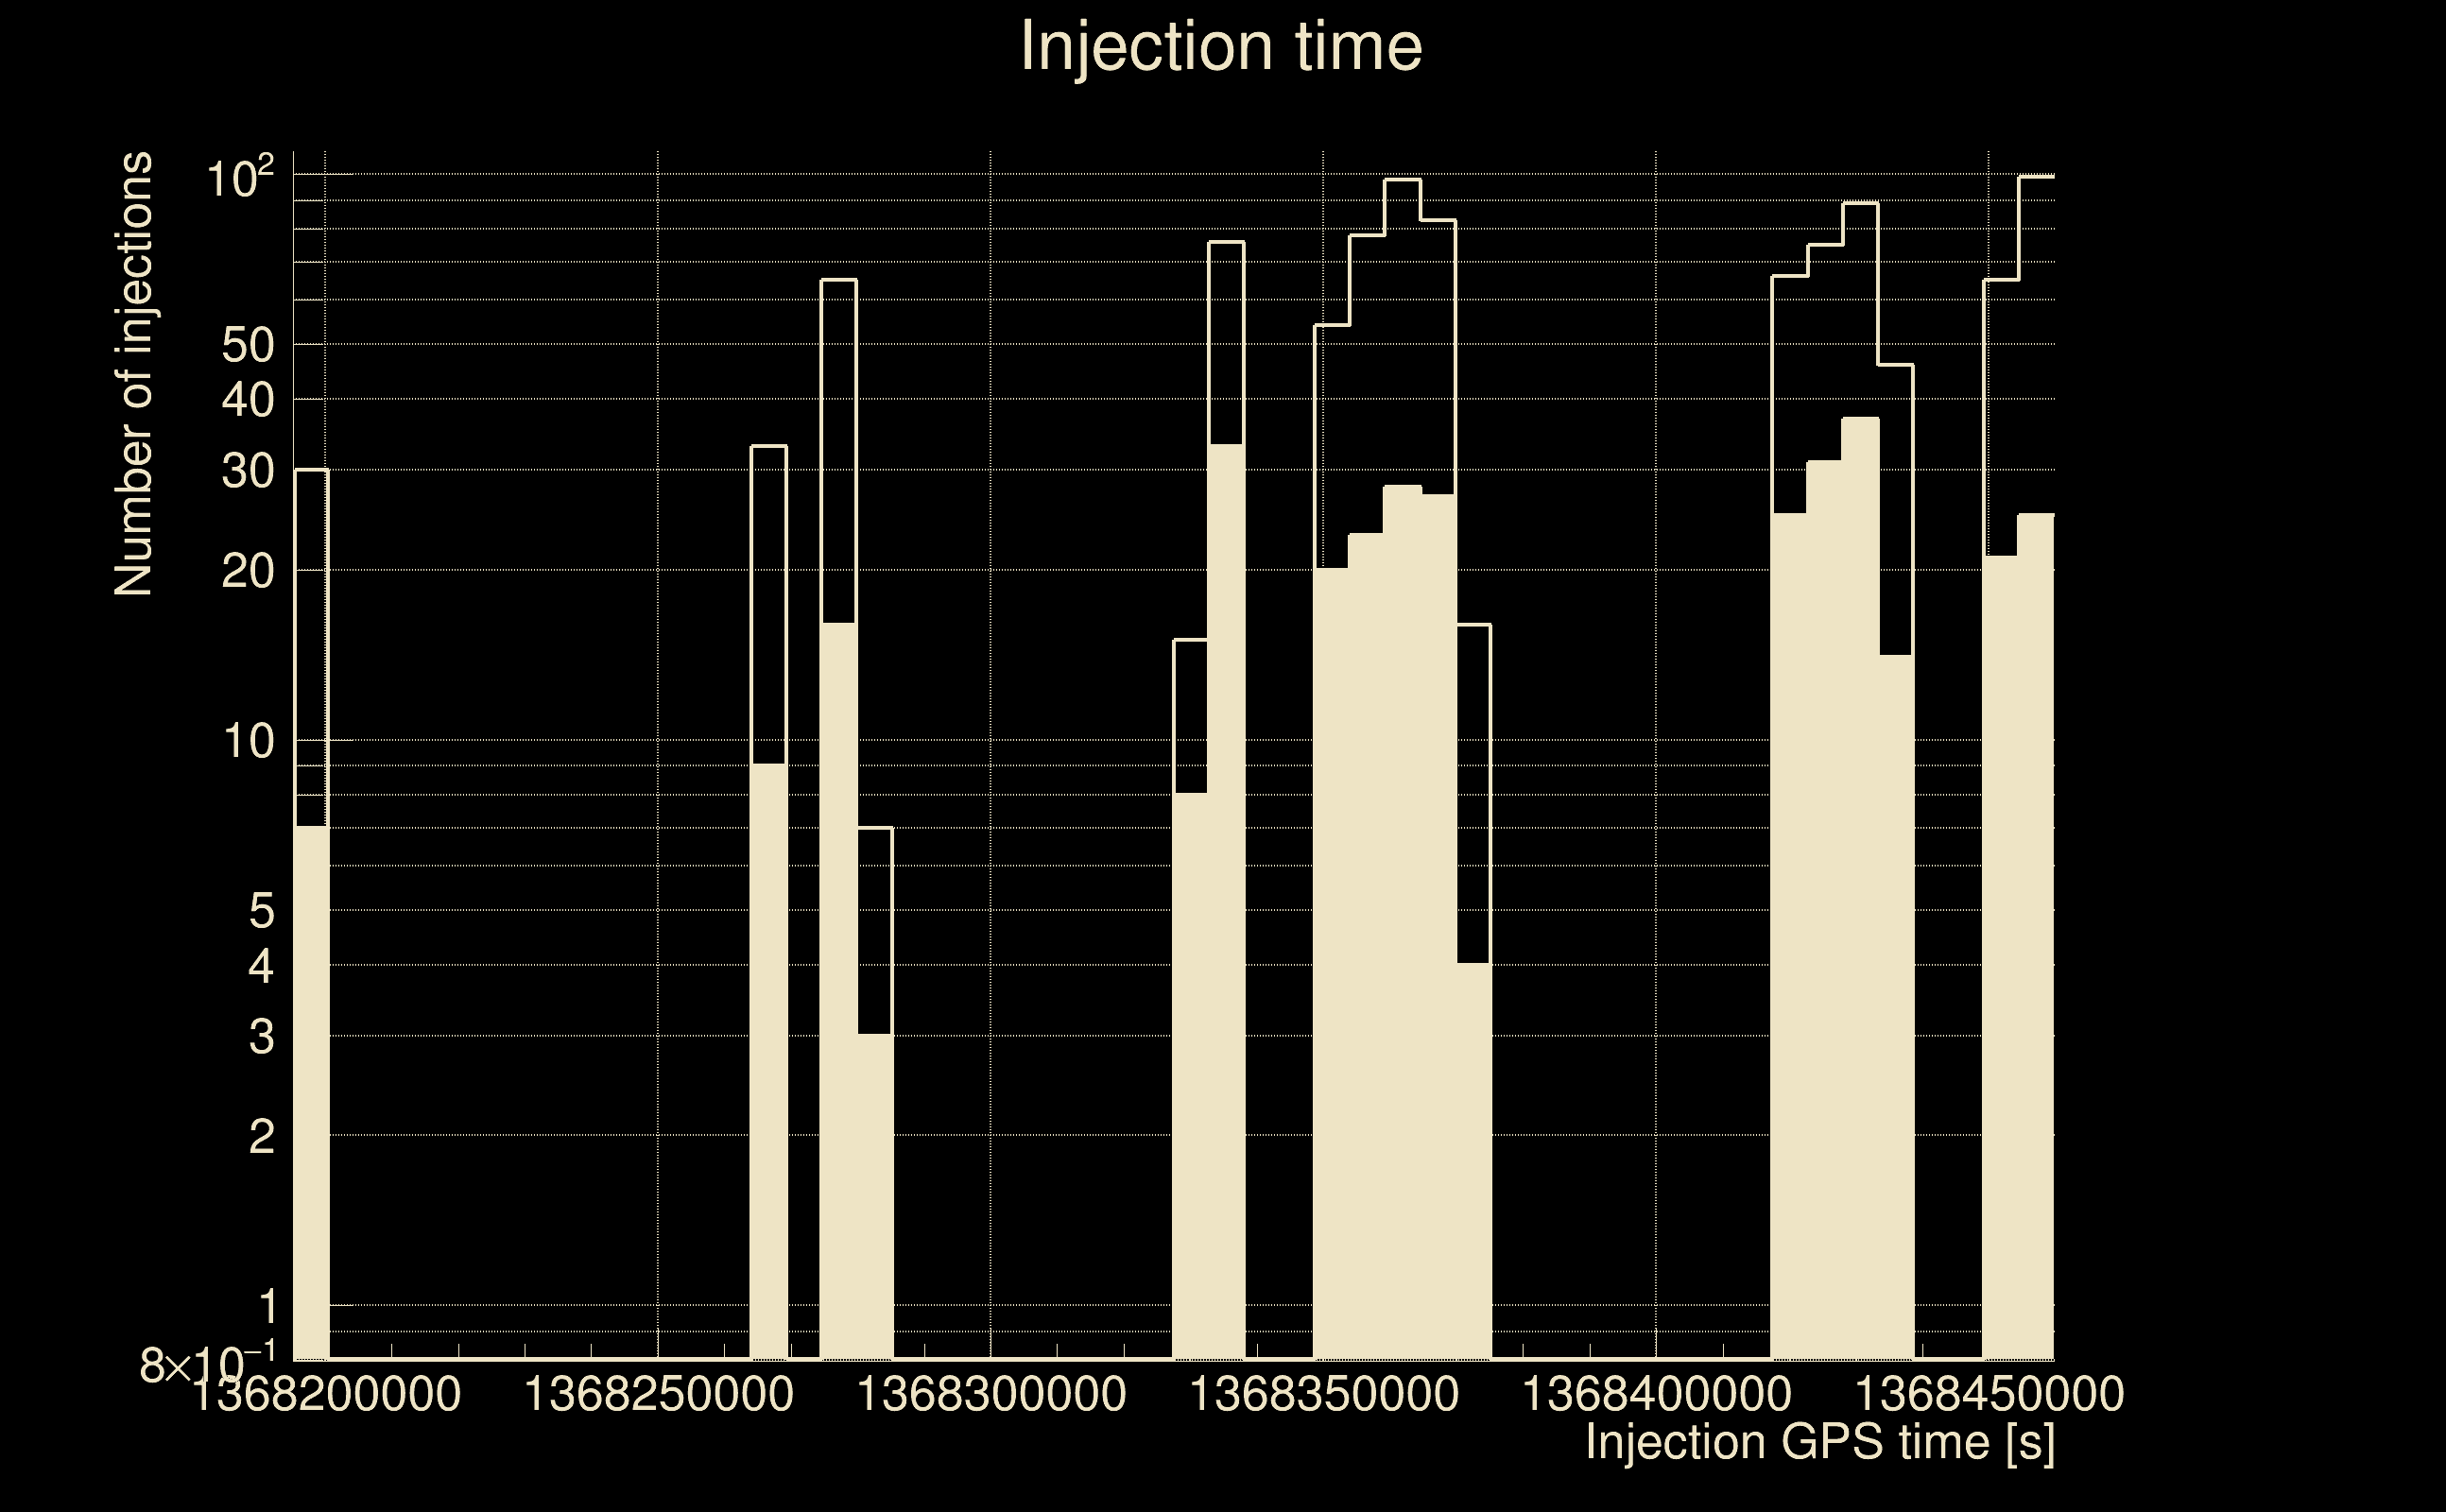
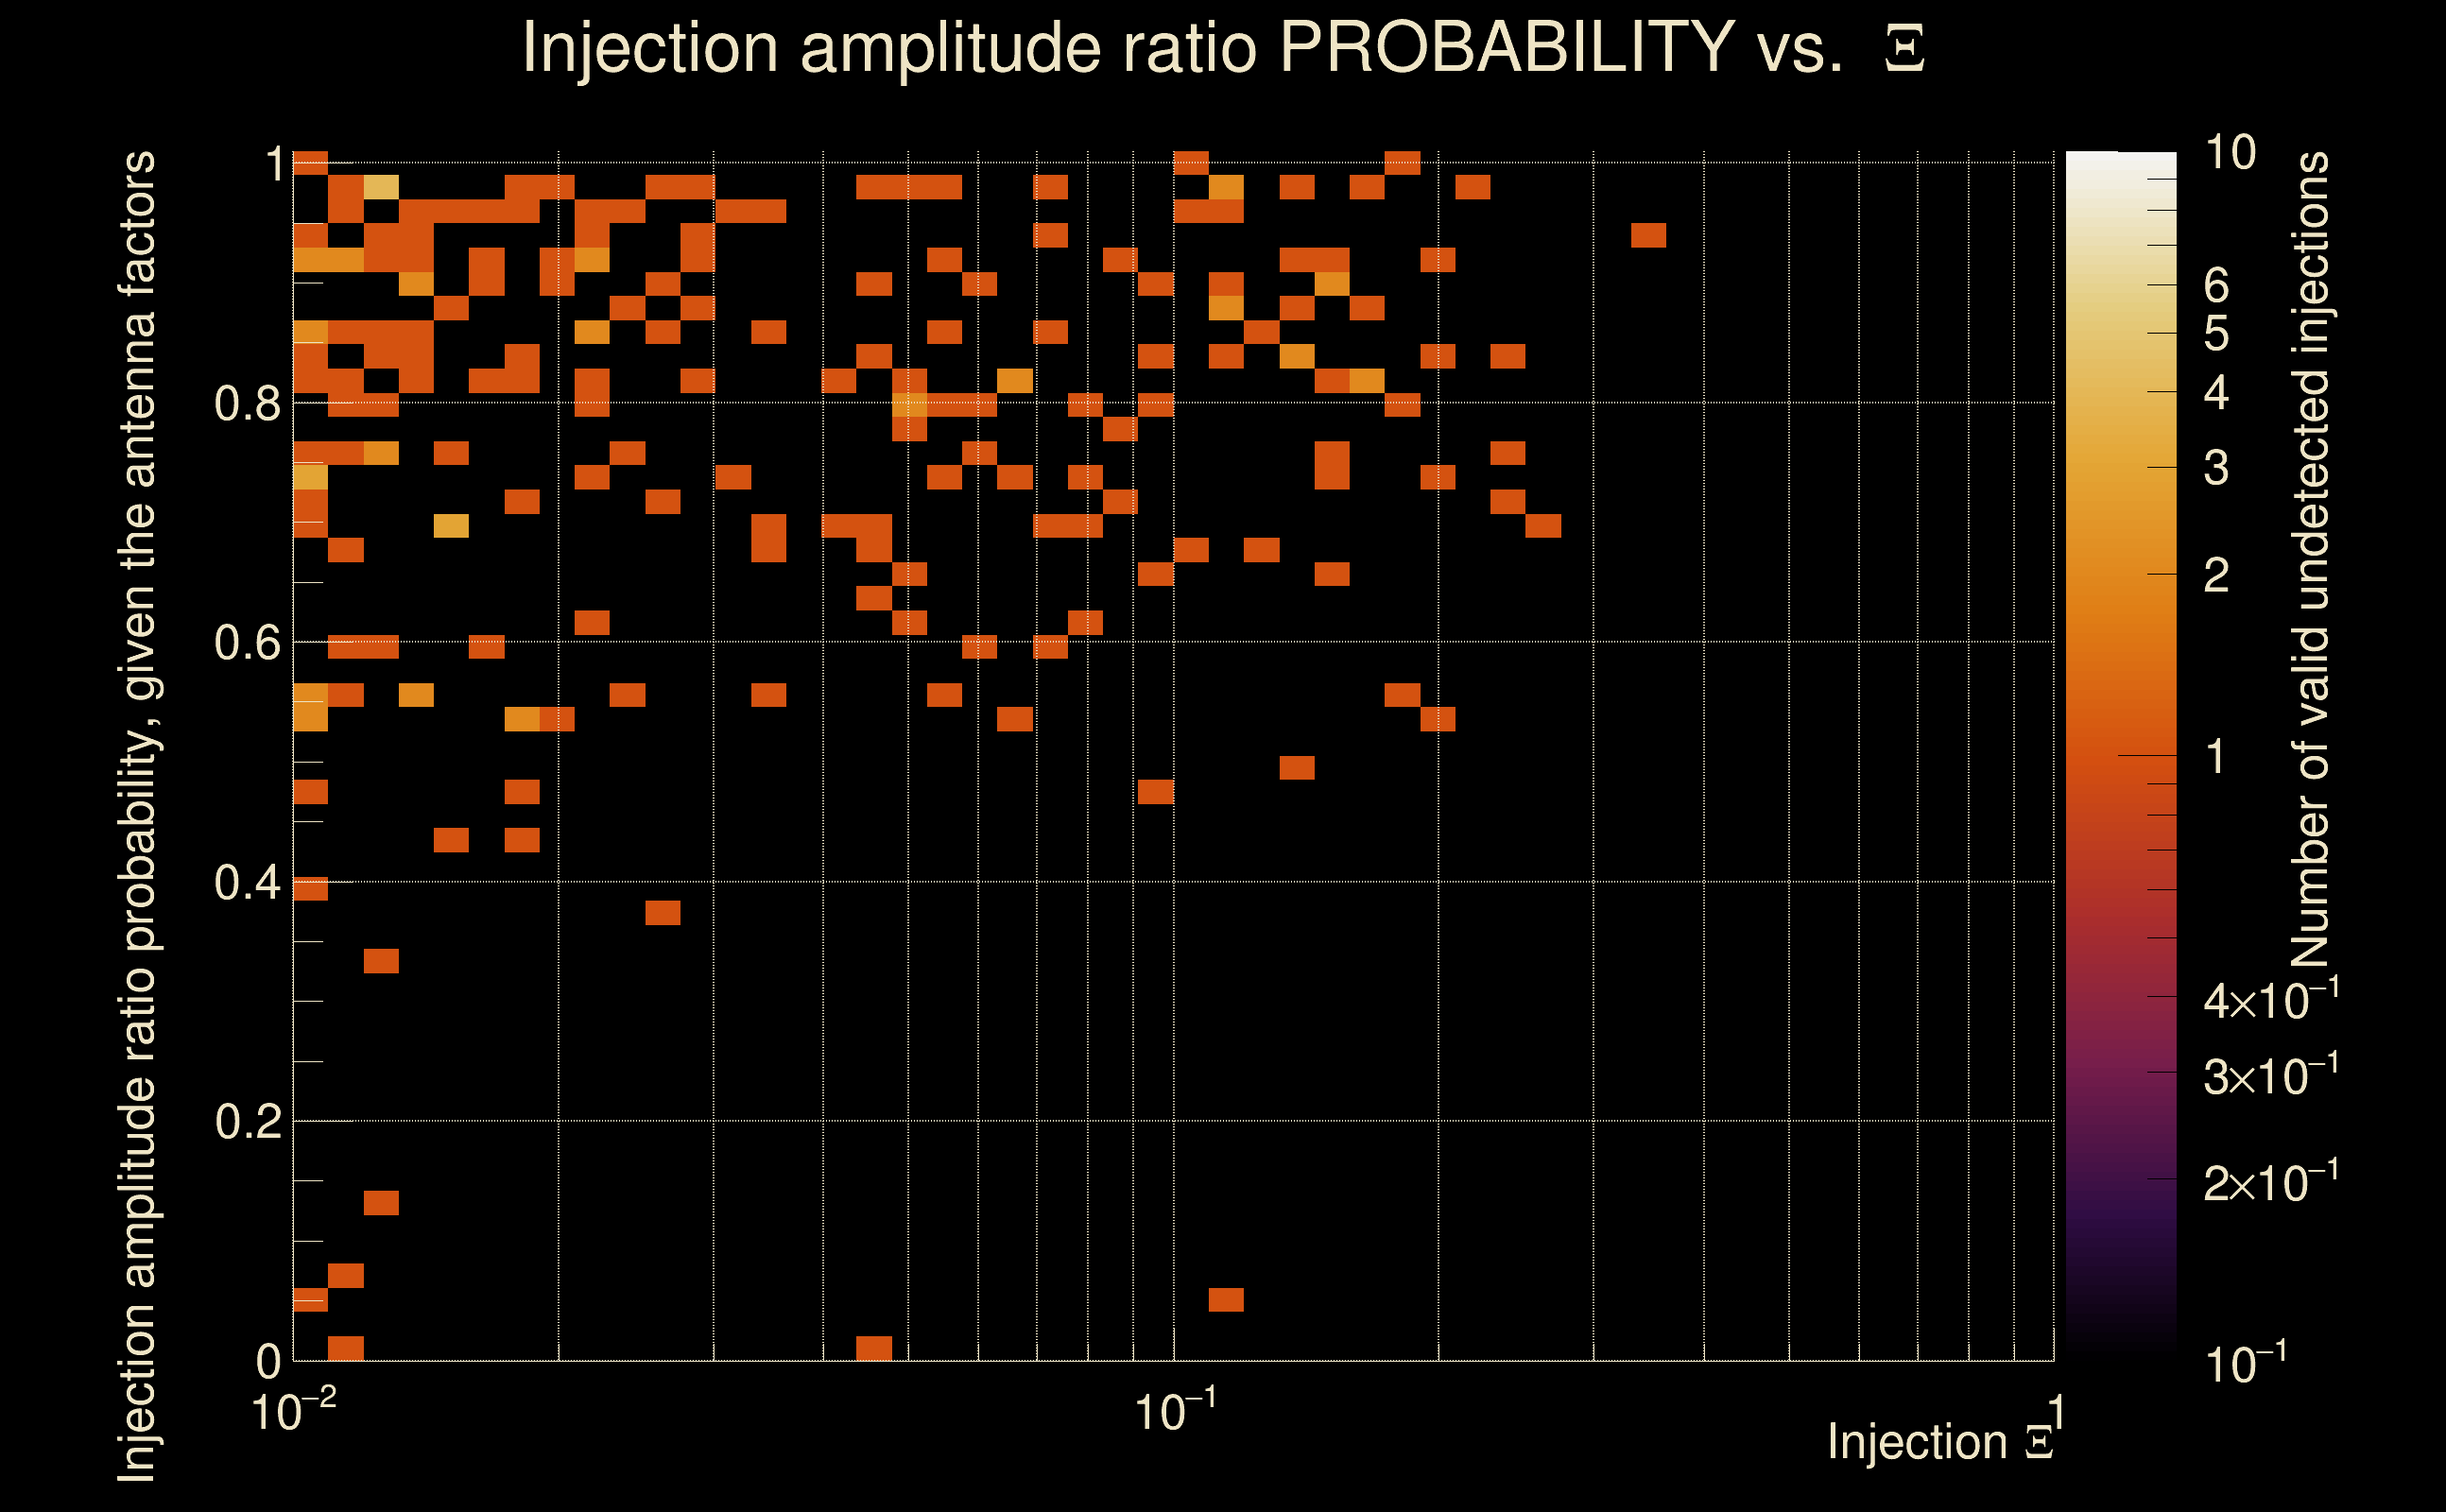
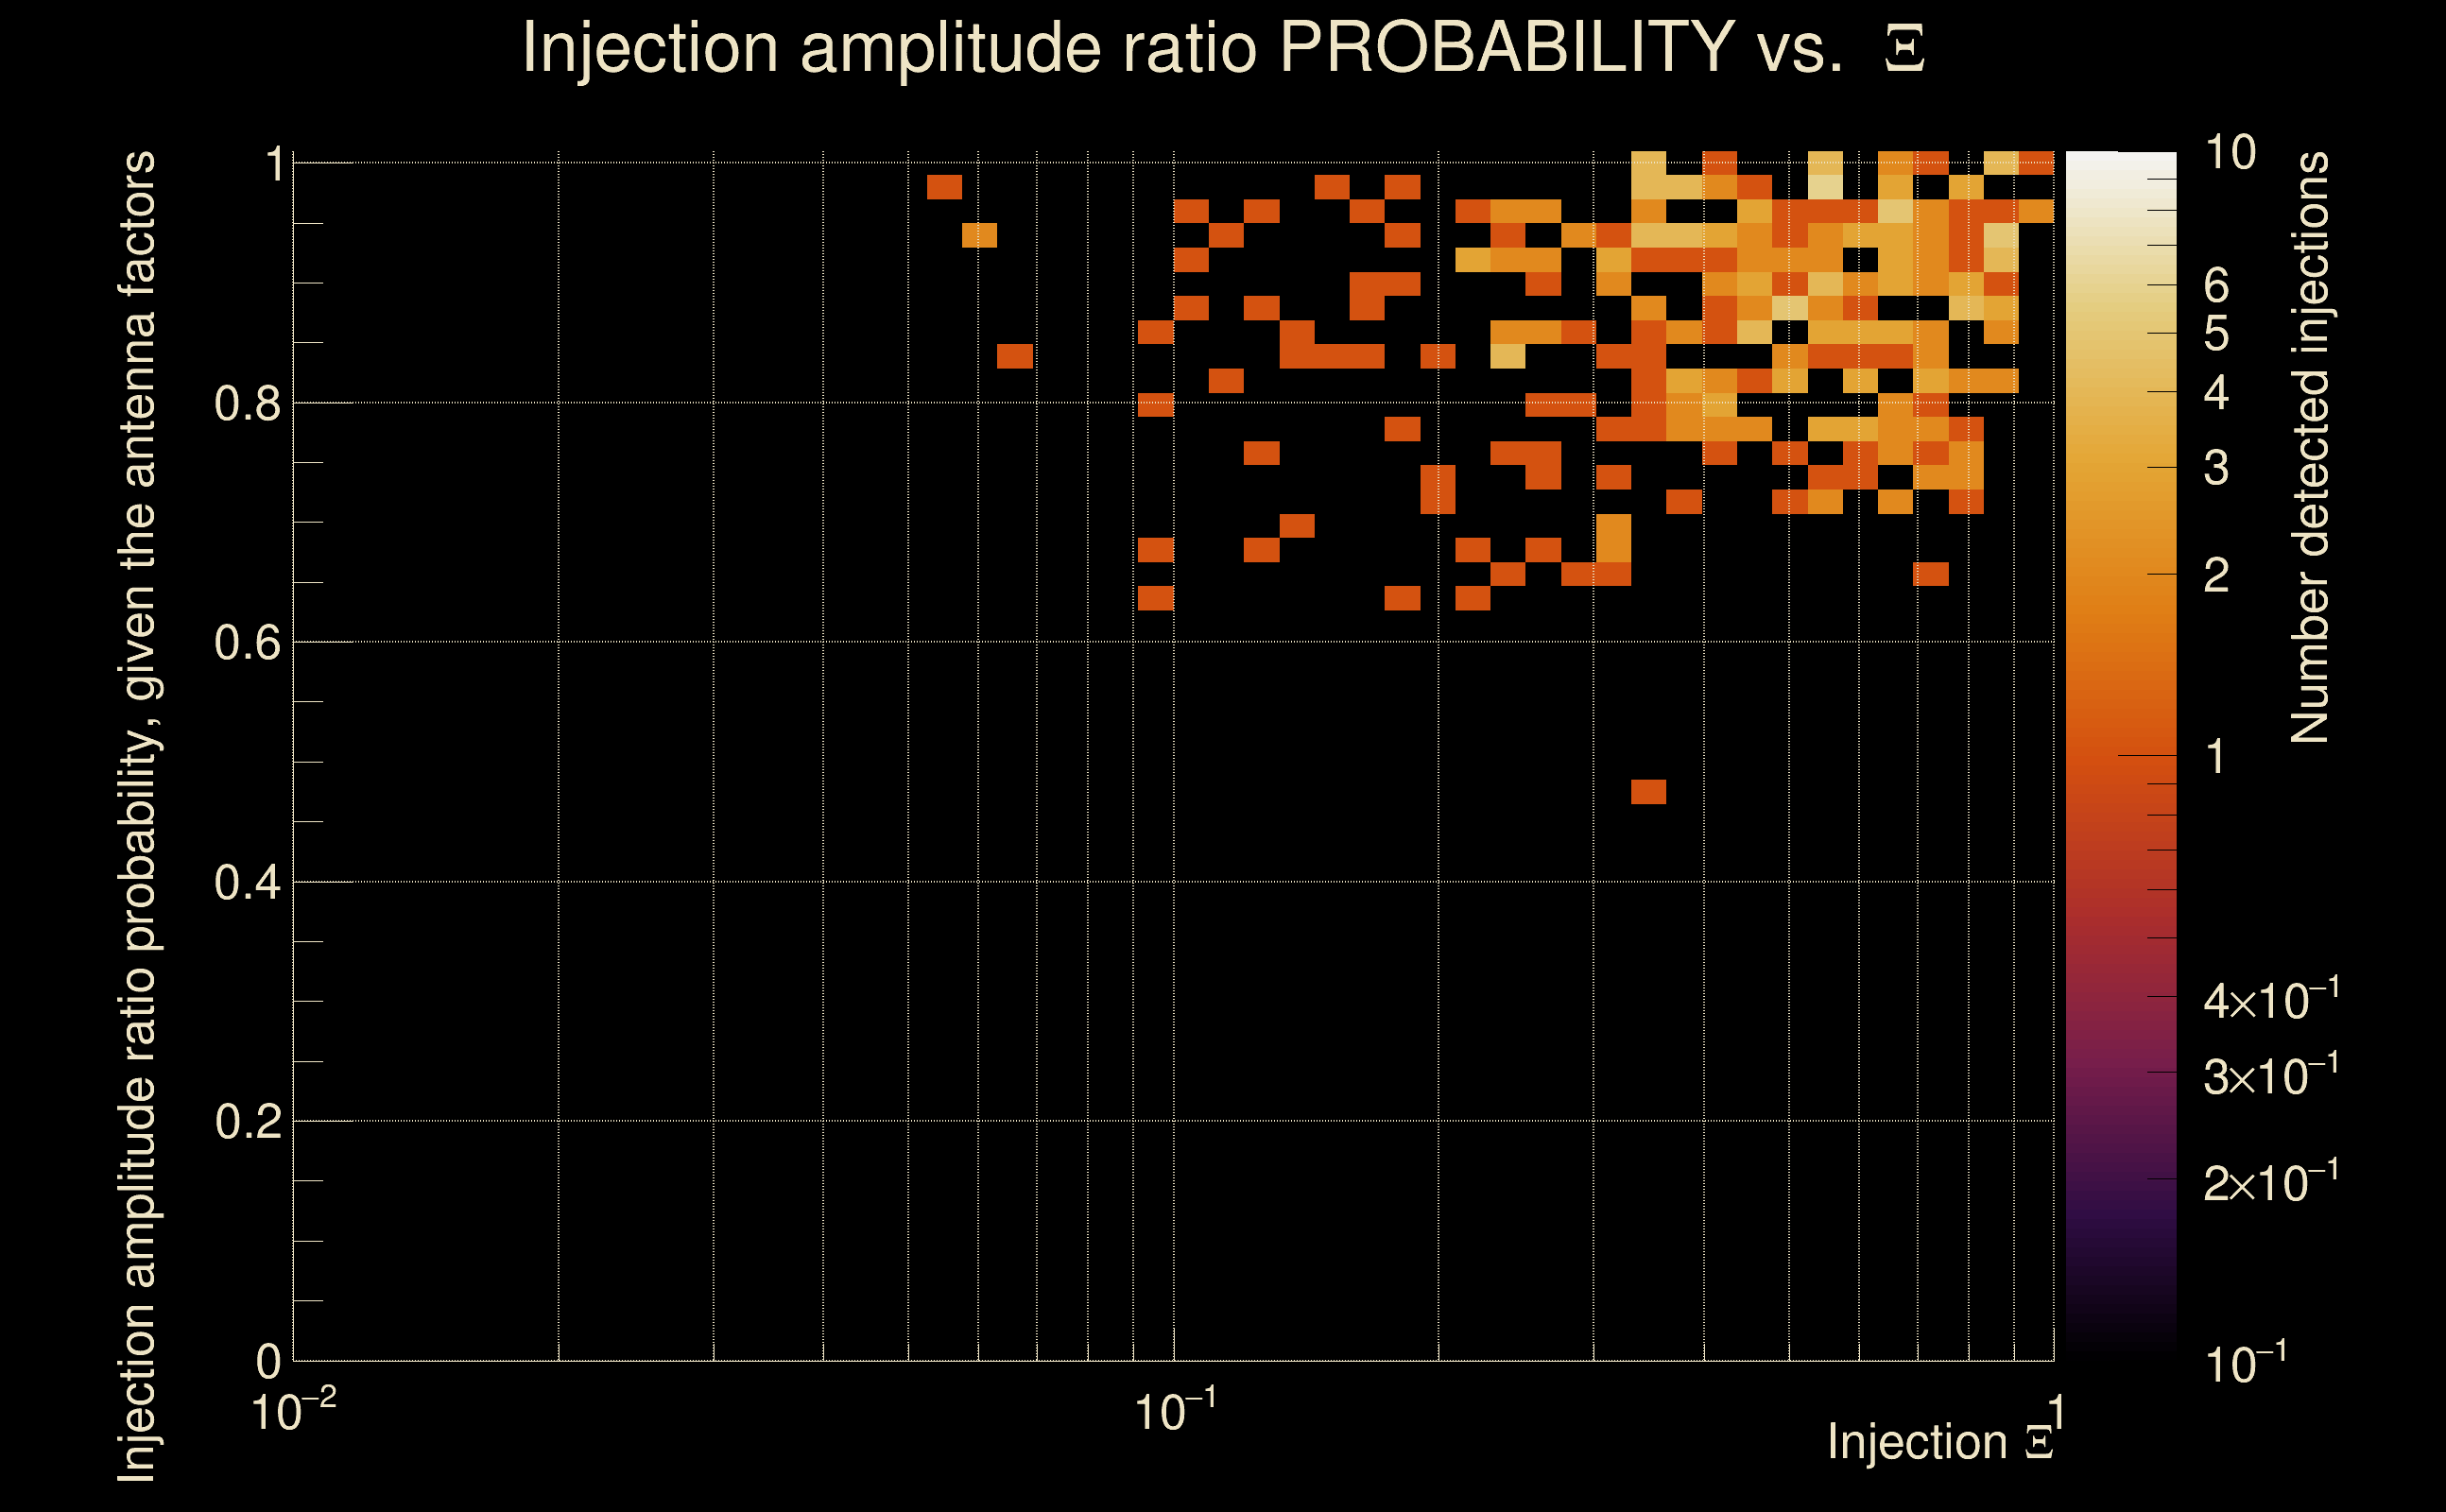
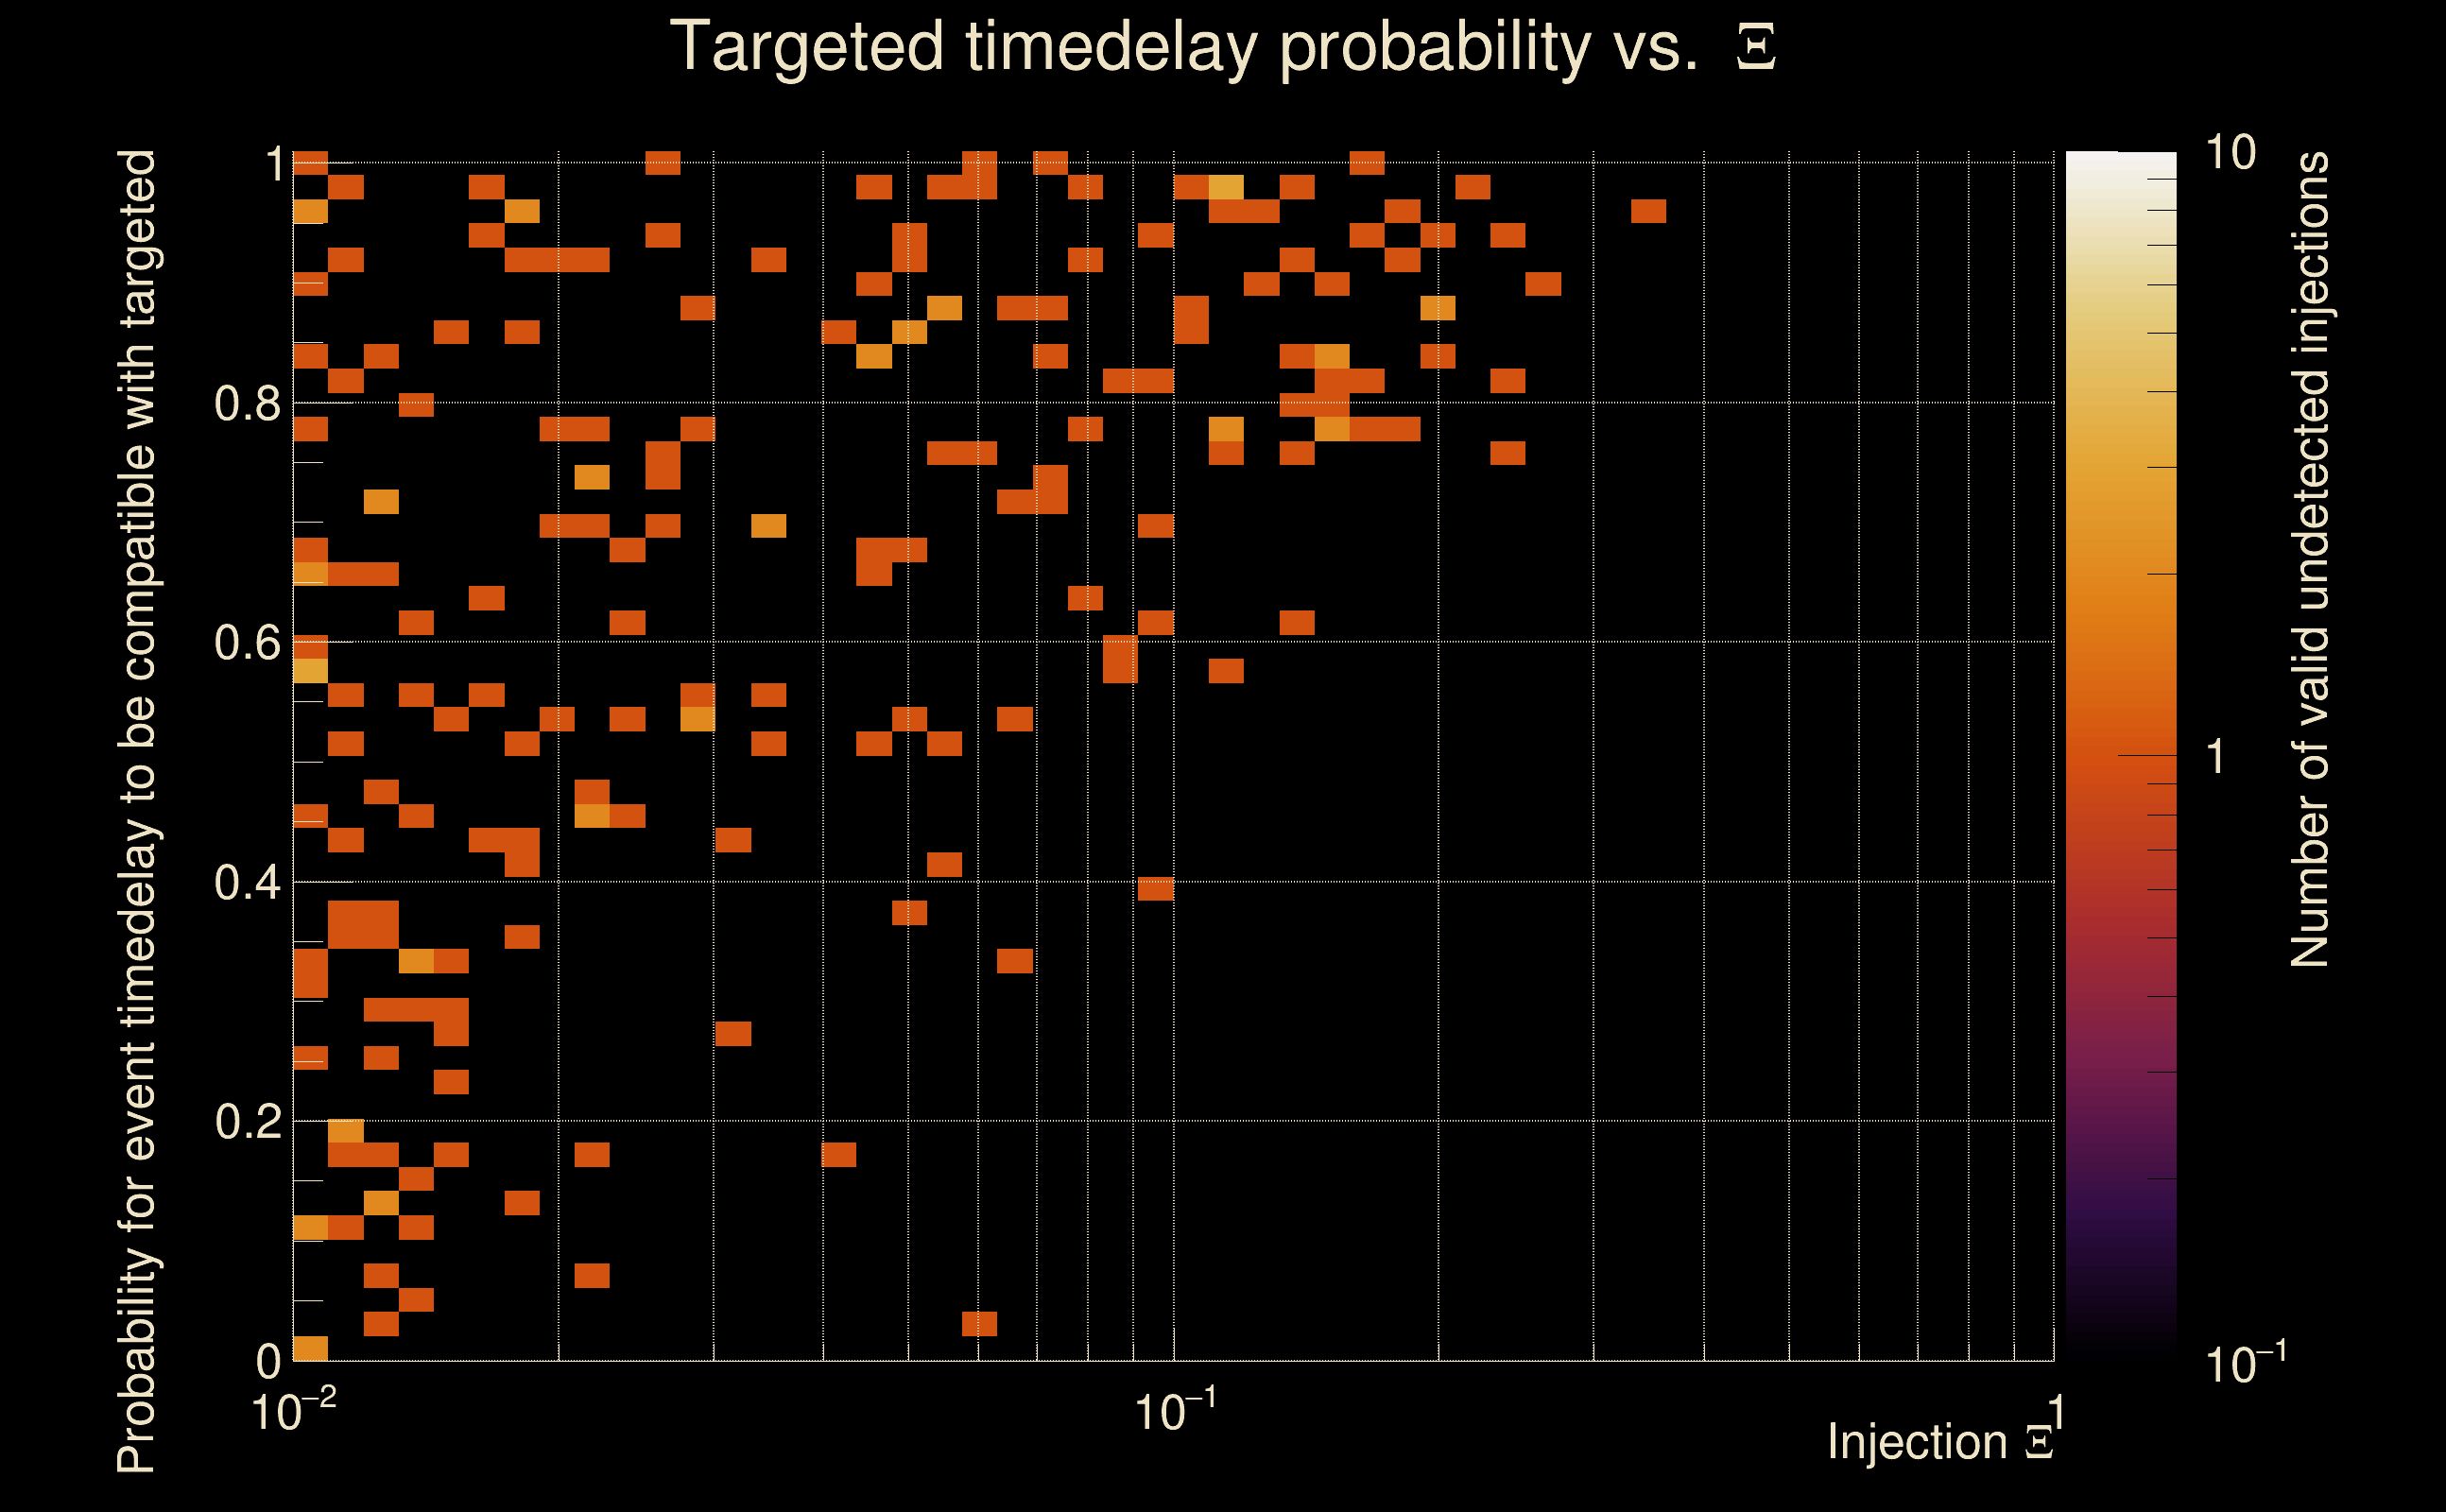
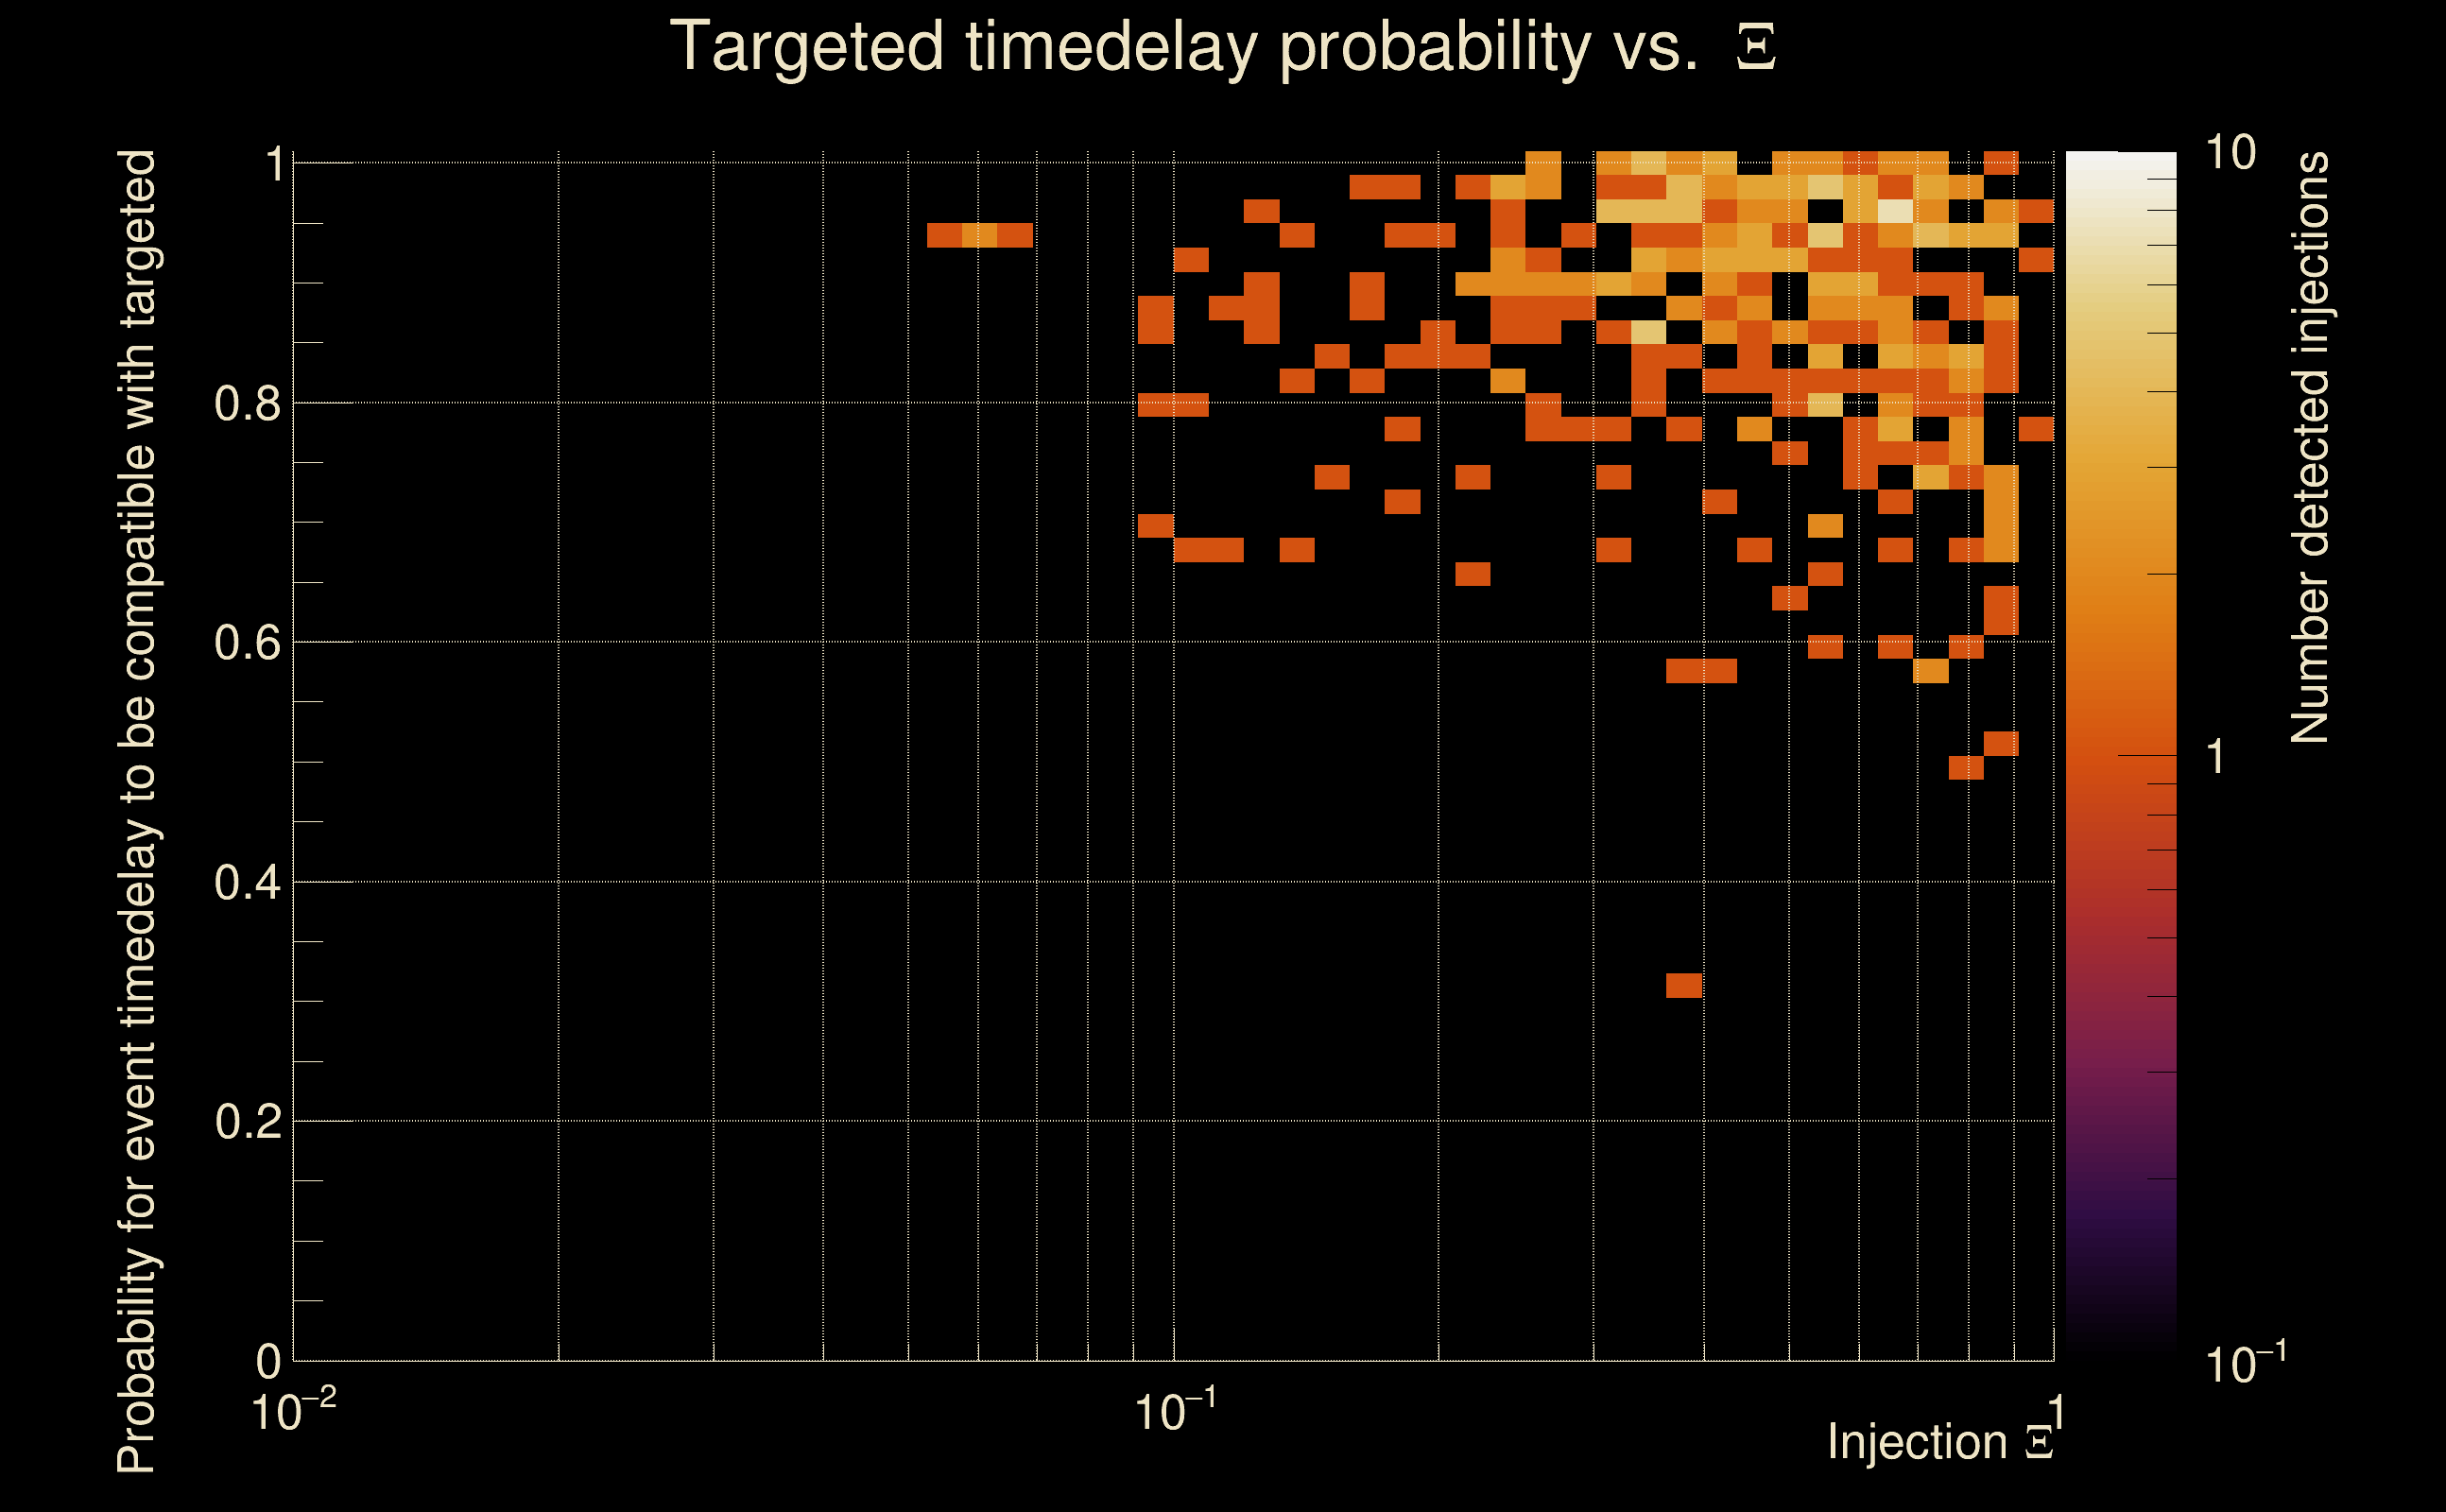
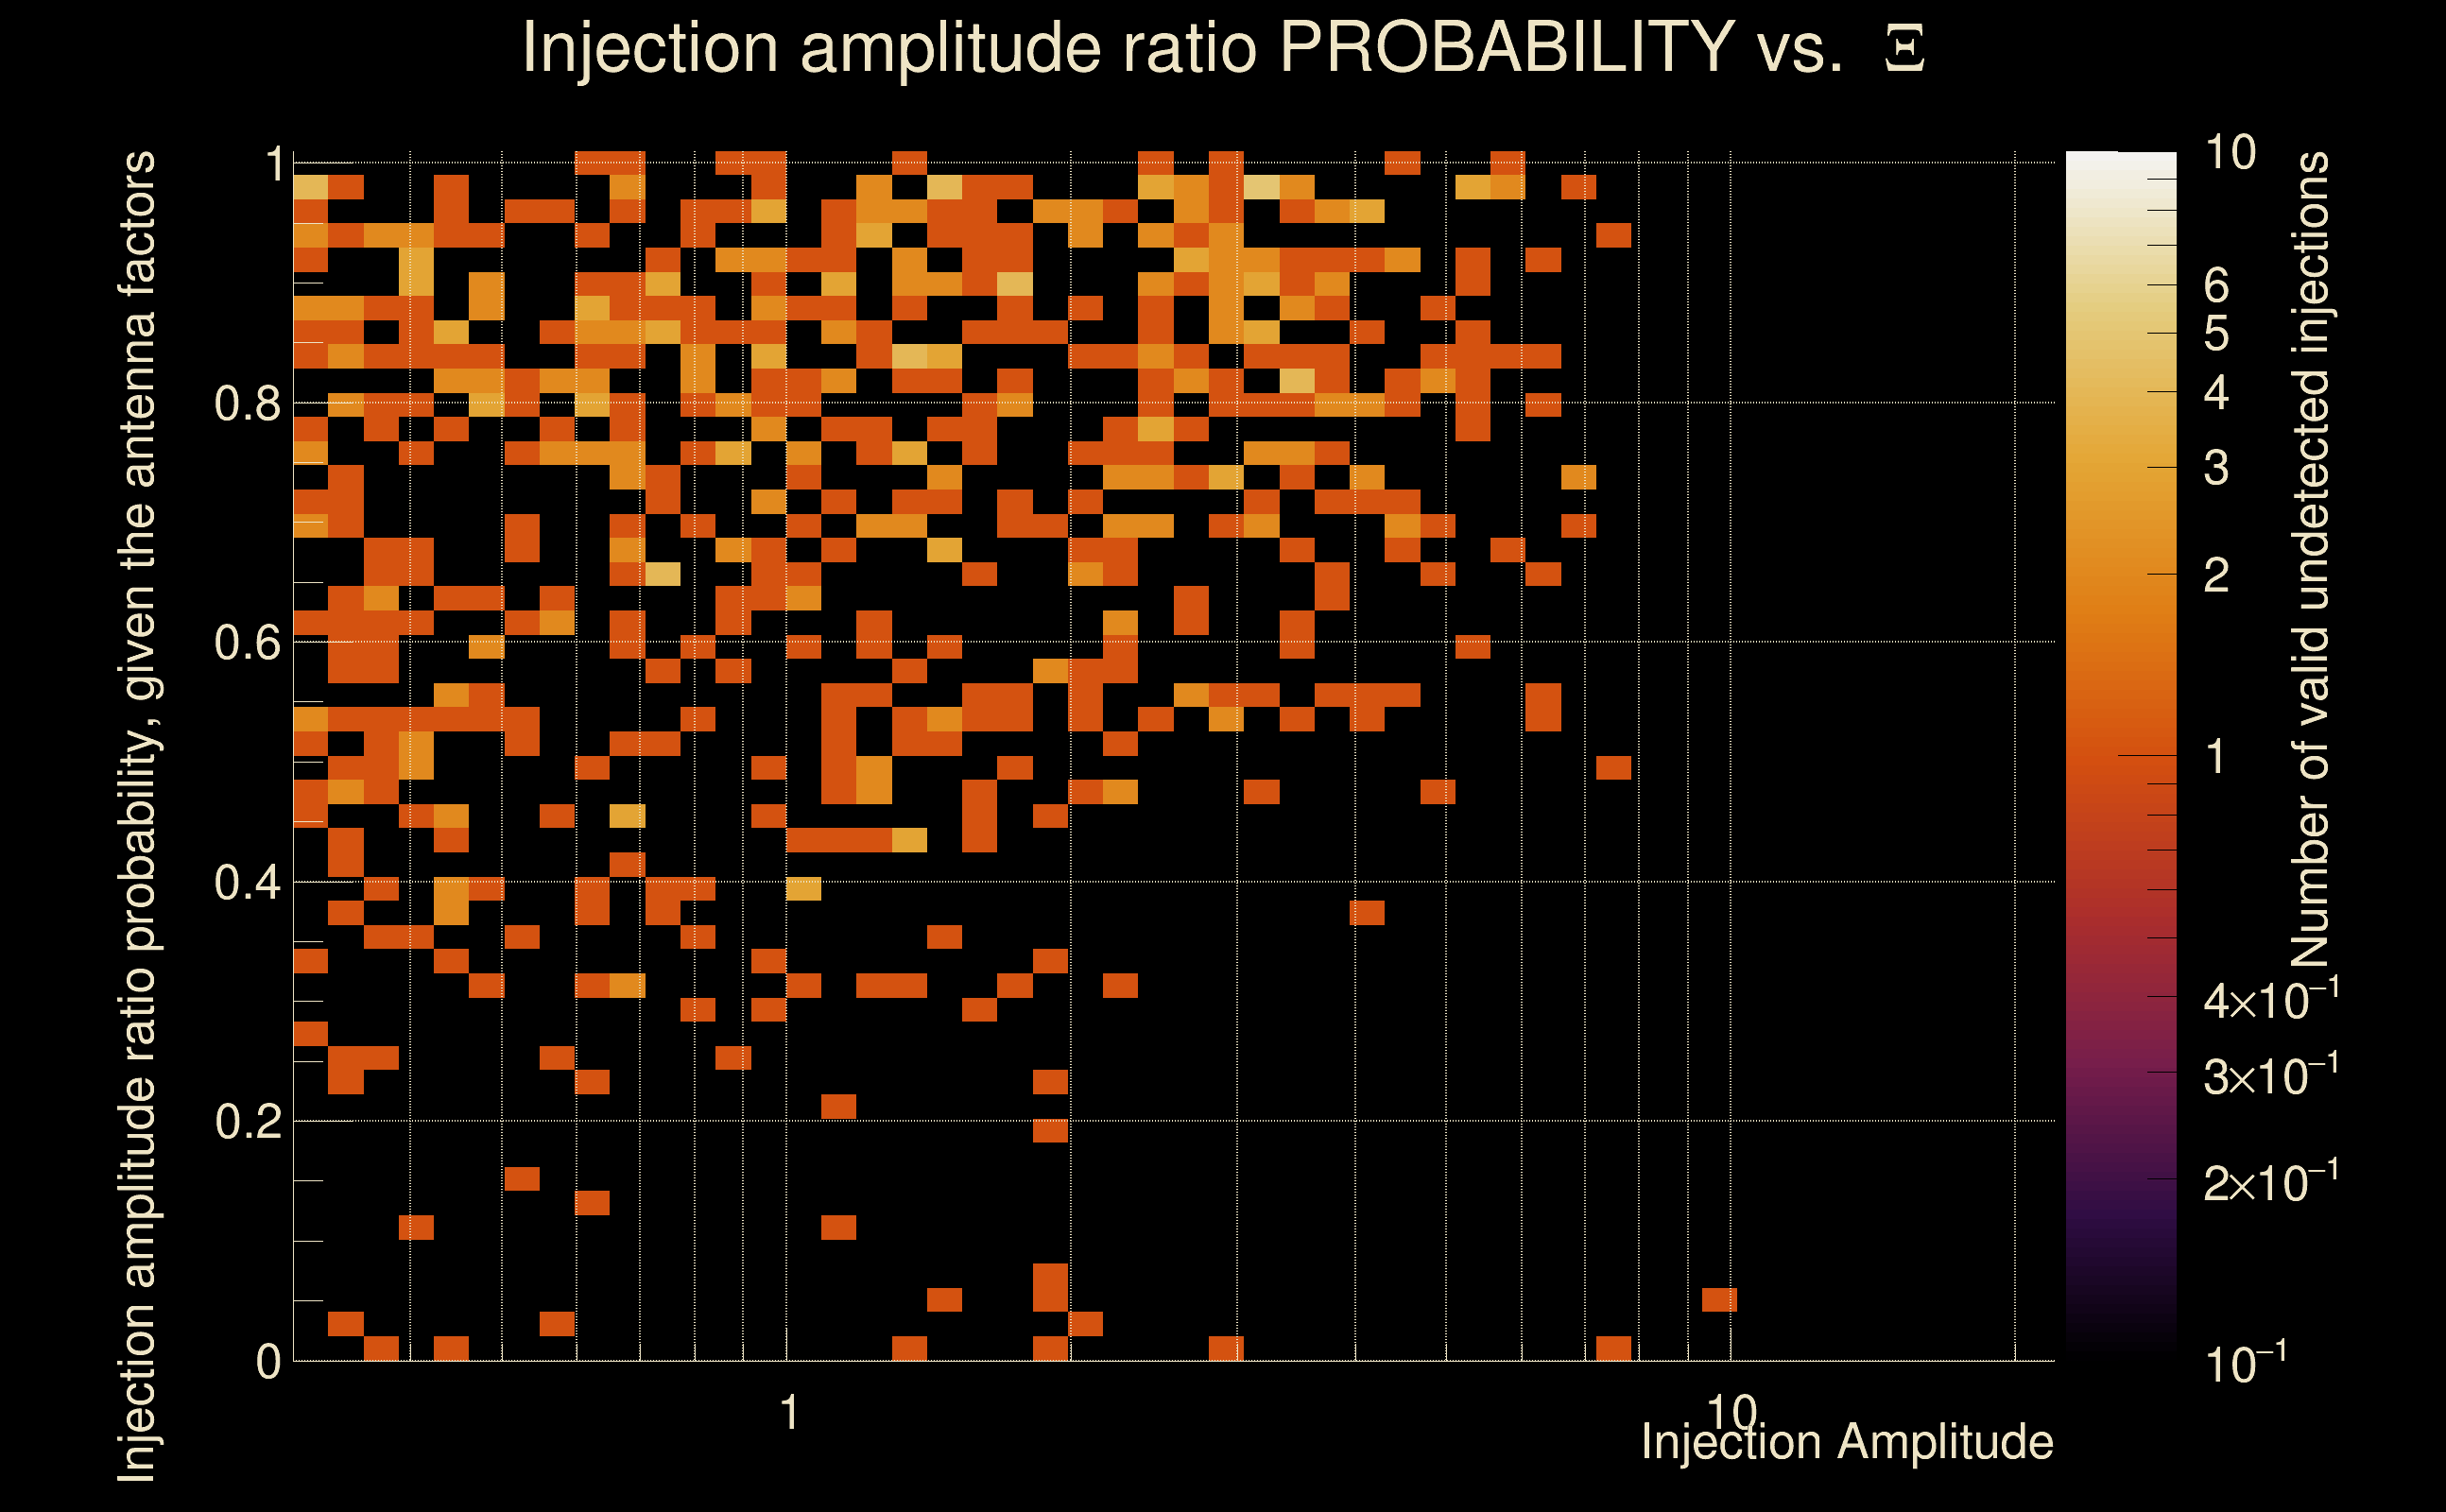
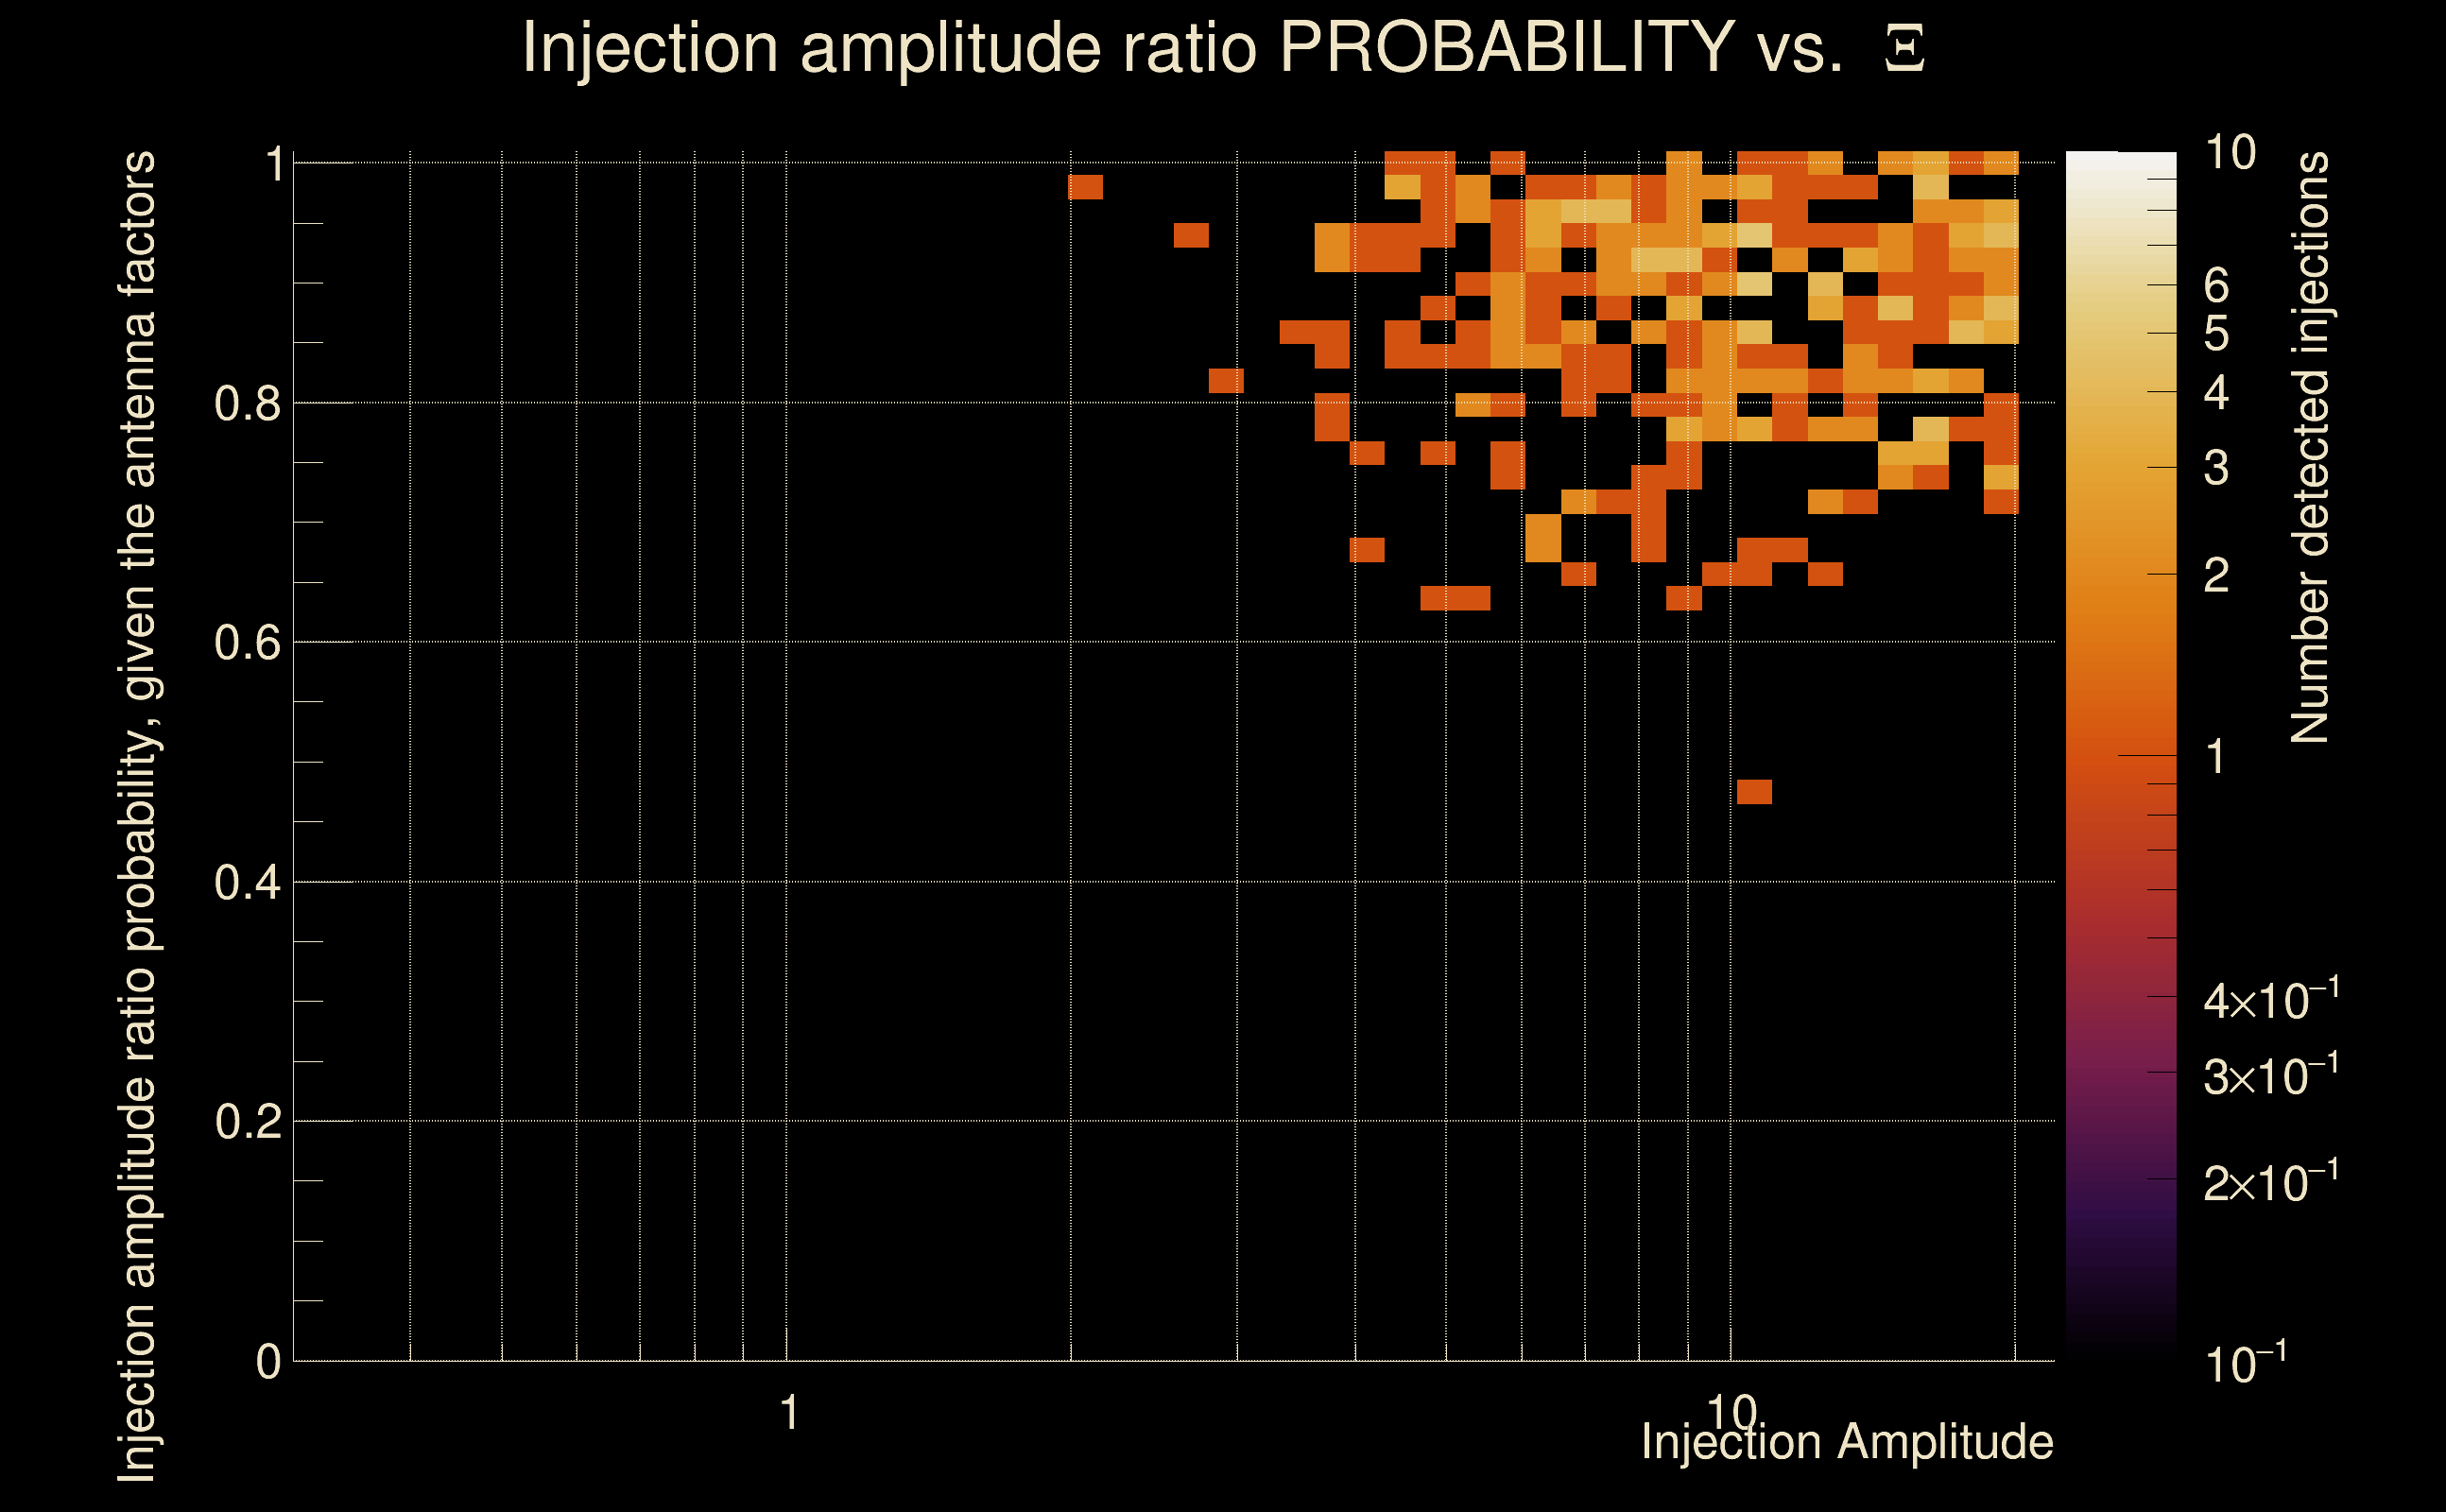
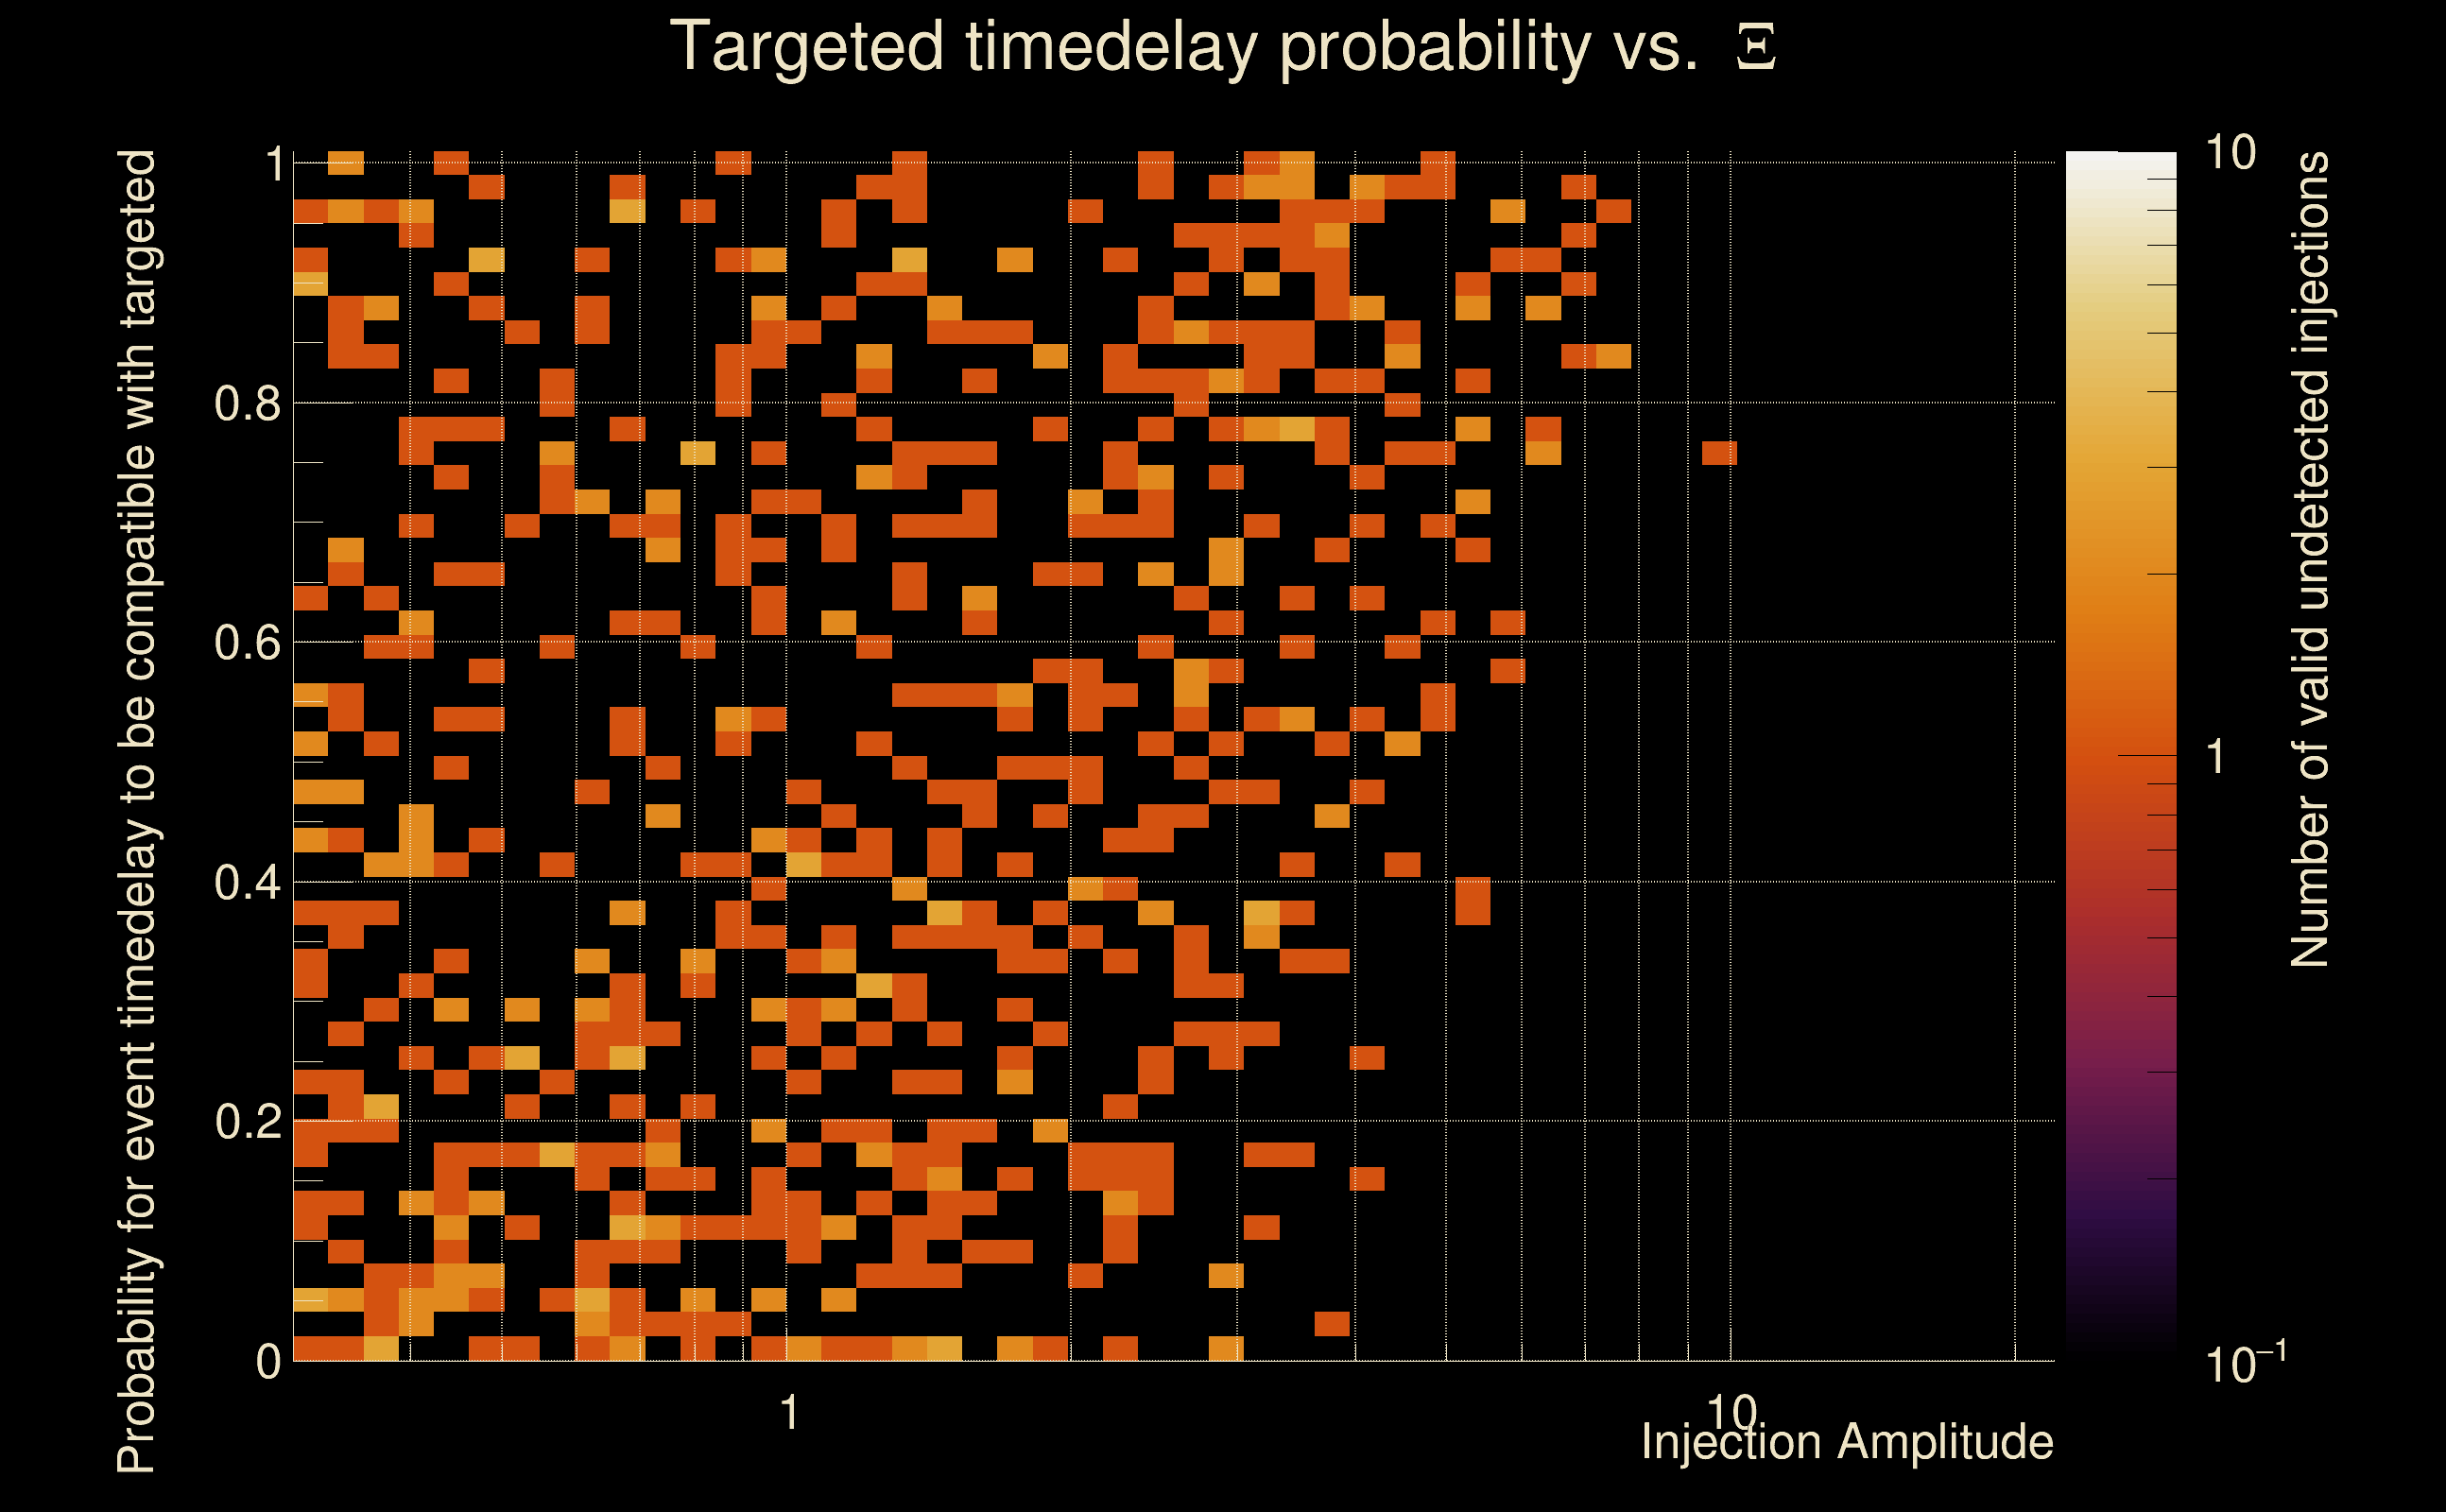
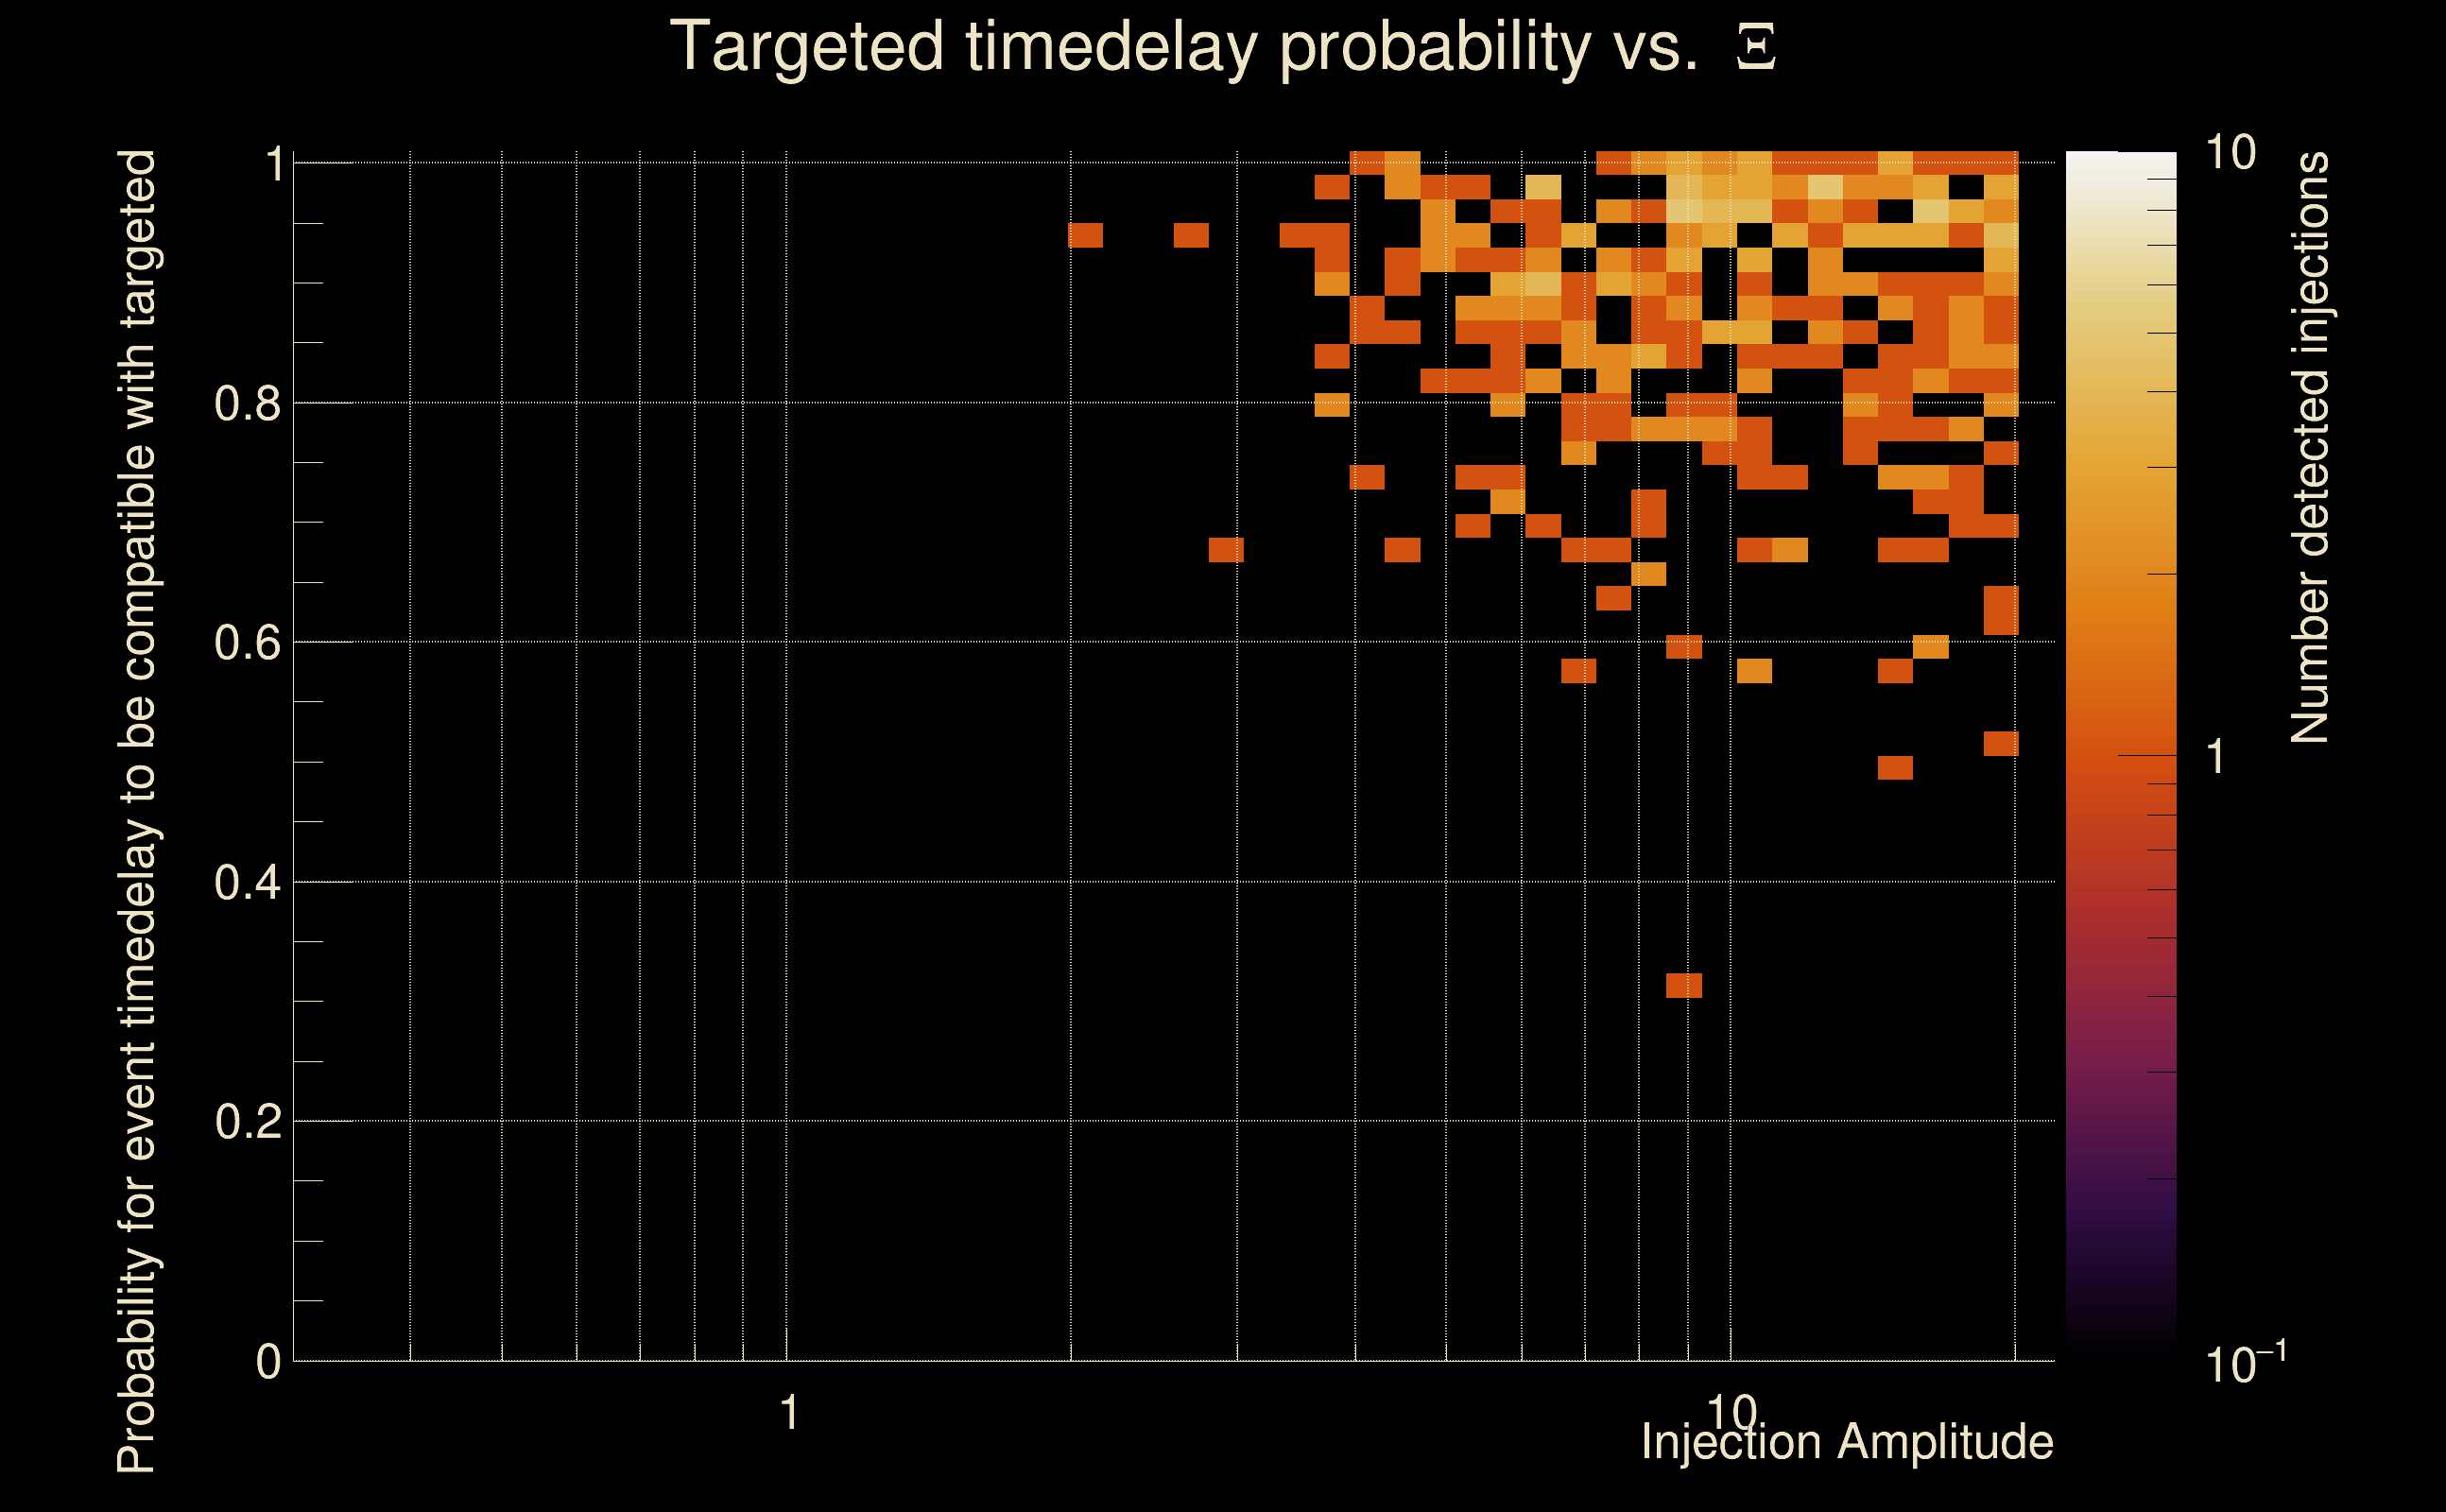
| Number of injections (total/valid/detected): | 1116 / 995 / 331 |
| List of missed injections: | ./Pow19-s18_missed.txt |
| Injection amplitude at 90% detection efficiency: | 7.76695 |
| Injection amplitude at 50% detection efficiency: | 5.37513 |
| Injection amplitude at 10% detection efficiency: | 3.52596 |
 |
 |
 |
 |
 |
 |
 |
|
 |
 |
|
 |
 |
|
 |
 |
|
 |
 |
|
 |
 |
|
 |
 |
|
 |
 |
|
 |
 |
 |
 |
 |
 |
 |
 |
 |
 |
 |
 |
 |
 |
 |
| florent.robinet@ijclab.in2p3.fr |