| Omicron version: | 4.2.0: documentation gitlab repository |
| Omicron run by: | unknown |
| Report produced on: | Wed Dec 17 09:48:14 2025 UTC |
| Ox option file: | TargIxfw_injpt1_options.txt |
| Omicron option files: | detector 0, detector 1 |
| Detector channel names: | H1:GDS-CALIB_STRAIN_CLEAN_AR_4096Hz, L1:GDS-CALIB_STRAIN_CLEAN_AR_4096Hz |
| Omicron analysis time window and overlap: | 16 s, 6 s |
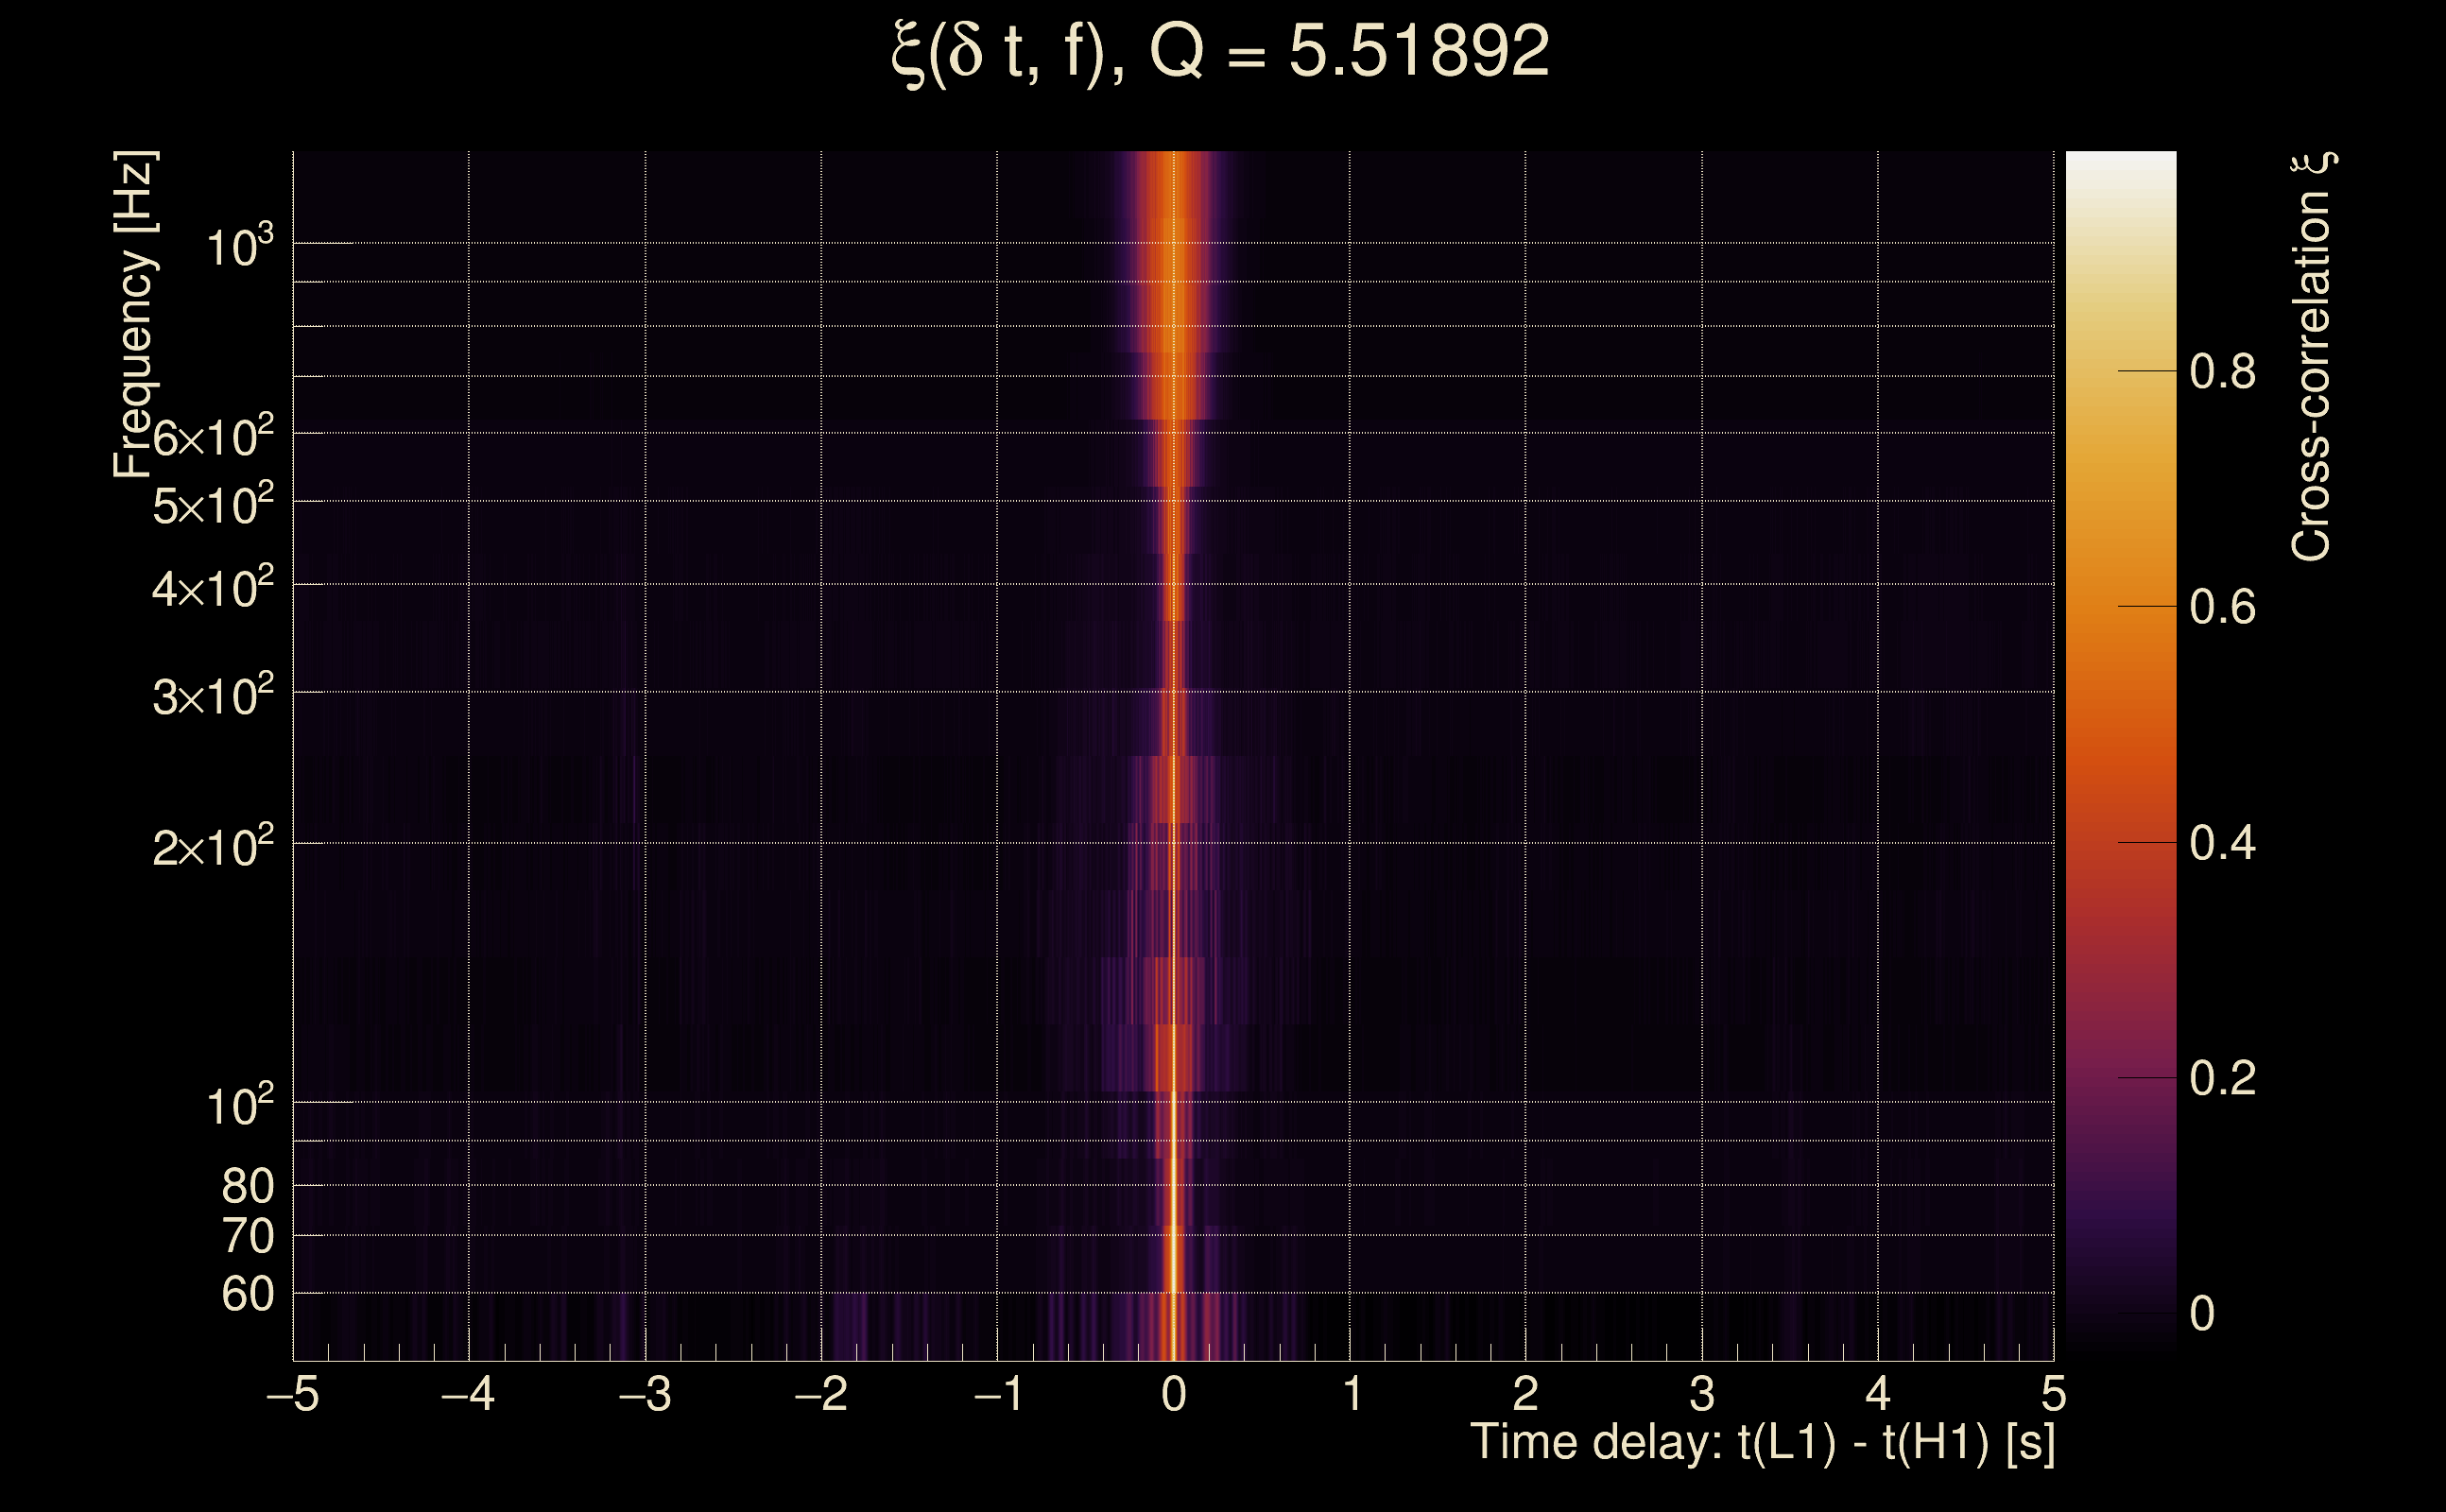
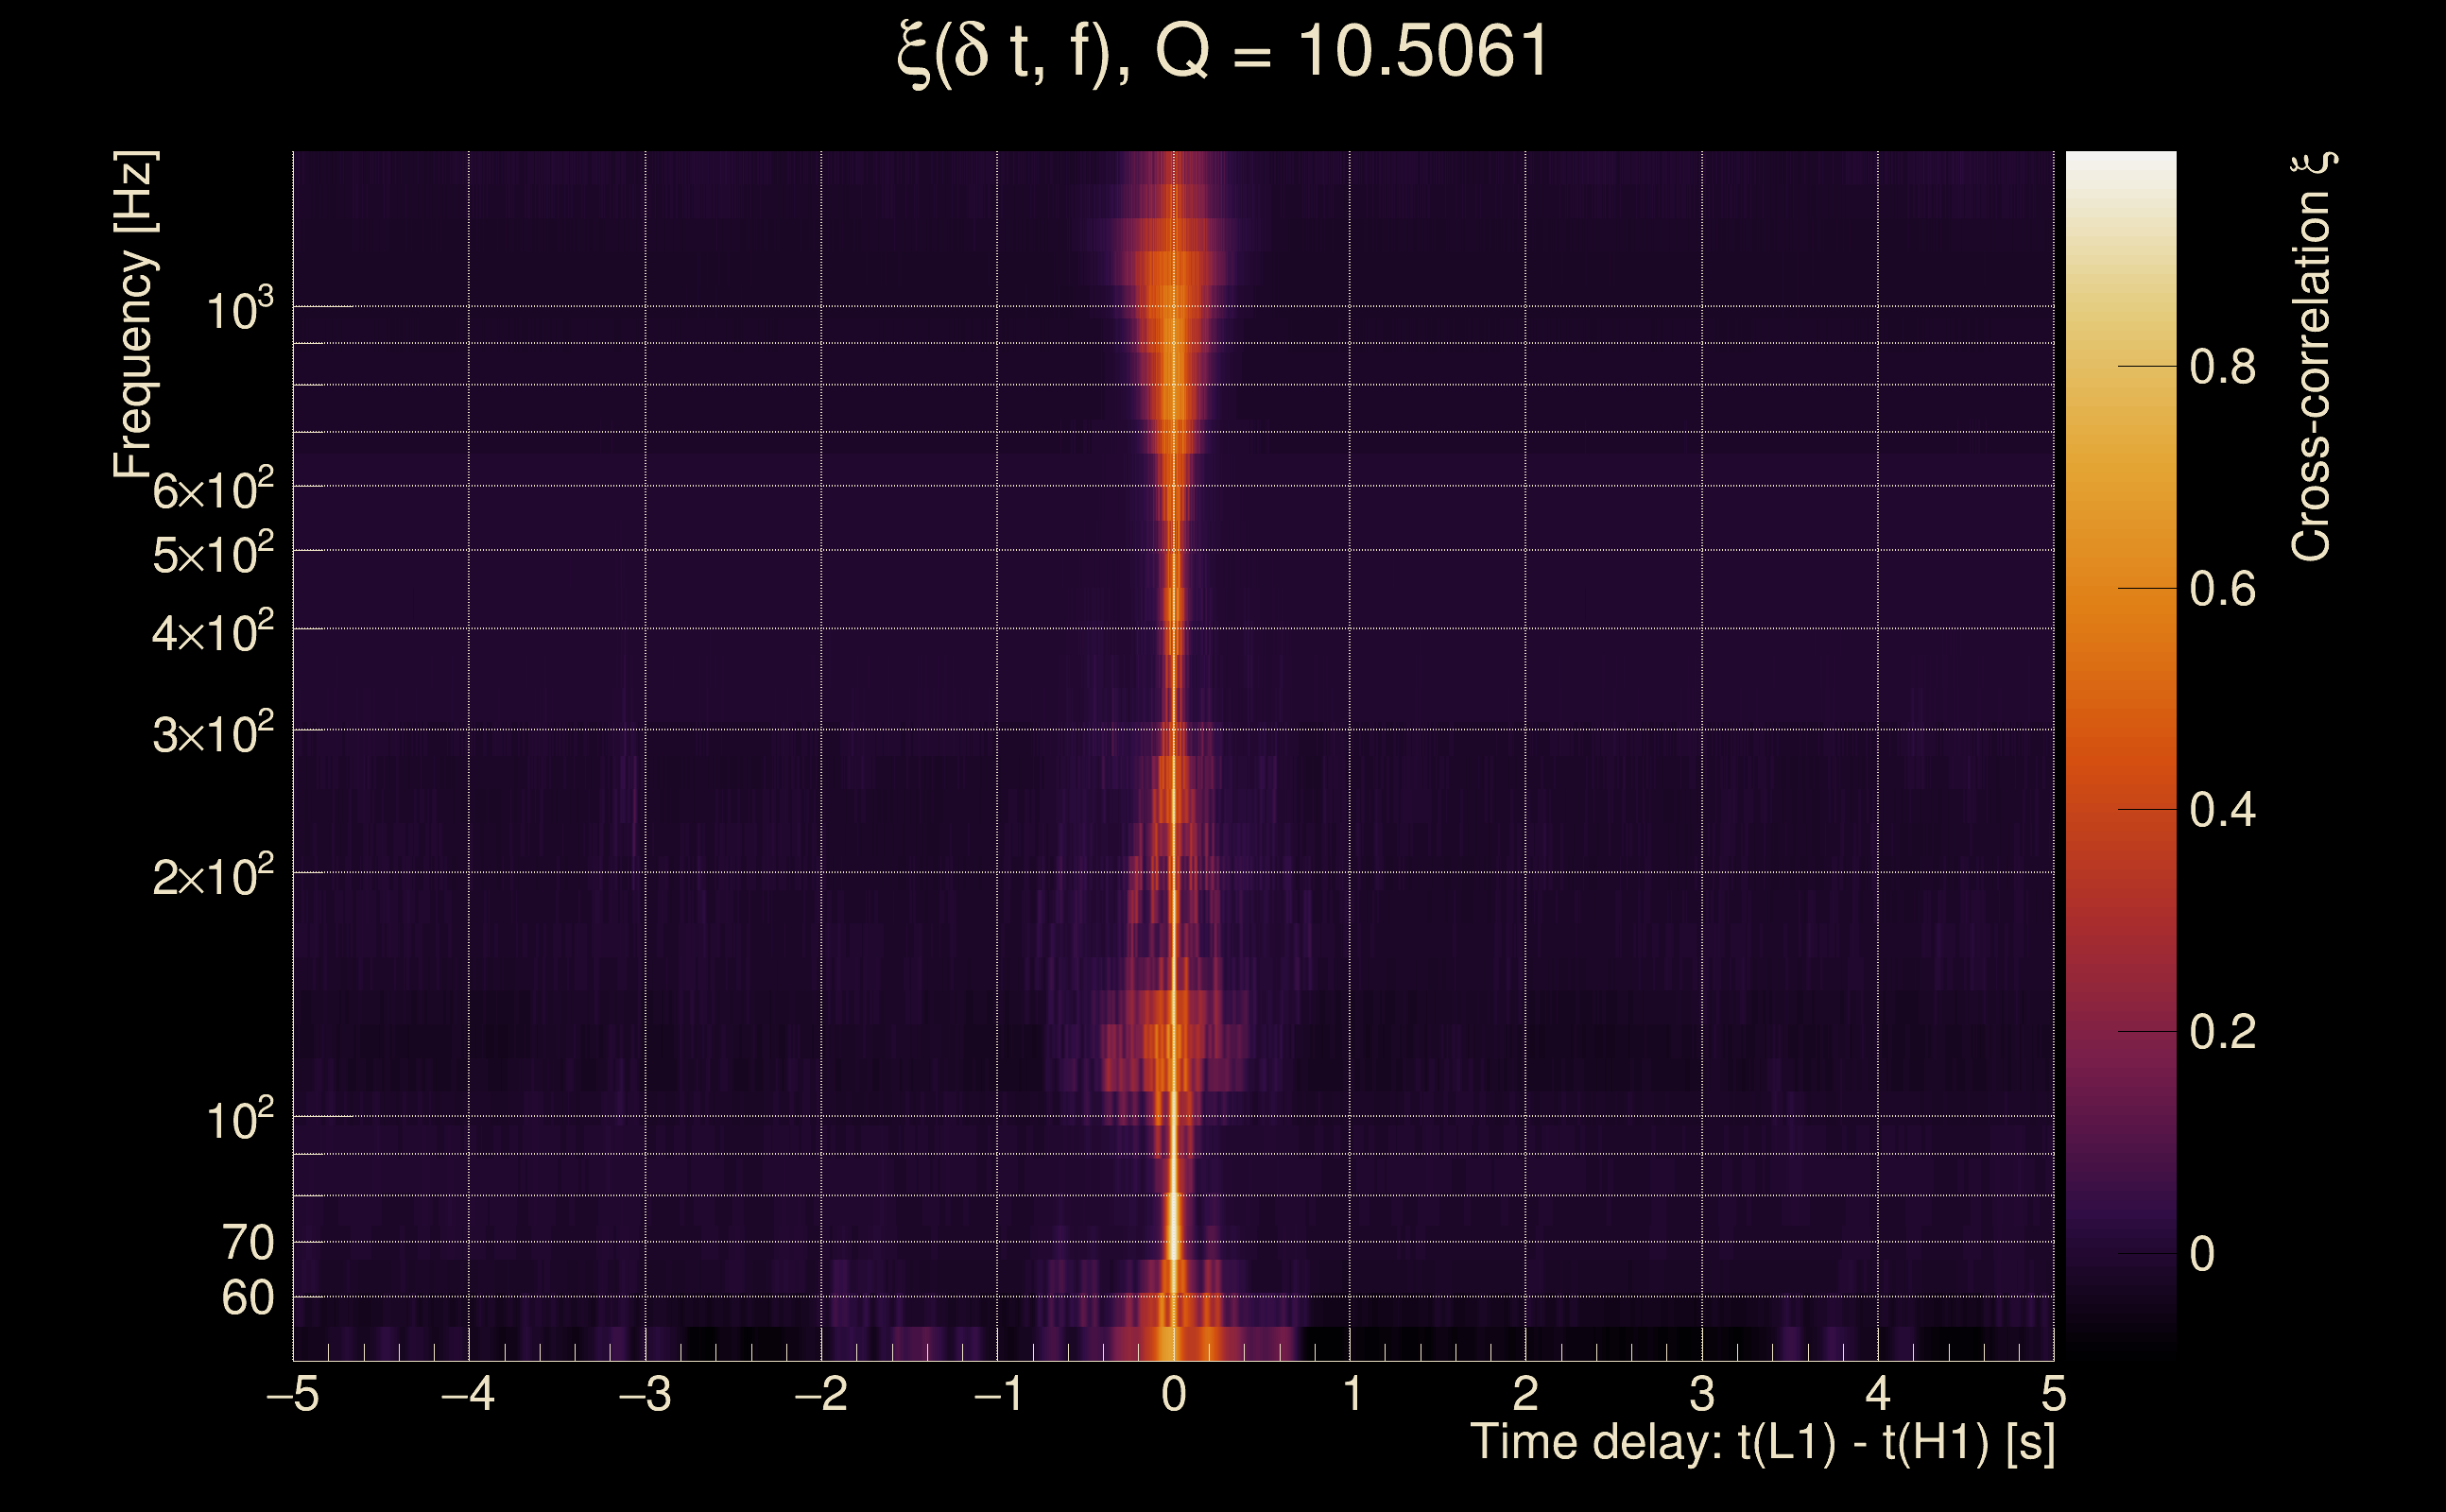
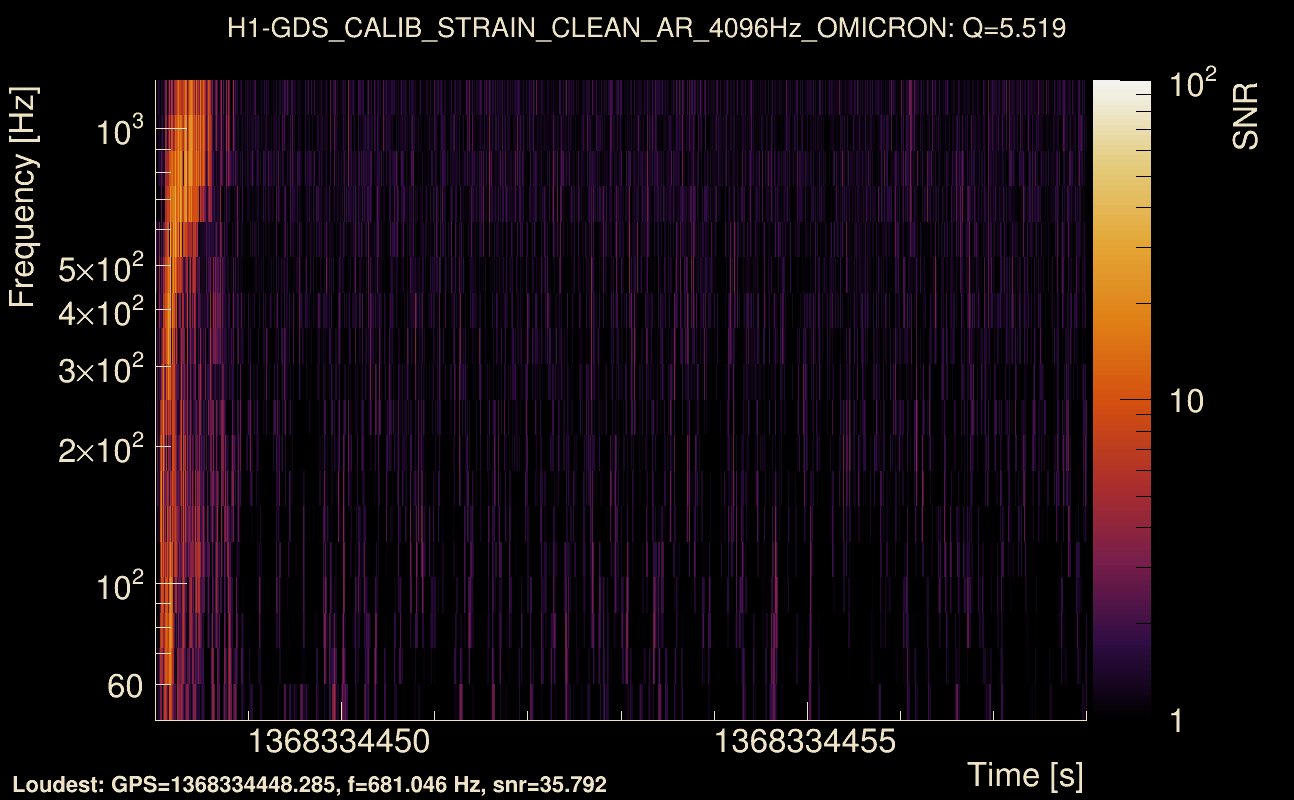
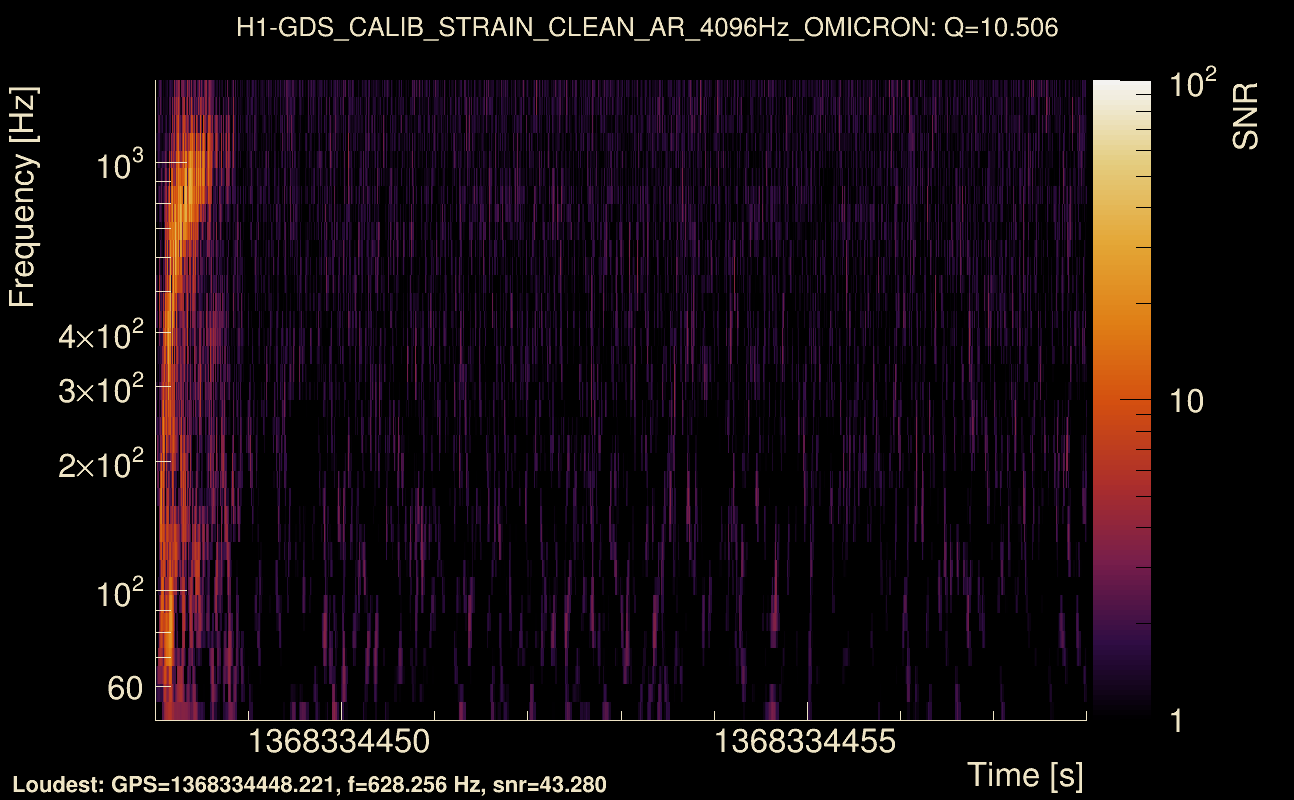
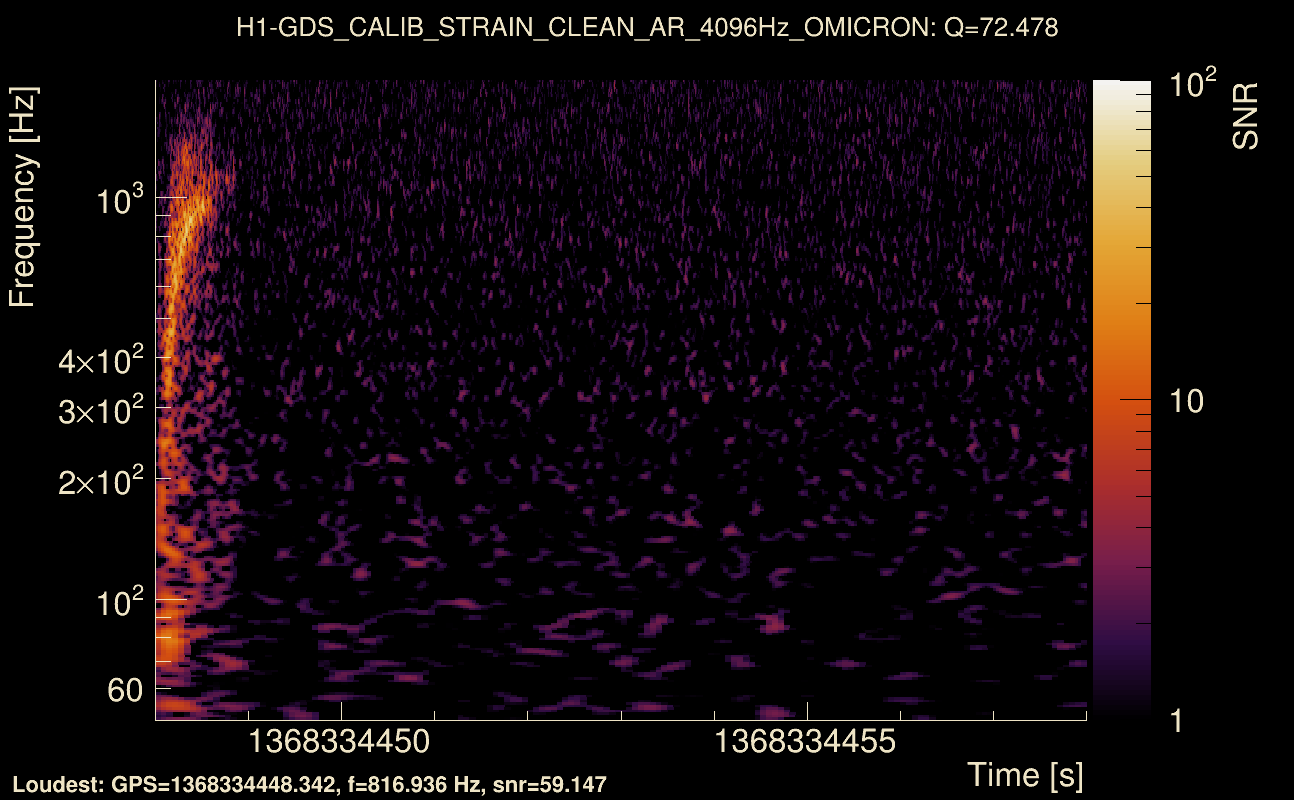
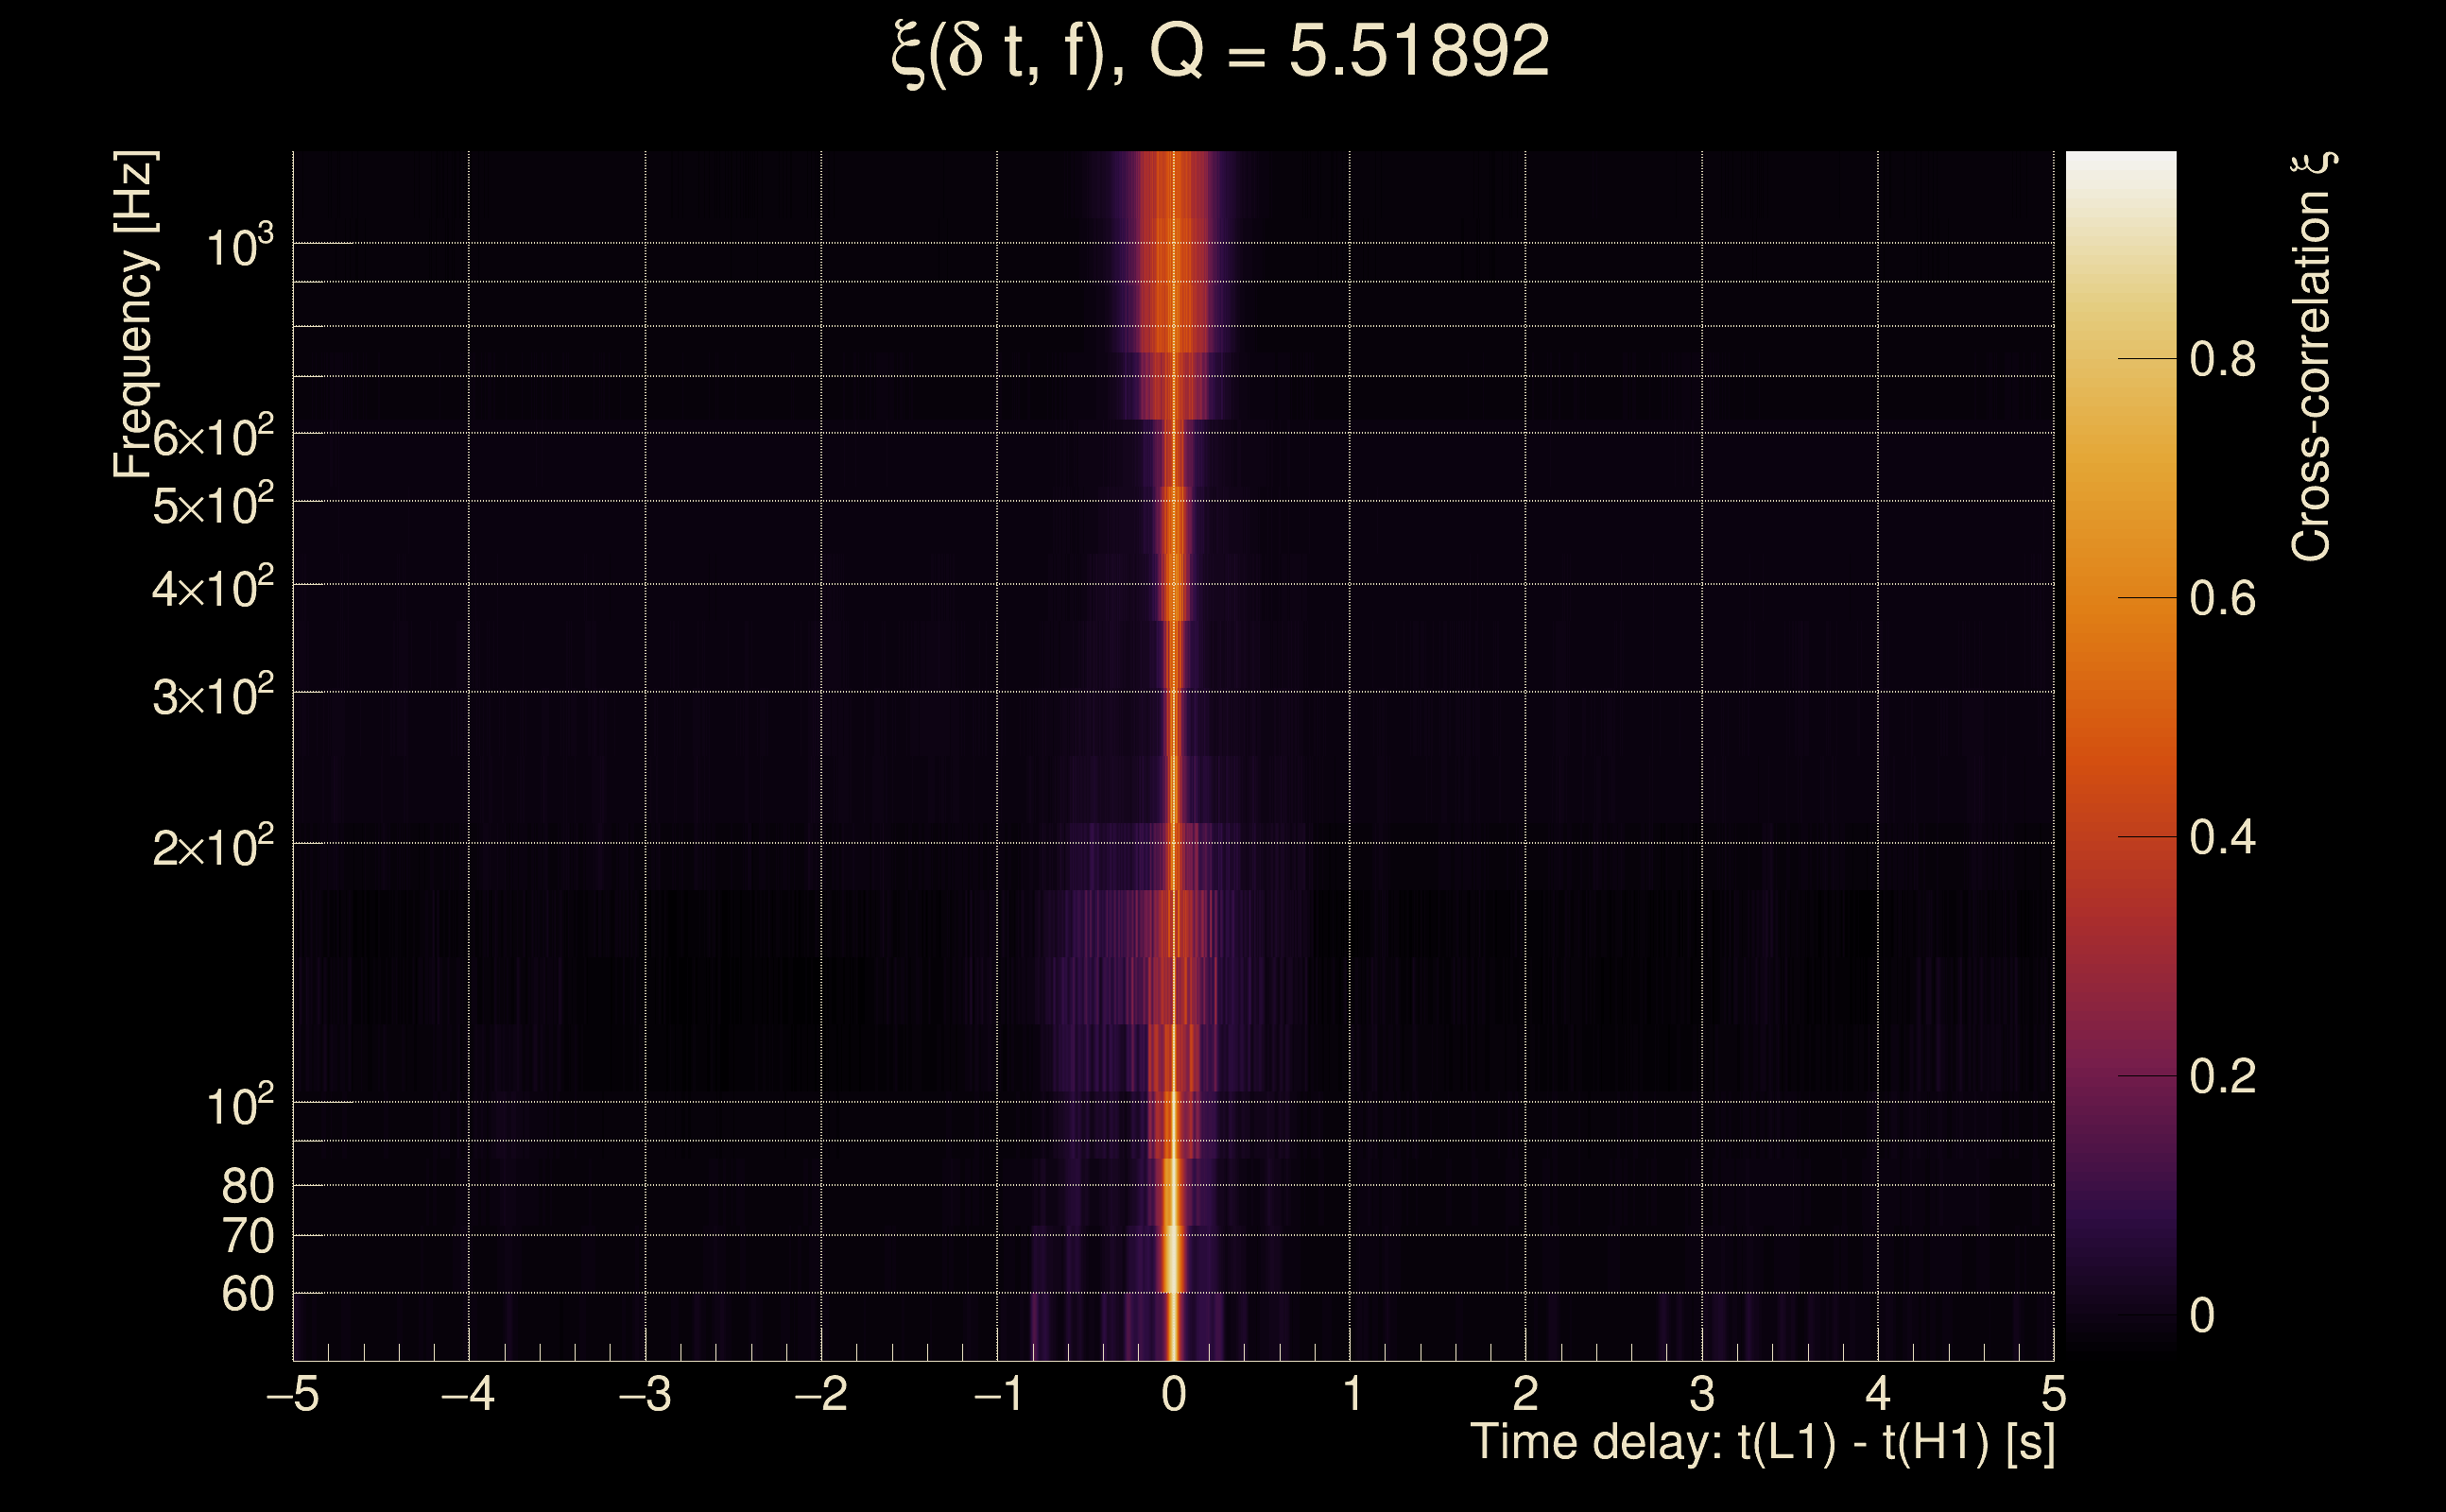
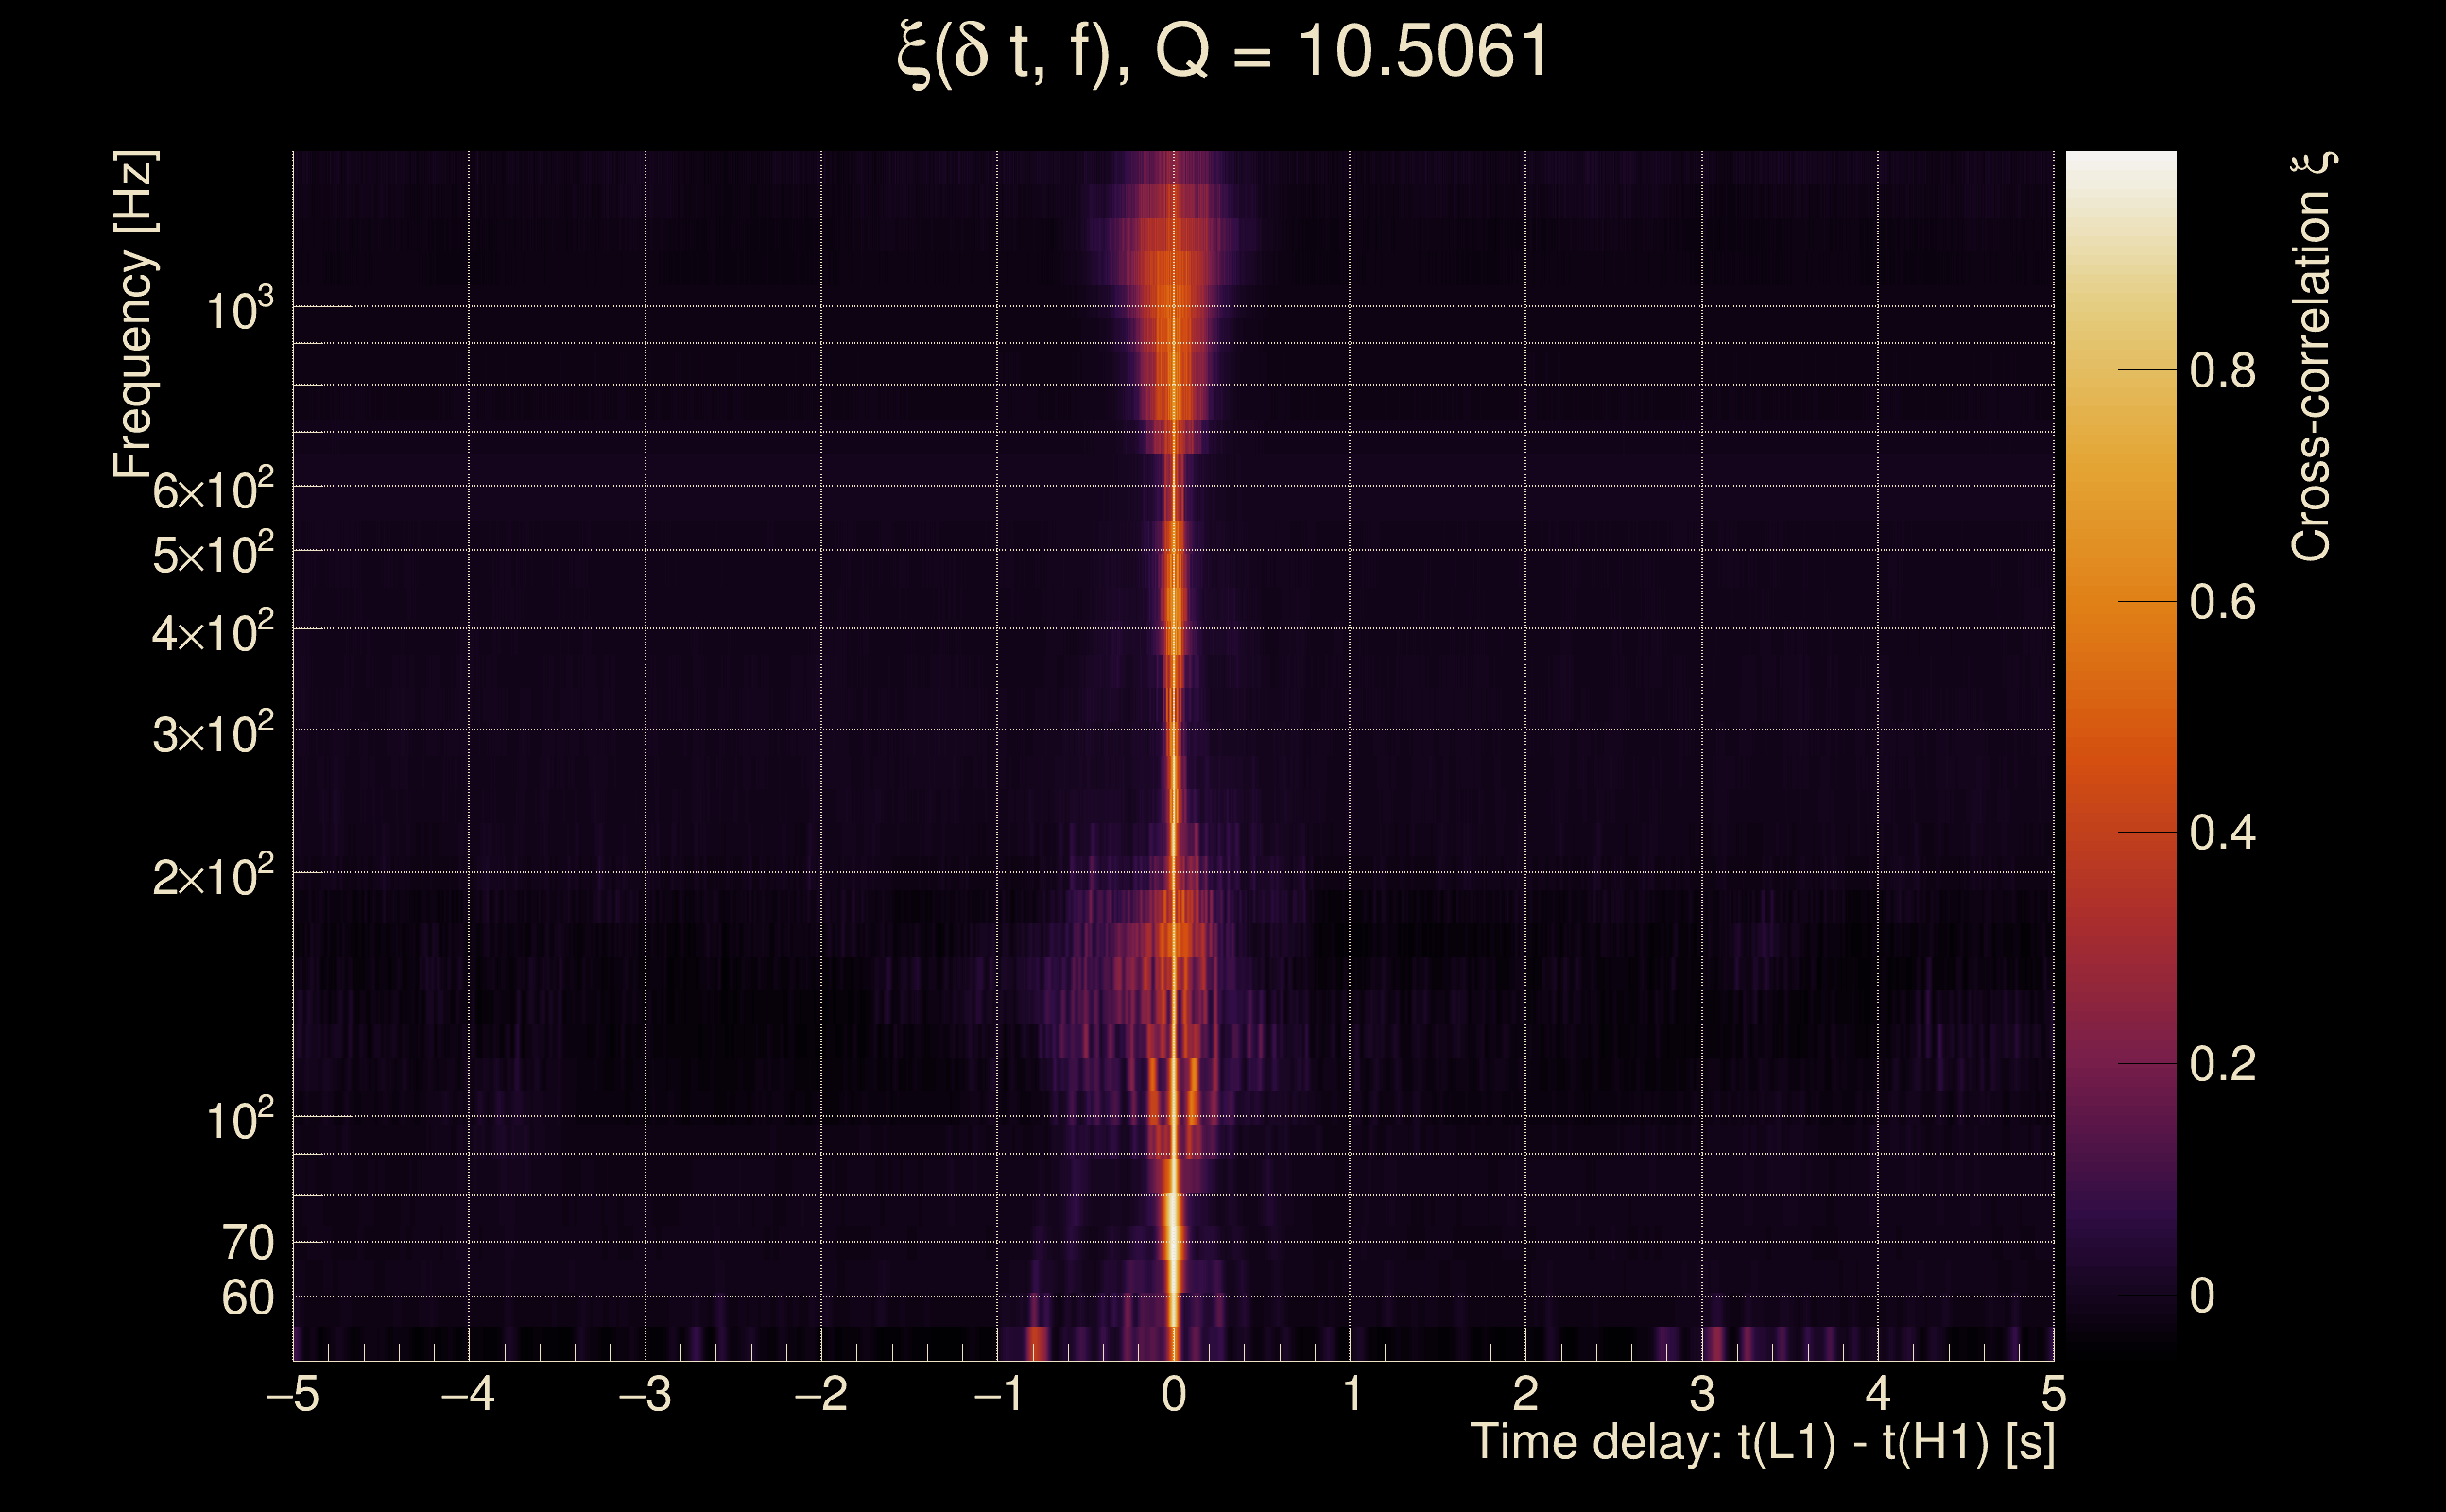
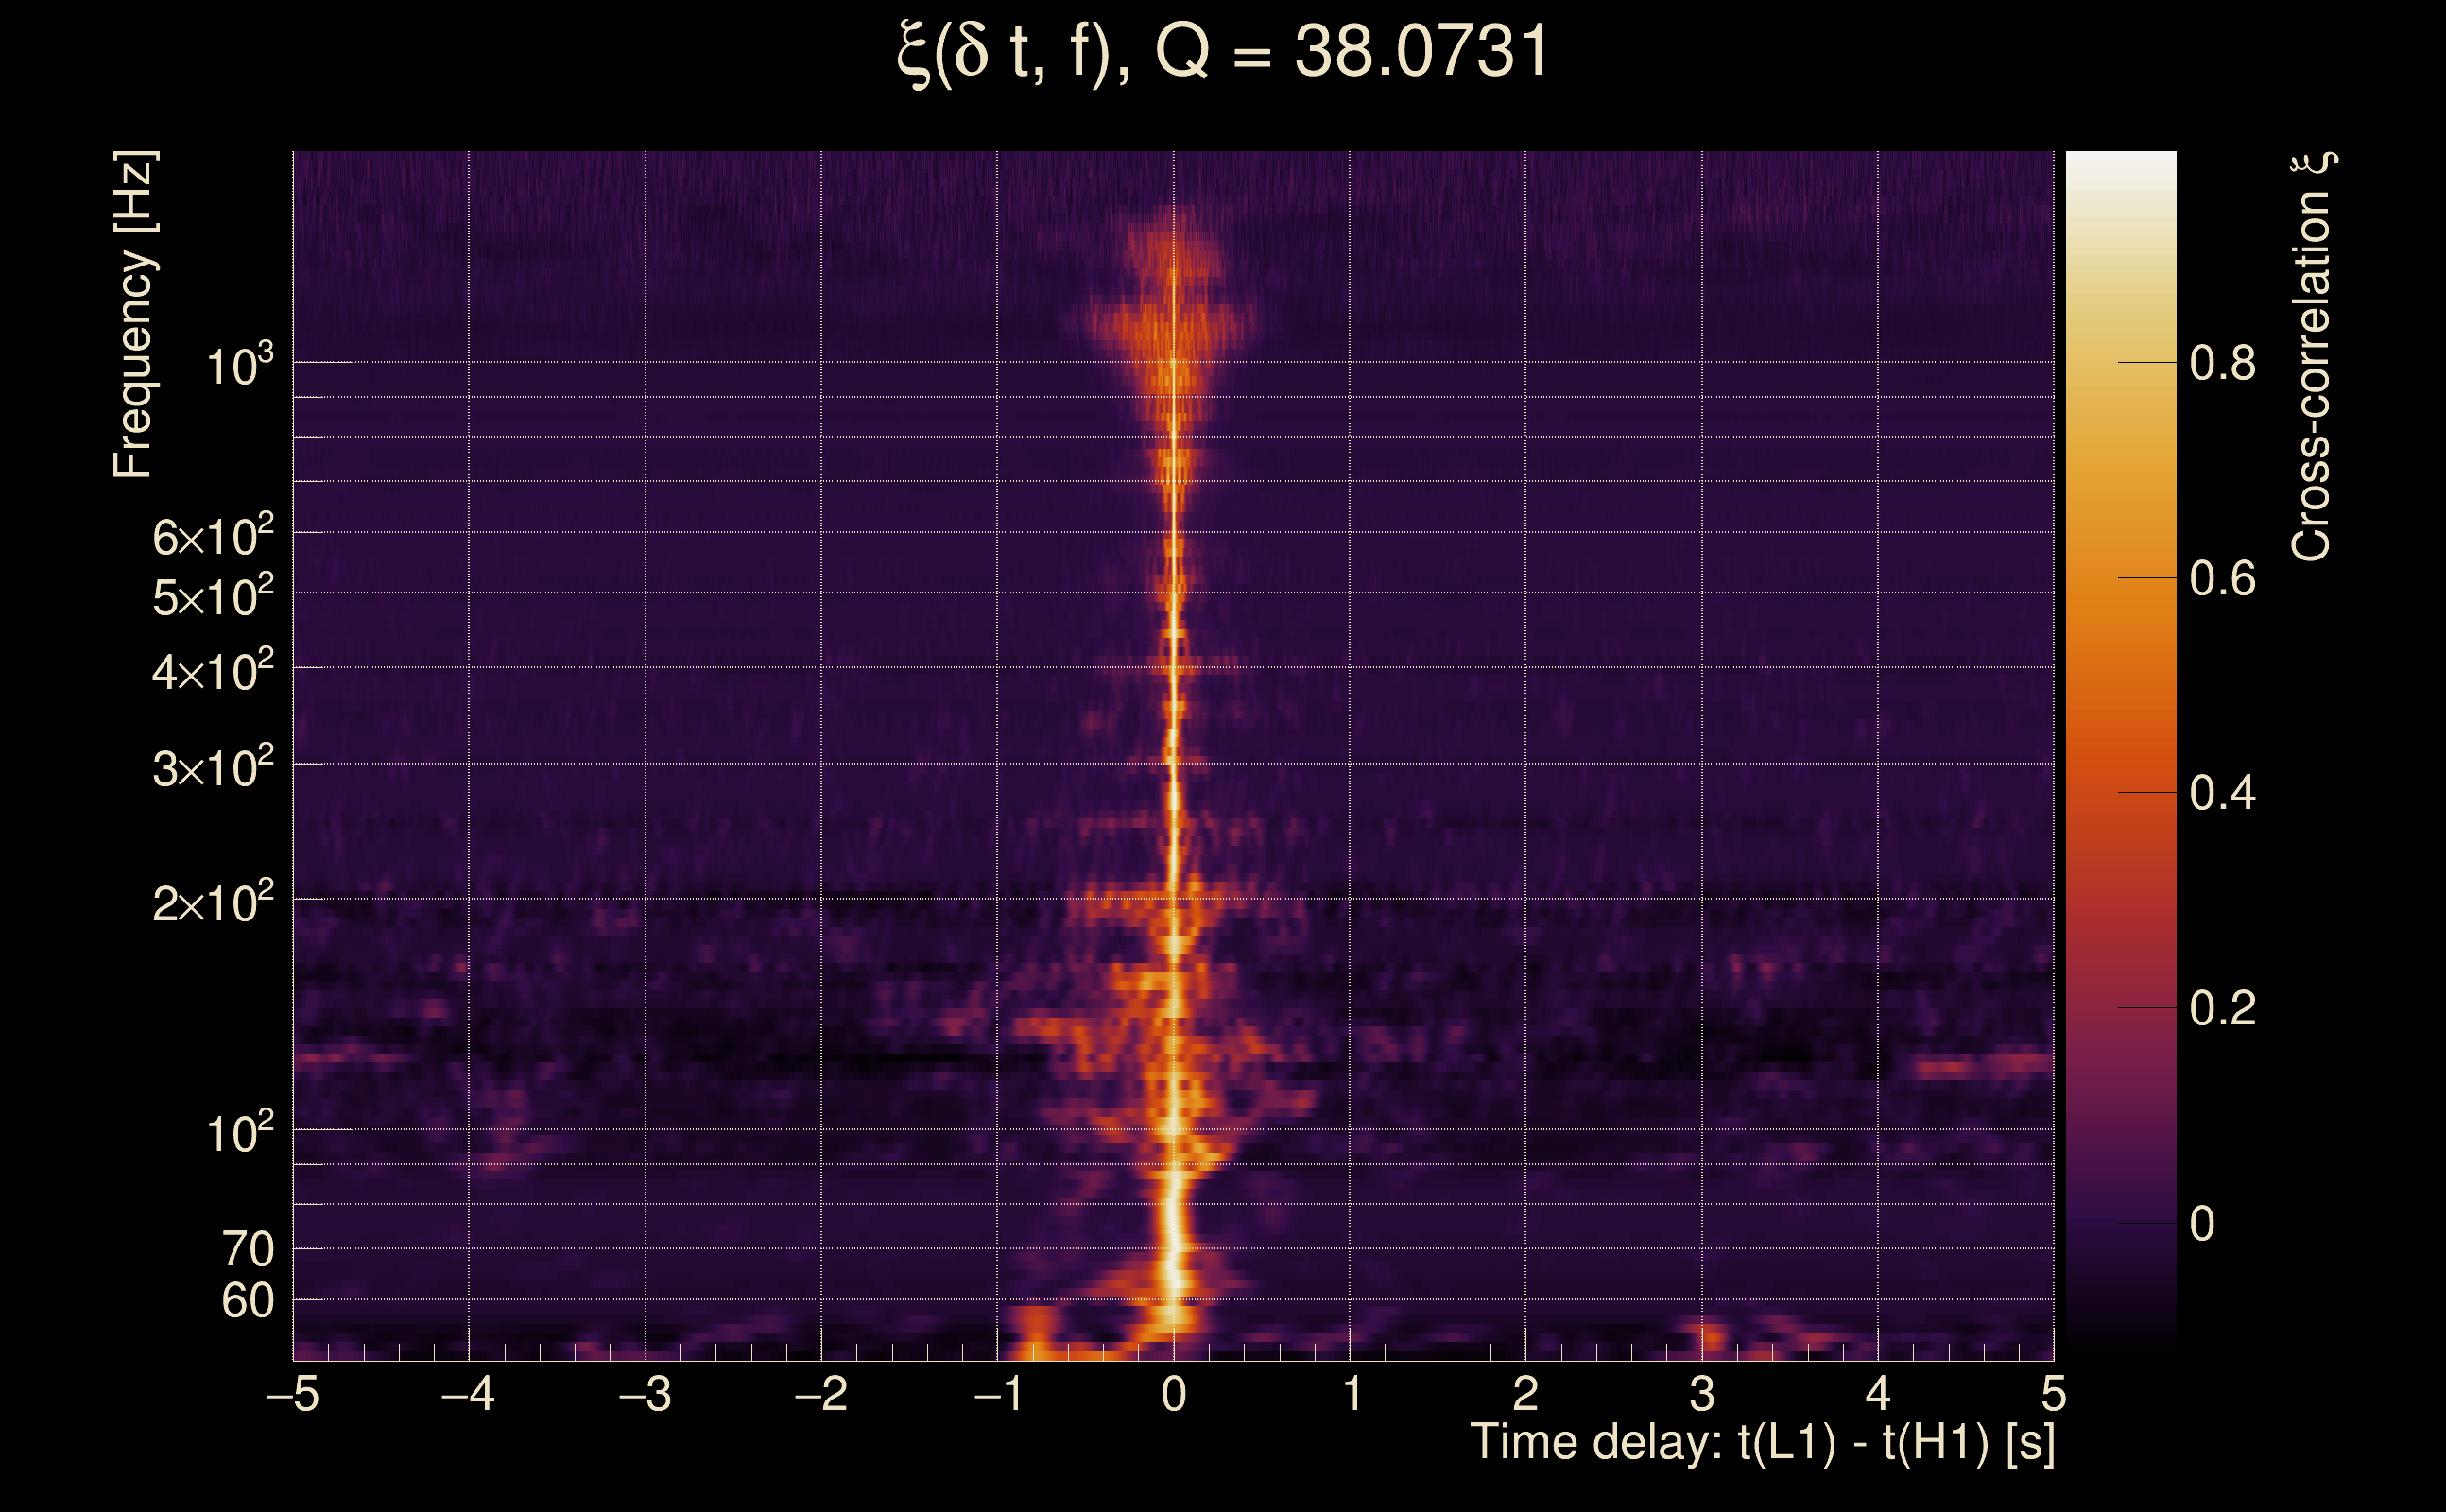
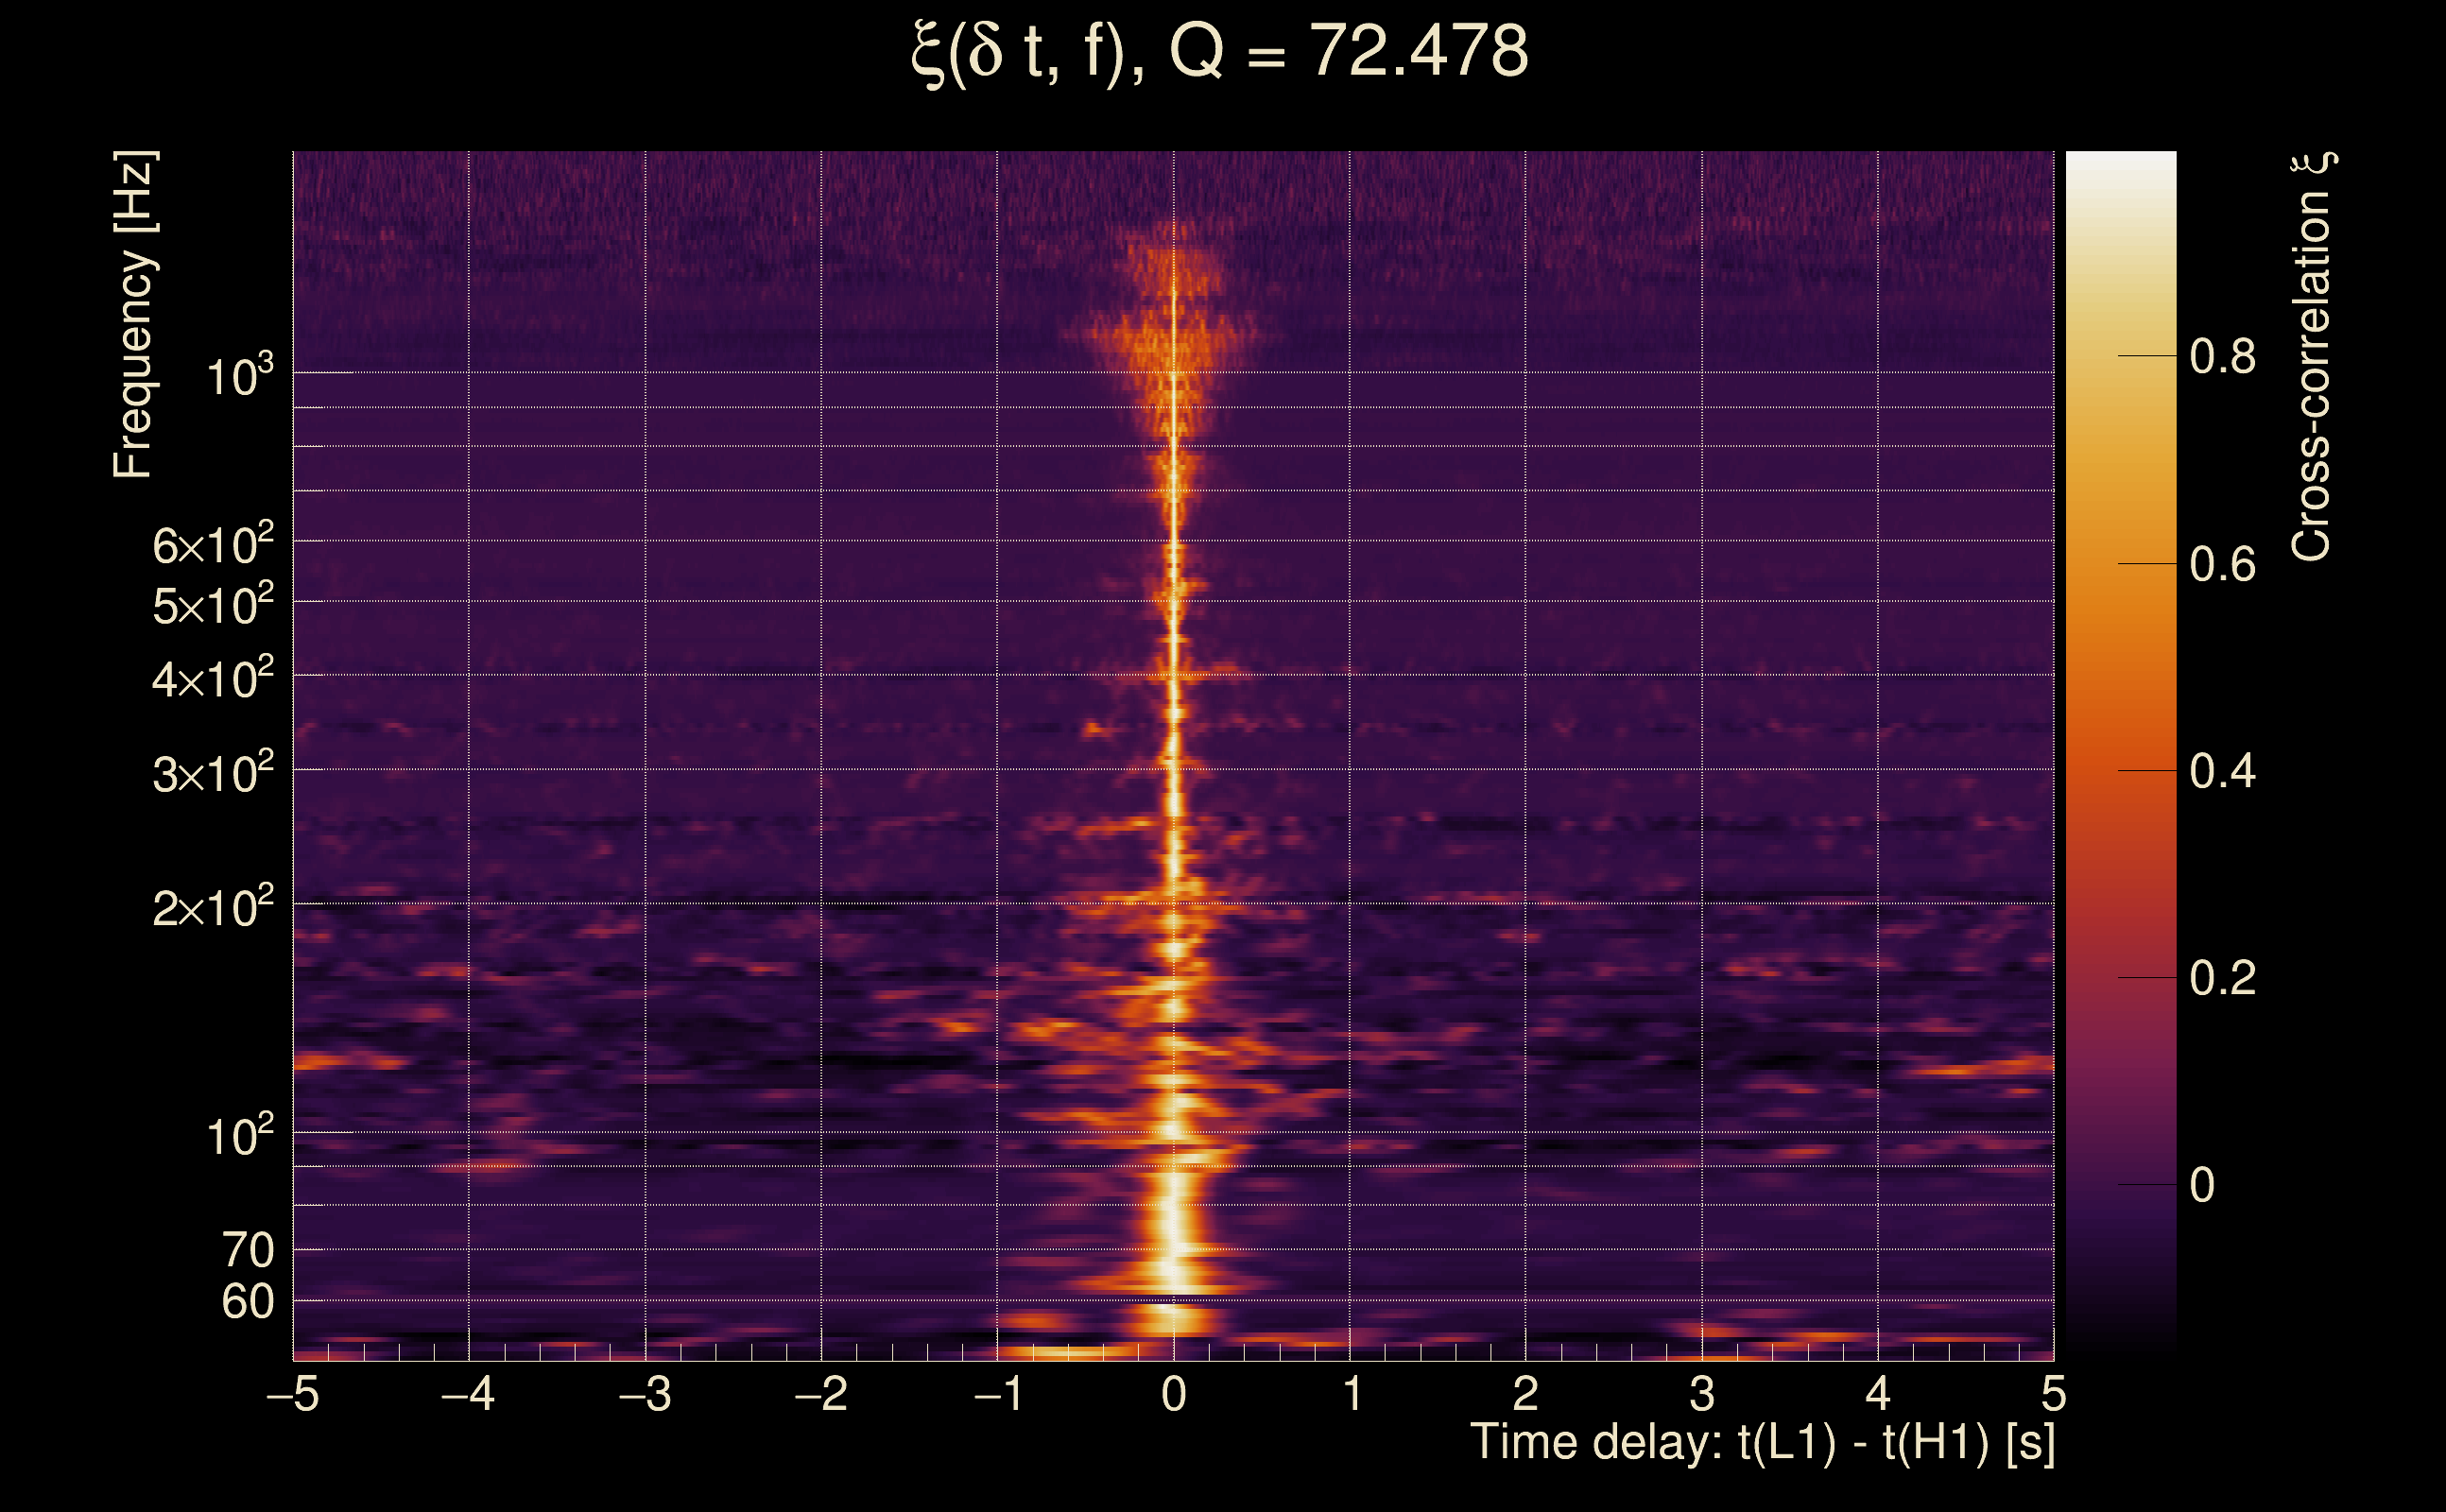
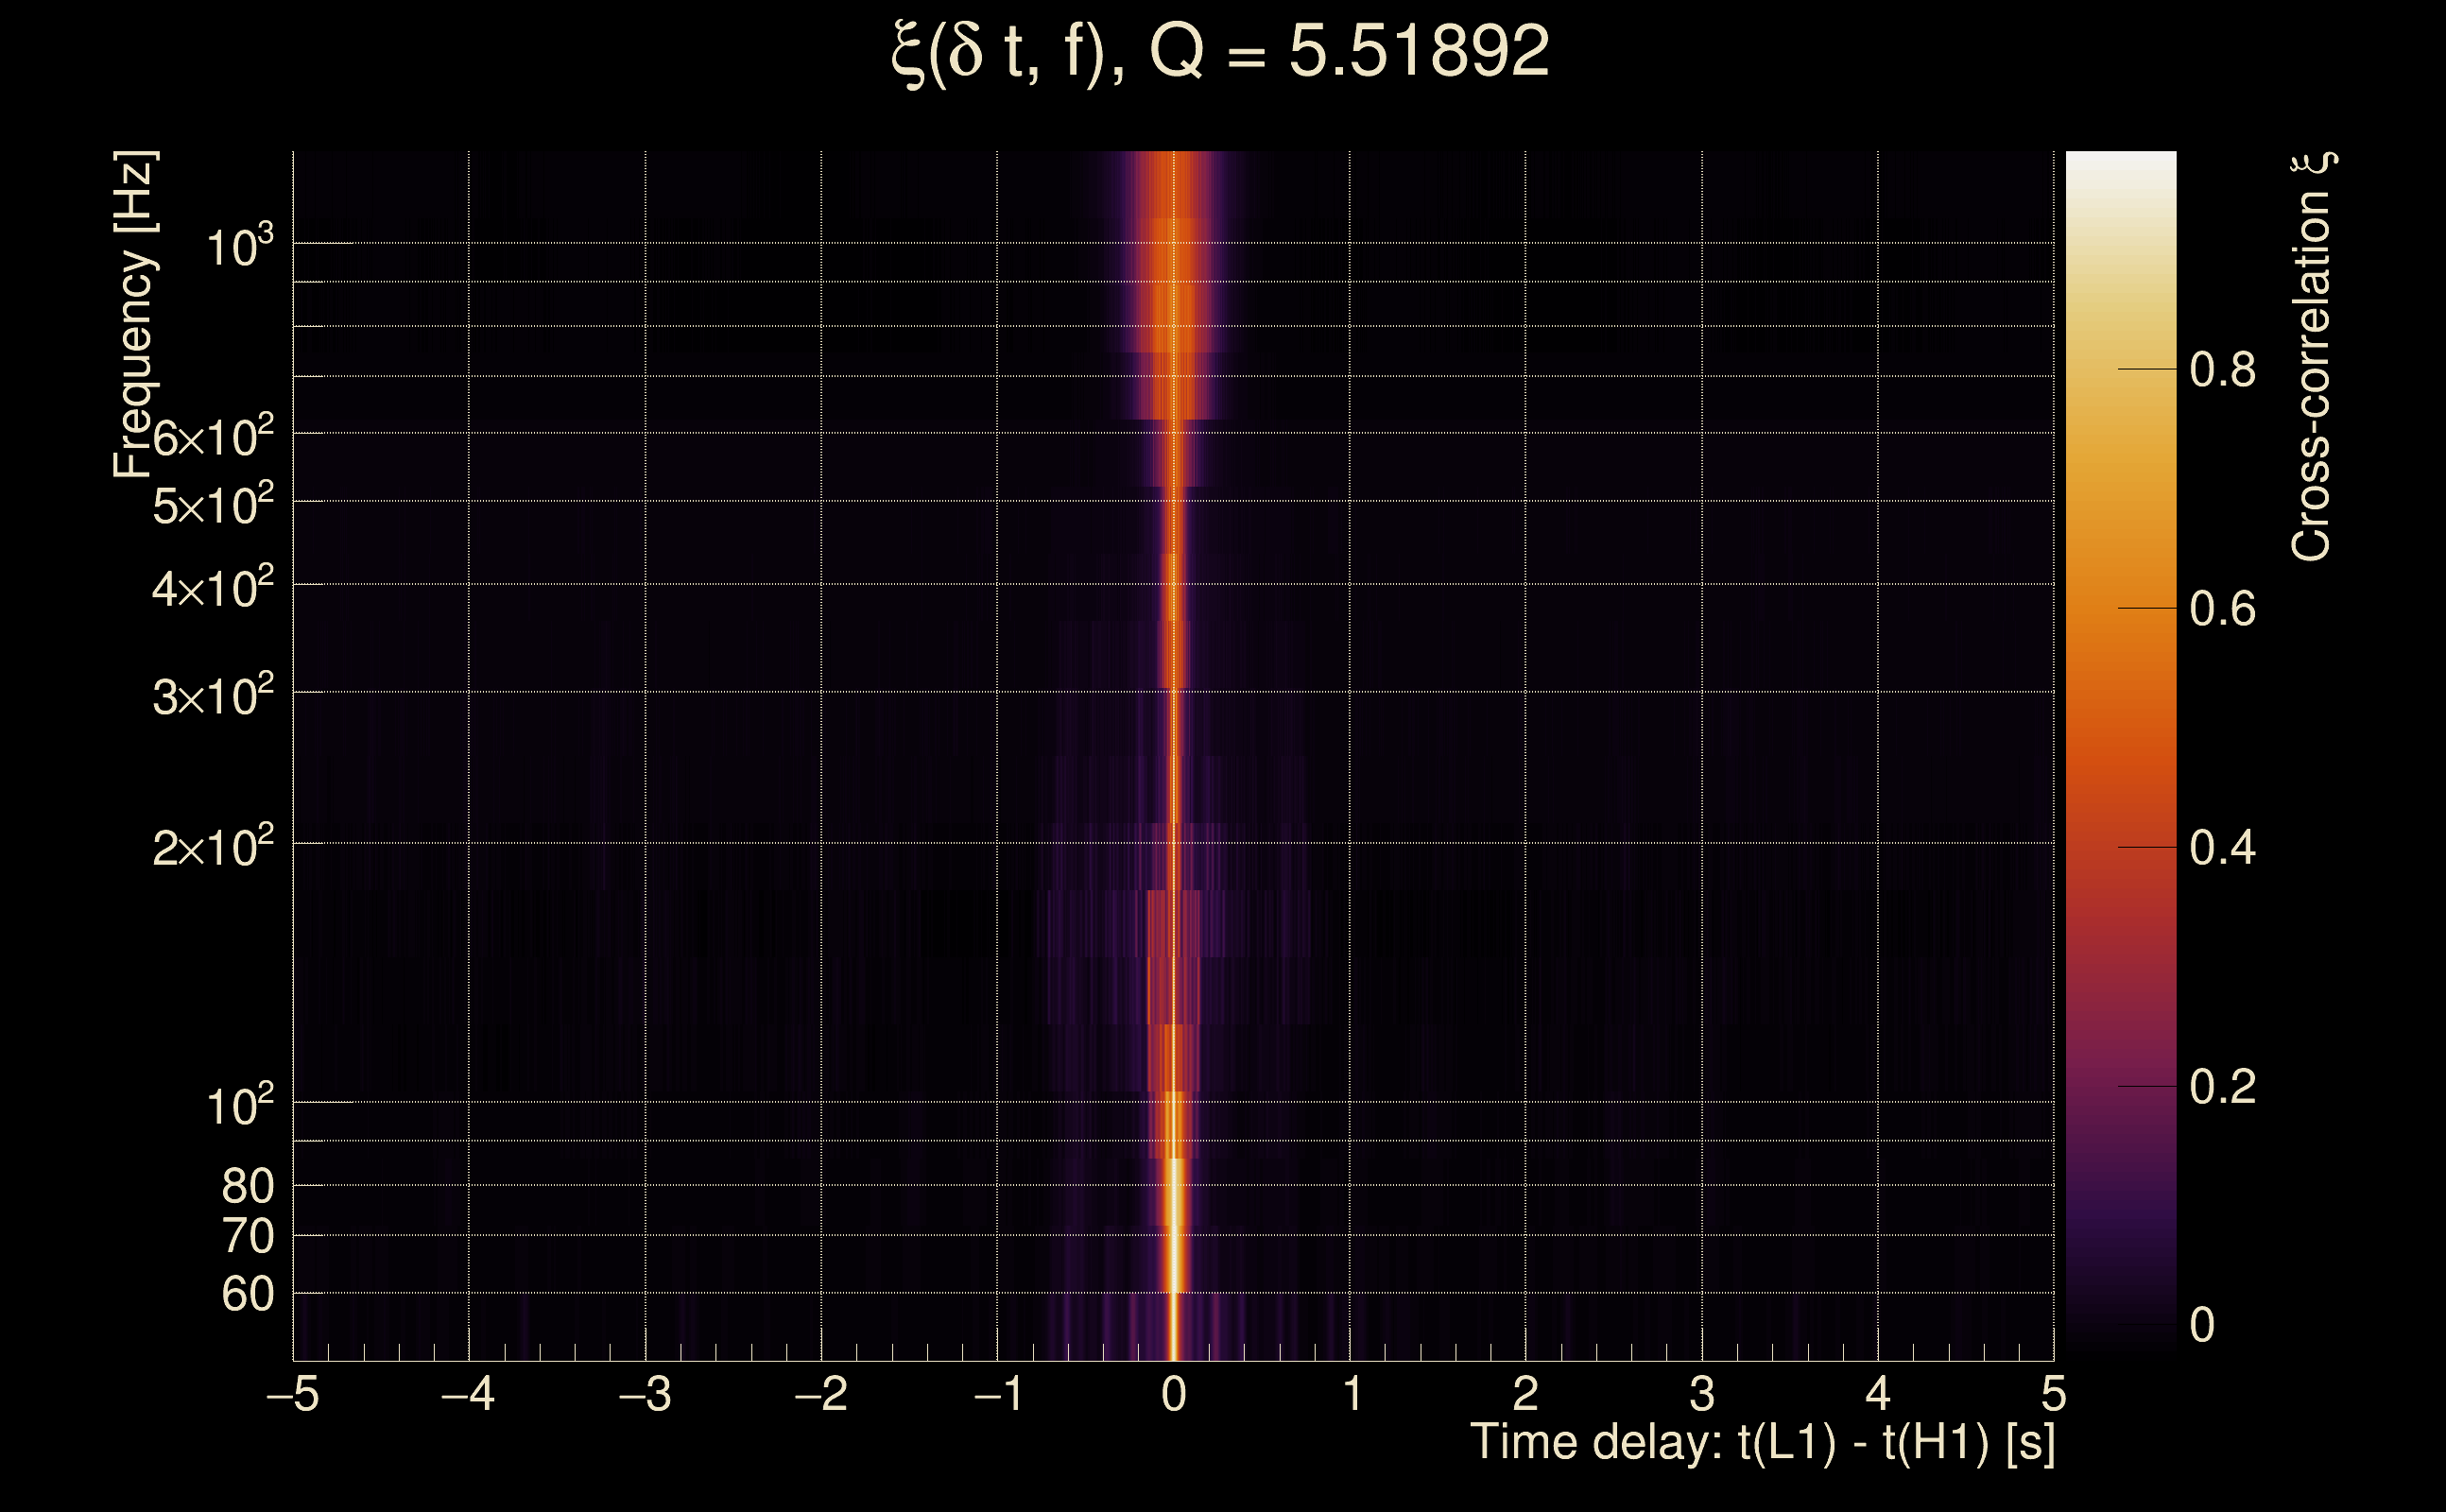
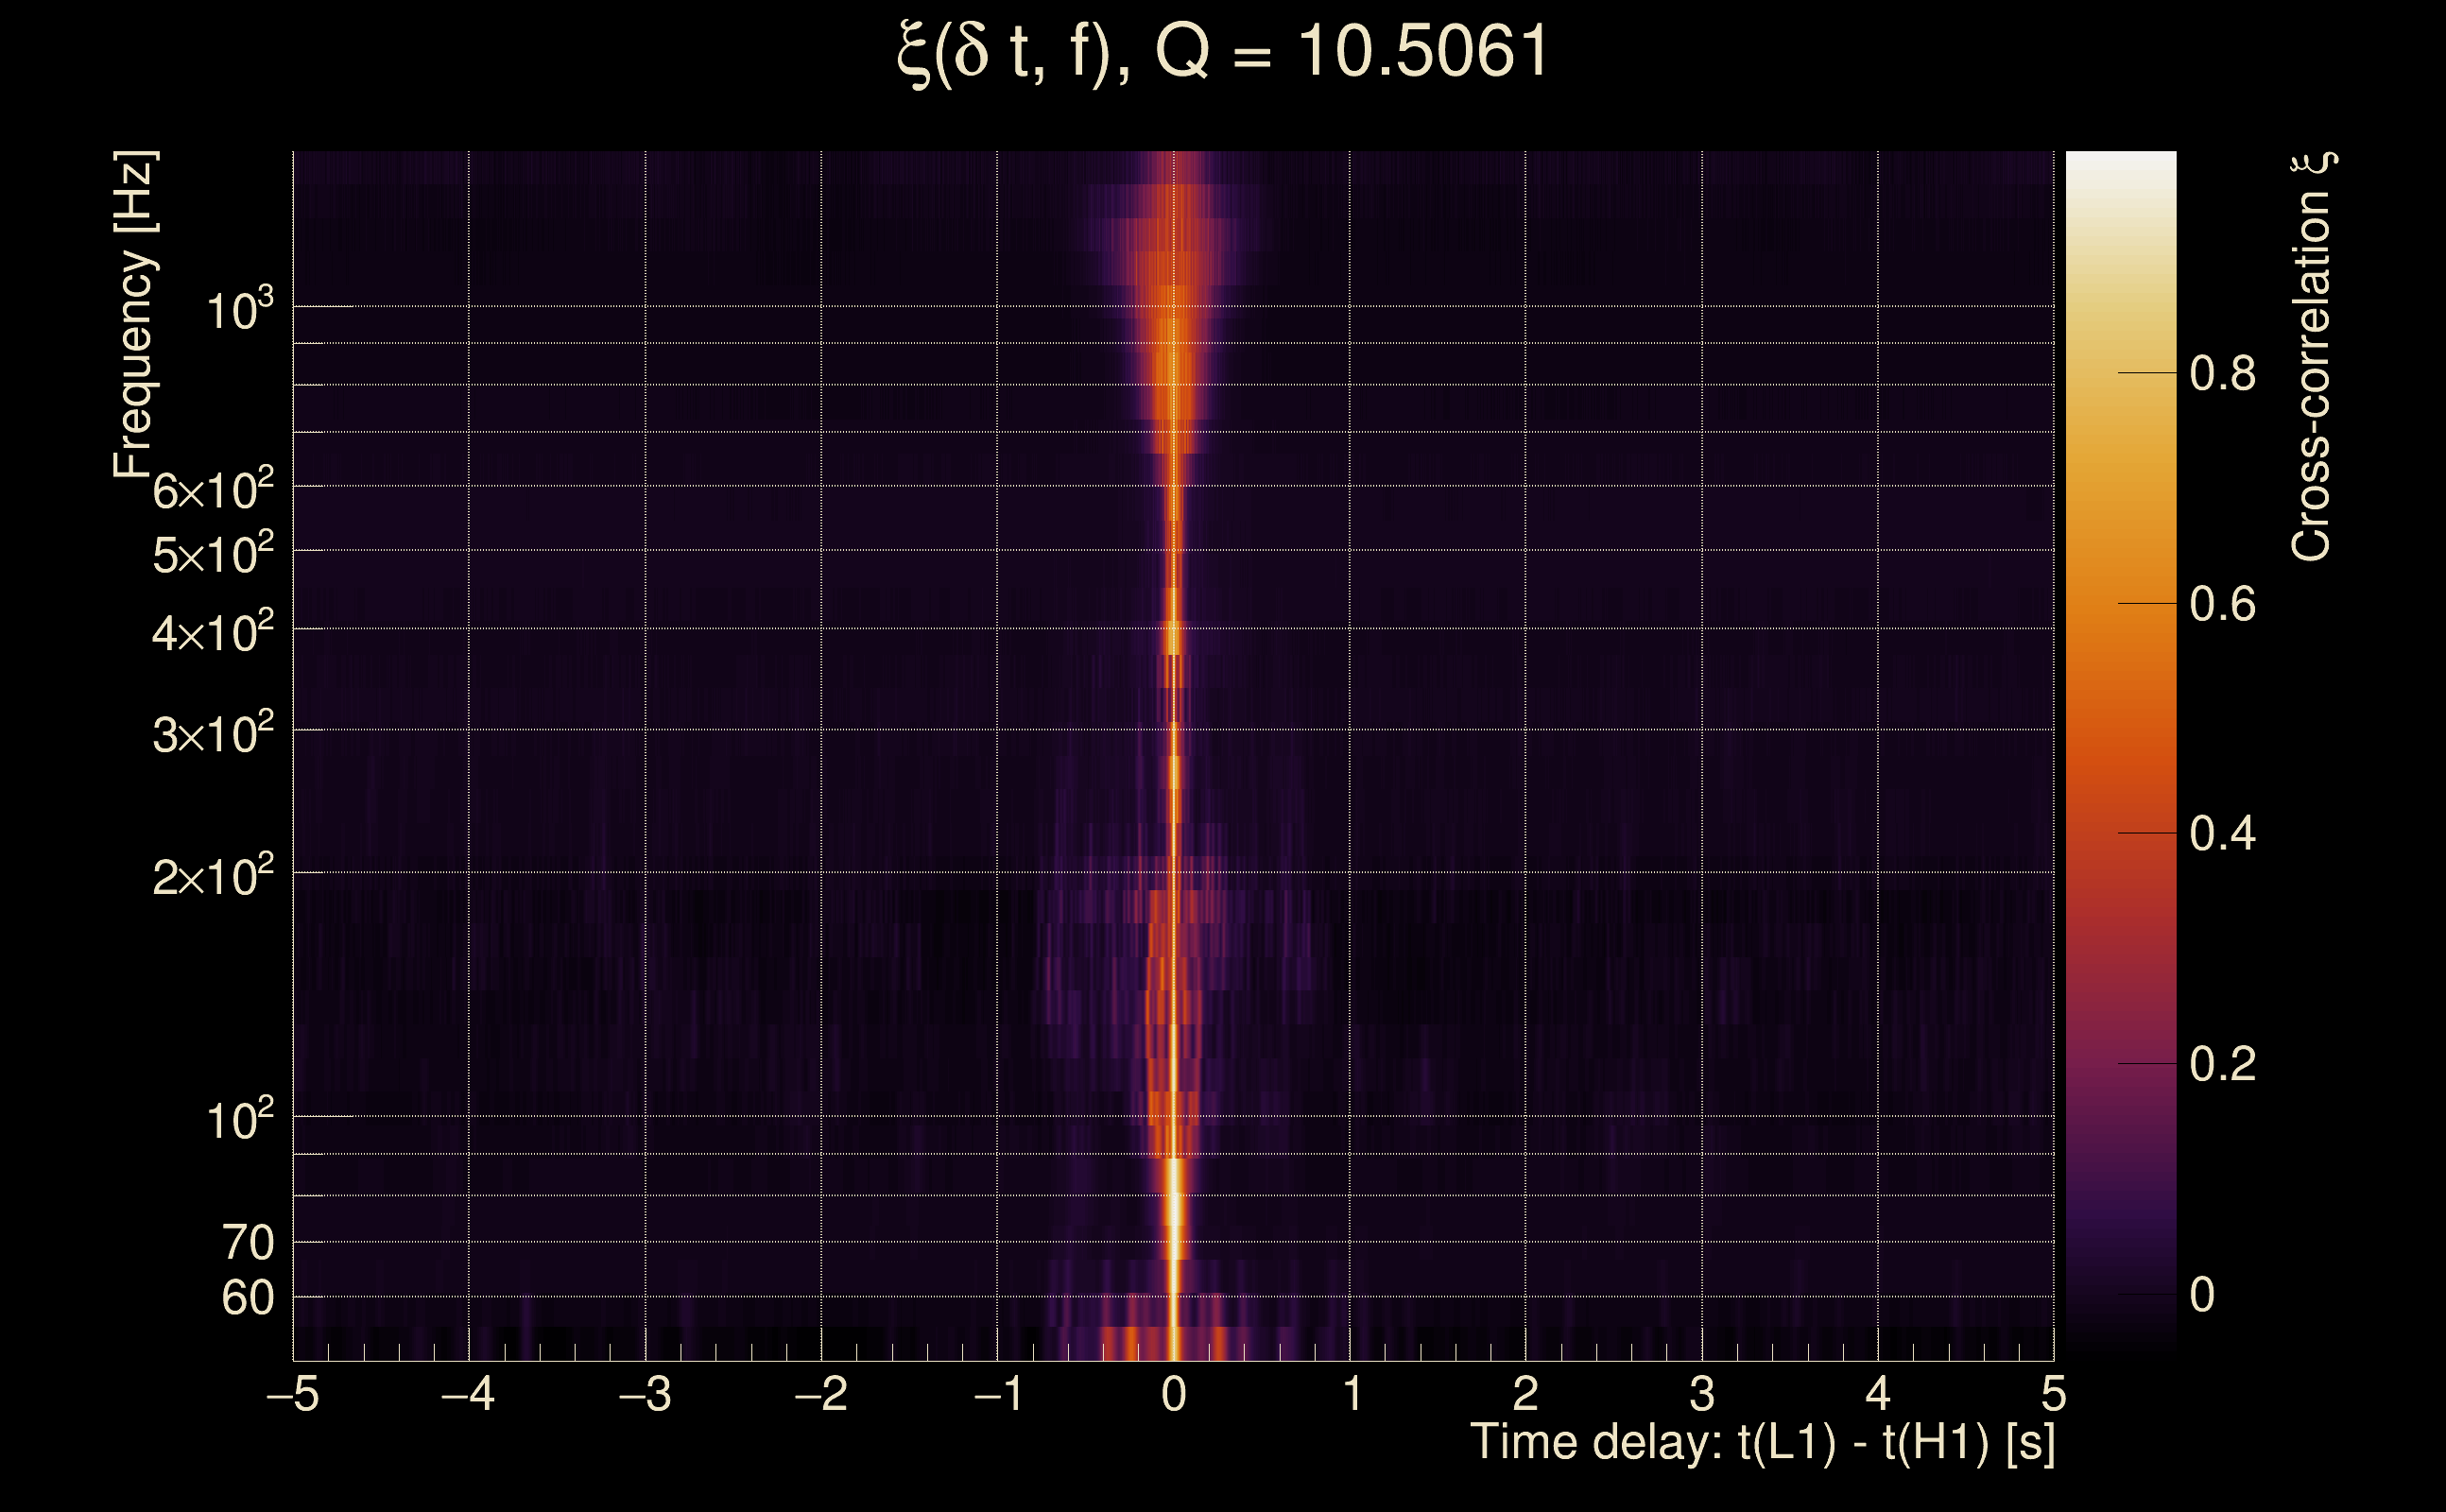
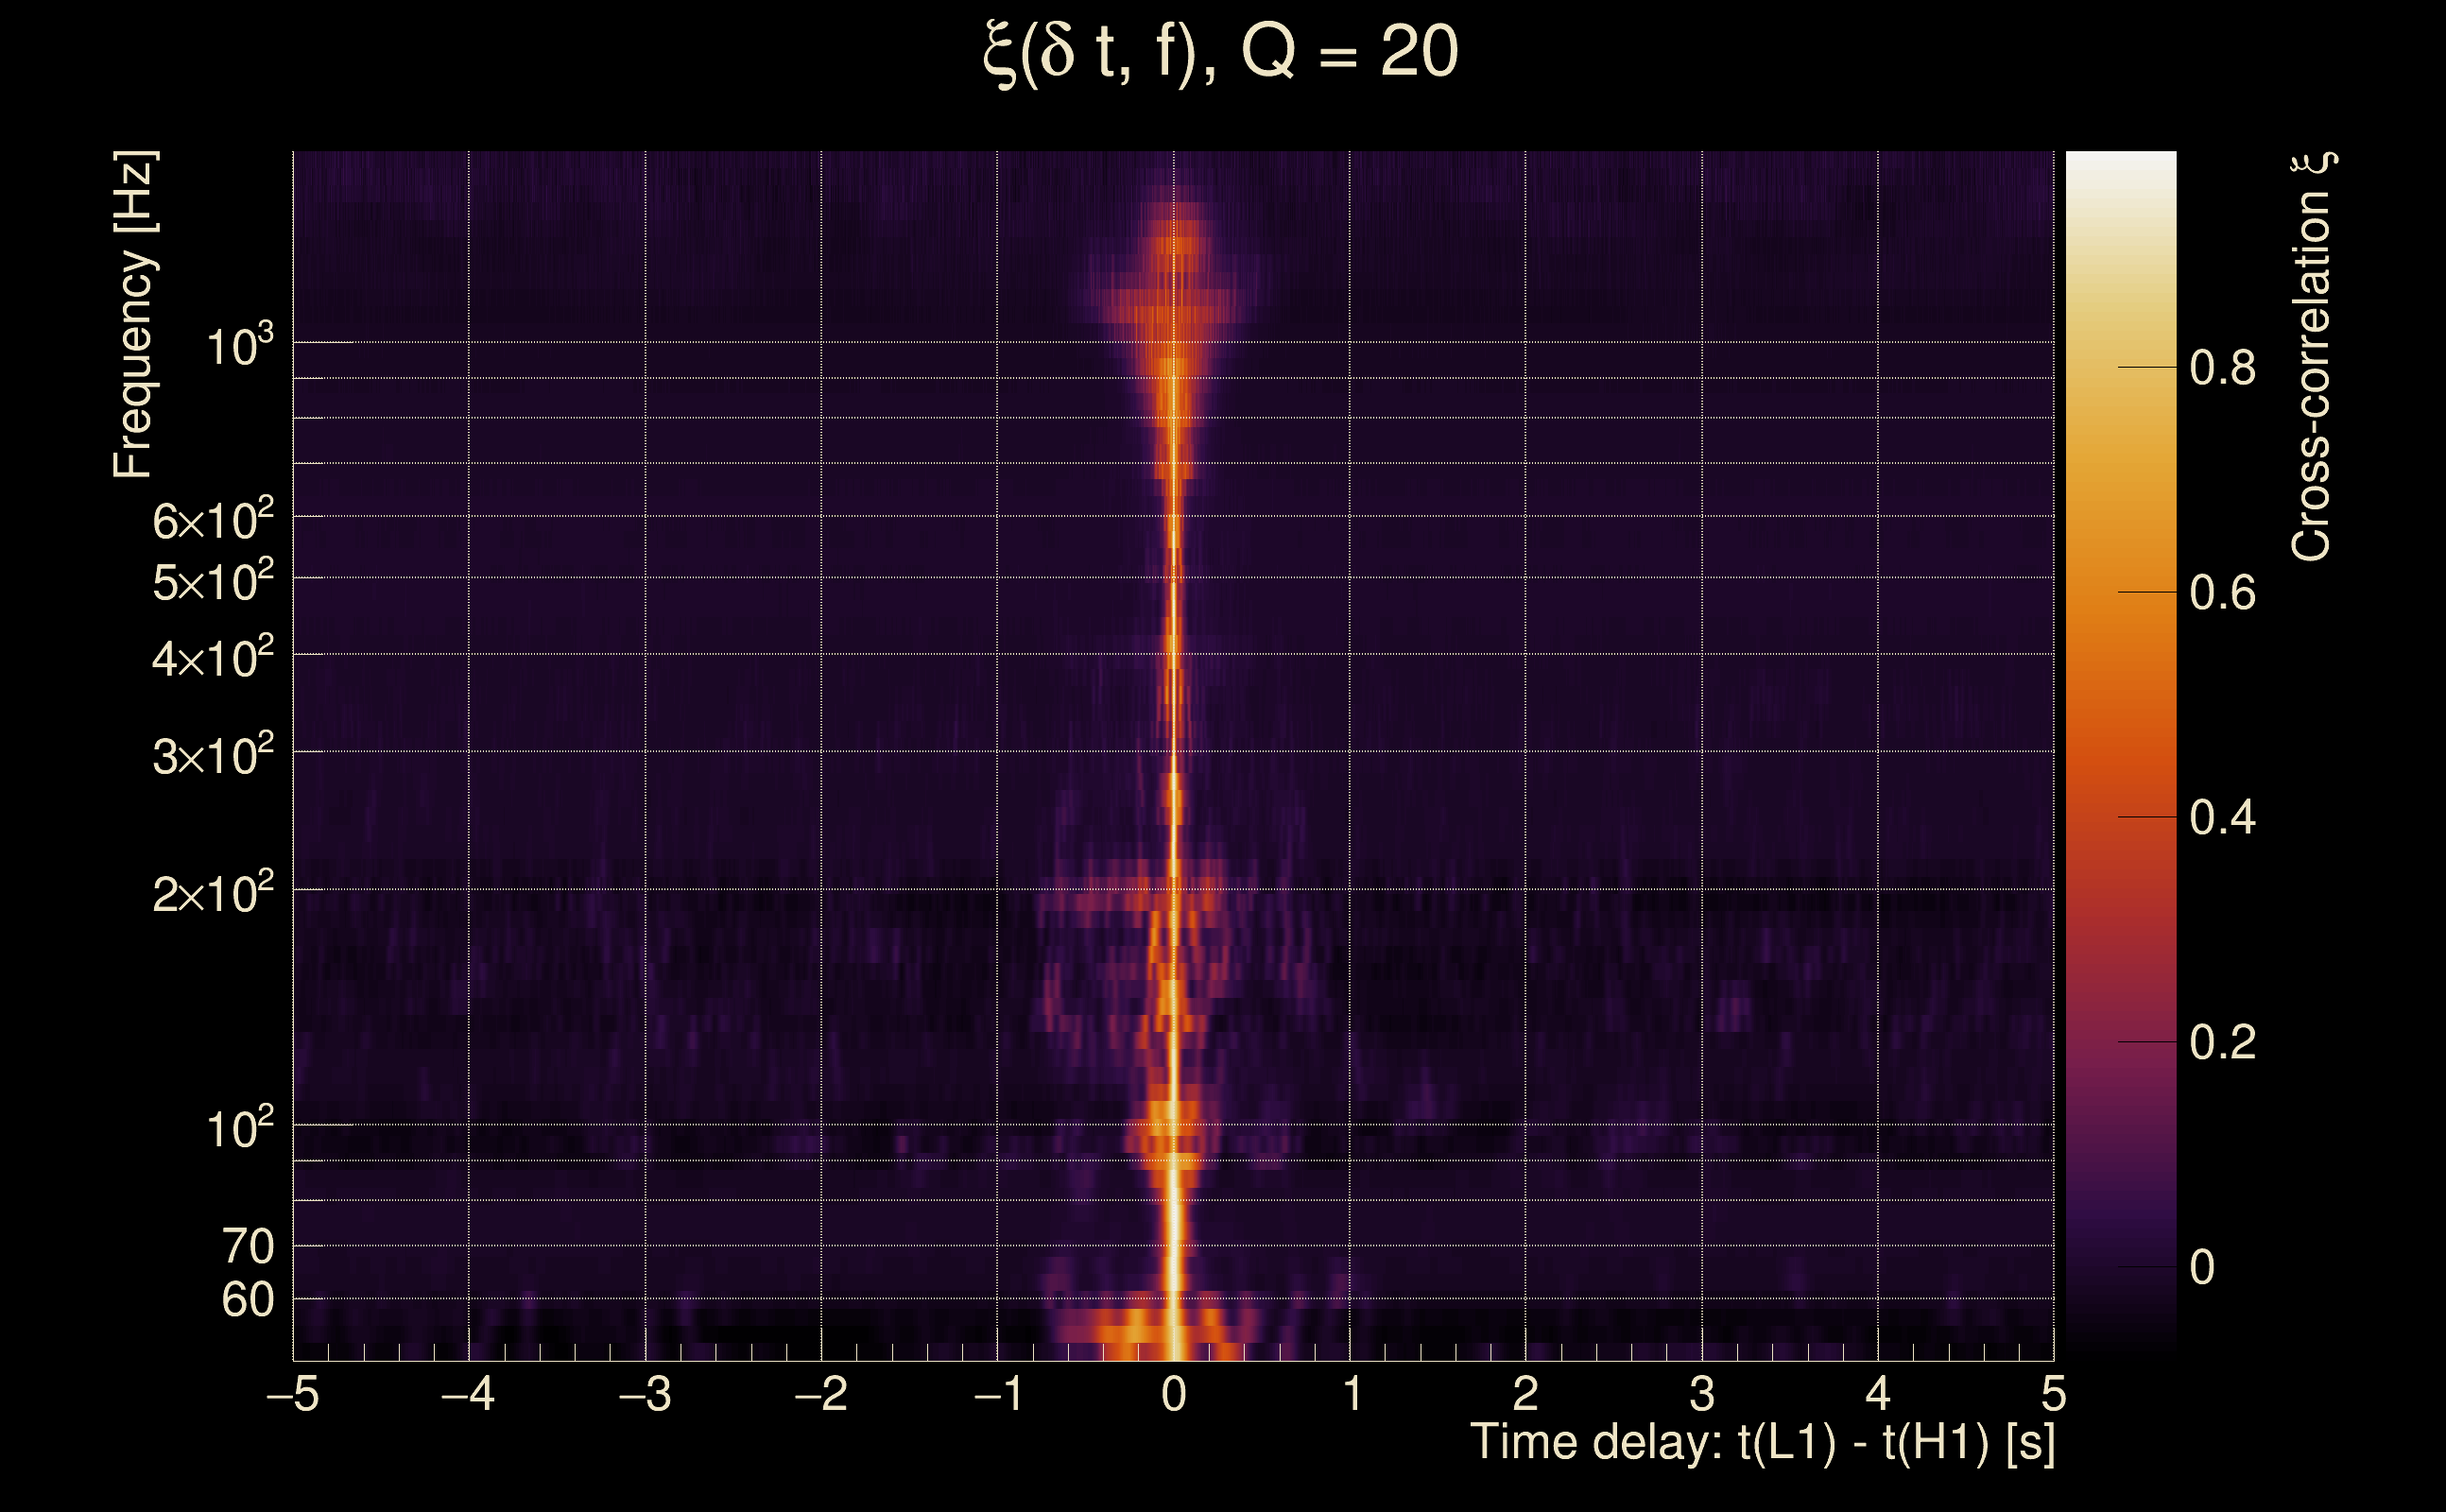
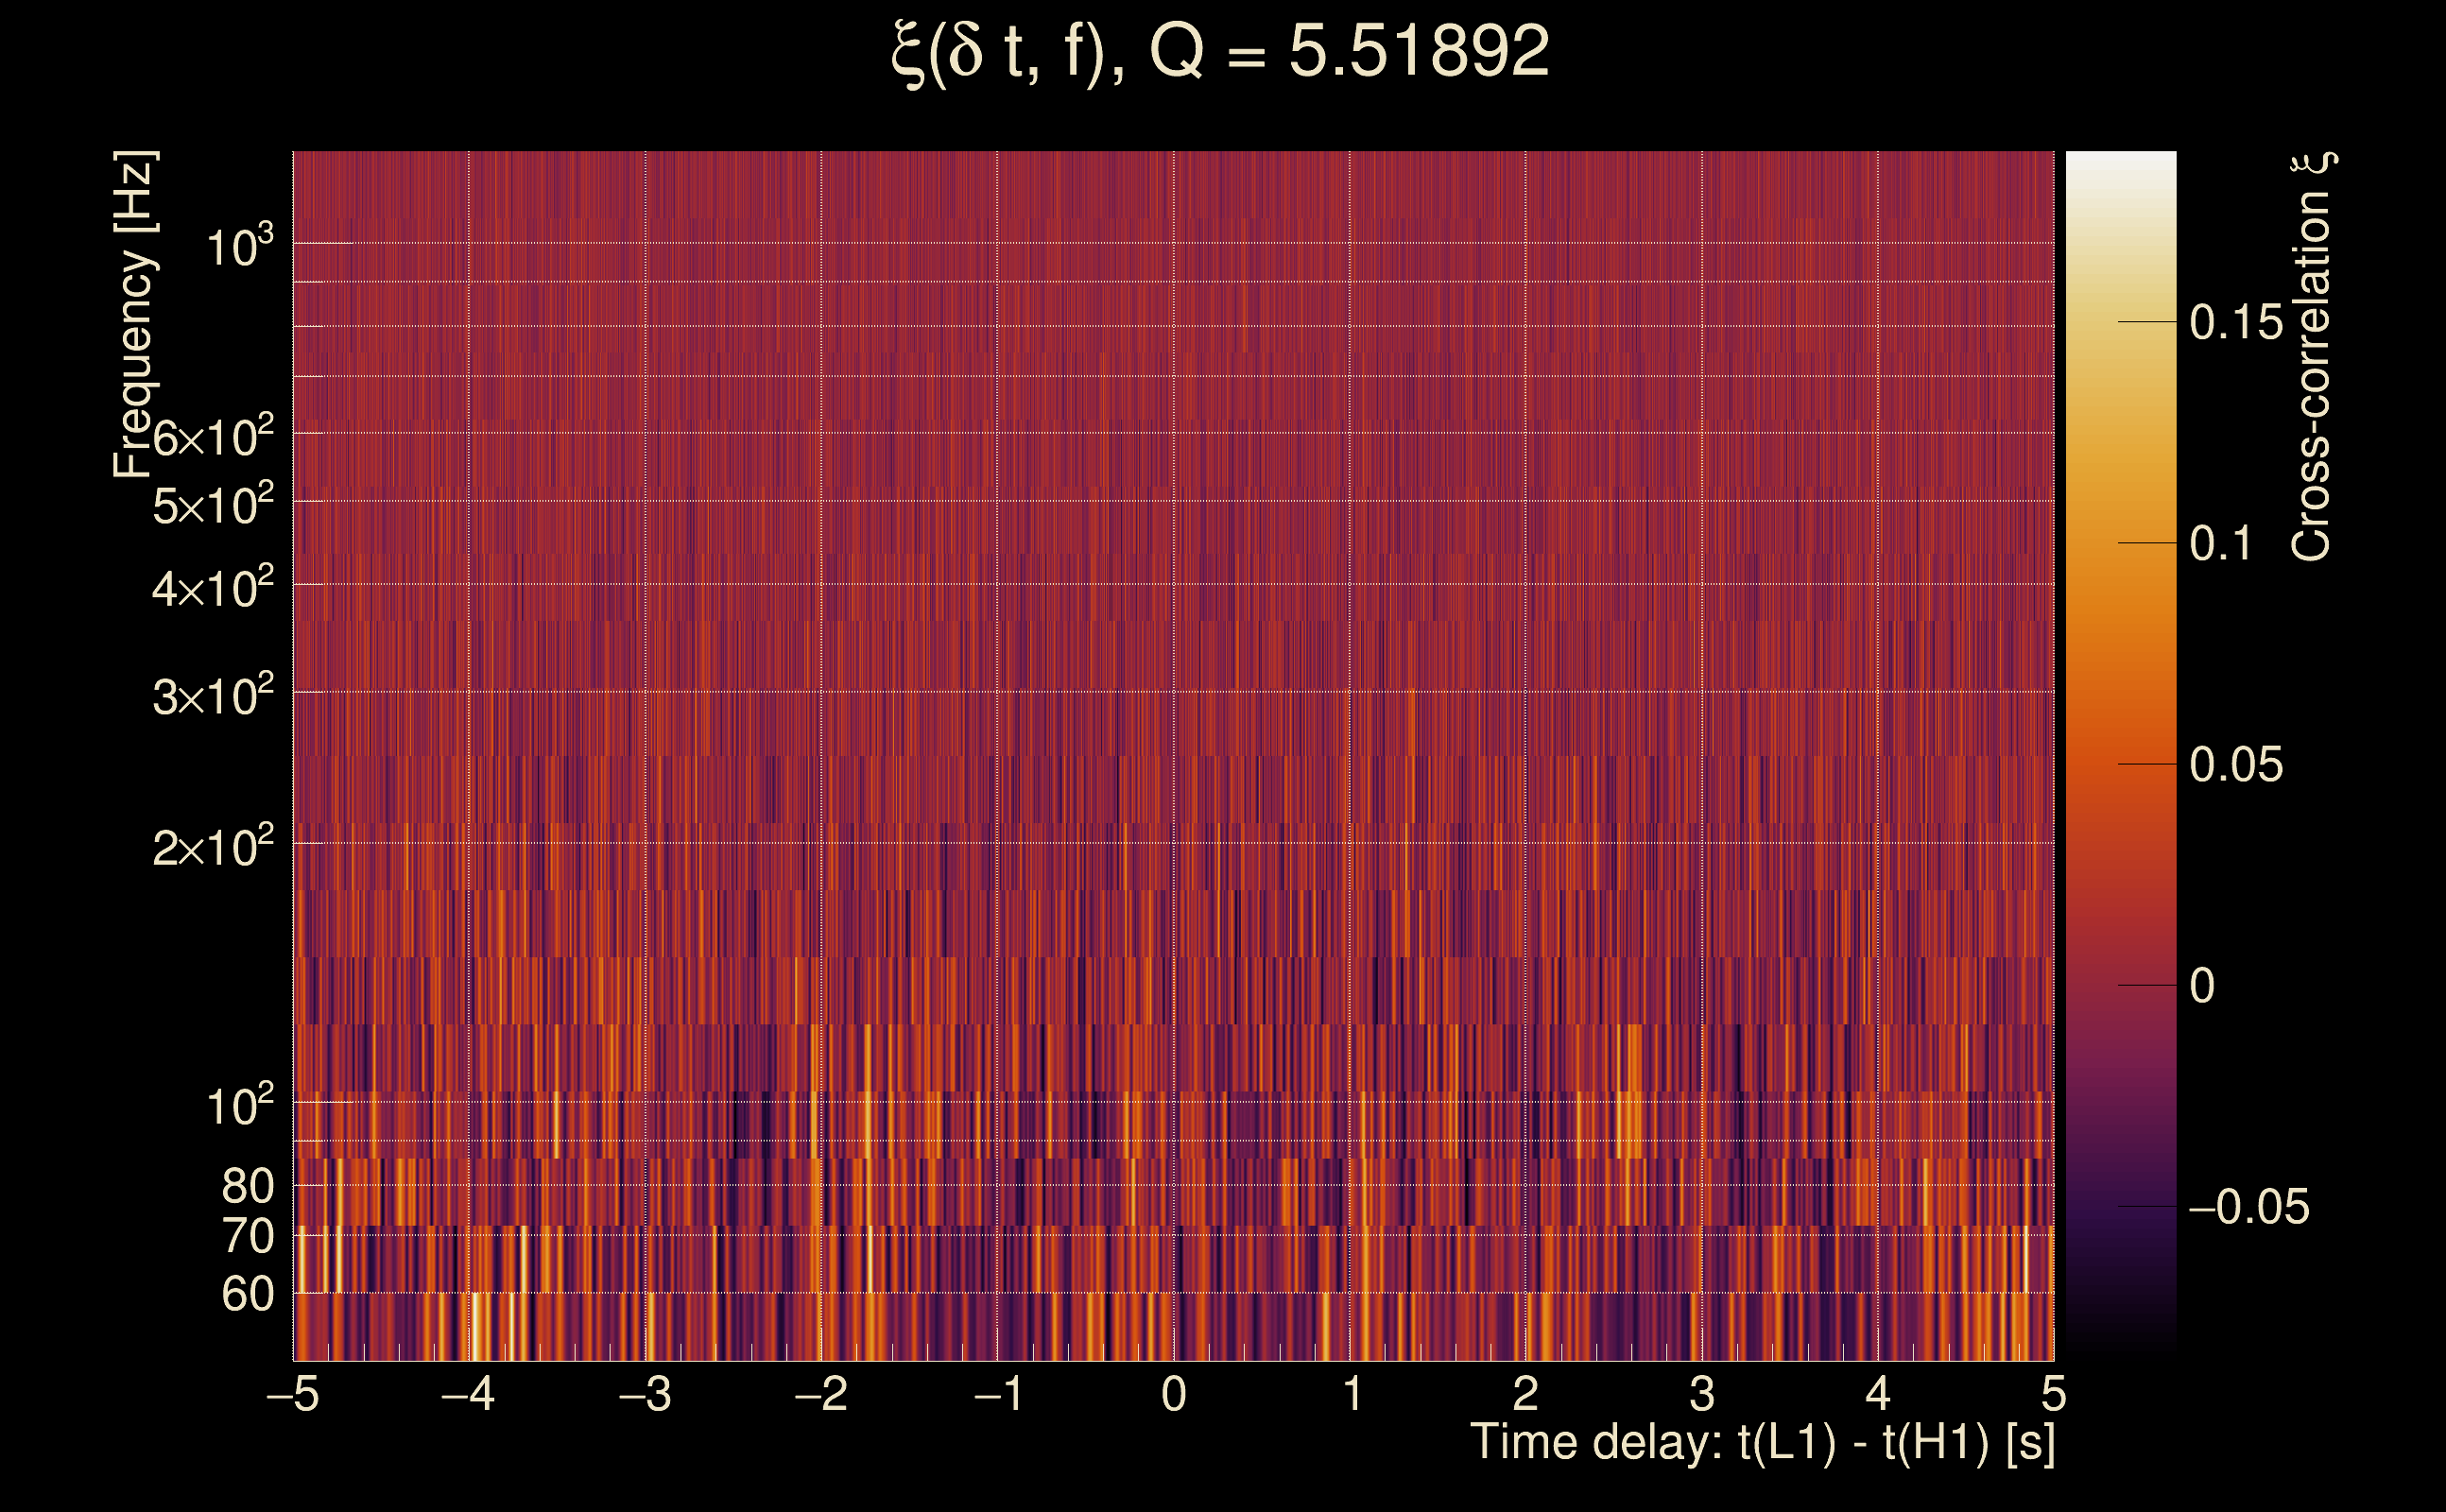
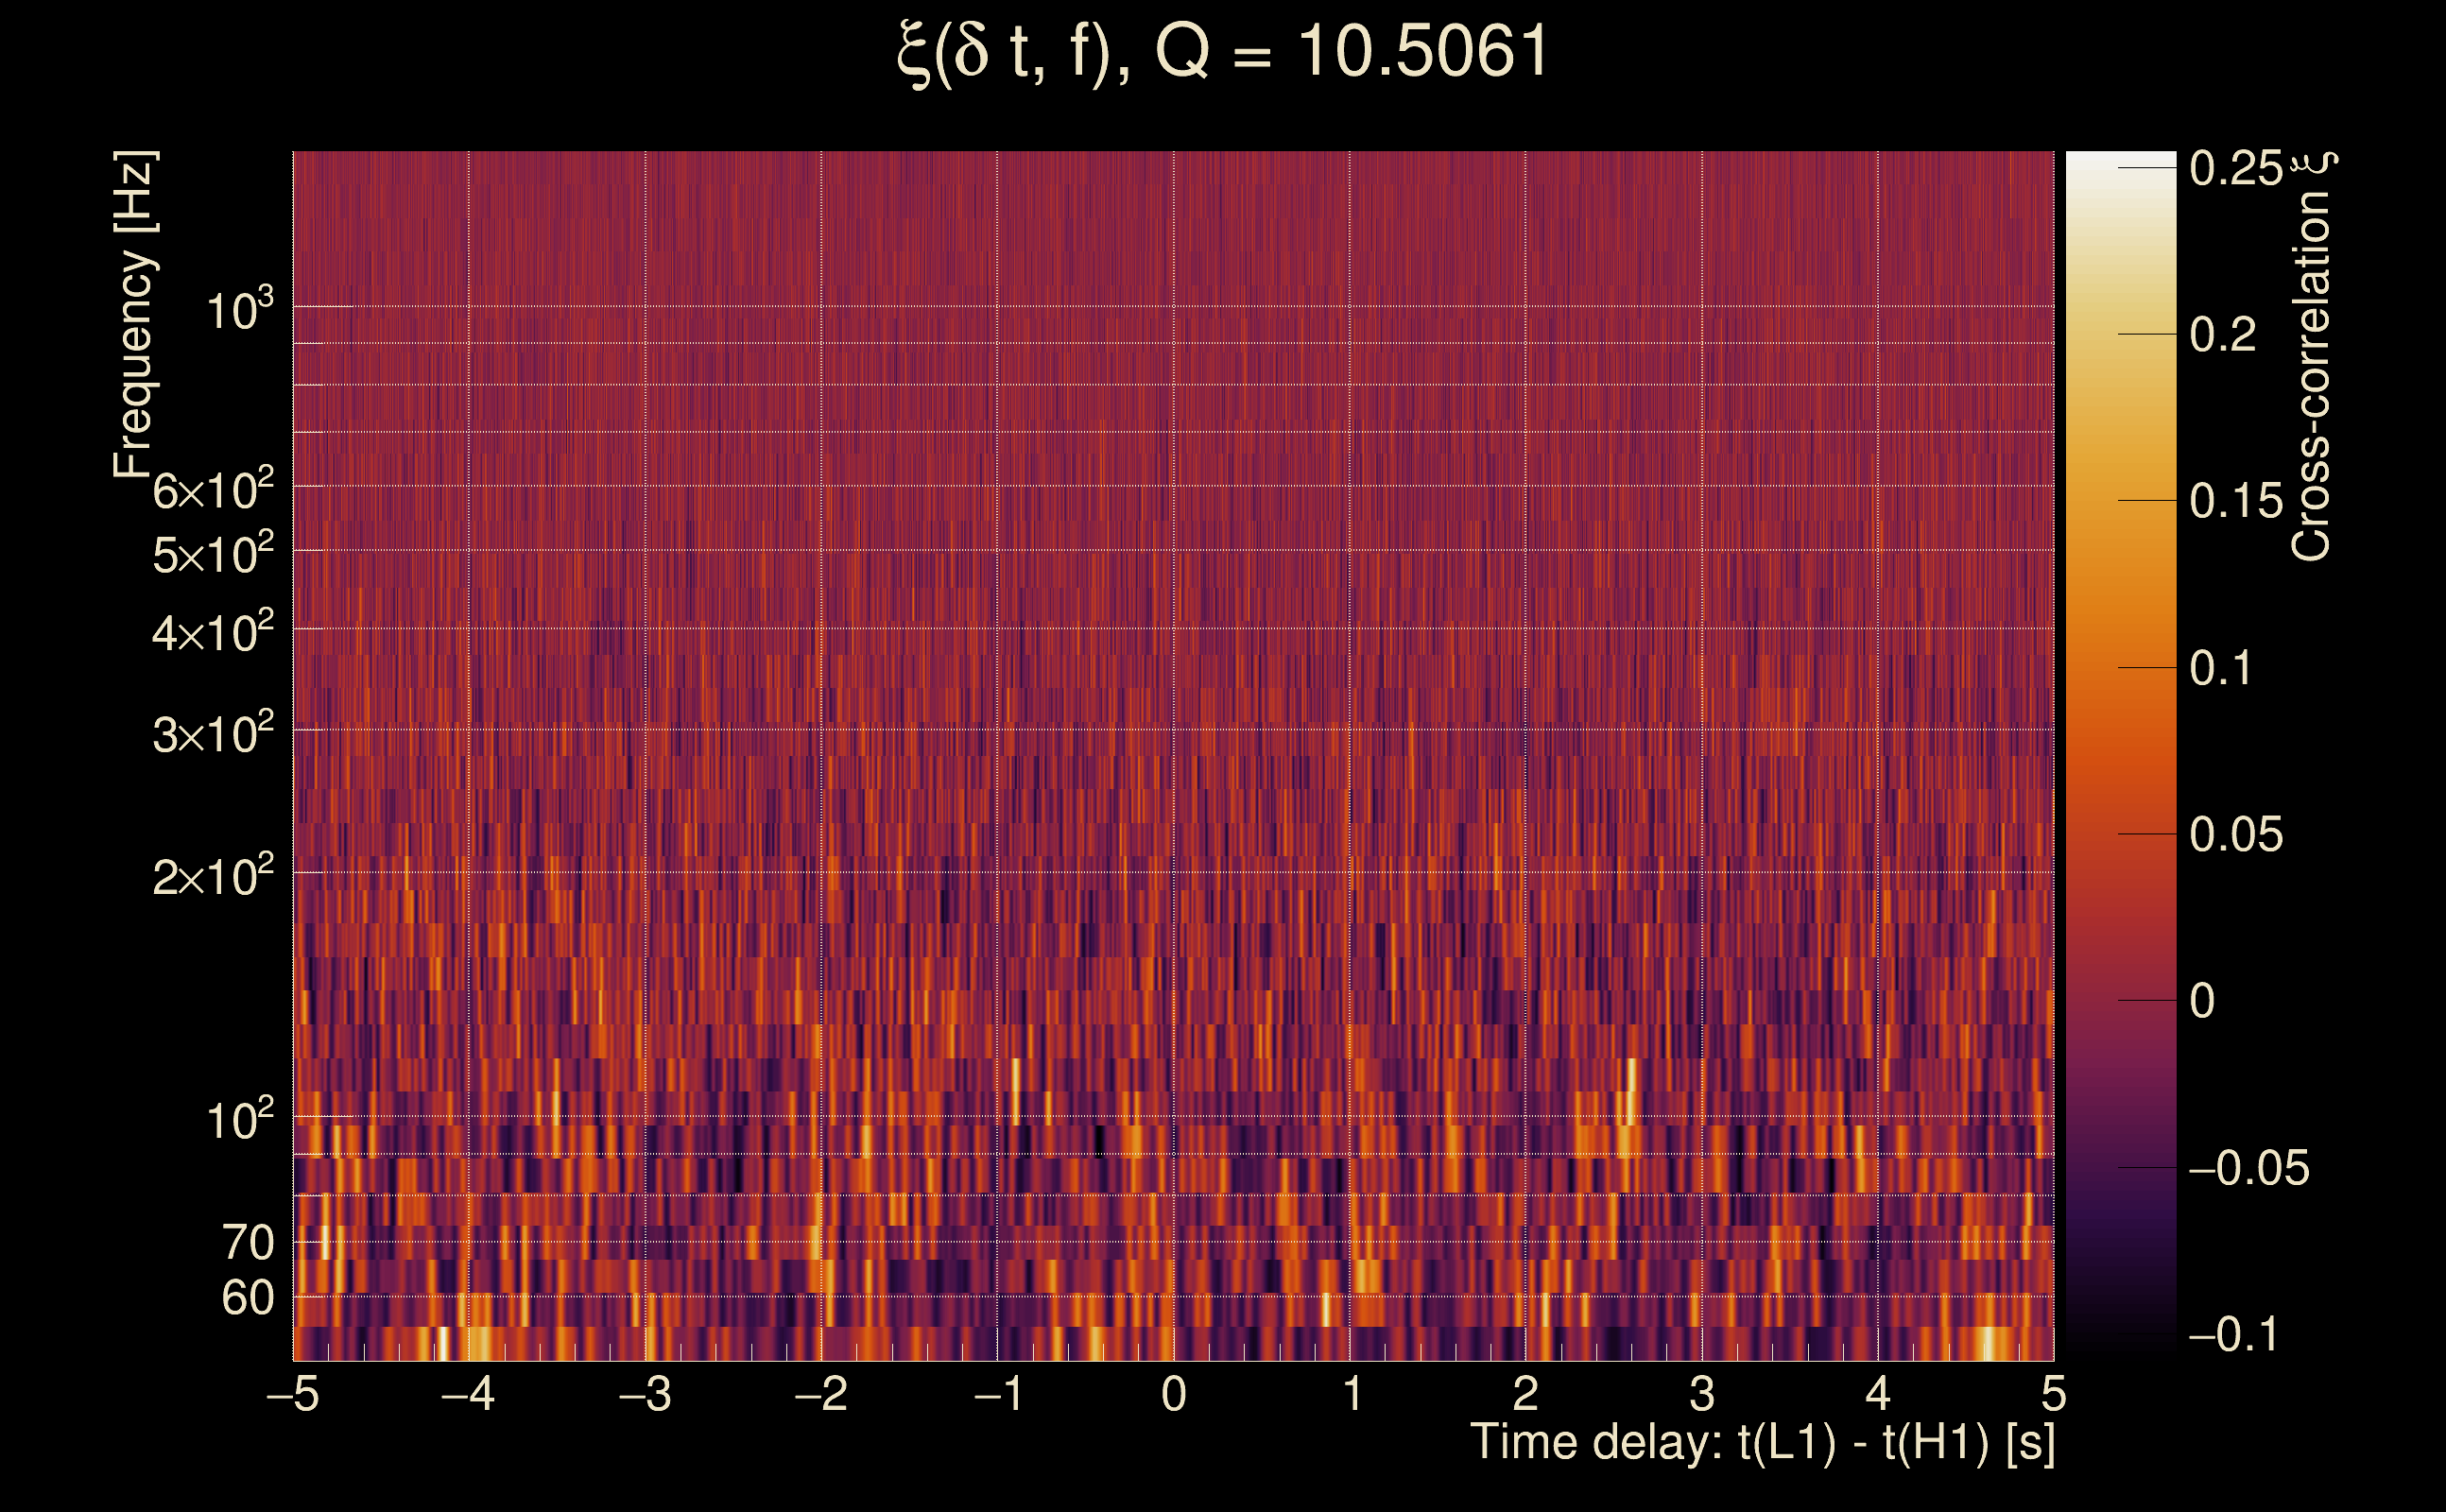
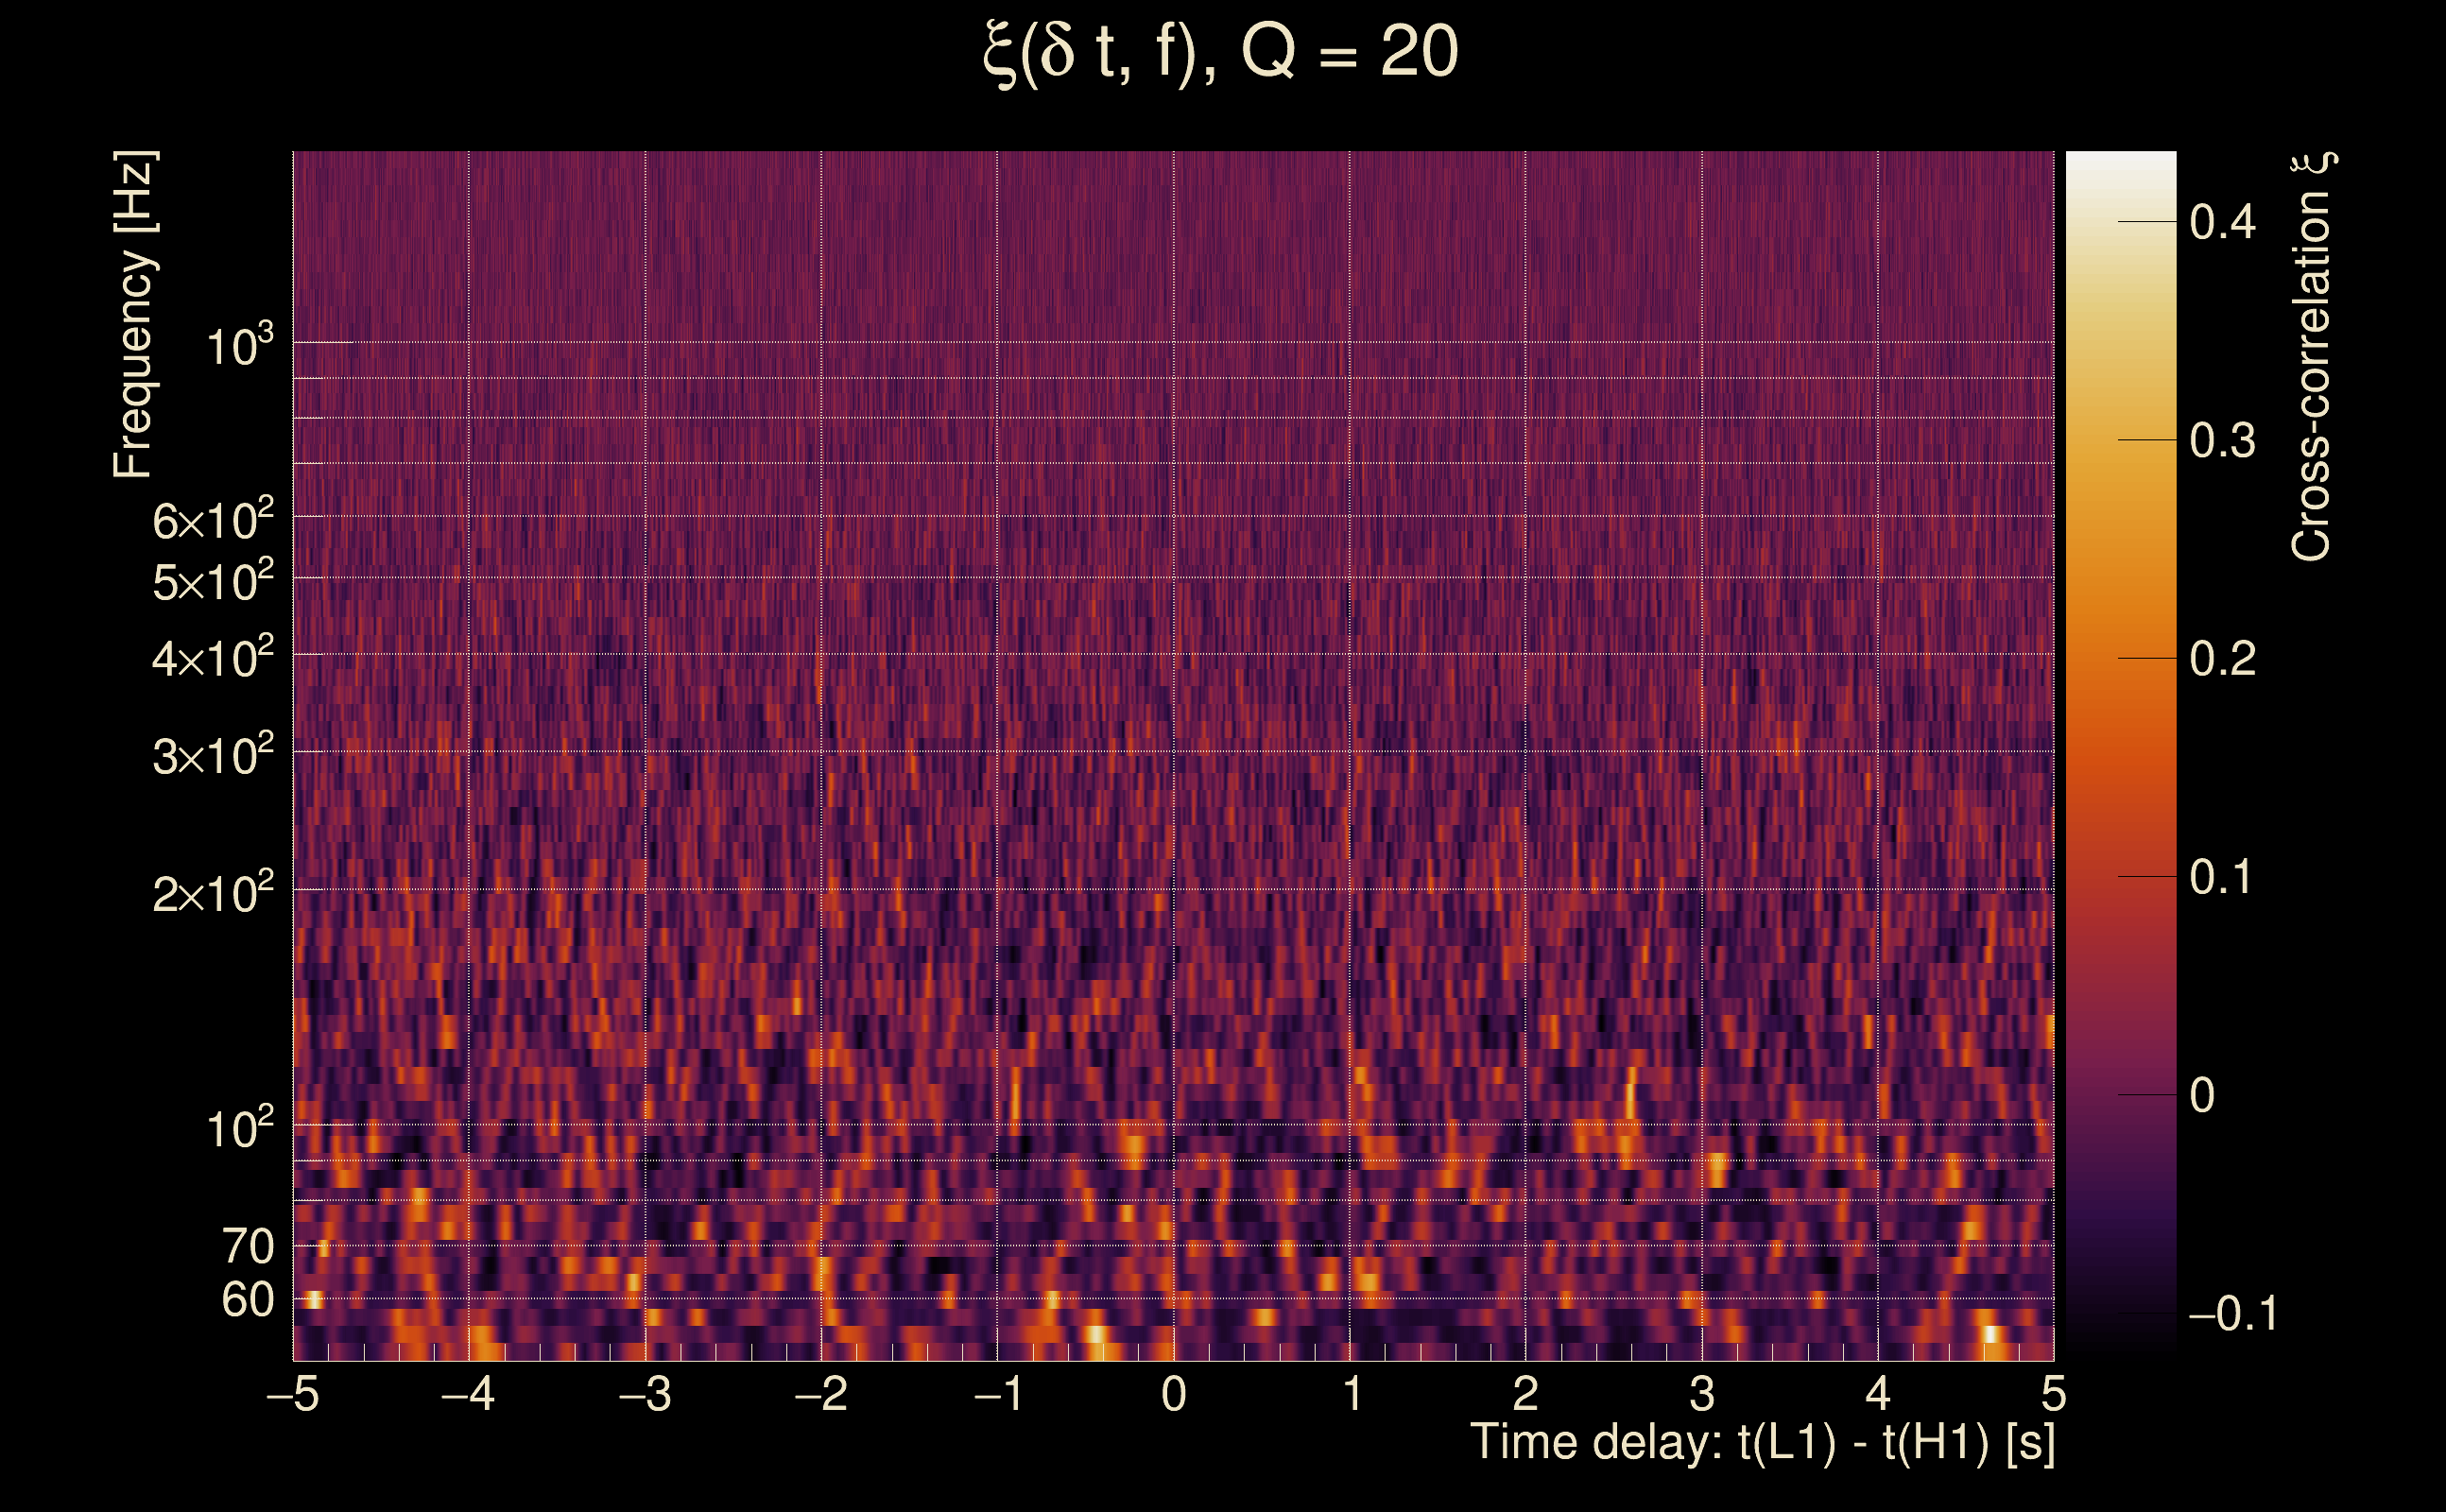
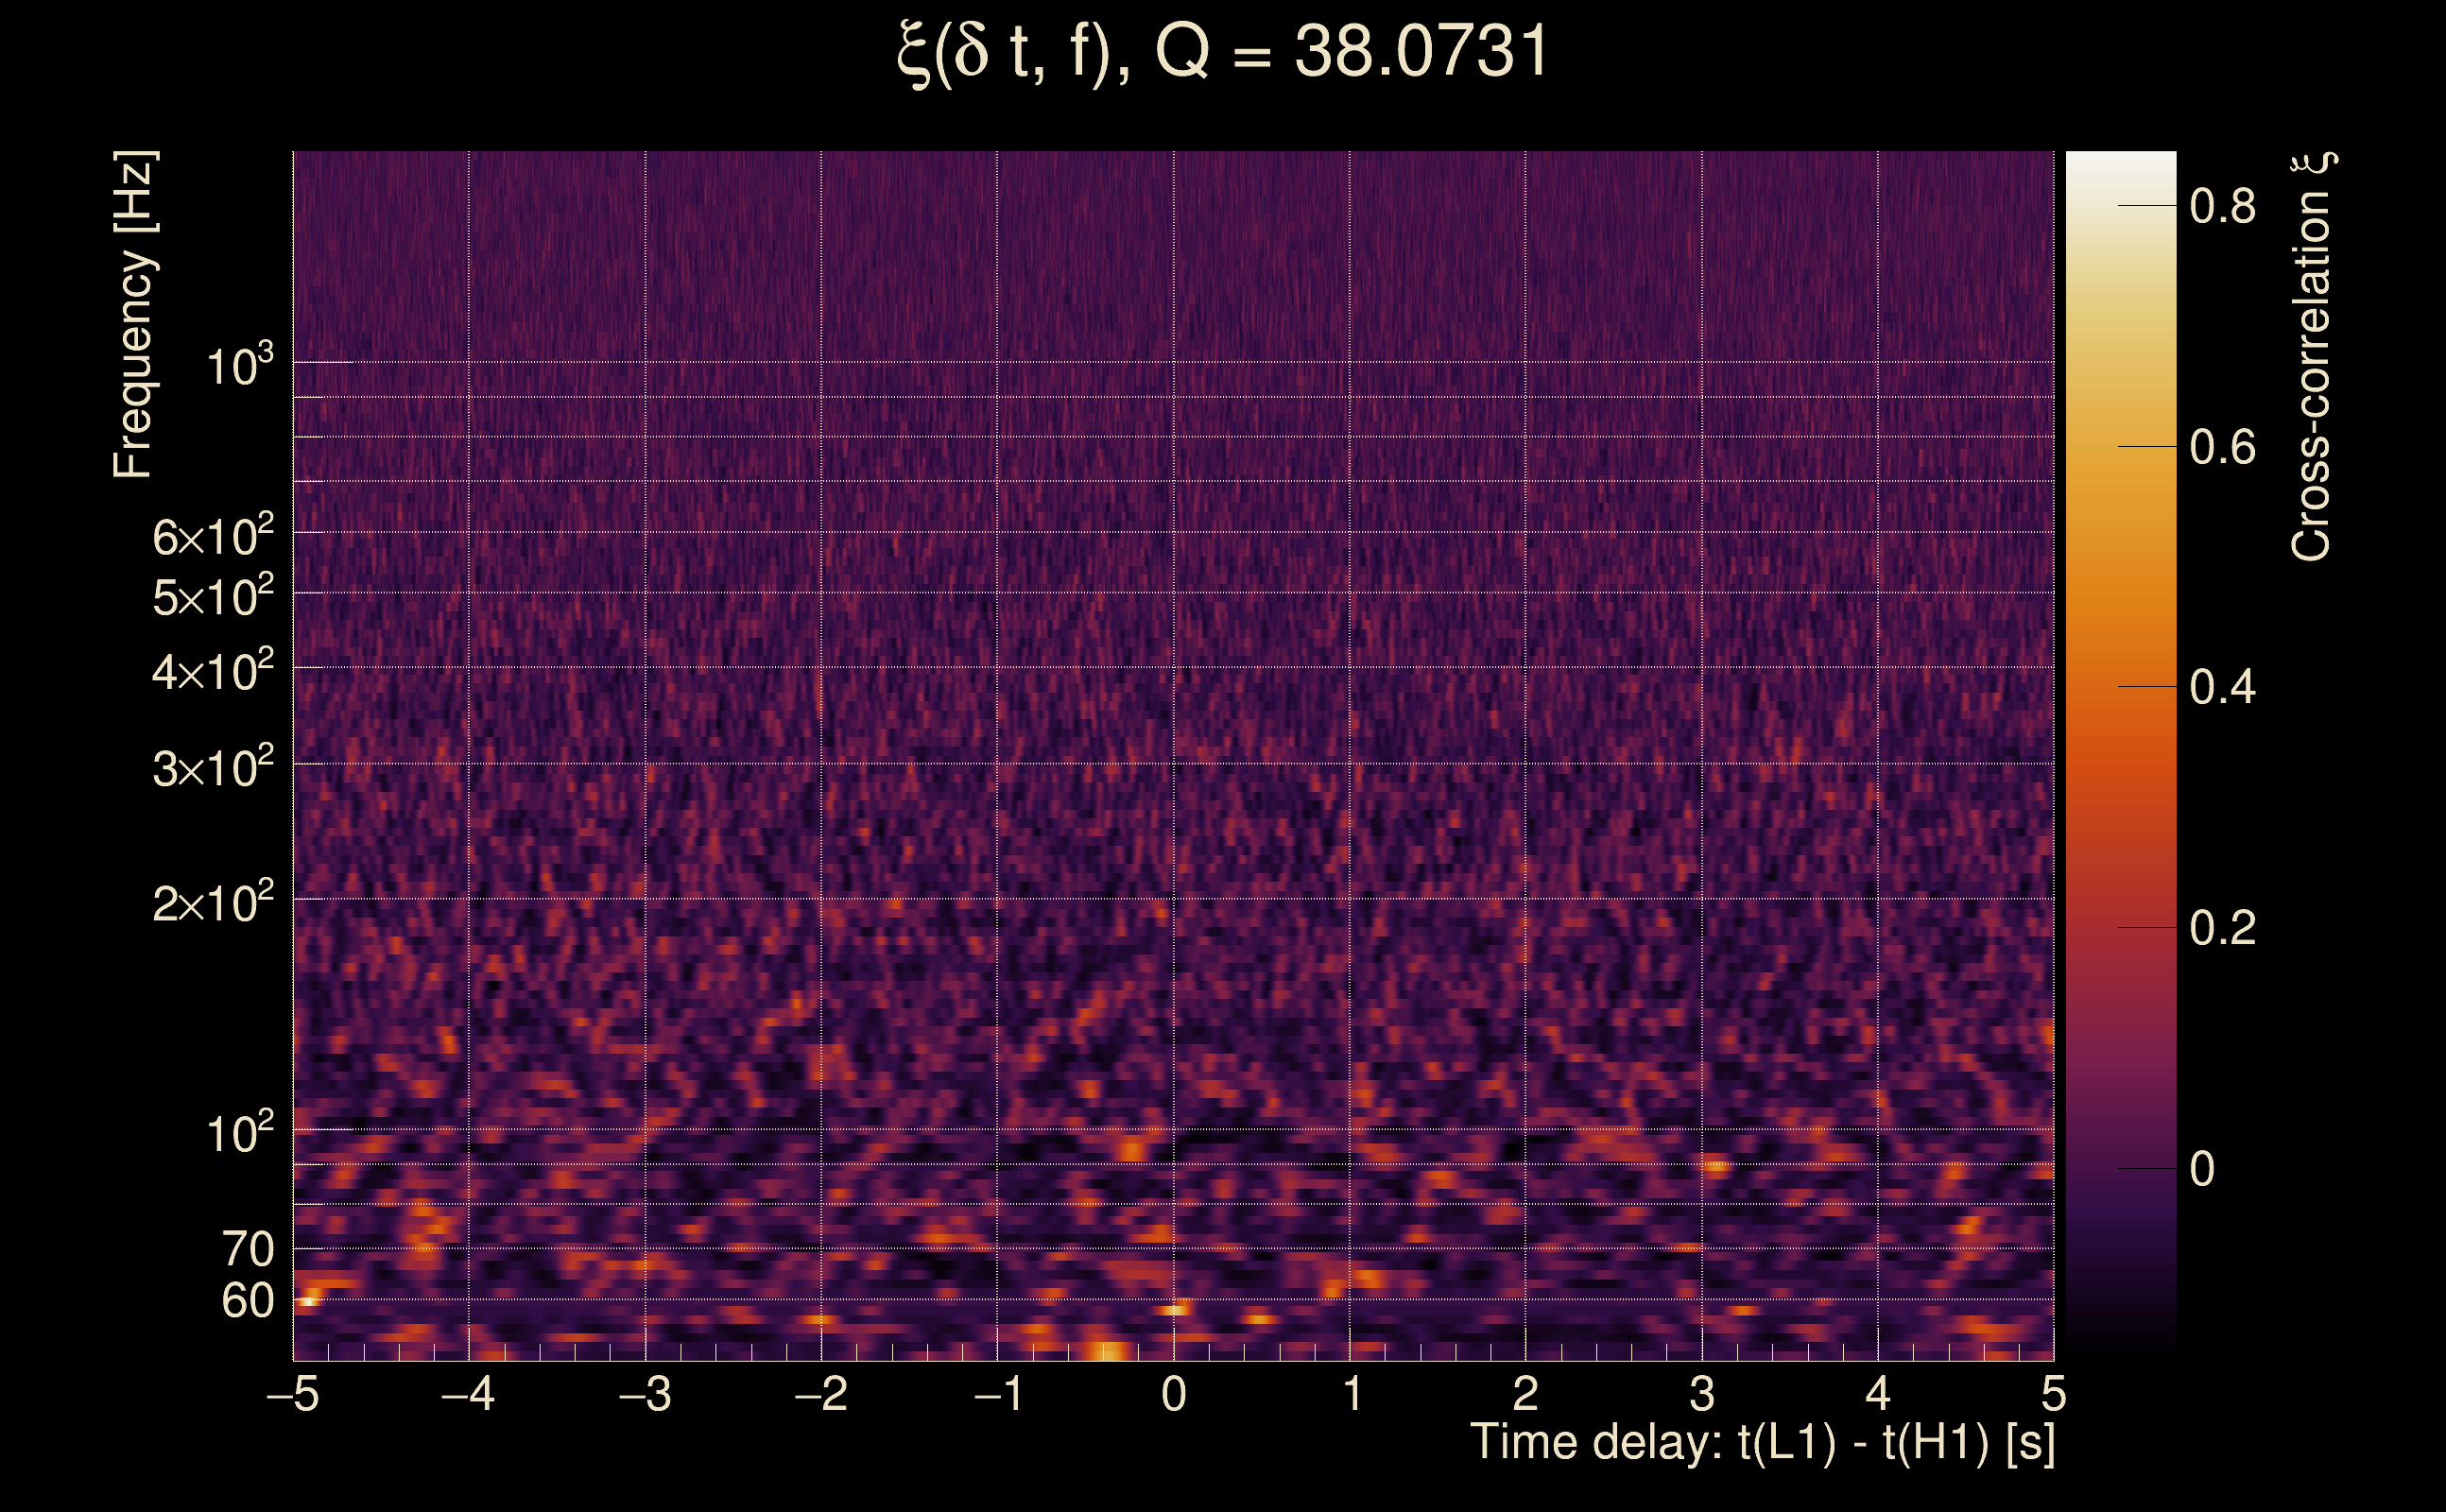
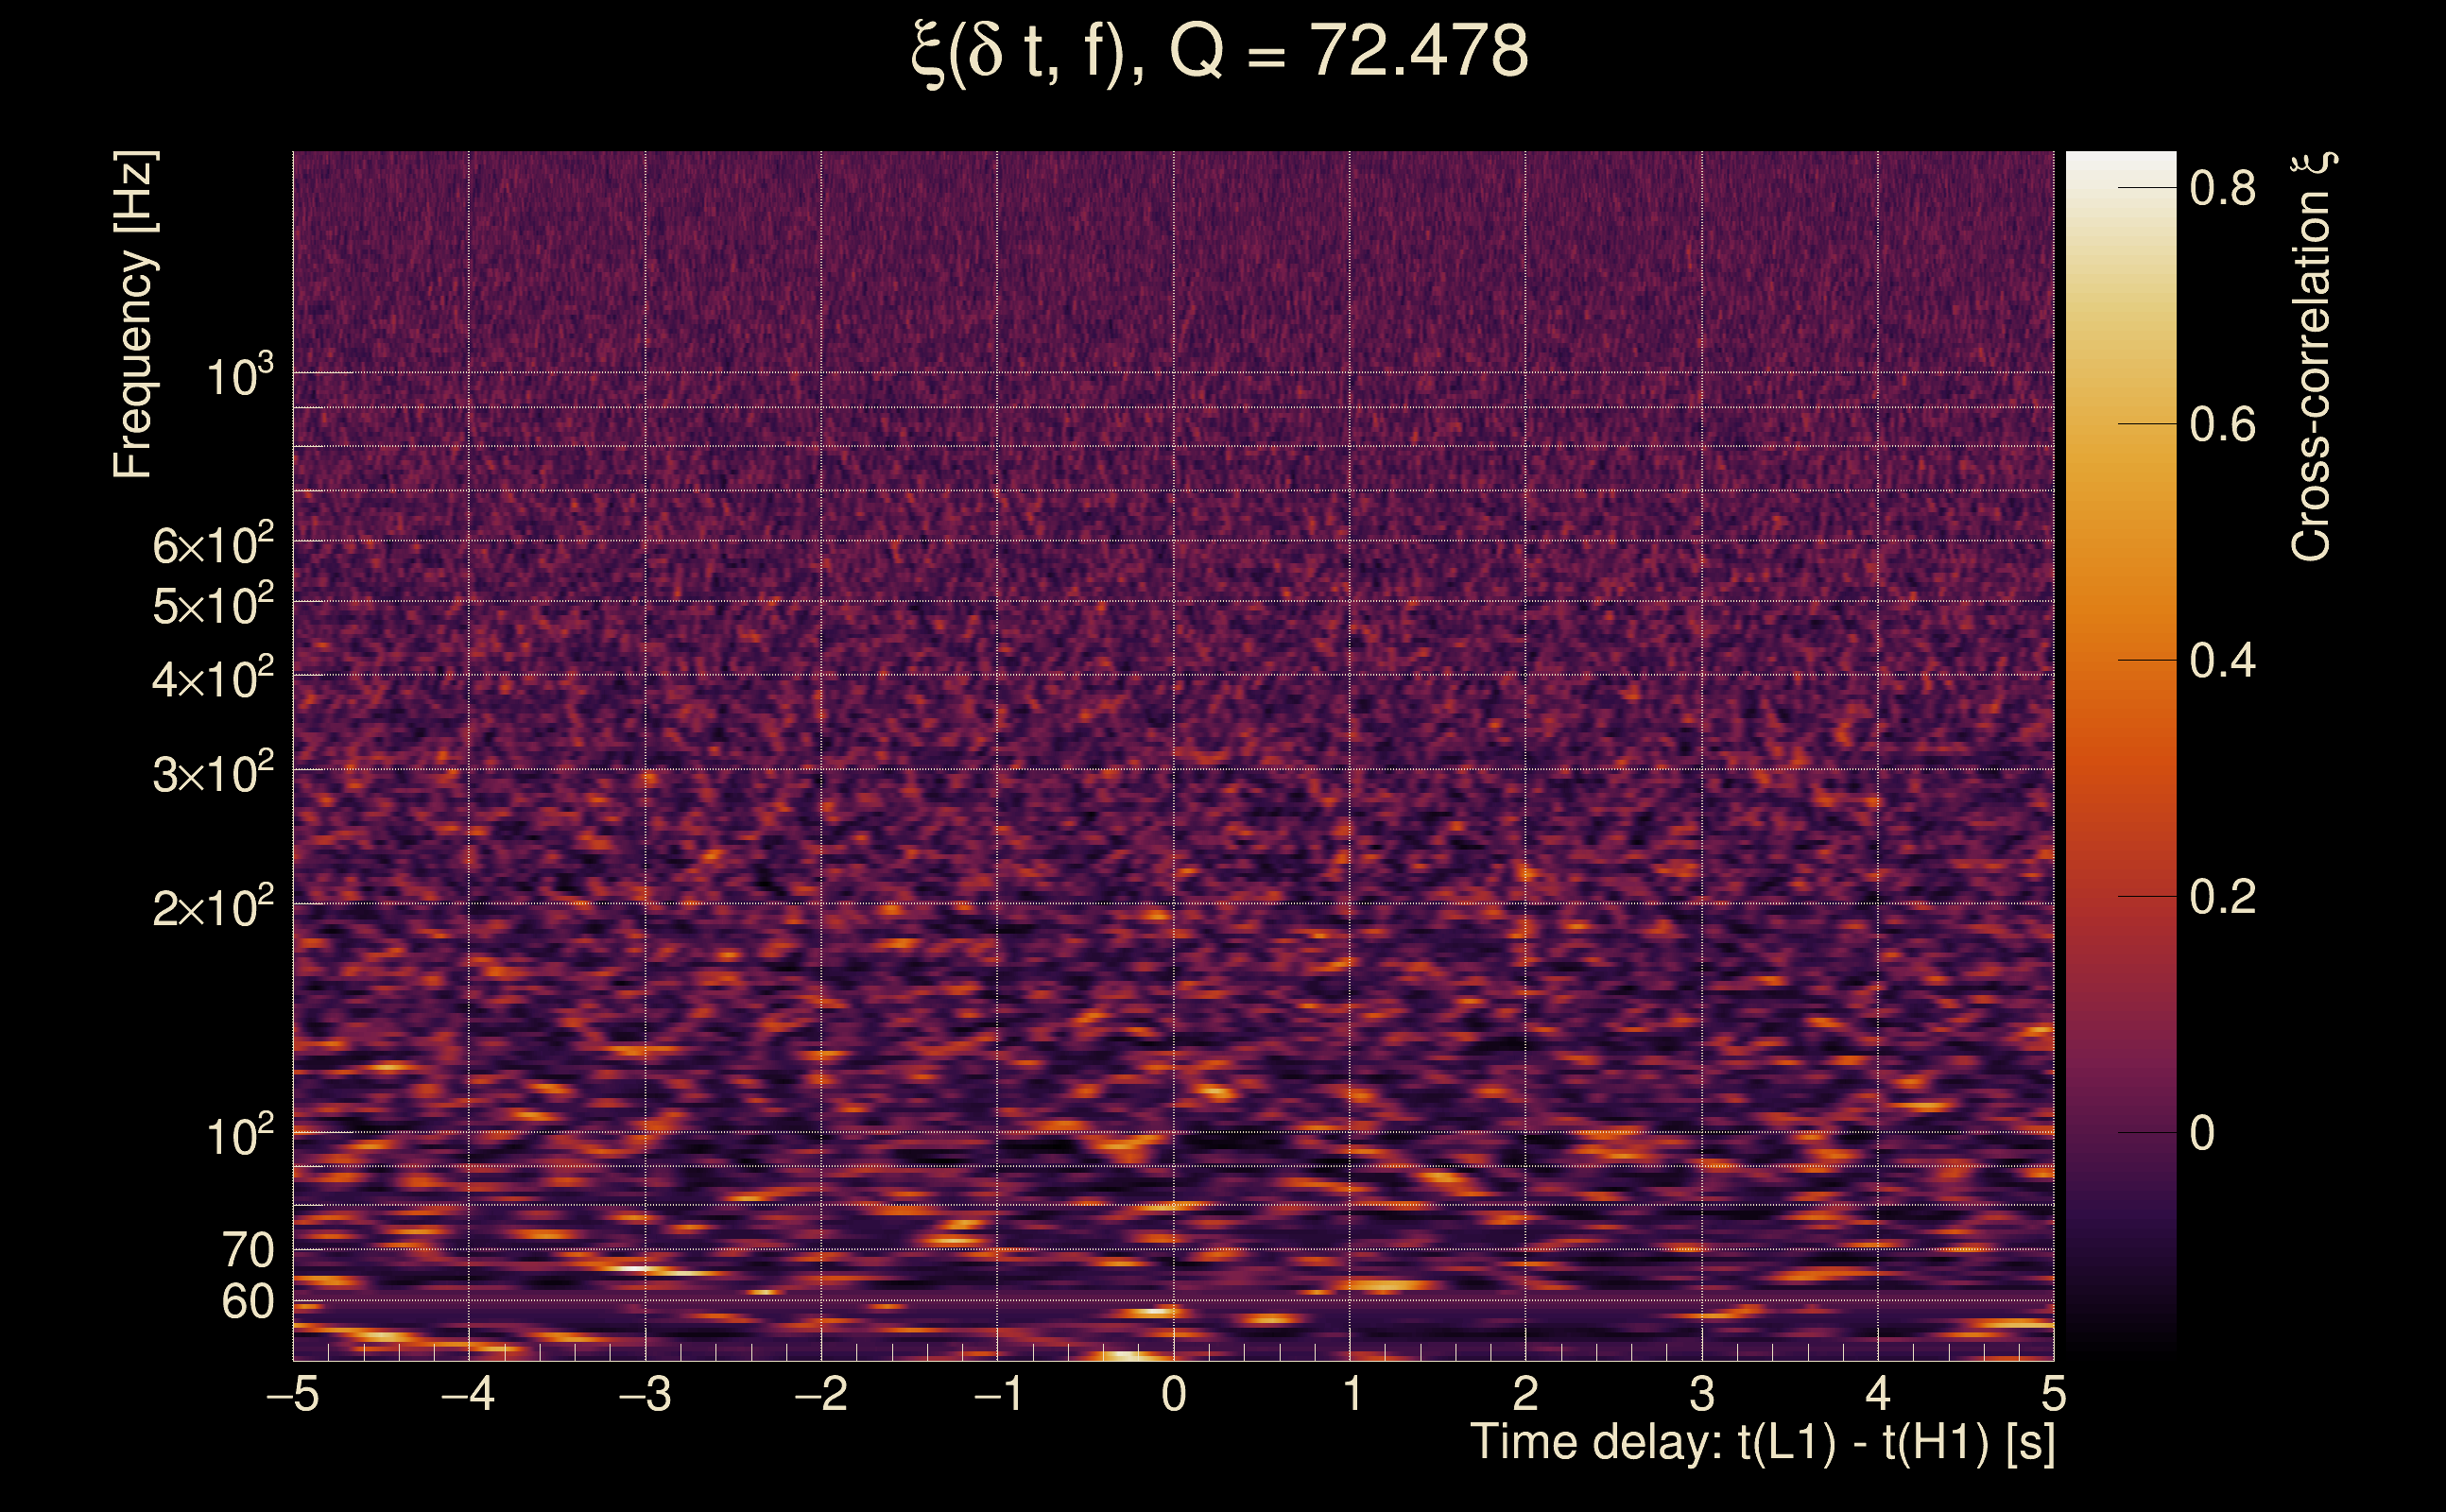
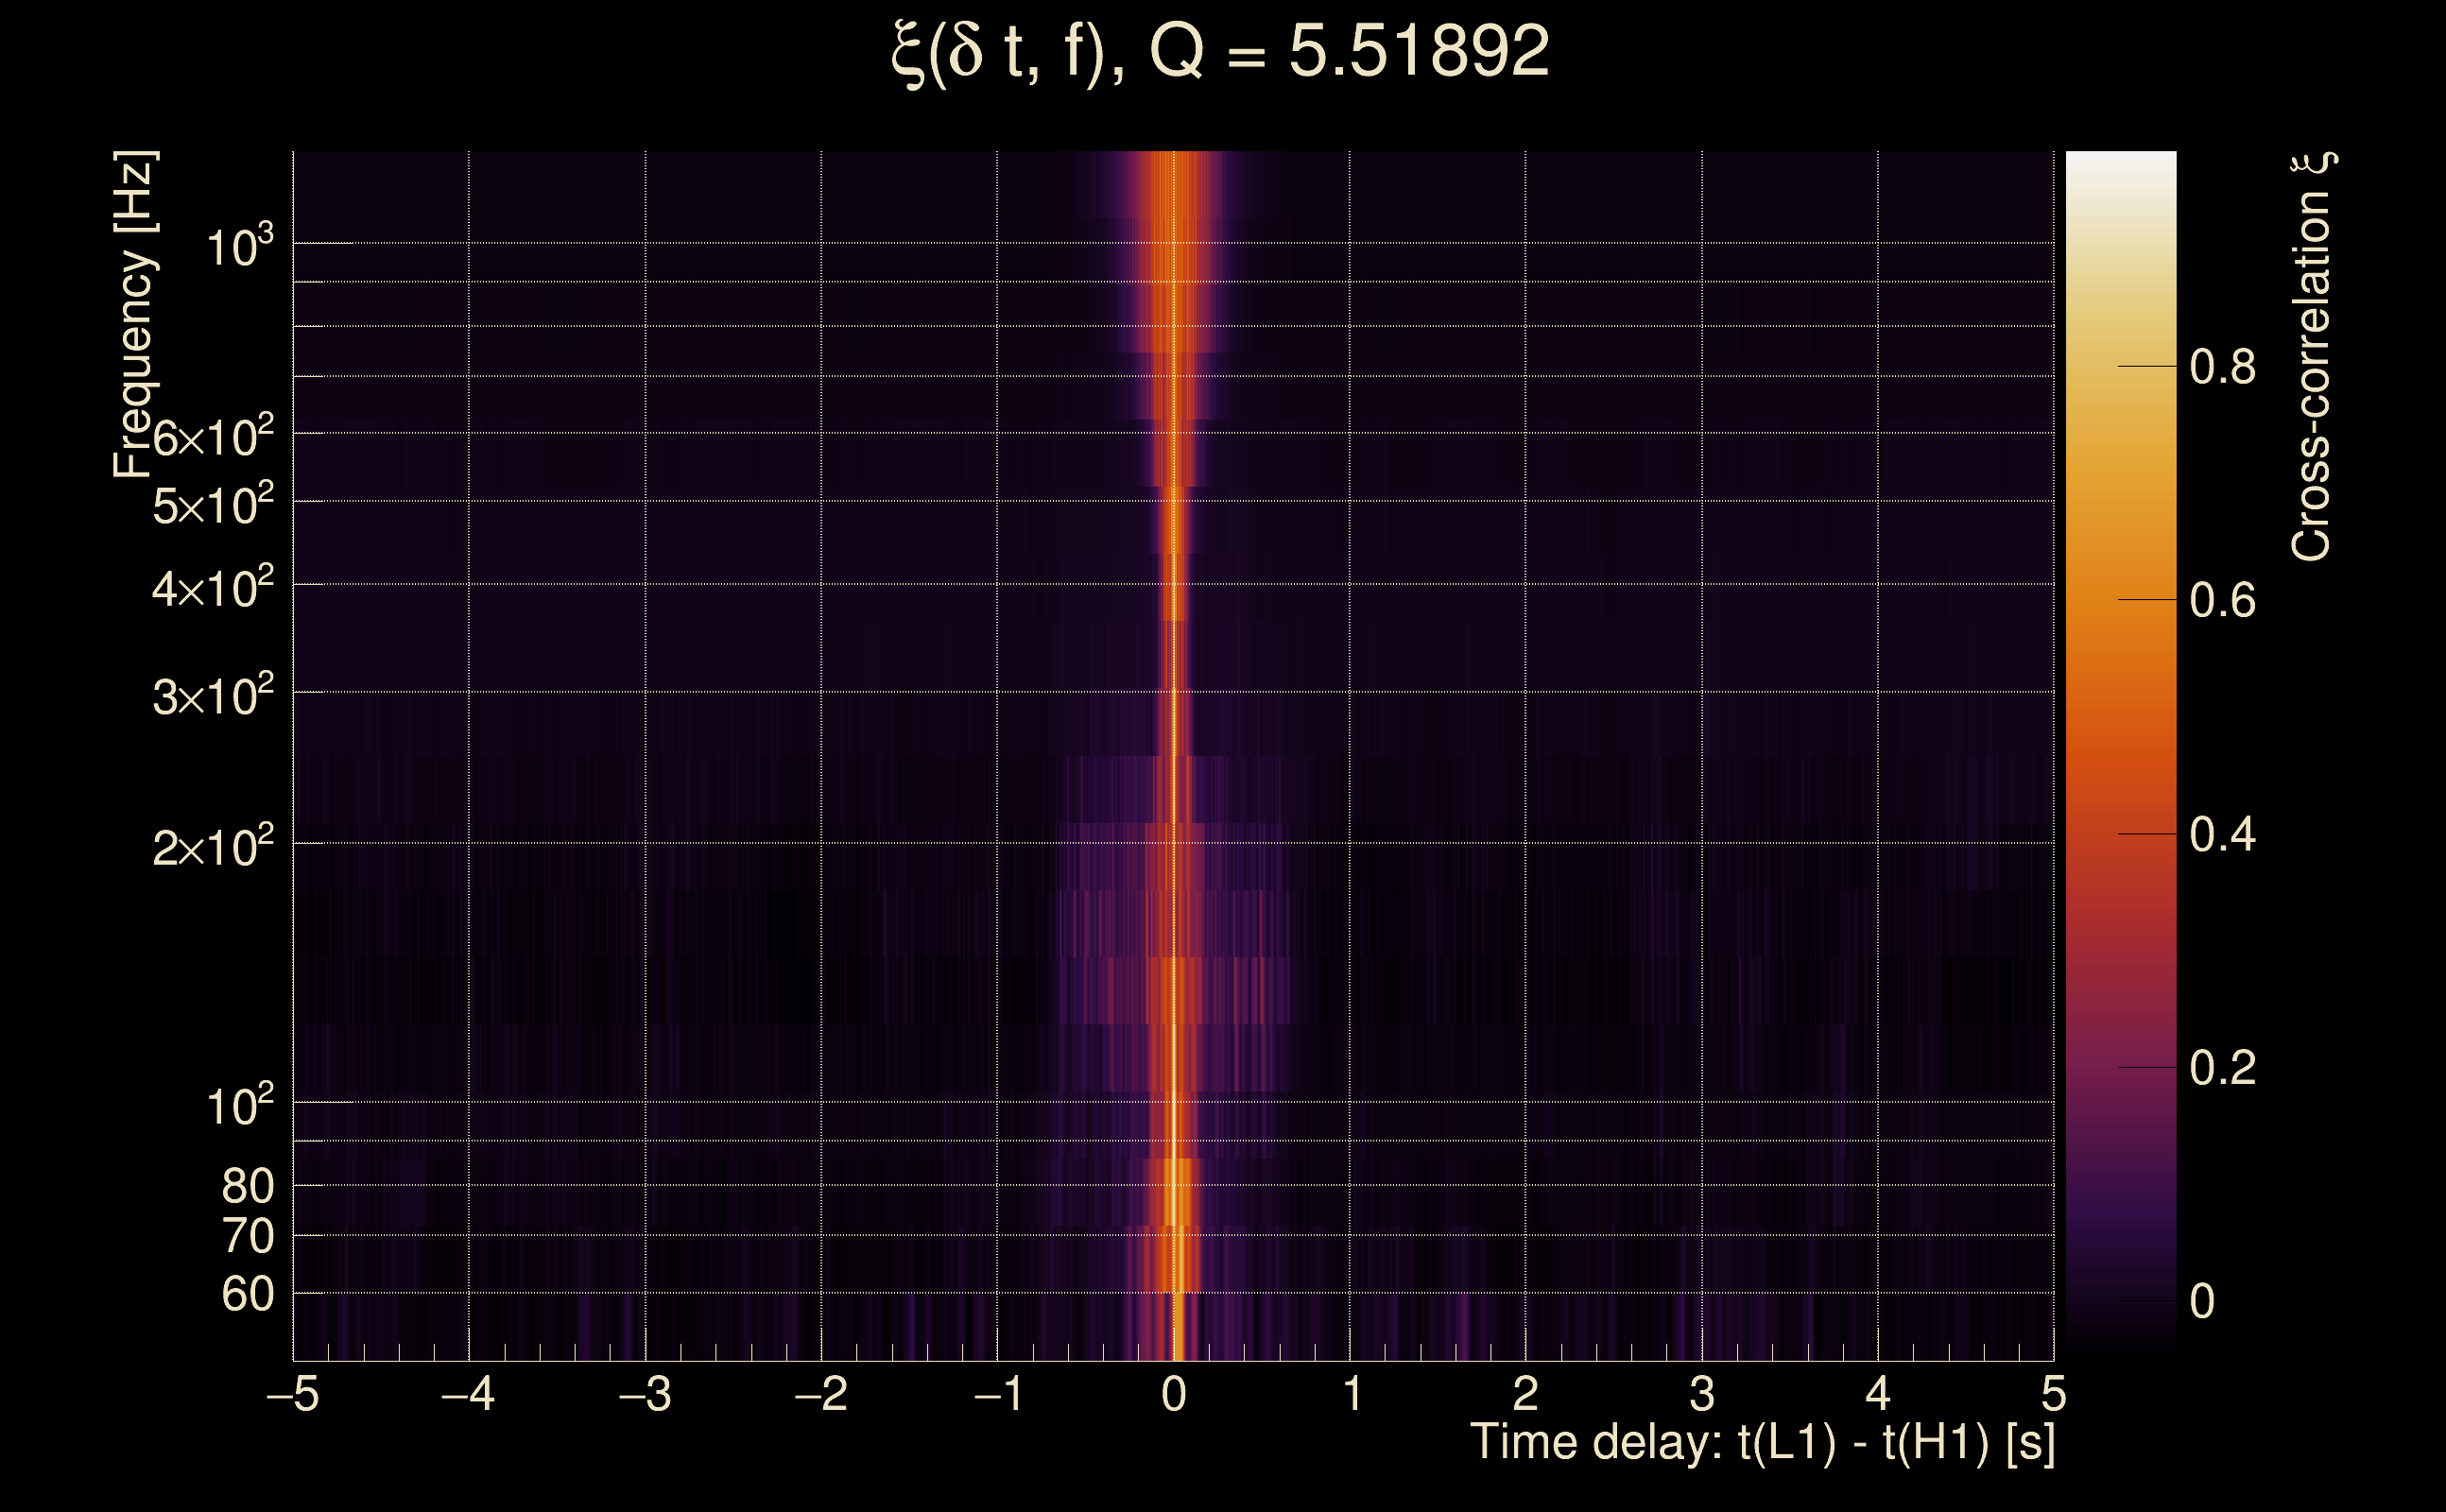
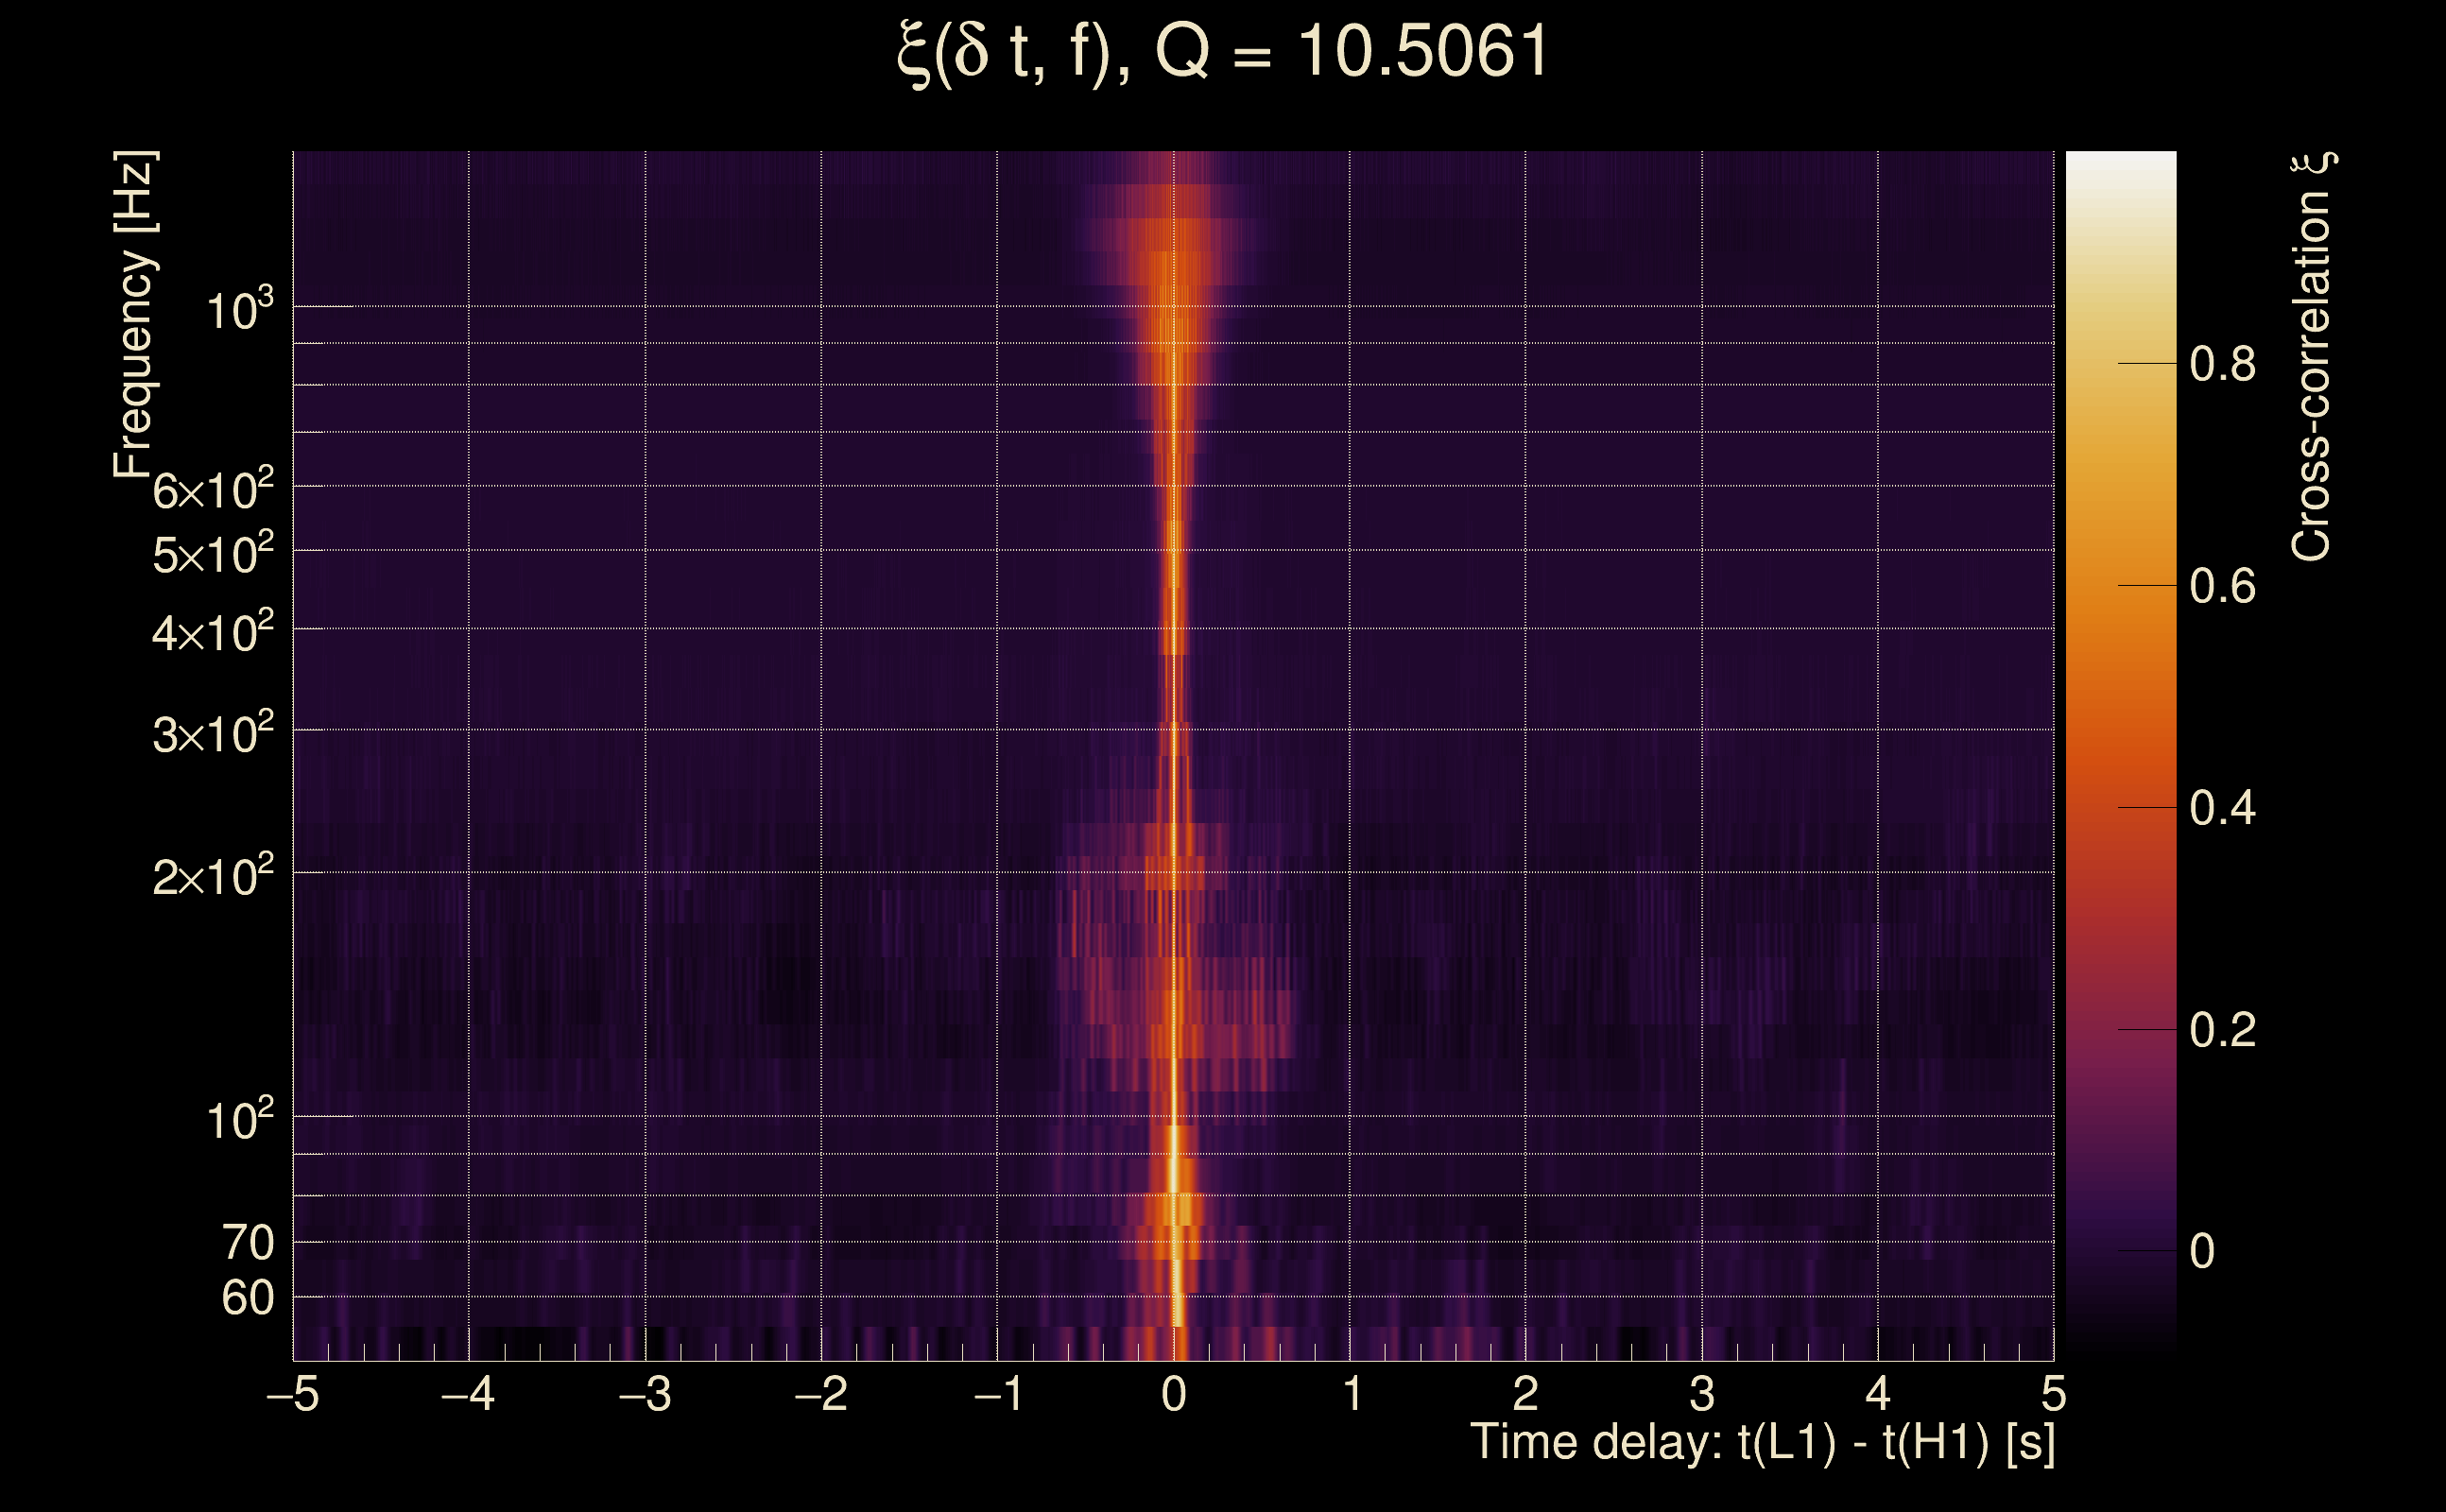
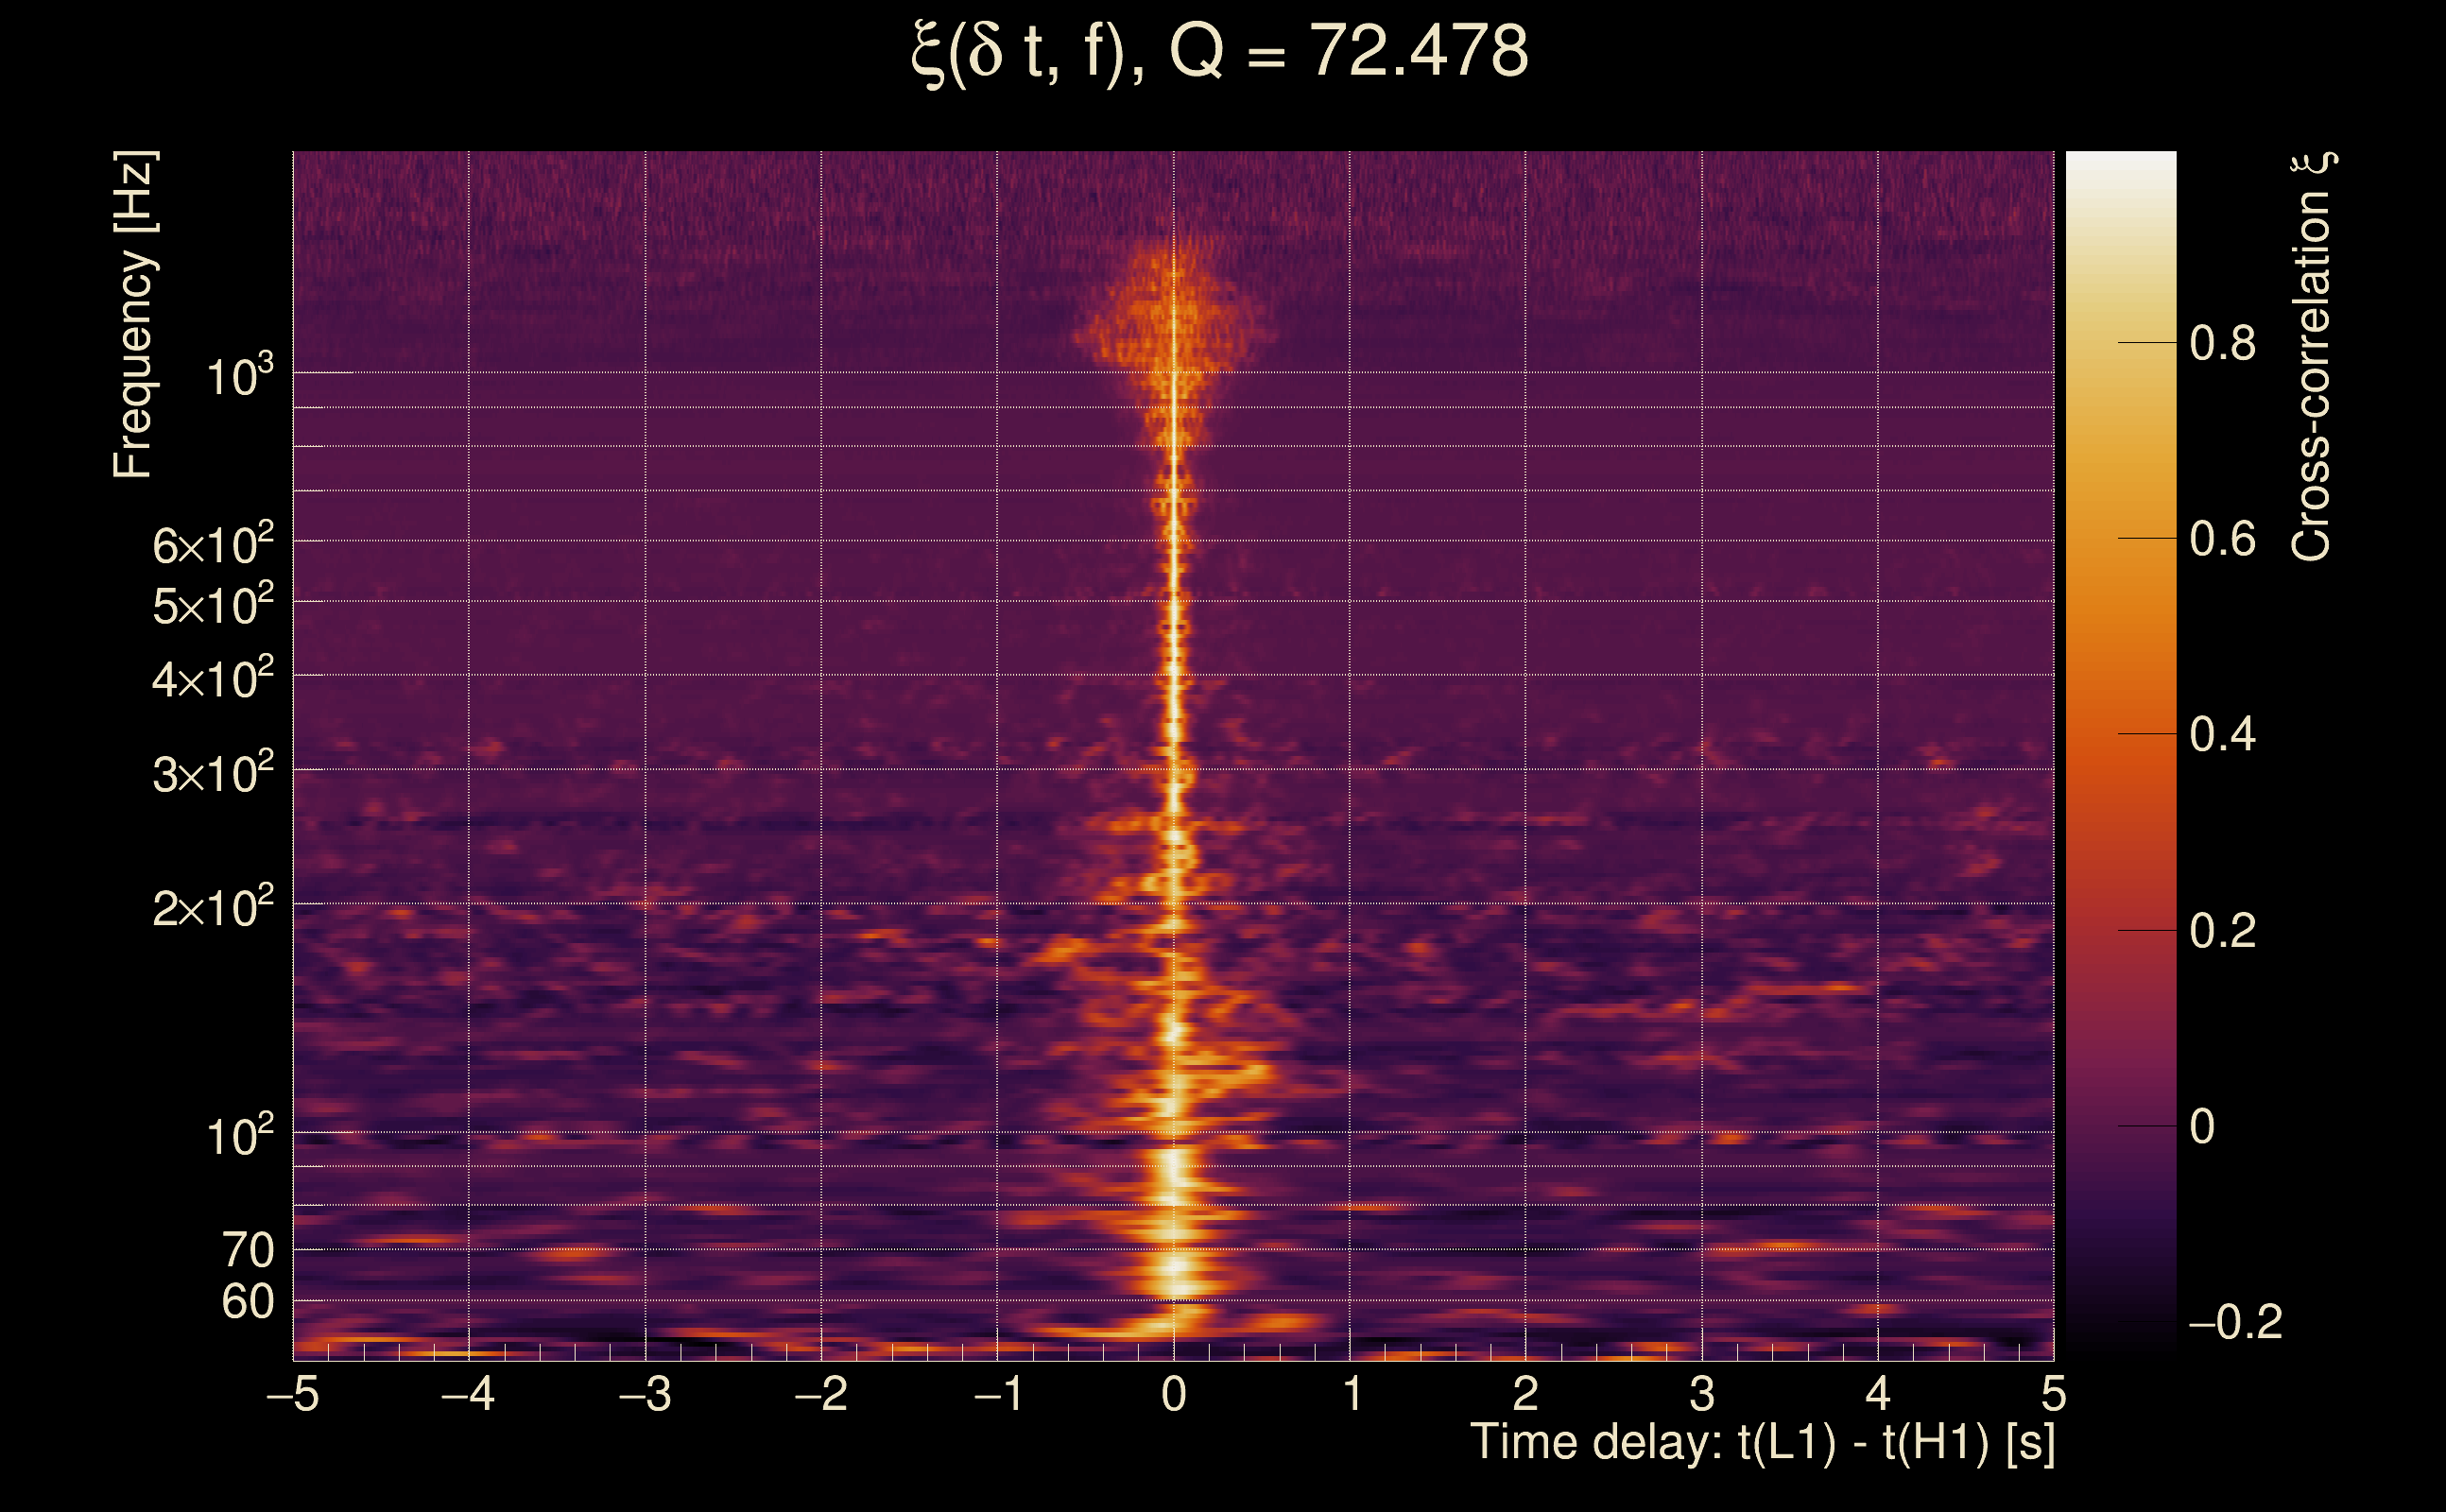
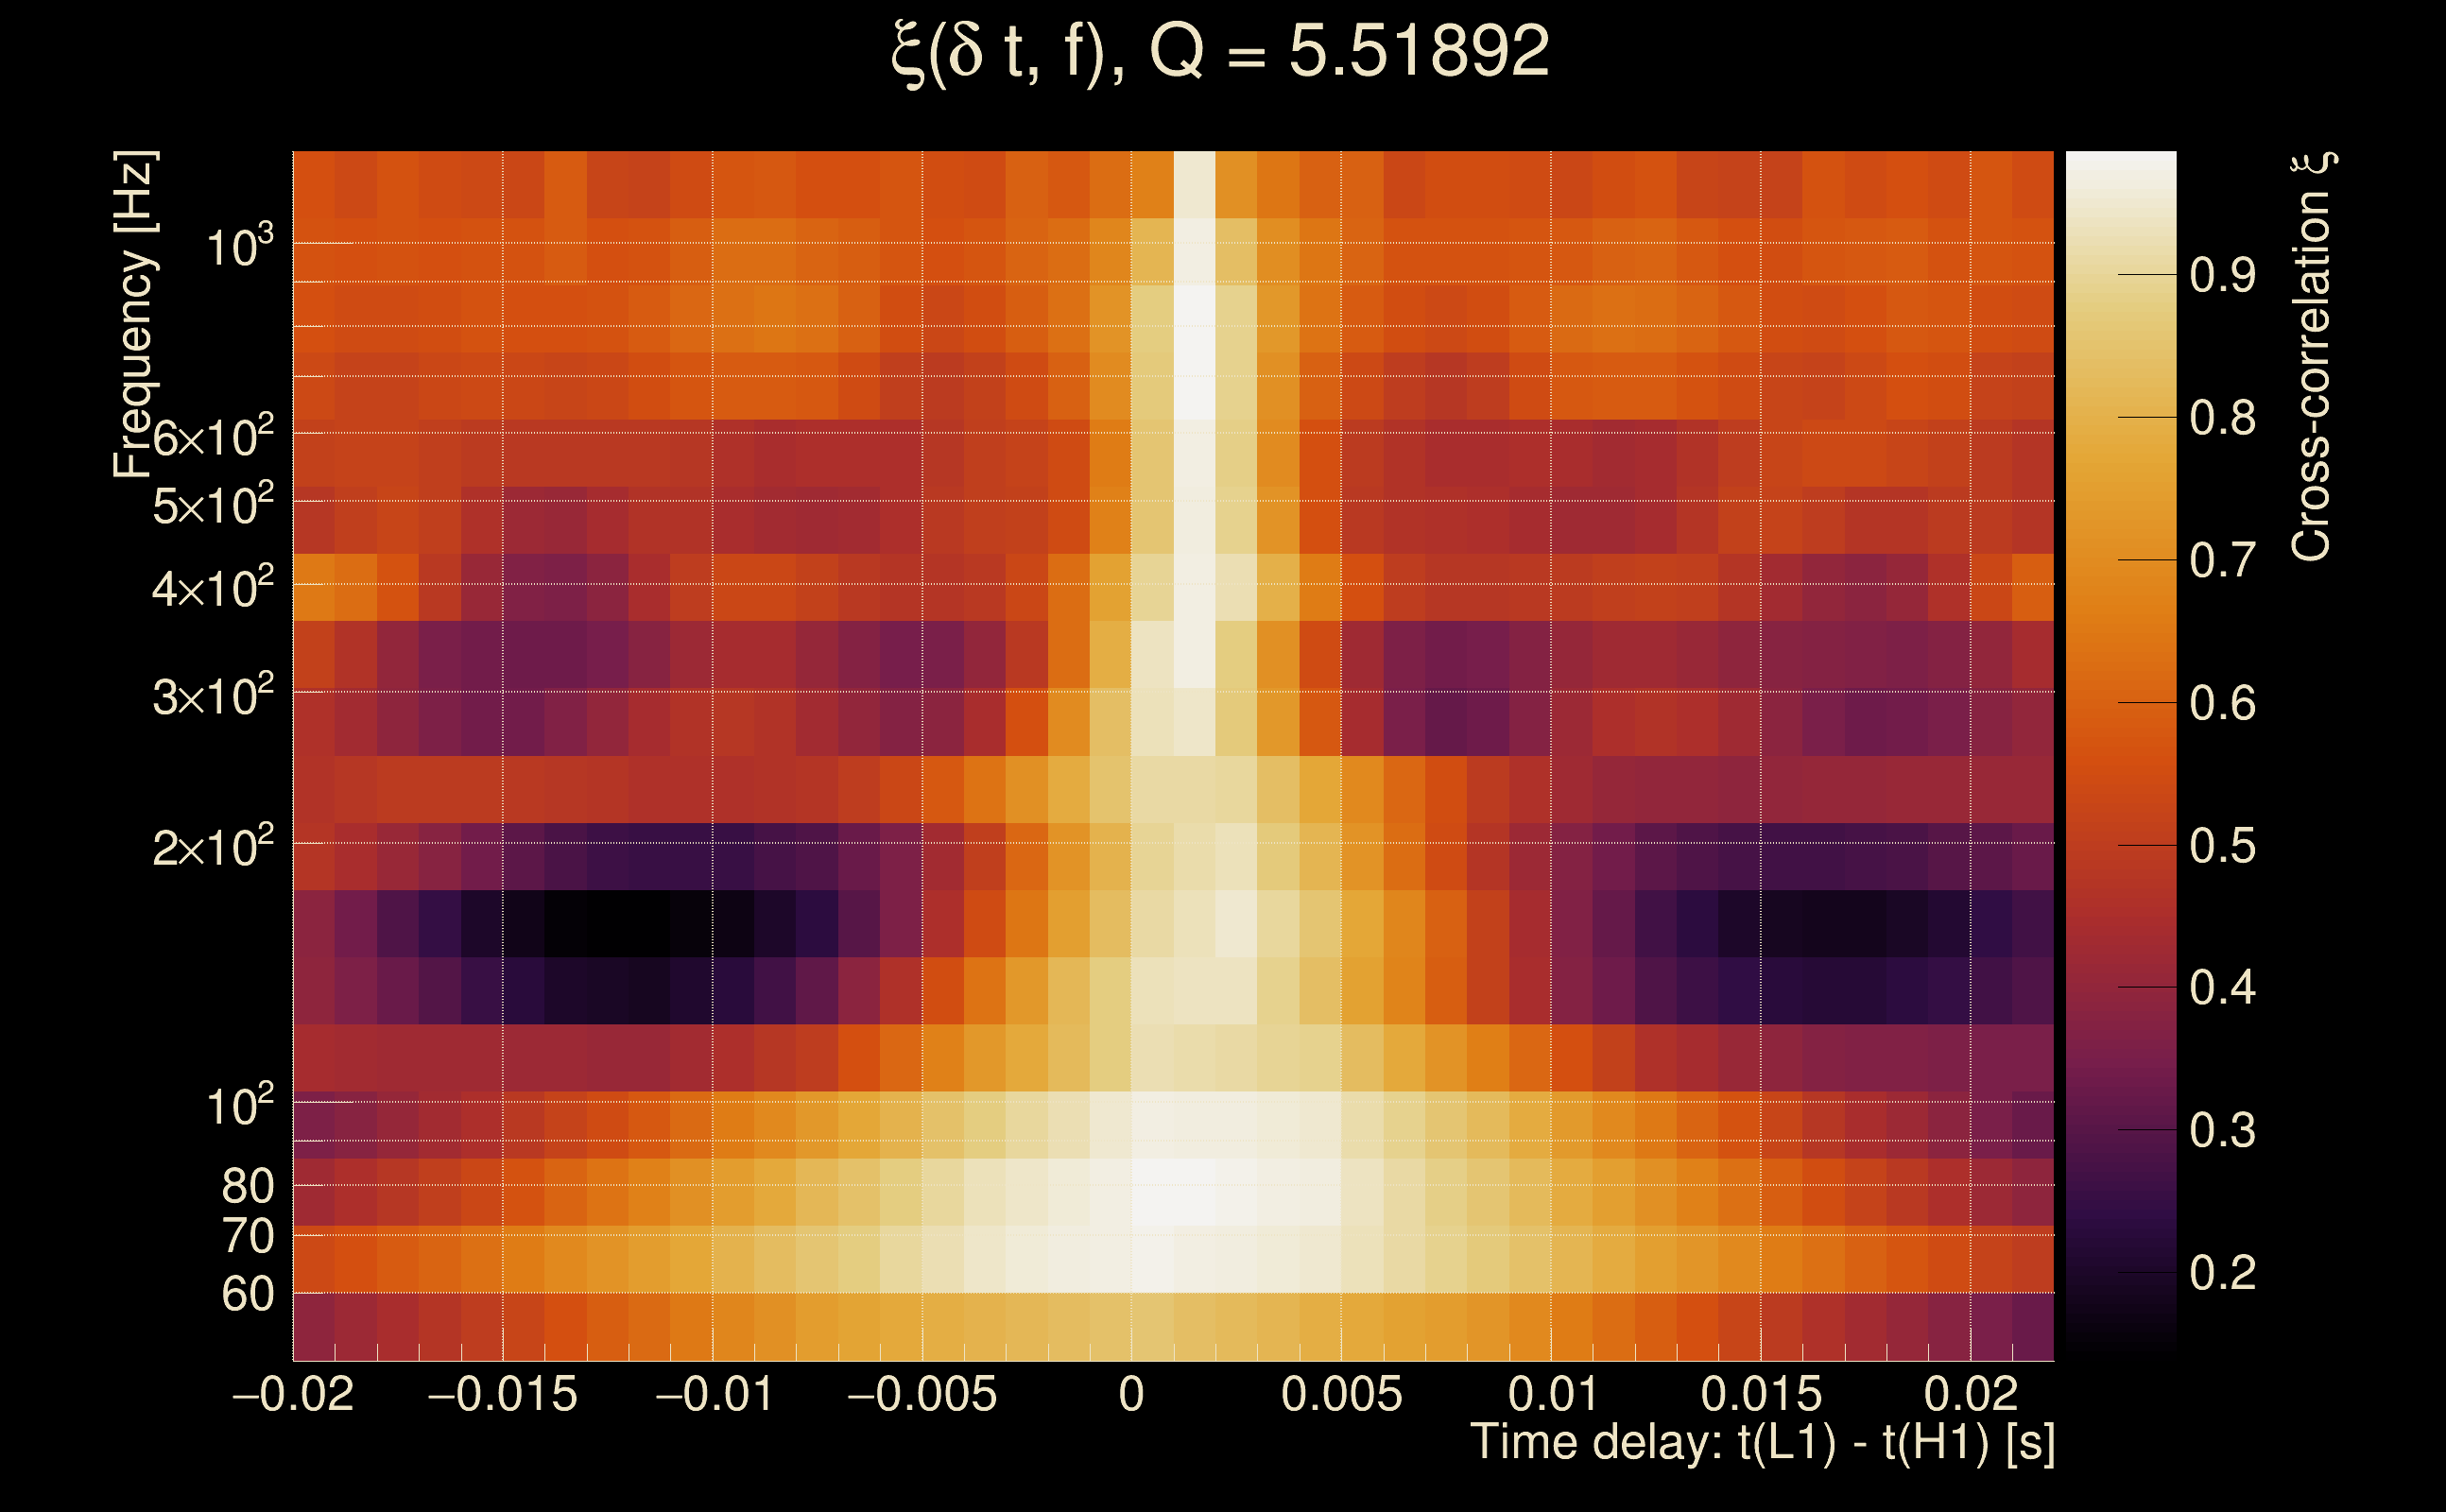
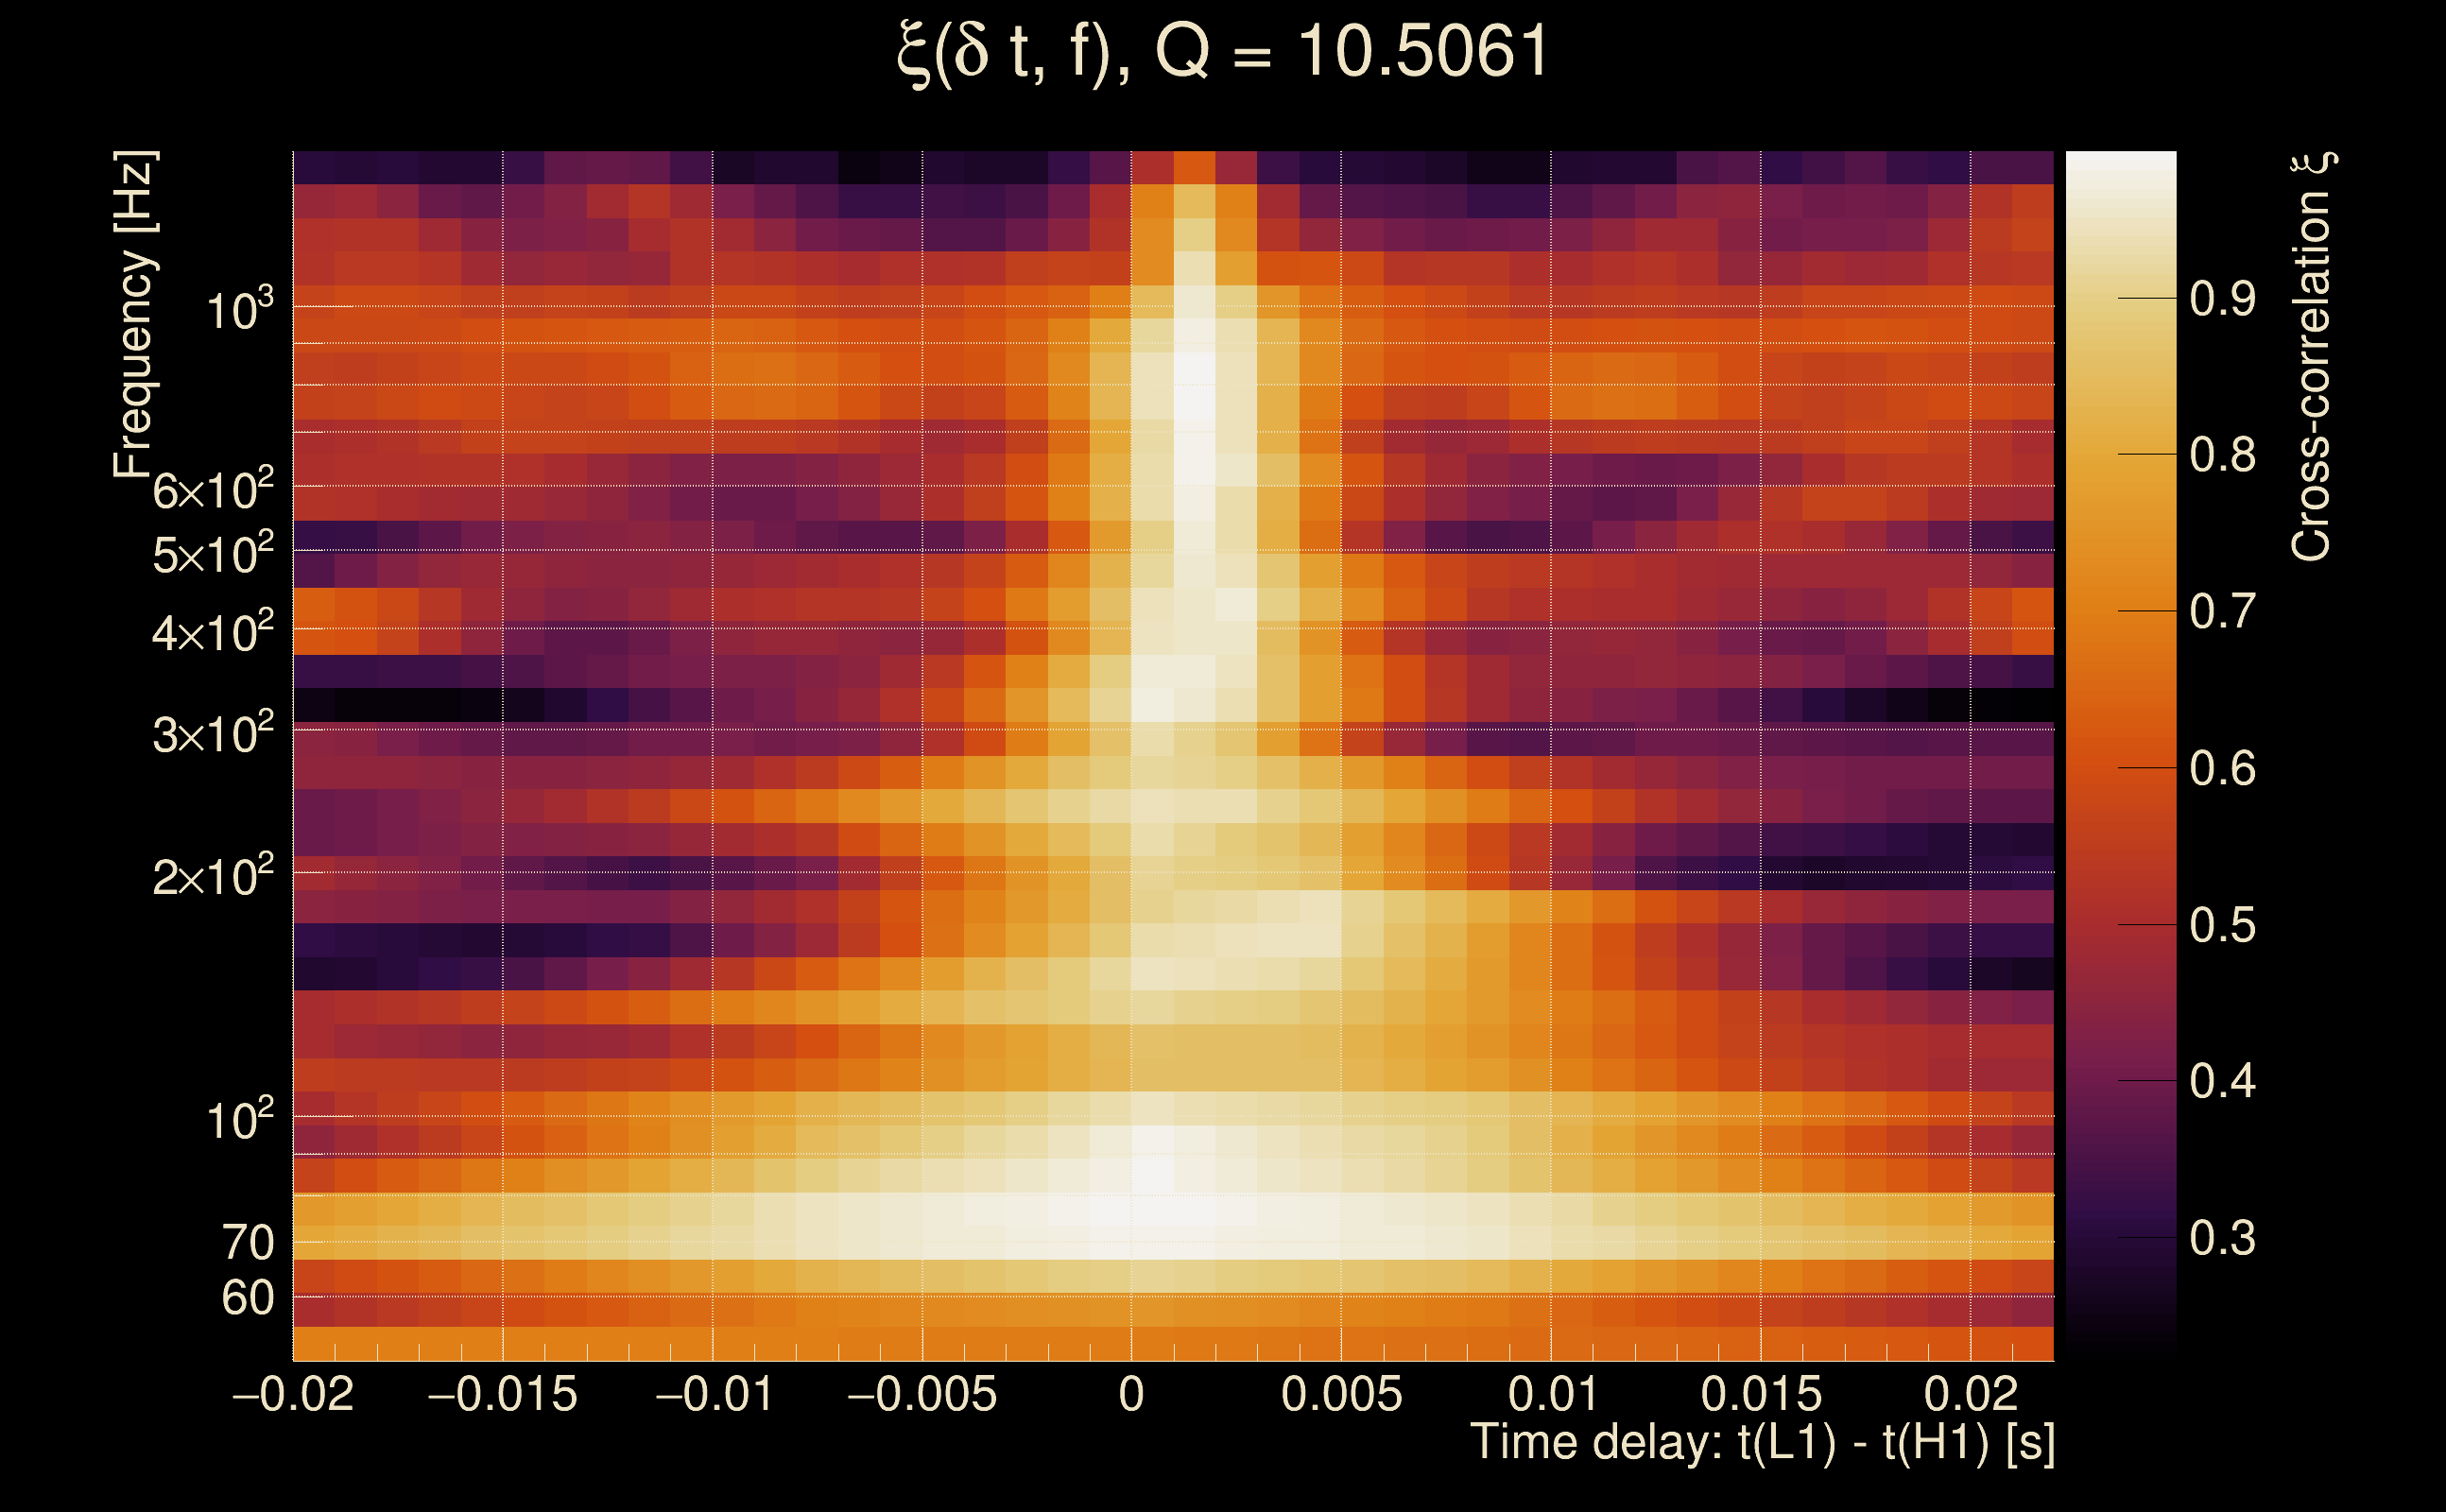
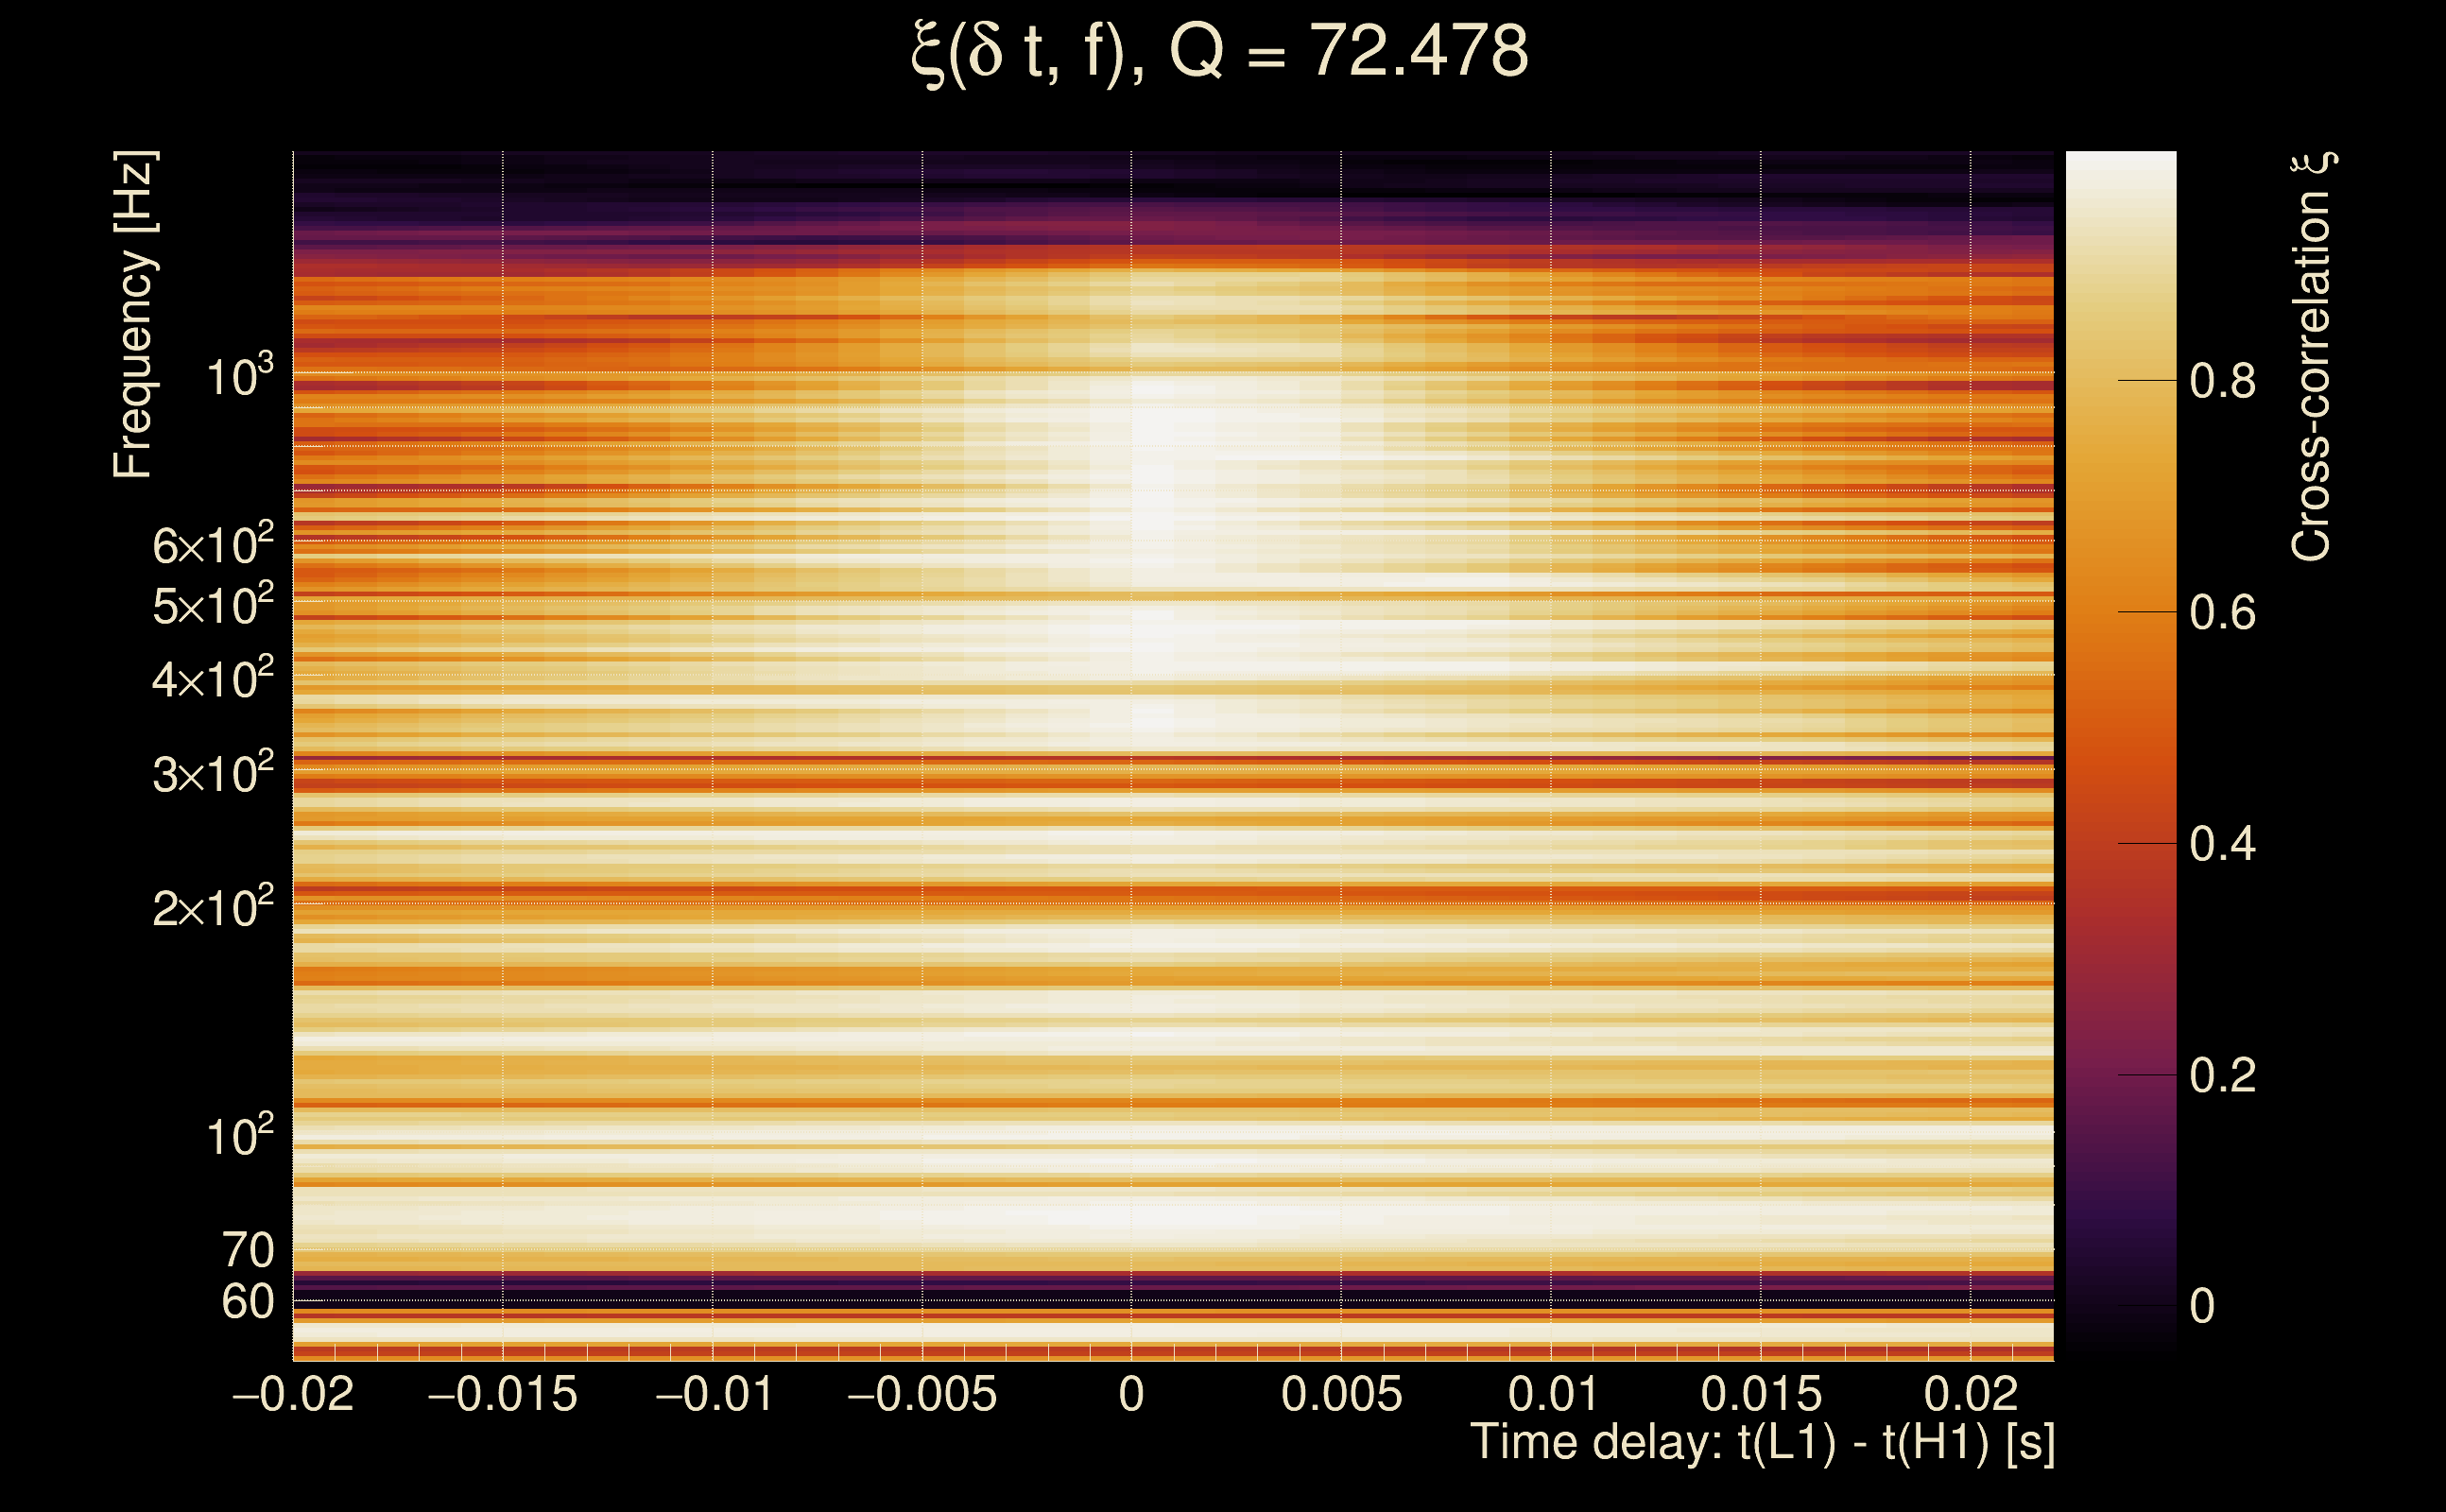
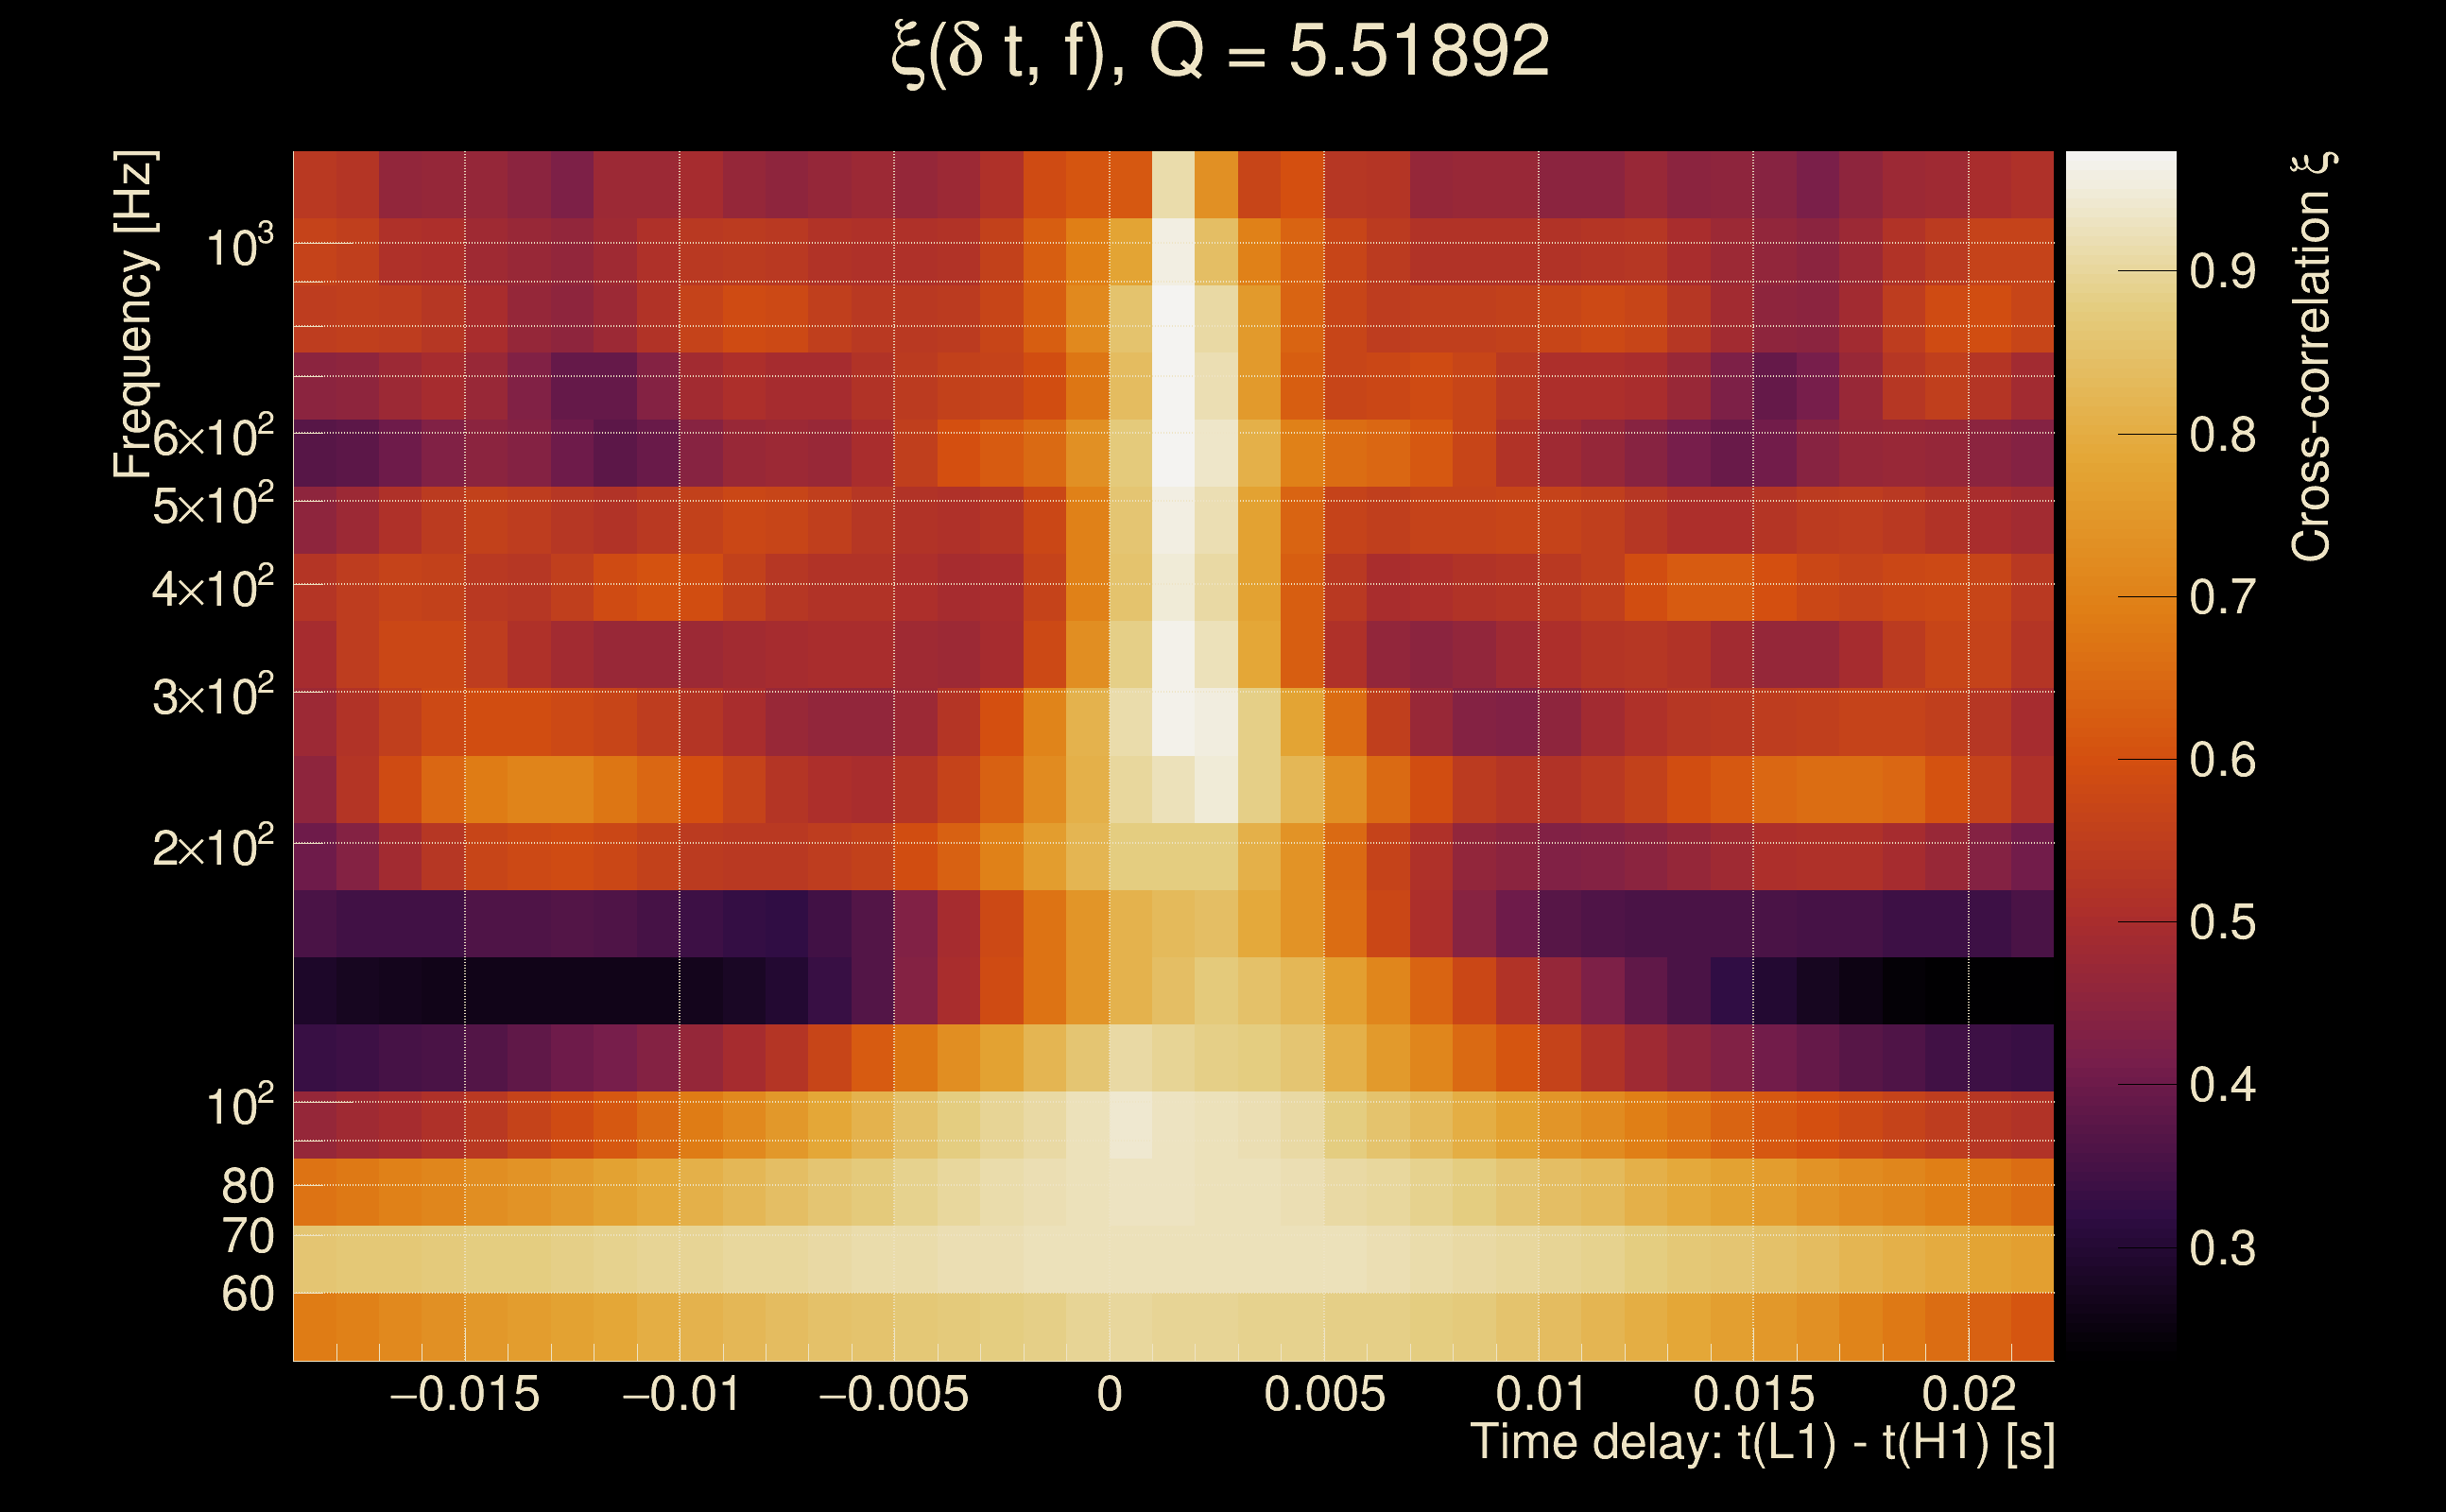
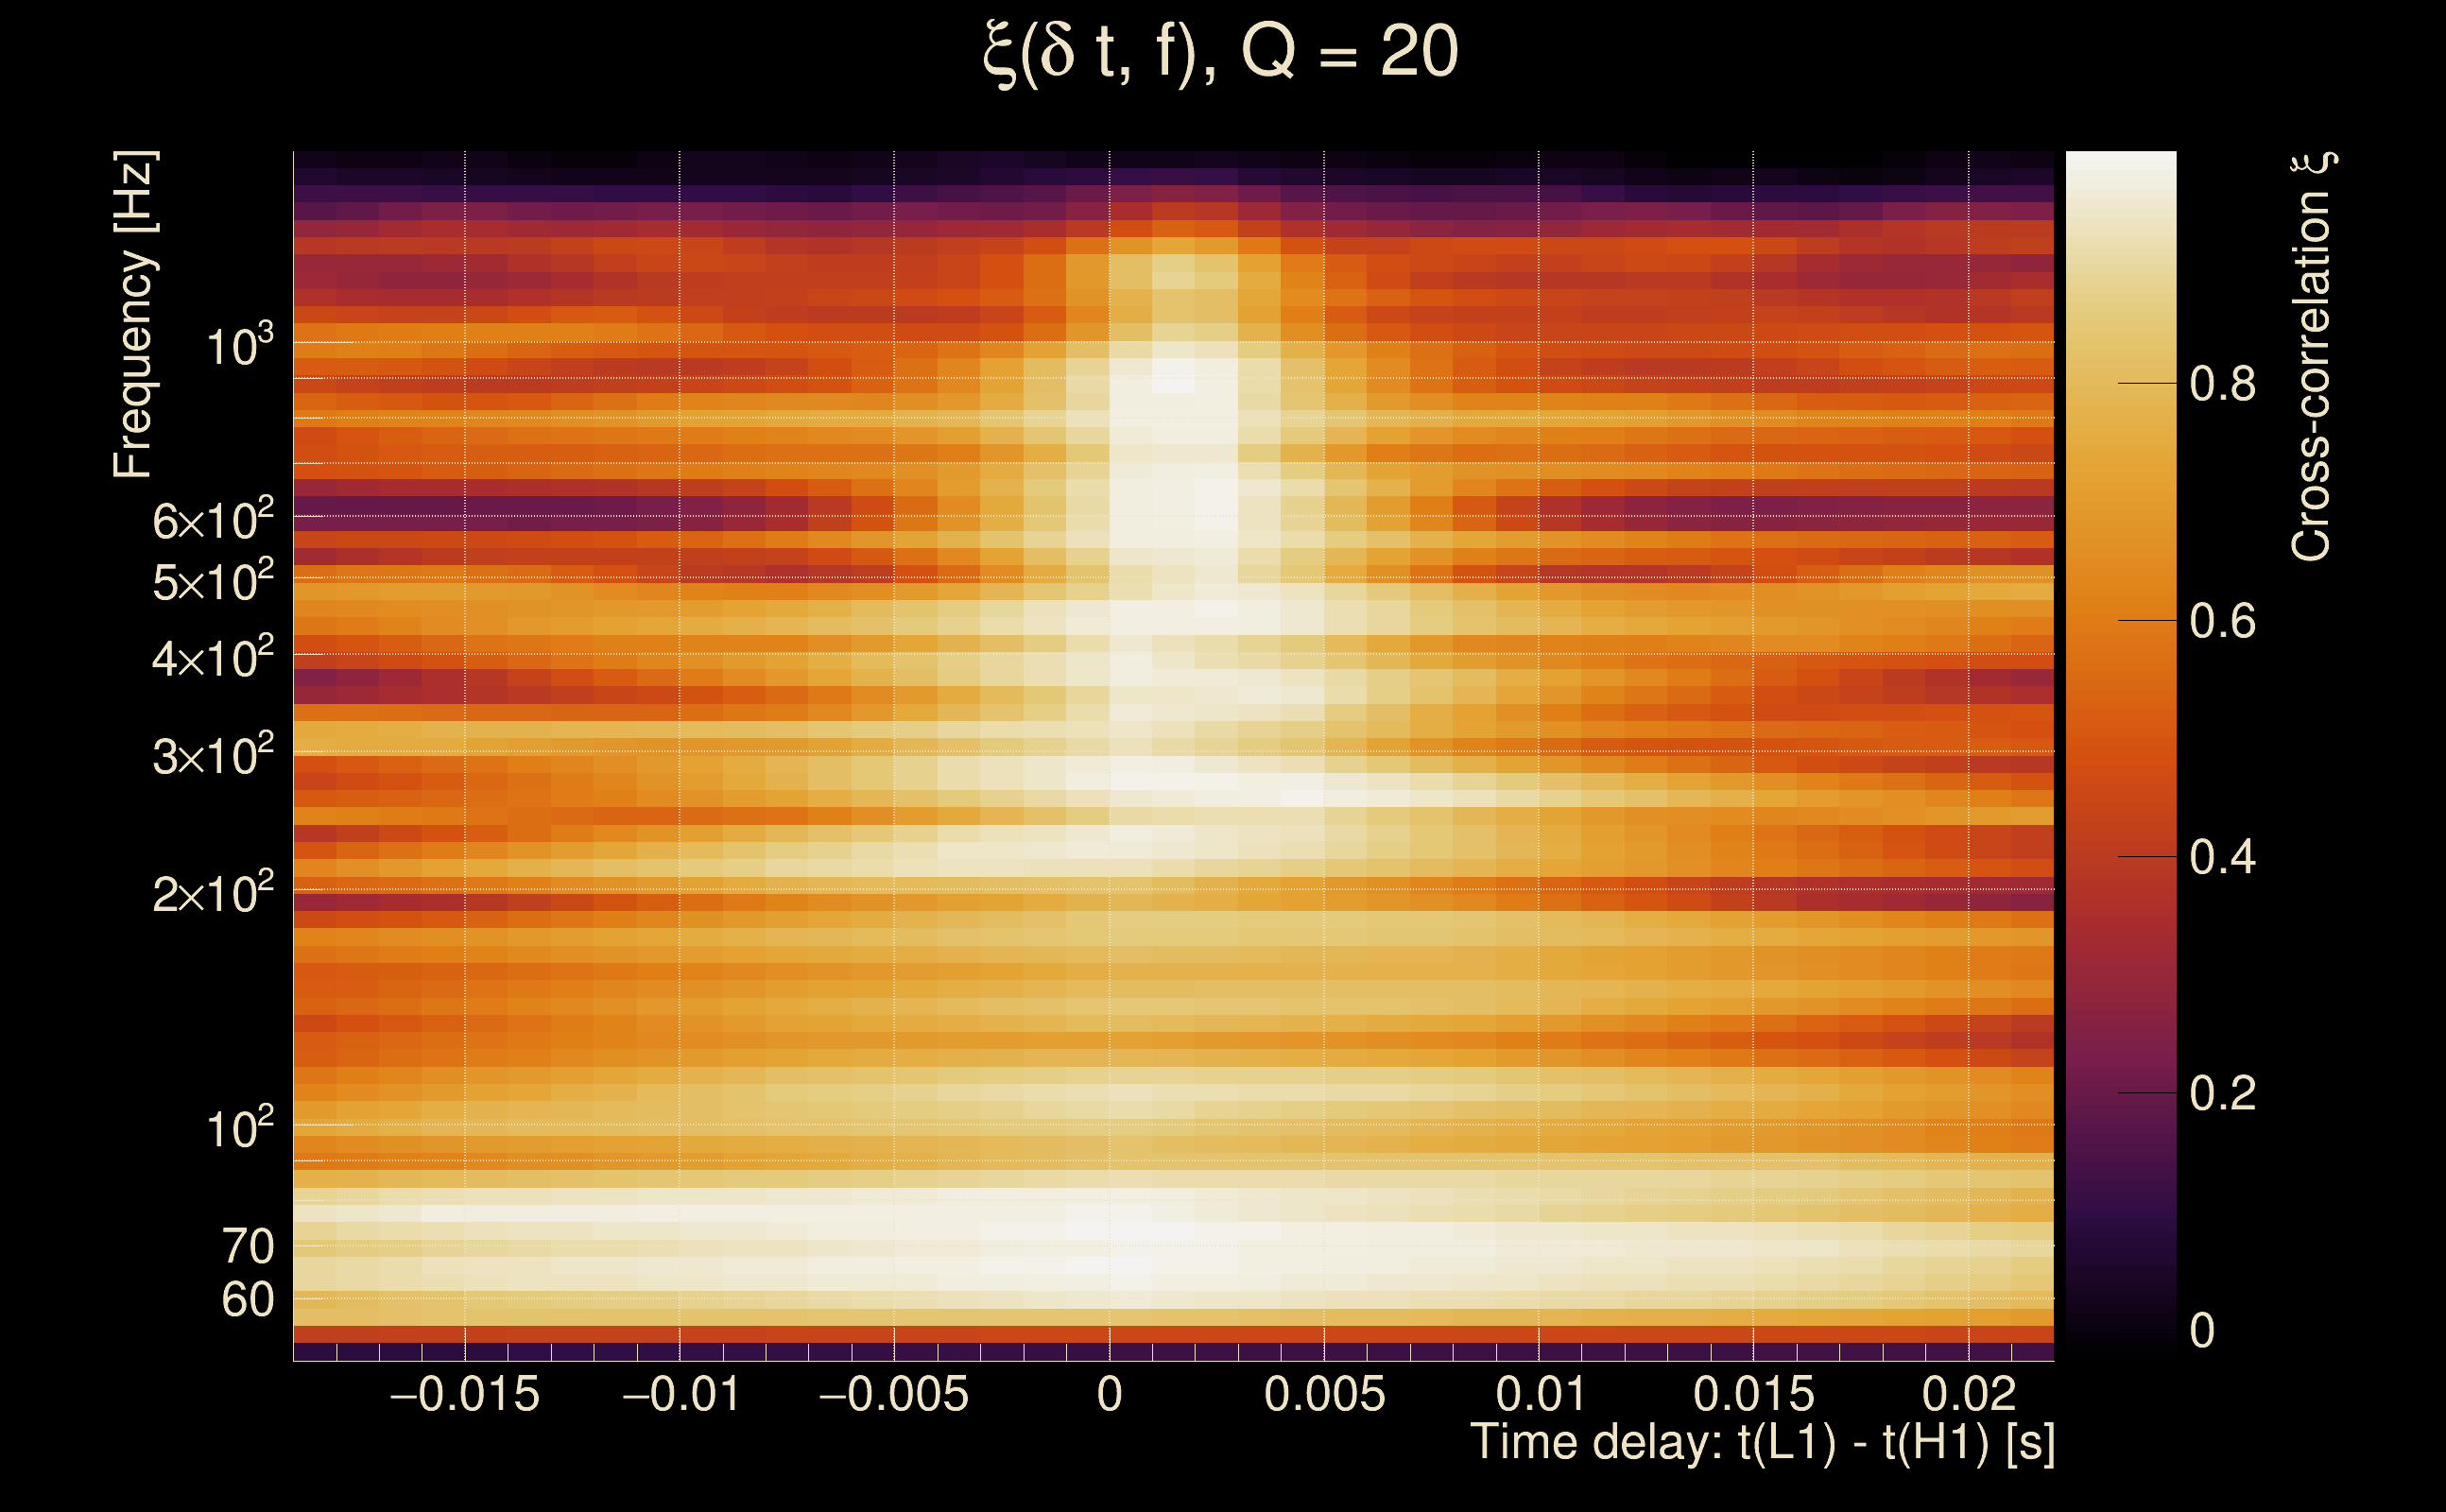
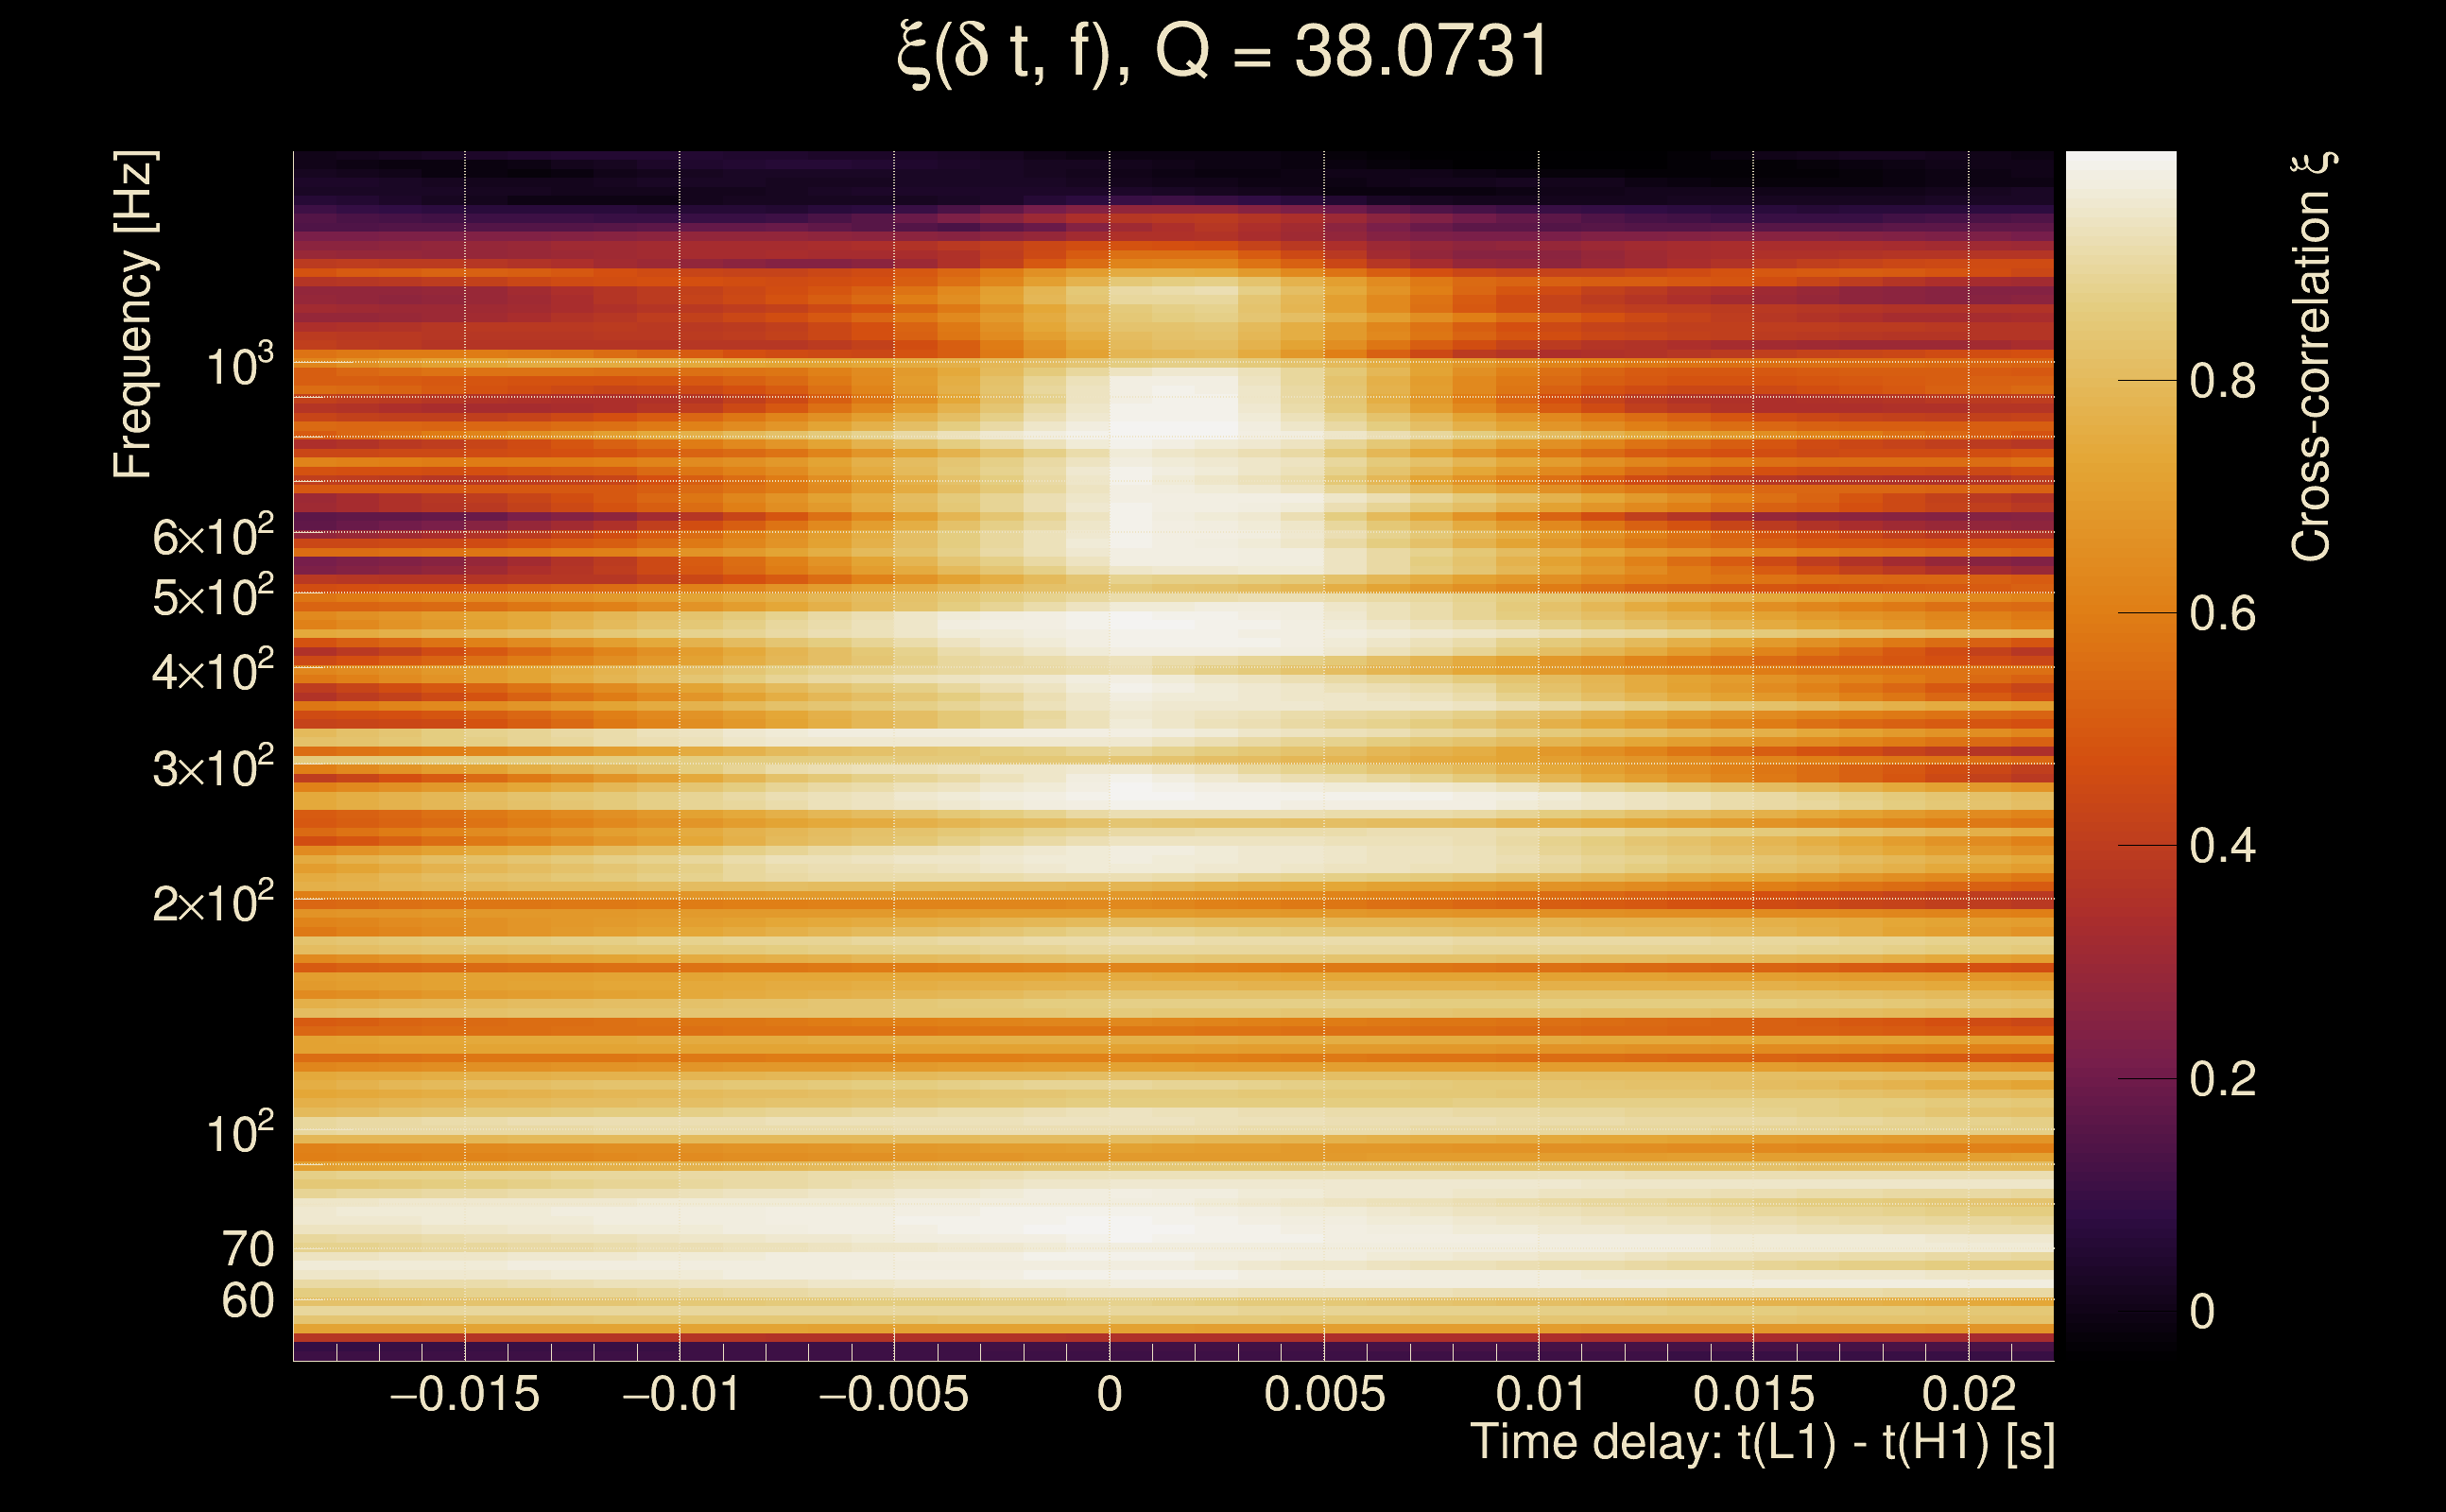
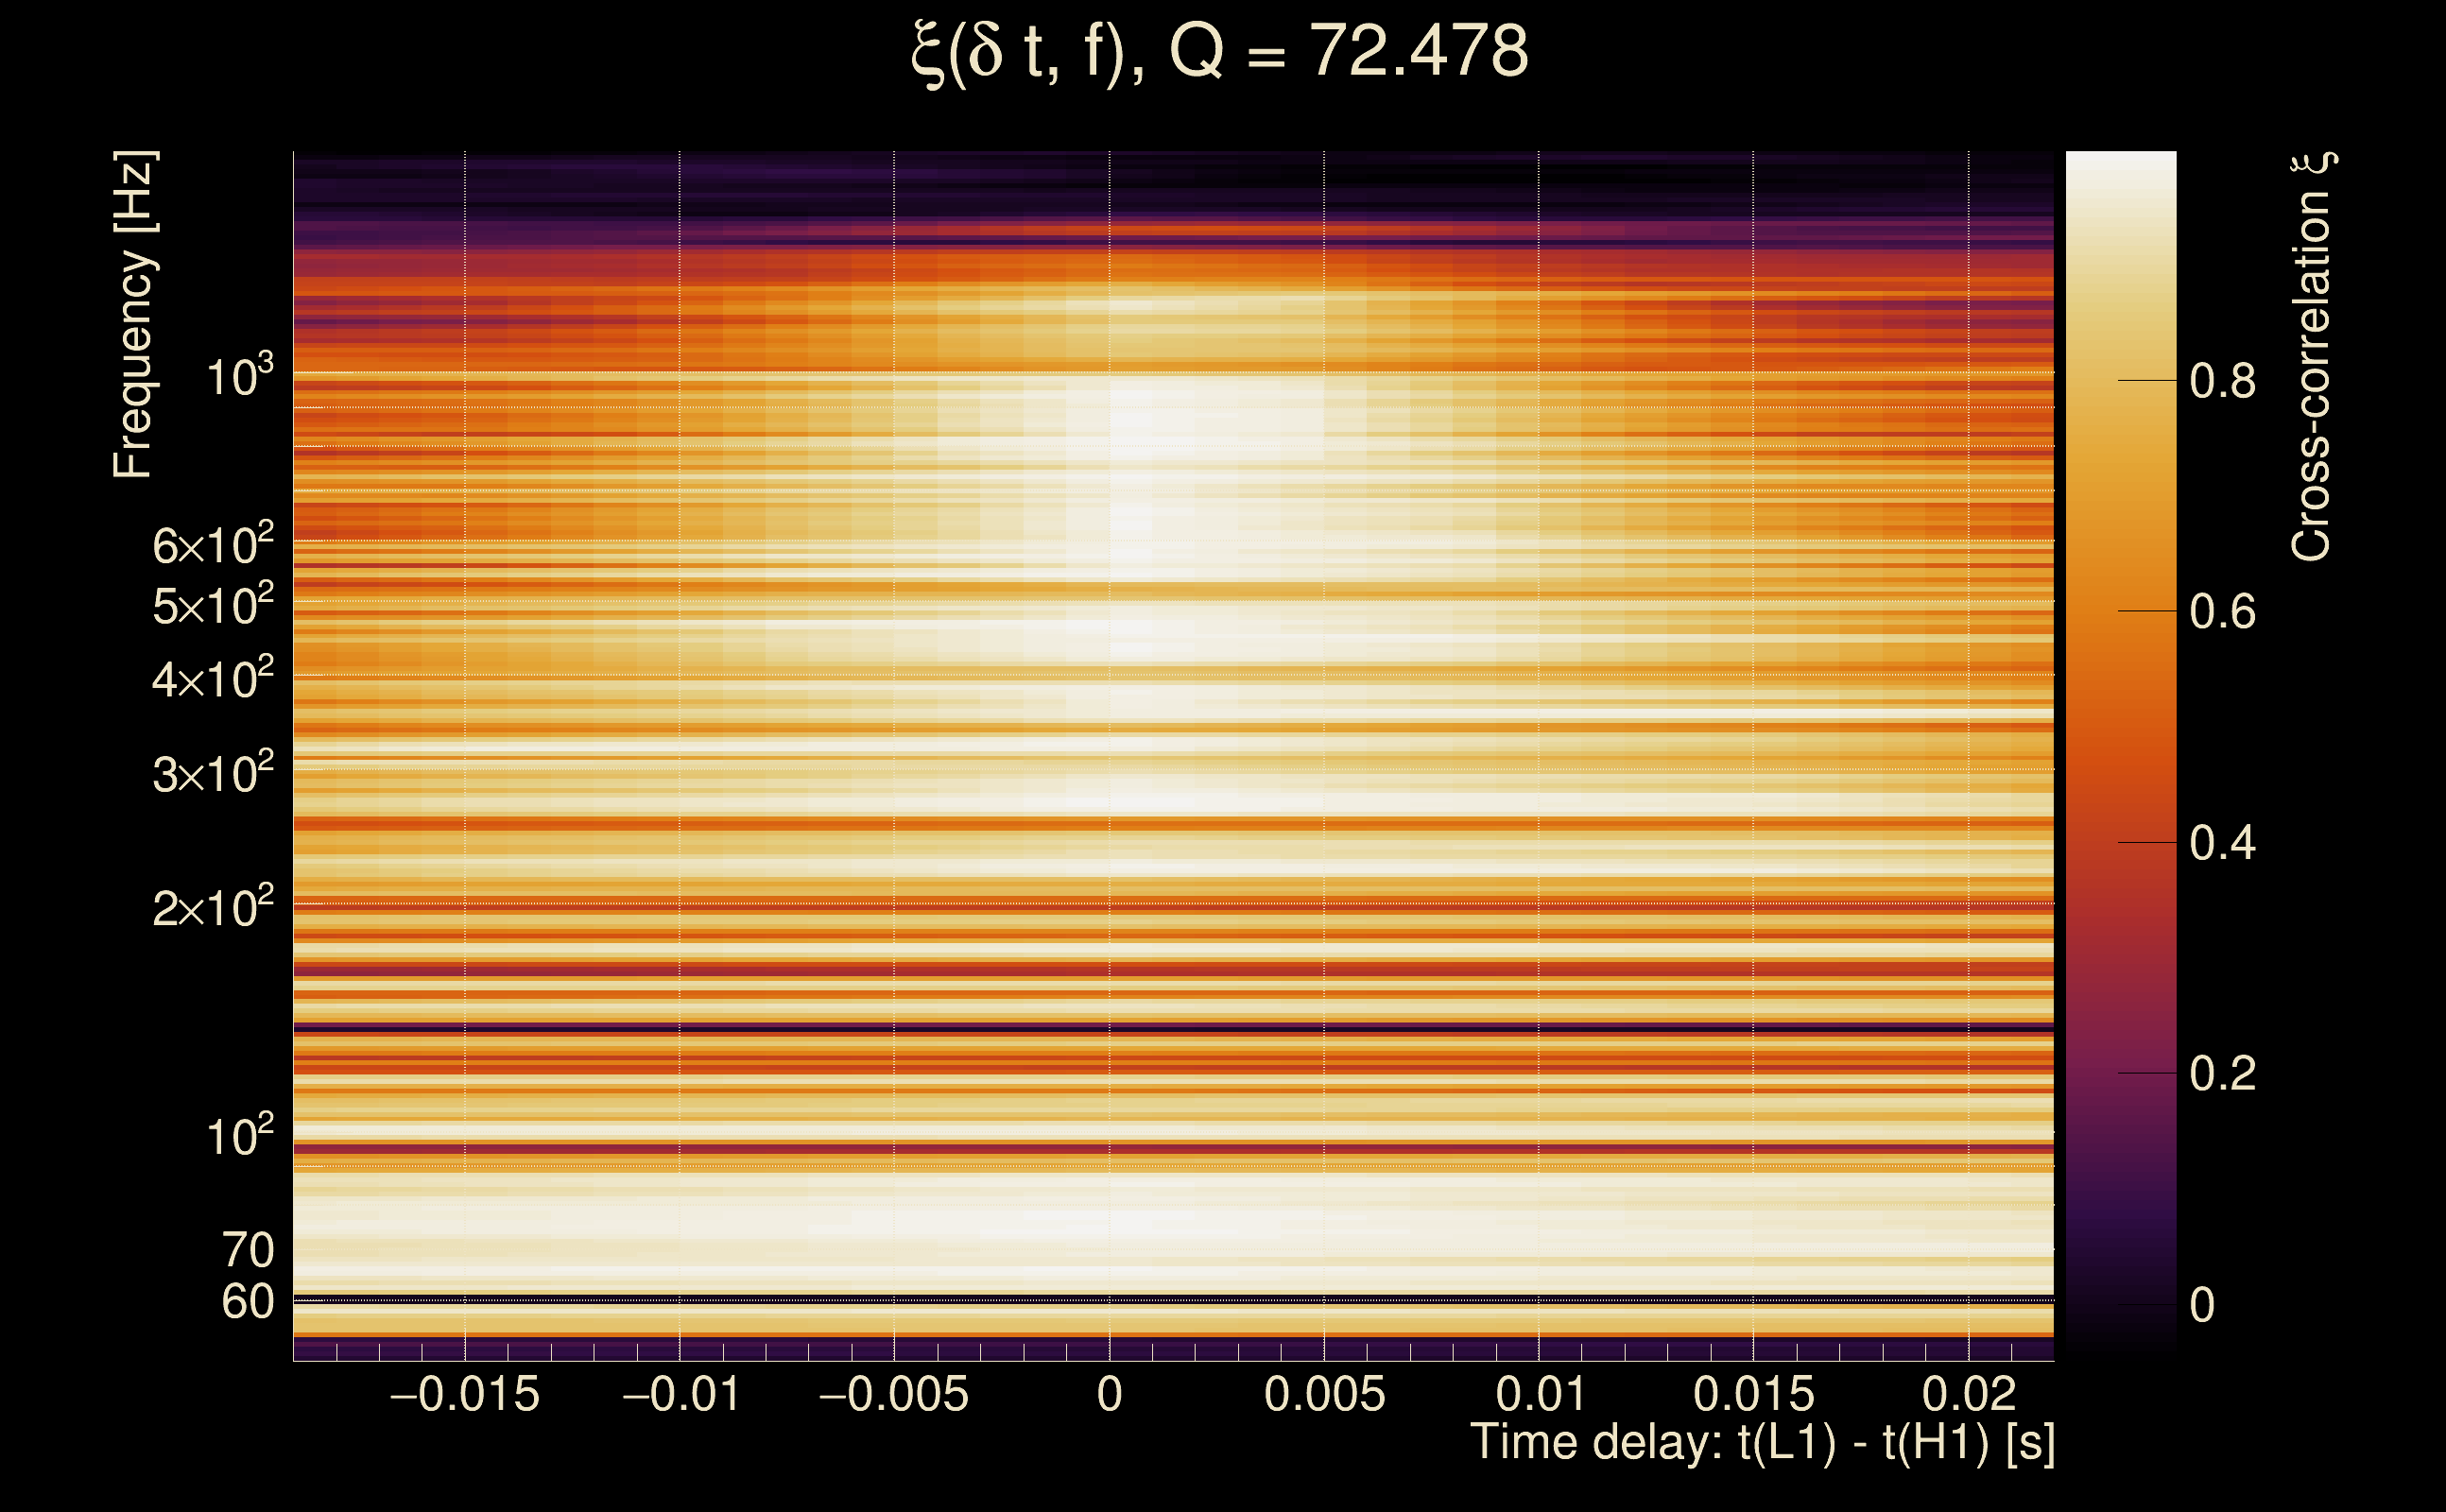
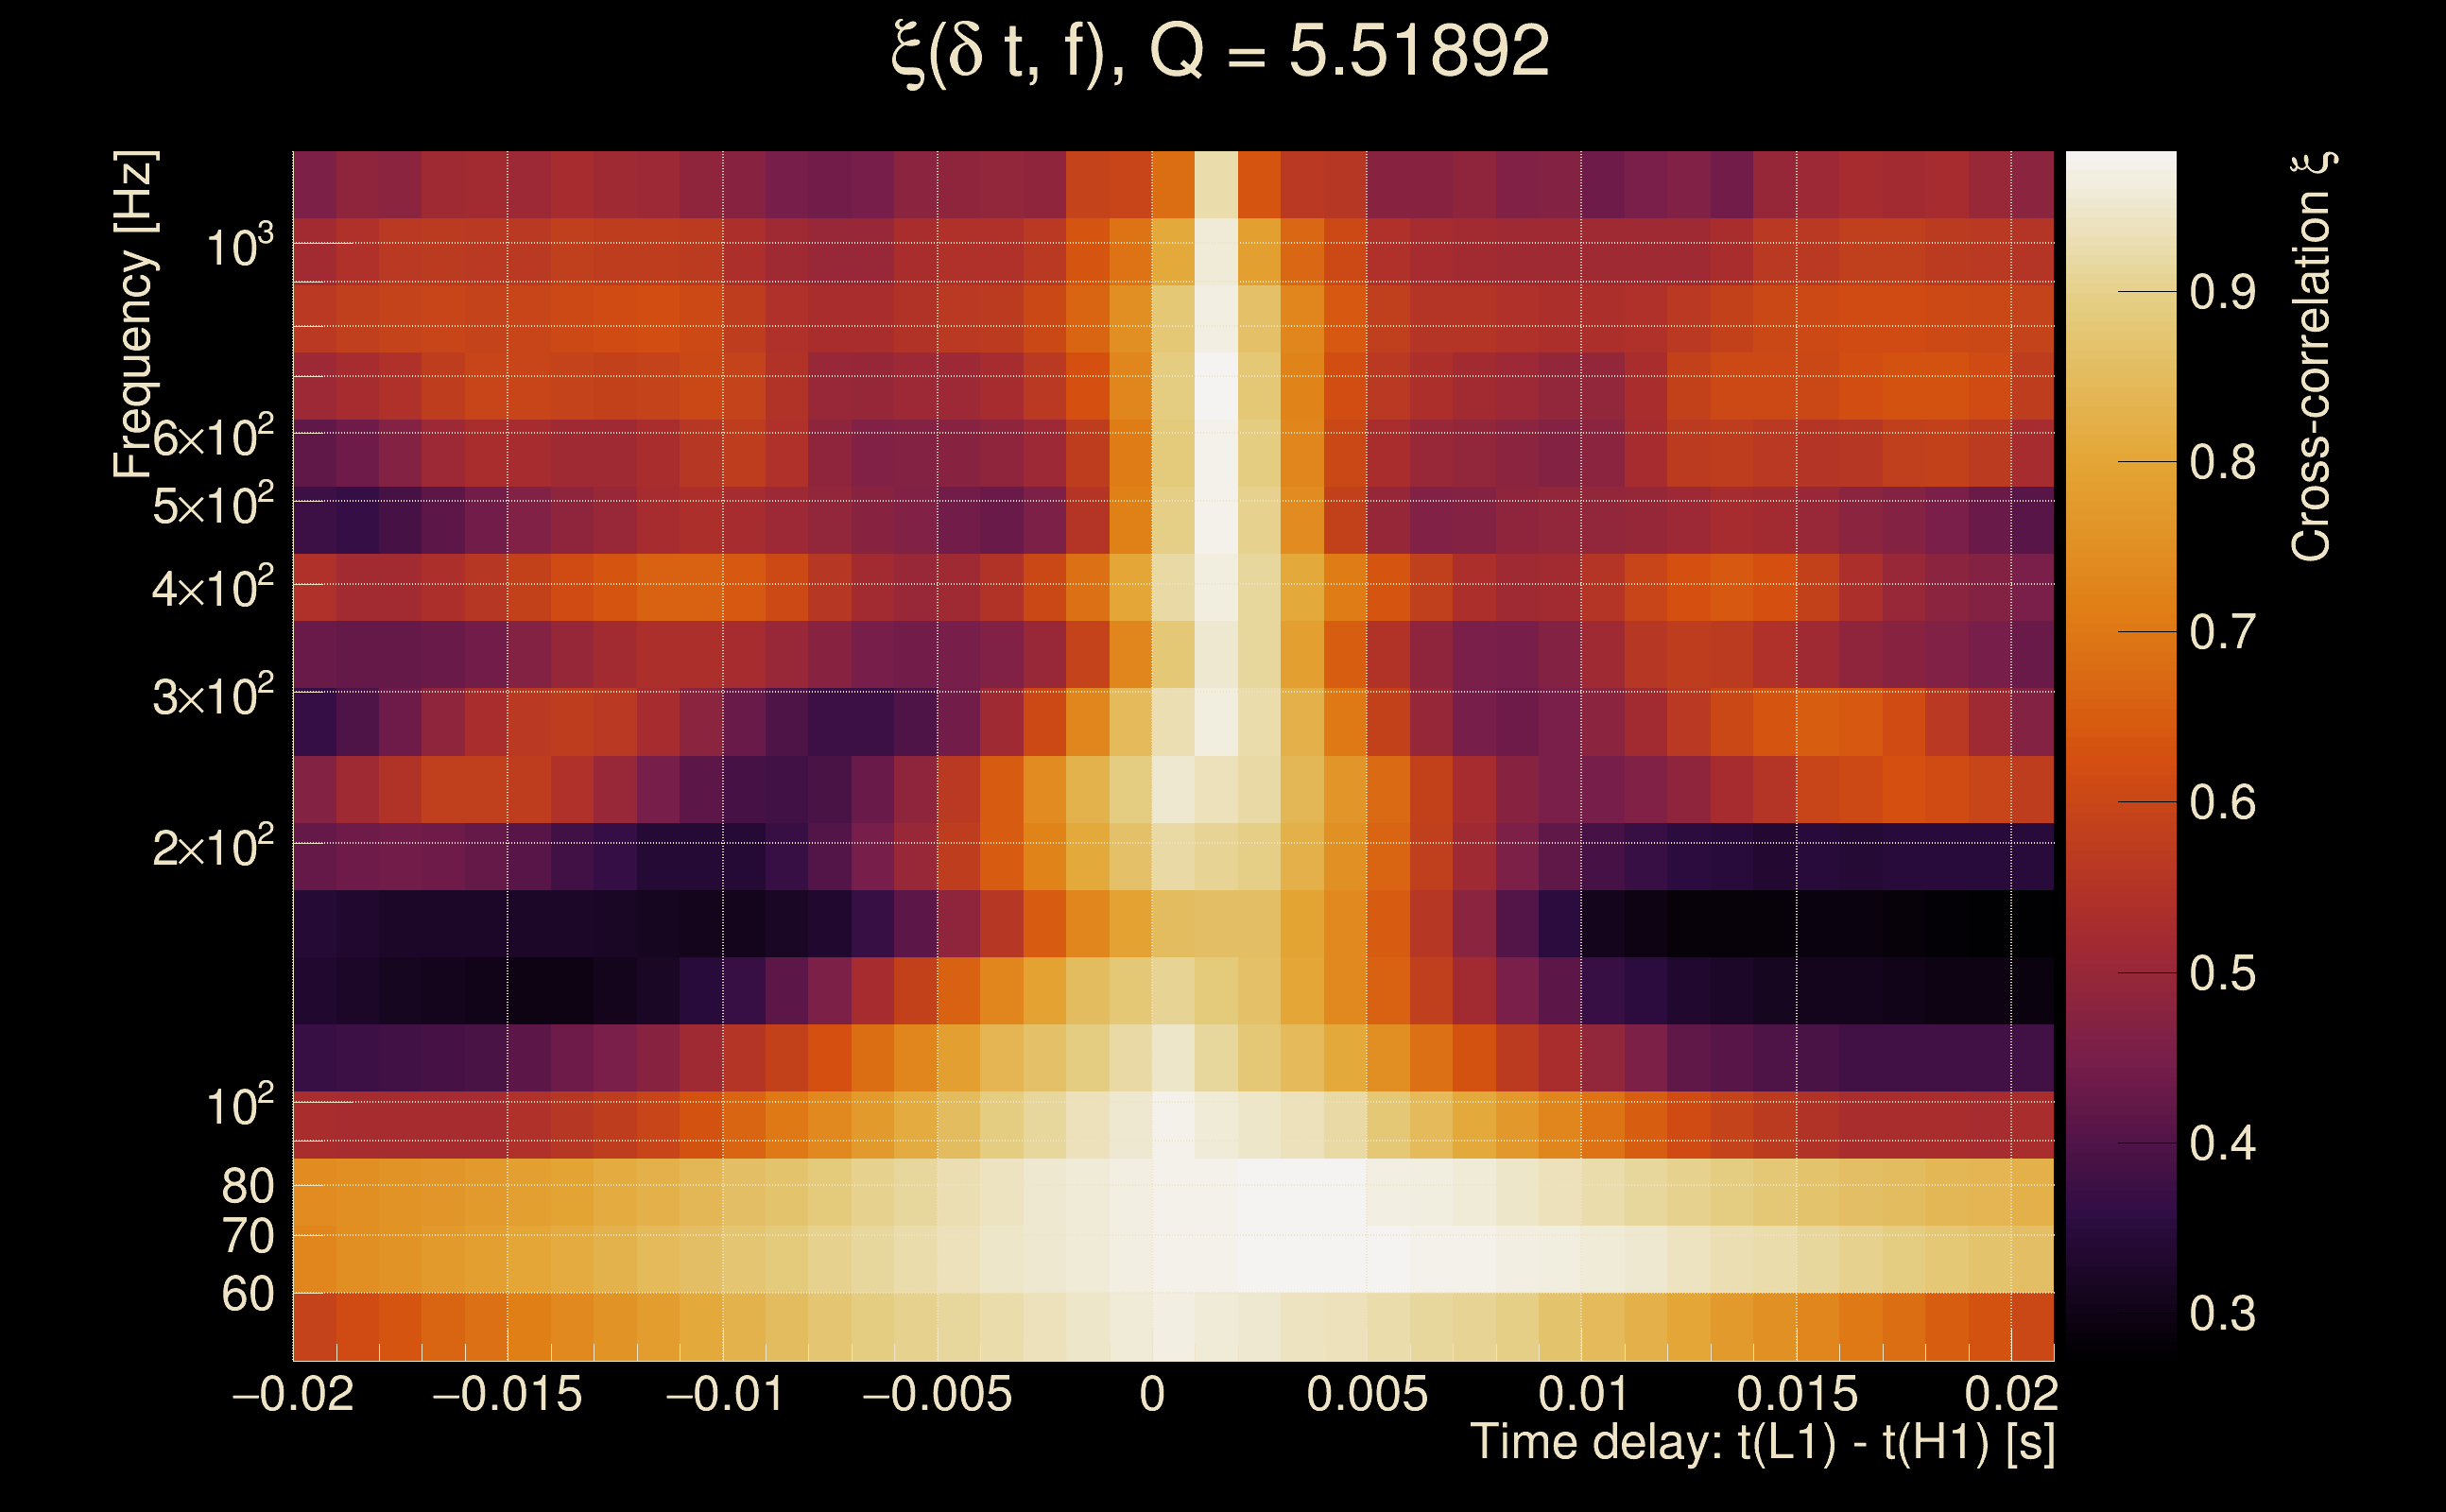
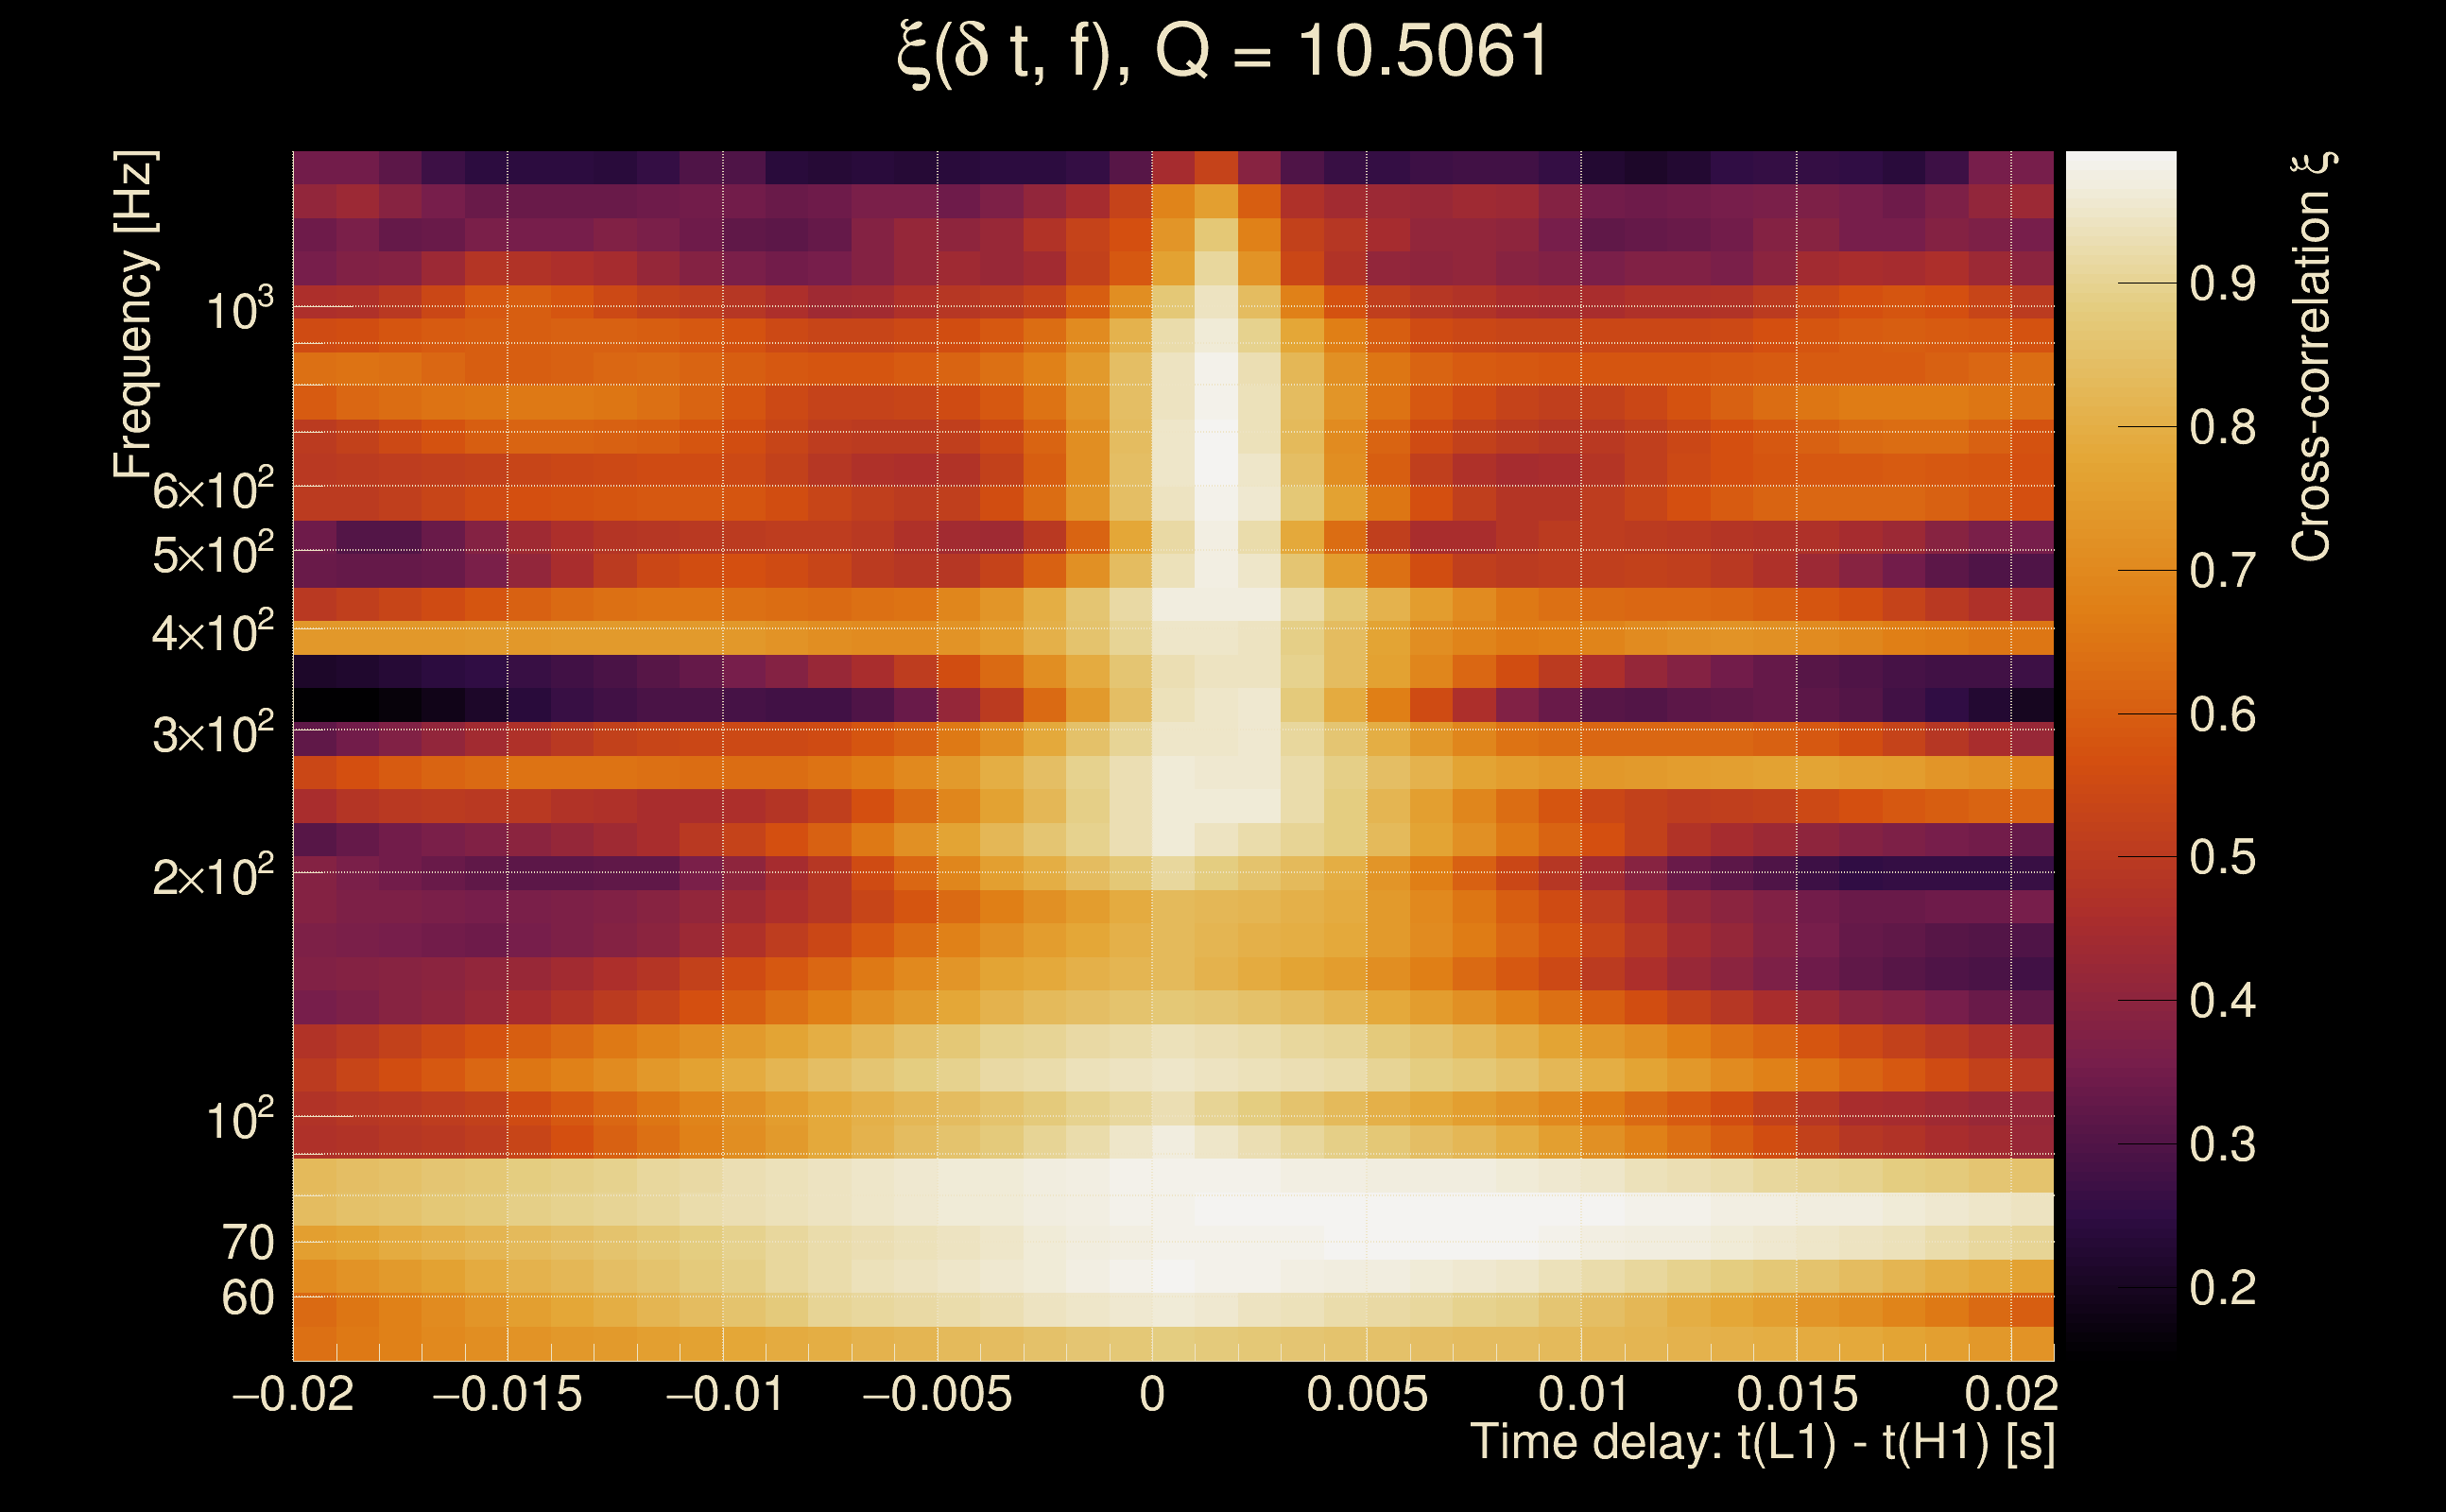
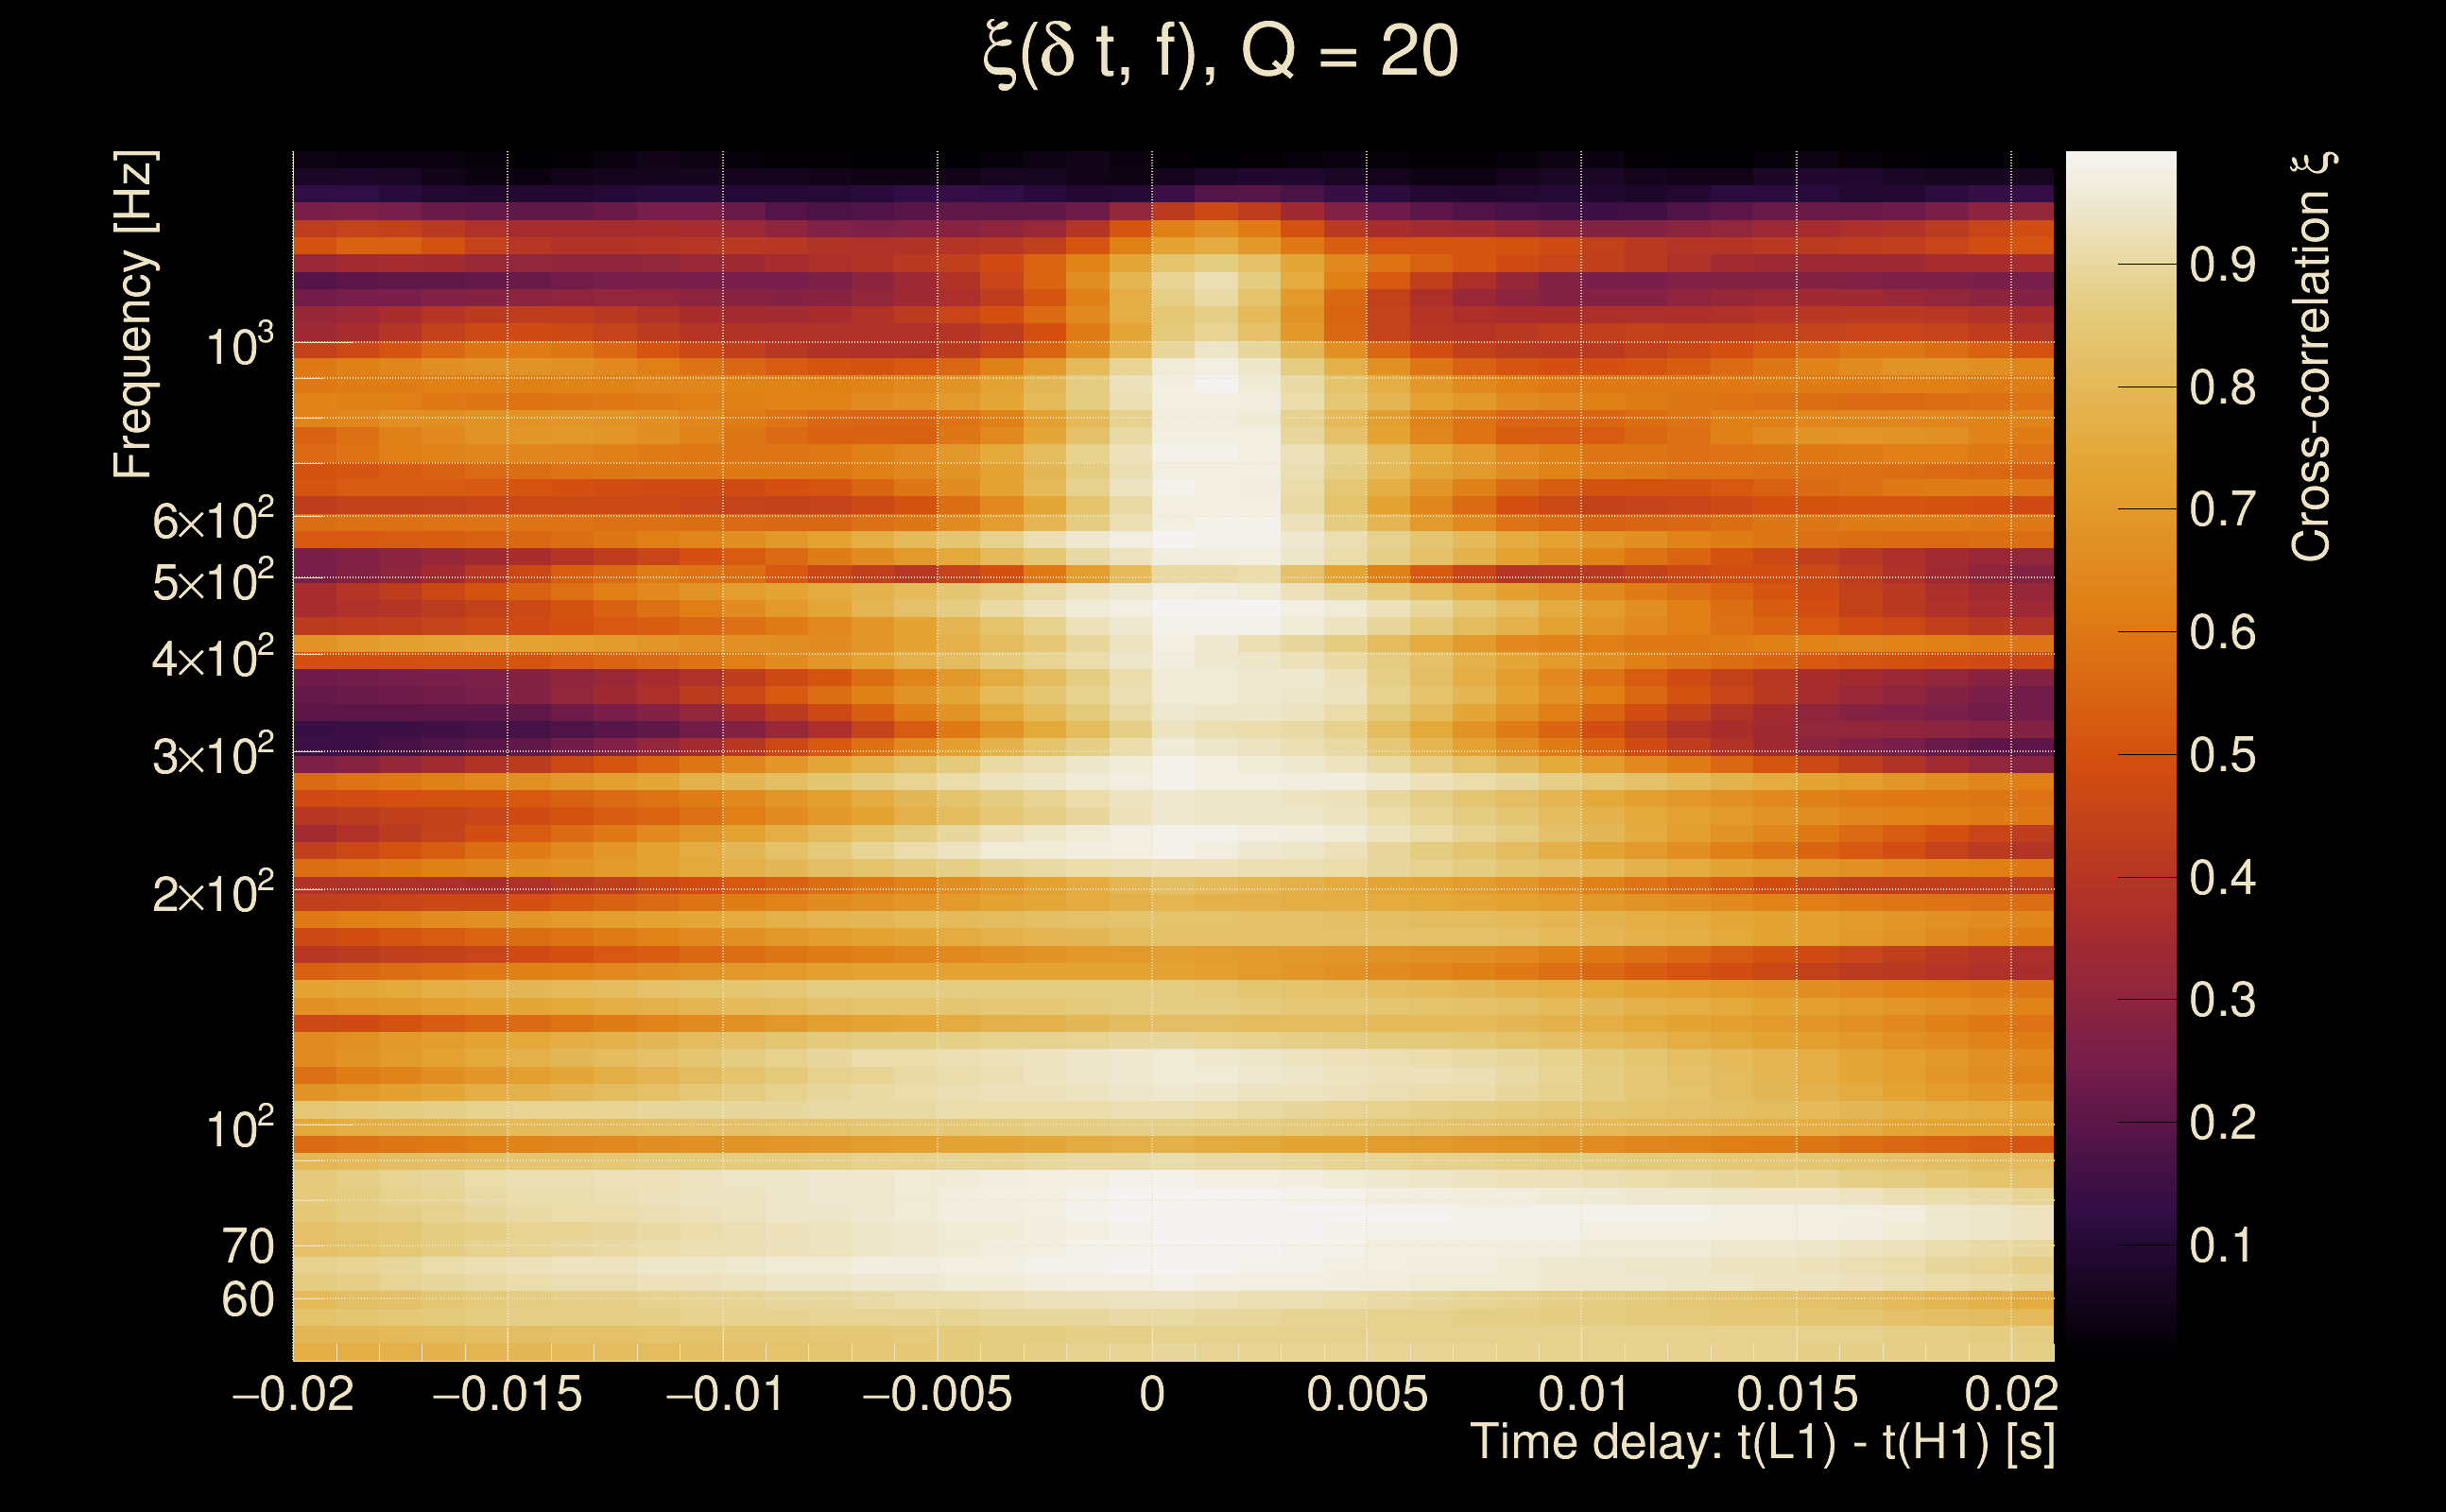
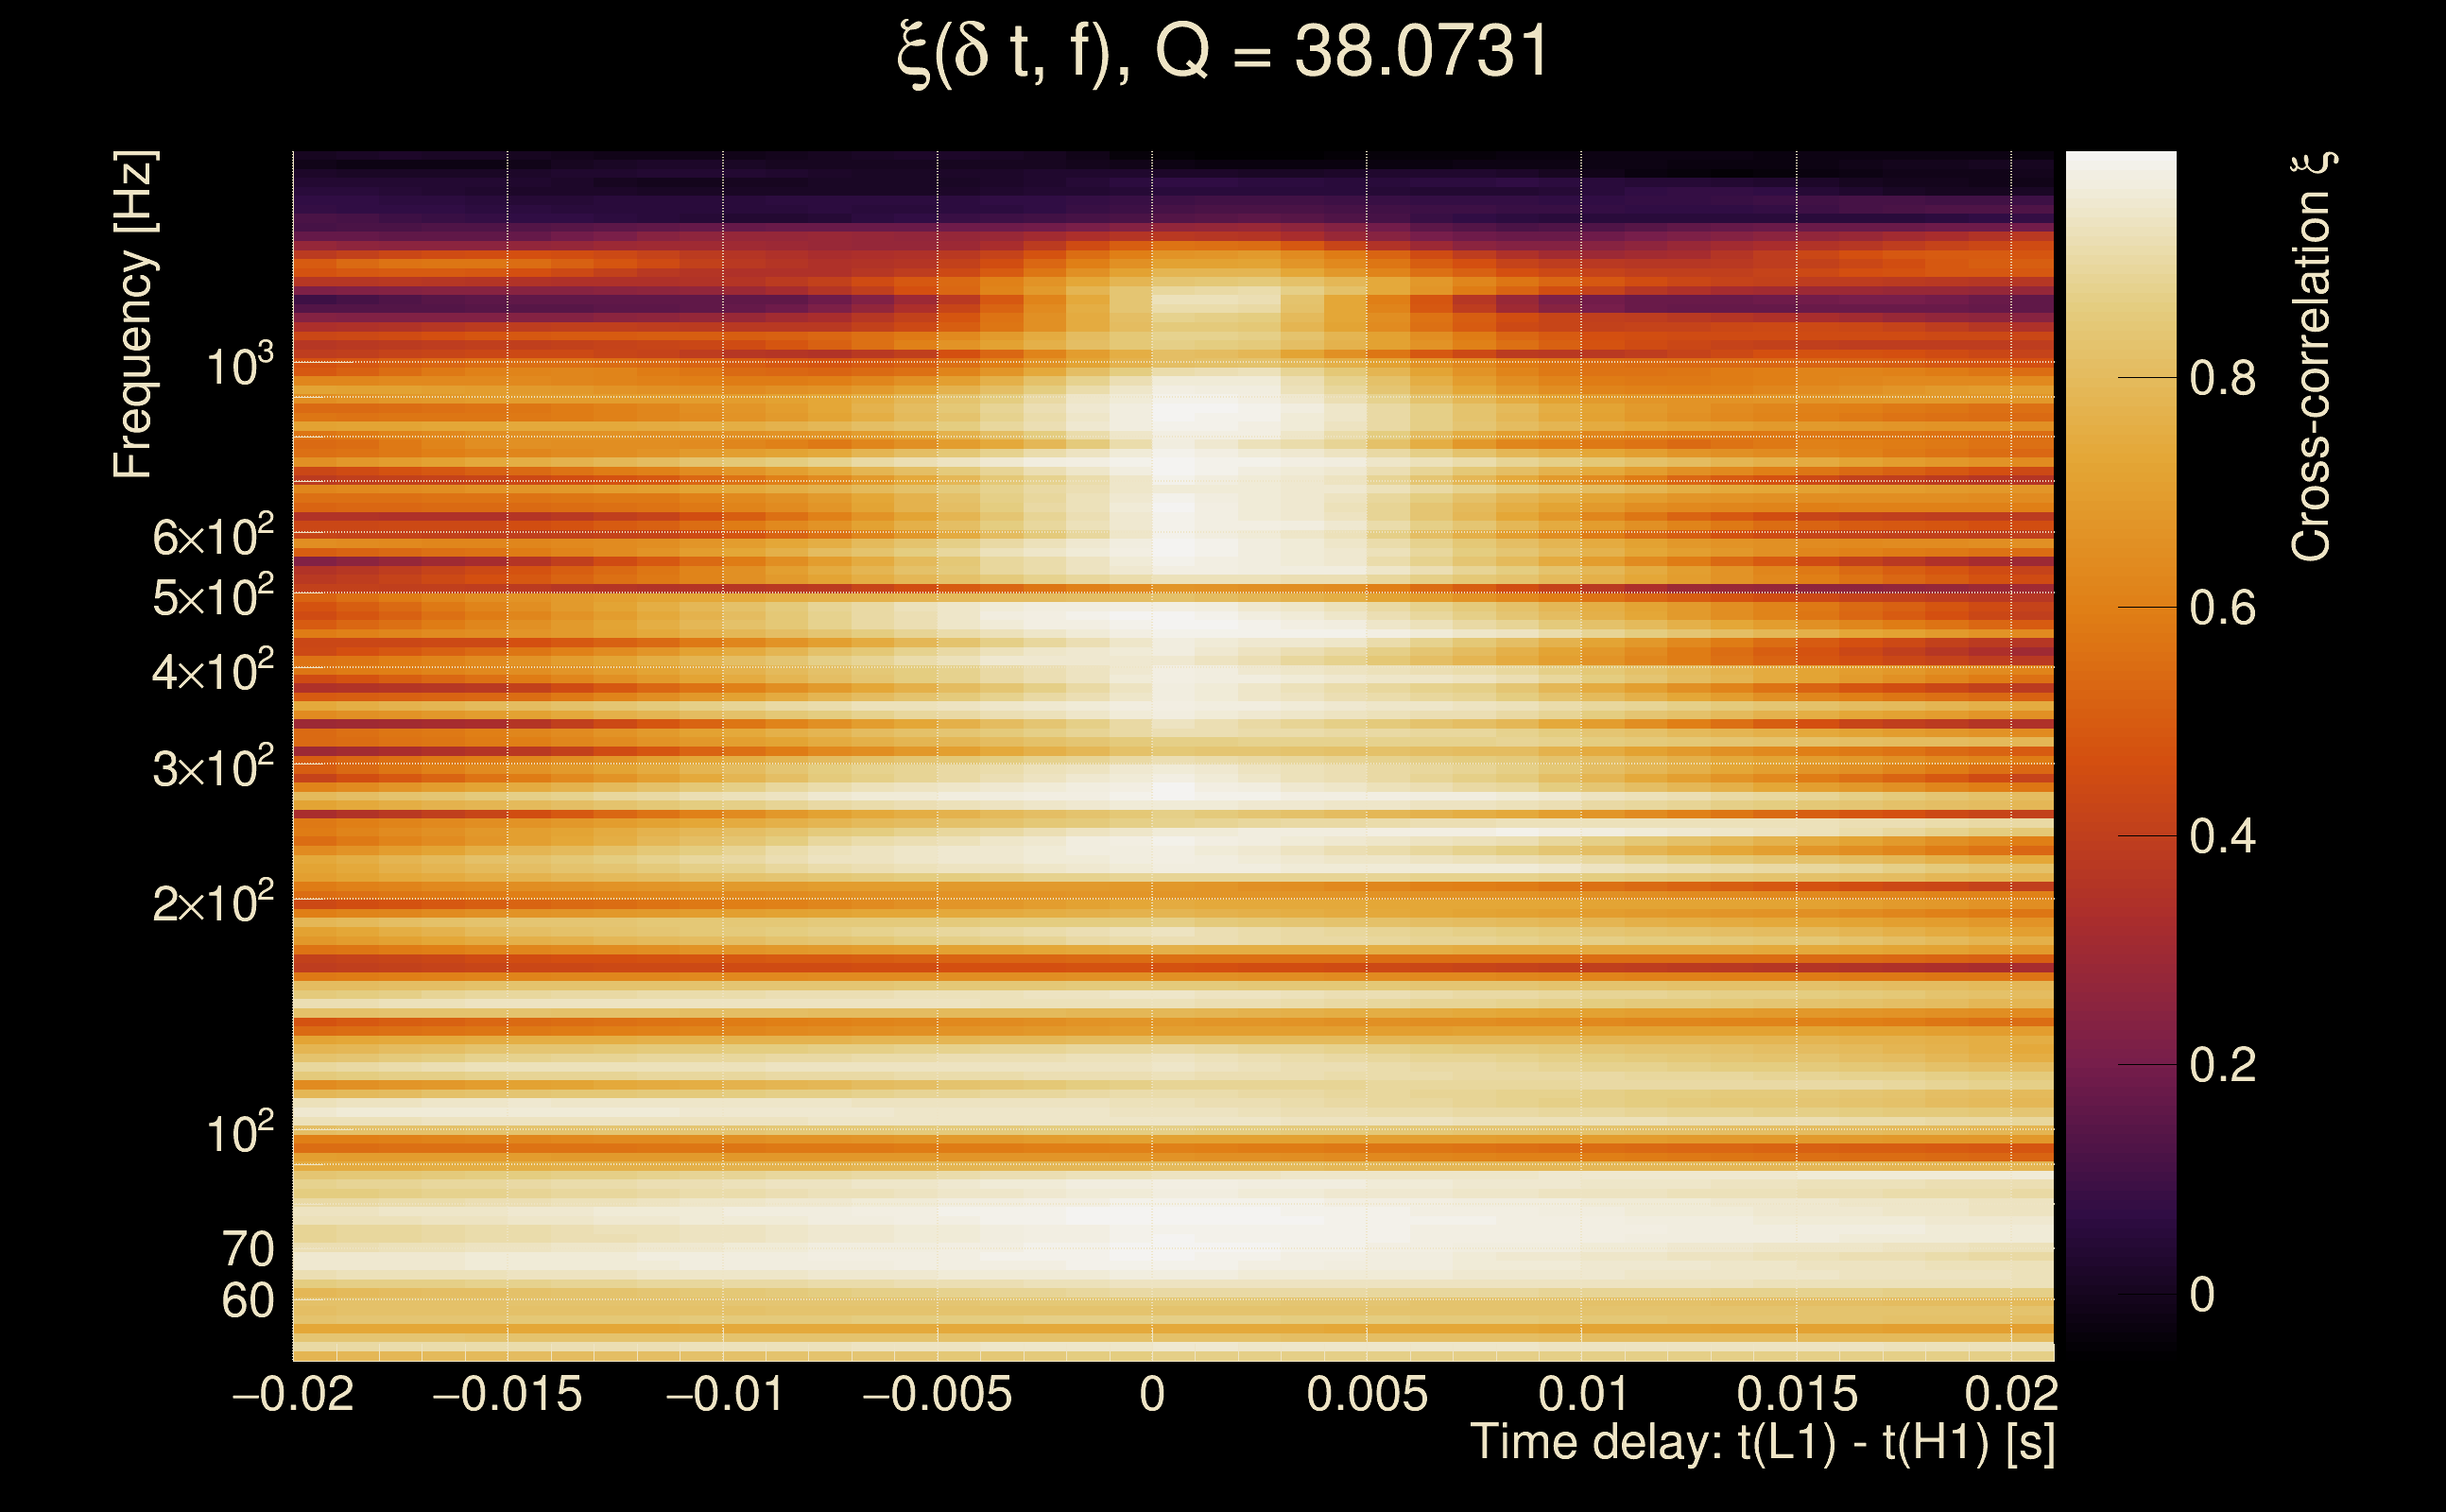
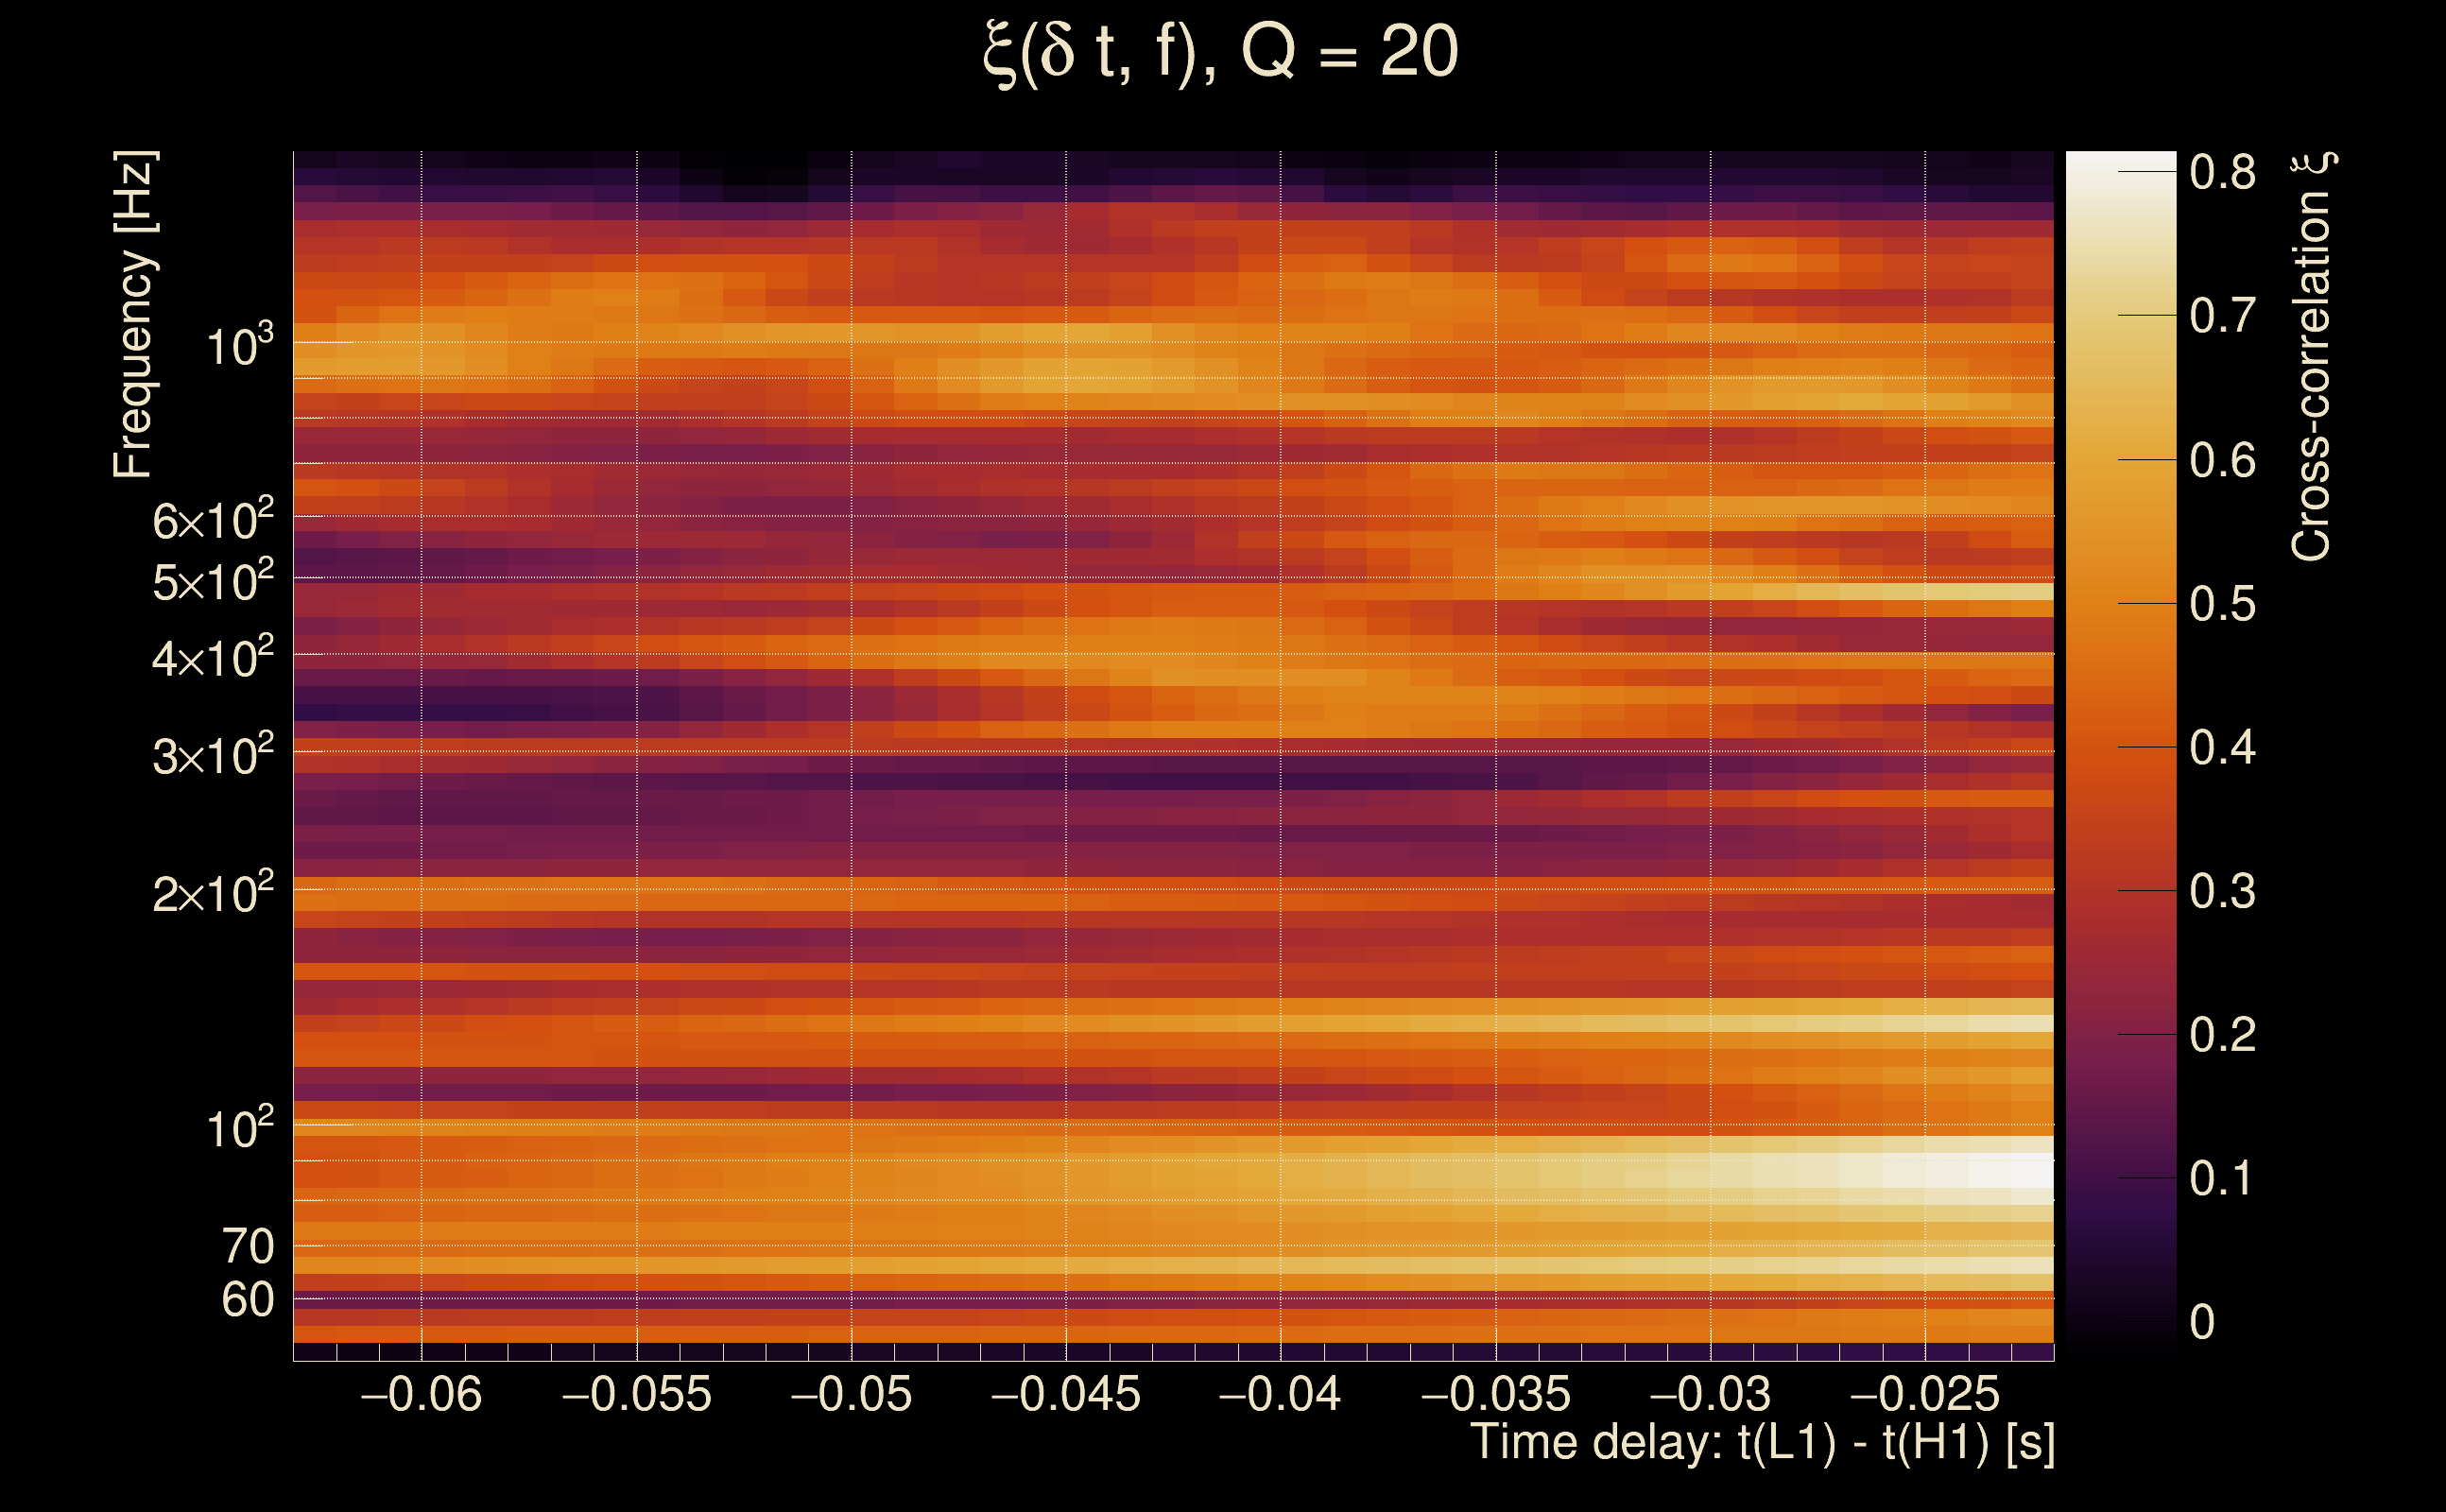
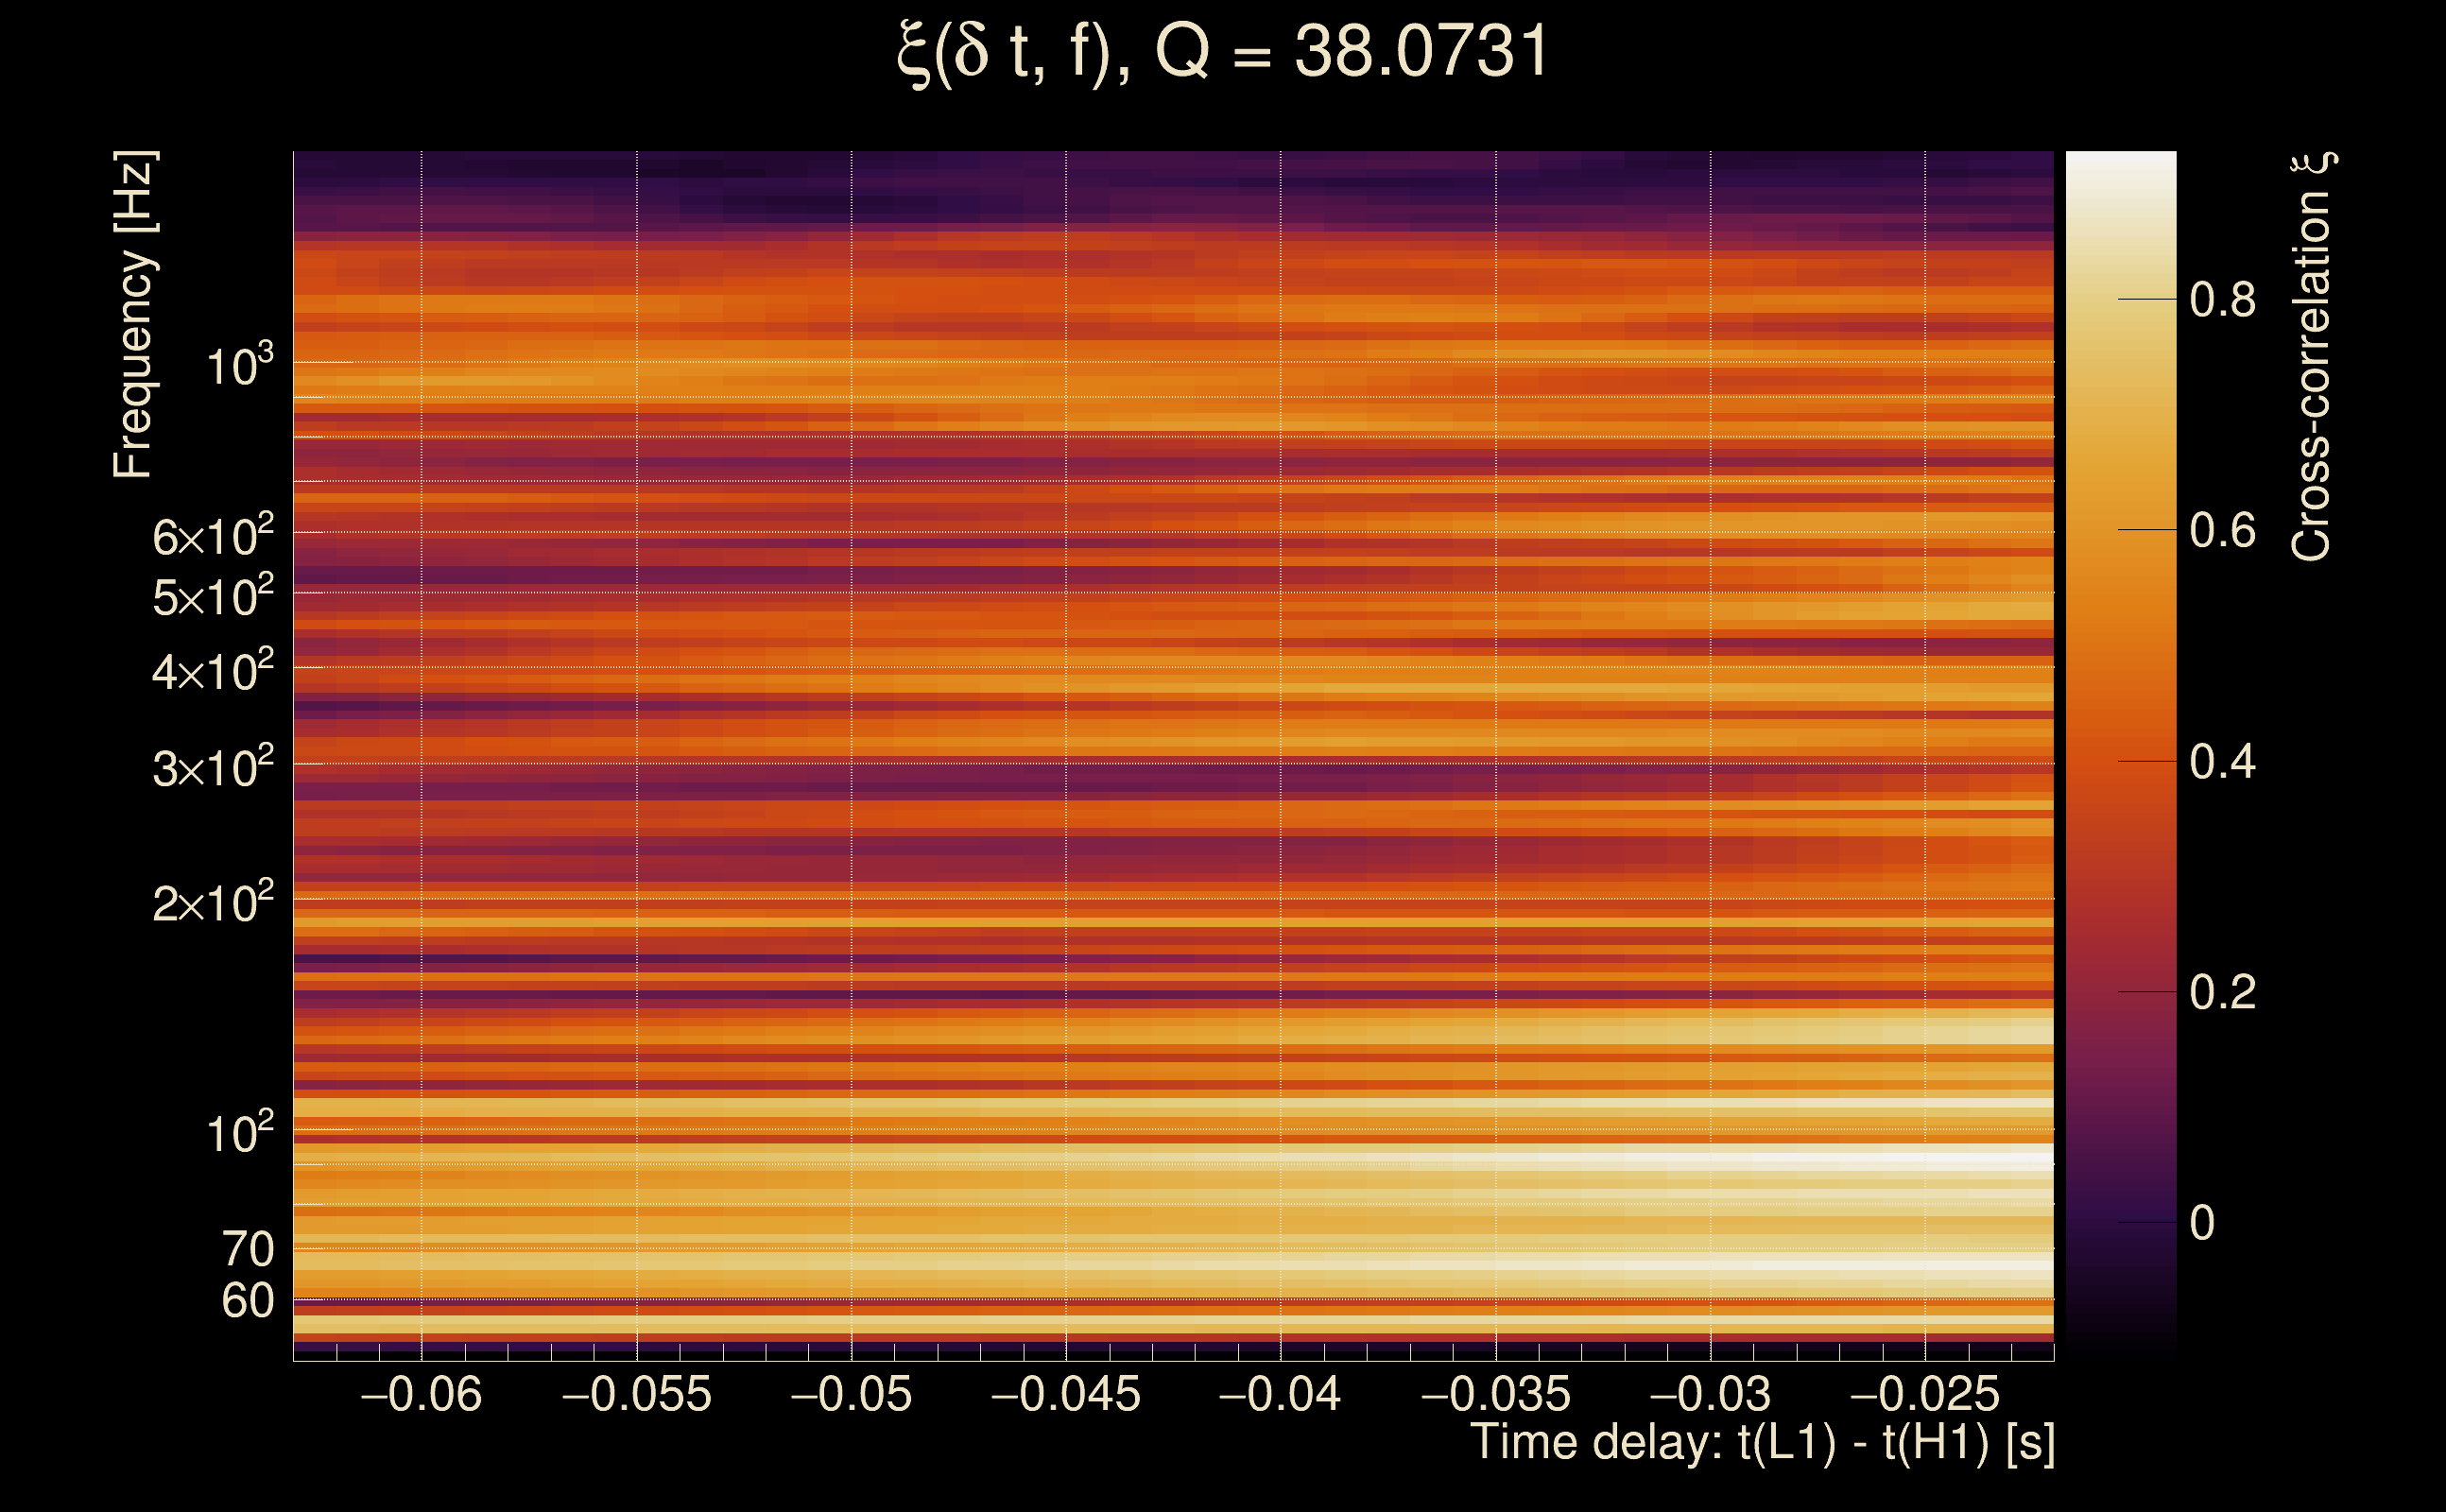
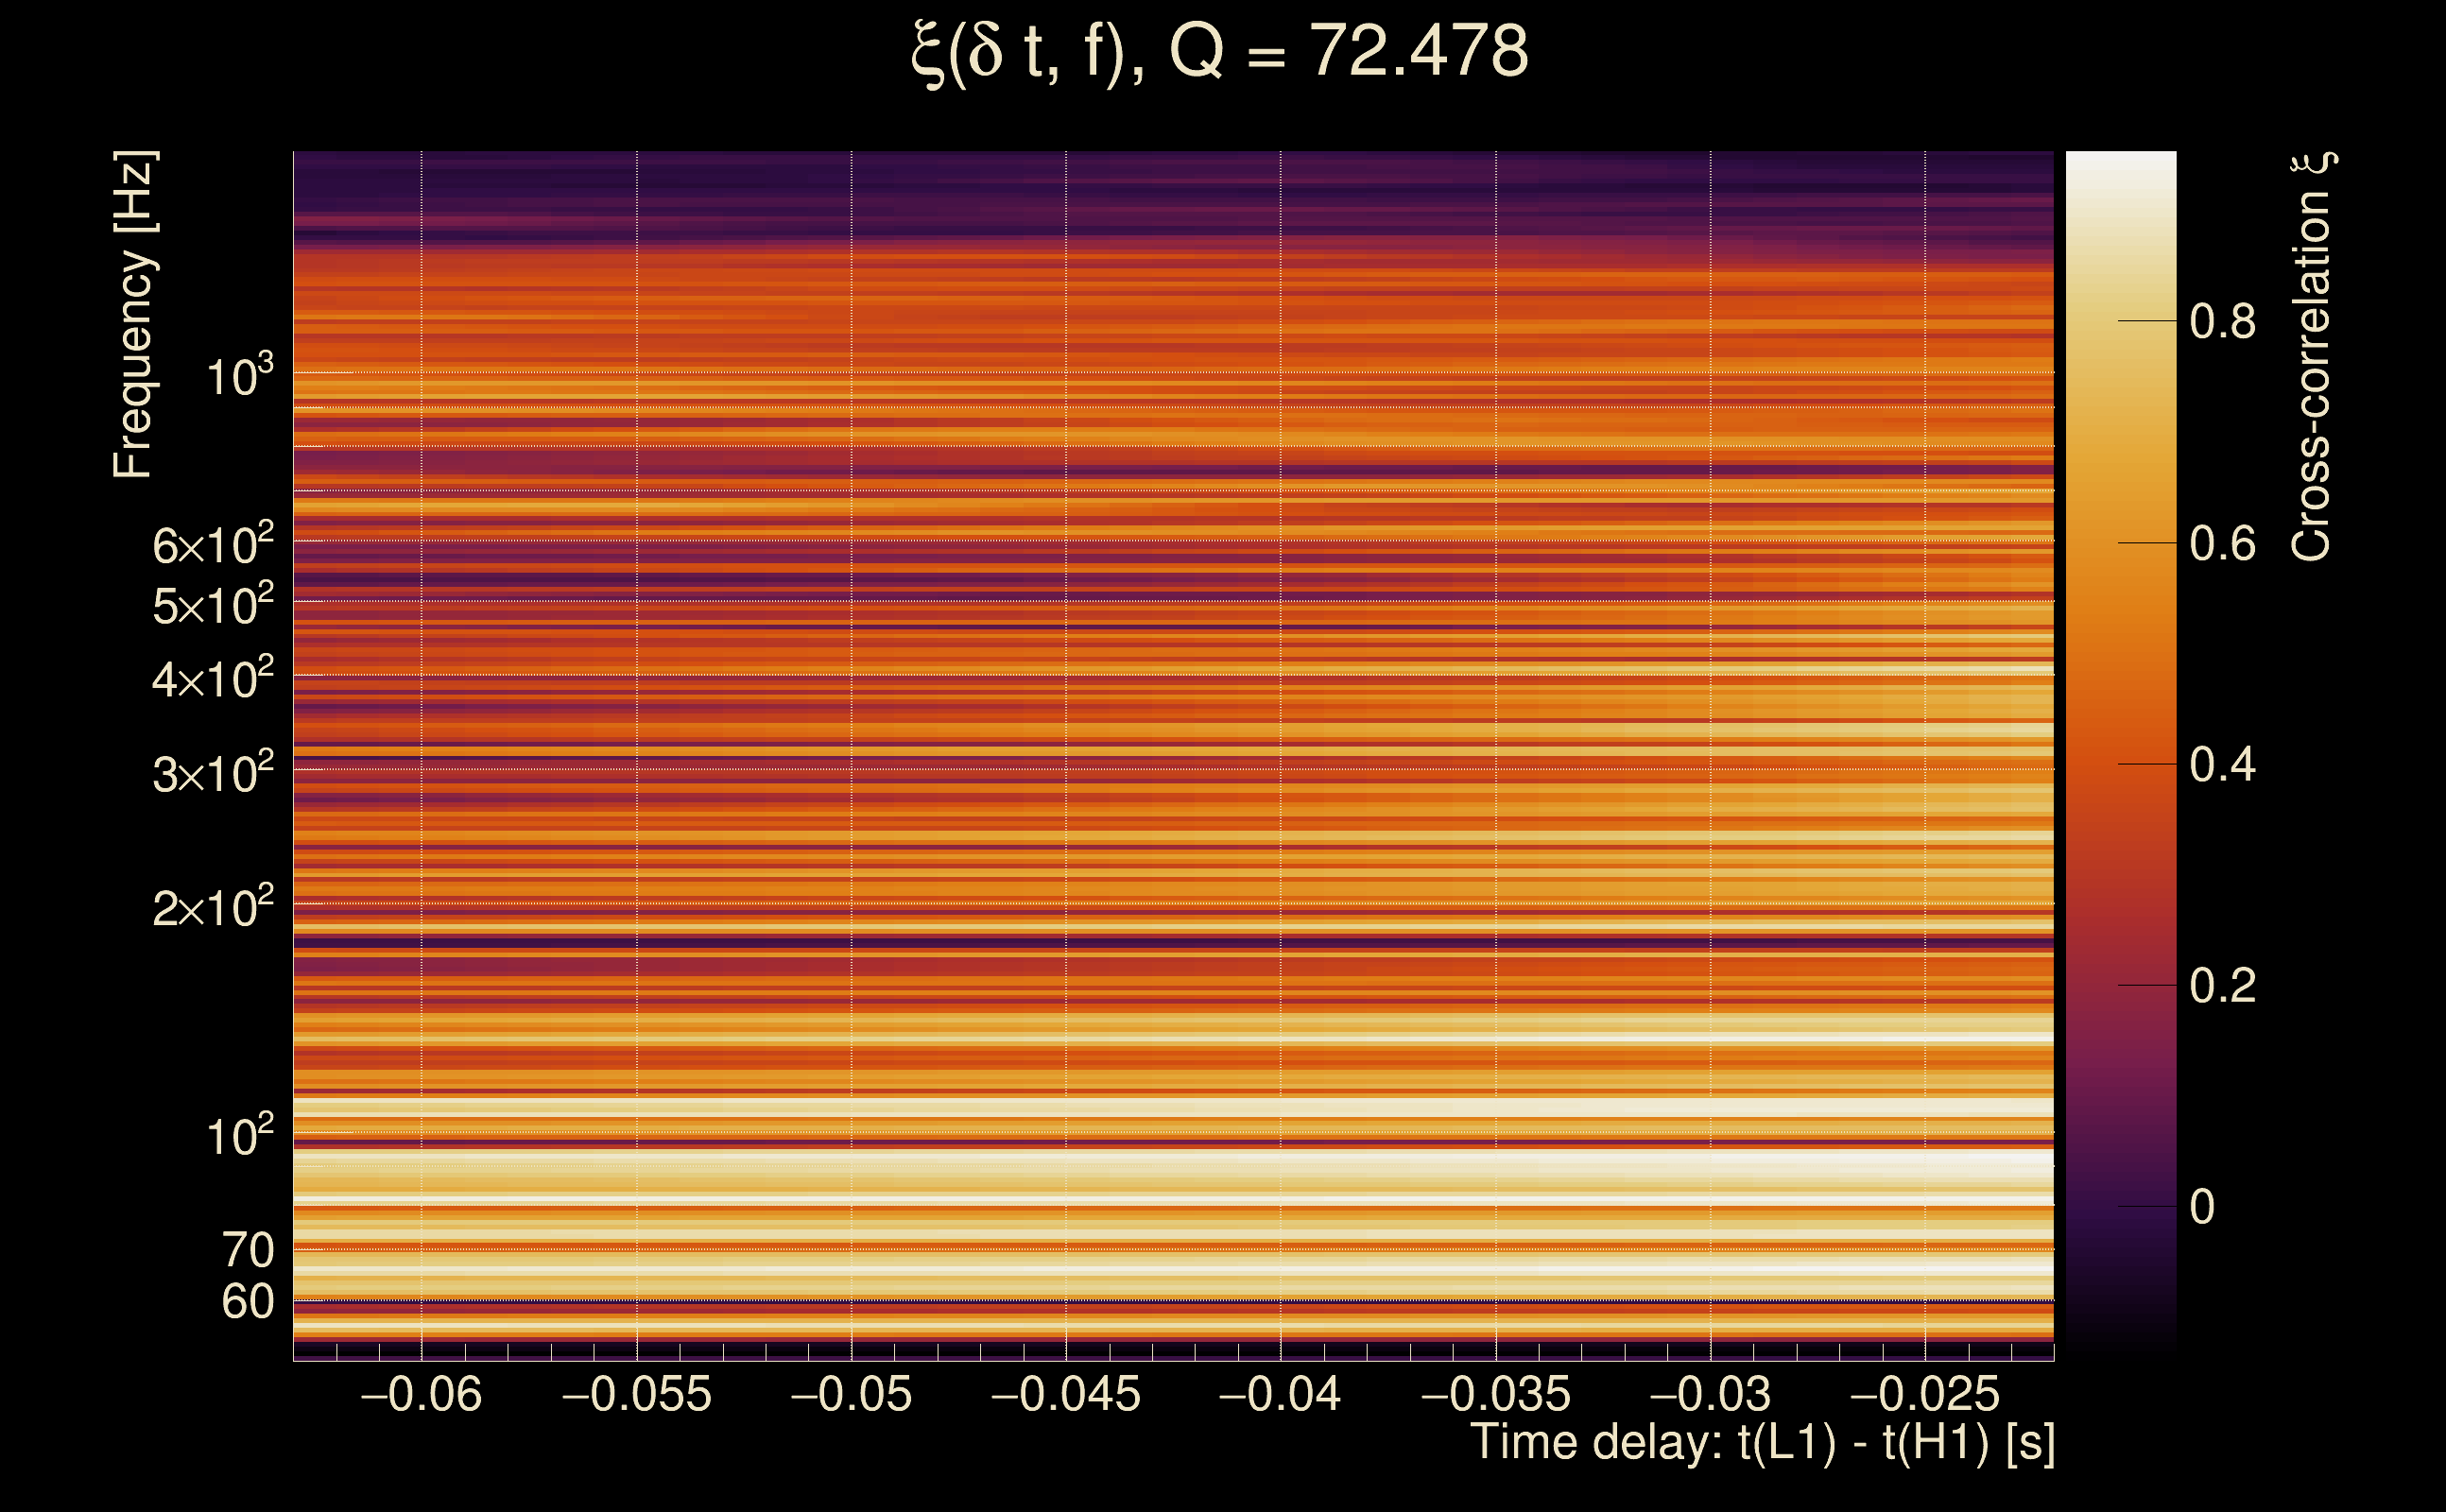
| Number of Q planes: | 5 (Q = 5.51892 → Q = 72.478) |
| Omicron frequency range: | 50 Hz → 1958.38 Hz |
| Light travel time between detectors: | 0.0100128 s |
| Slice extra-time (calibration uncertainty + slice veto): | 0.0129872 s |
| Number of time-delay bins in a cross-correlation map: | 10000 |
| Number of slices in a cross-correlation map: | 217 |
| Number of time-delay bins in a slice: | 46 |
| SNR gating: | < 100 (detector 0), < 100 (detector 1) |
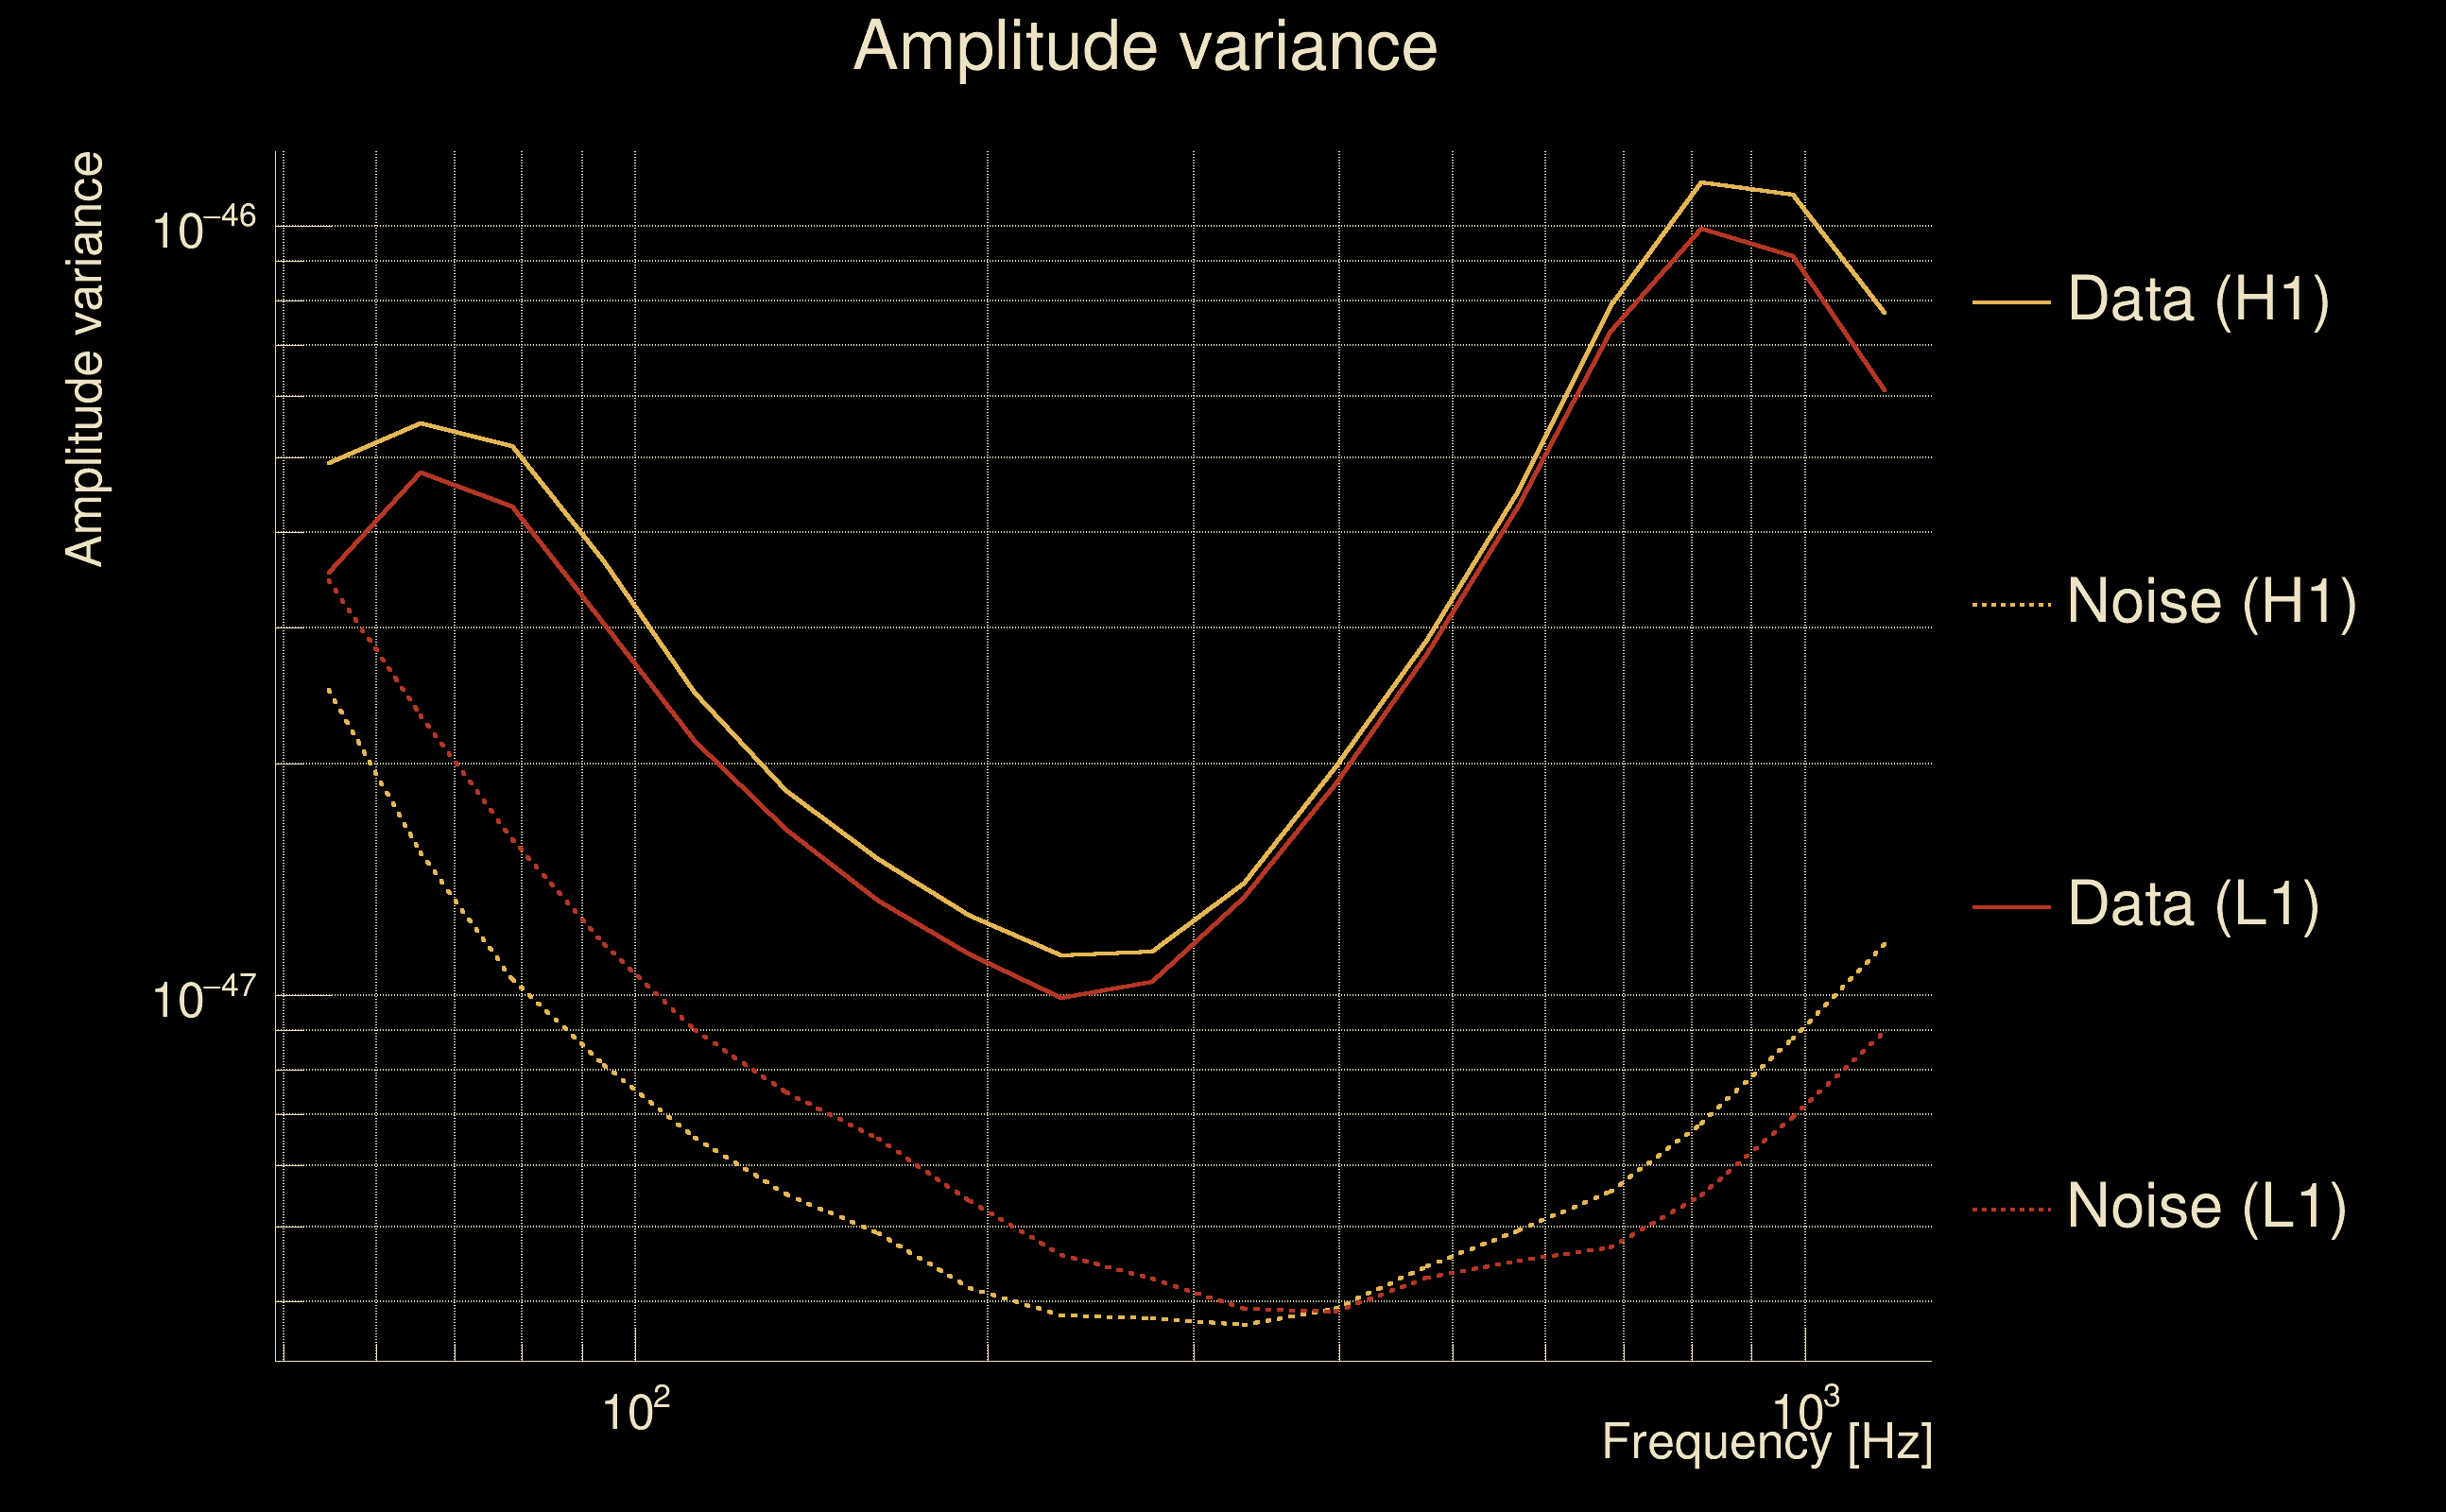
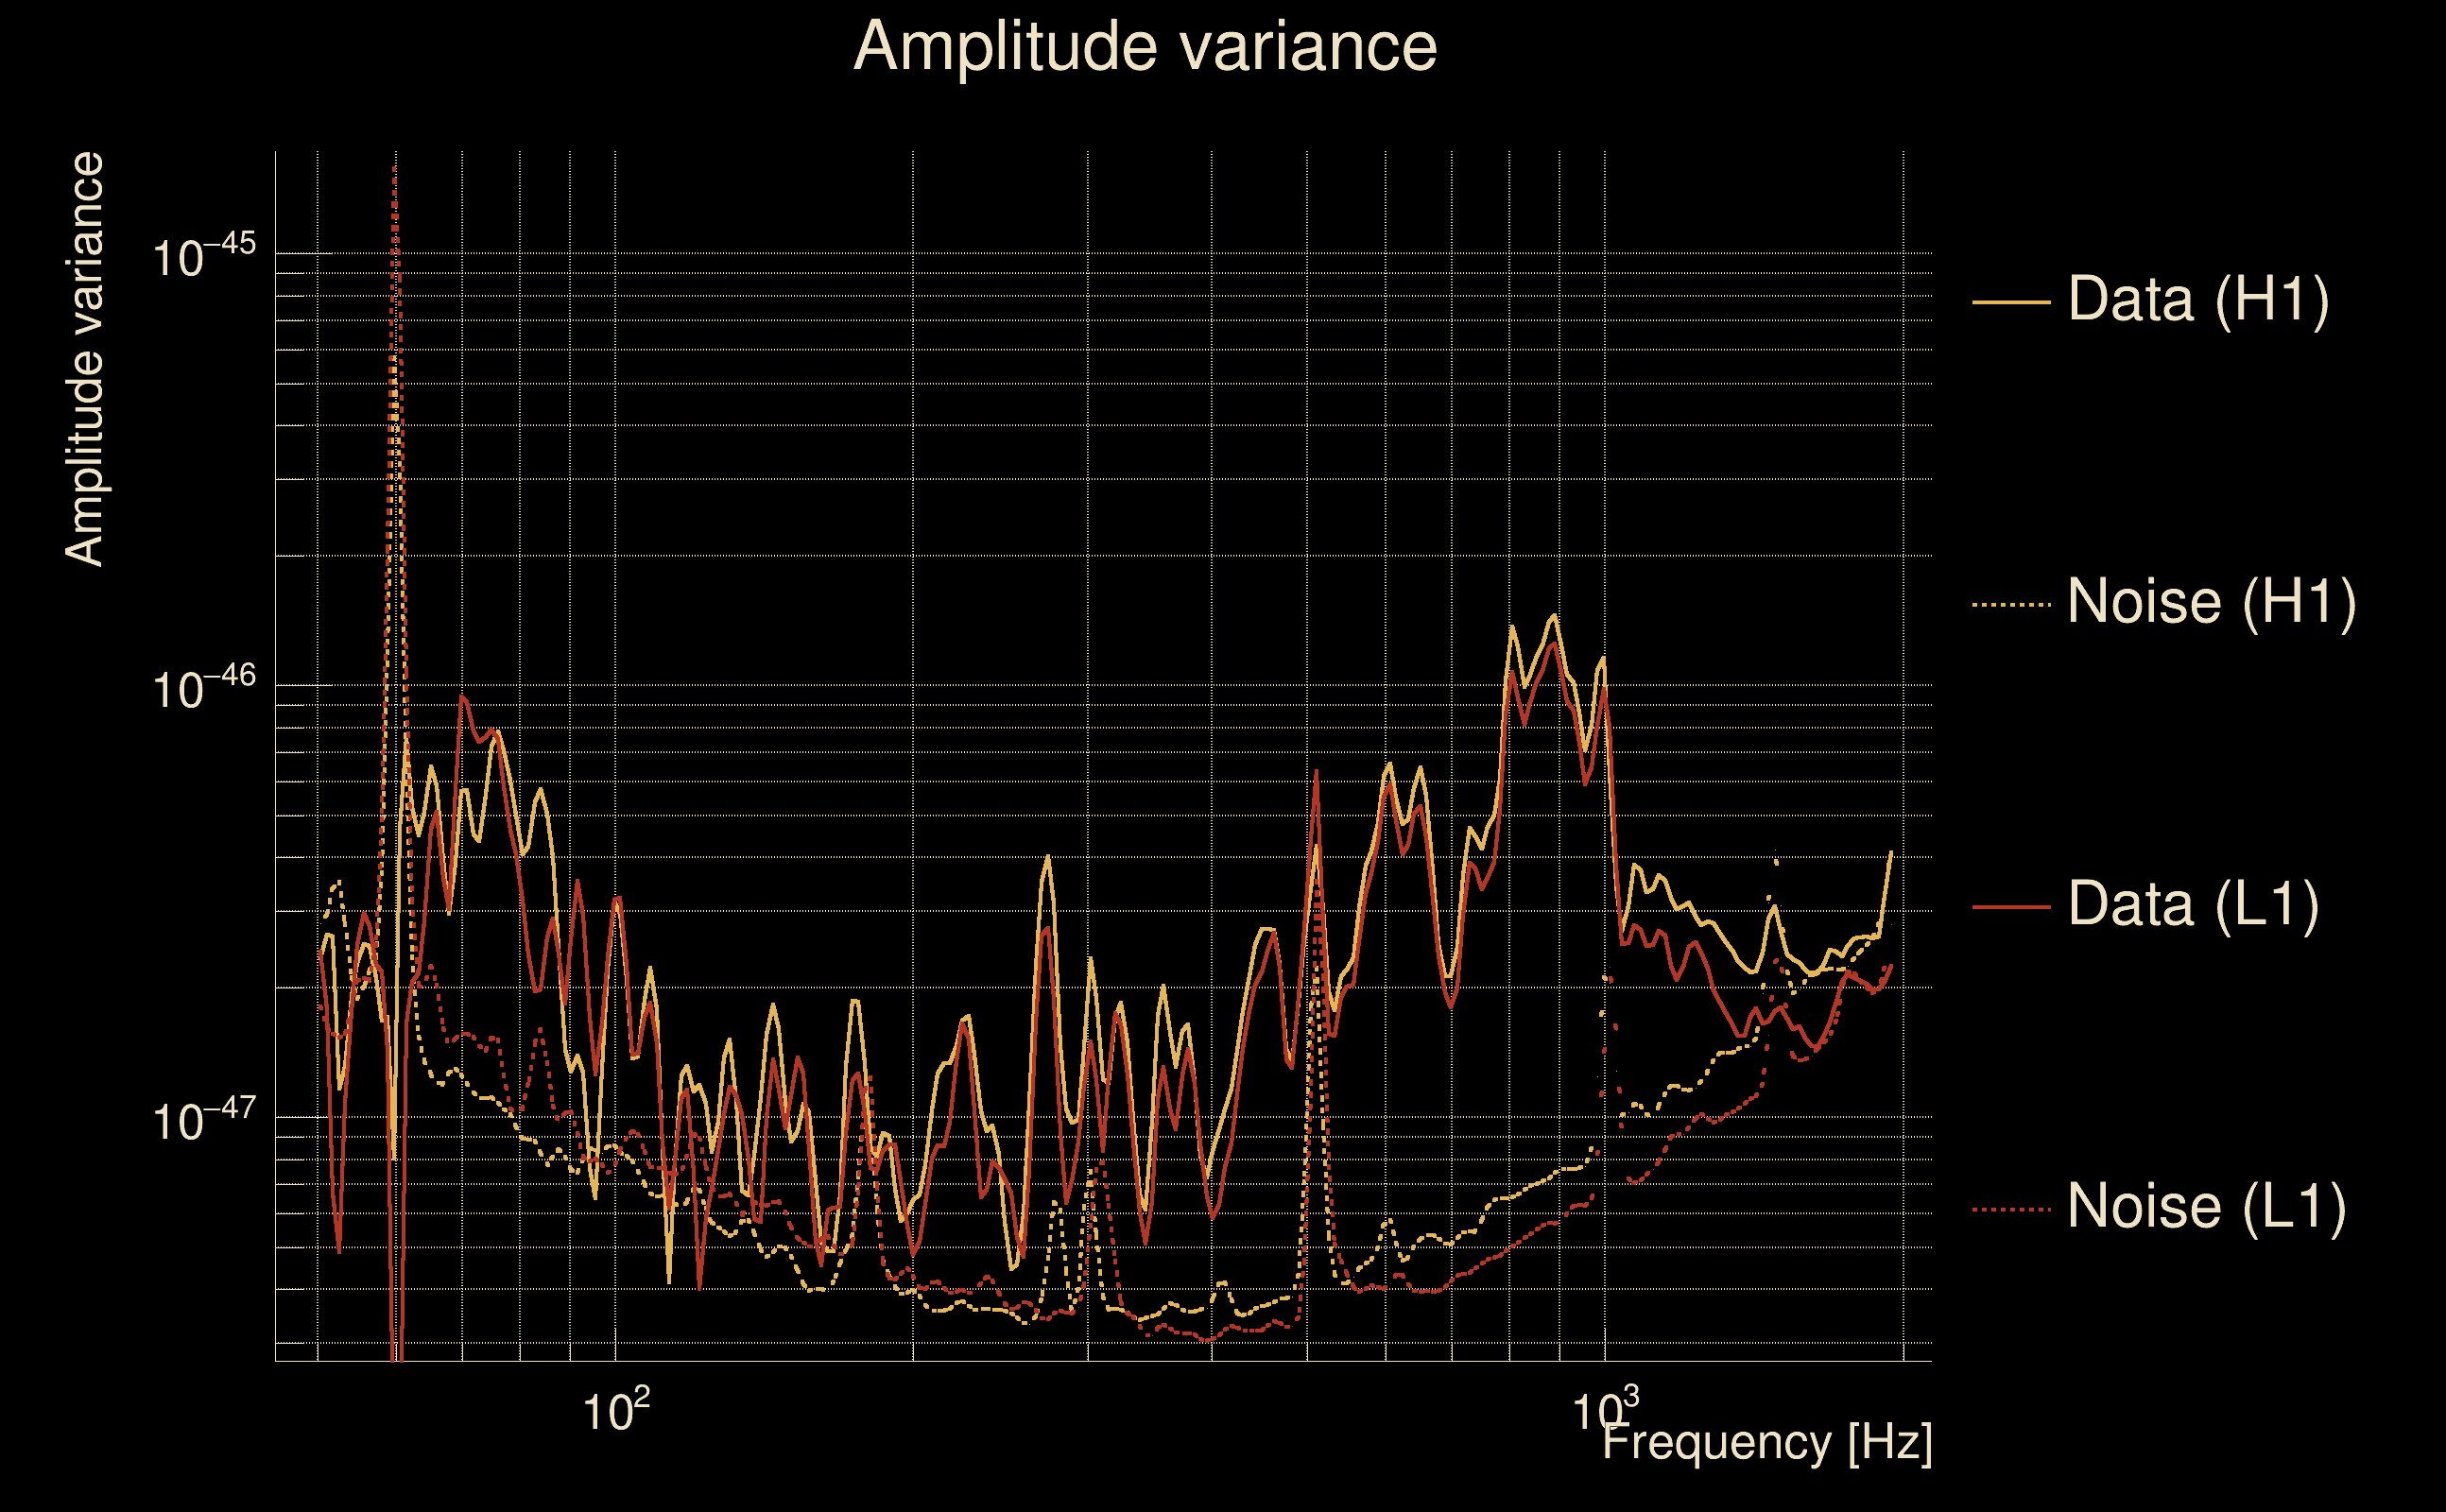
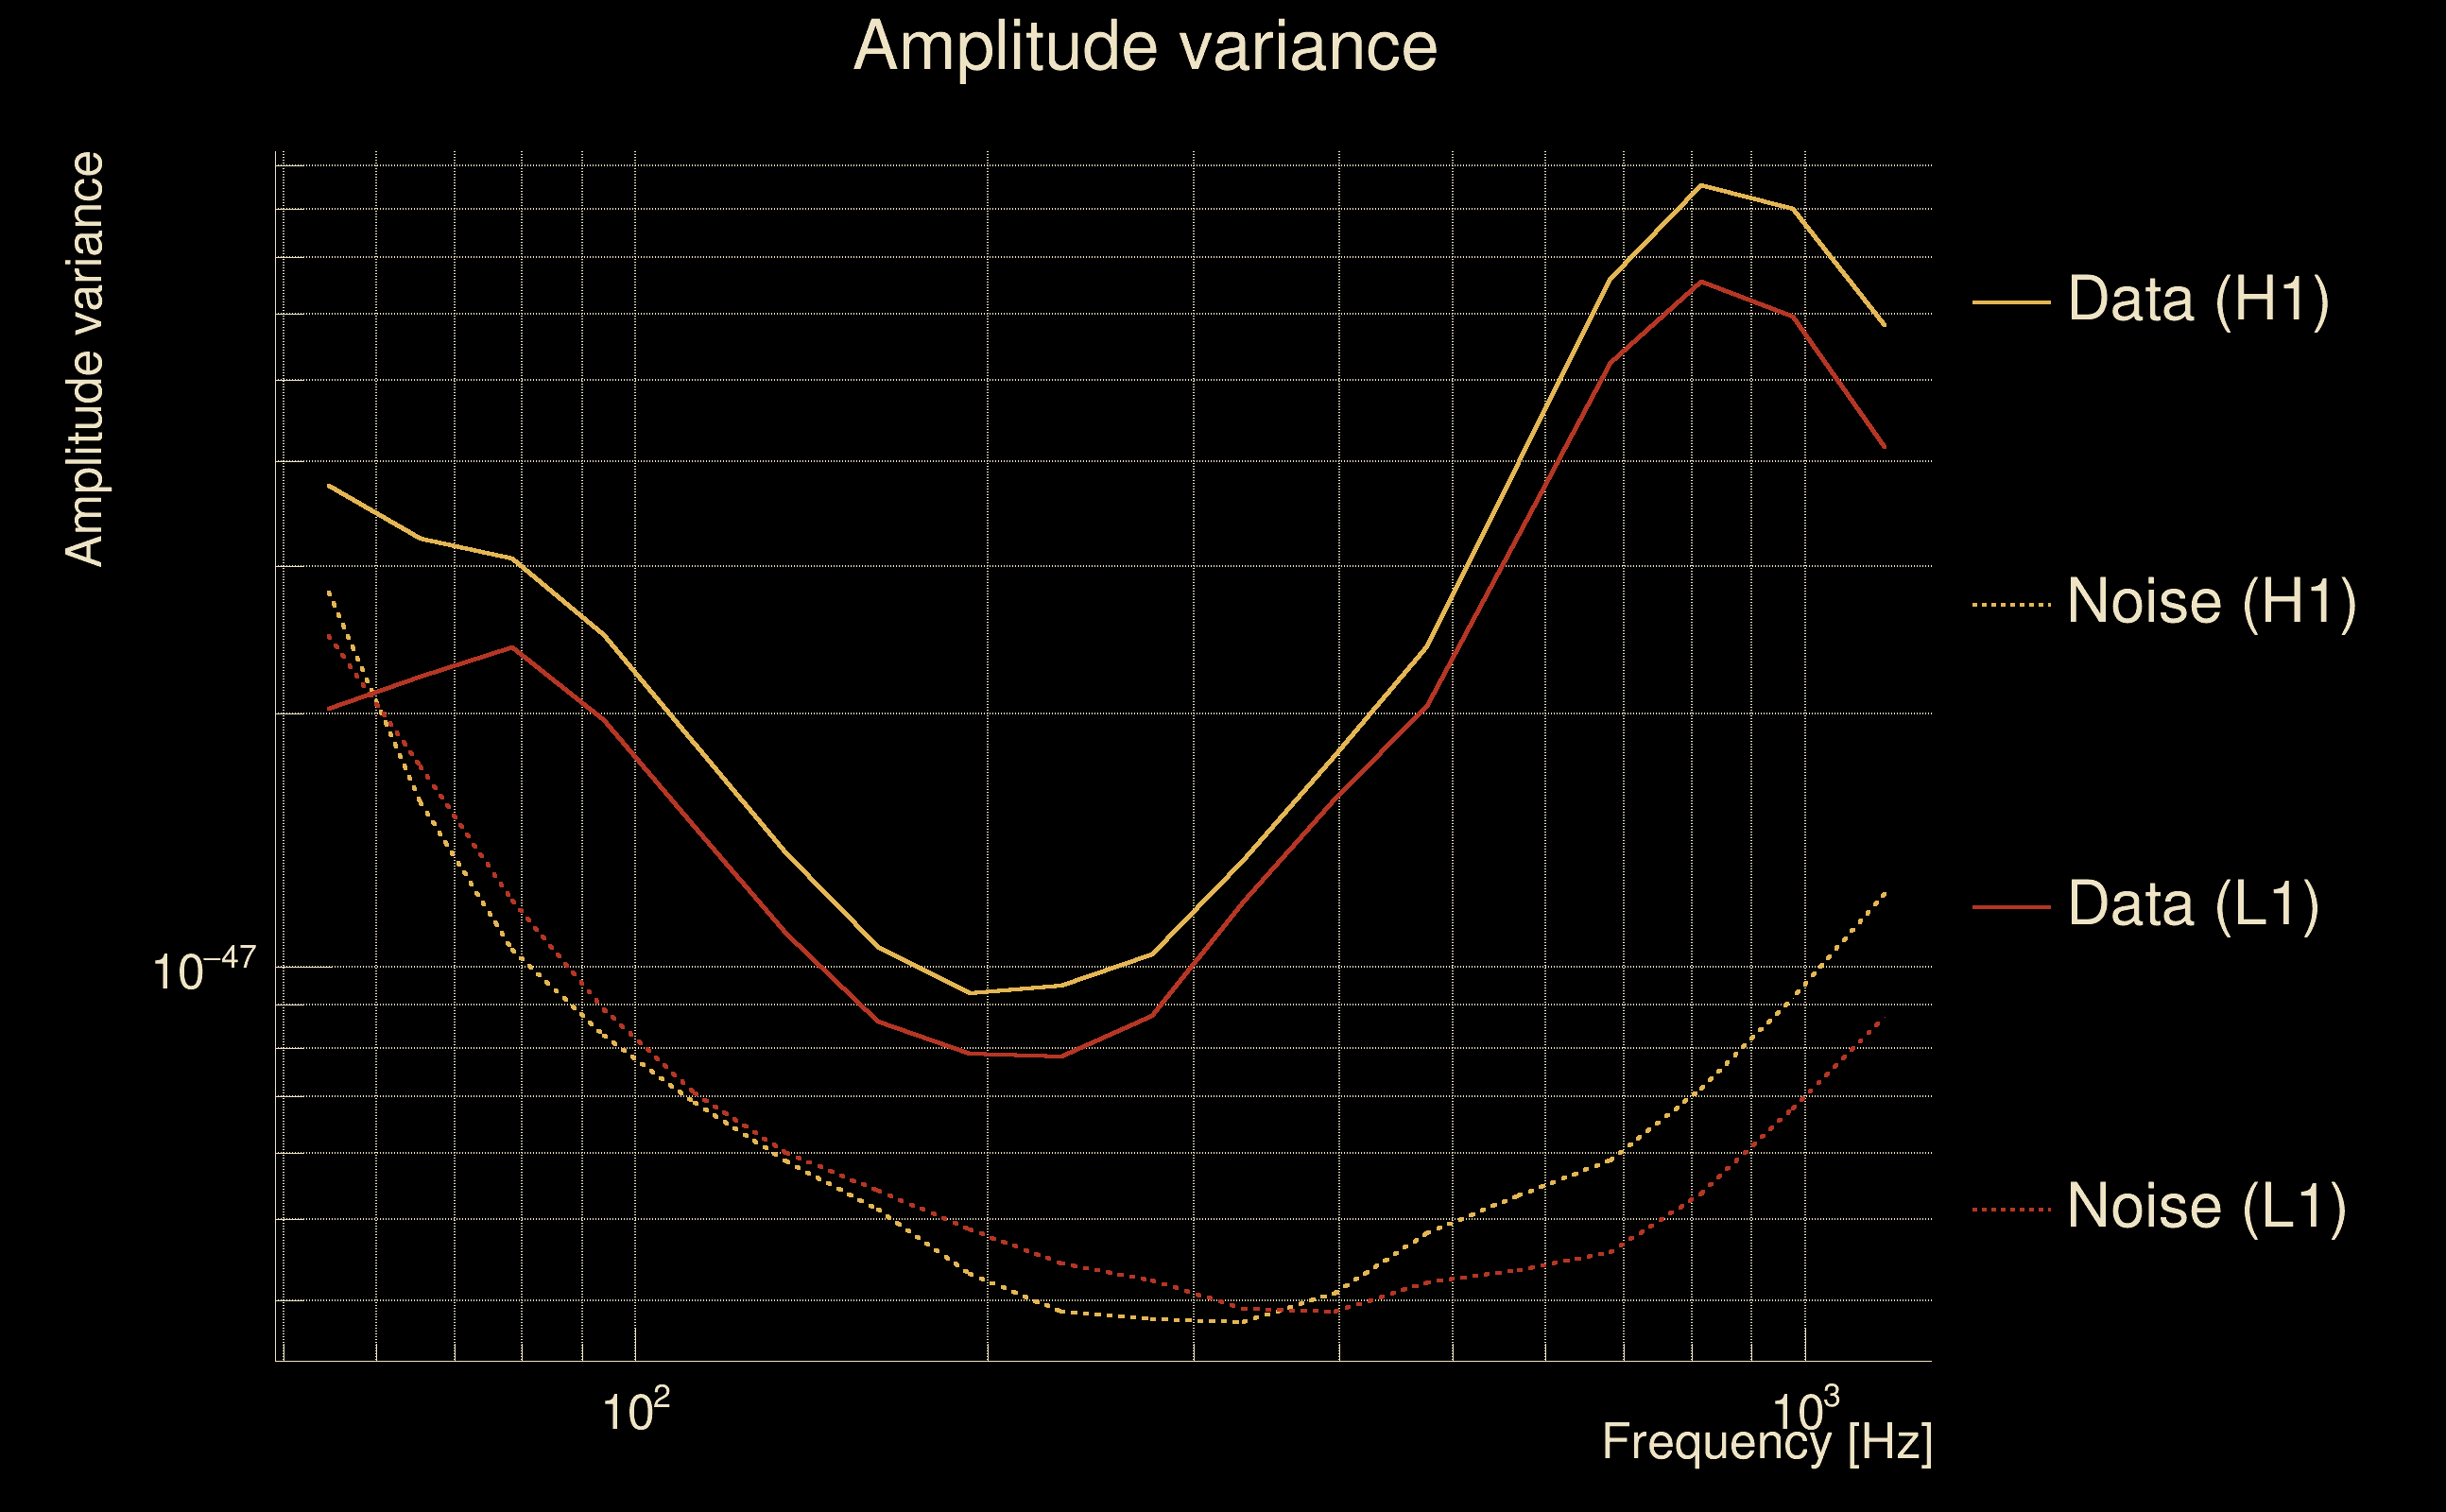
| Amplitude spectrograms: | normalization = 1e-22, power index = 2 |
| White noise SNR variance: | 0.523175 (after applying a correction factor = 1) |
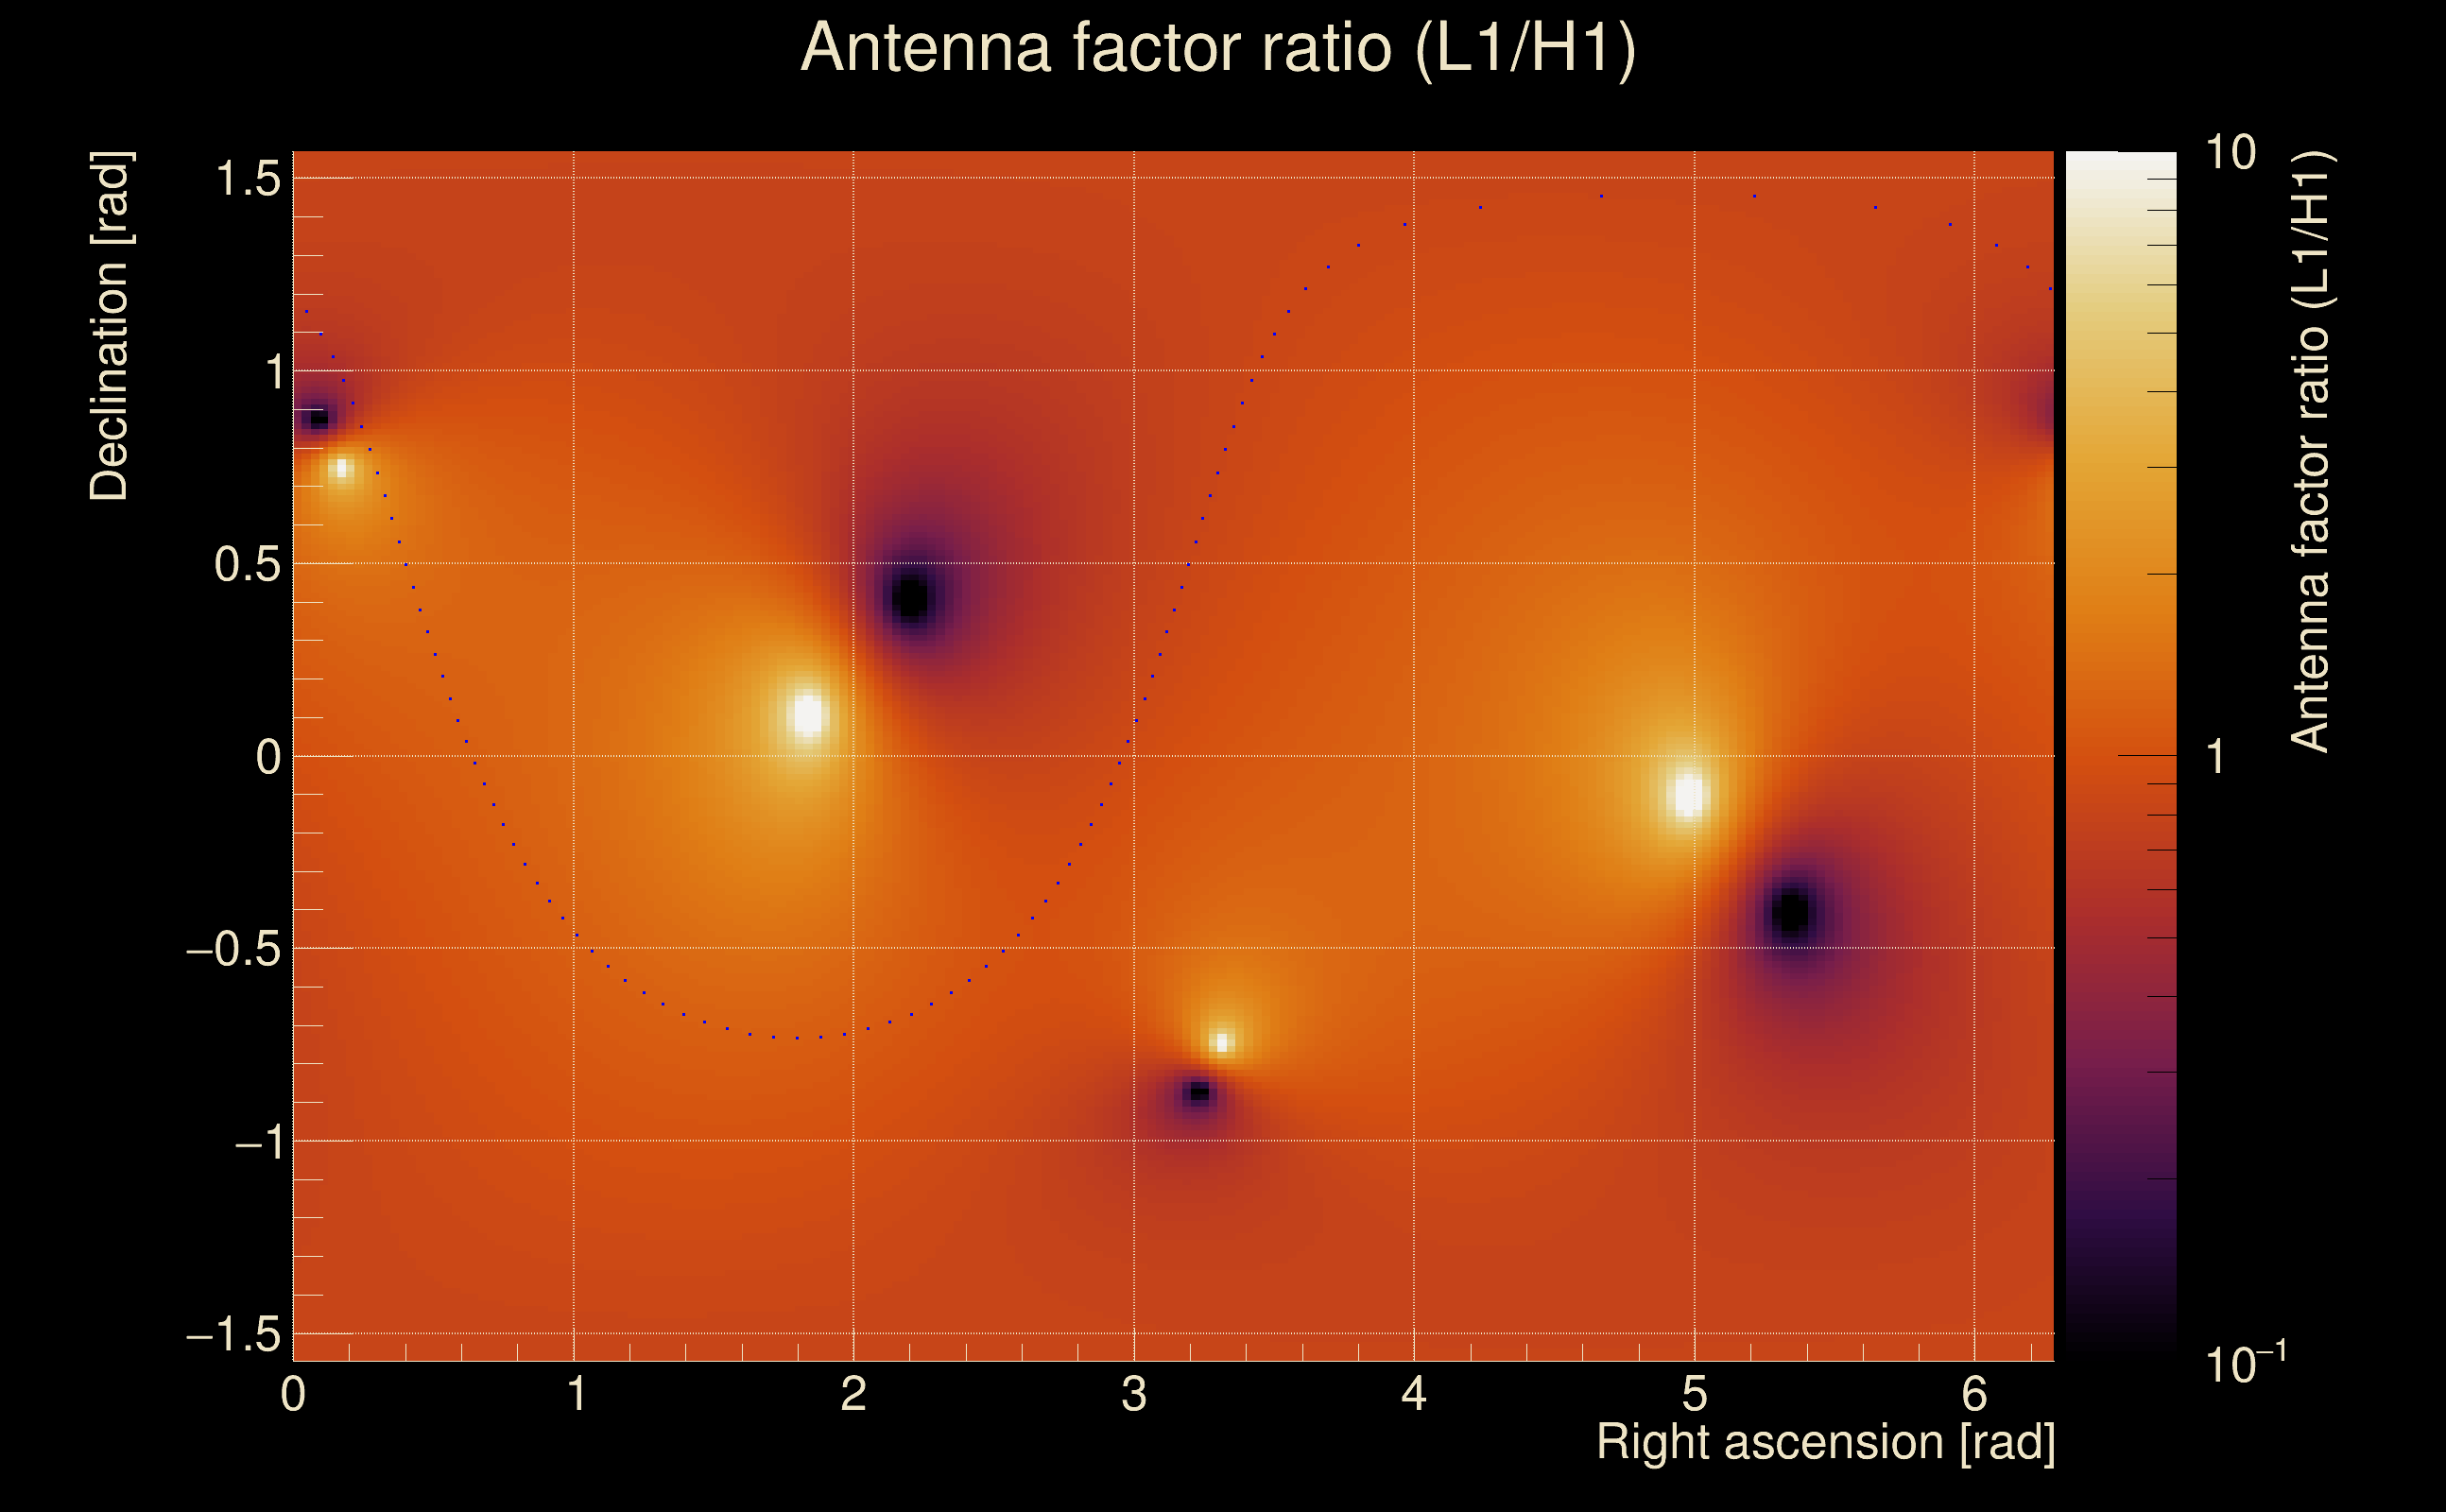
| Amplitude ratio confidence level: | 3 sigma |
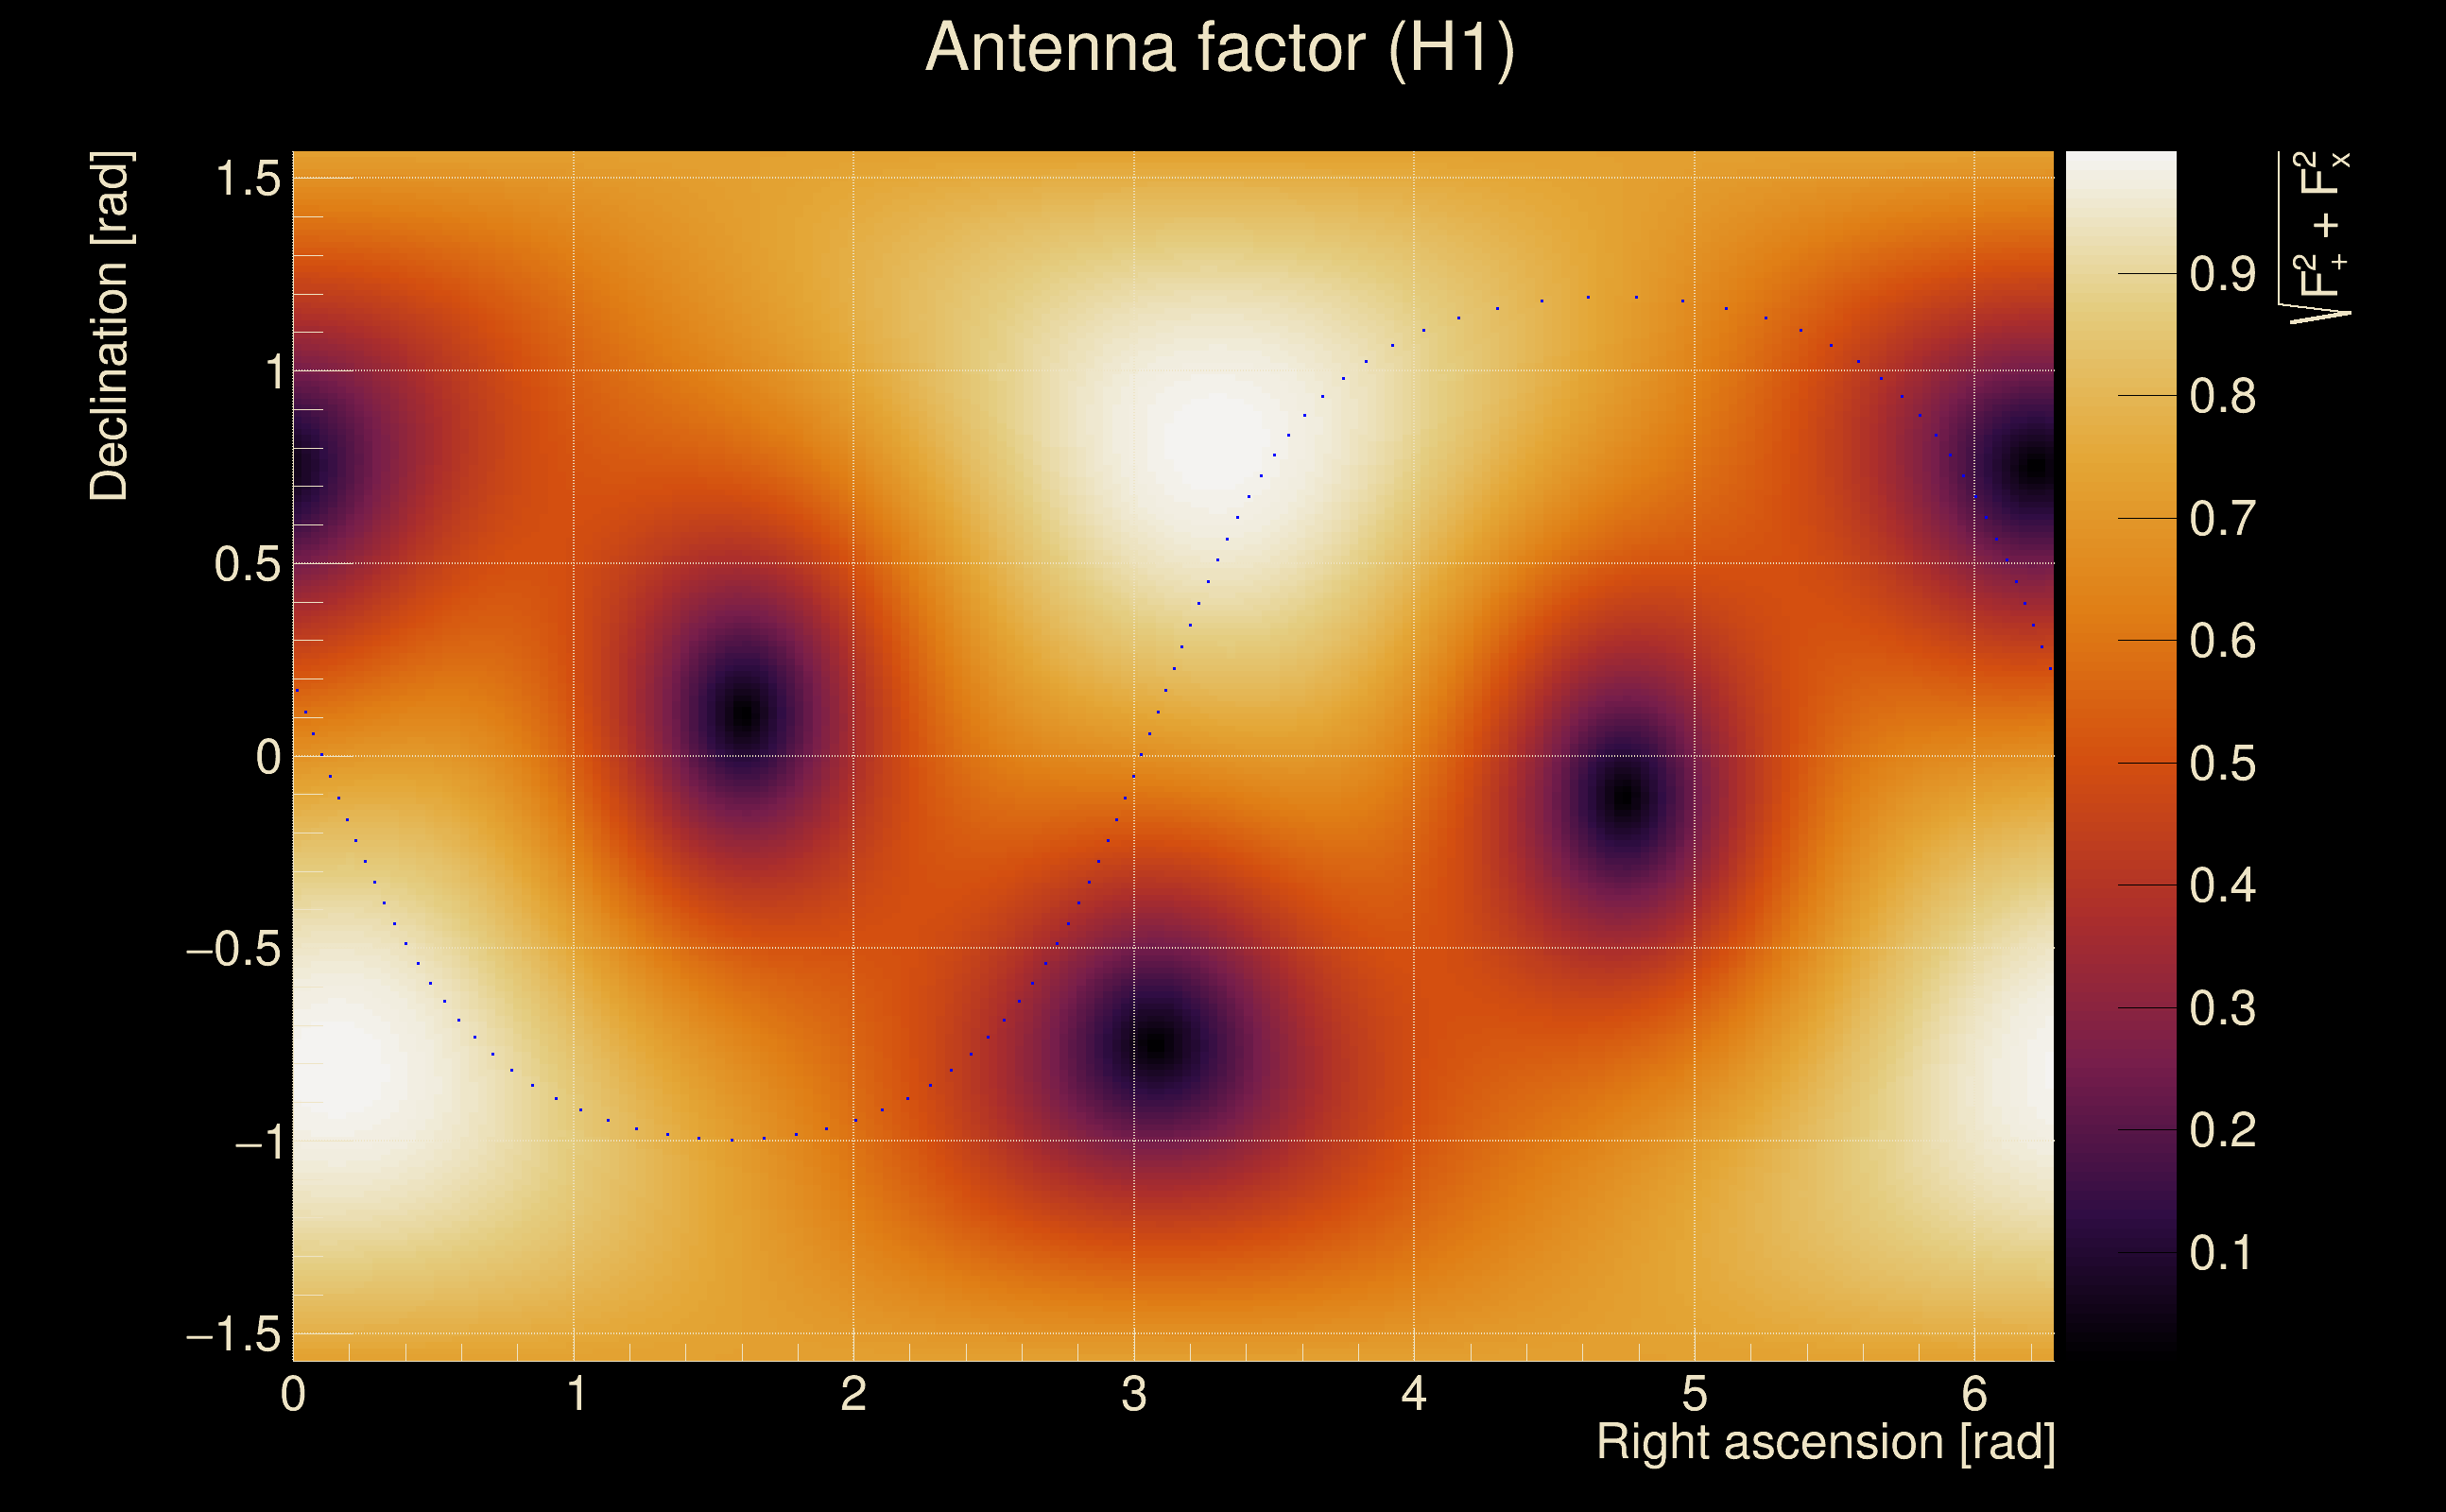
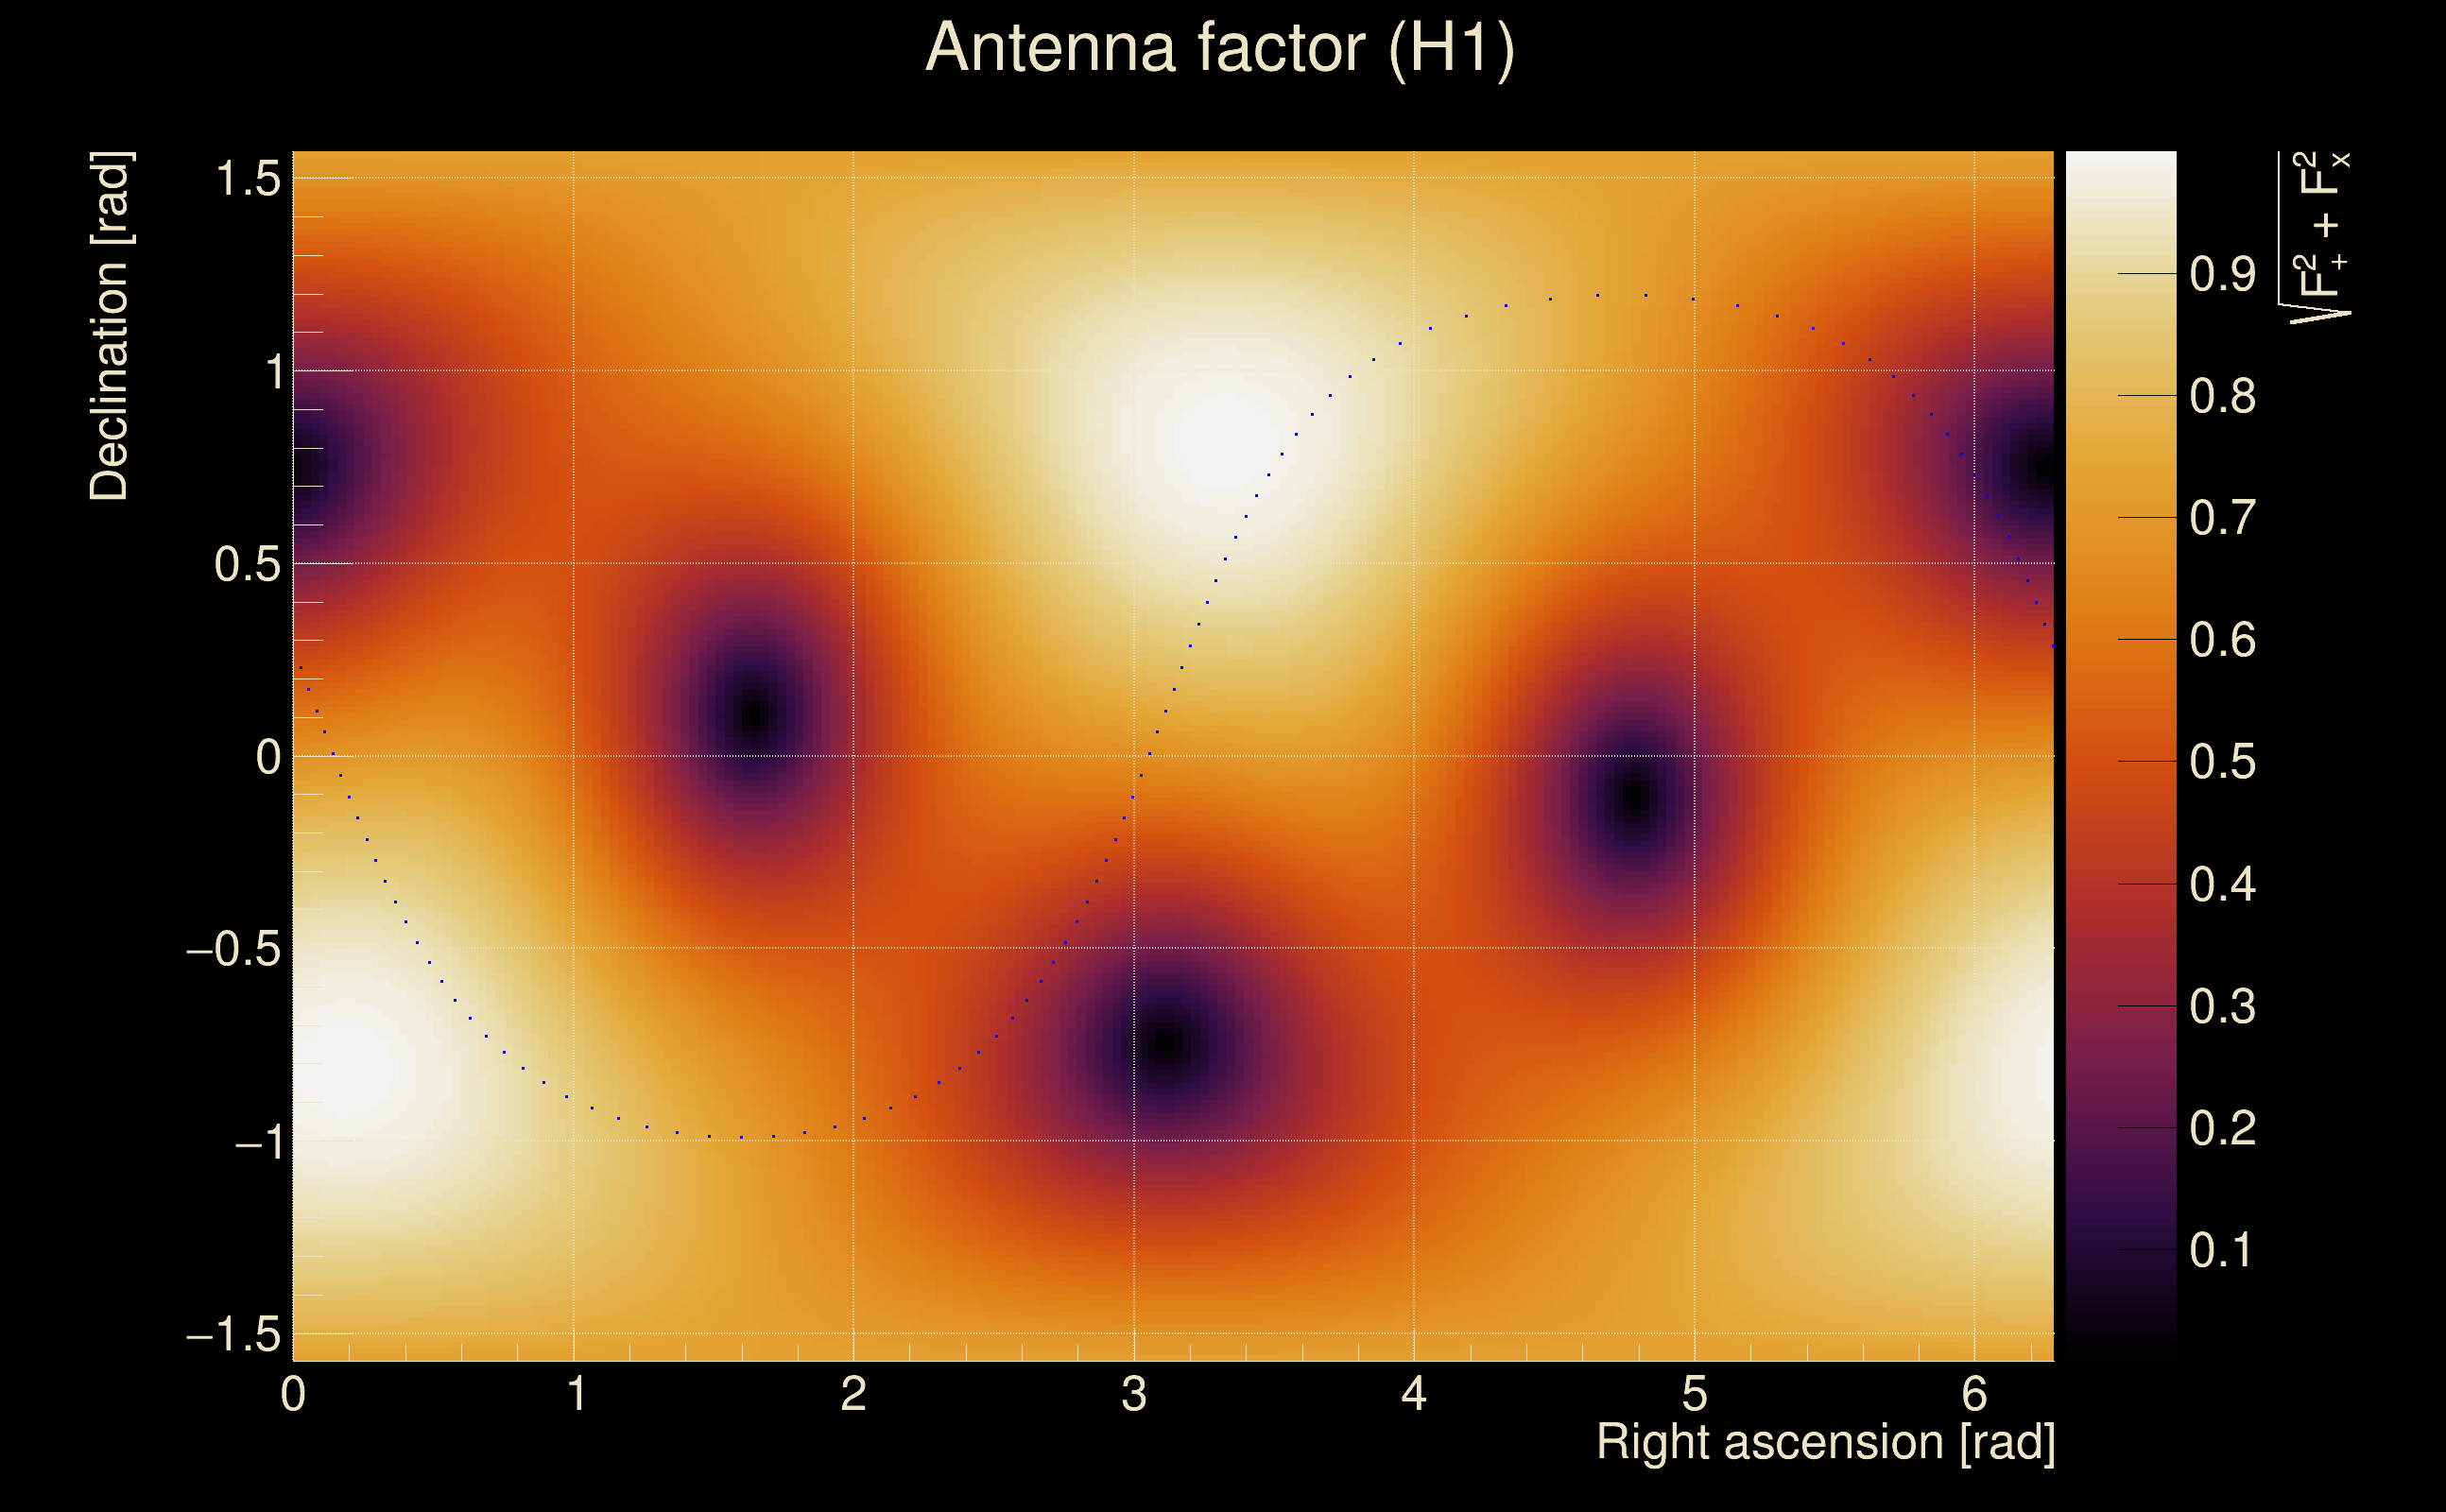
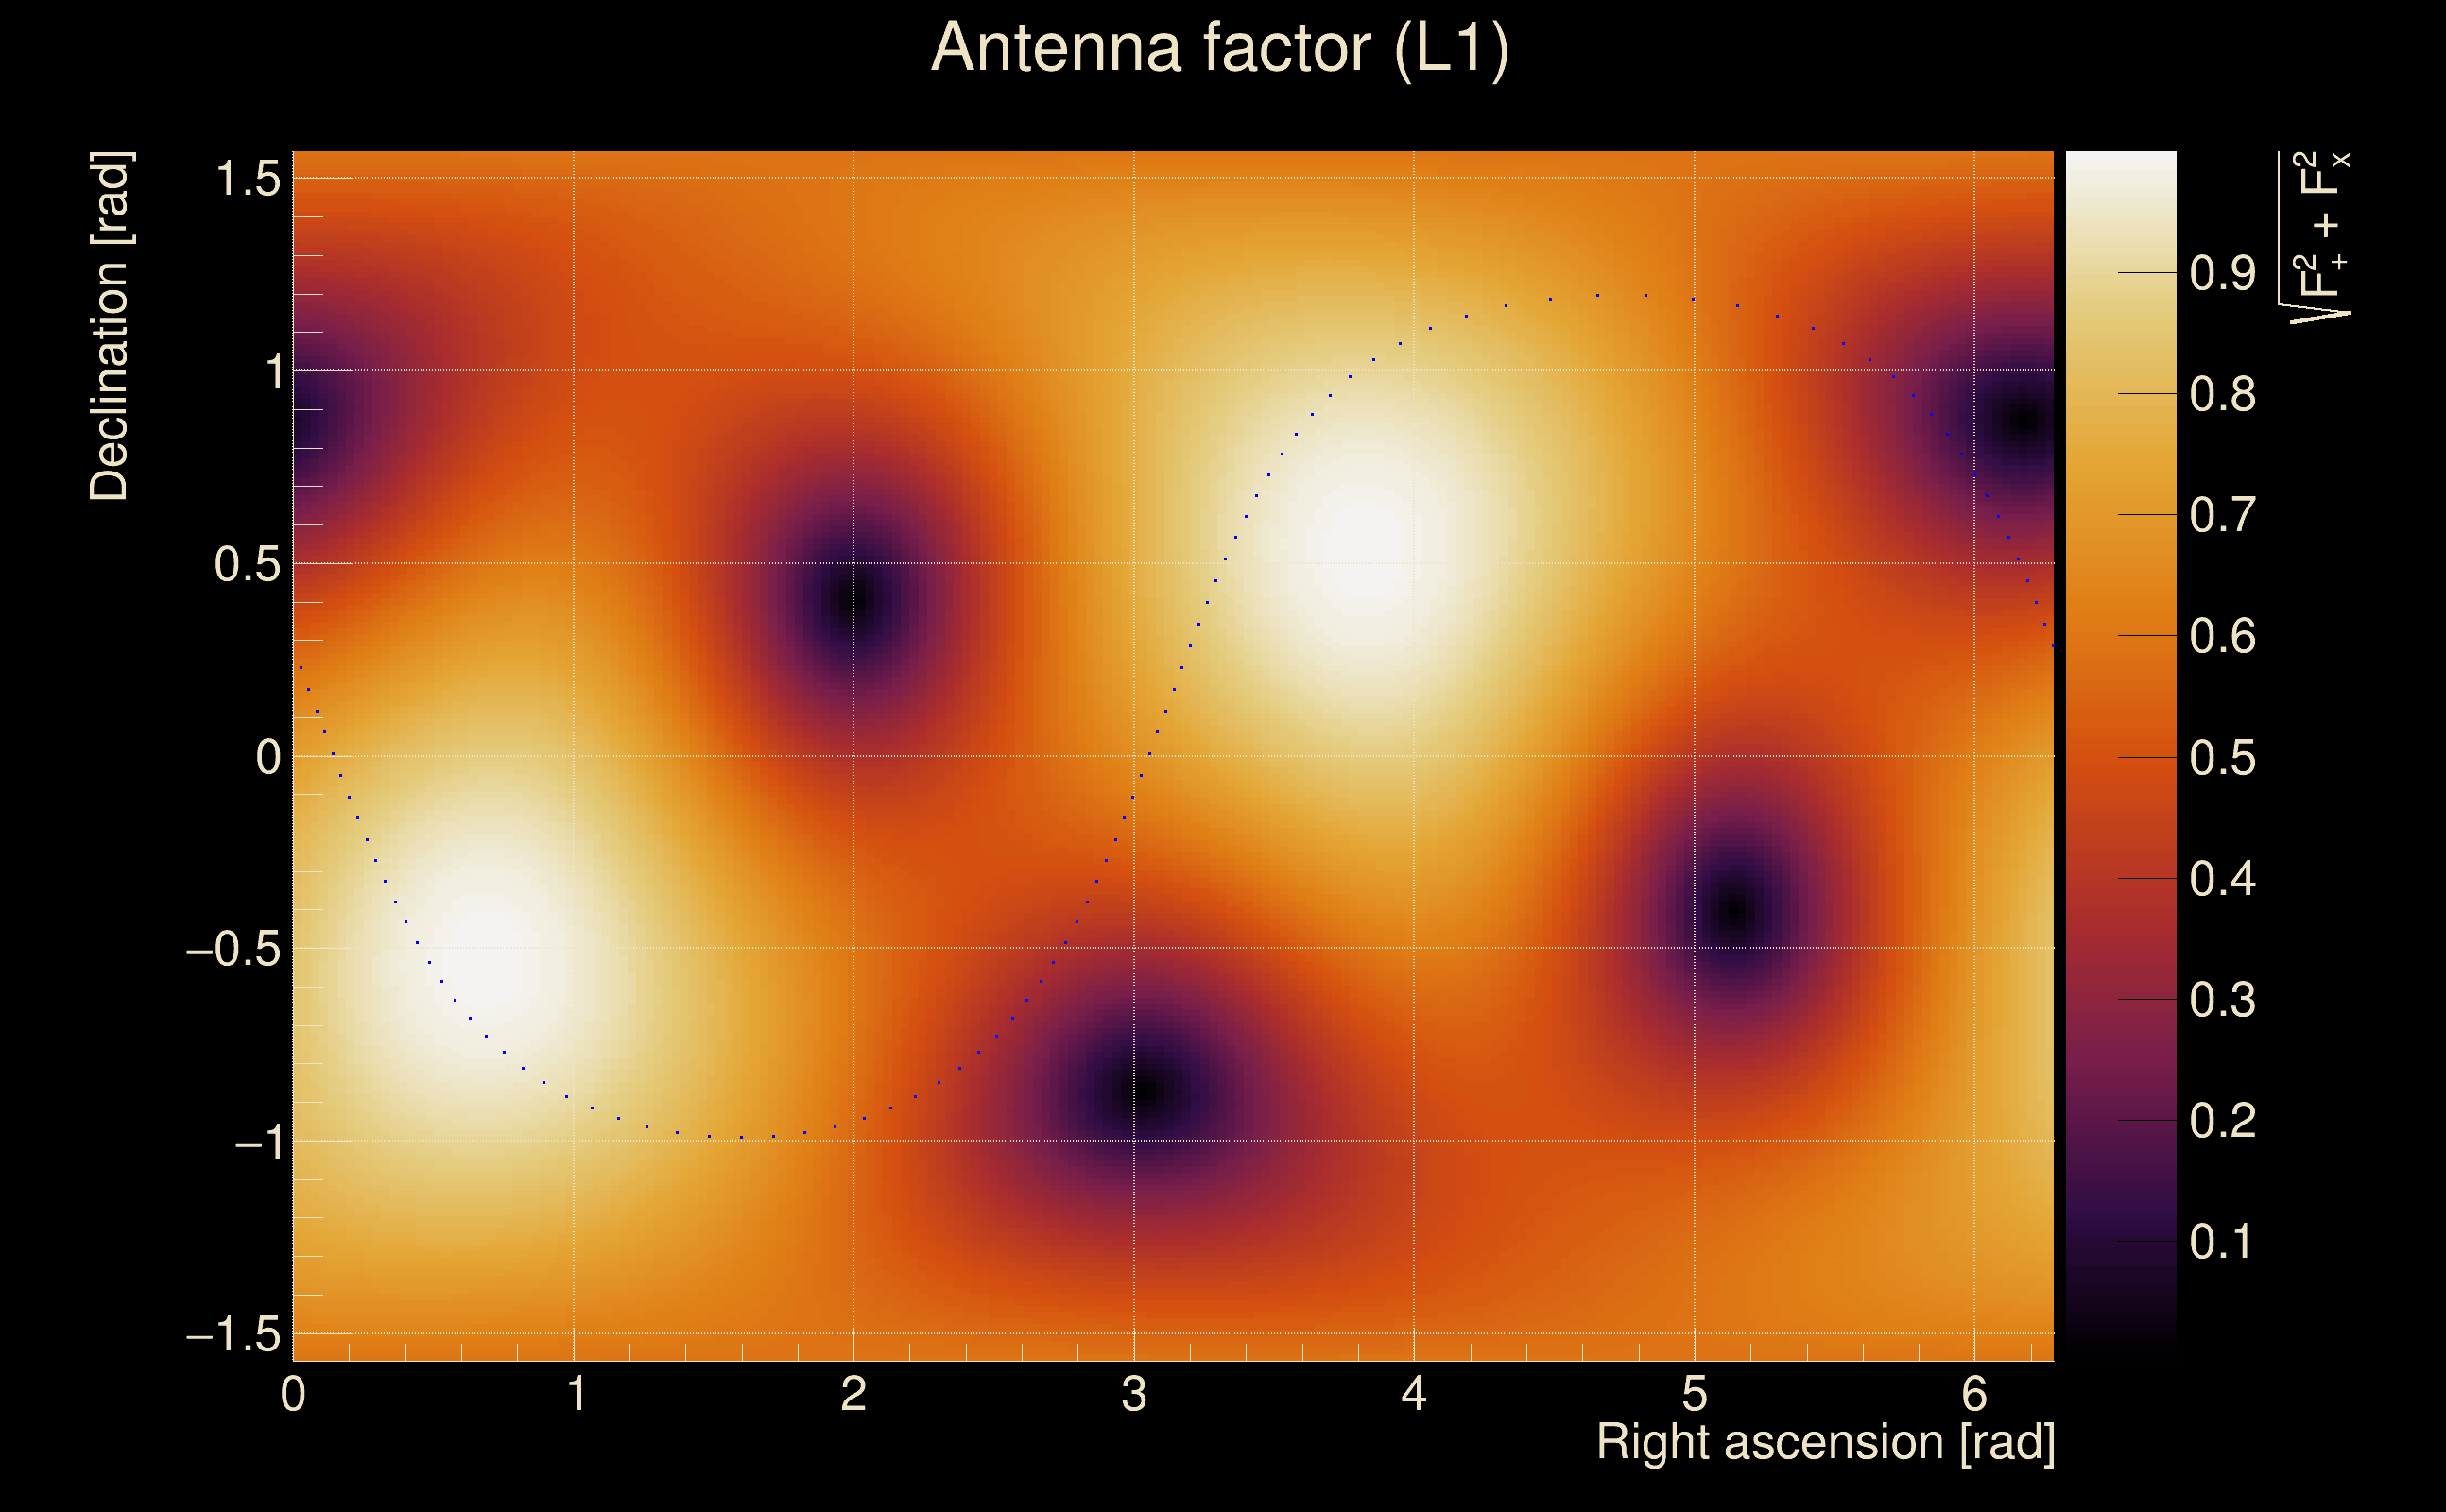
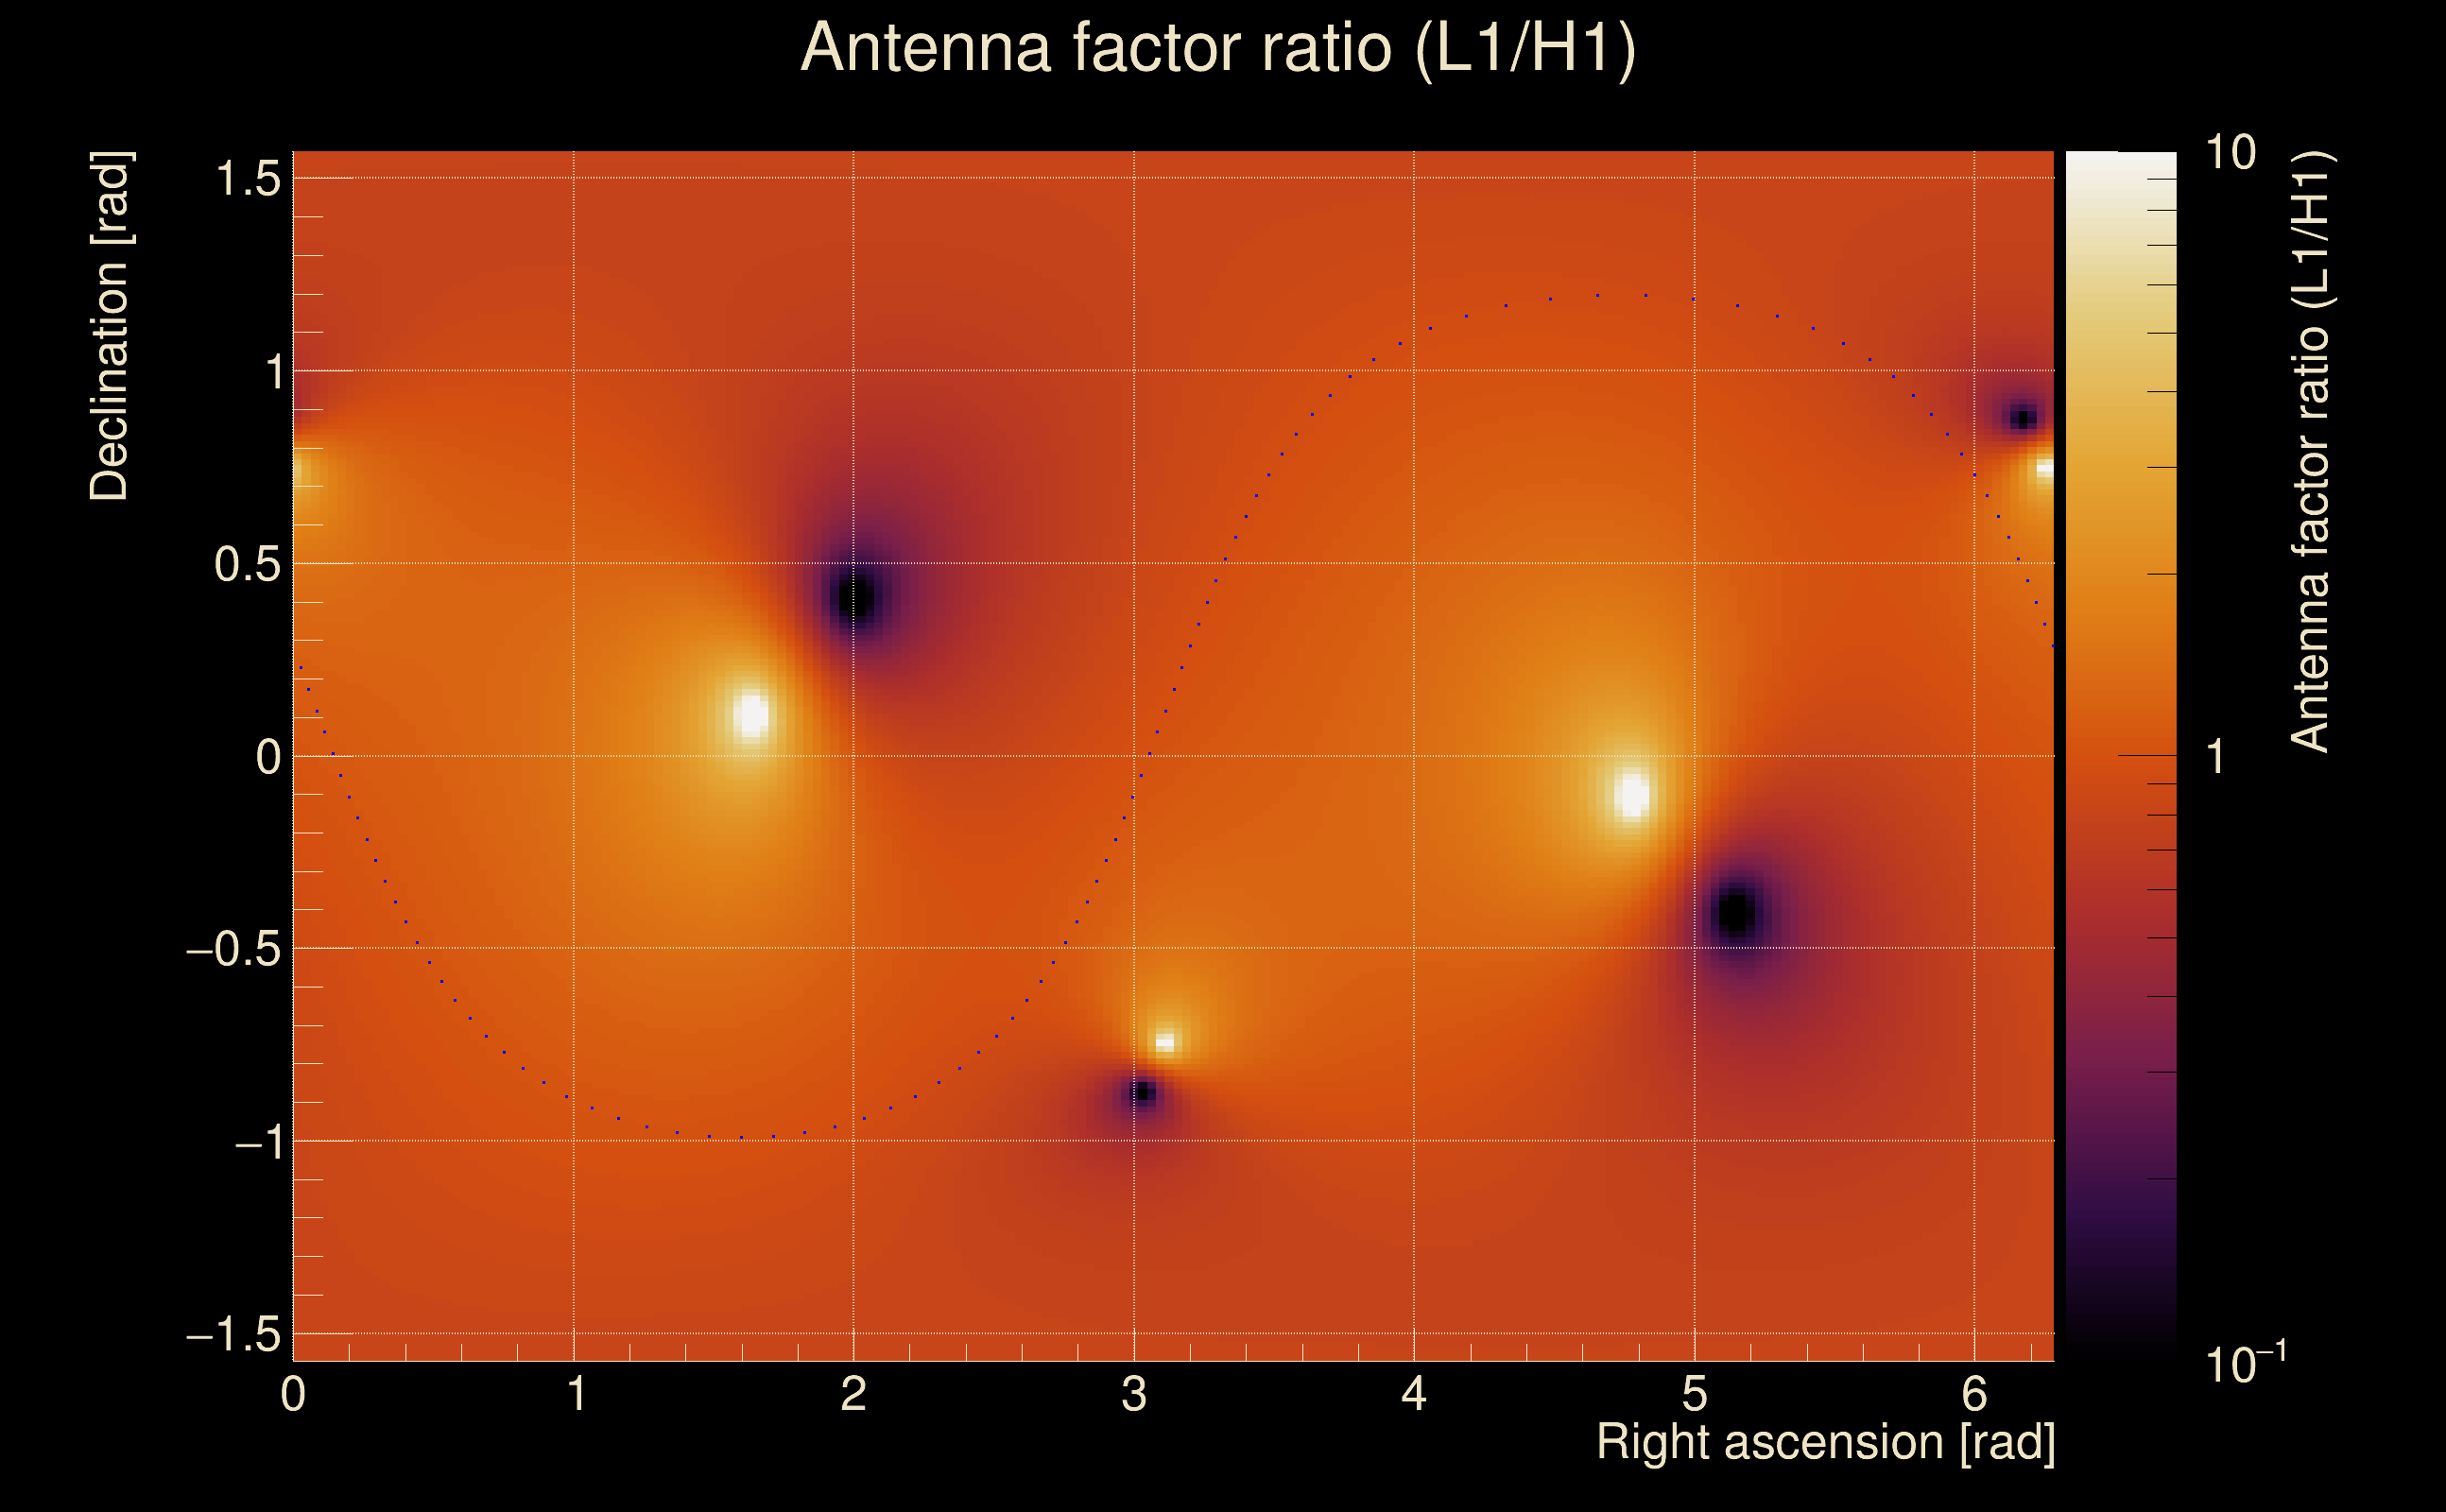
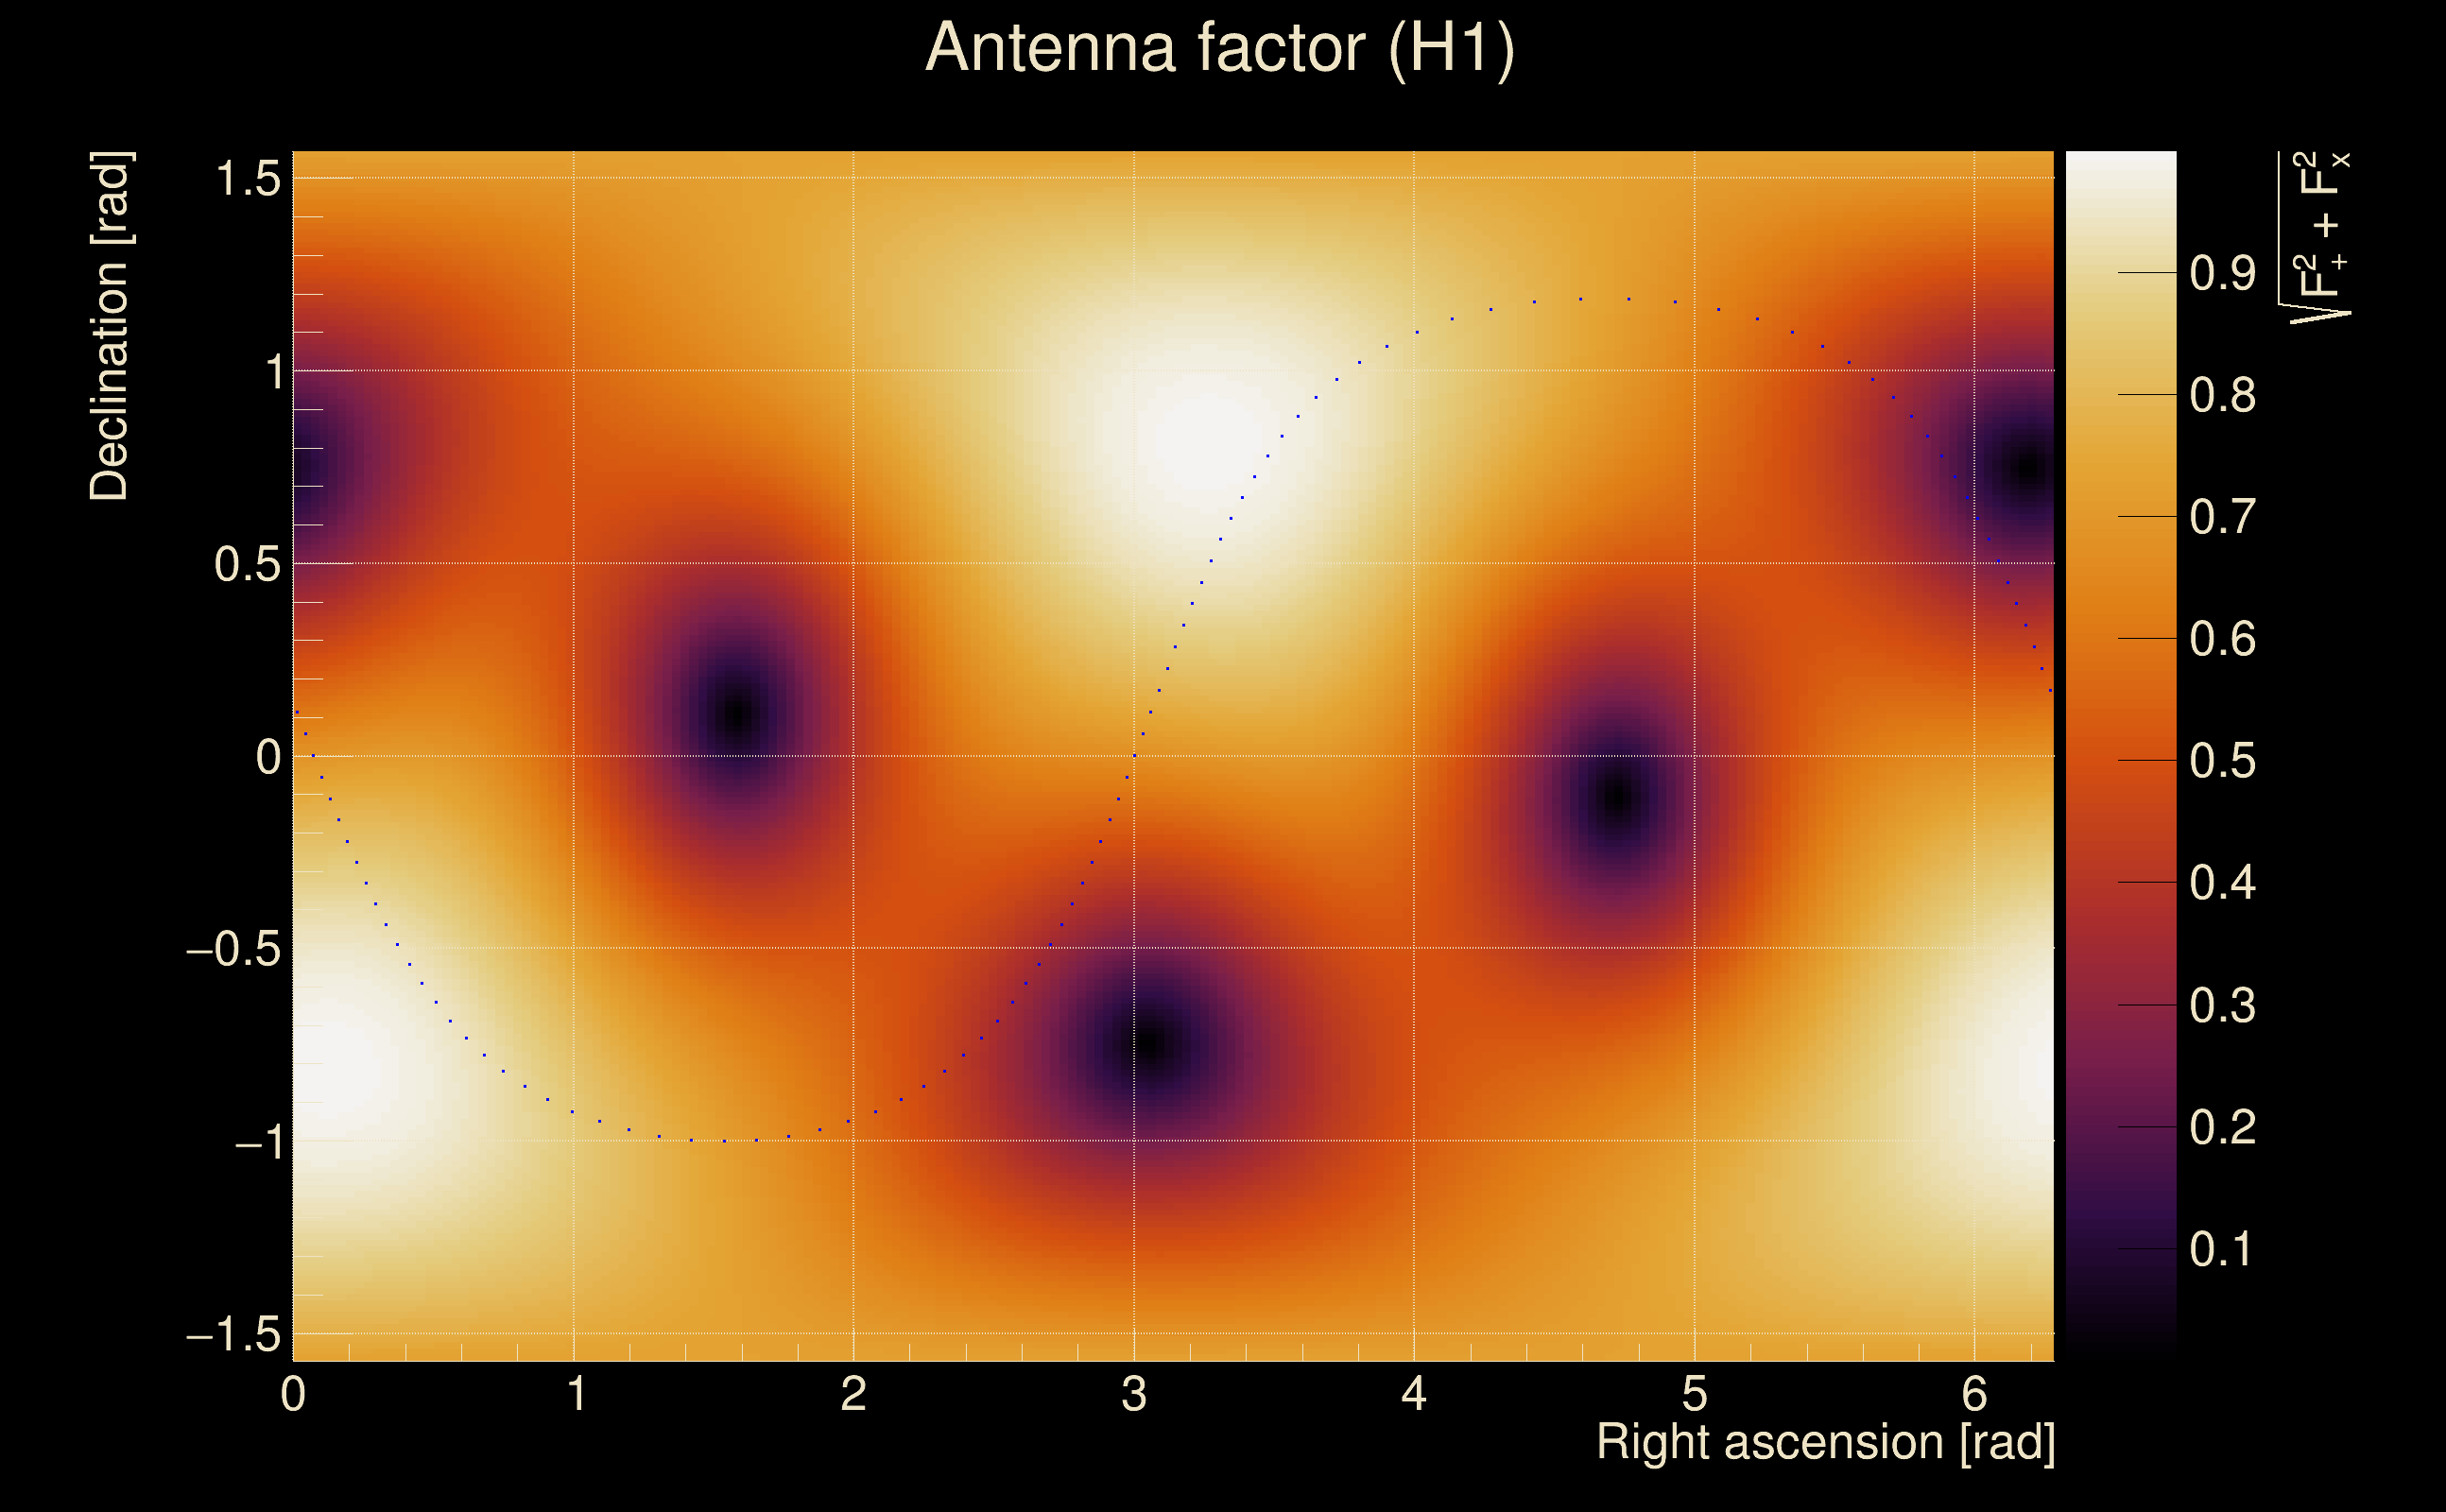
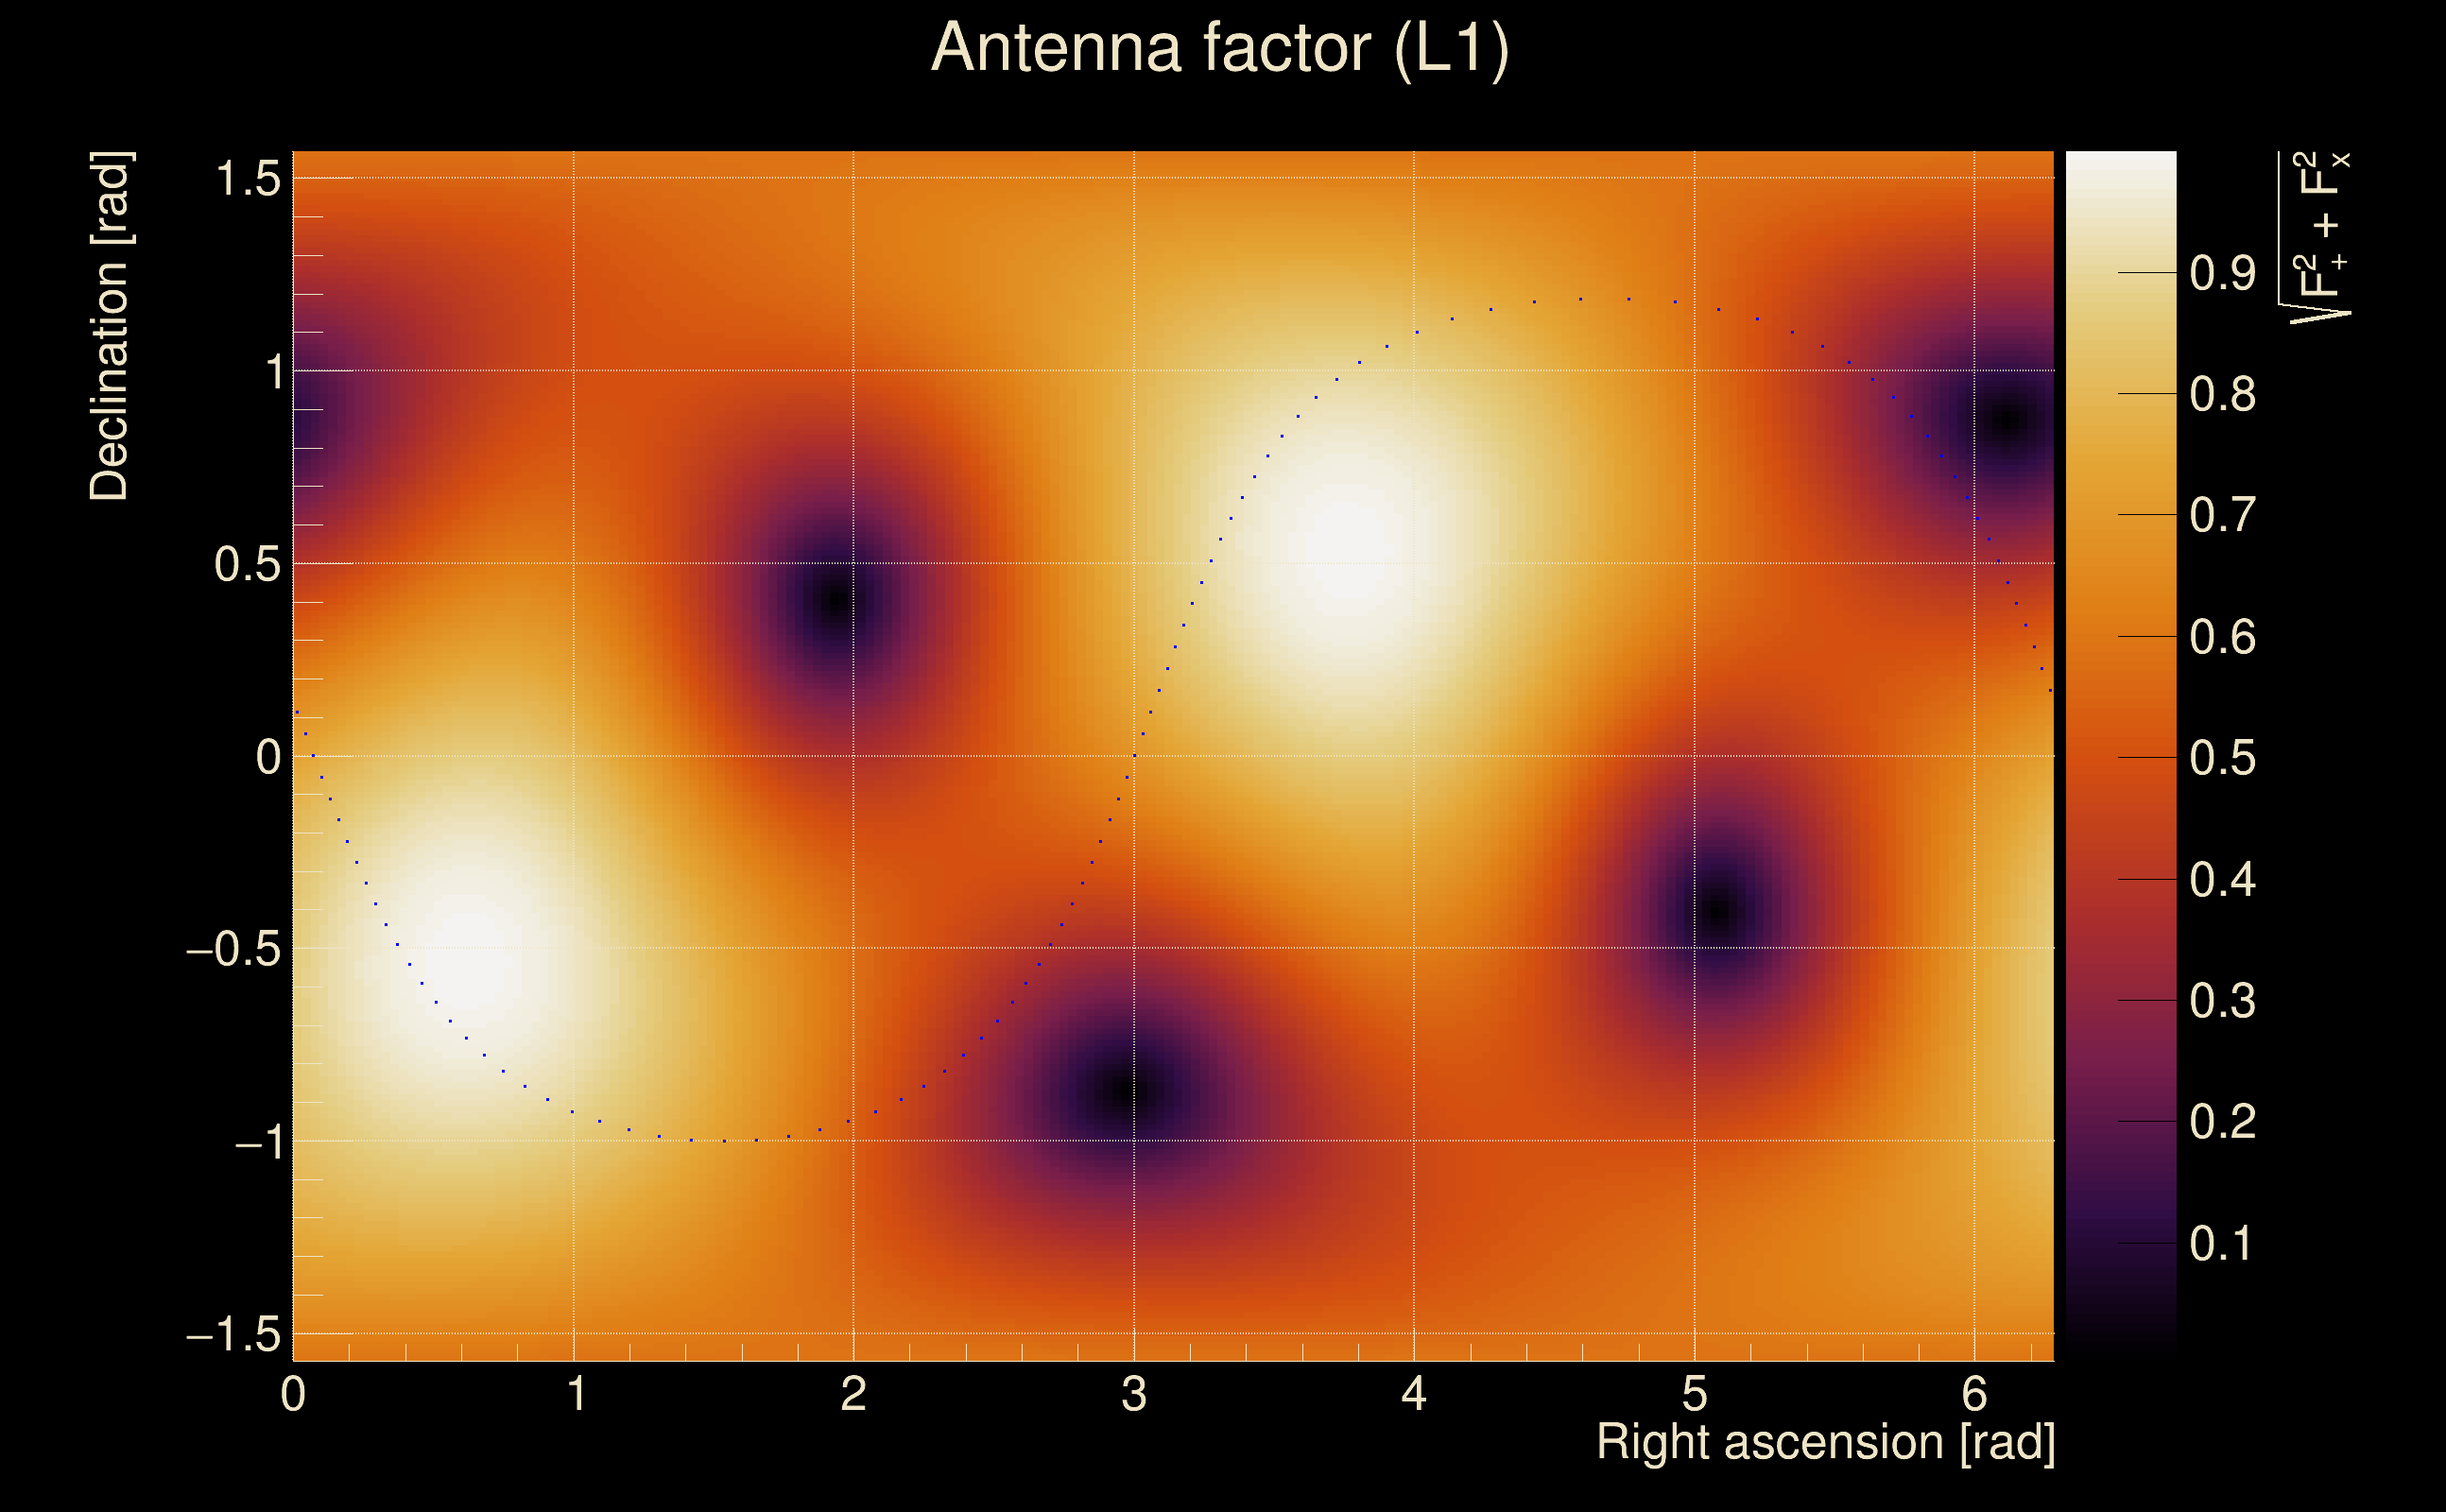
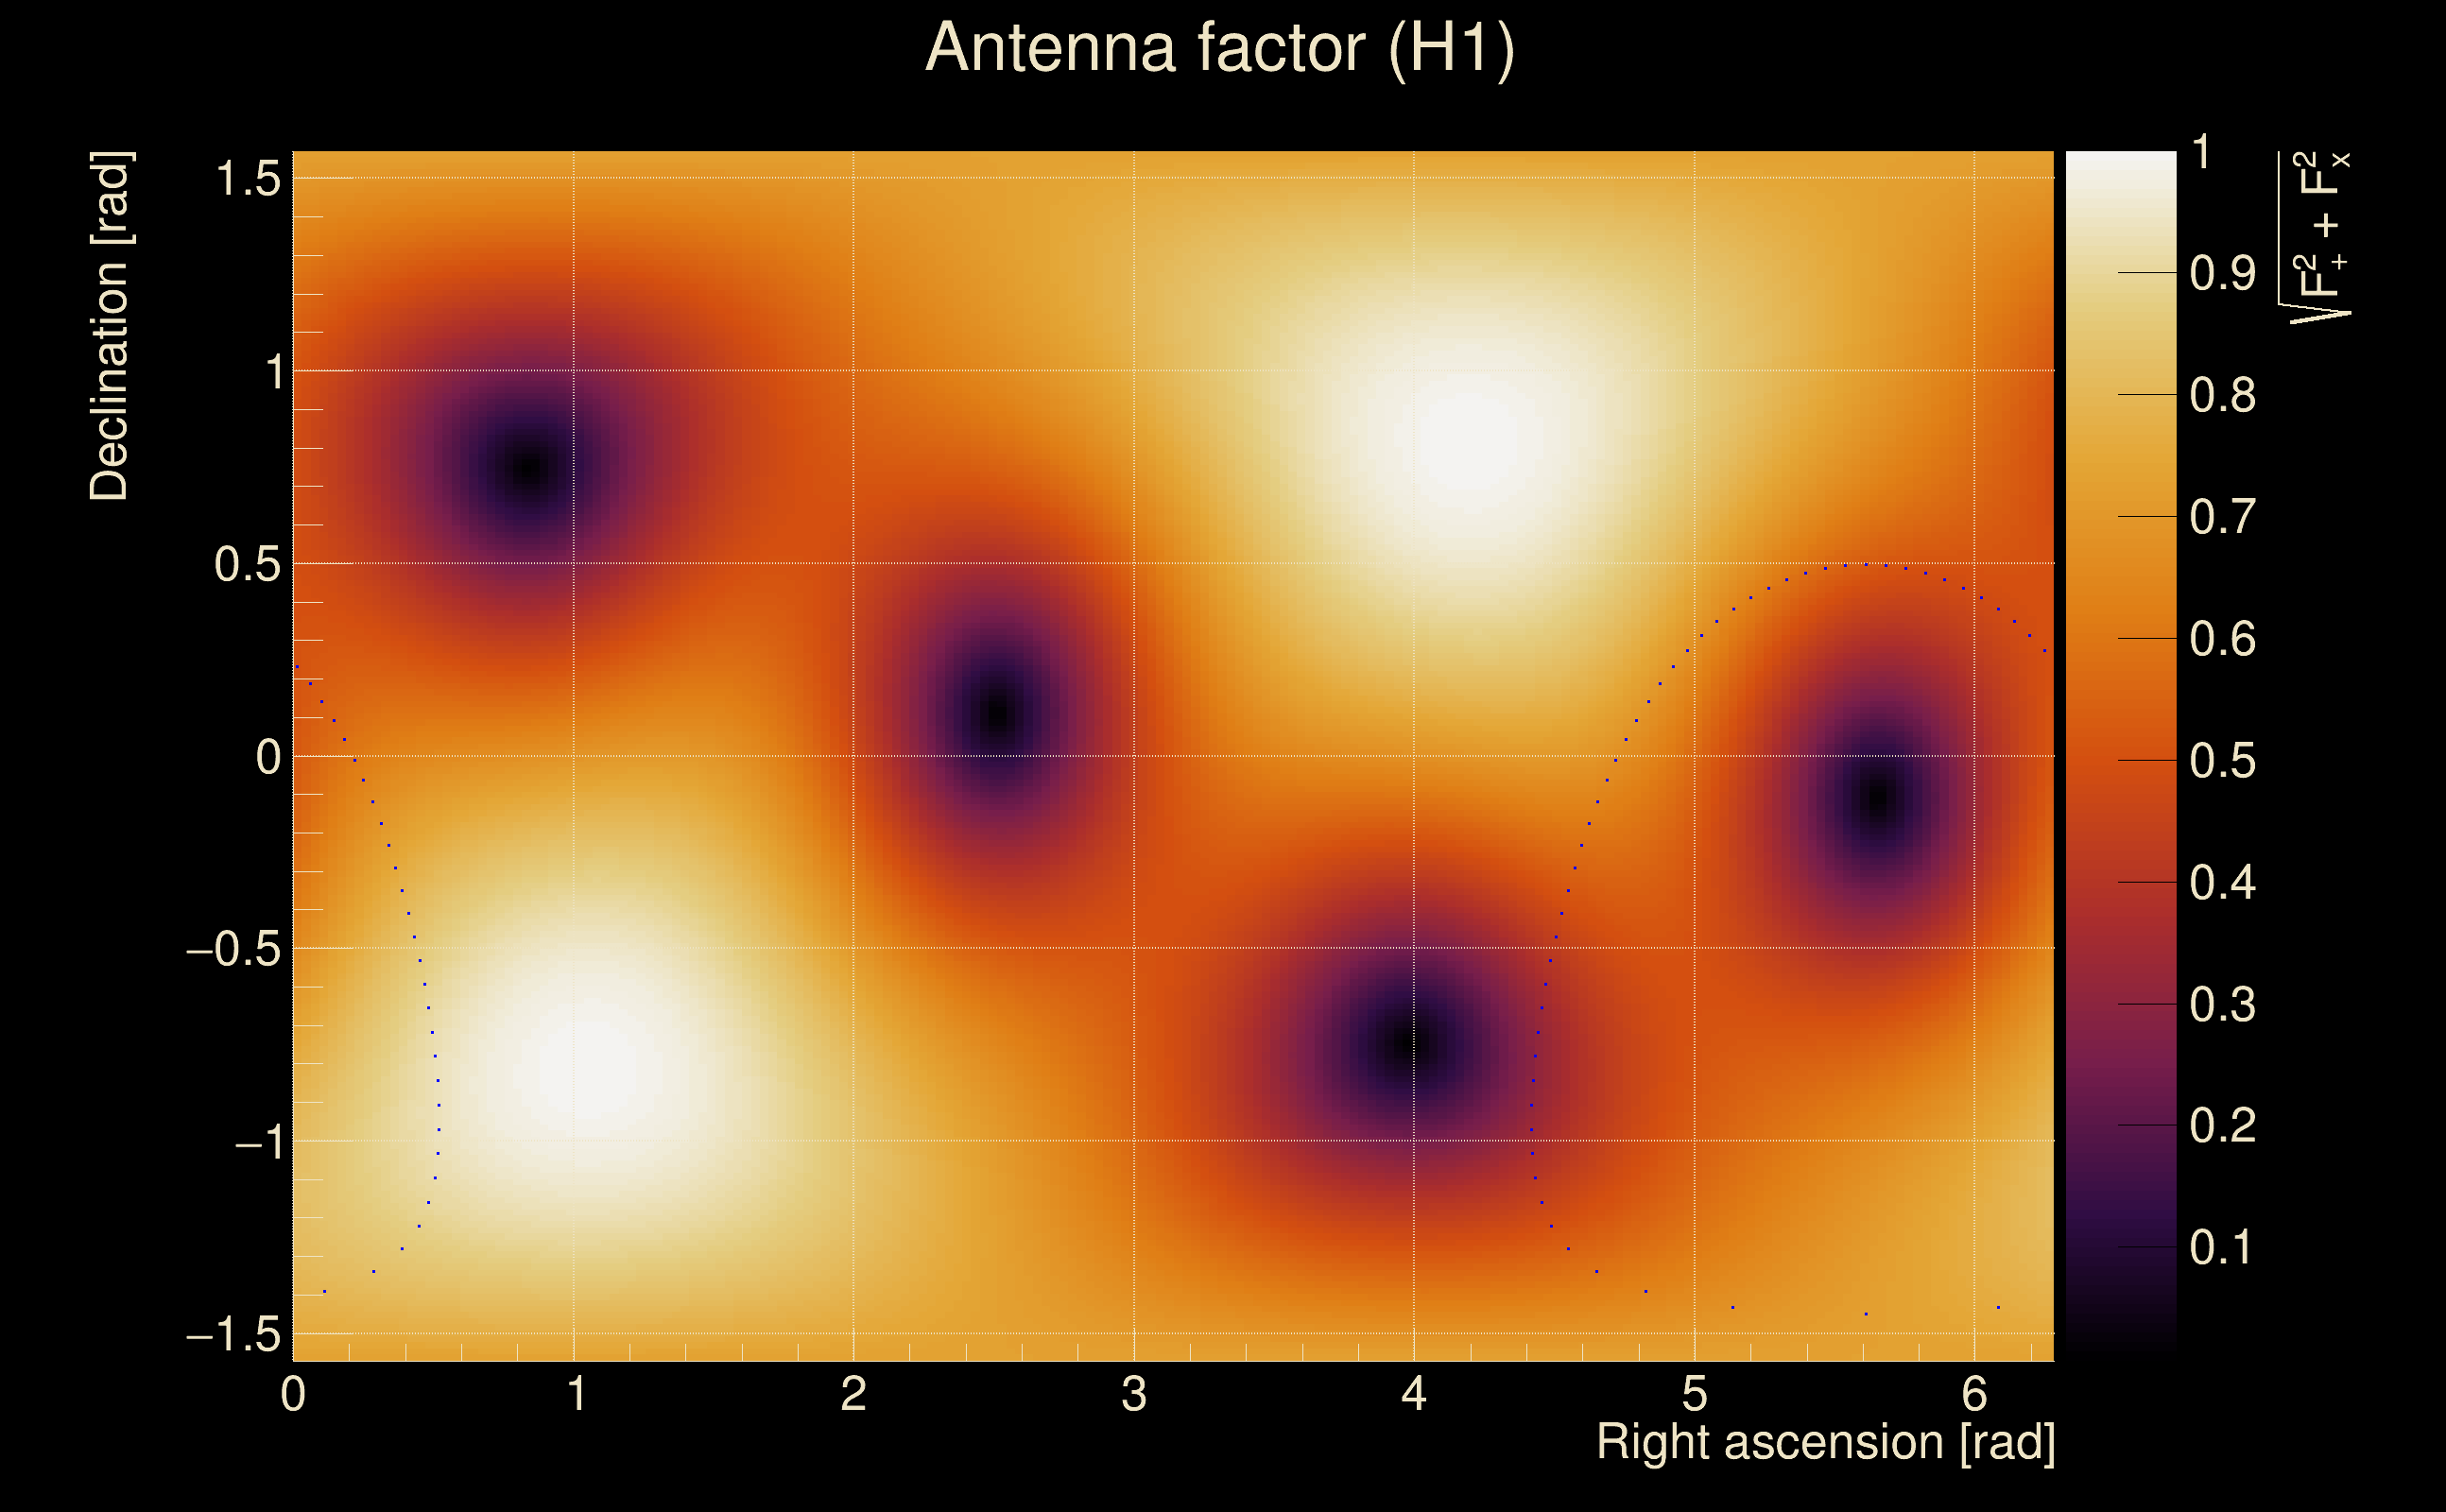
| Target sky positon: | Ra: 10, Dec: 10 [rad] |
| List of input Ox files: | TargIxfw_injpt1_file_list.txt (71 files) |
| Analysis result file: | TargIxfw_injpt1_results-0.root |
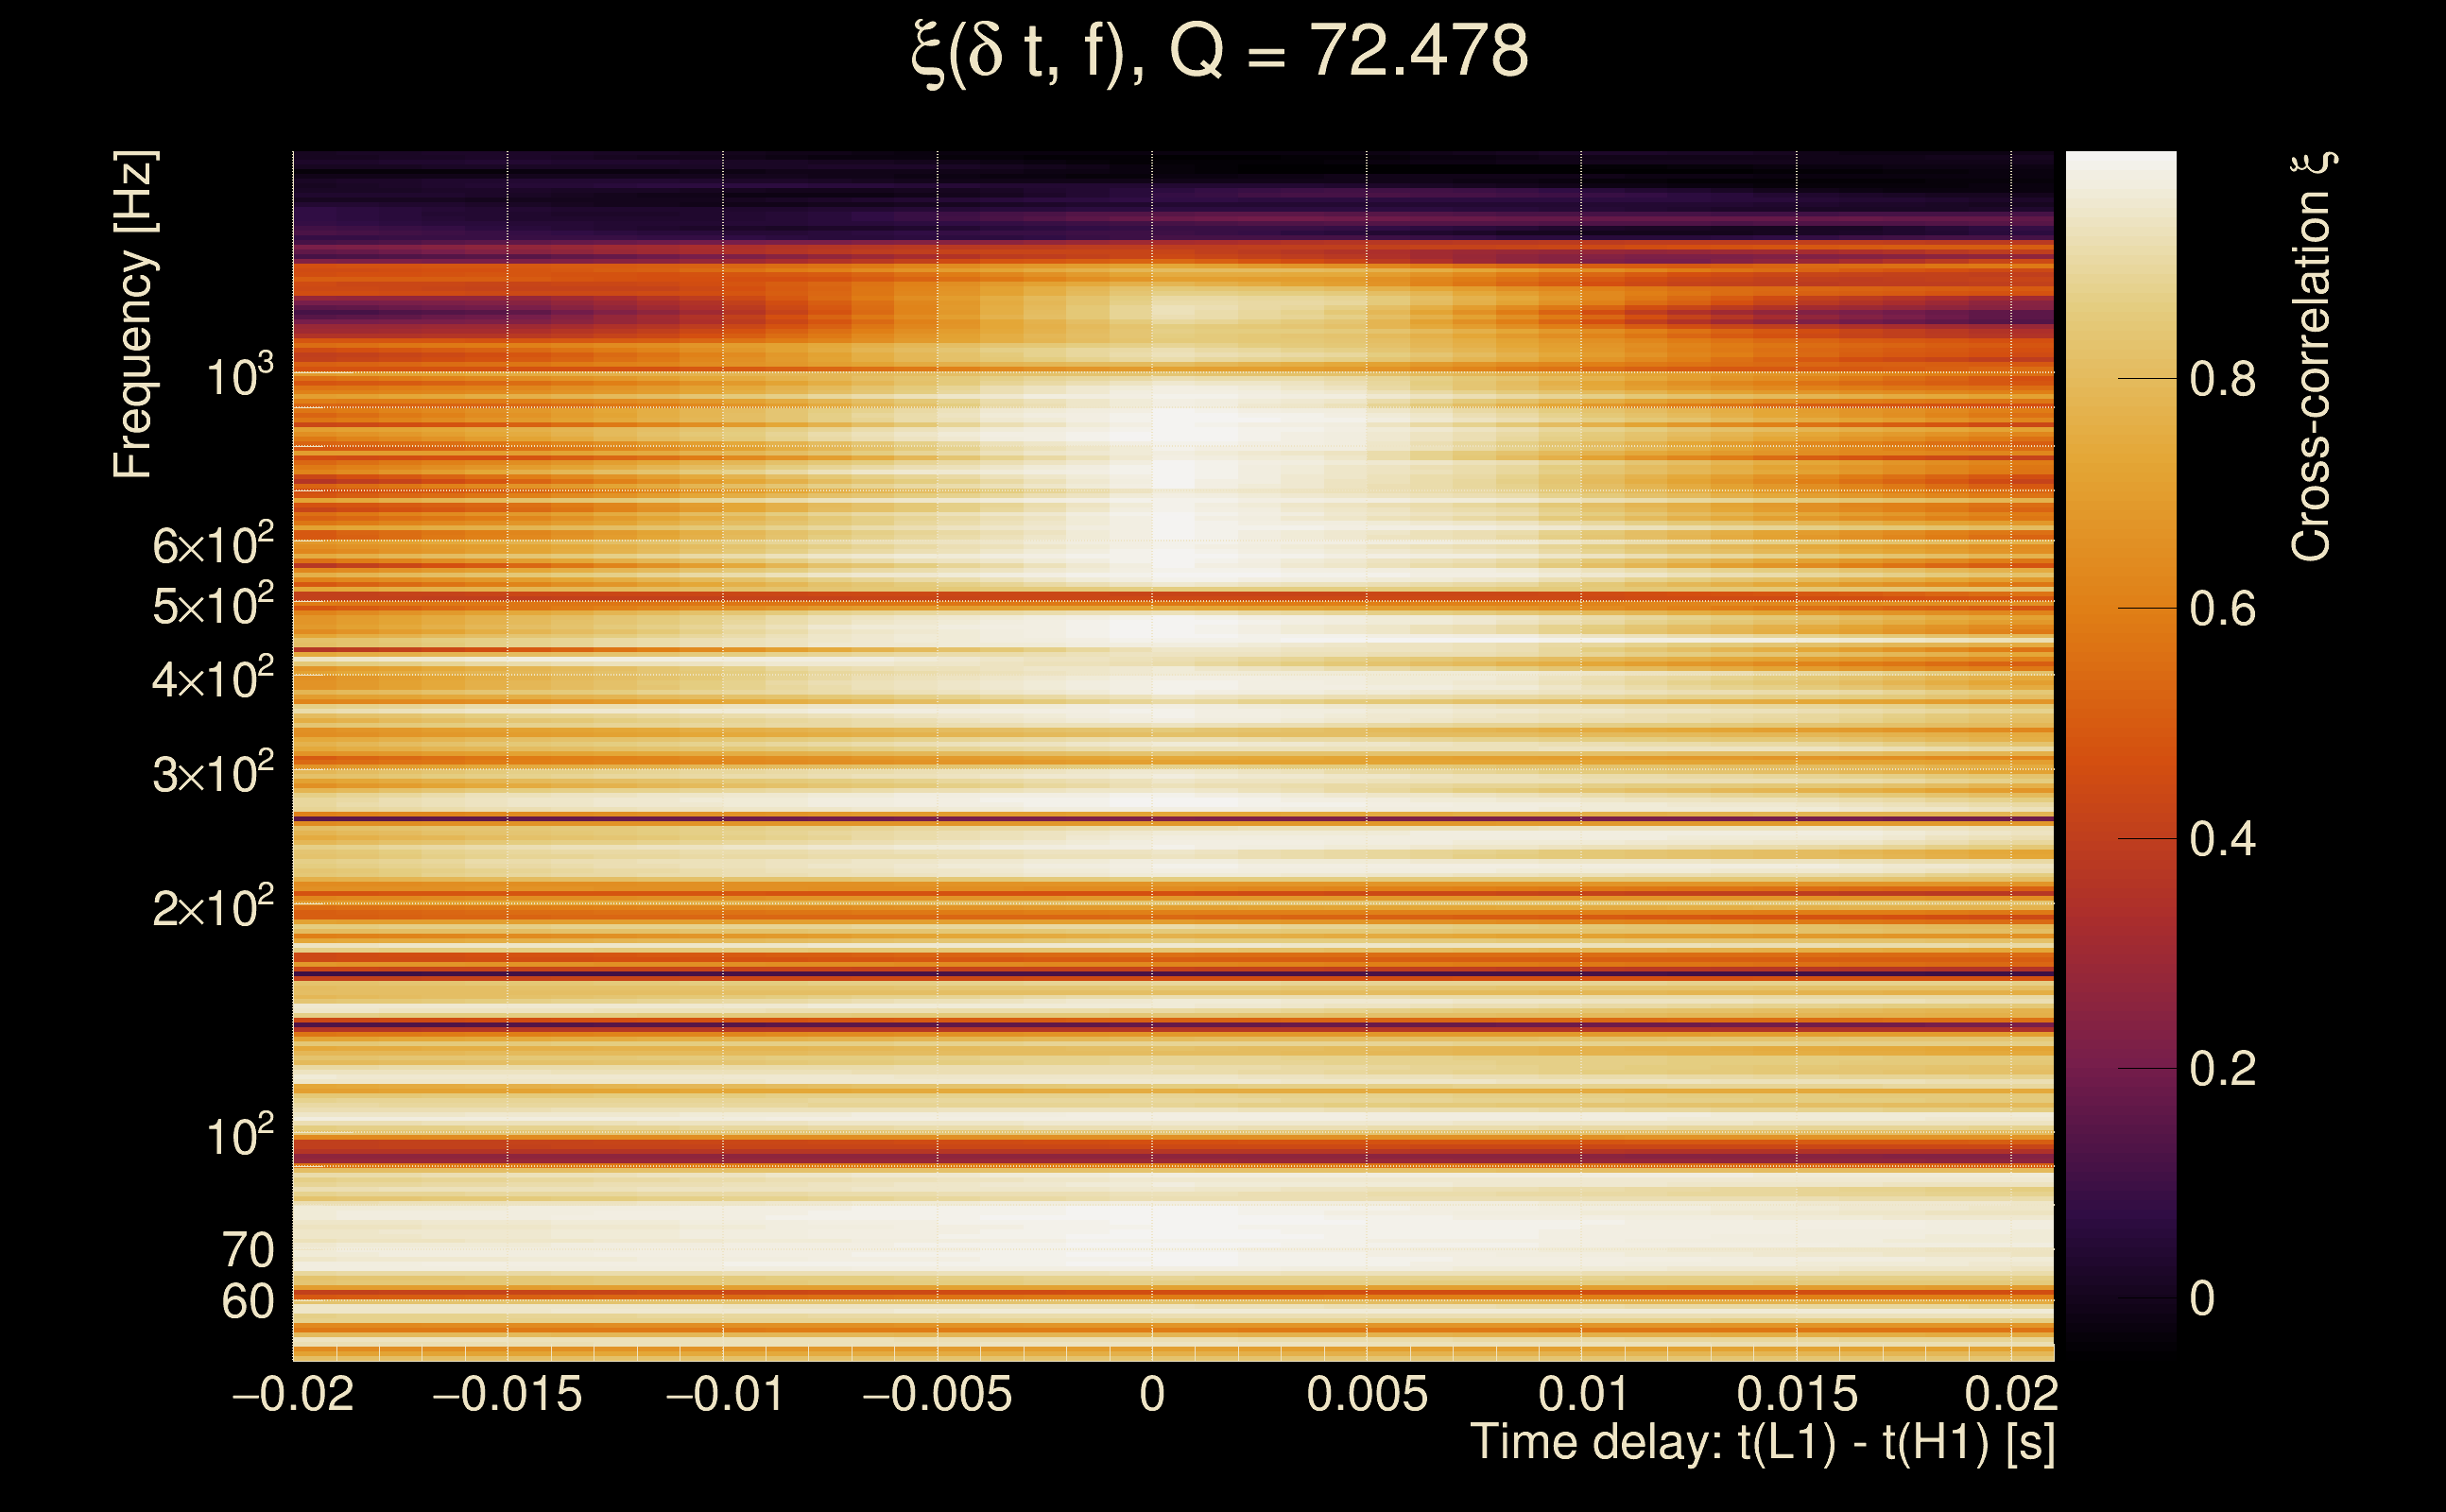
| Slice selected for the the fakeground: | slice index=89 (0.874 s), time lag = 0 s |
| Foreground | Fakeground | Background | ||
|---|---|---|---|---|
| Number of processed ox events | 12111 | 12111 | 2603865 | |
| Start Date (detector 0) | Mon May 15 14:13:25 2023 UTC | Mon May 15 14:13:25 2023 UTC | Mon May 15 14:13:25 2023 UTC | |
| End Date (detector 0) | Thu May 18 15:54:40 2023 UTC | Thu May 18 15:54:40 2023 UTC | Thu May 18 15:54:40 2023 UTC | |
| Start GPS (detector 0) | 1368195223 | 1368195223 | 1368195223 | |
| End GPS (detector 0) | 1368460498 | 1368460498 | 1368460498 | |
| Used livetime (detector 0) | 60875 s | 60875 s | 60875 s | |
| Start Date (detector 1) | Mon May 15 14:13:25 2023 UTC | Mon May 15 14:13:25 2023 UTC | Mon May 15 14:13:25 2023 UTC | |
| End Date (detector 1) | Thu May 18 15:54:40 2023 UTC | Thu May 18 15:54:40 2023 UTC | Thu May 18 15:54:40 2023 UTC | |
| Start GPS (detector 1) | 1368195223 | 1368195223 | 1368195223 | |
| End GPS (detector 1) | 1368460498 | 1368460498 | 1368460498 | |
| Used livetime (detector 1) | 60875 s | 60875 s | 60875 s | |
| Cumulative livetime | 121110 s | 121110 s | 26038650 s | |
| 0 years, 1 days, 9 hours, 38 min, 30 s | 0 years, 1 days, 9 hours, 38 min, 30 s | 0 years, 301 days, 8 hours, 57 min, 30 s |
|
|
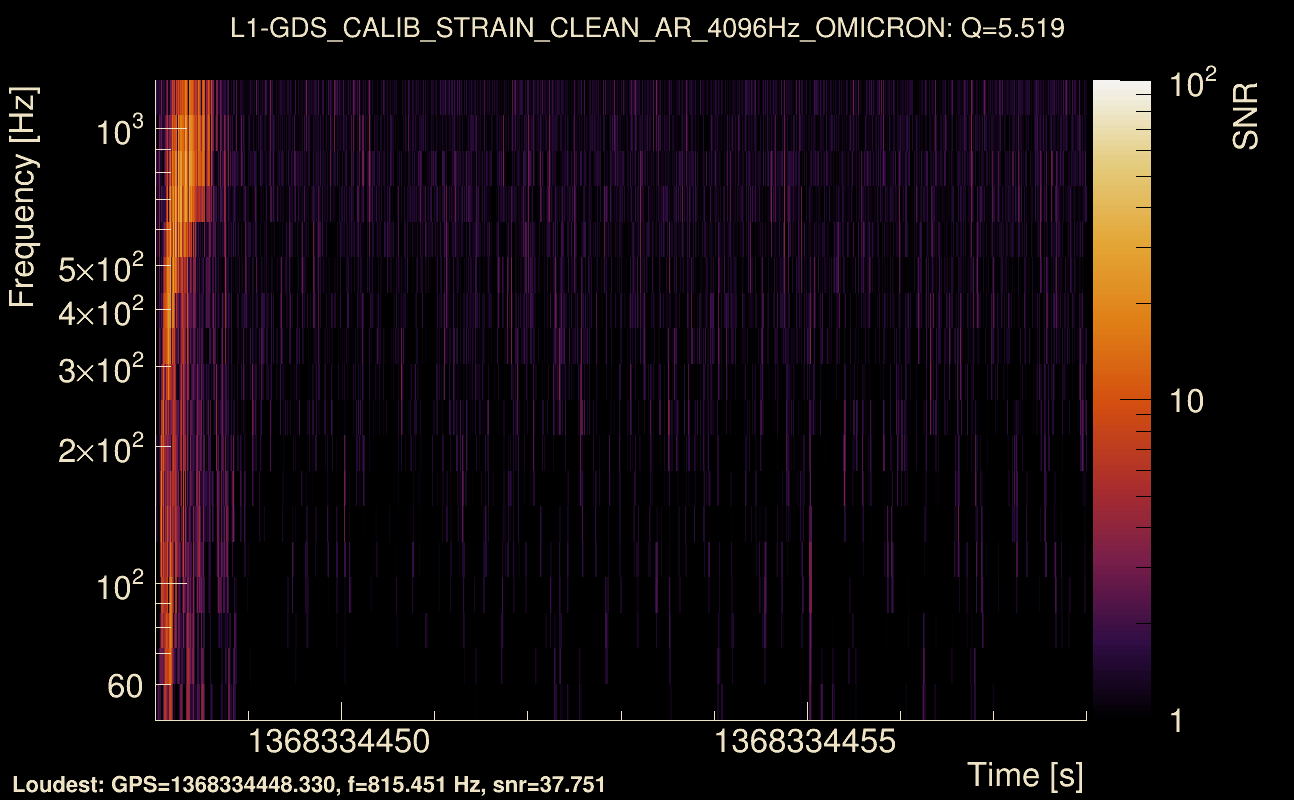
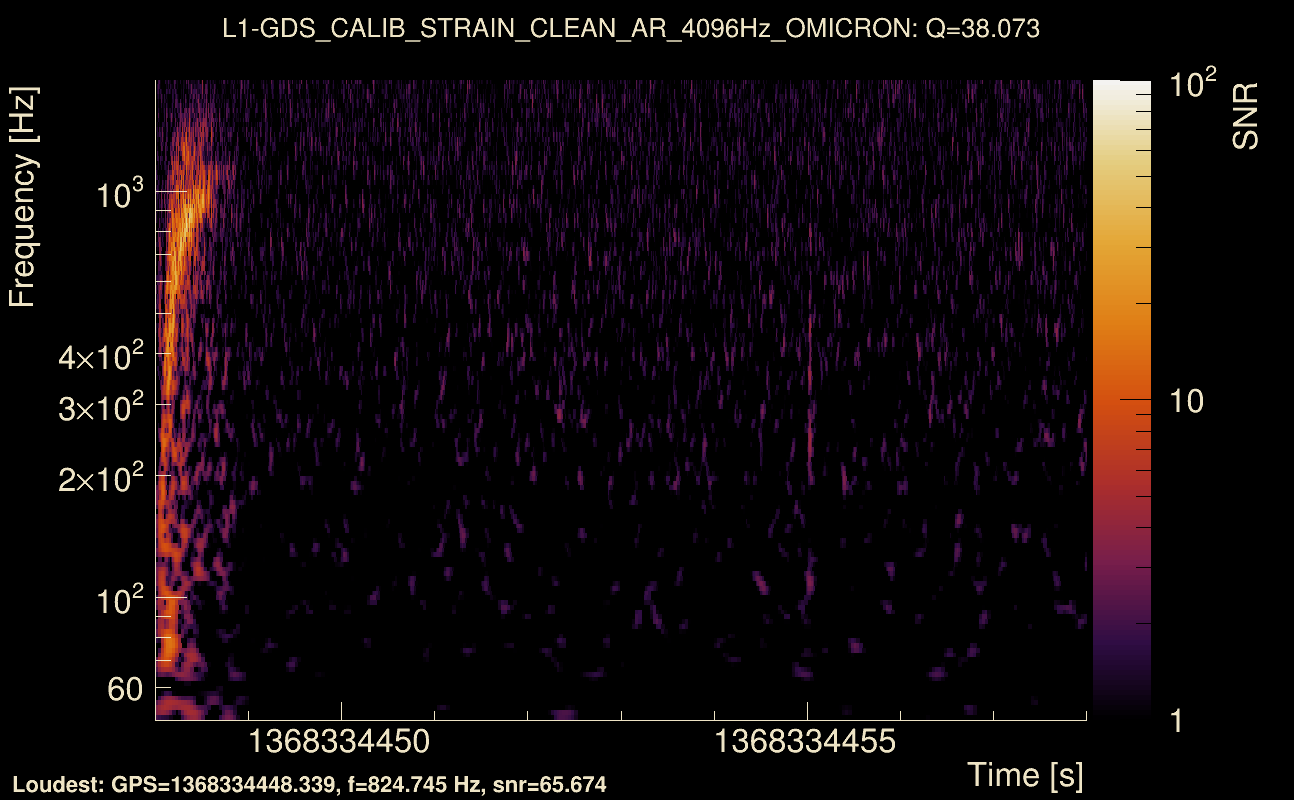
| Event time t(H1): | GPS = 1368334448 (Wed May 17 04:53:50 2023 ) → GPS = 1368334458 (Wed May 17 04:54:00 2023 ) |
| Event time t(L1): | GPS = 1368334448 (Wed May 17 04:54:00 2023 ) → GPS = 1368334458 (Wed May 17 04:54:00 2023 ) |
| Omicron analysis time window (H1): | GPS = 1368334445 → GPS = 1368334461 |
| Omicron analysis time window (L1): | GPS = 1368334445 → GPS = 1368334461 |
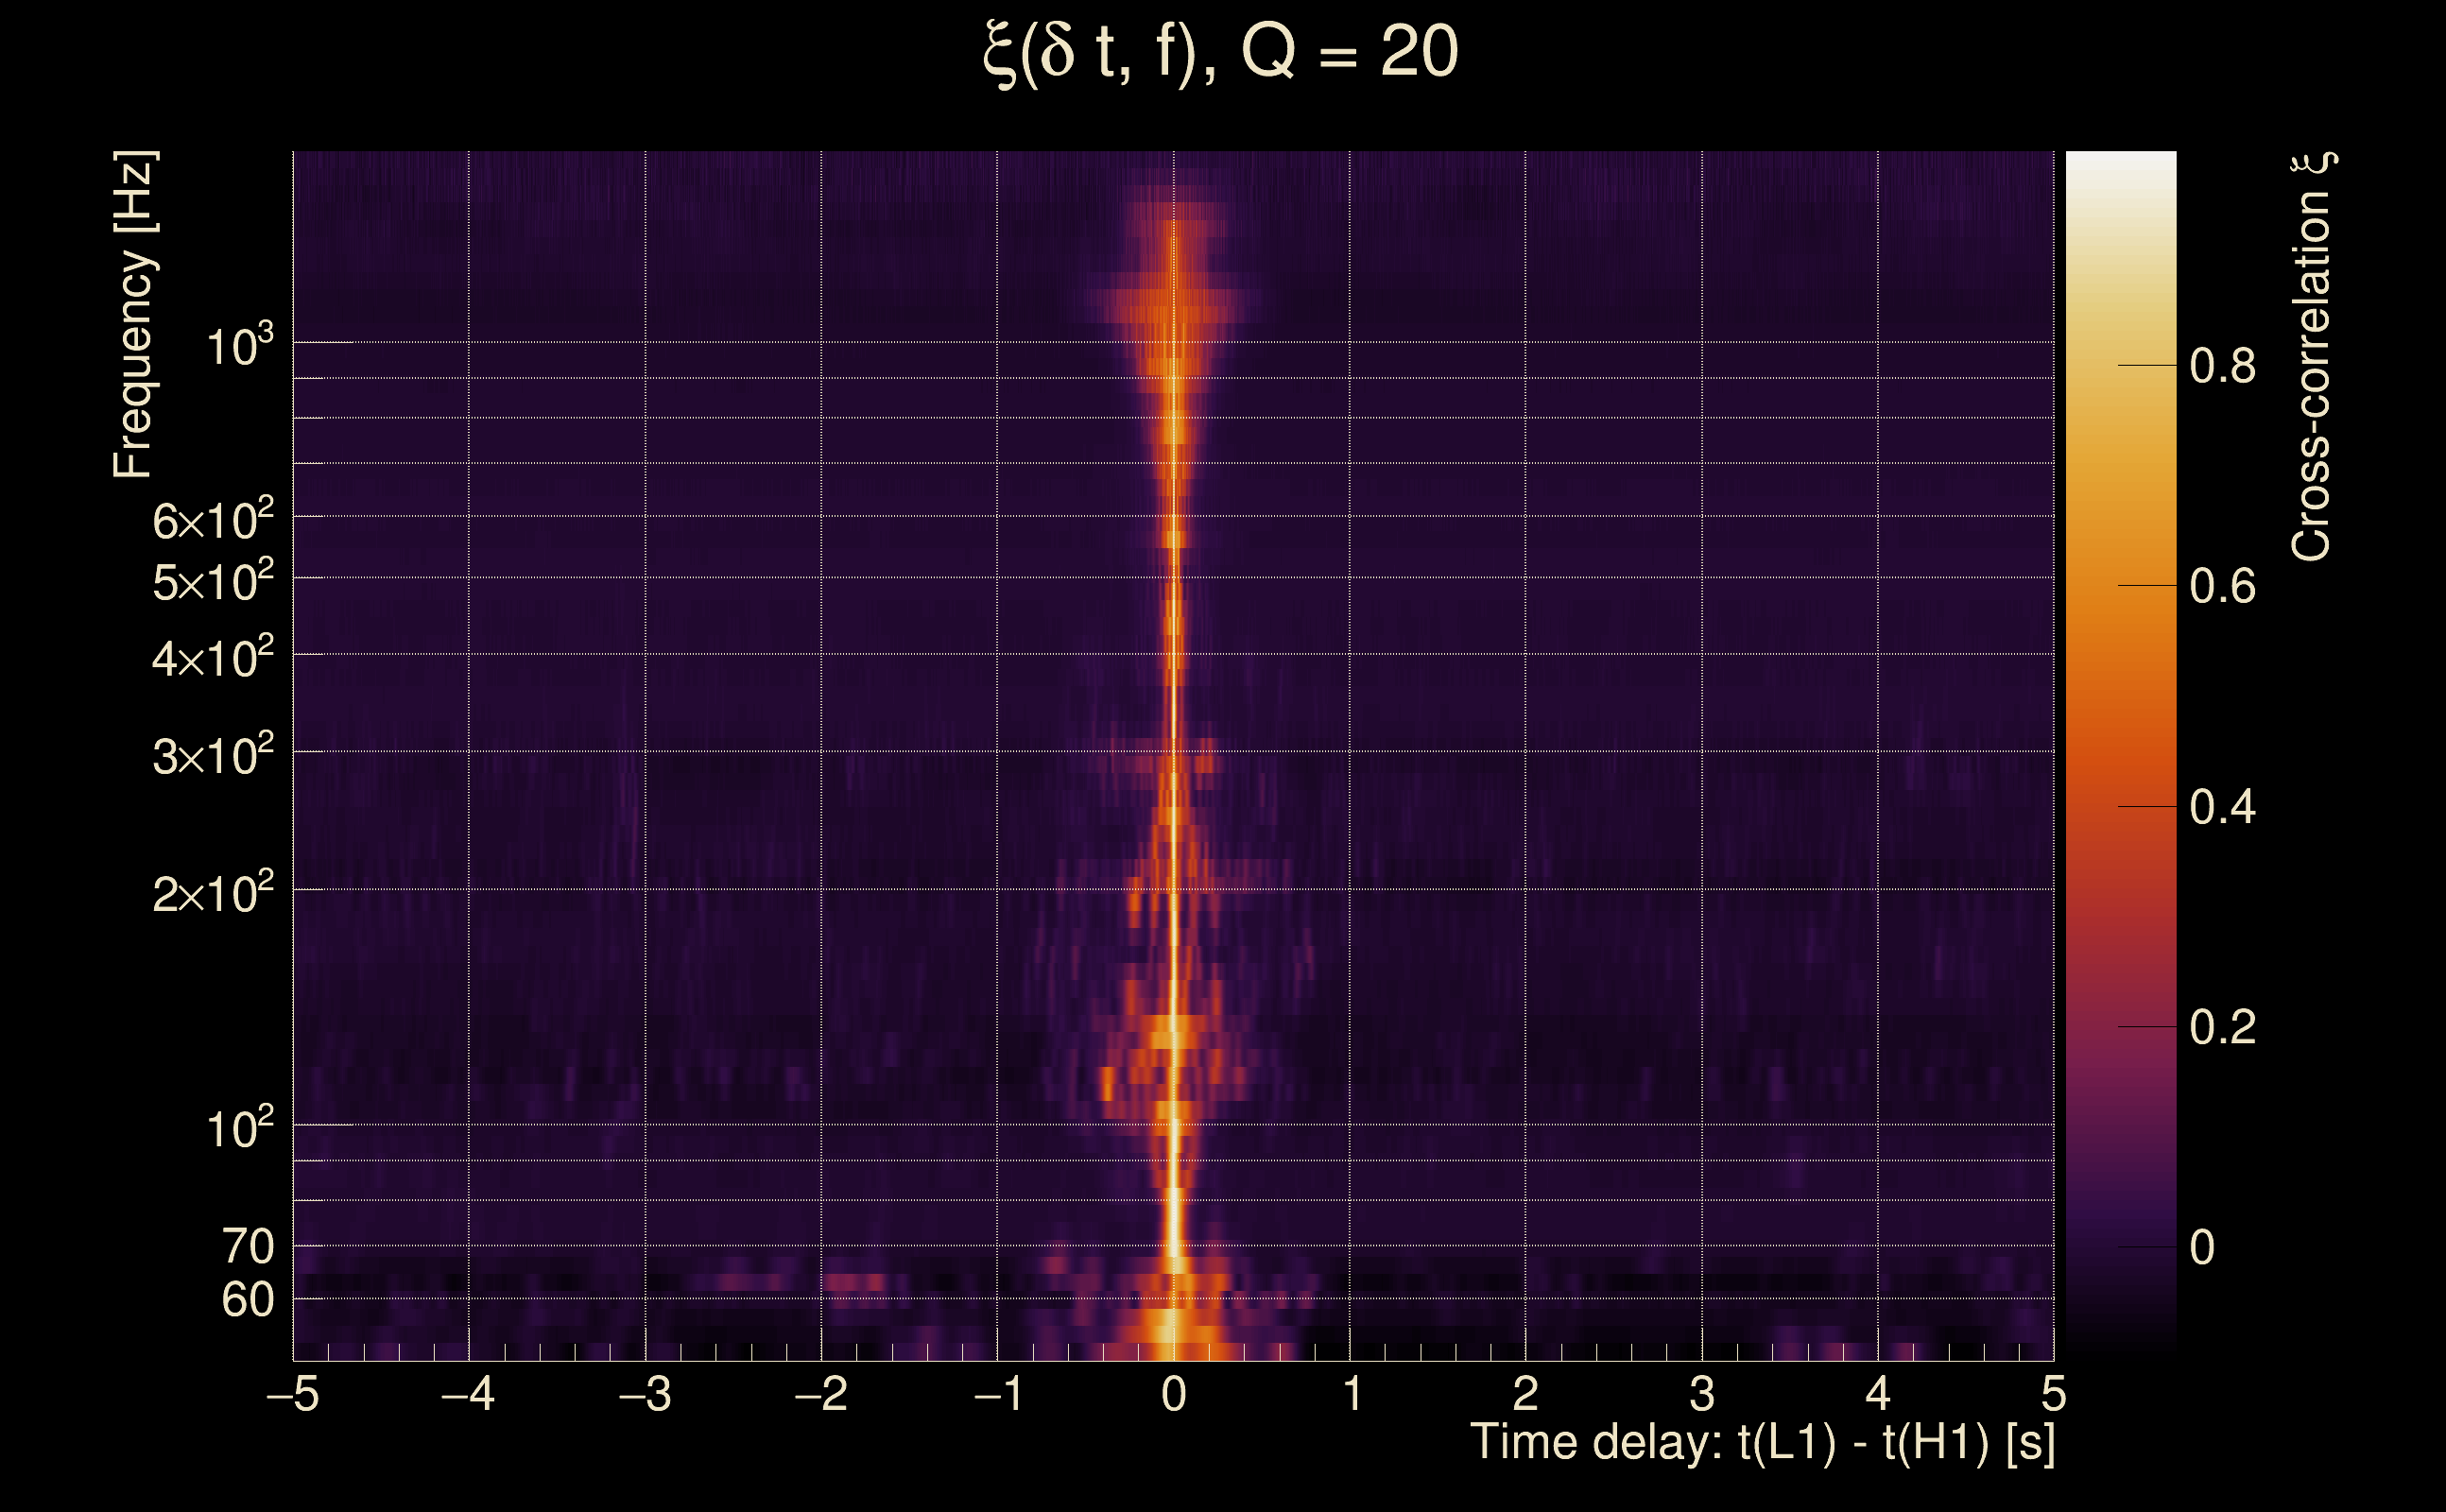
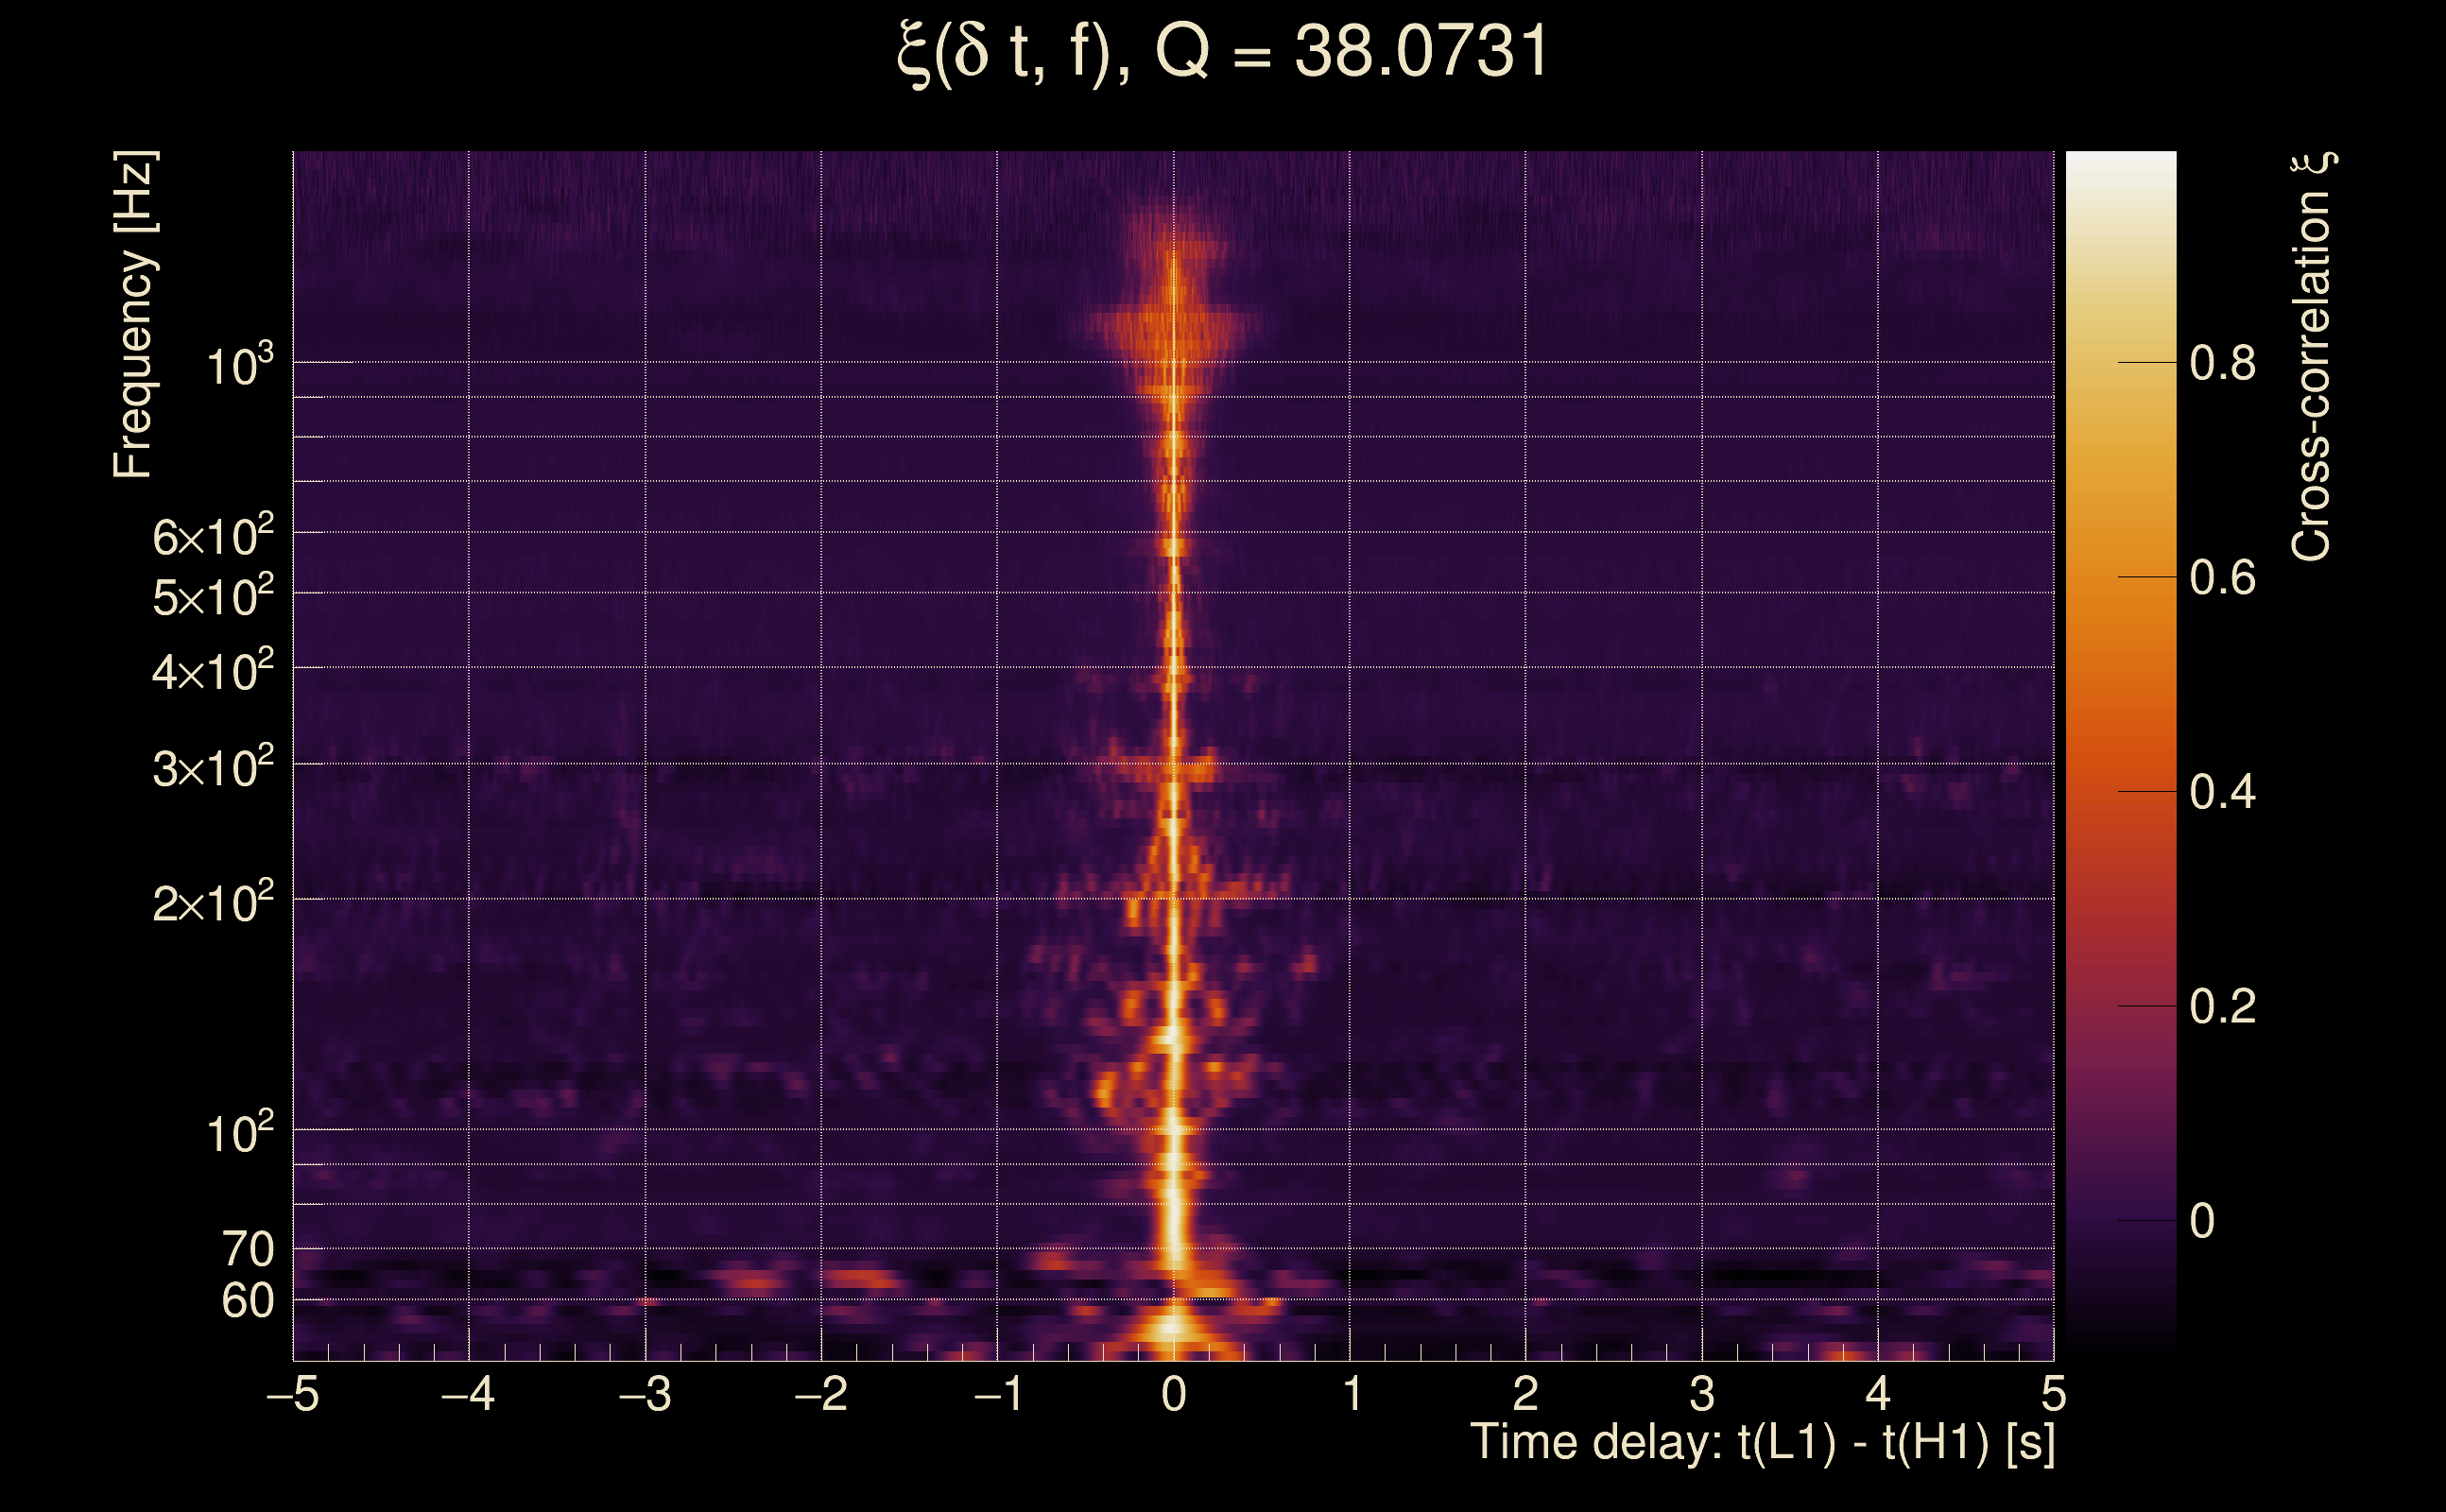
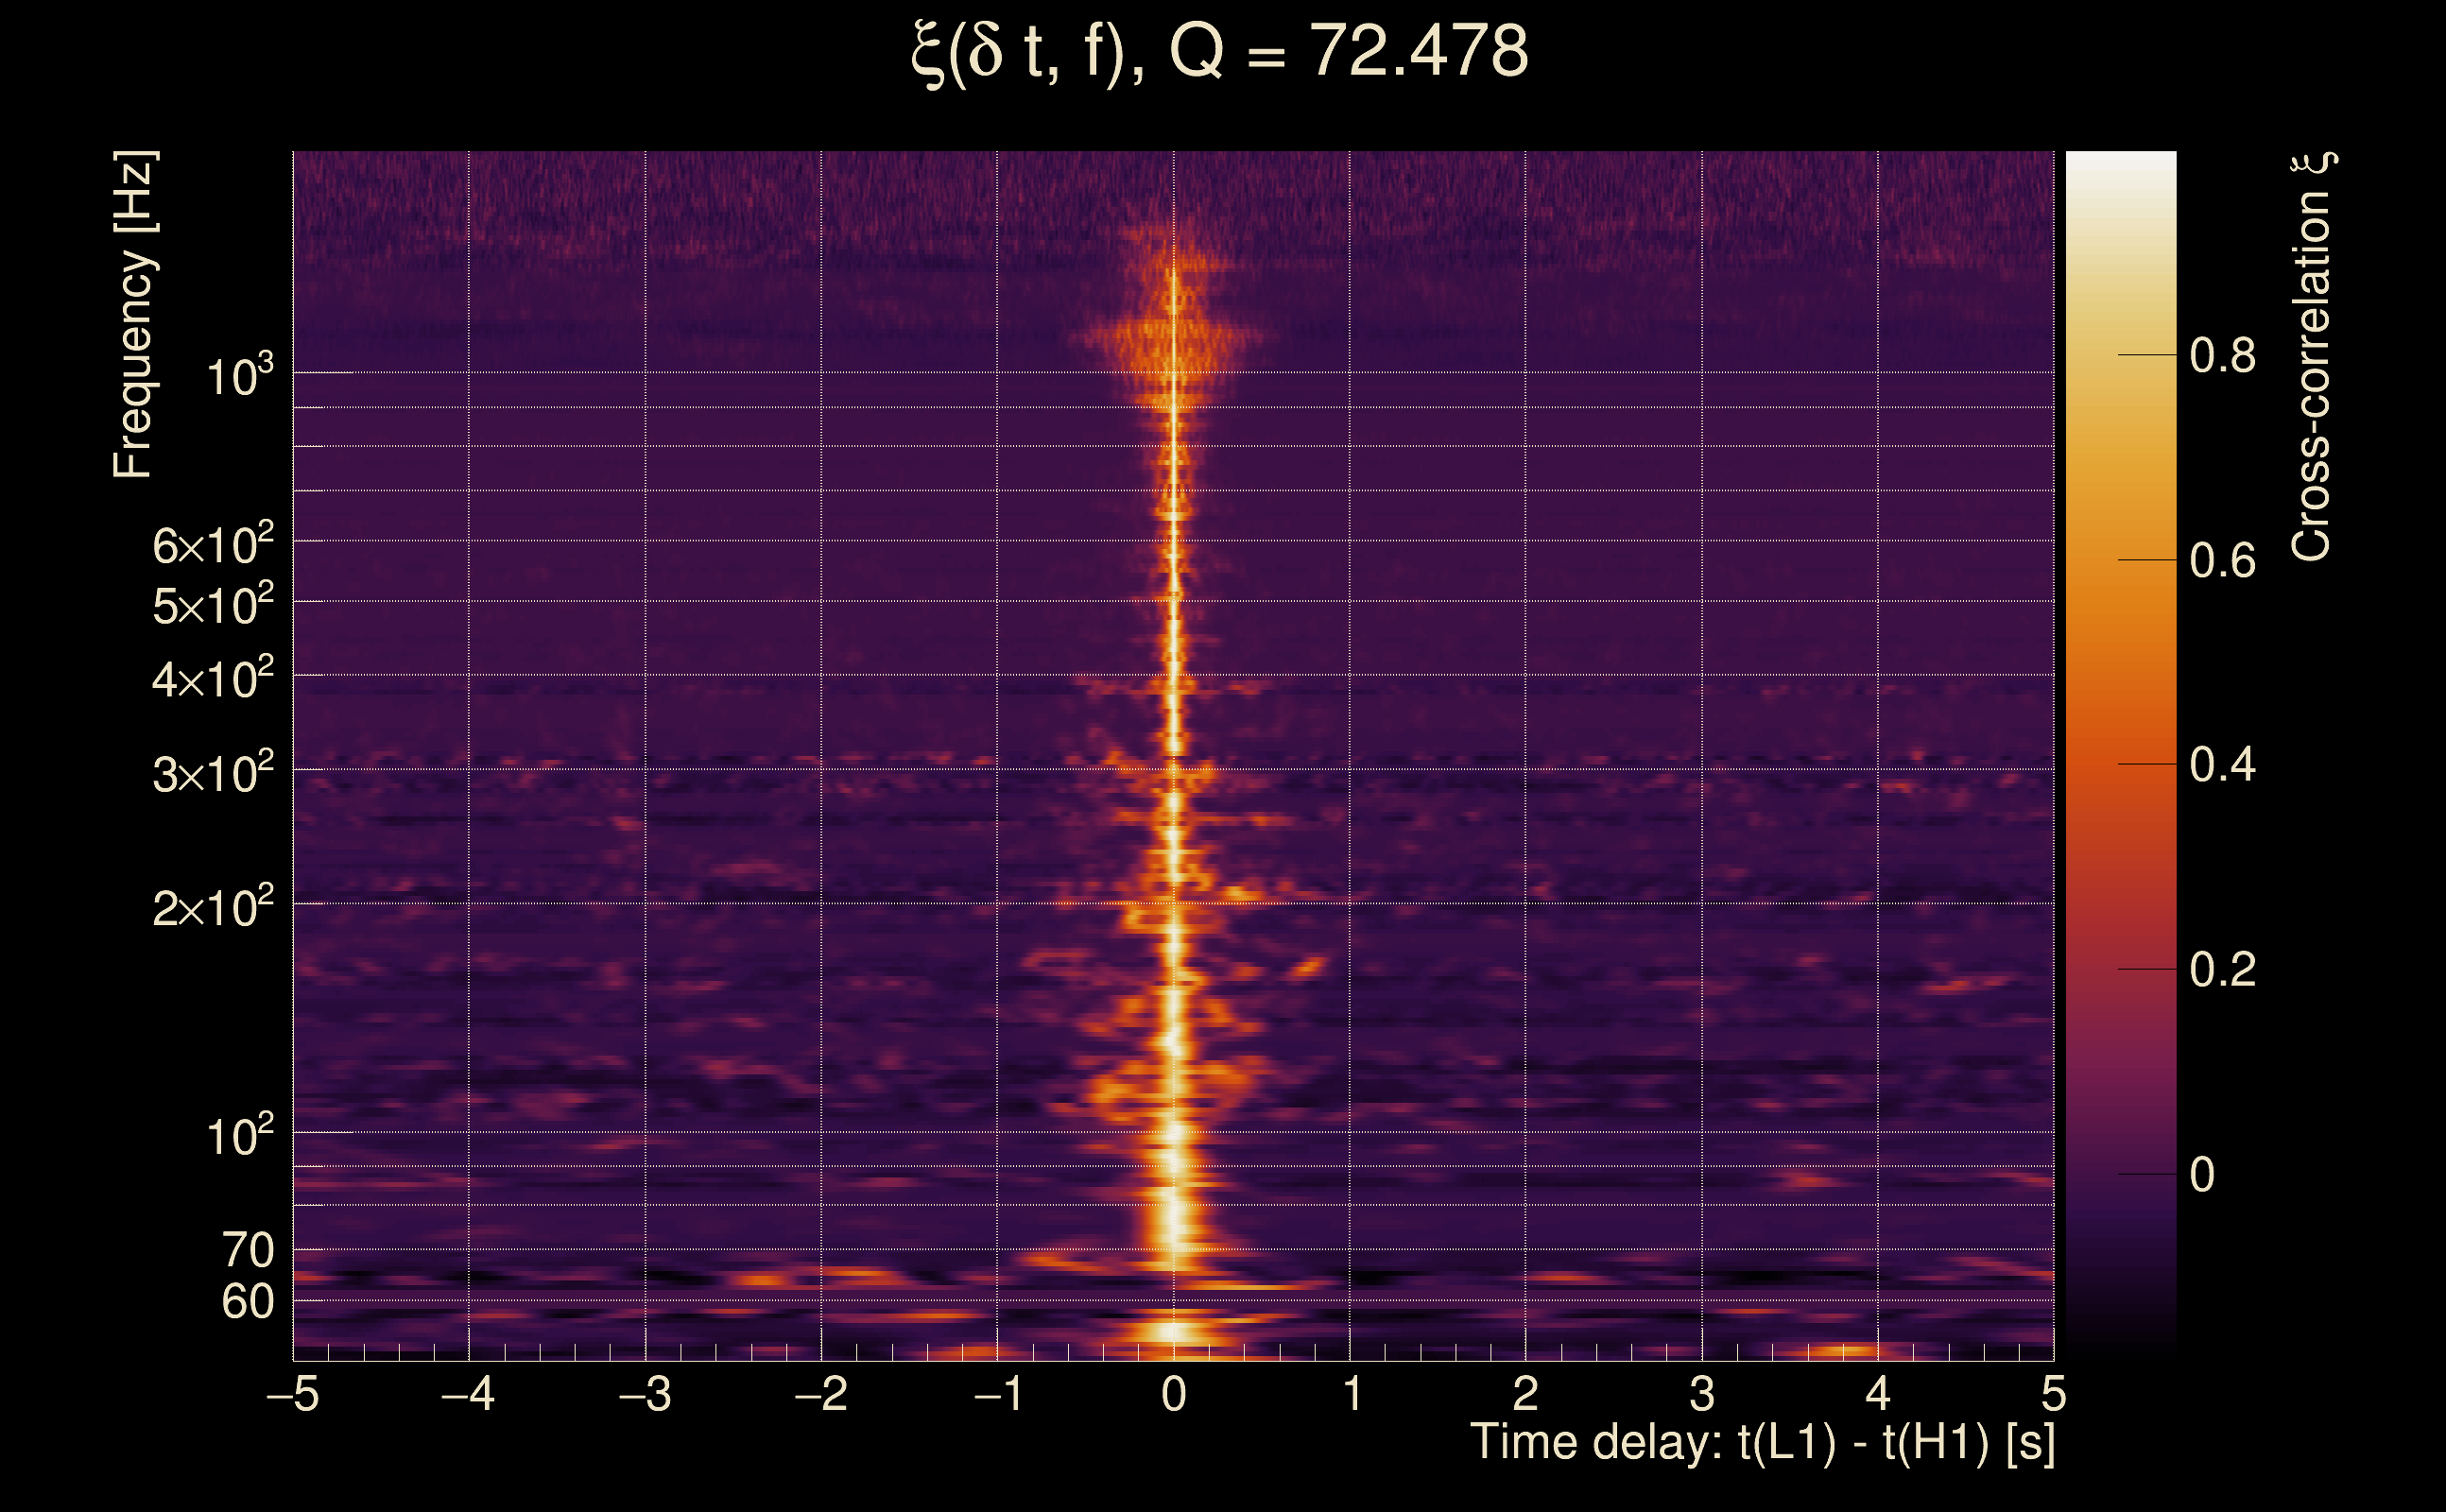
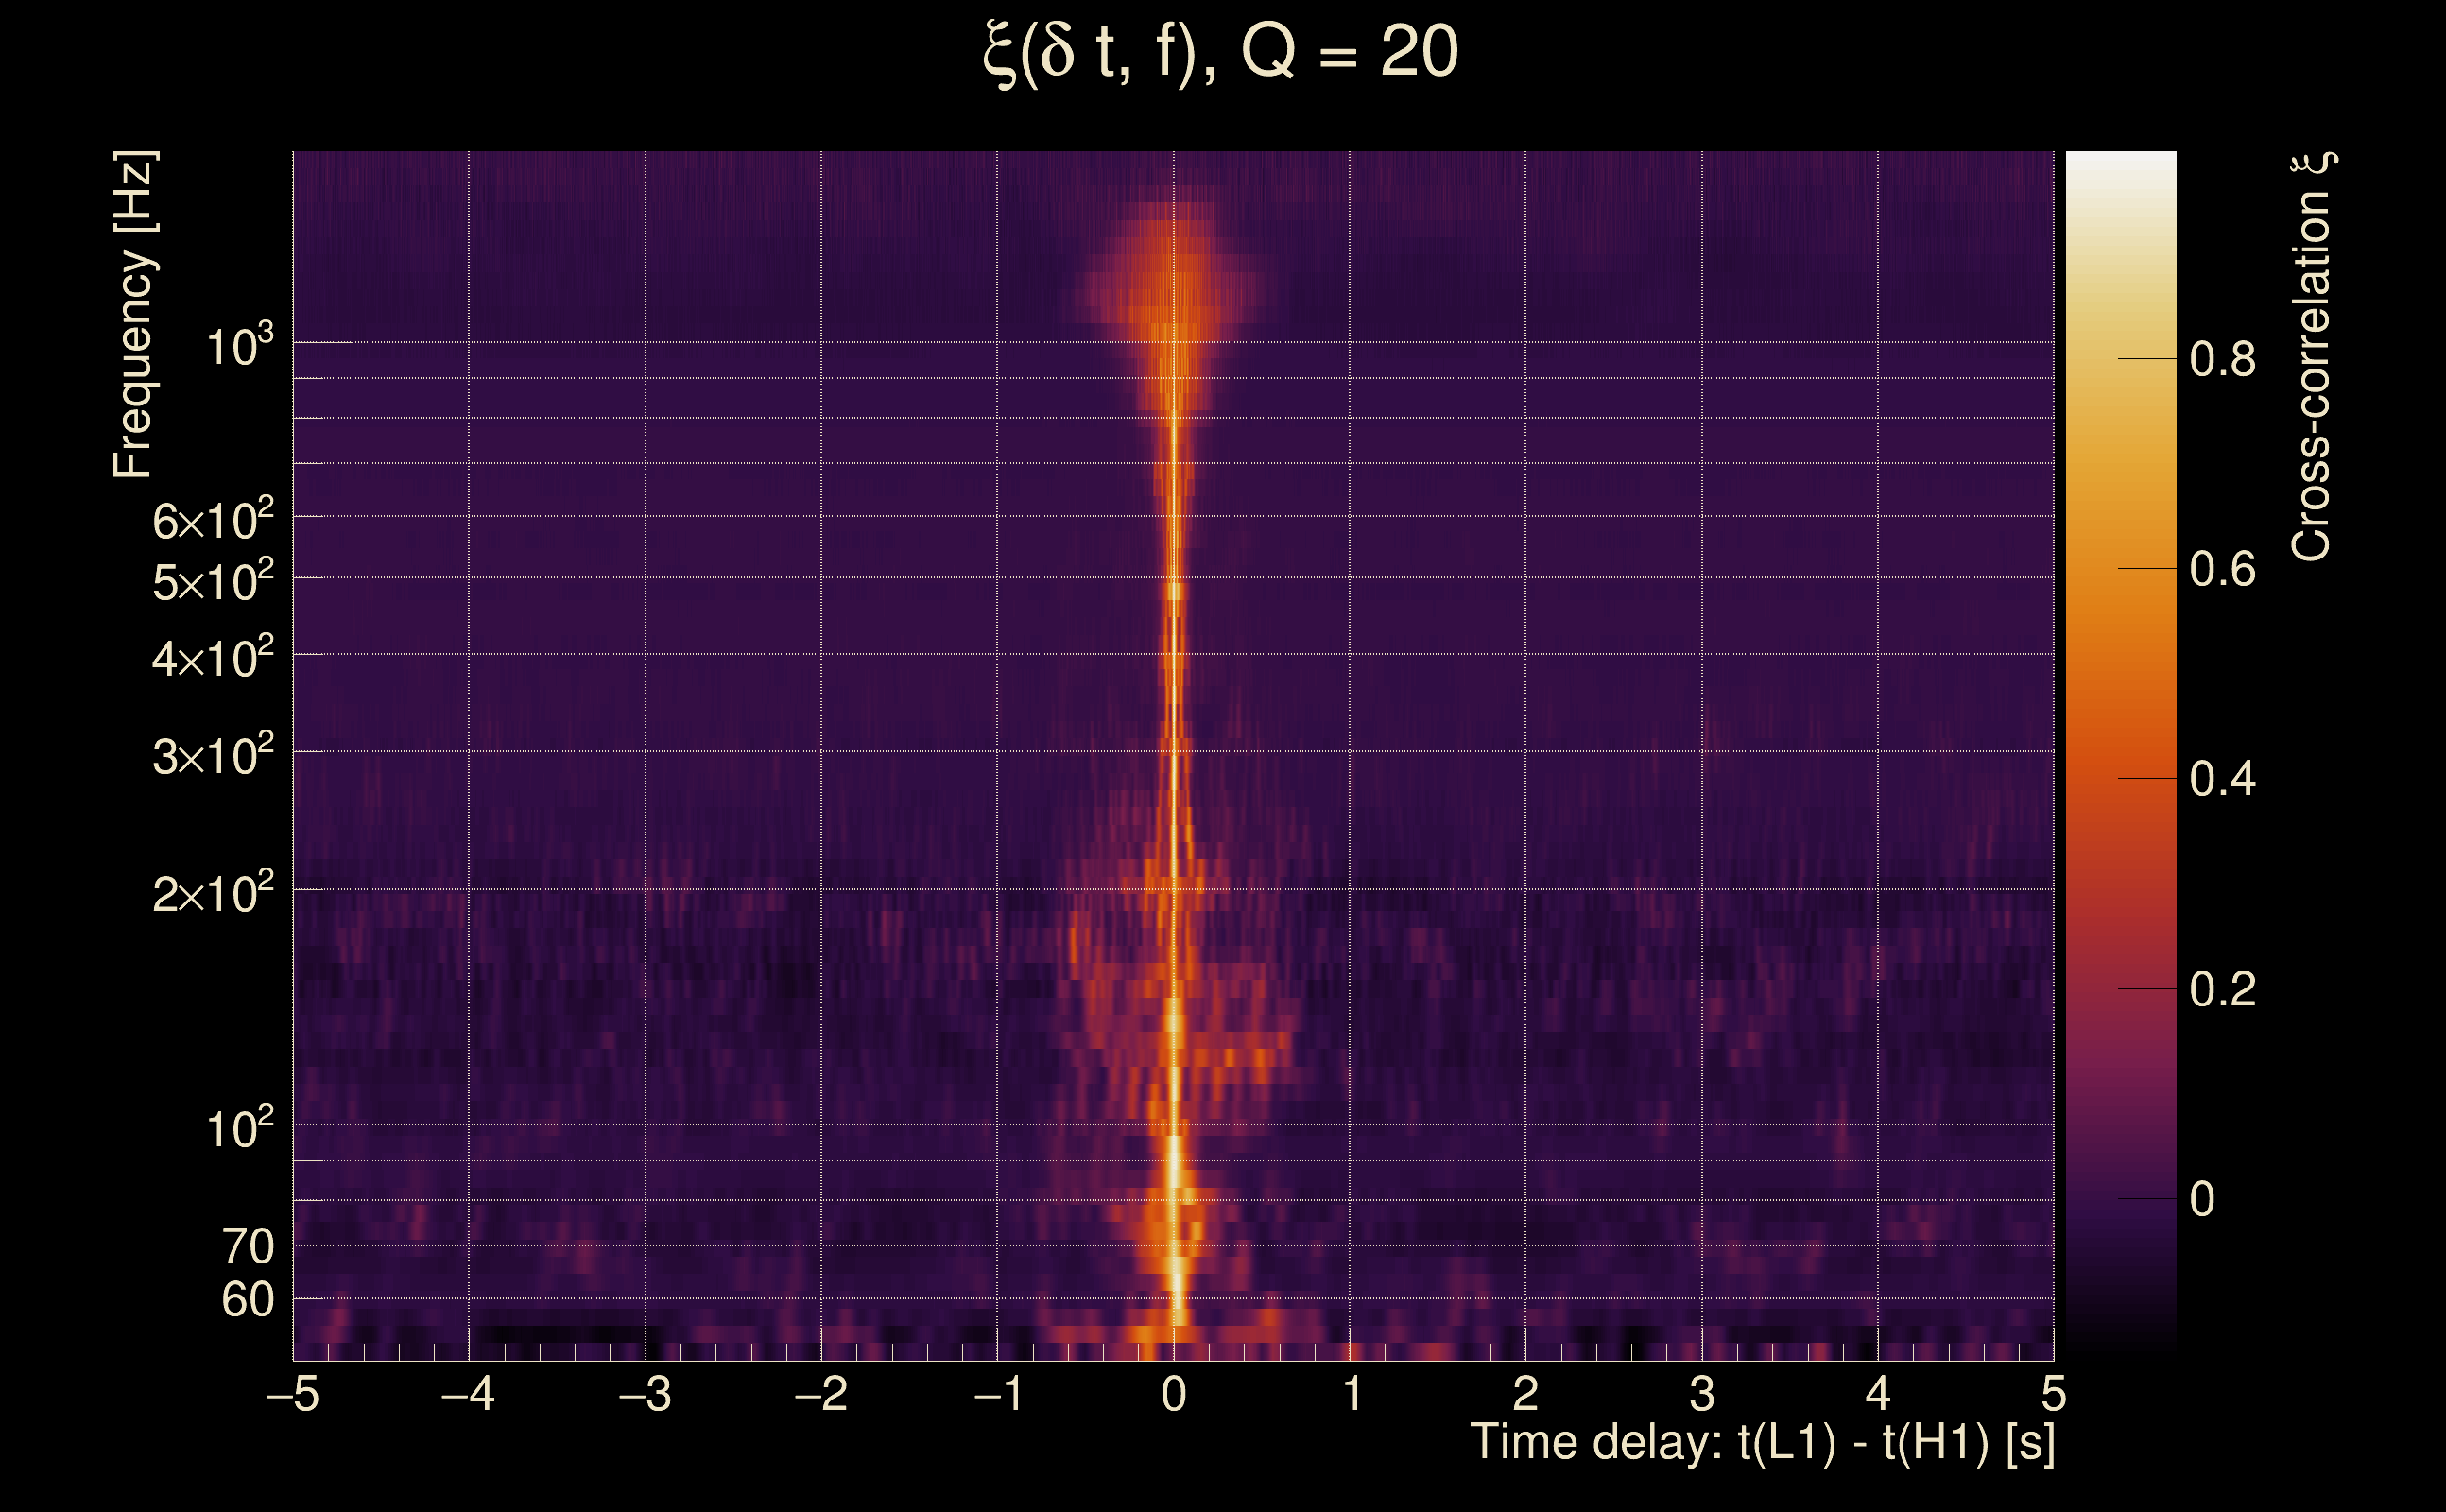
| Time delay between detectors t(L1) - t(H1): | 0.000979719 s (slice index = 108 / 217), δt_gw = 0.000979719 s |
| Time delay standard deviation: | 0.0211756 s |
| [targeted mode] Time delay probability: | 0.914991 (0.106745 sigmas), δt_target = 1.72247e+45 s |
| Frequency: | 290.604 Hz |
| Ξ: | 0.922245 ± 0.0115474 (variance = 0.000133342): Q0: 0.953586, Q1: 0.932339, Q2: 0.926196, Q3: 0.92542, Q4: 0.920857 |
| Rank: | R_A = 0.872157 |
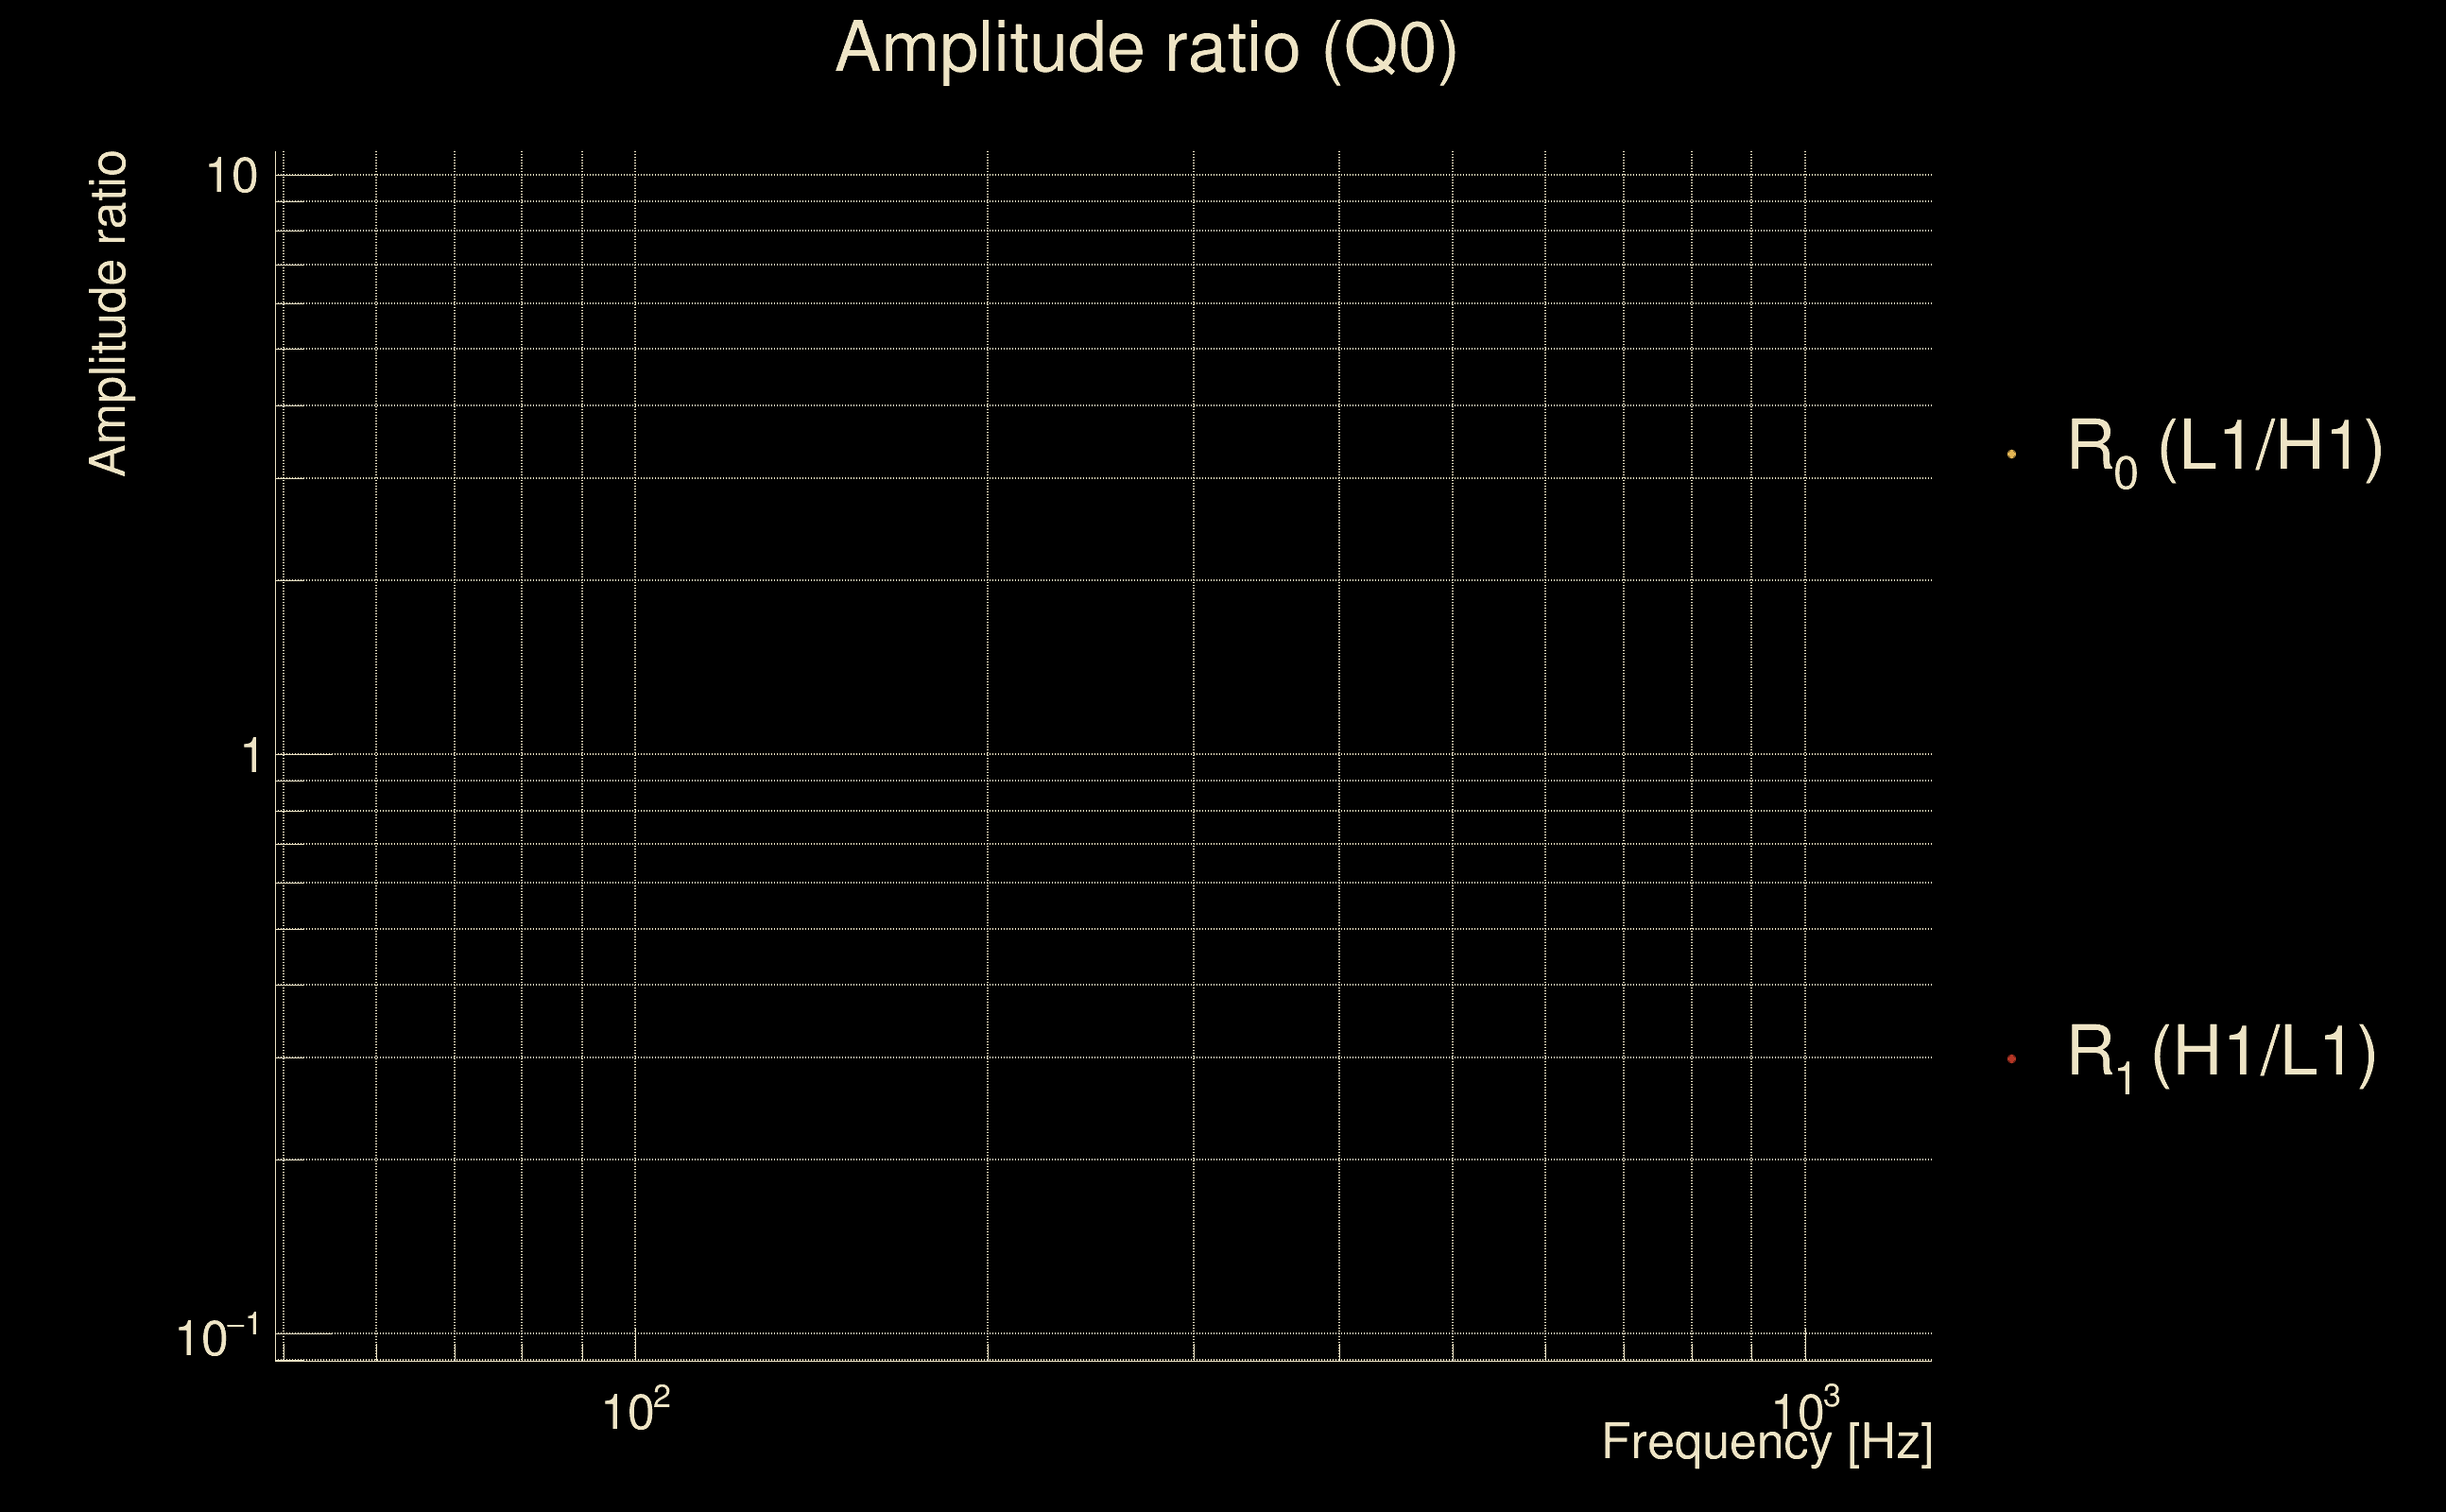
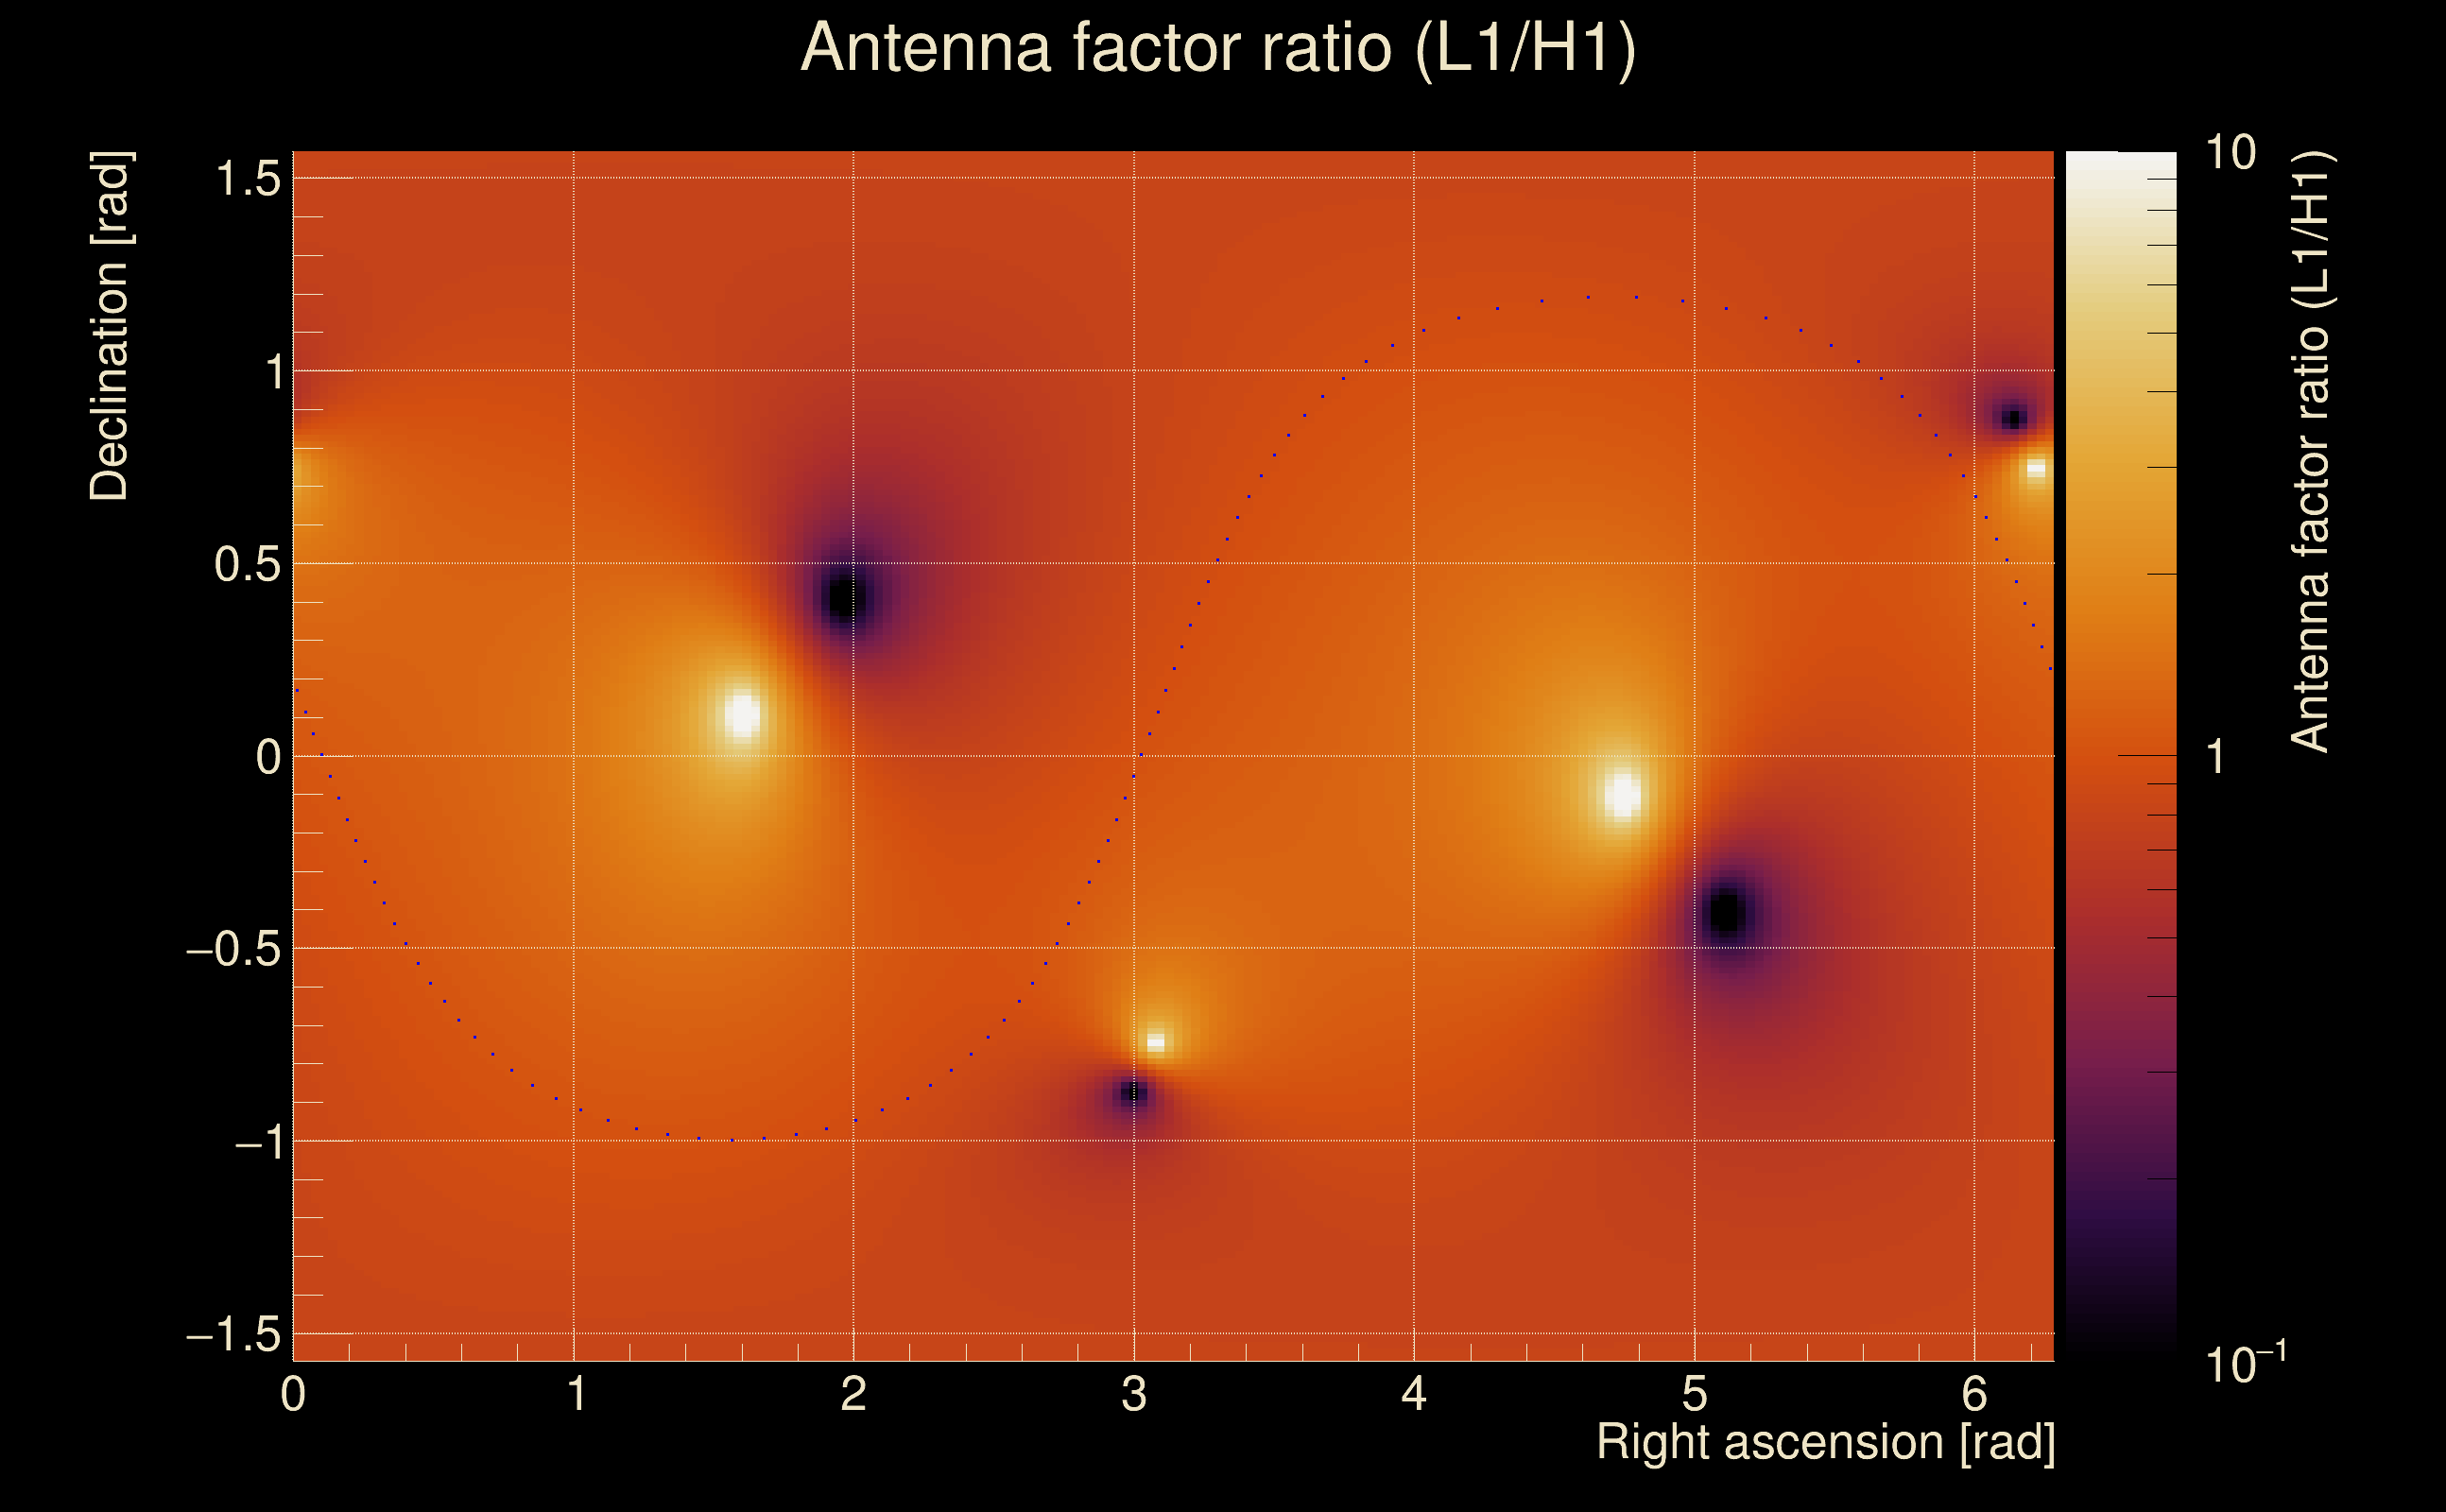
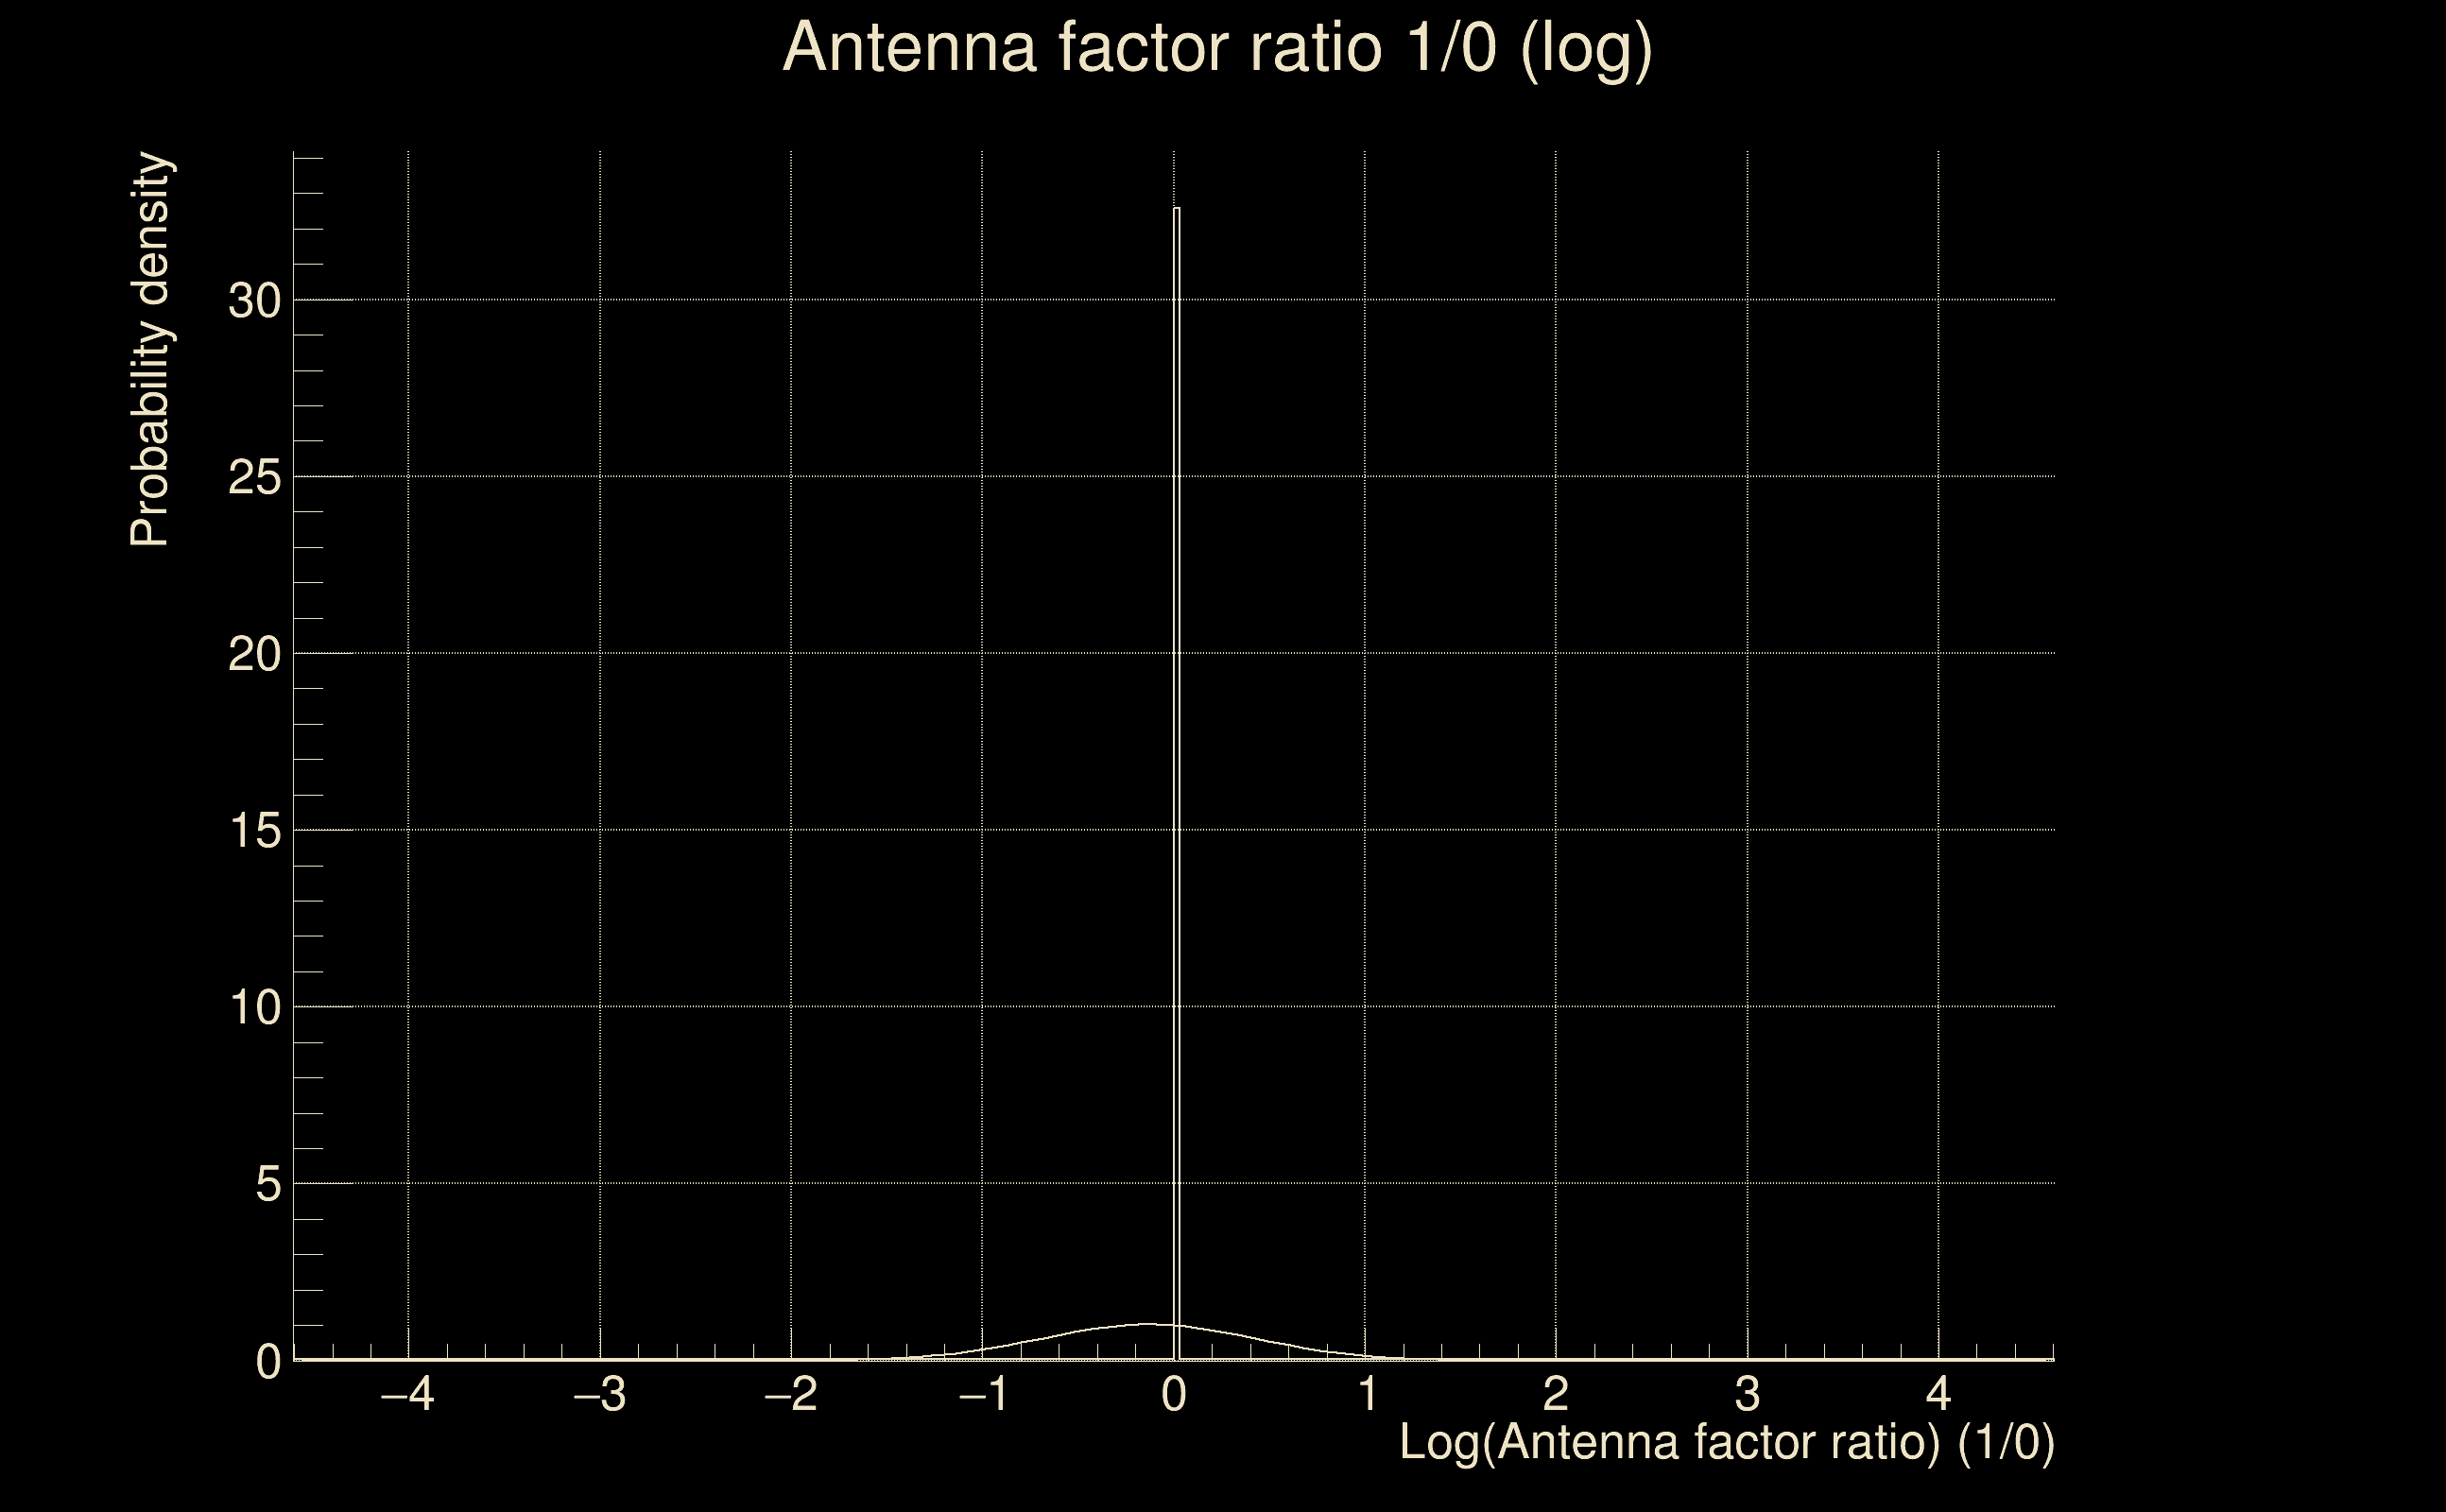
| Log of amplitude ratio (L1/H1): | -0.068774, variance = 0.153006 (L1/H1: -0.0765275, variance = 0.304038, H1/L1: 0.0620126, variance = 0.305009) |
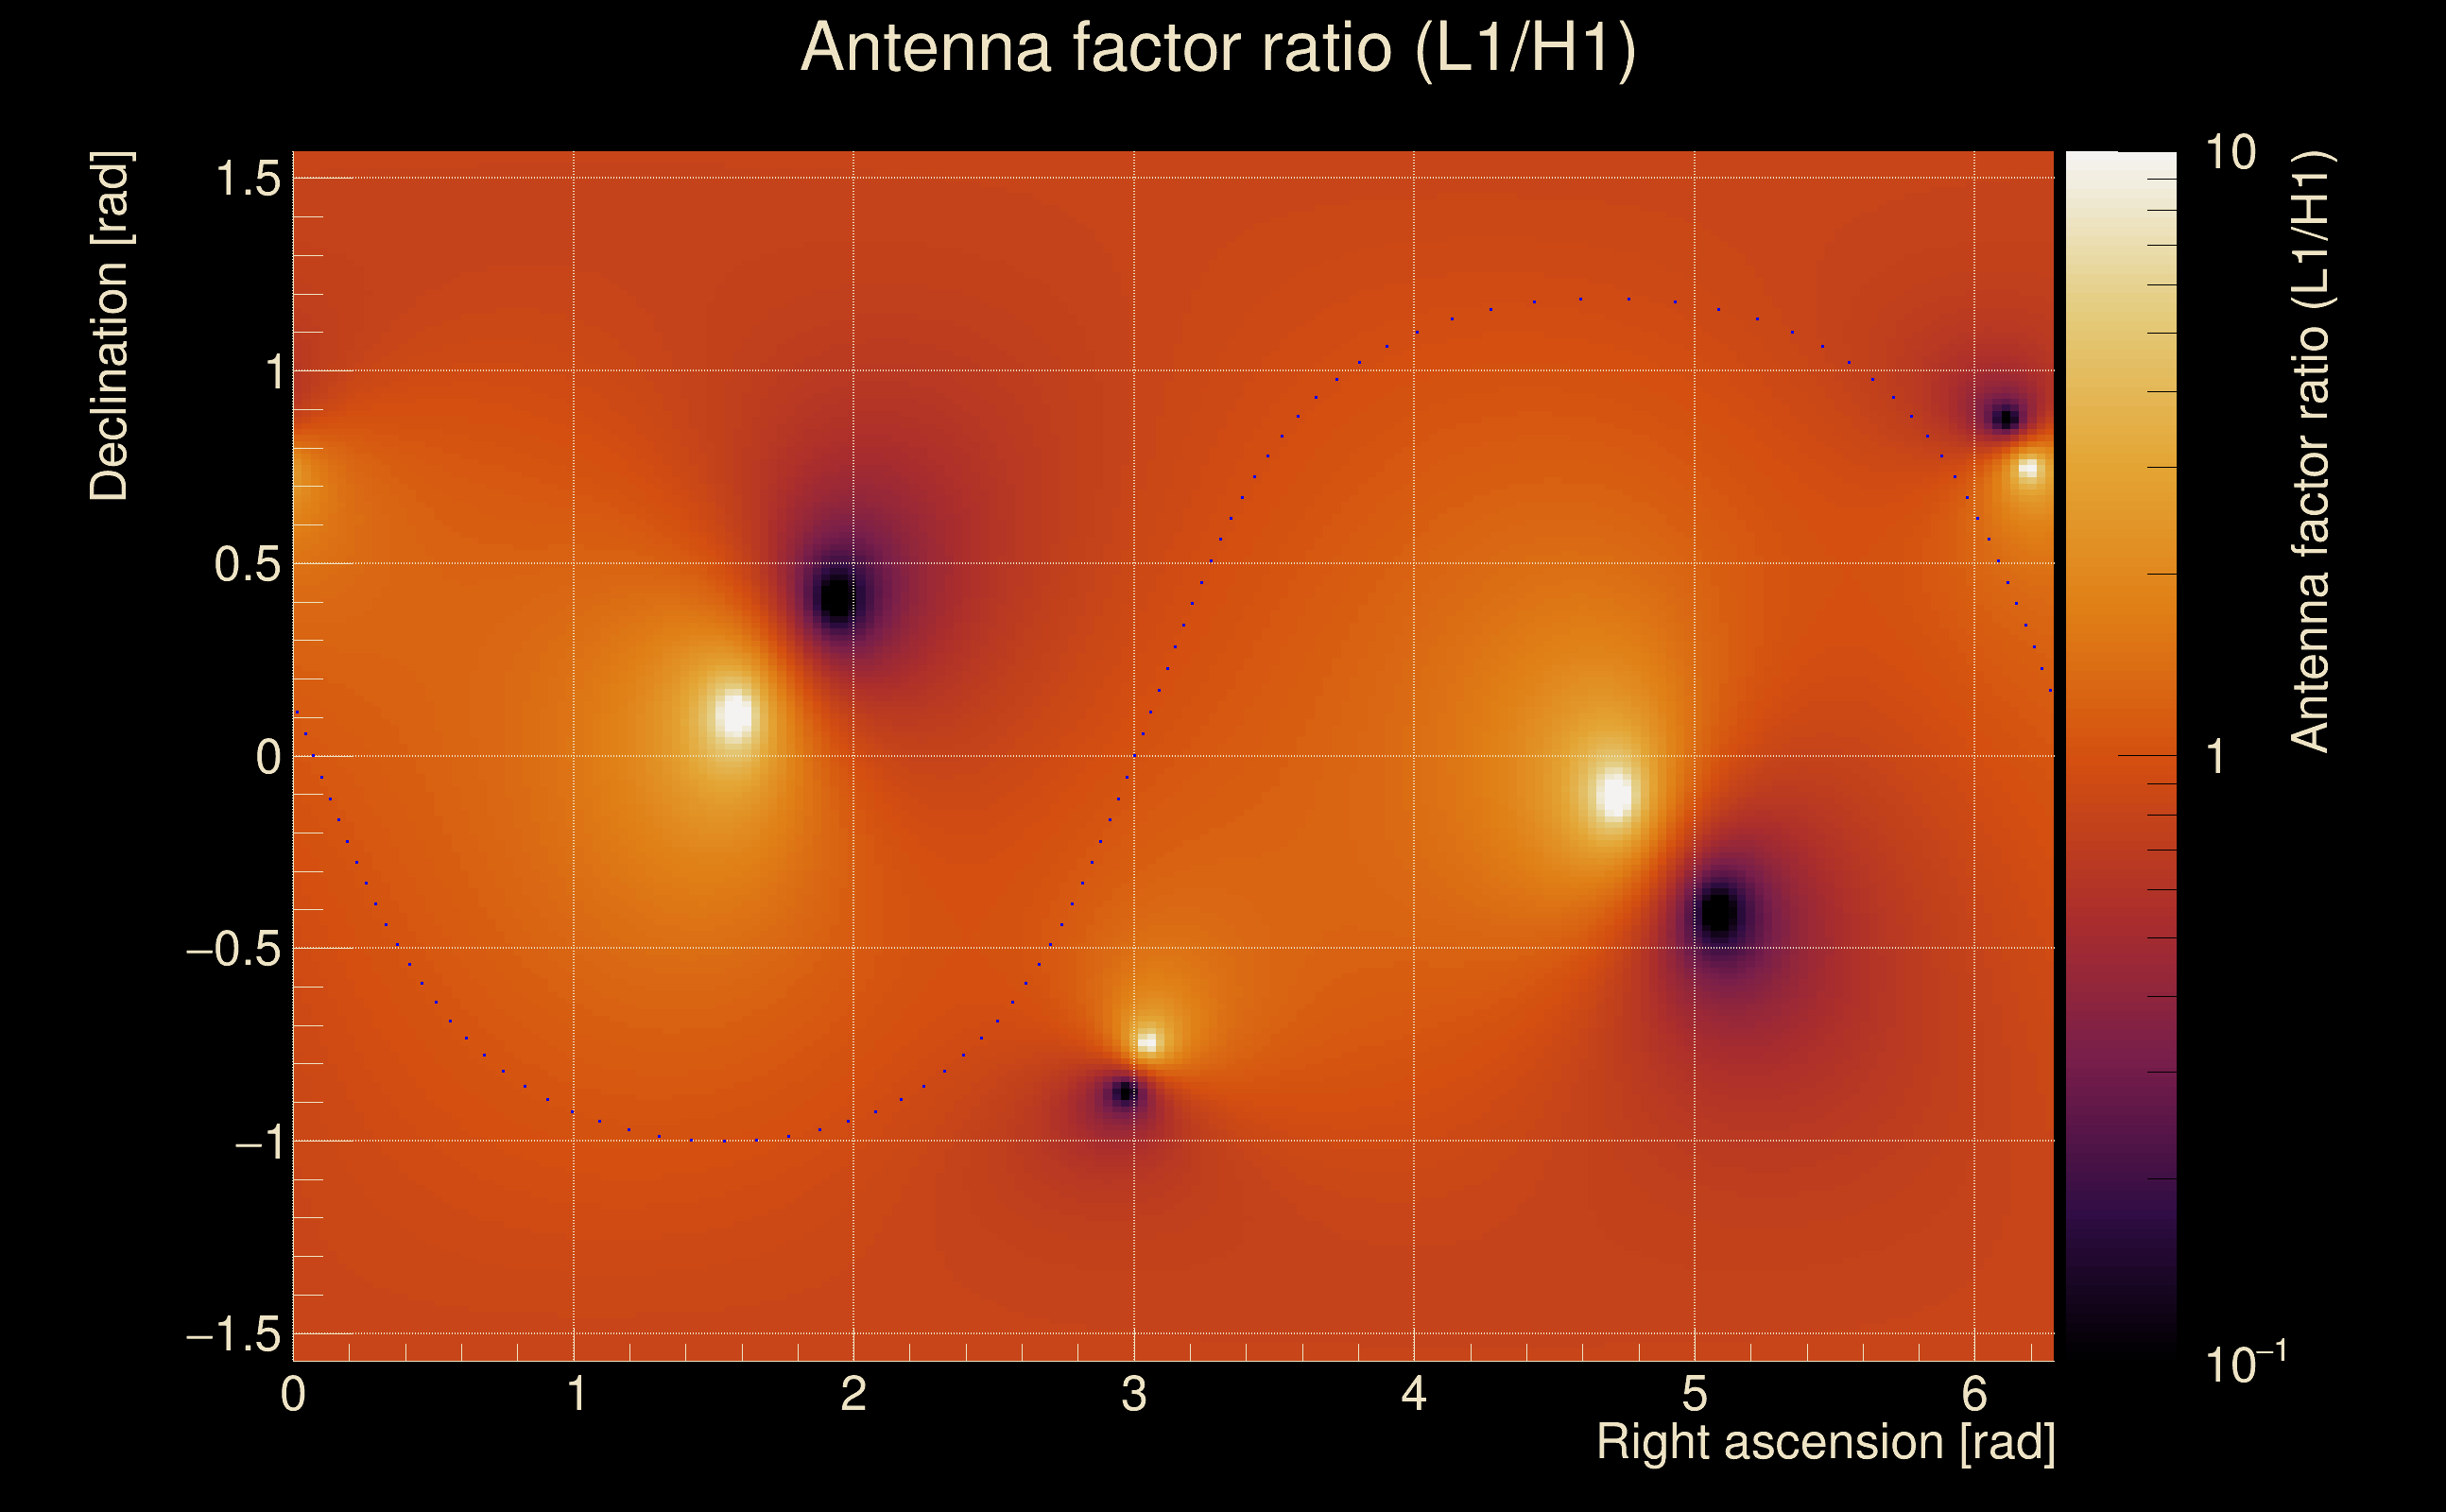
| Amplitude ratio (L1/H1): | 0.933538 ⋇ 1.4787 (L1/H1: 0.926327 ⋇ 1.73567, H1/L1: 1.06398 ⋇ 1.7372) |
| Amplitude ratio H1|L1 compatibility (probability): | 0.985161 |
| Antenna factor probability: | 0.959934 |
| Number of rejected frequency rows: | Q0: 0 / 18, Q1: 0 / 36, Q2: 4 / 70, Q3: 15 / 134, Q4: 41 / 258 |
| Maximum signal-to-noise ratio: | H1: 60.7755, L1: 65.0813 |
| SNR variance: | H1: 3.06121, L1: 3.09679 |
| Click here for a zoomed plot | Click here for a zoomed plot | Click here for a zoomed plot | Click here for a zoomed plot | Click here for a zoomed plot |
 |
 |
 |
 |
 |
 |
 |
 |
 |
 |
 |
 |
 |
 |
 |
 |
 |
 |
 |
 |
 |
 |
 |
 |
 |
 |
 |
 |
 |
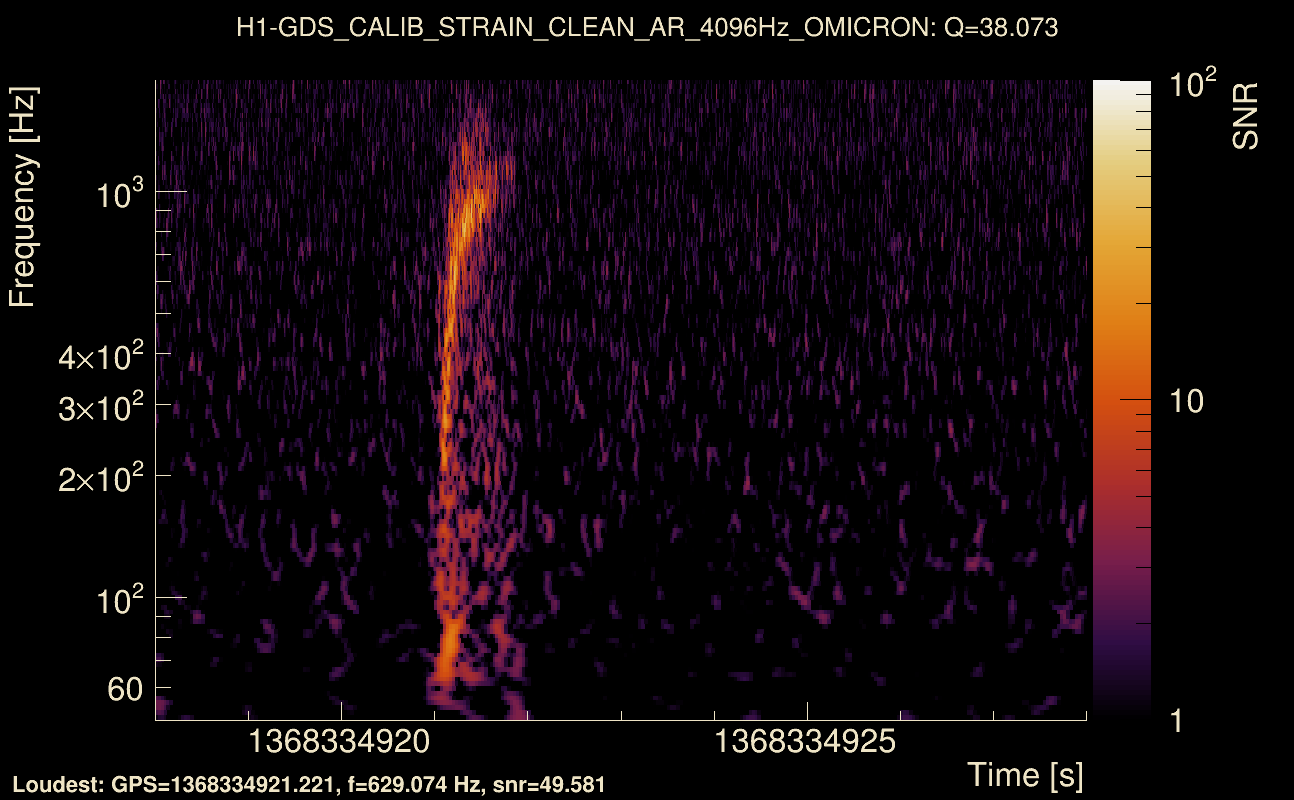
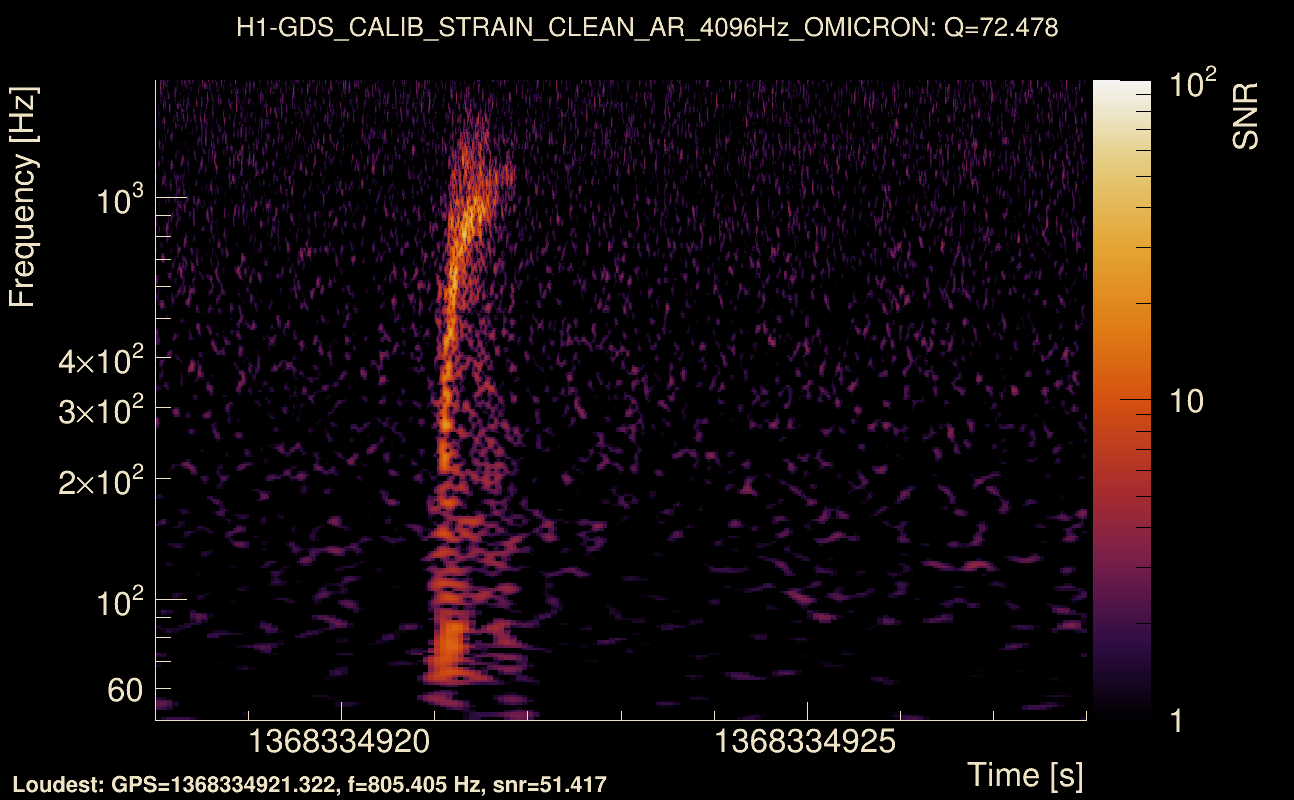
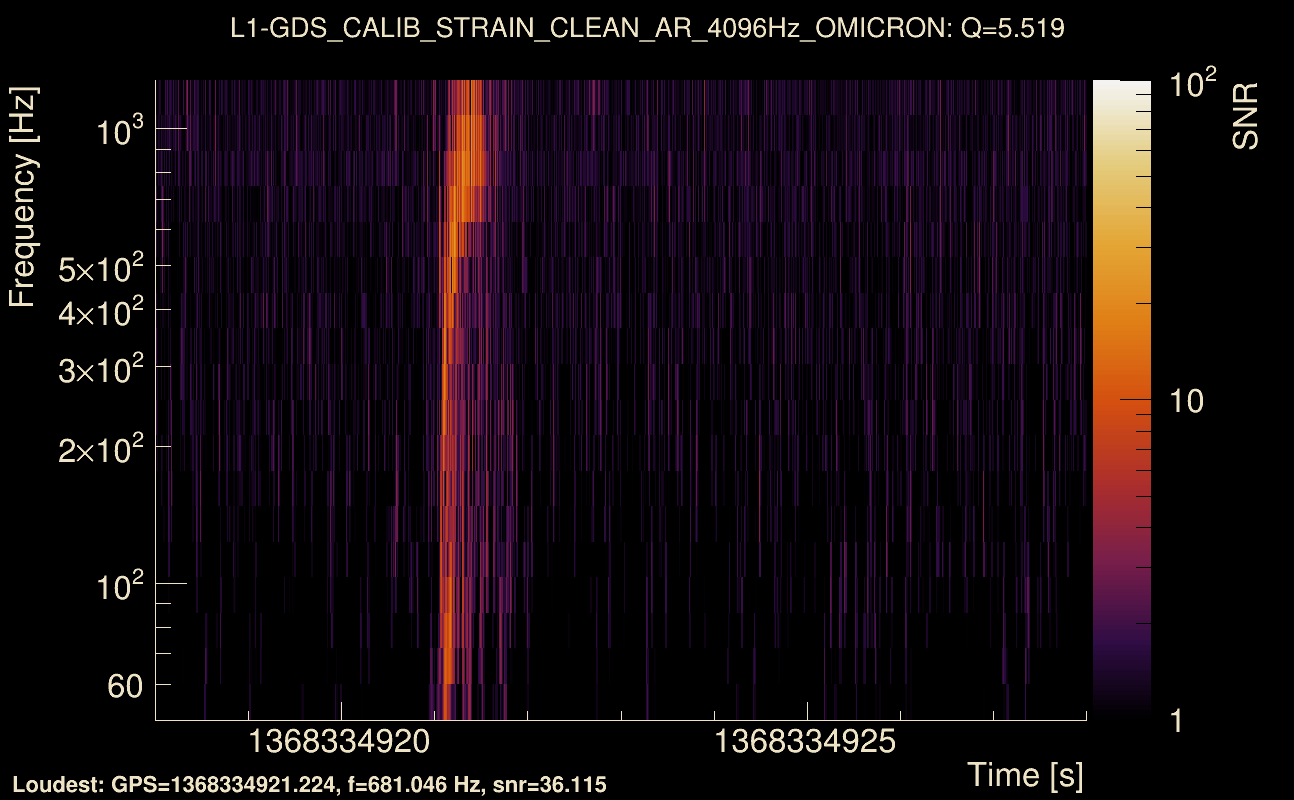
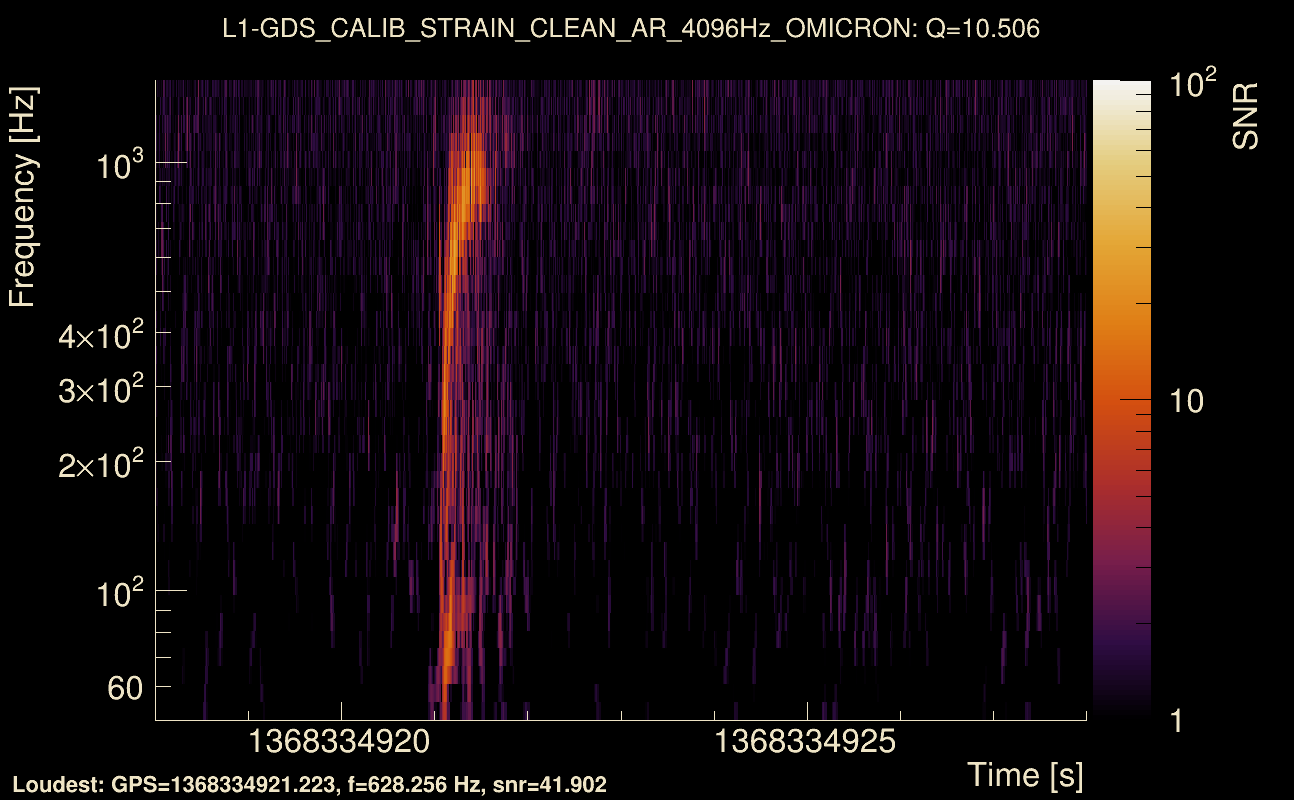
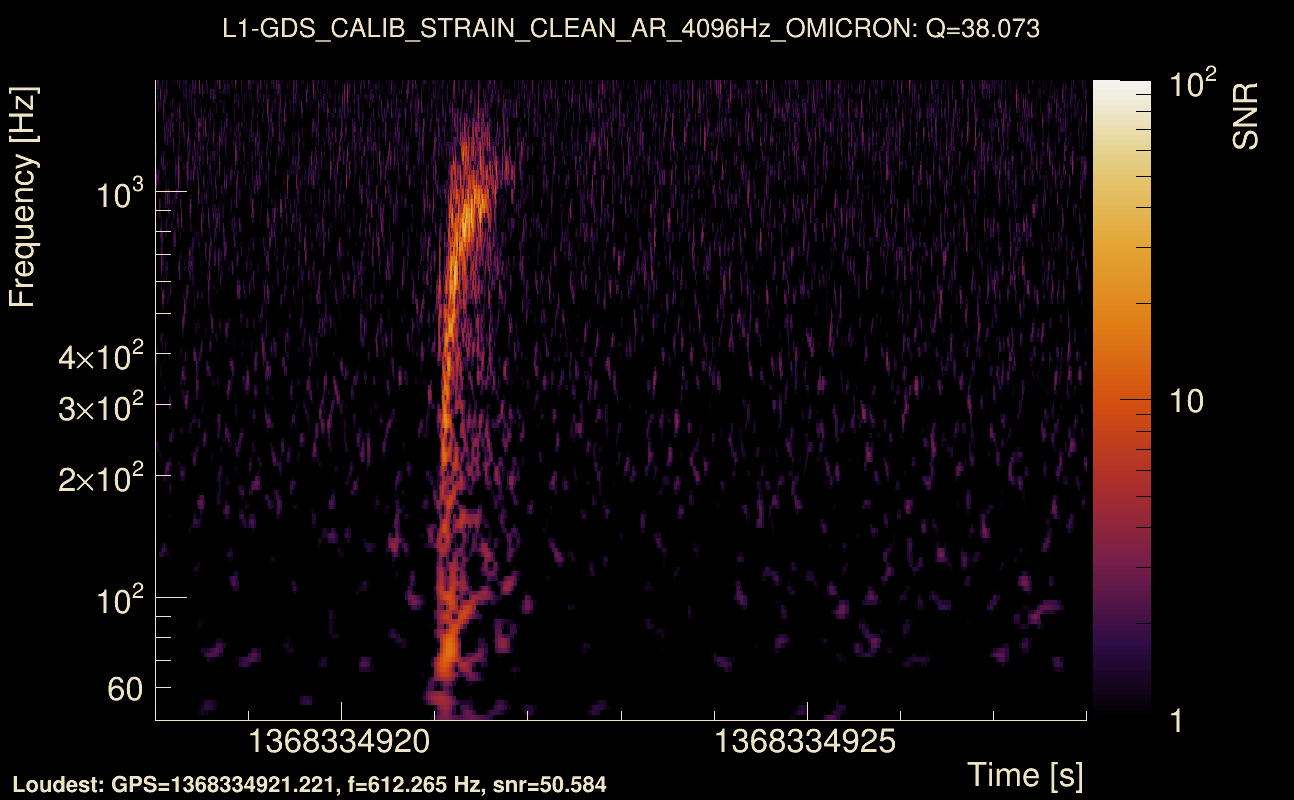
| Event time t(H1): | GPS = 1368334918 (Wed May 17 05:01:40 2023 ) → GPS = 1368334928 (Wed May 17 05:01:50 2023 ) |
| Event time t(L1): | GPS = 1368334918 (Wed May 17 05:01:50 2023 ) → GPS = 1368334928 (Wed May 17 05:01:50 2023 ) |
| Omicron analysis time window (H1): | GPS = 1368334915 → GPS = 1368334931 |
| Omicron analysis time window (L1): | GPS = 1368334915 → GPS = 1368334931 |
| Time delay between detectors t(L1) - t(H1): | 0.00102854 s (slice index = 108 / 217), δt_gw = 0.00102854 s |
| Time delay standard deviation: | 0.0252491 s |
| [targeted mode] Time delay probability: | 0.811129 (0.23897 sigmas), δt_target = 0.00161266 s |
| Frequency: | 287.103 Hz |
| Ξ: | 0.90934 ± 0.0123033 (variance = 0.000151372): Q0: 0.937358, Q1: 0.92046, Q2: 0.909191, Q3: 0.903655, Q4: 0.906877 |
| Rank: | R_A = 0.86102 |
| Log of amplitude ratio (L1/H1): | -0.0604066, variance = 0.155063 (L1/H1: -0.0835118, variance = 0.309679, H1/L1: 0.0392452, variance = 0.309402) |
| Amplitude ratio (L1/H1): | 0.941382 ⋇ 1.48257 (L1/H1: 0.91988 ⋇ 1.74454, H1/L1: 1.04003 ⋇ 1.7441) |
| Amplitude ratio H1|L1 compatibility (probability): | 0.955134 |
| Antenna factor probability: | 0.99134 |
| Number of rejected frequency rows: | Q0: 0 / 18, Q1: 0 / 36, Q2: 2 / 70, Q3: 14 / 134, Q4: 54 / 258 |
| Maximum signal-to-noise ratio: | H1: 51.361, L1: 53.6683 |
| SNR variance: | H1: 2.30379, L1: 2.3706 |
| Click here for a zoomed plot | Click here for a zoomed plot | Click here for a zoomed plot | Click here for a zoomed plot | Click here for a zoomed plot |
 |
 |
 |
 |
 |
 |
 |
 |
 |
 |
 |
 |
 |
 |
 |
 |
 |
 |
 |
 |
 |
 |
 |
 |
 |
 |
 |
 |
 |
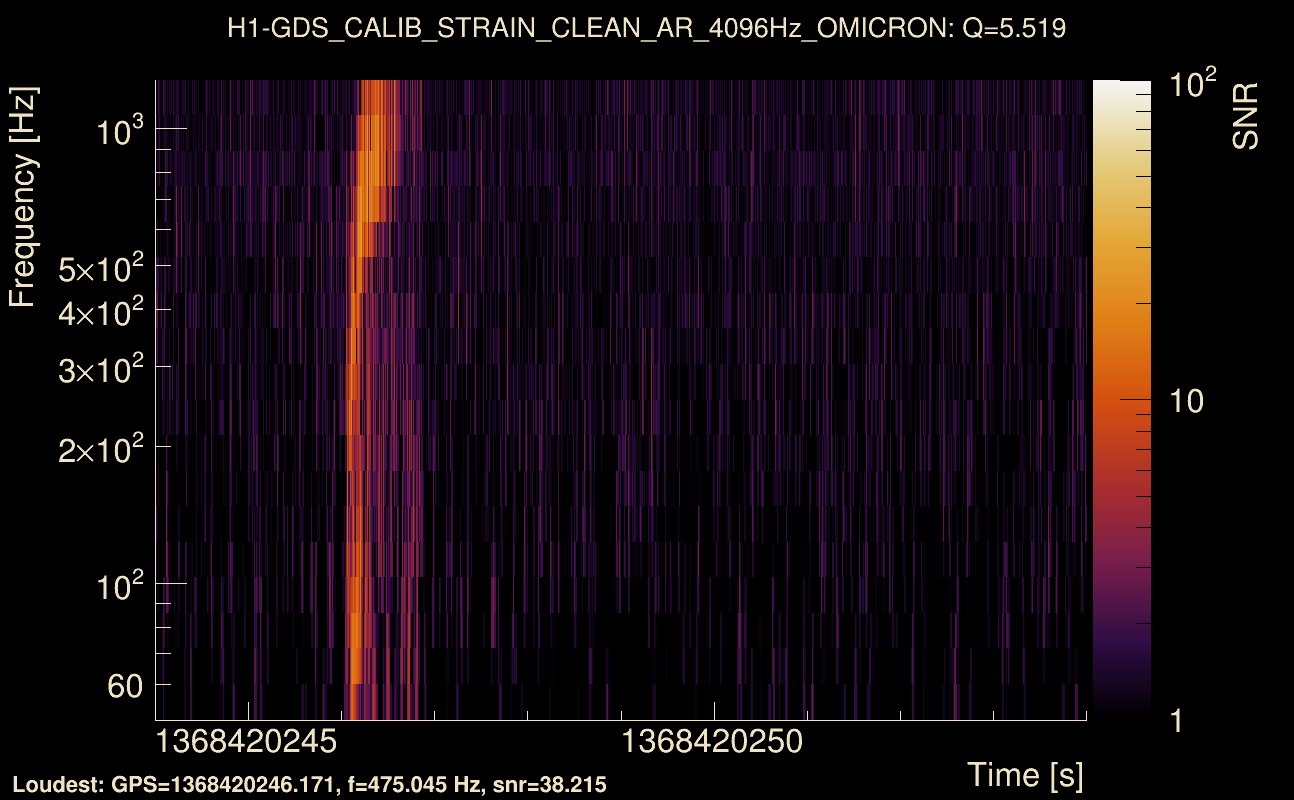
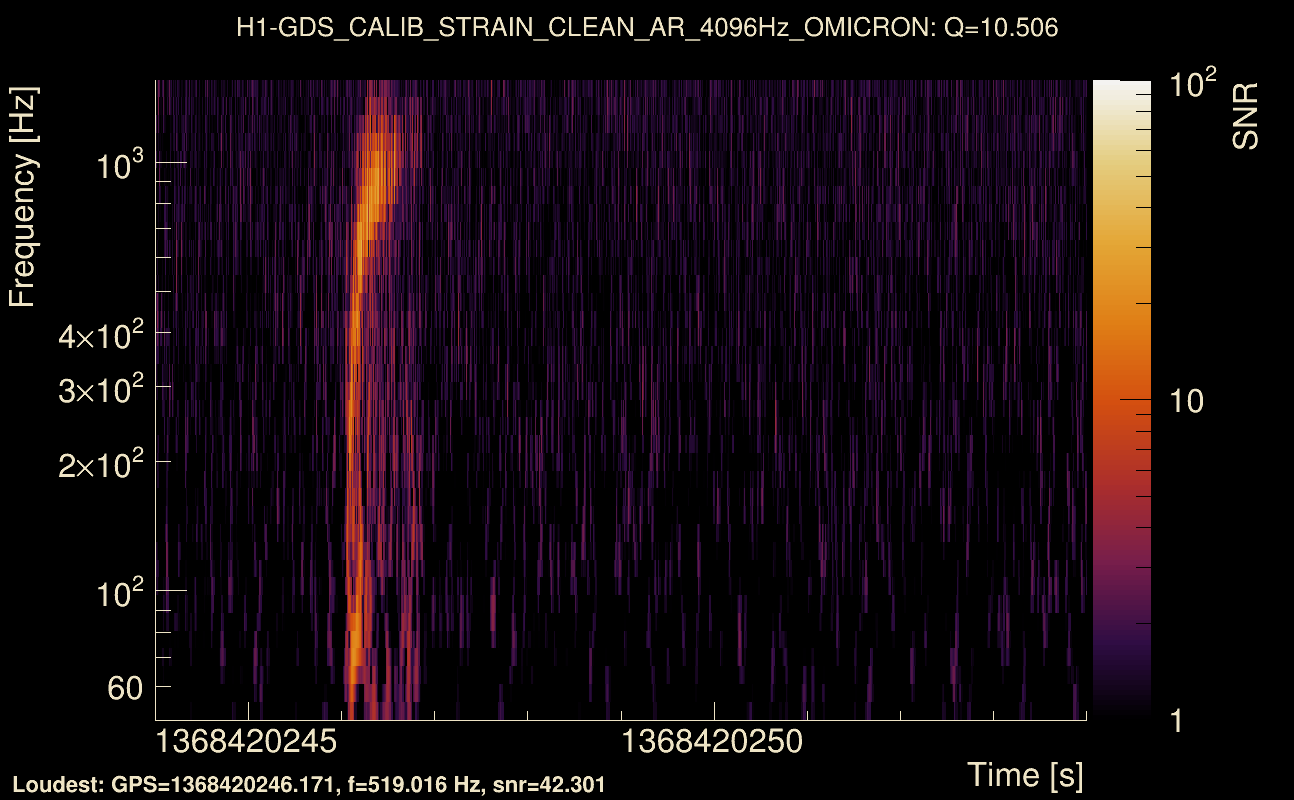
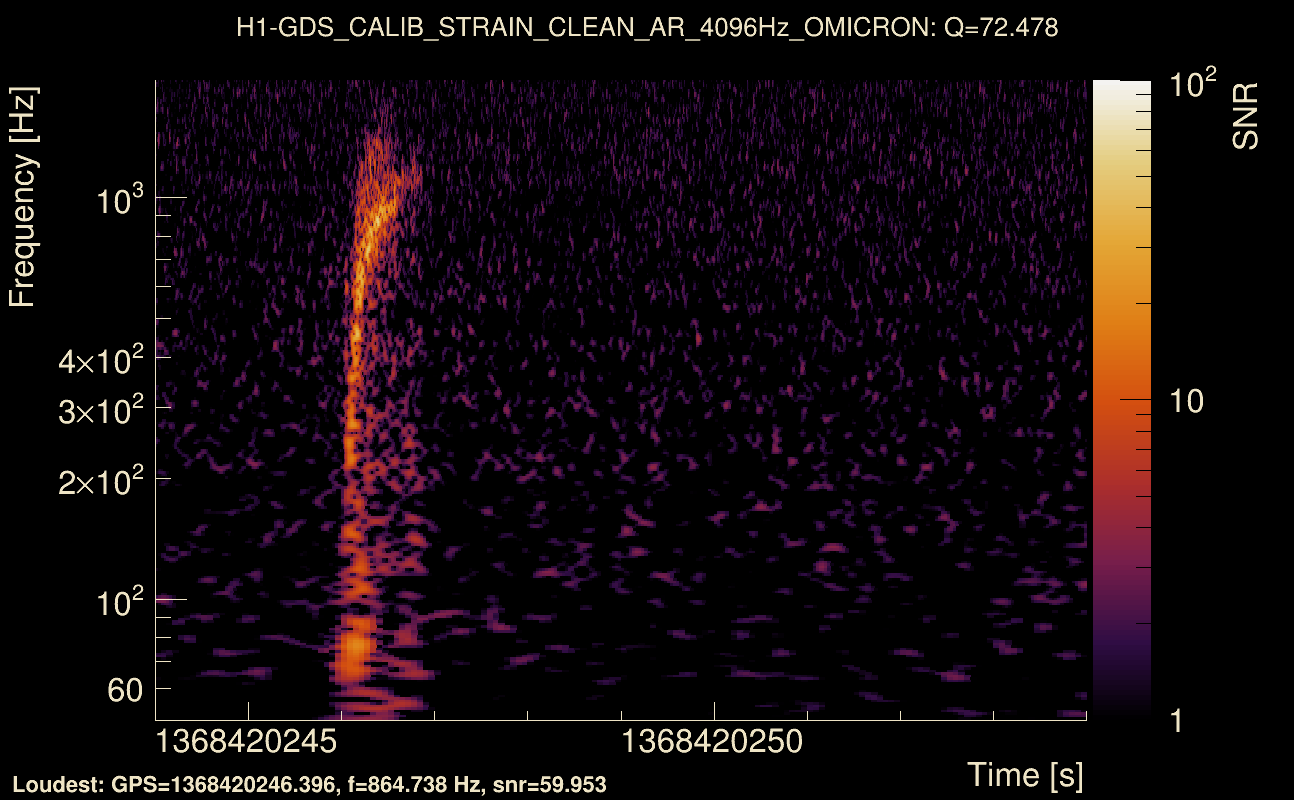
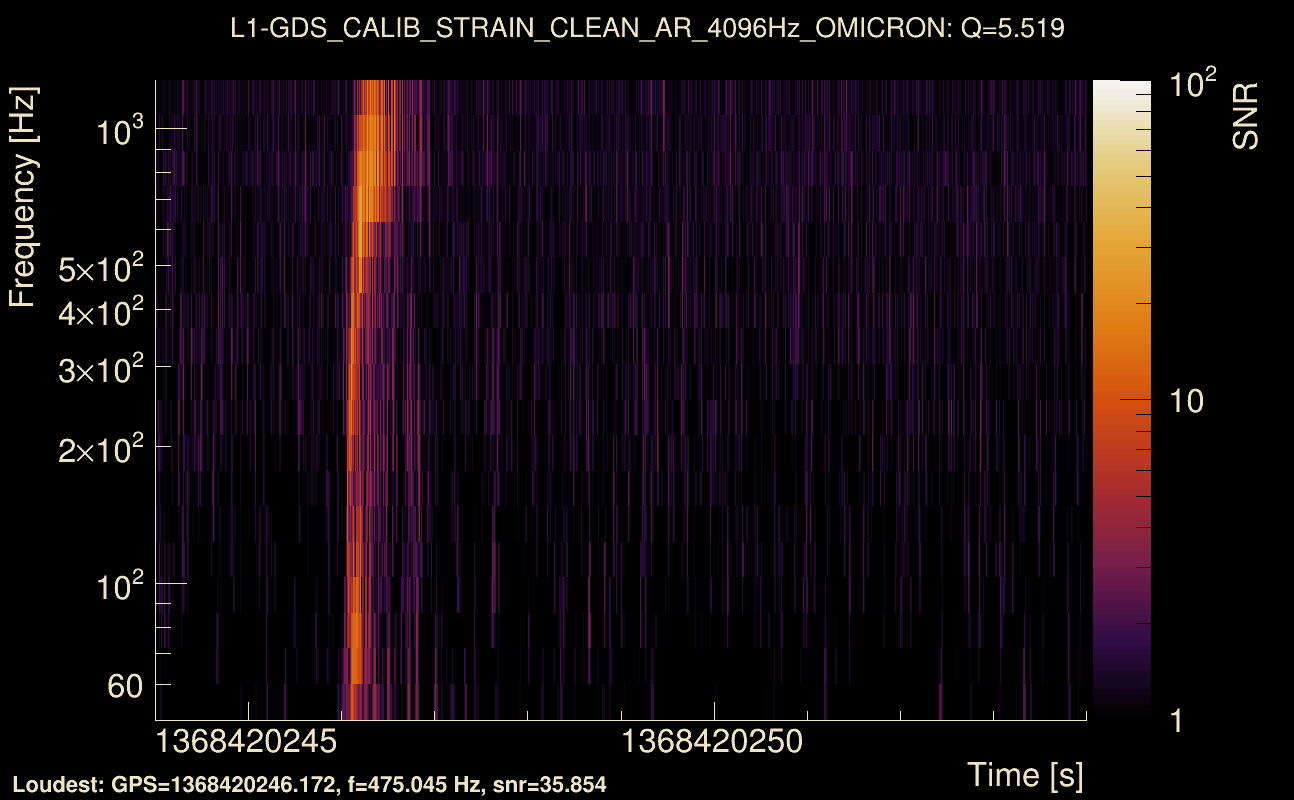
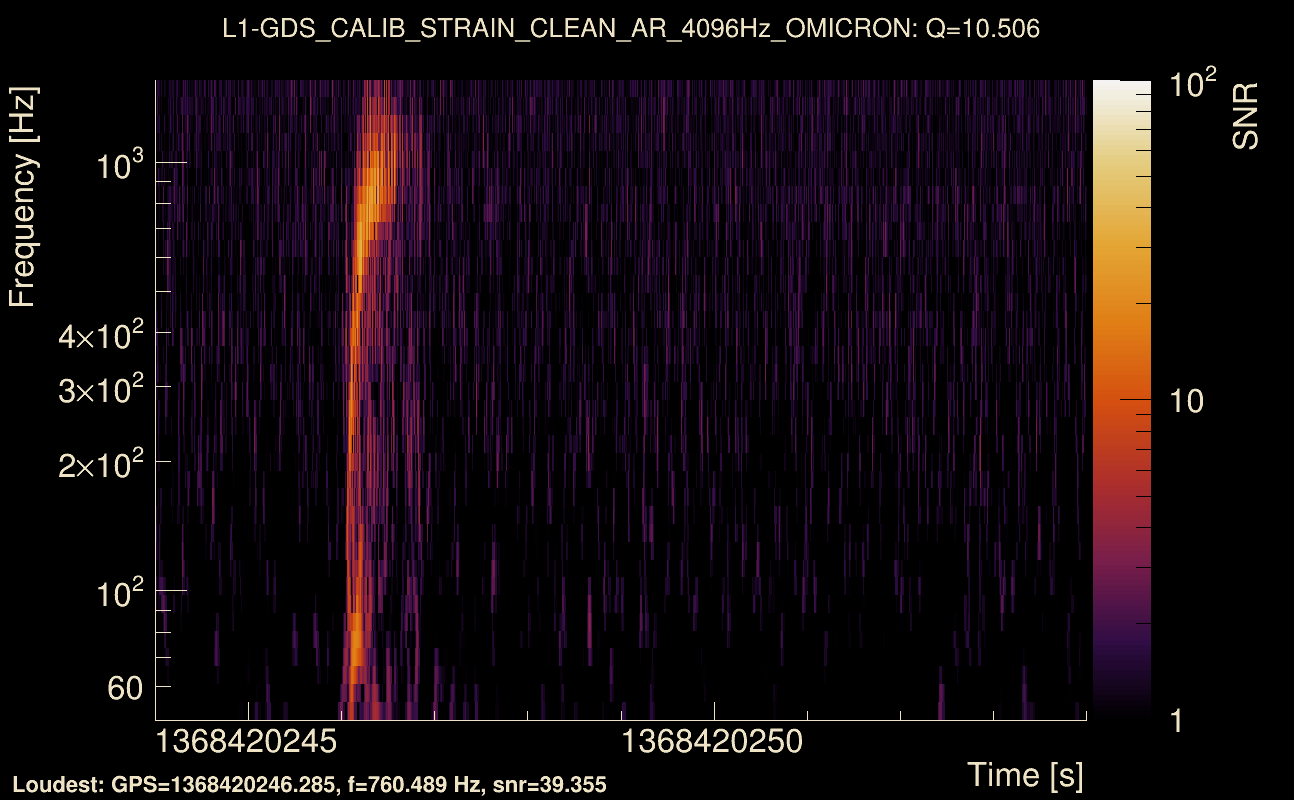
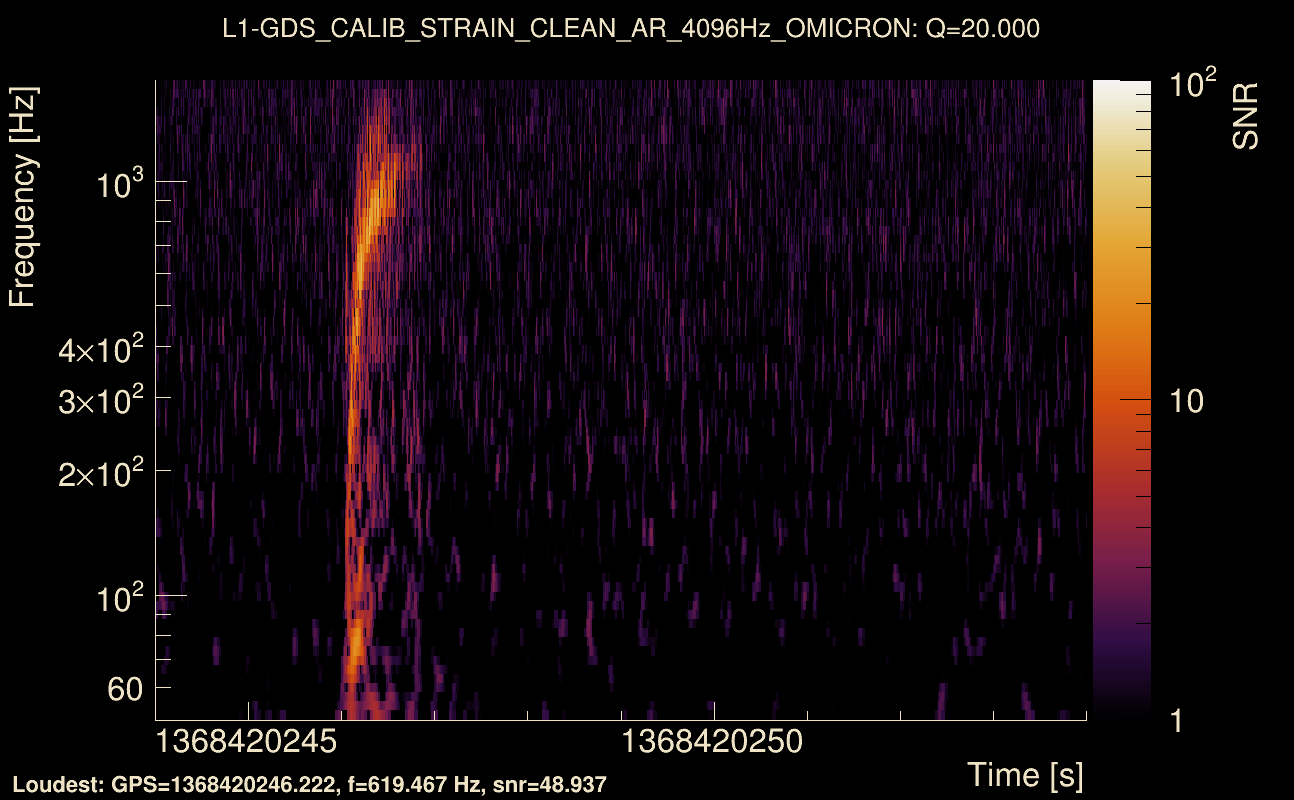
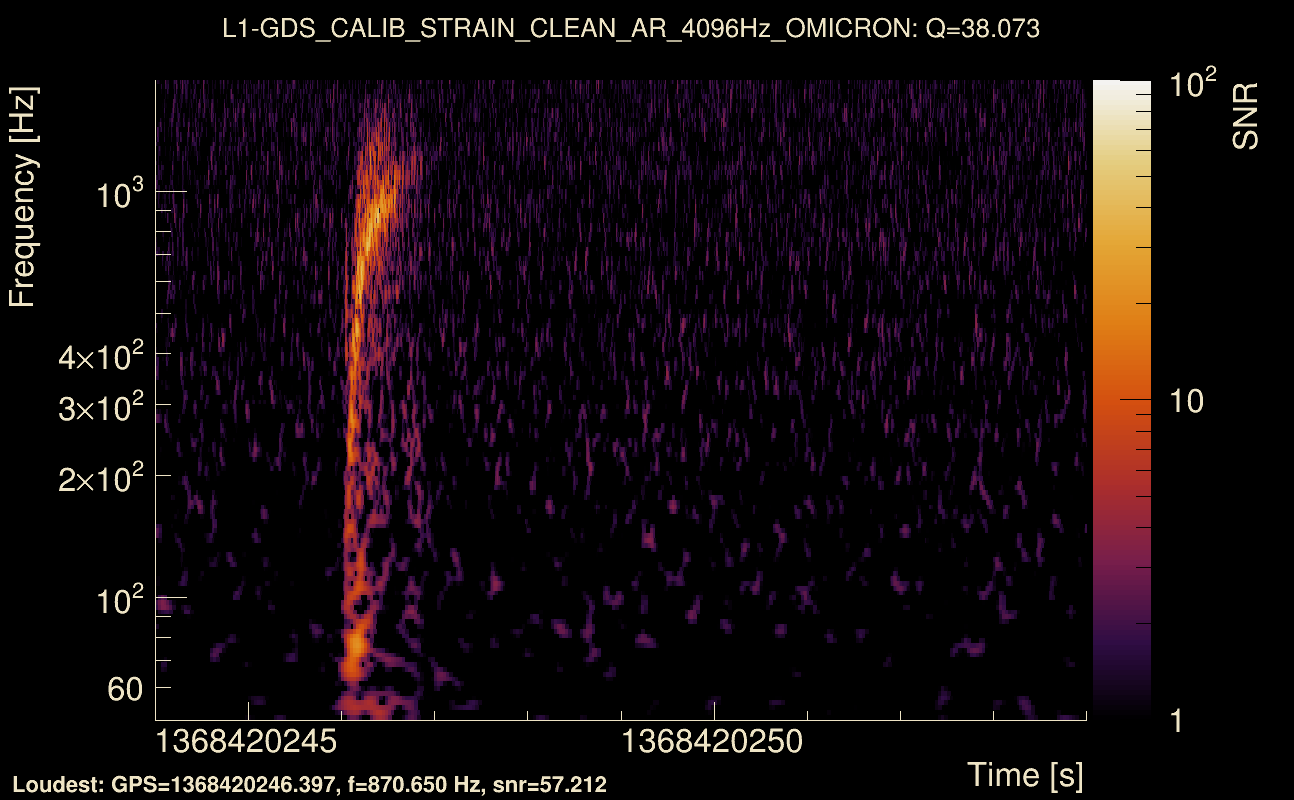
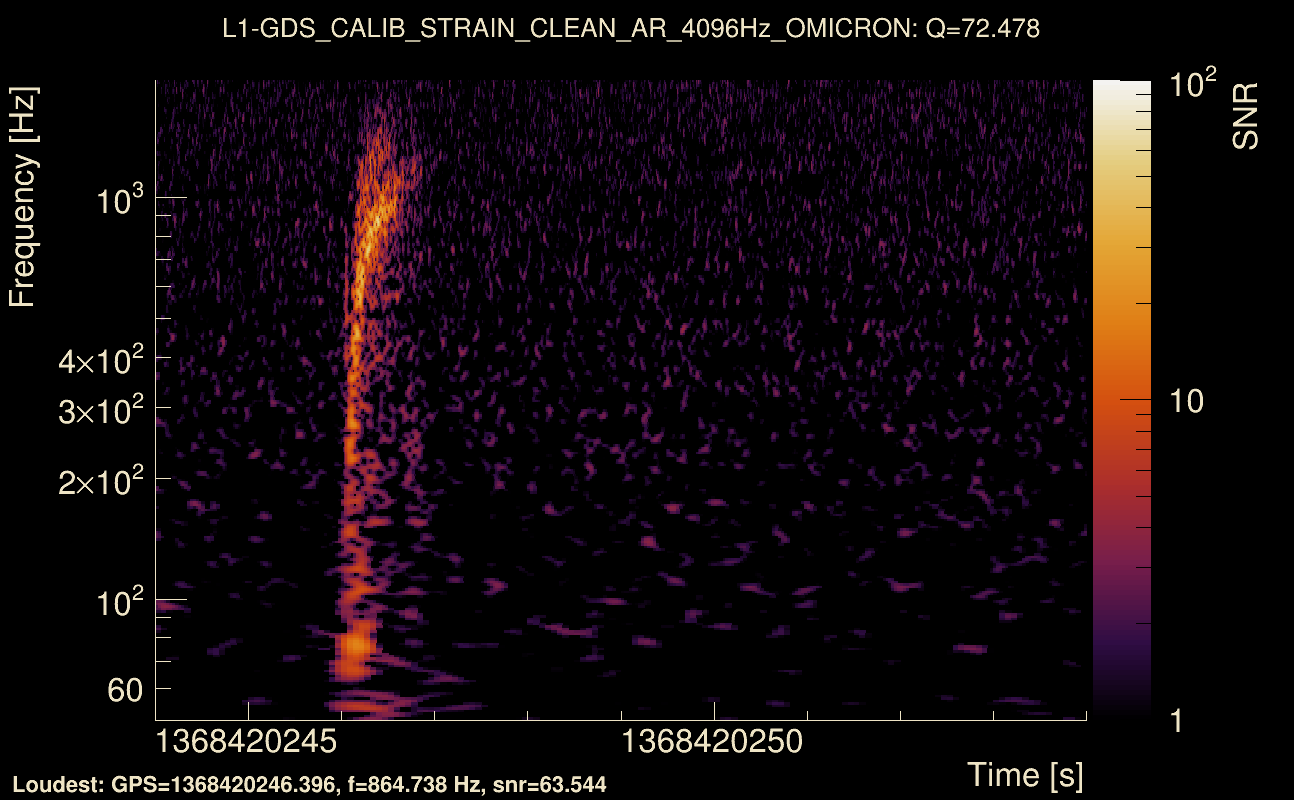
| Event time t(H1): | GPS = 1368420244 (Thu May 18 04:43:46 2023 ) → GPS = 1368420254 (Thu May 18 04:43:56 2023 ) |
| Event time t(L1): | GPS = 1368420244 (Thu May 18 04:43:56 2023 ) → GPS = 1368420254 (Thu May 18 04:43:56 2023 ) |
| Omicron analysis time window (H1): | GPS = 1368420241 → GPS = 1368420257 |
| Omicron analysis time window (L1): | GPS = 1368420241 → GPS = 1368420257 |
| Time delay between detectors t(L1) - t(H1): | 0.000935199 s (slice index = 108 / 217), δt_gw = 0.000935199 s |
| Time delay standard deviation: | 0.0214054 s |
| [targeted mode] Time delay probability: | 0.955388 (0.0559423 sigmas), δt_target = 0.00139642 s |
| Frequency: | 278.289 Hz |
| Ξ: | 0.920637 ± 0.0136218 (variance = 0.000185553): Q0: 0.952089, Q1: 0.934334, Q2: 0.921956, Q3: 0.914794, Q4: 0.91816 |
| Rank: | R_A = 0.854212 |
| Log of amplitude ratio (L1/H1): | -0.0450964, variance = 0.153941 (L1/H1: -0.0813774, variance = 0.306857, H1/L1: 0.0129135, variance = 0.306723) |
| Amplitude ratio (L1/H1): | 0.955905 ⋇ 1.48046 (L1/H1: 0.921846 ⋇ 1.74011, H1/L1: 1.013 ⋇ 1.7399) |
| Amplitude ratio H1|L1 compatibility (probability): | 0.930351 |
| Antenna factor probability: | 0.99731 |
| Number of rejected frequency rows: | Q0: 0 / 18, Q1: 0 / 36, Q2: 2 / 70, Q3: 18 / 134, Q4: 58 / 258 |
| Maximum signal-to-noise ratio: | H1: 59.4945, L1: 63.1689 |
| SNR variance: | H1: 2.79627, L1: 2.89062 |
| Click here for a zoomed plot | Click here for a zoomed plot | Click here for a zoomed plot | Click here for a zoomed plot | Click here for a zoomed plot |
 |
 |
 |
 |
 |
 |
 |
 |
 |
 |
 |
 |
 |
 |
 |
 |
 |
 |
 |
 |
 |
 |
 |
 |
 |
 |
 |
 |
 |
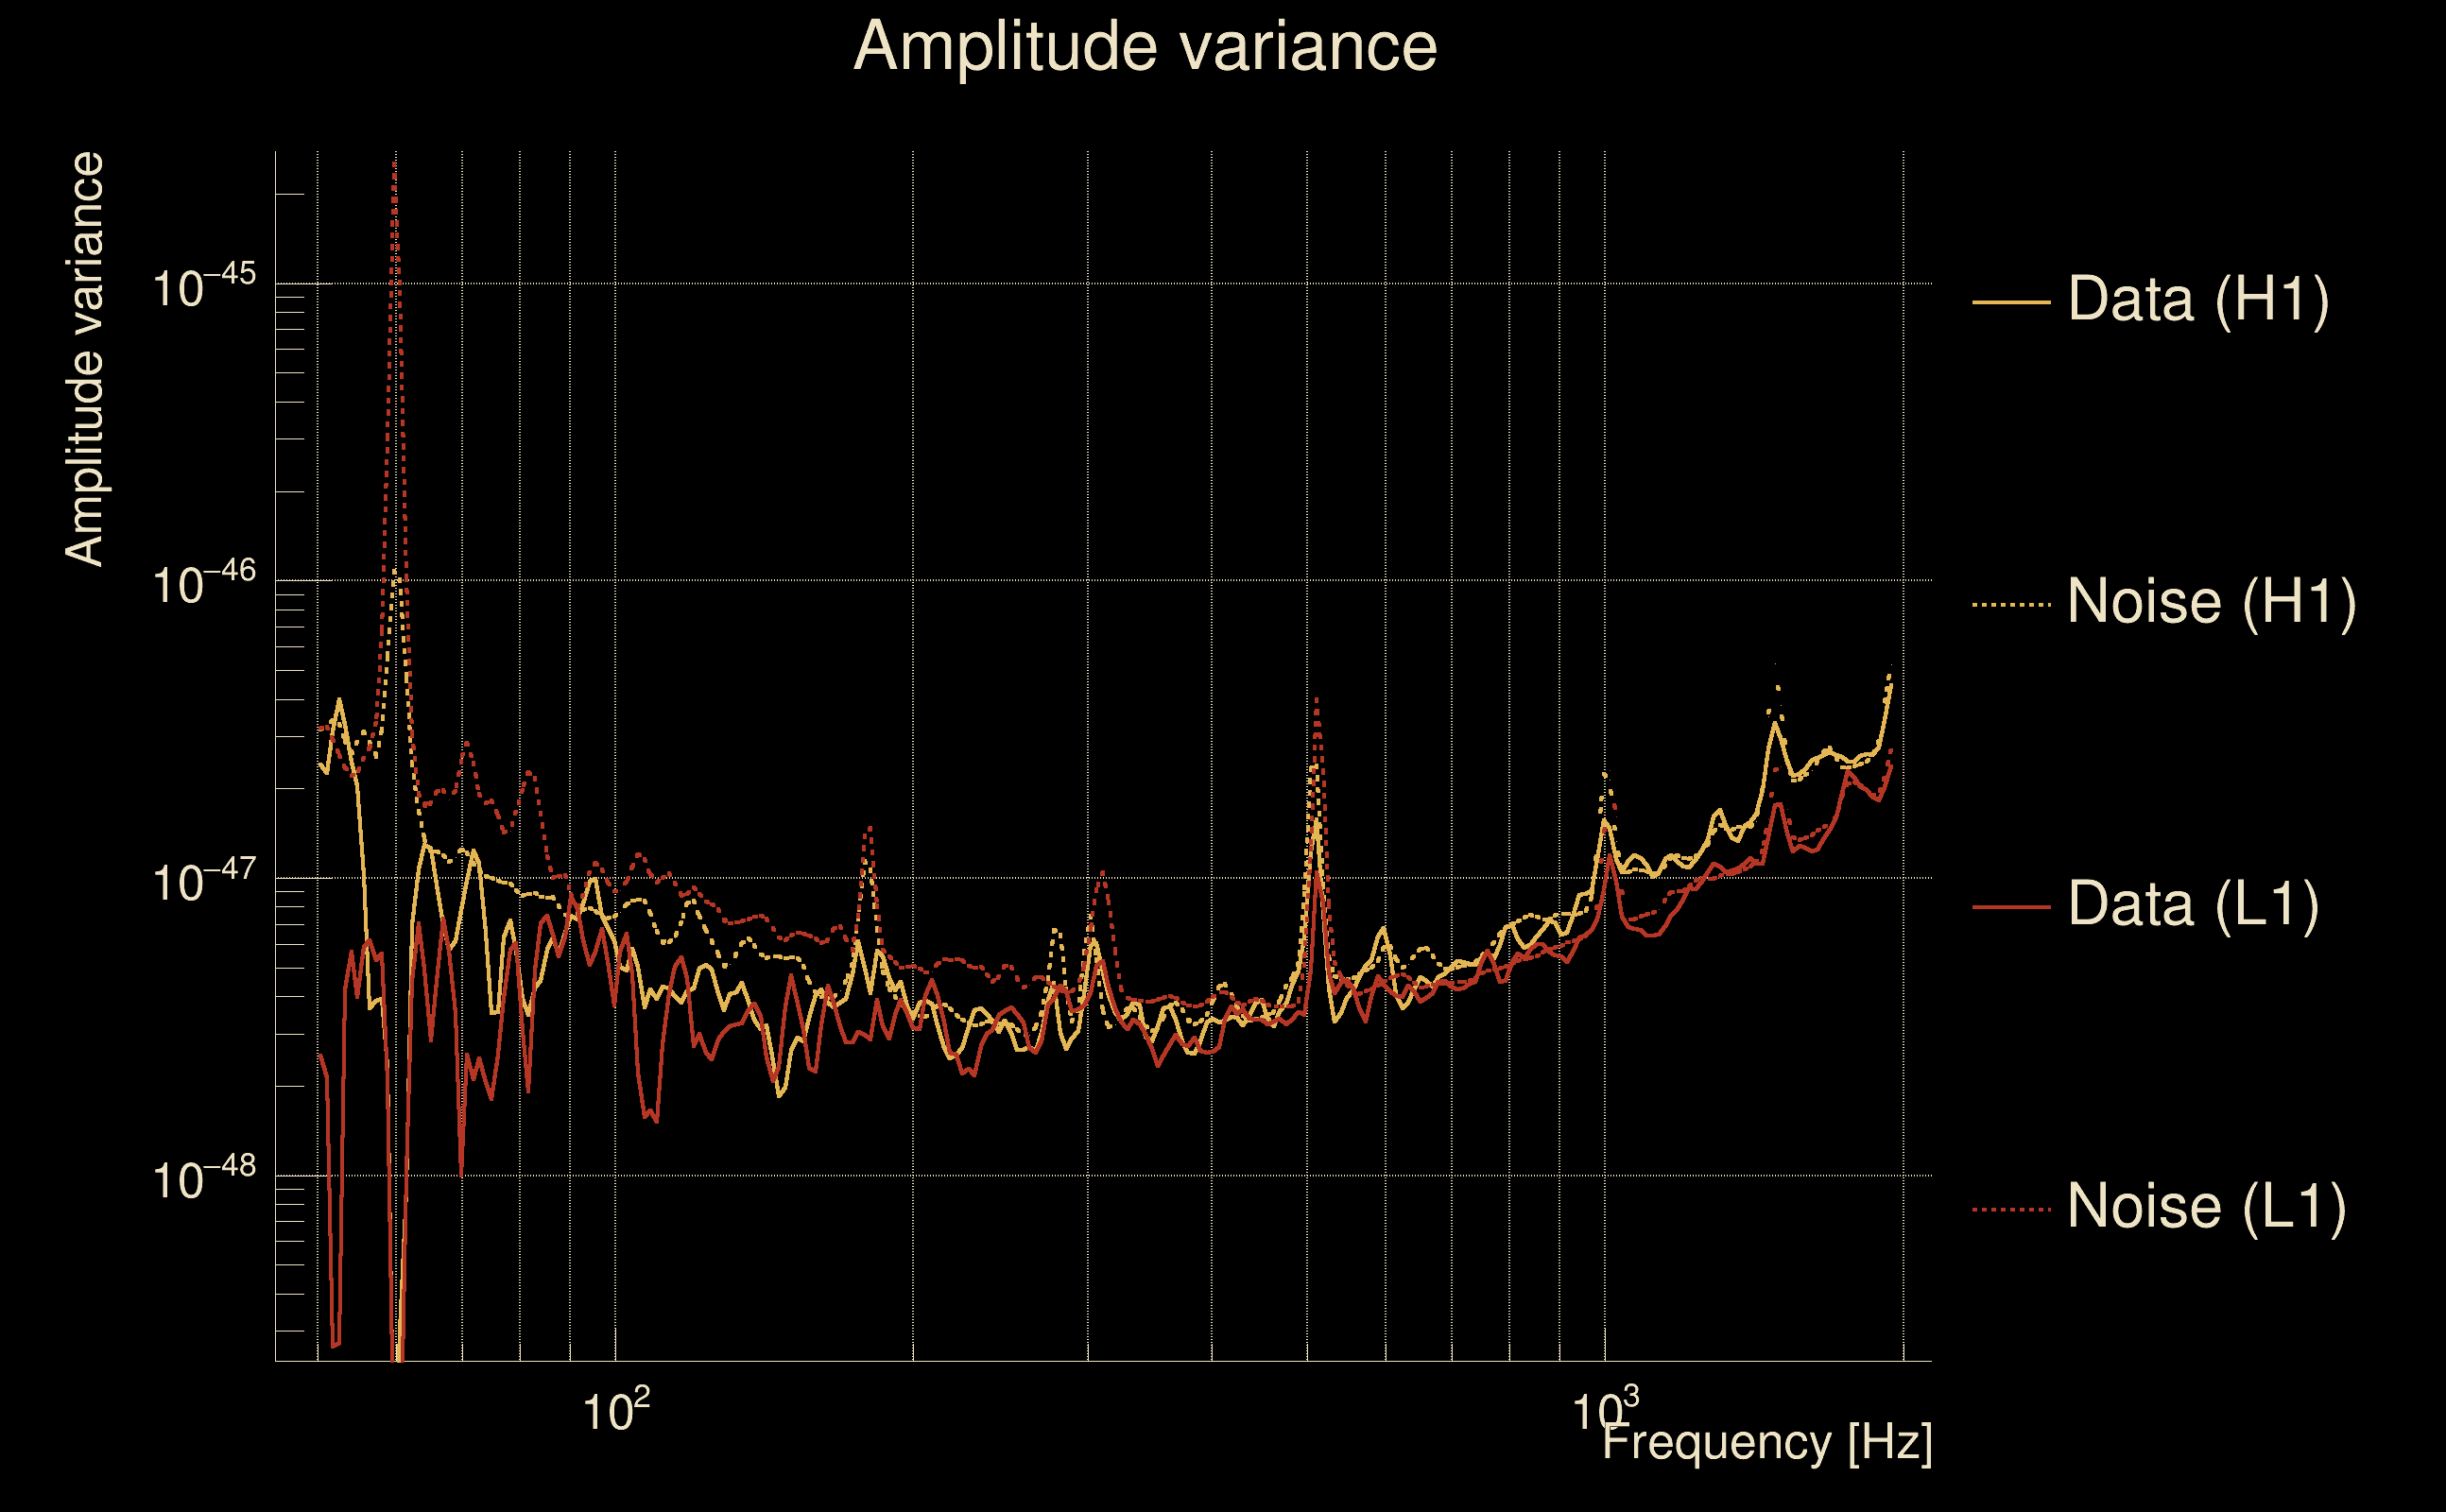
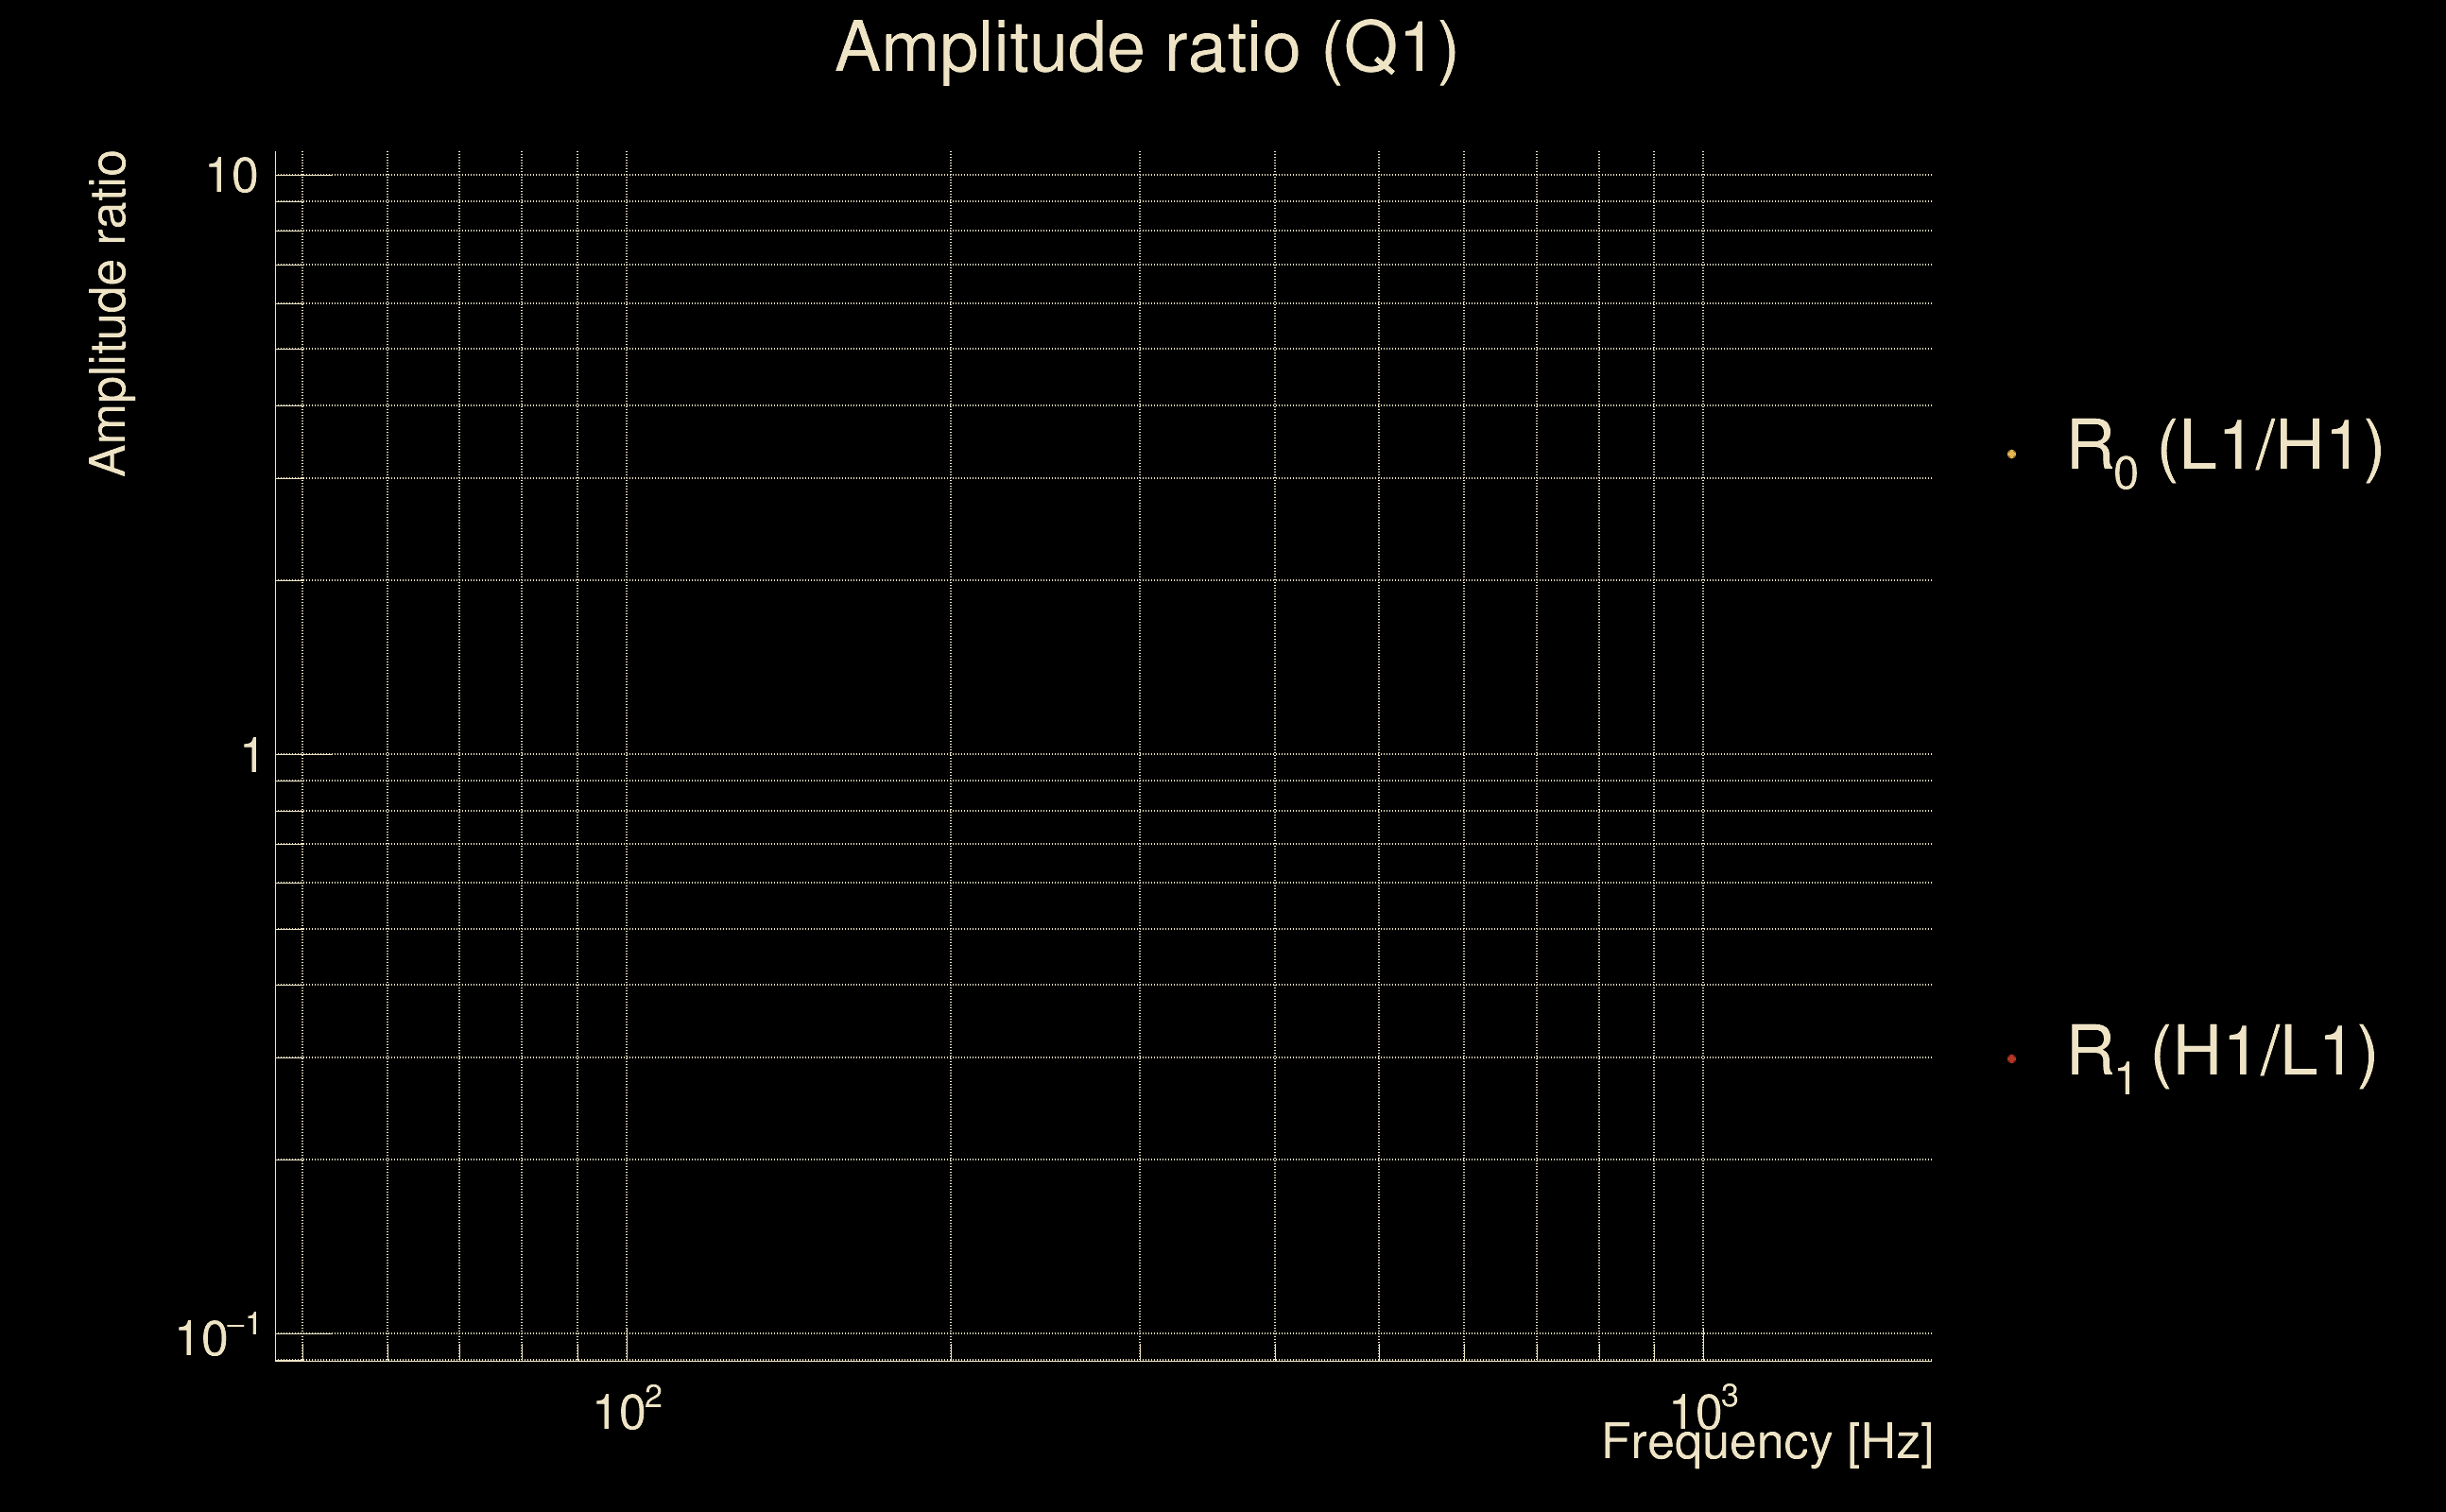
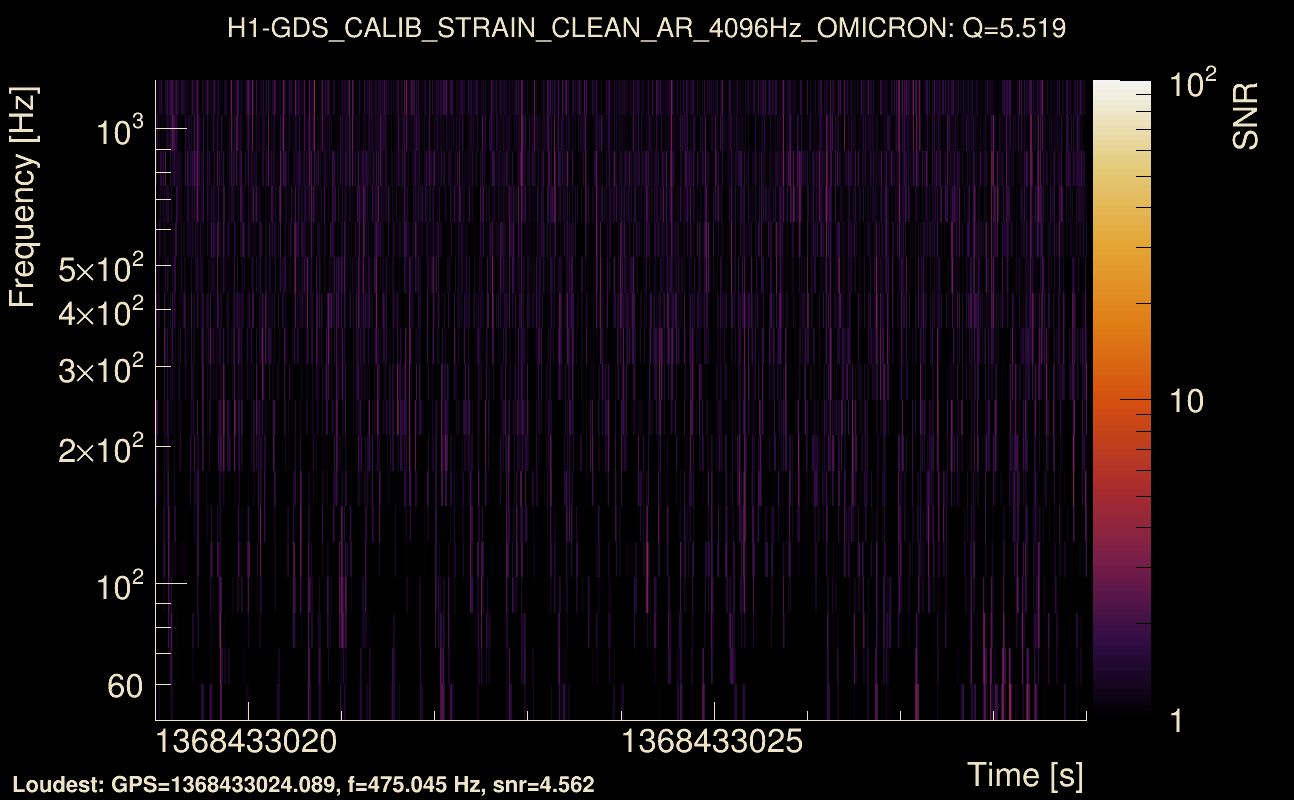
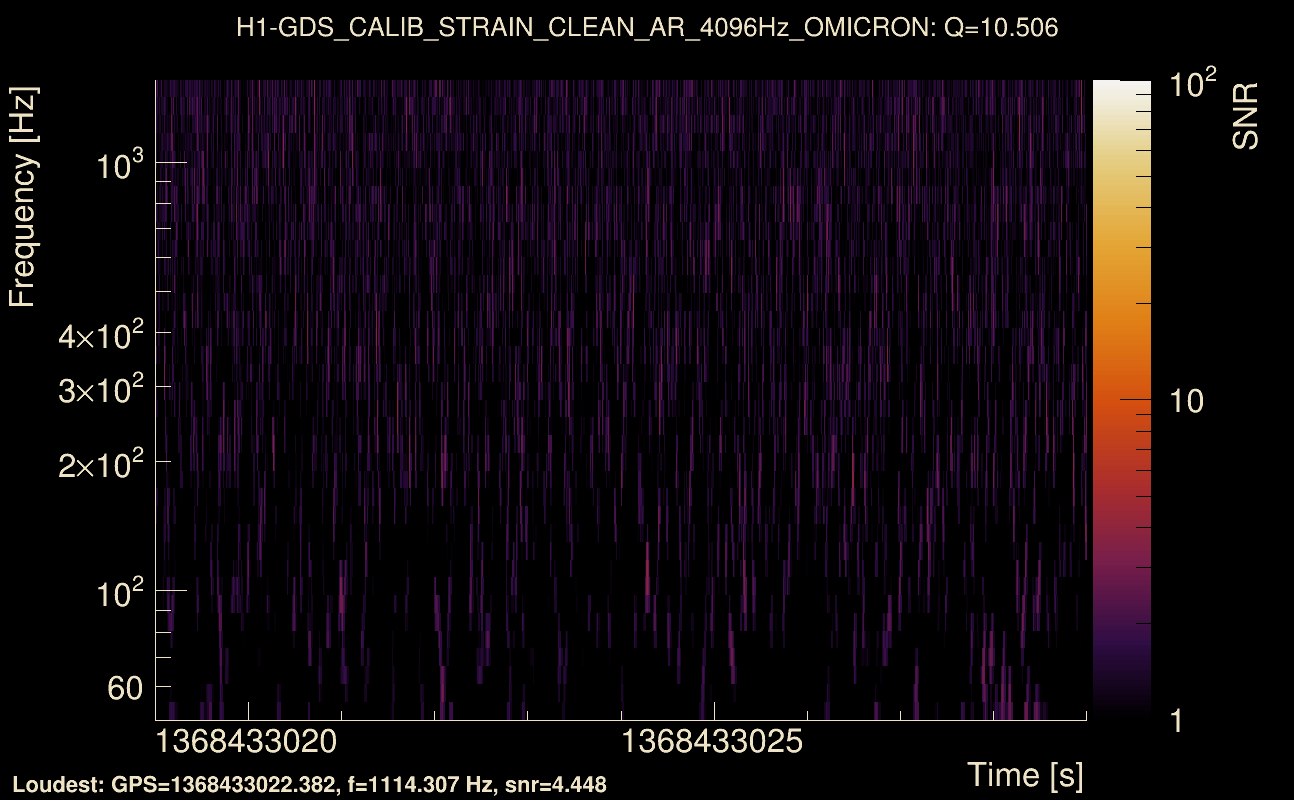
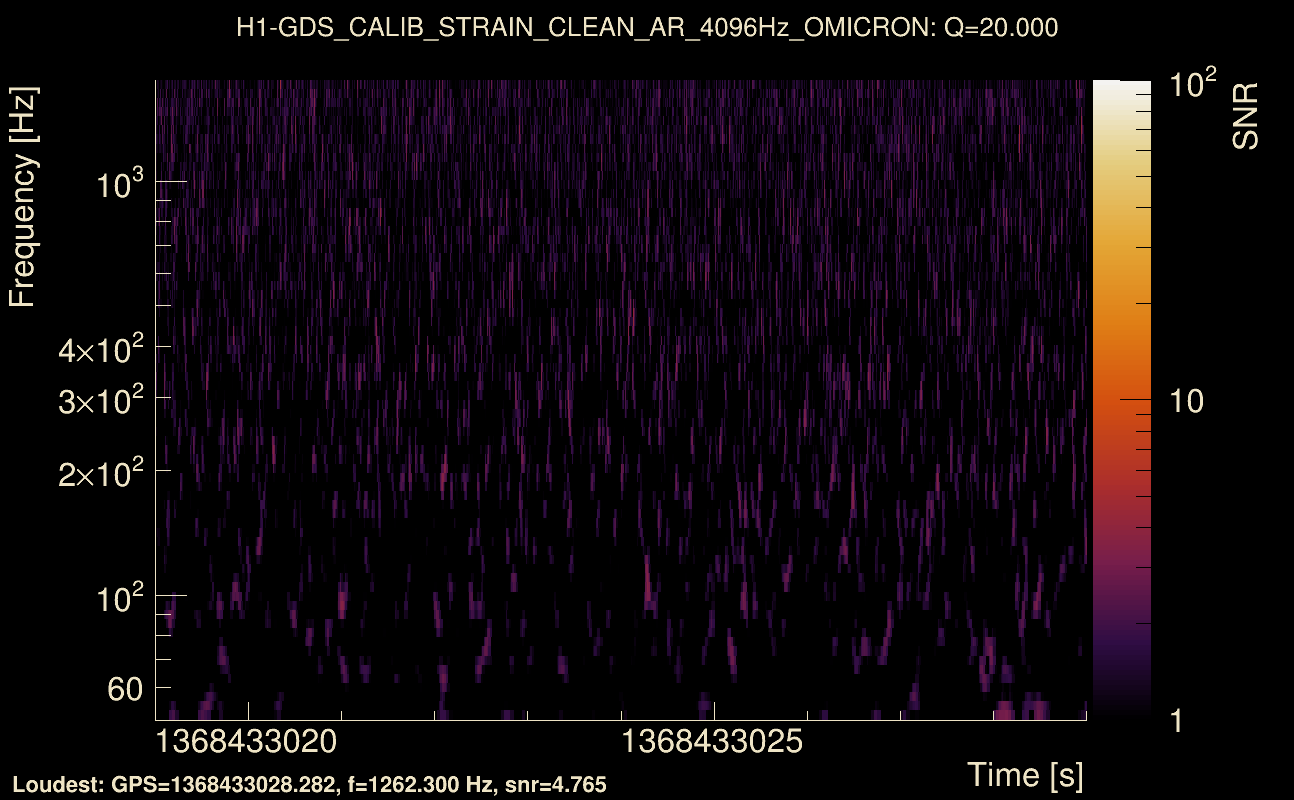
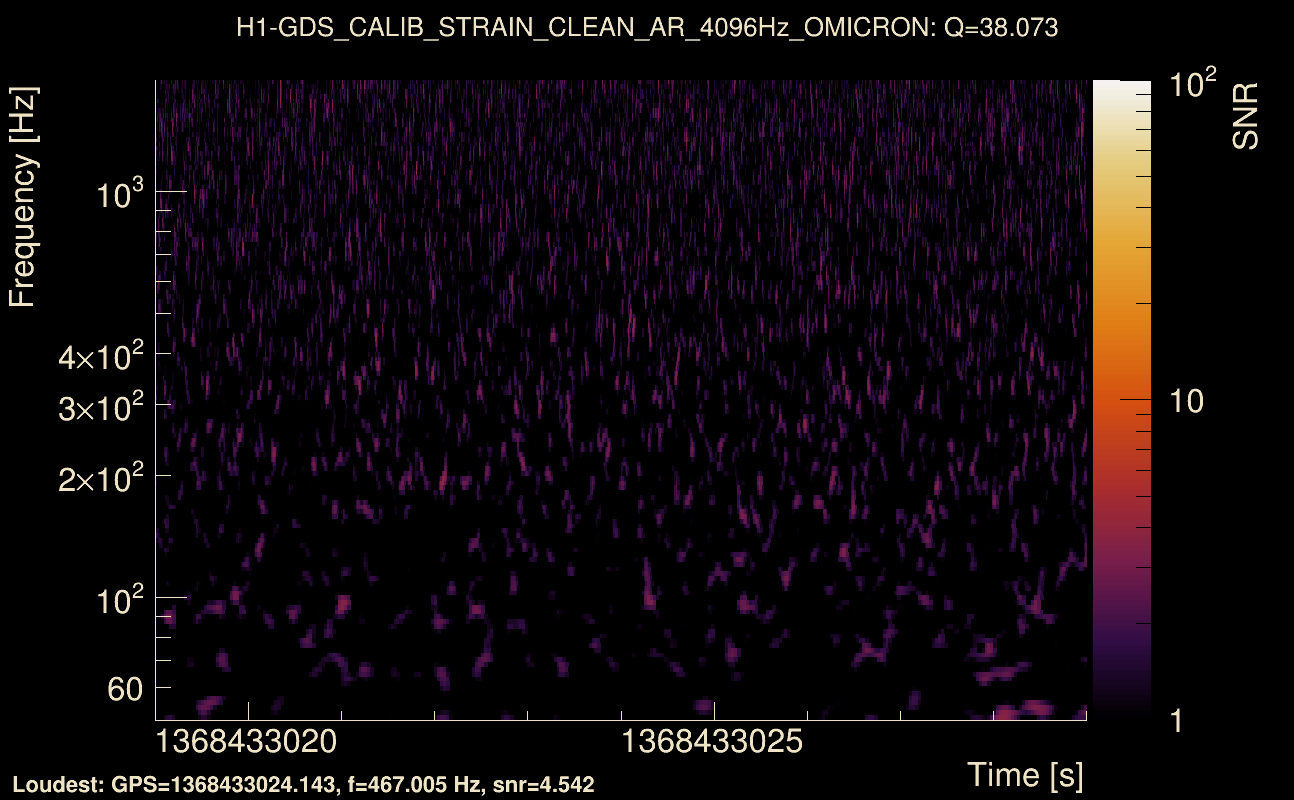
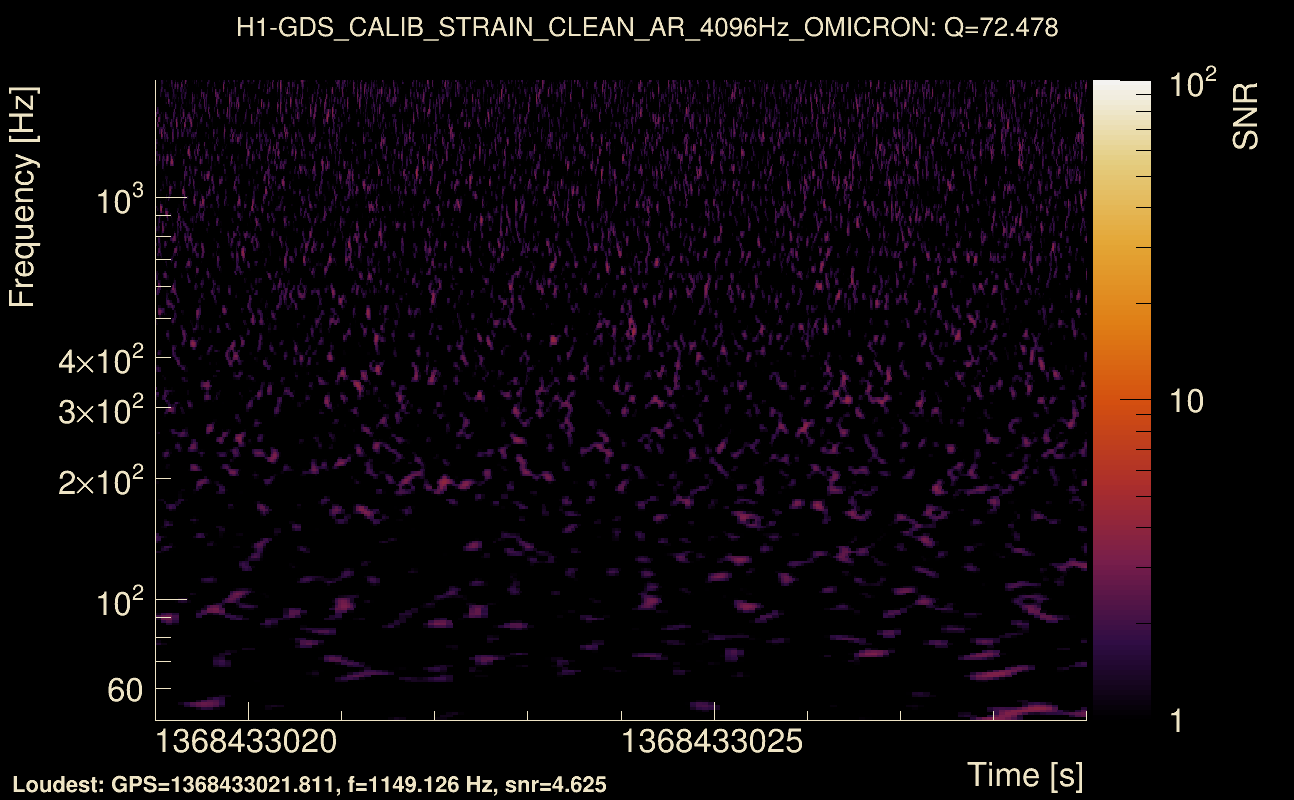
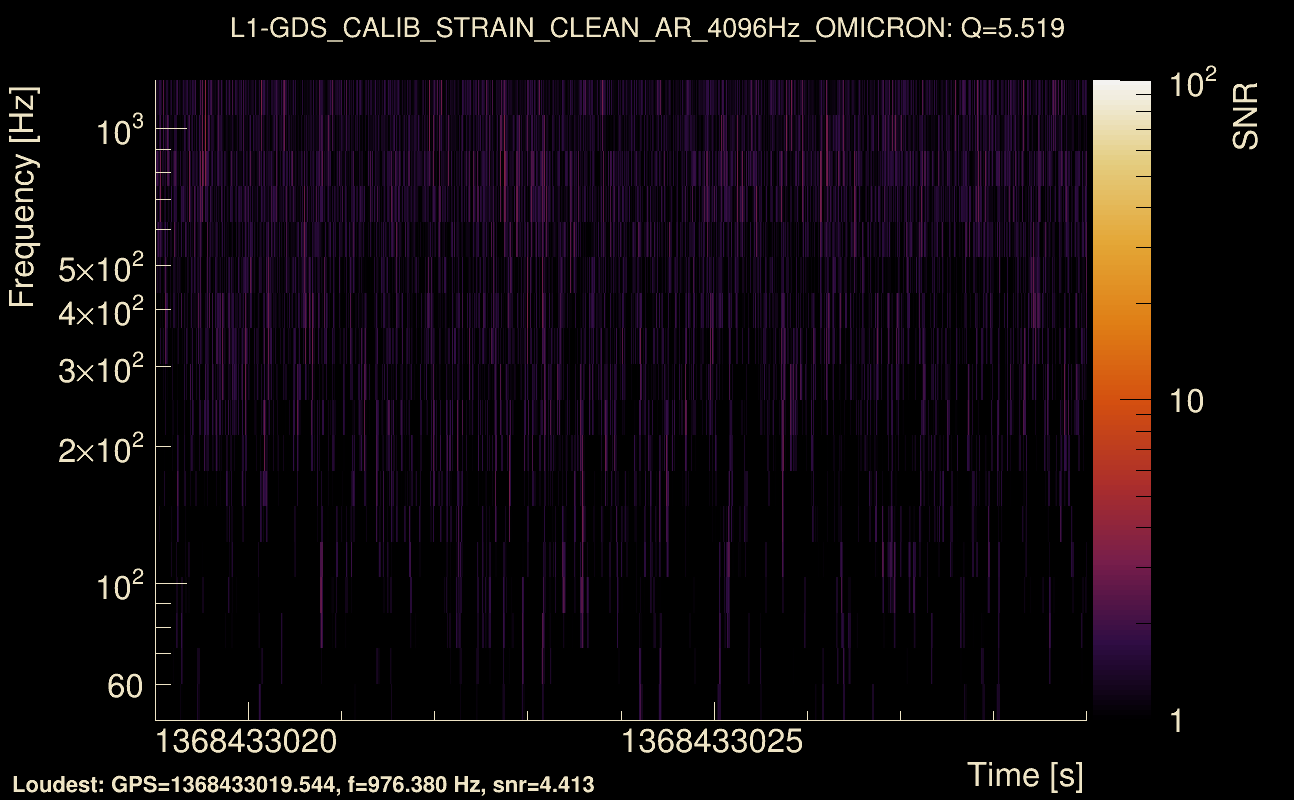
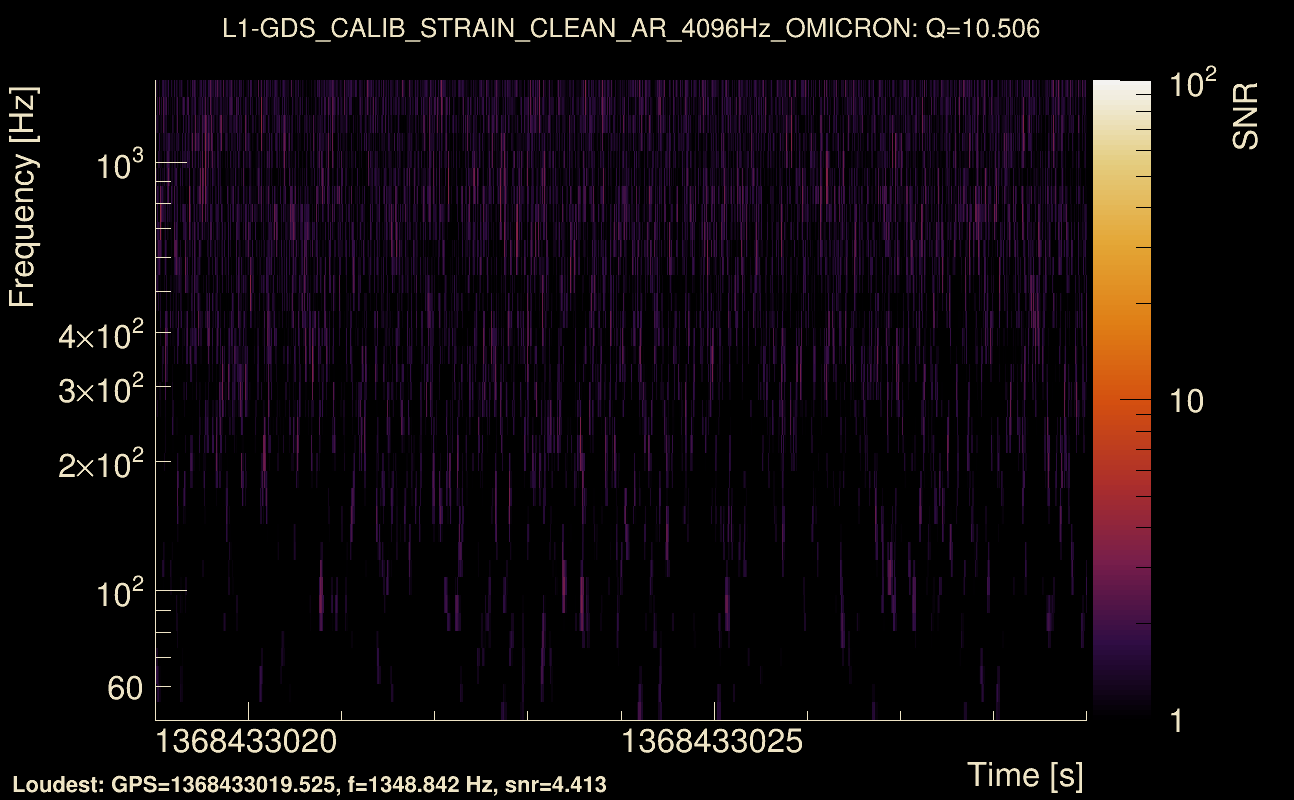
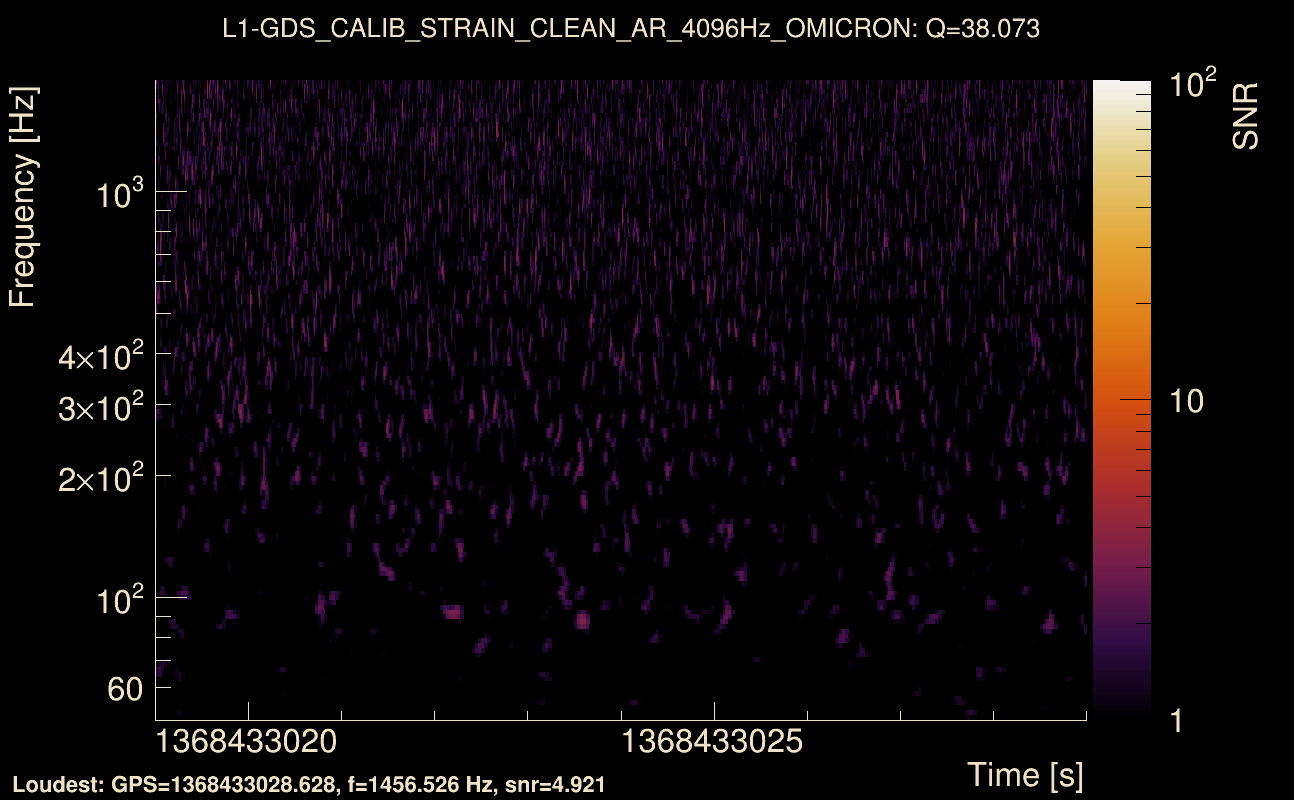
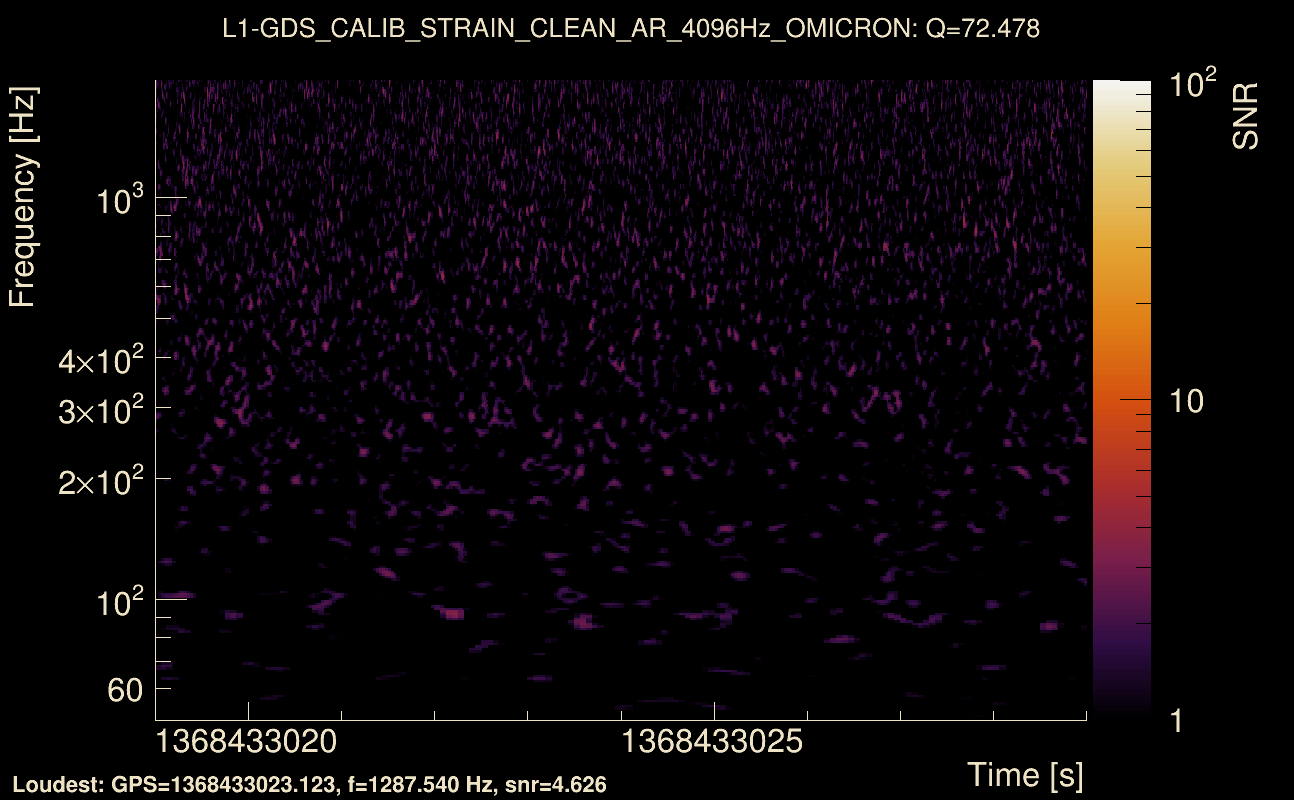
| Event time t(H1): | GPS = 1368433019 (Thu May 18 08:16:41 2023 ) → GPS = 1368433029 (Thu May 18 08:16:51 2023 ) |
| Event time t(L1): | GPS = 1368433019 (Thu May 18 08:16:51 2023 ) → GPS = 1368433029 (Thu May 18 08:16:51 2023 ) |
| Omicron analysis time window (H1): | GPS = 1368433016 → GPS = 1368433032 |
| Omicron analysis time window (L1): | GPS = 1368433016 → GPS = 1368433032 |
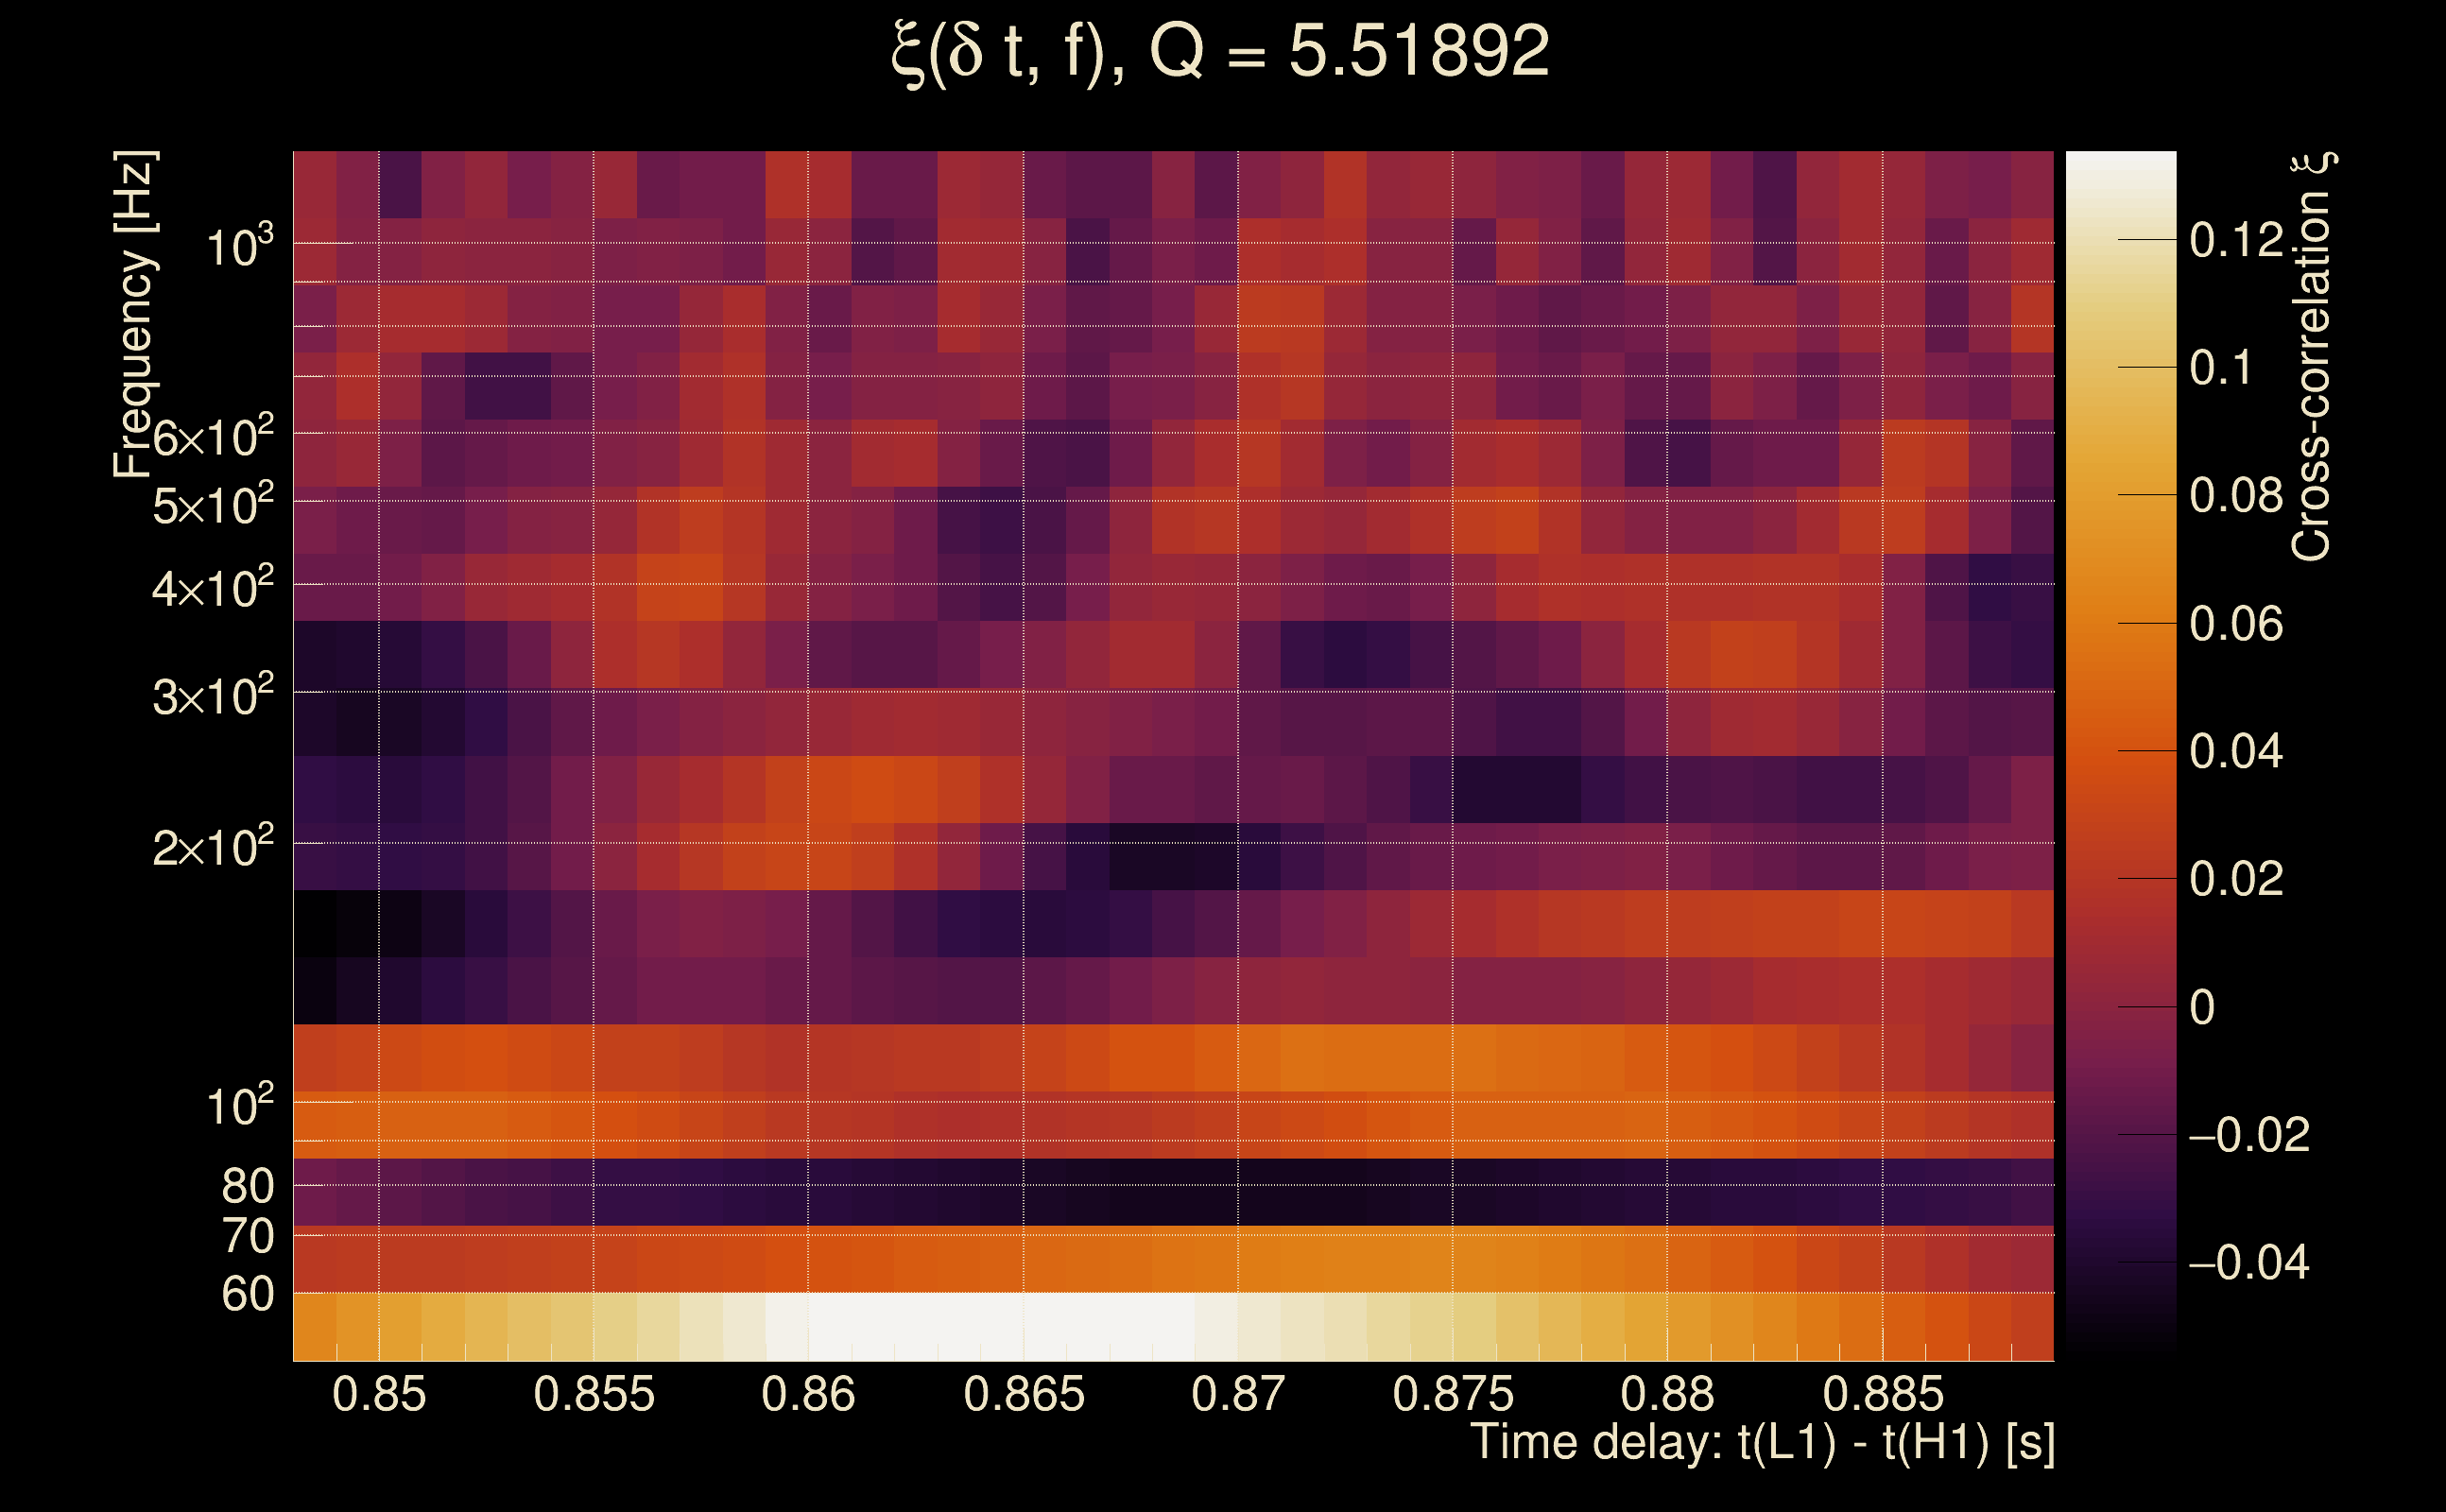
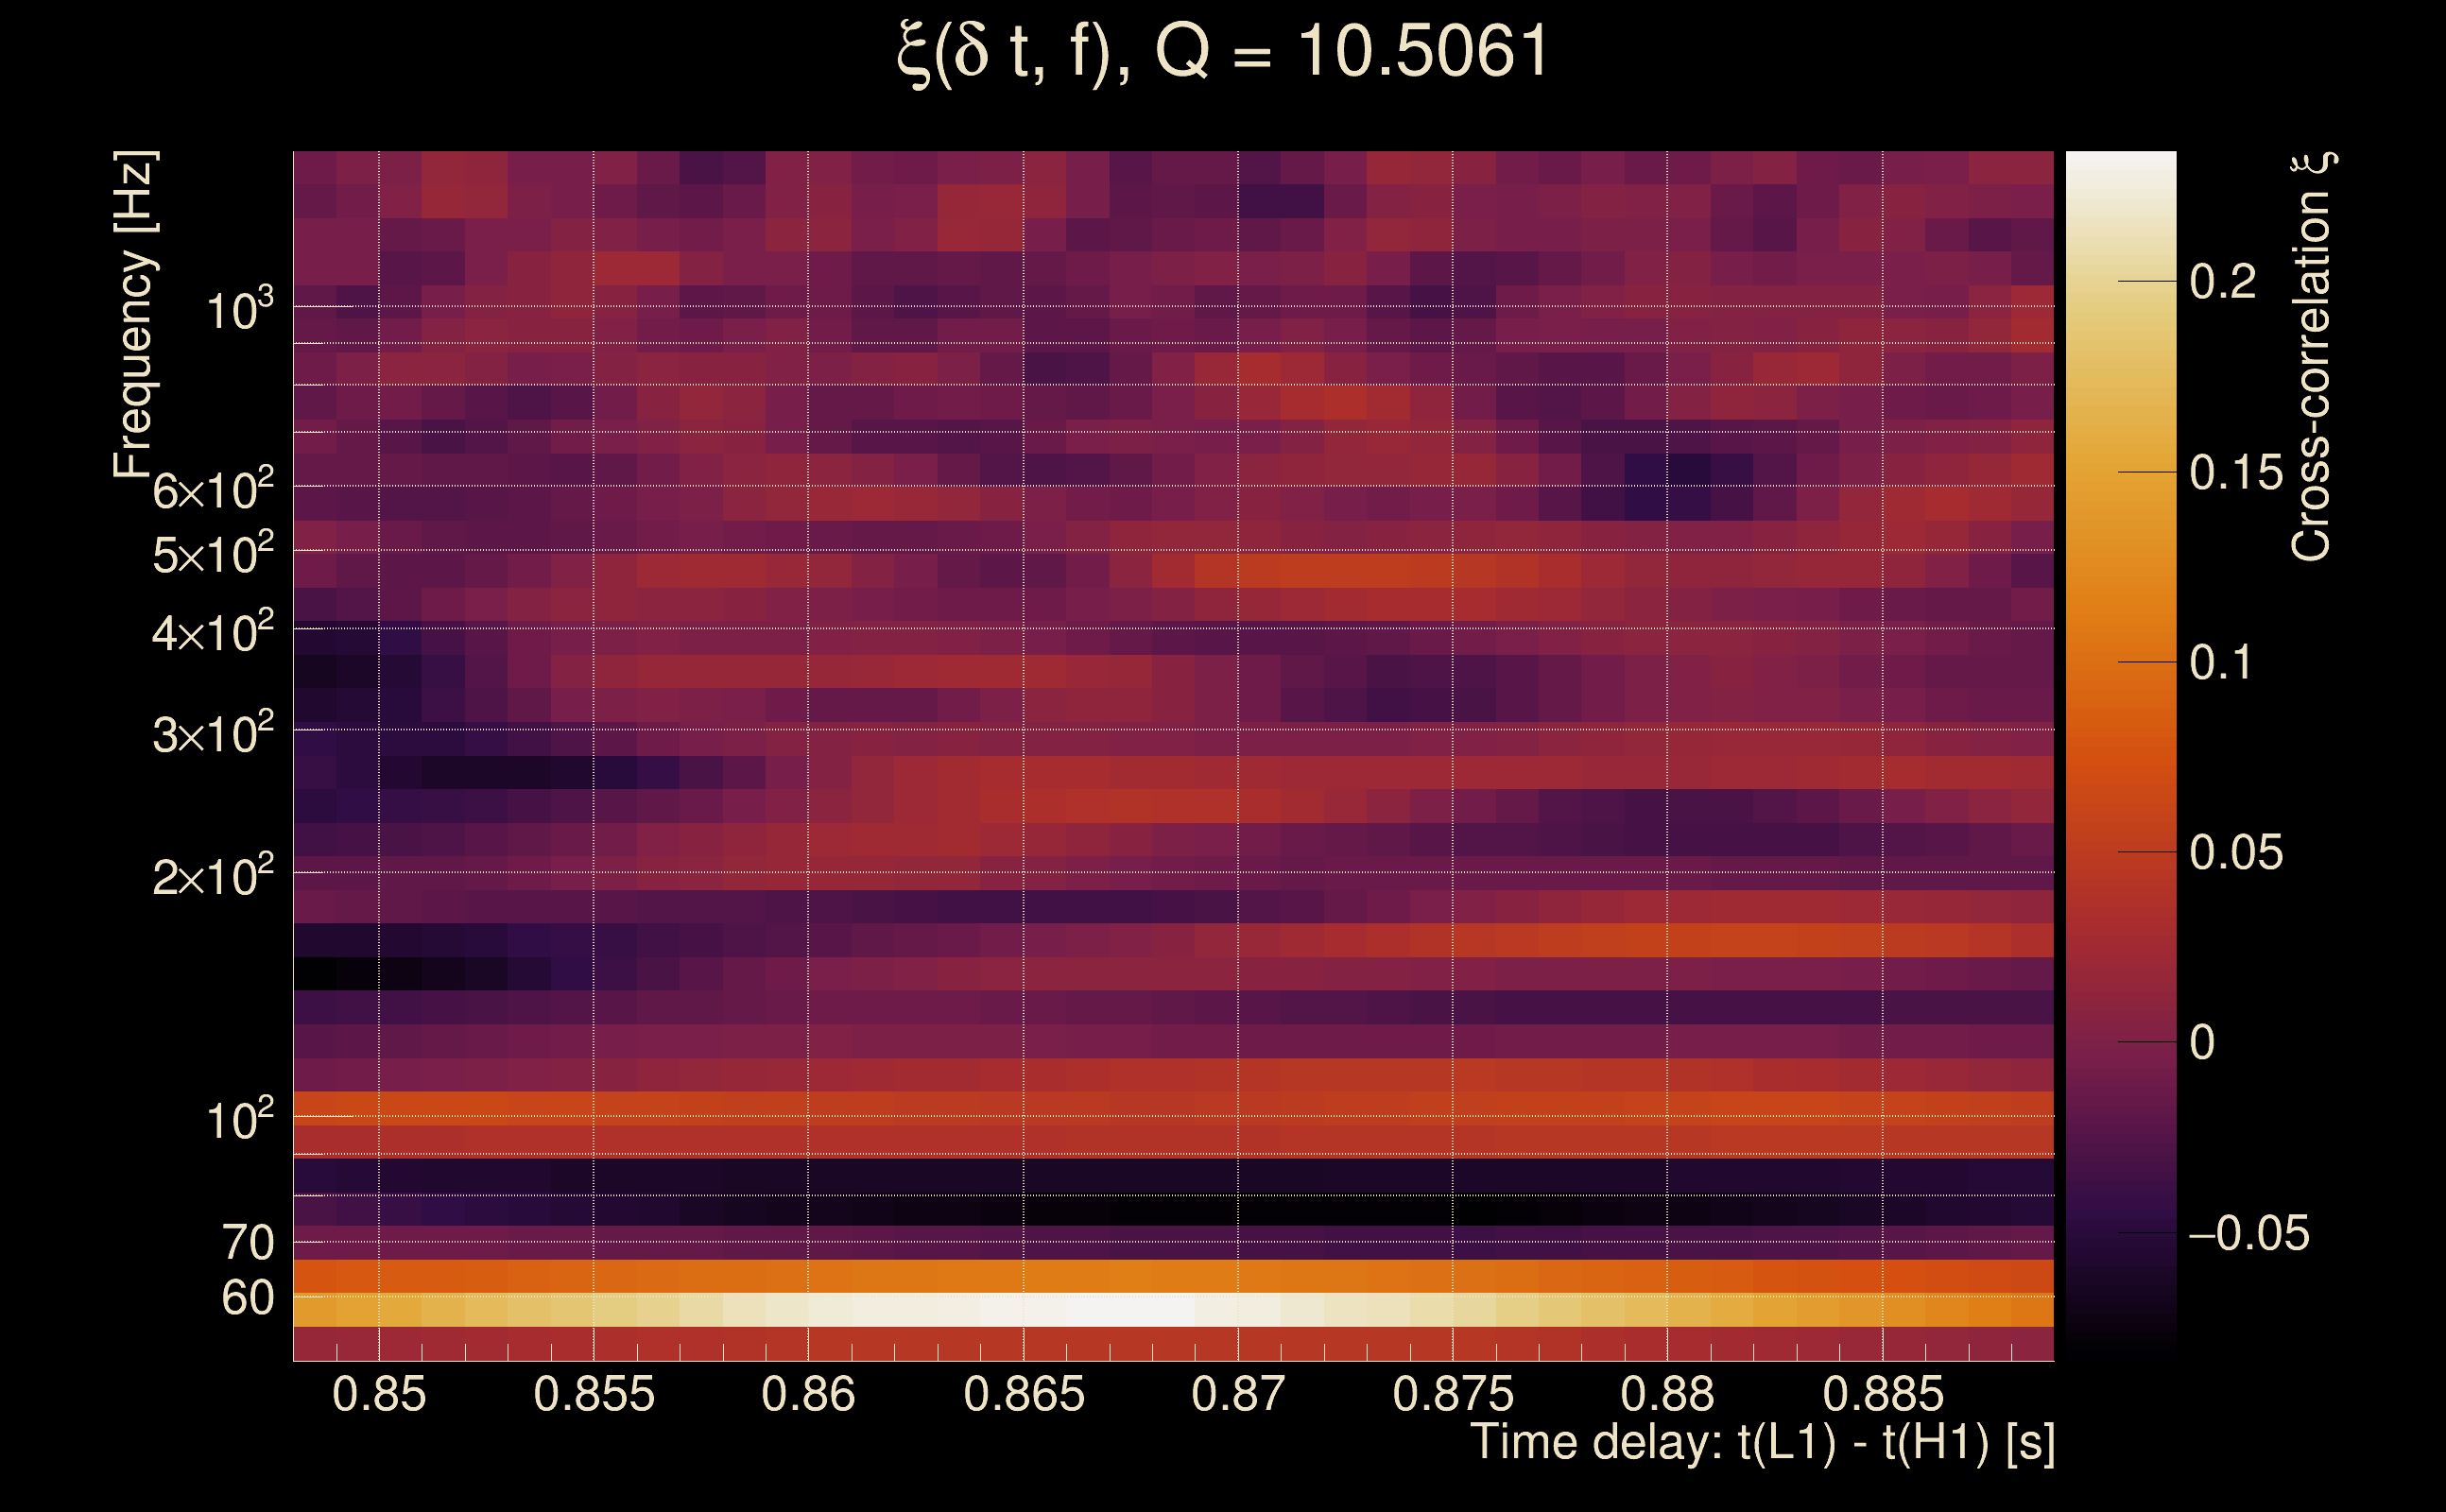
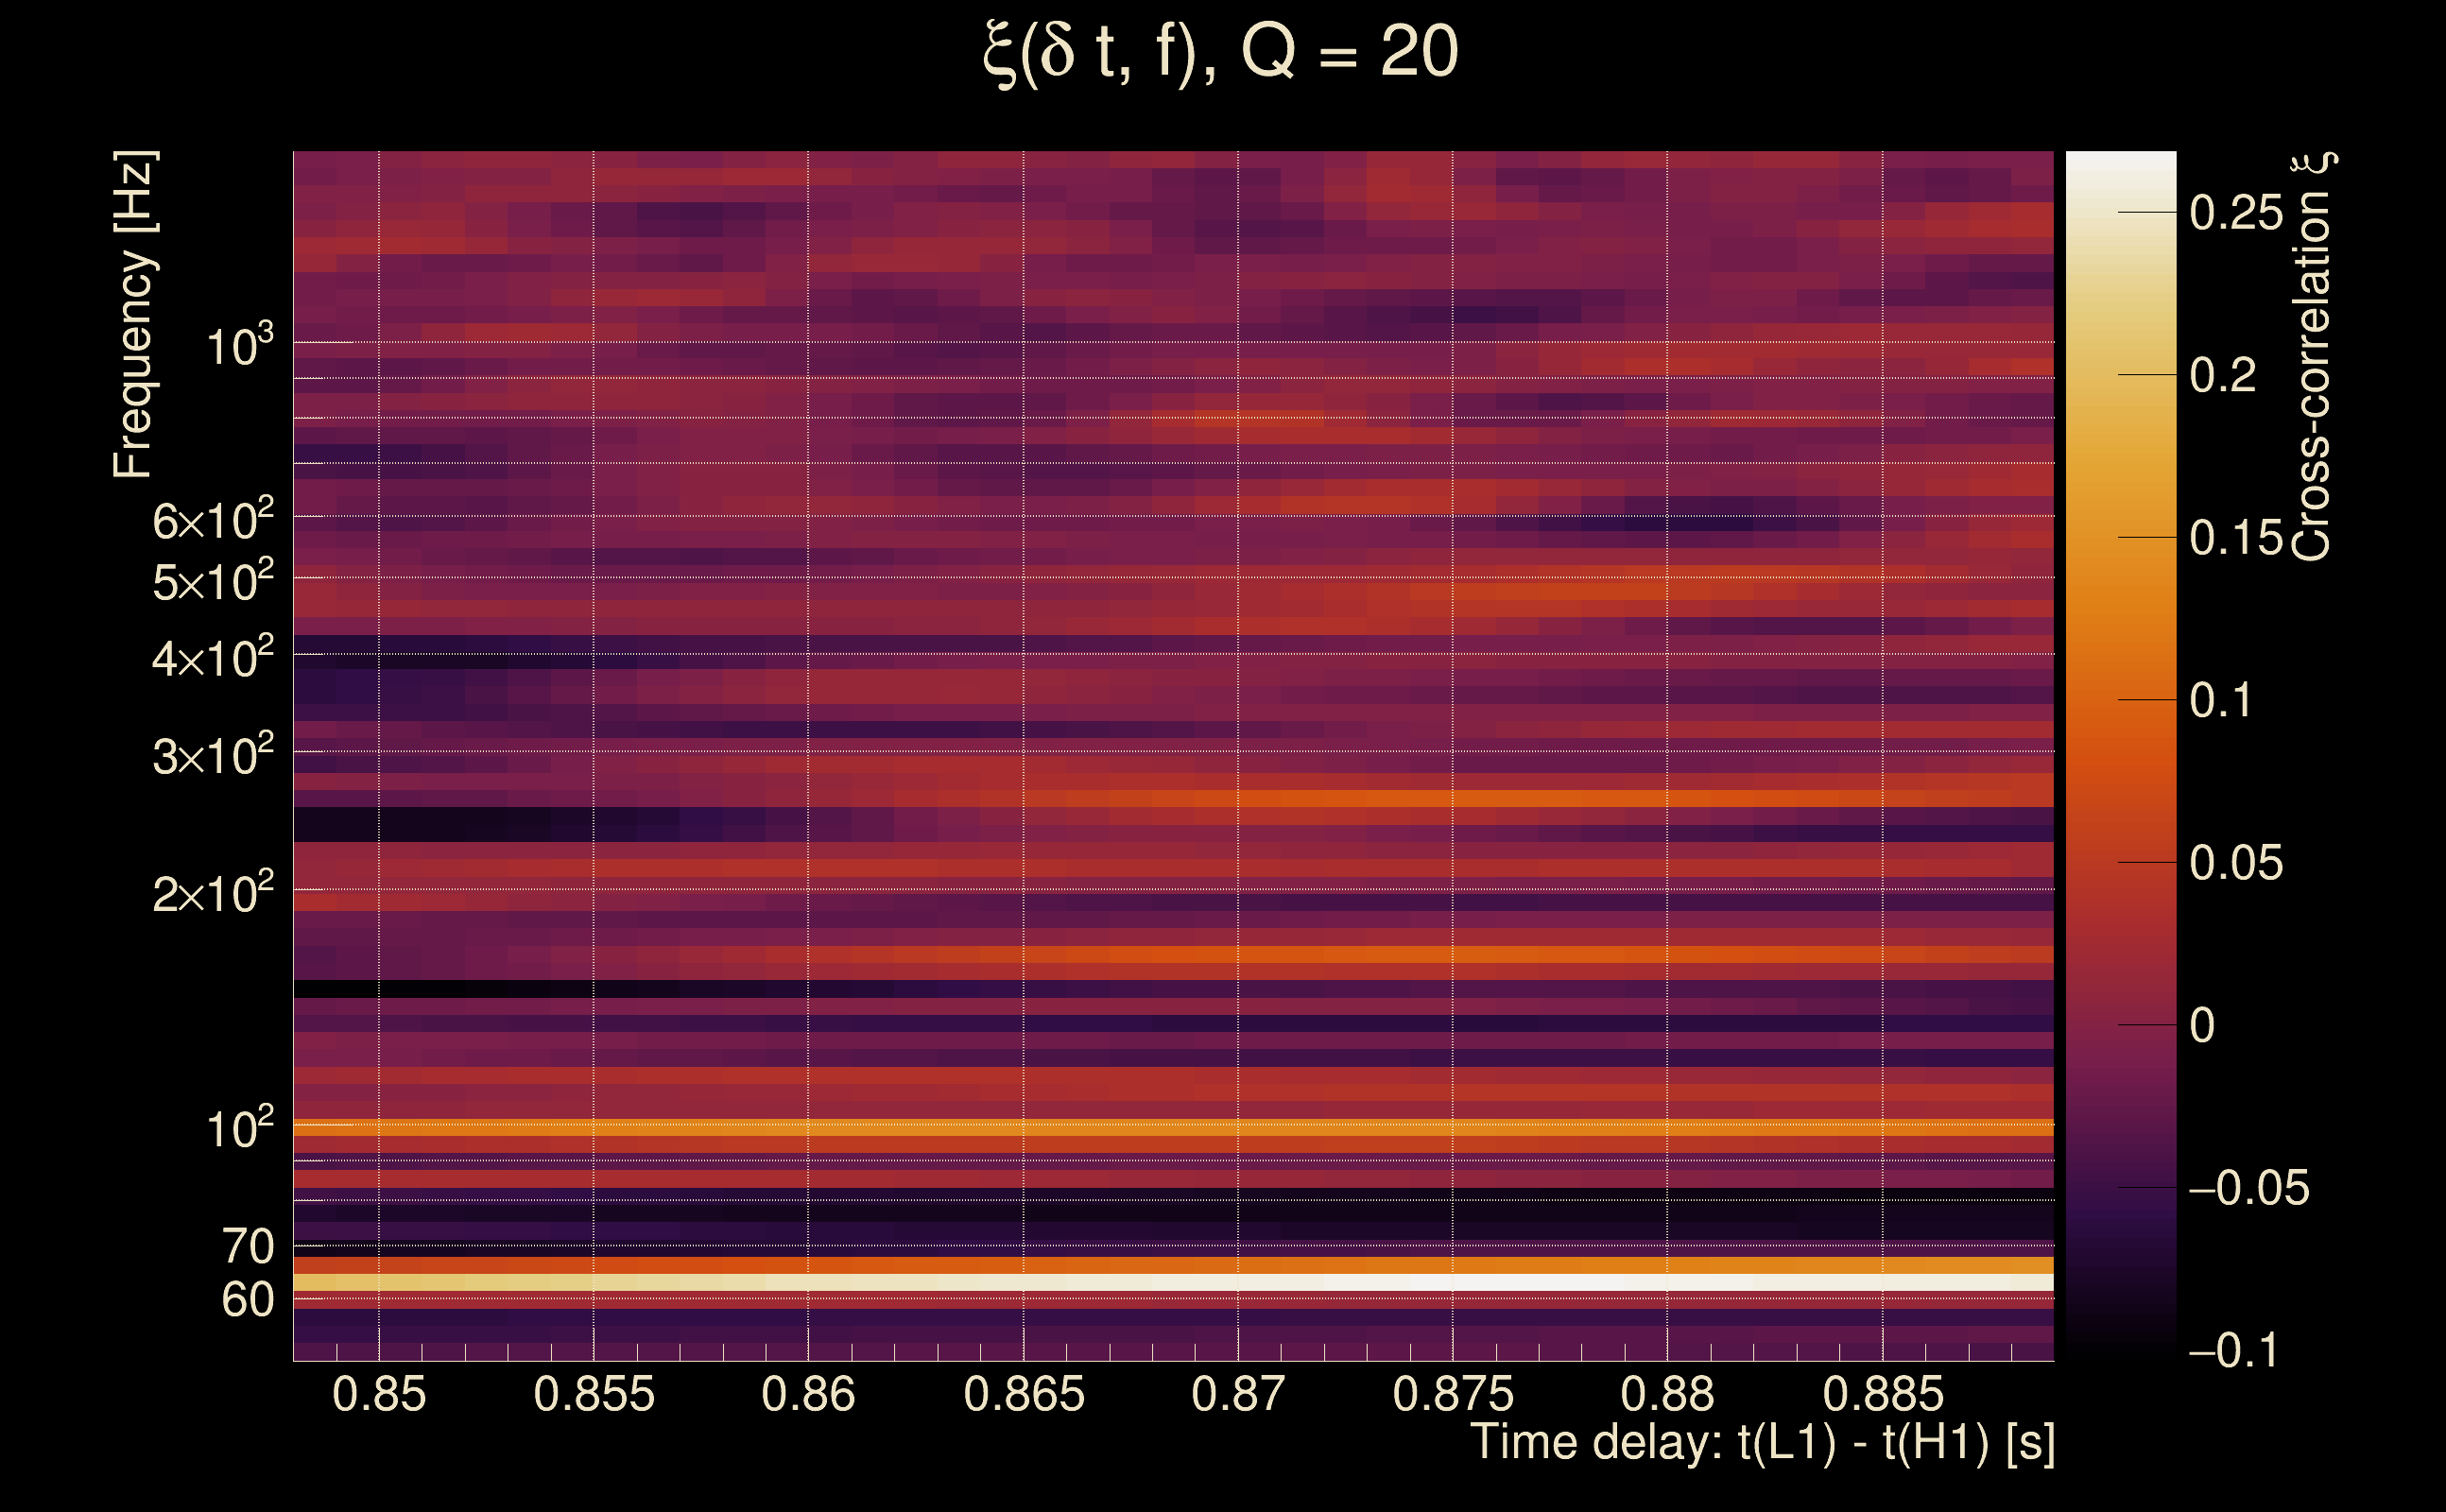
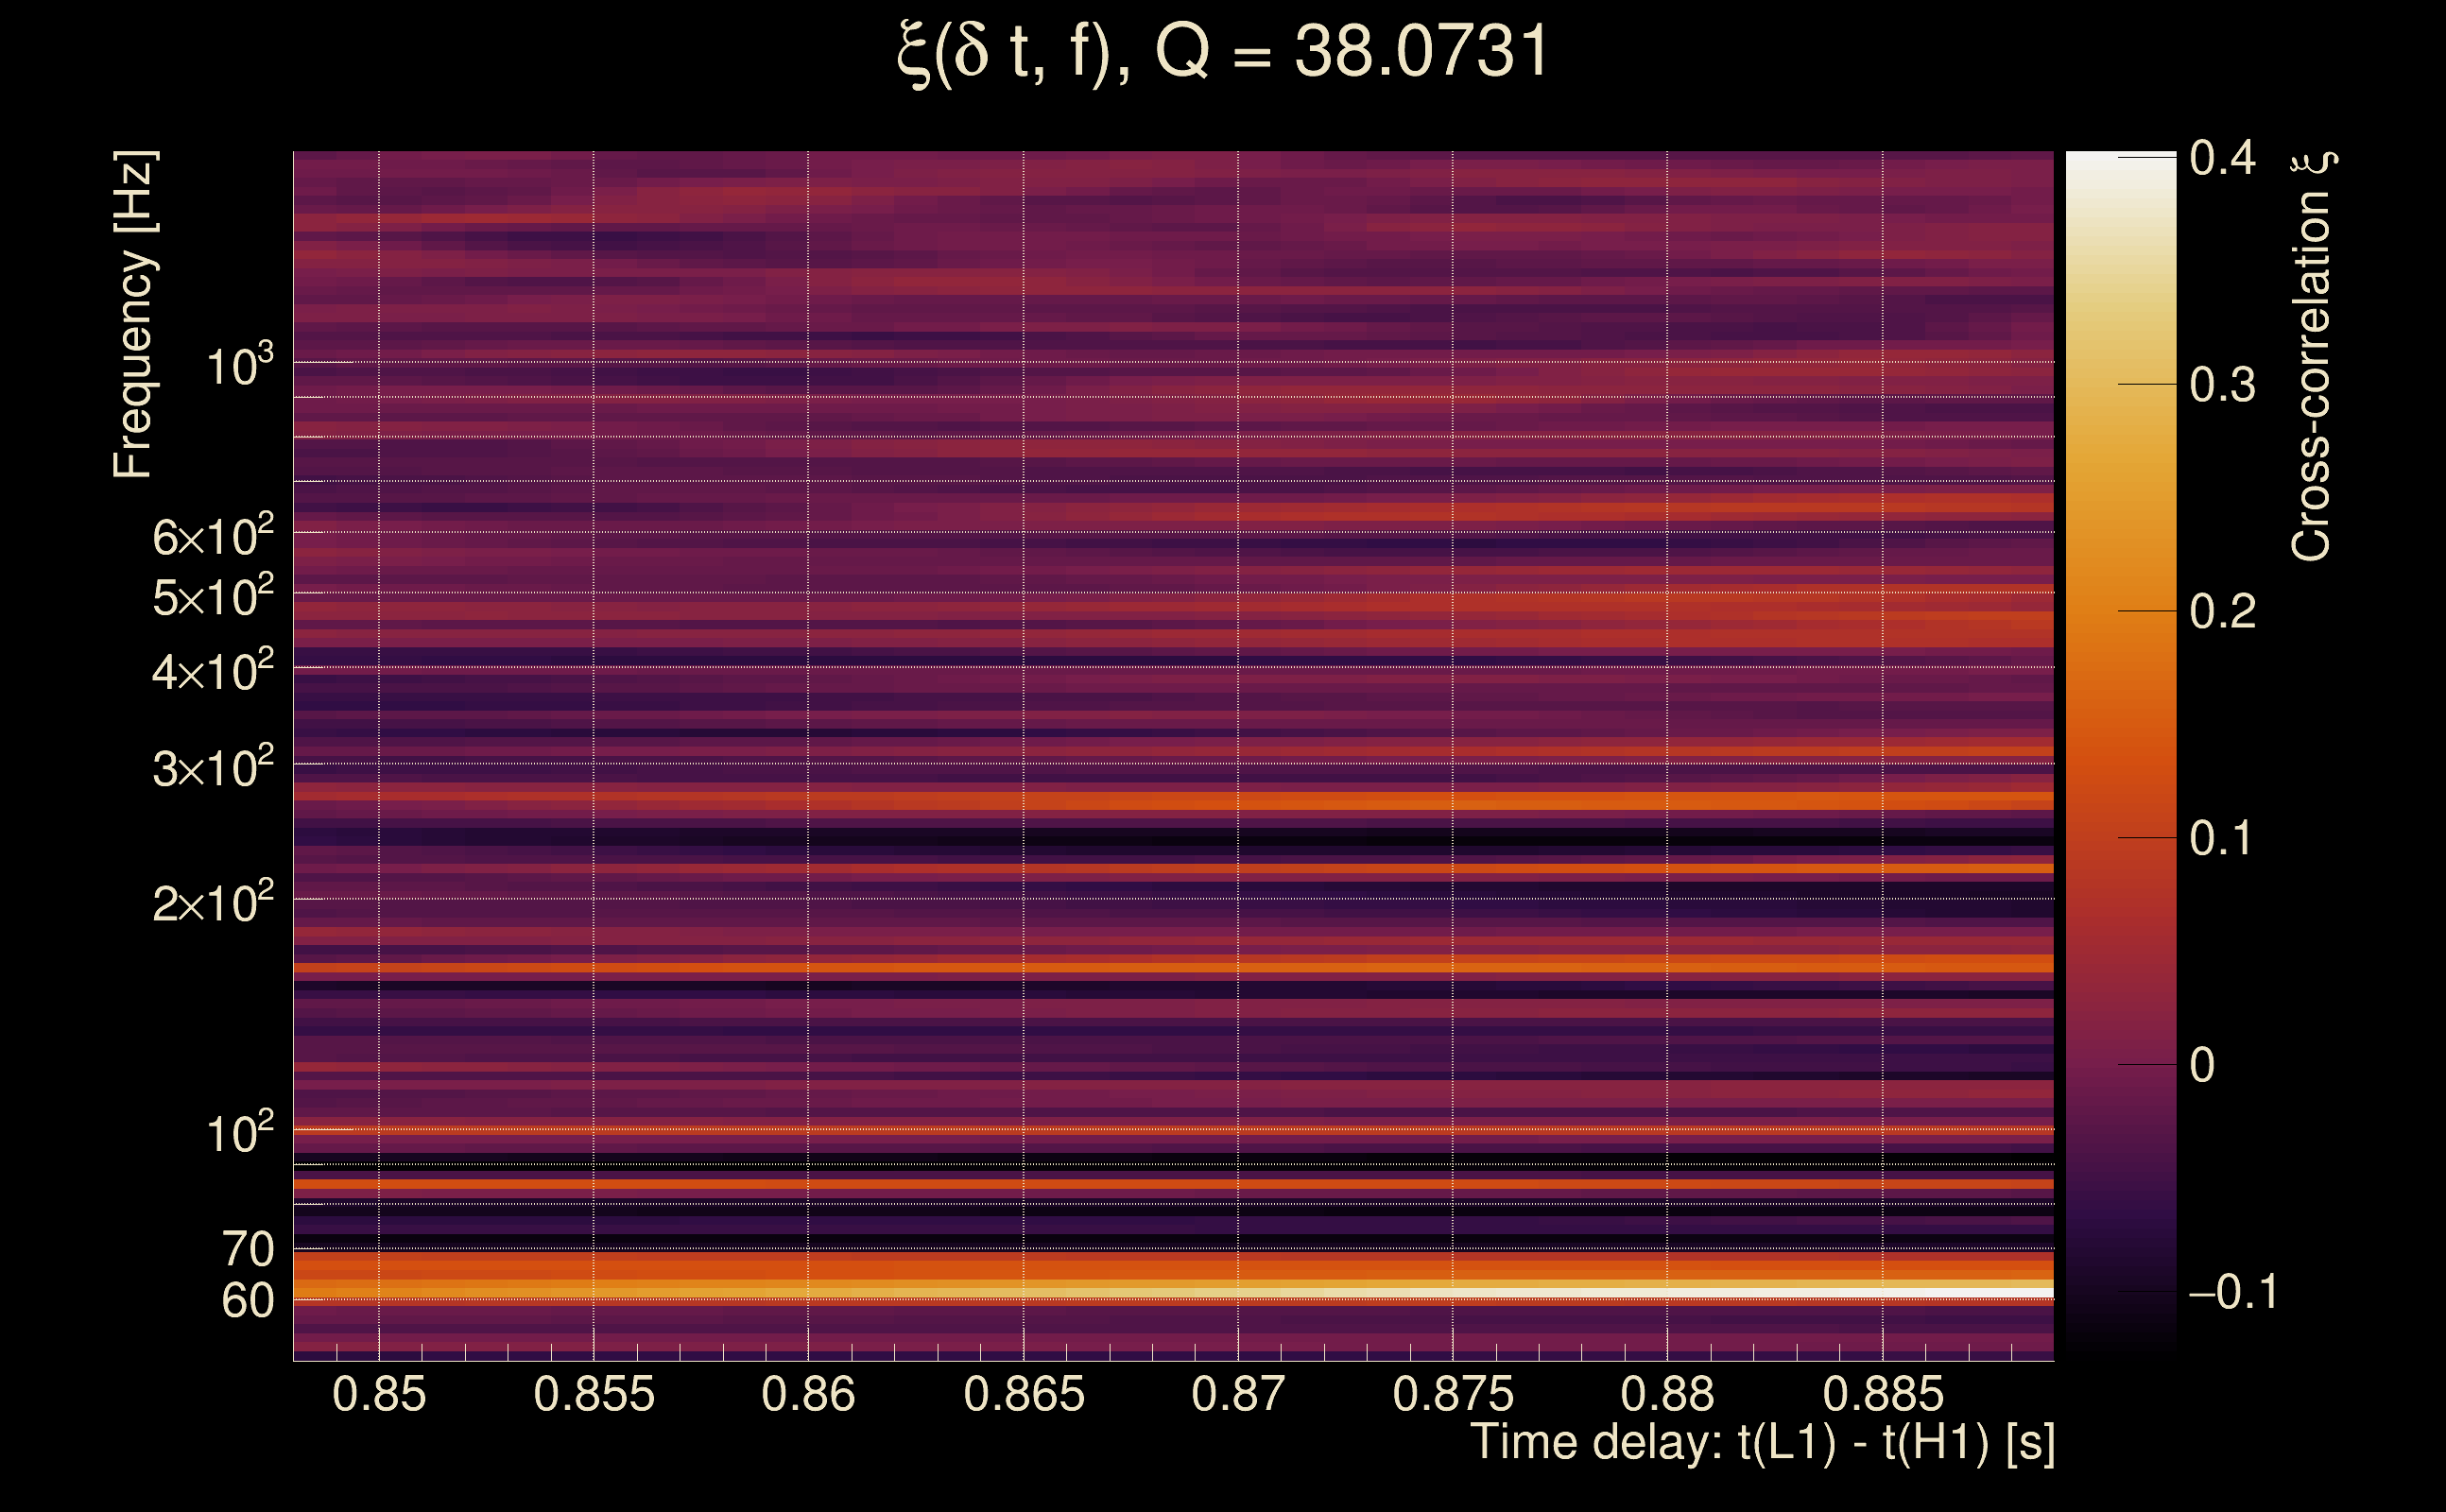
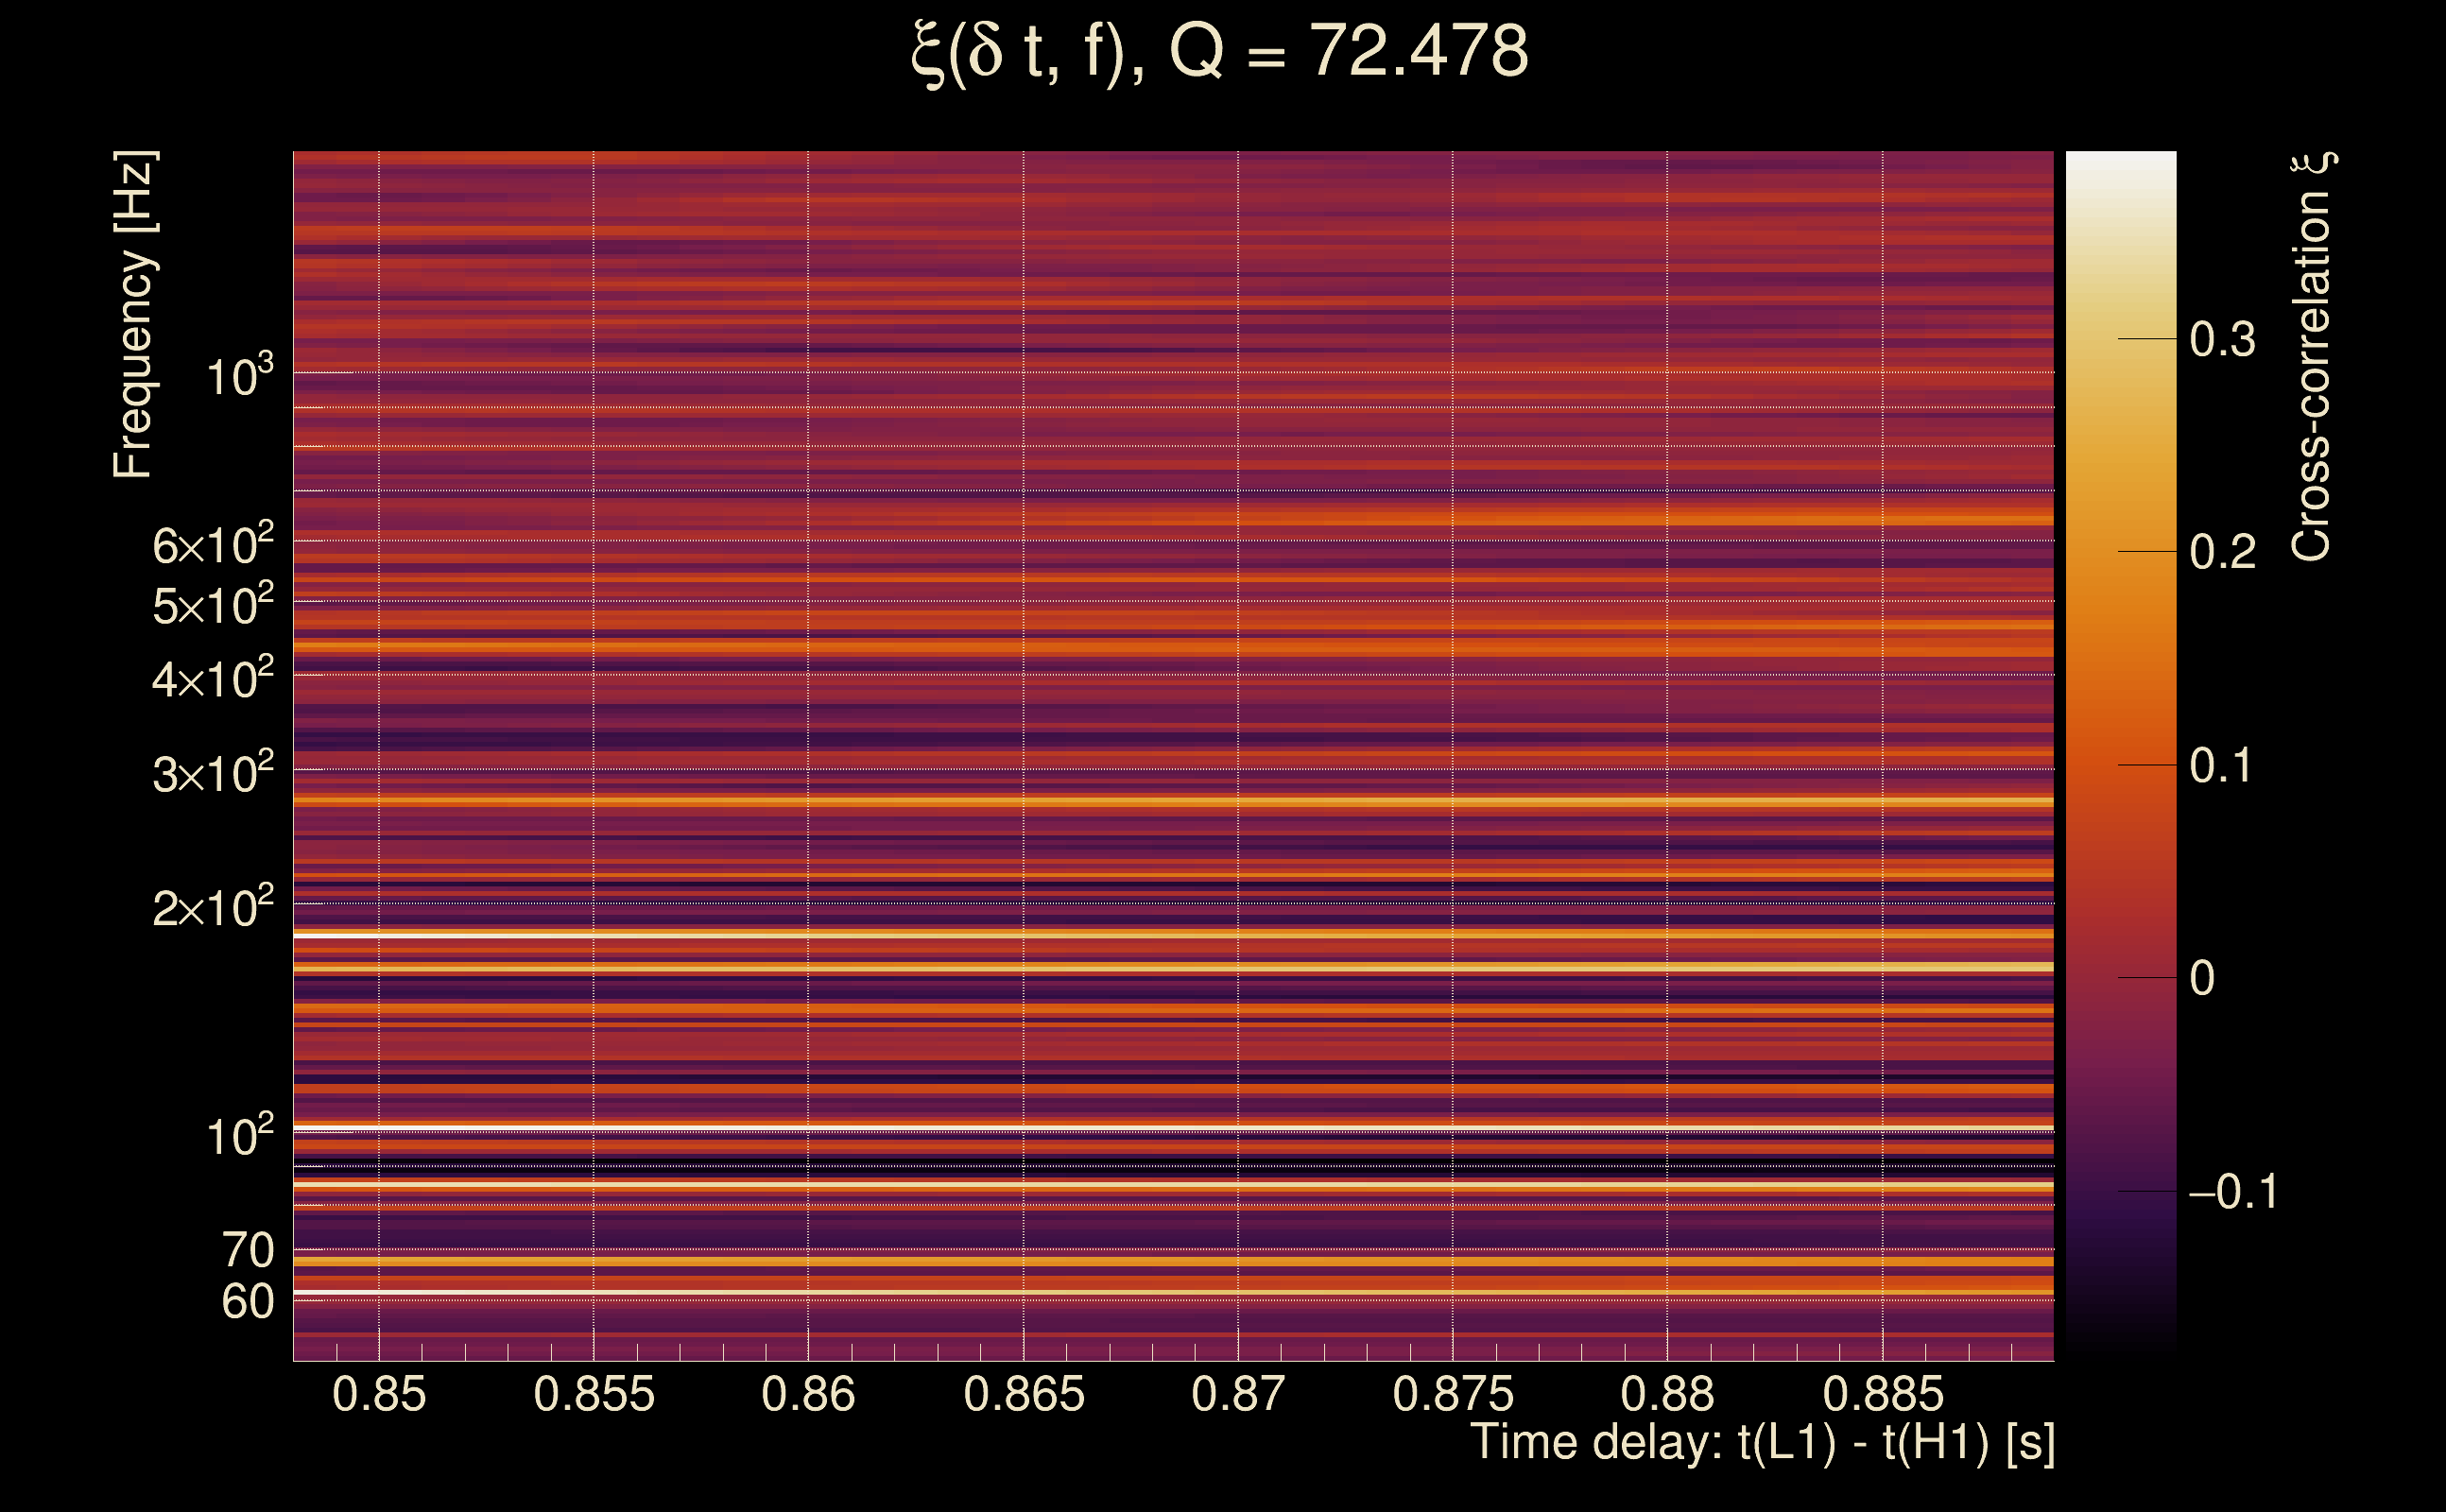
| Time delay between detectors t(L1) - t(H1): | 0.868354 s (slice index = 89 / 217), δt_gw = -0.00564625 s |
| Time delay standard deviation: | 0.0798578 s |
| [targeted mode] Time delay probability: | 0.0792785 (1.75489 sigmas), δt_target = 0.00177836 s |
| Frequency: | 118.051 Hz |
| Ξ: | 0.0243371 ± 0.0466116 (variance = 0.00217264): Q0: 0.102256, Q1: 0.131736, Q2: 0.226159, Q3: 0.10884, Q4: 0.177536 |
| Rank: | R_A = 0.0150837 |
| Log of amplitude ratio (L1/H1): | -0.275581, variance = 0.738988 (L1/H1: -0.668033, variance = 1.94405, H1/L1: -0.14688, variance = 0.933575) |
| Amplitude ratio (L1/H1): | 0.759131 ⋇ 2.36232 (L1/H1: 0.512716 ⋇ 4.03213, H1/L1: 0.863398 ⋇ 2.62798) |
| Amplitude ratio H1|L1 compatibility (probability): | 0.63095 |
| Antenna factor probability: | 0.982301 |
| Number of rejected frequency rows: | Q0: 13 / 18, Q1: 28 / 36, Q2: 66 / 70, Q3: 125 / 134, Q4: 250 / 258 |
| Maximum signal-to-noise ratio: | H1: 5.3903, L1: 5.19533 |
| SNR variance: | H1: 0.500212, L1: 0.533818 |
| Click here for a zoomed plot | Click here for a zoomed plot | Click here for a zoomed plot | Click here for a zoomed plot | Click here for a zoomed plot |
 |
 |
 |
 |
 |
 |
 |
 |
 |
 |
 |
 |
 |
 |
 |
 |
 |
 |
 |
 |
 |
 |
 |
 |
 |
 |
 |
 |
 |
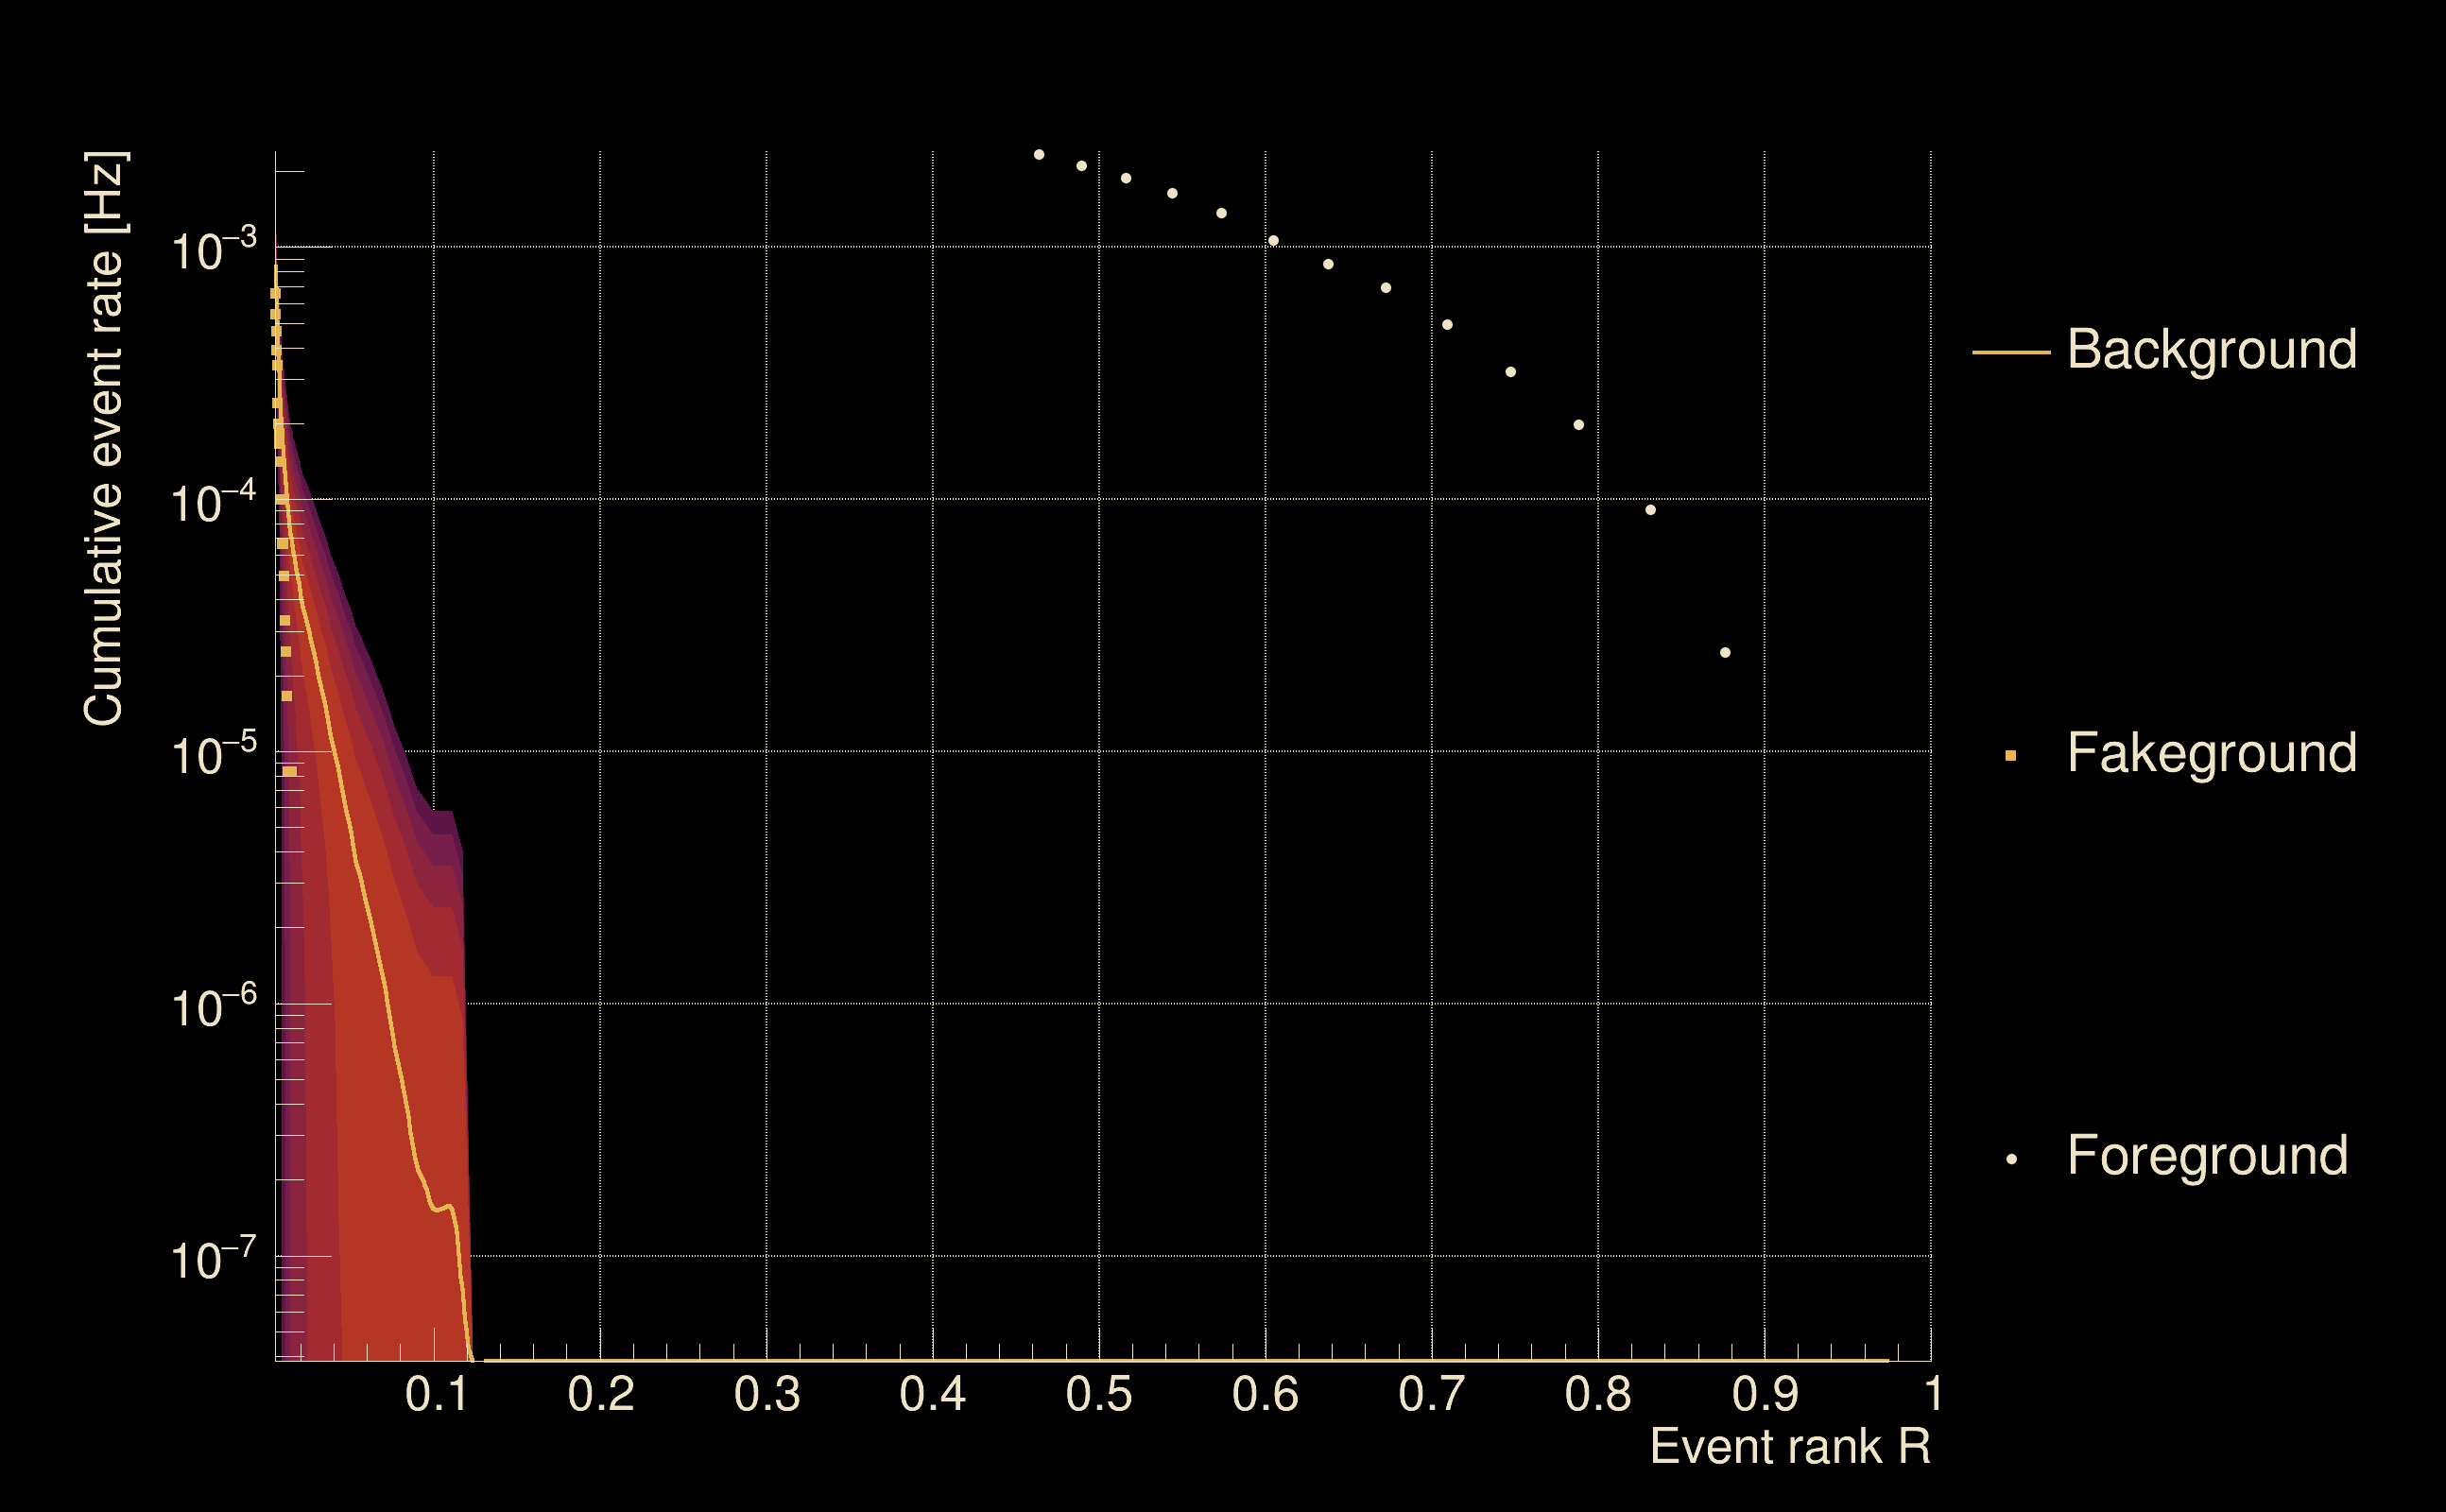
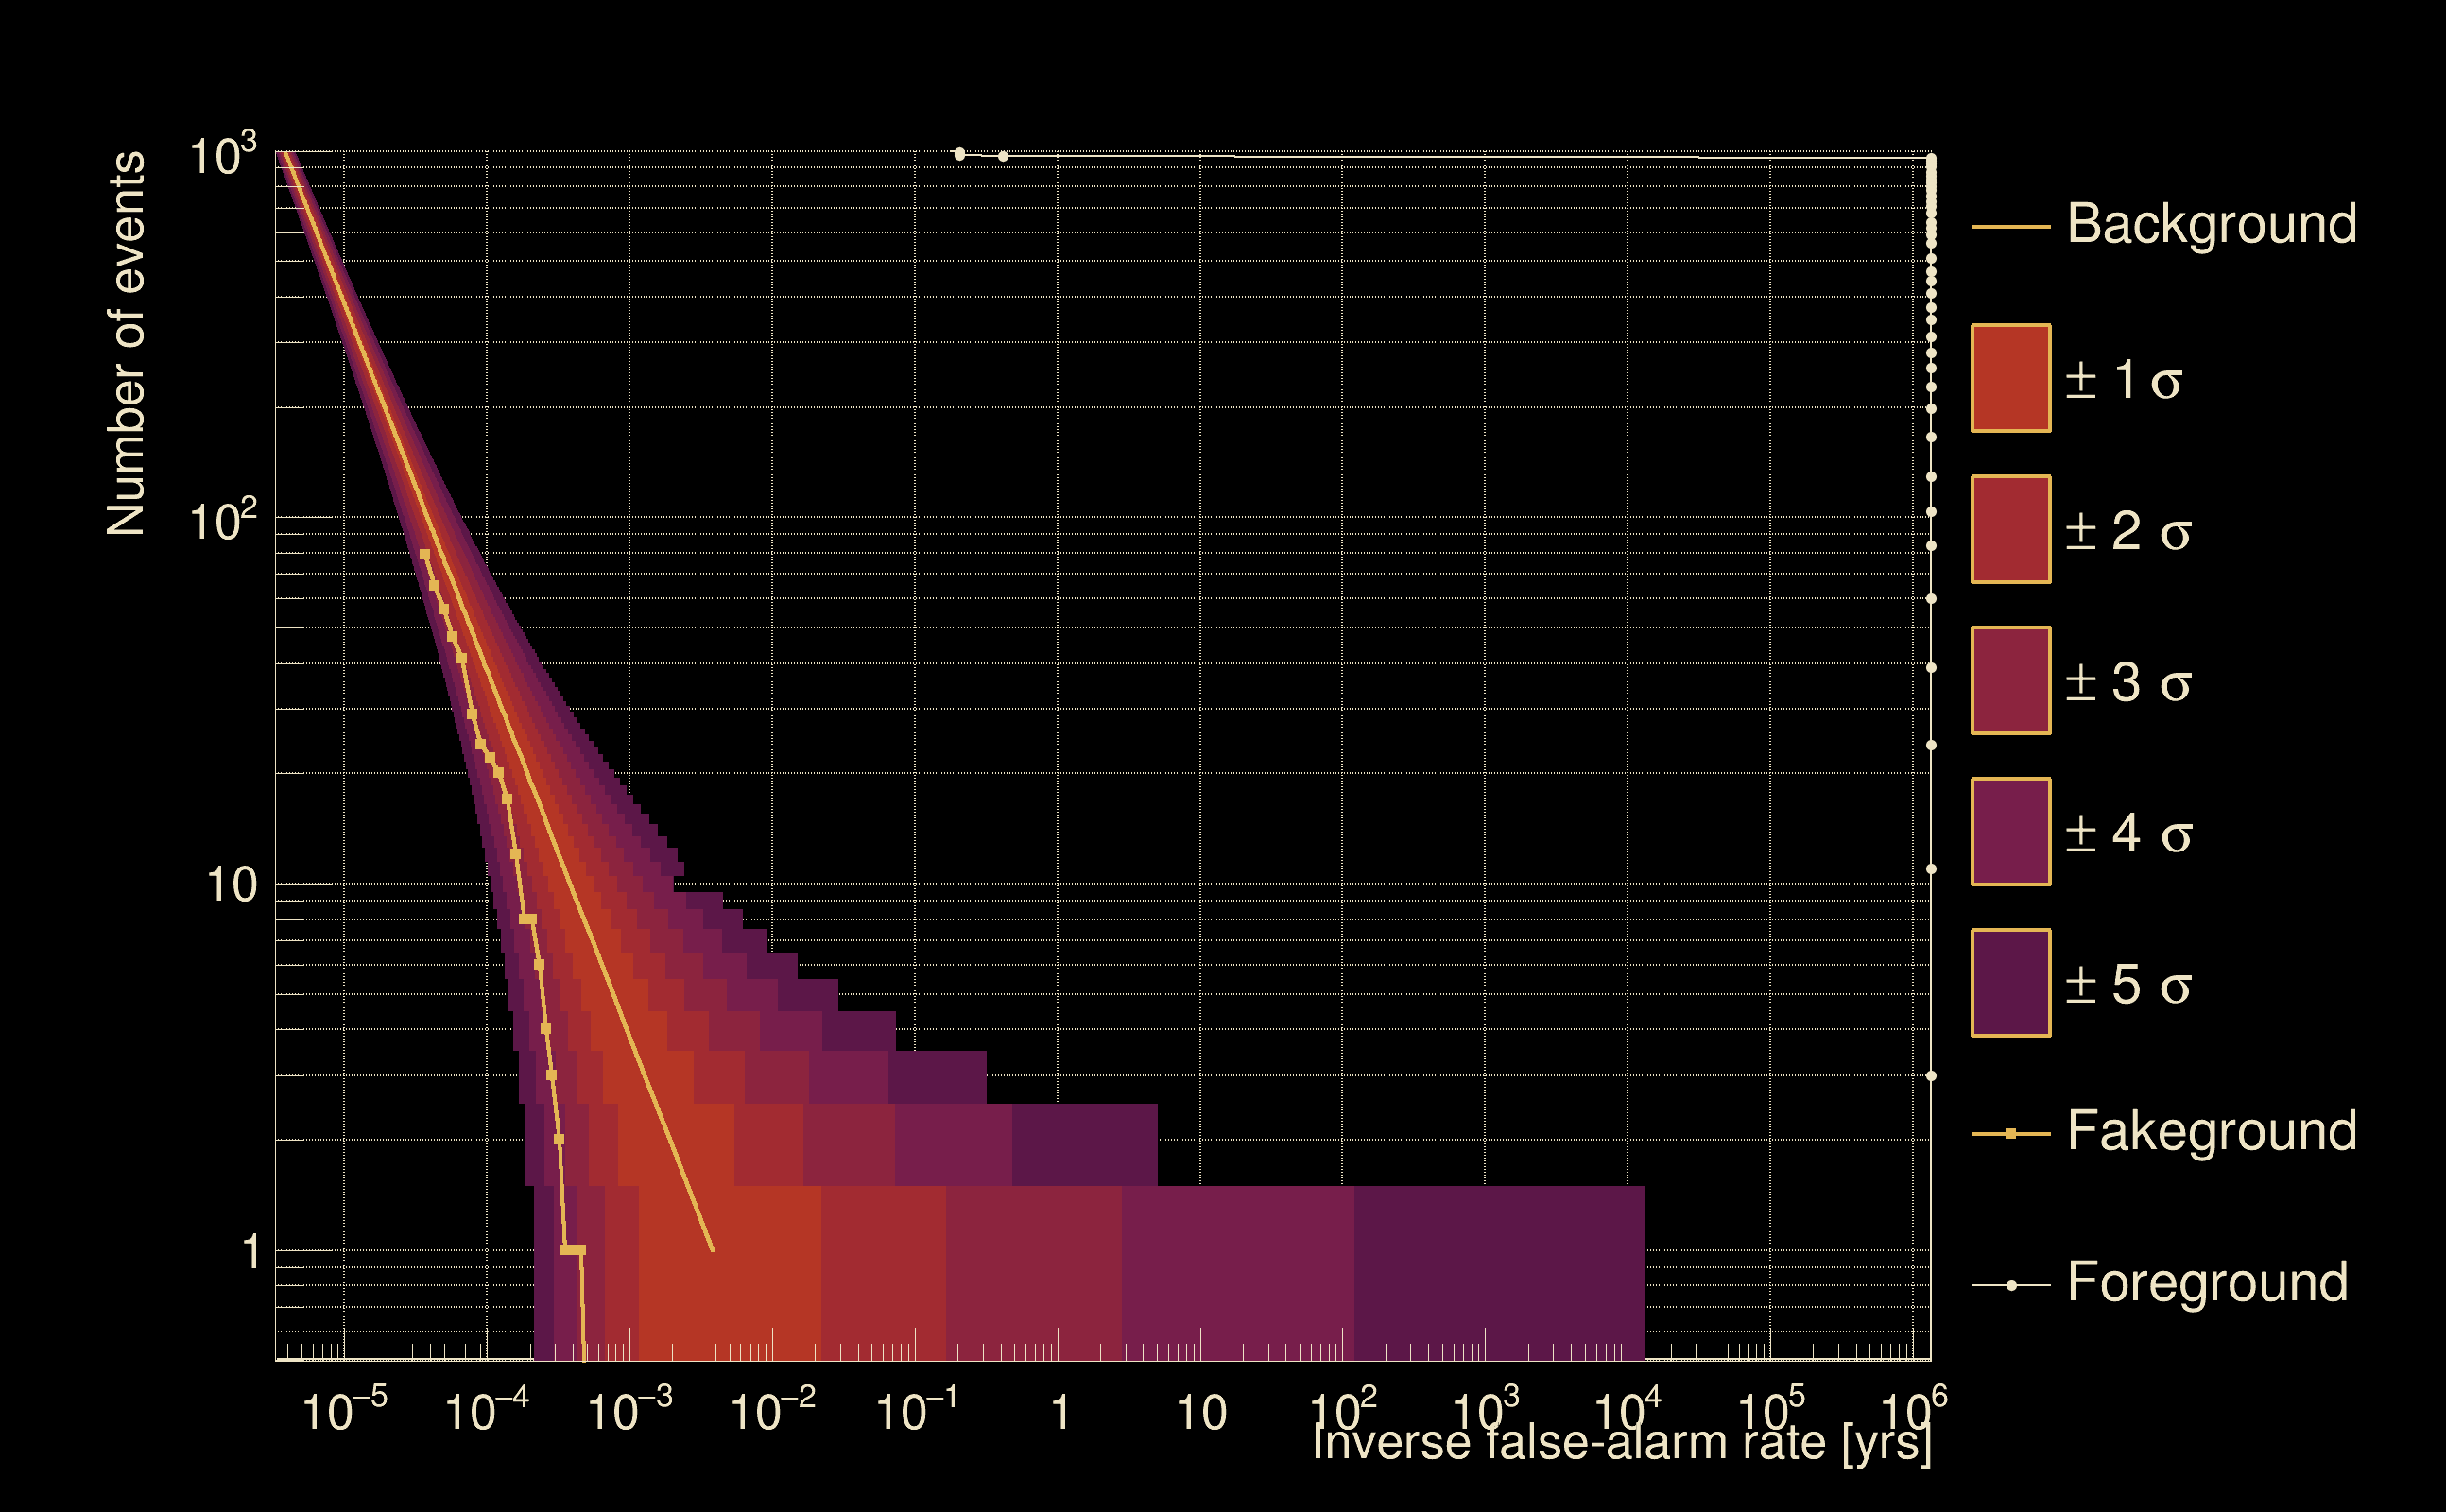
| Detection threshold: | R > 0.0410955 |
| False-alarm rate above that detection threshold: | 8.86829e-06 |
| Alternative threshold at 1/1000 yrs: | R > 0.117013 |
| Alternative threshold at 1/100 yrs: | R > 0.117013 |
| Alternative threshold at 1/10 yrs: | R > 0.117013 |
| Alternative threshold at 1/1 yr: | R > 0.117013 |
| Alternative threshold at 1/1 d: | R > 0.0365499 |
 |
|
 |
 |
 |
 |
 |
 |
 |
 |
 |
 |
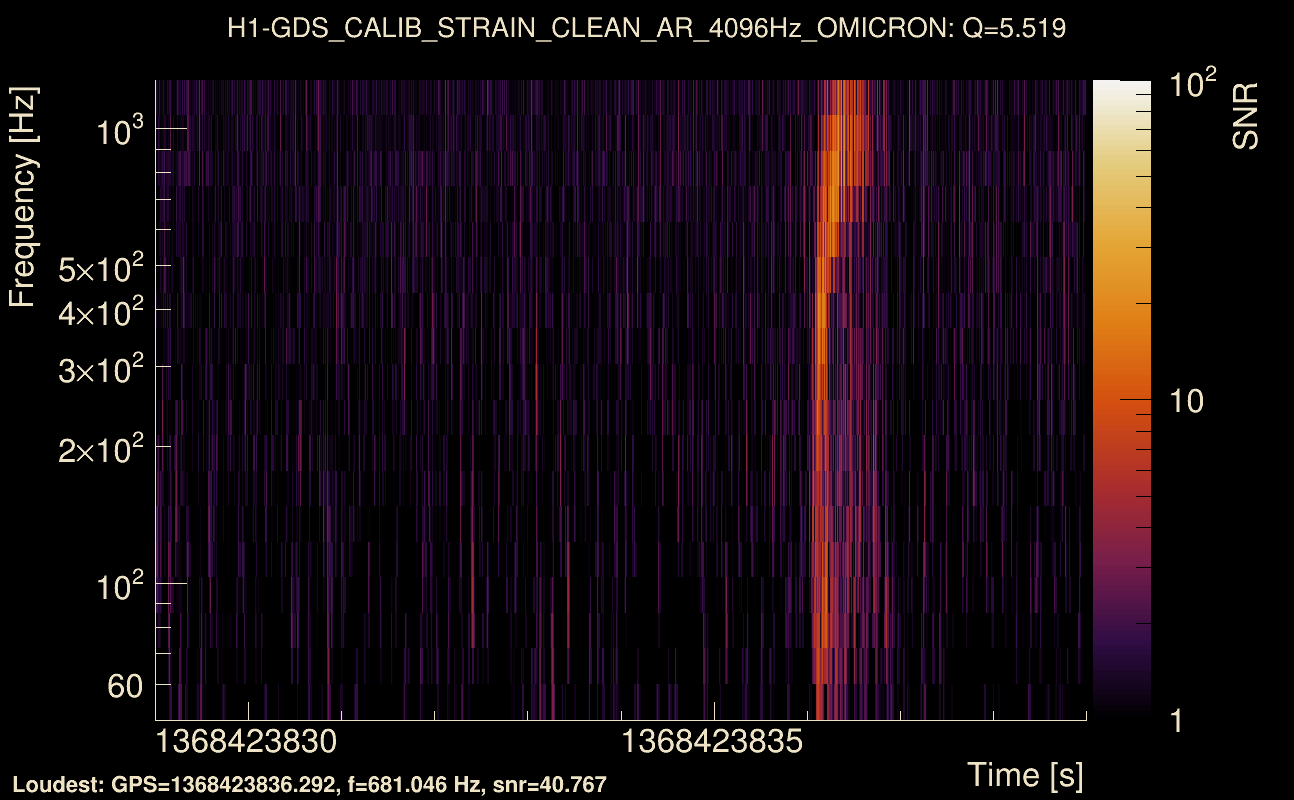
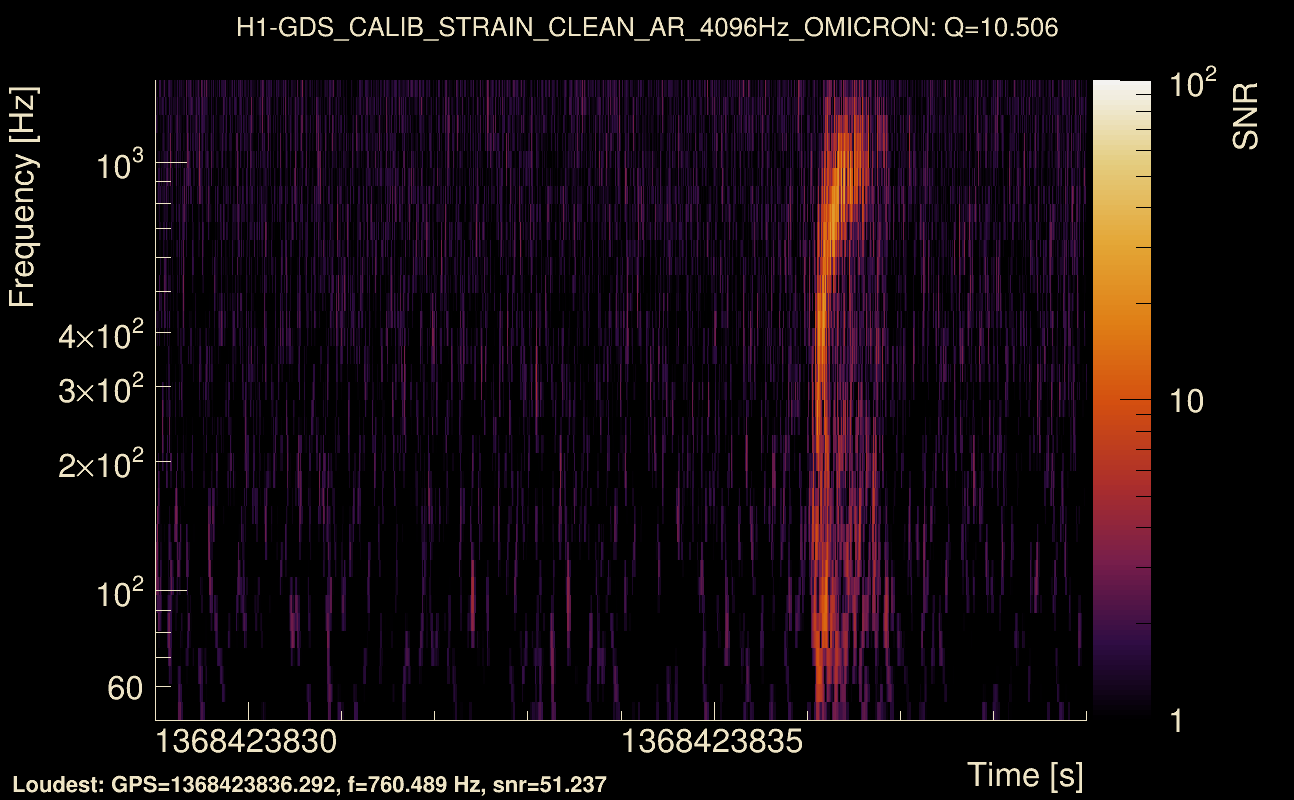
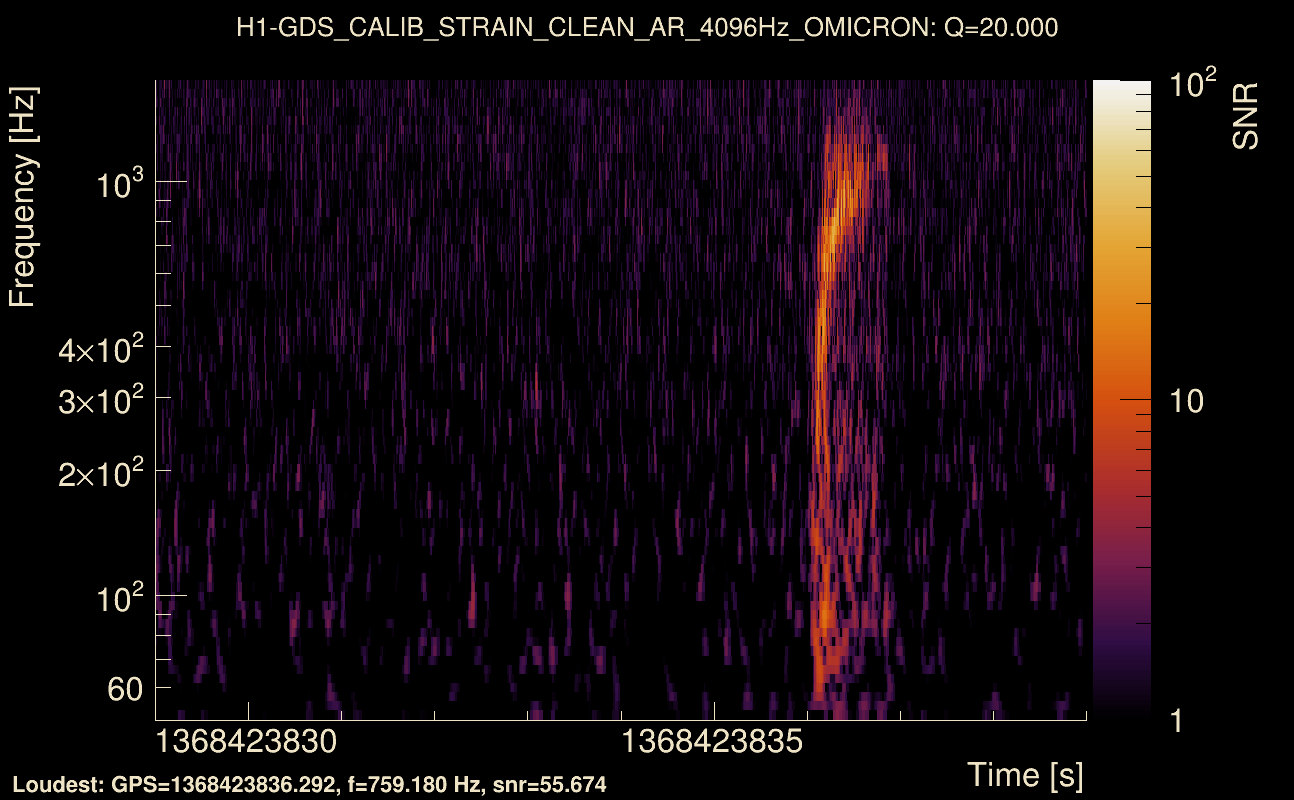
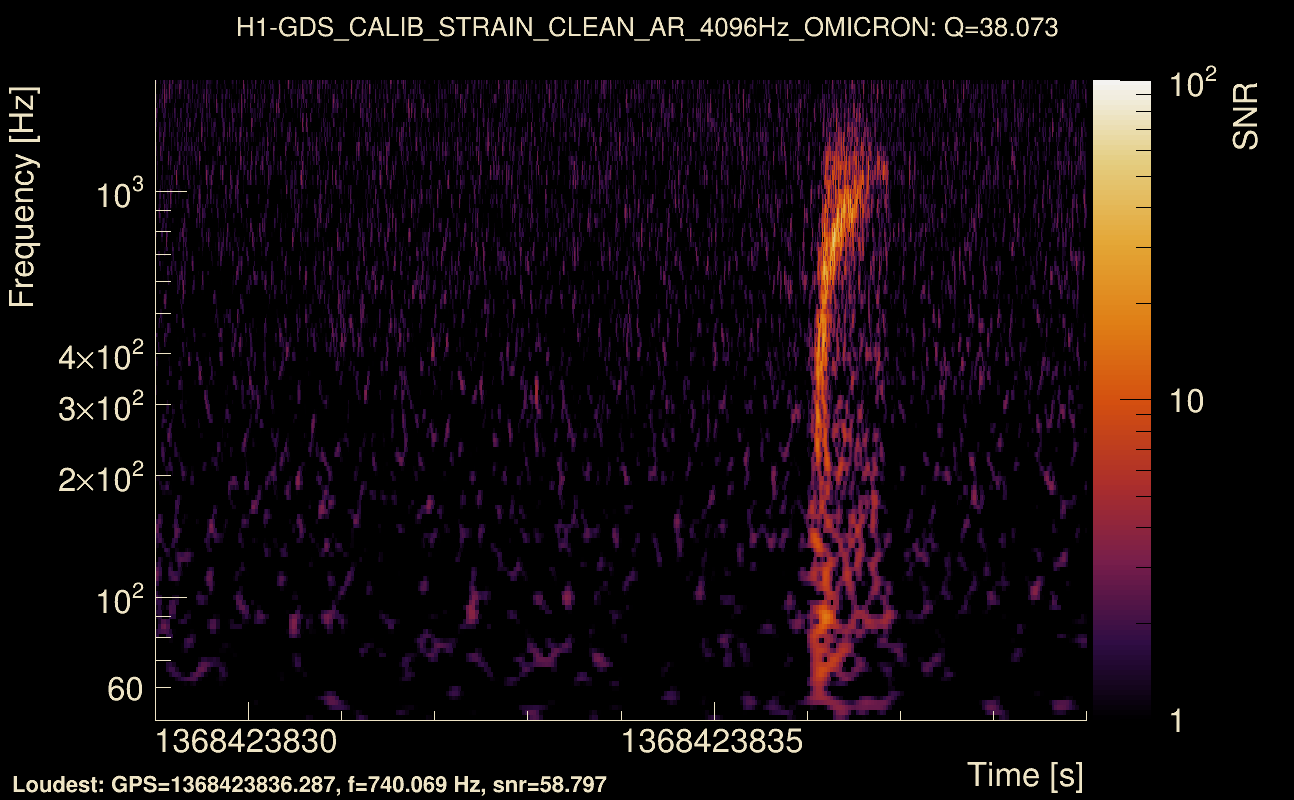
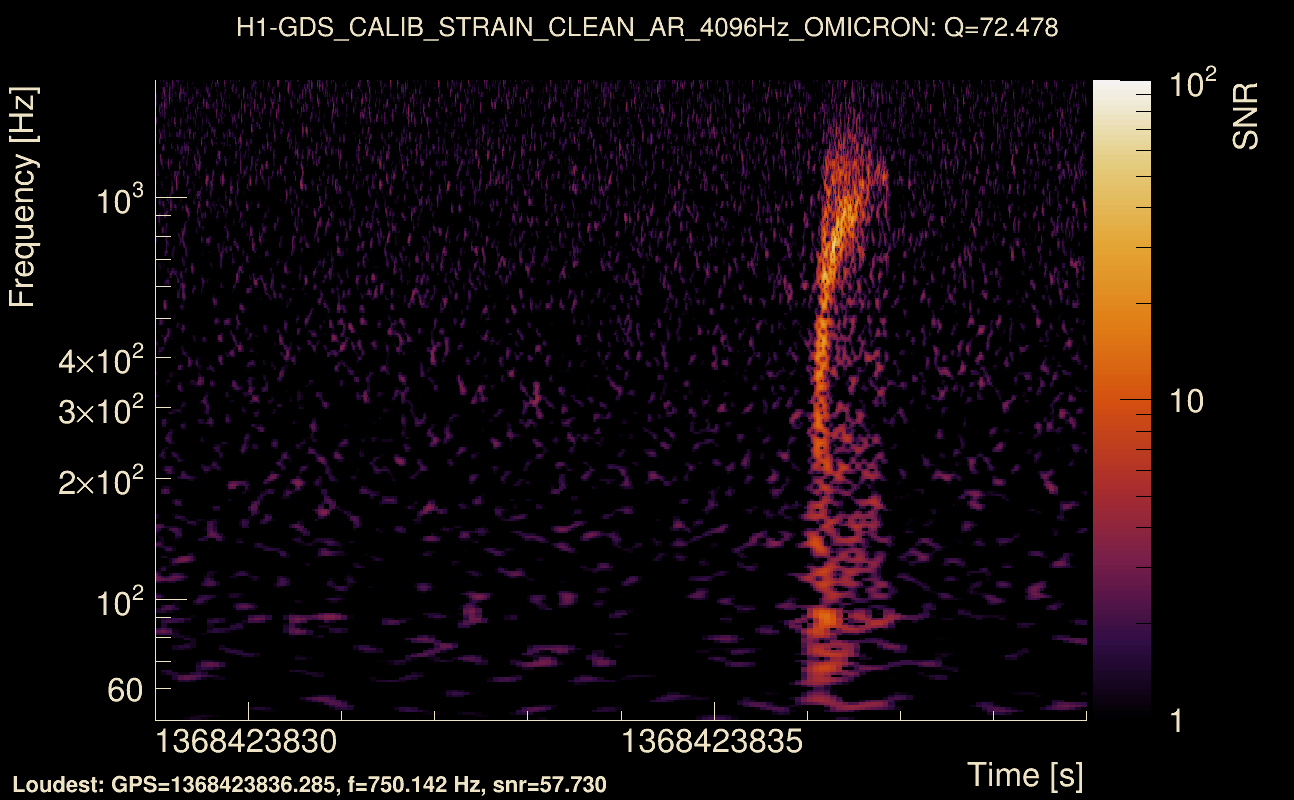
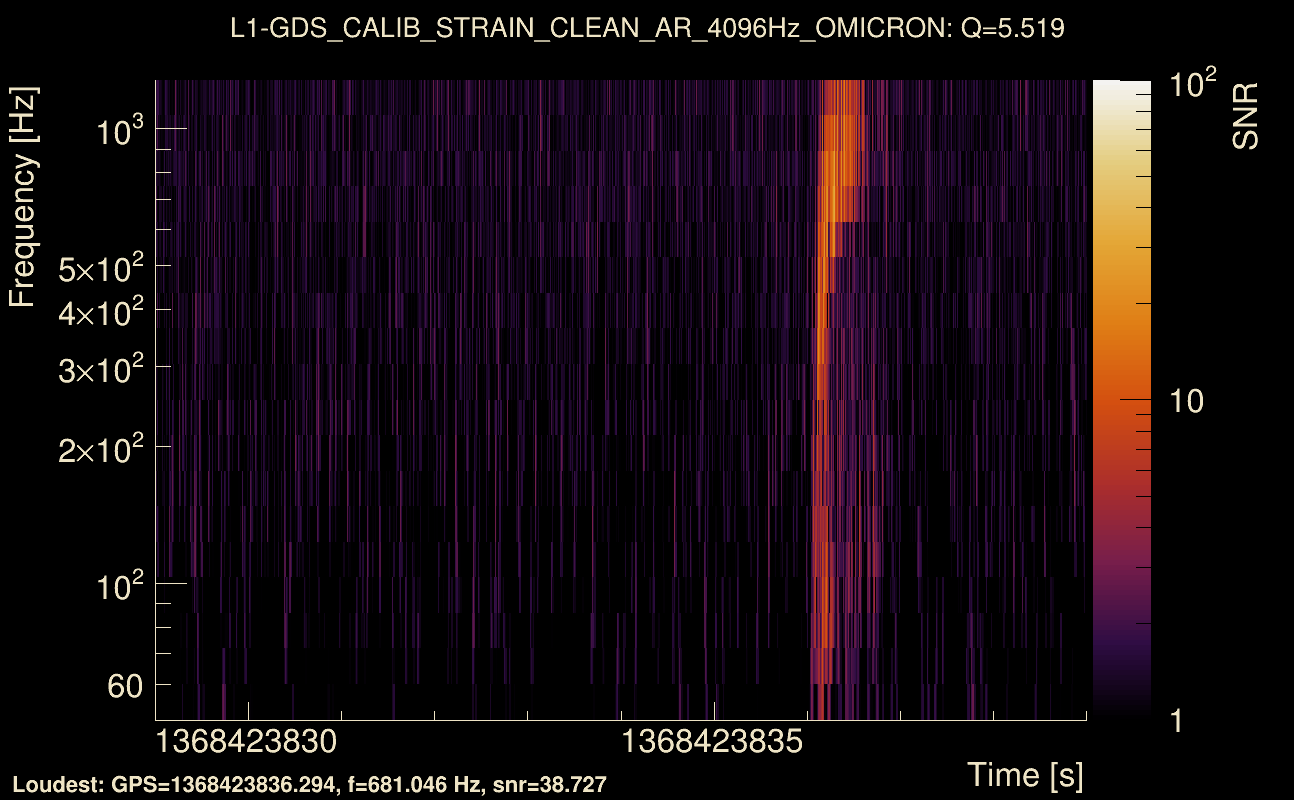
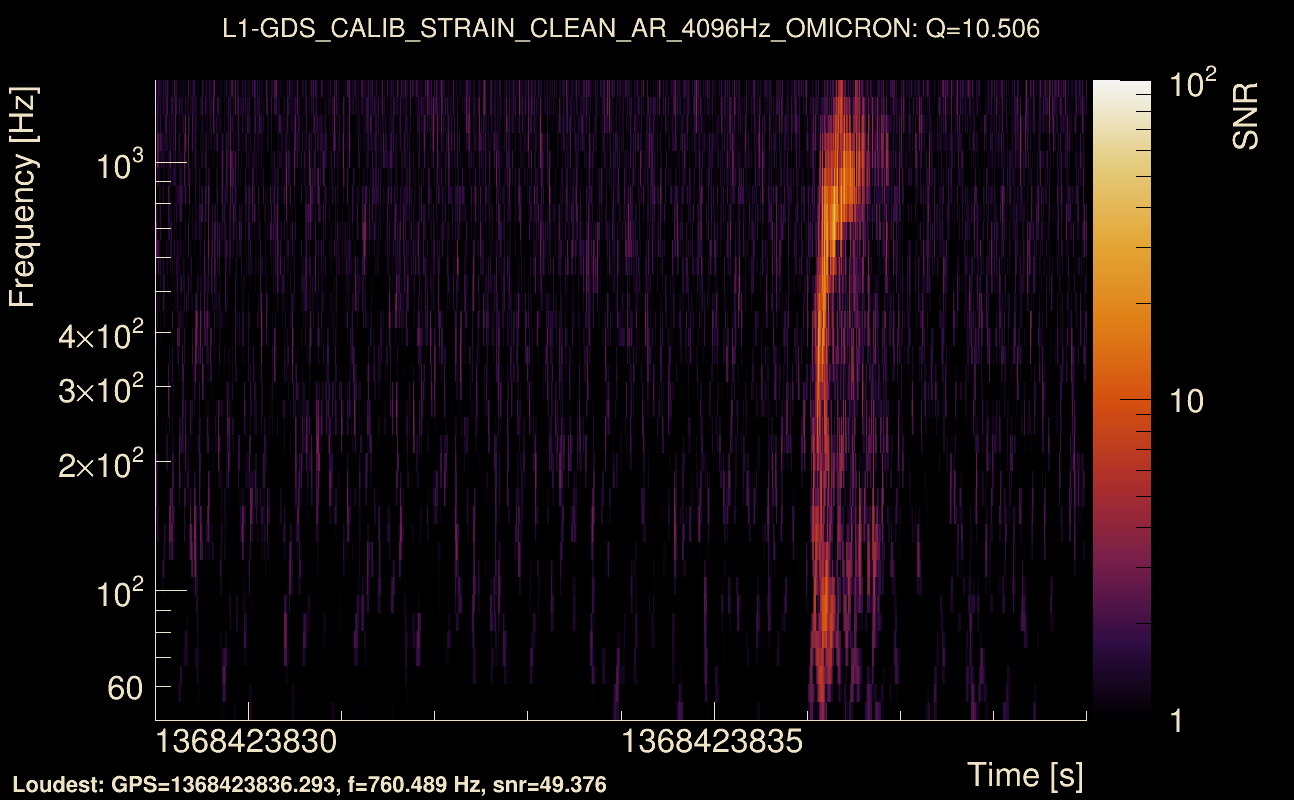
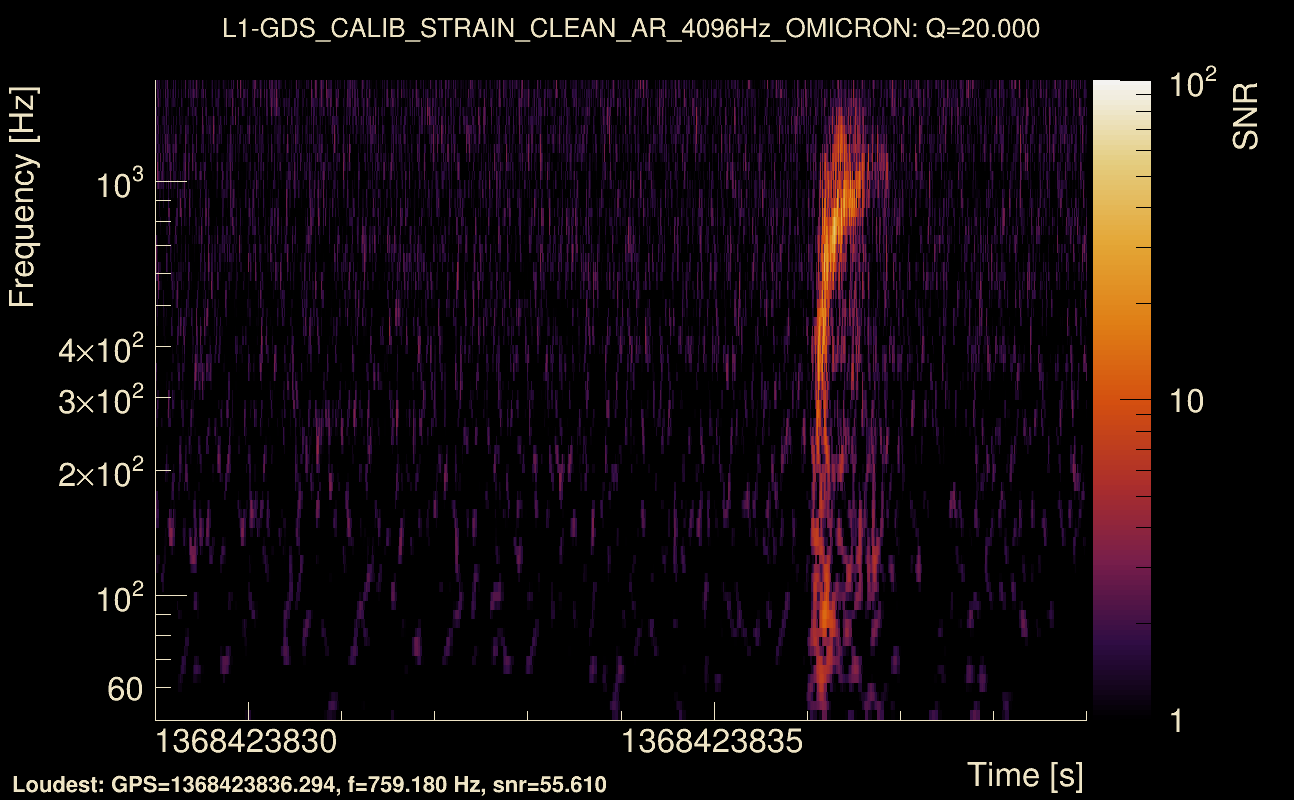
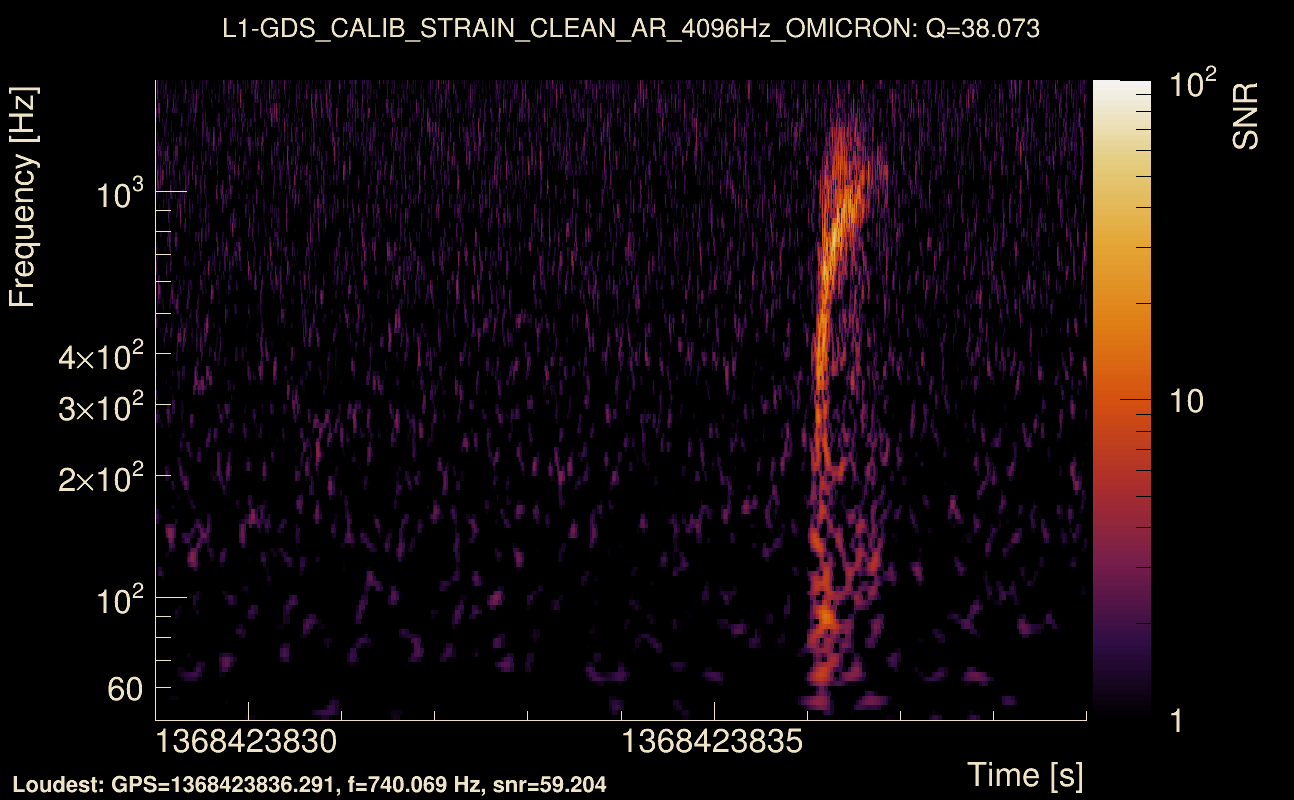
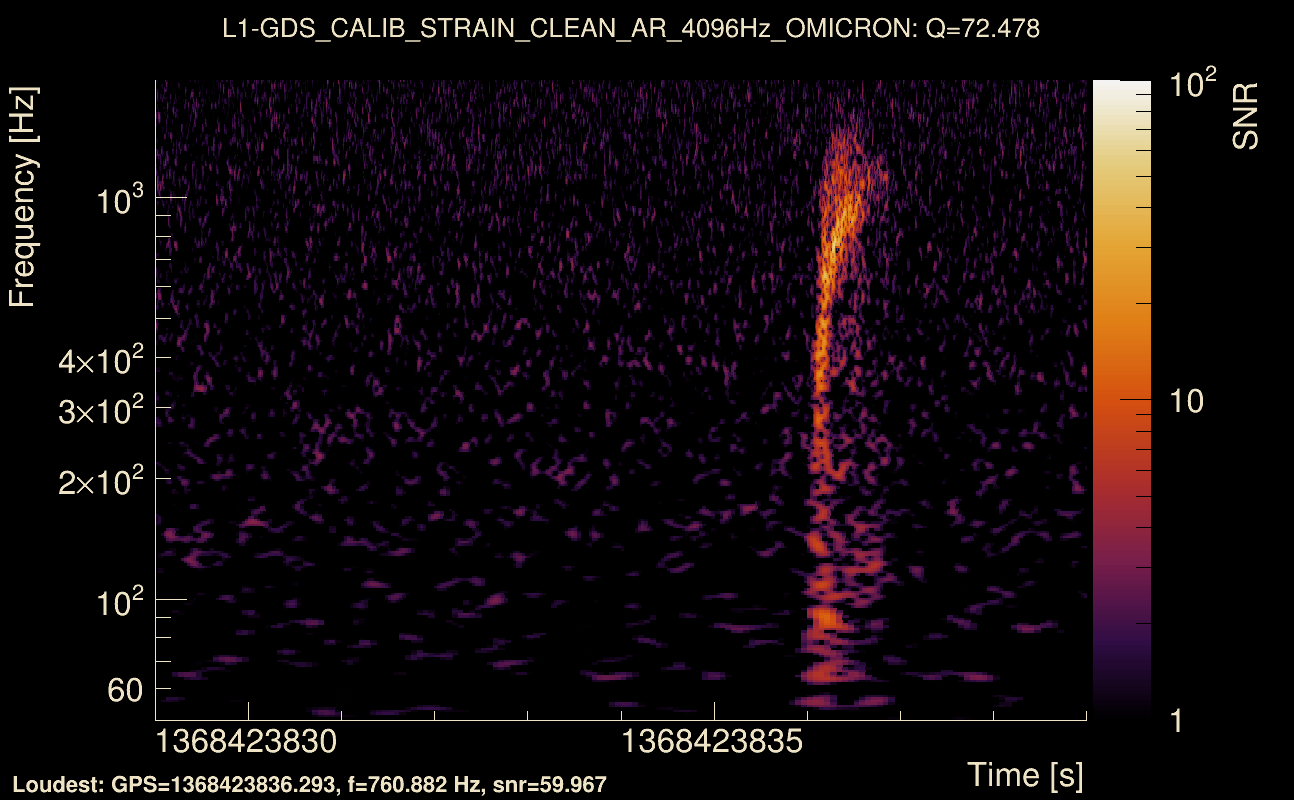
| Event time t(H1): | GPS = 1368423829 (Thu May 18 05:43:31 2023 ) → GPS = 1368423839 (Thu May 18 05:43:41 2023 ) |
| Event time t(L1): | GPS = 1368423829 (Thu May 18 05:43:41 2023 ) → GPS = 1368423839 (Thu May 18 05:43:41 2023 ) |
| Omicron analysis time window (H1): | GPS = 1368423826 → GPS = 1368423842 |
| Omicron analysis time window (L1): | GPS = 1368423826 → GPS = 1368423842 |
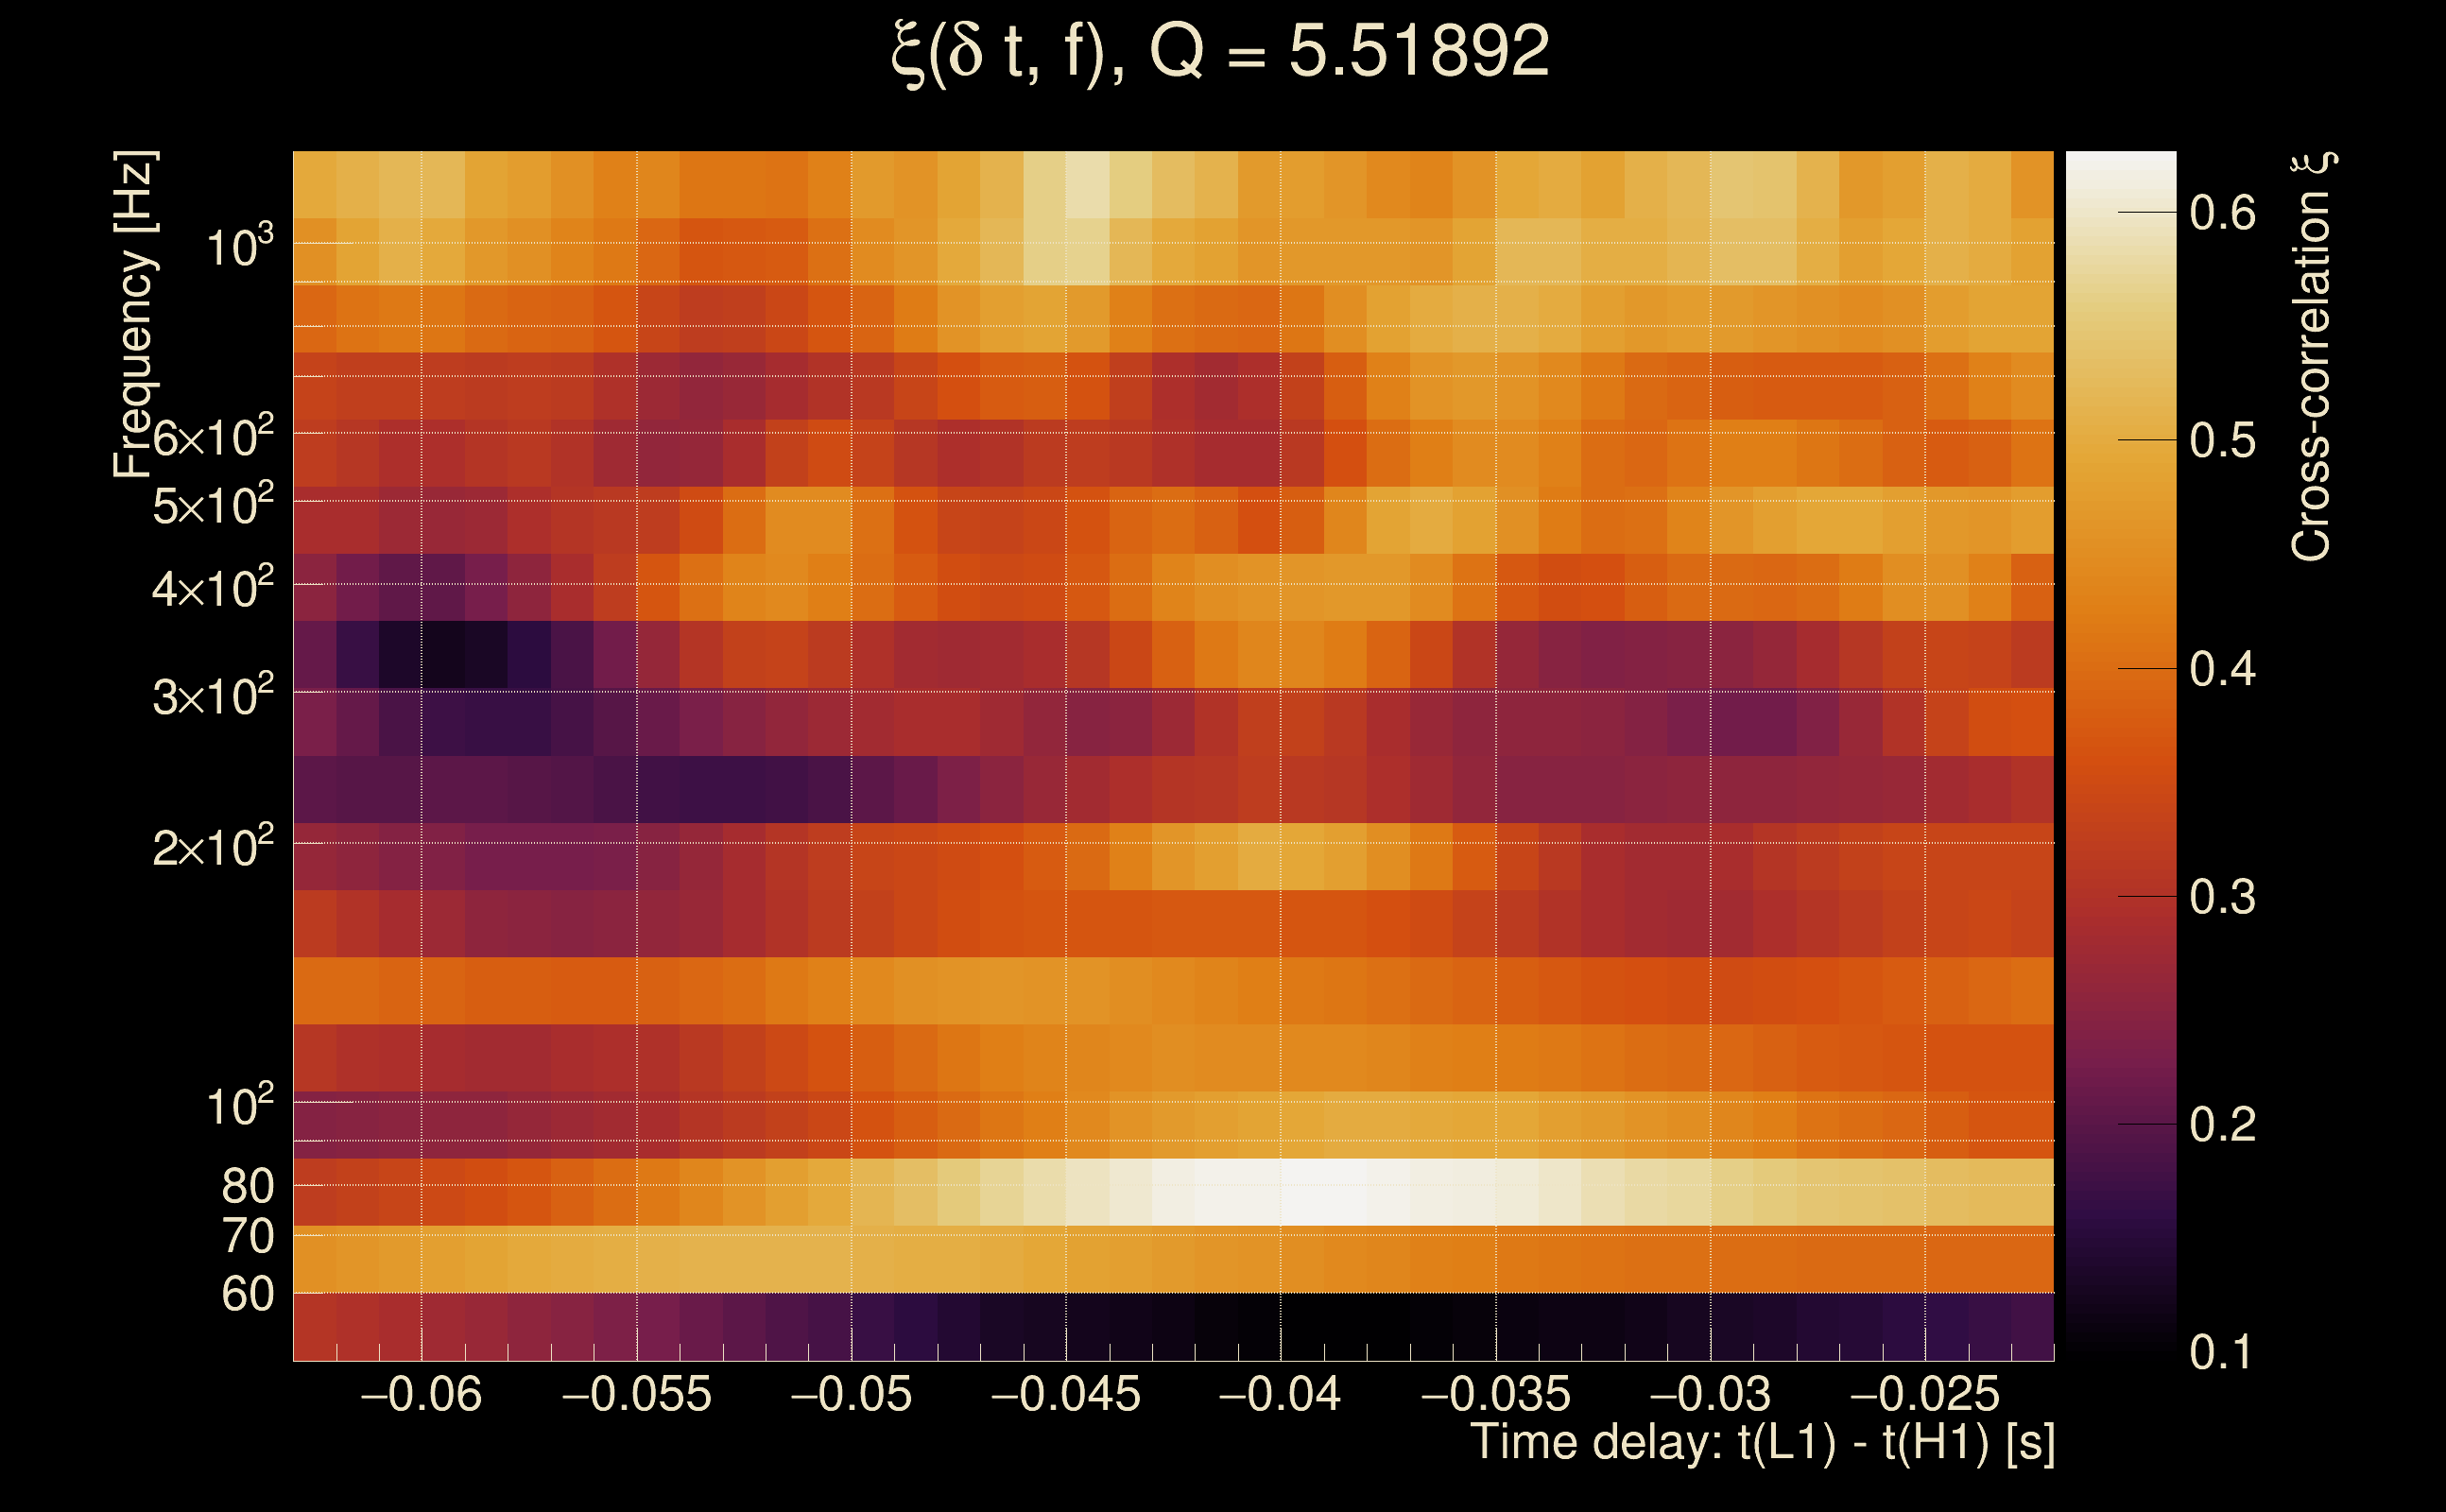
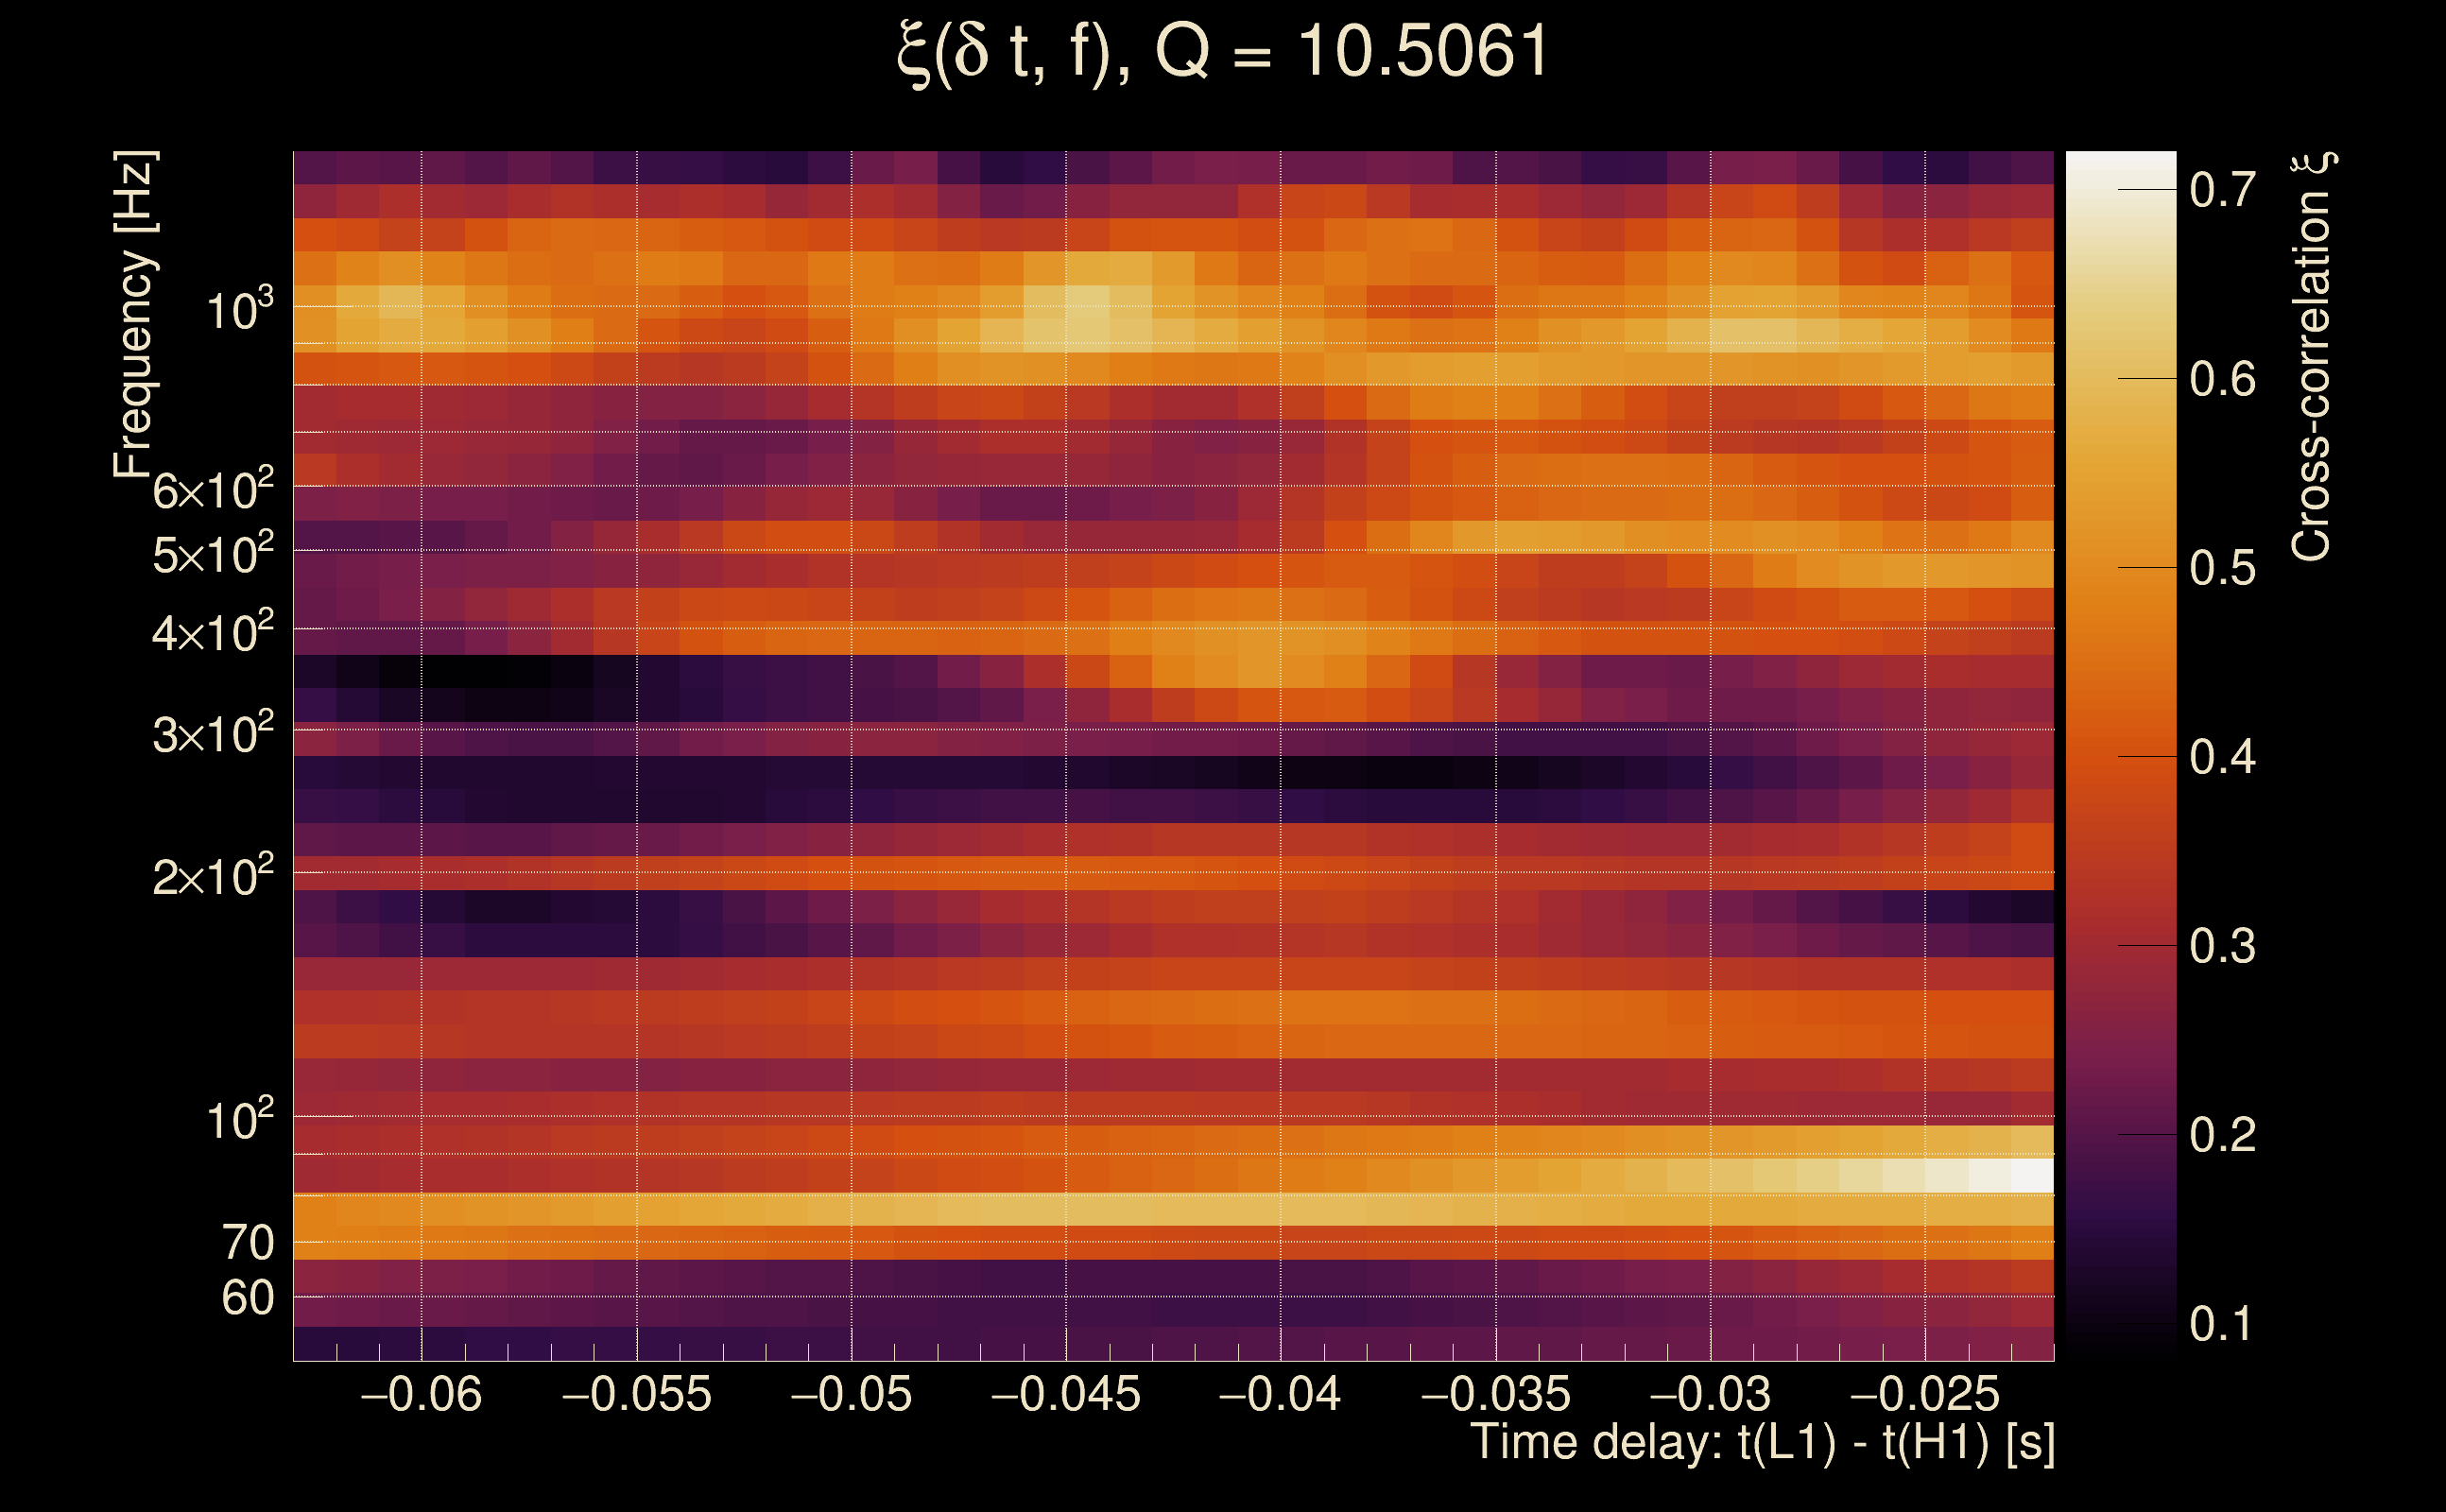
| Time delay between detectors t(L1) - t(H1): | -0.04245 s (slice index = 109 / 217), δt_gw = 0.00355002 s |
| Time delay standard deviation: | 0.0676731 s |
| [targeted mode] Time delay probability: | 0.756829 (0.309648 sigmas), δt_target = -0.00485921 s |
| Frequency: | 384.563 Hz |
| Ξ: | 0.317243 ± 0.00798301 (variance = 6.37284e-05): Q0: 0.491605, Q1: 0.496606, Q2: 0.499169, Q3: 0.514561, Q4: 0.50606 |
| Rank: | R_A = 0.118744 |
| Log of amplitude ratio (L1/H1): | -0.138875, variance = 0.153711 (L1/H1: -0.462515, variance = 0.304816, H1/L1: -0.189656, variance = 0.310071) |
| Amplitude ratio (L1/H1): | 0.870337 ⋇ 1.48003 (L1/H1: 0.629698 ⋇ 1.7369, H1/L1: 0.827243 ⋇ 1.74515) |
| Amplitude ratio H1|L1 compatibility (probability): | 0.405582 |
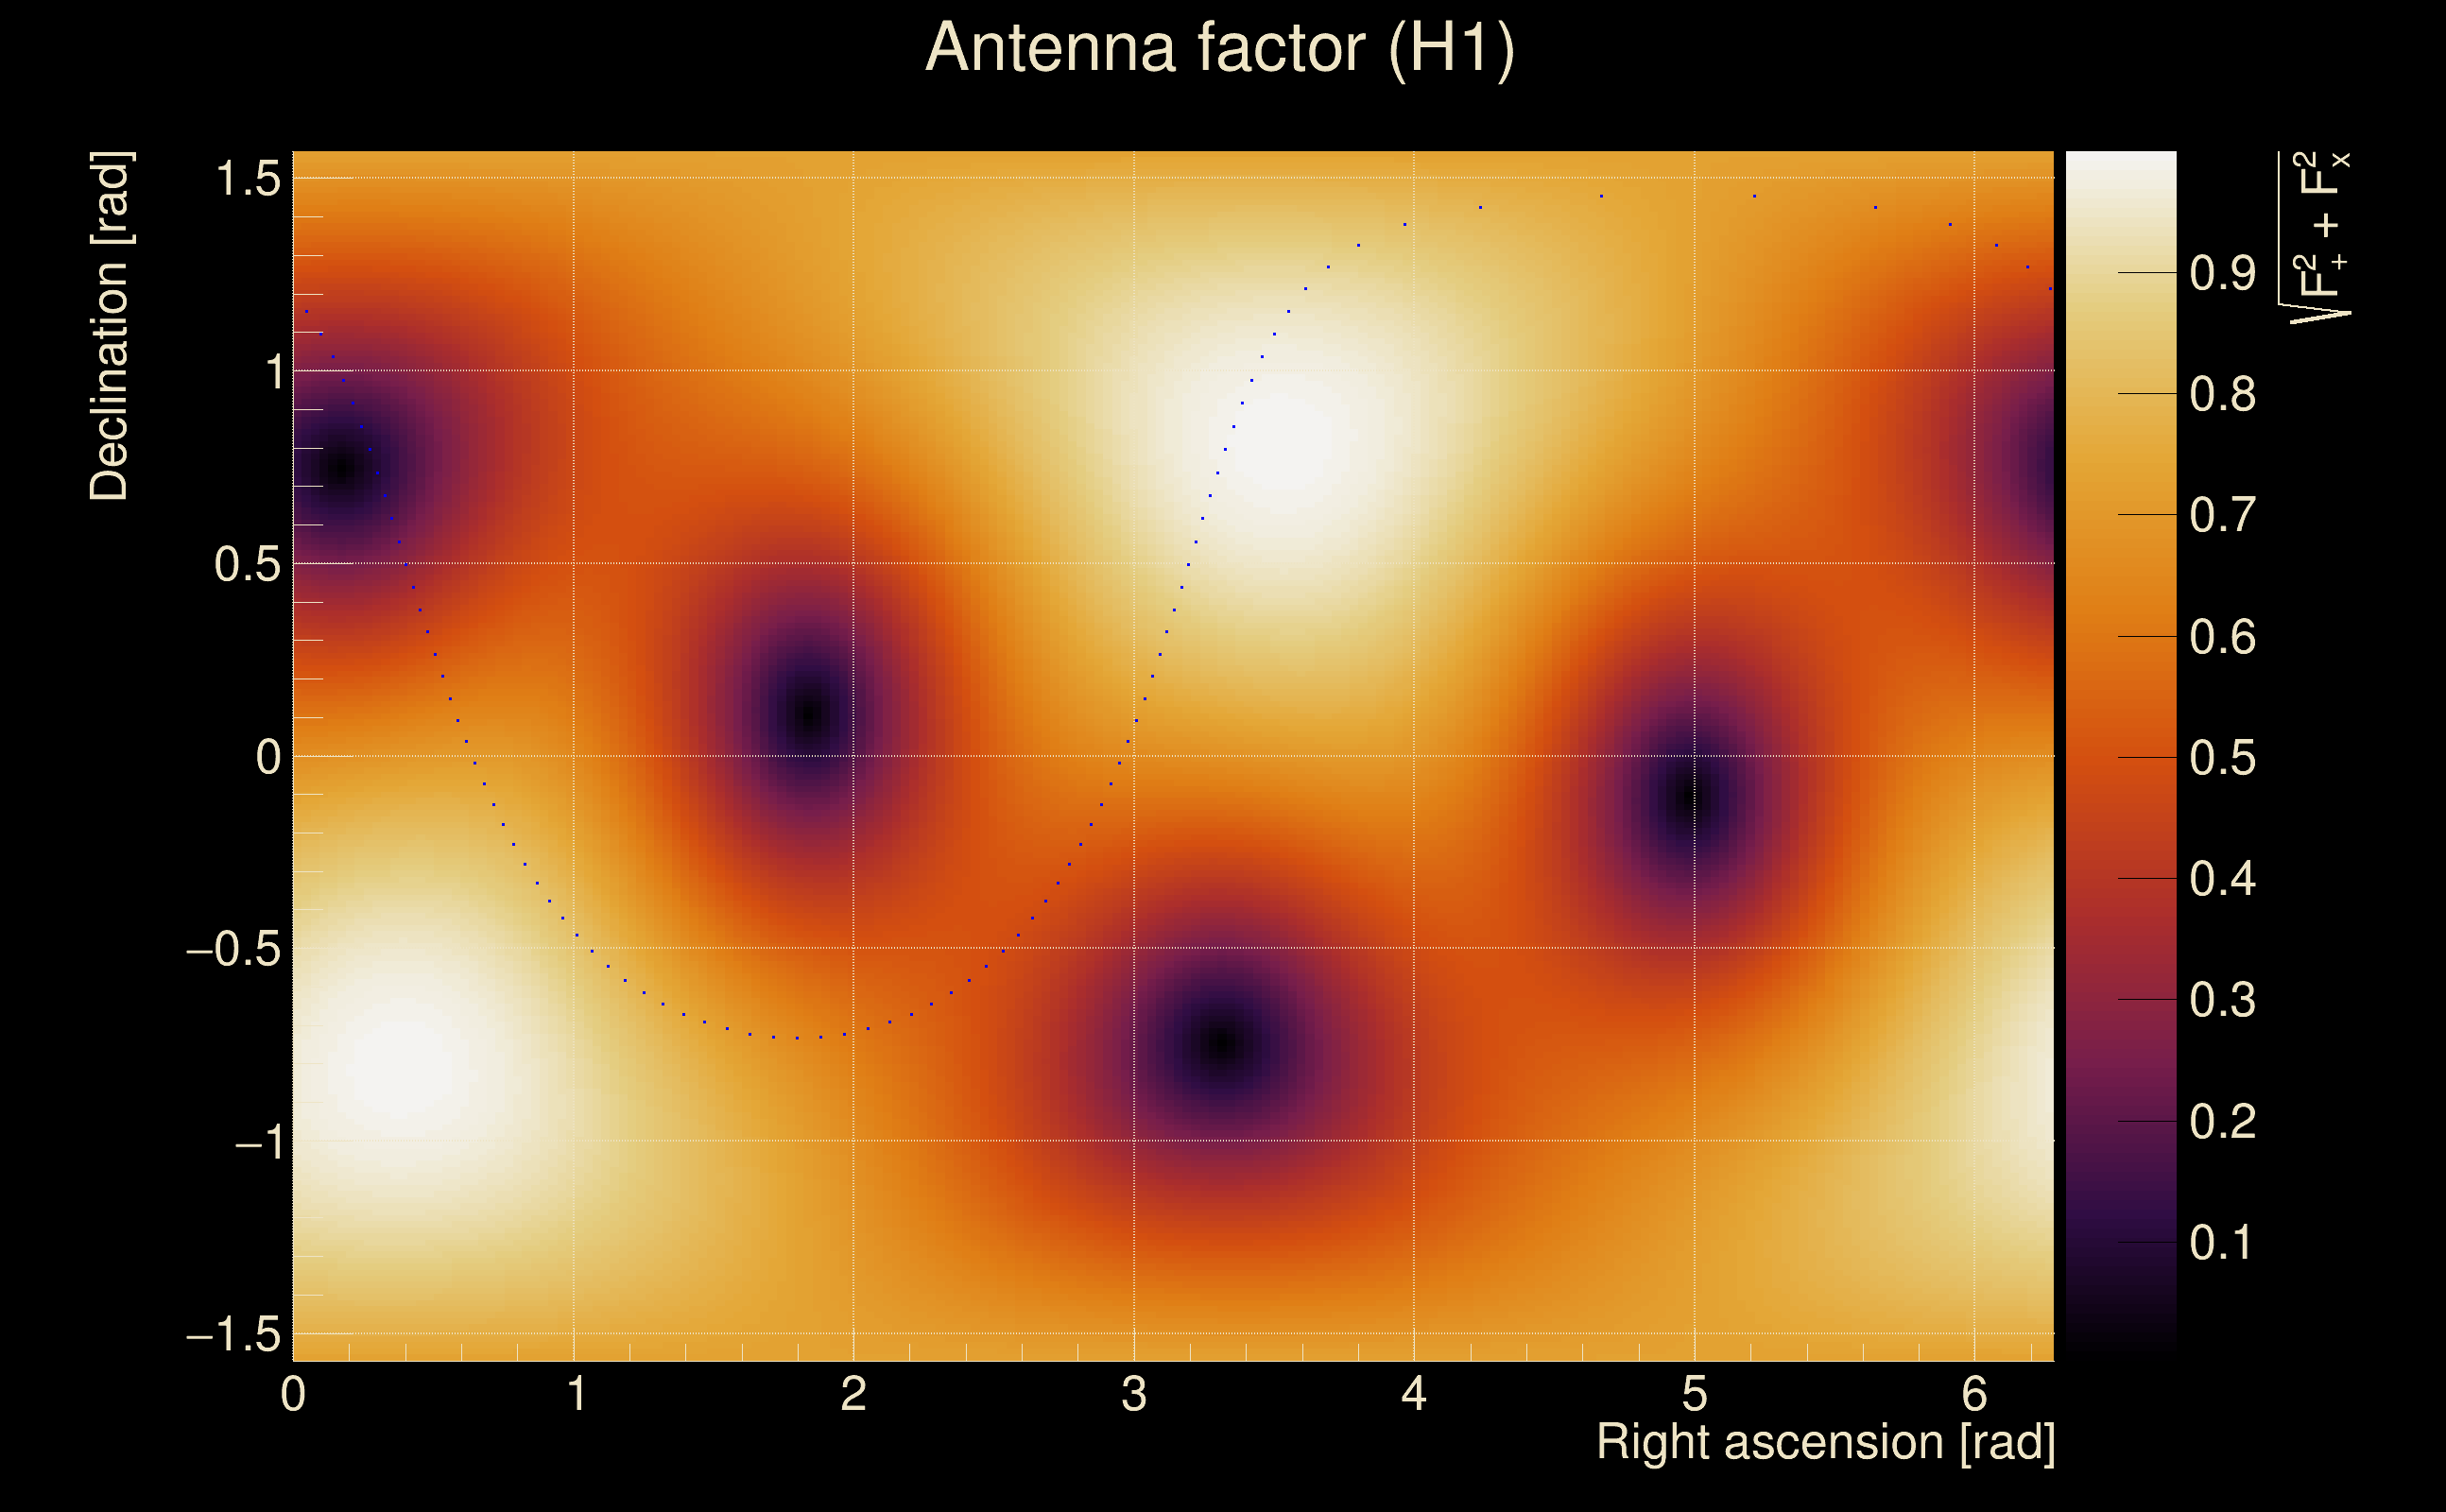
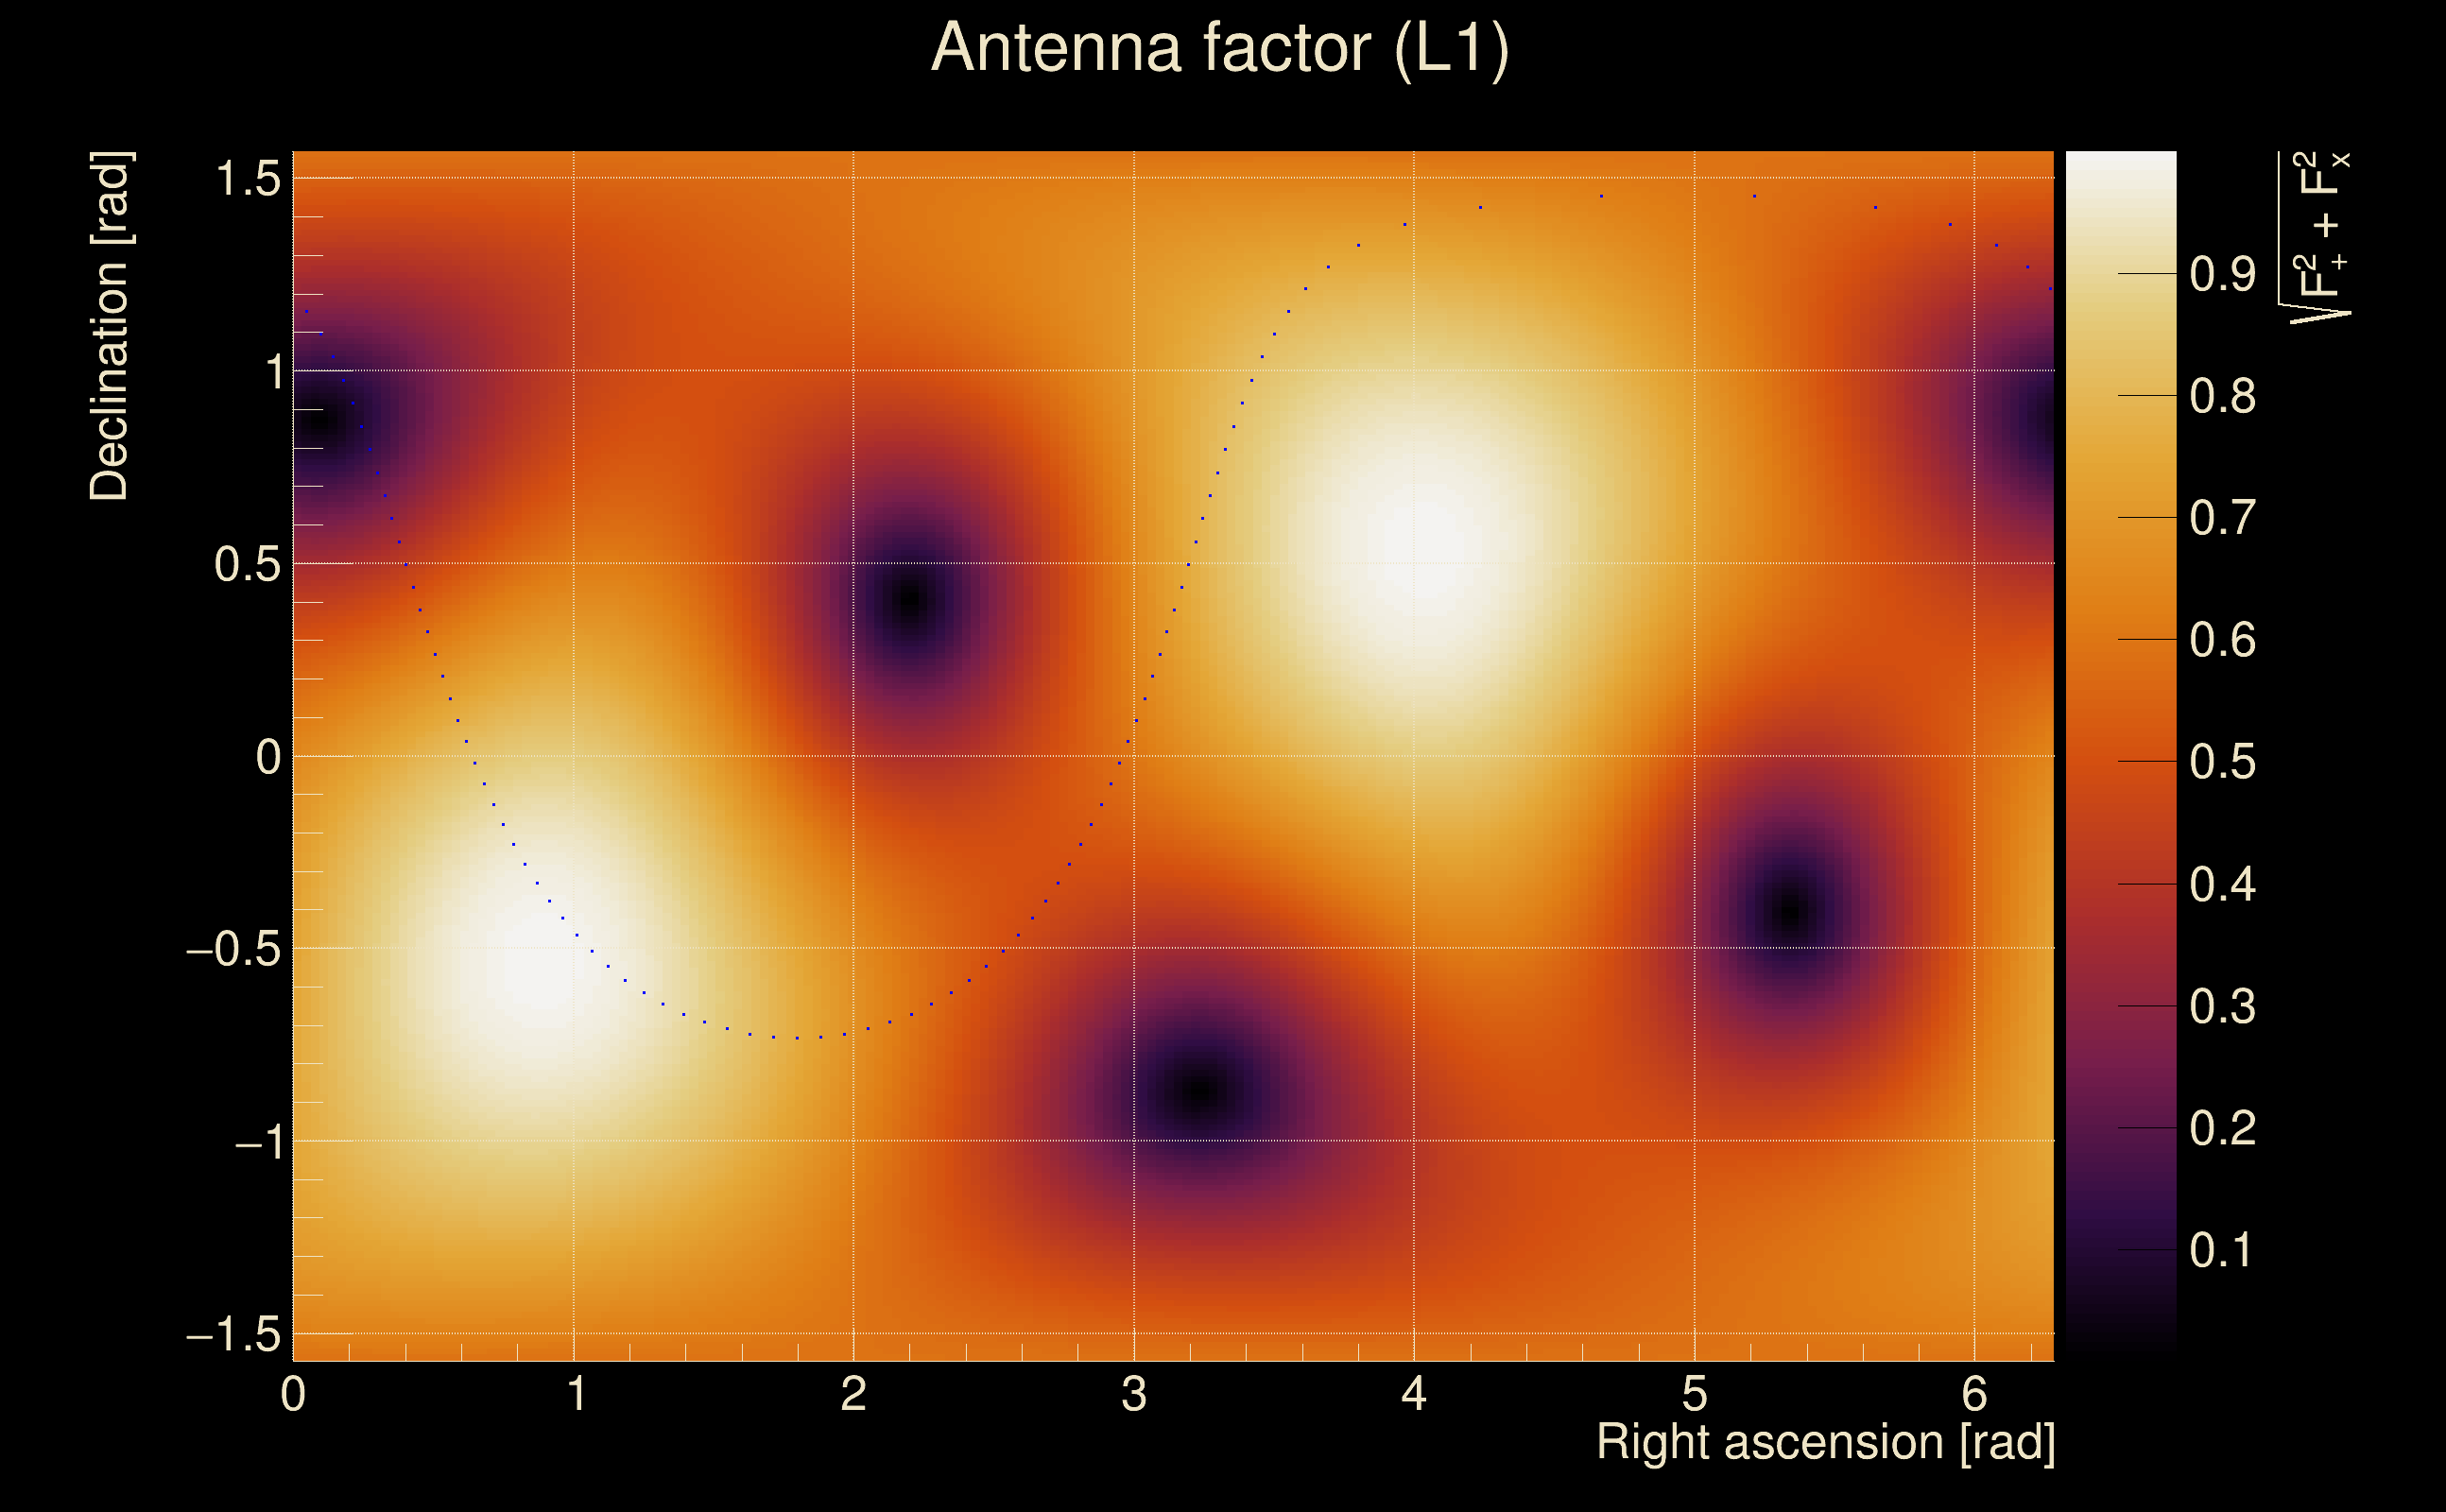
| Antenna factor probability: | 0.922869 |
| Number of rejected frequency rows: | Q0: 2 / 18, Q1: 17 / 36, Q2: 50 / 70, Q3: 107 / 134, Q4: 232 / 258 |
| Maximum signal-to-noise ratio: | H1: 60.364, L1: 59.913 |
| SNR variance: | H1: 0.482098, L1: 0.450547 |
| Click here for a zoomed plot | Click here for a zoomed plot | Click here for a zoomed plot | Click here for a zoomed plot | Click here for a zoomed plot |
 |
 |
 |
 |
 |
 |
 |
 |
 |
 |
 |
 |
 |
 |
 |
 |
 |
 |
 |
 |
 |
 |
 |
 |
 |
 |
 |
 |
 |
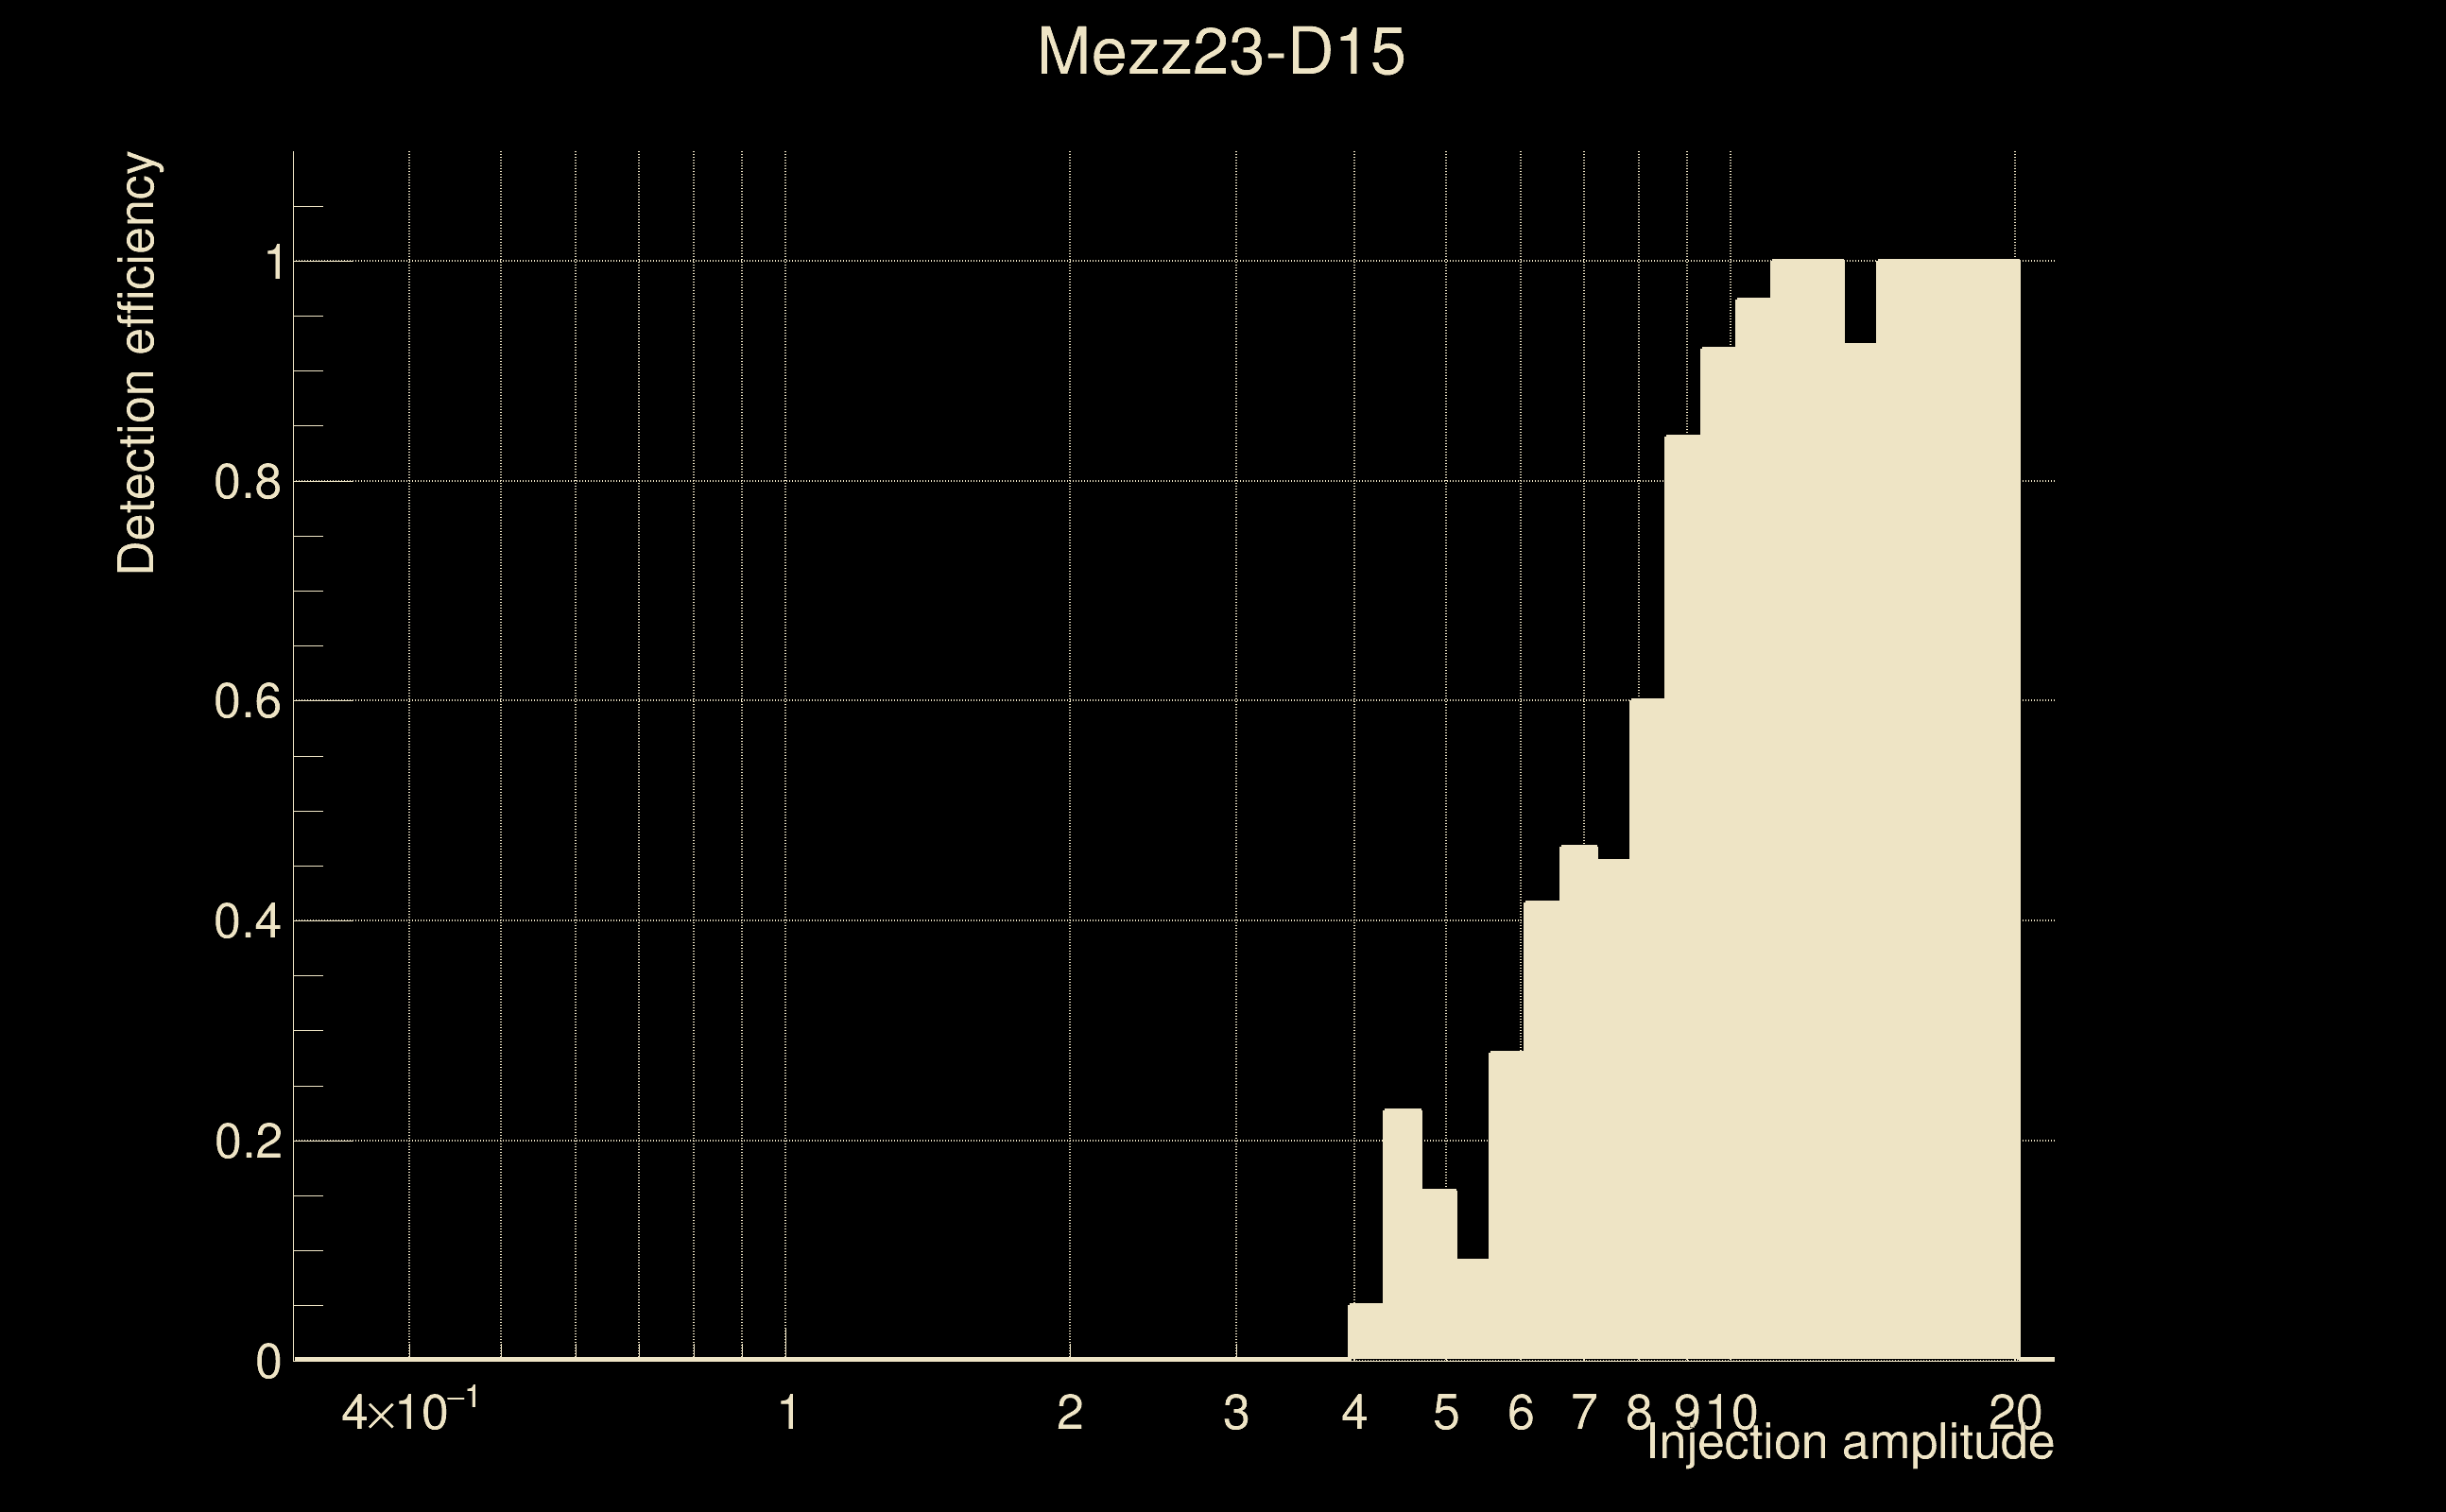
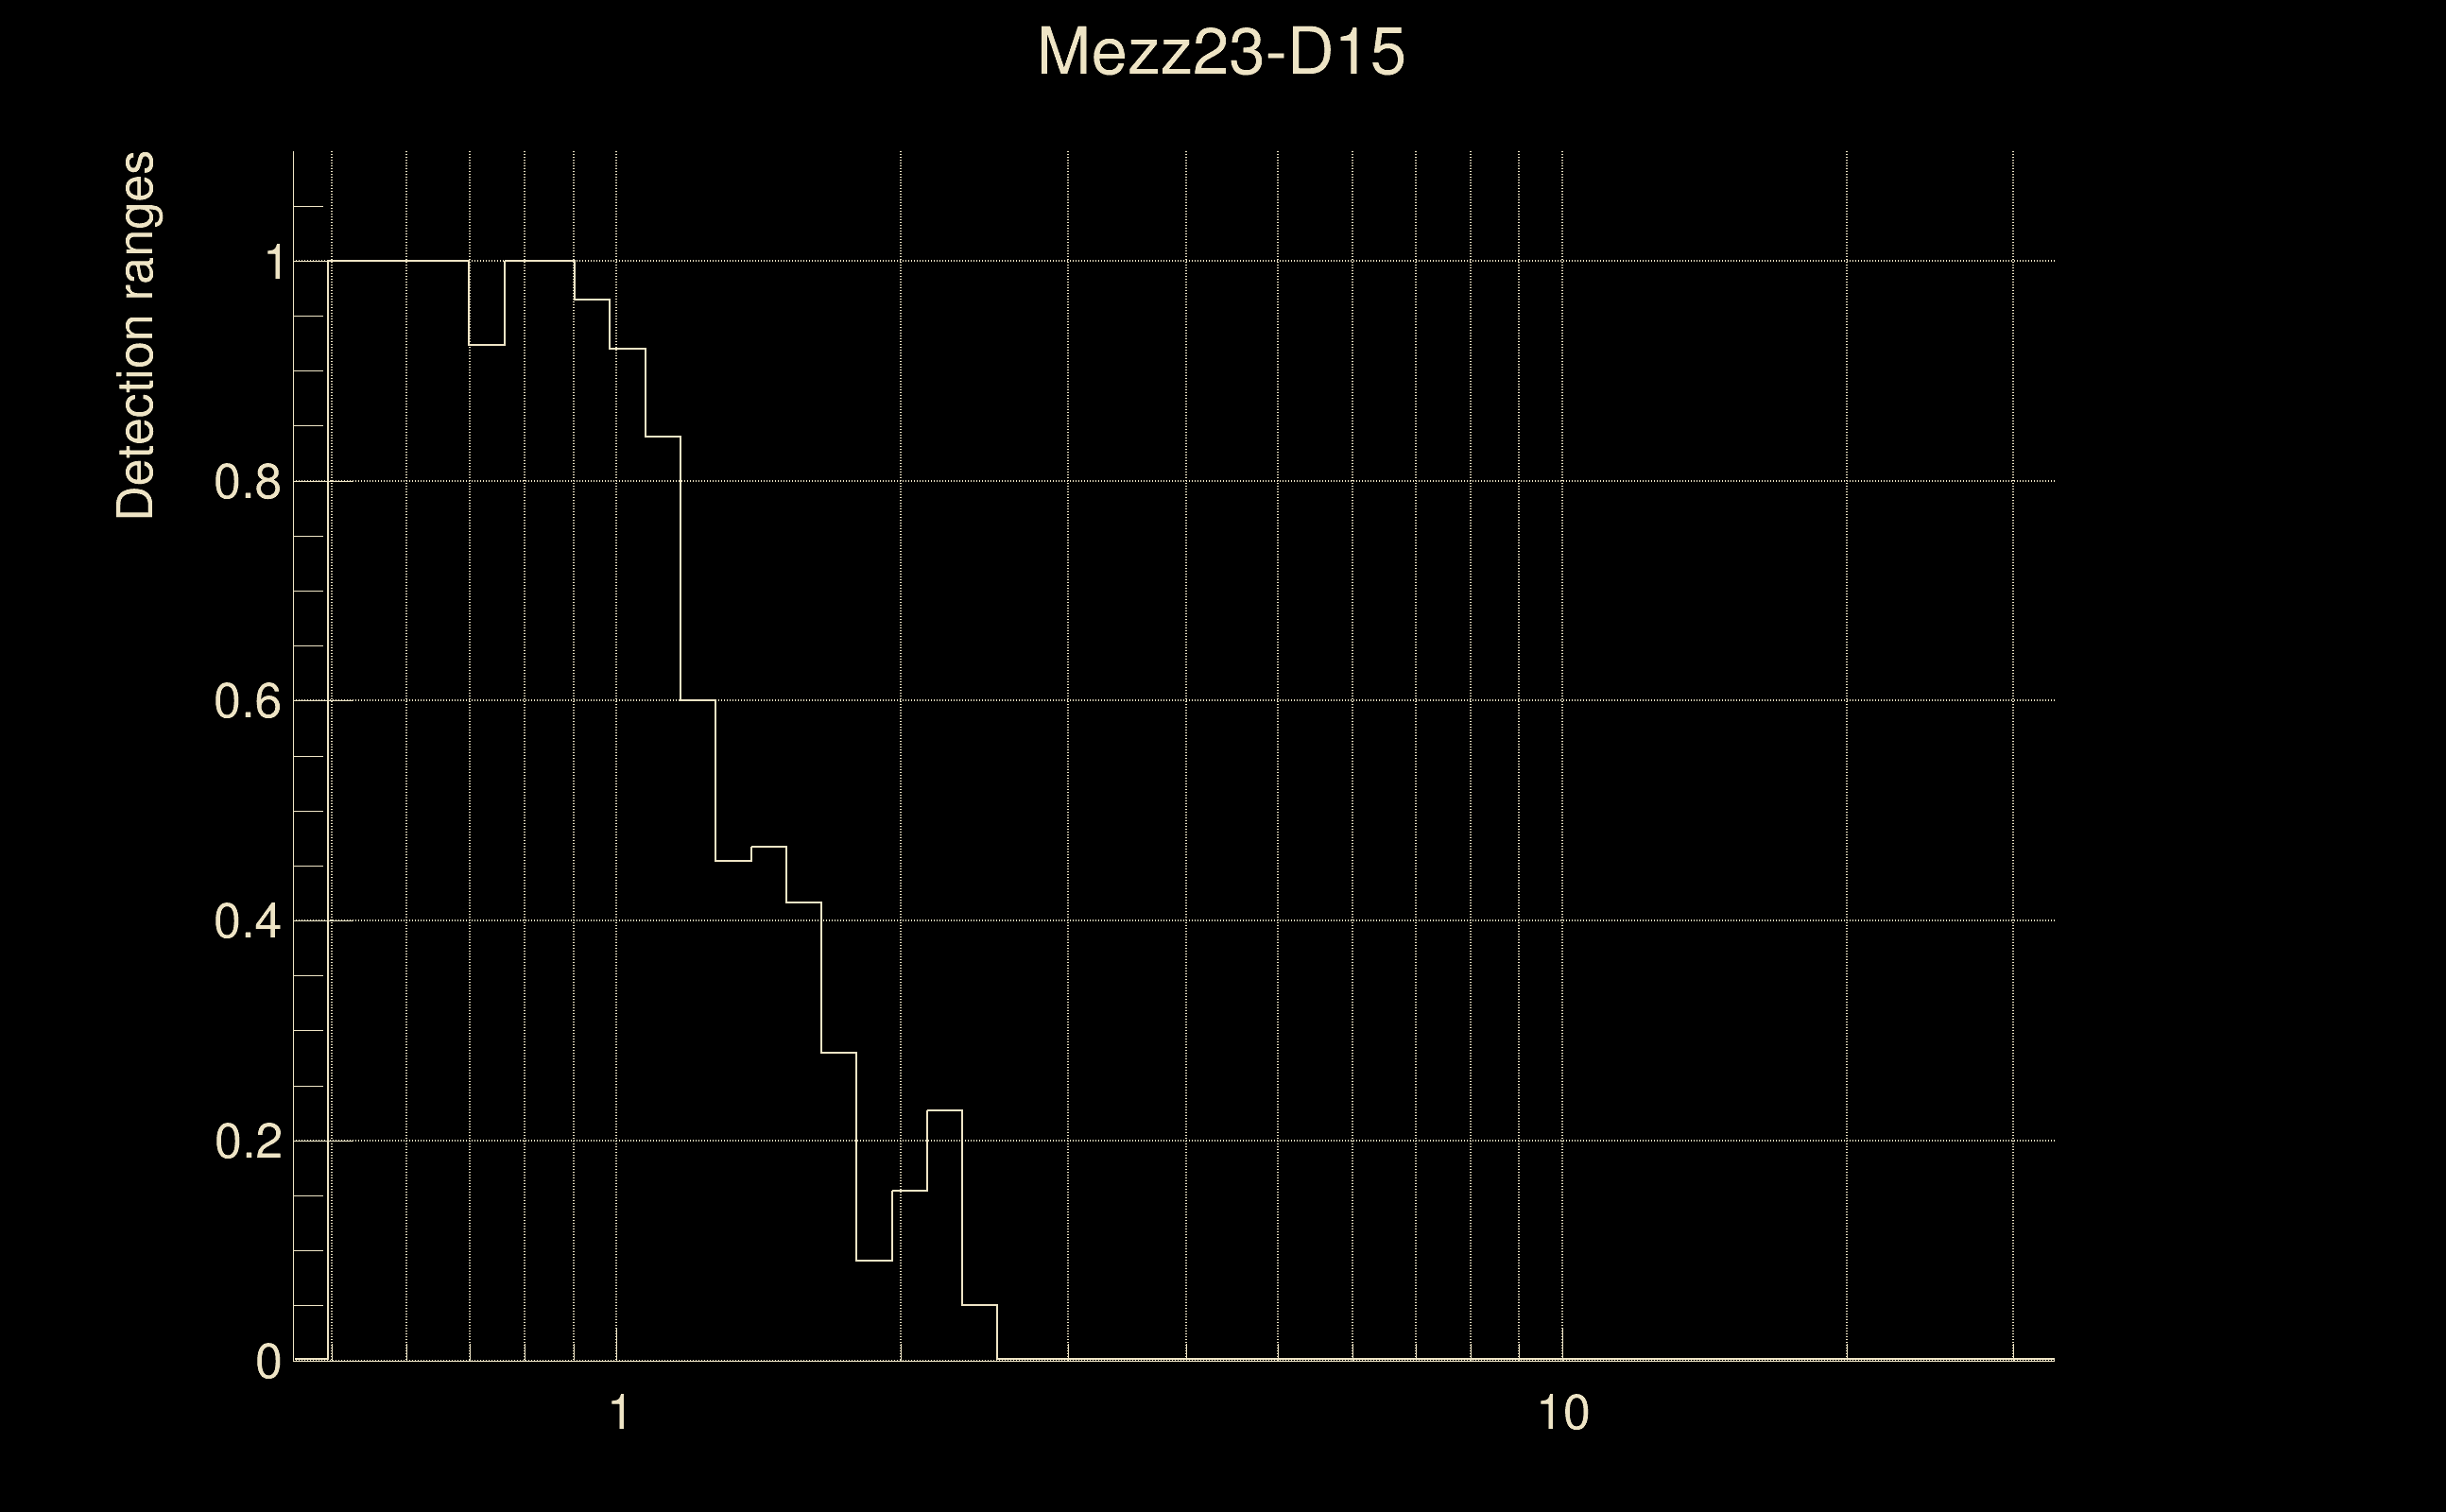
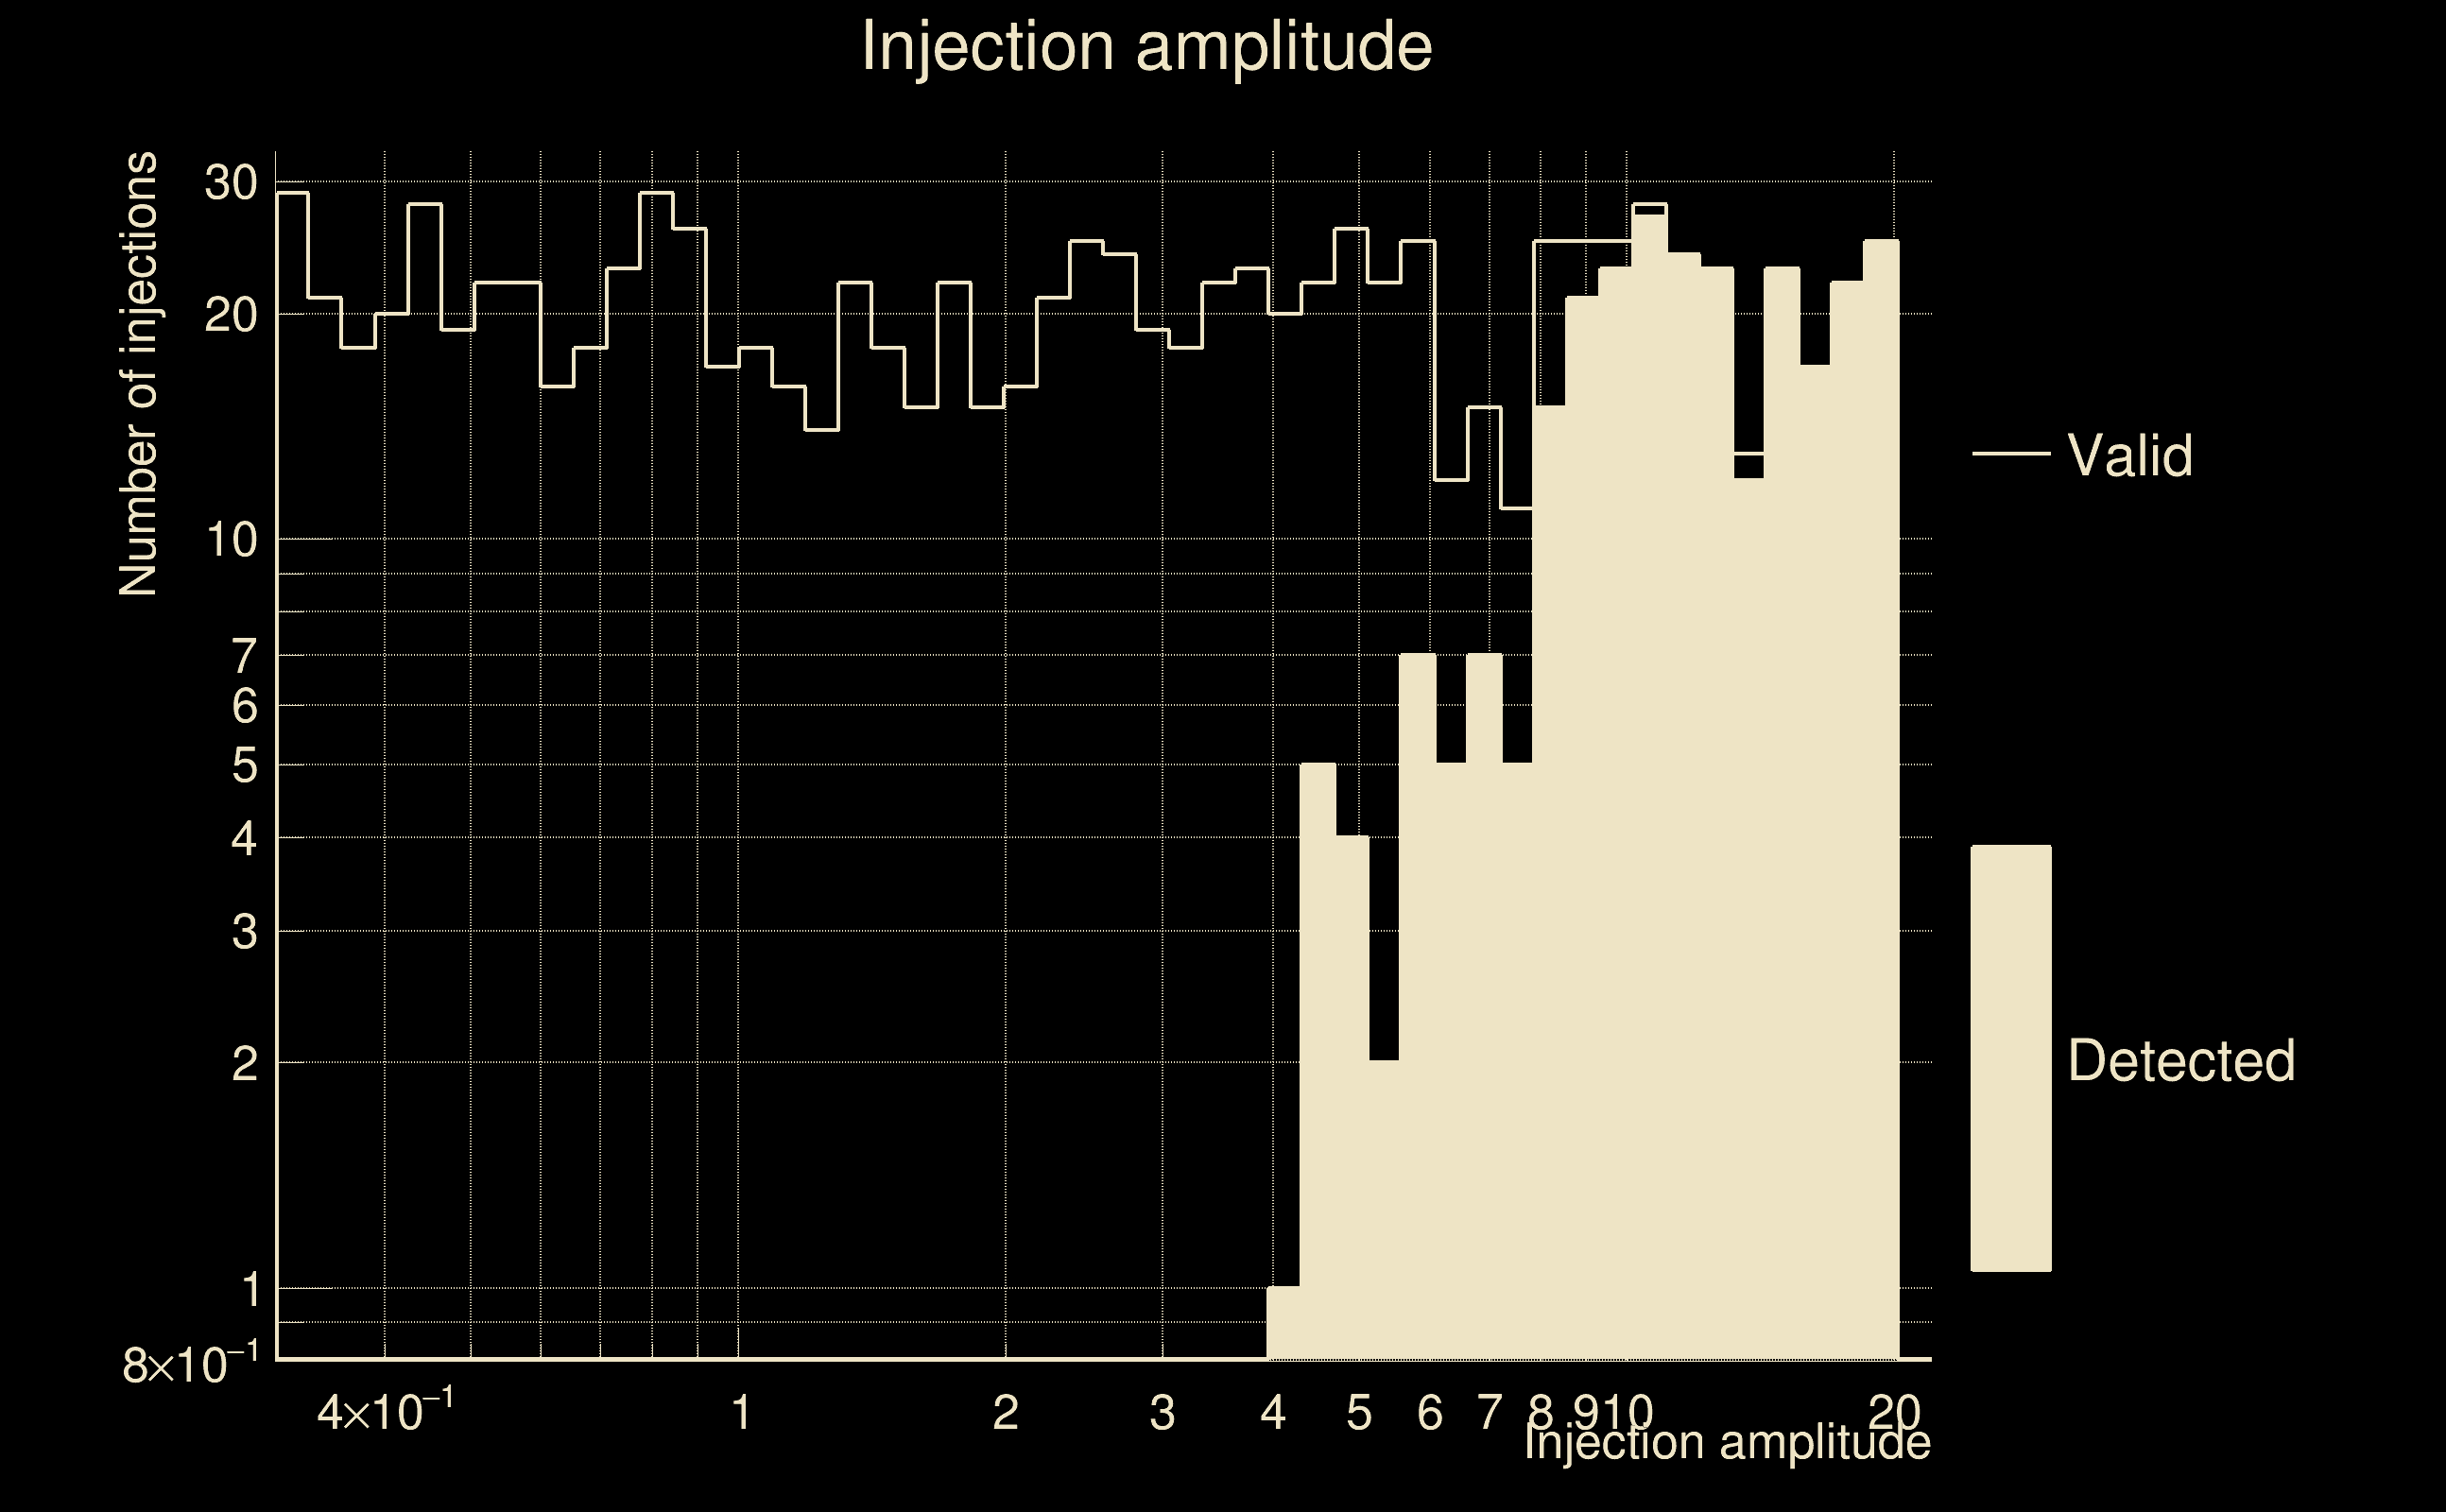
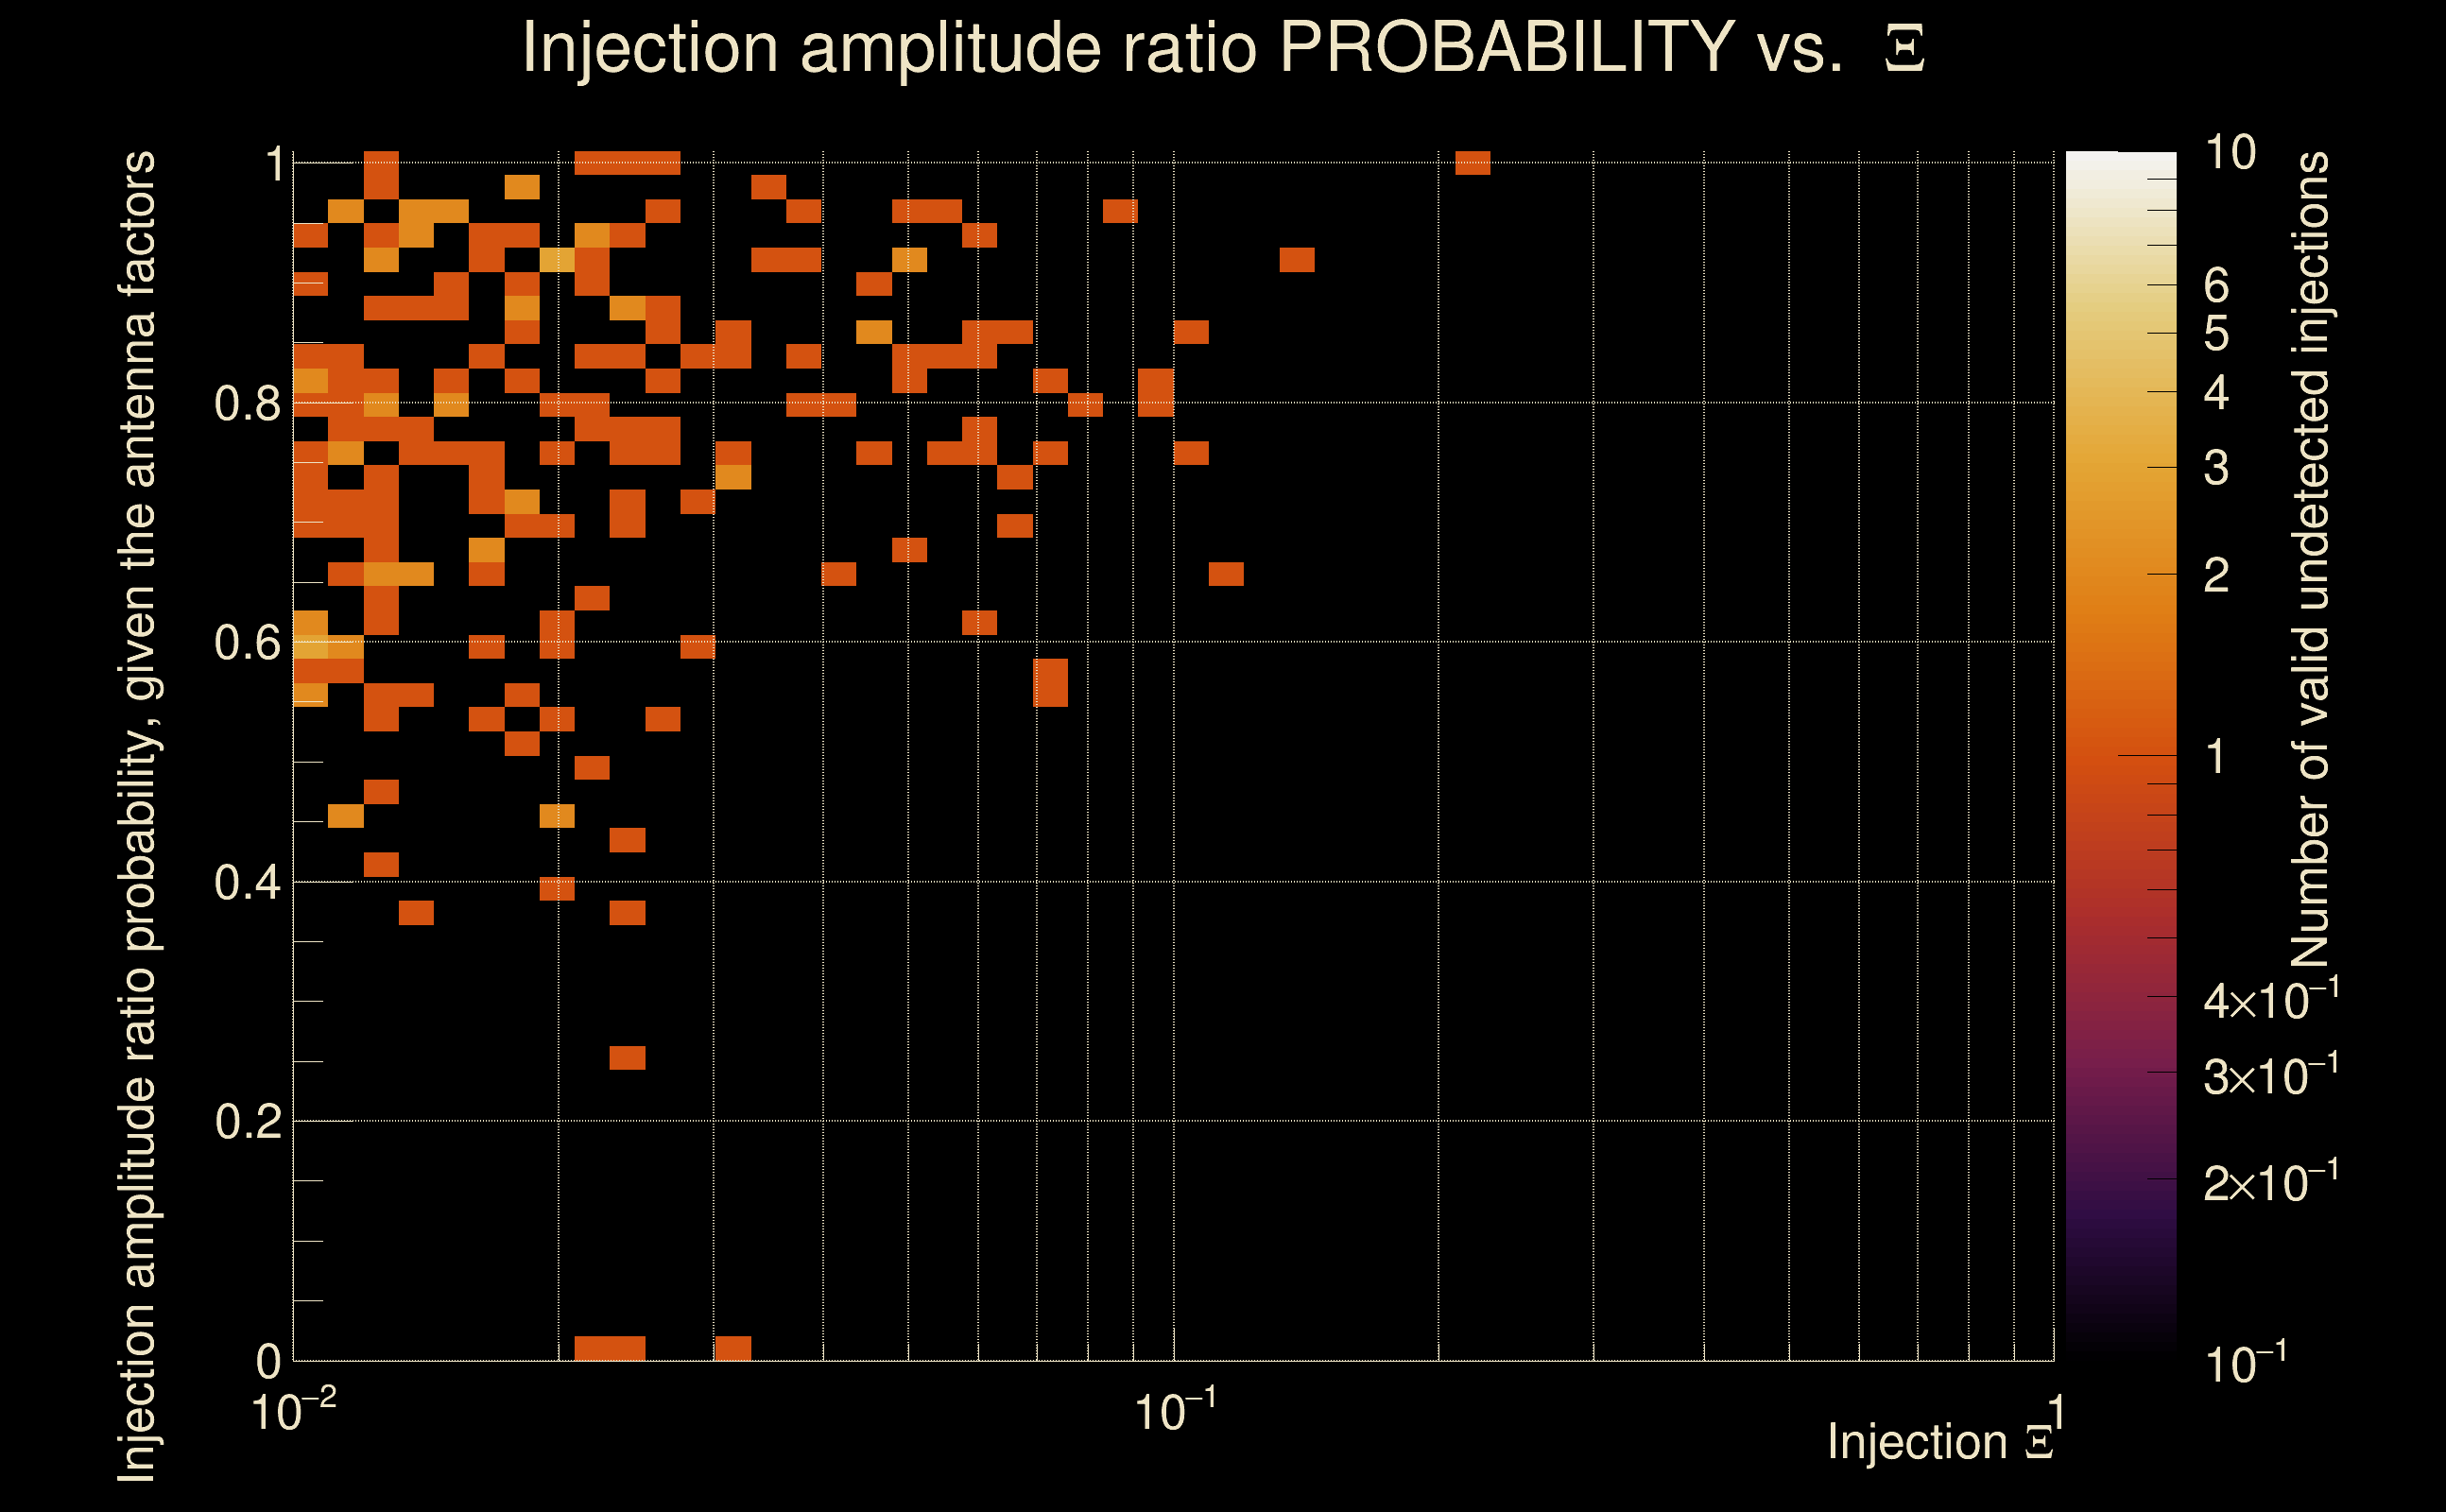
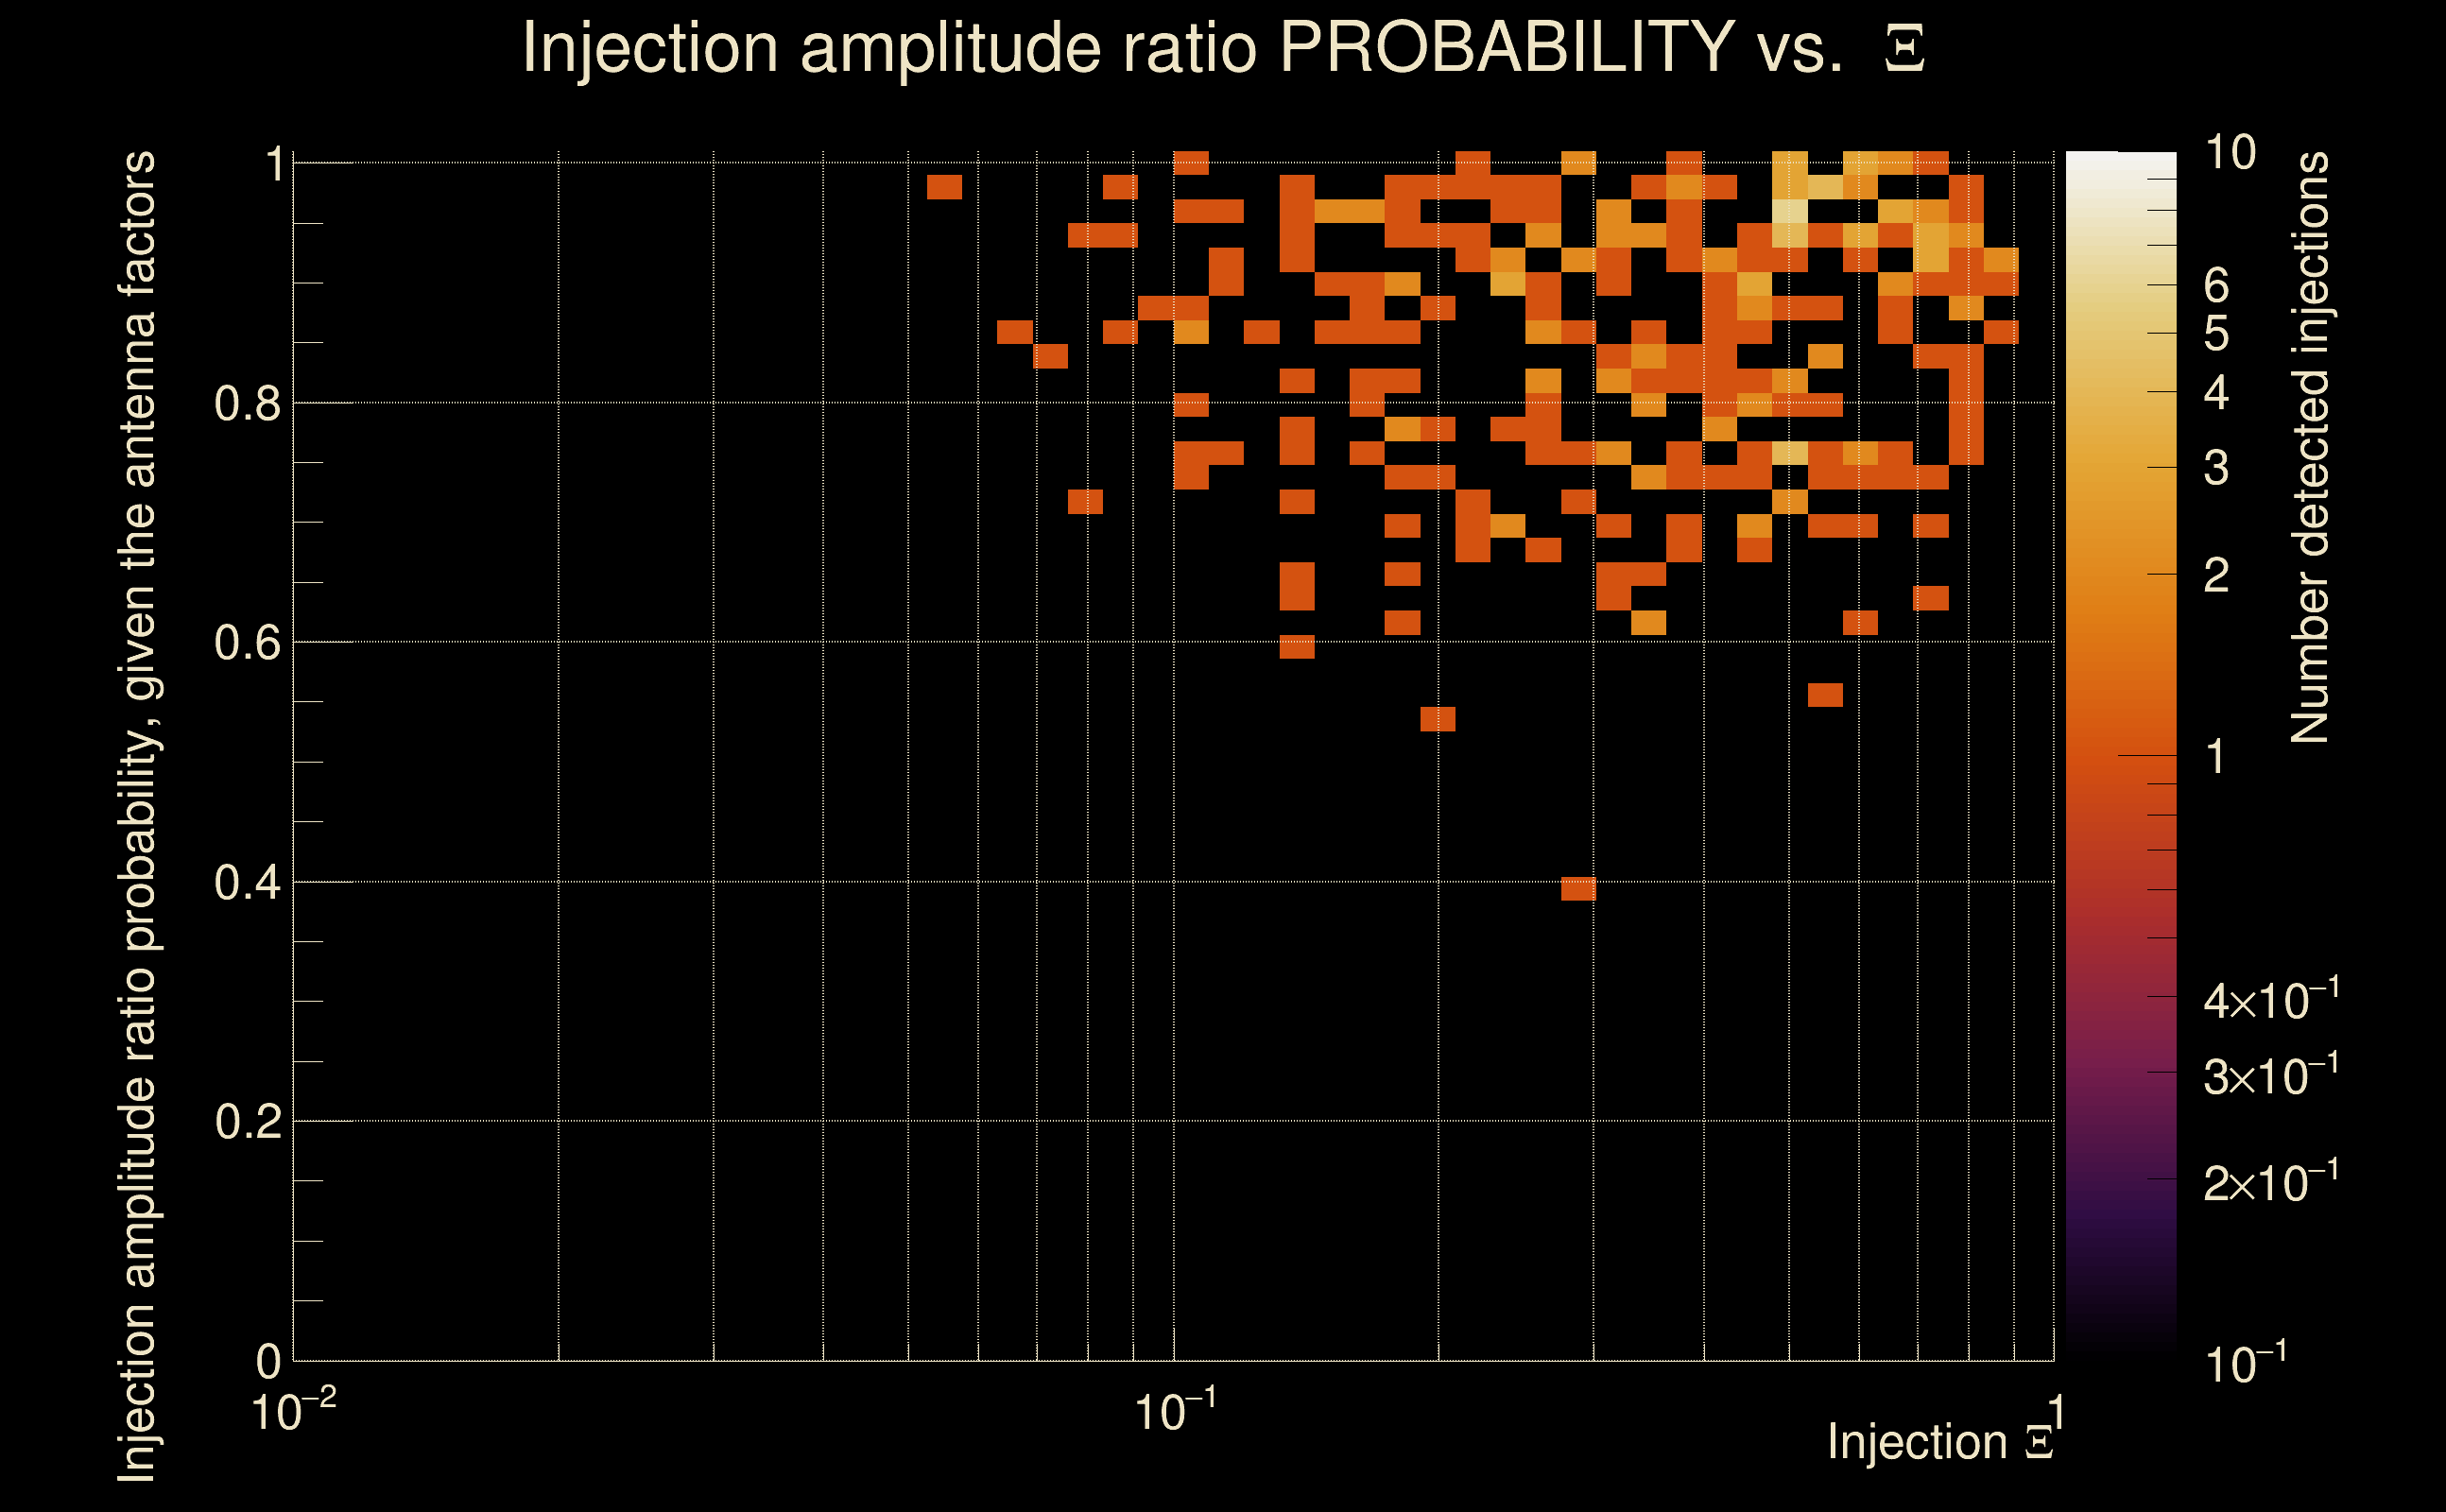
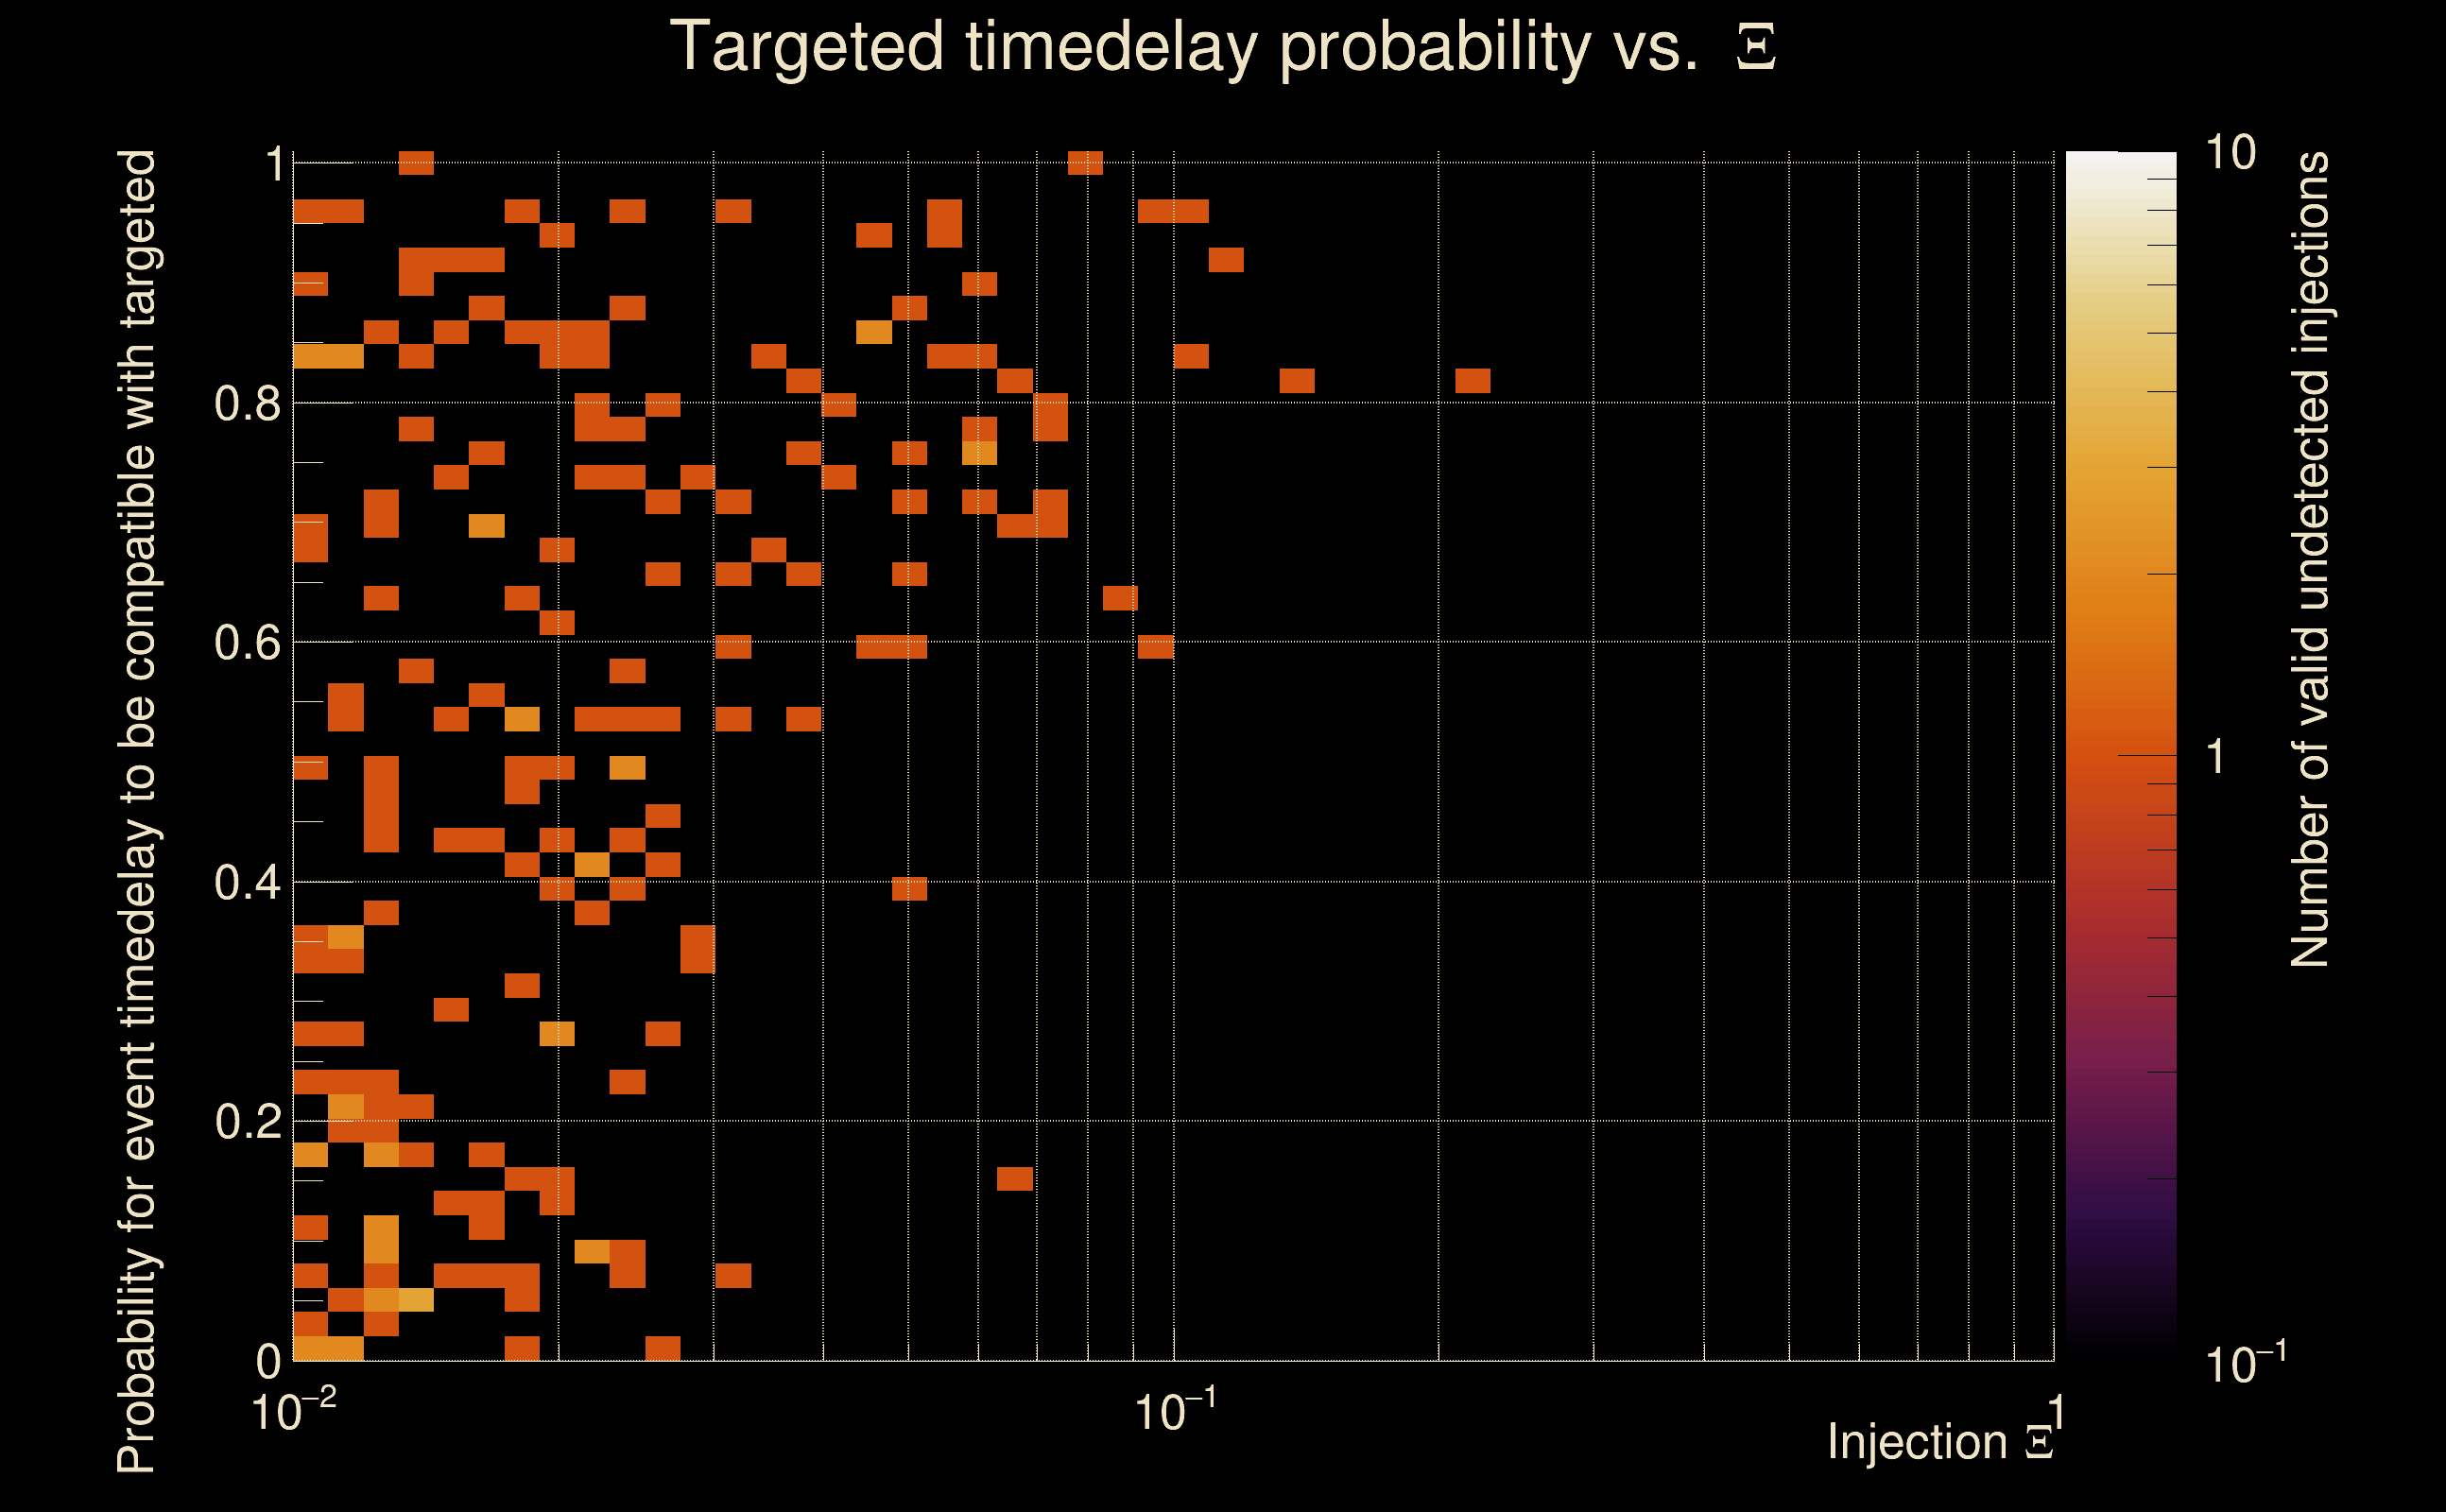
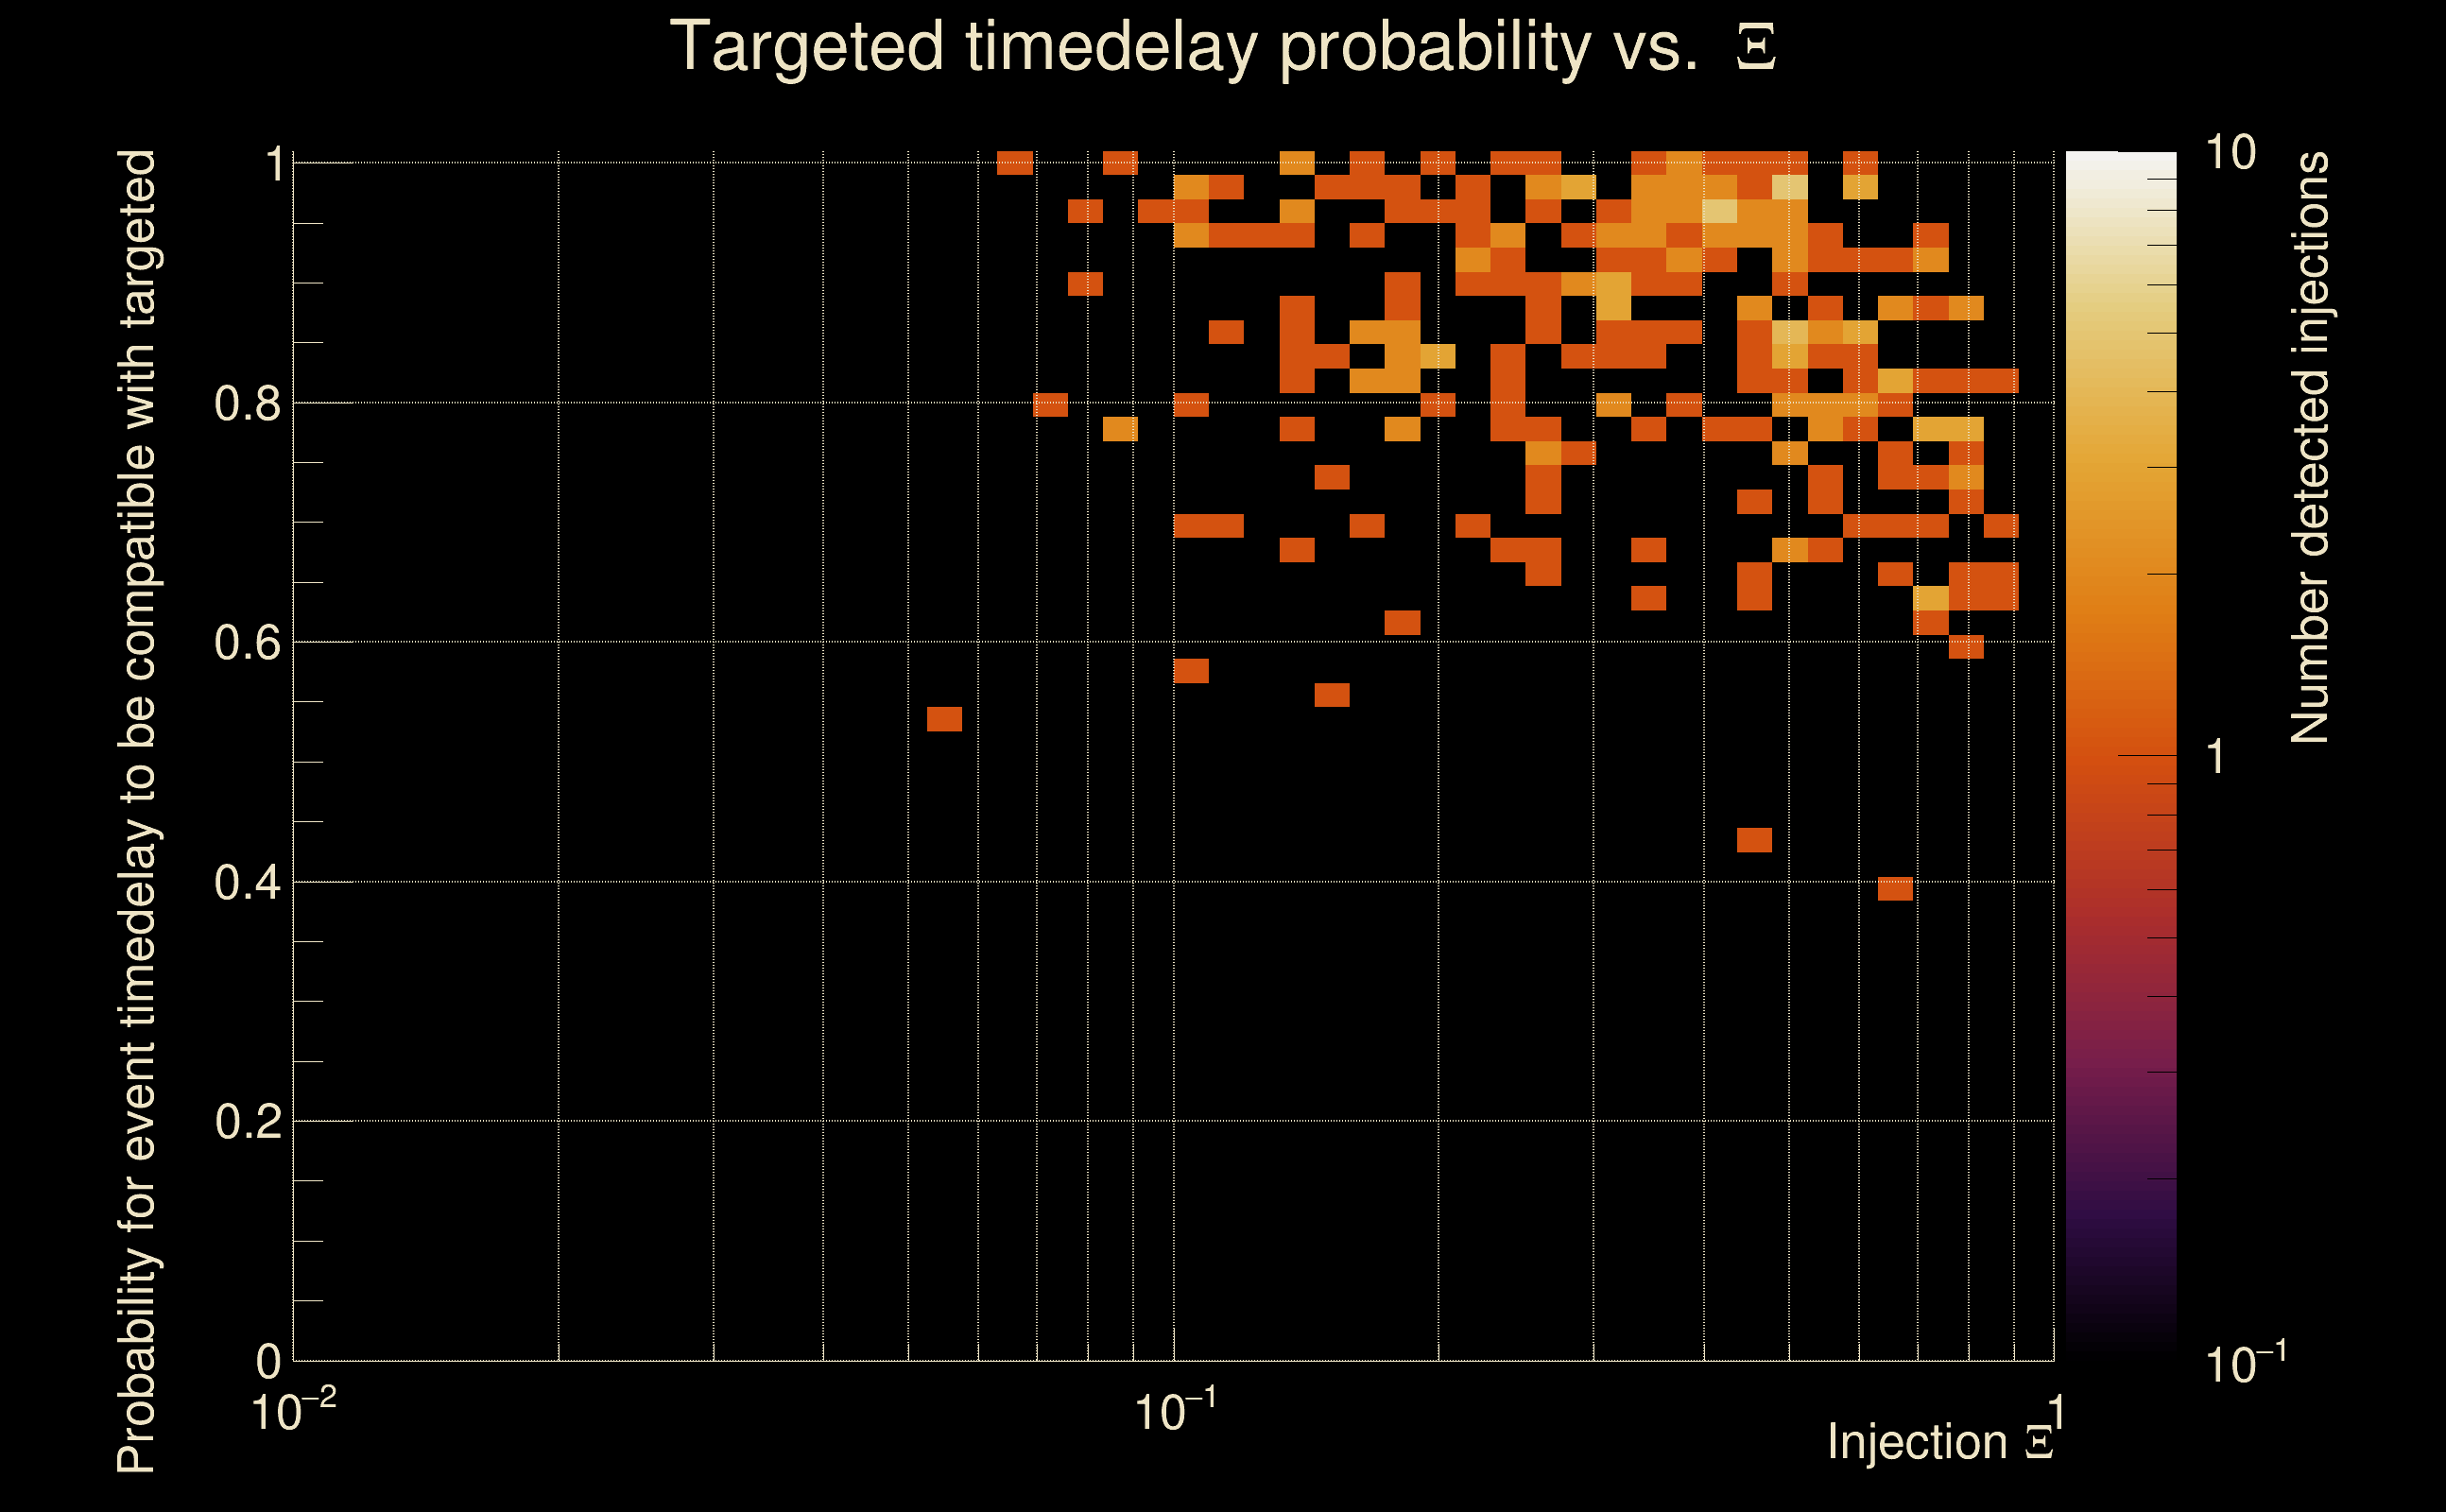
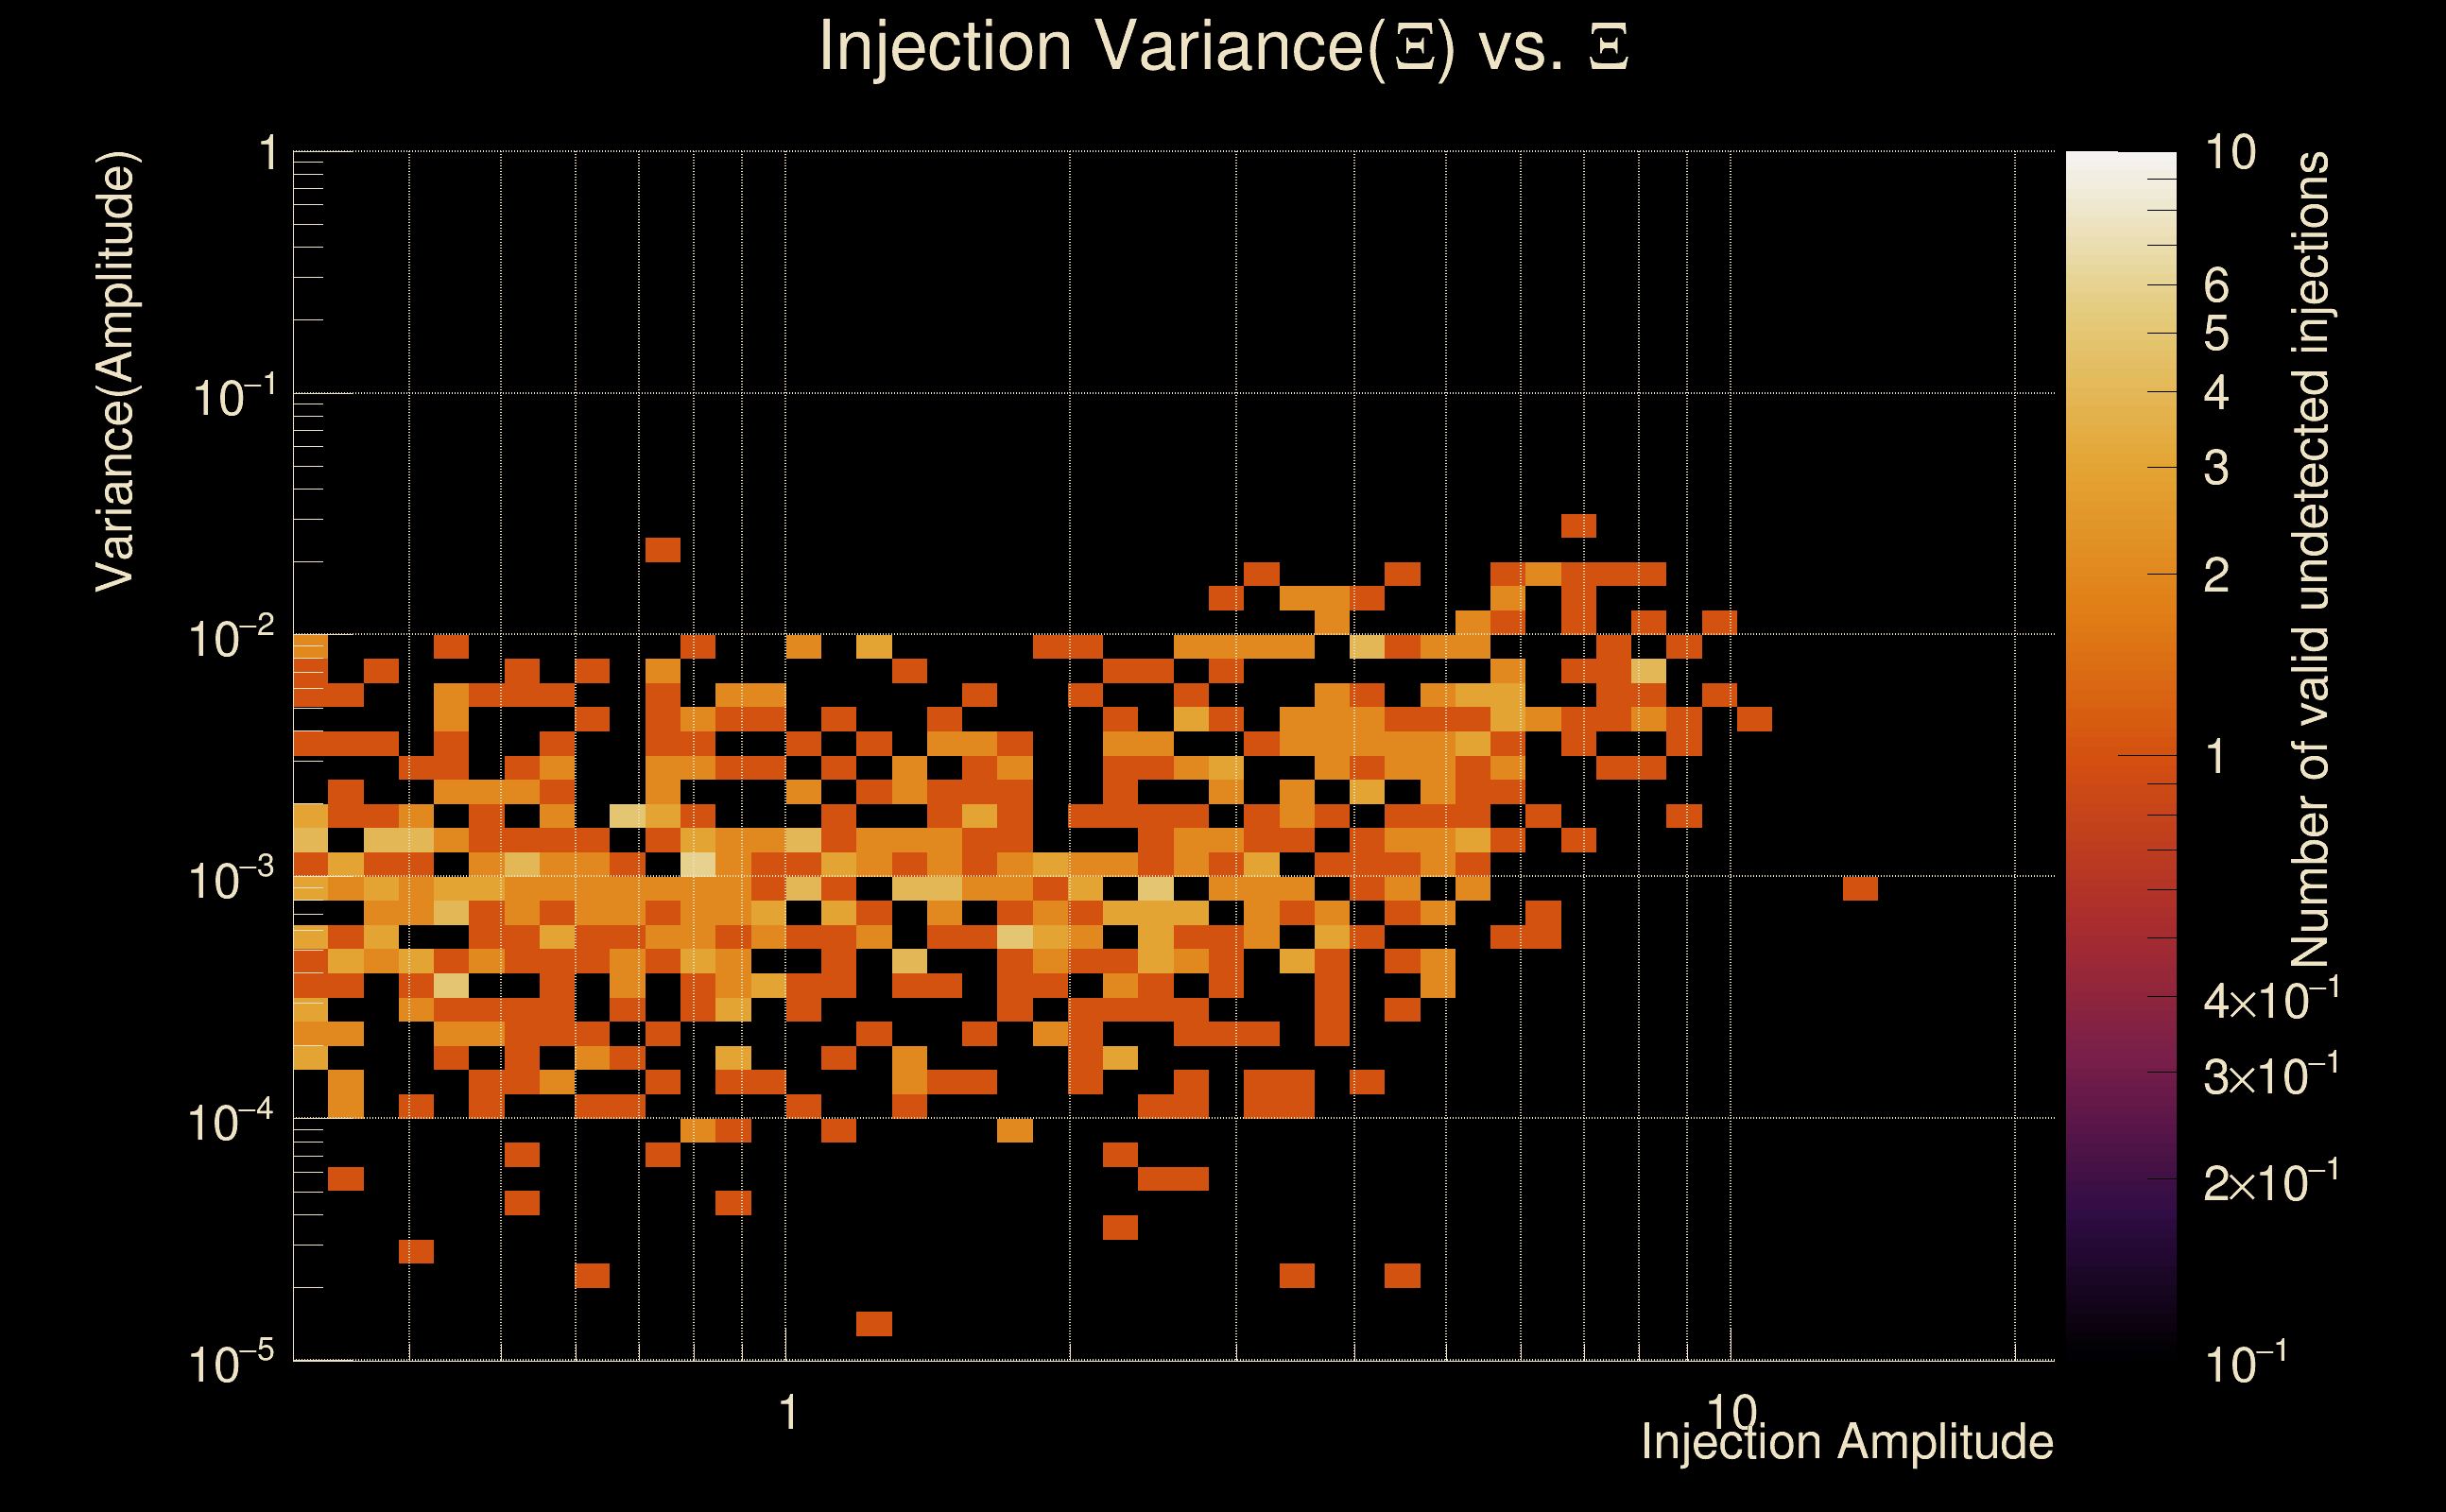
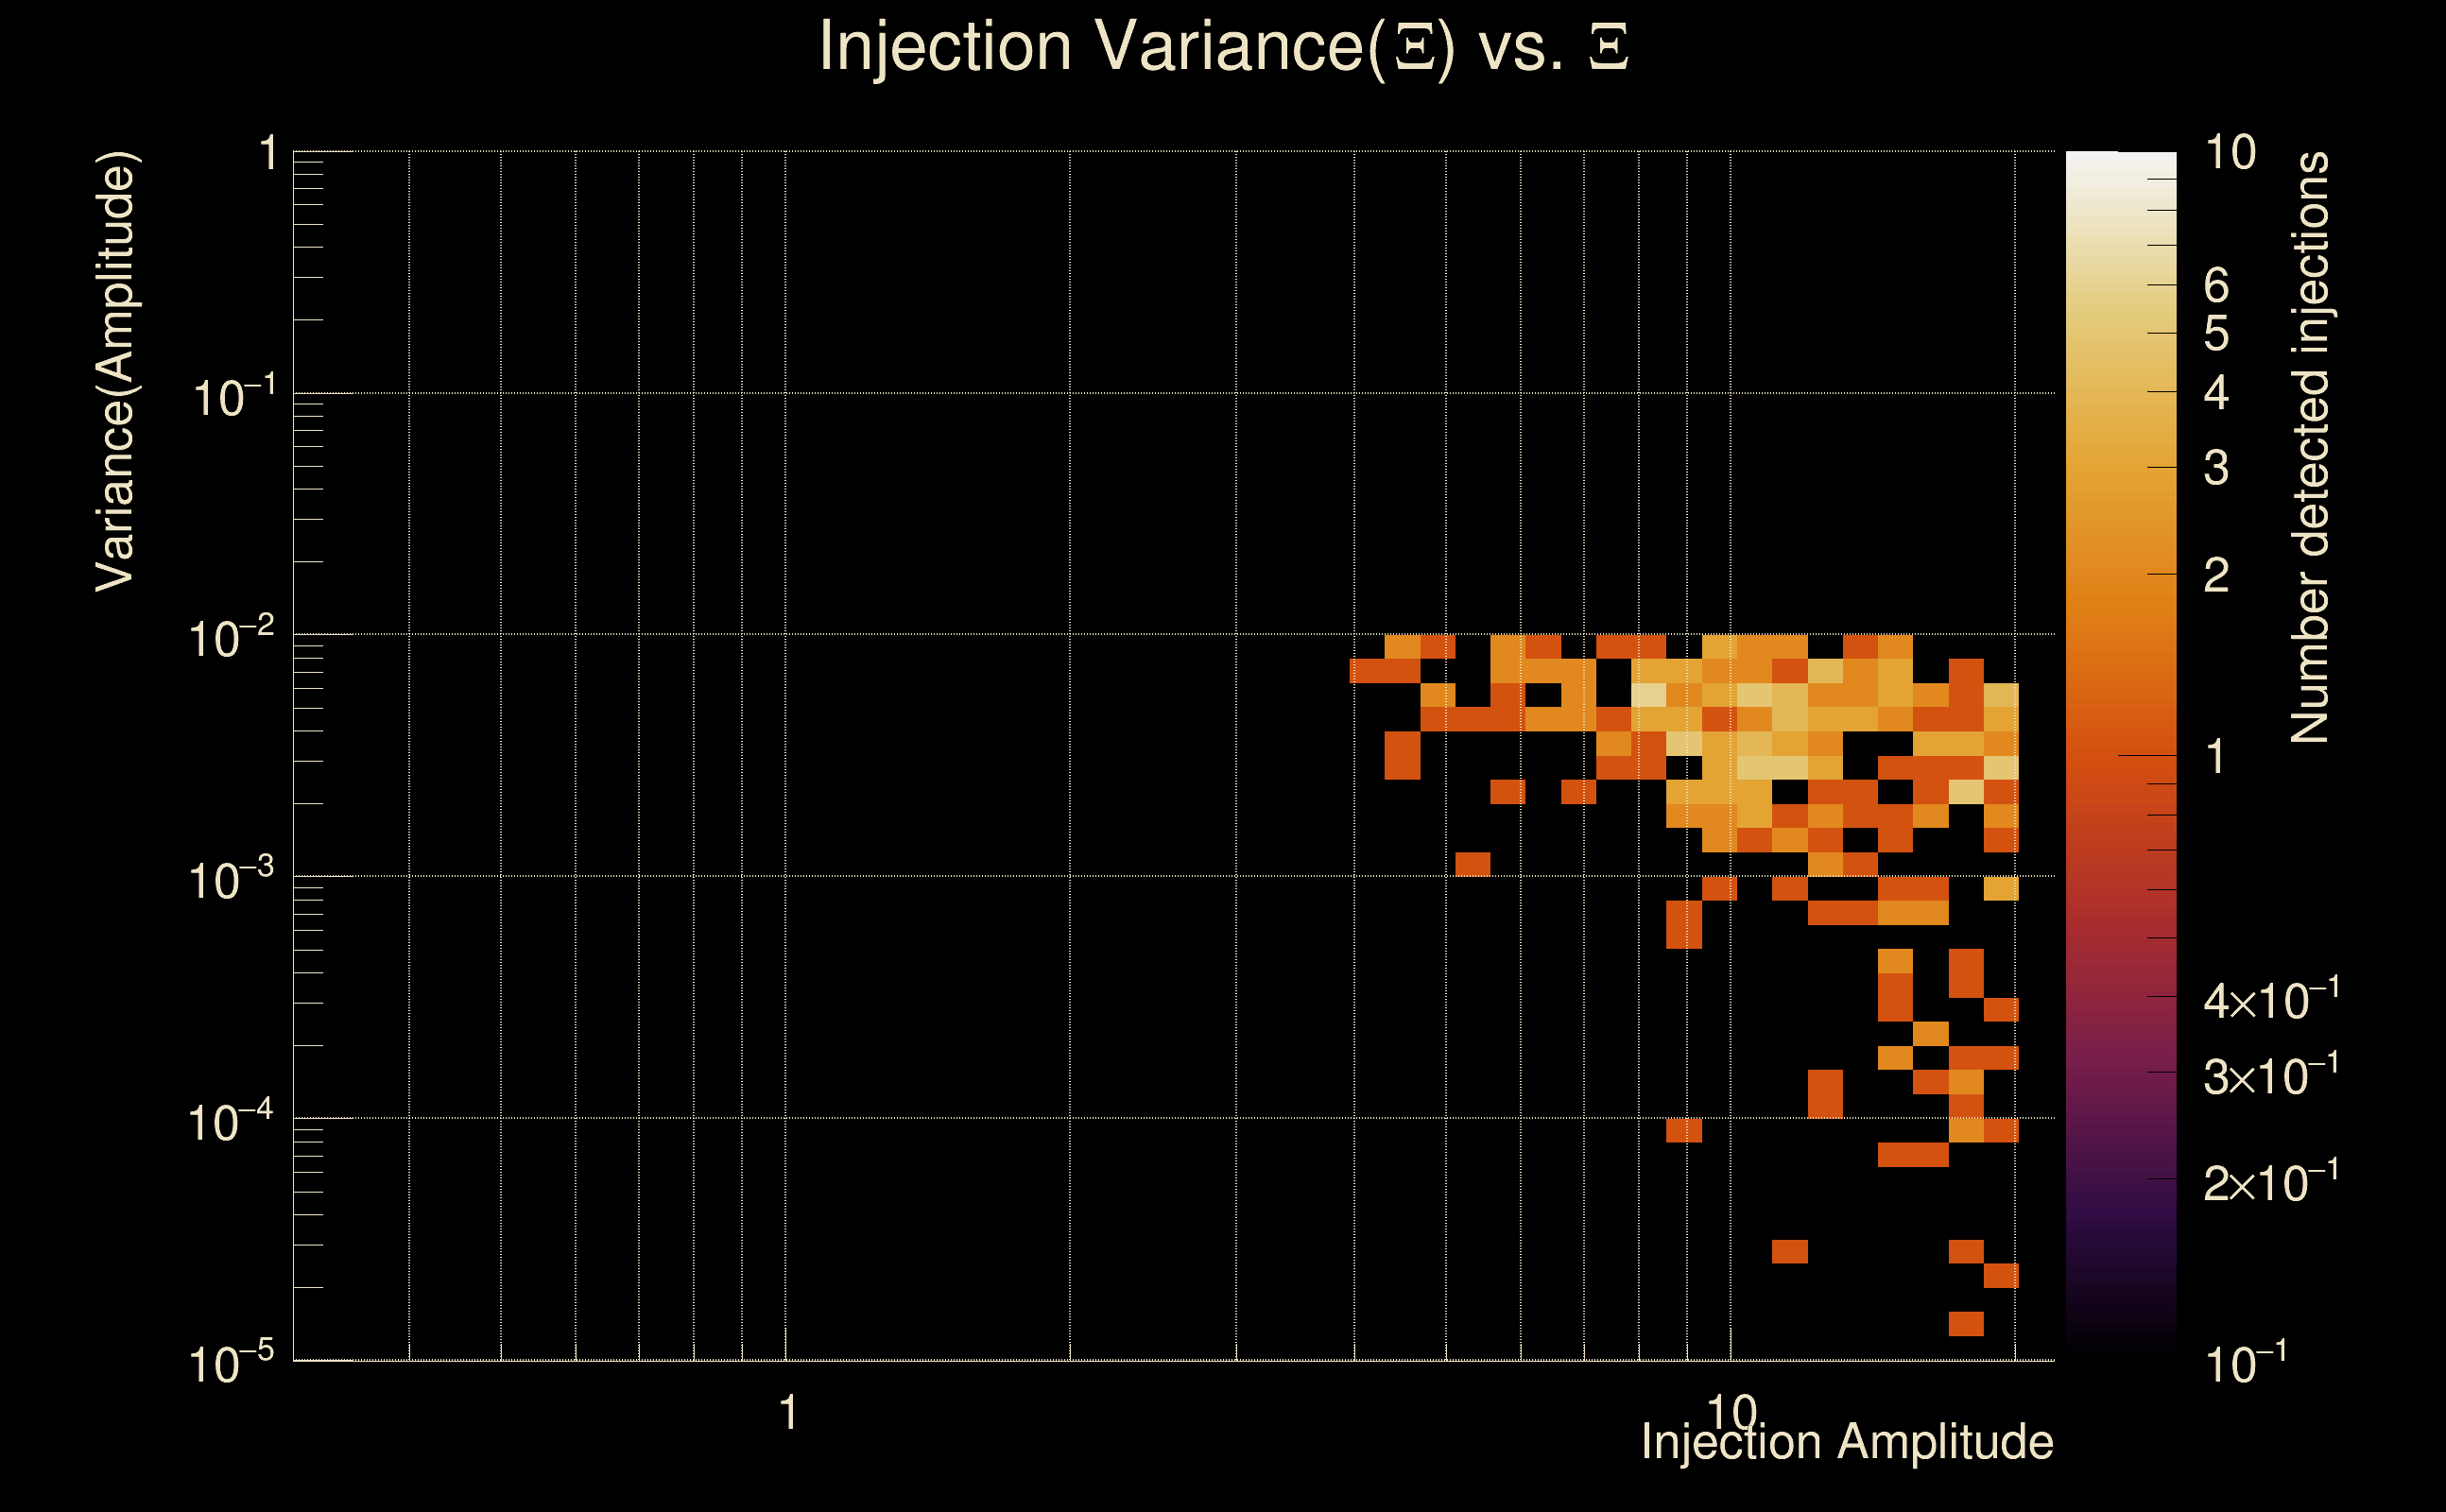
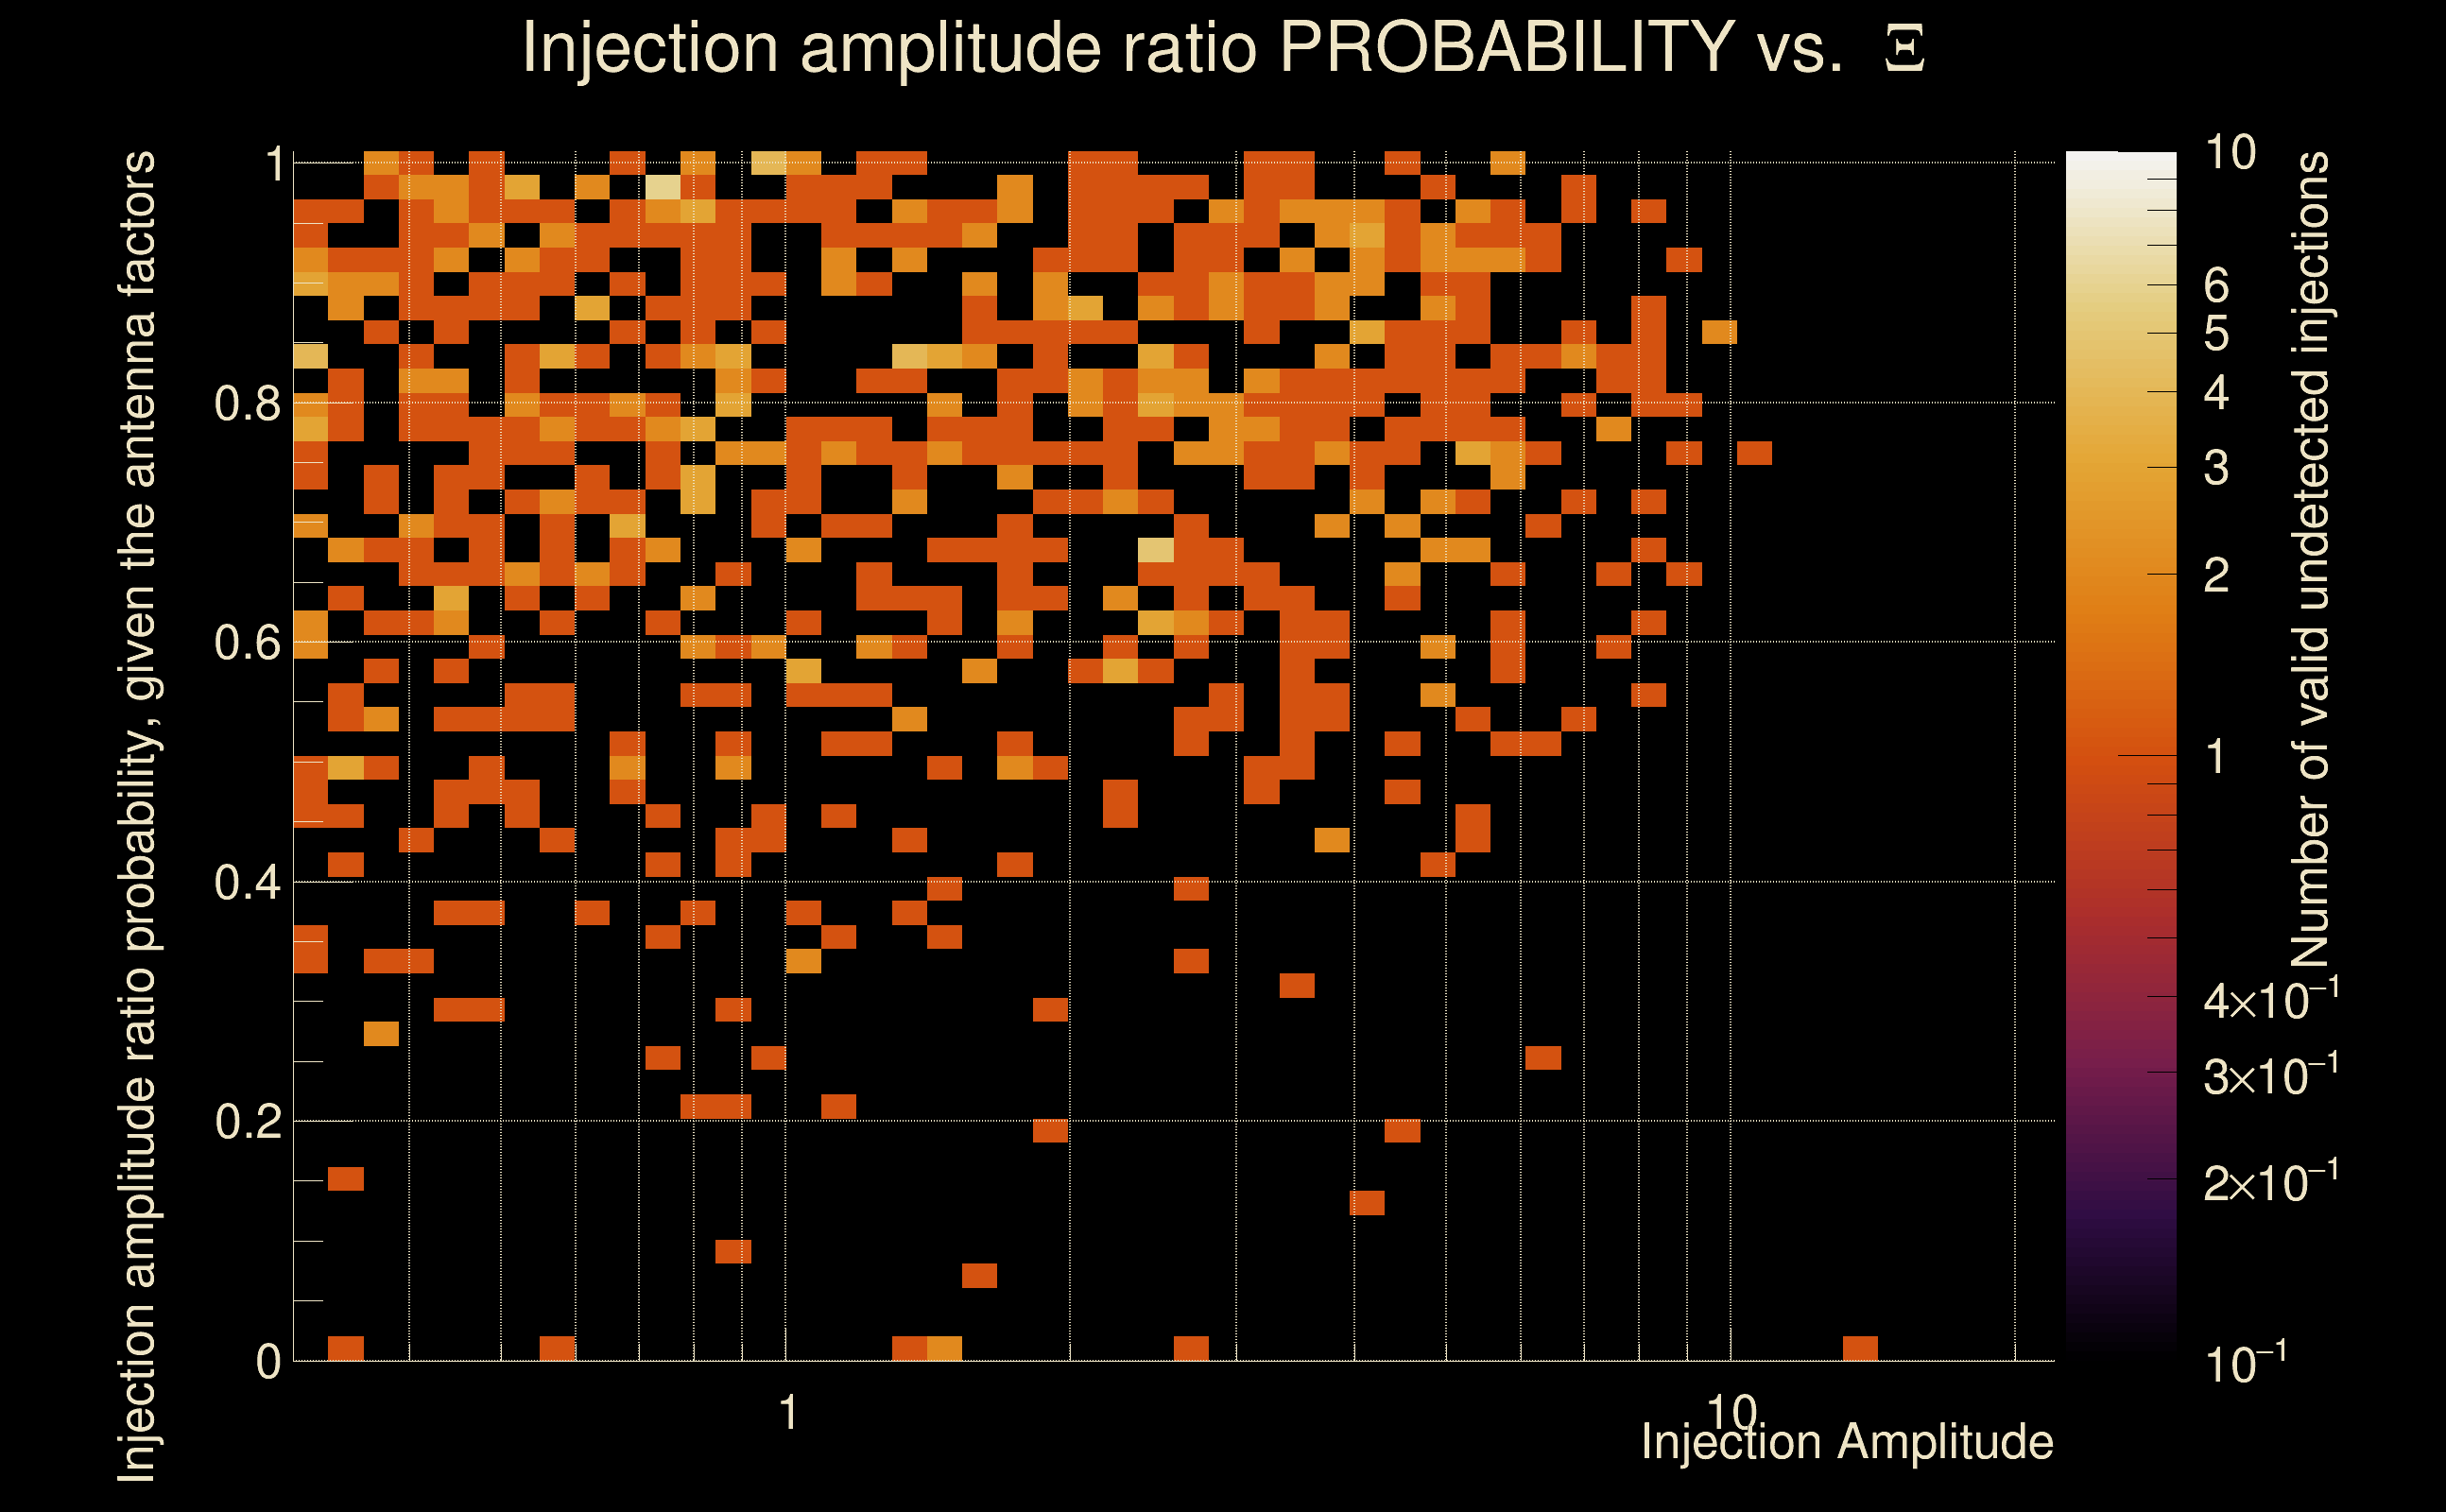
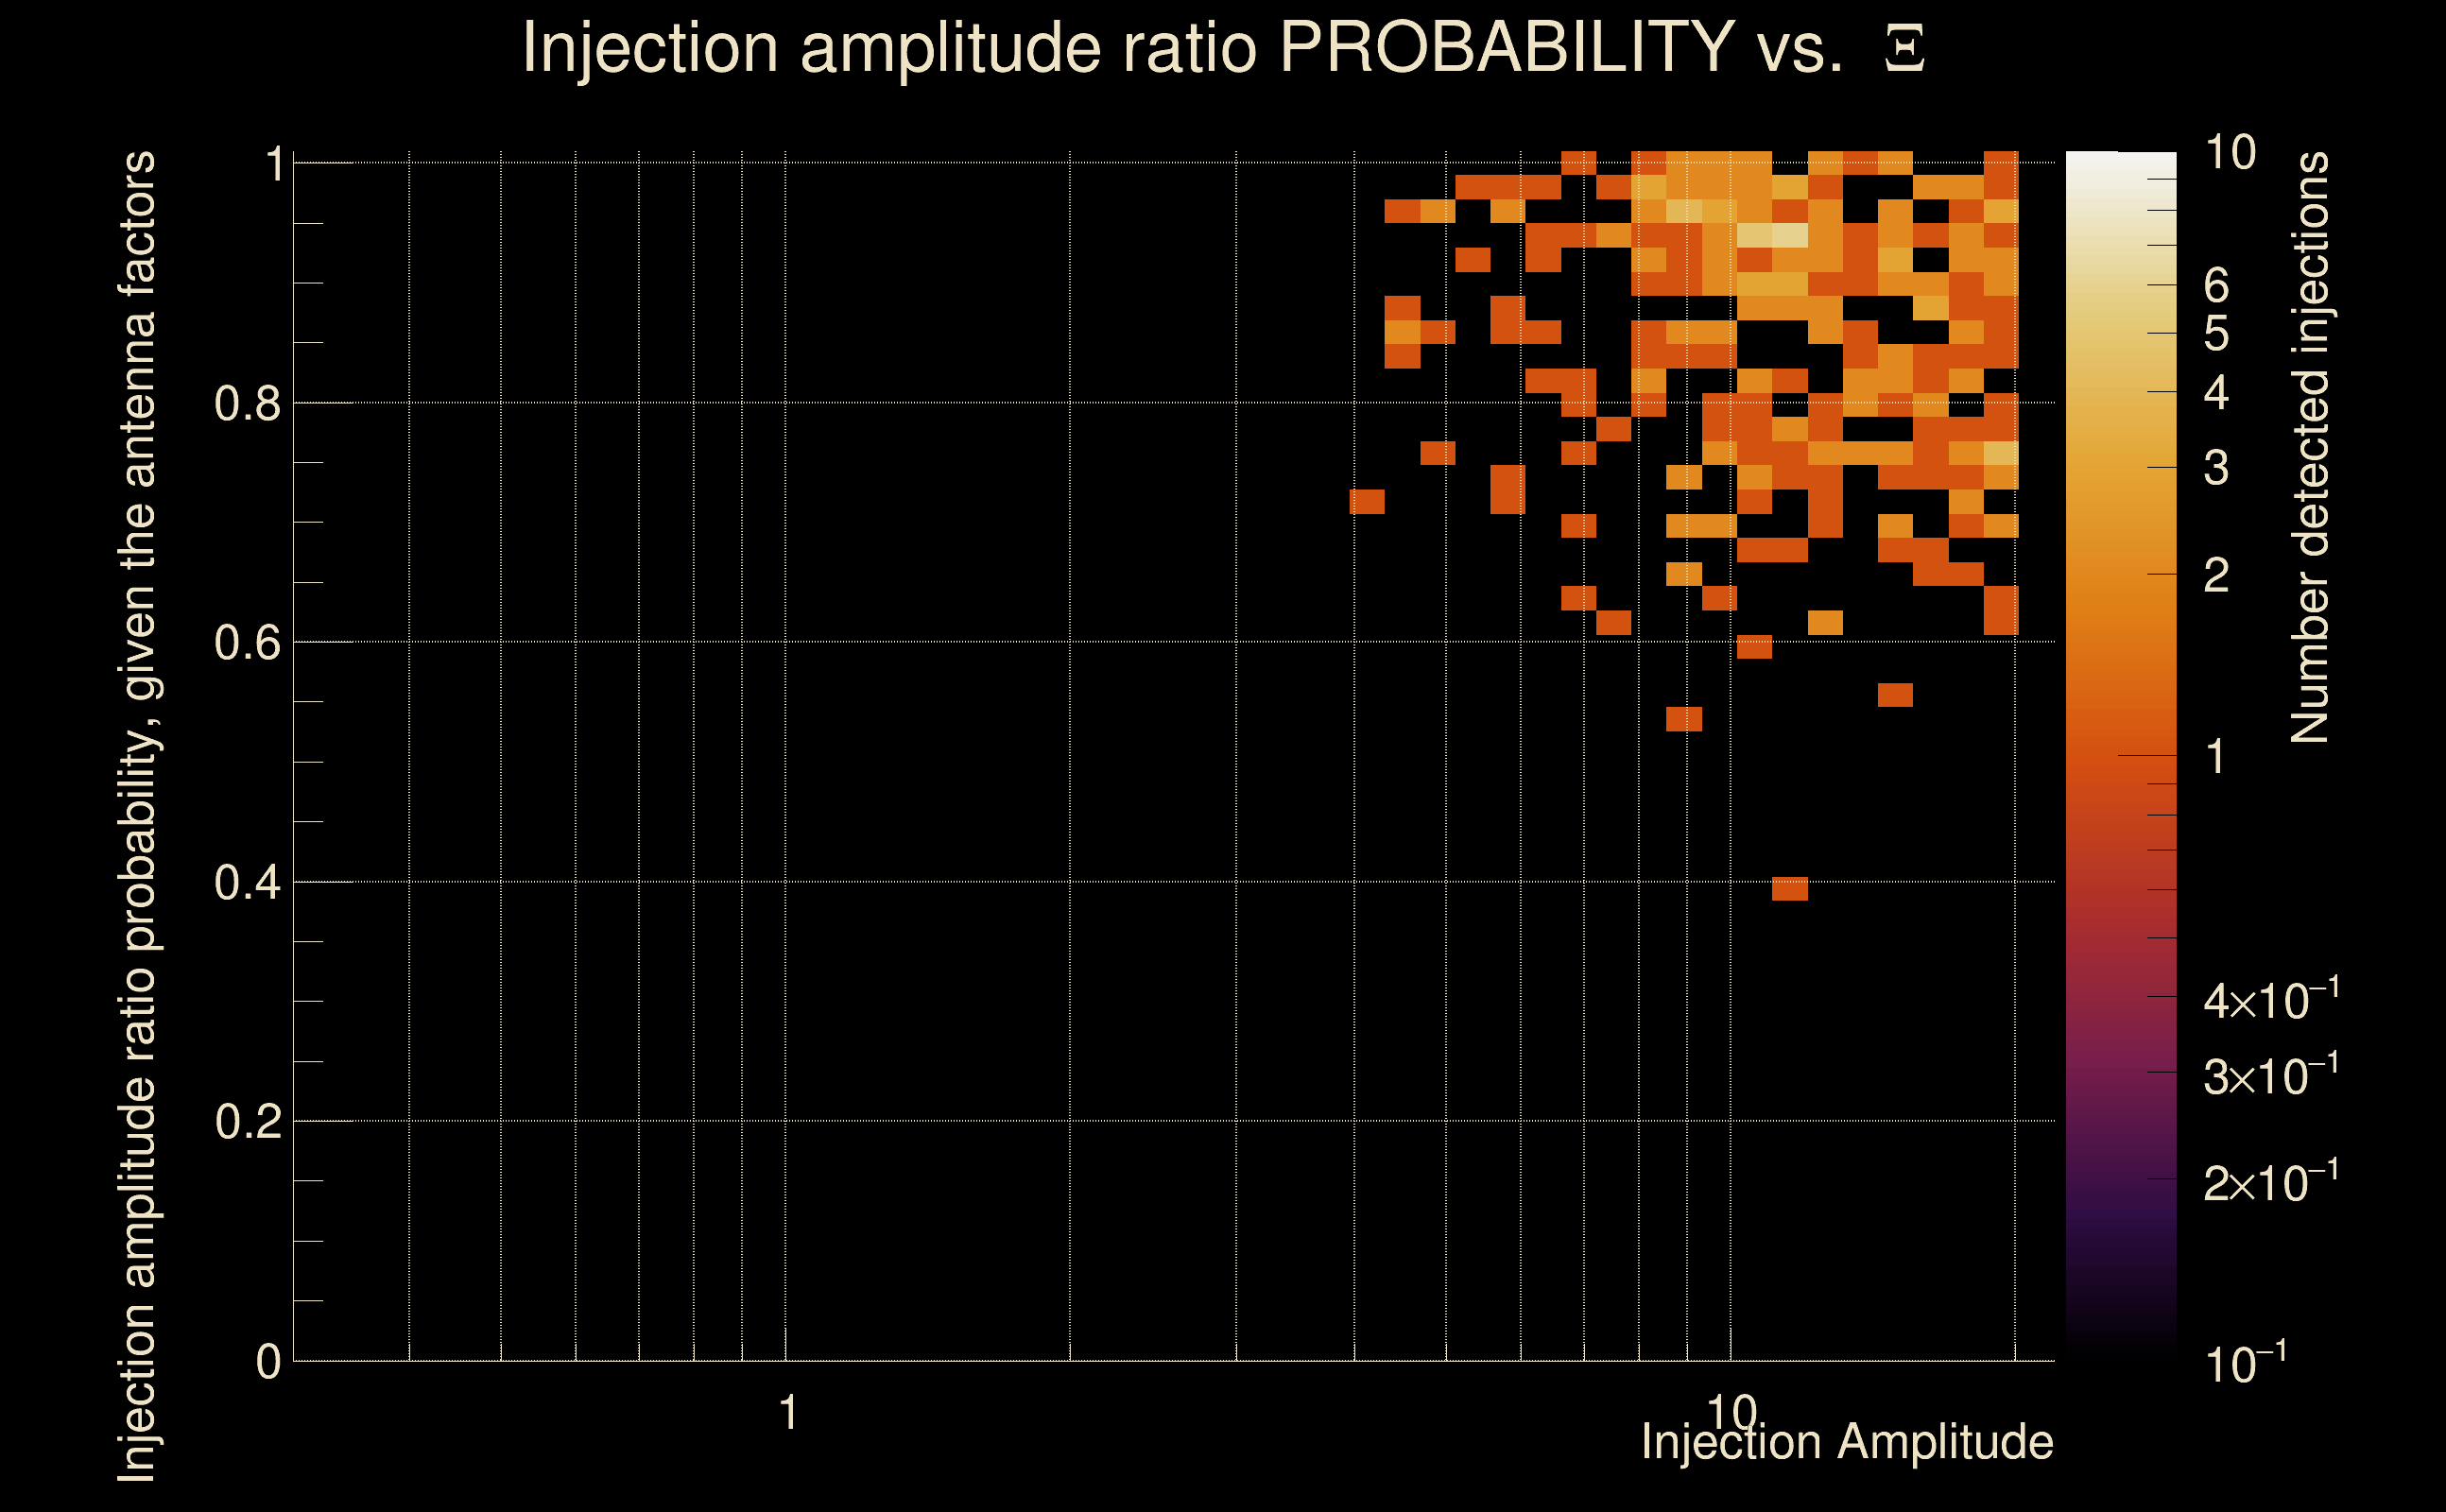
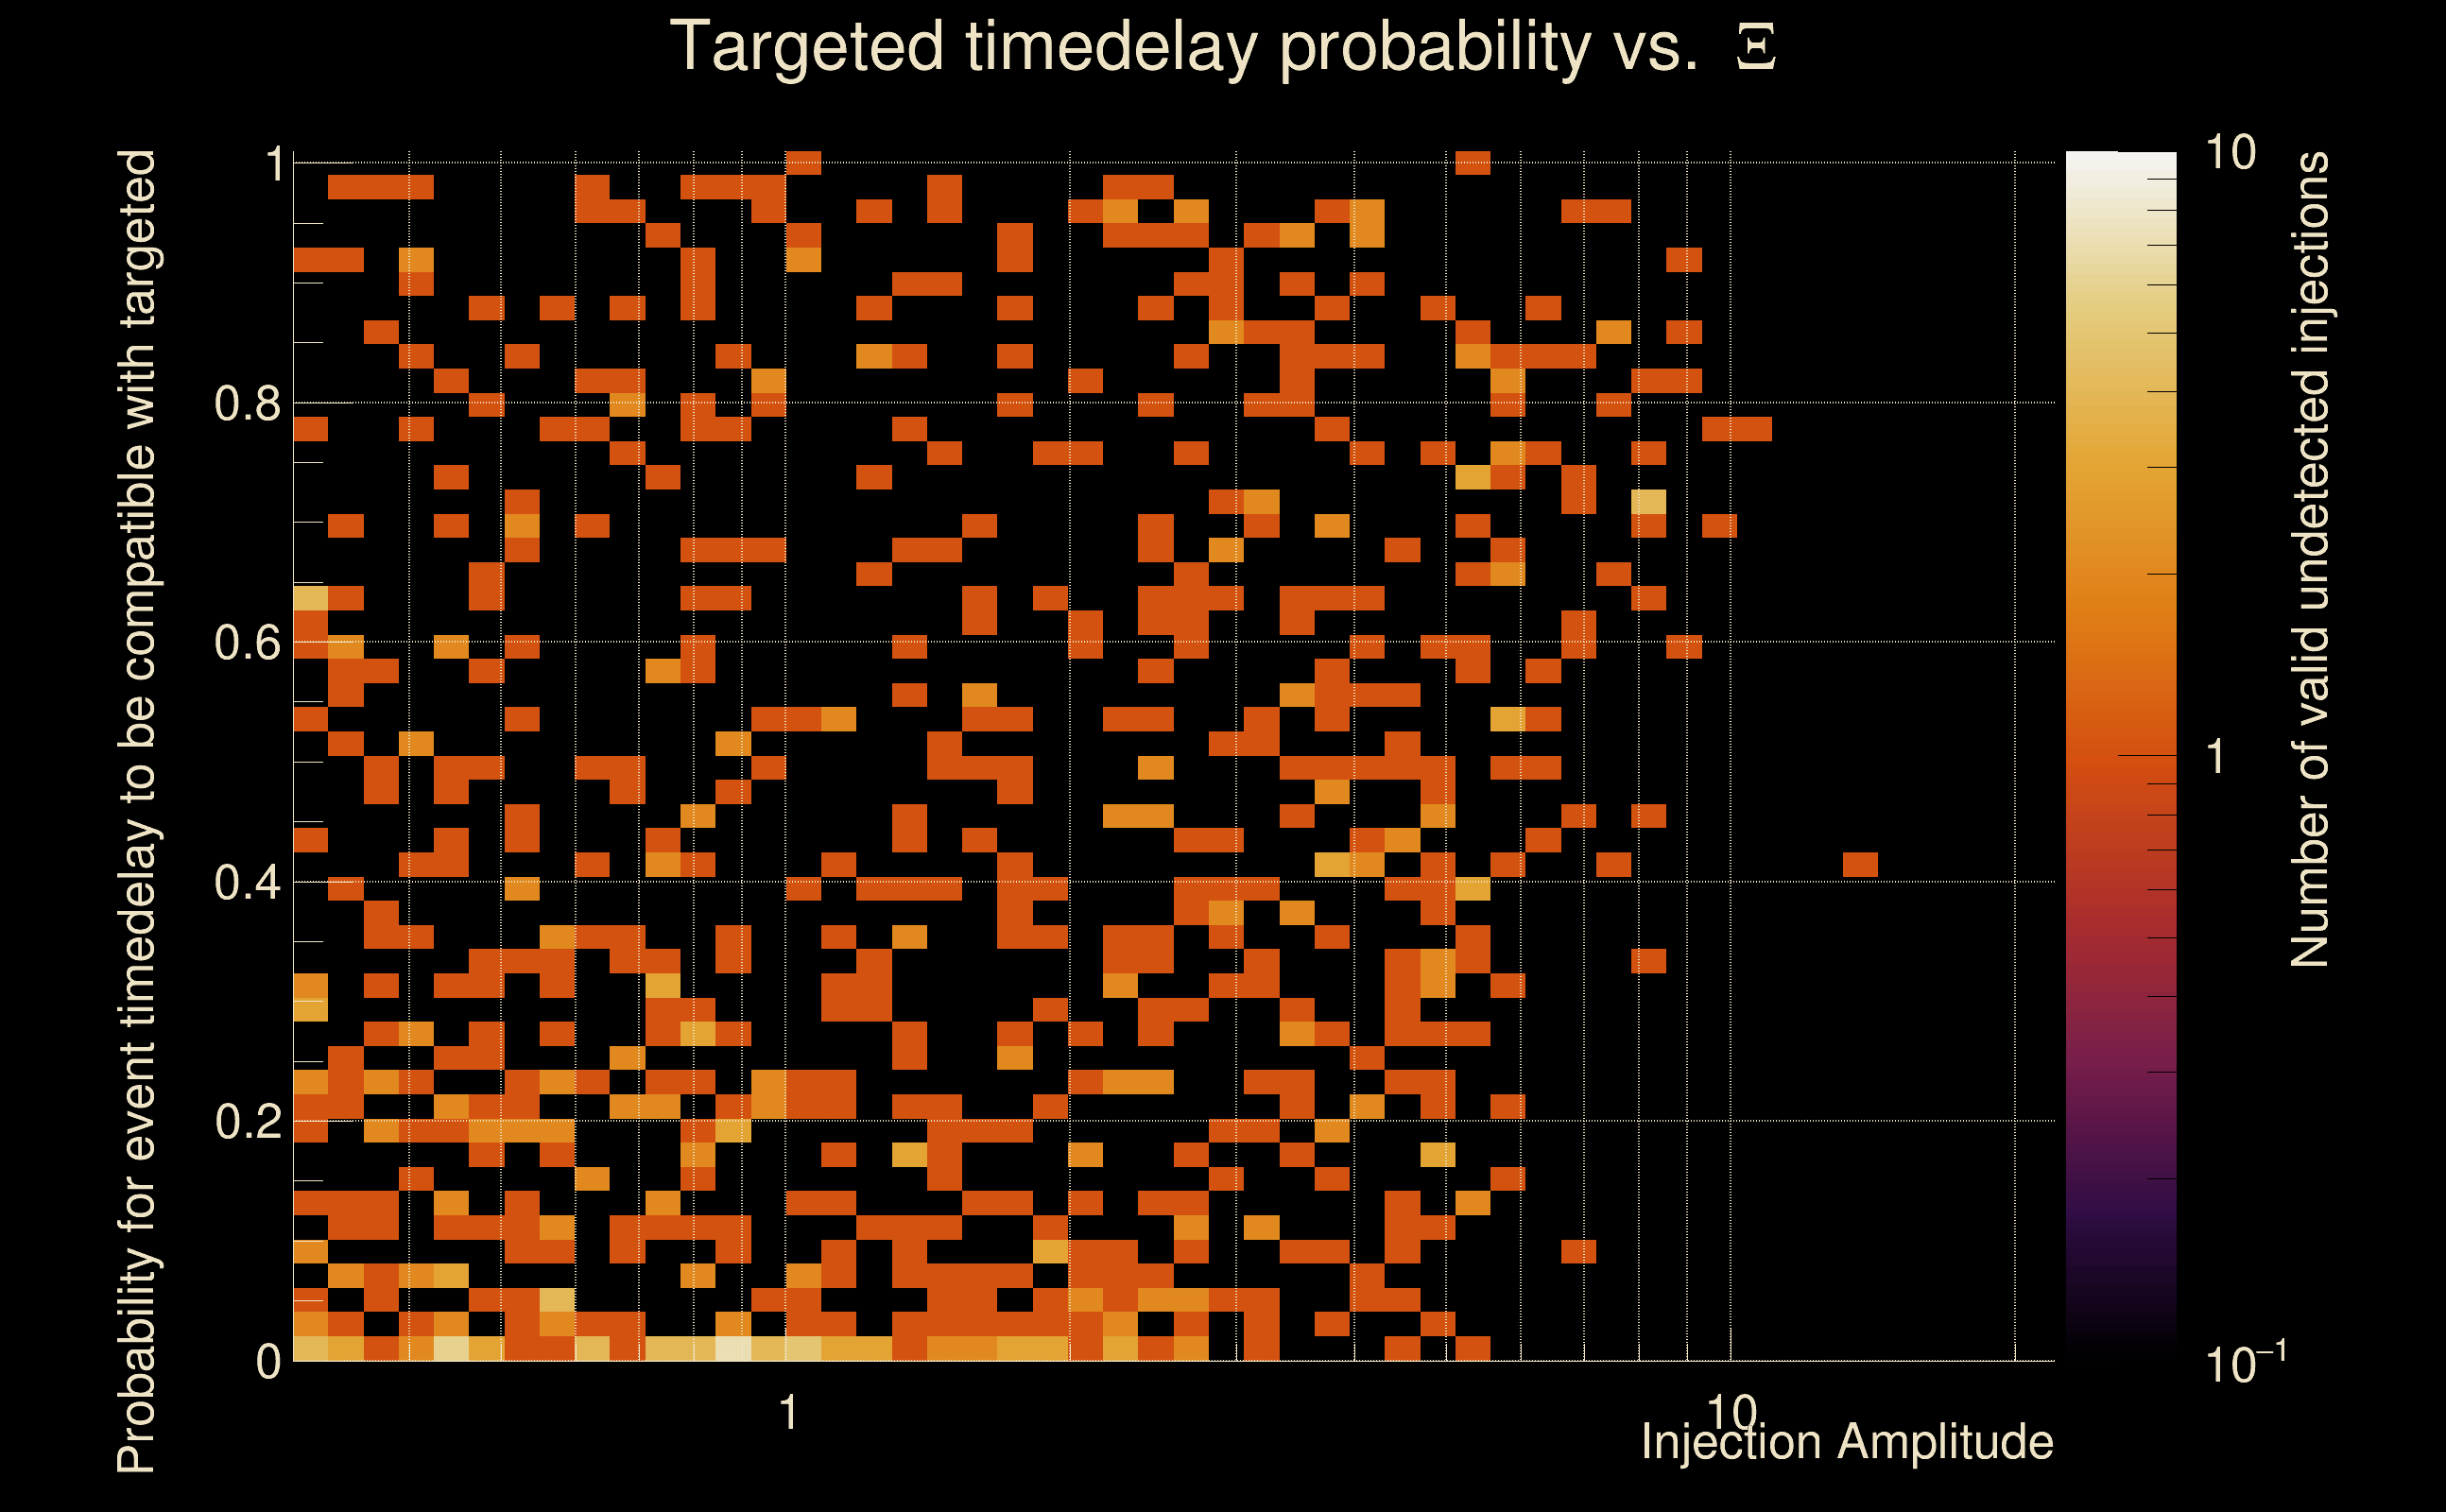
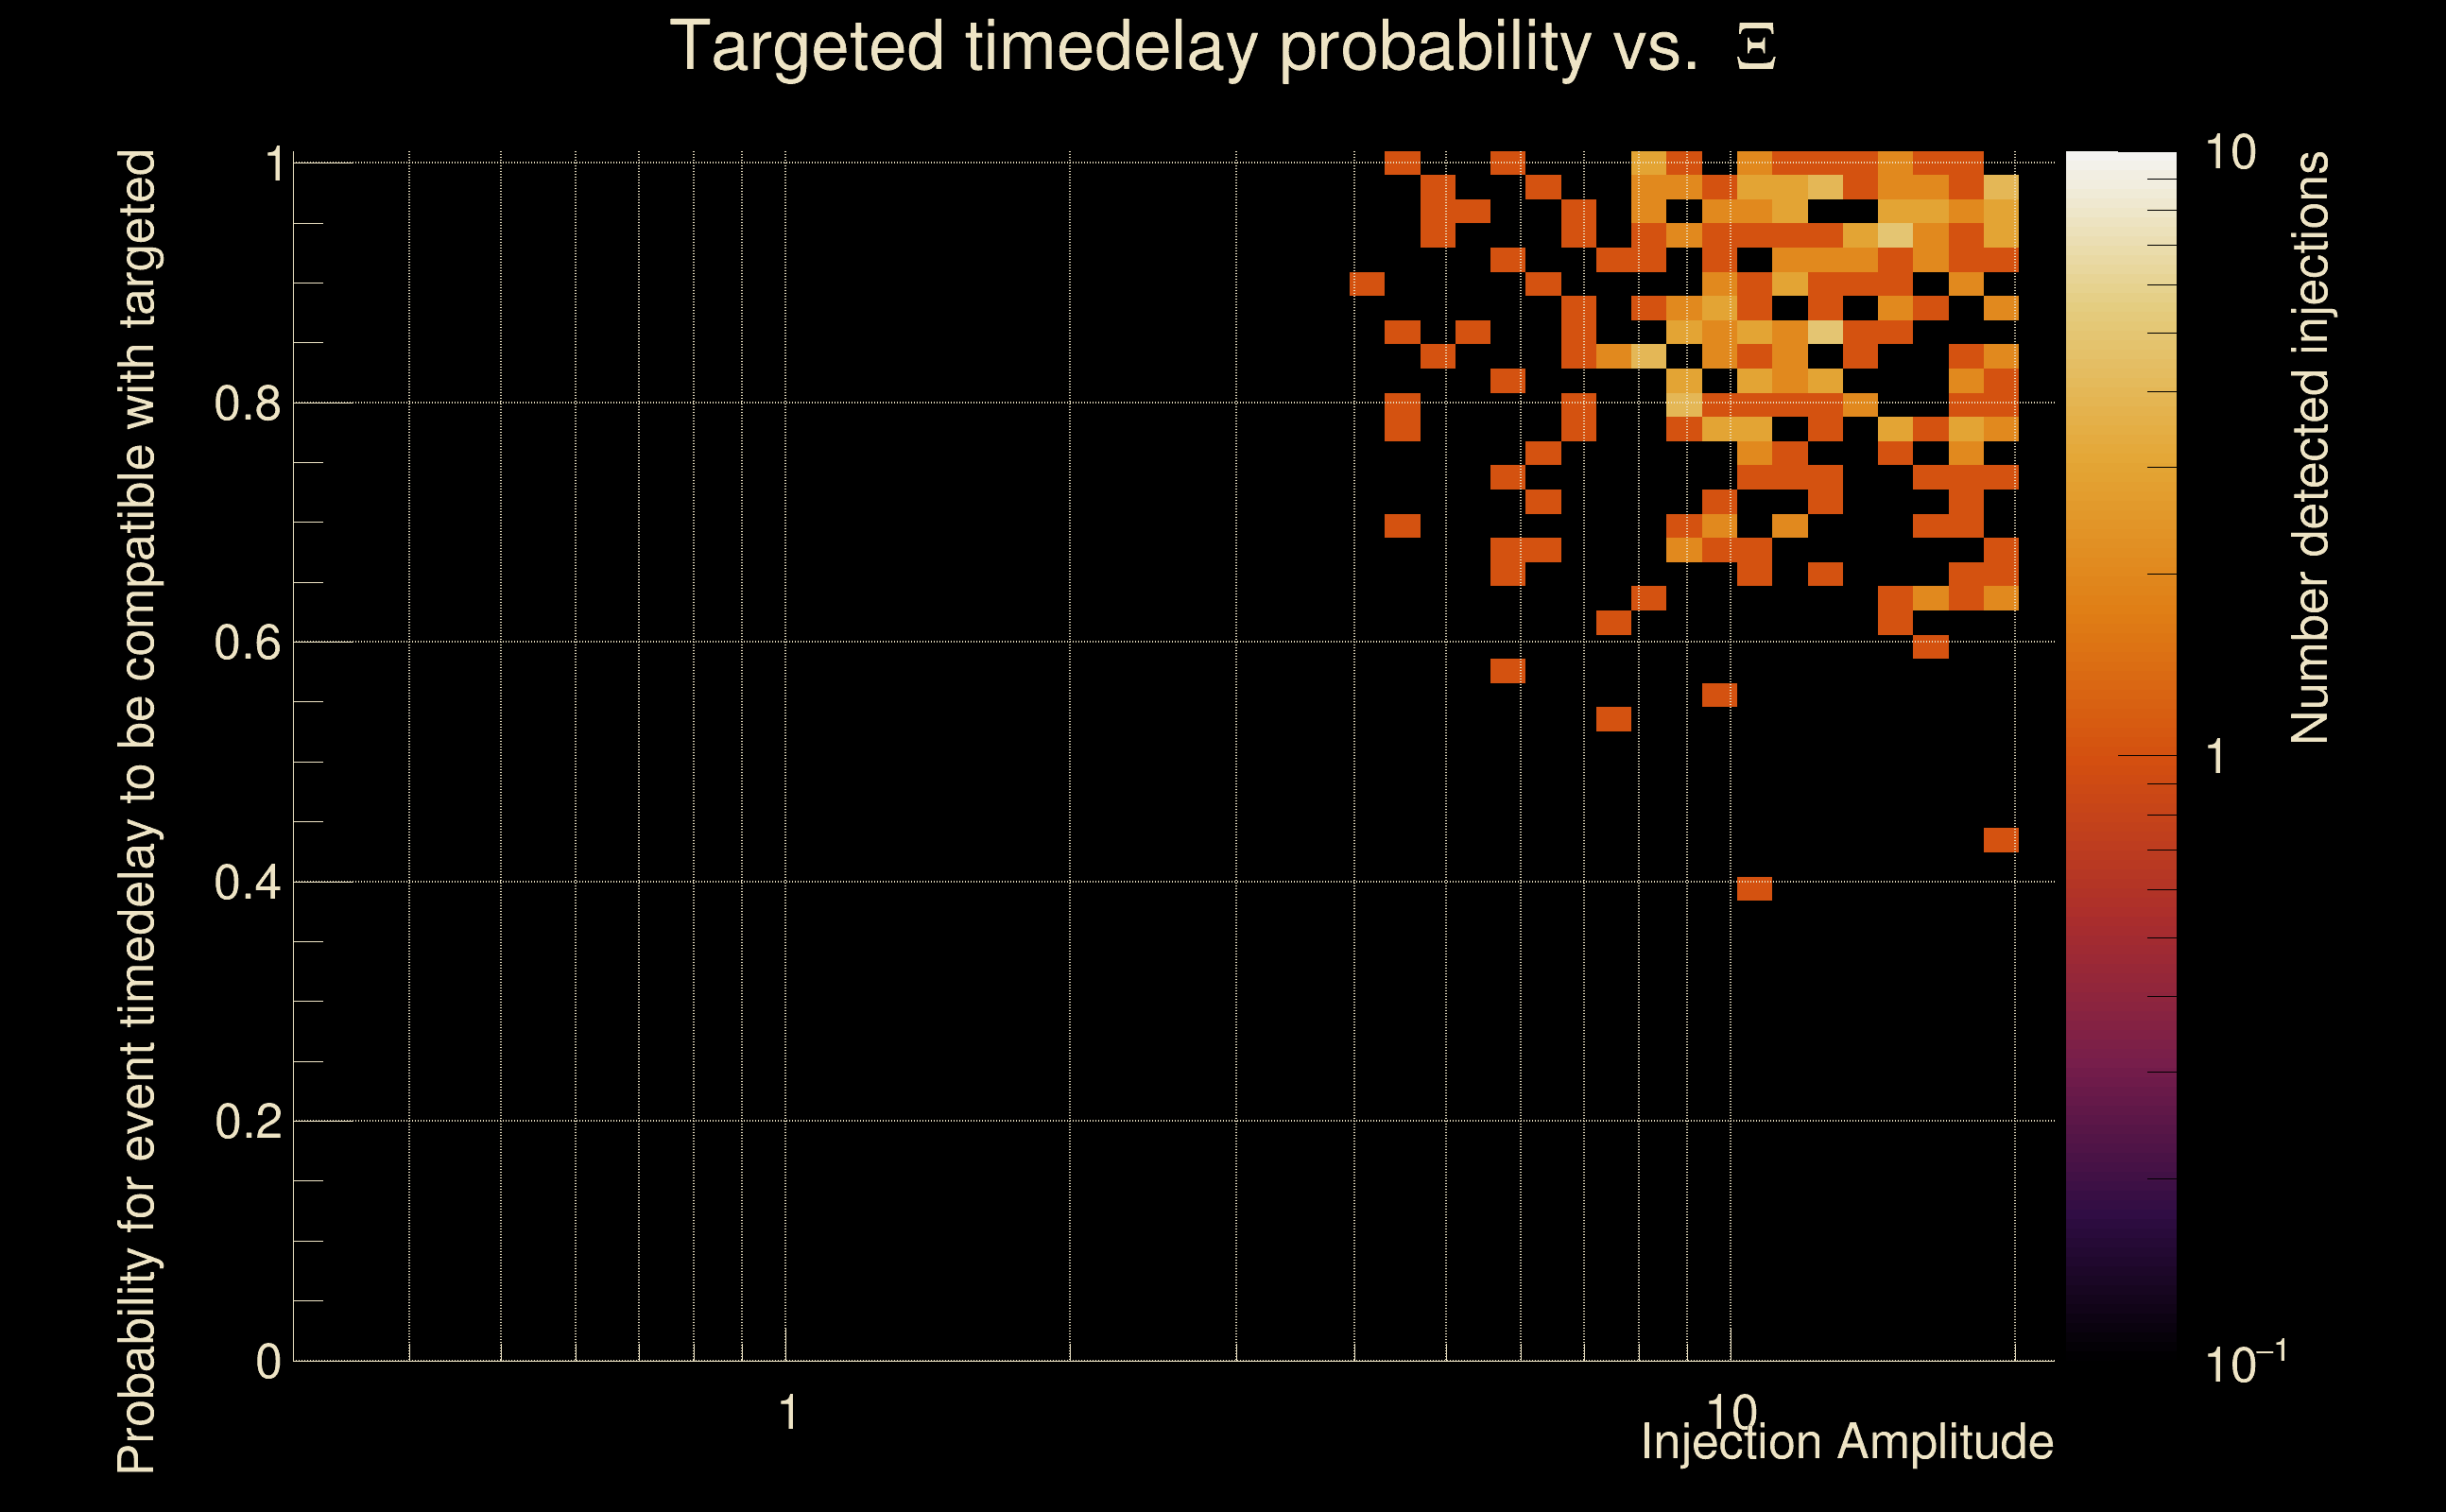
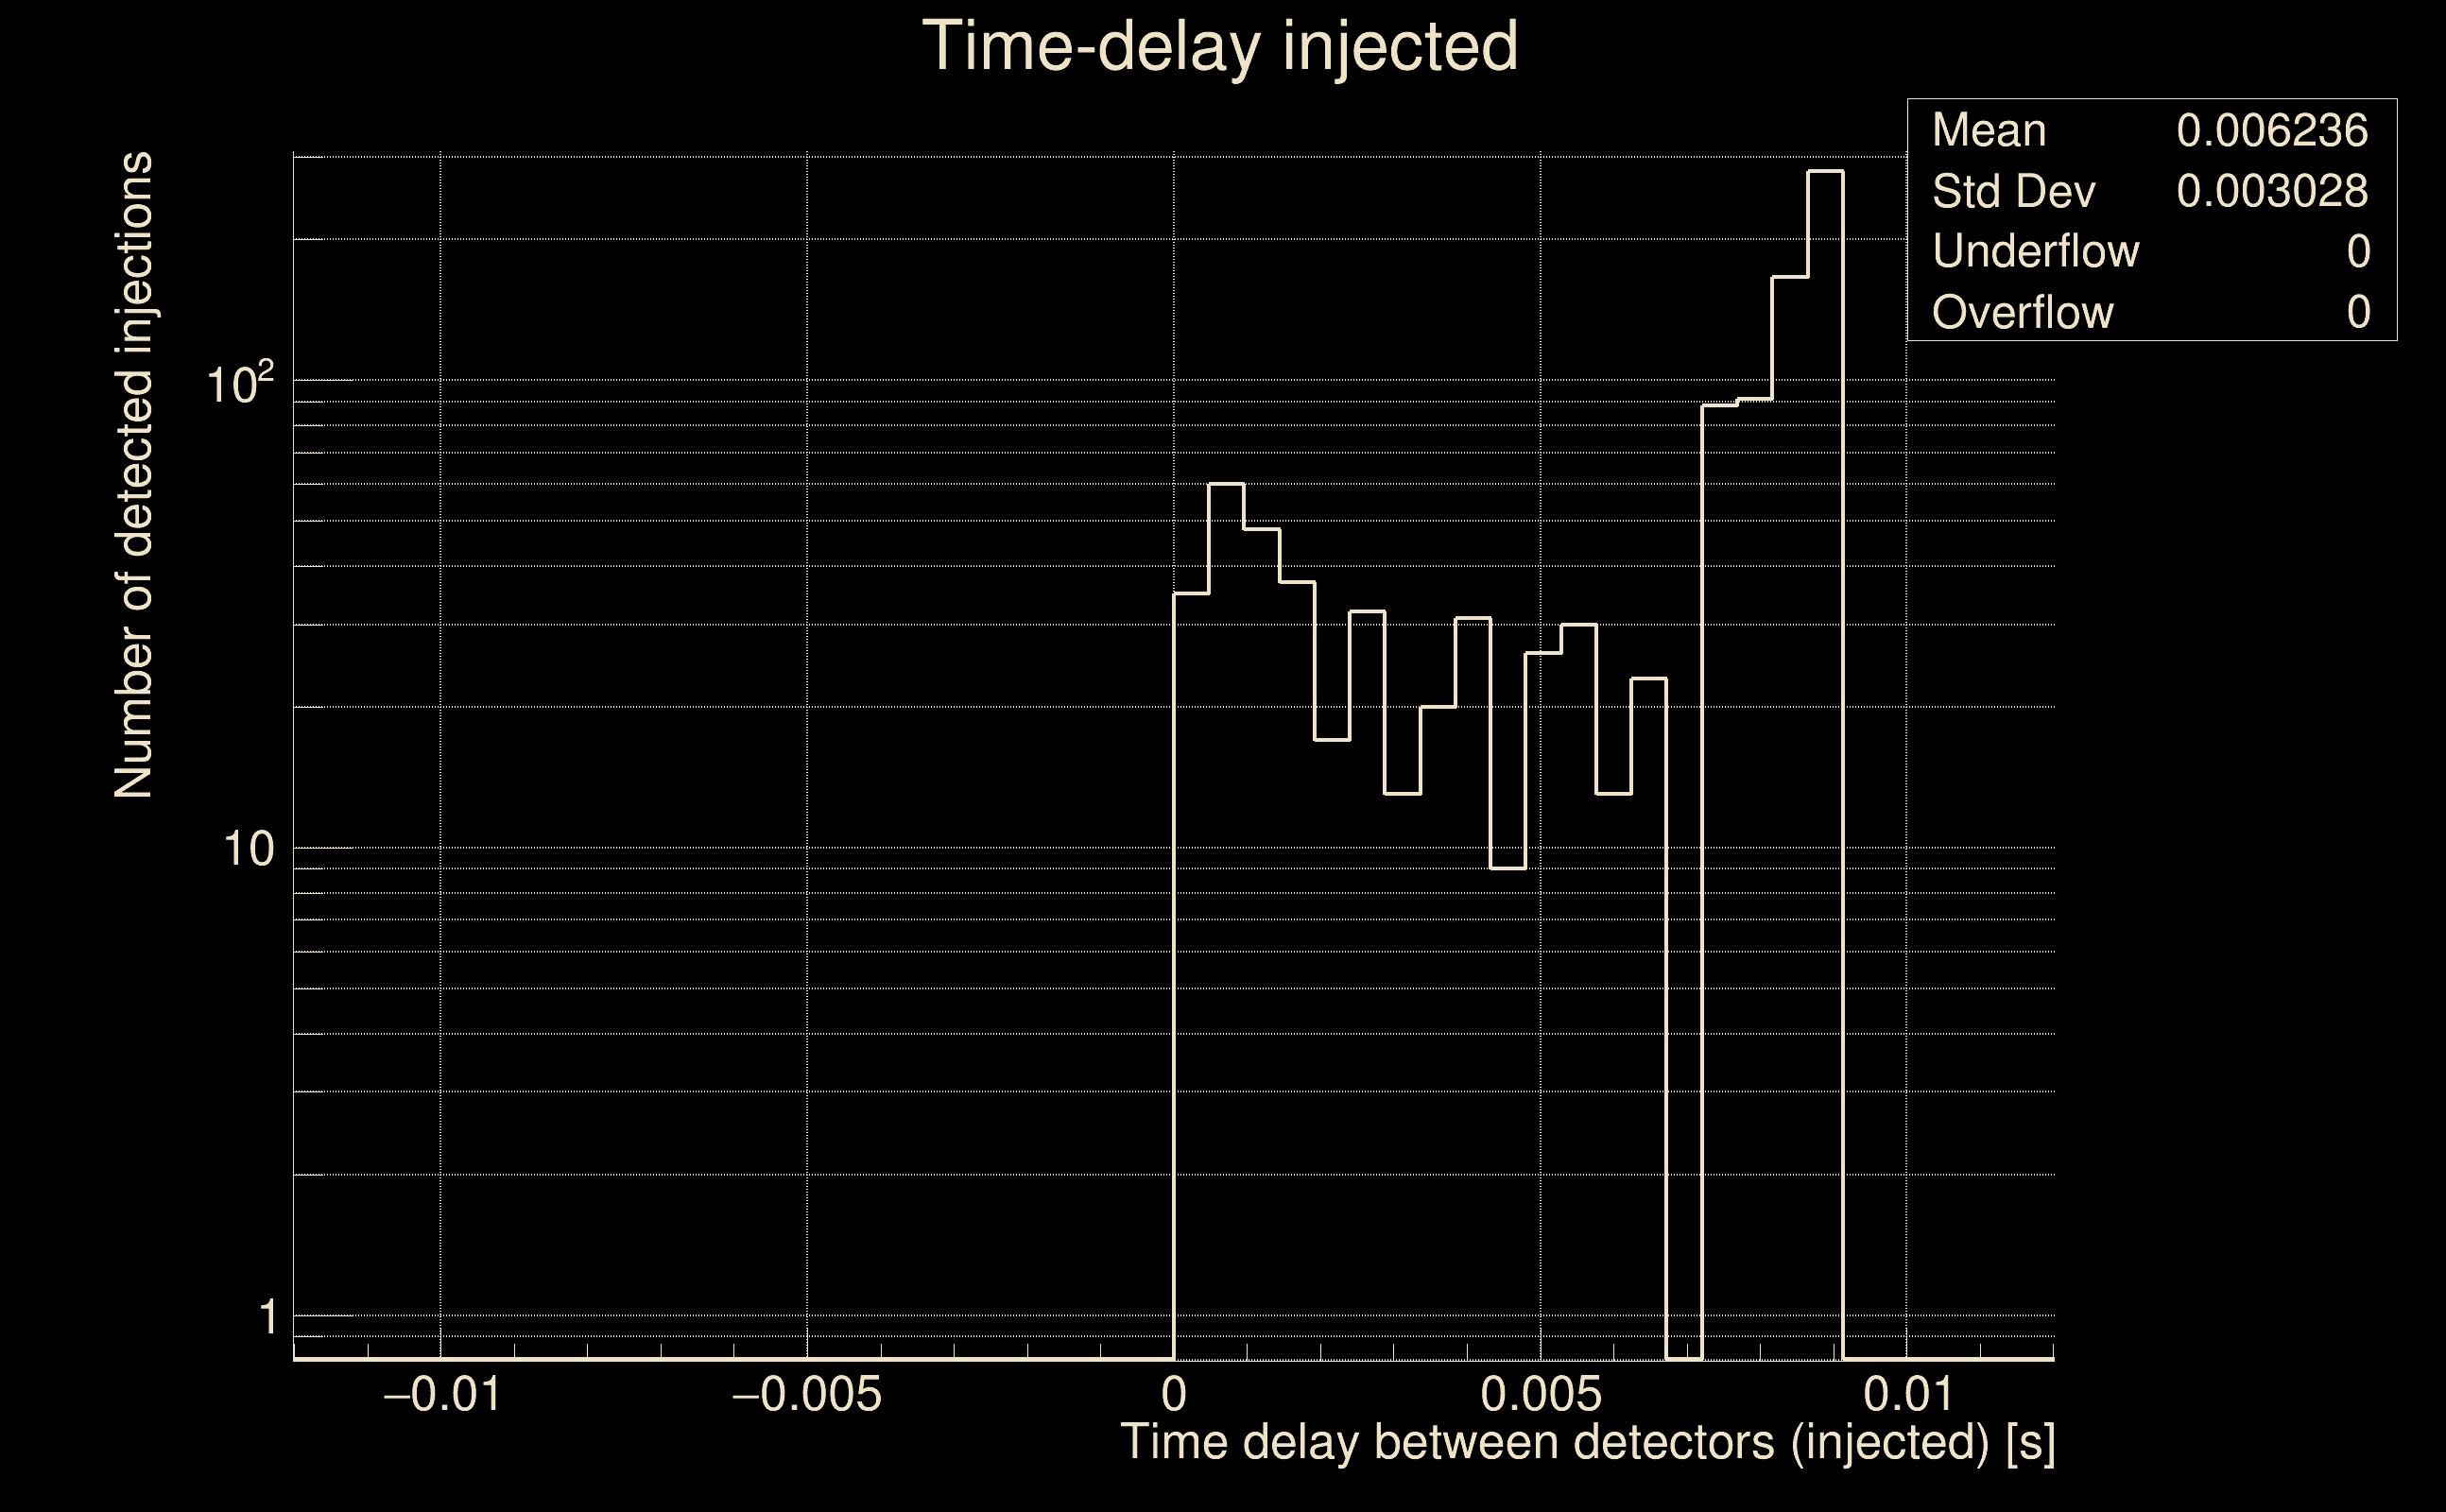
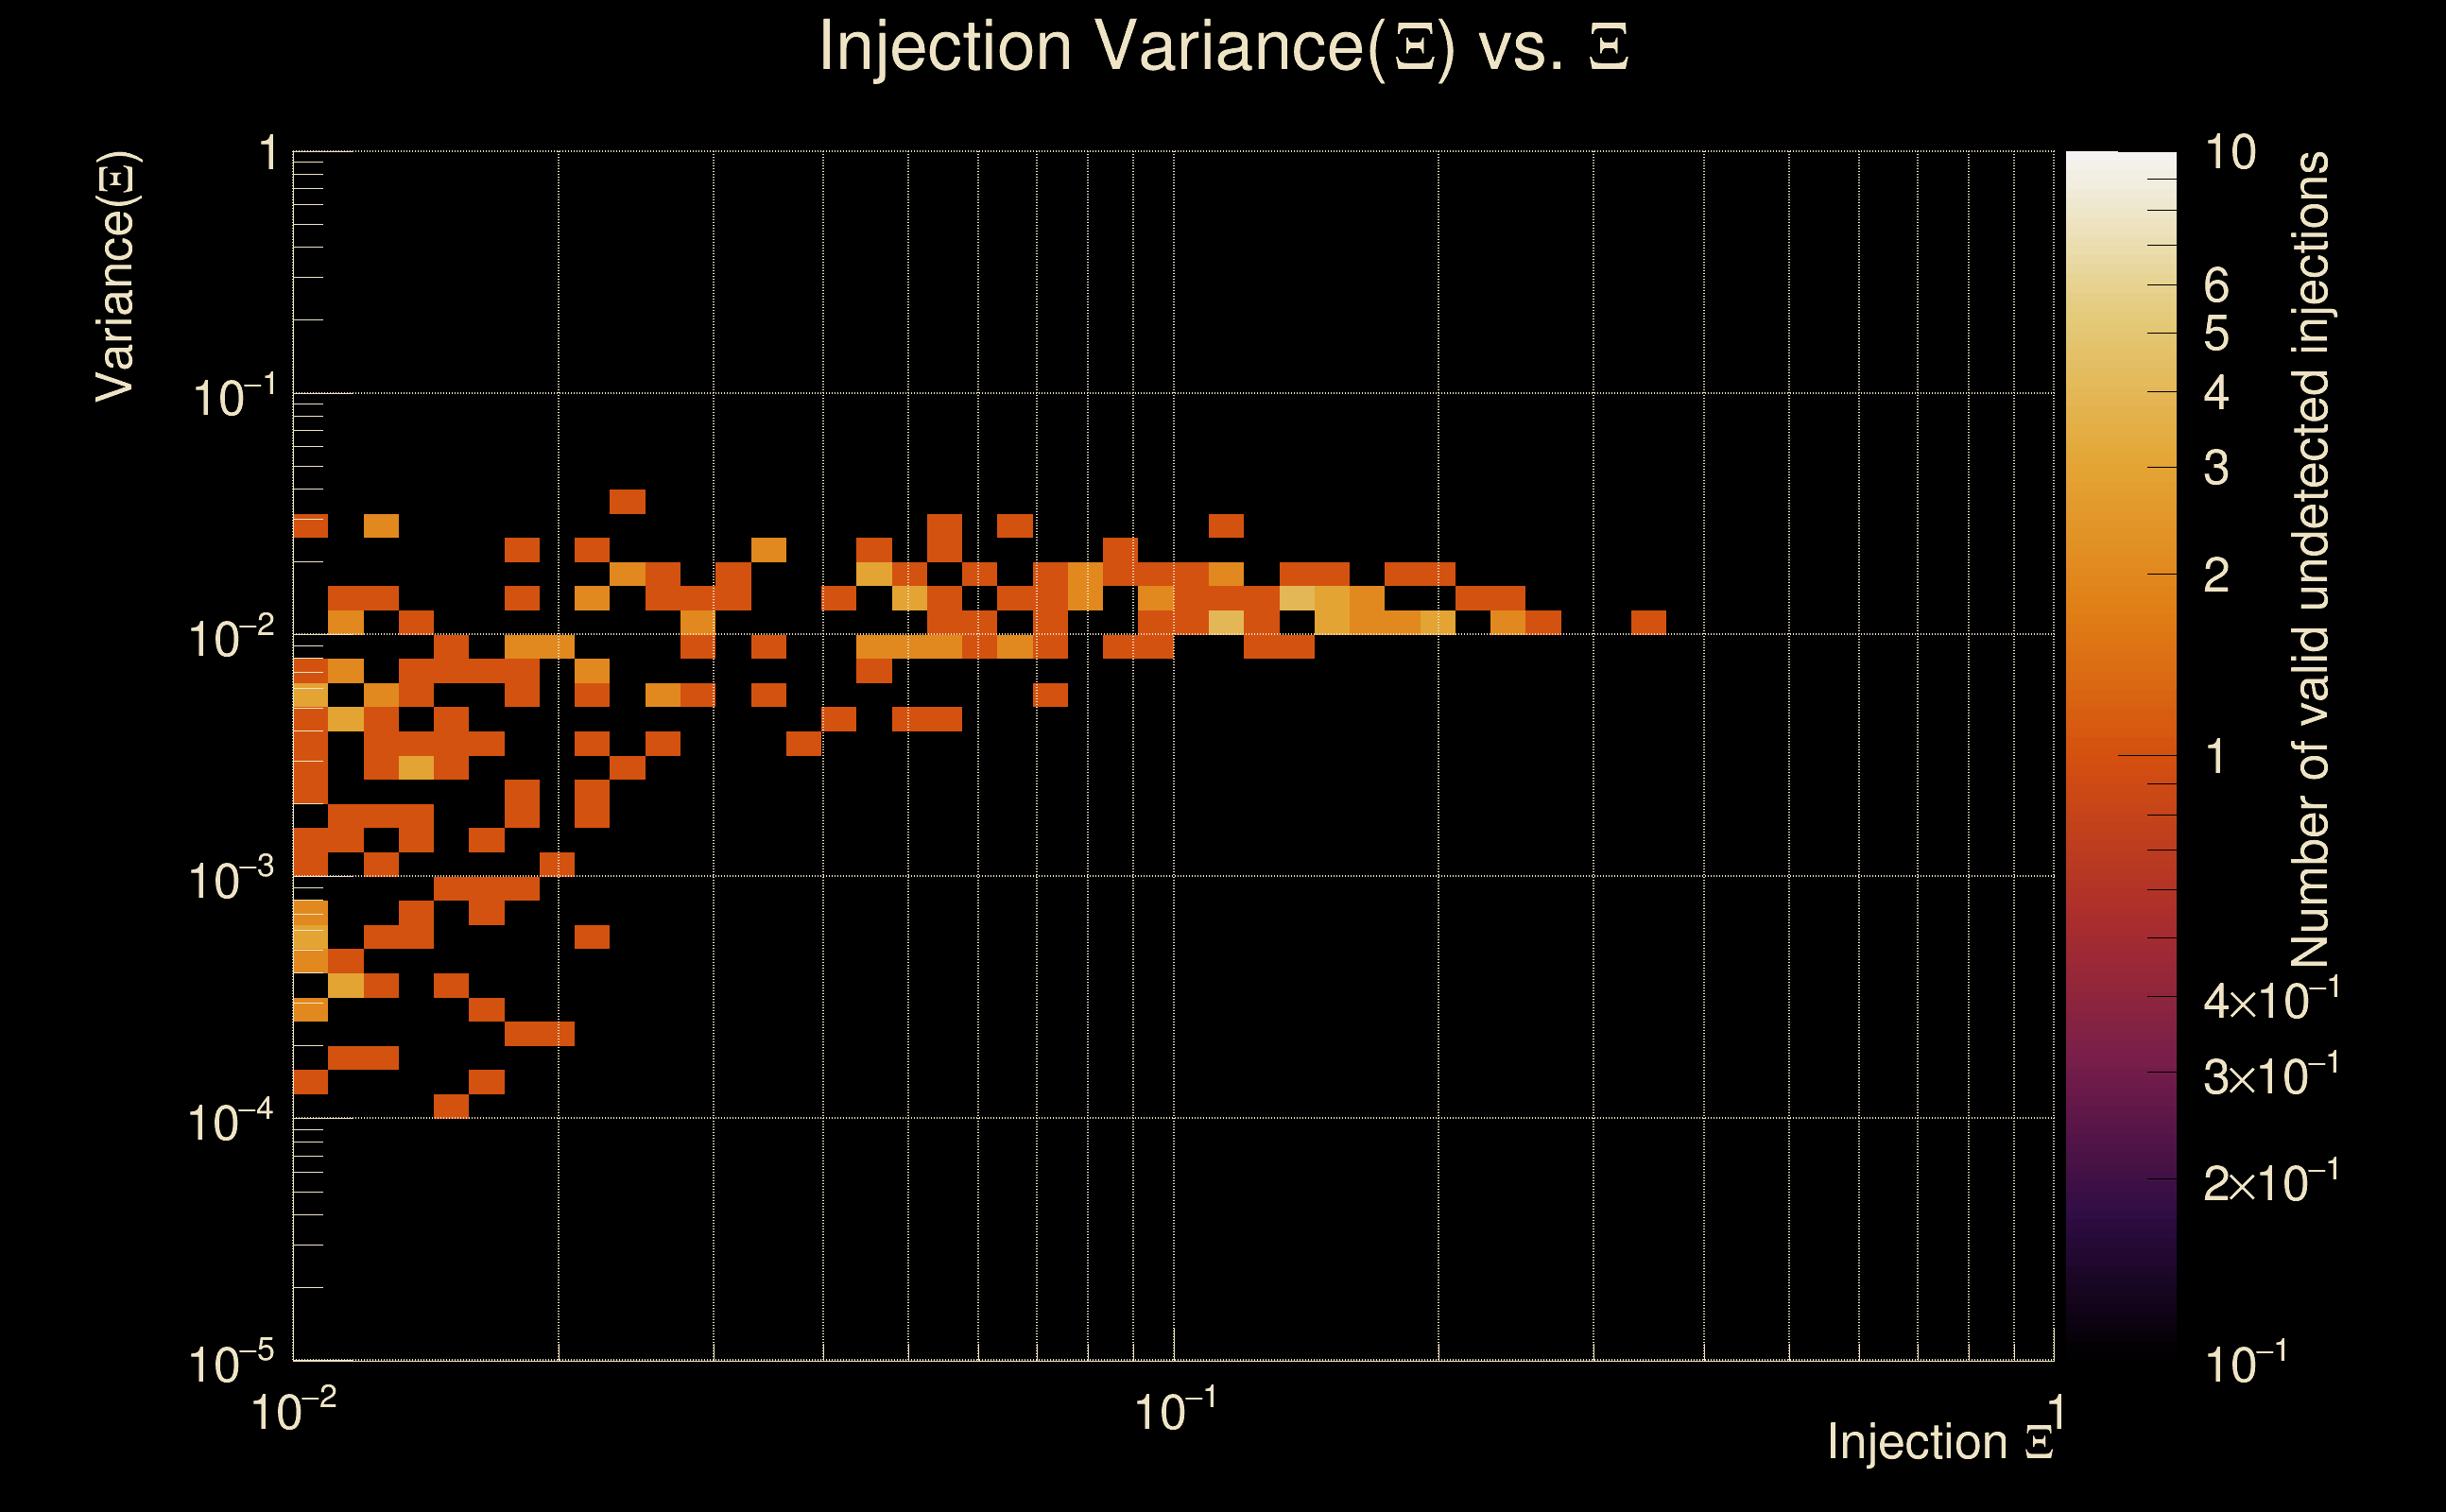
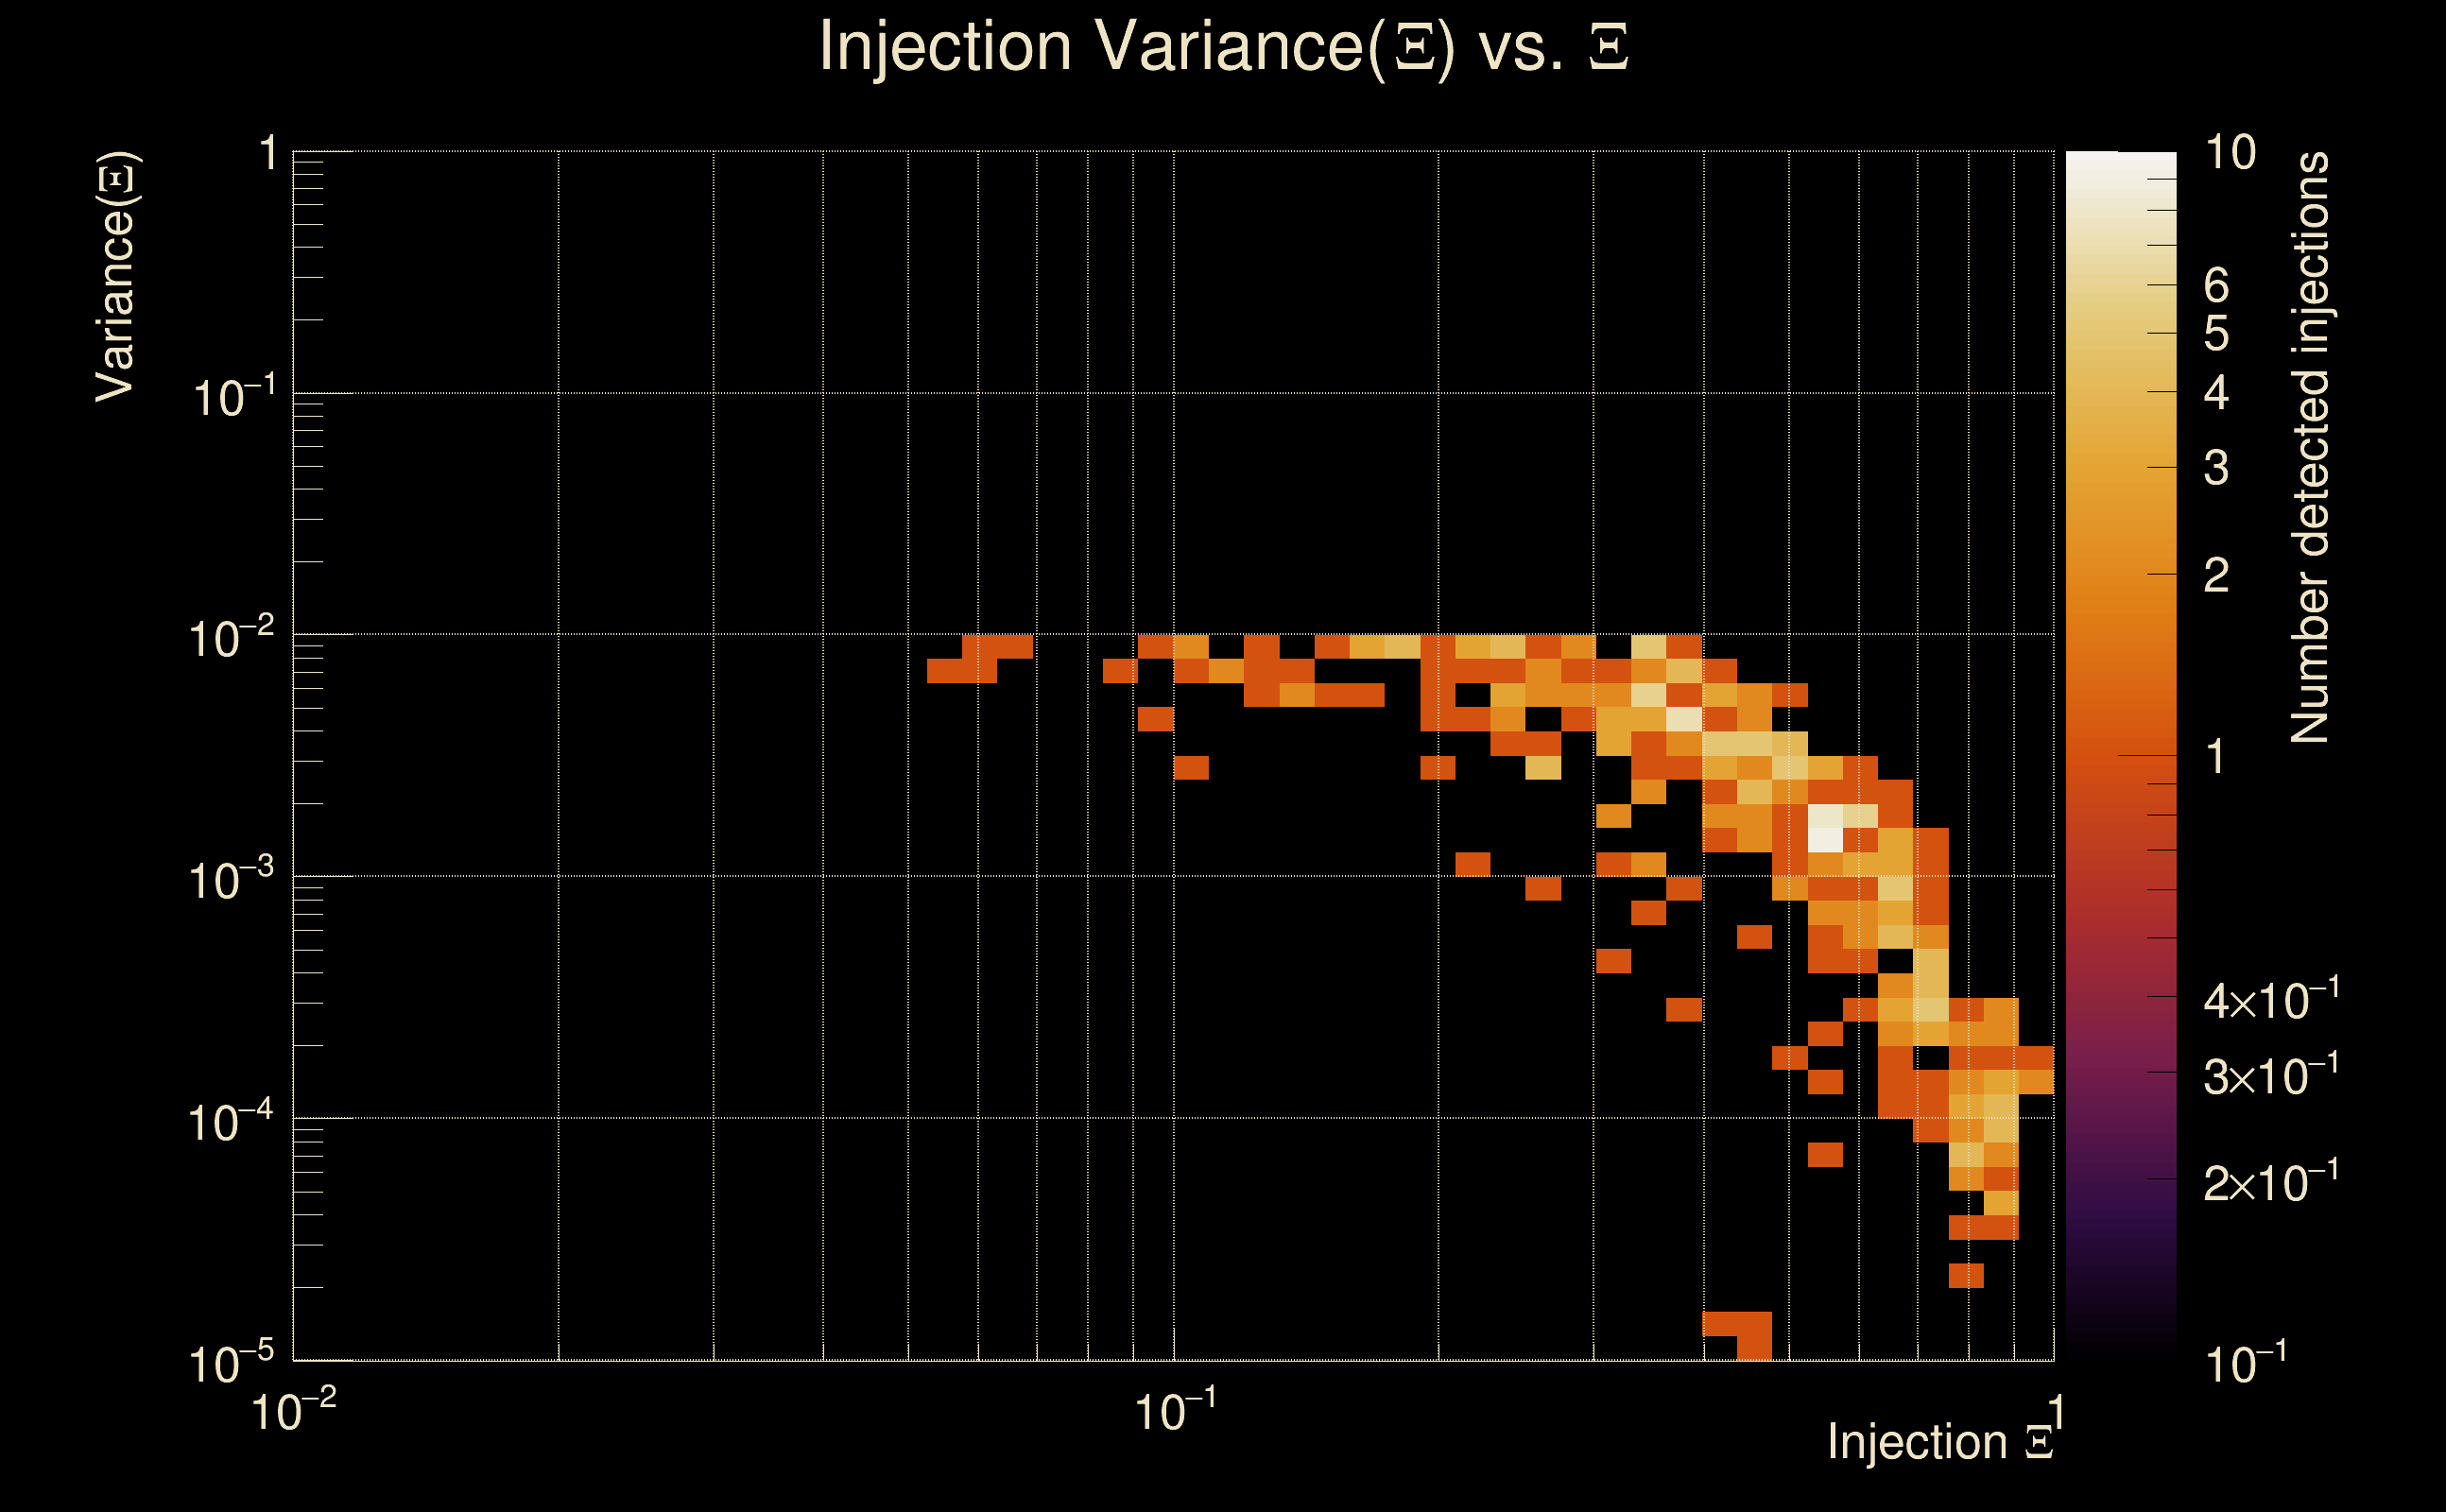
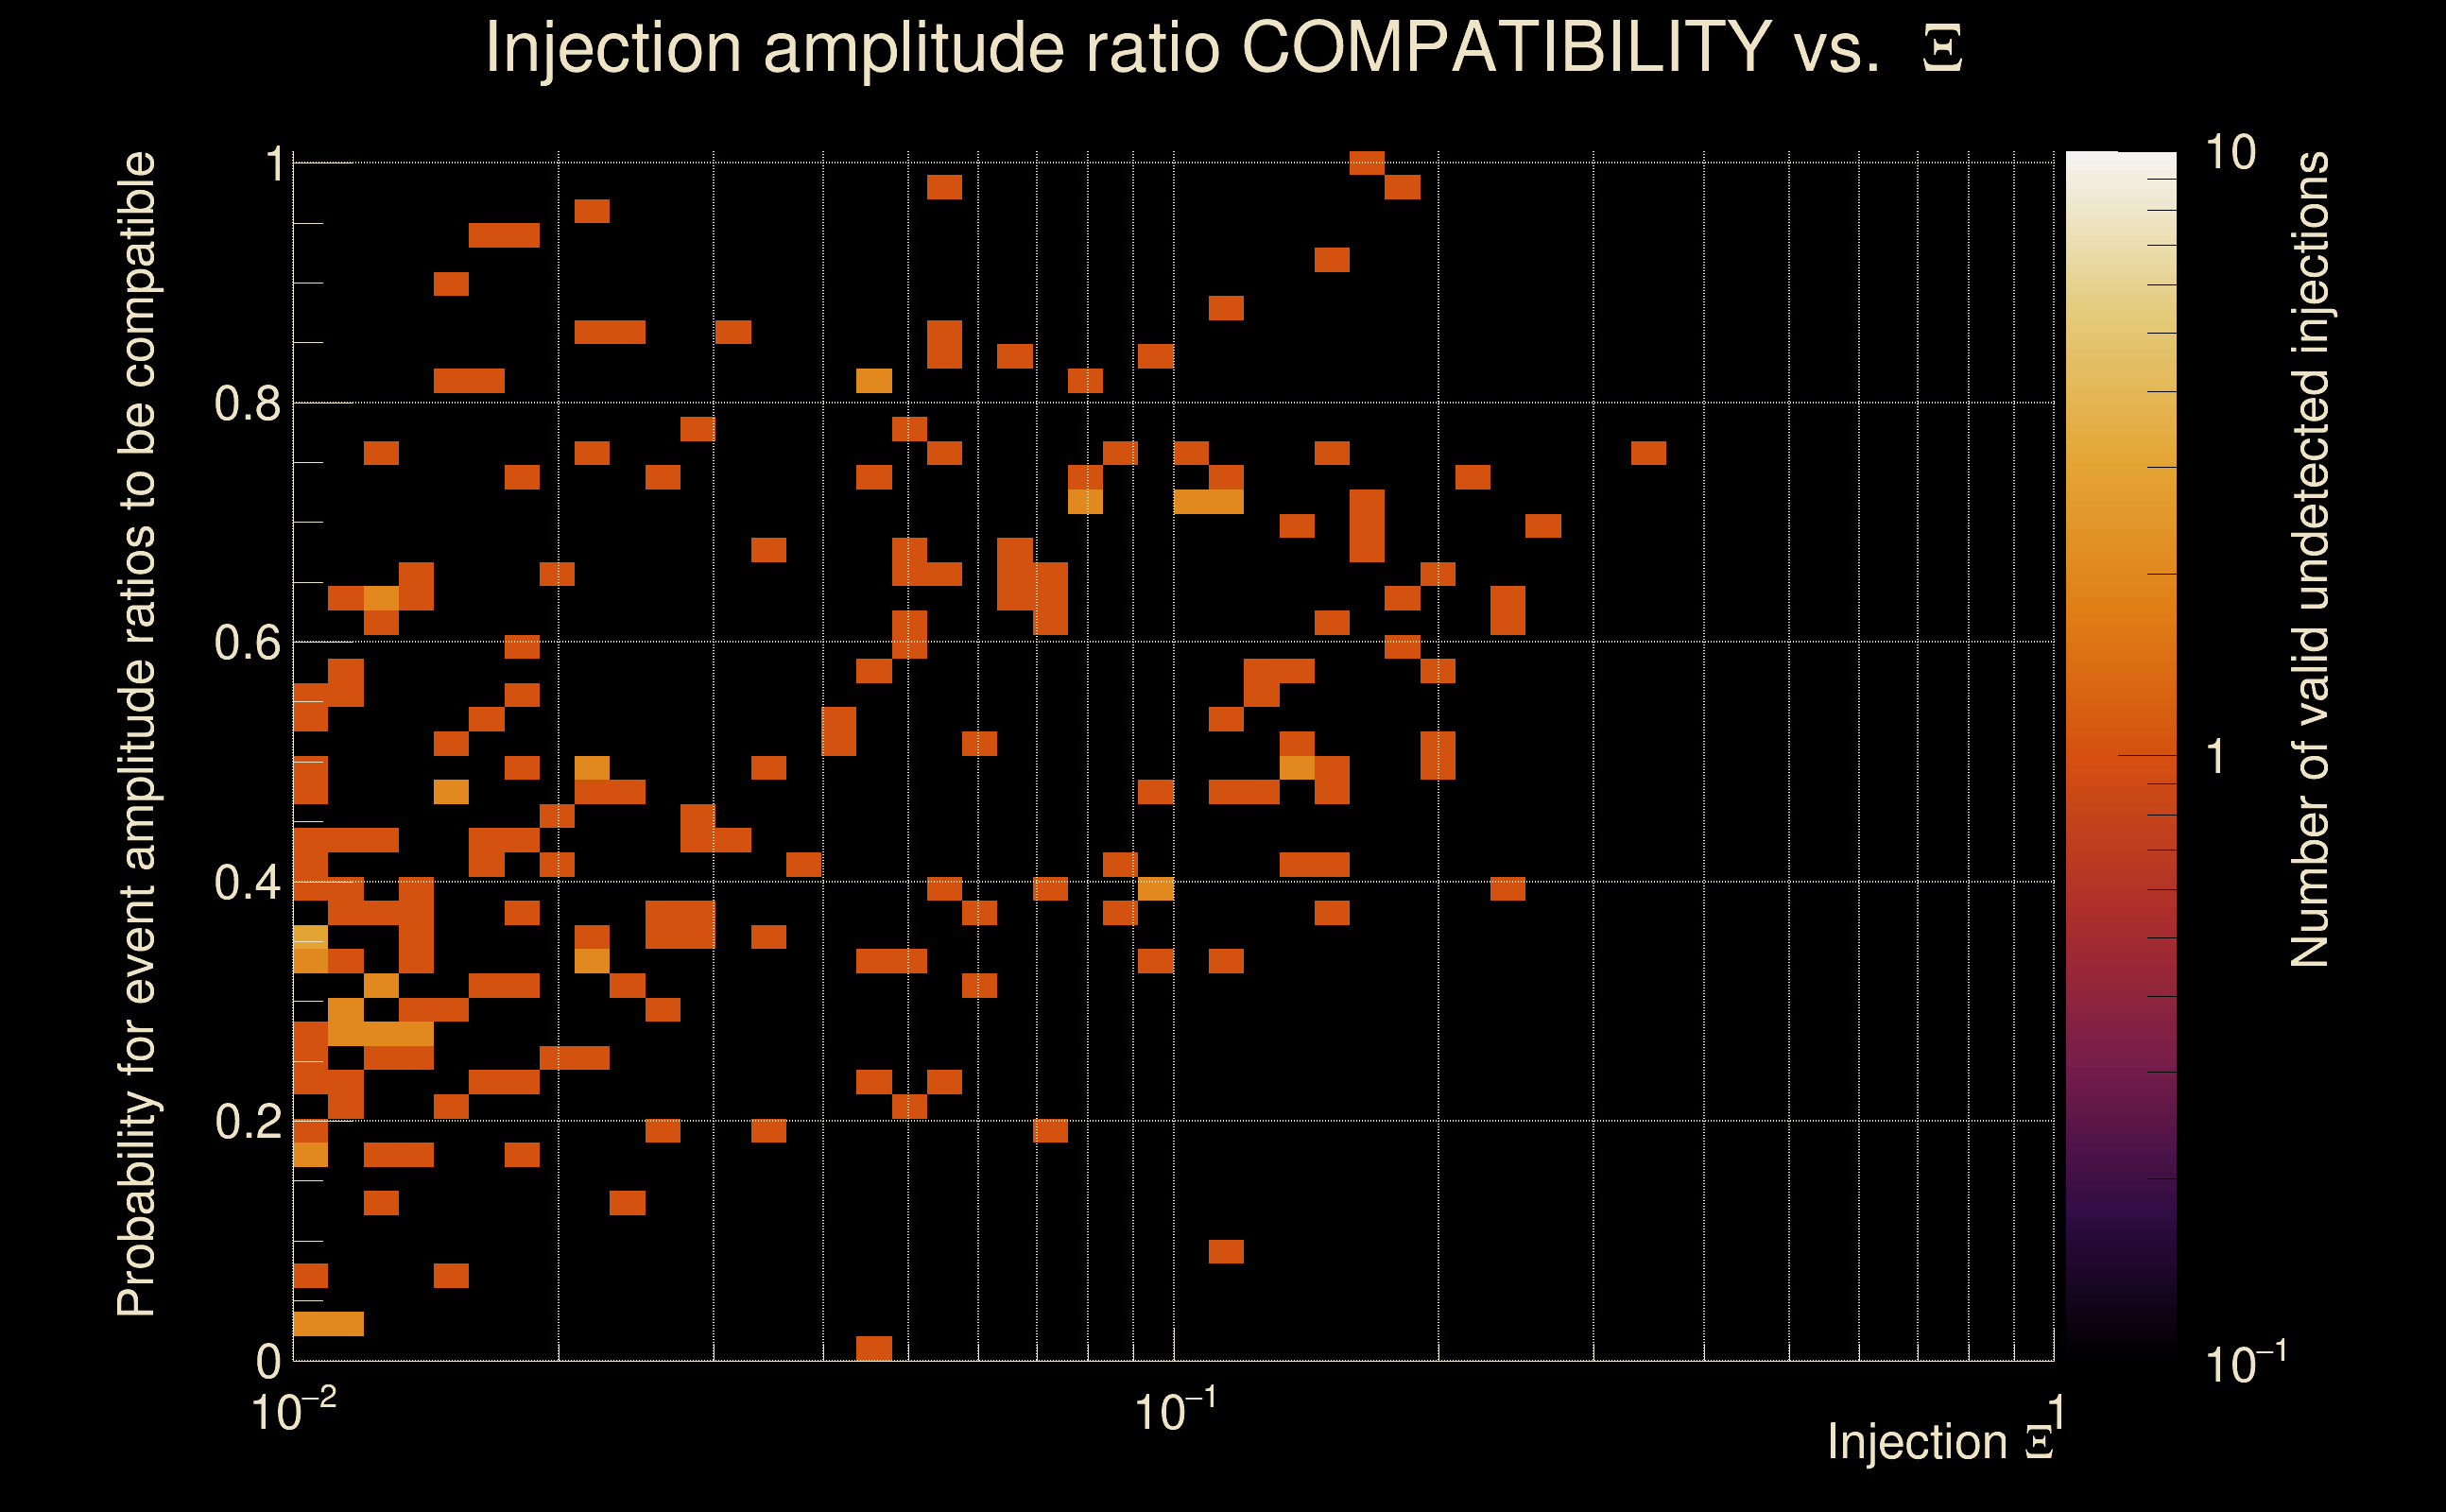
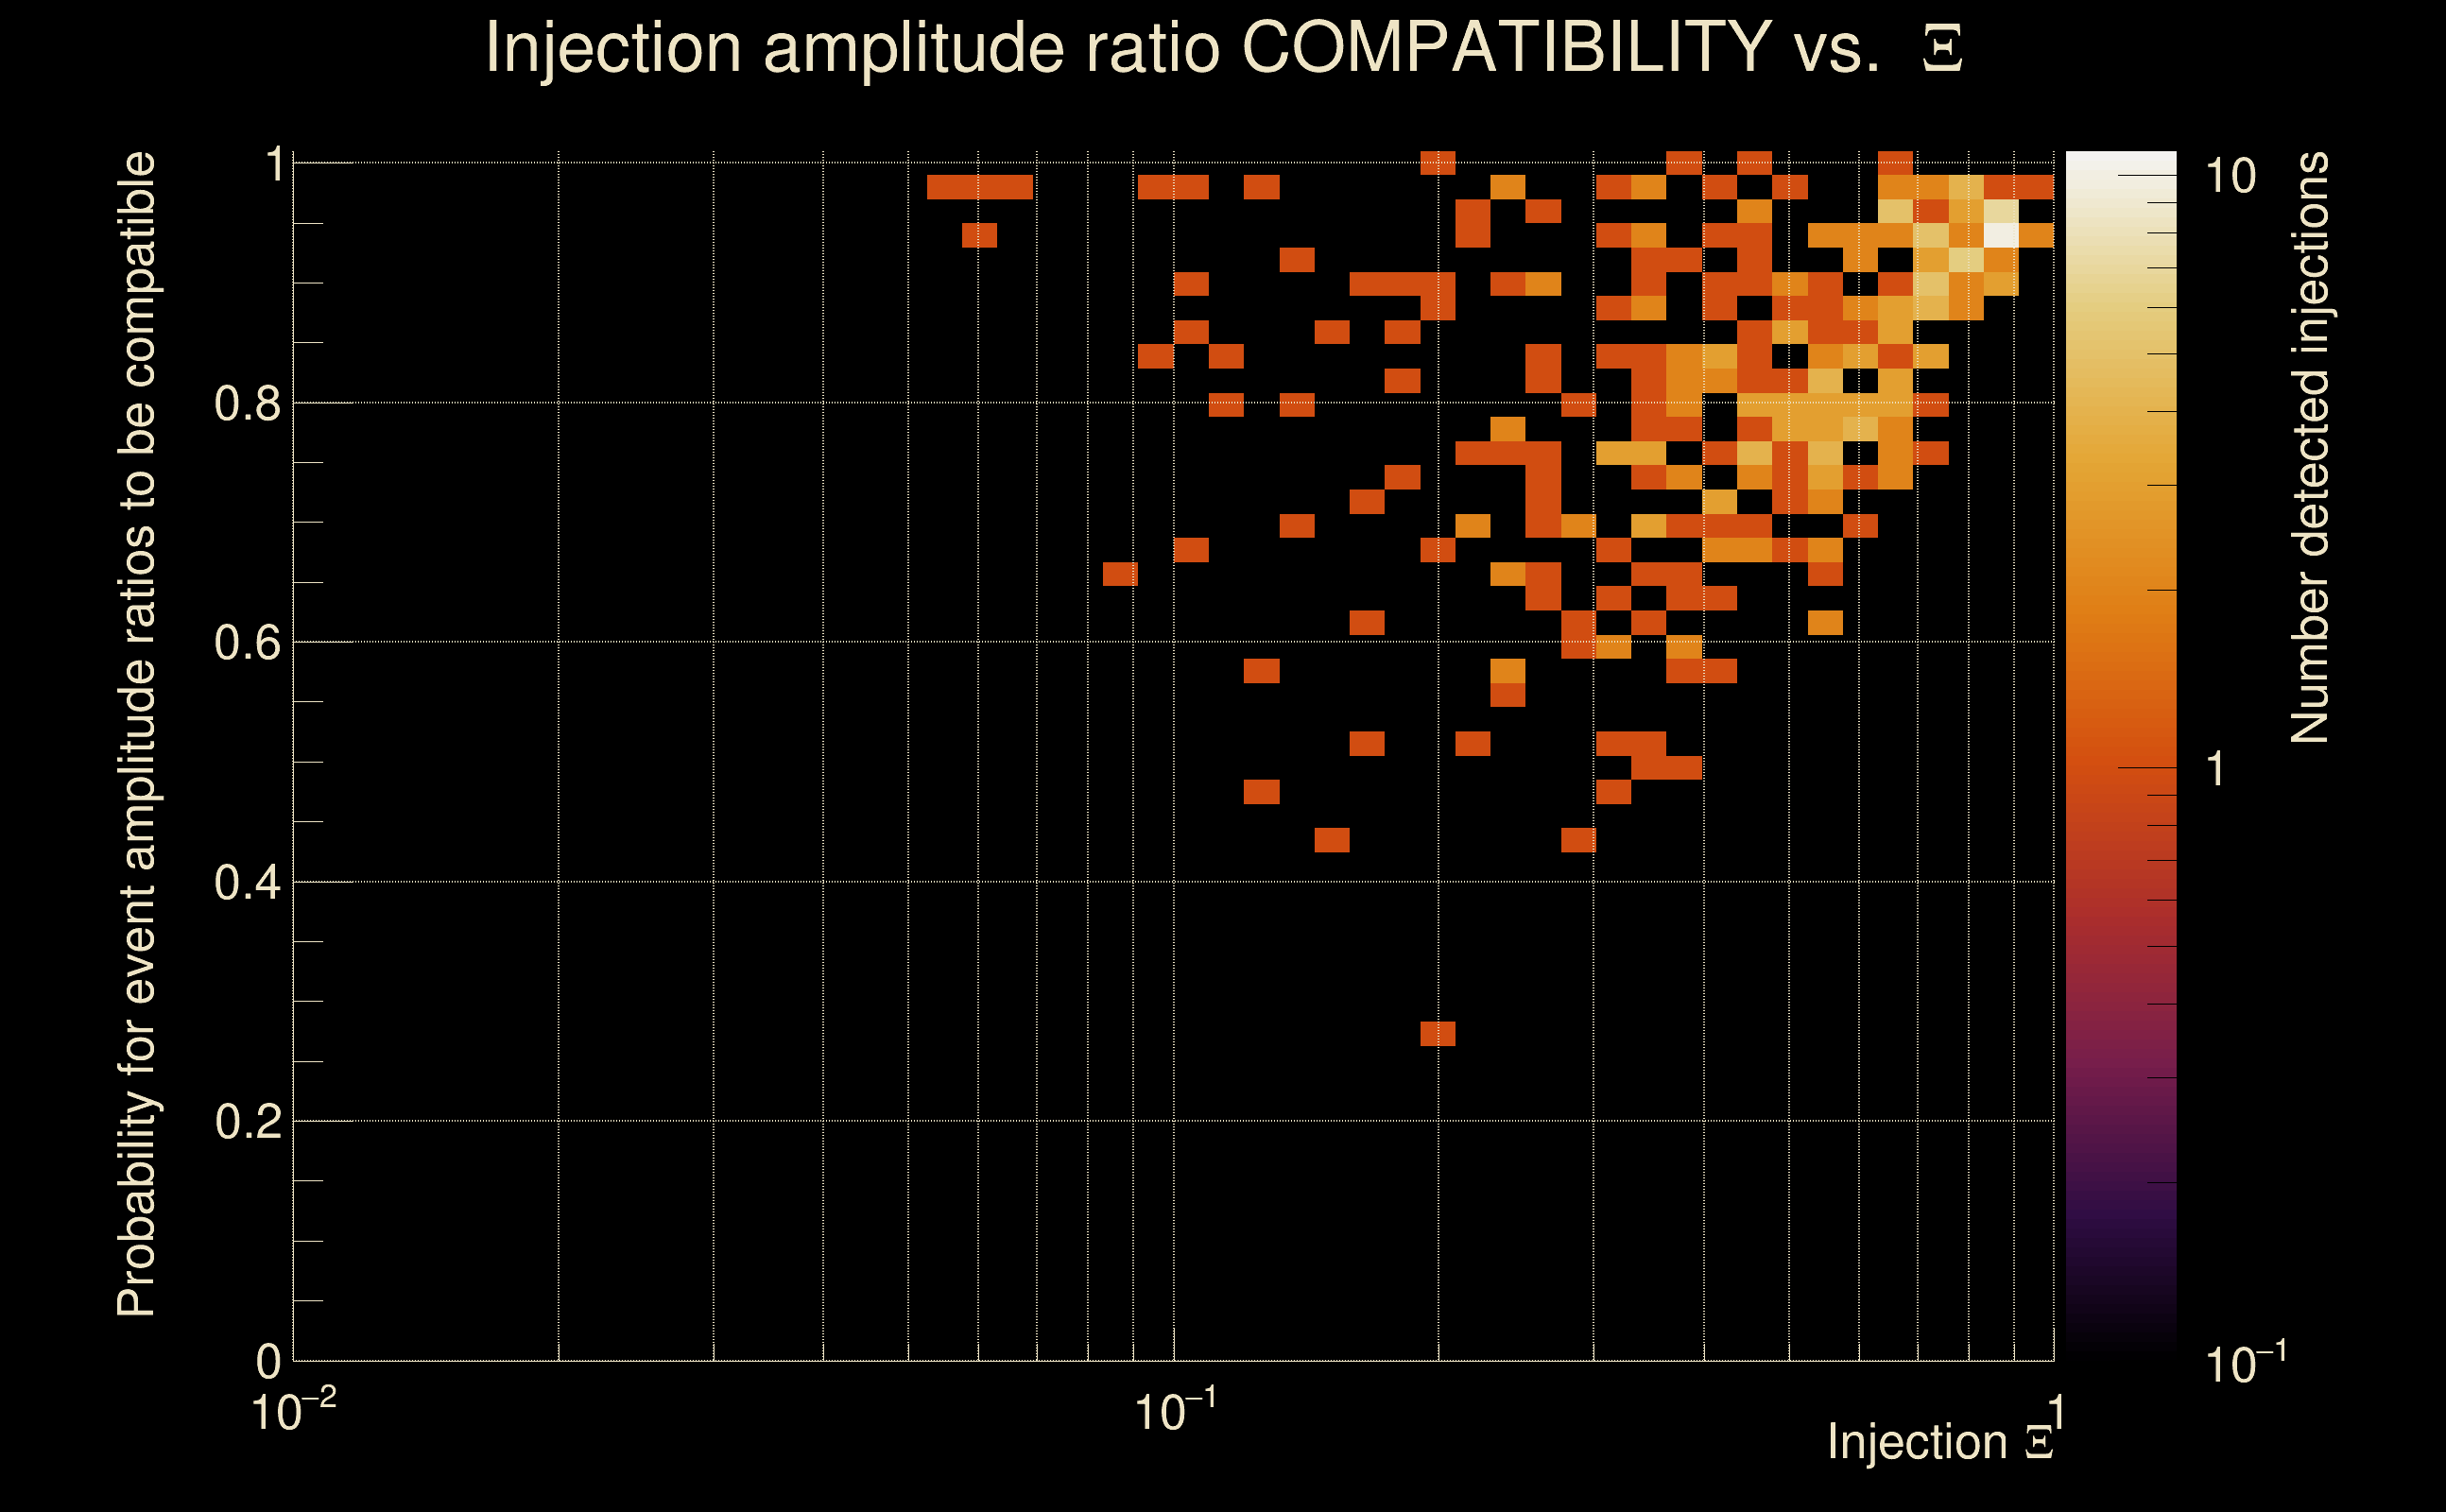
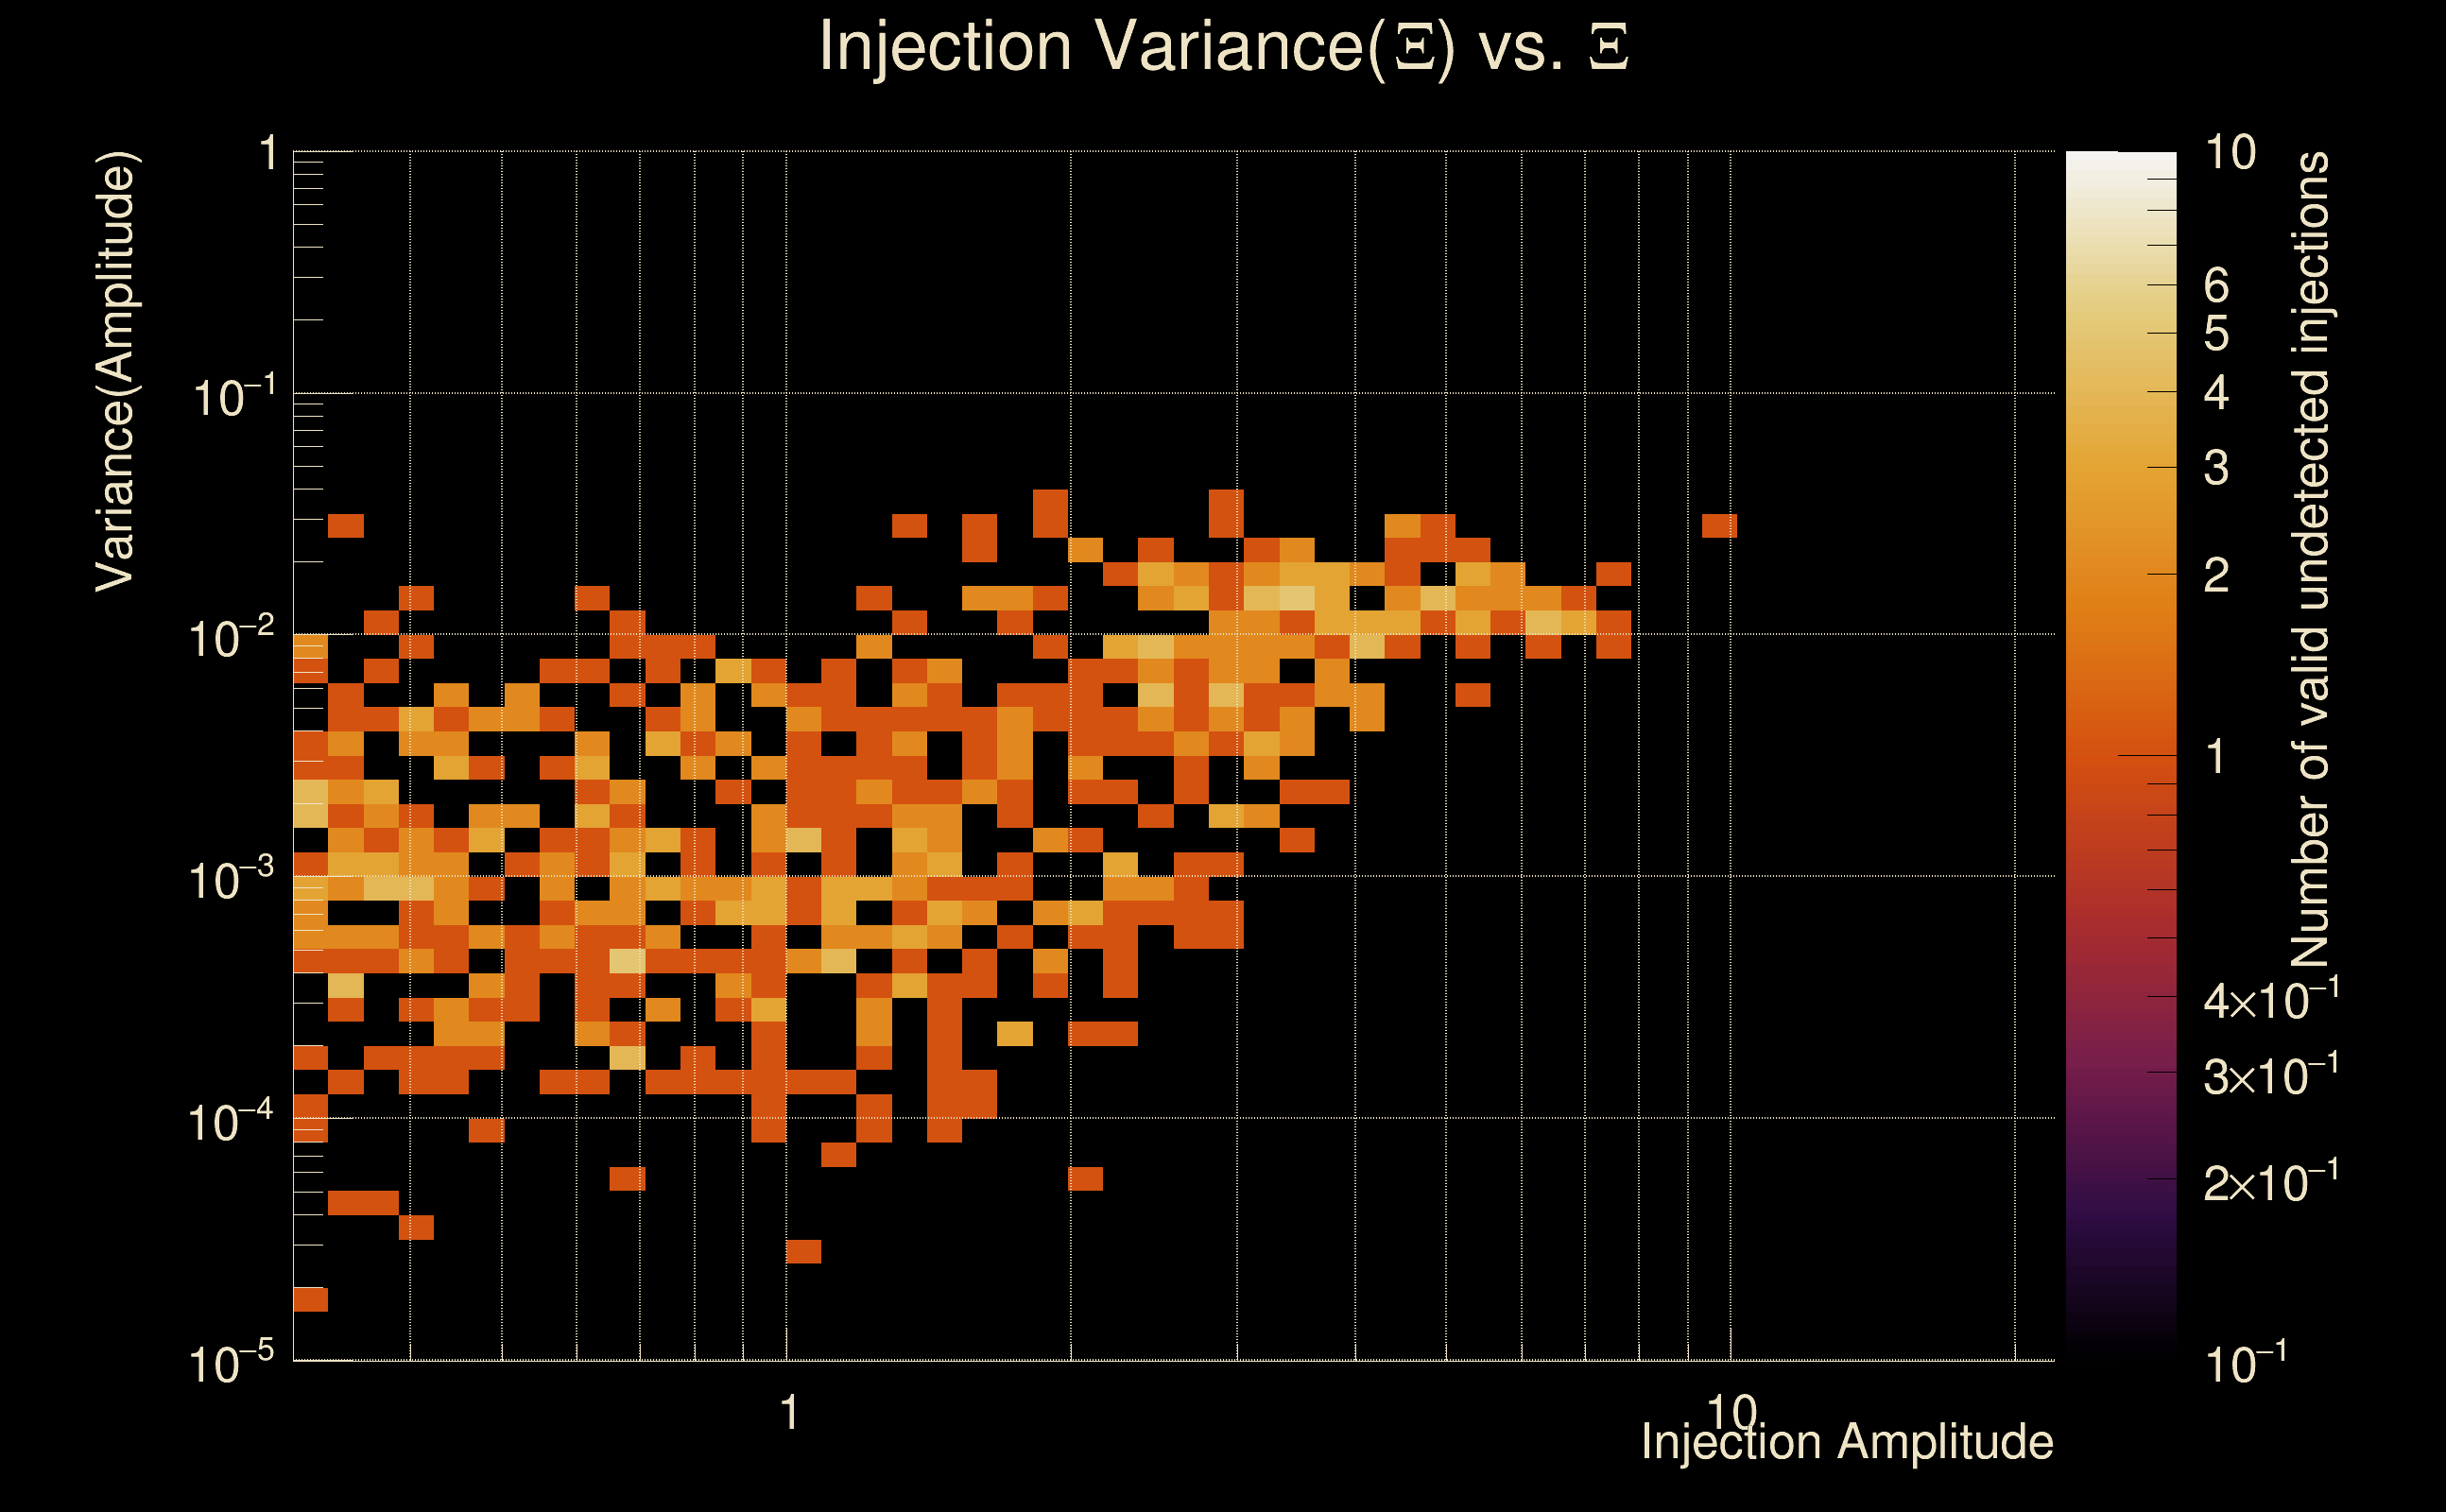
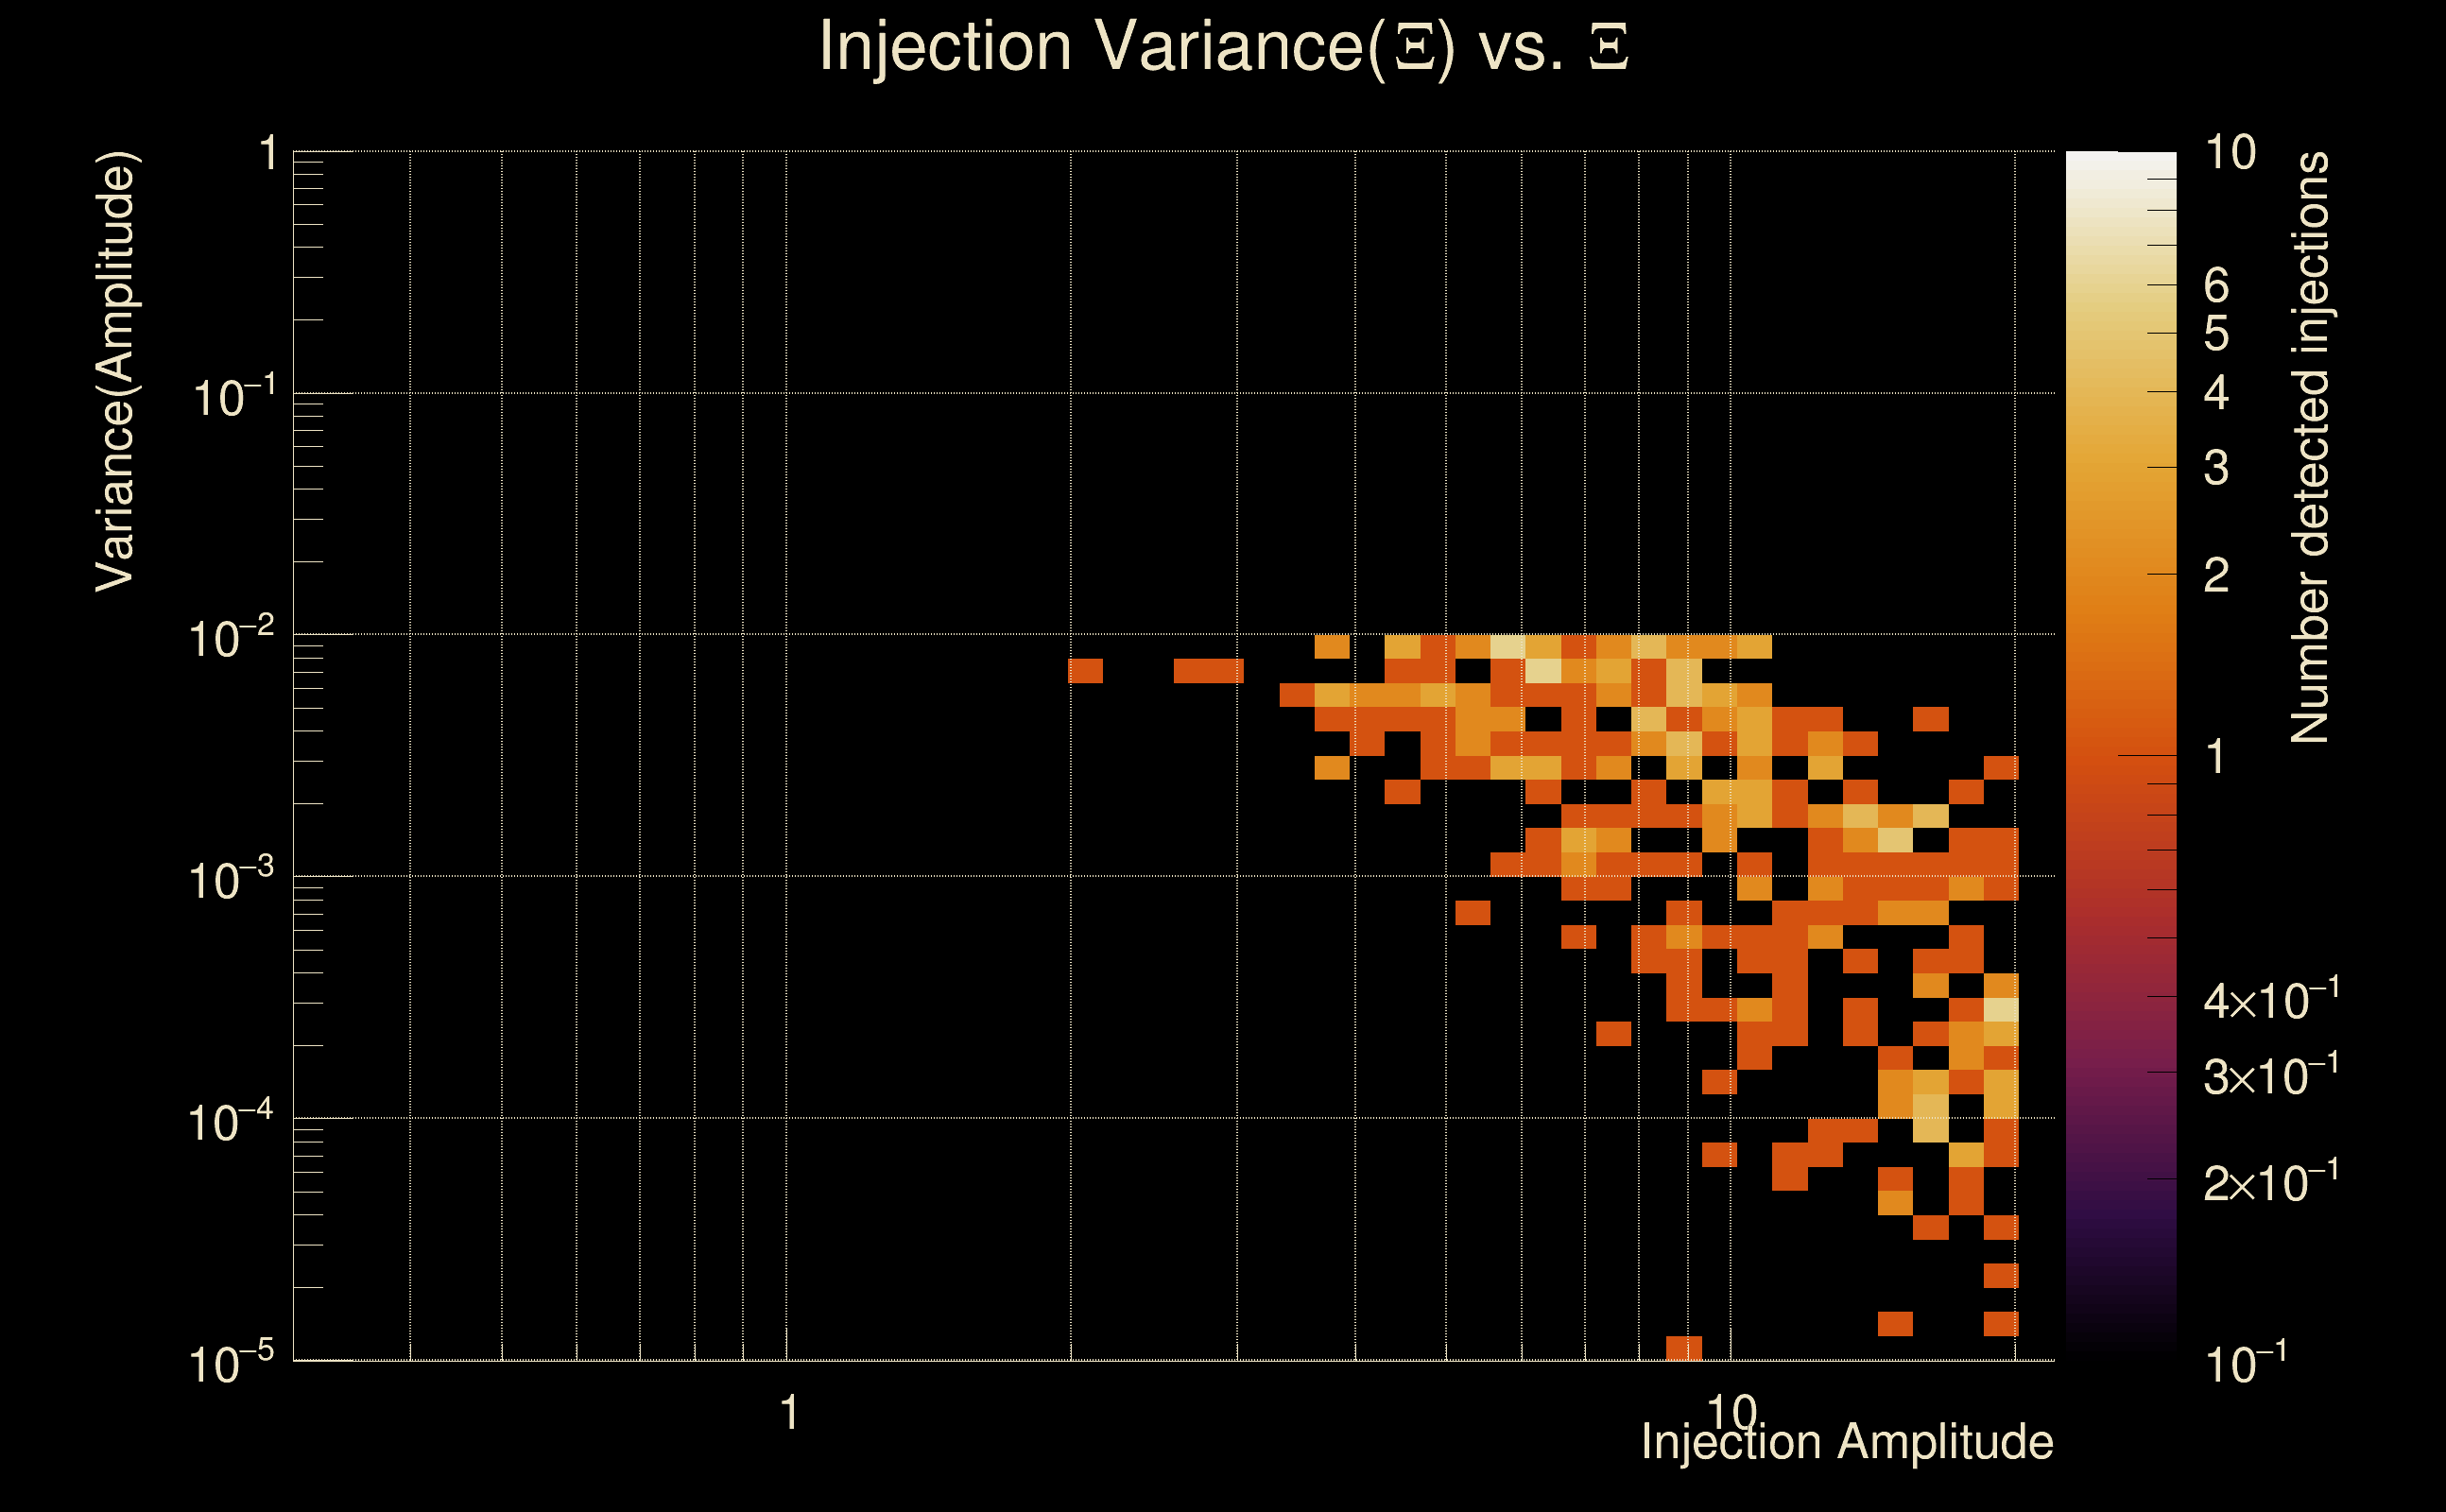
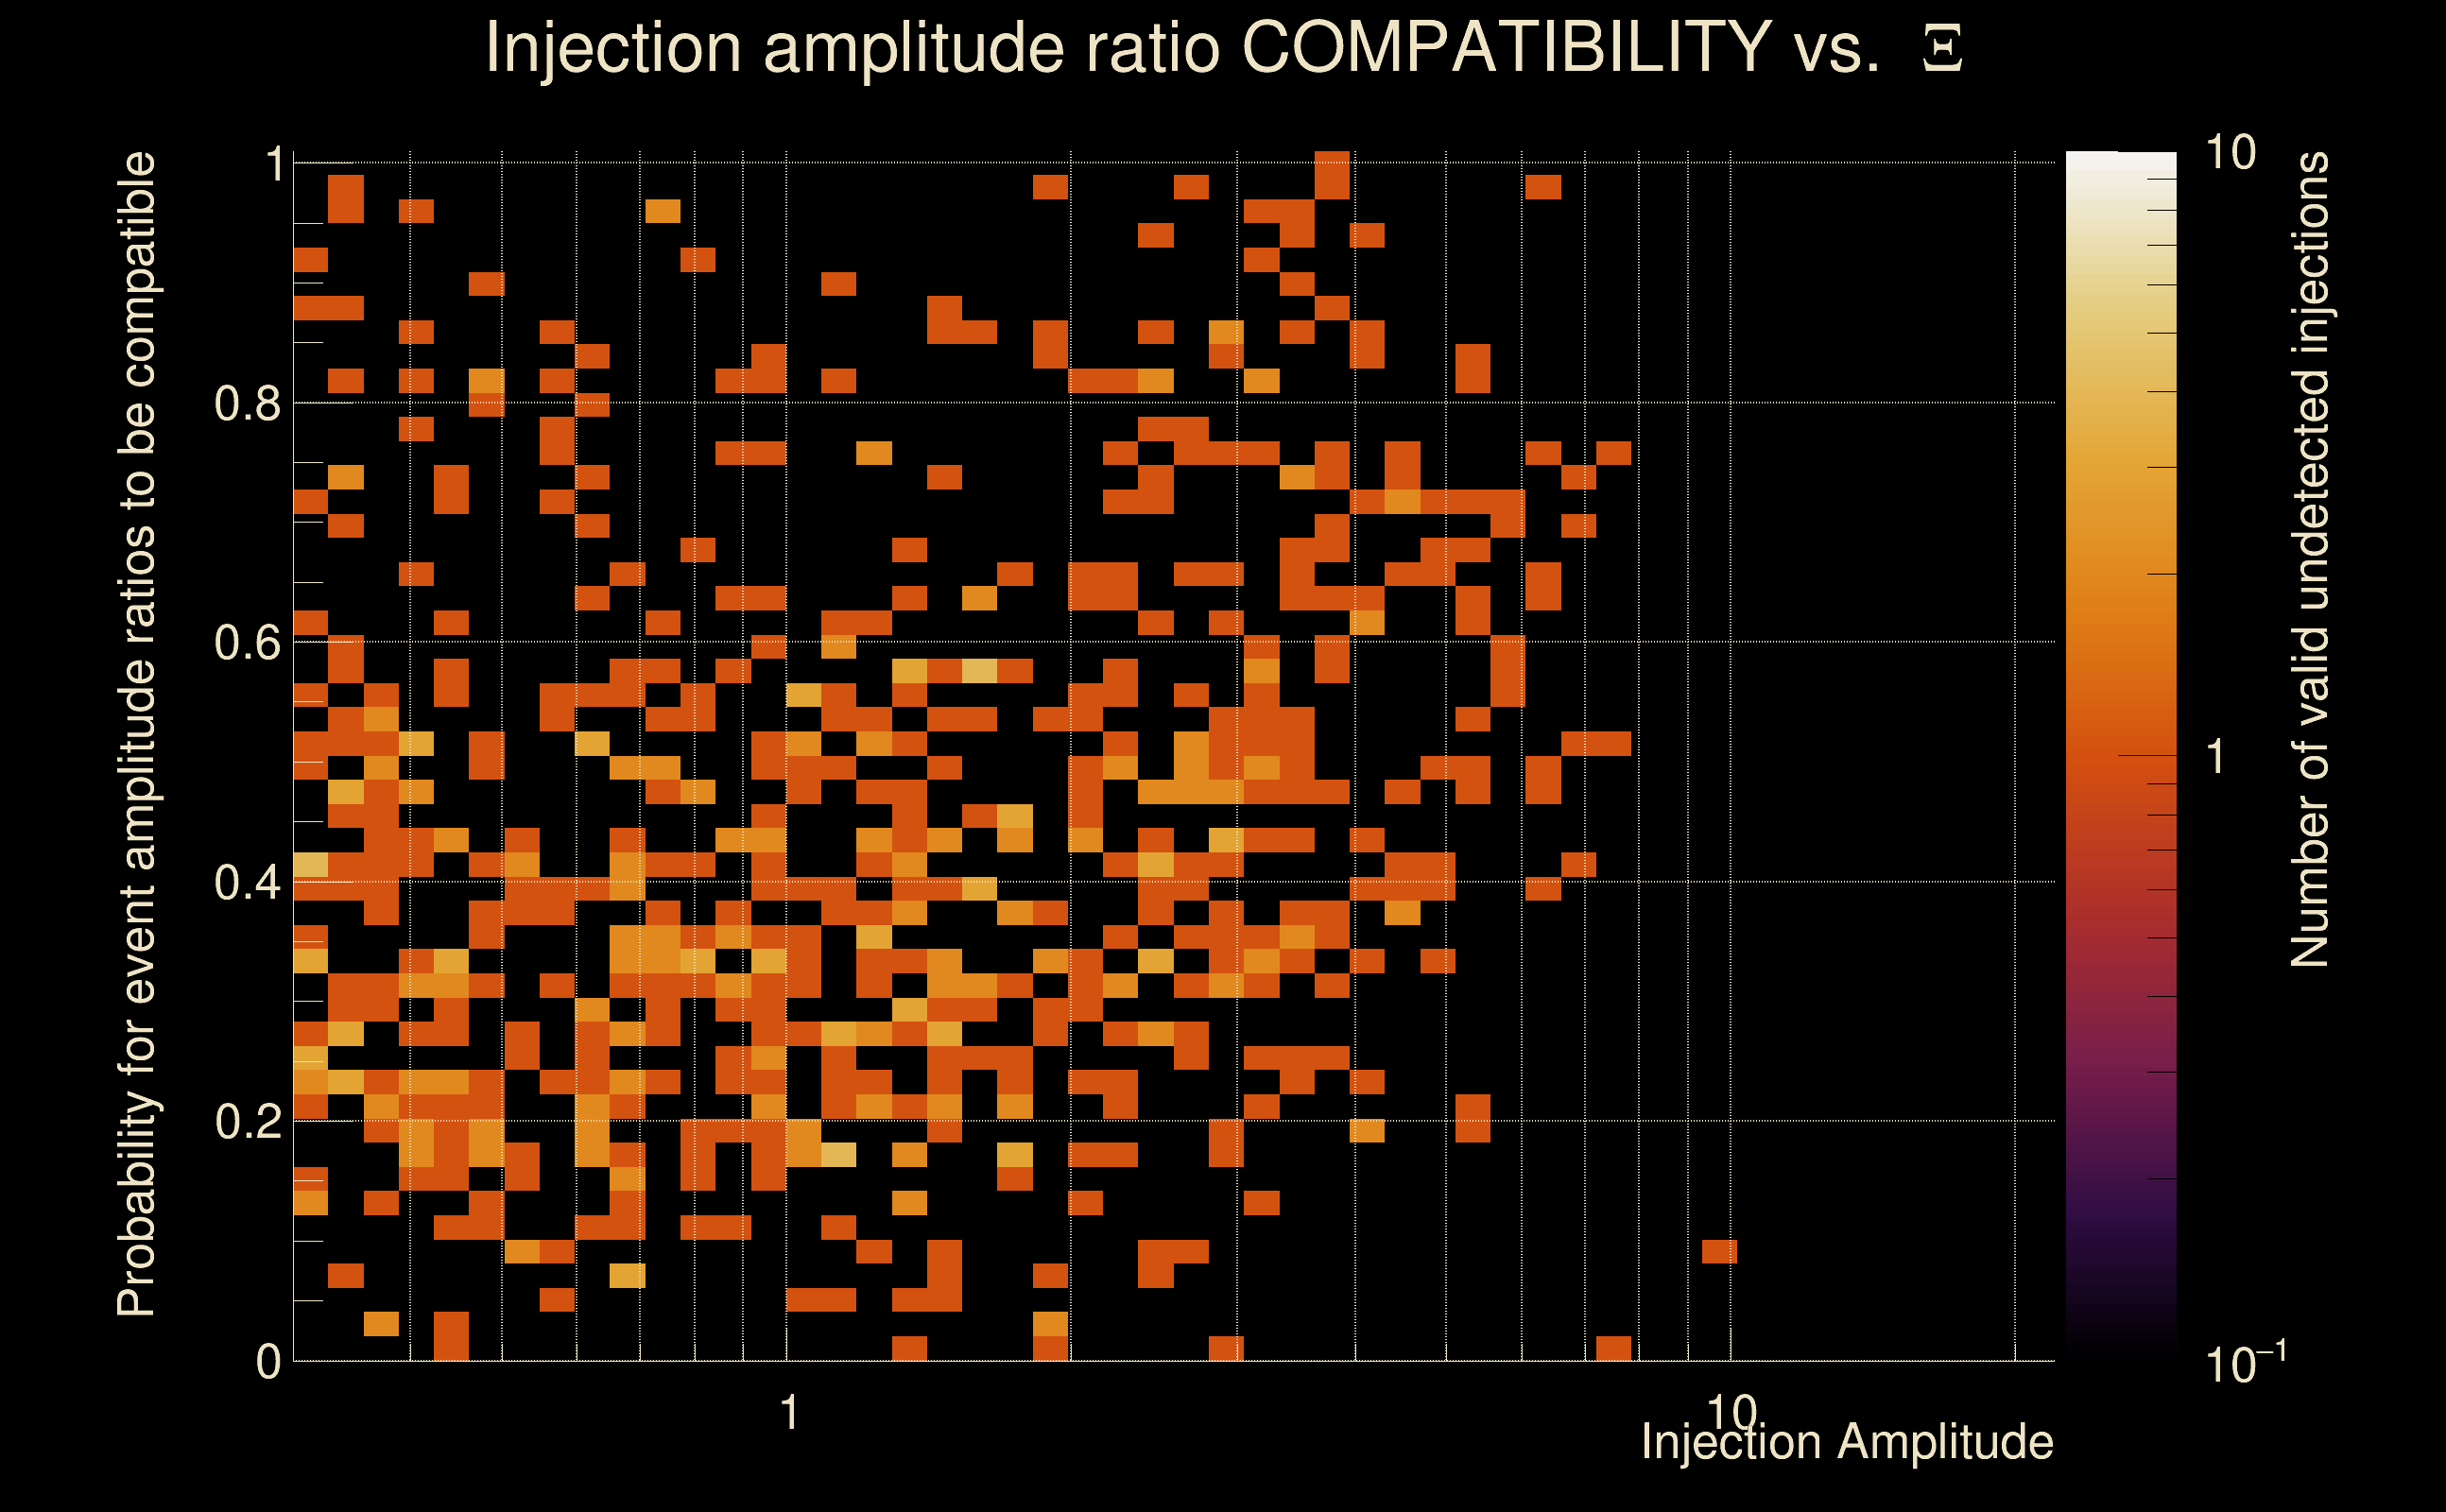
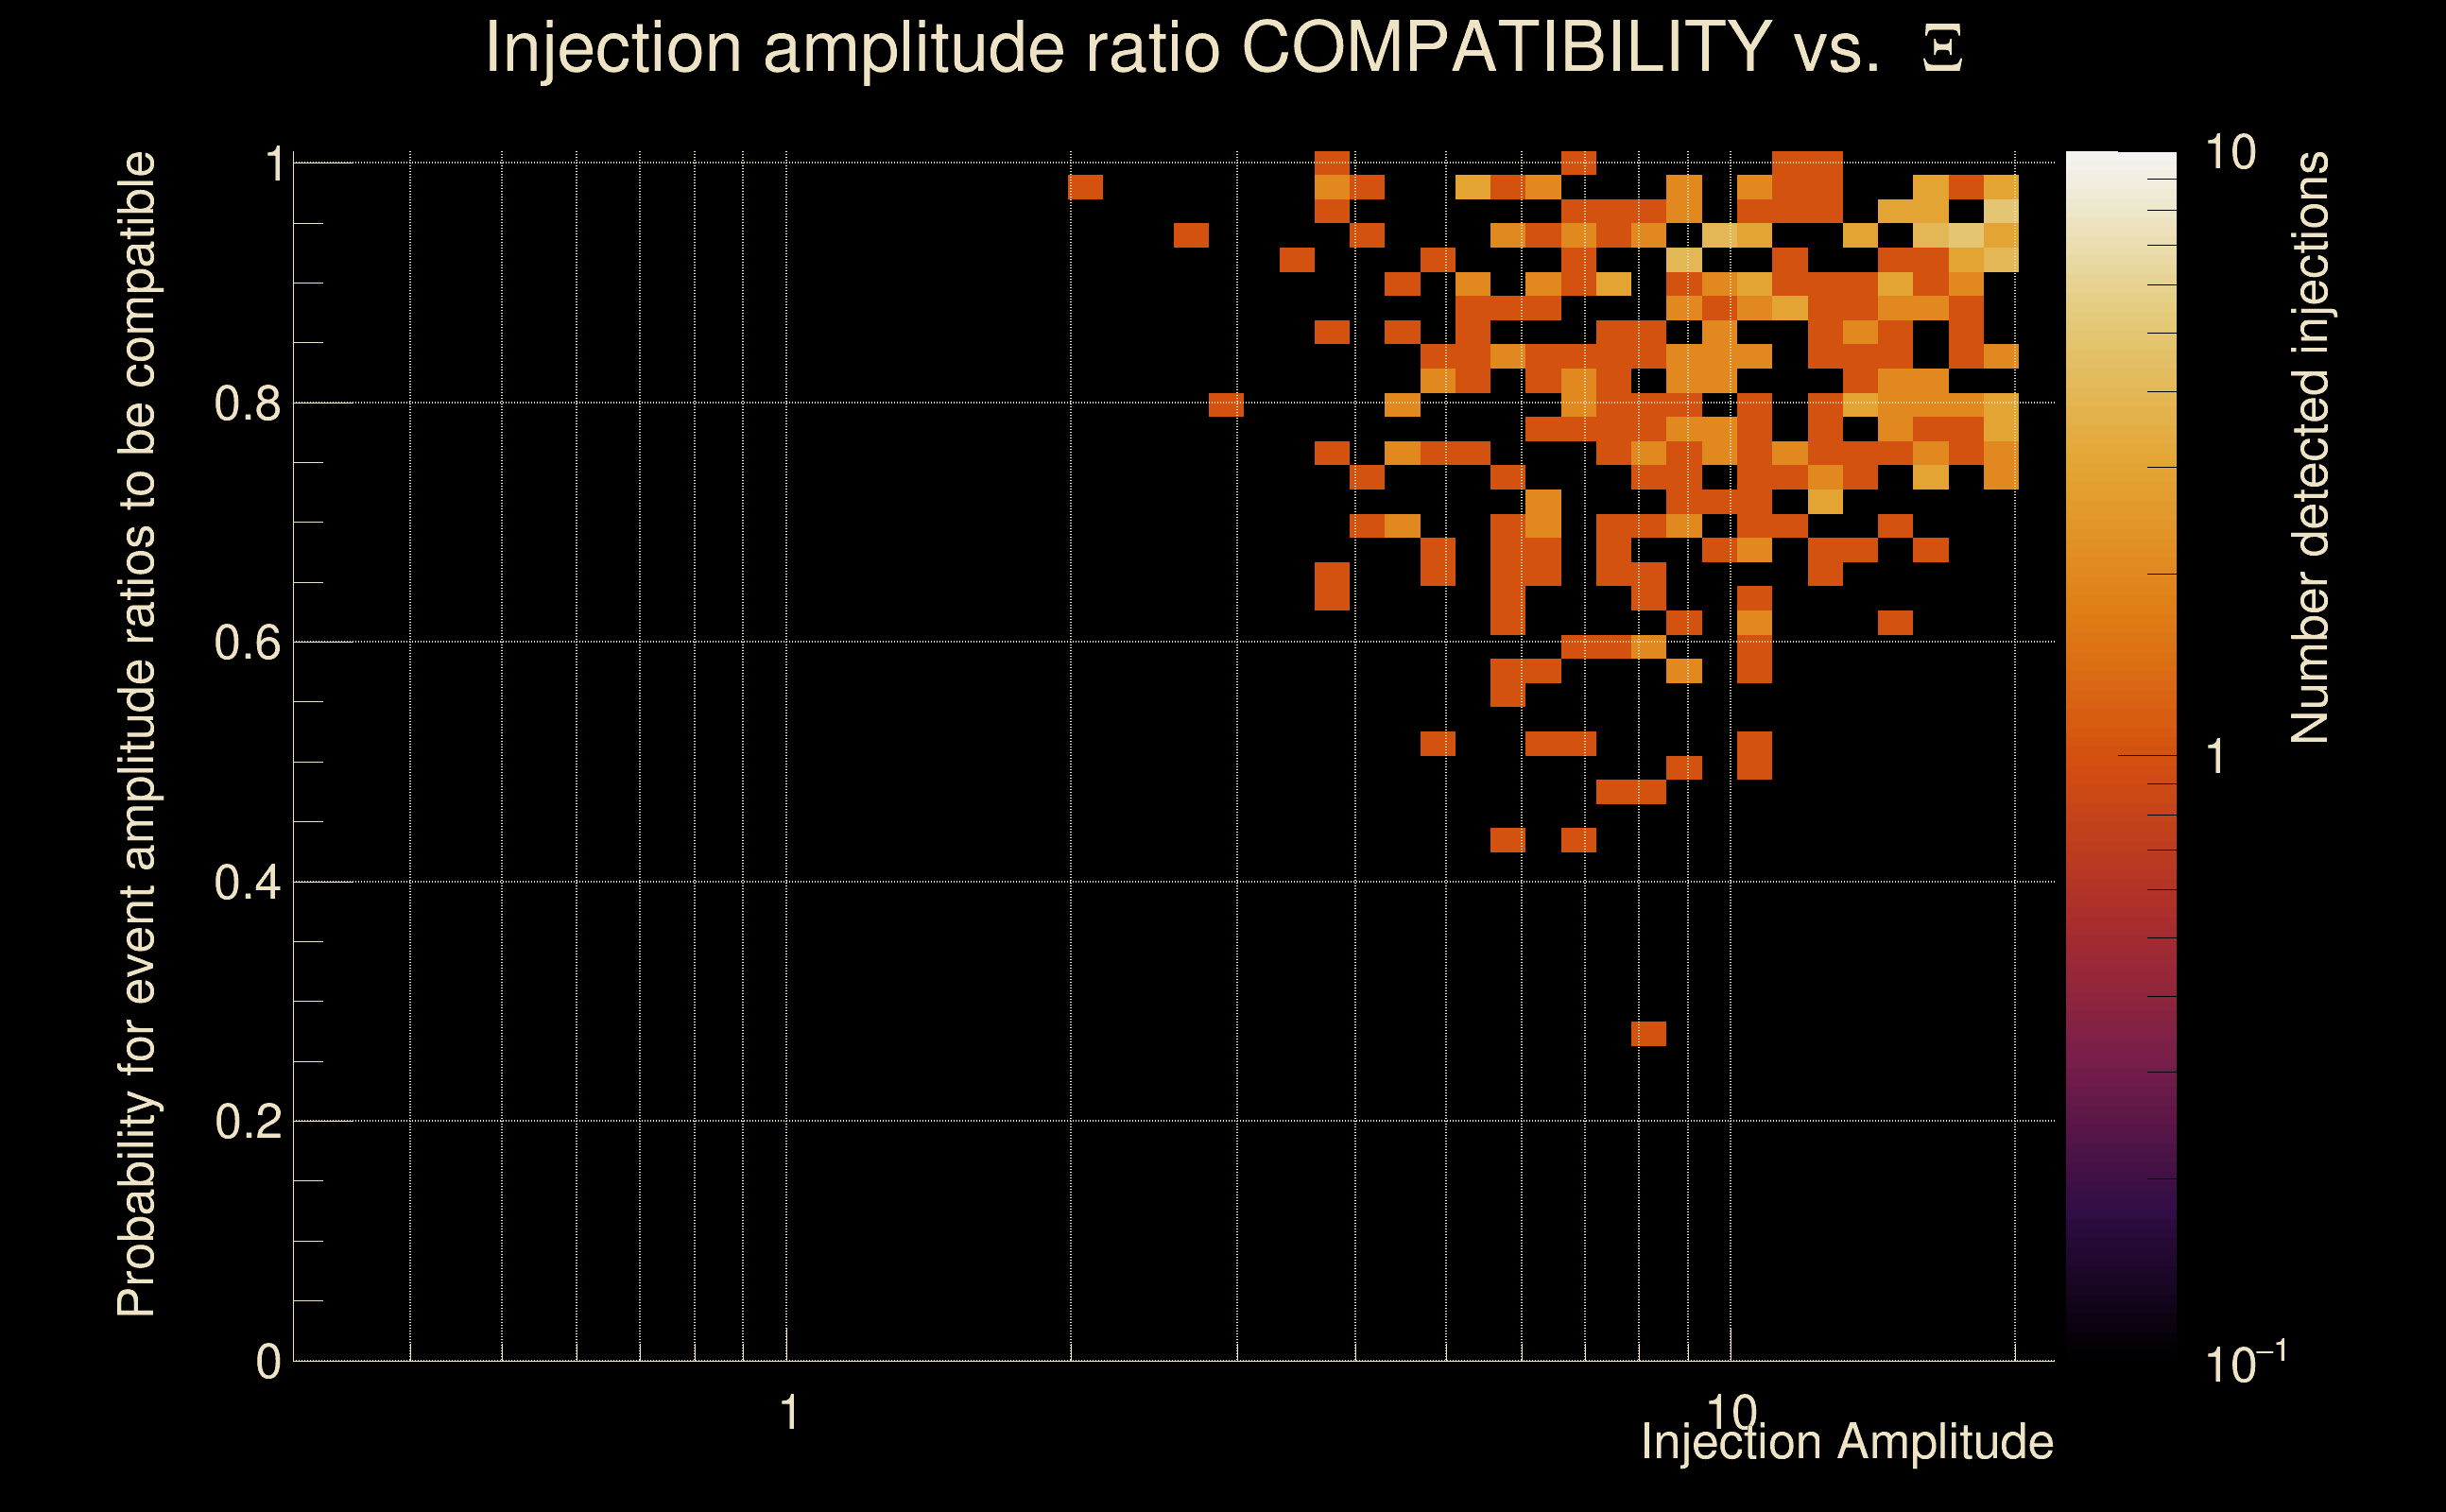
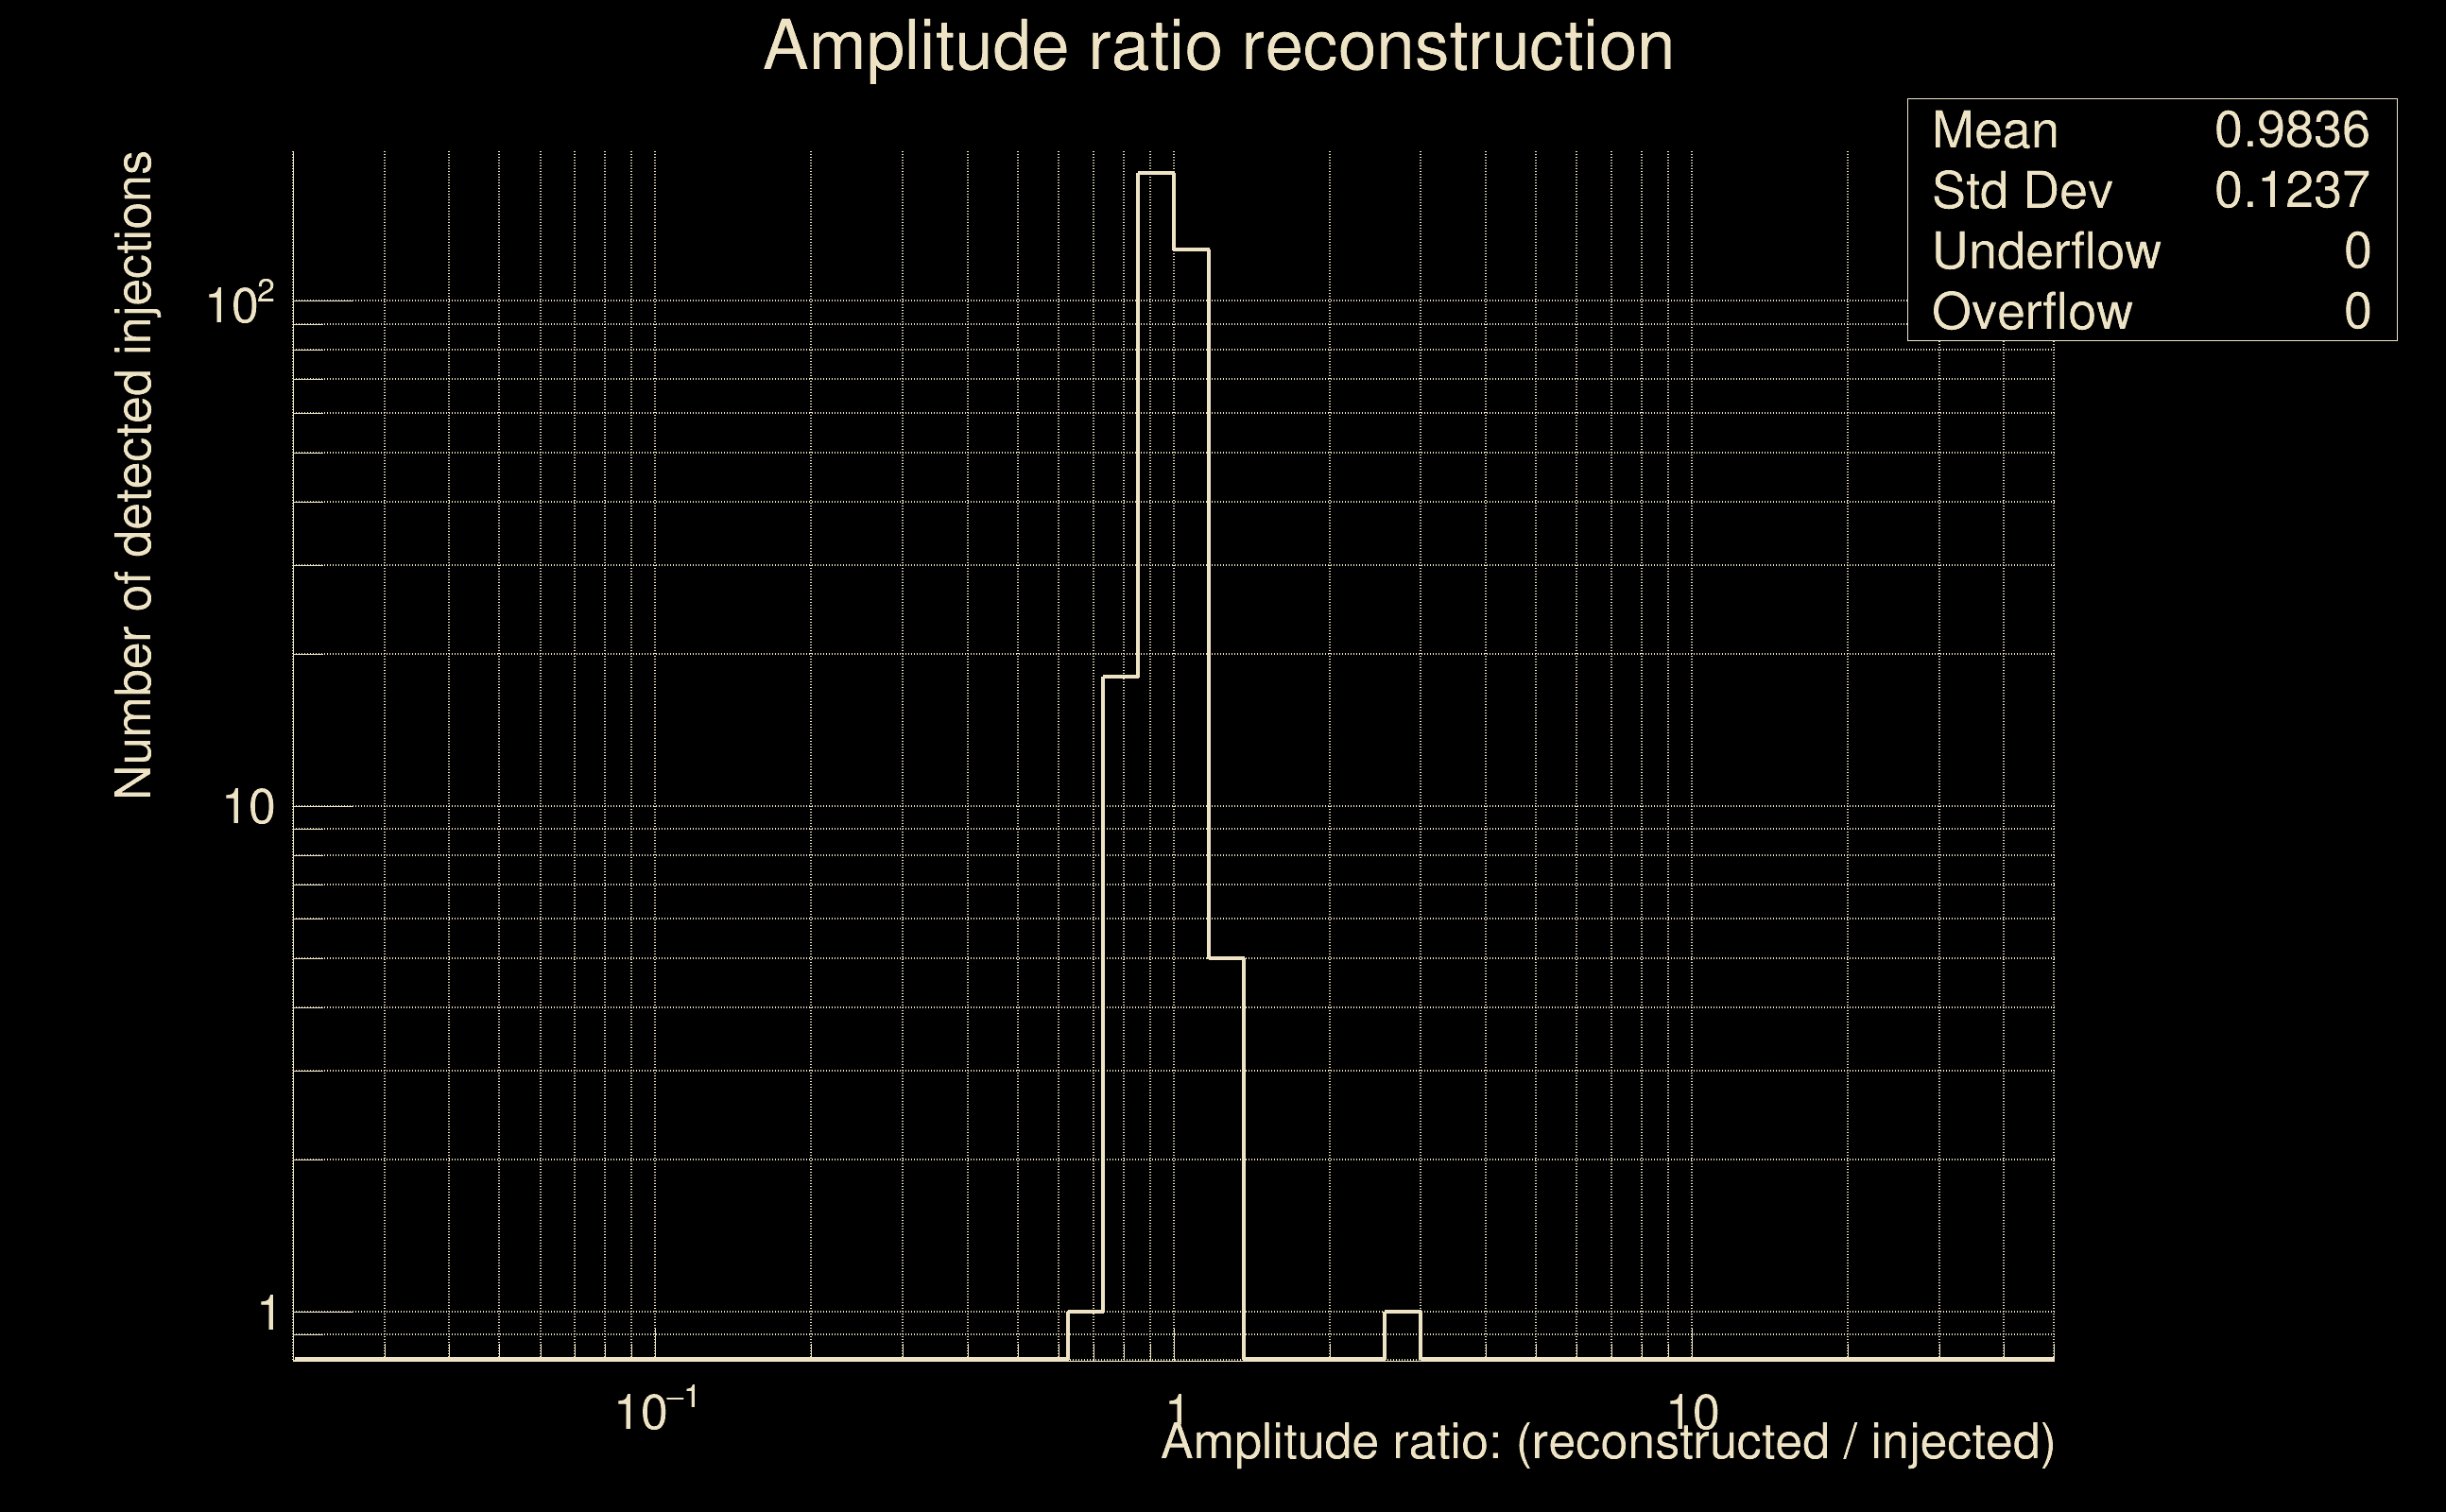
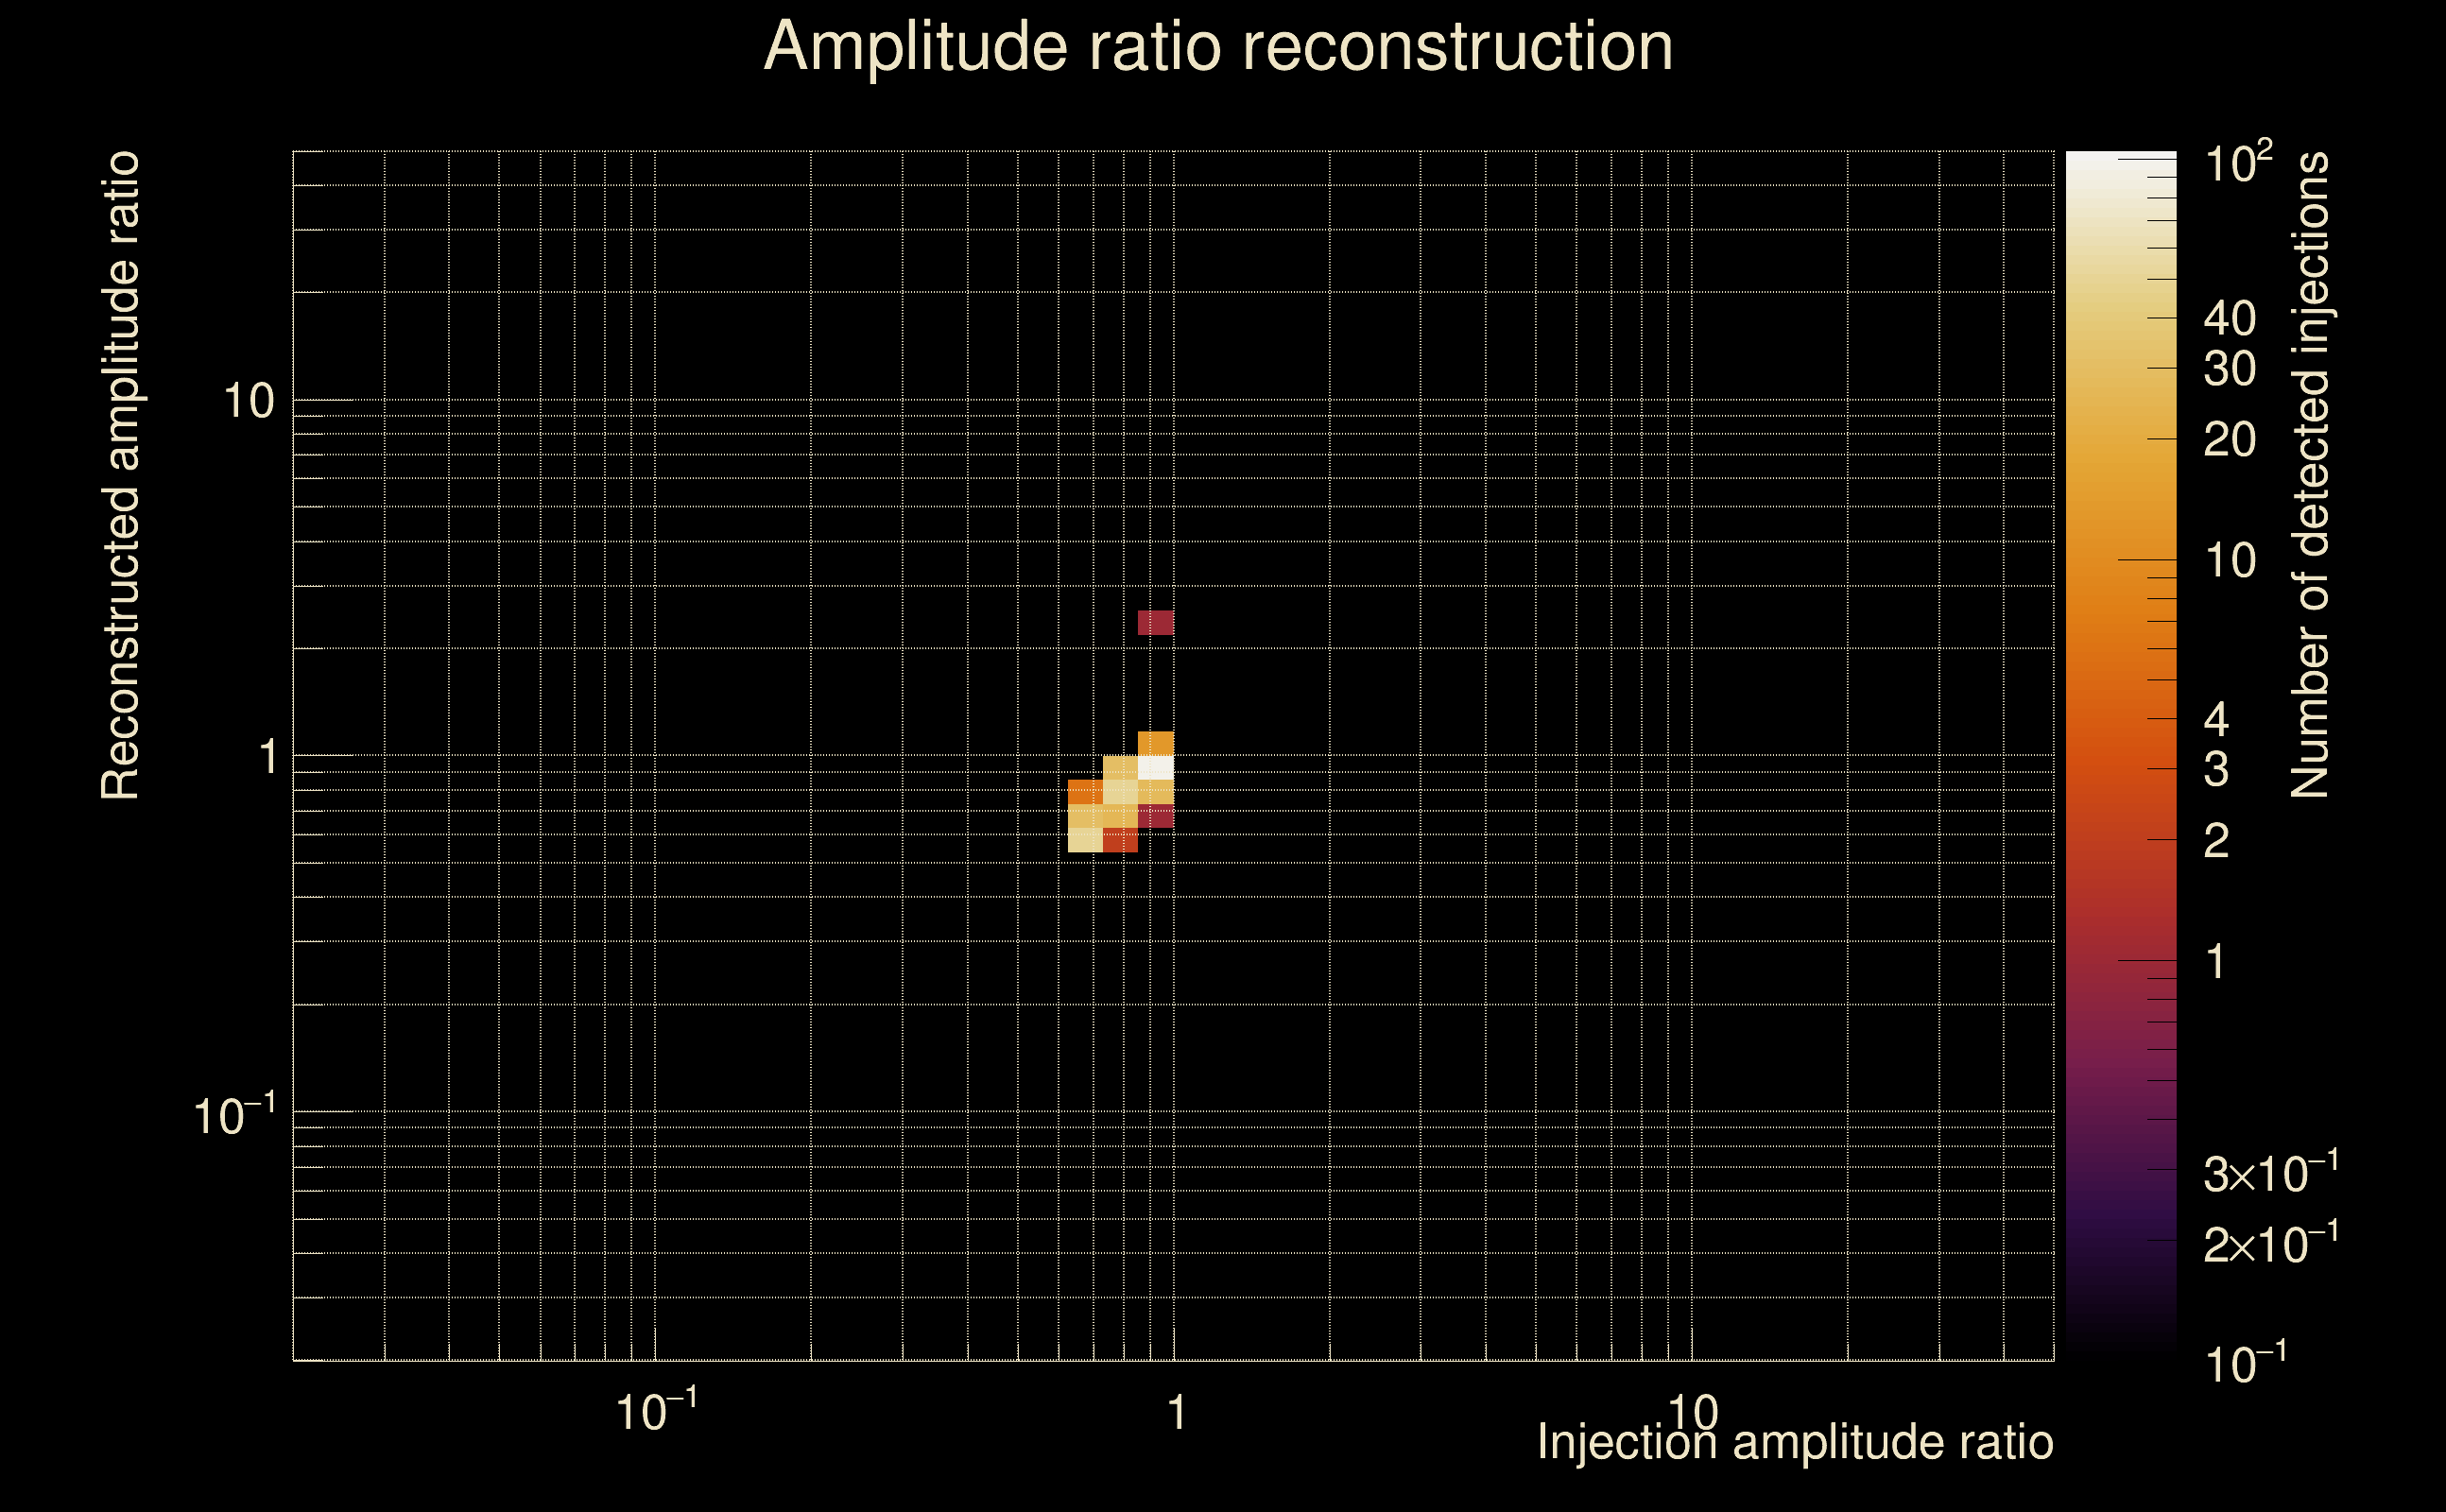
| Number of injections (total/valid/detected): | 1162 / 1019 / 268 |
| List of missed injections: | ./Mezz23-D15_missed.txt |
| Injection amplitude at 90% detection efficiency: | 9.53324 |
| Injection amplitude at 50% detection efficiency: | 7.73533 |
| Injection amplitude at 10% detection efficiency: | 5.36203 |
 |
 |
 |
 |
 |
 |
 |
|
 |
 |
|
 |
 |
|
 |
 |
|
 |
 |
|
 |
 |
|
 |
 |
|
 |
 |
|
 |
 |
 |
 |
 |
 |
 |
 |
 |
 |
 |
 |
 |
 |
 |
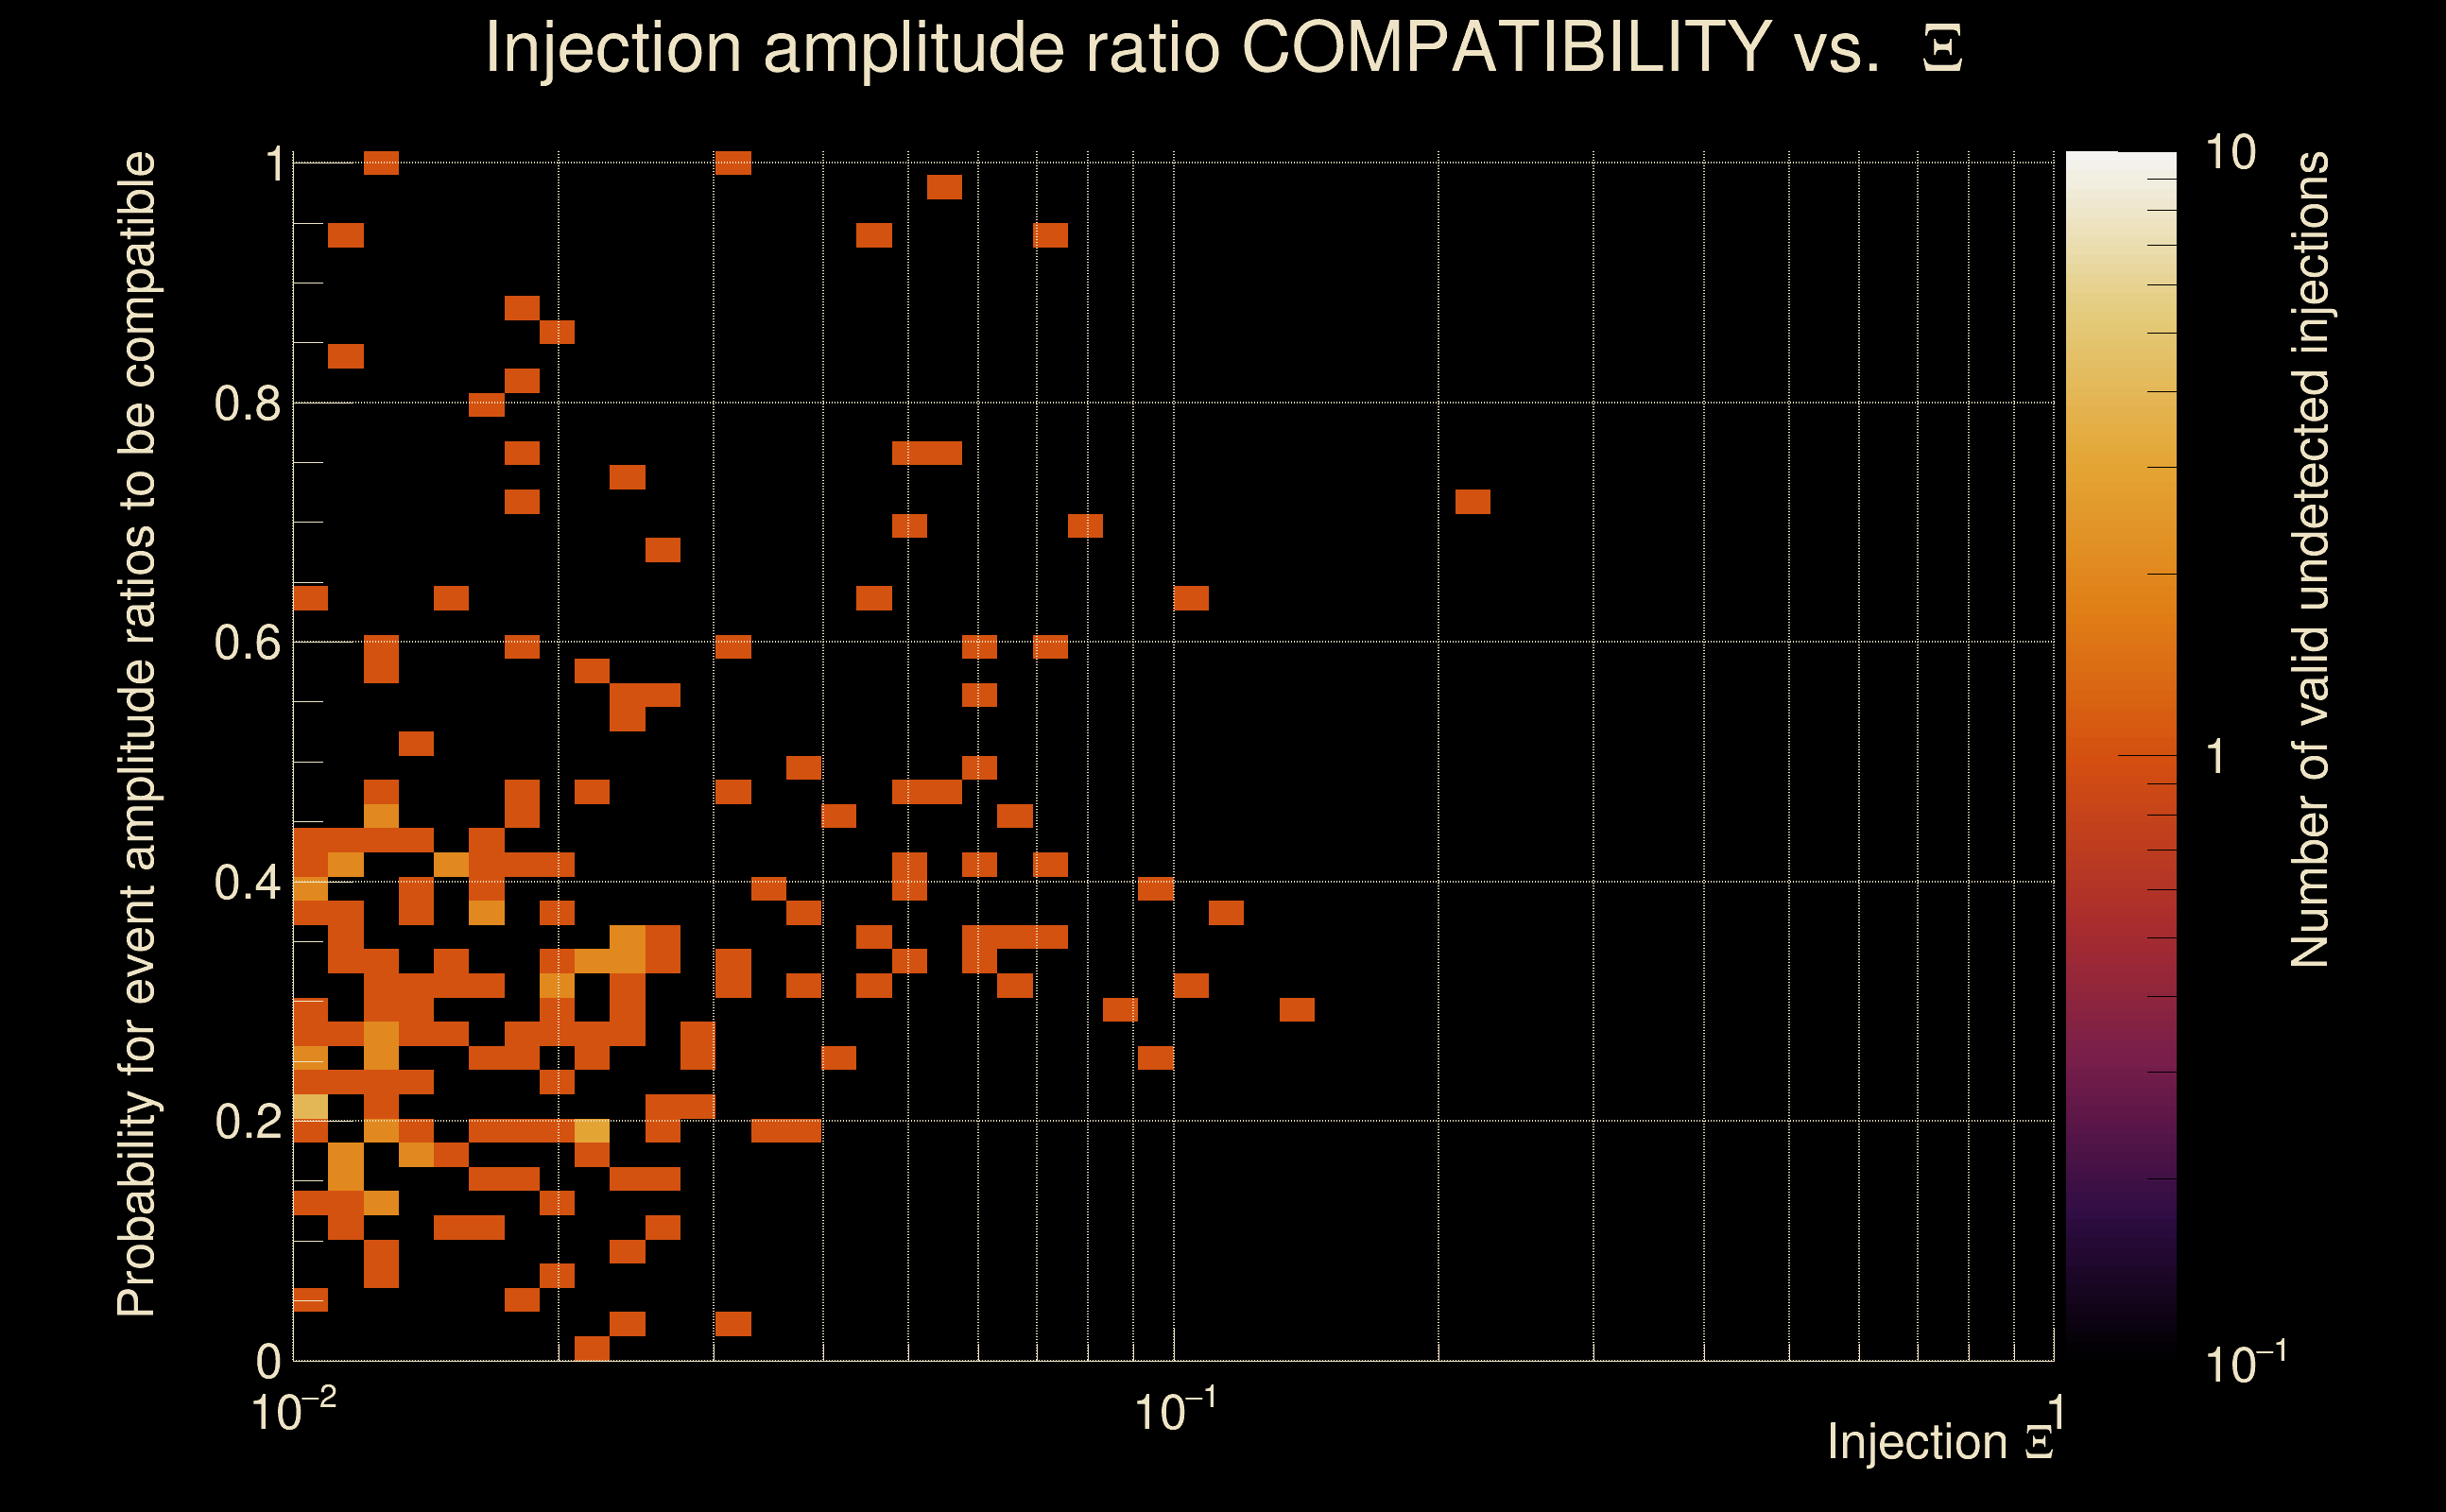
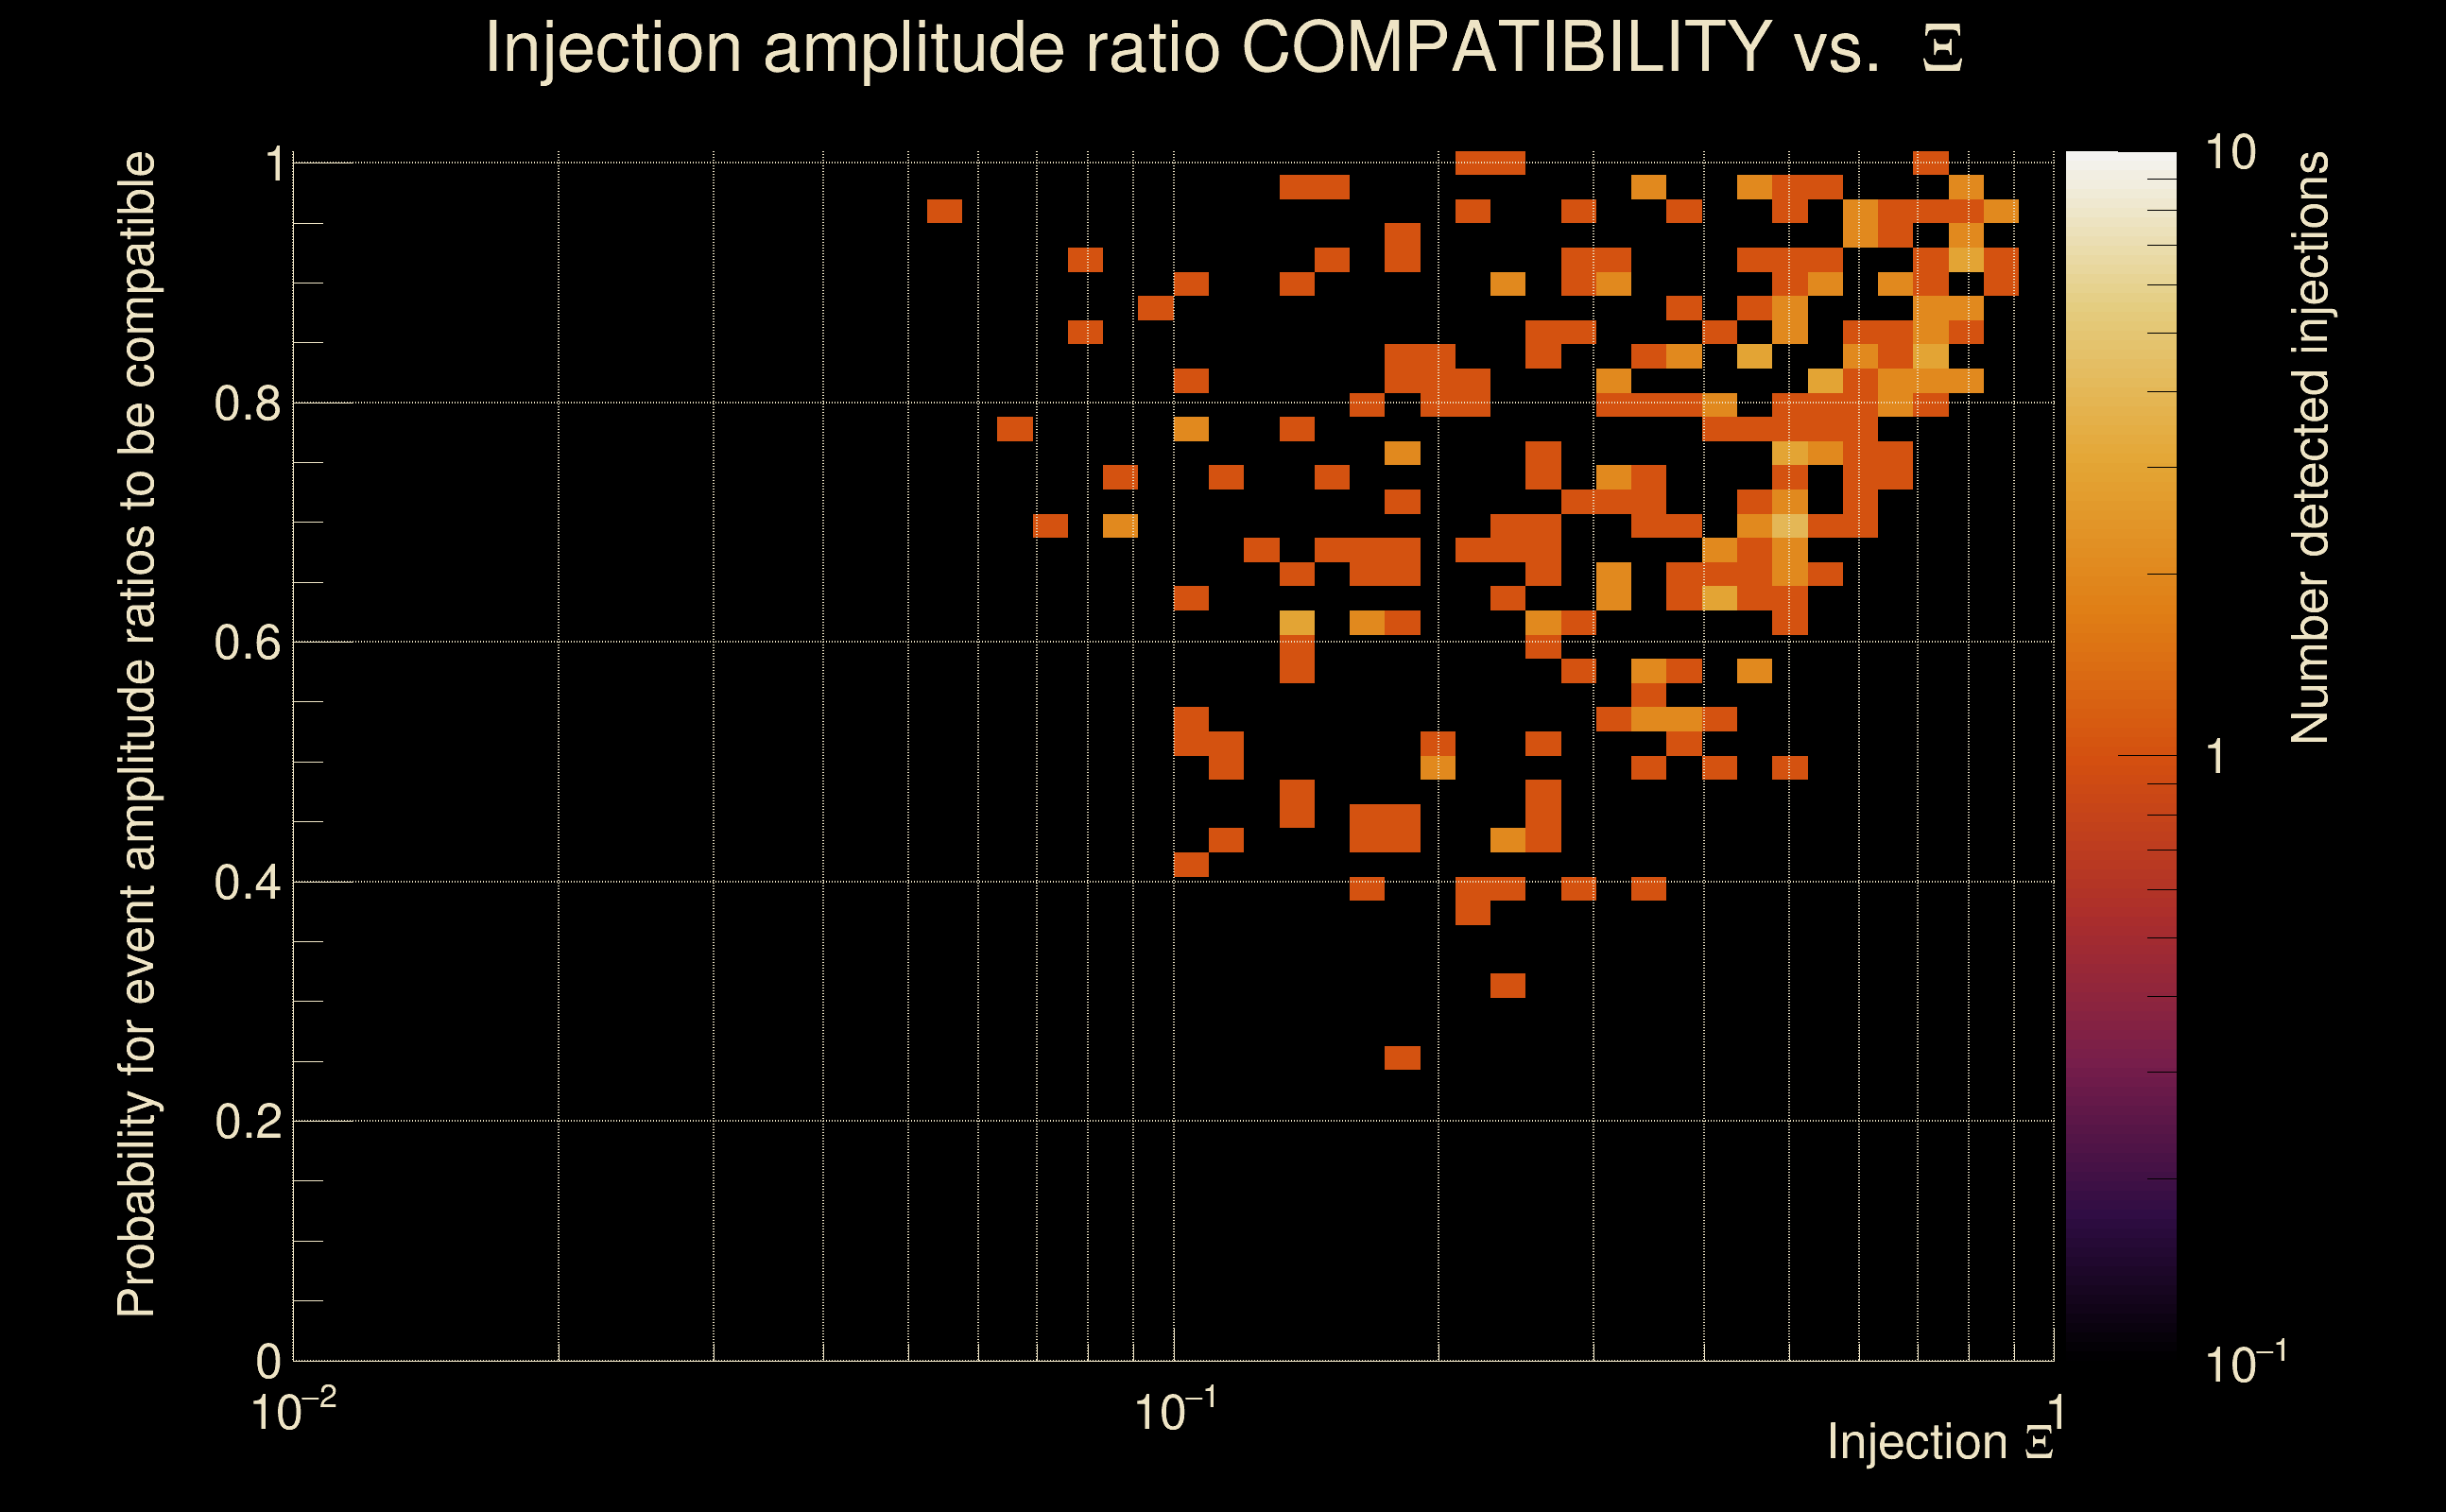
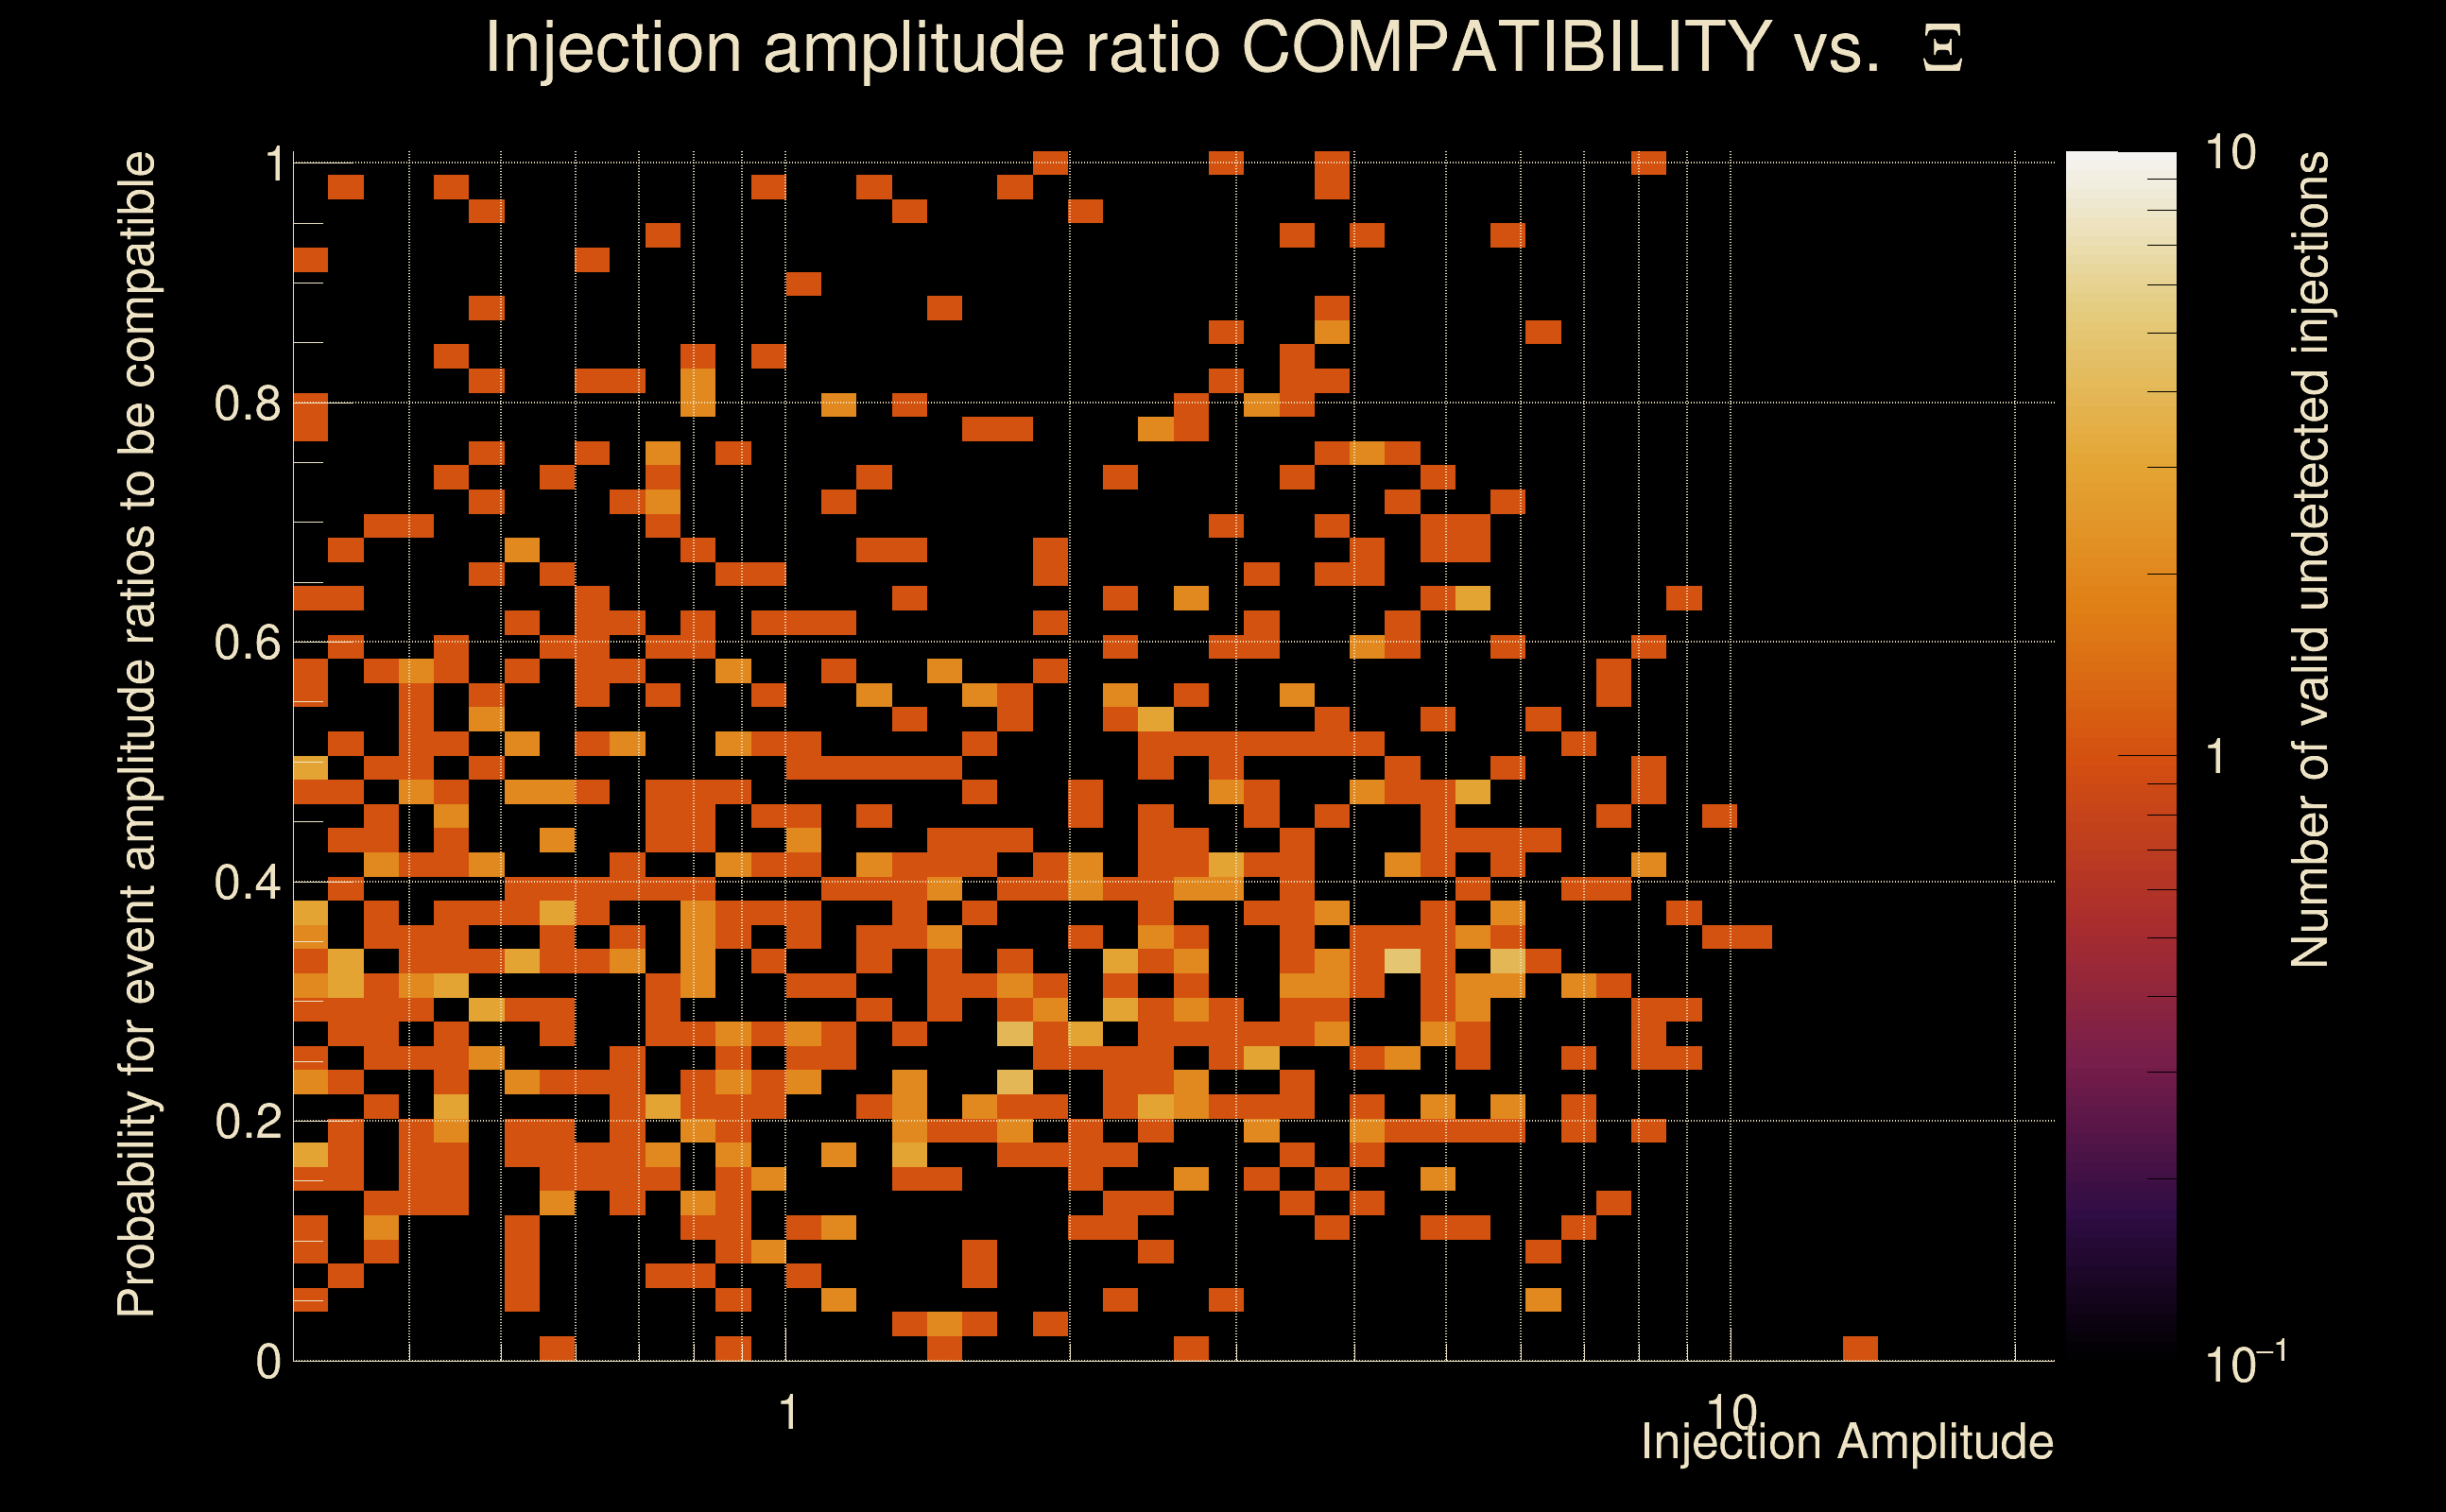
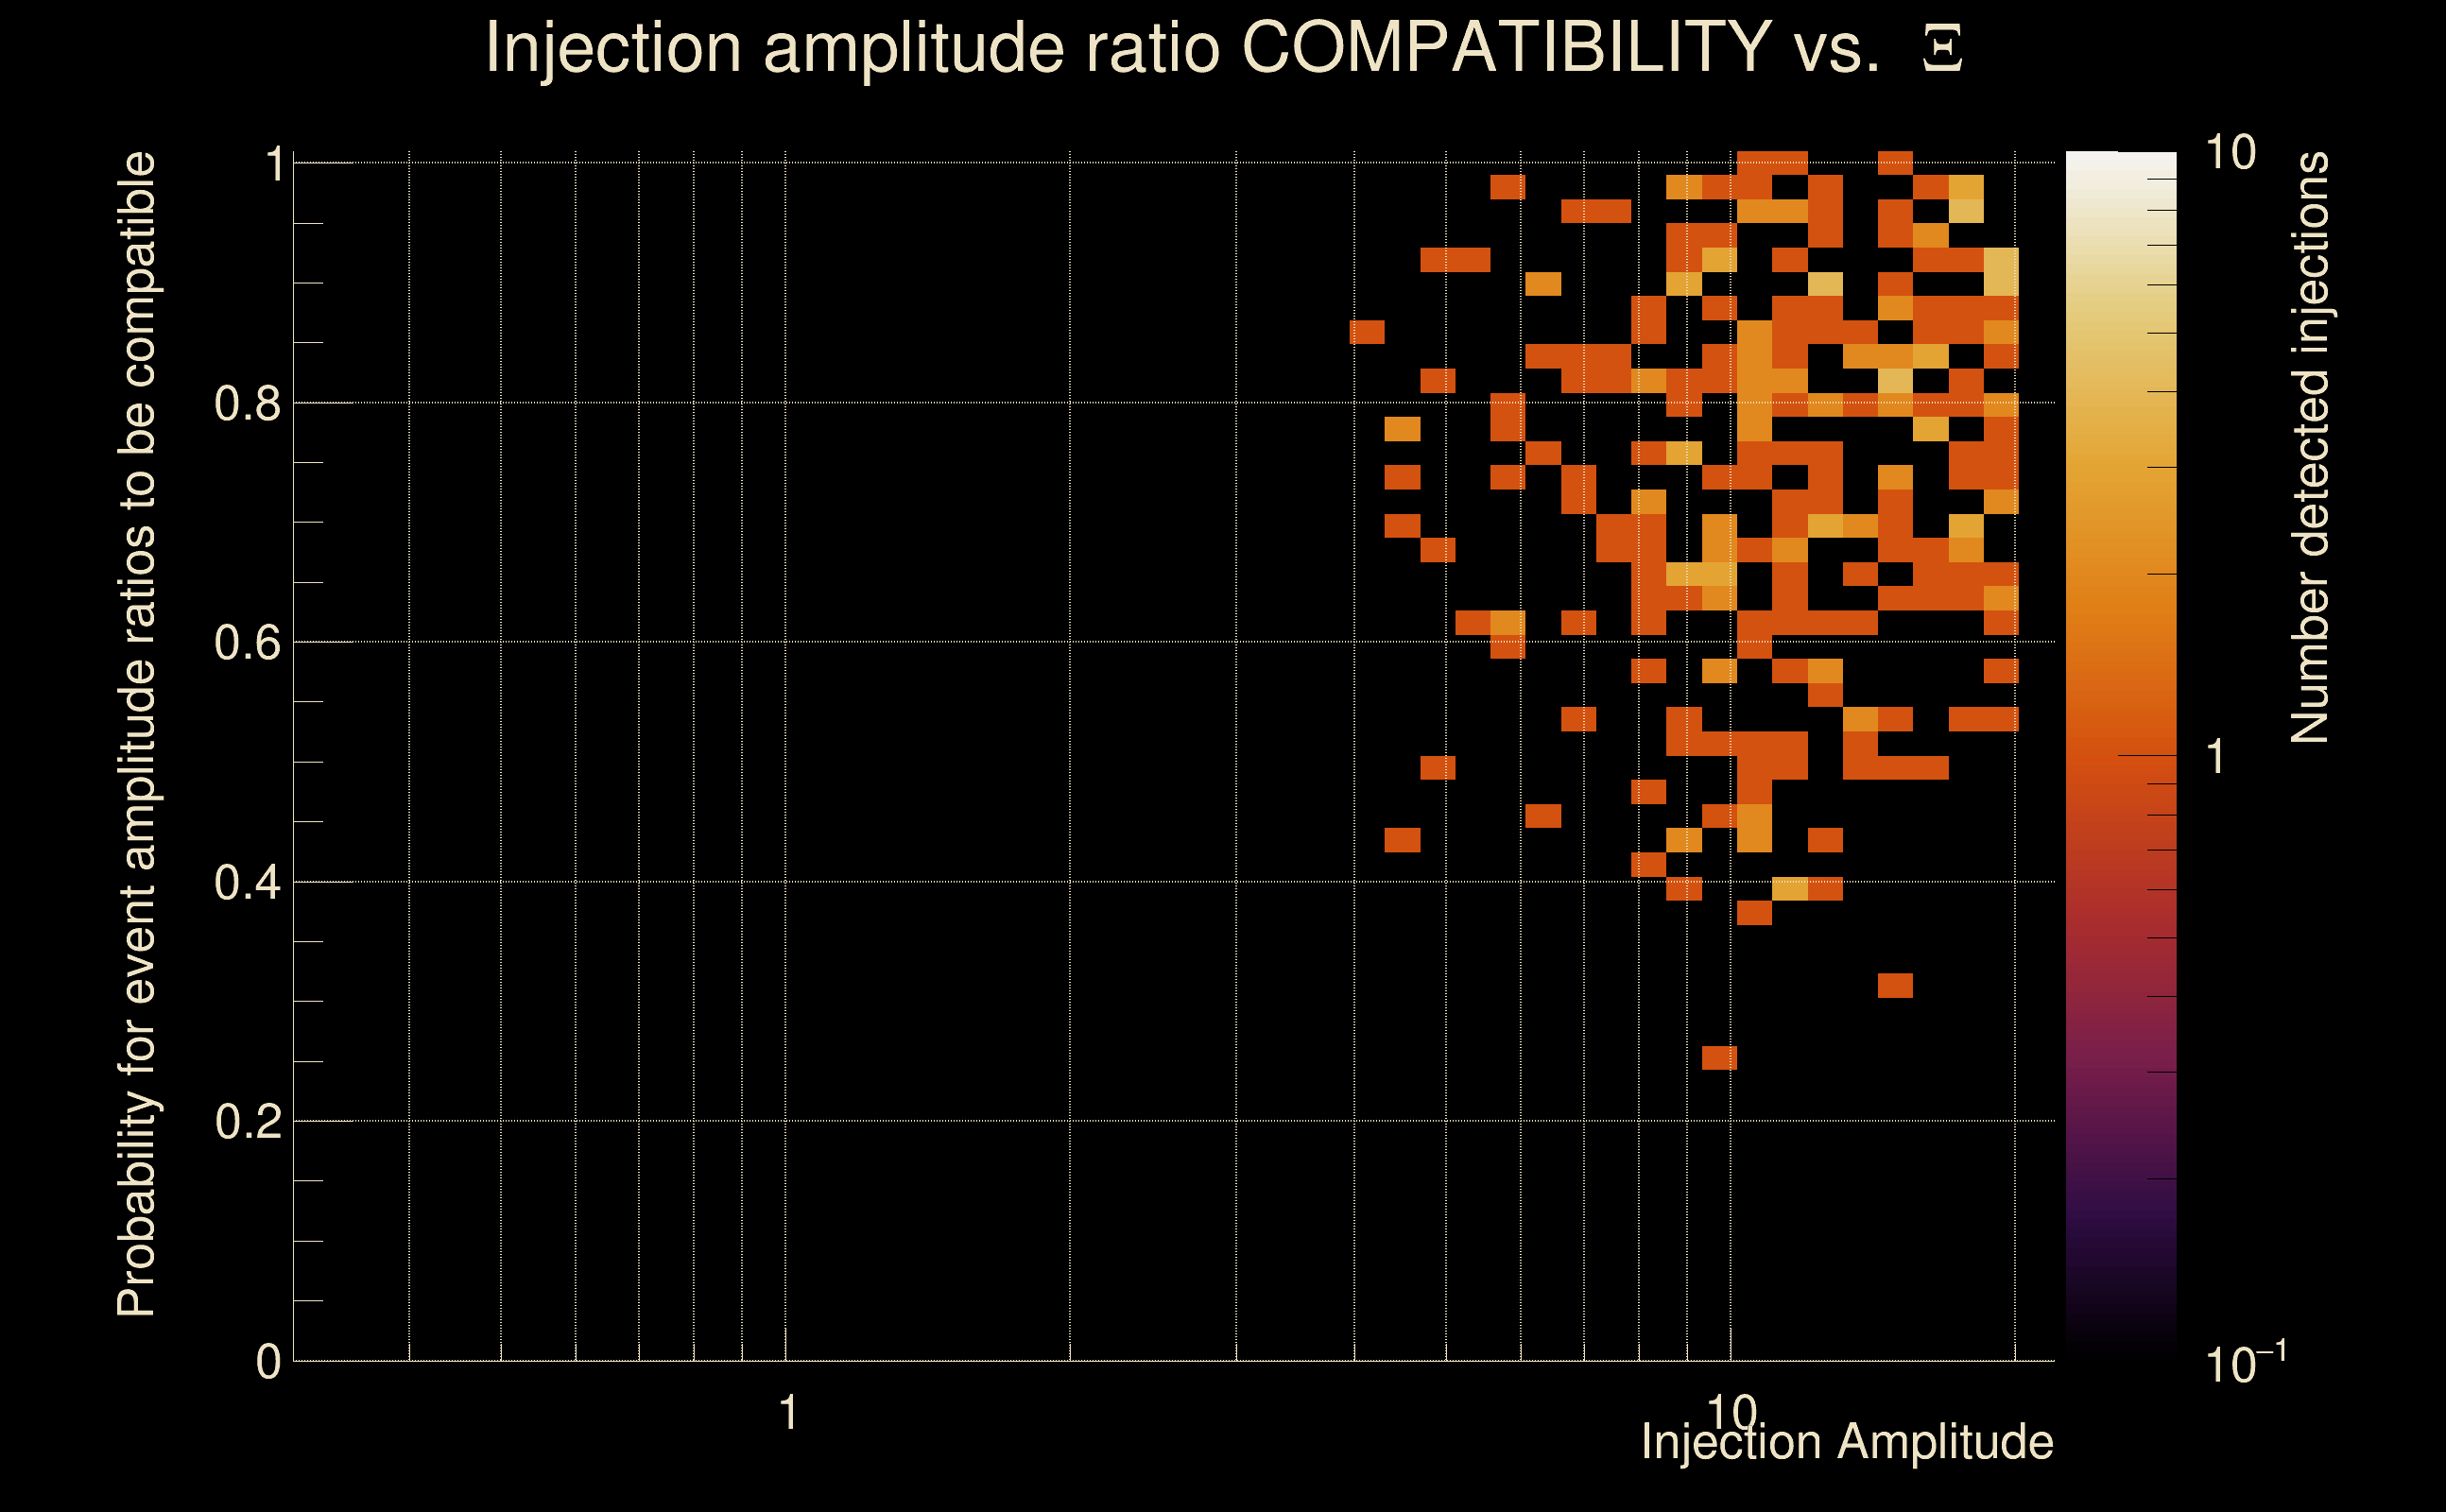
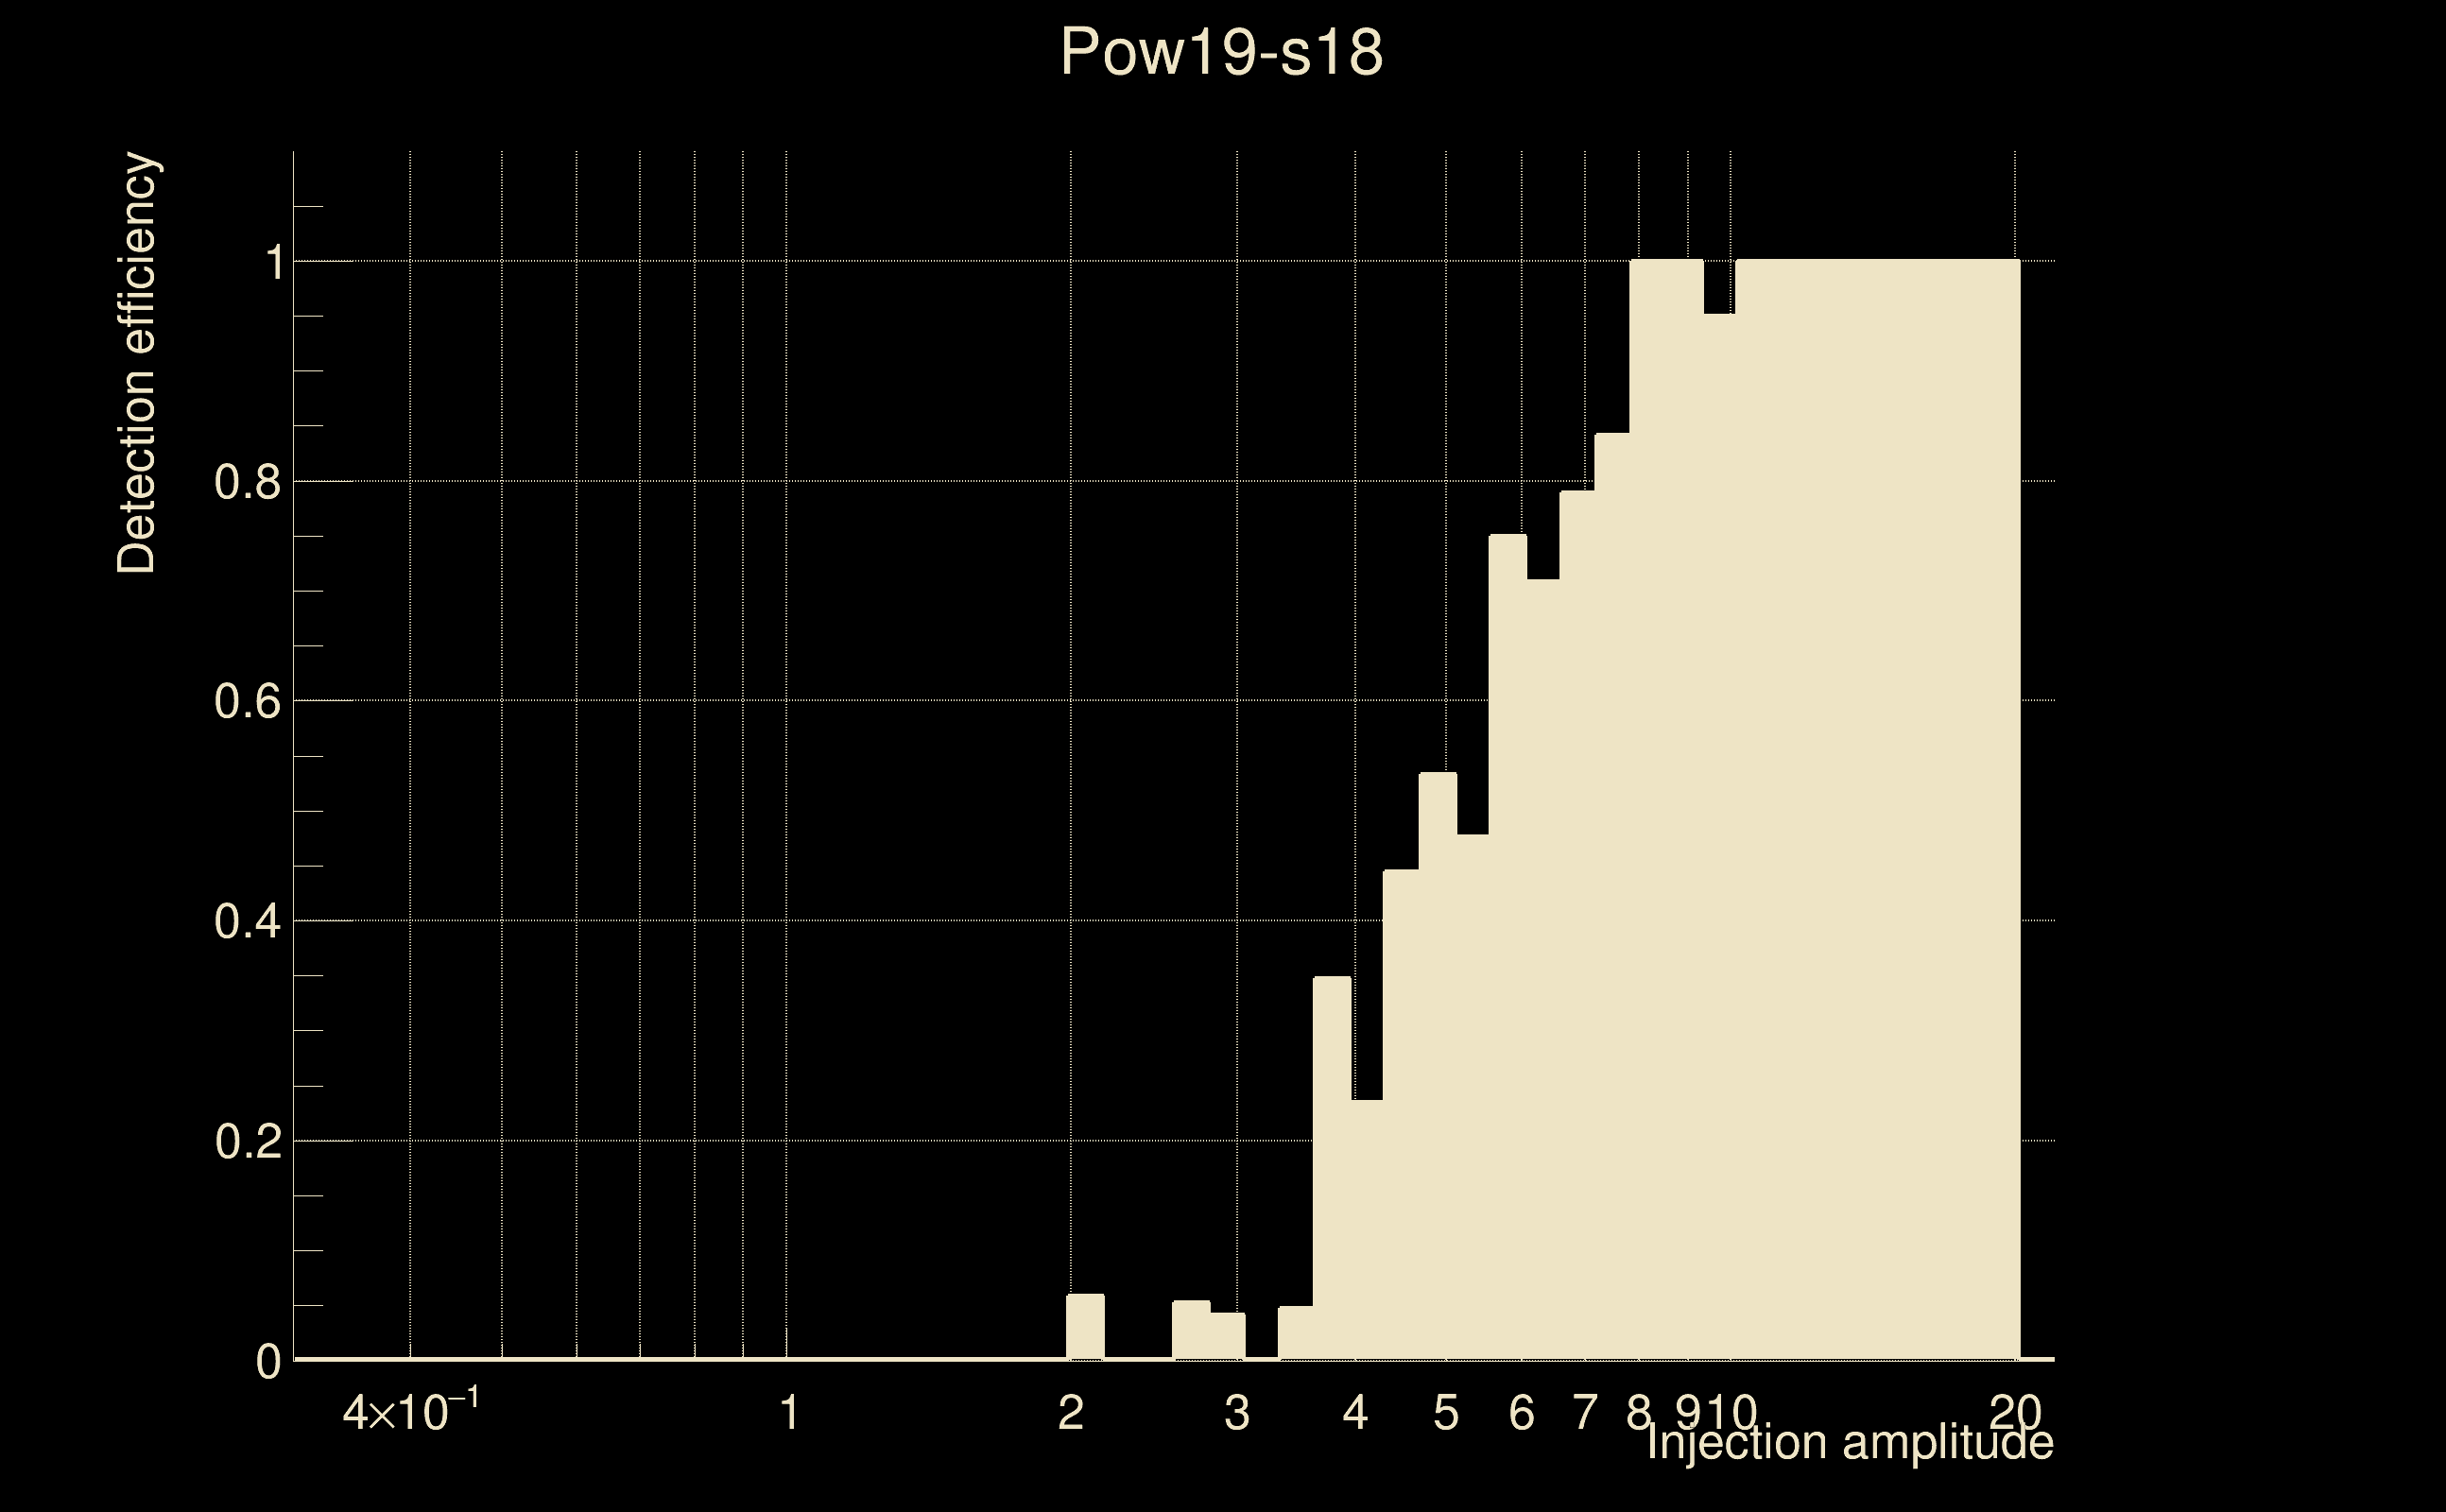
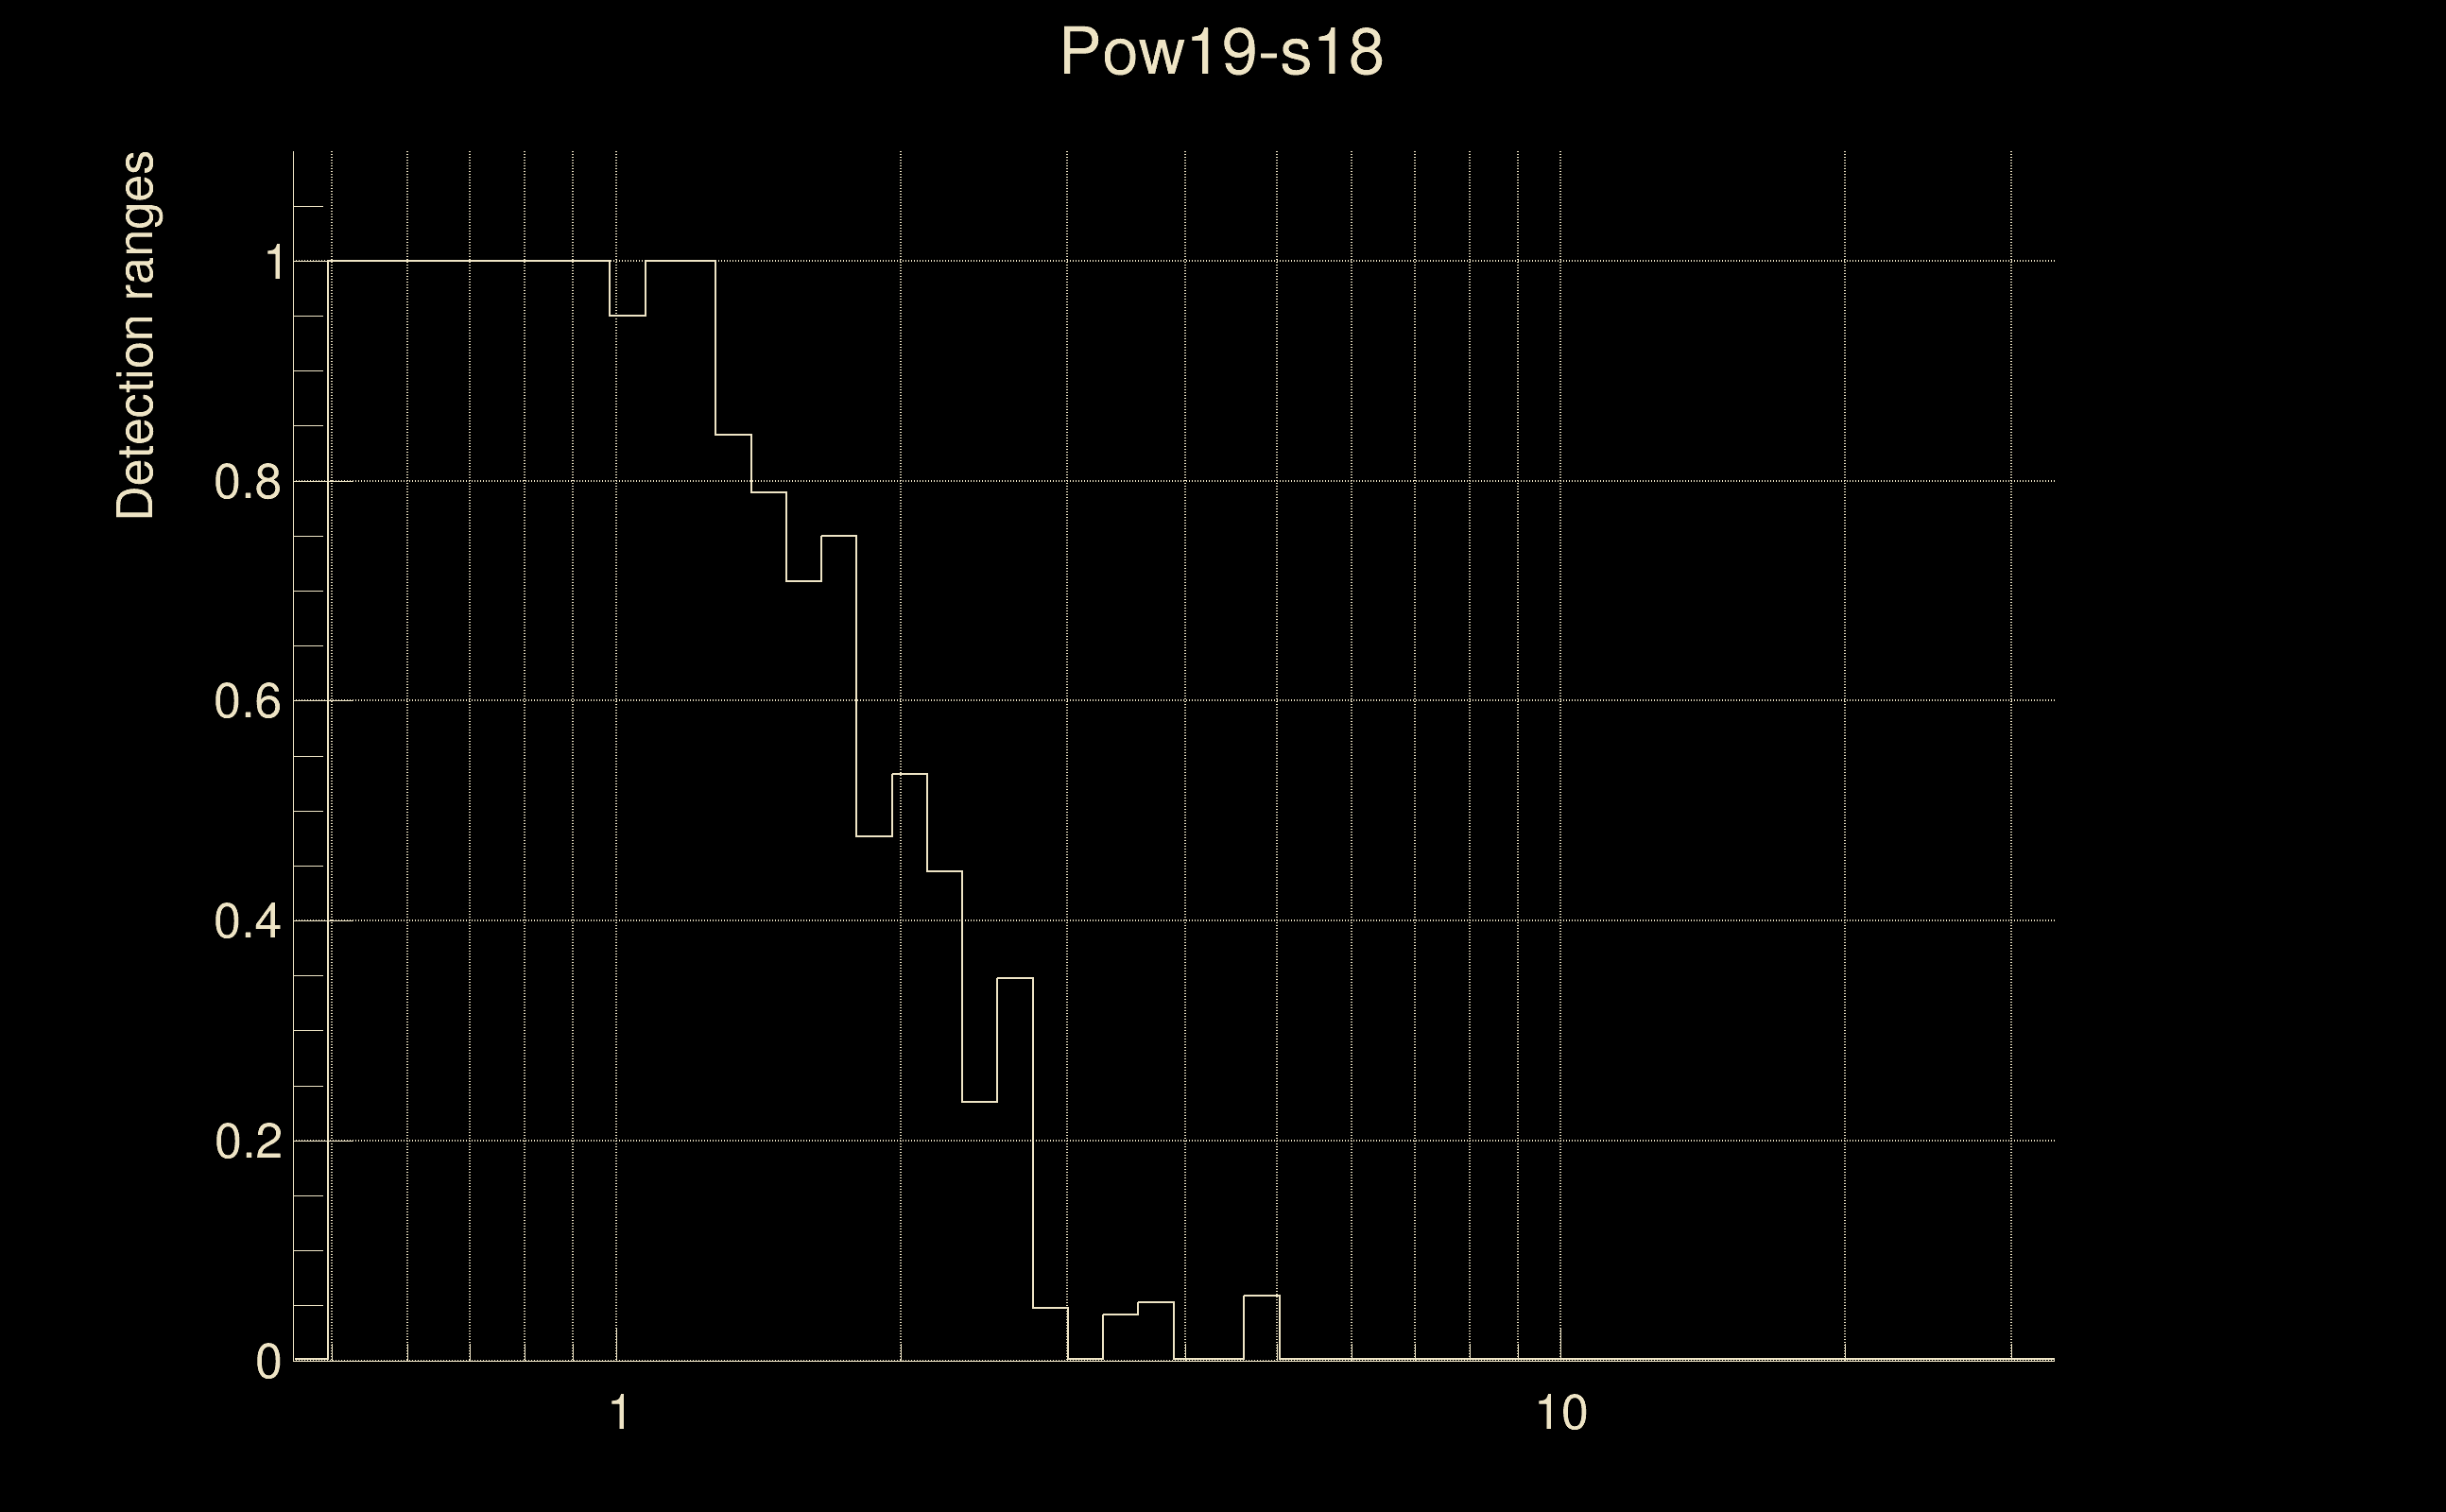
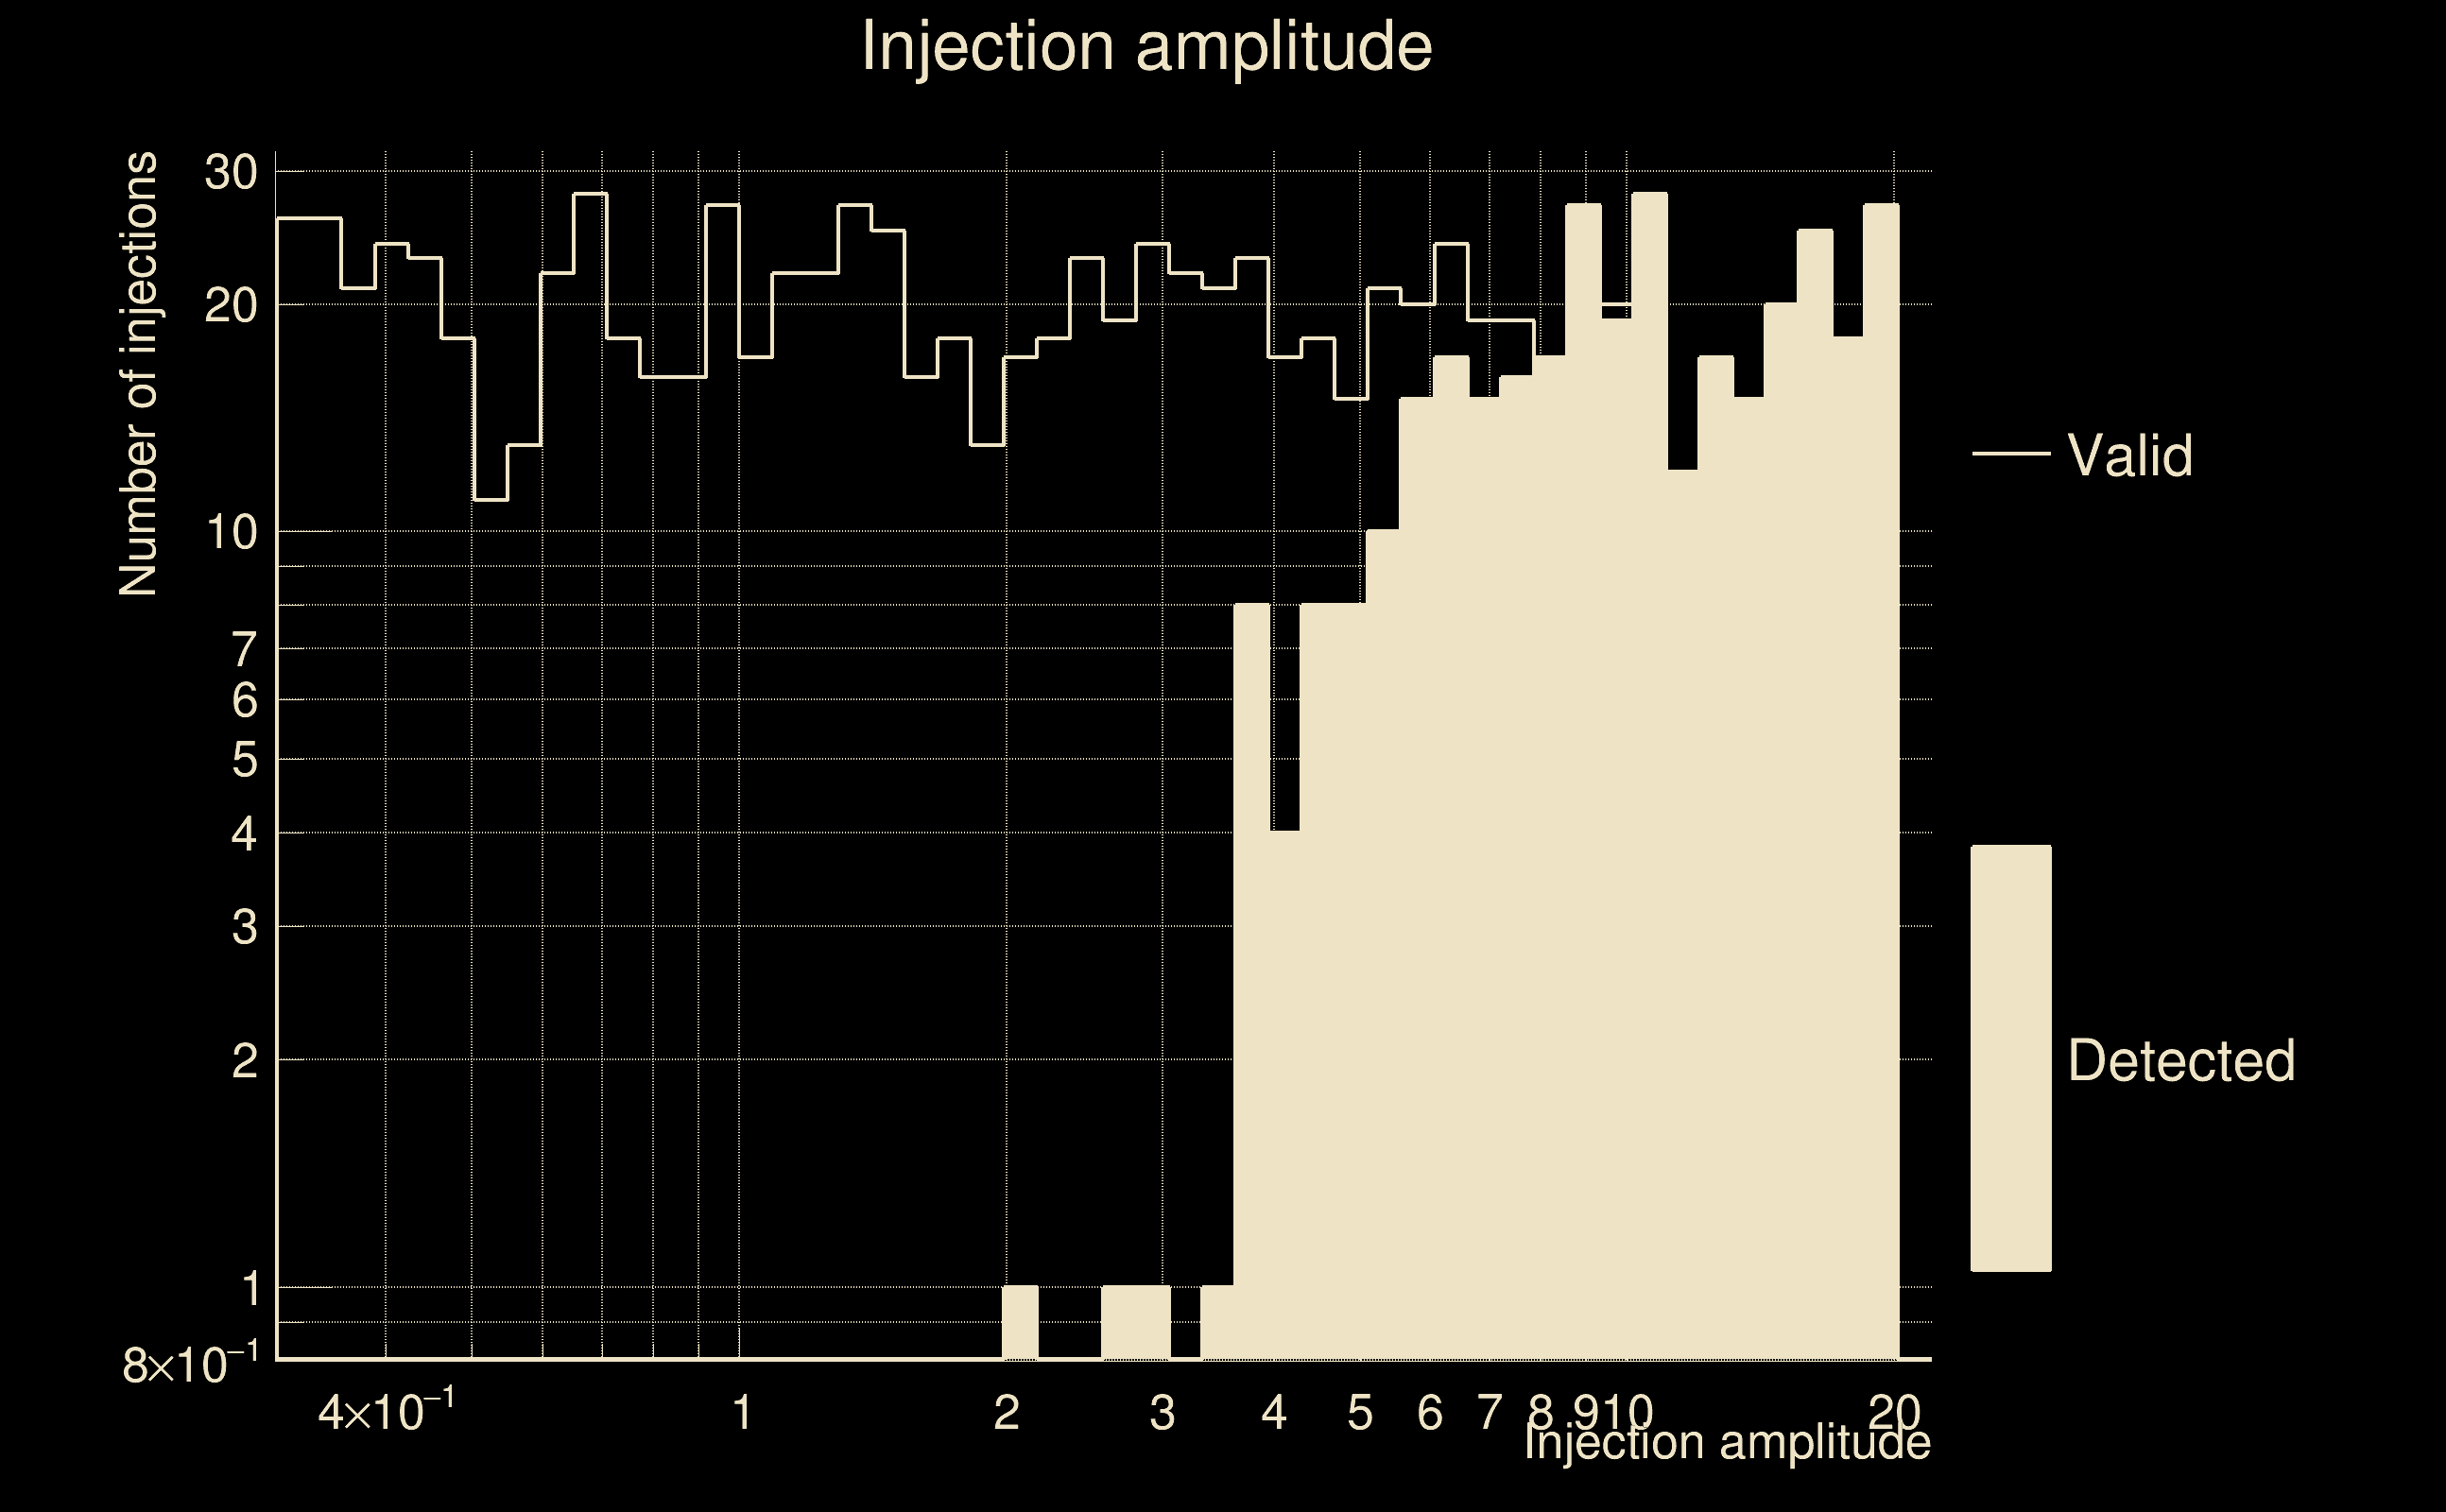
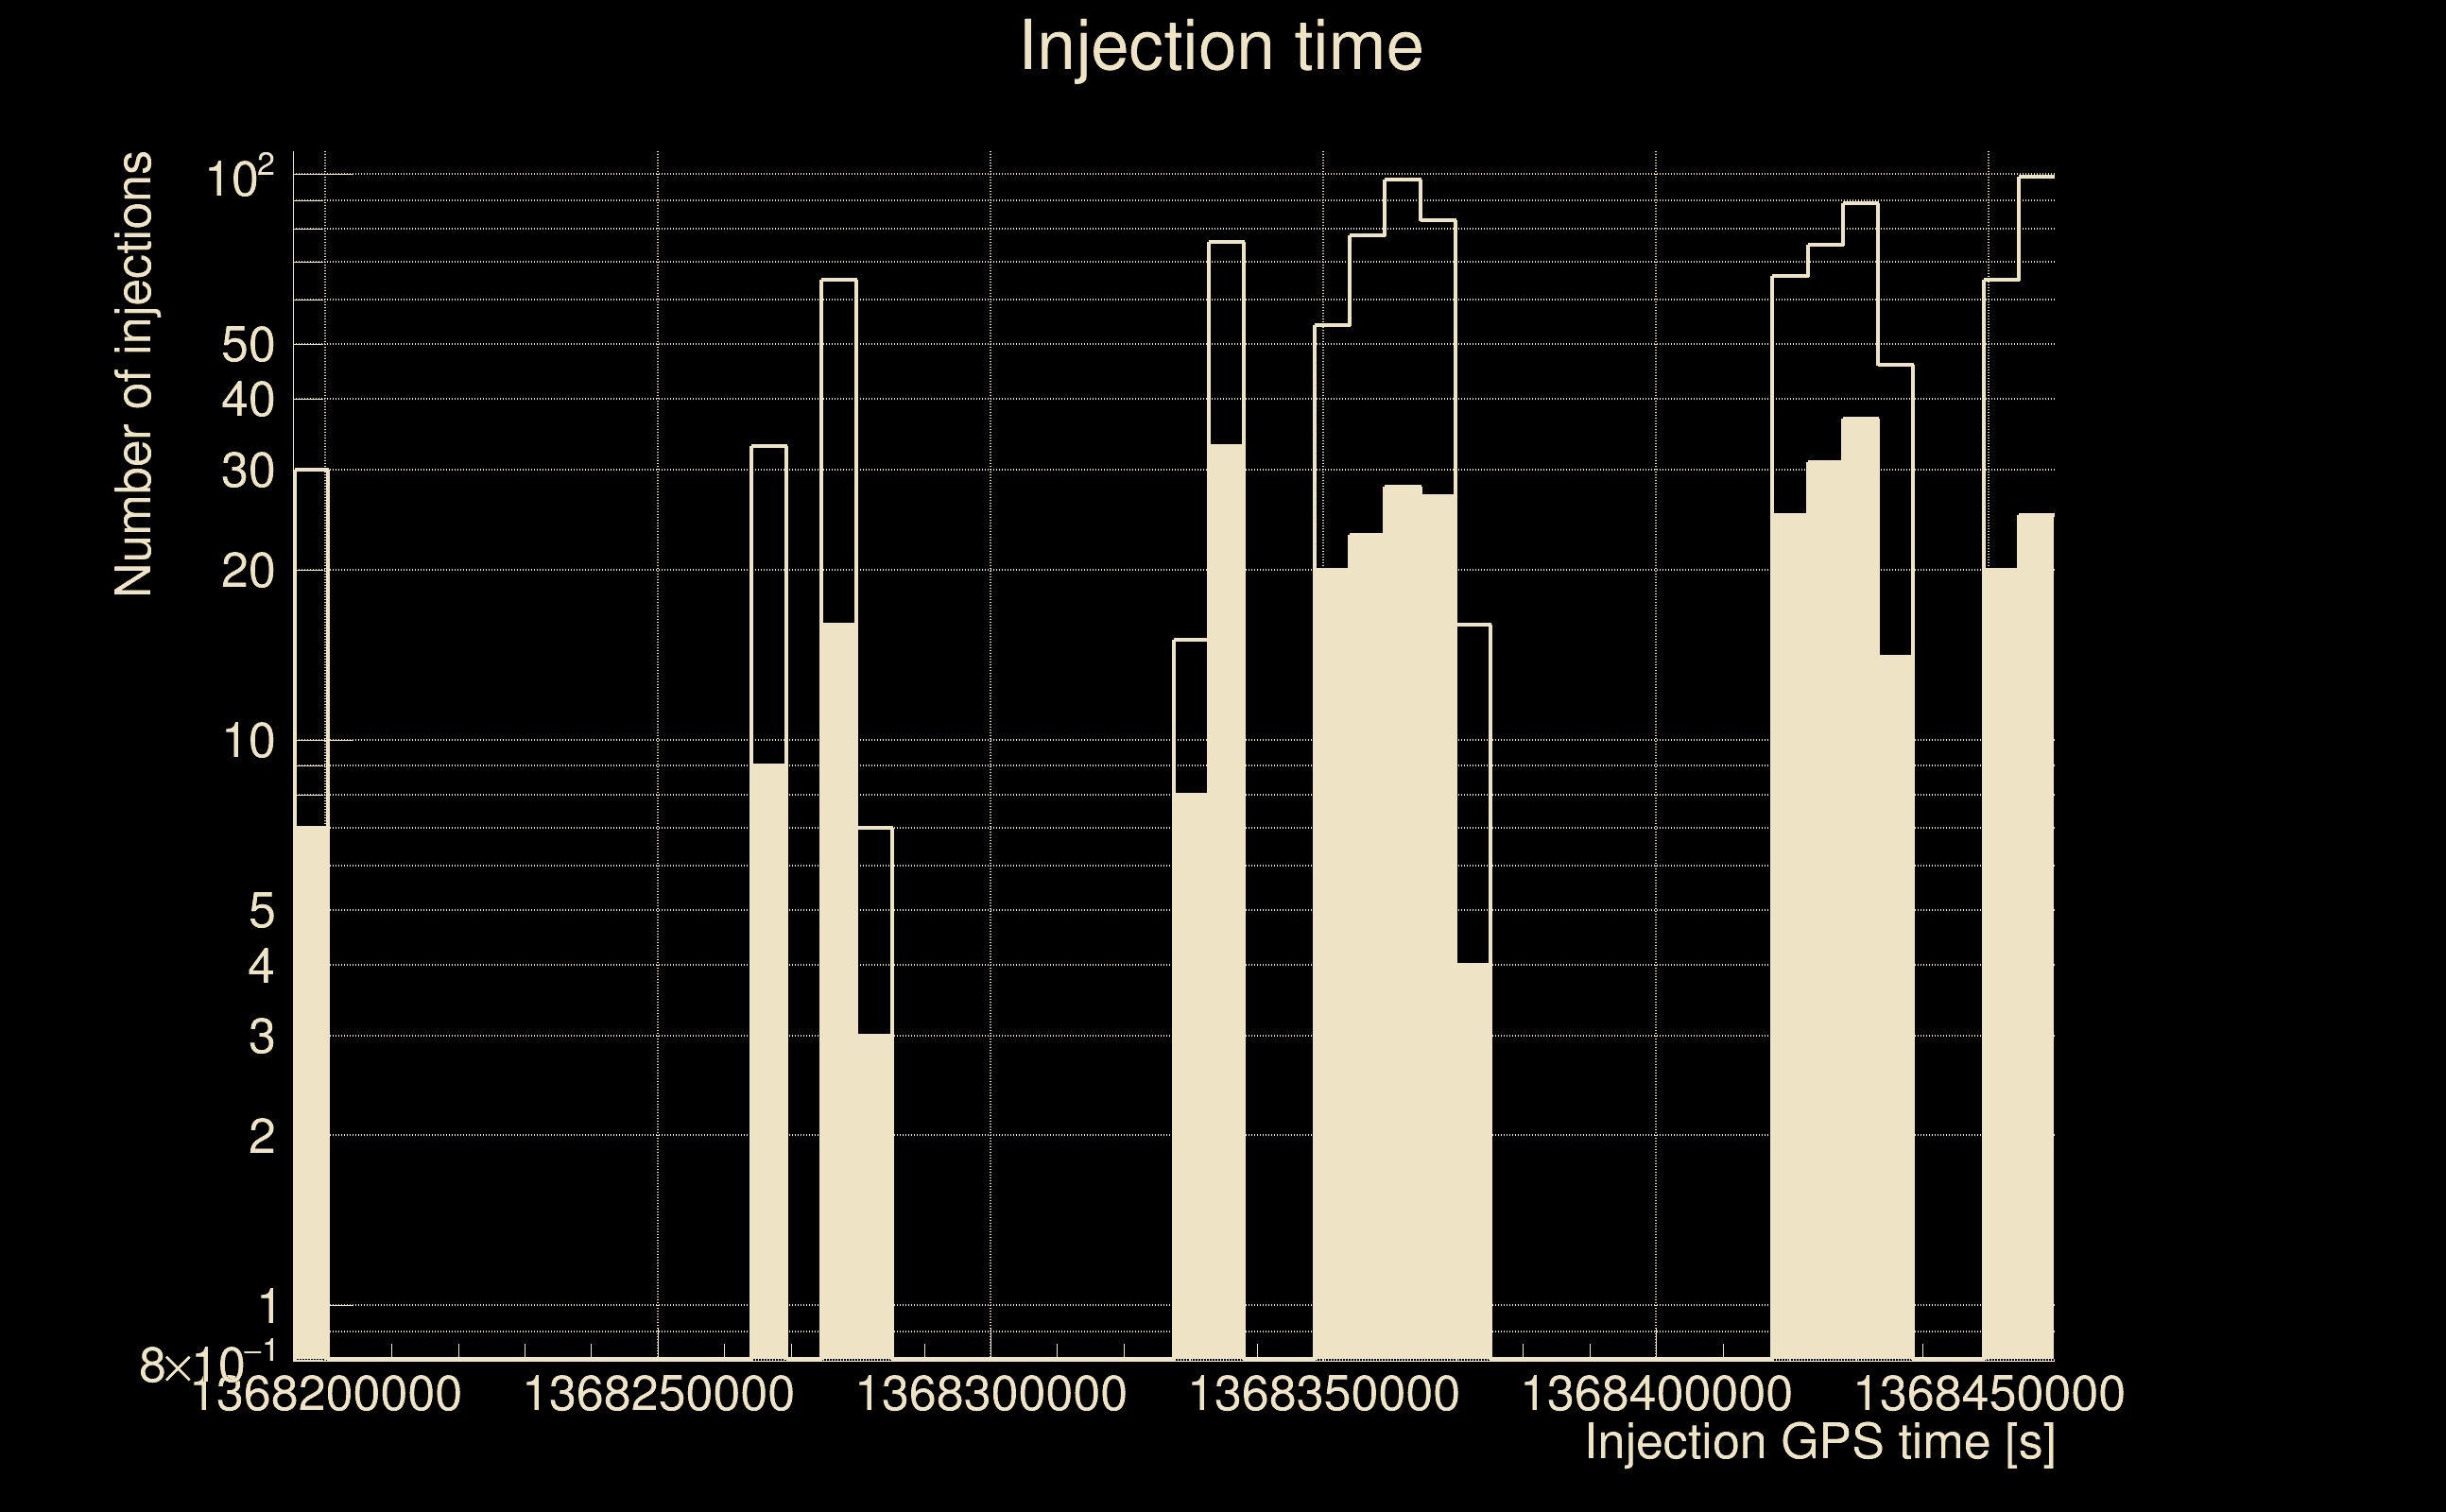
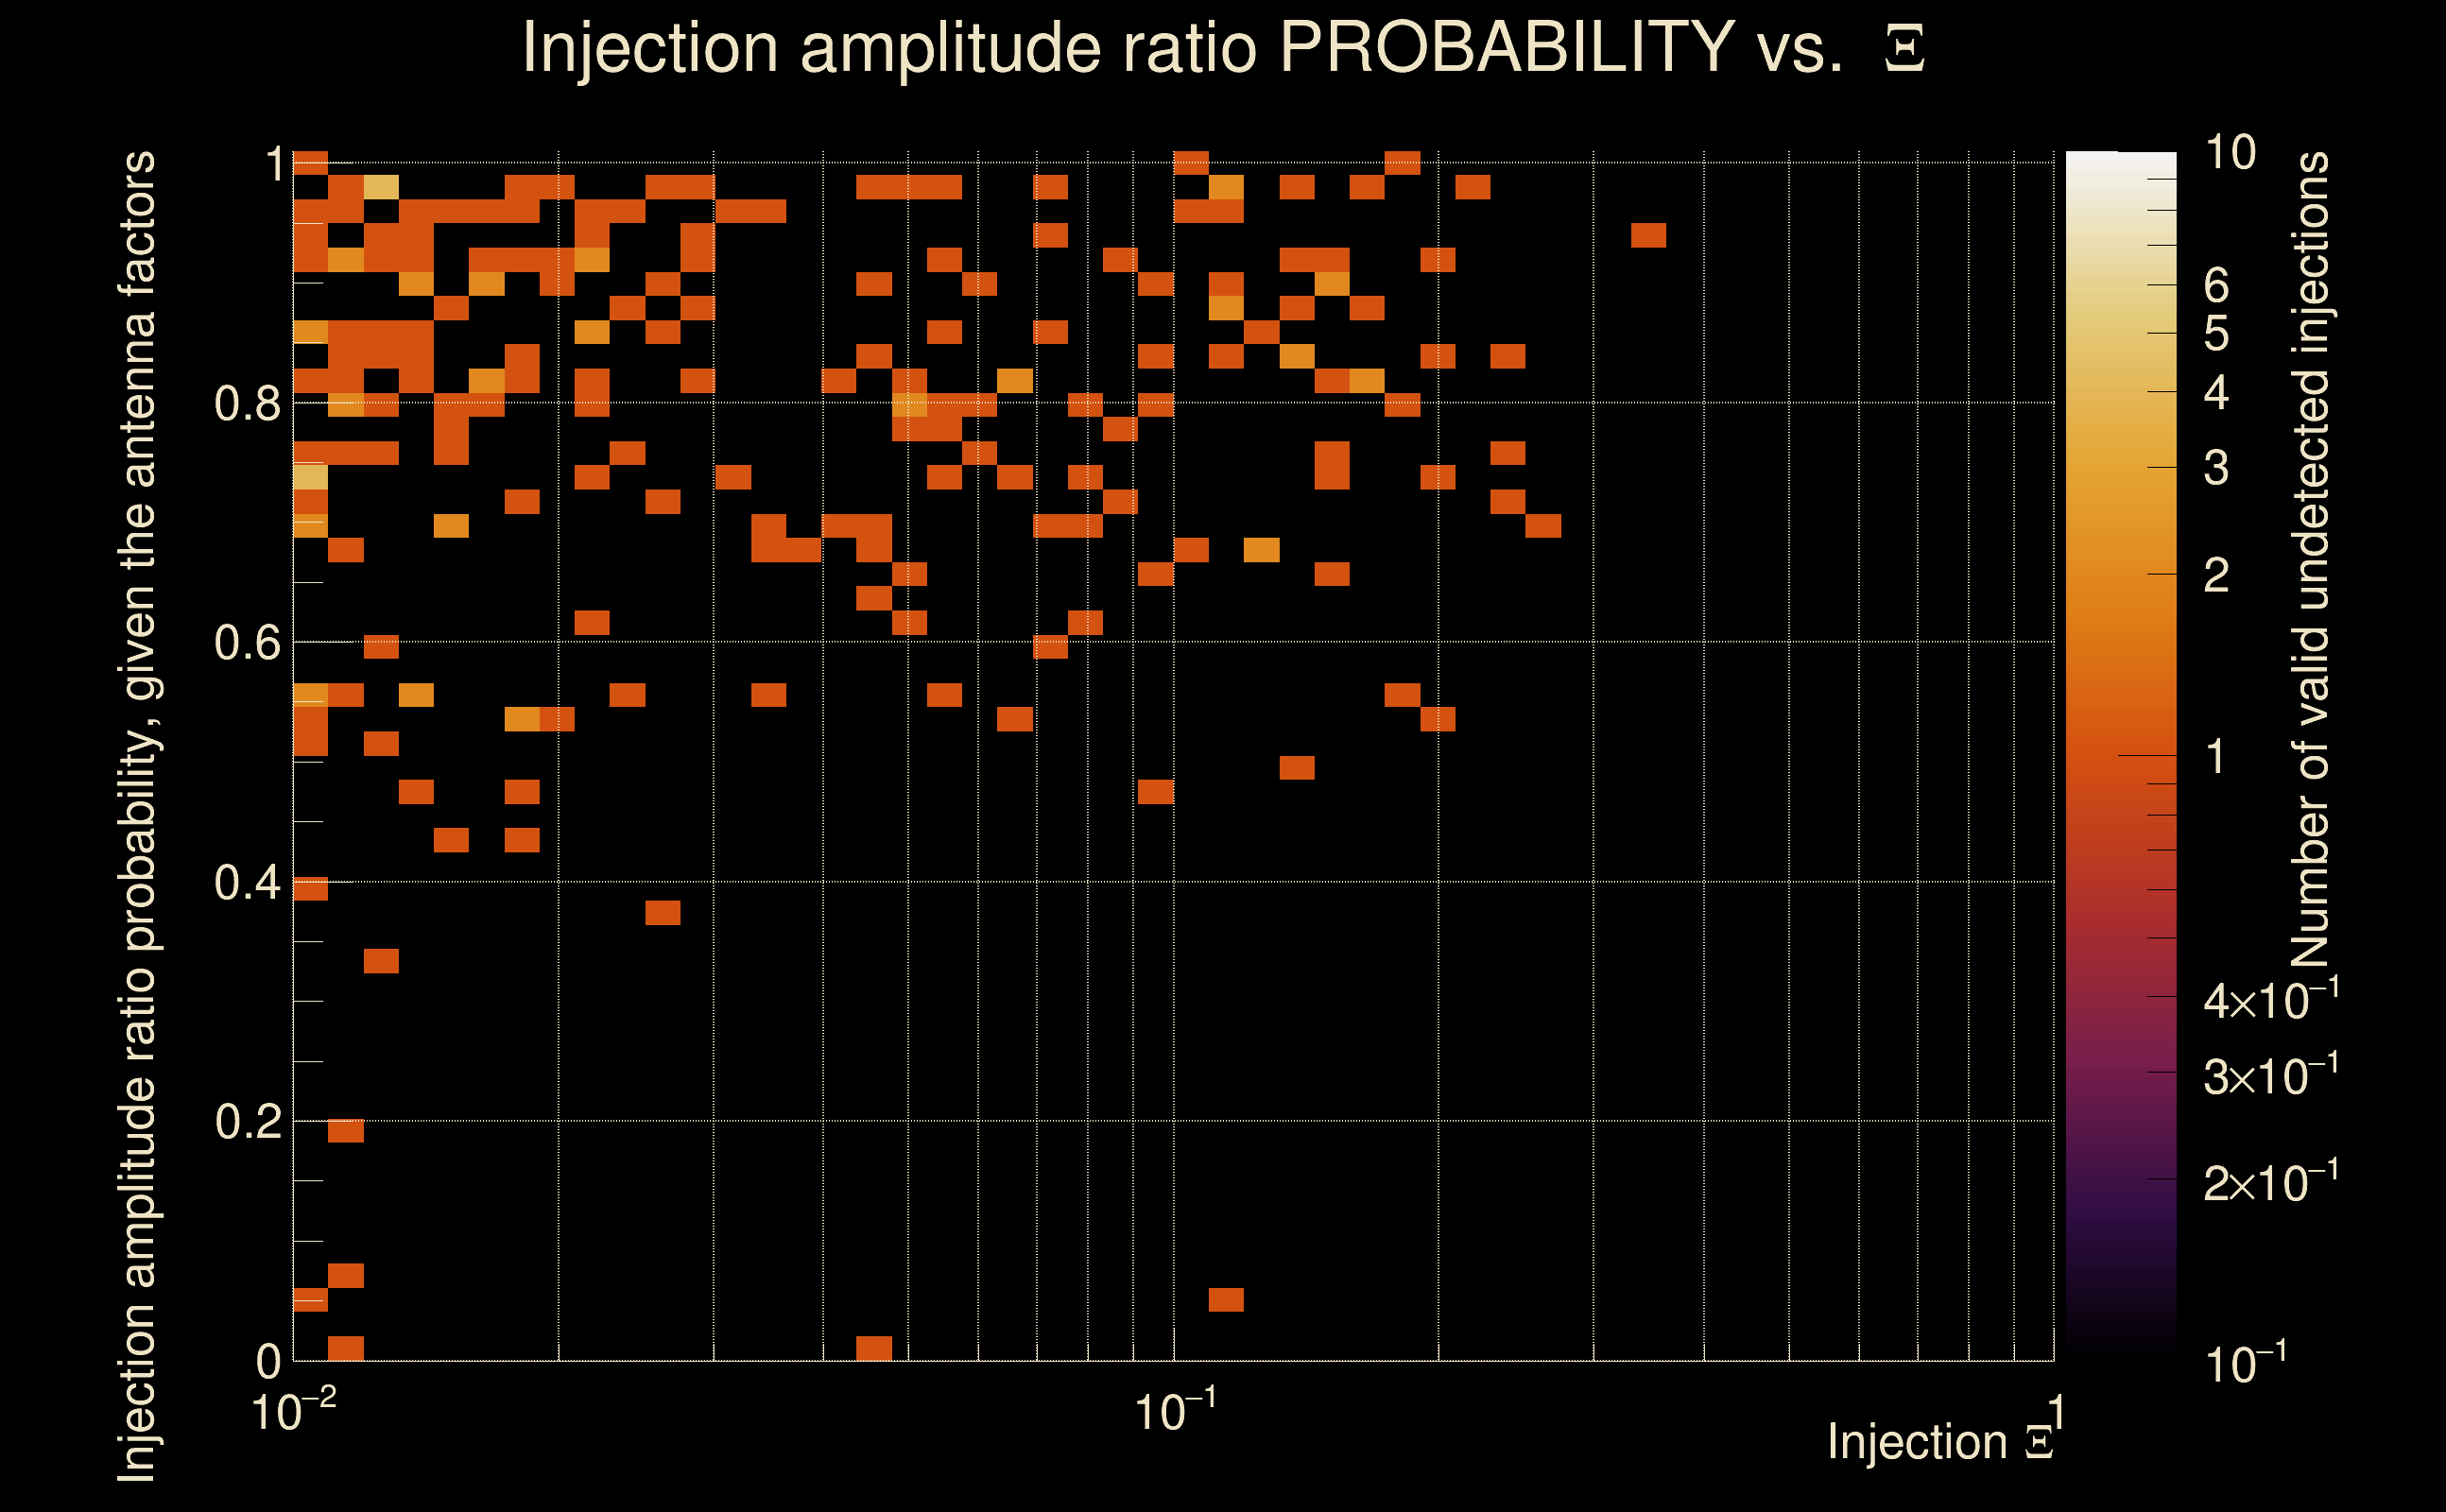
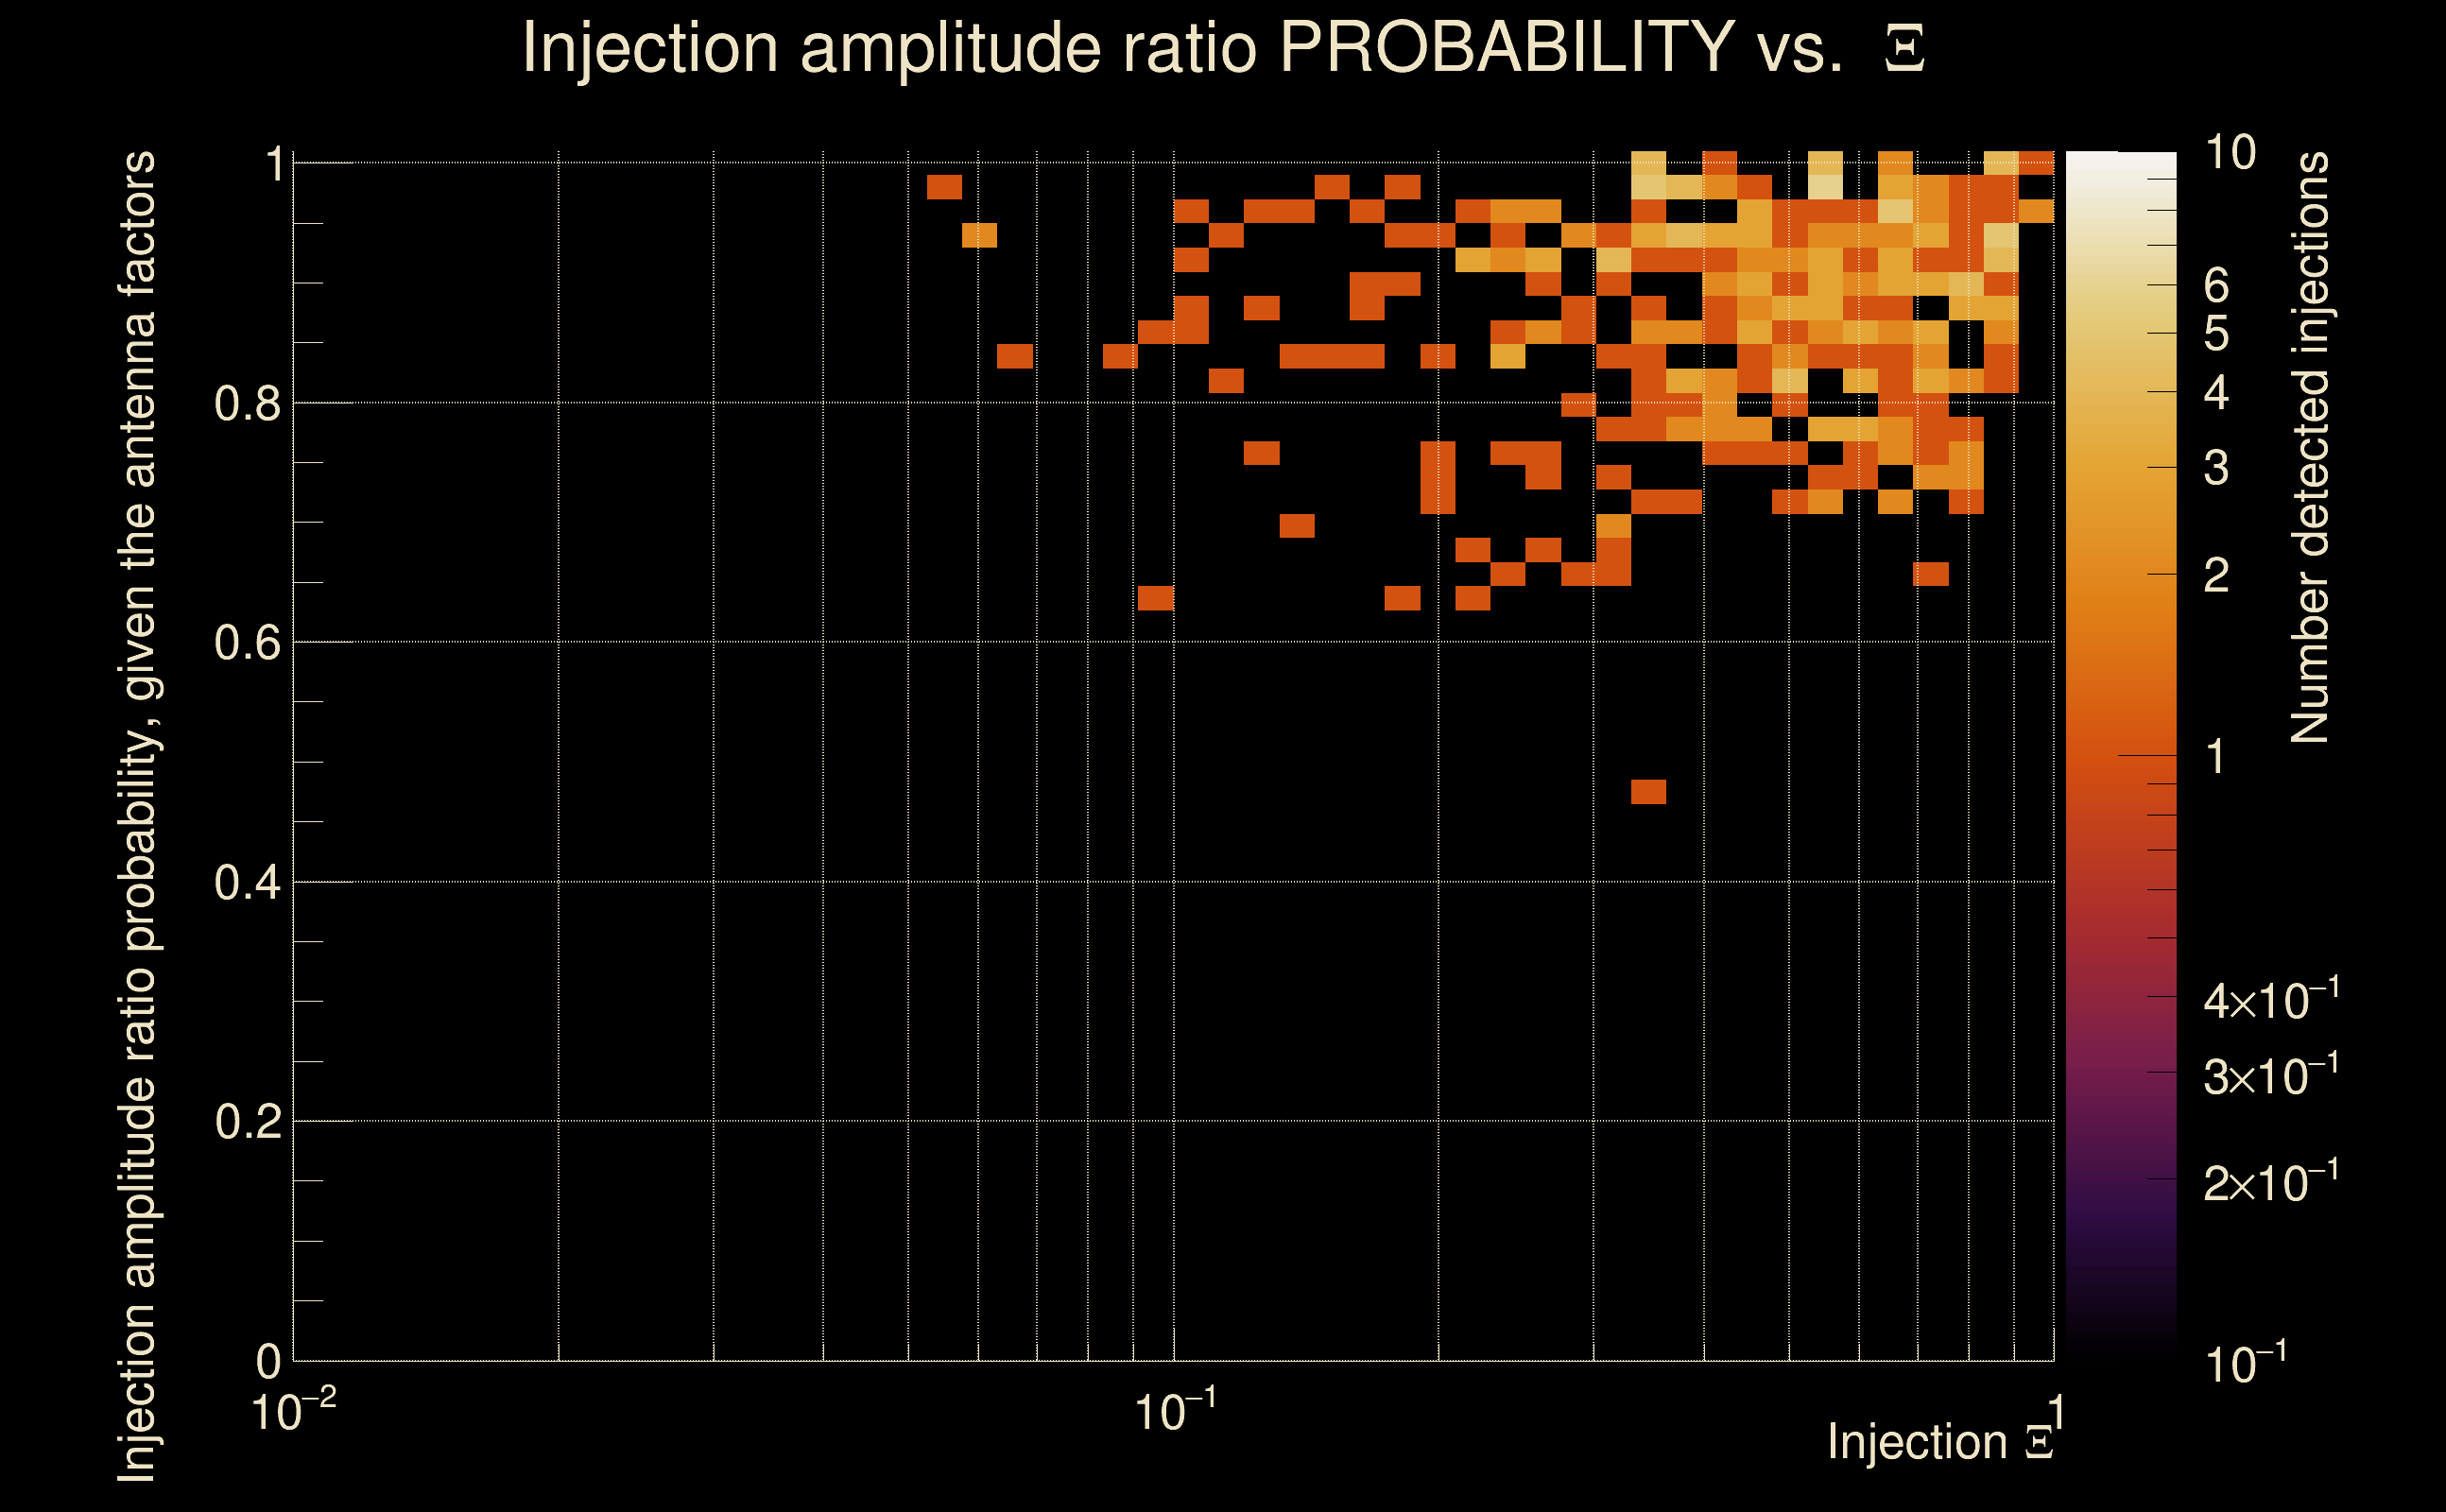
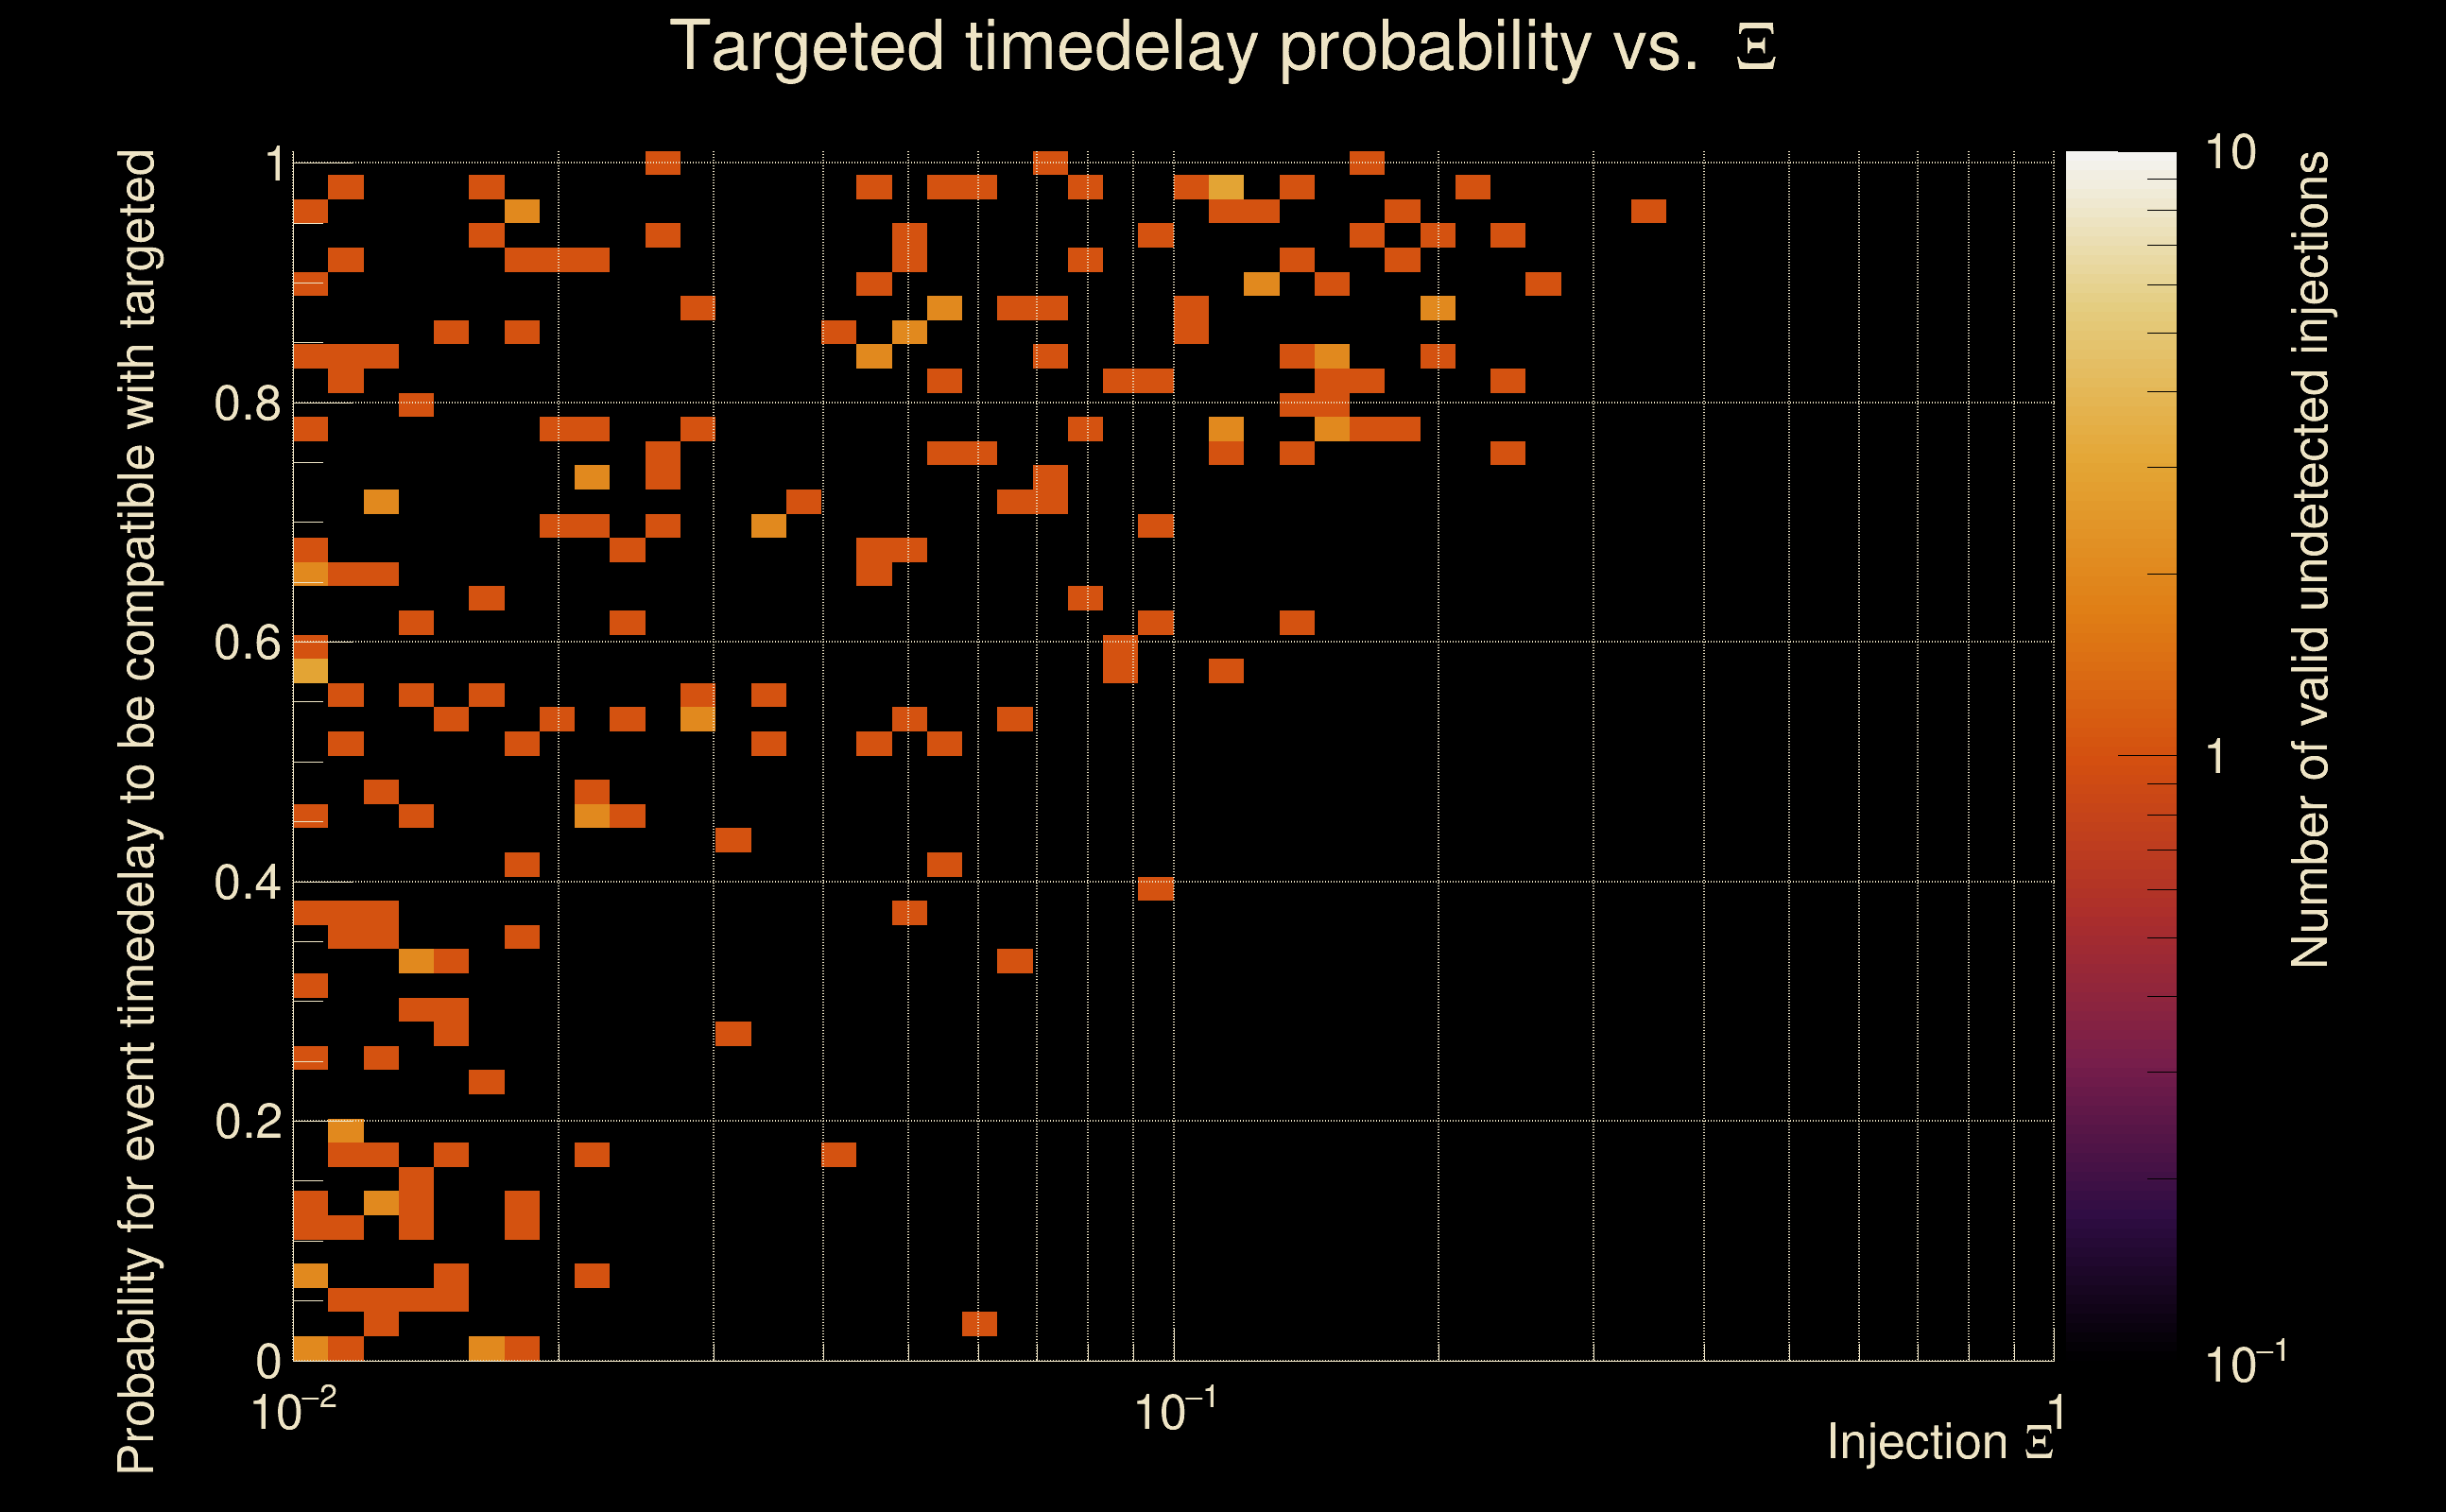
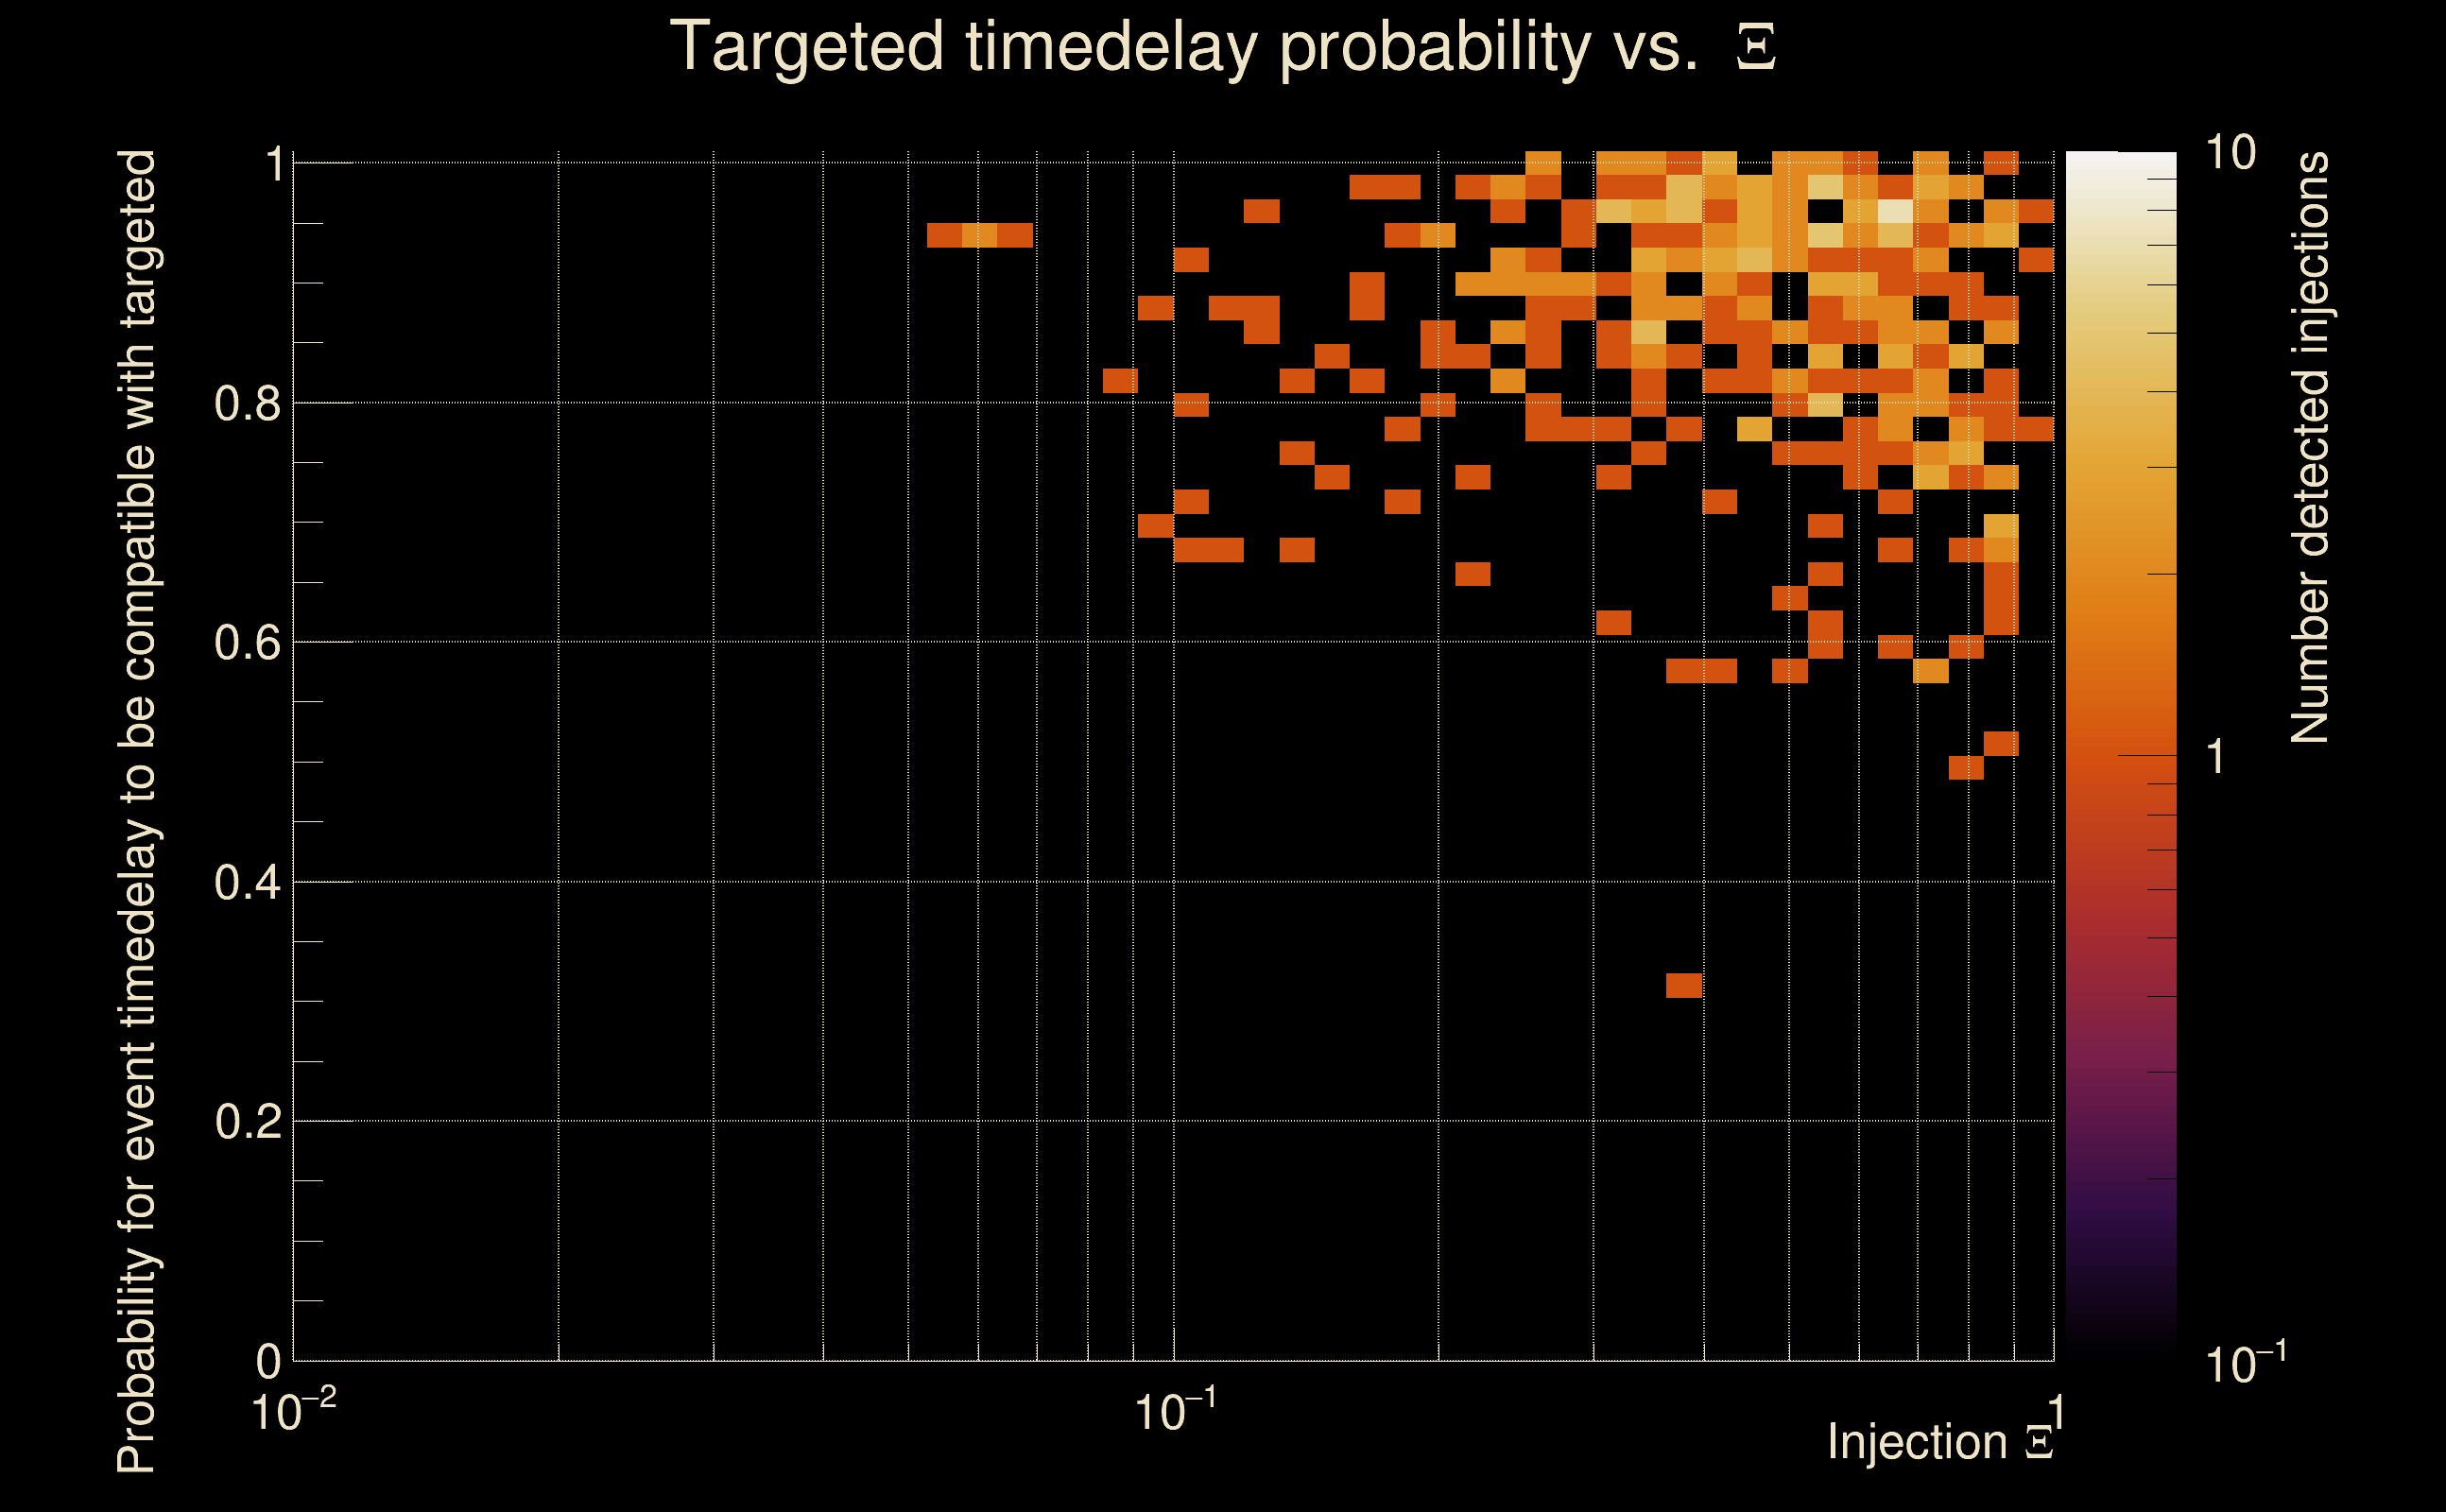
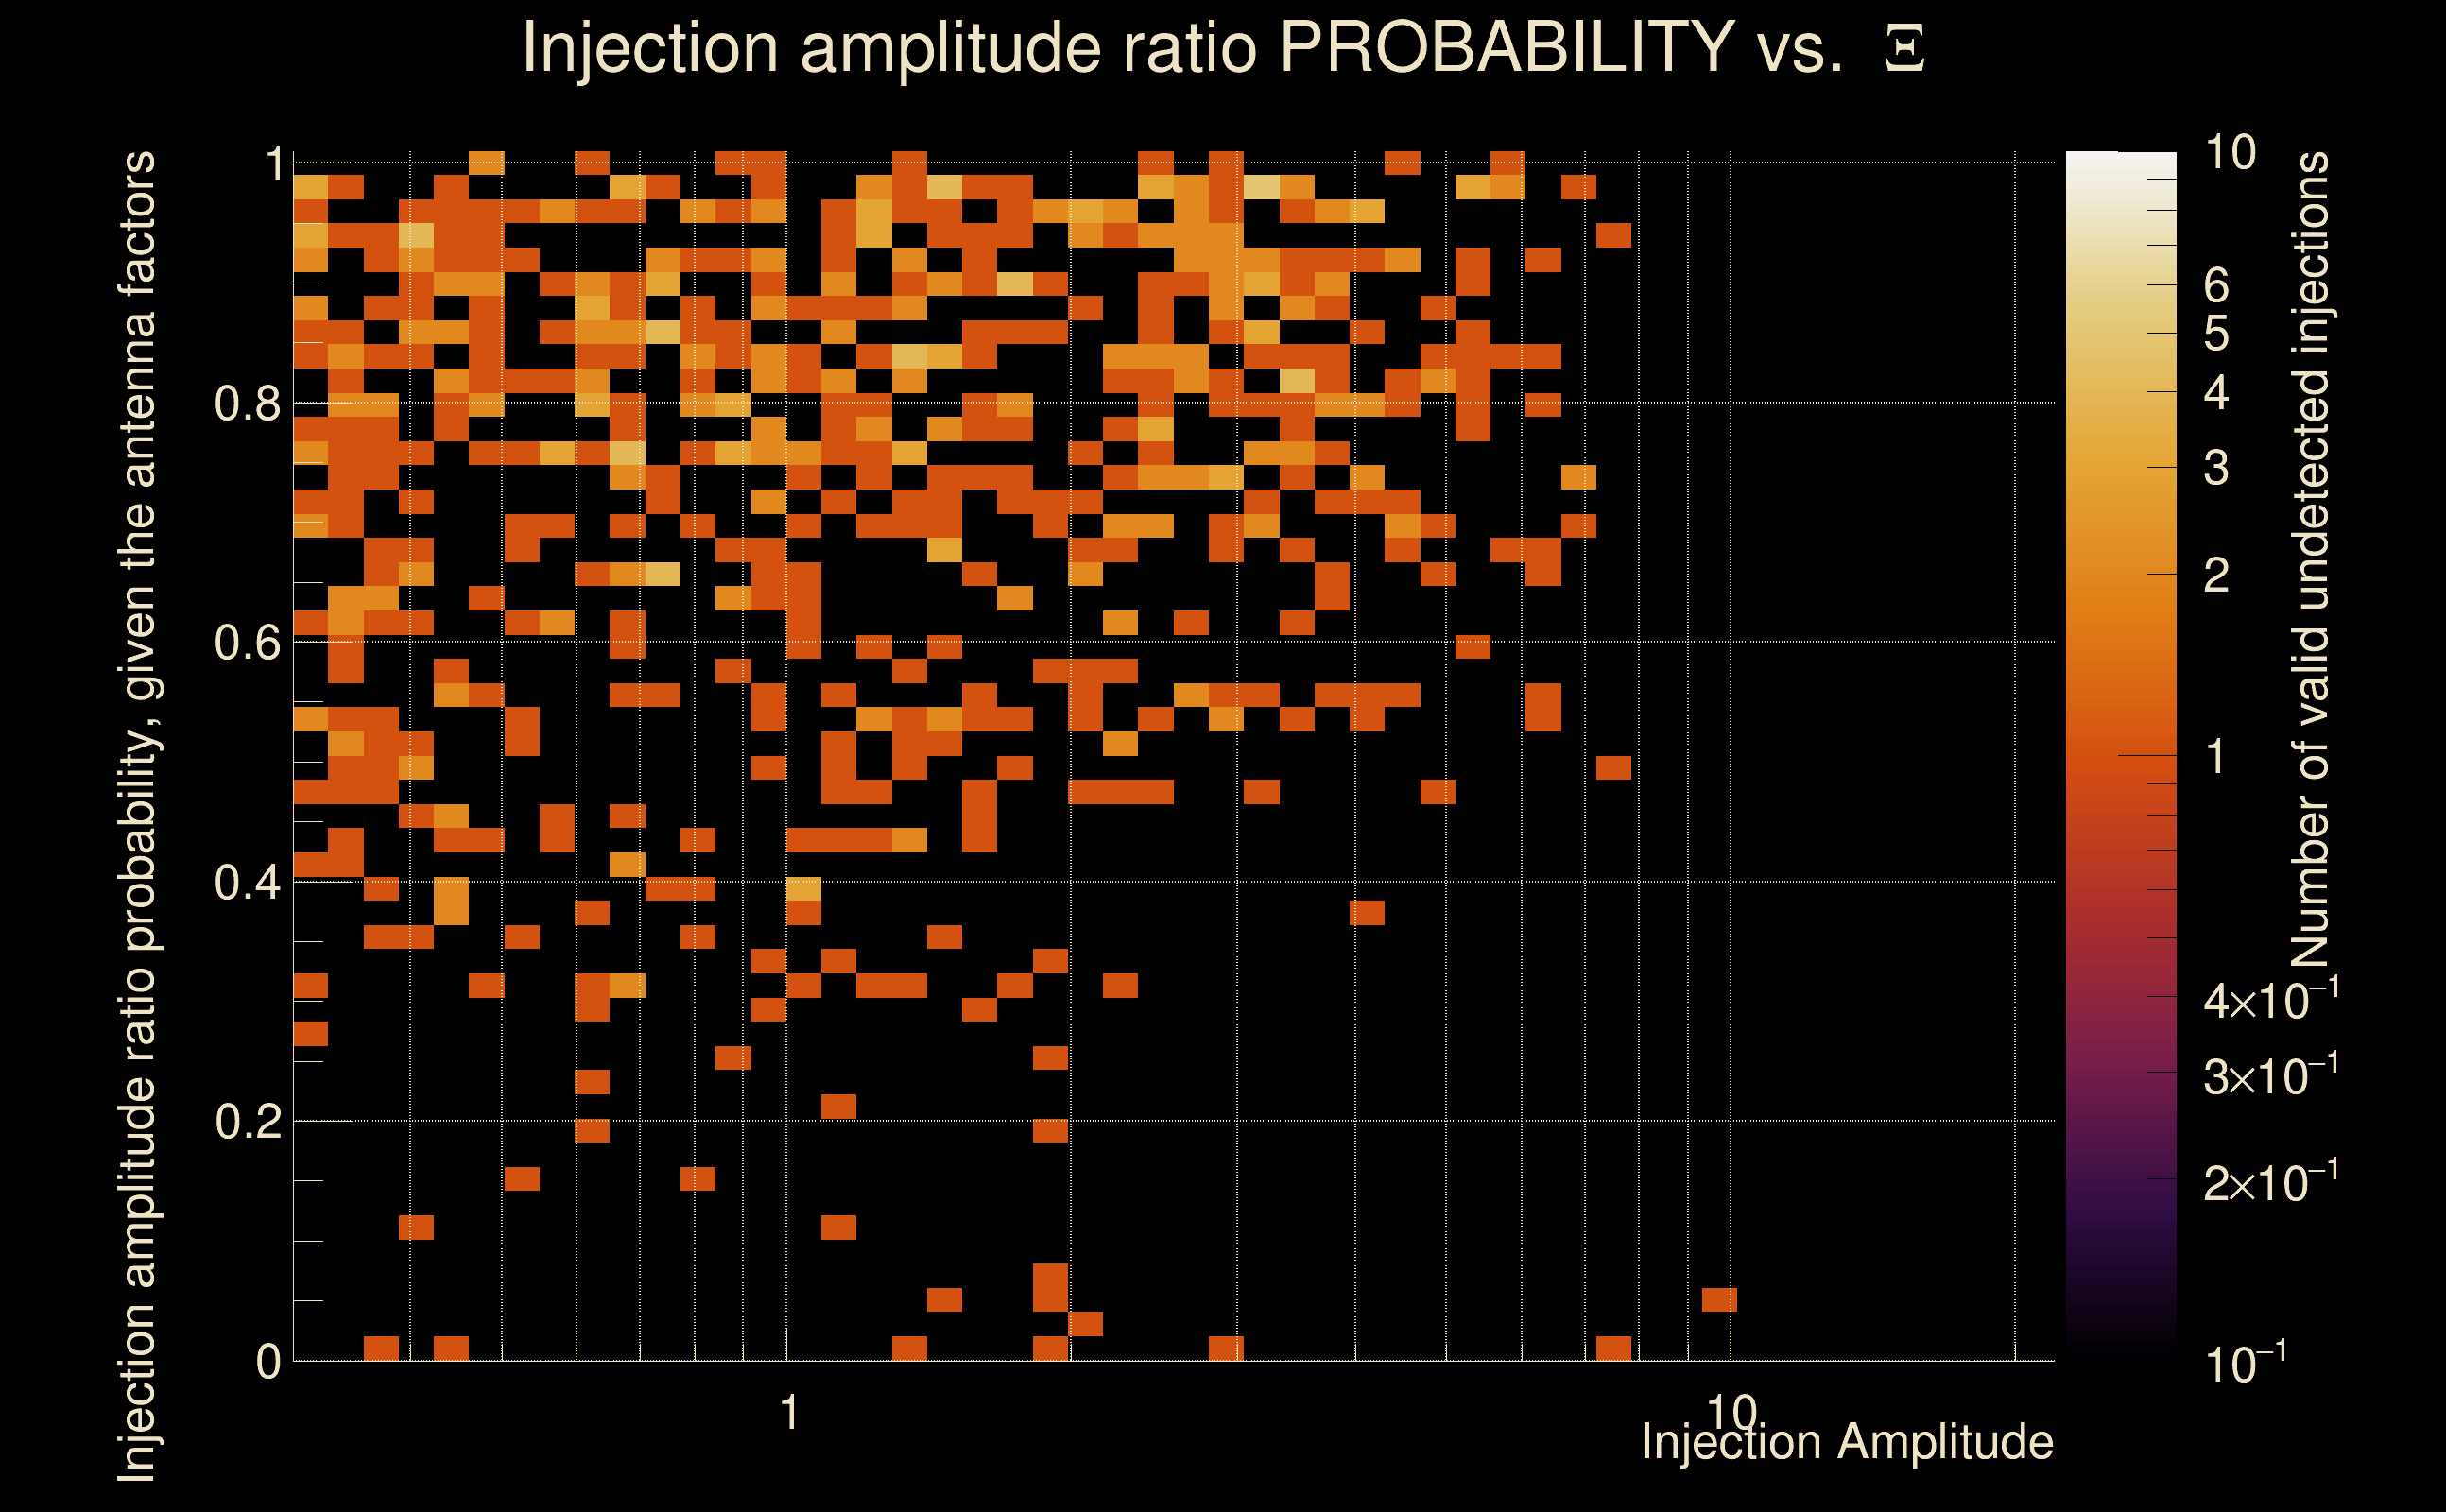
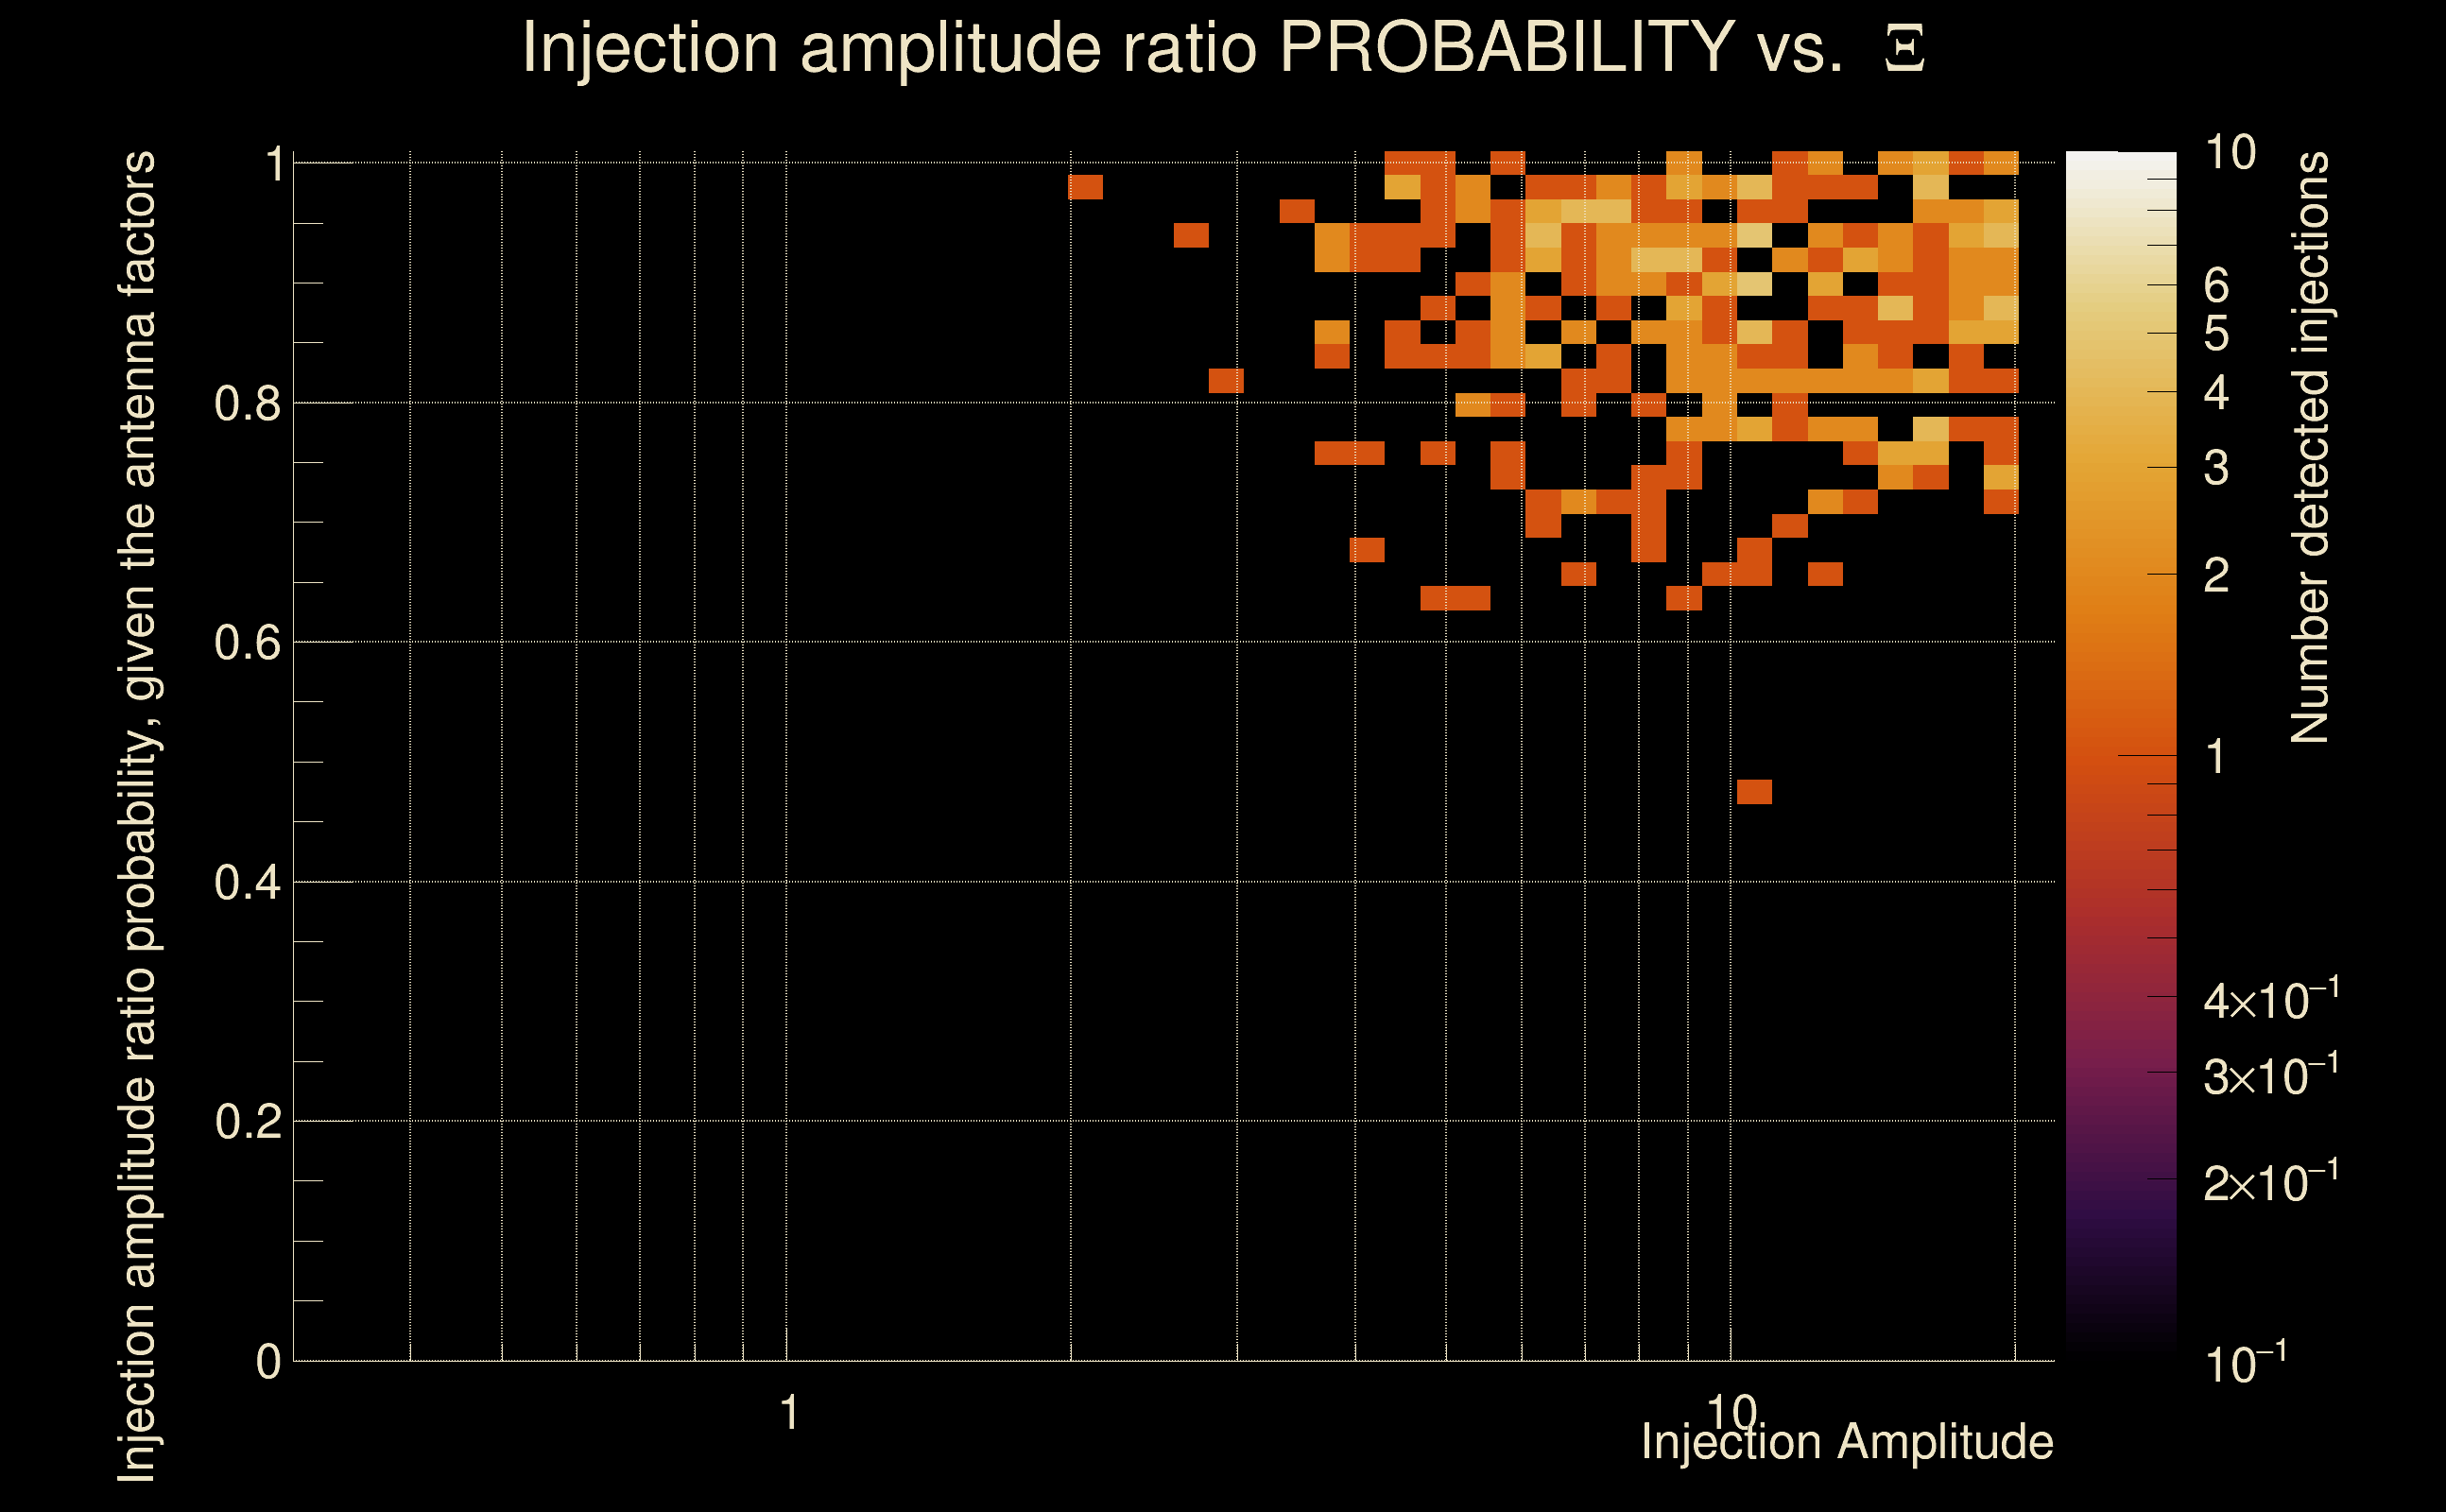
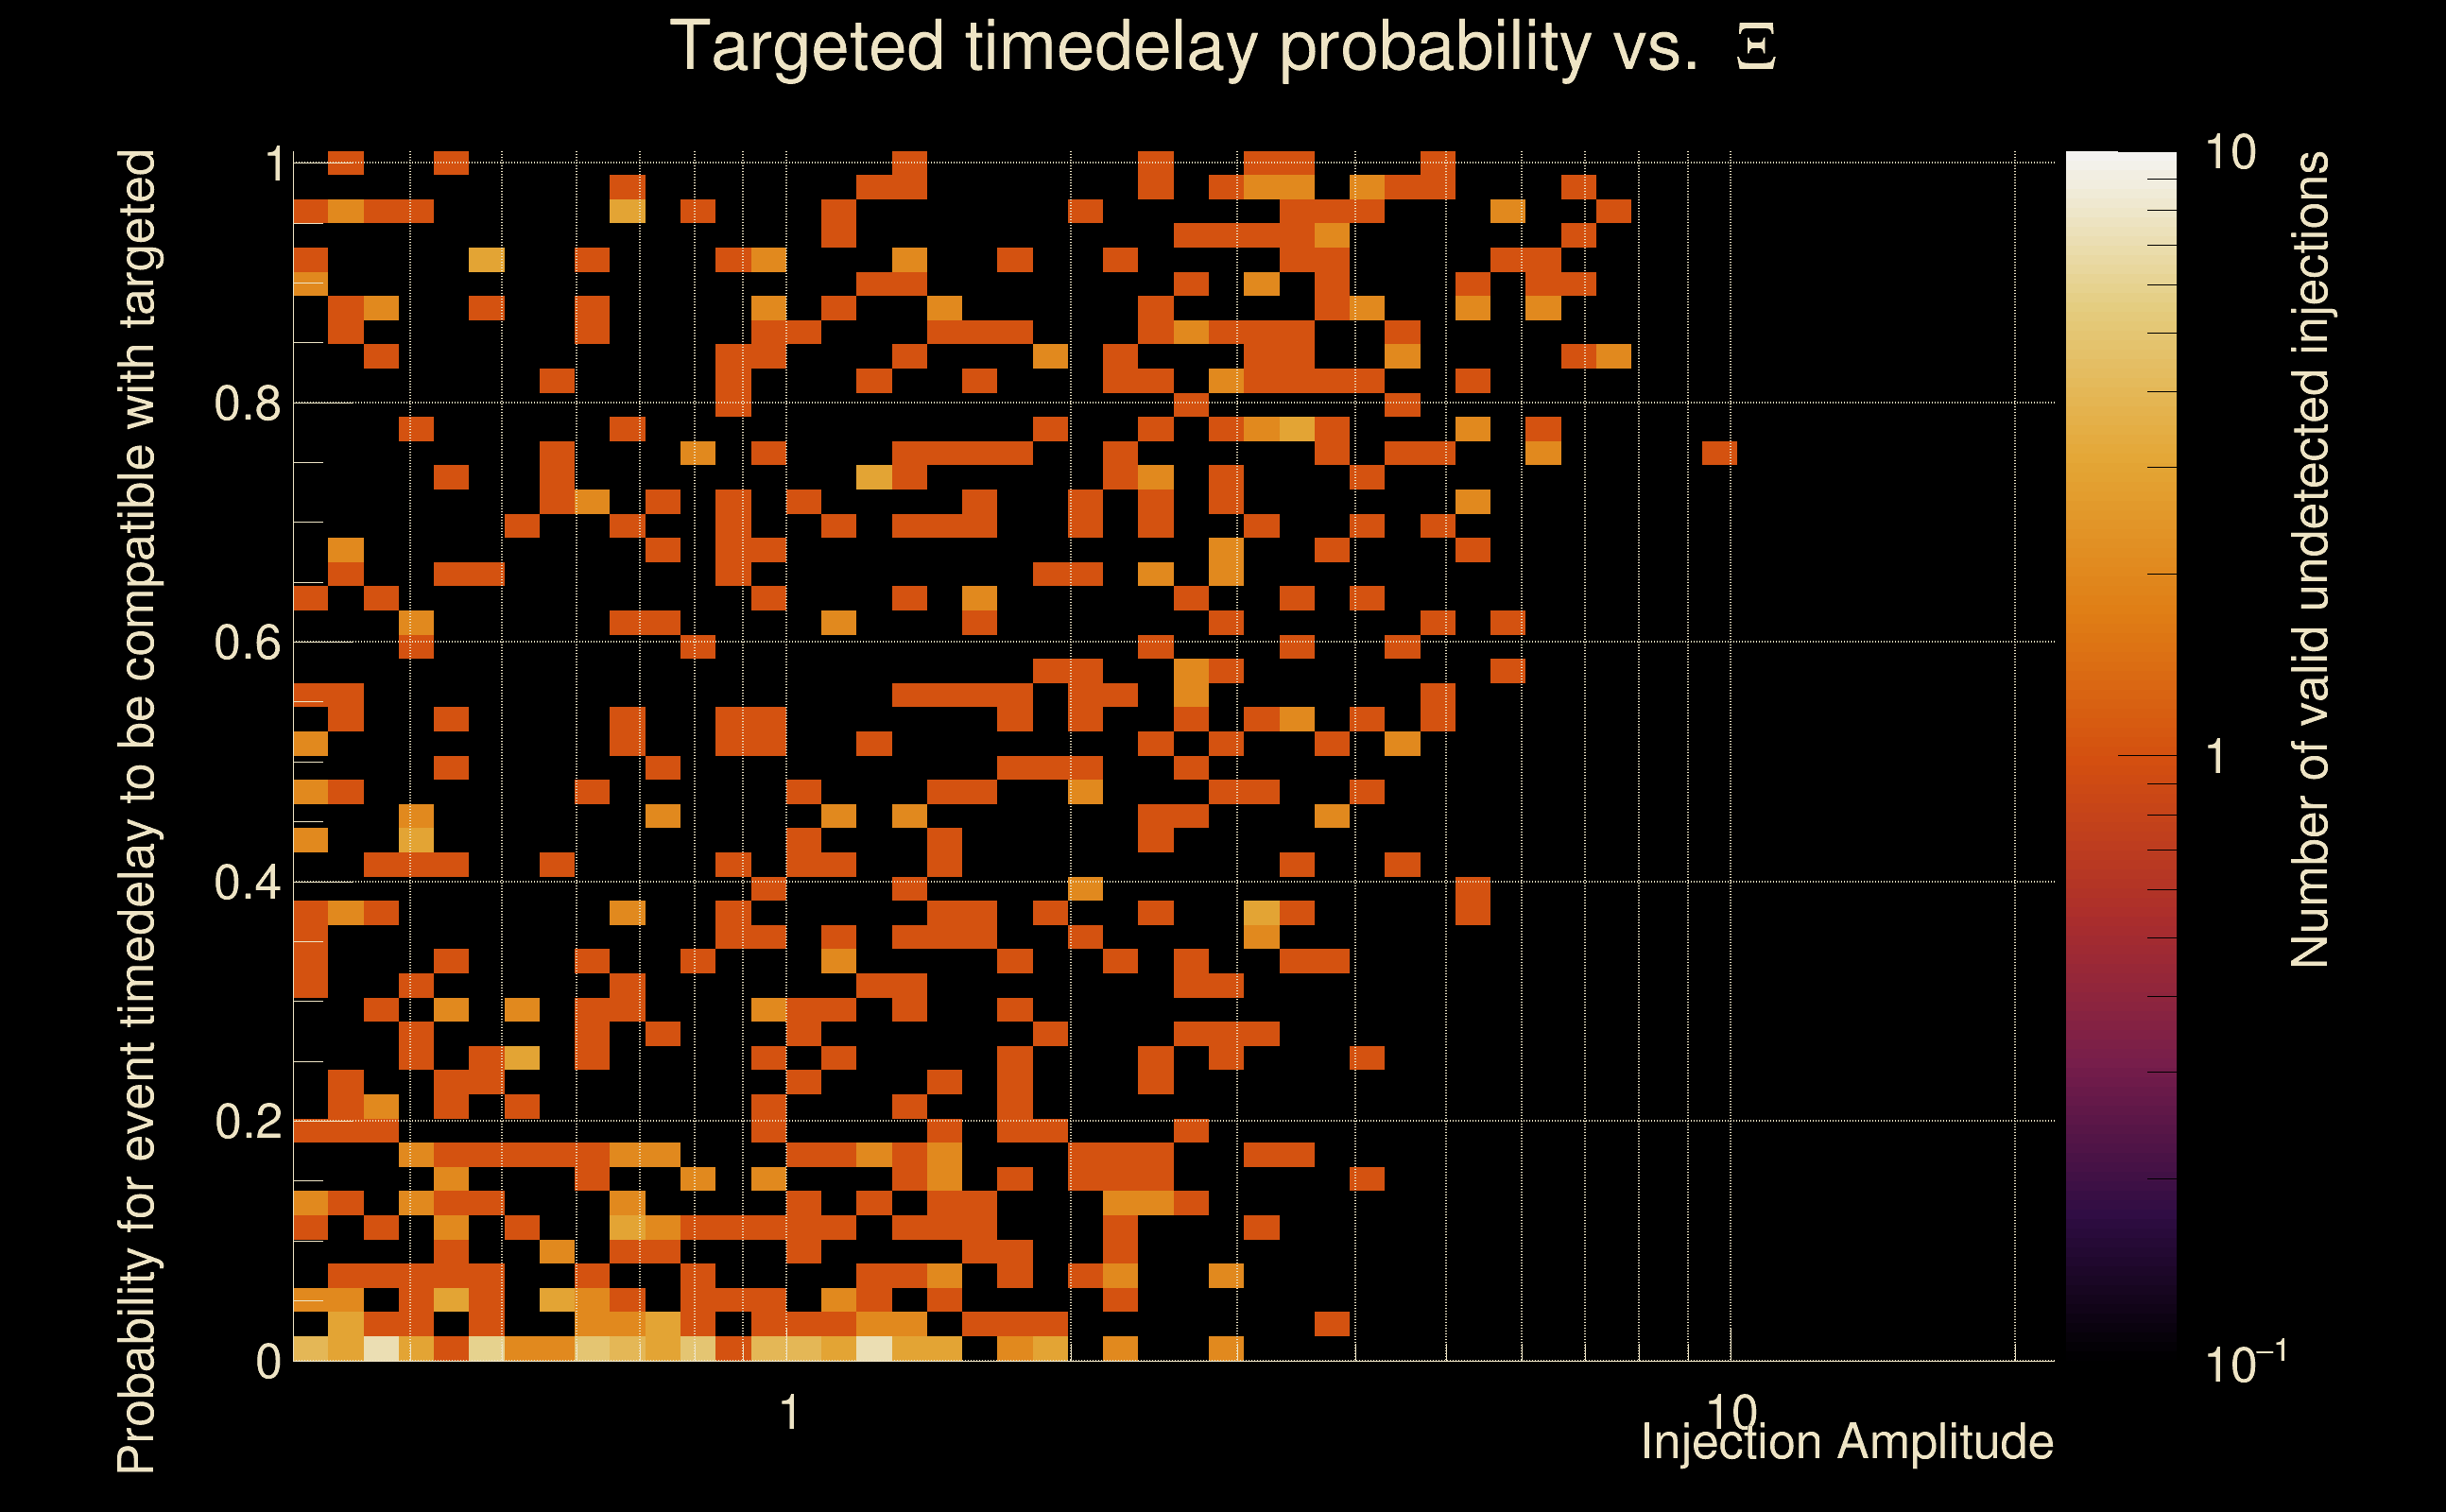
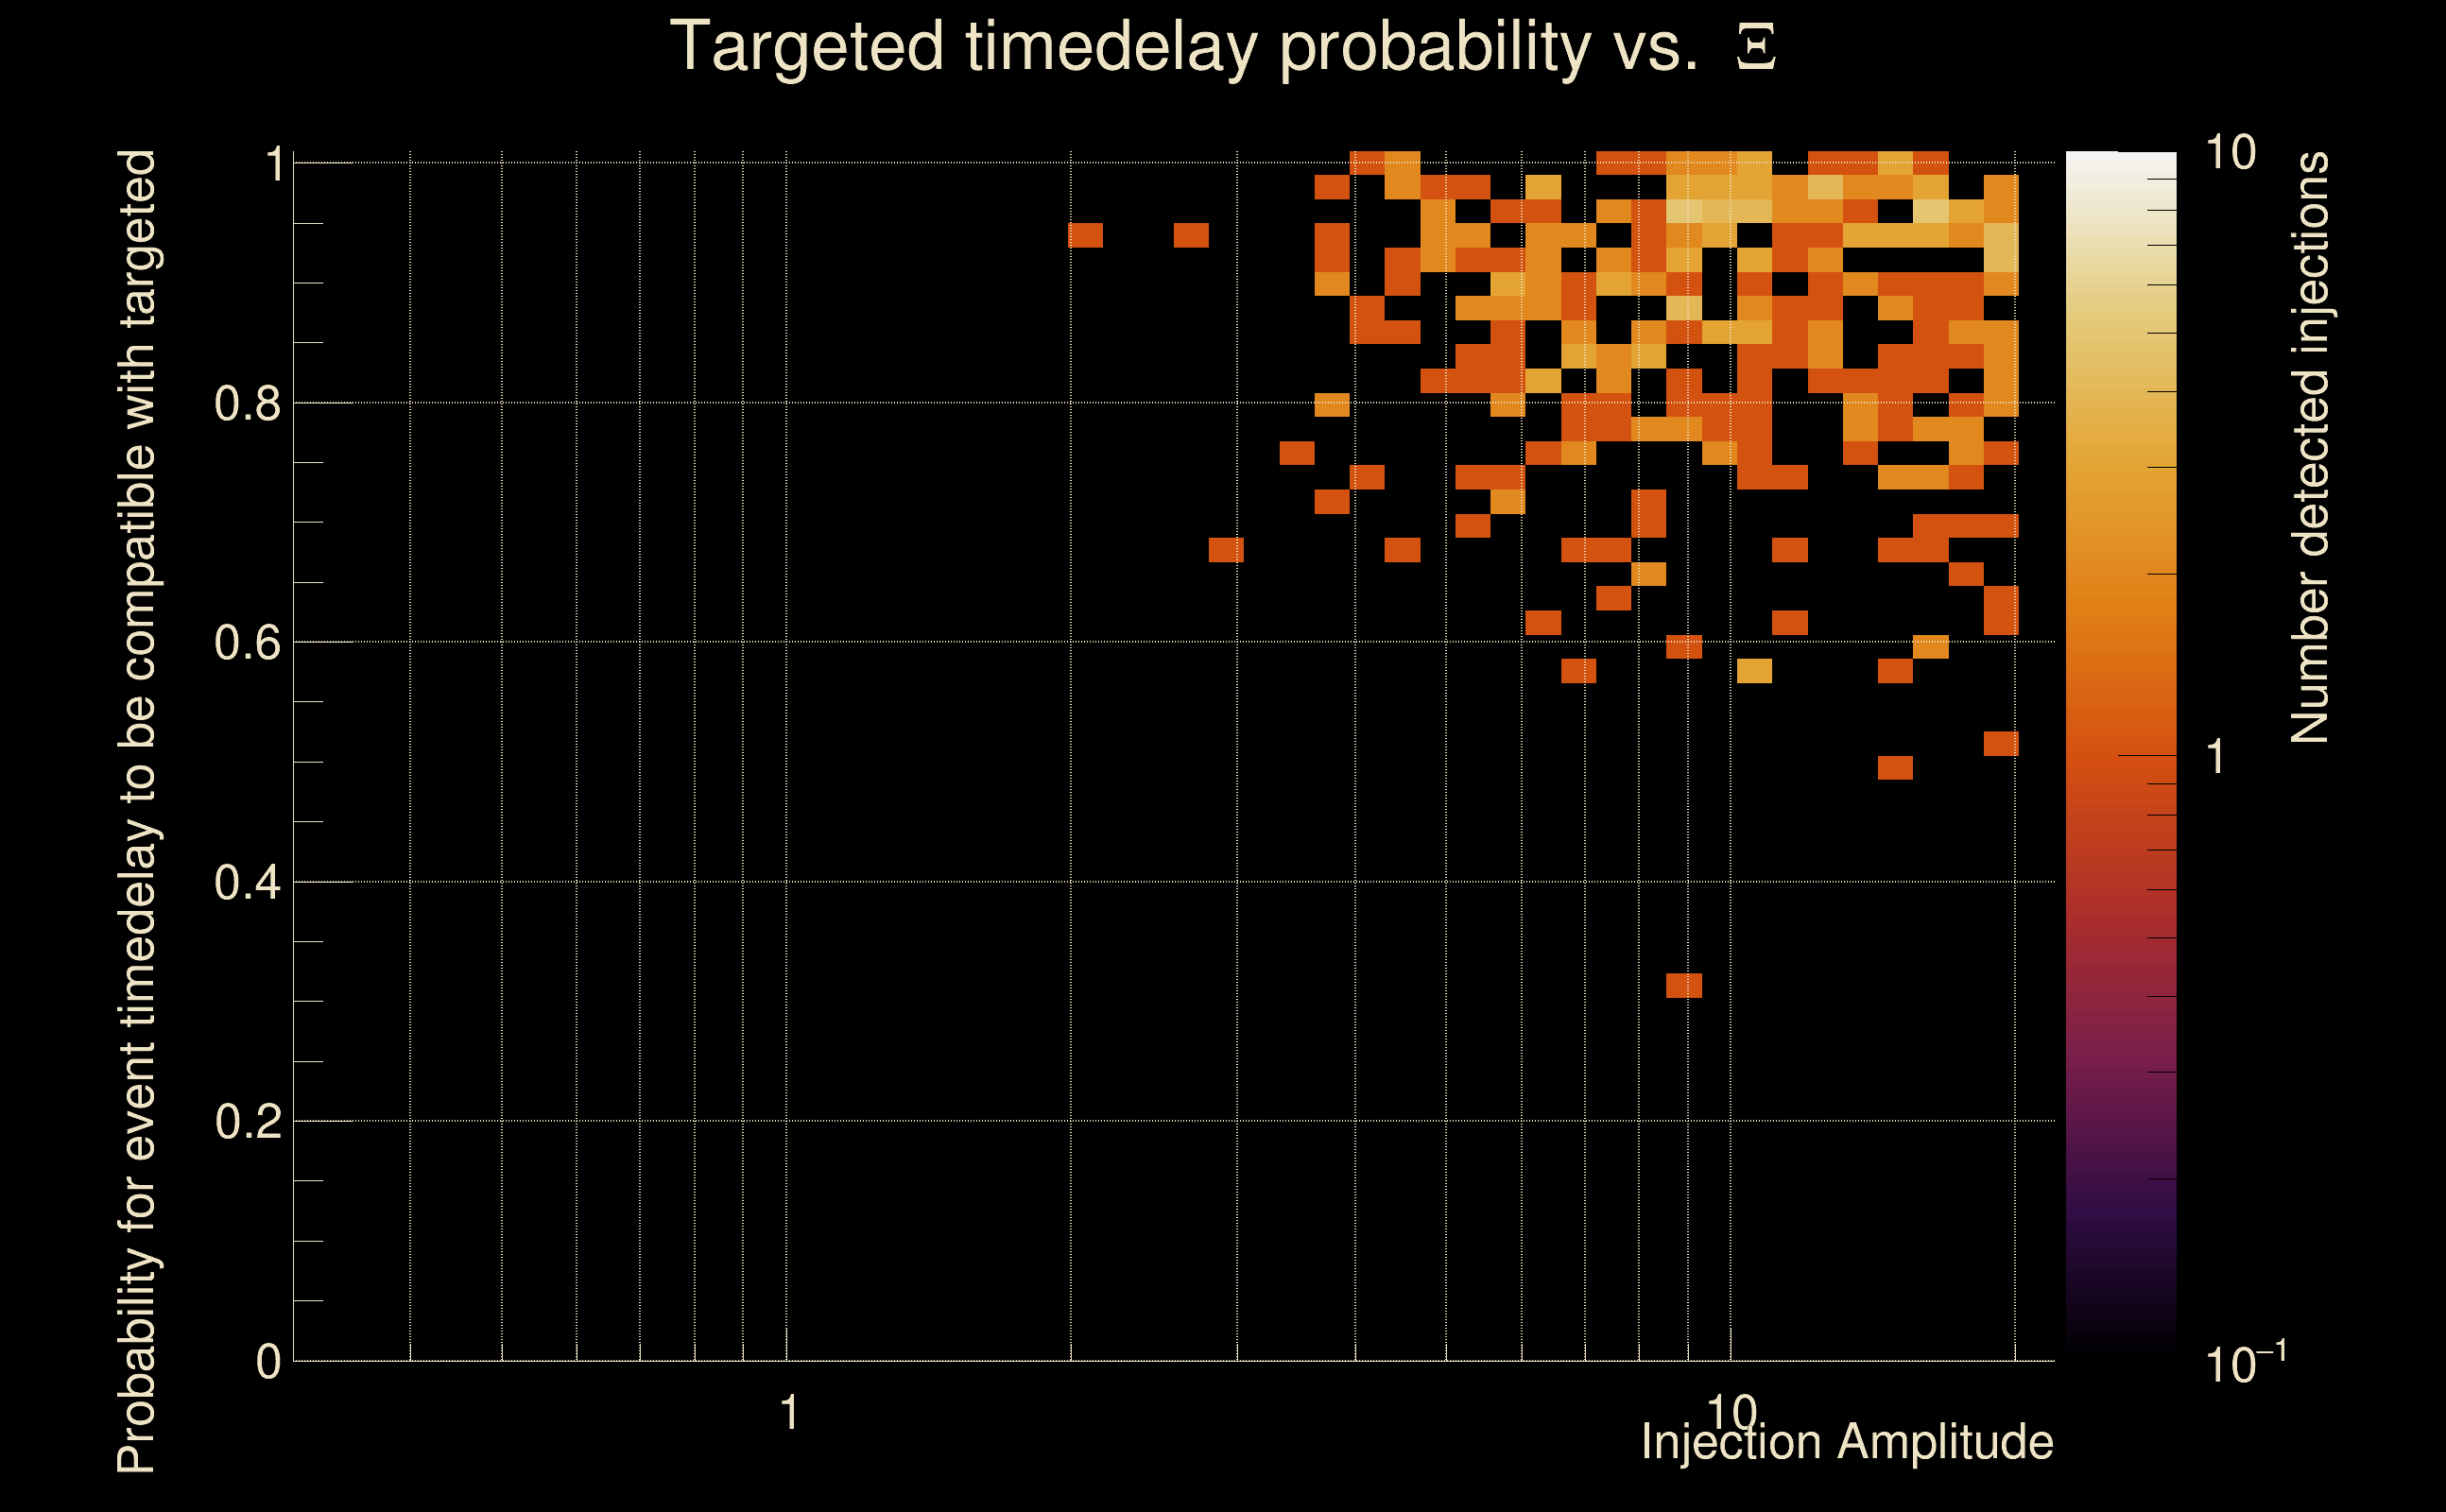
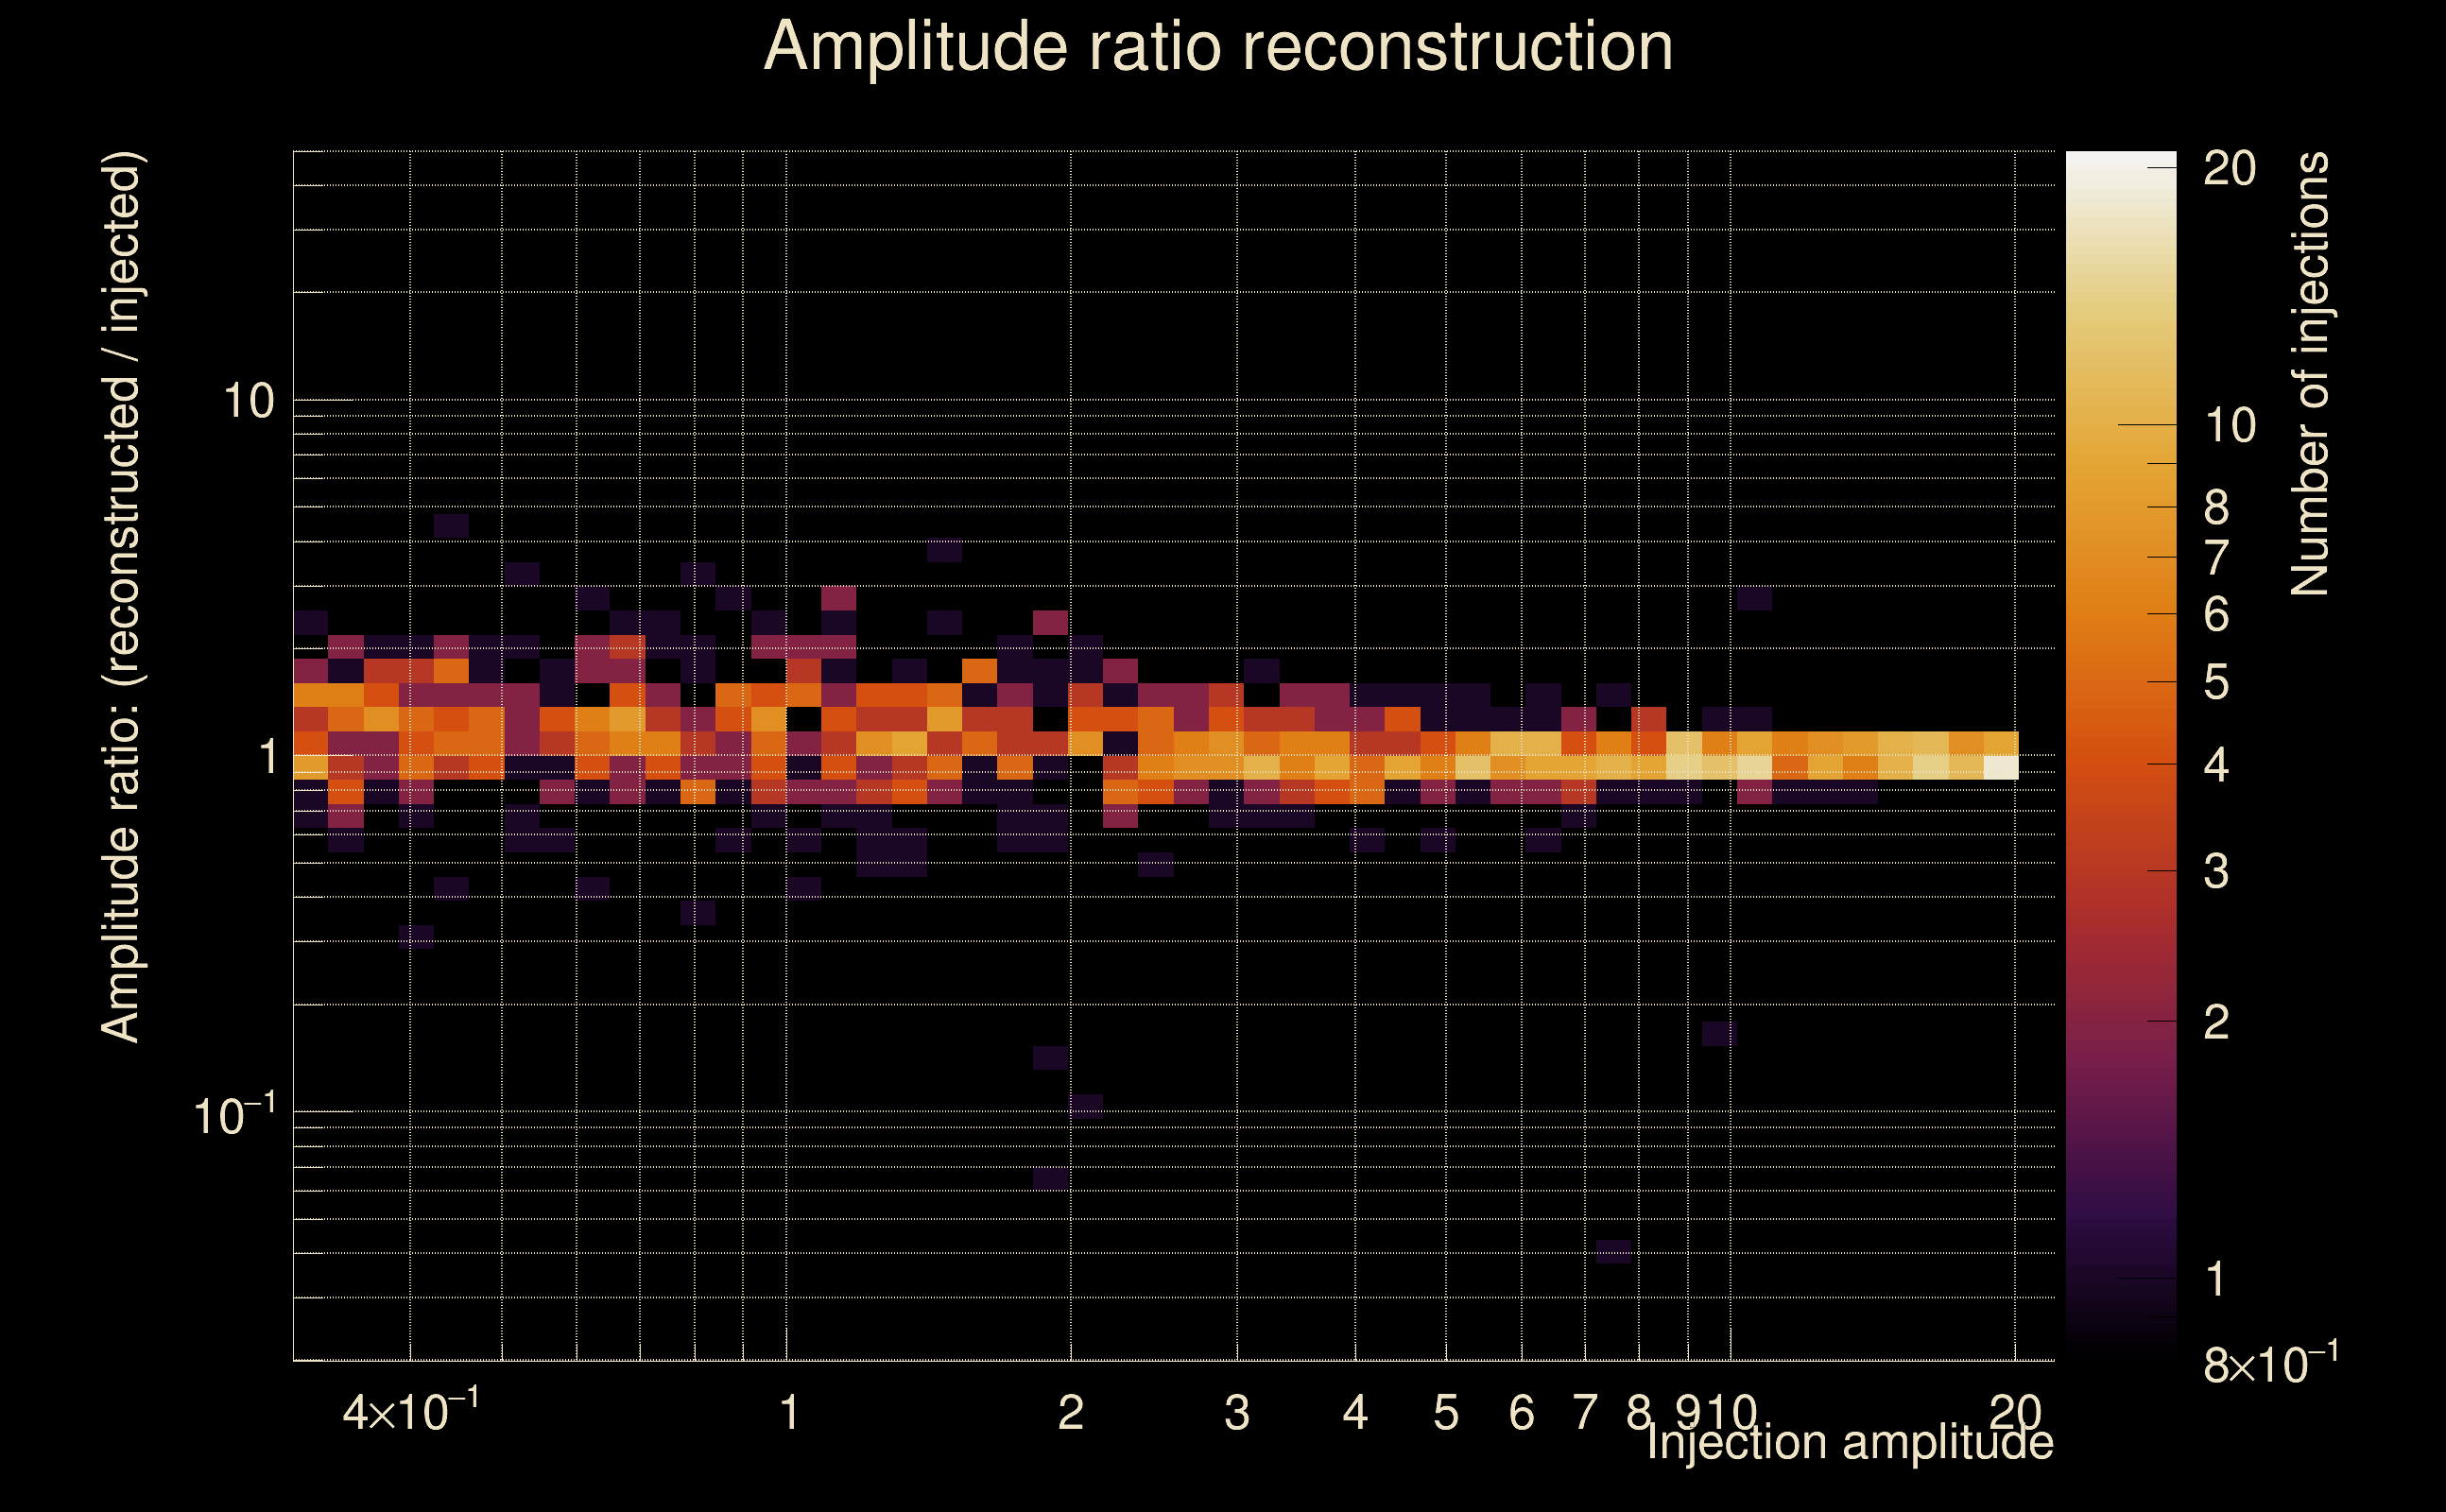
| Number of injections (total/valid/detected): | 1116 / 995 / 330 |
| List of missed injections: | ./Pow19-s18_missed.txt |
| Injection amplitude at 90% detection efficiency: | 7.76695 |
| Injection amplitude at 50% detection efficiency: | 5.37513 |
| Injection amplitude at 10% detection efficiency: | 3.52596 |
 |
 |
 |
 |
 |
 |
 |
|
 |
 |
|
 |
 |
|
 |
 |
|
 |
 |
|
 |
 |
|
 |
 |
|
 |
 |
|
 |
 |
 |
 |
 |
 |
 |
 |
 |
 |
 |
 |
 |
 |
 |
| florent.robinet@ijclab.in2p3.fr |