| Omicron version: | 4.2.0: documentation gitlab repository |
| Omicron run by: | unknown |
| Report produced on: | Wed Dec 17 09:48:12 2025 UTC |
| Ox option file: | TargIxfw_injpt1_options.txt |
| Omicron option files: | detector 0, detector 1 |
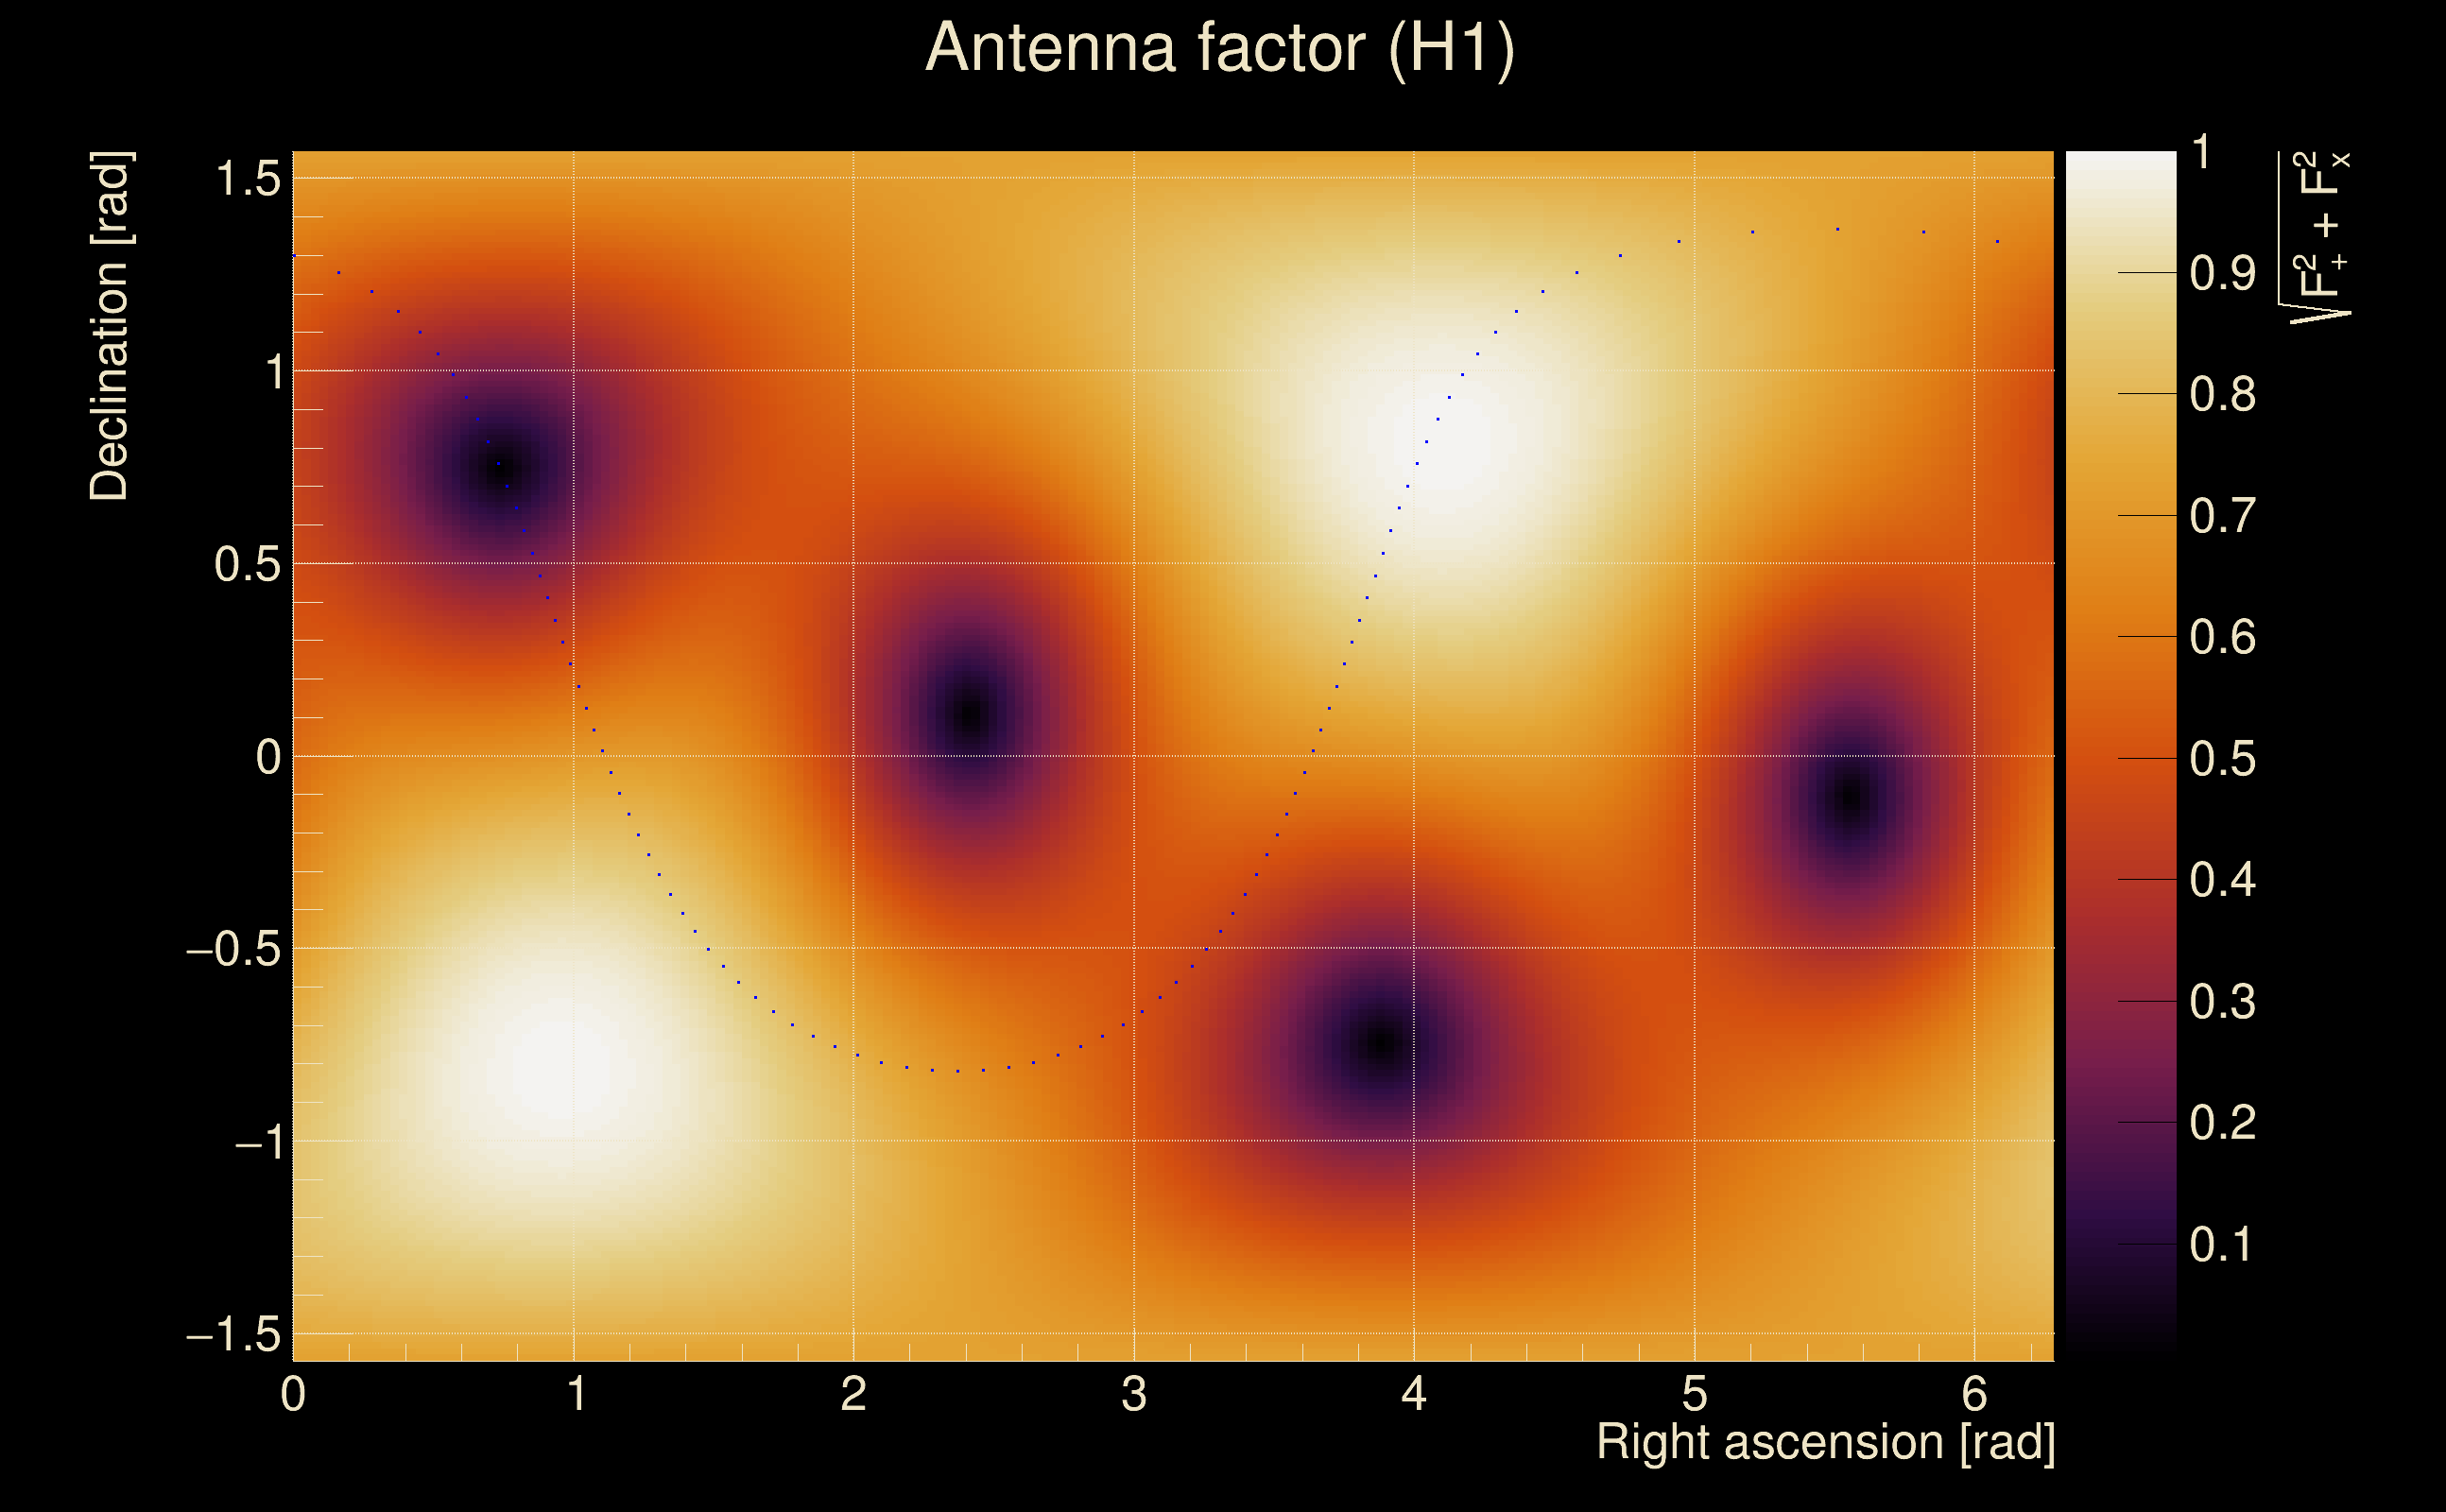
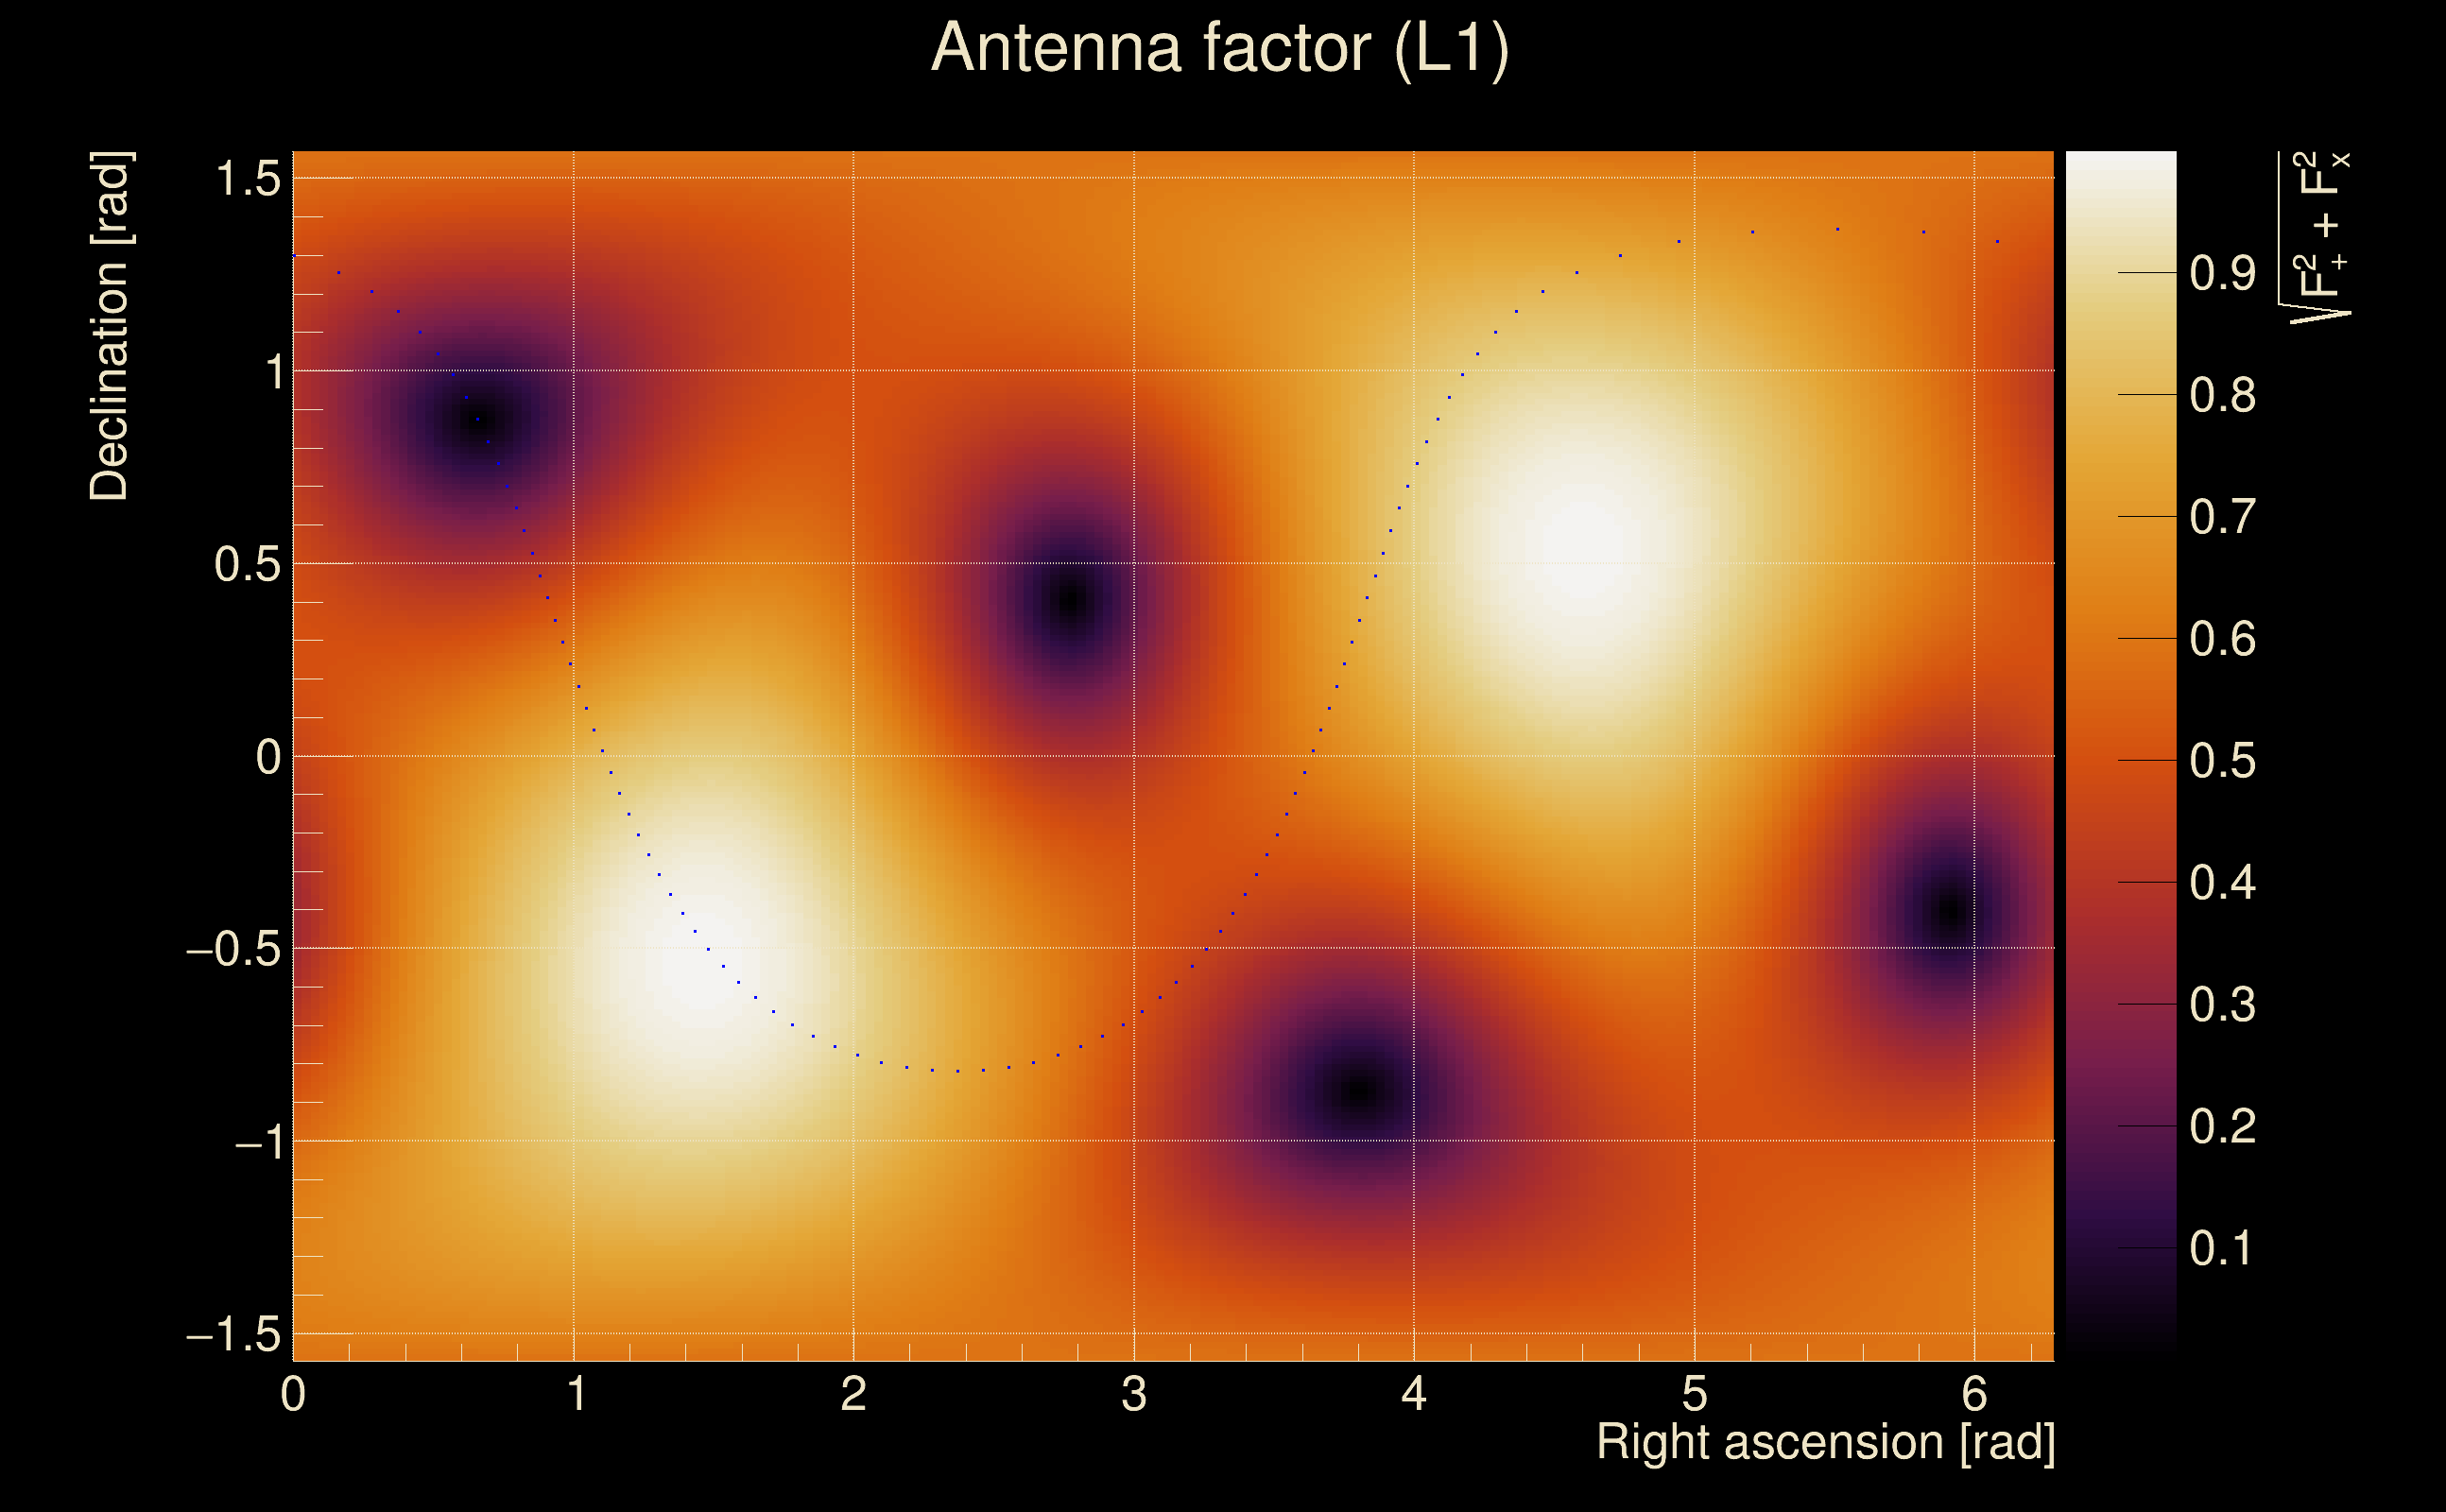
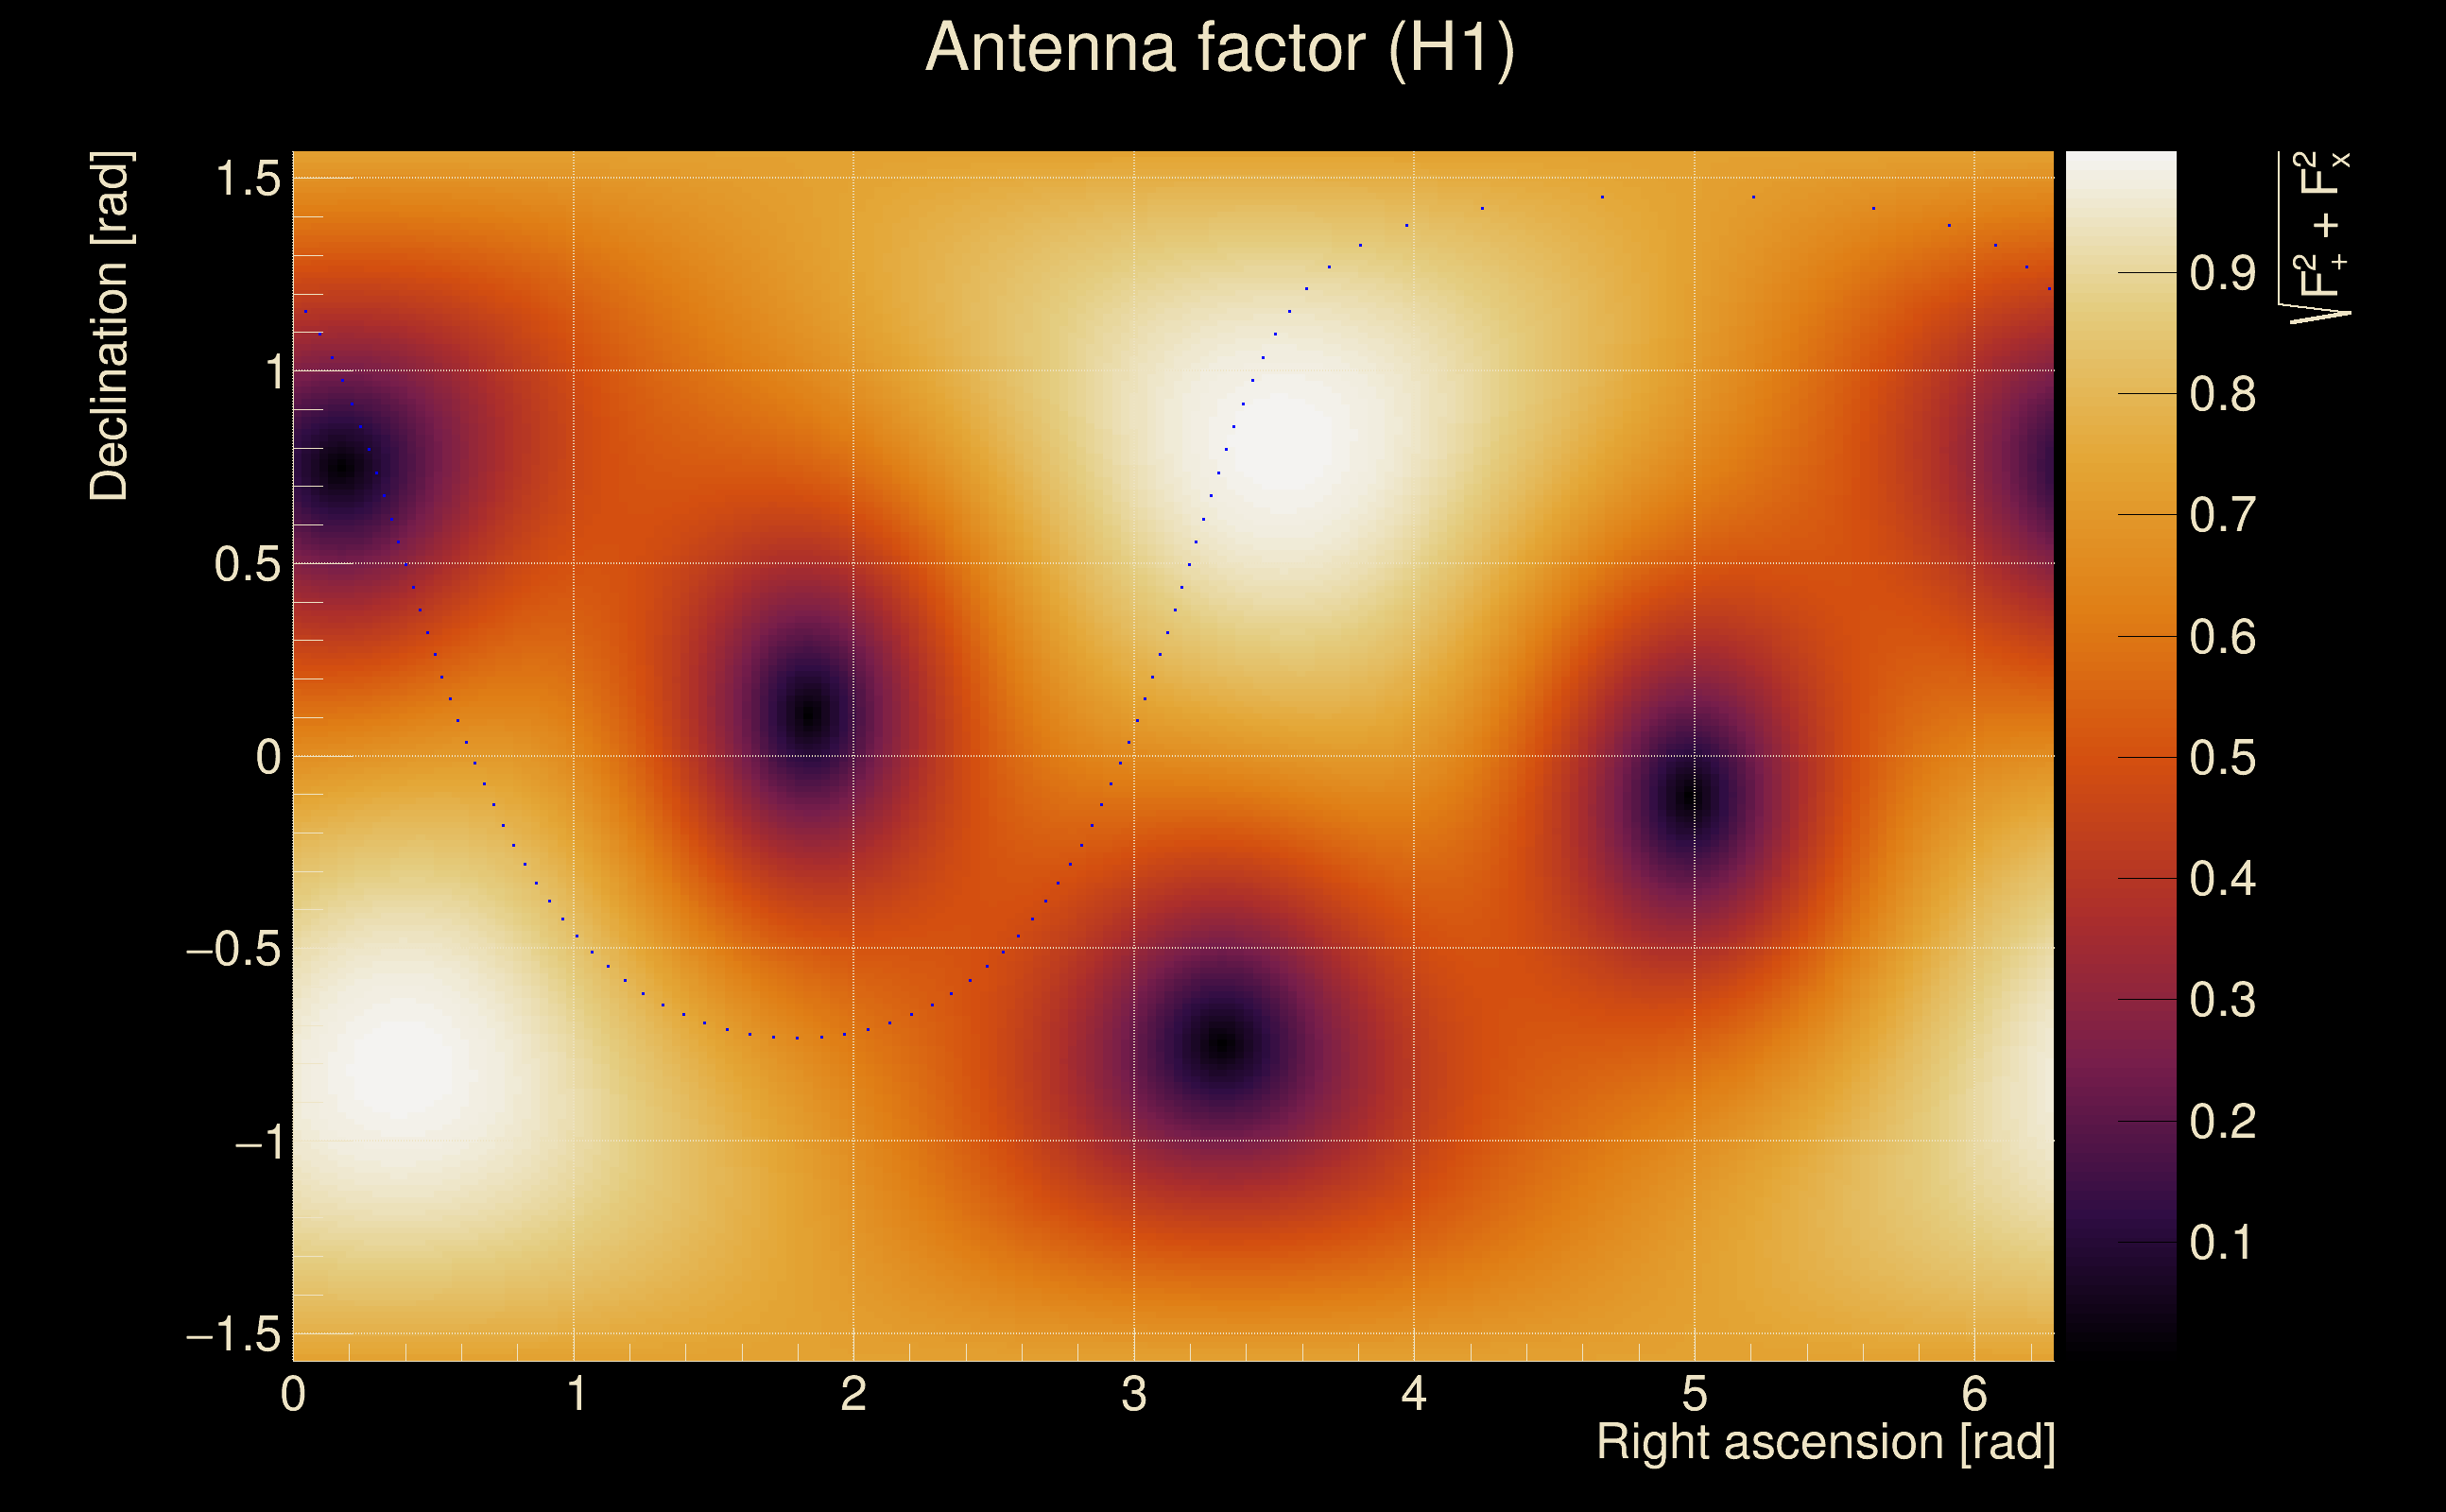
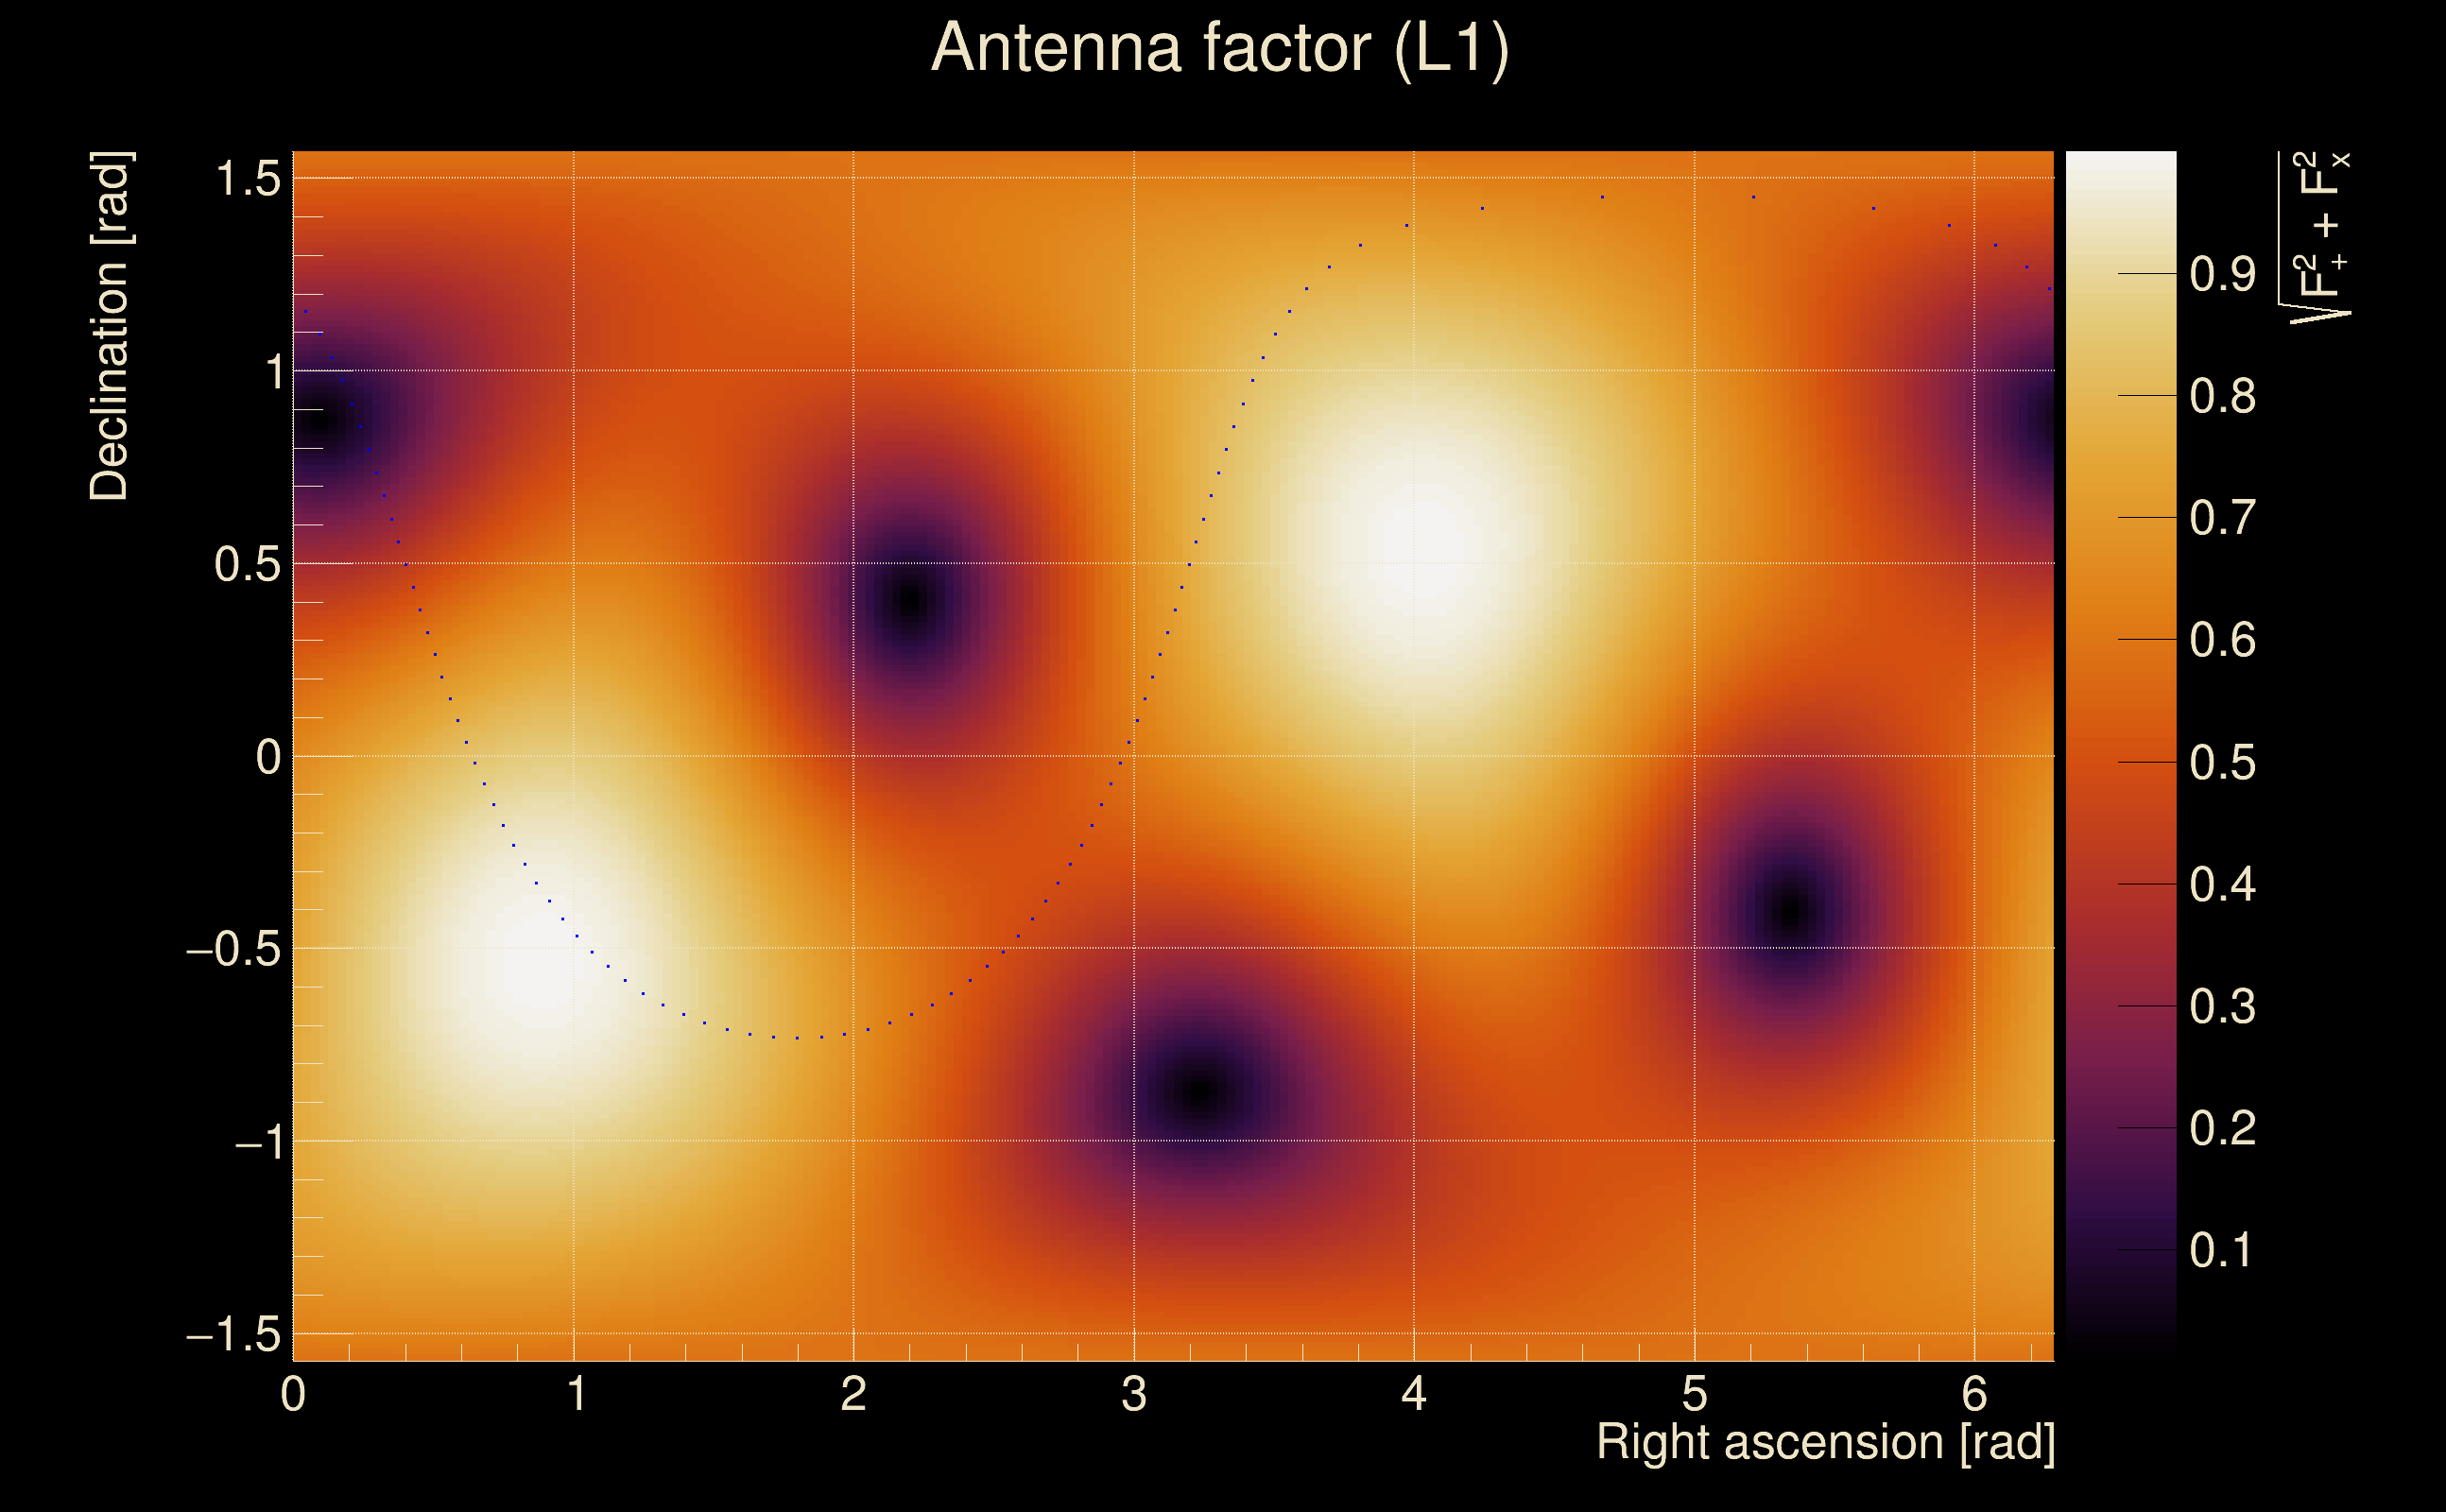
| Detector channel names: | H1:GDS-CALIB_STRAIN_CLEAN_AR_4096Hz, L1:GDS-CALIB_STRAIN_CLEAN_AR_4096Hz |
| Omicron analysis time window and overlap: | 16 s, 6 s |
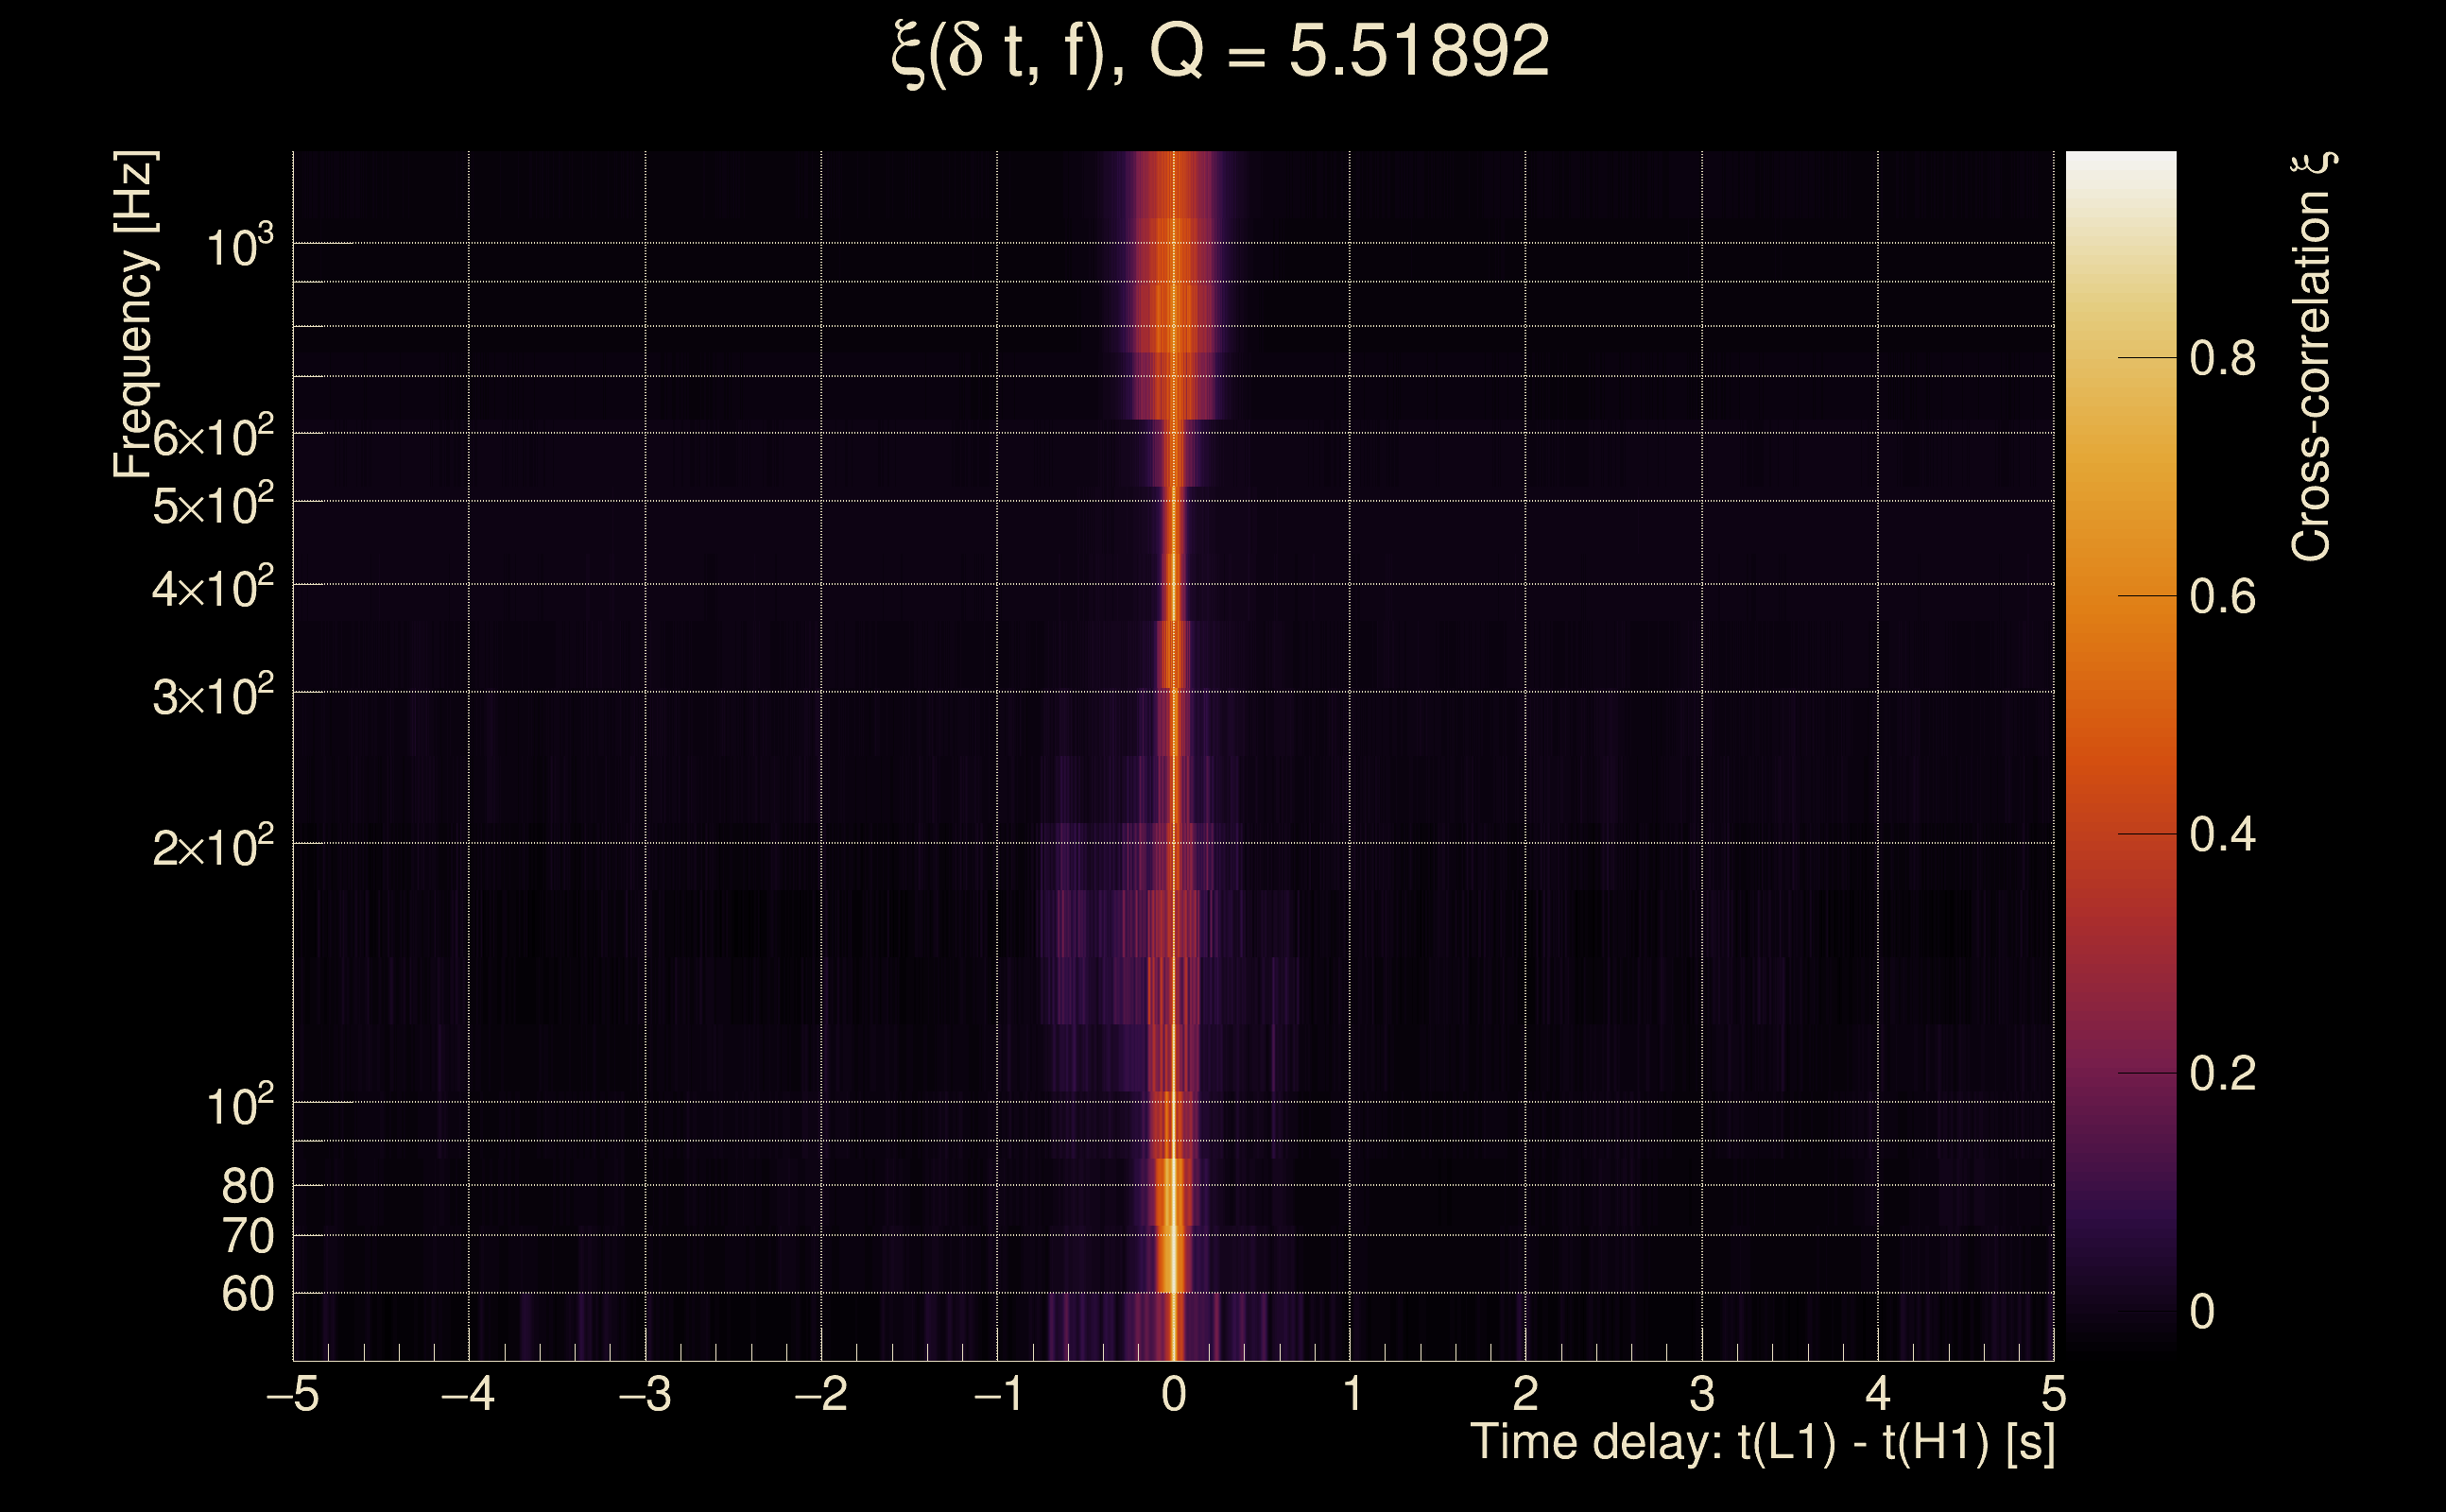
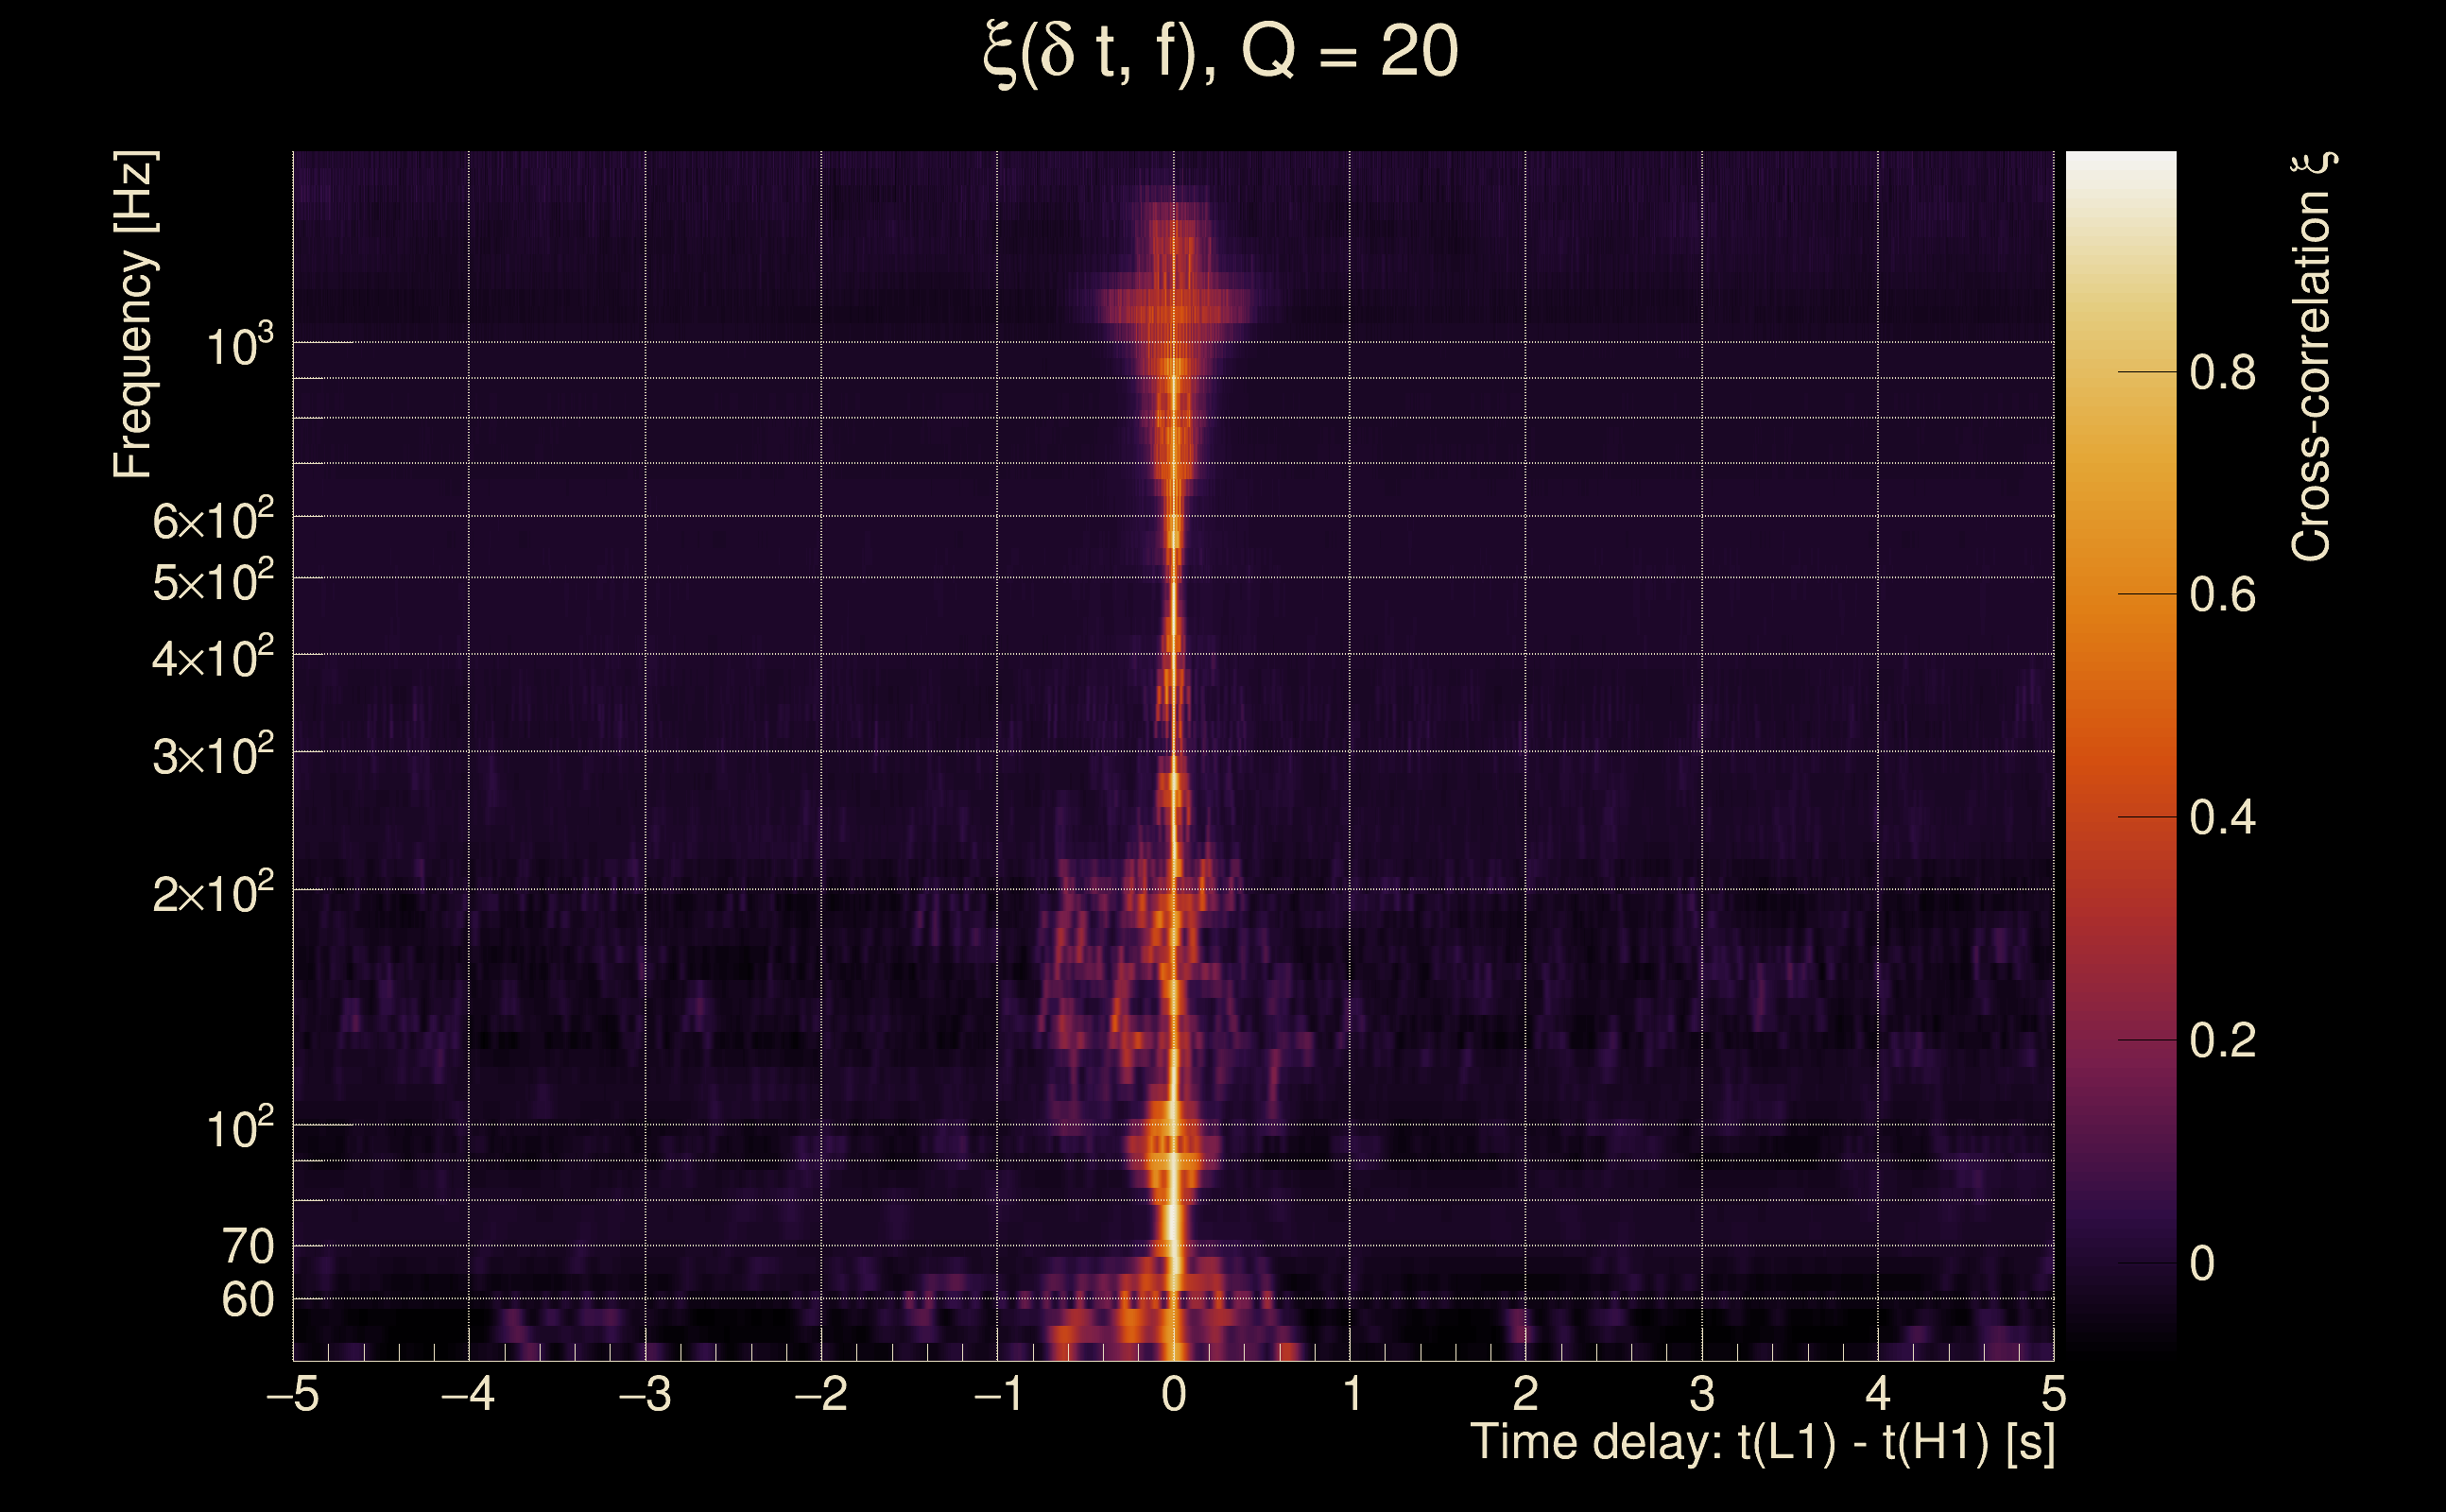
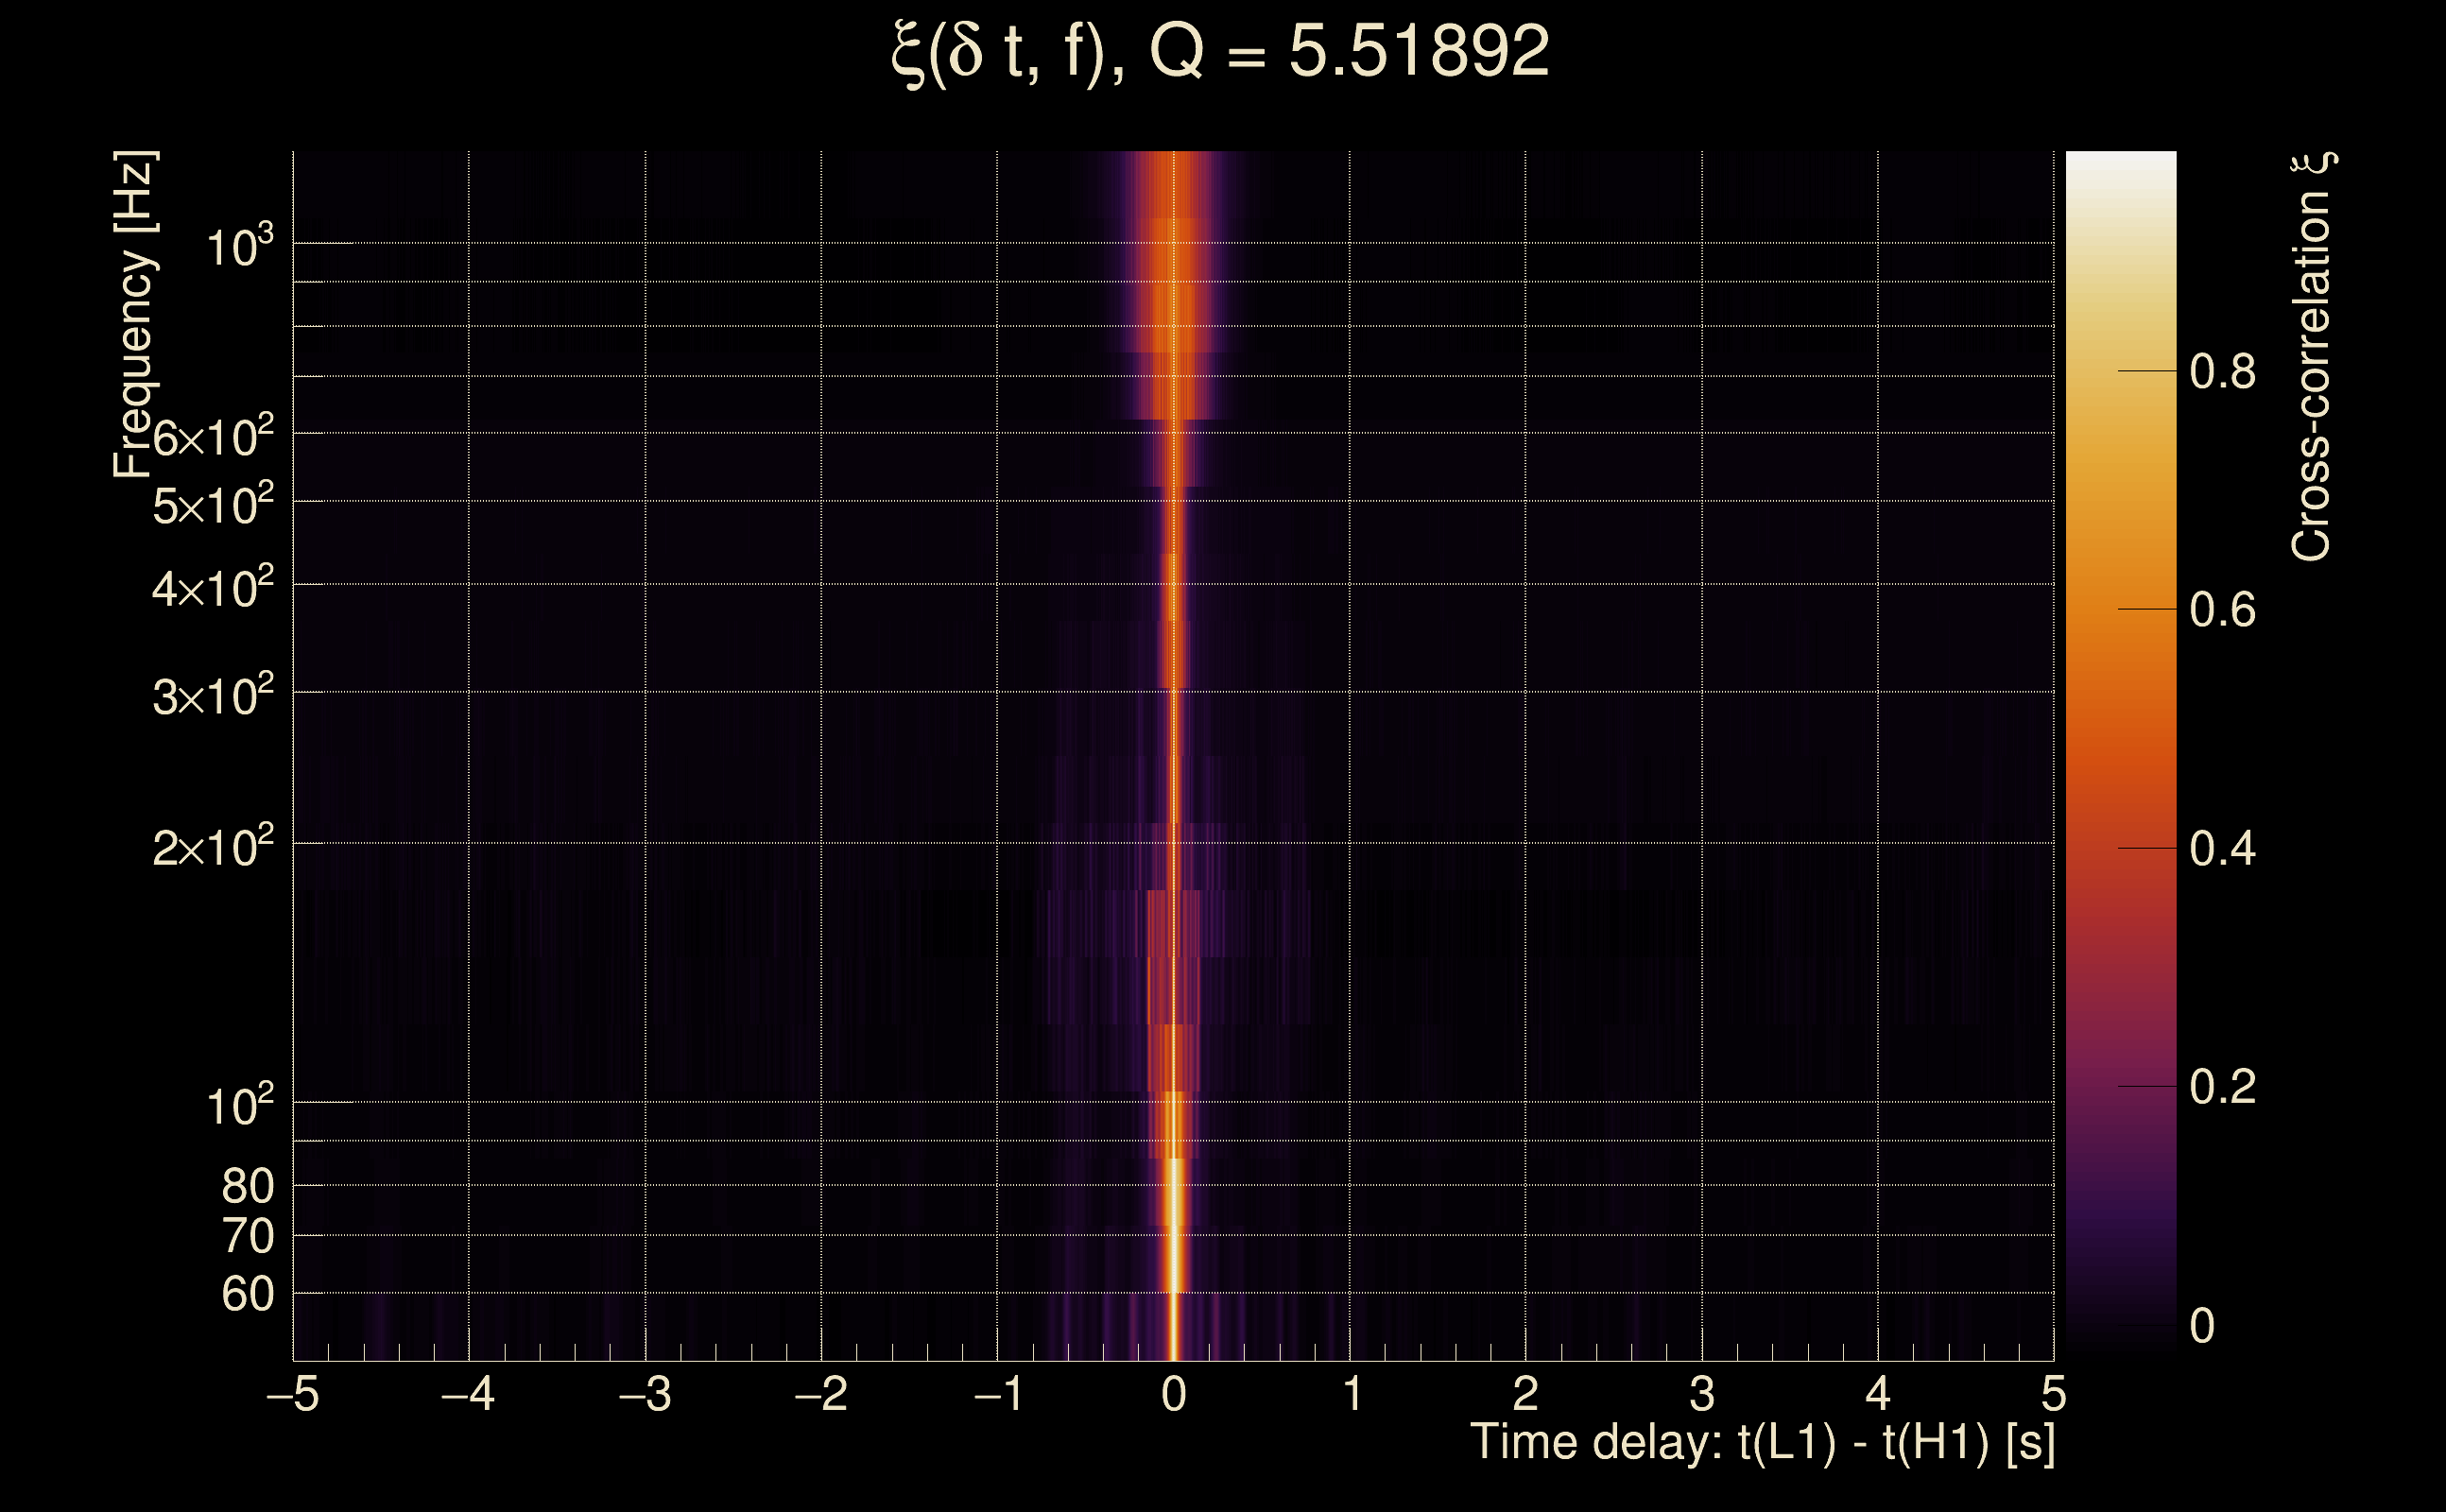
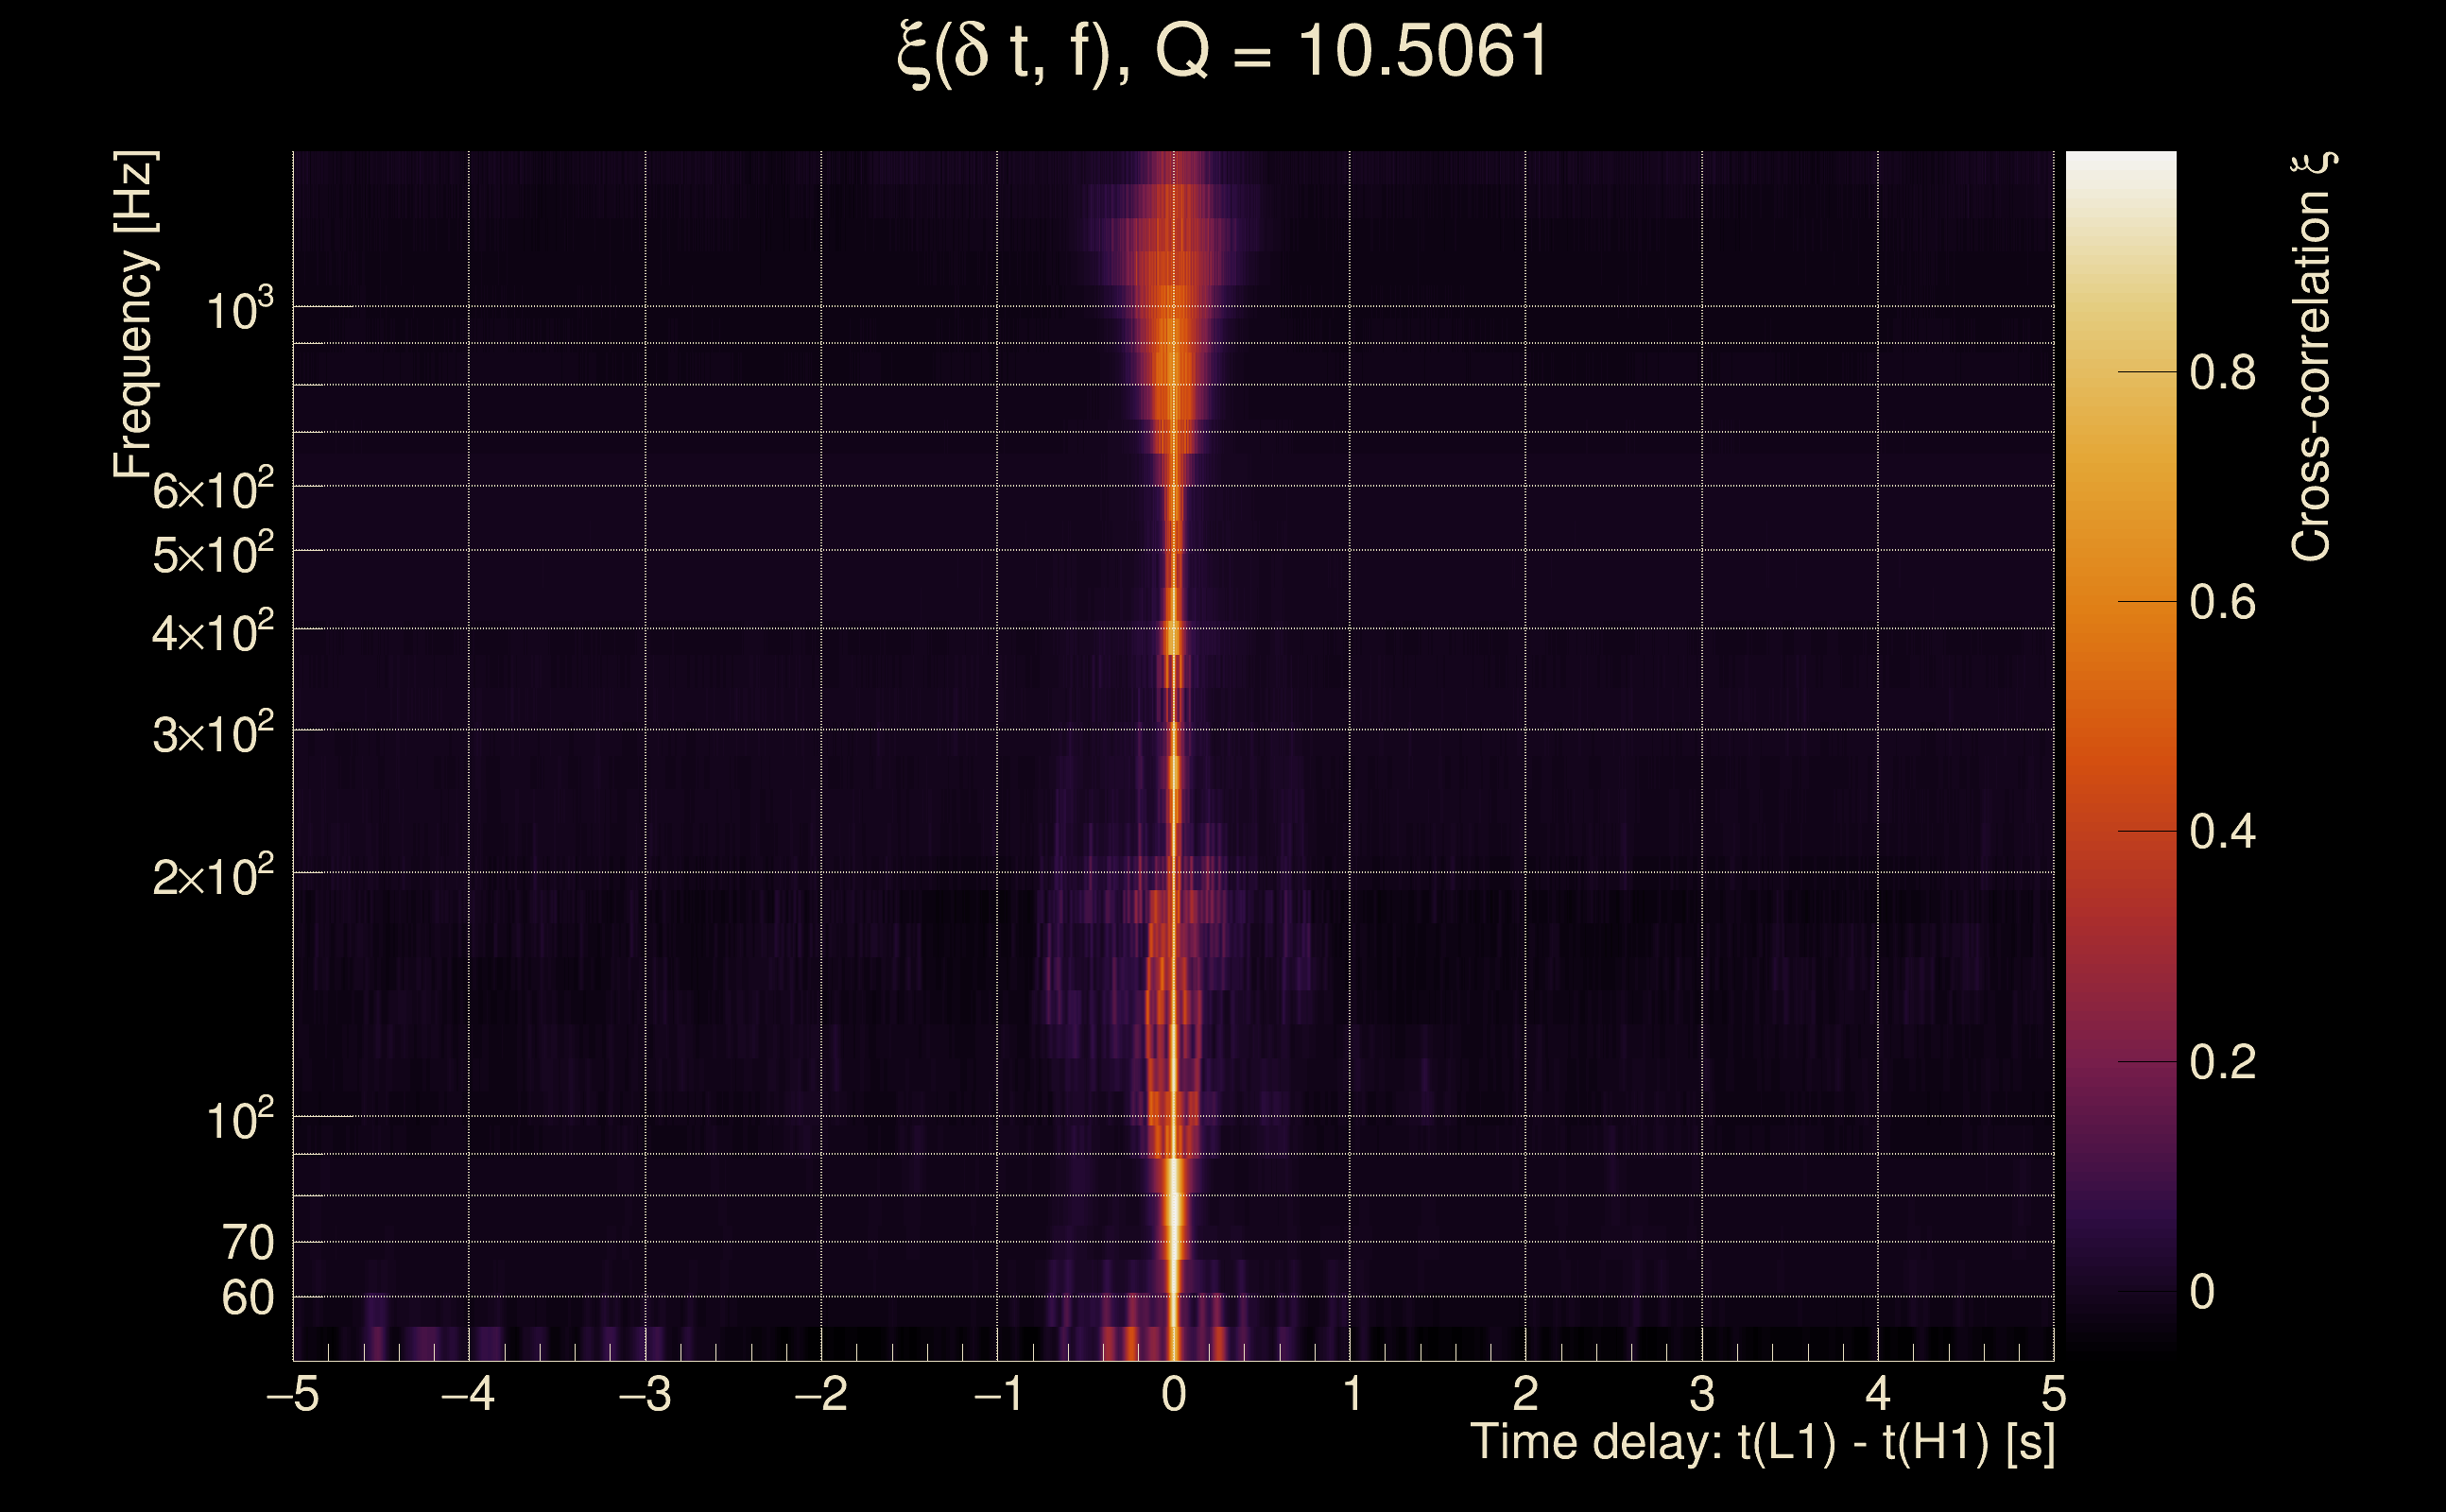
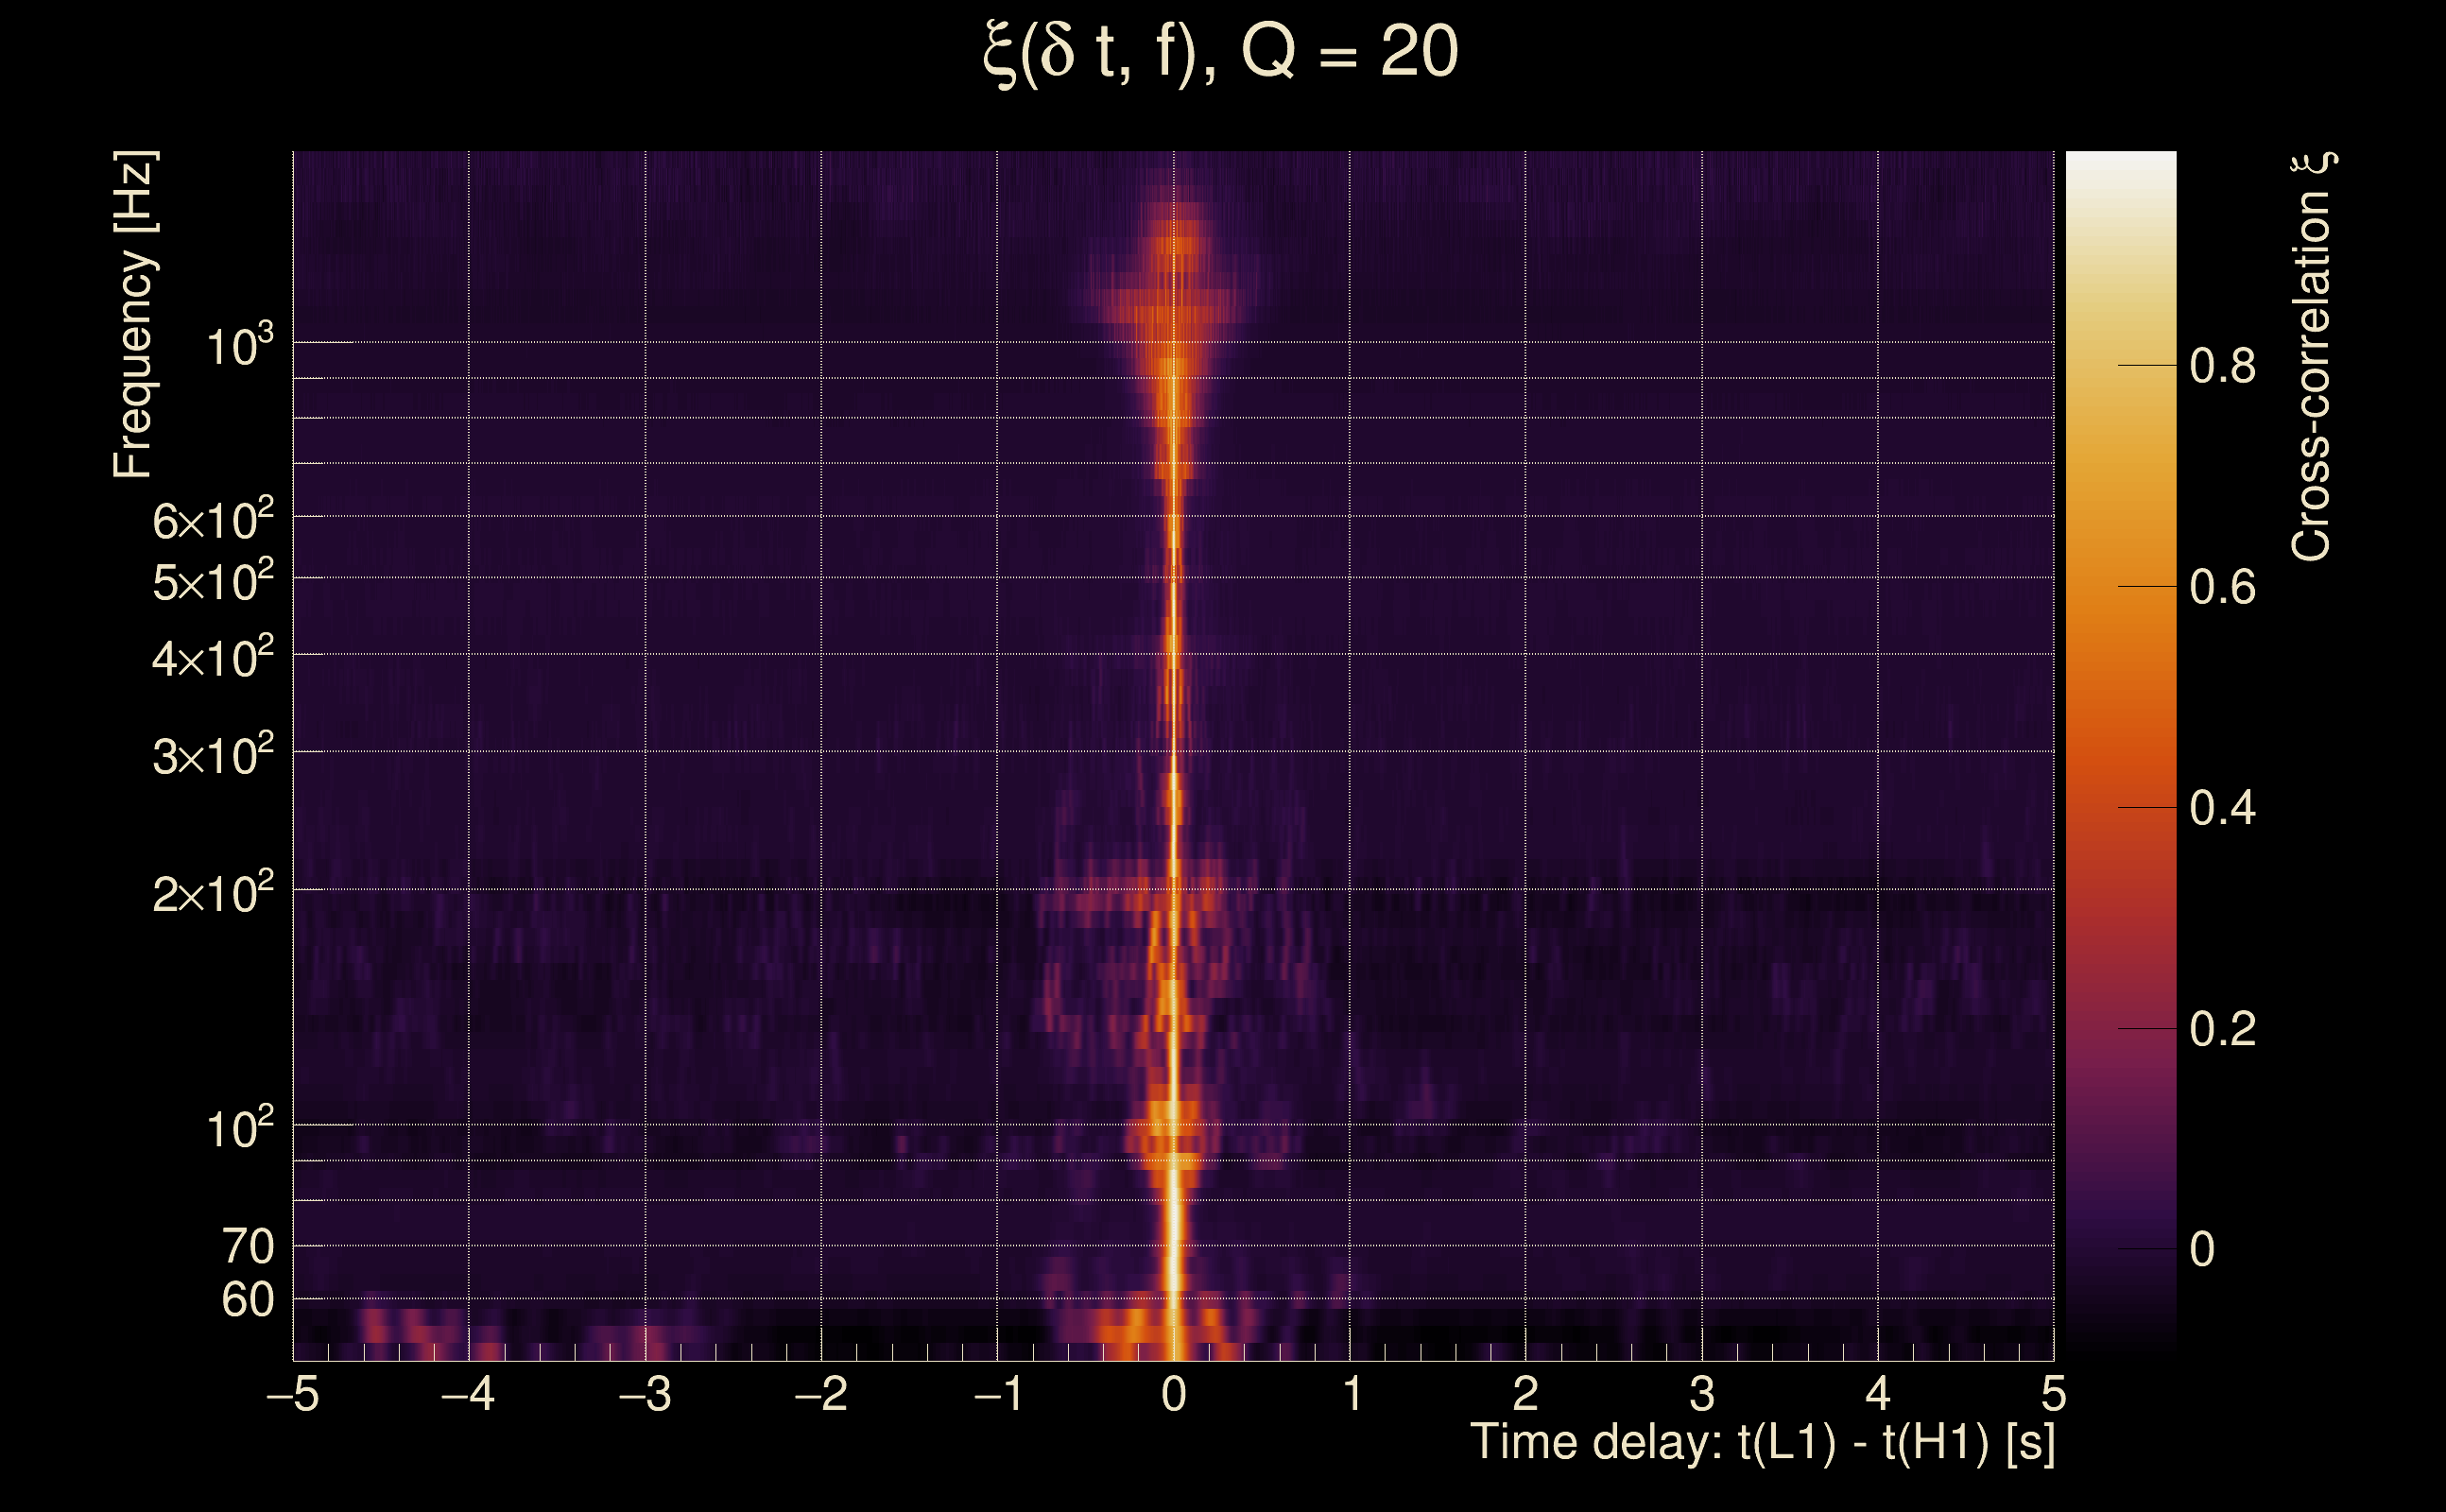
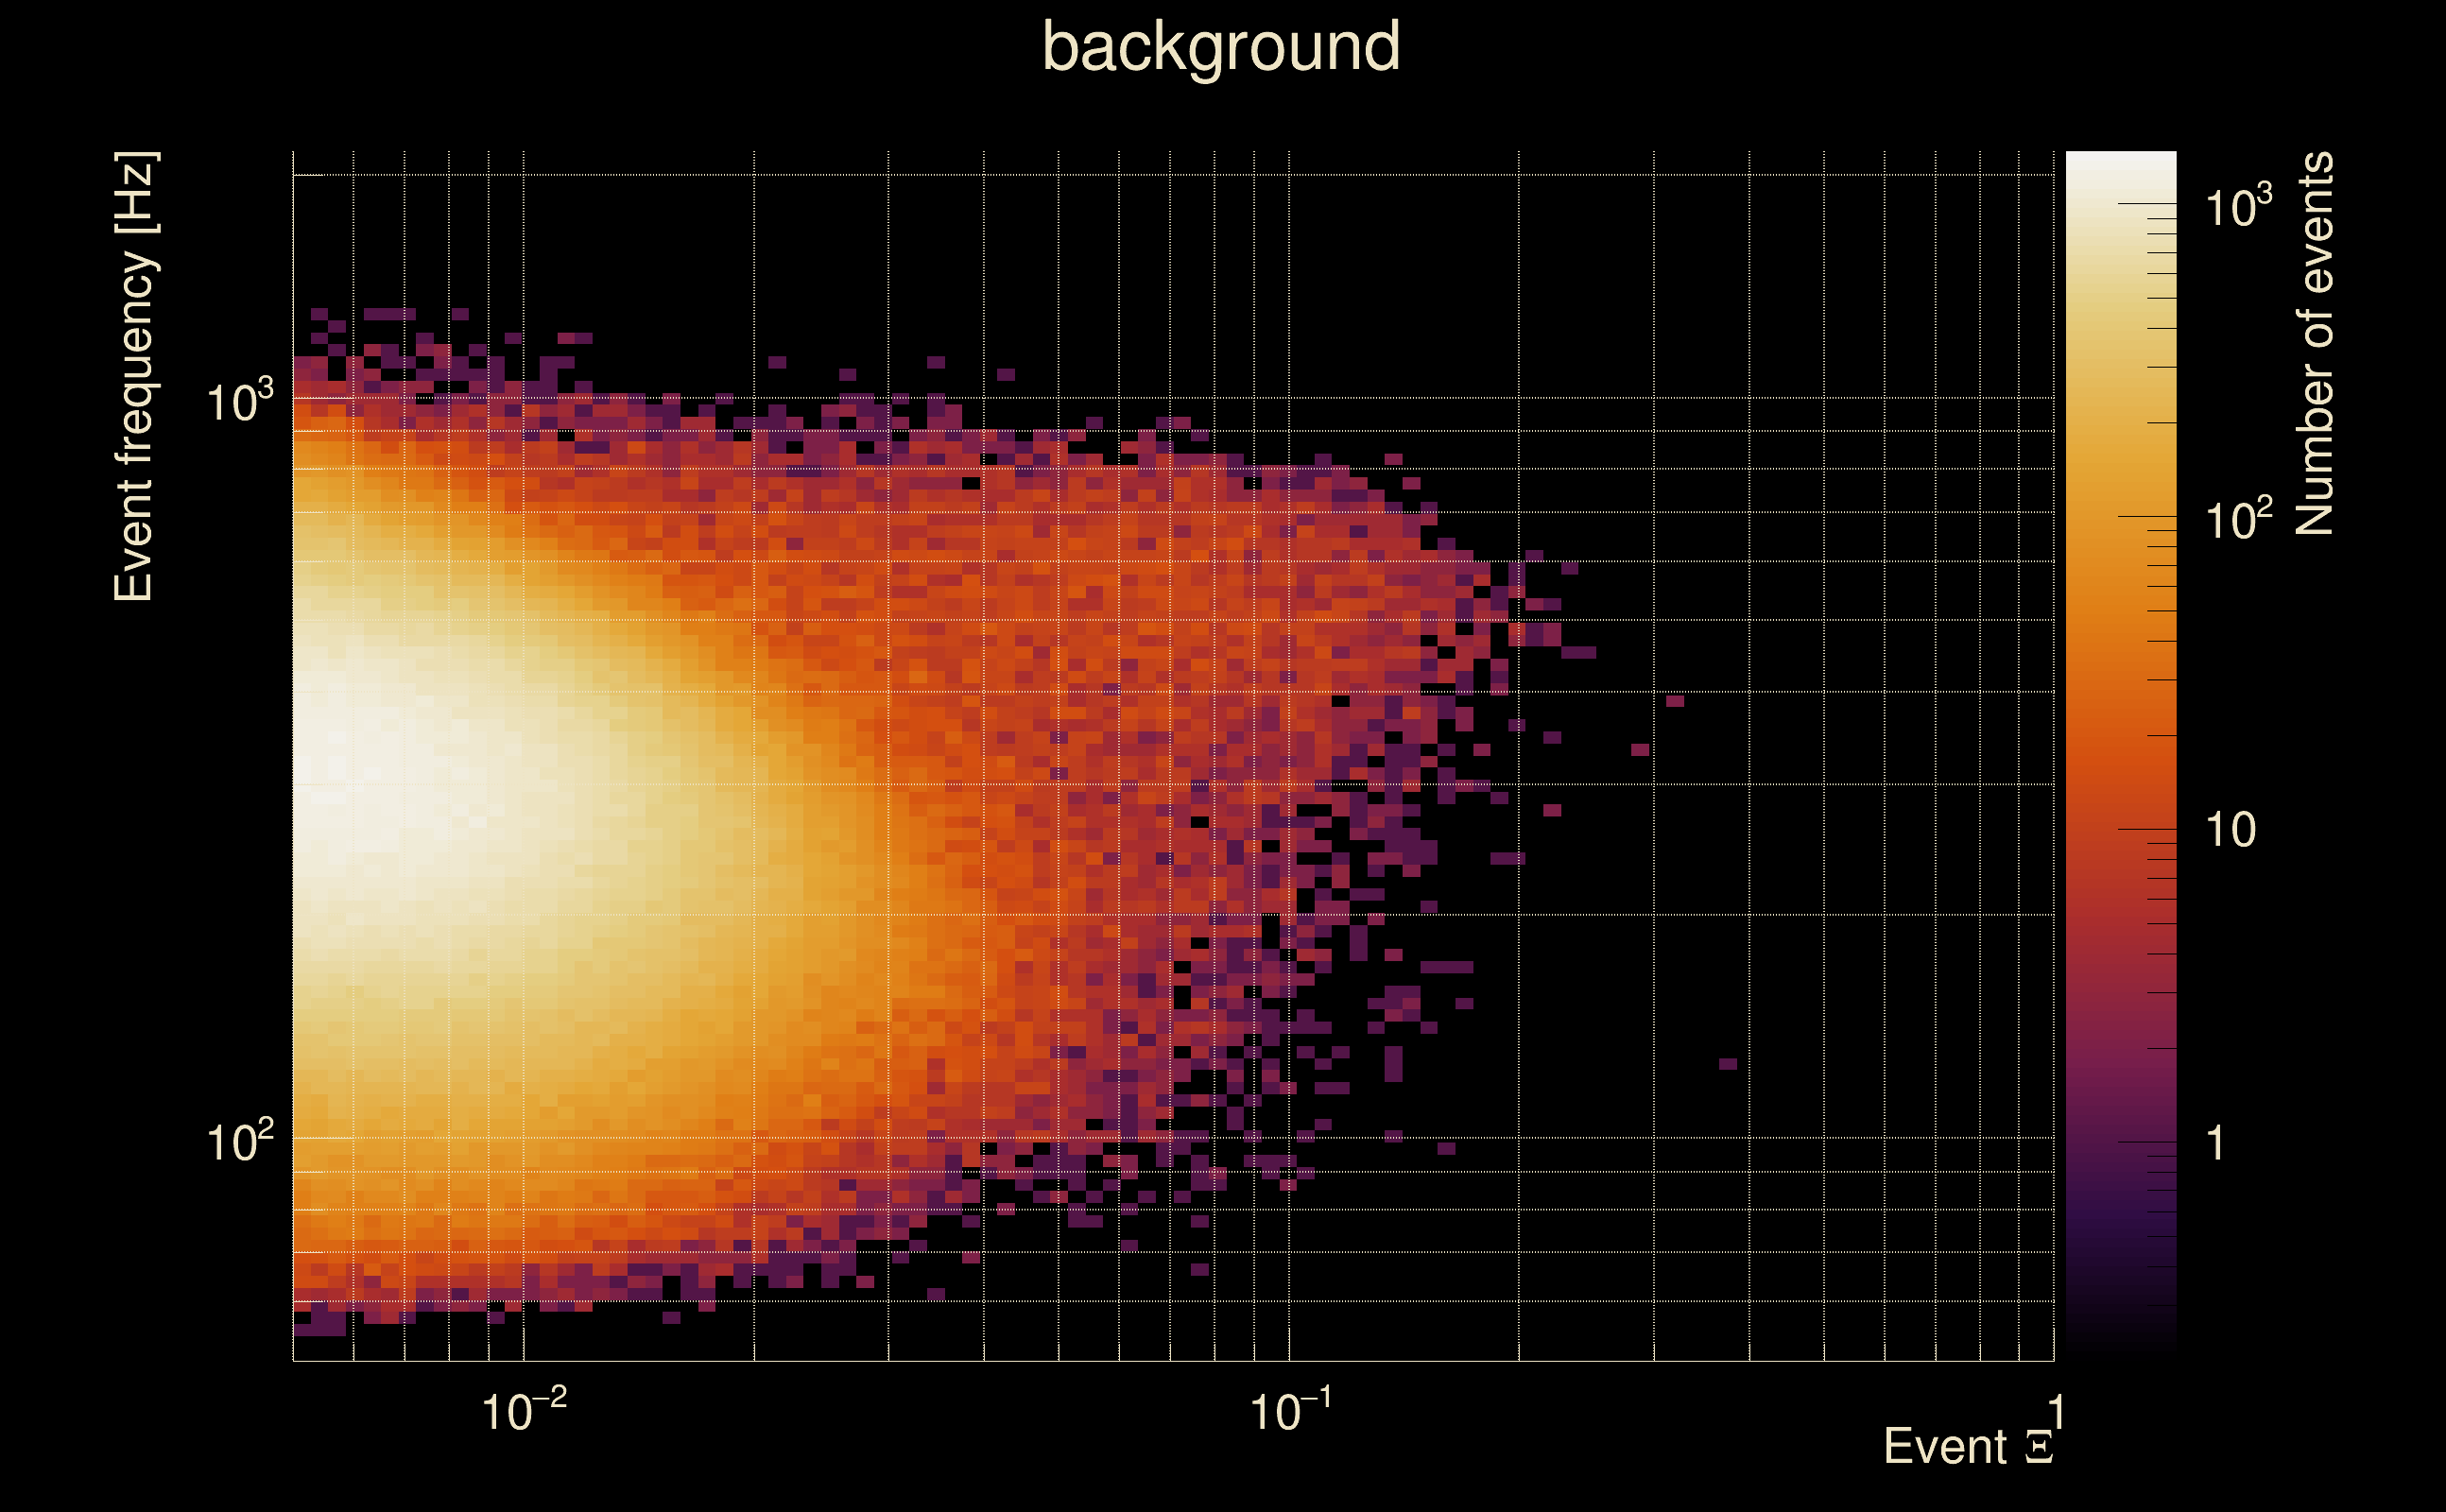
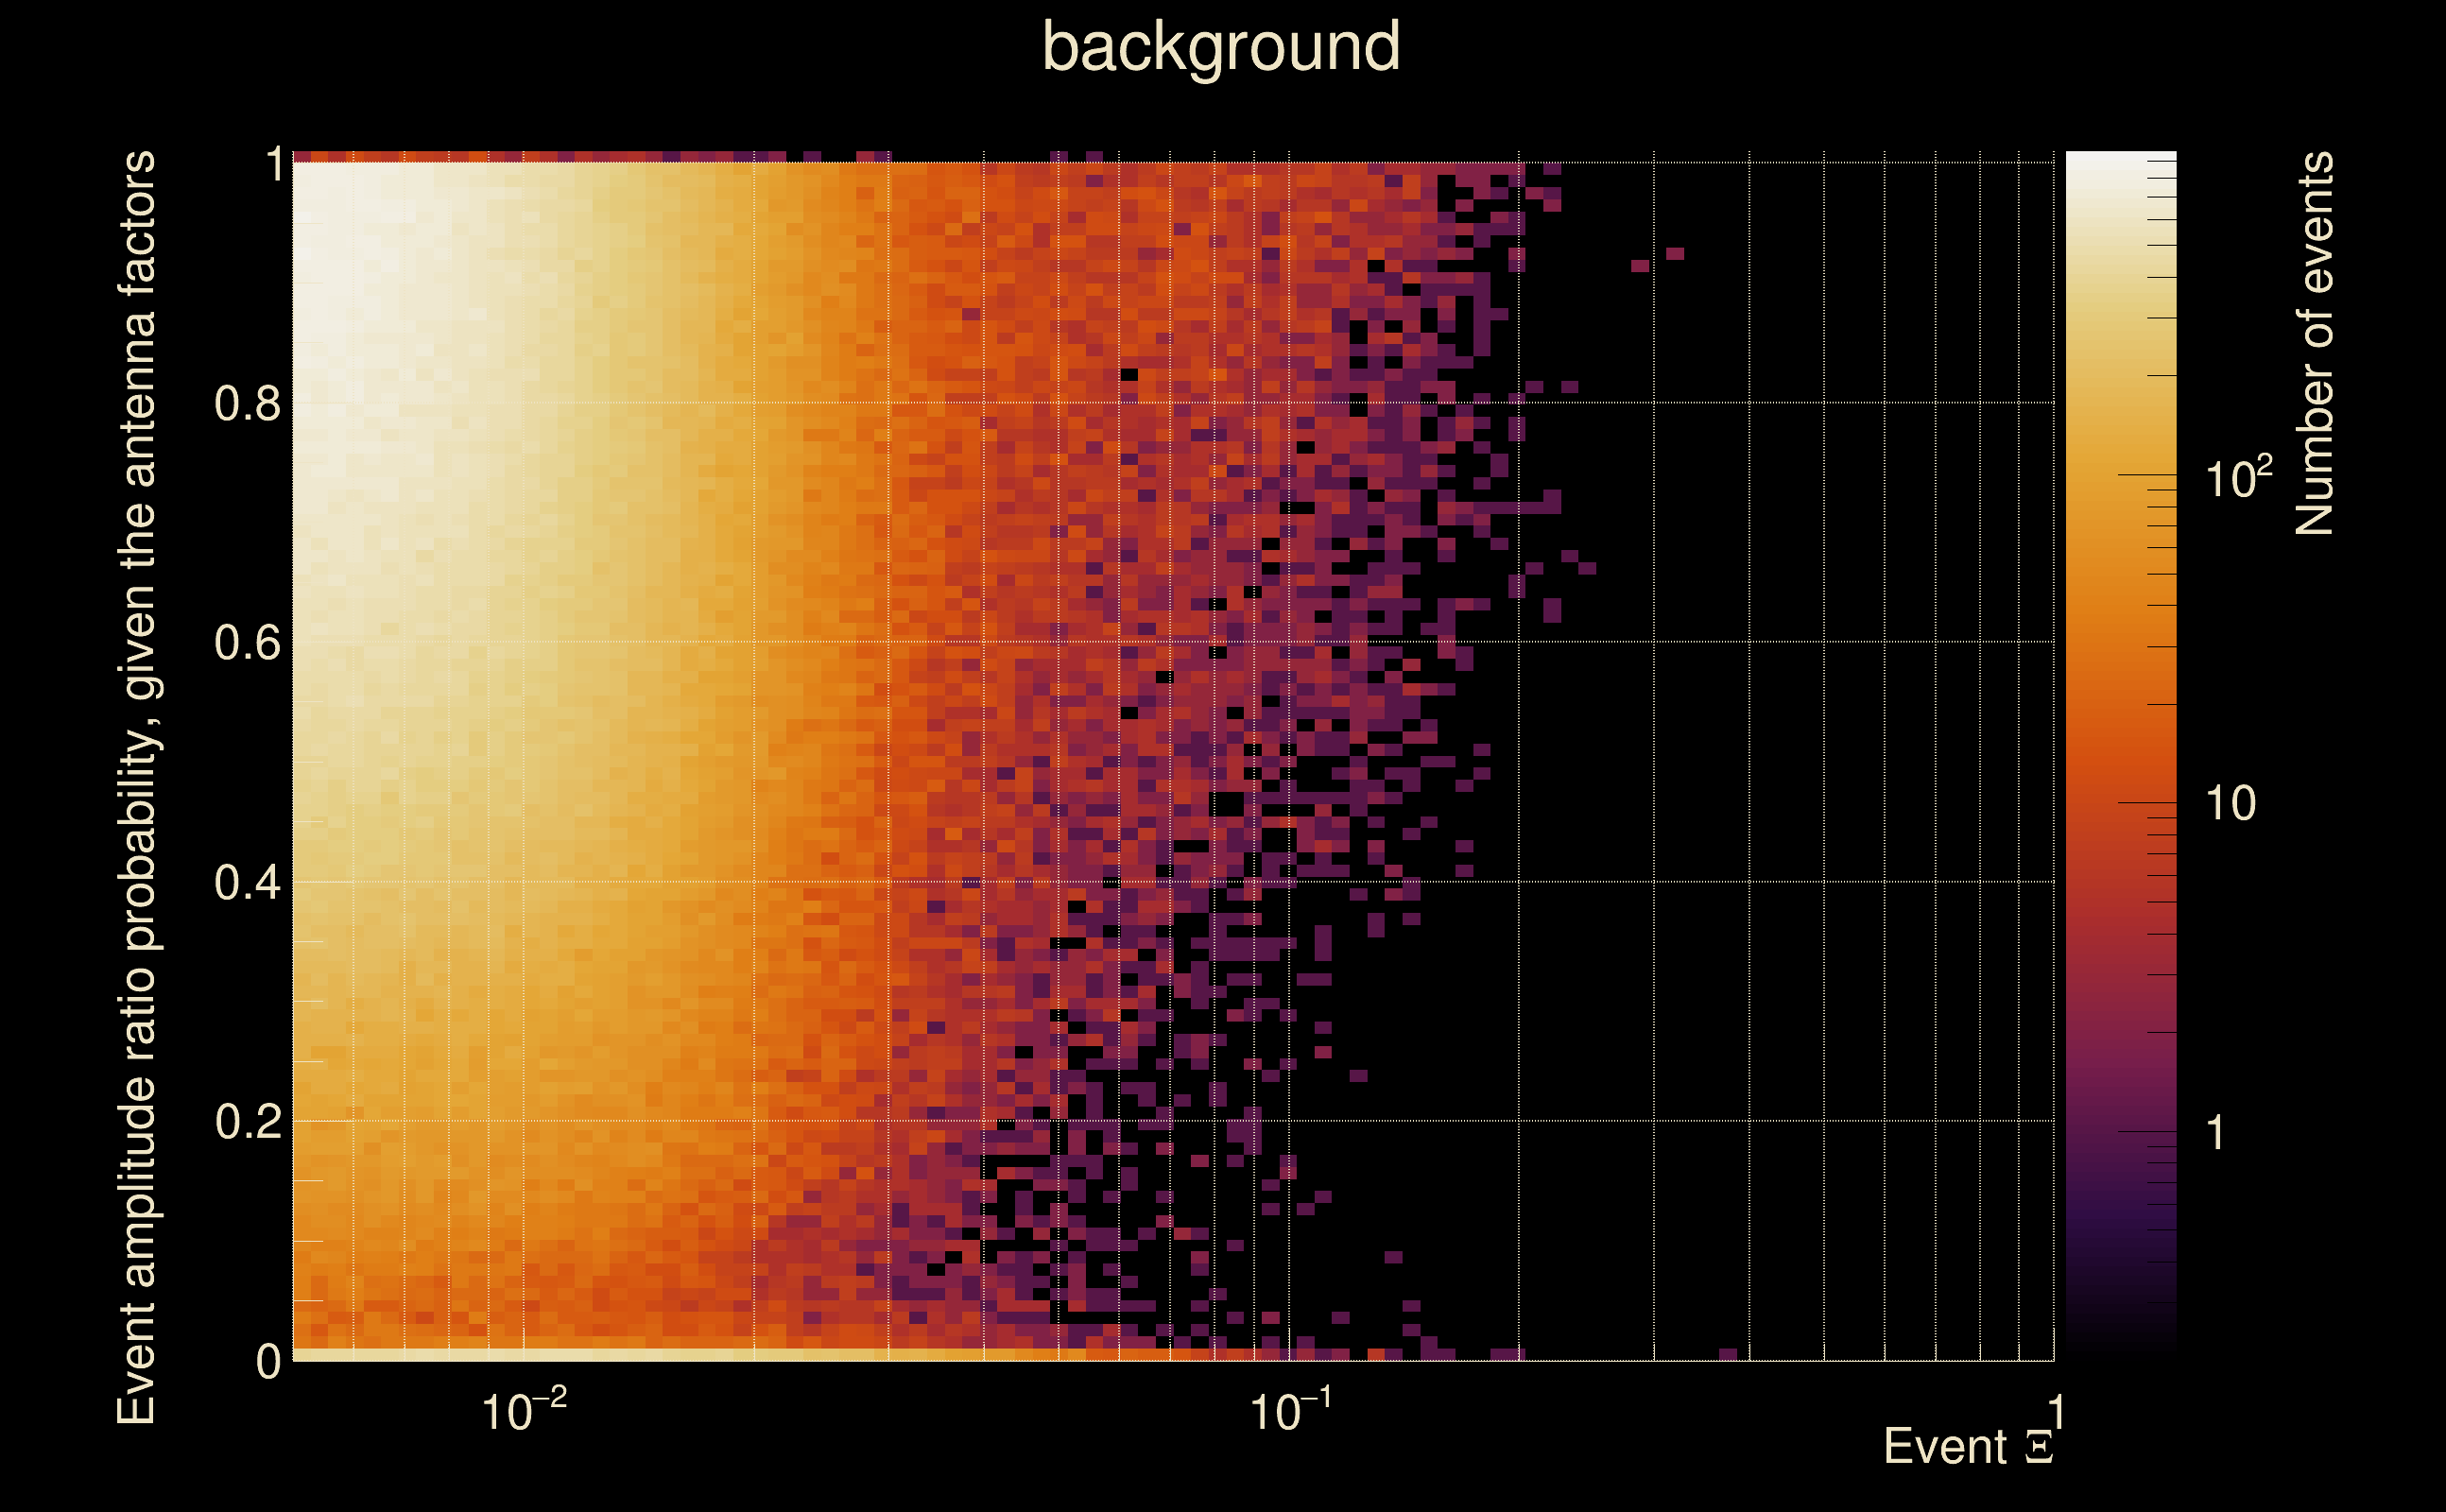
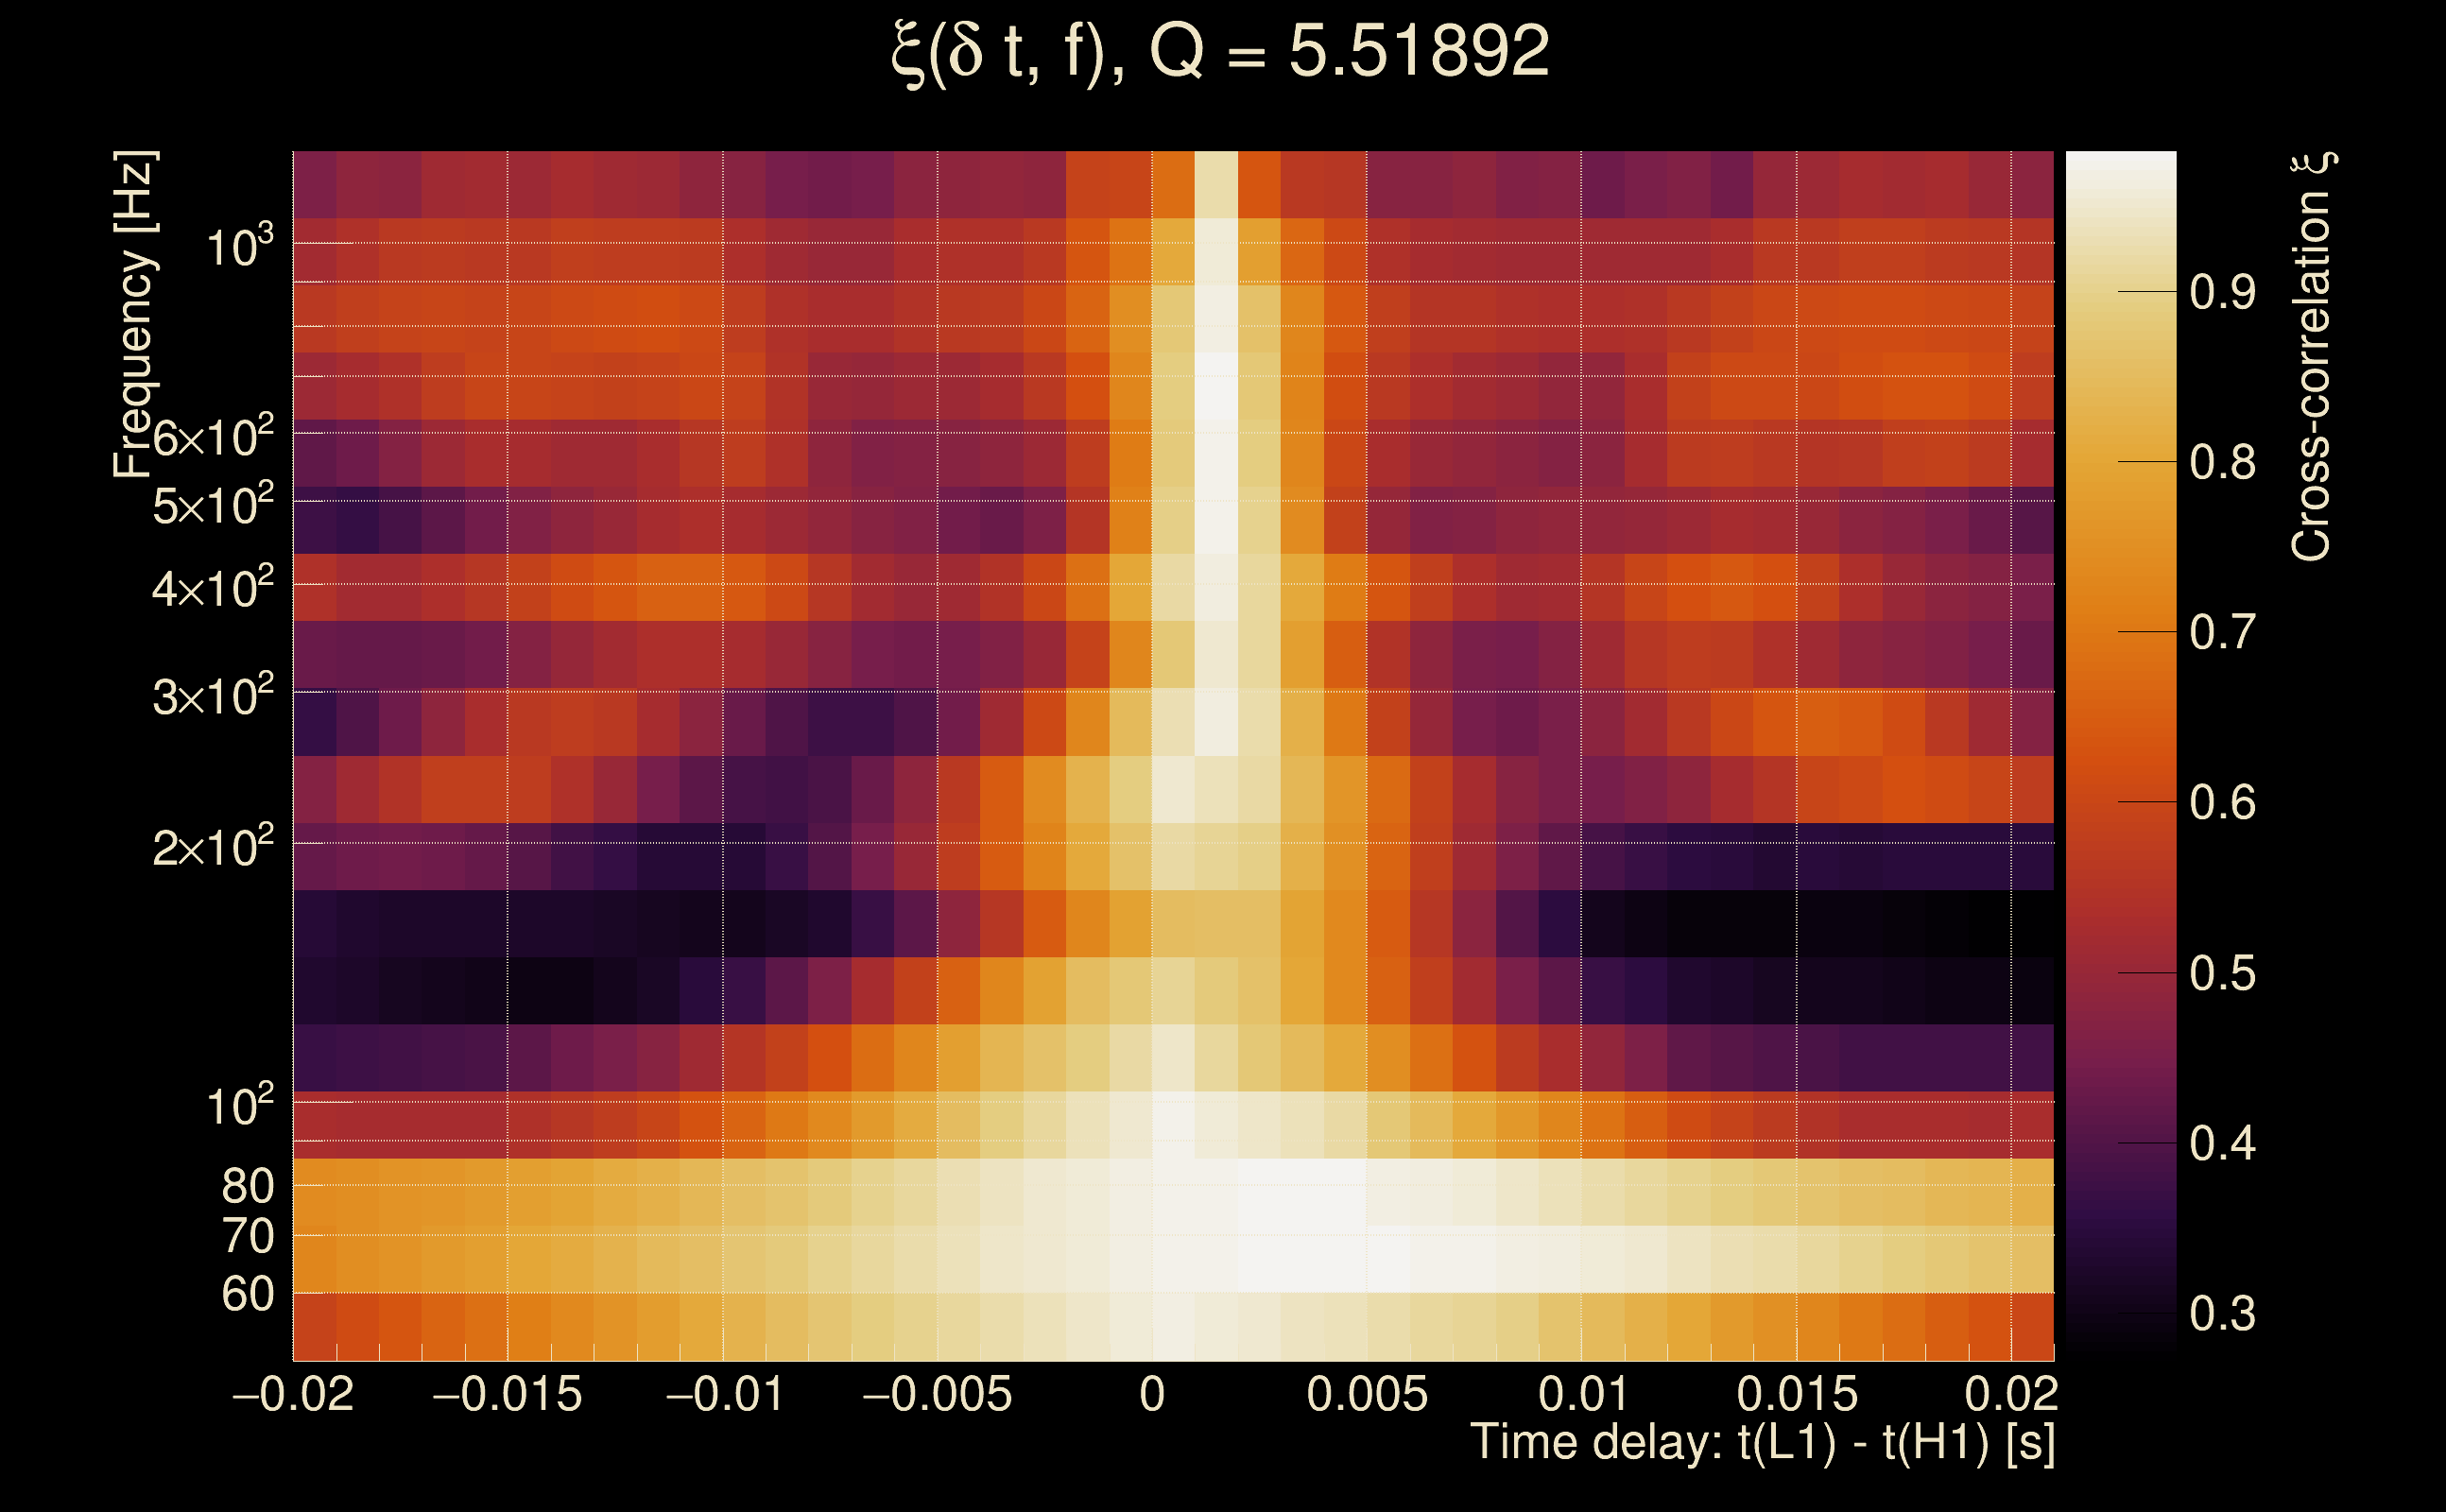
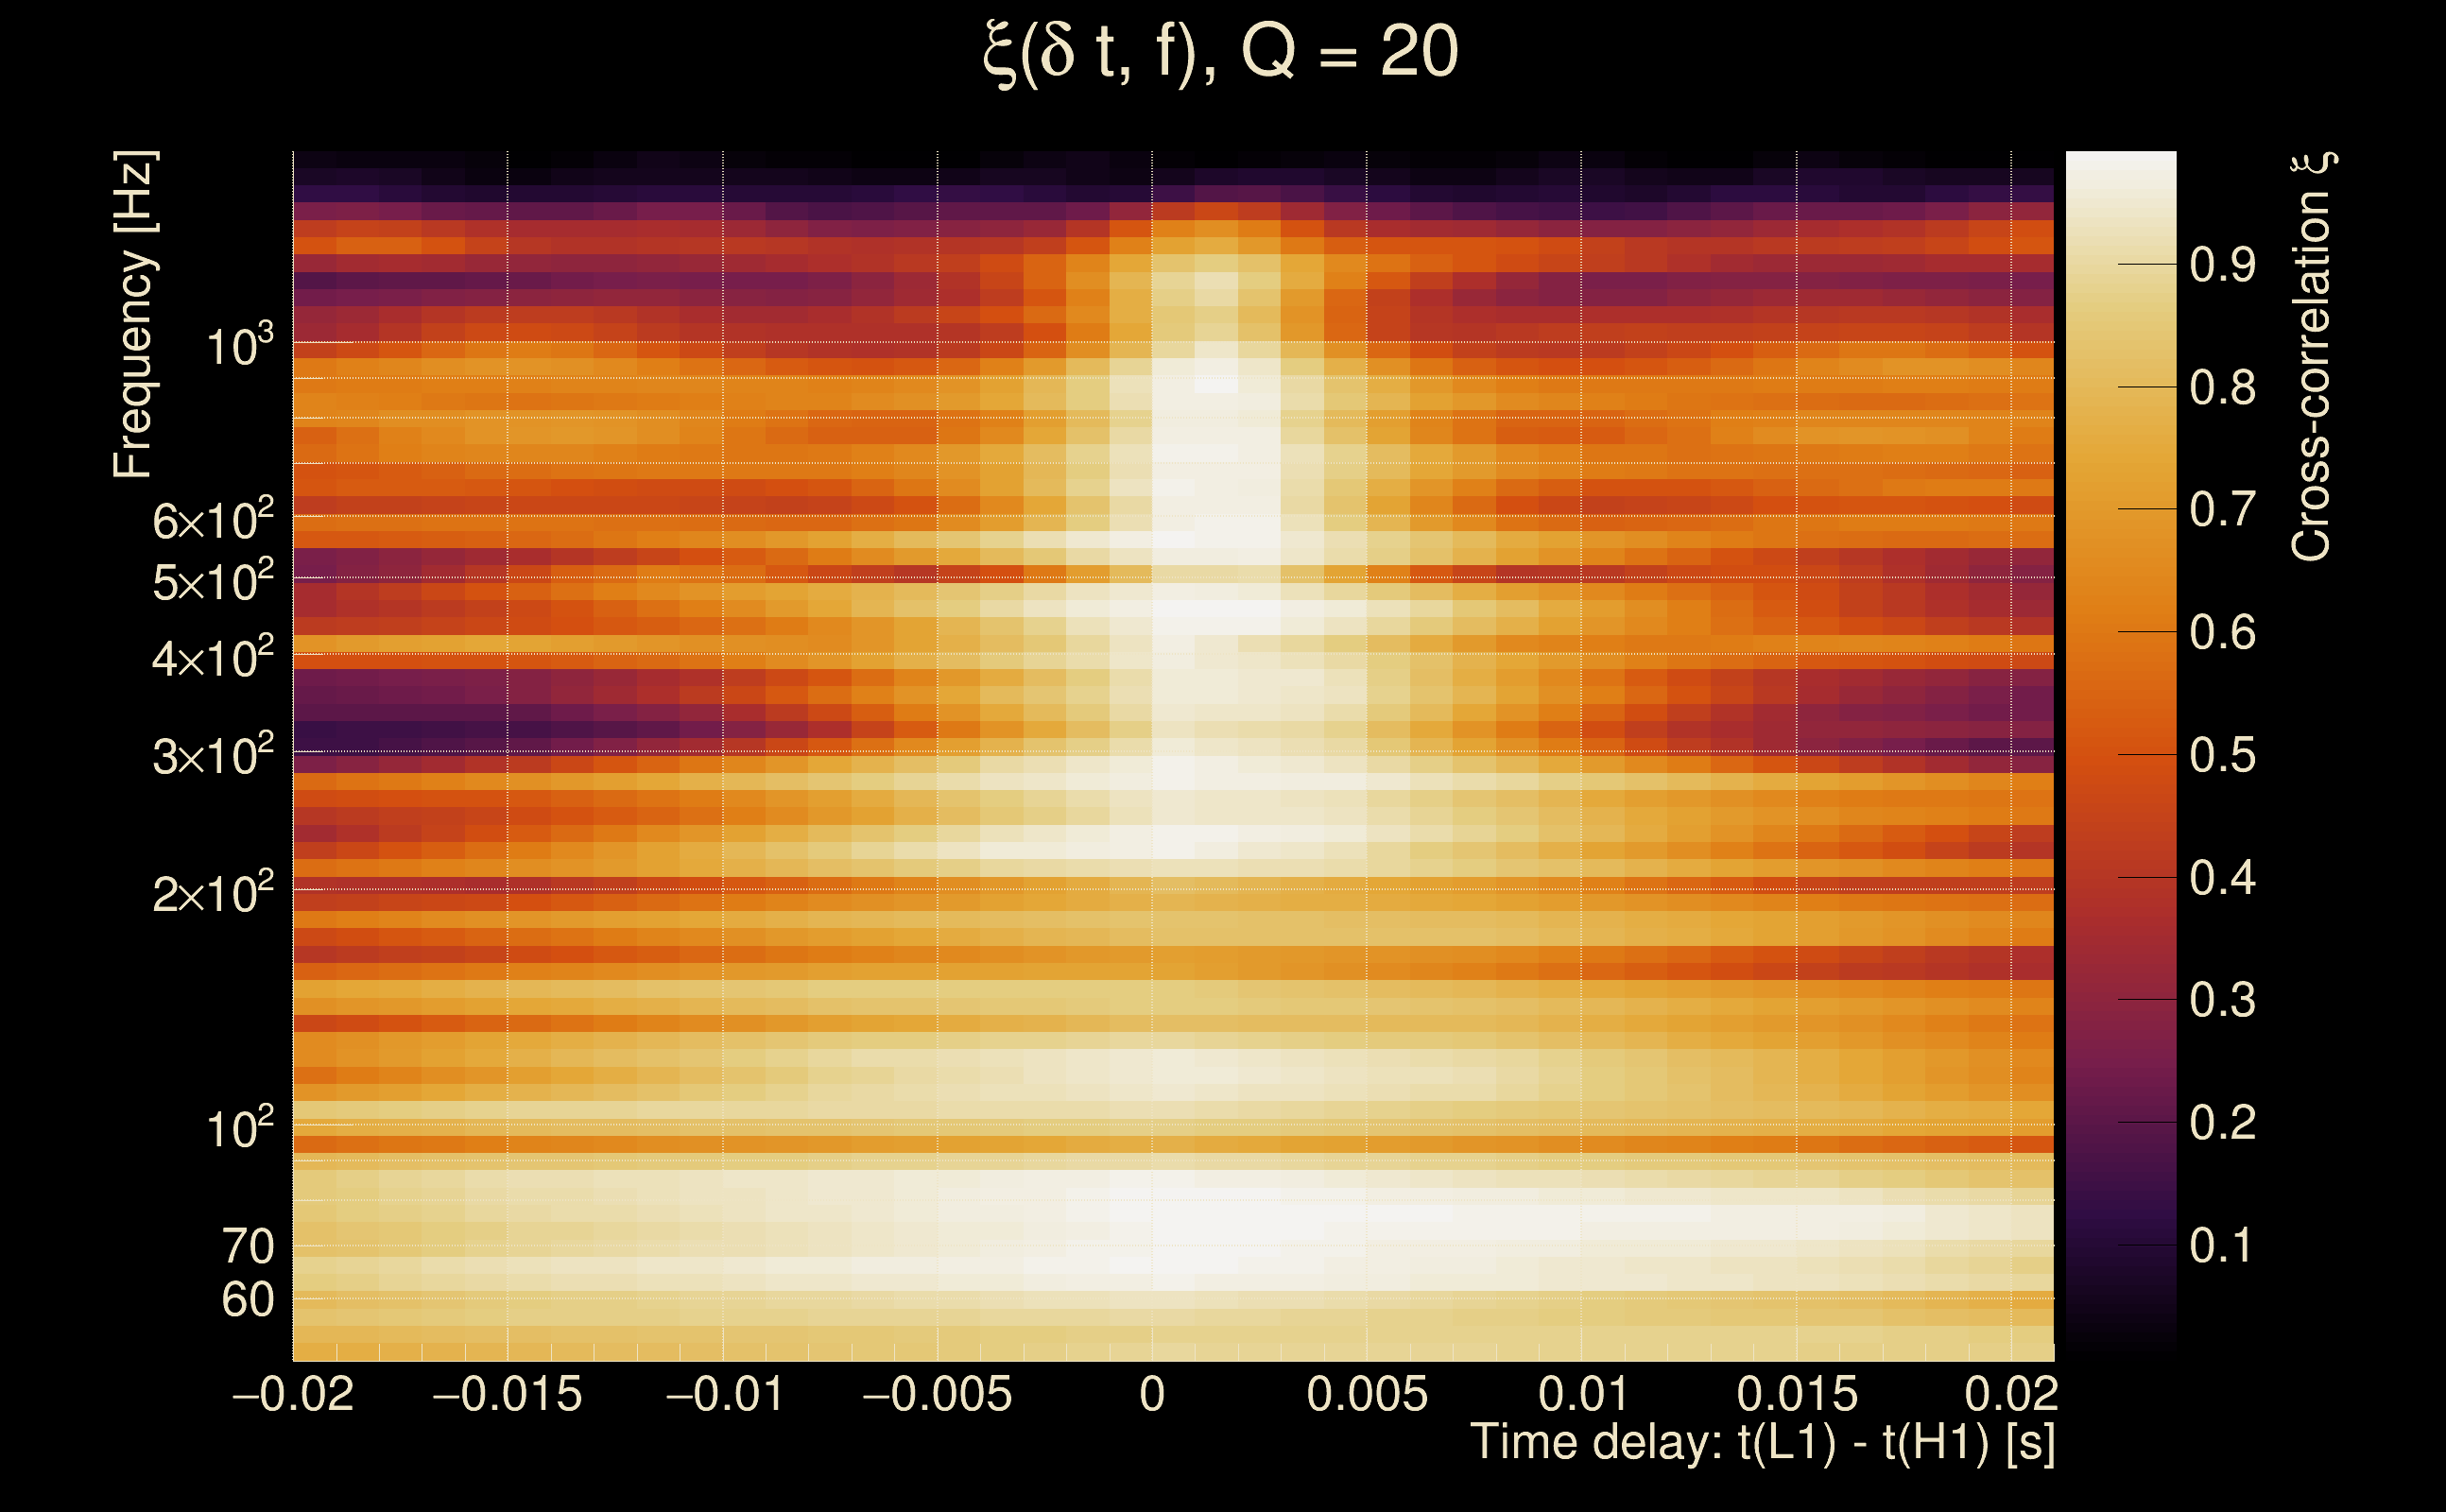
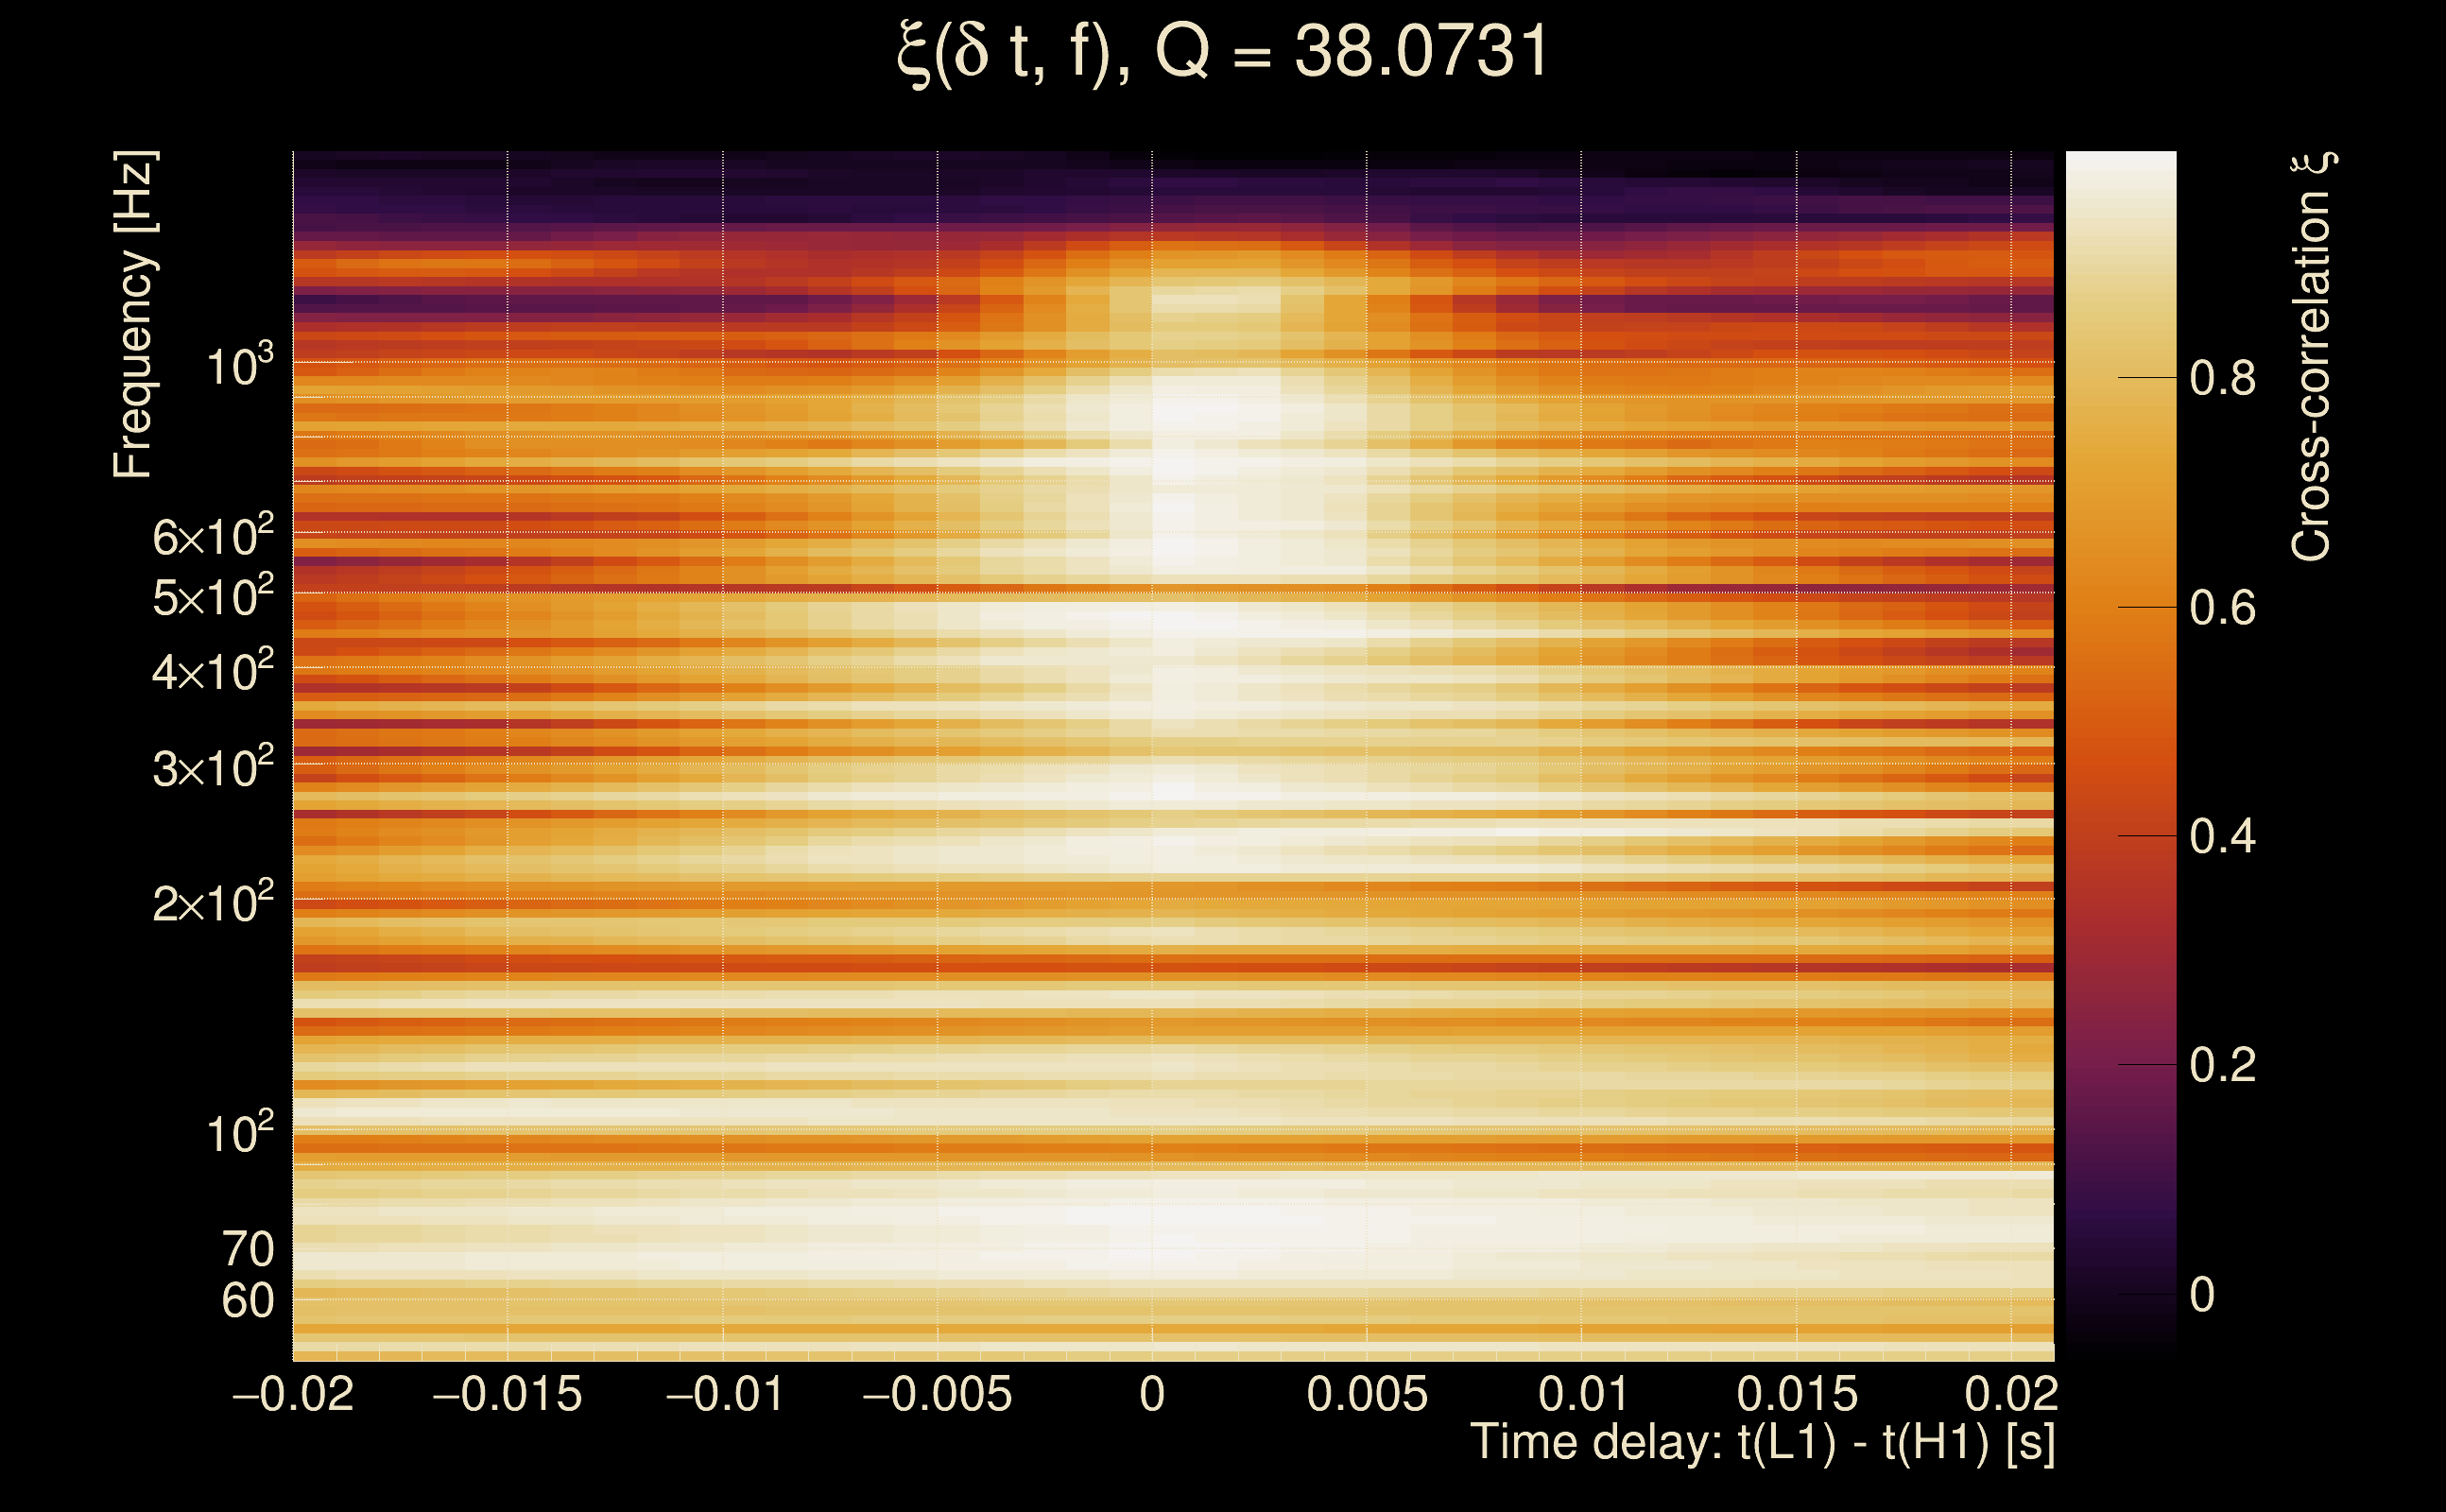
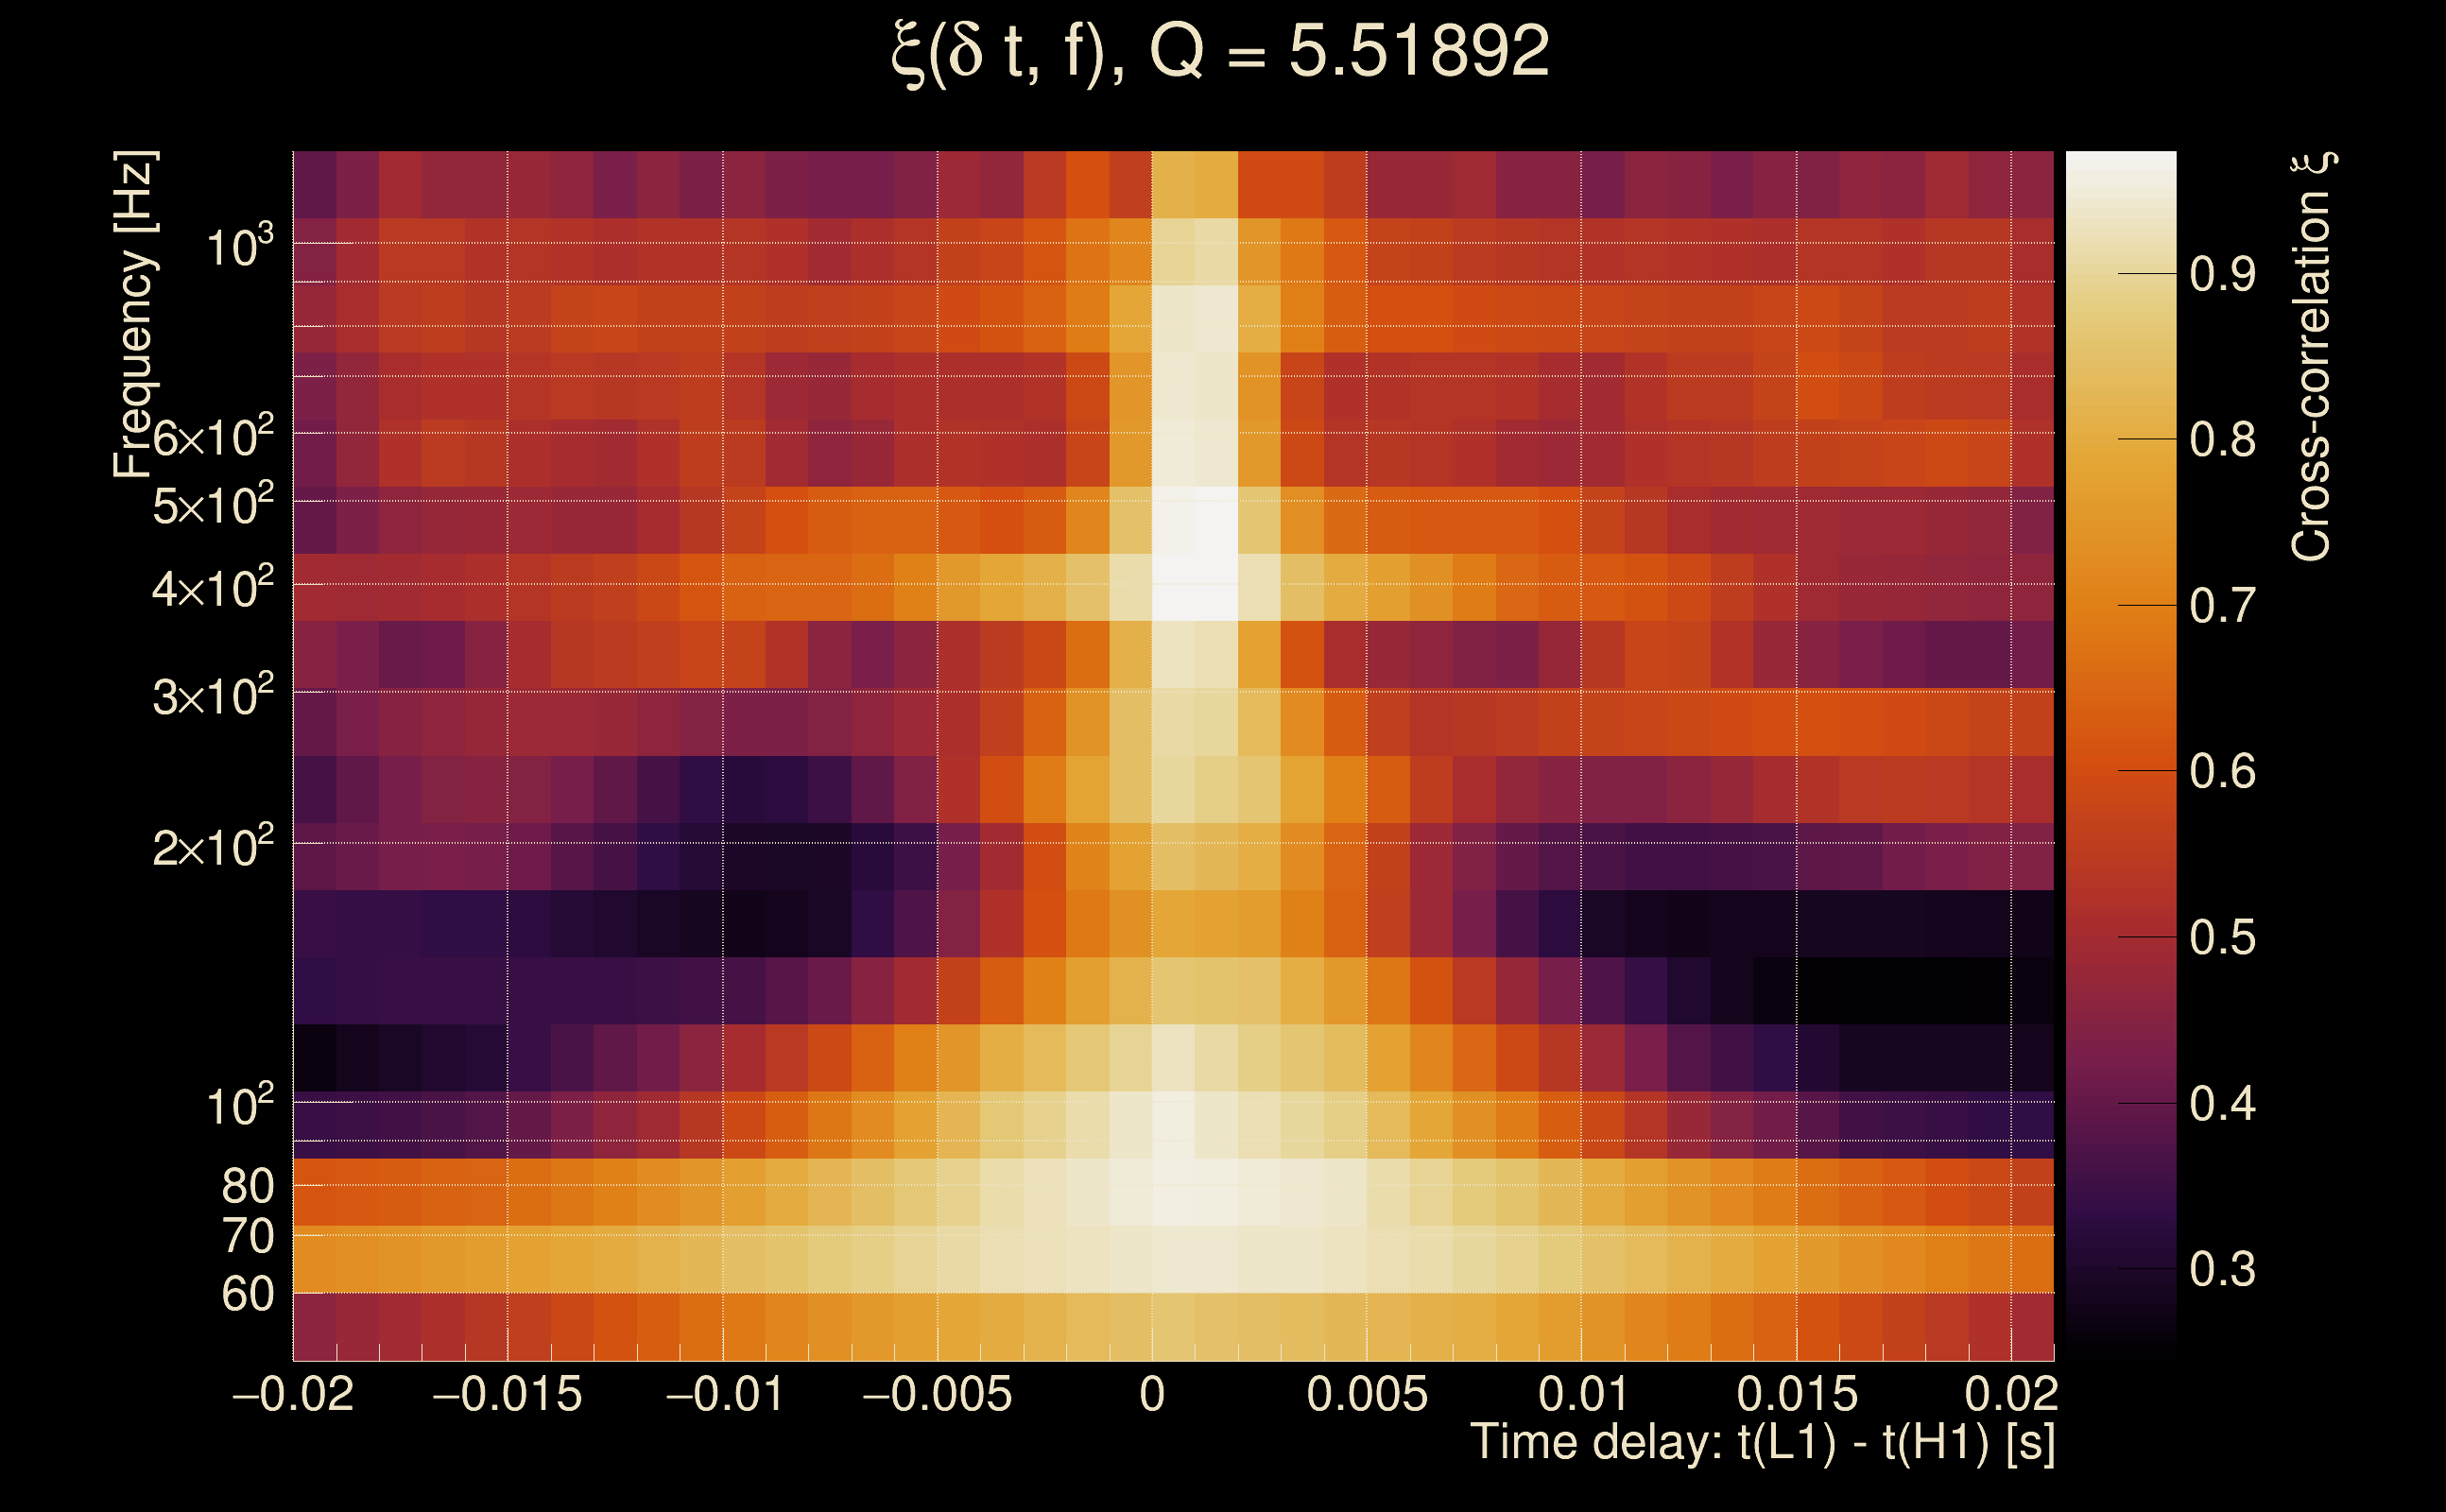
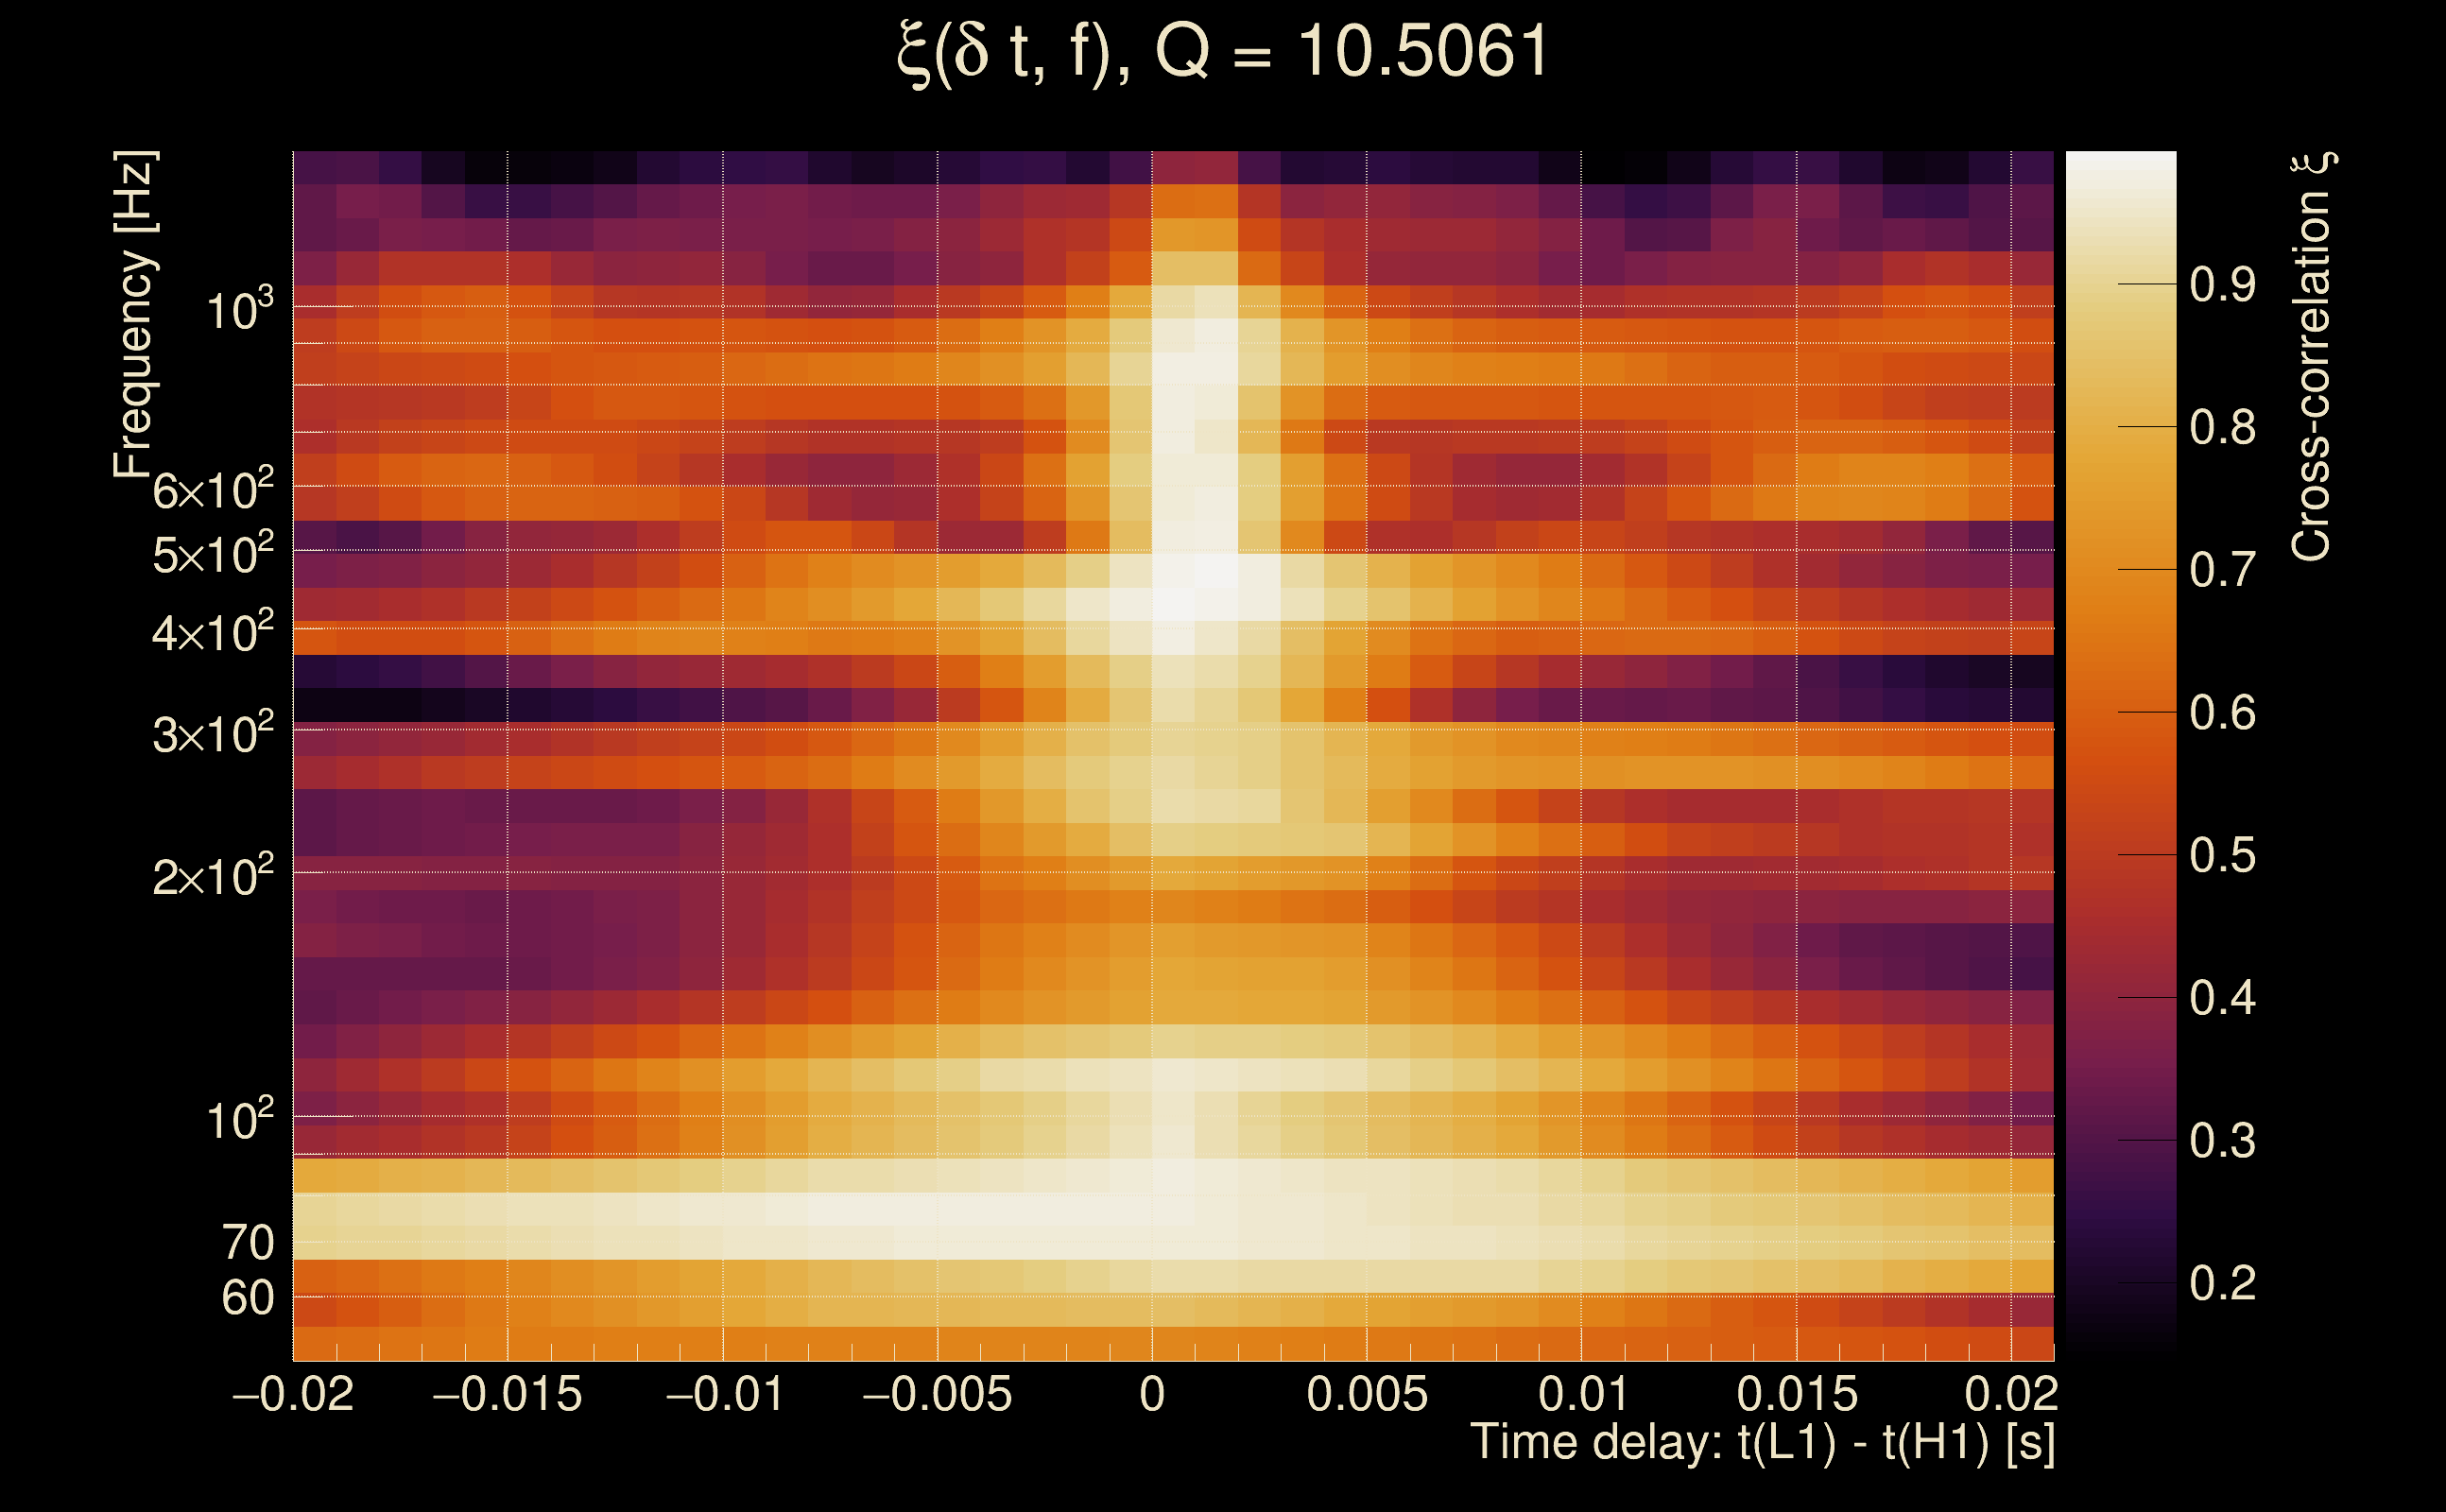
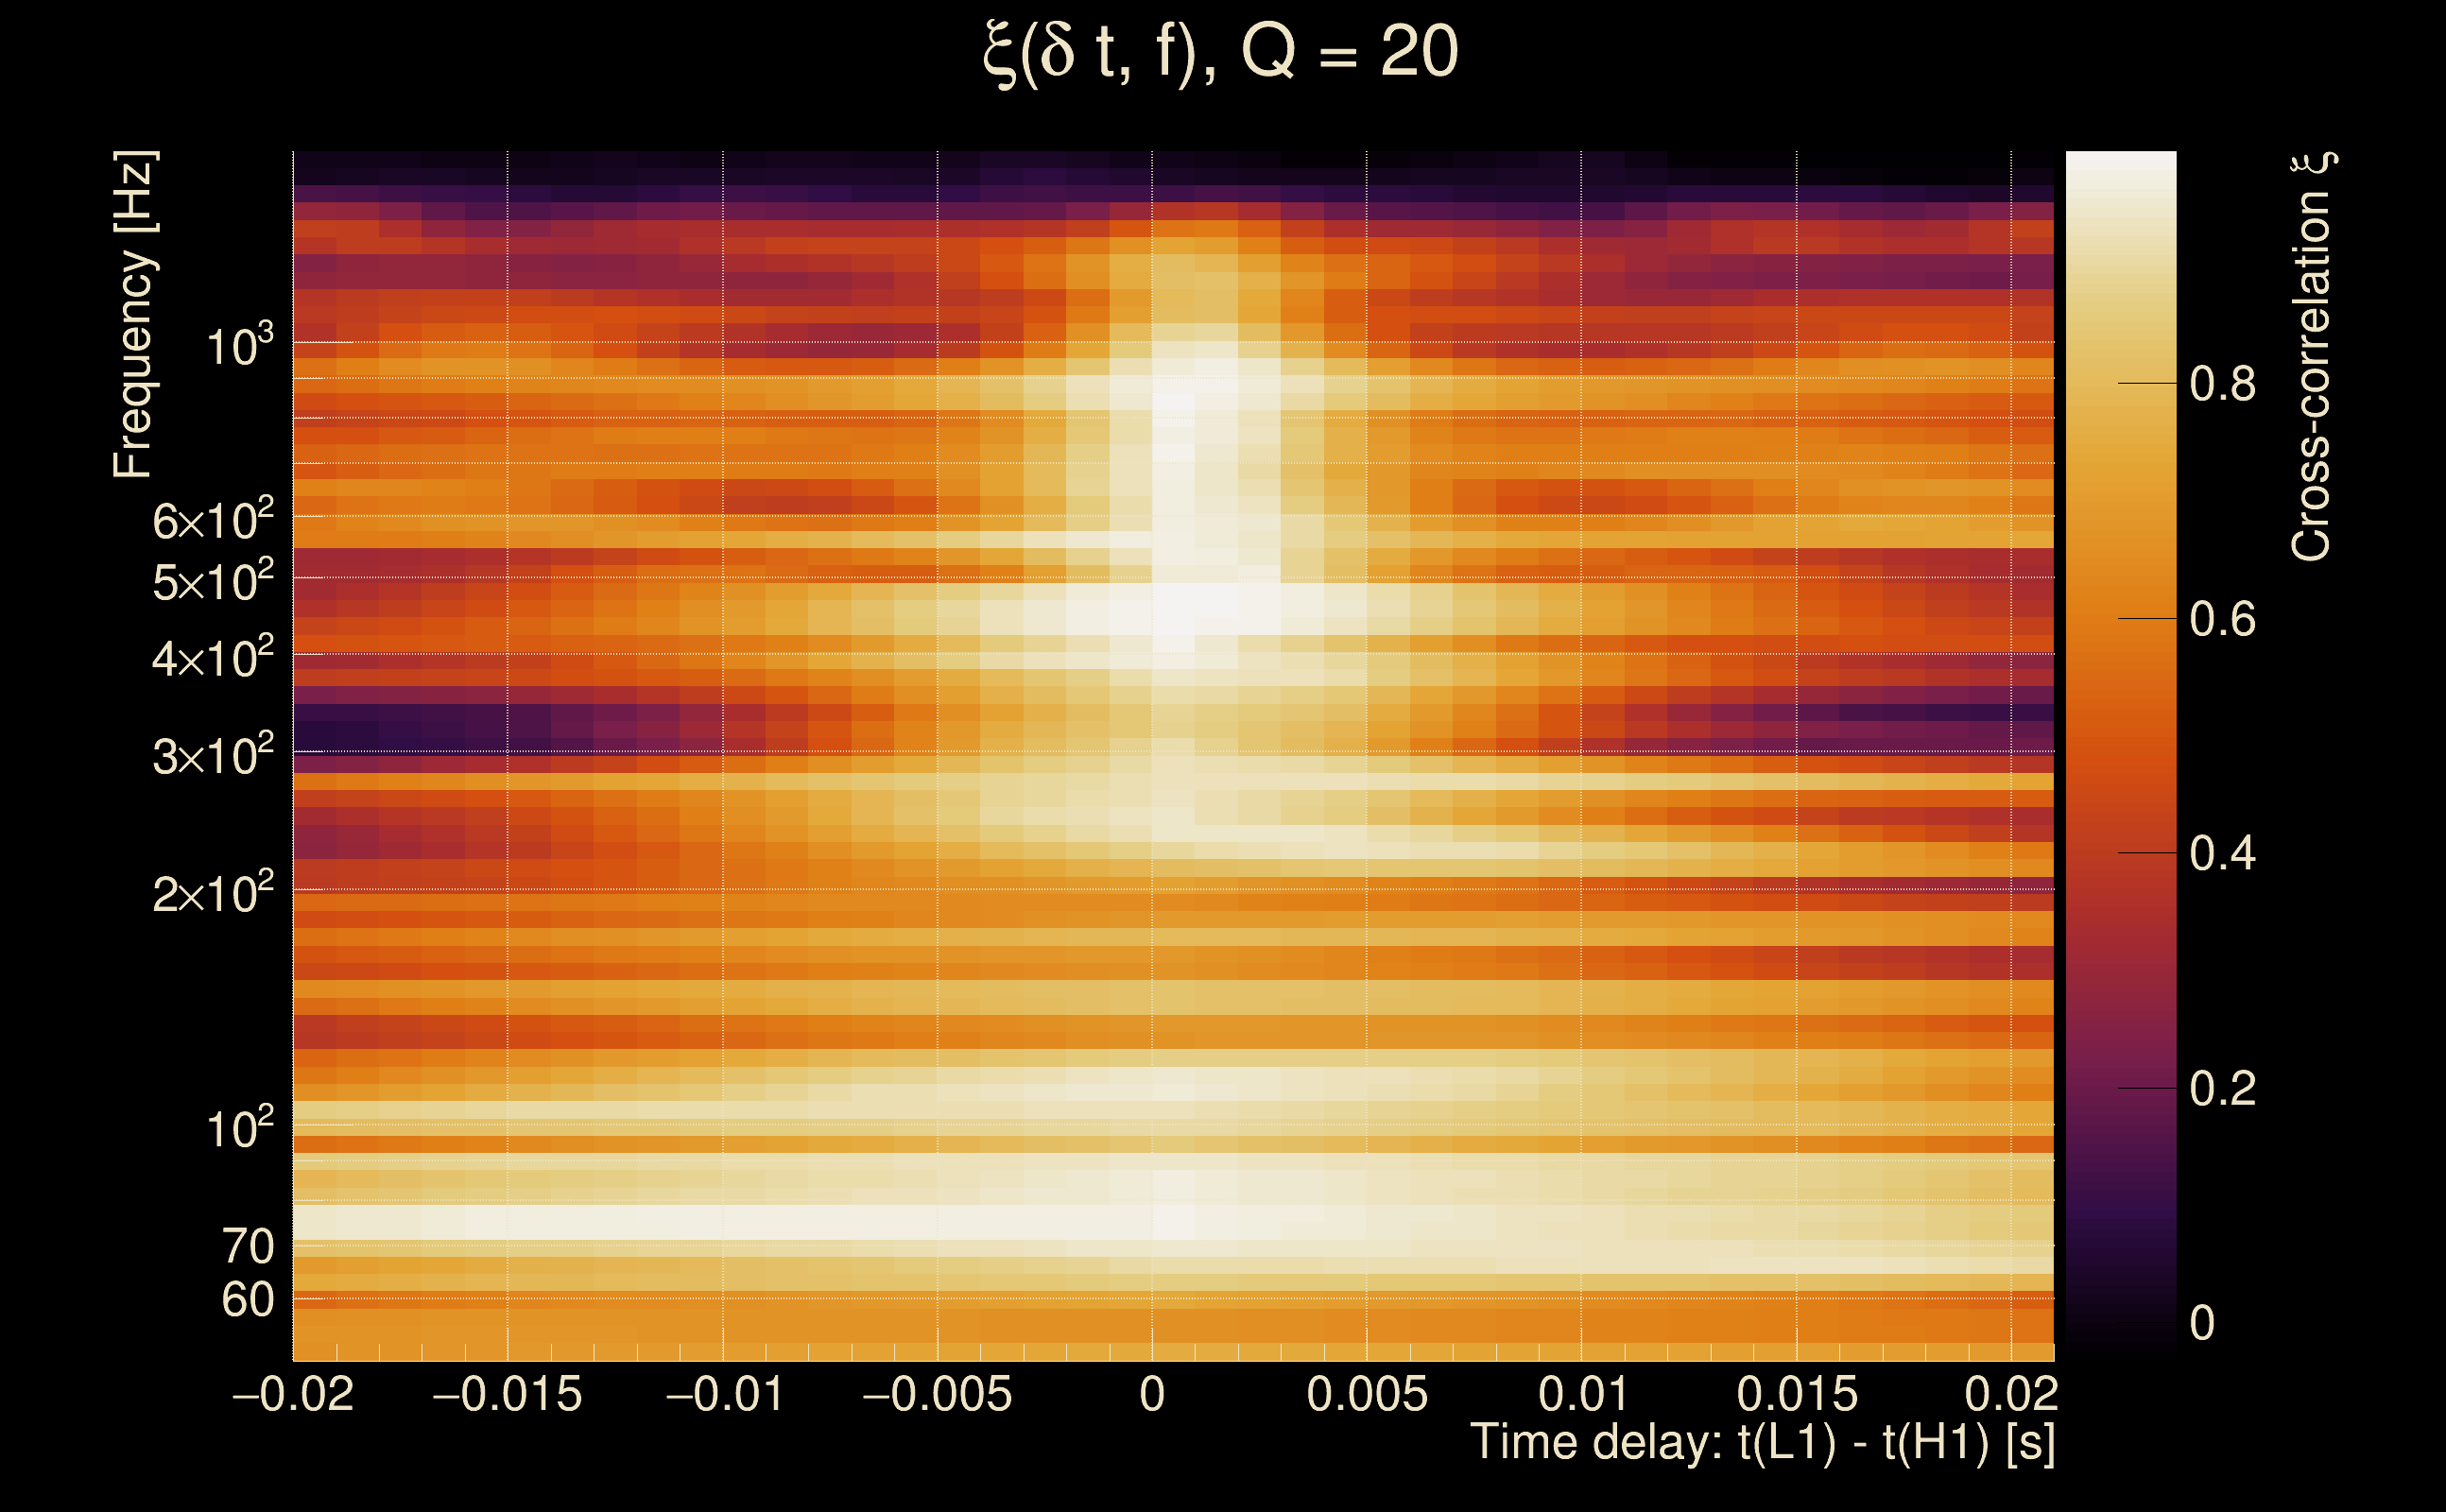
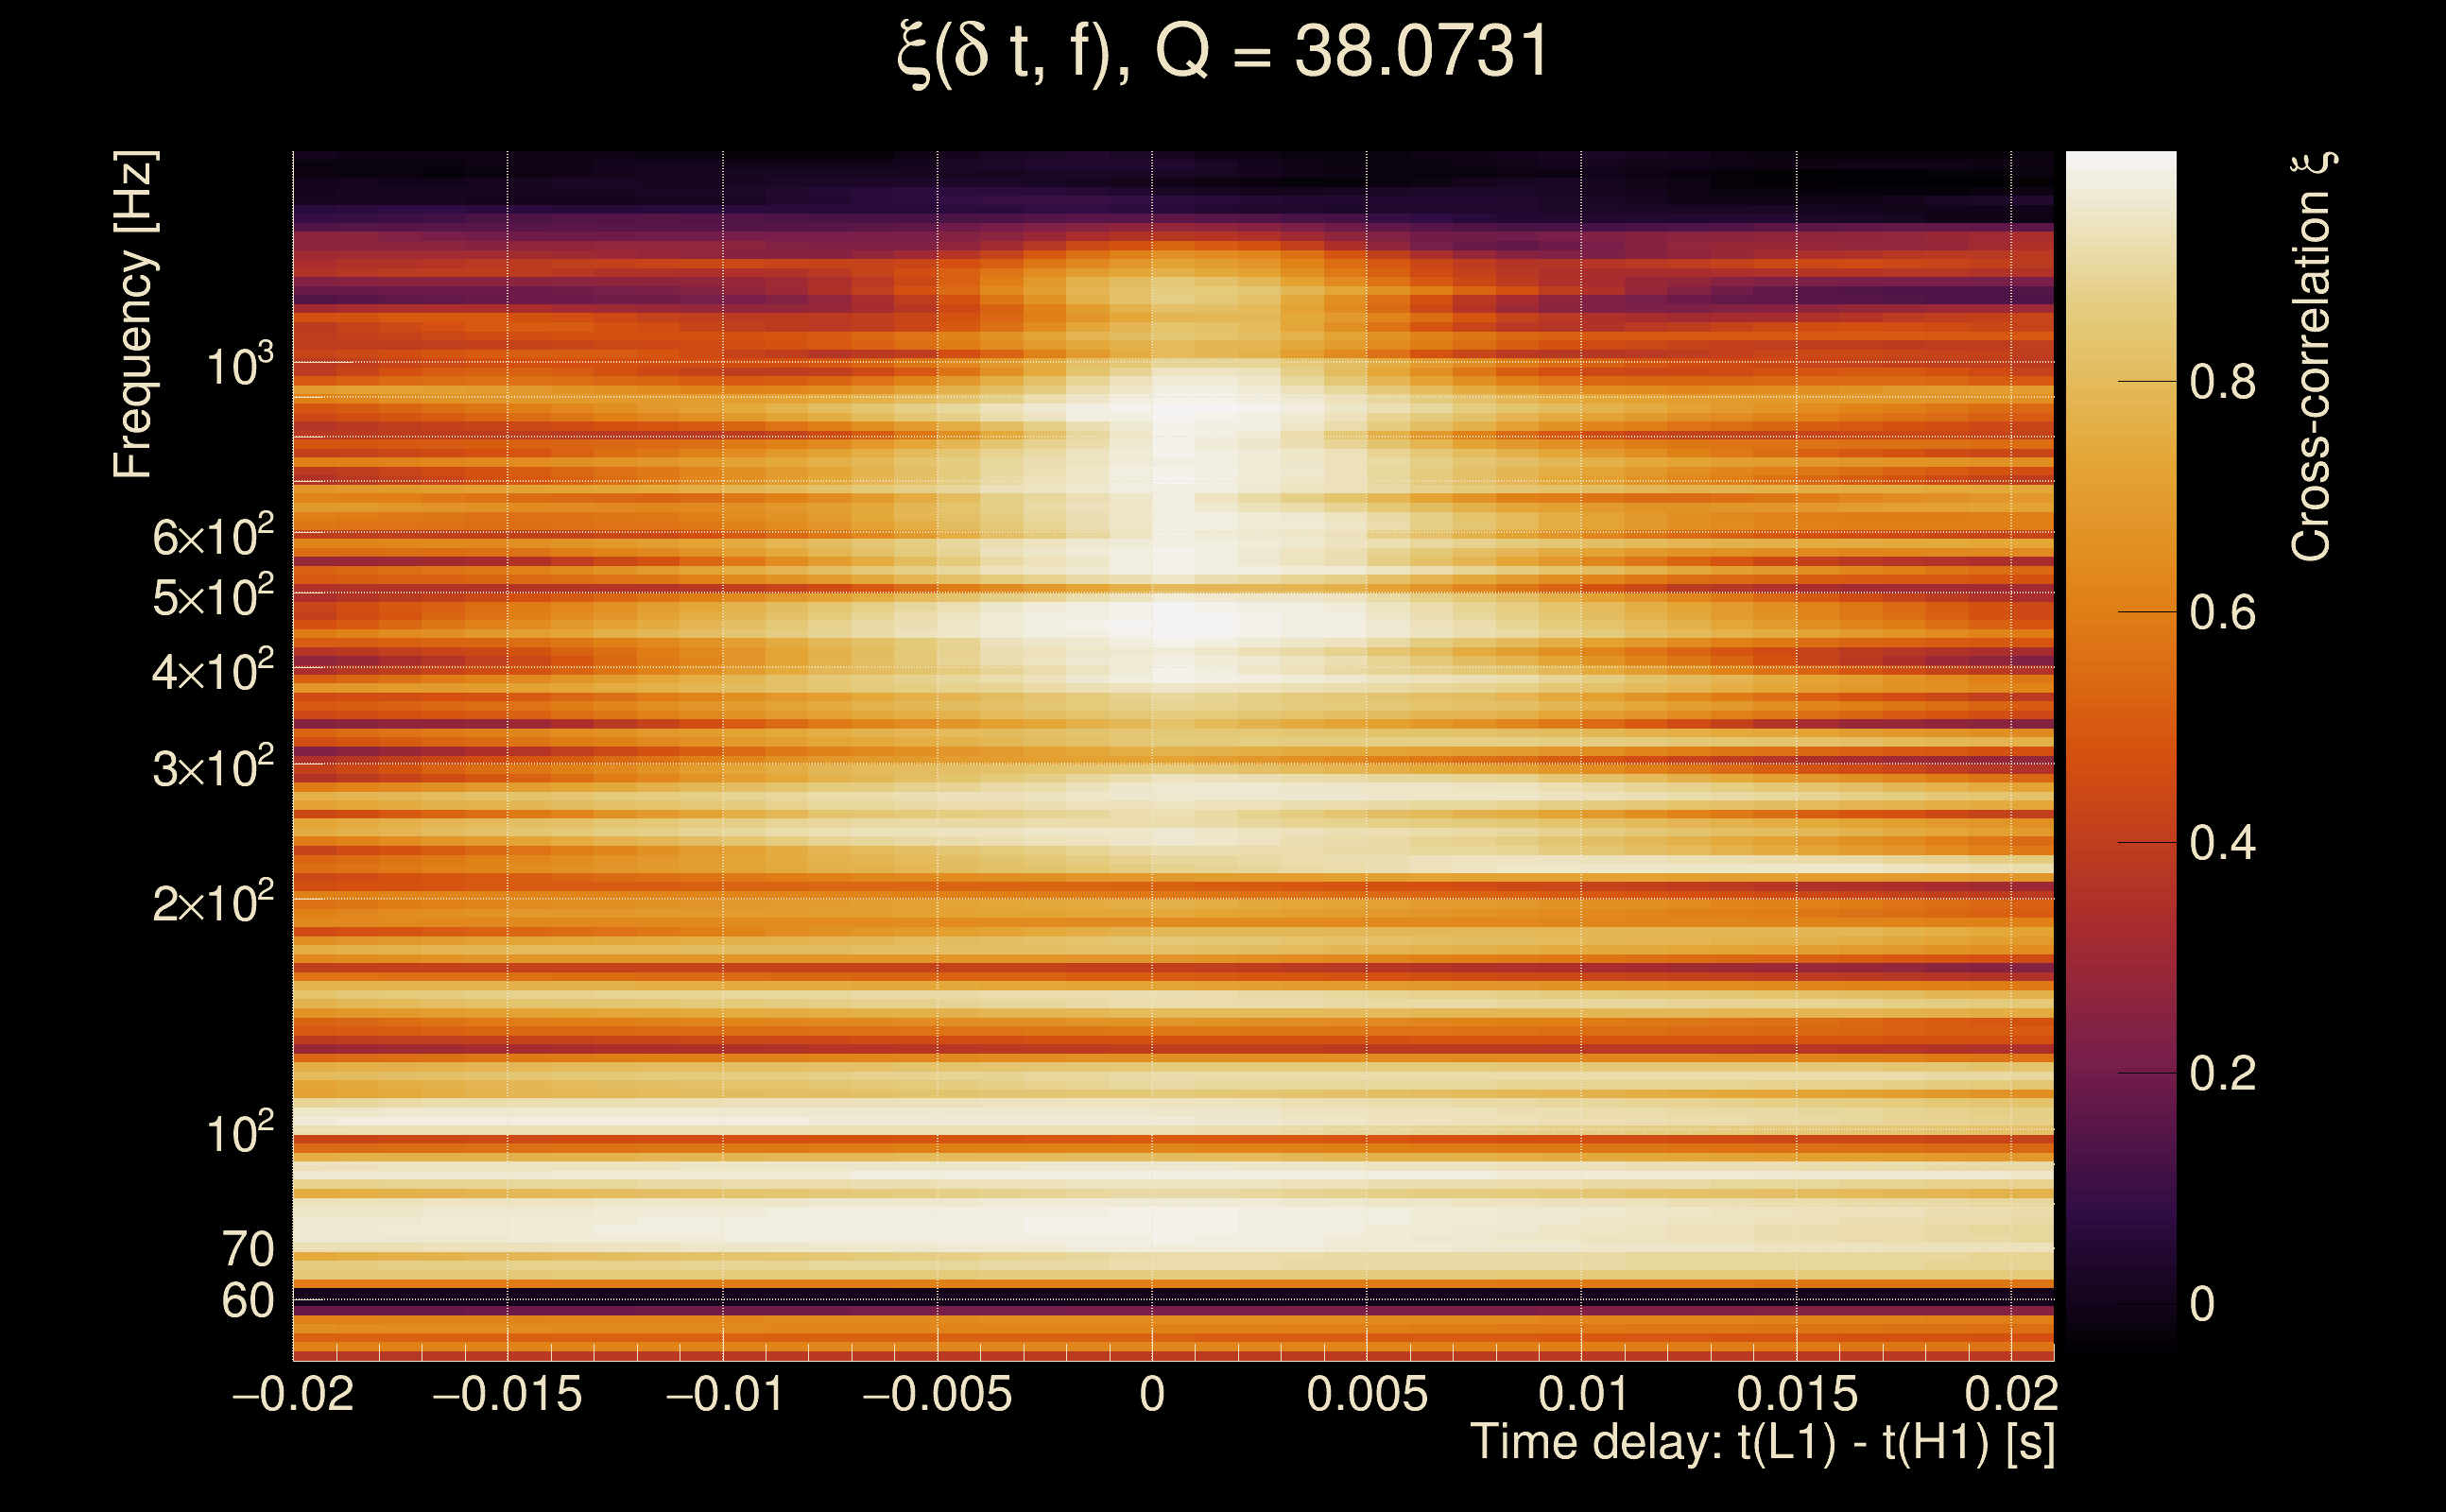
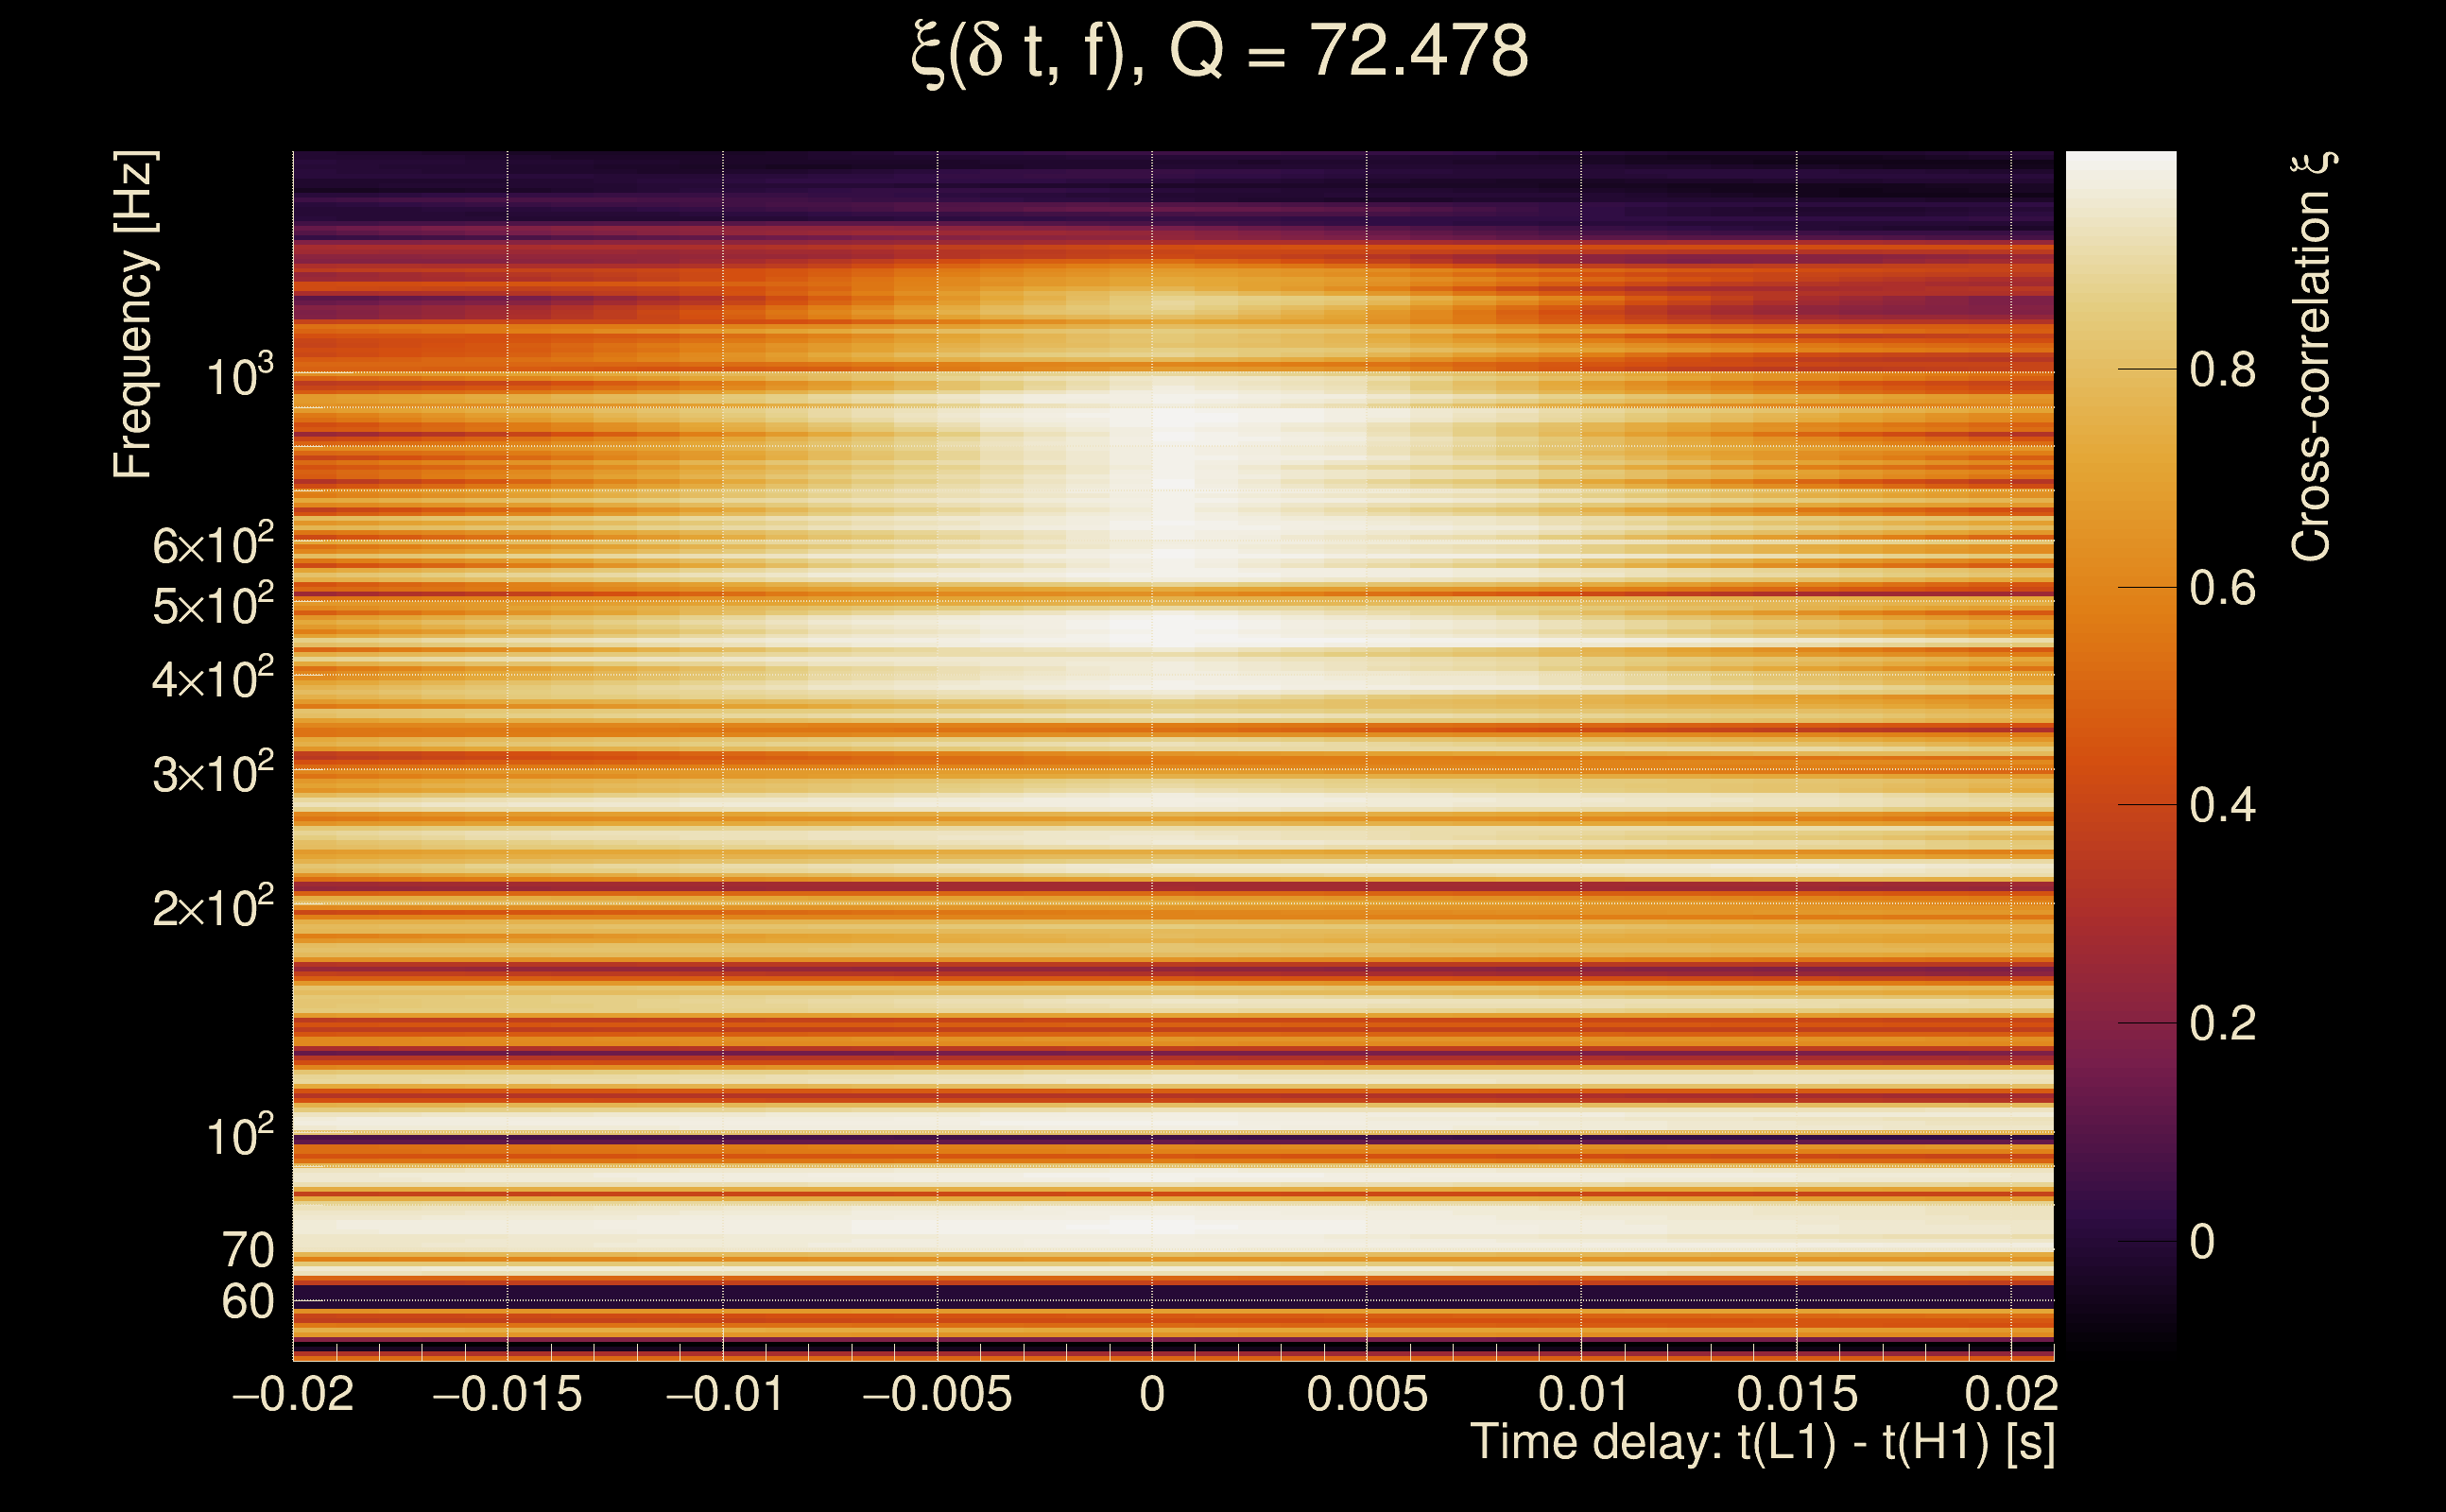
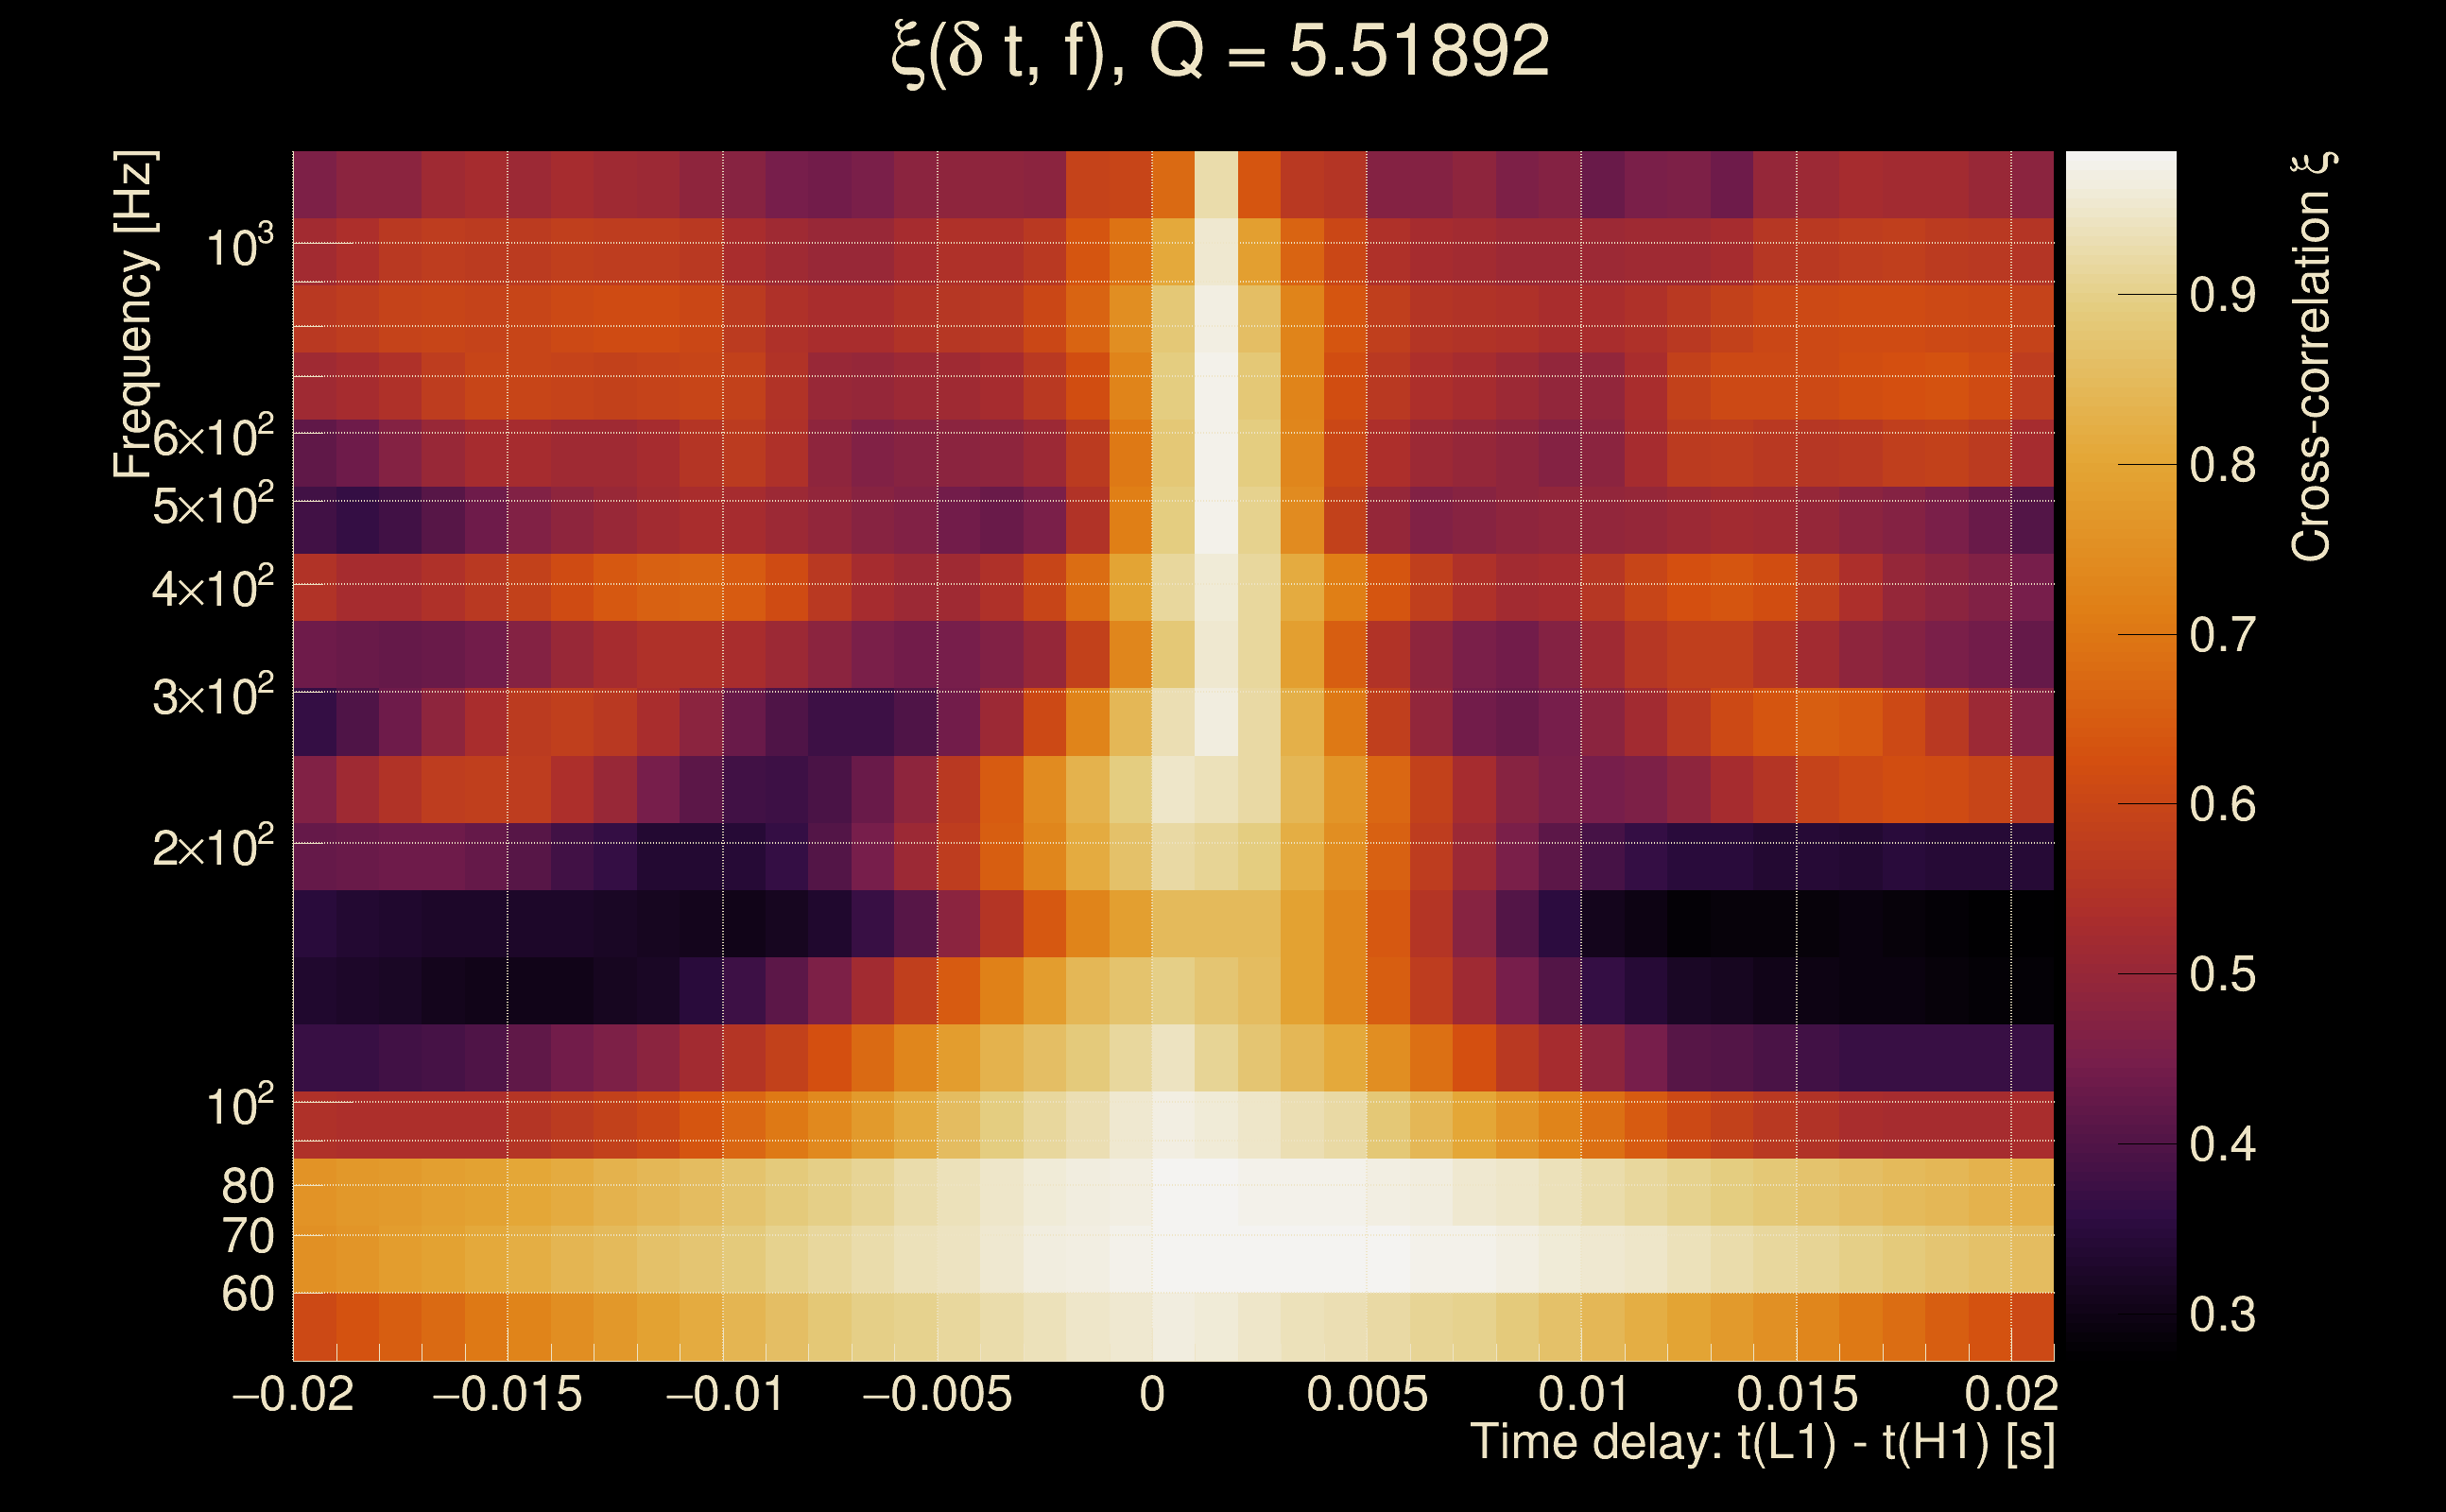
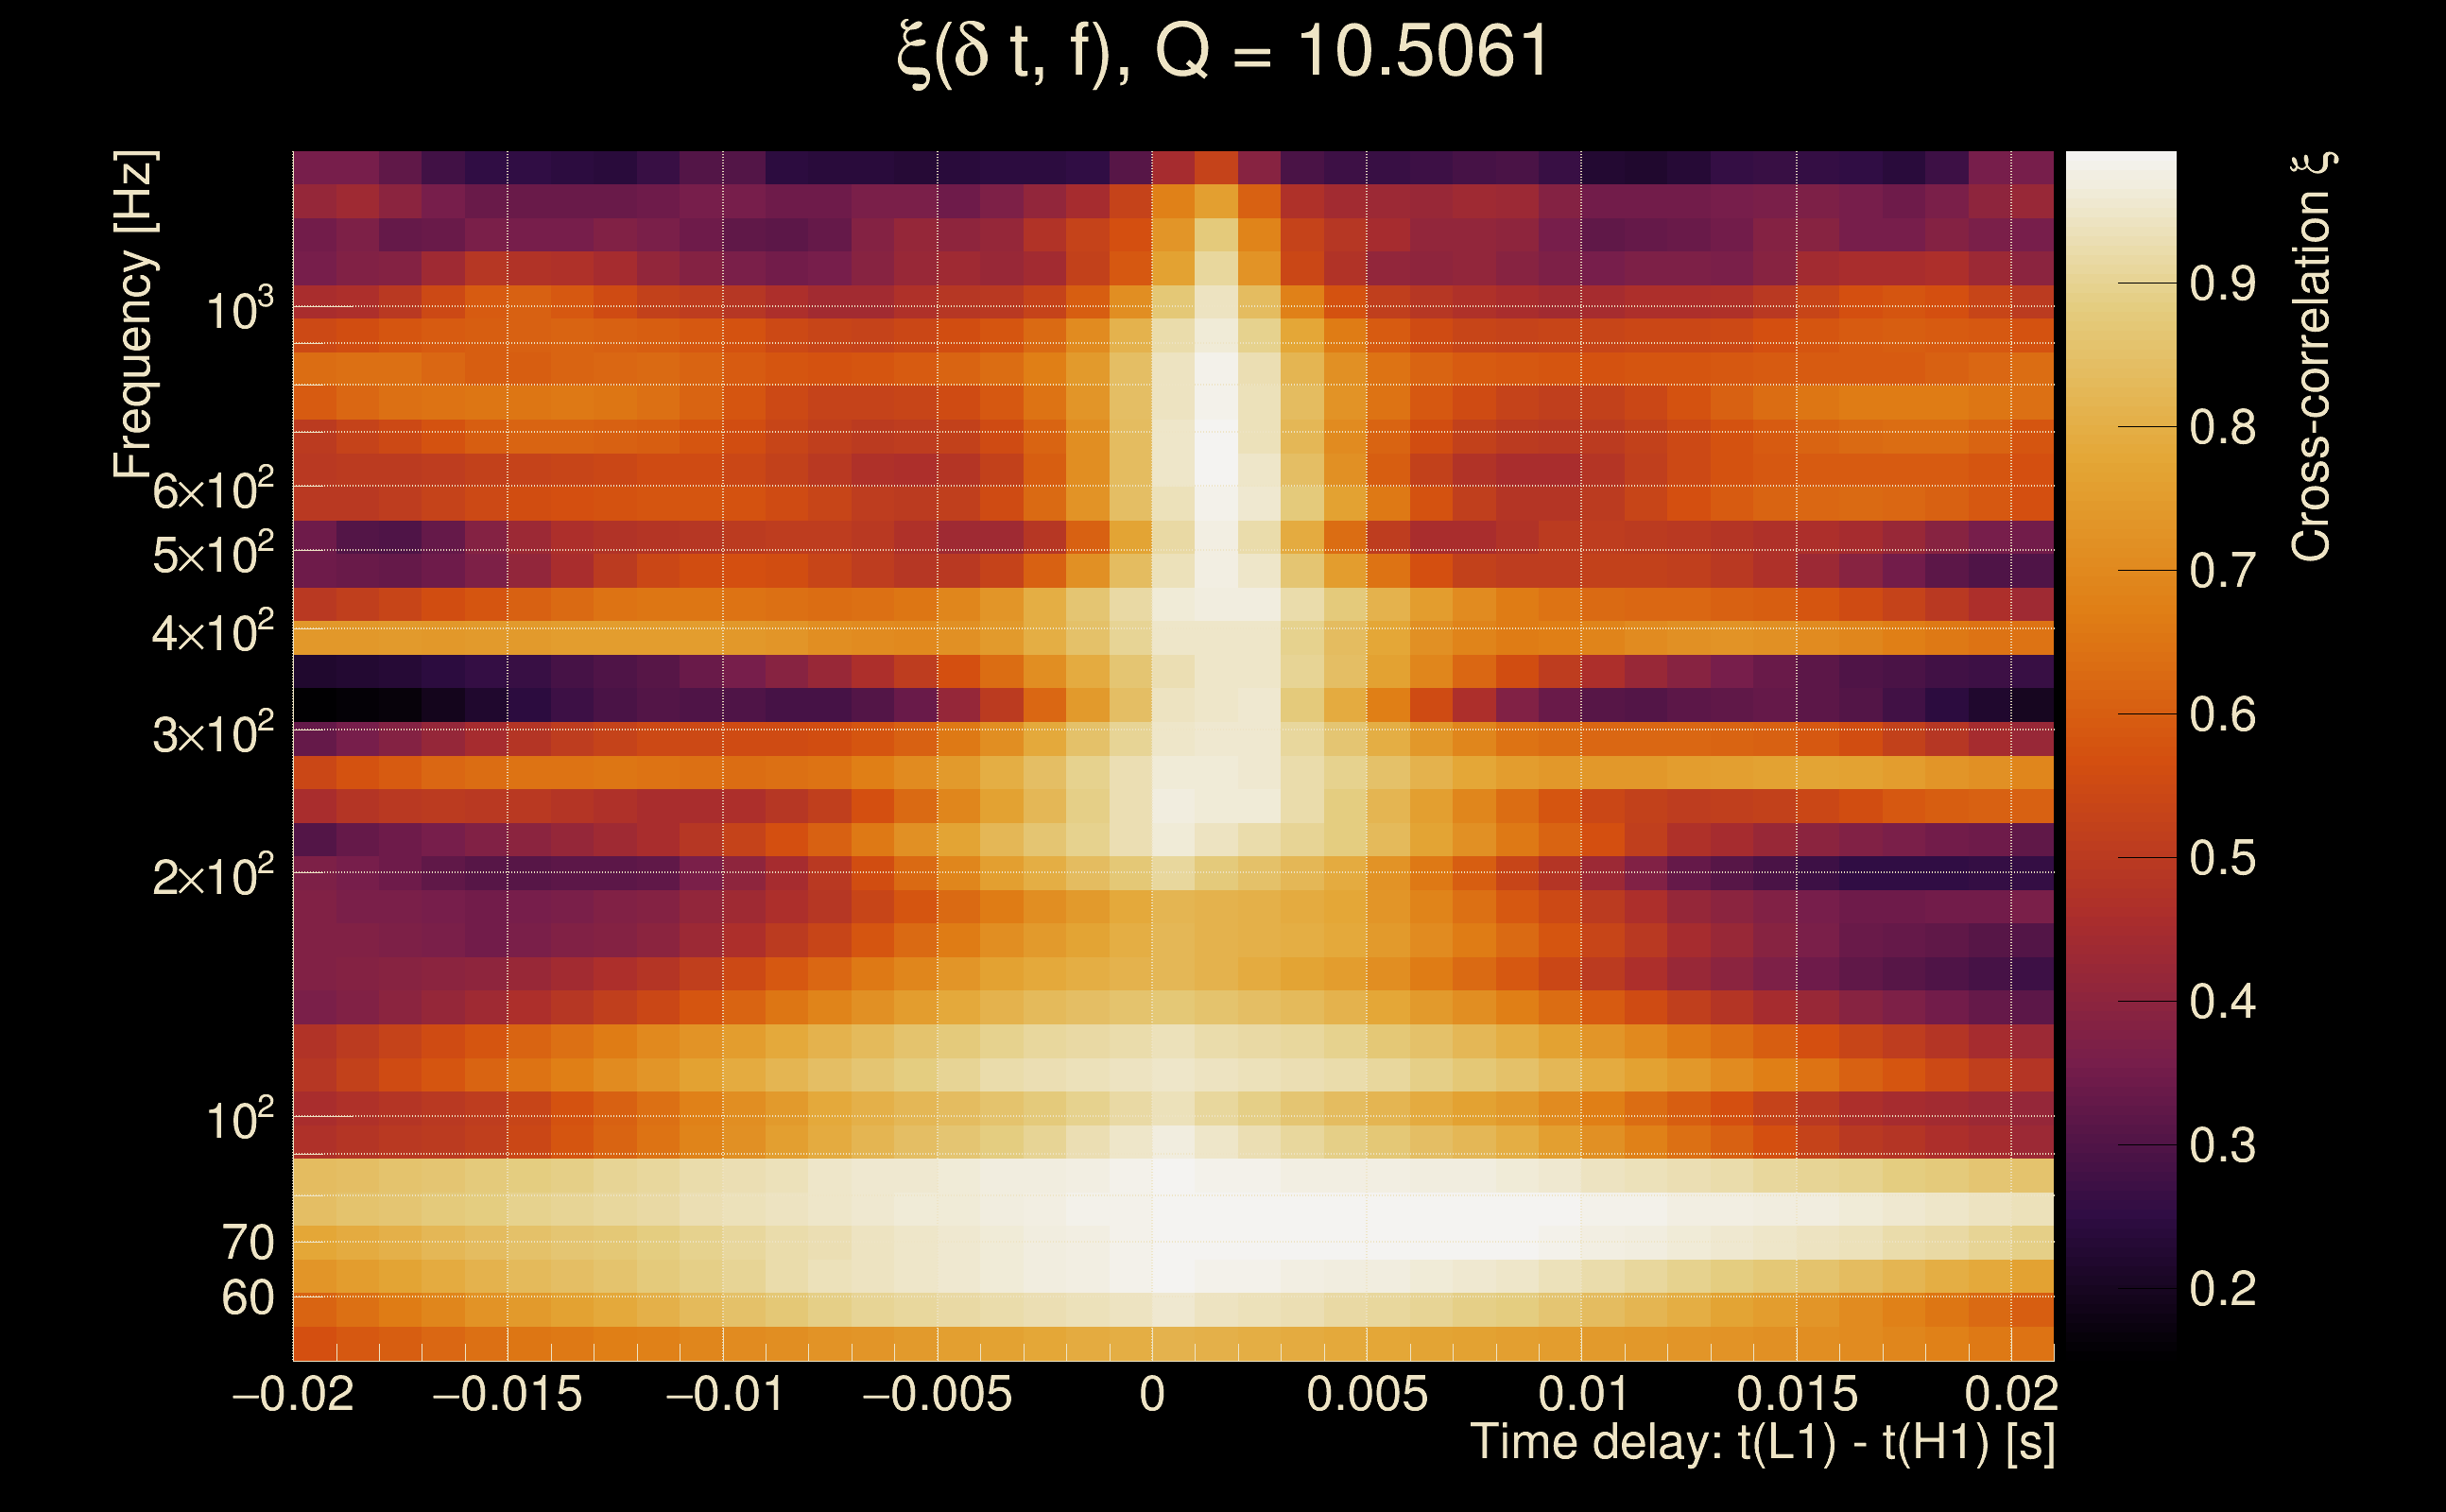
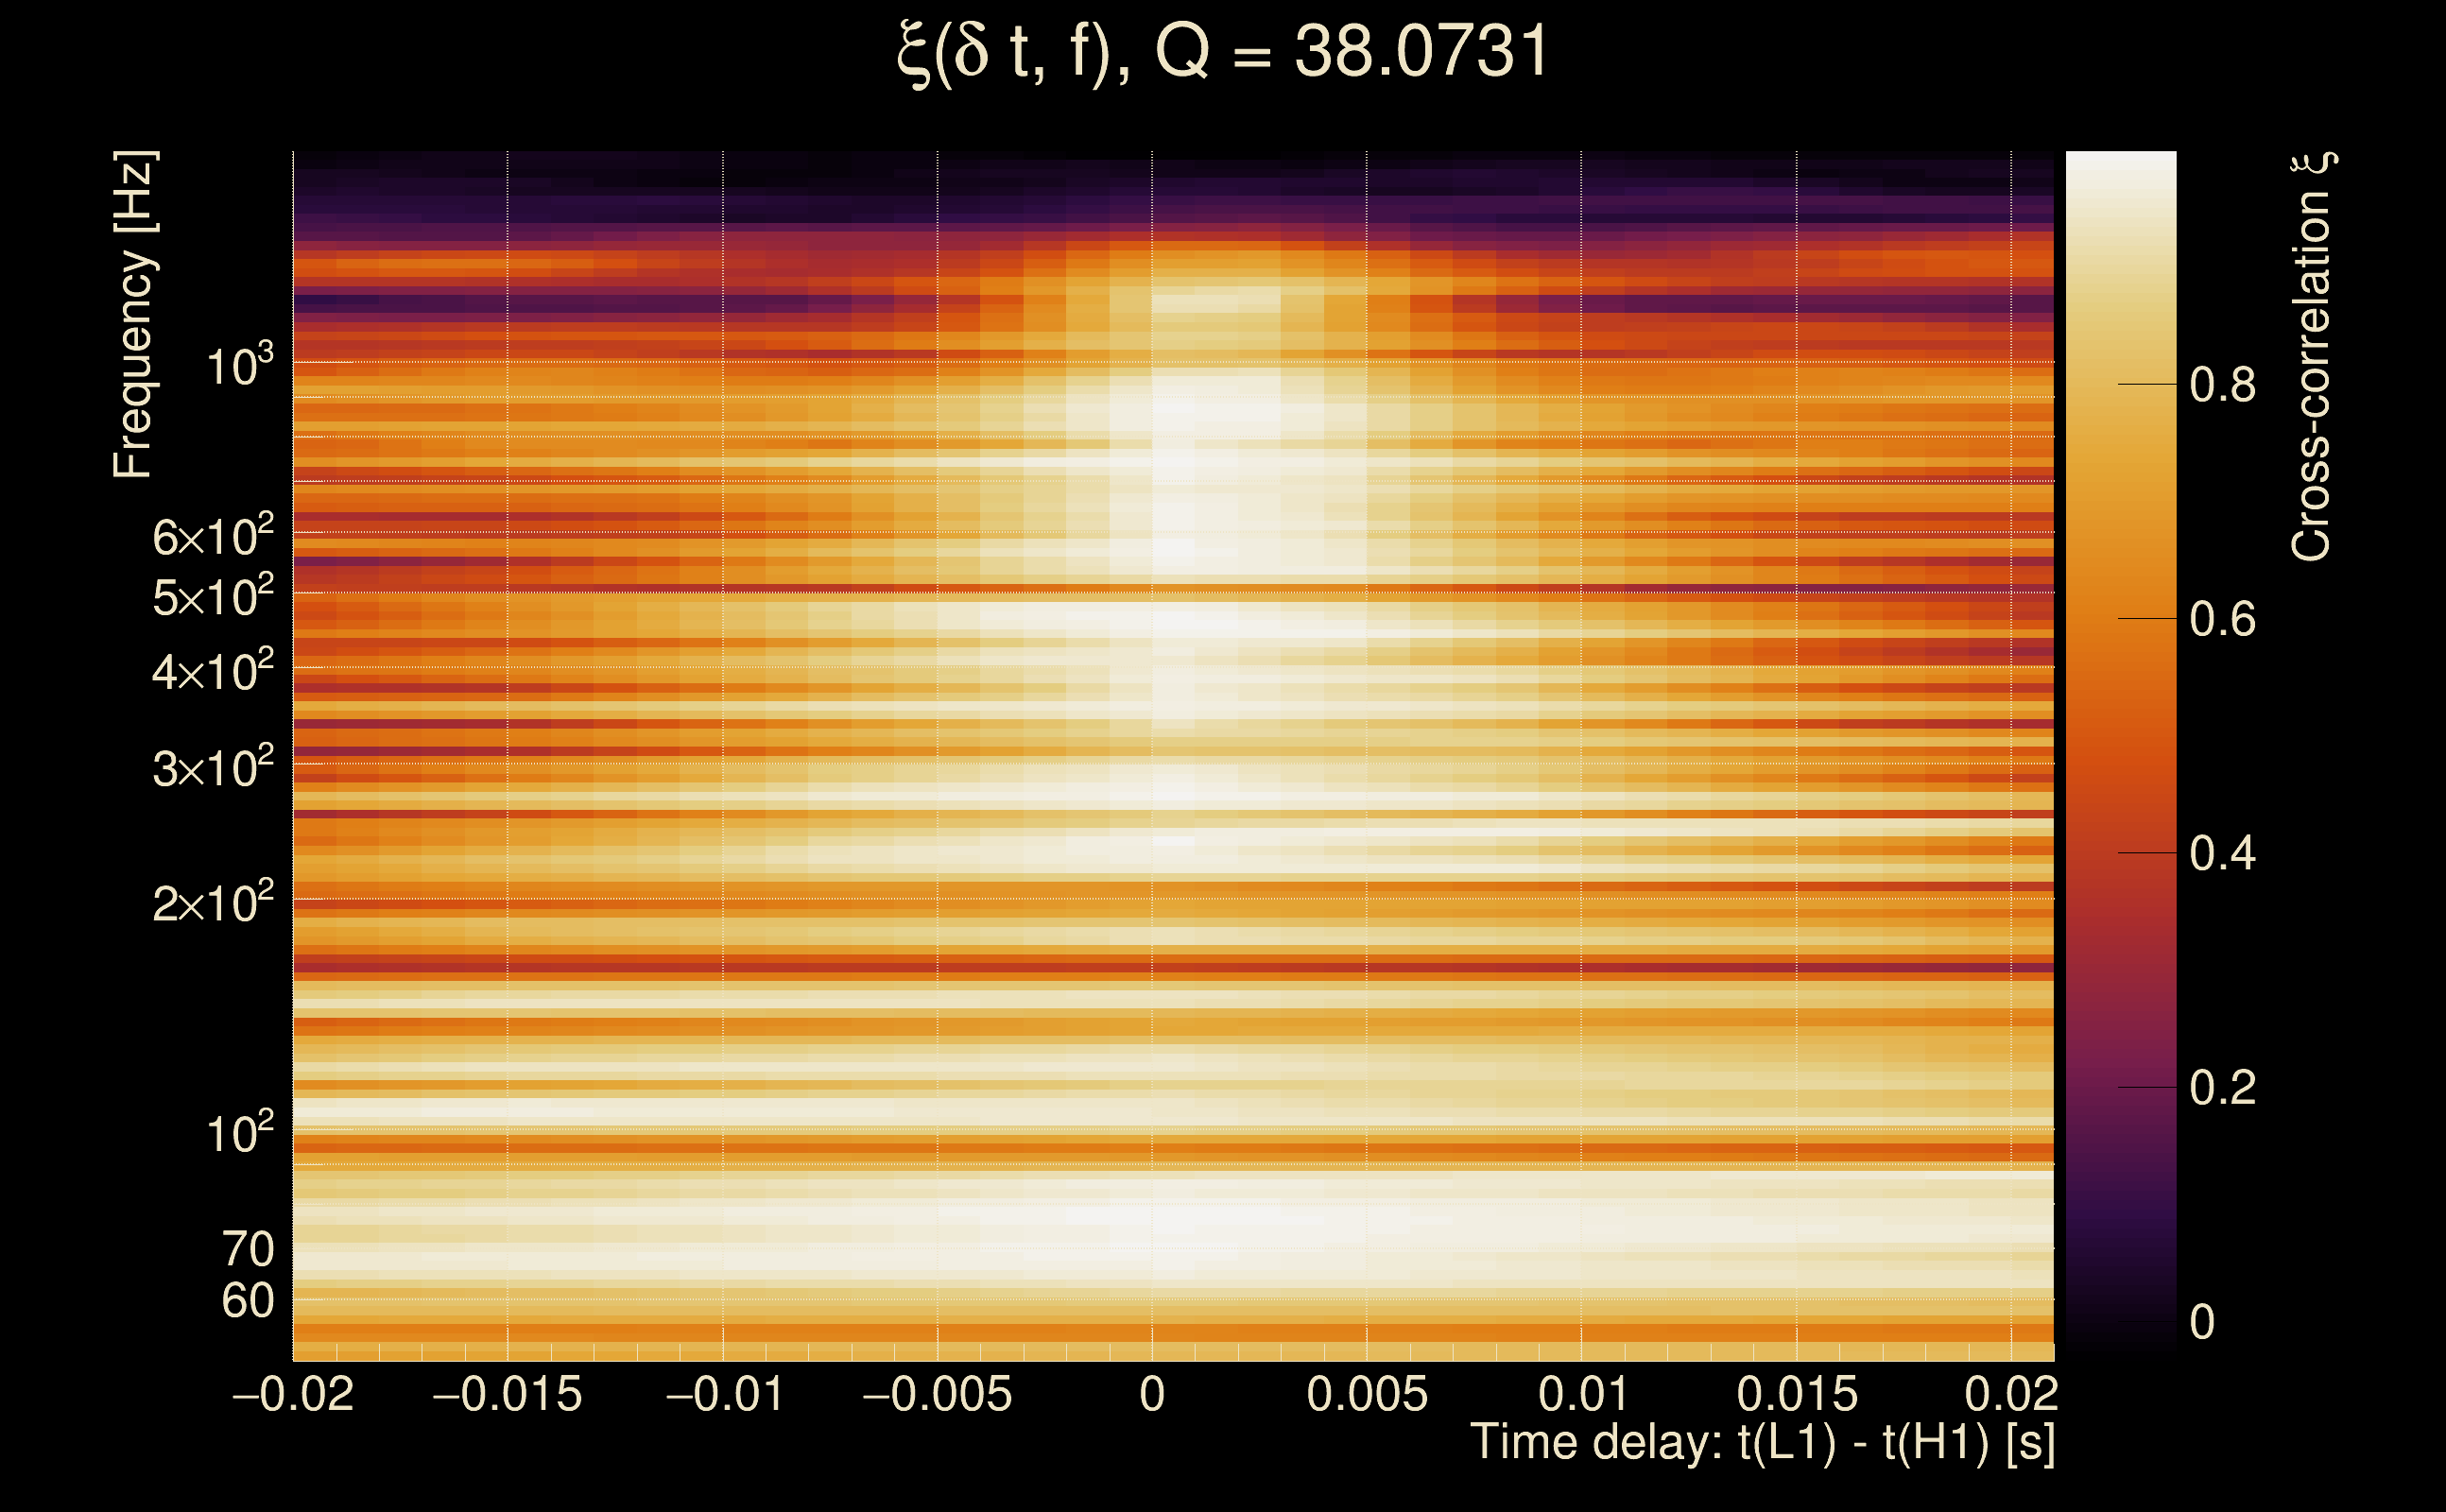
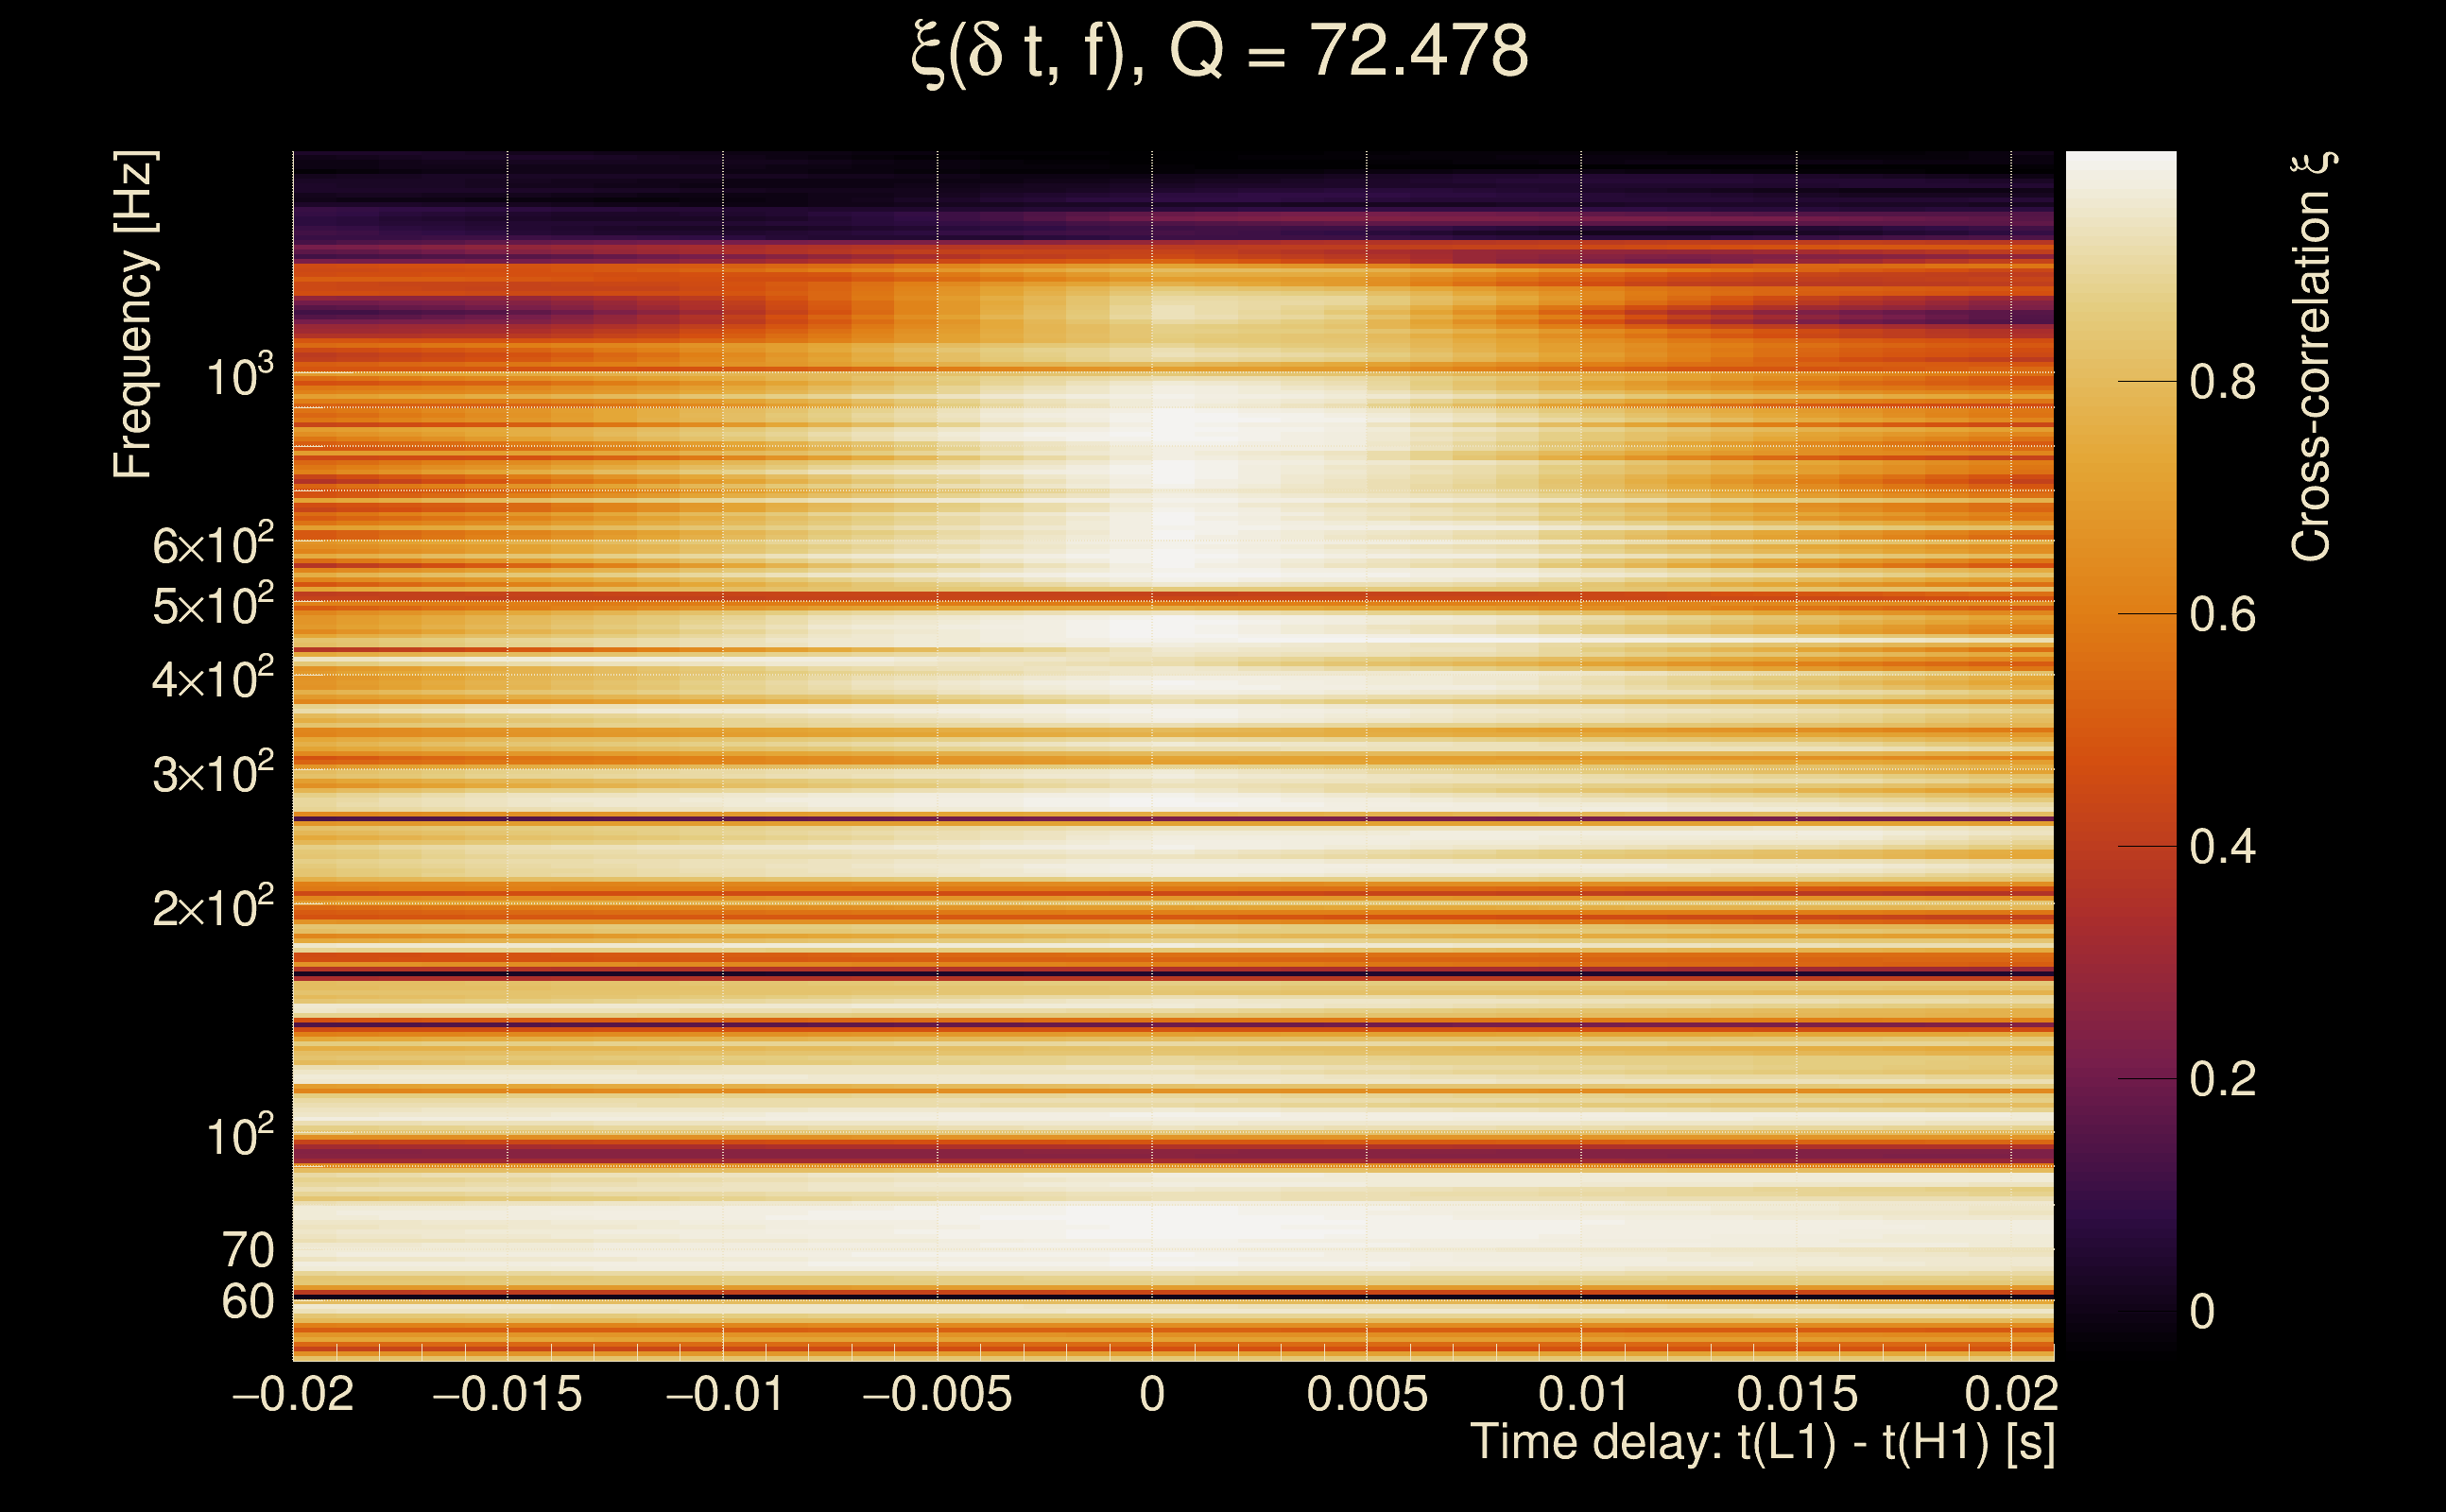
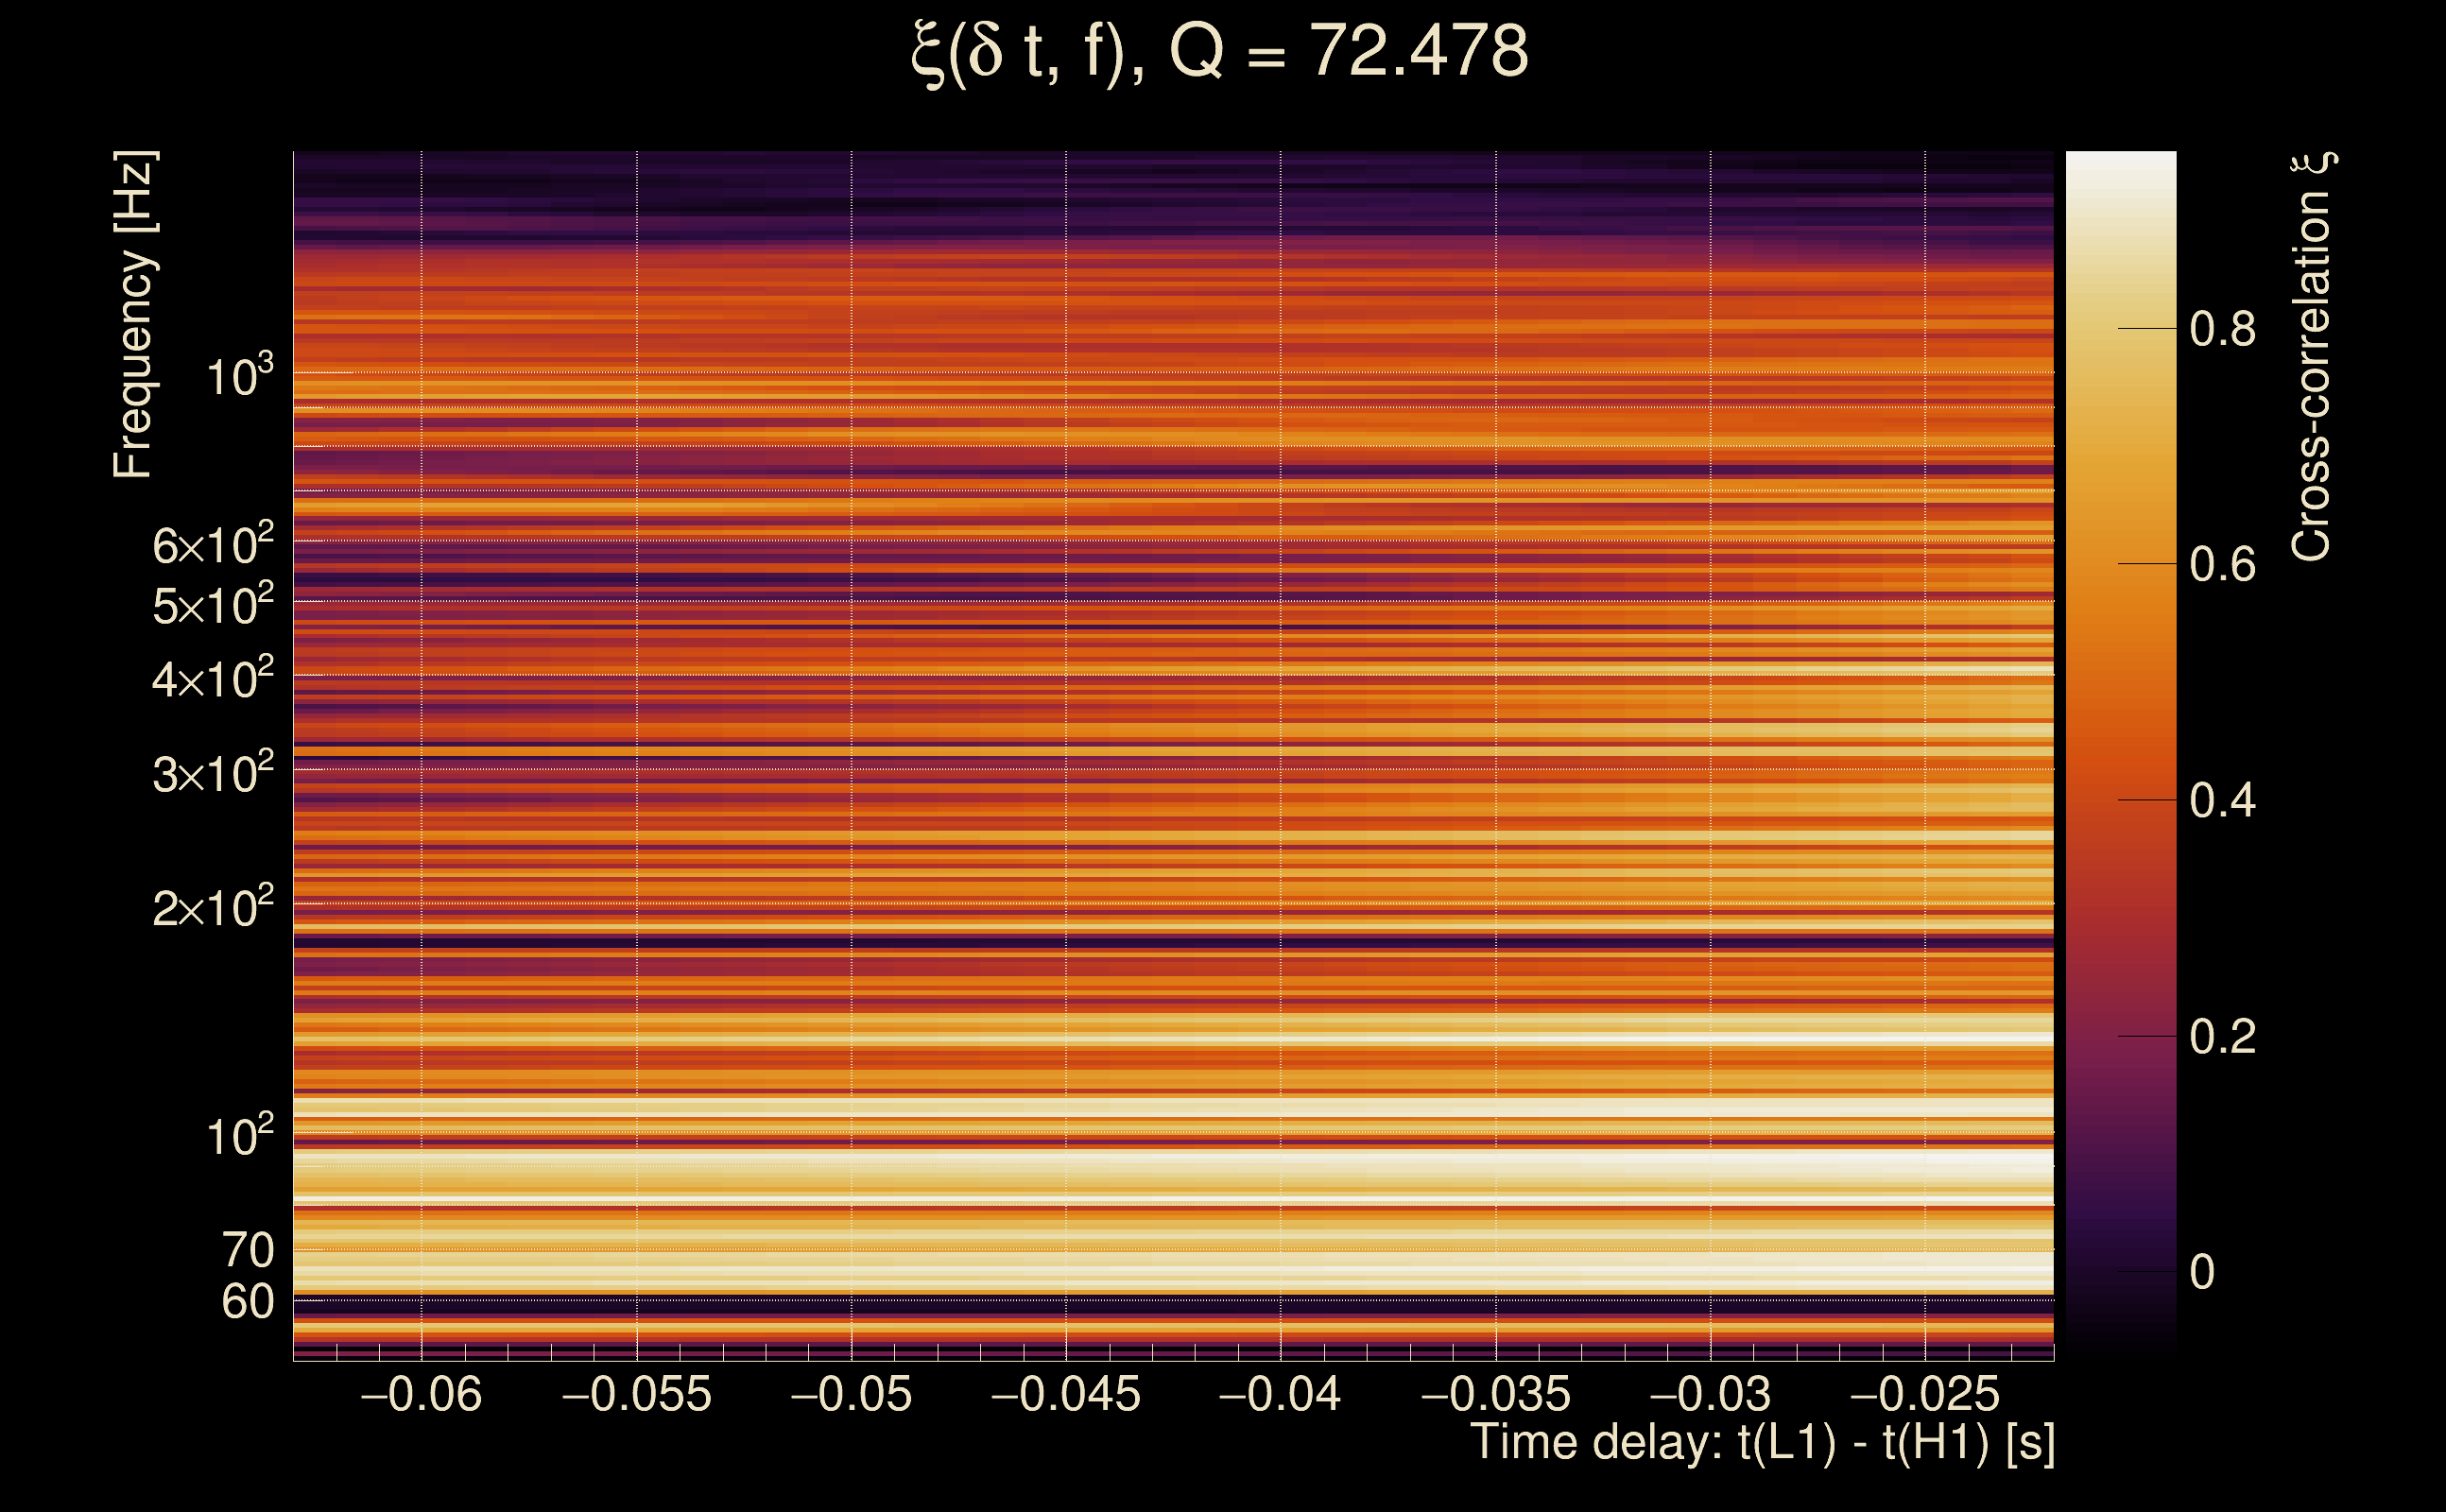
| Number of Q planes: | 5 (Q = 5.51892 → Q = 72.478) |
| Omicron frequency range: | 50 Hz → 1958.38 Hz |
| Light travel time between detectors: | 0.0100128 s |
| Slice extra-time (calibration uncertainty + slice veto): | 0.0129872 s |
| Number of time-delay bins in a cross-correlation map: | 10000 |
| Number of slices in a cross-correlation map: | 217 |
| Number of time-delay bins in a slice: | 46 |
| SNR gating: | < 100 (detector 0), < 100 (detector 1) |
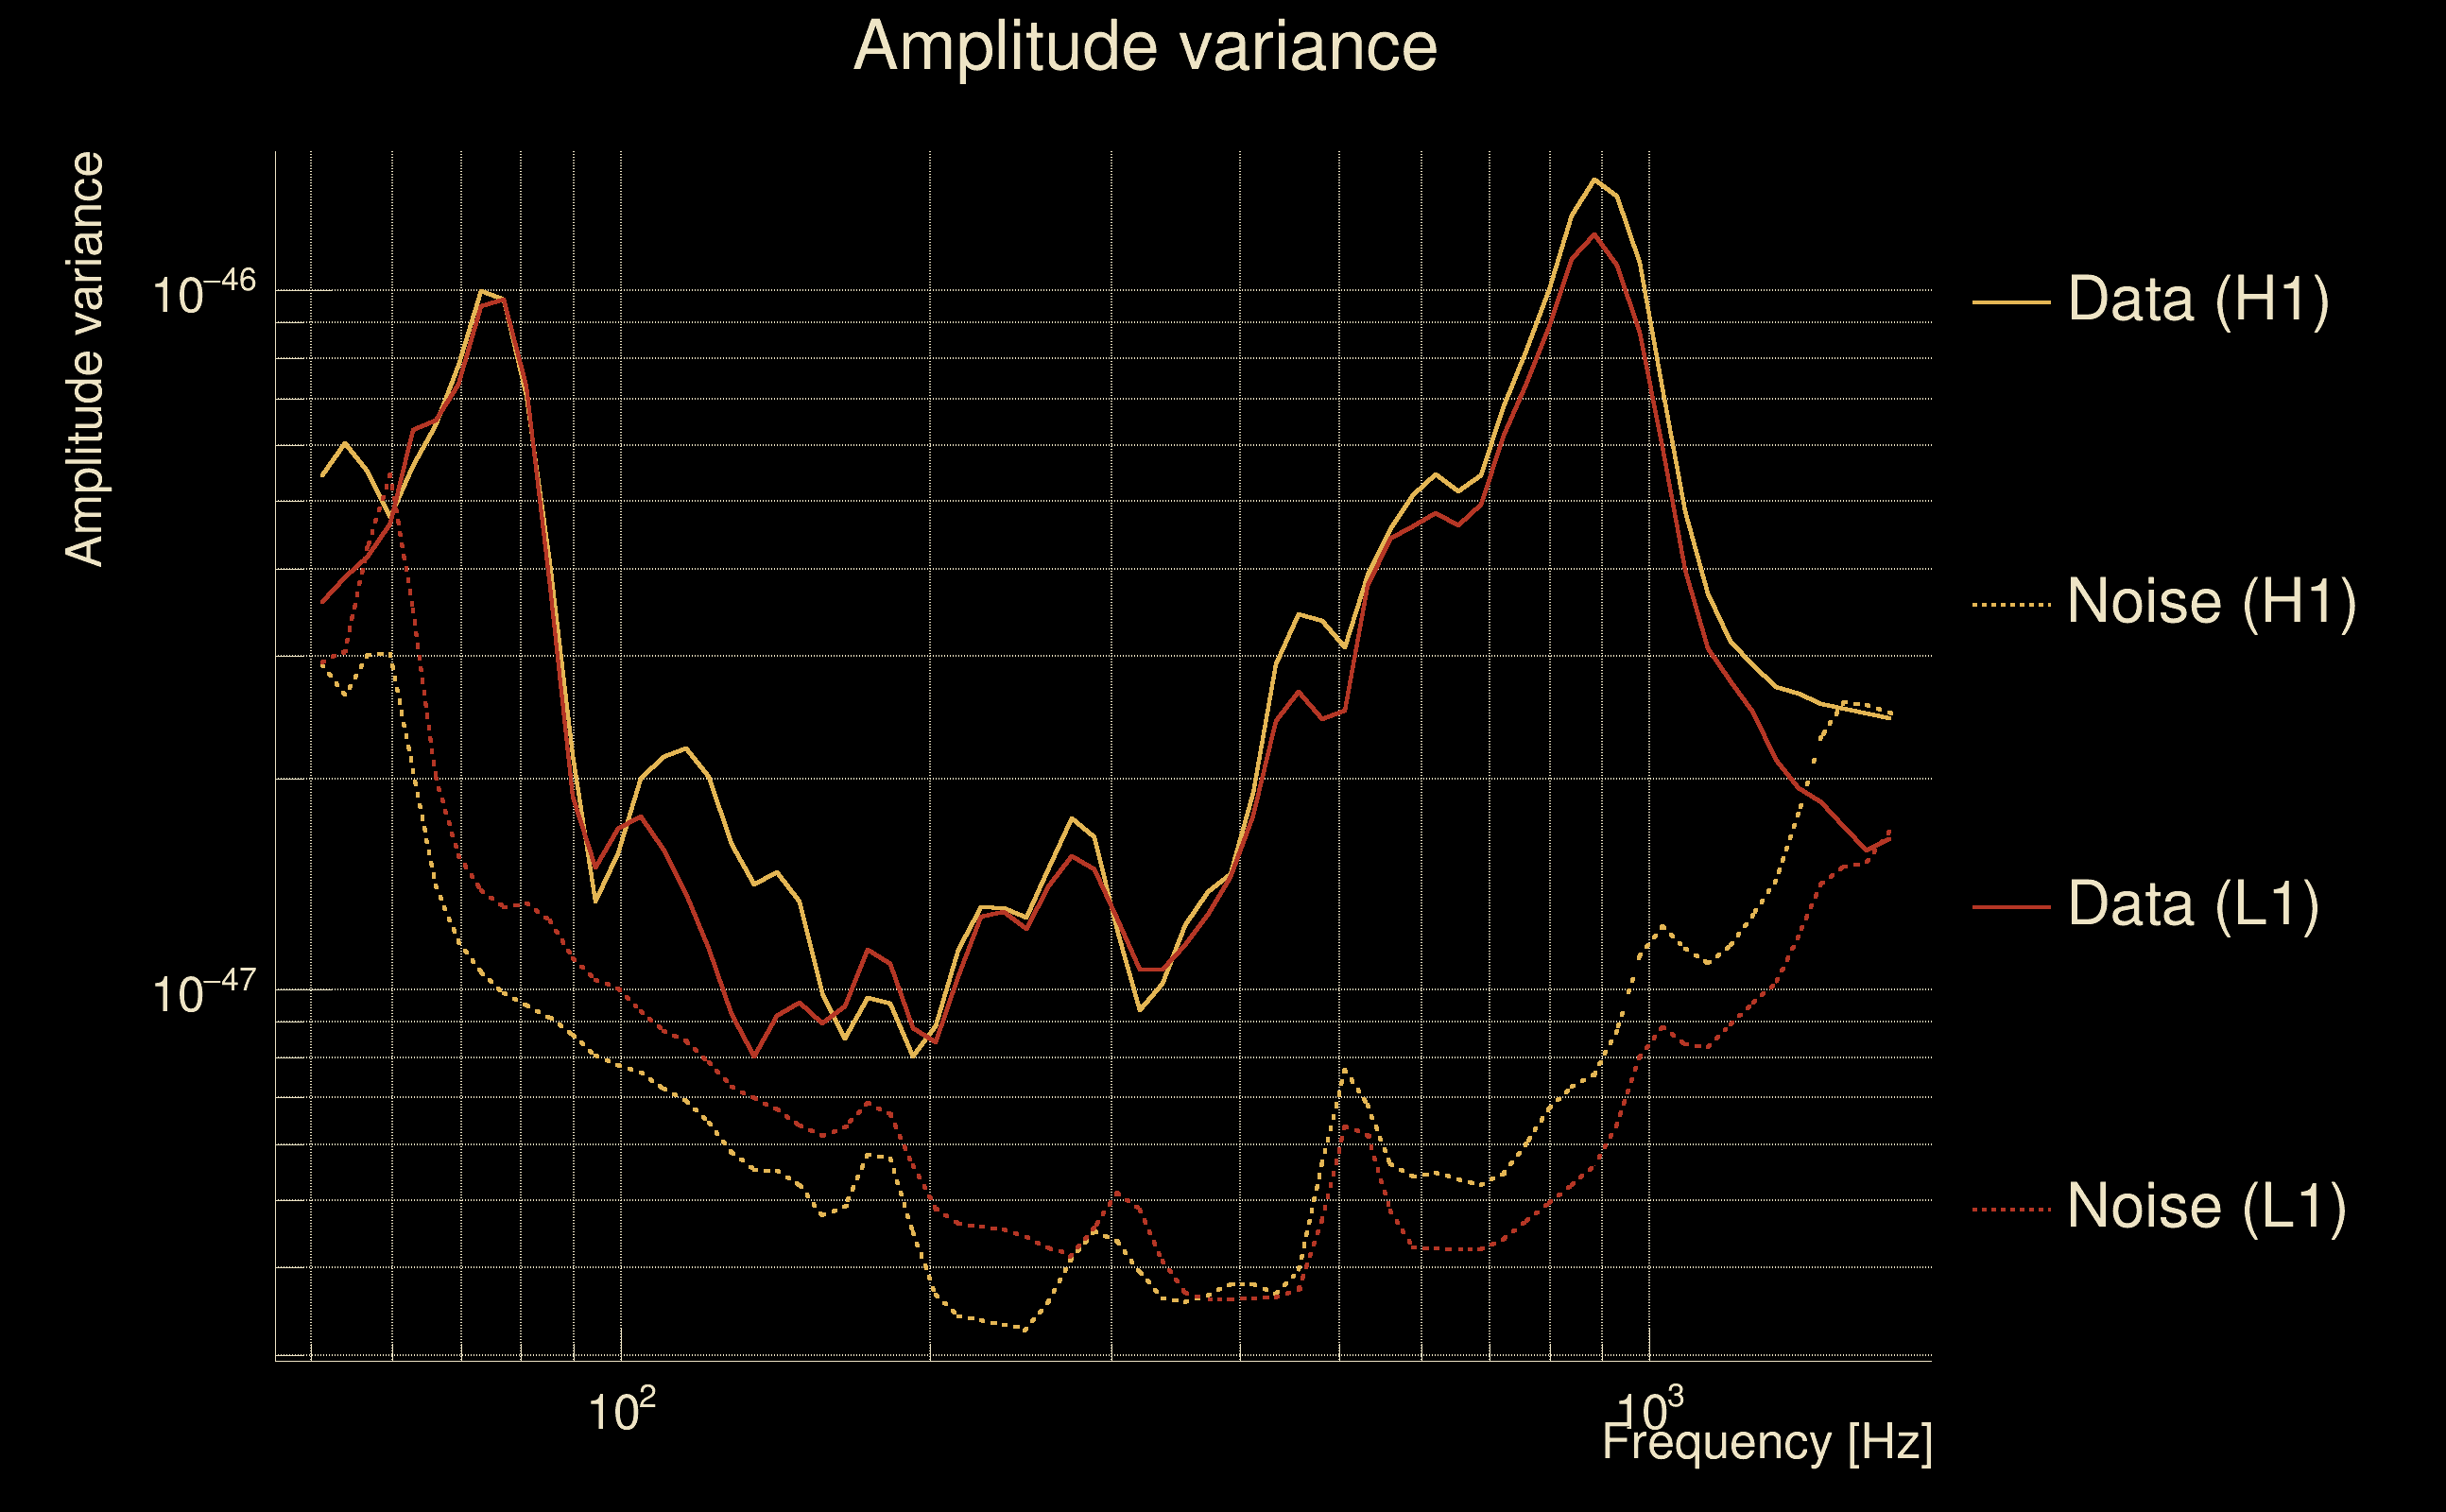
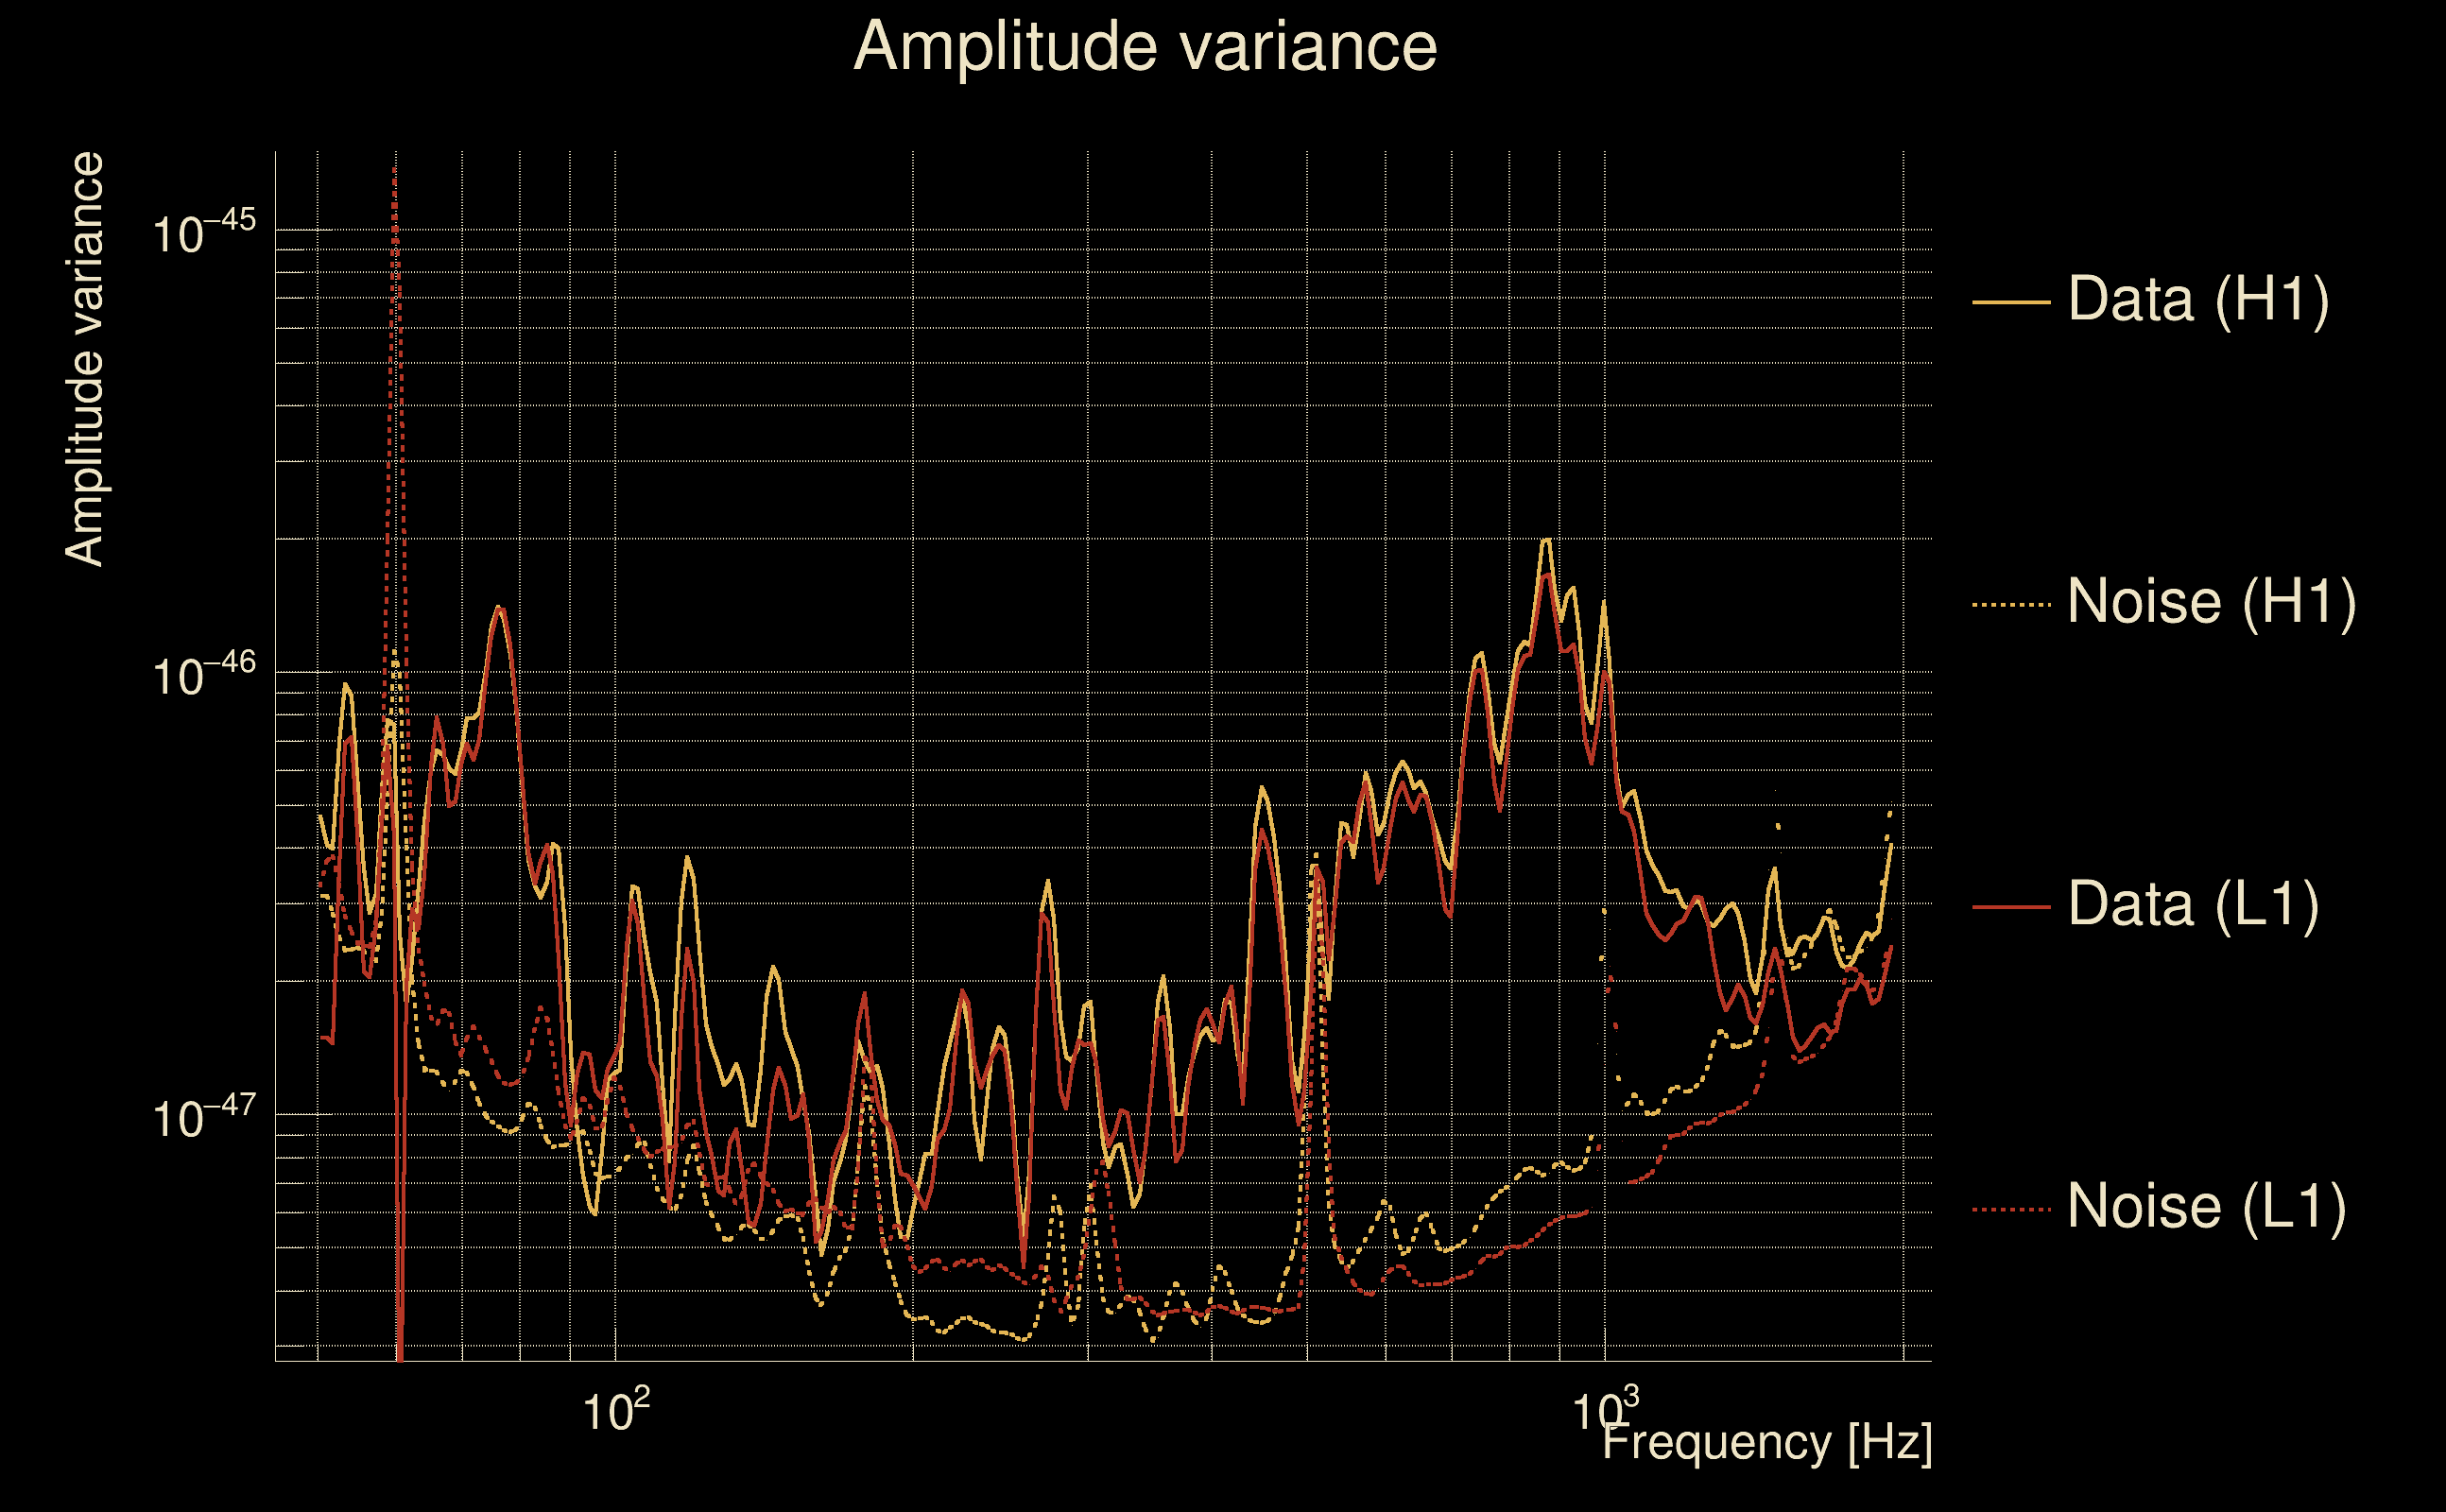
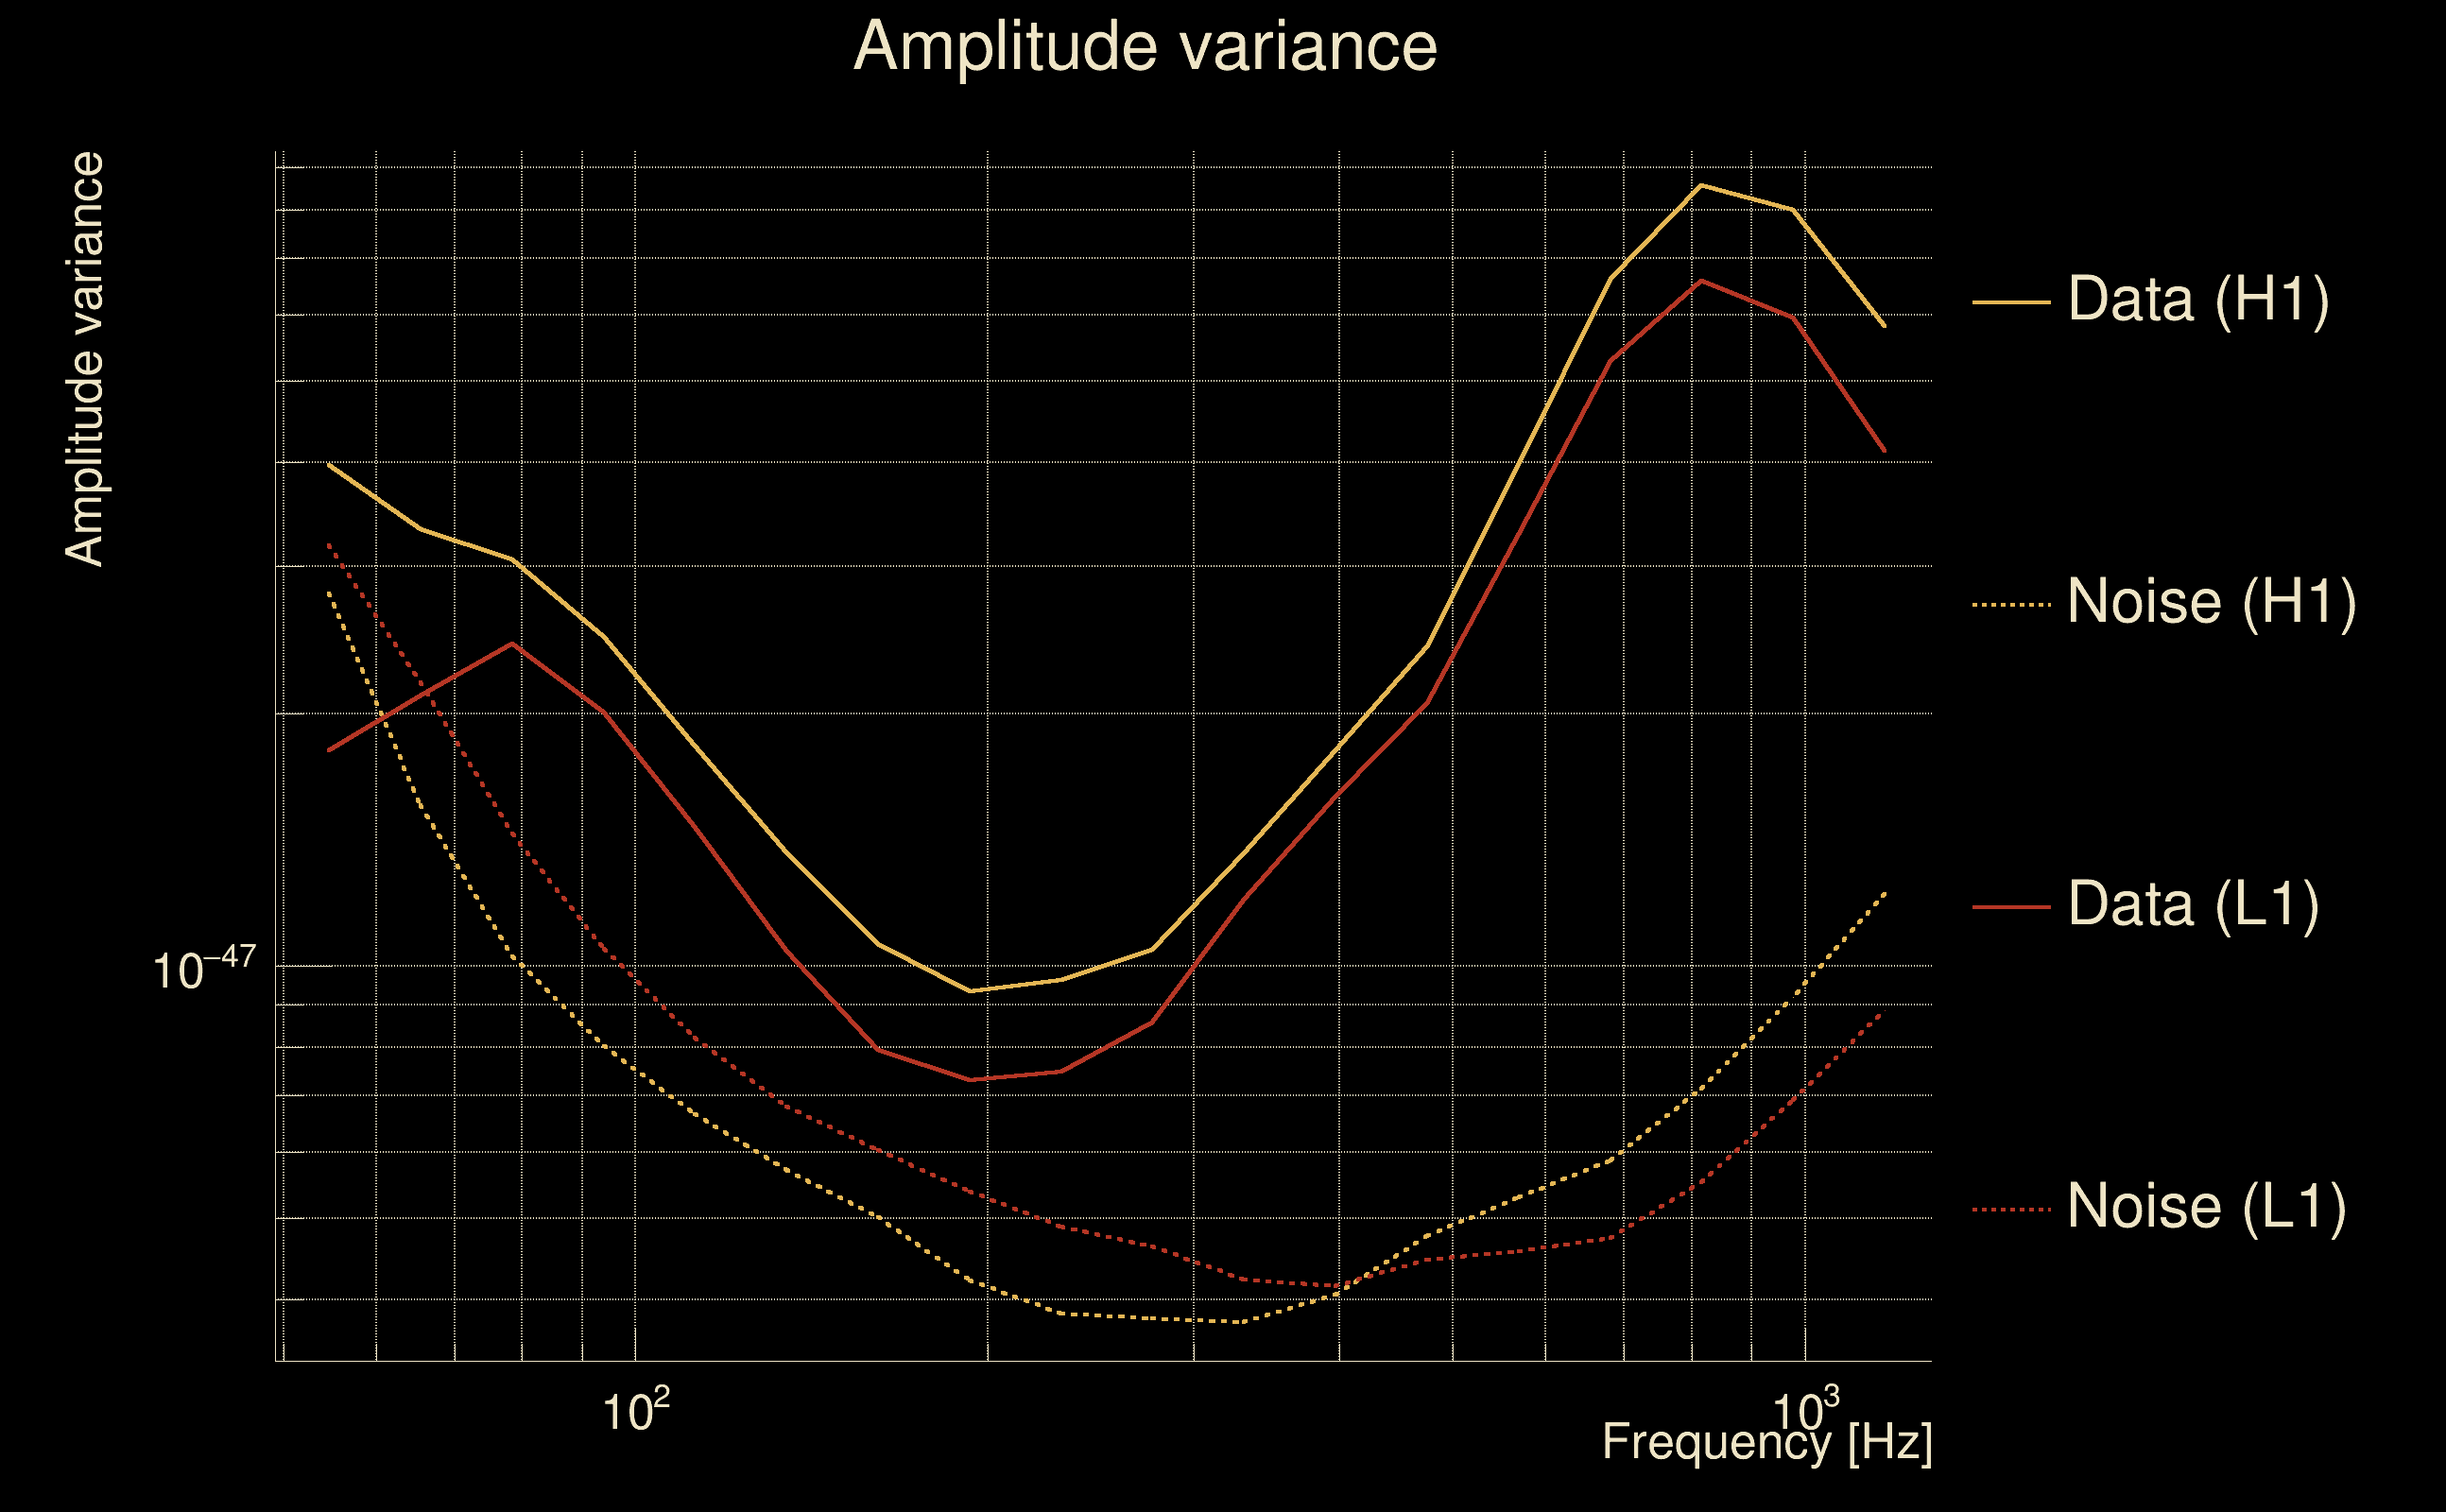
| Amplitude spectrograms: | normalization = 1e-22, power index = 2 |
| White noise SNR variance: | 0.523175 (after applying a correction factor = 1) |
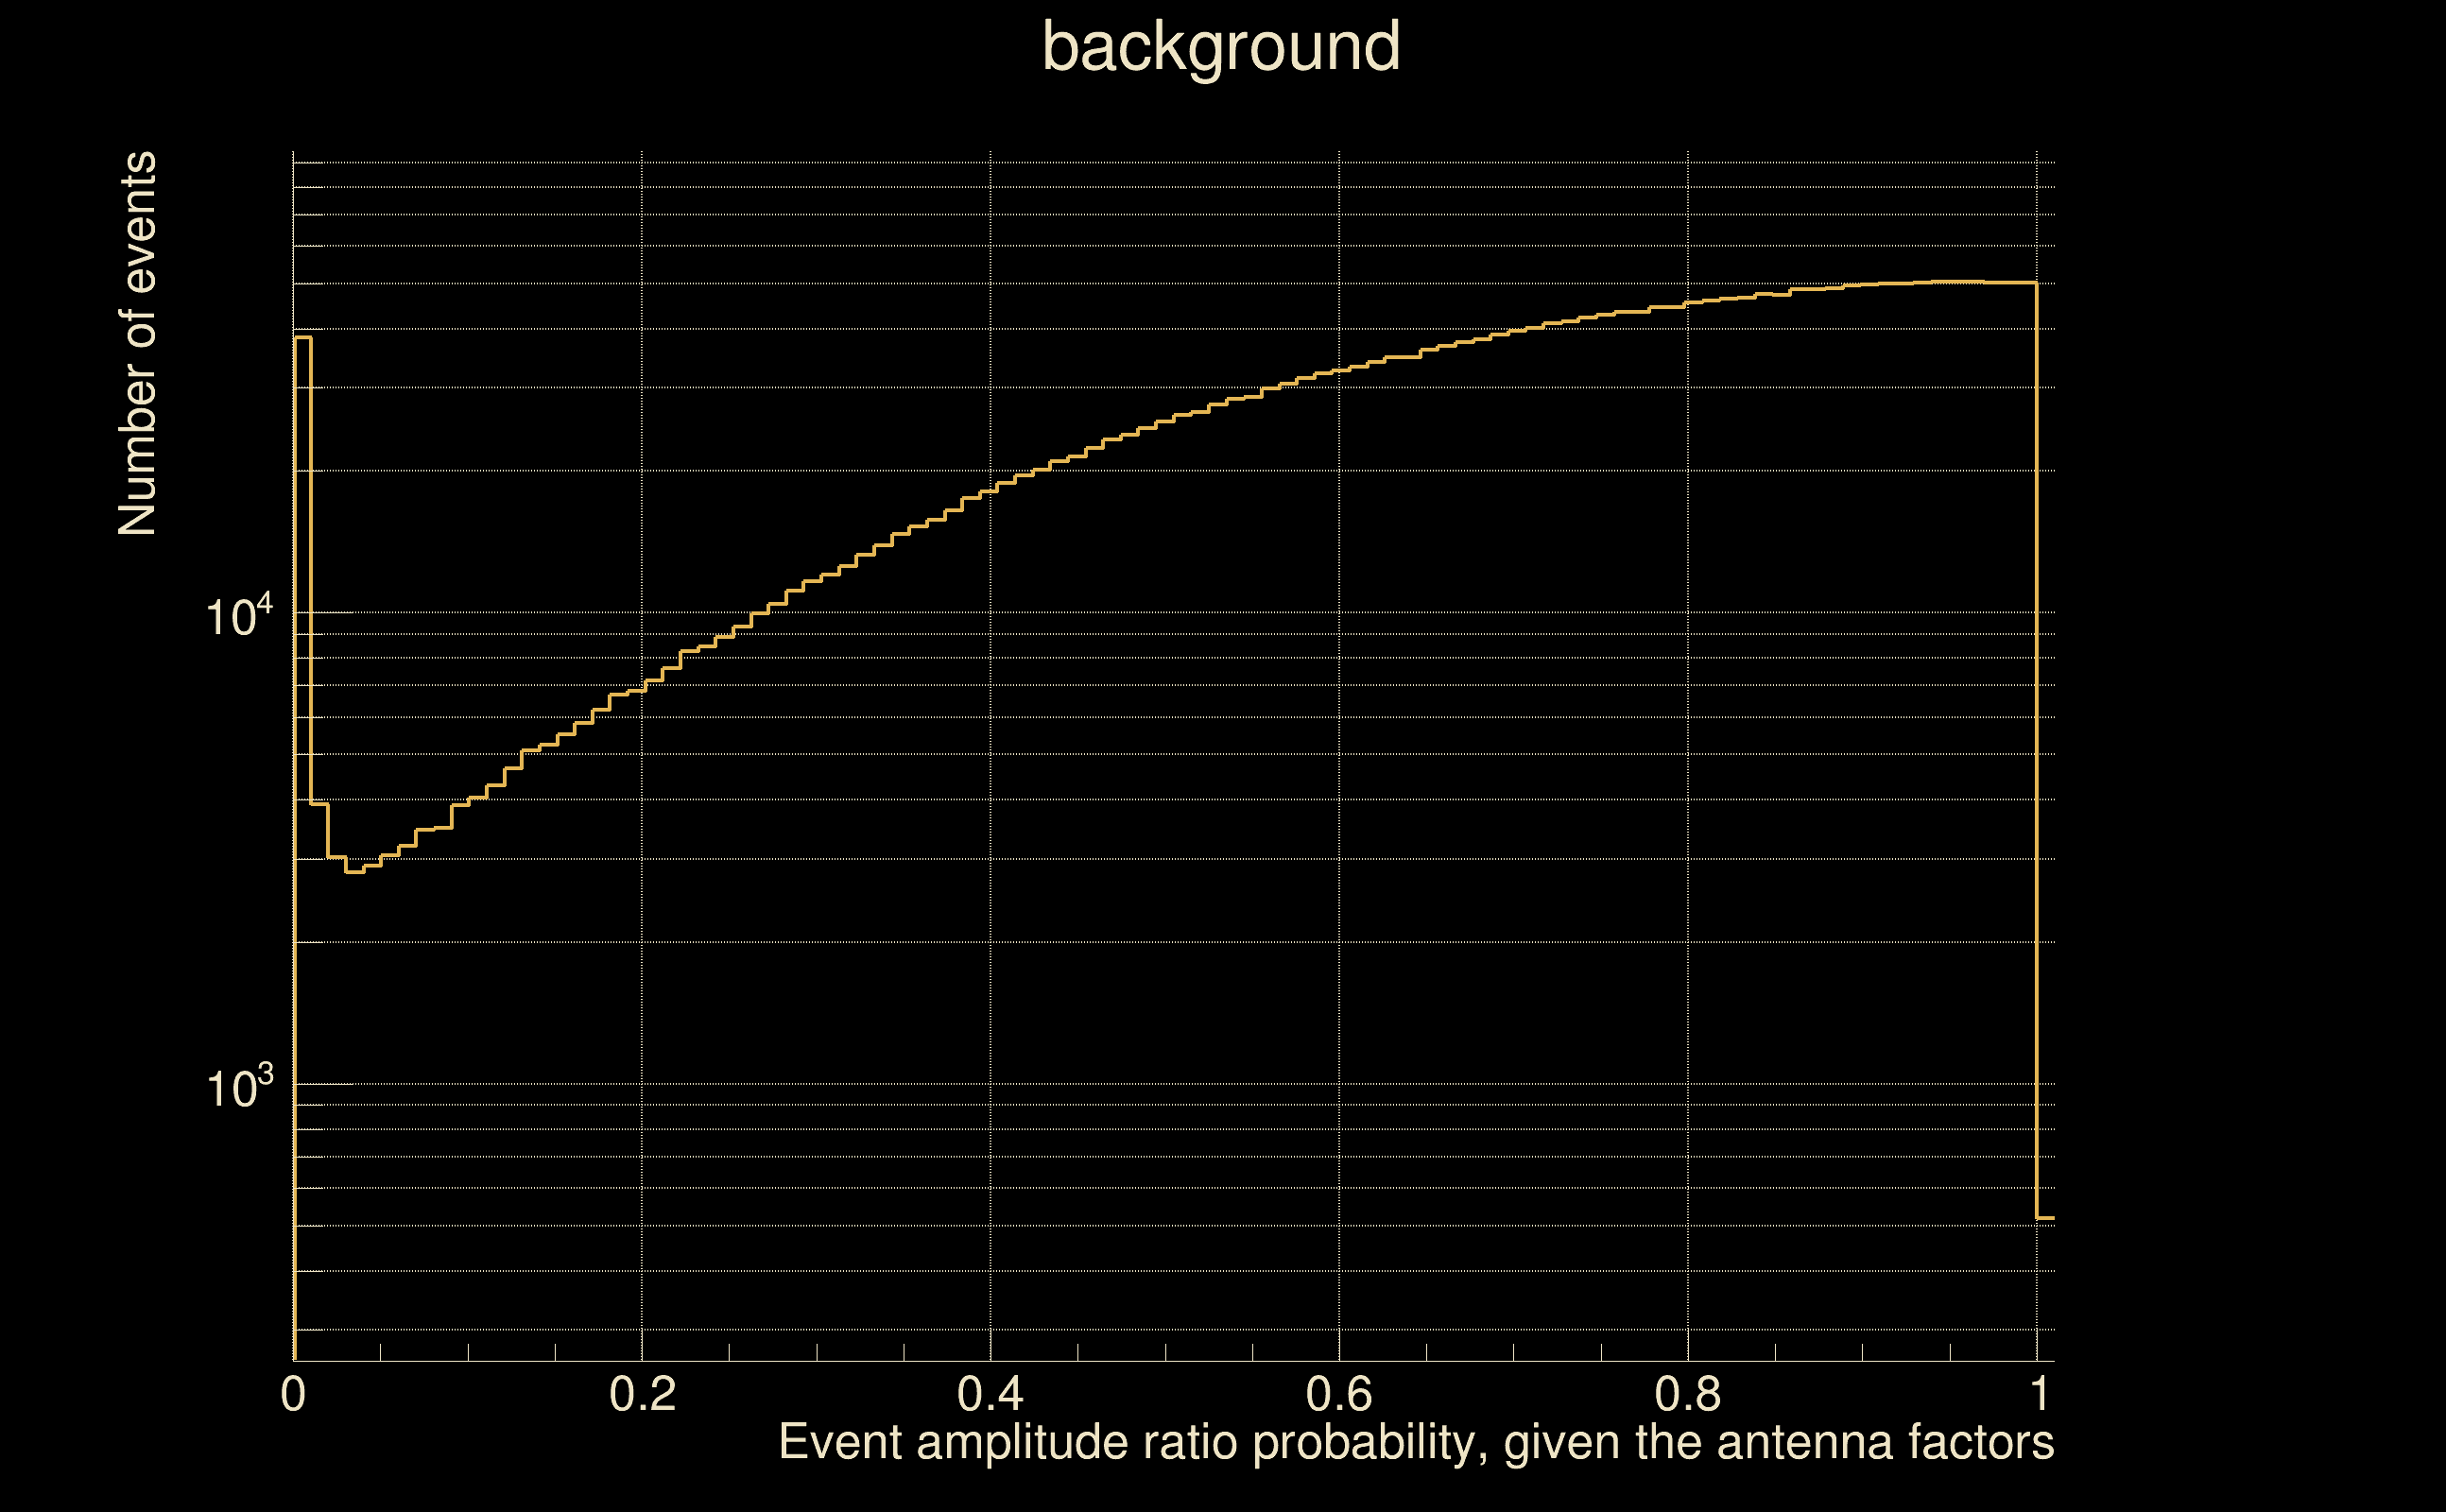
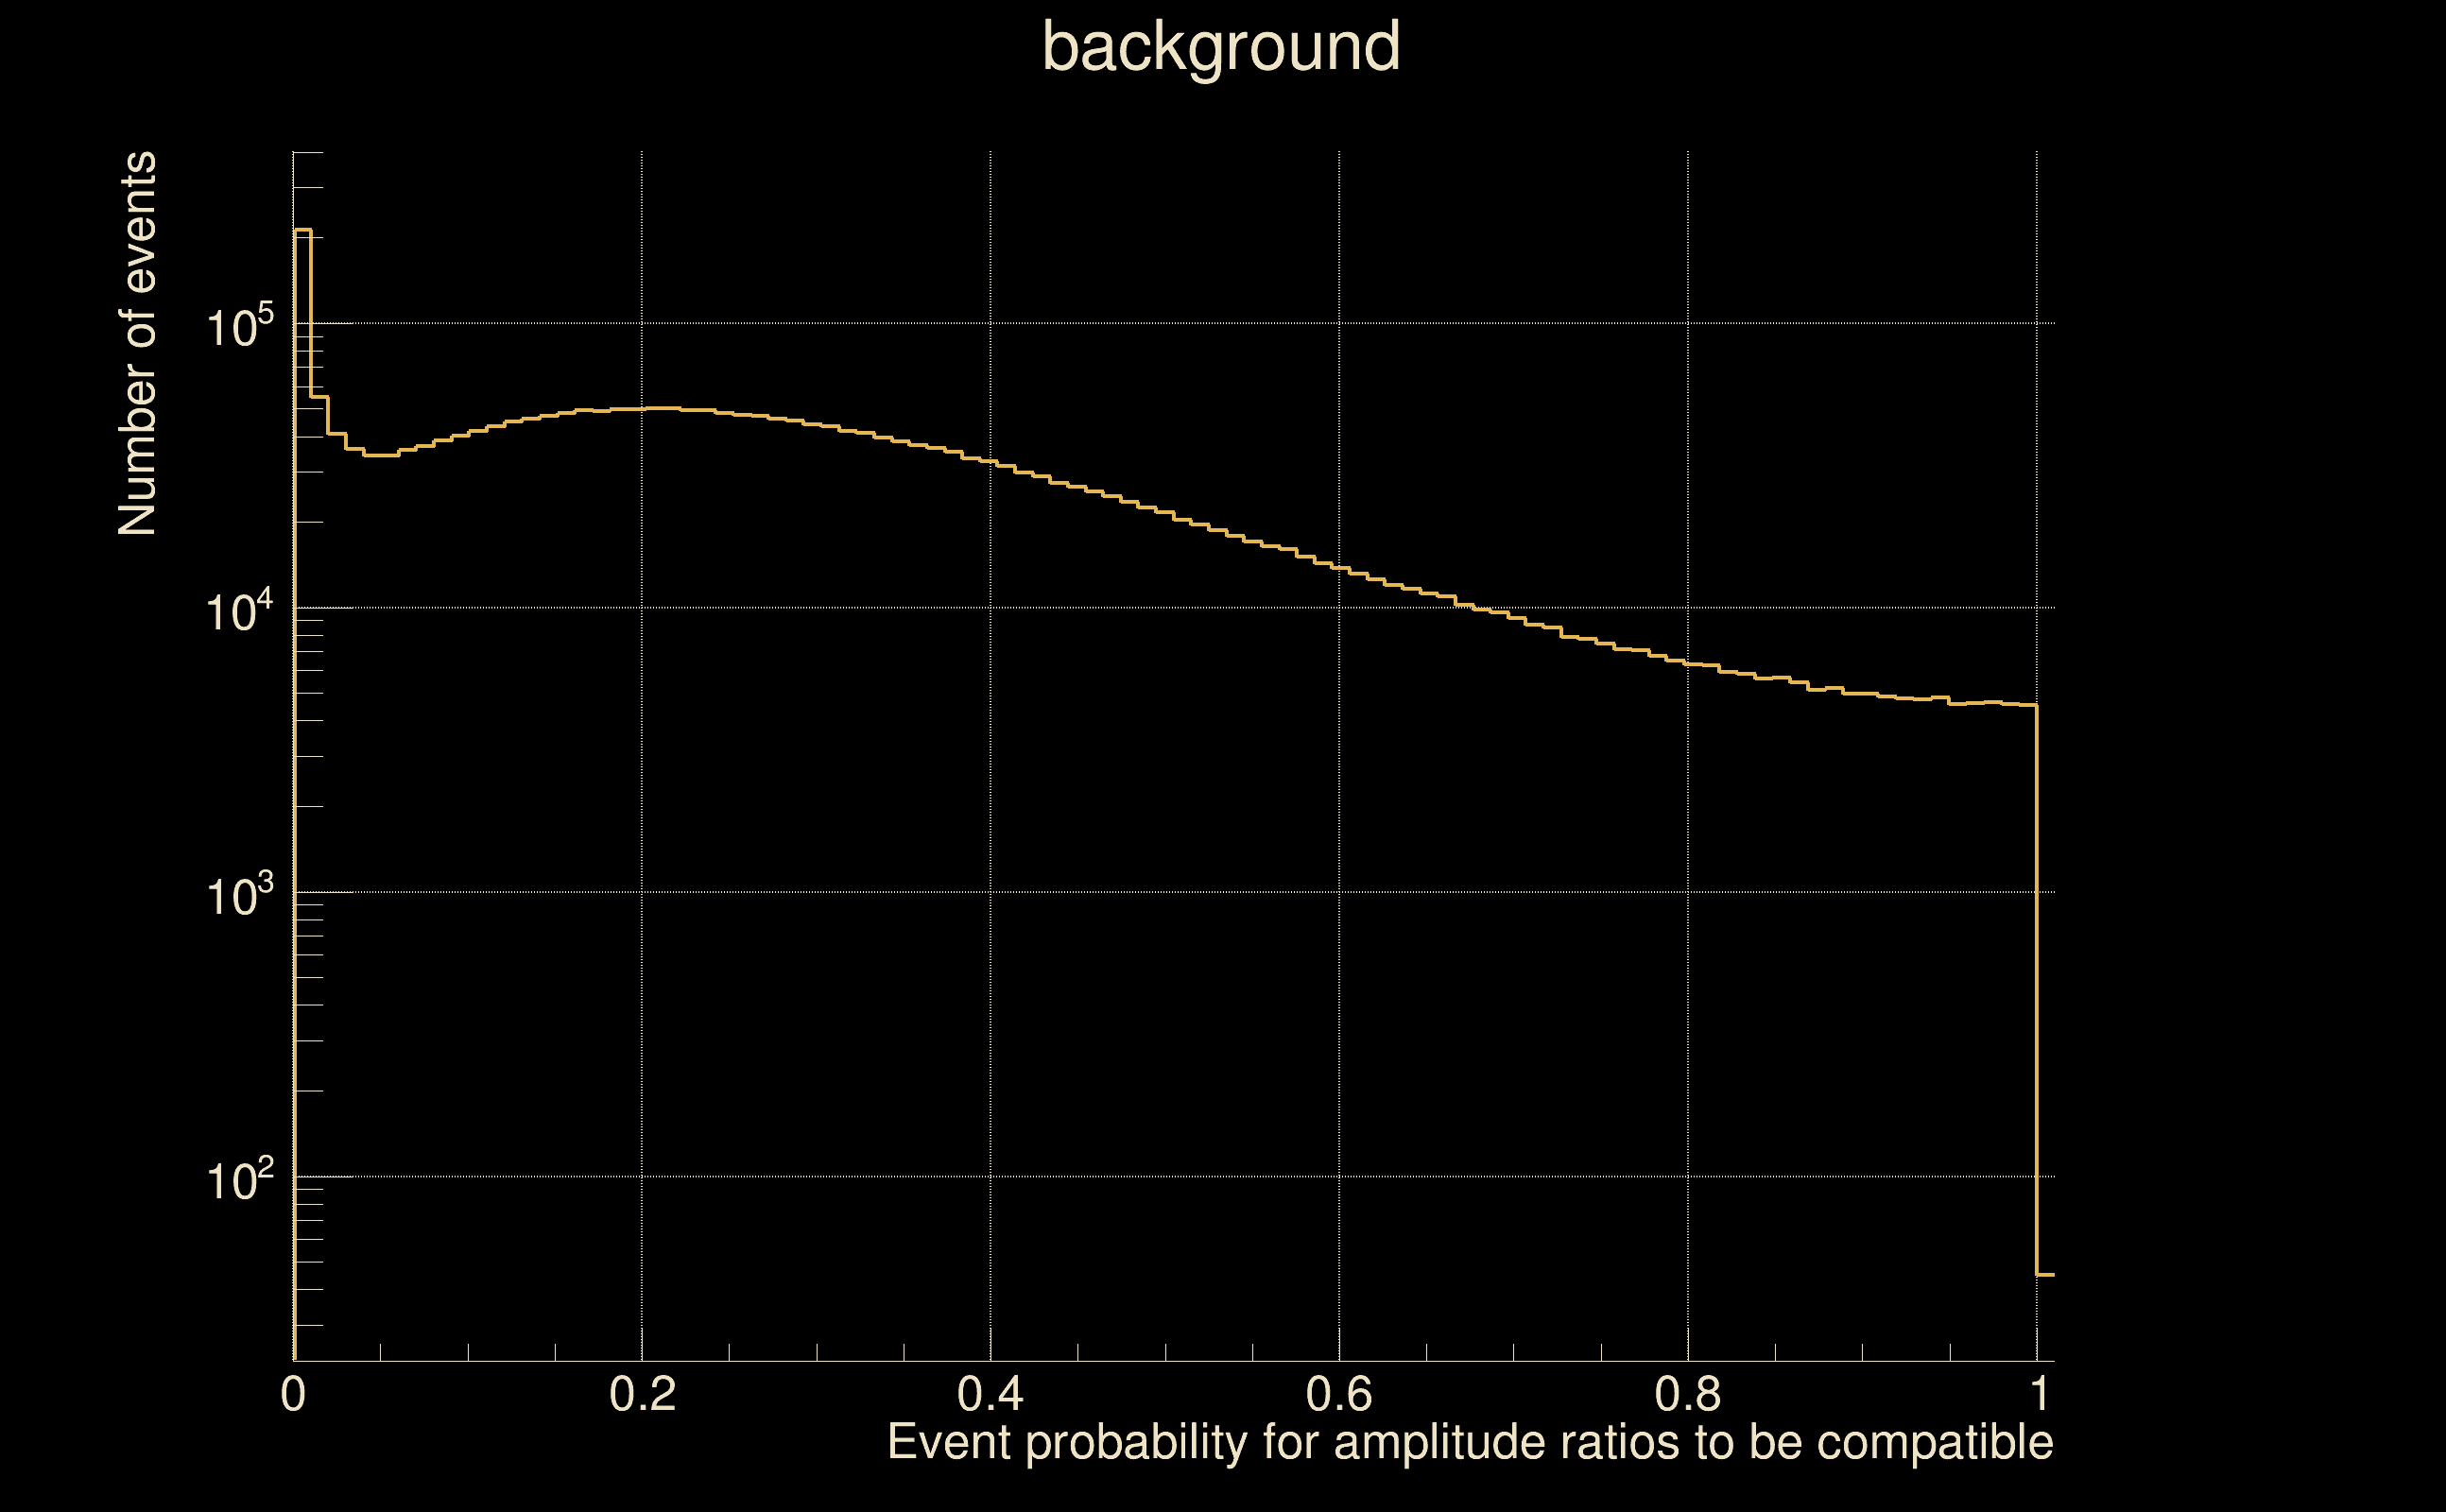
| Amplitude ratio confidence level: | 3 sigma |
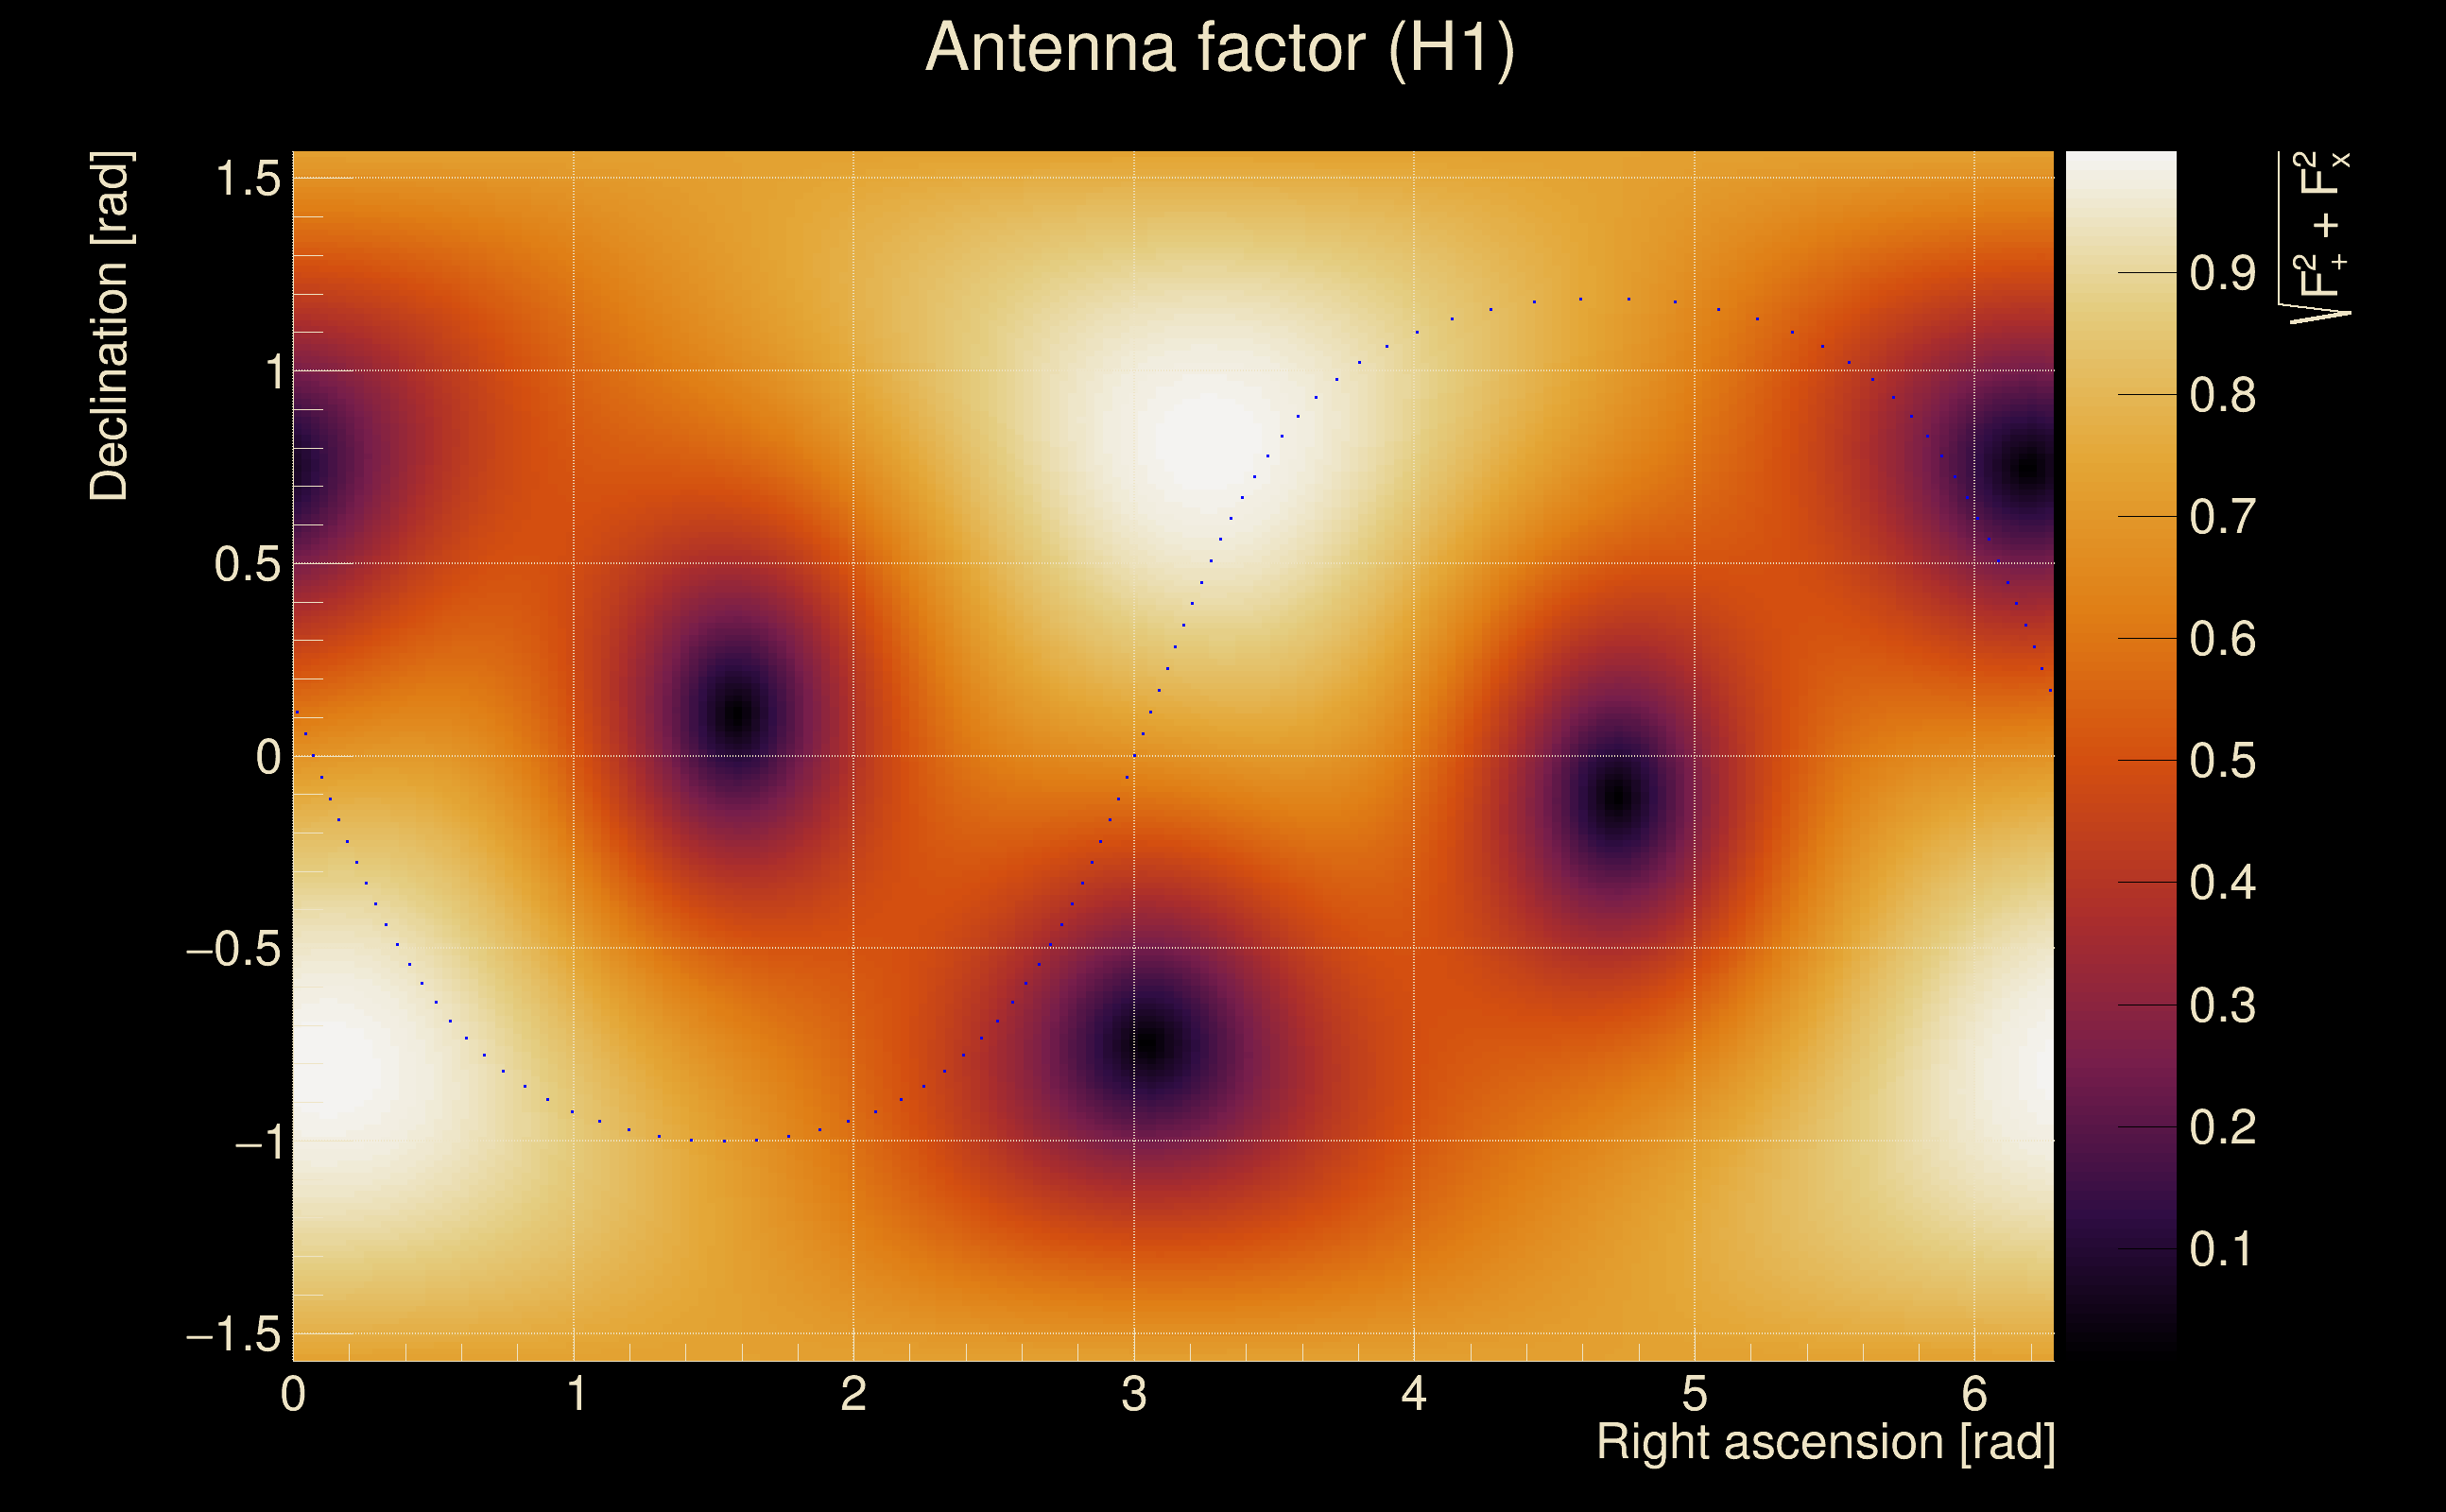
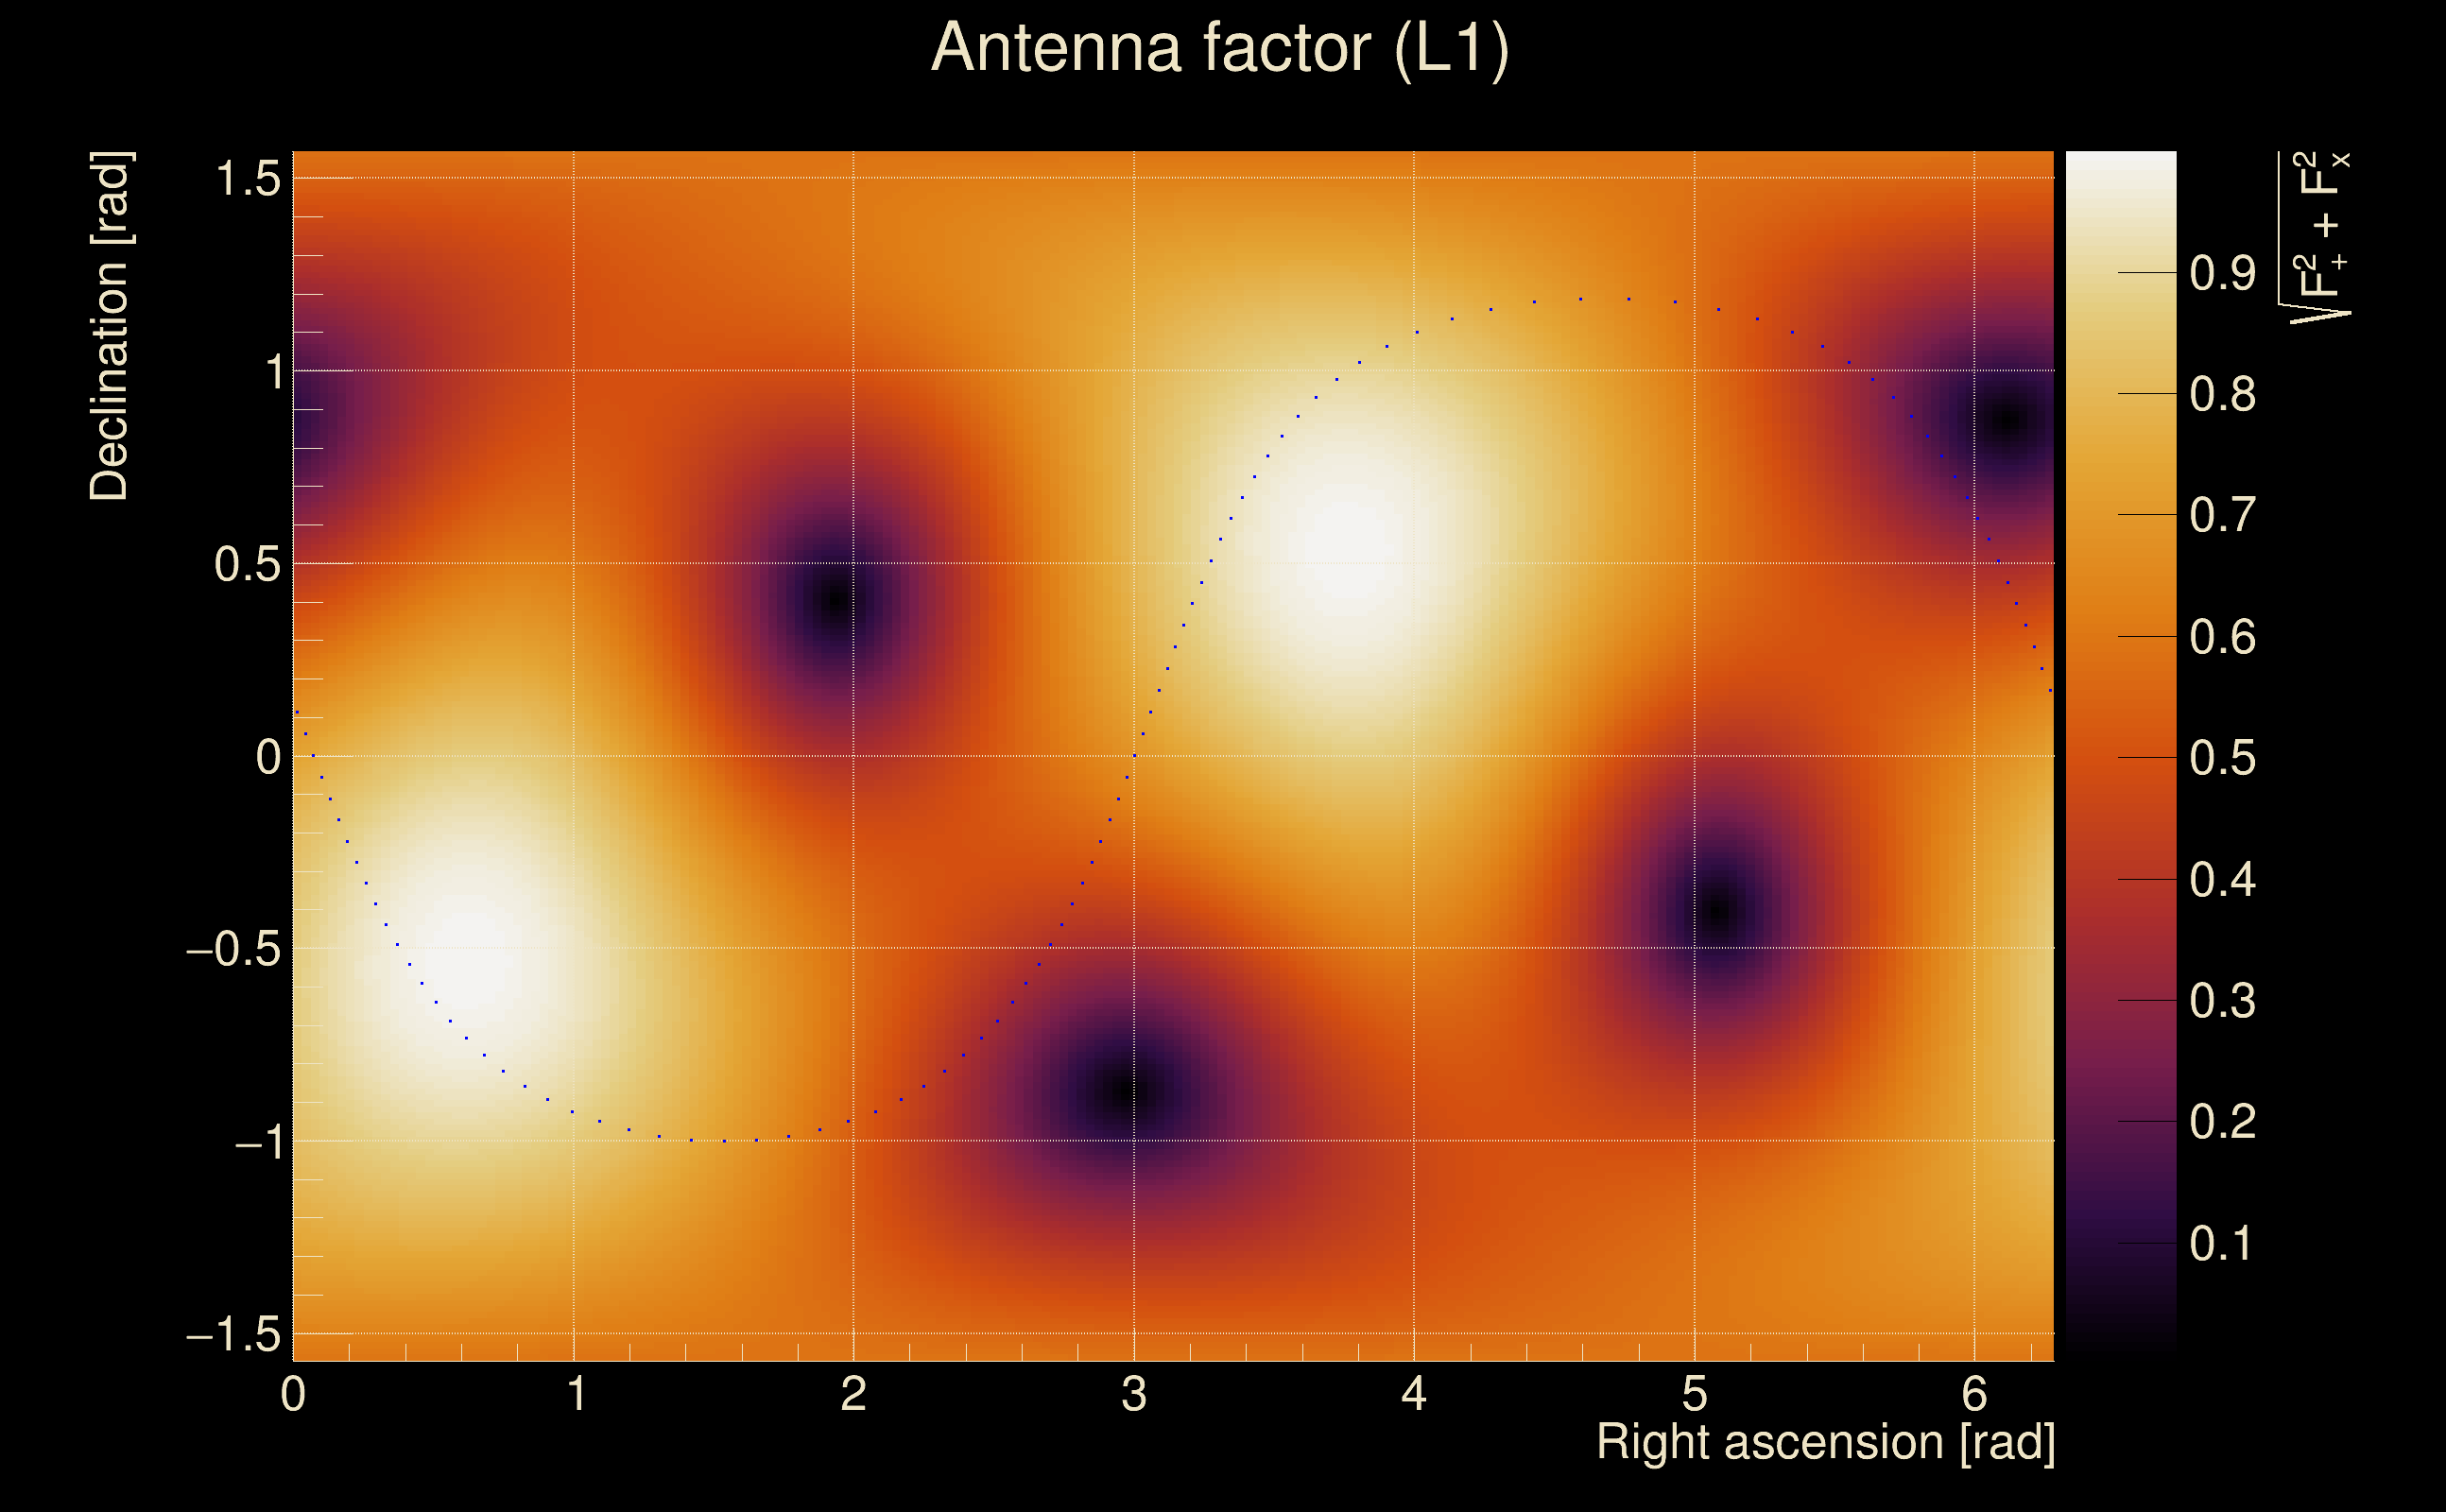
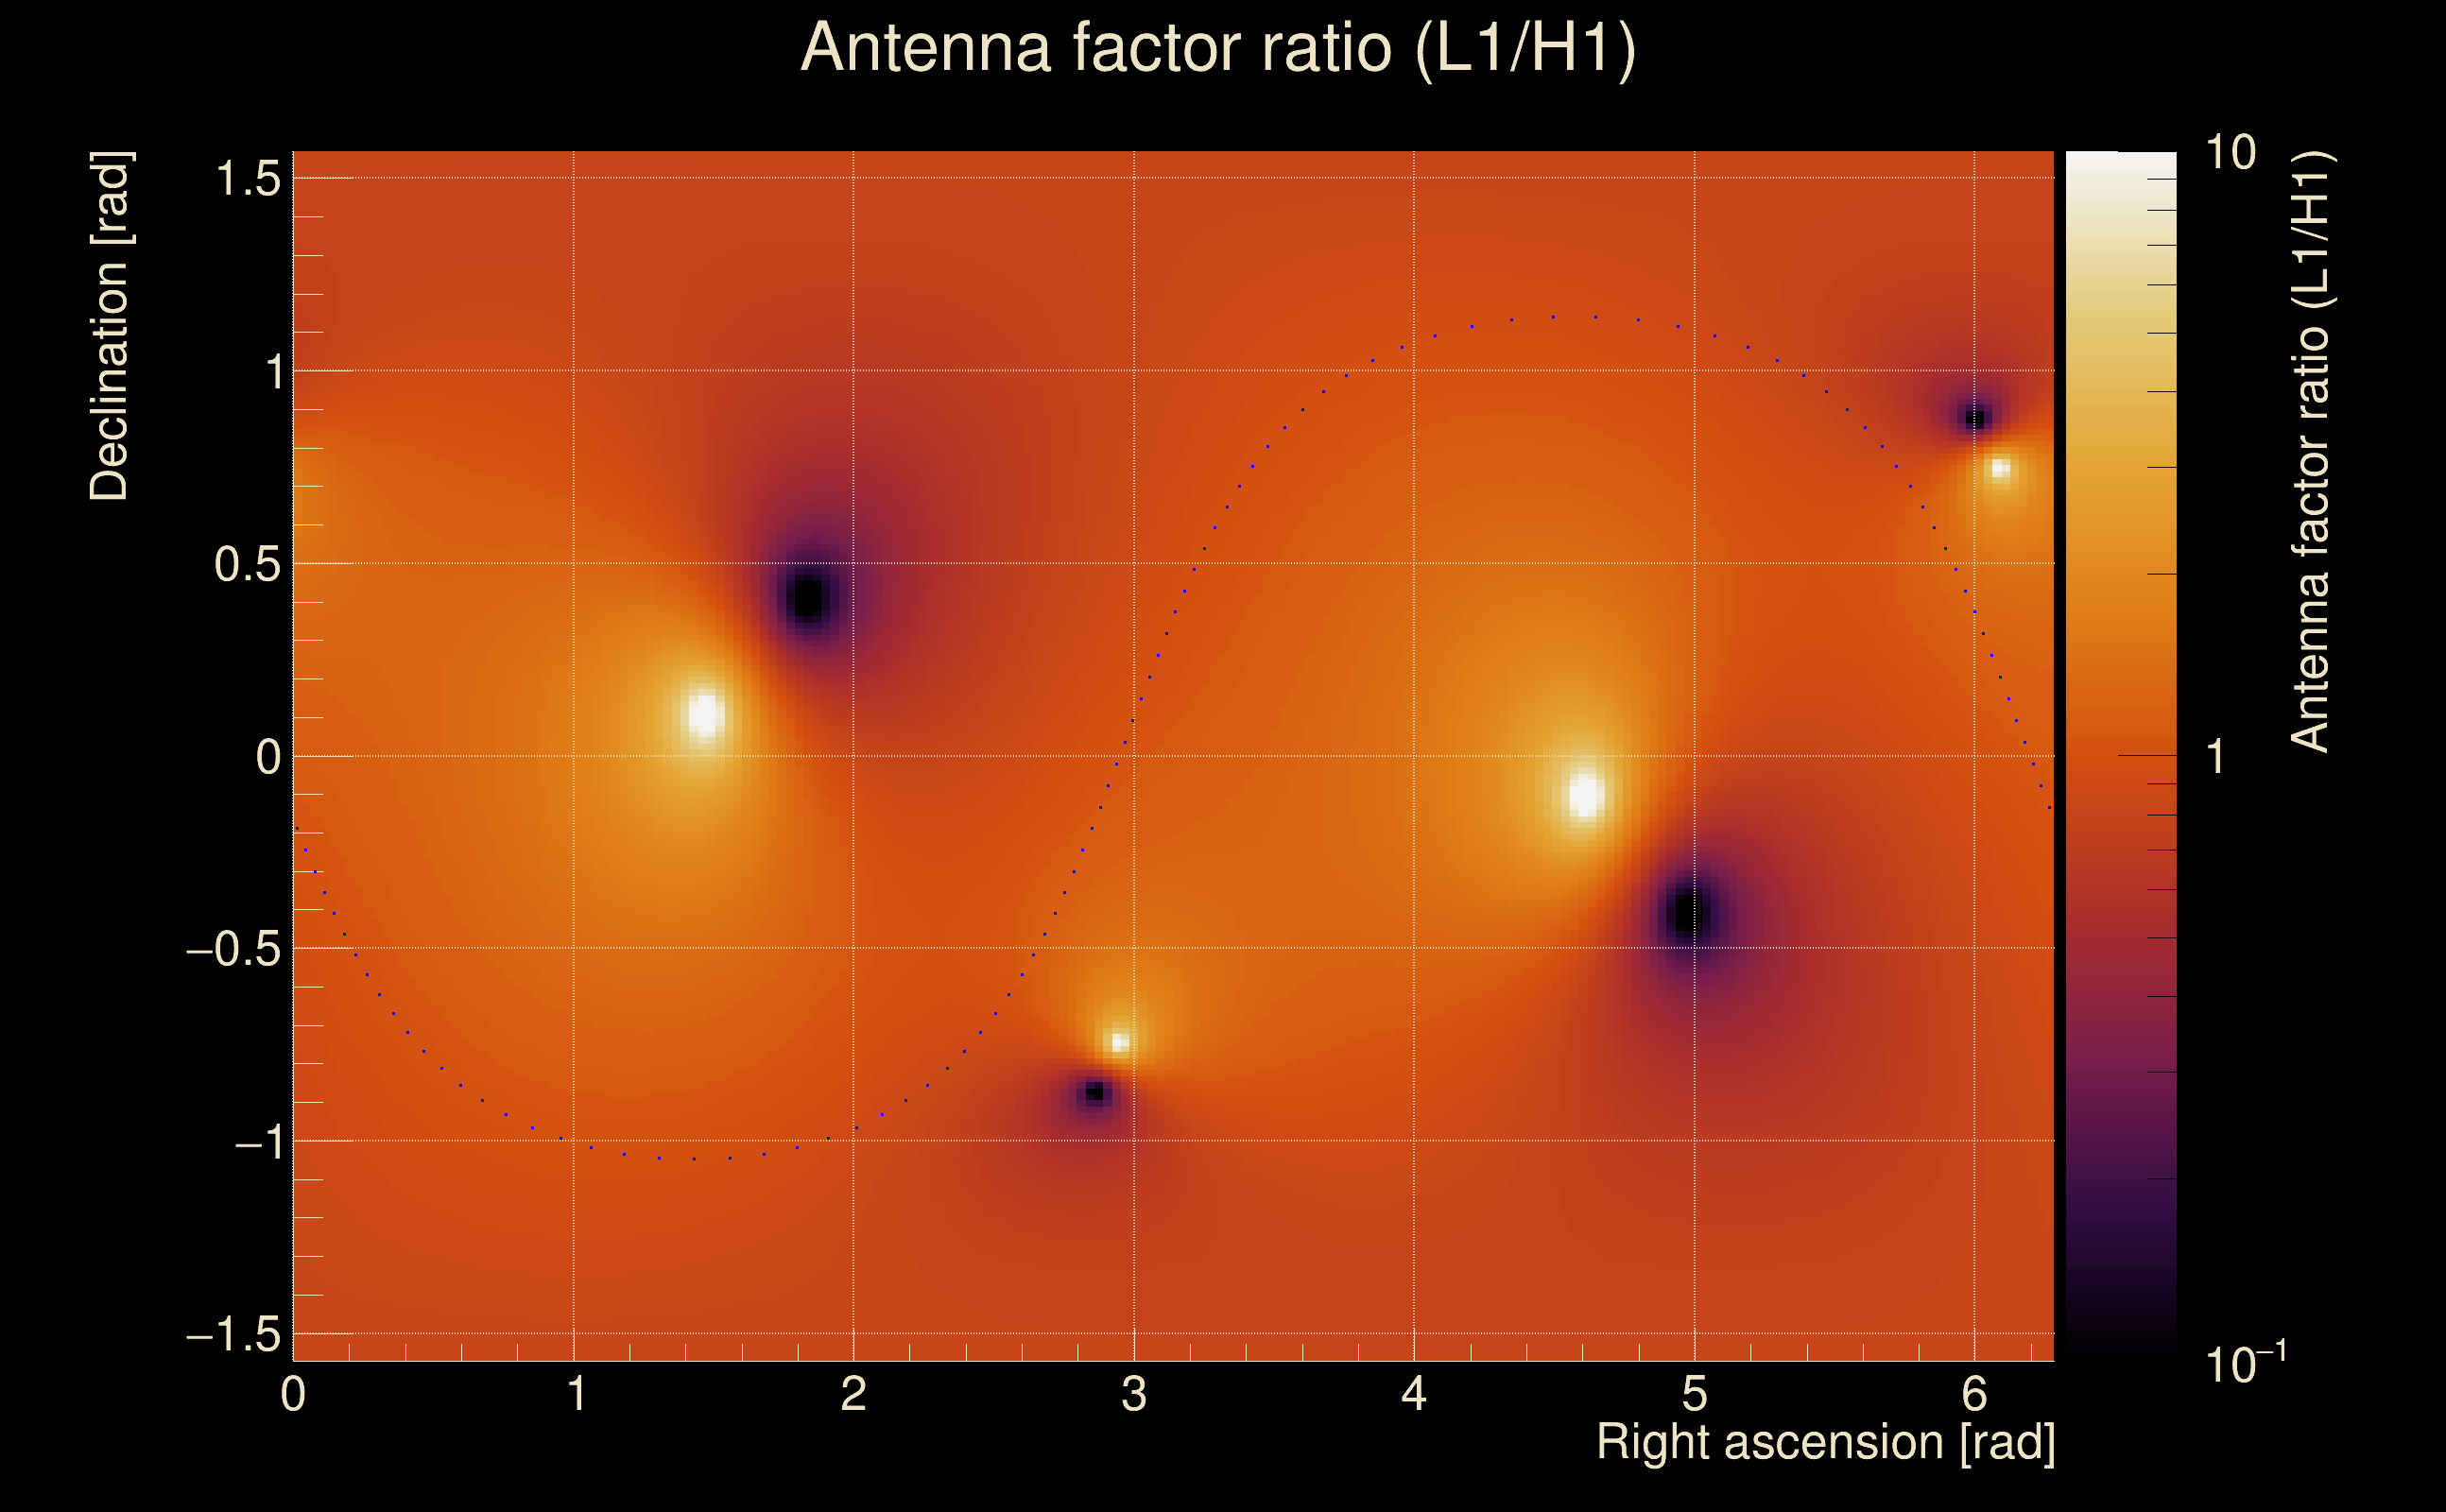
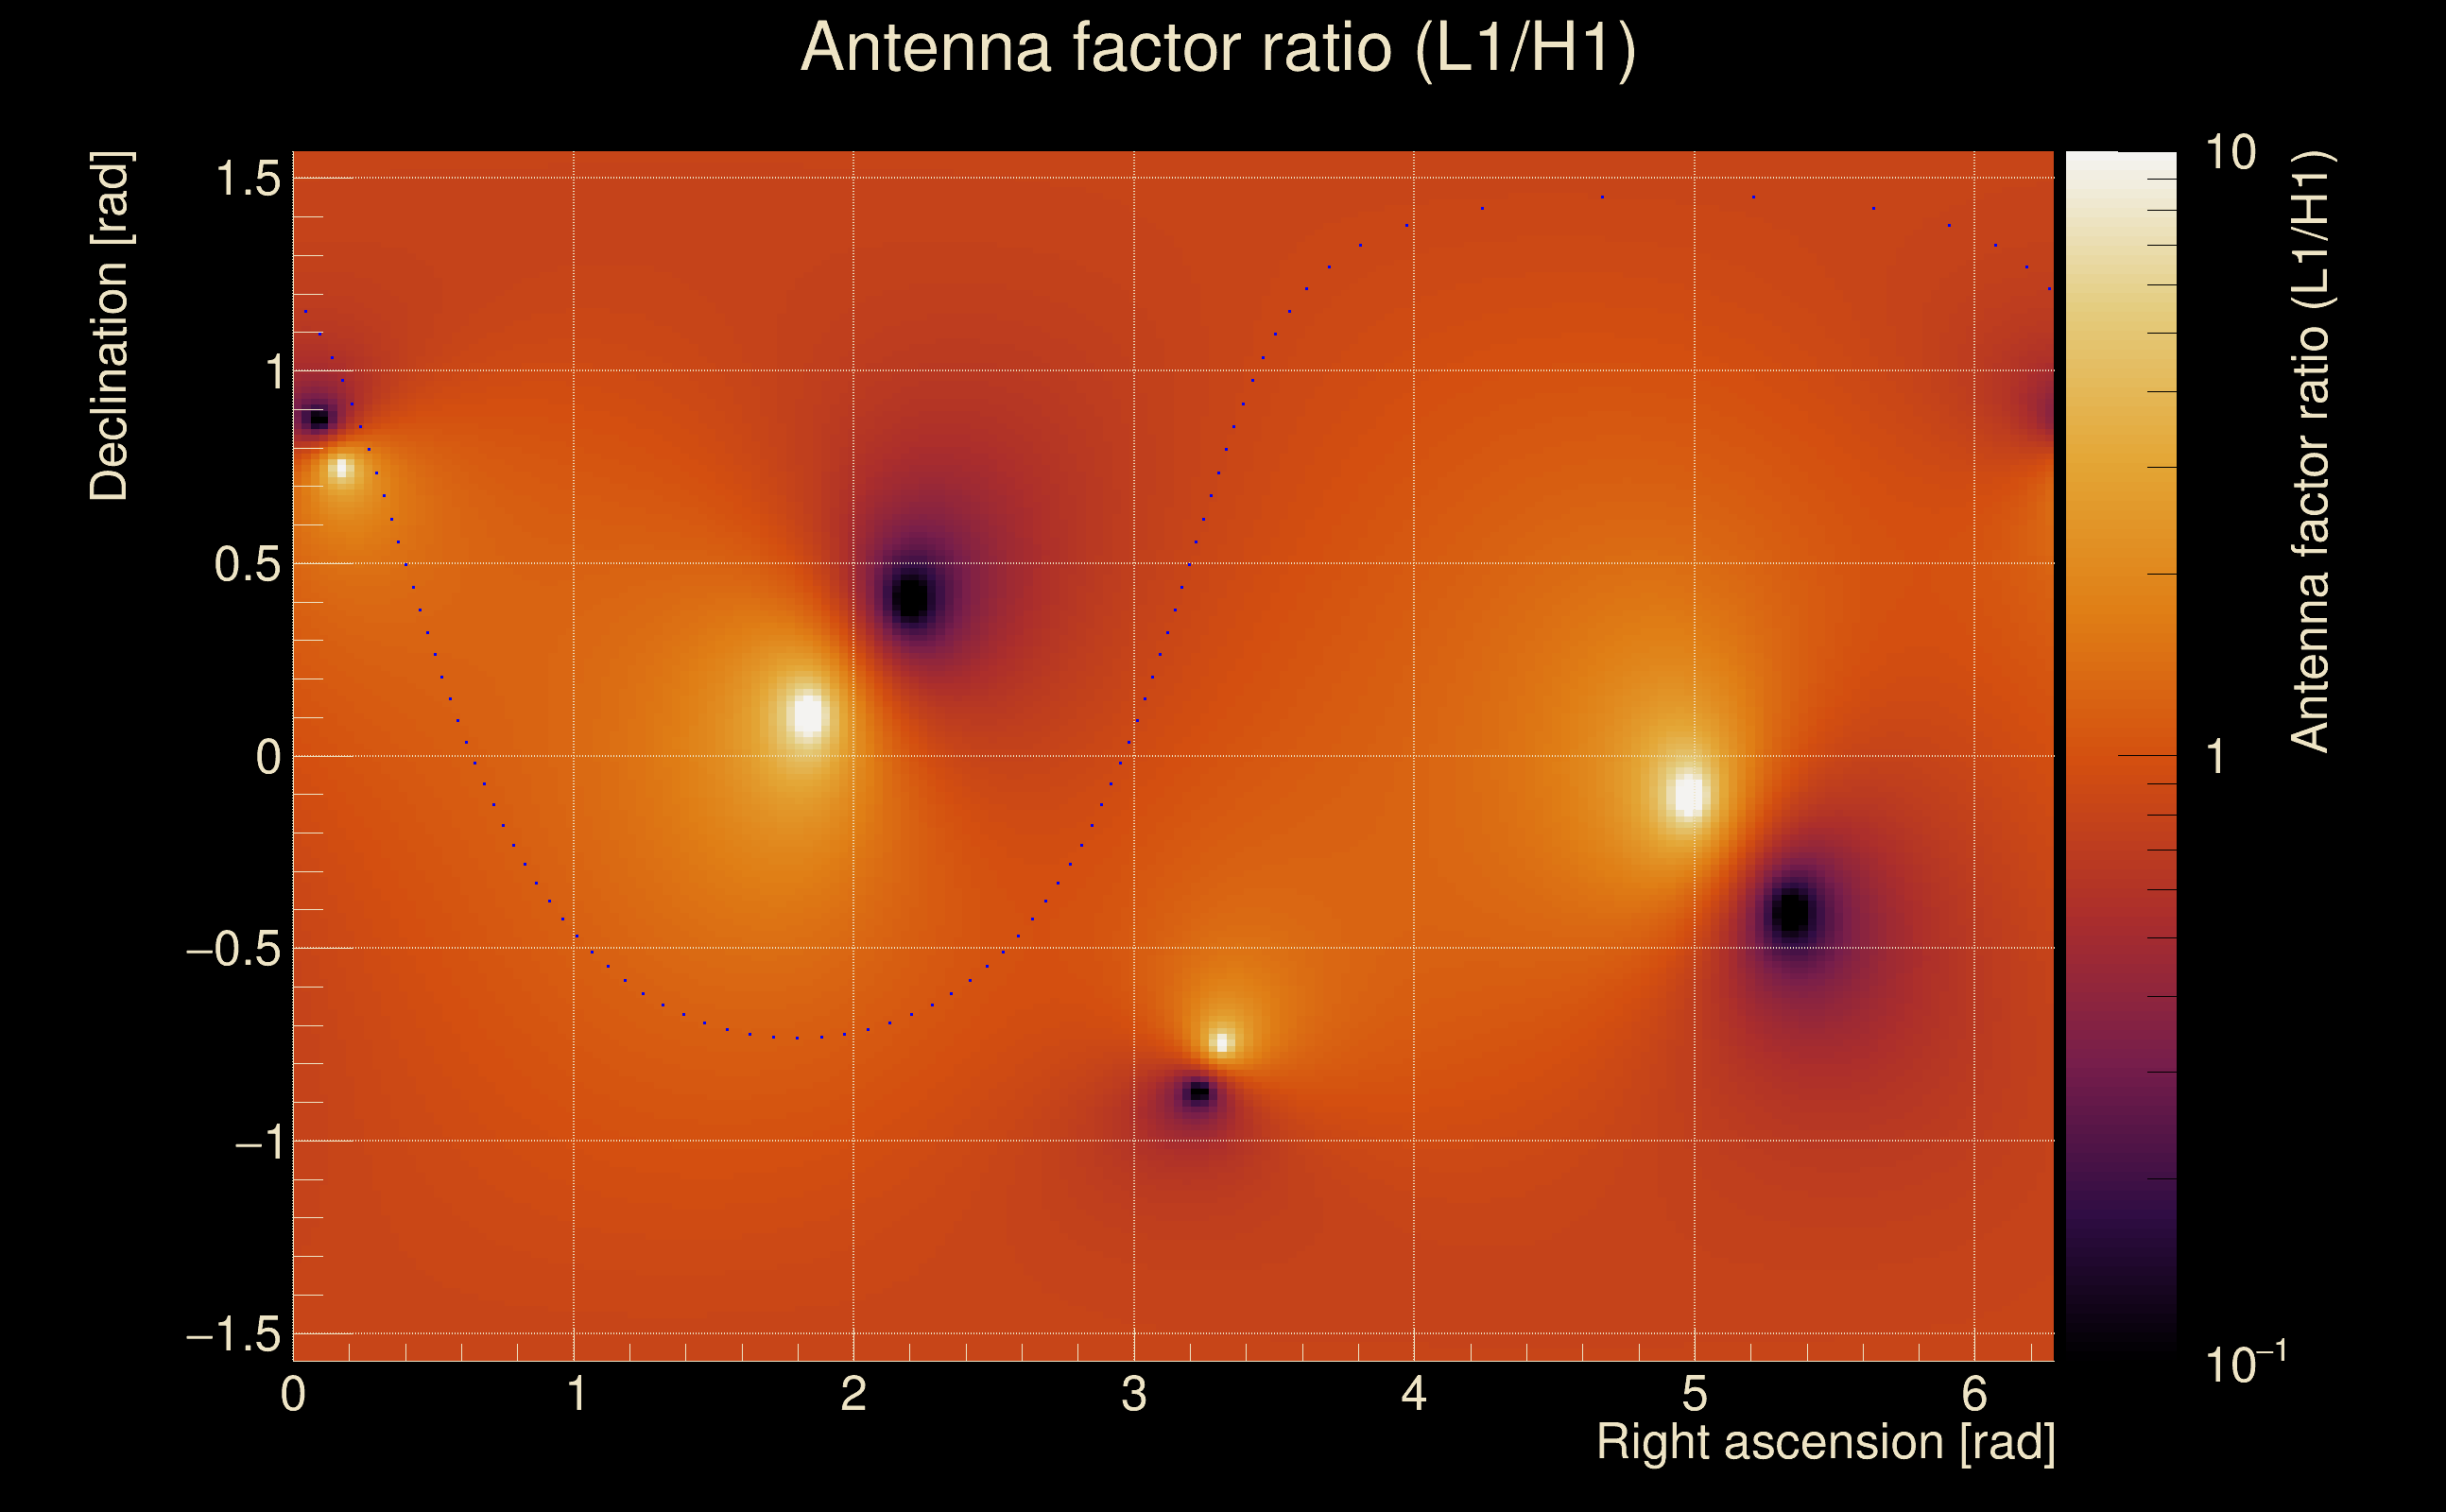
| Target sky positon: | Ra: 3.68109, Dec: 0.94792 [rad] |
| List of input Ox files: | TargIxfw_injpt1_file_list.txt (71 files) |
| Analysis result file: | TargIxfw_injpt1_results-0.root |
| Slice selected for the the fakeground: | slice index=172 (-2.944 s), time lag = 0 s |
| Foreground | Fakeground | Background | ||
|---|---|---|---|---|
| Number of processed ox events | 12111 | 12111 | 2603865 | |
| Start Date (detector 0) | Mon May 15 14:13:25 2023 UTC | Mon May 15 14:13:25 2023 UTC | Mon May 15 14:13:25 2023 UTC | |
| End Date (detector 0) | Thu May 18 15:54:40 2023 UTC | Thu May 18 15:54:40 2023 UTC | Thu May 18 15:54:40 2023 UTC | |
| Start GPS (detector 0) | 1368195223 | 1368195223 | 1368195223 | |
| End GPS (detector 0) | 1368460498 | 1368460498 | 1368460498 | |
| Used livetime (detector 0) | 60875 s | 60875 s | 60875 s | |
| Start Date (detector 1) | Mon May 15 14:13:25 2023 UTC | Mon May 15 14:13:25 2023 UTC | Mon May 15 14:13:25 2023 UTC | |
| End Date (detector 1) | Thu May 18 15:54:40 2023 UTC | Thu May 18 15:54:40 2023 UTC | Thu May 18 15:54:40 2023 UTC | |
| Start GPS (detector 1) | 1368195223 | 1368195223 | 1368195223 | |
| End GPS (detector 1) | 1368460498 | 1368460498 | 1368460498 | |
| Used livetime (detector 1) | 60875 s | 60875 s | 60875 s | |
| Cumulative livetime | 121110 s | 121110 s | 26038650 s | |
| 0 years, 1 days, 9 hours, 38 min, 30 s | 0 years, 1 days, 9 hours, 38 min, 30 s | 0 years, 301 days, 8 hours, 57 min, 30 s |
|
|
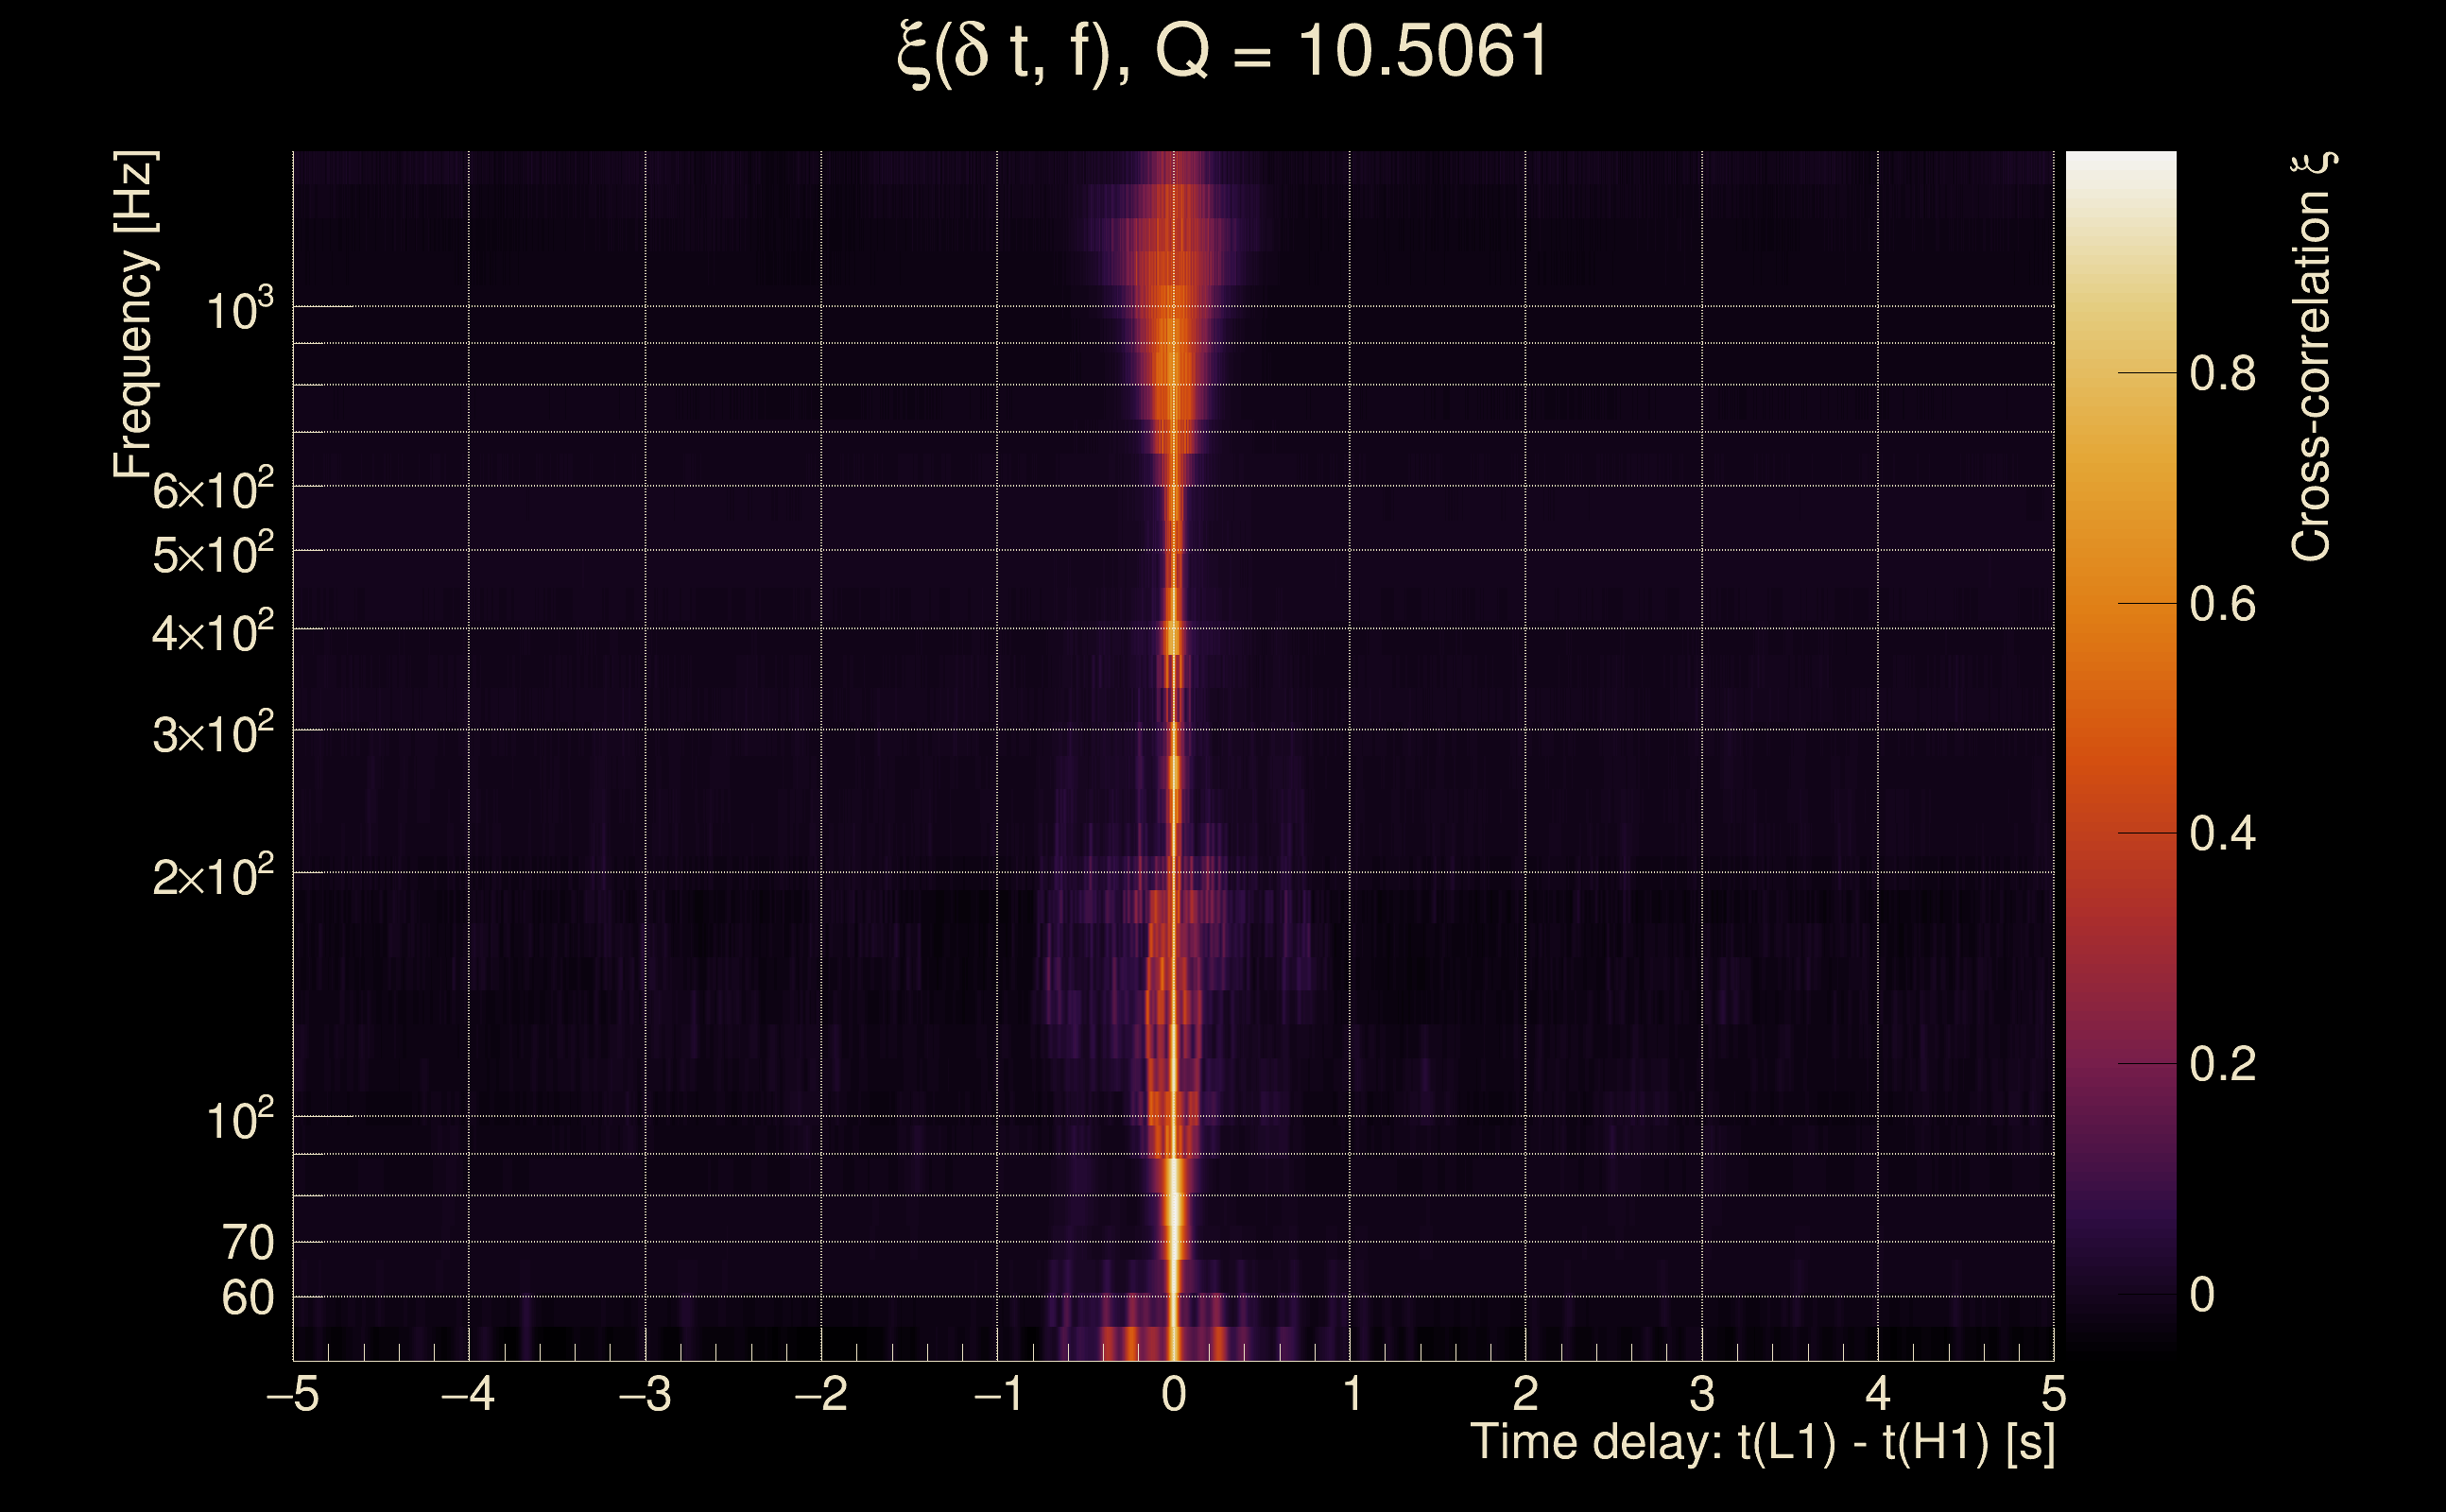
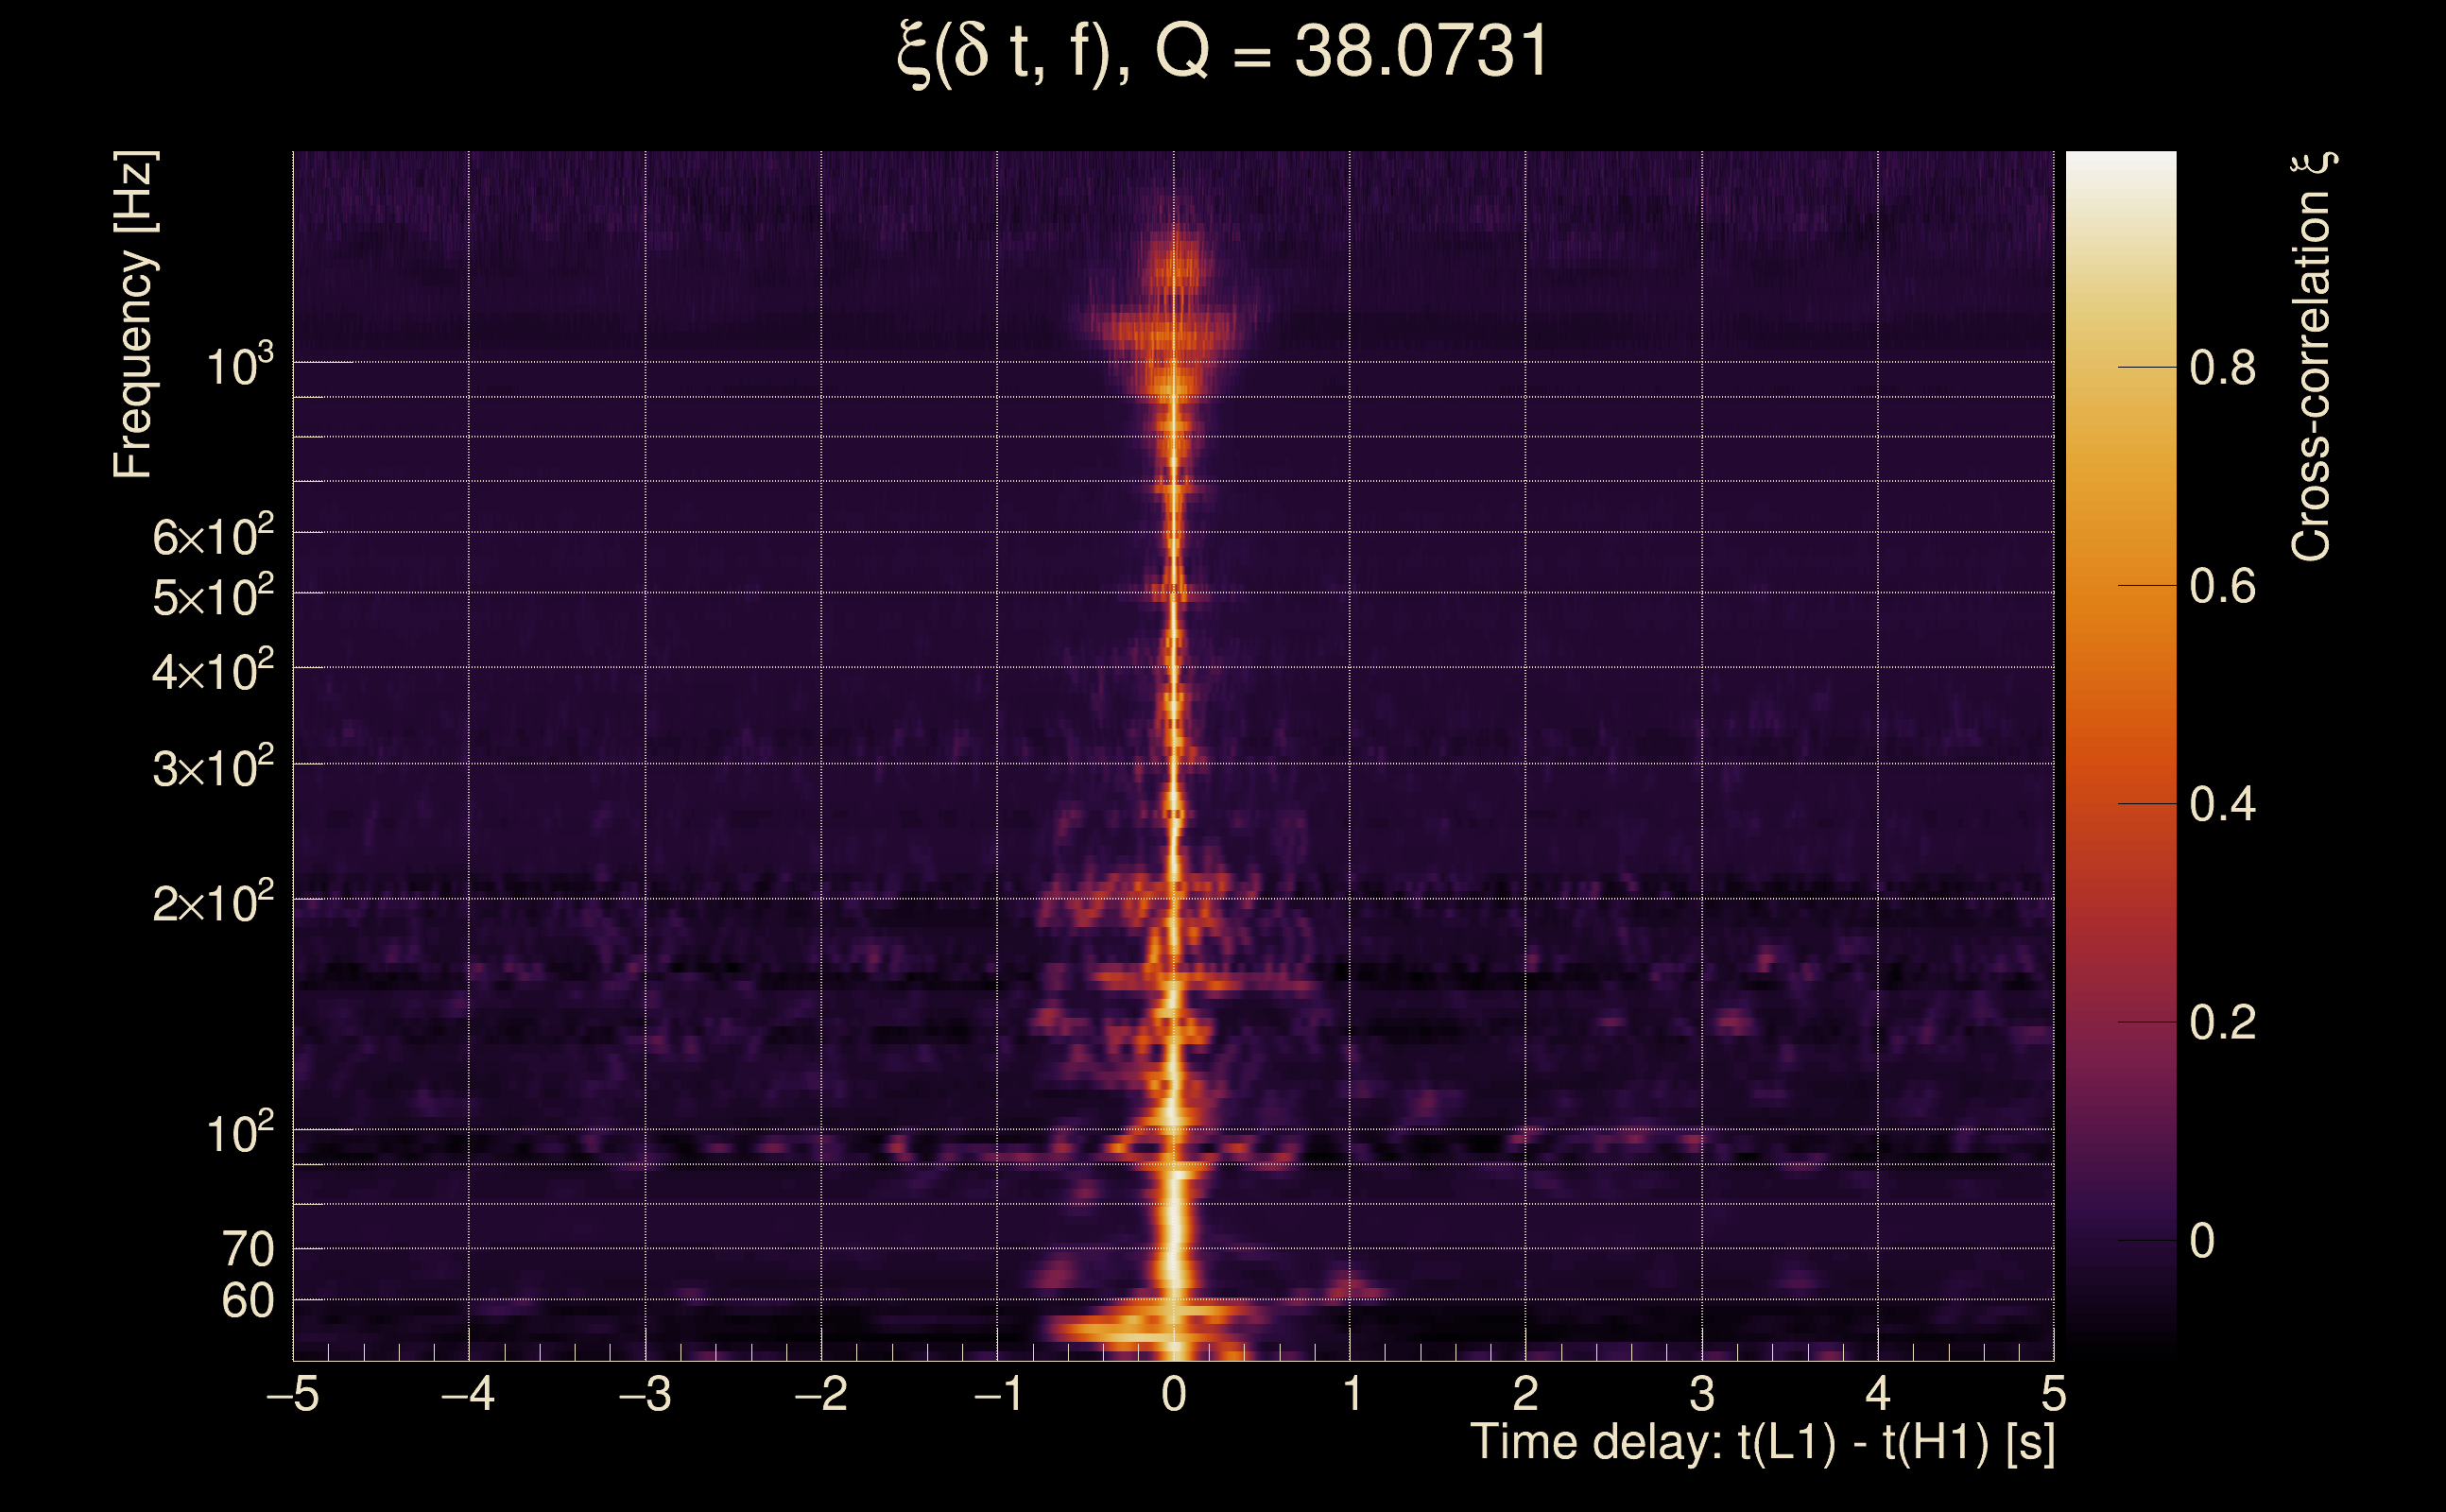
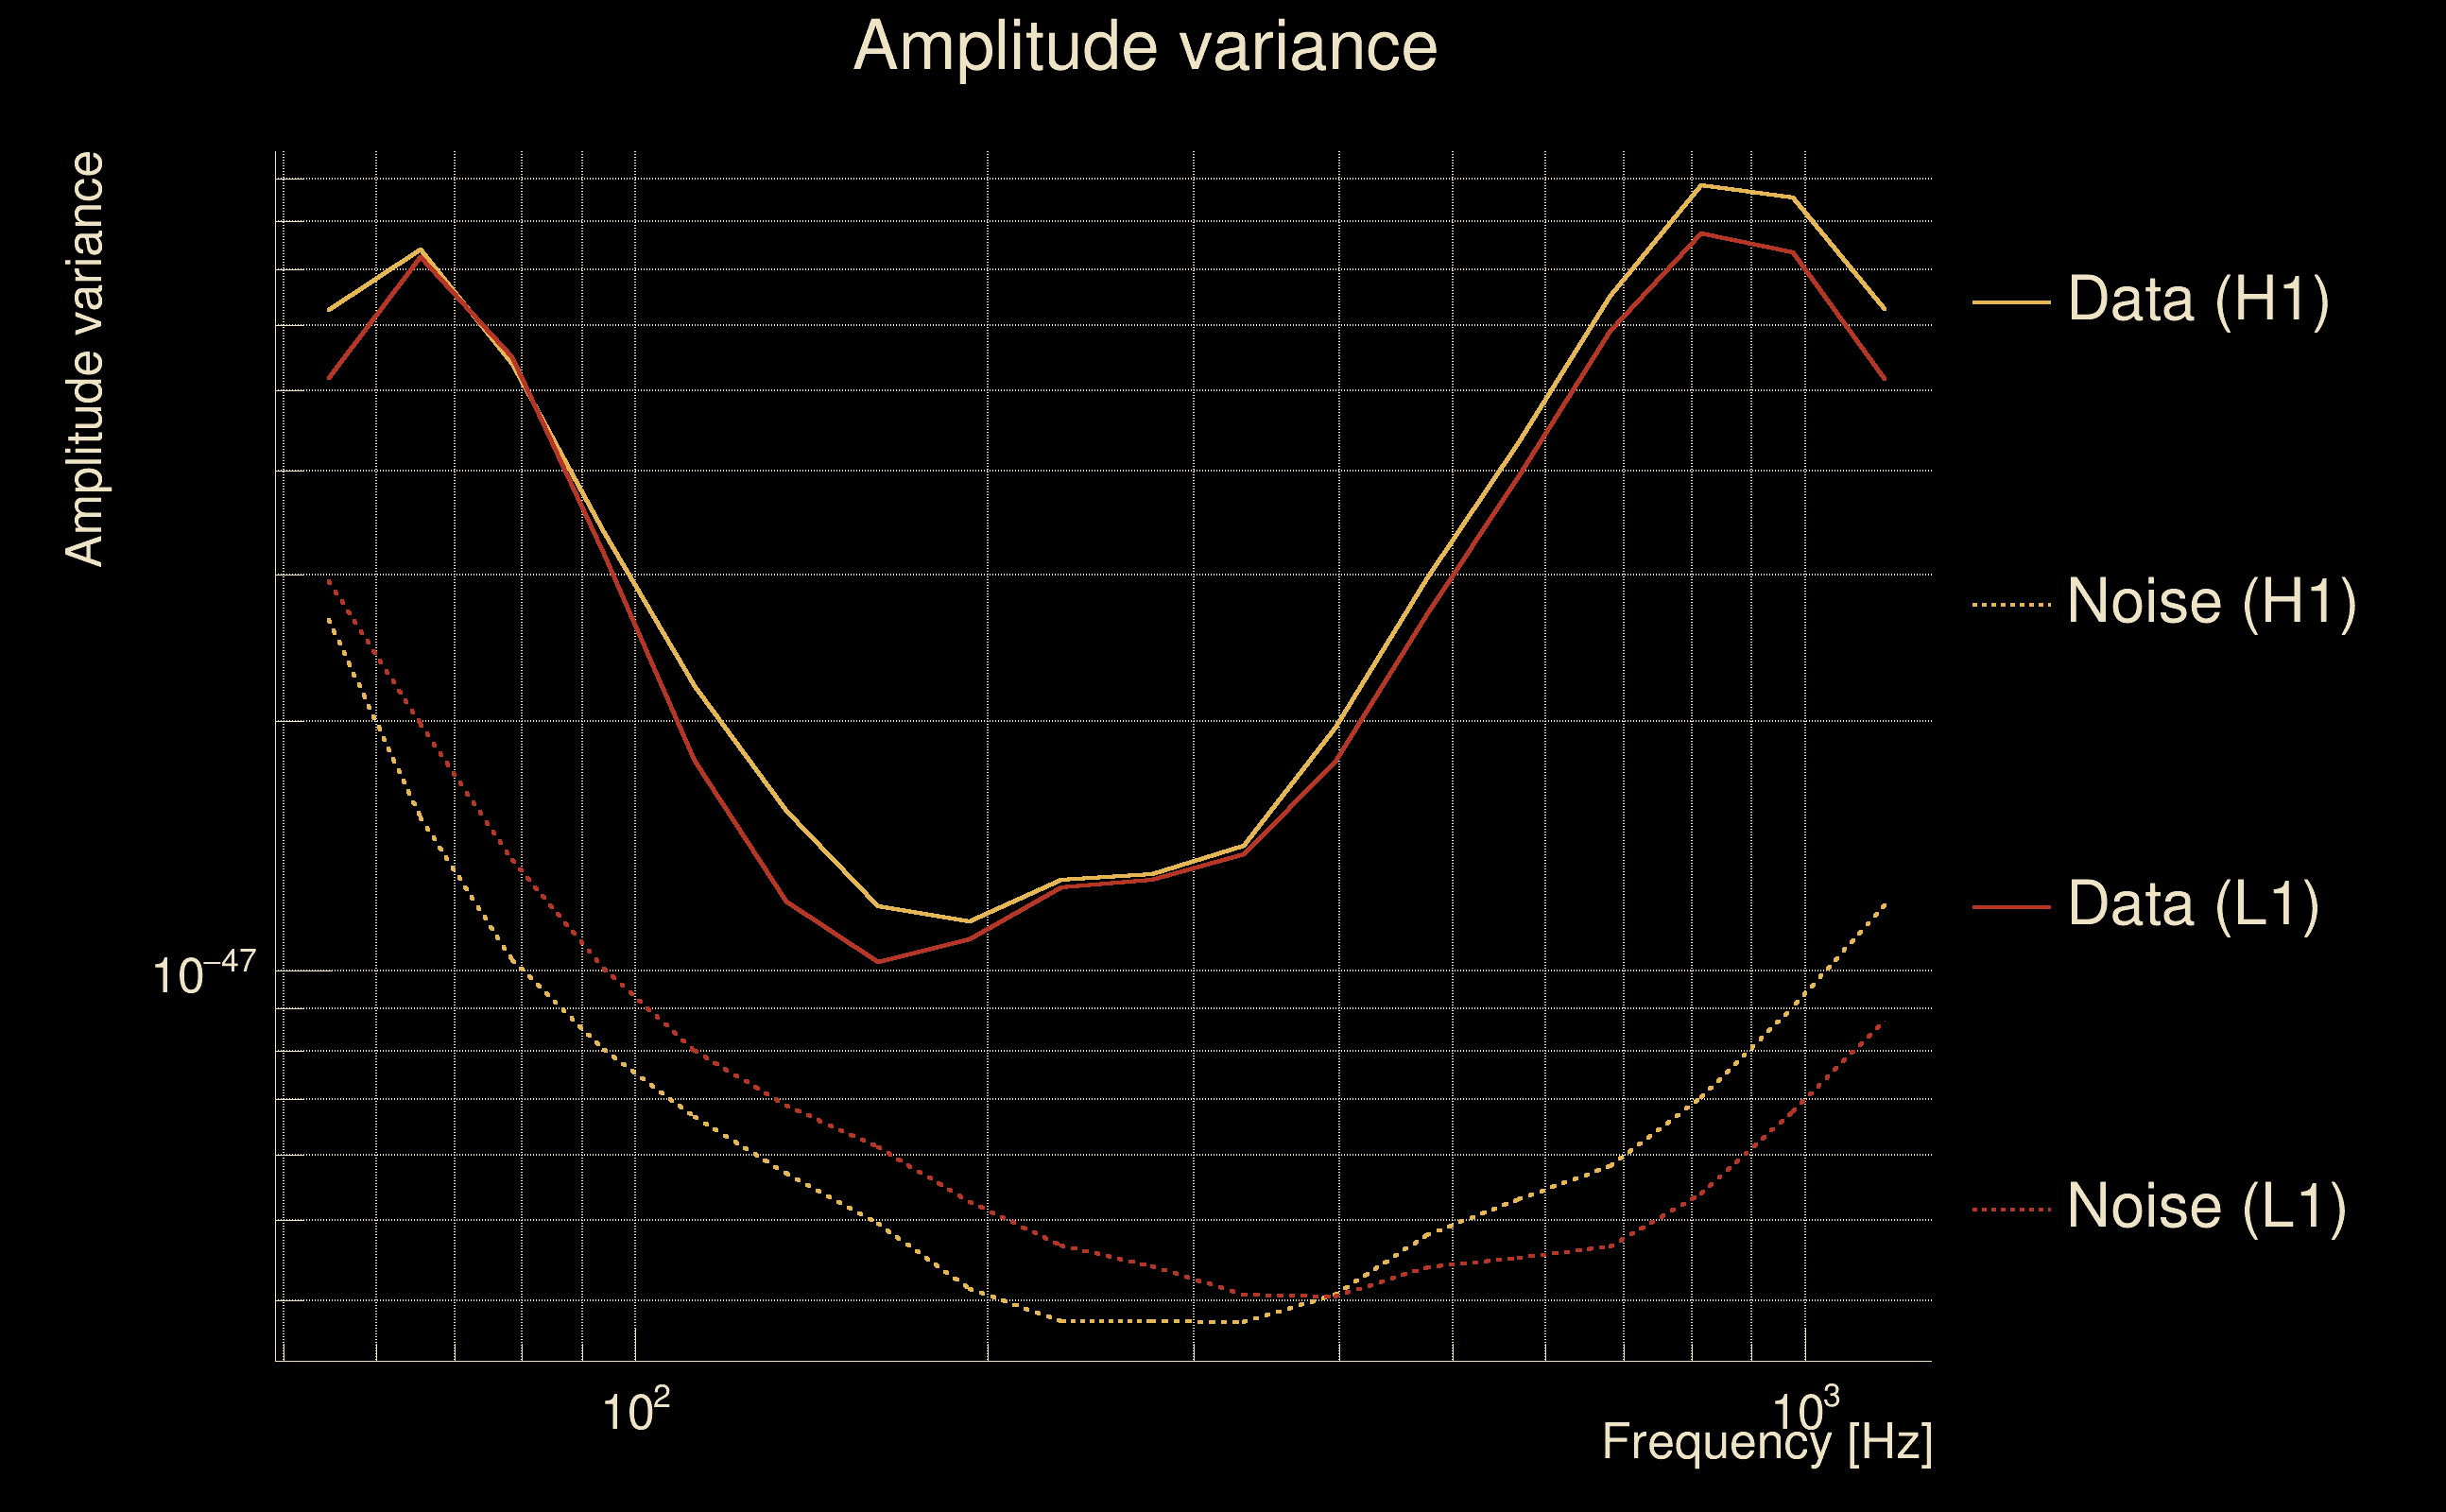
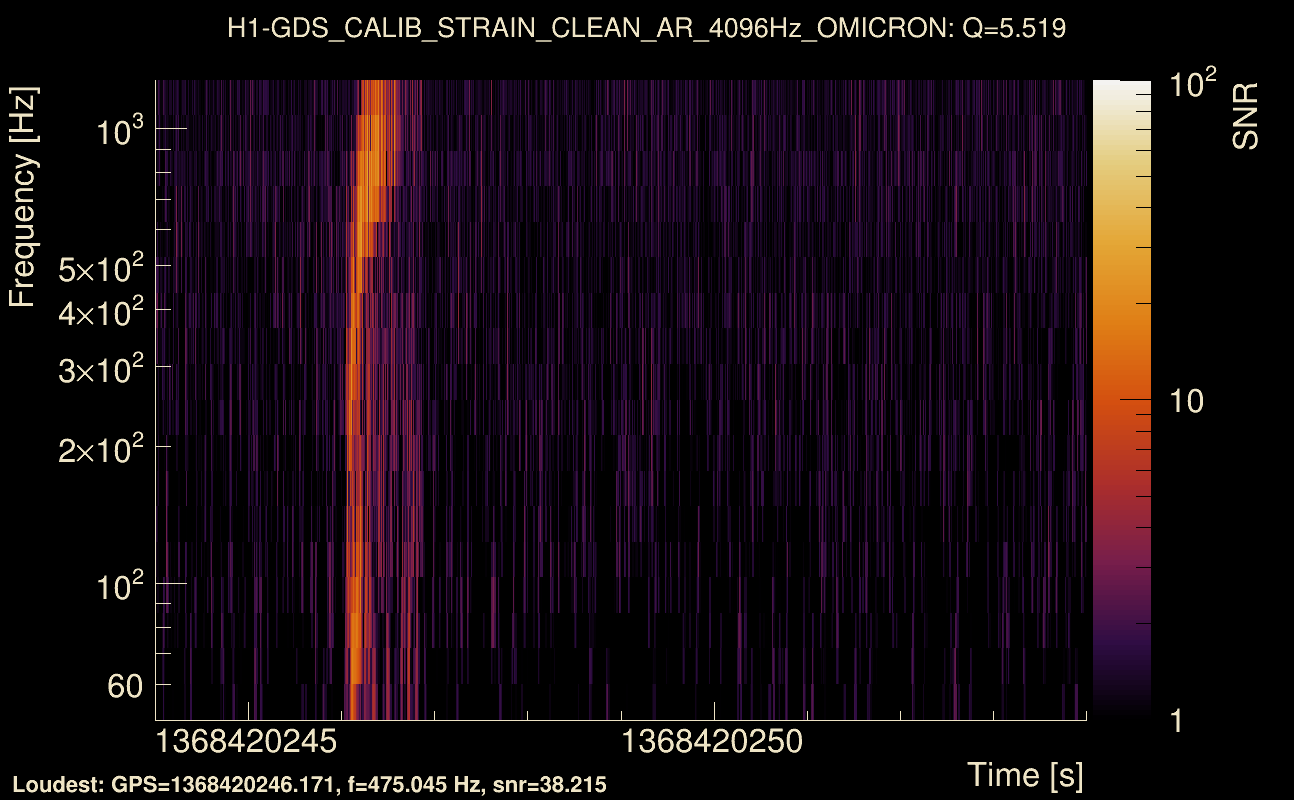
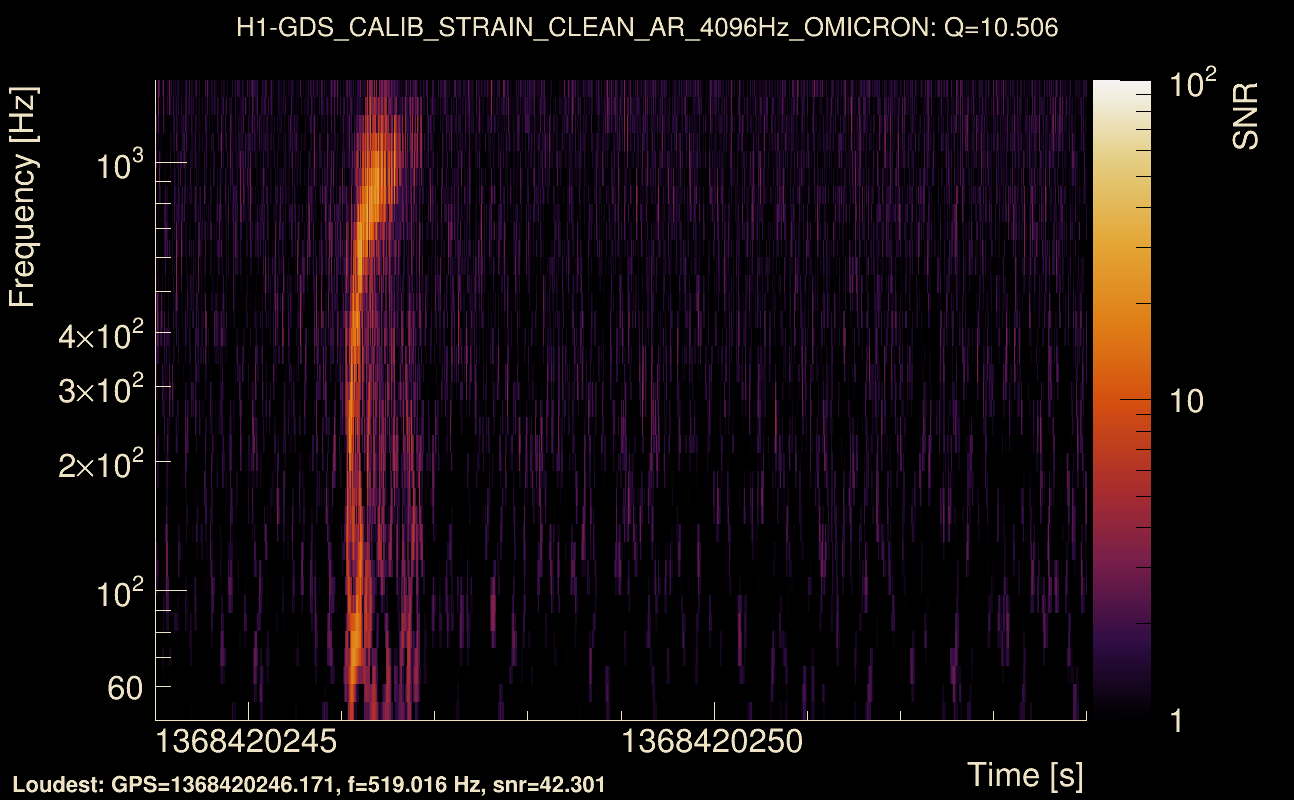
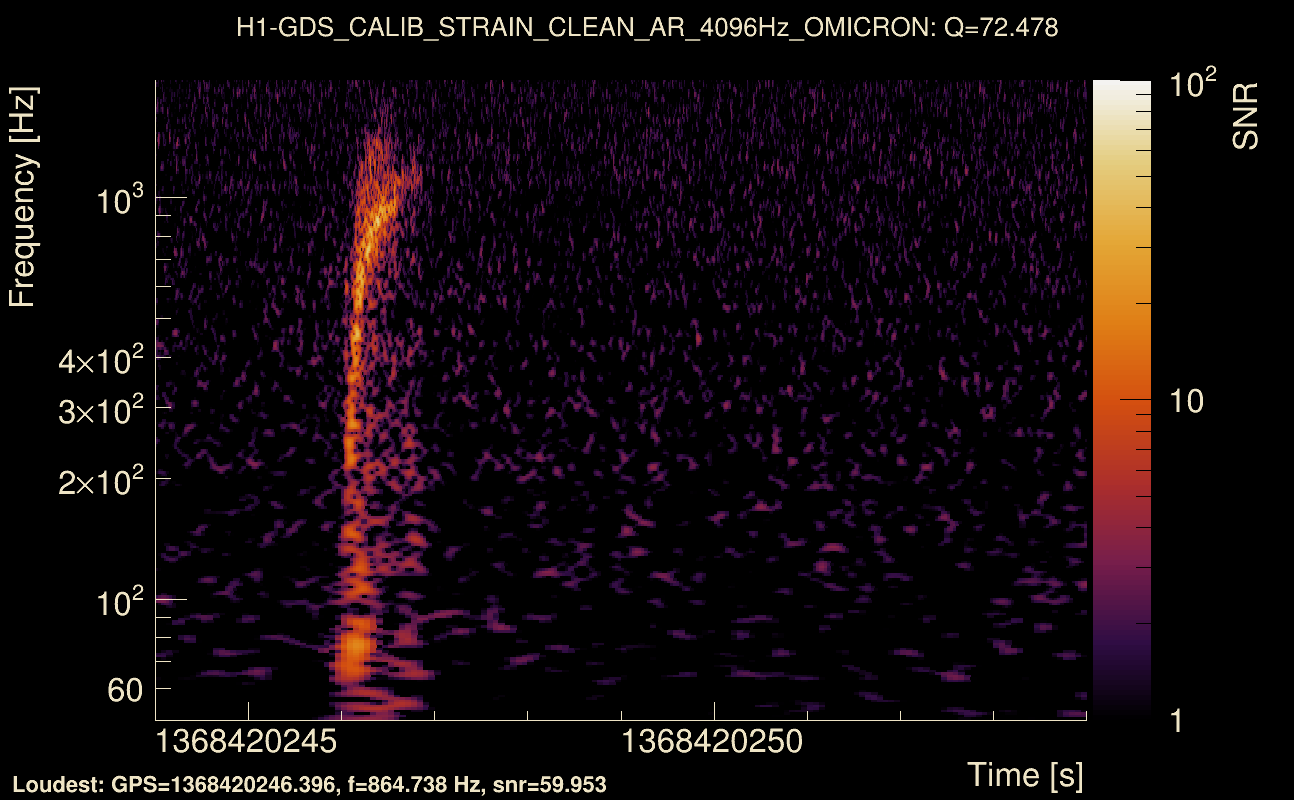
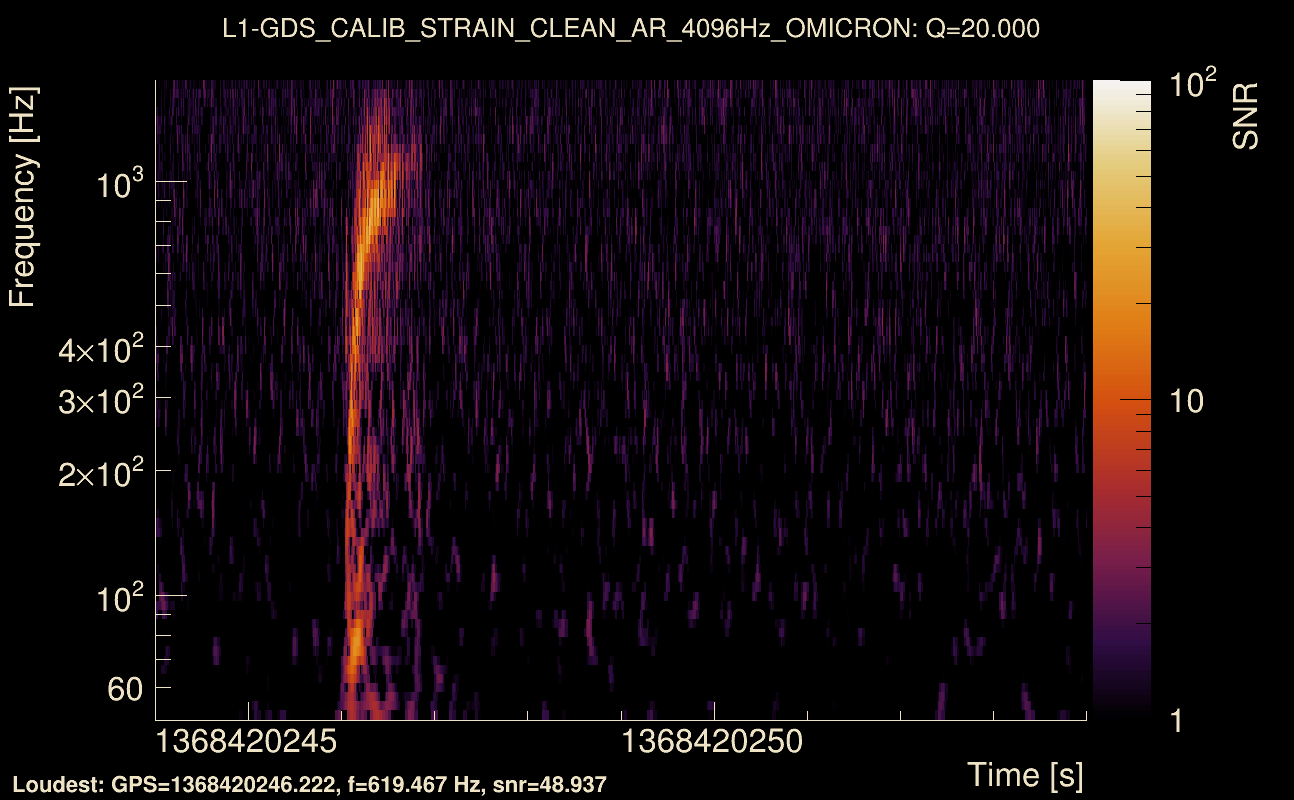
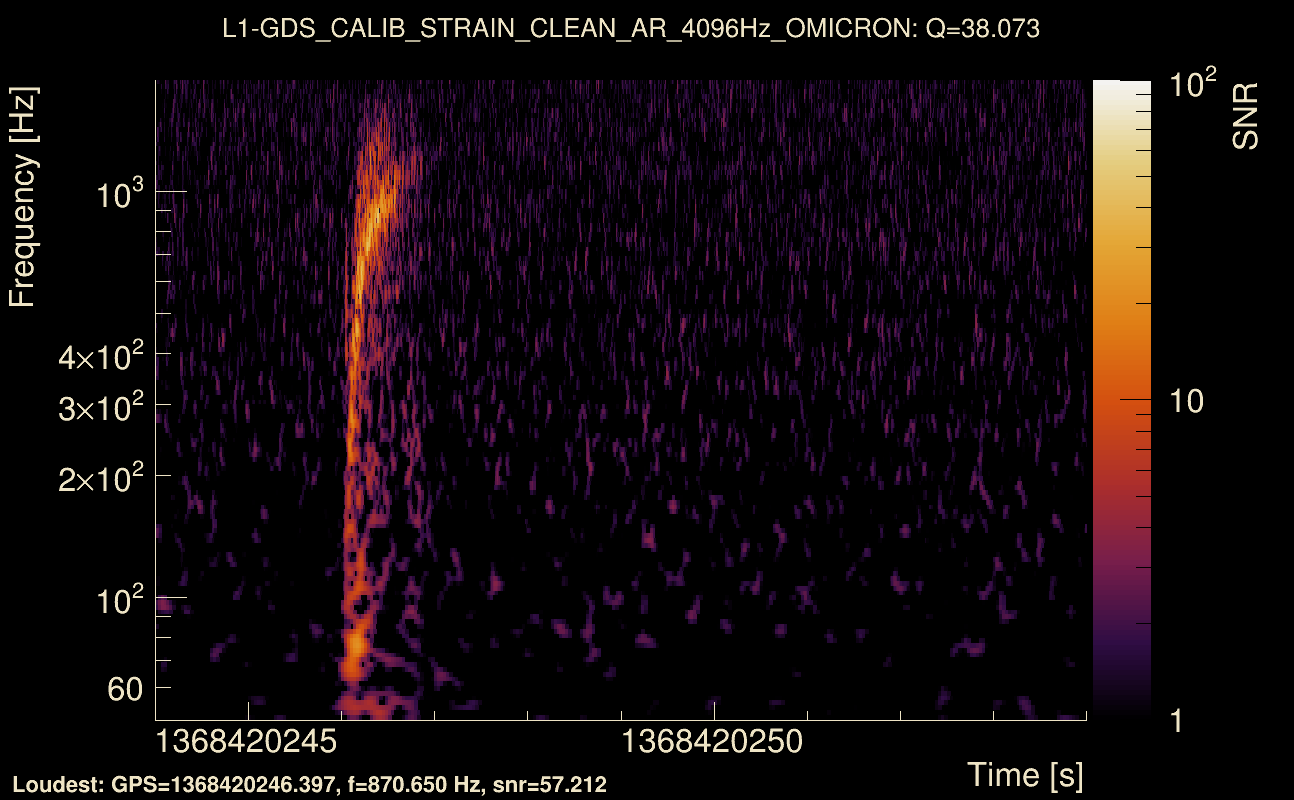
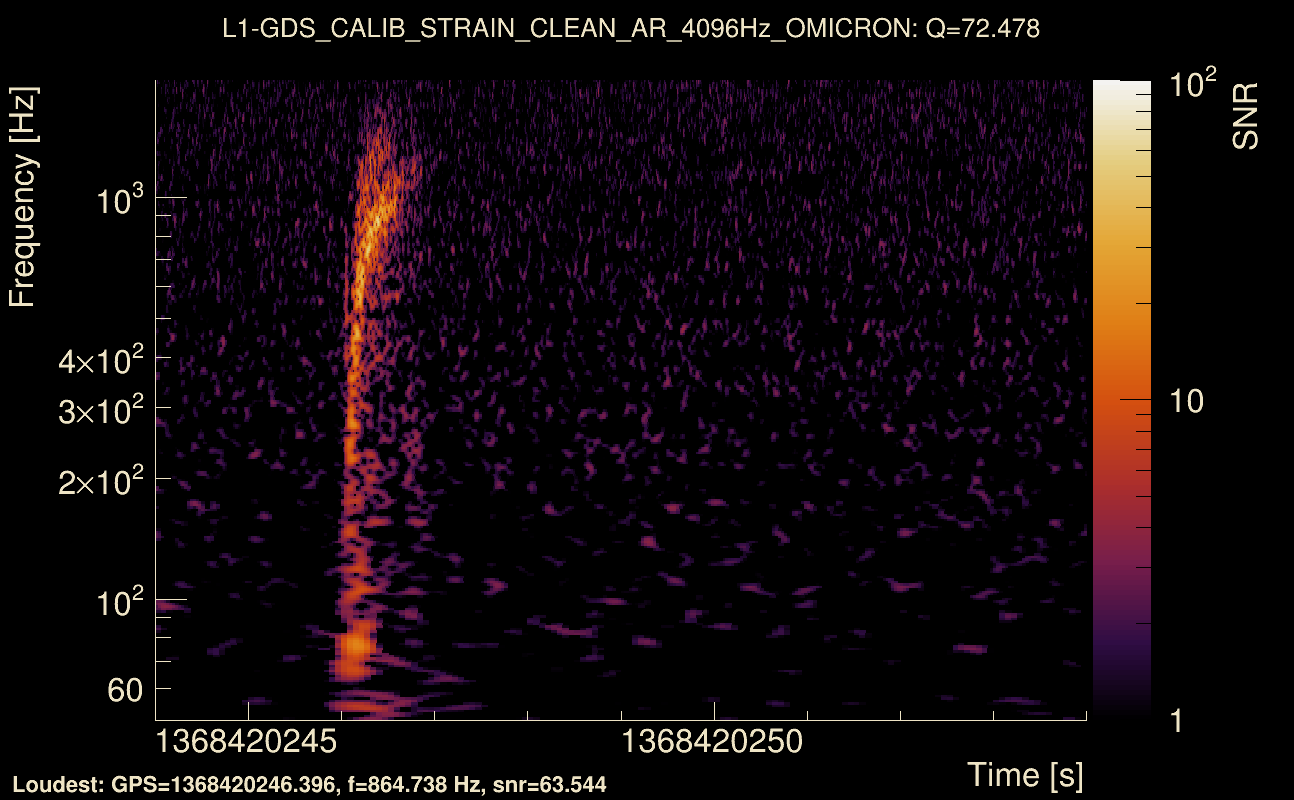
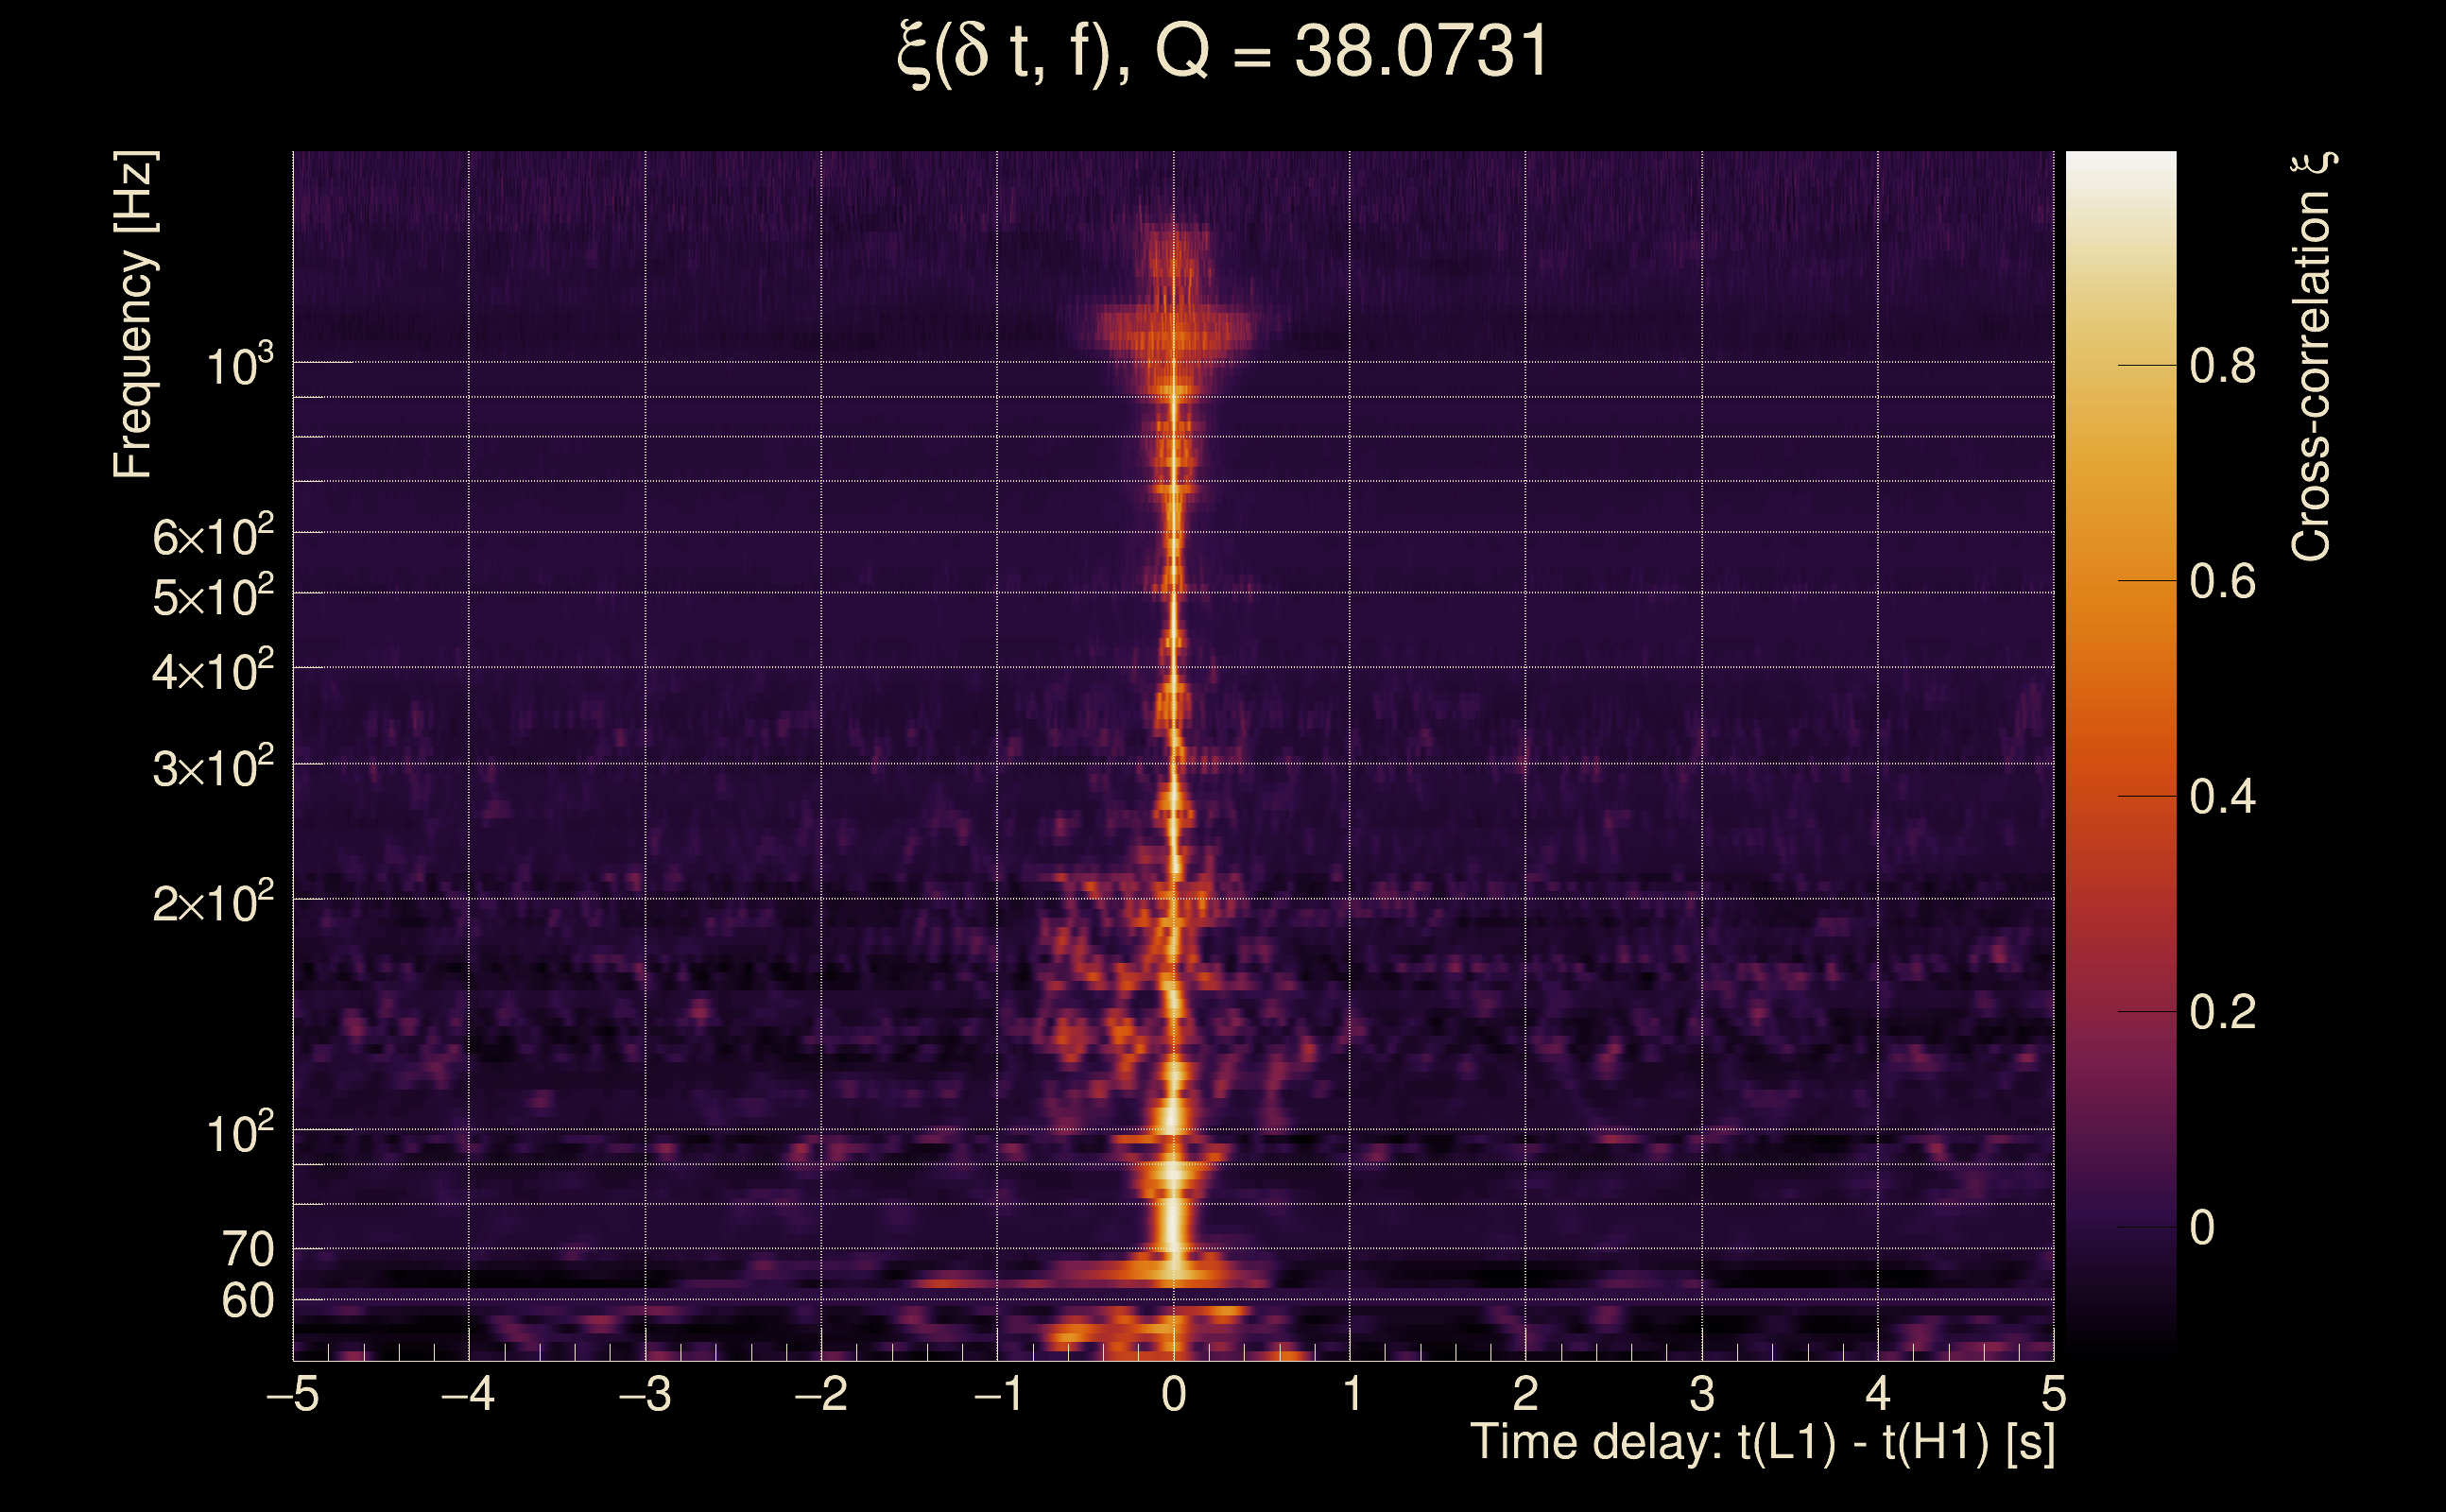
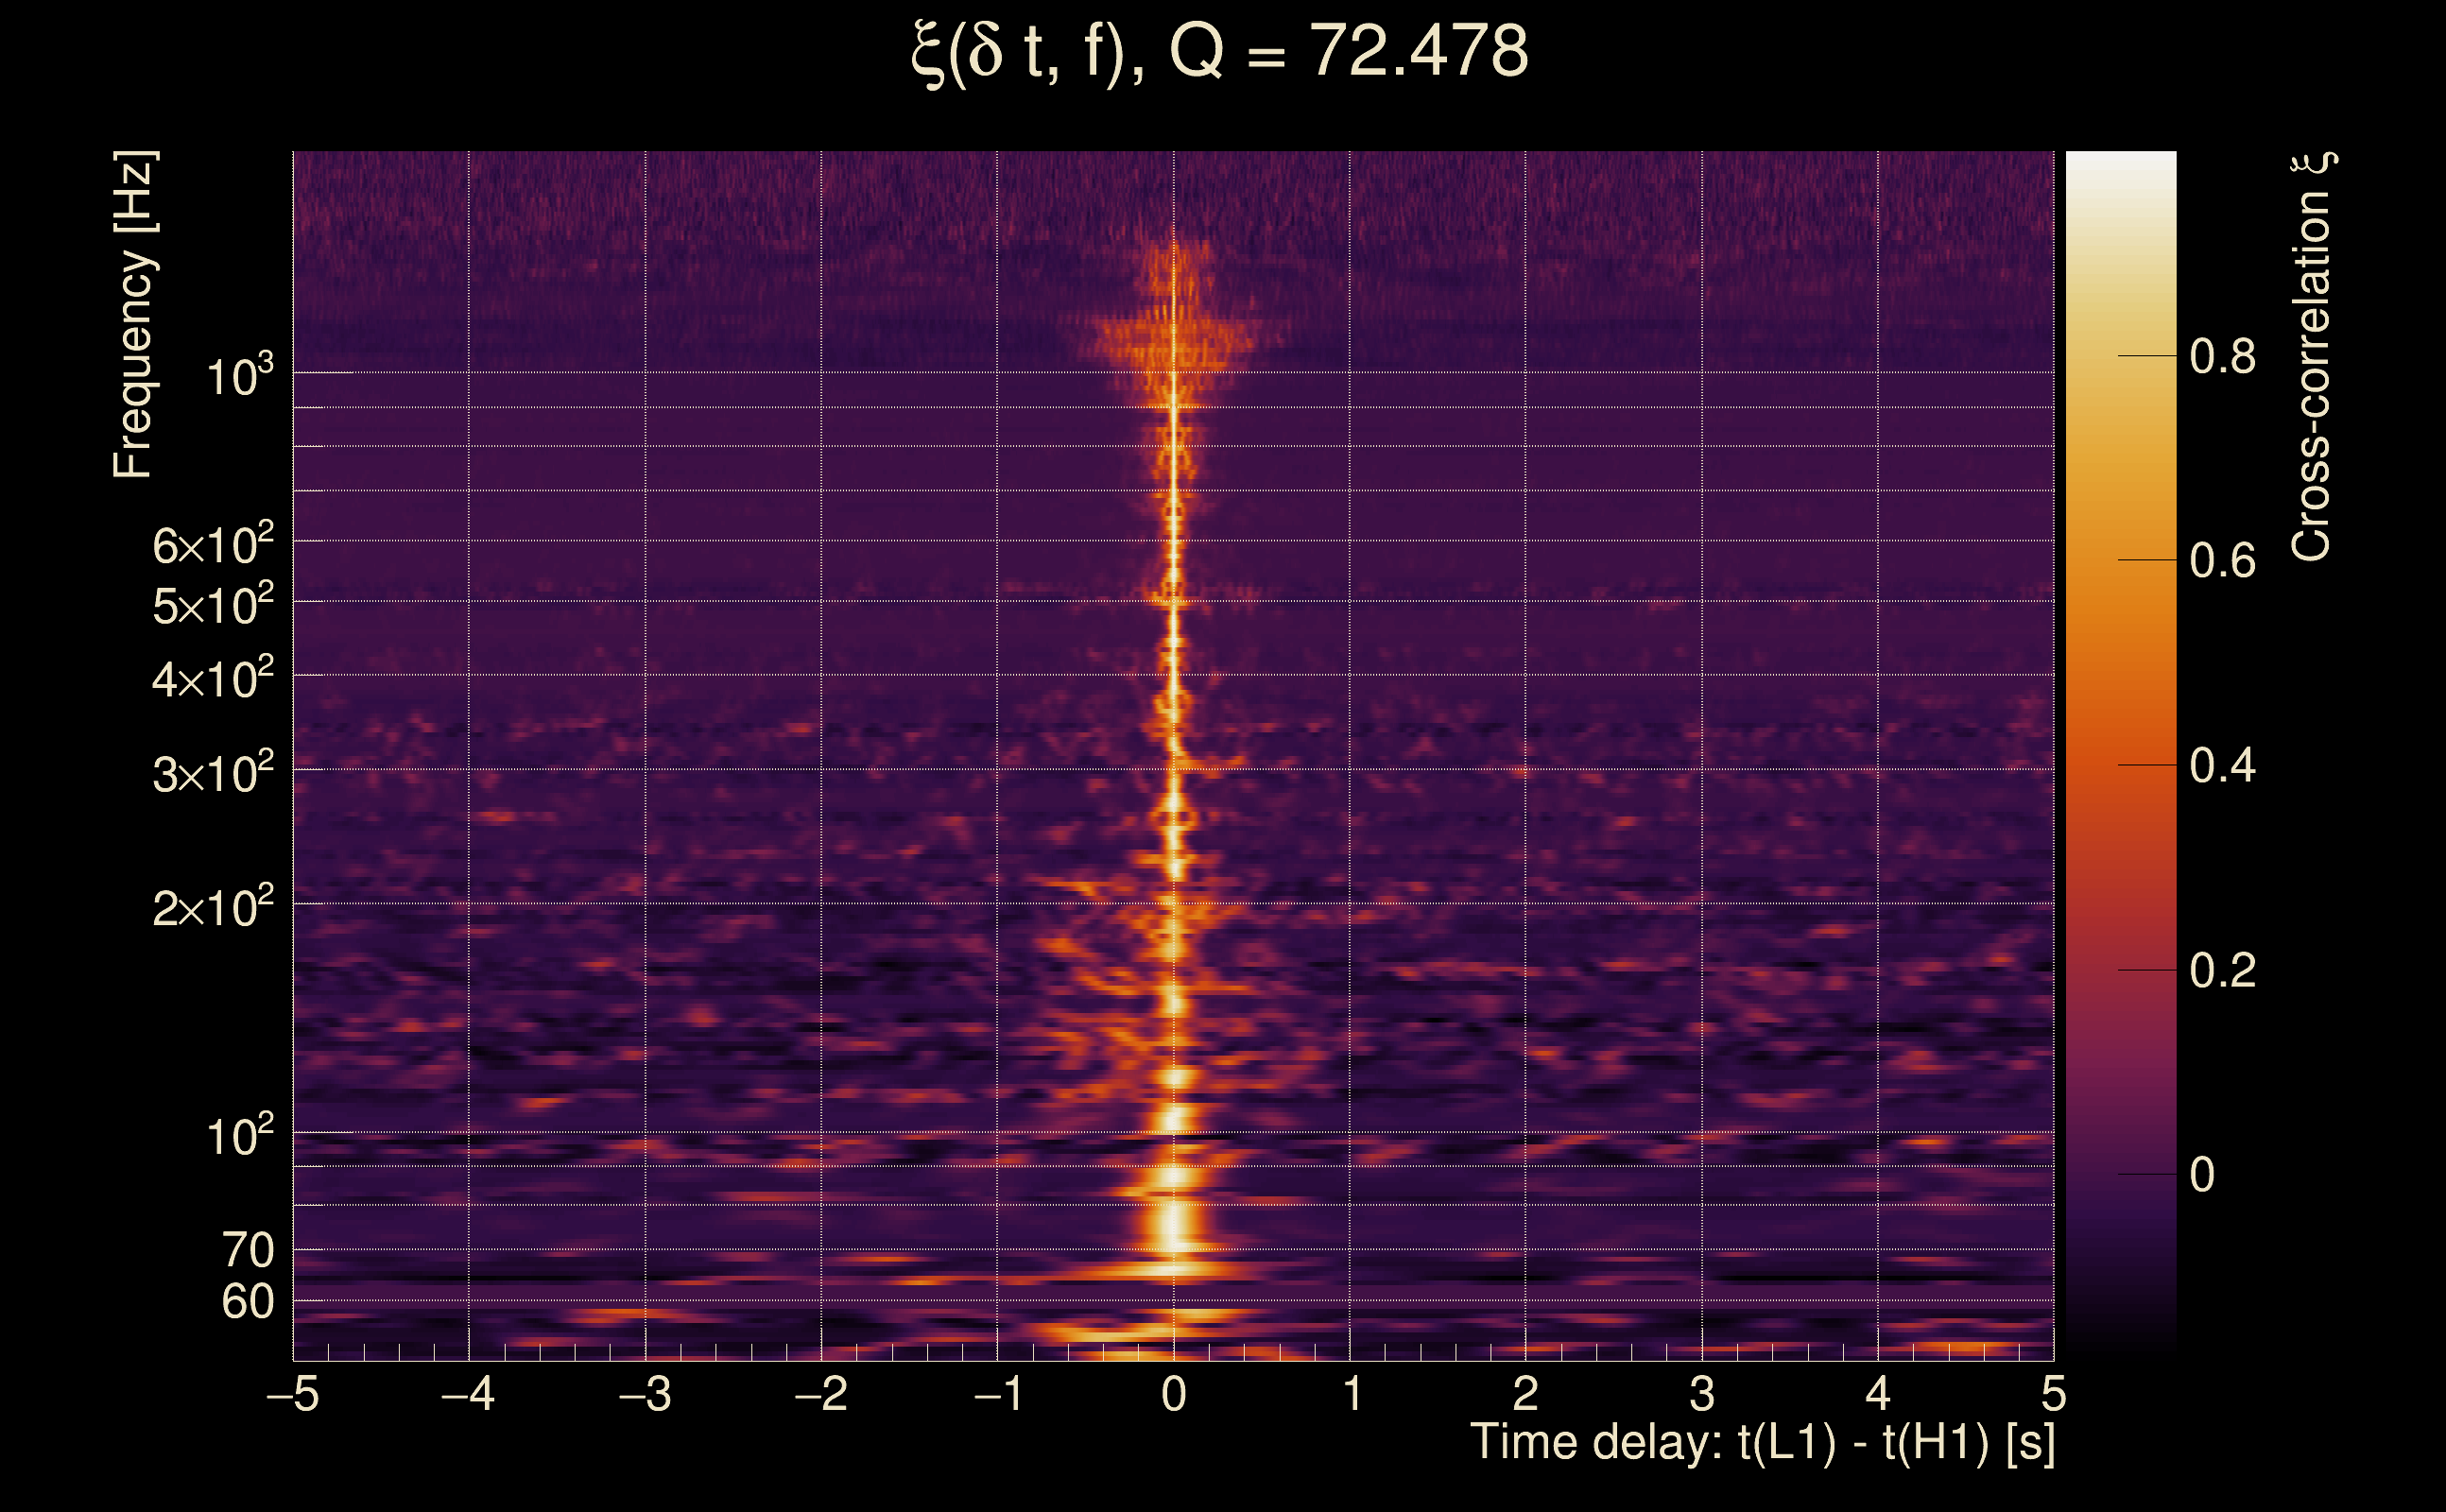
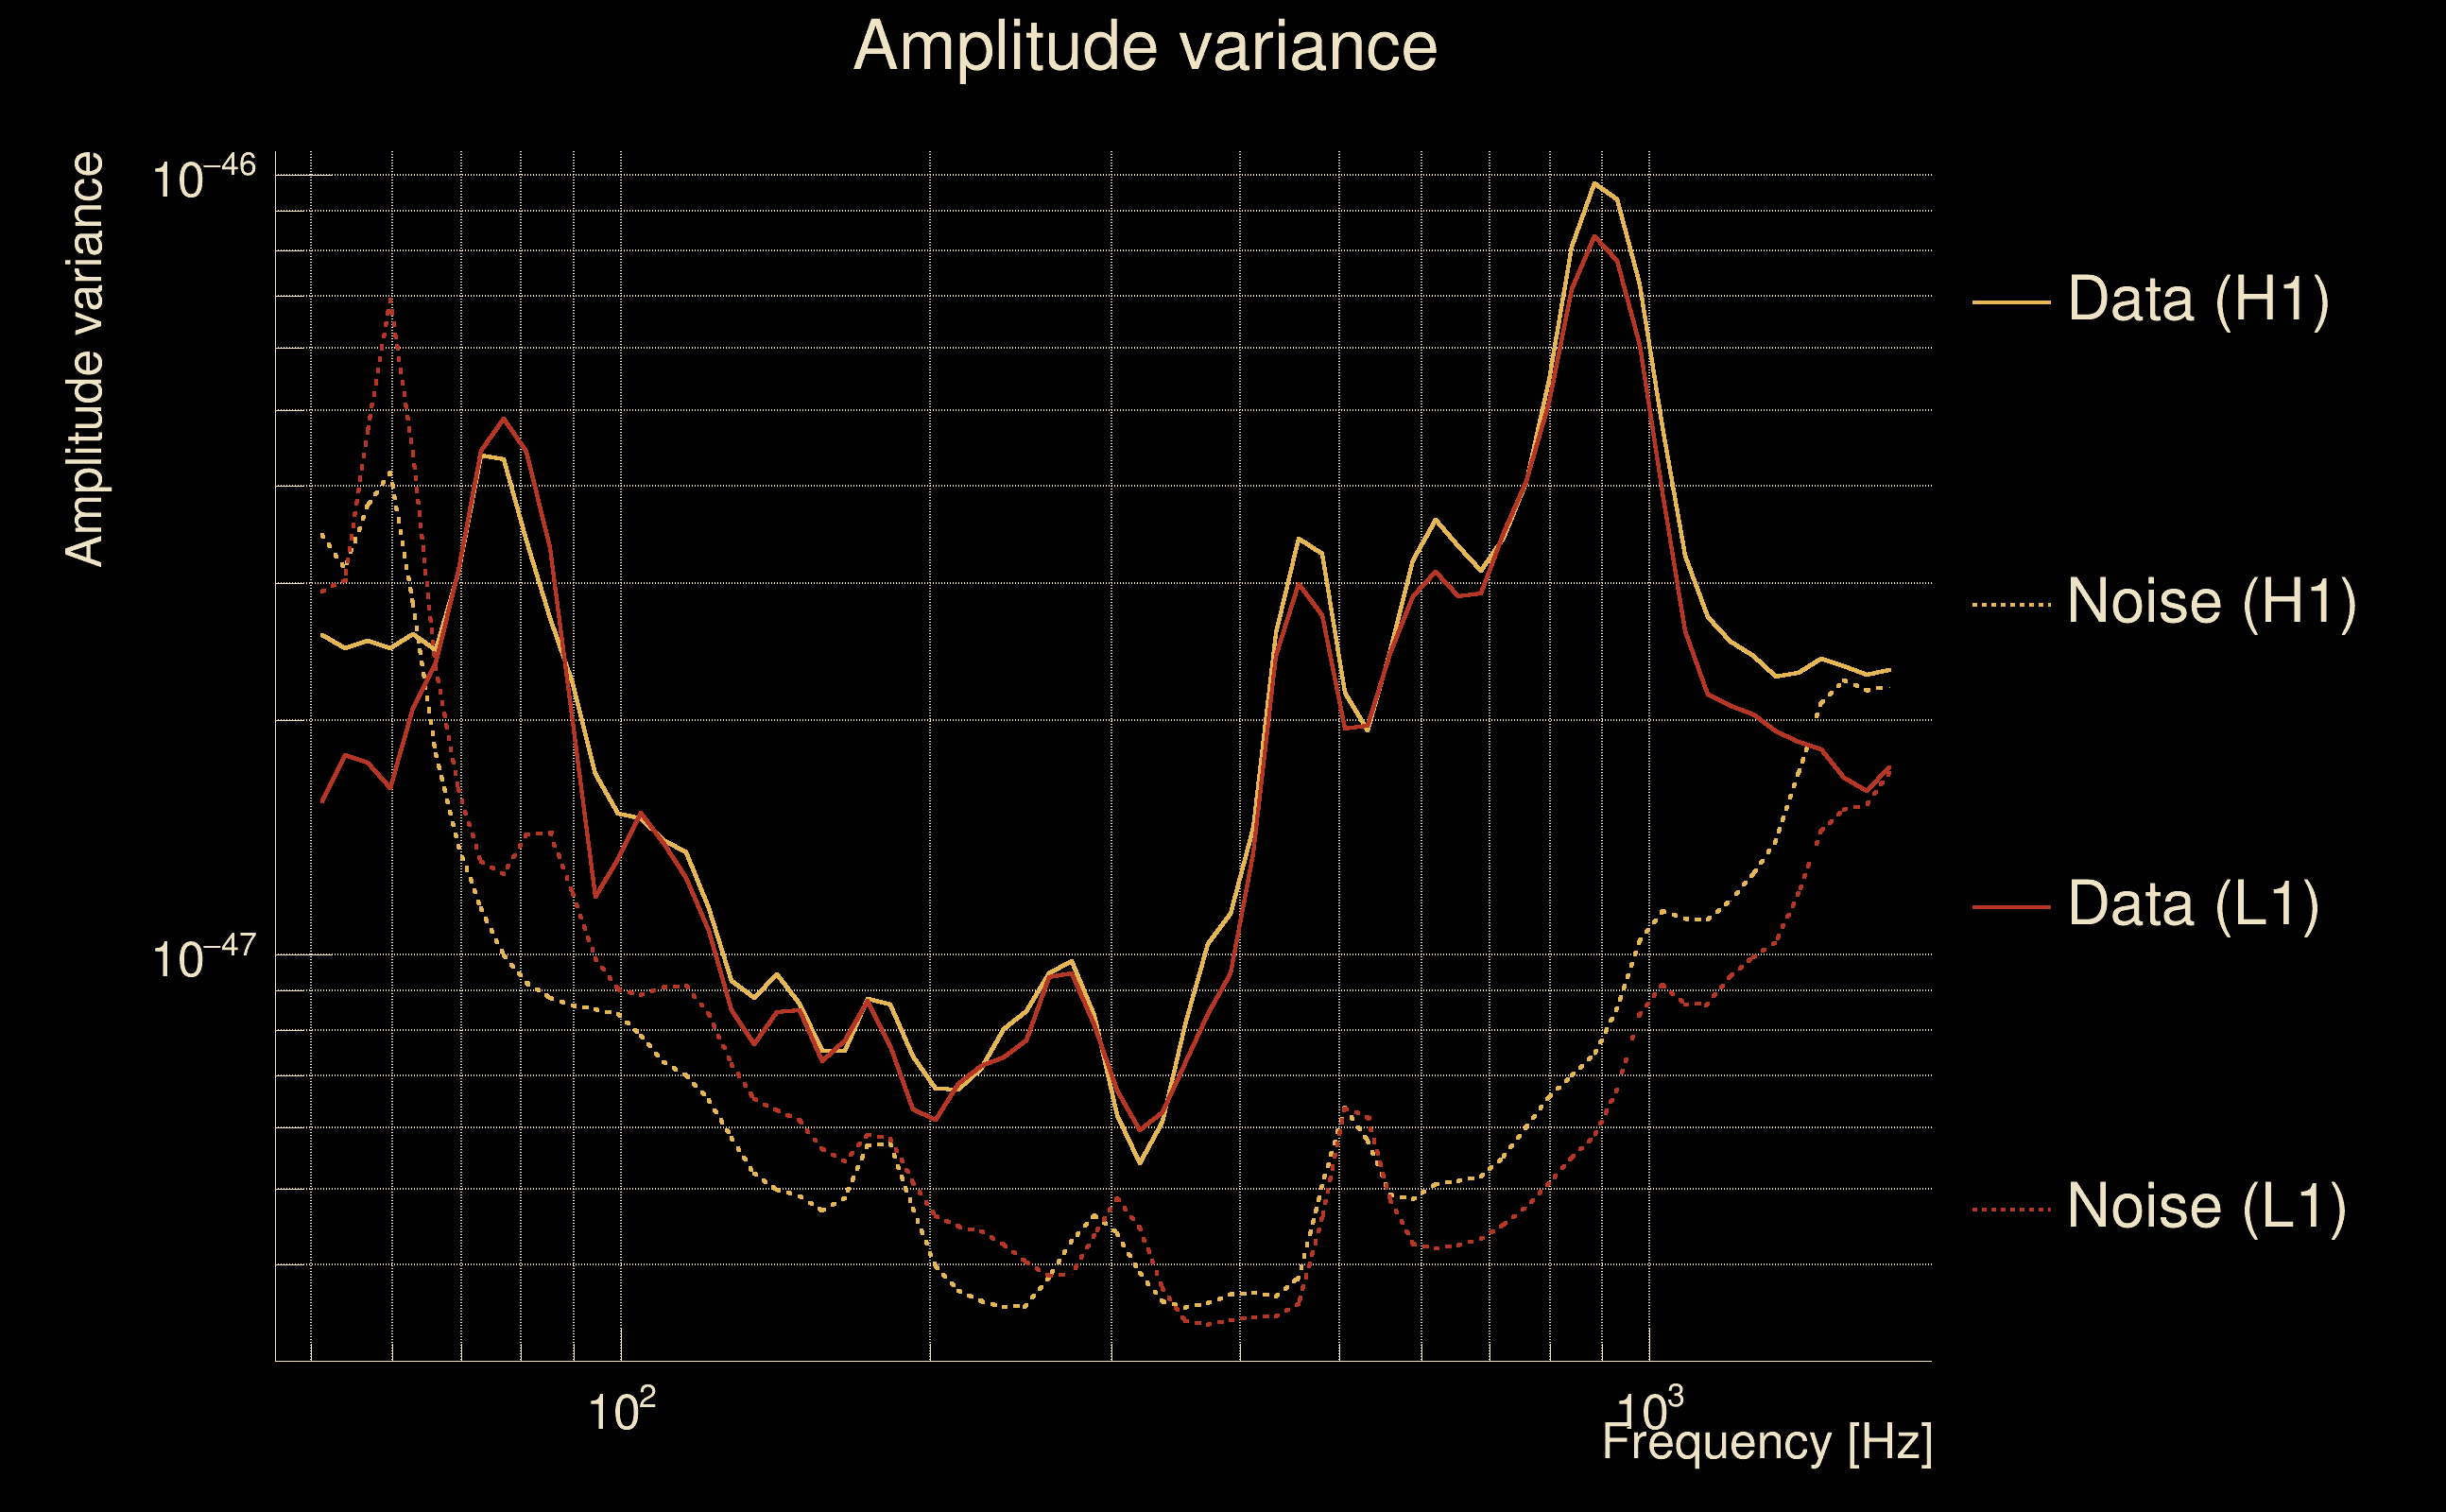
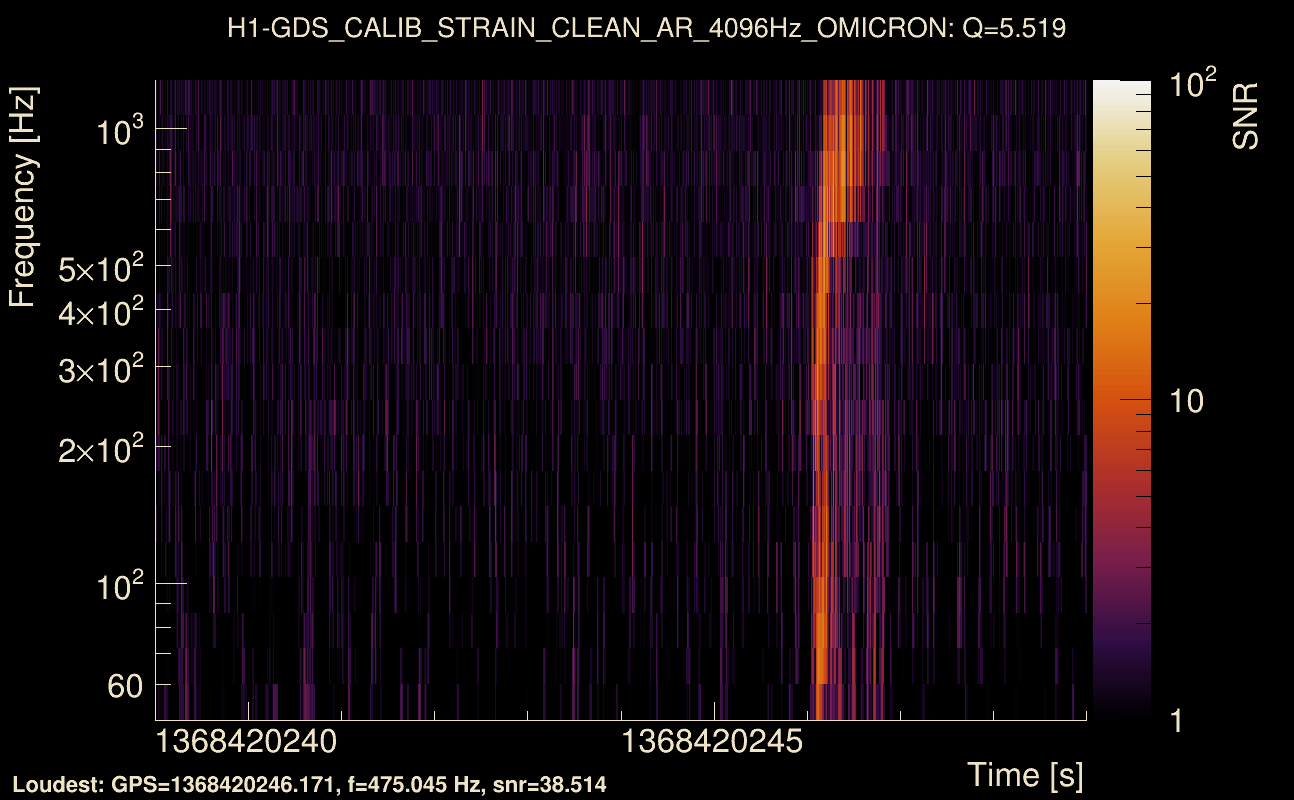
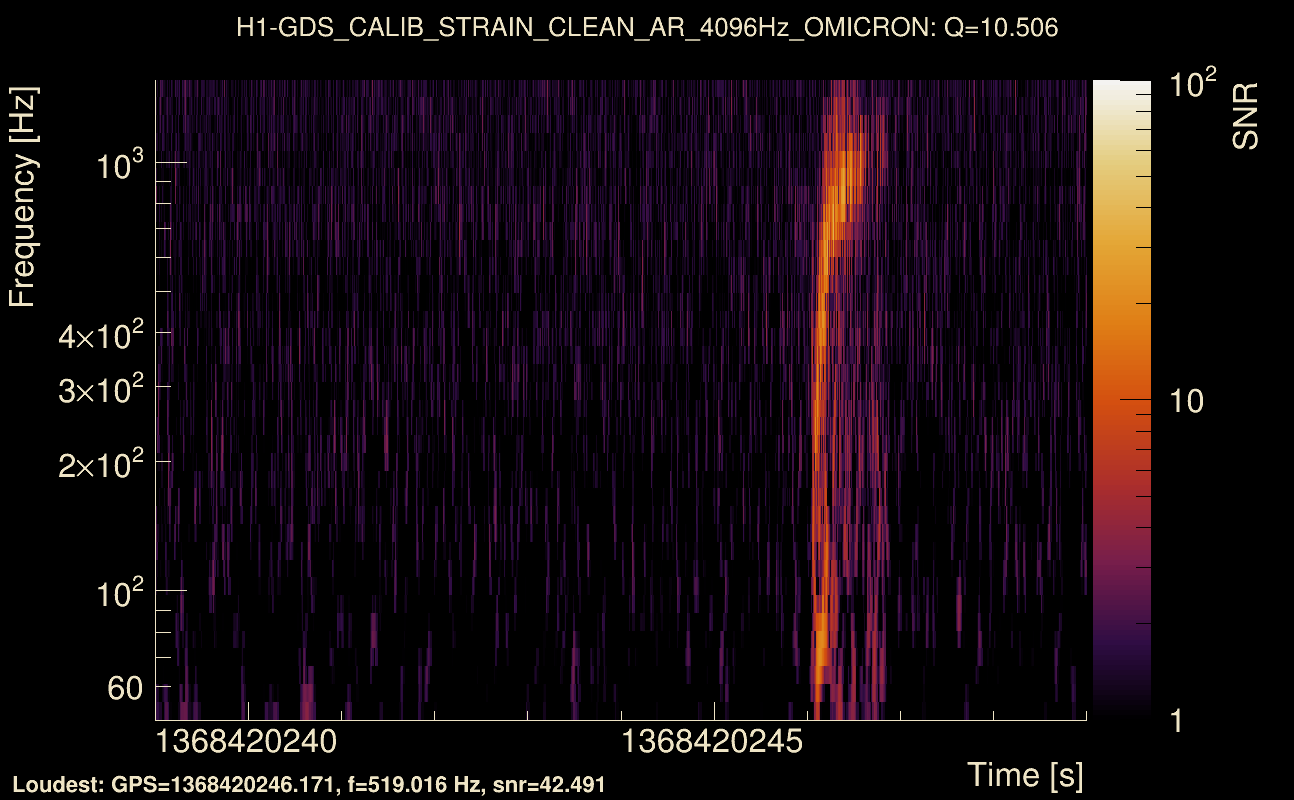
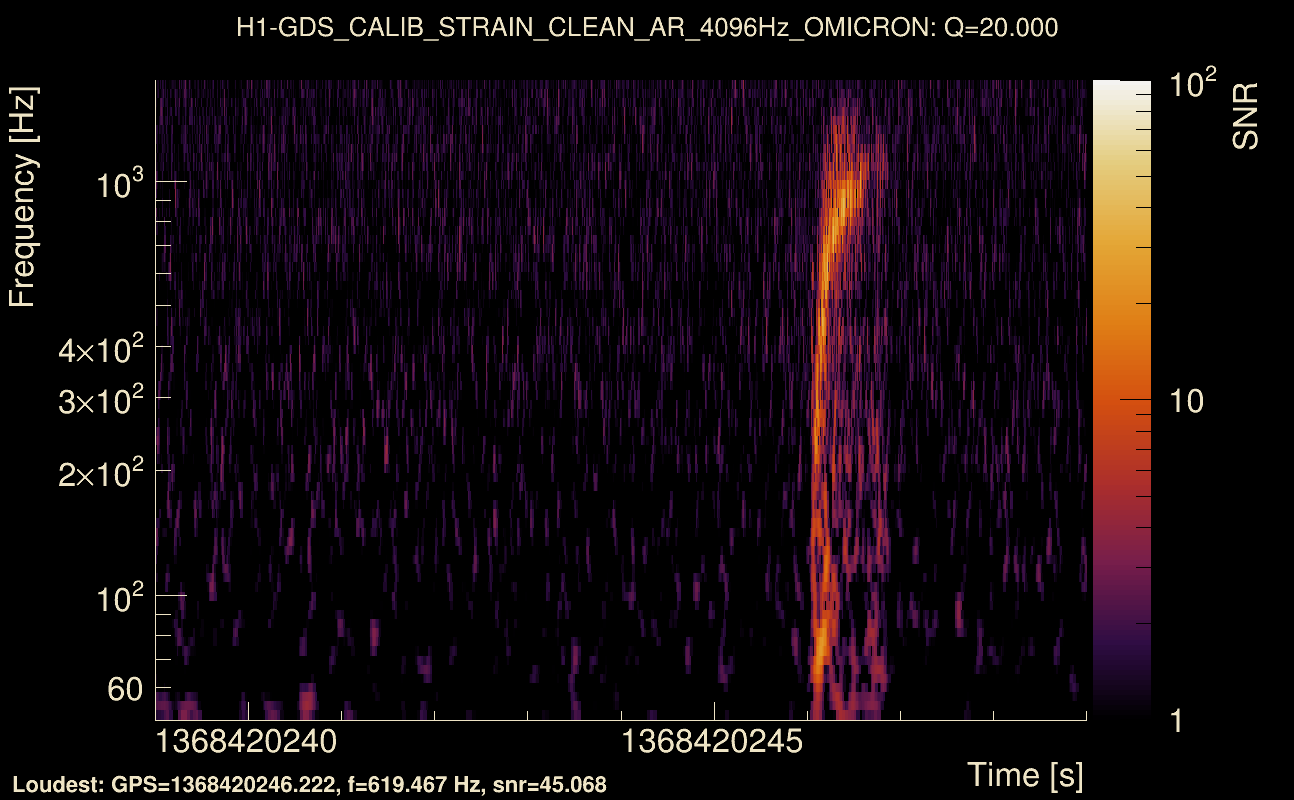
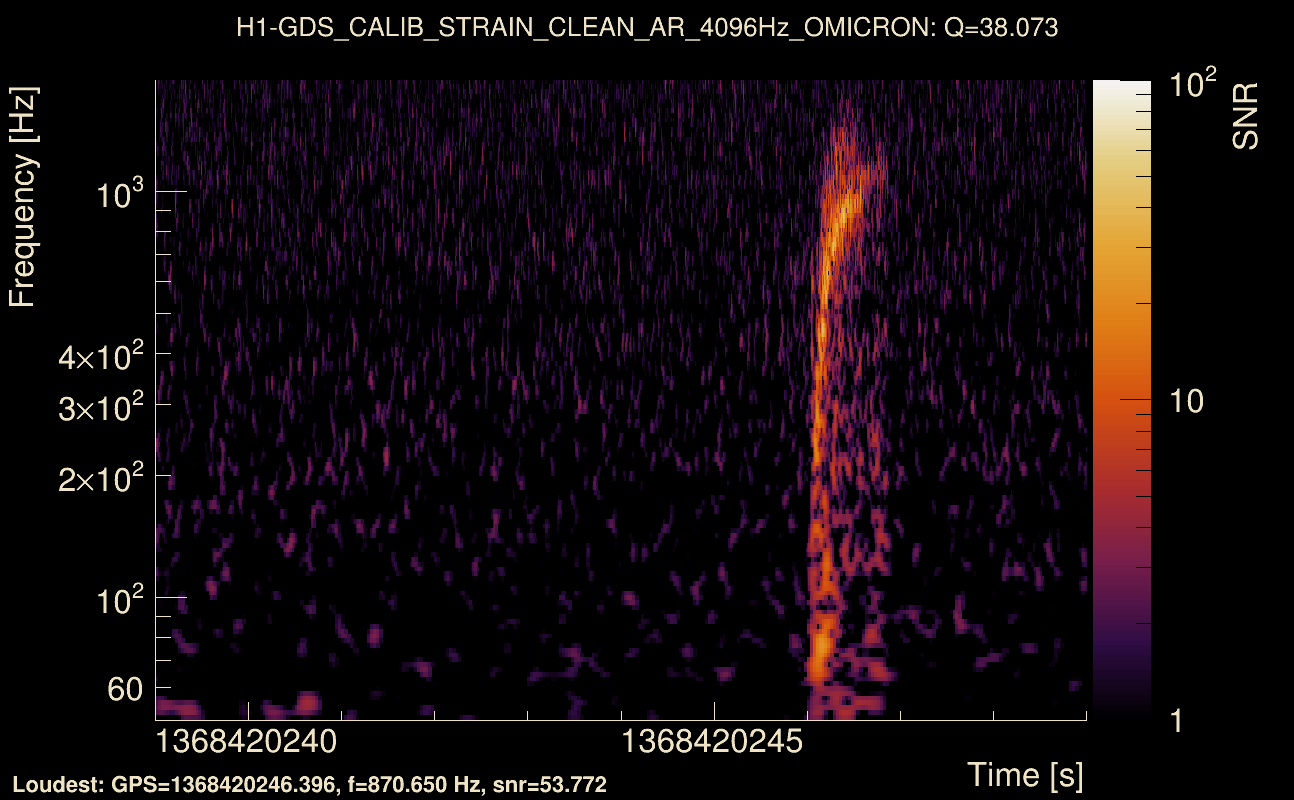
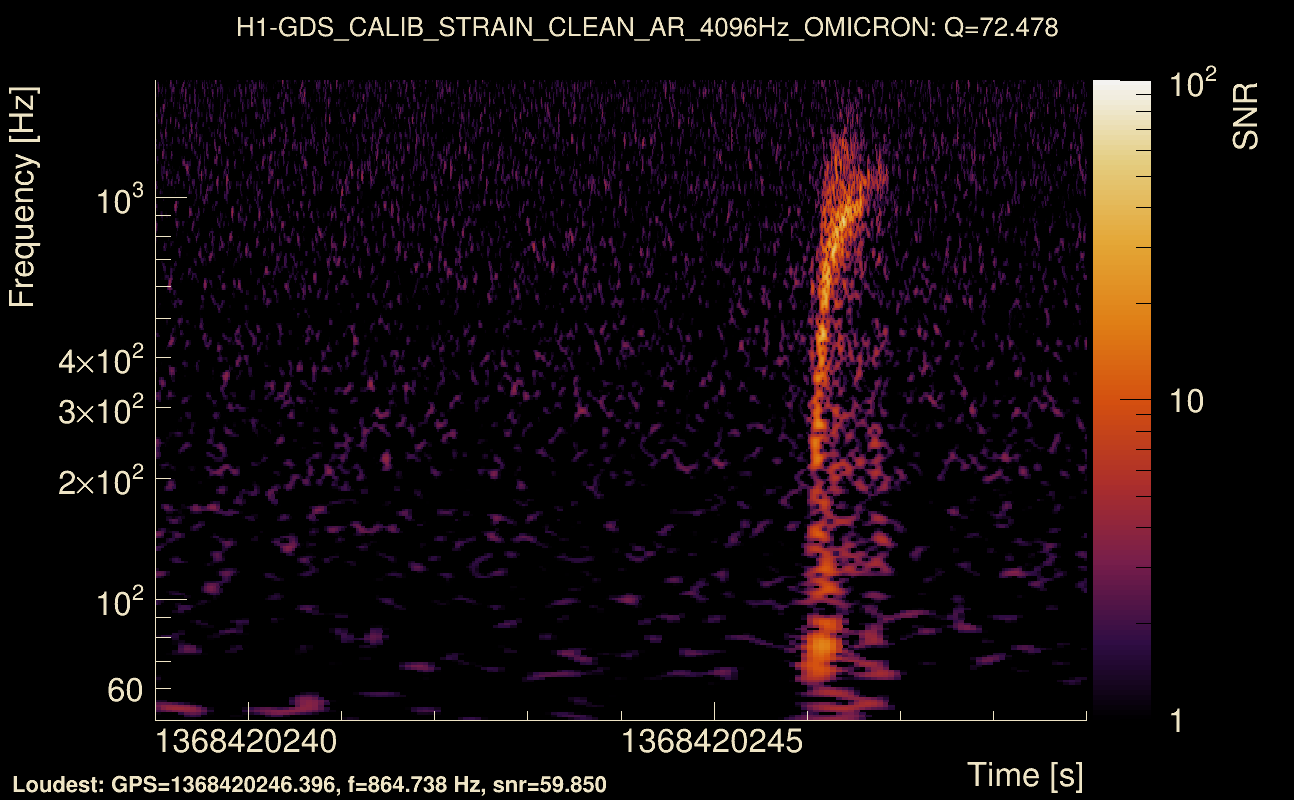
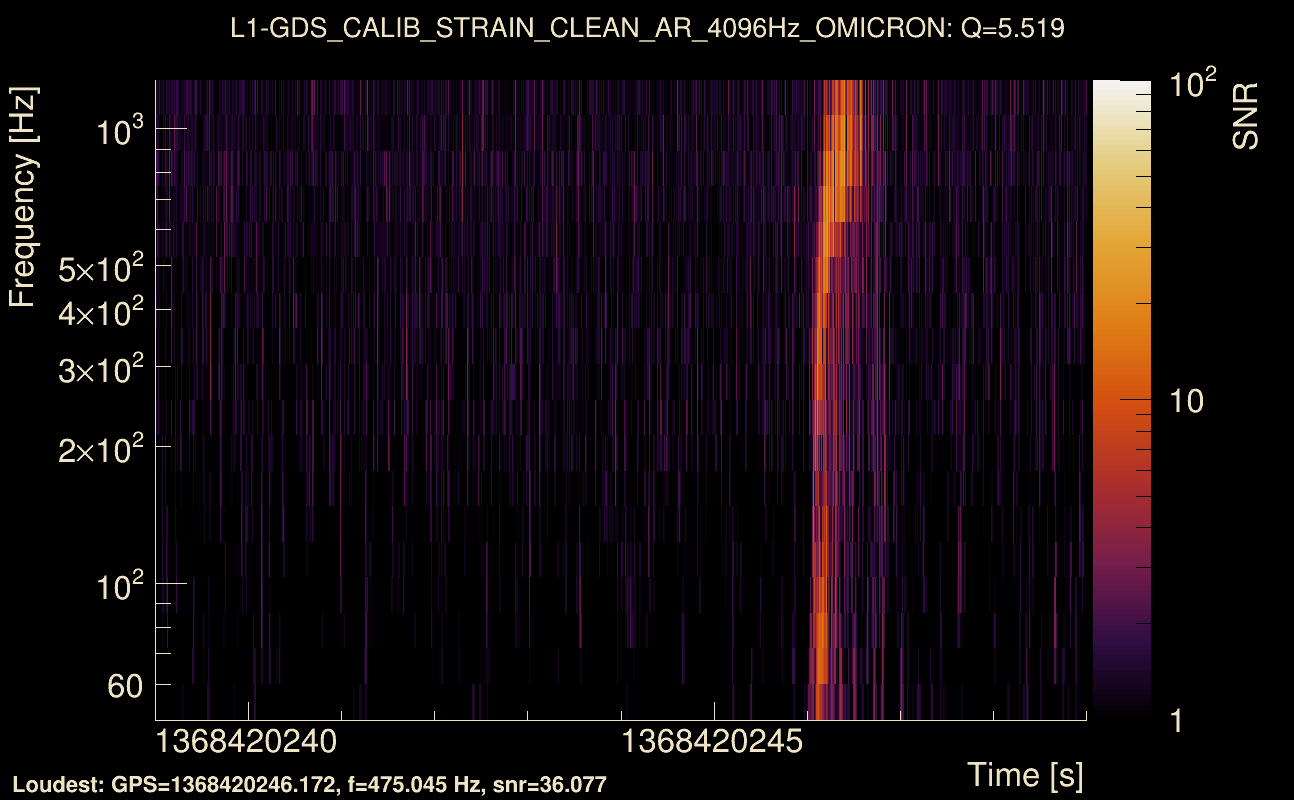
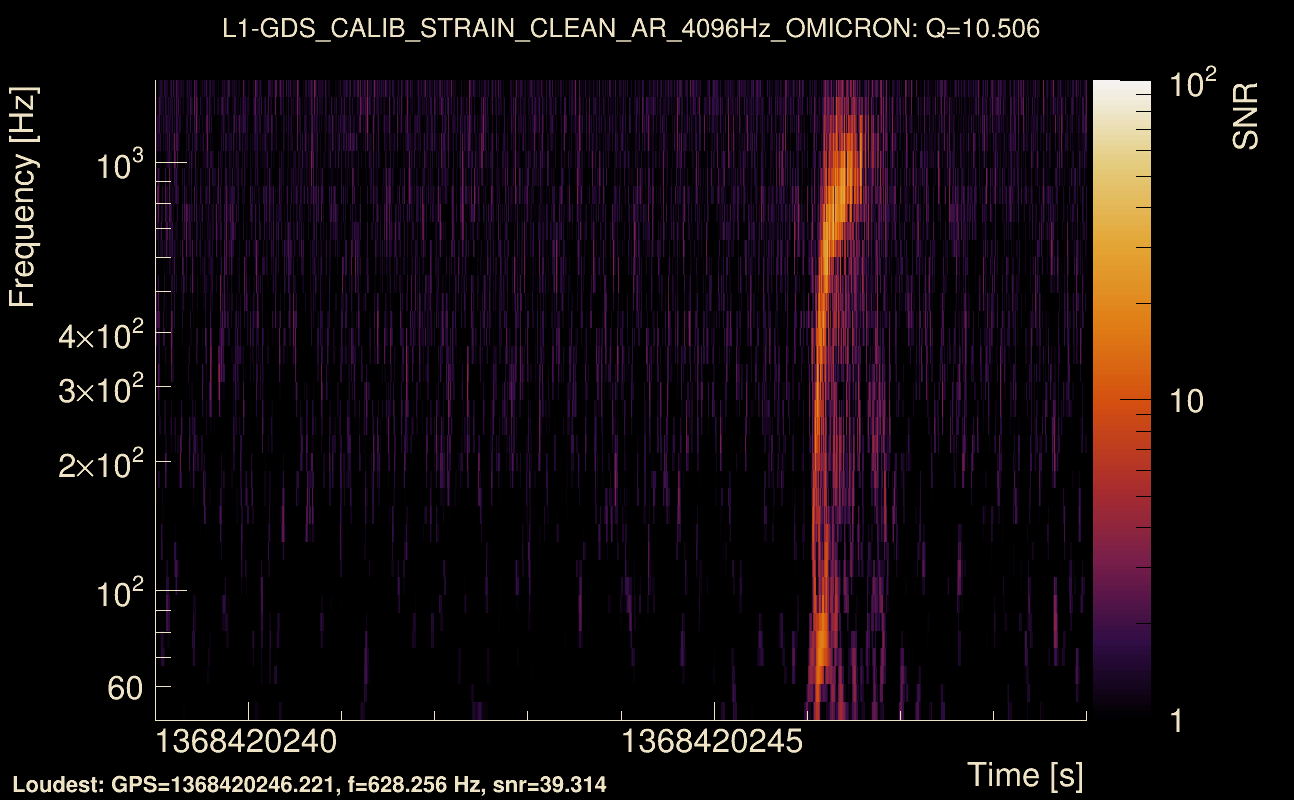
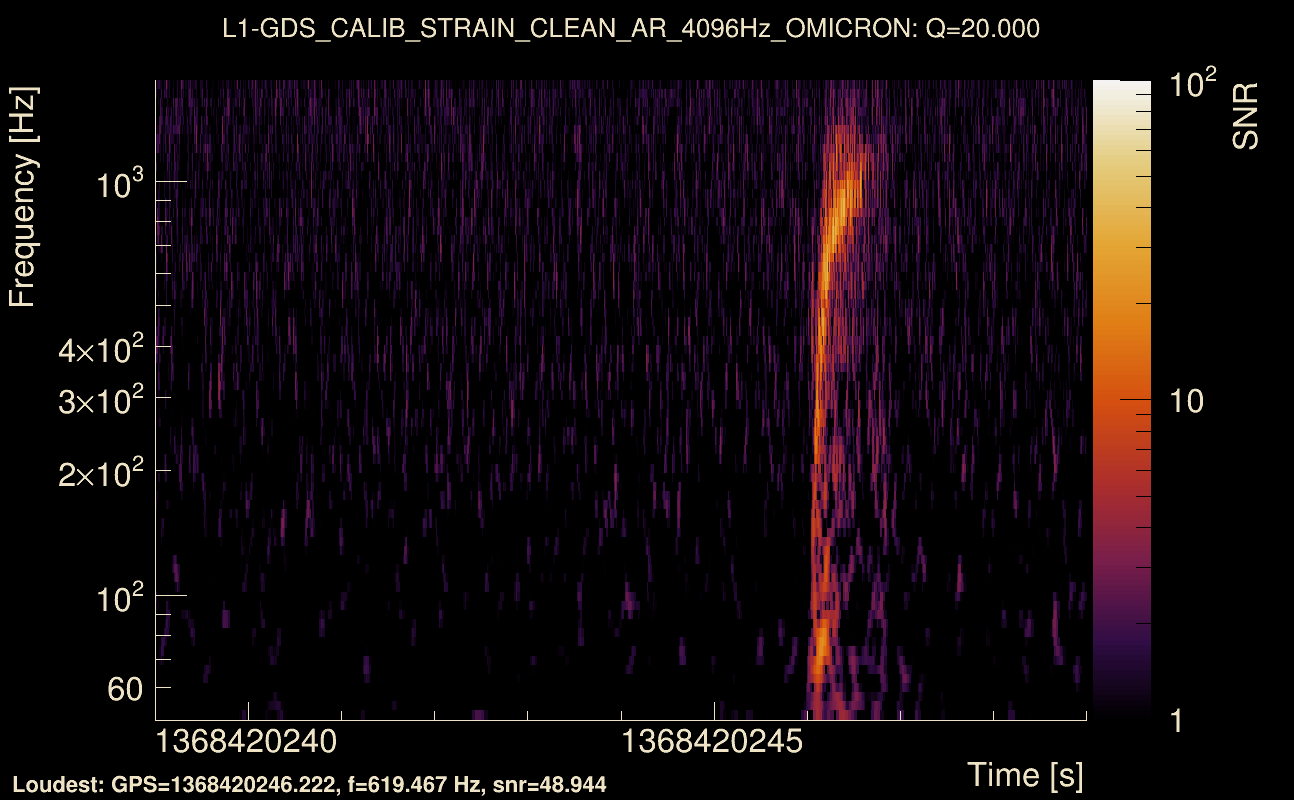
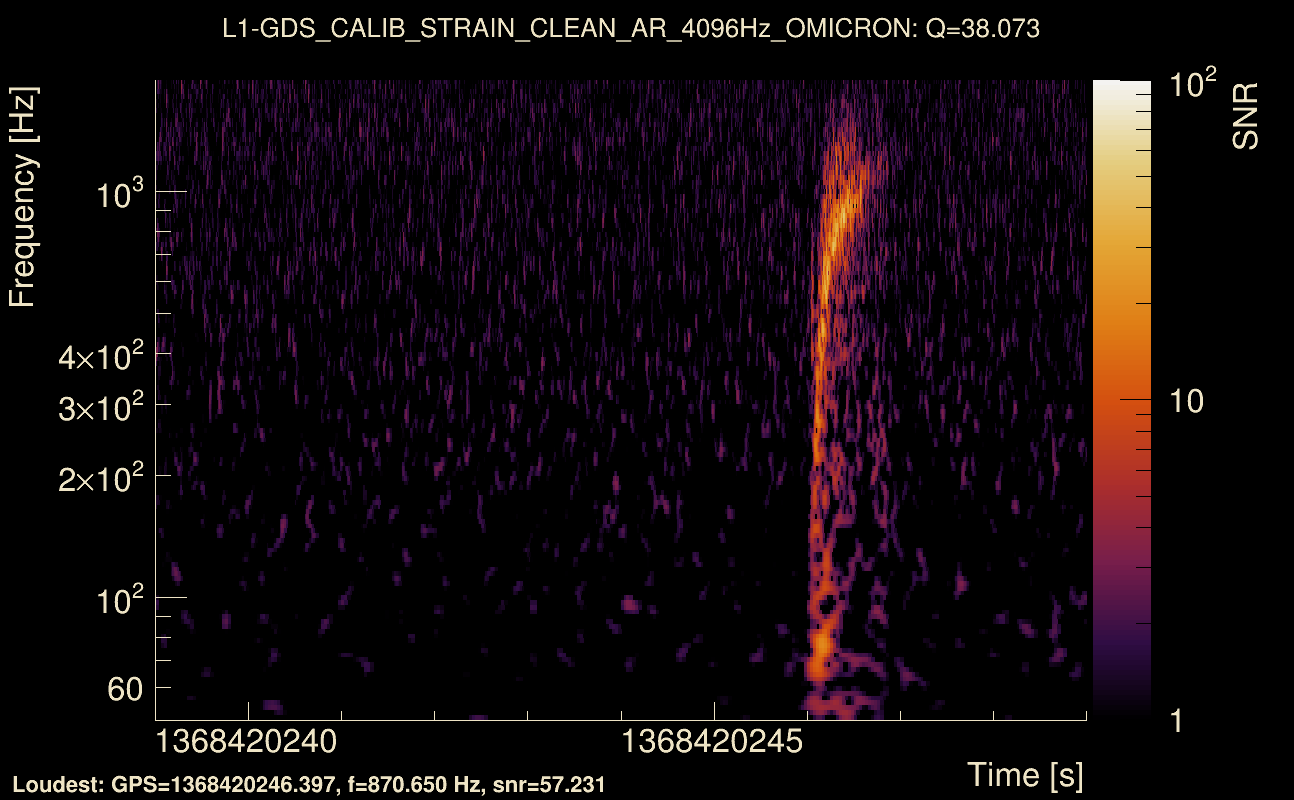
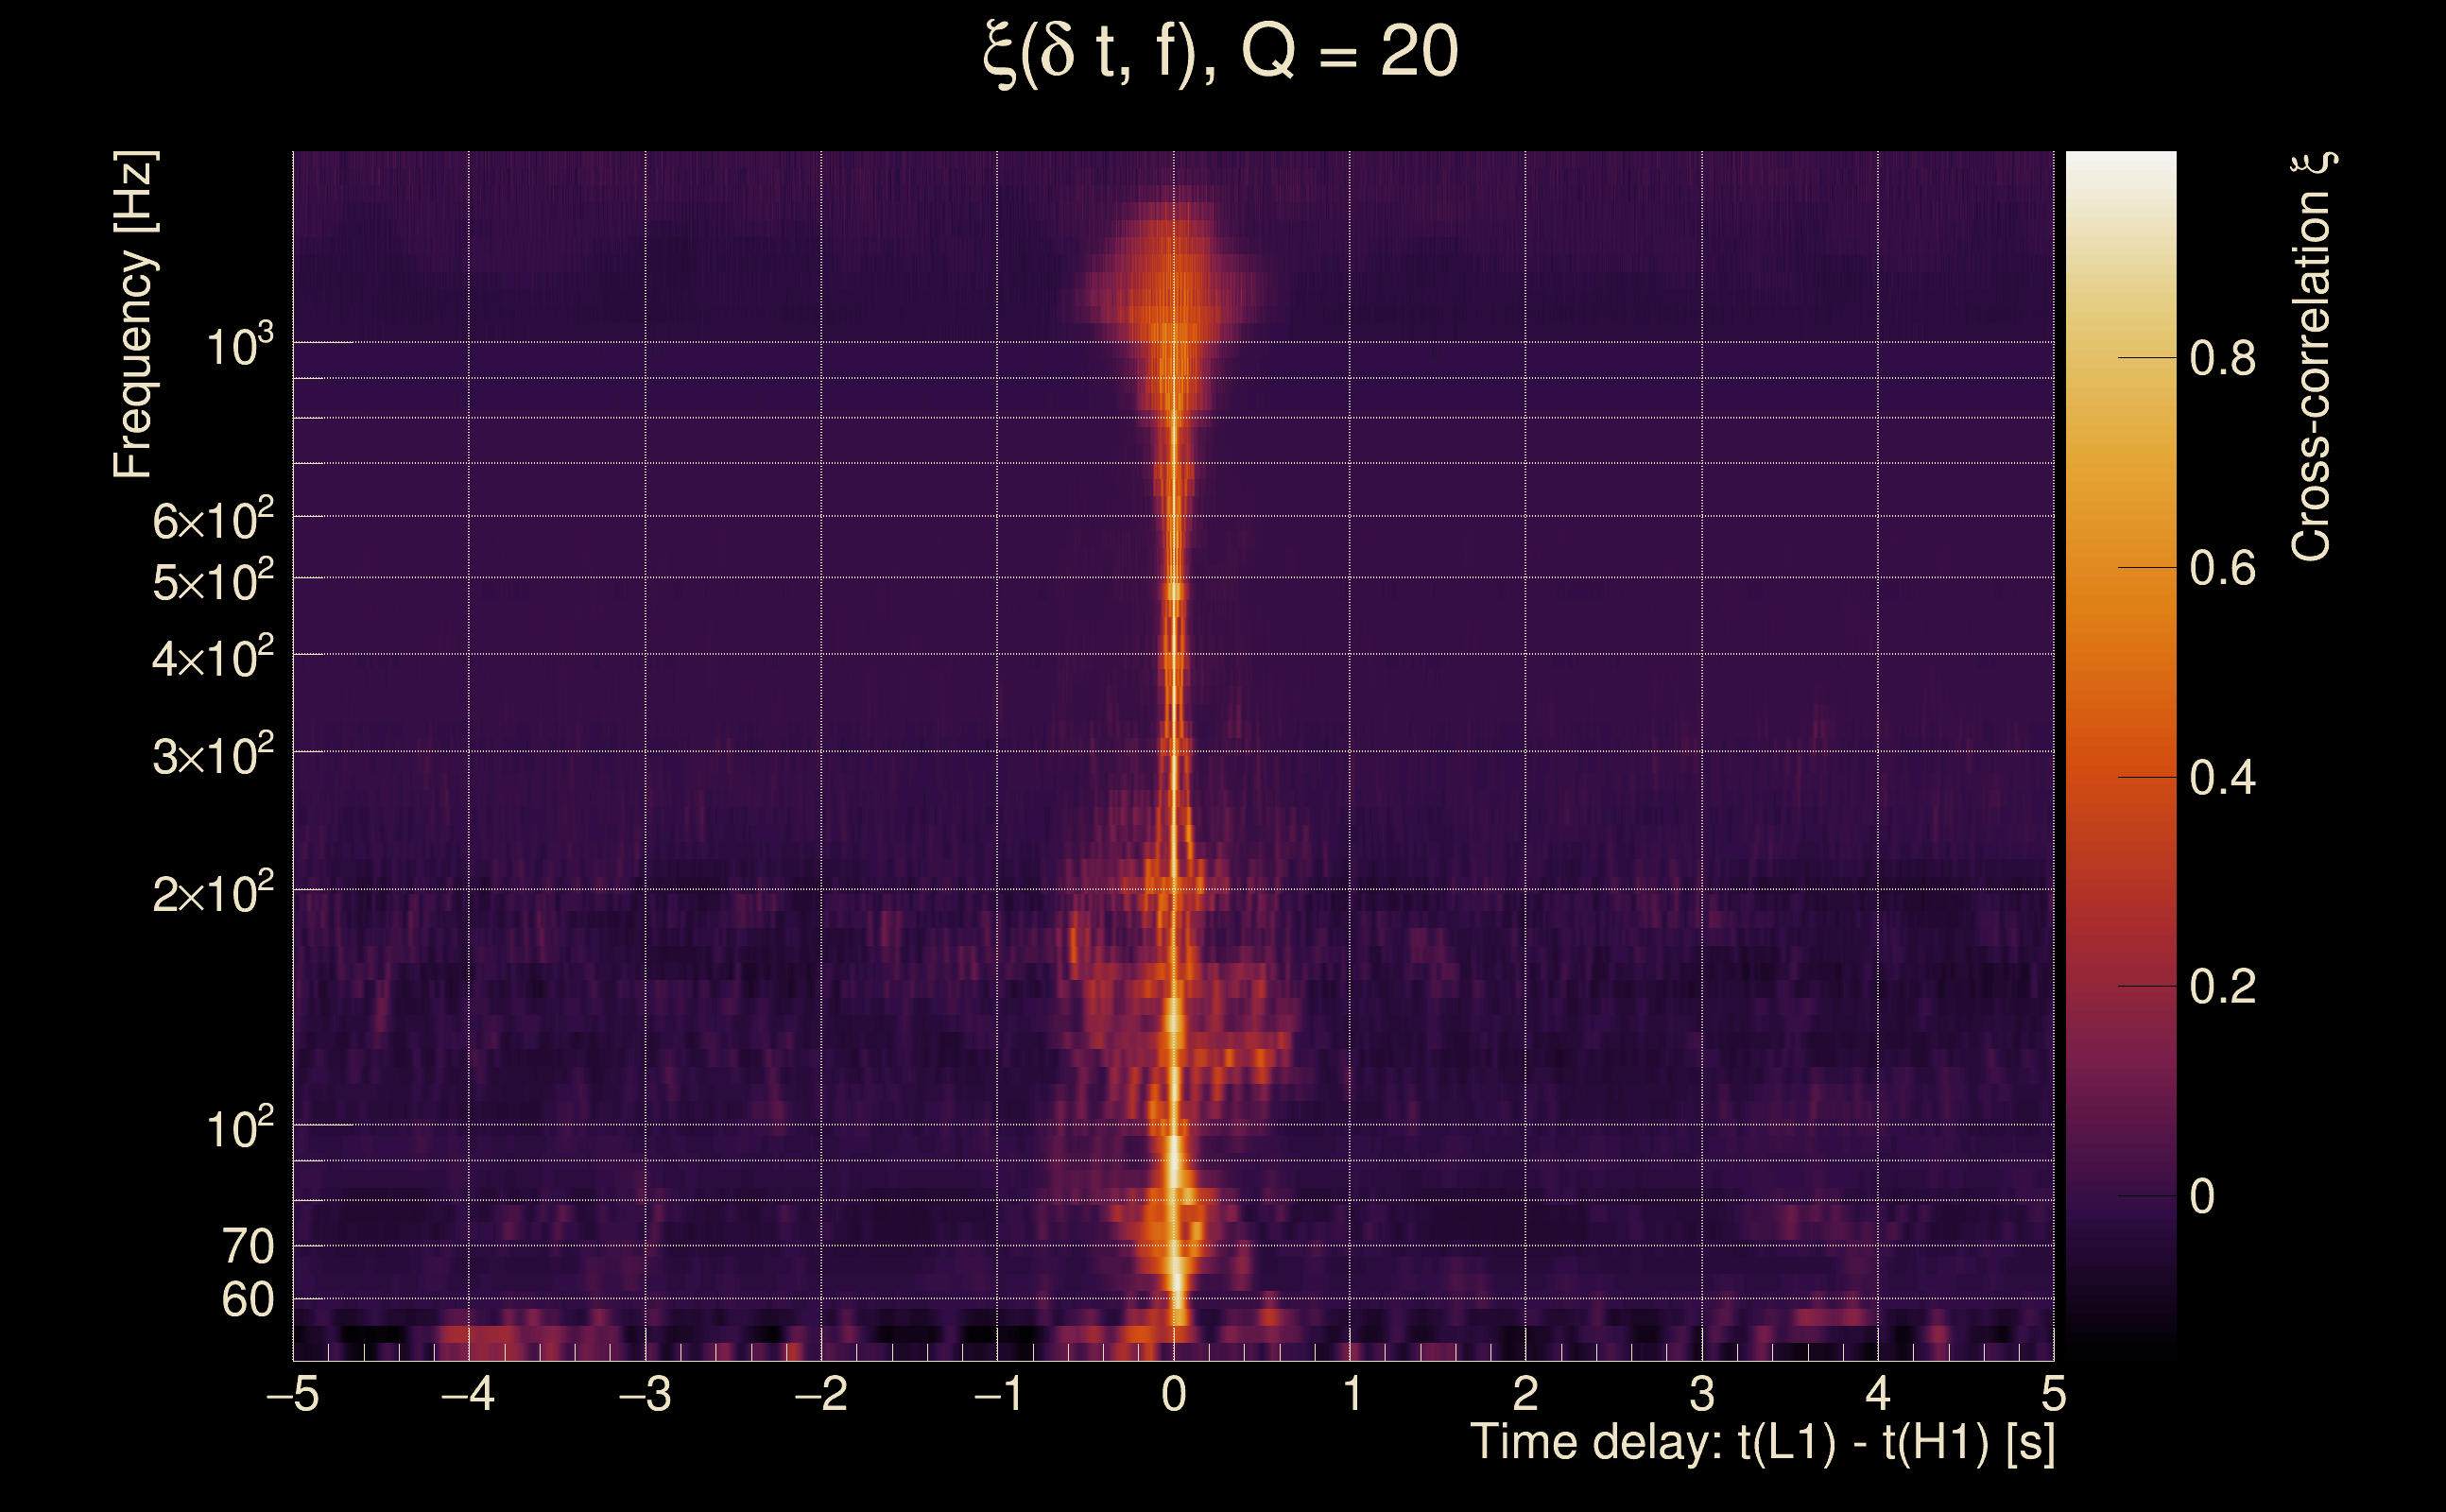
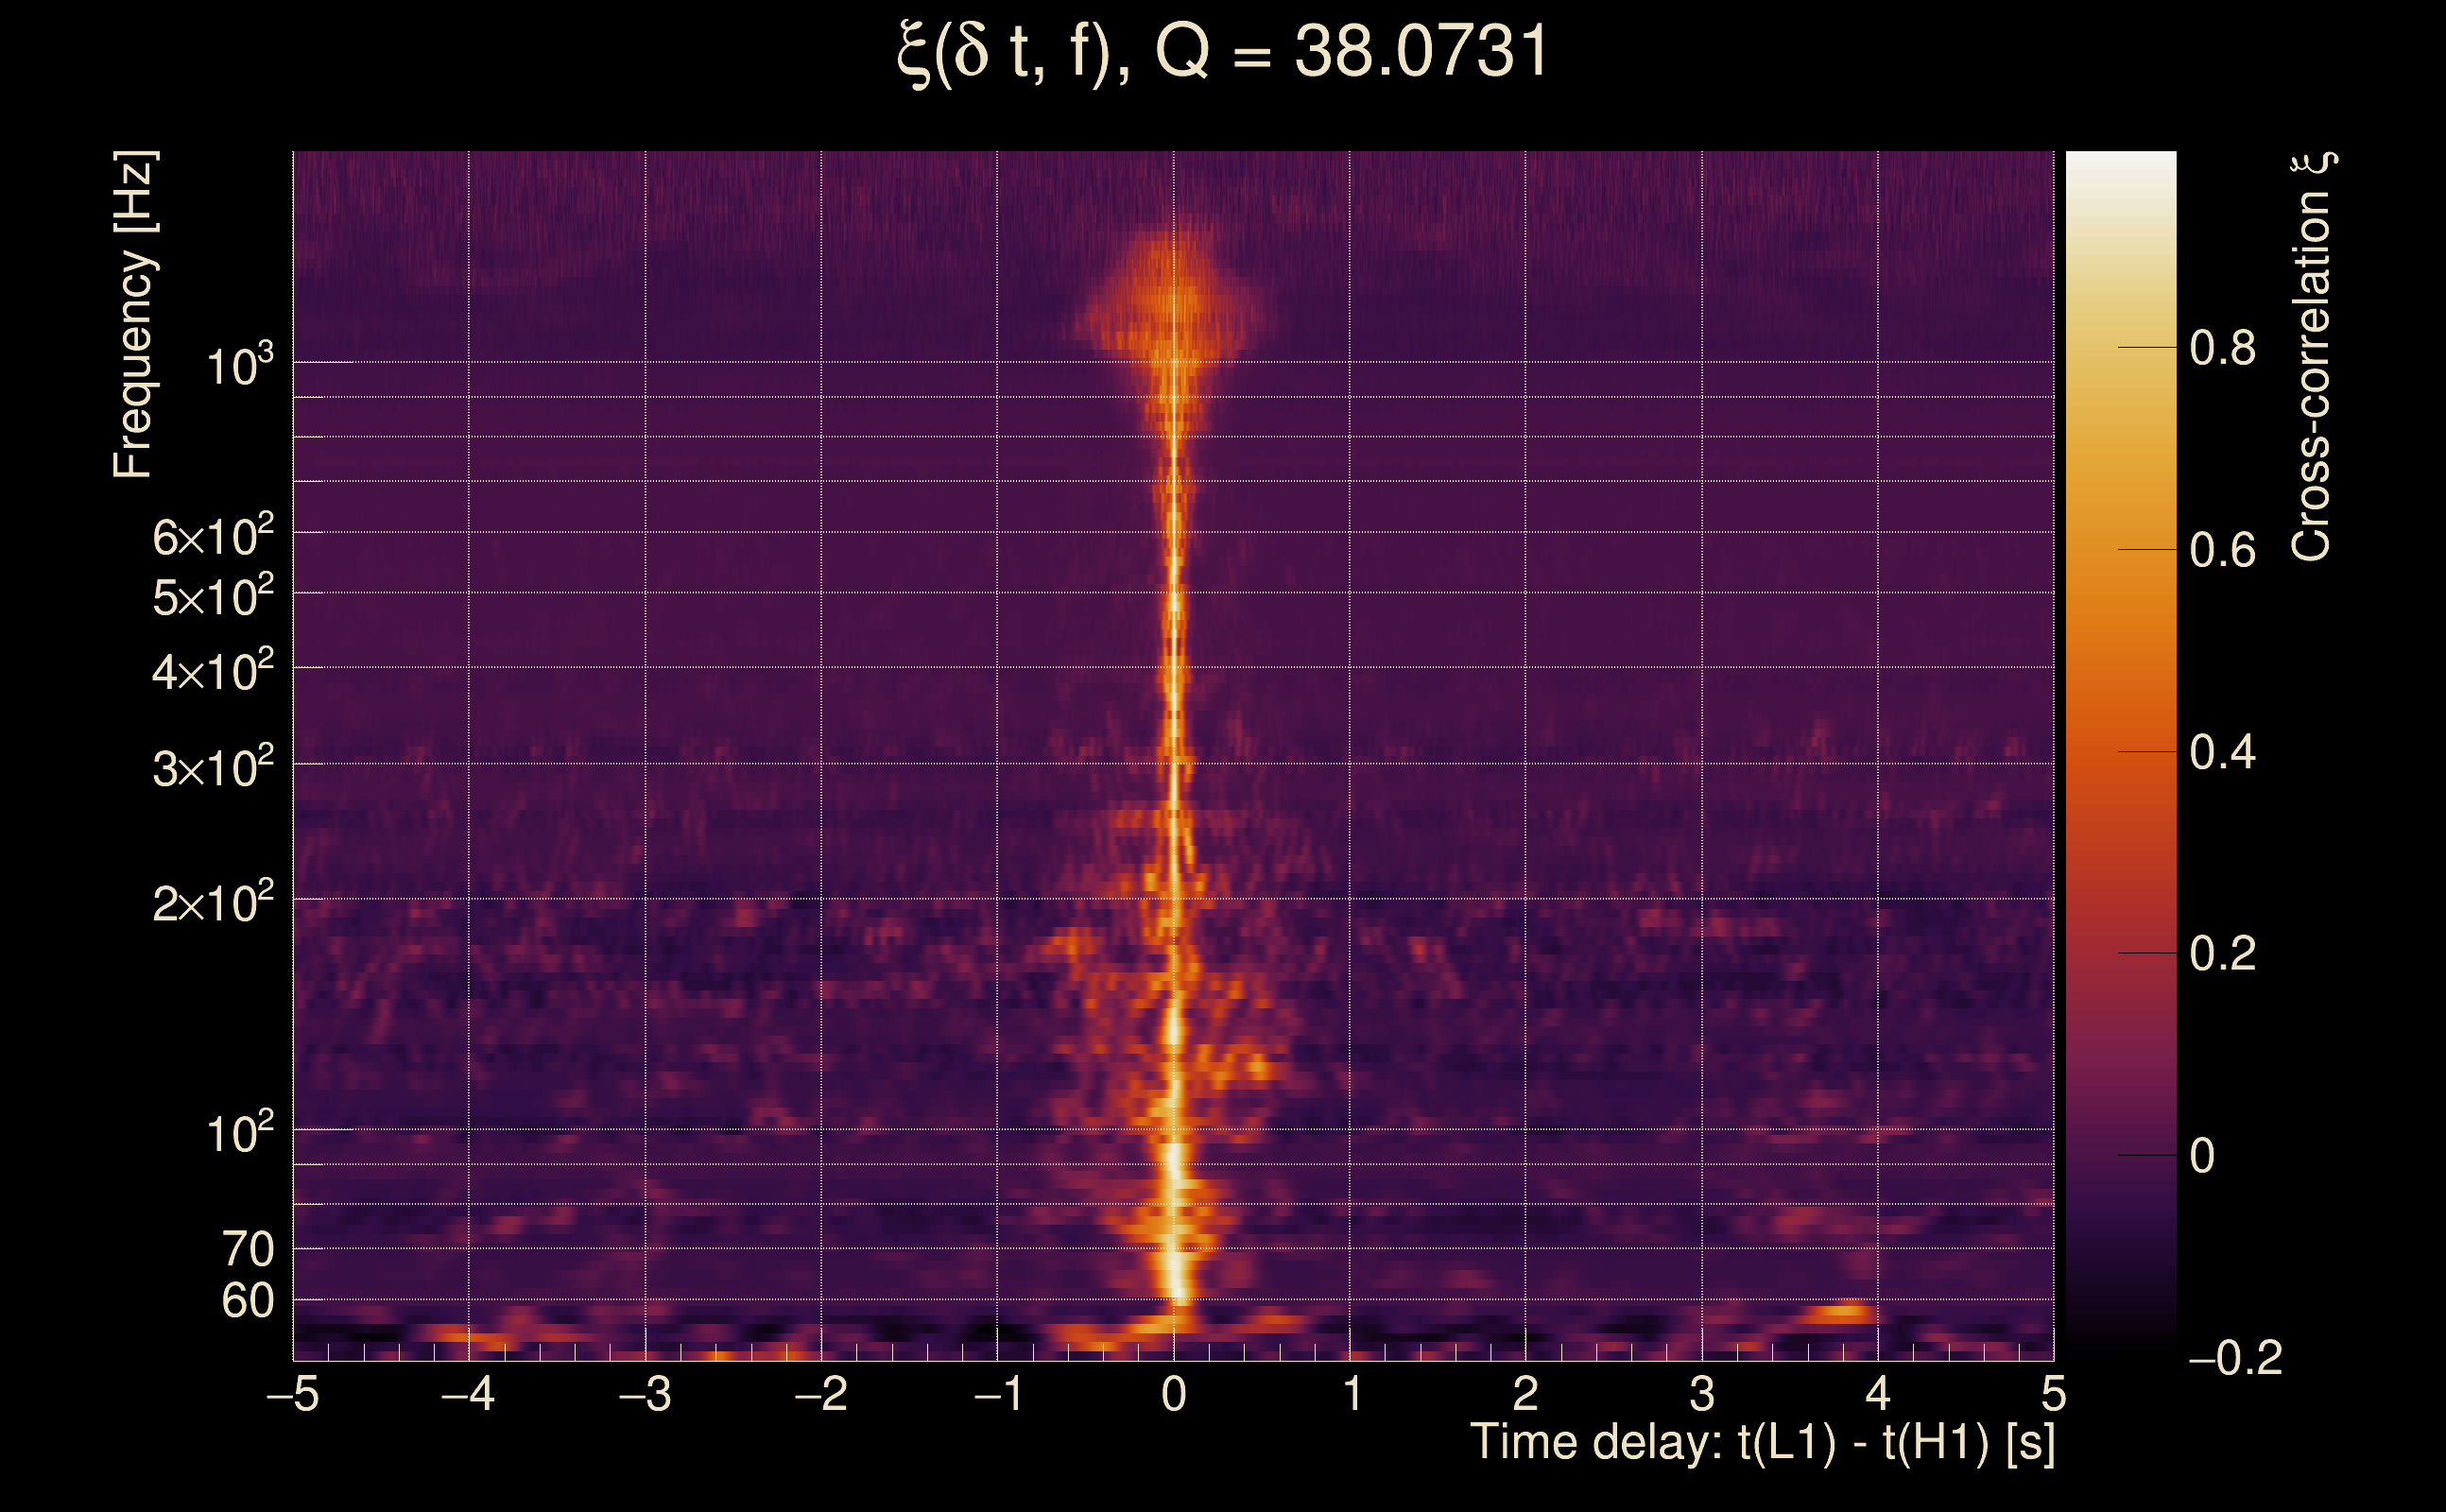
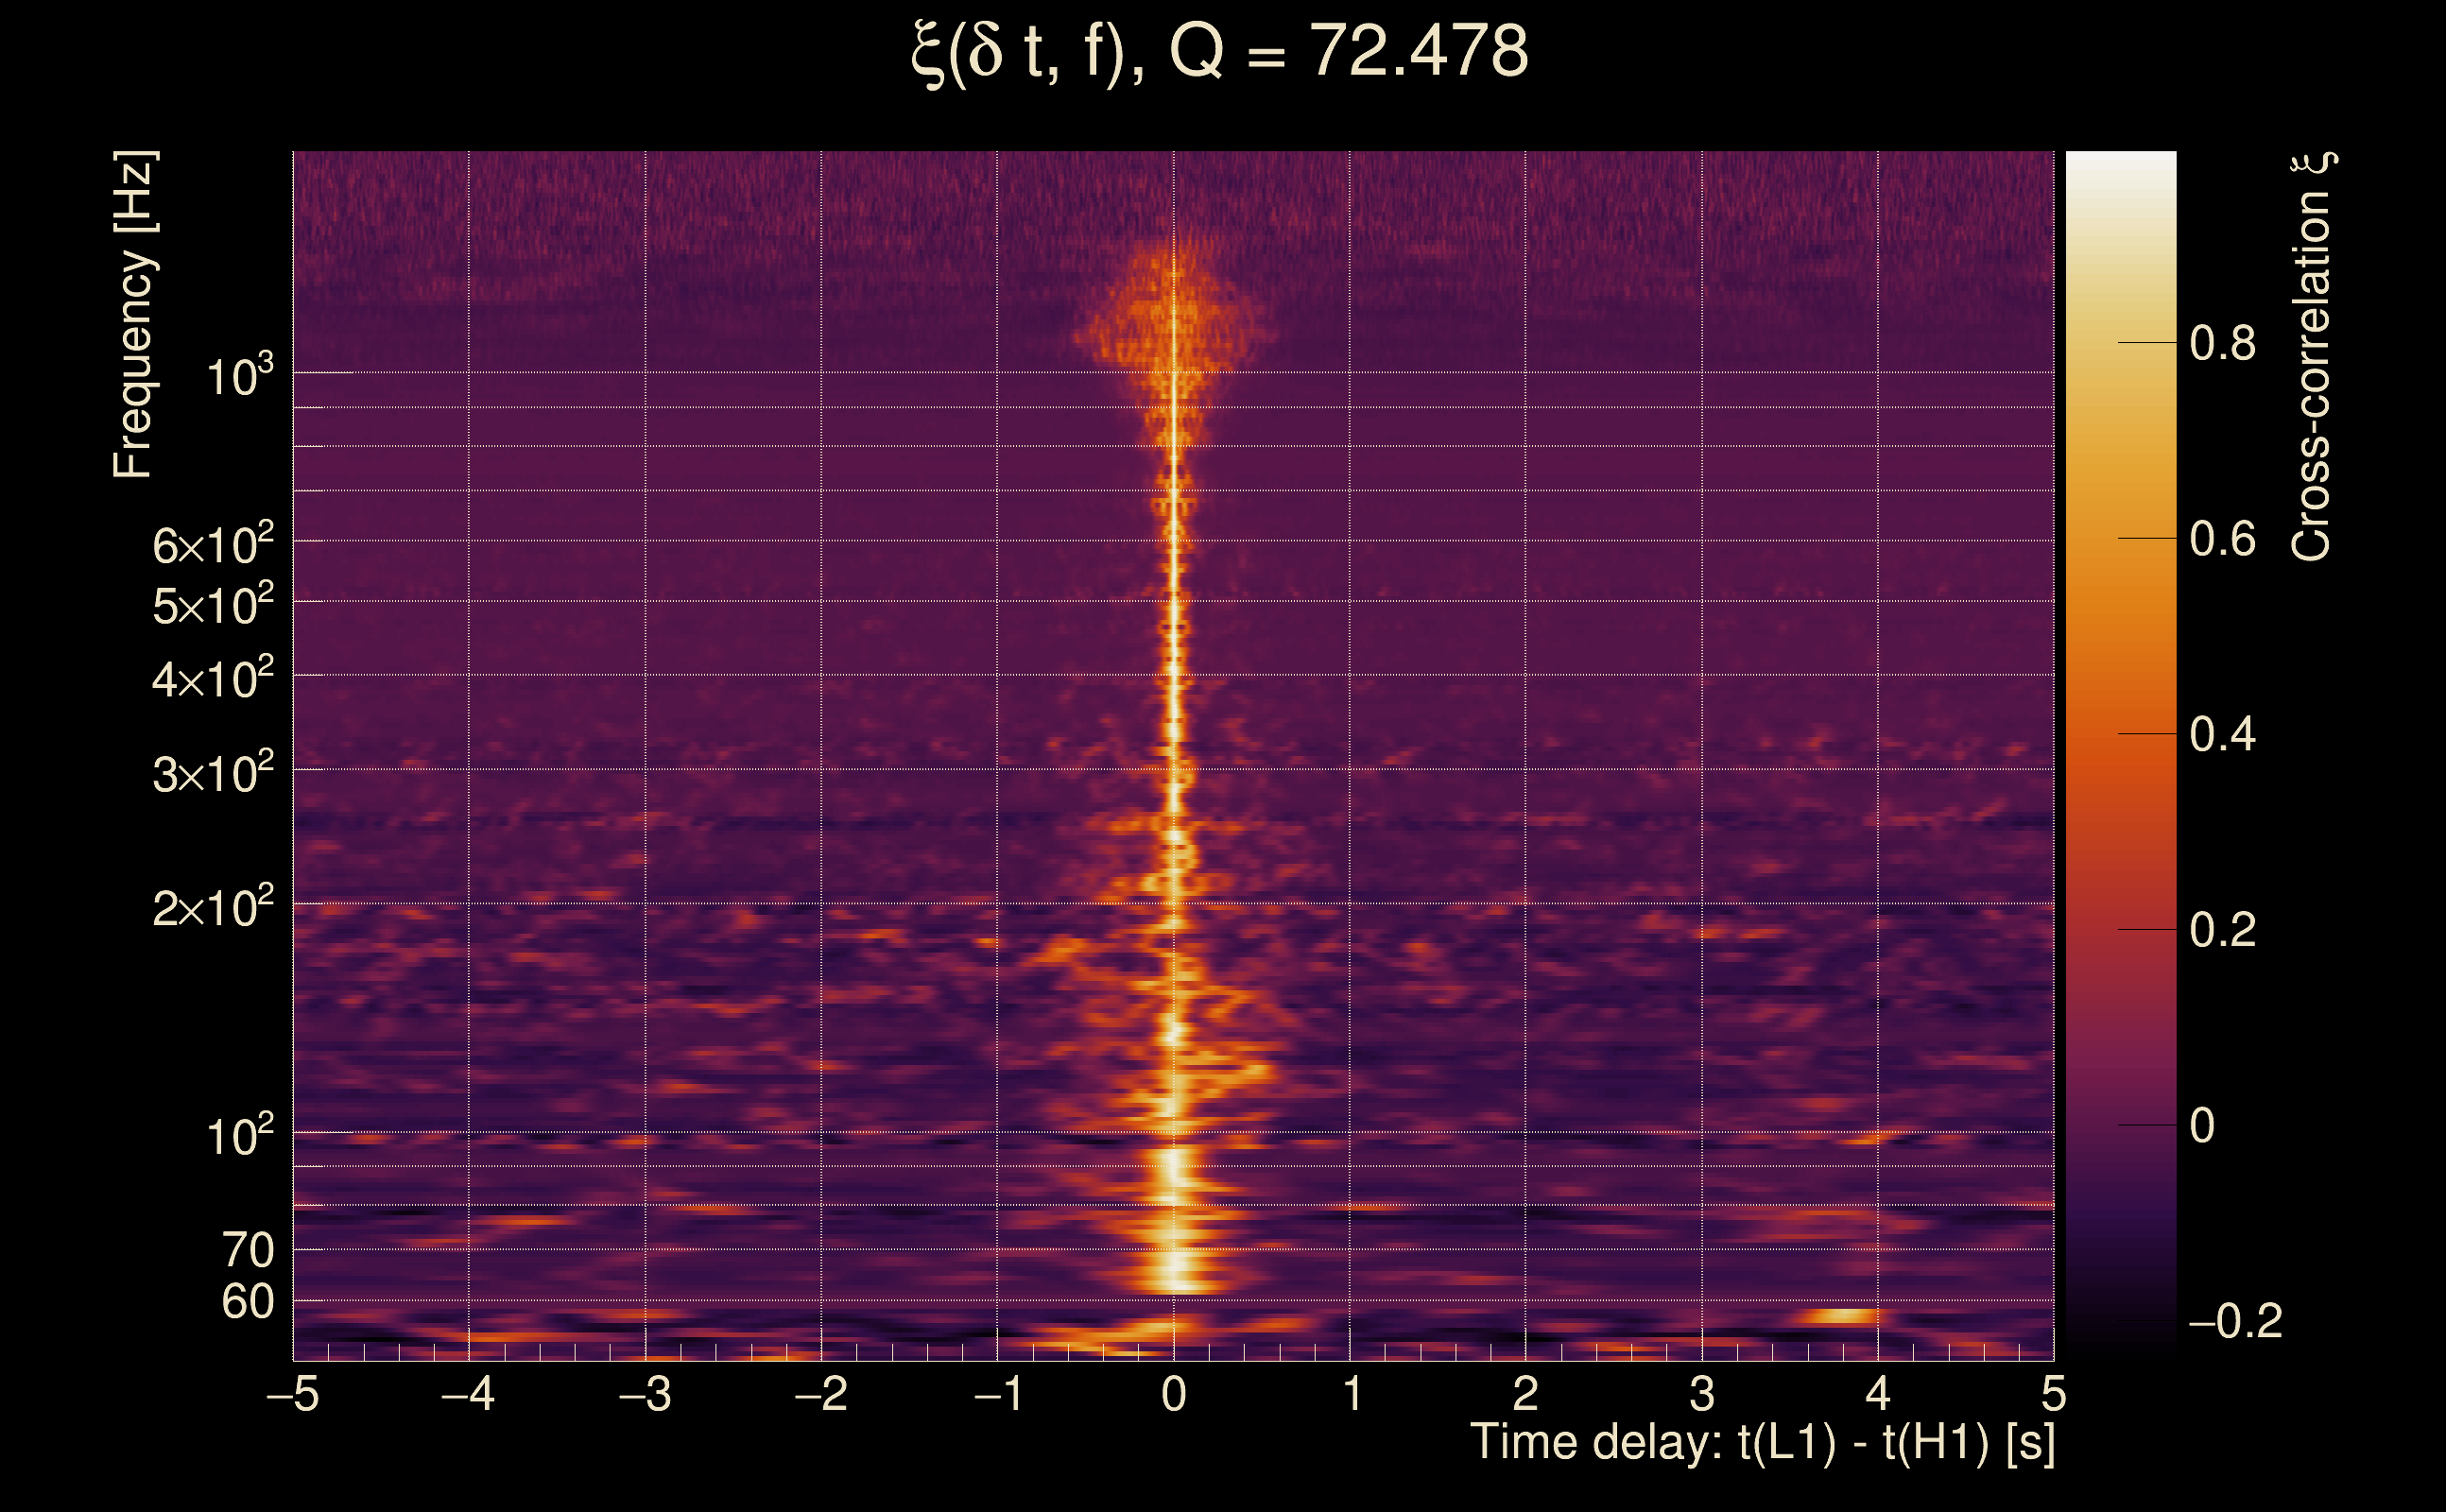
| Event time t(H1): | GPS = 1368420244 (Thu May 18 04:43:46 2023 ) → GPS = 1368420254 (Thu May 18 04:43:56 2023 ) |
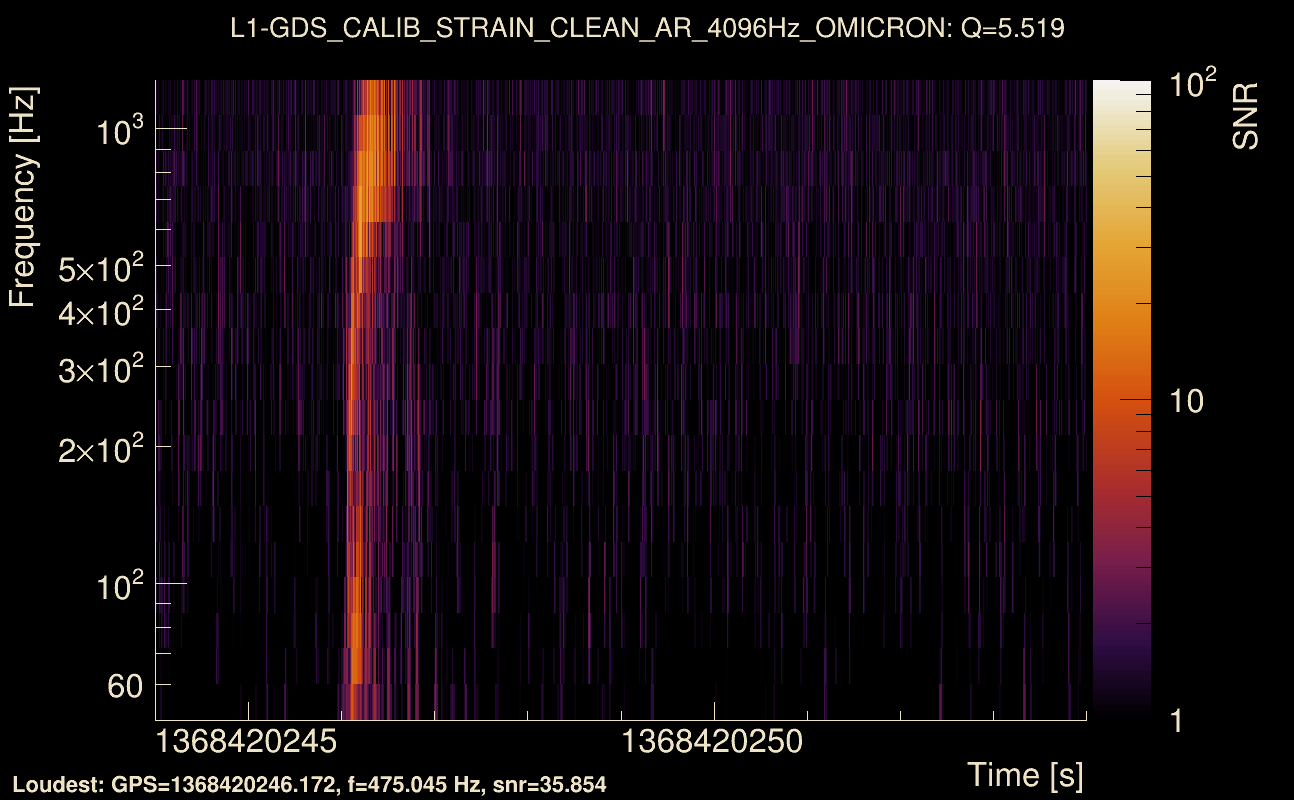
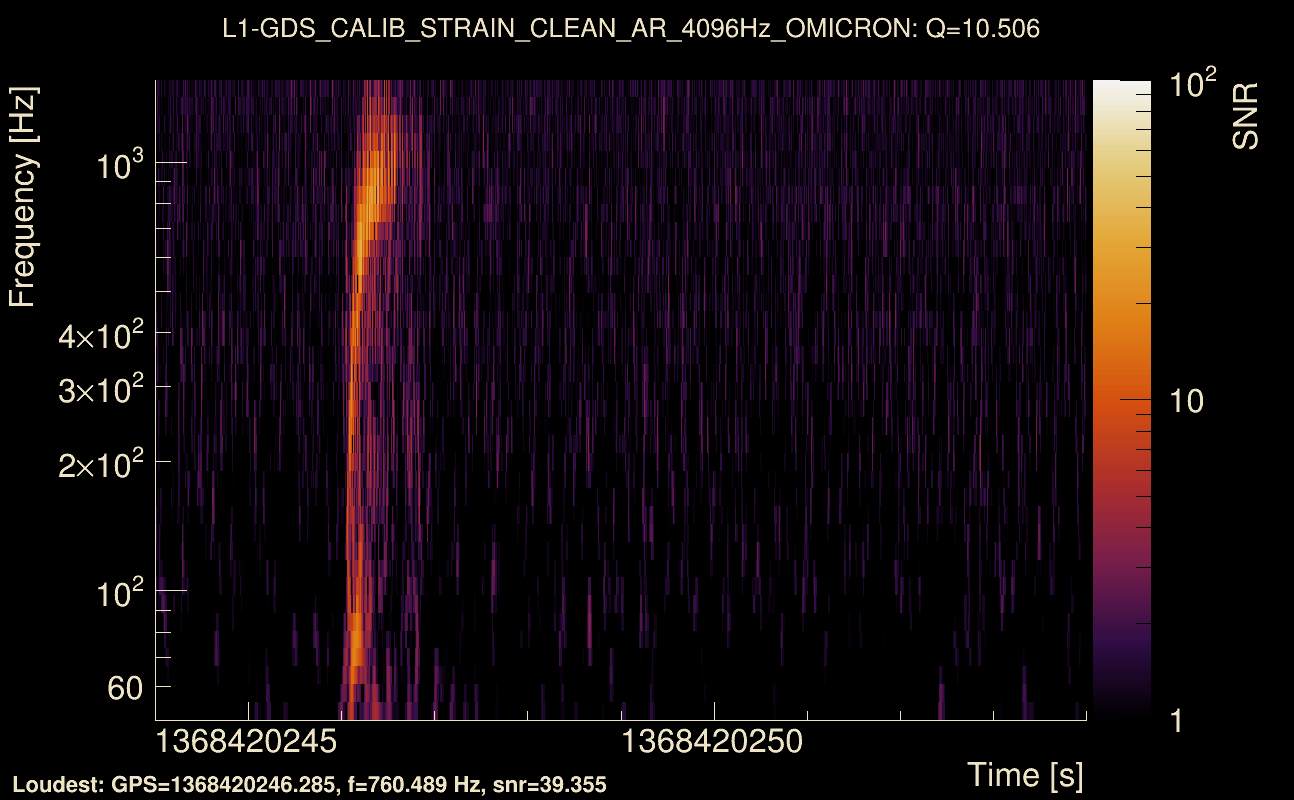
| Event time t(L1): | GPS = 1368420244 (Thu May 18 04:43:56 2023 ) → GPS = 1368420254 (Thu May 18 04:43:56 2023 ) |
| Omicron analysis time window (H1): | GPS = 1368420241 → GPS = 1368420257 |
| Omicron analysis time window (L1): | GPS = 1368420241 → GPS = 1368420257 |
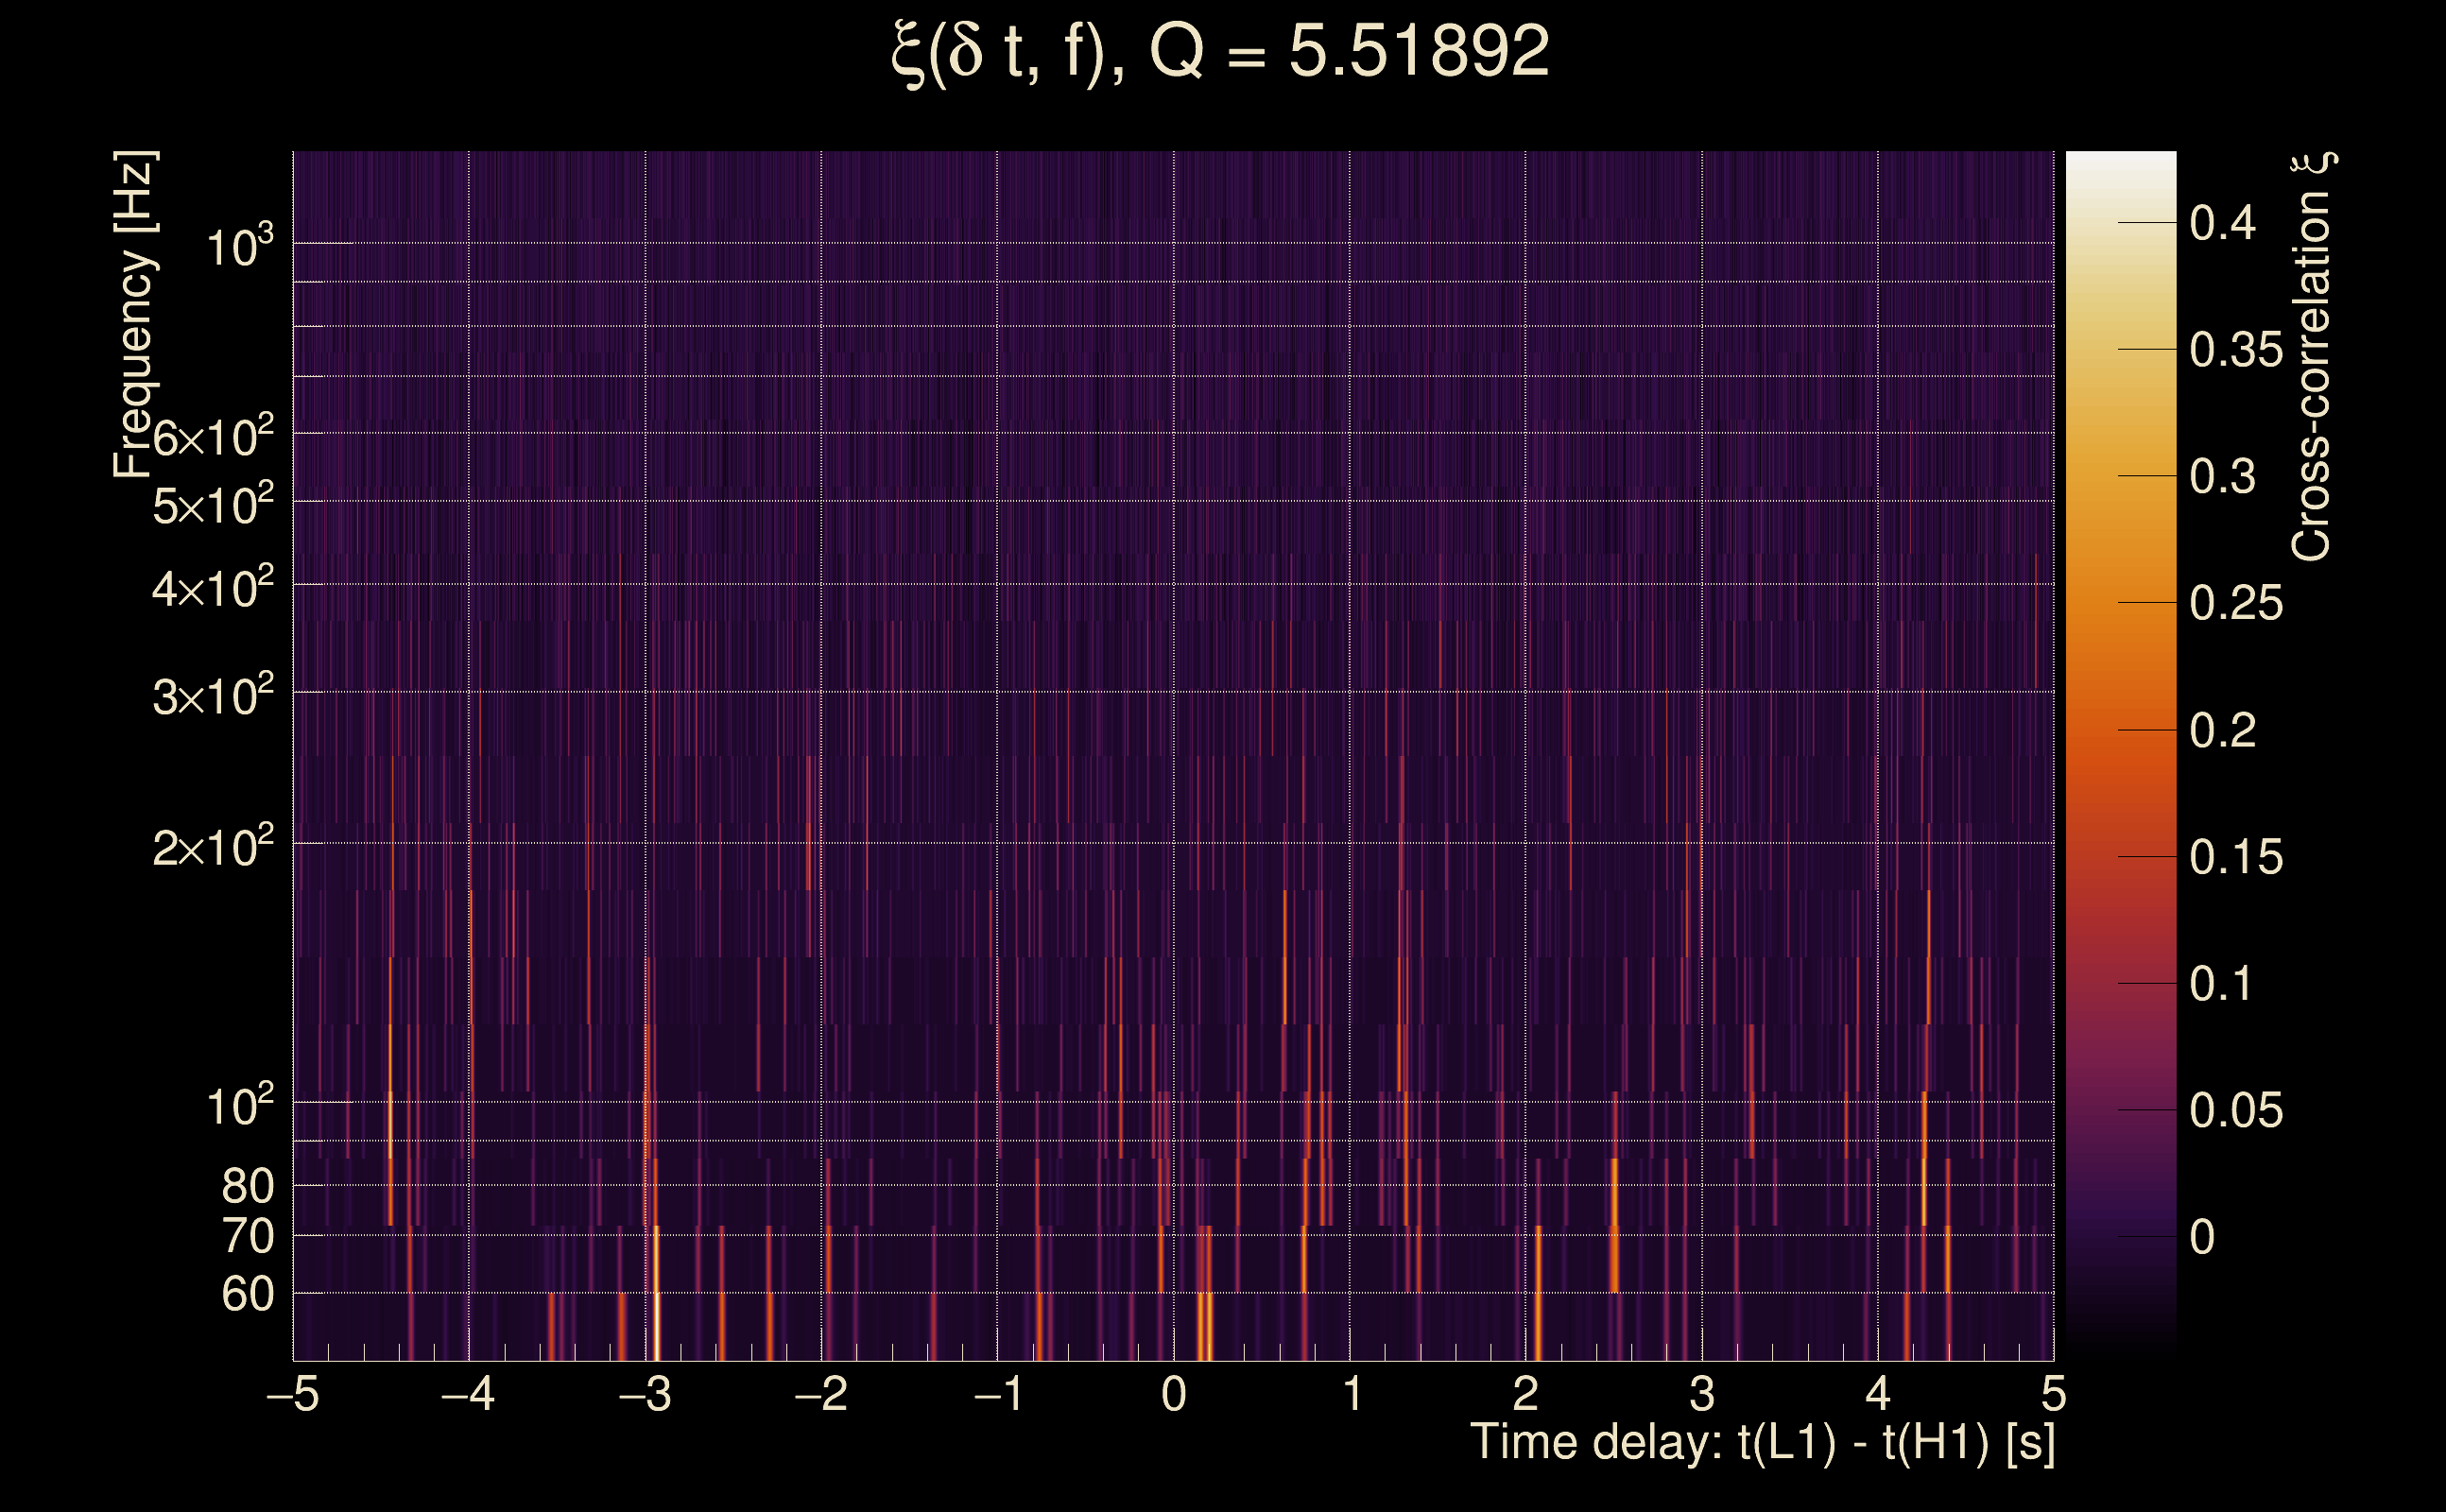
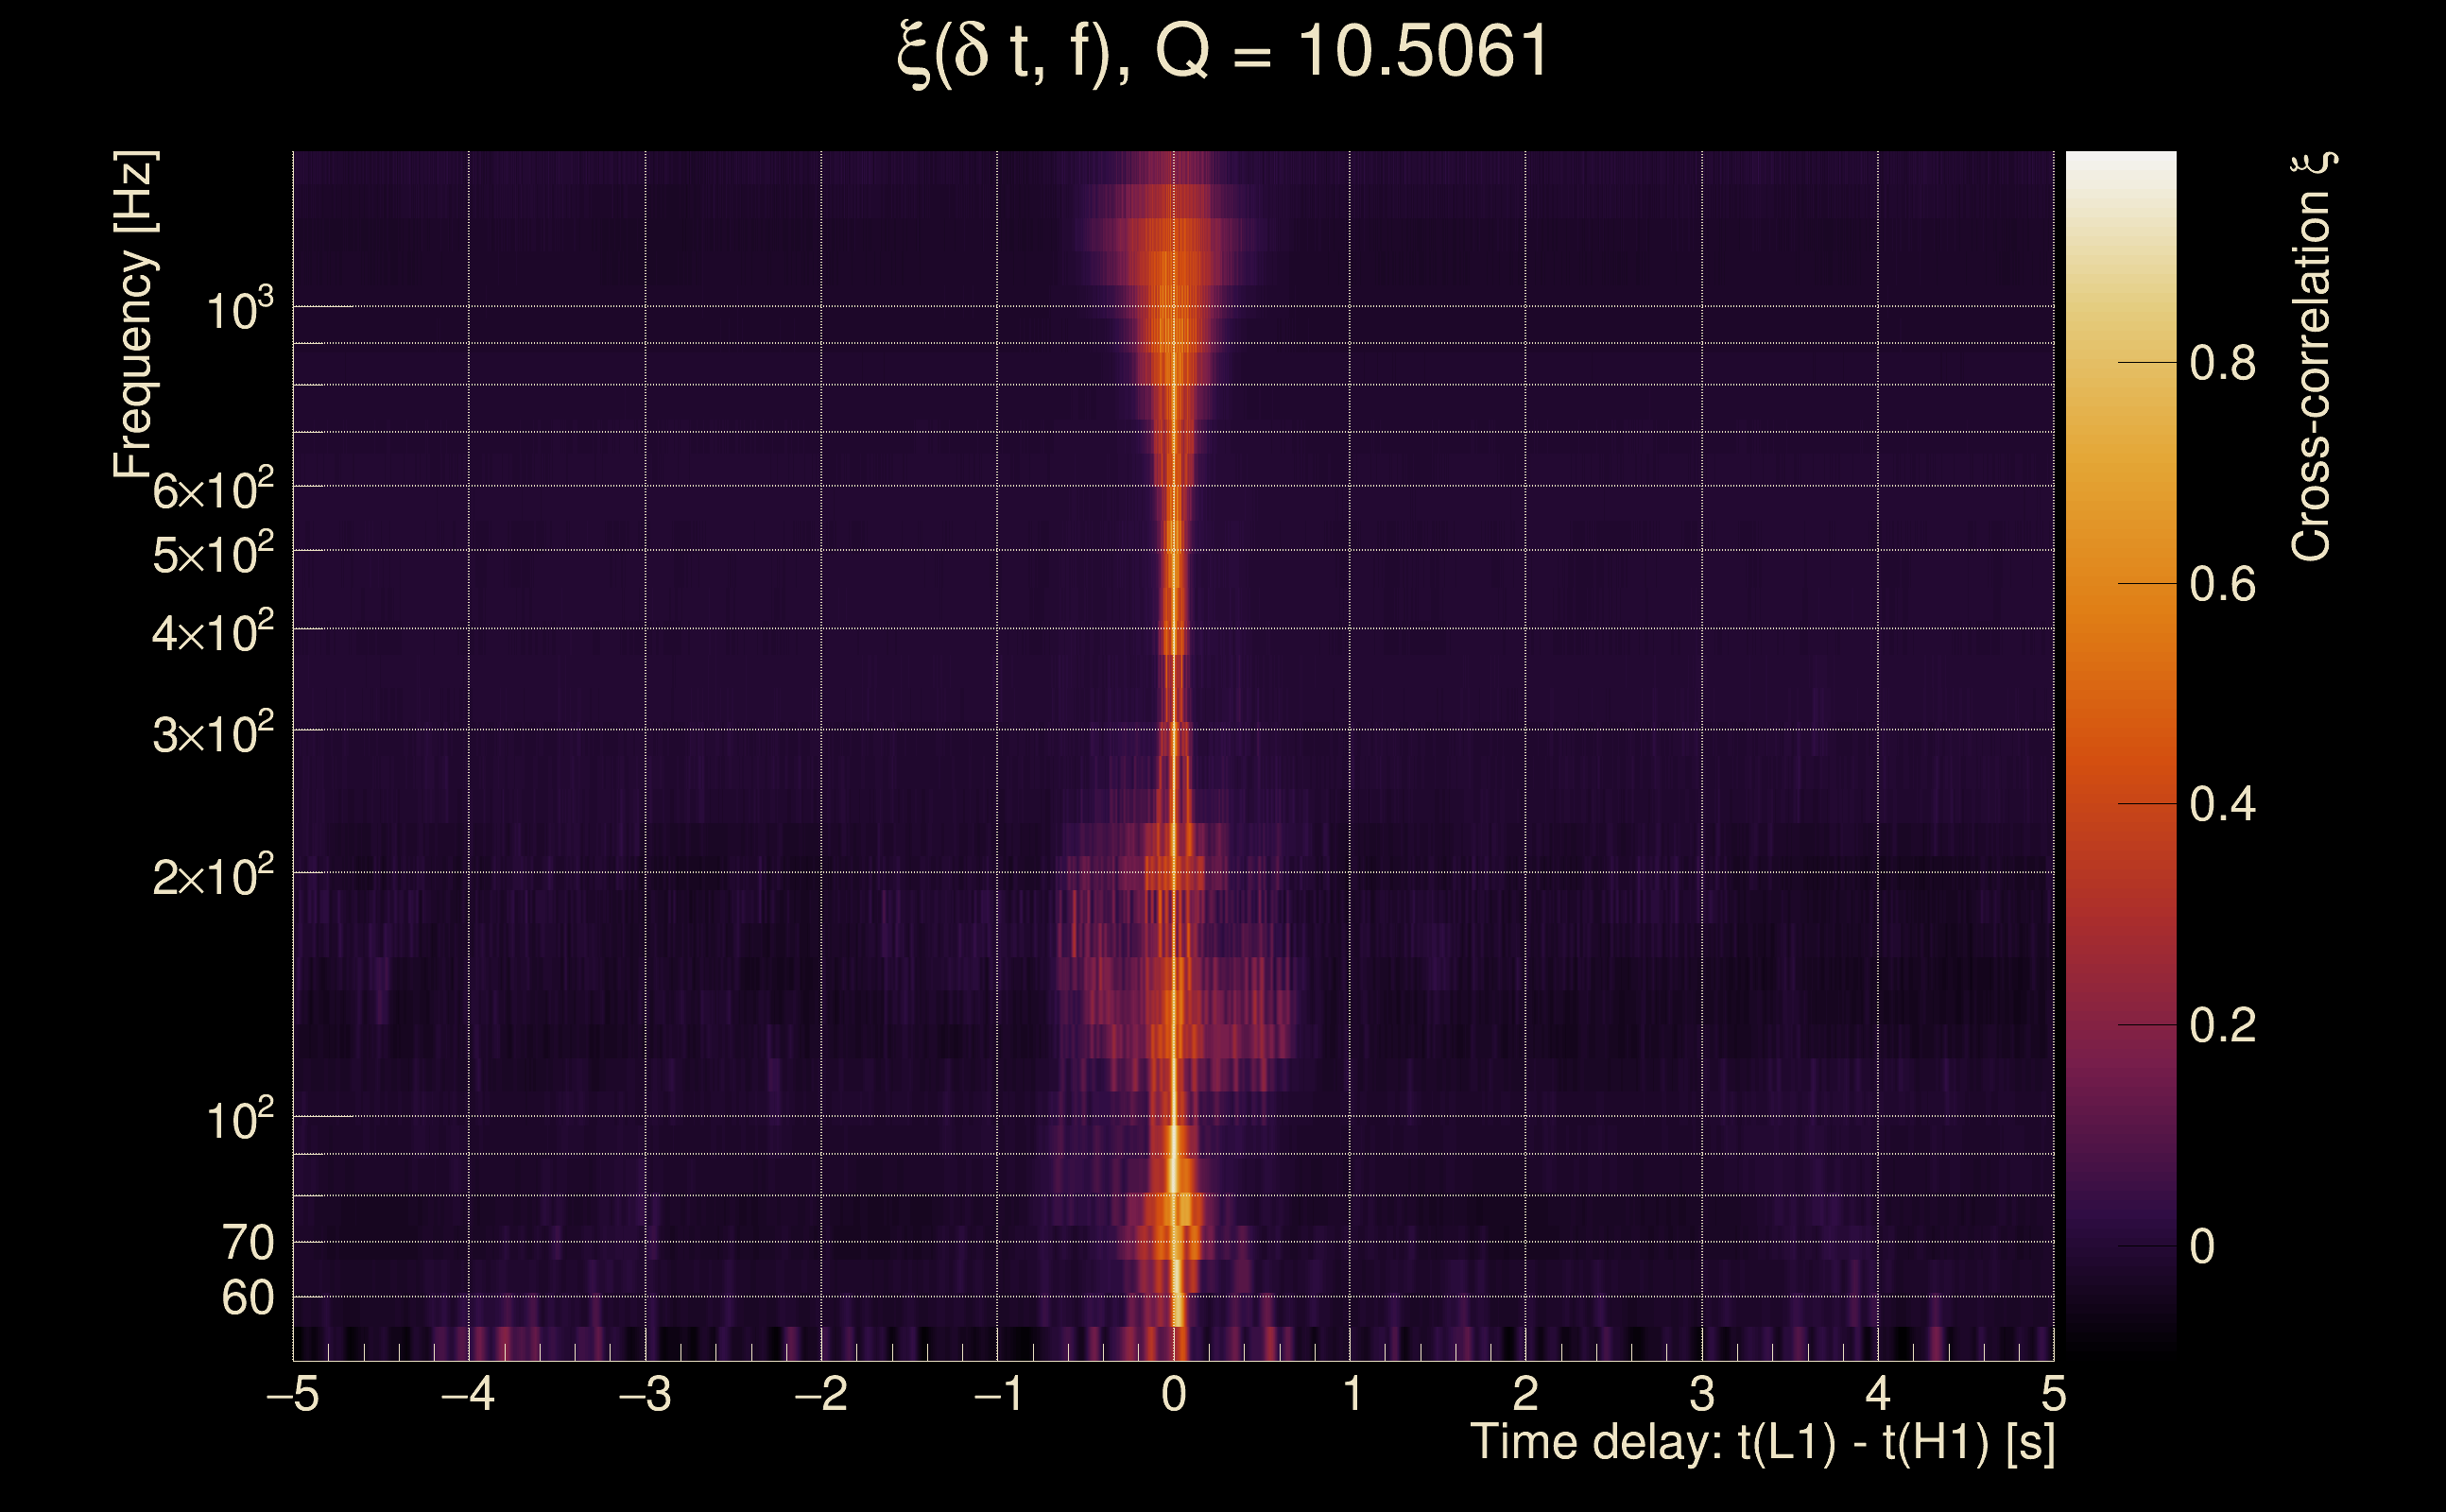
| Time delay between detectors t(L1) - t(H1): | 0.000935199 s (slice index = 108 / 217), δt_gw = 0.000935199 s |
| Time delay standard deviation: | 0.0214054 s |
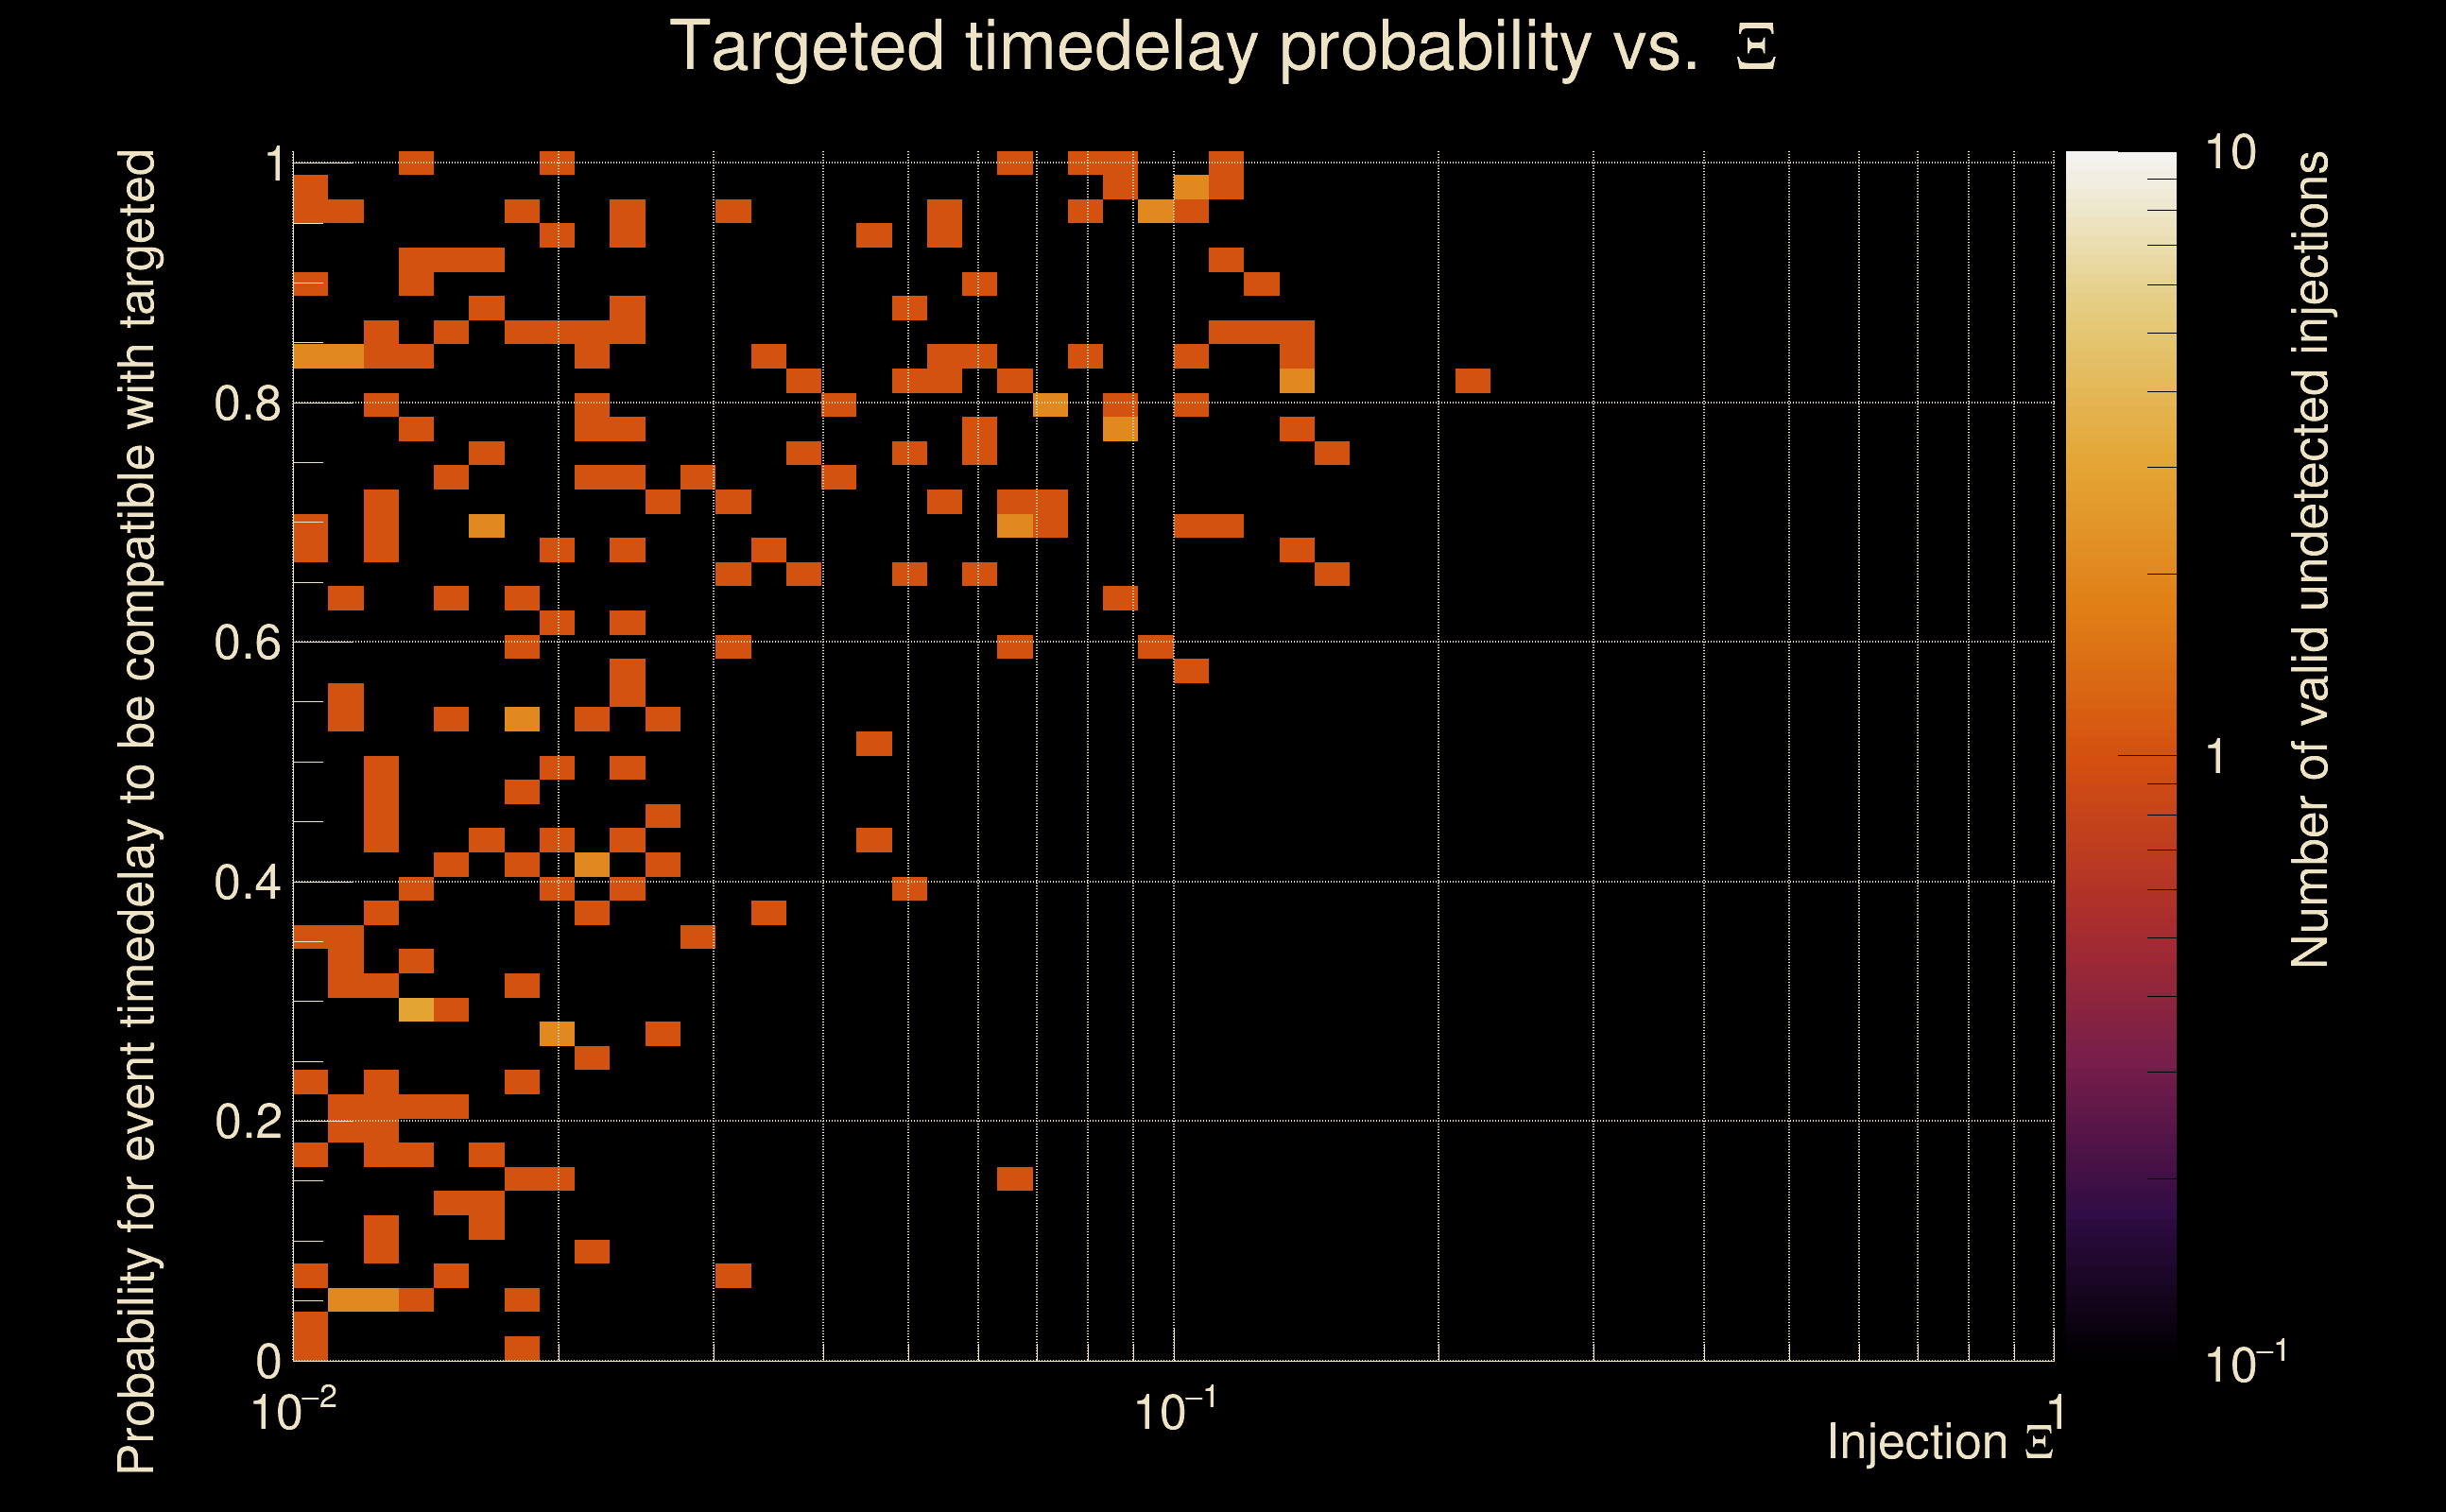
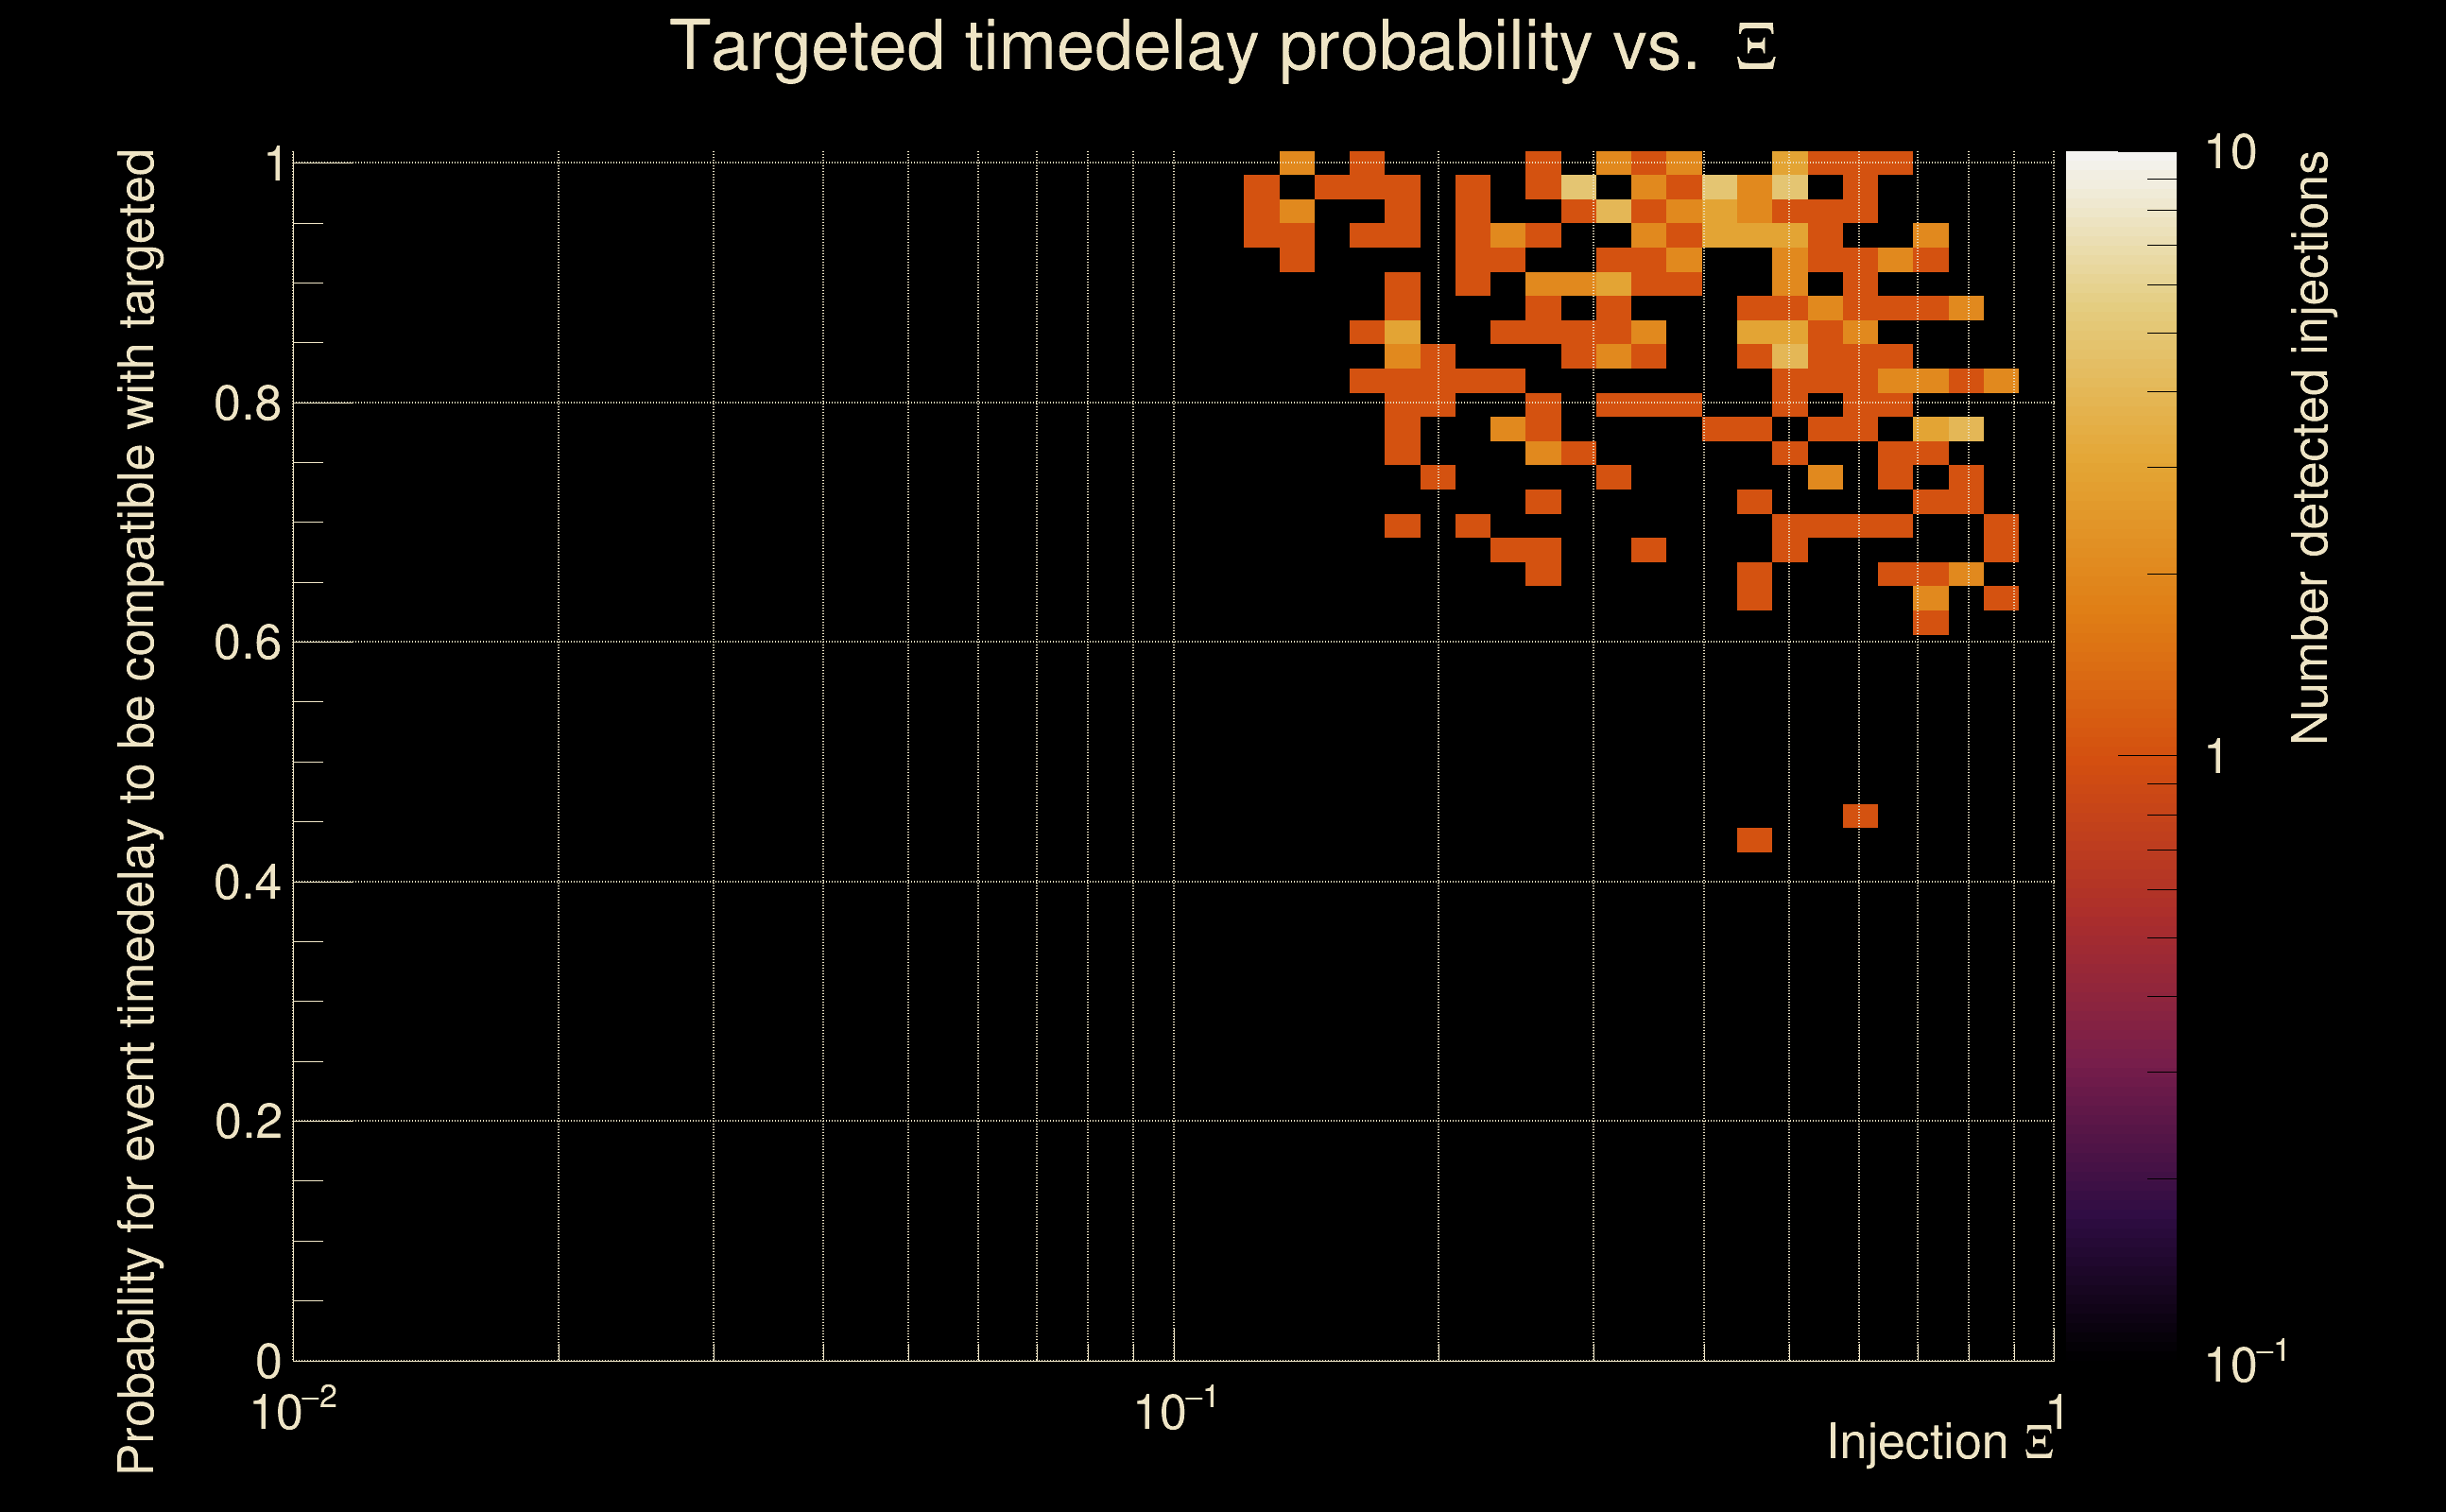
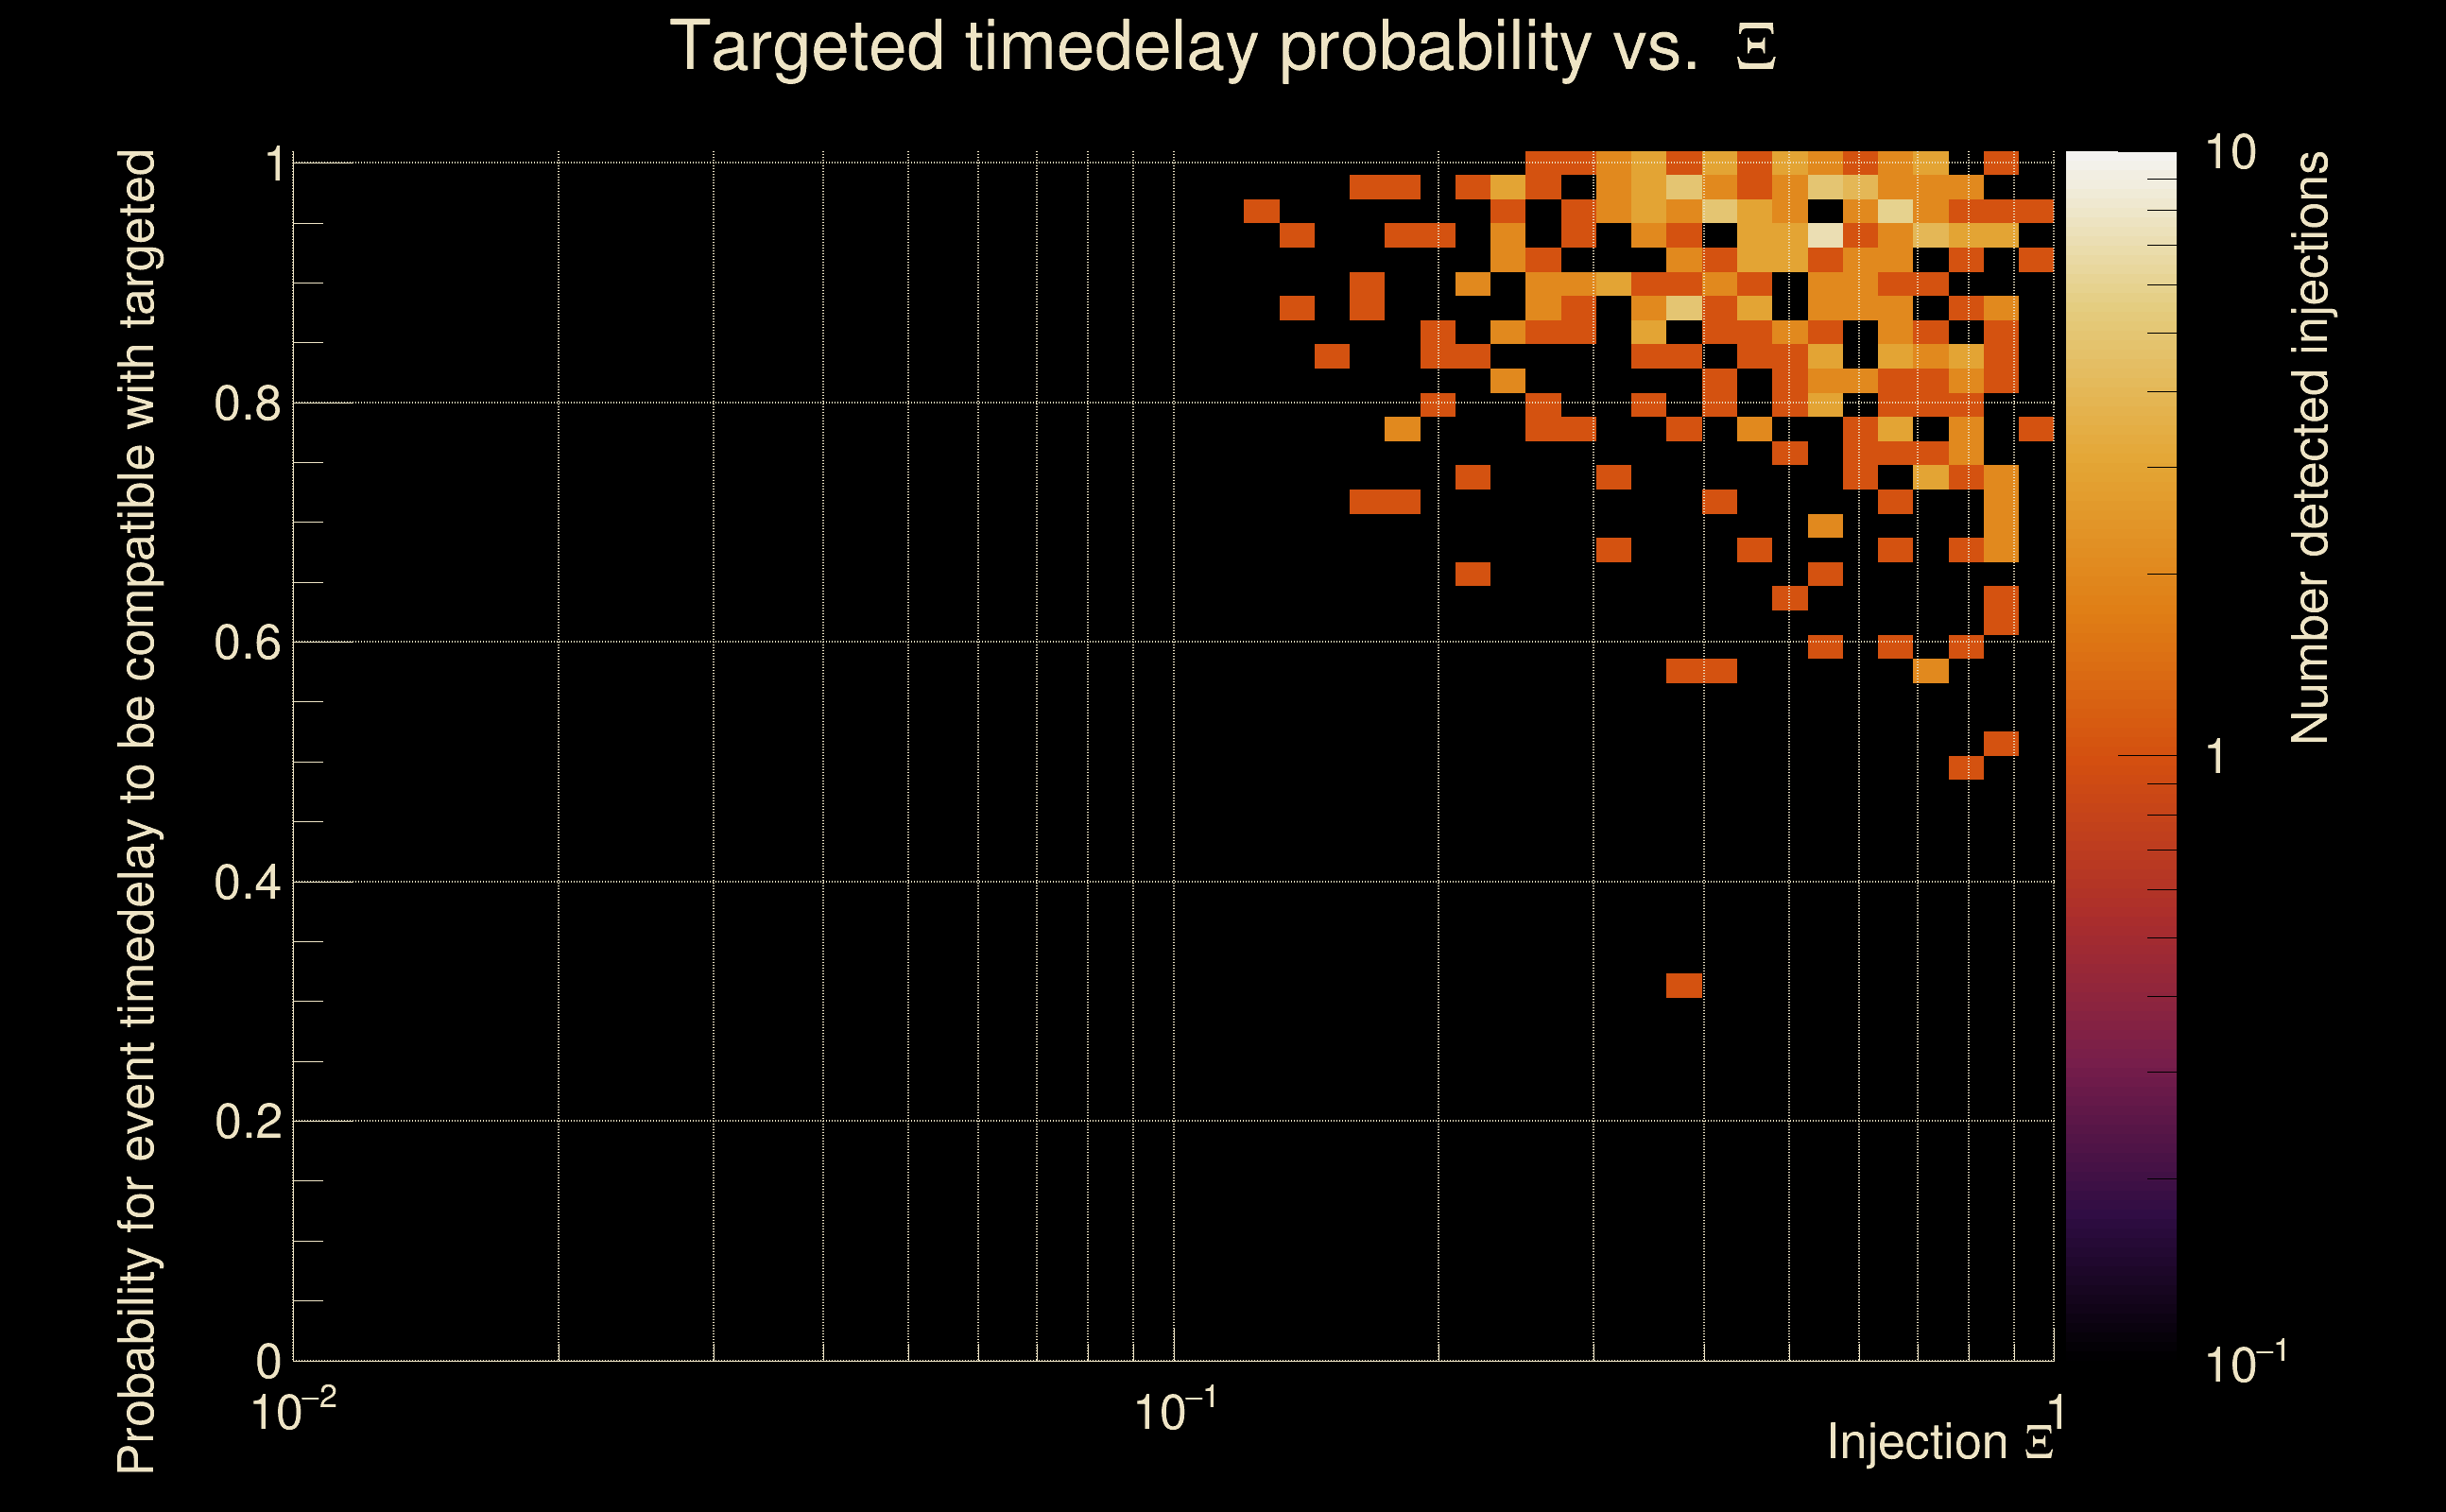
| [targeted mode] Time delay probability: | 0.955388 (0.0559423 sigmas), δt_target = 1.72247e+45 s |
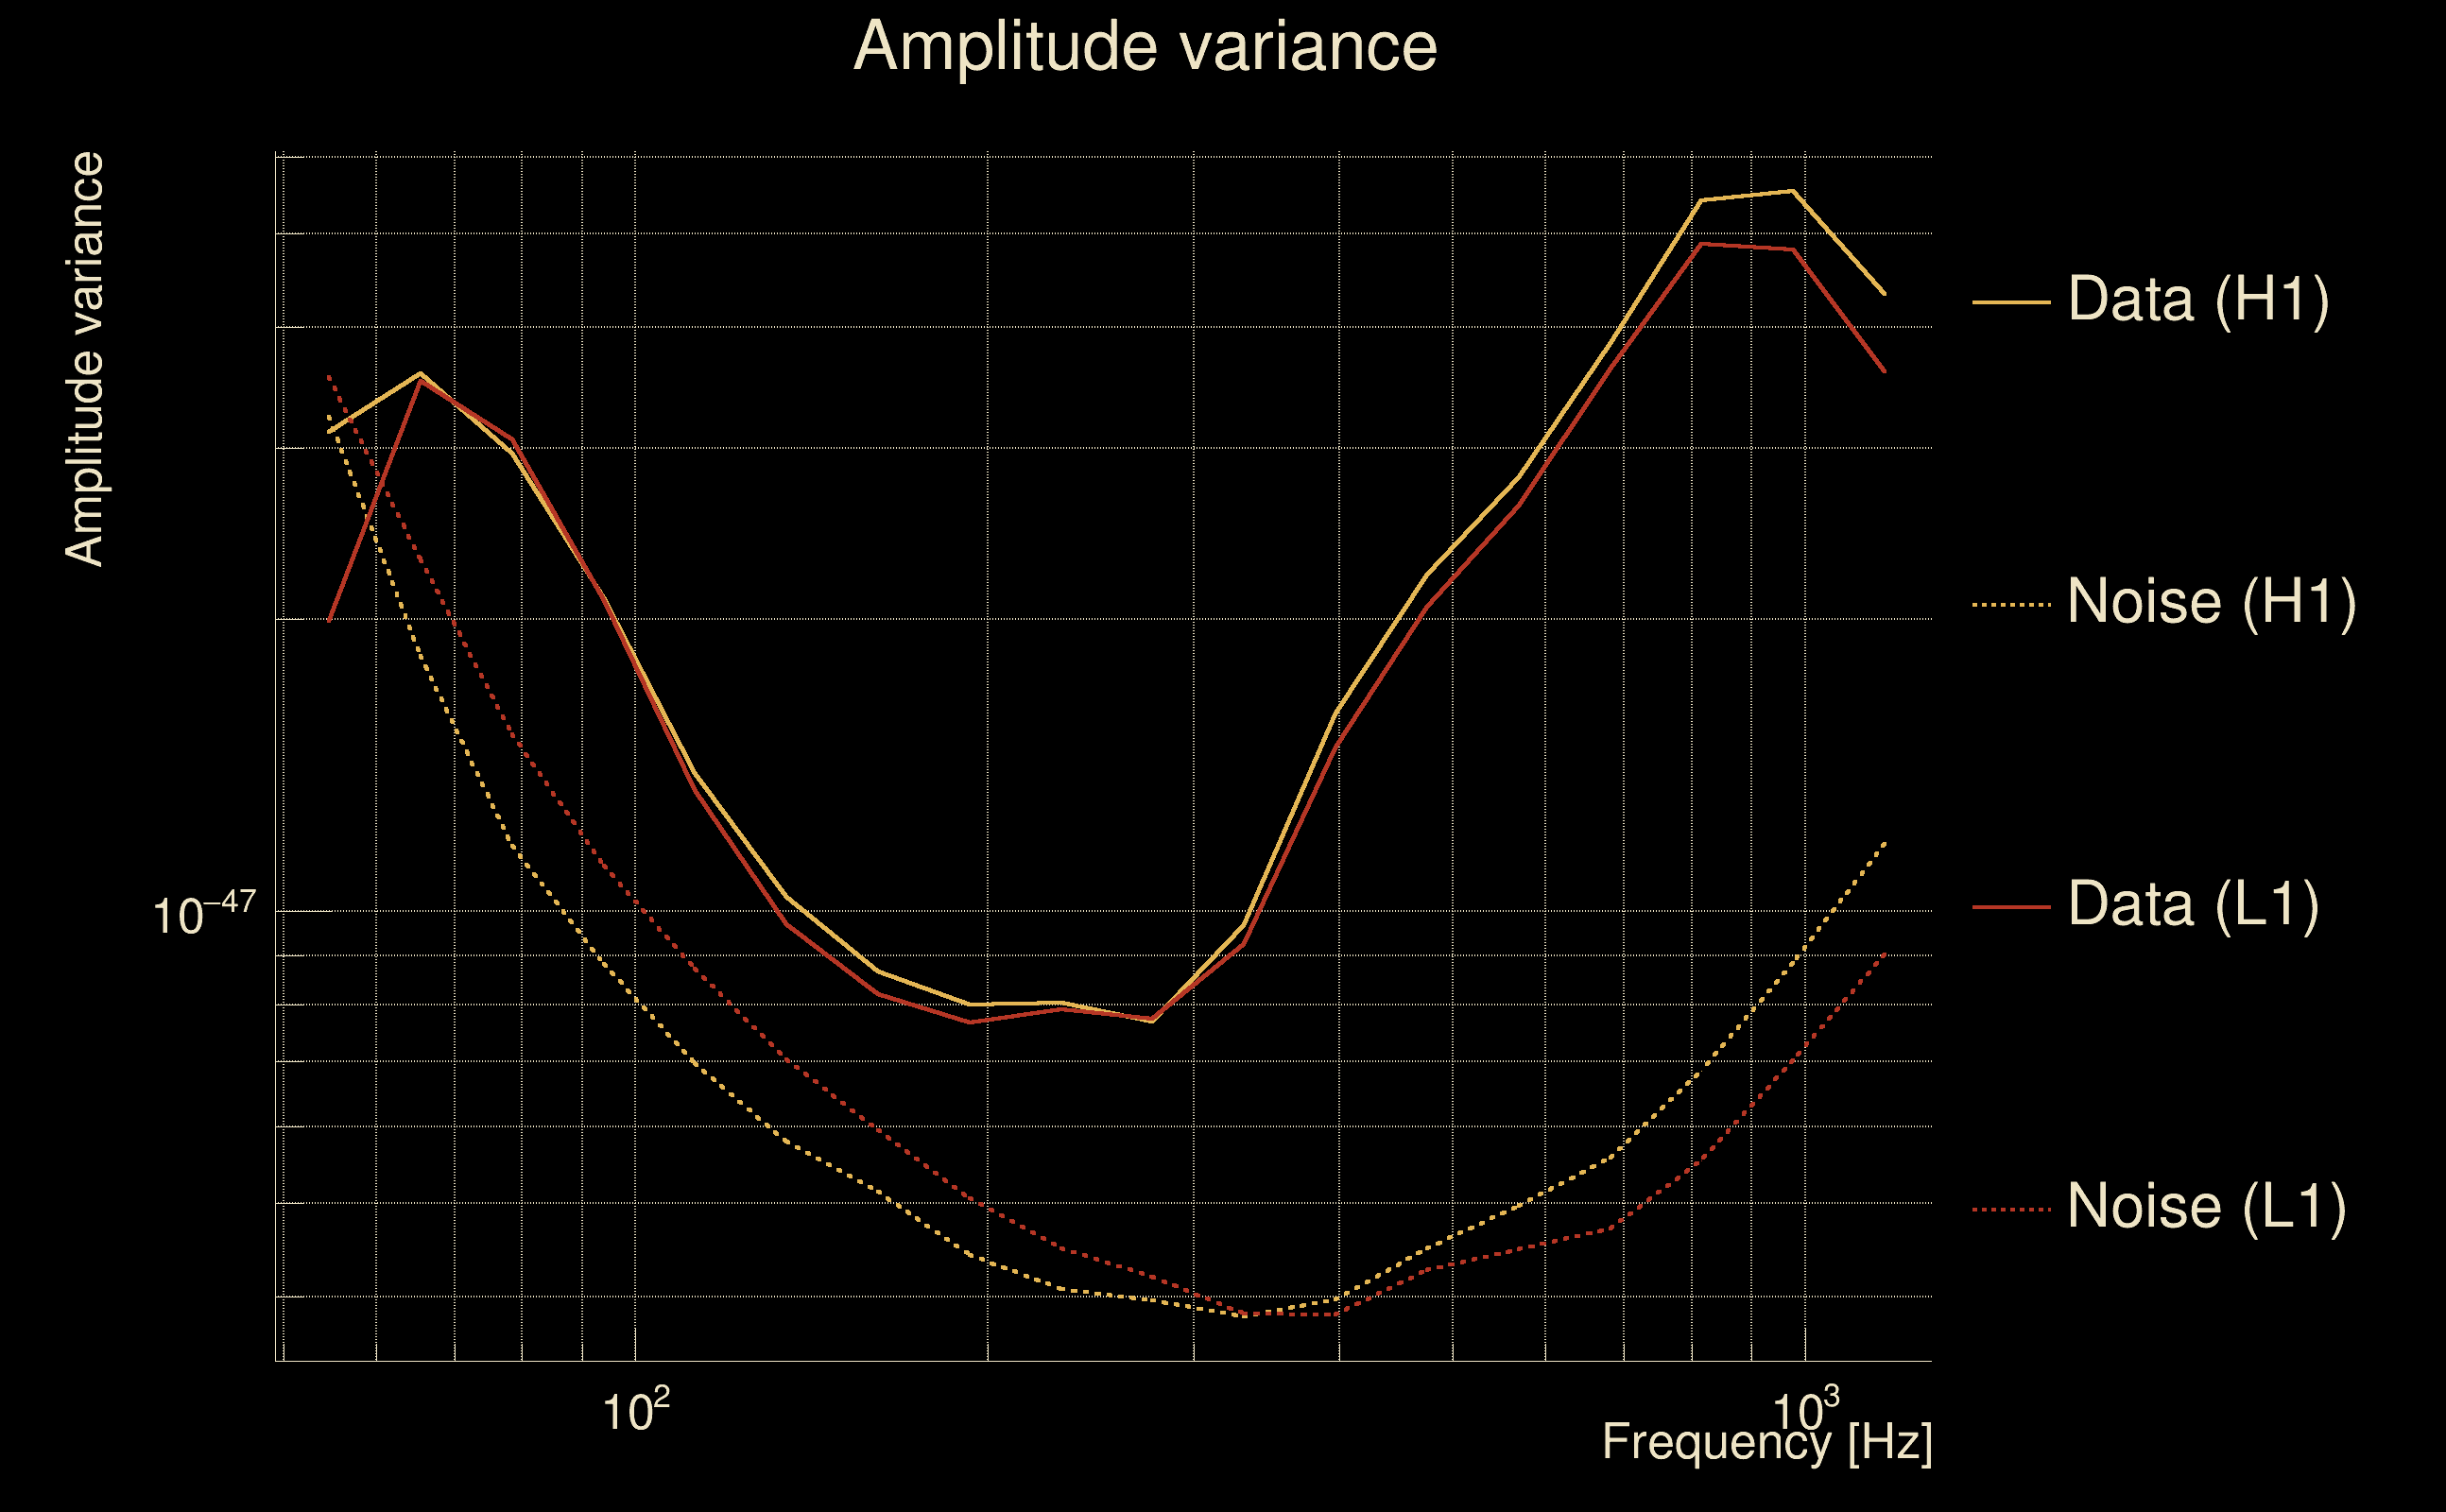
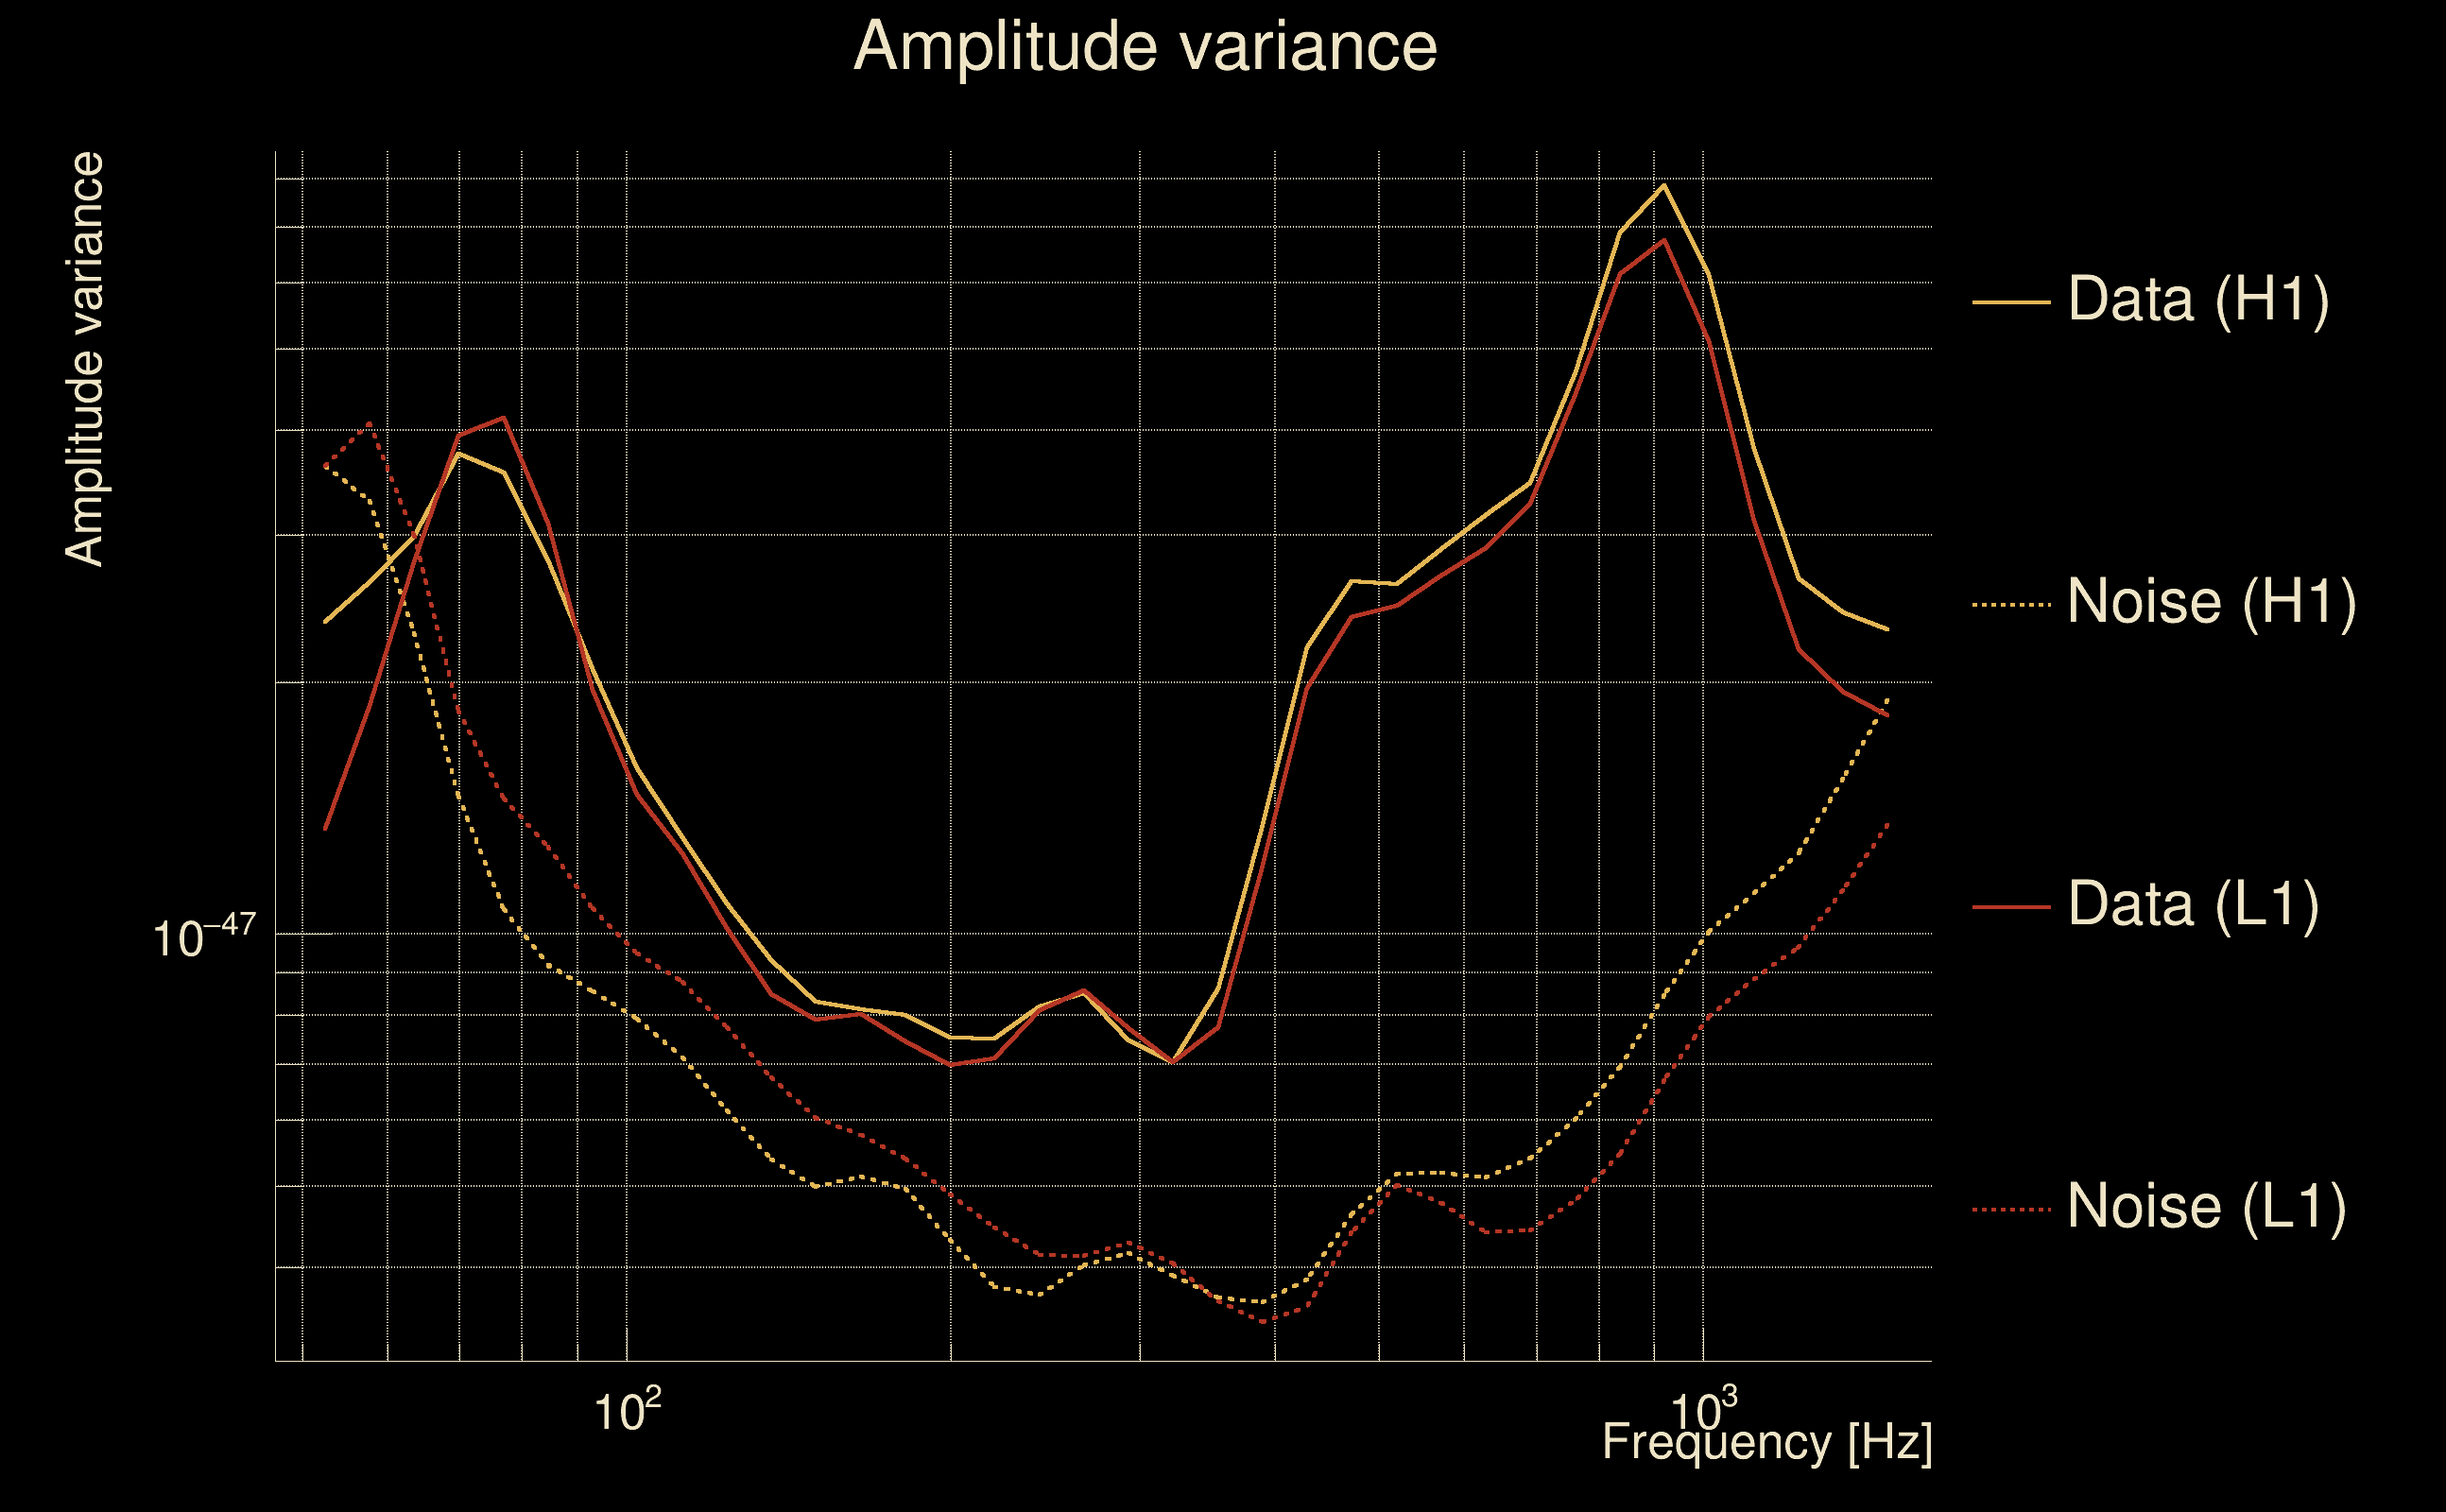
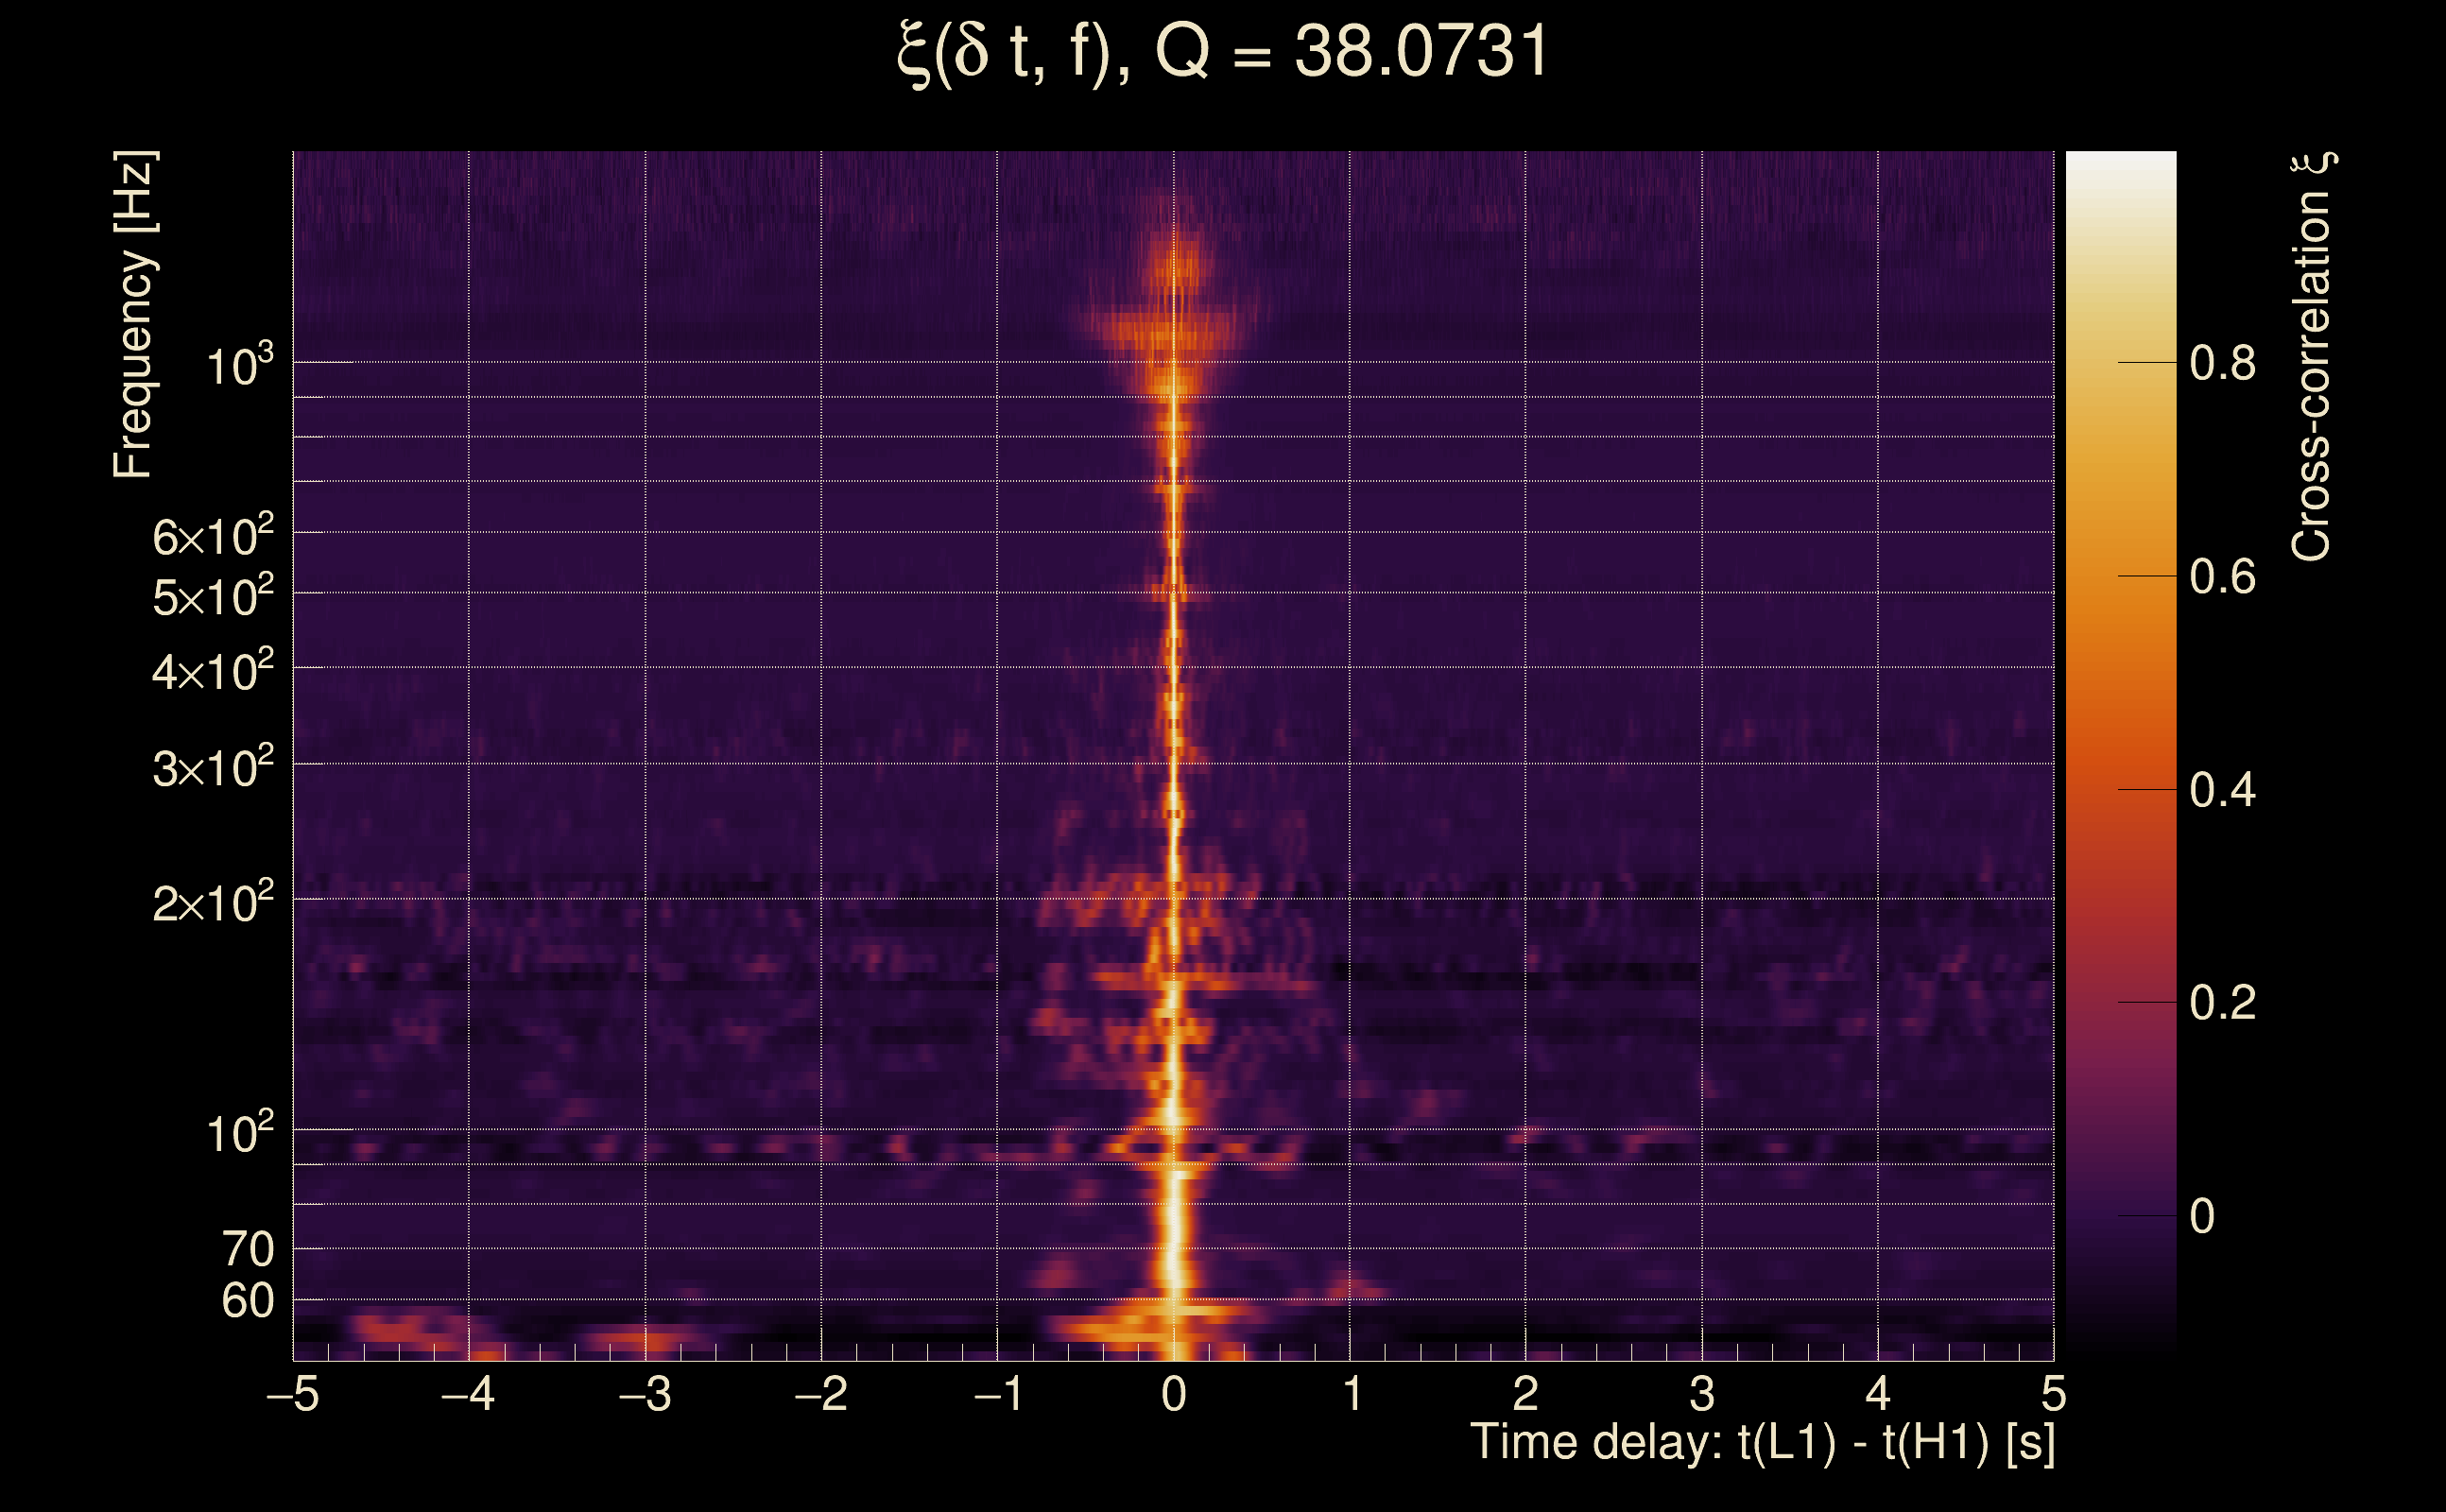
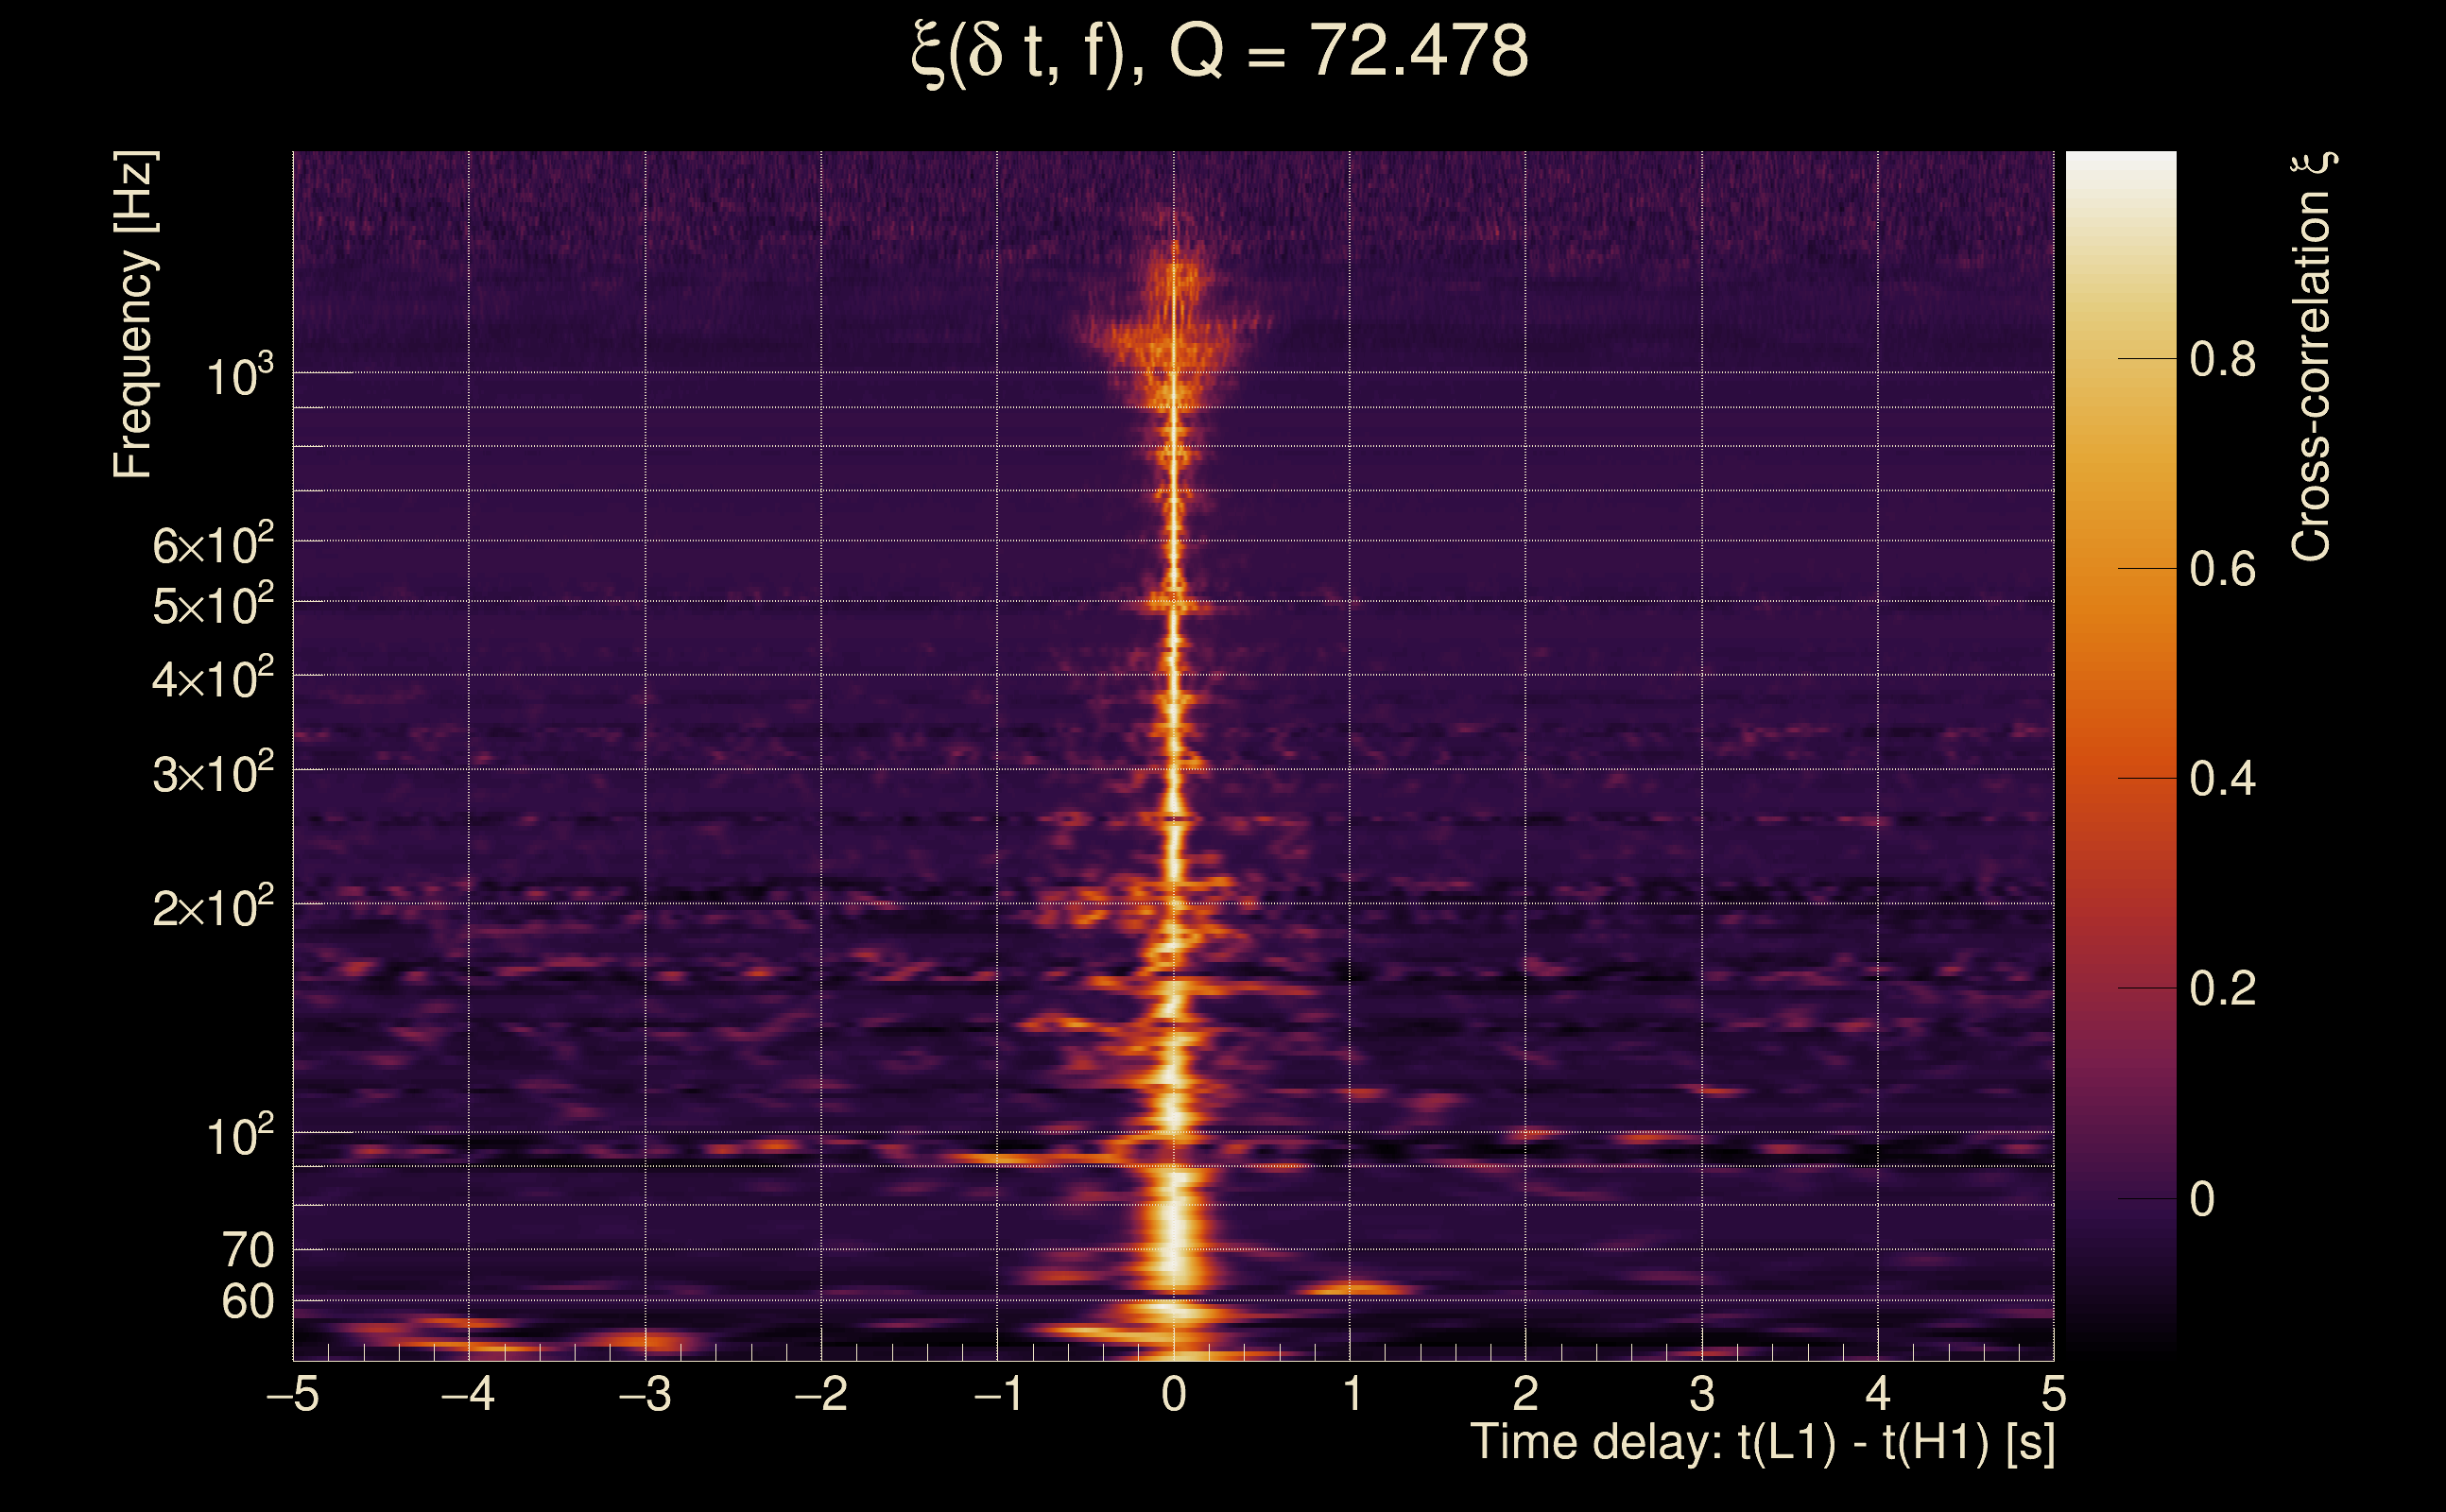
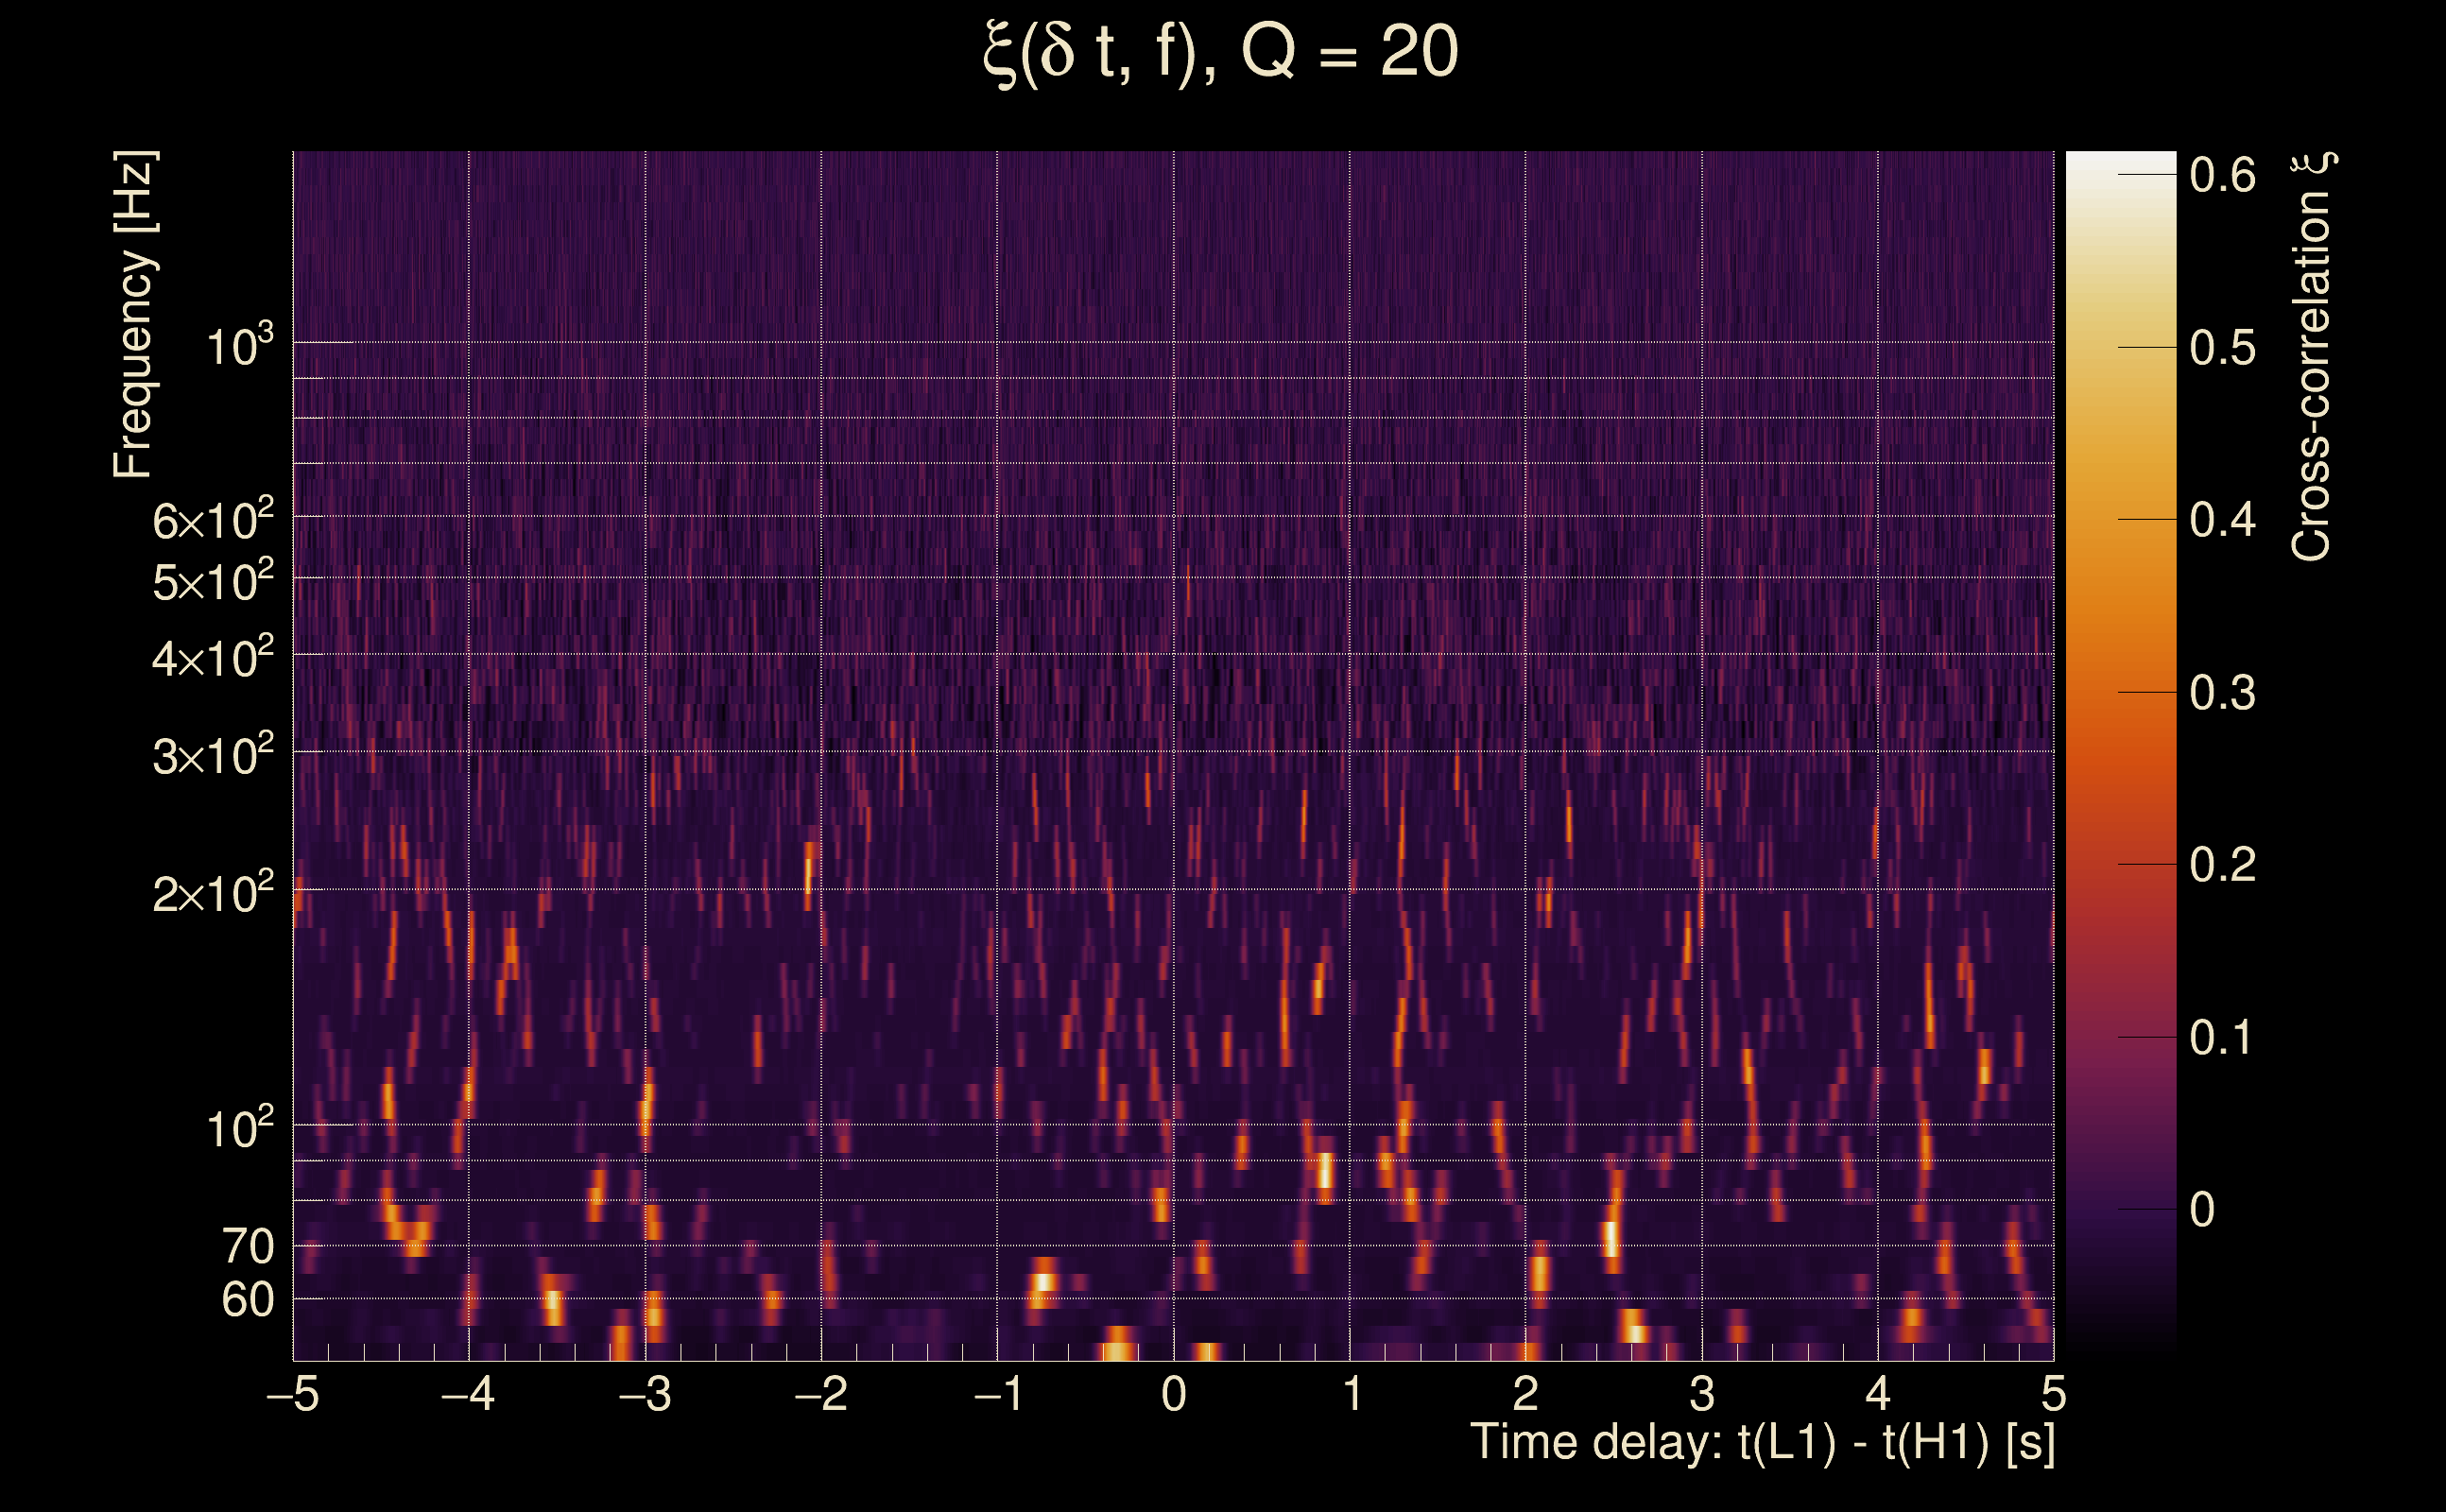
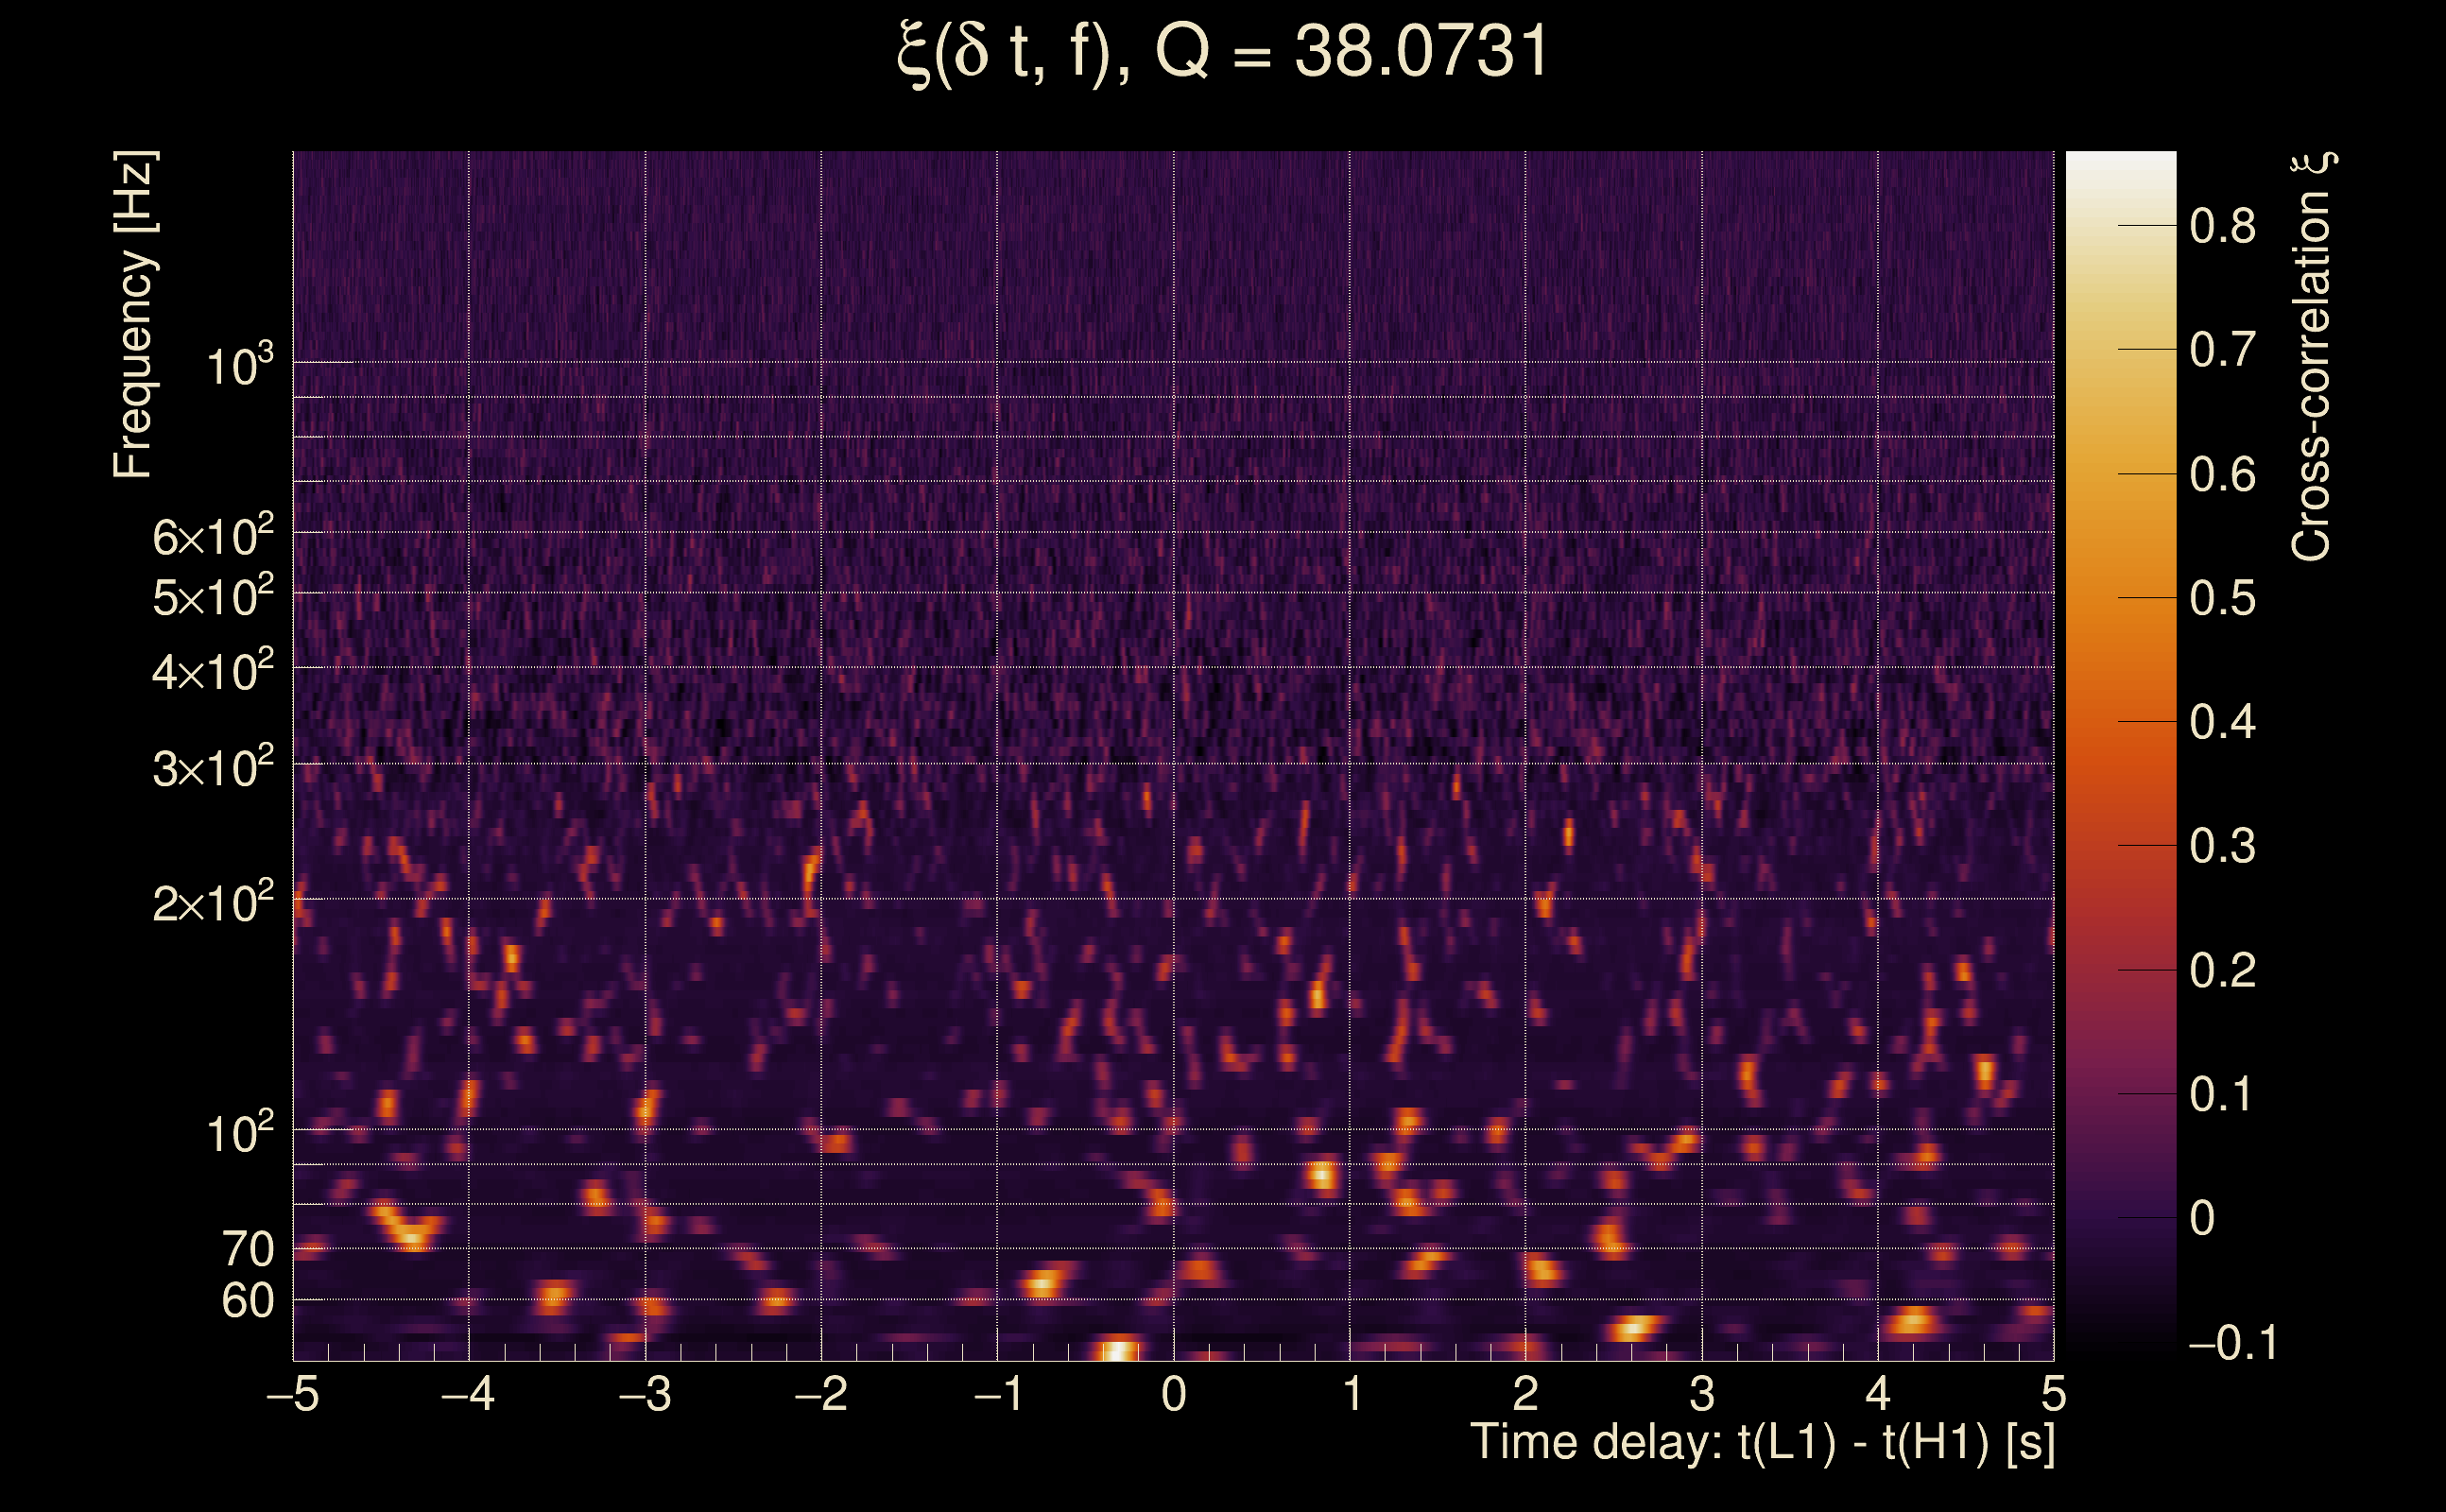
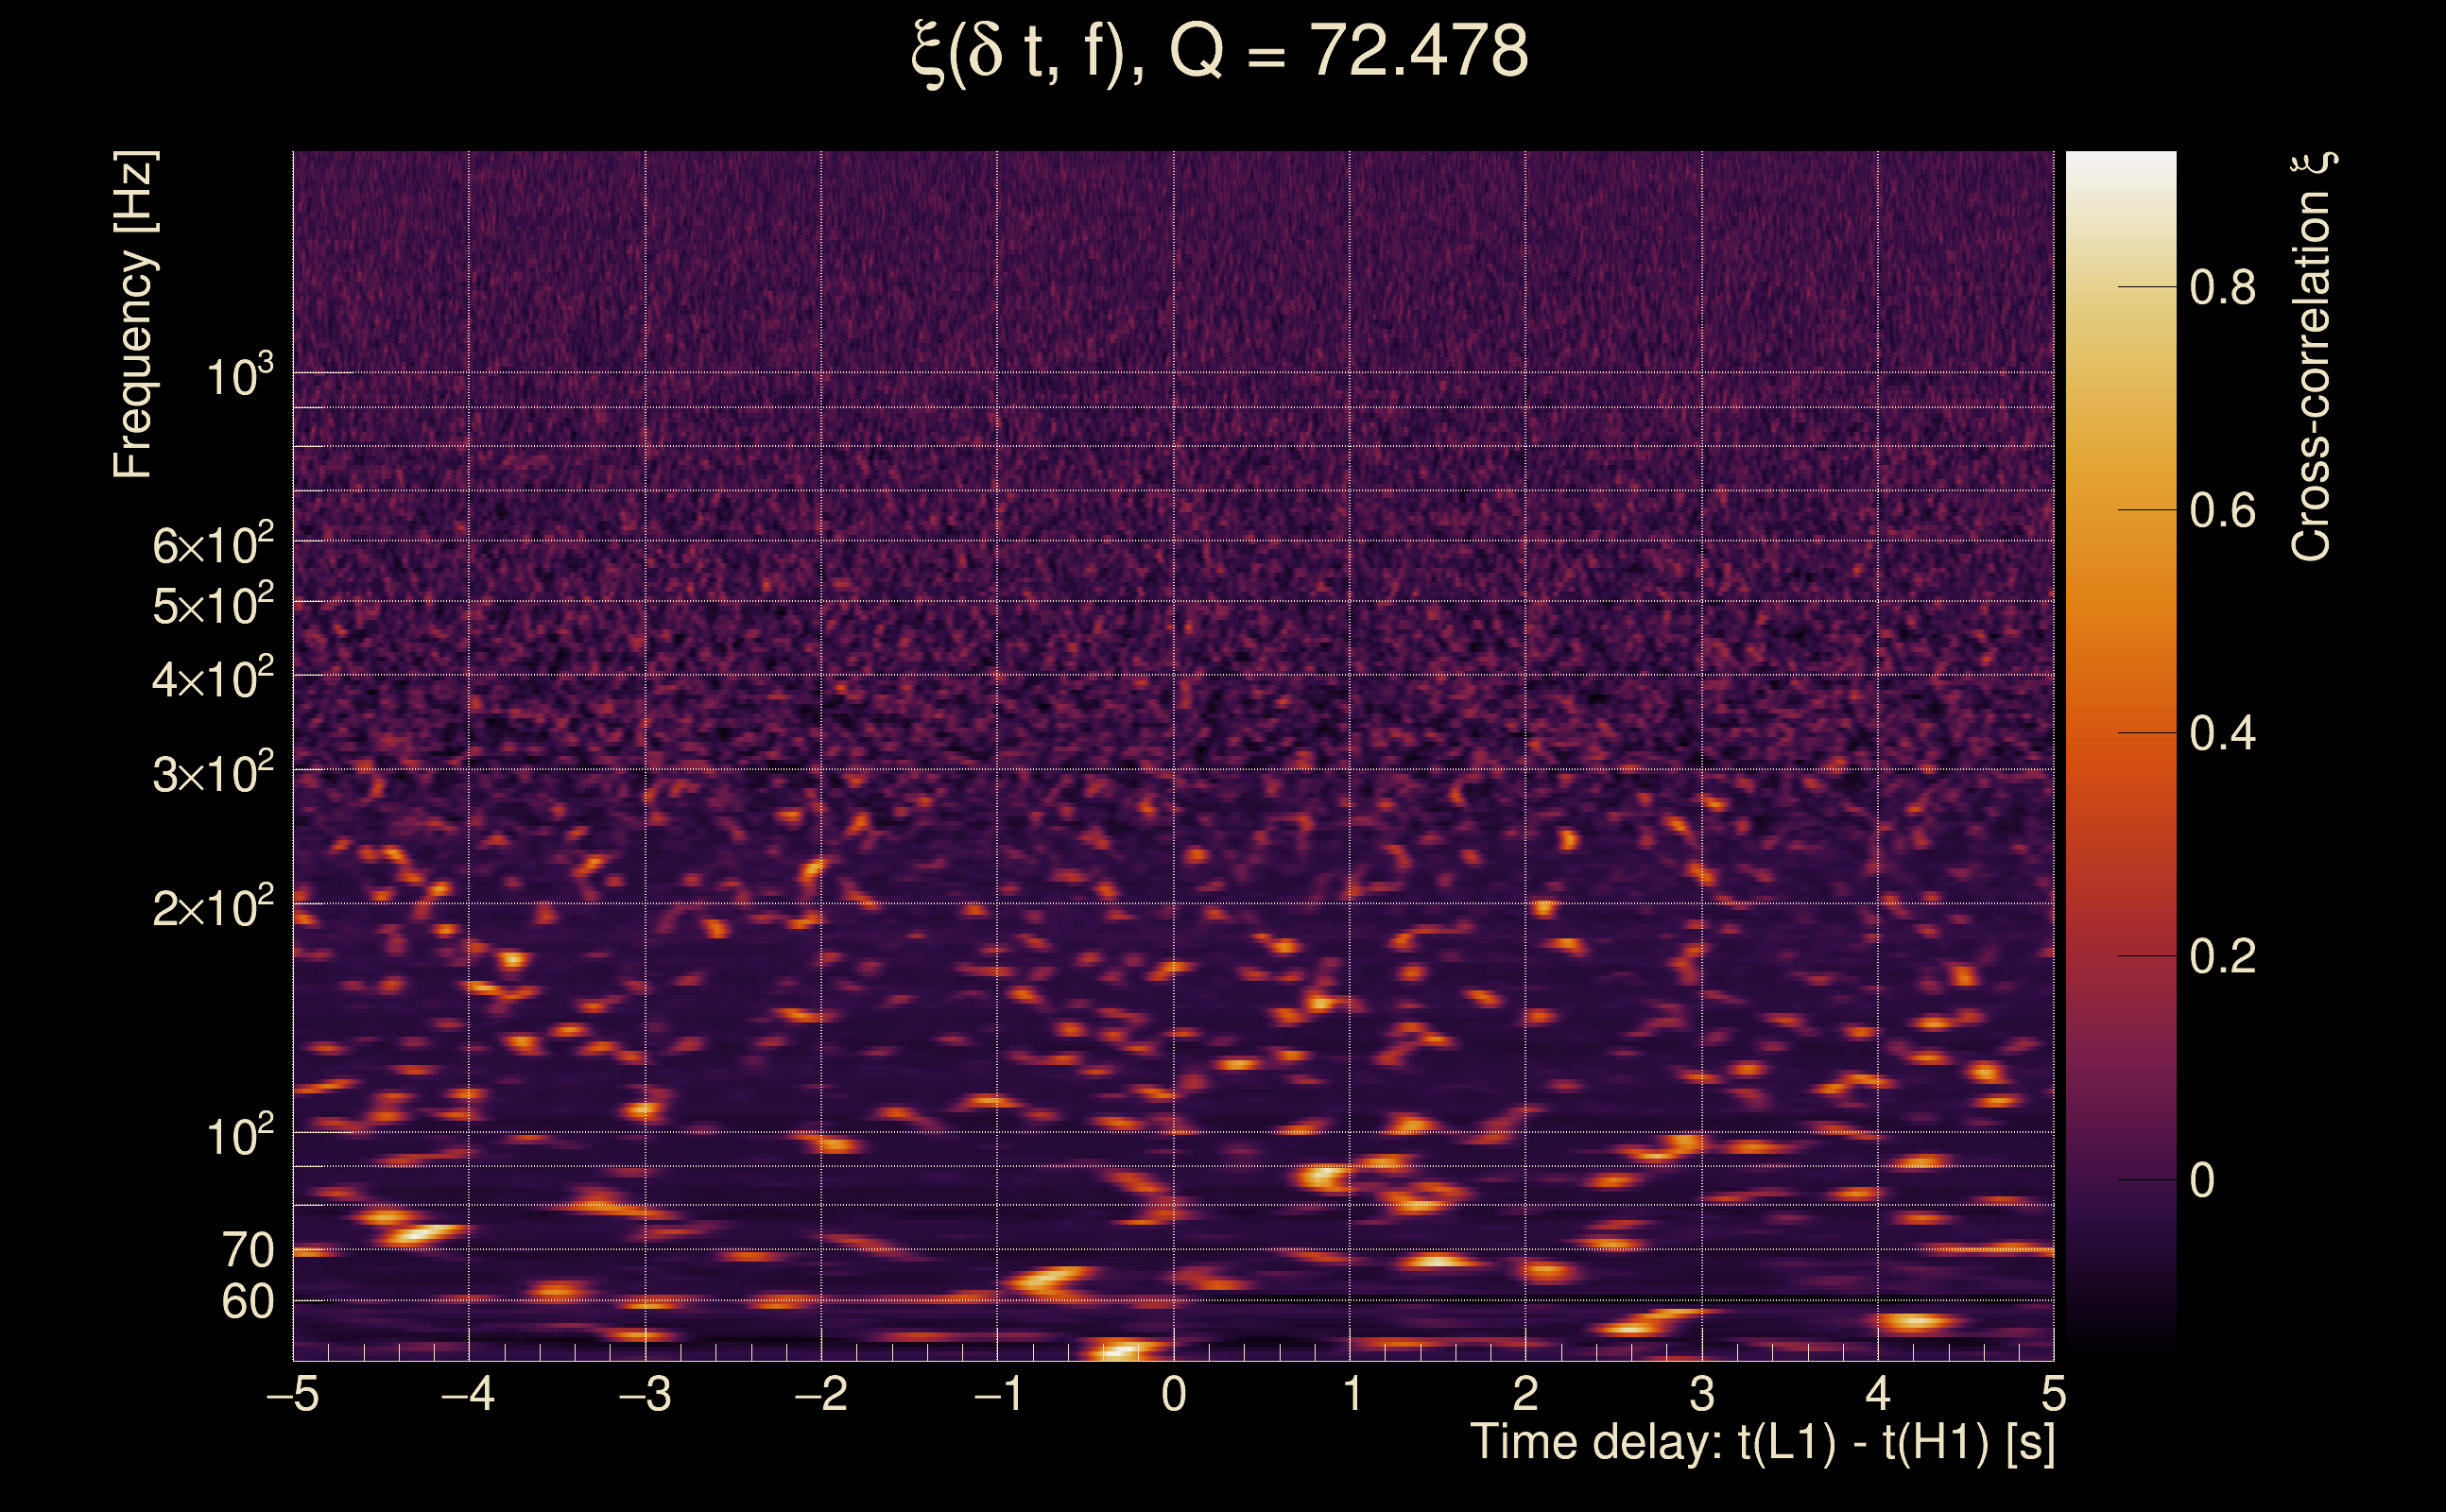
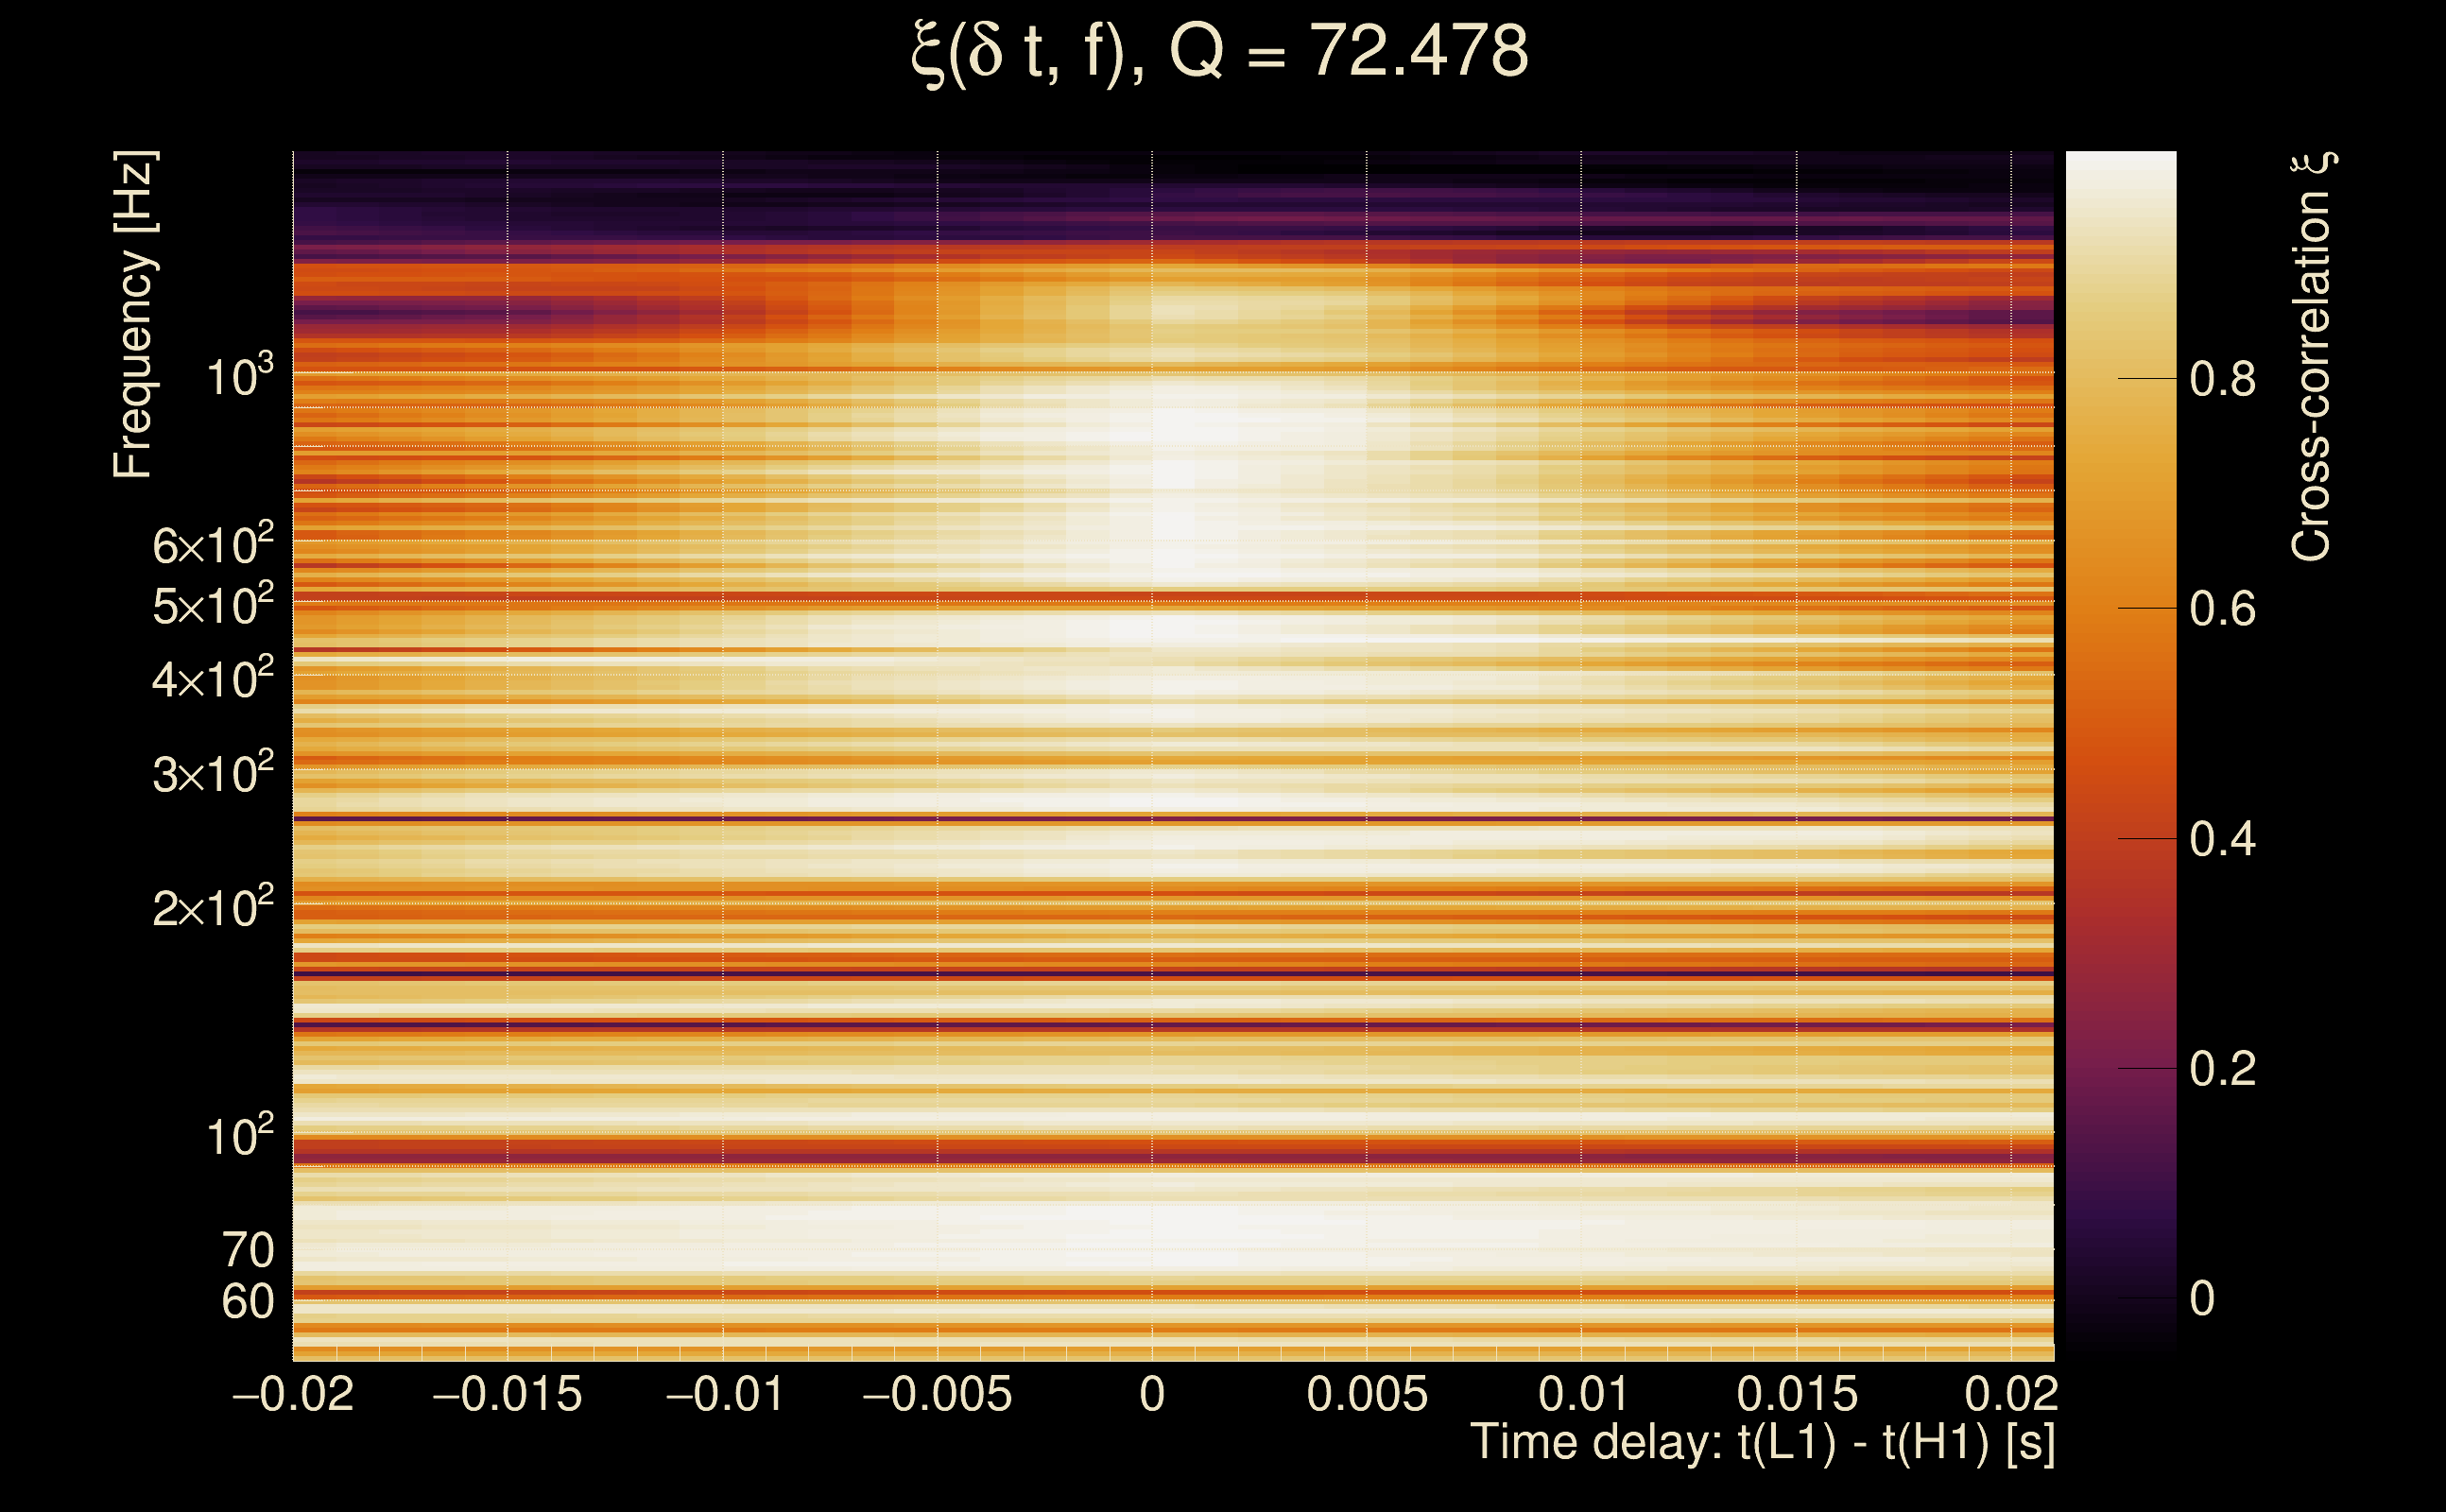
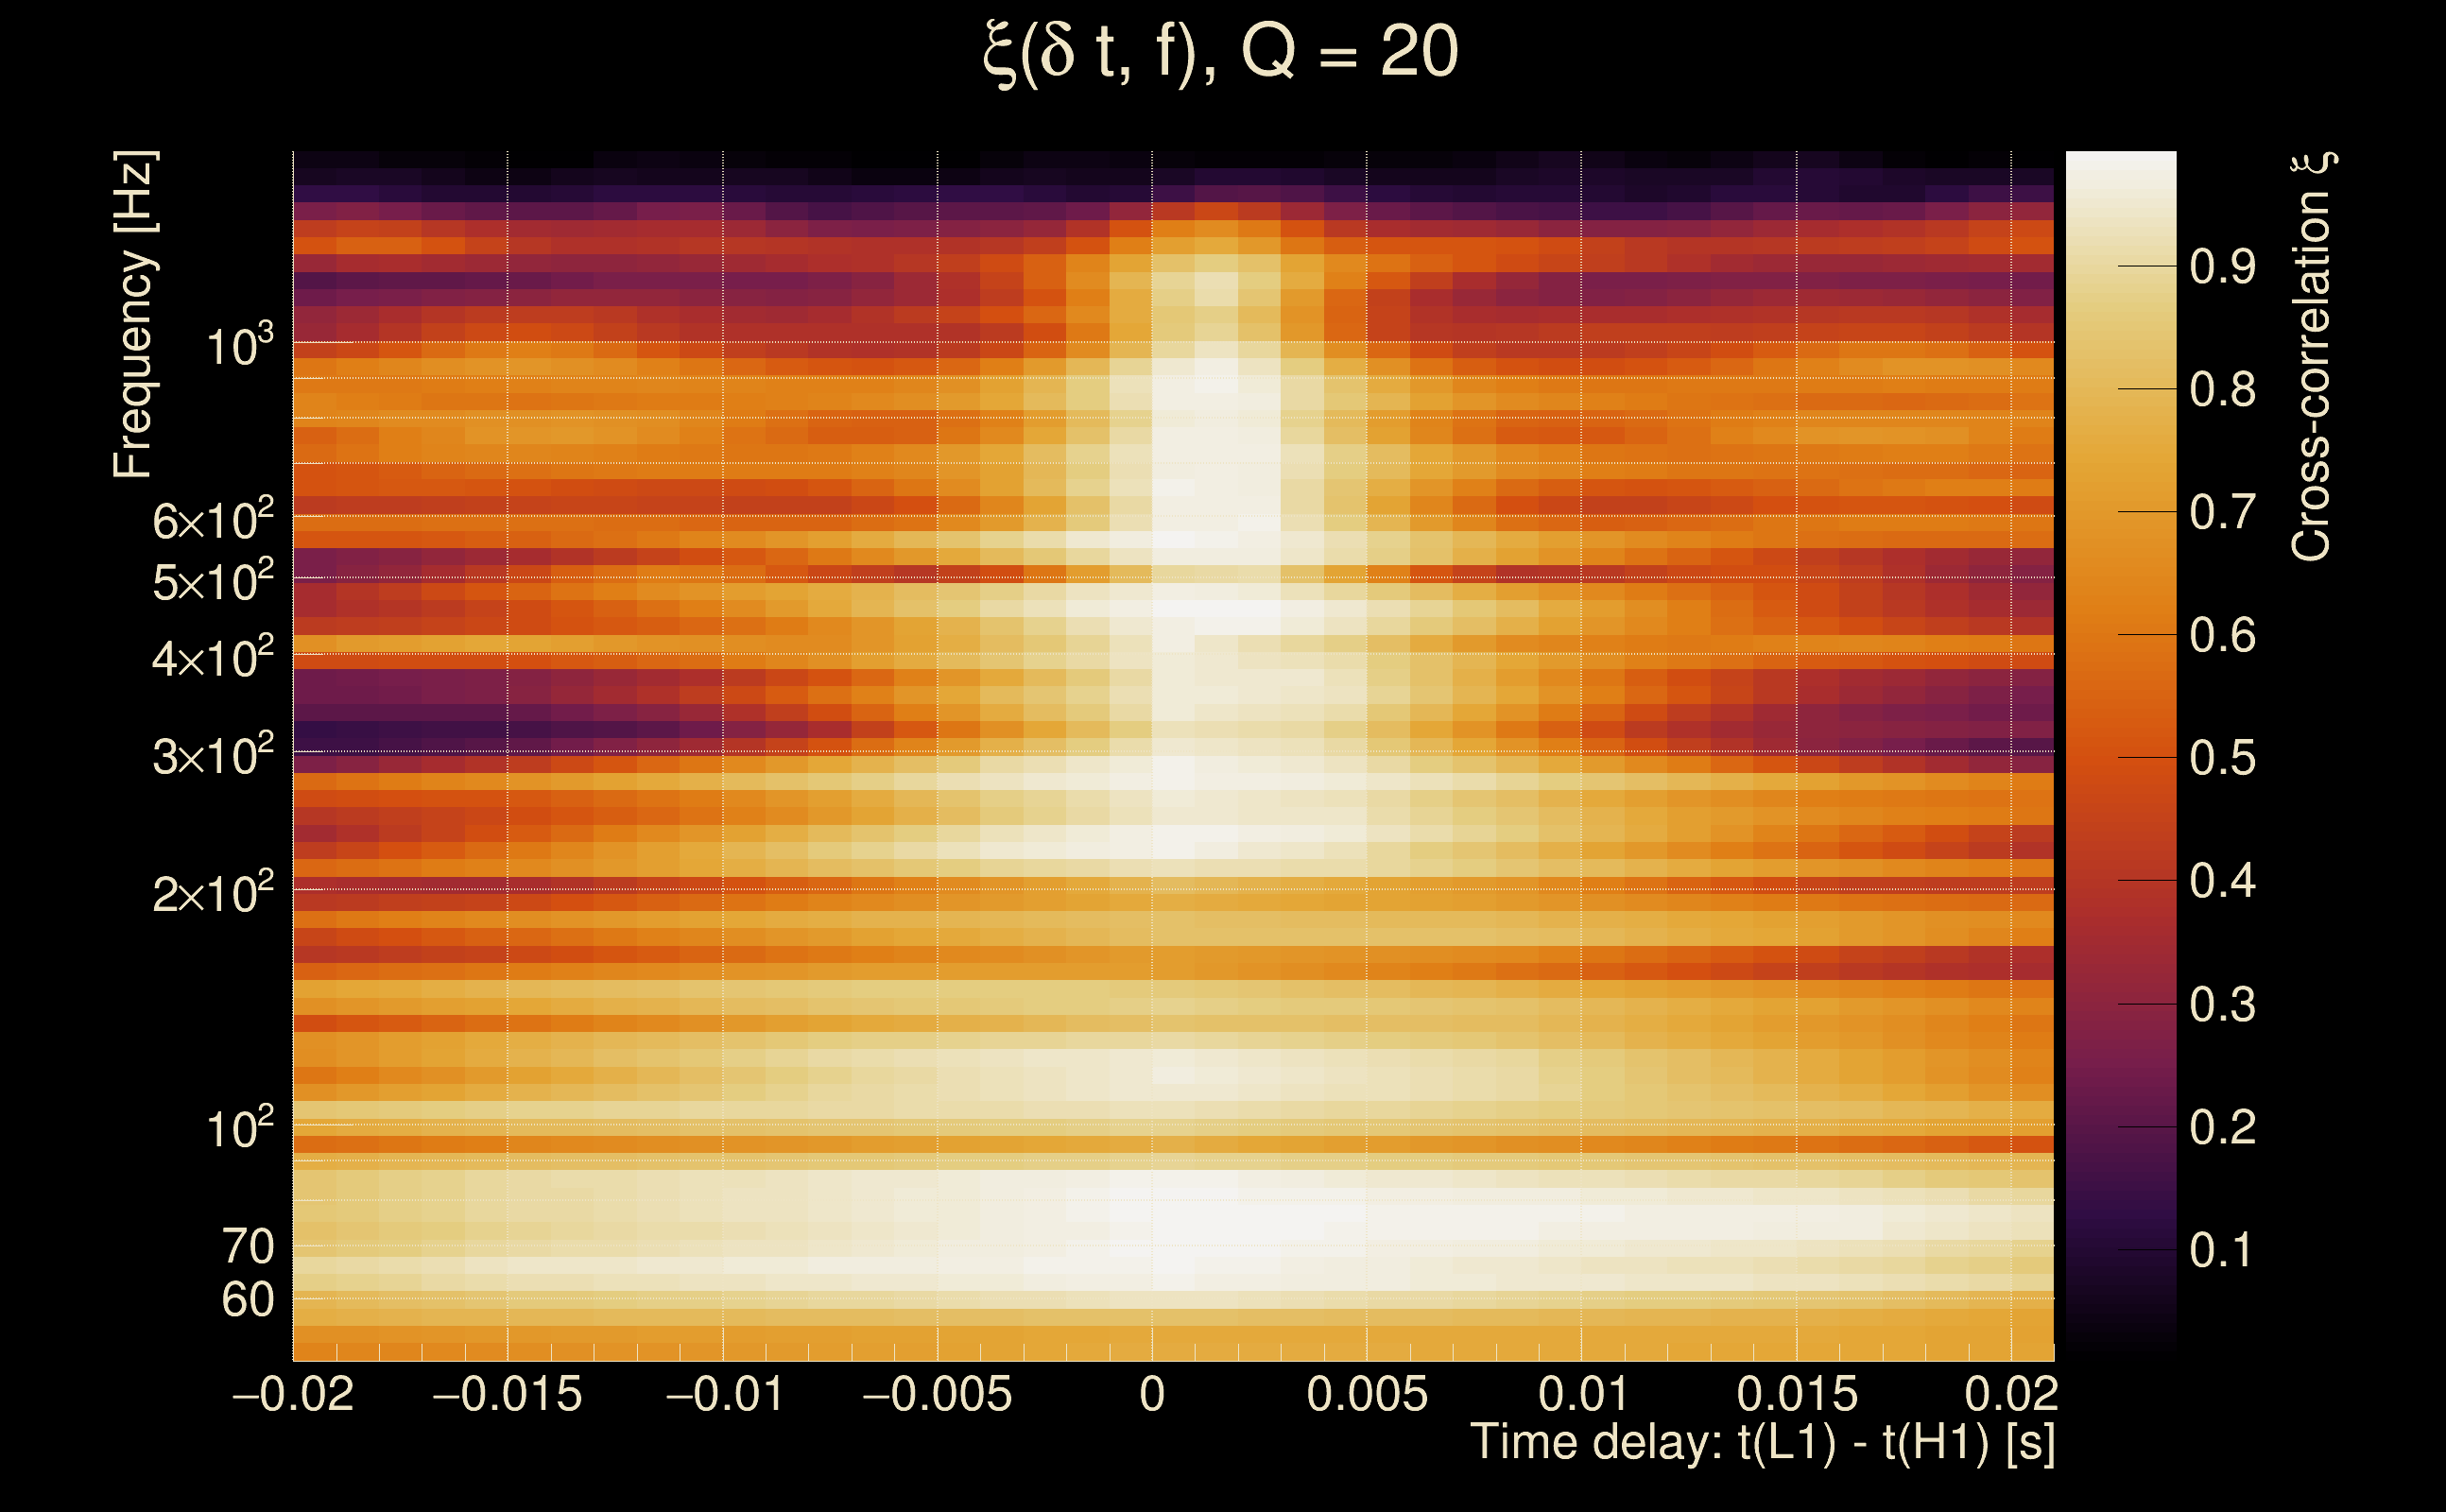
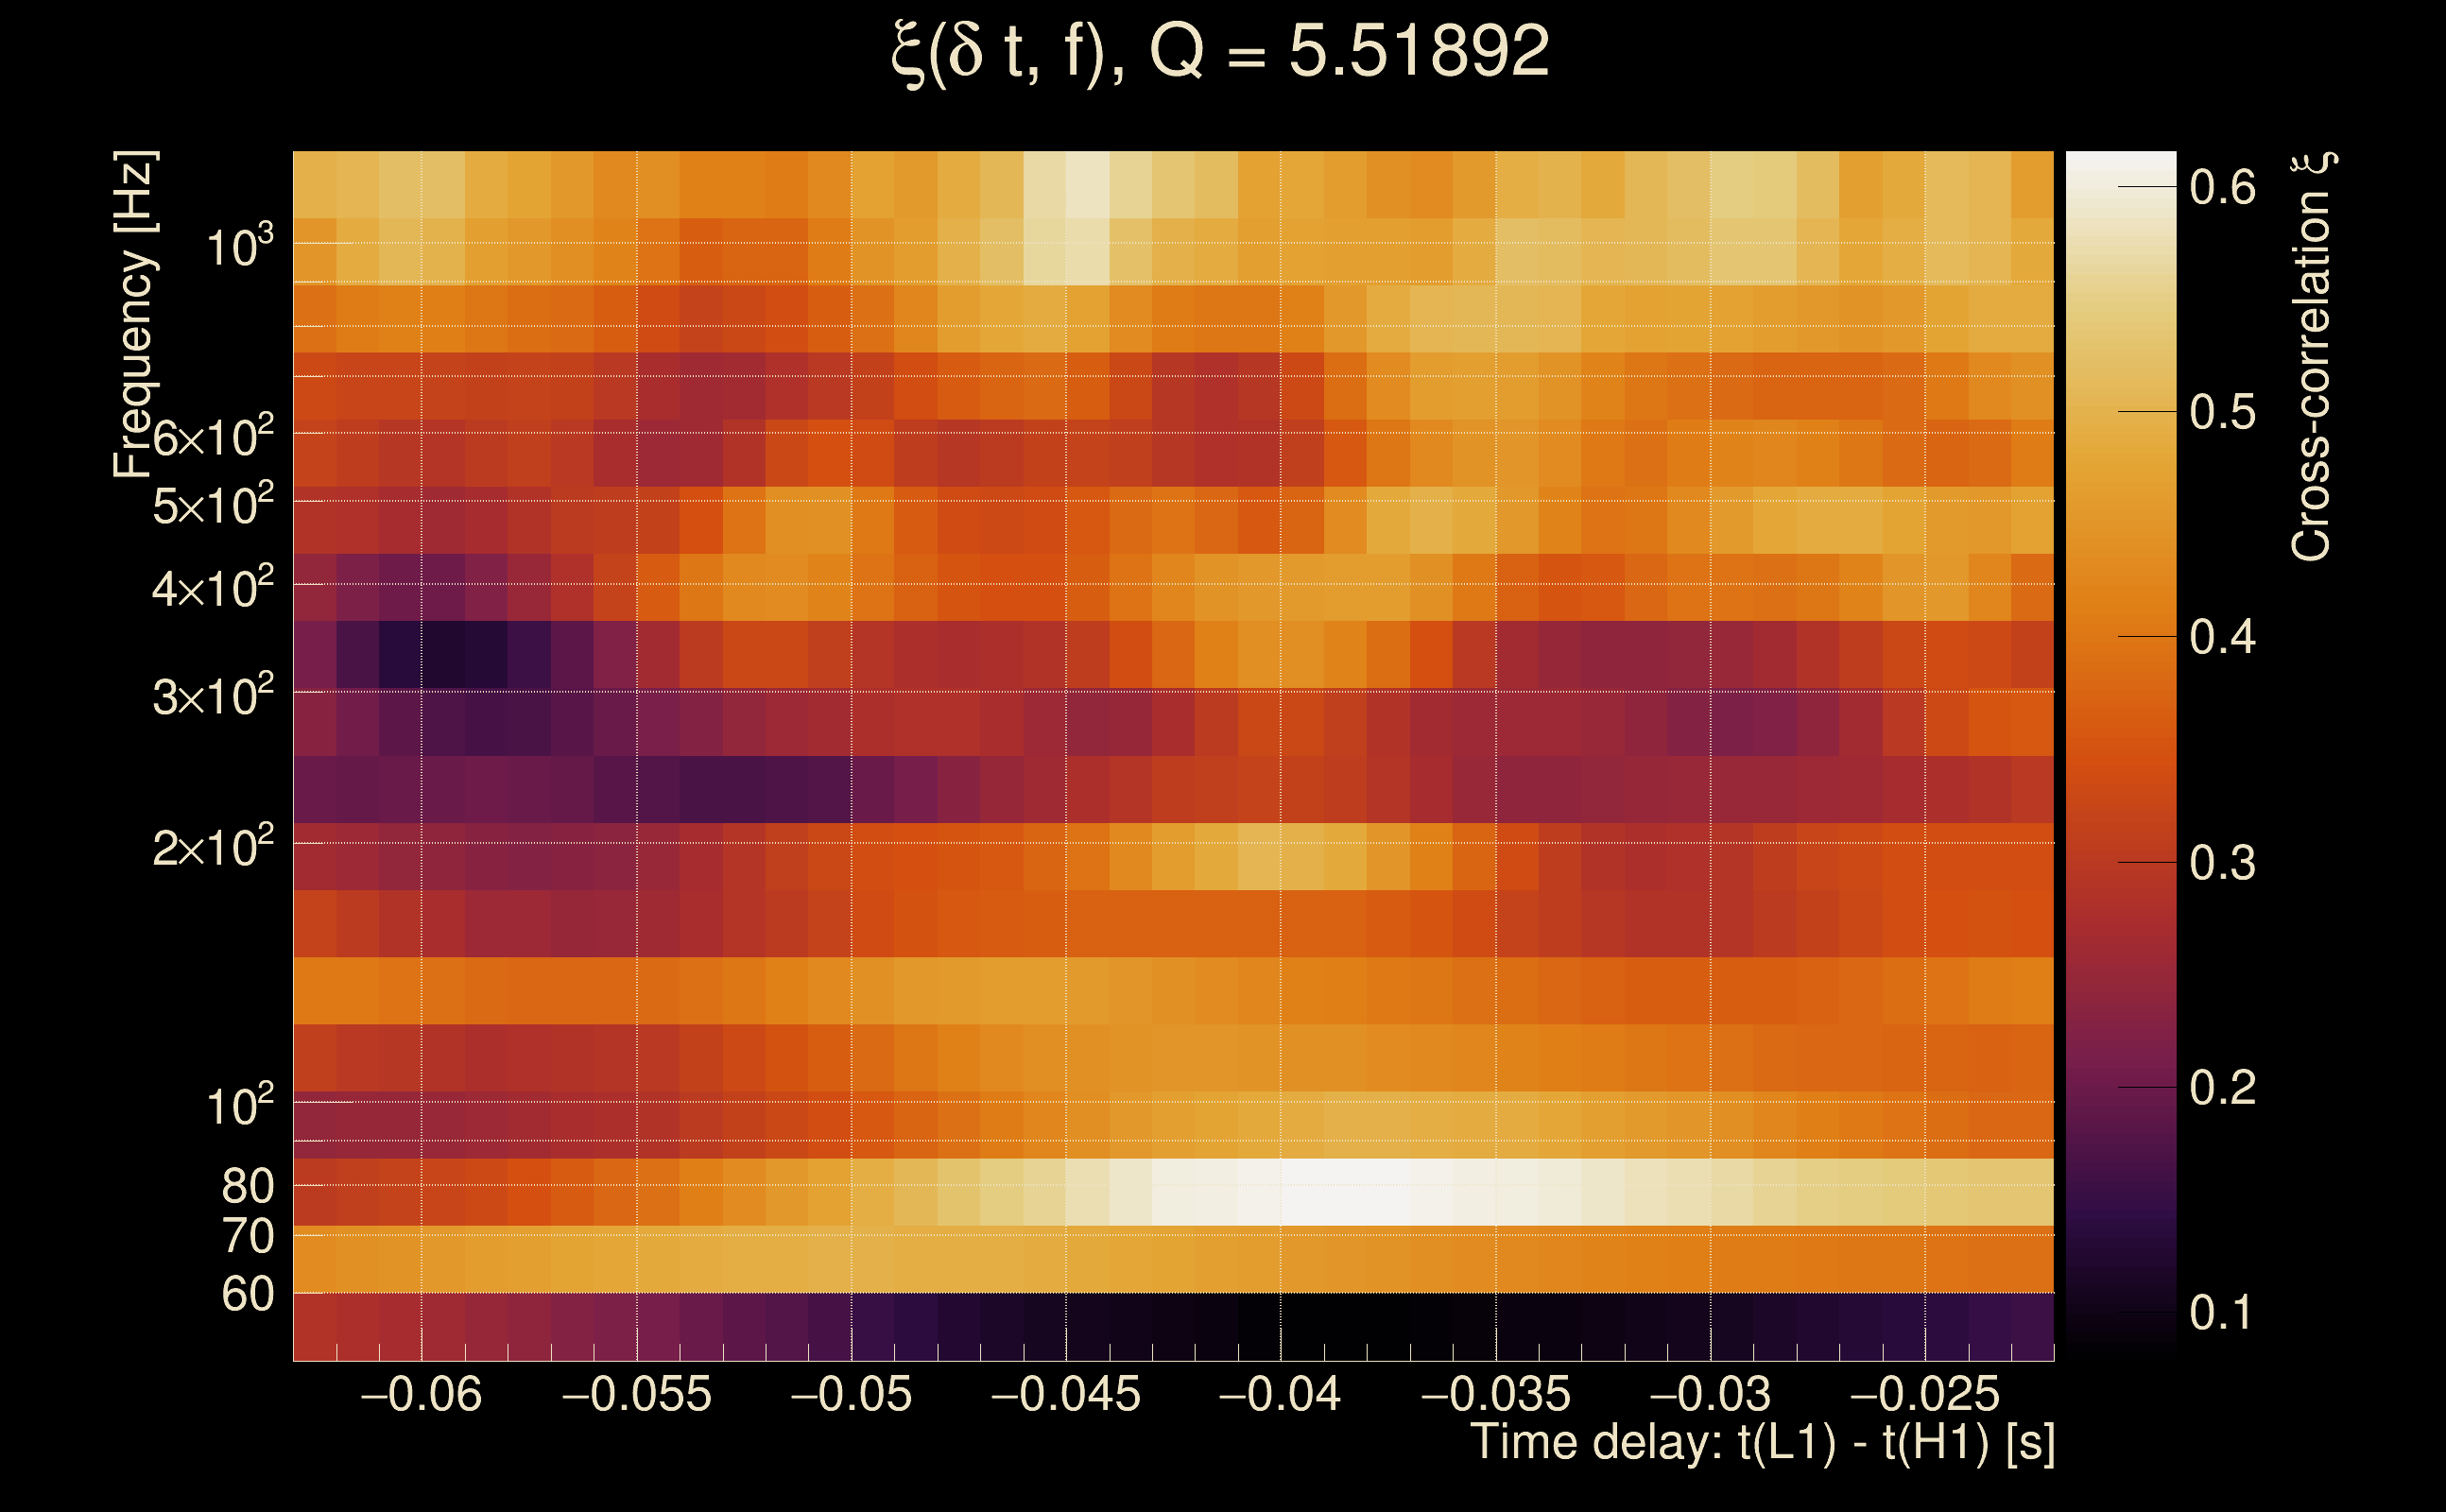
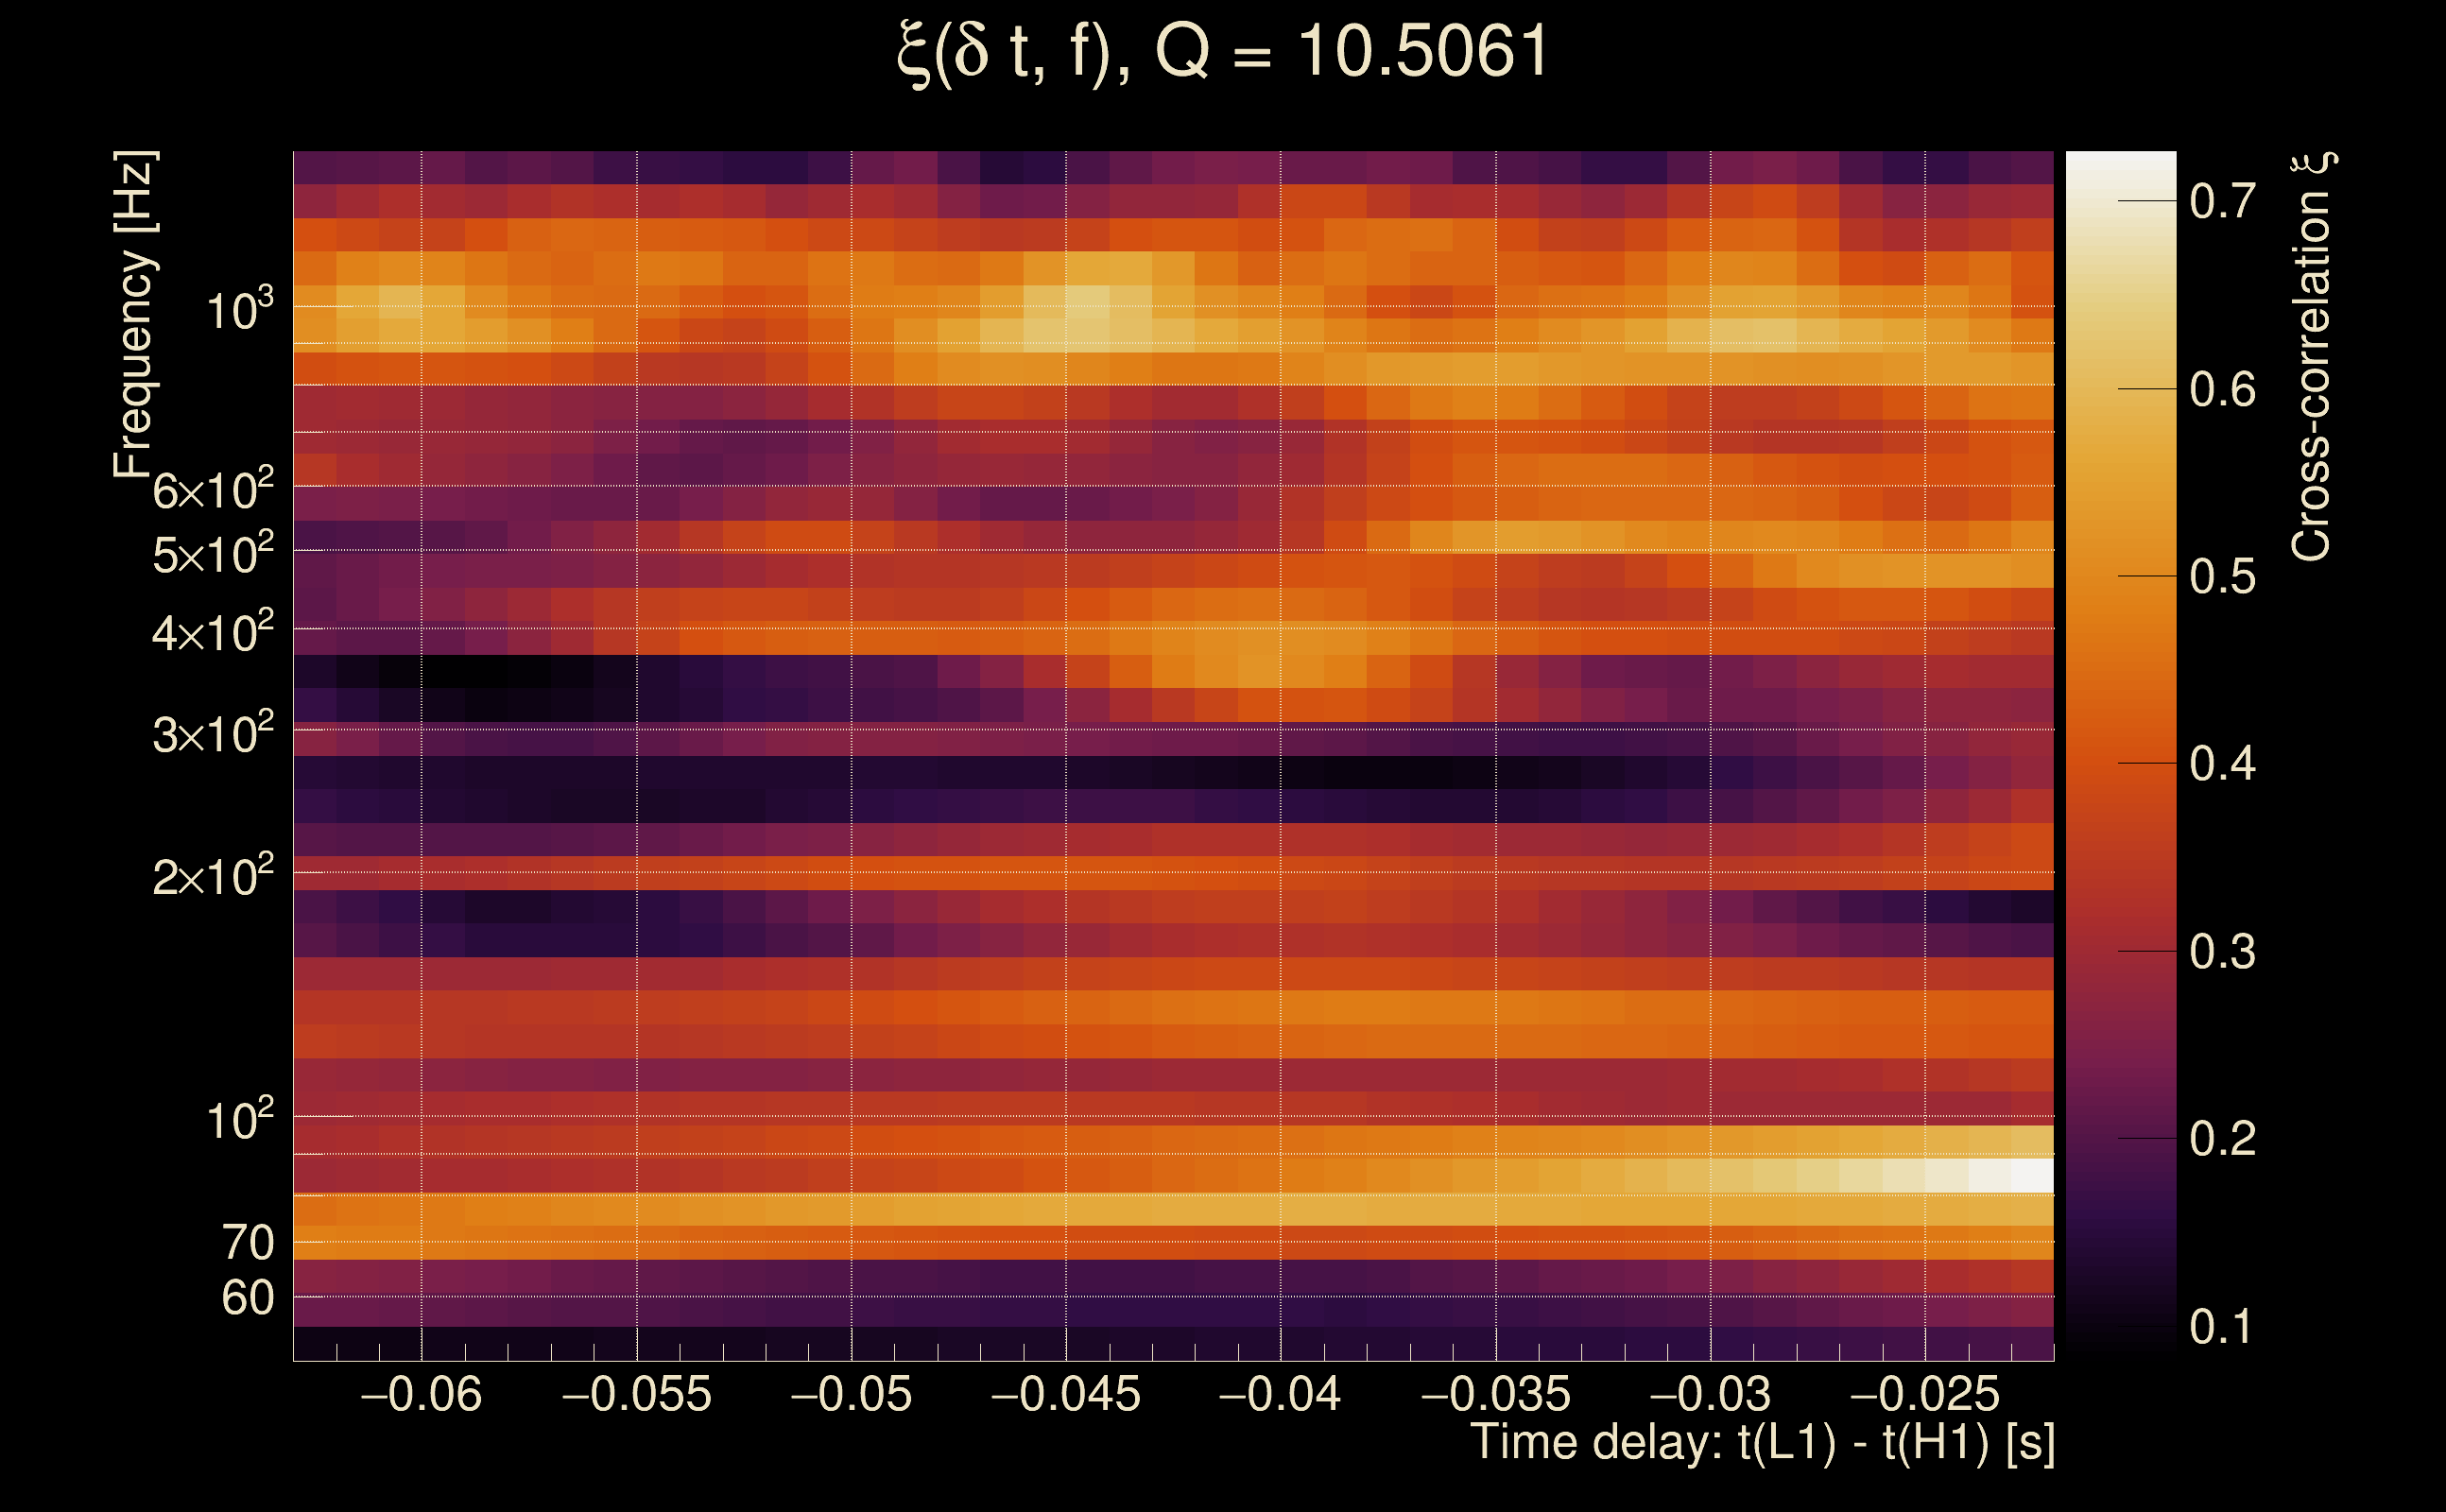
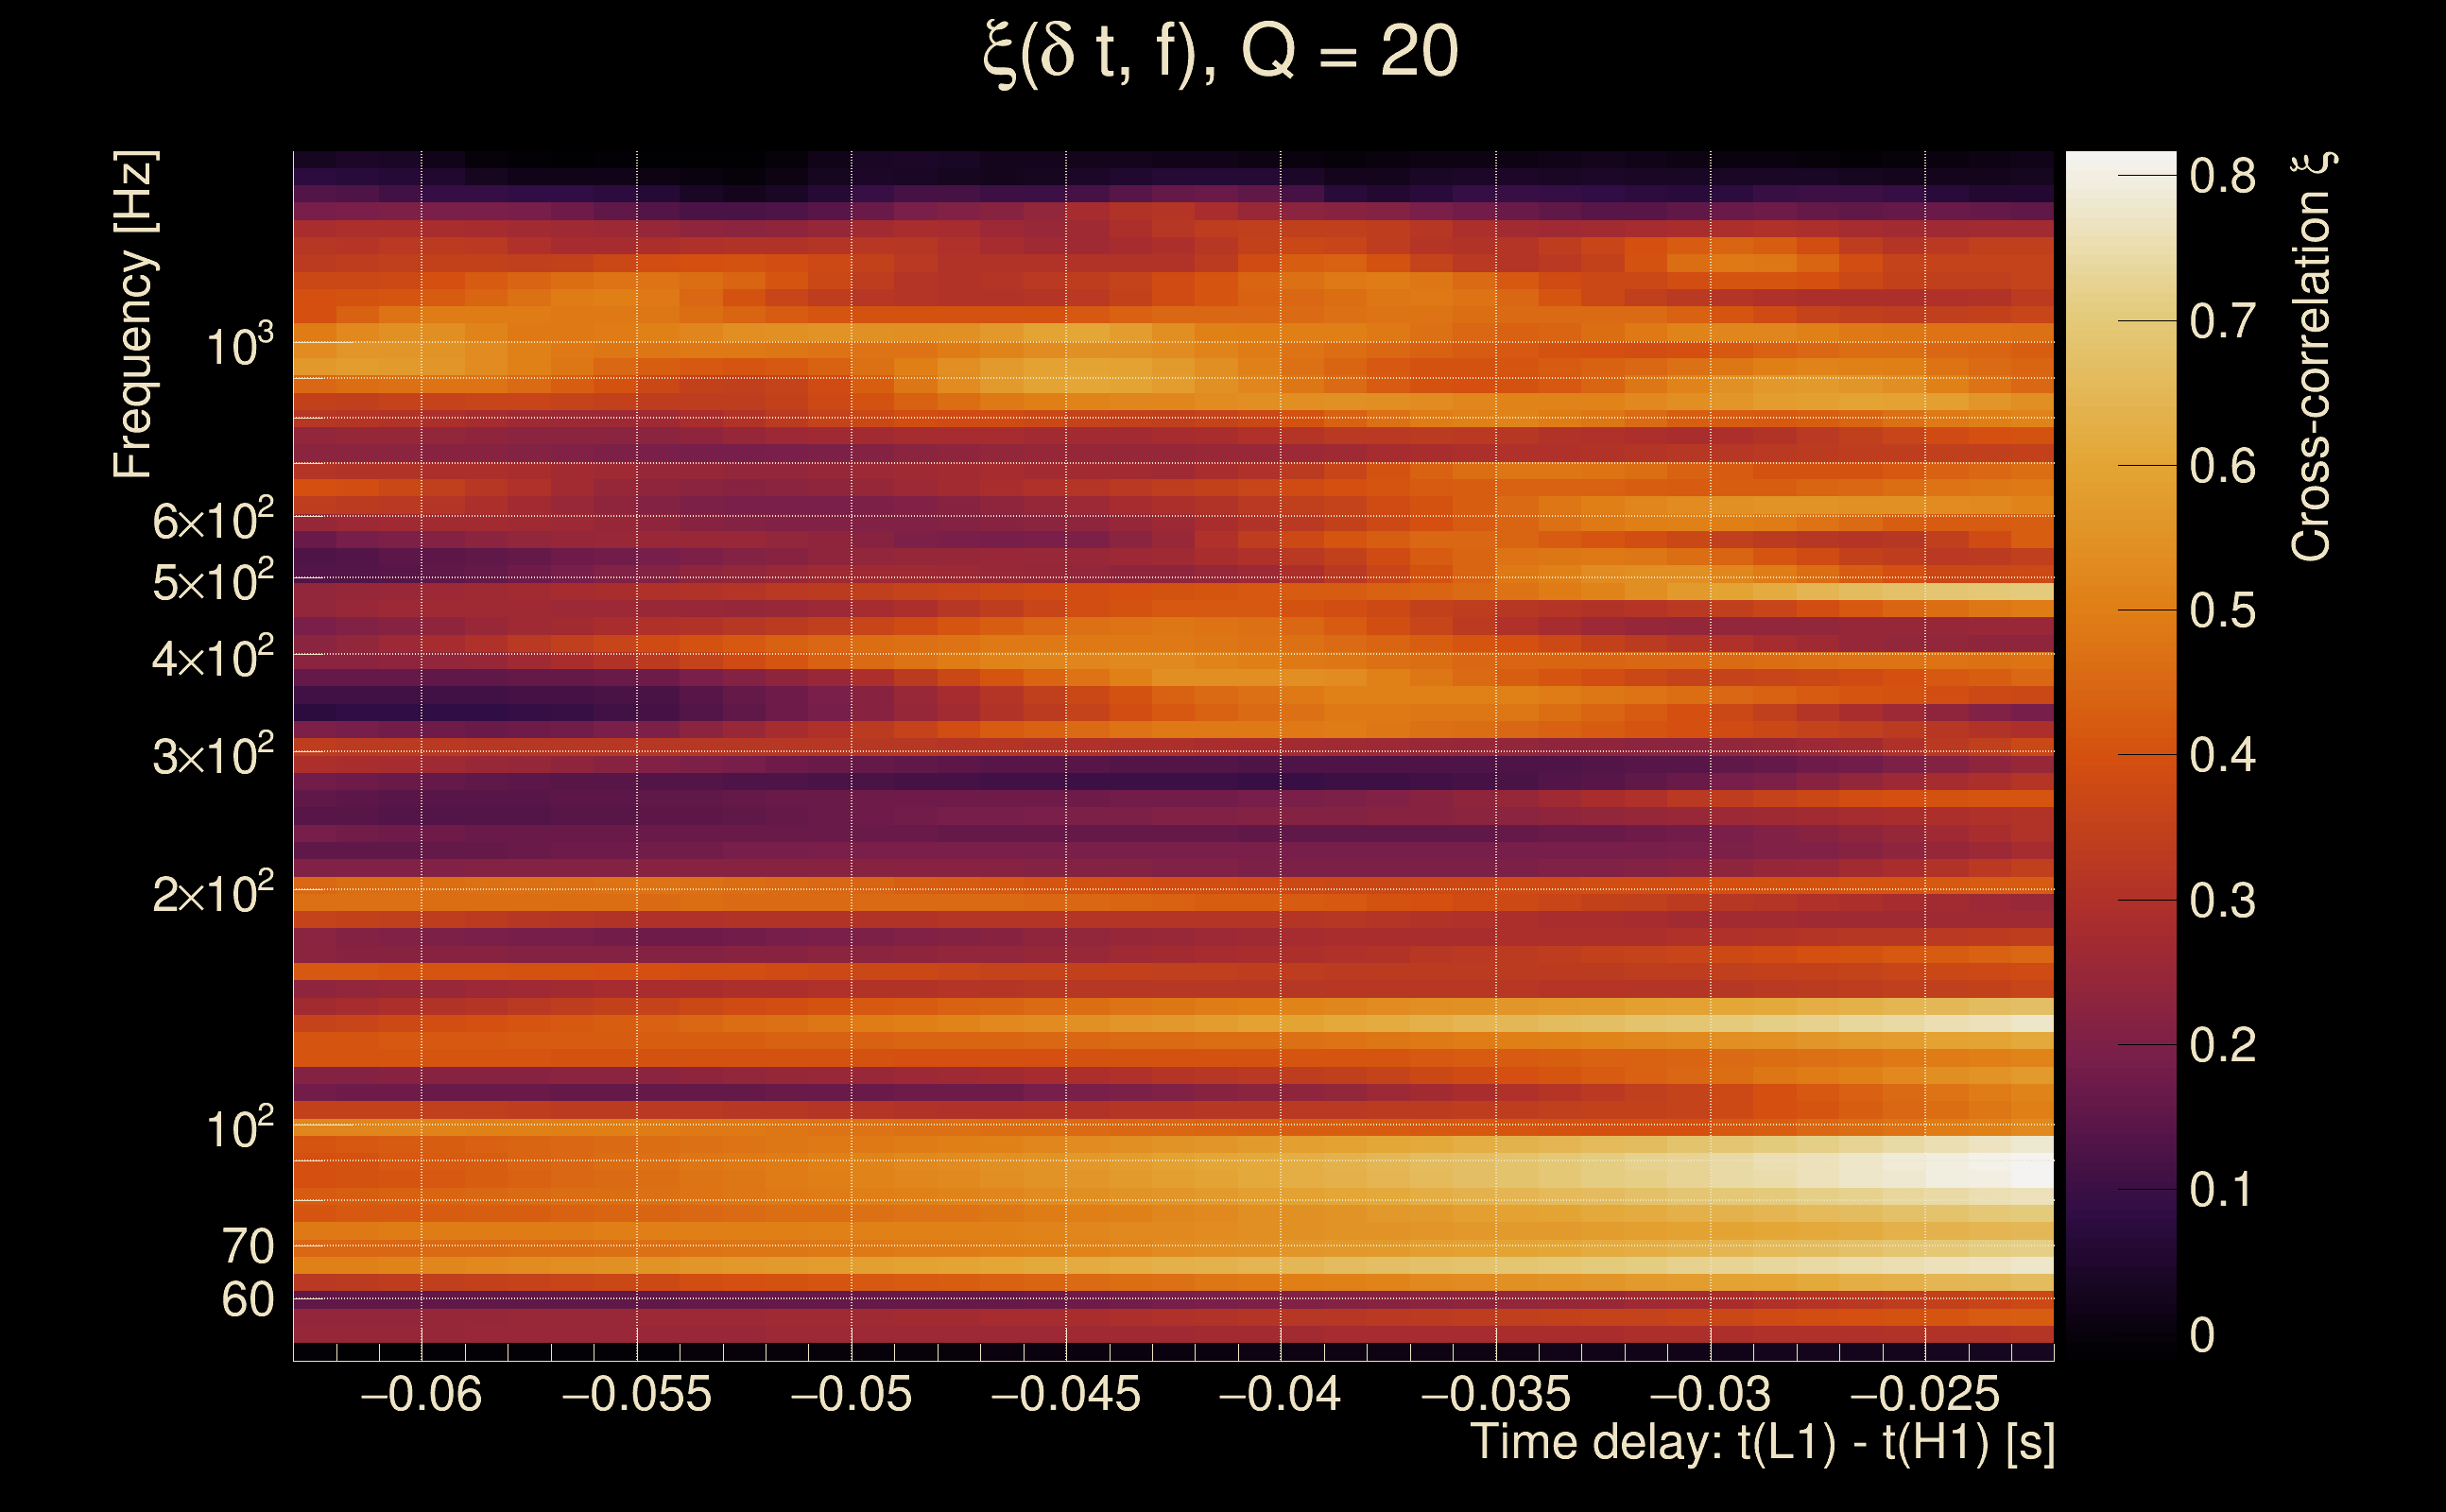
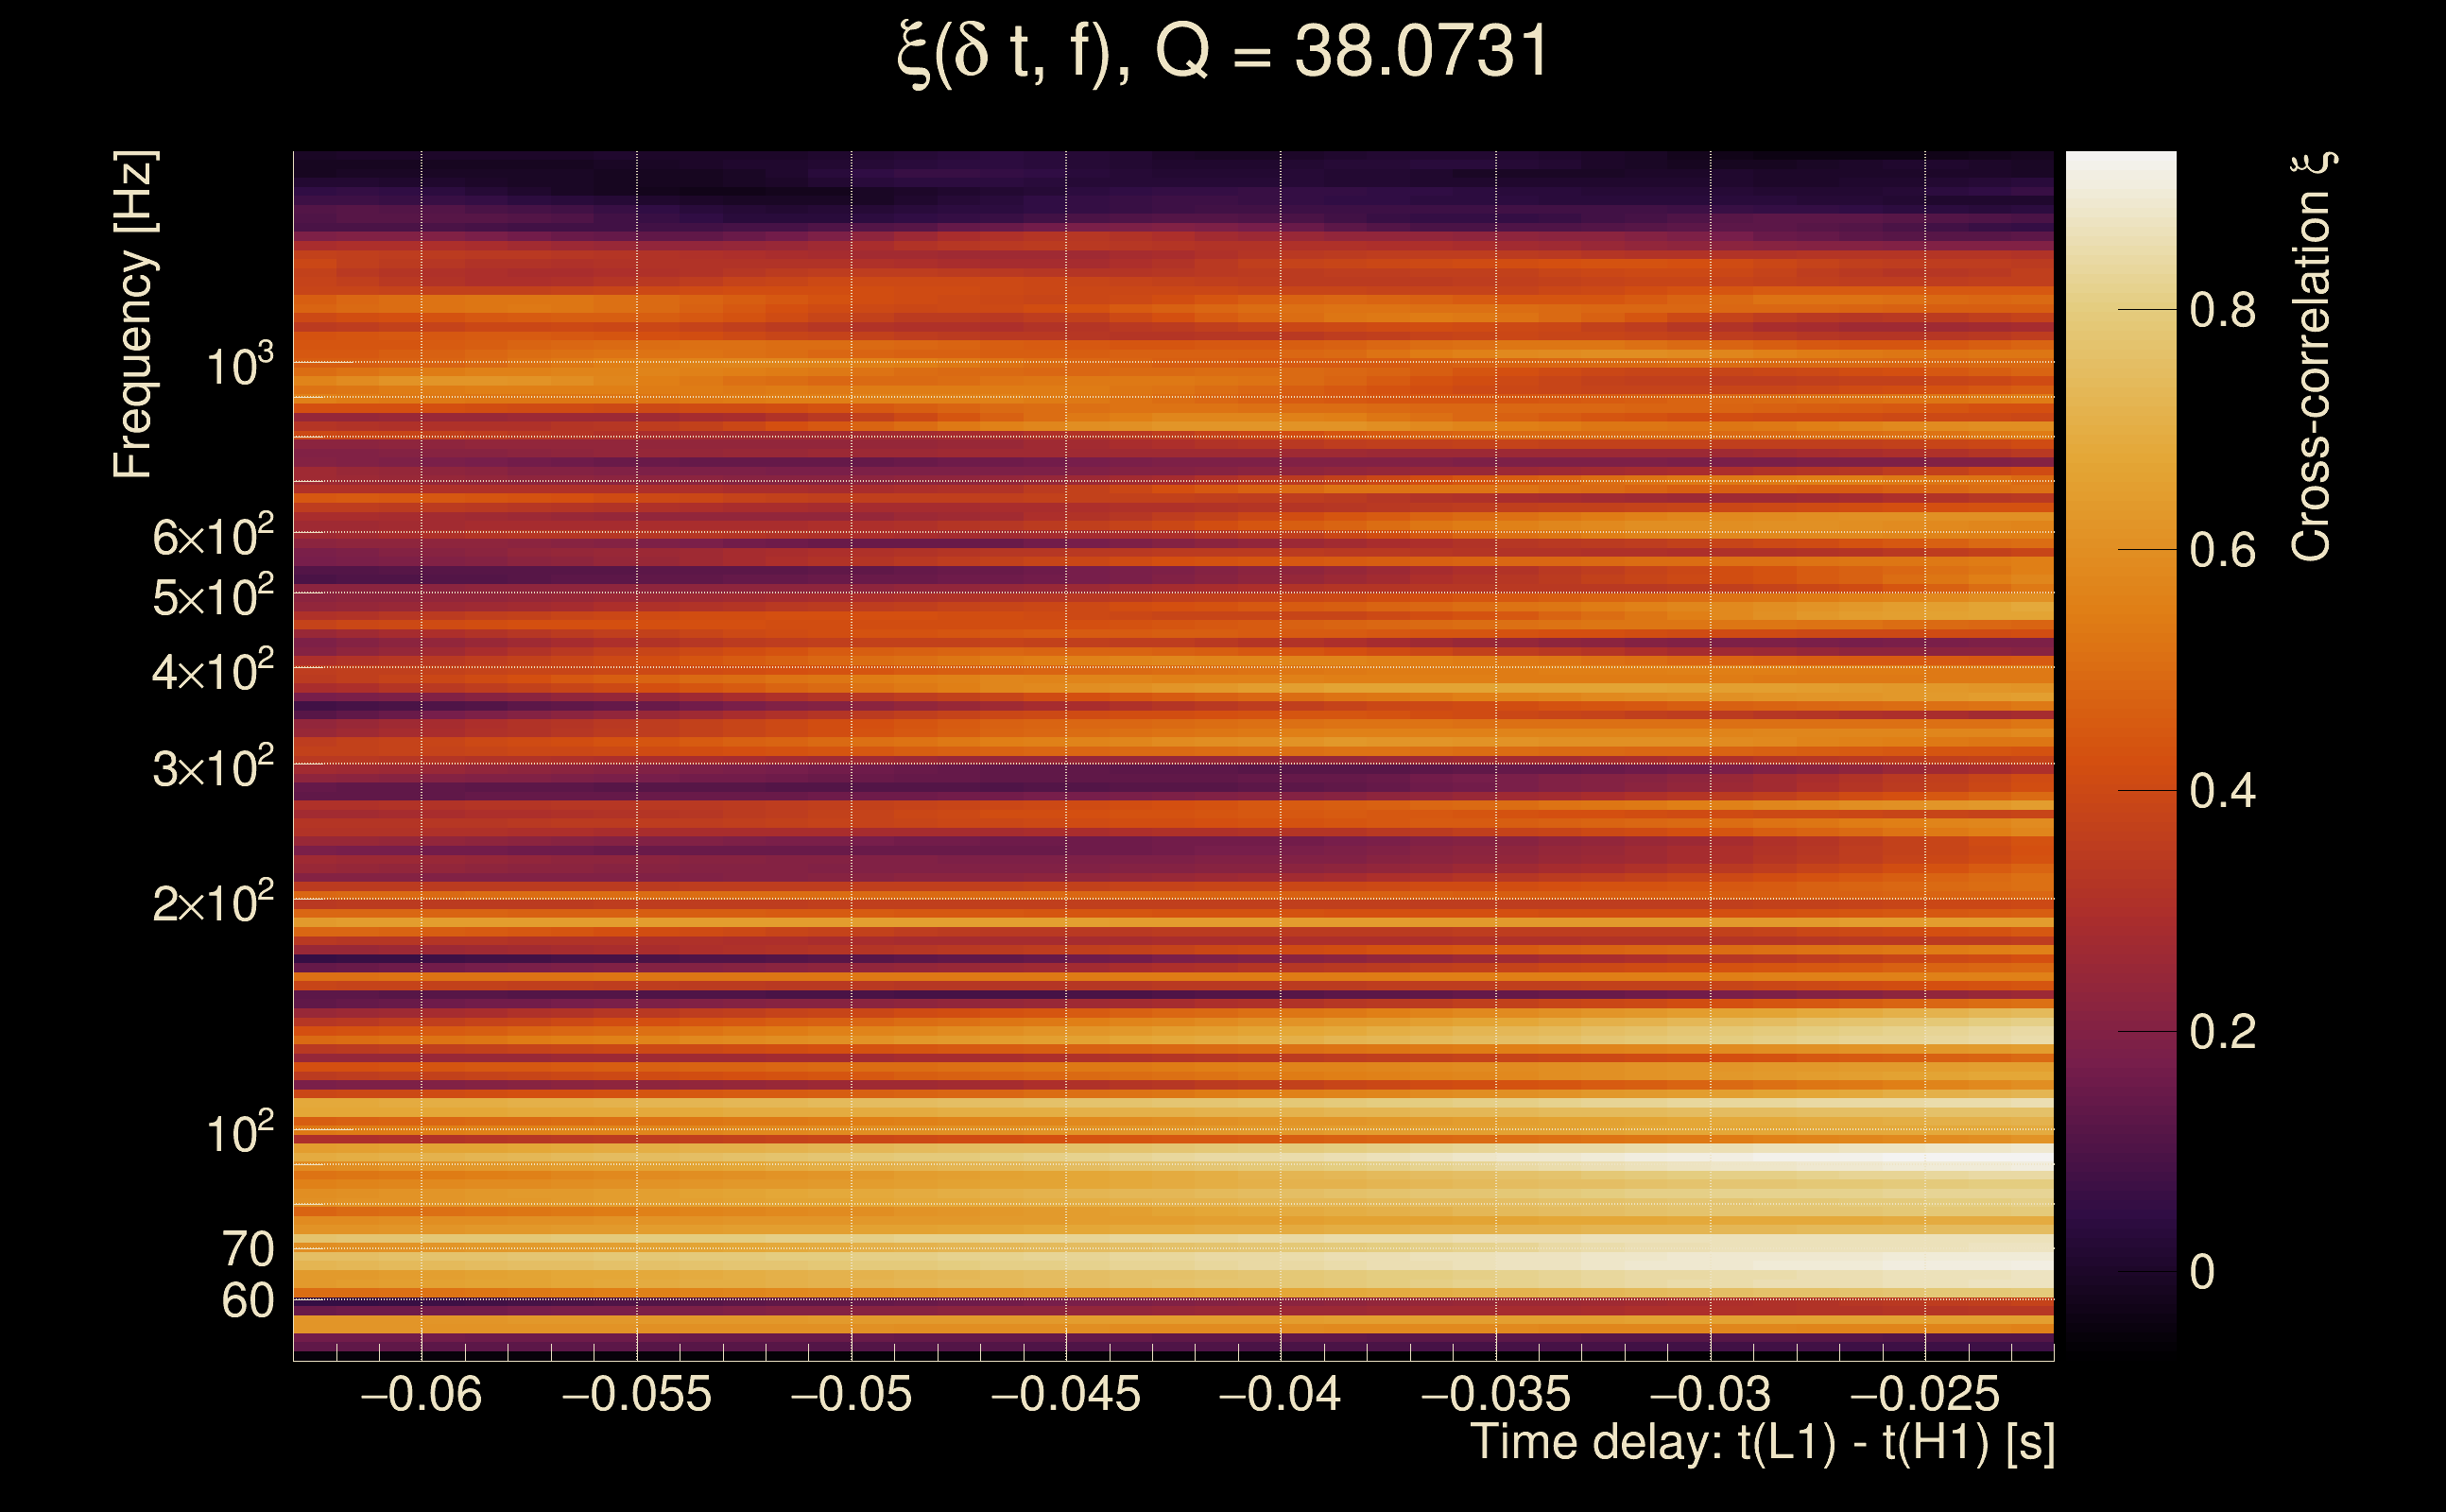
| Frequency: | 278.289 Hz |
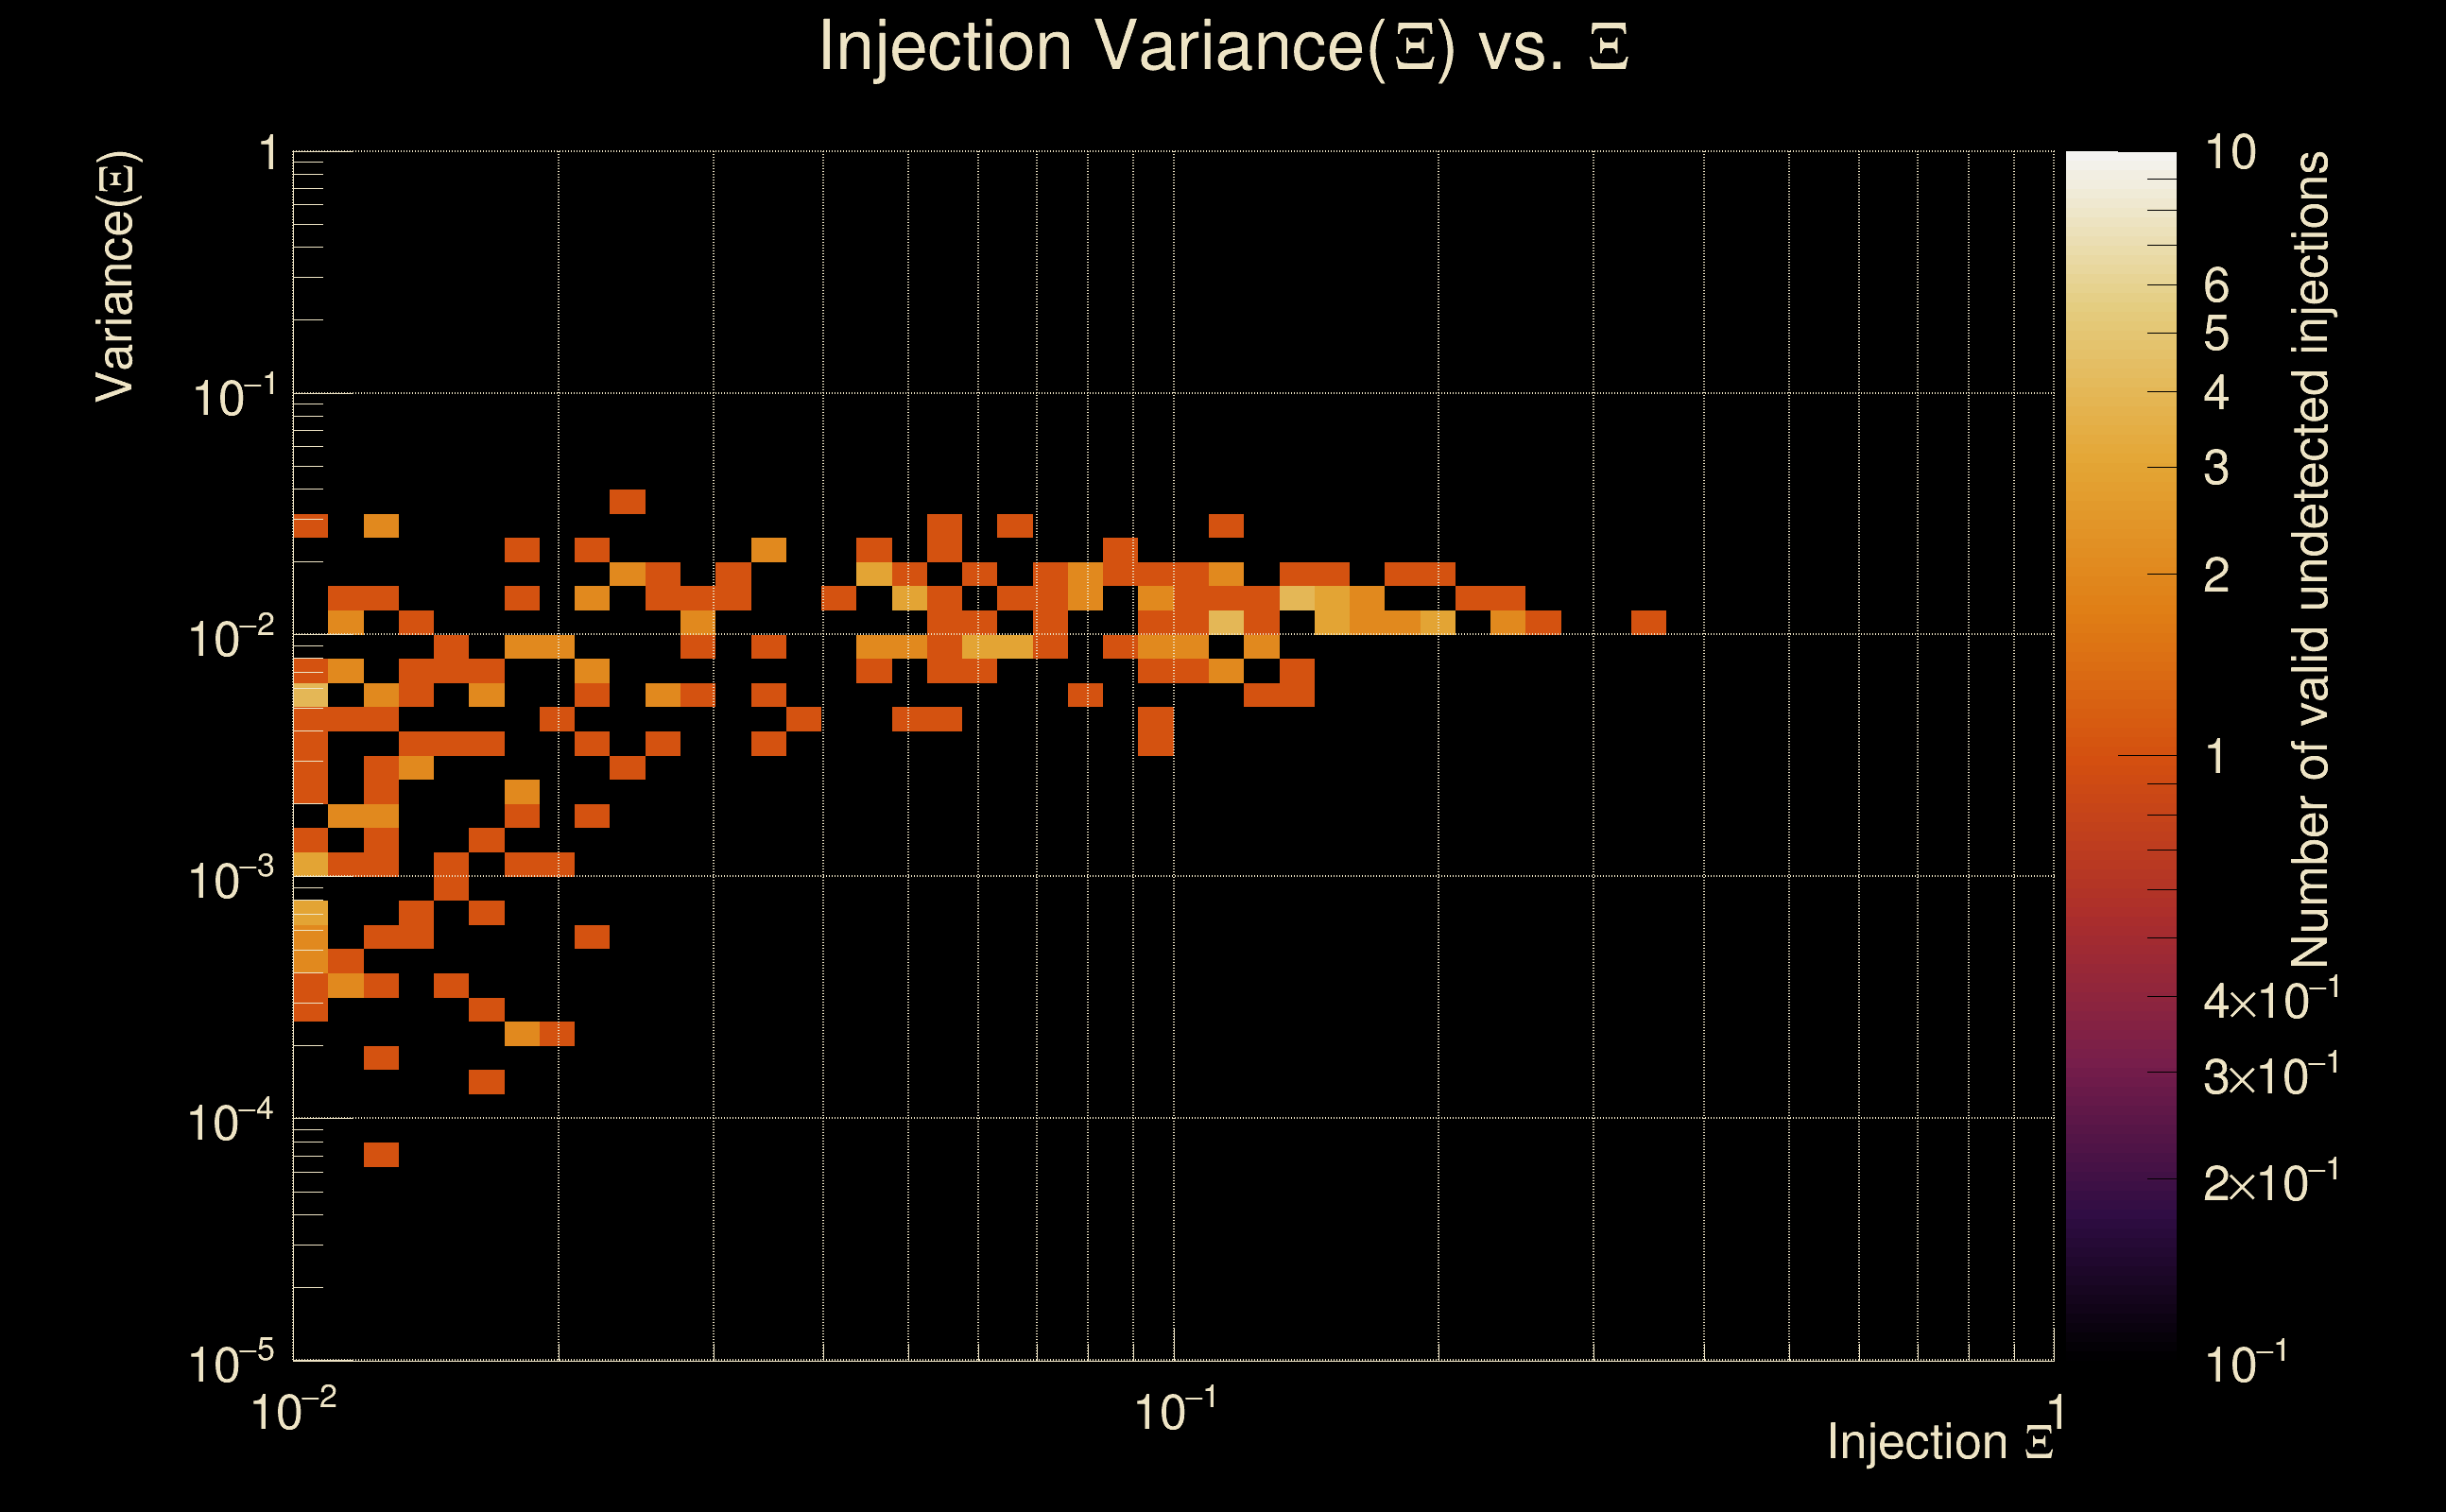
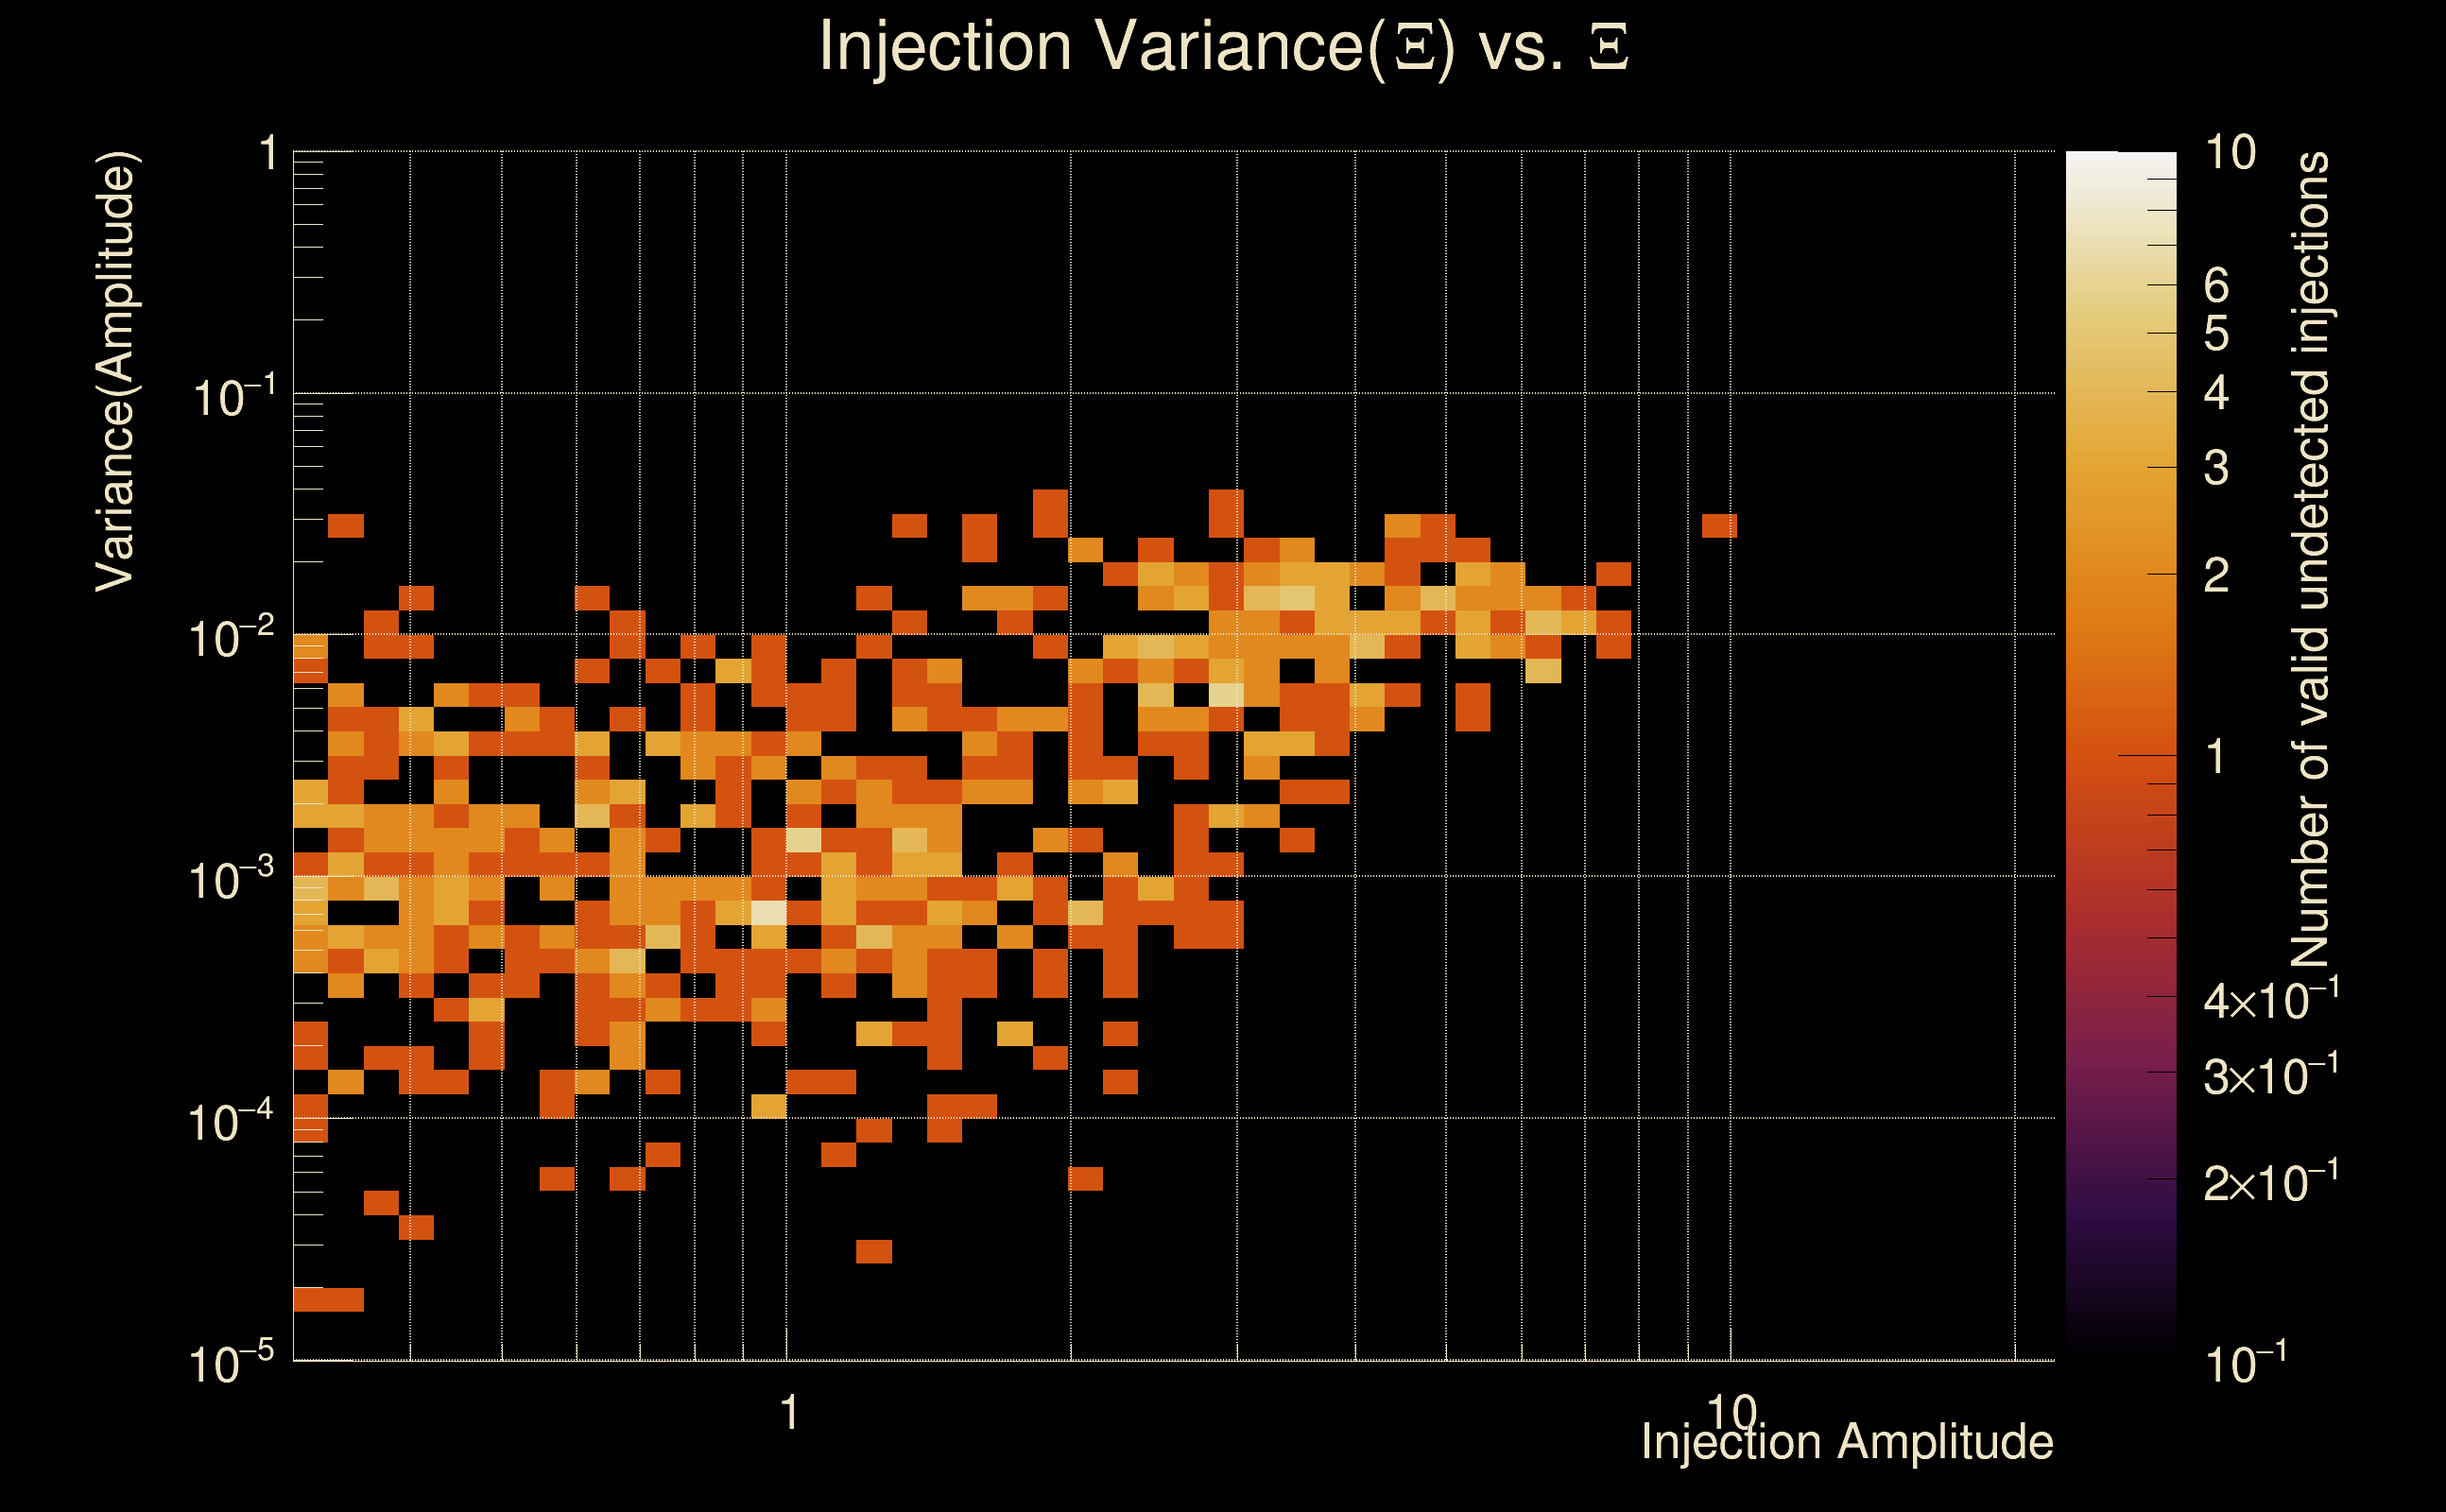
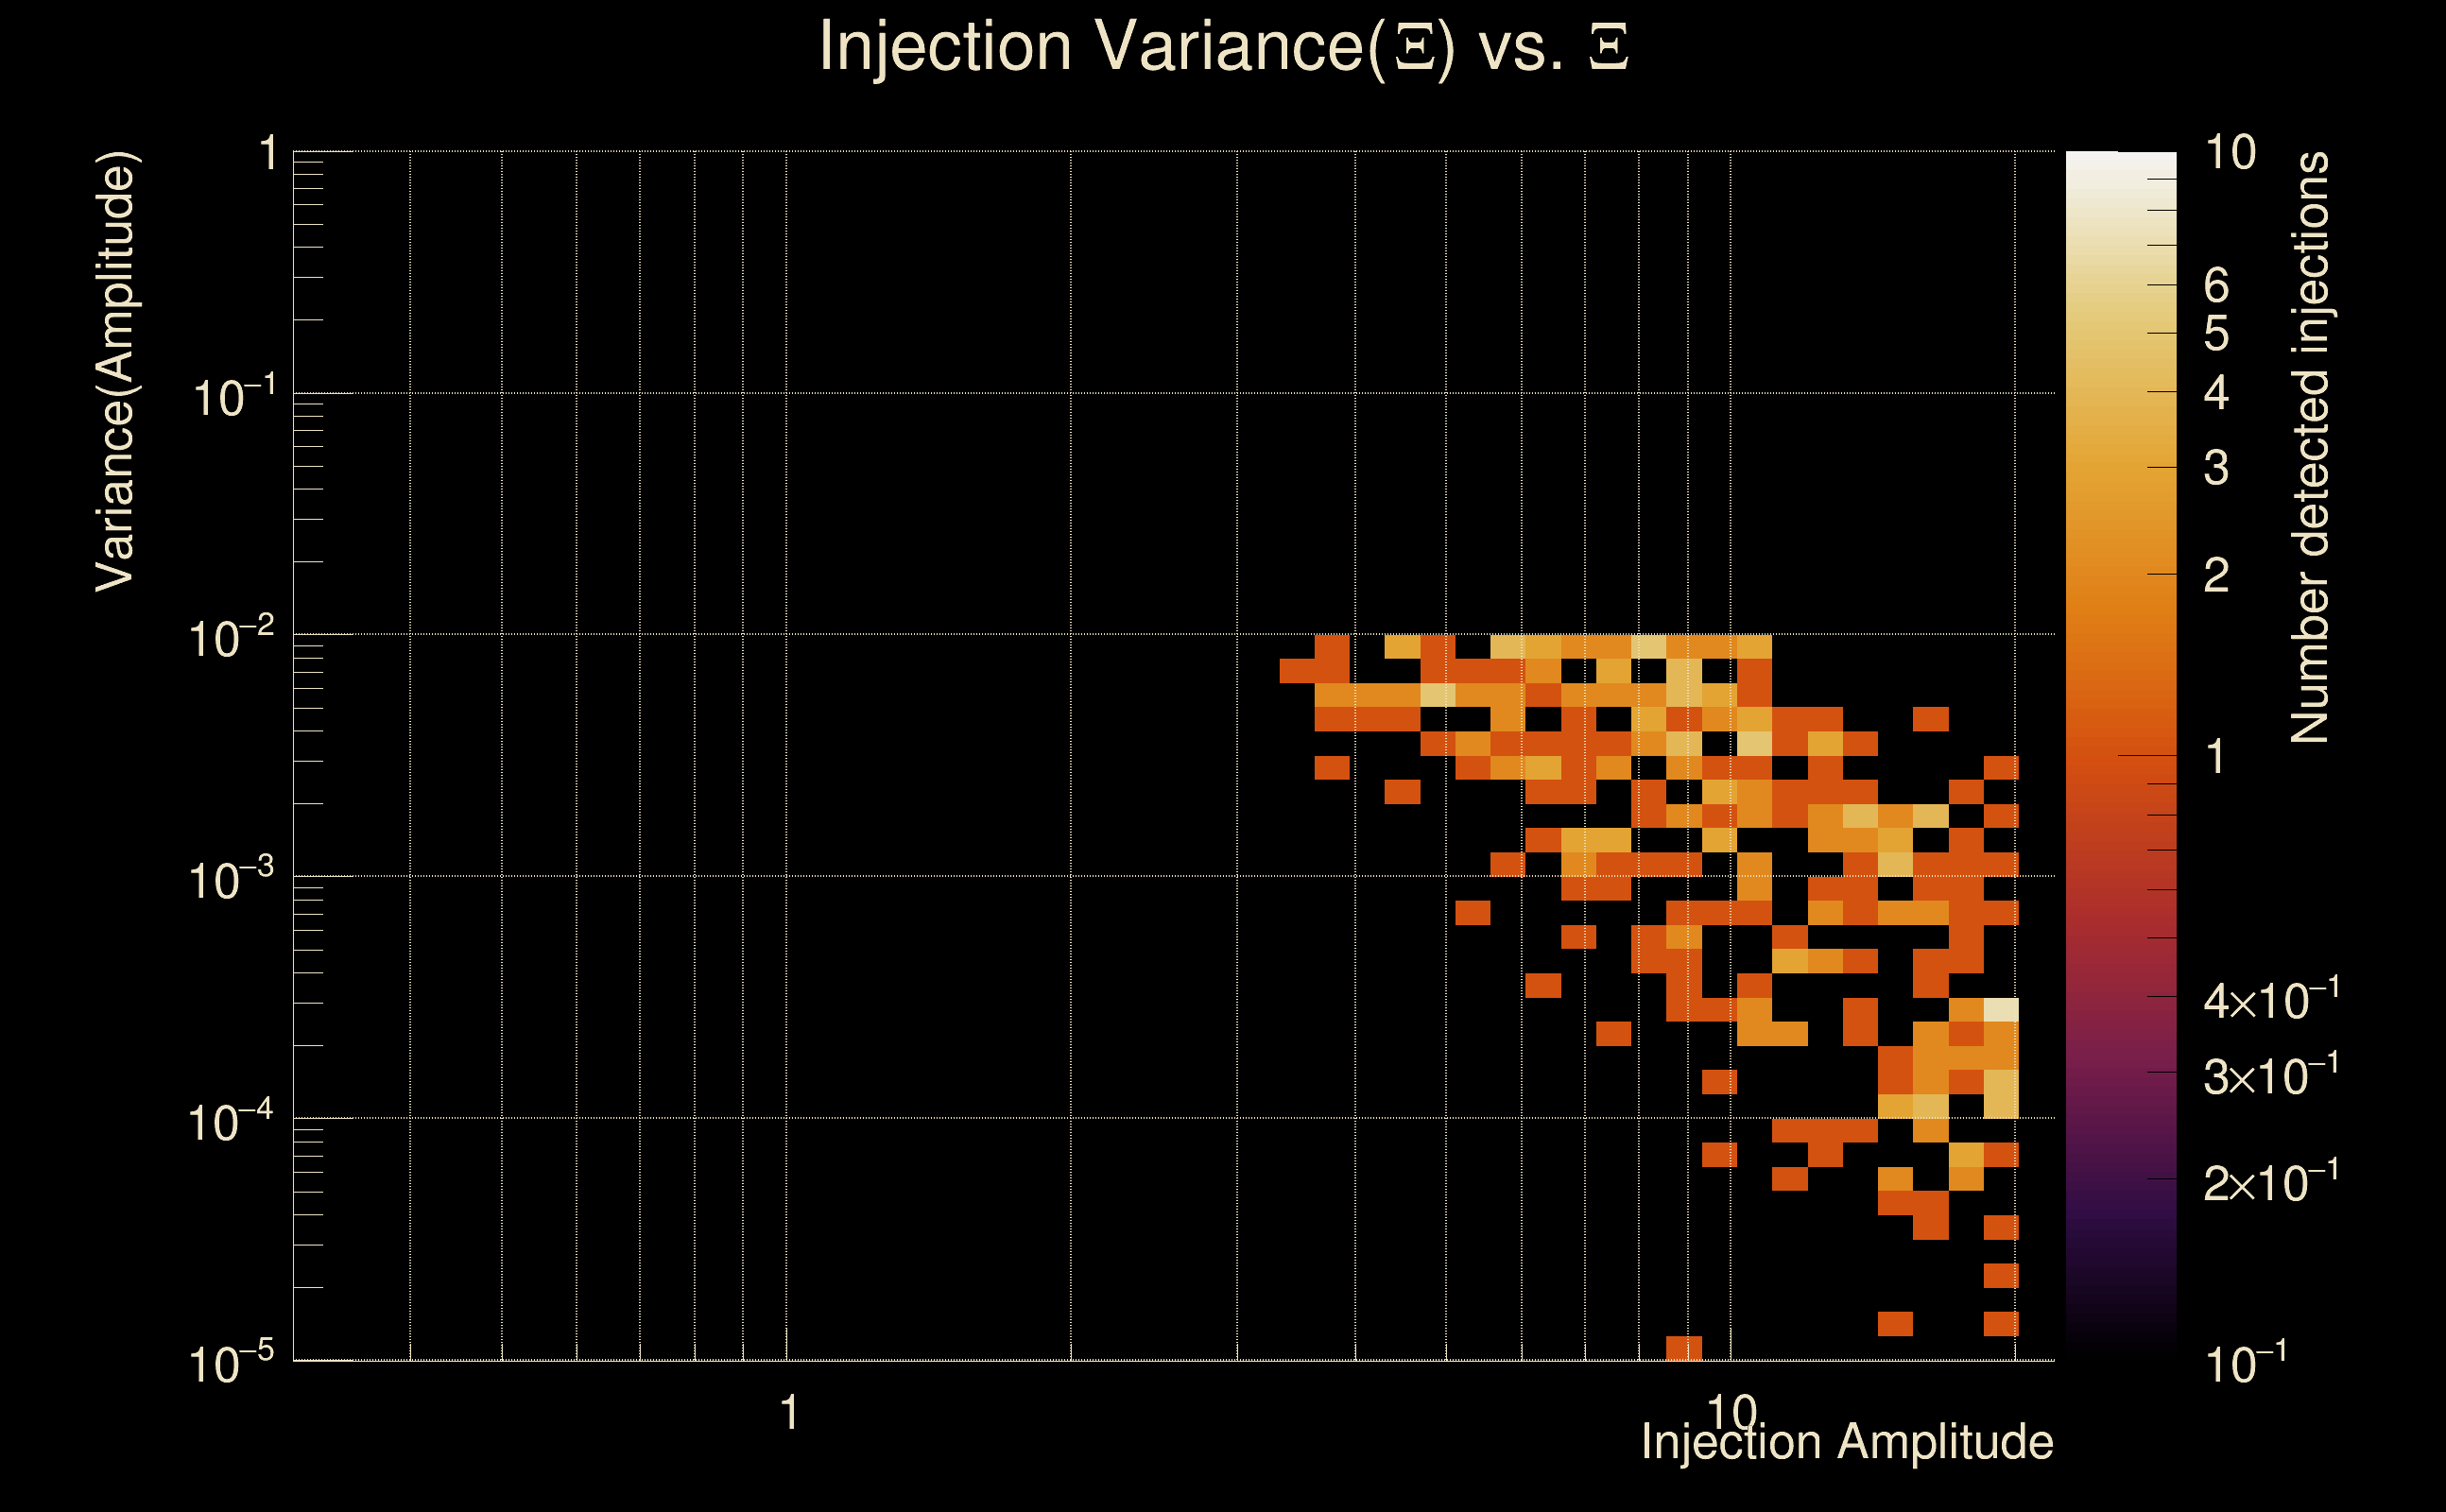
| Ξ: | 0.920637 ± 0.0136218 (variance = 0.000185553): Q0: 0.952089, Q1: 0.934334, Q2: 0.921956, Q3: 0.914794, Q4: 0.91816 |
| Rank: | R_A = 0.879566 |
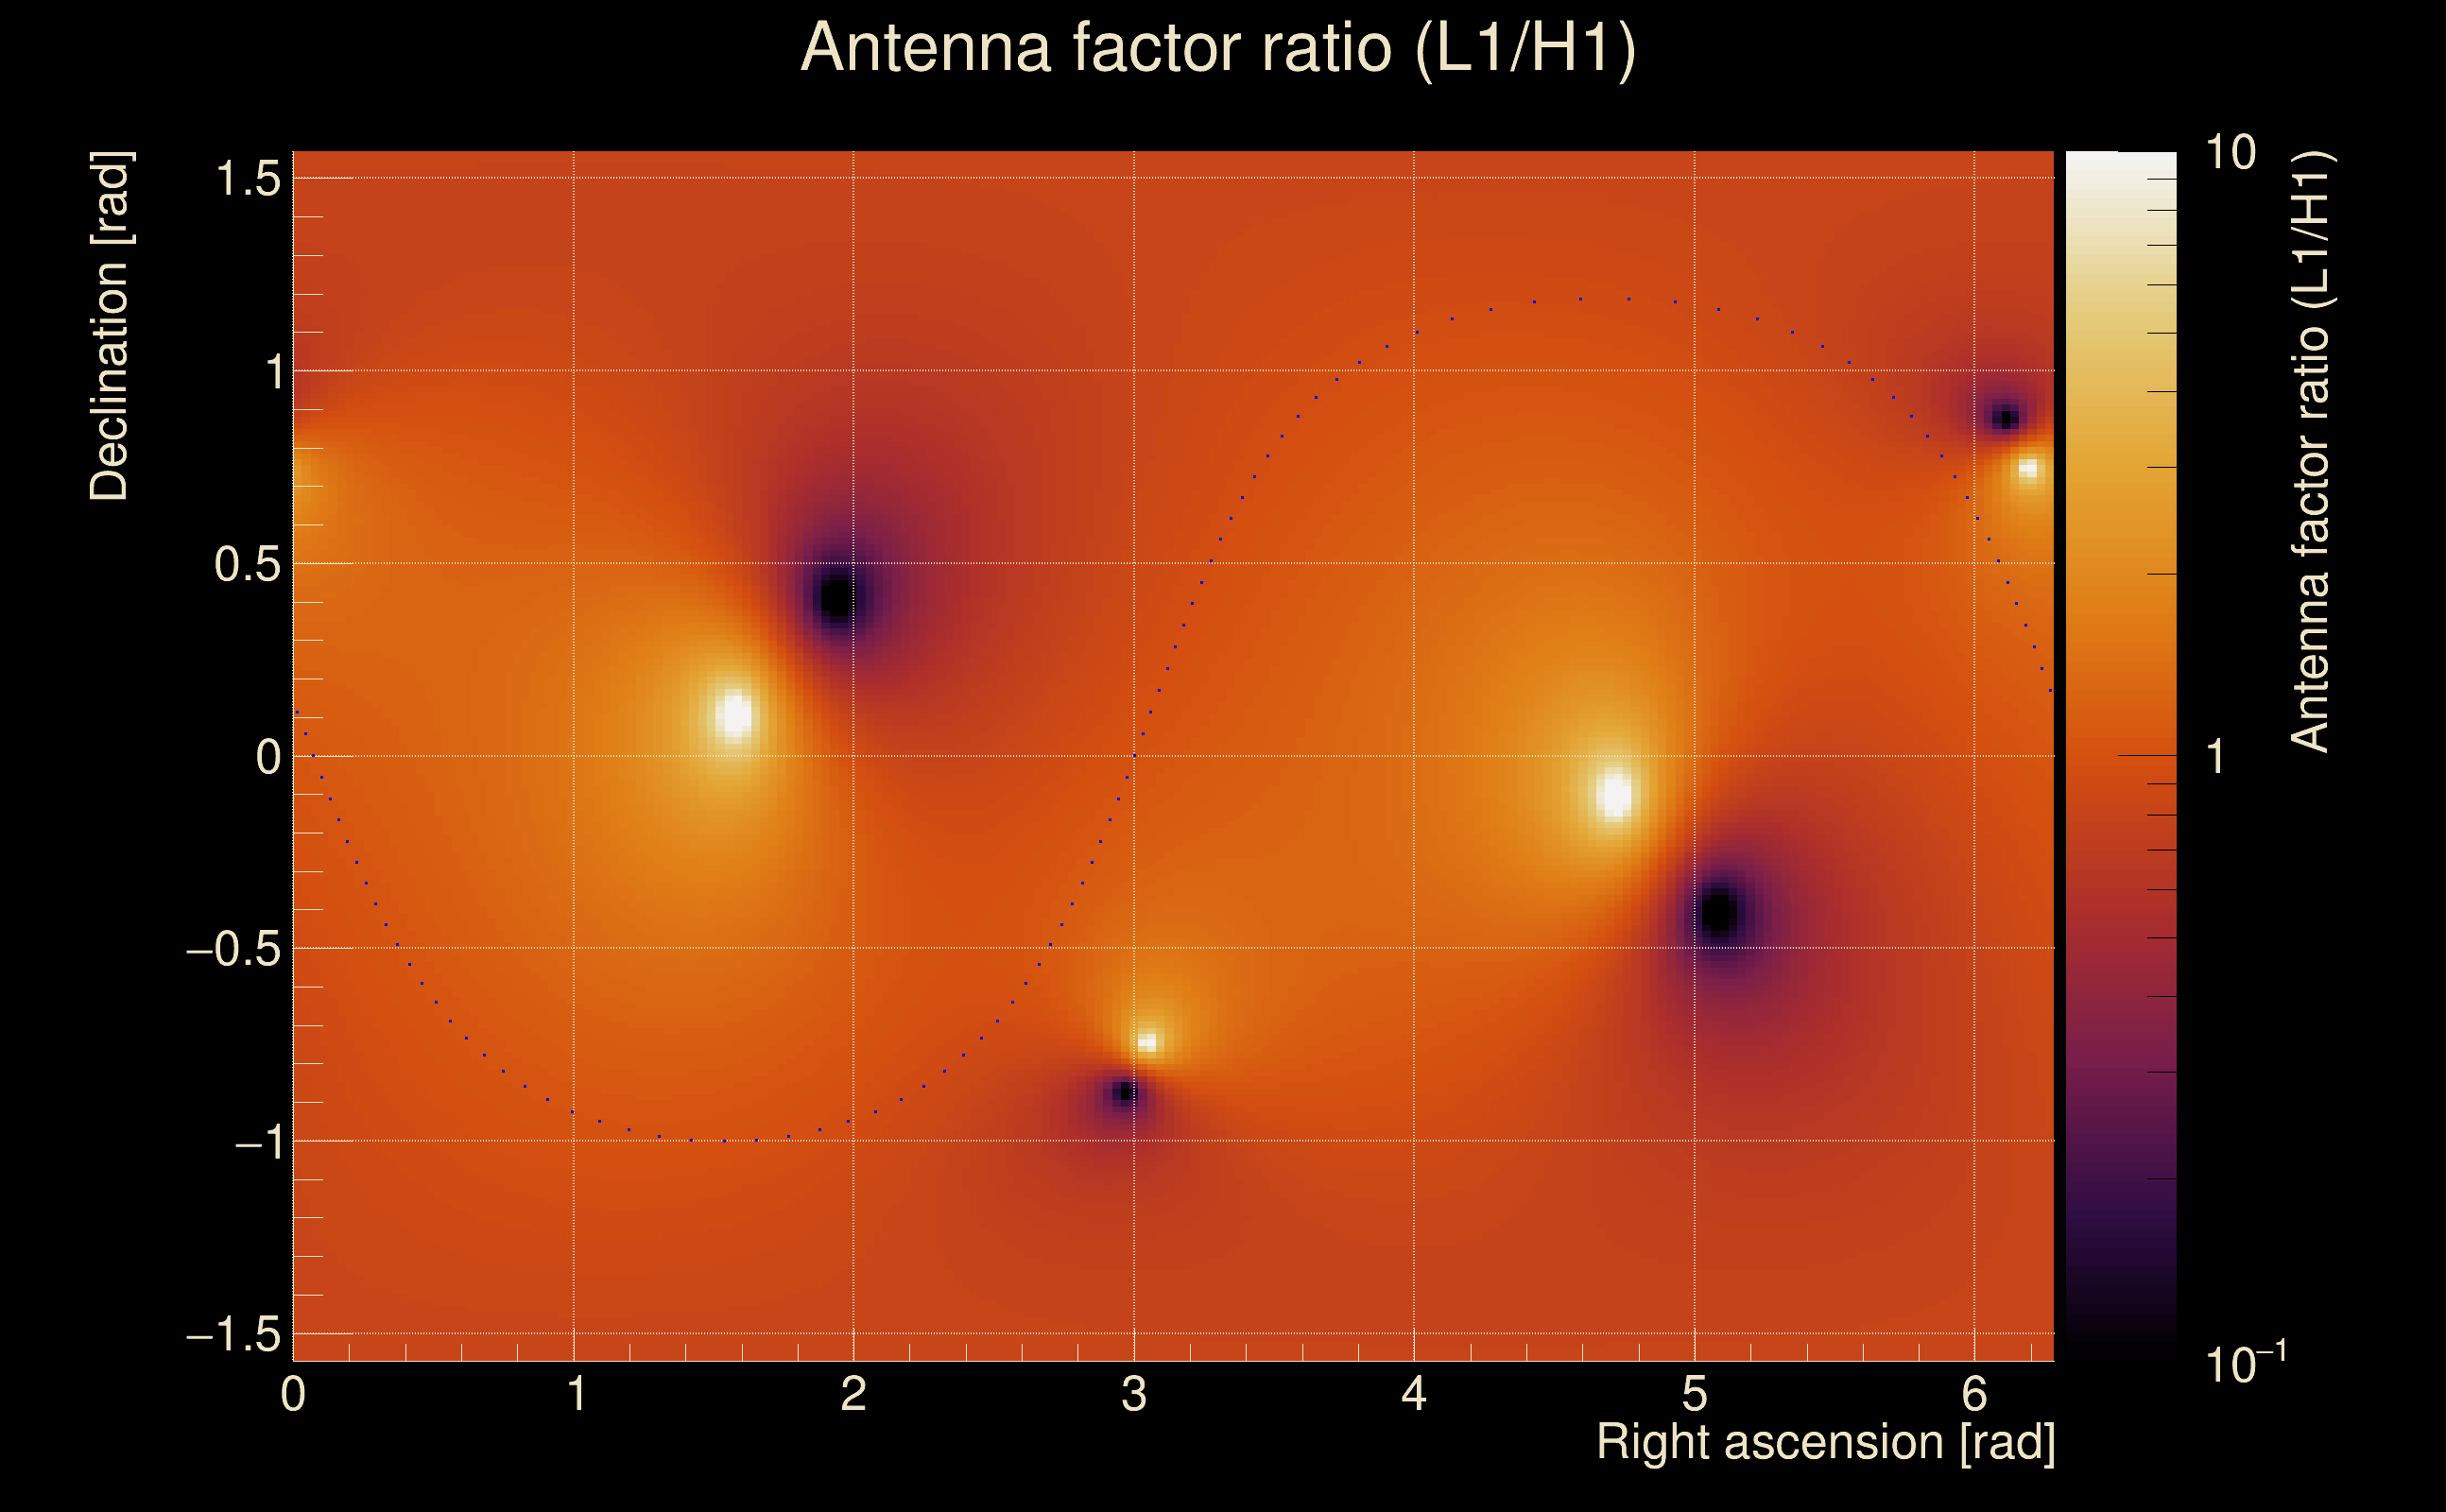
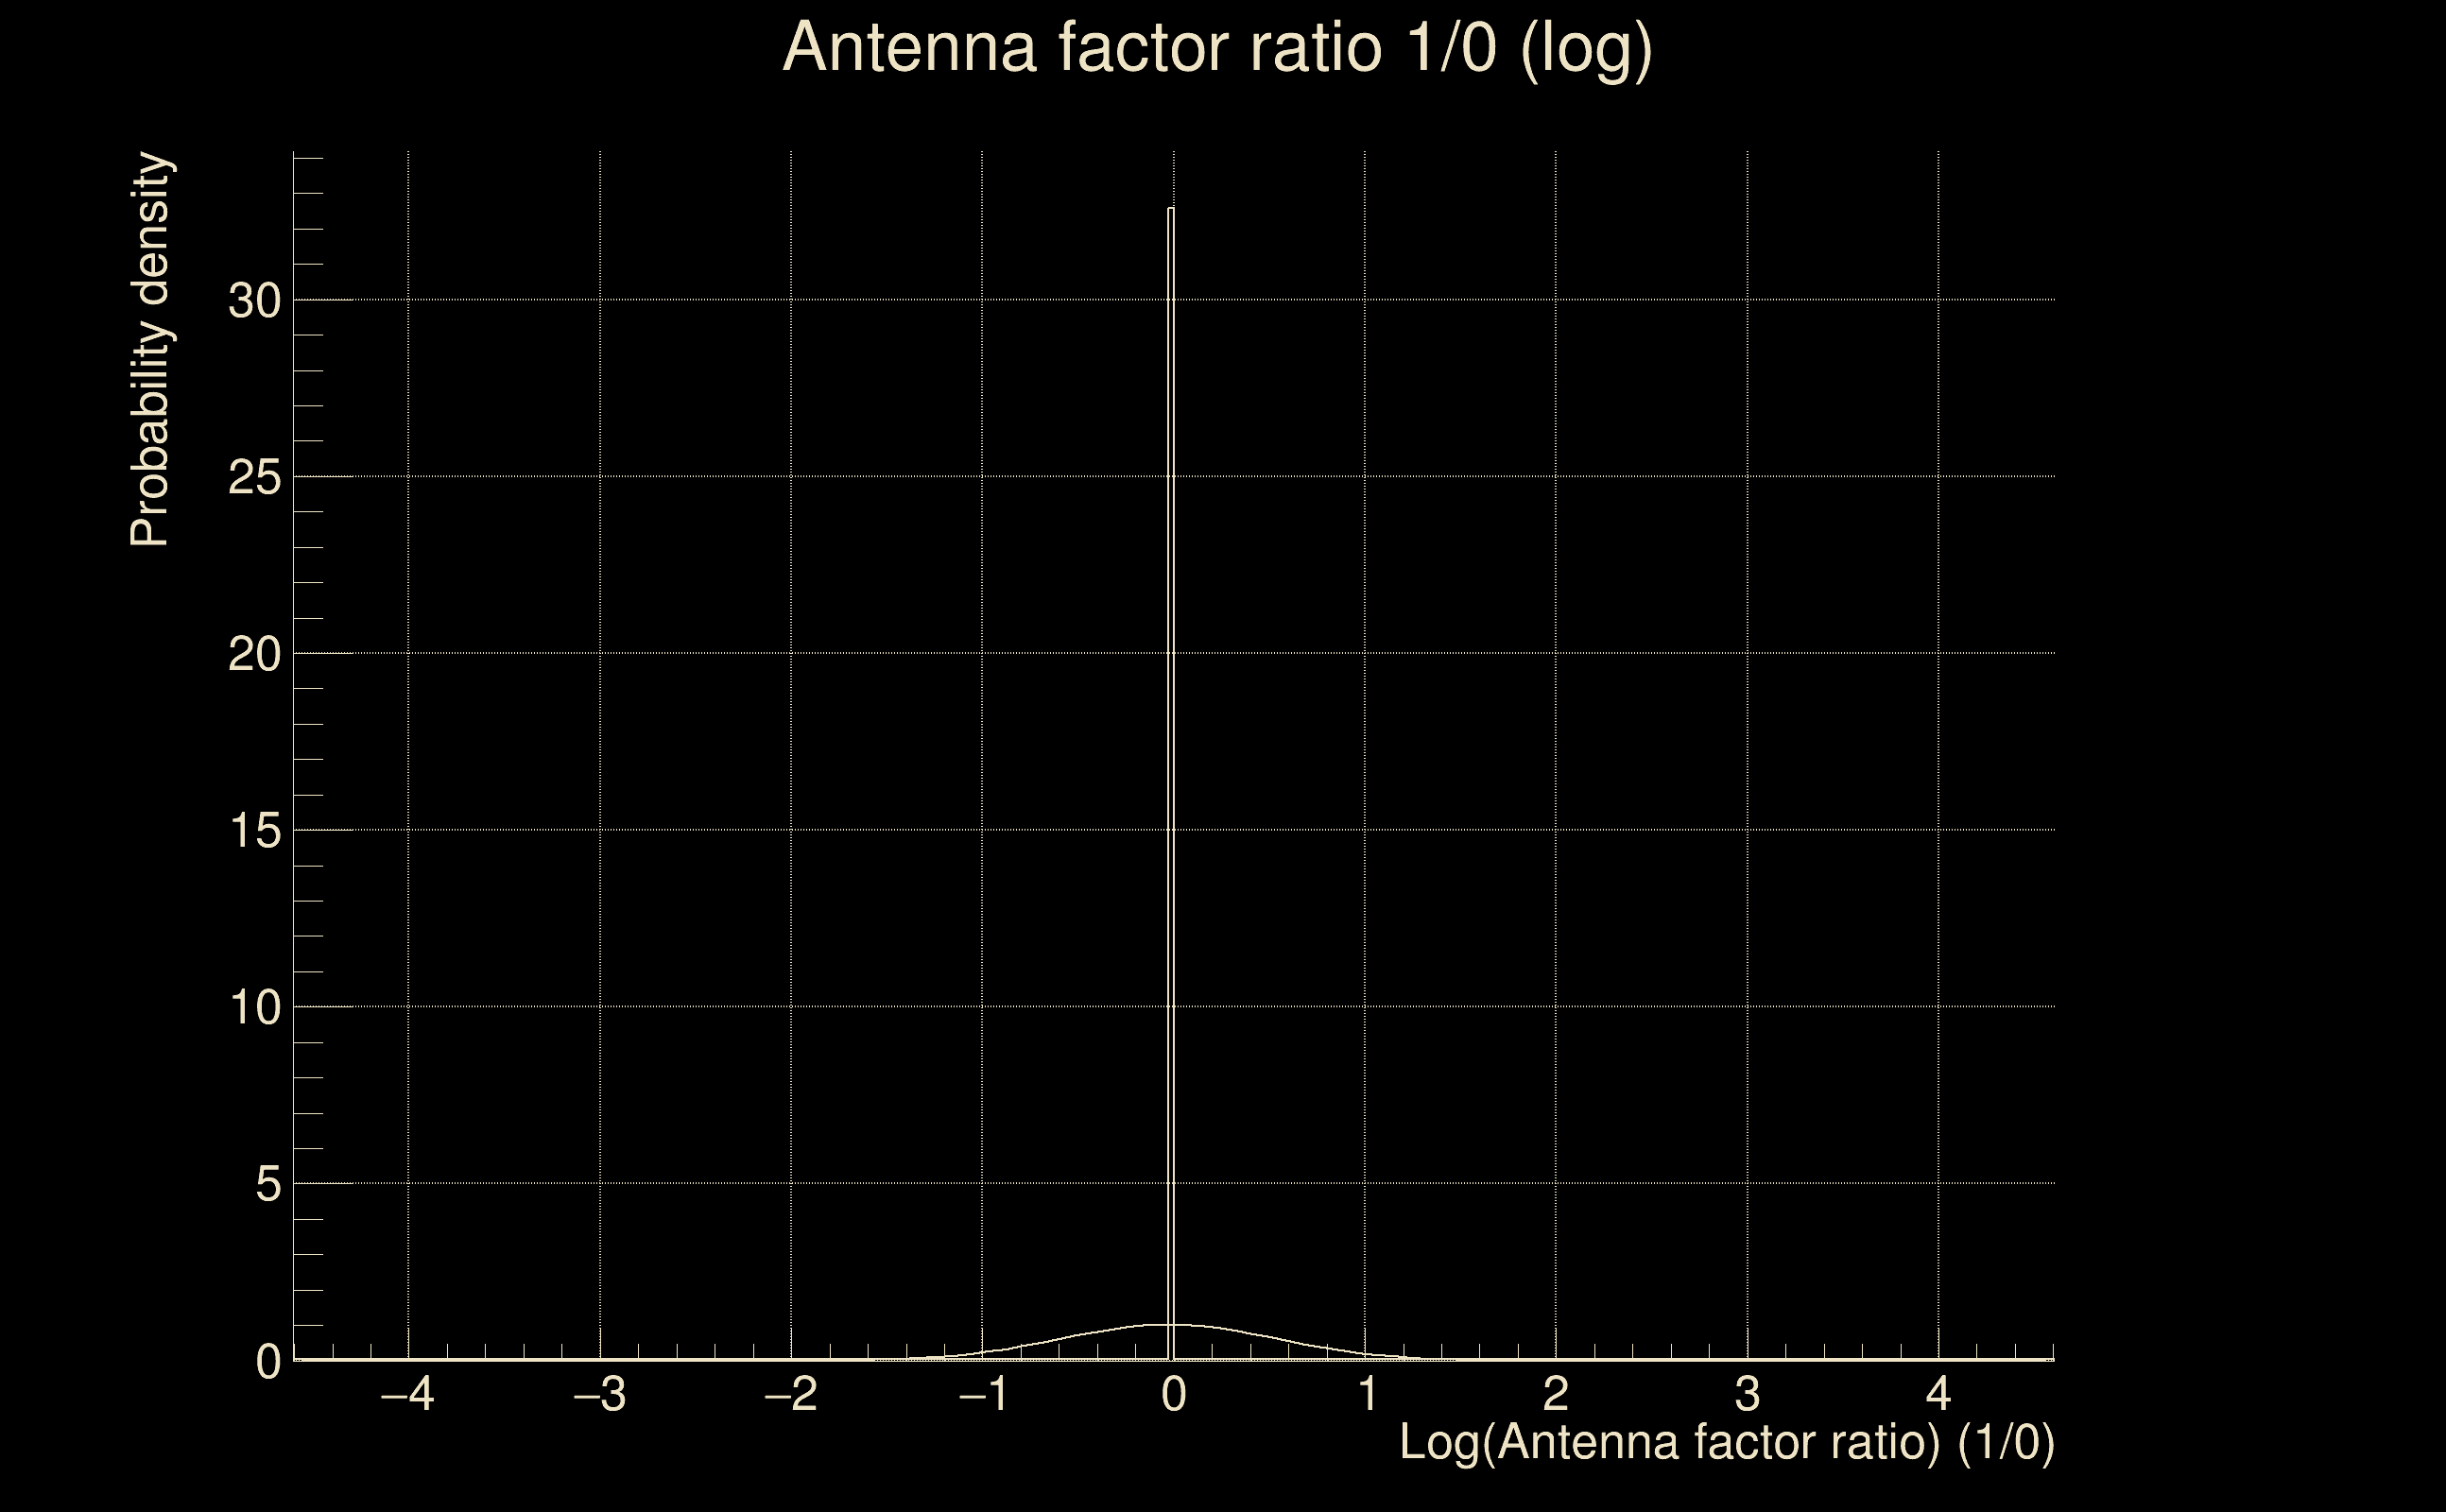
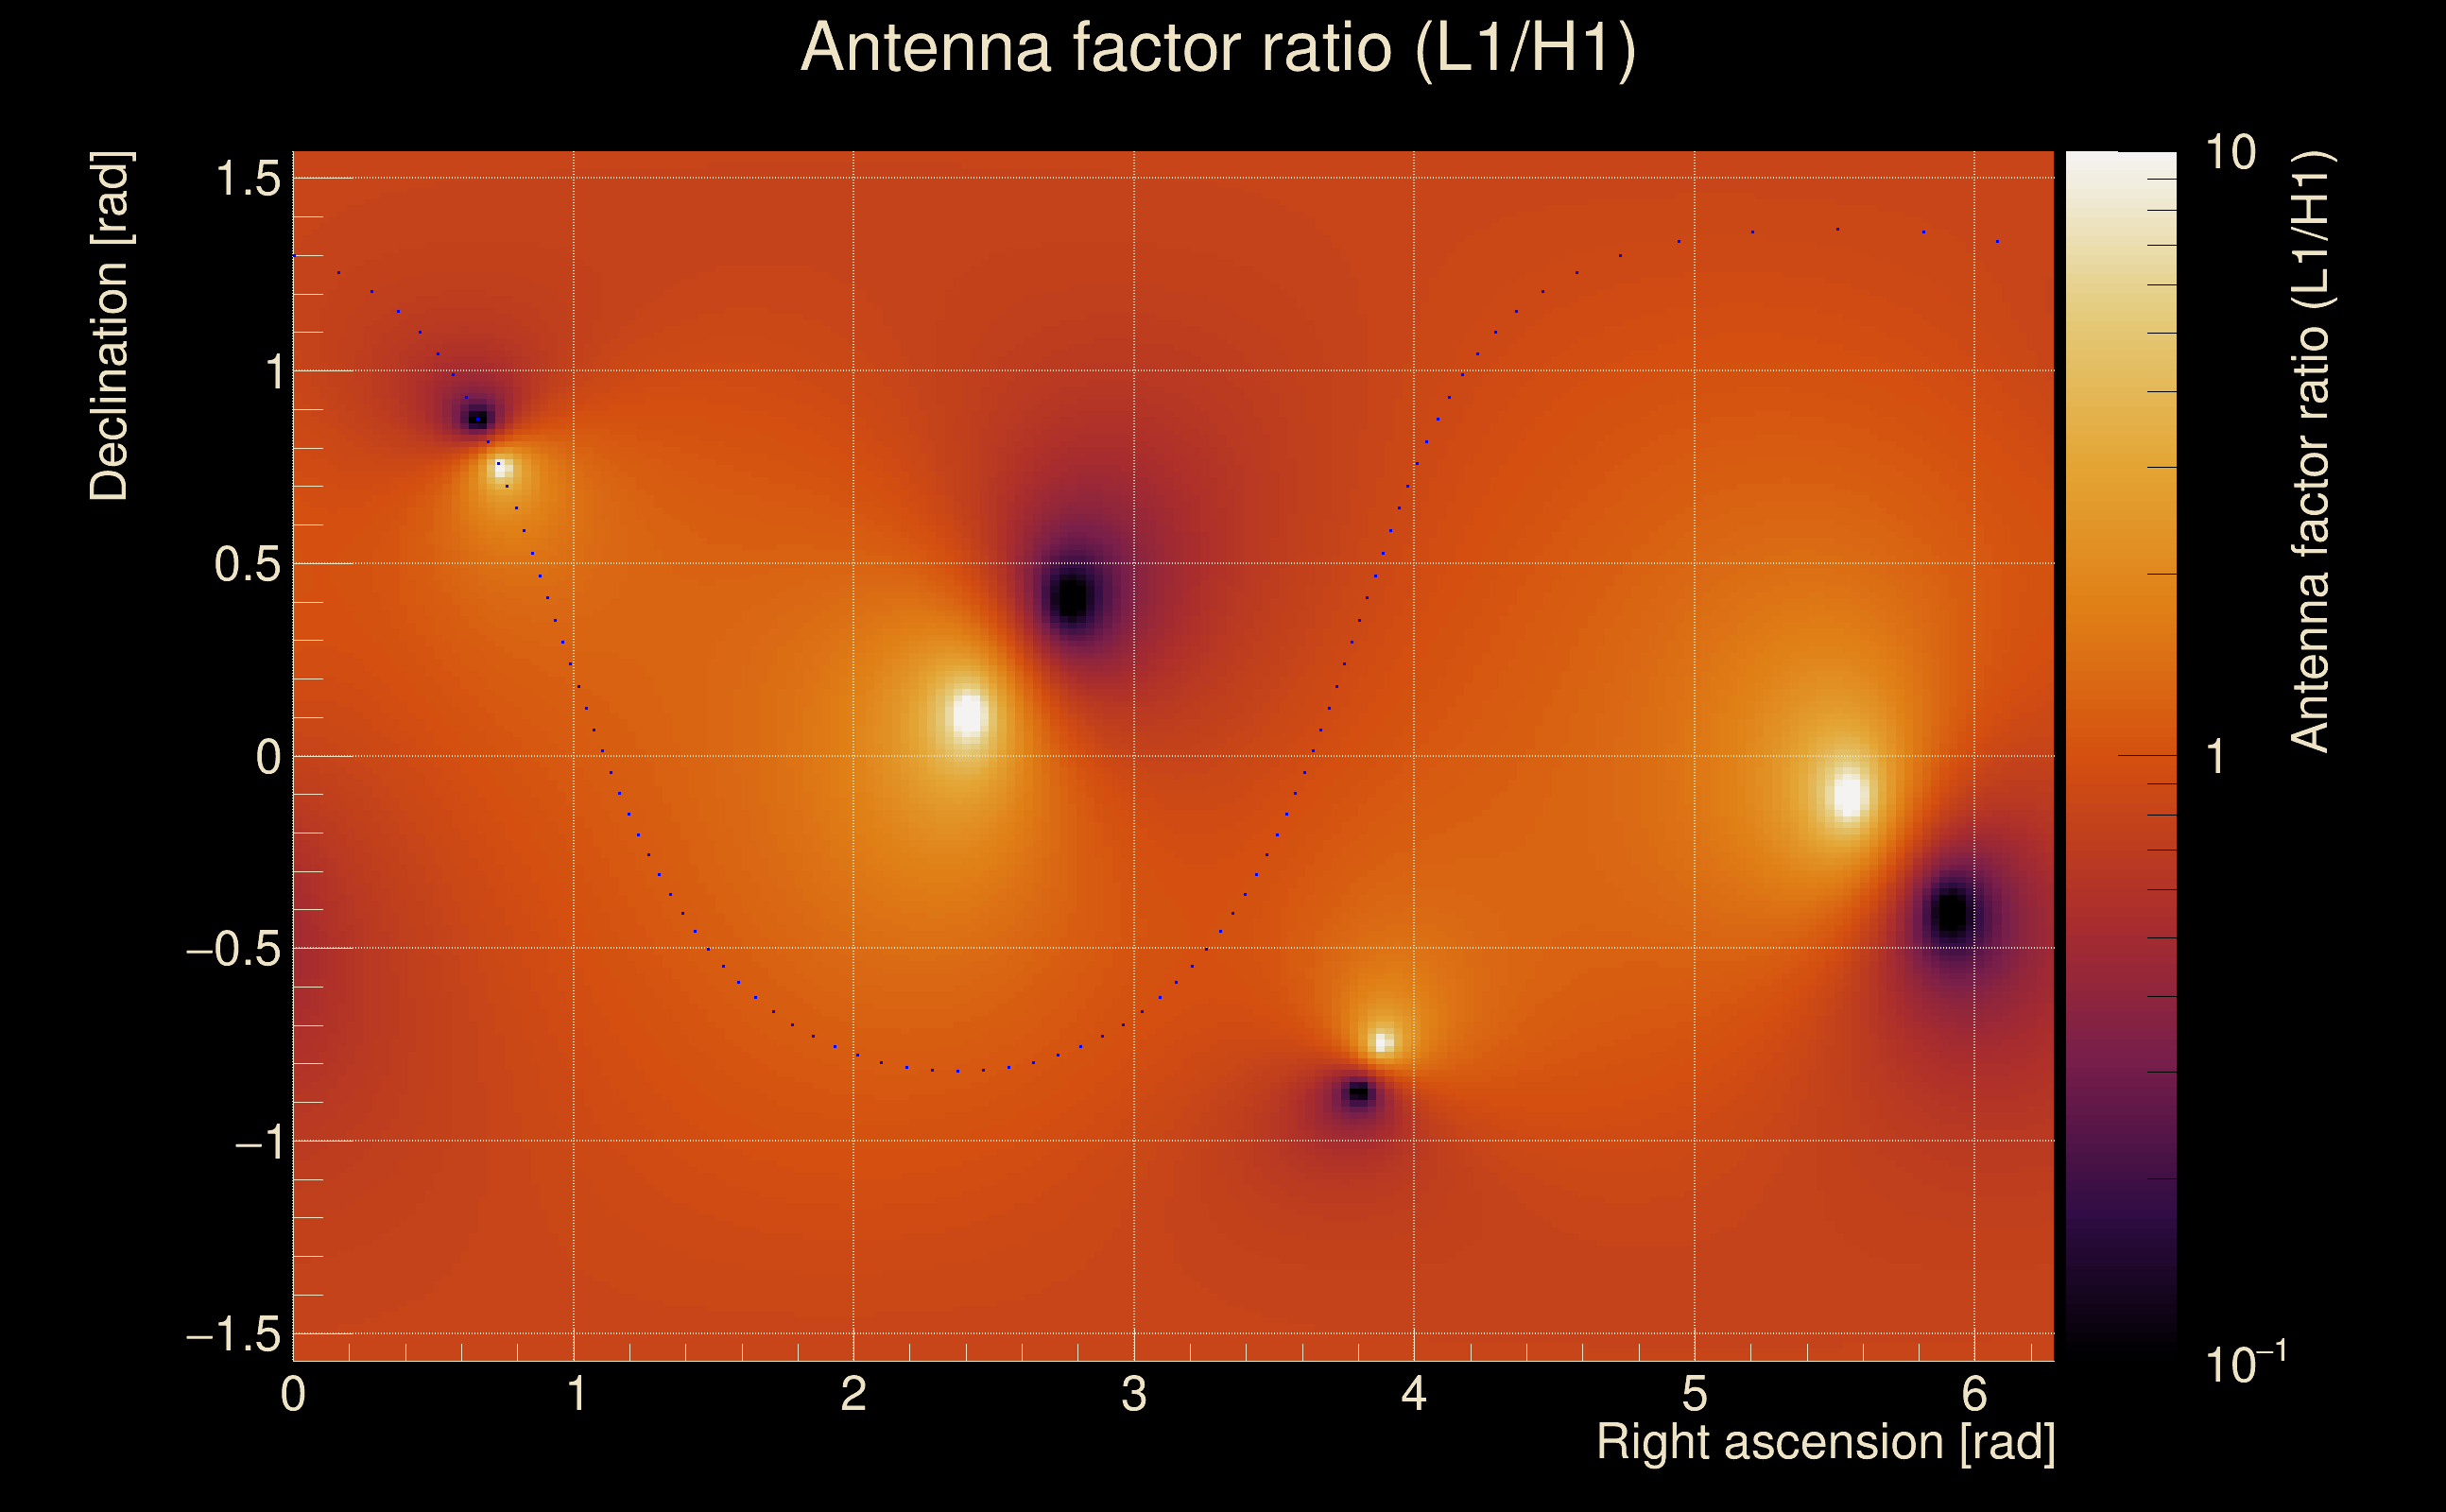
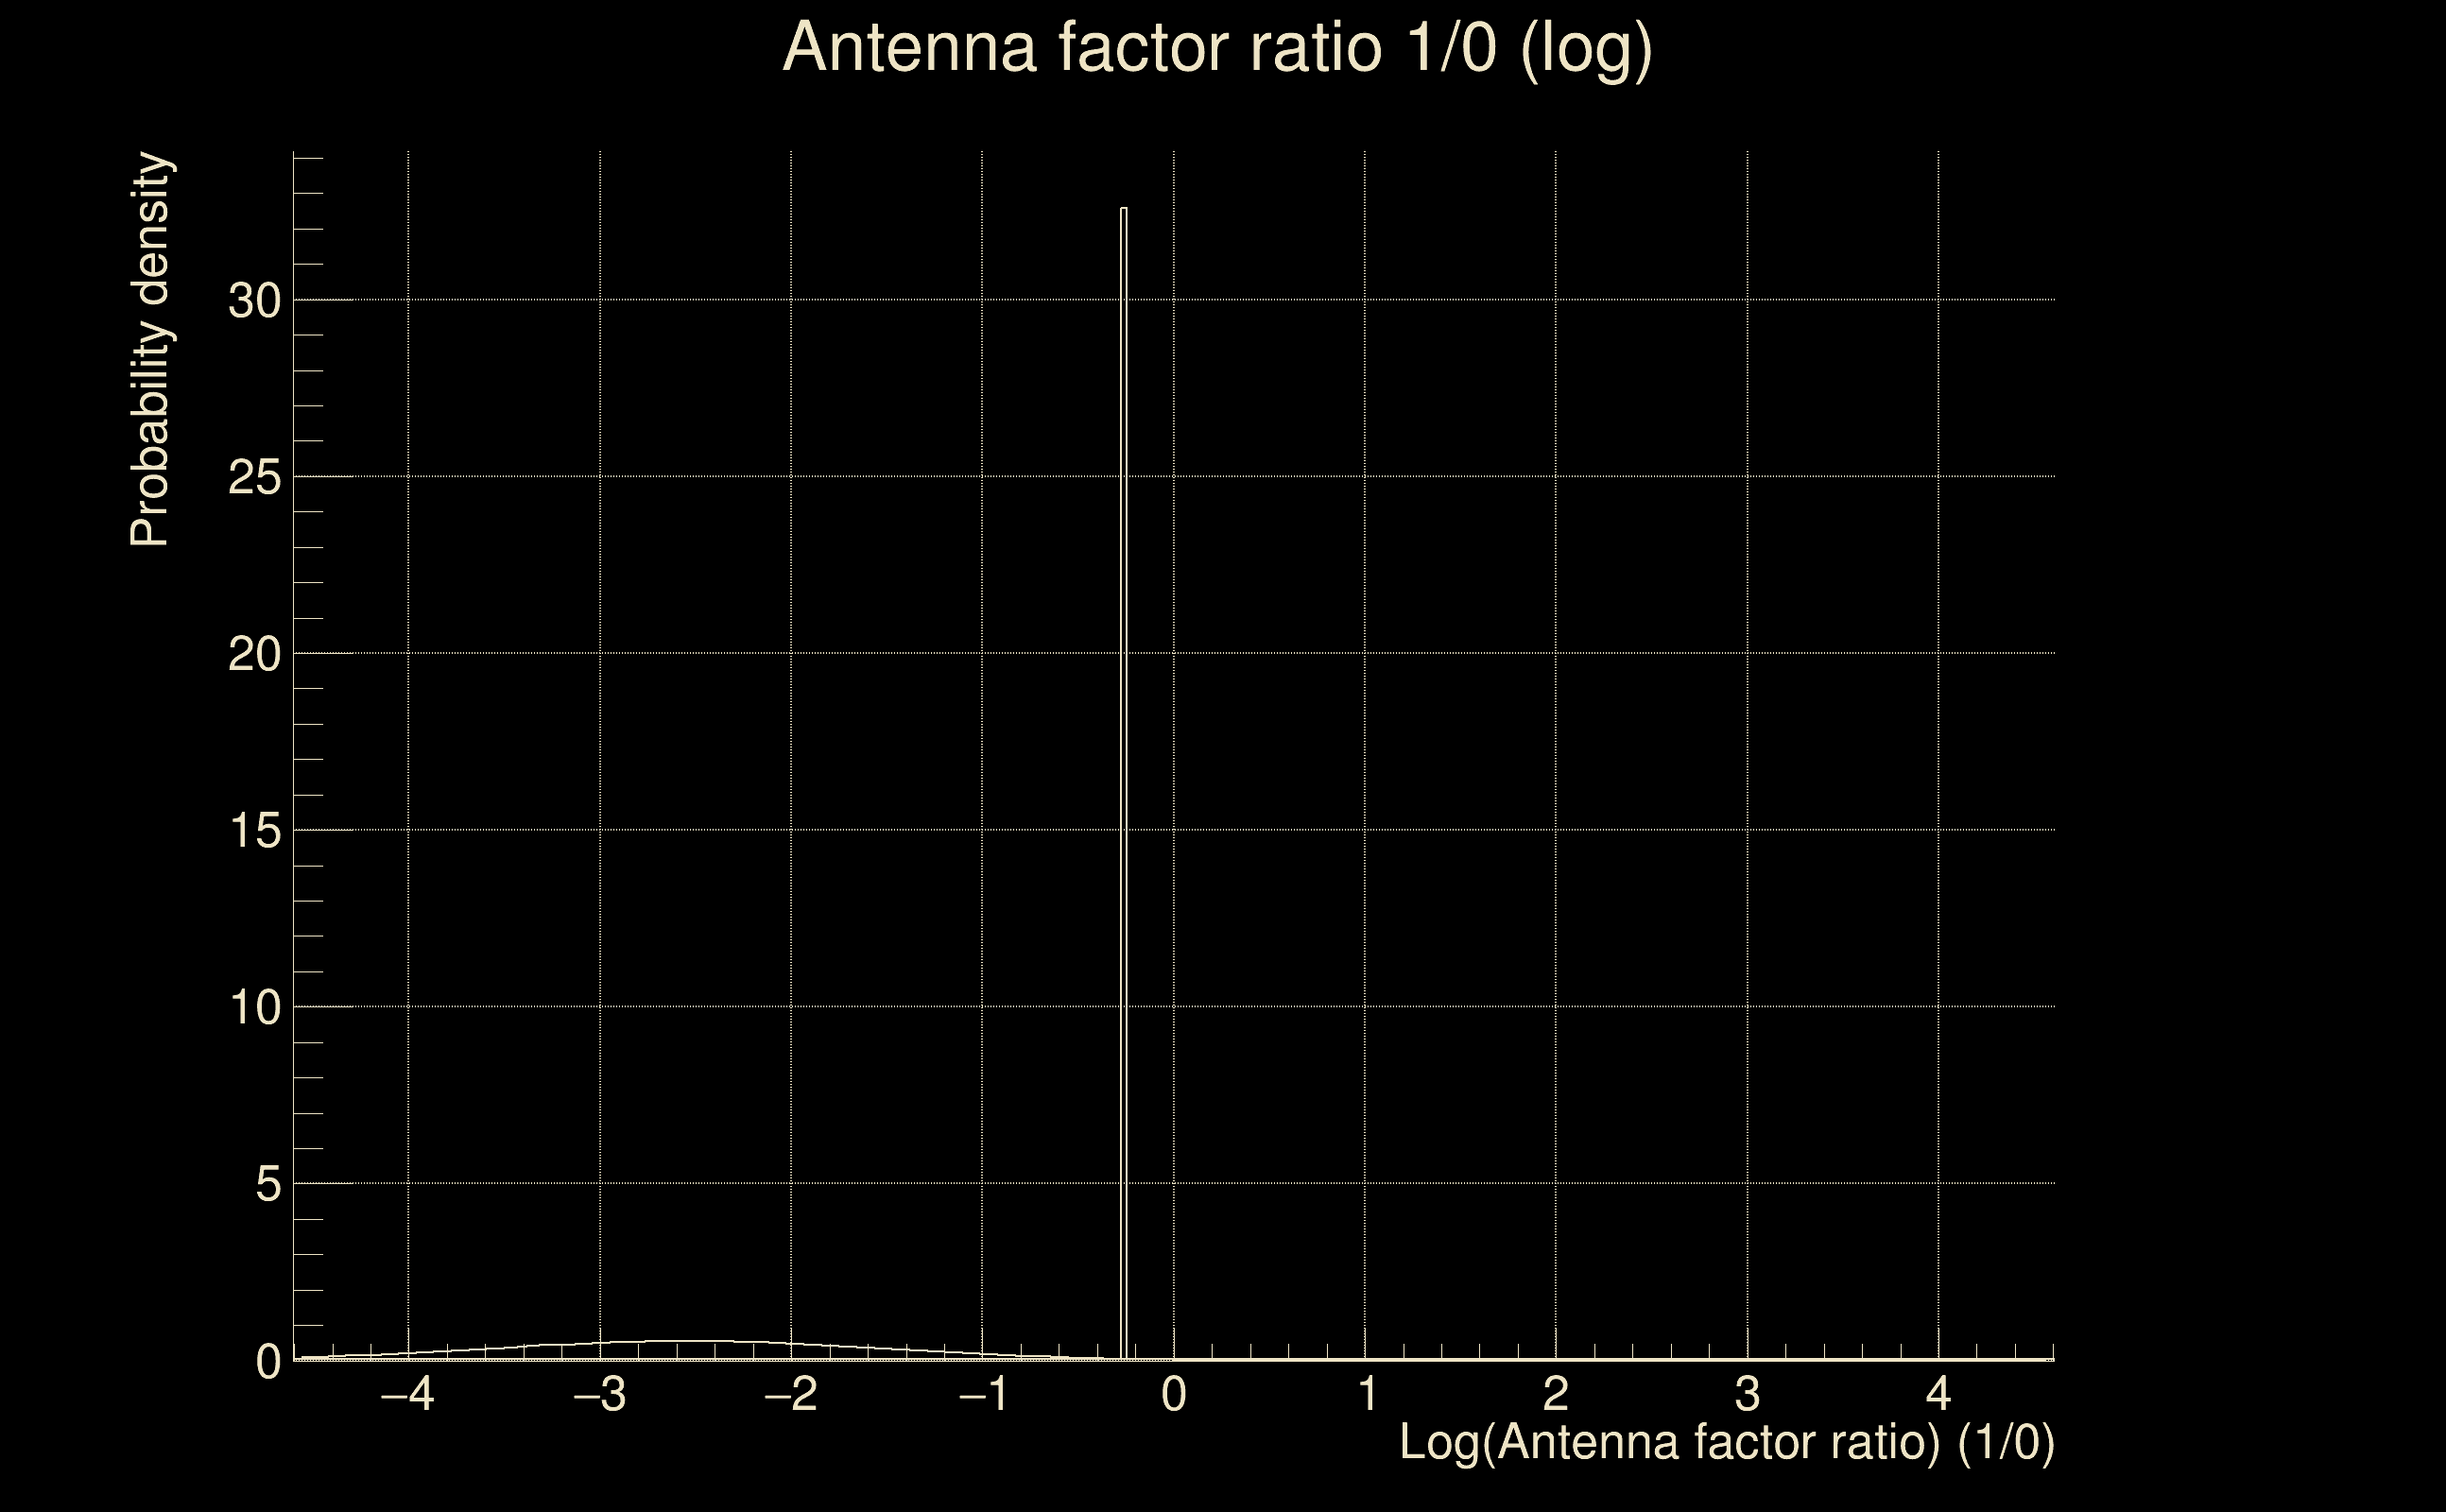
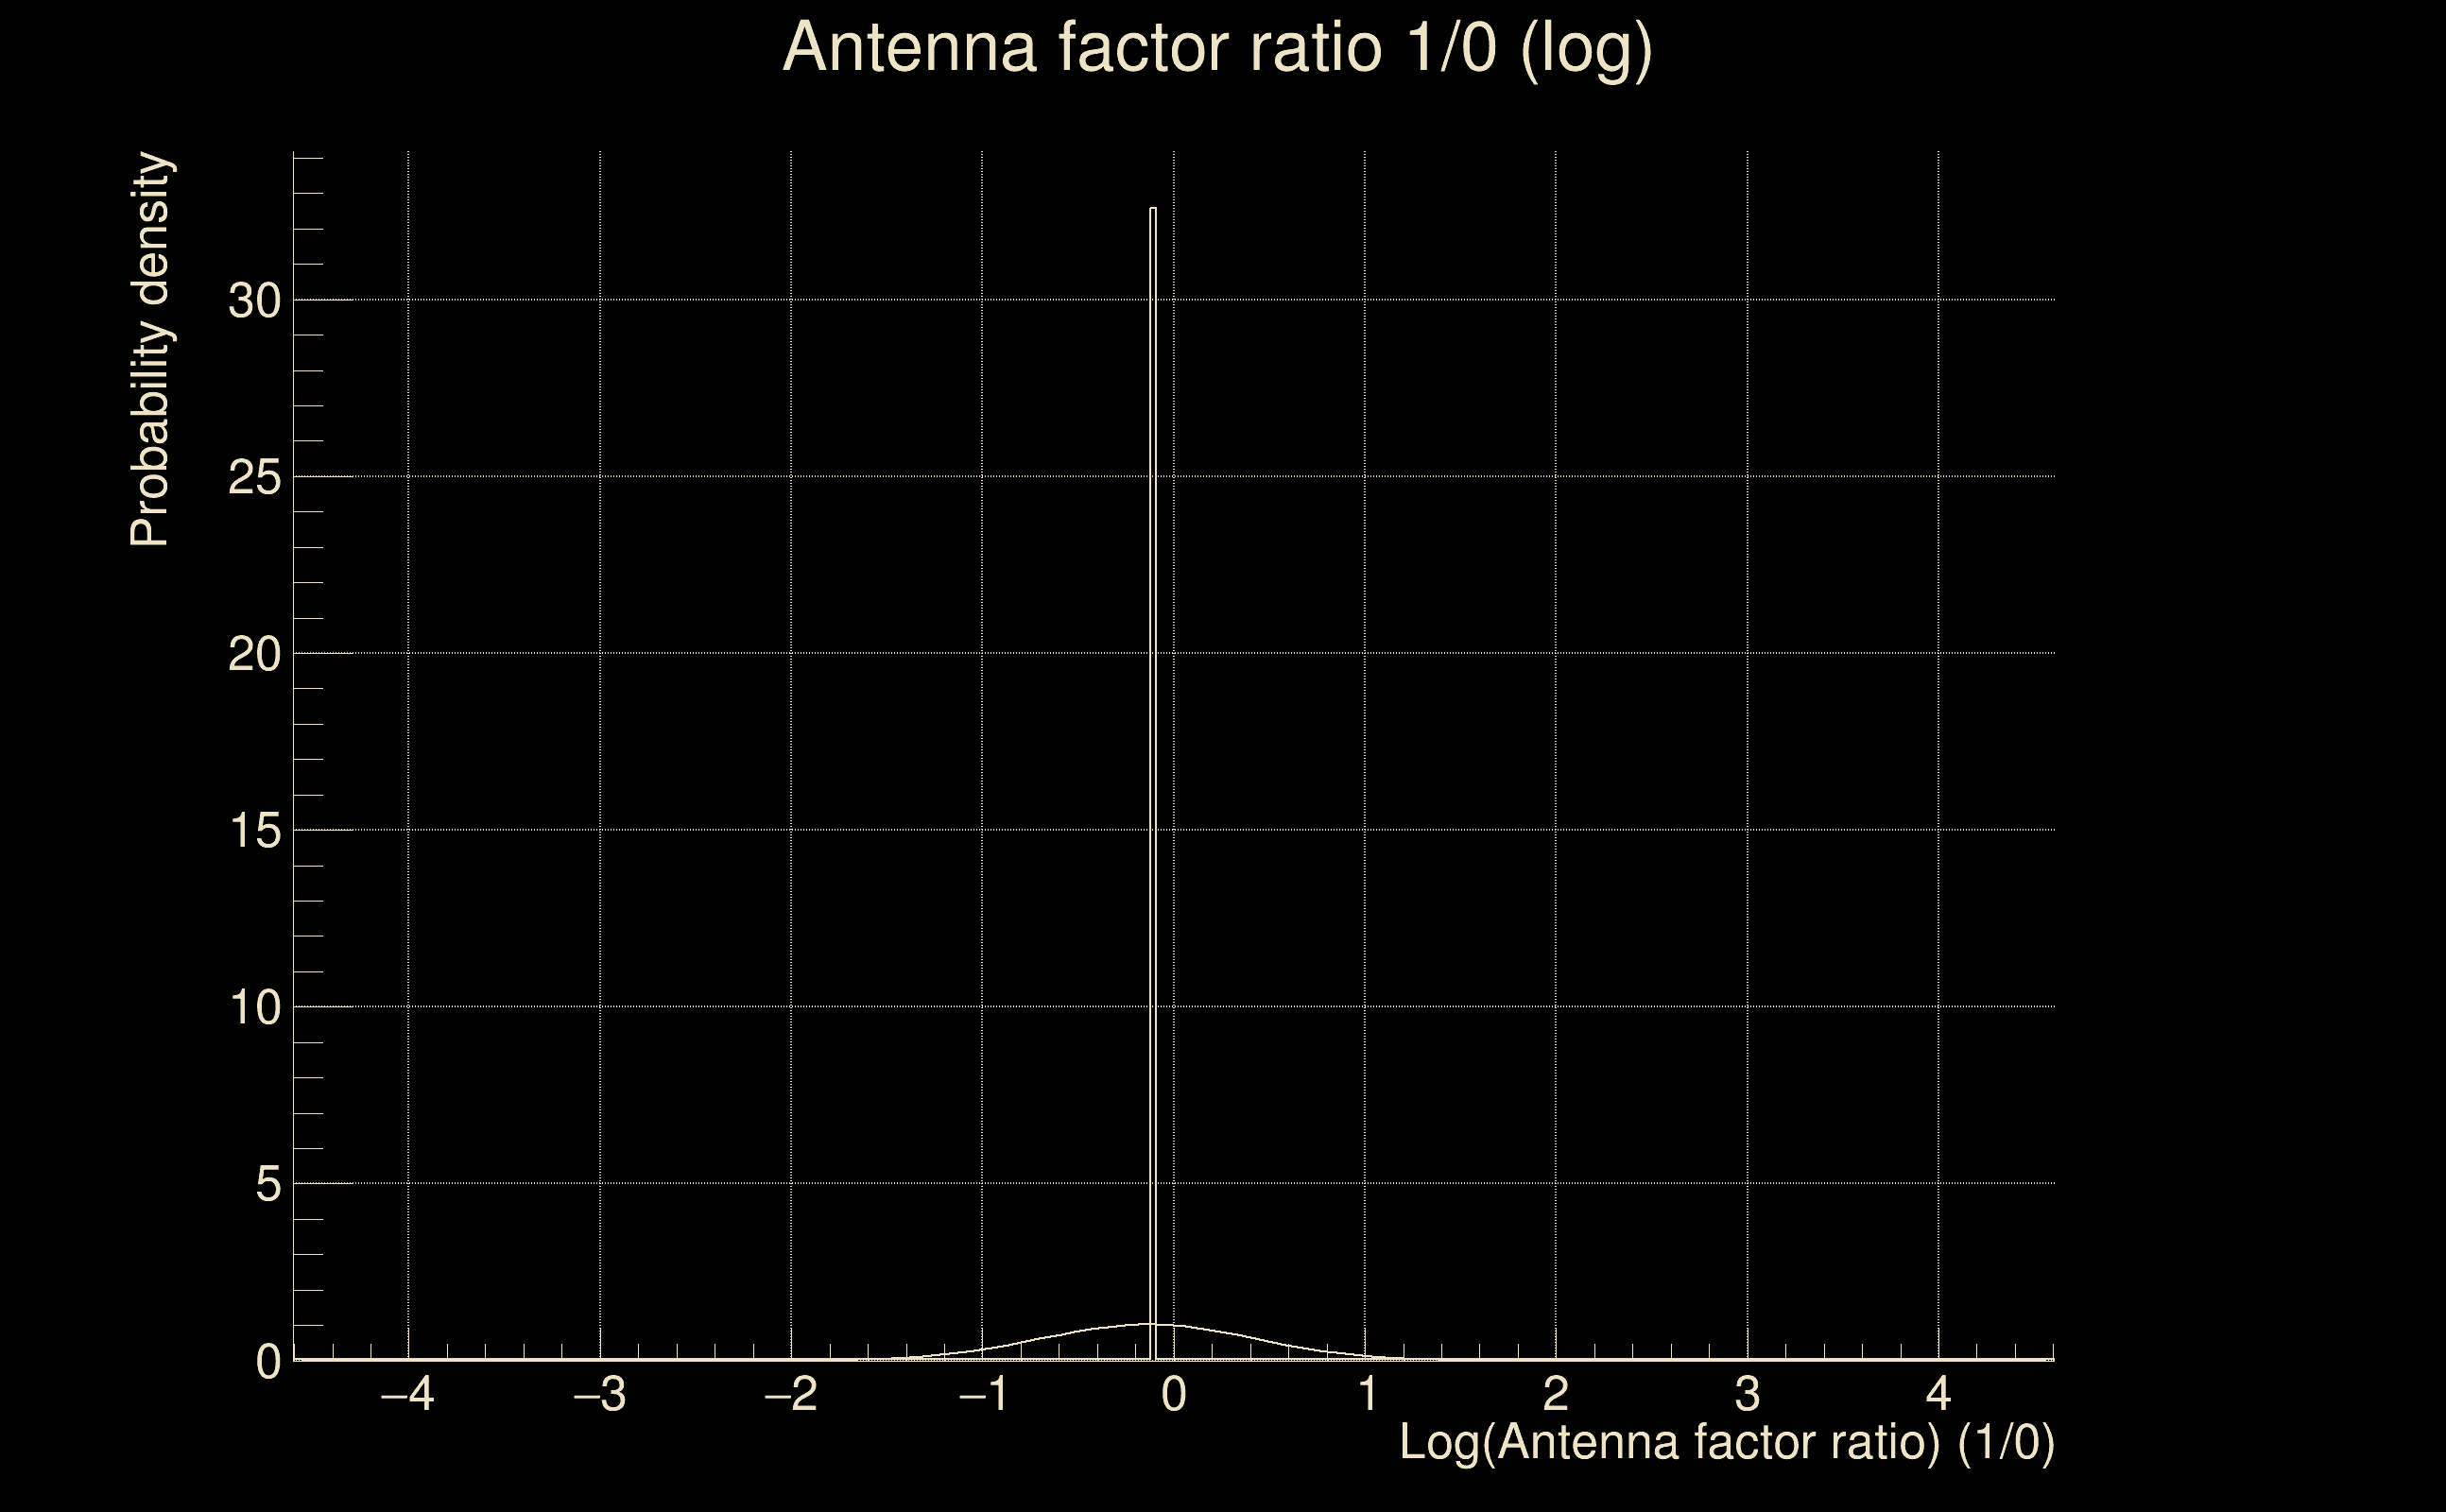
| Log of amplitude ratio (L1/H1): | -0.0450964, variance = 0.153941 (L1/H1: -0.0813774, variance = 0.306857, H1/L1: 0.0129135, variance = 0.306723) |
| Amplitude ratio (L1/H1): | 0.955905 ⋇ 1.48046 (L1/H1: 0.921846 ⋇ 1.74011, H1/L1: 1.013 ⋇ 1.7399) |
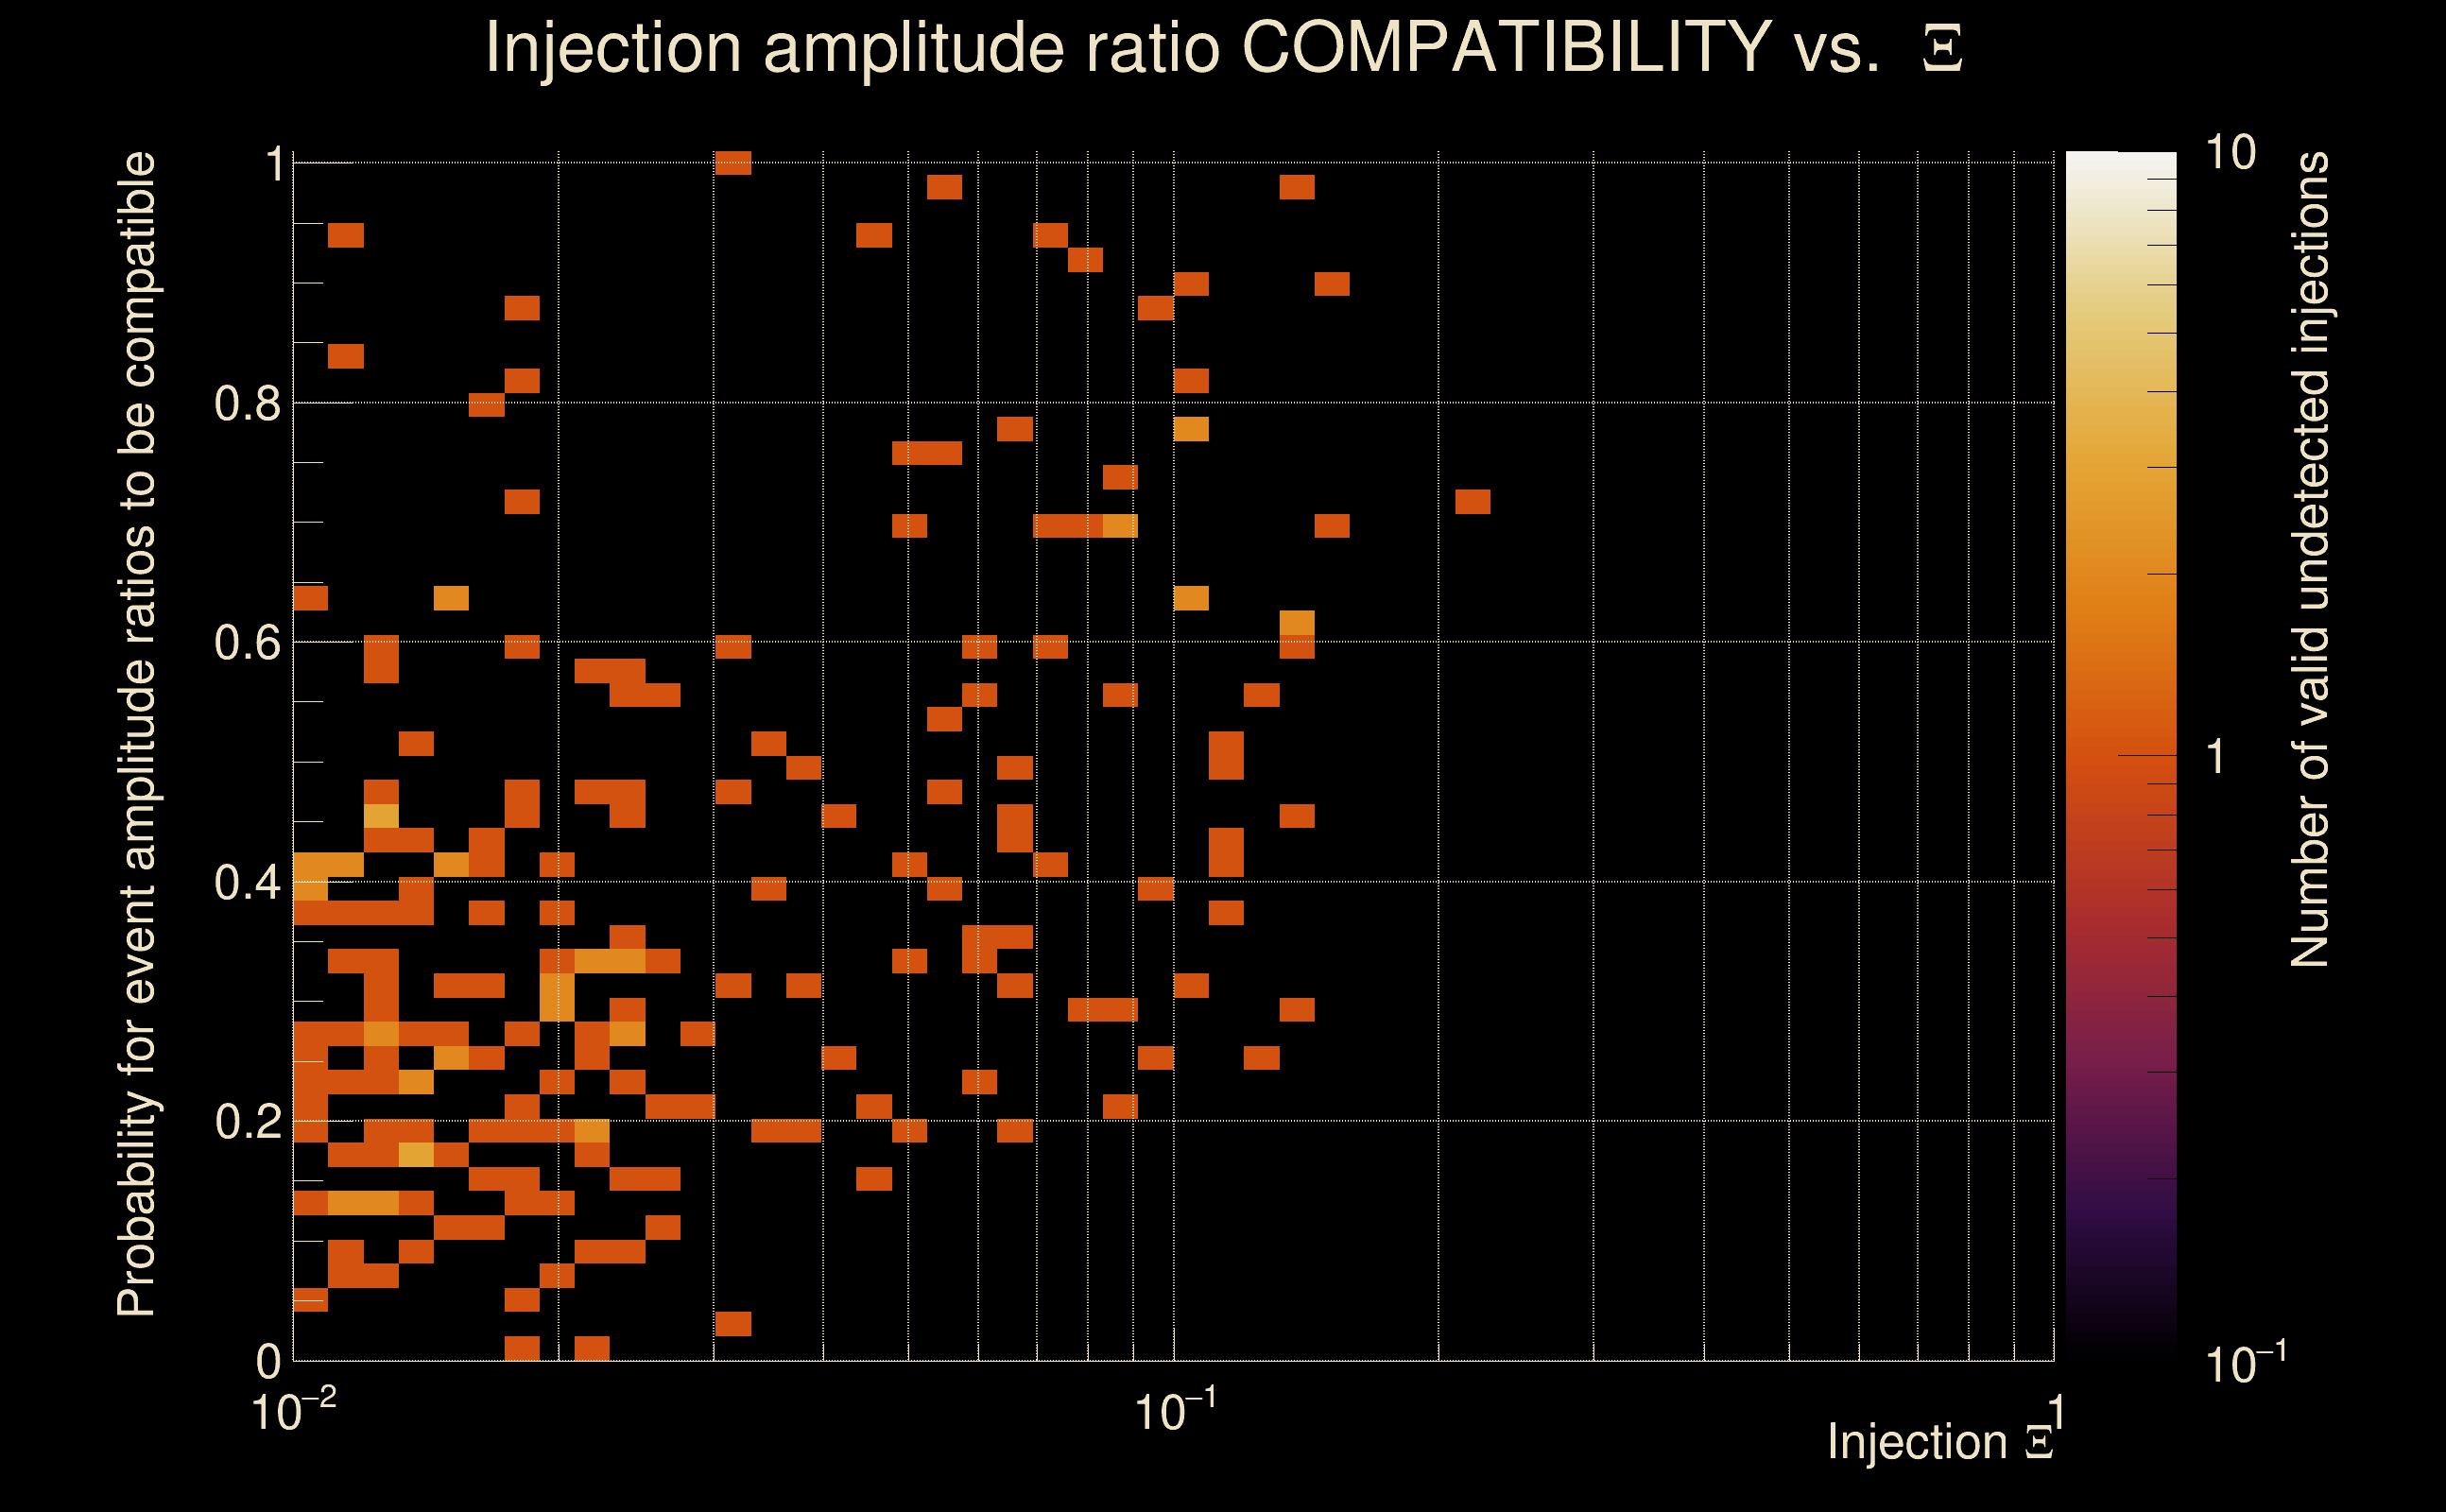
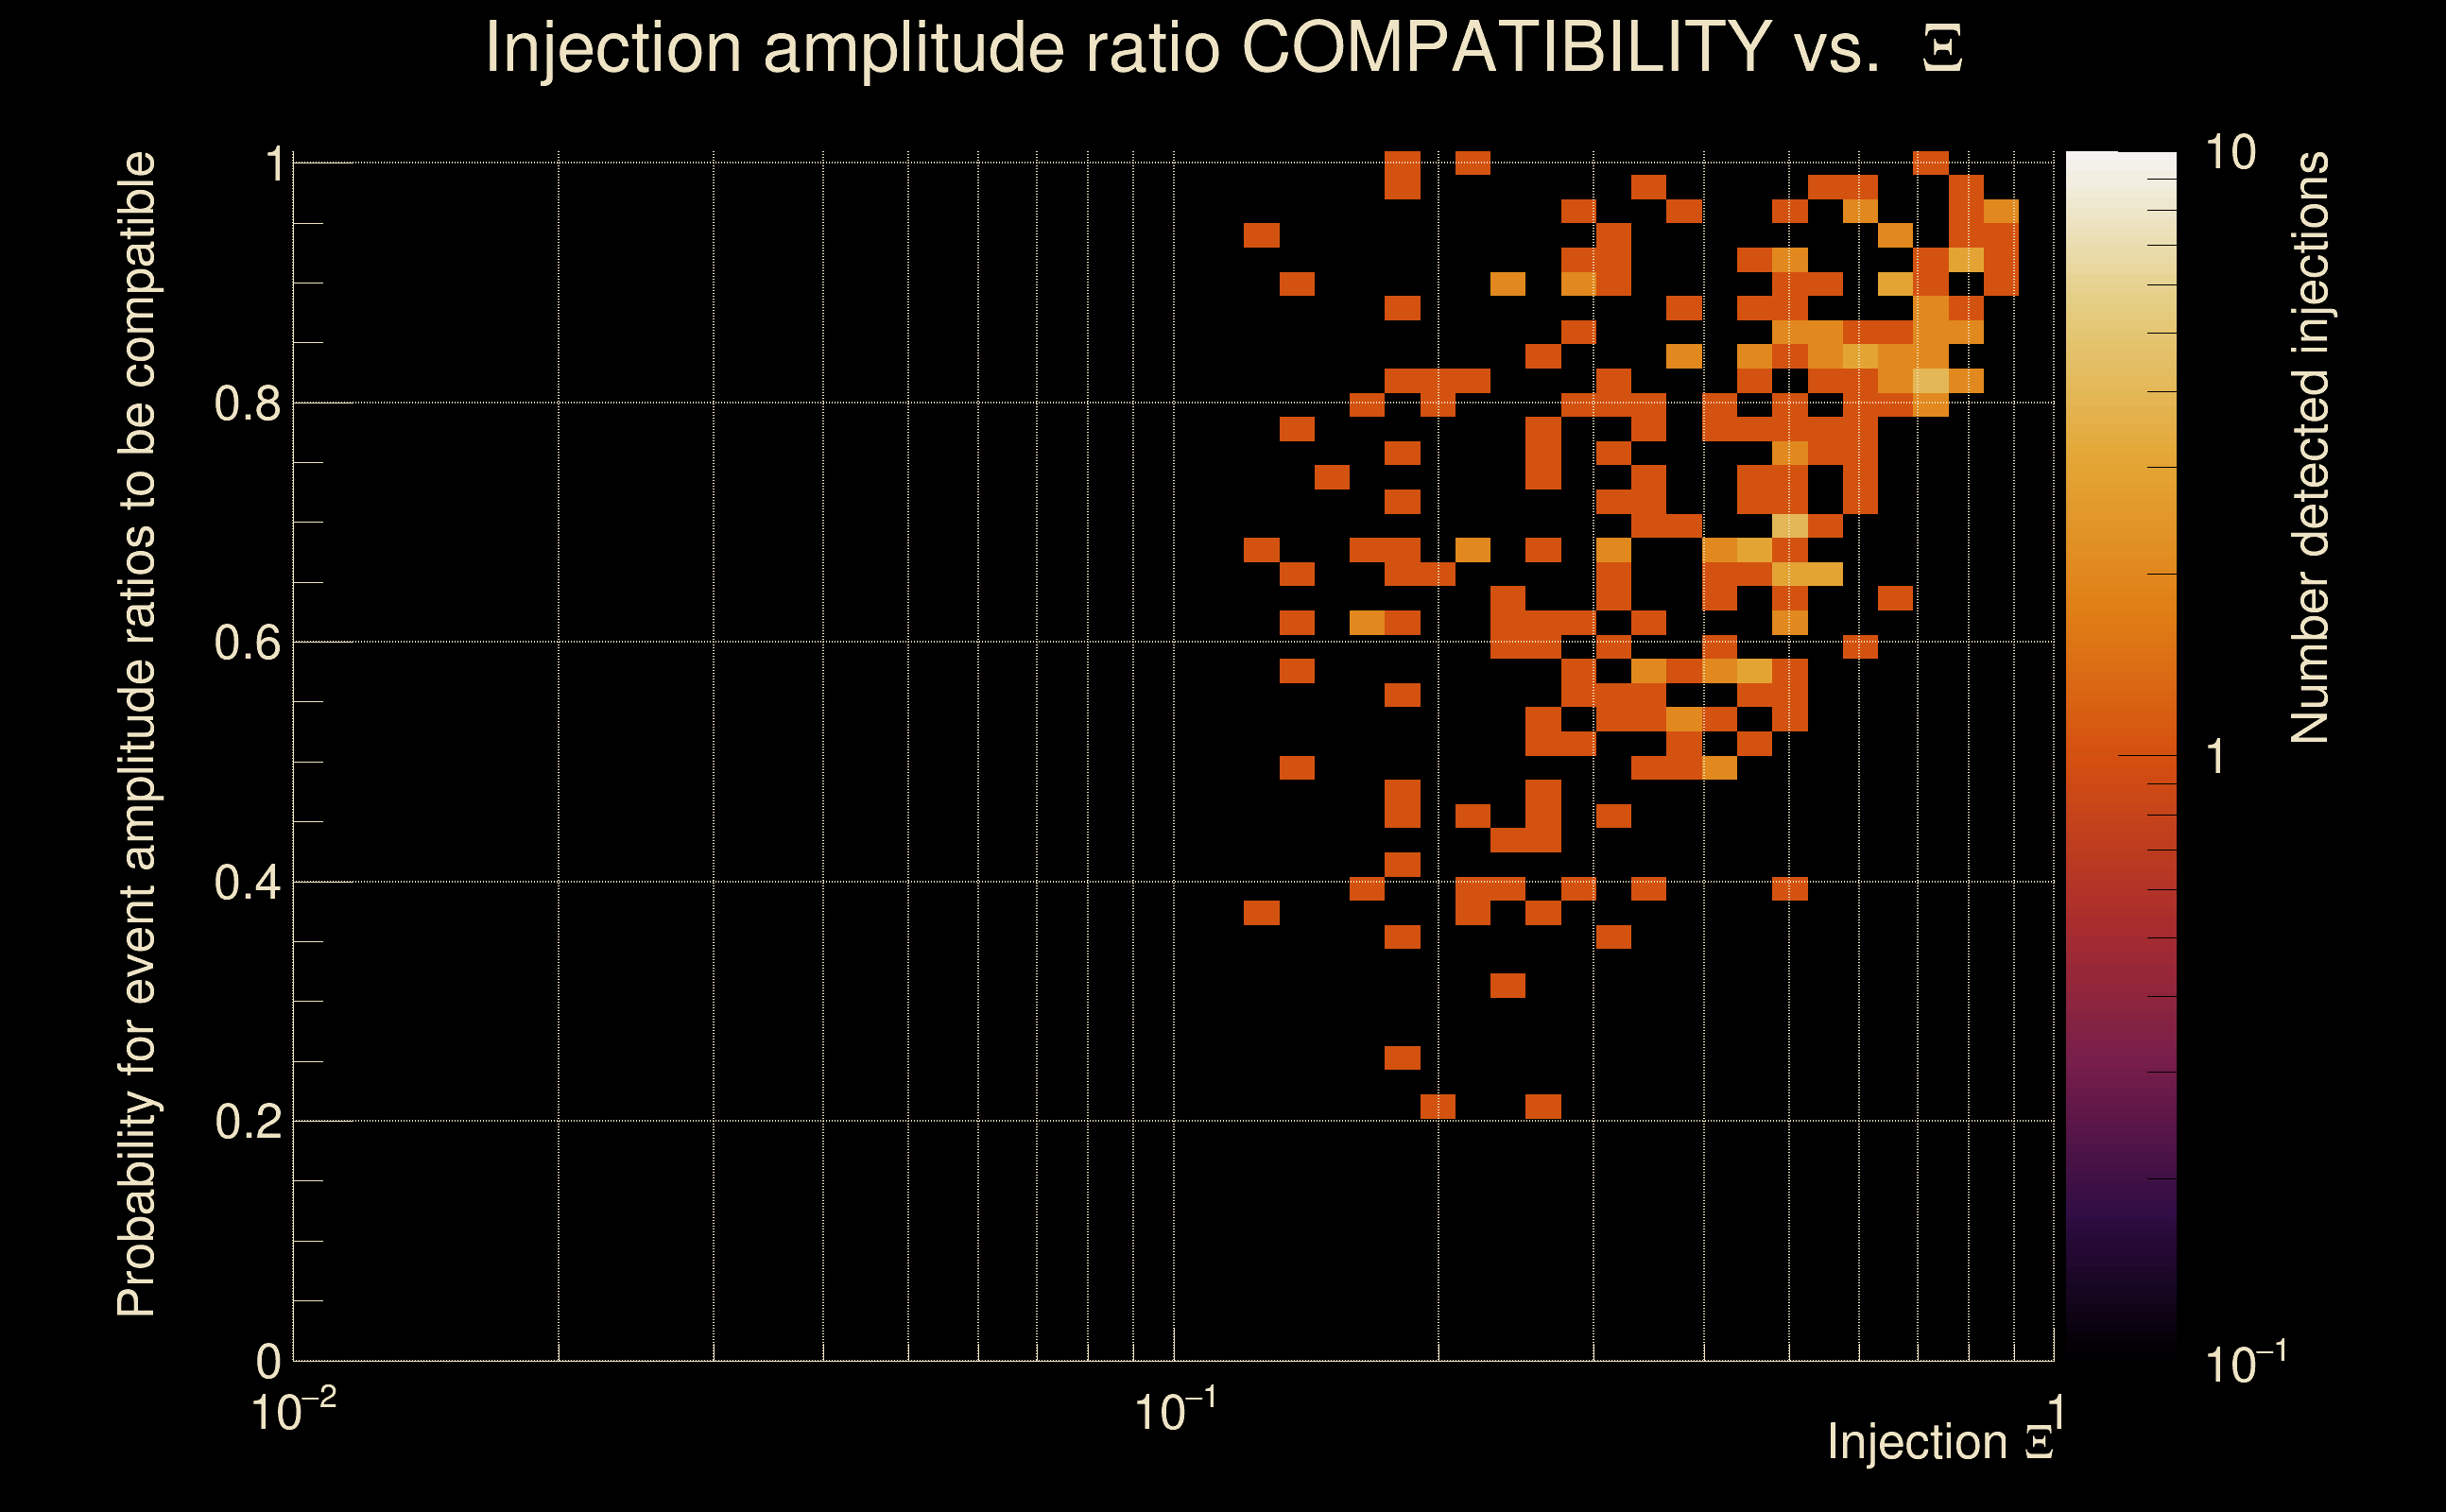
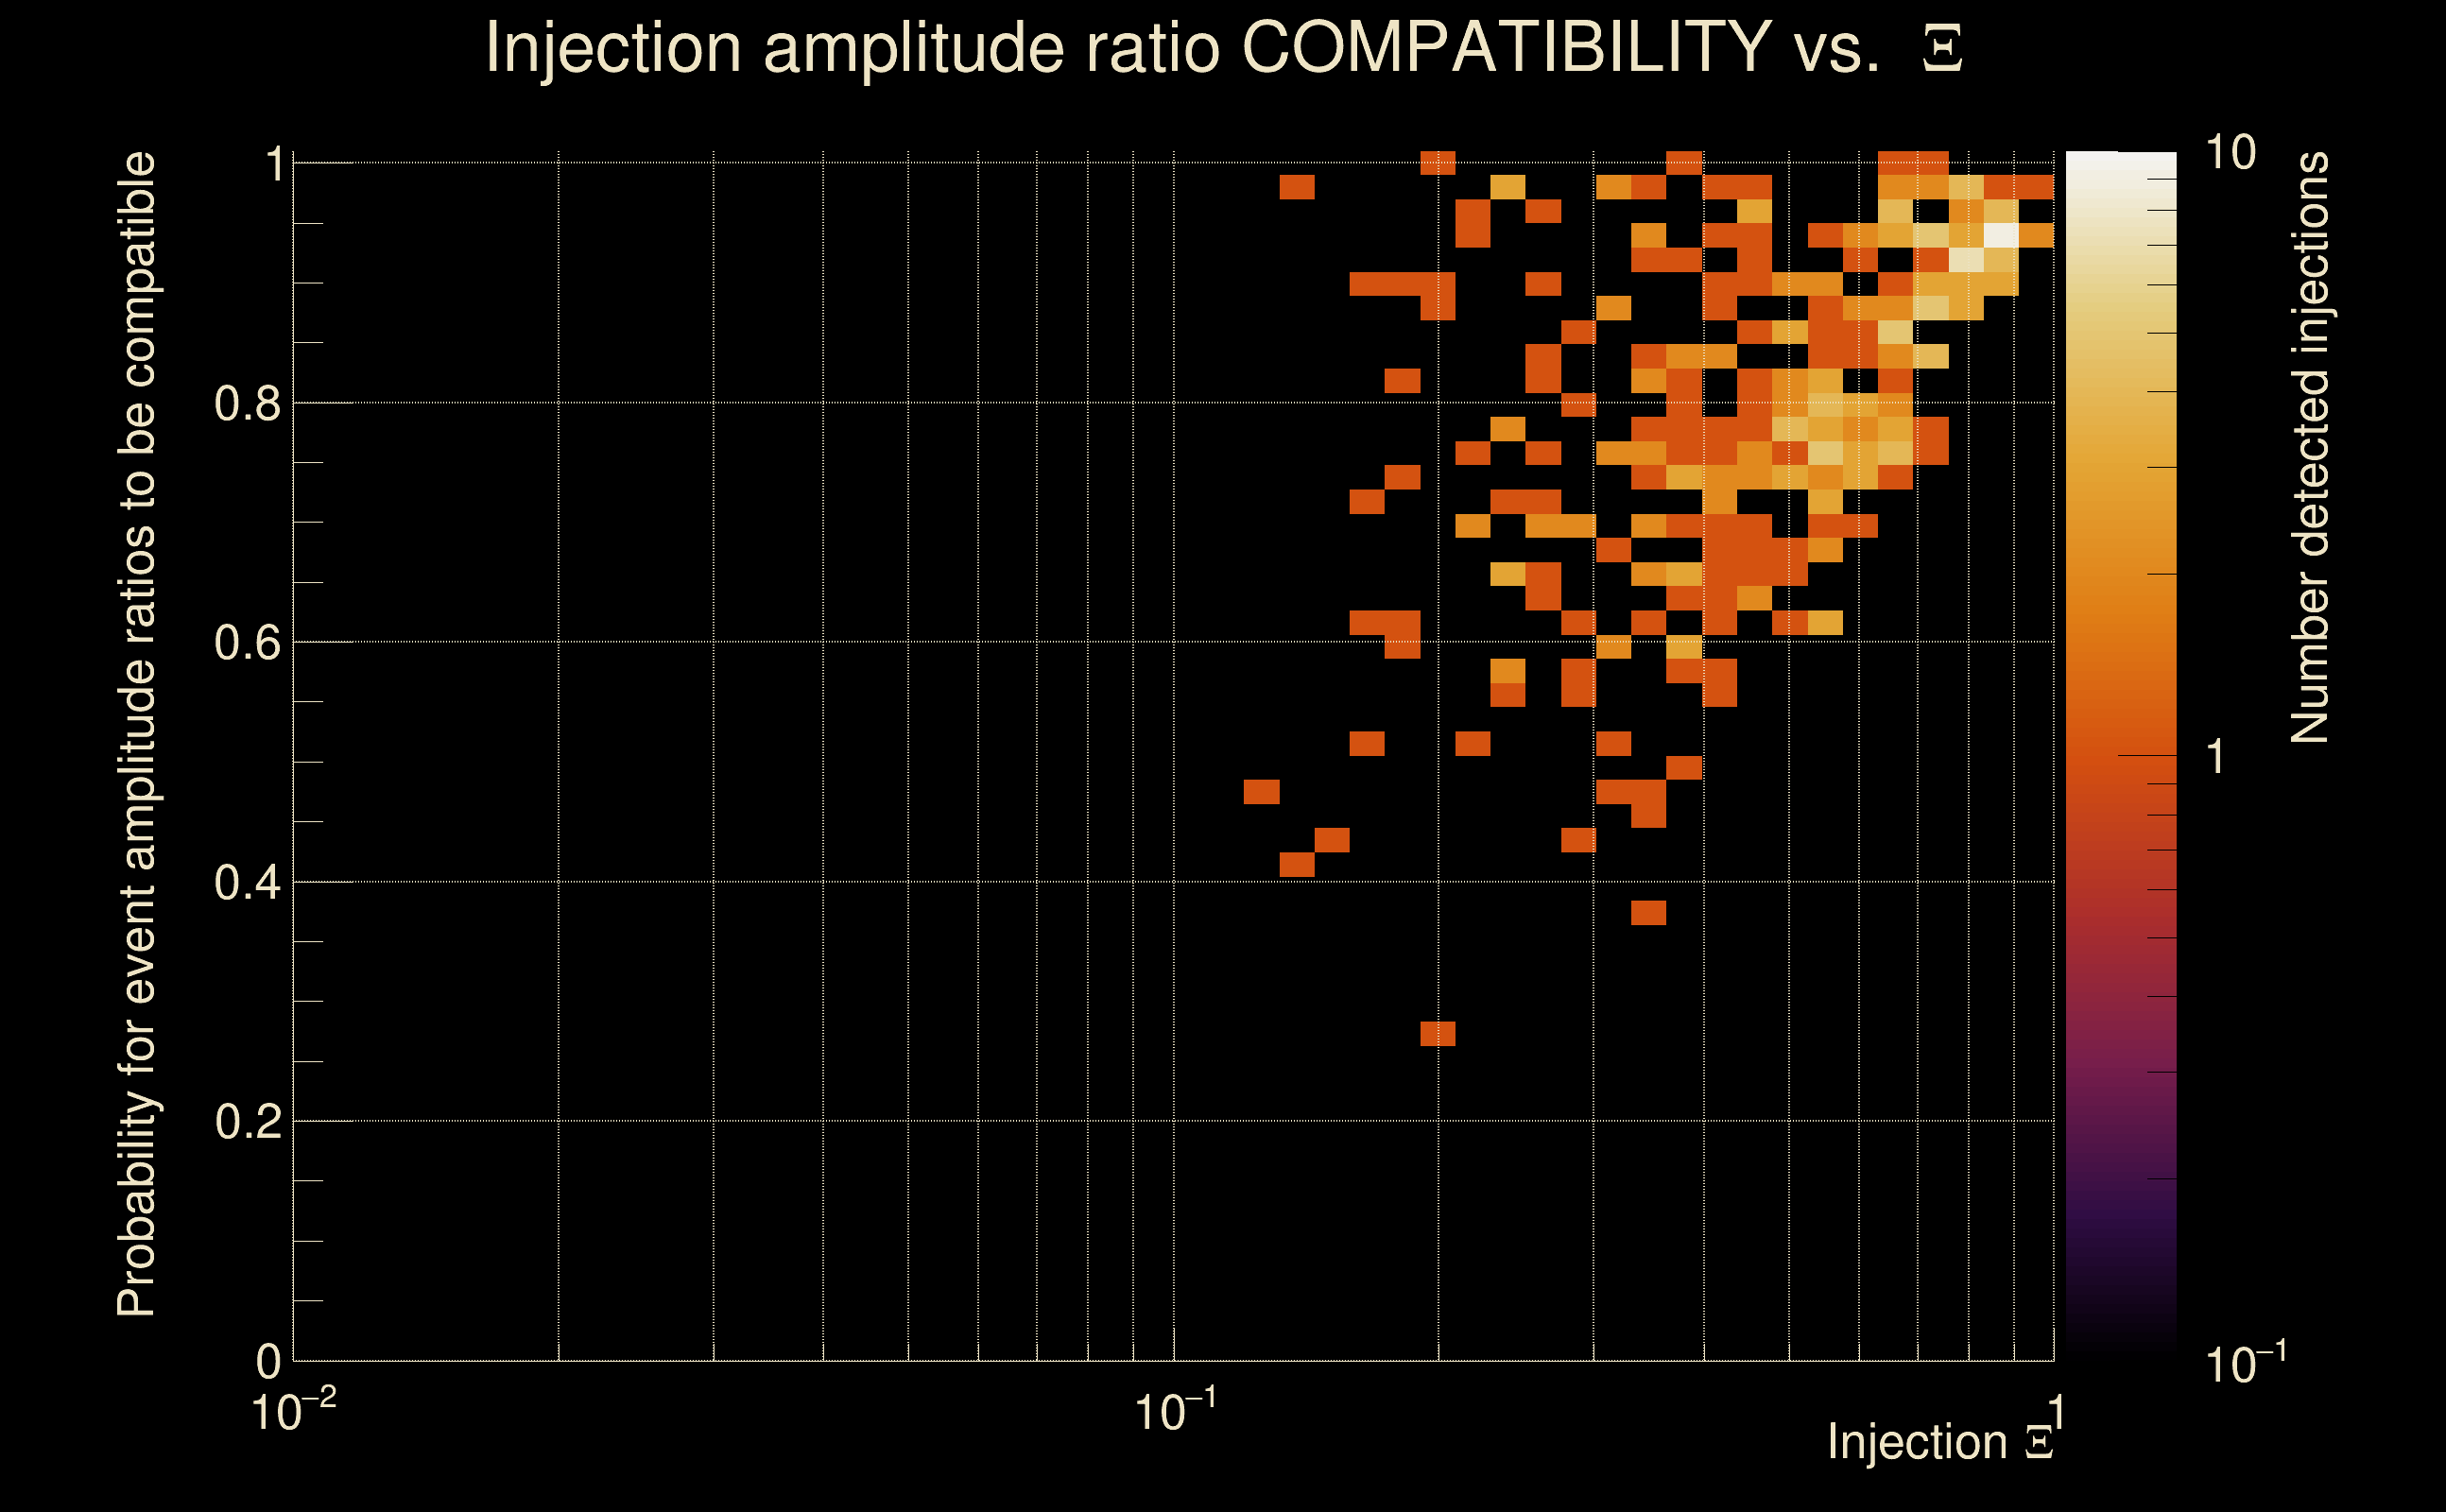
| Amplitude ratio H1|L1 compatibility (probability): | 0.930351 |
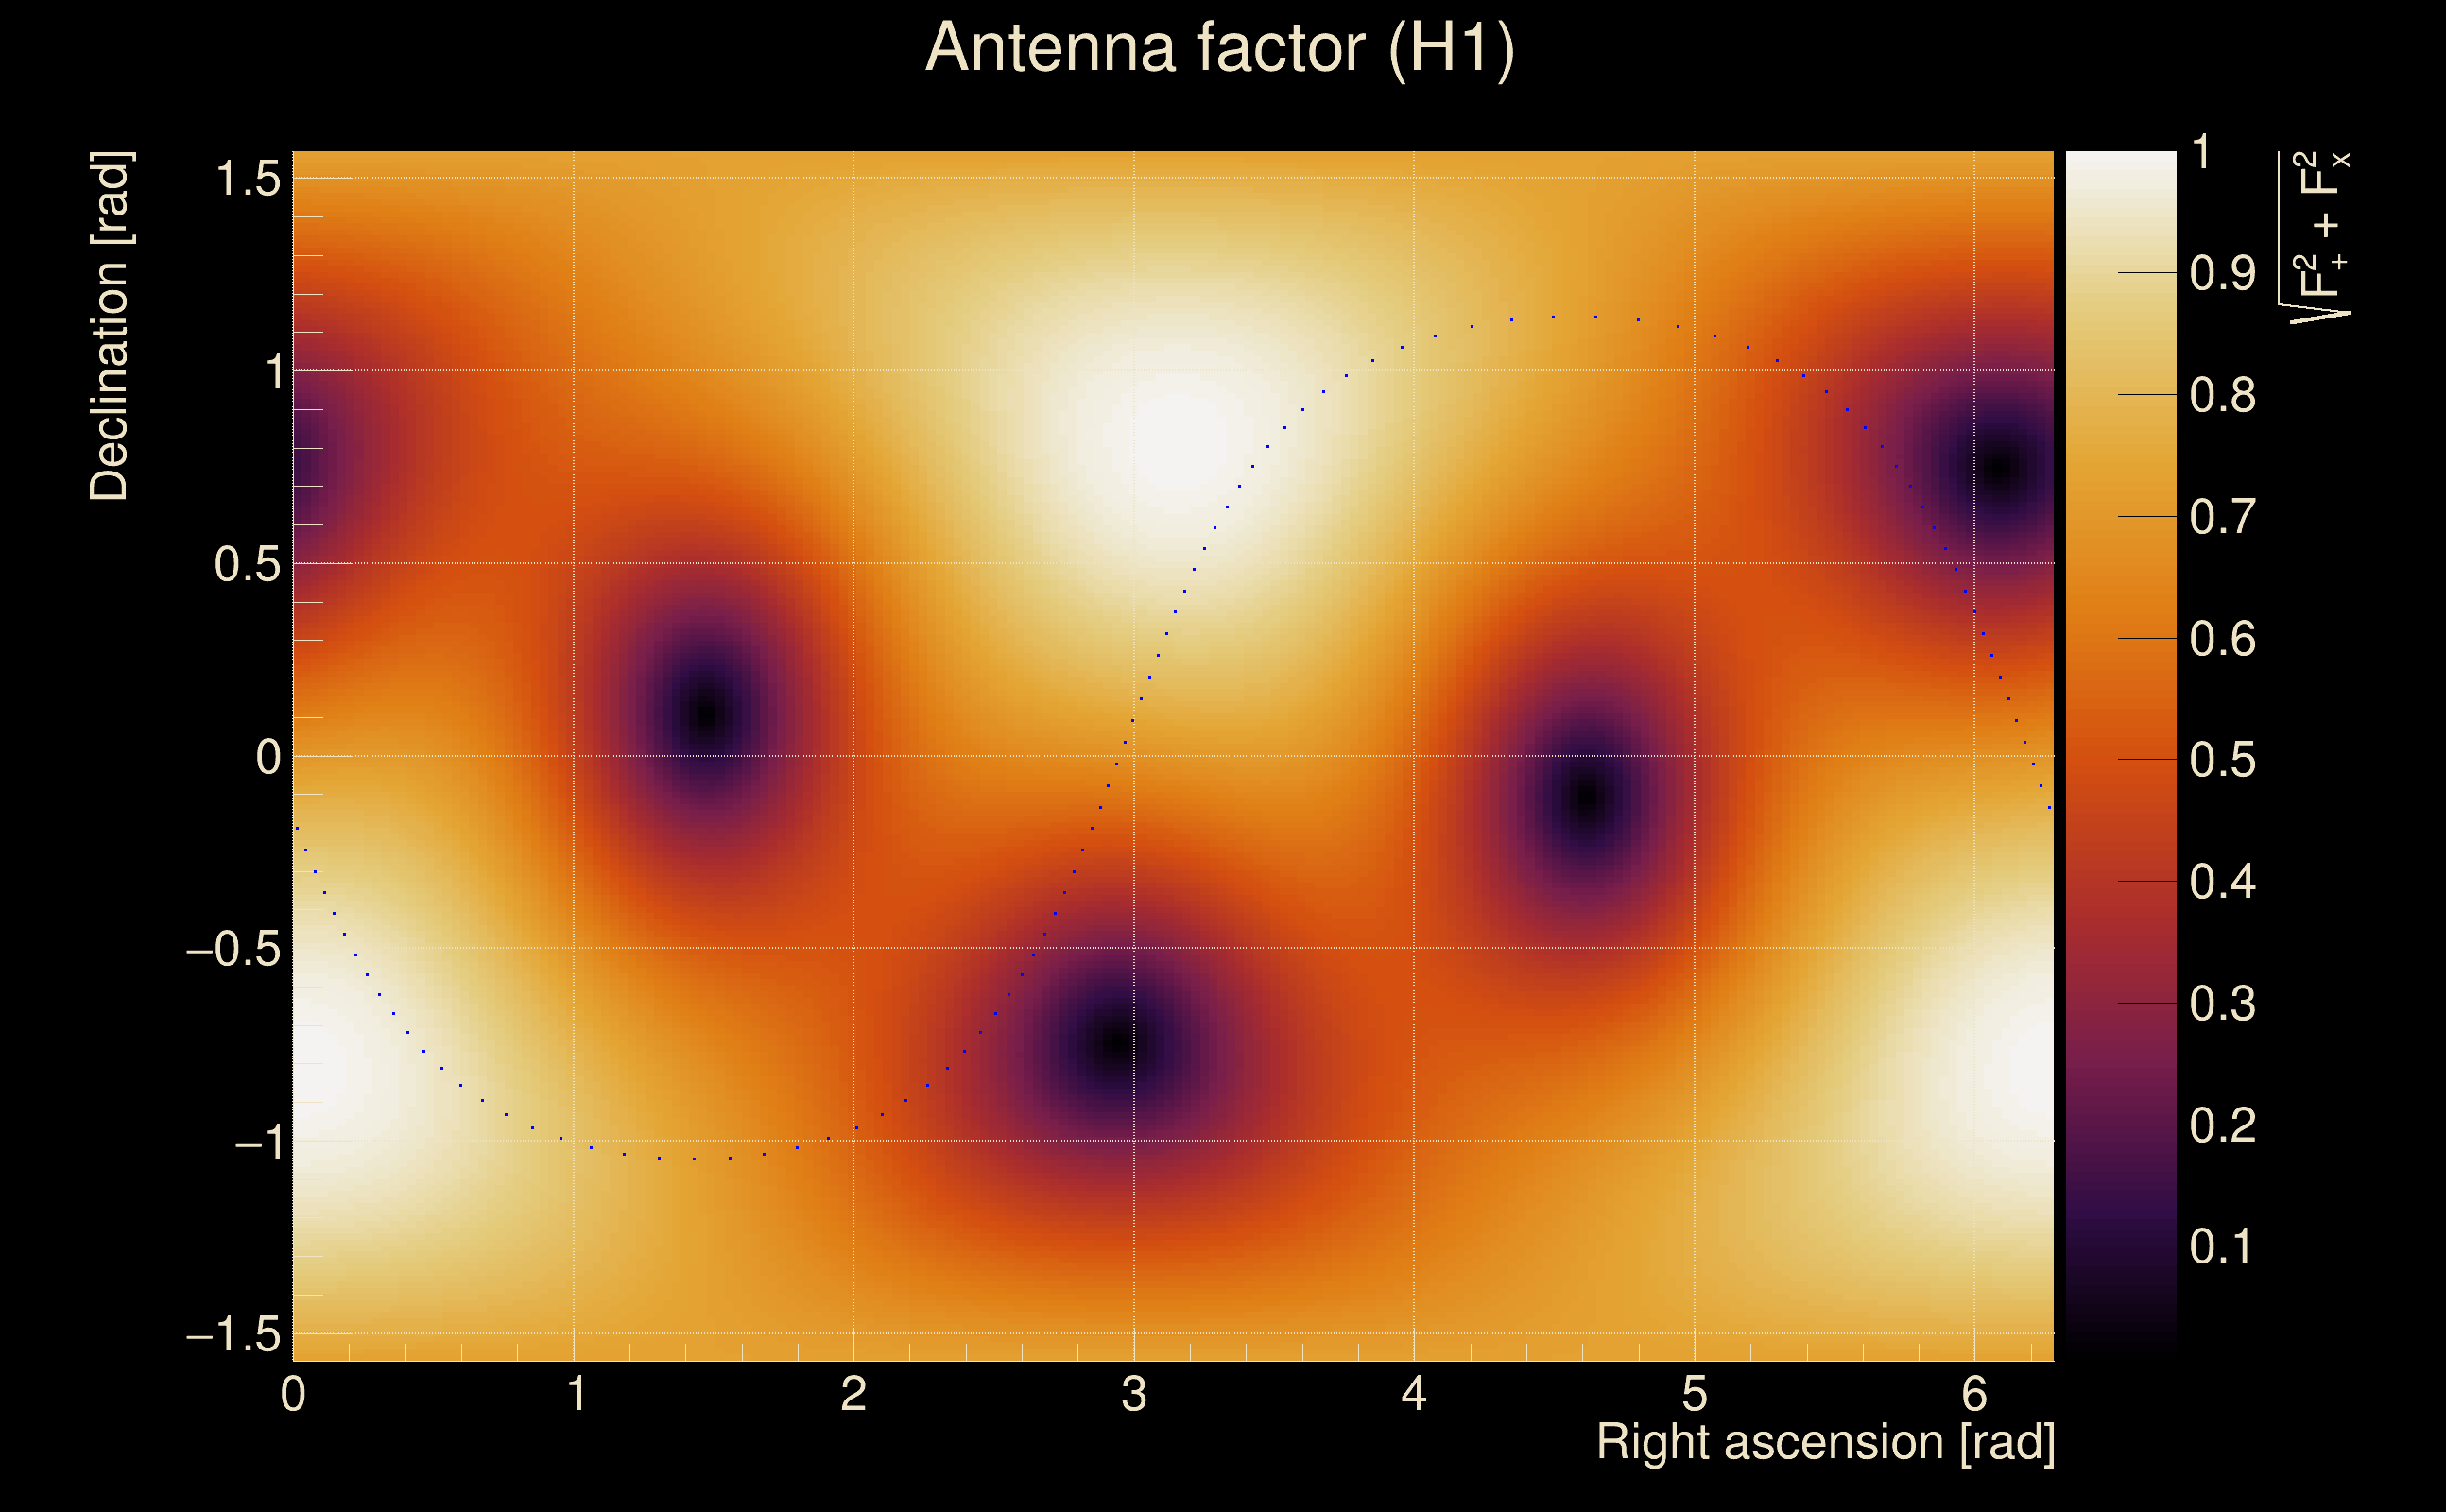
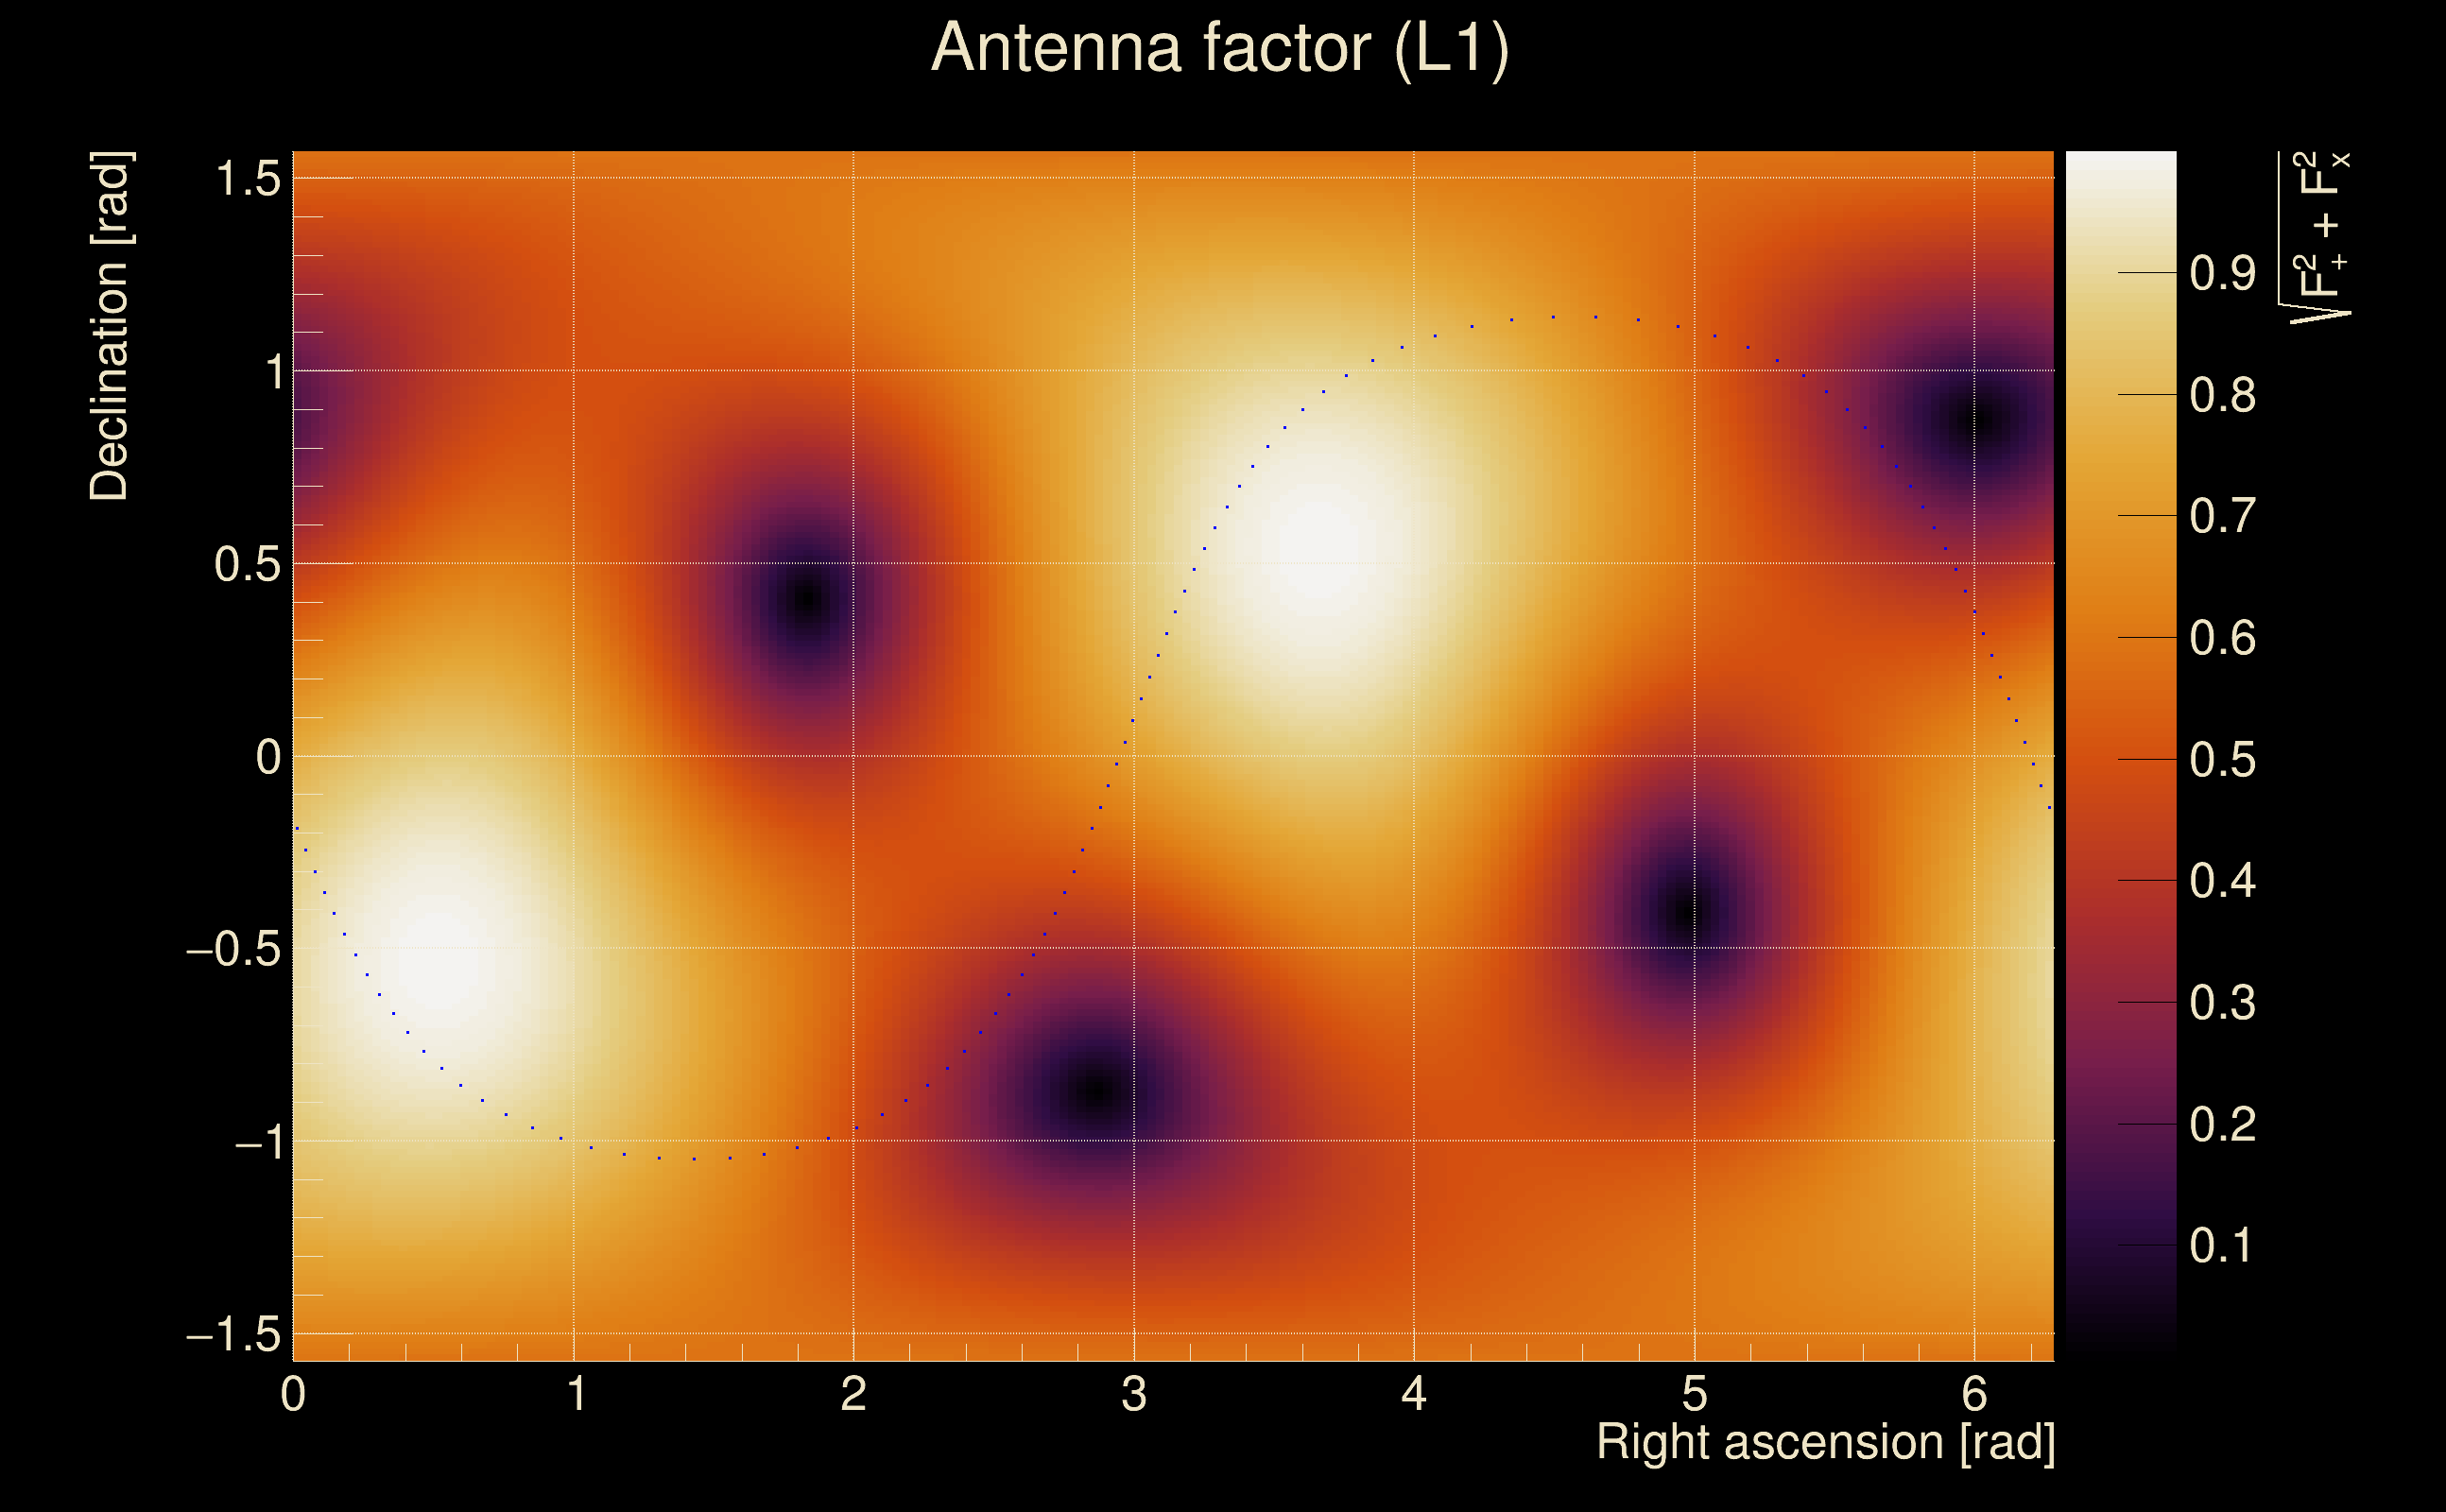
| Antenna factor probability: | 0.99731 |
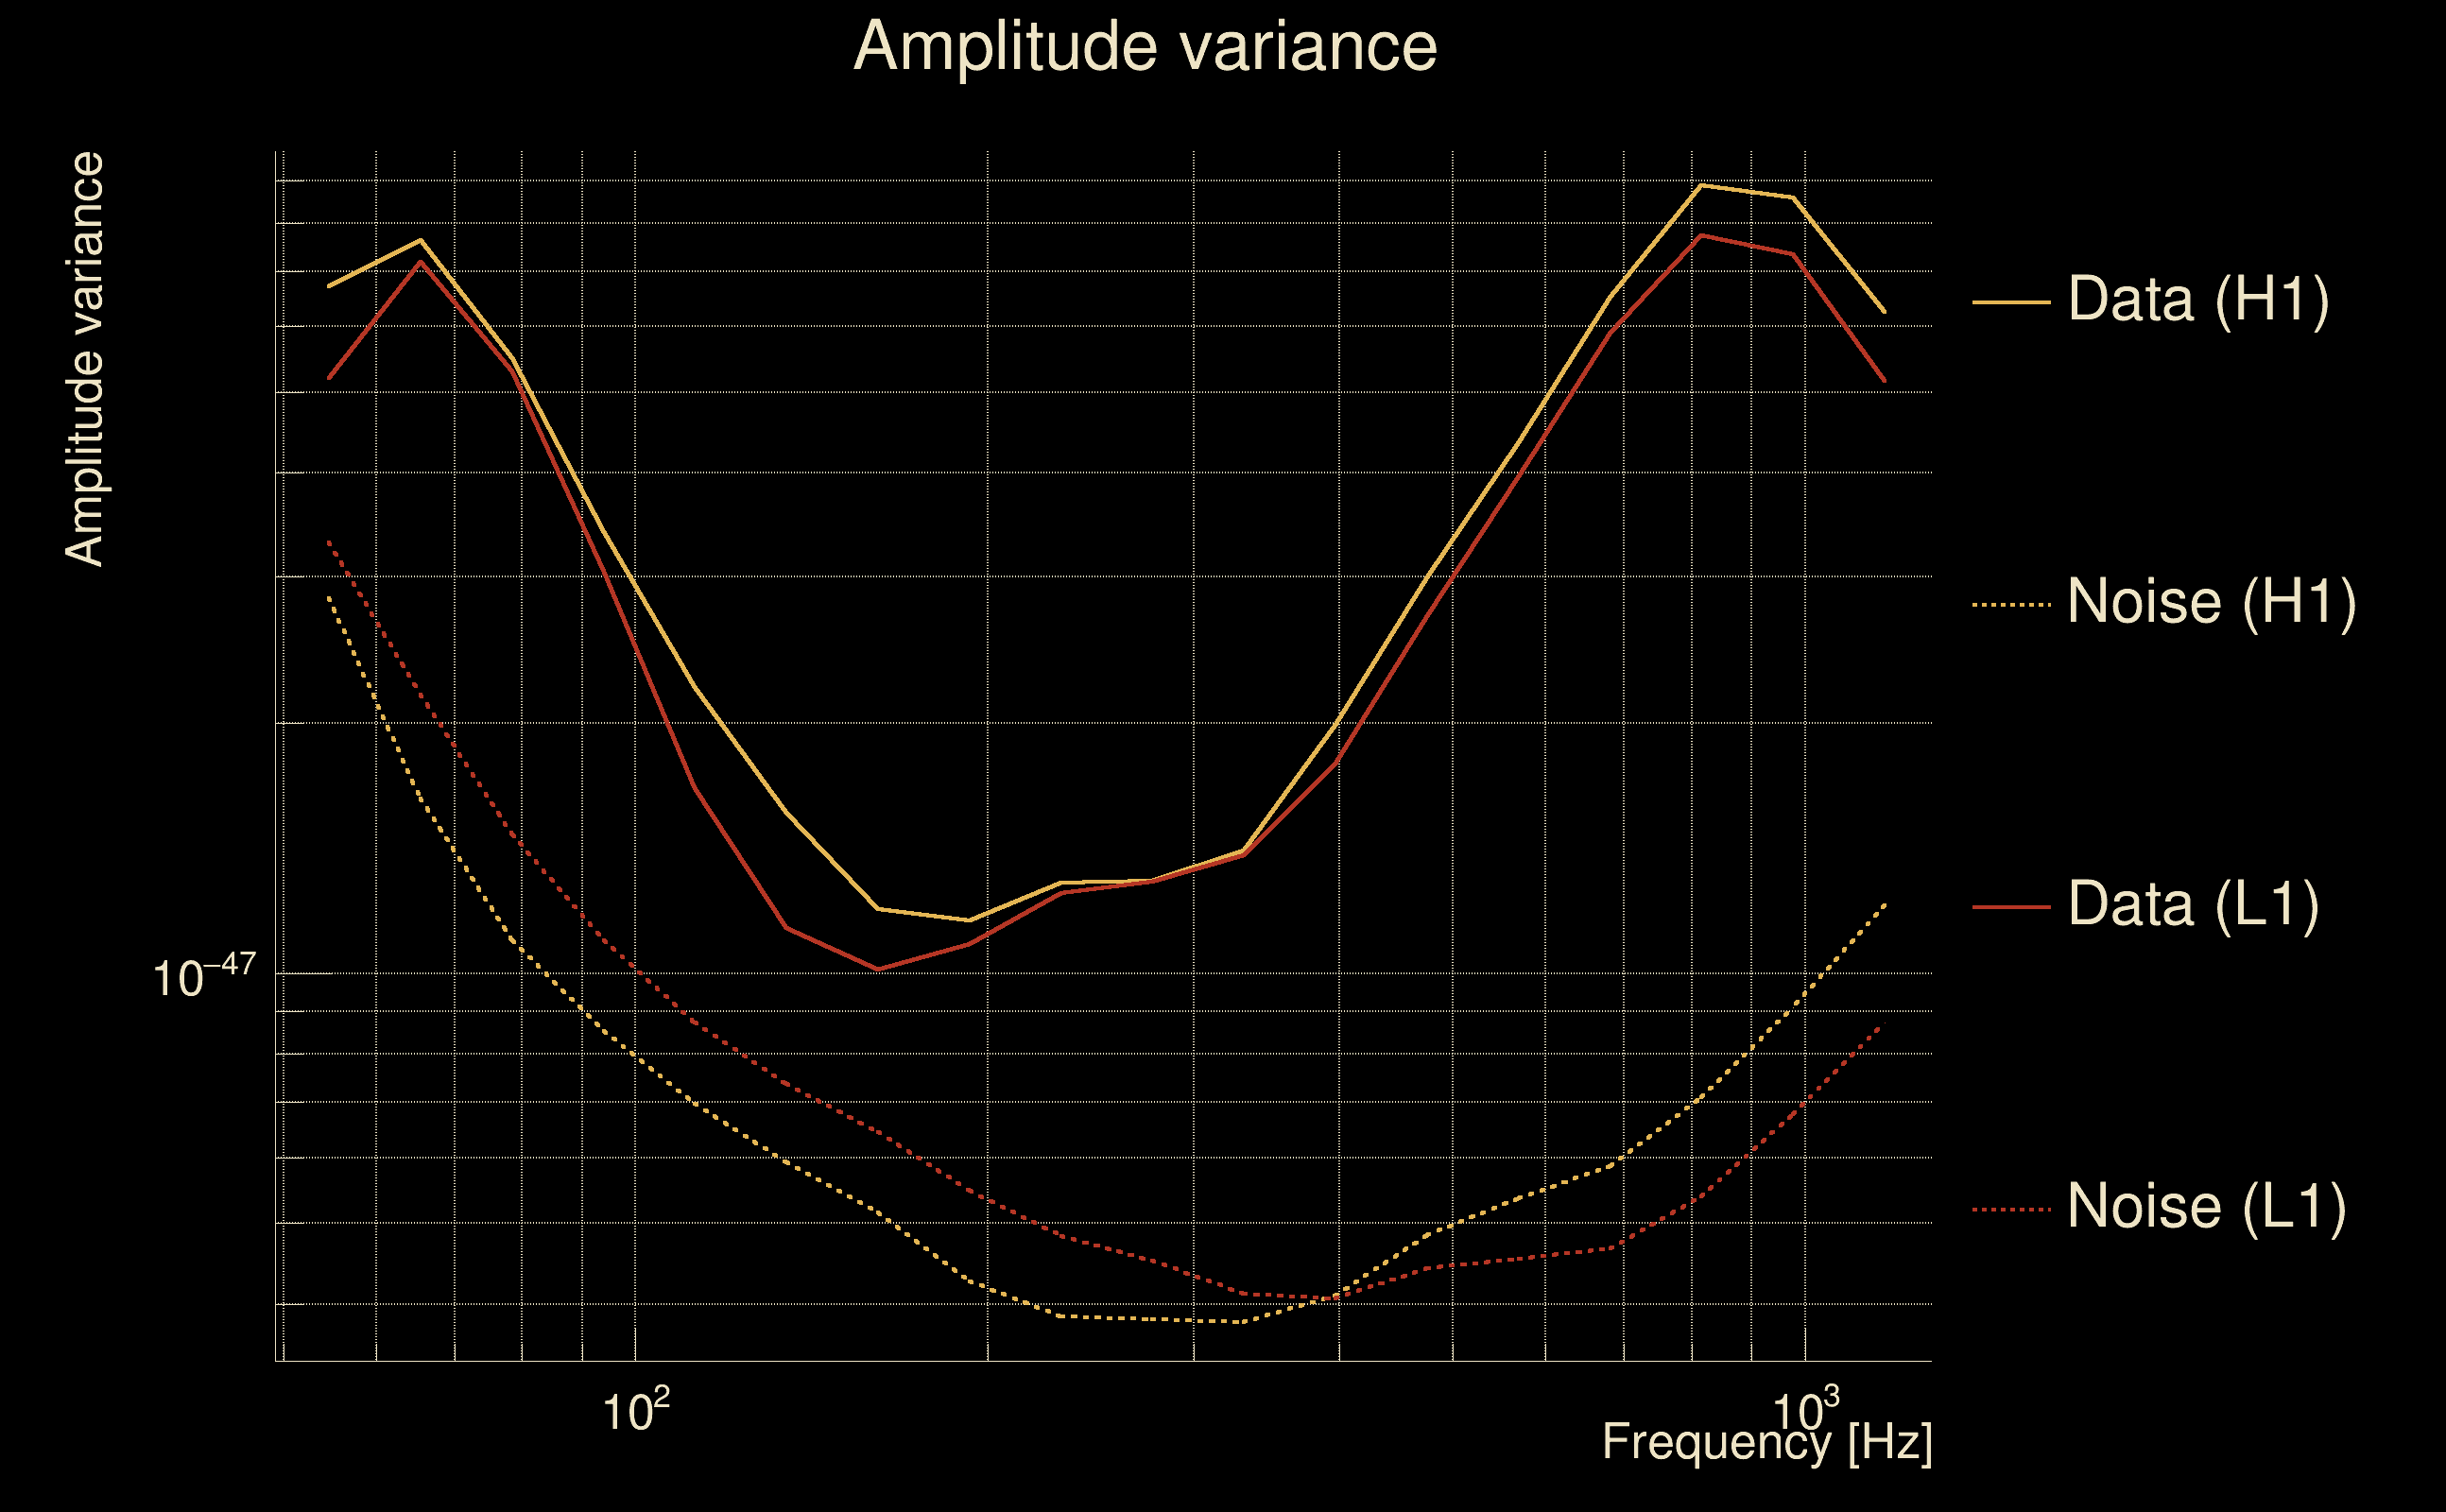
| Number of rejected frequency rows: | Q0: 0 / 18, Q1: 0 / 36, Q2: 2 / 70, Q3: 18 / 134, Q4: 58 / 258 |
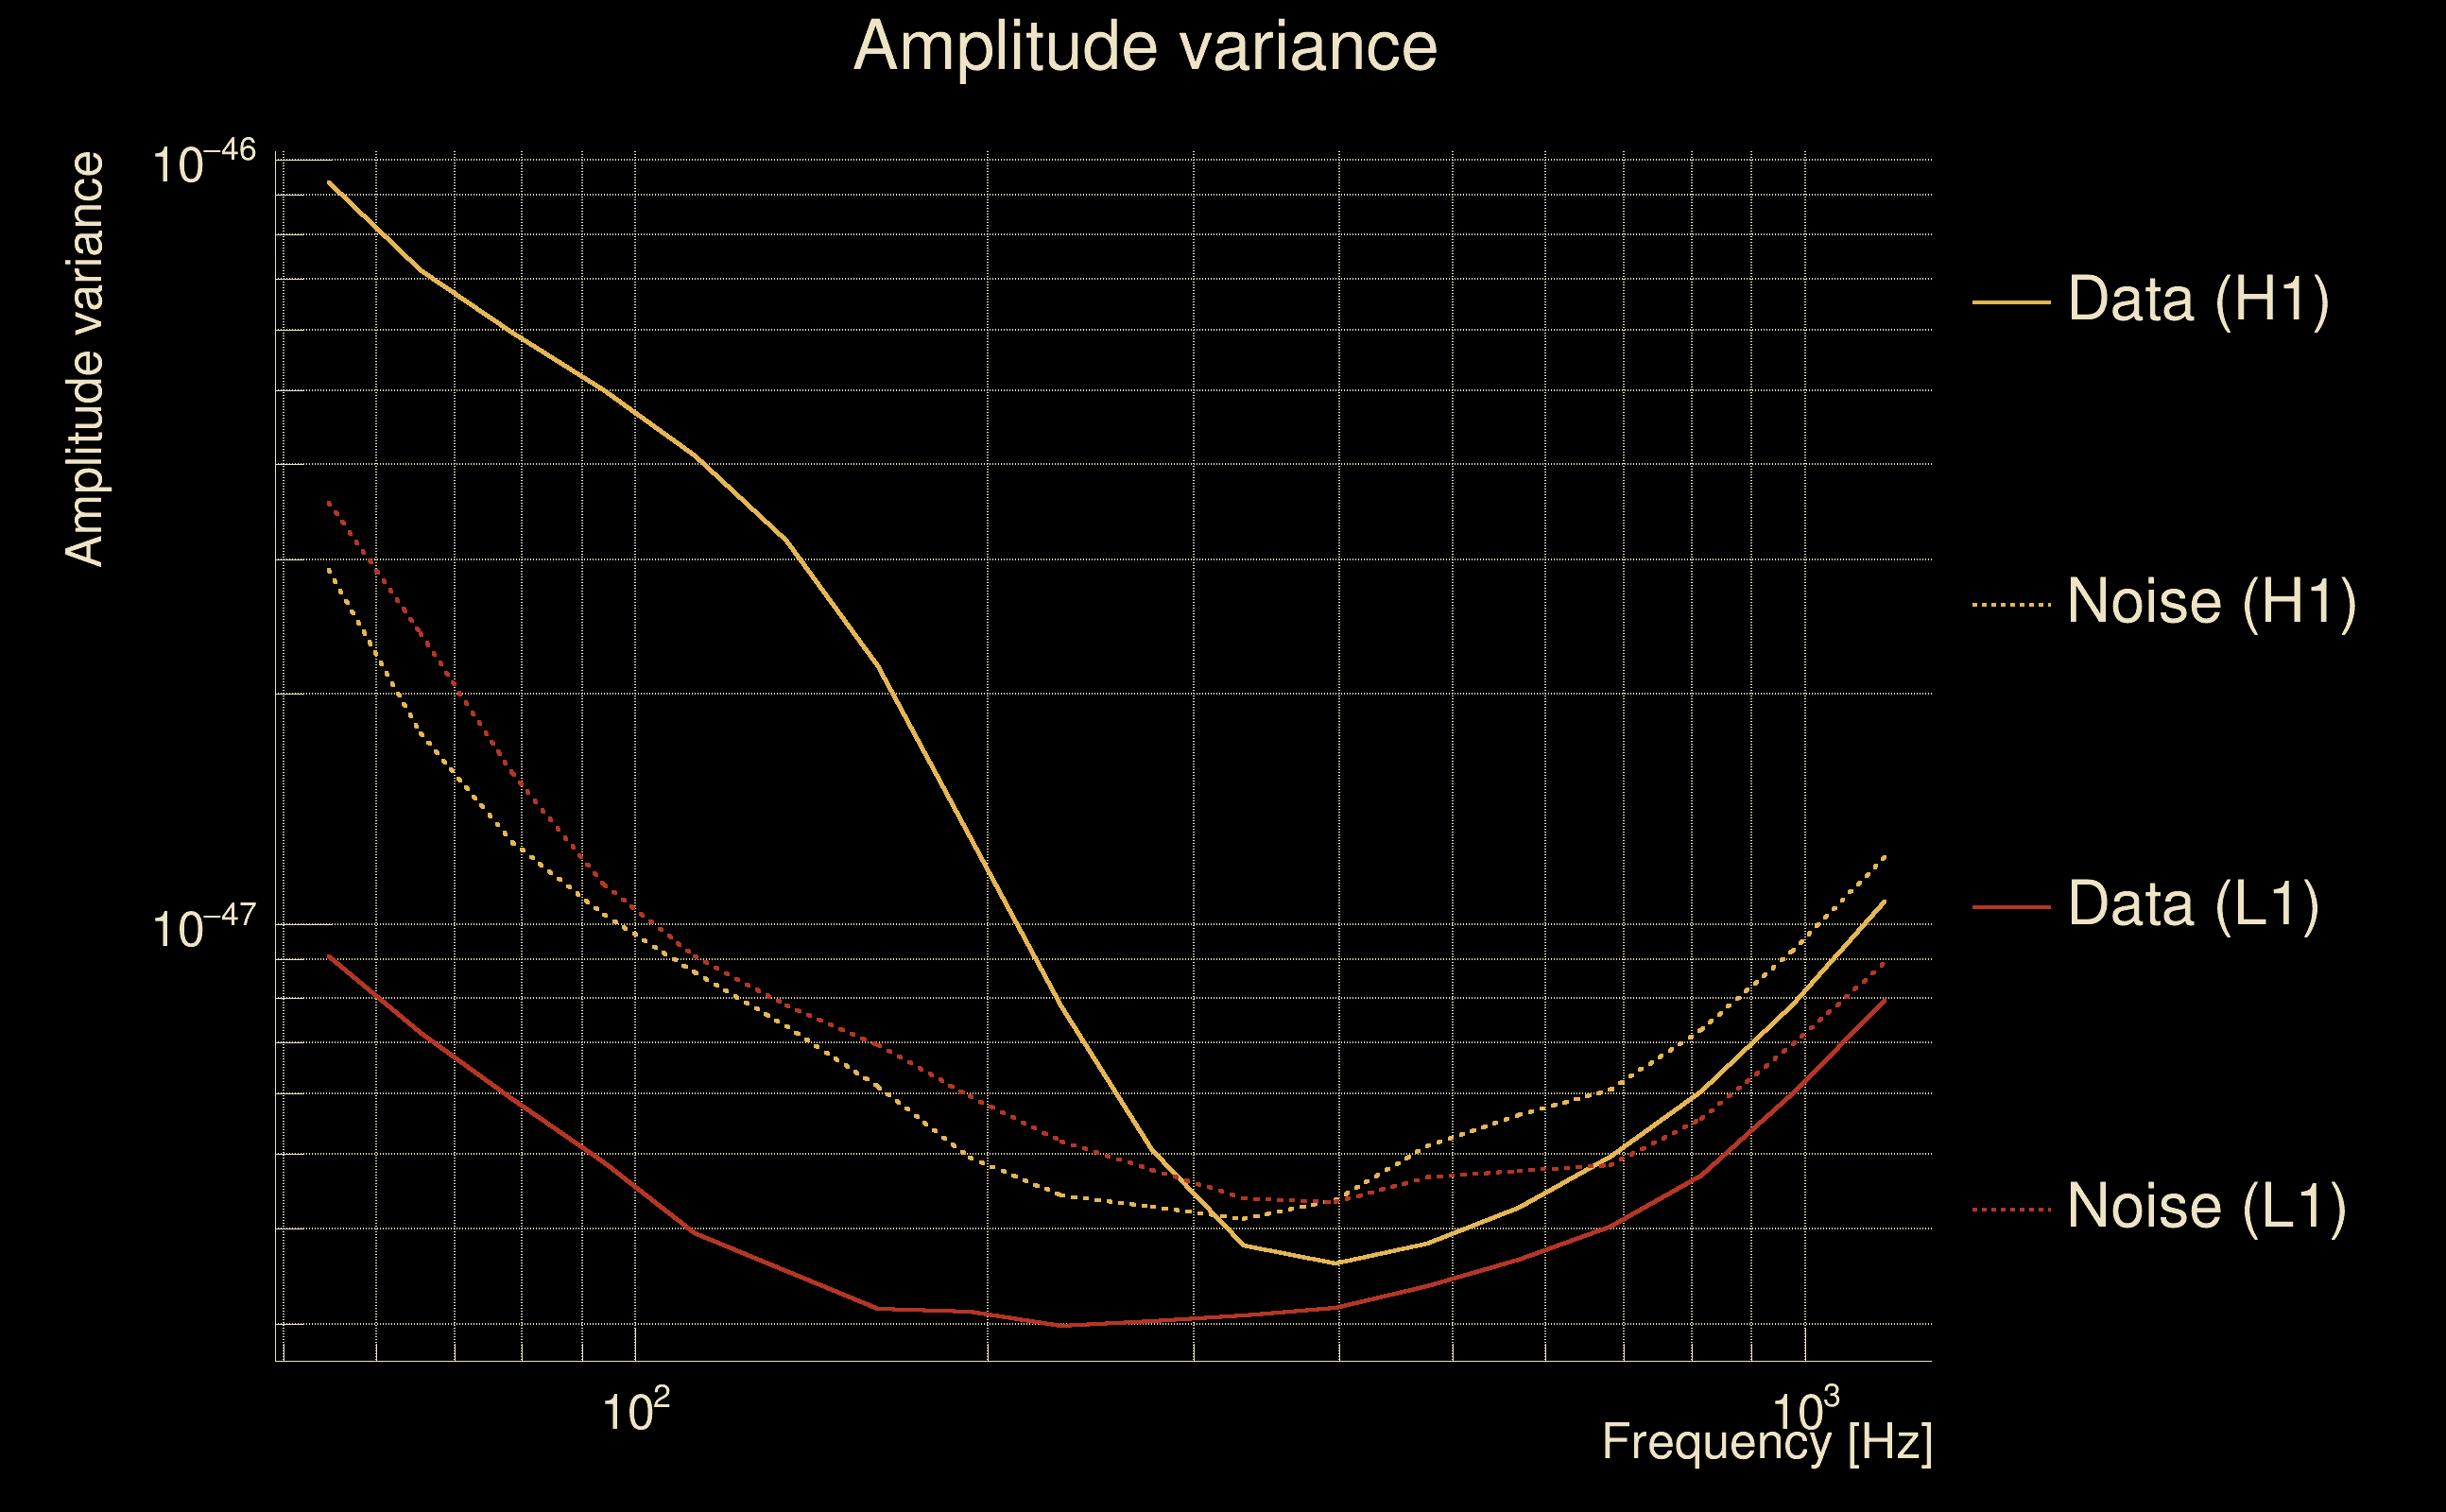
| Maximum signal-to-noise ratio: | H1: 59.4945, L1: 63.1689 |
| SNR variance: | H1: 2.79627, L1: 2.89062 |
| Click here for a zoomed plot | Click here for a zoomed plot | Click here for a zoomed plot | Click here for a zoomed plot | Click here for a zoomed plot |
 |
 |
 |
 |
 |
 |
 |
 |
 |
 |
 |
 |
 |
 |
 |
 |
 |
 |
 |
 |
 |
 |
 |
 |
 |
 |
 |
 |
 |
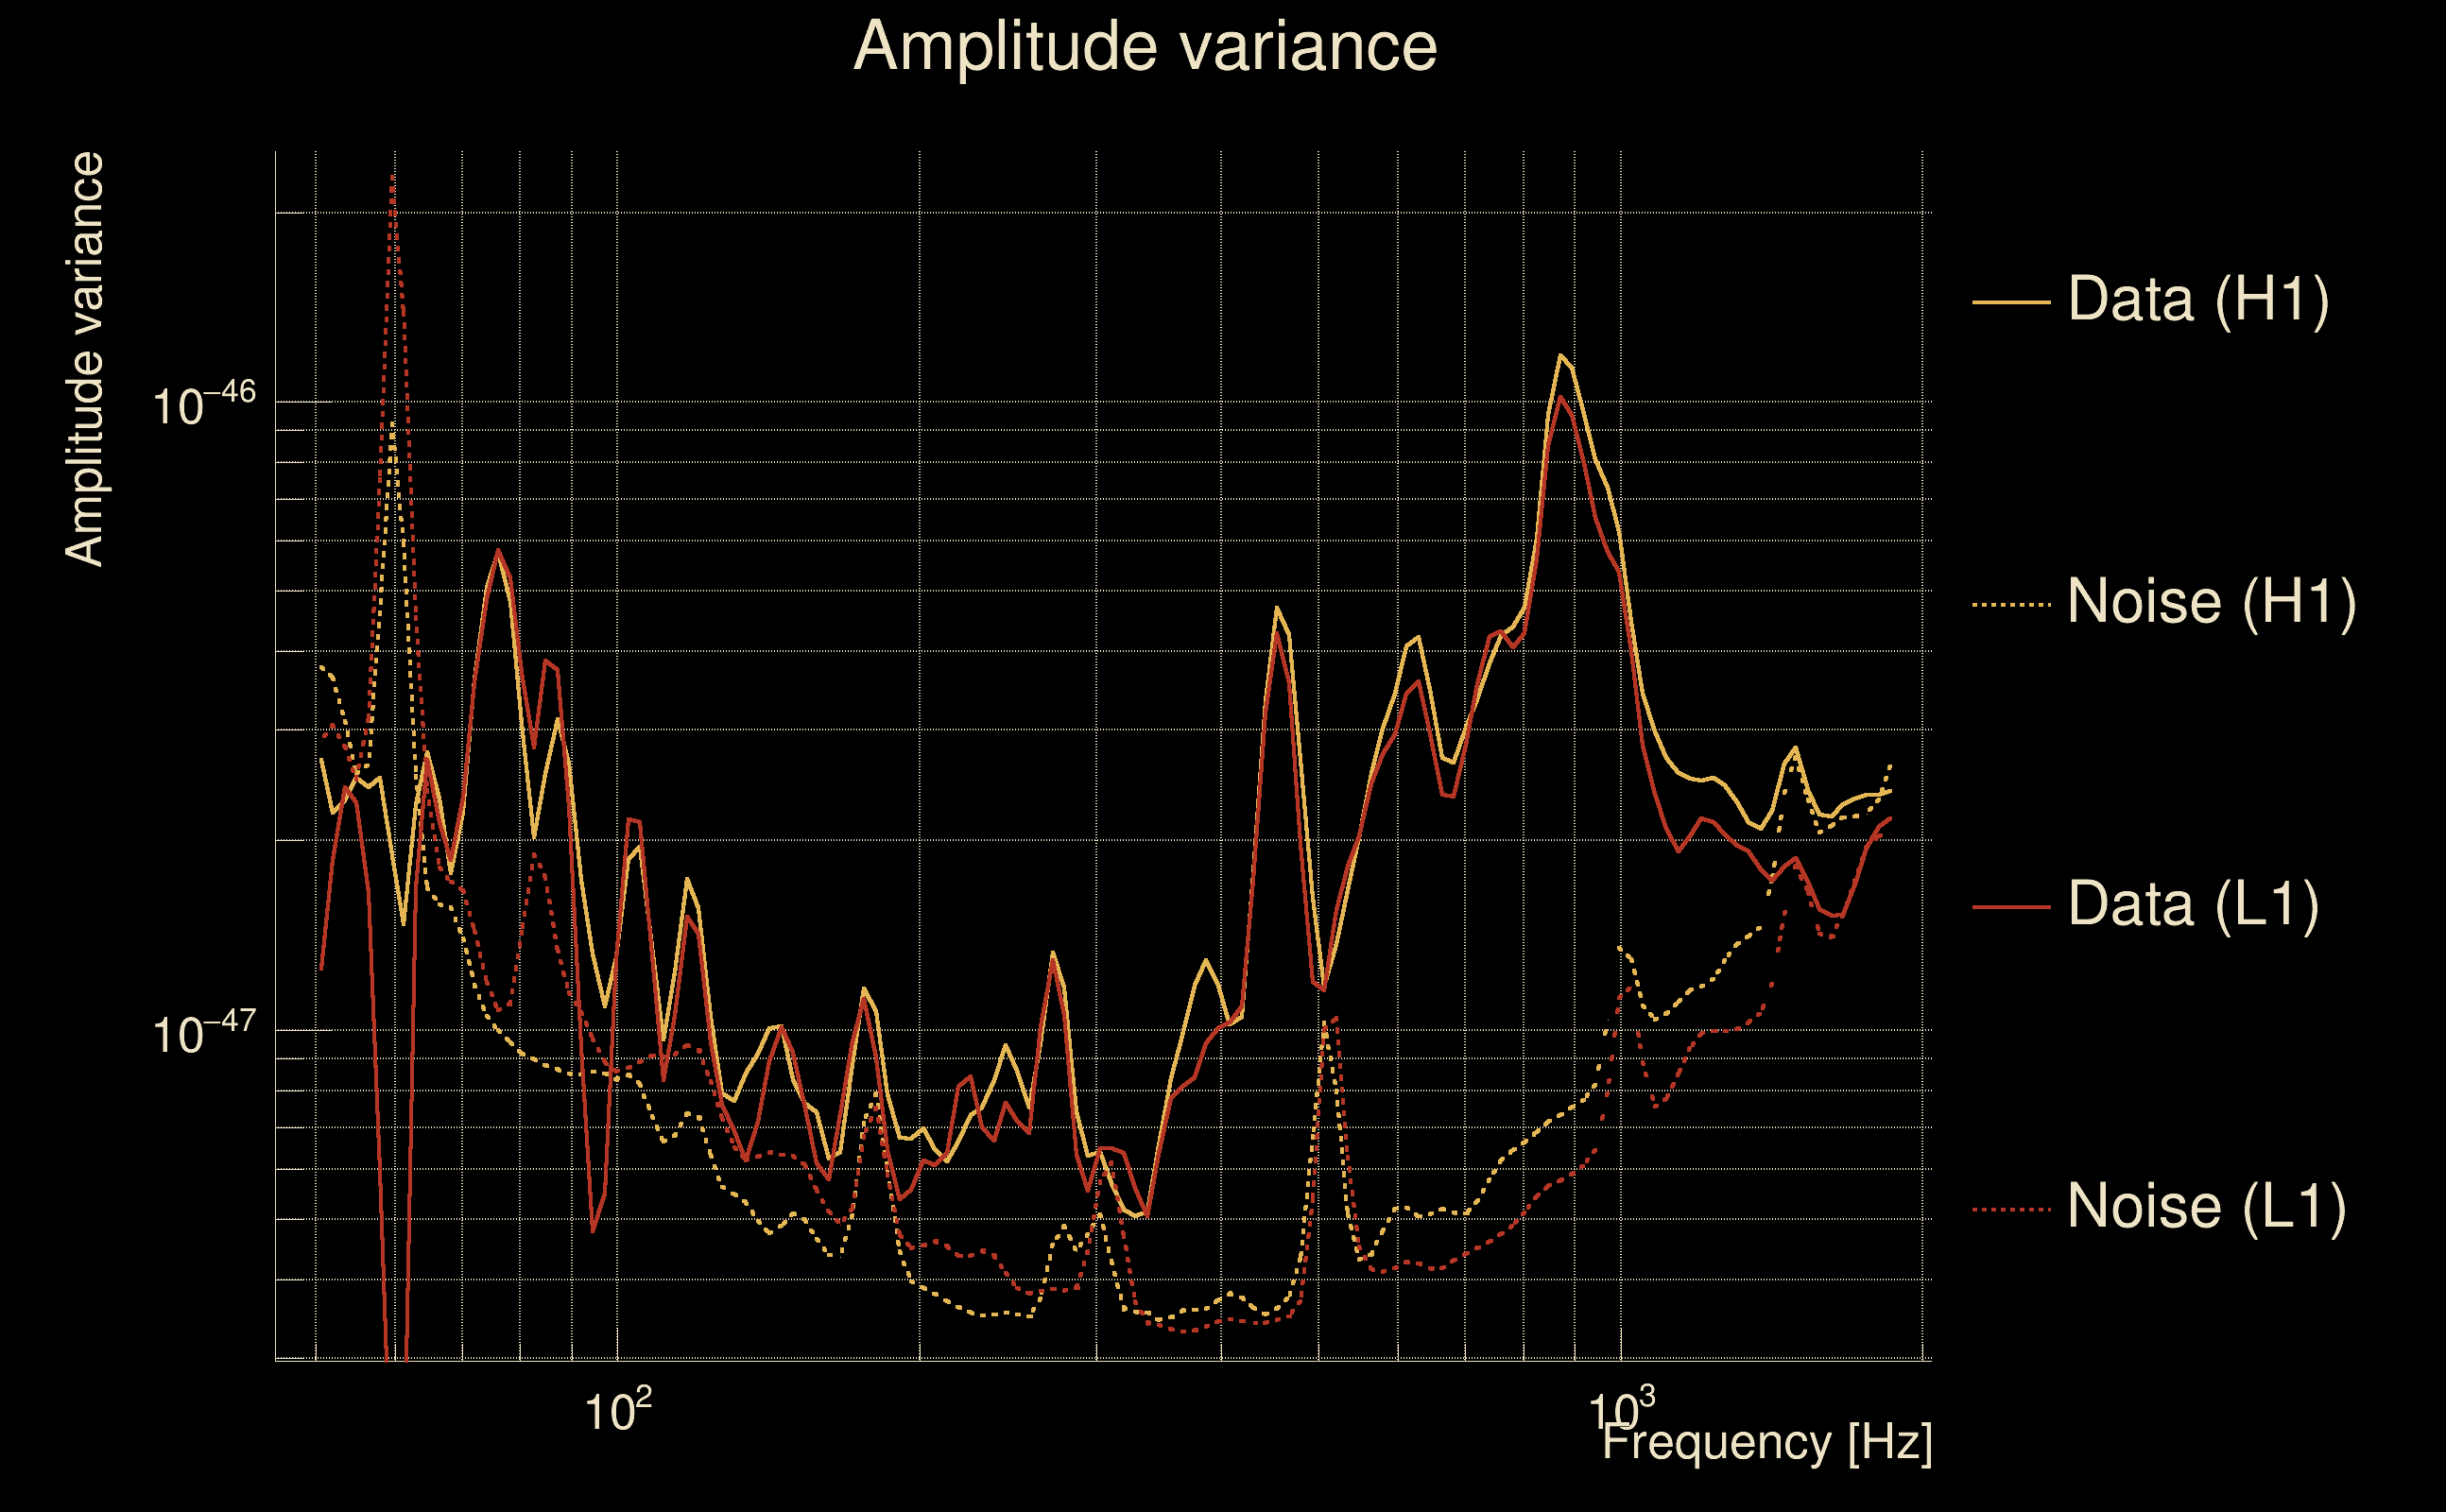
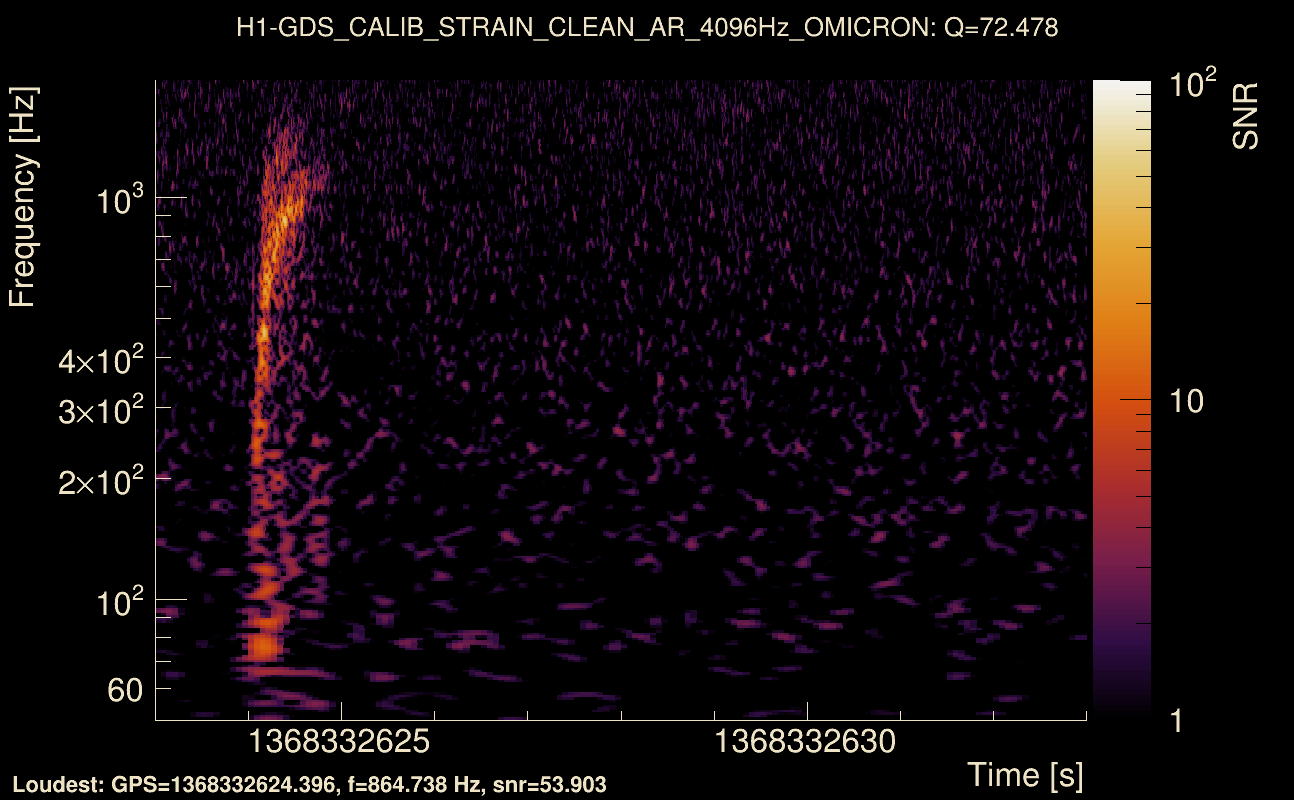
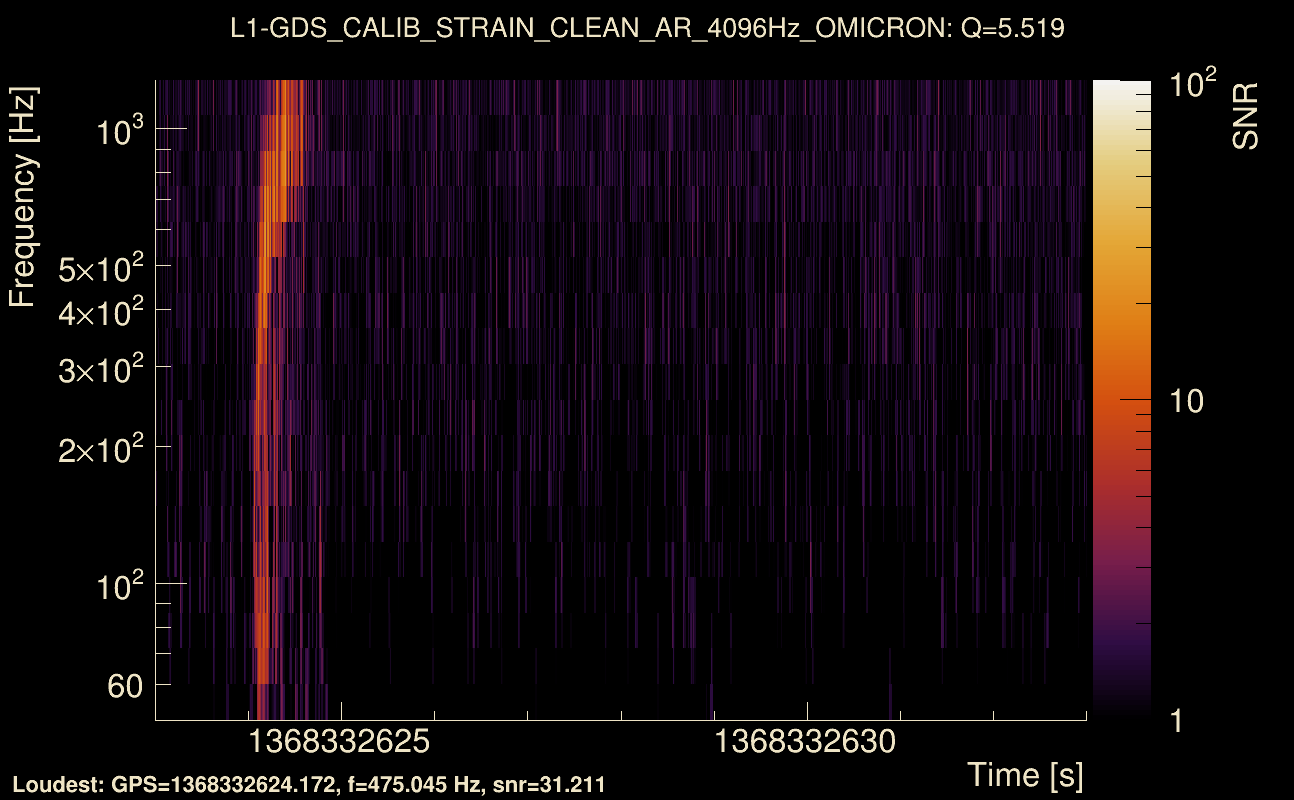
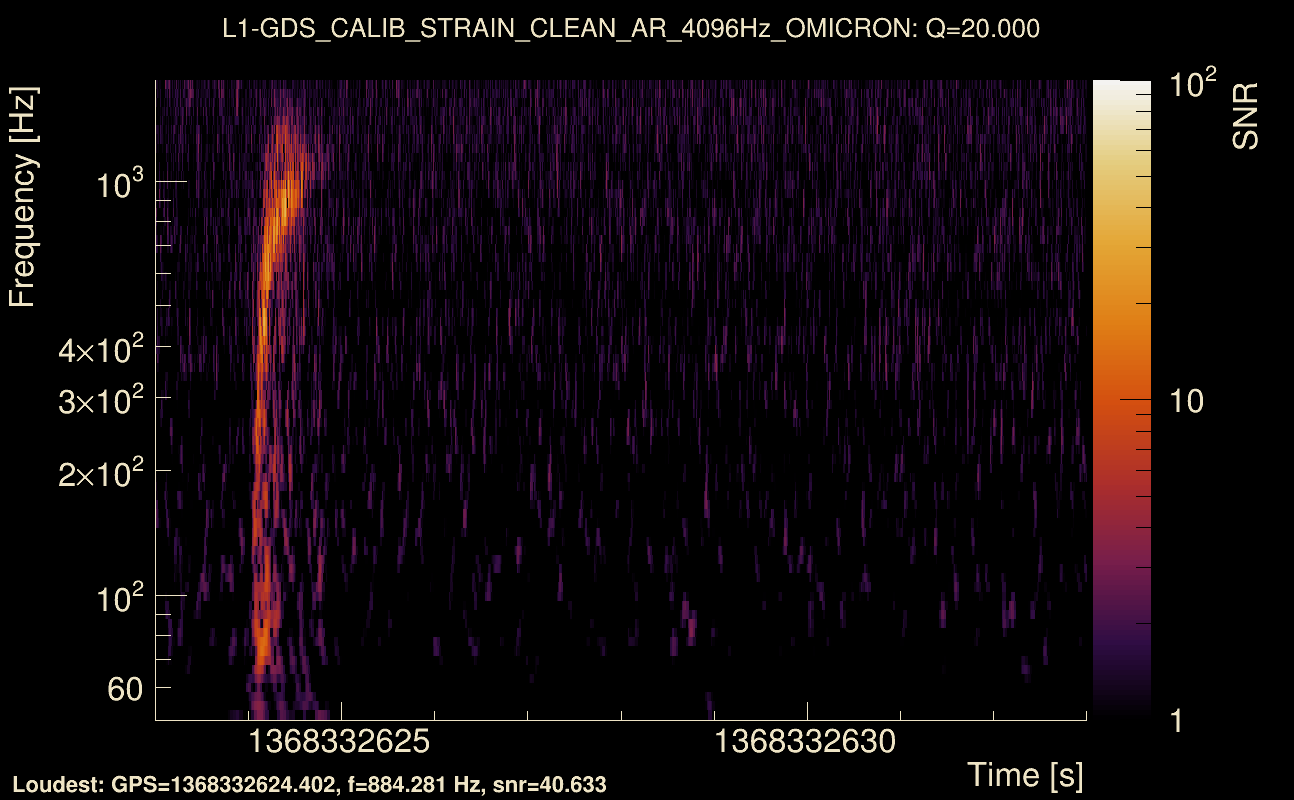
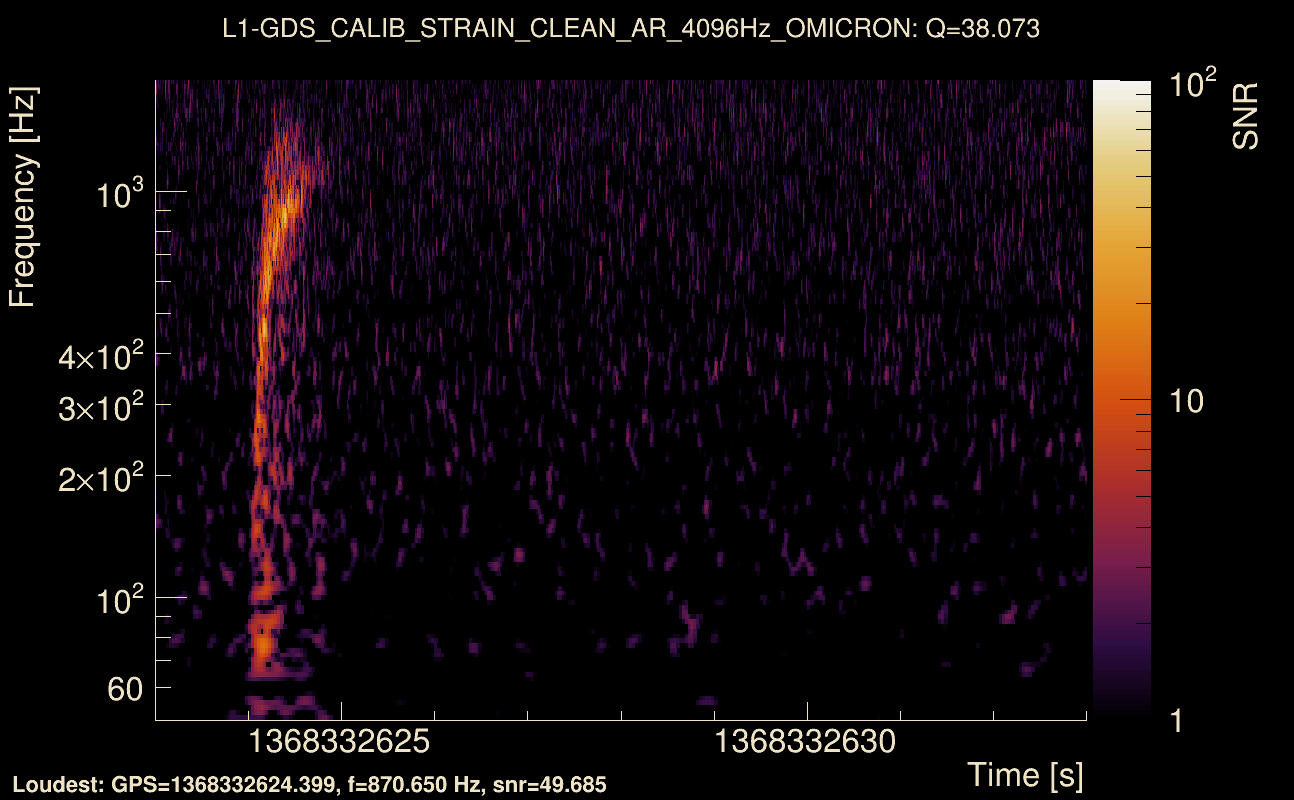
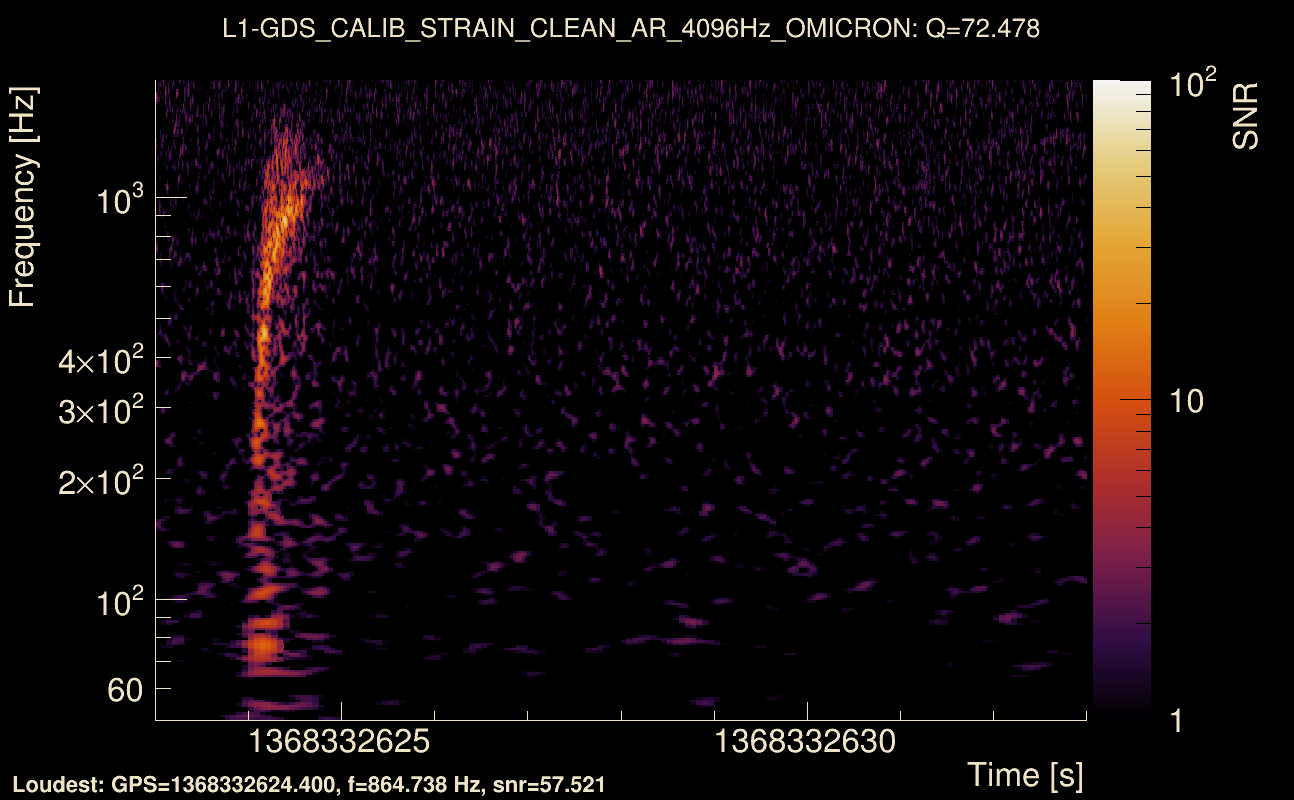
| Event time t(H1): | GPS = 1368332623 (Wed May 17 04:23:25 2023 ) → GPS = 1368332633 (Wed May 17 04:23:35 2023 ) |
| Event time t(L1): | GPS = 1368332623 (Wed May 17 04:23:35 2023 ) → GPS = 1368332633 (Wed May 17 04:23:35 2023 ) |
| Omicron analysis time window (H1): | GPS = 1368332620 → GPS = 1368332636 |
| Omicron analysis time window (L1): | GPS = 1368332620 → GPS = 1368332636 |
| Time delay between detectors t(L1) - t(H1): | 0.0004653 s (slice index = 108 / 217), δt_gw = 0.0004653 s |
| Time delay standard deviation: | 0.0252795 s |
| [targeted mode] Time delay probability: | 0.997139 (0.00358514 sigmas), δt_target = 0.000909567 s |
| Frequency: | 294.515 Hz |
| Ξ: | 0.879783 ± 0.0105855 (variance = 0.000112053): Q0: 0.909687, Q1: 0.895697, Q2: 0.889725, Q3: 0.881227, Q4: 0.881341 |
| Rank: | R_A = 0.877266 |
| Log of amplitude ratio (L1/H1): | -0.0241103, variance = 0.15568 (L1/H1: -0.0464861, variance = 0.310434, H1/L1: 0.00526445, variance = 0.308144) |
| Amplitude ratio (L1/H1): | 0.976178 ⋇ 1.48374 (L1/H1: 0.954578 ⋇ 1.74572, H1/L1: 1.00528 ⋇ 1.74213) |
| Amplitude ratio H1|L1 compatibility (probability): | 0.958201 |
| Antenna factor probability: | 0.999472 |
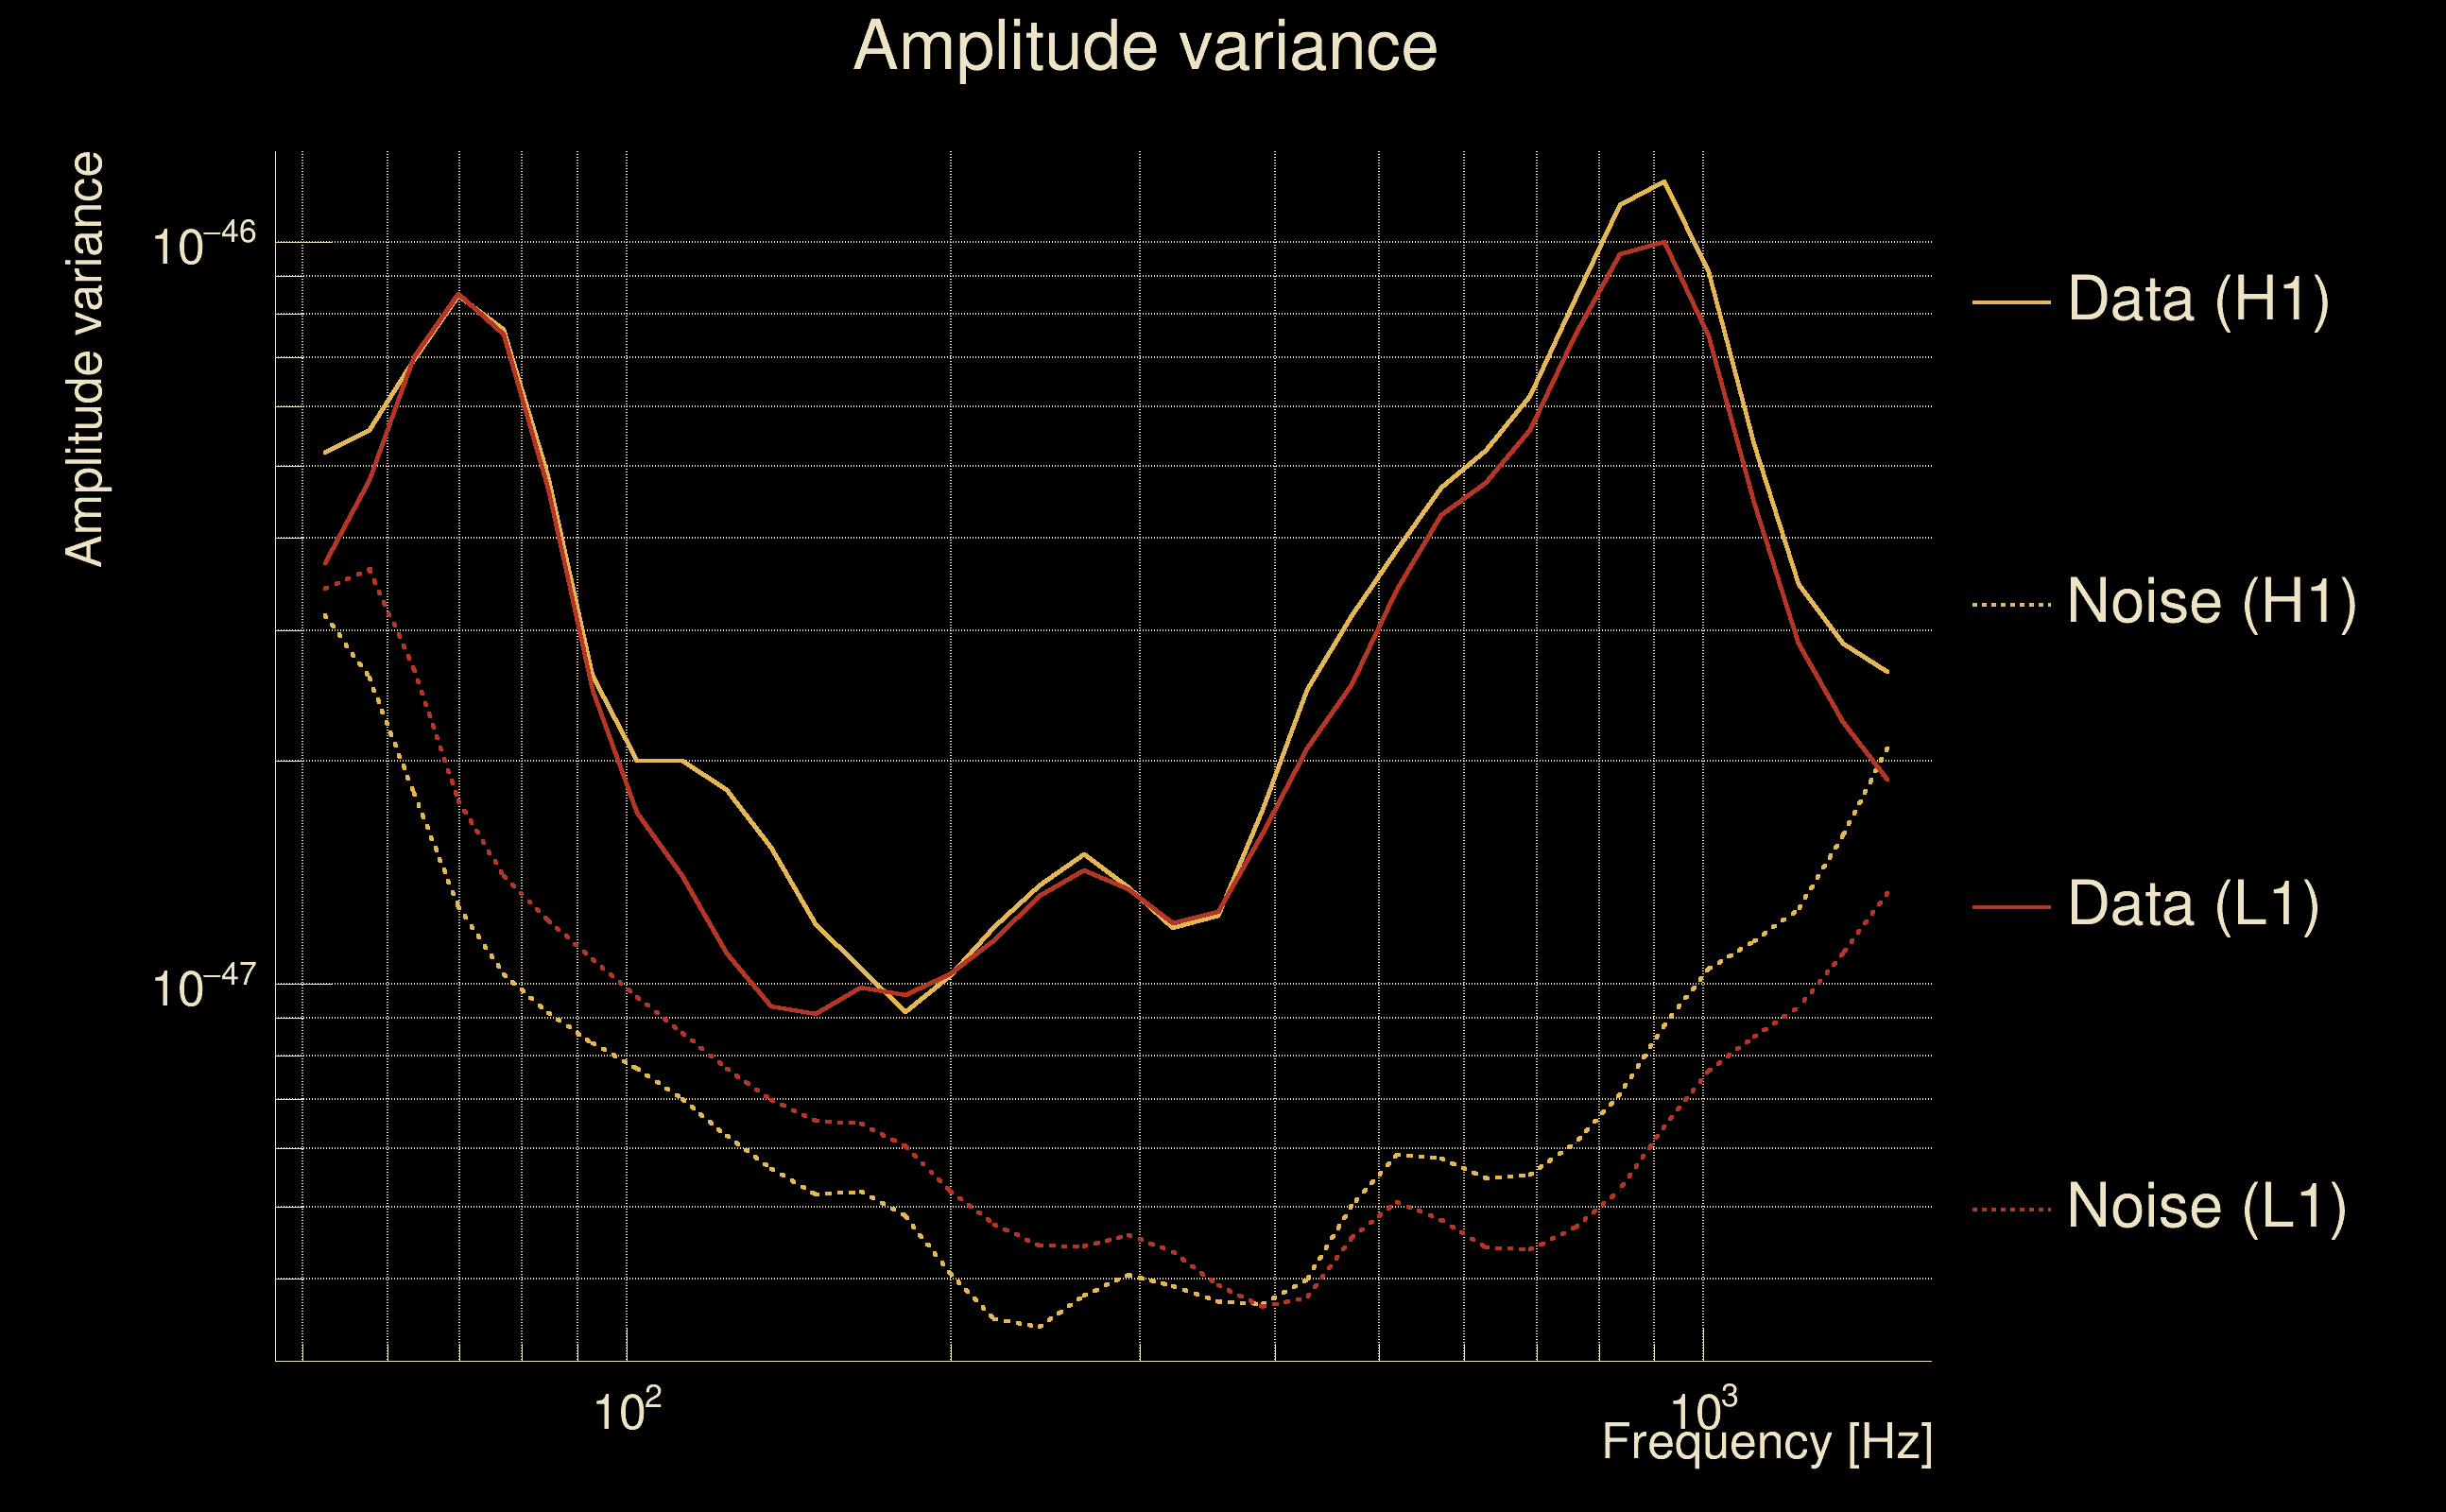
| Number of rejected frequency rows: | Q0: 0 / 18, Q1: 0 / 36, Q2: 3 / 70, Q3: 18 / 134, Q4: 63 / 258 |
| Maximum signal-to-noise ratio: | H1: 54.6996, L1: 59.6027 |
| SNR variance: | H1: 1.81471, L1: 2.01022 |
| Click here for a zoomed plot | Click here for a zoomed plot | Click here for a zoomed plot | Click here for a zoomed plot | Click here for a zoomed plot |
 |
 |
 |
 |
 |
 |
 |
 |
 |
 |
 |
 |
 |
 |
 |
 |
 |
 |
 |
 |
 |
 |
 |
 |
 |
 |
 |
 |
 |
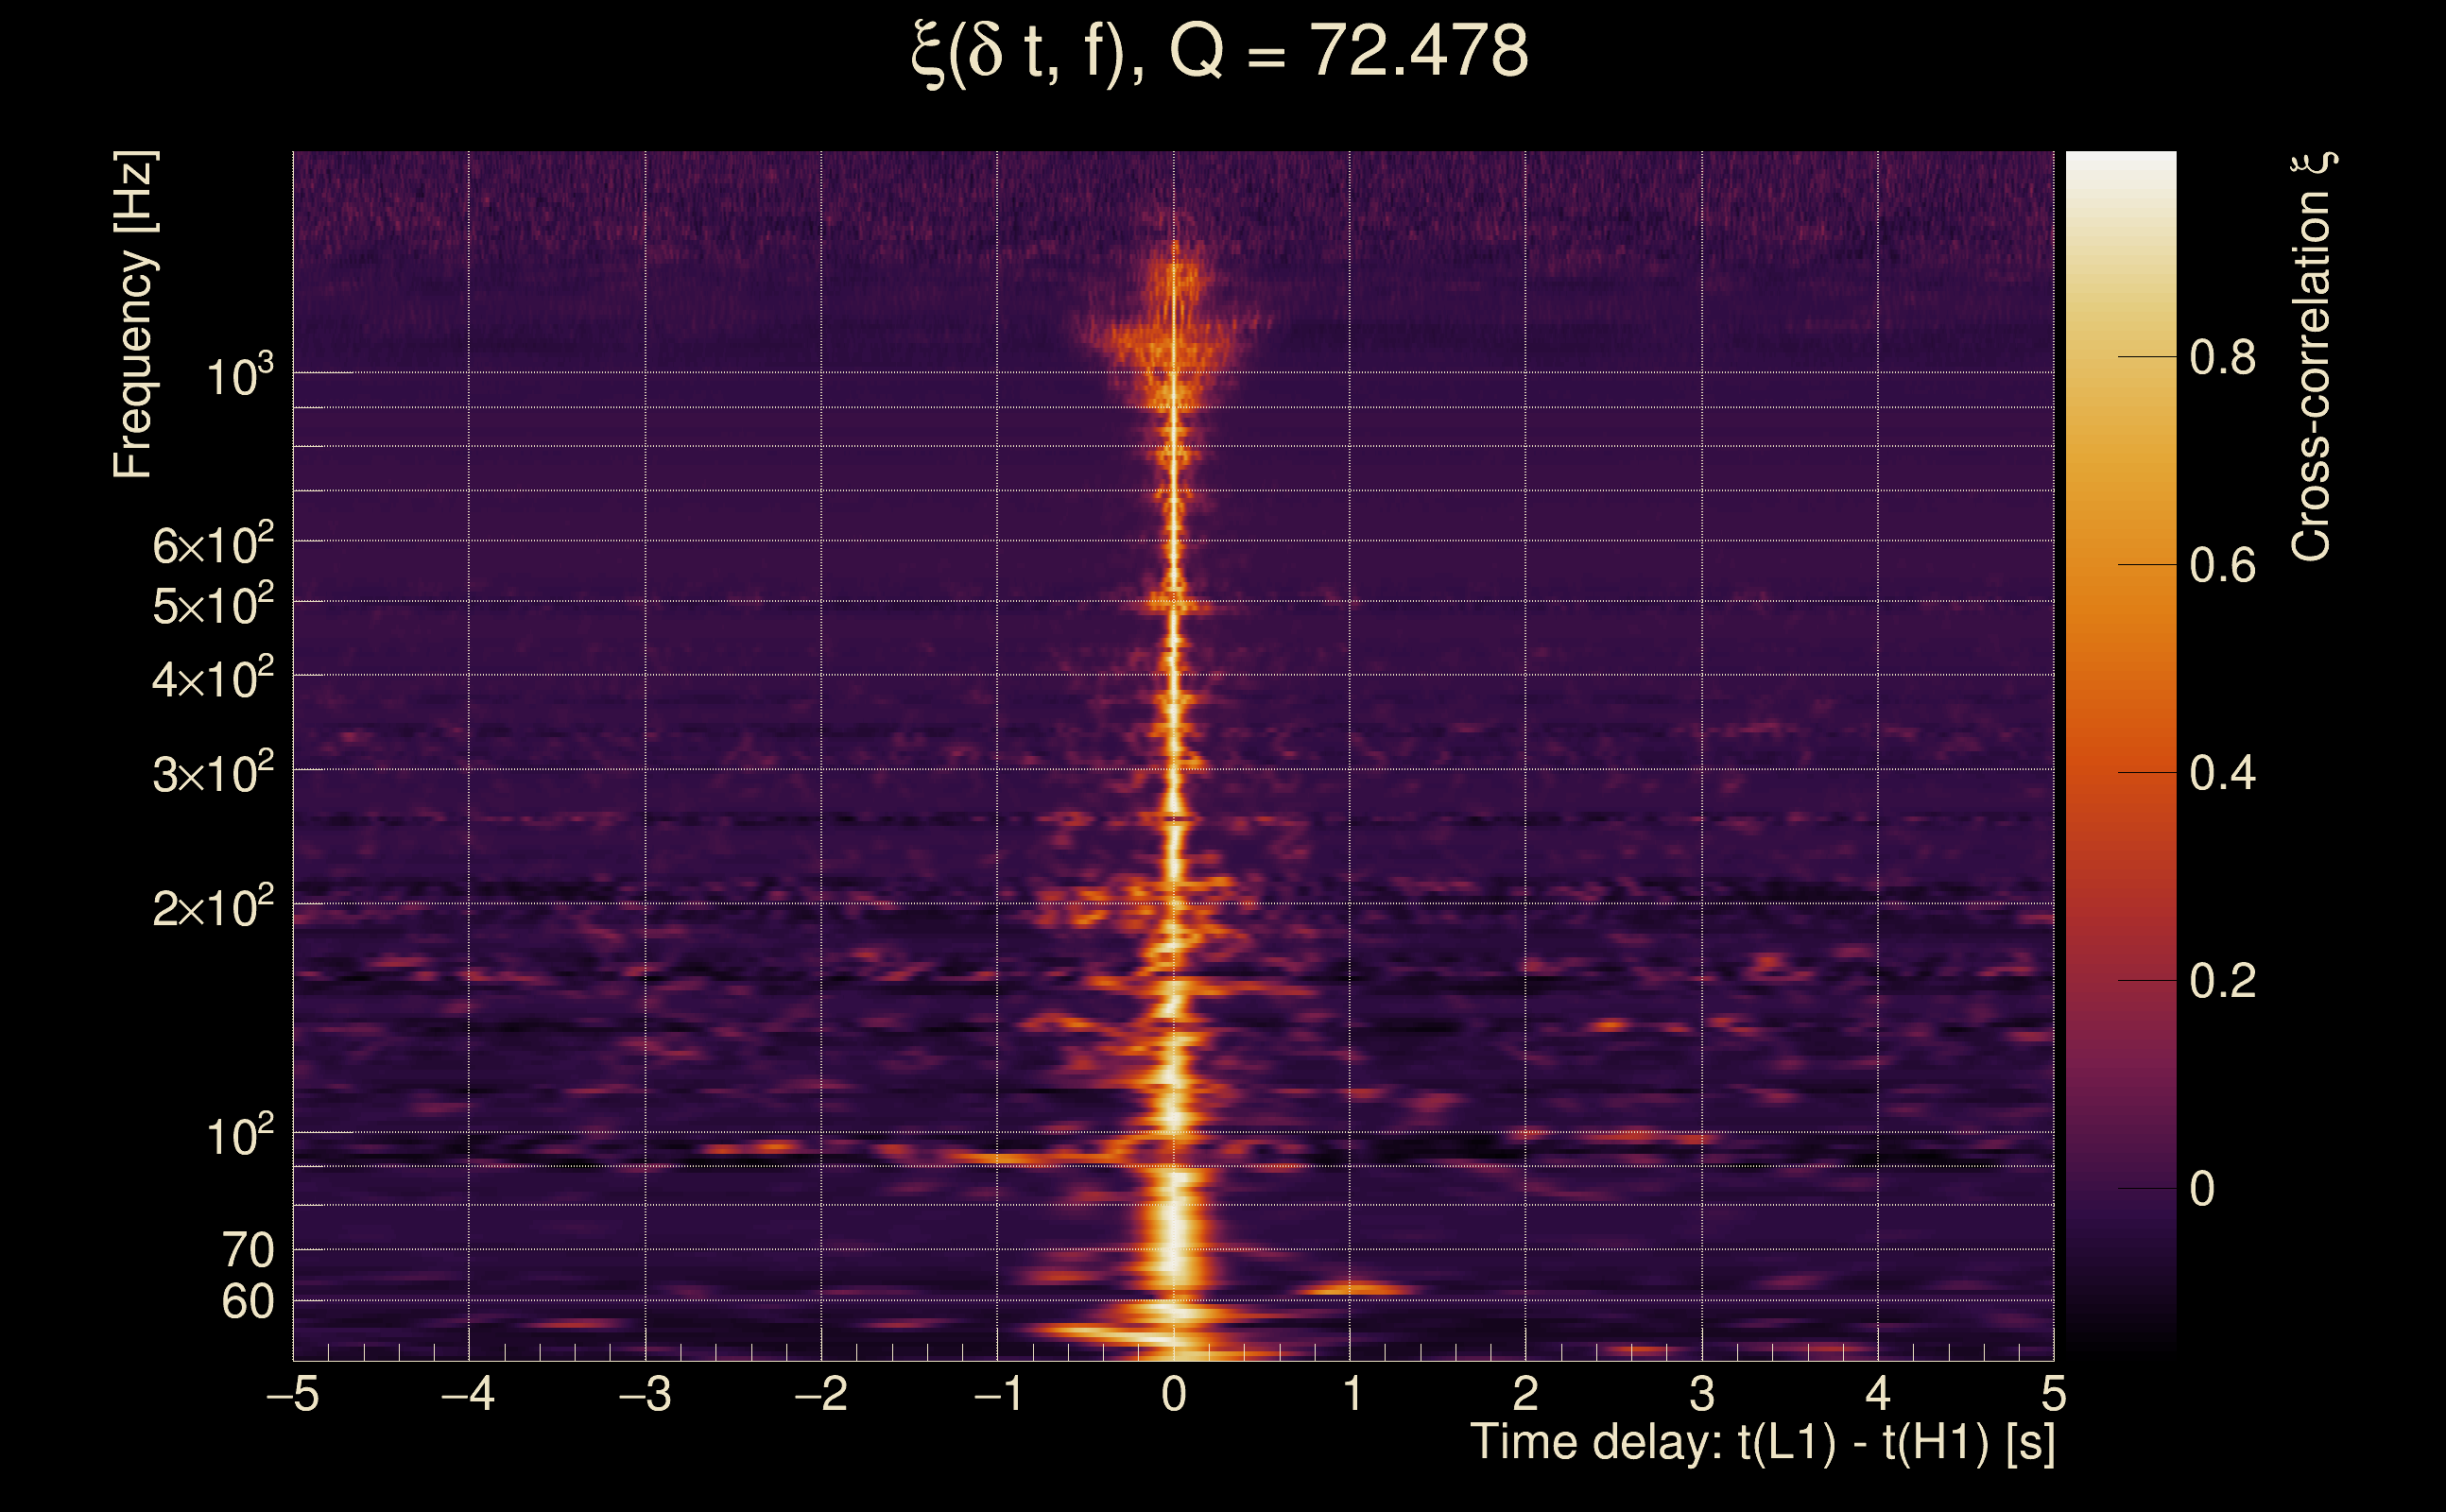
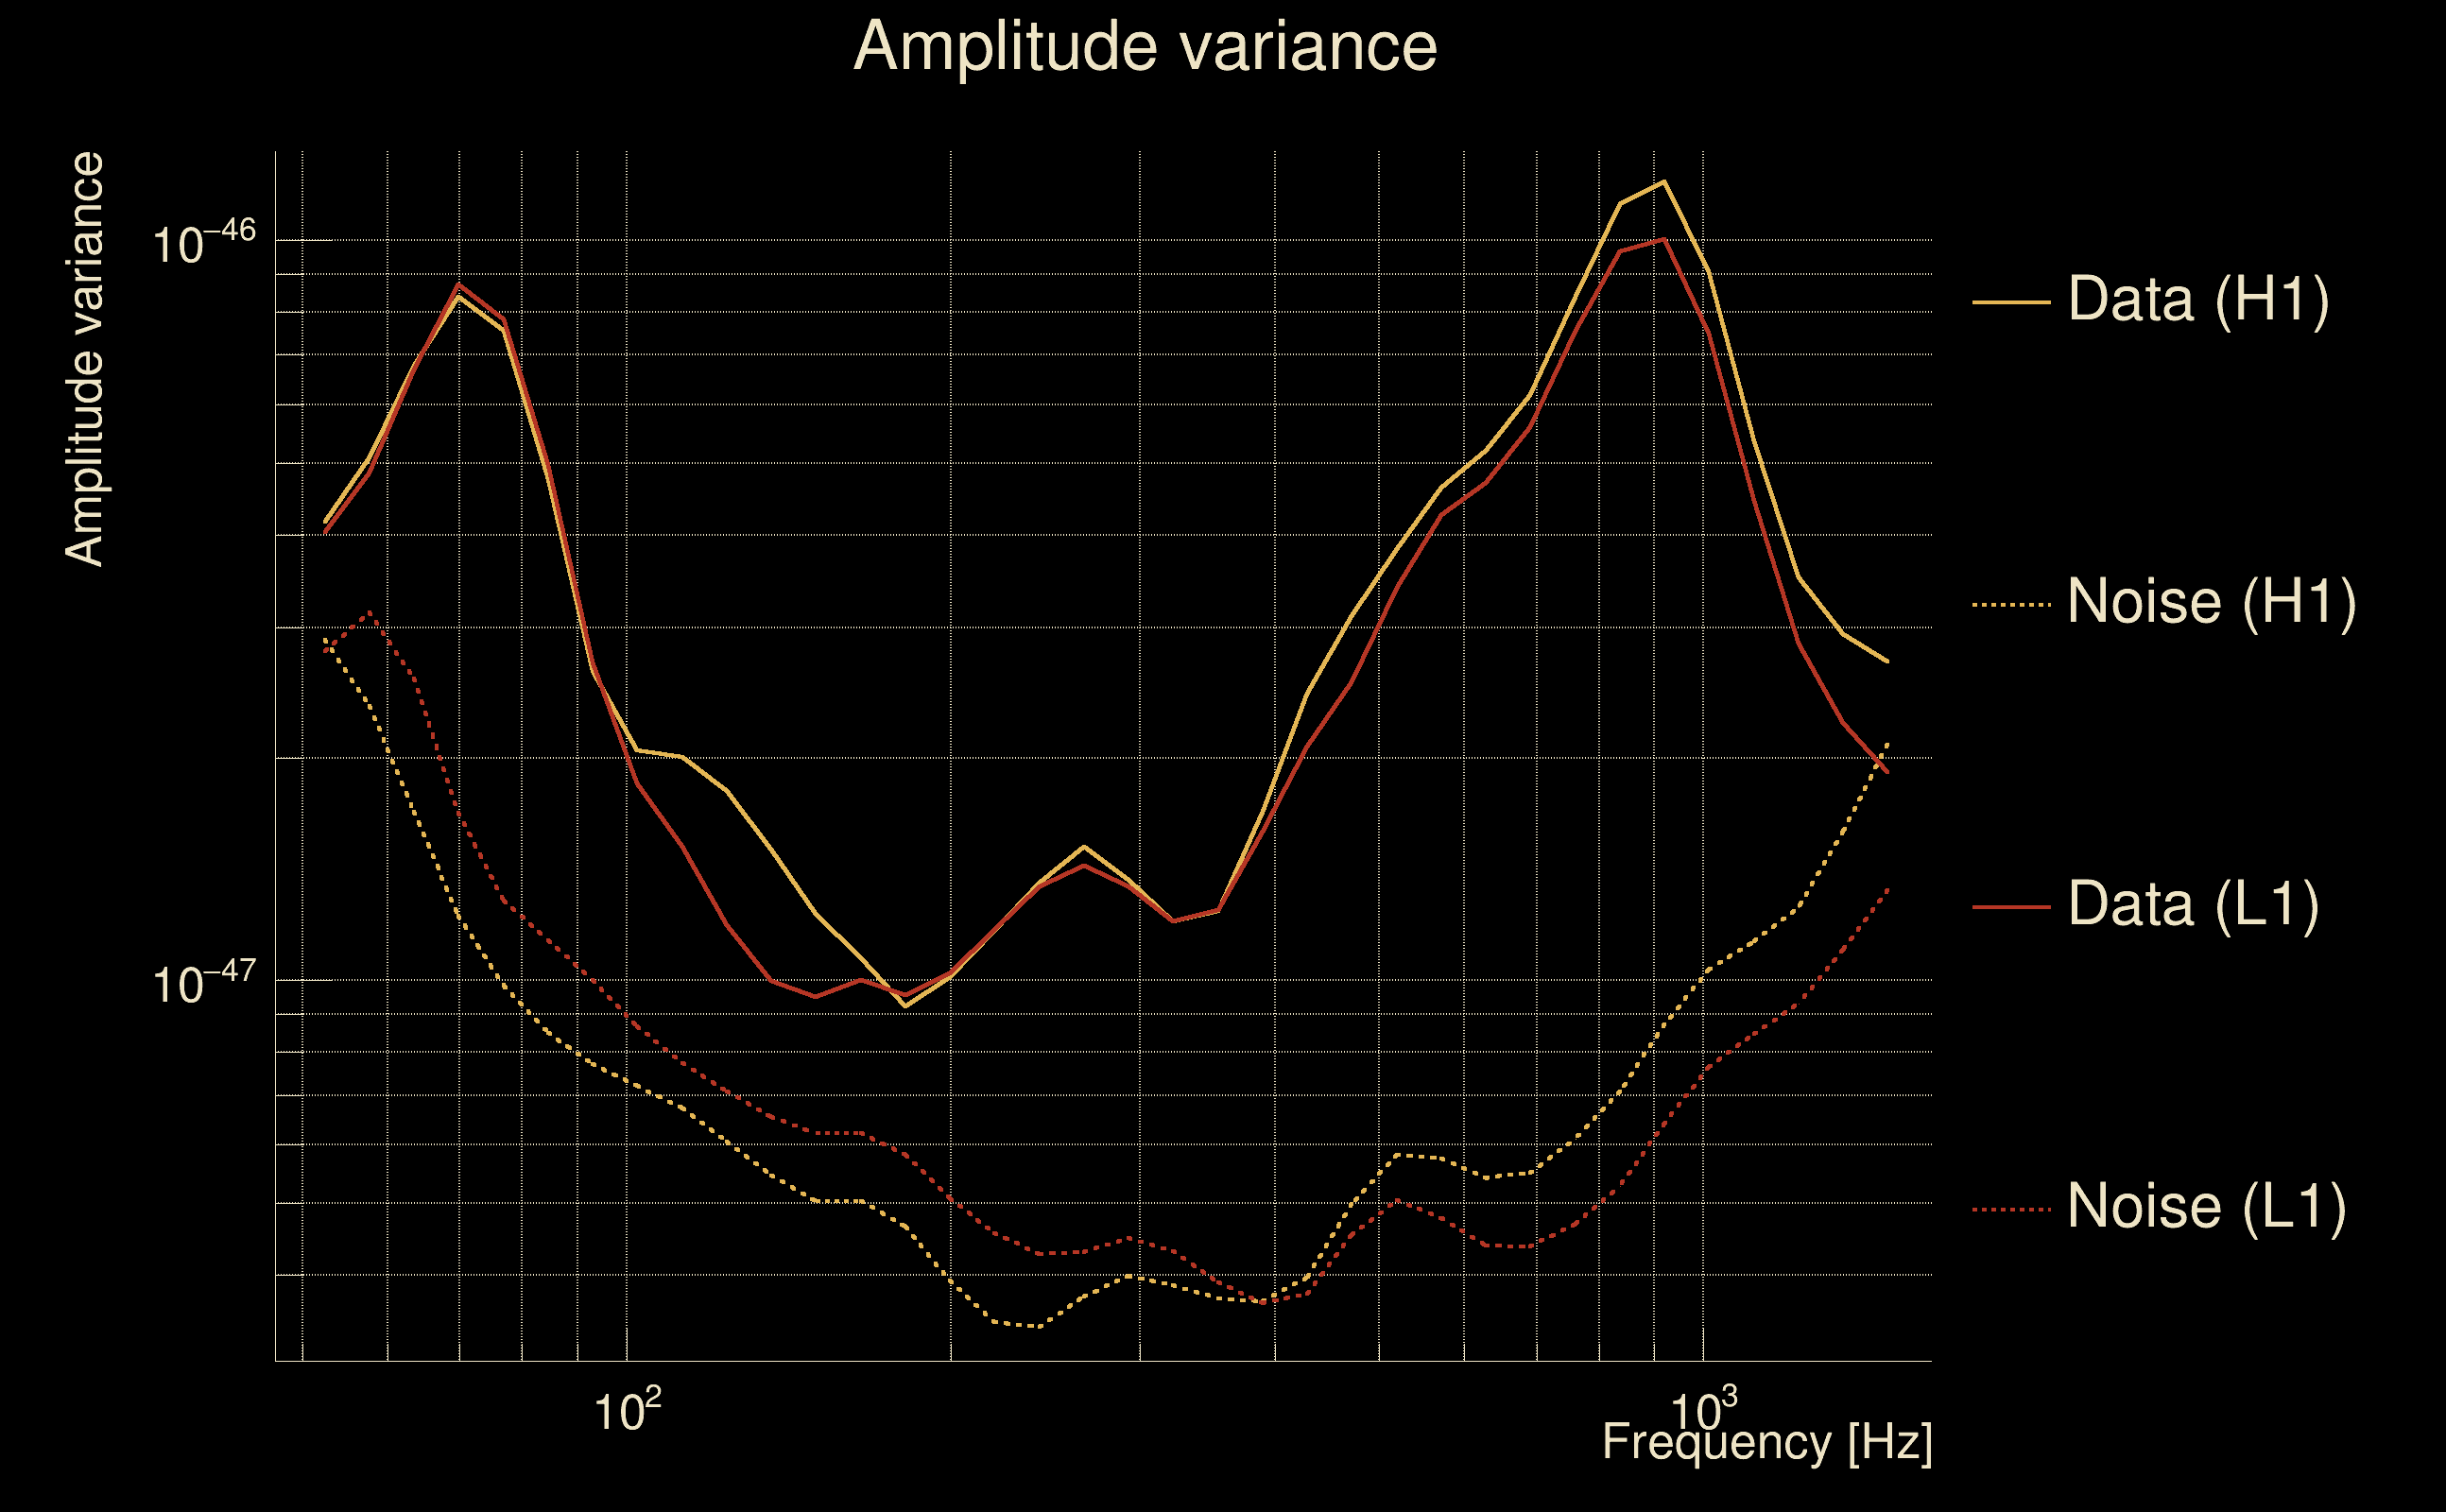
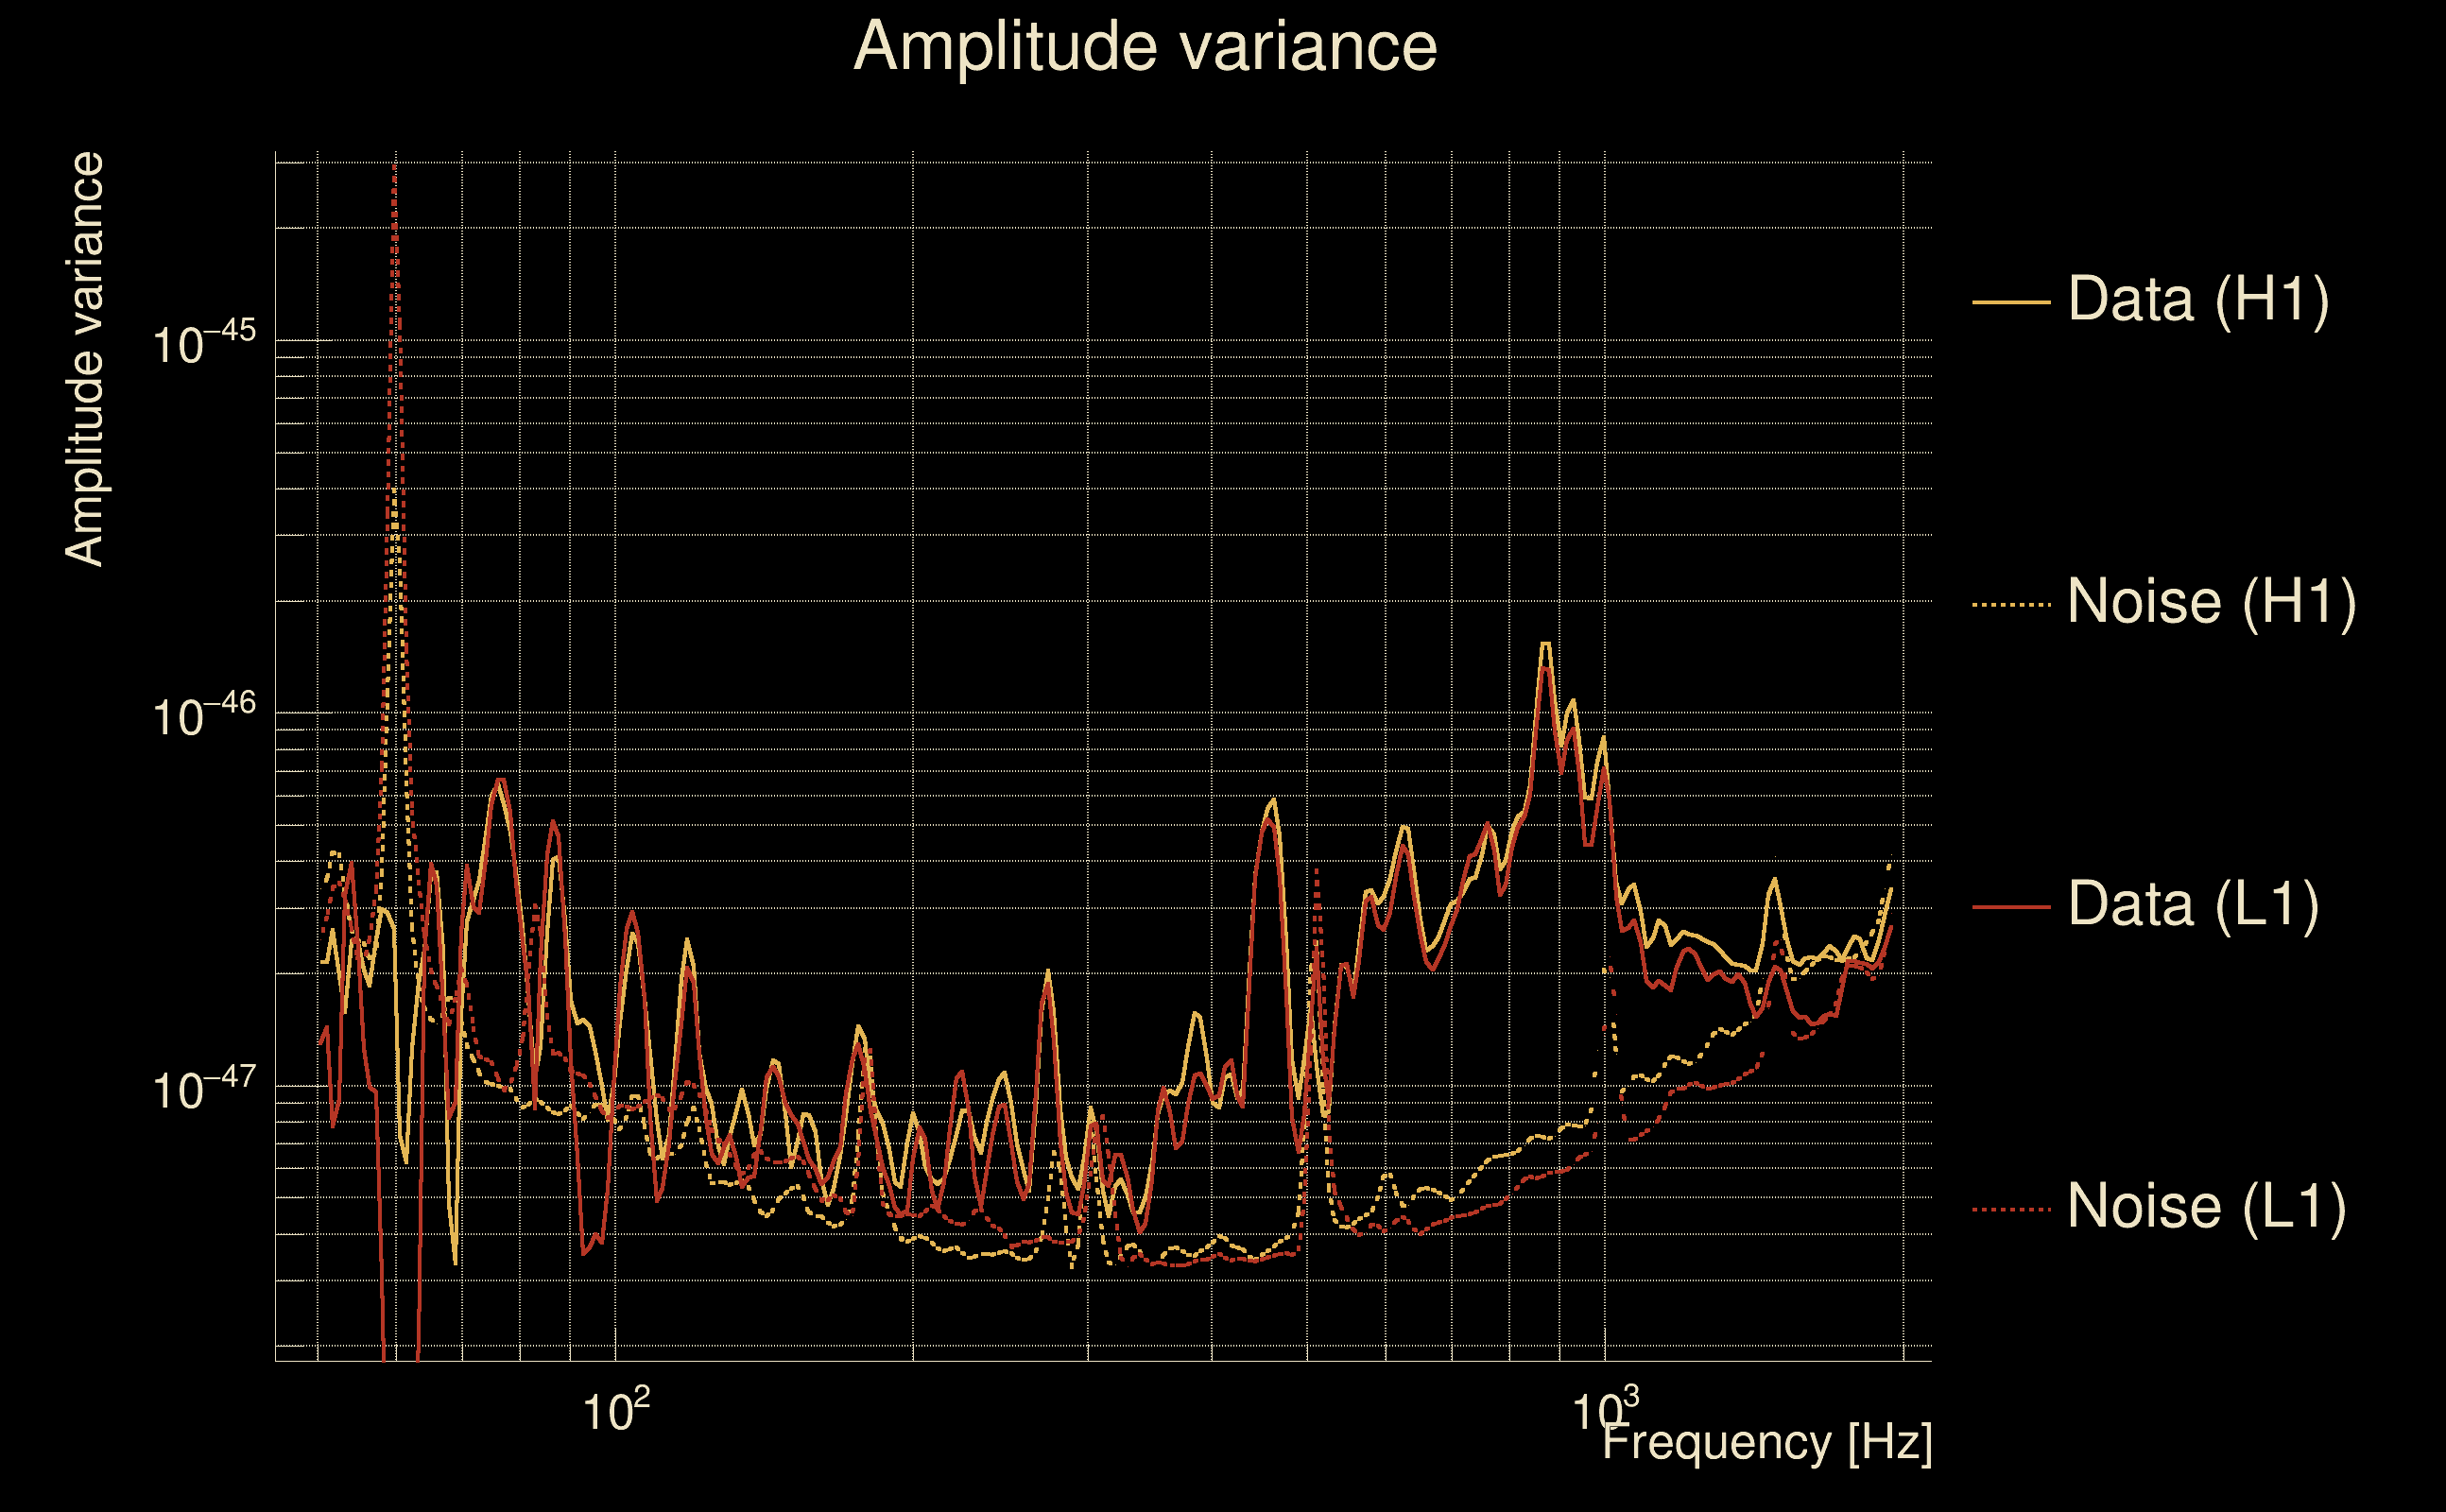
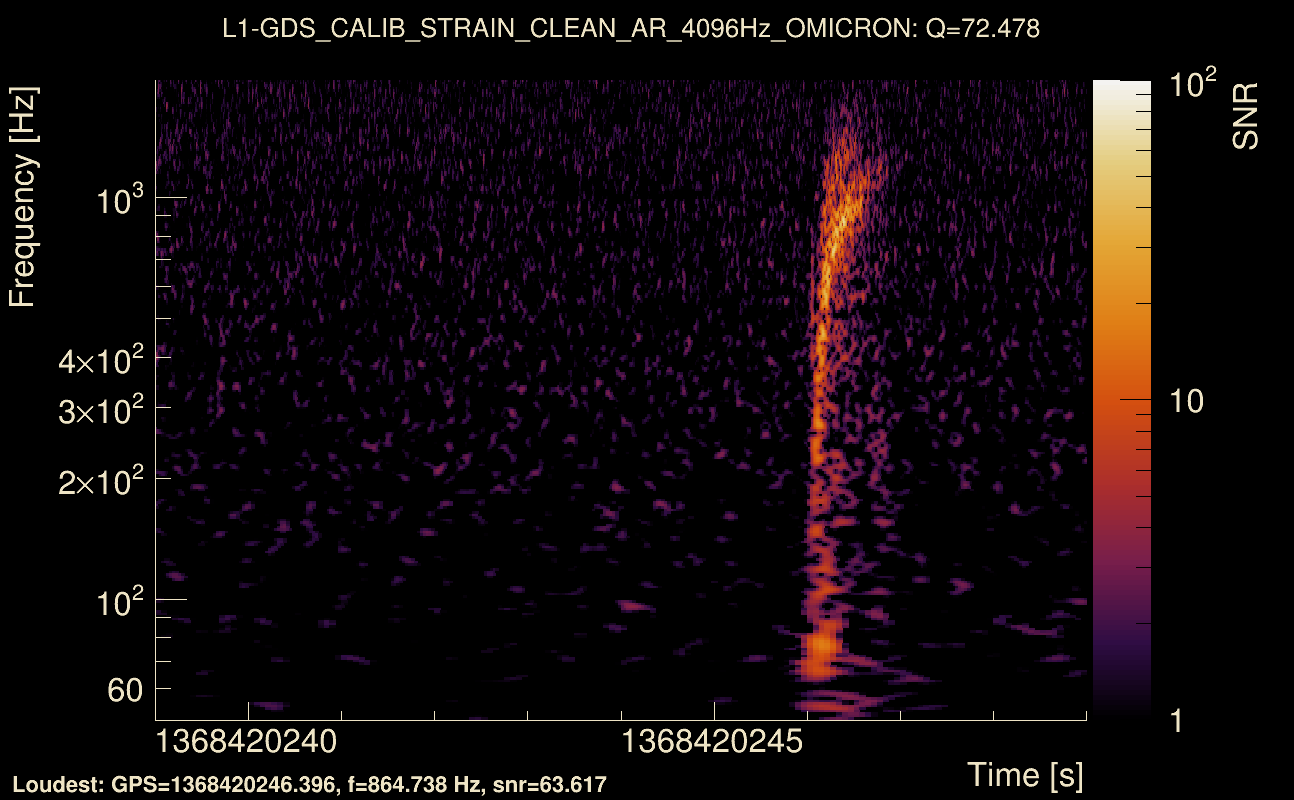
| Event time t(H1): | GPS = 1368420239 (Thu May 18 04:43:41 2023 ) → GPS = 1368420249 (Thu May 18 04:43:51 2023 ) |
| Event time t(L1): | GPS = 1368420239 (Thu May 18 04:43:51 2023 ) → GPS = 1368420249 (Thu May 18 04:43:51 2023 ) |
| Omicron analysis time window (H1): | GPS = 1368420236 → GPS = 1368420252 |
| Omicron analysis time window (L1): | GPS = 1368420236 → GPS = 1368420252 |
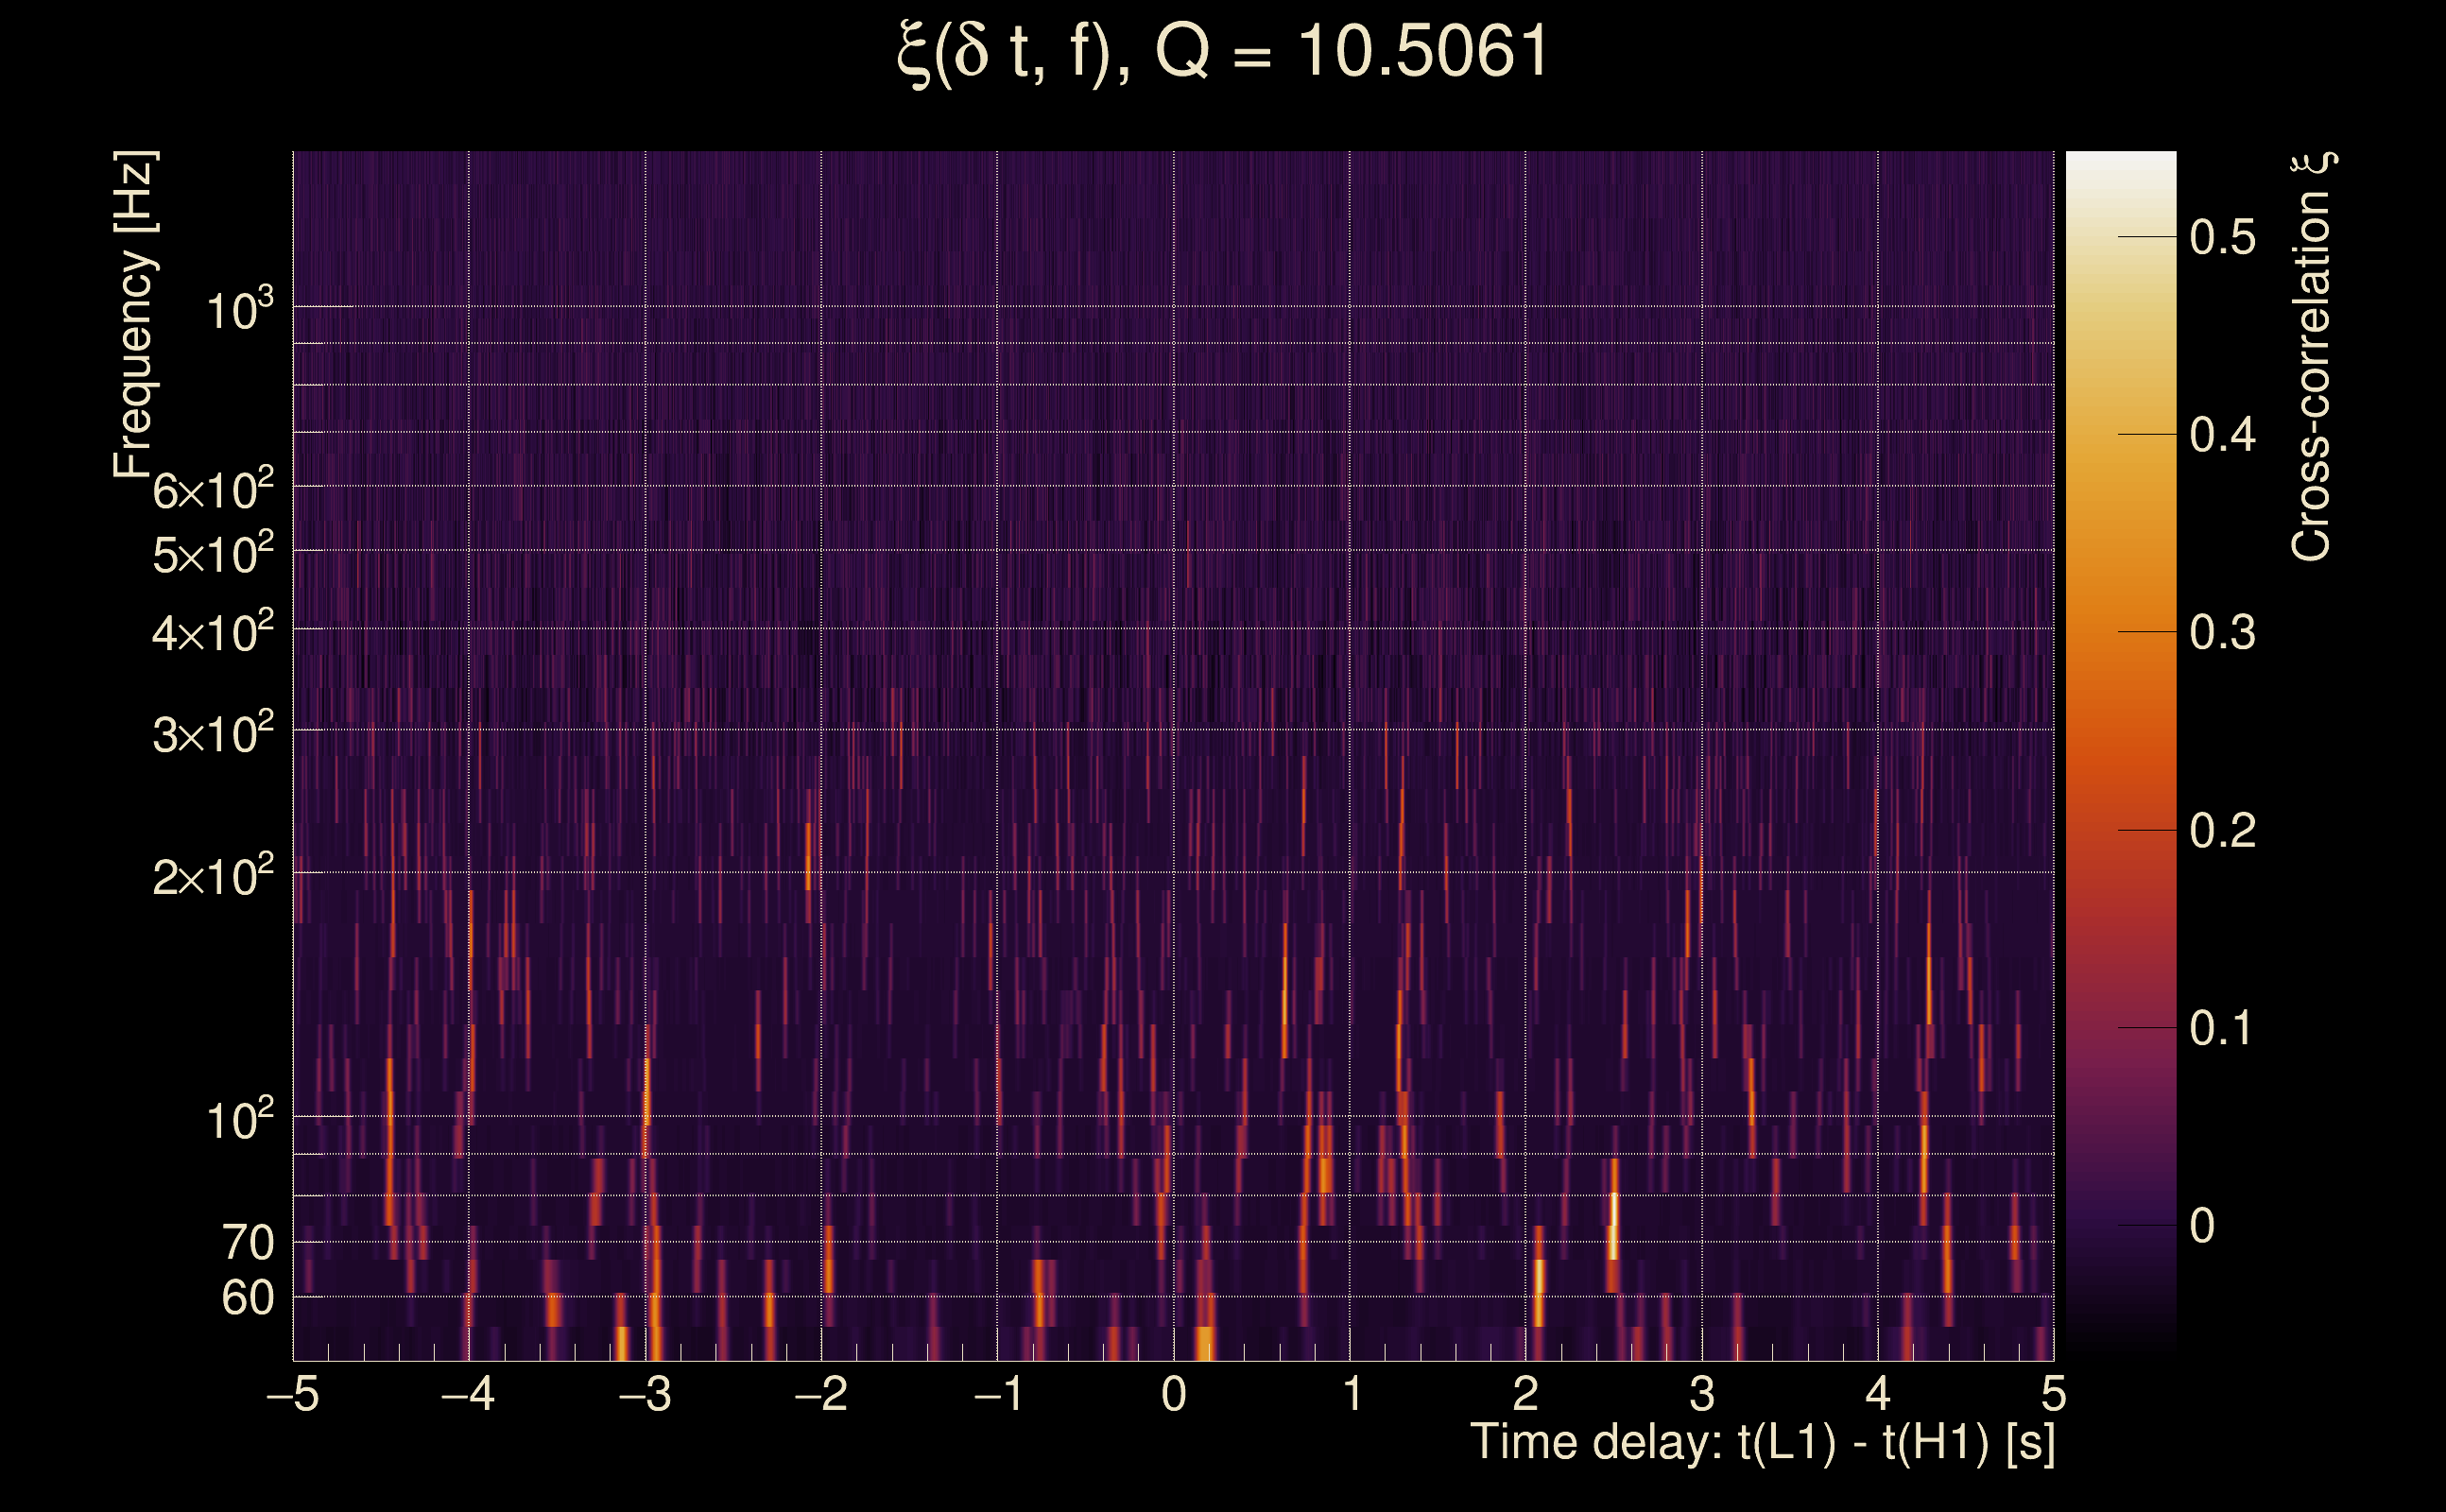
| Time delay between detectors t(L1) - t(H1): | 0.000936075 s (slice index = 108 / 217), δt_gw = 0.000936075 s |
| Time delay standard deviation: | 0.0203456 s |
| [targeted mode] Time delay probability: | 0.945271 (0.0686466 sigmas), δt_target = 0.000463009 s |
| Frequency: | 279.493 Hz |
| Ξ: | 0.917551 ± 0.0140271 (variance = 0.00019676): Q0: 0.951772, Q1: 0.933302, Q2: 0.921294, Q3: 0.913382, Q4: 0.916387 |
| Rank: | R_A = 0.867334 |
| Log of amplitude ratio (L1/H1): | -0.0492565, variance = 0.15395 (L1/H1: -0.0892562, variance = 0.306116, H1/L1: 0.0139243, variance = 0.307196) |
| Amplitude ratio (L1/H1): | 0.951937 ⋇ 1.48048 (L1/H1: 0.914611 ⋇ 1.73894, H1/L1: 1.01402 ⋇ 1.74064) |
| Amplitude ratio H1|L1 compatibility (probability): | 0.923368 |
| Antenna factor probability: | 0.988705 |
| Number of rejected frequency rows: | Q0: 0 / 18, Q1: 0 / 36, Q2: 3 / 70, Q3: 19 / 134, Q4: 60 / 258 |
| Maximum signal-to-noise ratio: | H1: 59.5803, L1: 63.3936 |
| SNR variance: | H1: 0.537636, L1: 0.4741 |
| Click here for a zoomed plot | Click here for a zoomed plot | Click here for a zoomed plot | Click here for a zoomed plot | Click here for a zoomed plot |
 |
 |
 |
 |
 |
 |
 |
 |
 |
 |
 |
 |
 |
 |
 |
 |
 |
 |
 |
 |
 |
 |
 |
 |
 |
 |
 |
 |
 |
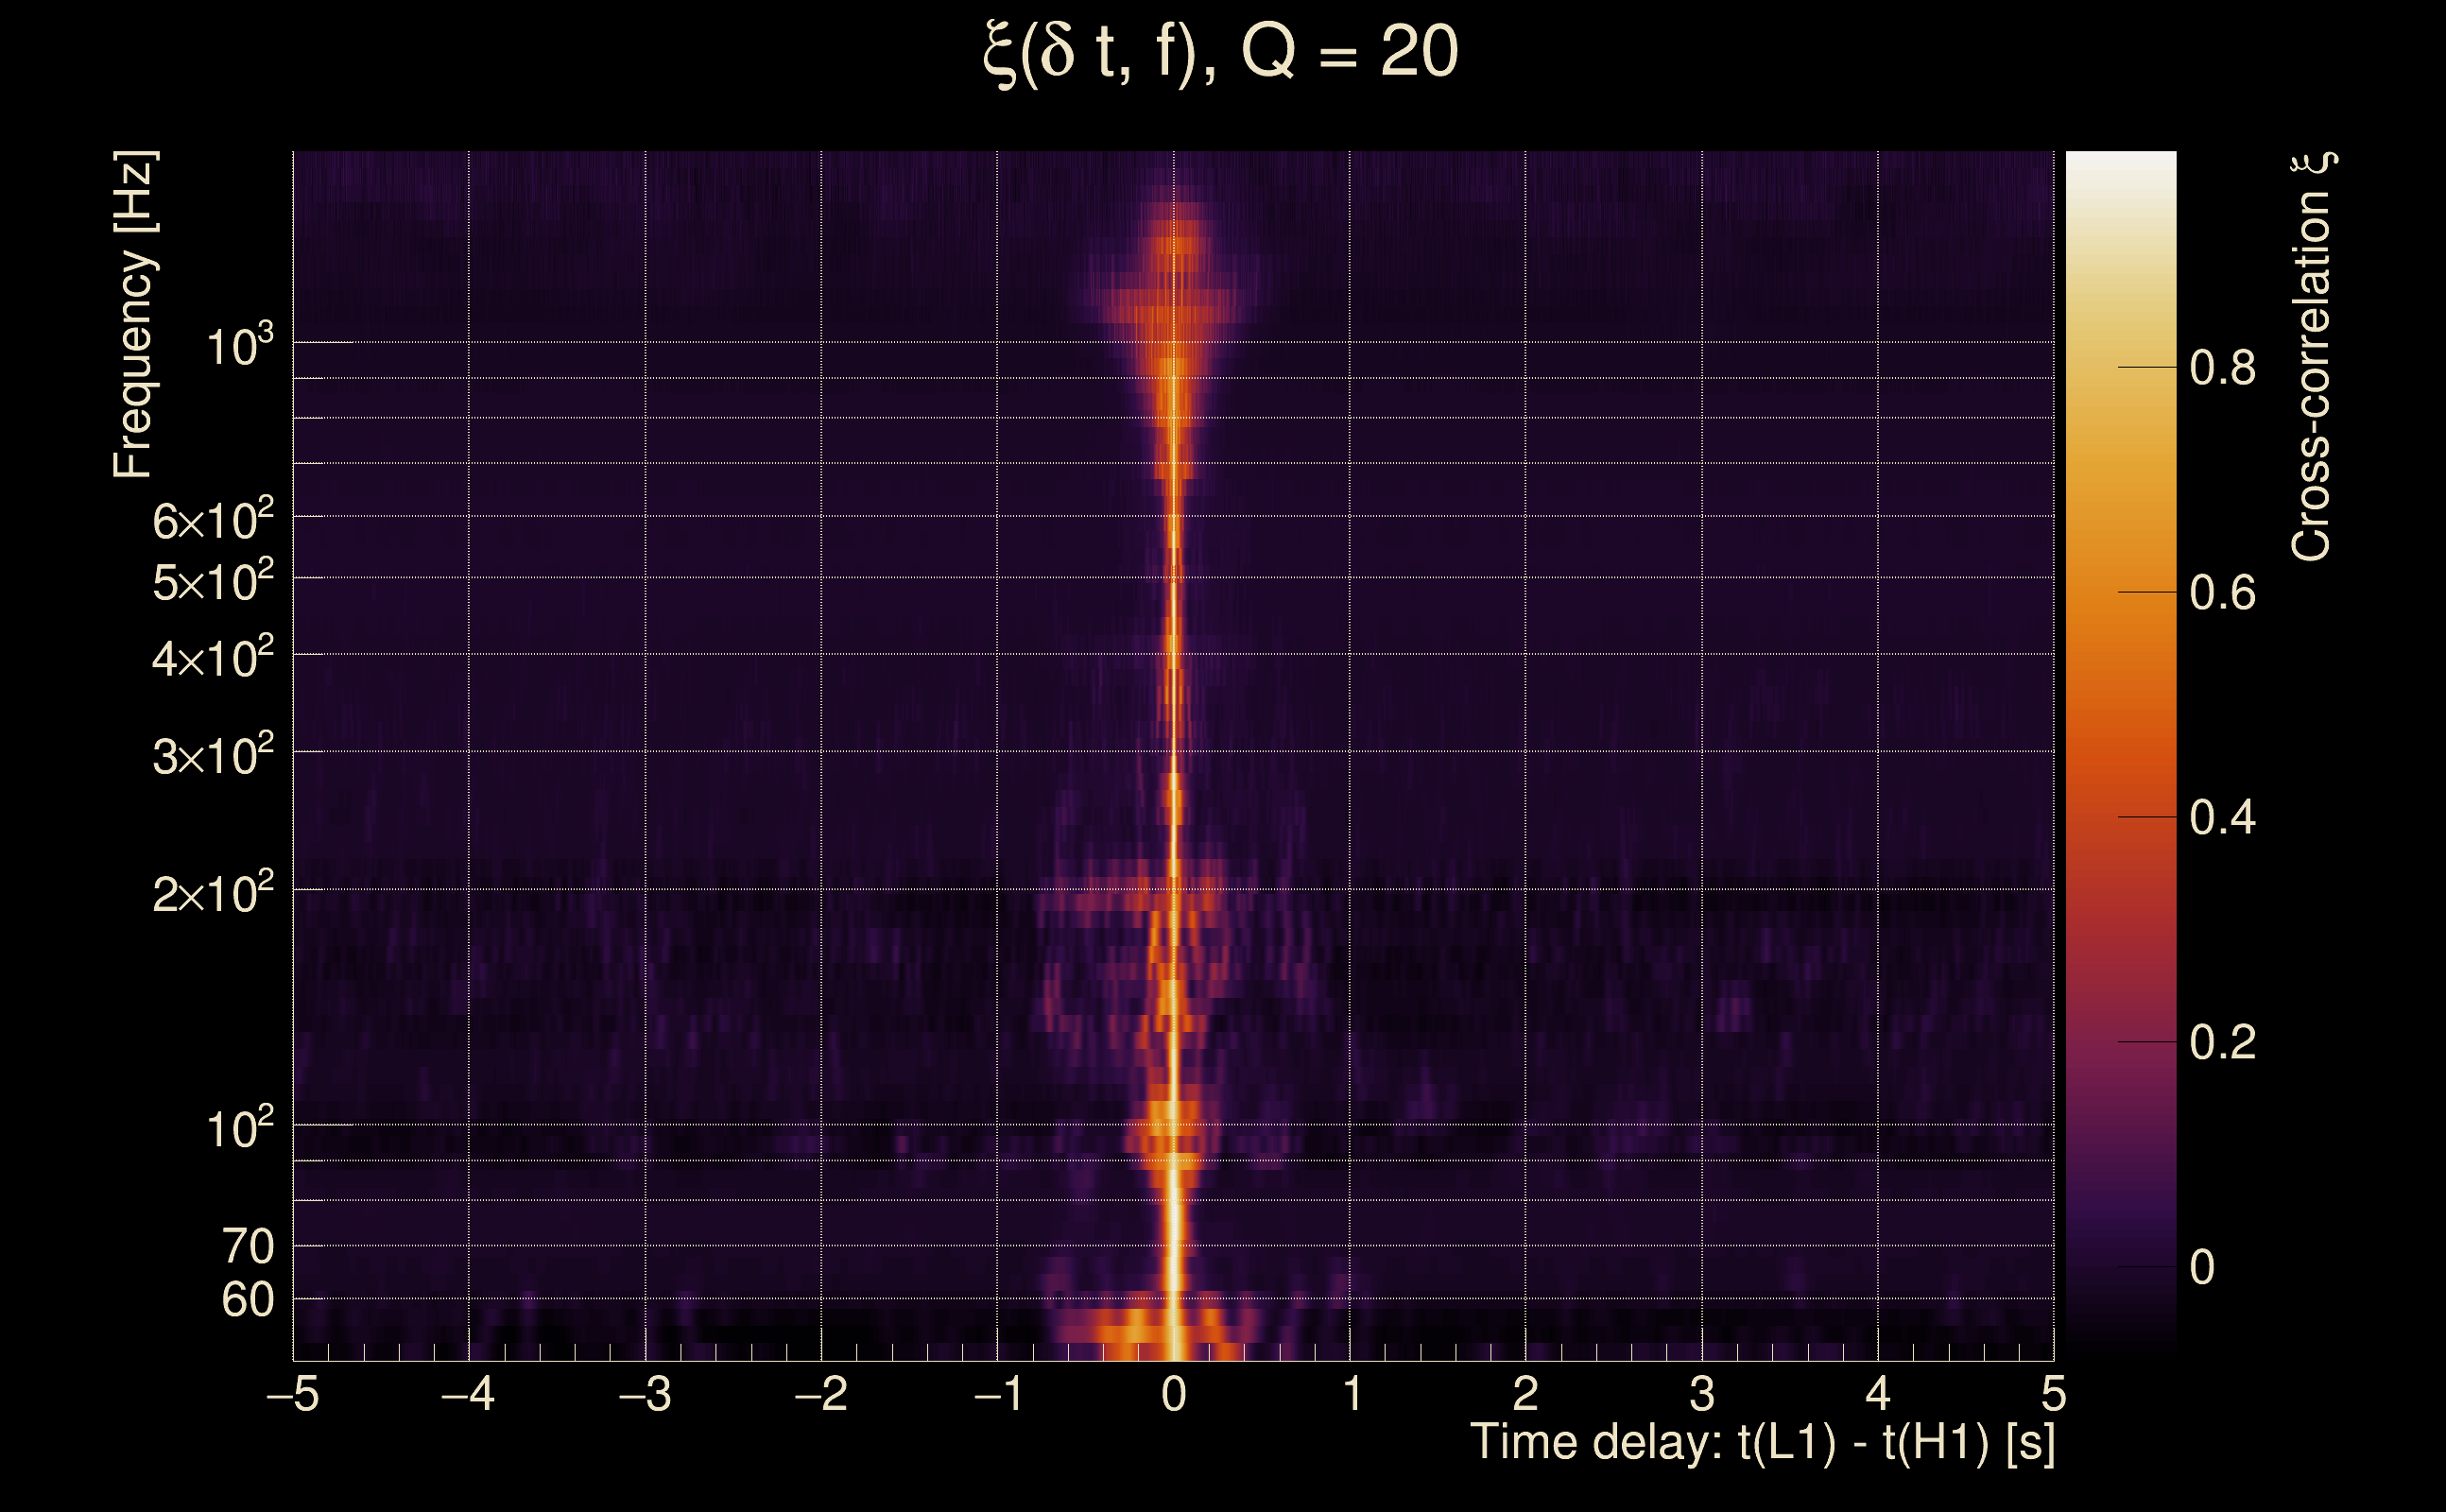
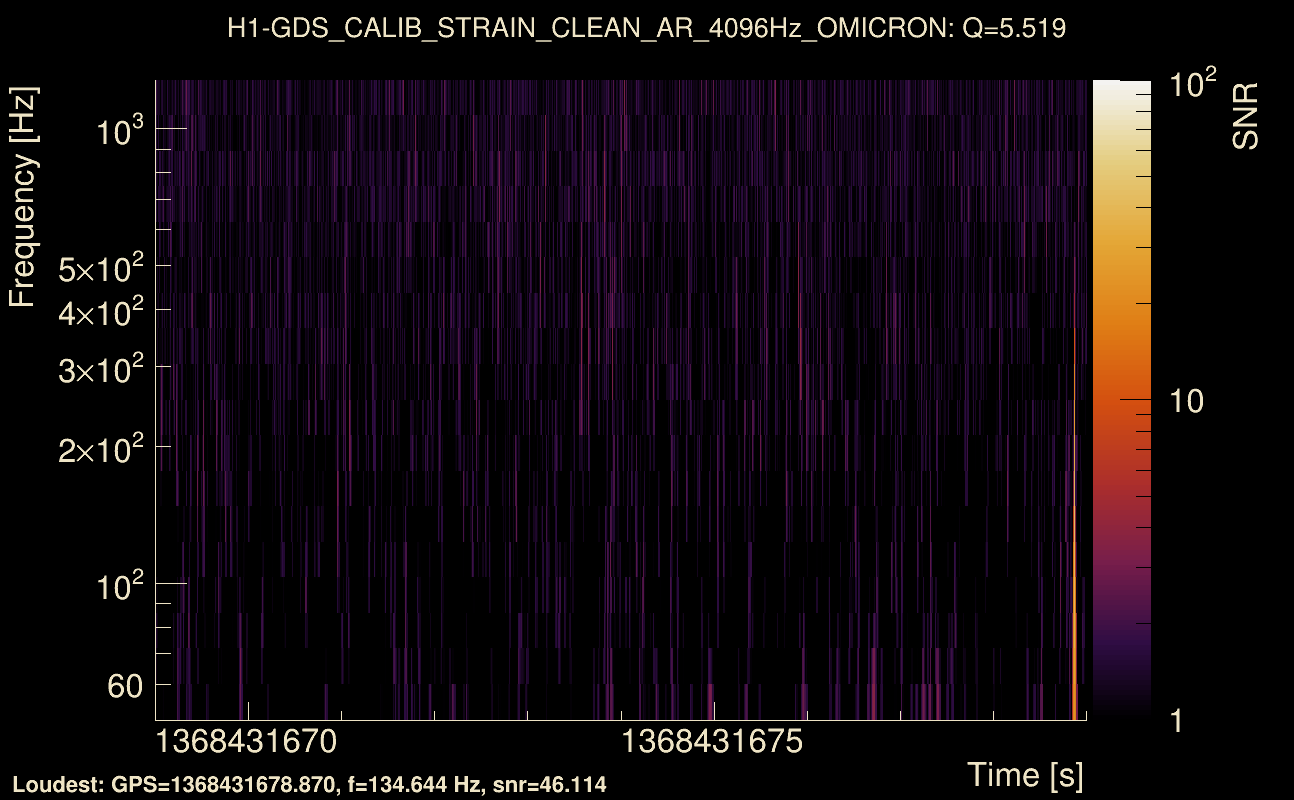
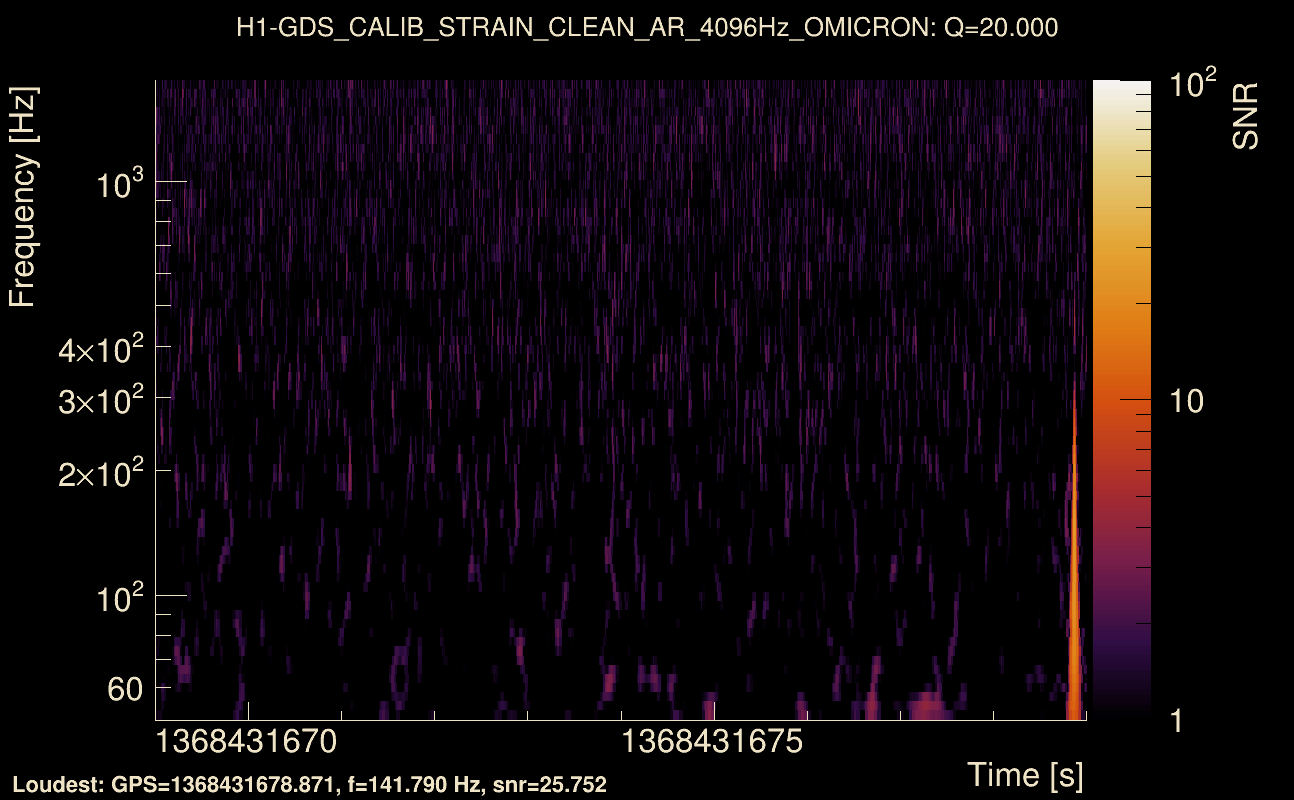
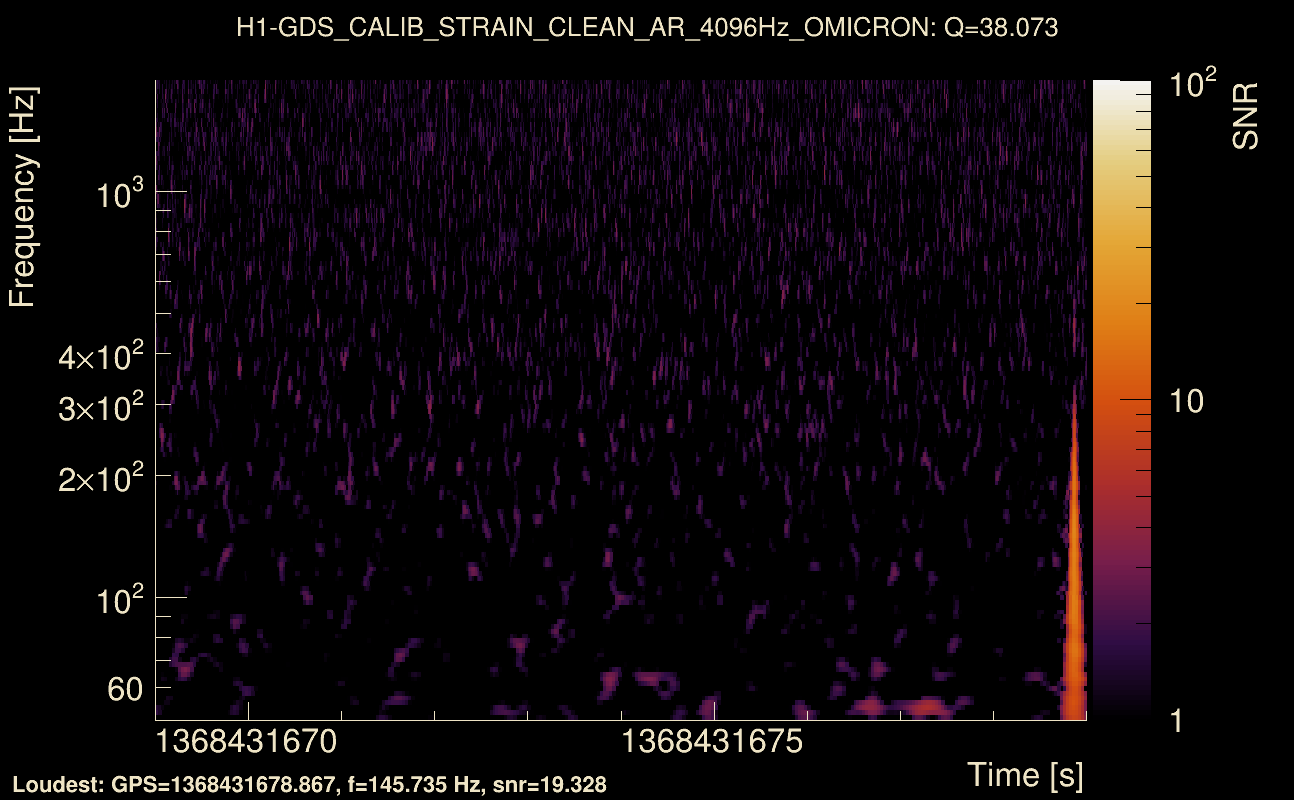
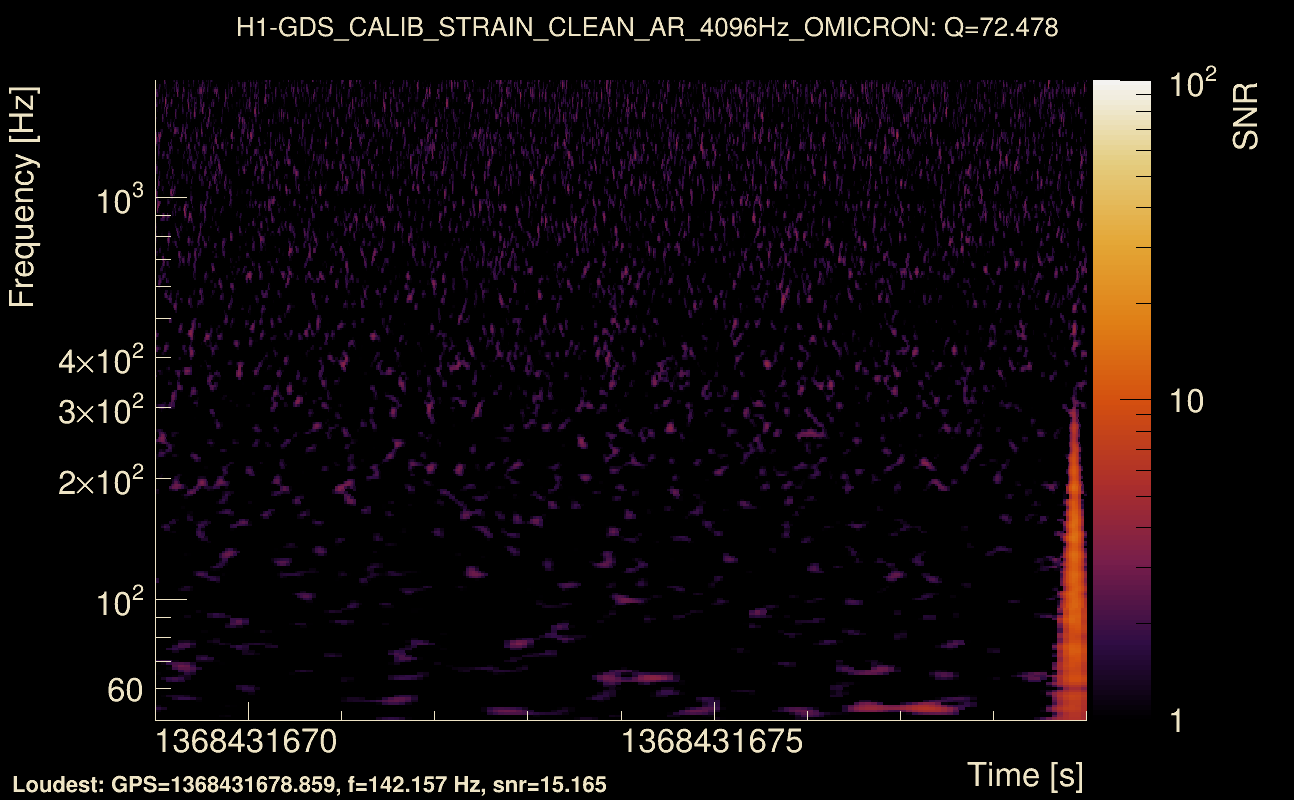
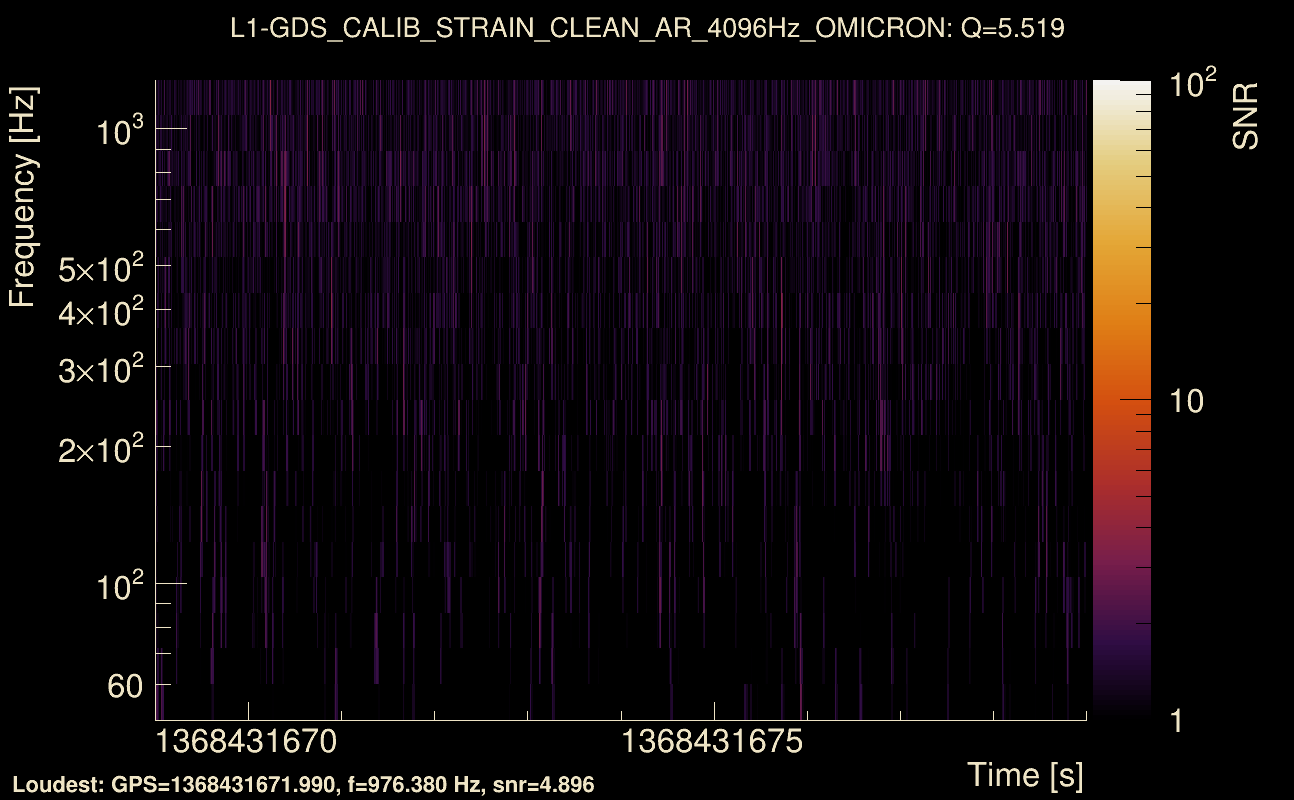
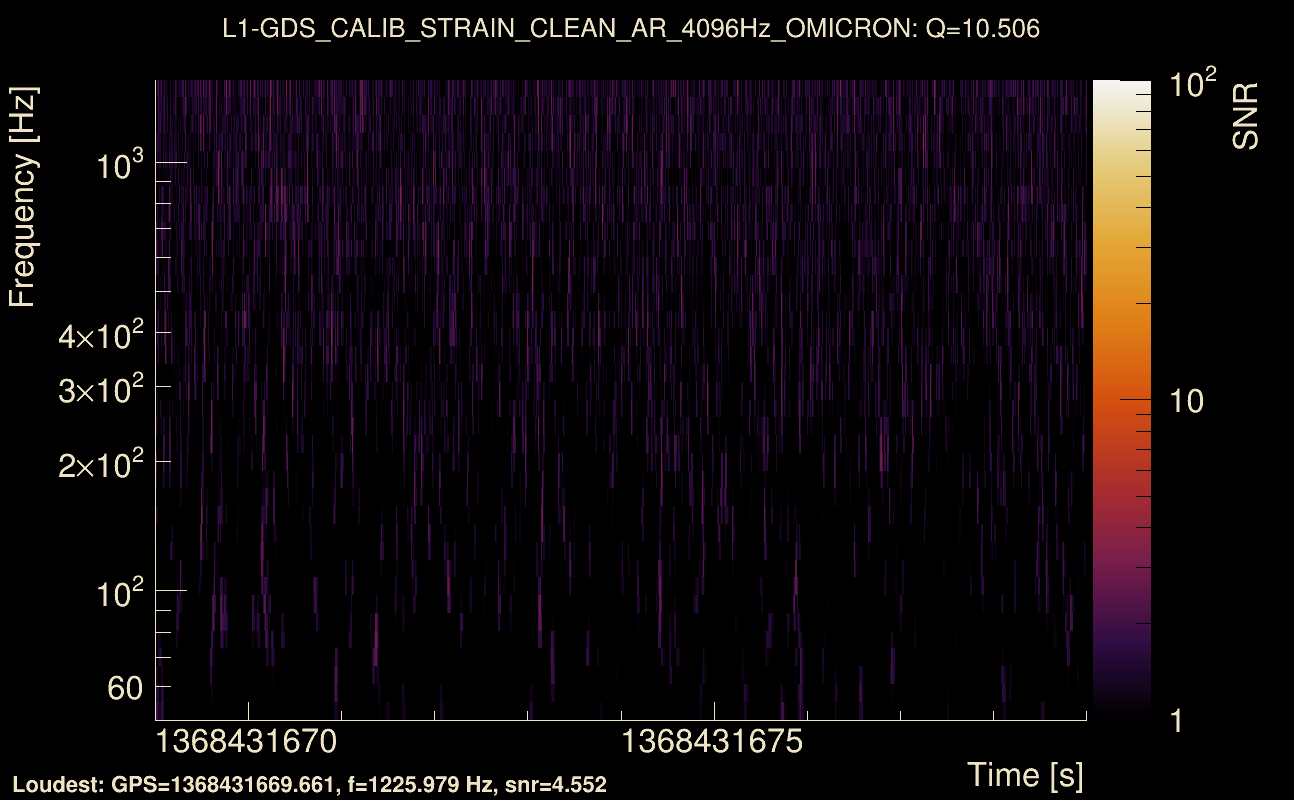
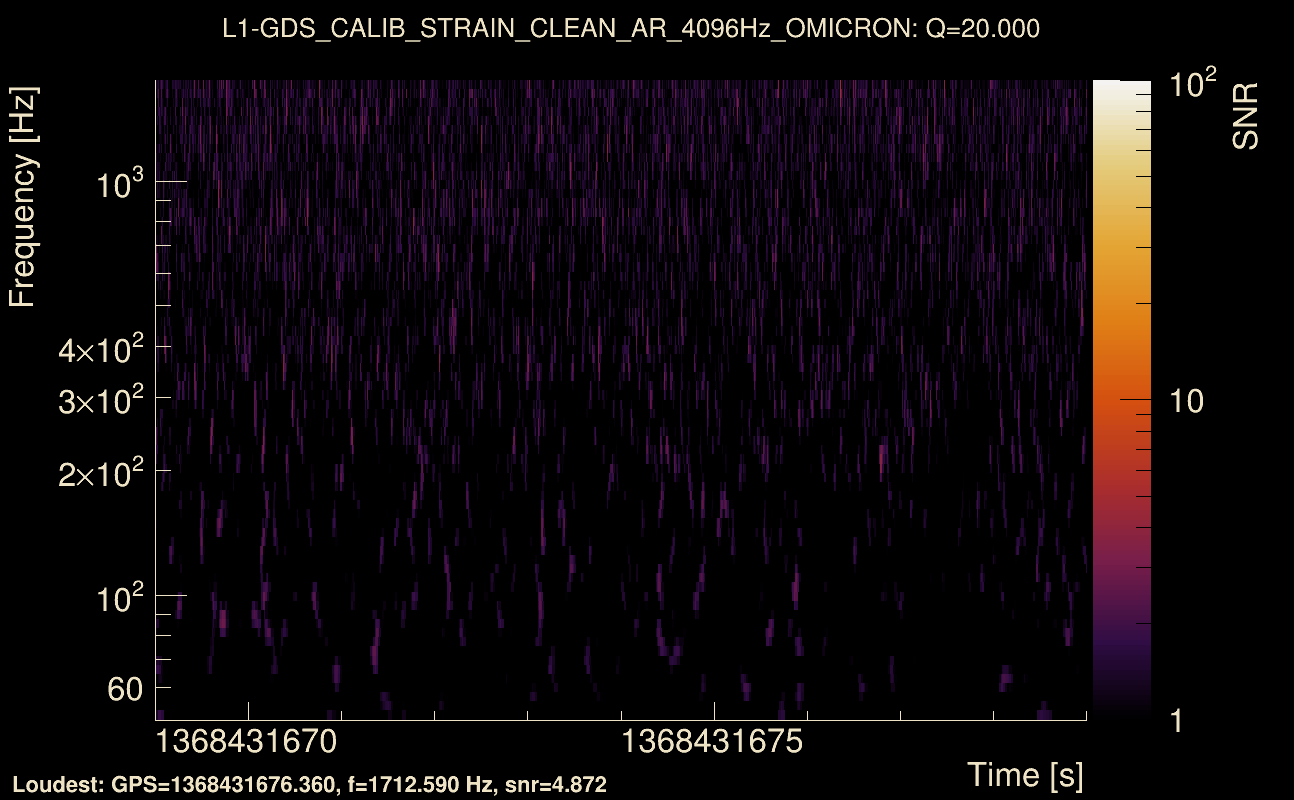
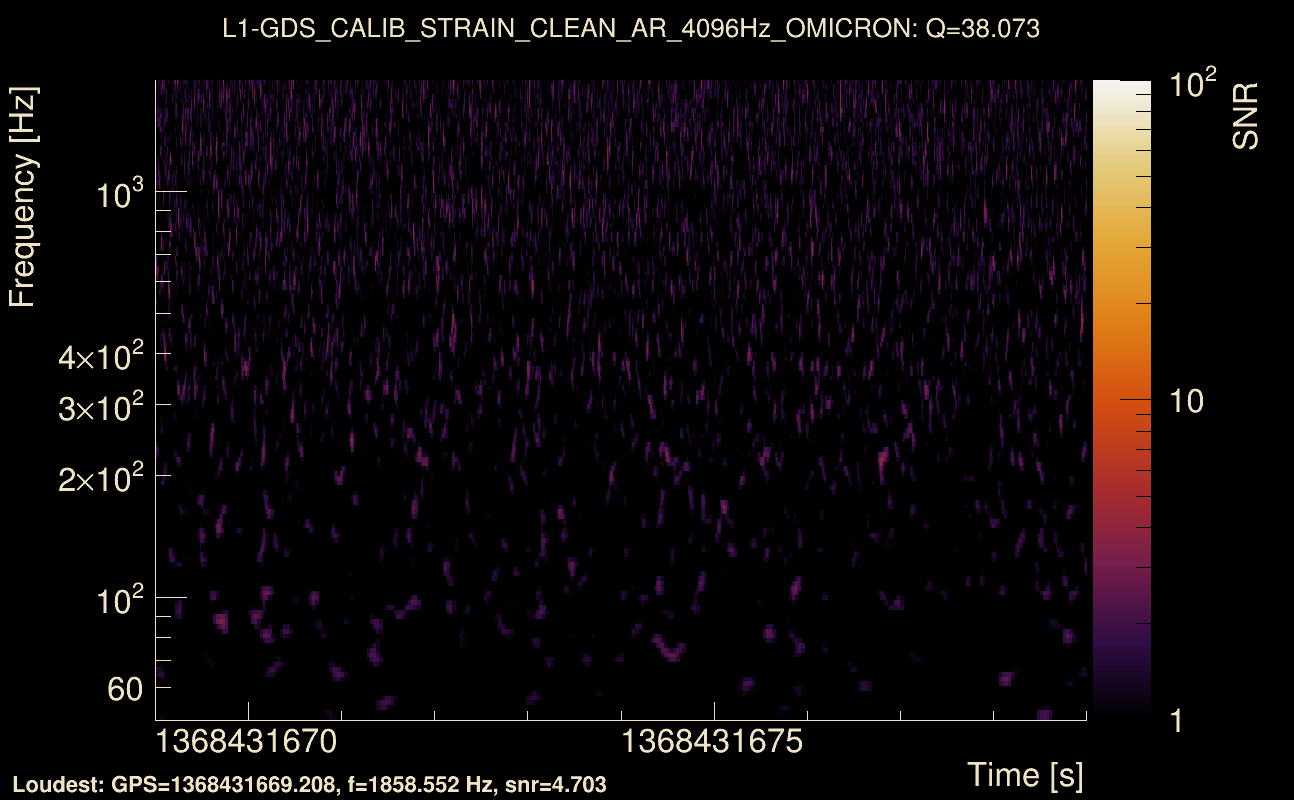
| Event time t(H1): | GPS = 1368431669 (Thu May 18 07:54:11 2023 ) → GPS = 1368431679 (Thu May 18 07:54:21 2023 ) |
| Event time t(L1): | GPS = 1368431669 (Thu May 18 07:54:21 2023 ) → GPS = 1368431679 (Thu May 18 07:54:21 2023 ) |
| Omicron analysis time window (H1): | GPS = 1368431666 → GPS = 1368431682 |
| Omicron analysis time window (L1): | GPS = 1368431666 → GPS = 1368431682 |
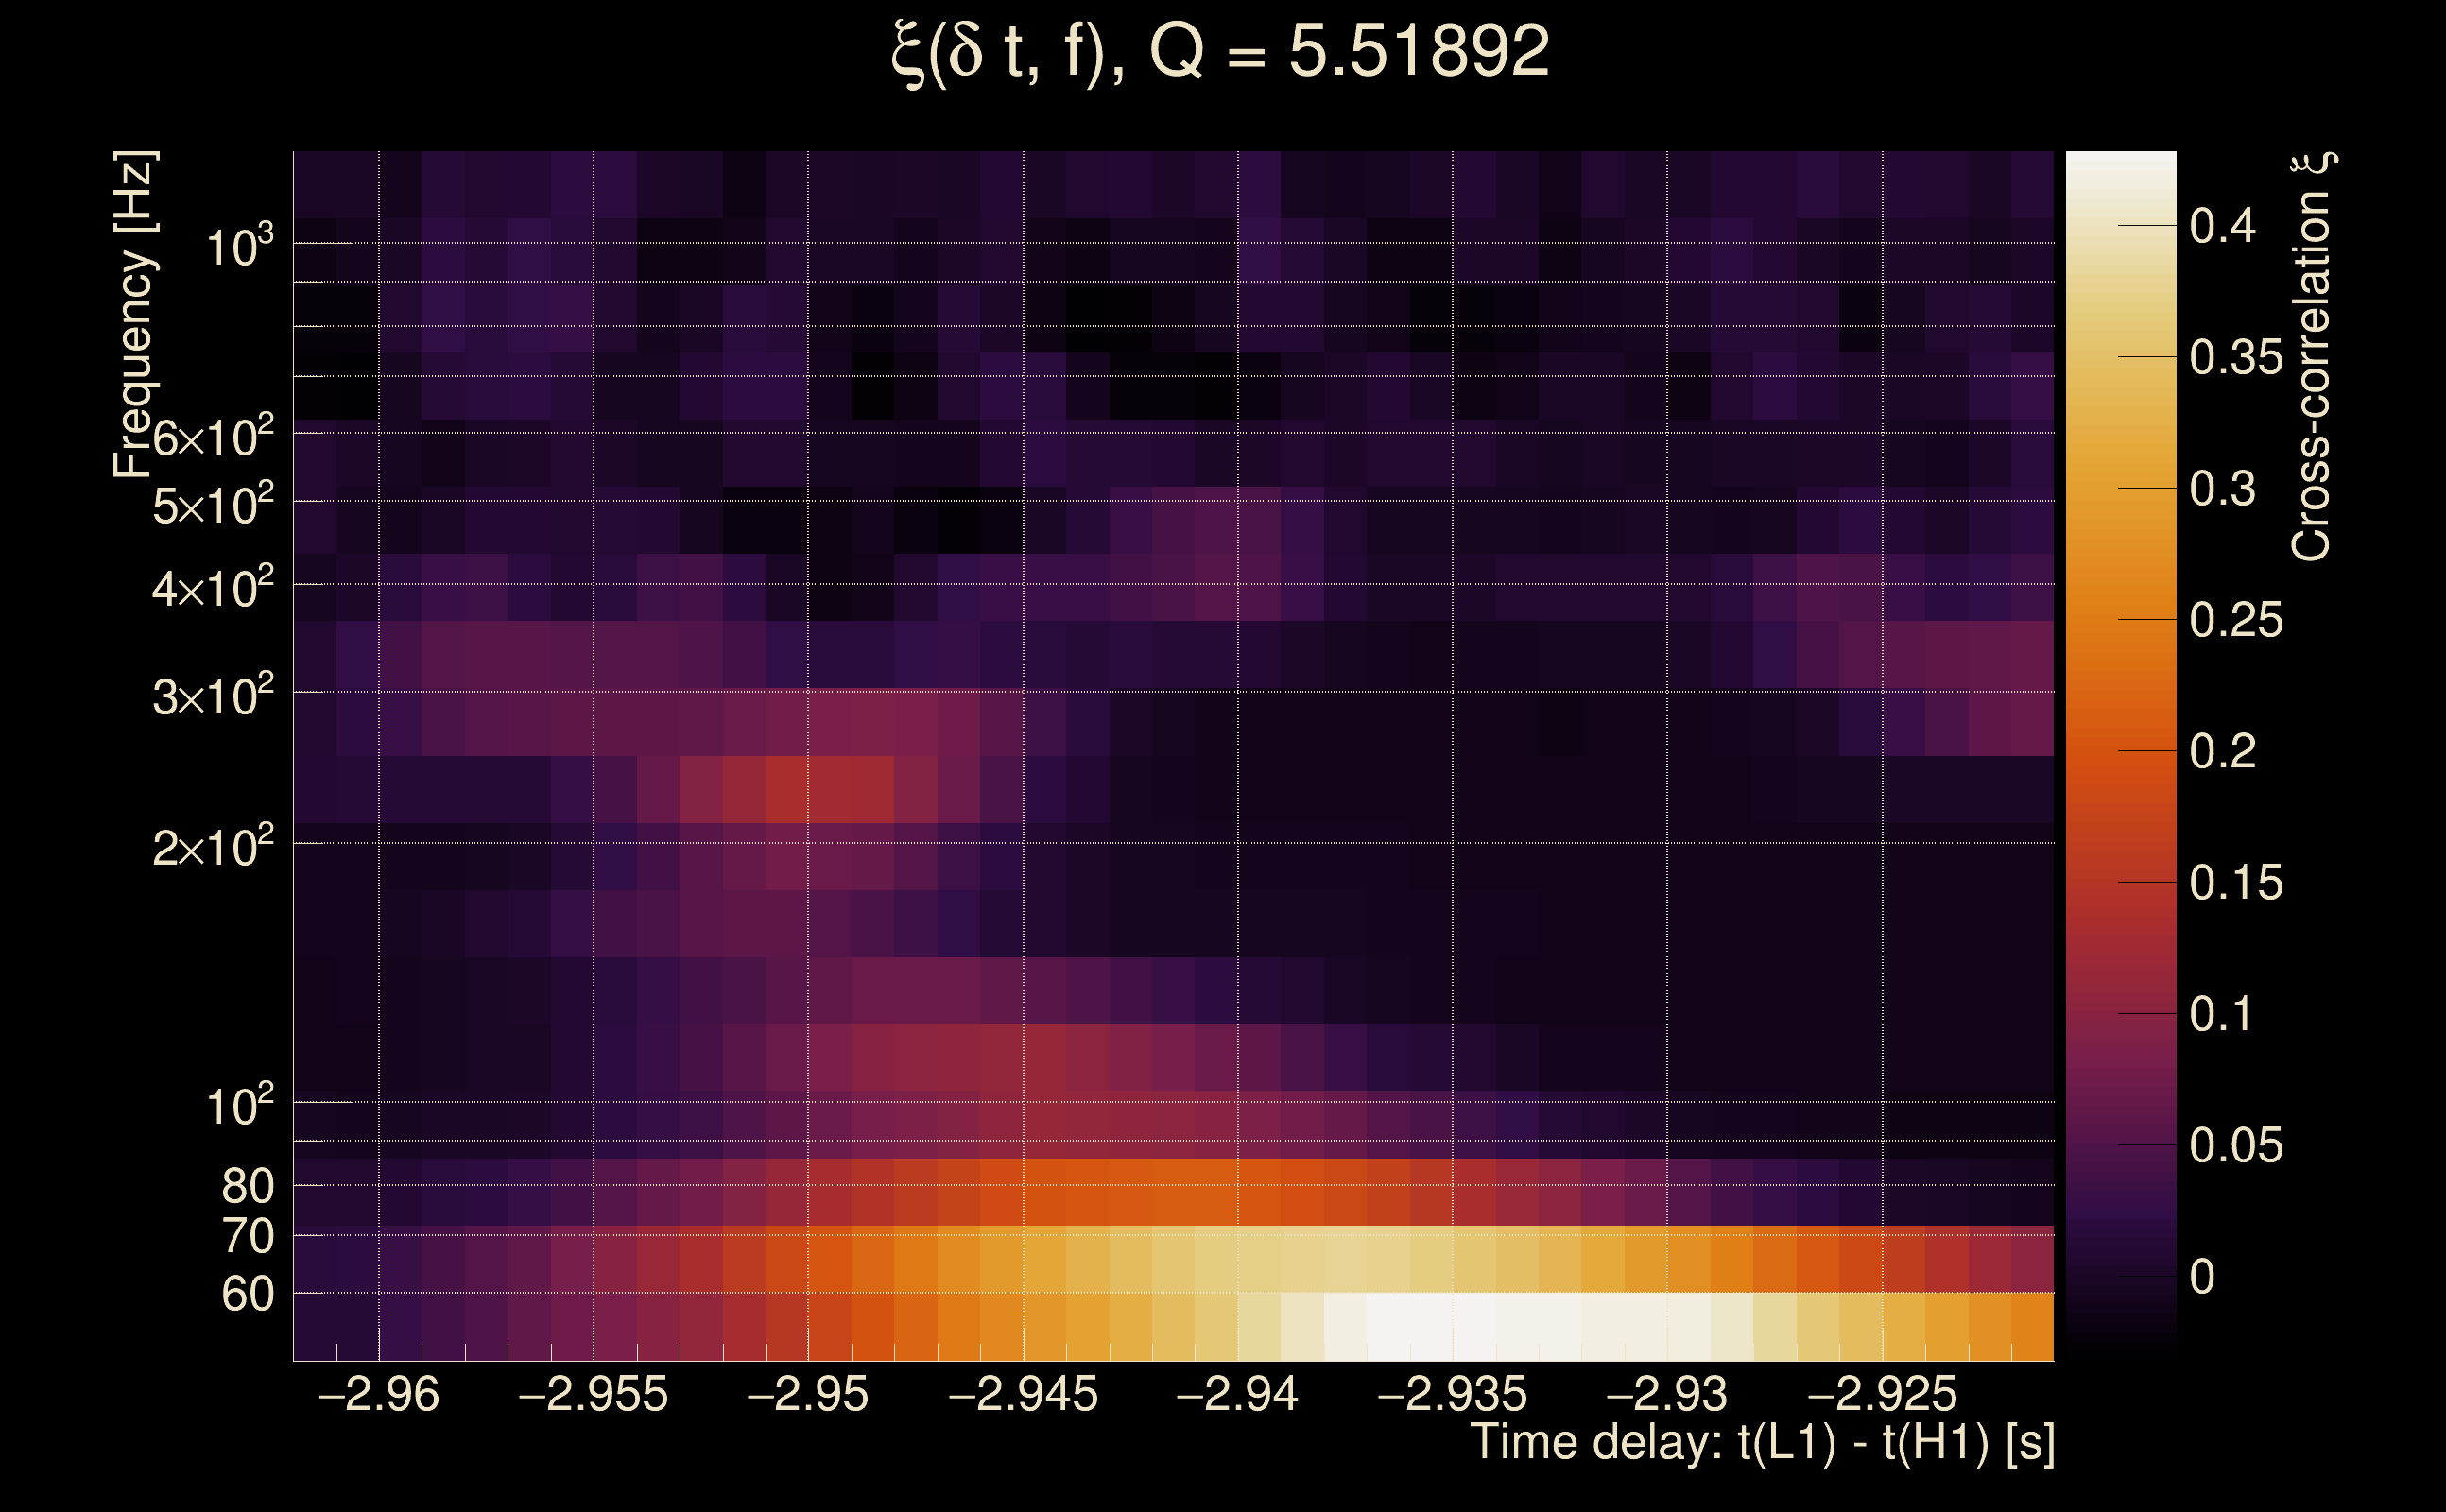
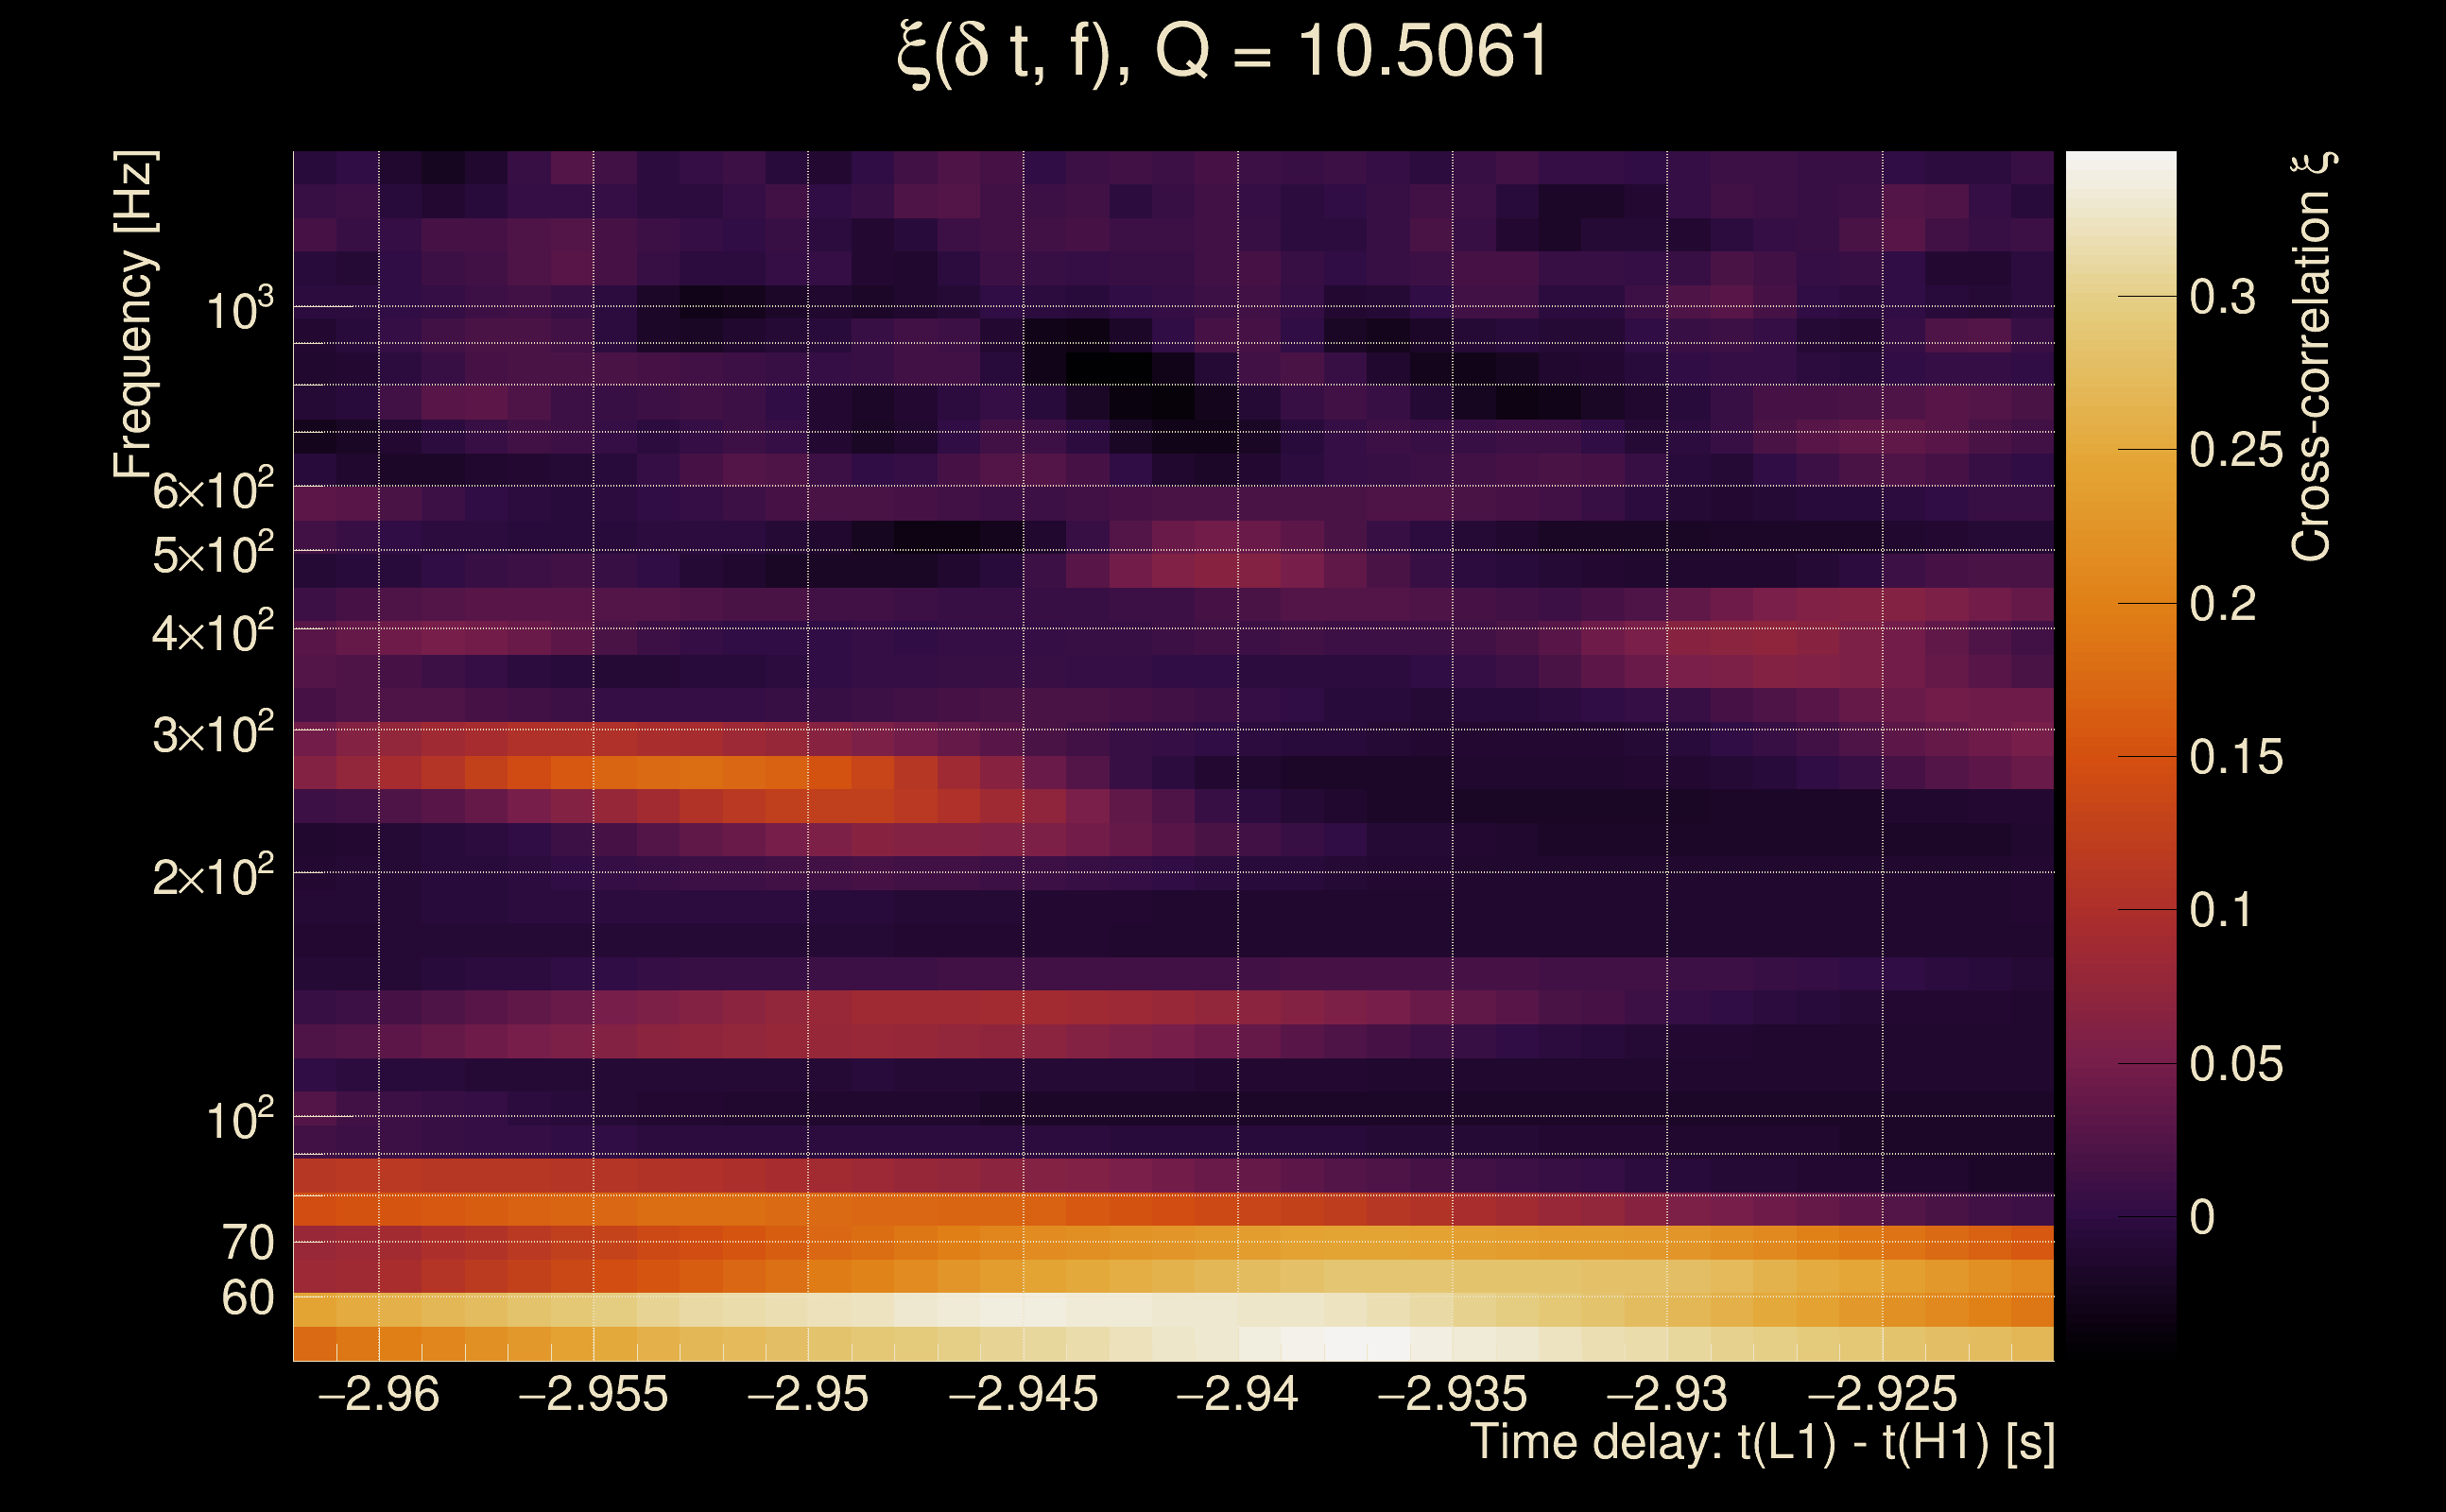
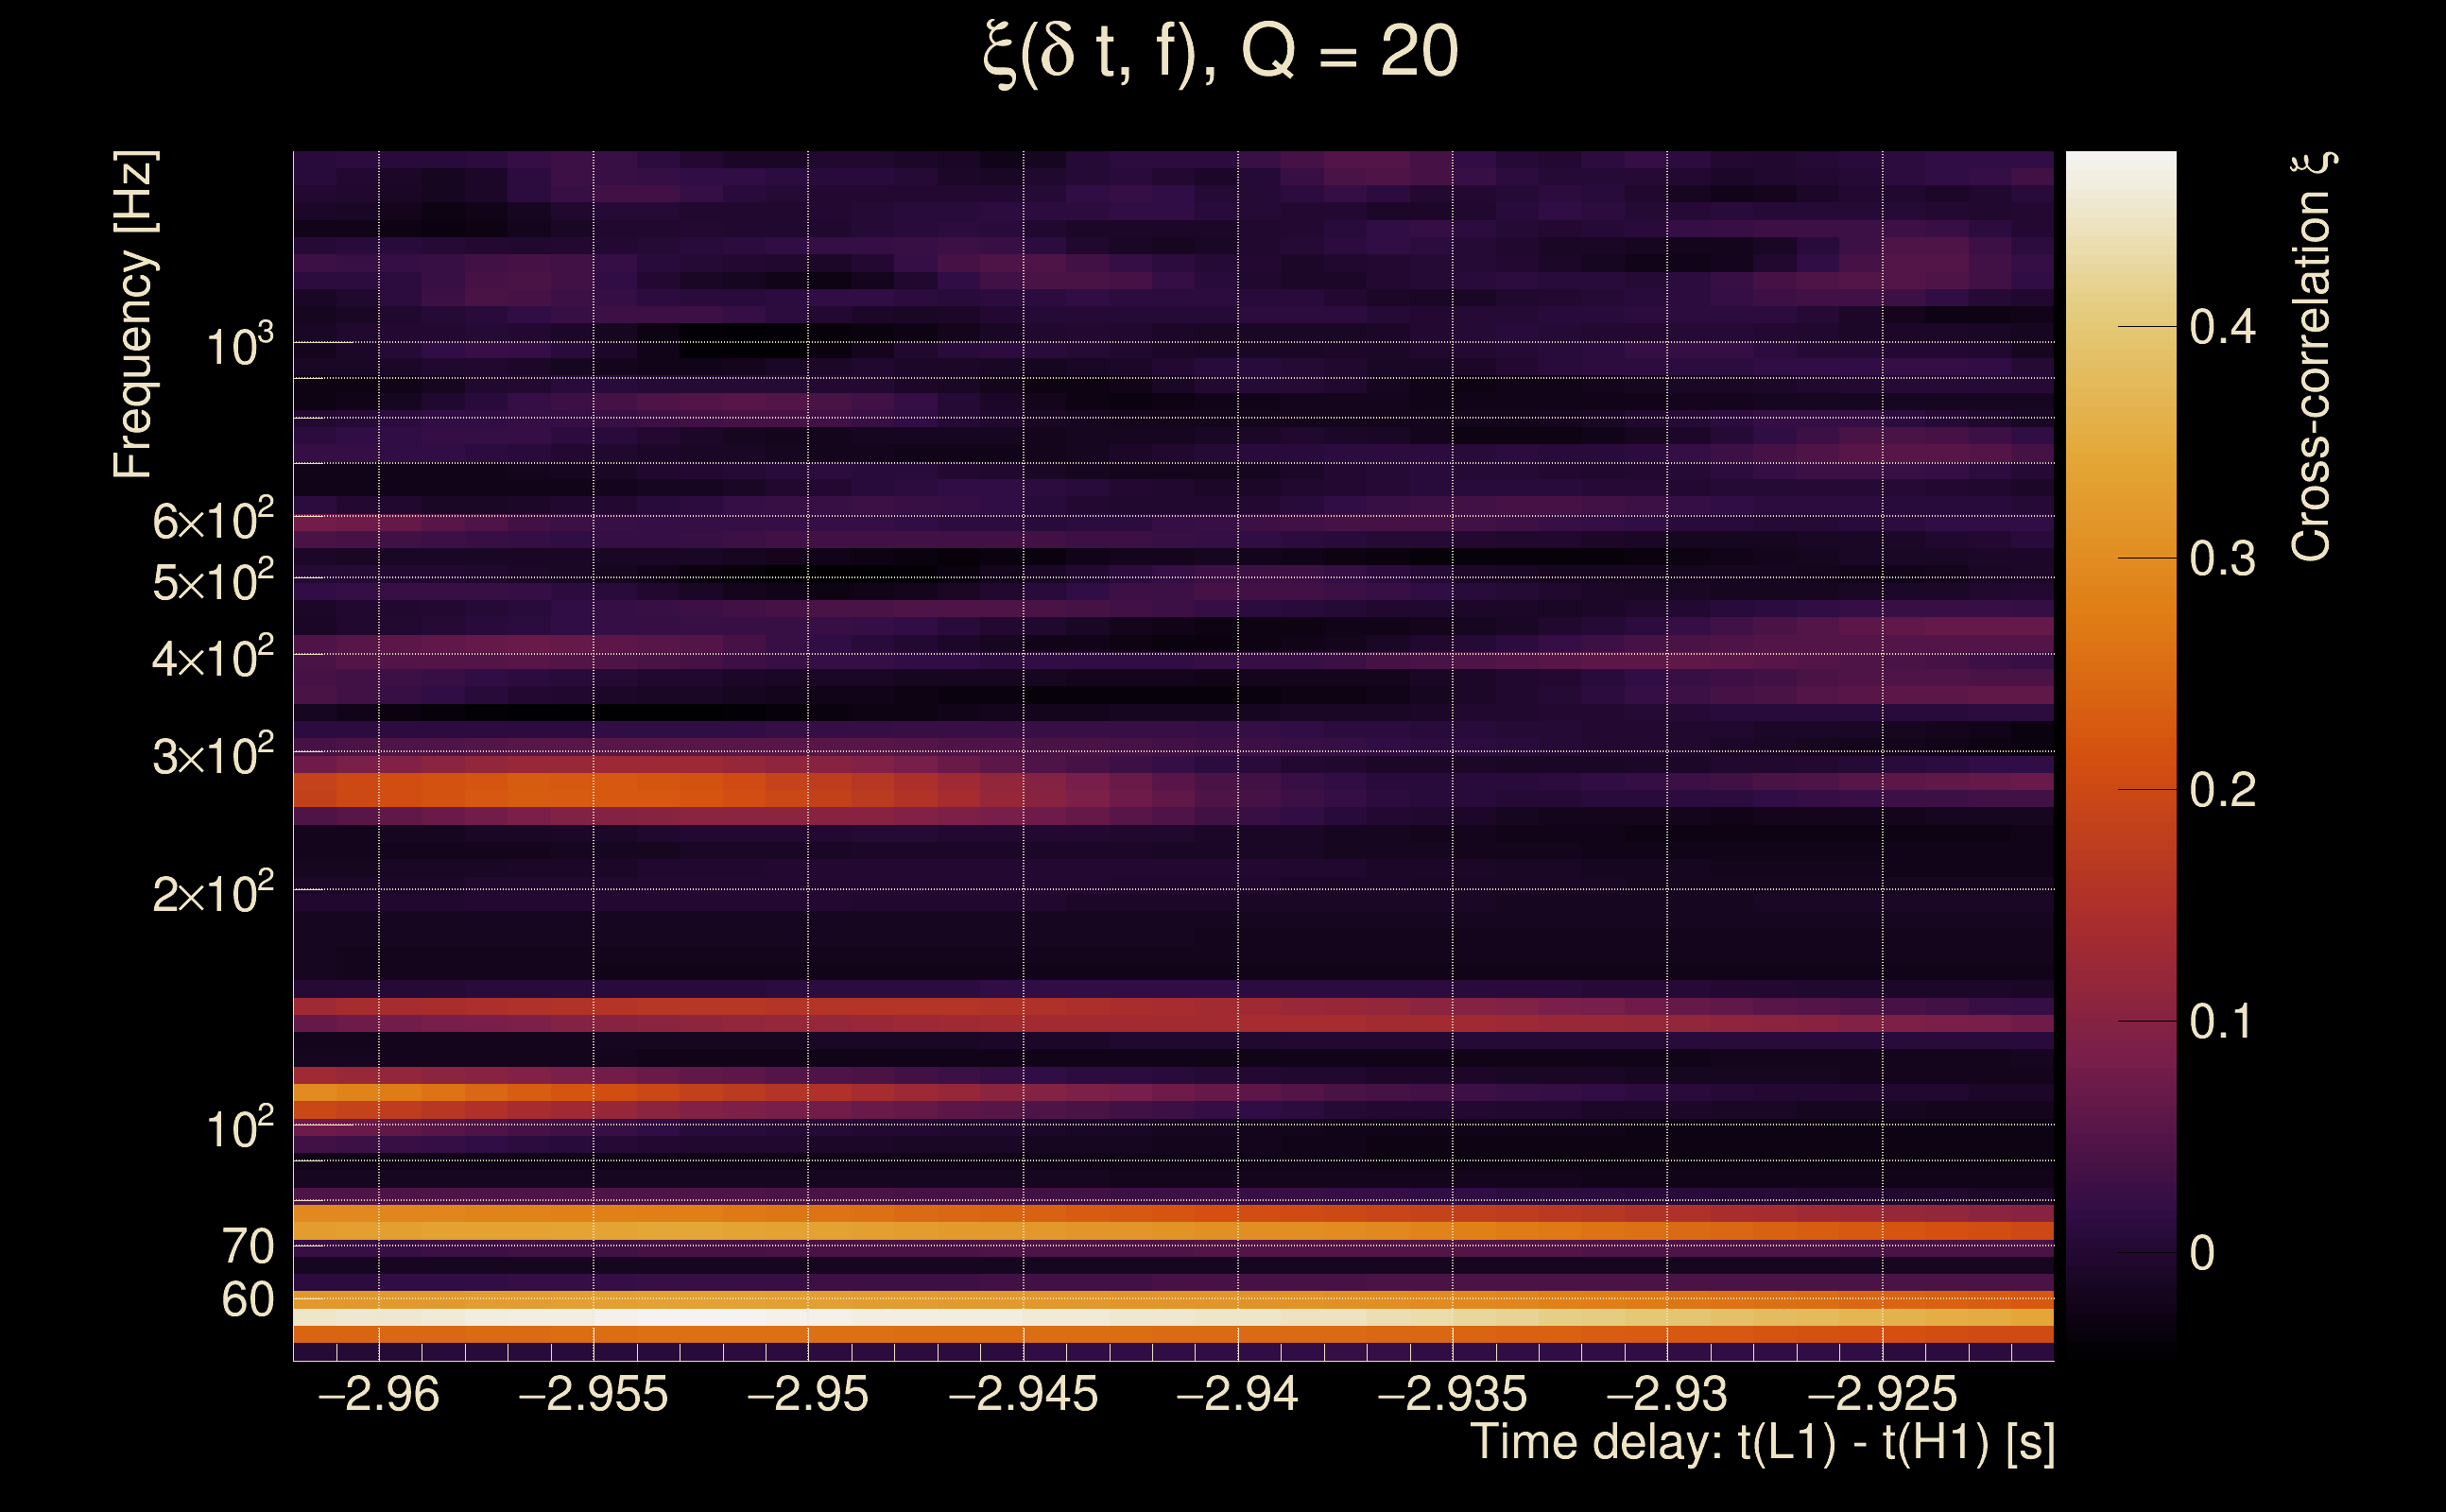
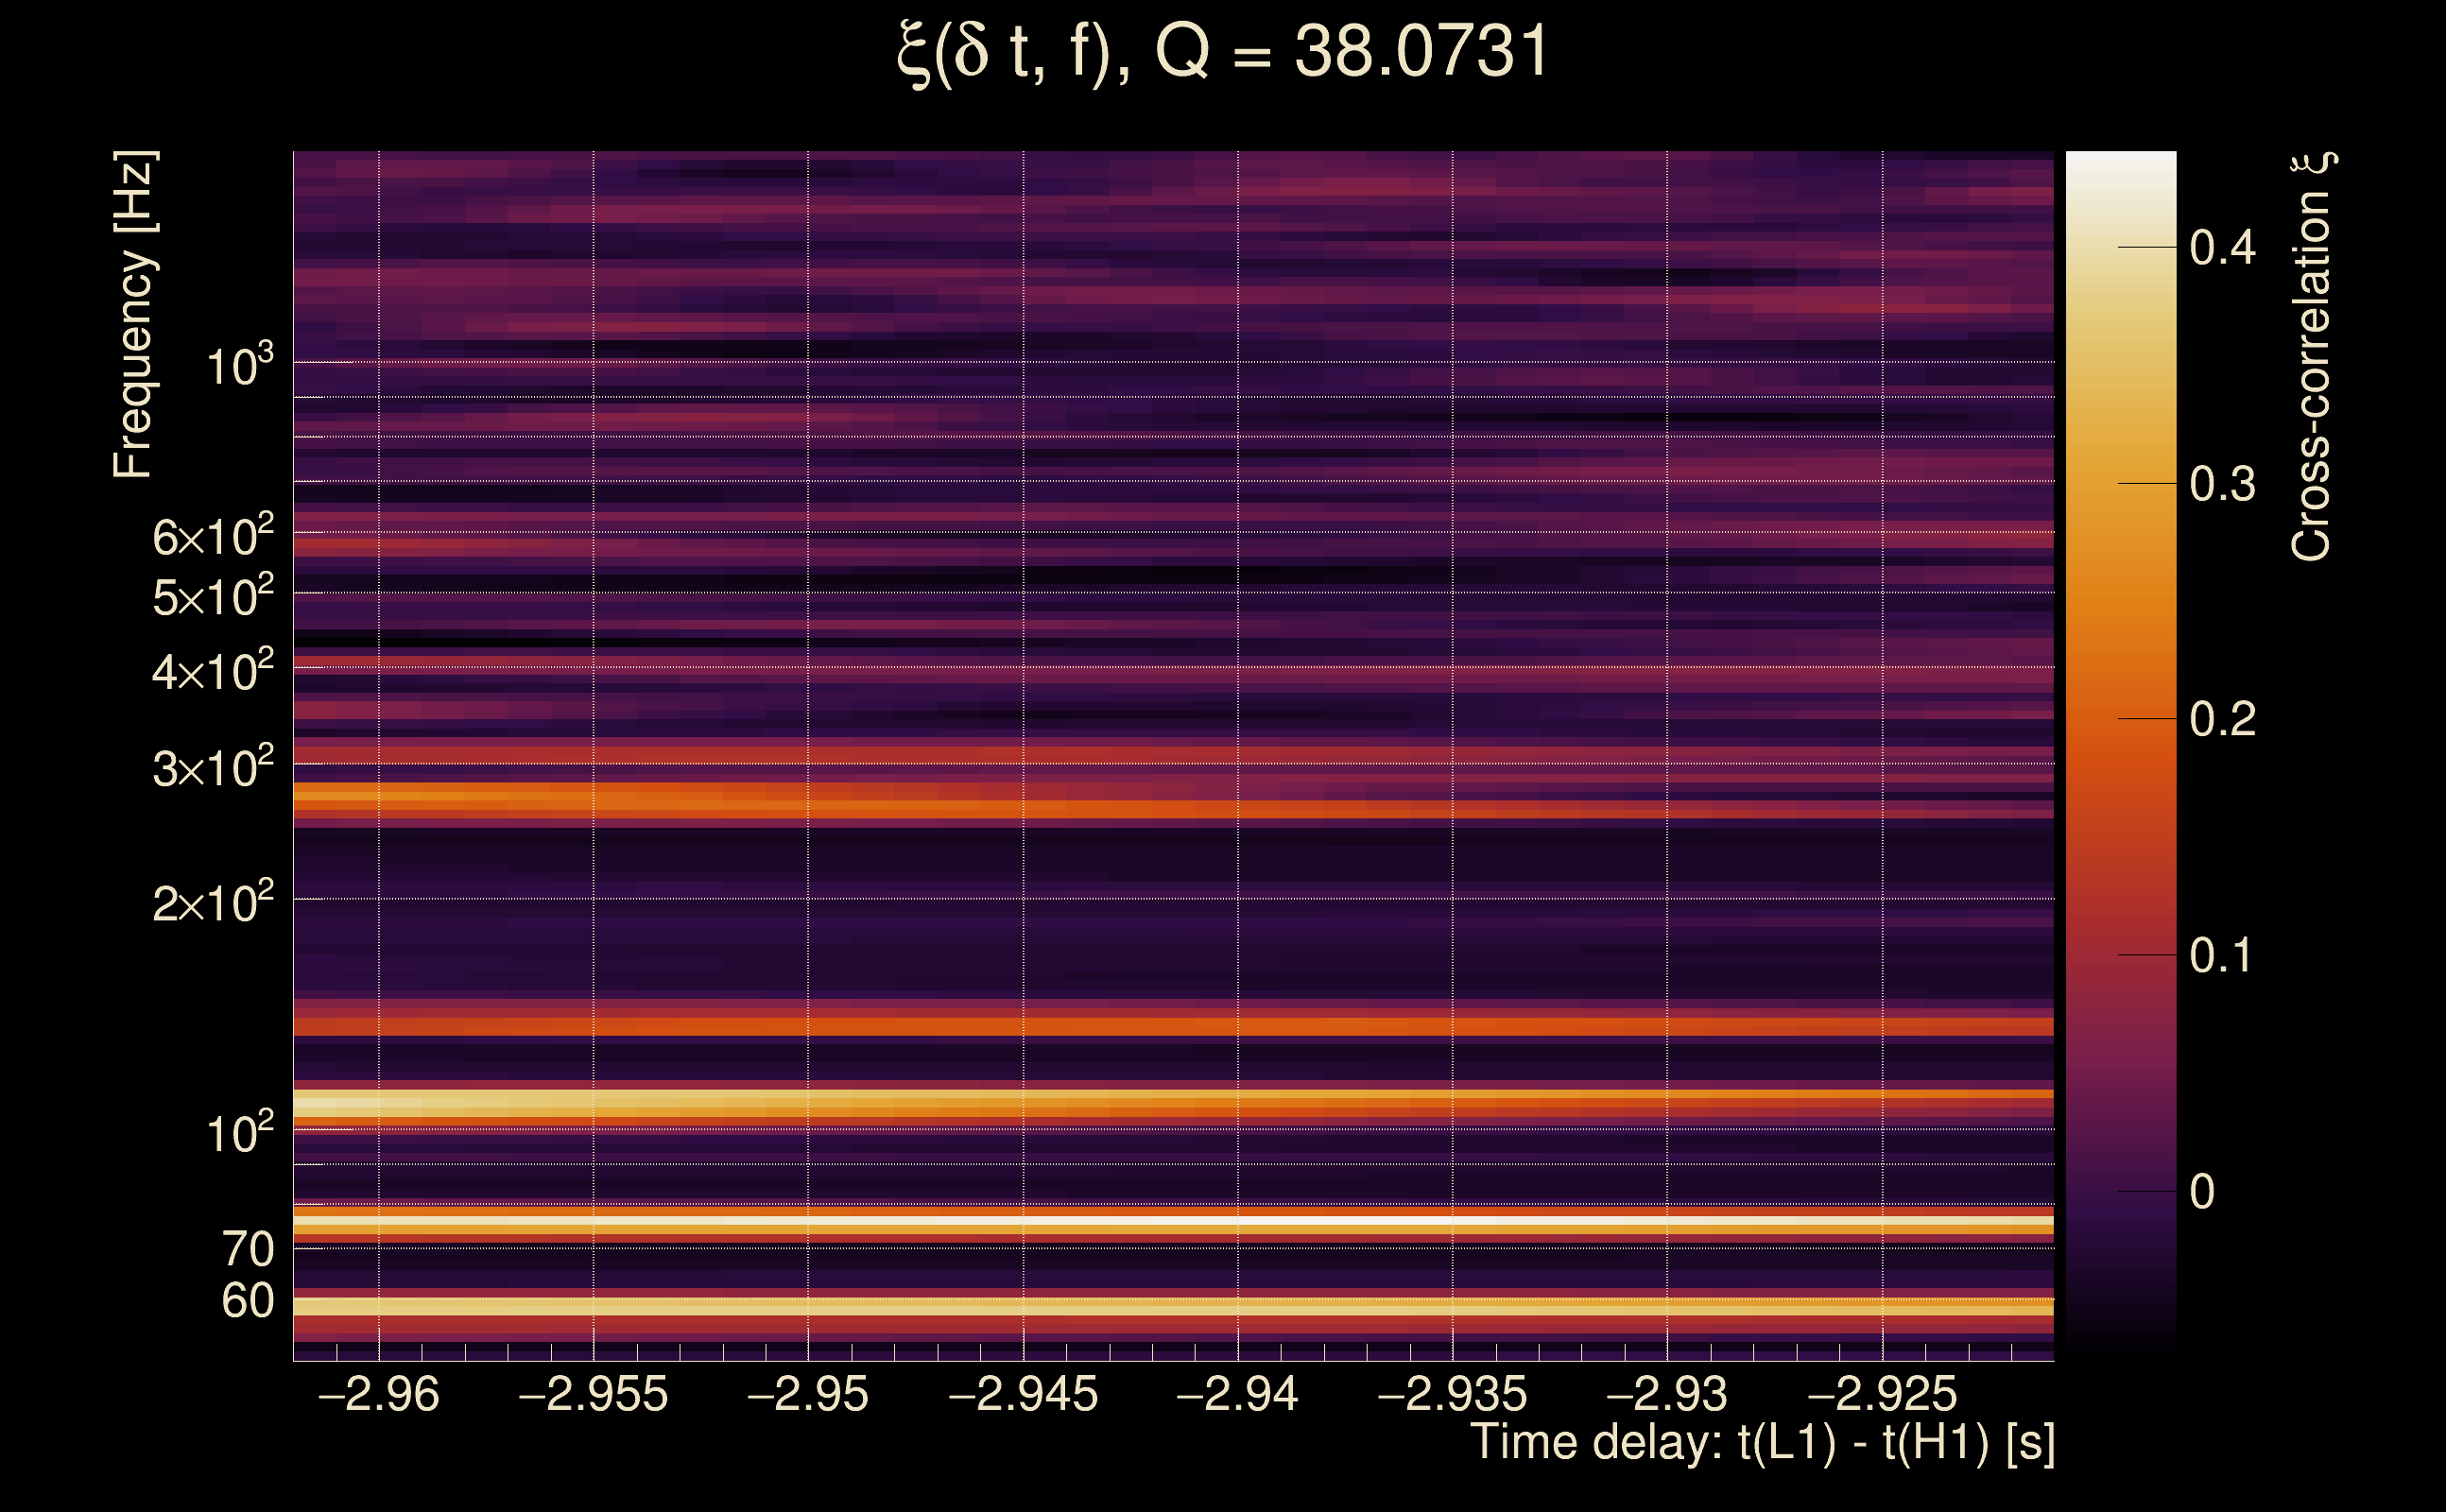
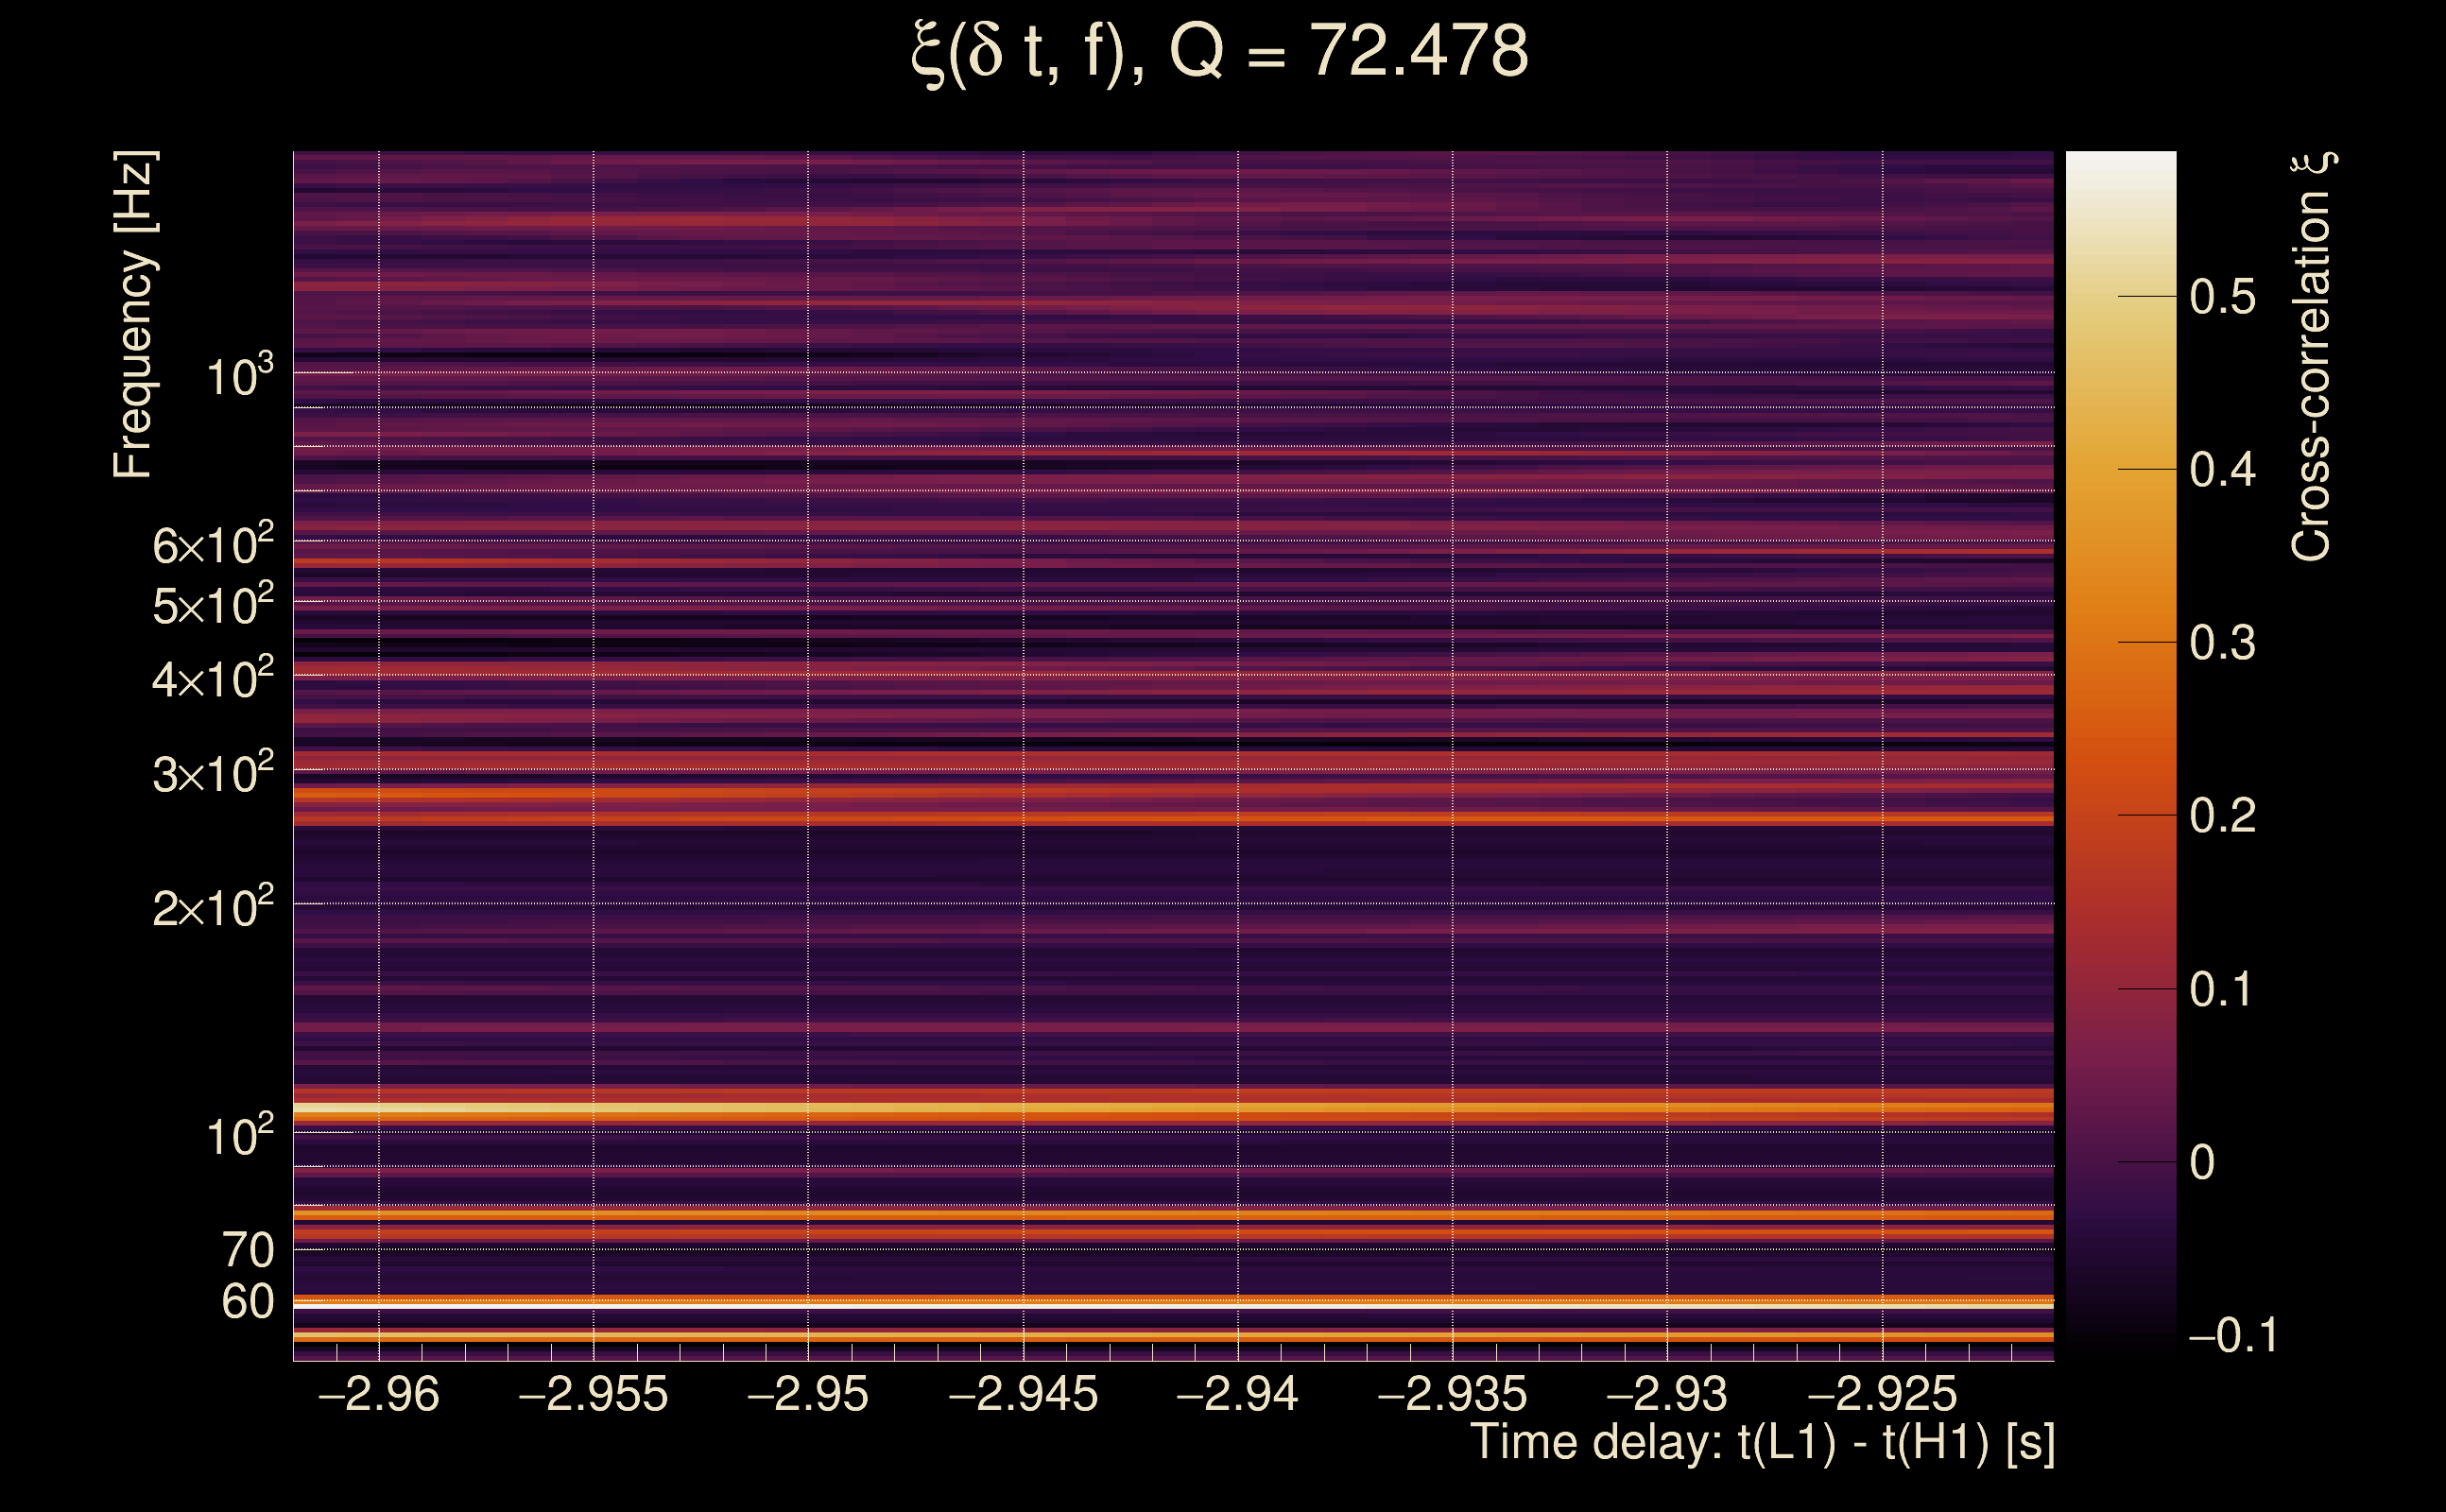
| Time delay between detectors t(L1) - t(H1): | -2.94129 s (slice index = 172 / 217), δt_gw = 0.00271215 s |
| Time delay standard deviation: | 0.08099 s |
| [targeted mode] Time delay probability: | 0.720585 (0.357677 sigmas), δt_target = 0.00090766 s |
| Frequency: | 80.0269 Hz |
| Ξ: | 0.0725181 ± 0.0484781 (variance = 0.00235012): Q0: 0.364651, Q1: 0.275693, Q2: 0.286312, Q3: 0.234264, Q4: 0.230509 |
| Rank: | R_A = 0.0522554 |
| Log of amplitude ratio (L1/H1): | -2.55566, variance = 0.536203 (L1/H1: -2.57567, variance = 0.545409, H1/L1: 0.232052, variance = 0.935129) |
| Amplitude ratio (L1/H1): | 0.077641 ⋇ 2.07977 (L1/H1: 0.0761028 ⋇ 2.09283, H1/L1: 1.26118 ⋇ 2.6301) |
| Amplitude ratio H1|L1 compatibility (probability): | 0.0540928 |
| Antenna factor probability: | 0.00173881 |
| Number of rejected frequency rows: | Q0: 14 / 18, Q1: 25 / 36, Q2: 56 / 70, Q3: 120 / 134, Q4: 241 / 258 |
| Maximum signal-to-noise ratio: | H1: 56.3369, L1: 5.2282 |
| SNR variance: | H1: 0.517878, L1: 0.529211 |
| Click here for a zoomed plot | Click here for a zoomed plot | Click here for a zoomed plot | Click here for a zoomed plot | Click here for a zoomed plot |
 |
 |
 |
 |
 |
 |
 |
 |
 |
 |
 |
 |
 |
 |
 |
 |
 |
 |
 |
 |
 |
 |
 |
 |
 |
 |
 |
 |
 |
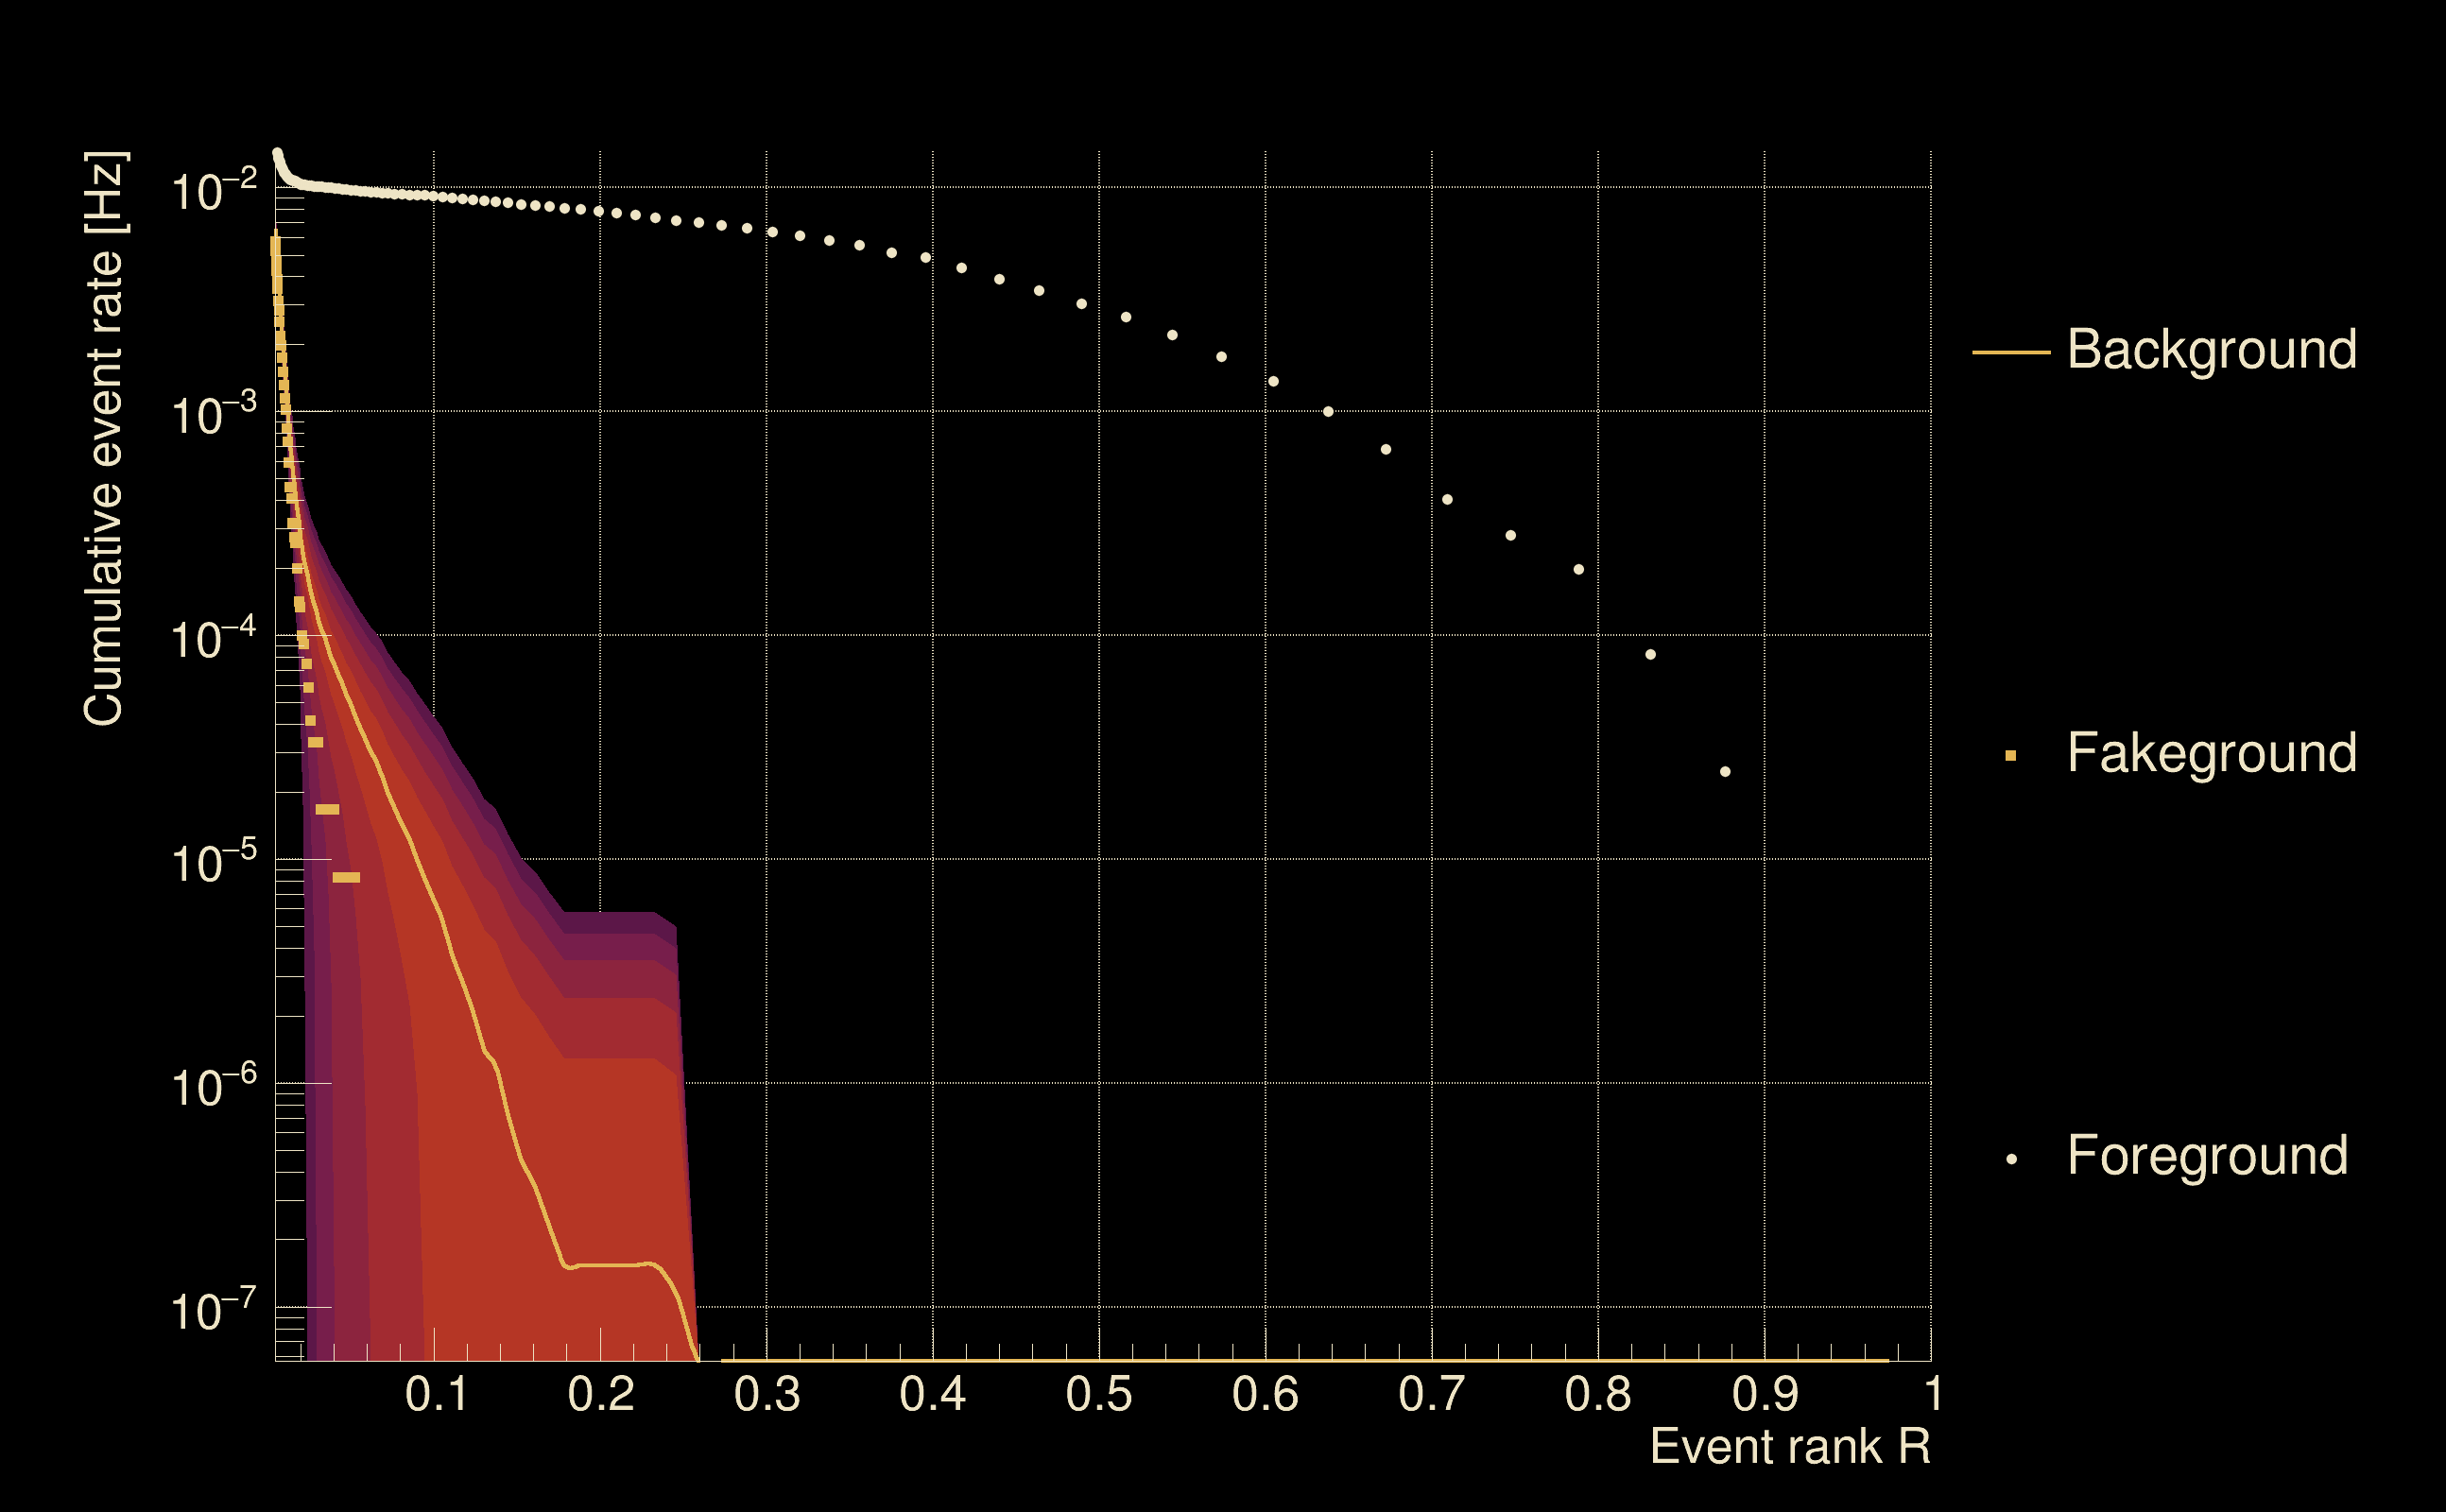
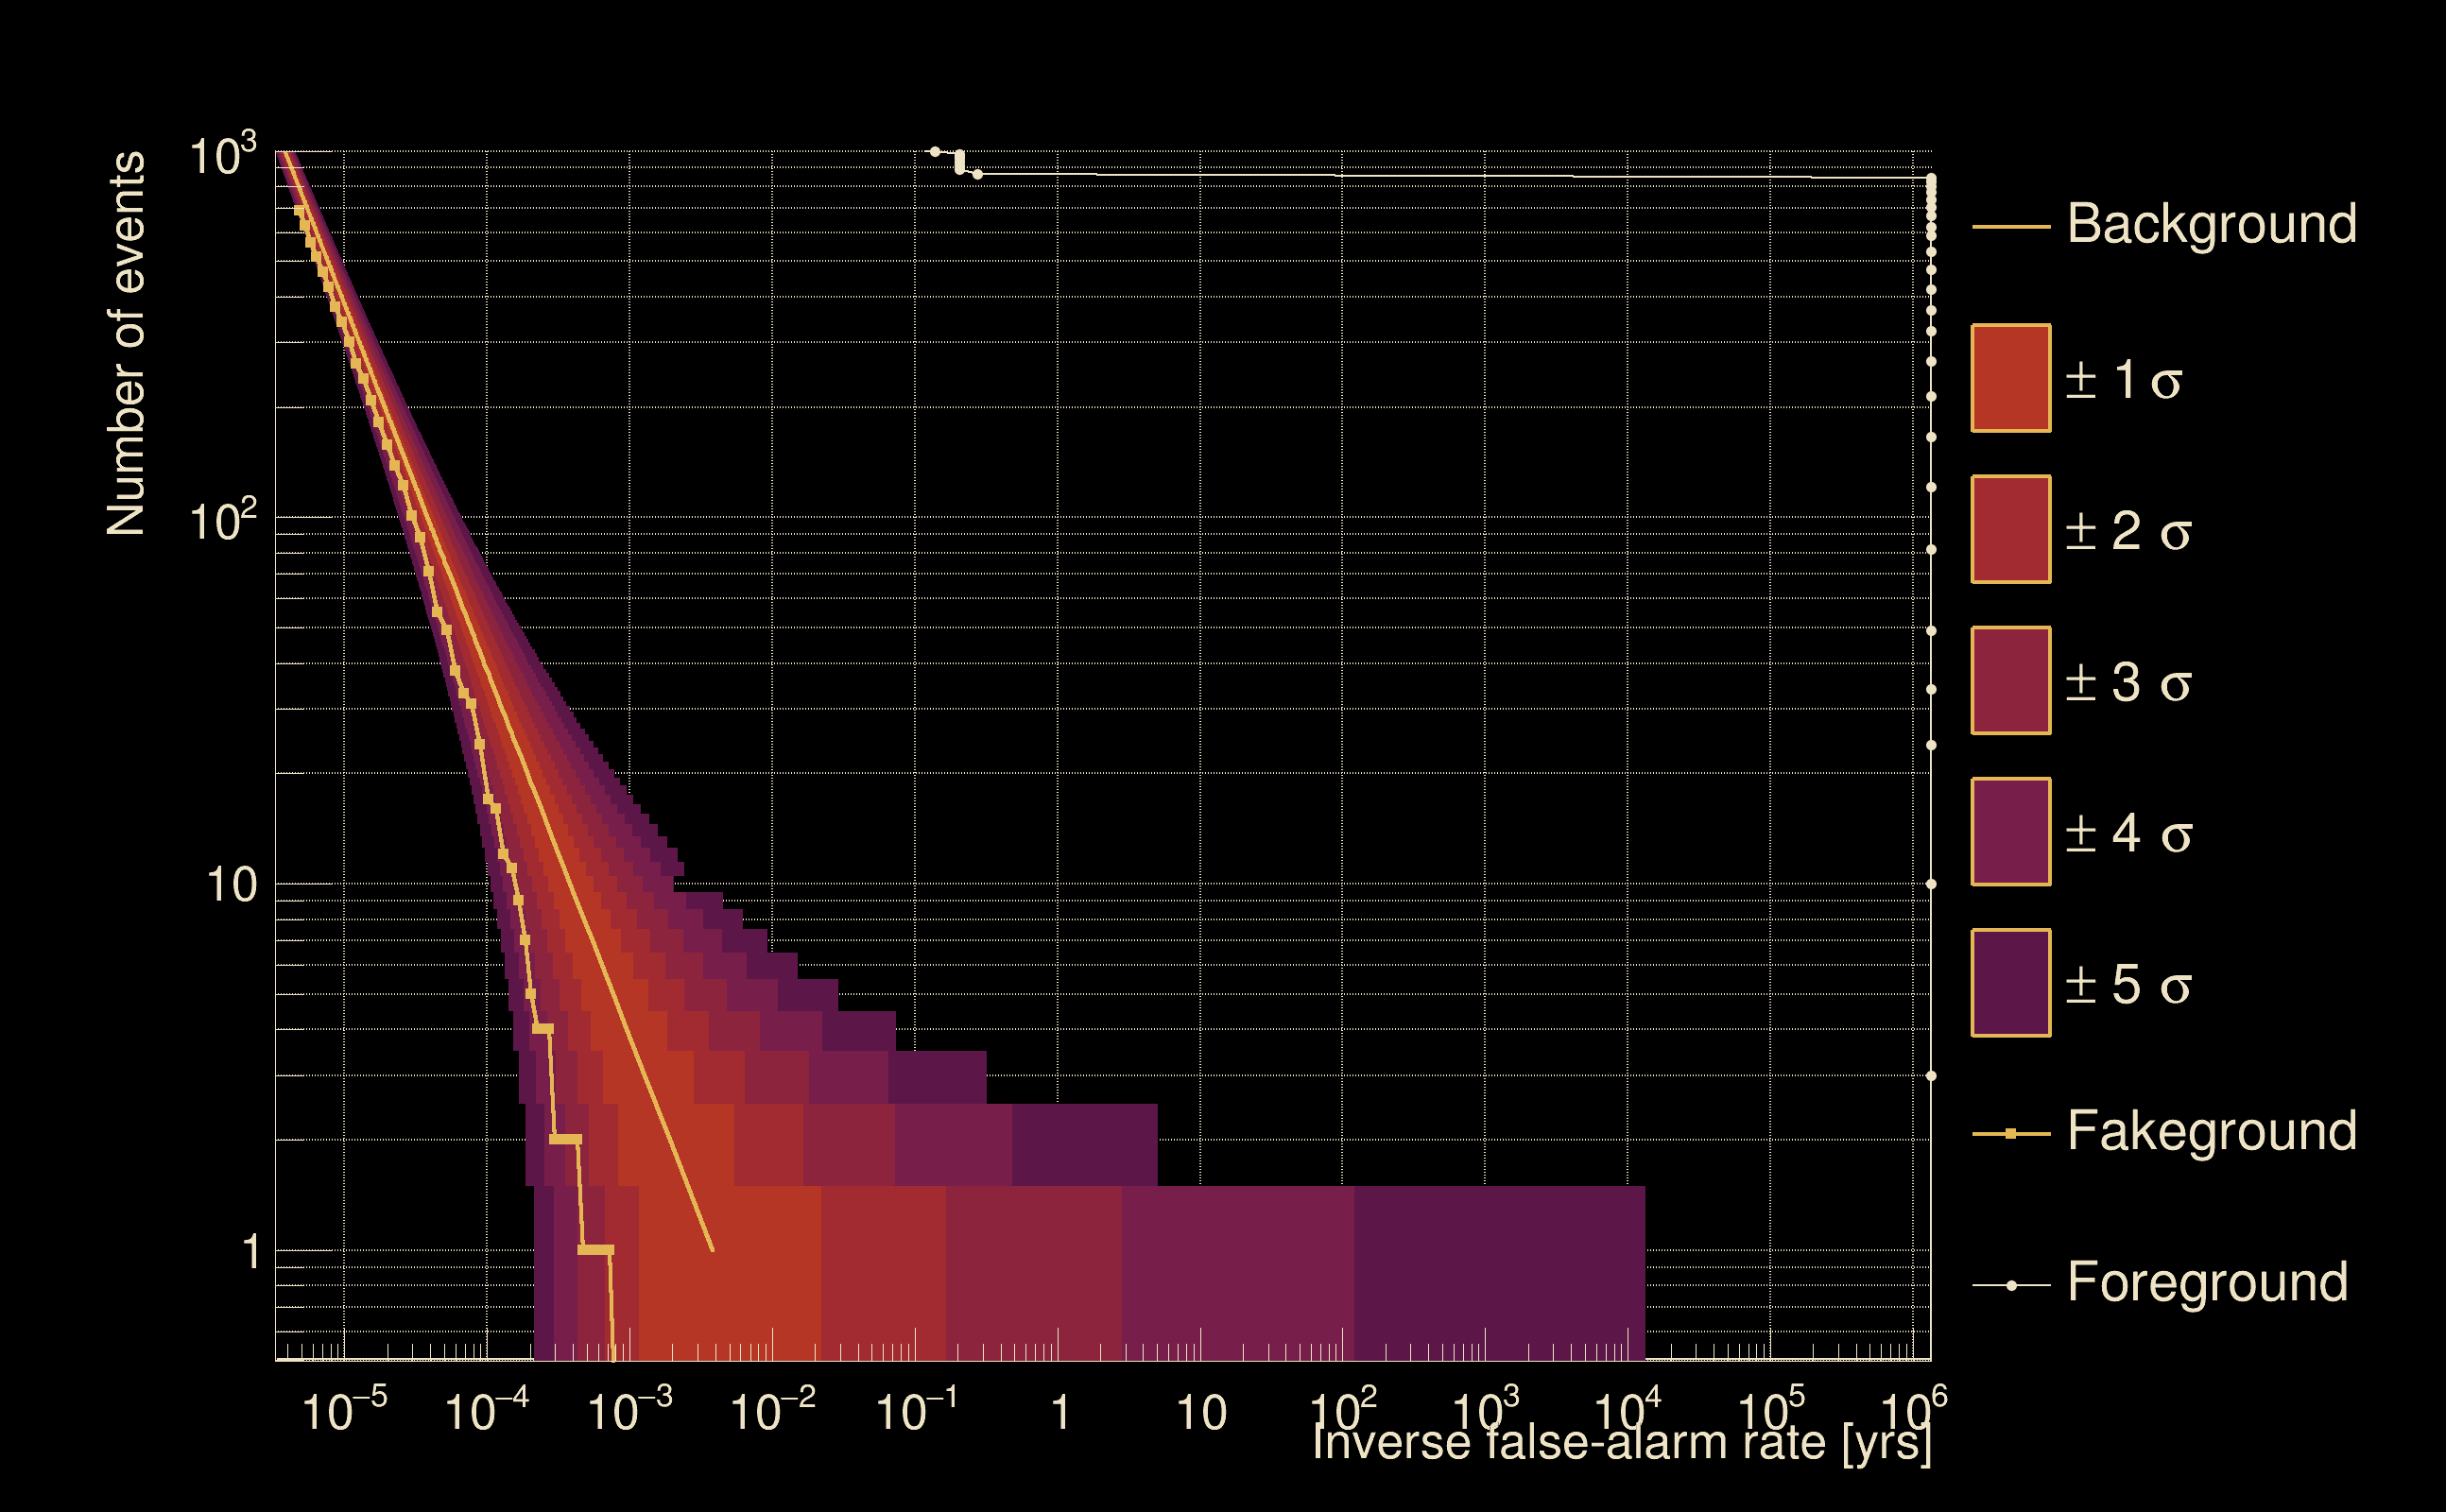
| Detection threshold: | R > 0.117856 |
| False-alarm rate above that detection threshold: | 2.37788e-06 |
| Alternative threshold at 1/1000 yrs: | R > 0.245685 |
| Alternative threshold at 1/100 yrs: | R > 0.245685 |
| Alternative threshold at 1/10 yrs: | R > 0.245685 |
| Alternative threshold at 1/1 yr: | R > 0.245685 |
| Alternative threshold at 1/1 d: | R > 0.0852189 |
 |
|
 |
 |
 |
 |
 |
 |
 |
 |
 |
 |
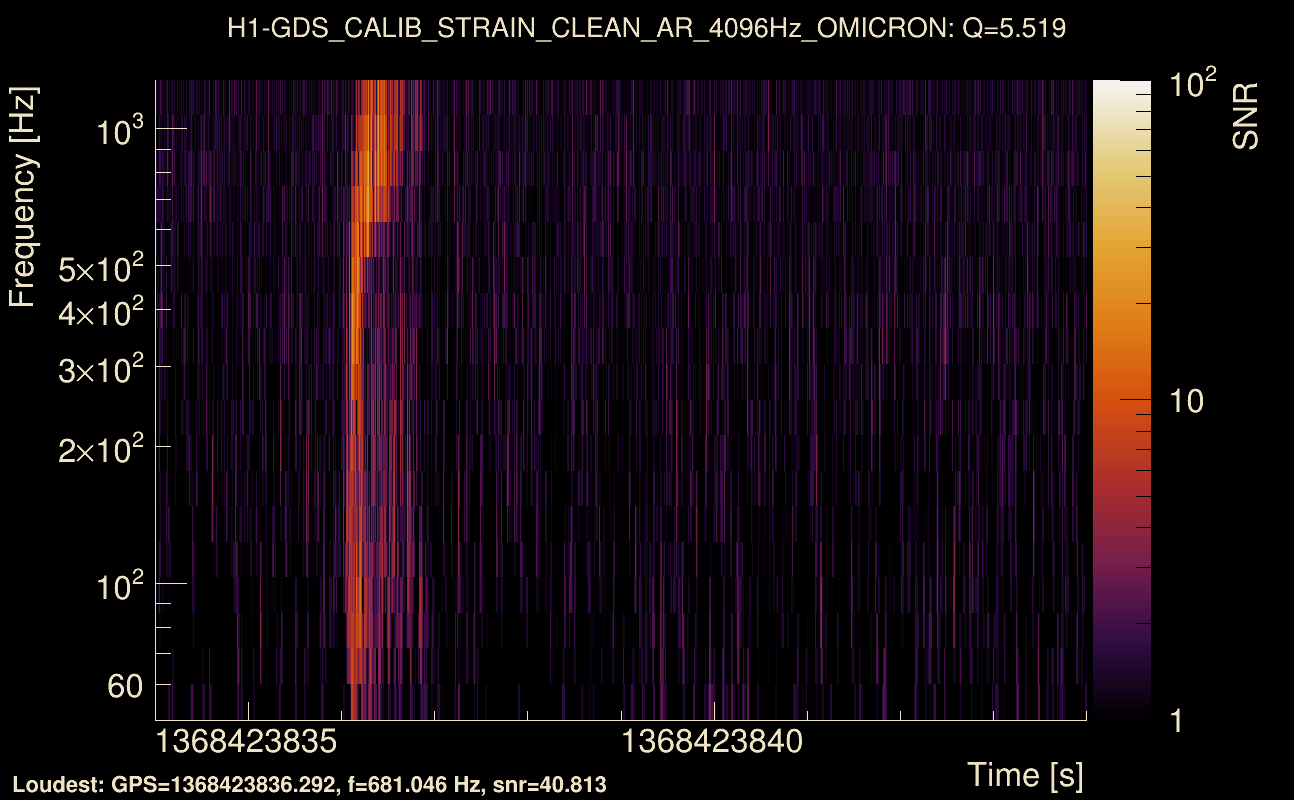
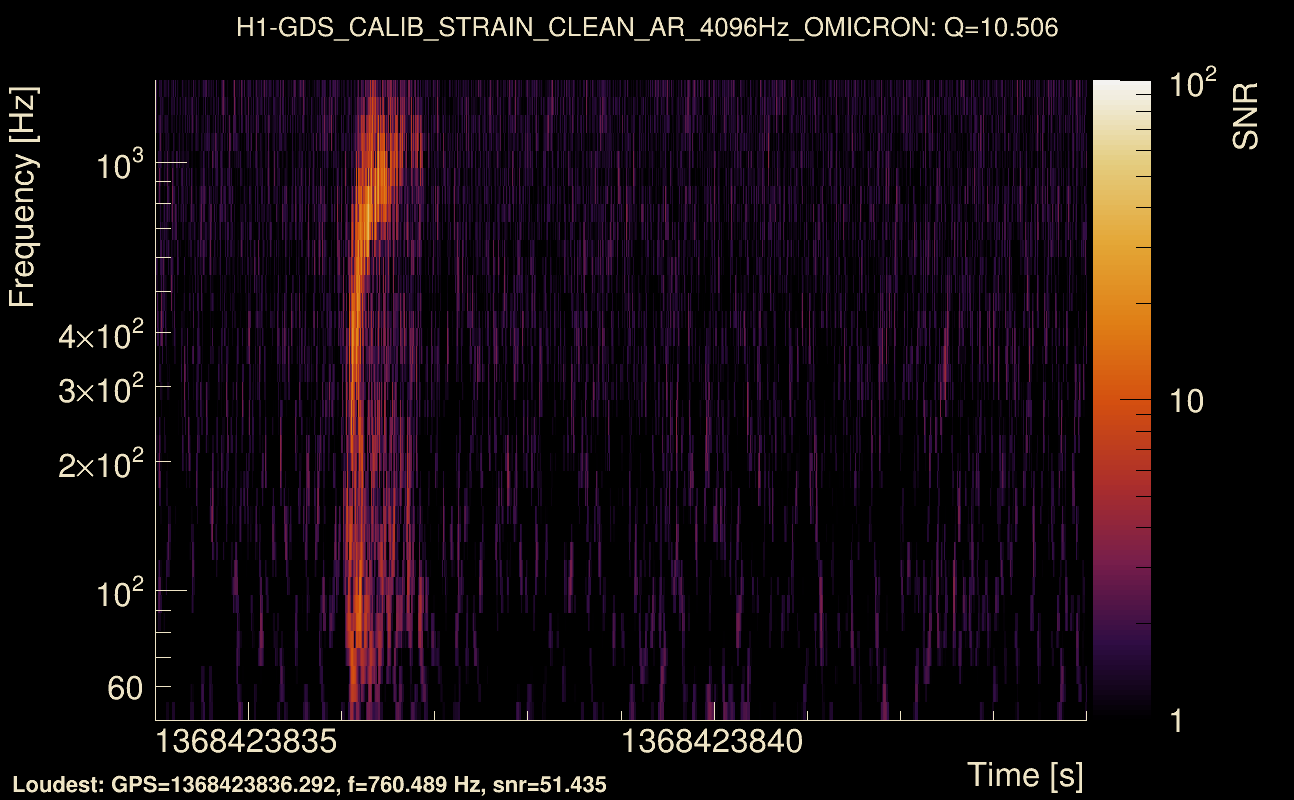
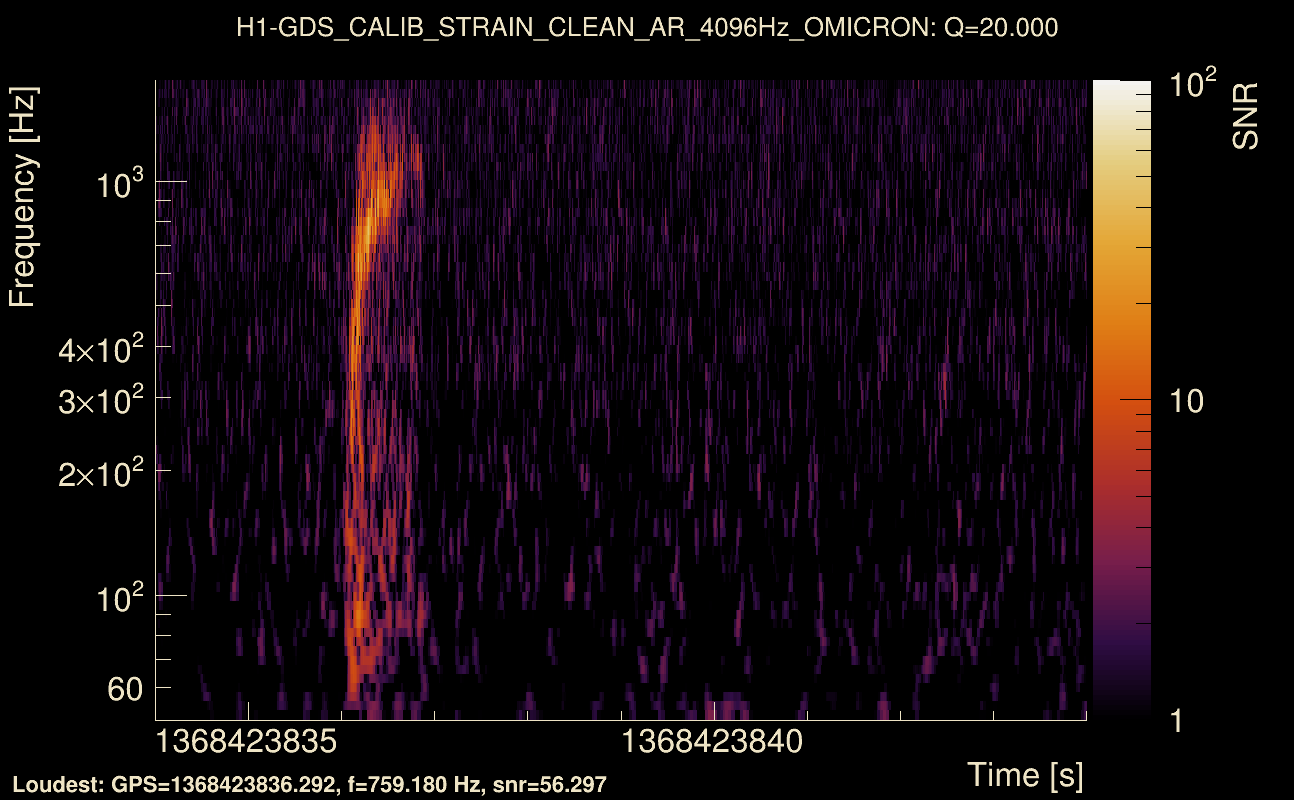
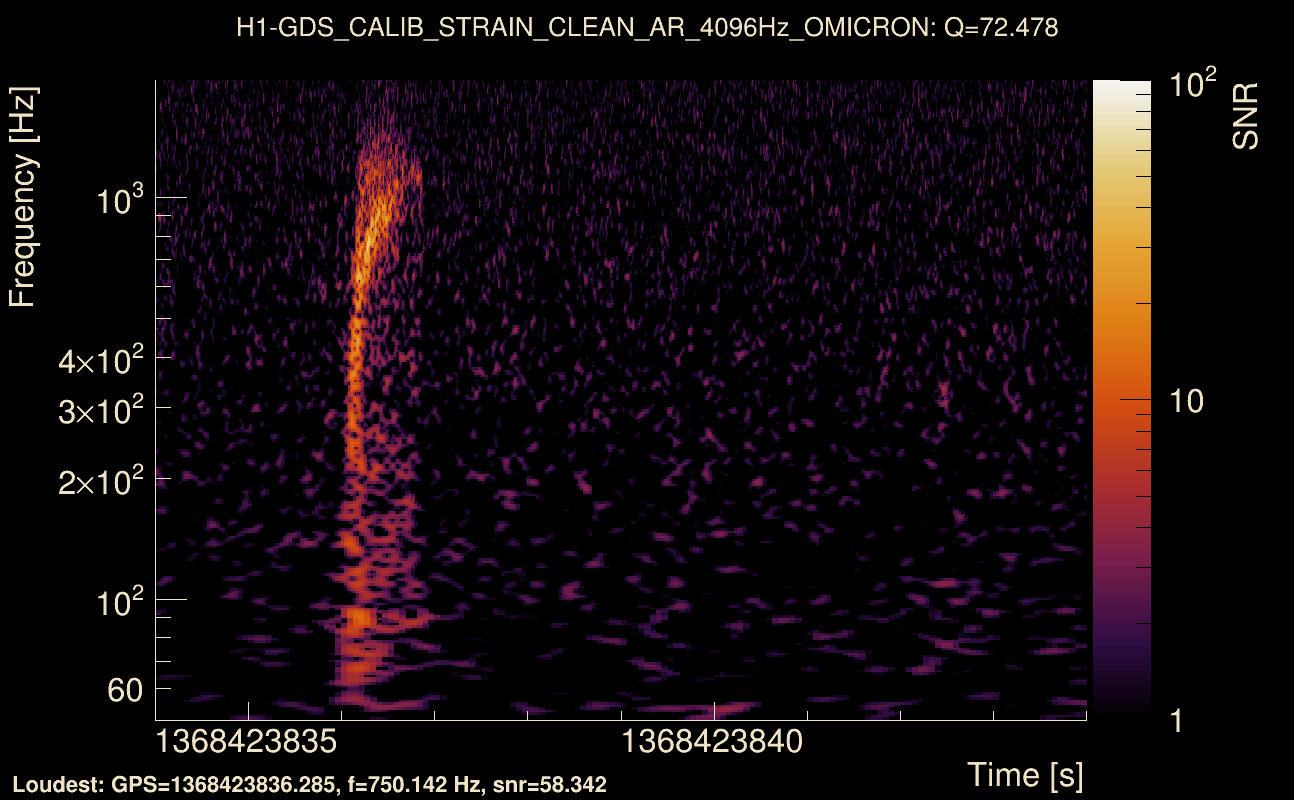
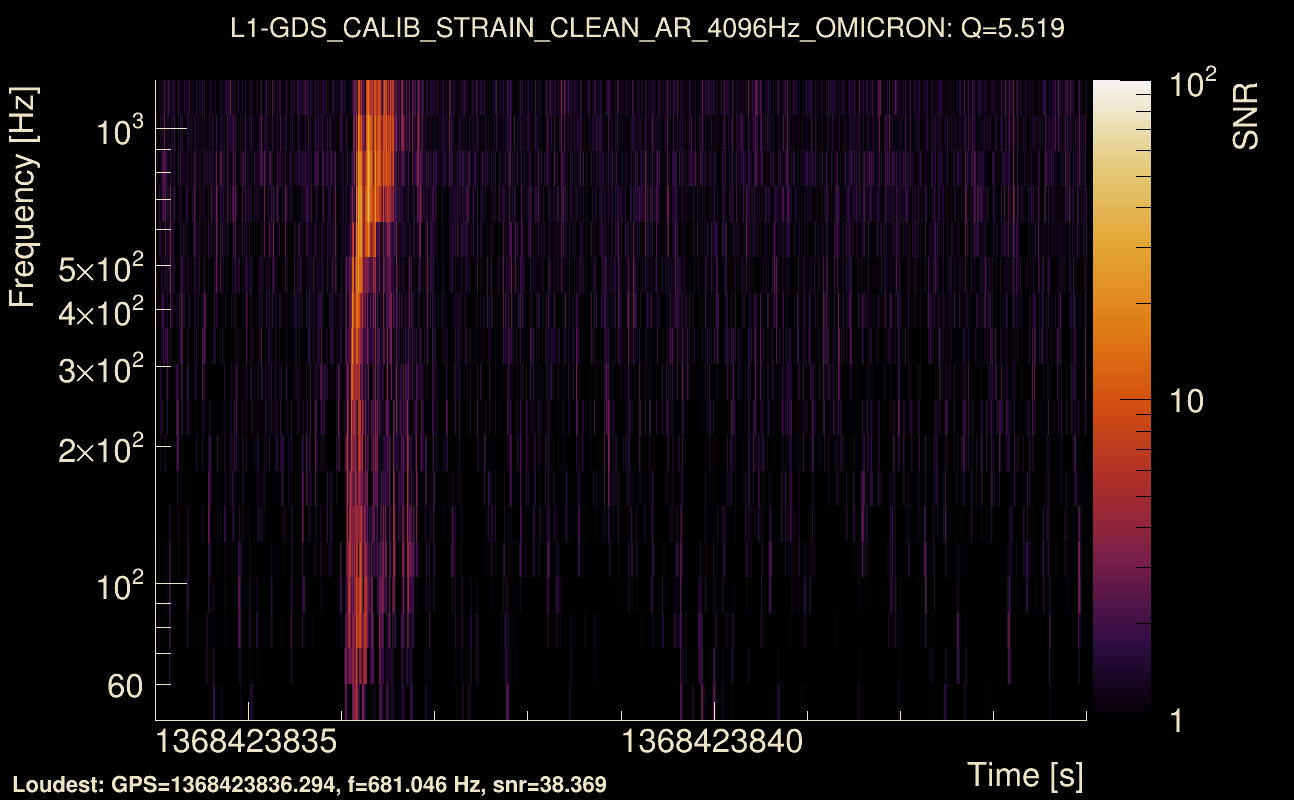
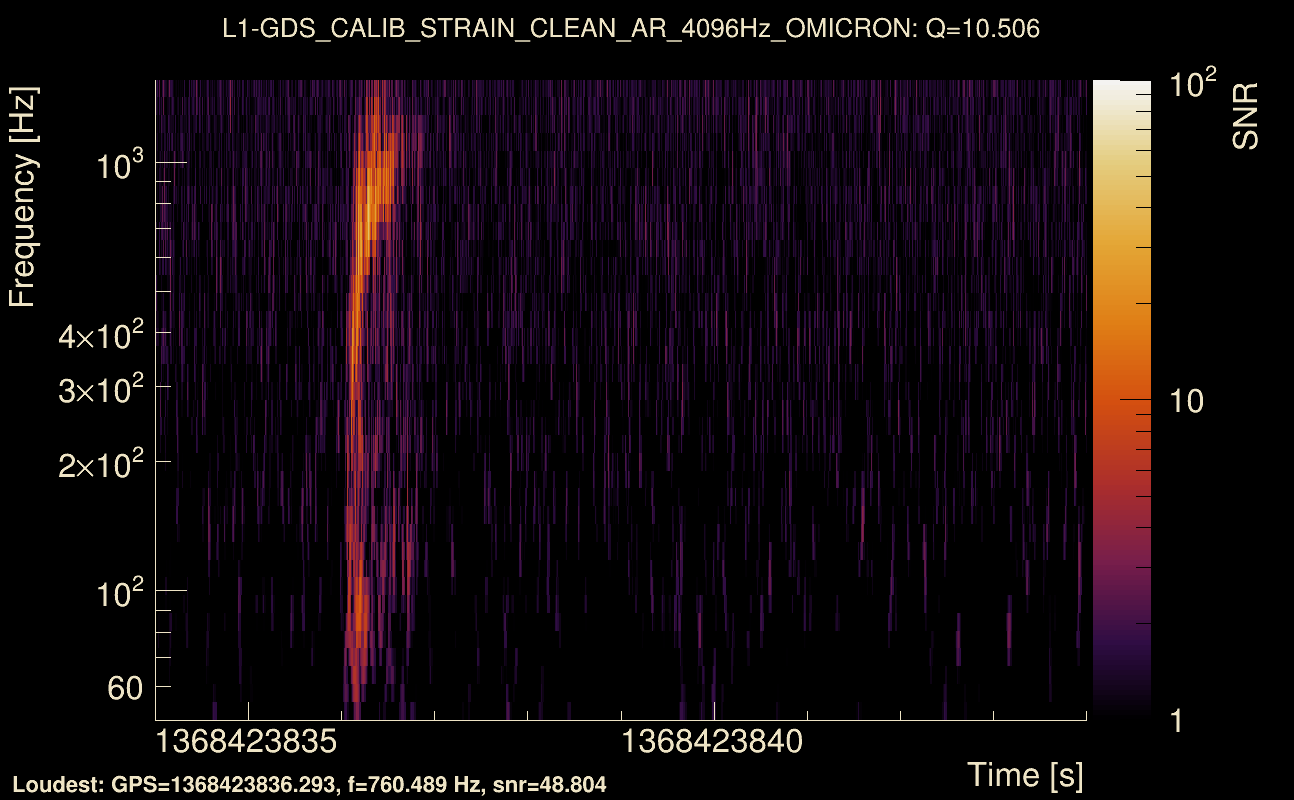
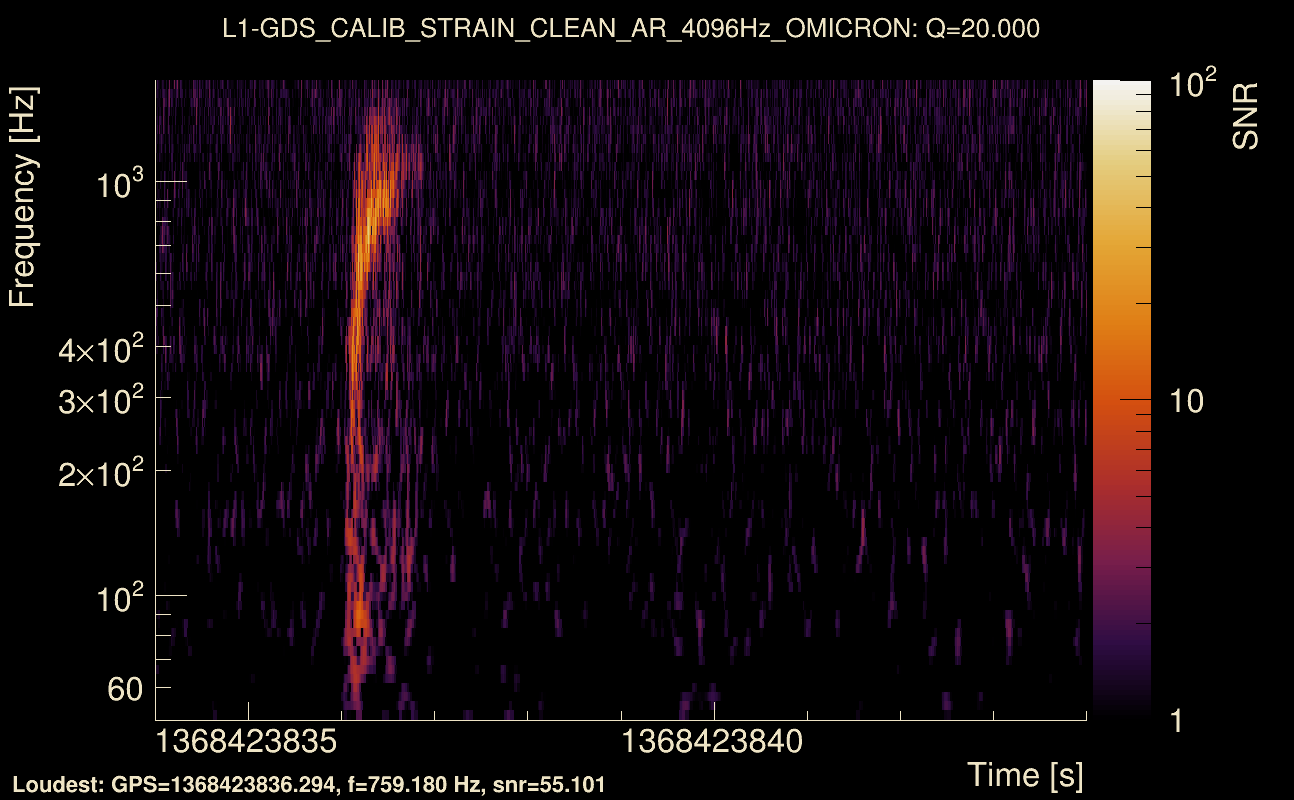
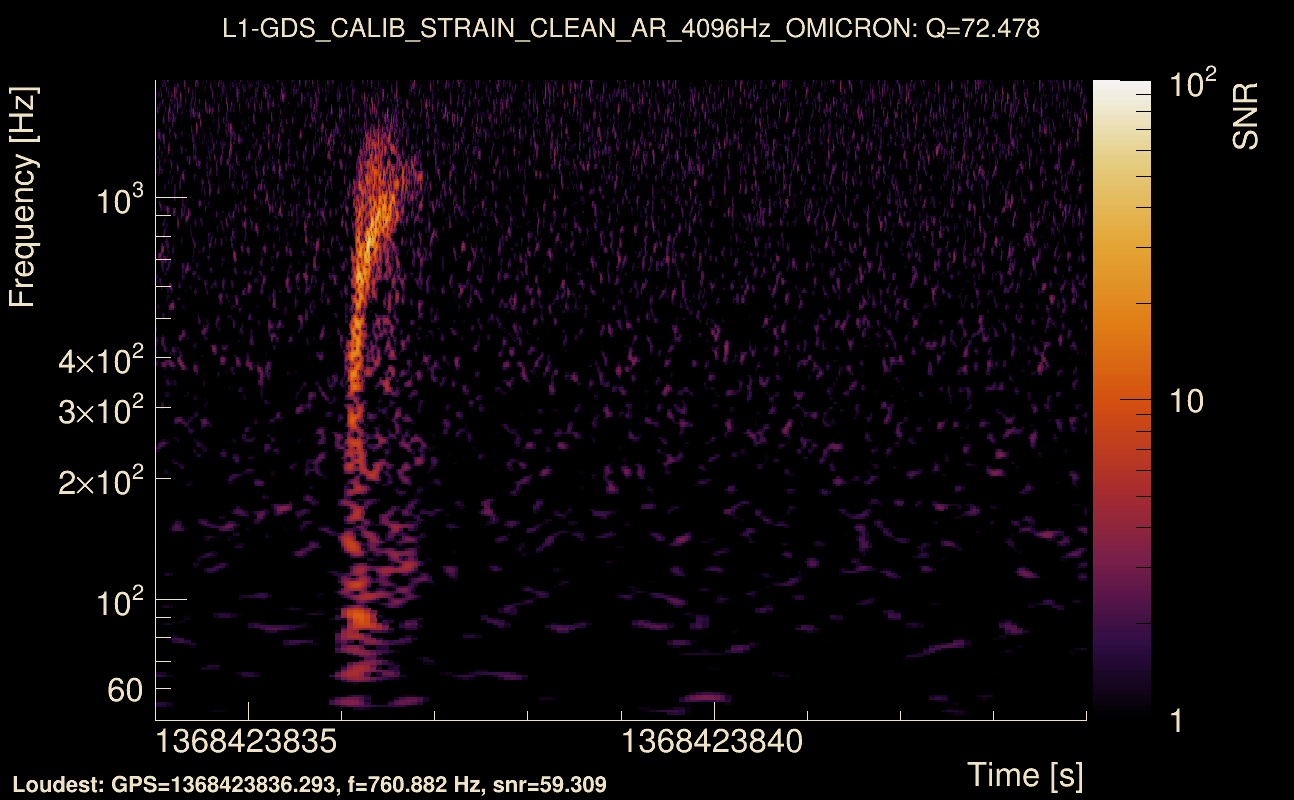
| Event time t(H1): | GPS = 1368423834 (Thu May 18 05:43:36 2023 ) → GPS = 1368423844 (Thu May 18 05:43:46 2023 ) |
| Event time t(L1): | GPS = 1368423834 (Thu May 18 05:43:46 2023 ) → GPS = 1368423844 (Thu May 18 05:43:46 2023 ) |
| Omicron analysis time window (H1): | GPS = 1368423831 → GPS = 1368423847 |
| Omicron analysis time window (L1): | GPS = 1368423831 → GPS = 1368423847 |
| Time delay between detectors t(L1) - t(H1): | -0.0424643 s (slice index = 109 / 217), δt_gw = 0.00353572 s |
| Time delay standard deviation: | 0.0677297 s |
| [targeted mode] Time delay probability: | 0.759871 (0.305651 sigmas), δt_target = 0.00505829 s |
| Frequency: | 384.288 Hz |
| Ξ: | 0.317847 ± 0.0105219 (variance = 0.000110711): Q0: 0.492901, Q1: 0.497179, Q2: 0.498991, Q3: 0.511902, Q4: 0.521242 |
| Rank: | R_A = 0.241522 |
| Log of amplitude ratio (L1/H1): | -0.138034, variance = 0.153787 (L1/H1: -0.462505, variance = 0.304756, H1/L1: -0.192823, variance = 0.310445) |
| Amplitude ratio (L1/H1): | 0.871069 ⋇ 1.48017 (L1/H1: 0.629704 ⋇ 1.7368, H1/L1: 0.824628 ⋇ 1.74574) |
| Amplitude ratio H1|L1 compatibility (probability): | 0.403433 |
| Antenna factor probability: | 0.924767 |
| Number of rejected frequency rows: | Q0: 2 / 18, Q1: 17 / 36, Q2: 50 / 70, Q3: 107 / 134, Q4: 233 / 258 |
| Maximum signal-to-noise ratio: | H1: 59.9591, L1: 59.3776 |
| SNR variance: | H1: 2.28823, L1: 2.1284 |
| Click here for a zoomed plot | Click here for a zoomed plot | Click here for a zoomed plot | Click here for a zoomed plot | Click here for a zoomed plot |
 |
 |
 |
 |
 |
 |
 |
 |
 |
 |
 |
 |
 |
 |
 |
 |
 |
 |
 |
 |
 |
 |
 |
 |
 |
 |
 |
 |
 |
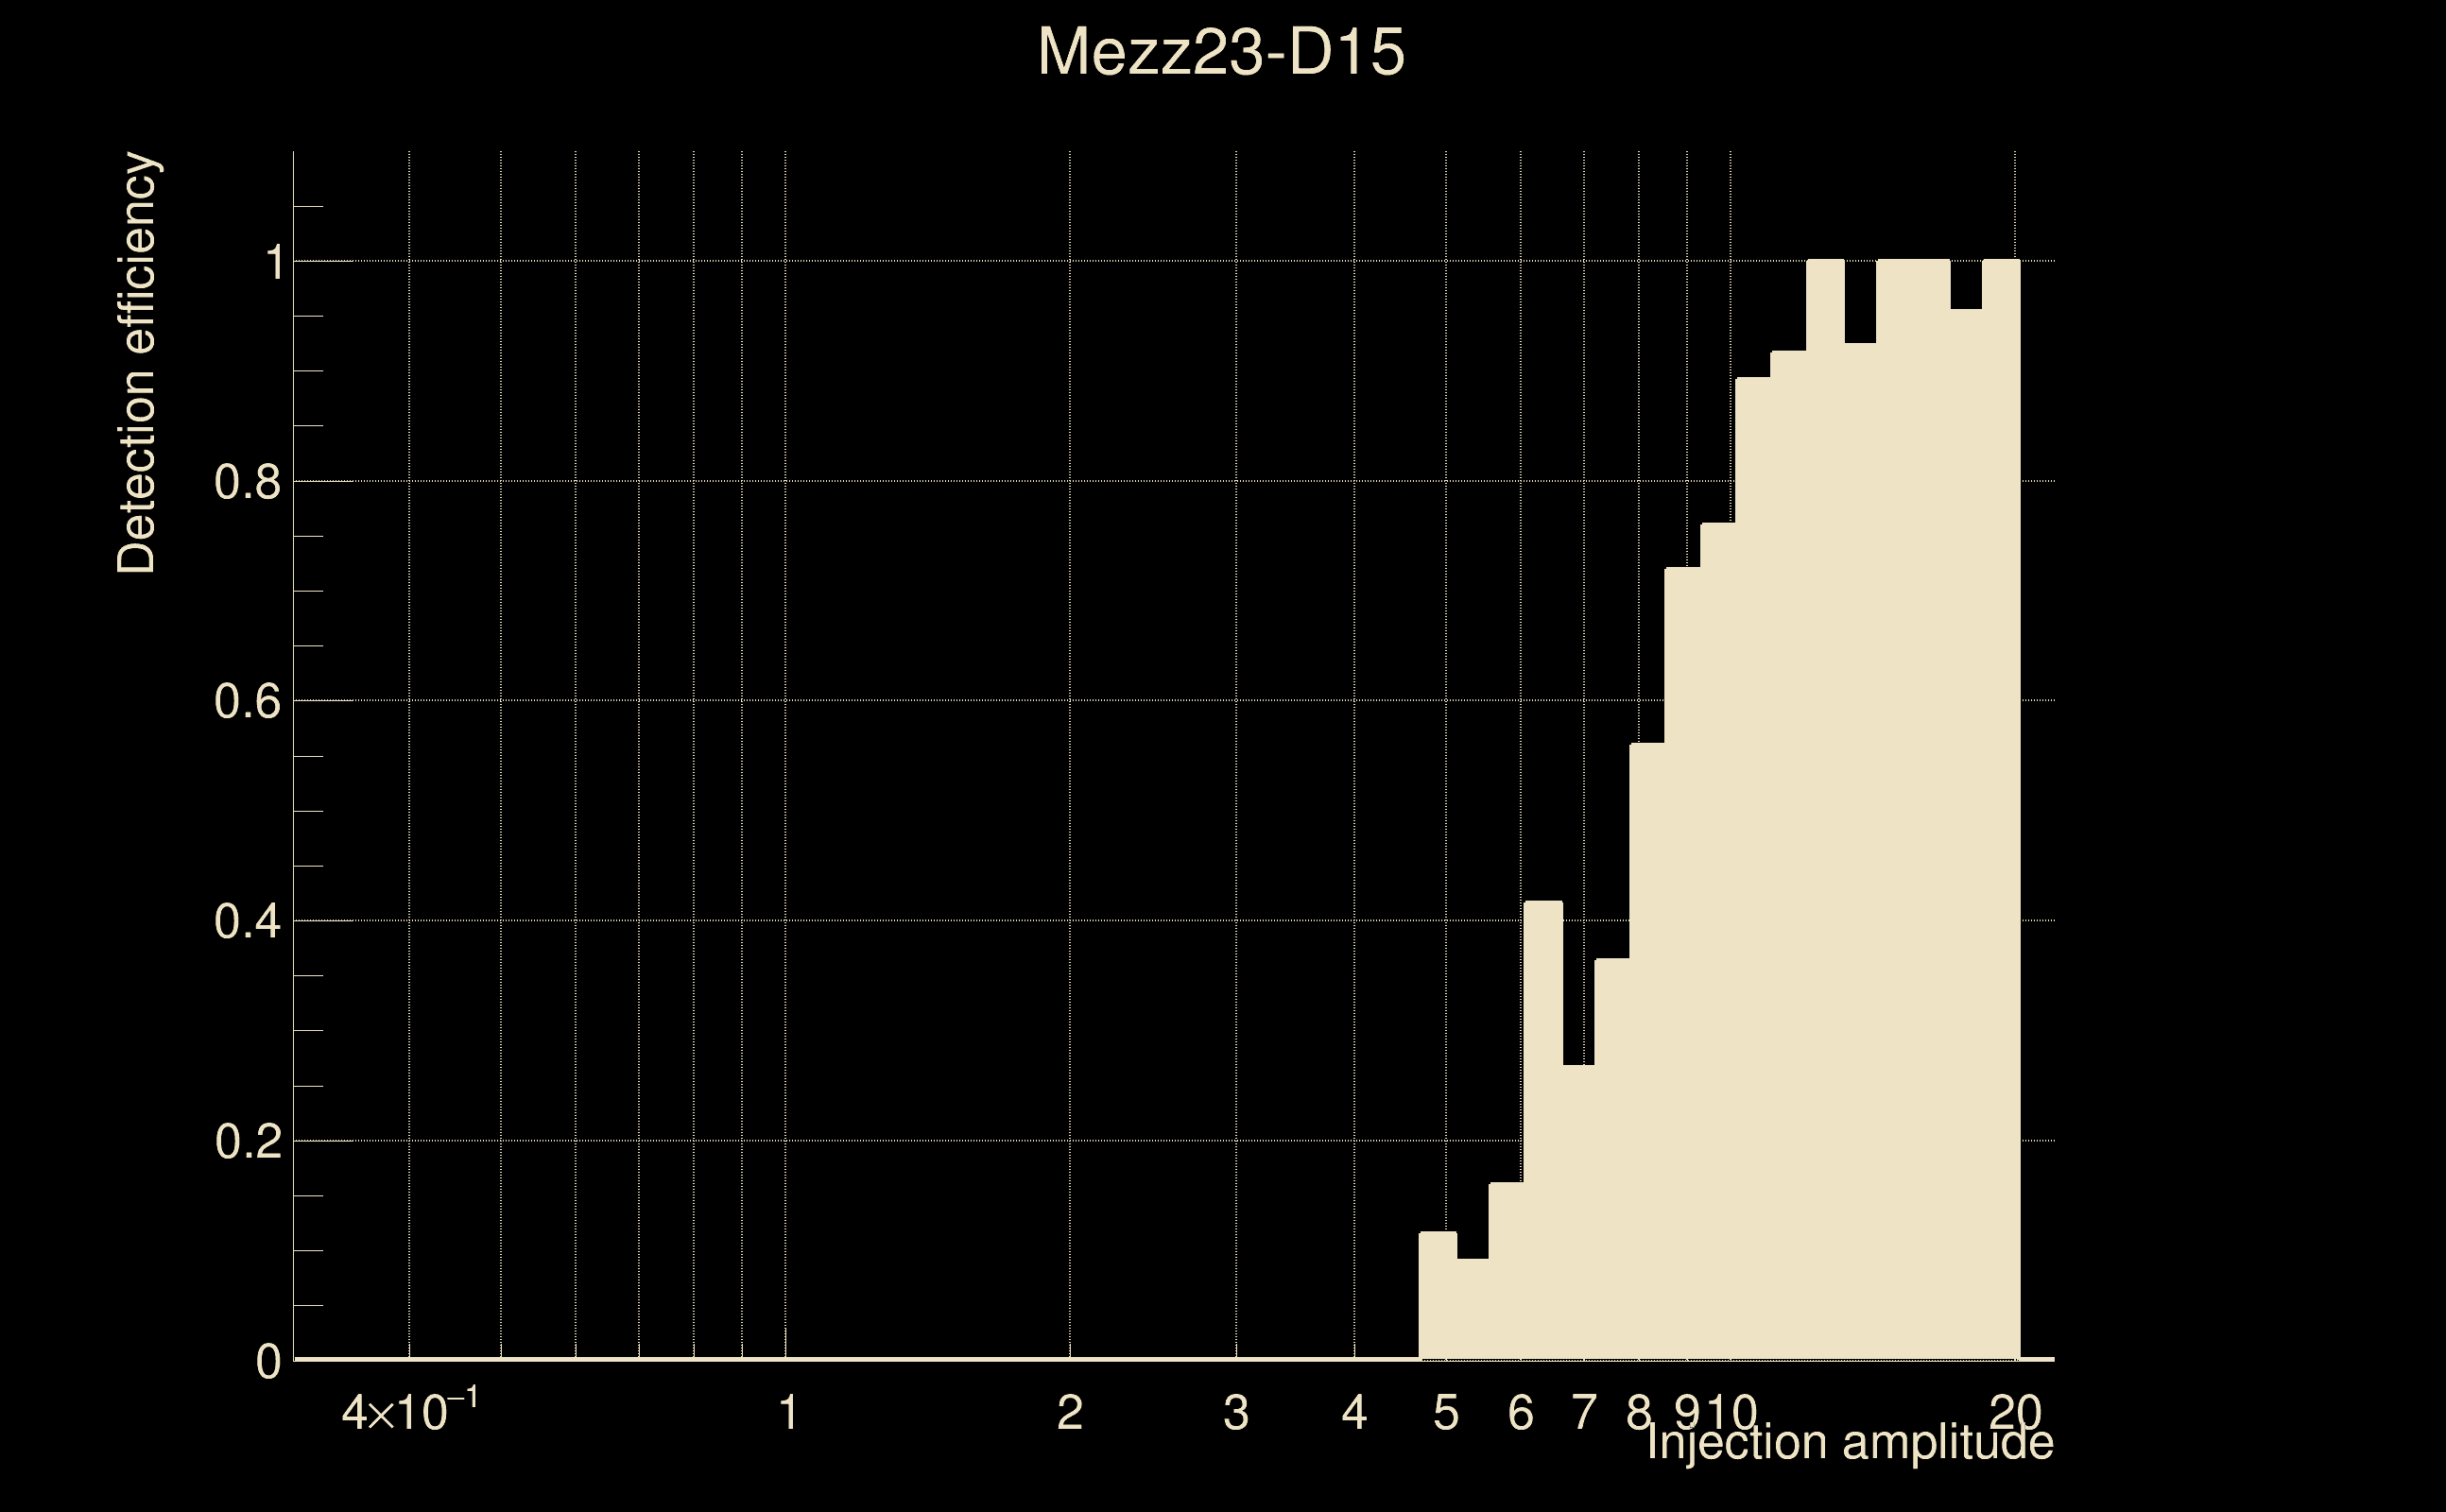
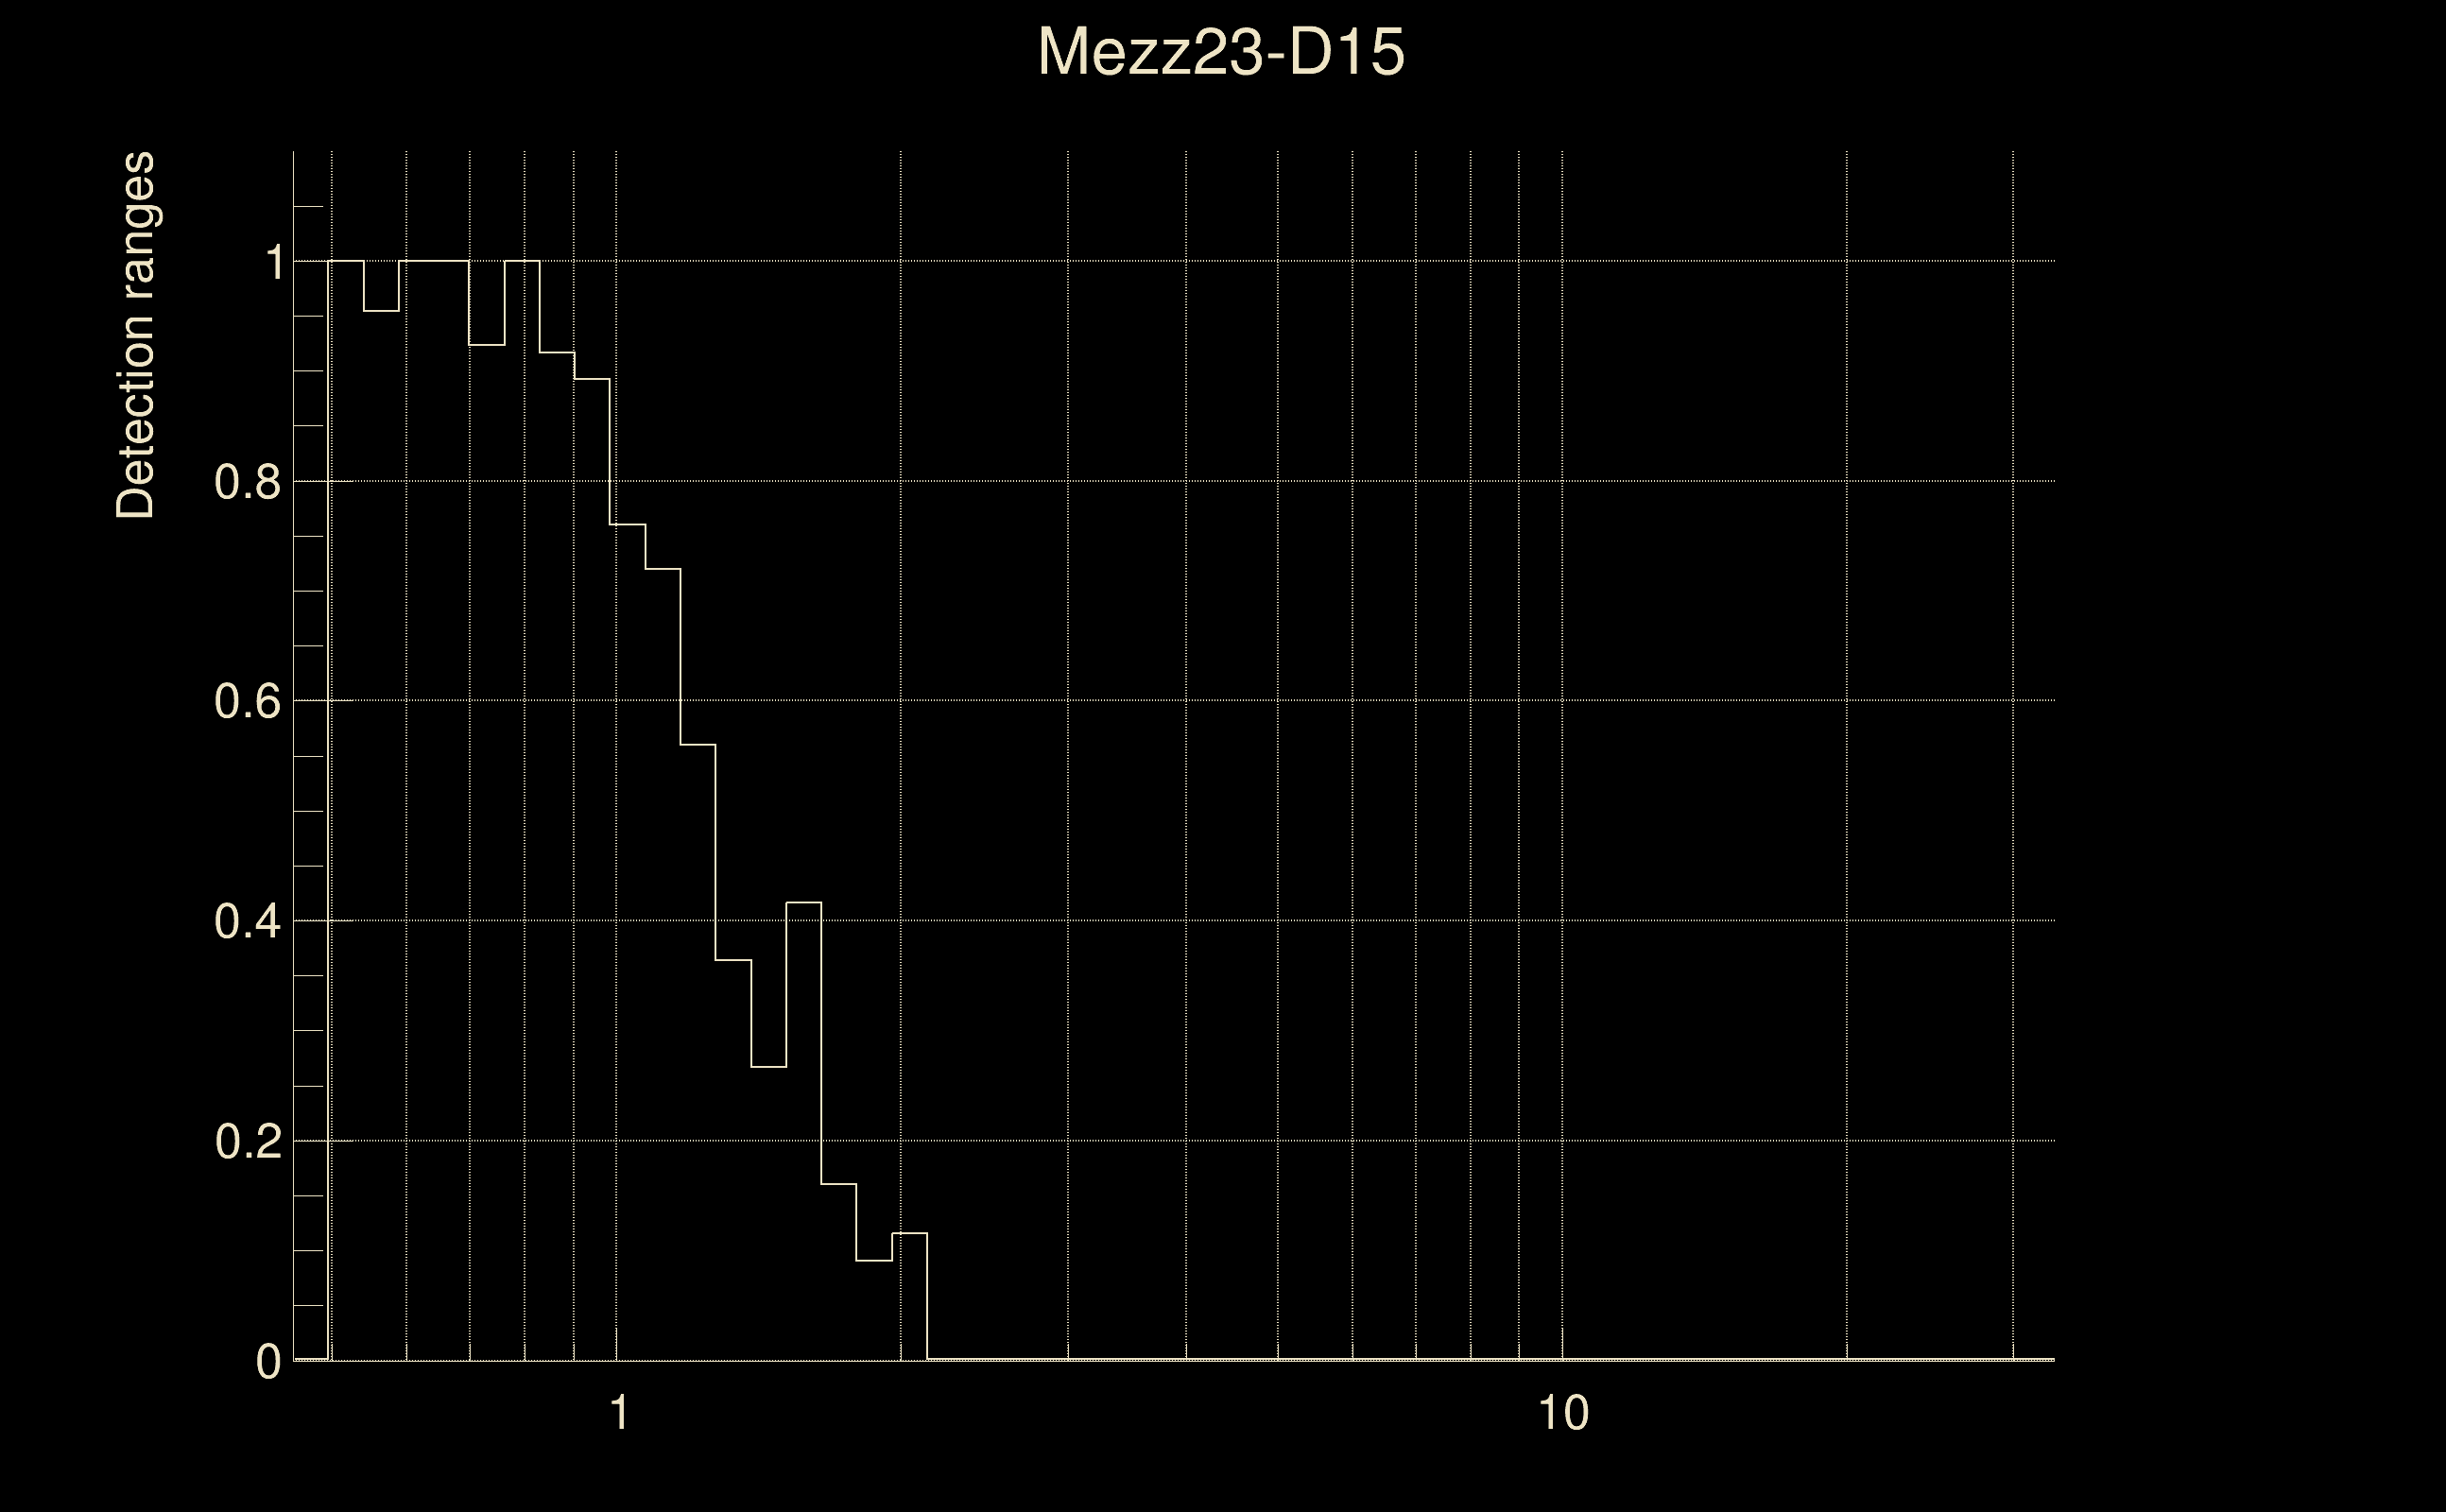
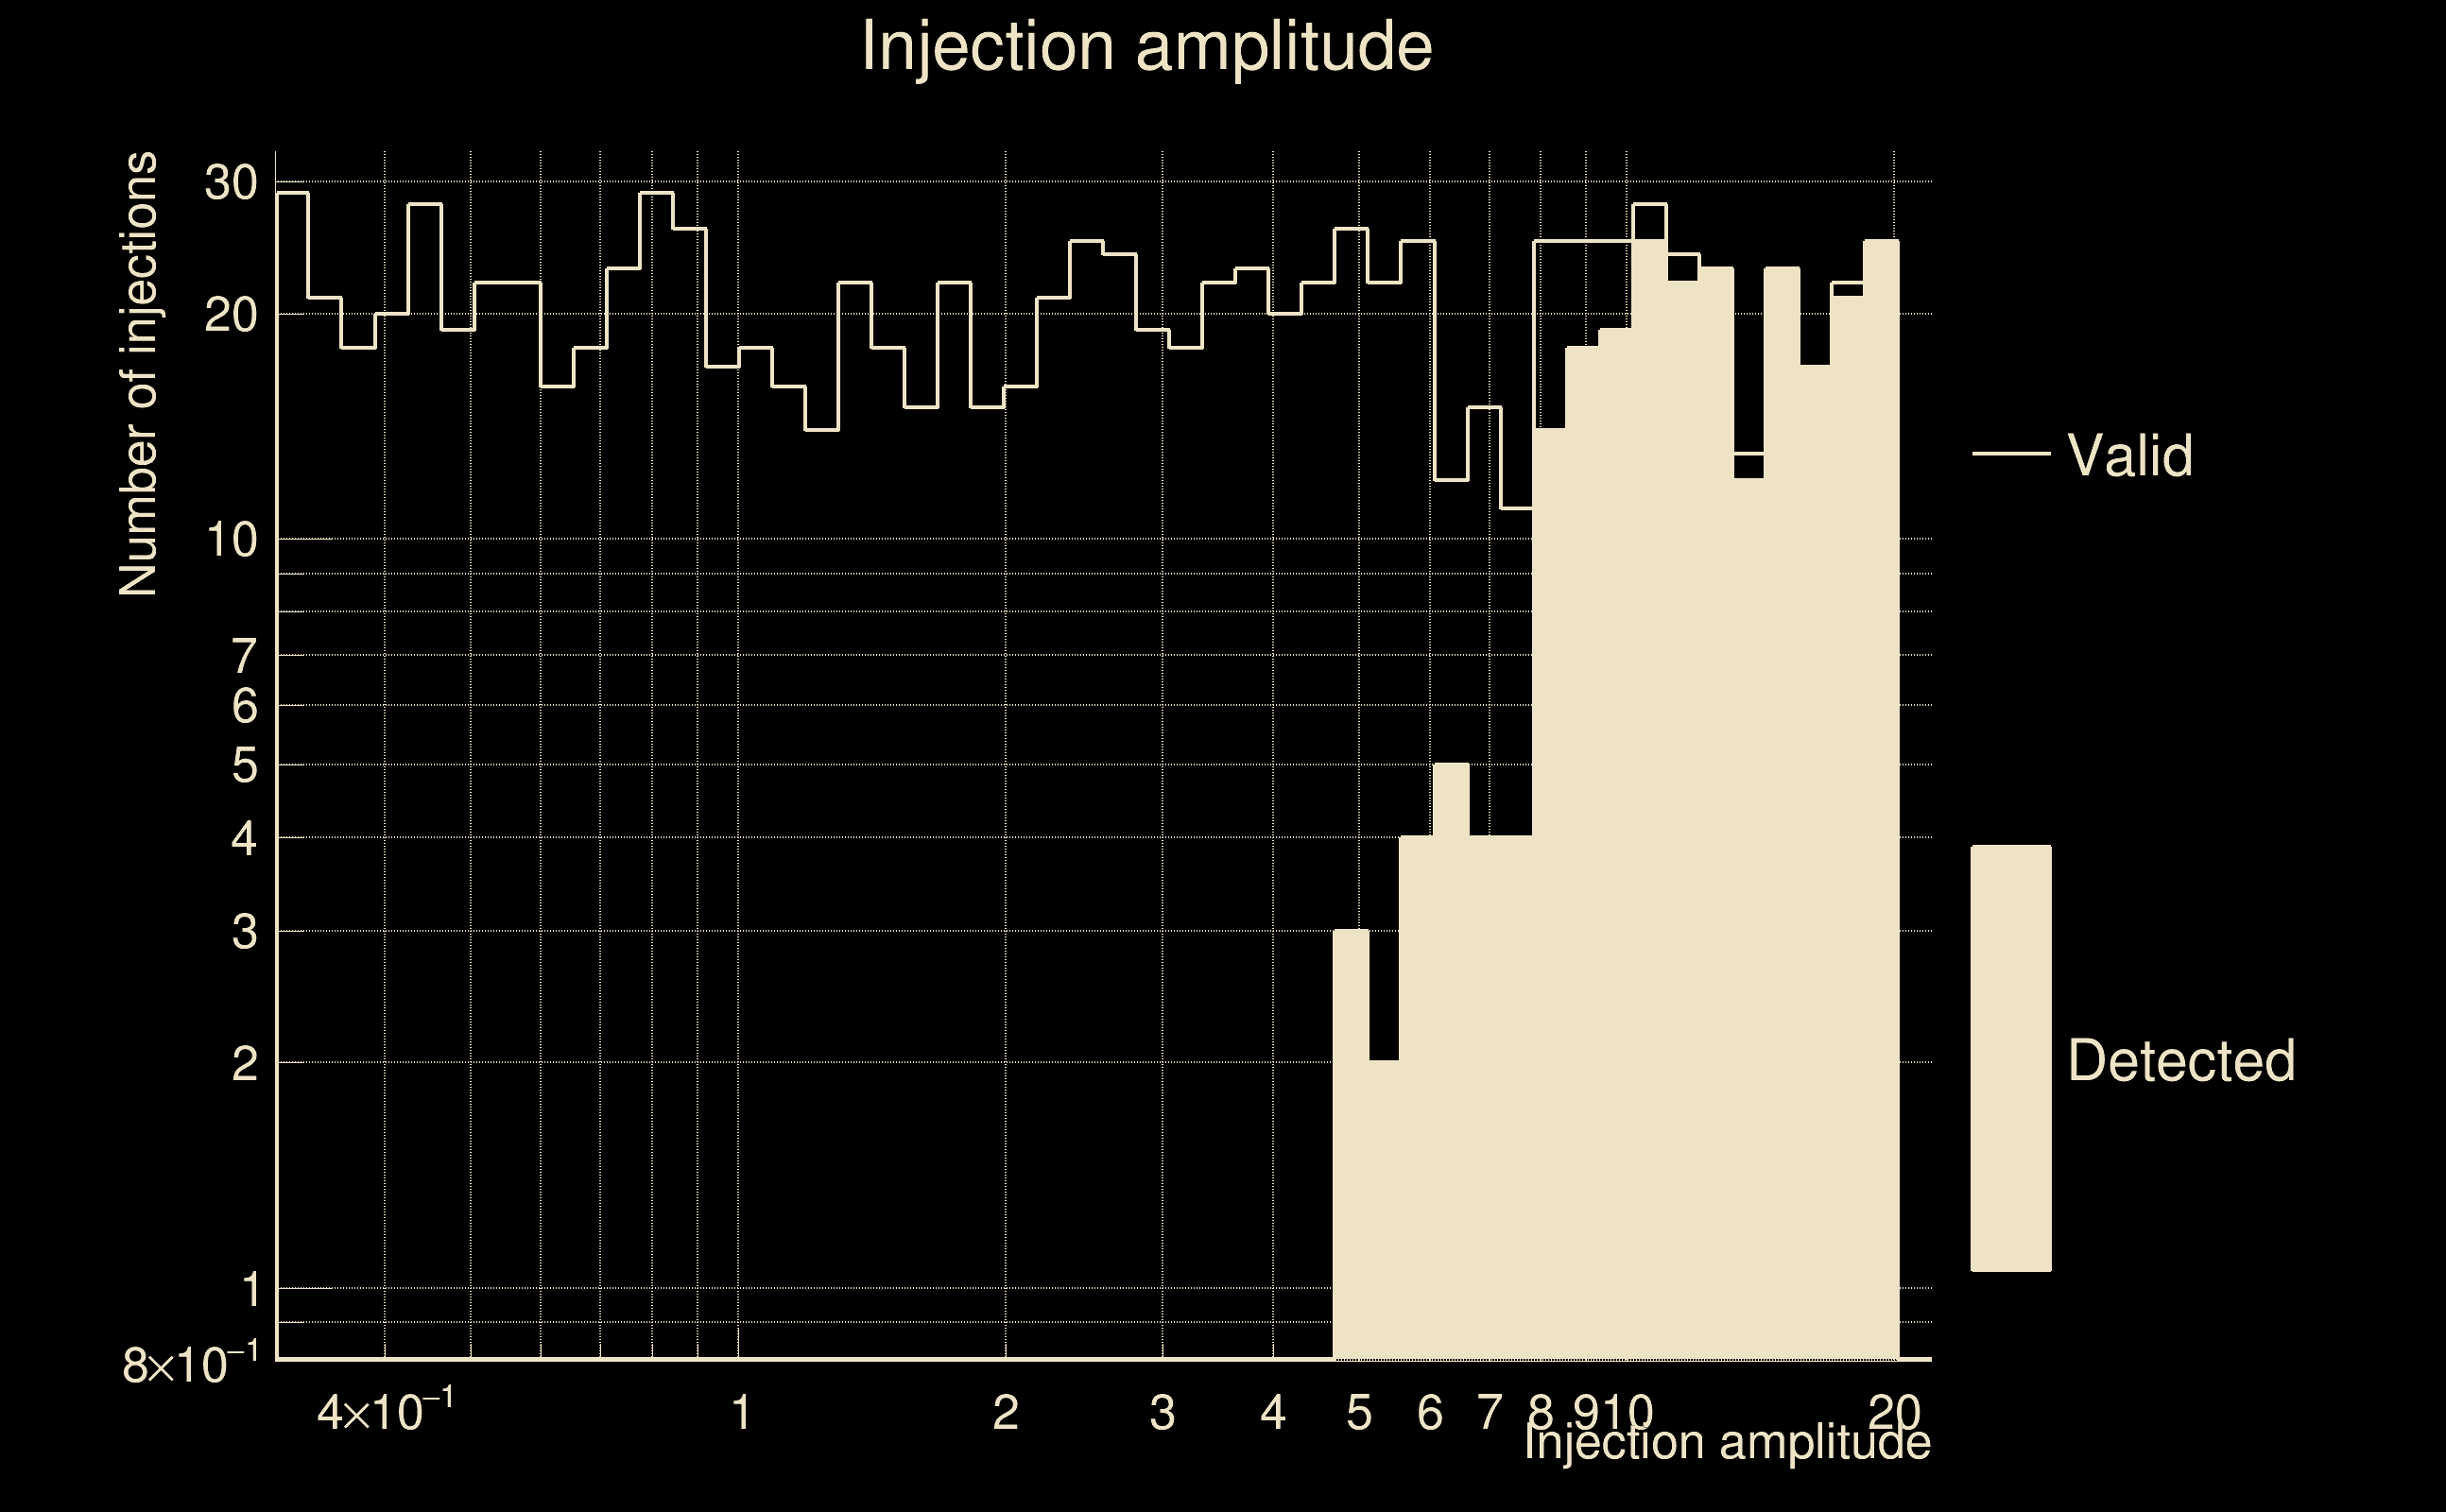
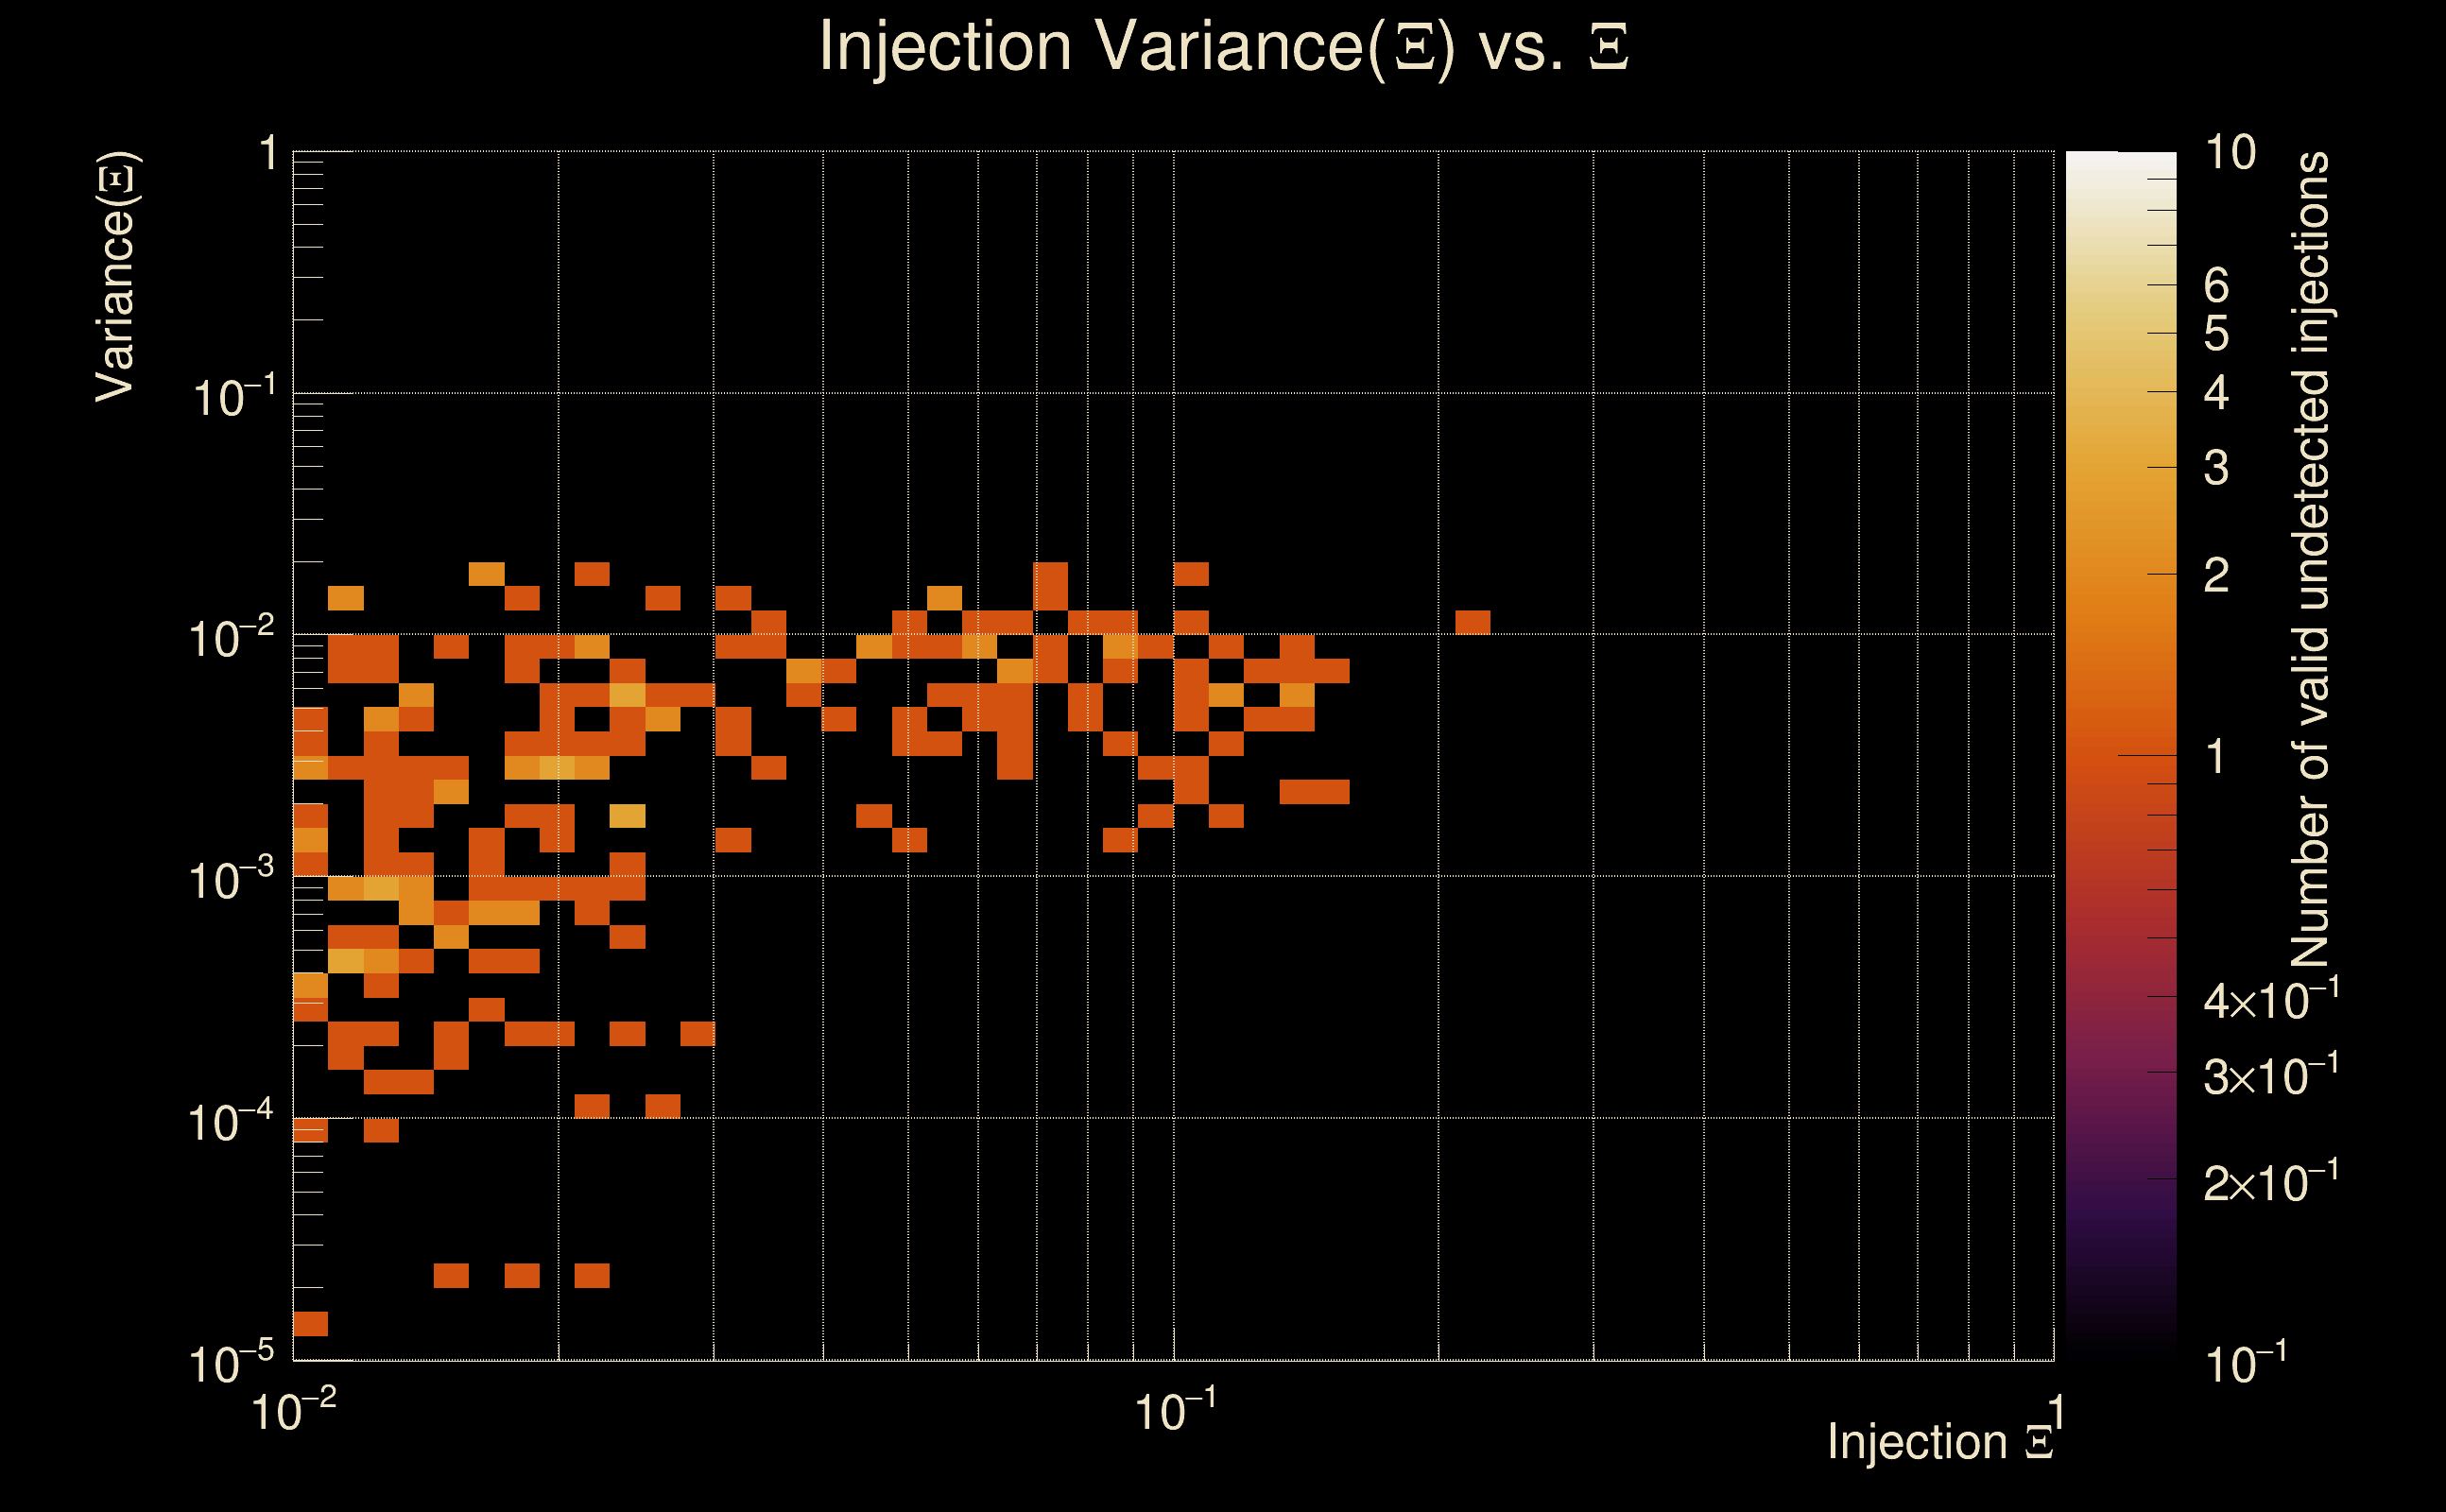
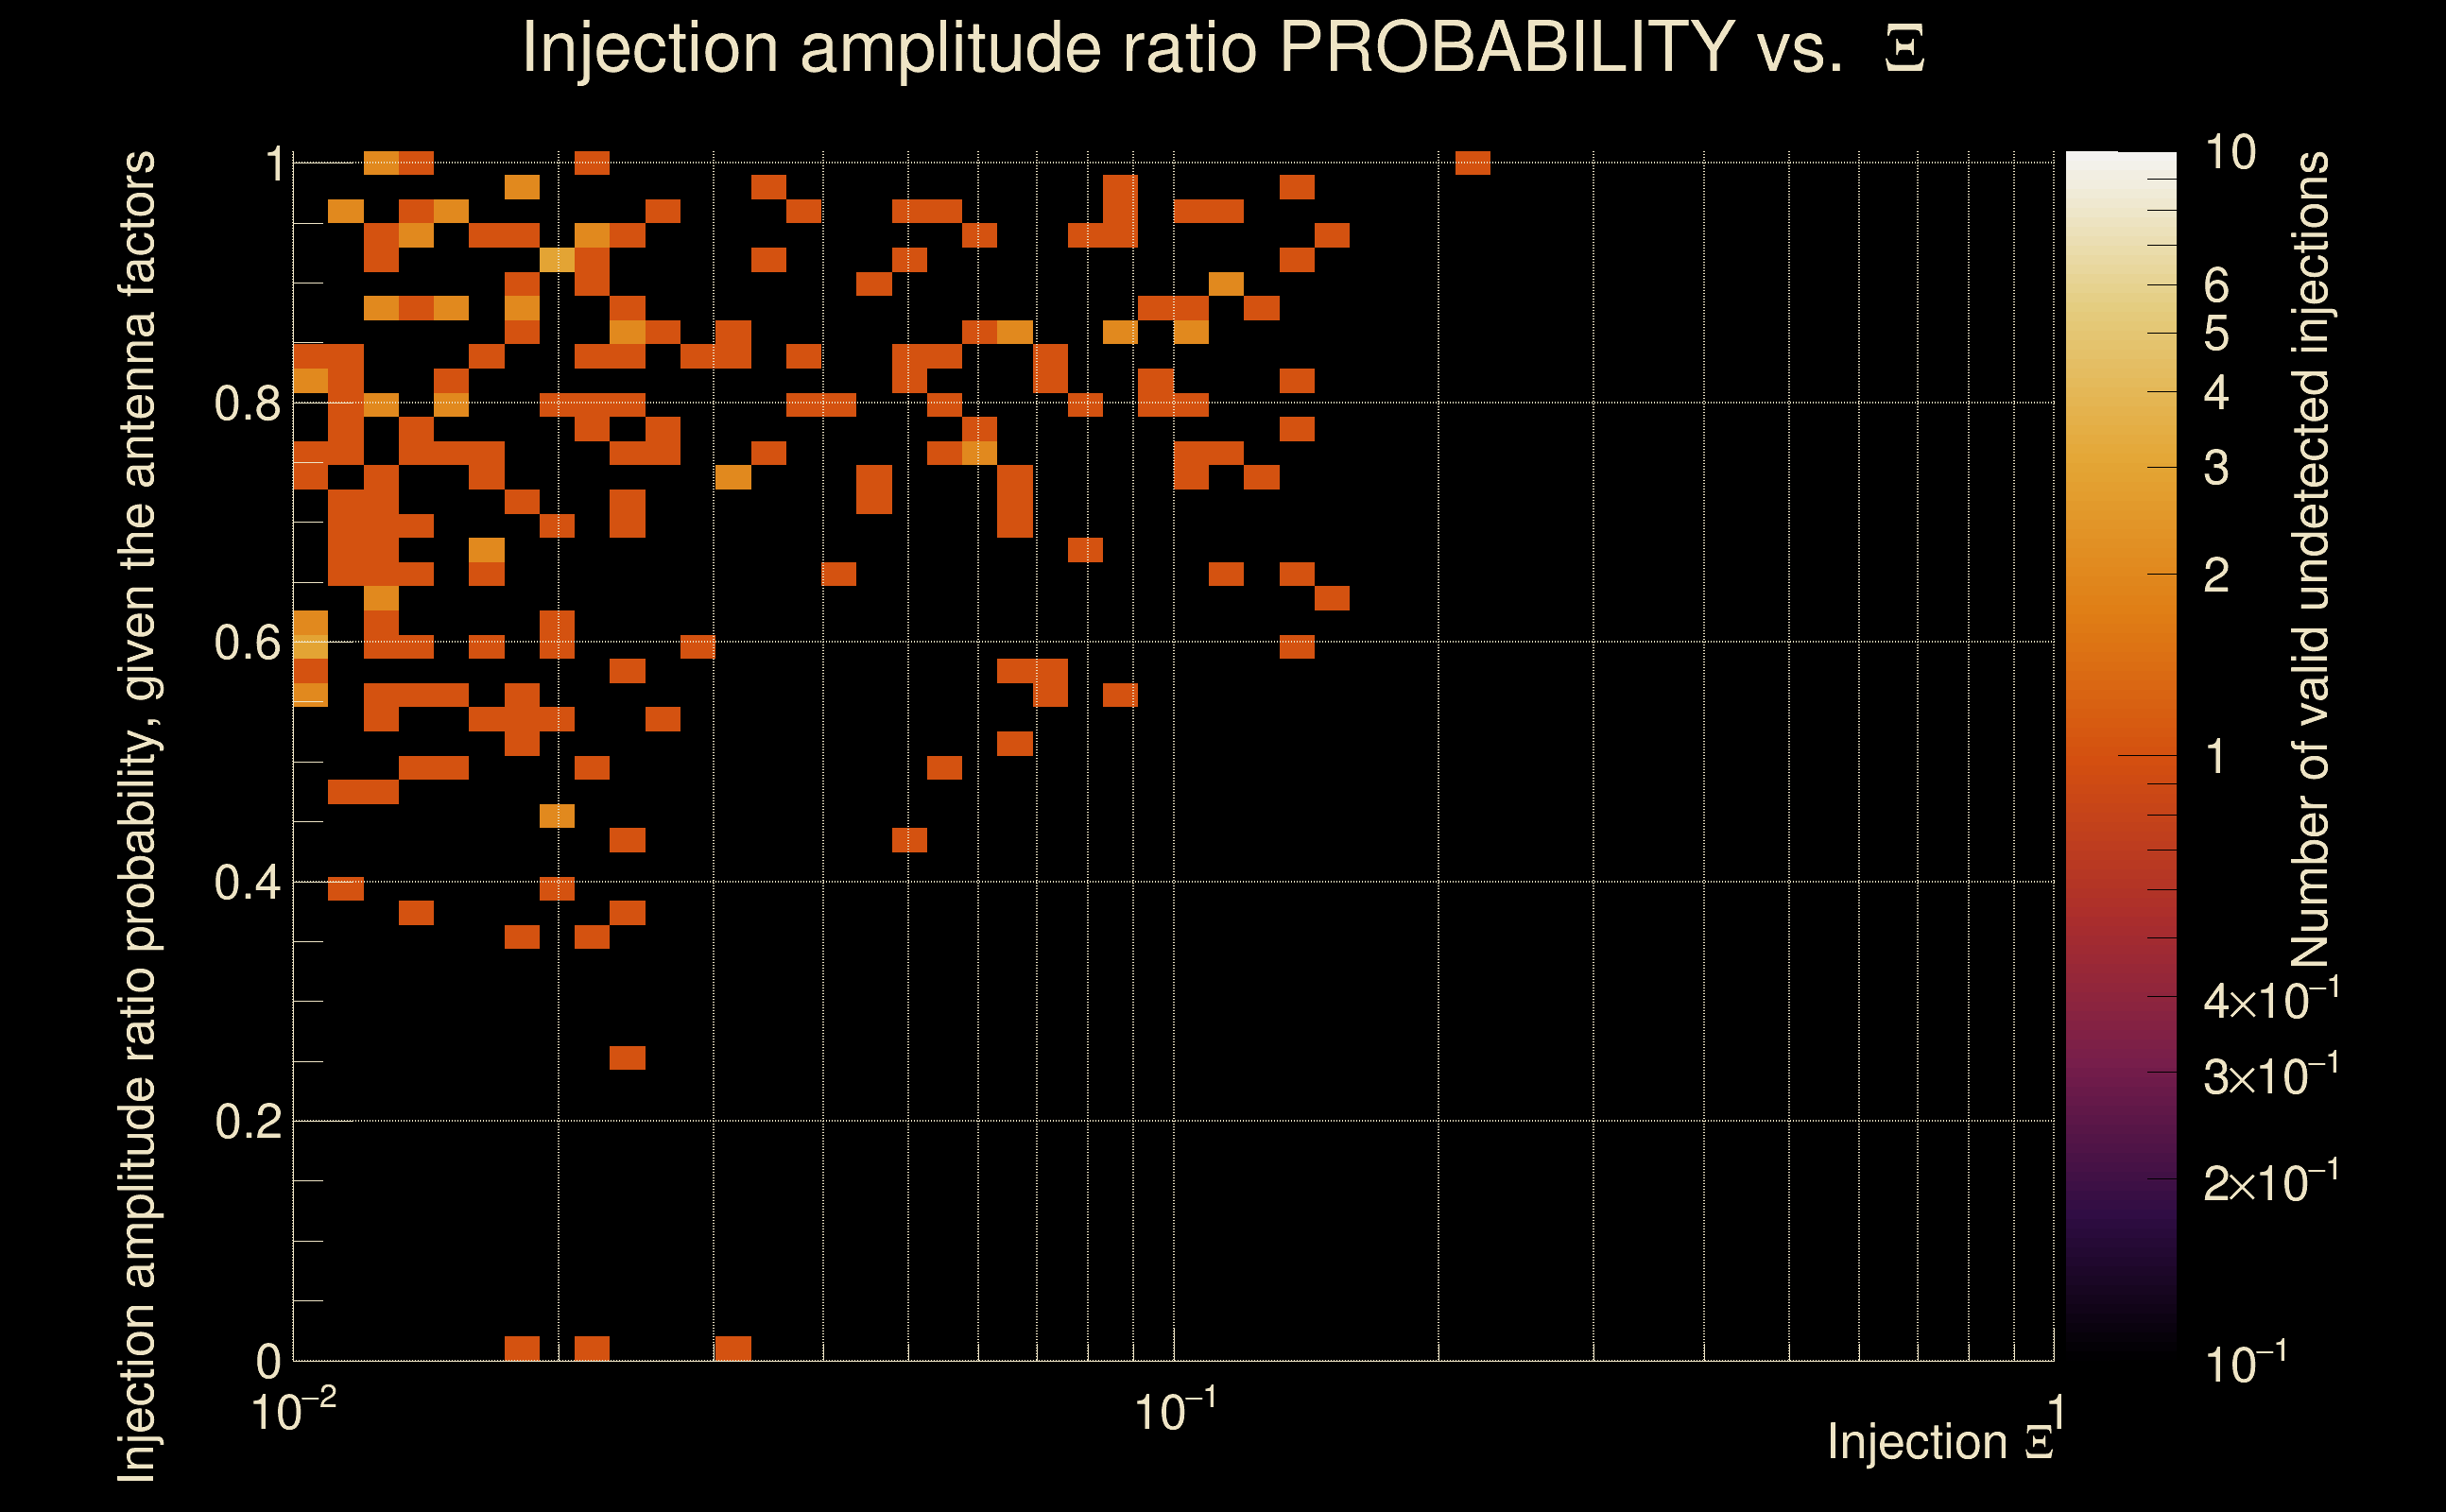
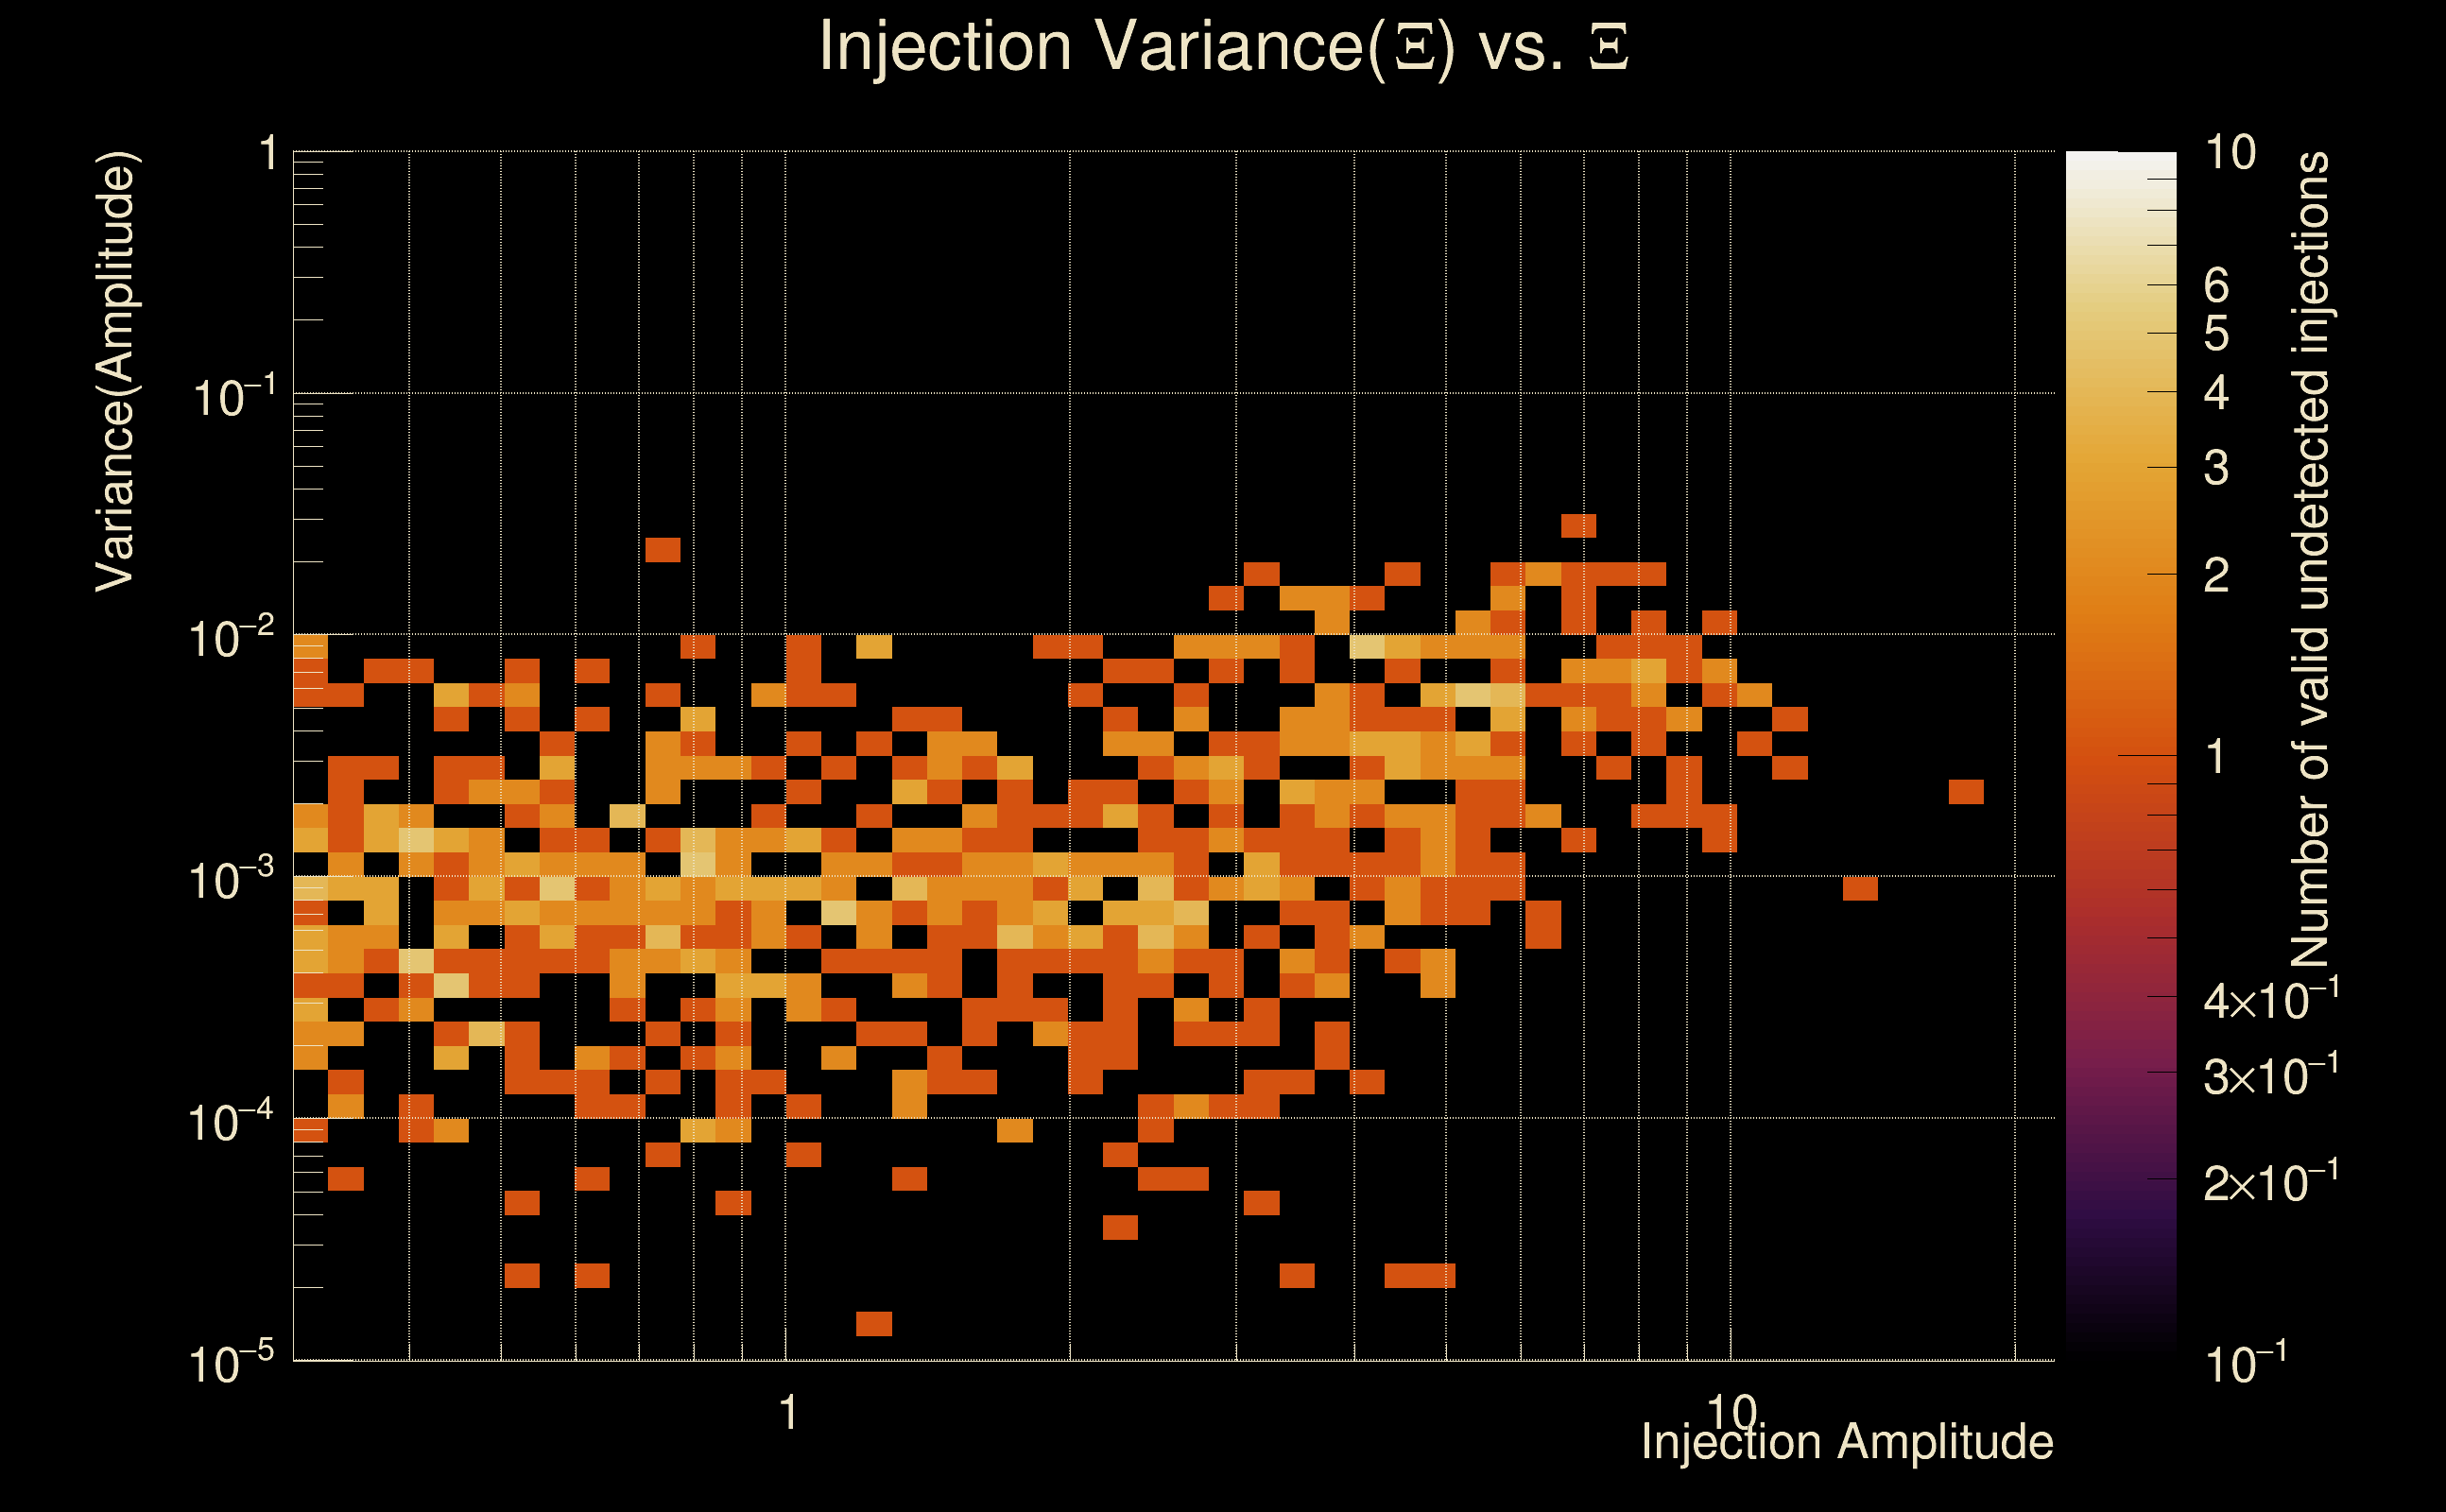
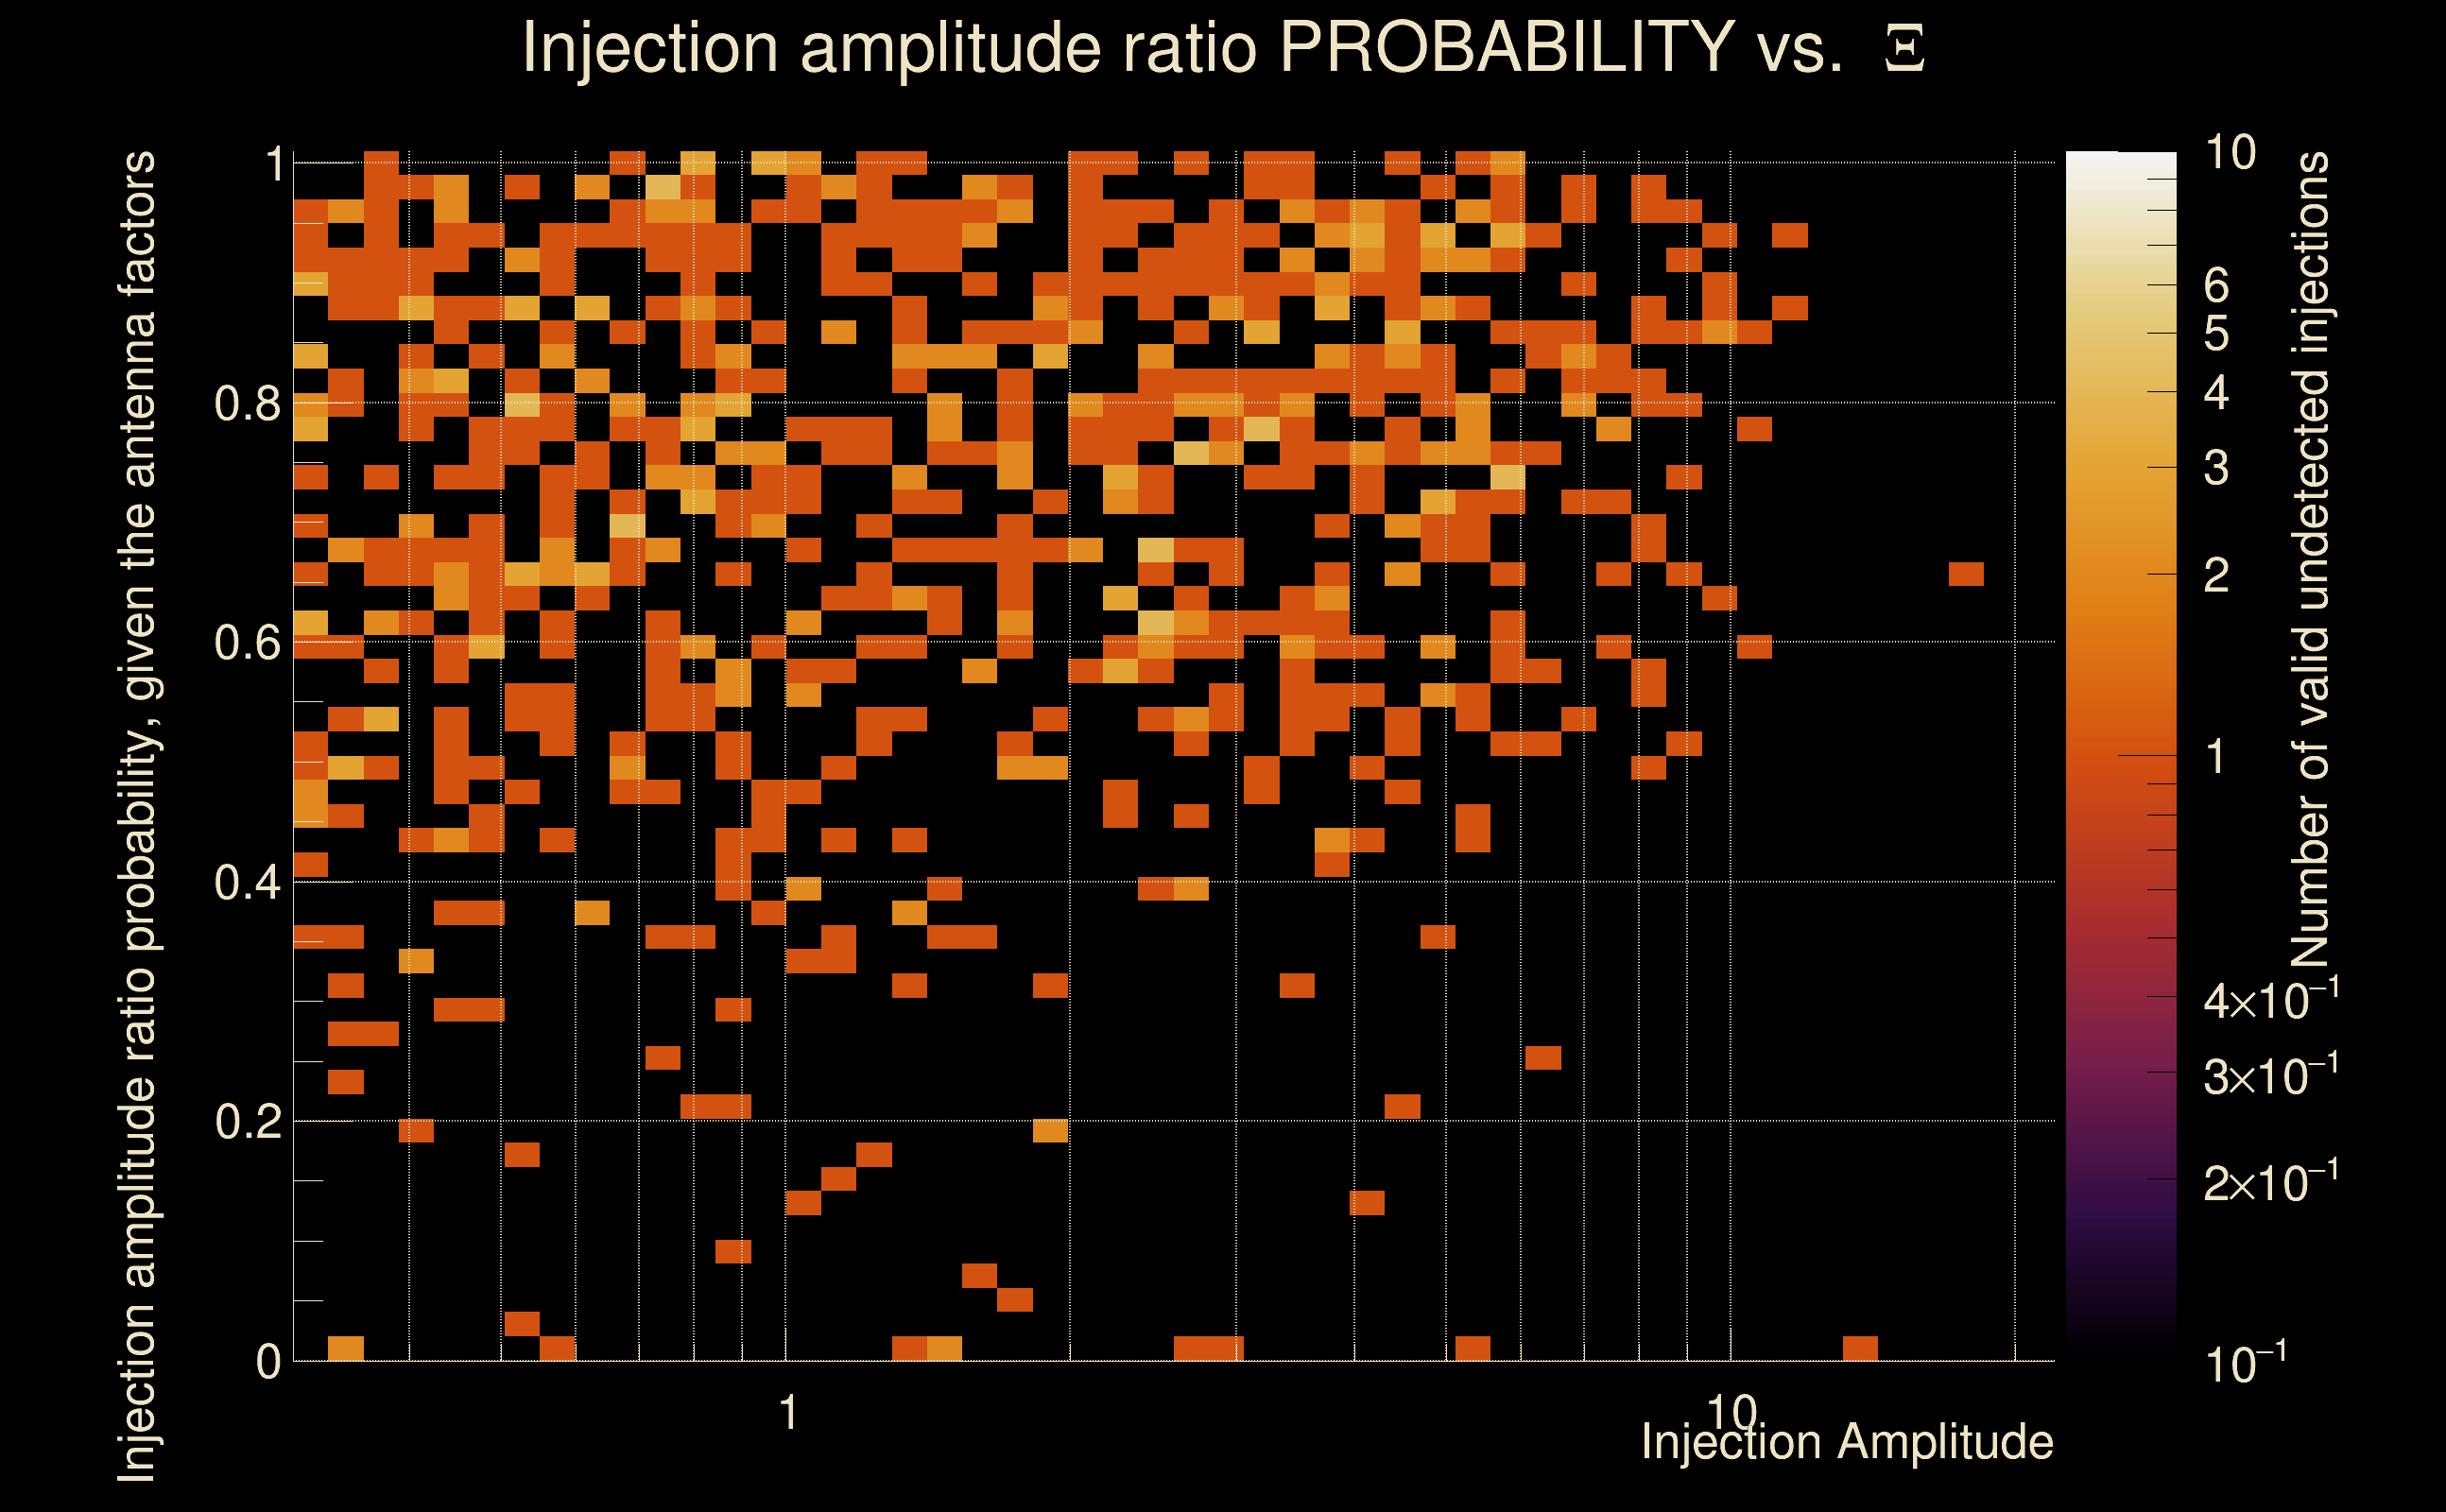
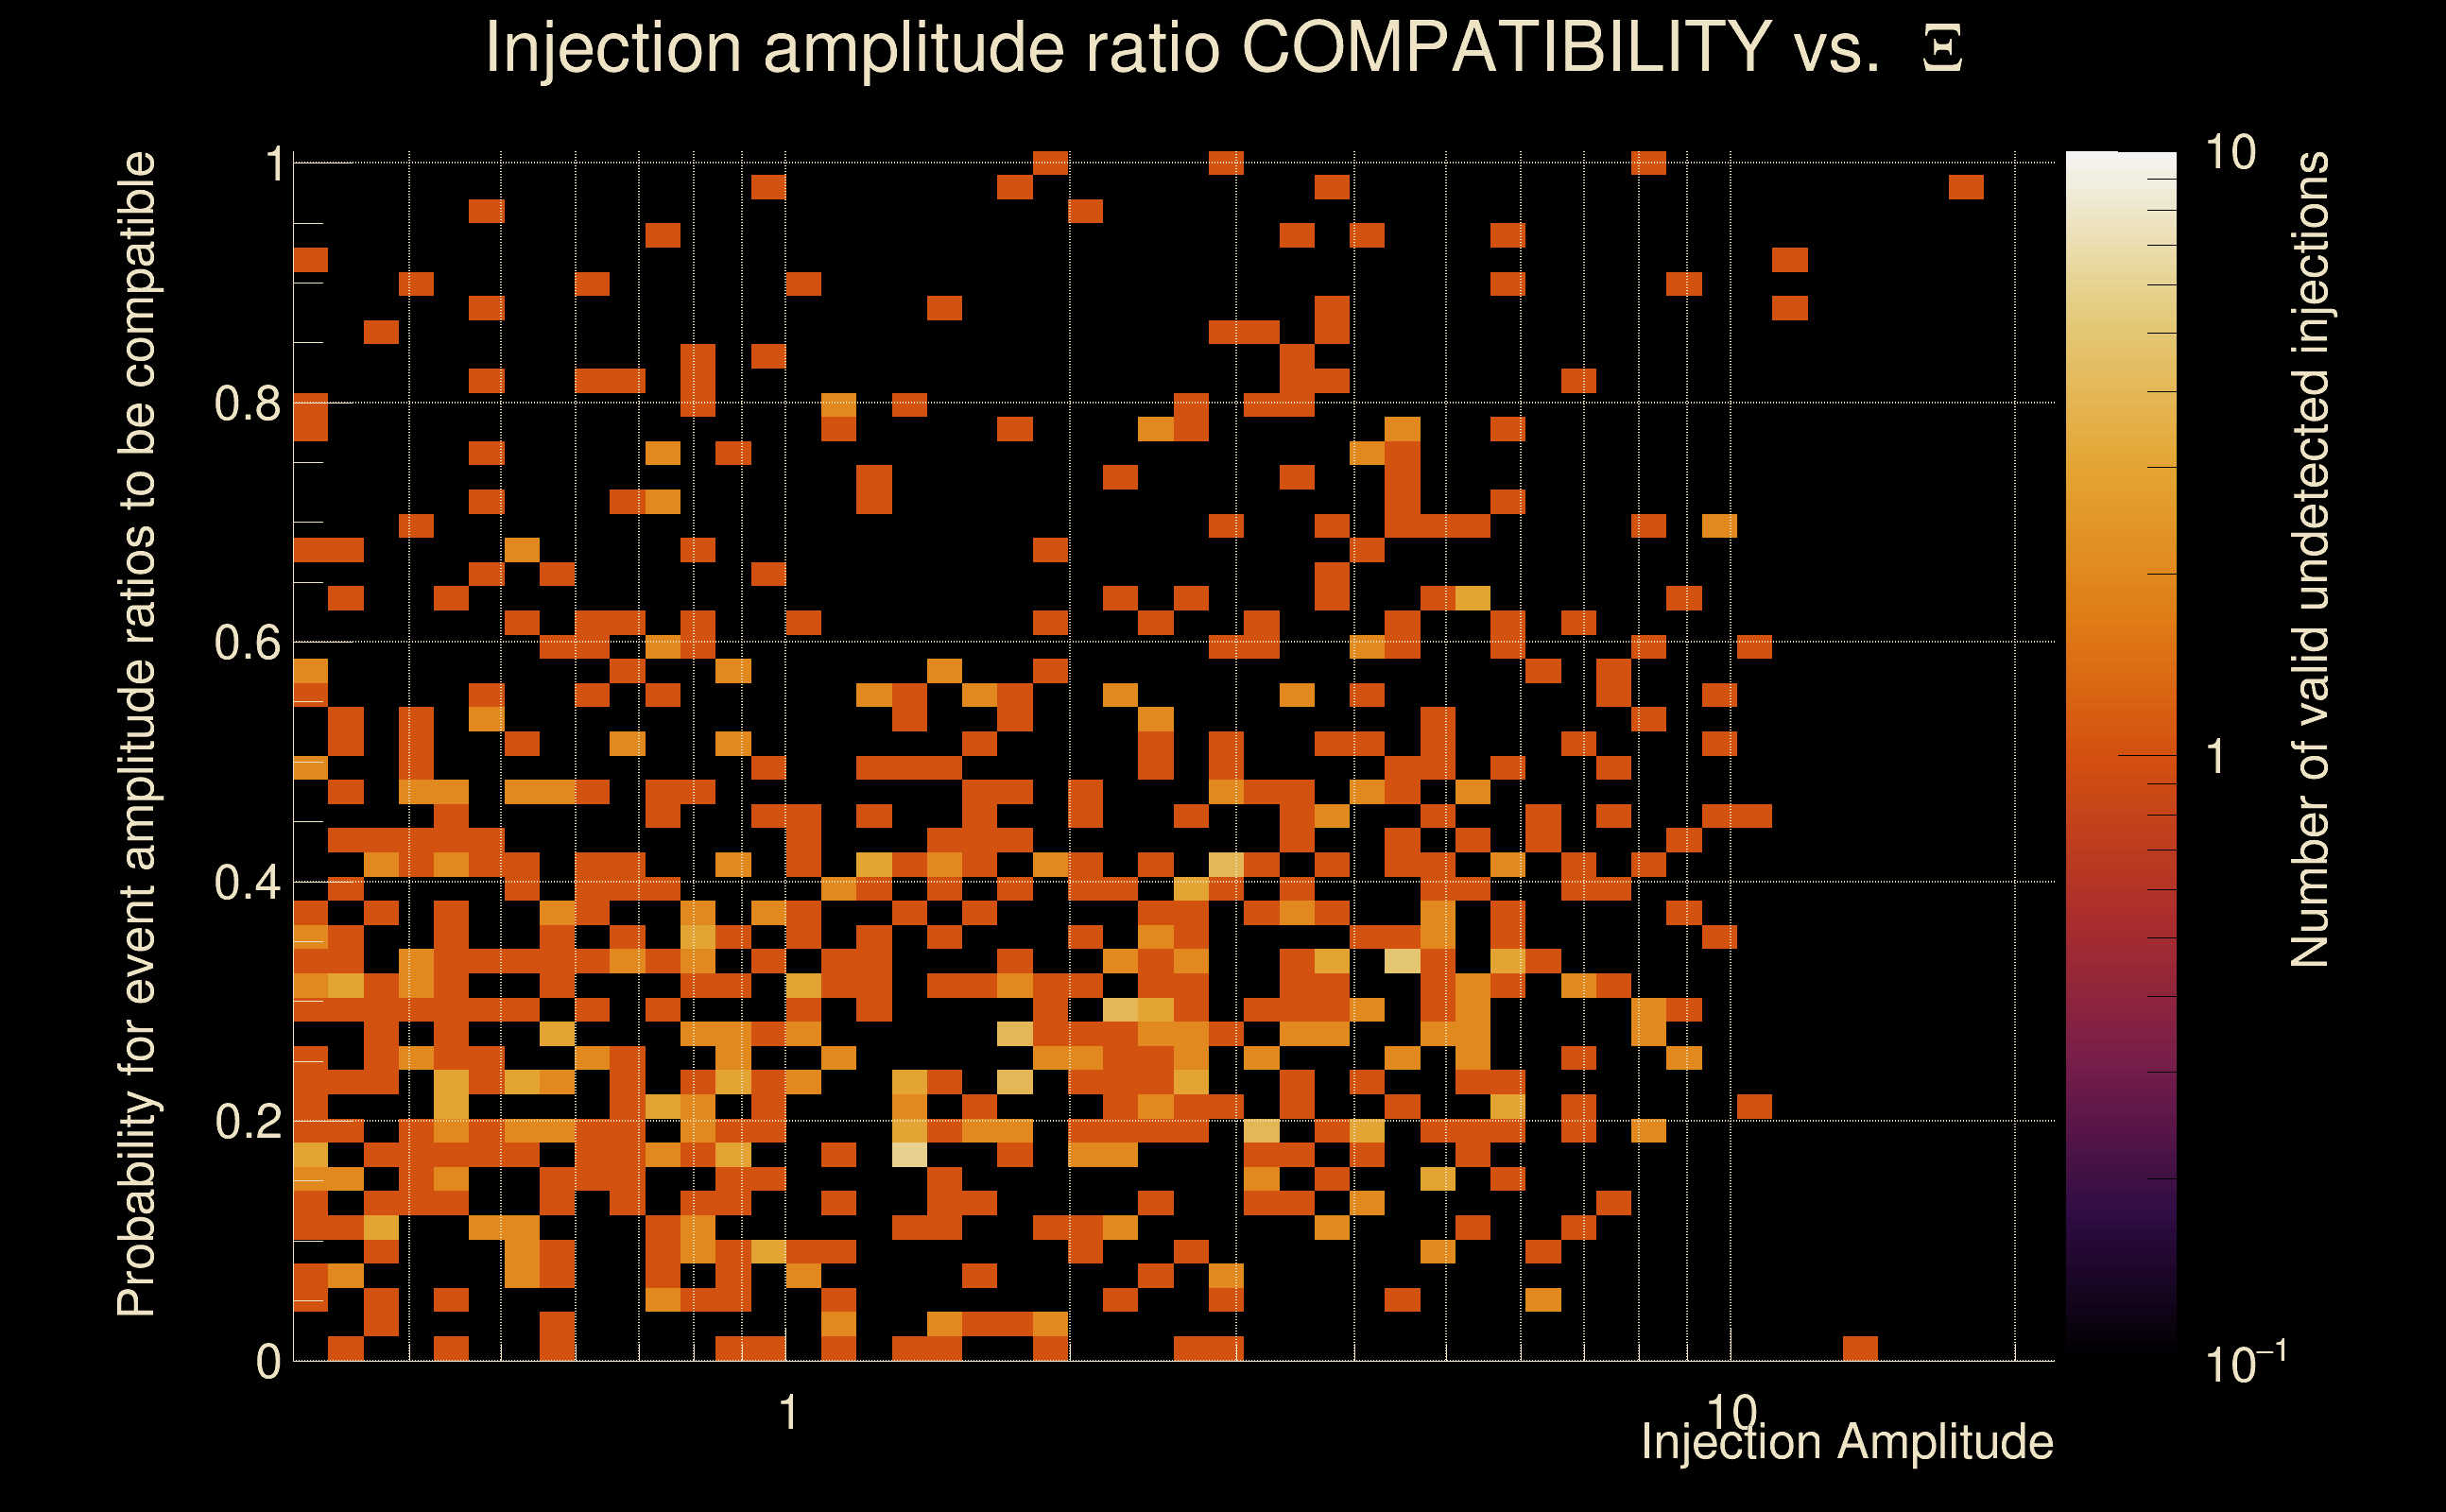
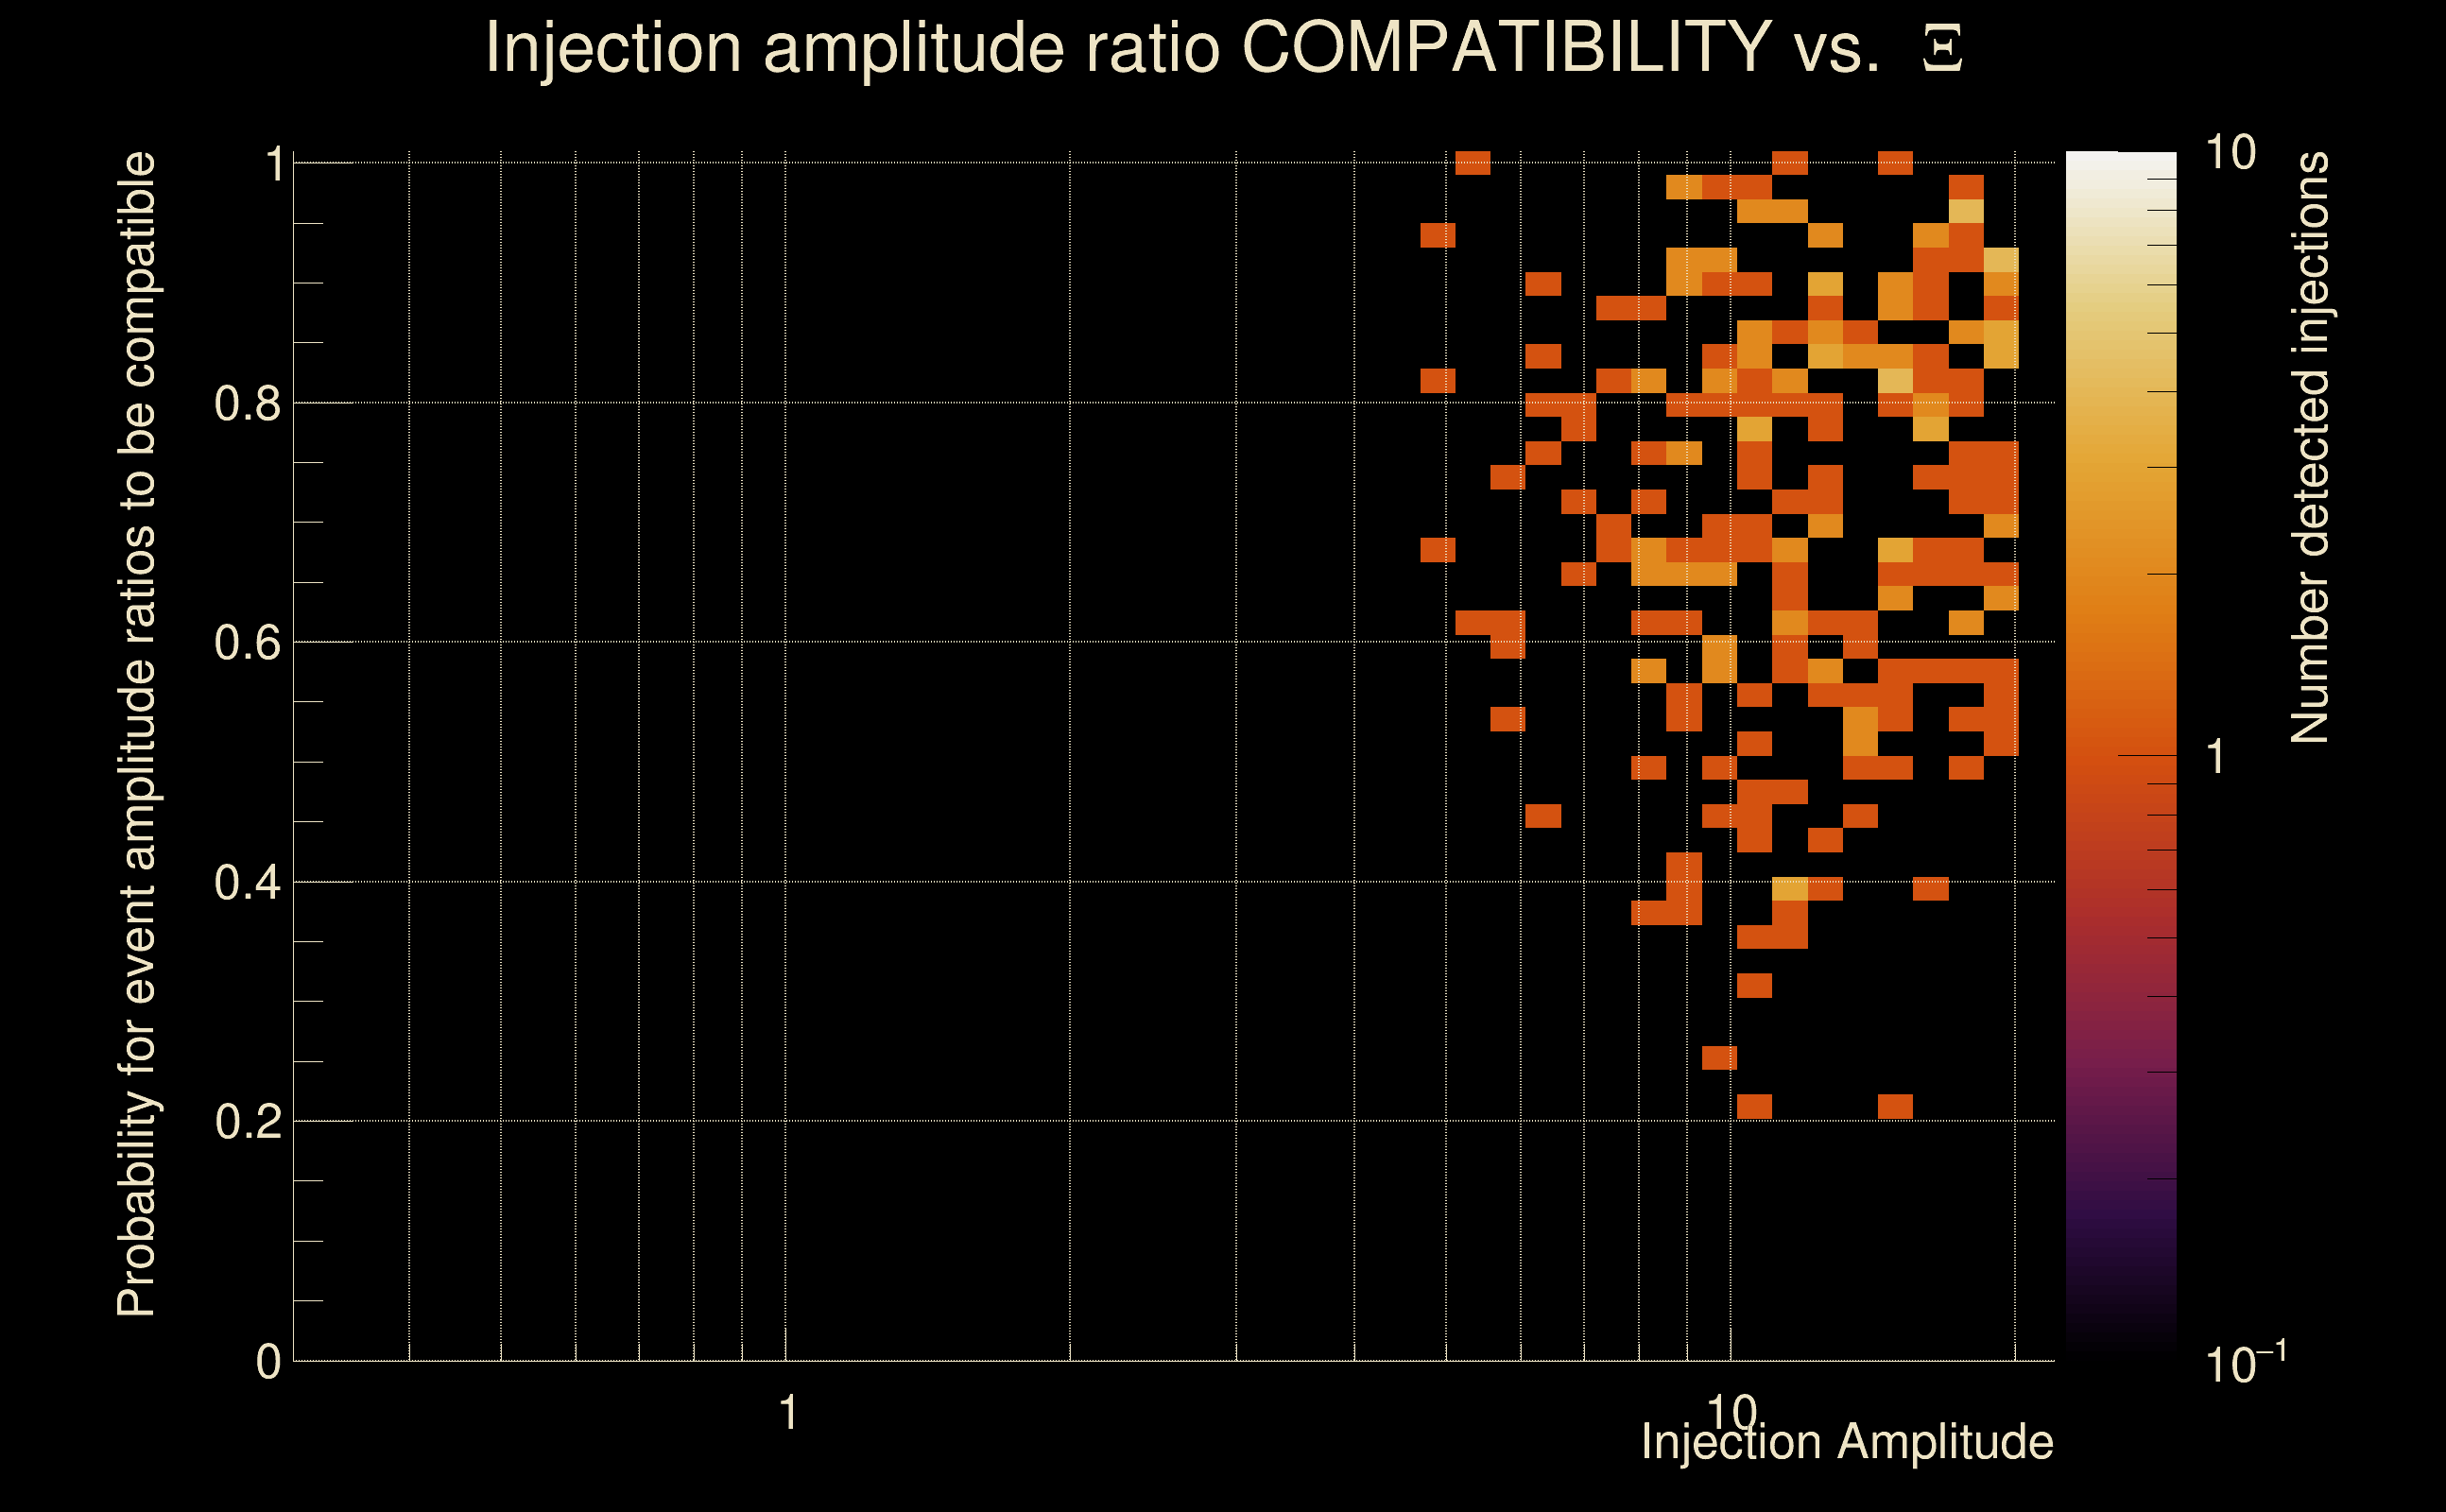
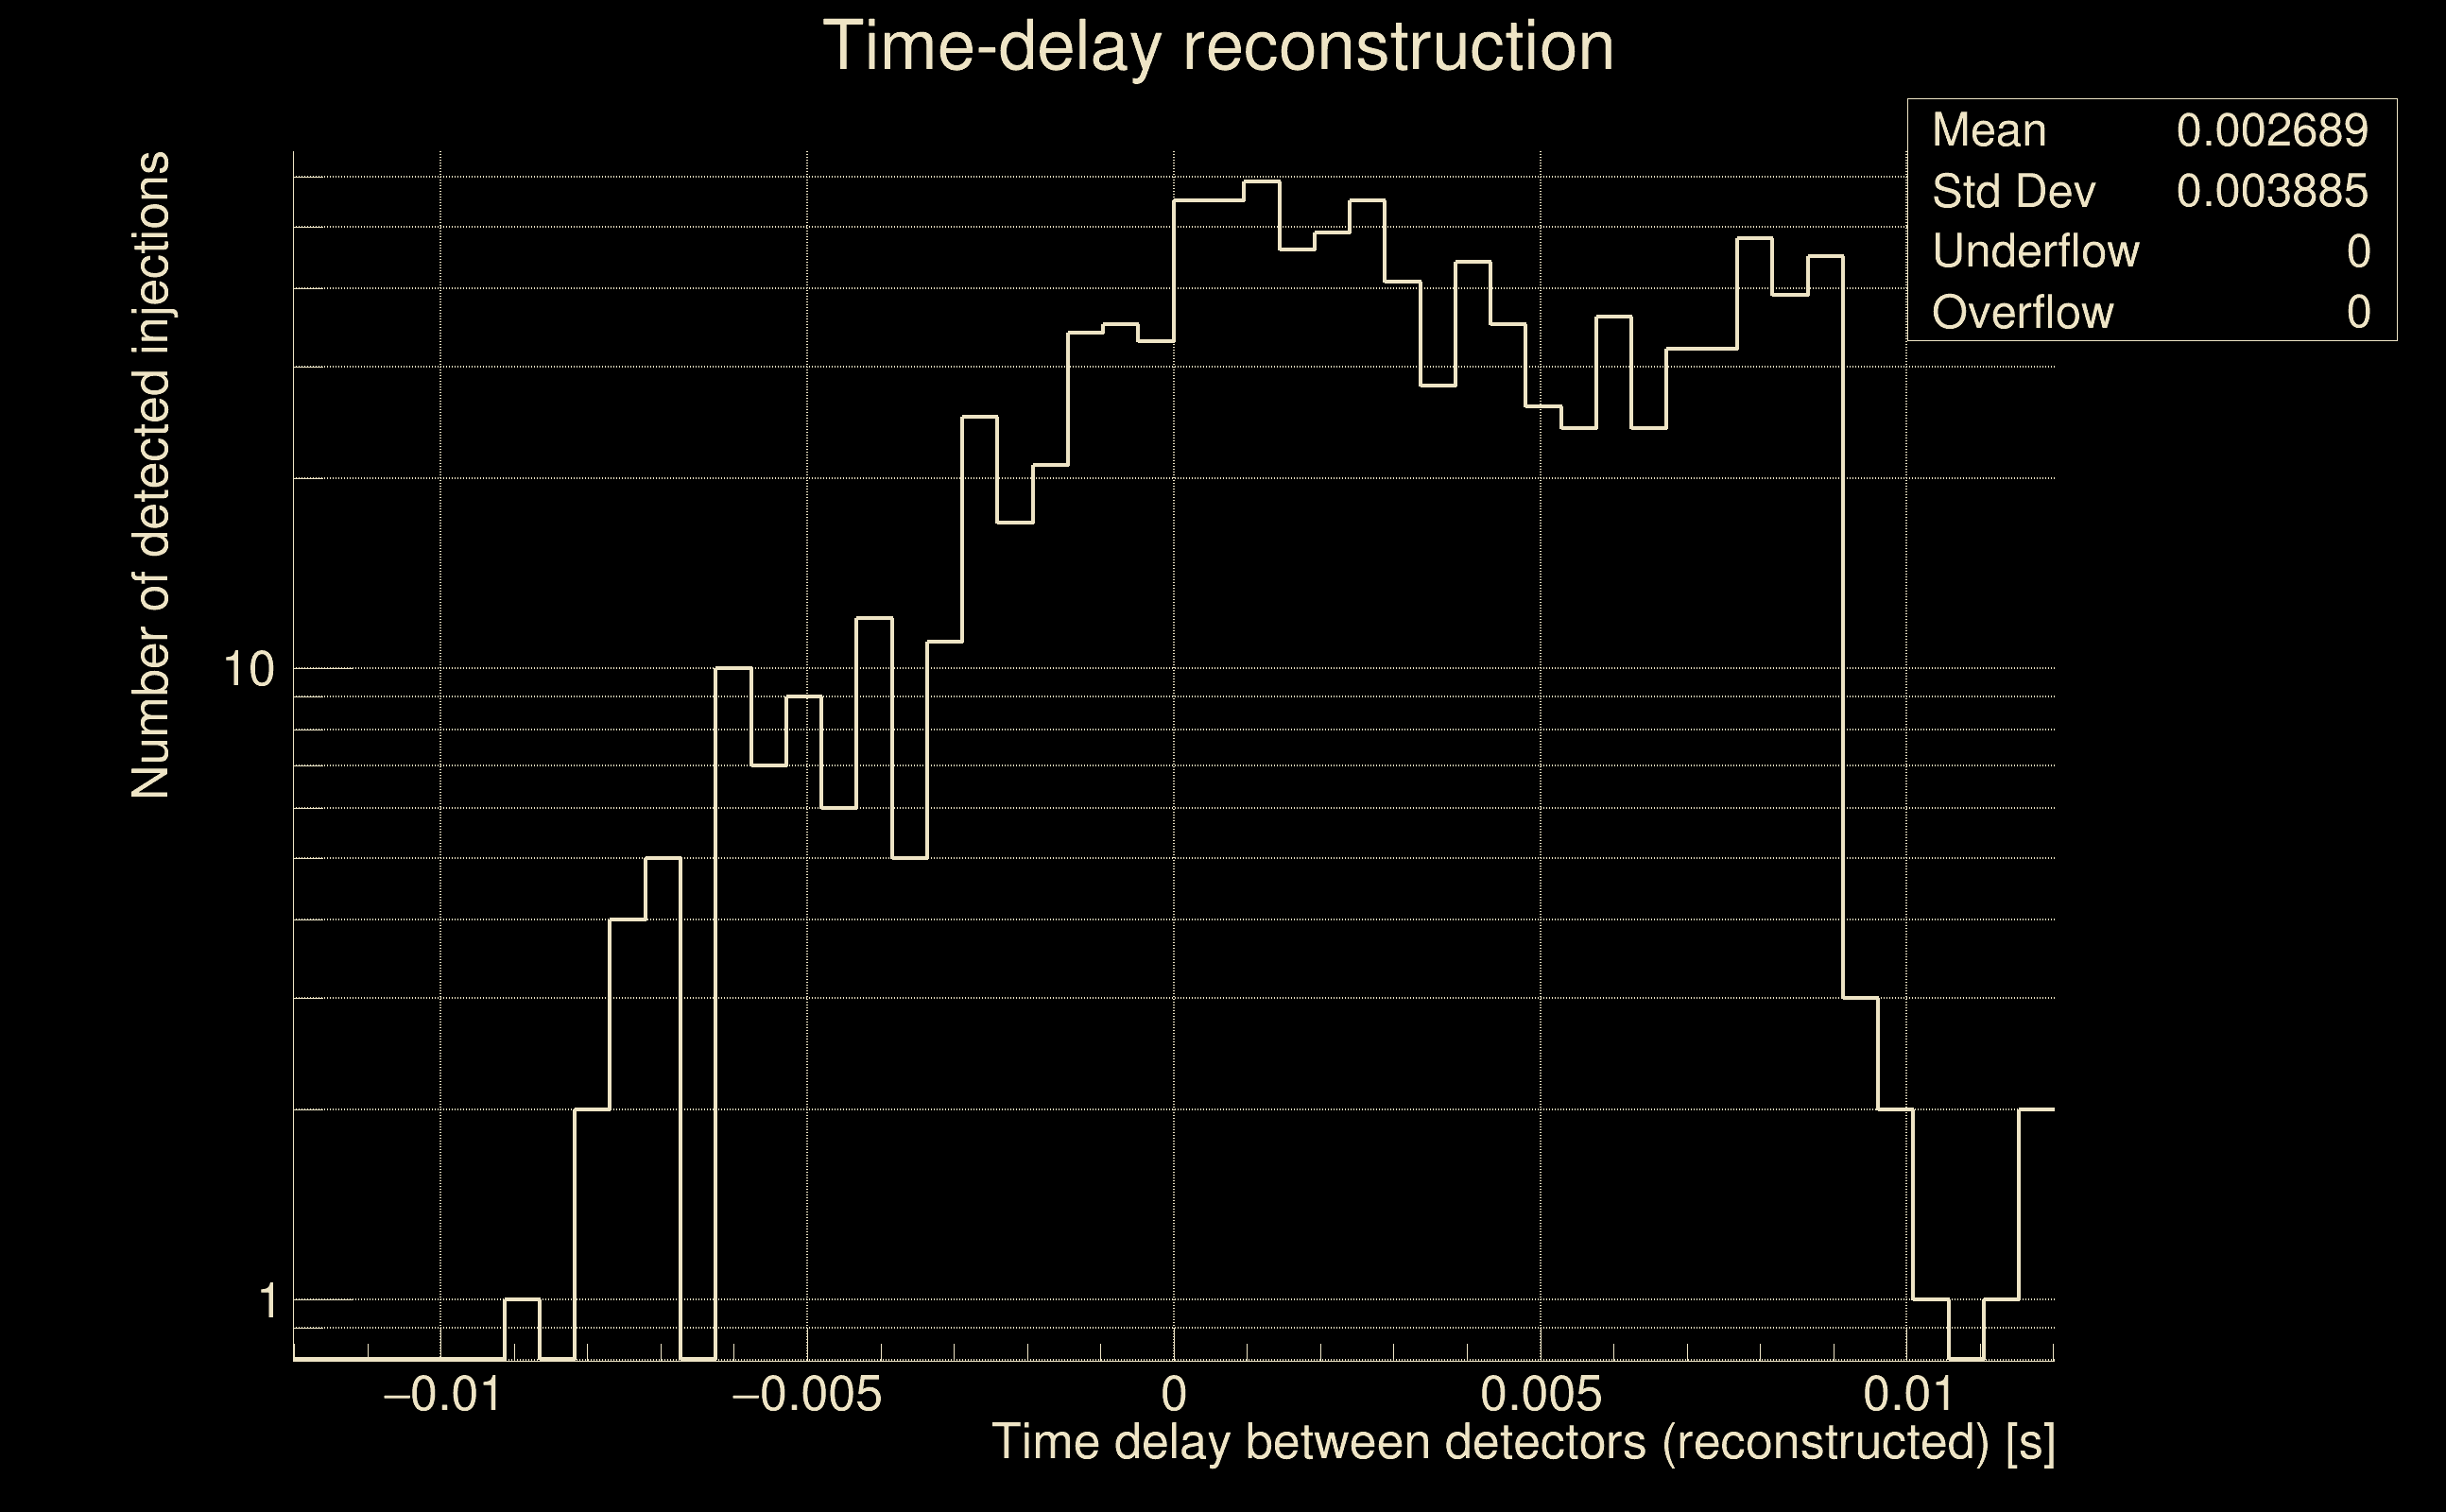
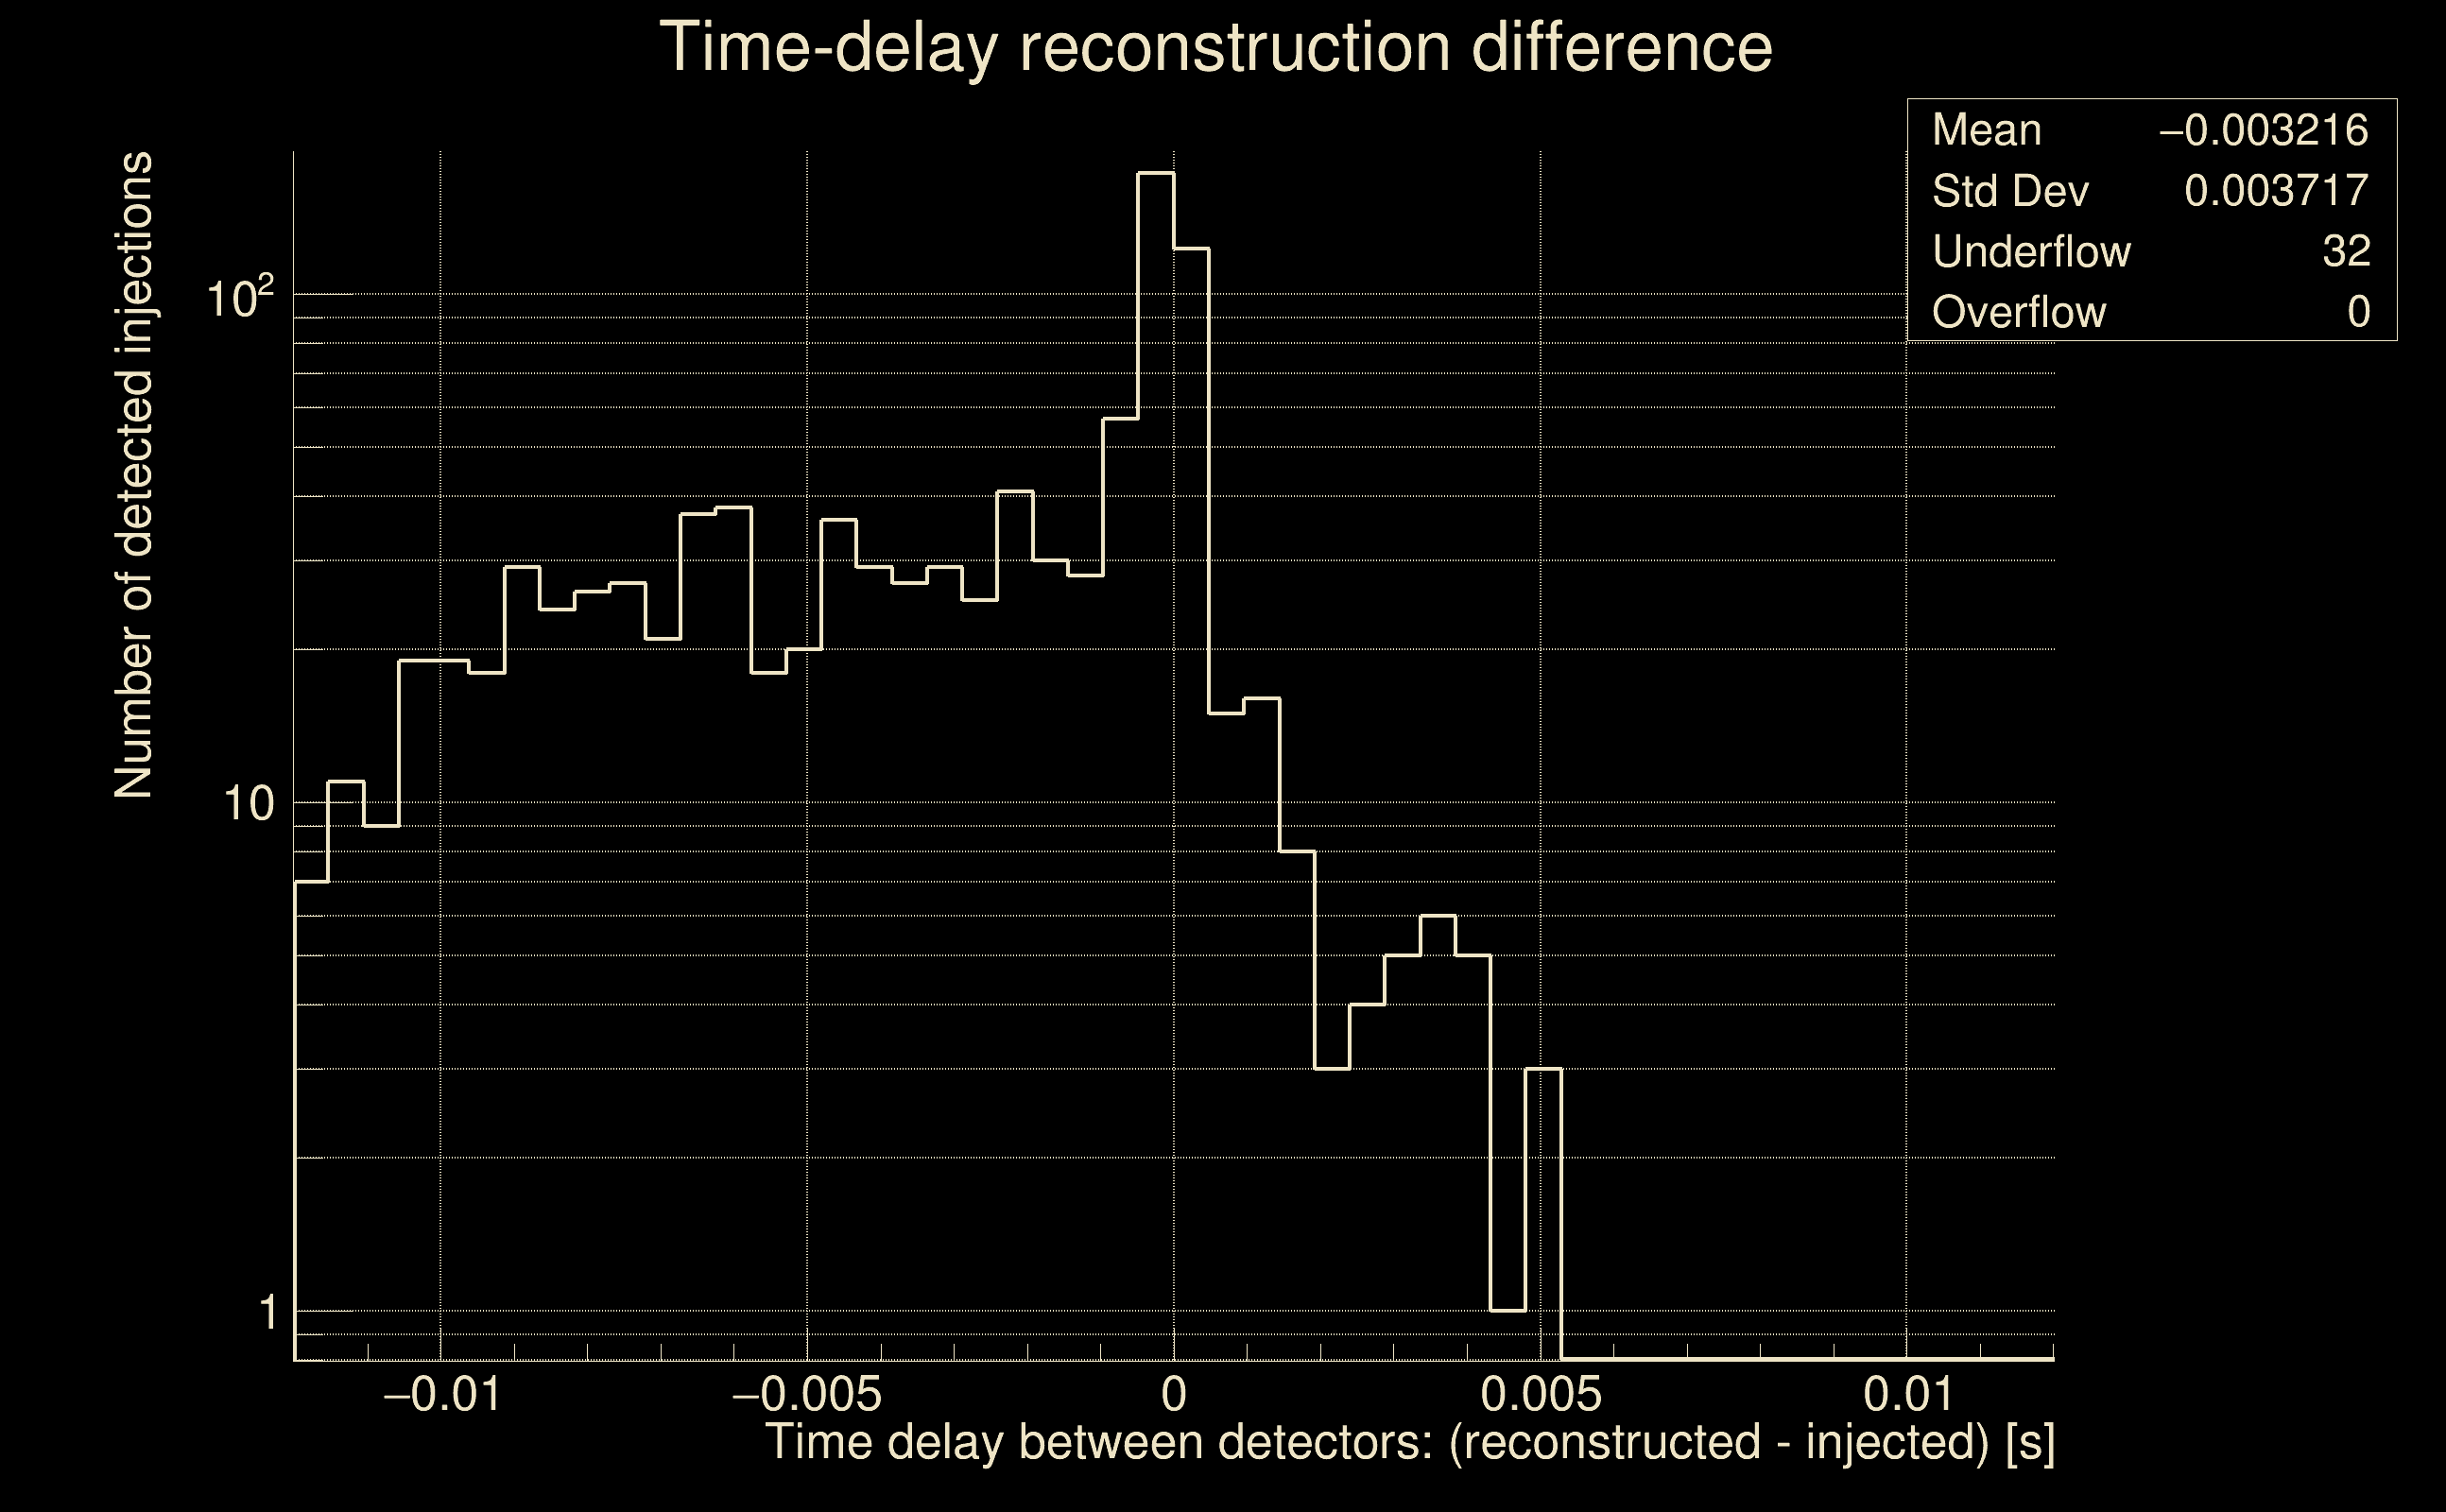
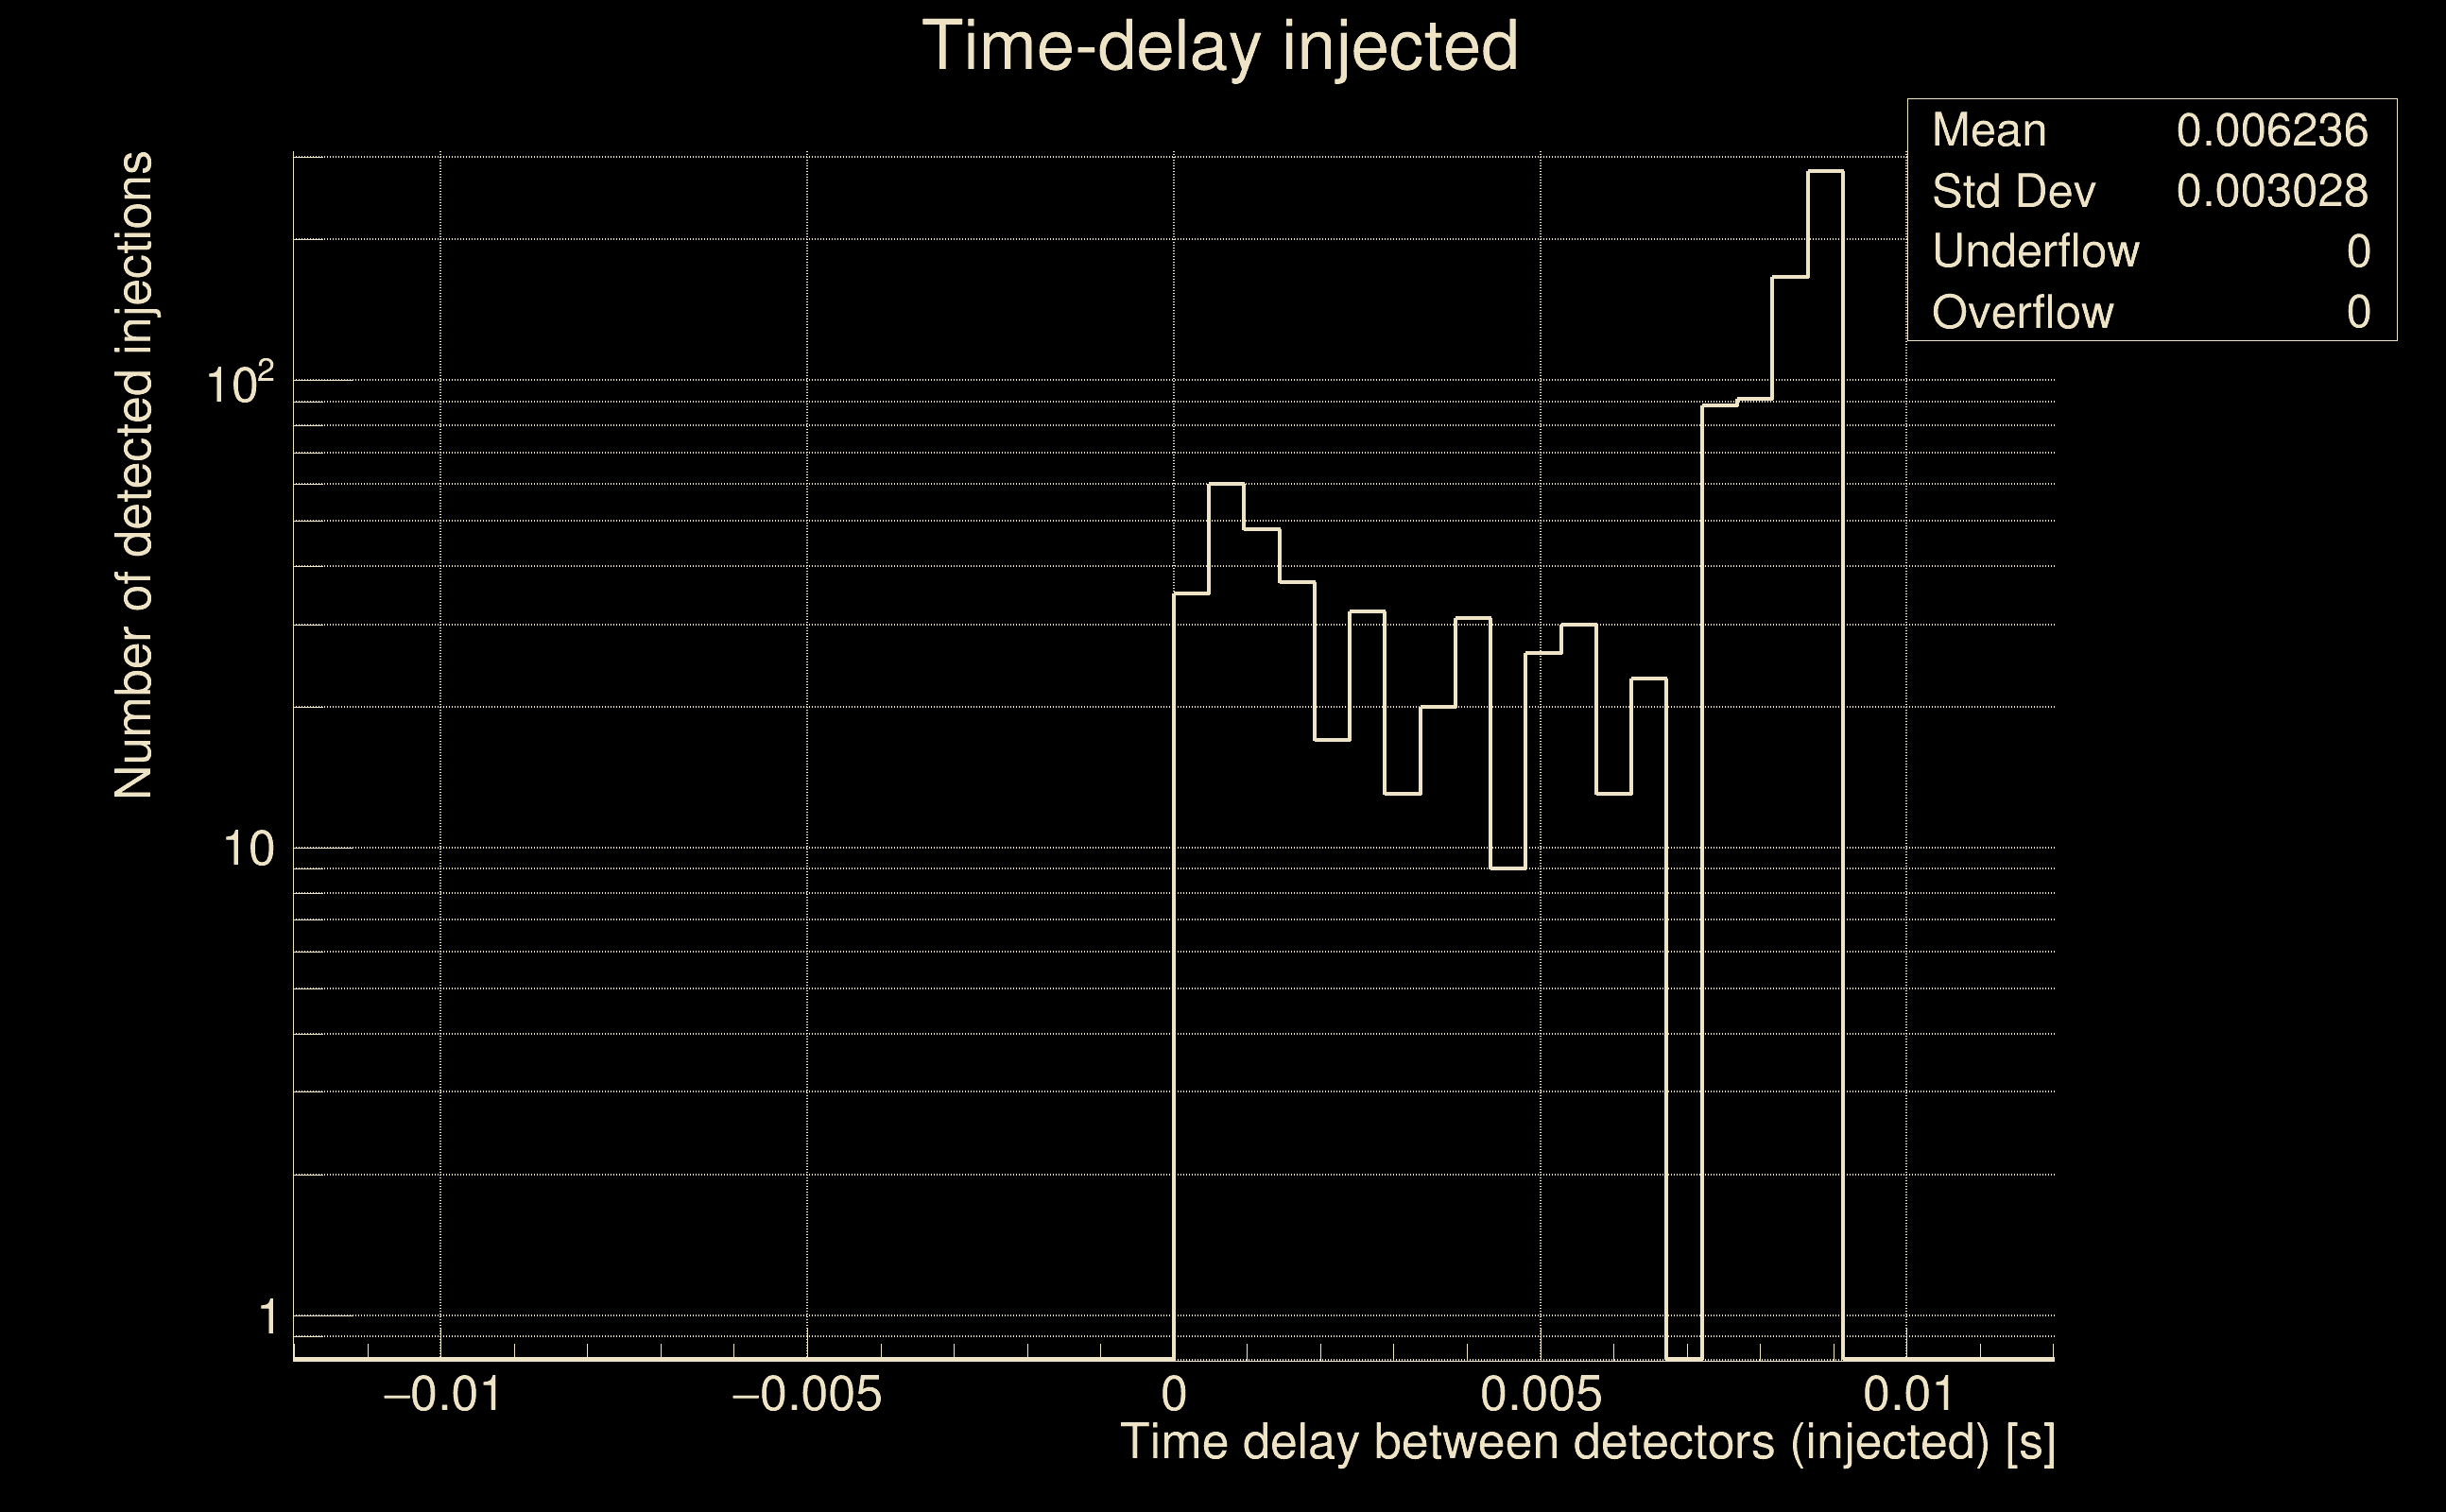
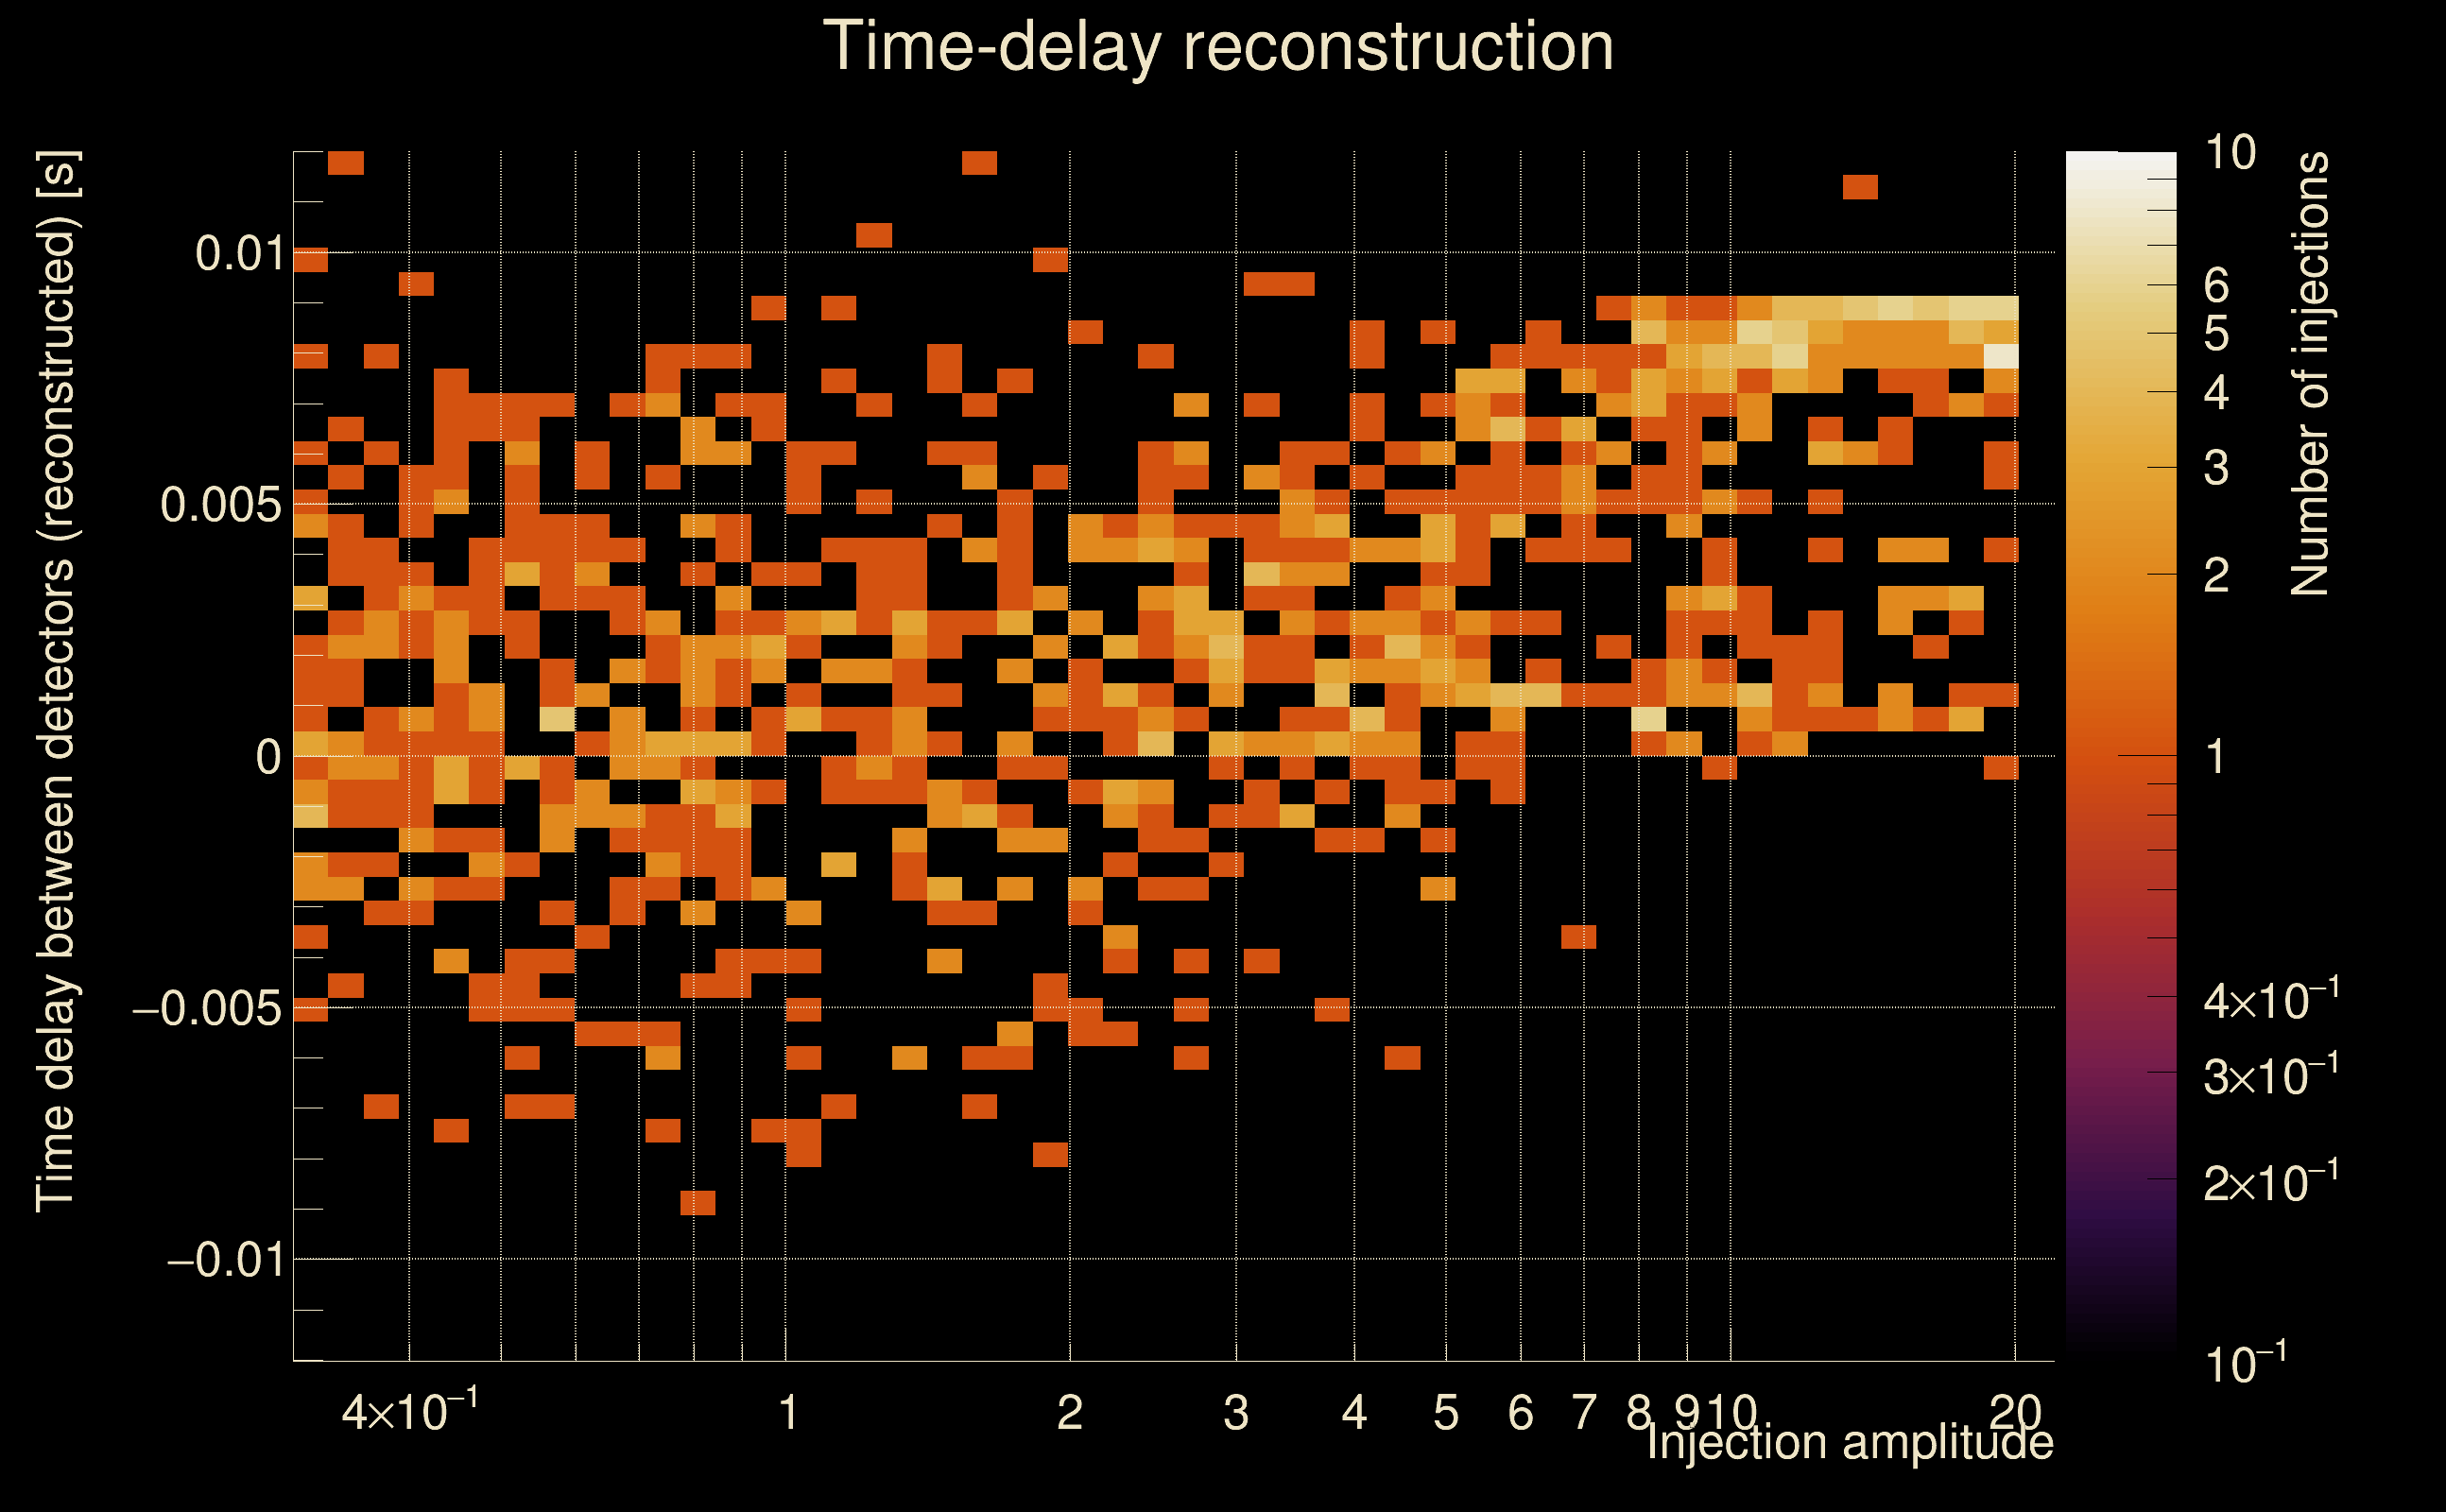
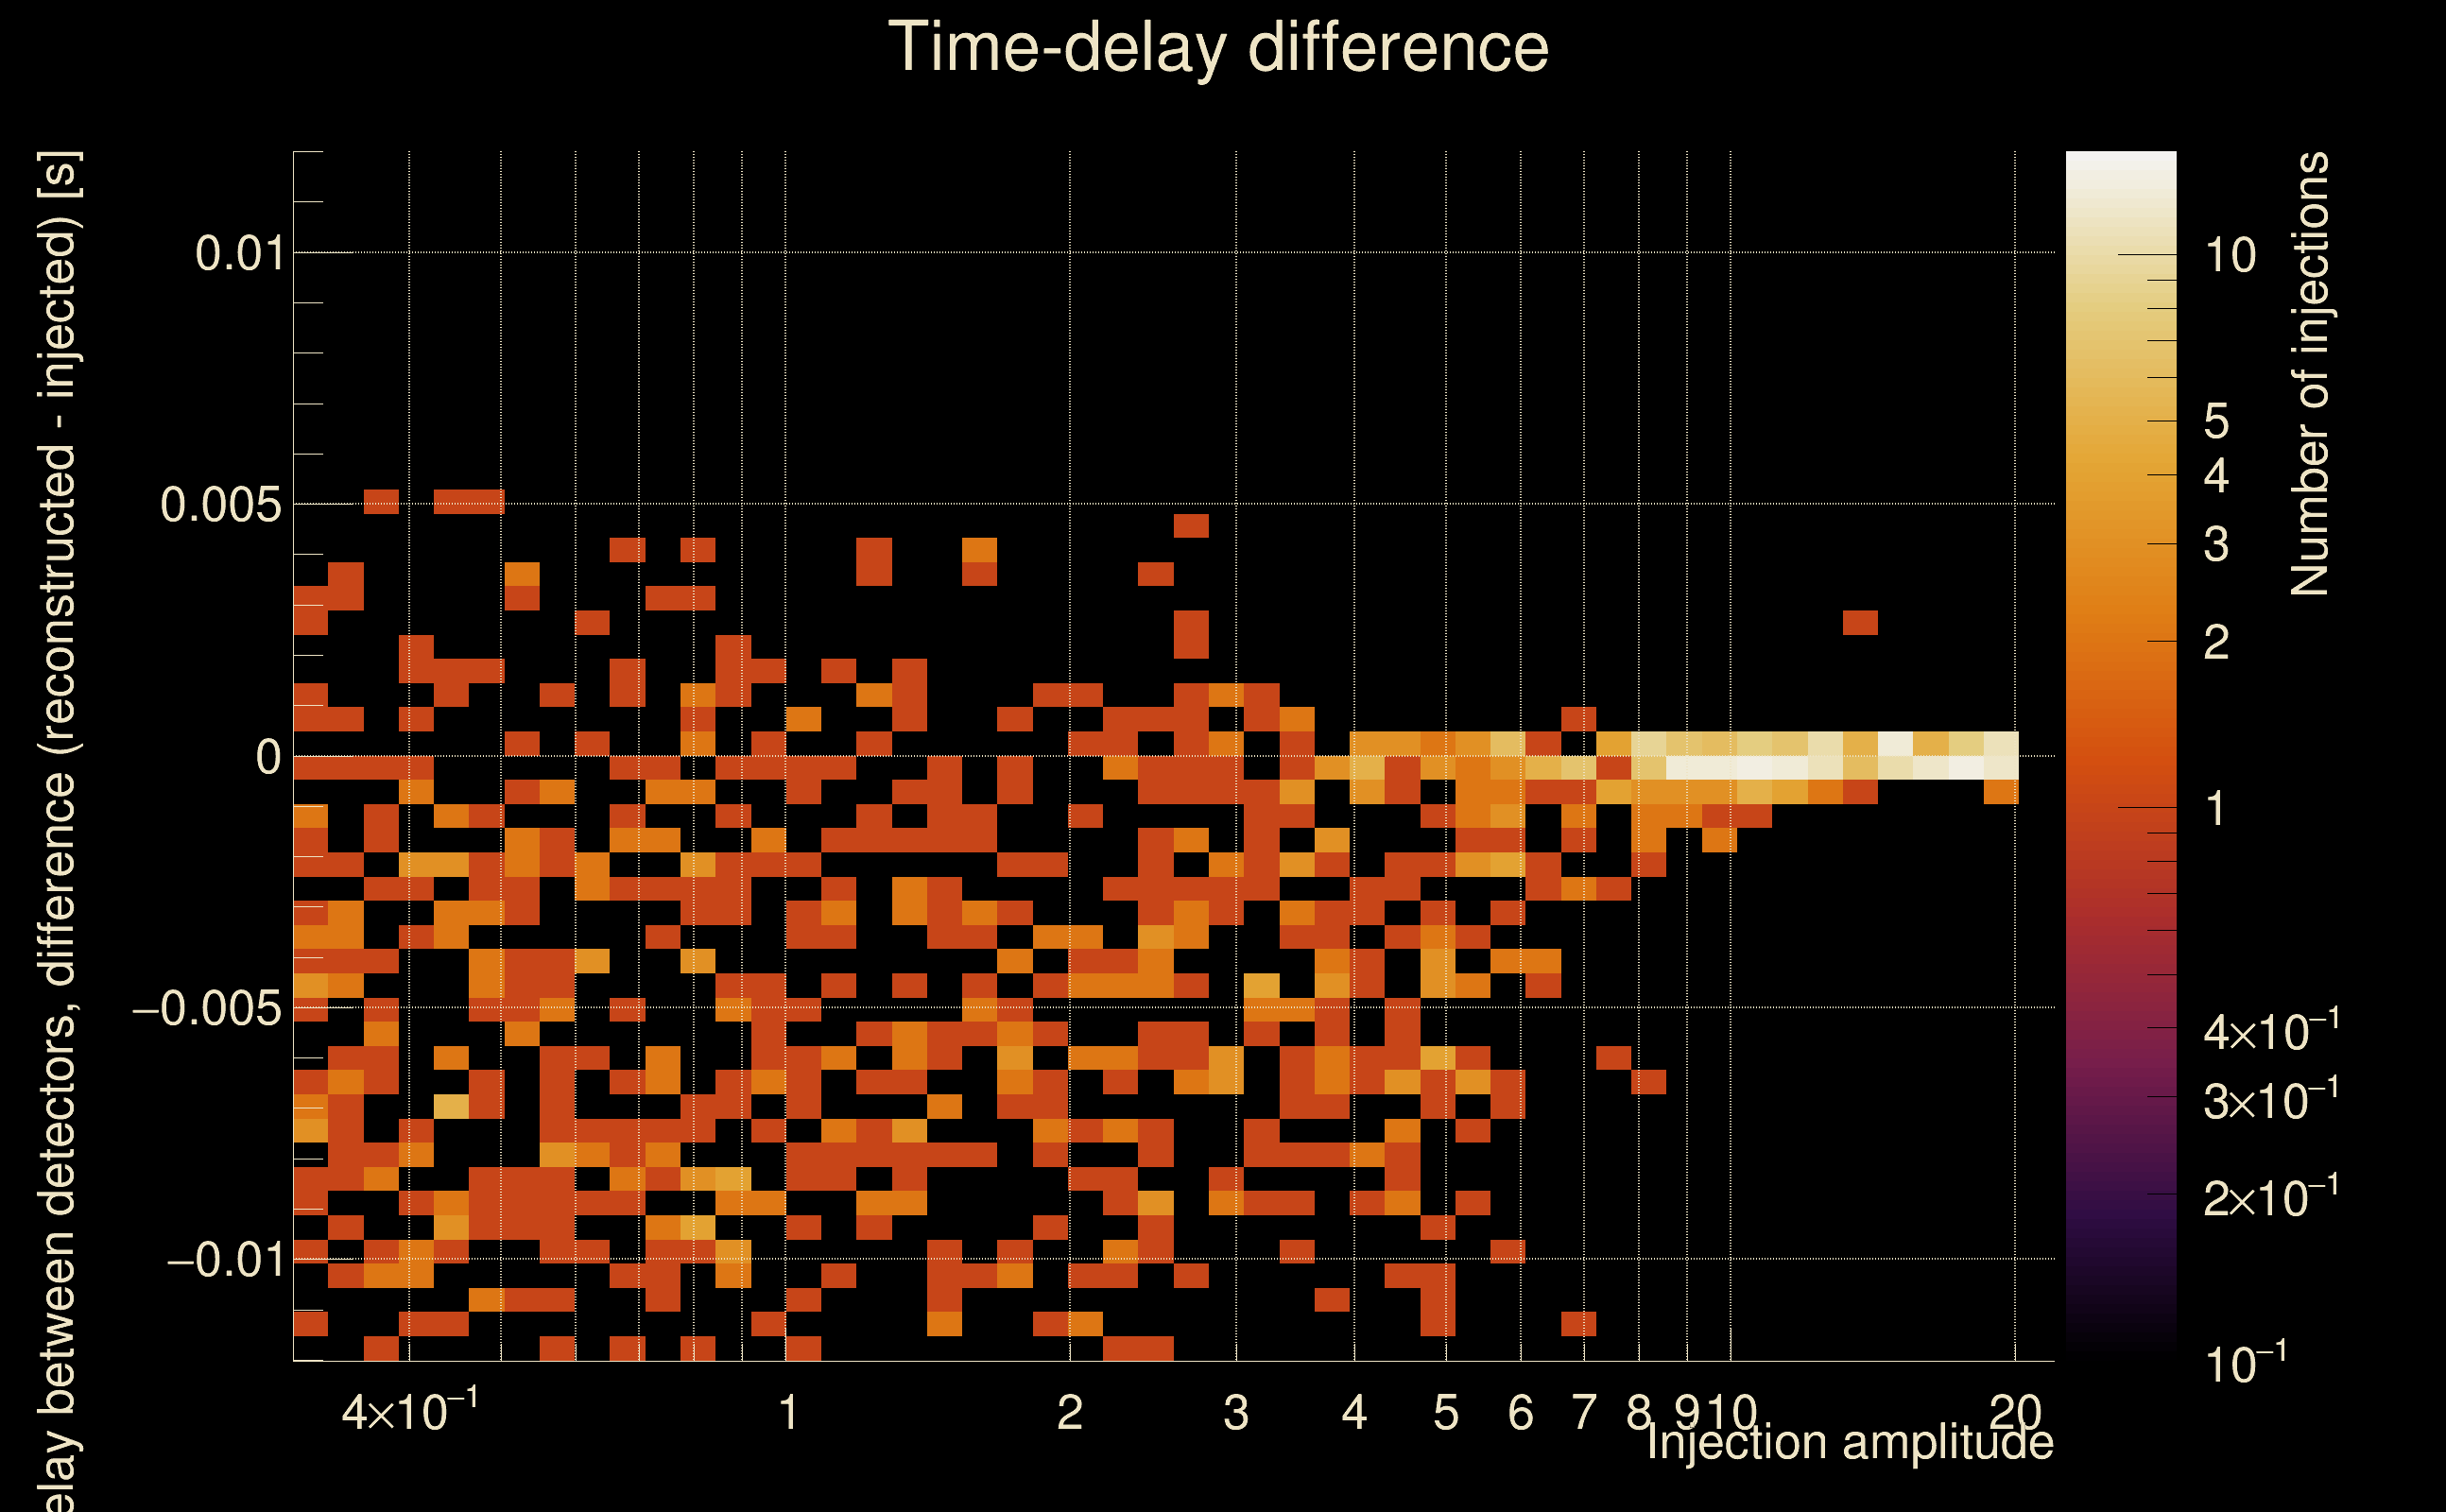
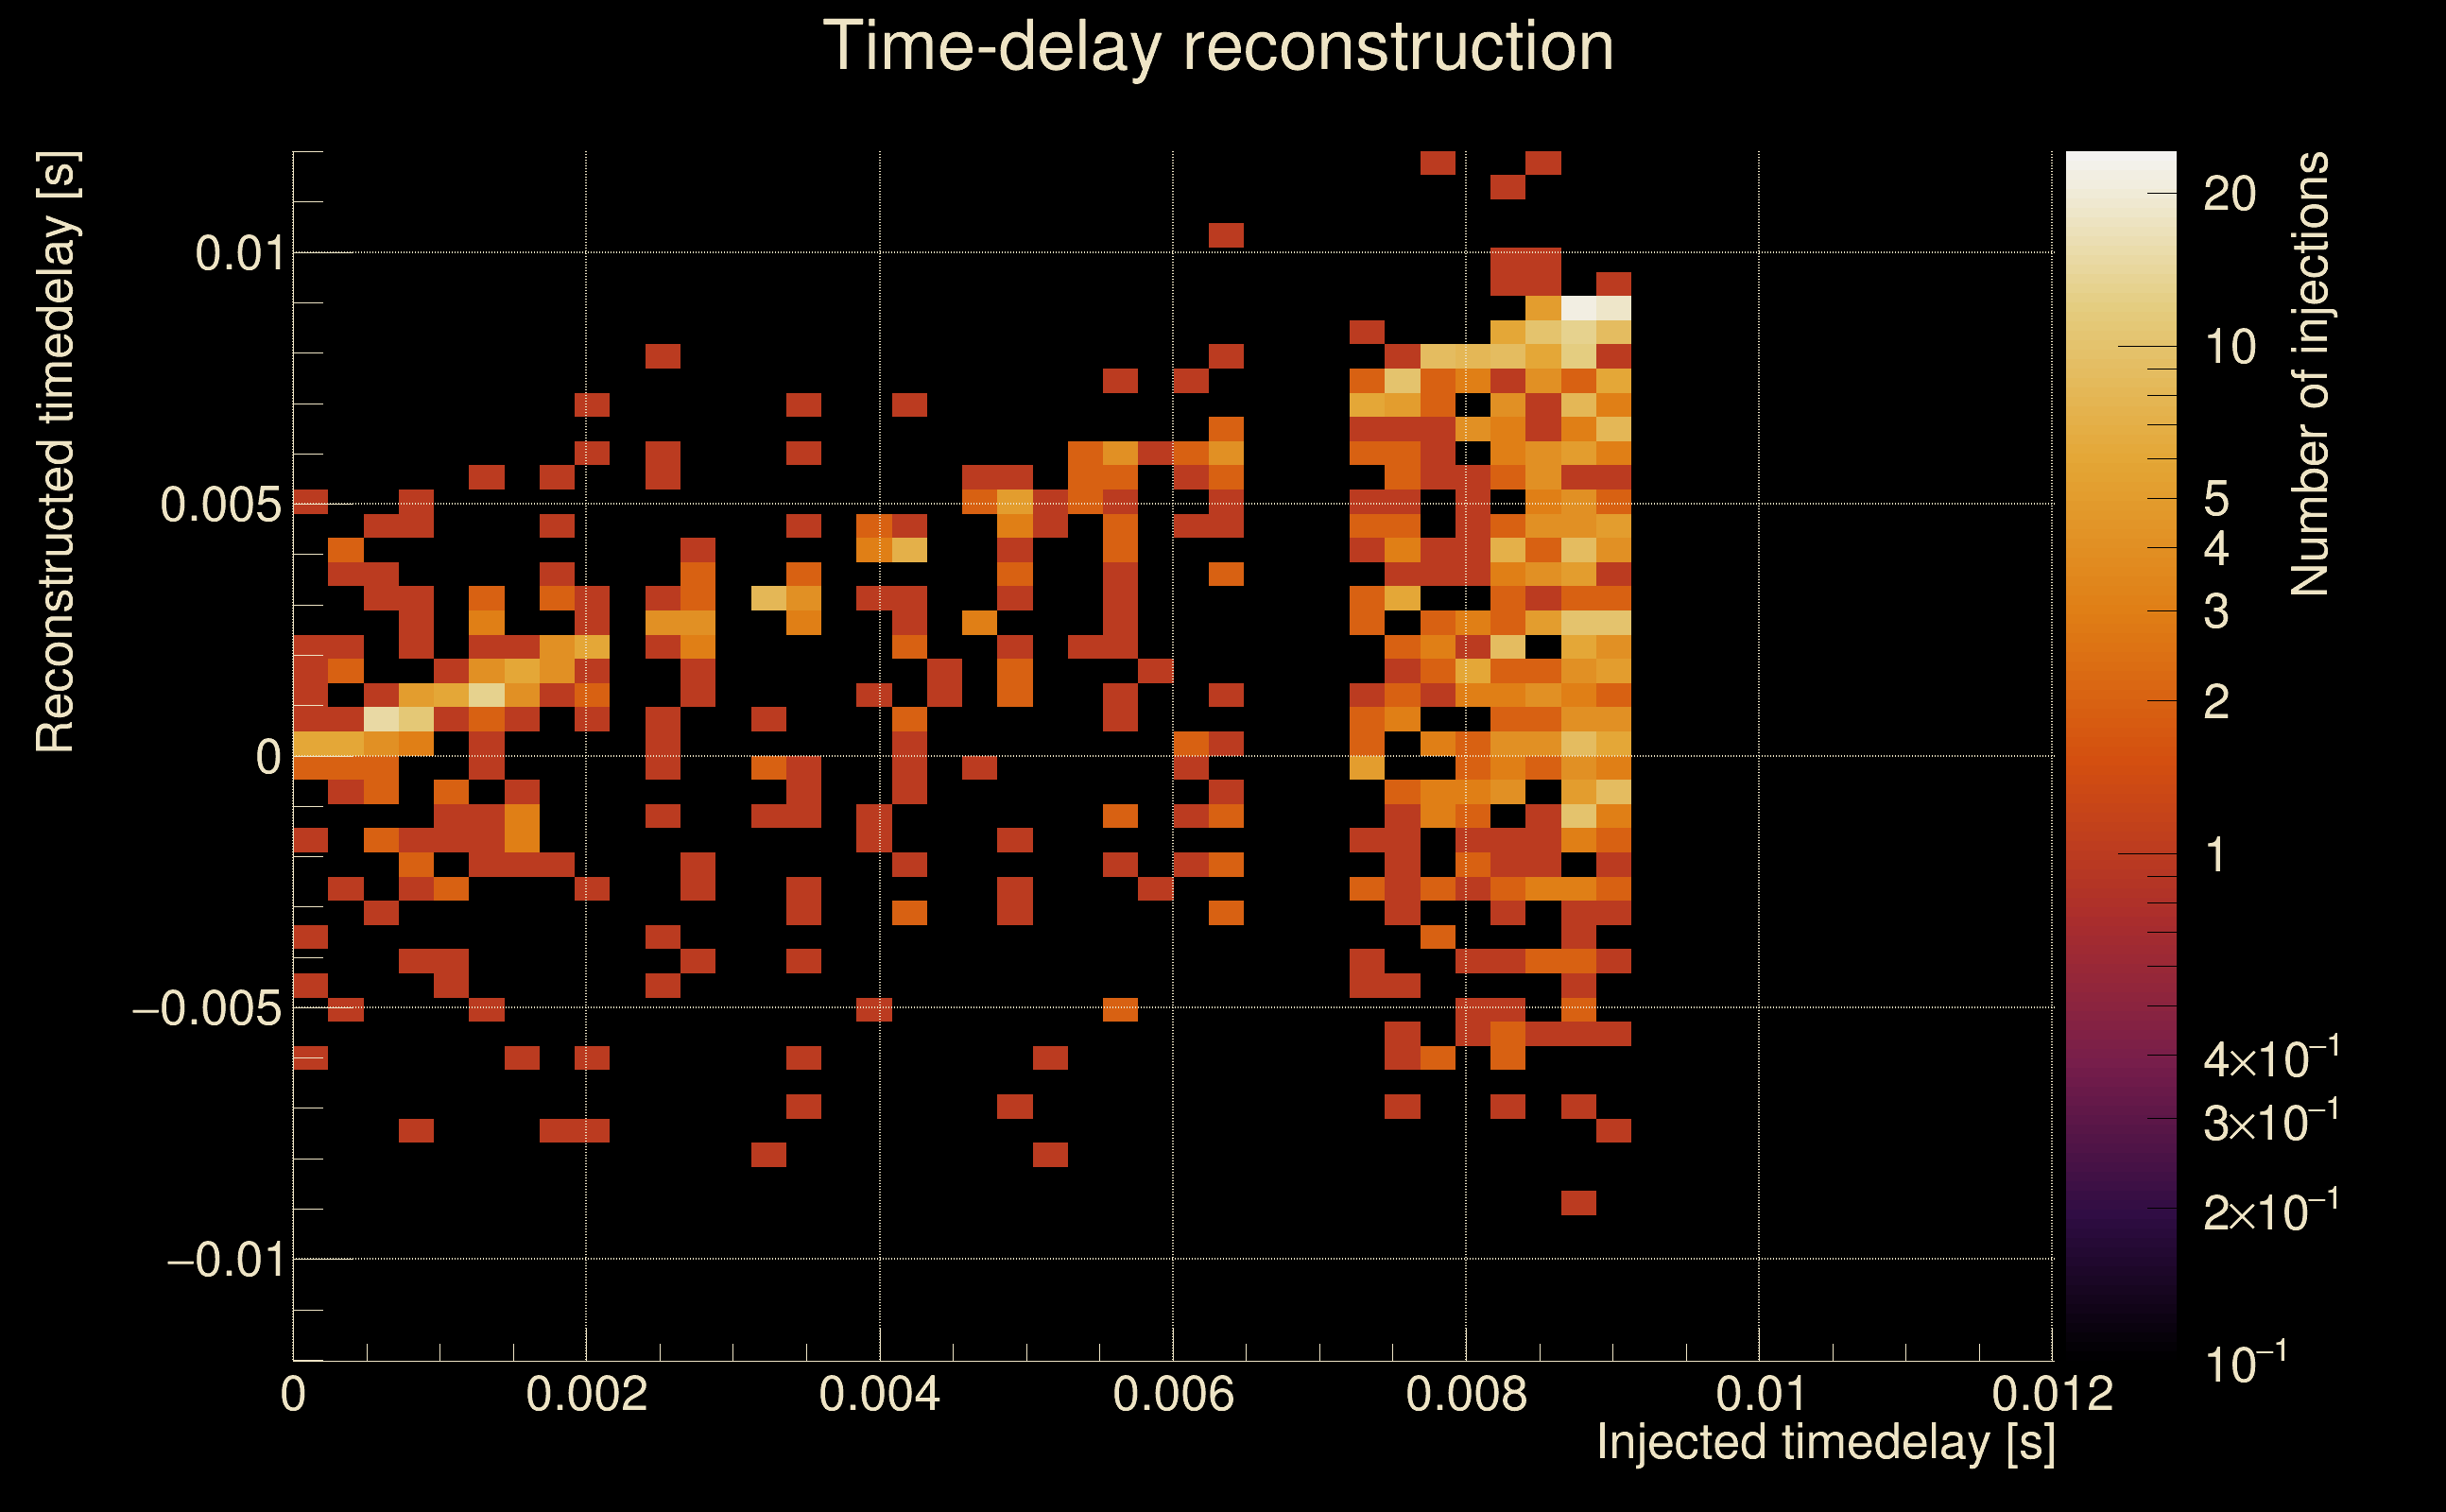
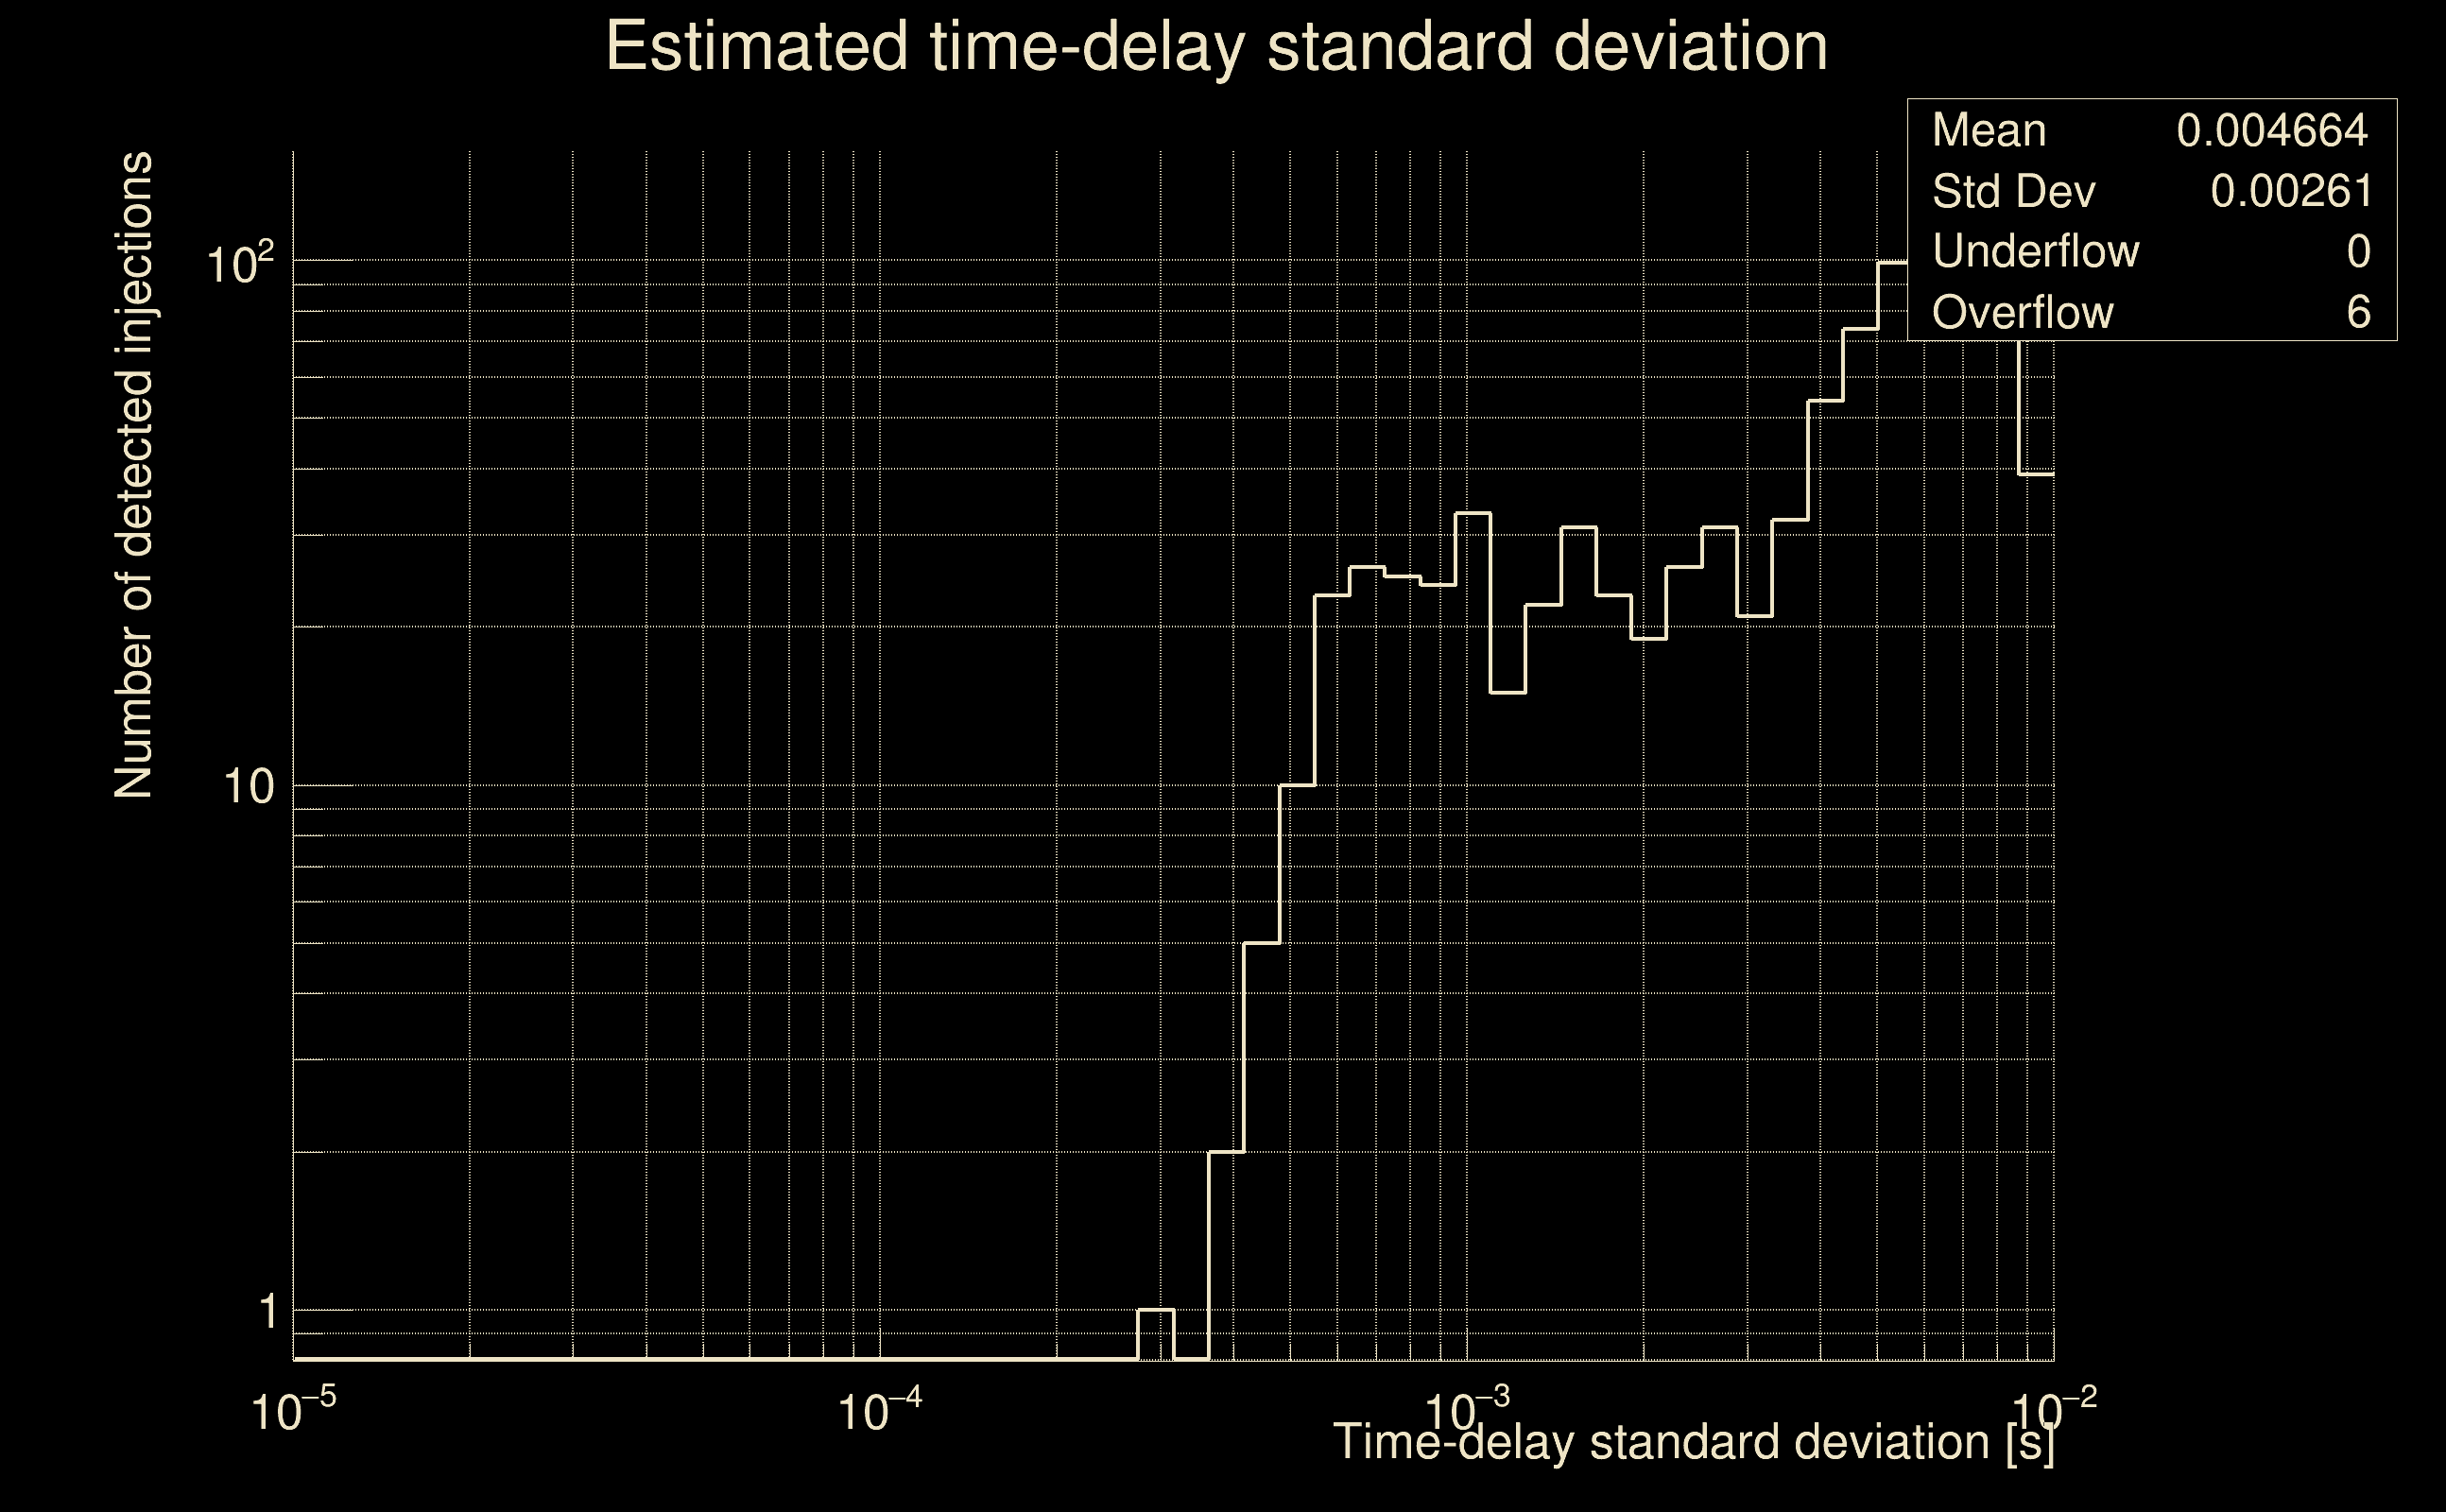
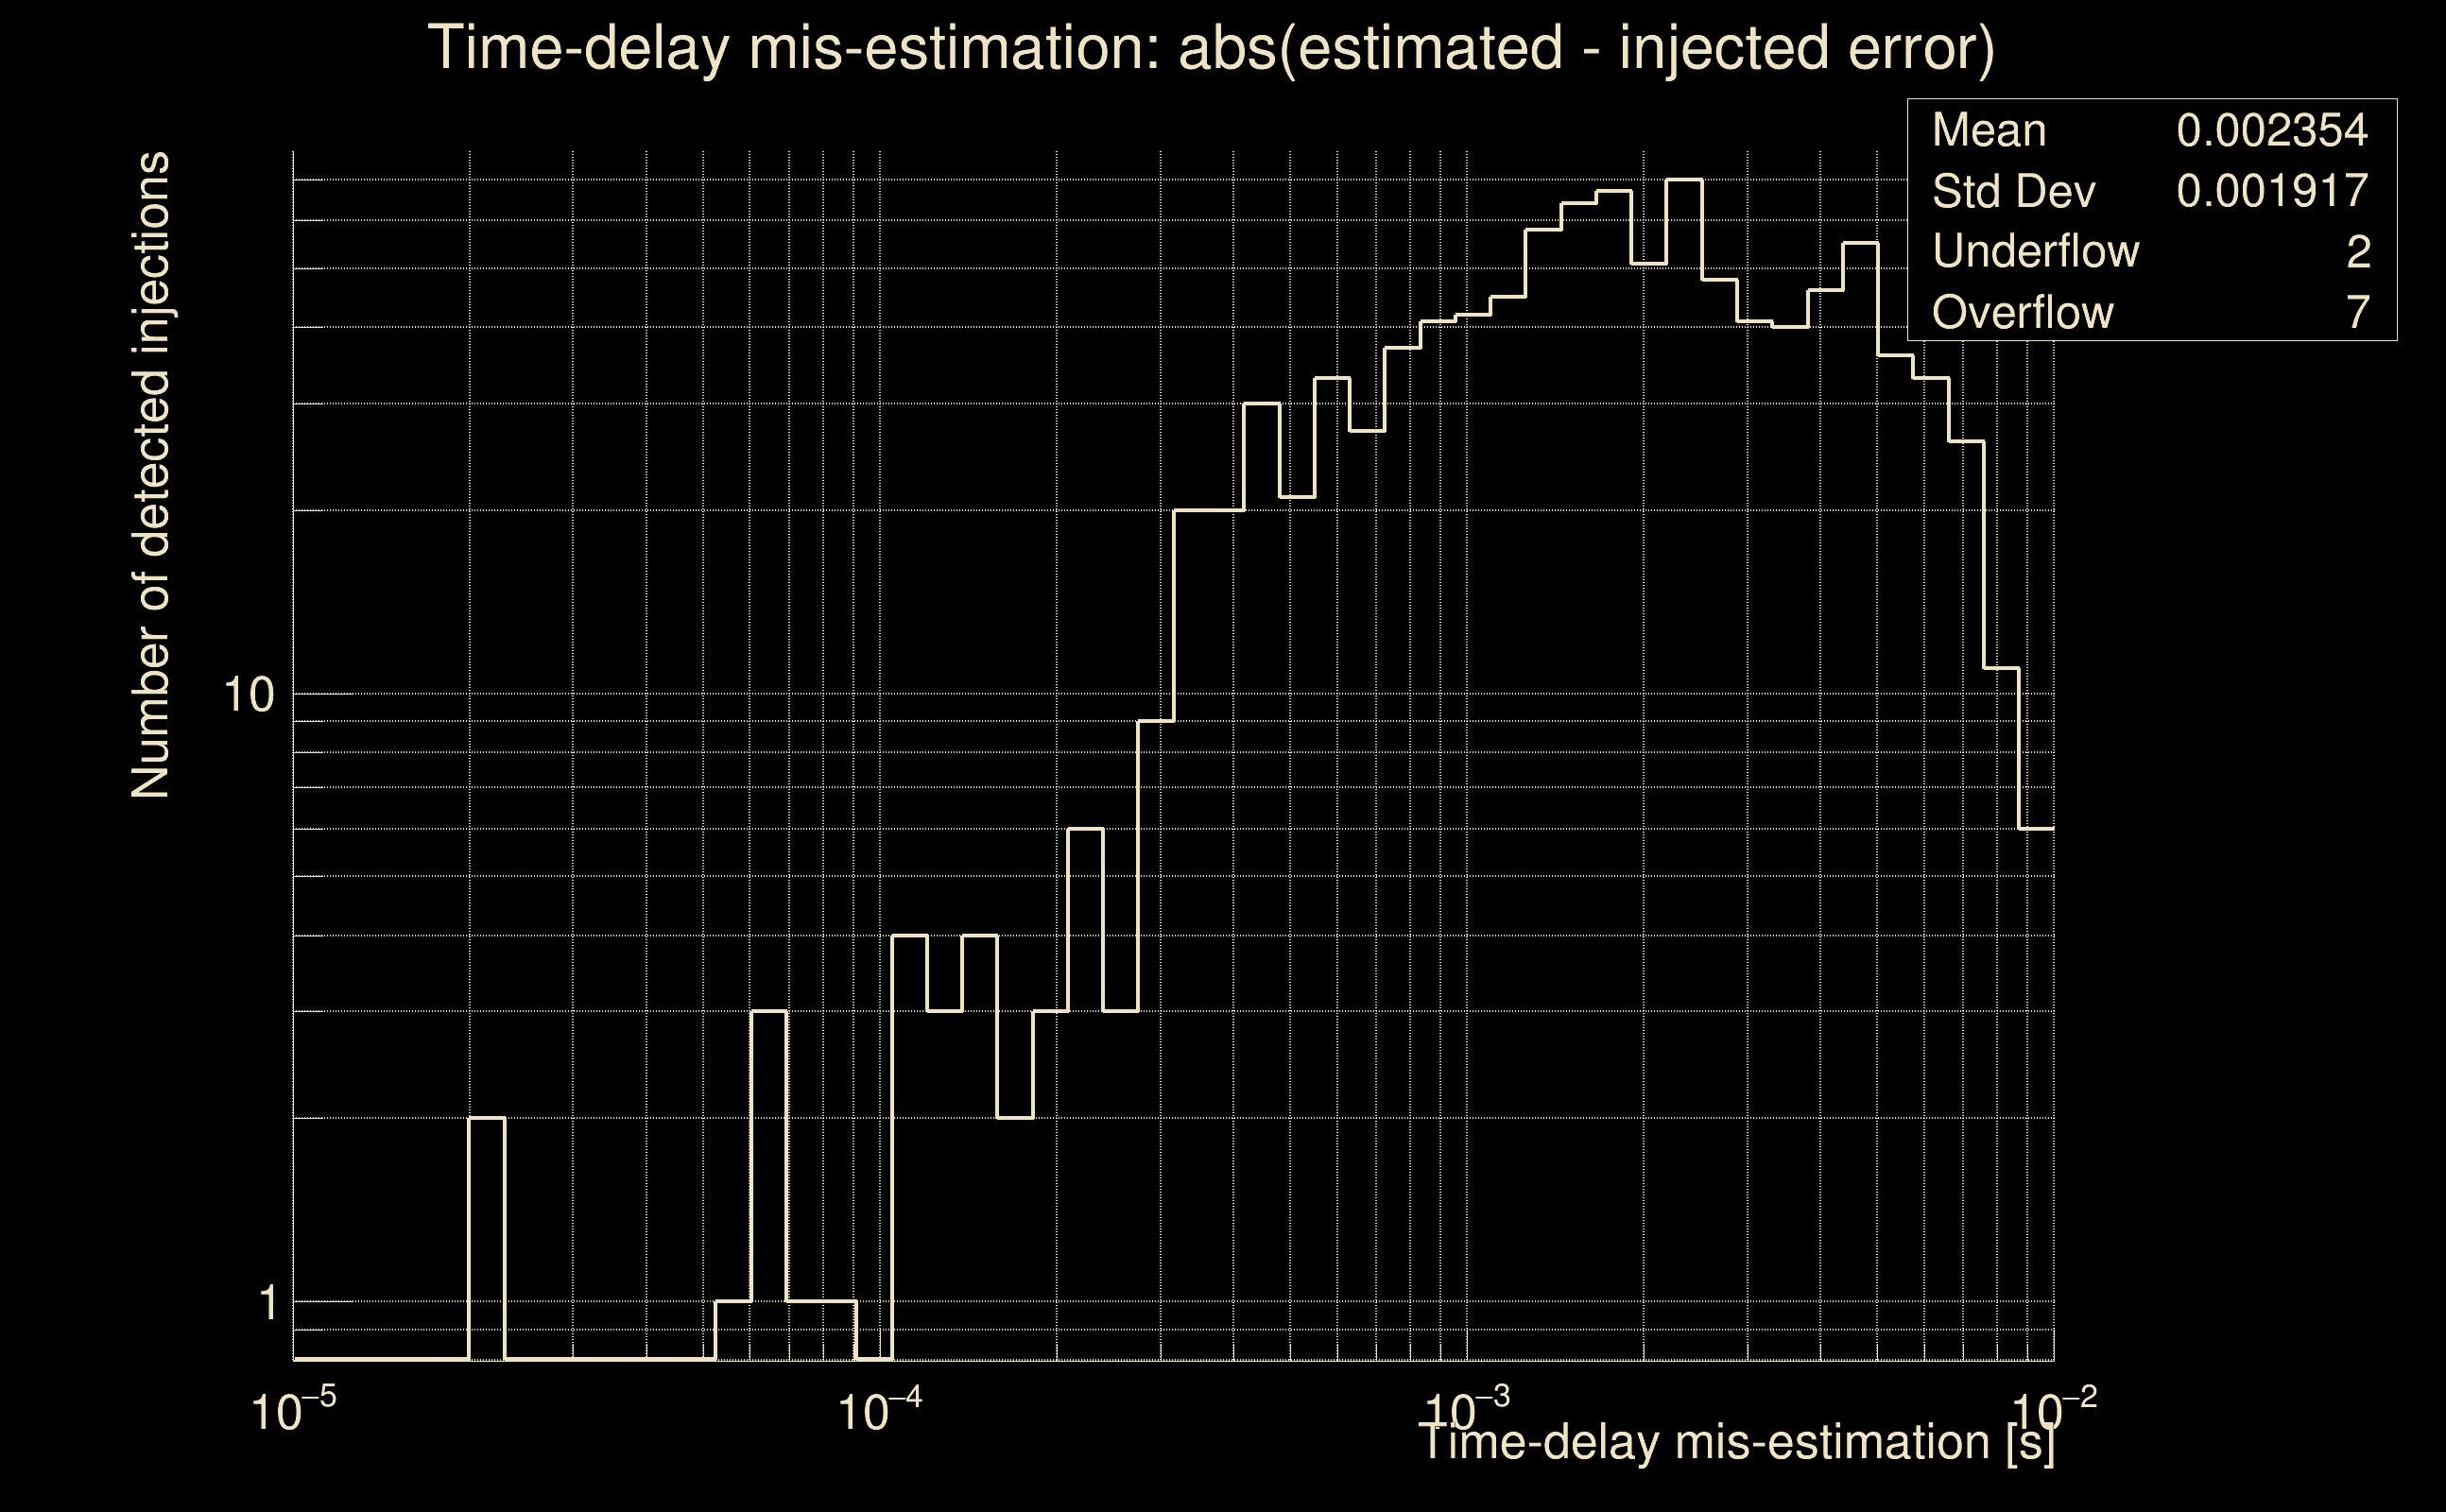
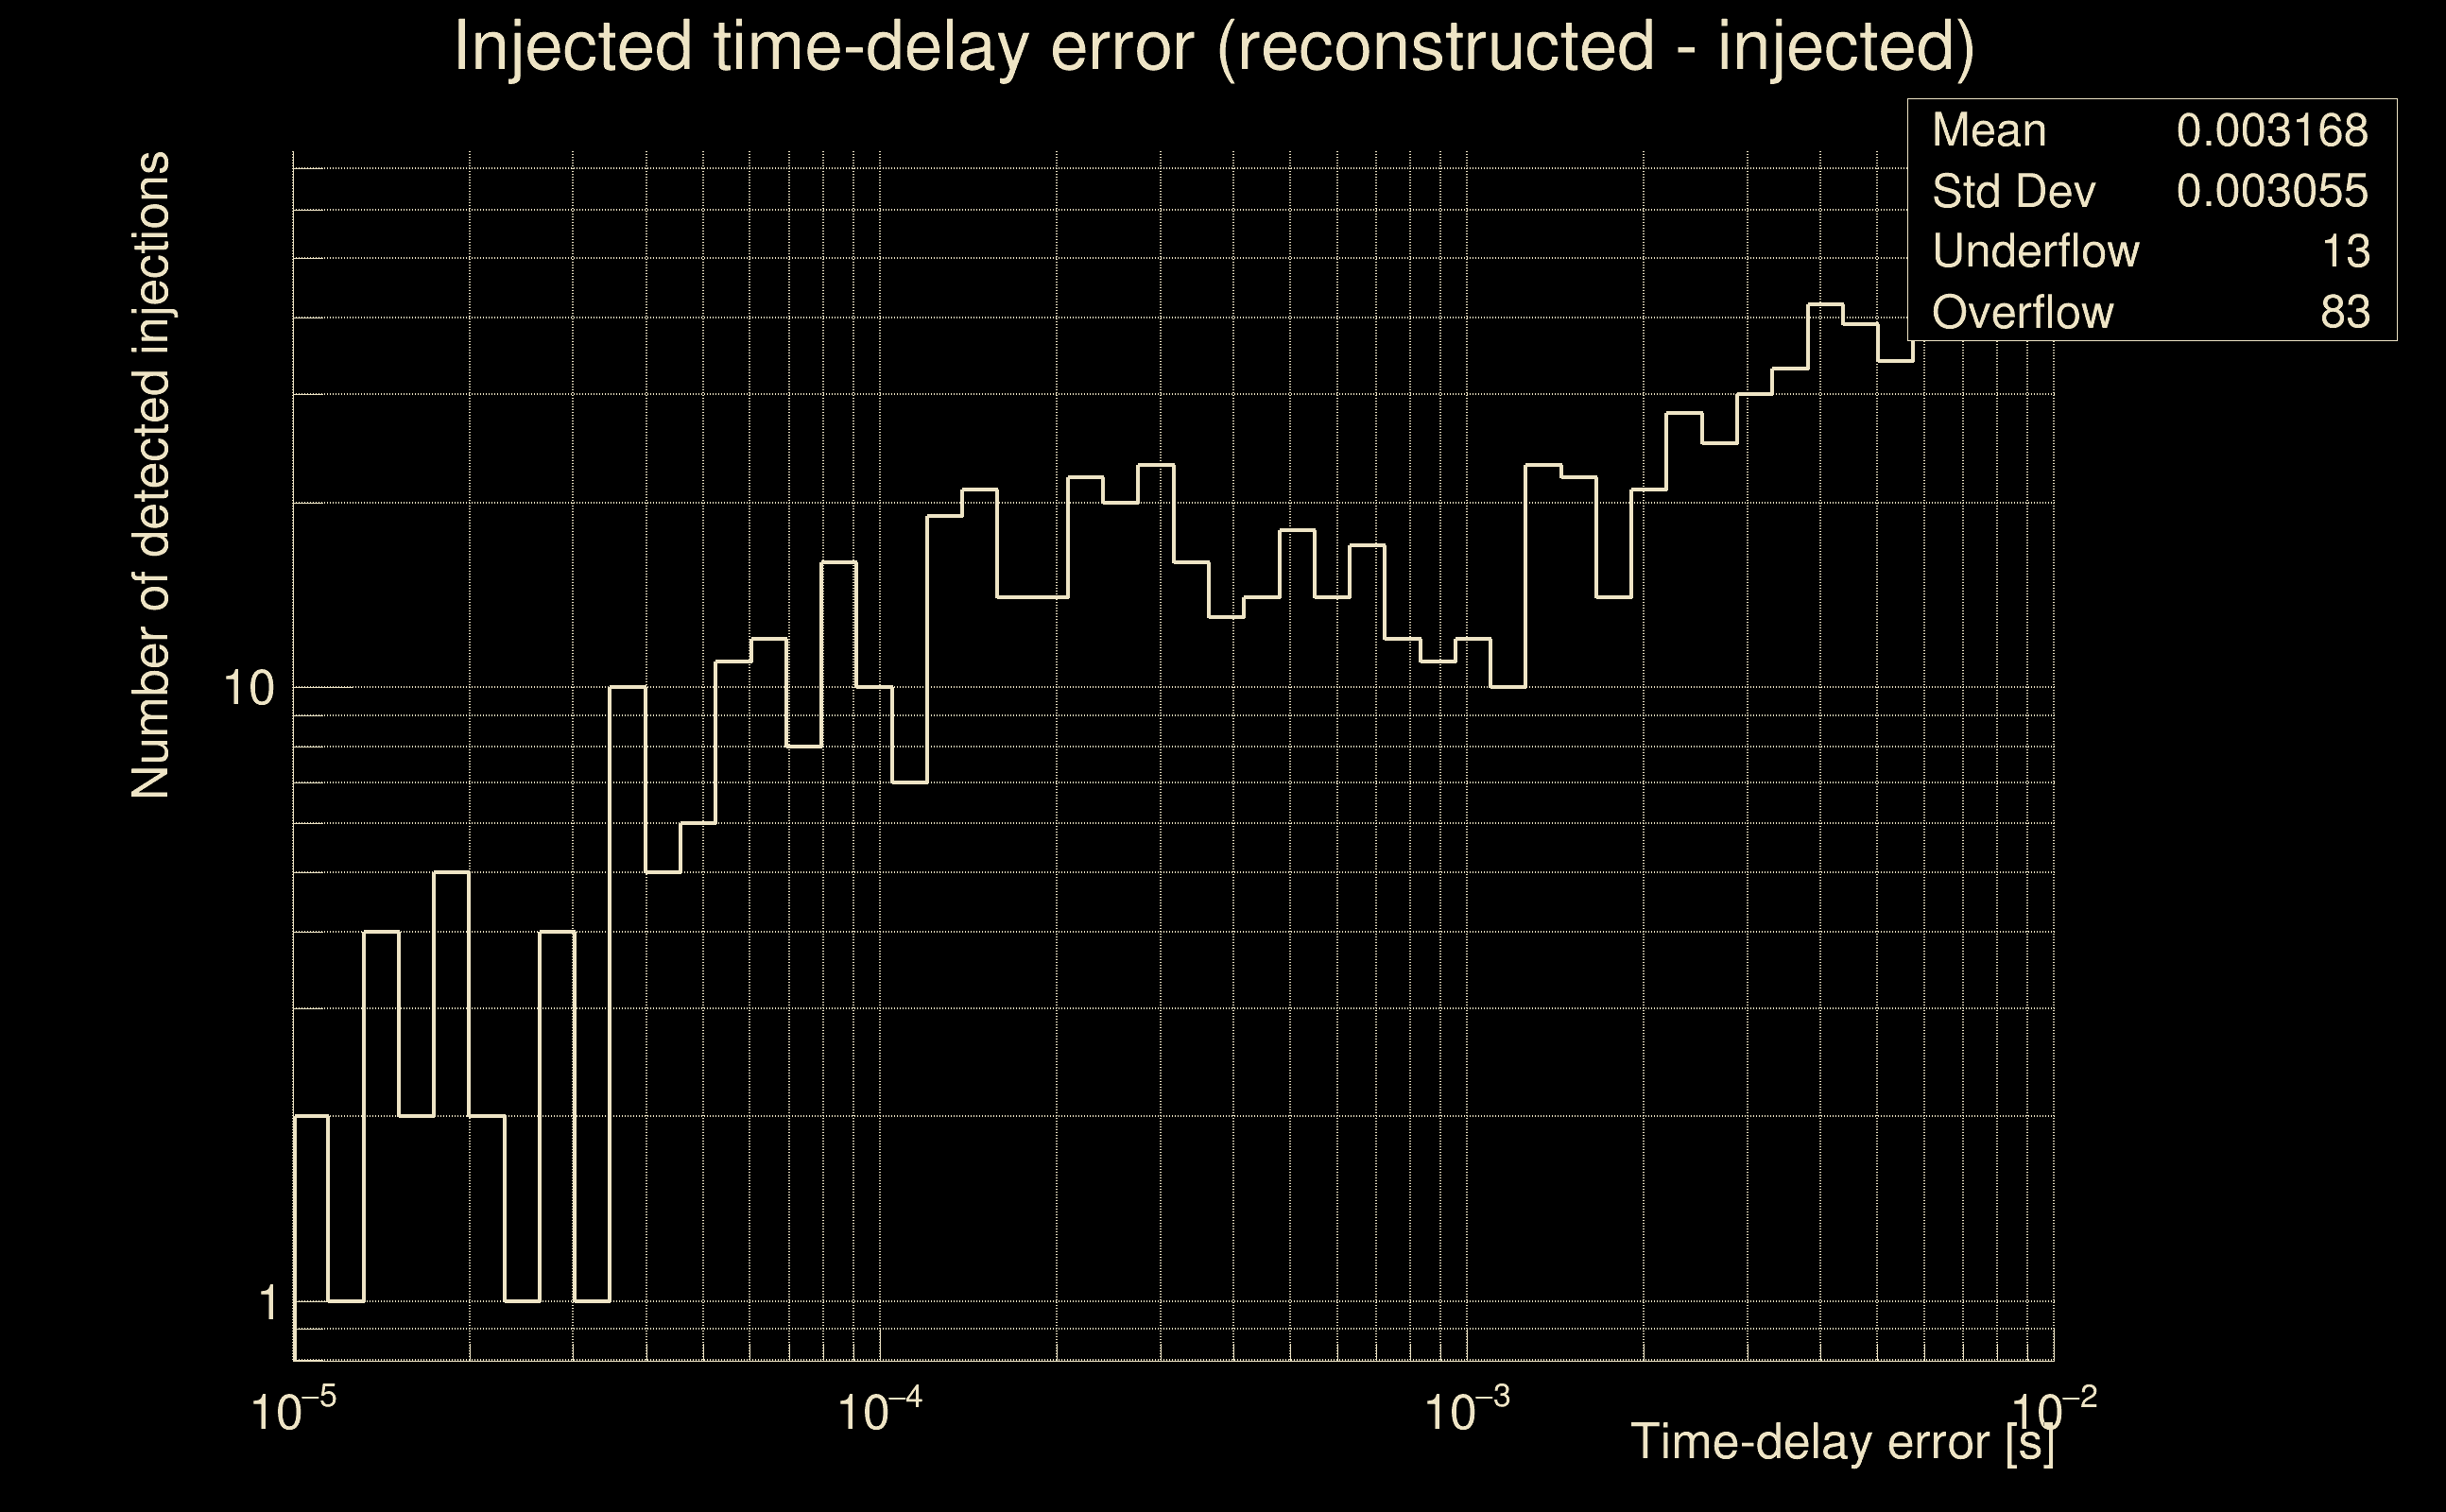
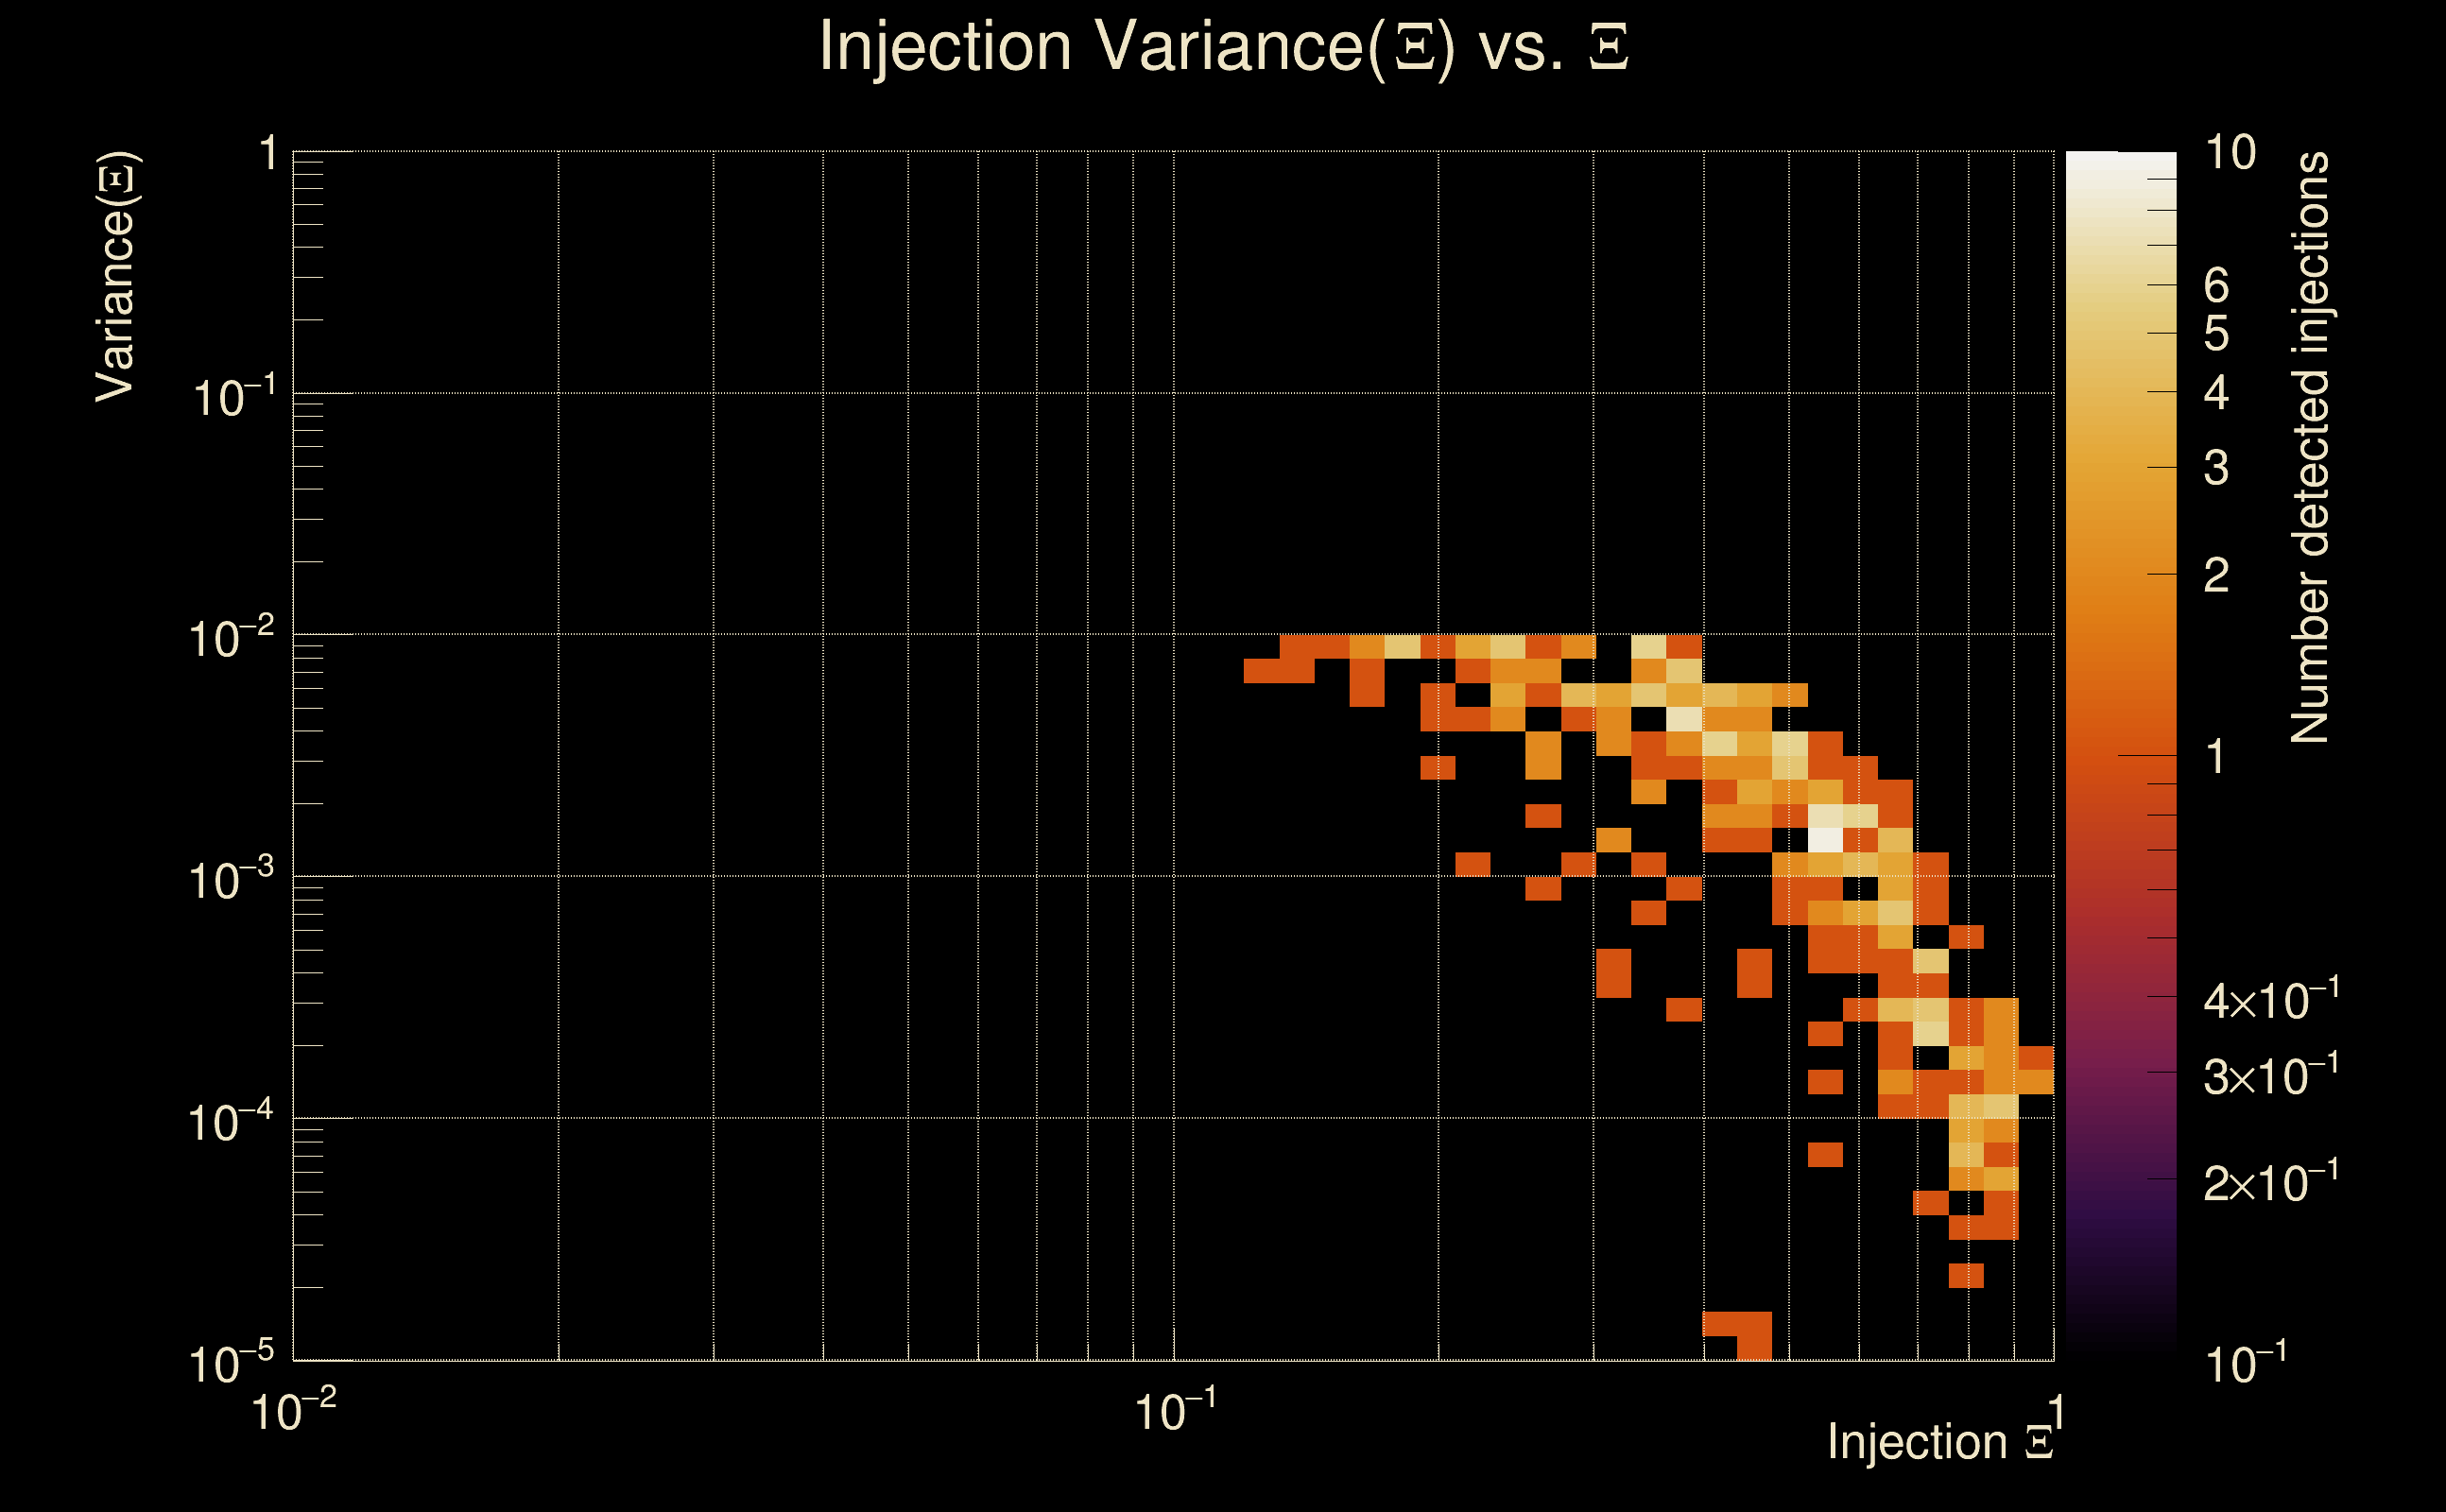
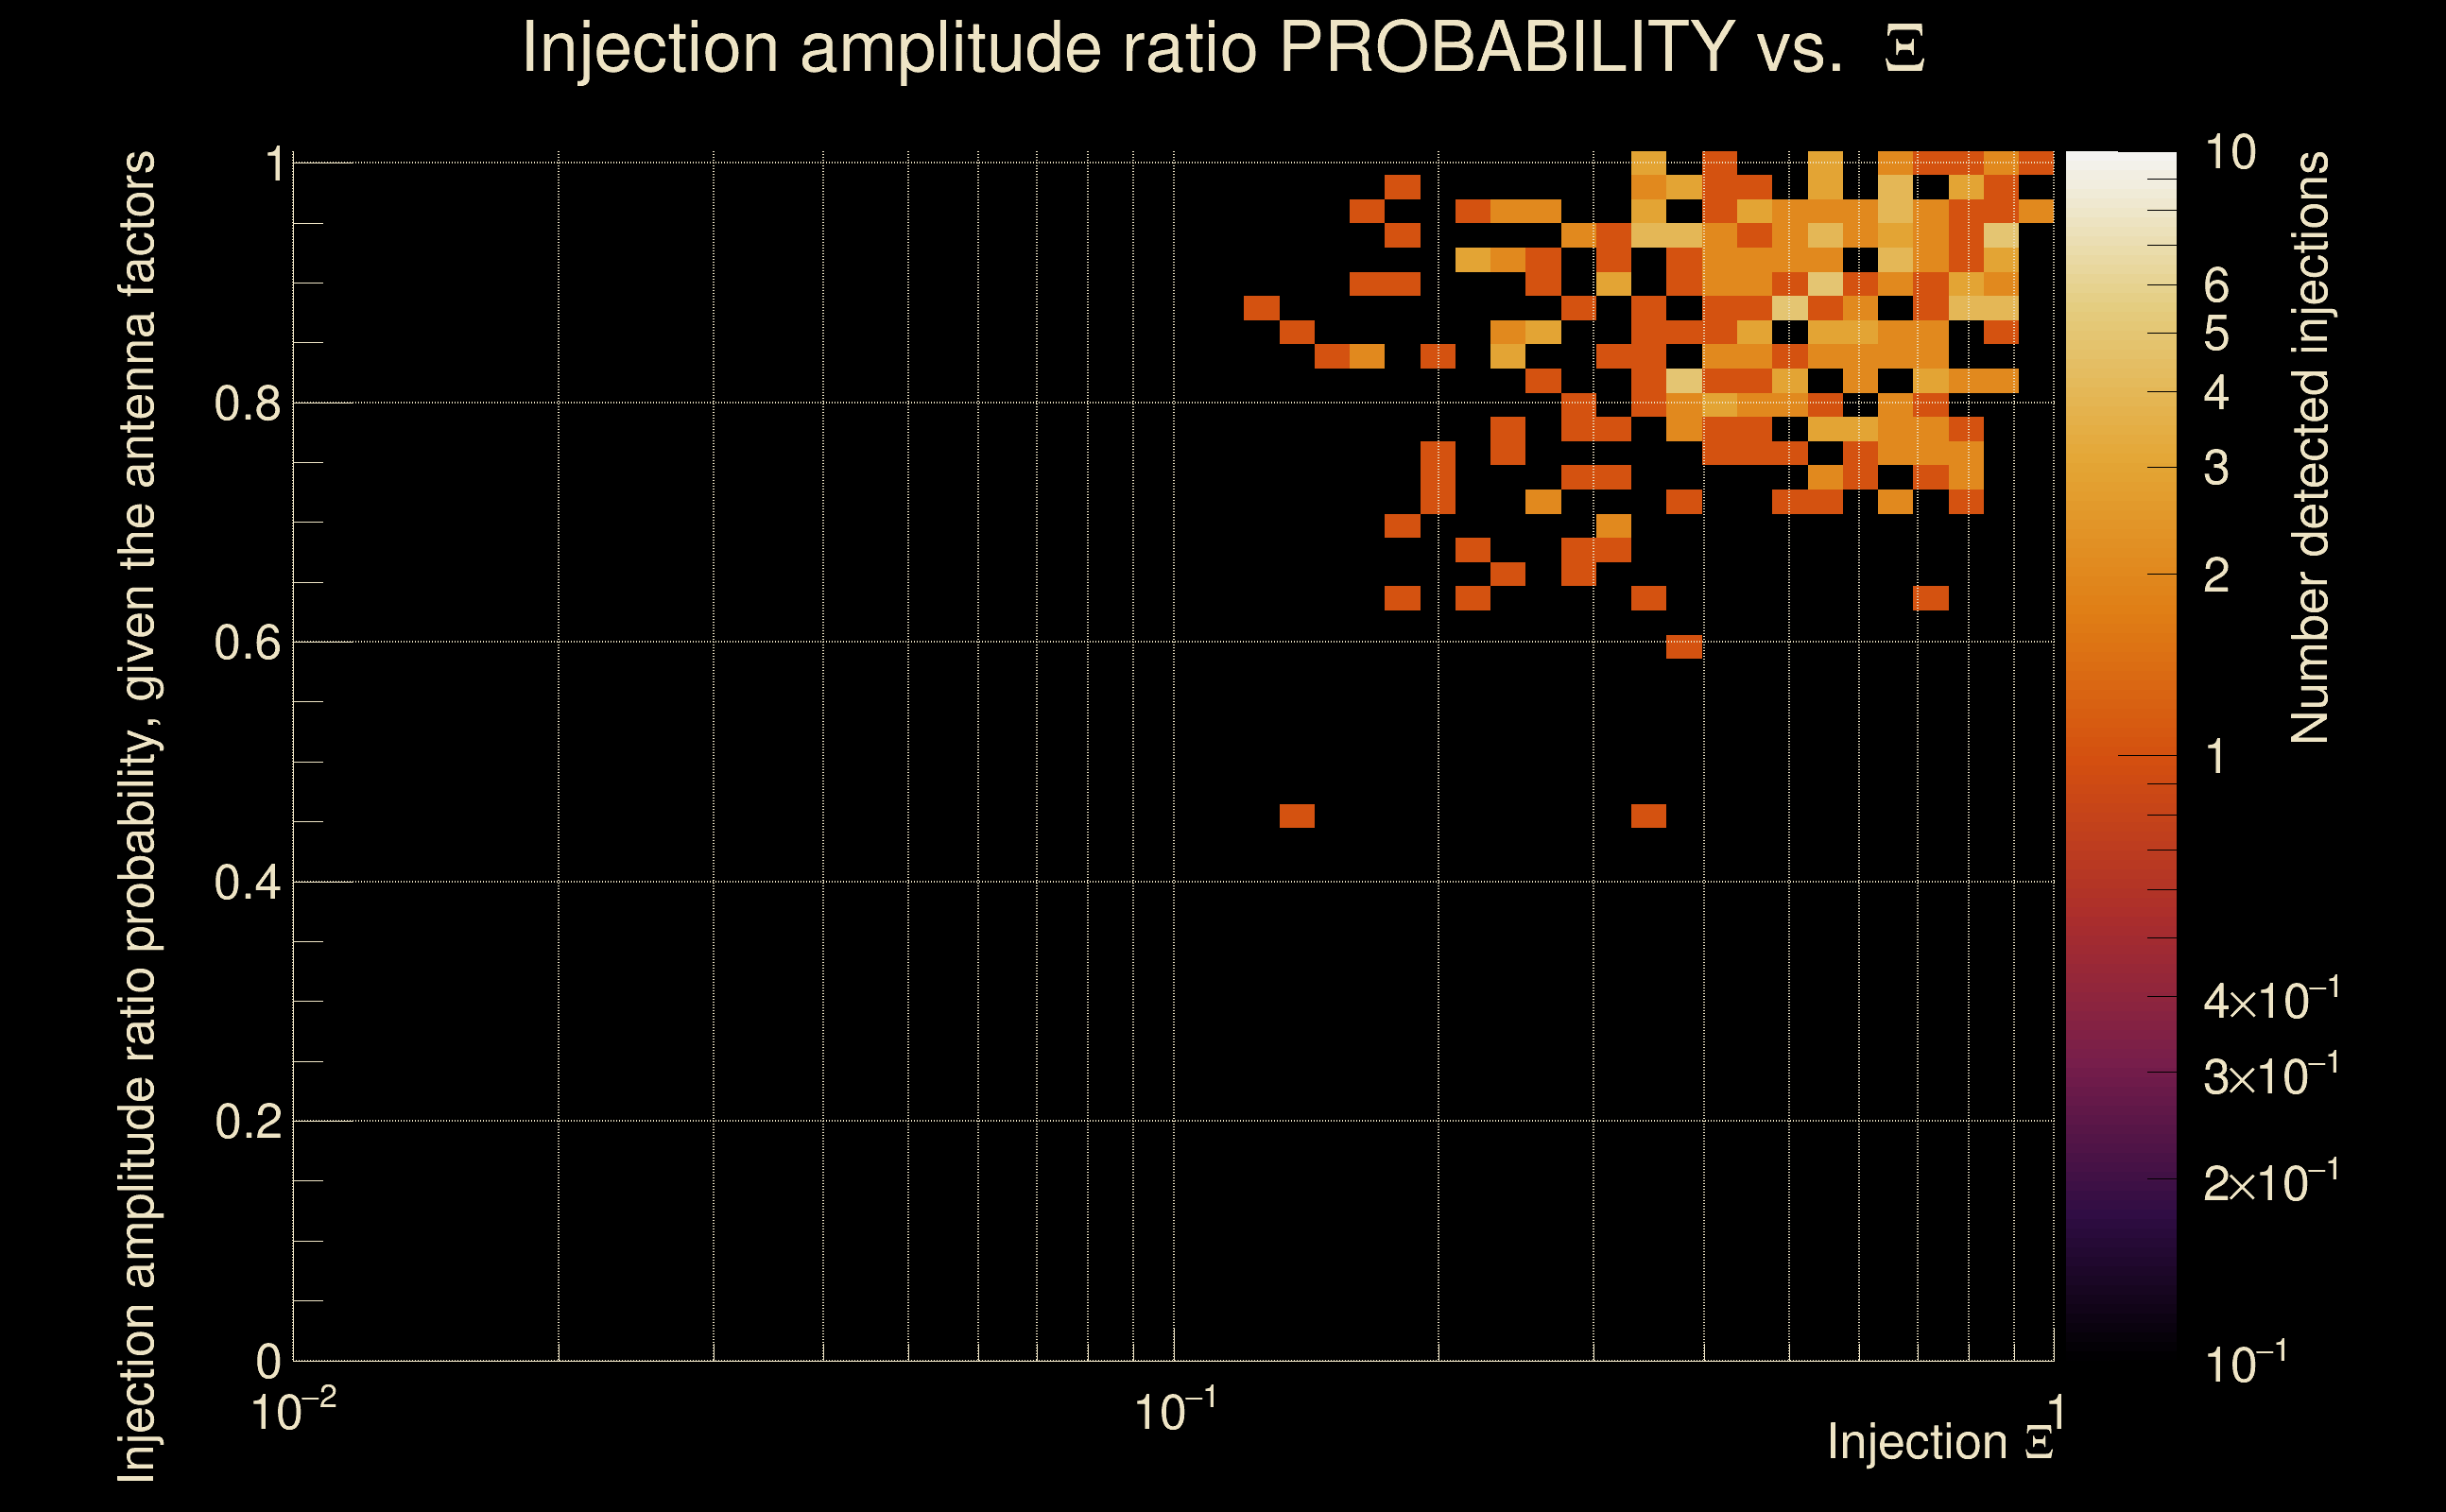
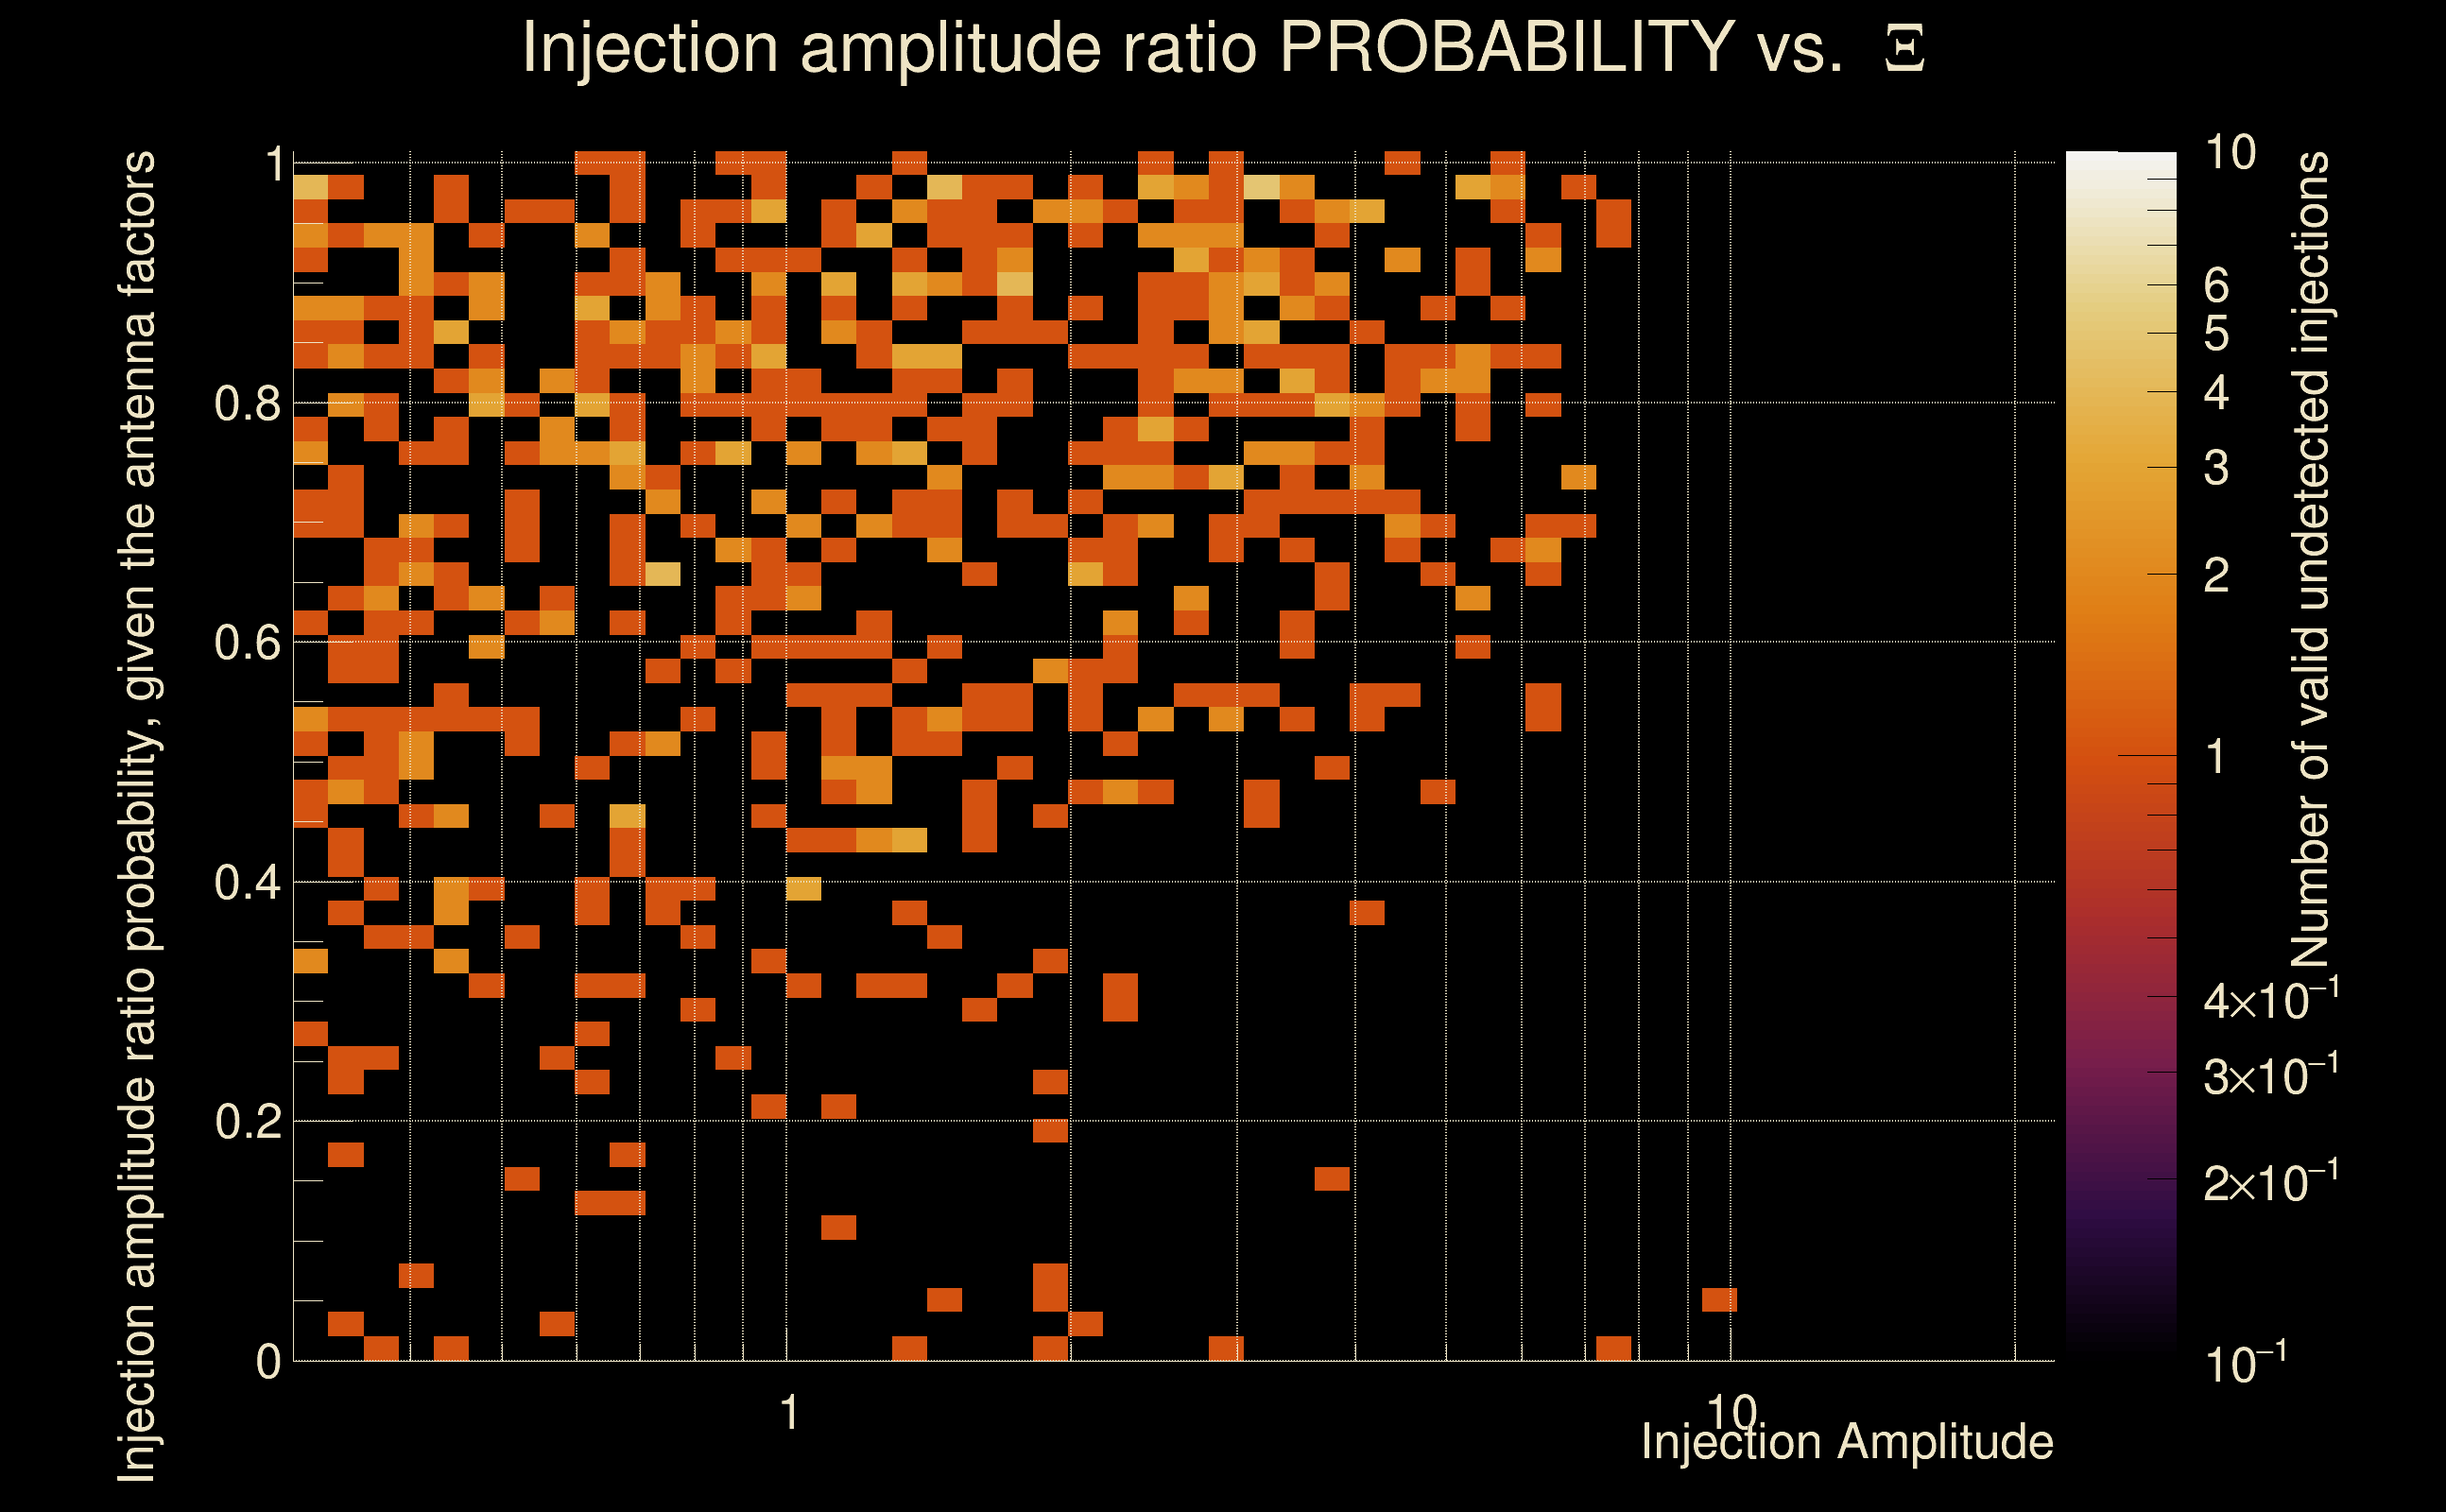
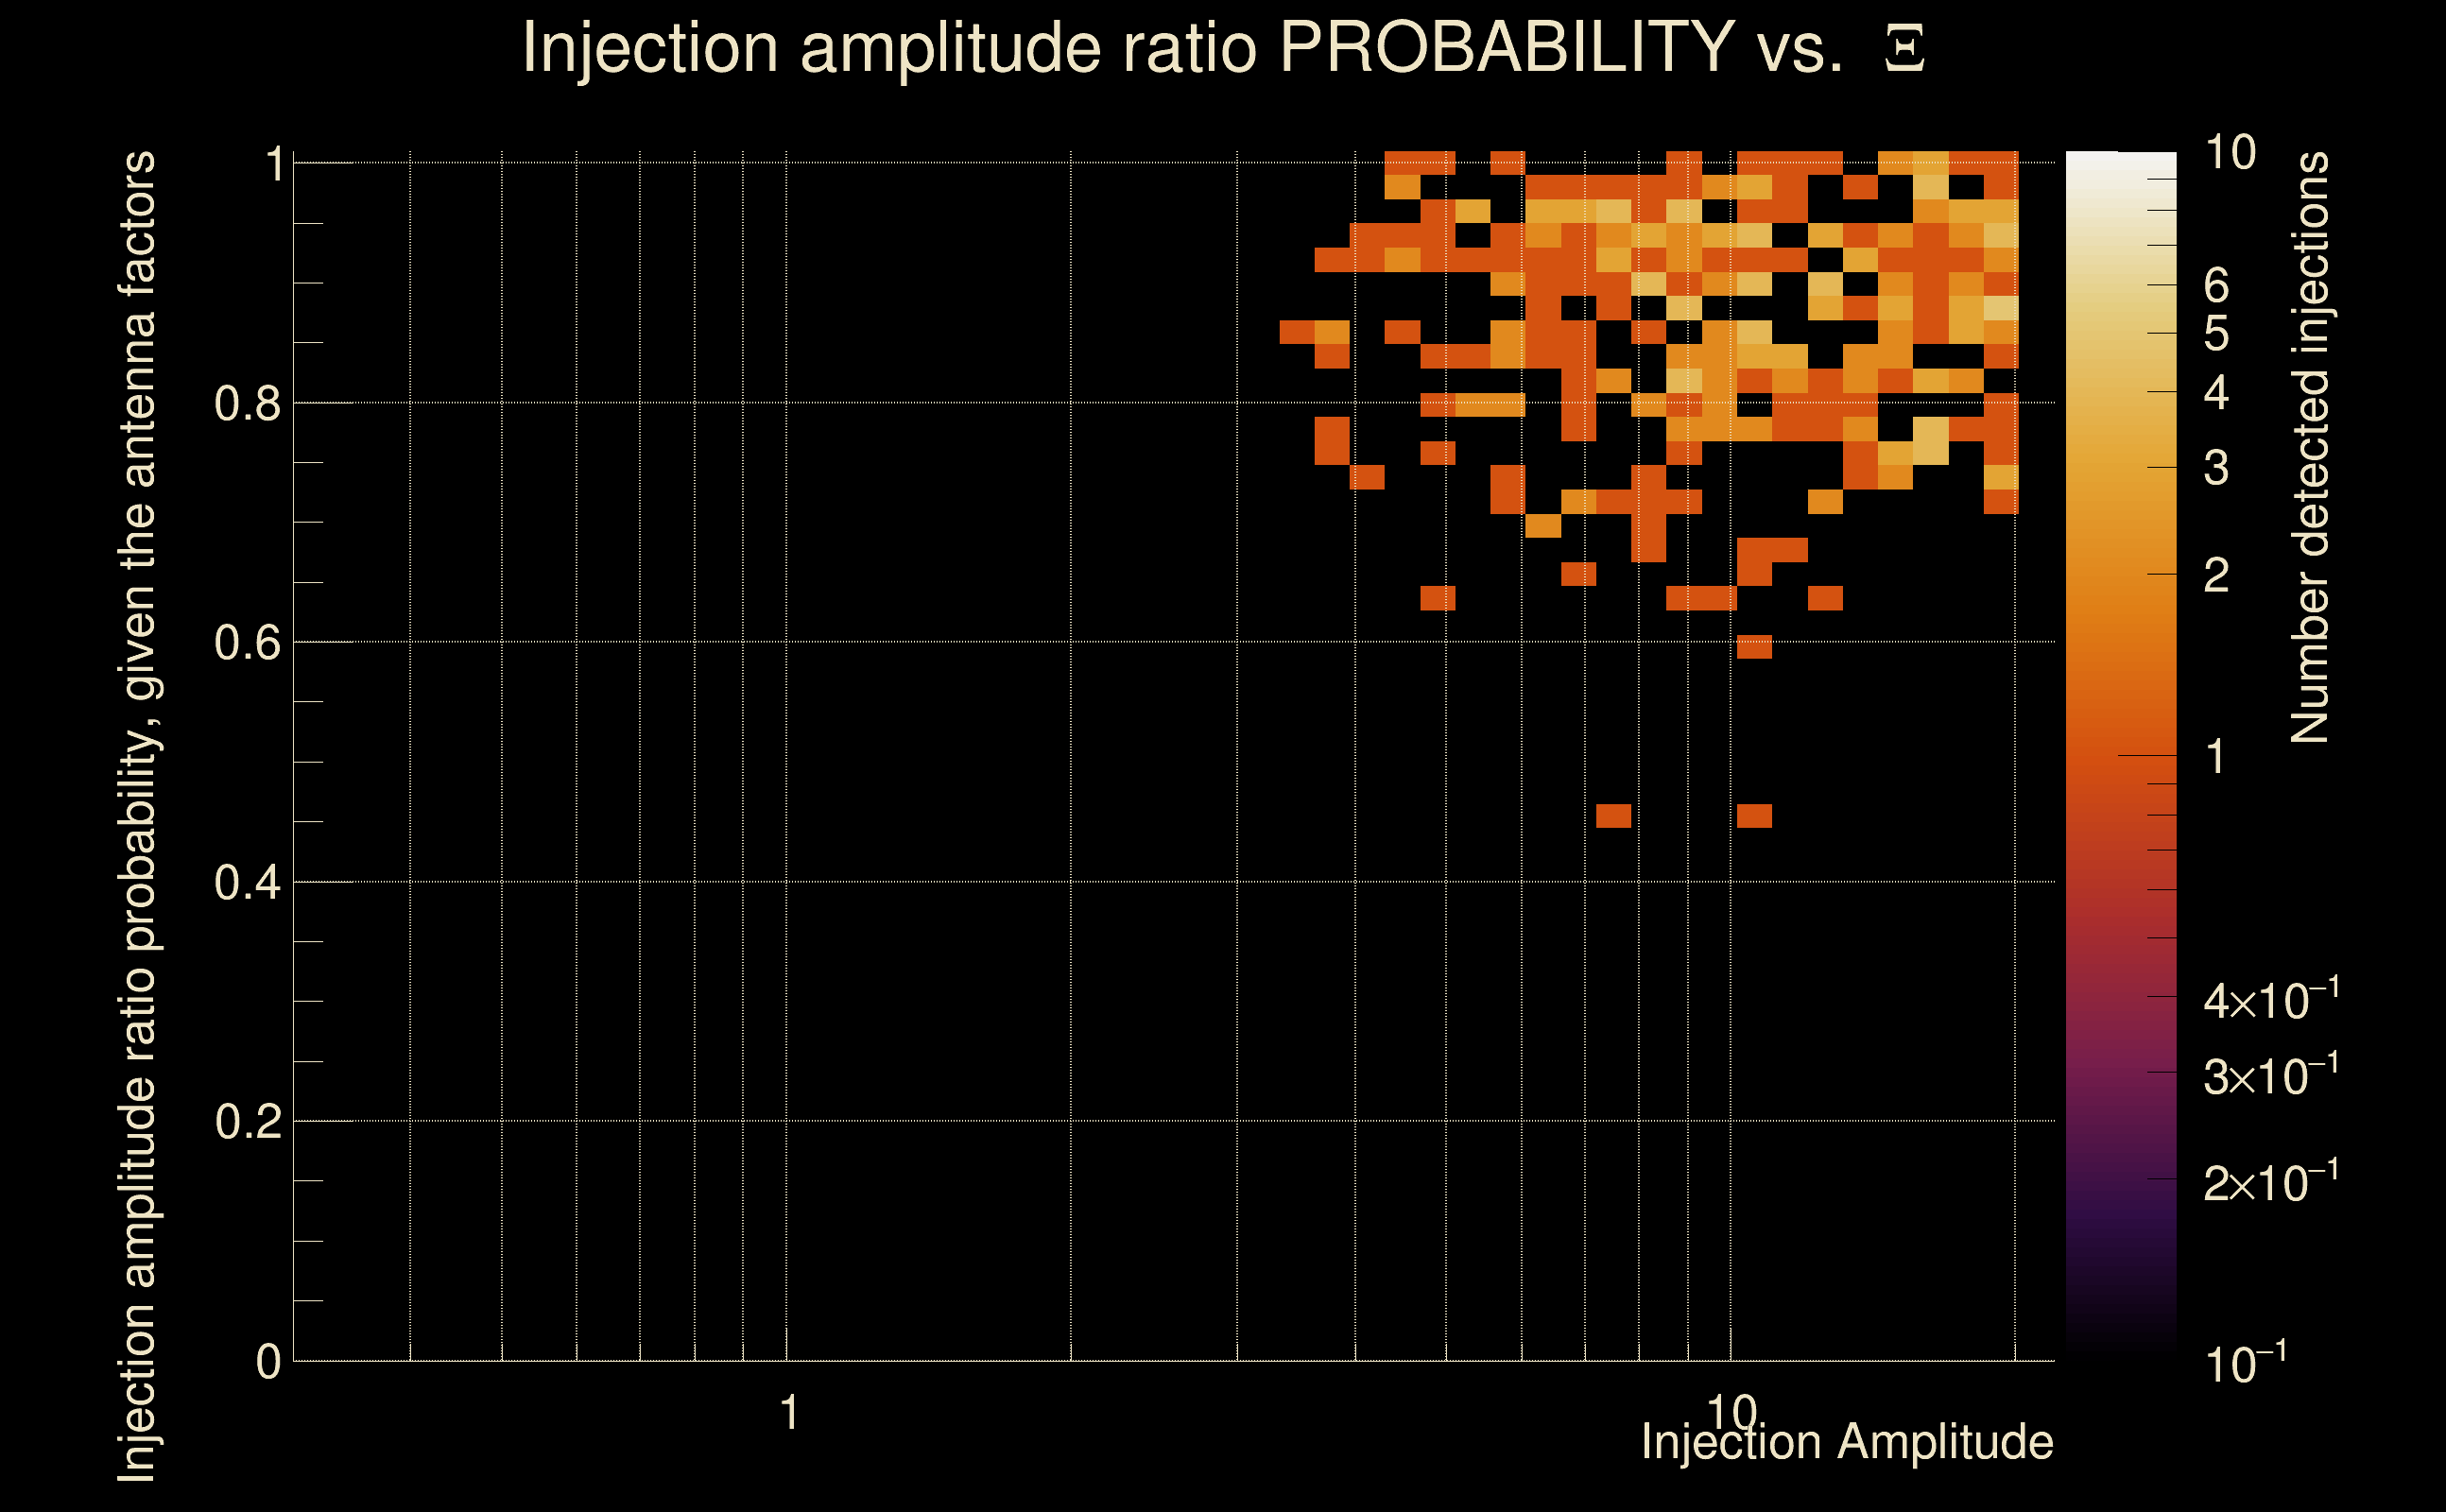
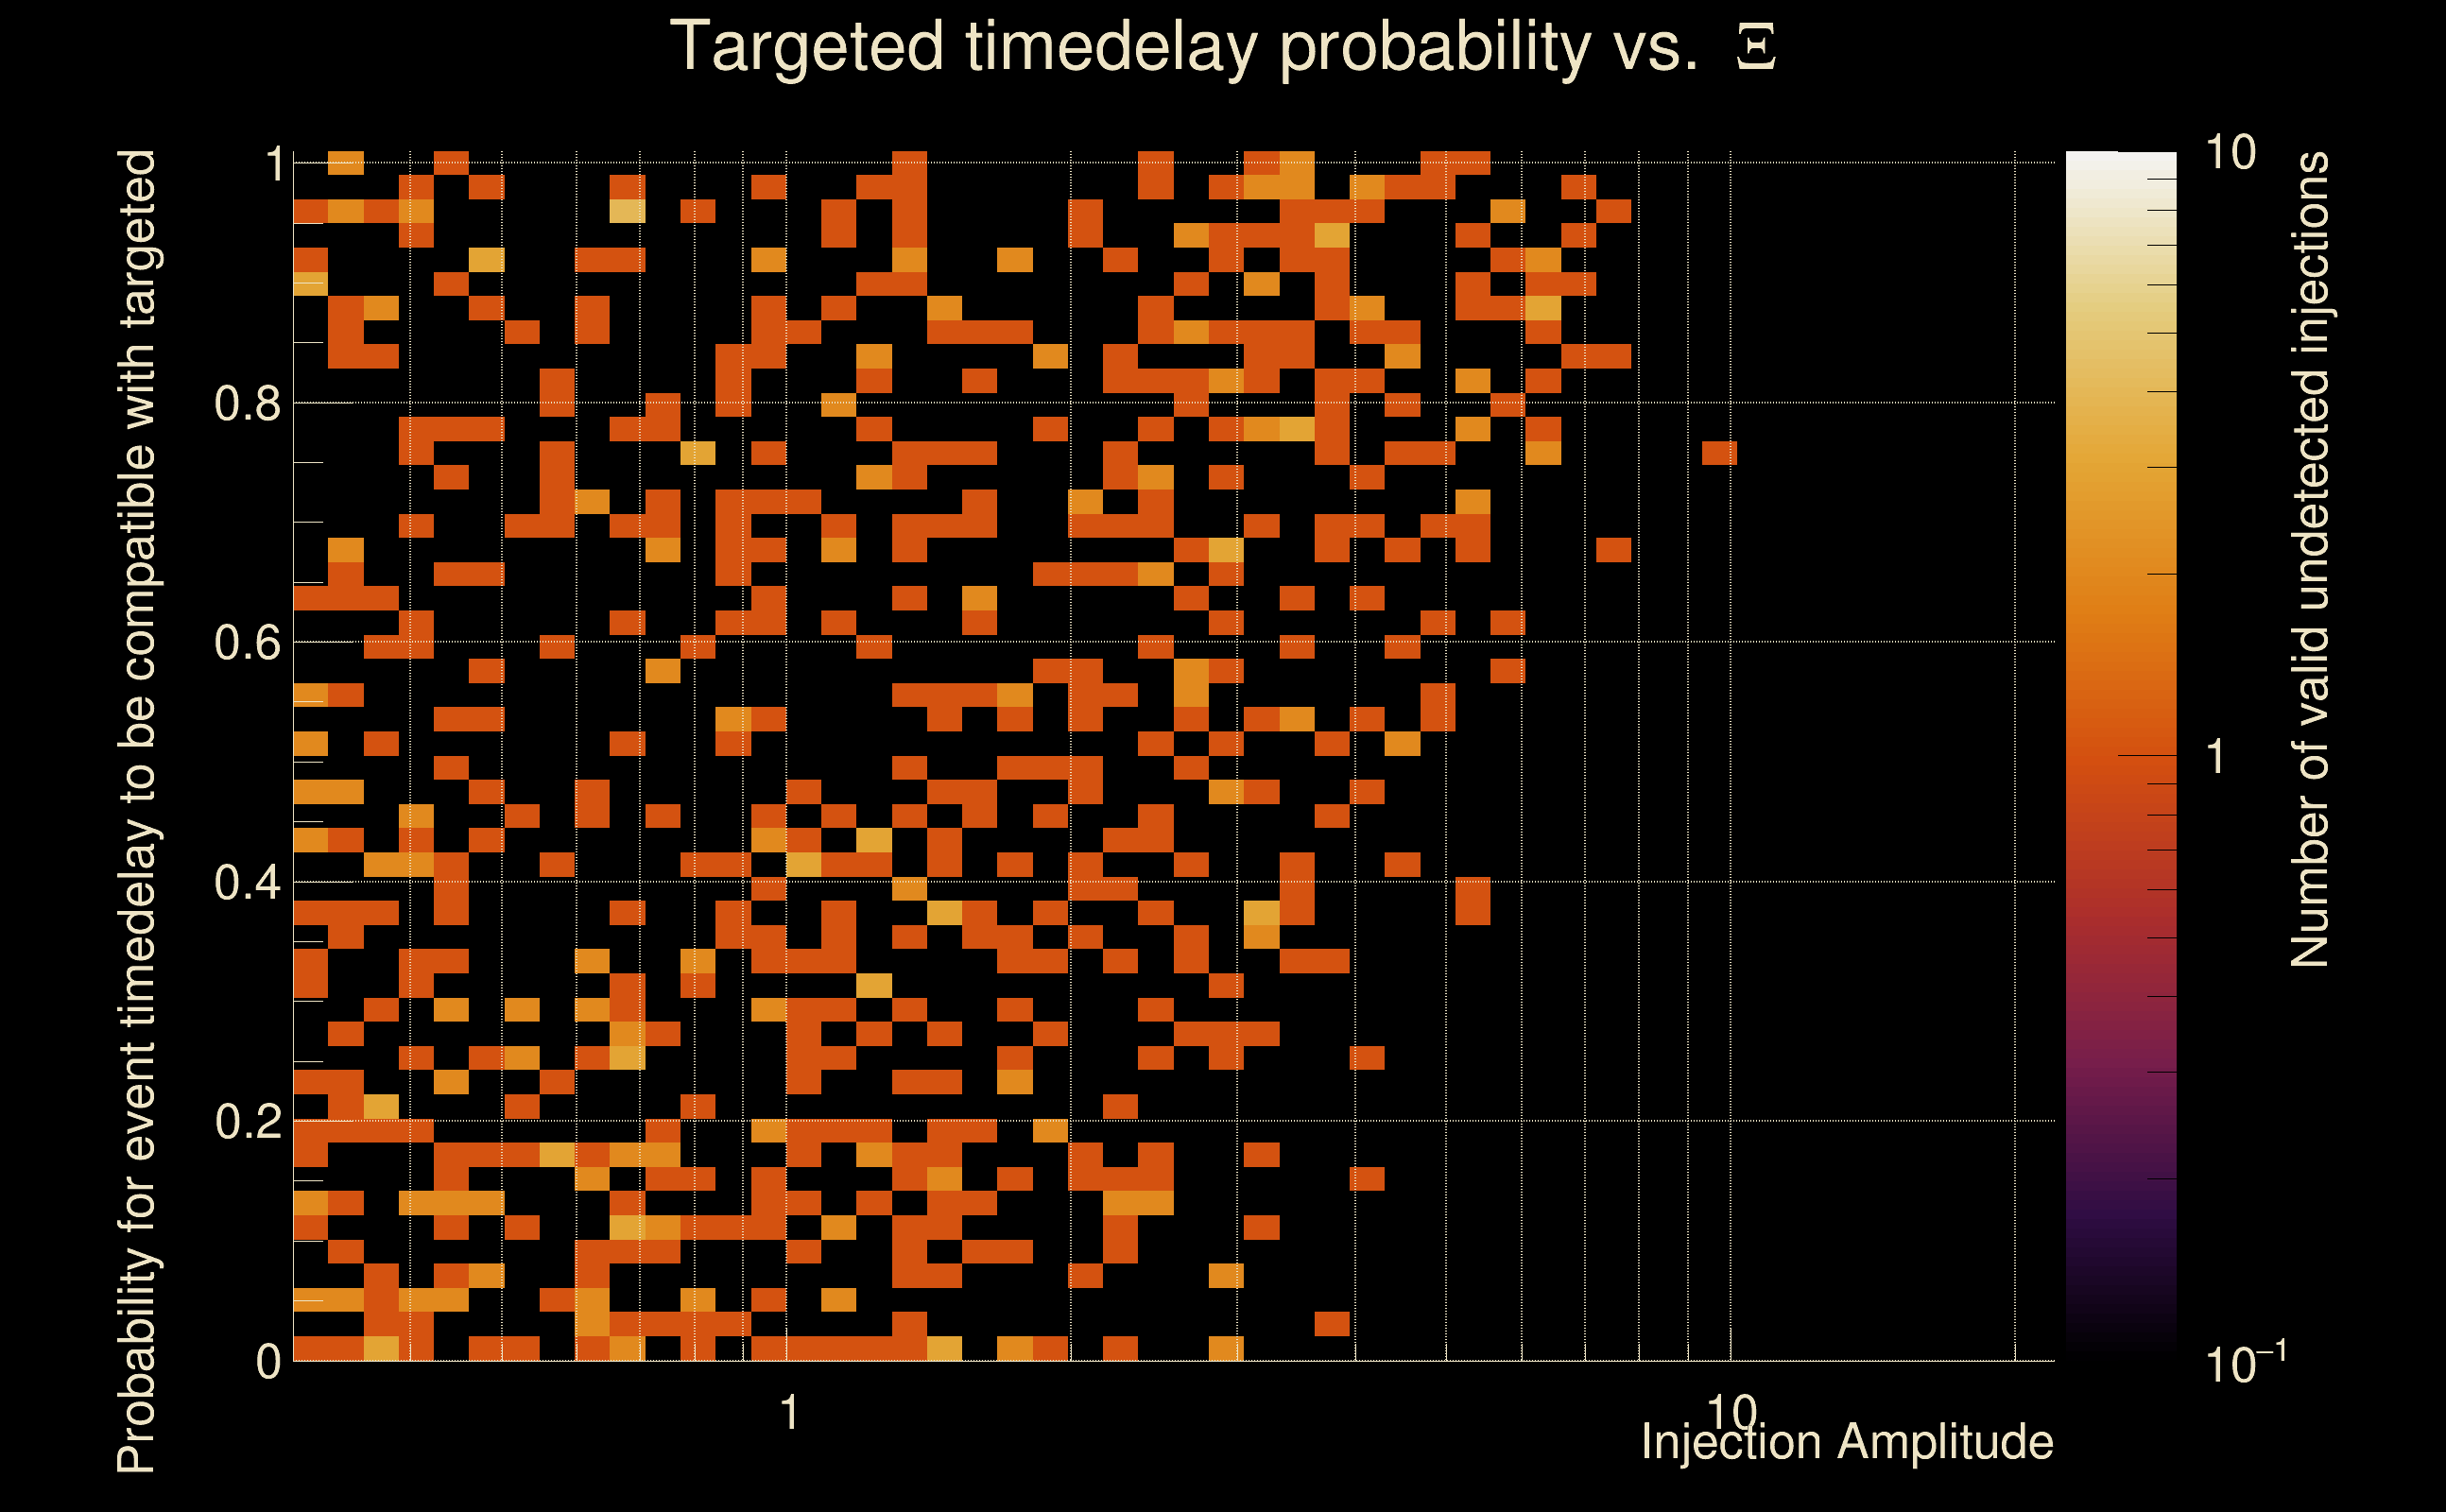
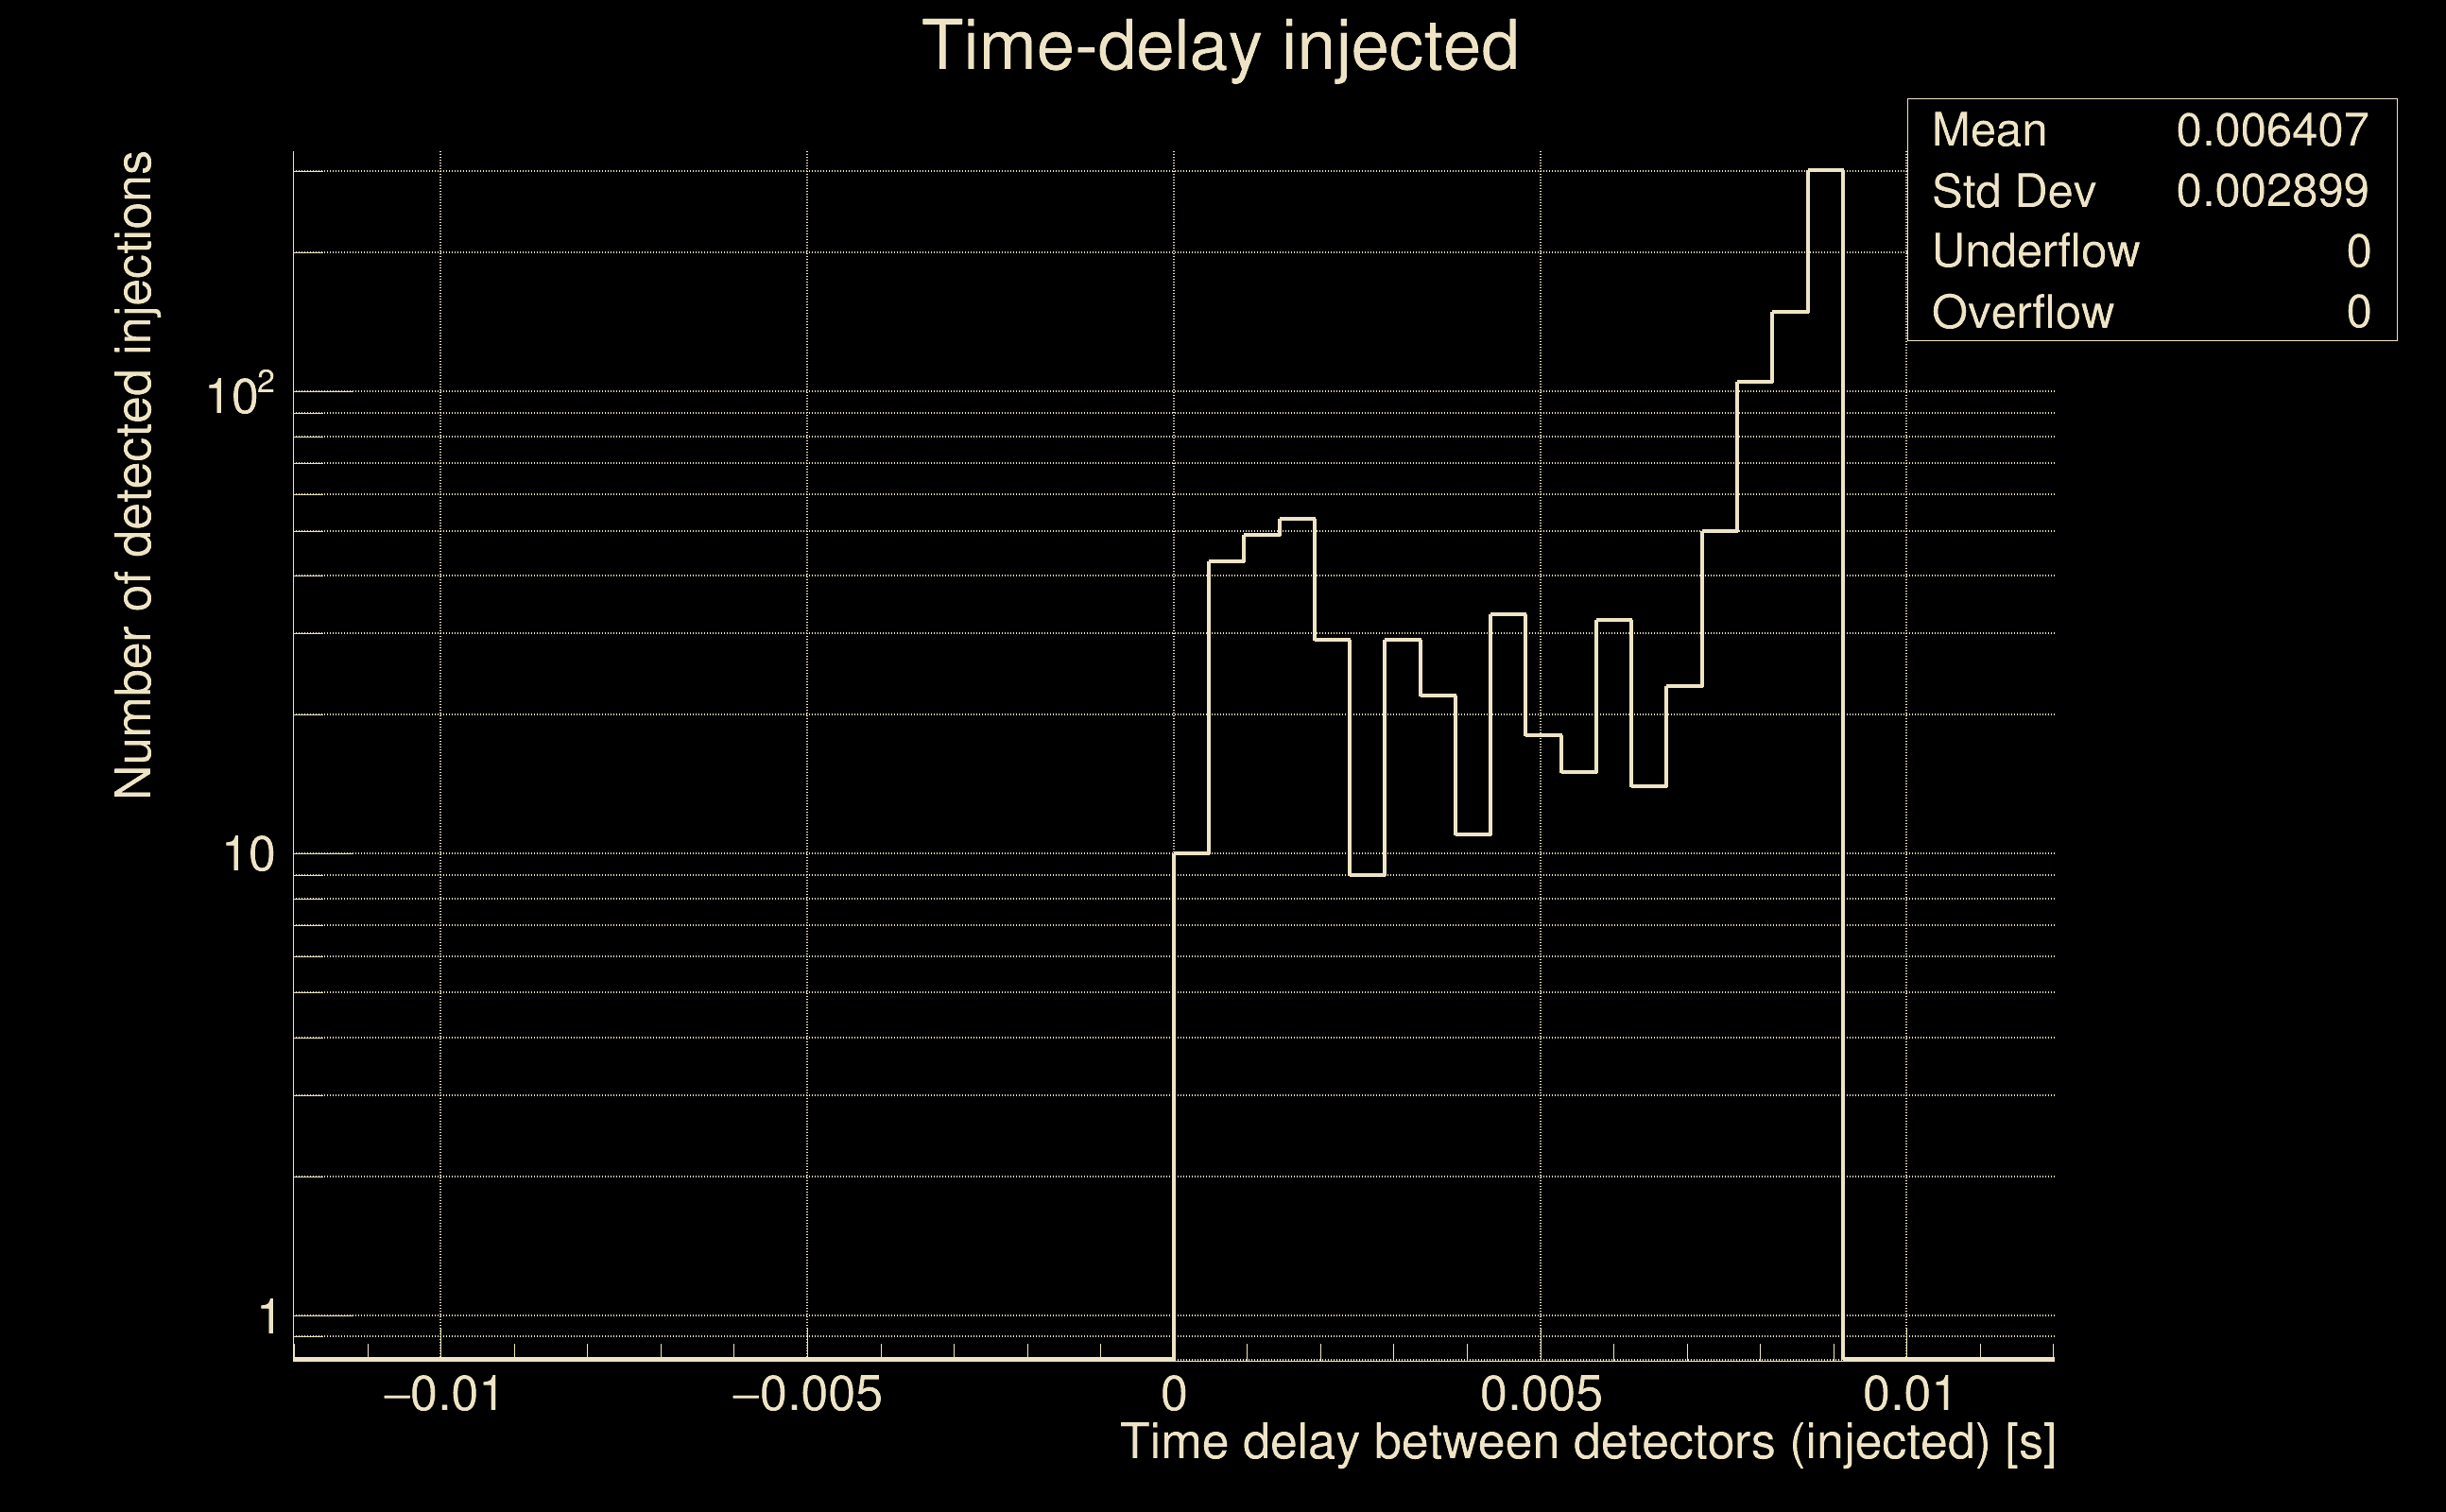
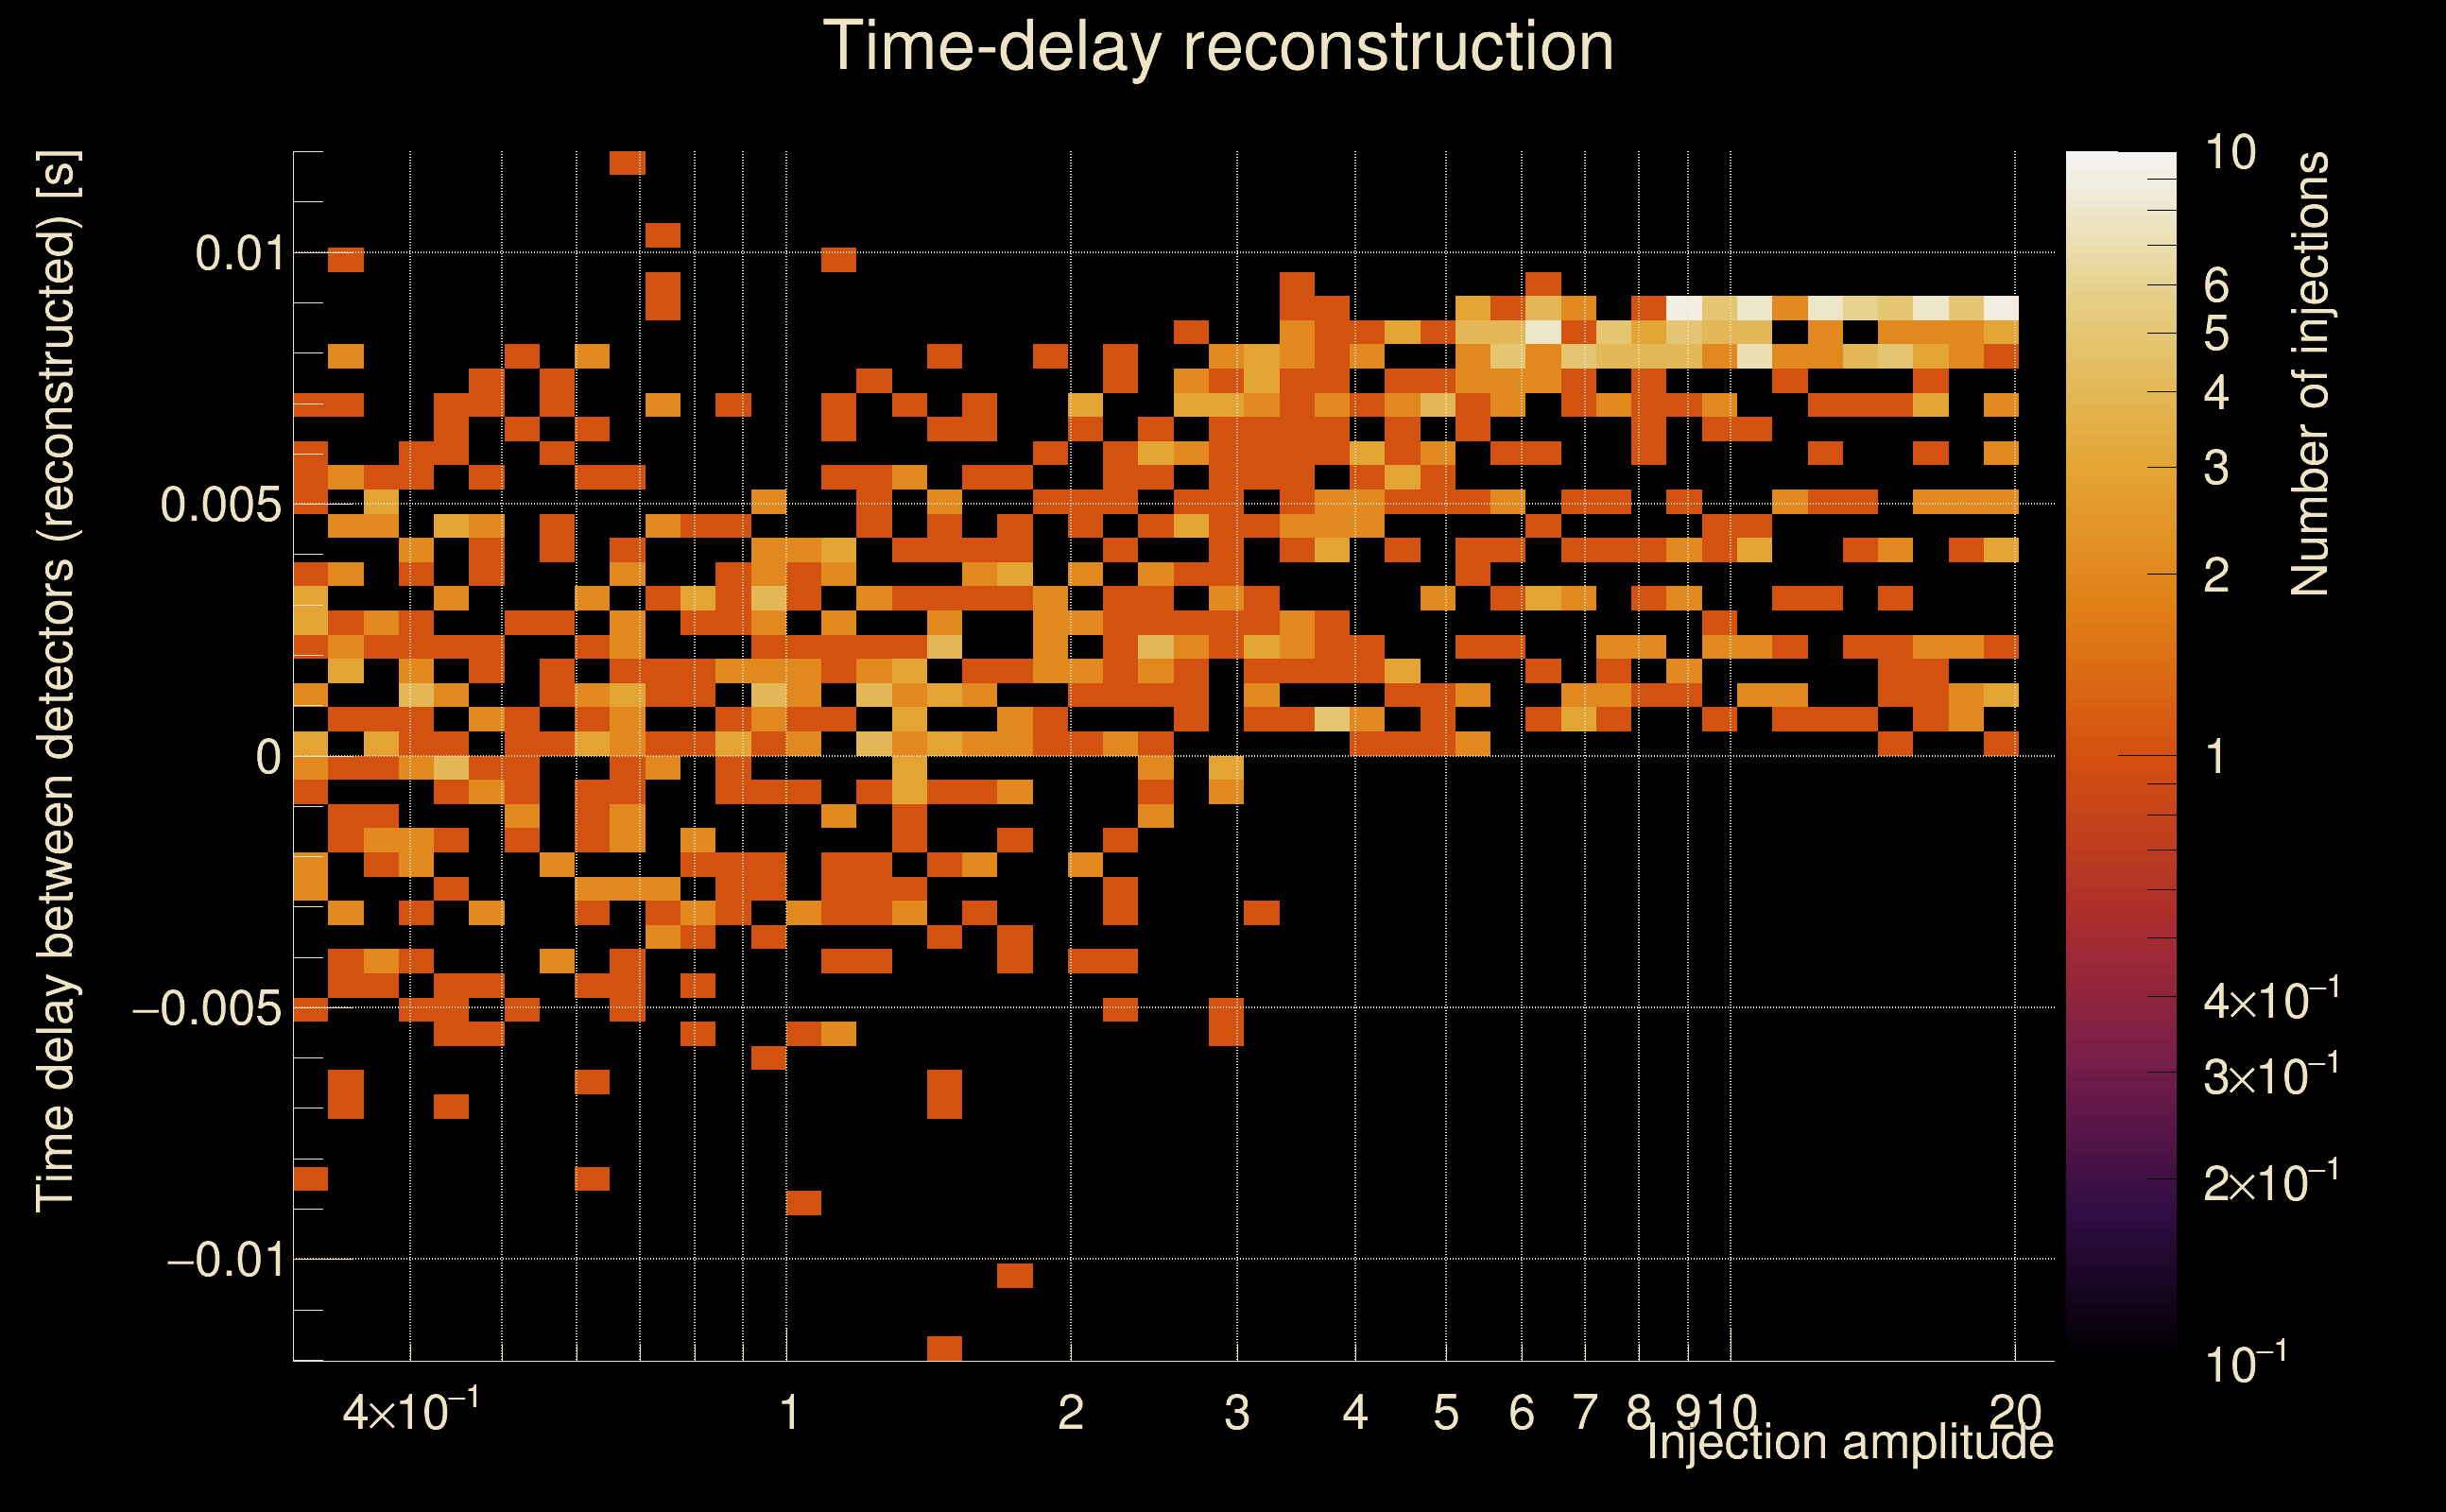
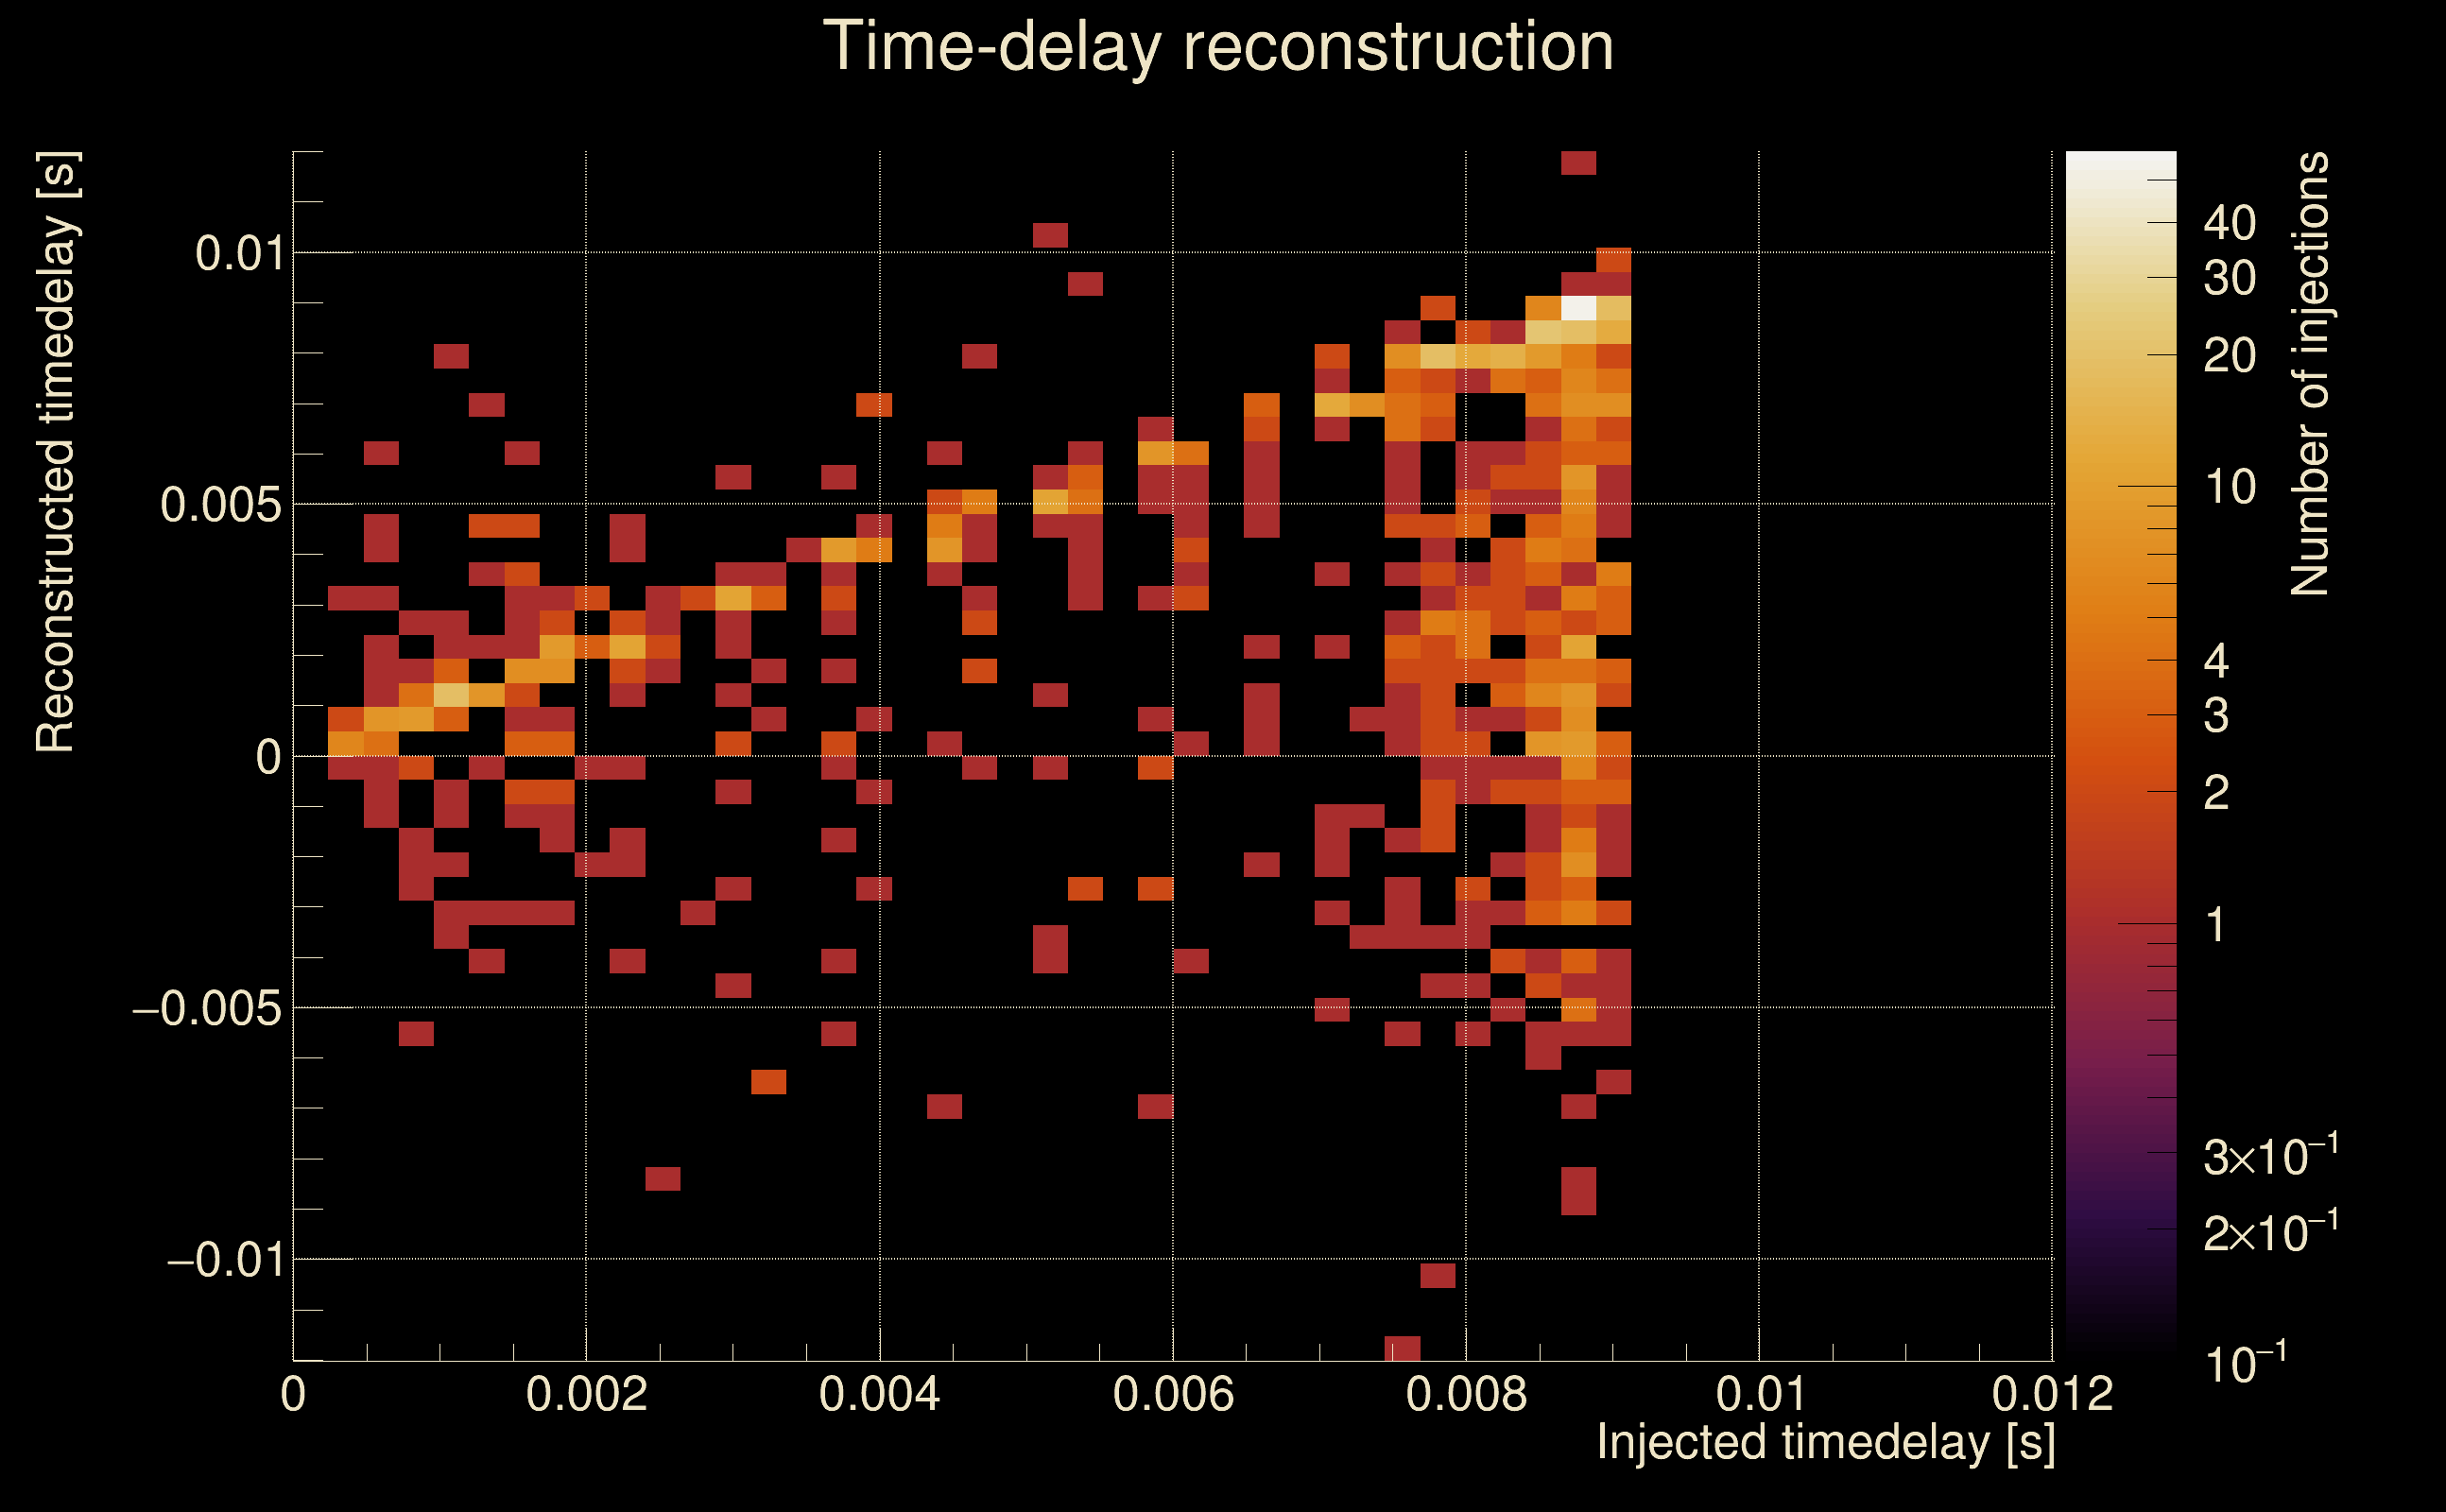
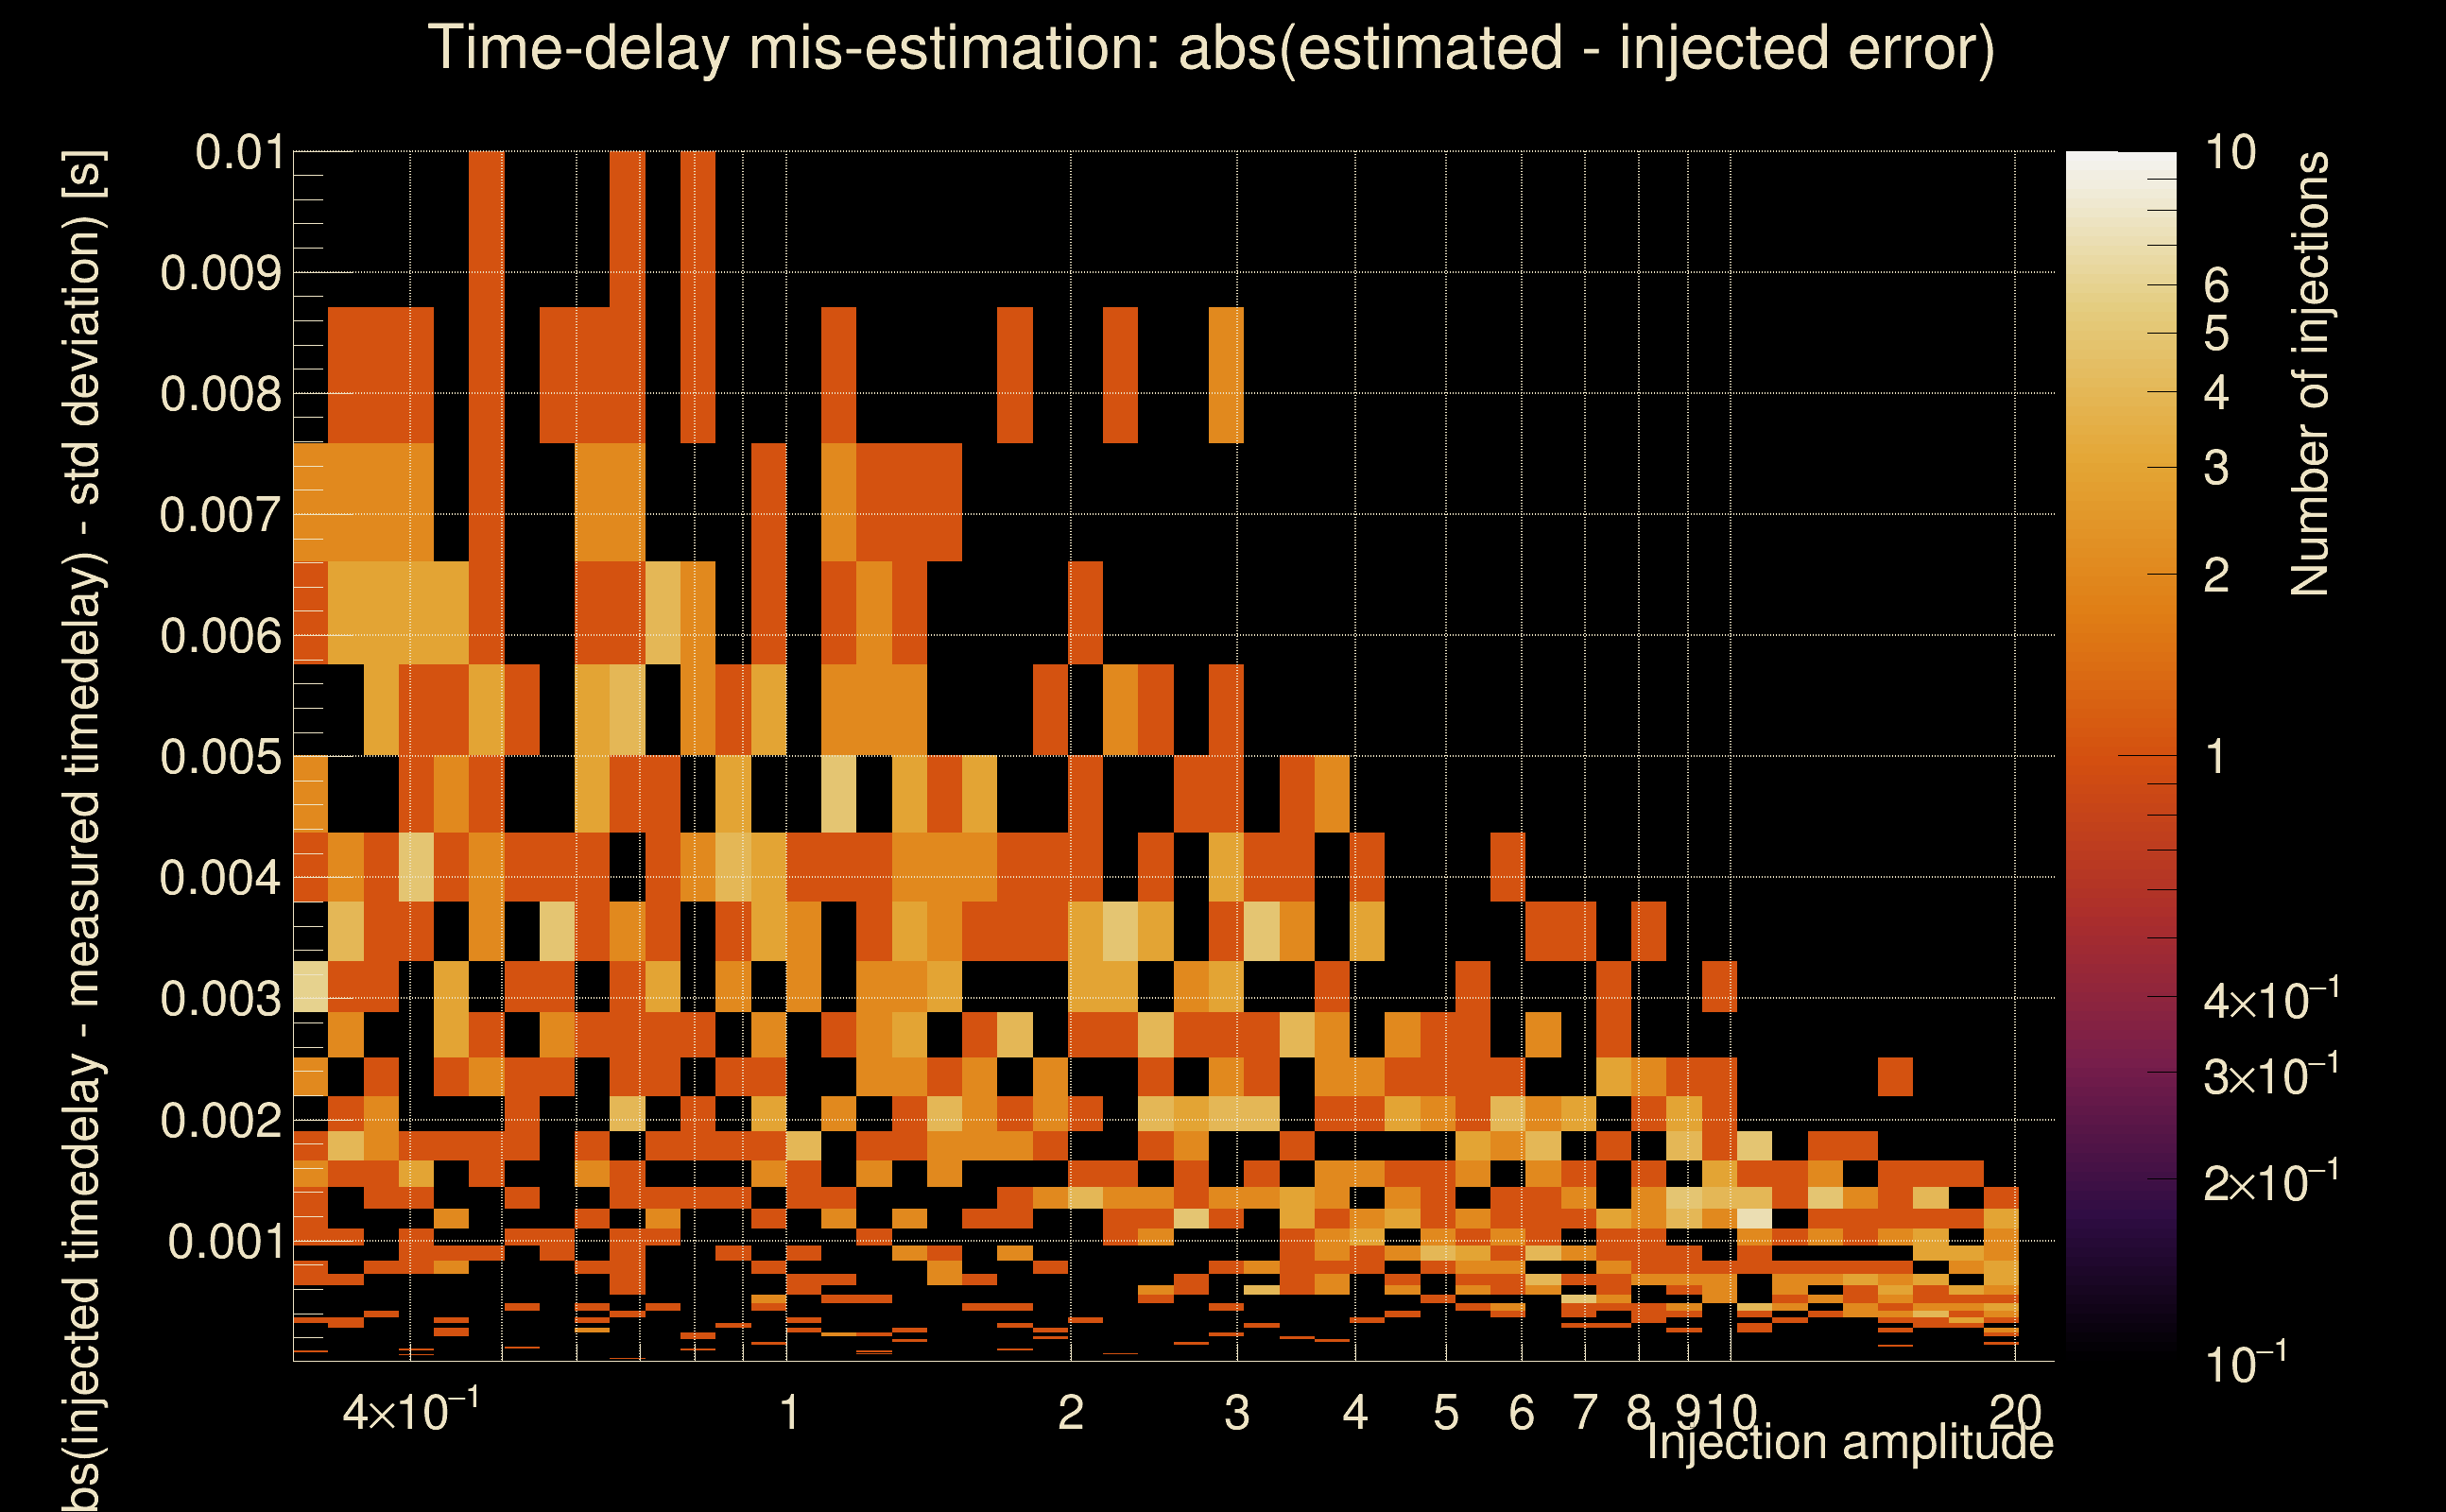
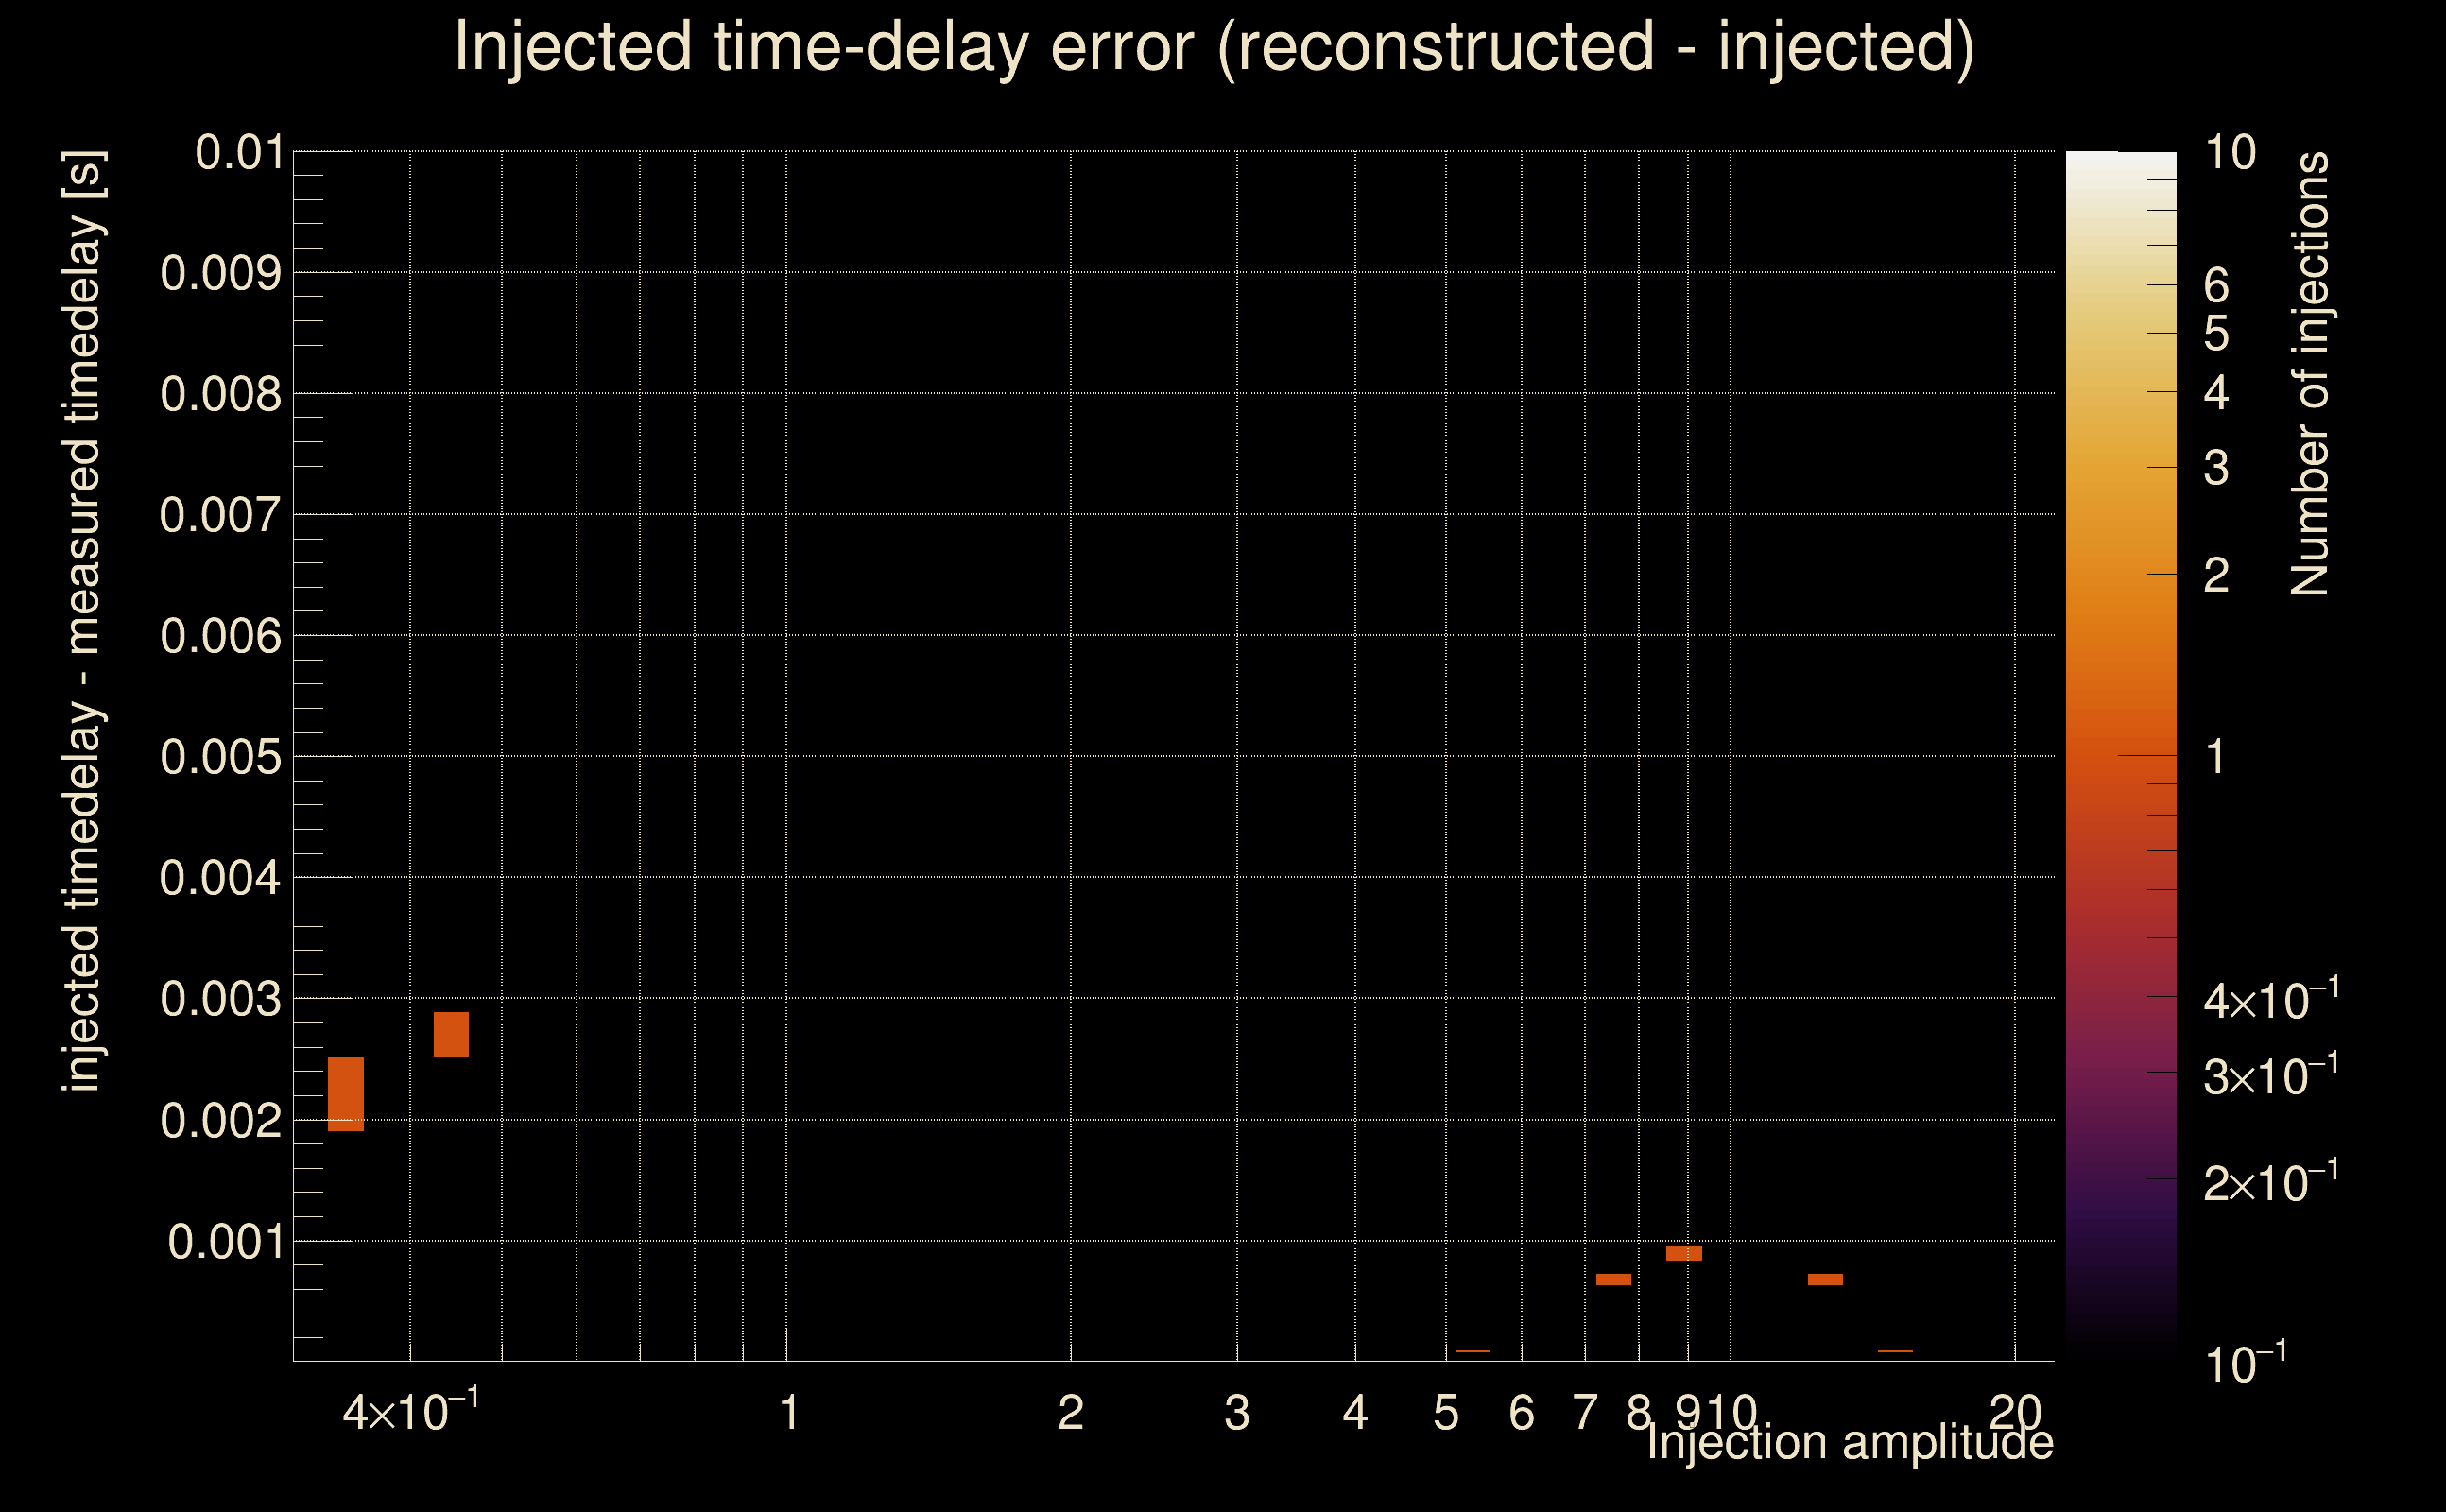
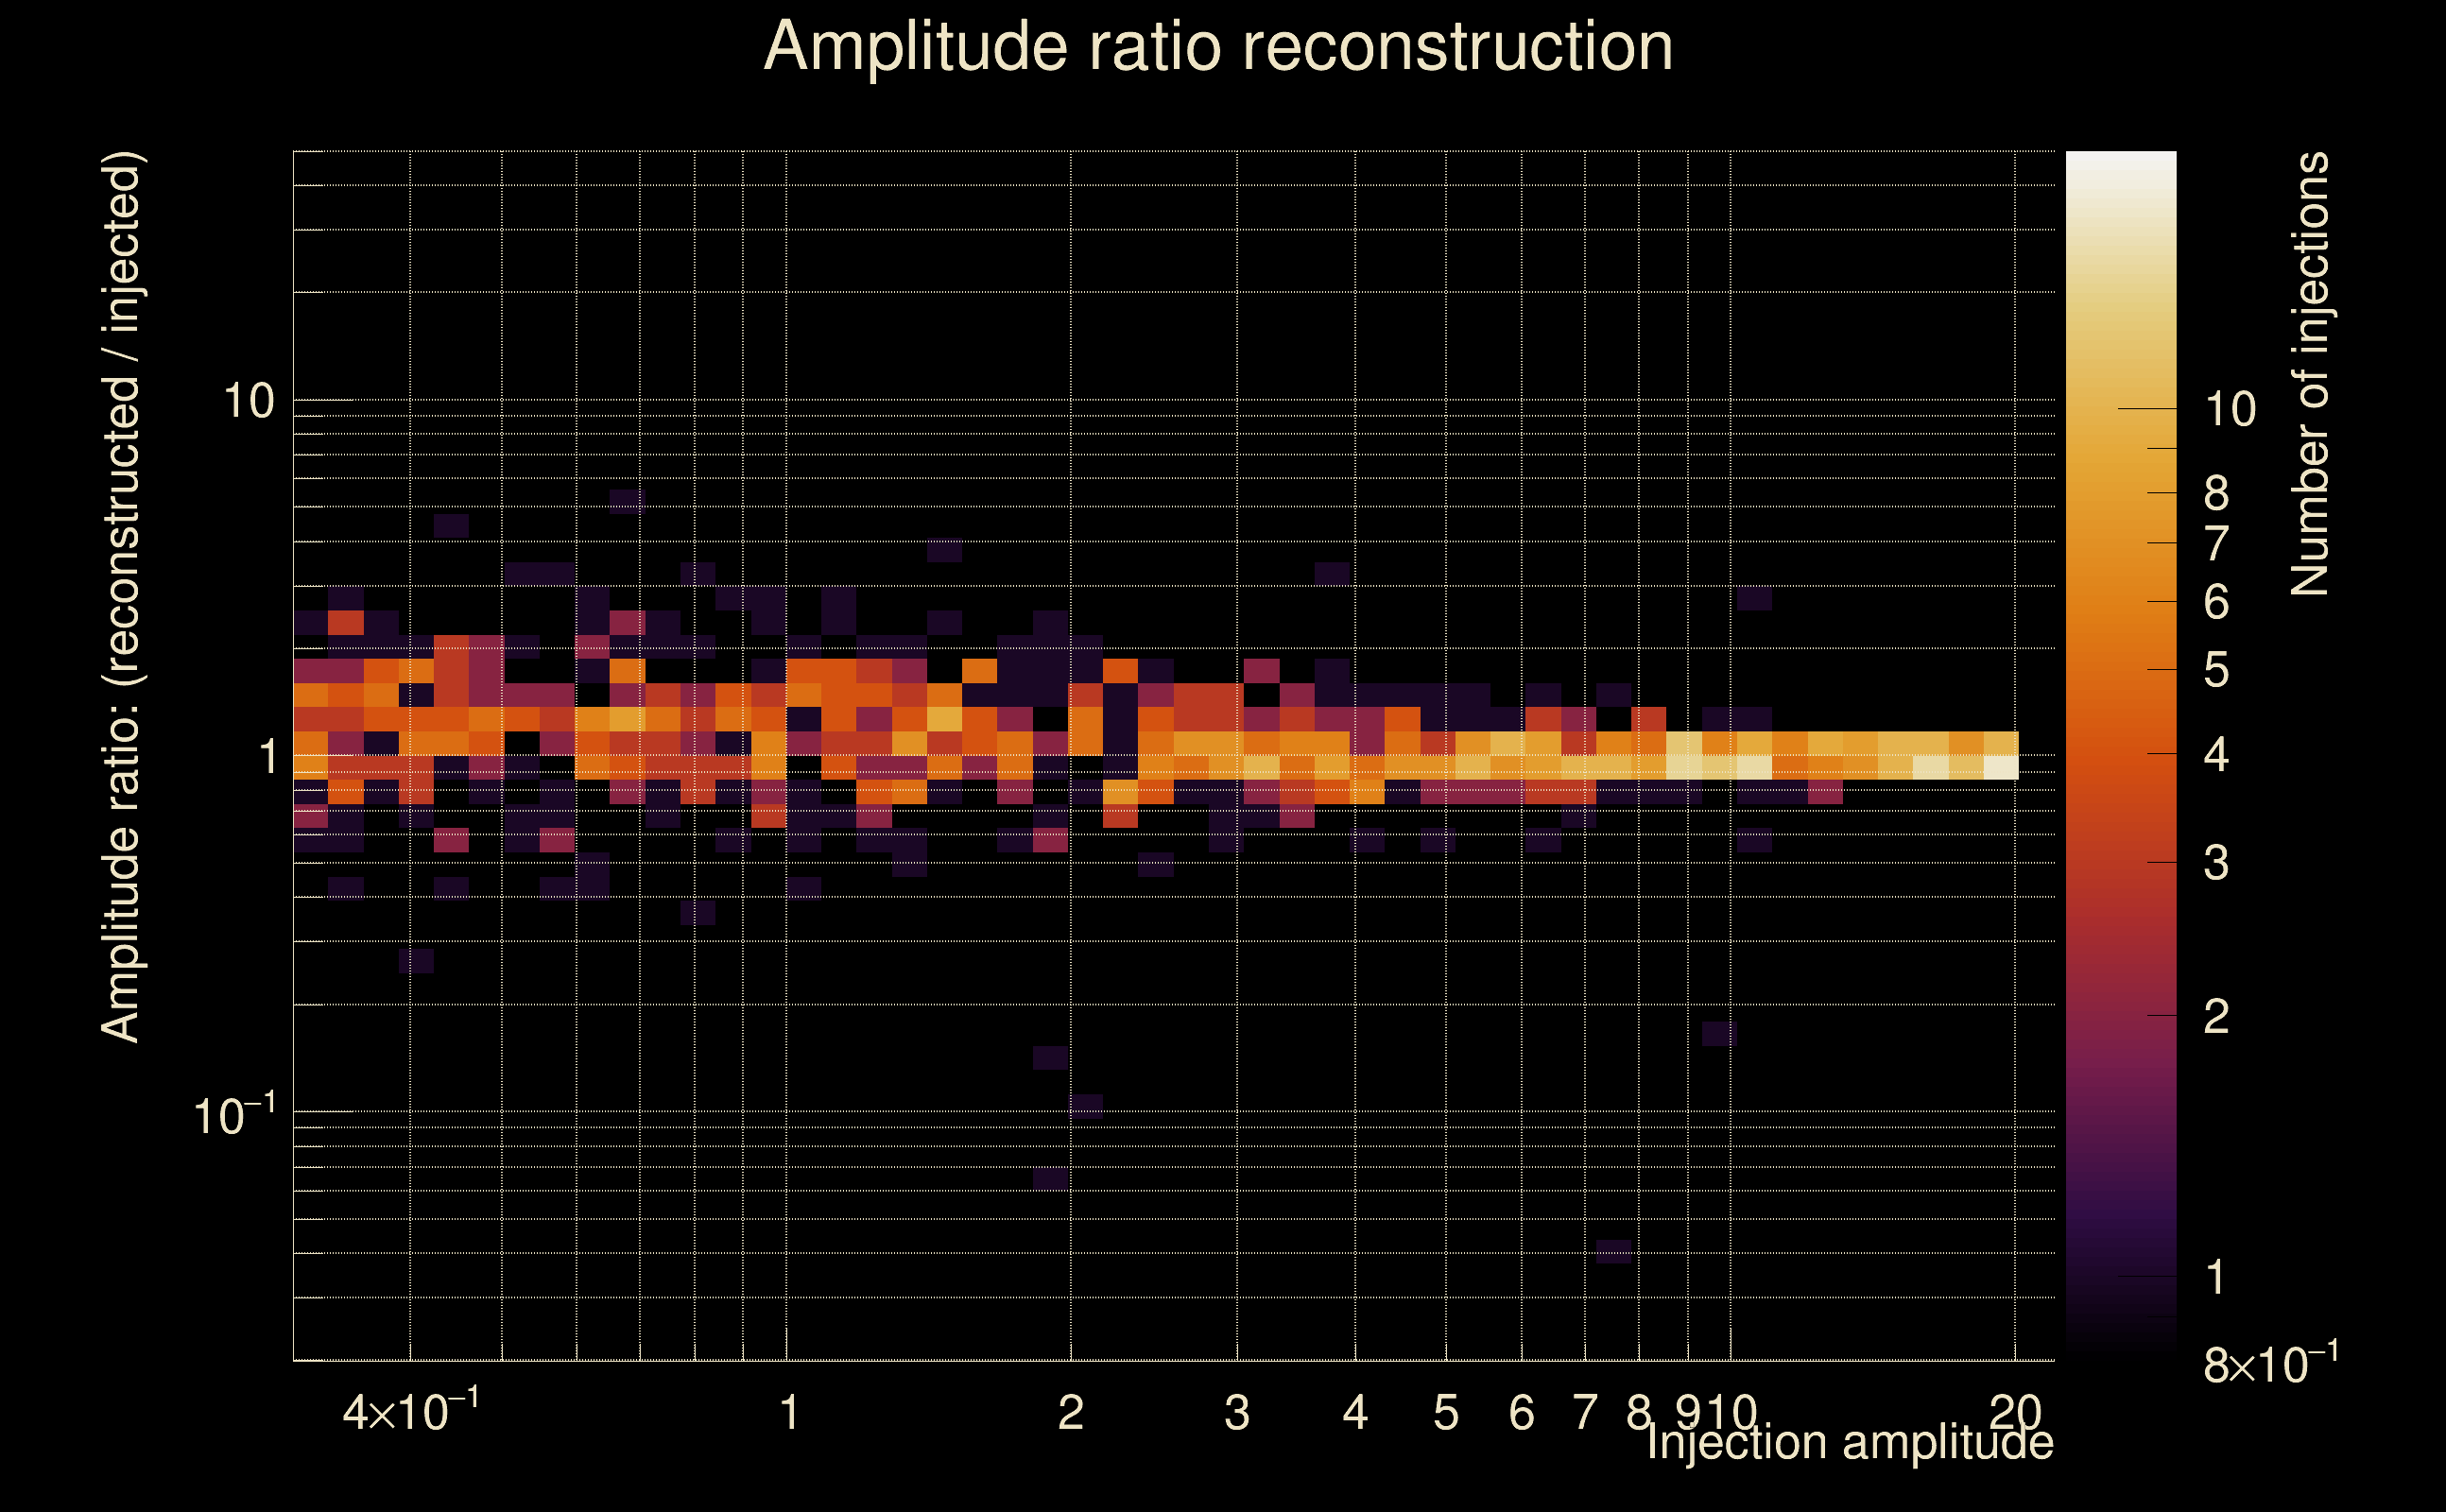
| Number of injections (total/valid/detected): | 1162 / 1019 / 241 |
| List of missed injections: | ./Mezz23-D15_missed.txt |
| Injection amplitude at 90% detection efficiency: | 10.8901 |
| Injection amplitude at 50% detection efficiency: | 7.99277 |
| Injection amplitude at 10% detection efficiency: | 5.40196 |
 |
 |
 |
 |
 |
 |
 |
|
 |
 |
|
 |
 |
|
 |
 |
|
 |
 |
|
 |
 |
|
 |
 |
|
 |
 |
|
 |
 |
 |
 |
 |
 |
 |
 |
 |
 |
 |
 |
 |
 |
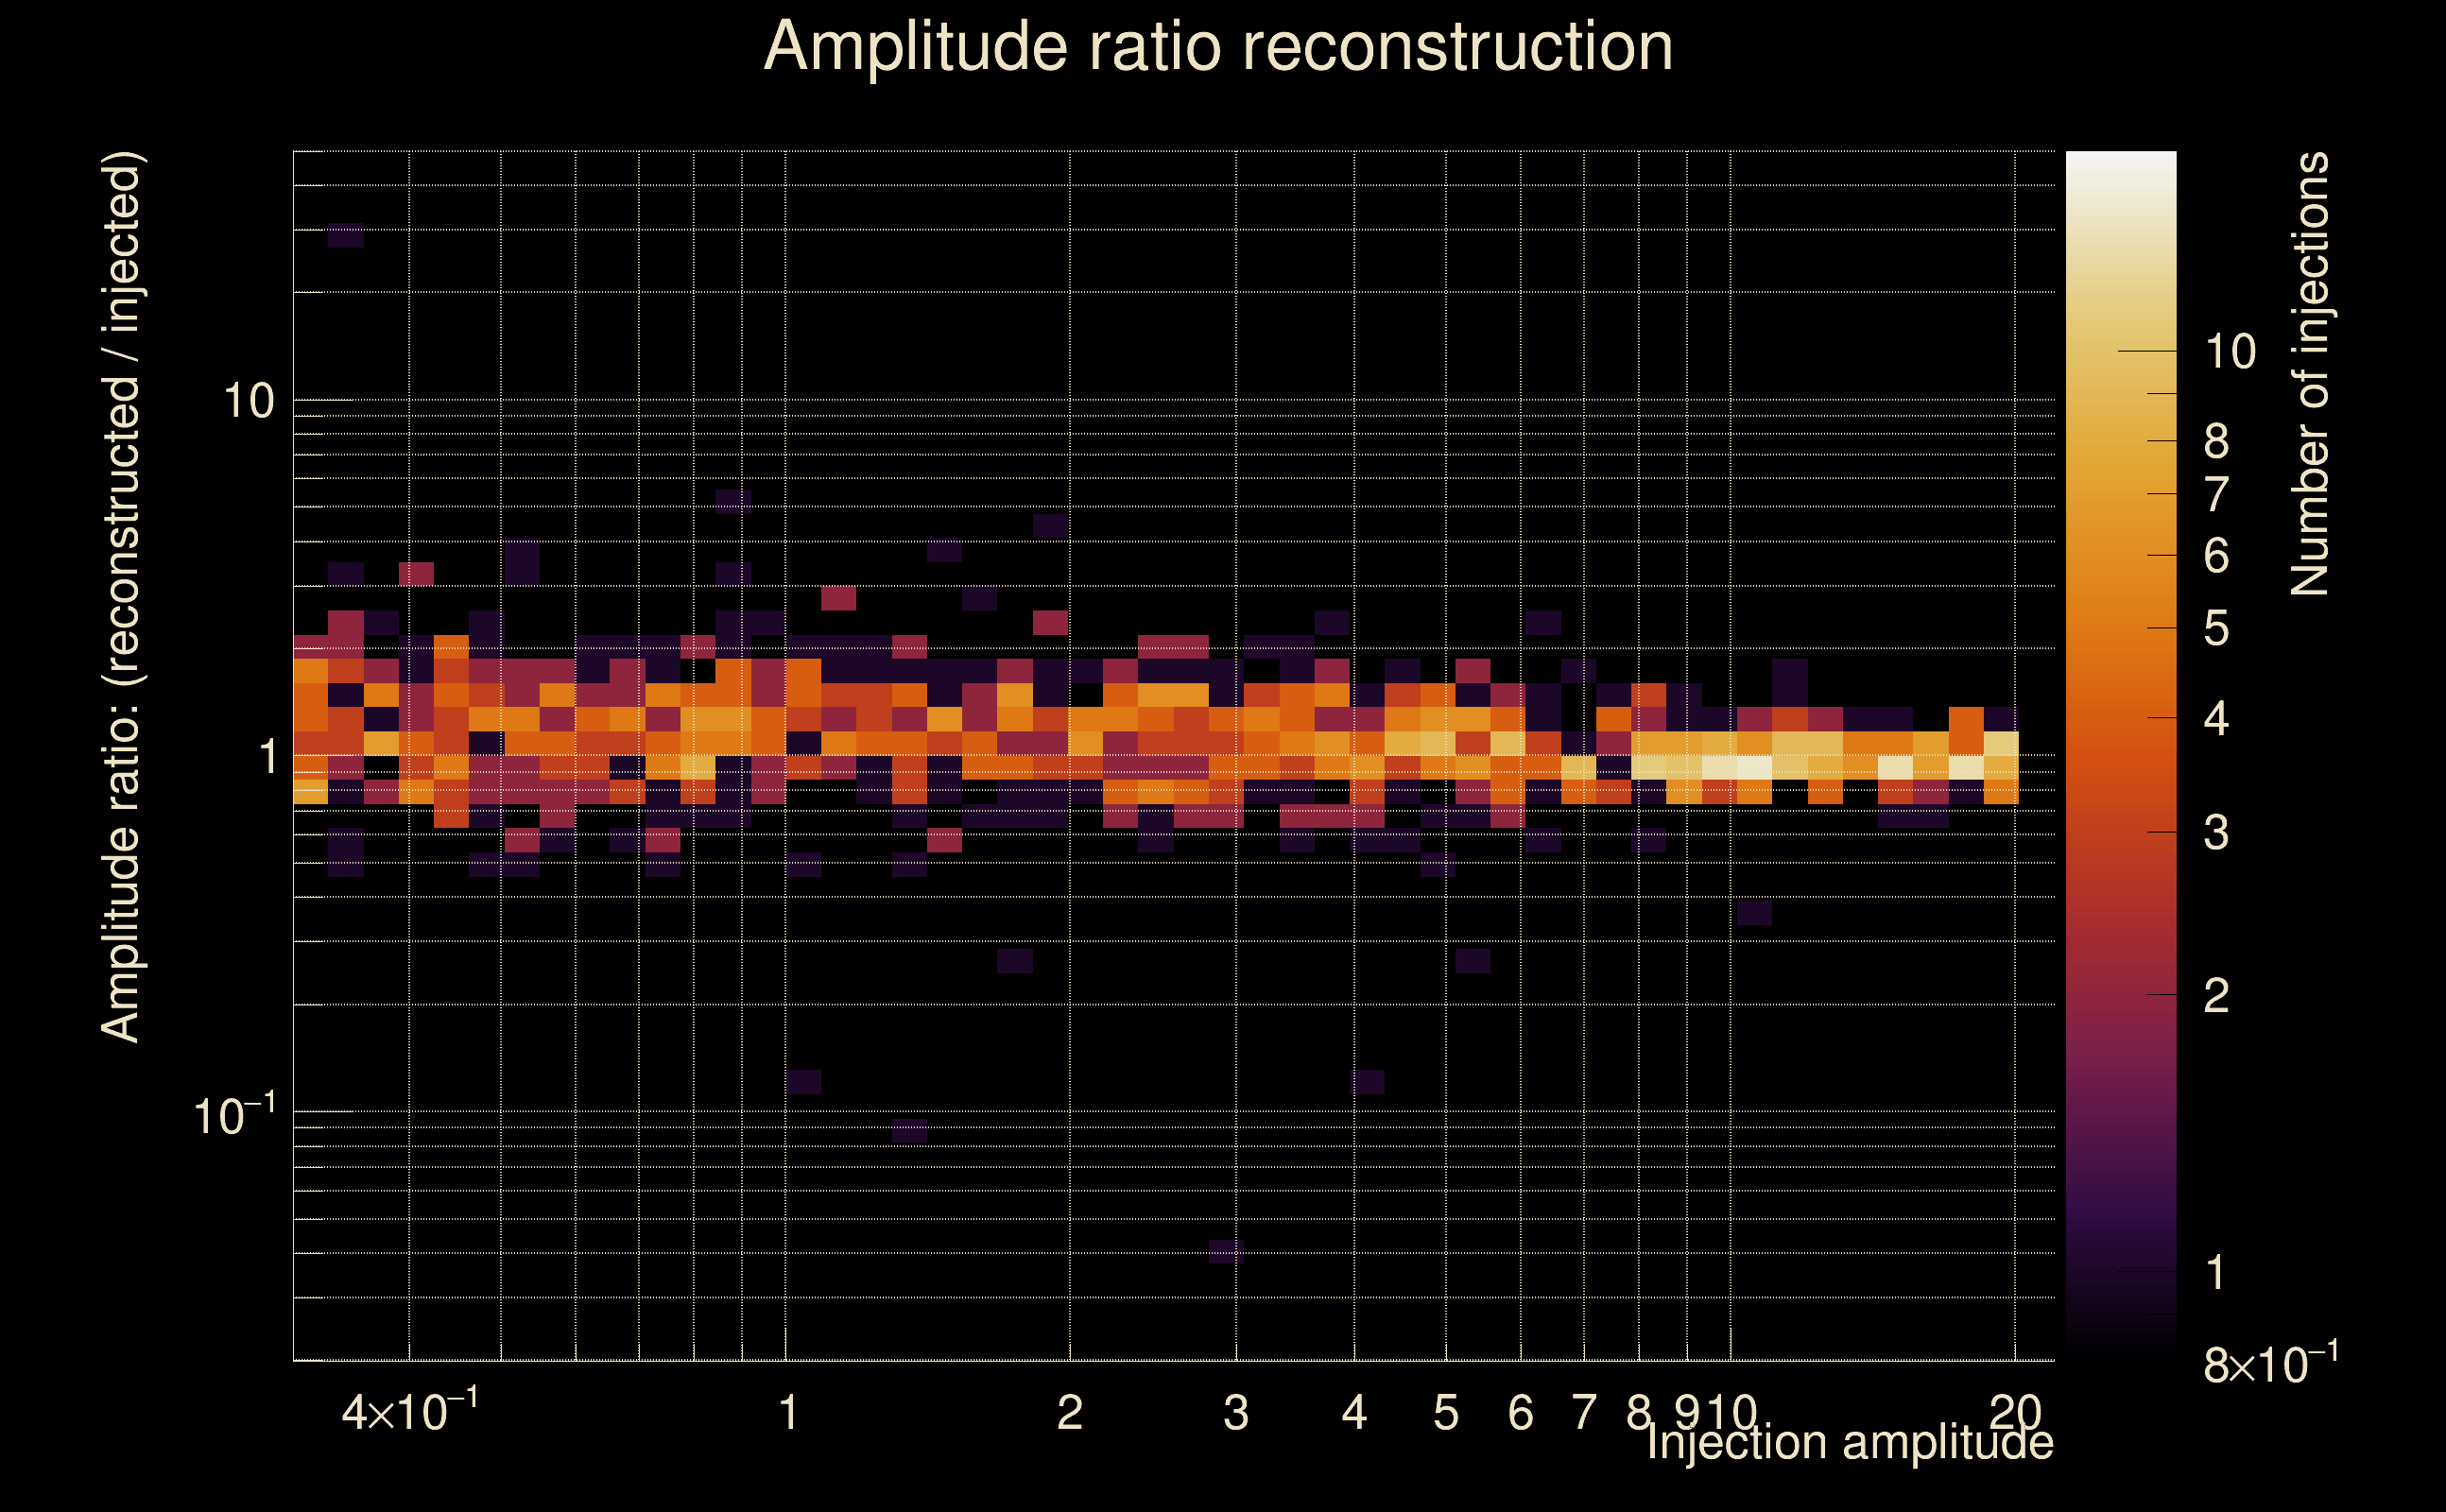 |
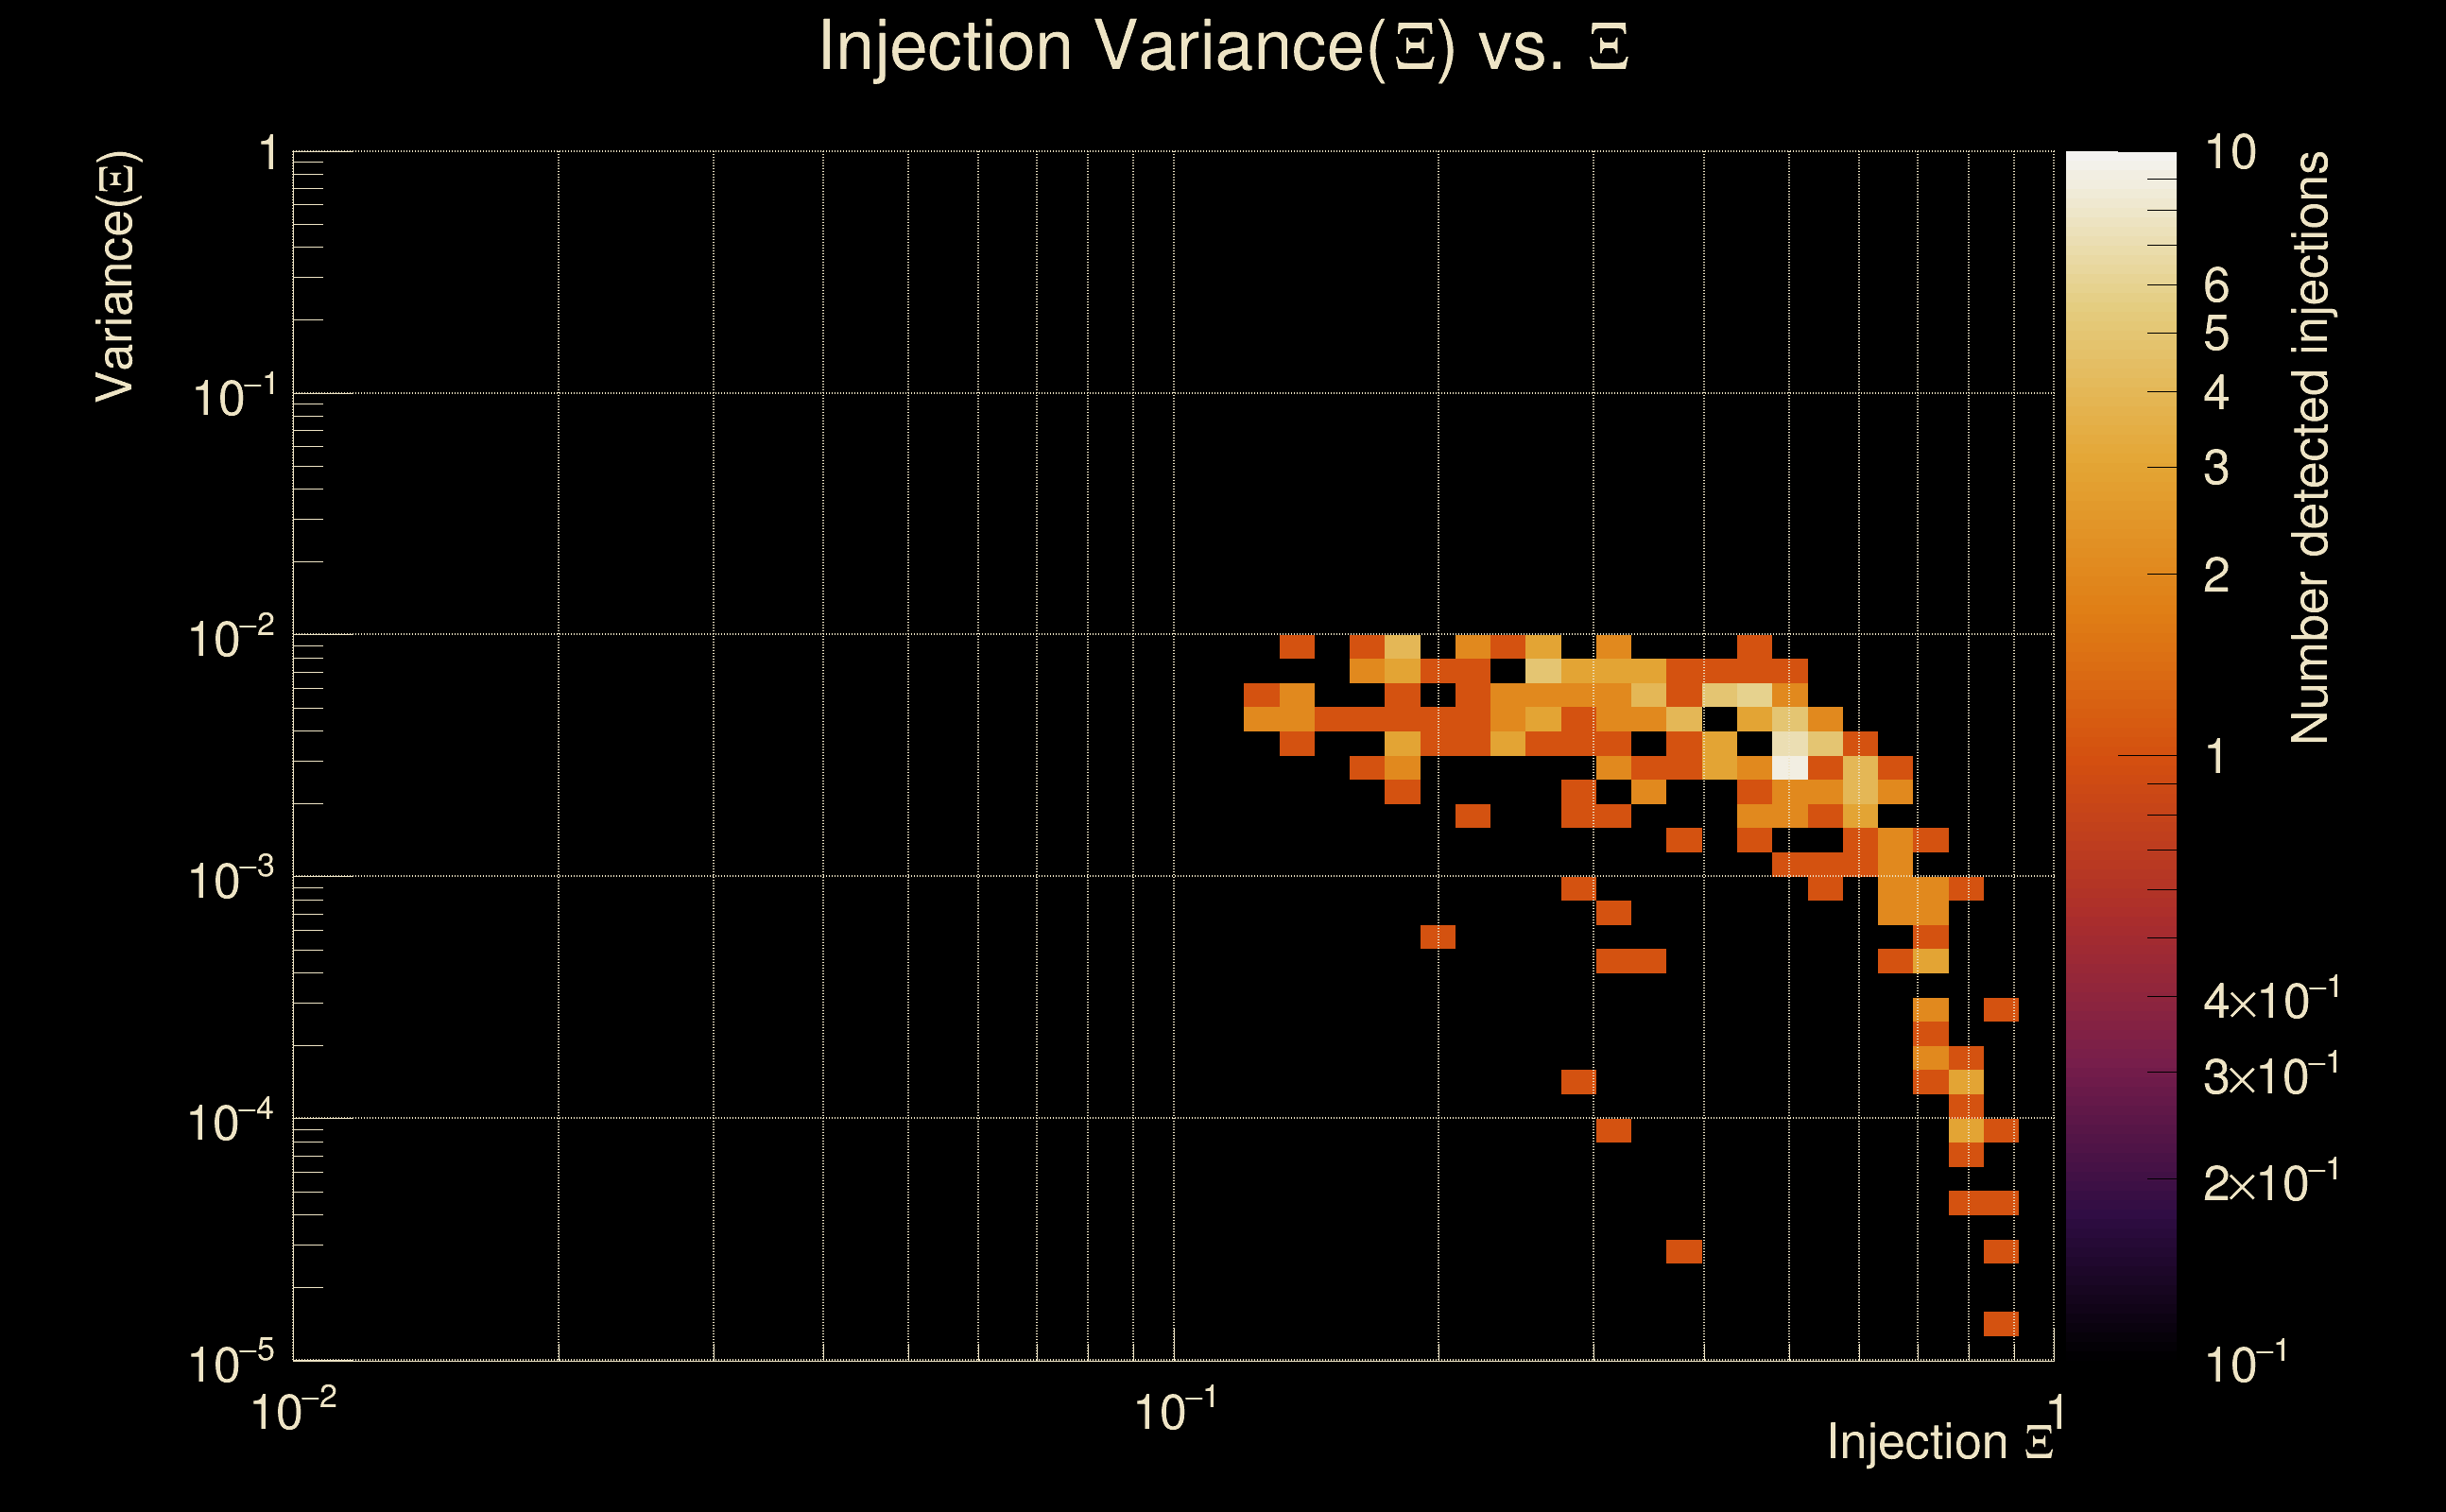
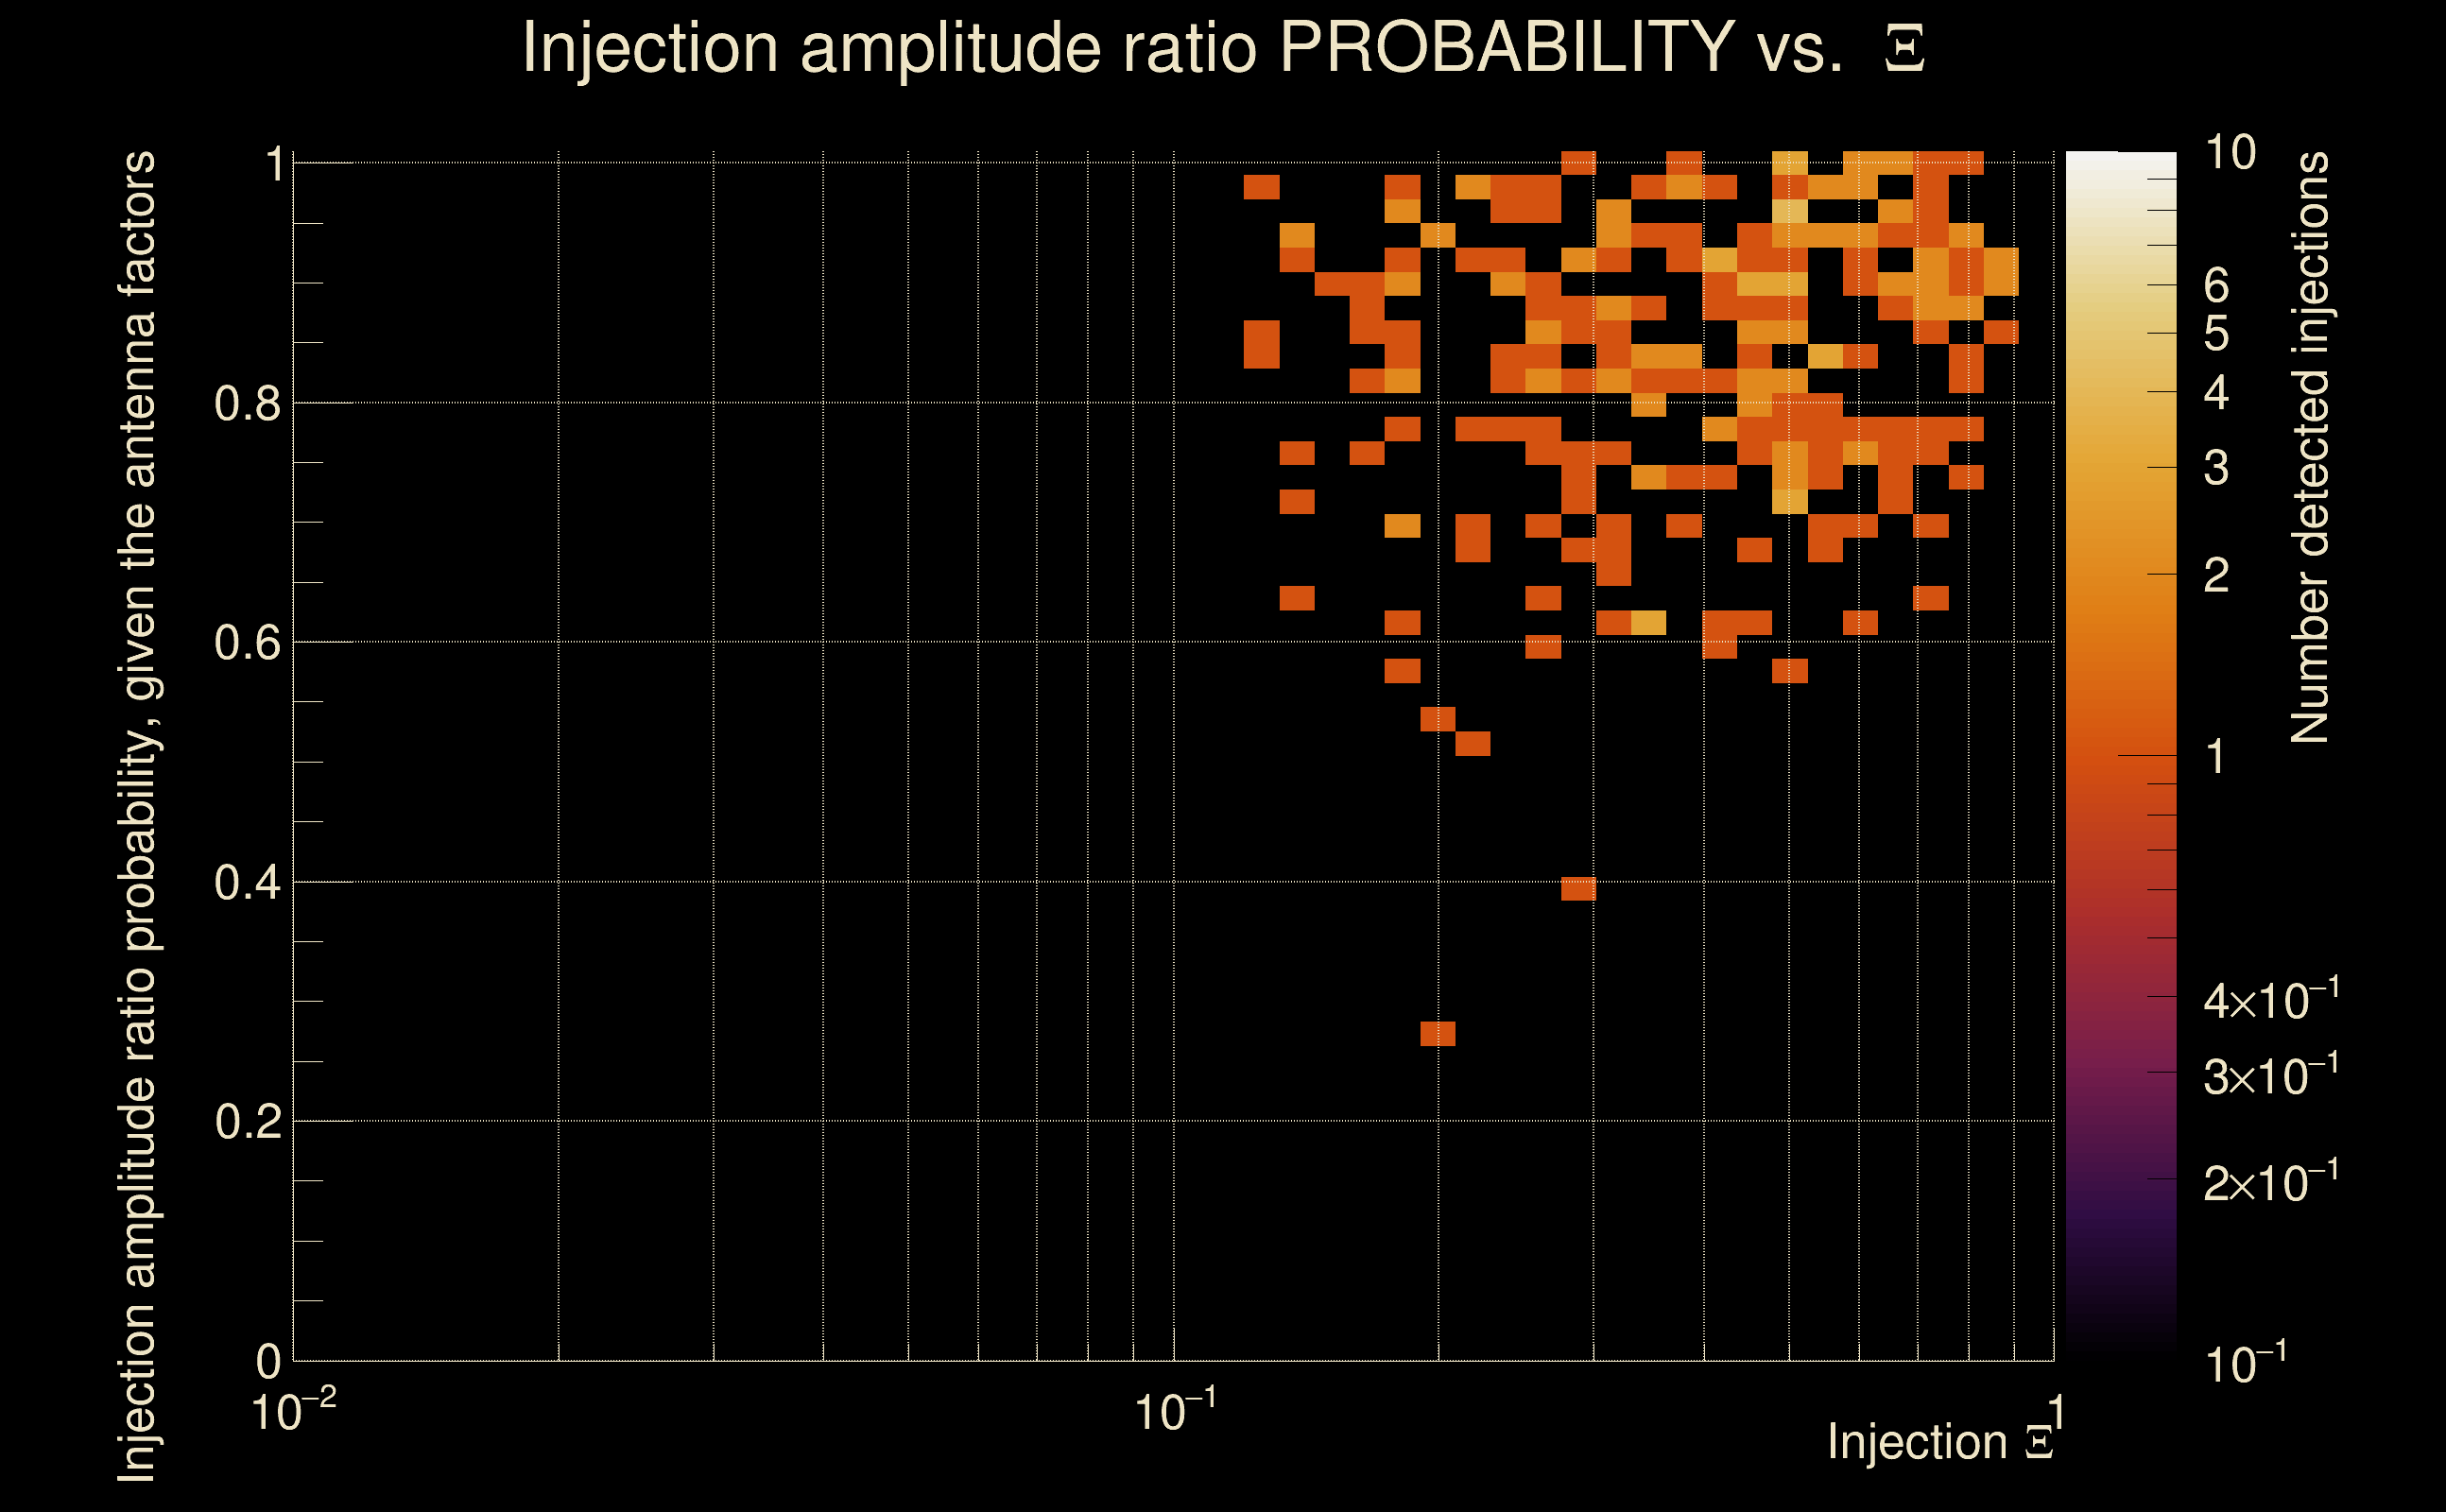
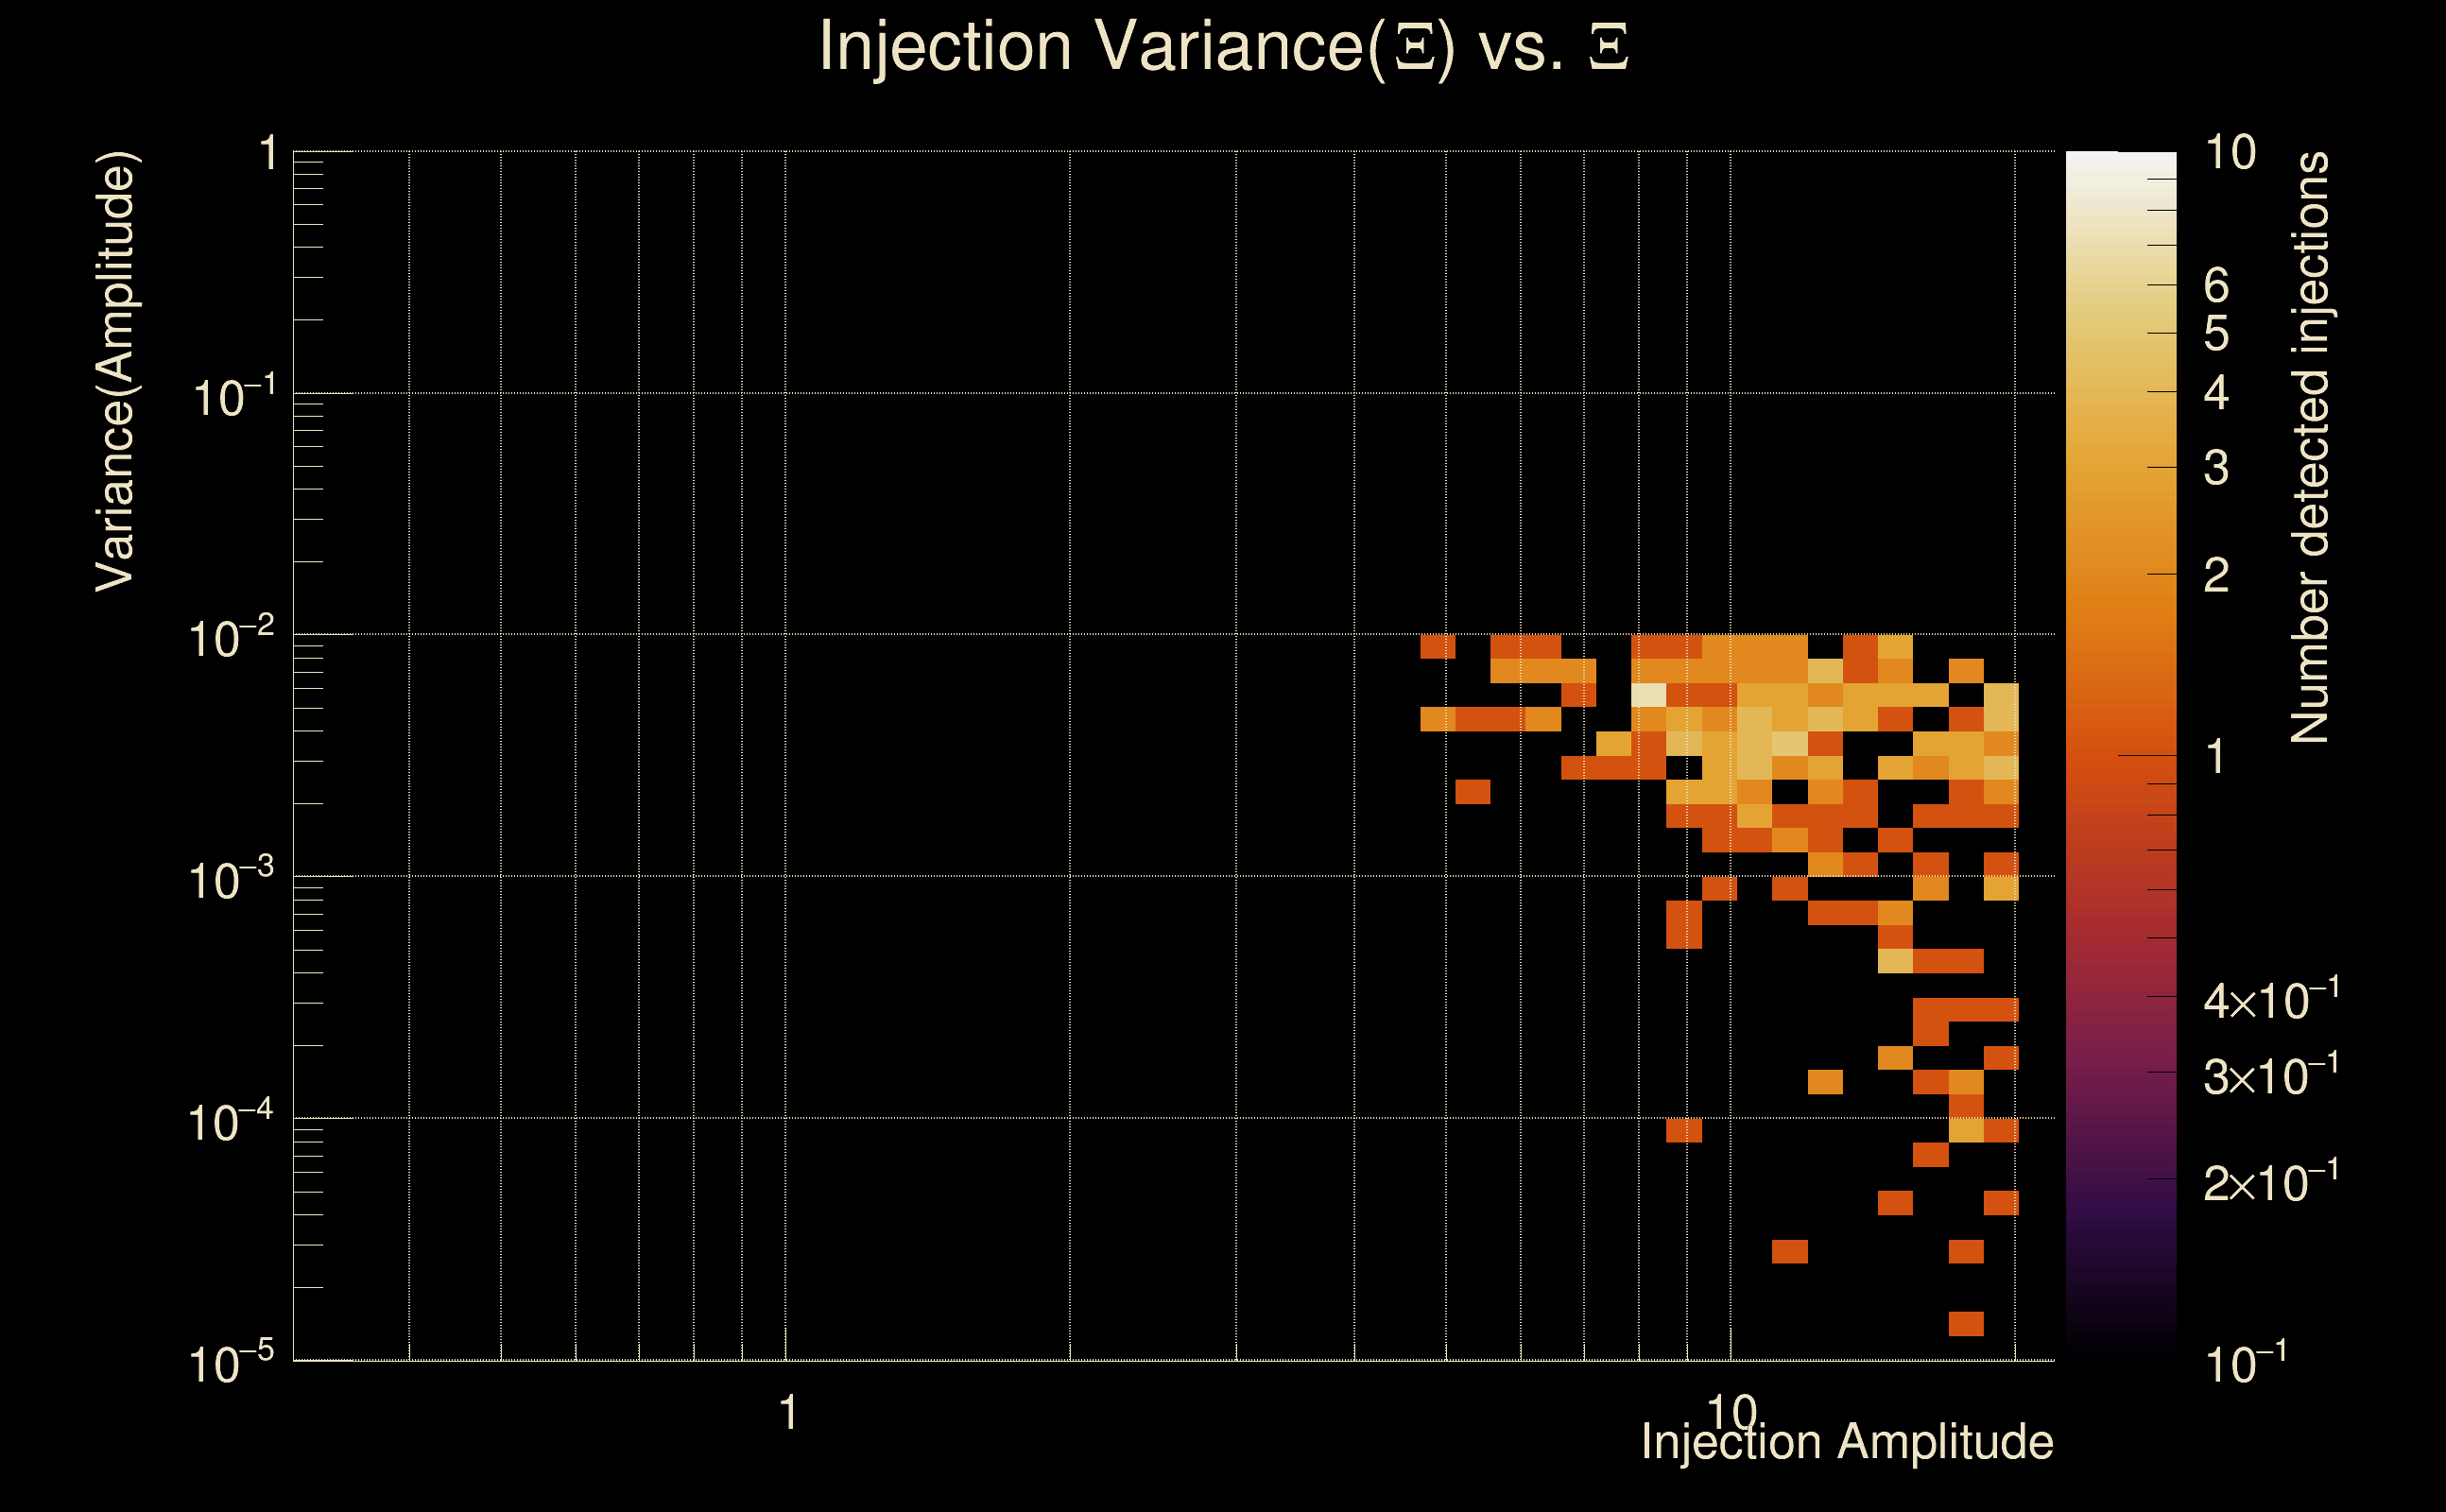
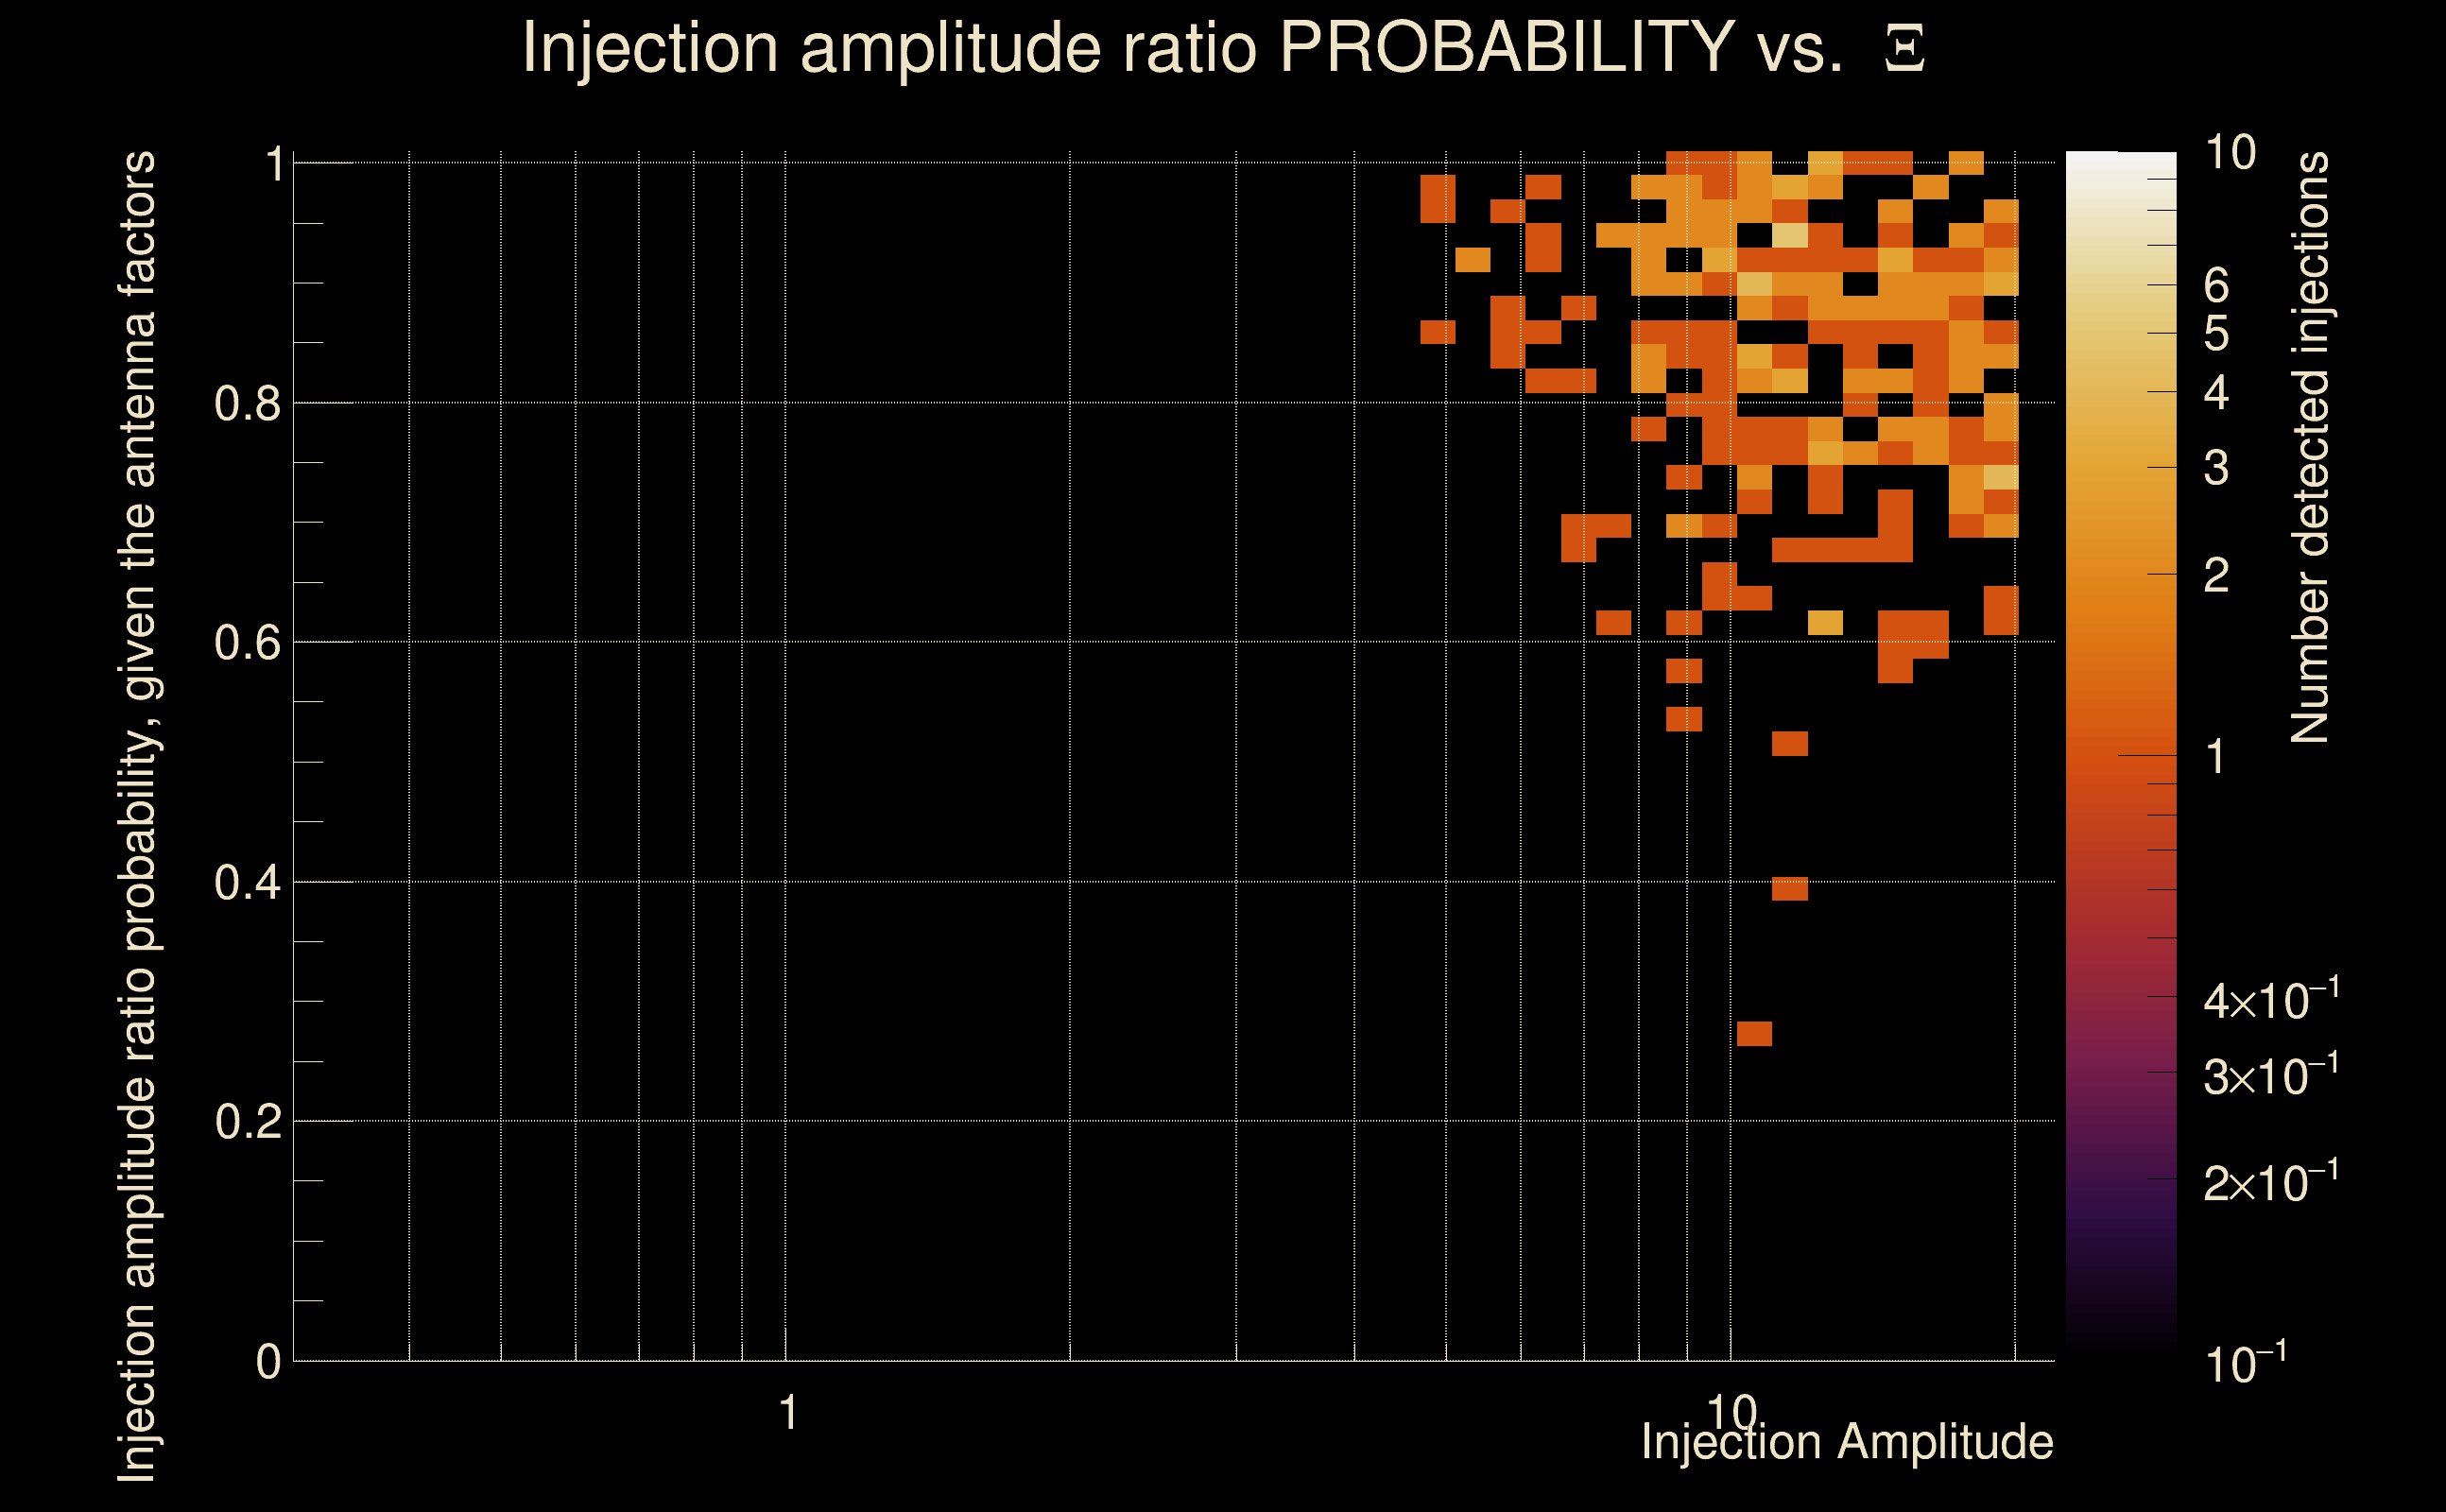
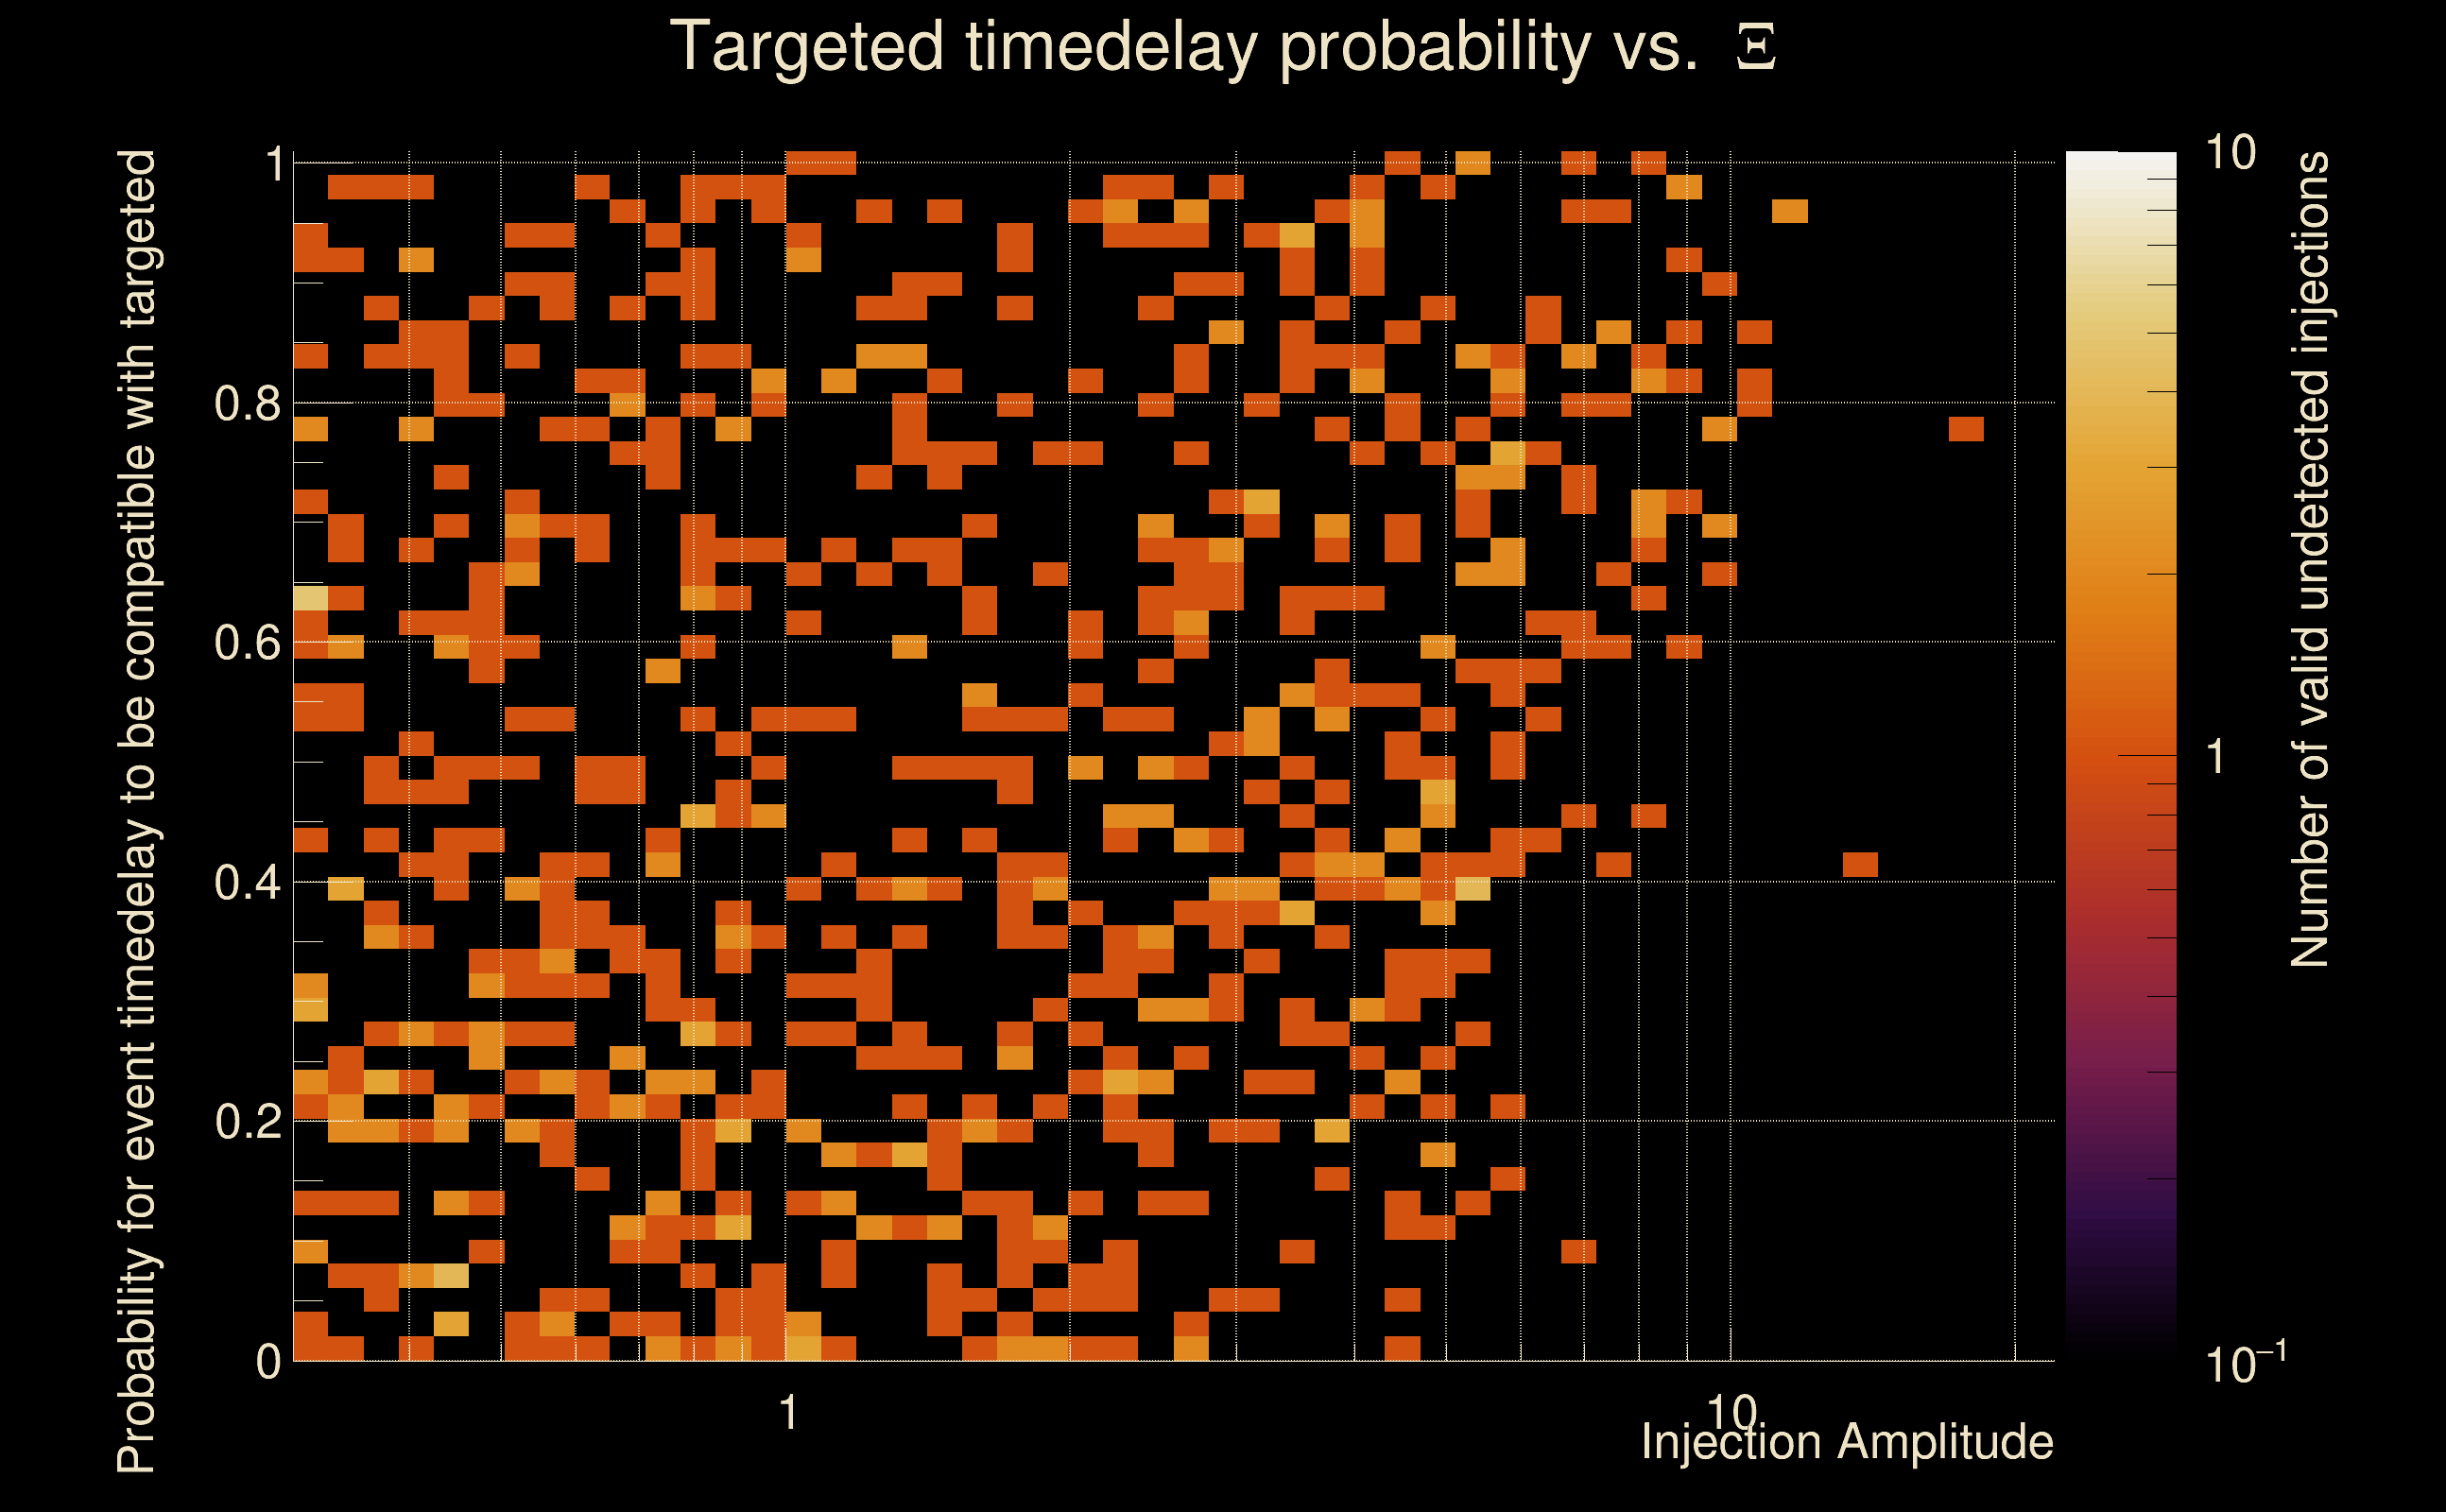
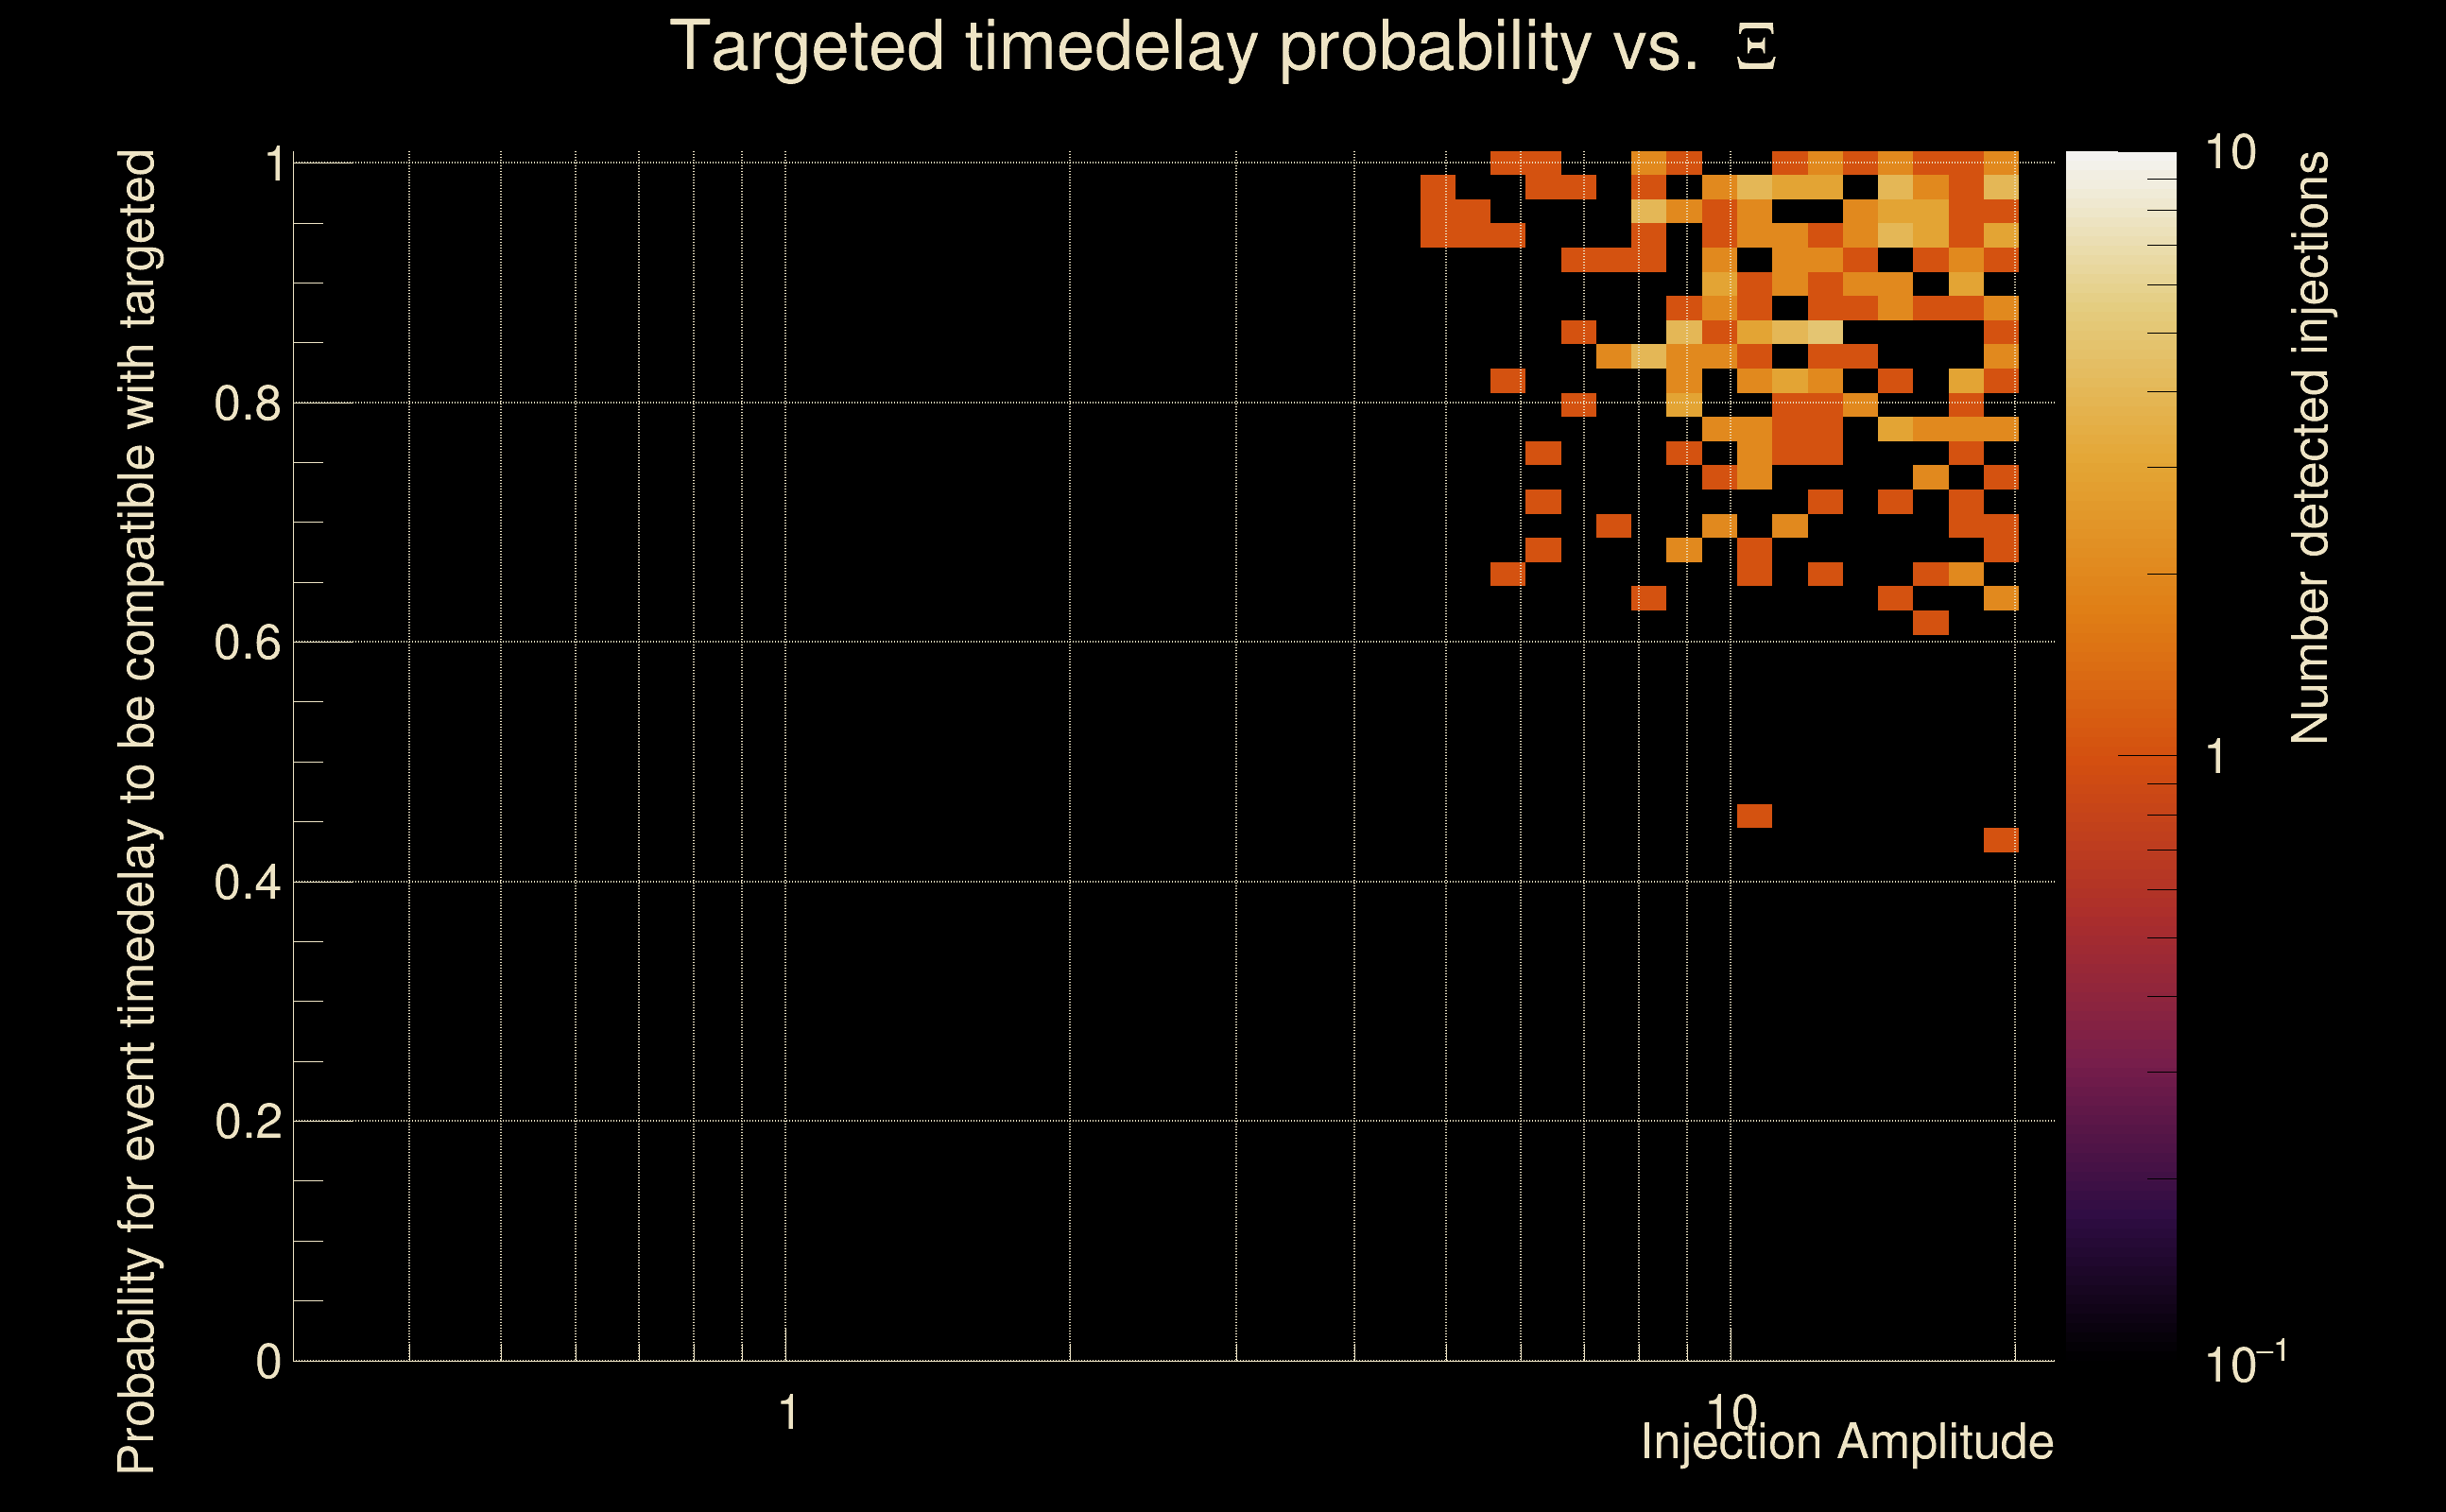
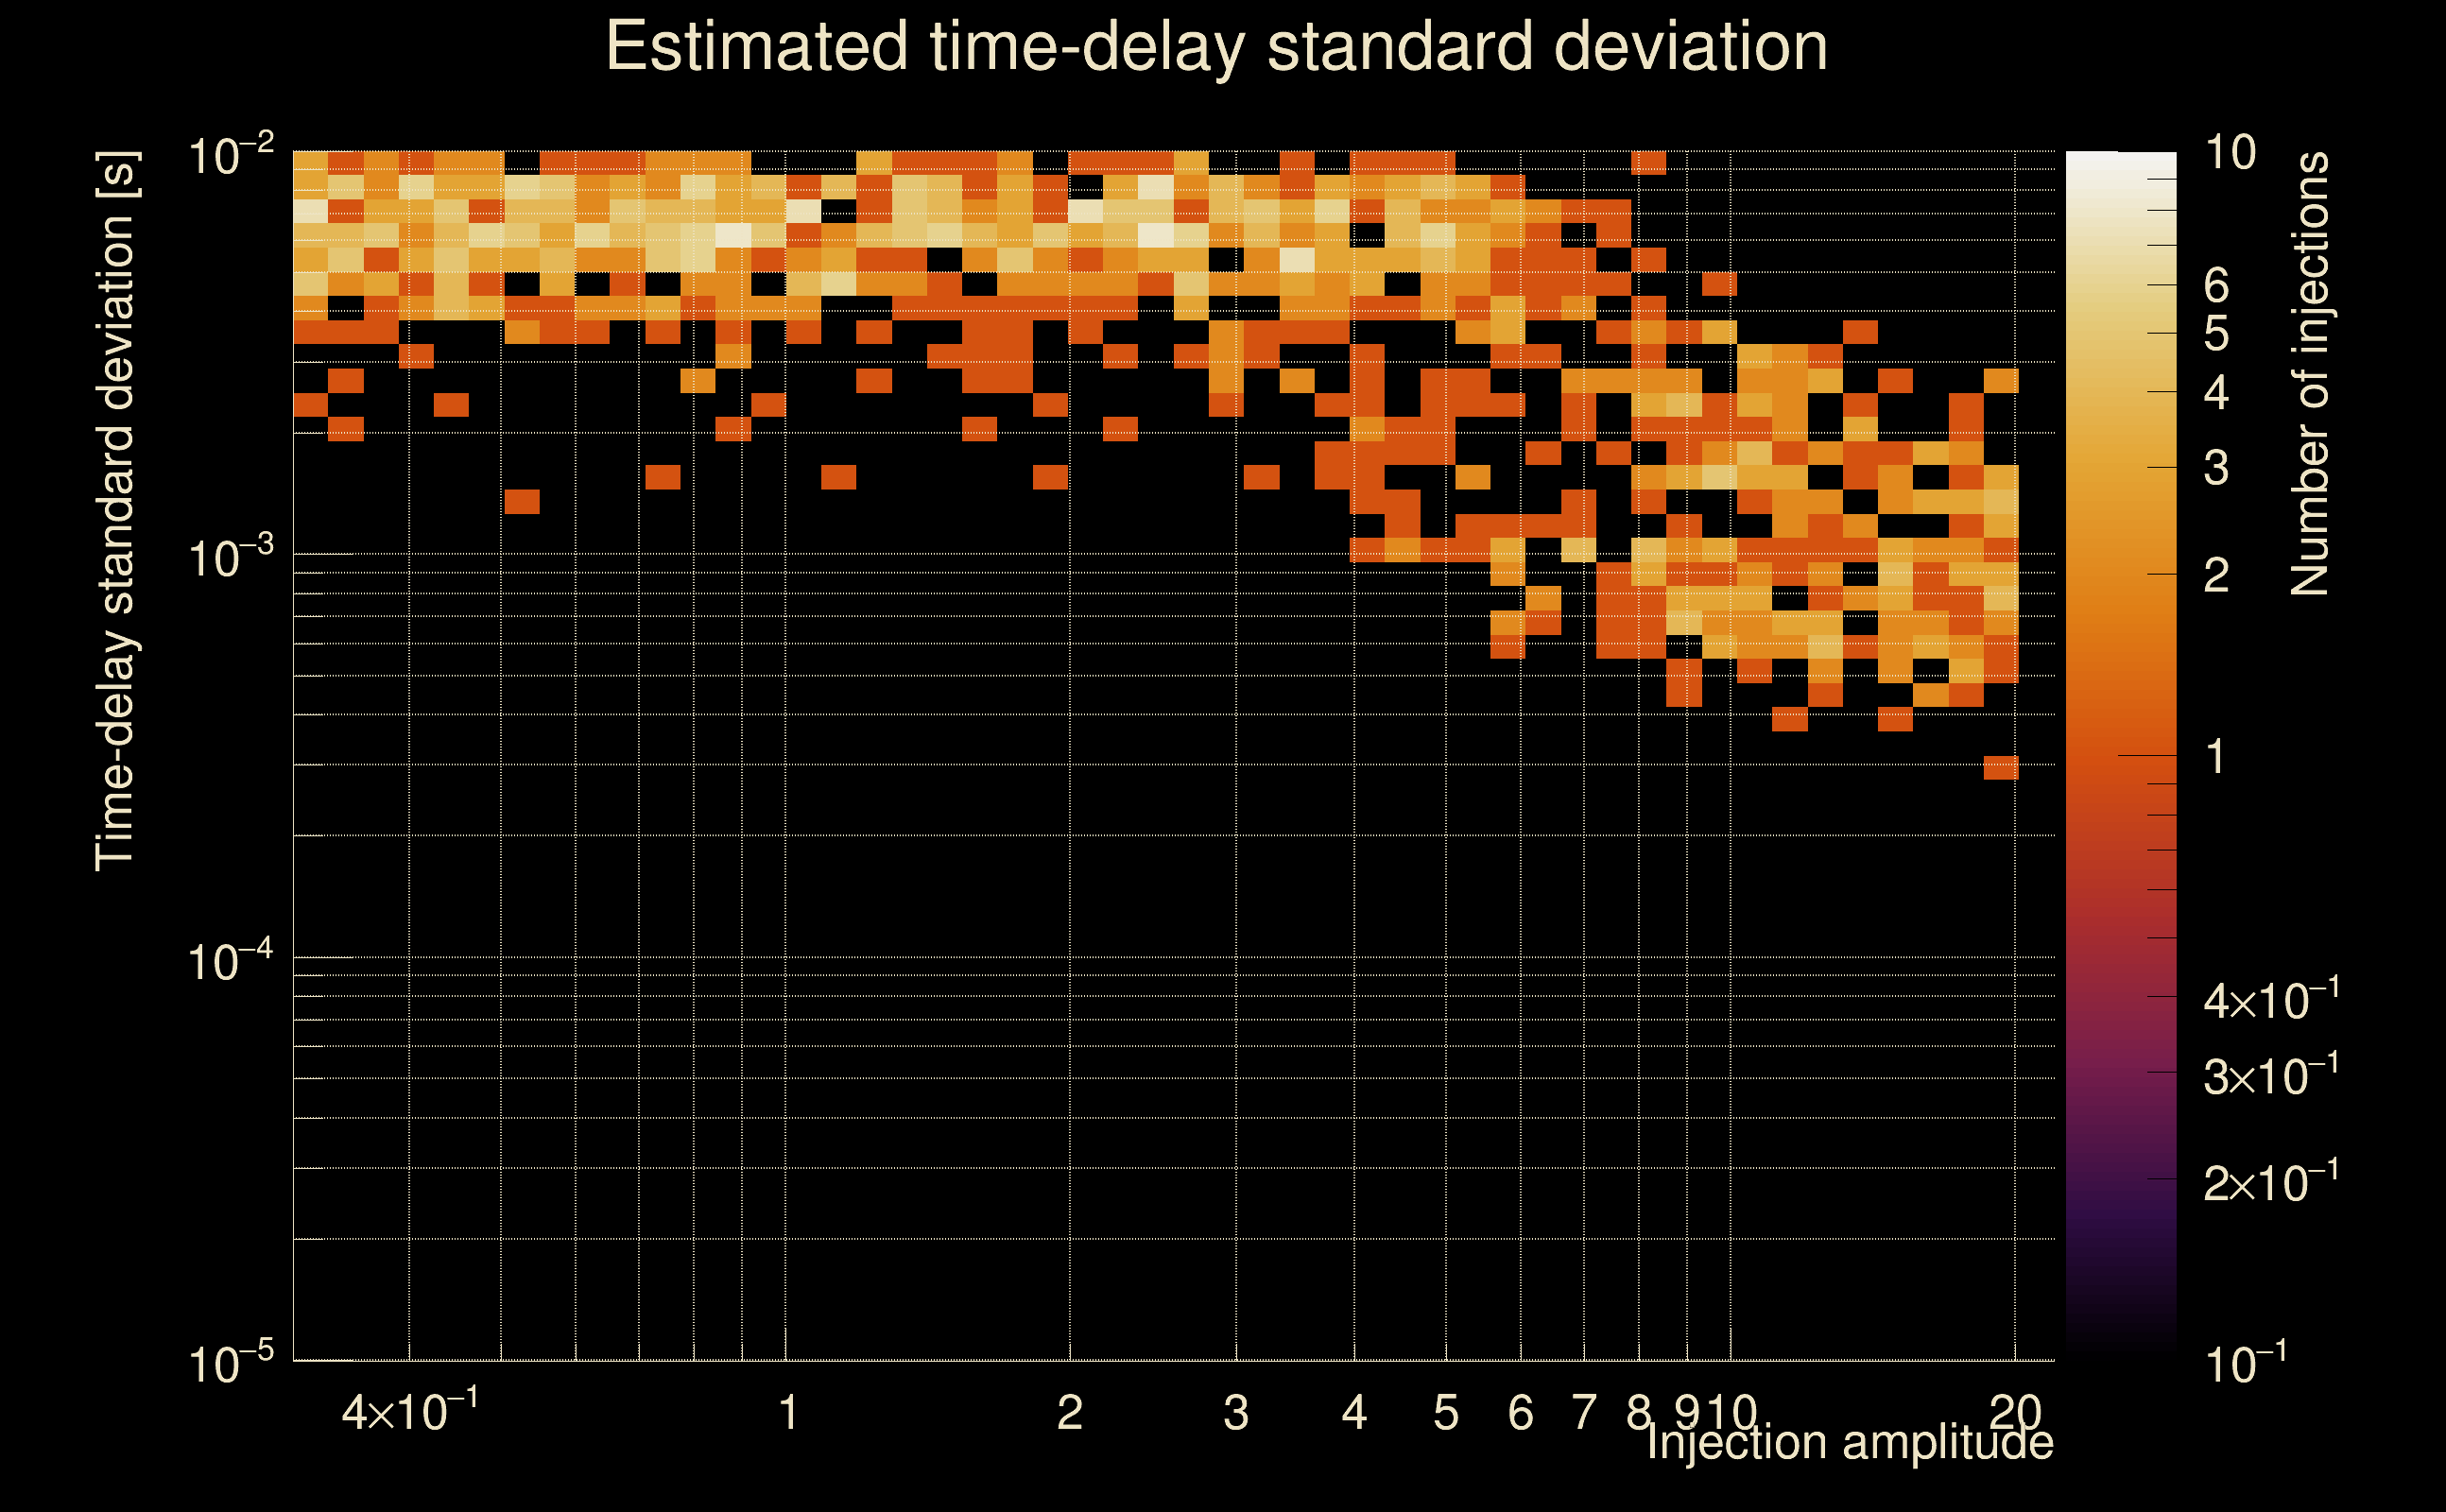
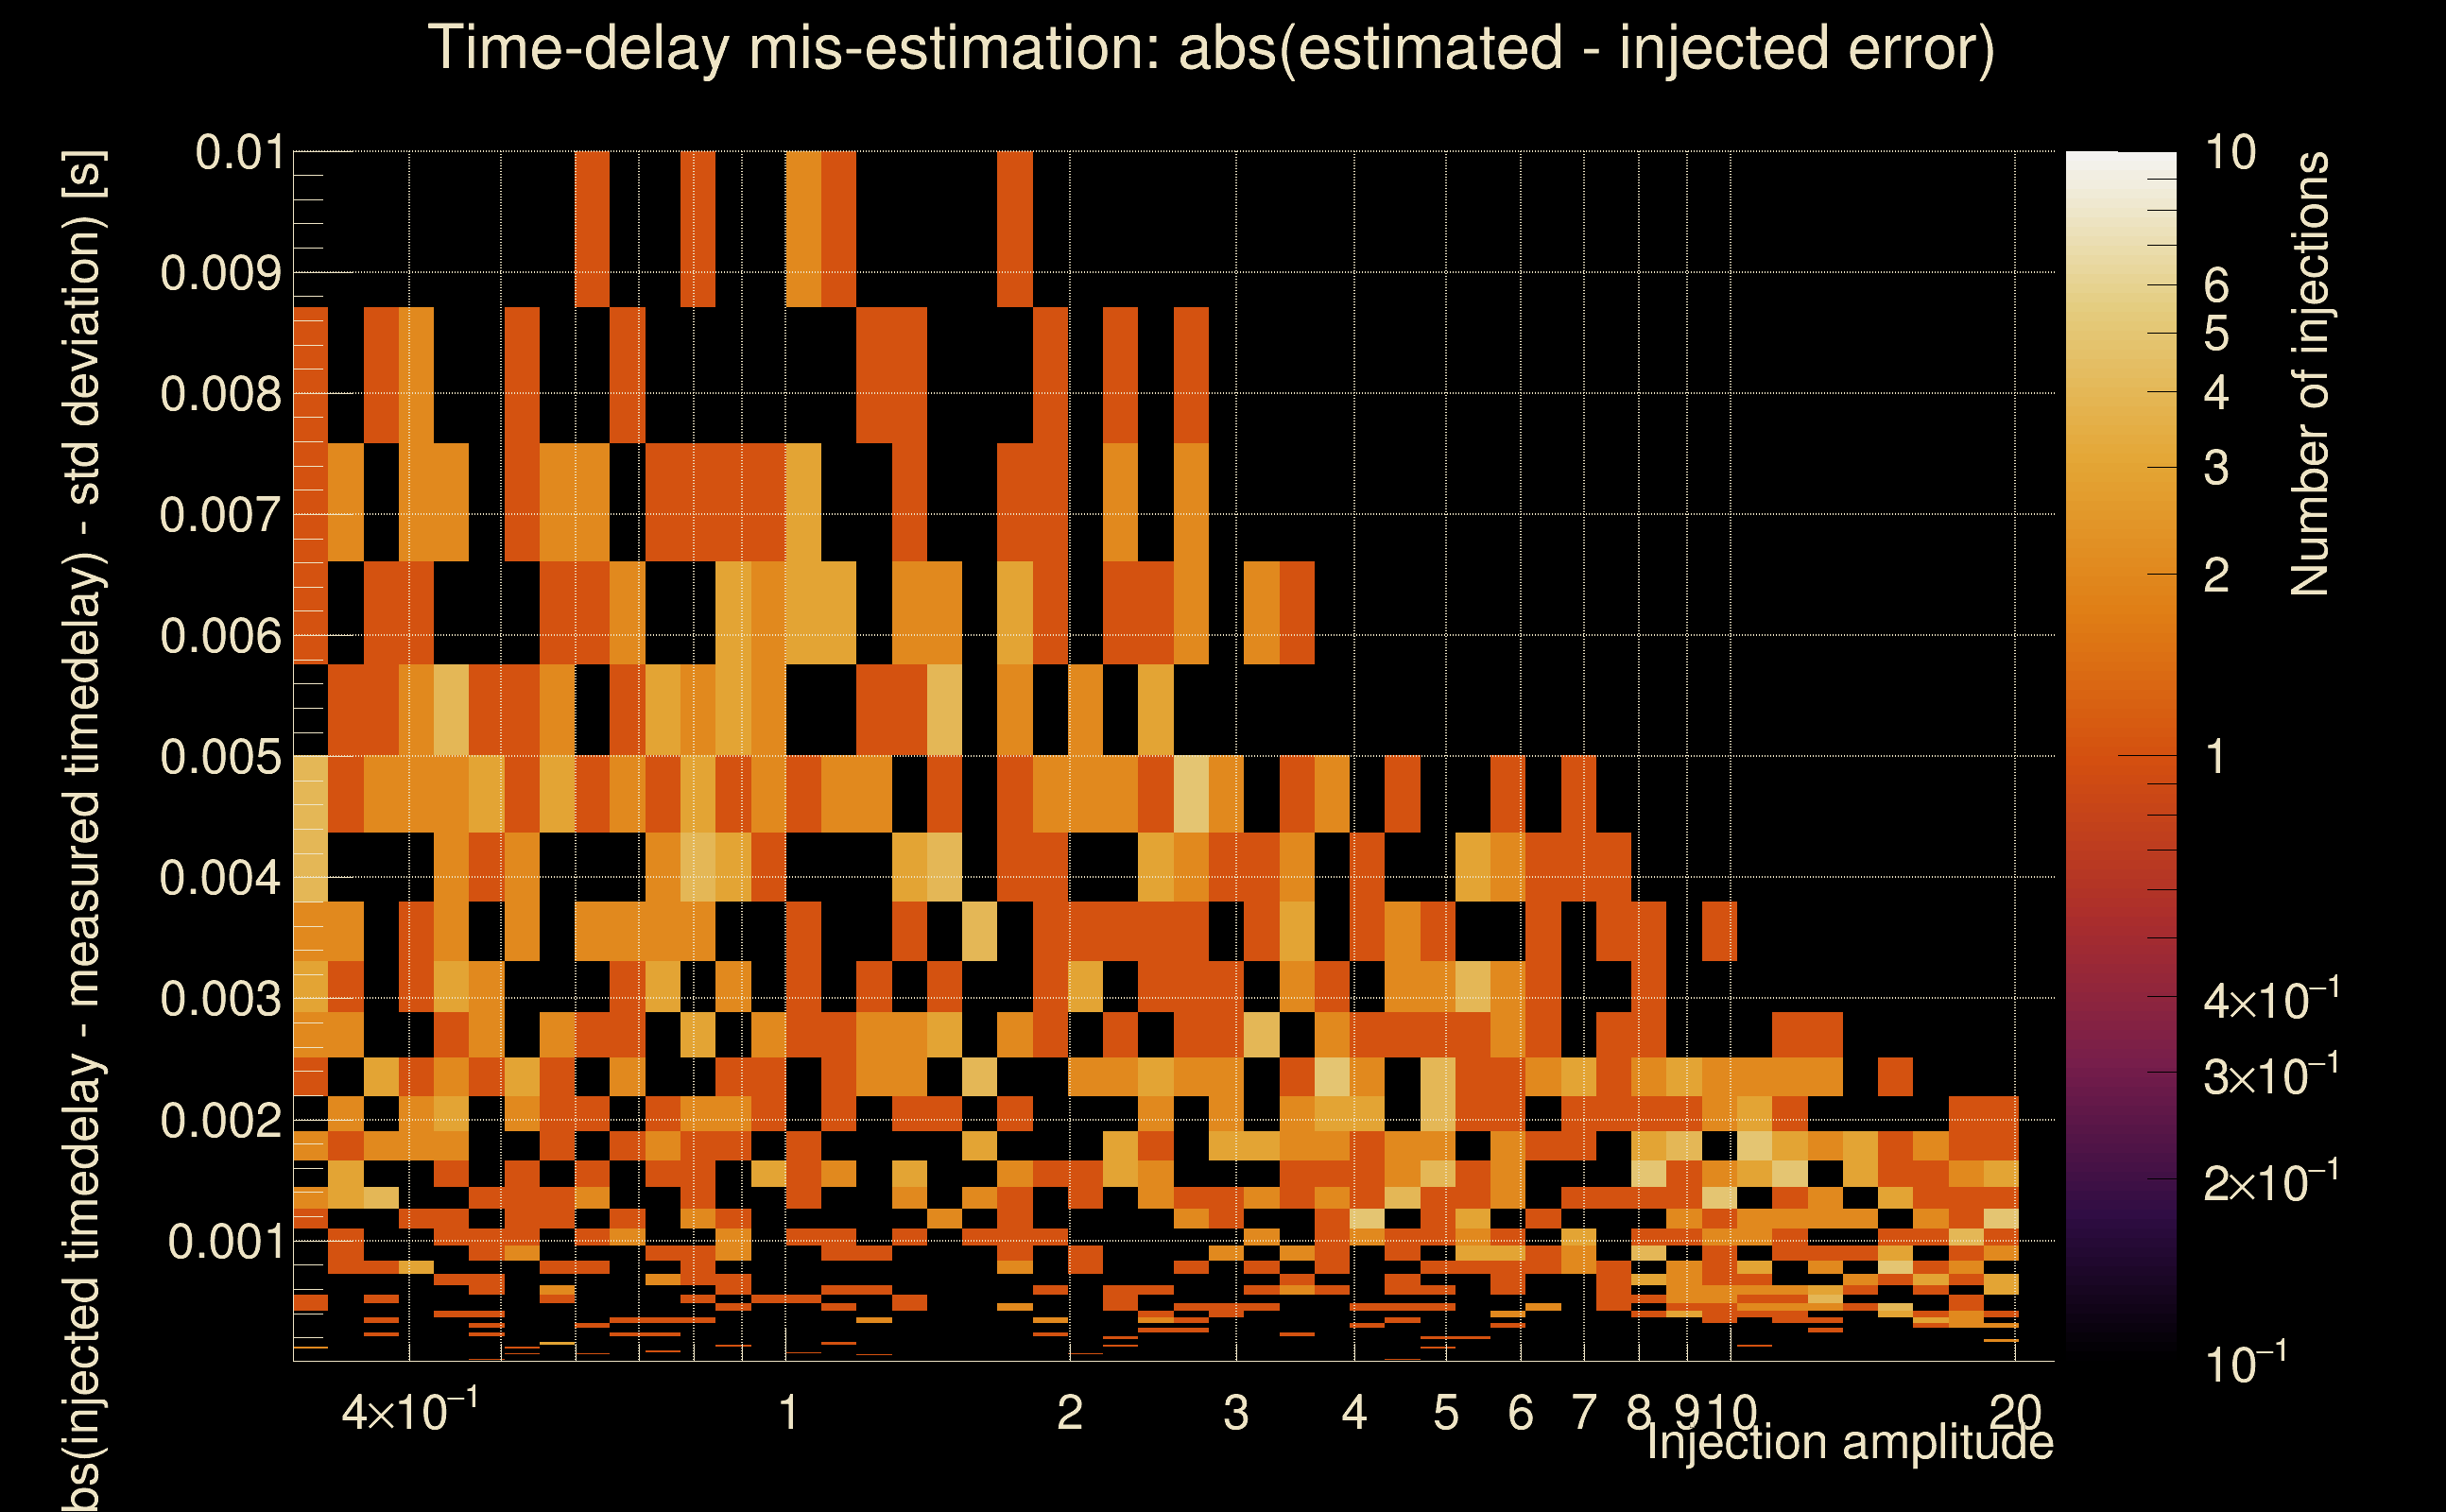
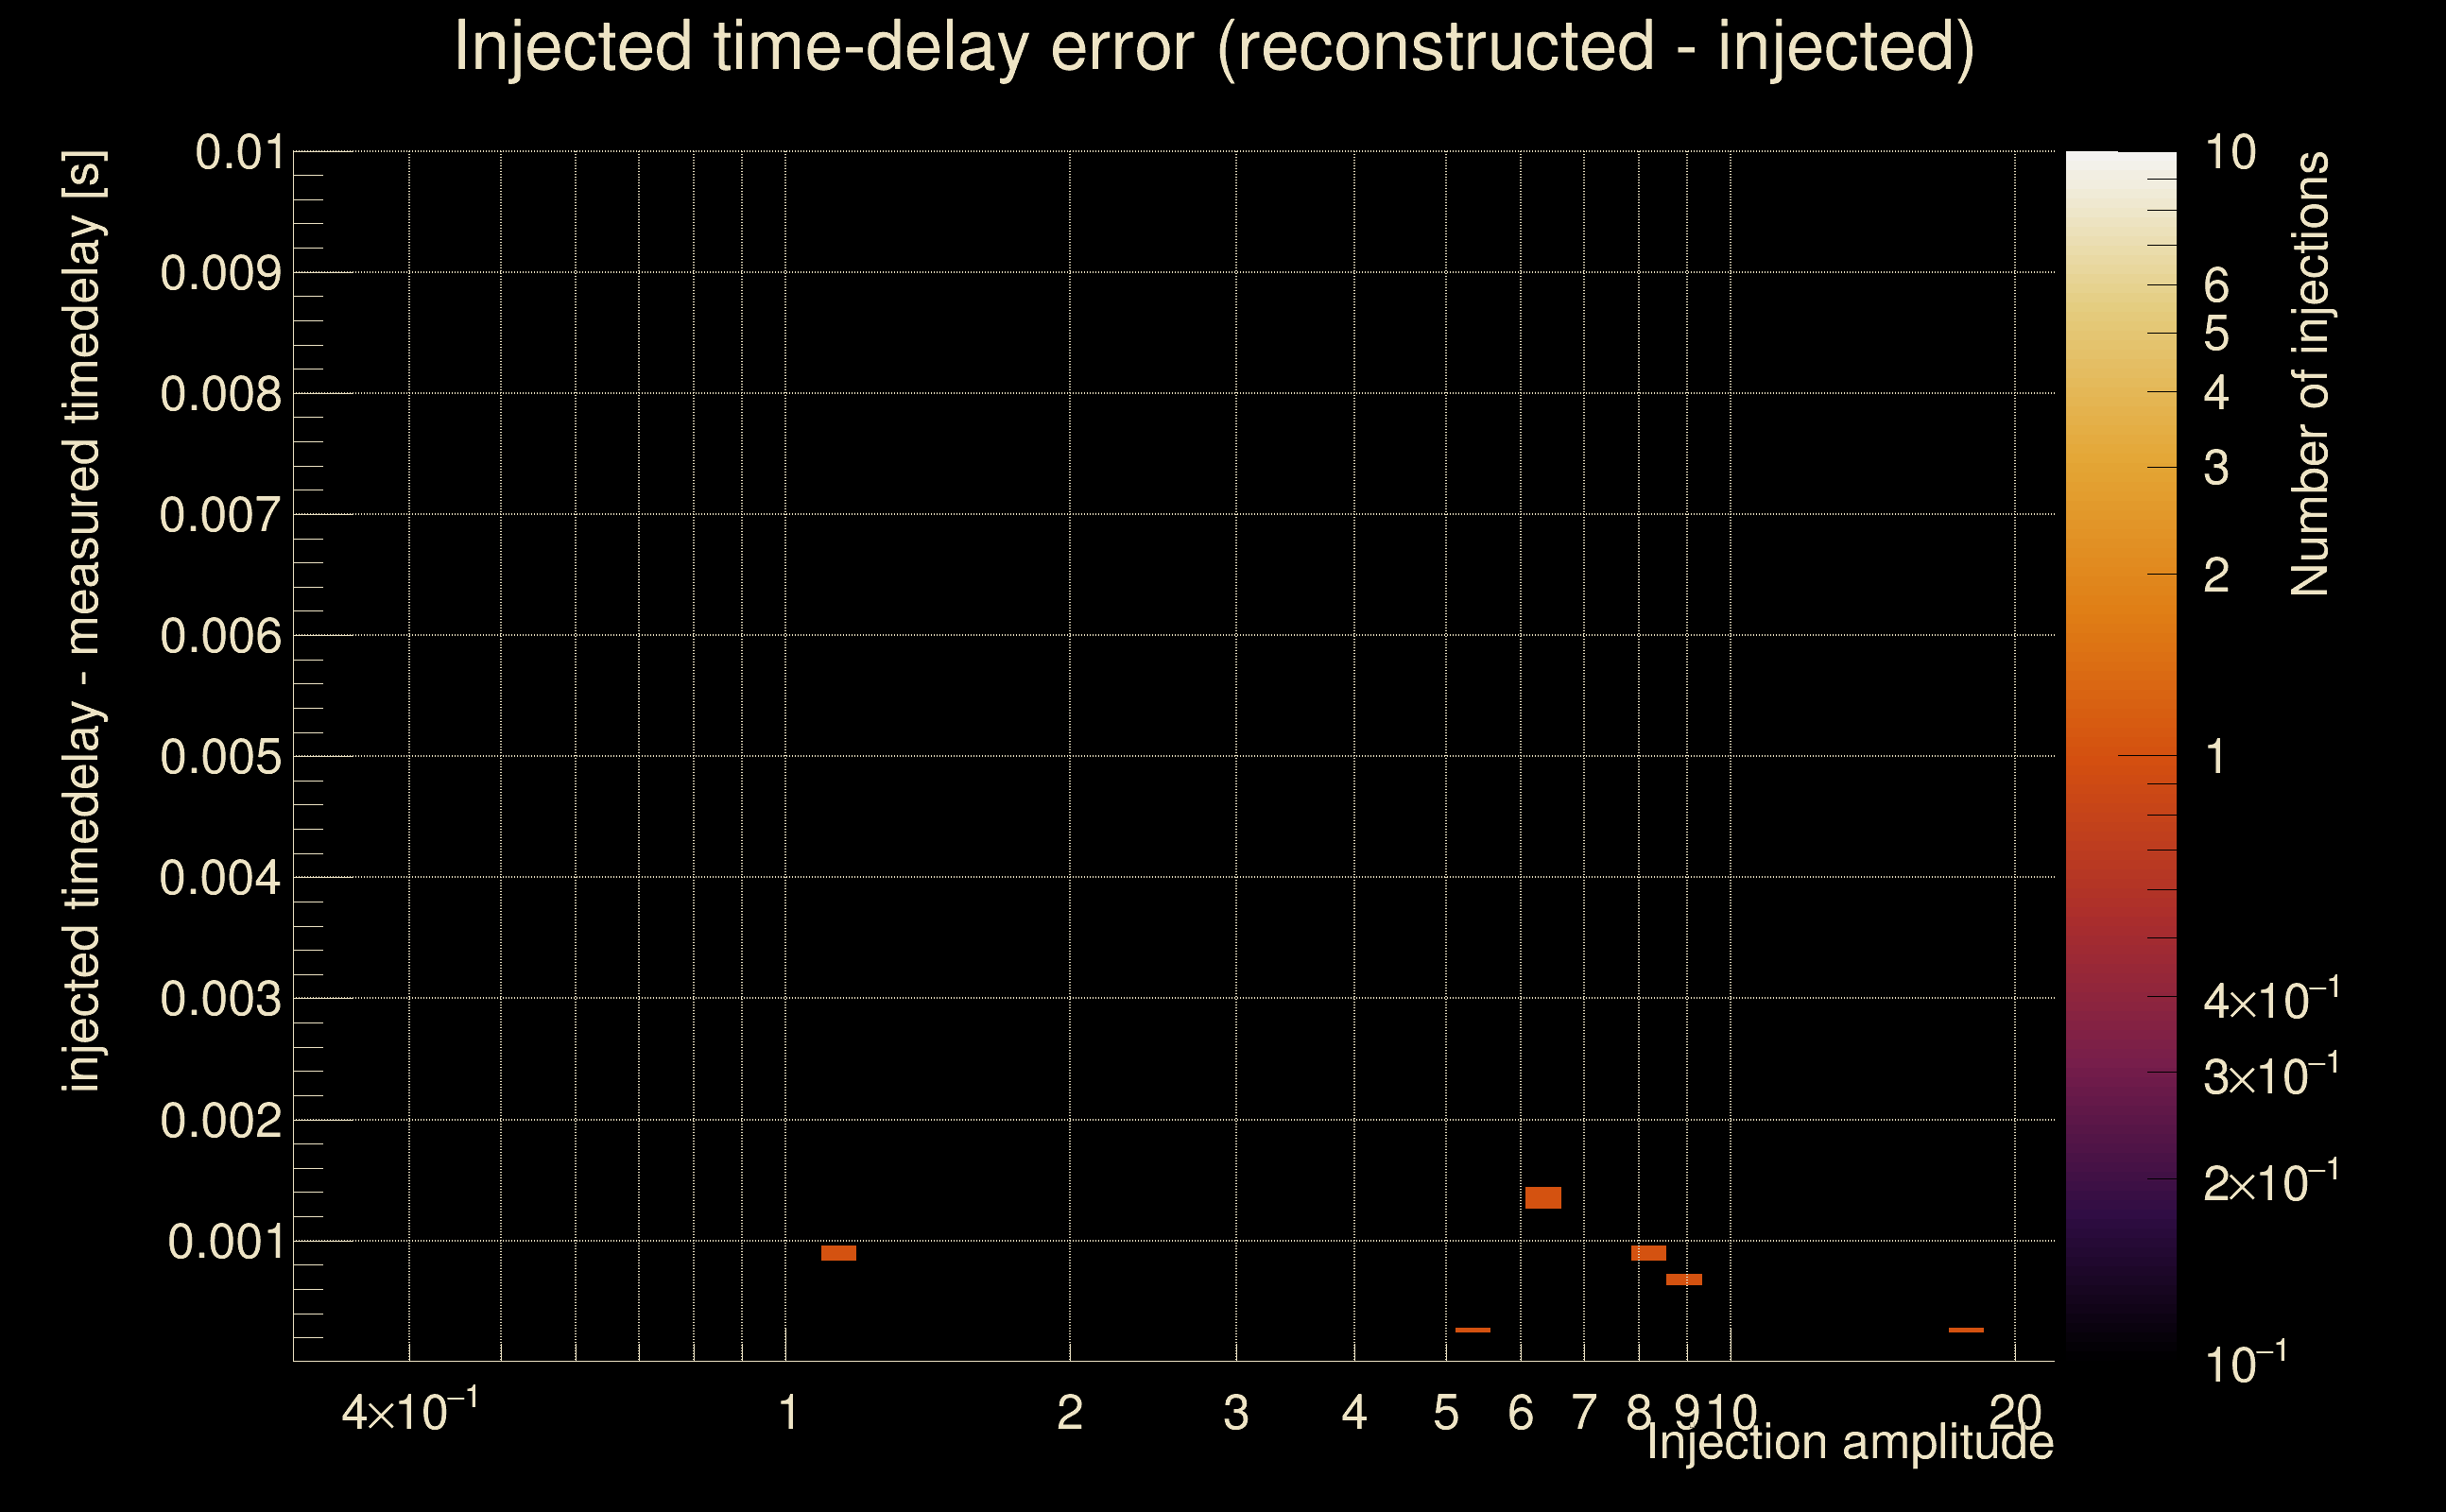
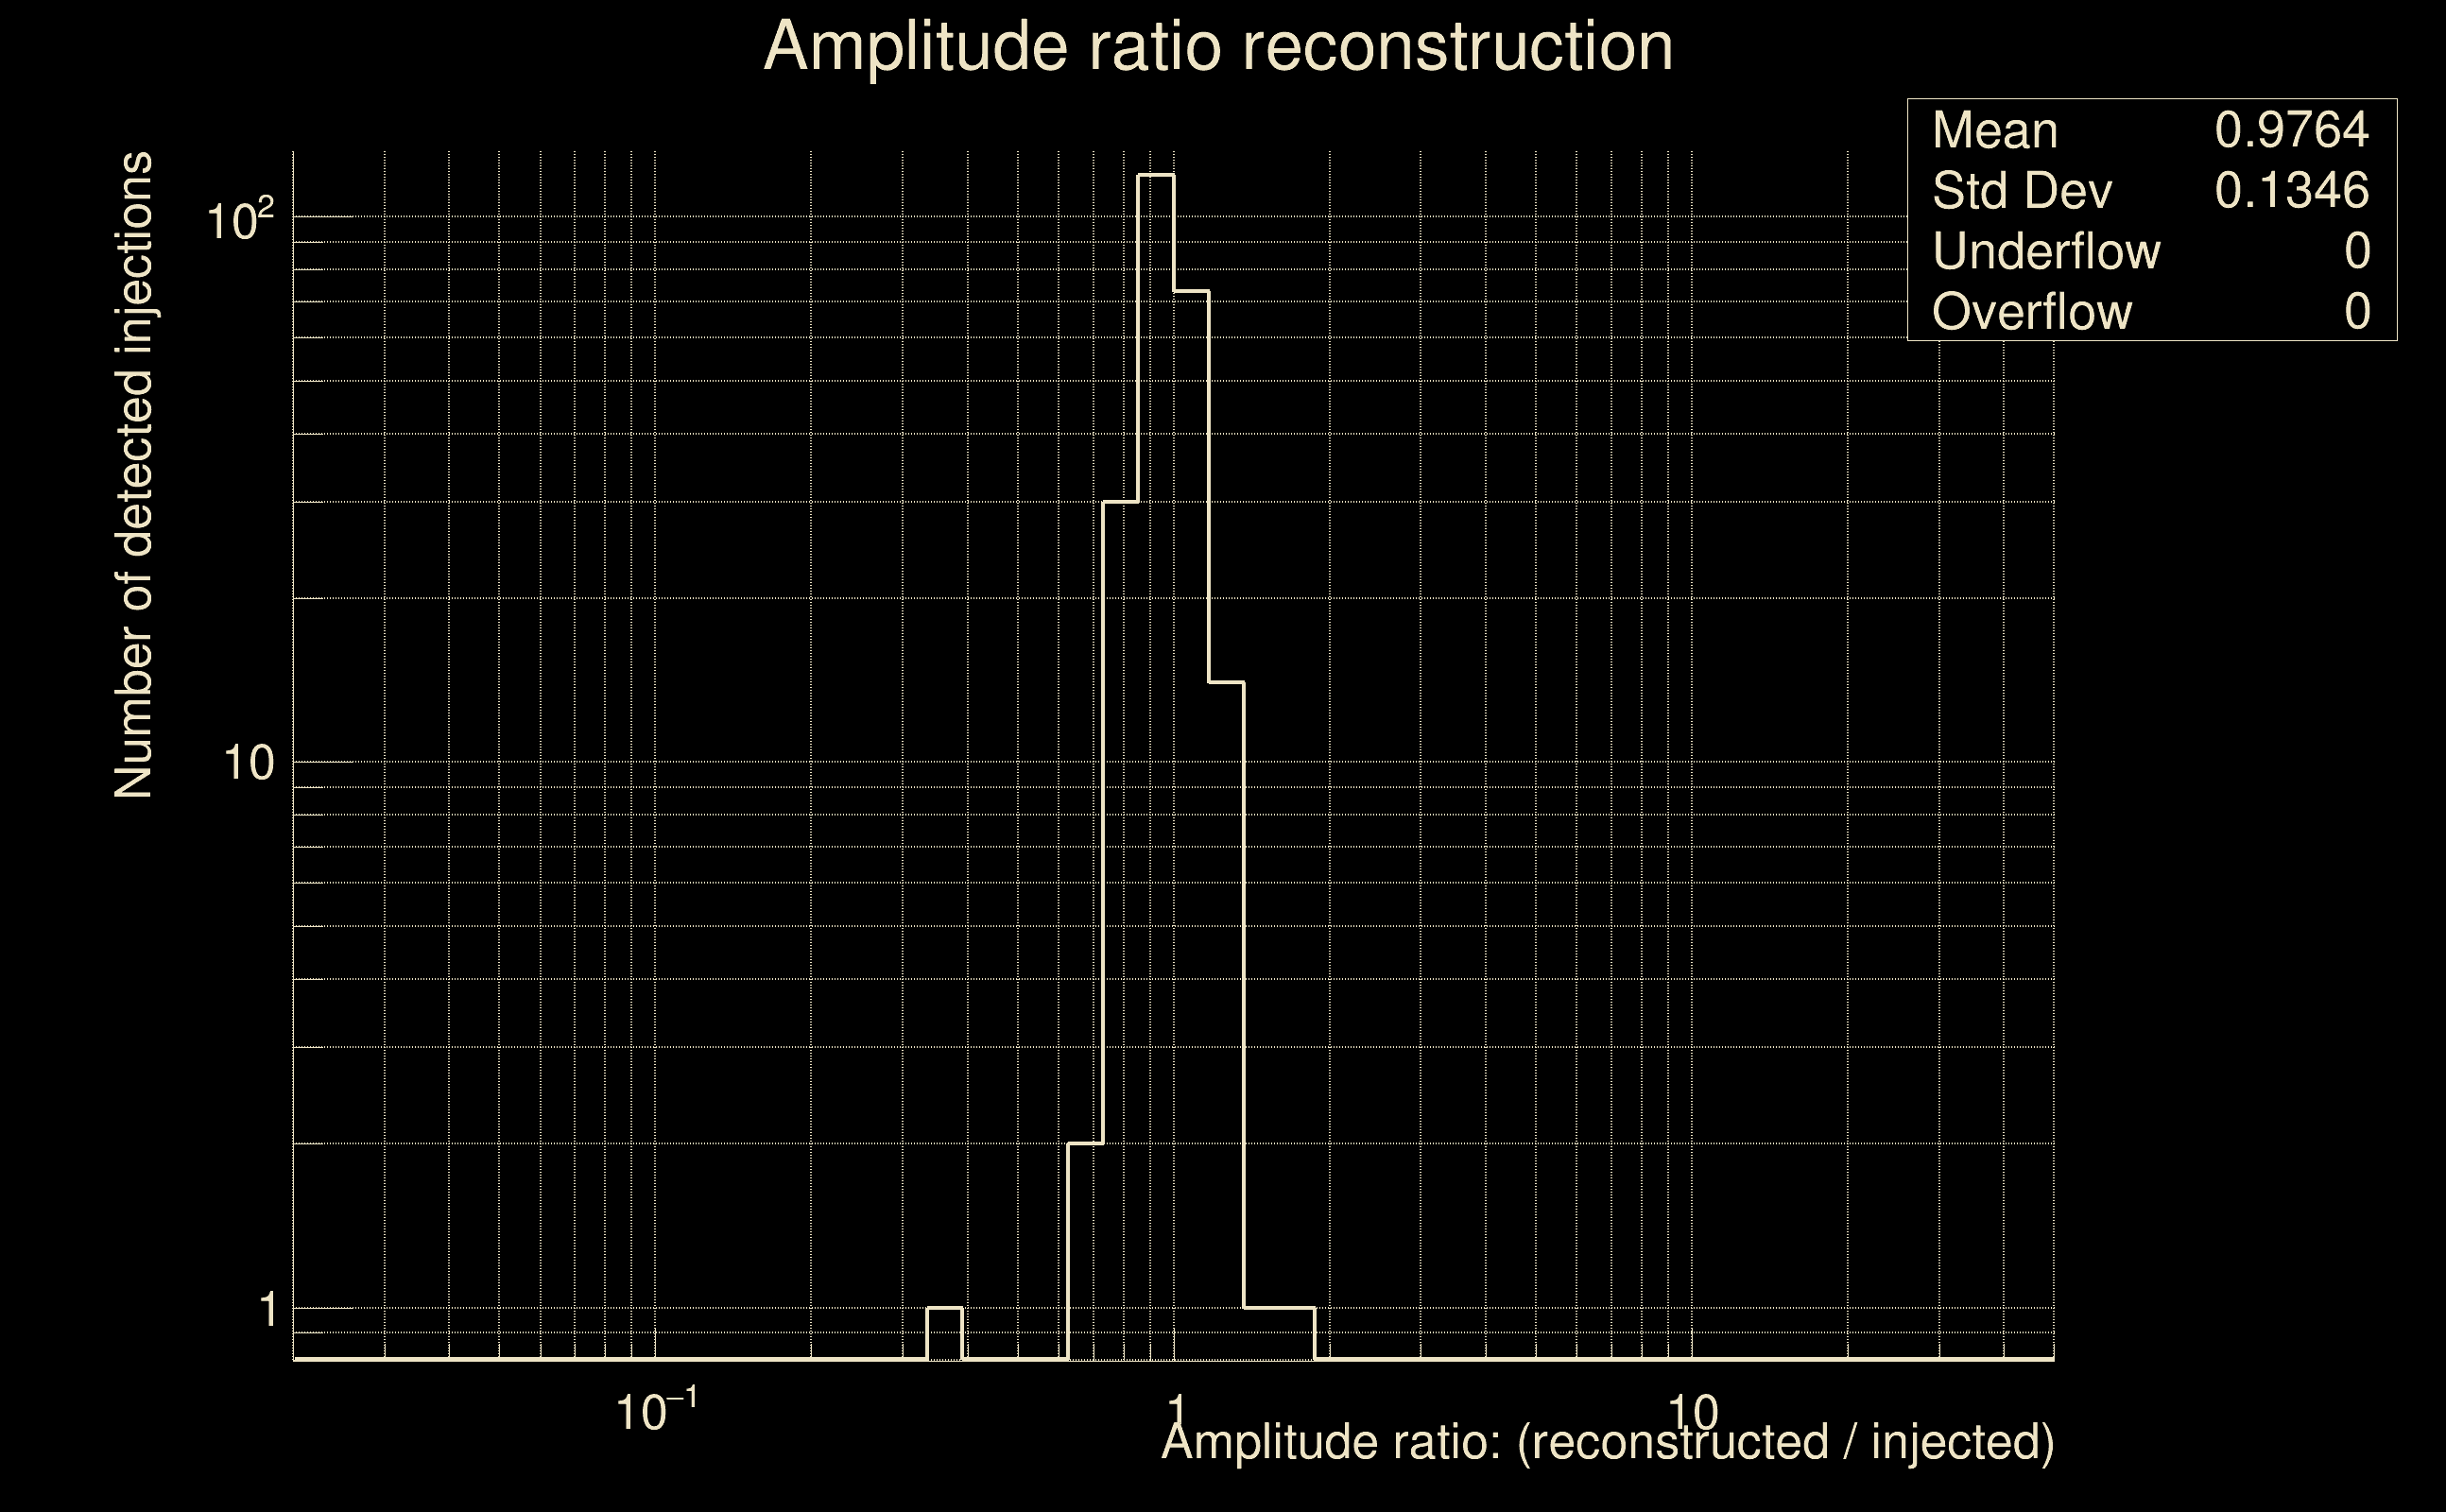
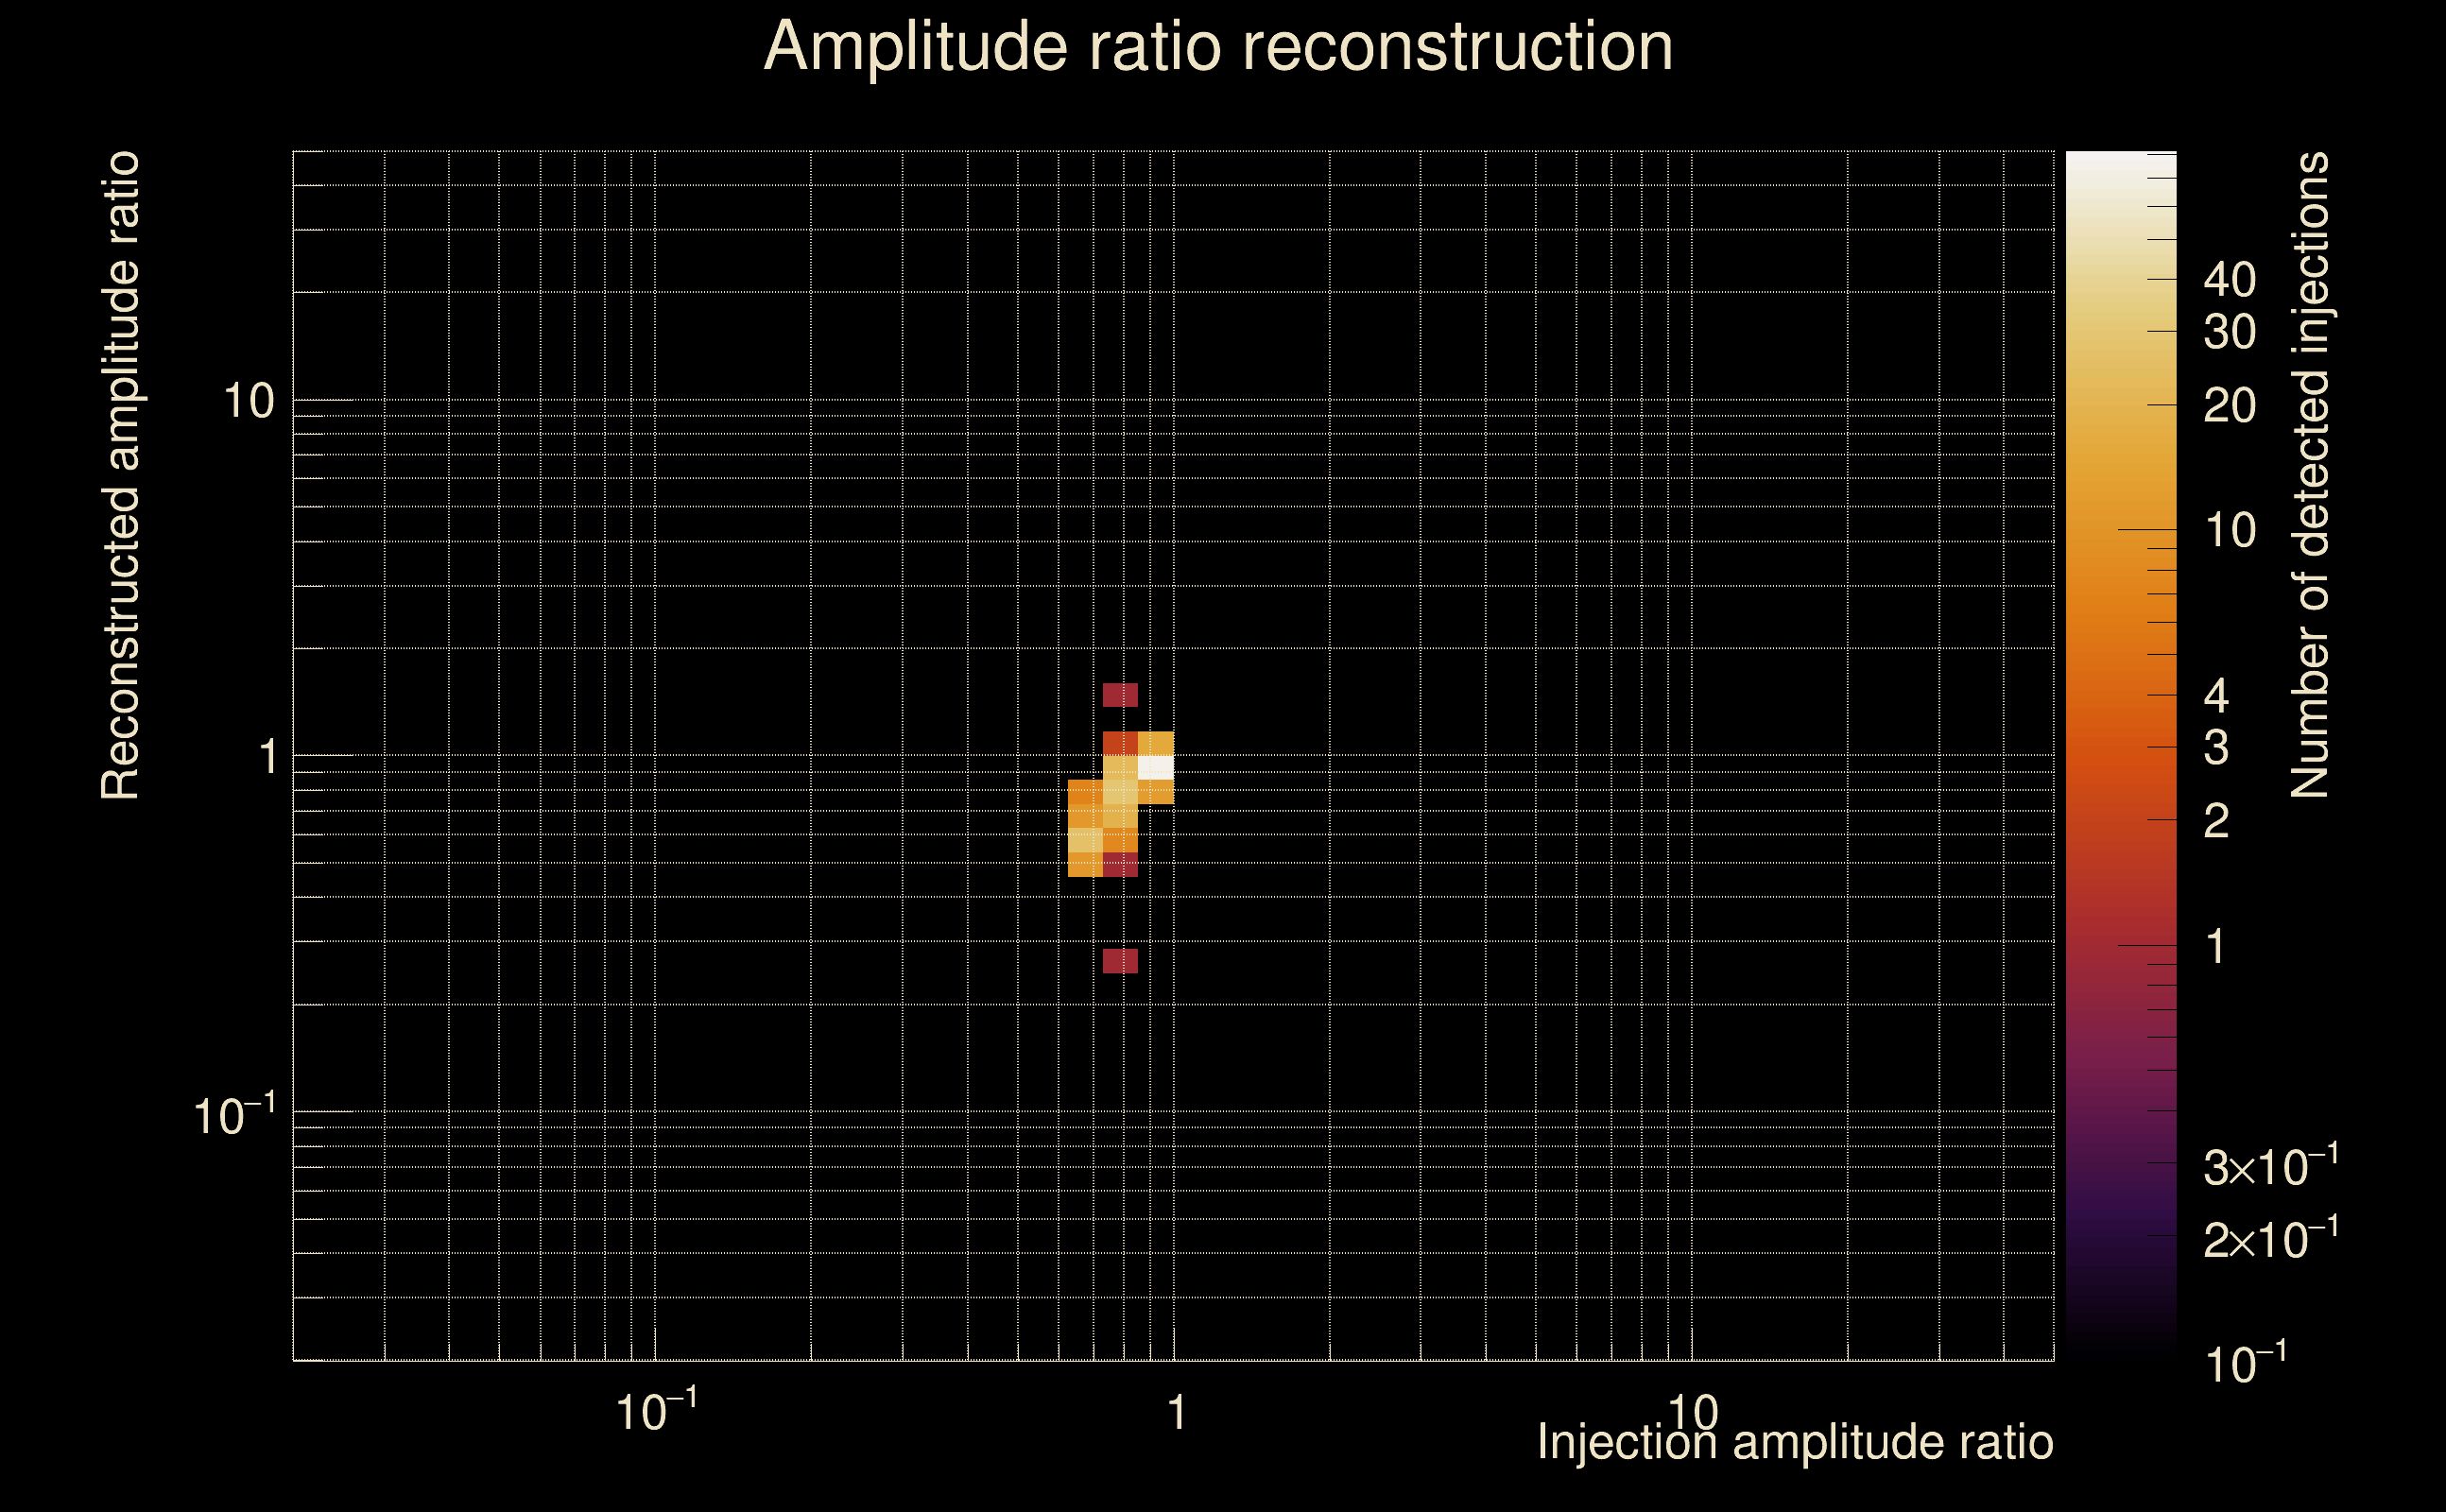
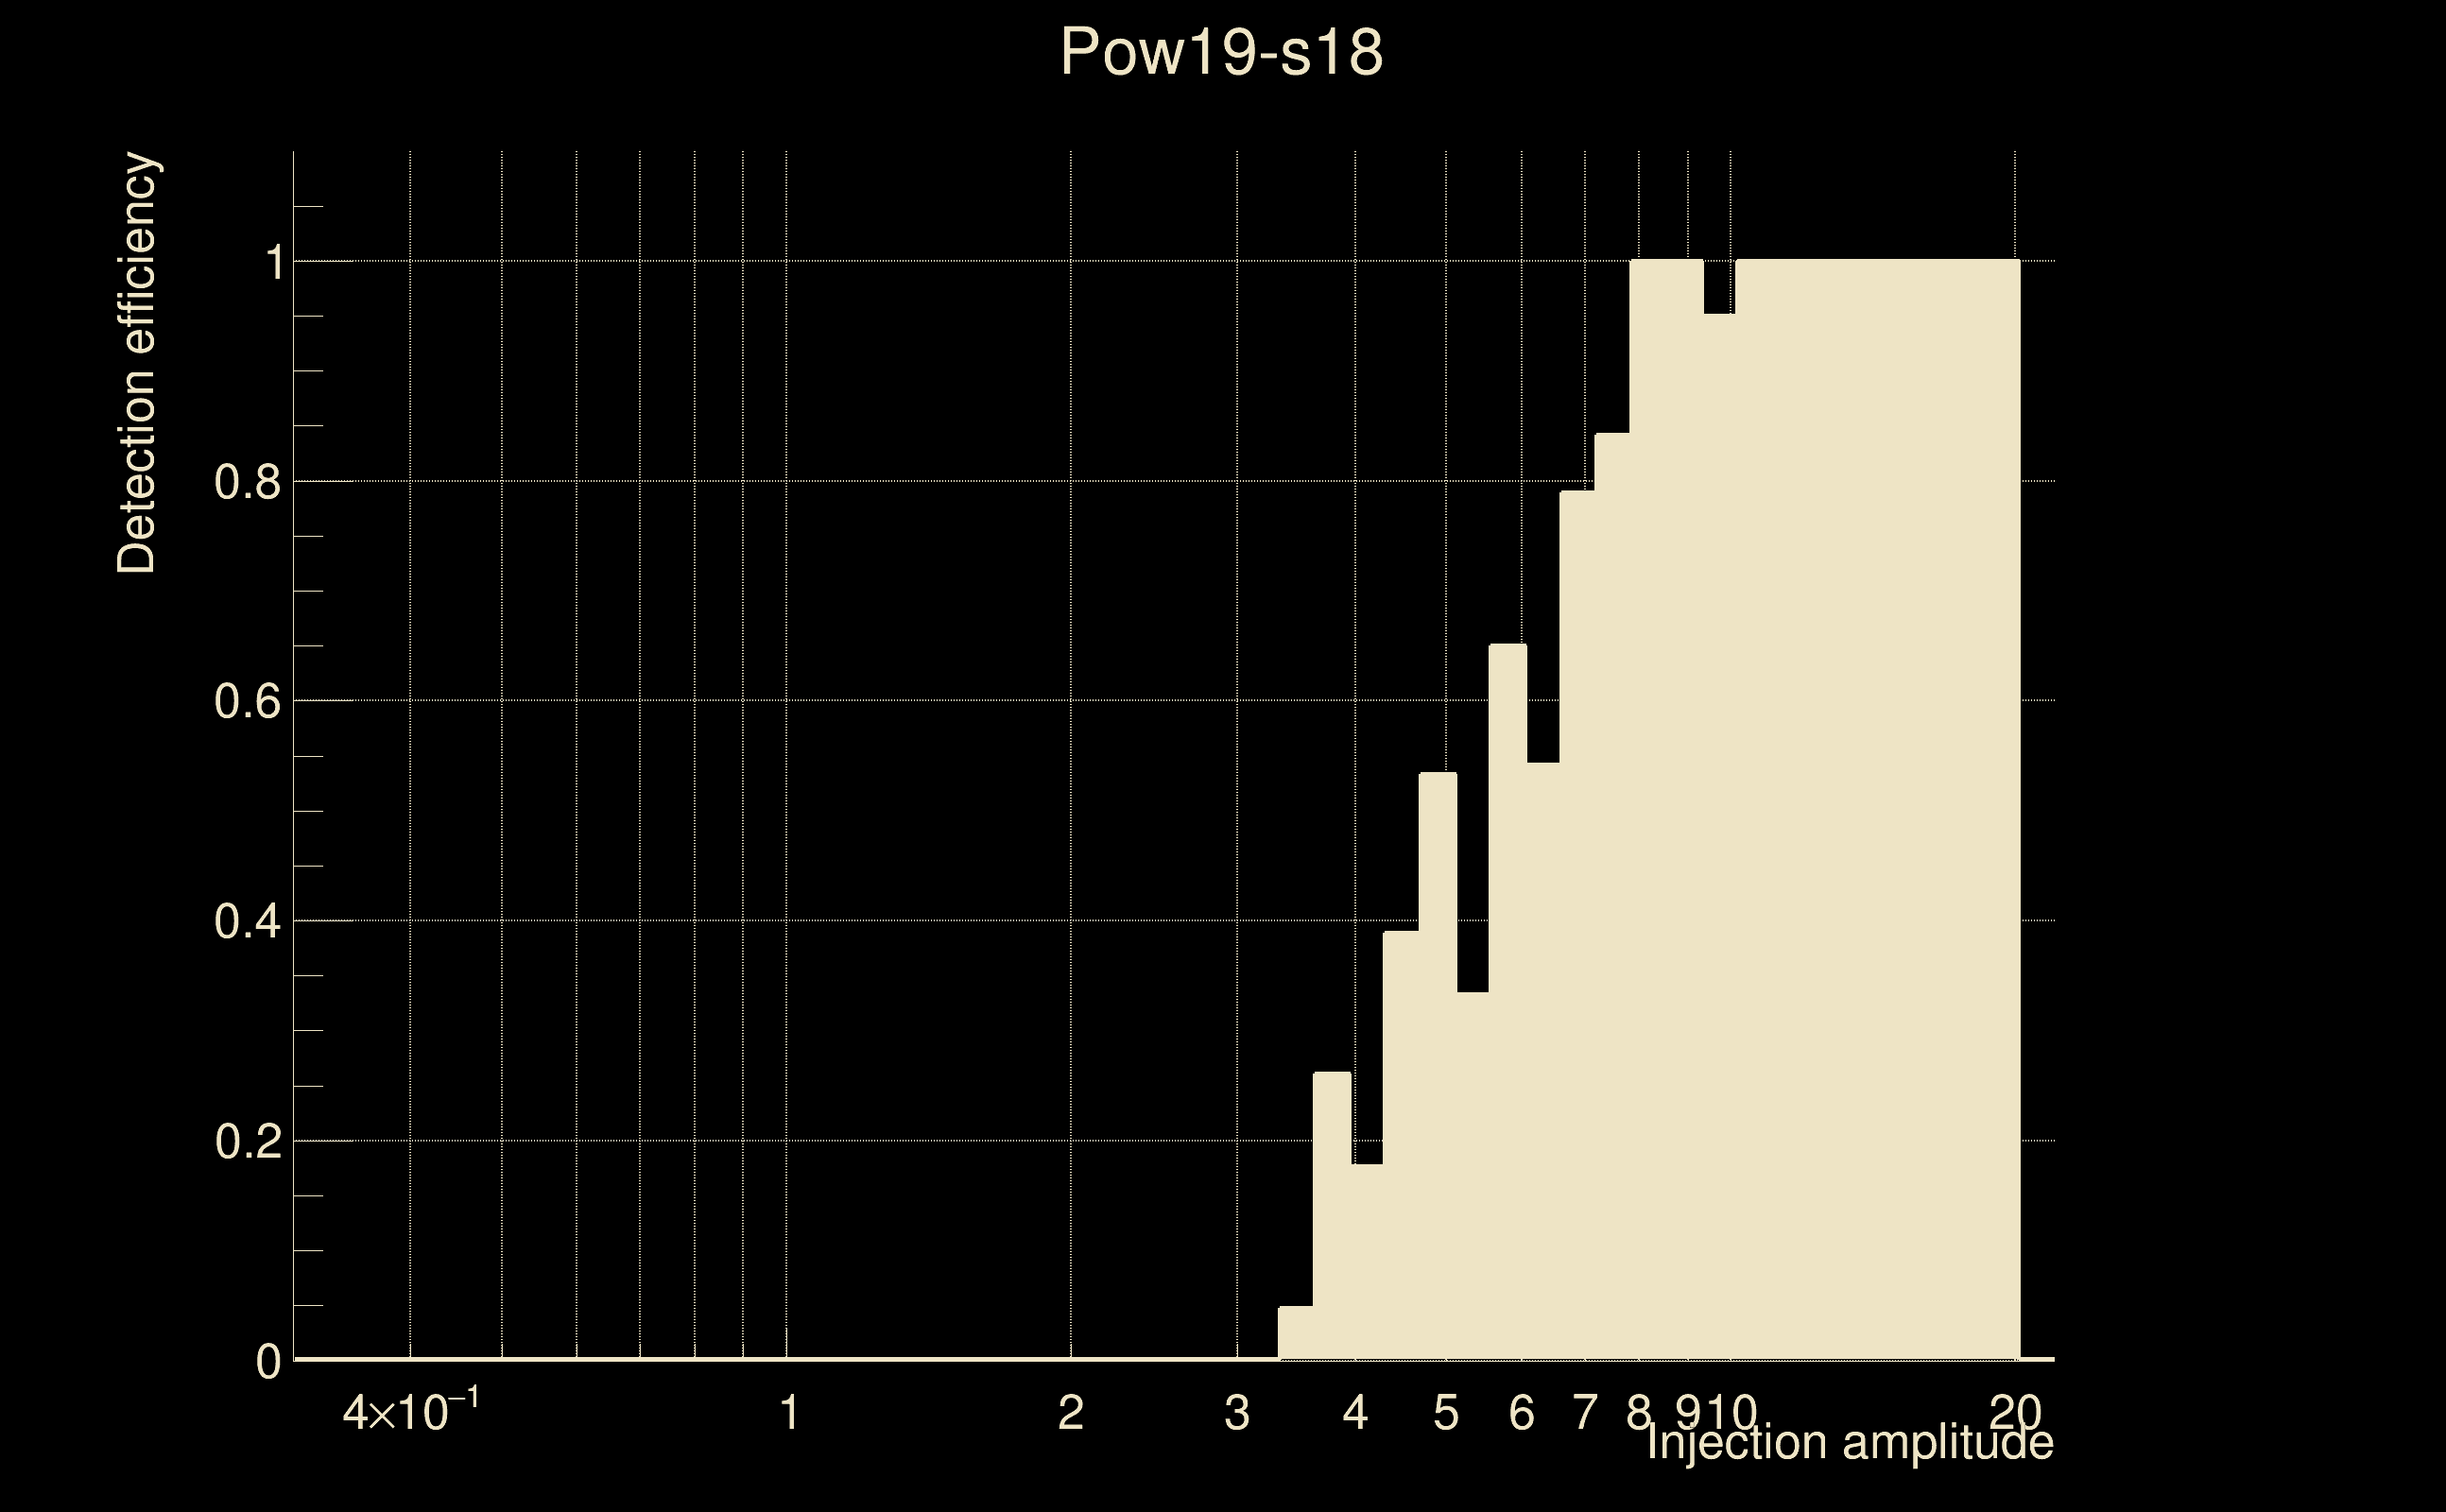
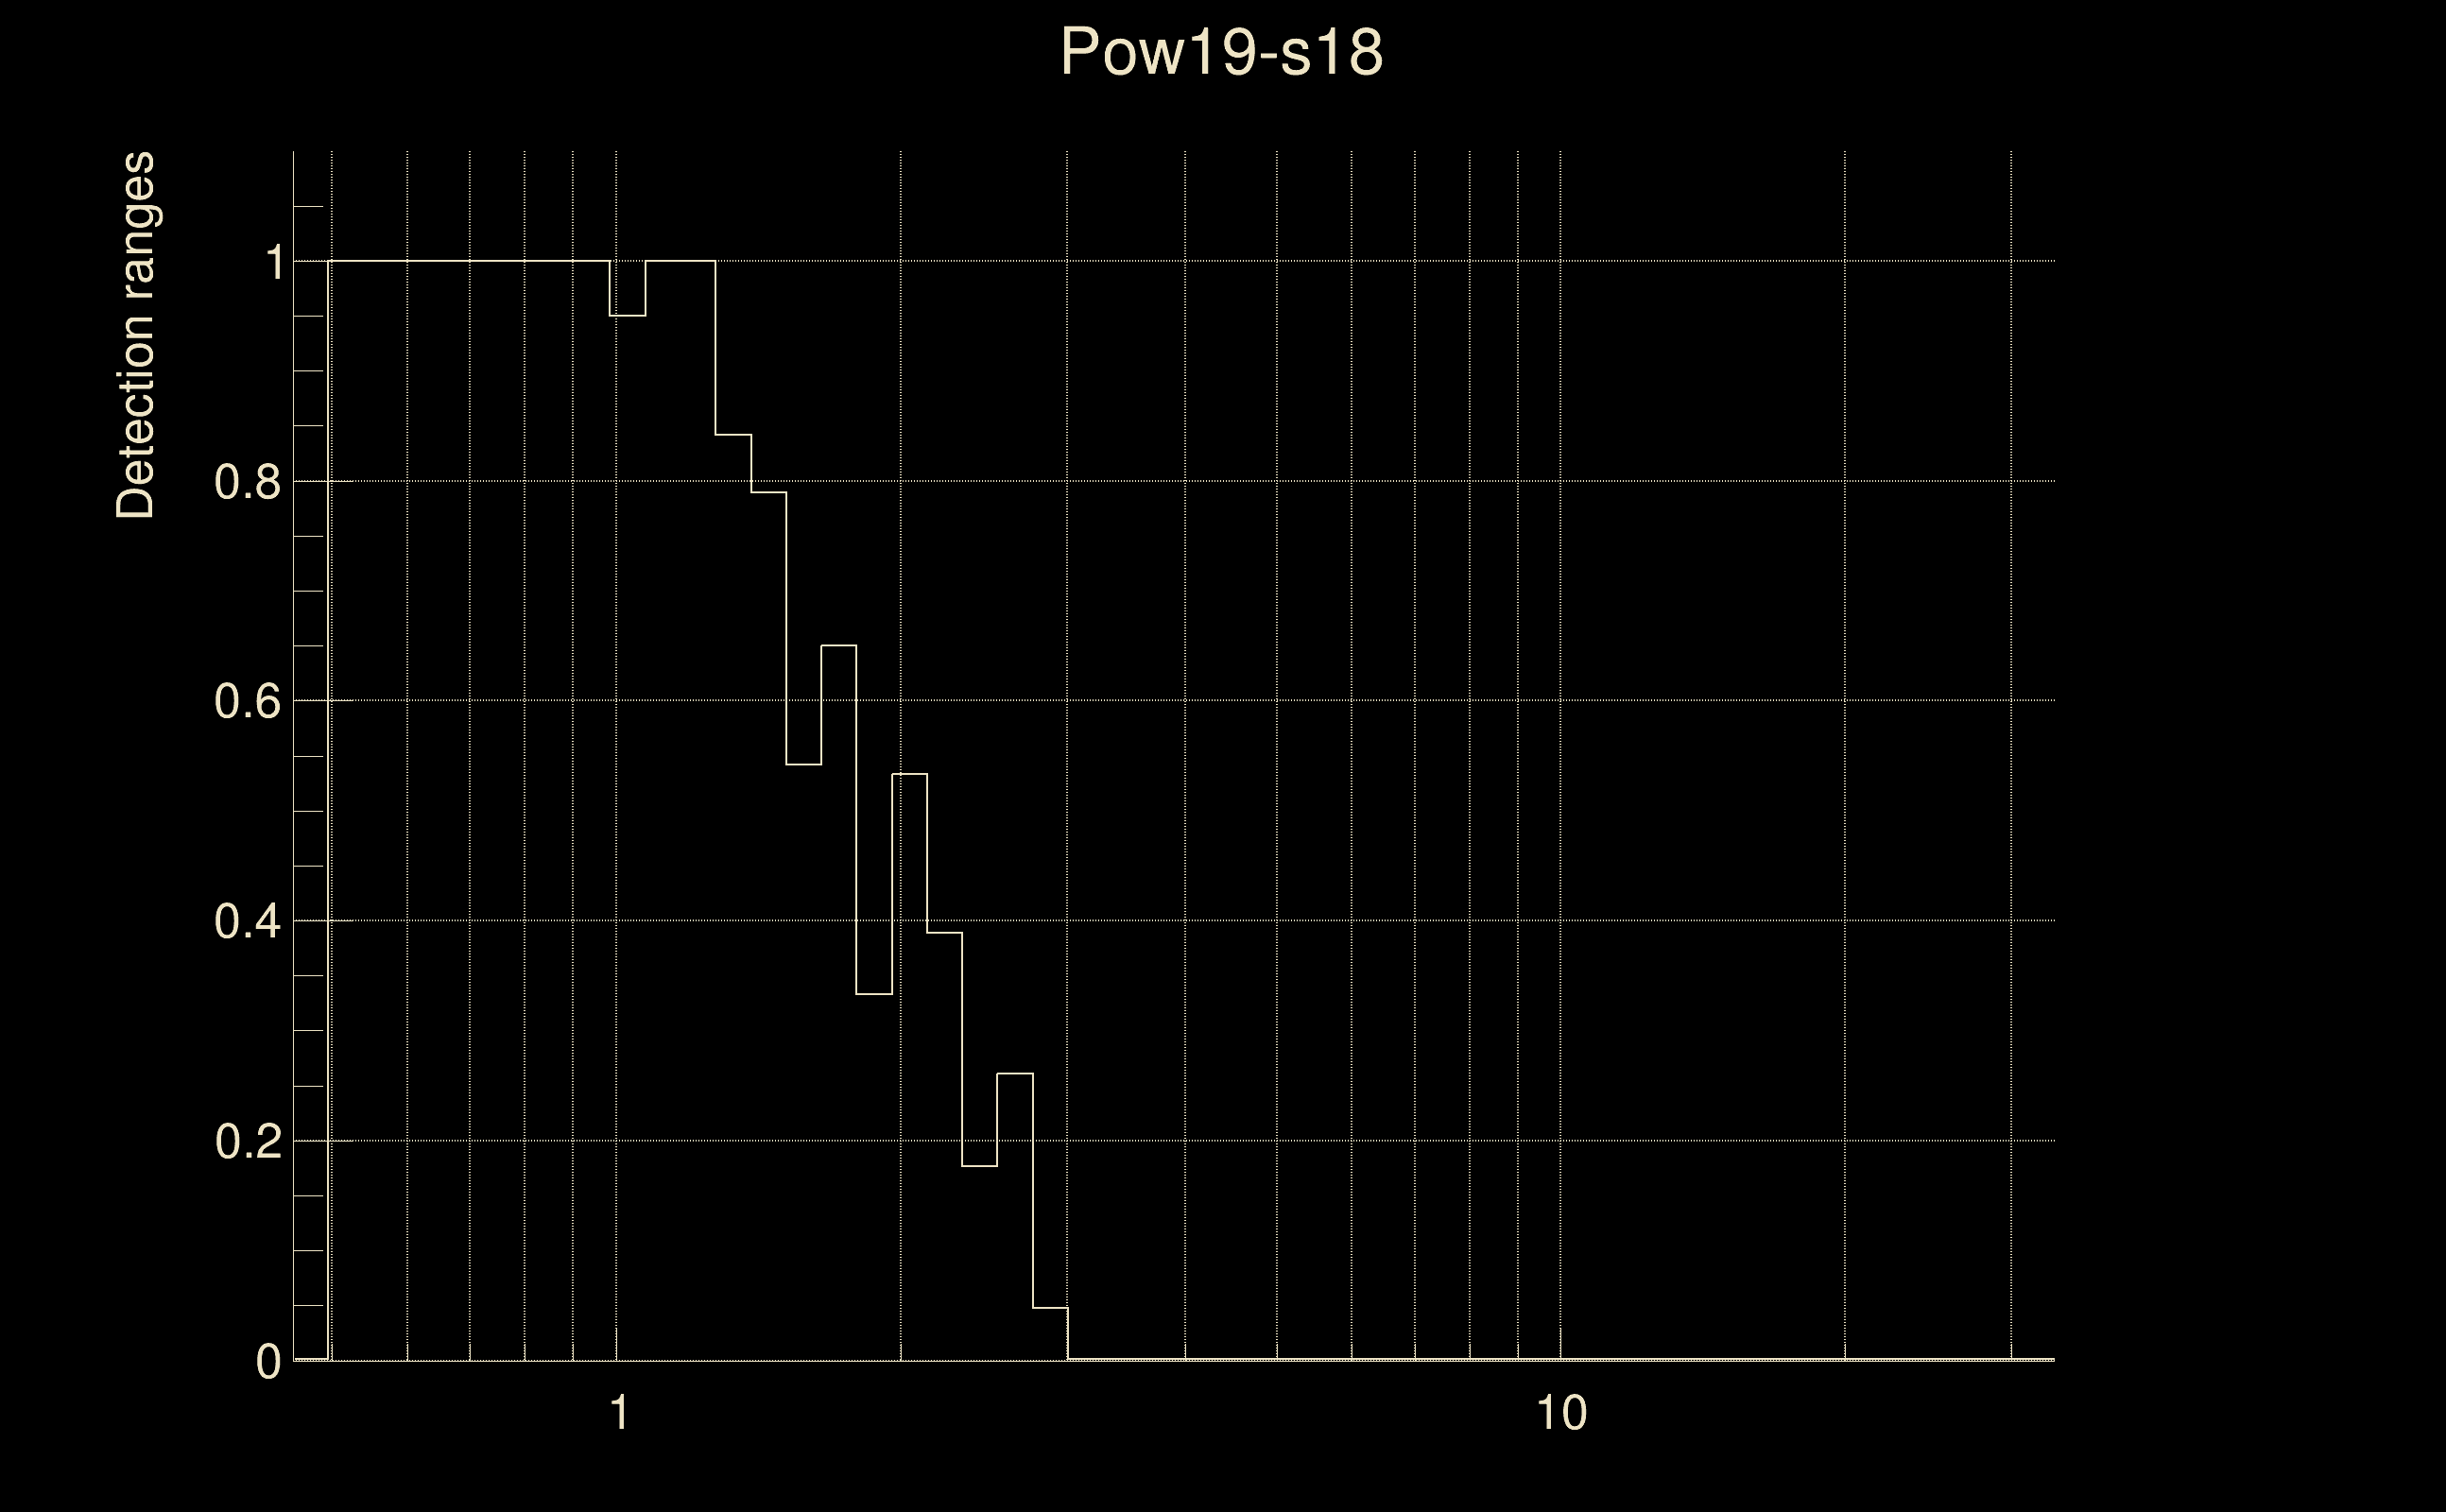
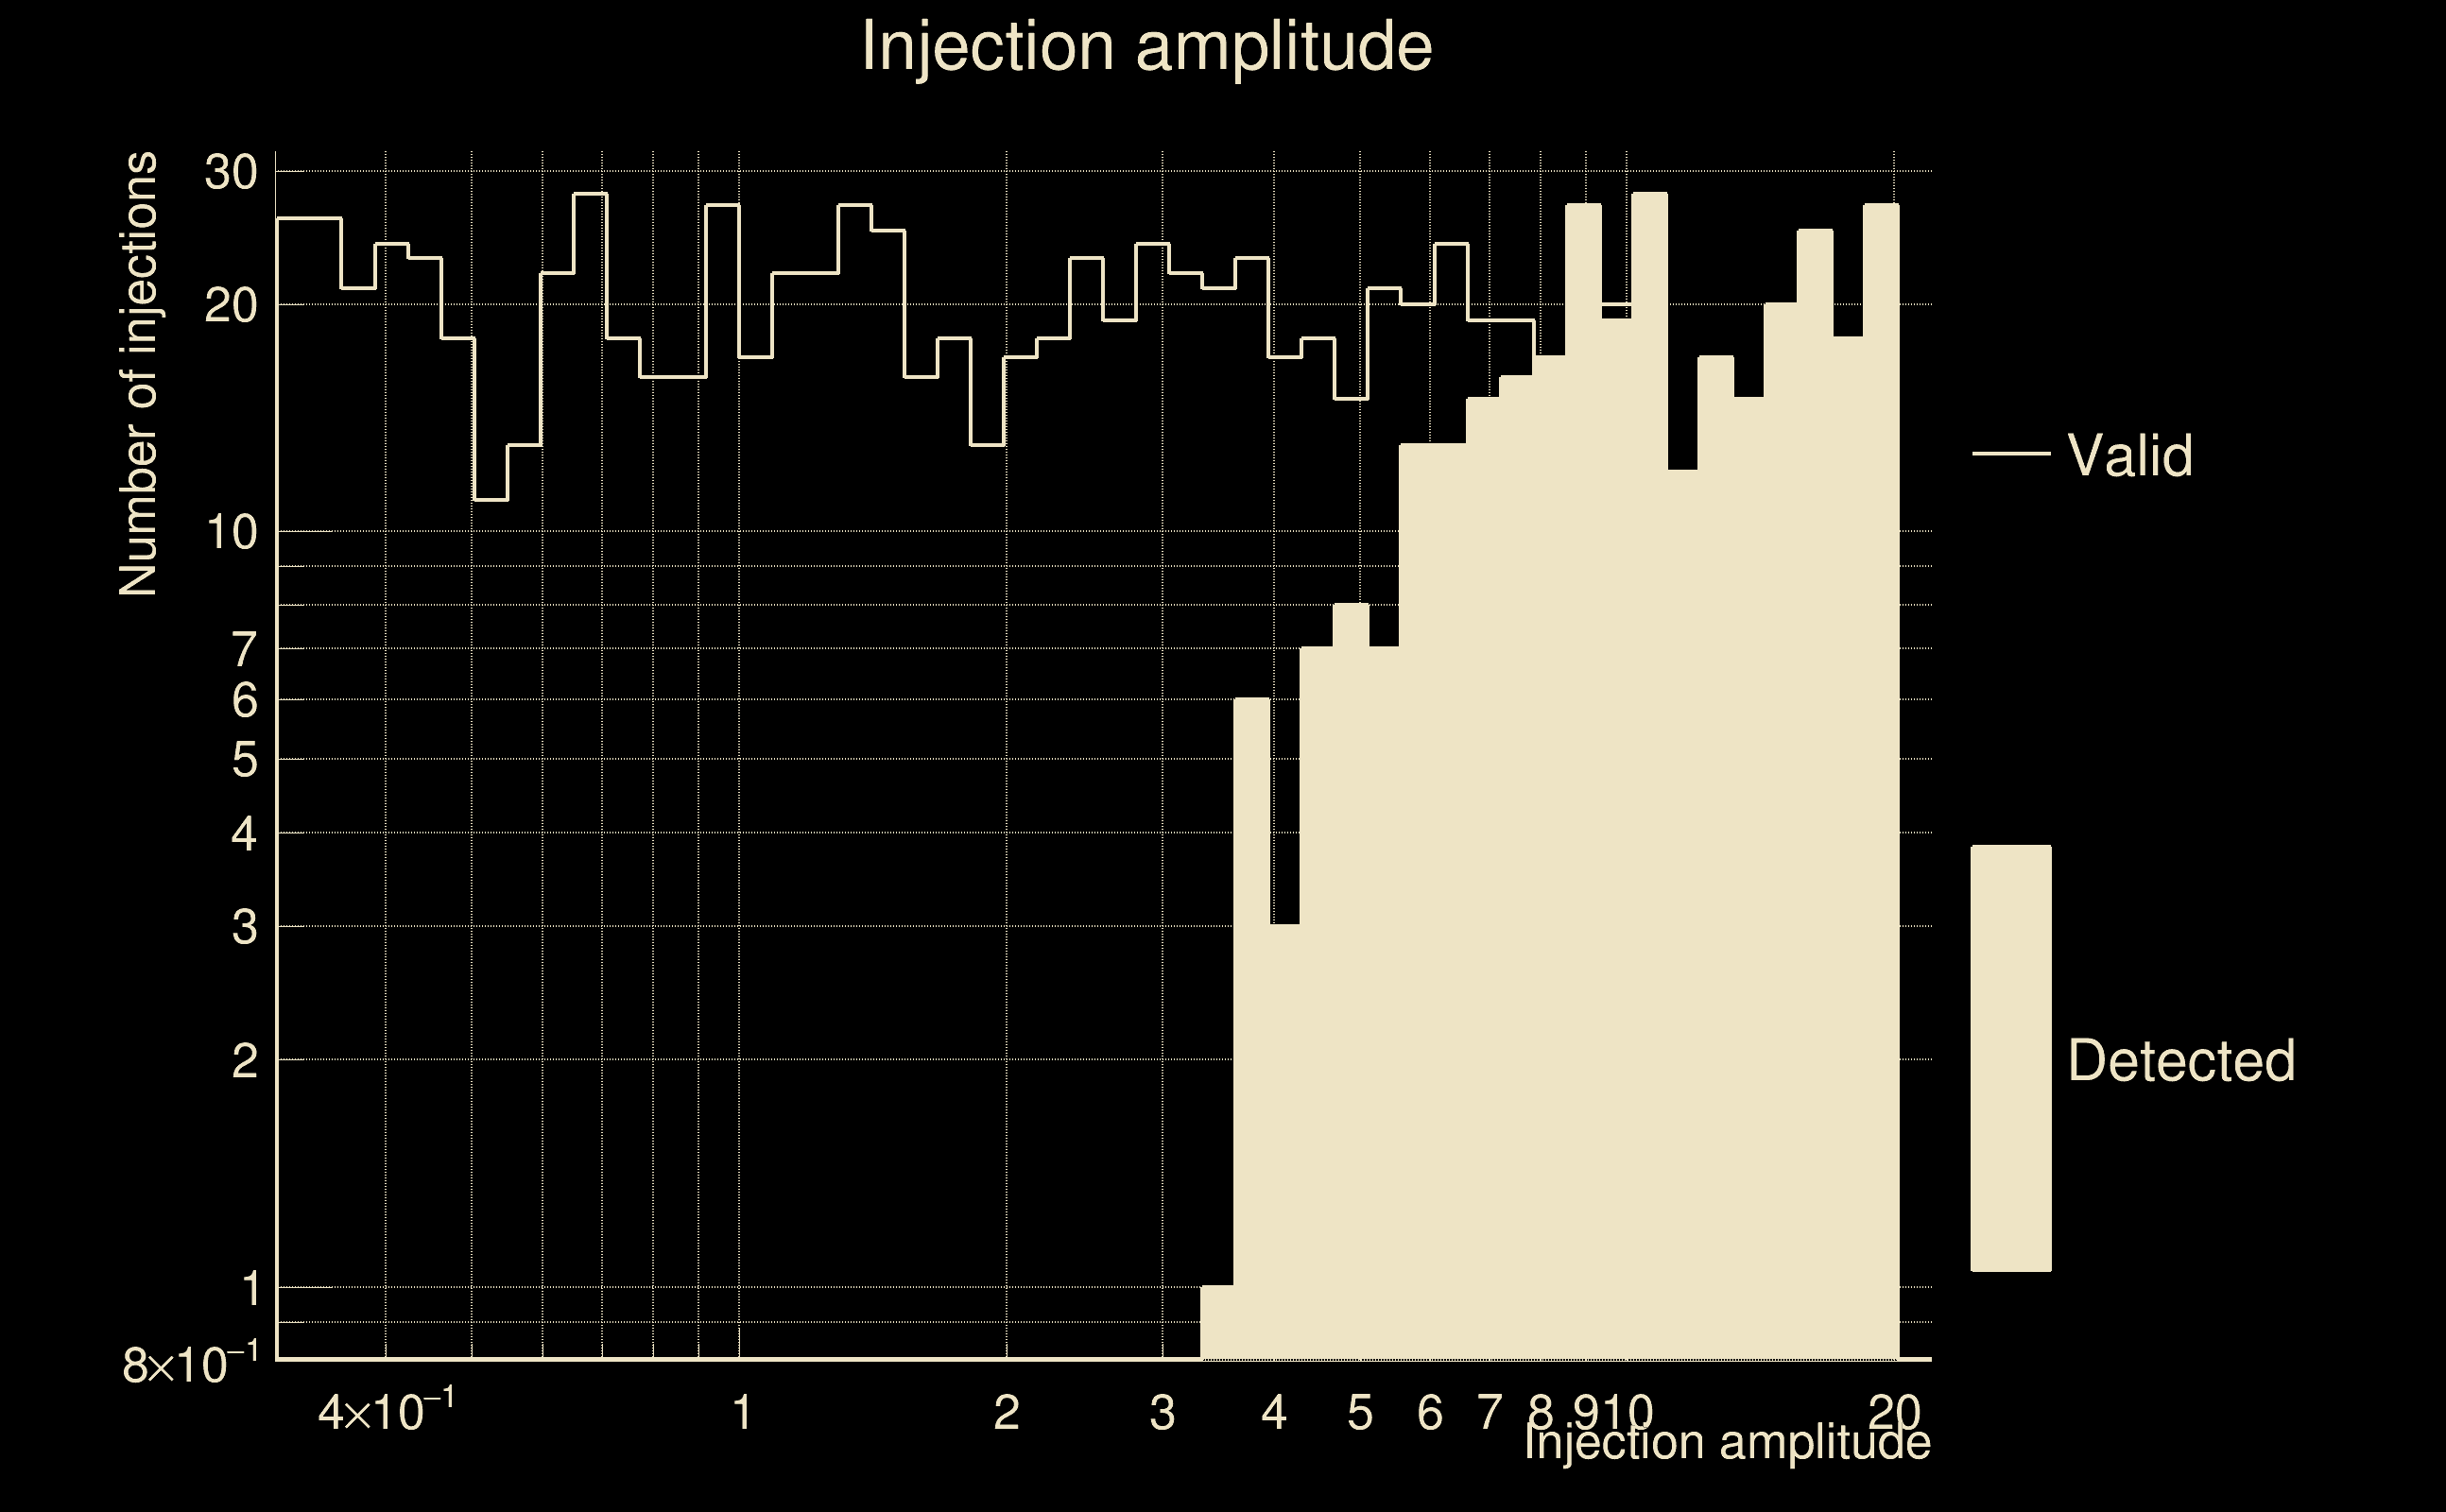
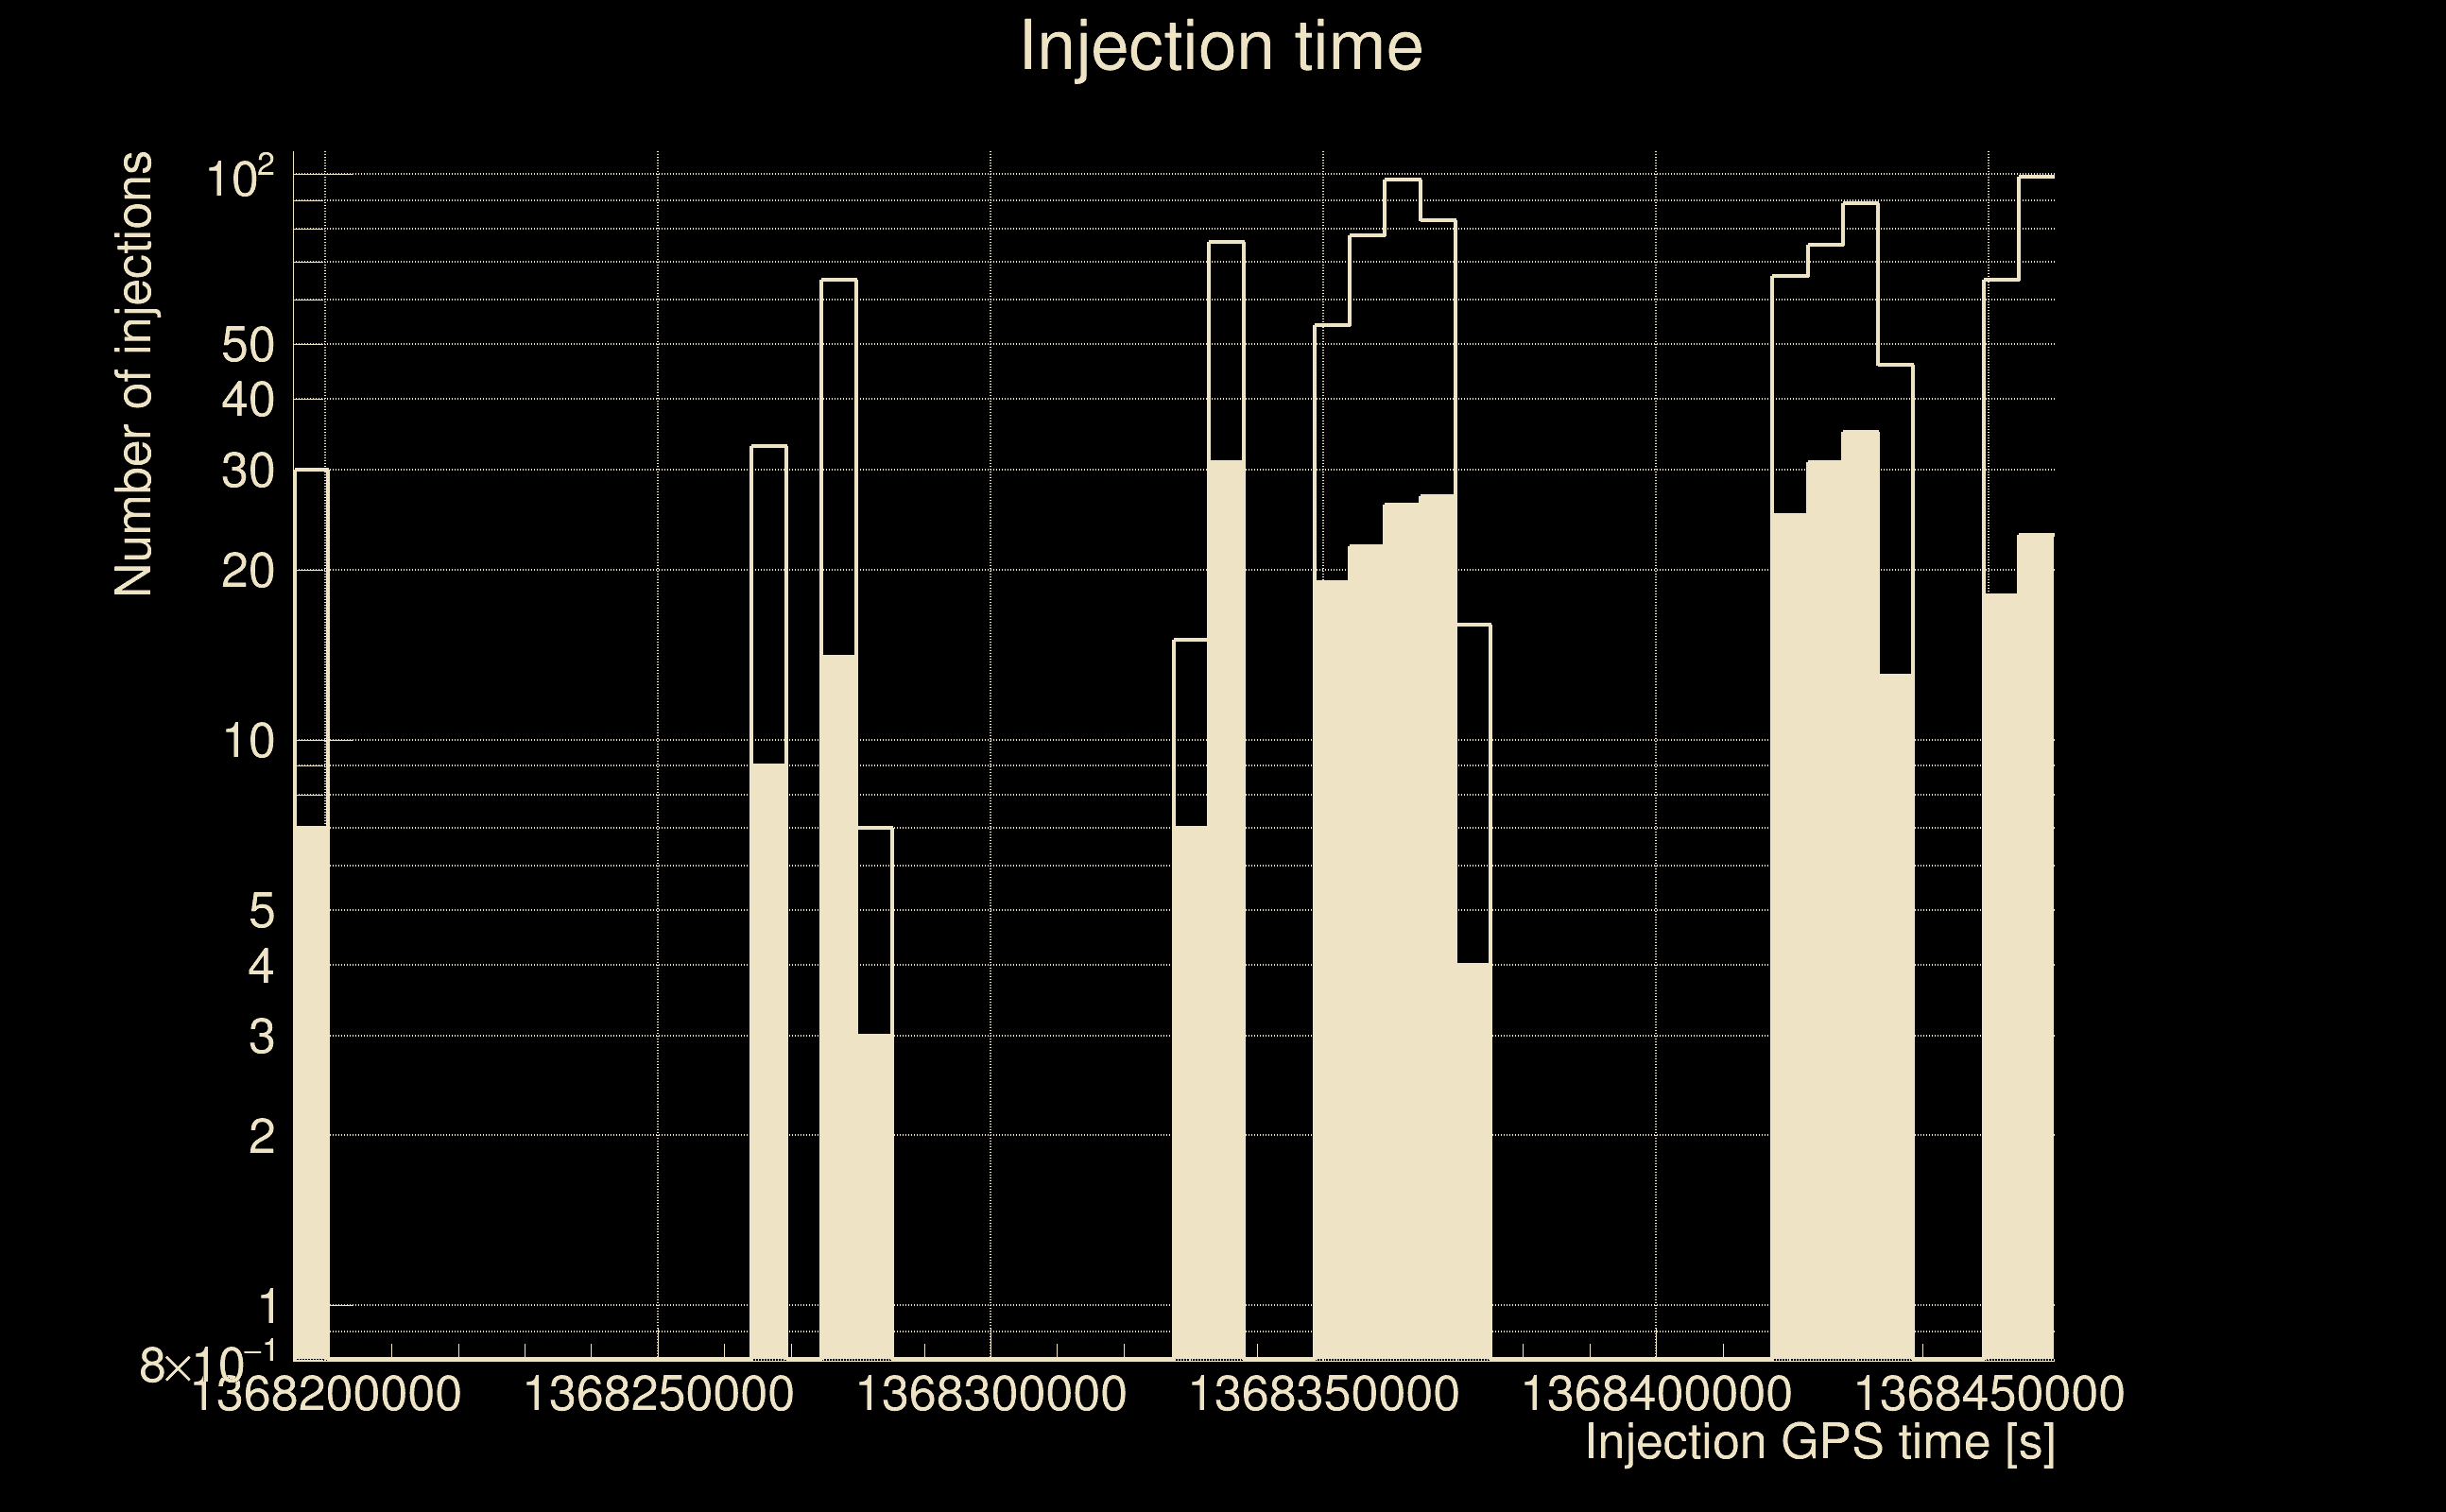
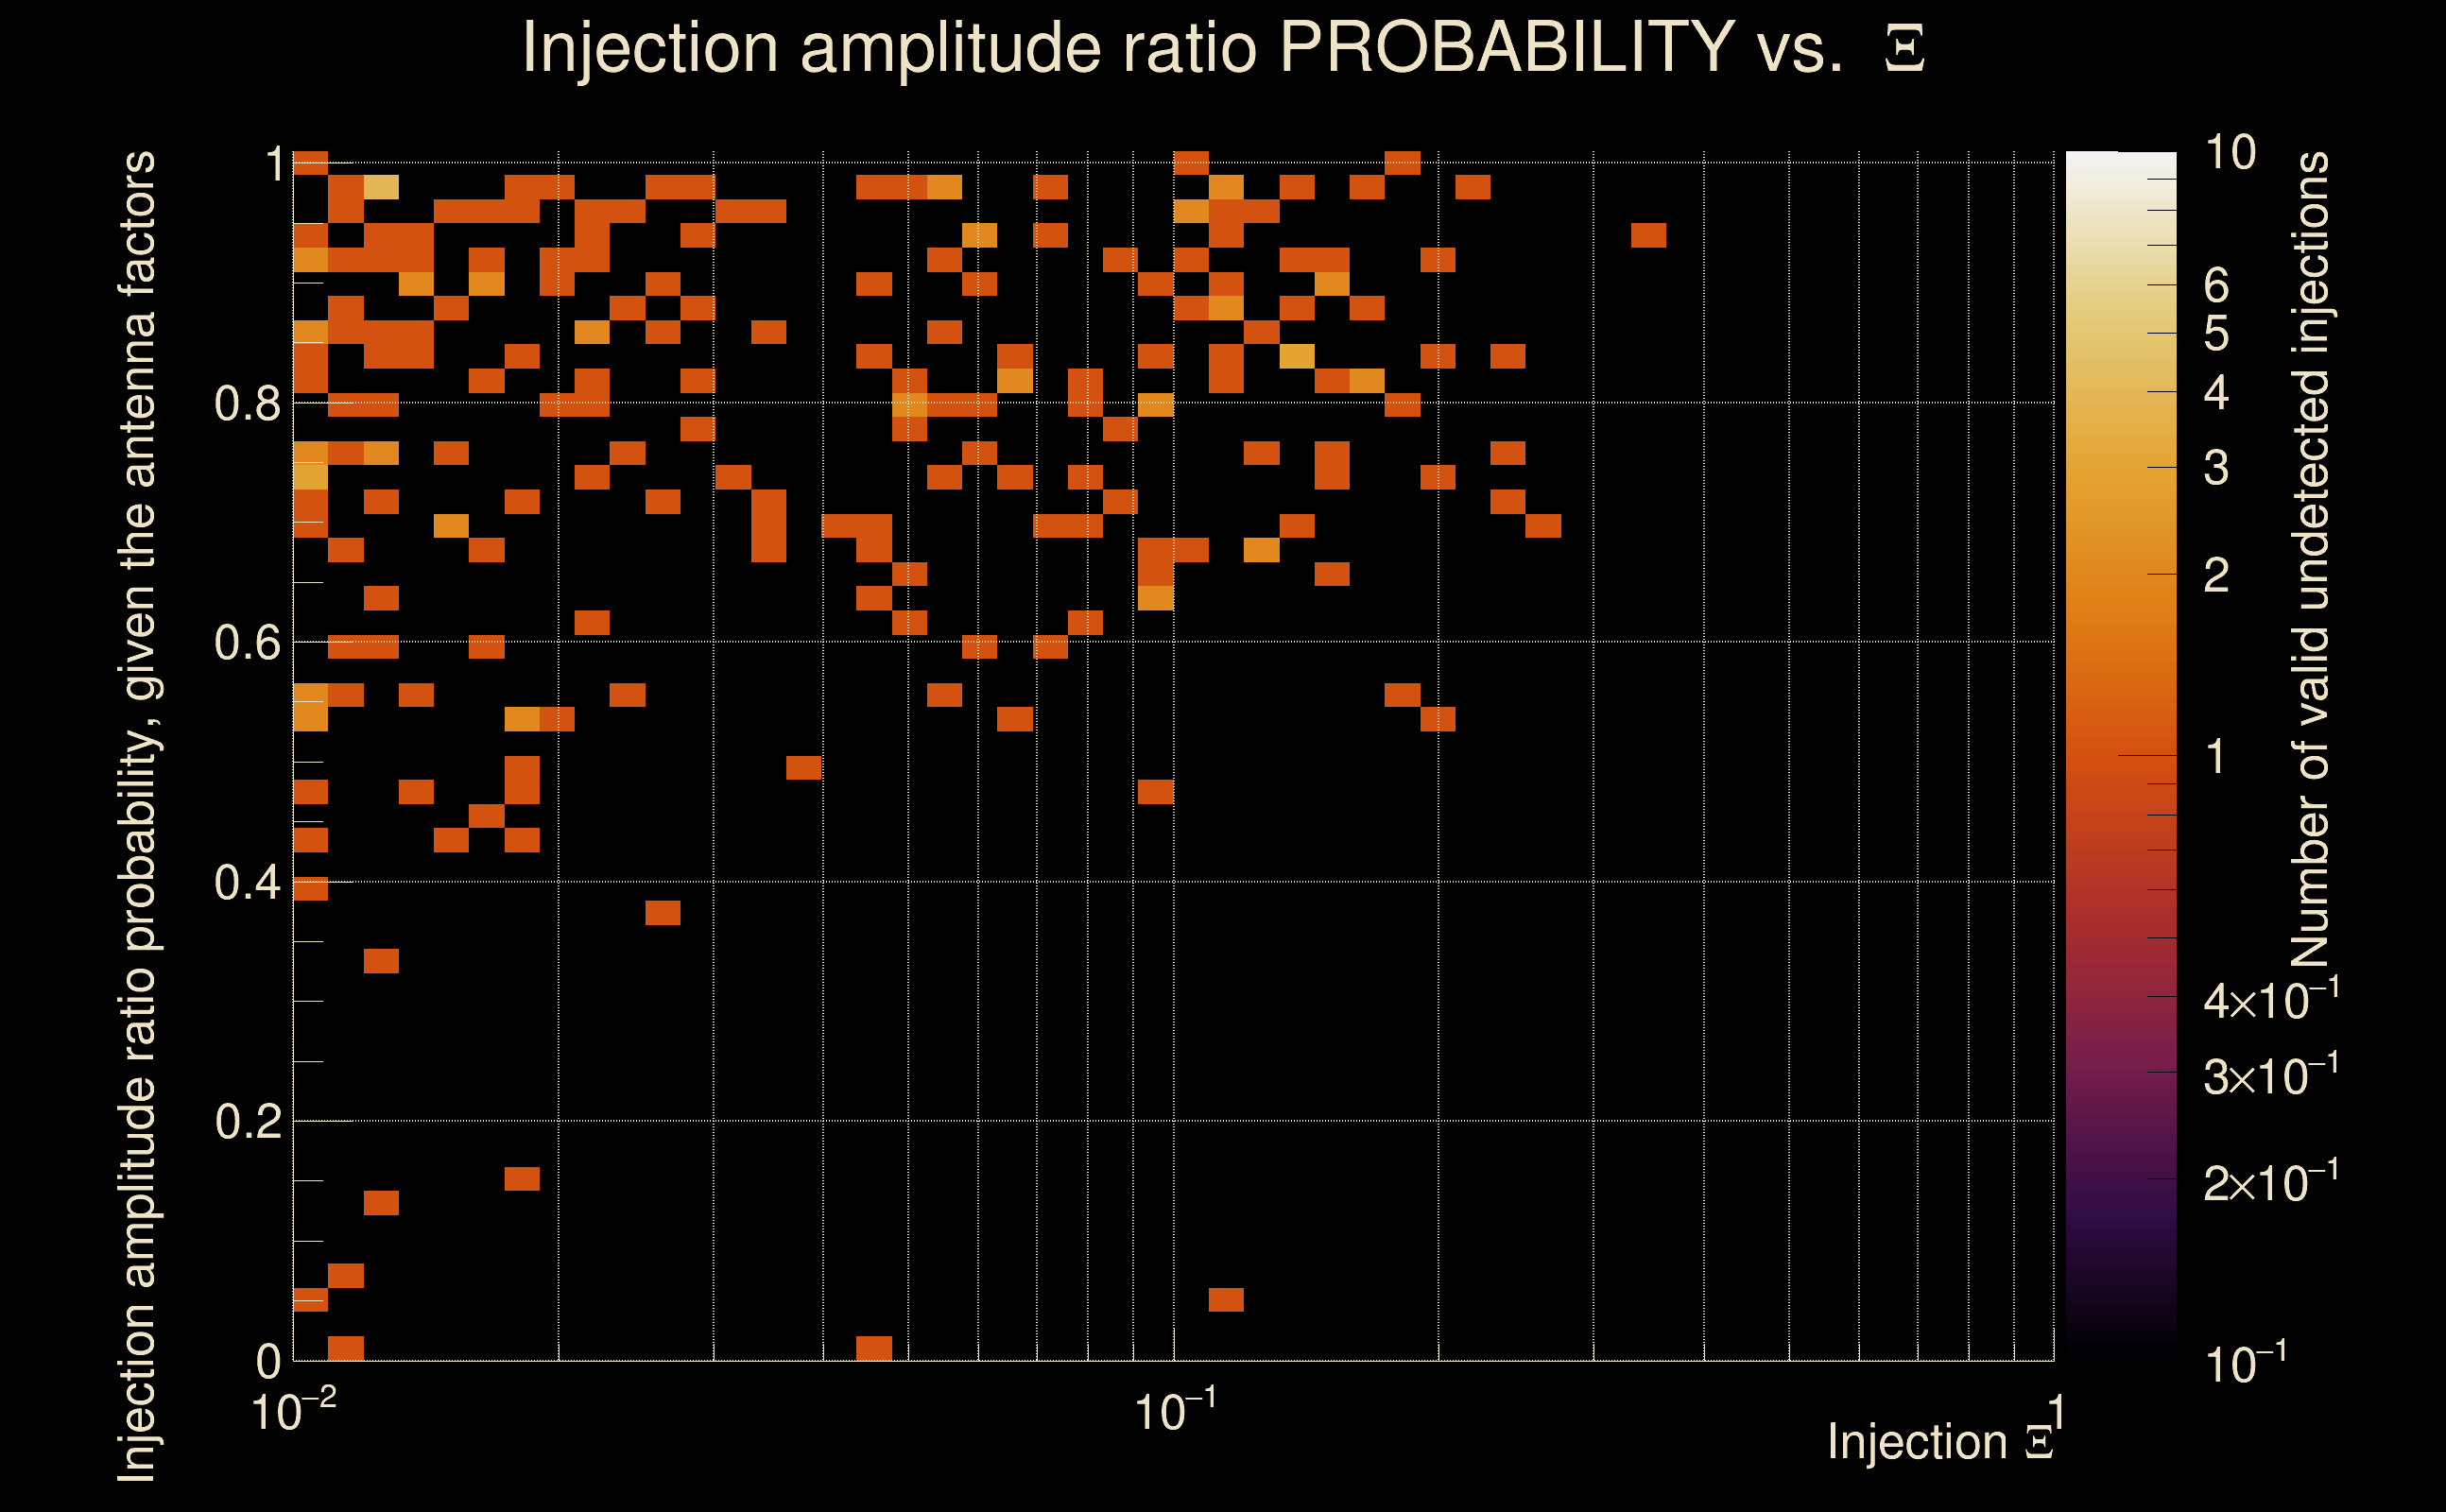
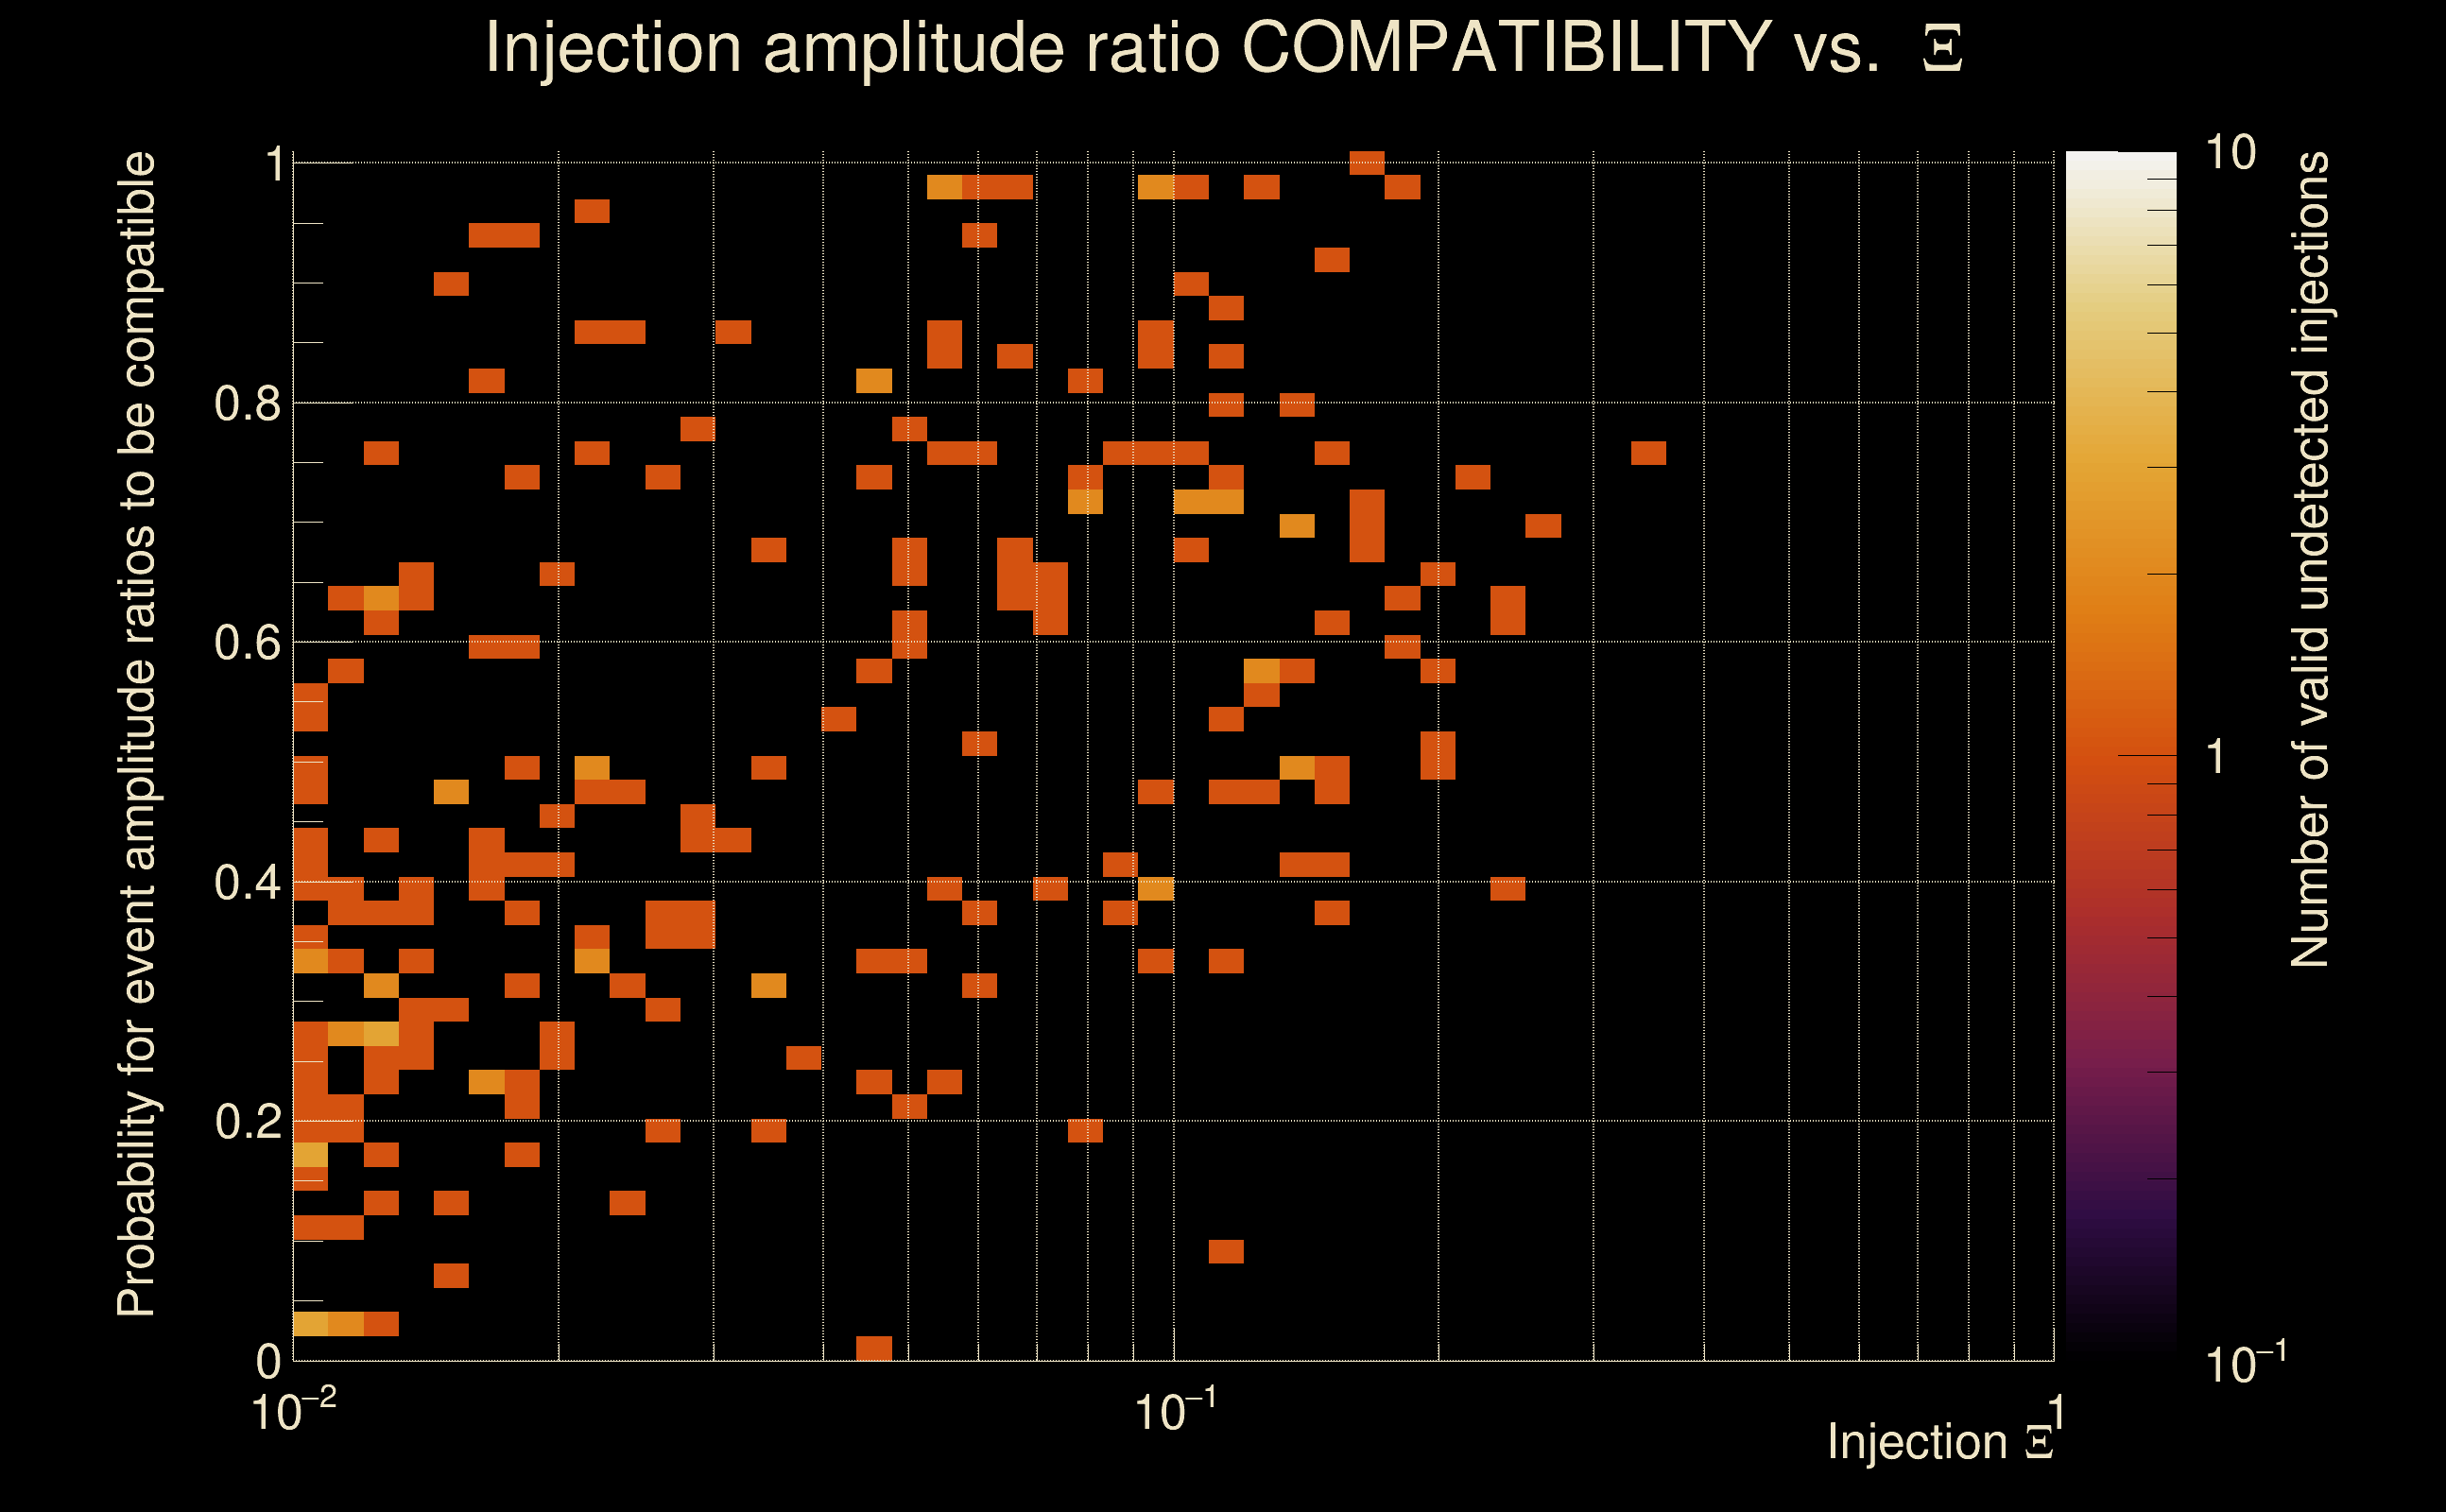
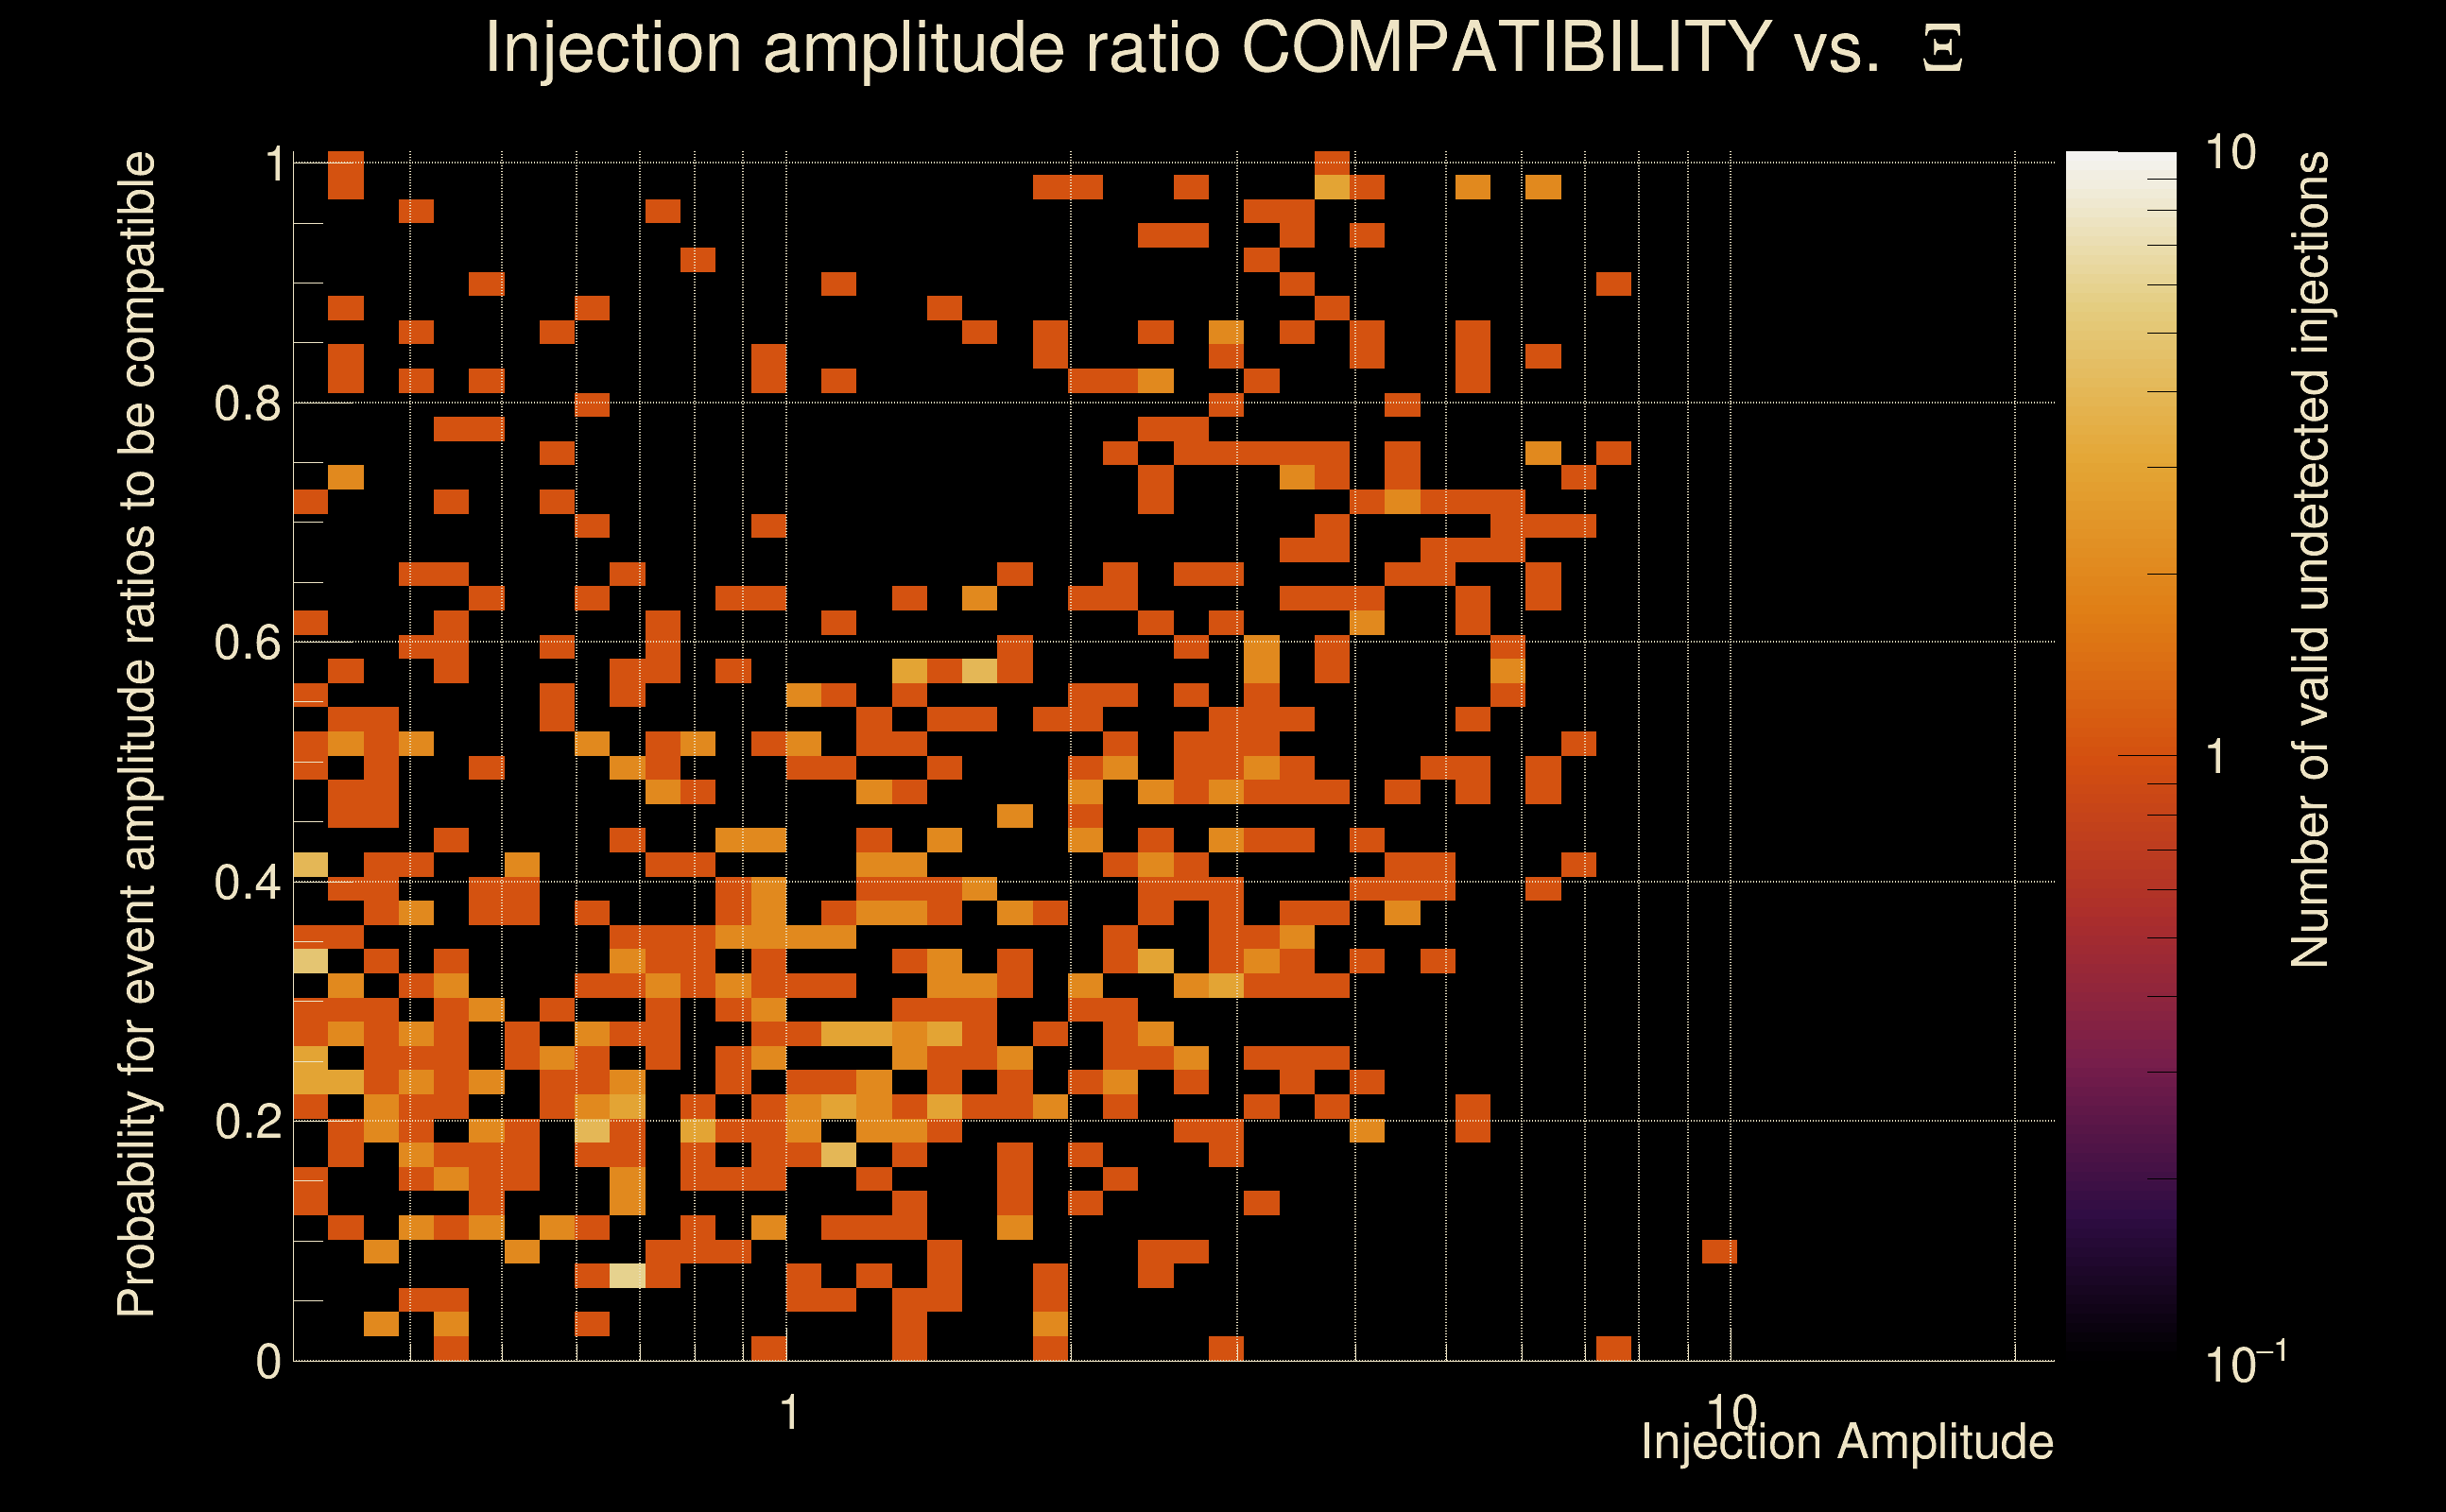
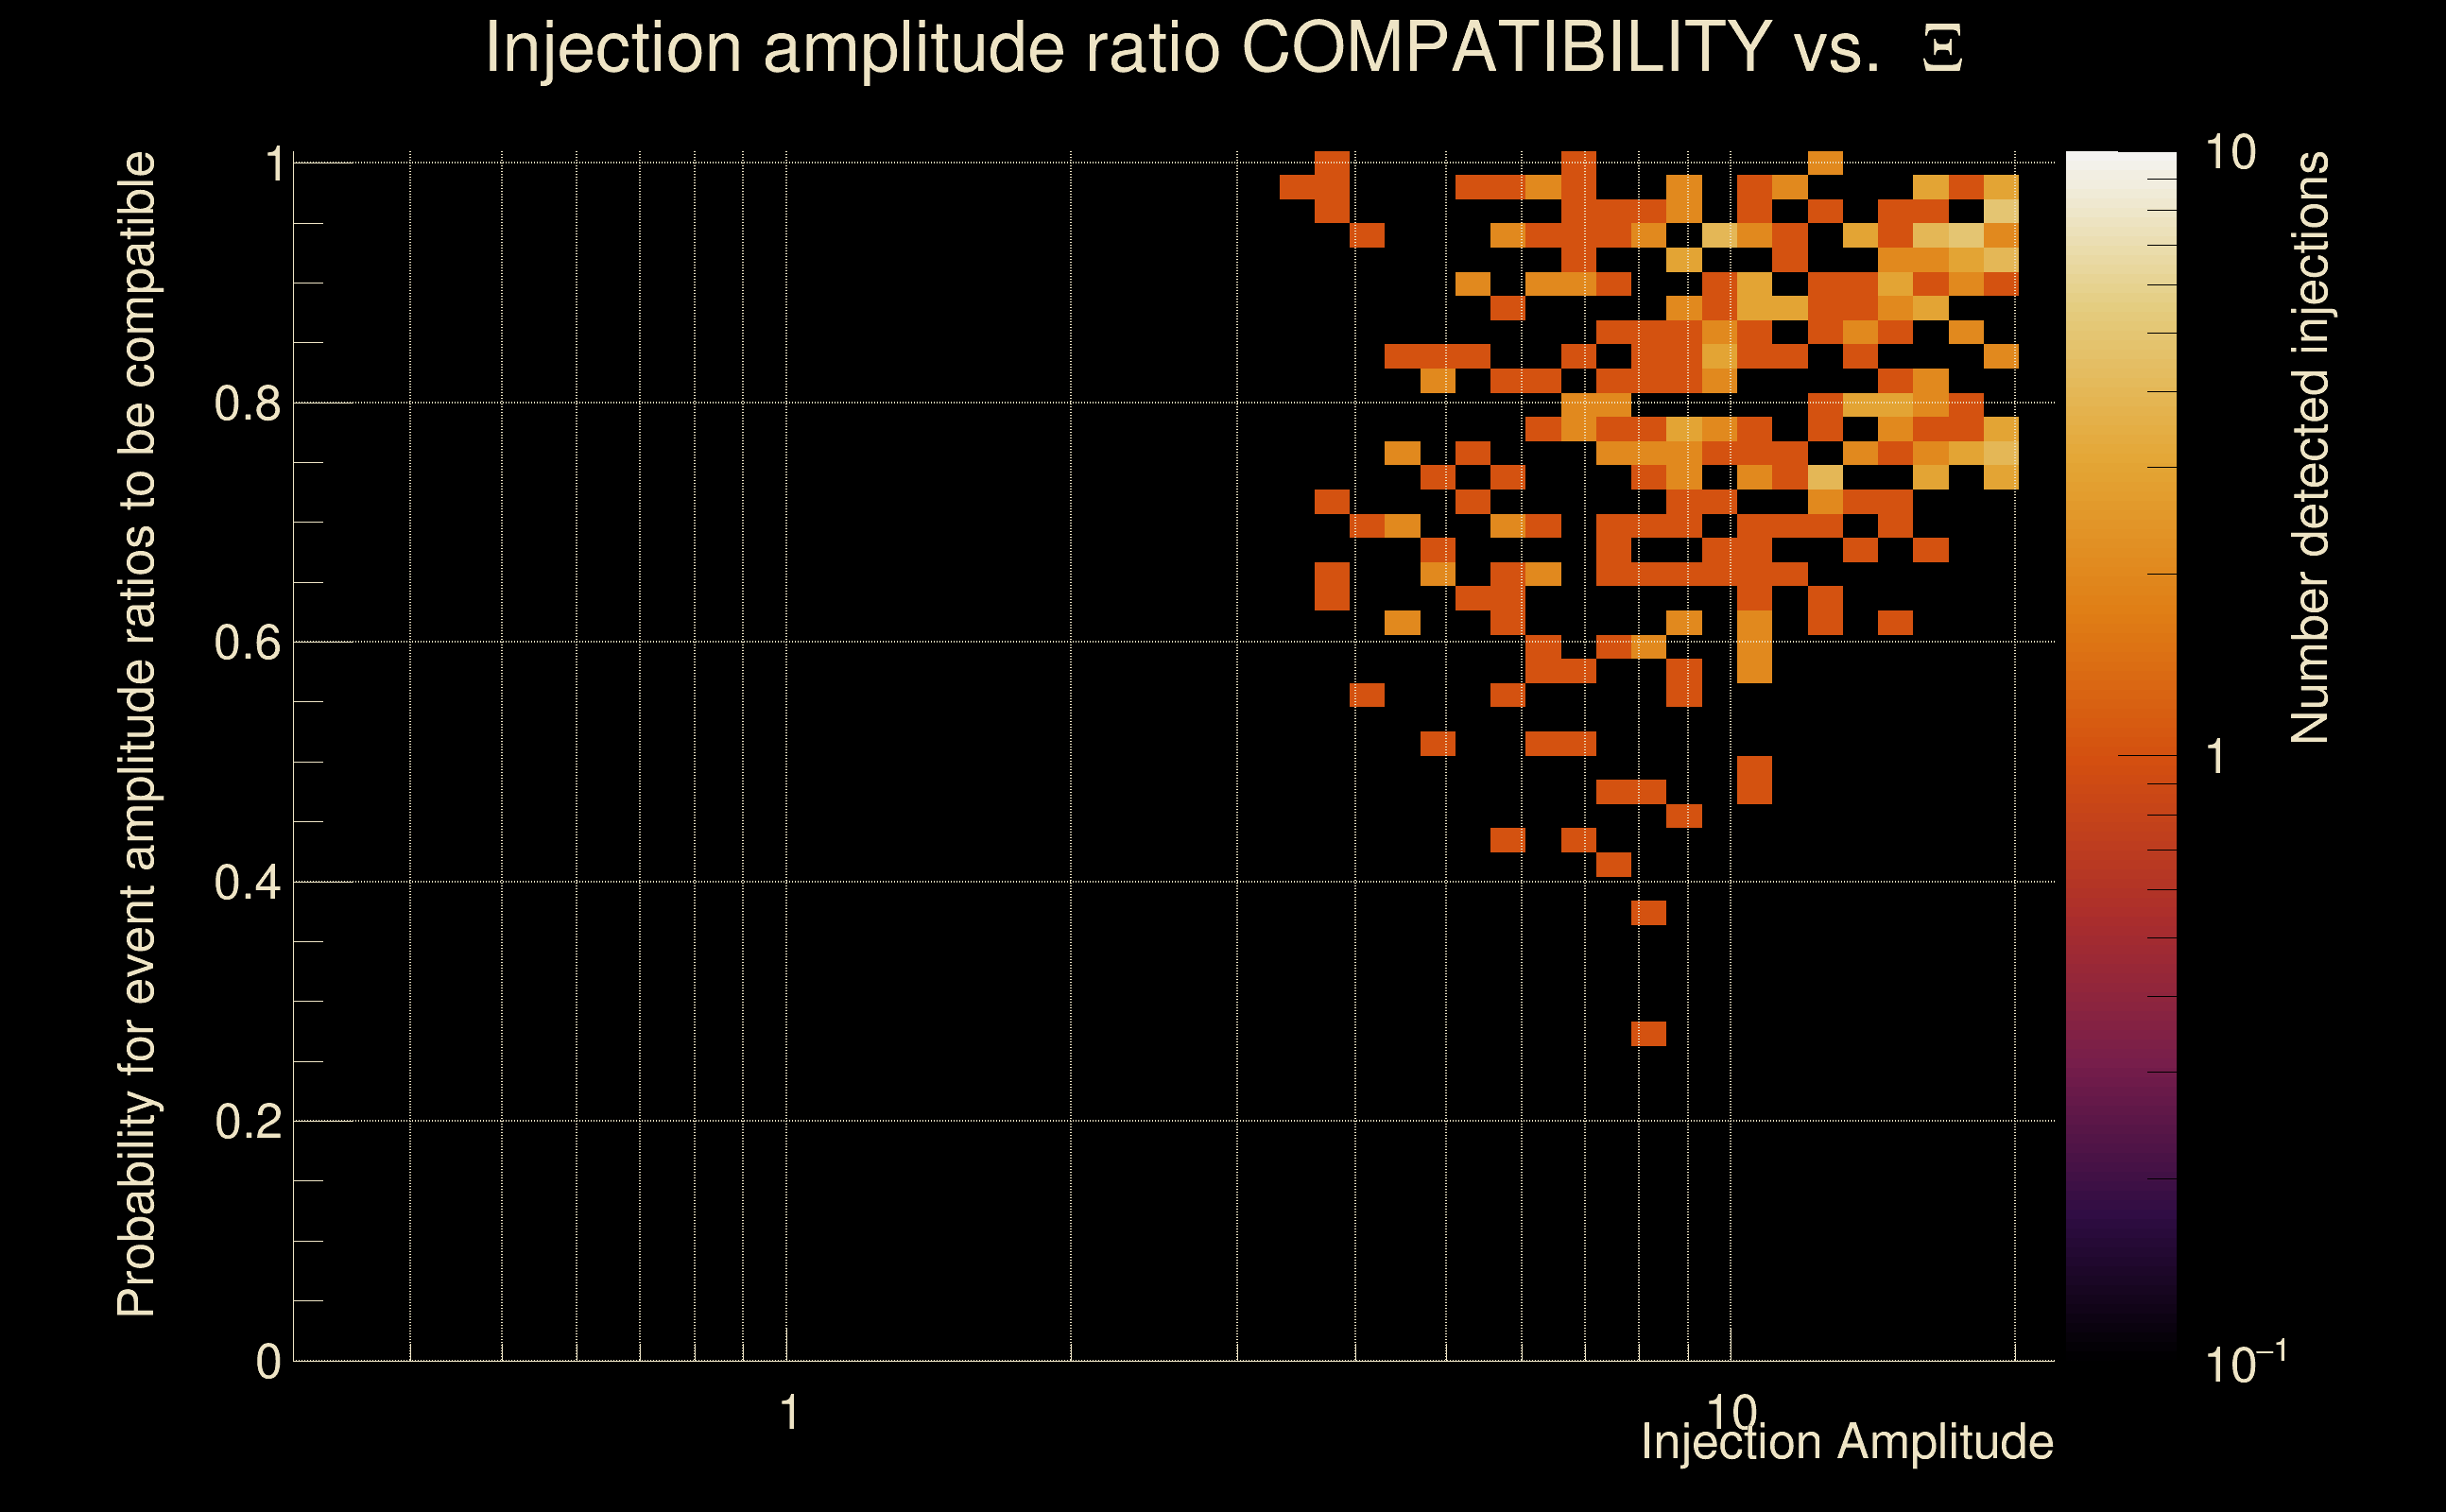
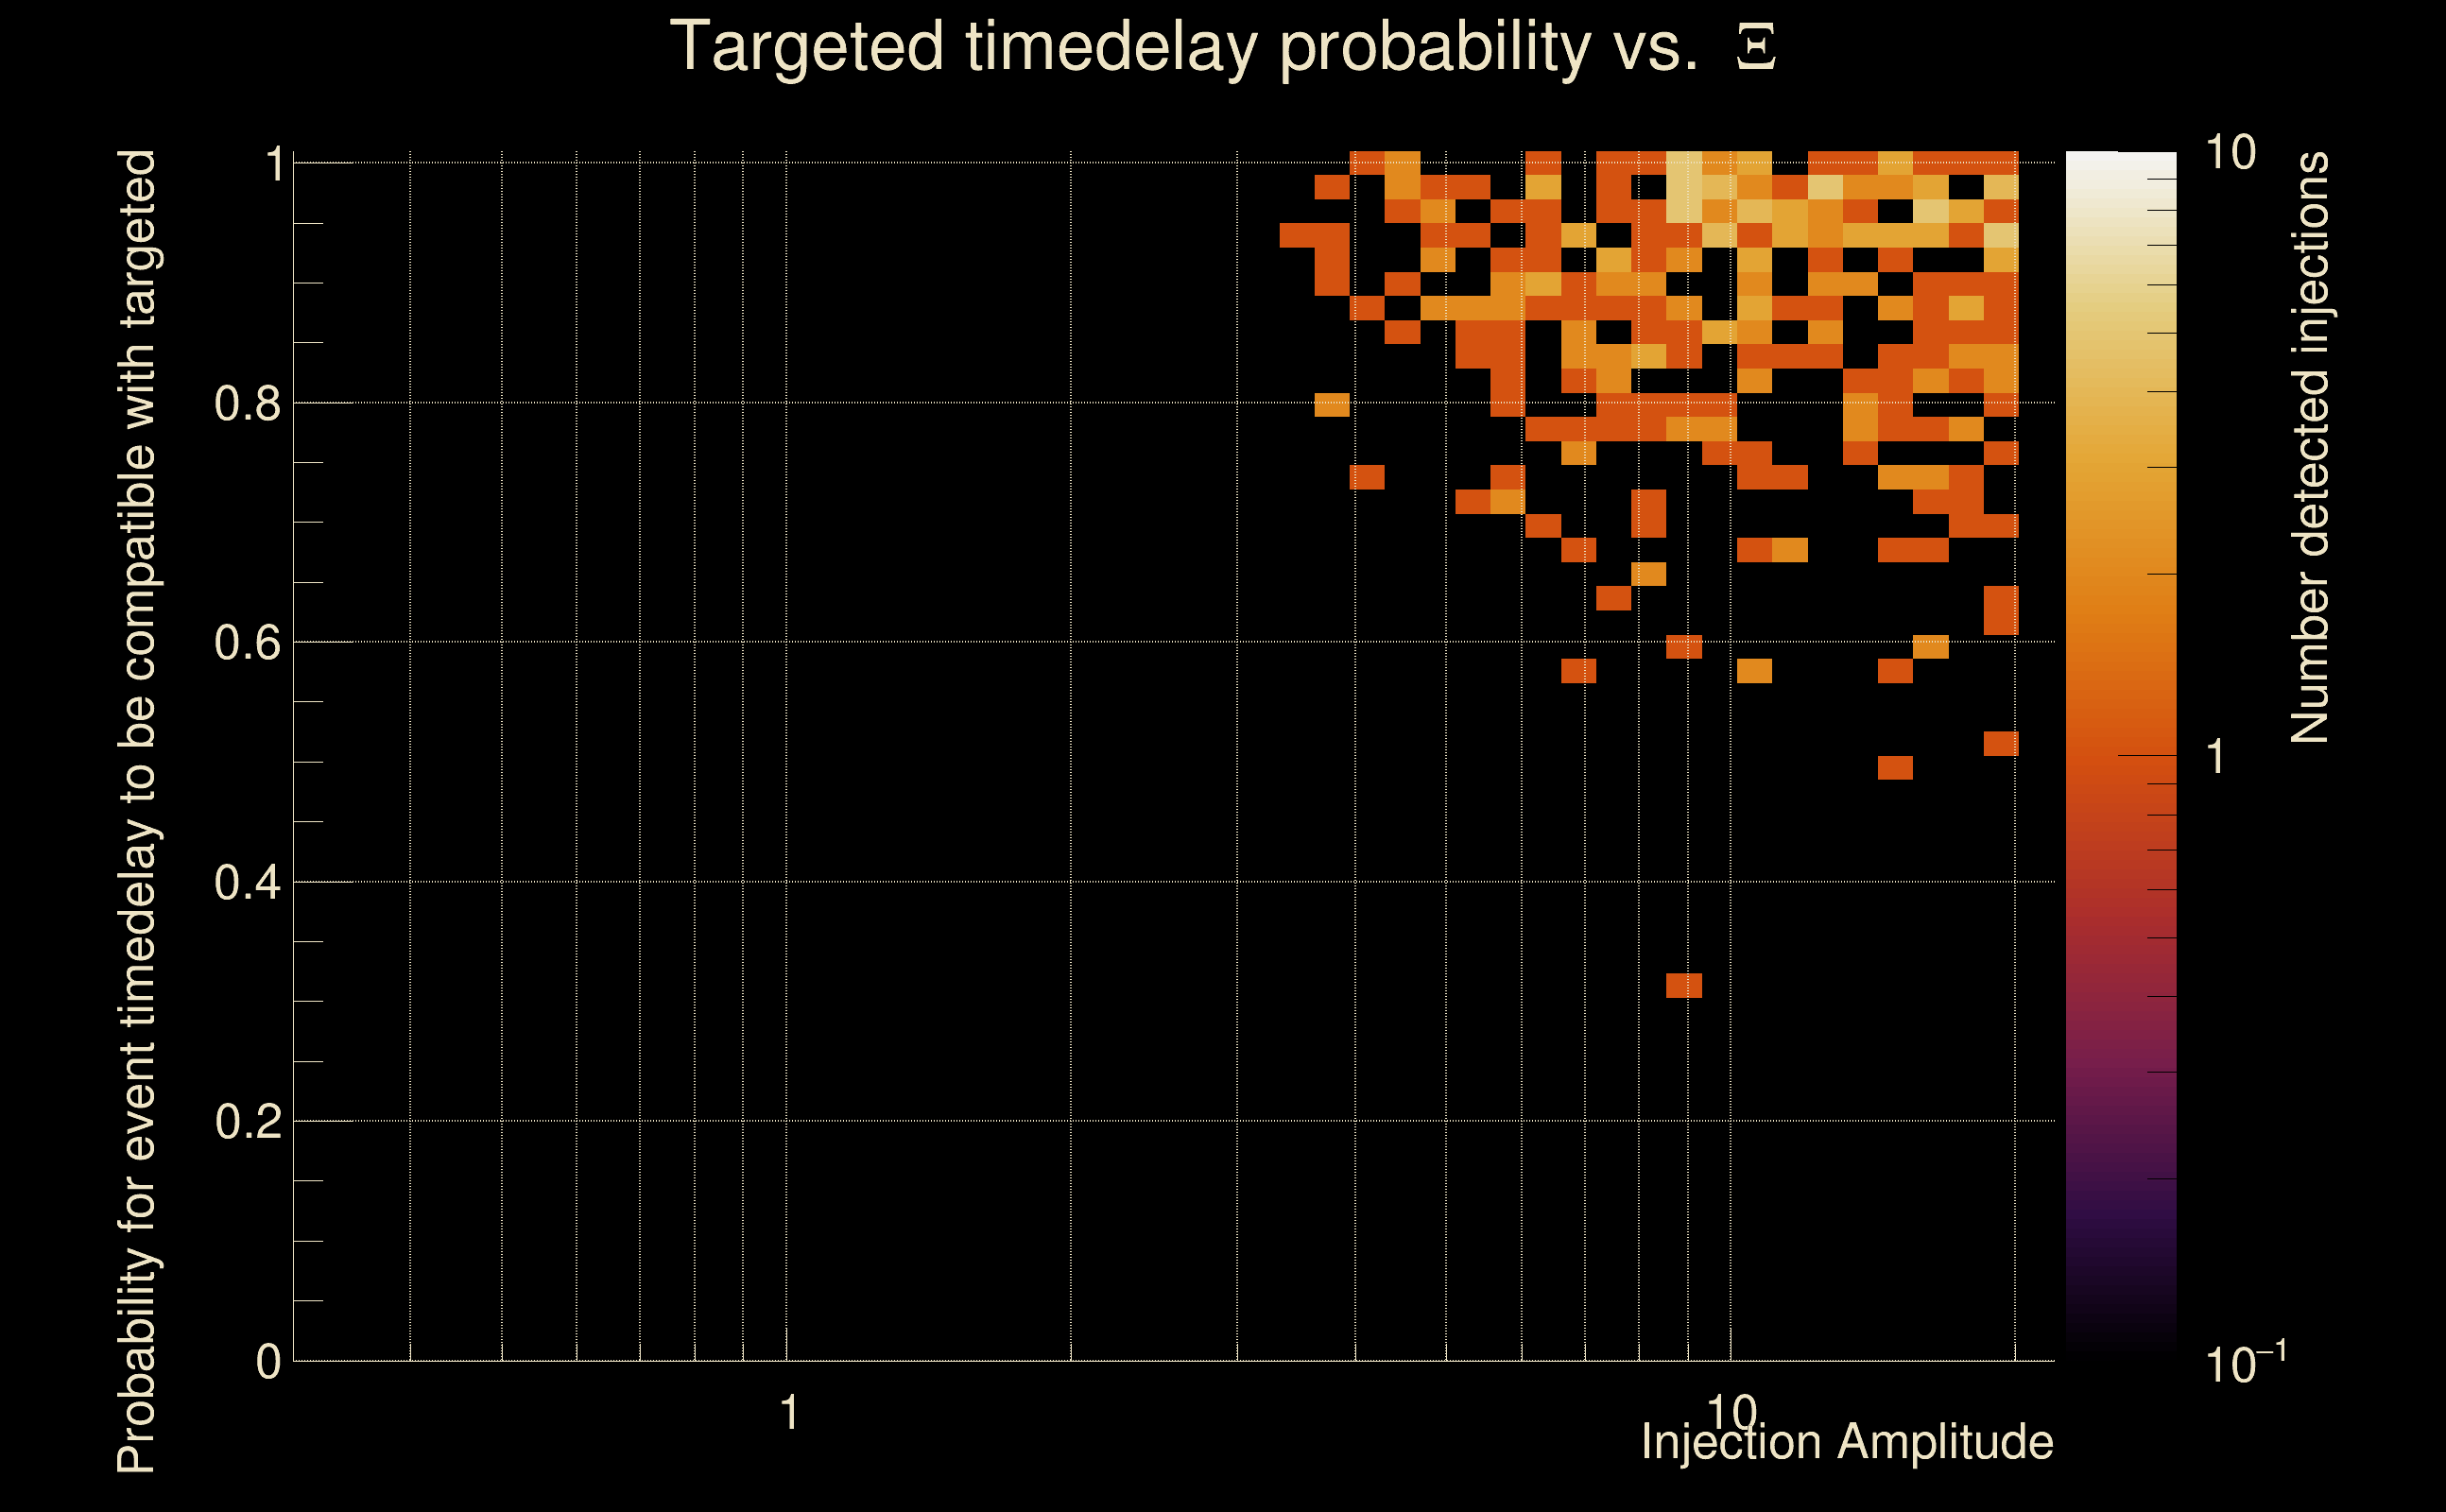
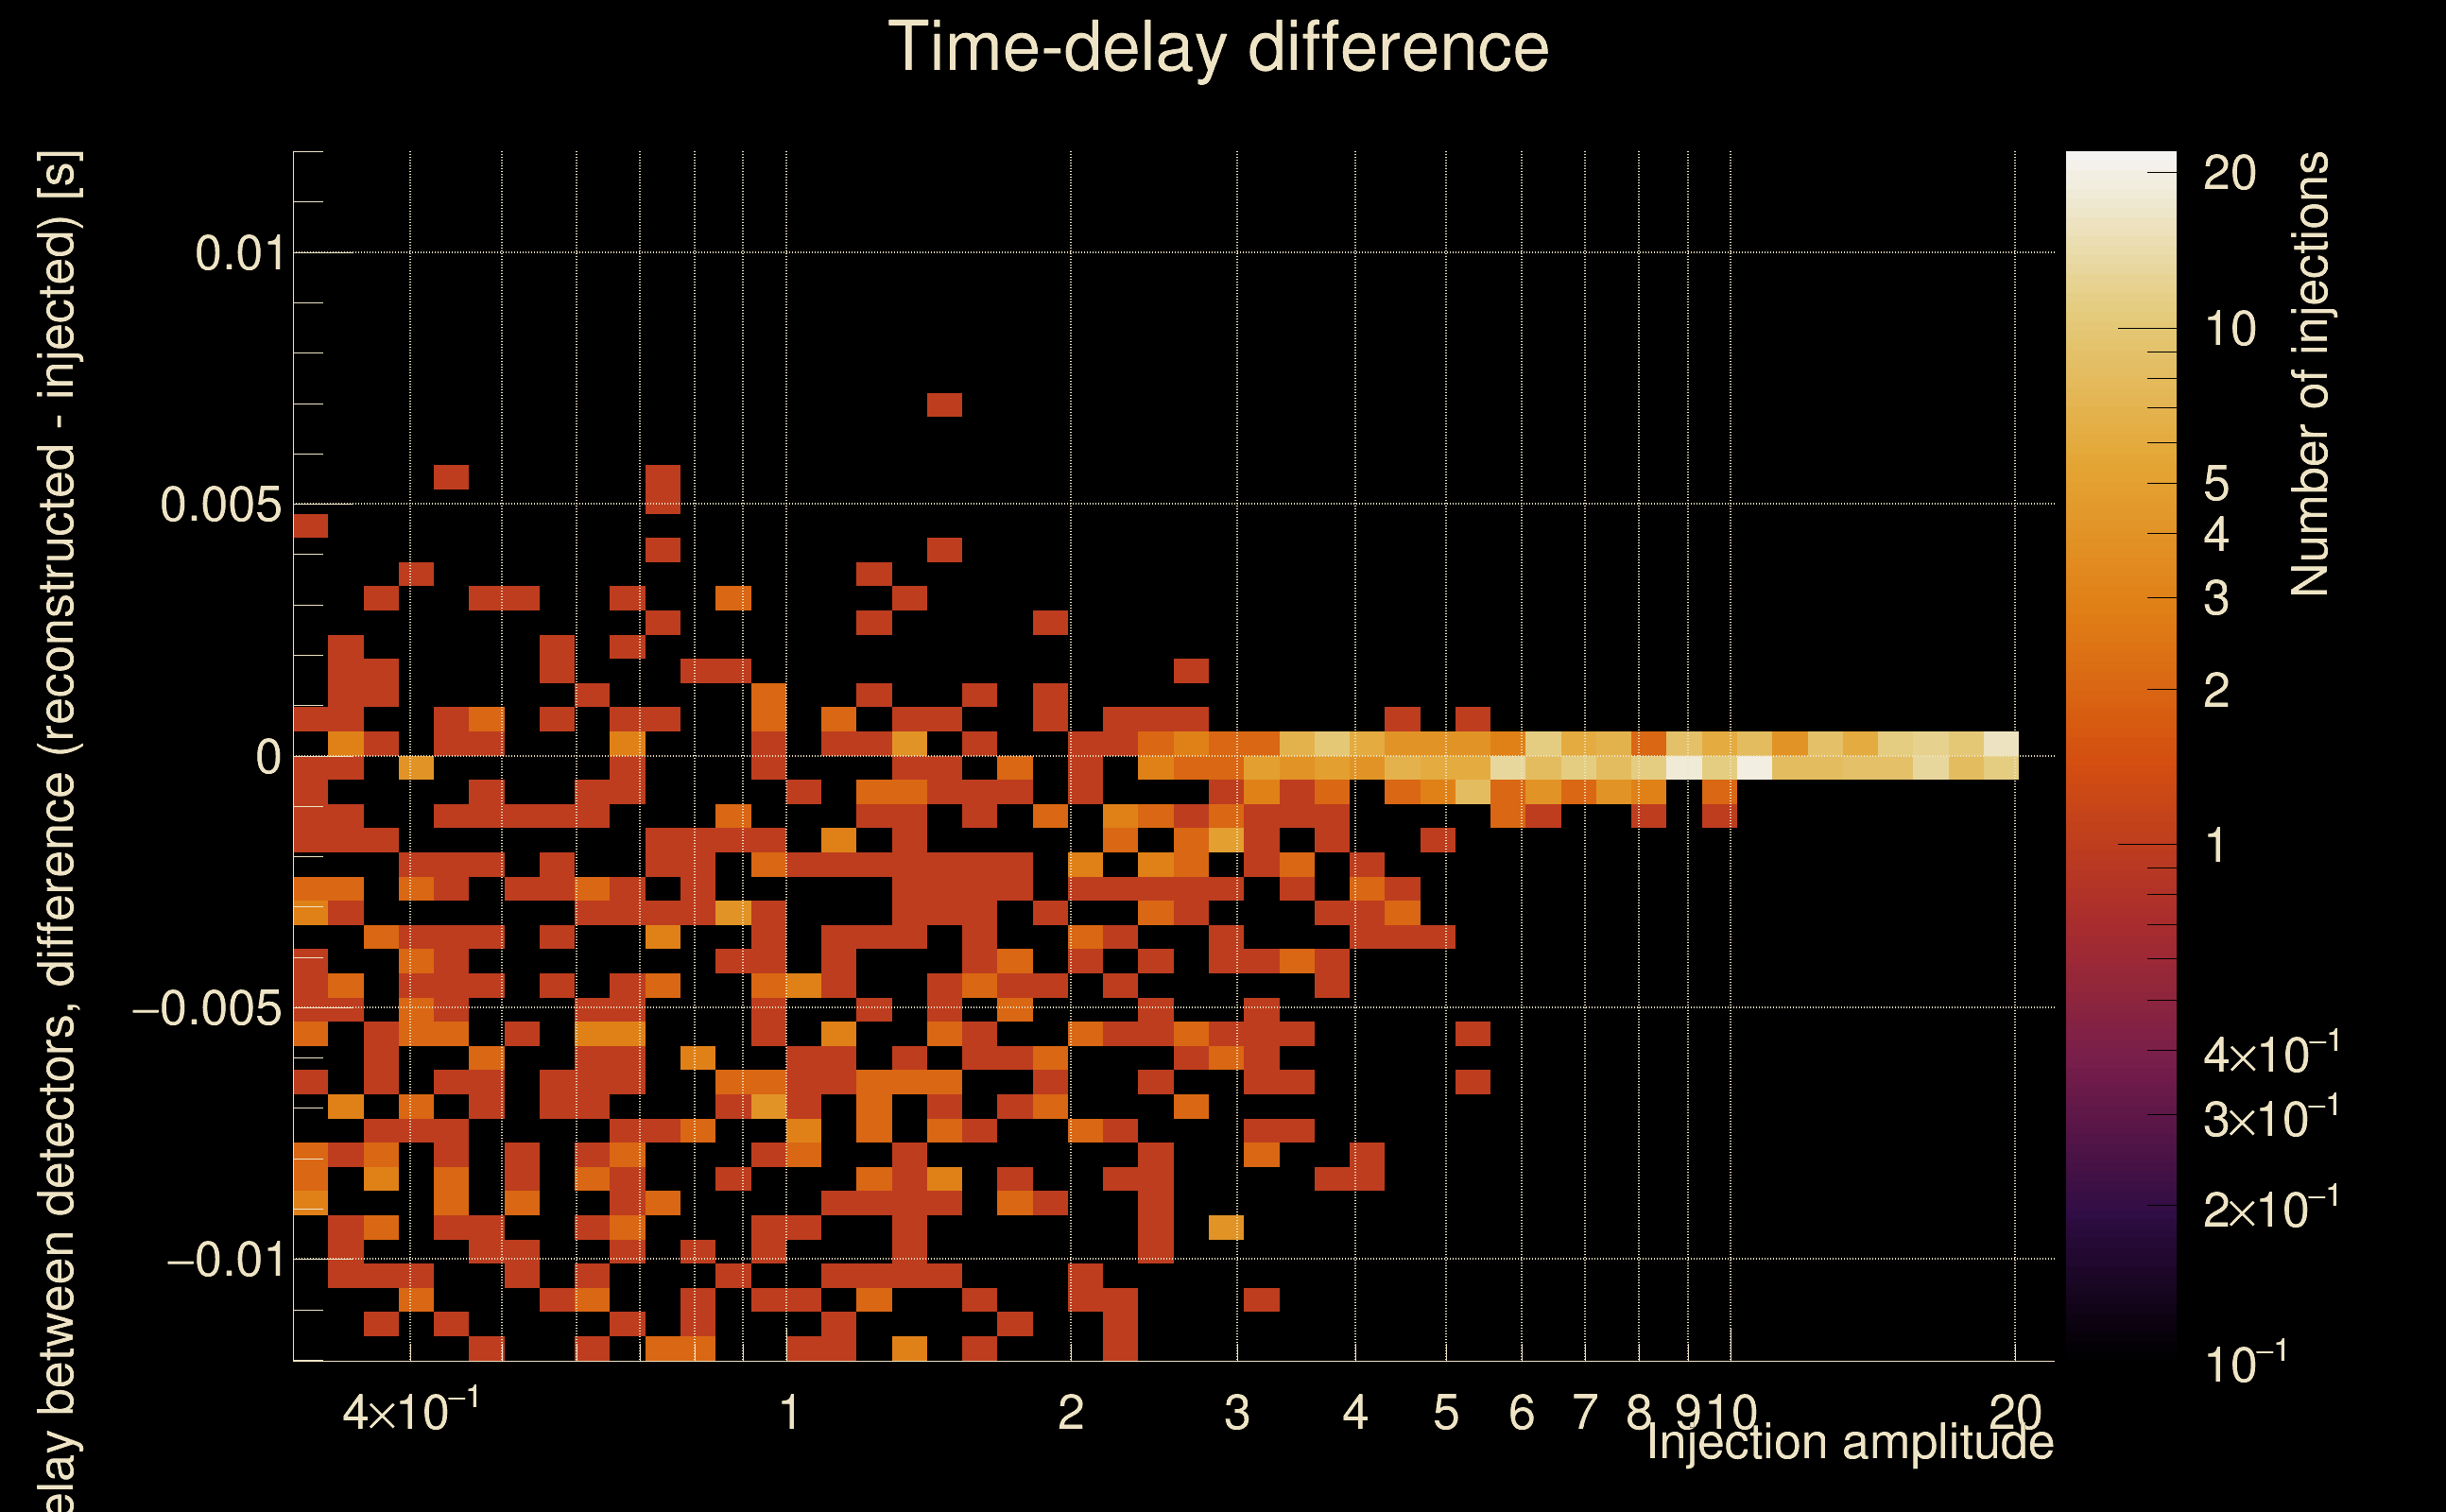
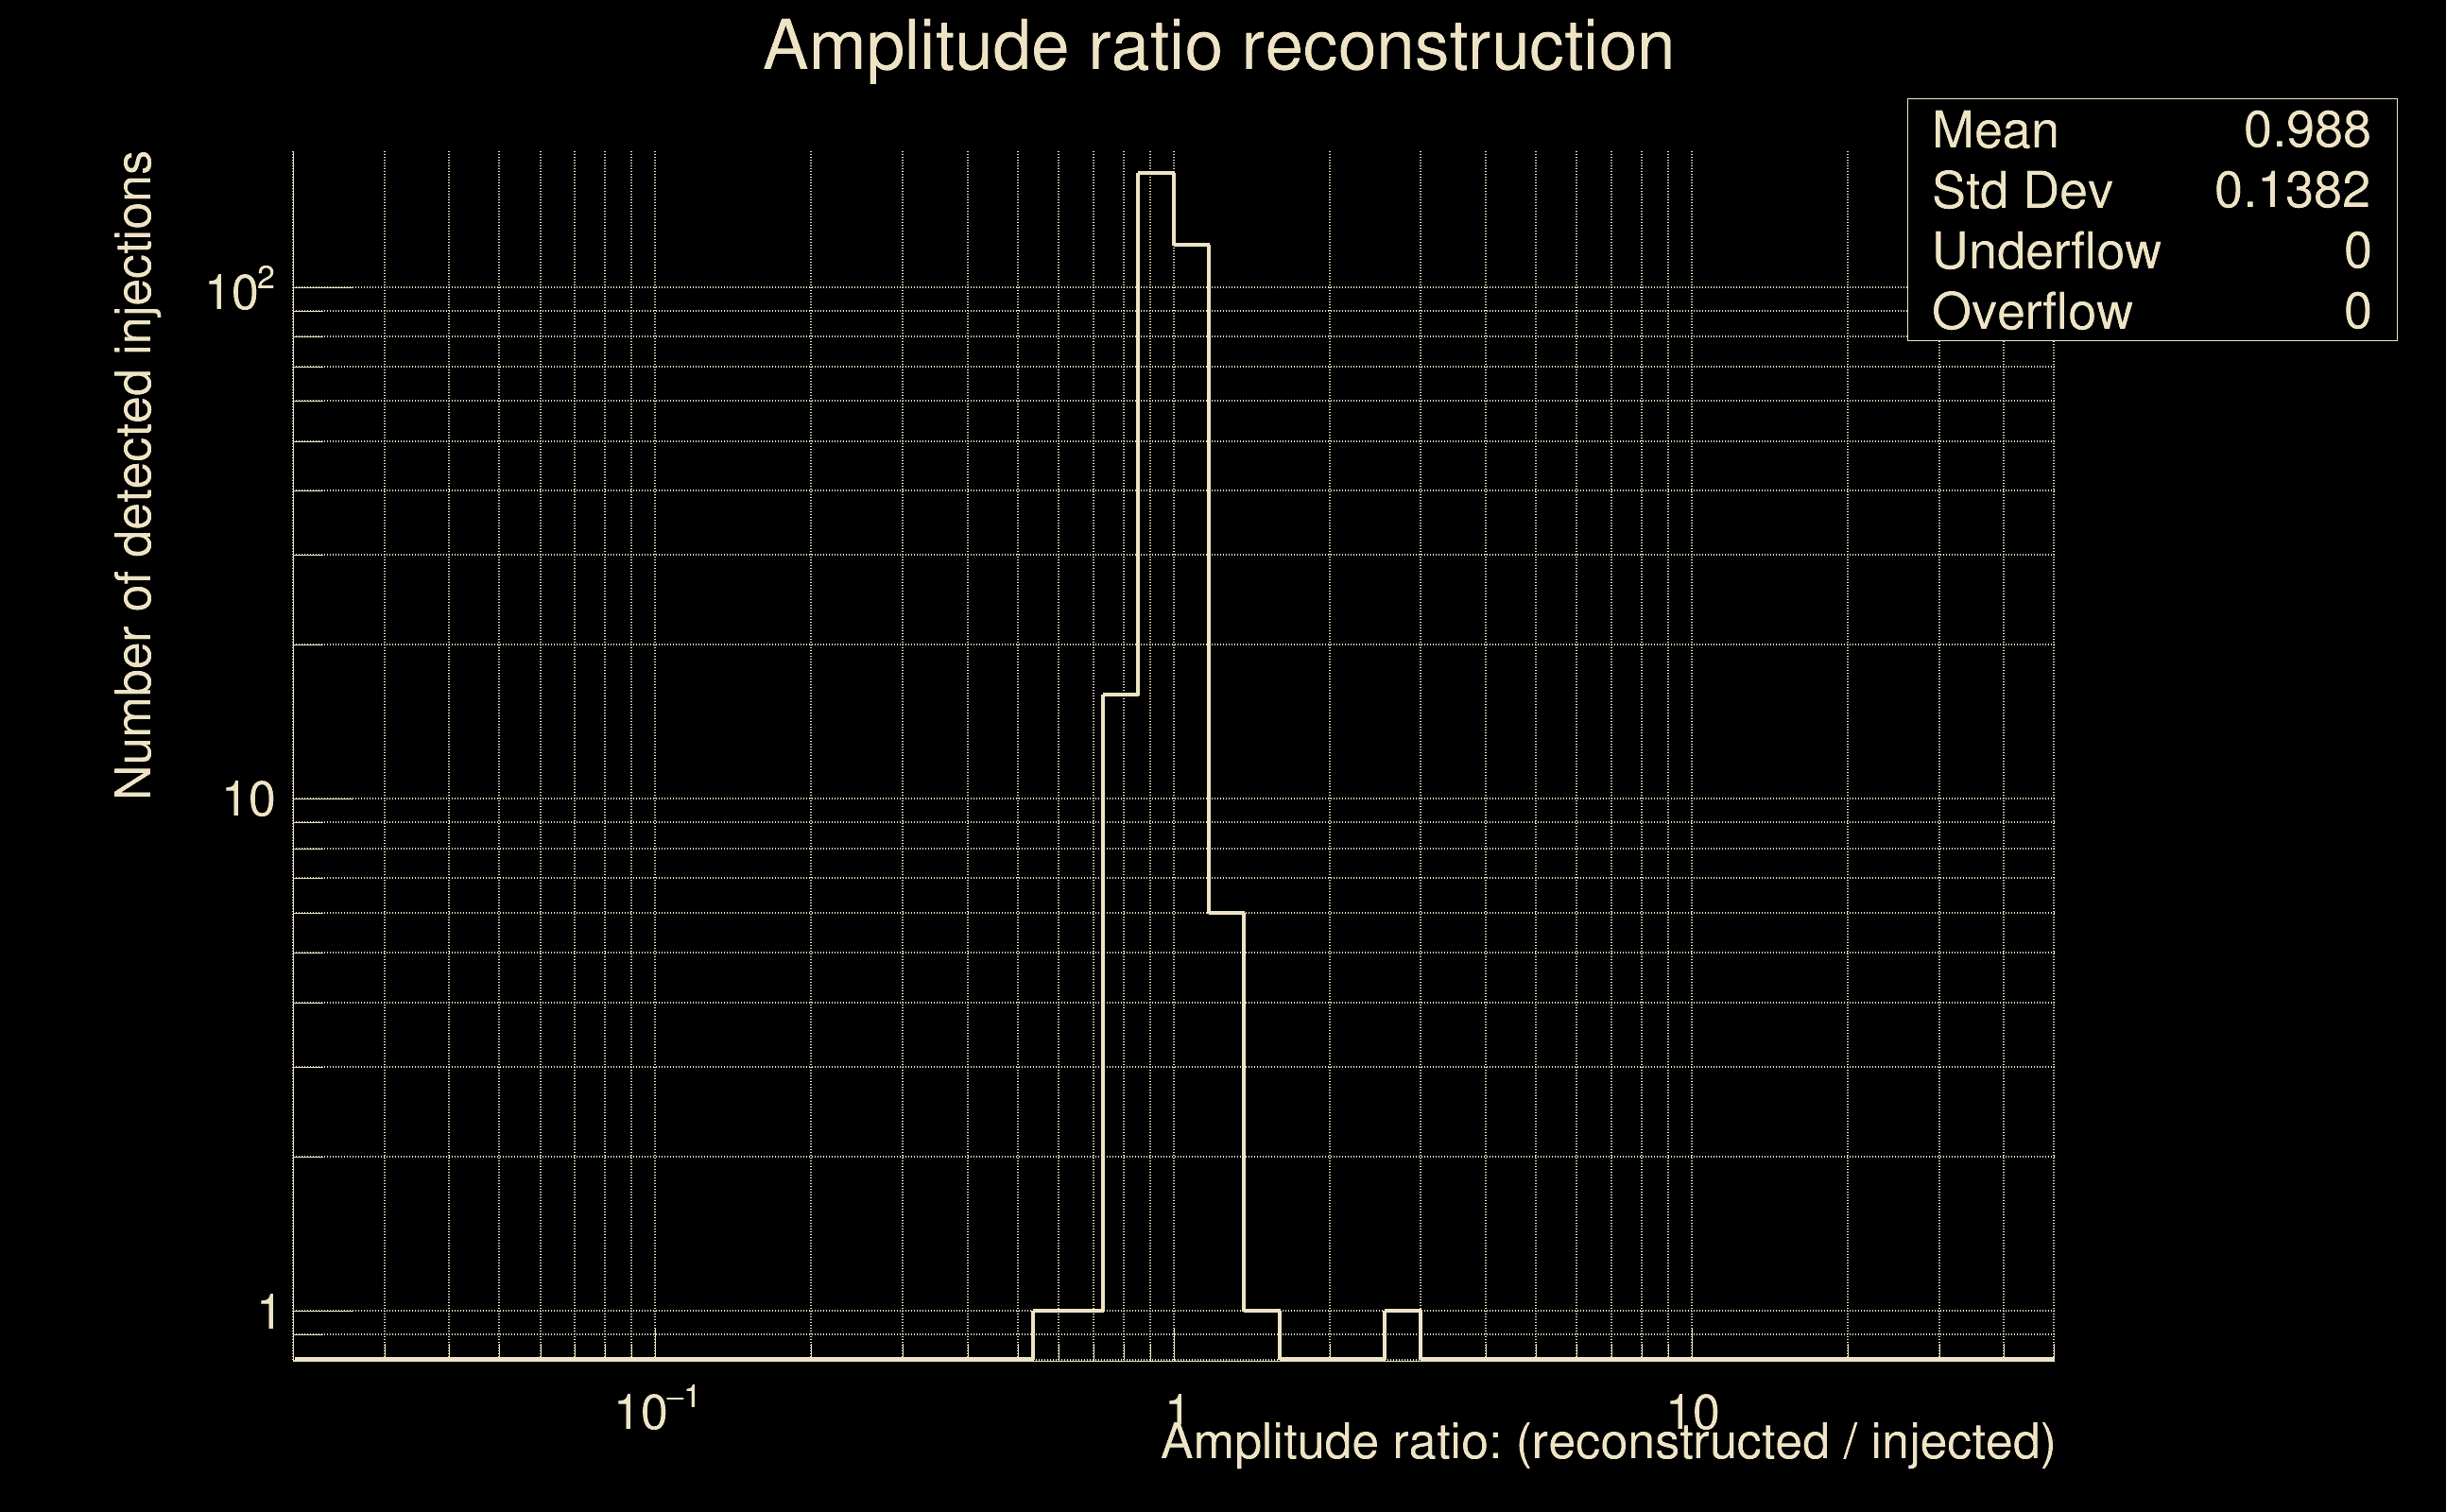
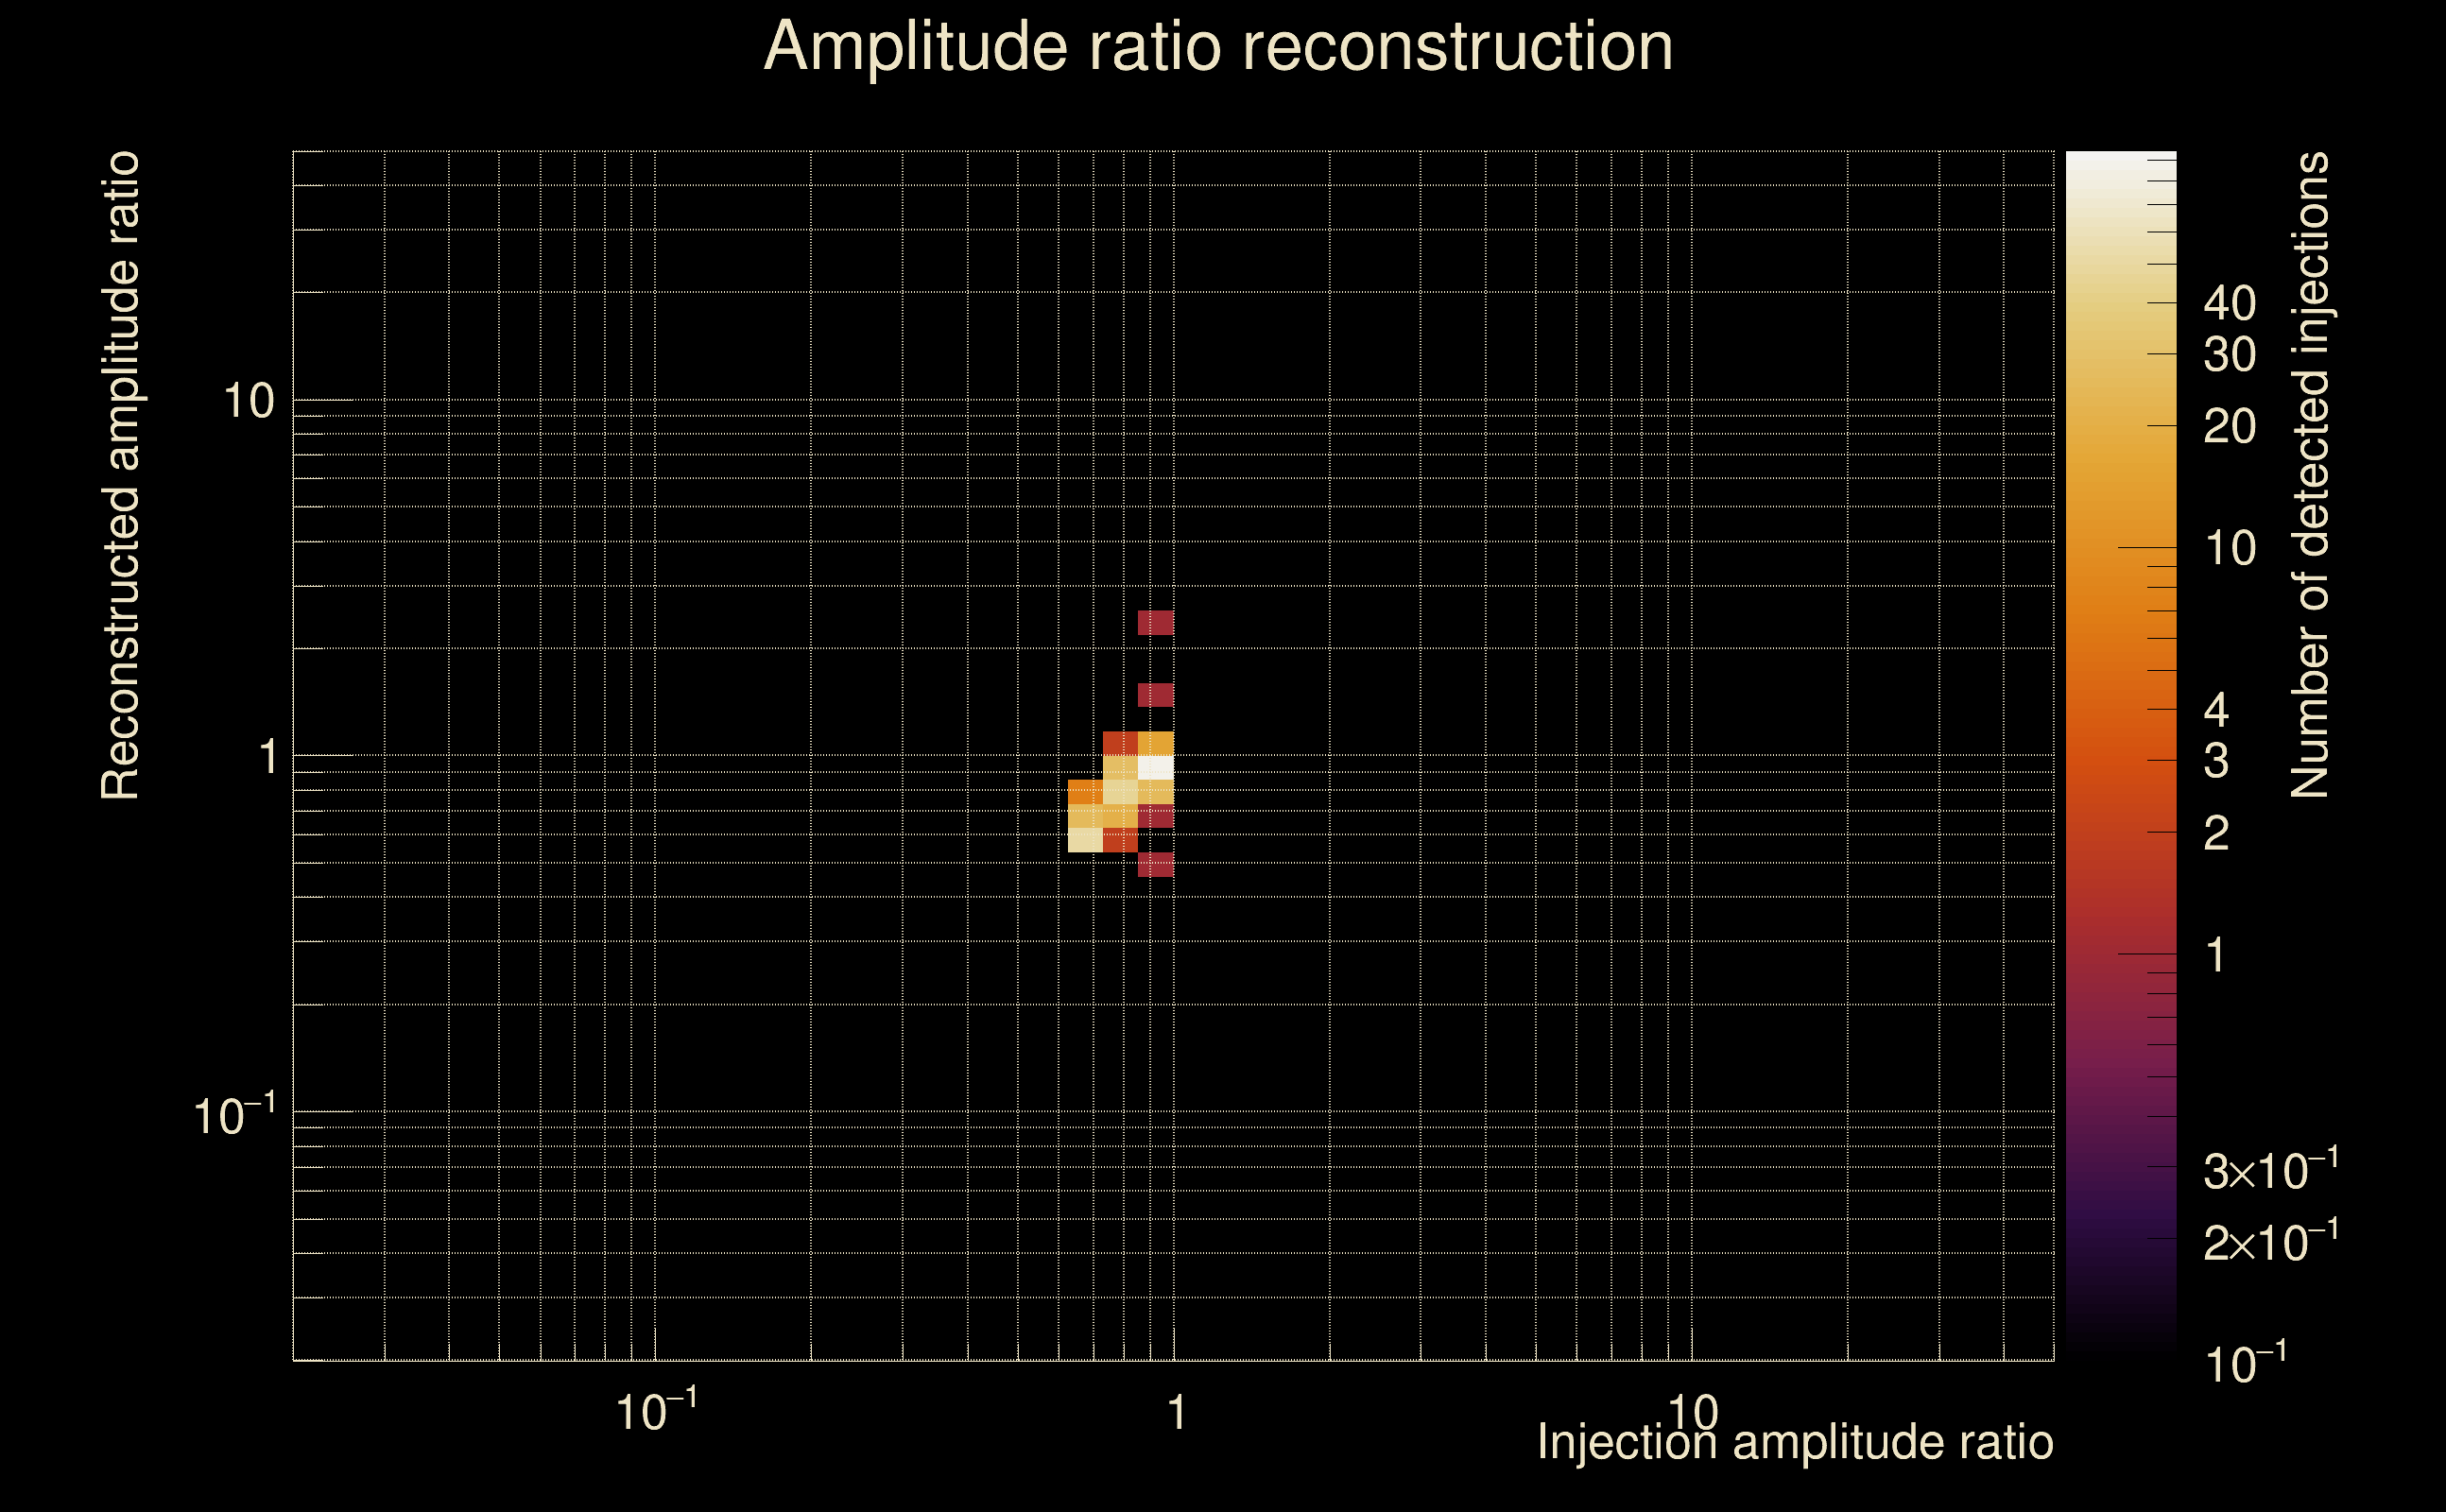
| Number of injections (total/valid/detected): | 1116 / 995 / 314 |
| List of missed injections: | ./Pow19-s18_missed.txt |
| Injection amplitude at 90% detection efficiency: | 7.76695 |
| Injection amplitude at 50% detection efficiency: | 5.58527 |
| Injection amplitude at 10% detection efficiency: | 3.54811 |
 |
 |
 |
 |
 |
 |
 |
|
 |
 |
|
 |
 |
|
 |
 |
|
 |
 |
|
 |
 |
|
 |
 |
|
 |
 |
|
 |
 |
 |
 |
 |
 |
 |
 |
 |
 |
 |
 |
 |
 |
 |
| florent.robinet@ijclab.in2p3.fr |