| Omicron version: | 4.2.0: documentation gitlab repository |
| Omicron run by: | unknown |
| Report produced on: | Wed Dec 17 09:48:14 2025 UTC |
| Ox option file: | TargIxfw_injpt1_options.txt |
| Omicron option files: | detector 0, detector 1 |
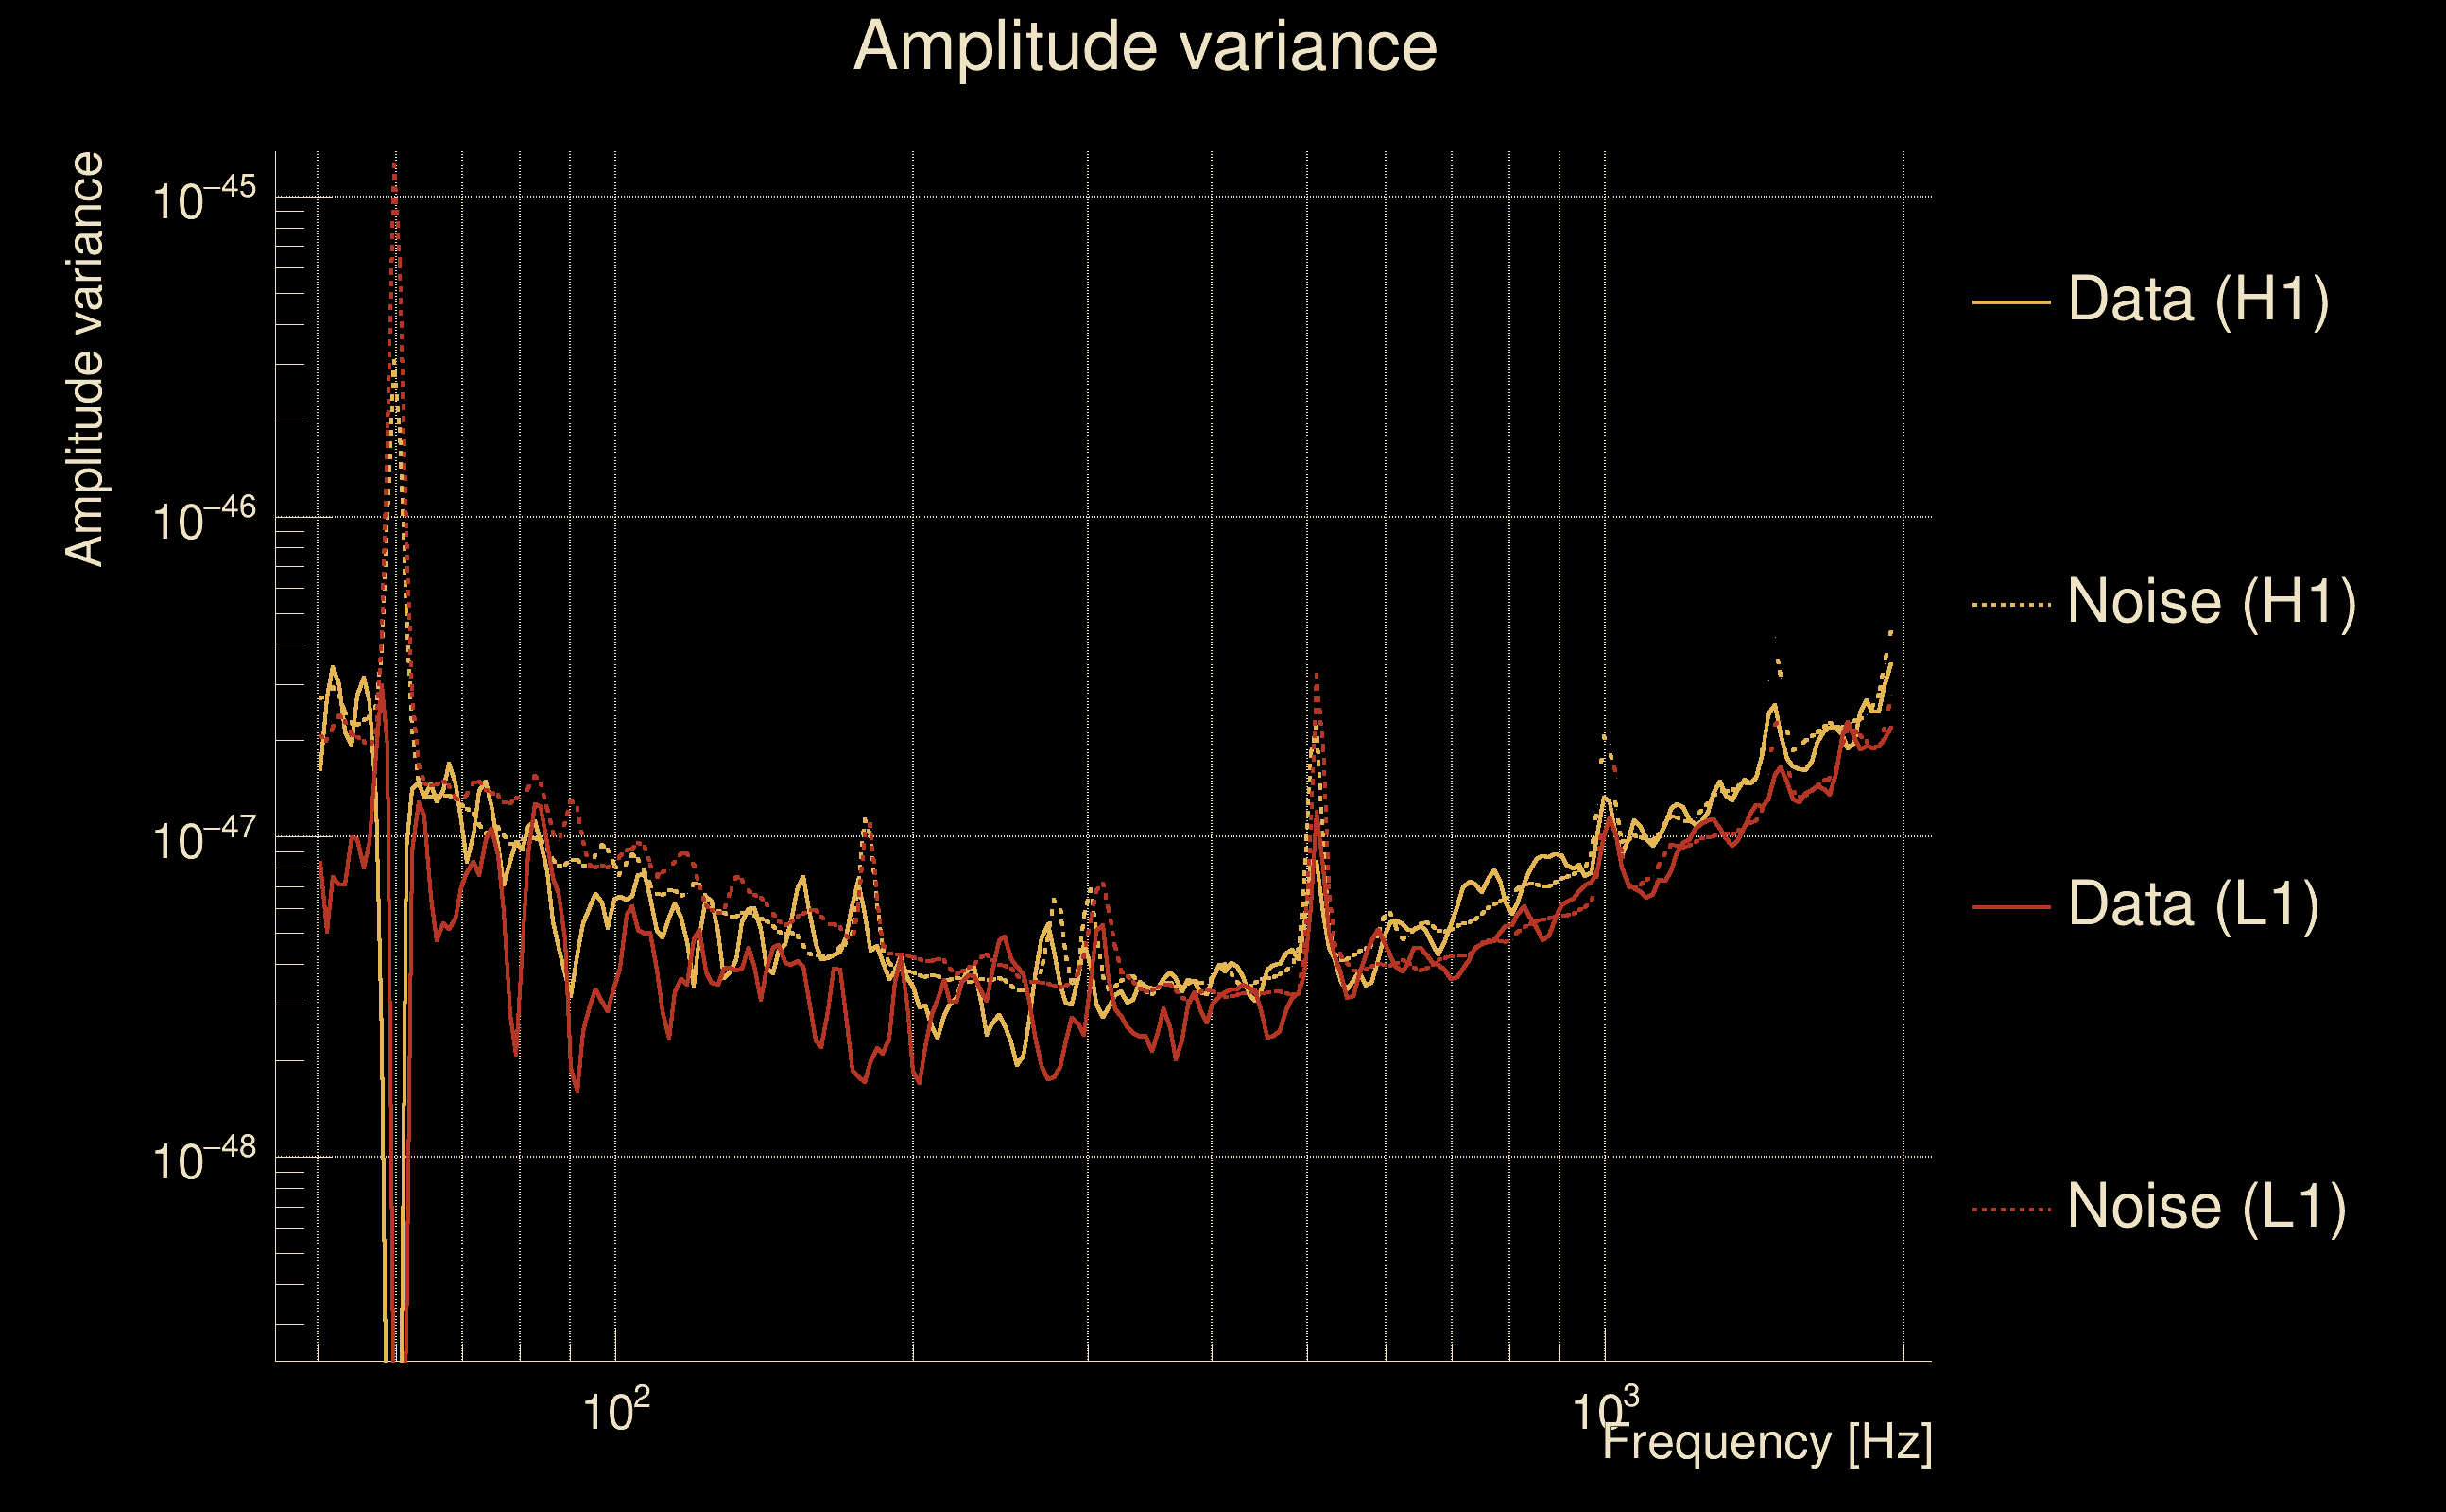
| Detector channel names: | H1:GDS-CALIB_STRAIN_CLEAN_AR_4096Hz, L1:GDS-CALIB_STRAIN_CLEAN_AR_4096Hz |
| Omicron analysis time window and overlap: | 16 s, 6 s |
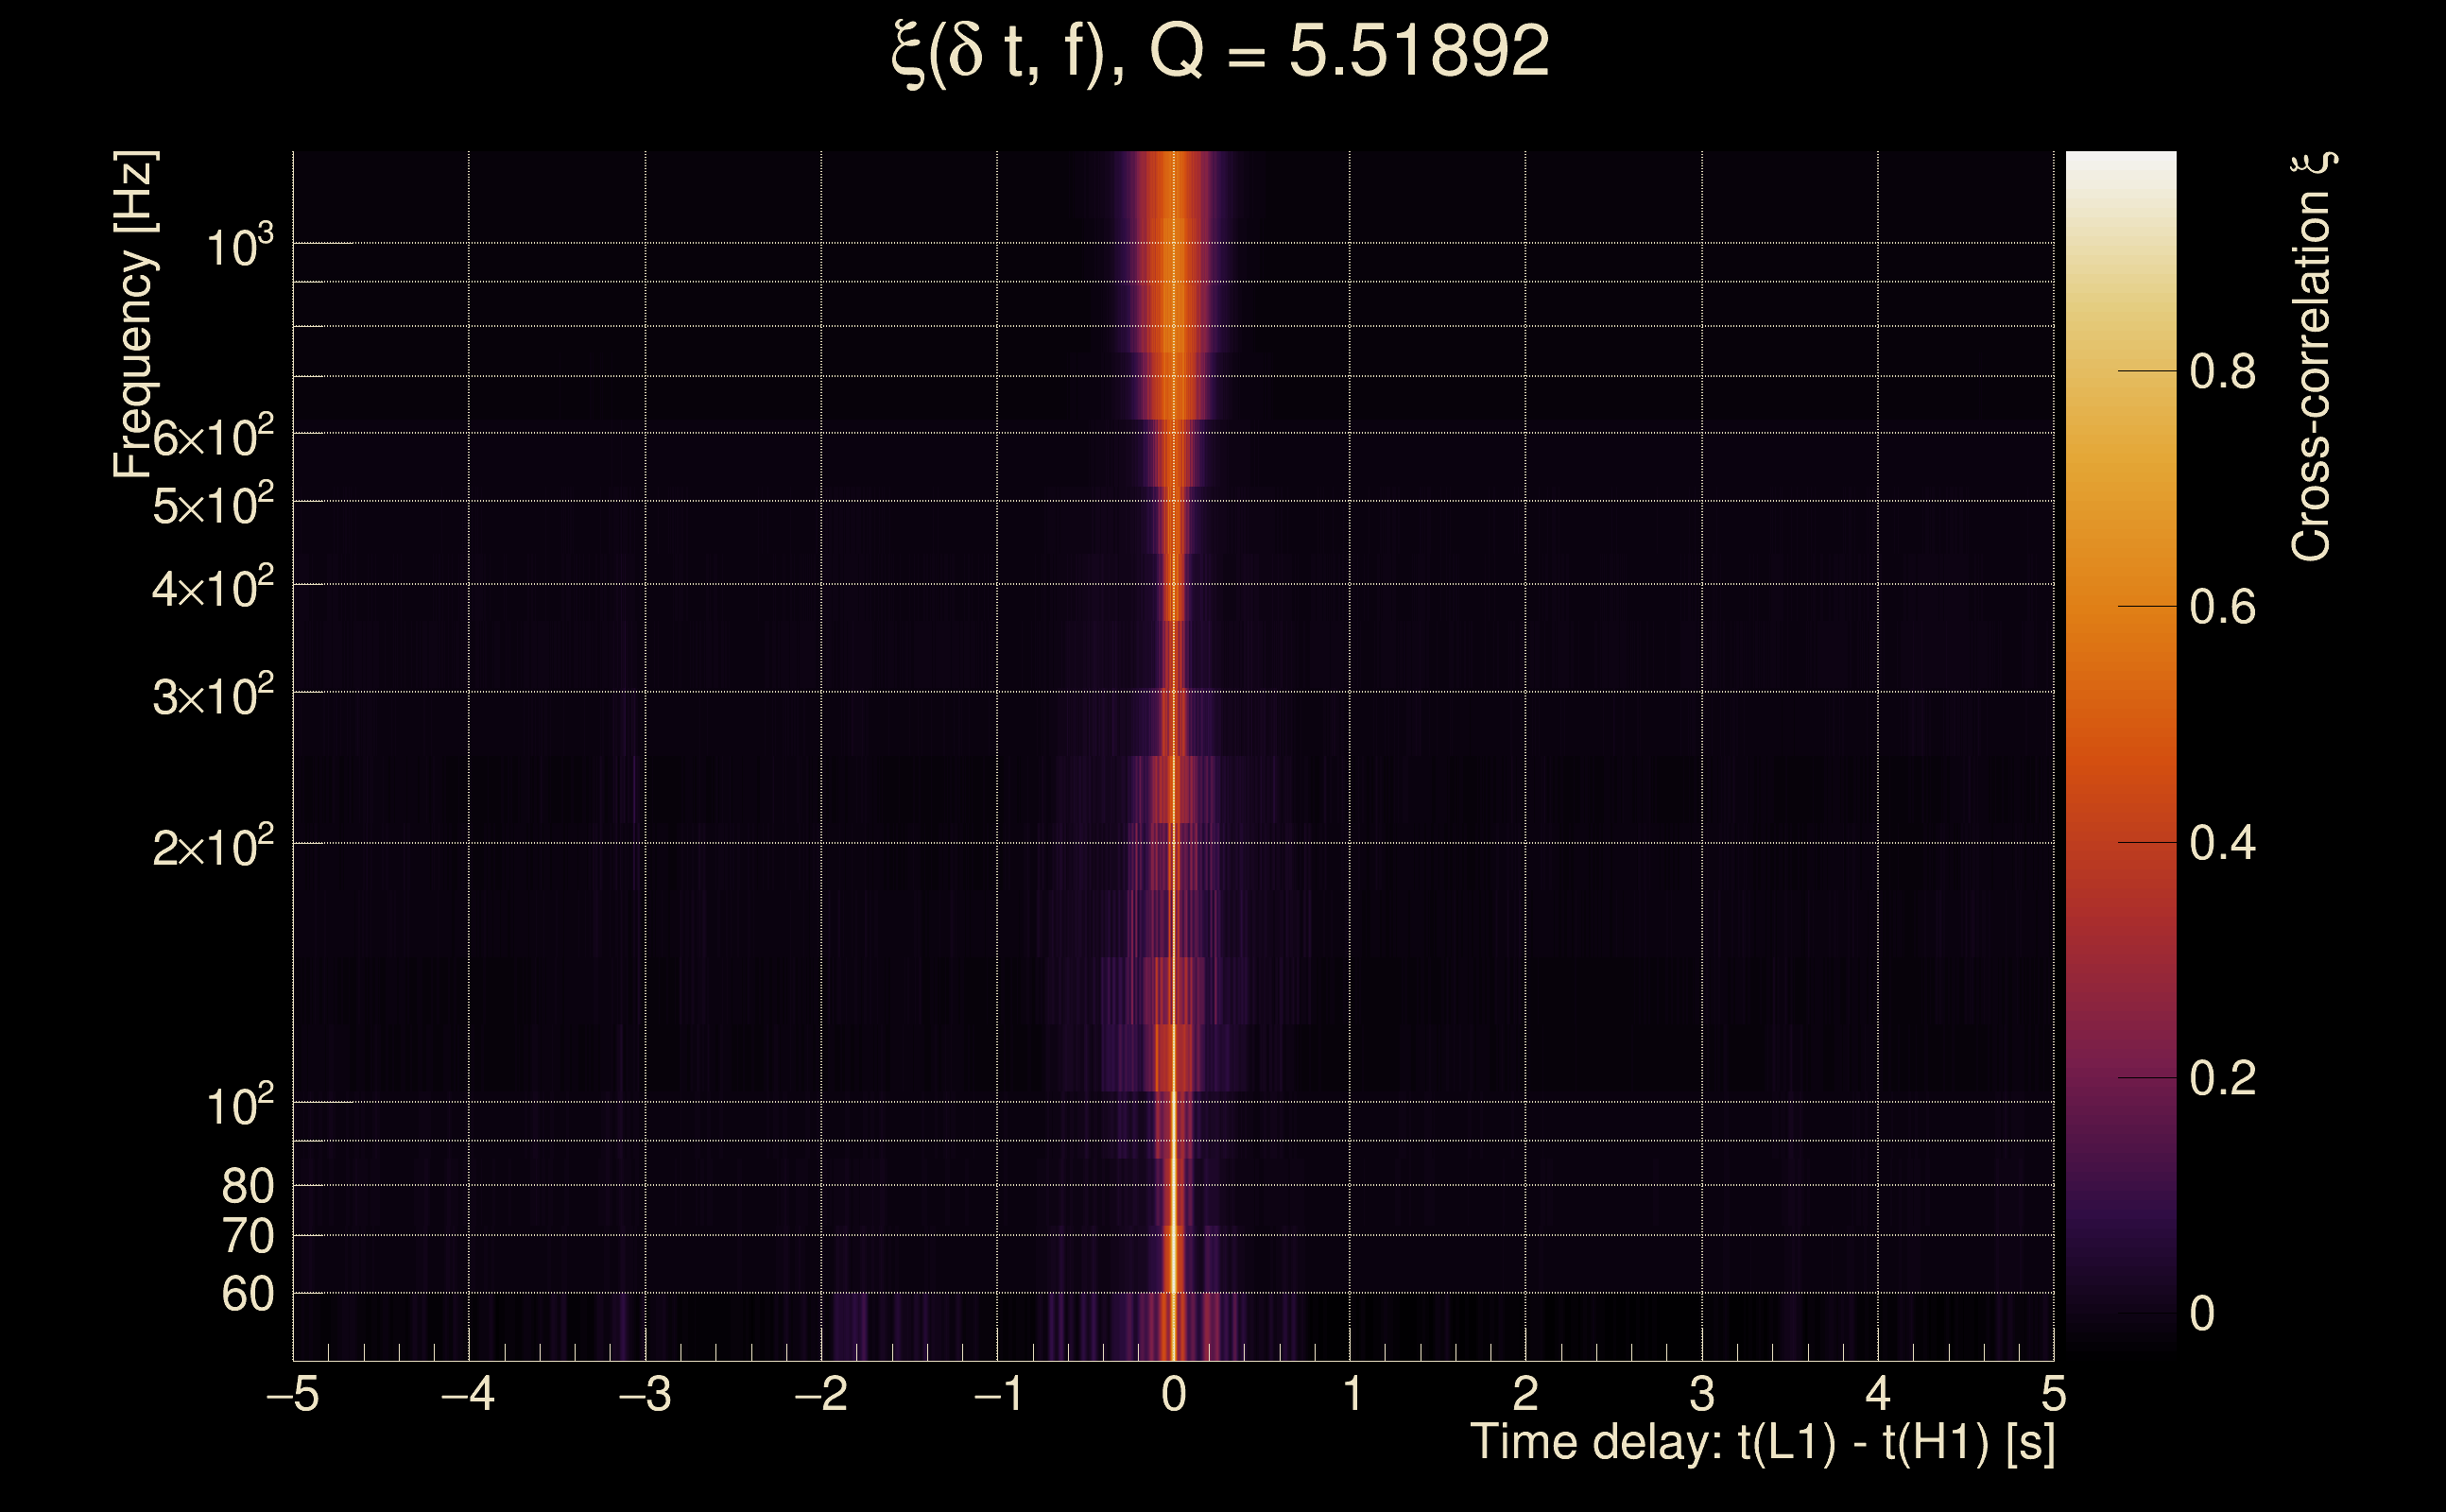
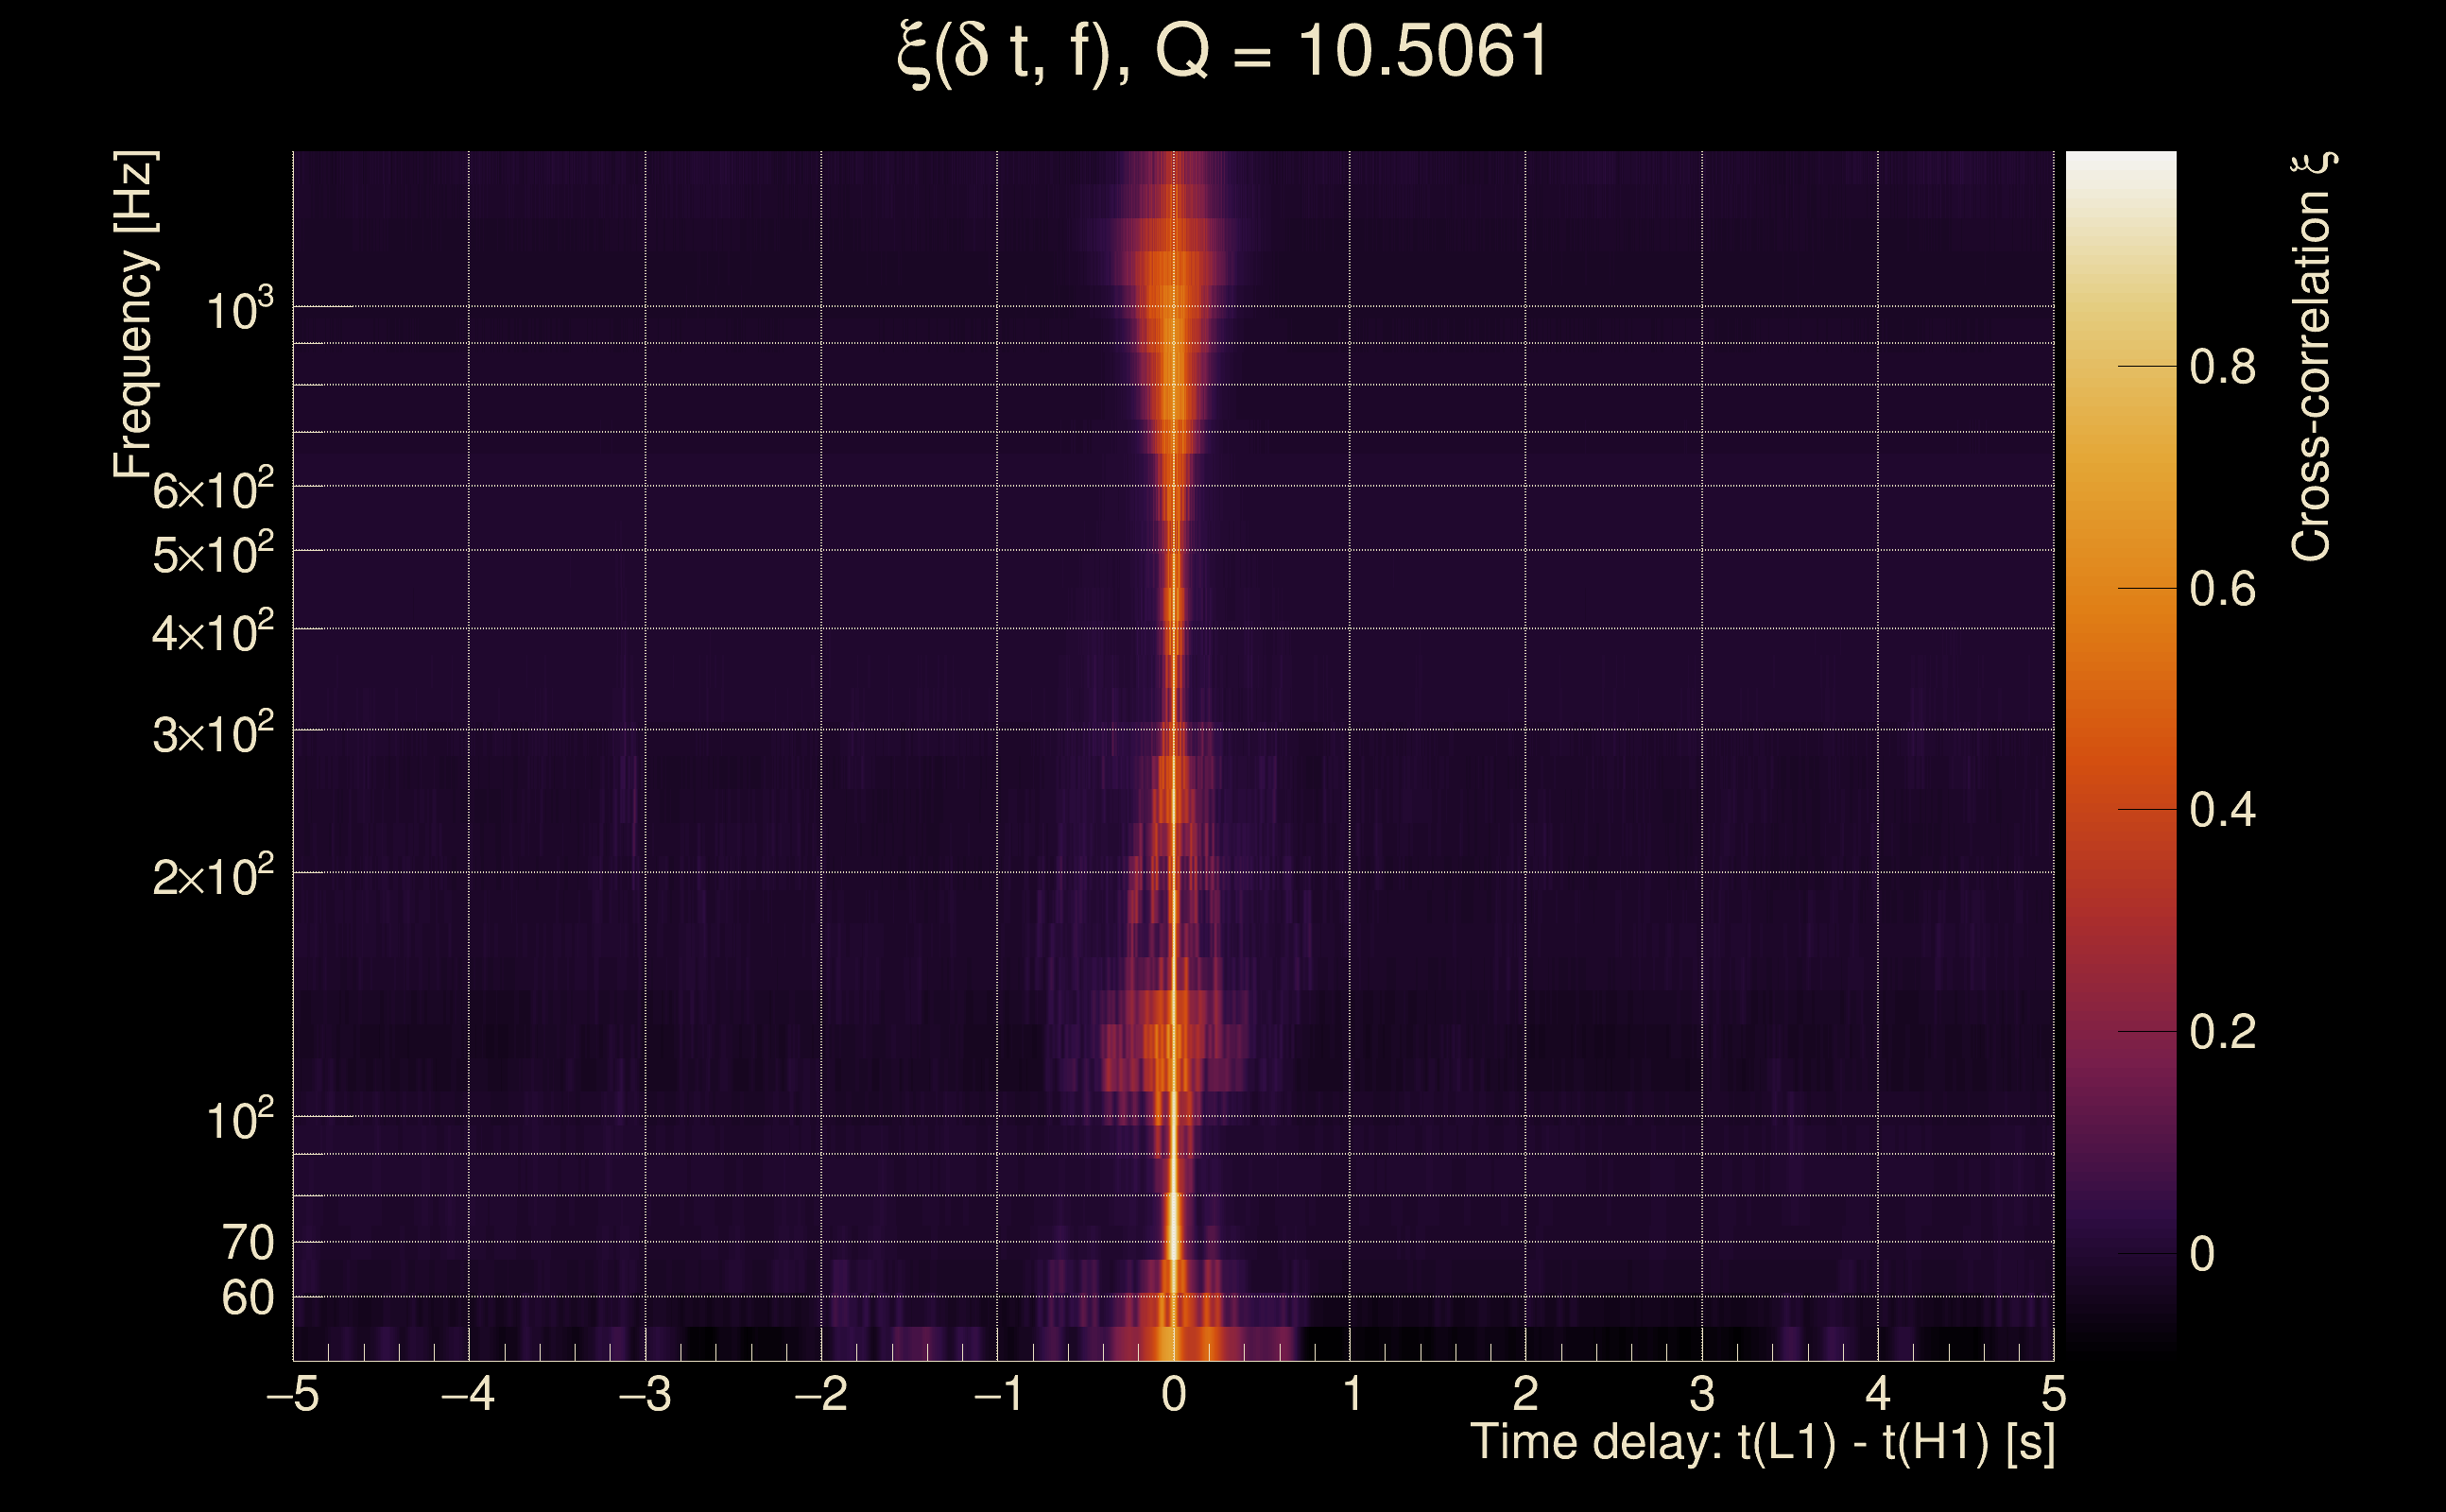
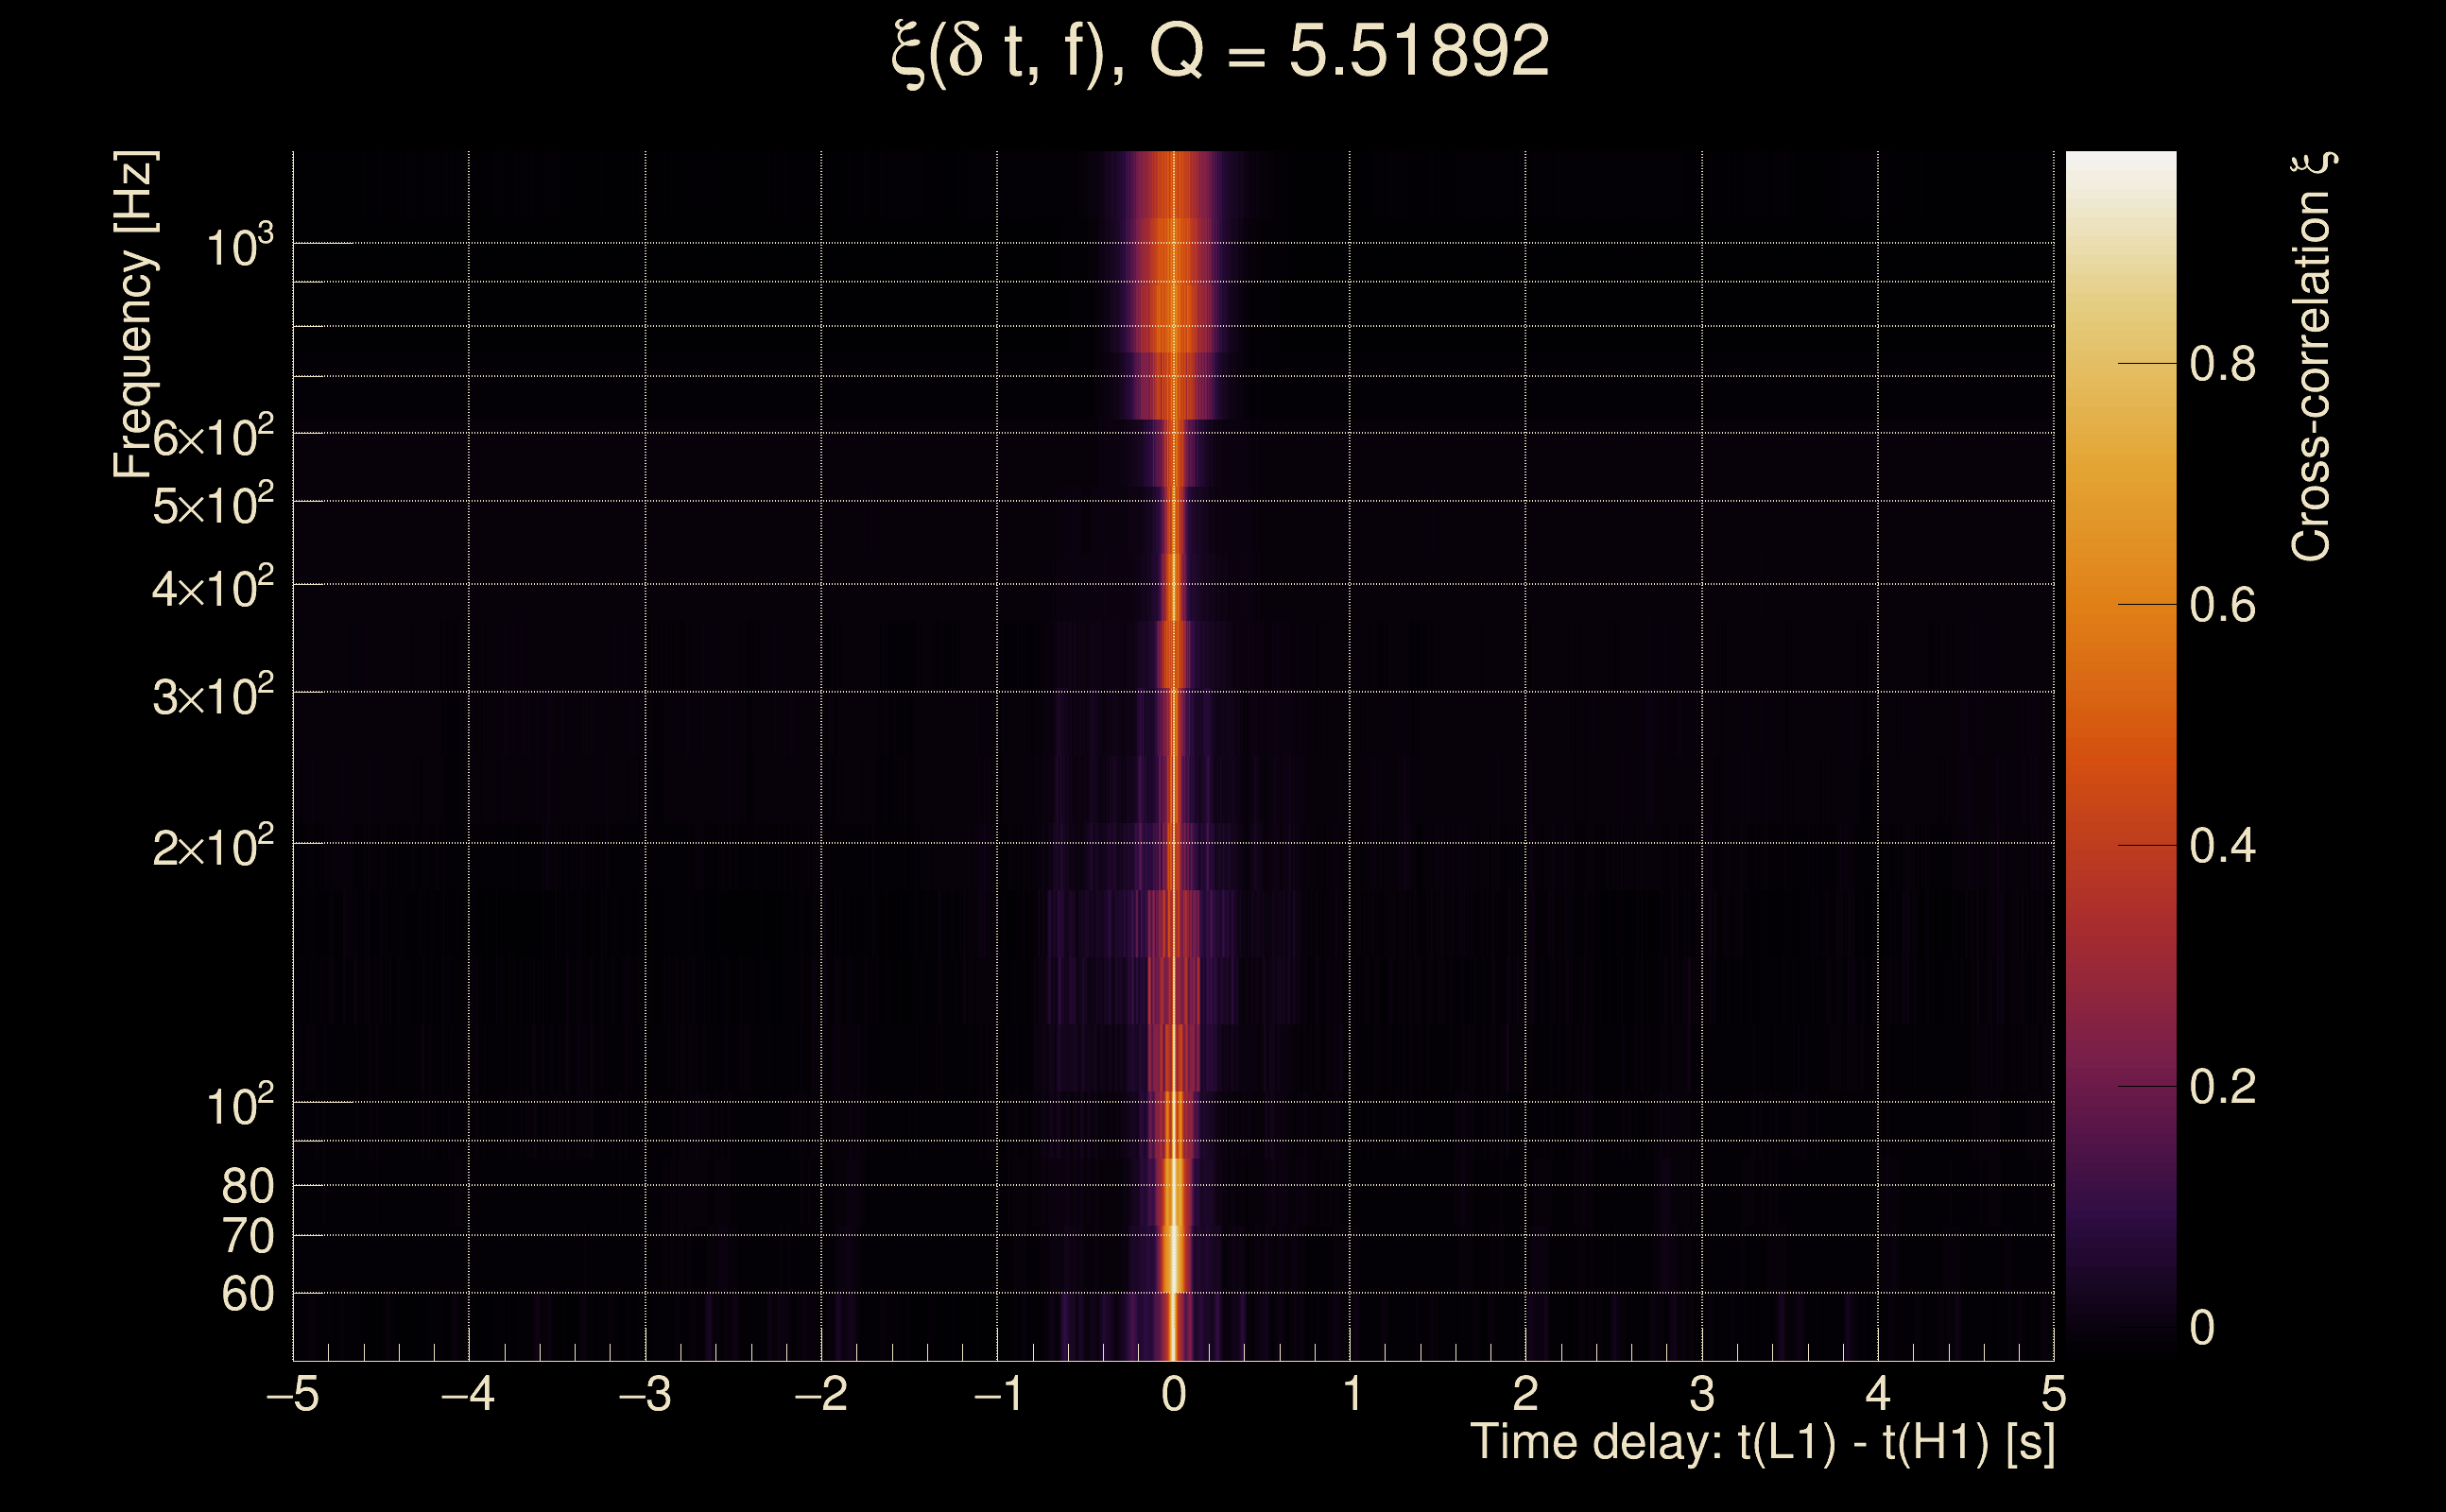
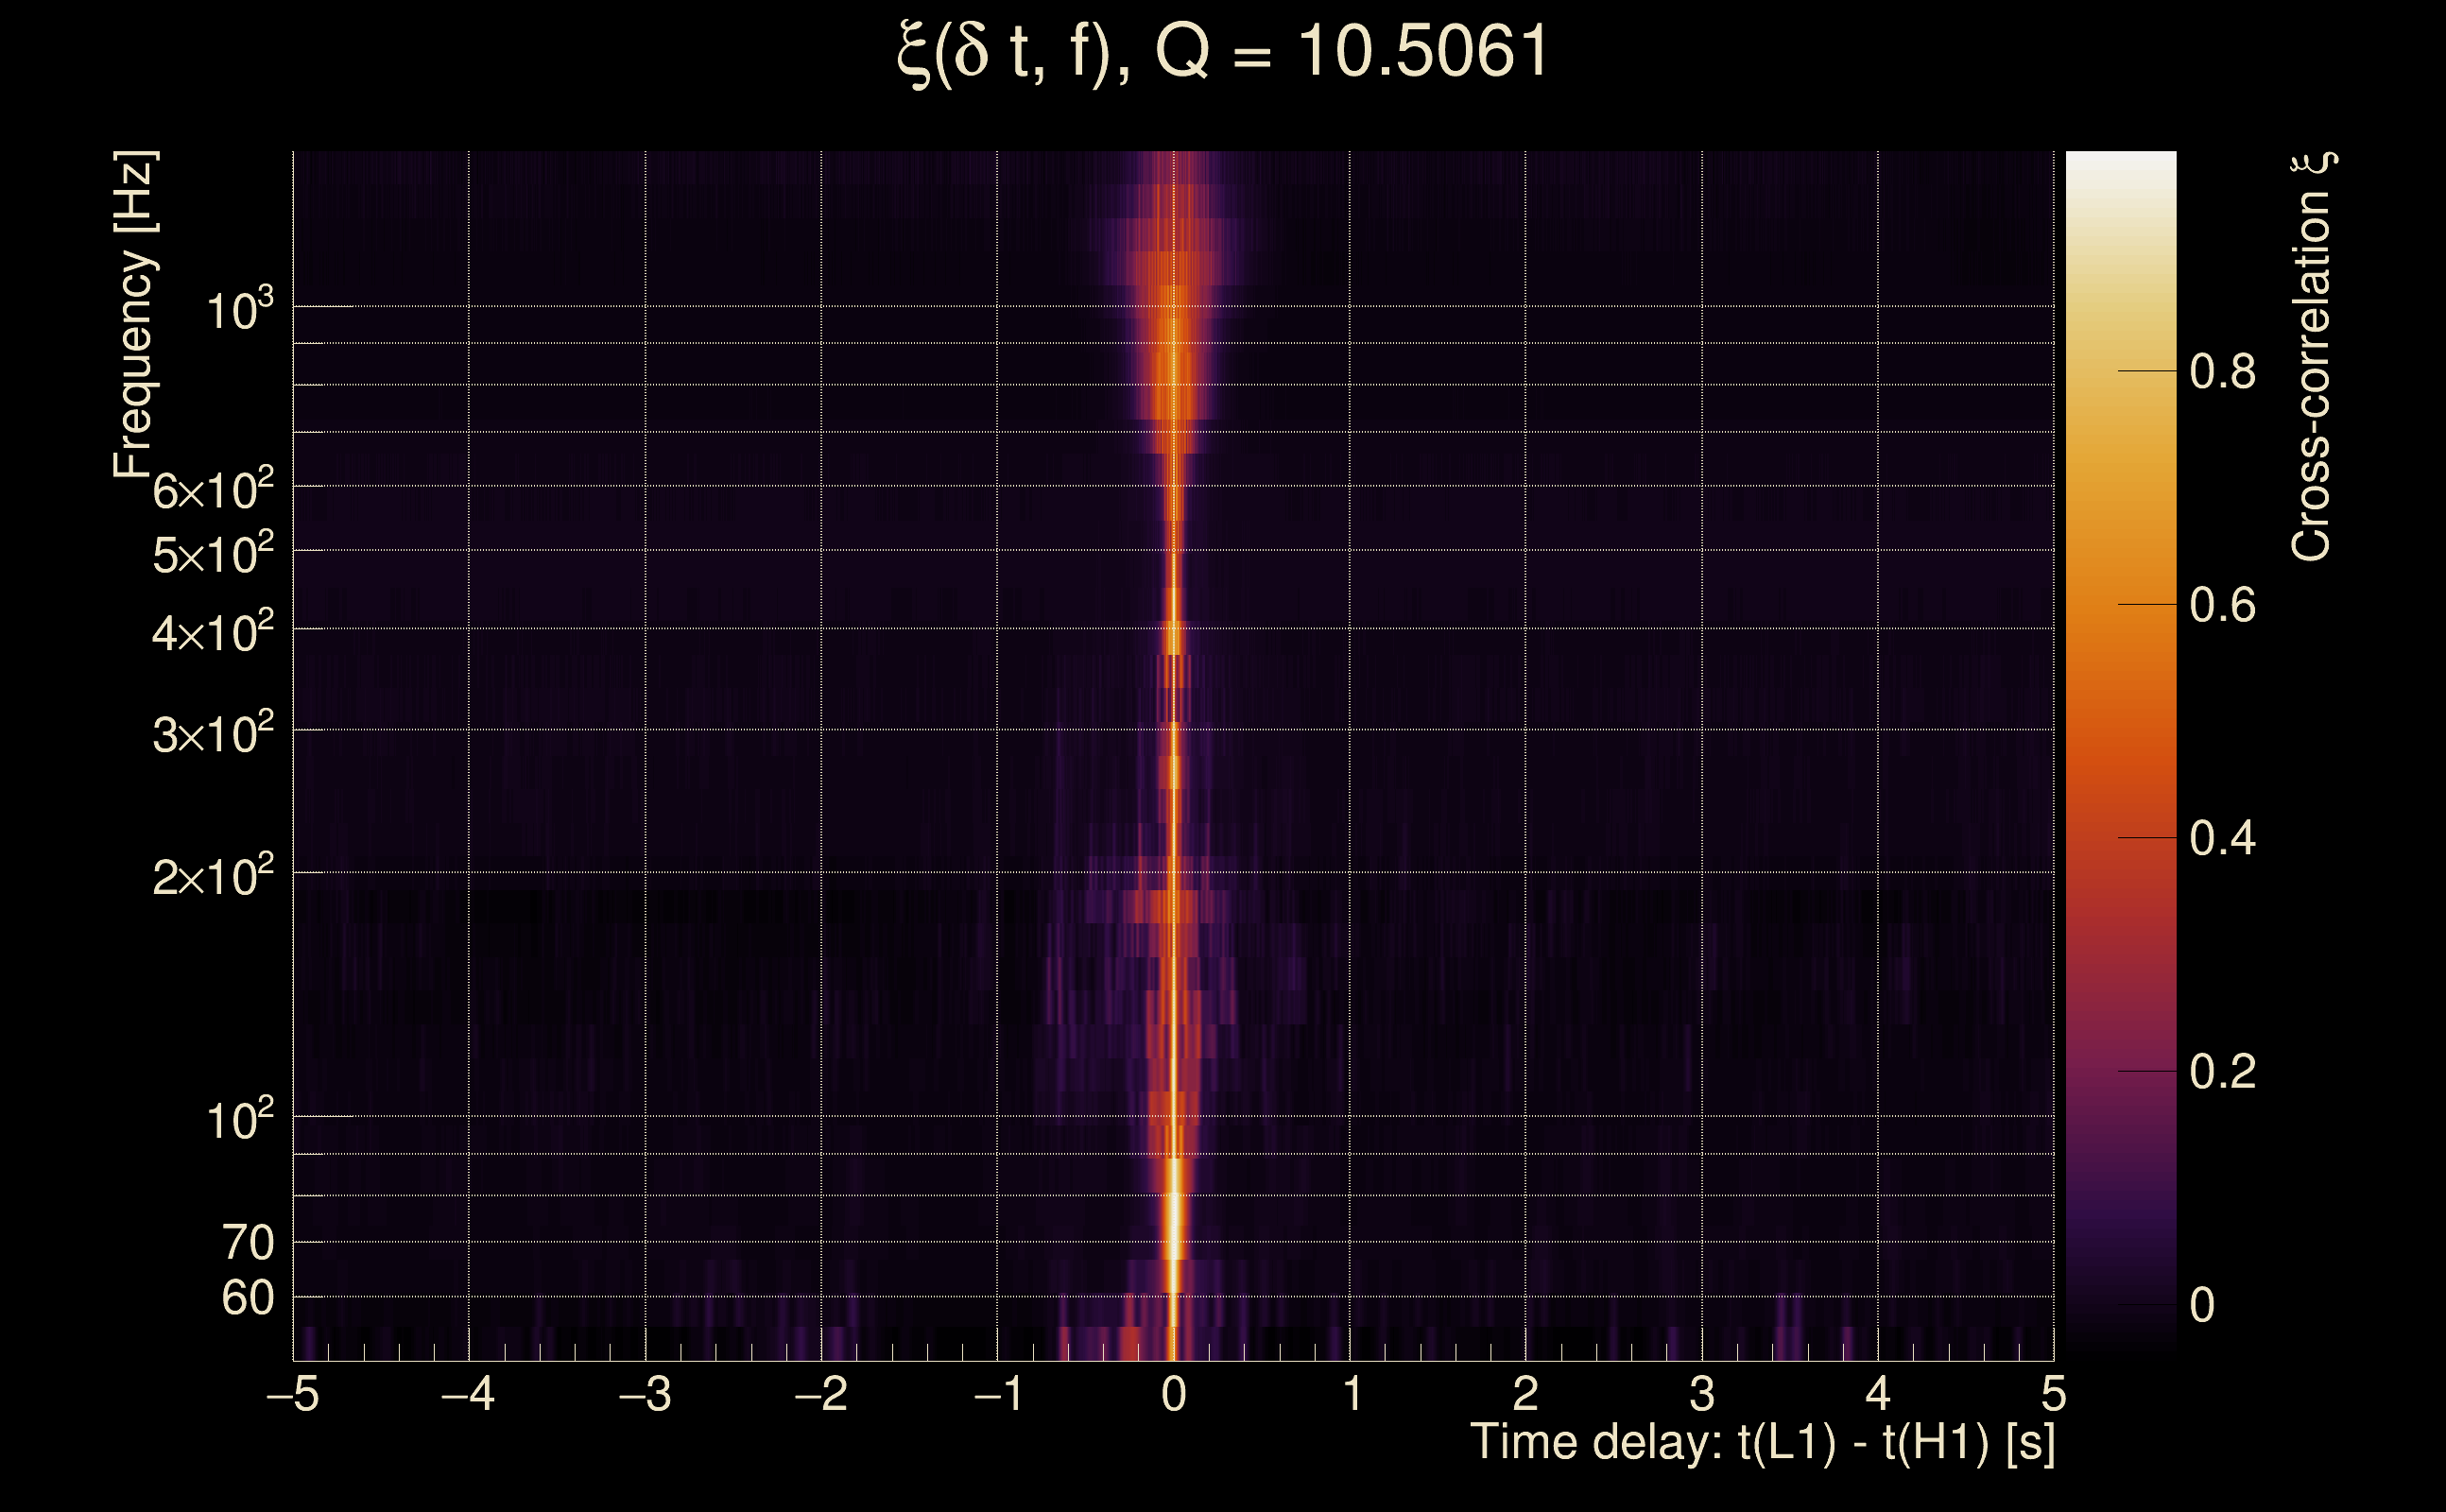
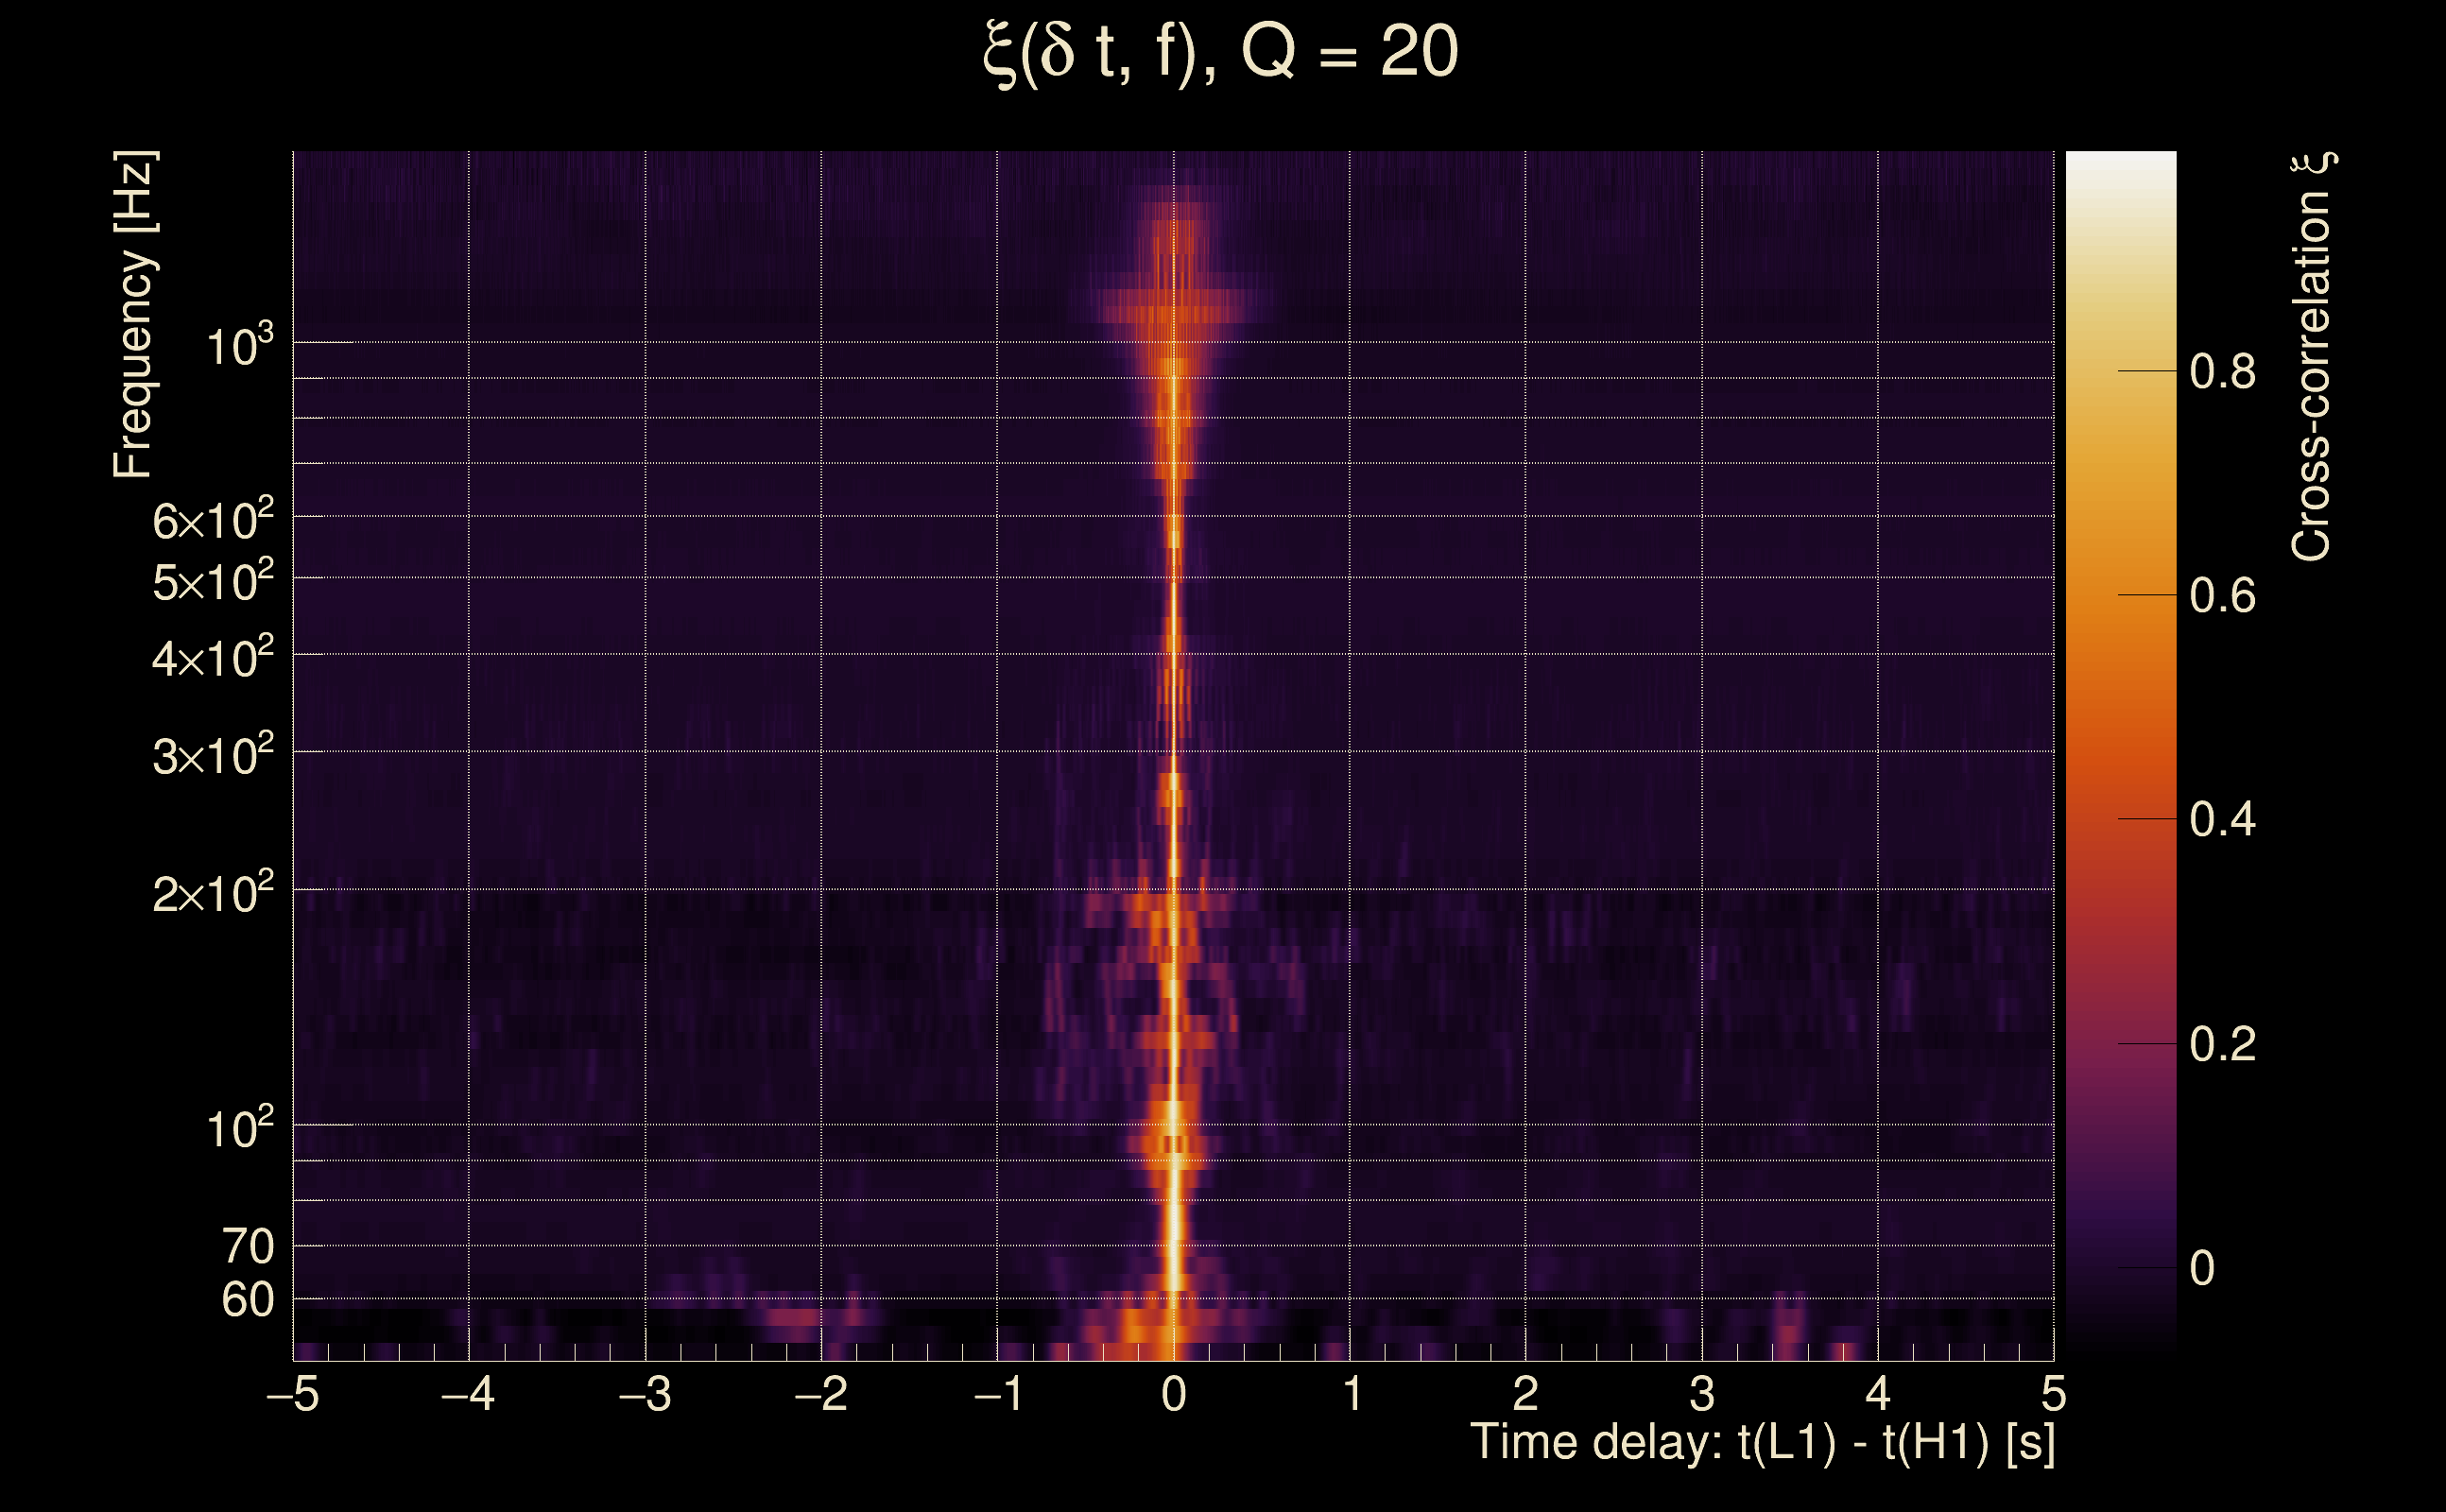
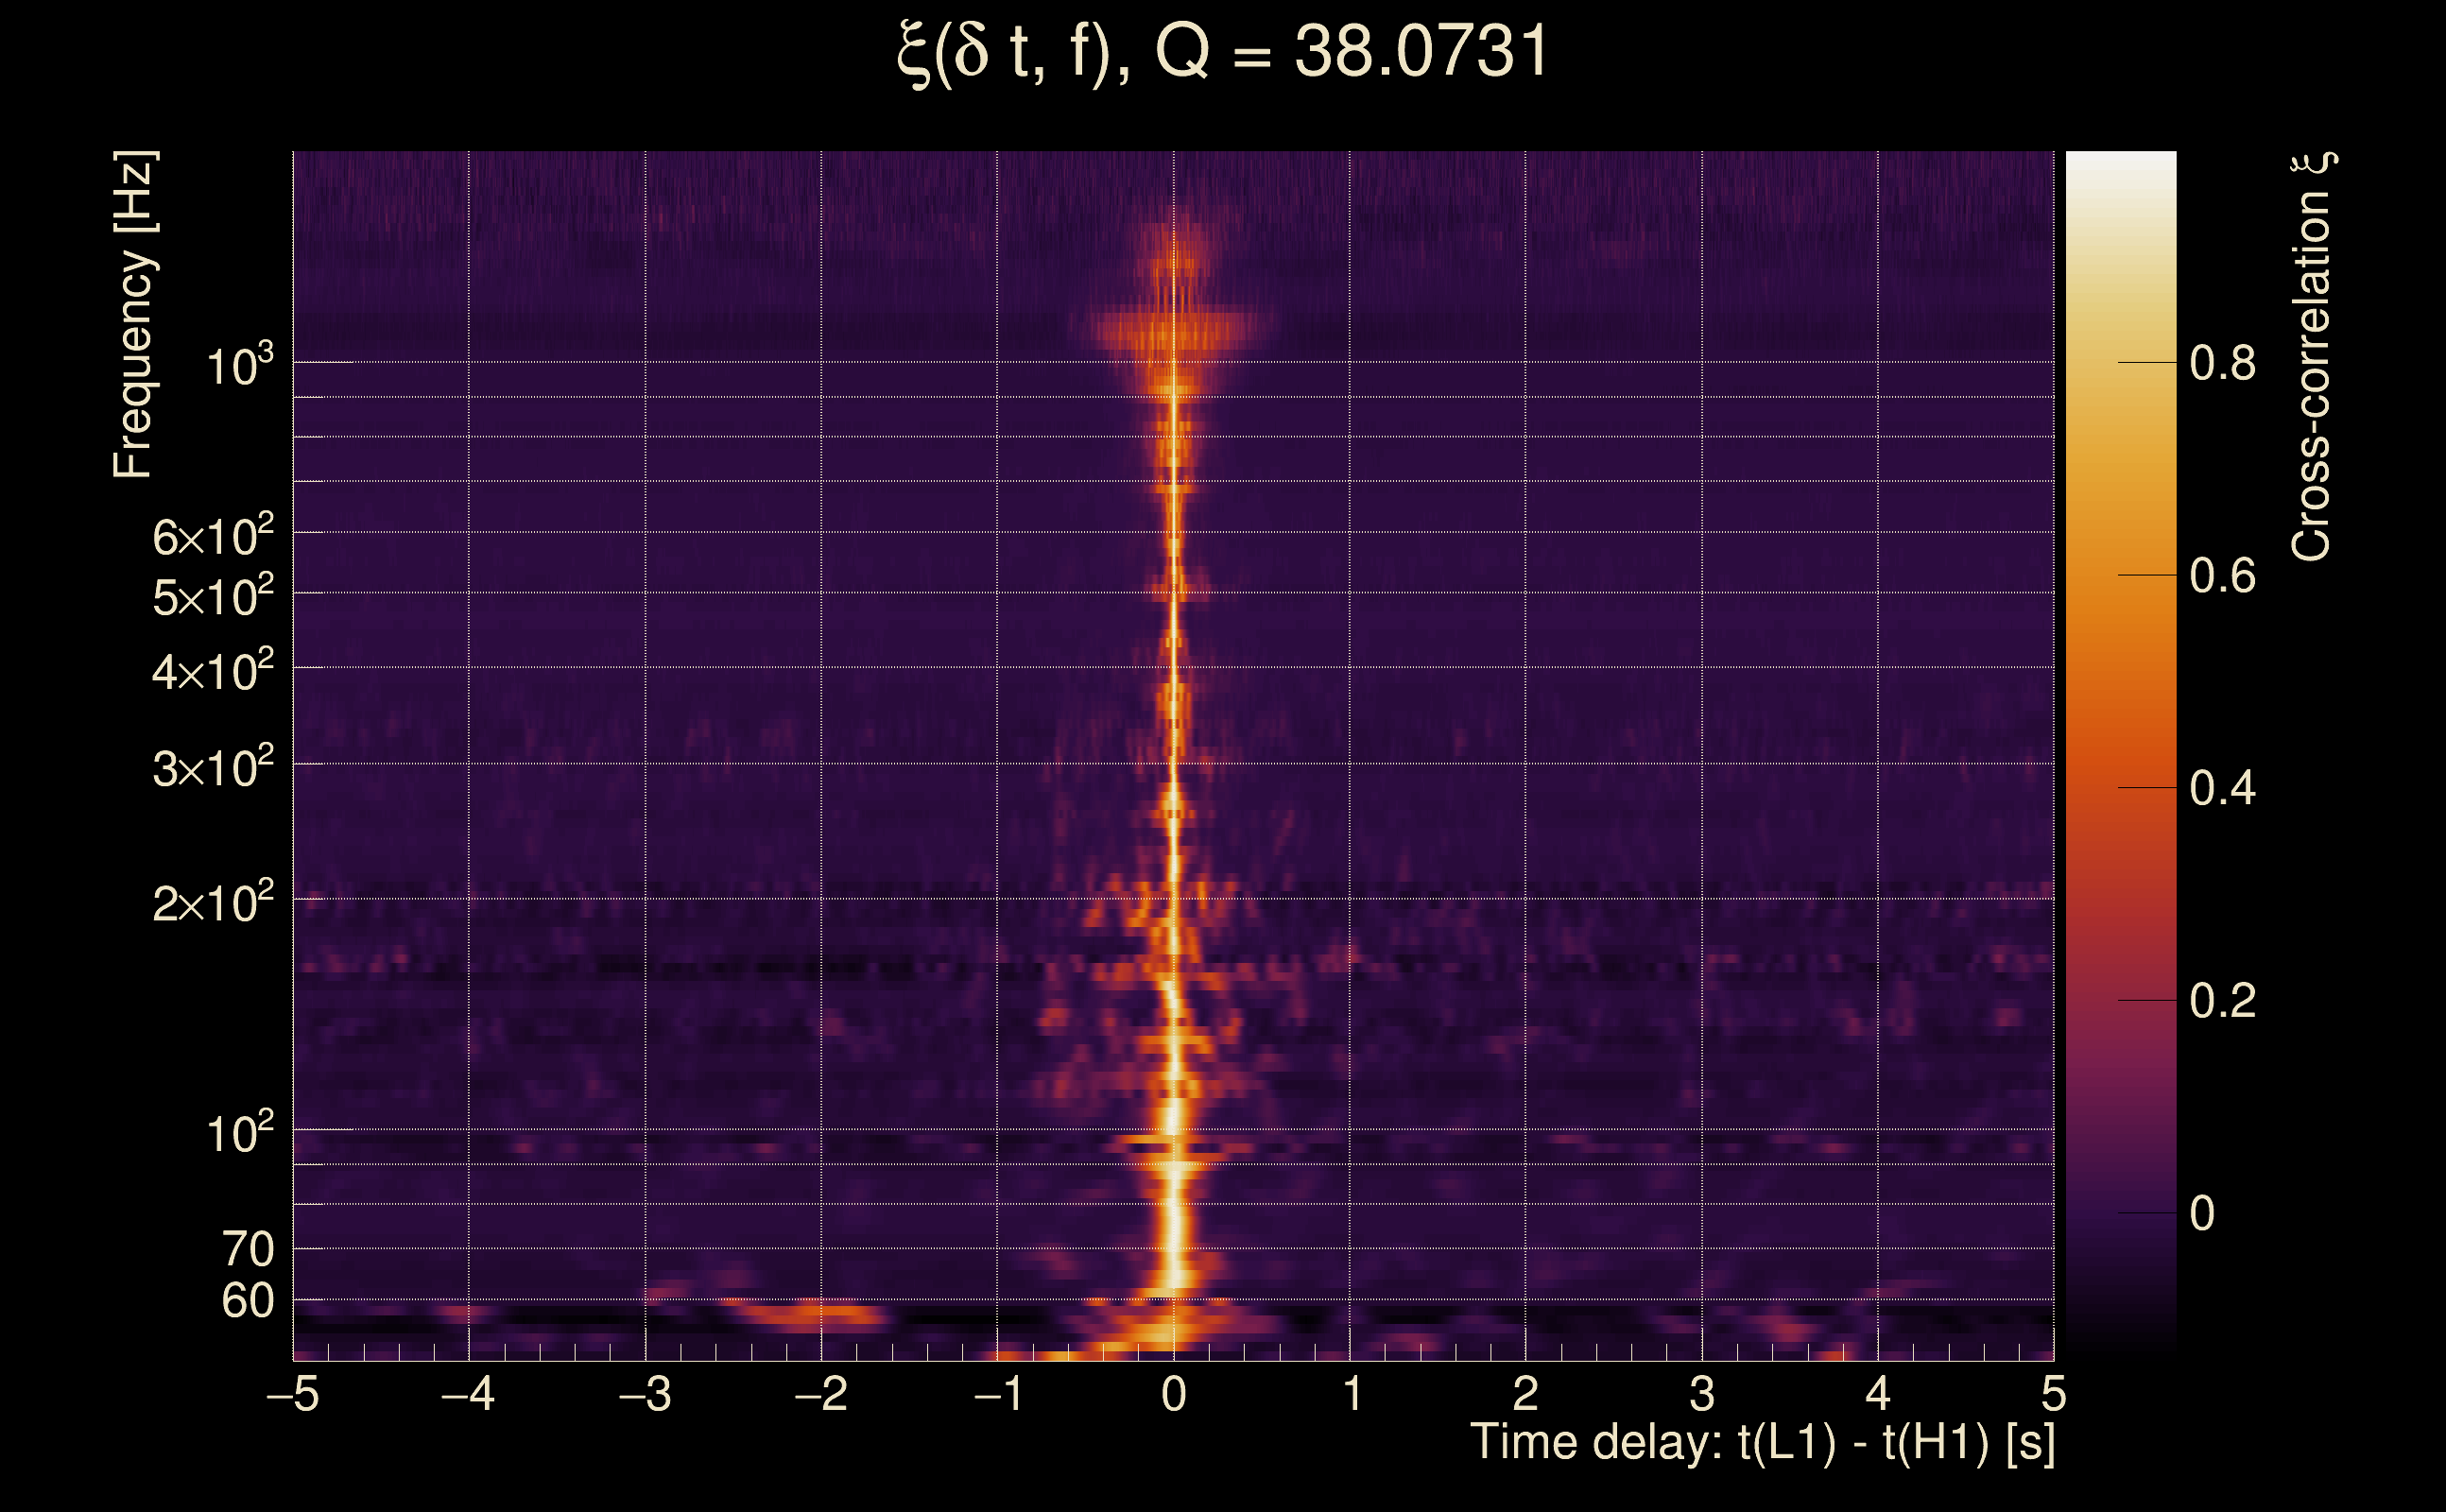
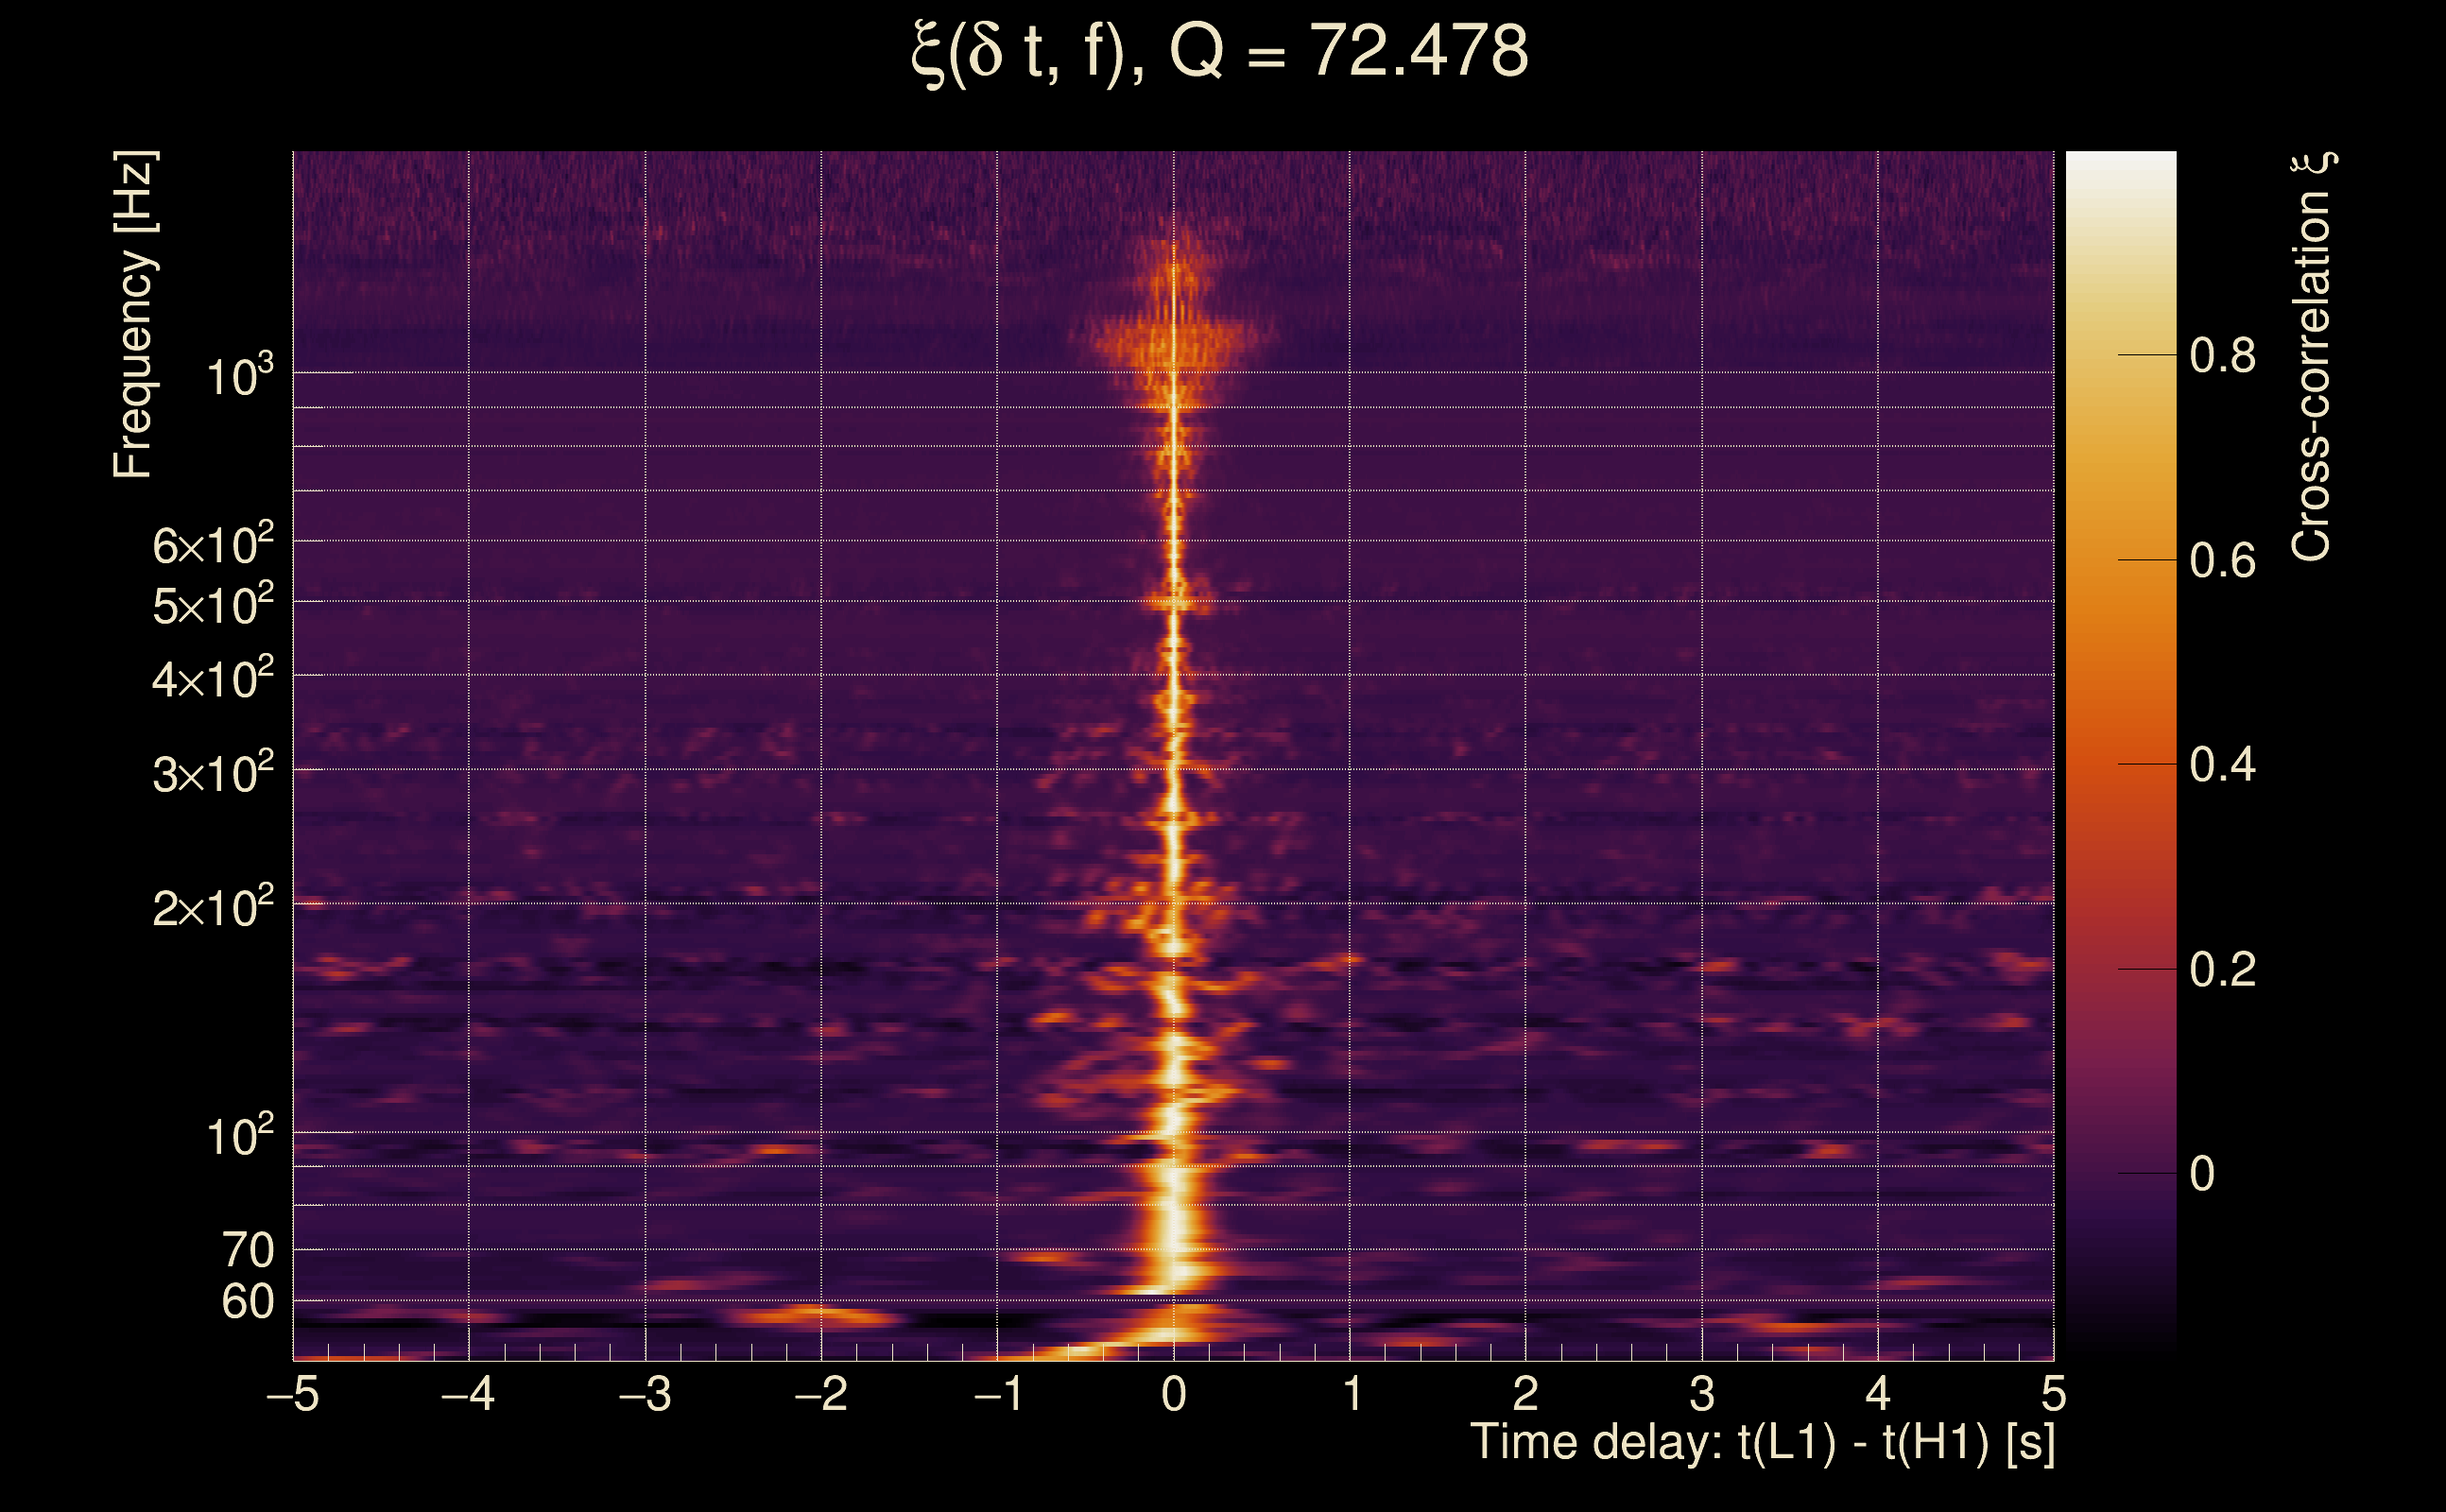
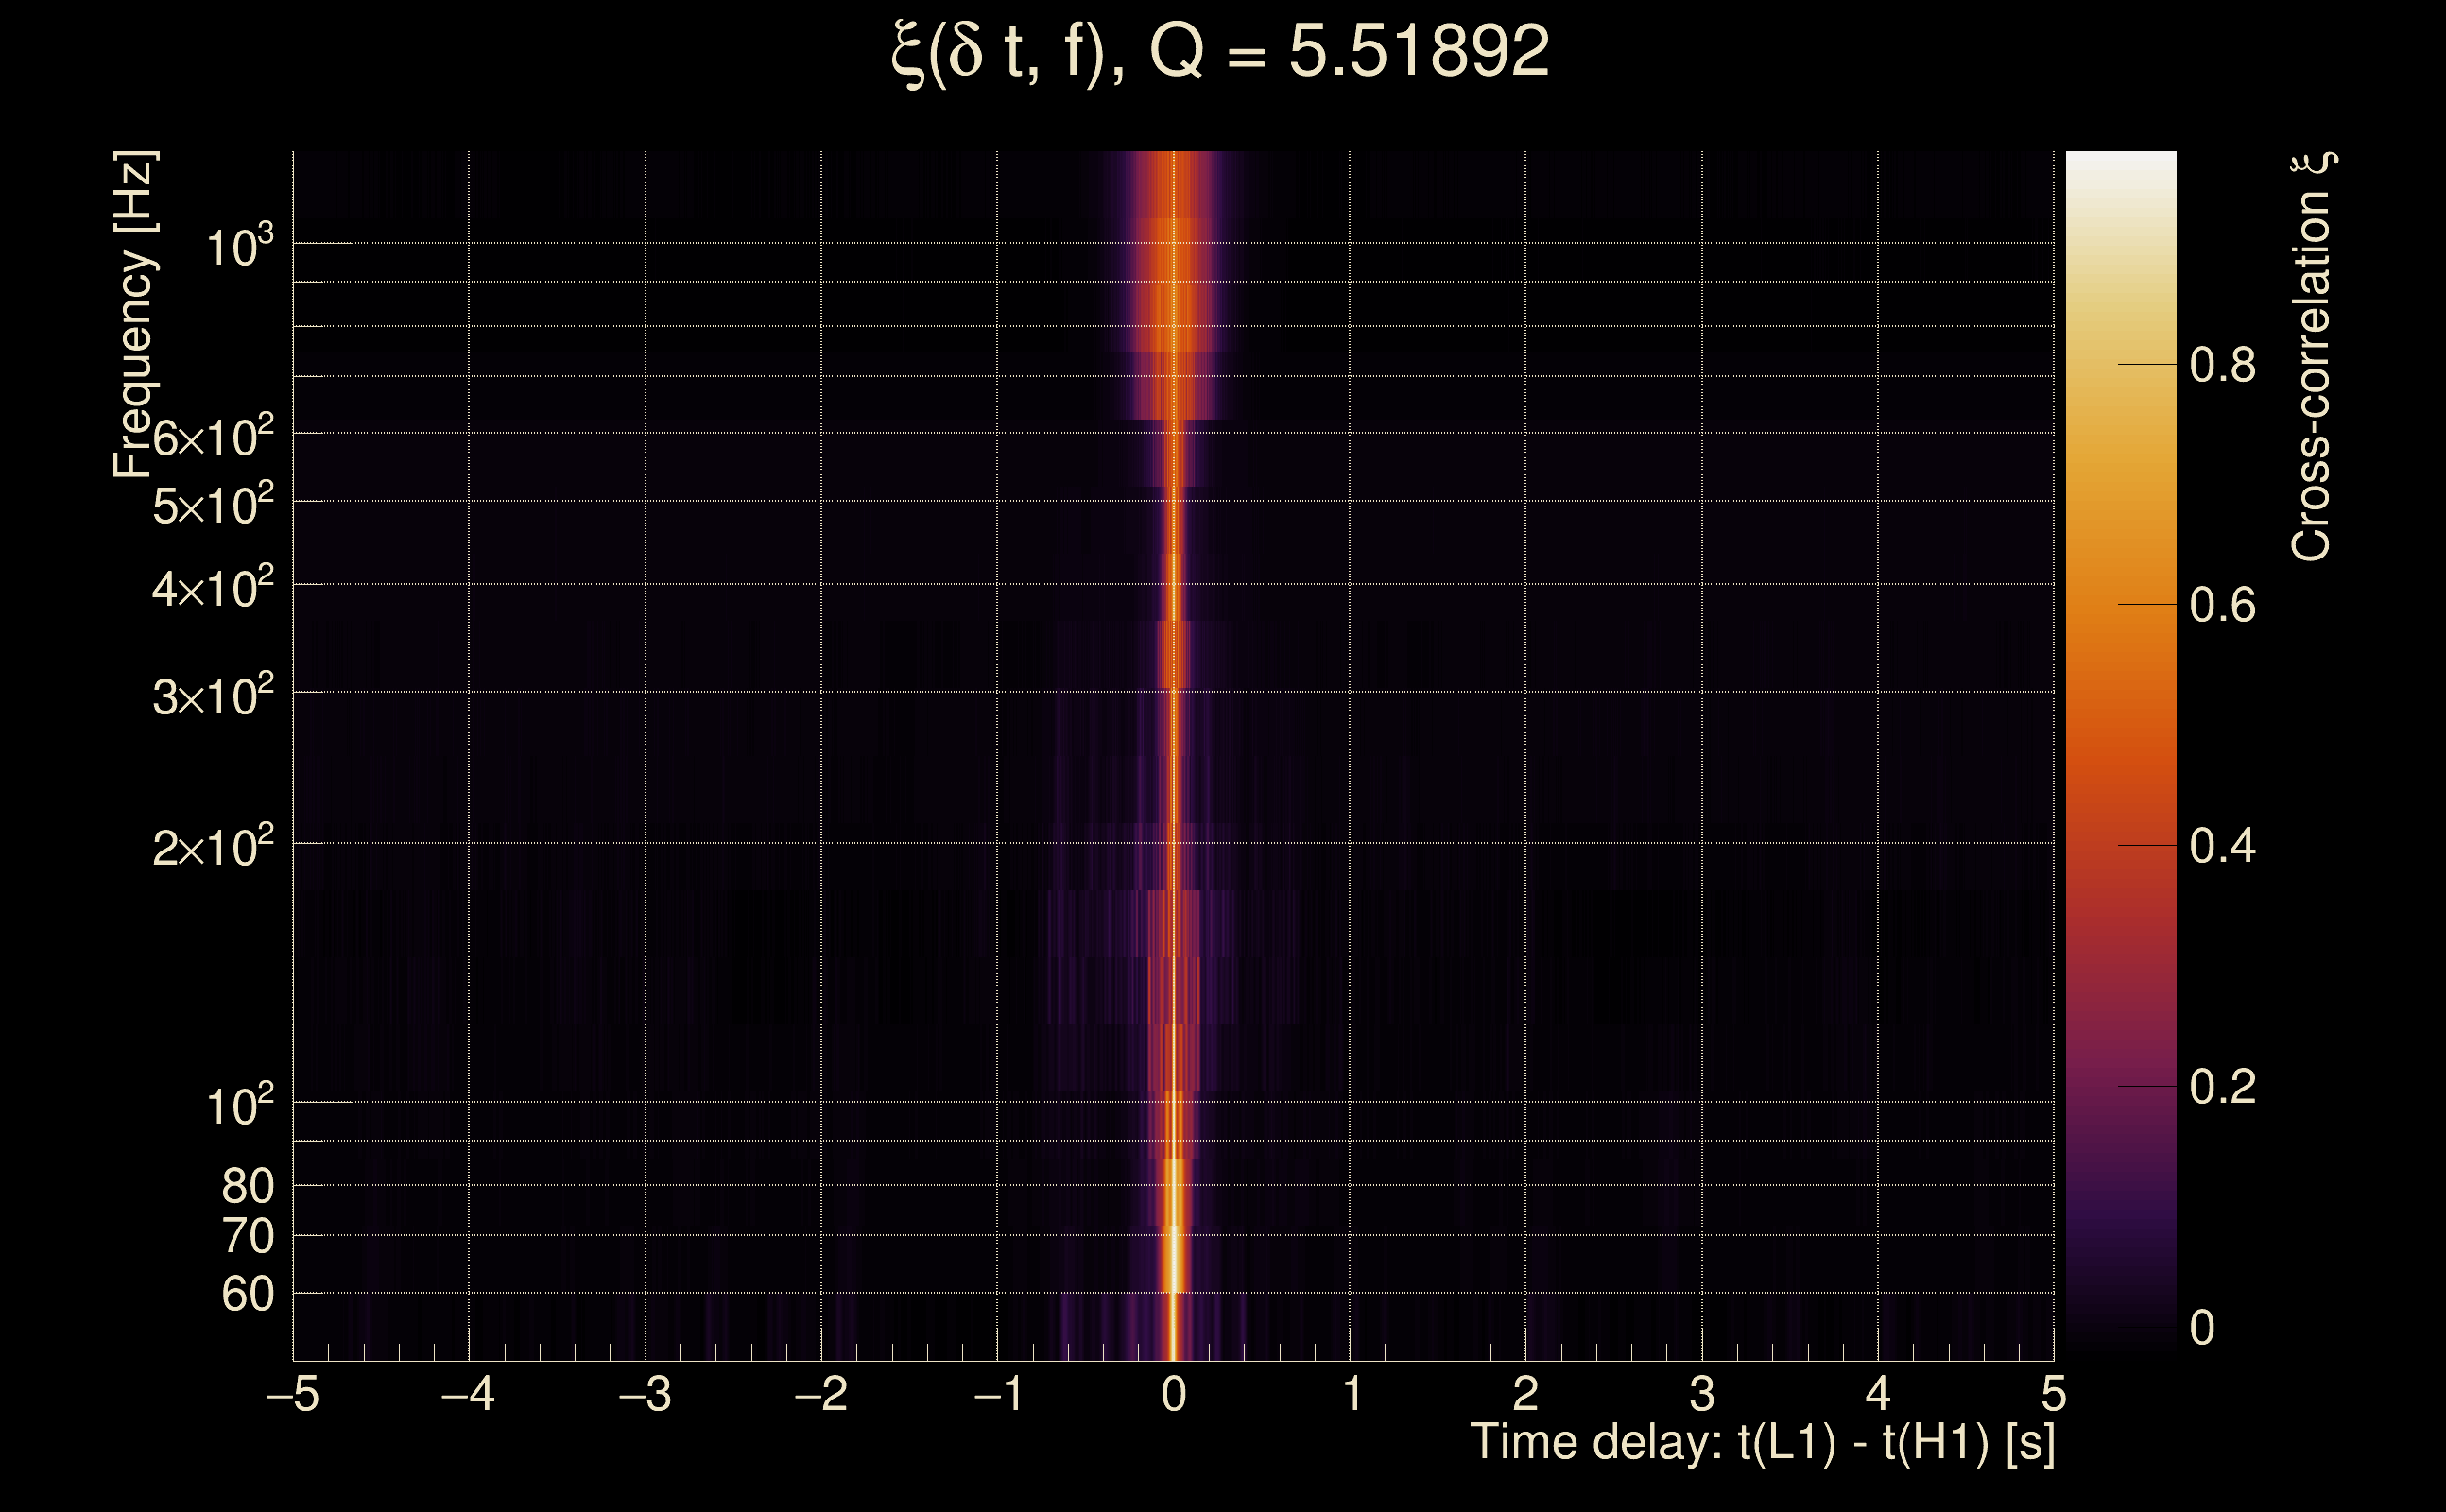
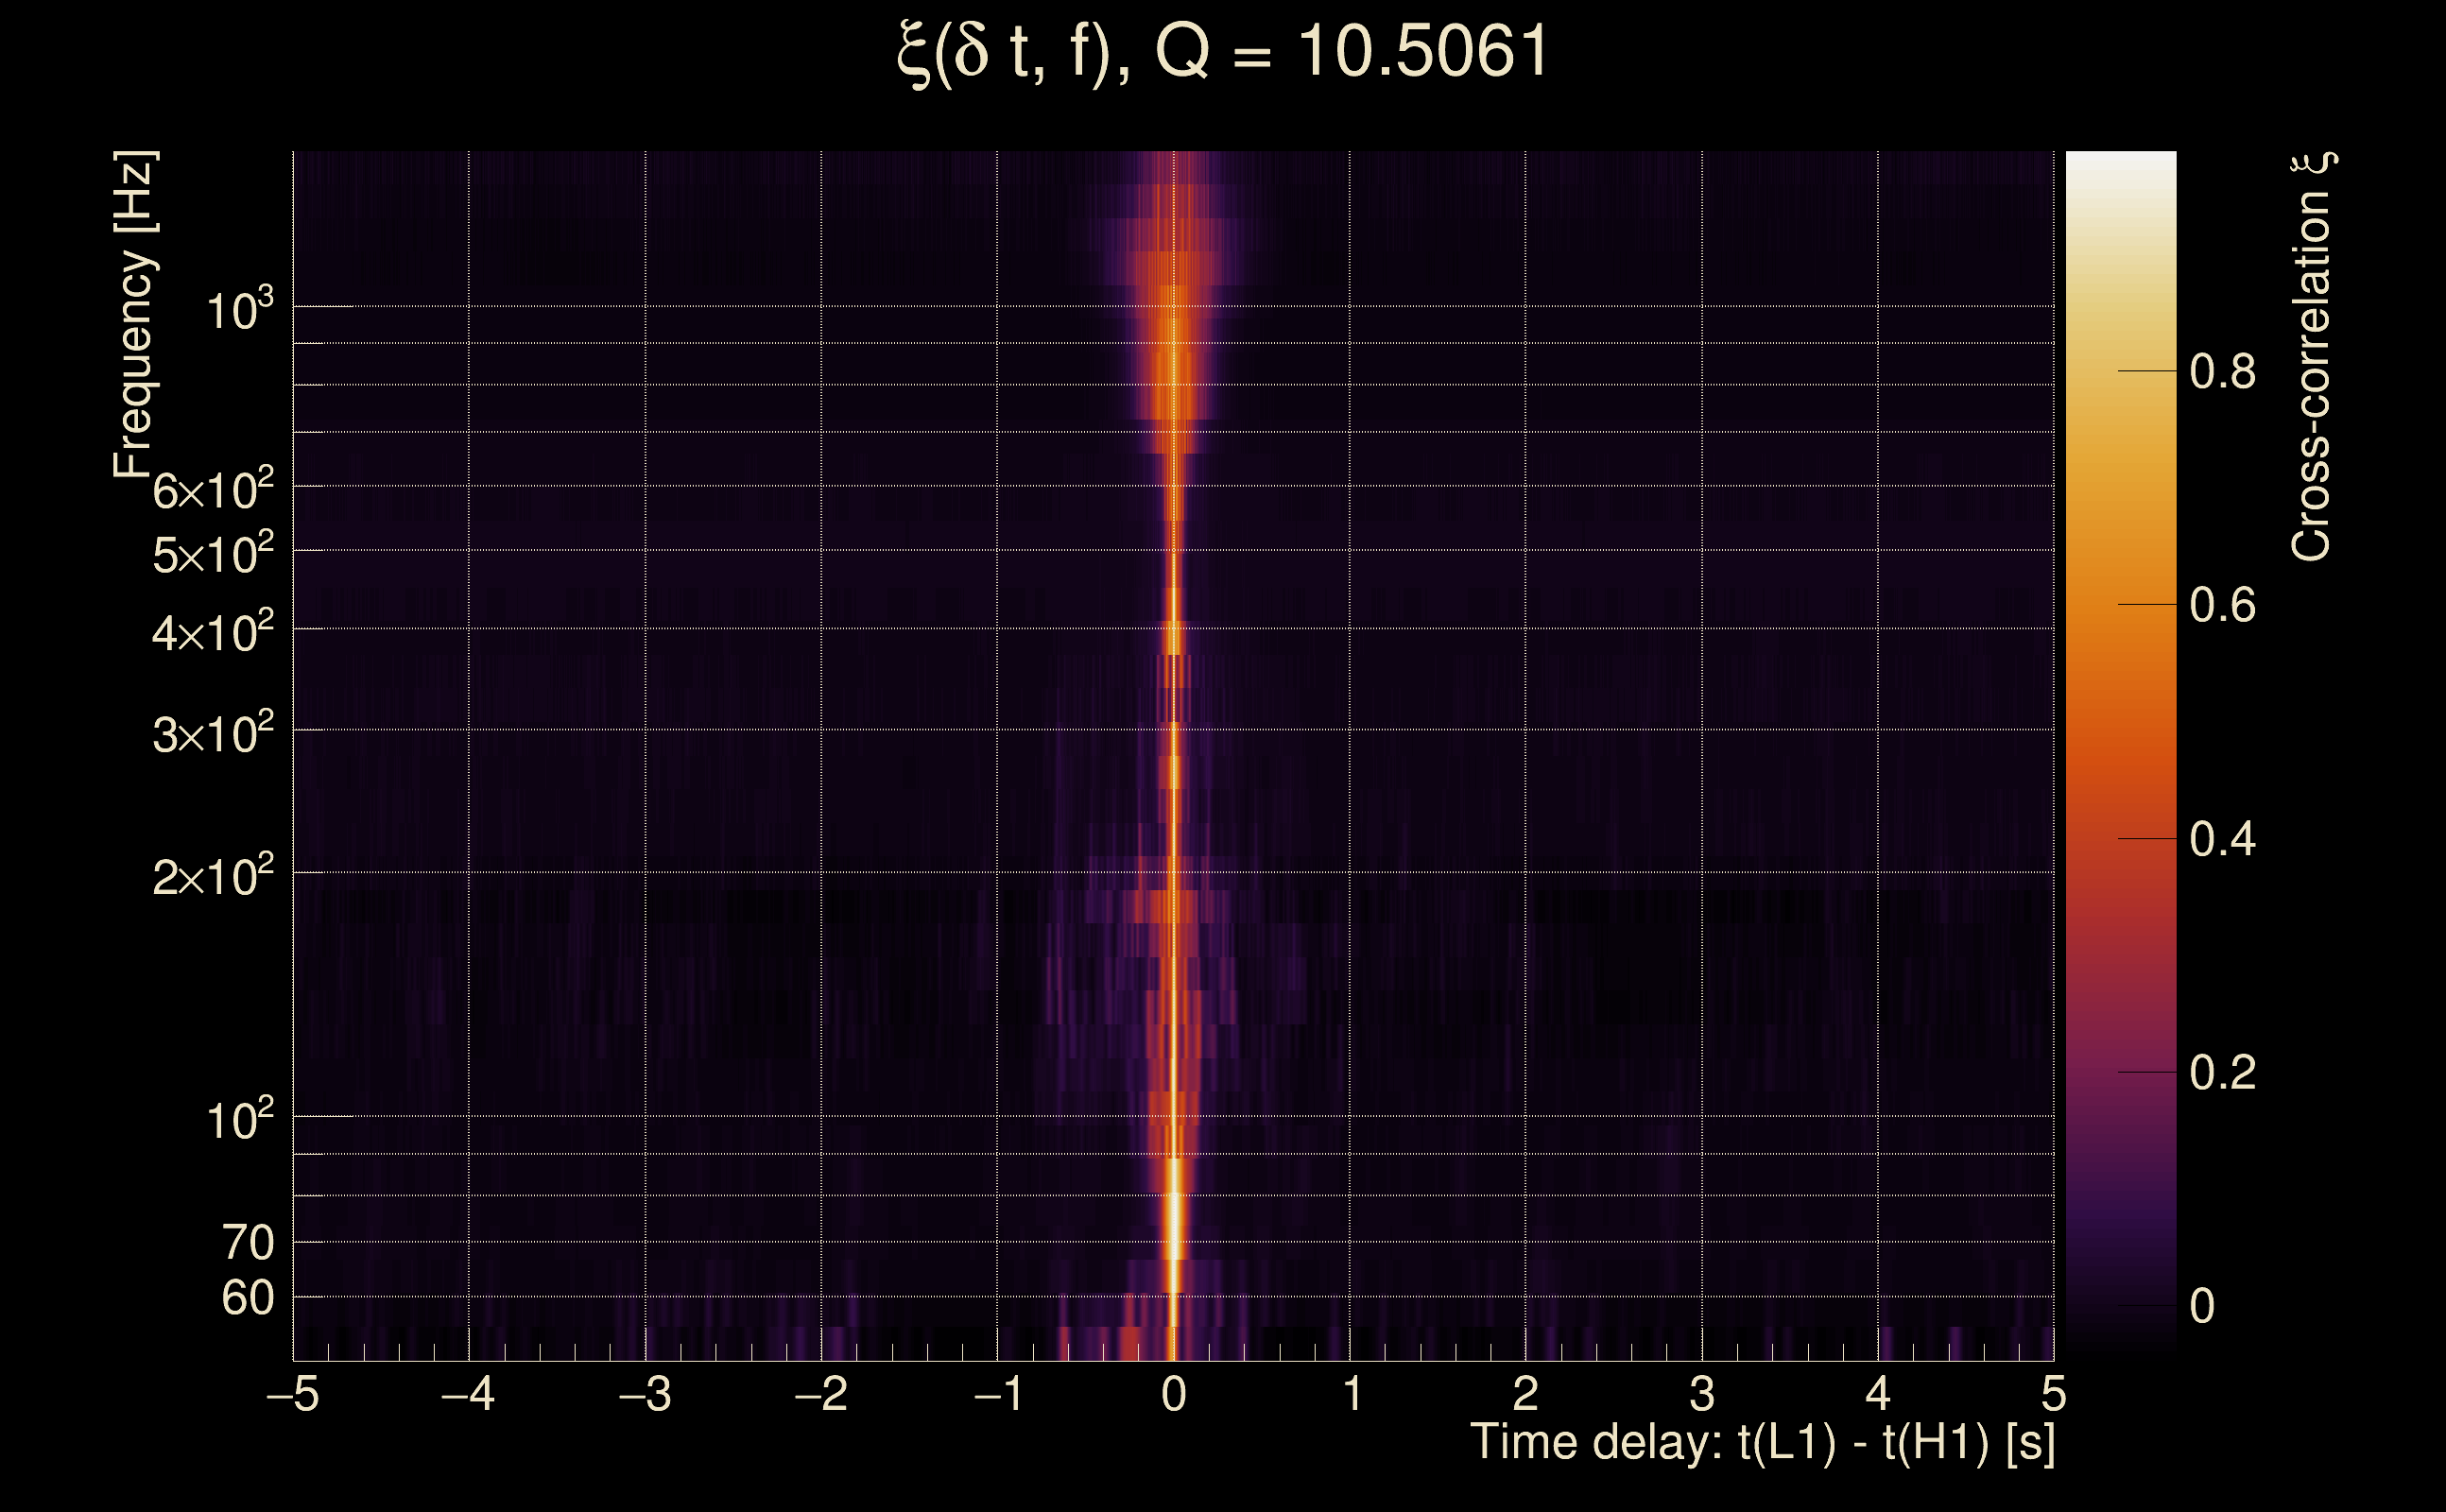
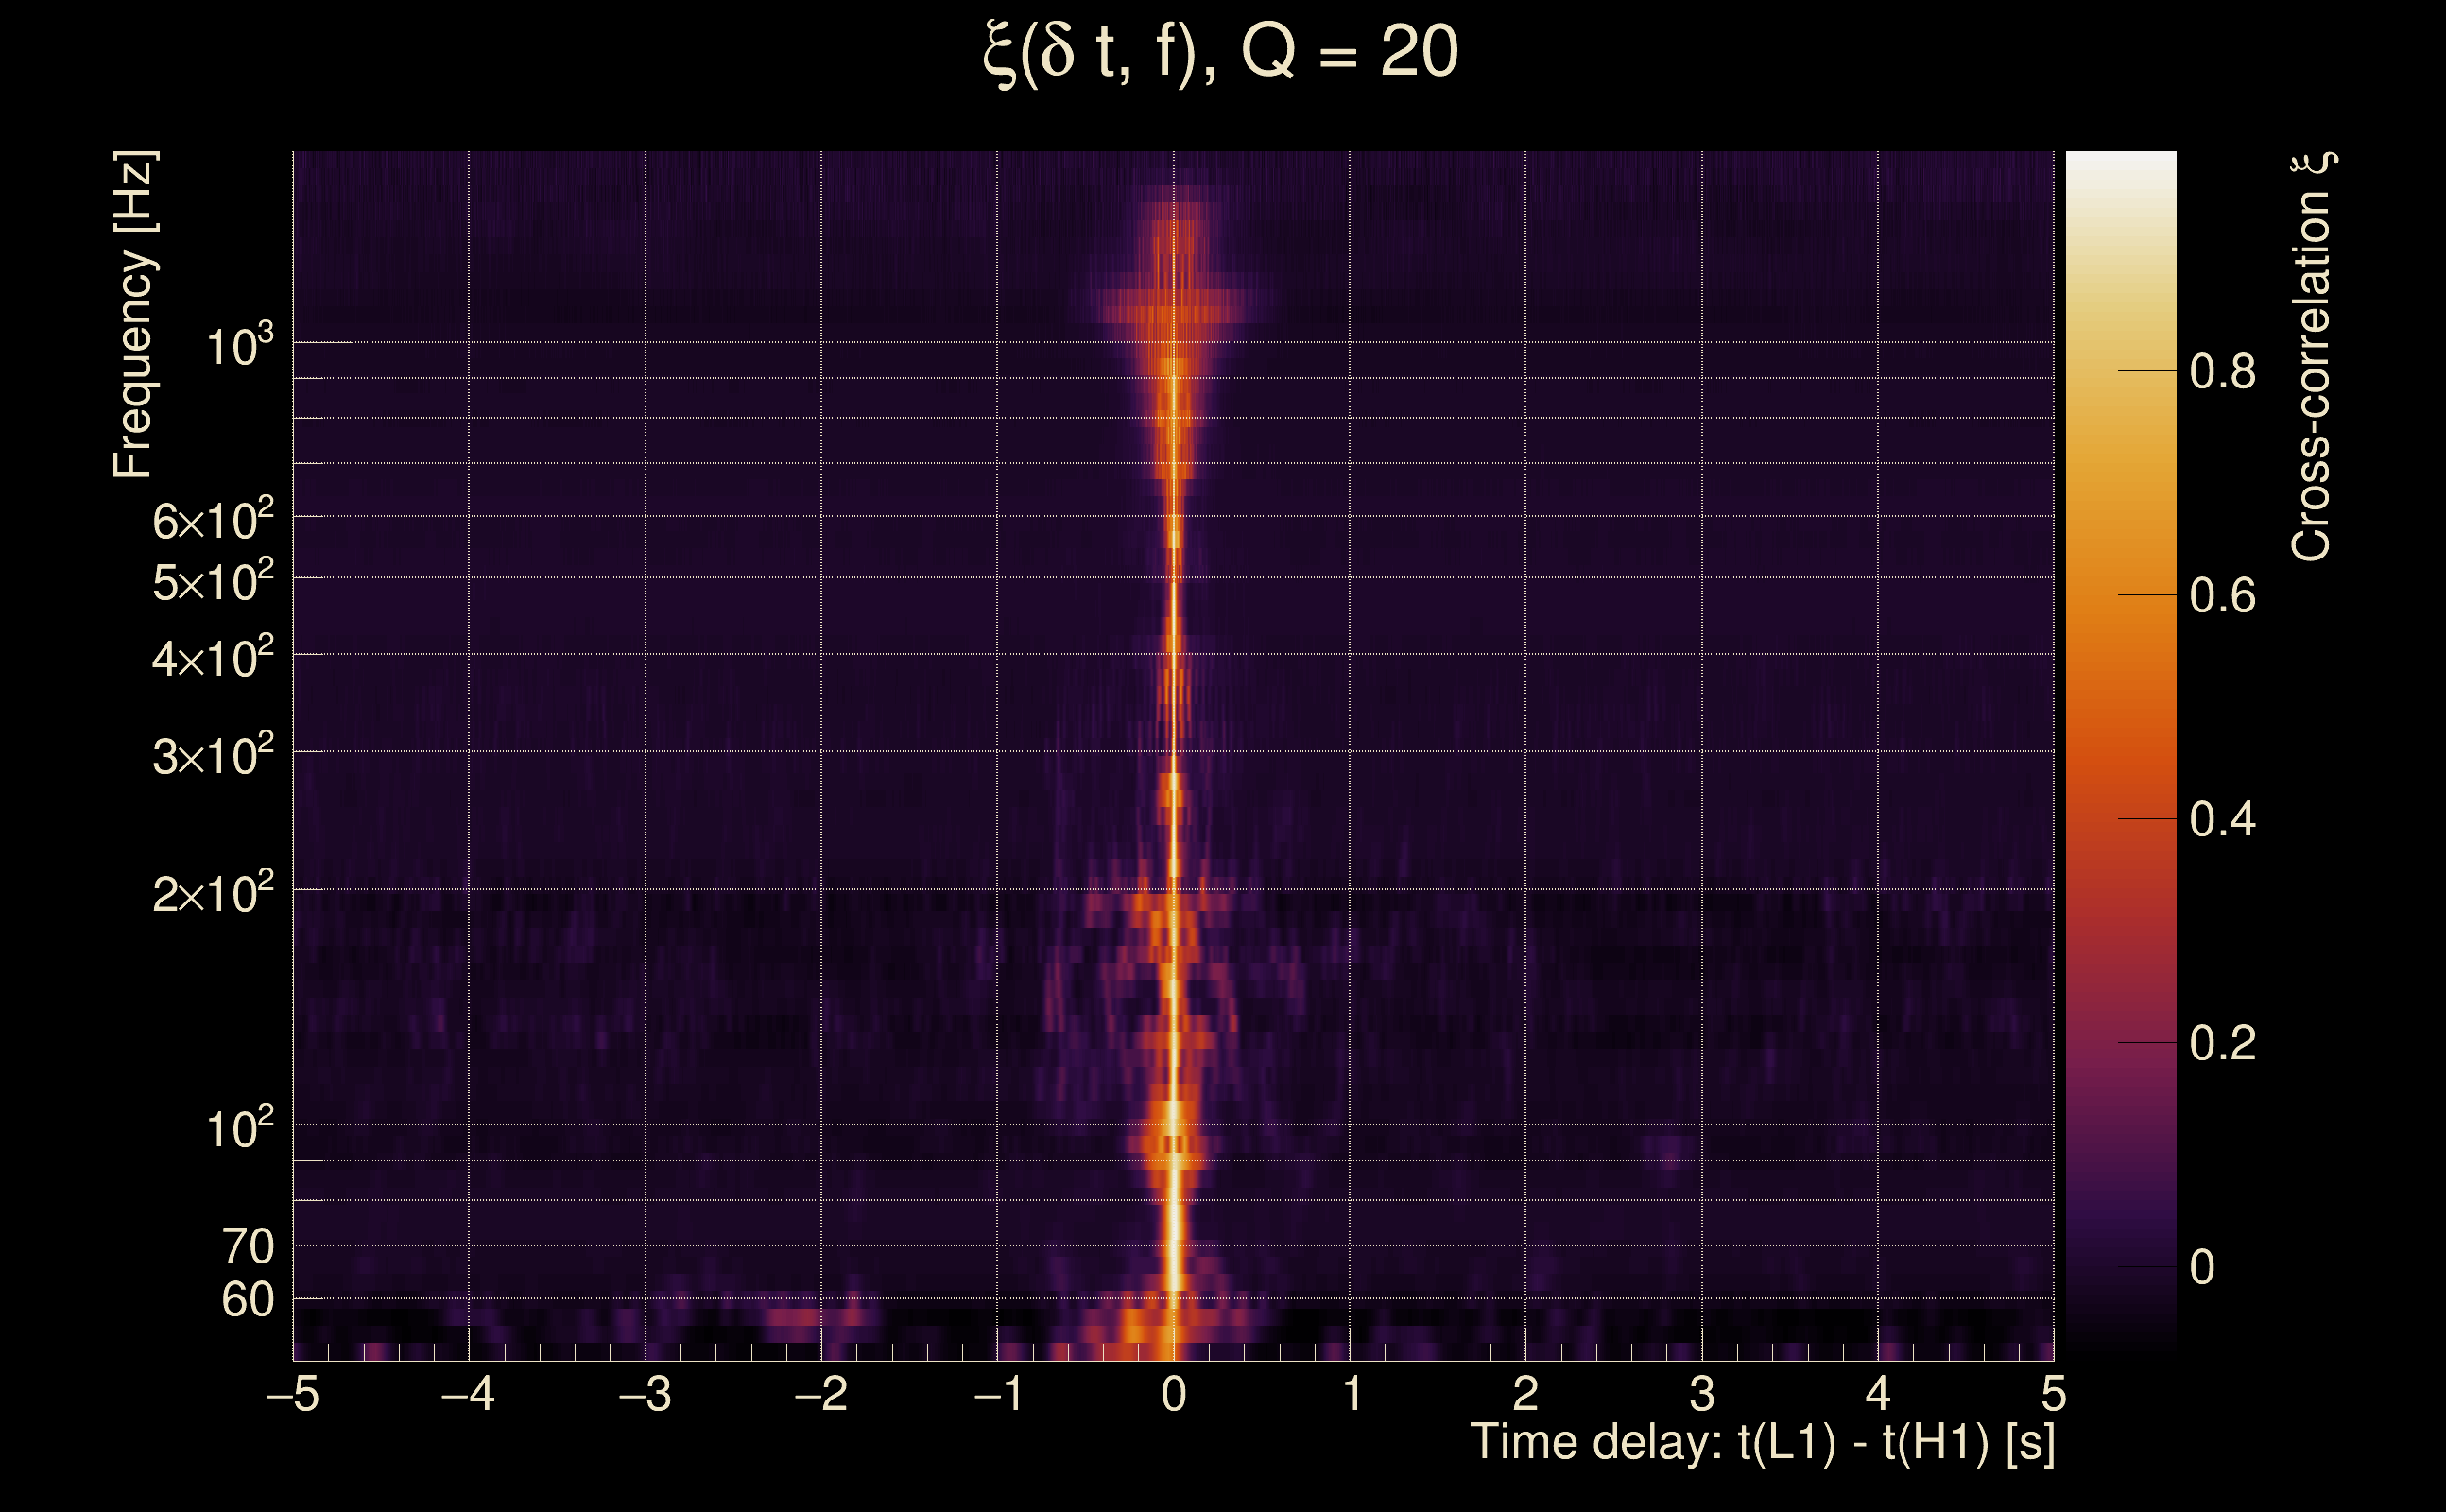
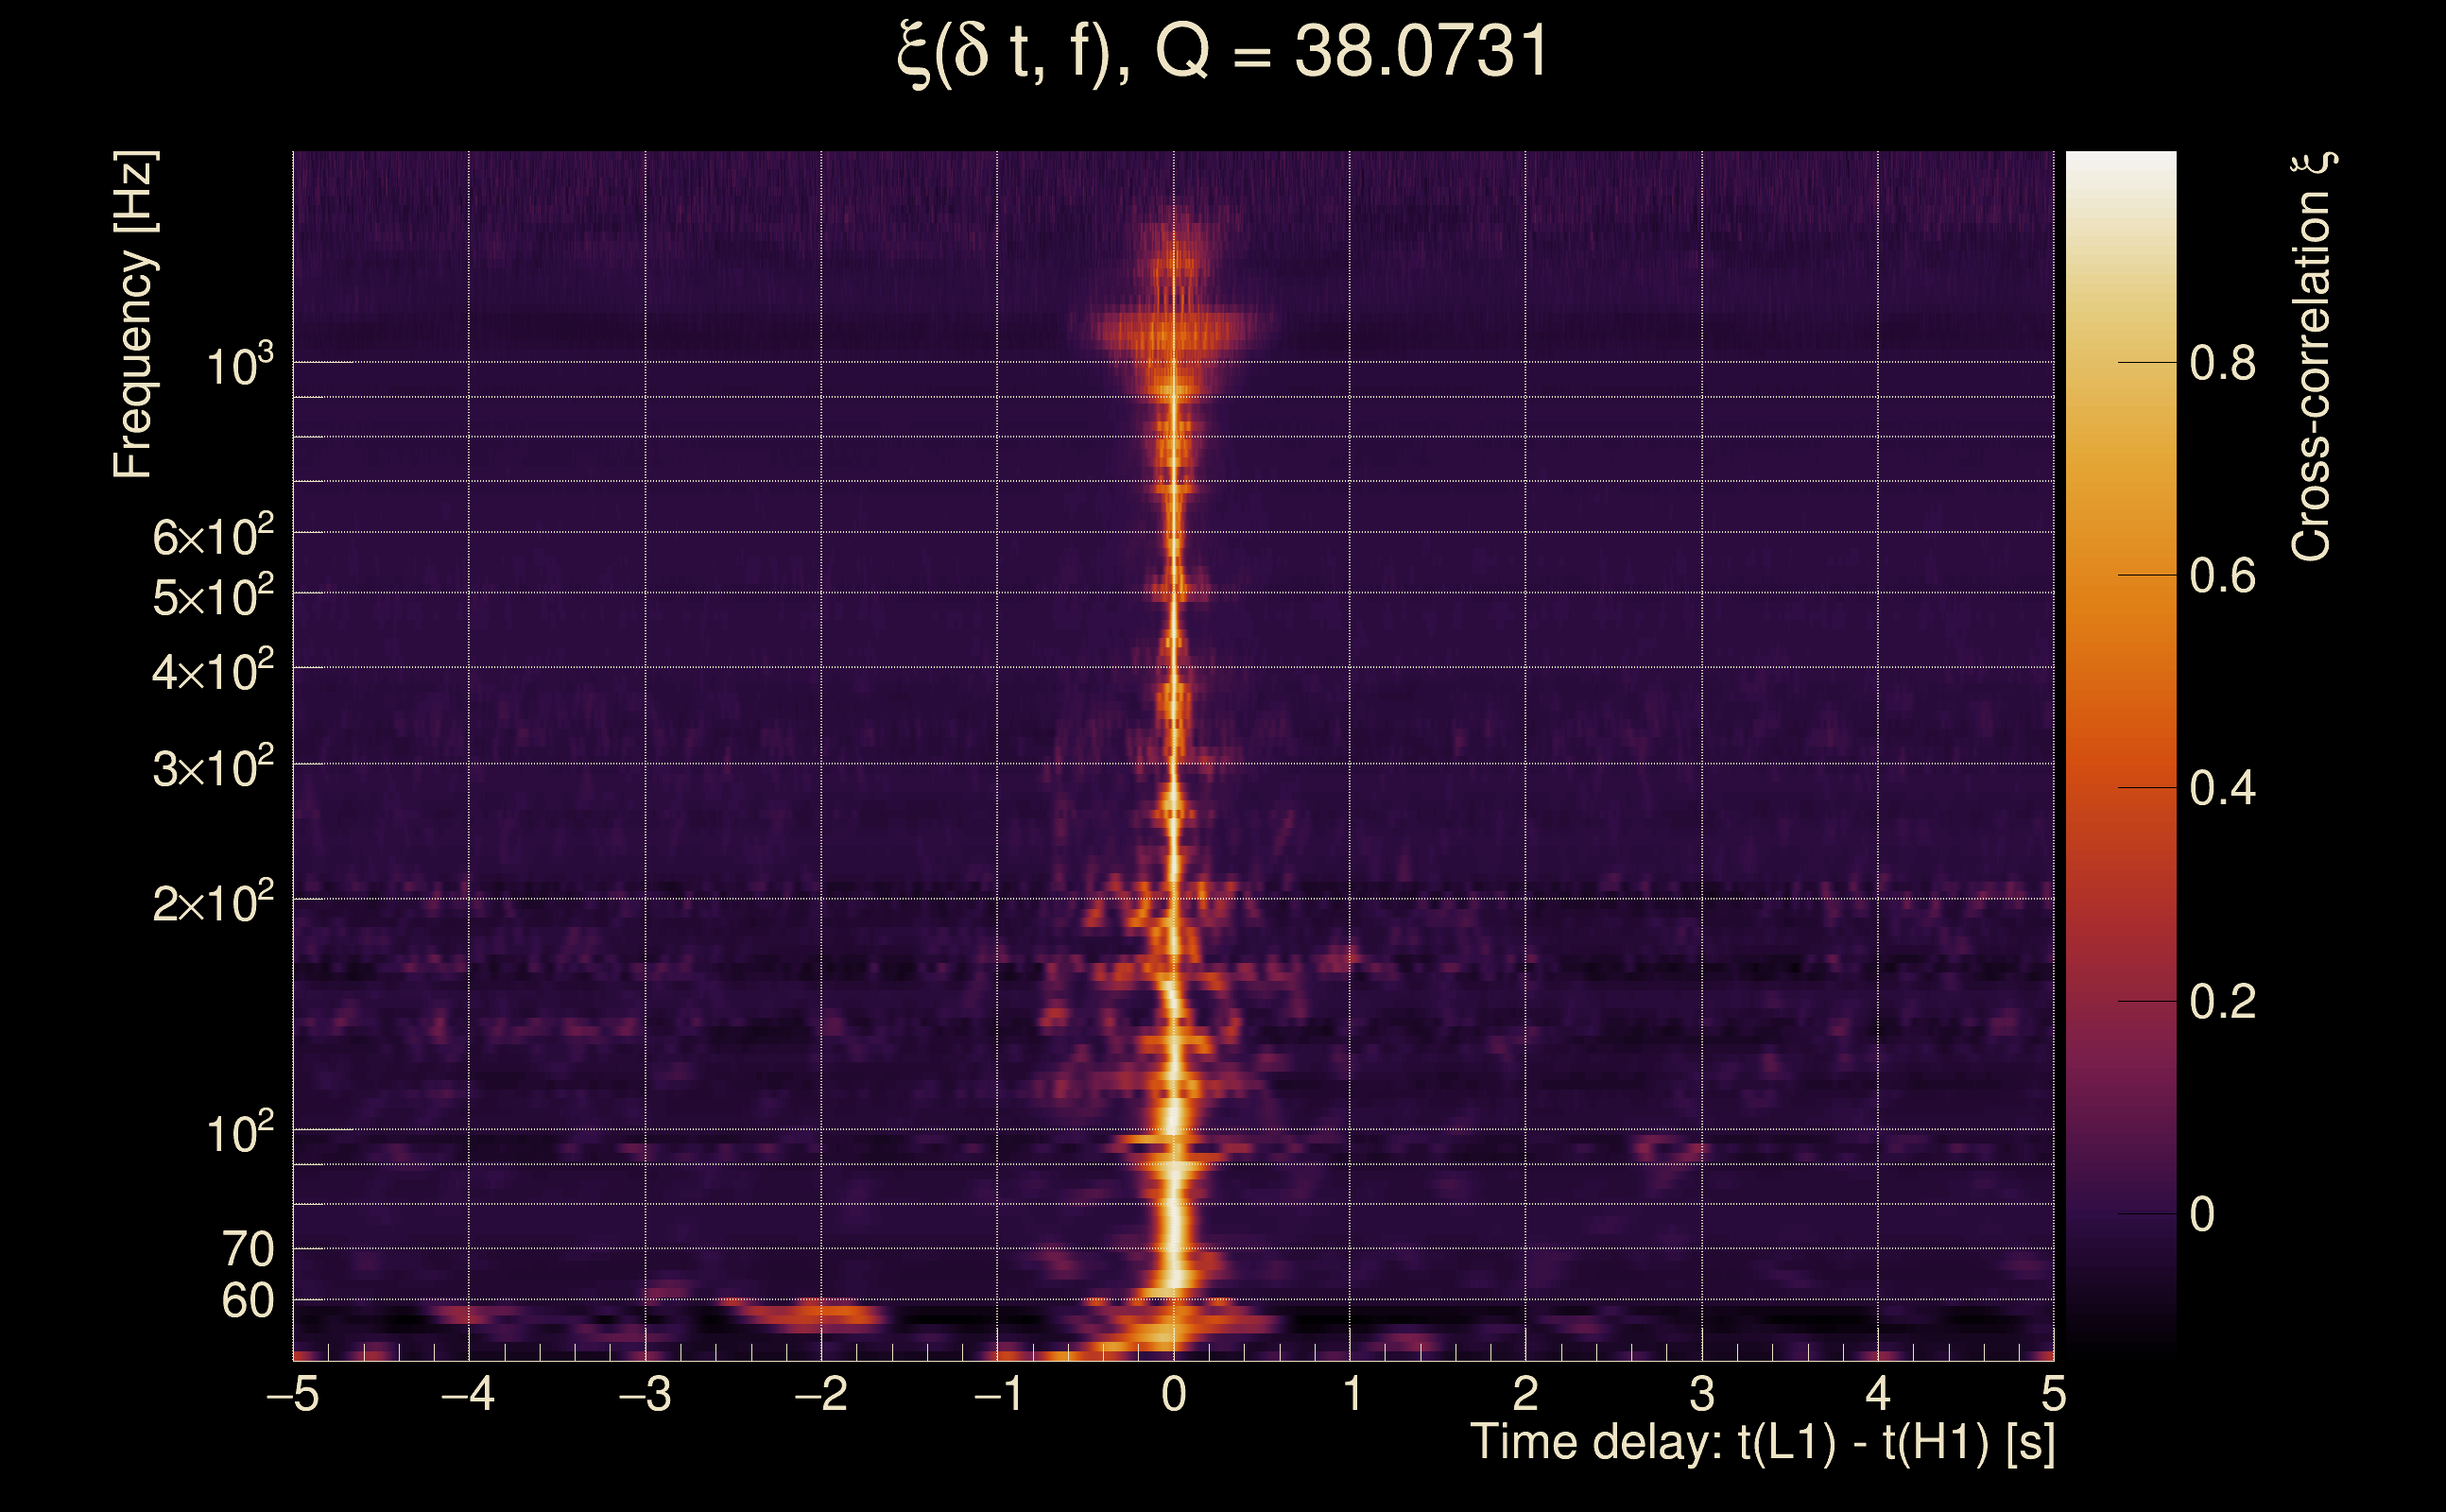
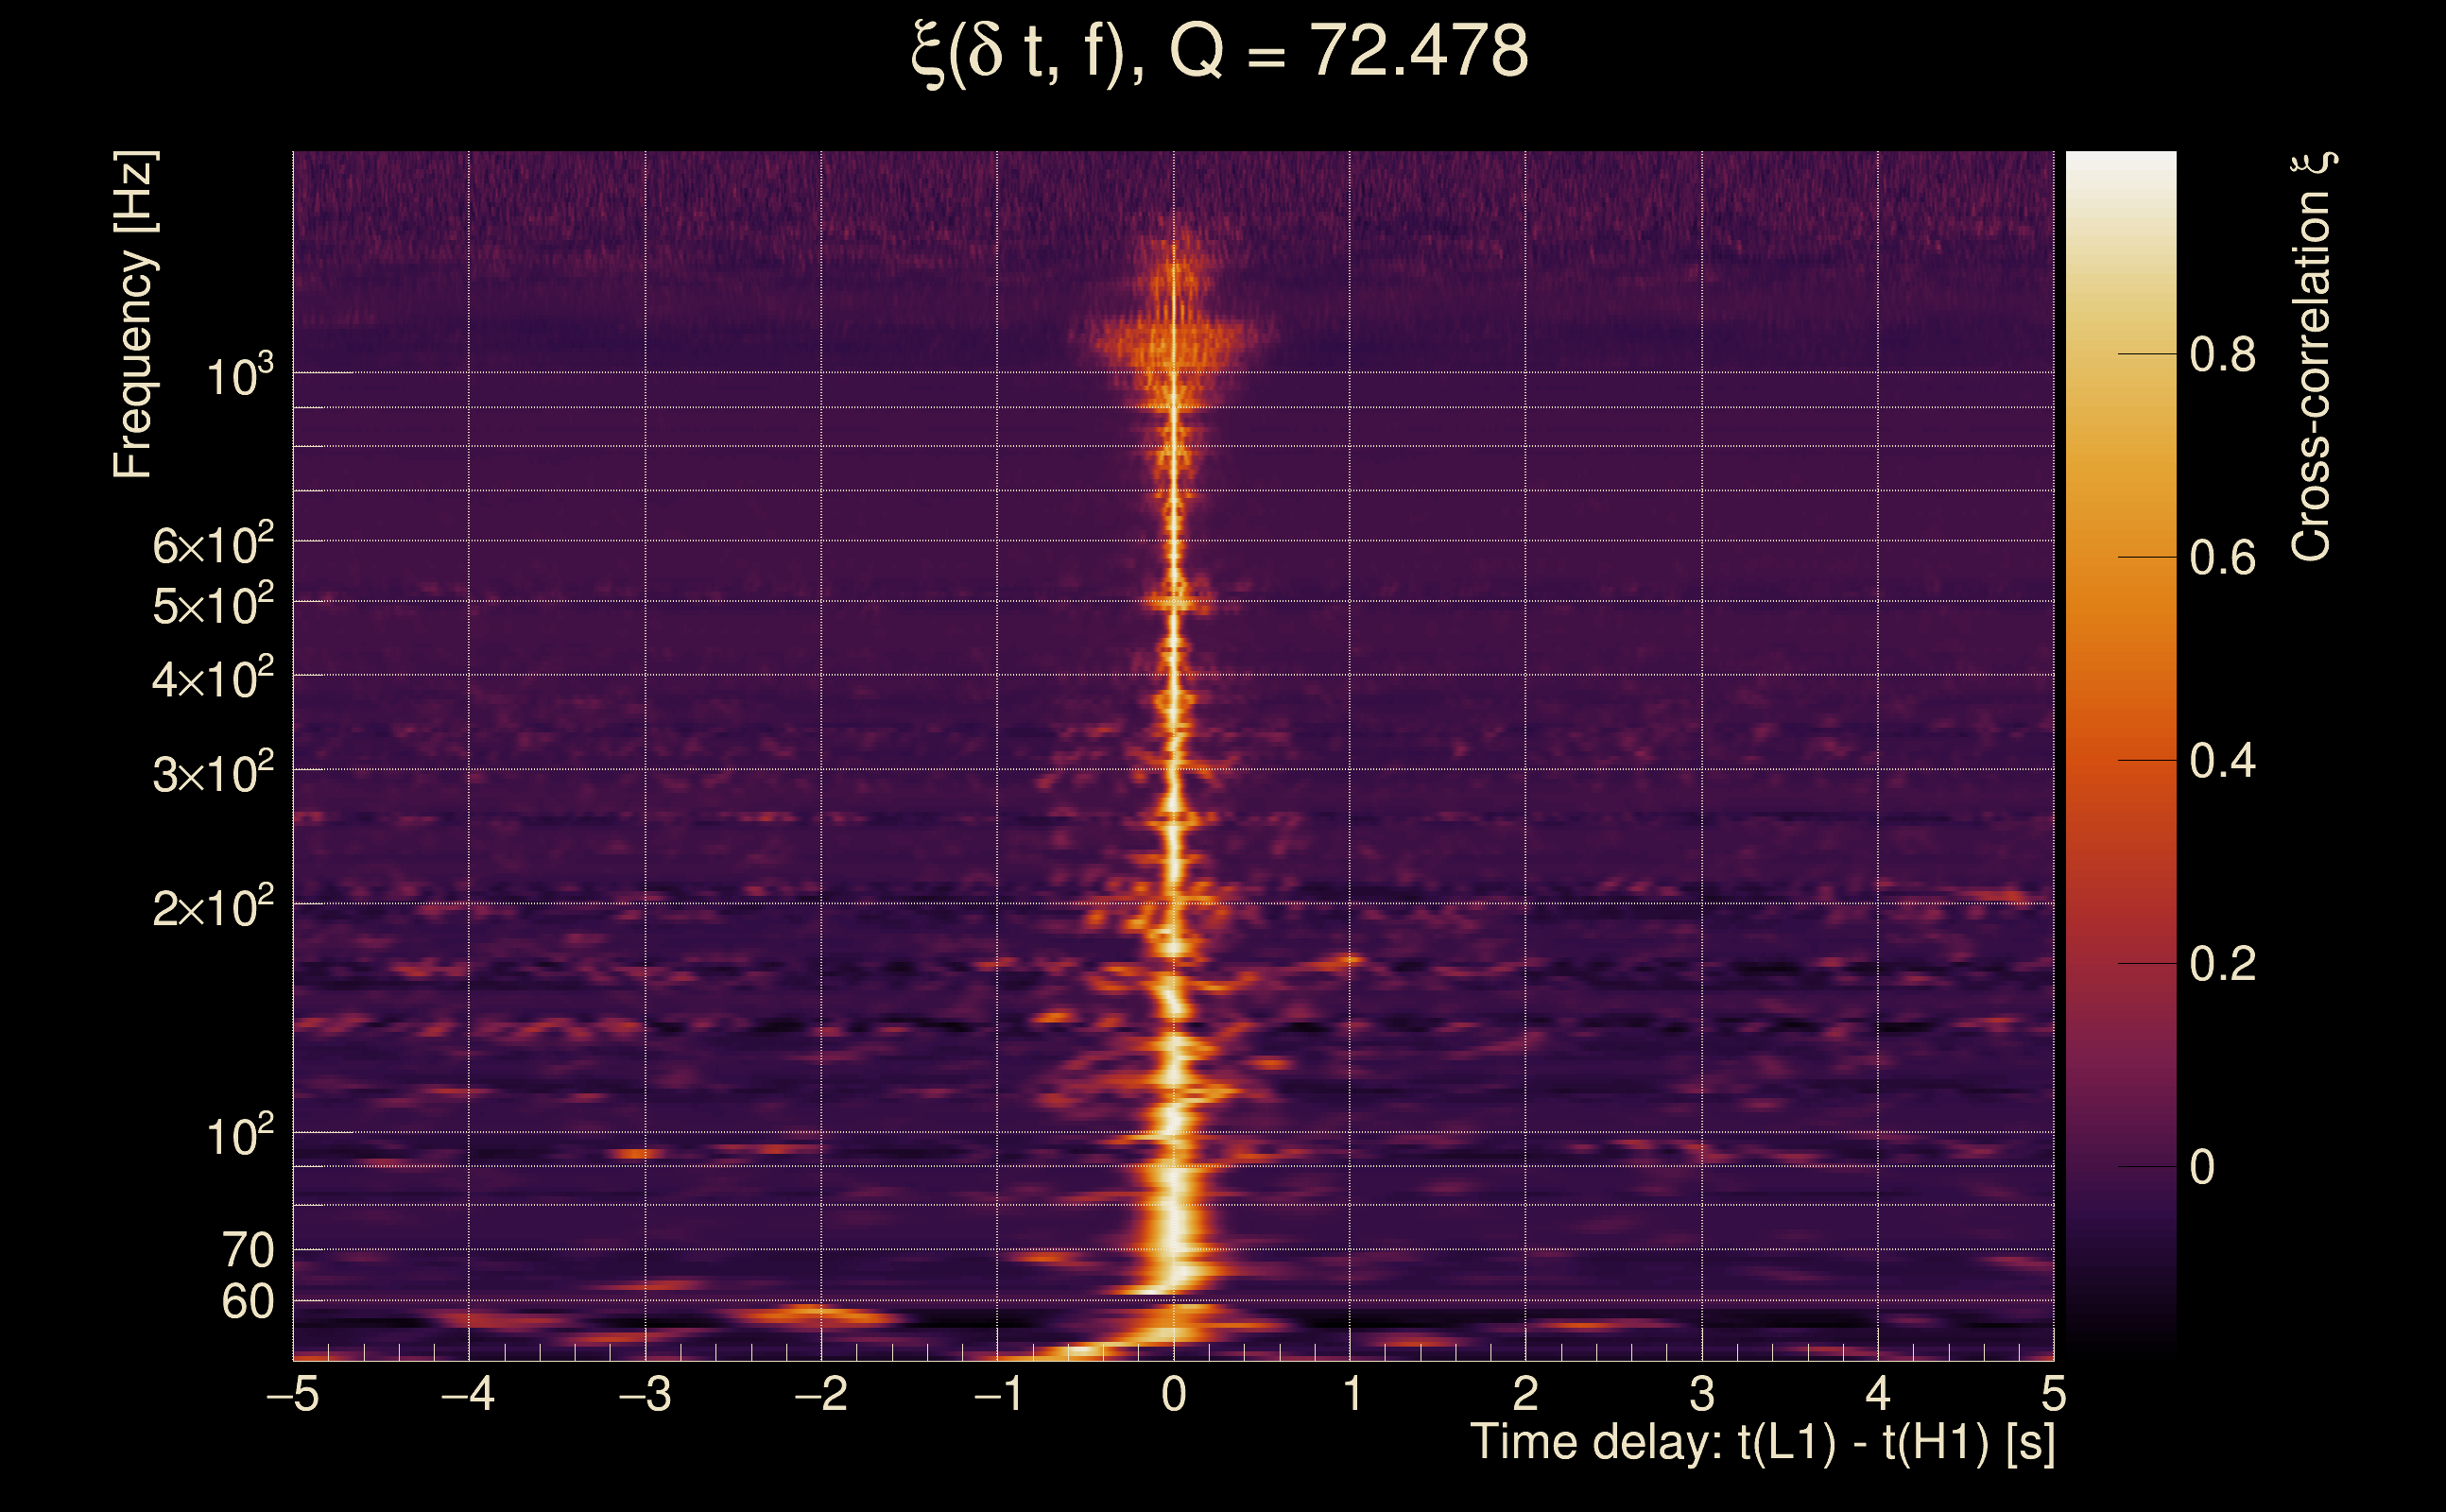
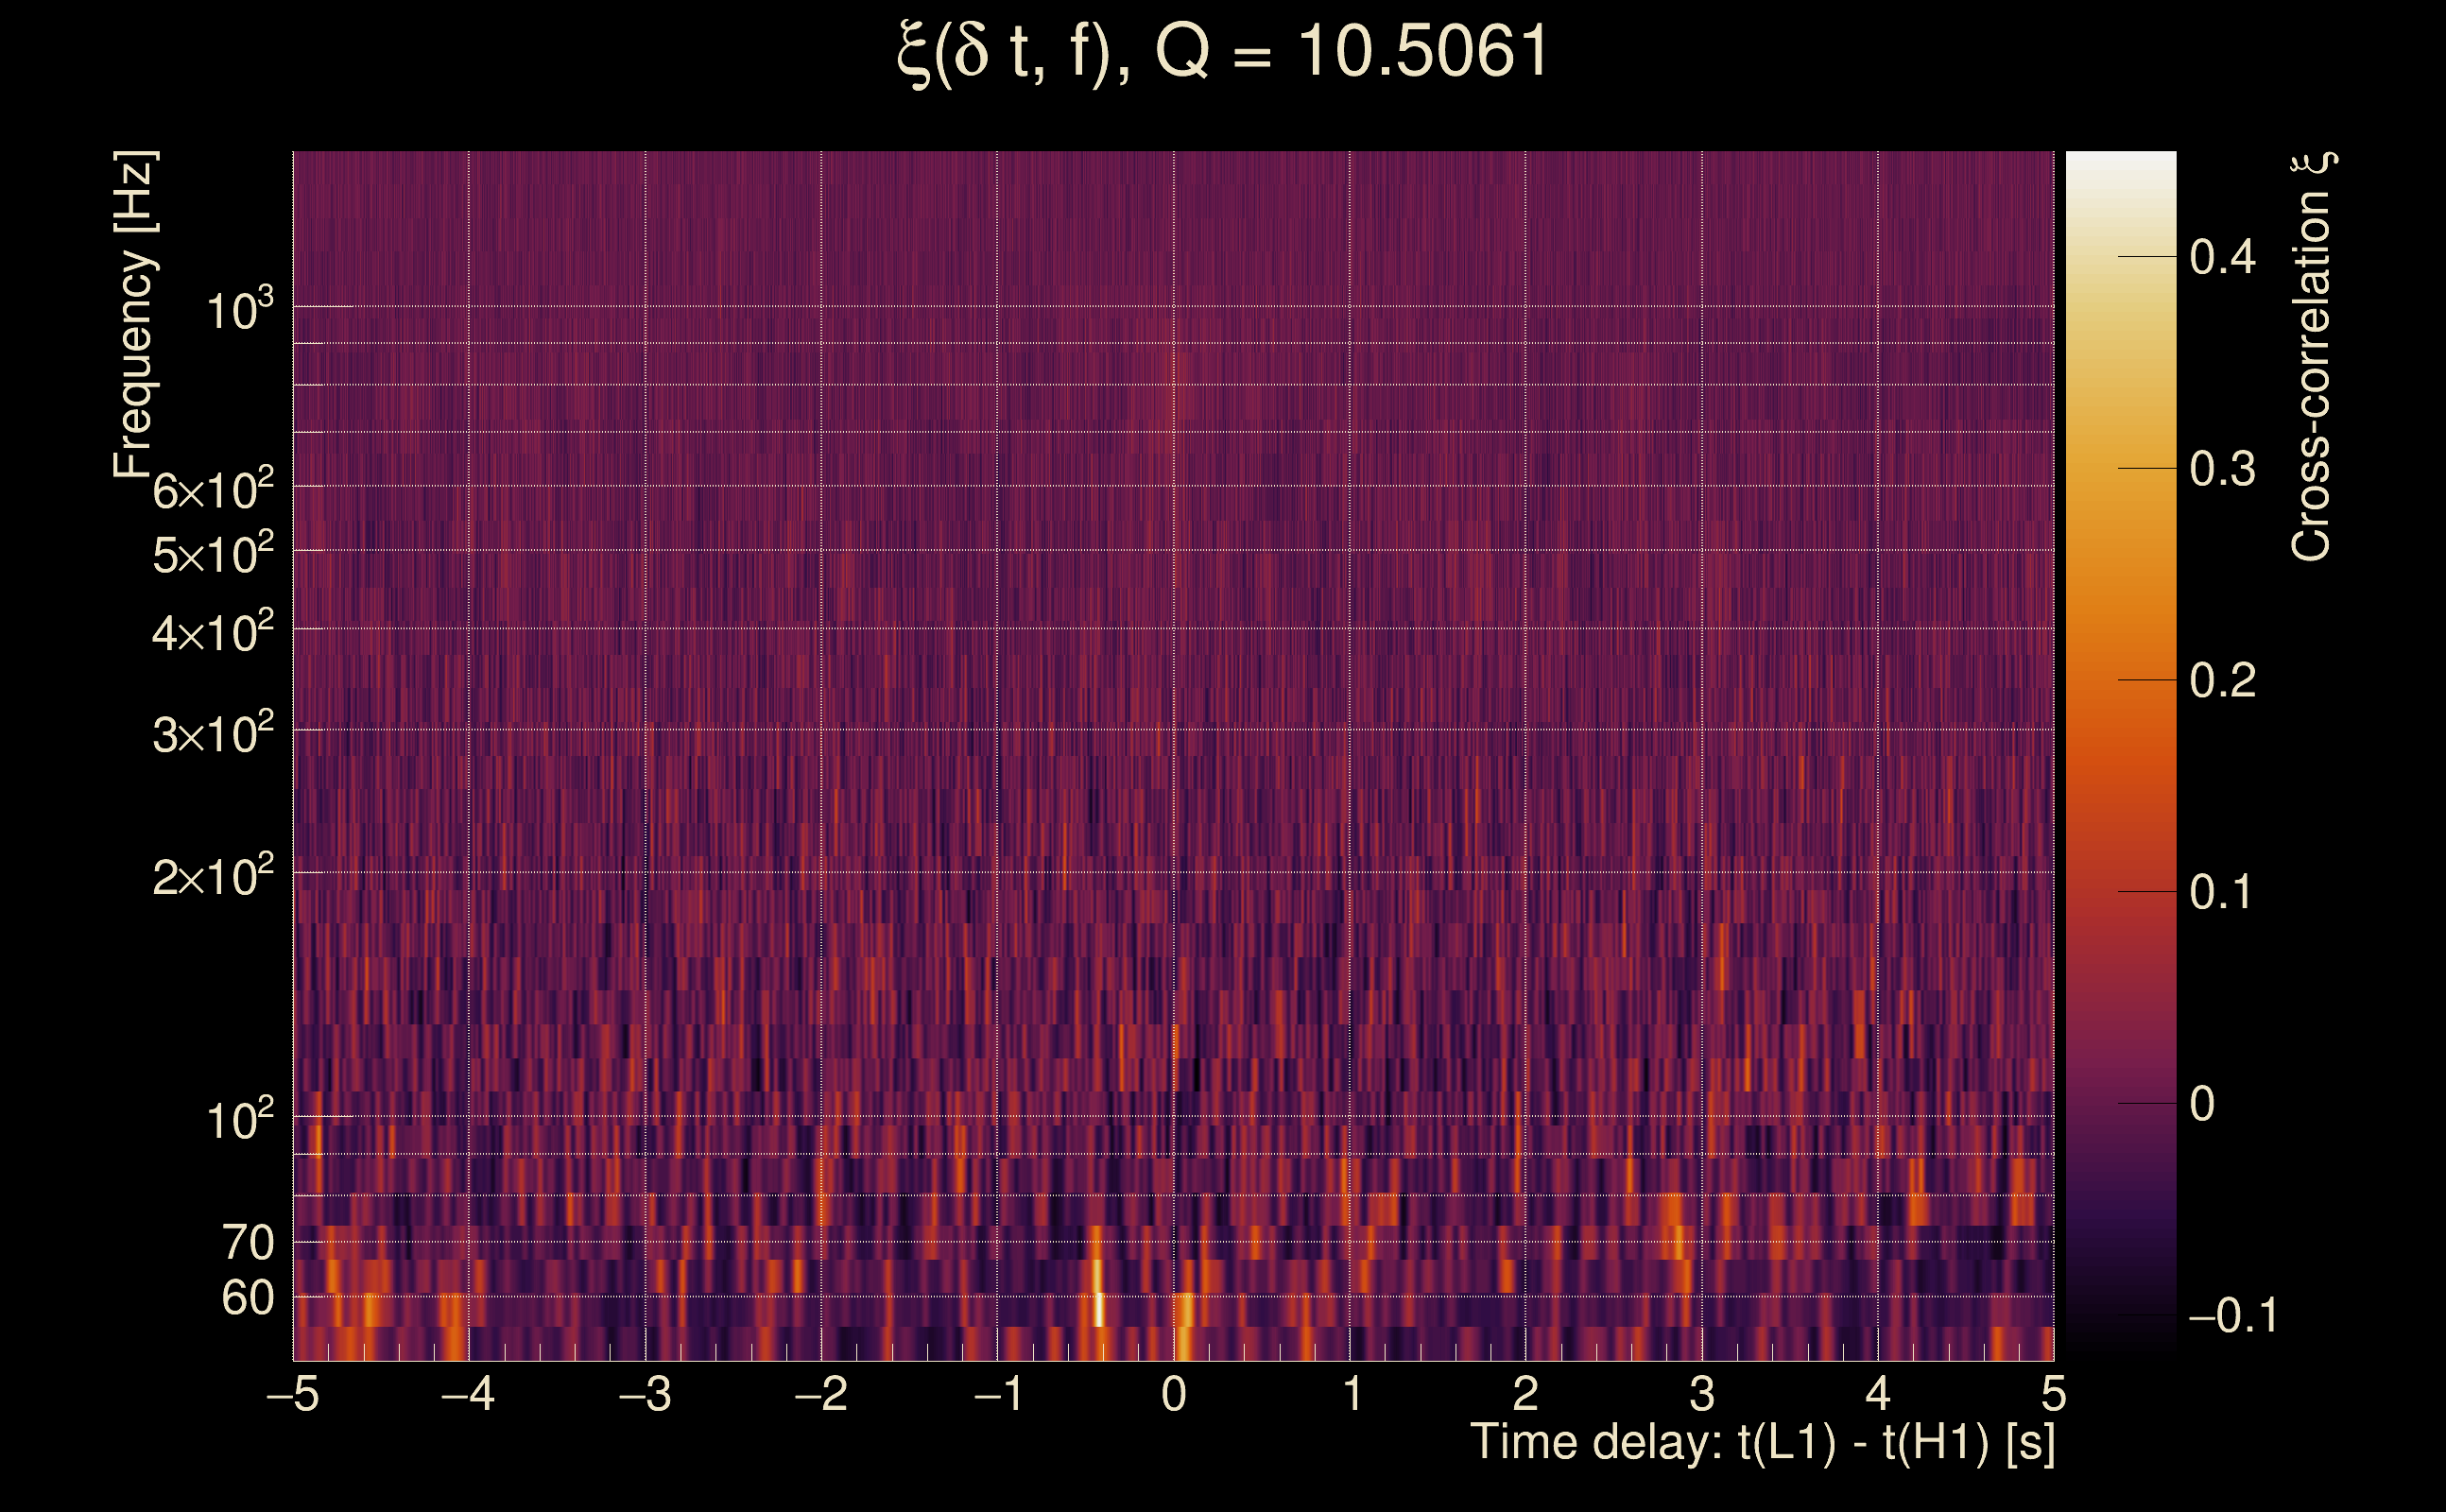
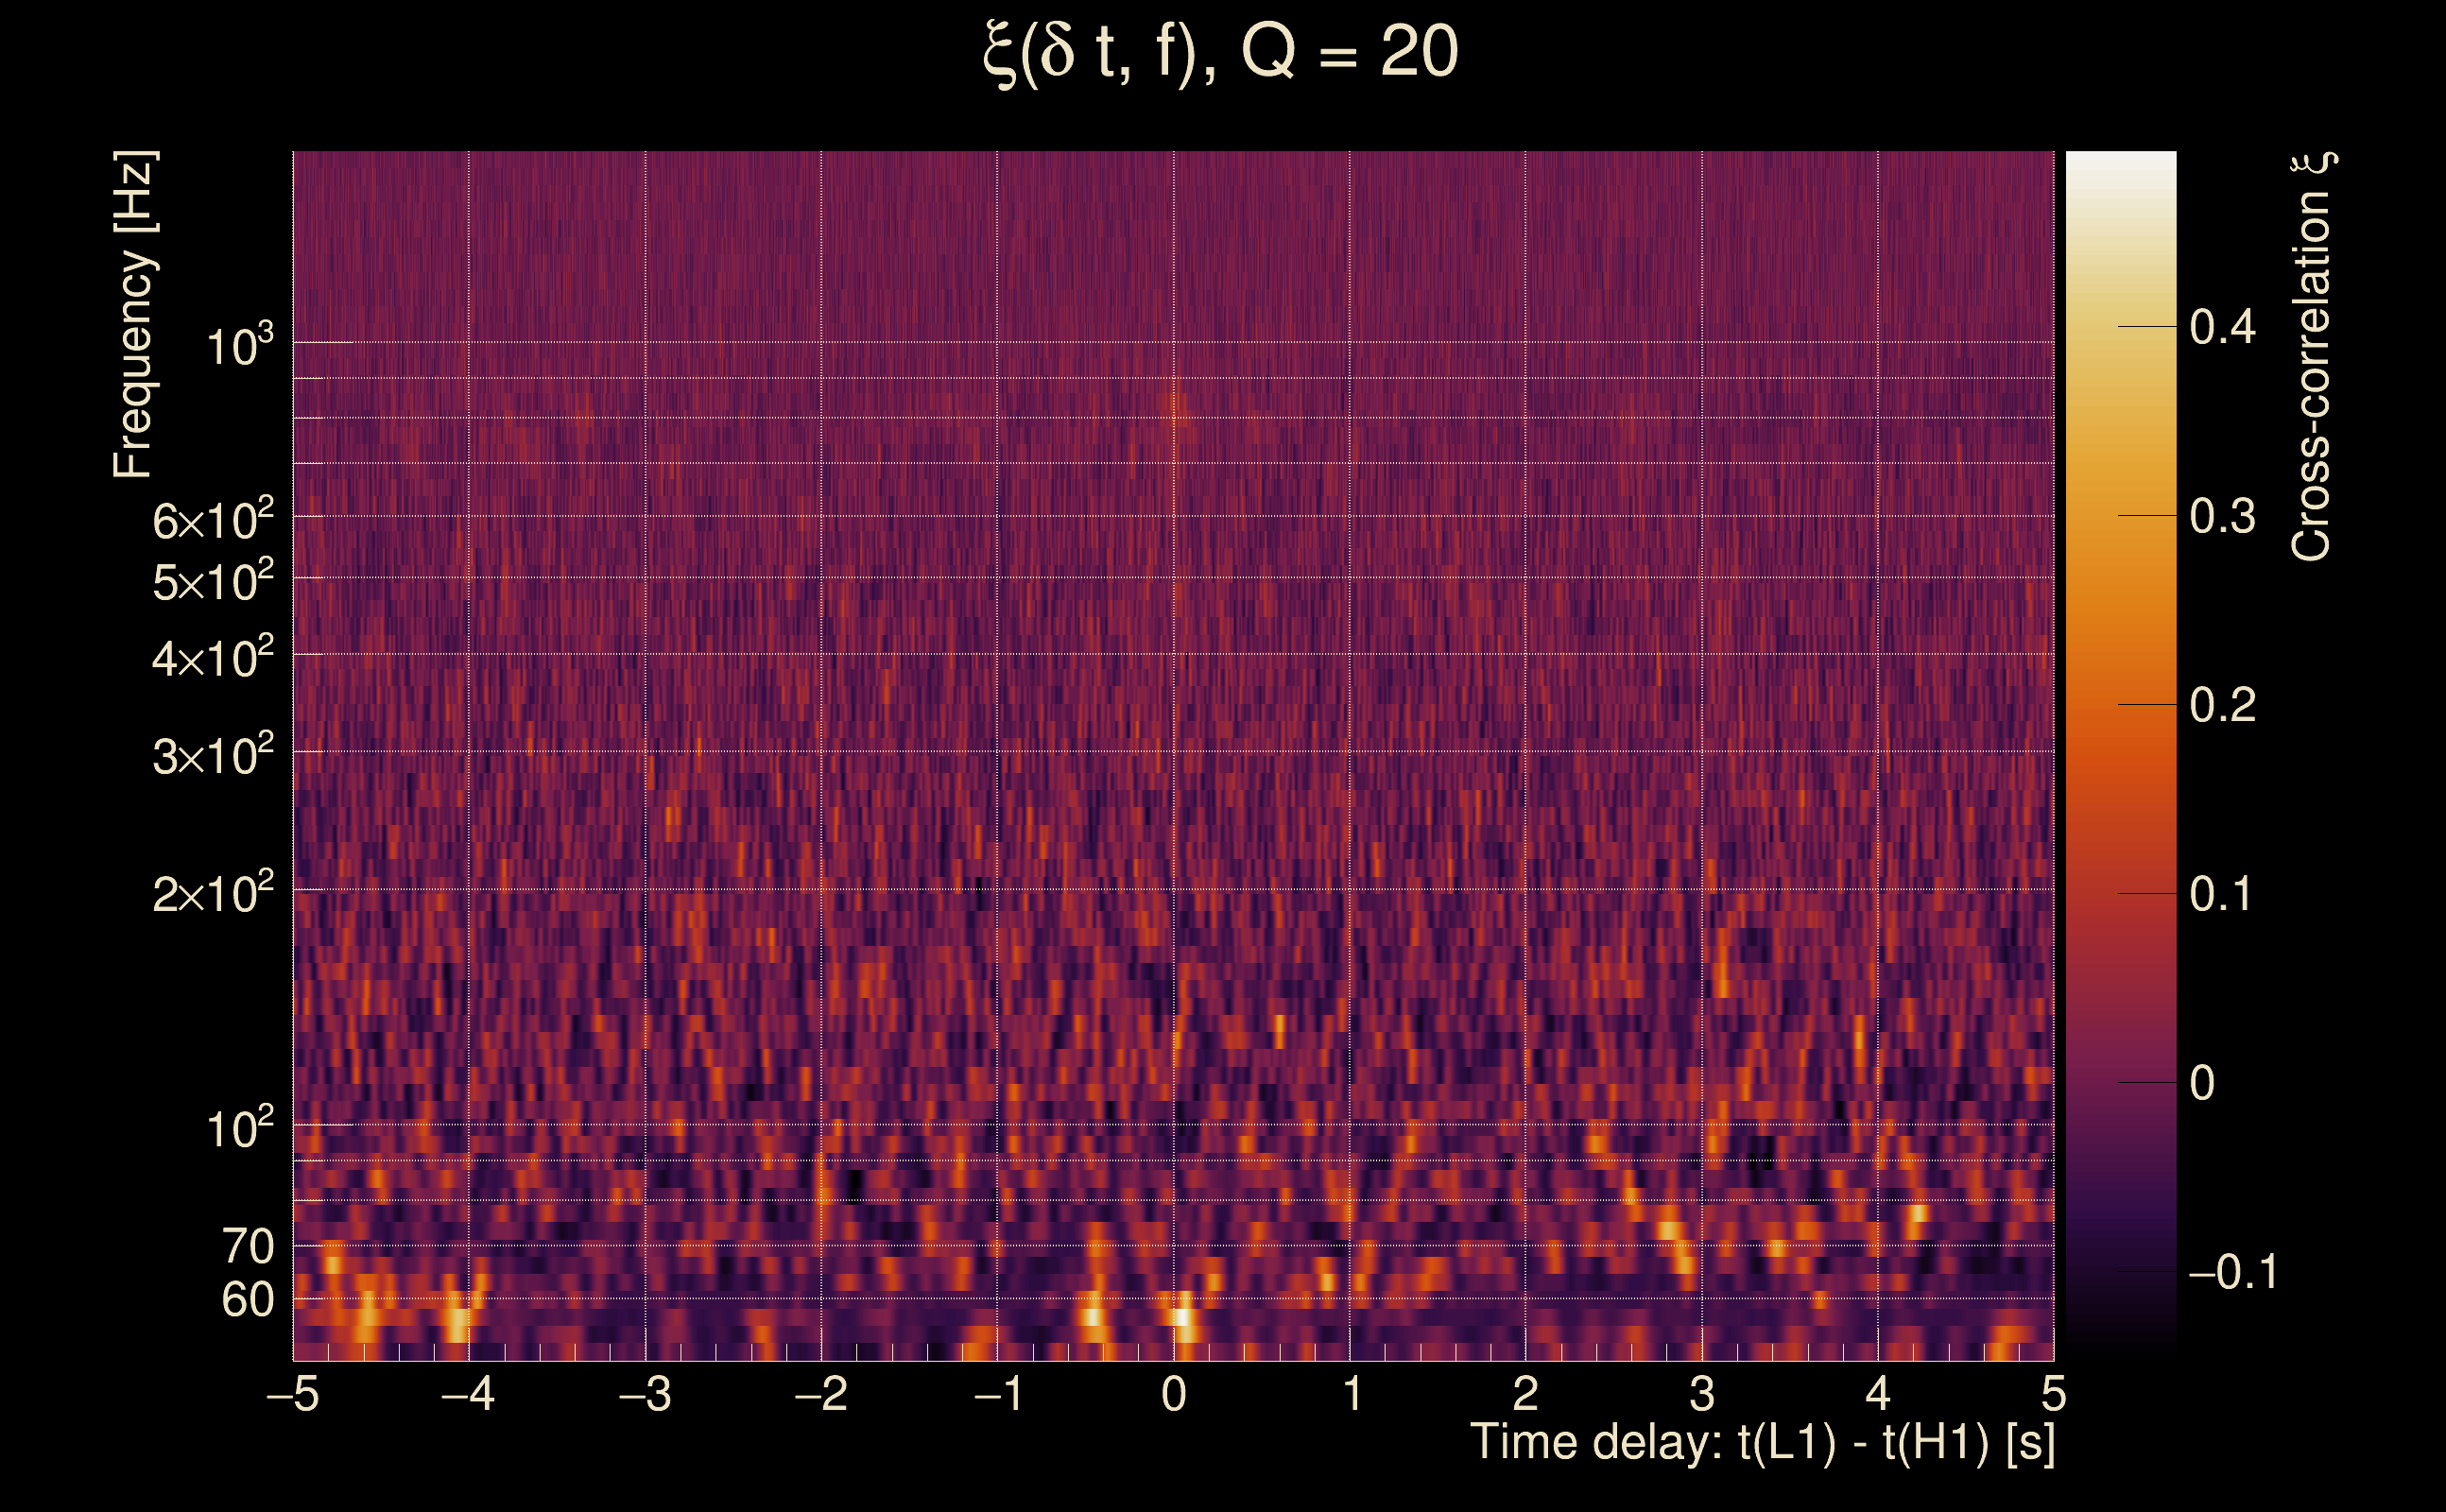
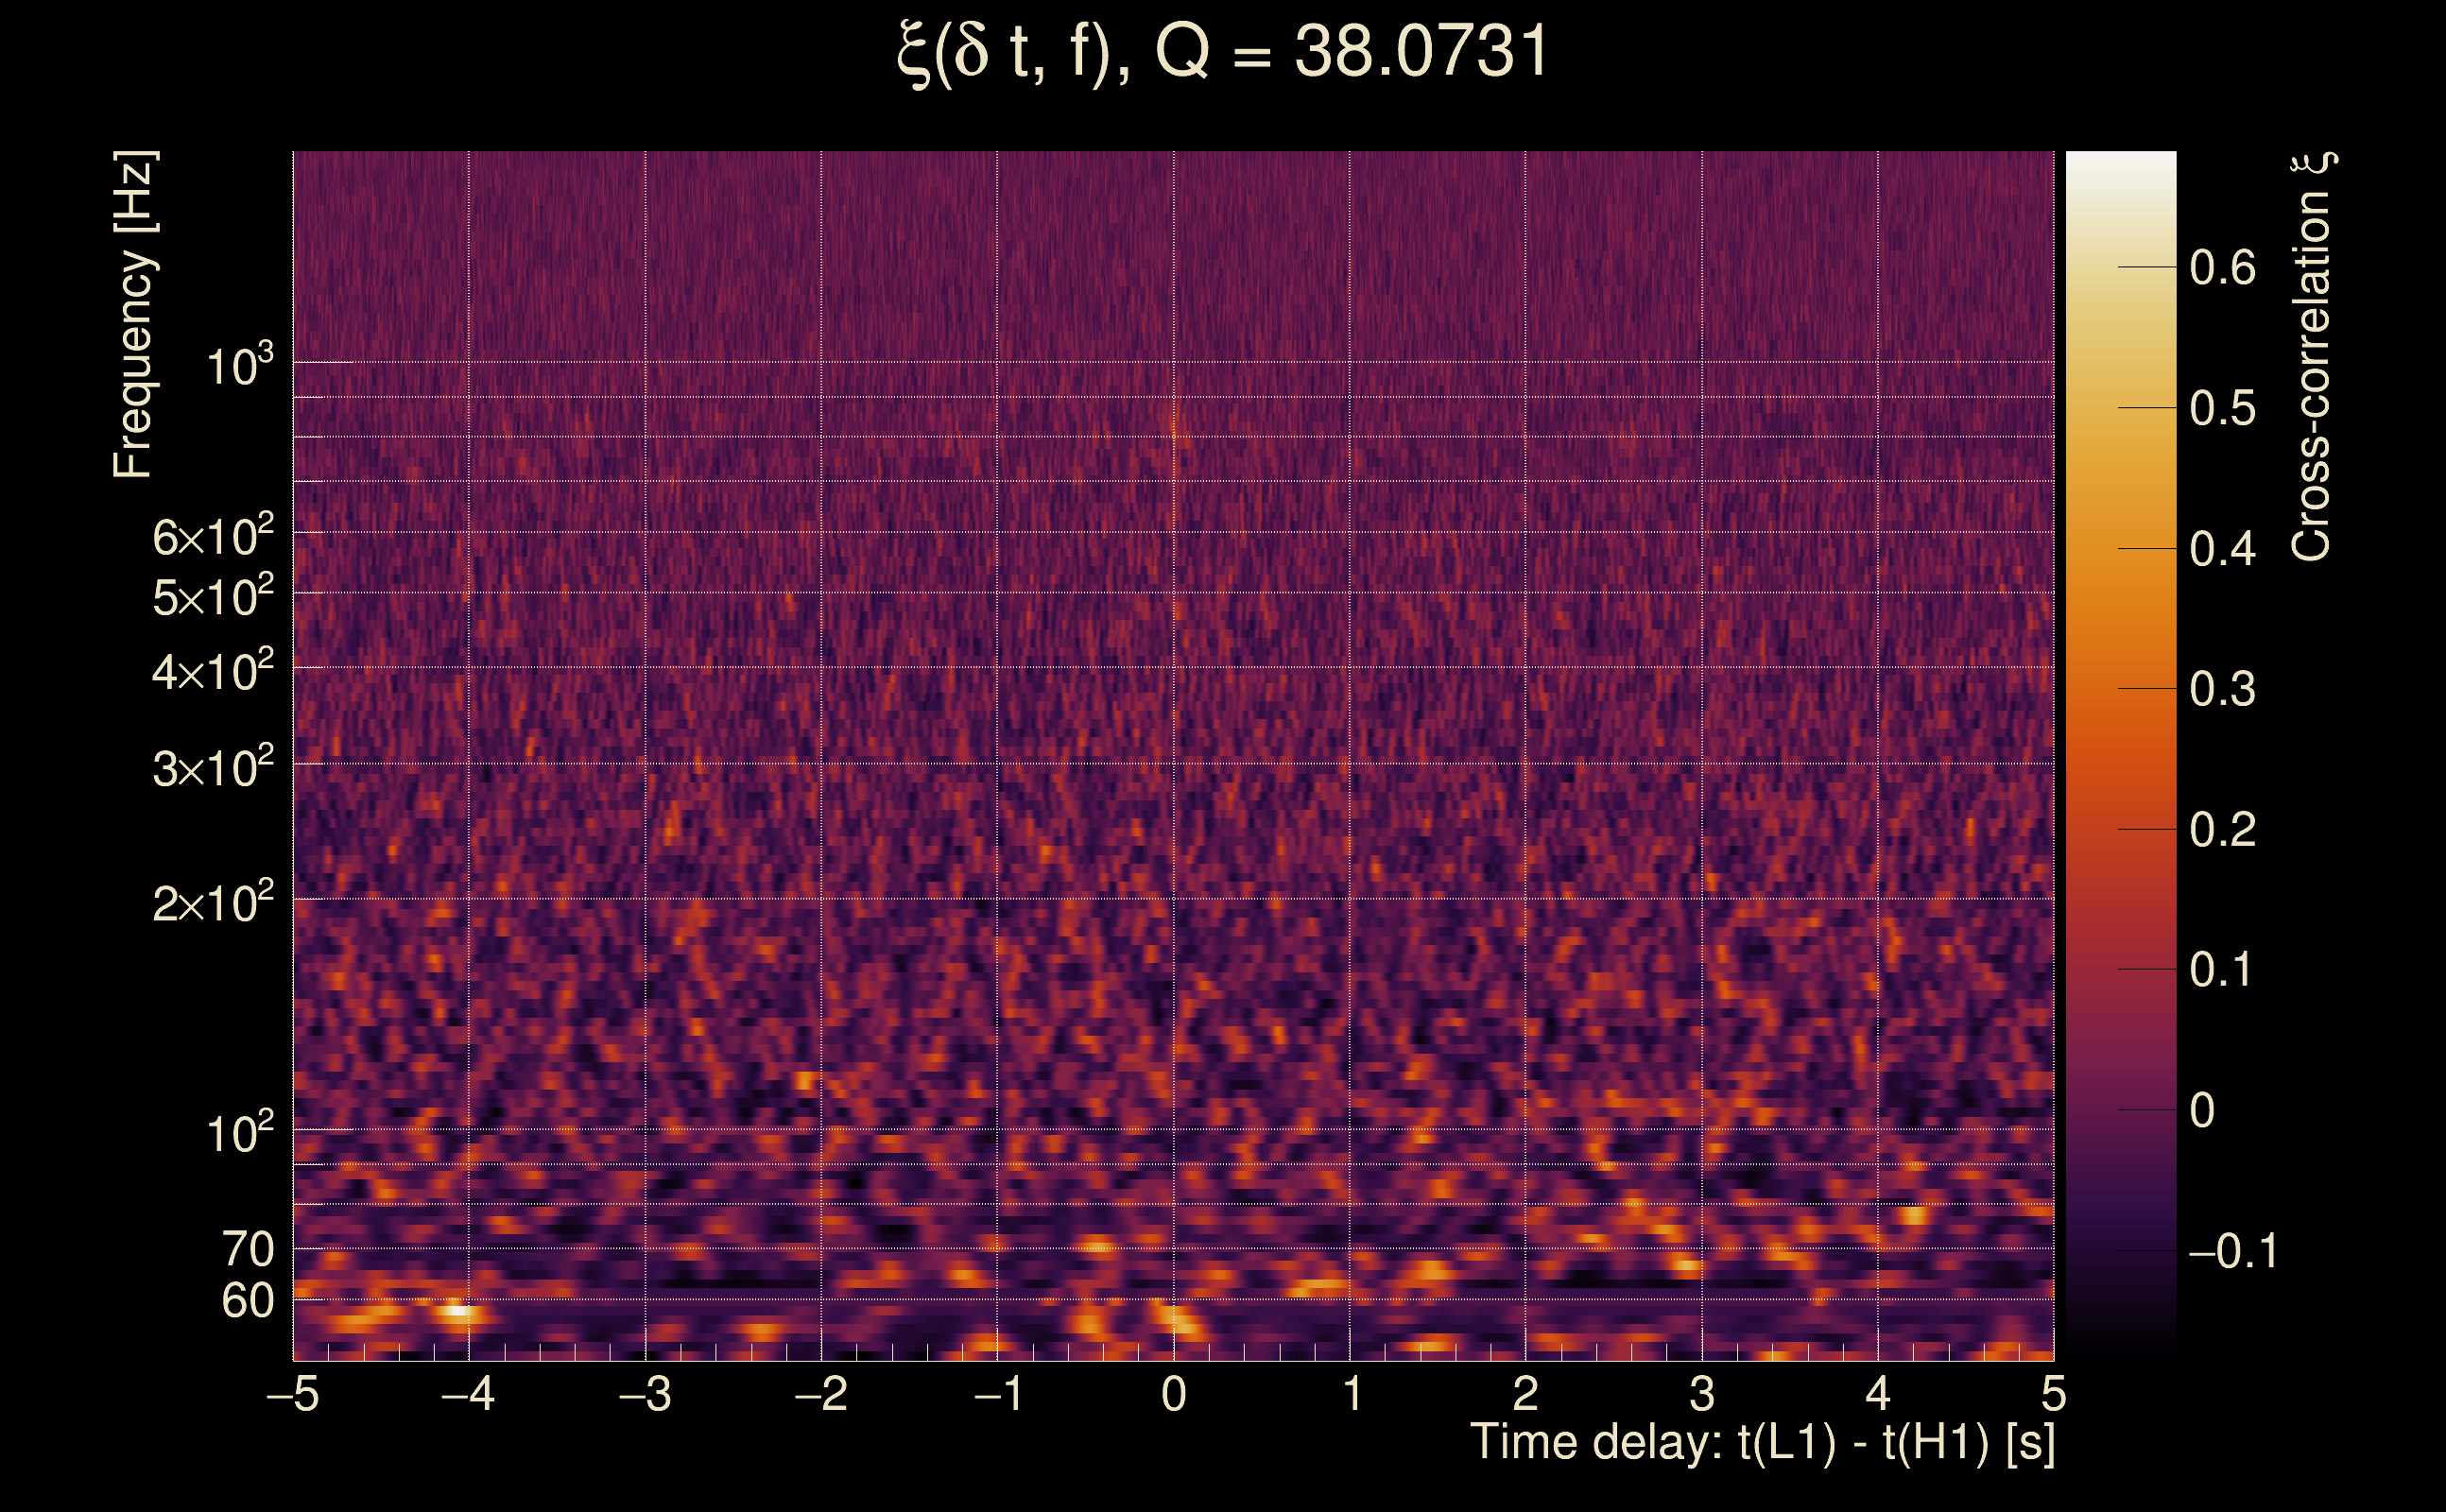
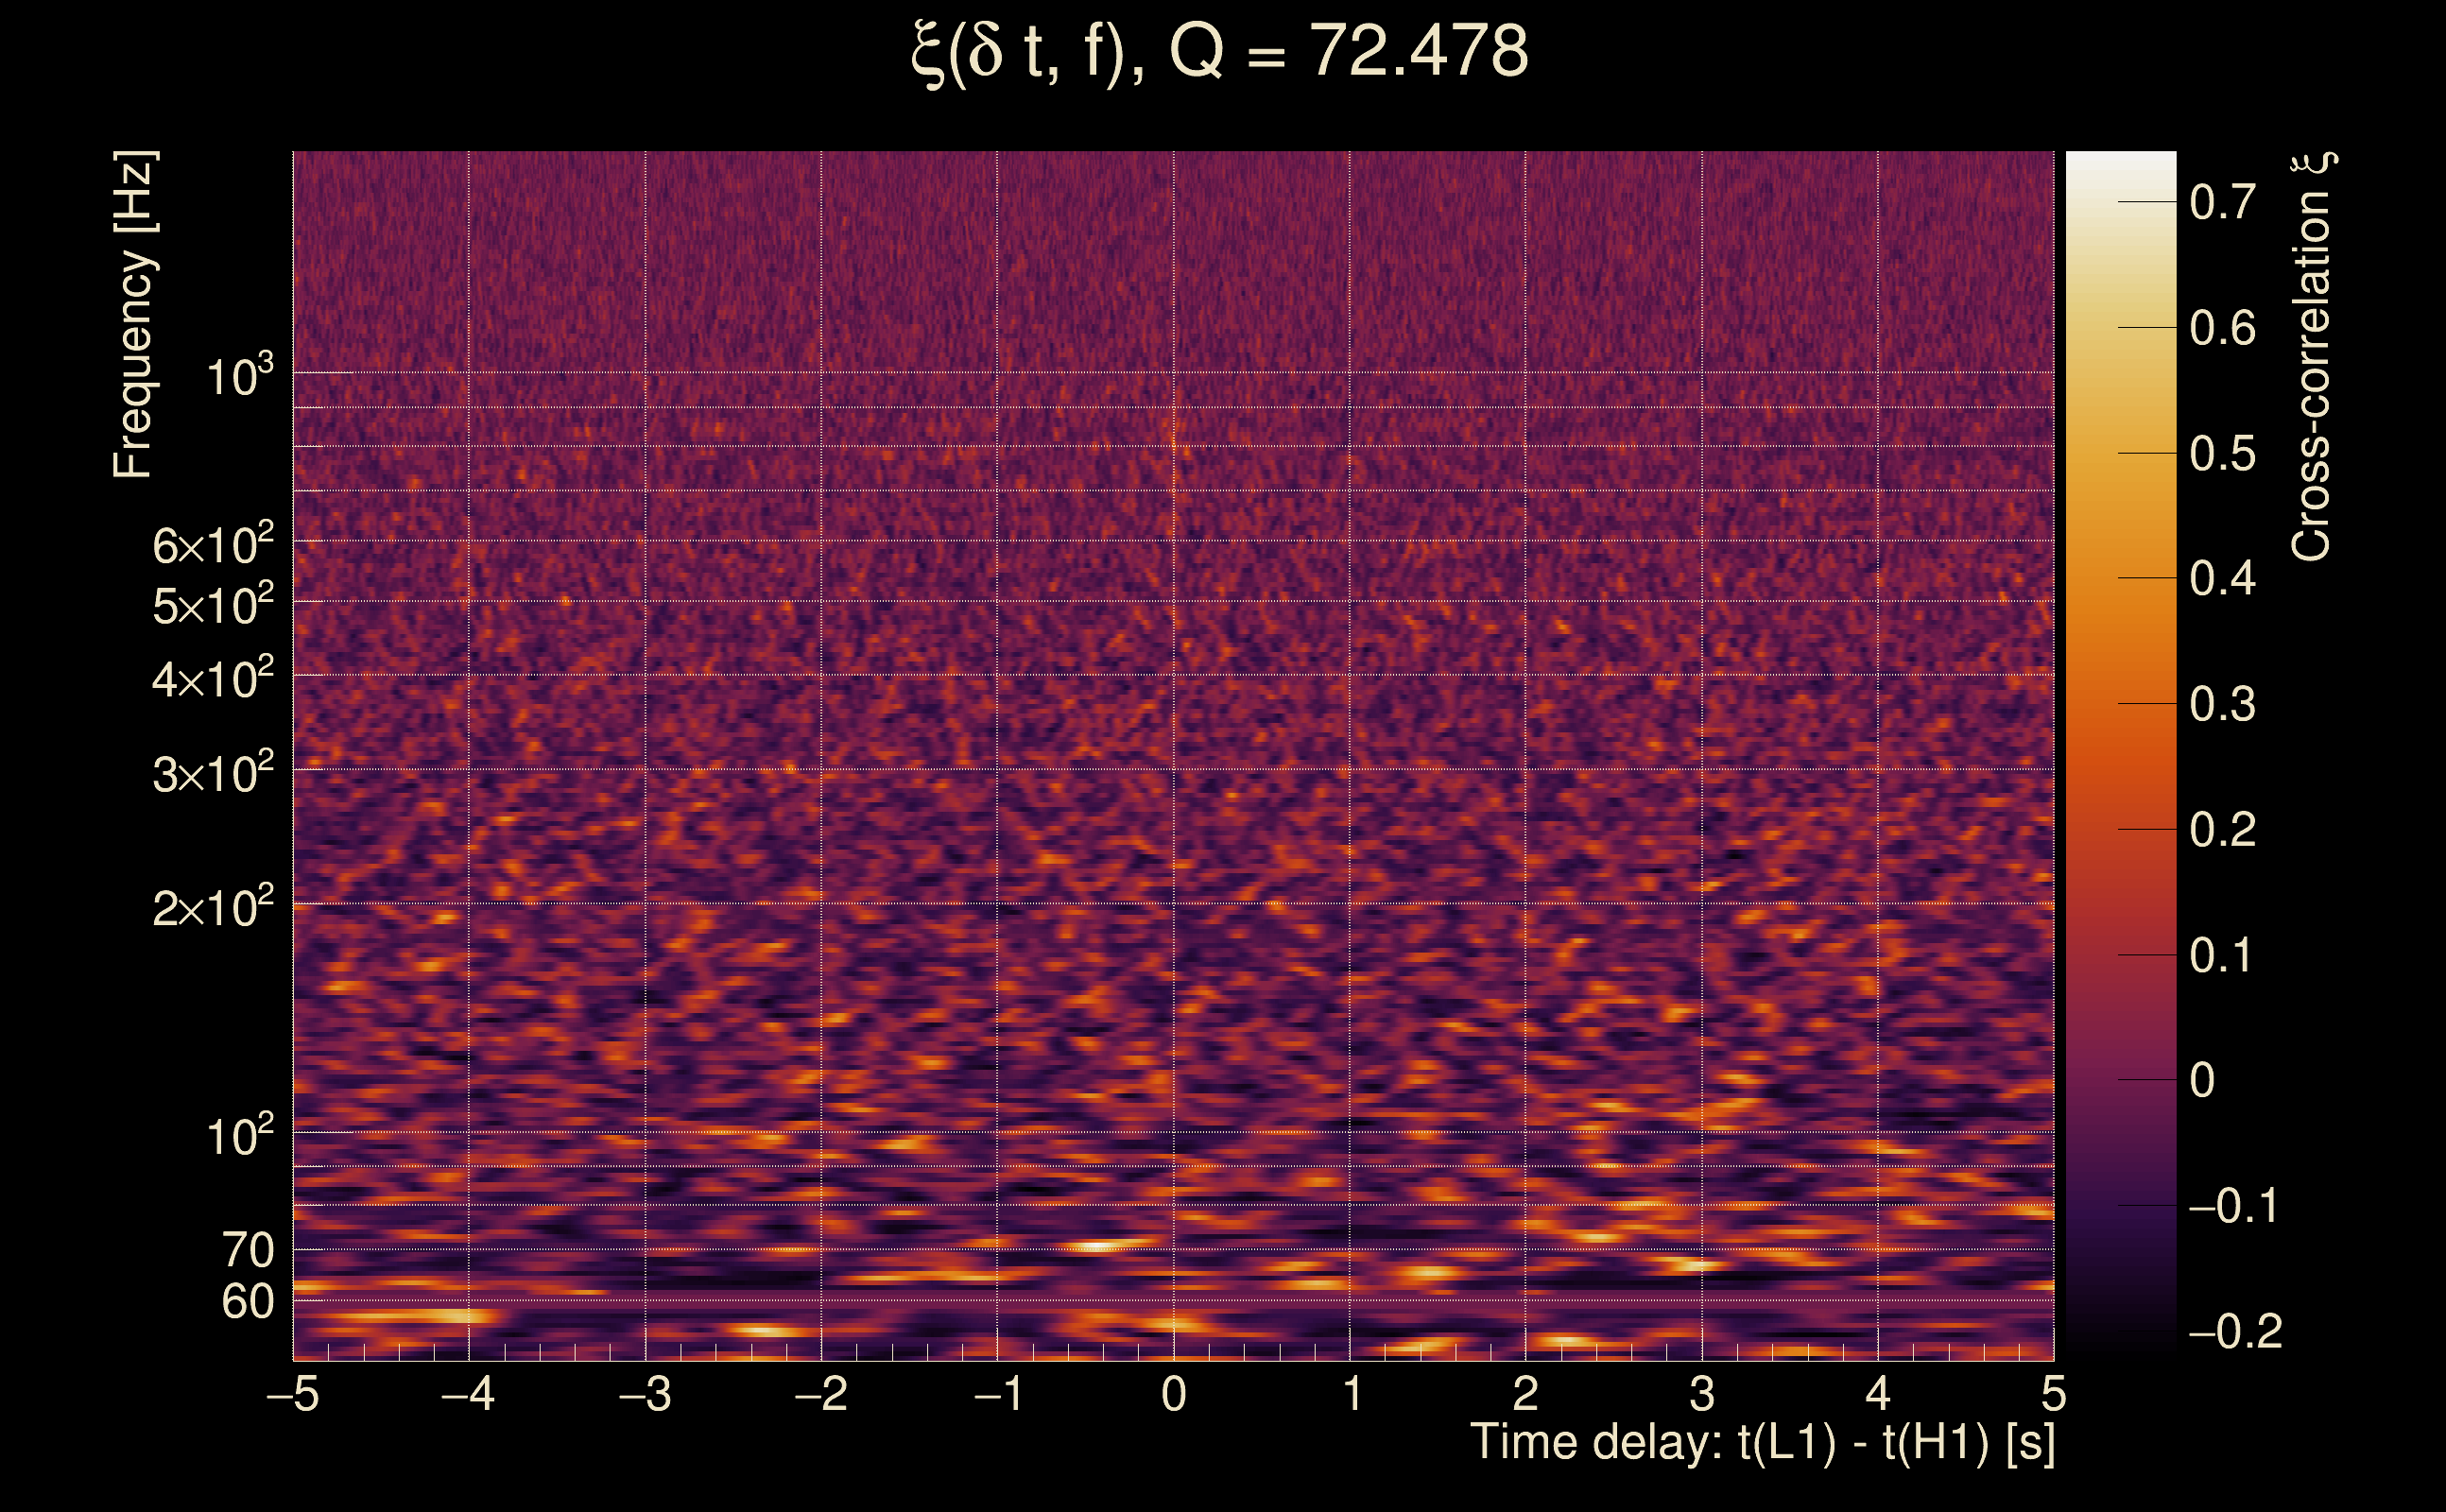
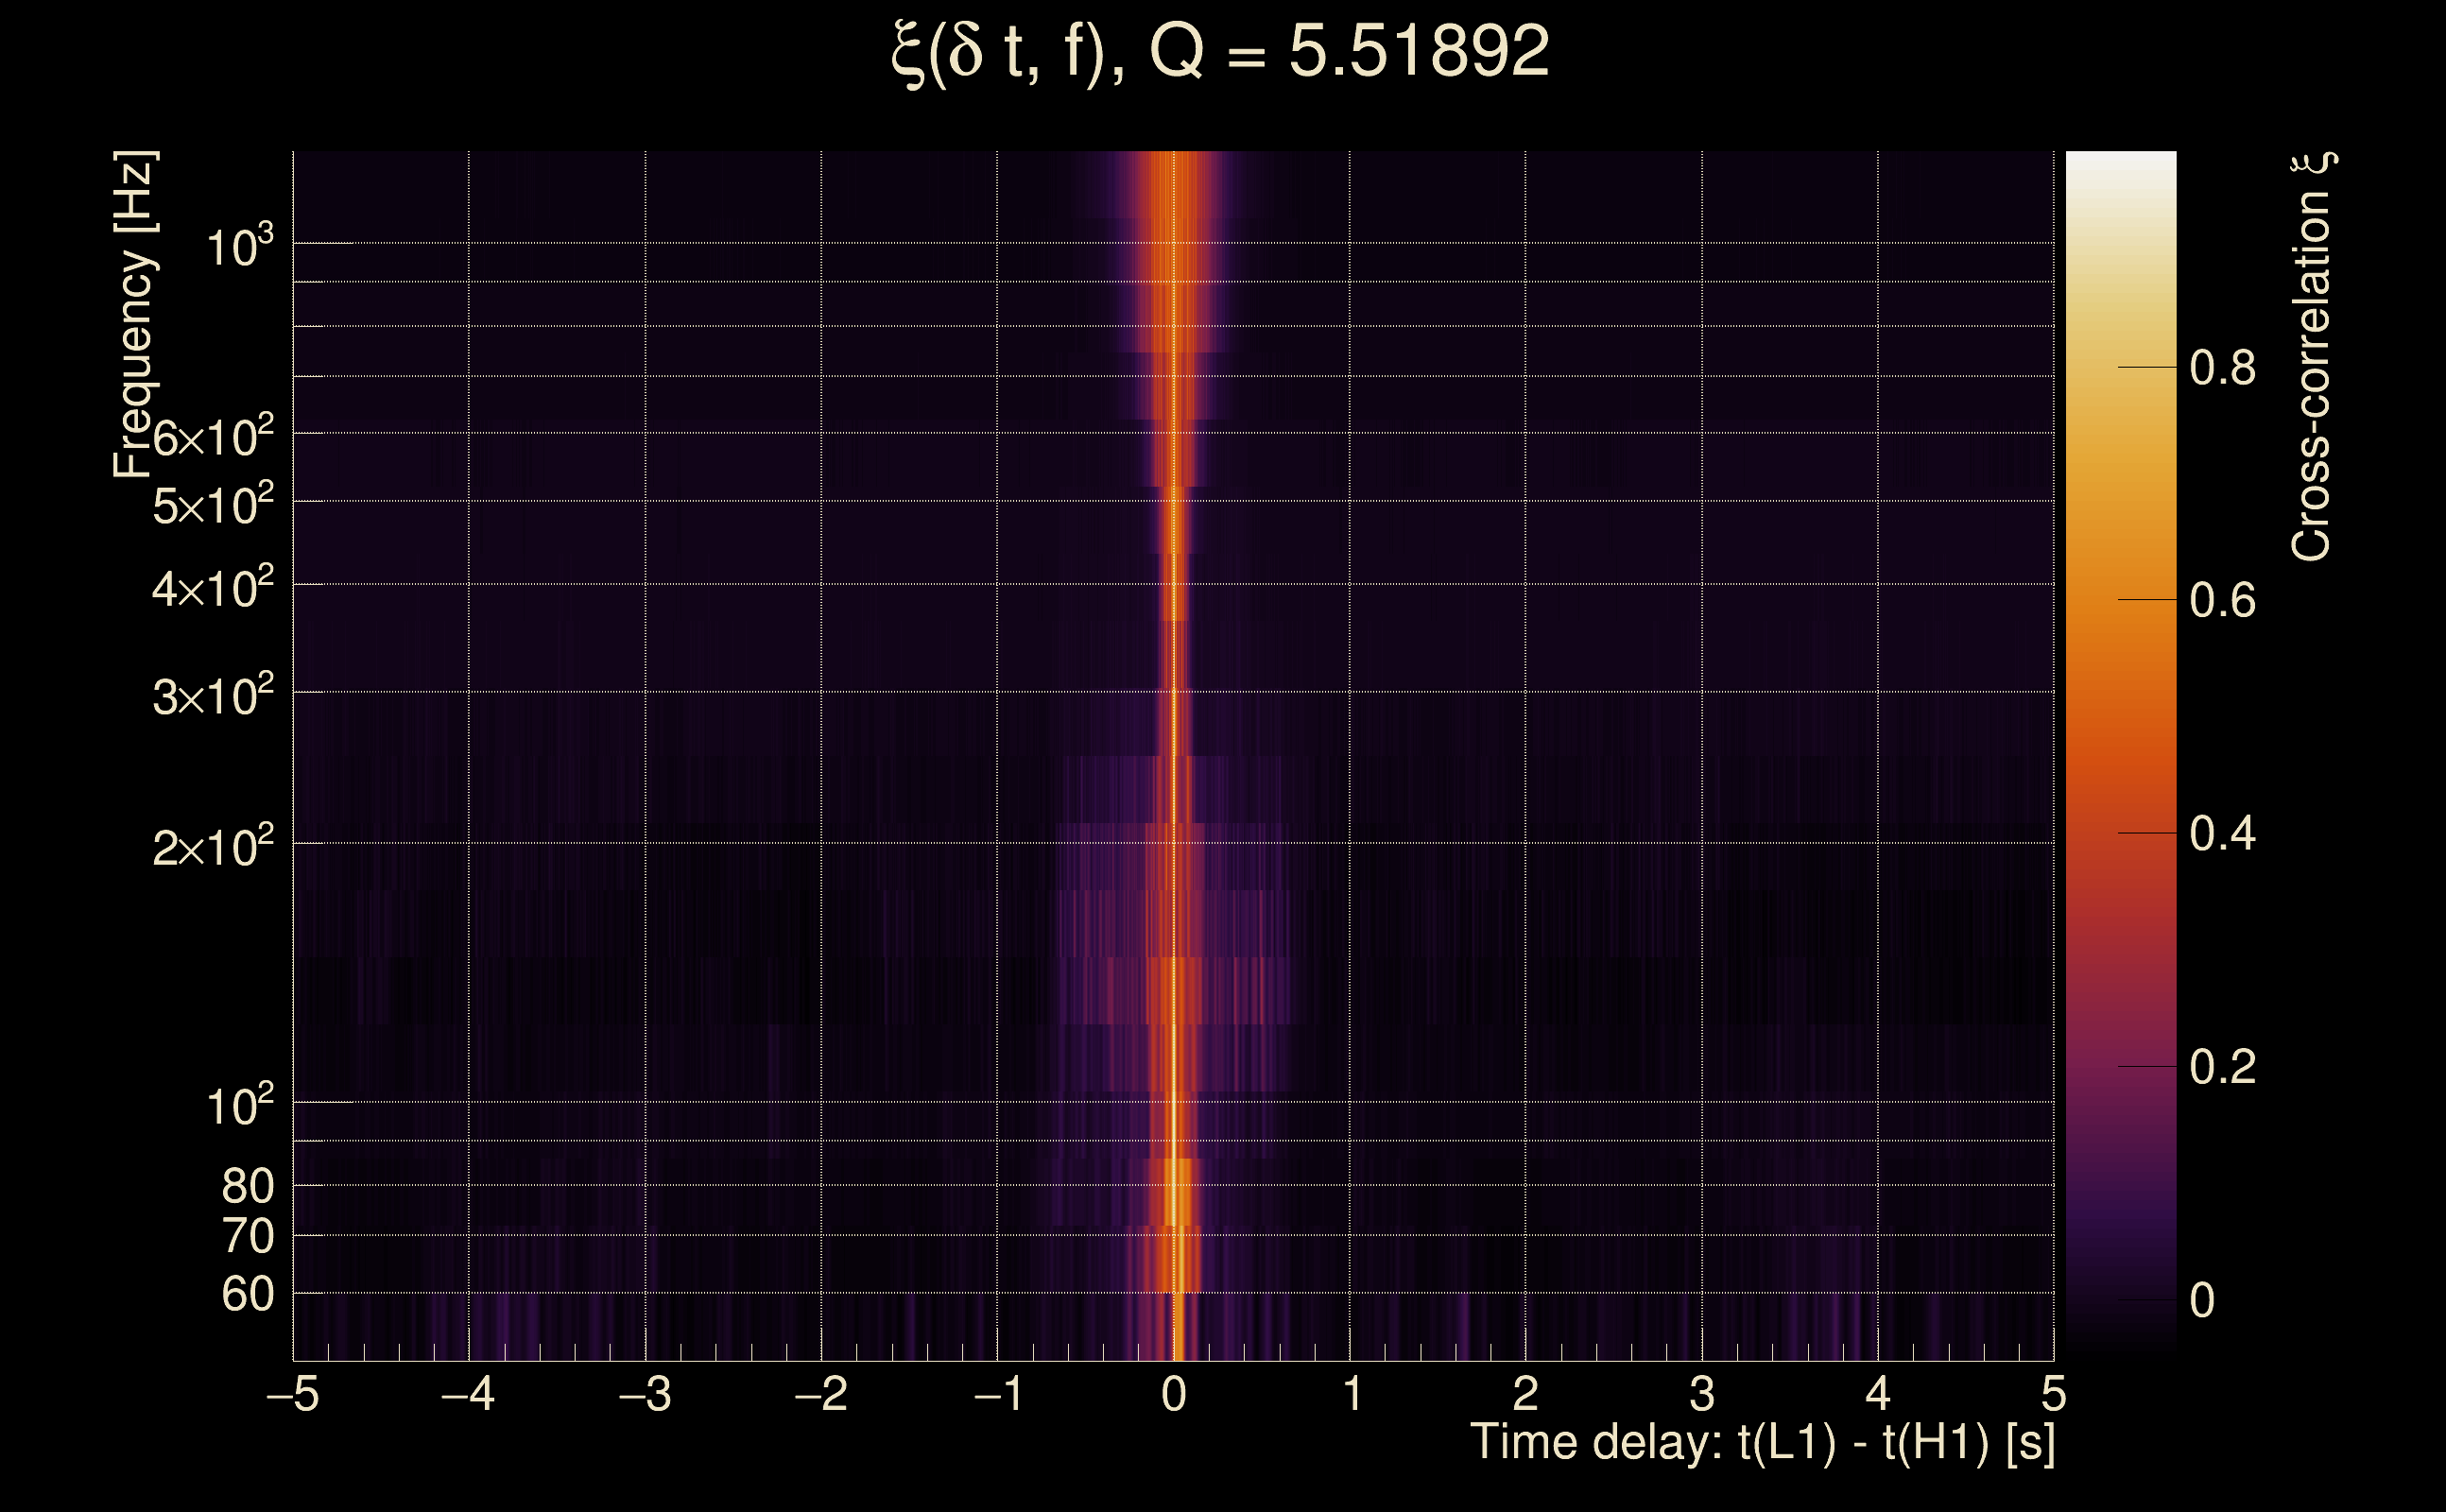
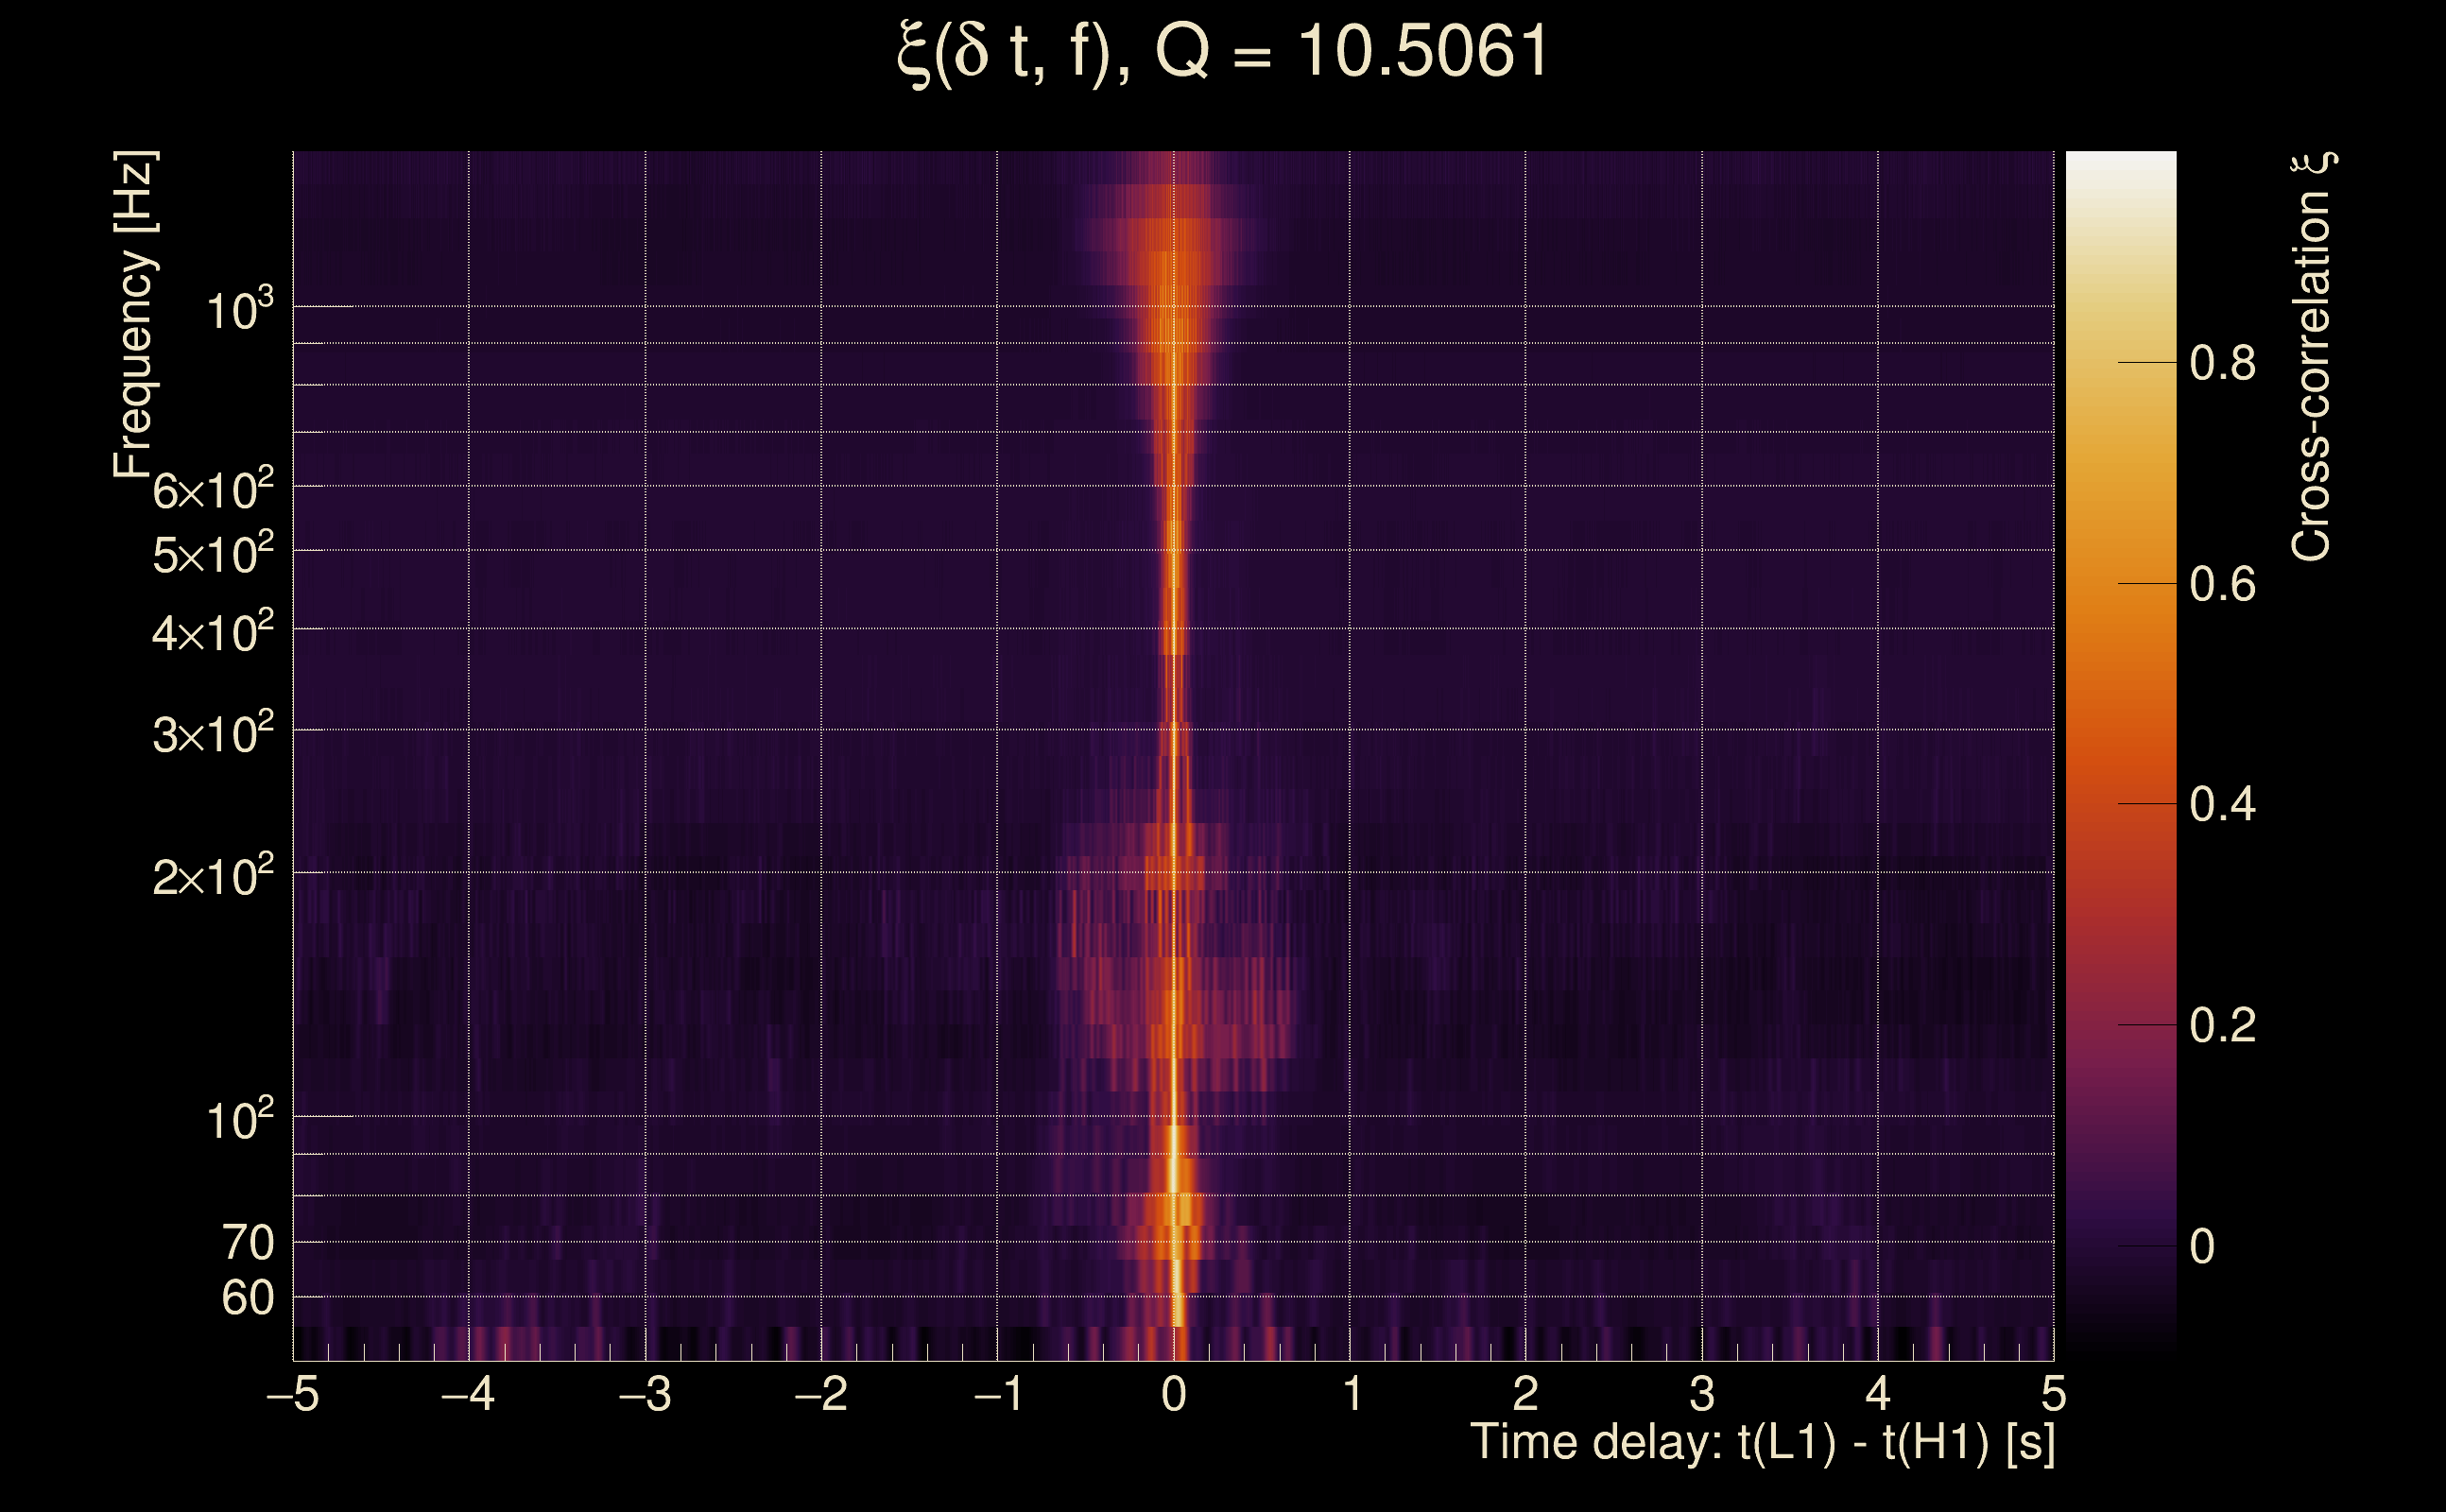
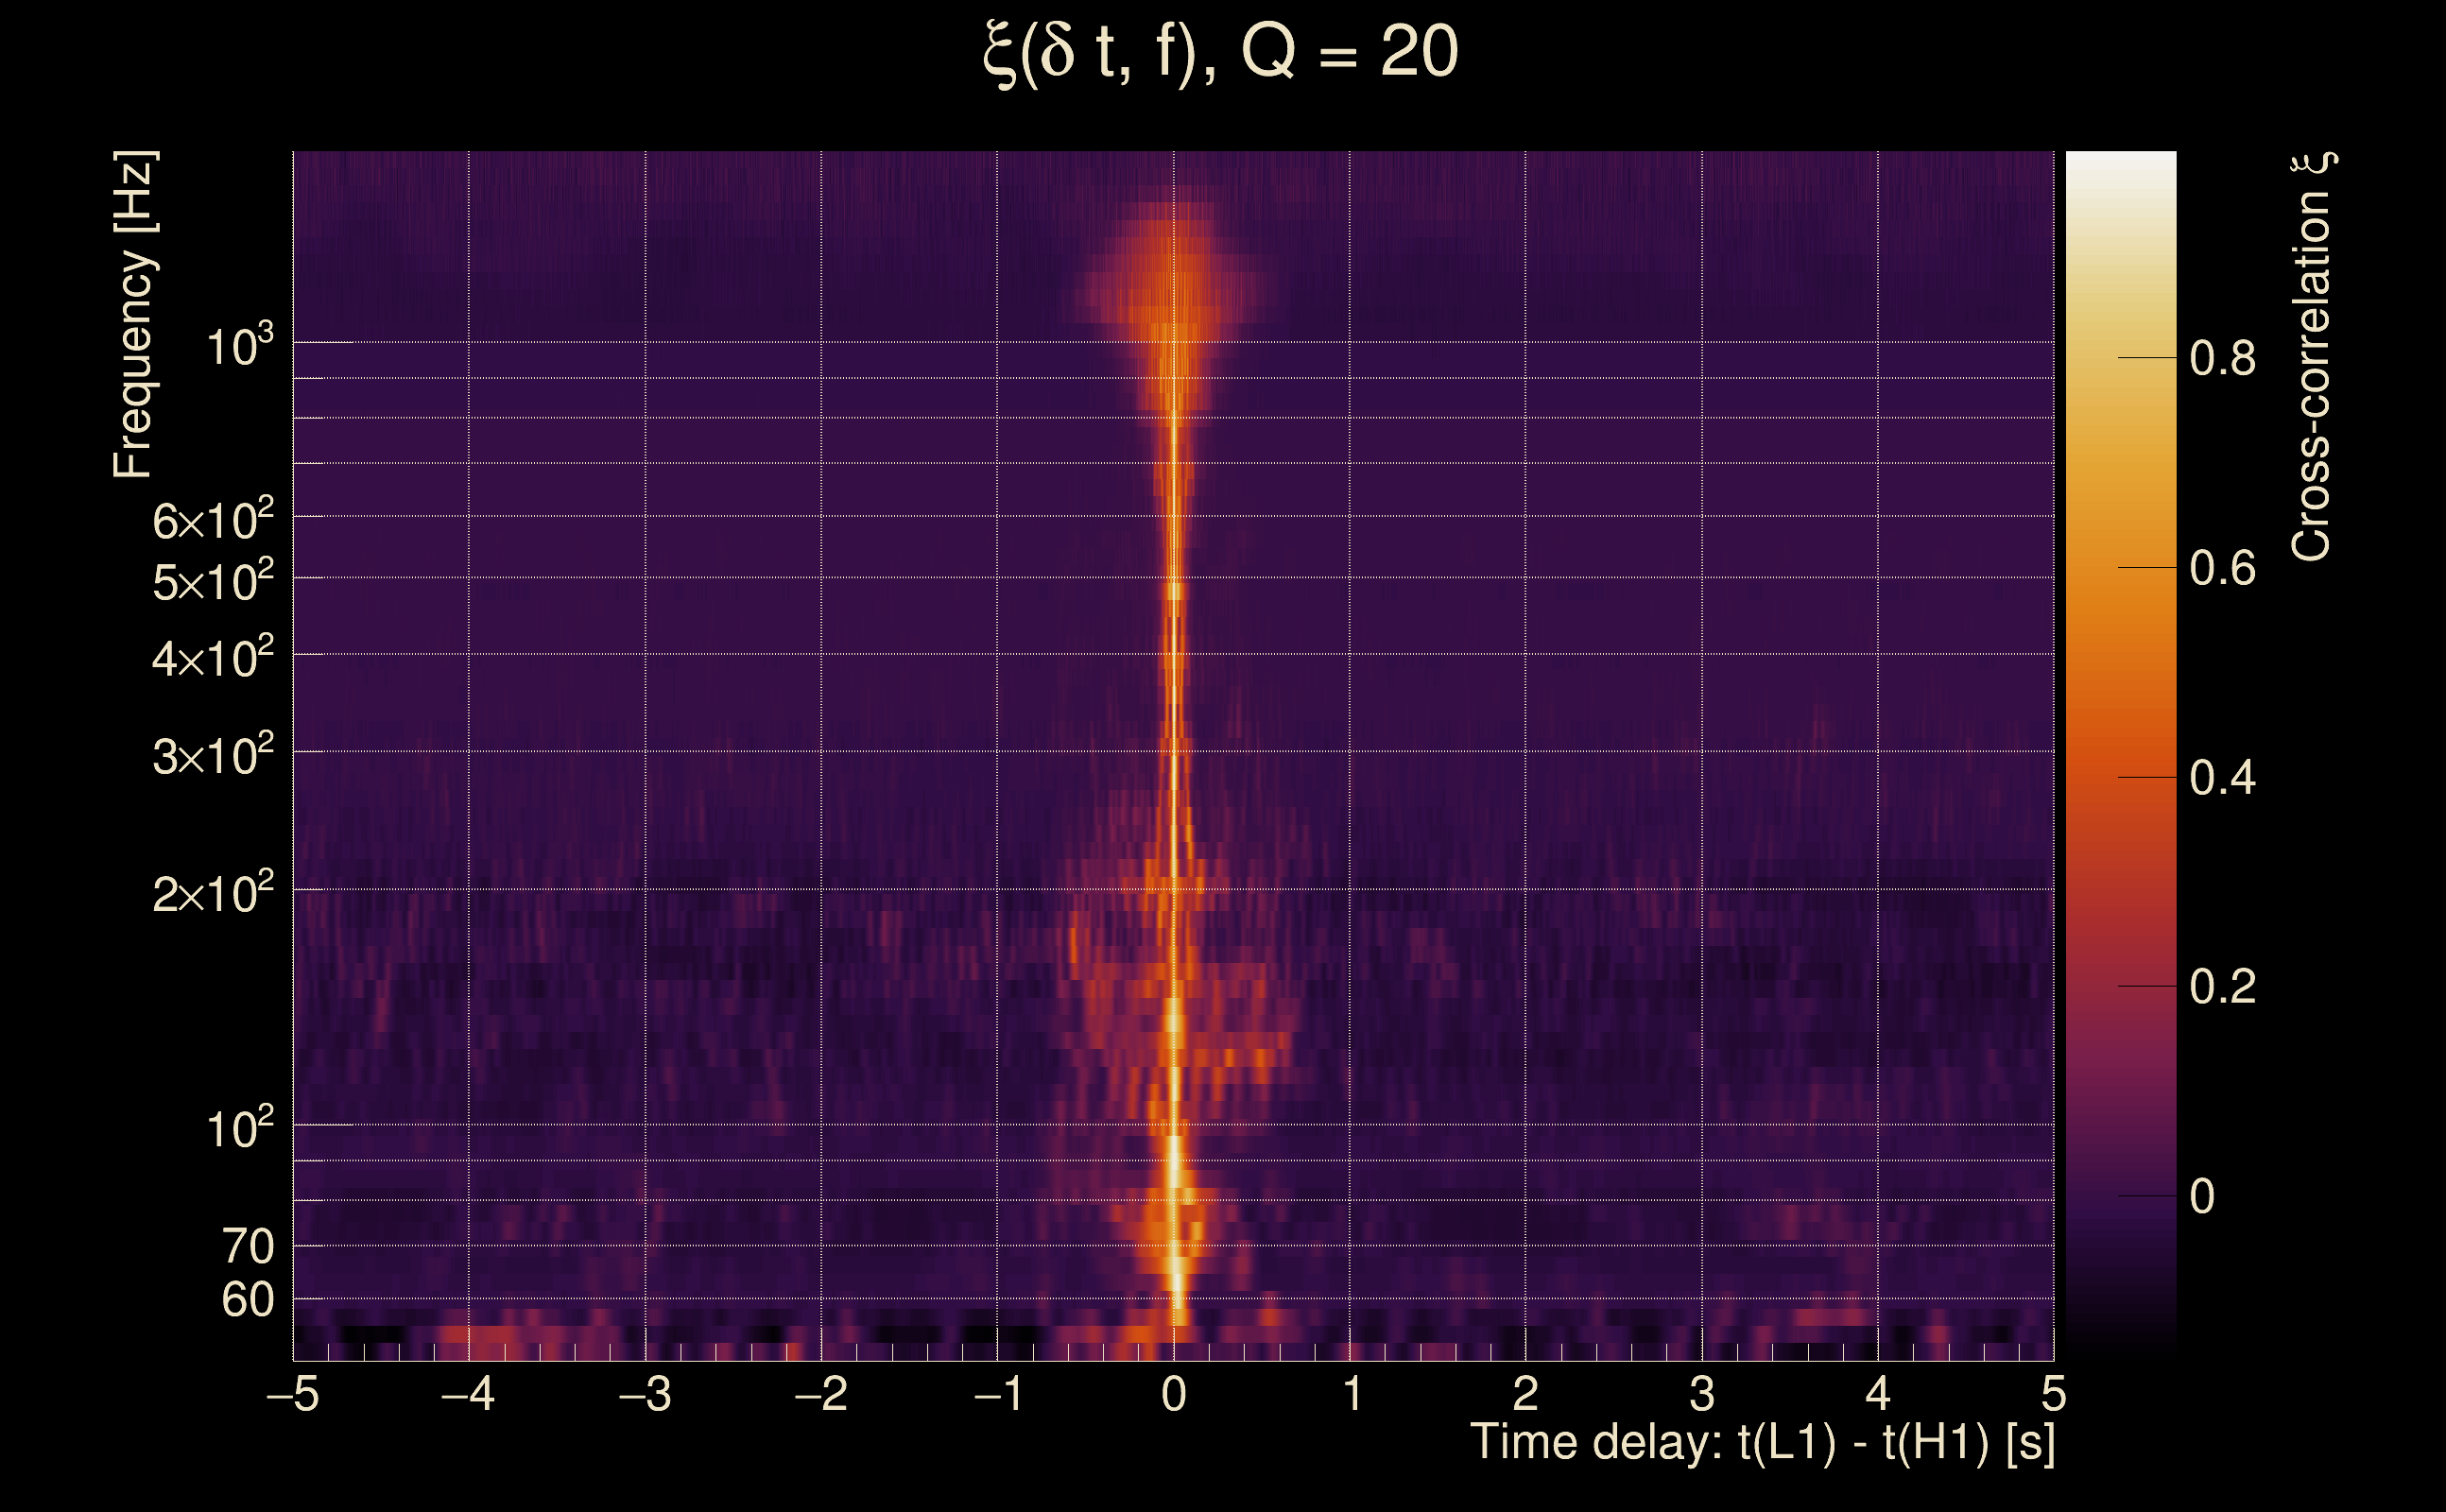
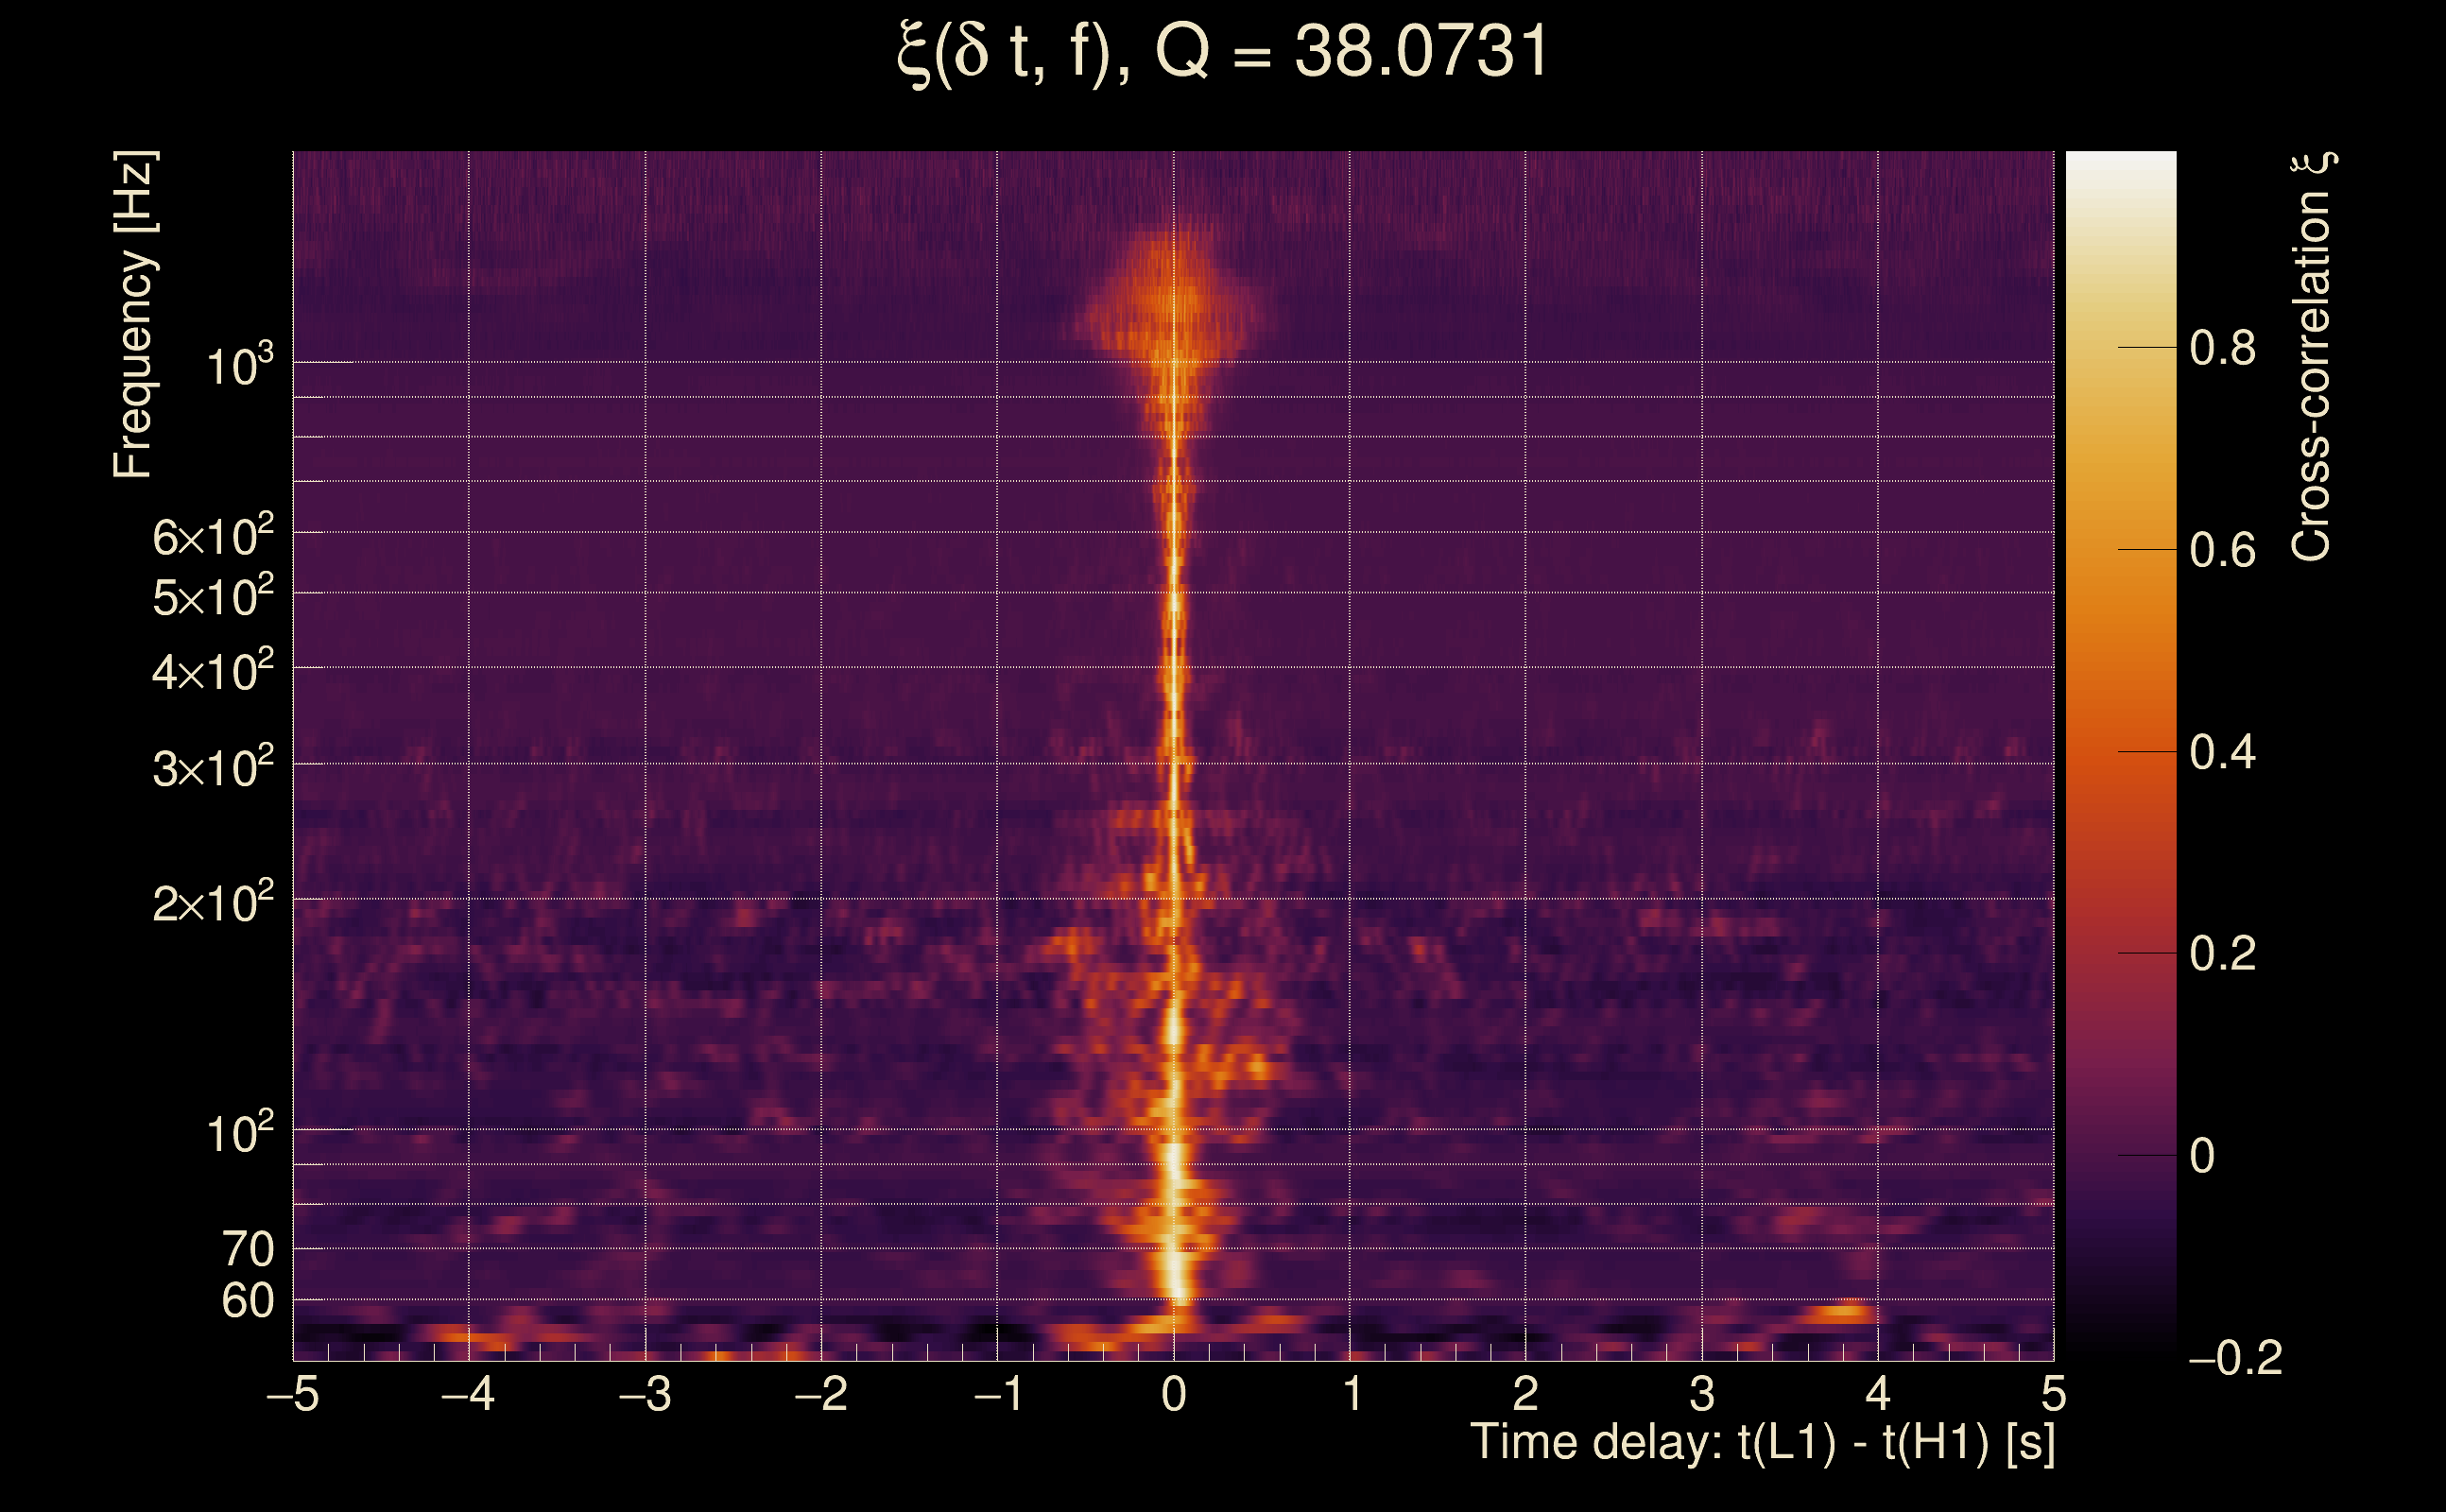
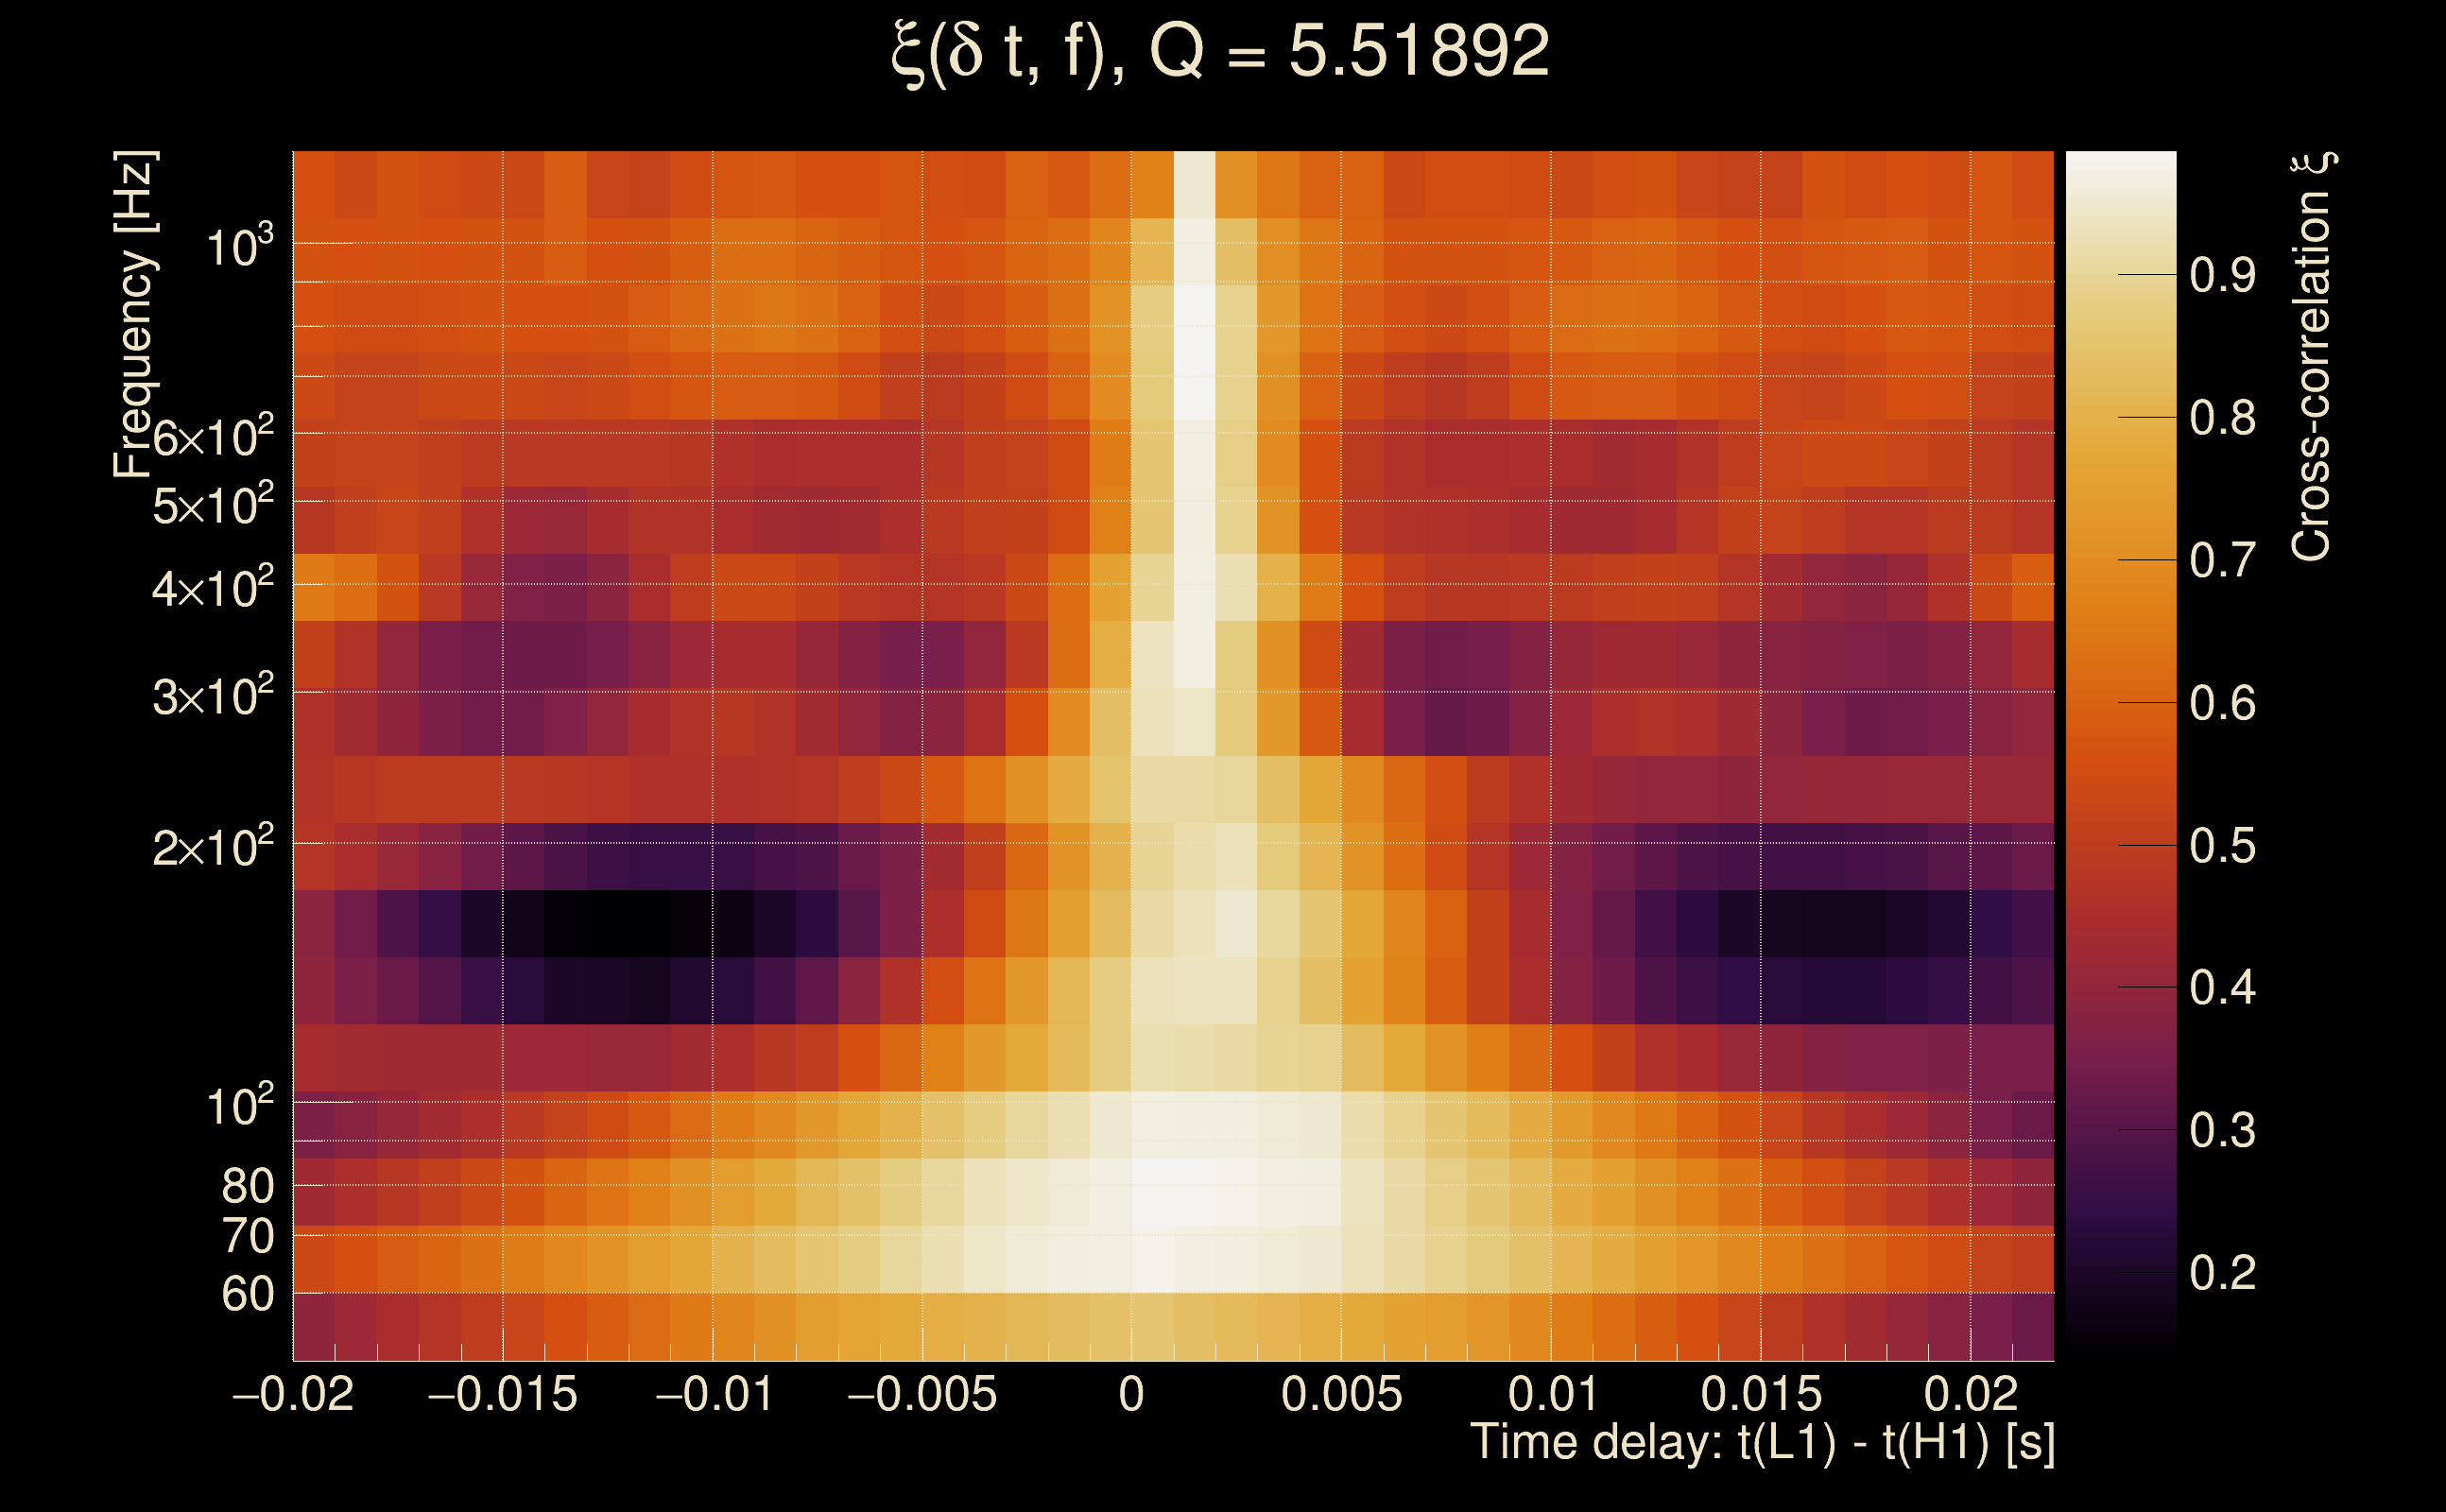
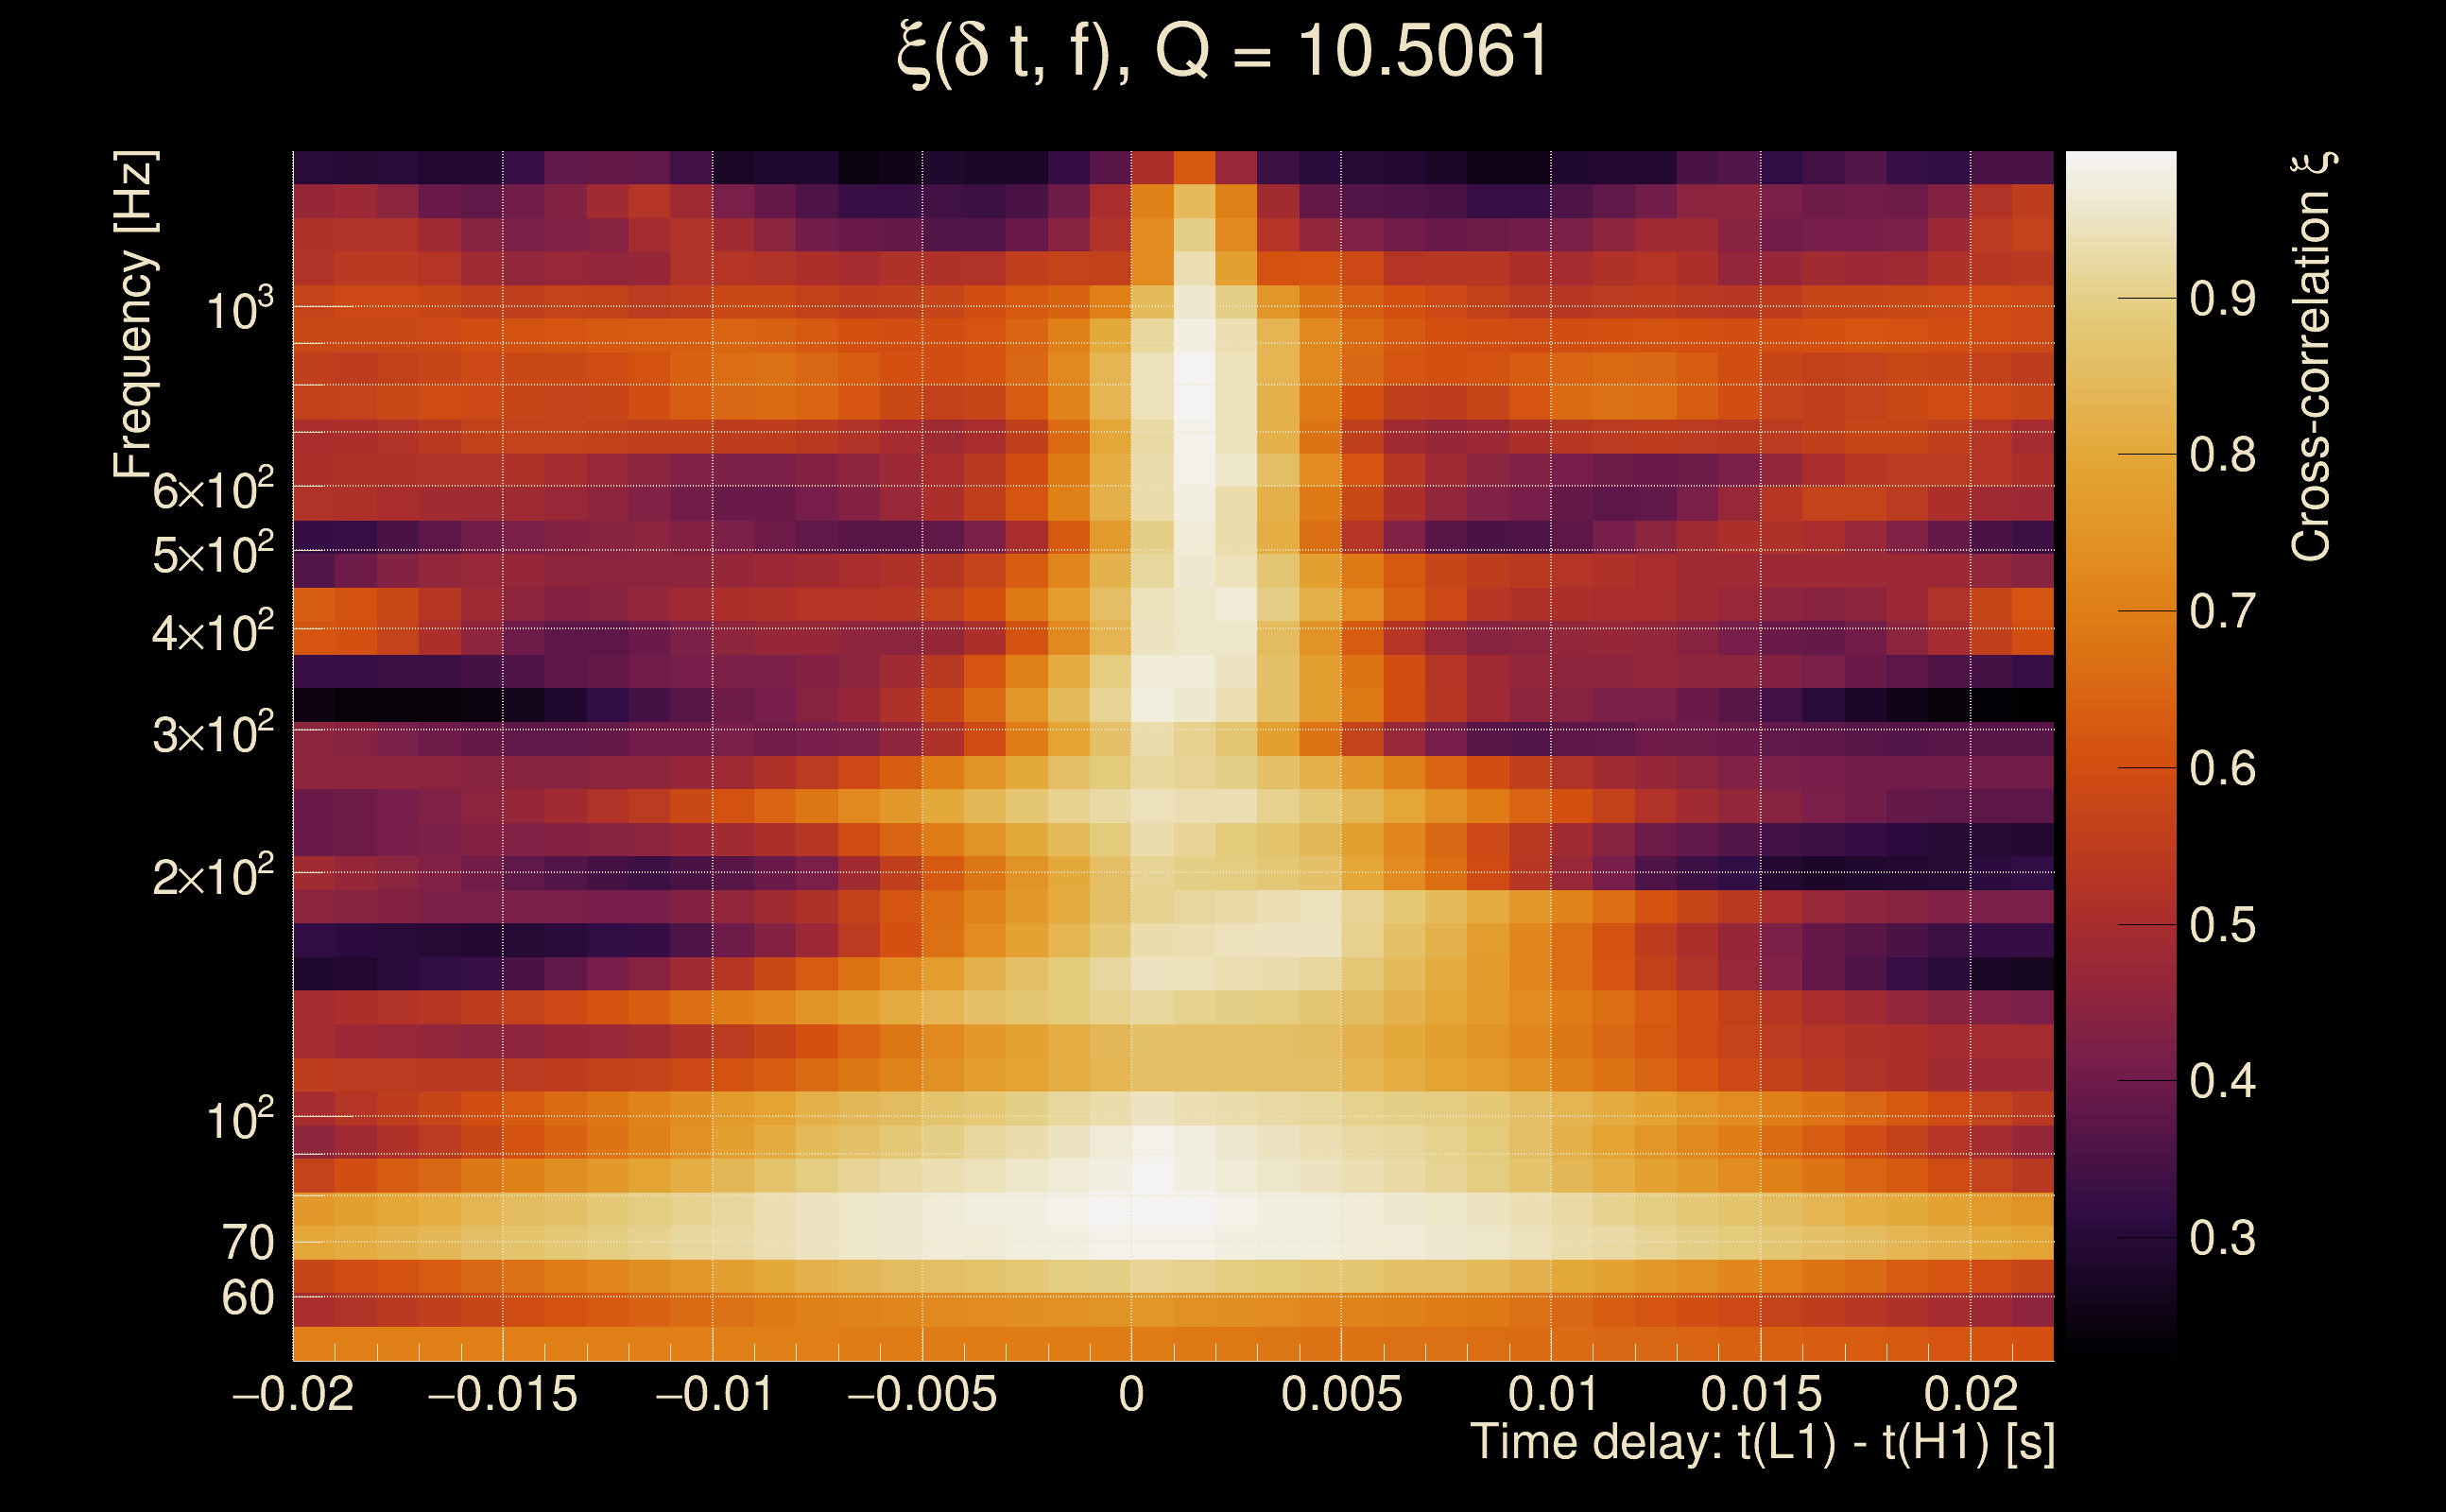
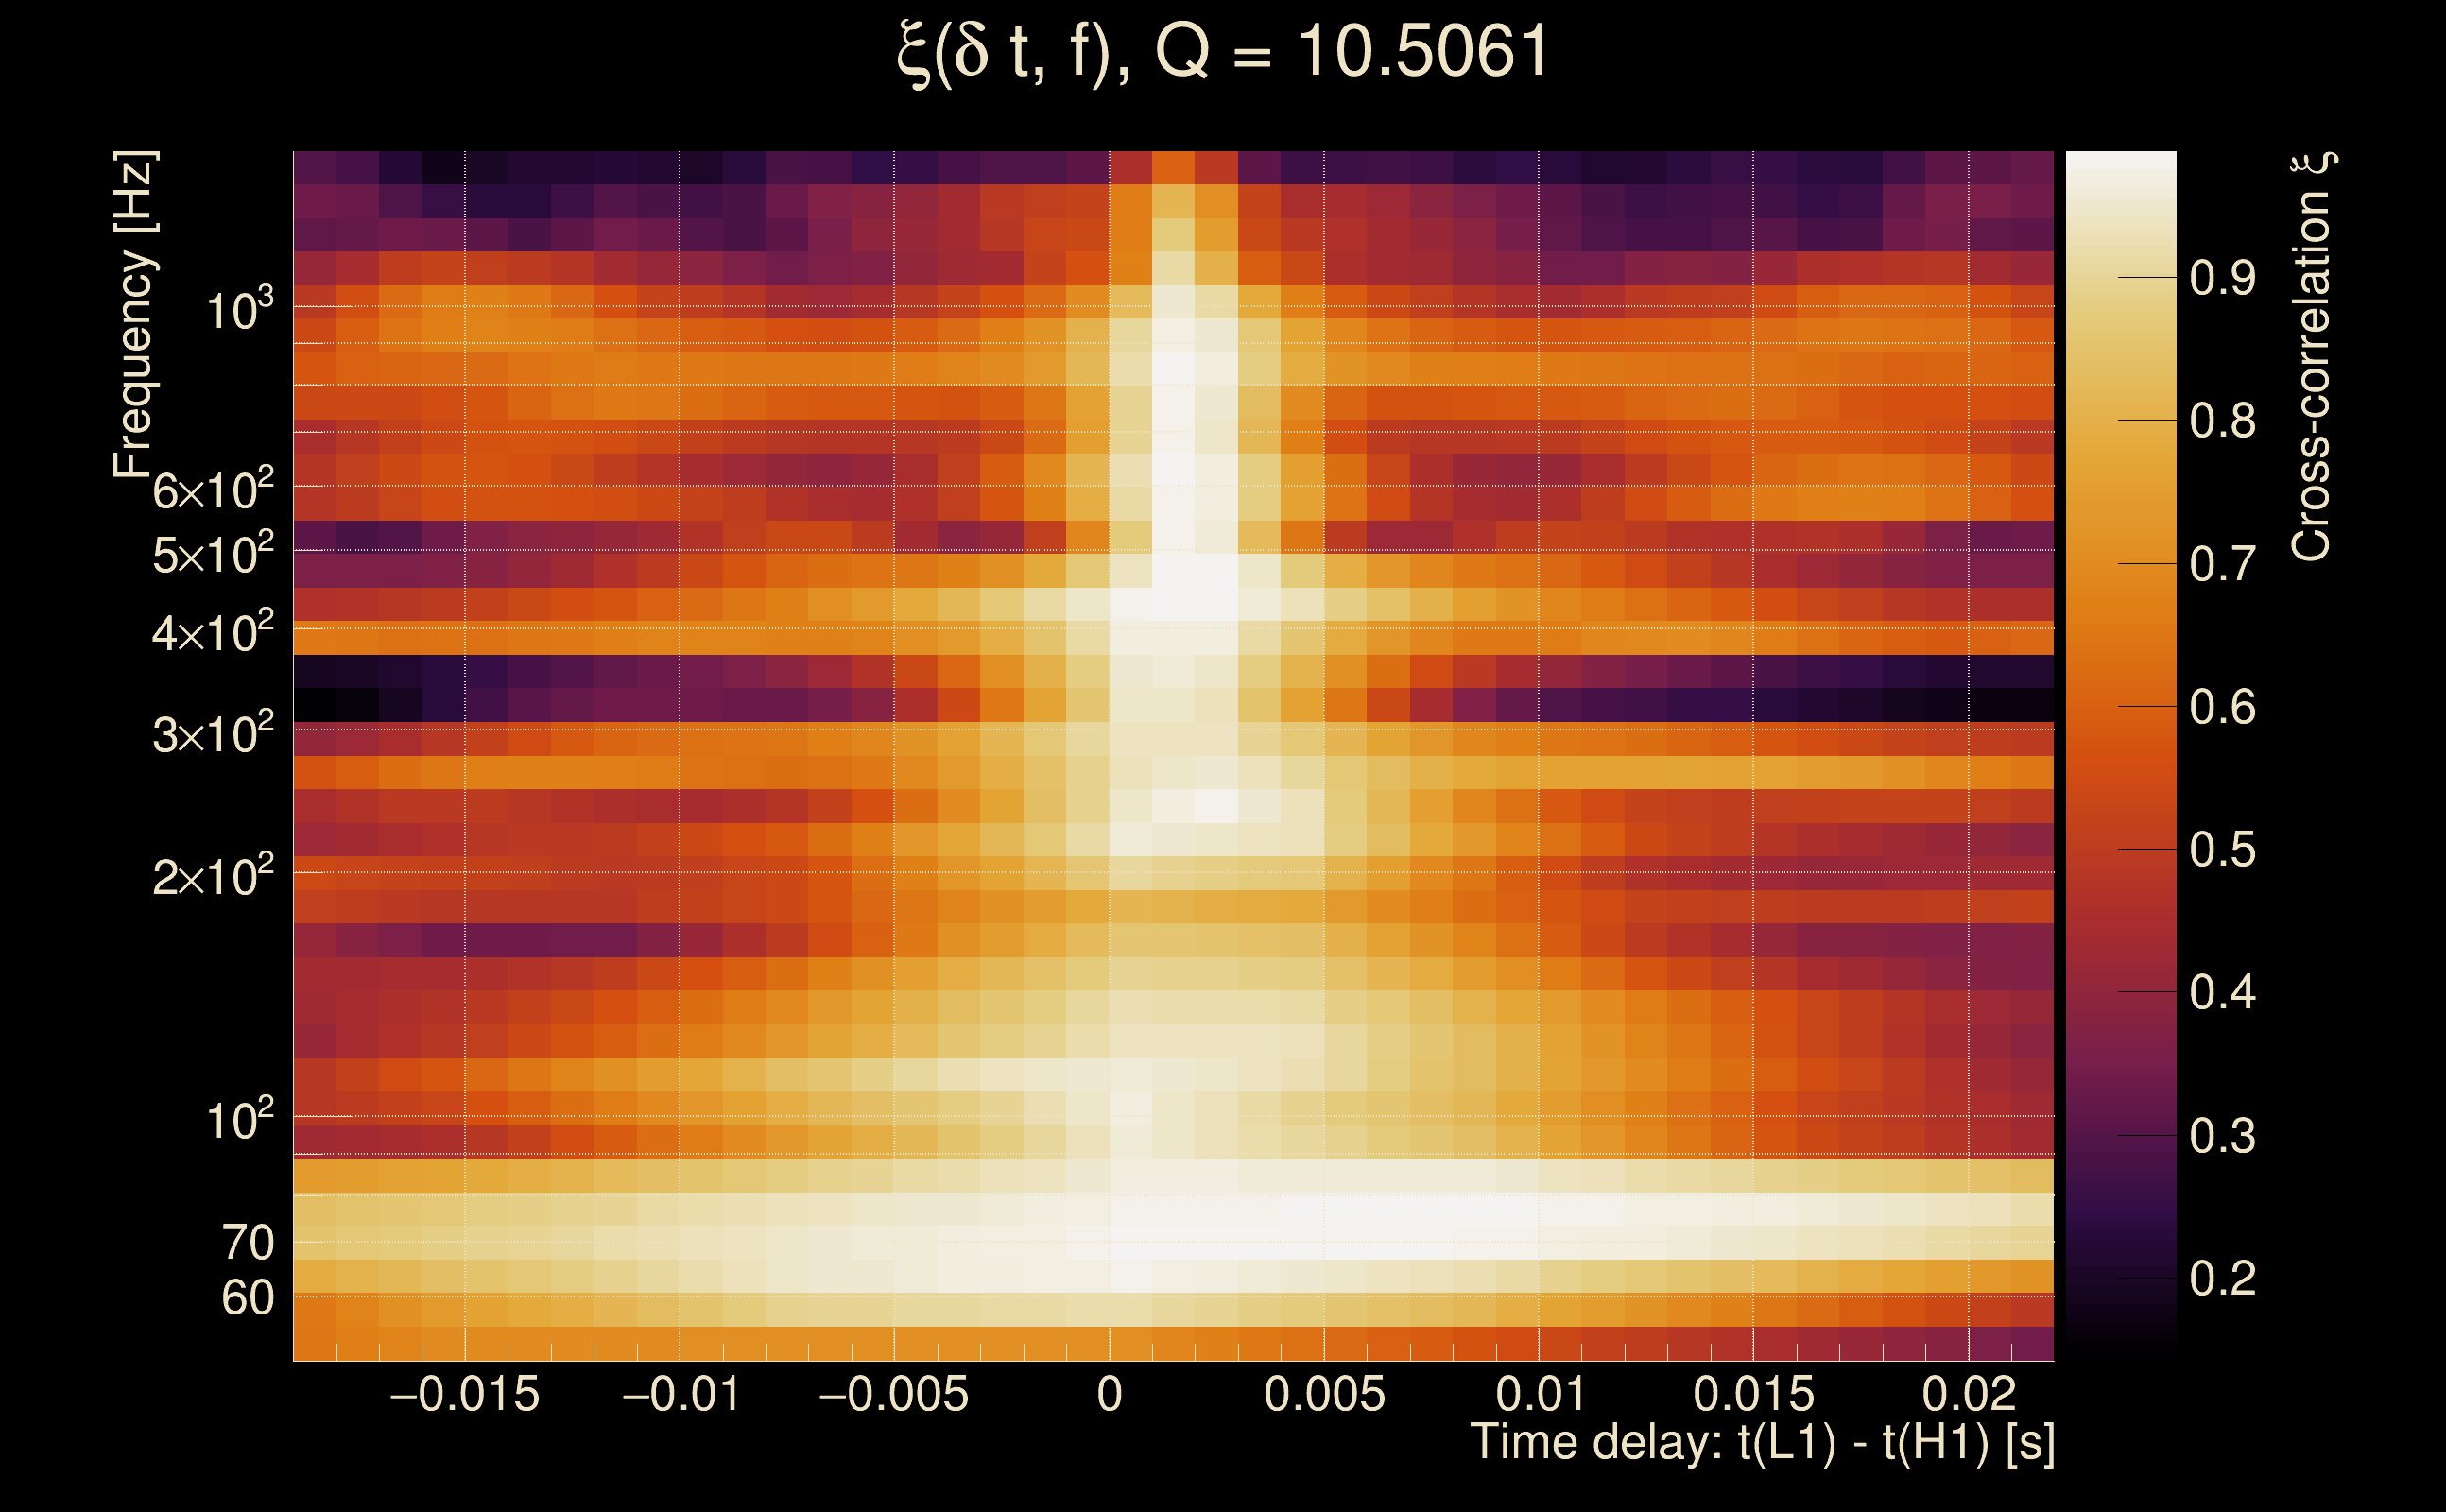
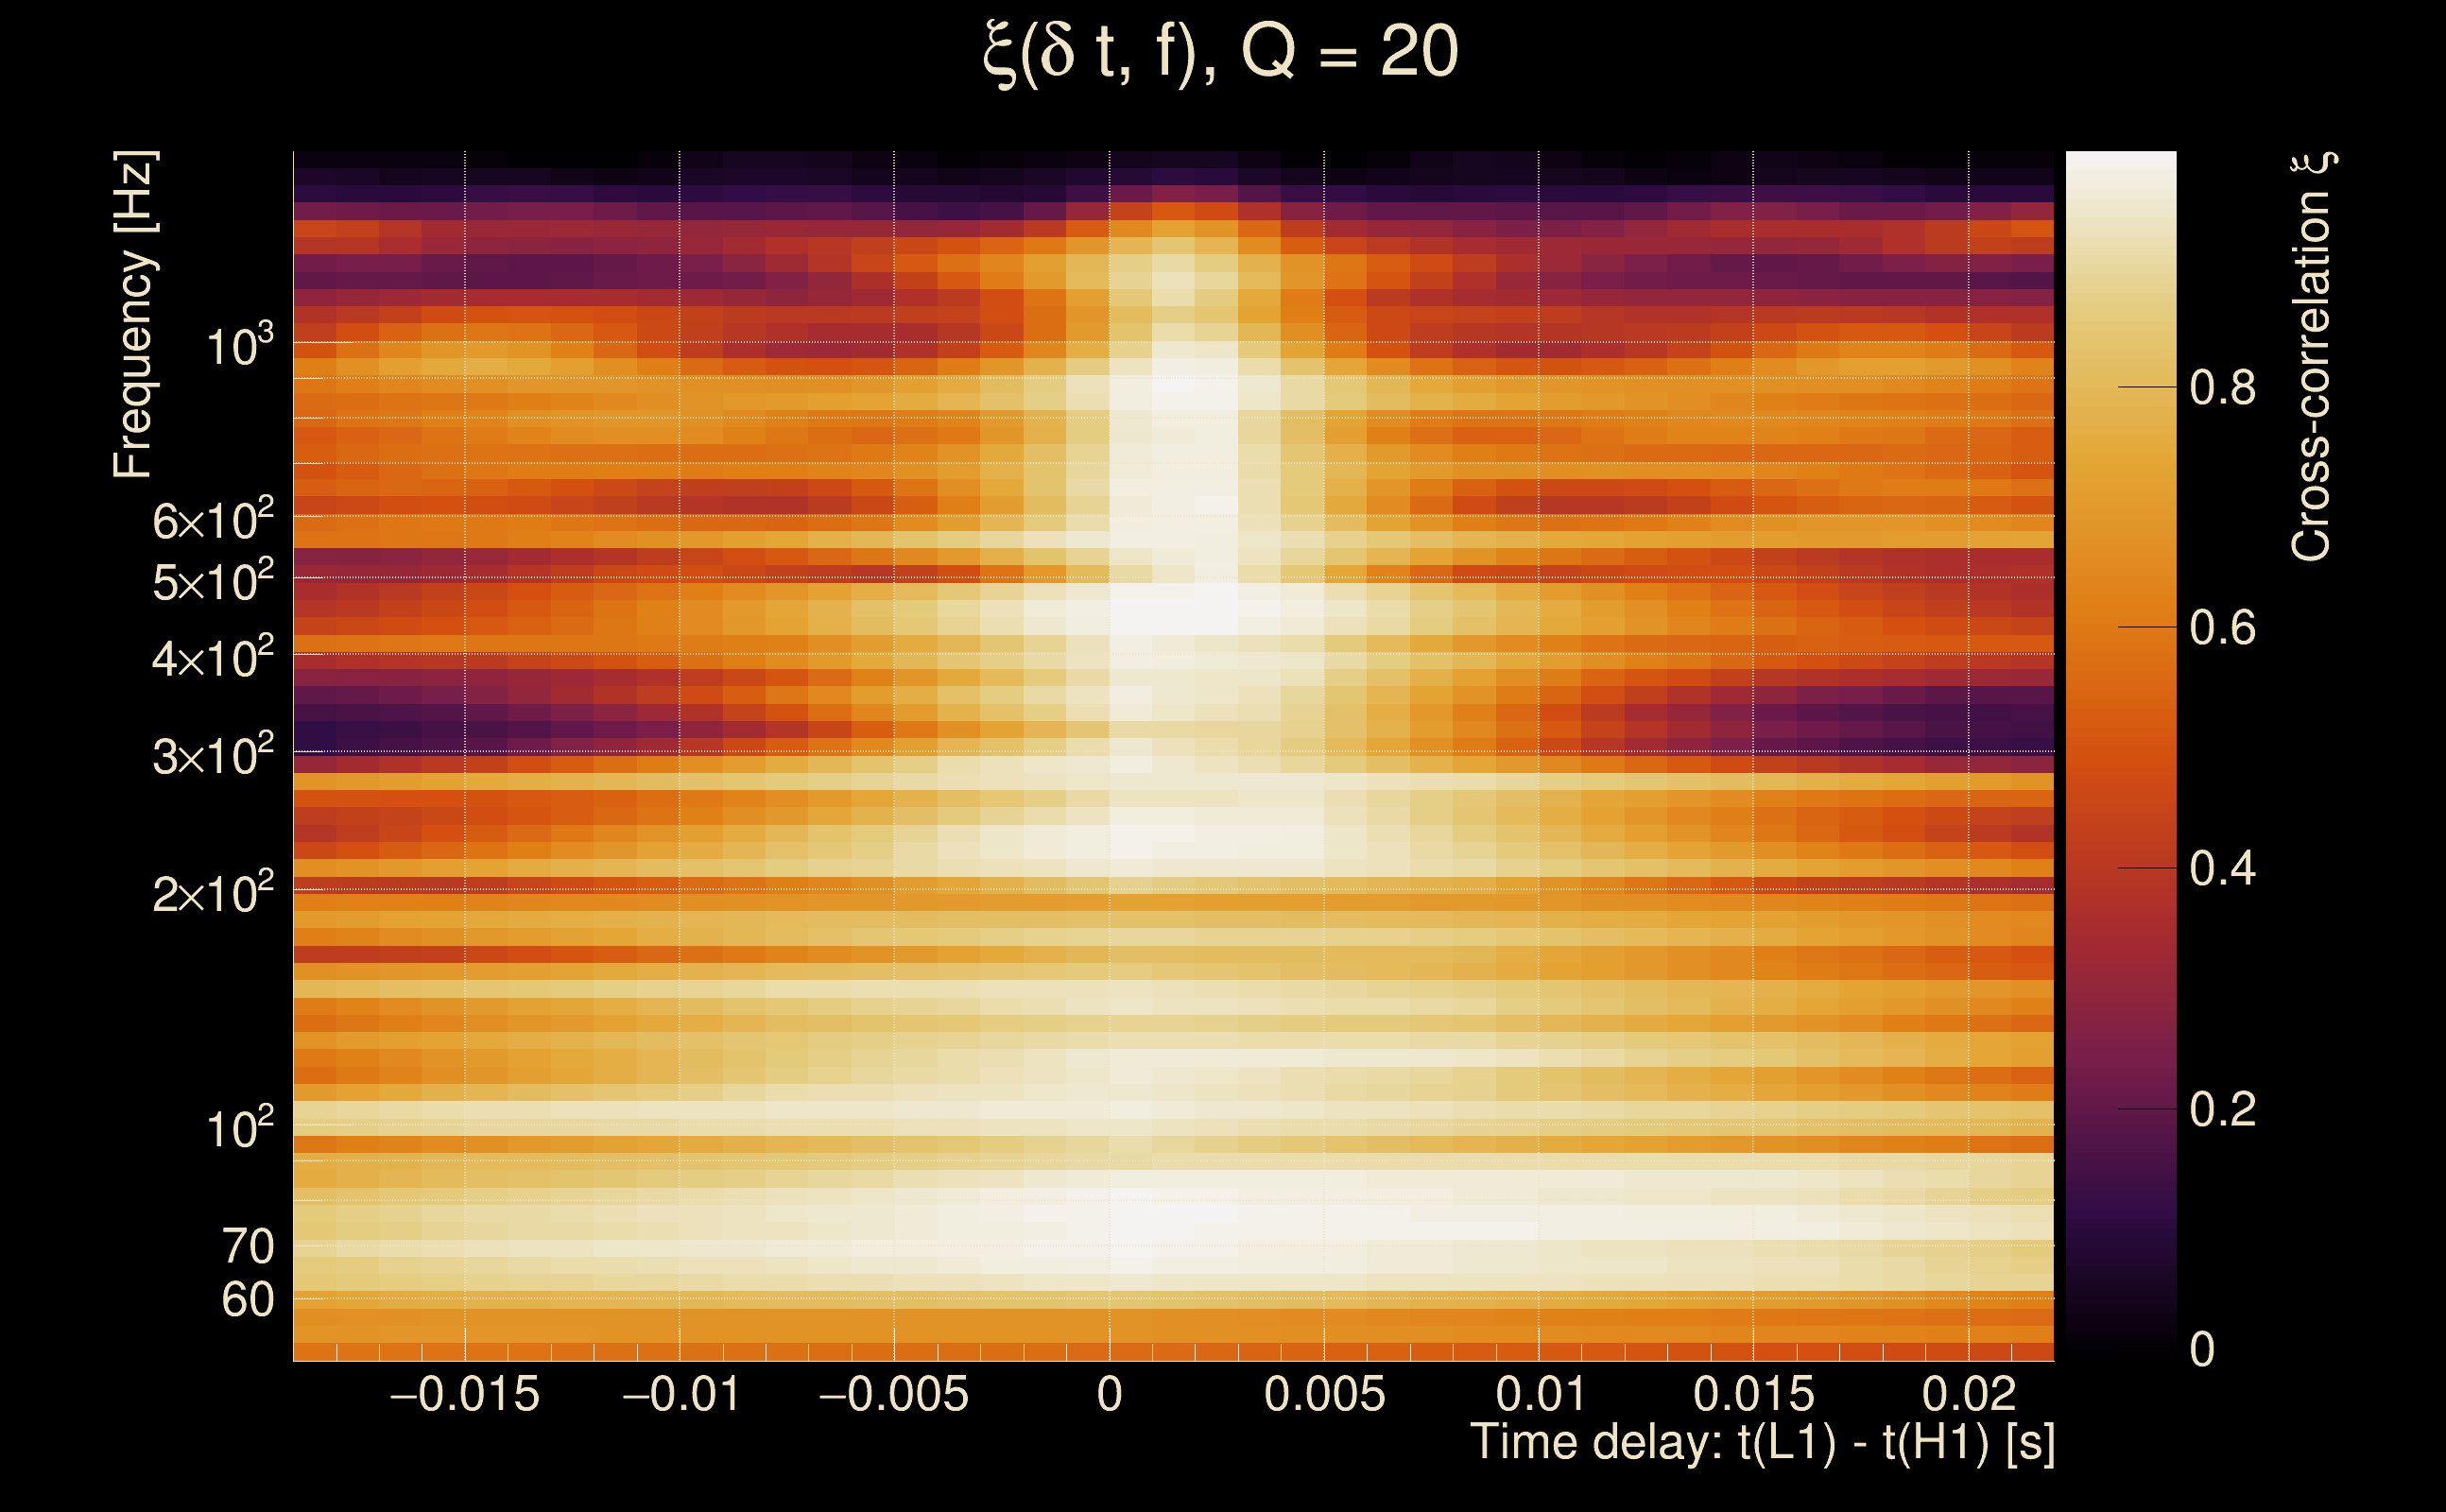
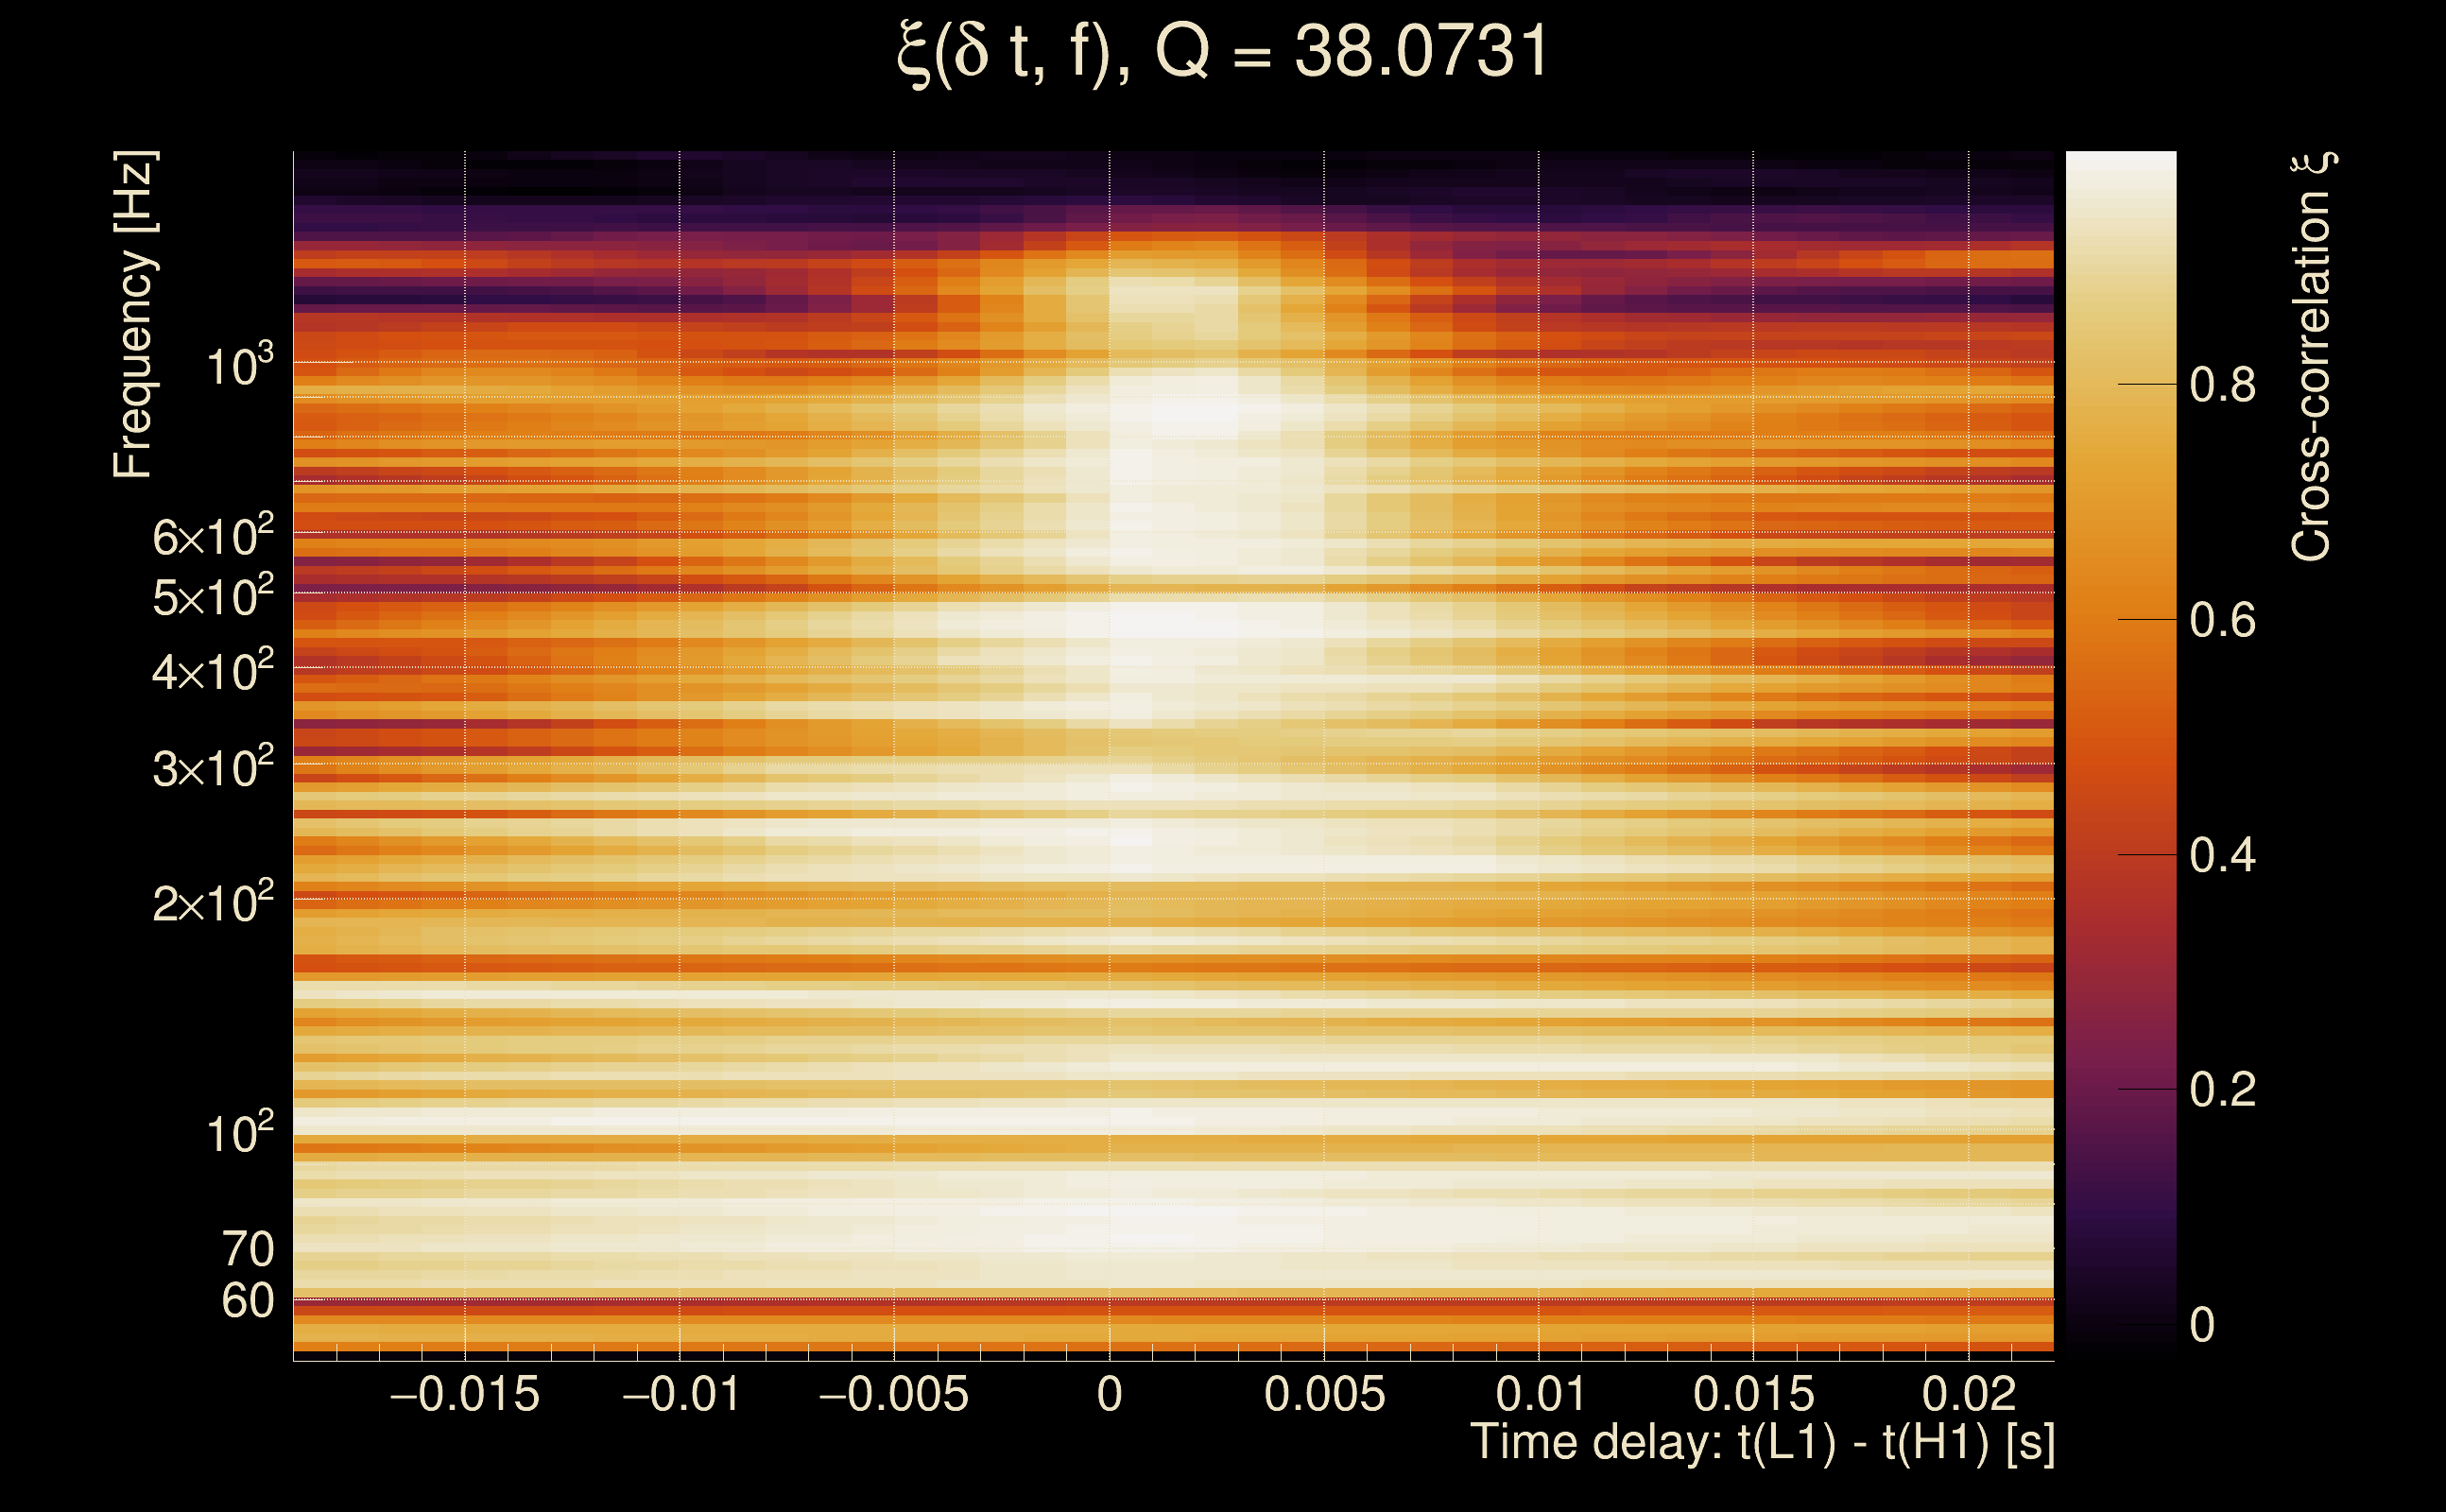
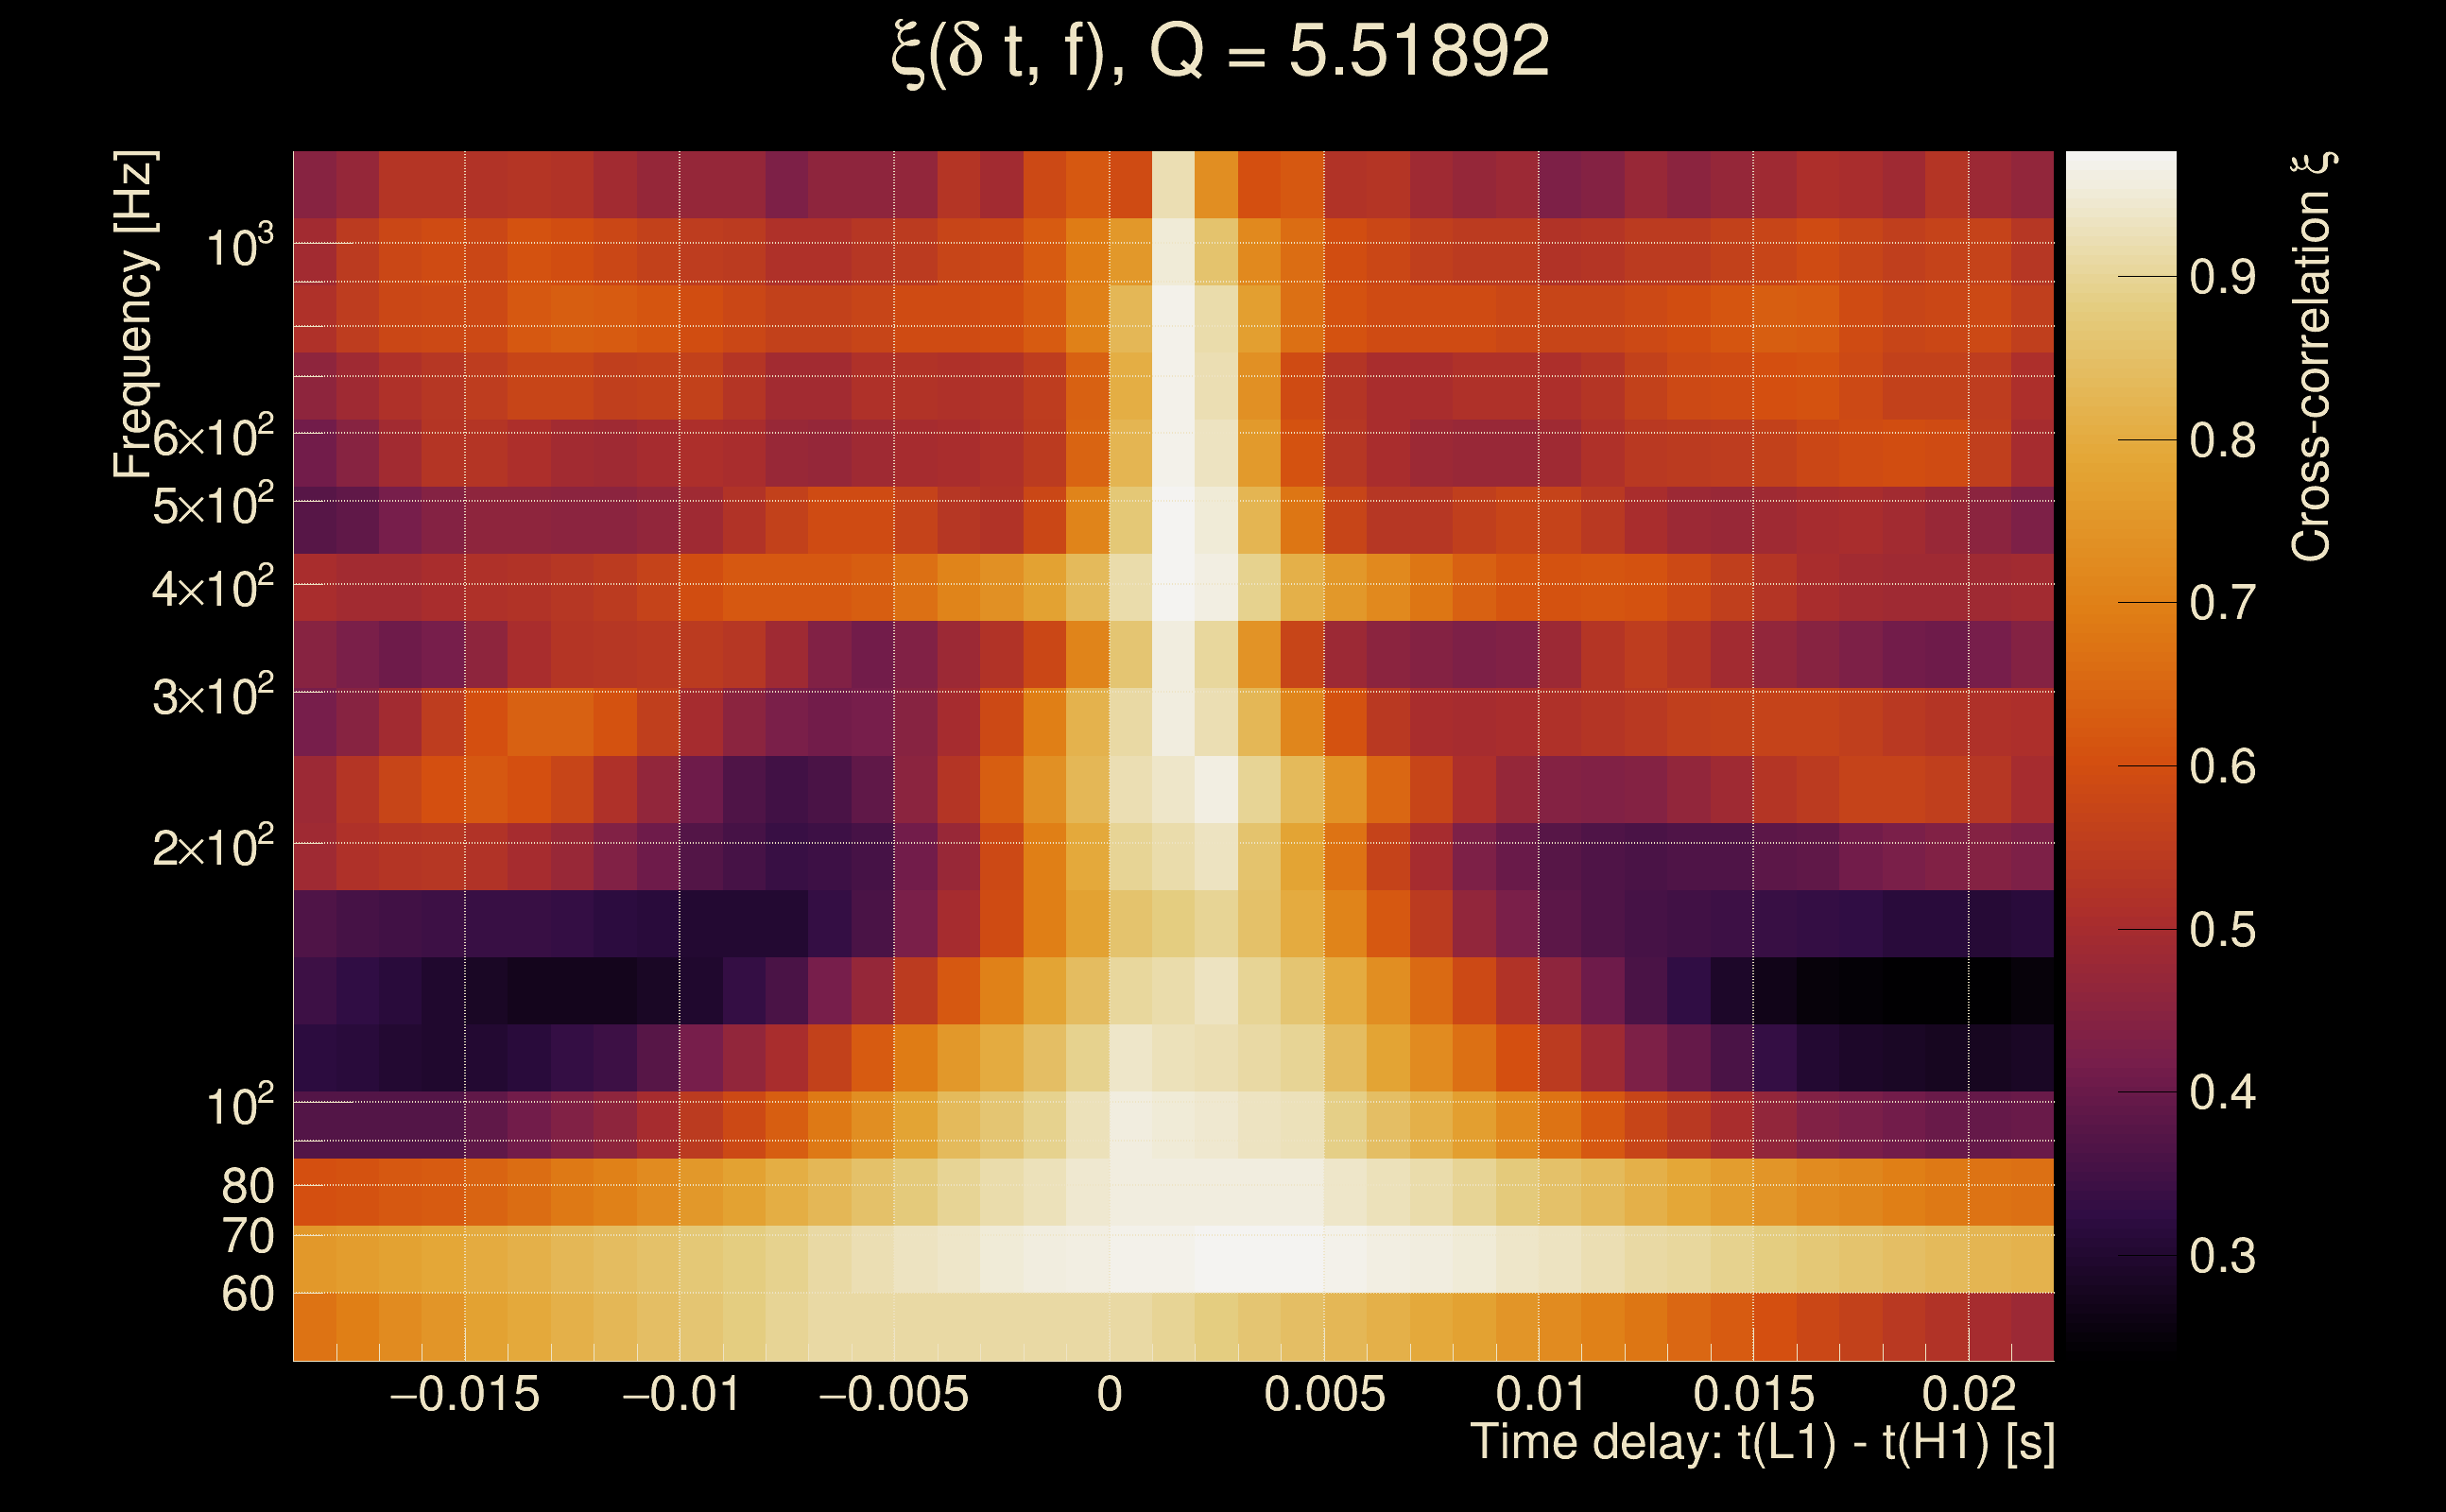
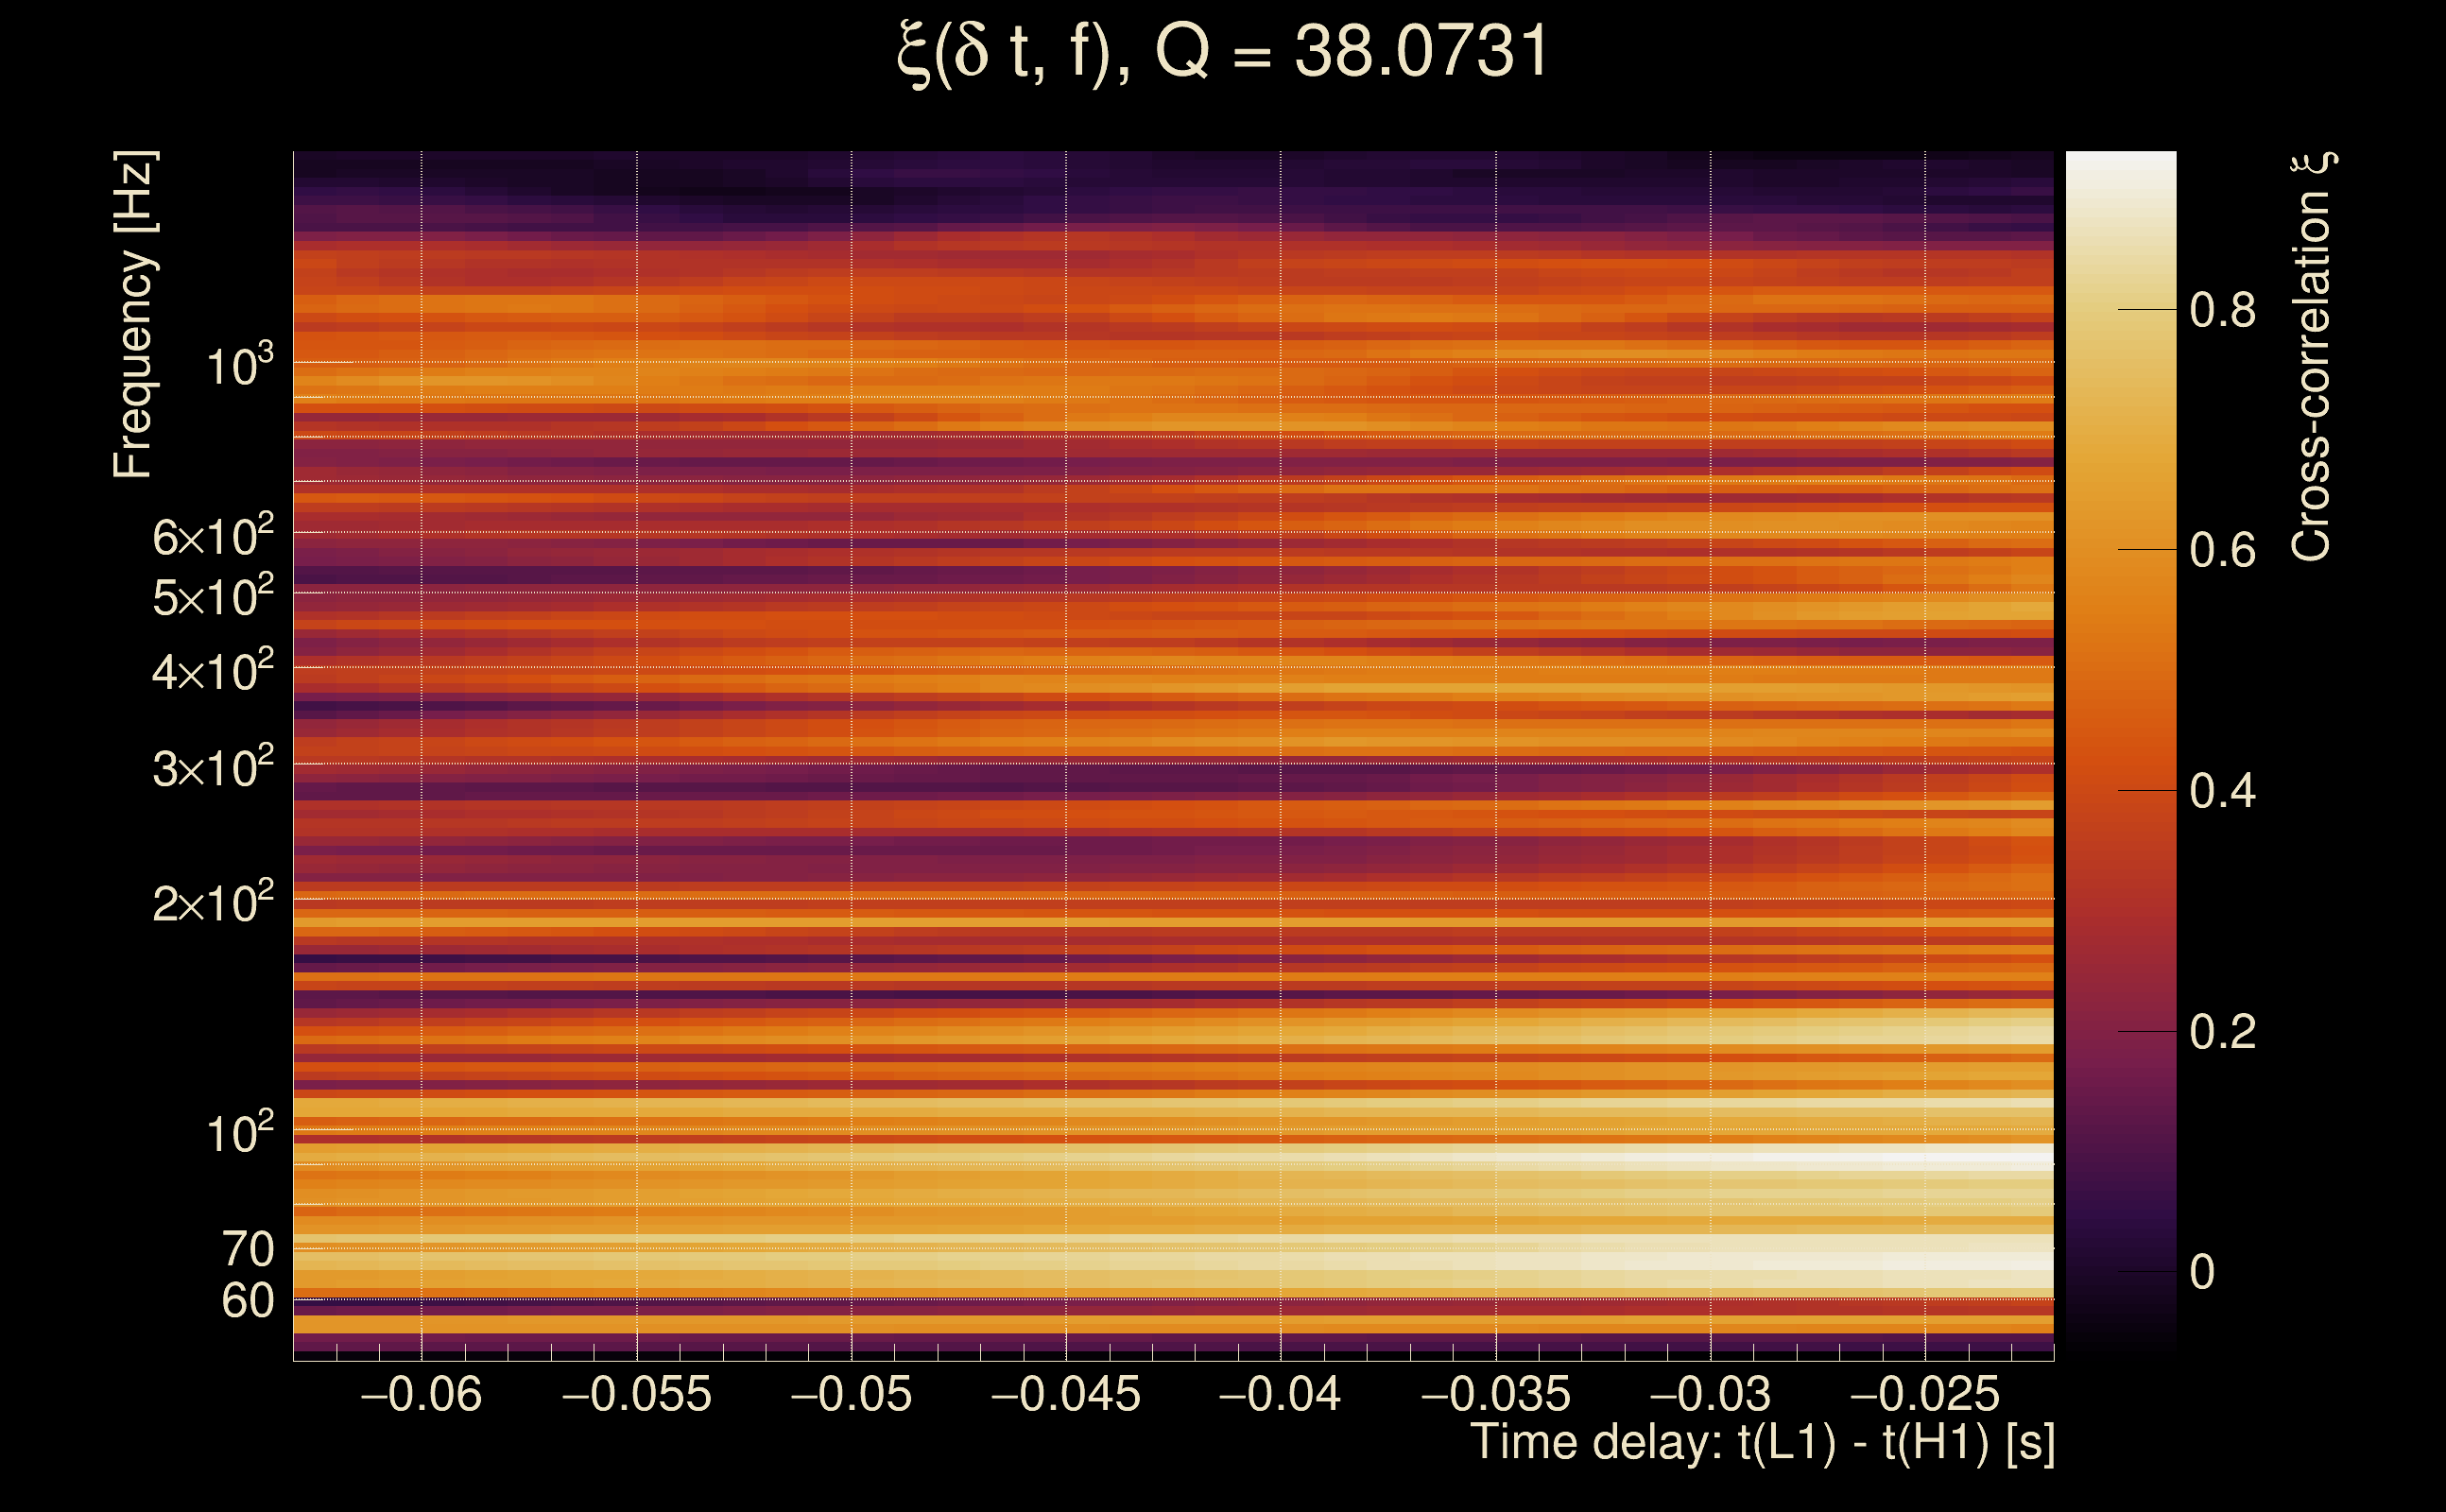
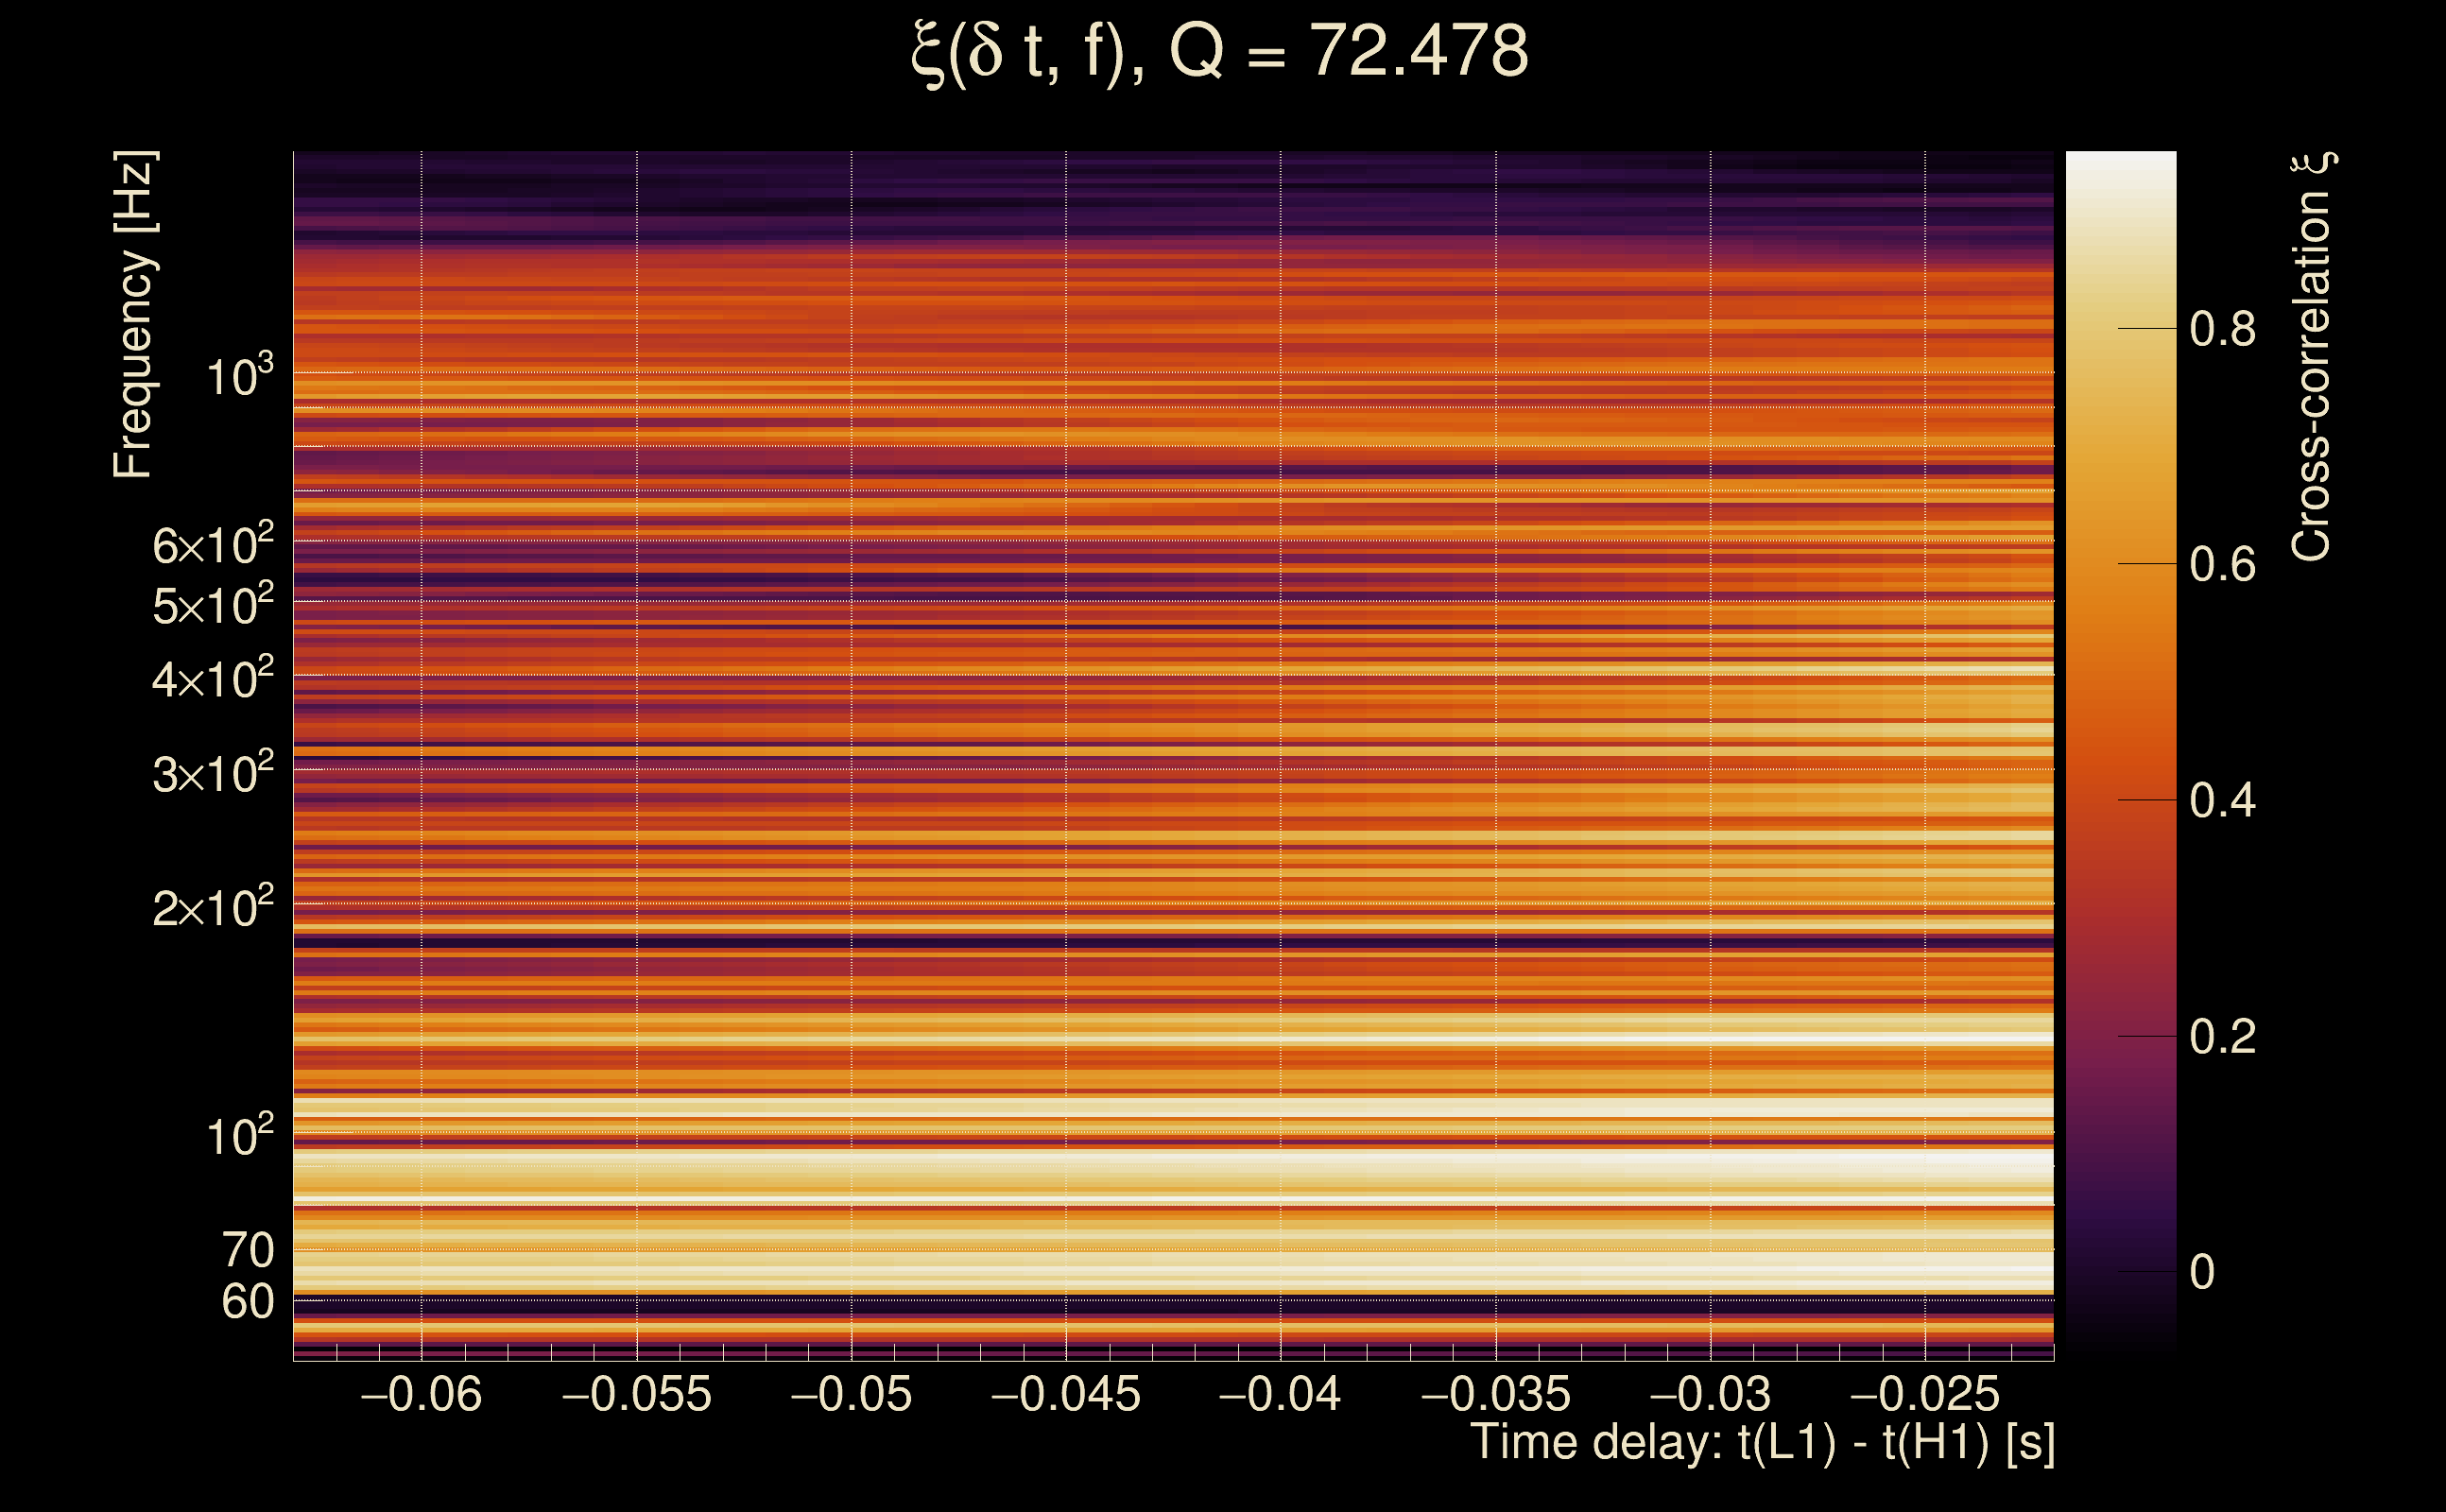
| Number of Q planes: | 5 (Q = 5.51892 → Q = 72.478) |
| Omicron frequency range: | 50 Hz → 1958.38 Hz |
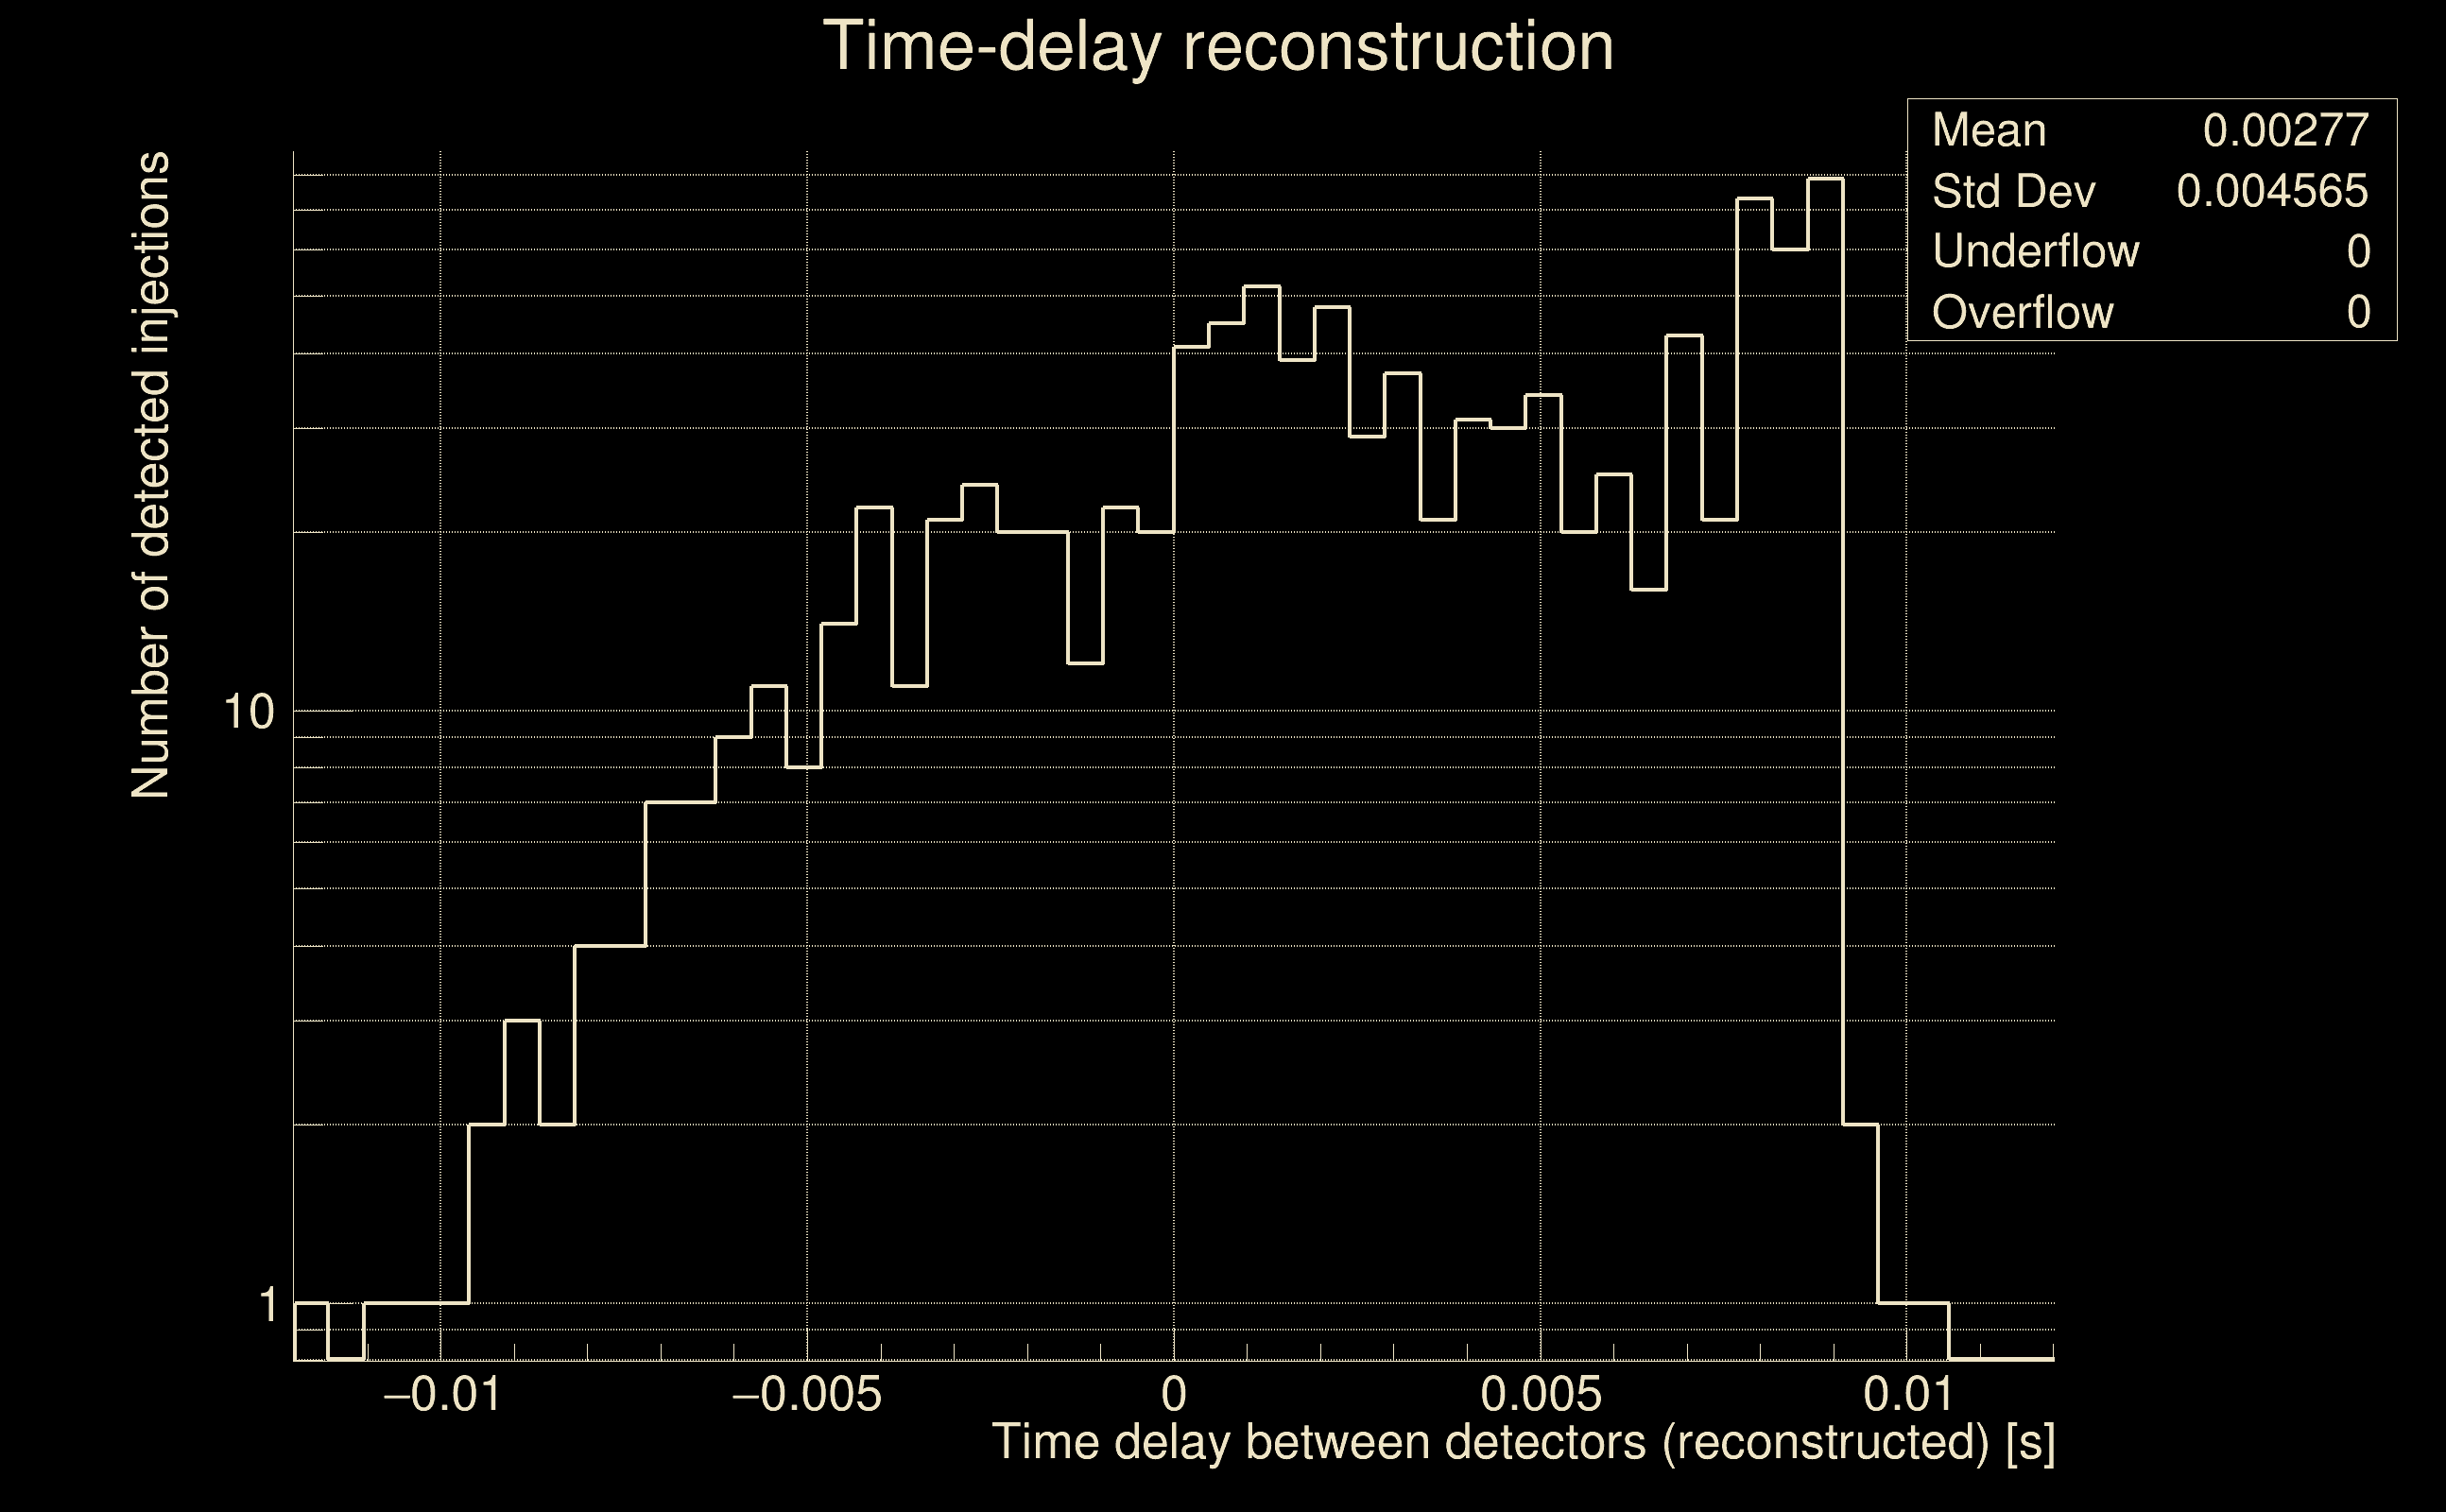
| Light travel time between detectors: | 0.0100128 s |
| Slice extra-time (calibration uncertainty + slice veto): | 0.0129872 s |
| Number of time-delay bins in a cross-correlation map: | 10000 |
| Number of slices in a cross-correlation map: | 217 |
| Number of time-delay bins in a slice: | 46 |
| SNR gating: | < 100 (detector 0), < 100 (detector 1) |
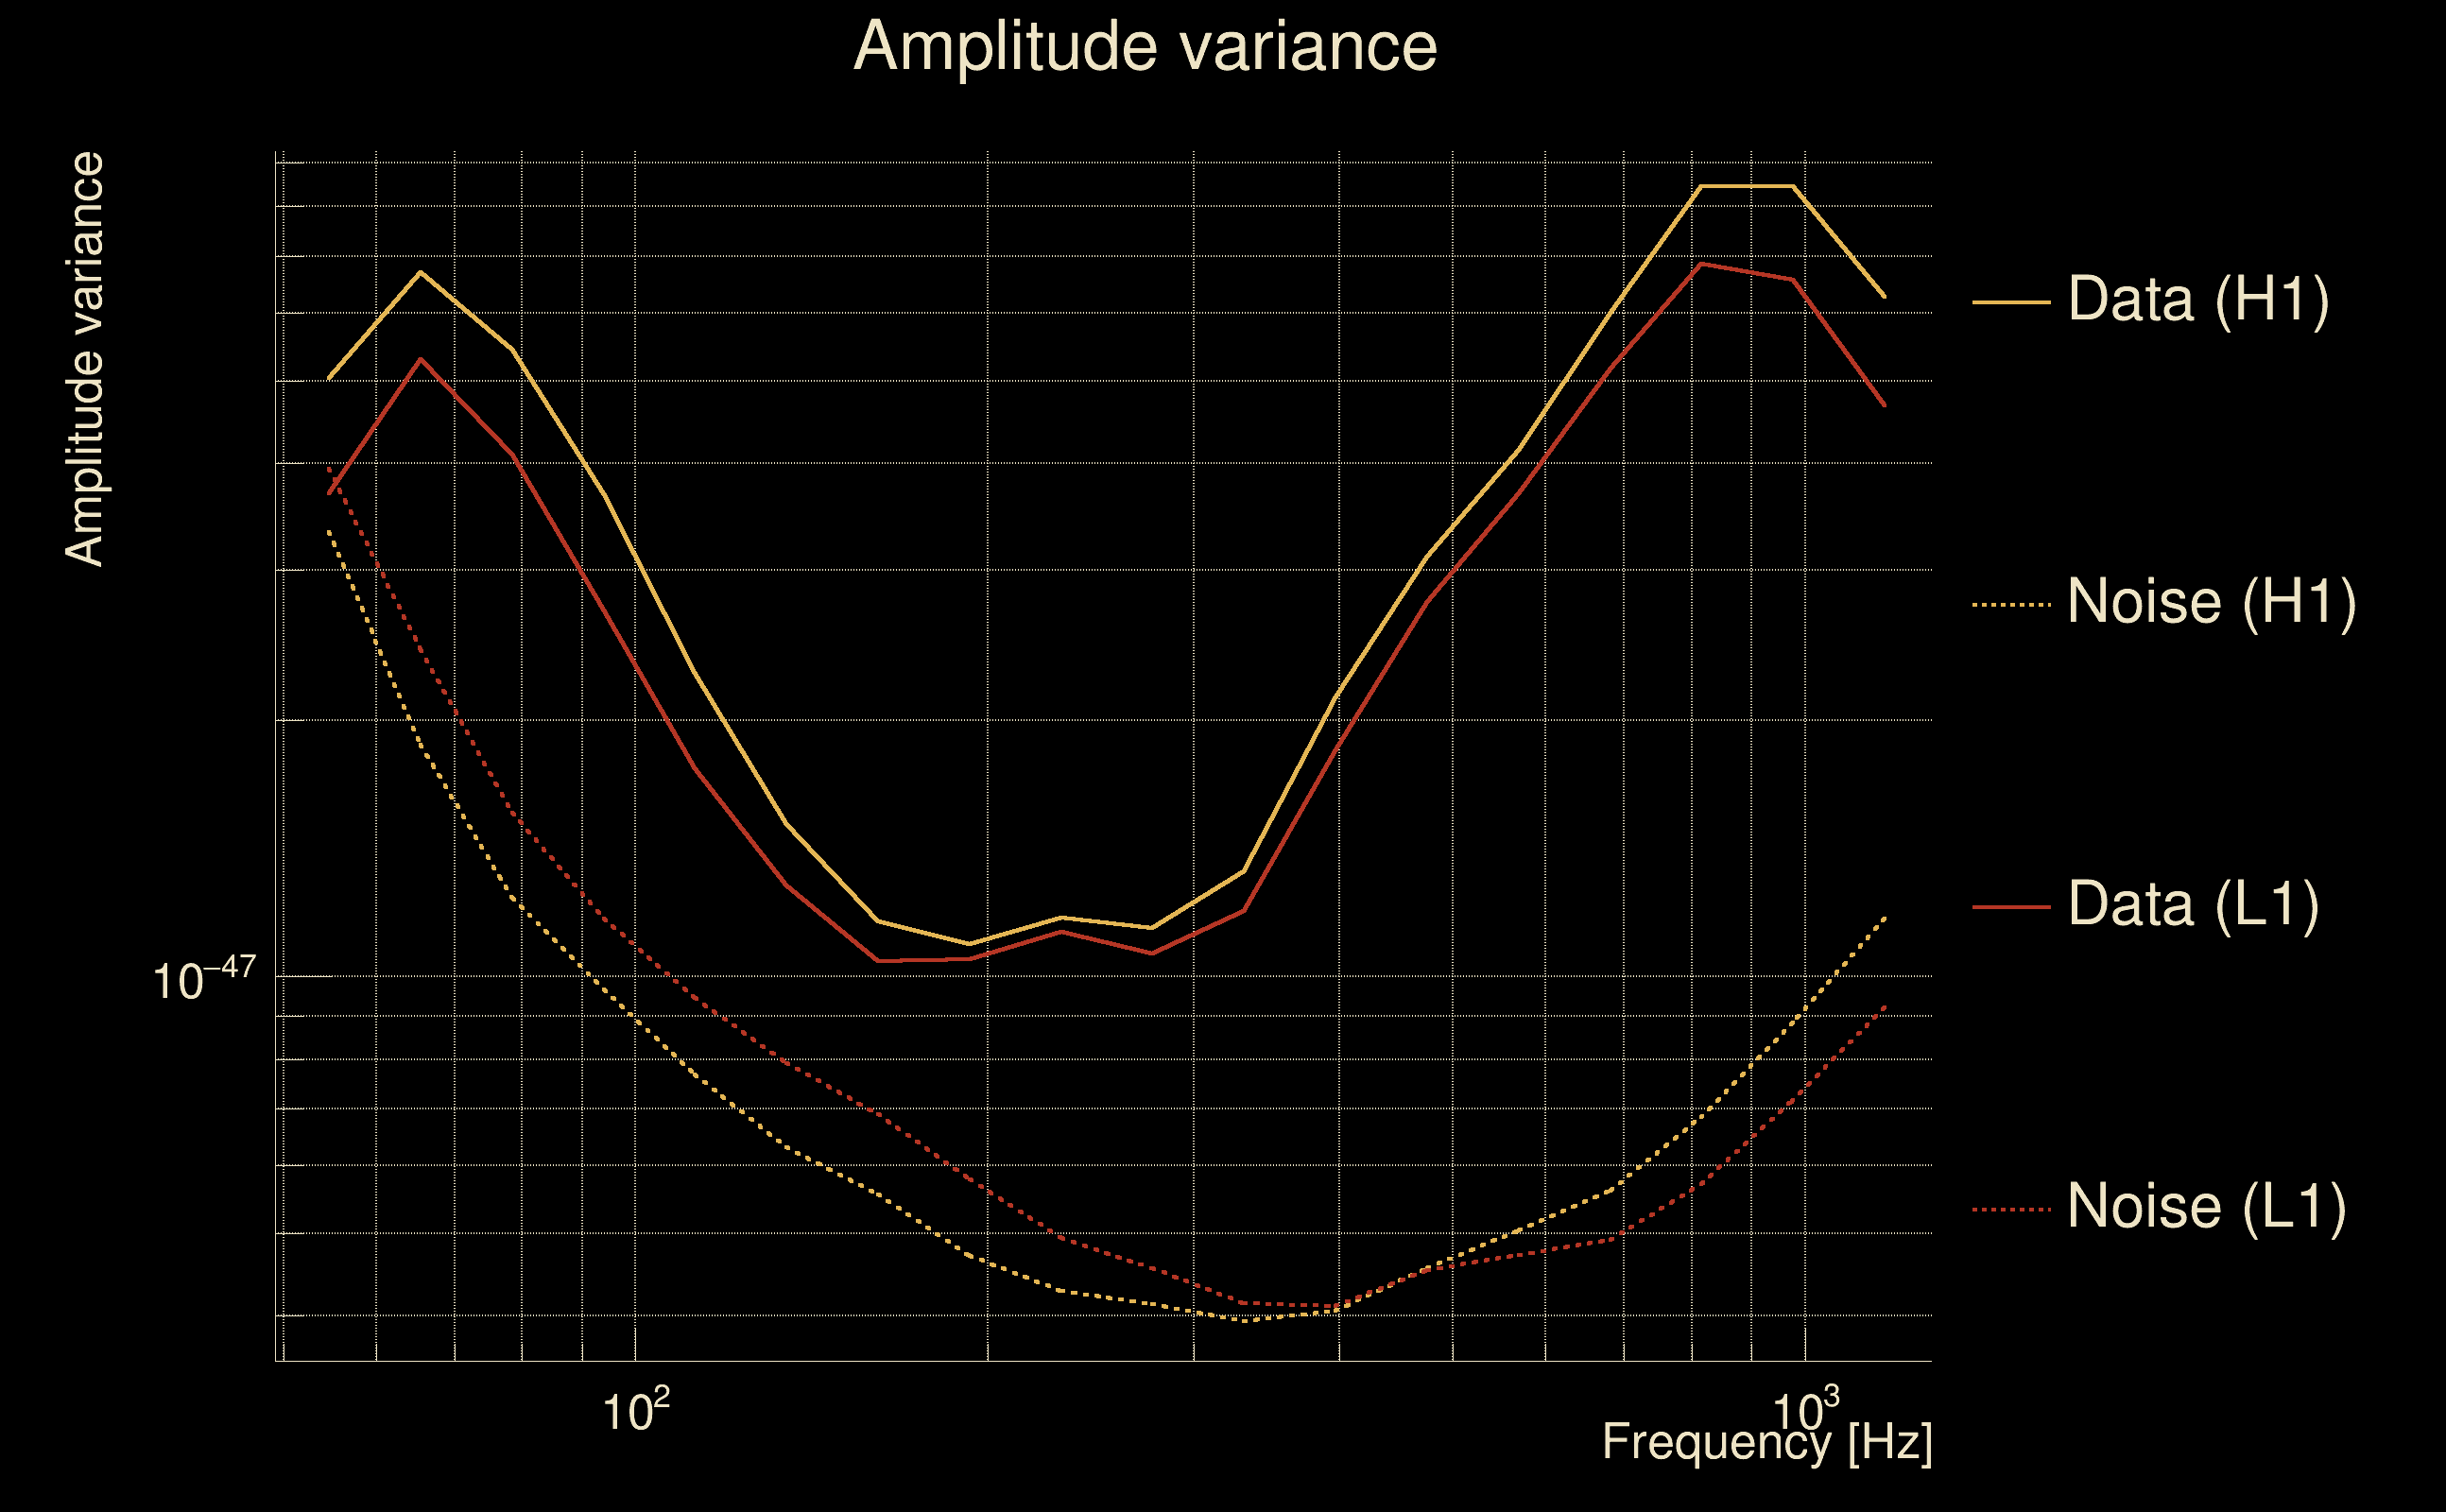
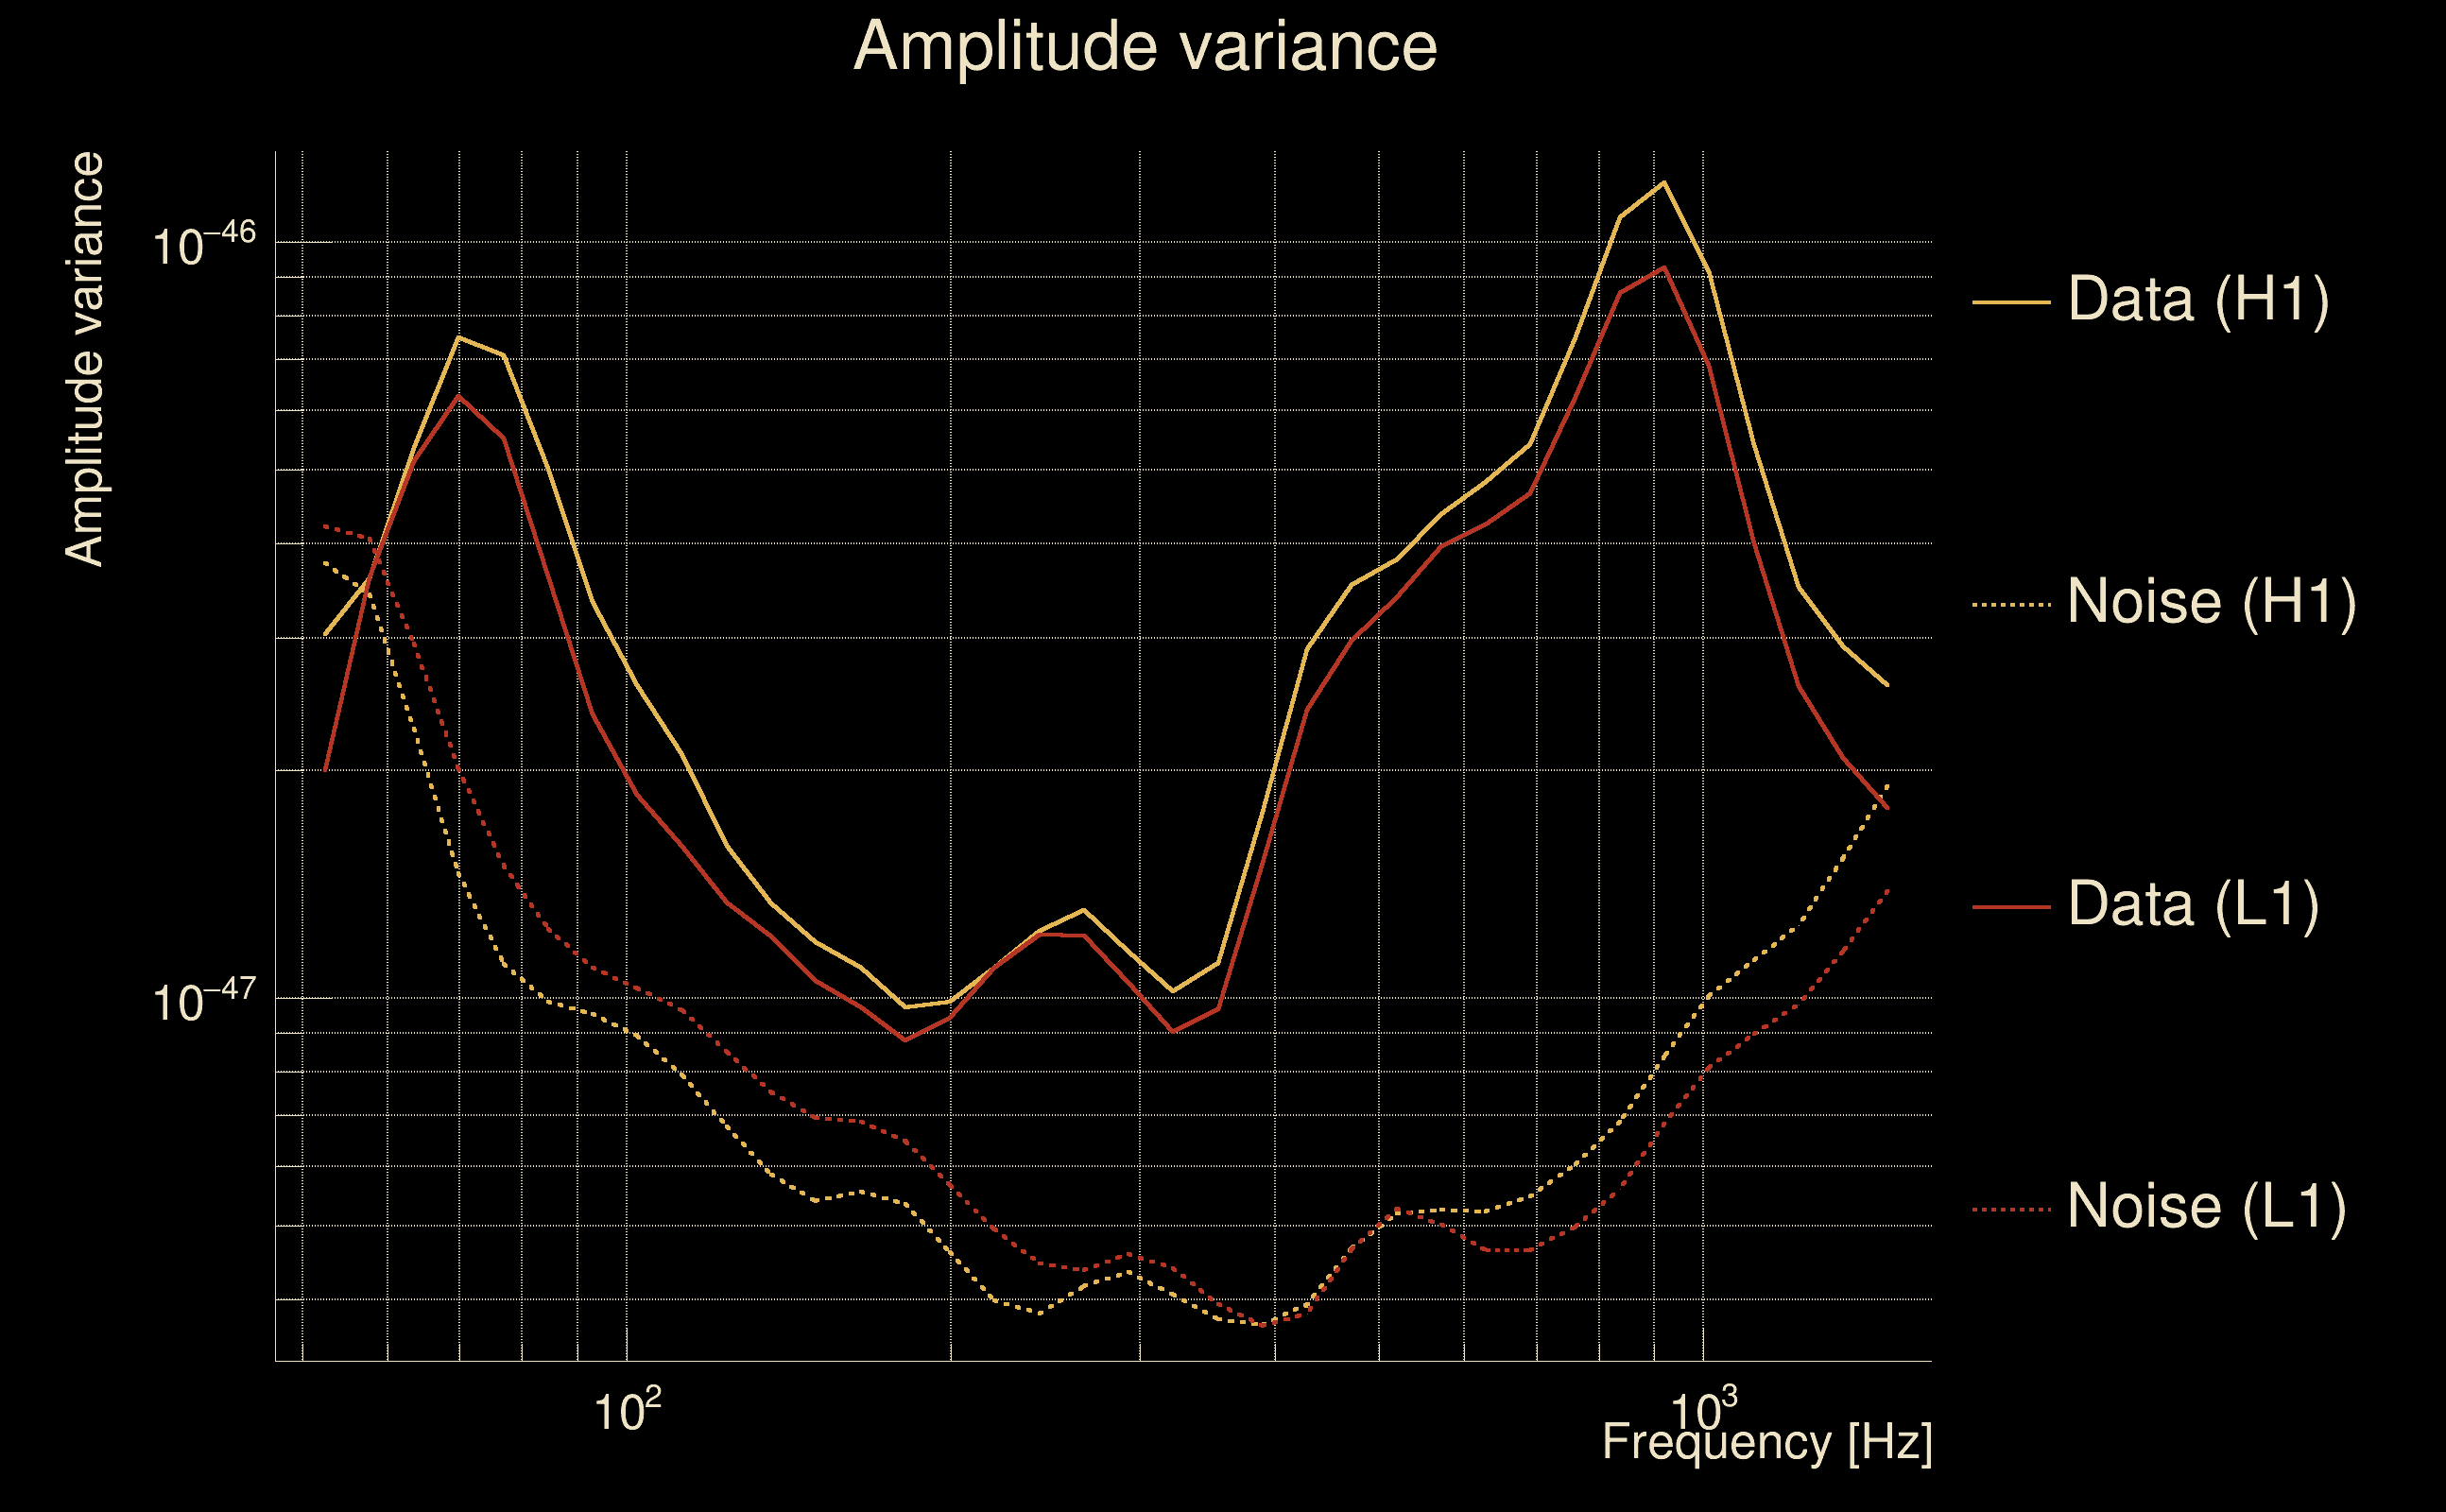
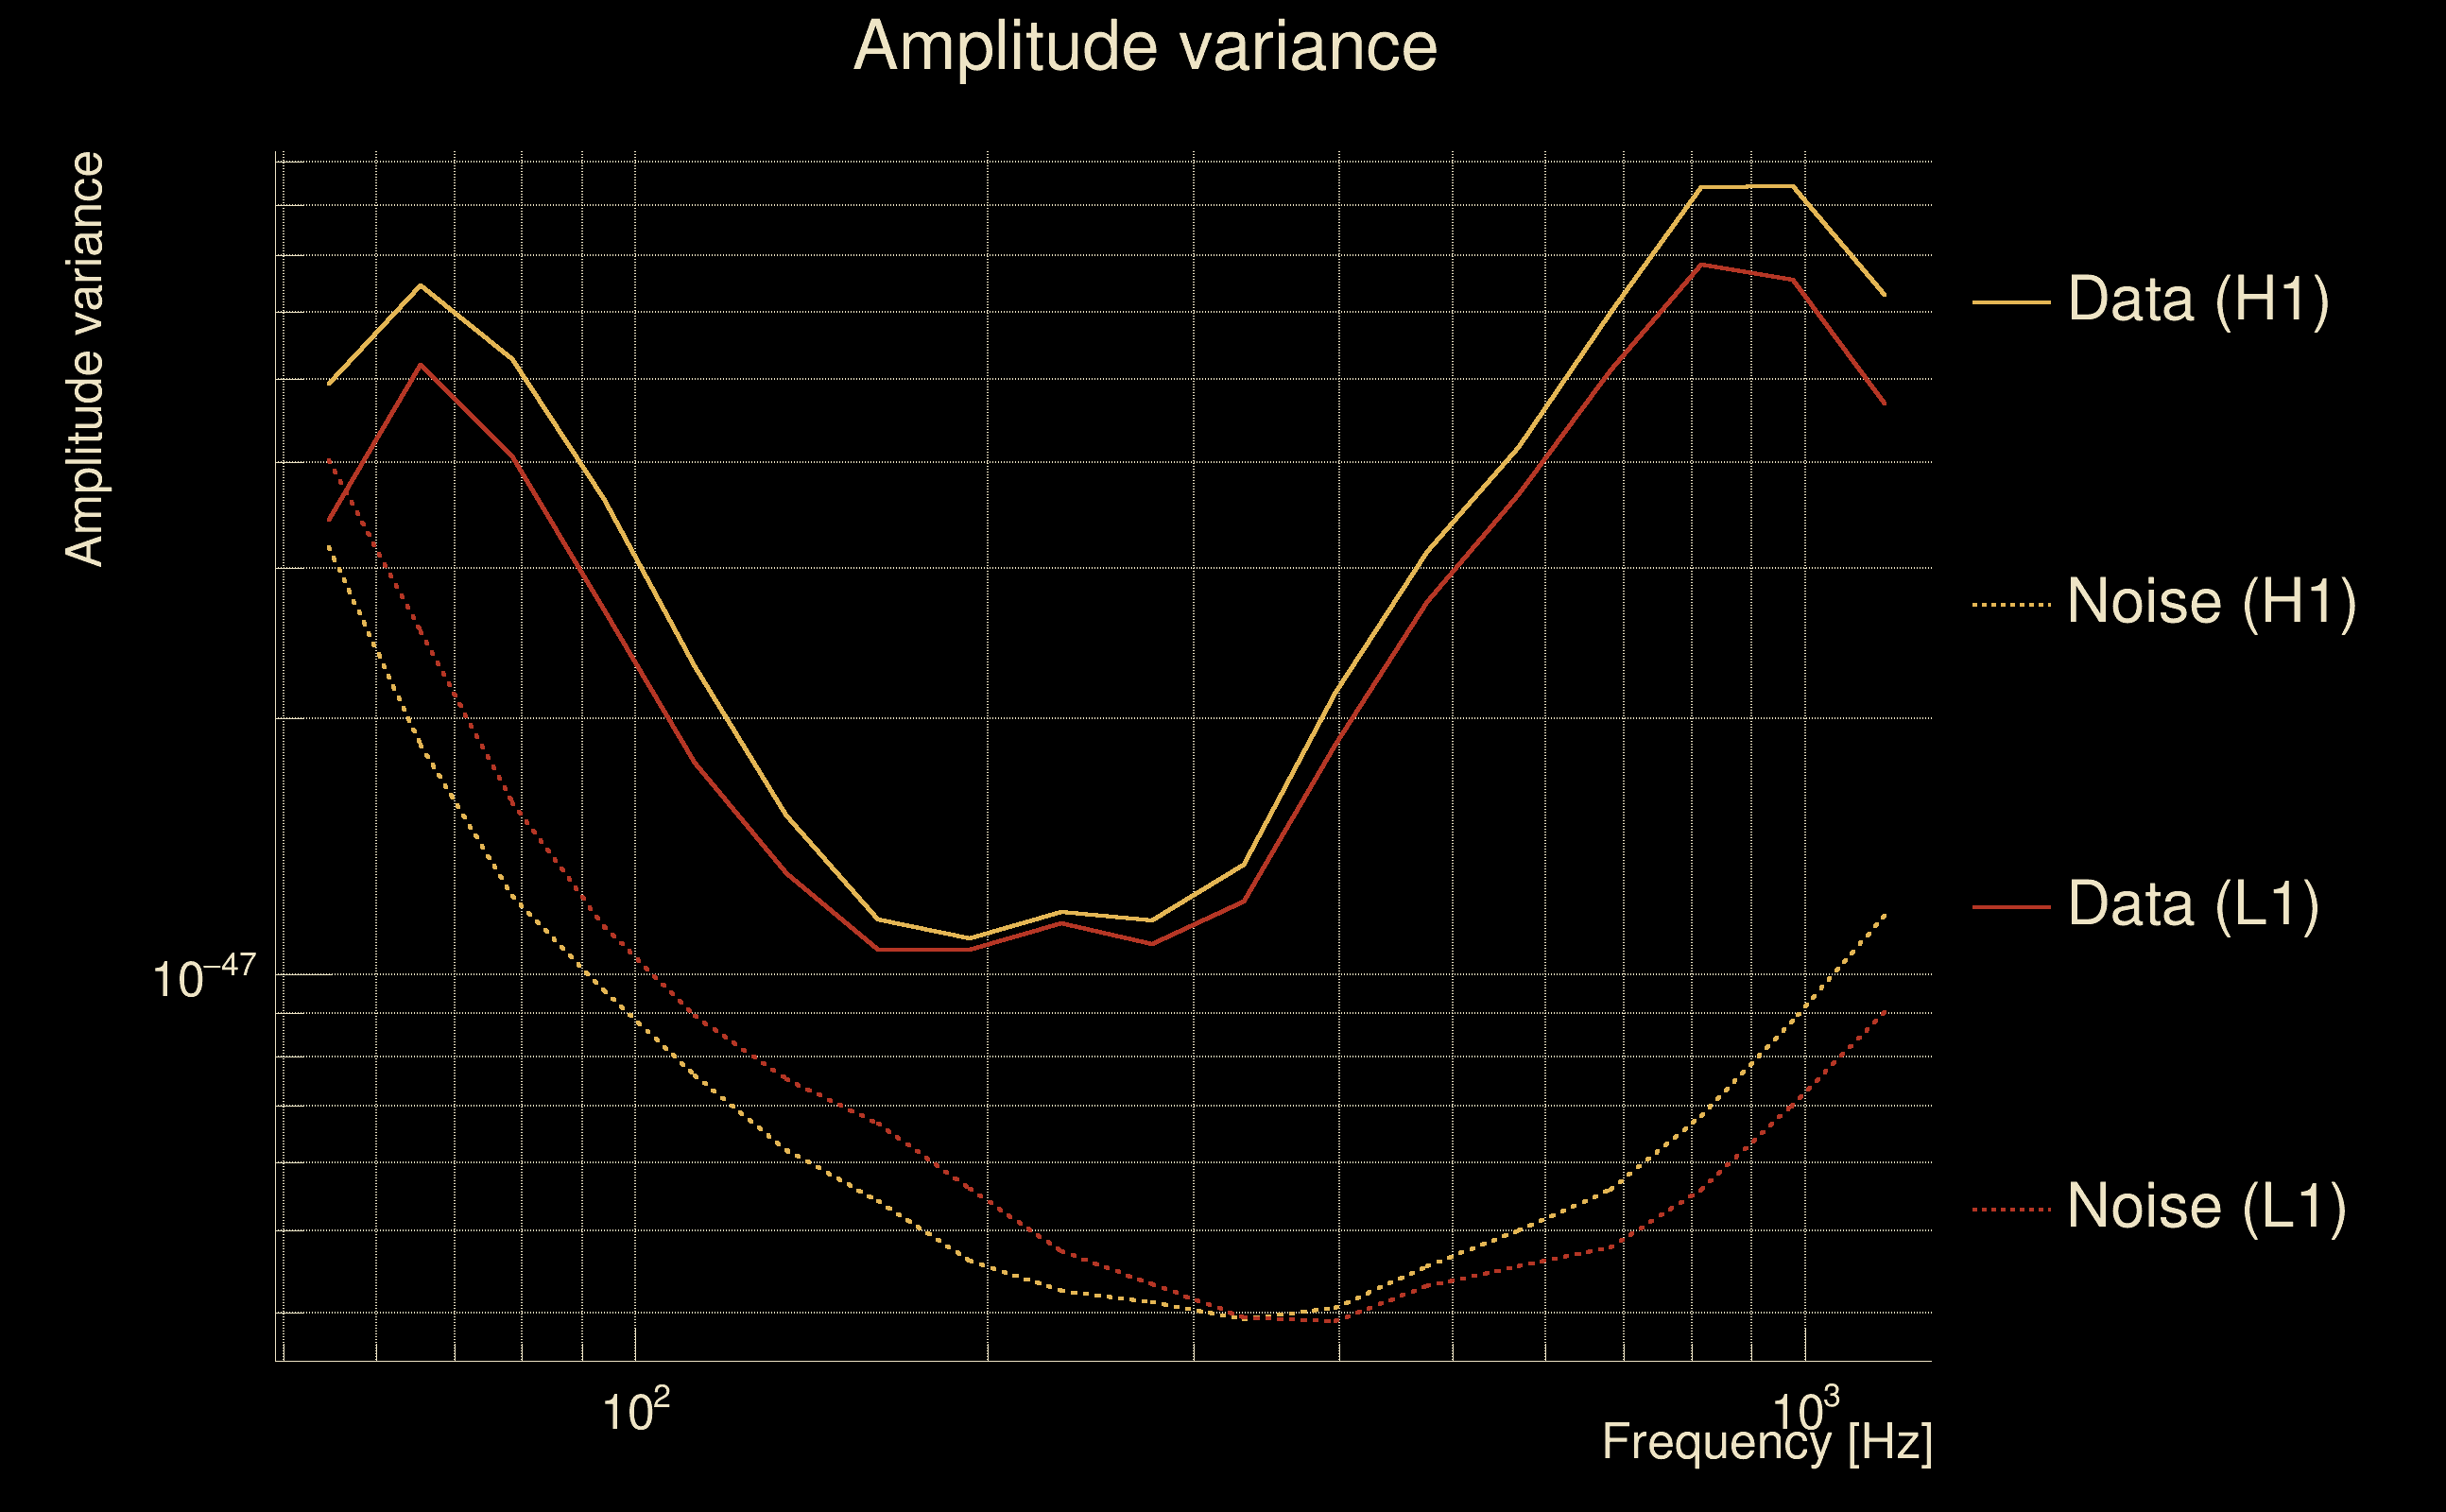
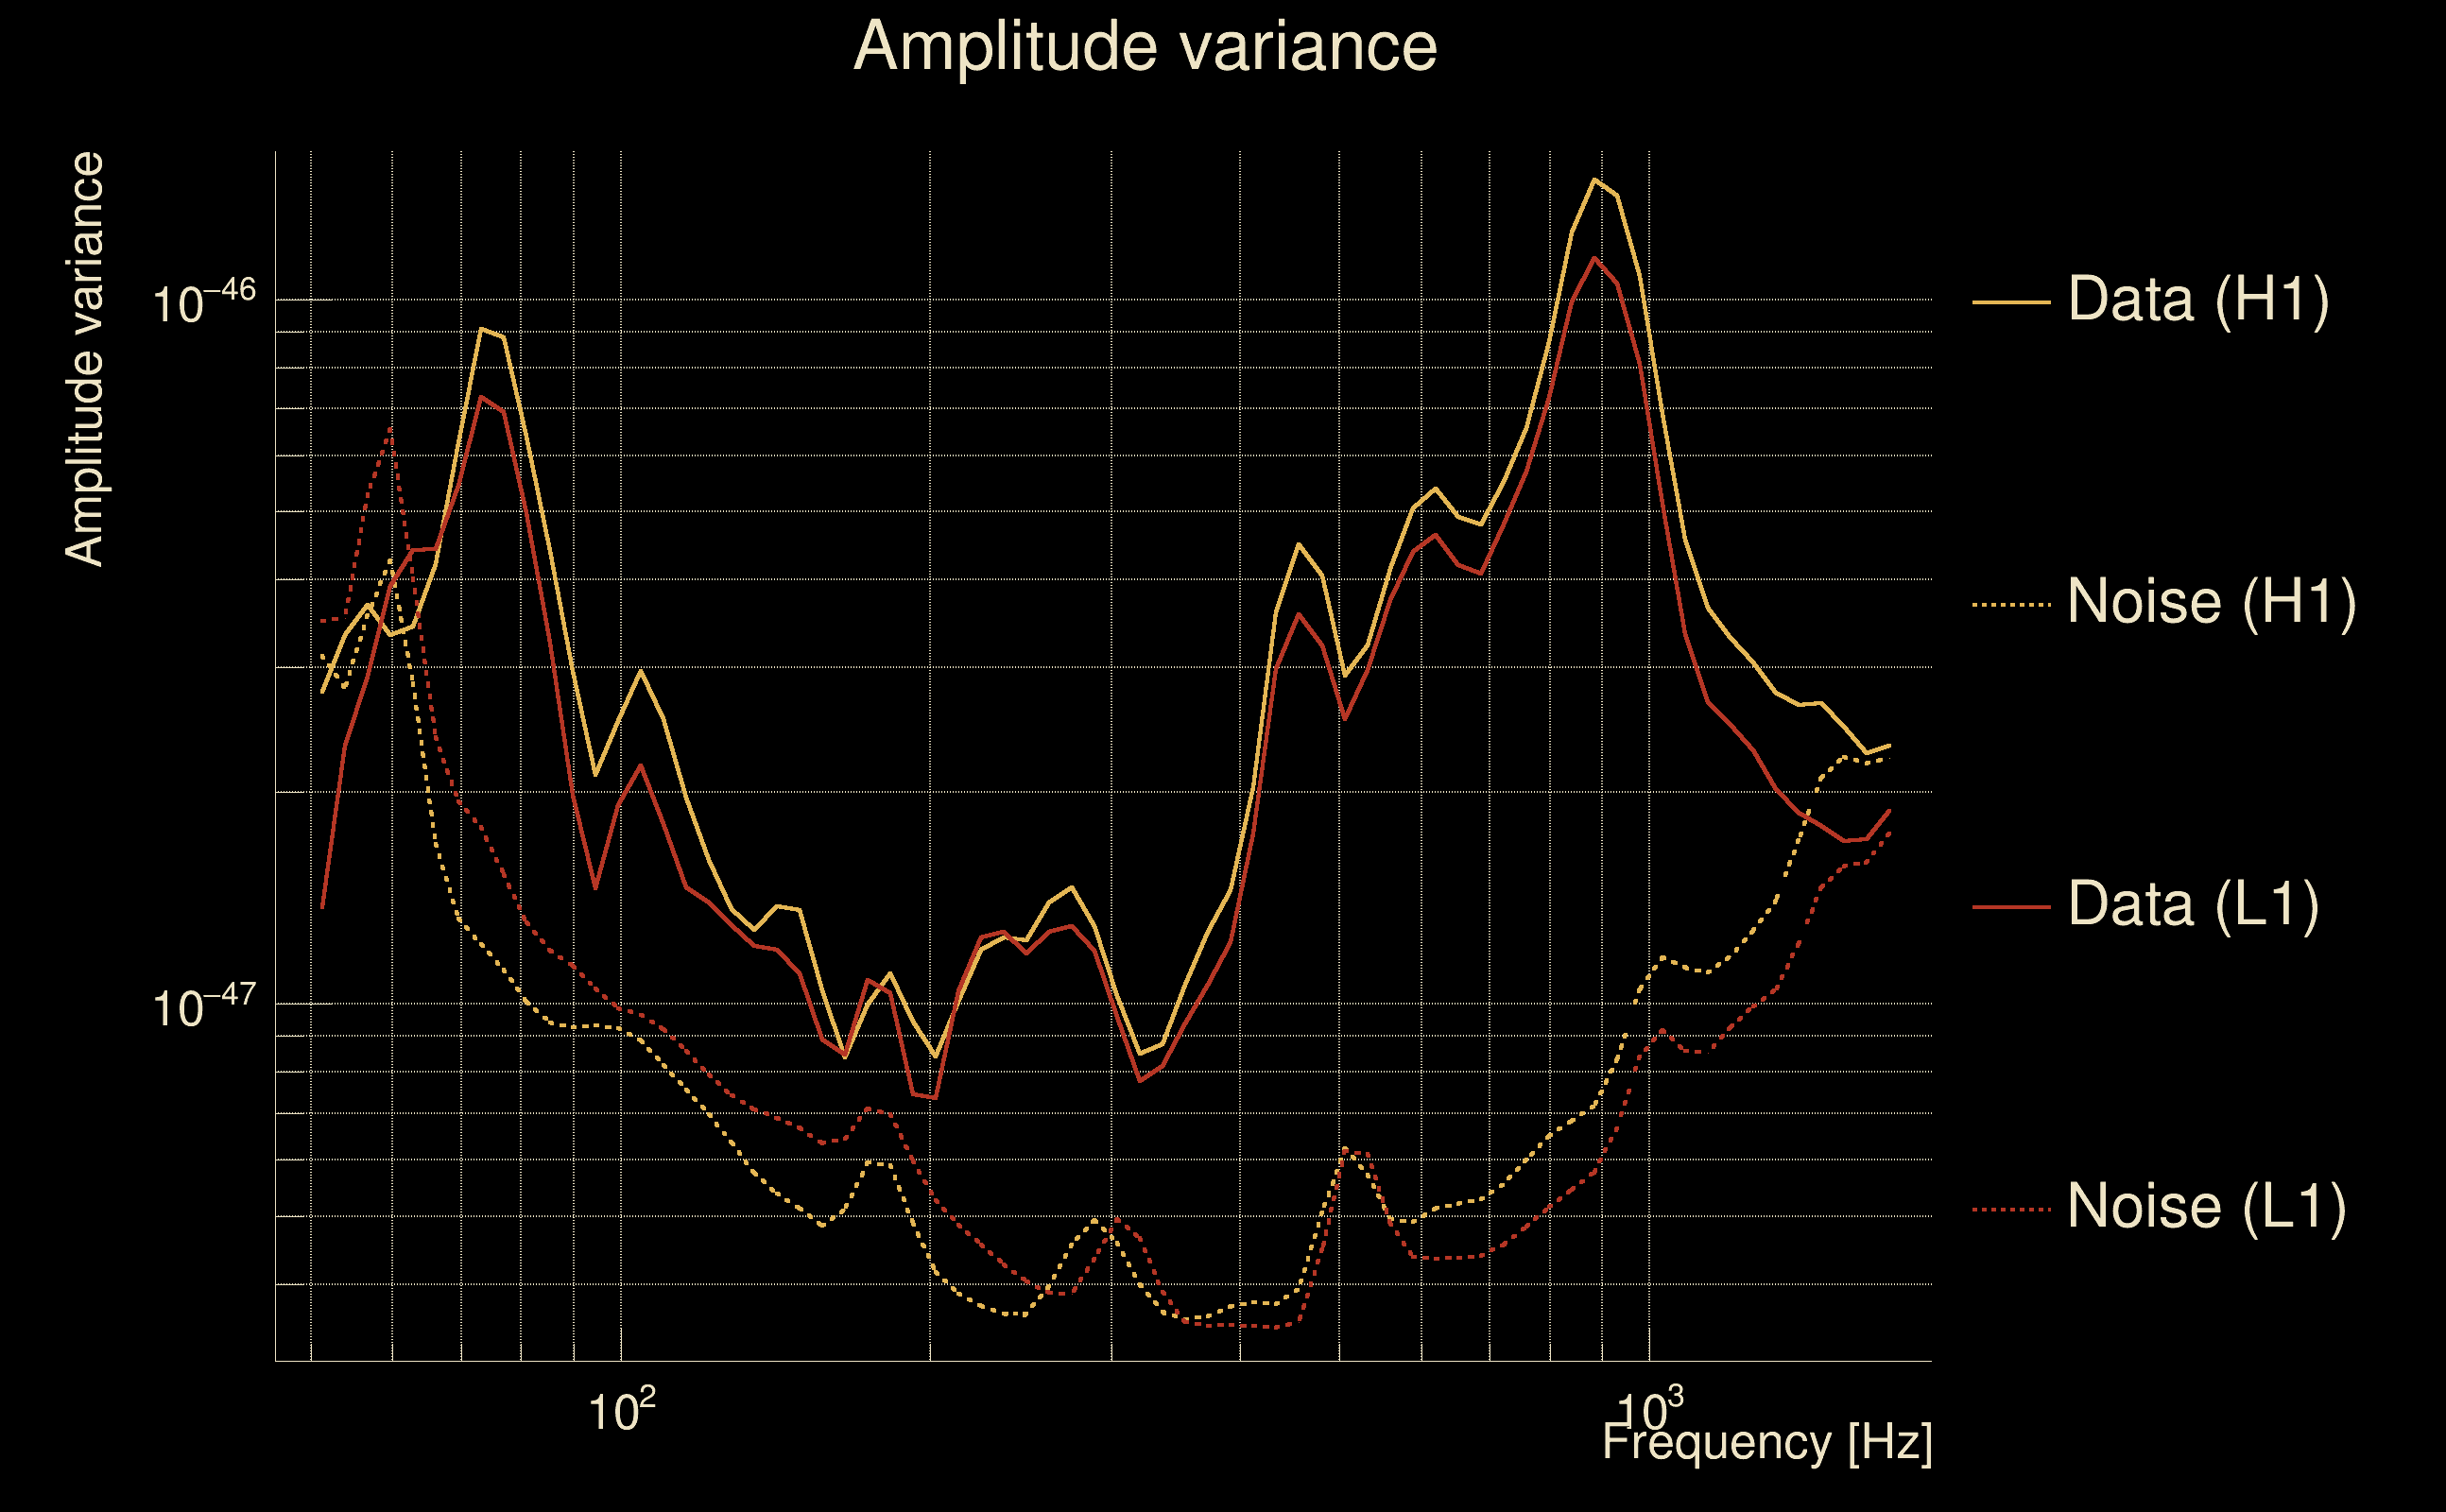
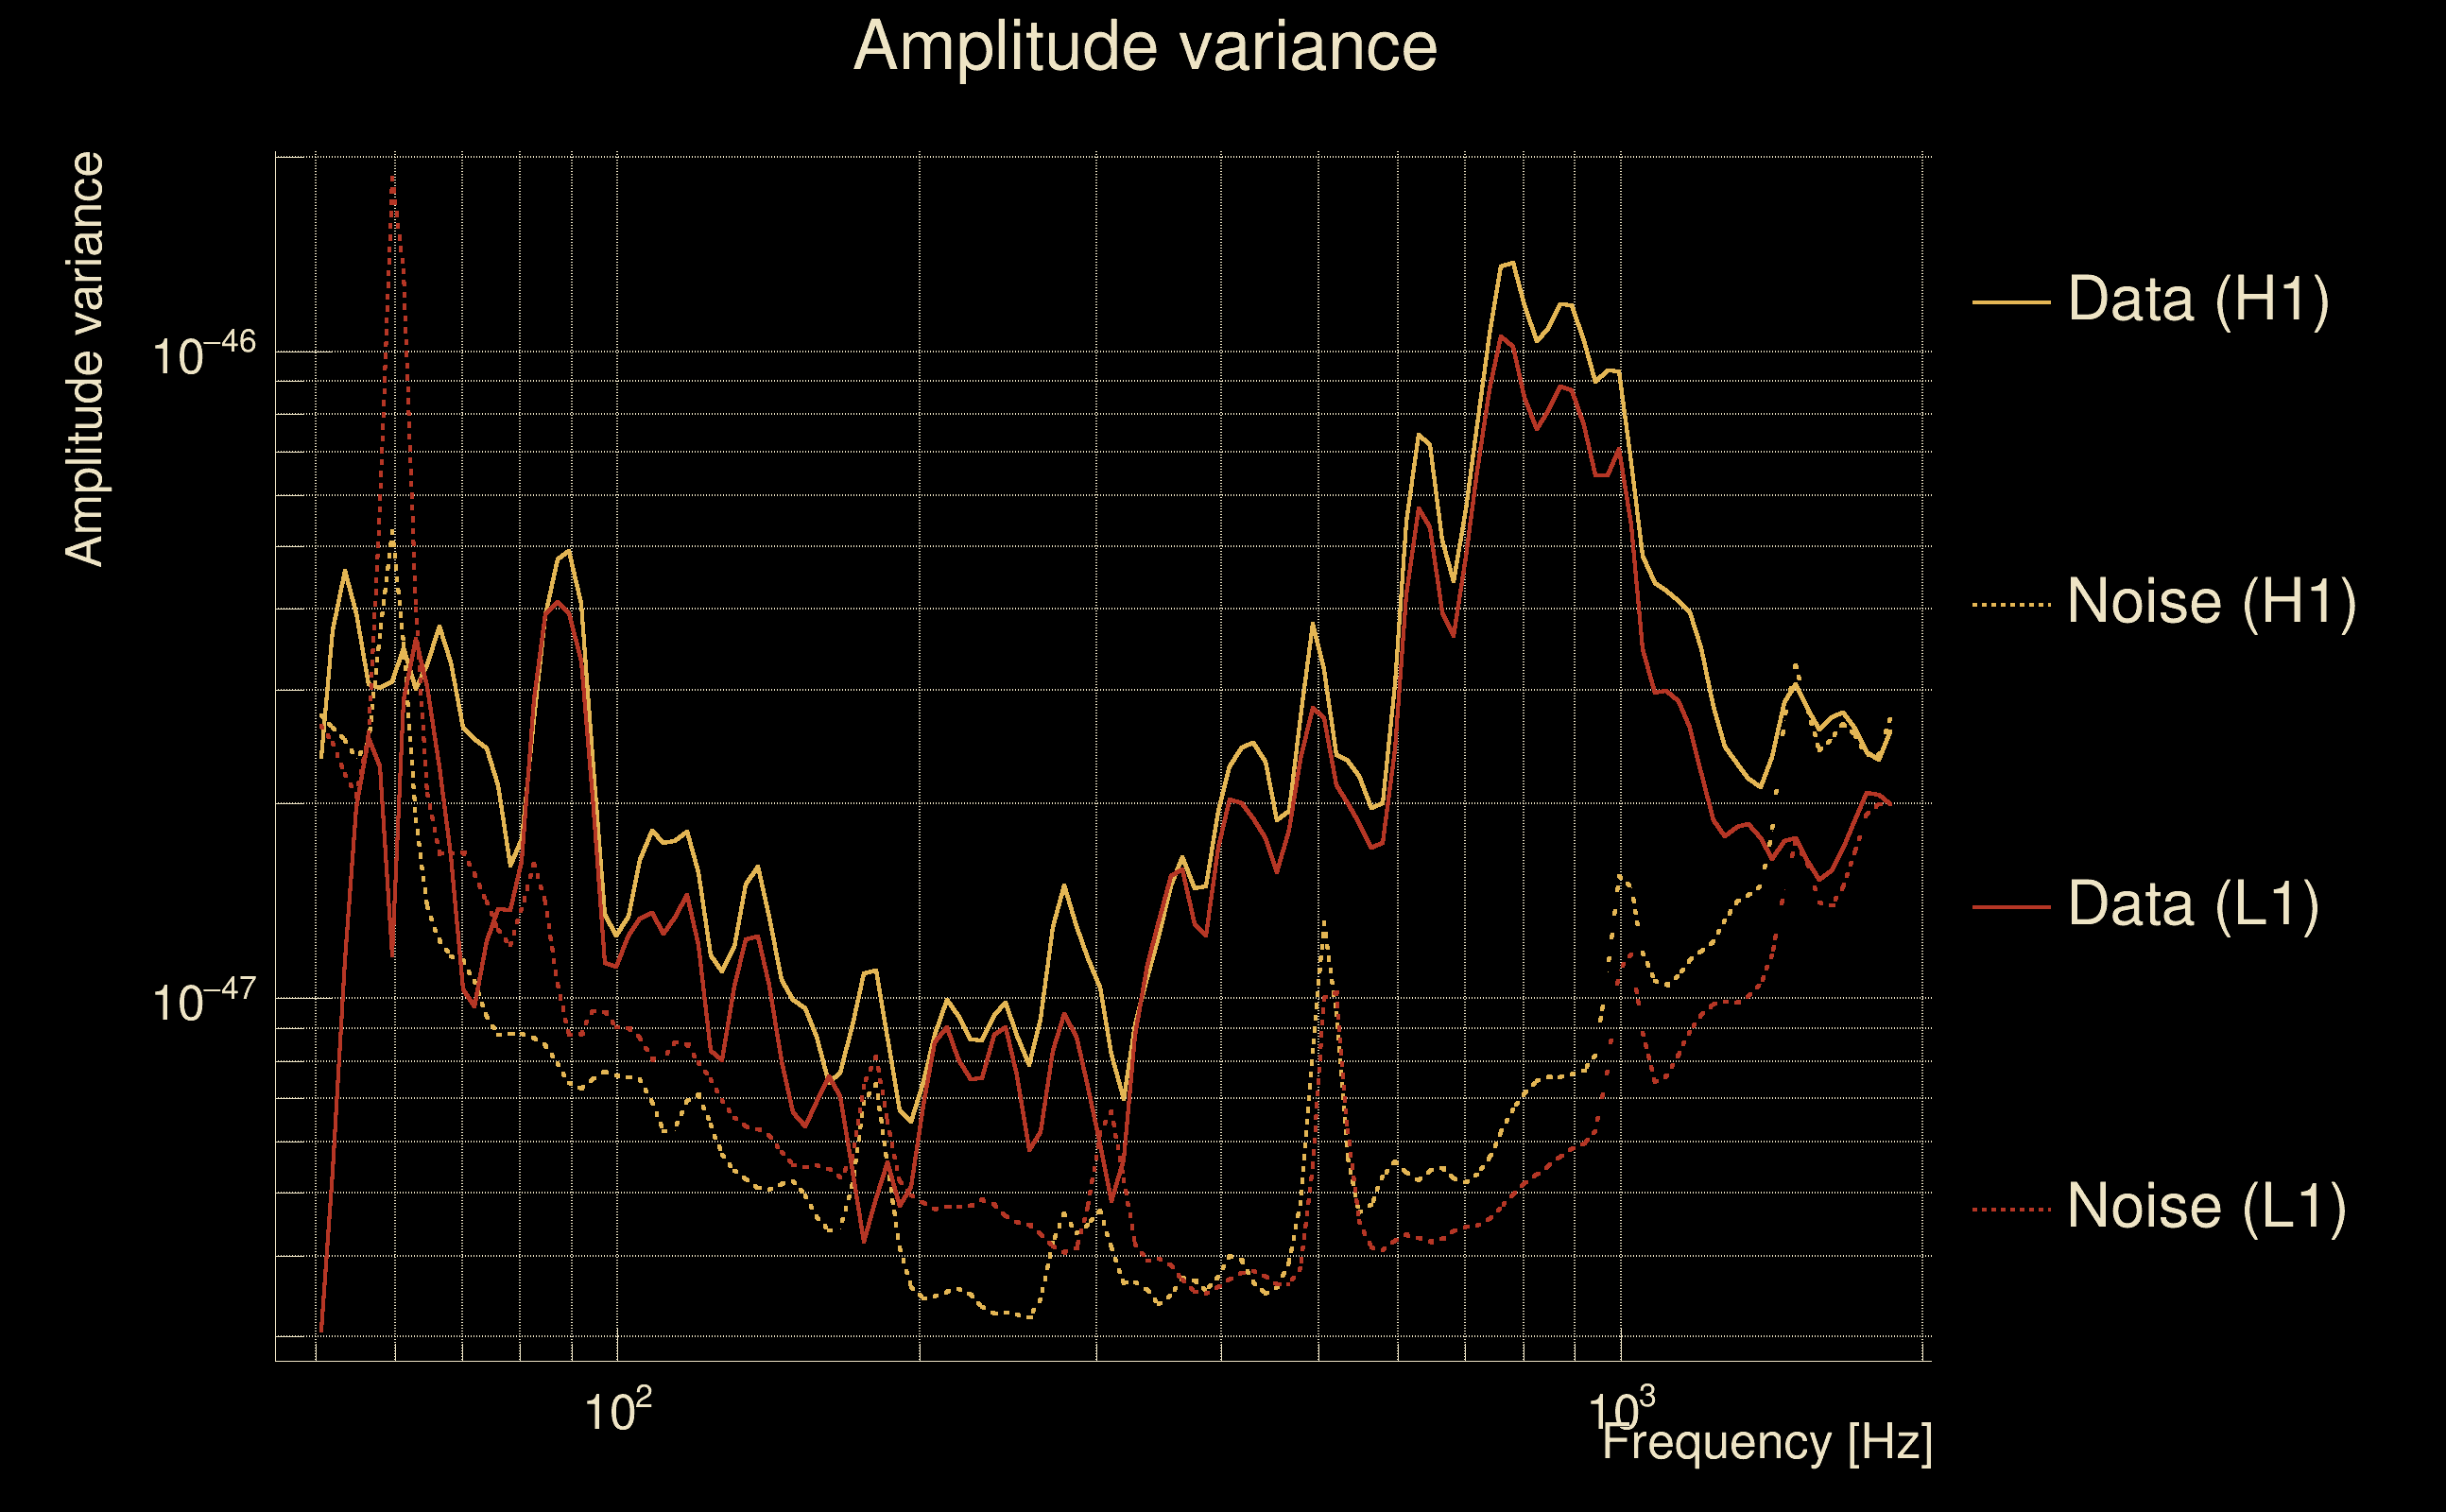
| Amplitude spectrograms: | normalization = 1e-22, power index = 2 |
| White noise SNR variance: | 0.523175 (after applying a correction factor = 1) |
| Amplitude ratio confidence level: | 3 sigma |
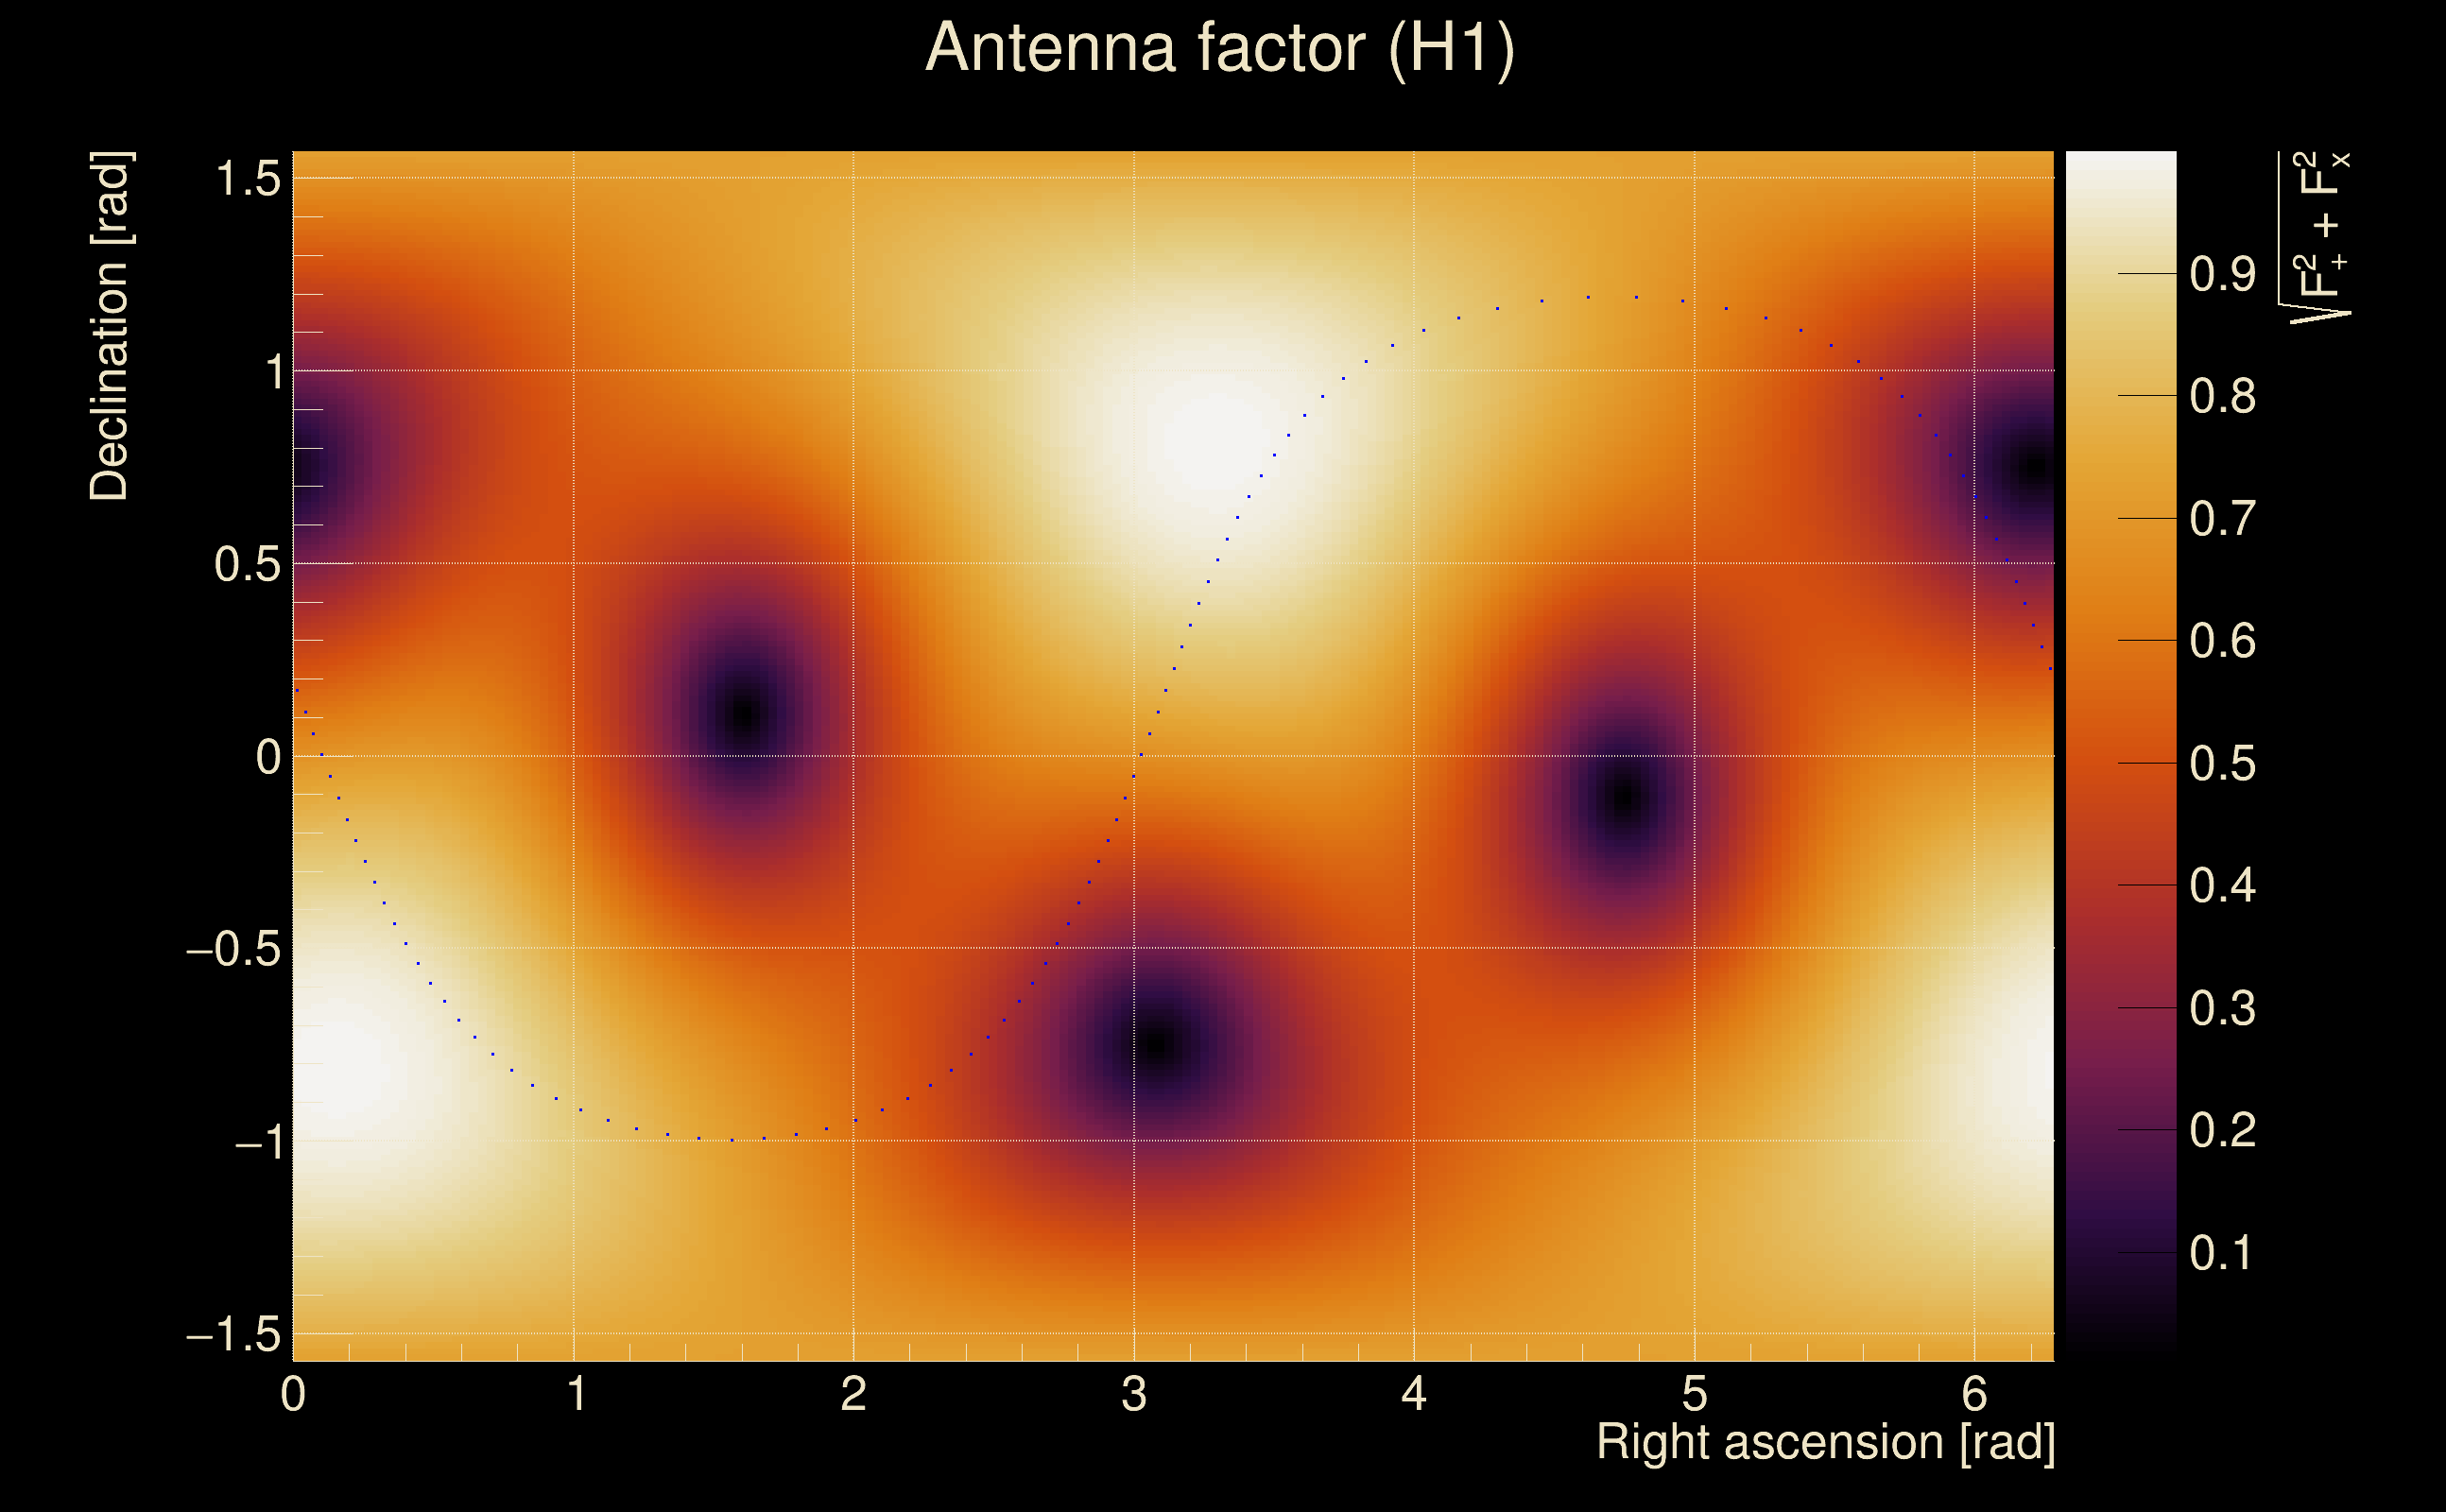
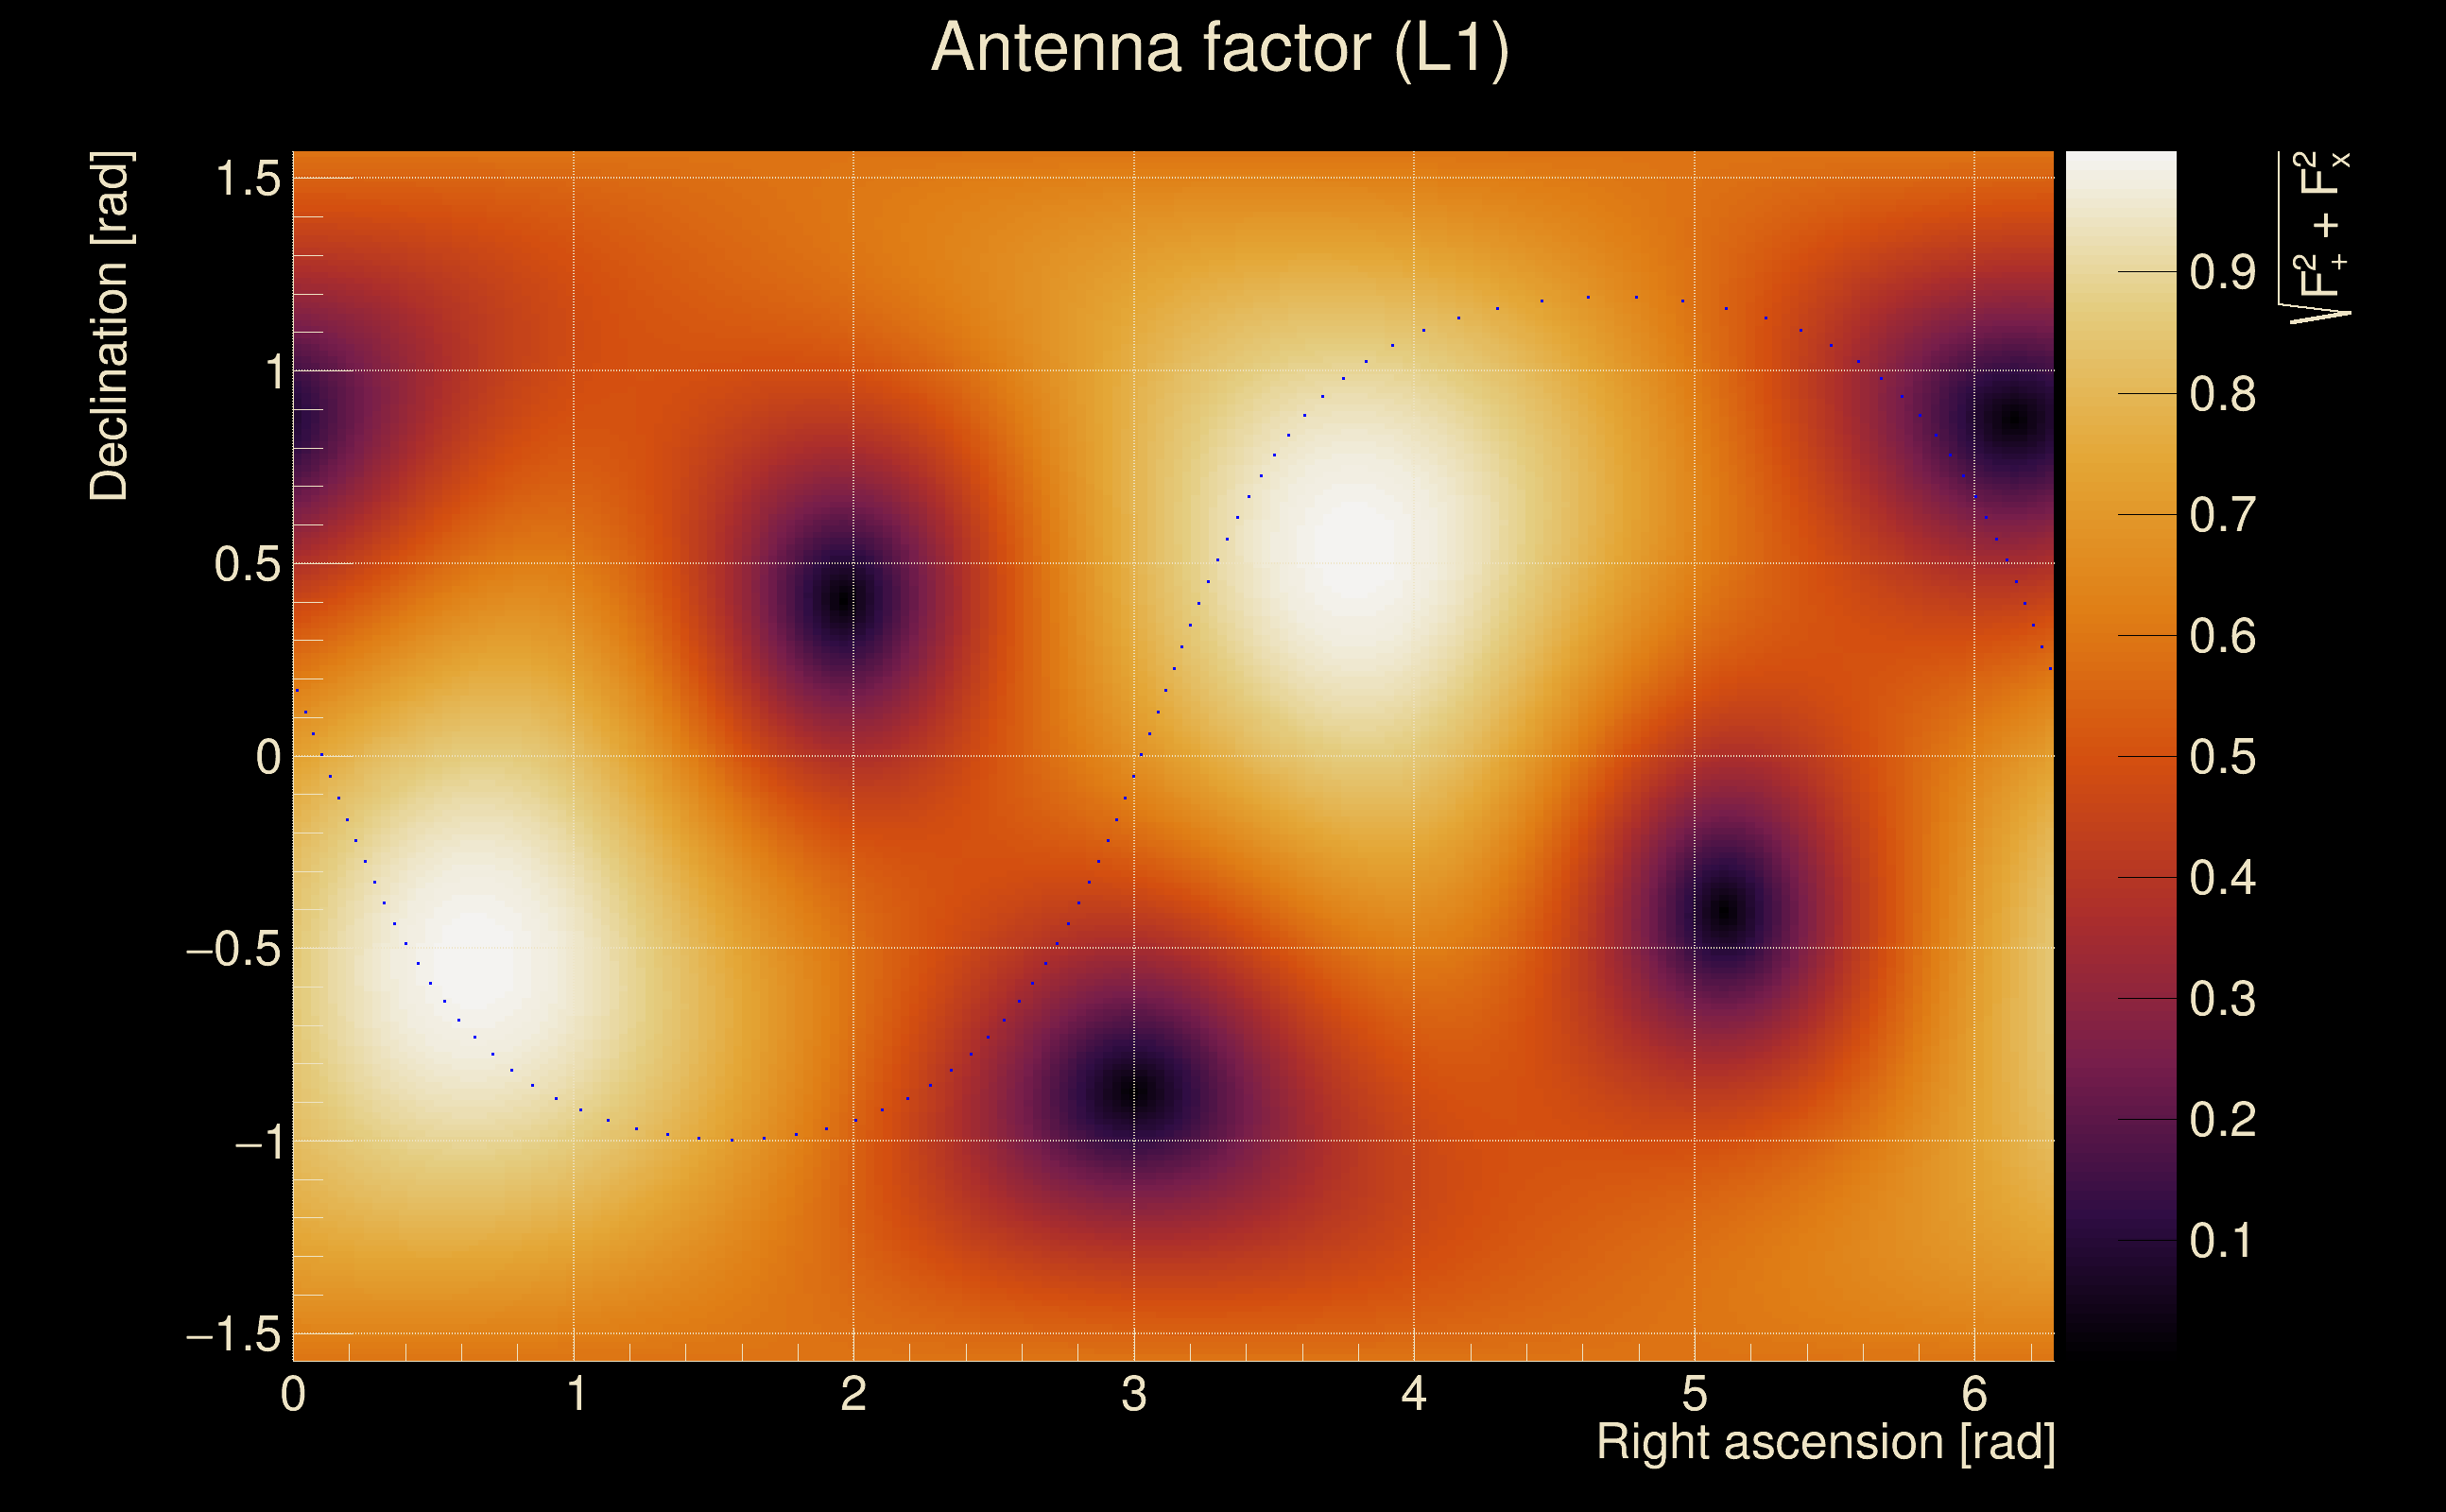
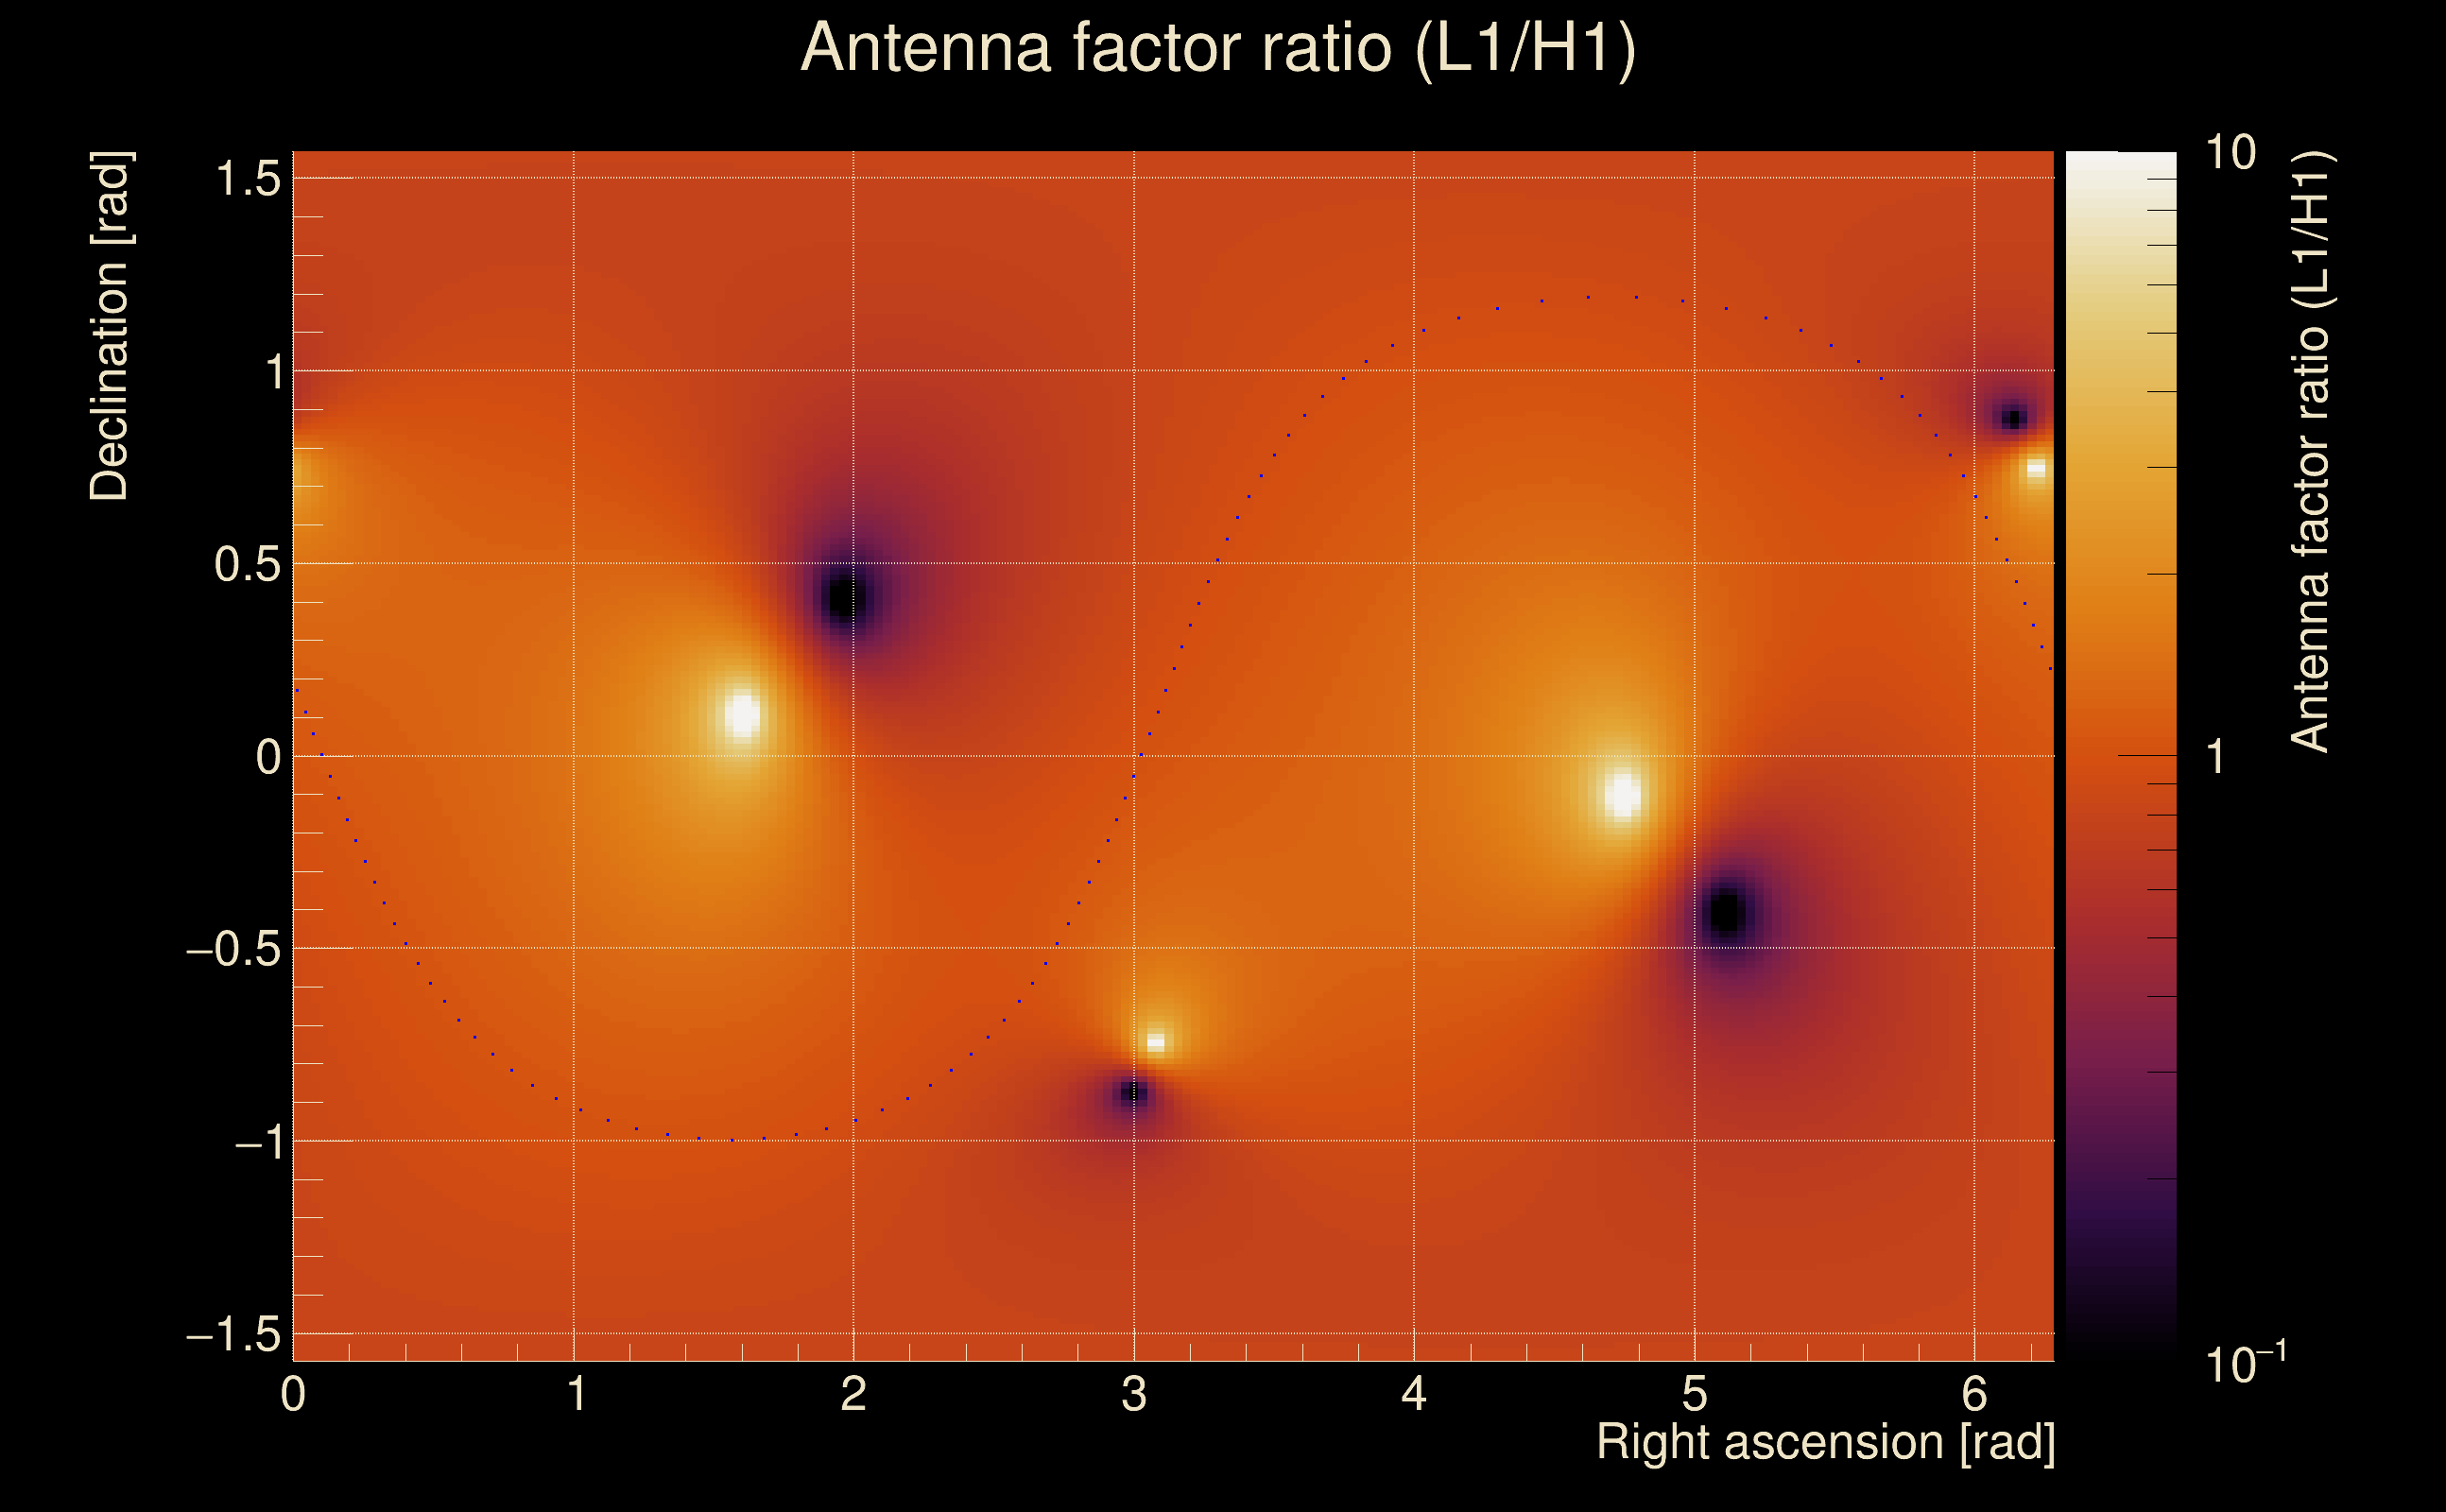
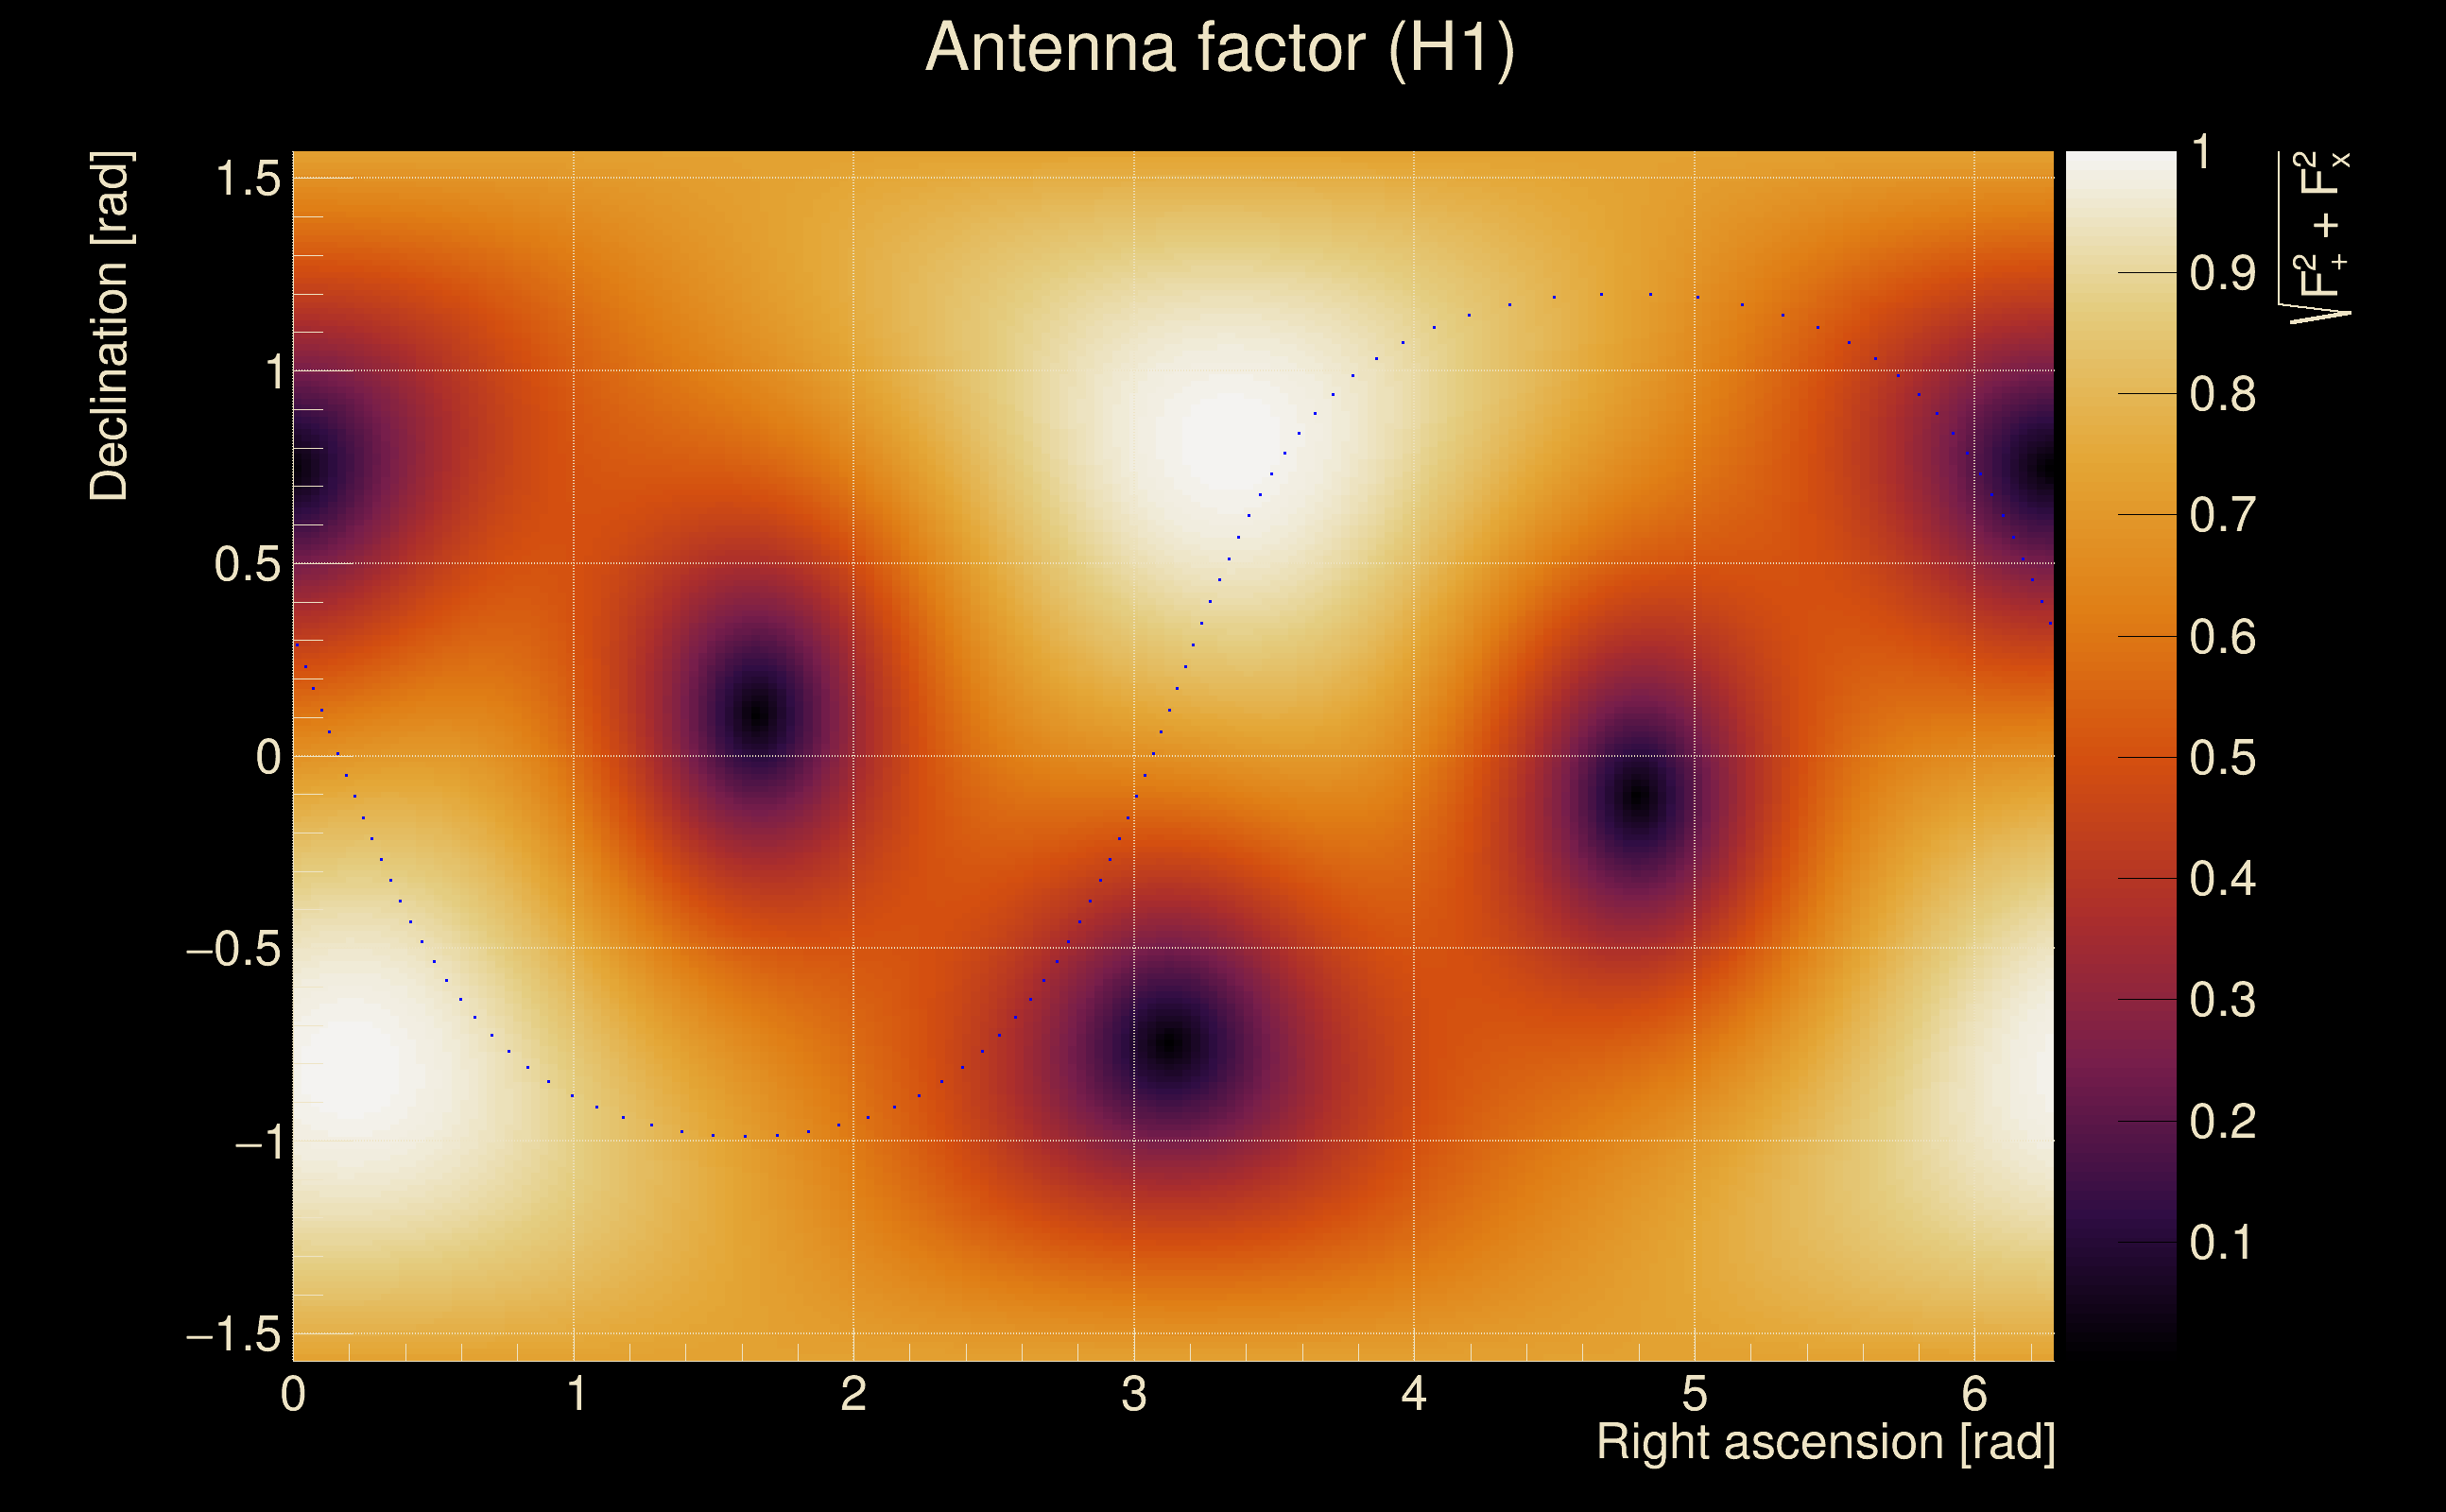
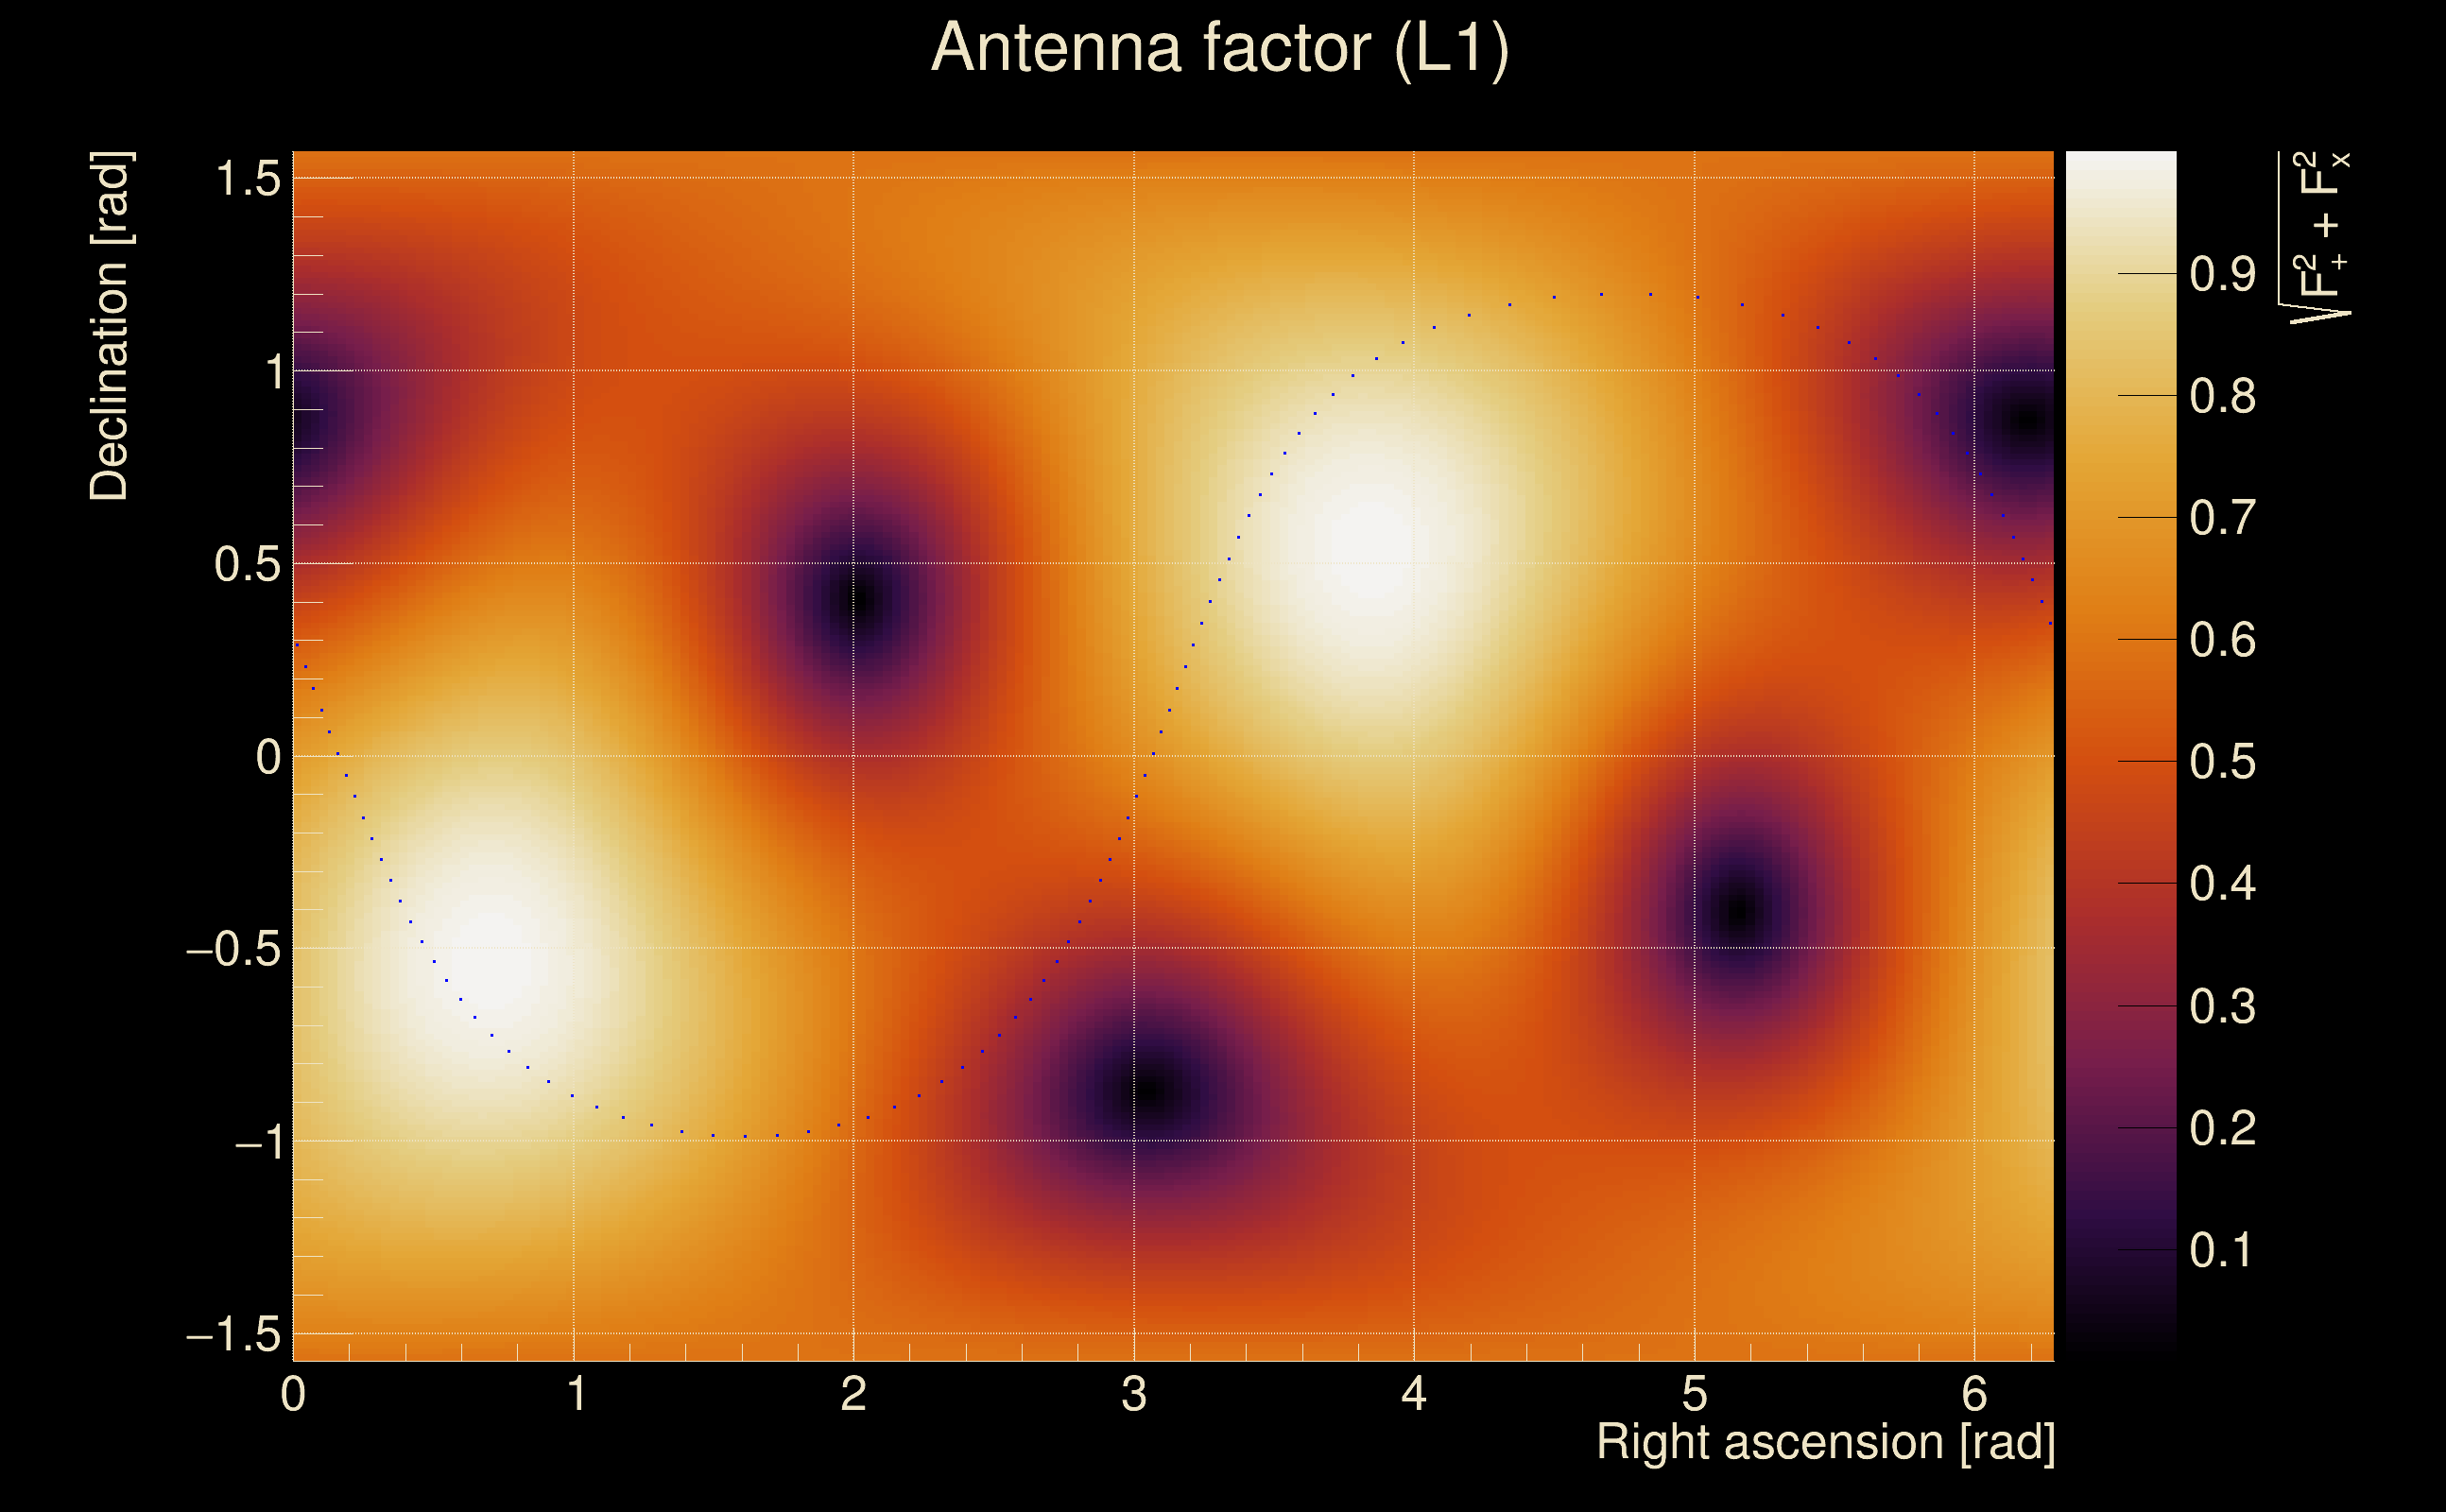
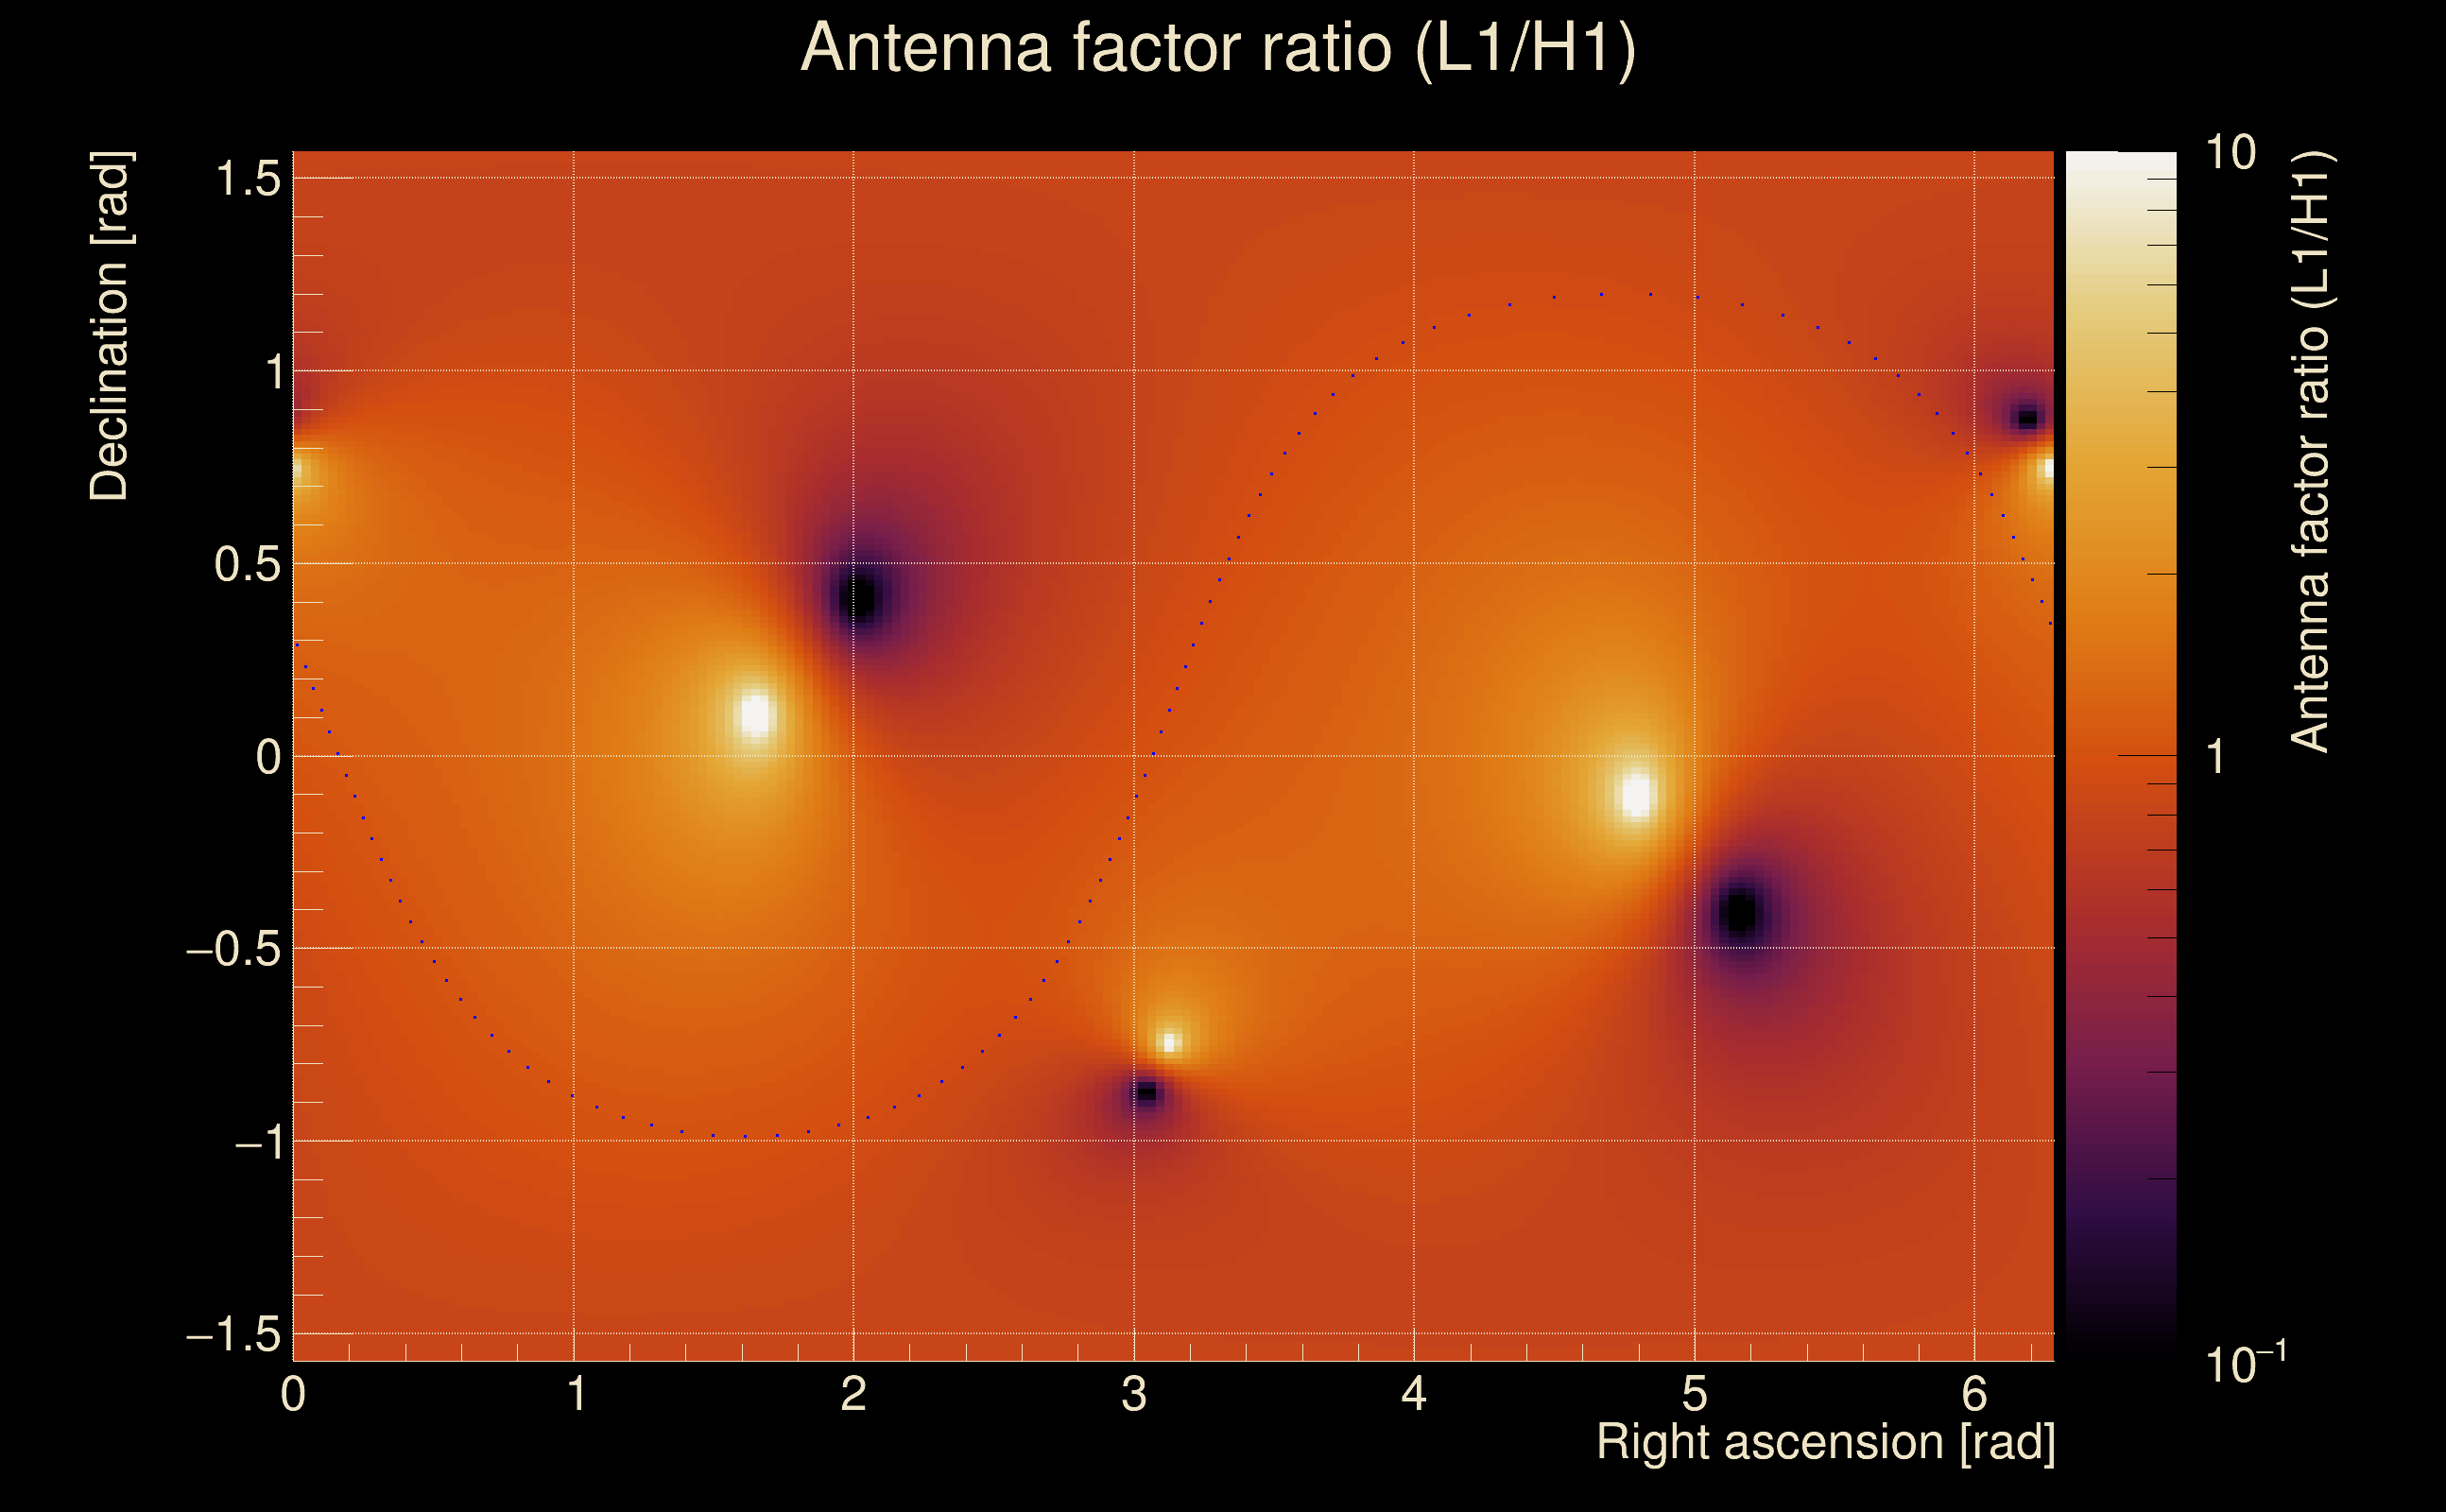
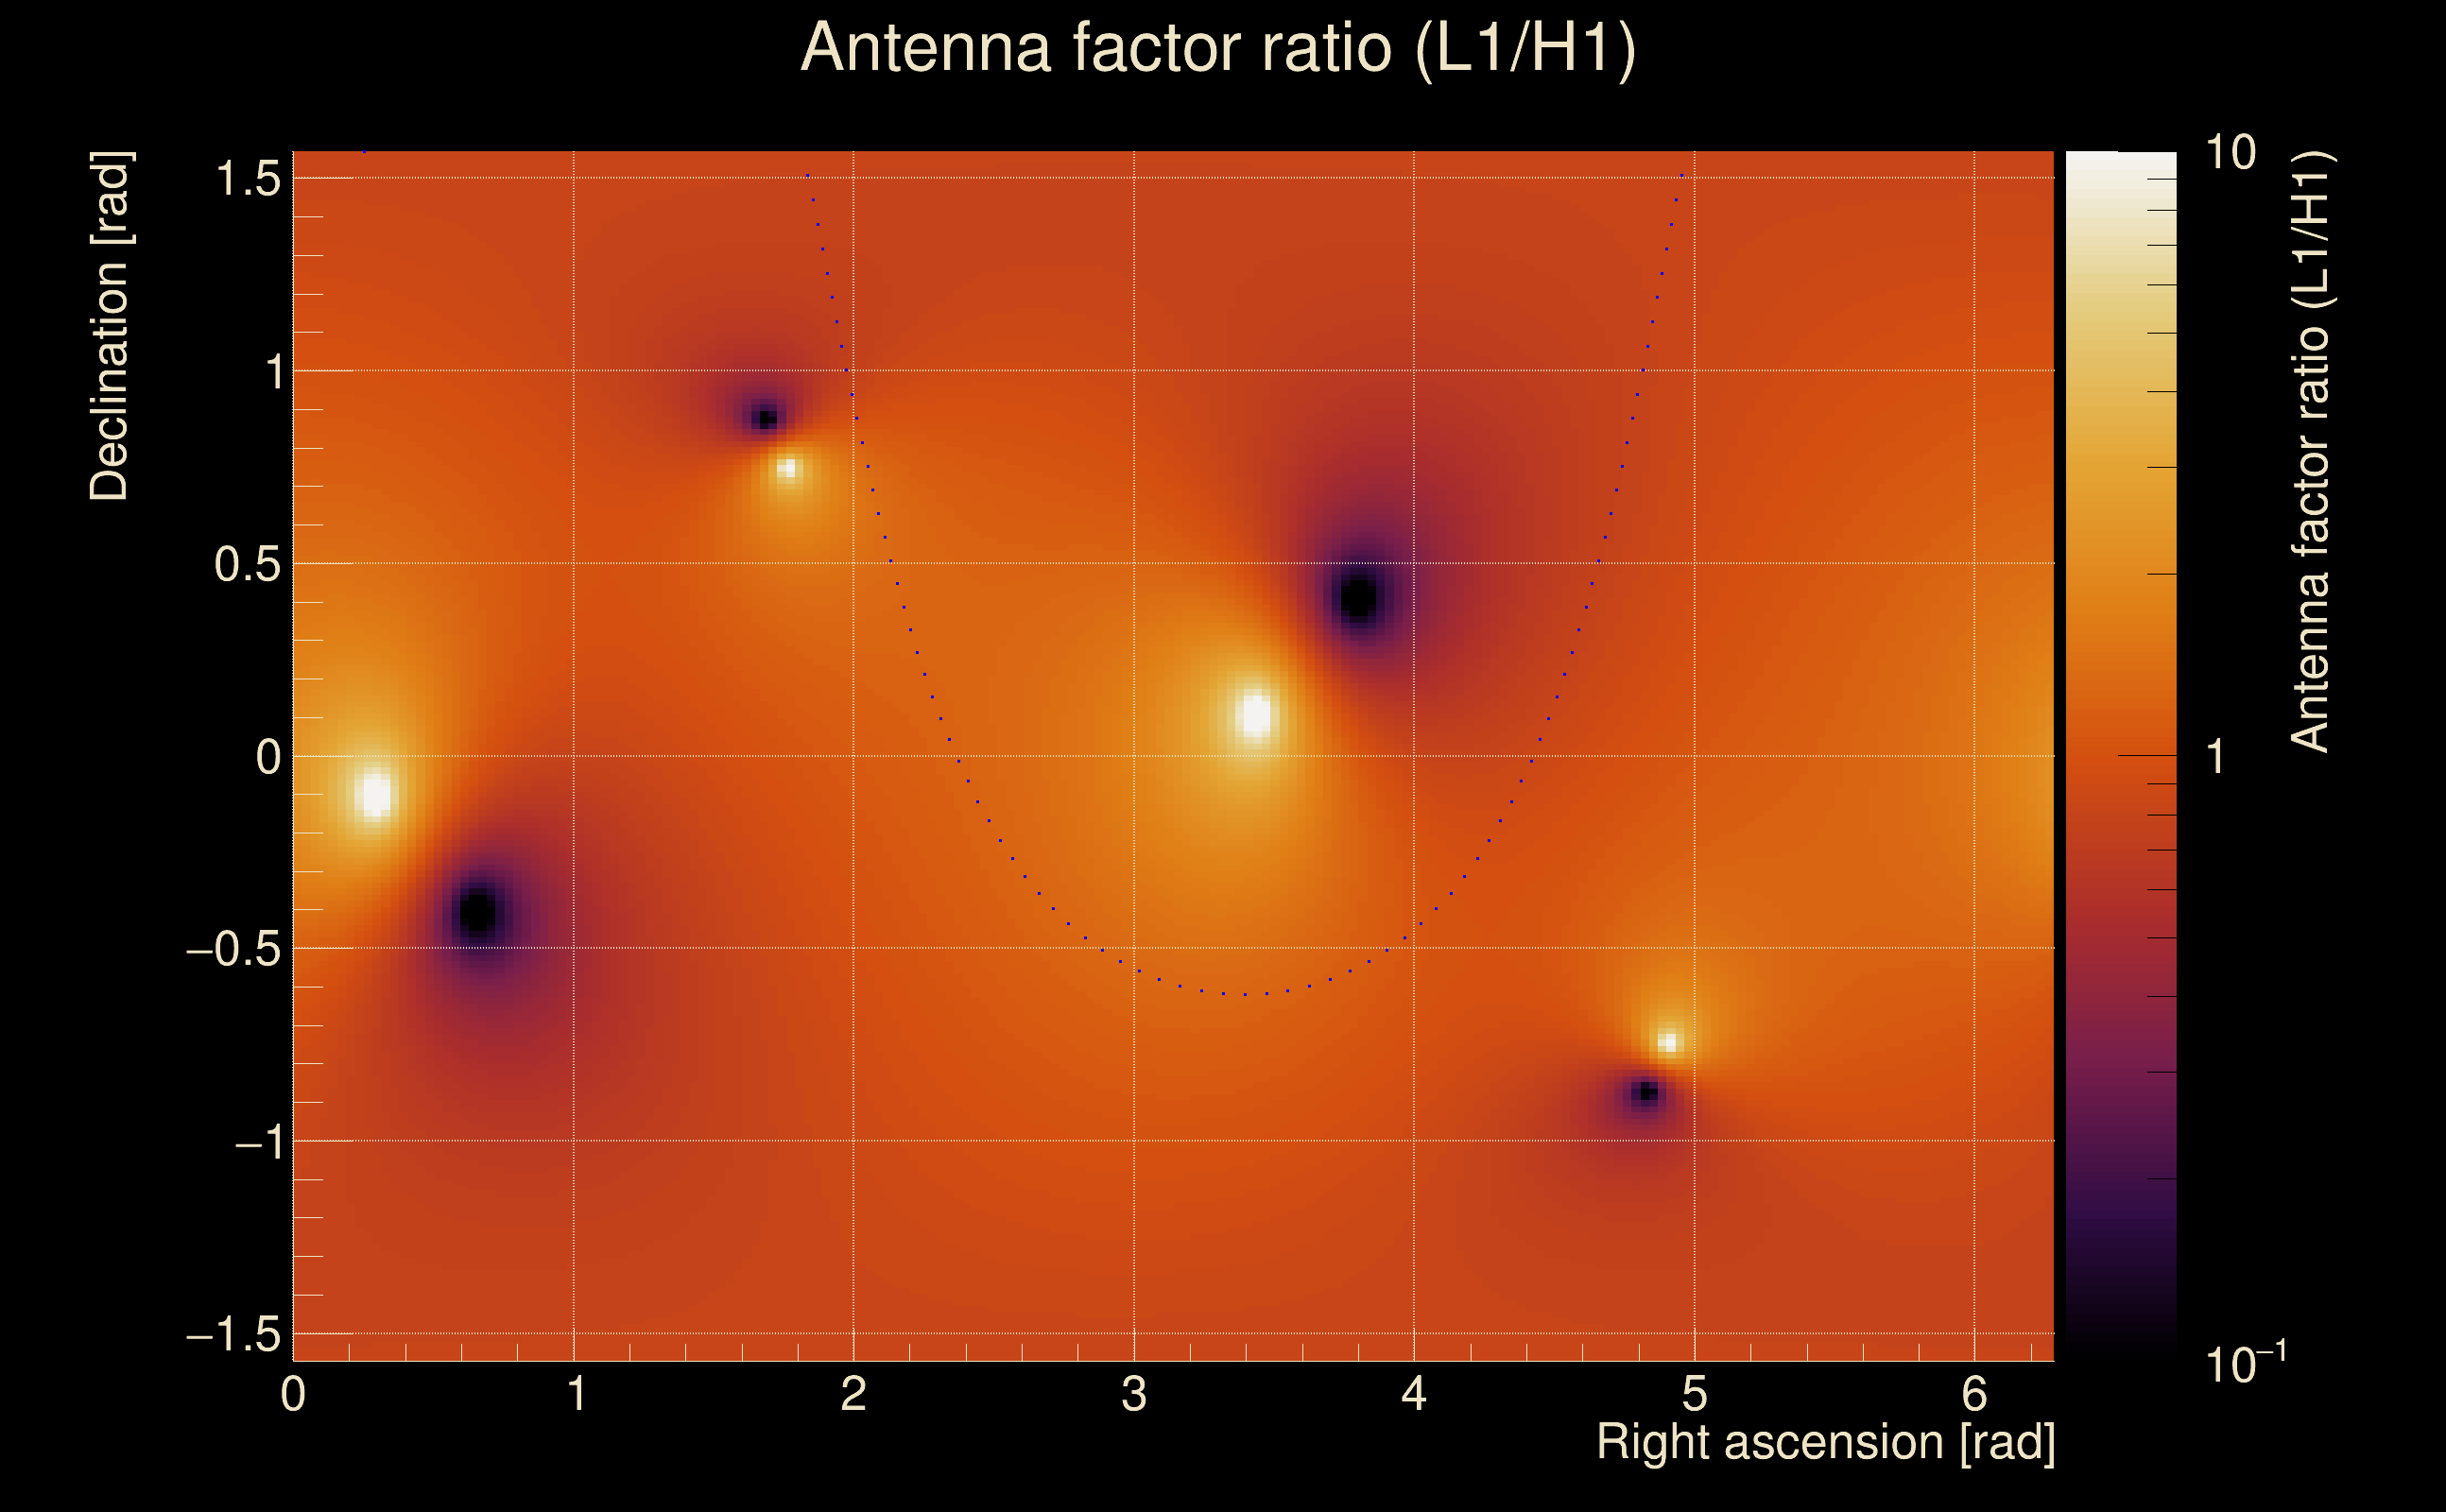
| Target sky positon: | Ra: 10, Dec: 10 [rad] |
| List of input Ox files: | TargIxfw_injpt1_file_list.txt (71 files) |
| Analysis result file: | TargIxfw_injpt1_results-0.root |
| Slice selected for the the fakeground: | slice index=46 (2.852 s), time lag = 0 s |
| Foreground | Fakeground | Background | ||
|---|---|---|---|---|
| Number of processed ox events | 12111 | 12111 | 2603865 | |
| Start Date (detector 0) | Mon May 15 14:13:25 2023 UTC | Mon May 15 14:13:25 2023 UTC | Mon May 15 14:13:25 2023 UTC | |
| End Date (detector 0) | Thu May 18 15:54:40 2023 UTC | Thu May 18 15:54:40 2023 UTC | Thu May 18 15:54:40 2023 UTC | |
| Start GPS (detector 0) | 1368195223 | 1368195223 | 1368195223 | |
| End GPS (detector 0) | 1368460498 | 1368460498 | 1368460498 | |
| Used livetime (detector 0) | 60875 s | 60875 s | 60875 s | |
| Start Date (detector 1) | Mon May 15 14:13:25 2023 UTC | Mon May 15 14:13:25 2023 UTC | Mon May 15 14:13:25 2023 UTC | |
| End Date (detector 1) | Thu May 18 15:54:40 2023 UTC | Thu May 18 15:54:40 2023 UTC | Thu May 18 15:54:40 2023 UTC | |
| Start GPS (detector 1) | 1368195223 | 1368195223 | 1368195223 | |
| End GPS (detector 1) | 1368460498 | 1368460498 | 1368460498 | |
| Used livetime (detector 1) | 60875 s | 60875 s | 60875 s | |
| Cumulative livetime | 121110 s | 121110 s | 26038650 s | |
| 0 years, 1 days, 9 hours, 38 min, 30 s | 0 years, 1 days, 9 hours, 38 min, 30 s | 0 years, 301 days, 8 hours, 57 min, 30 s |
|
|
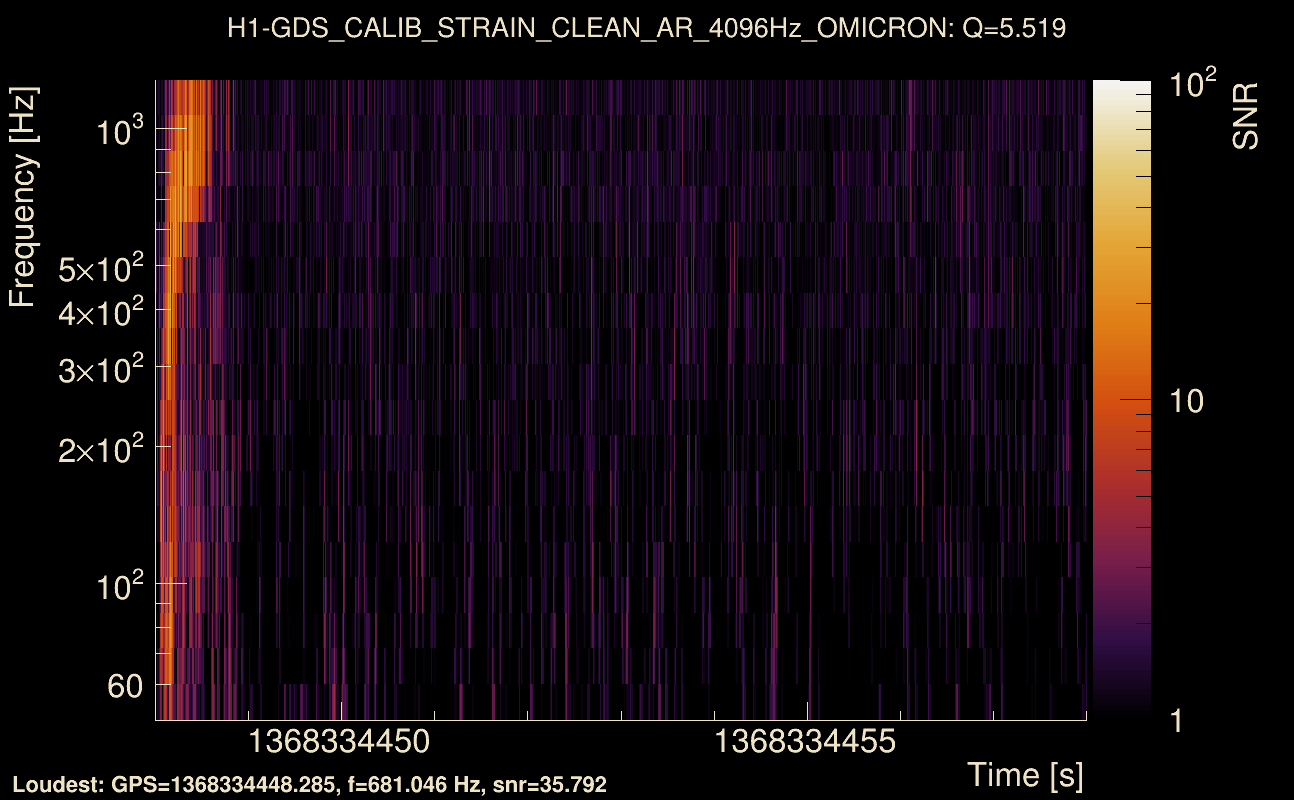
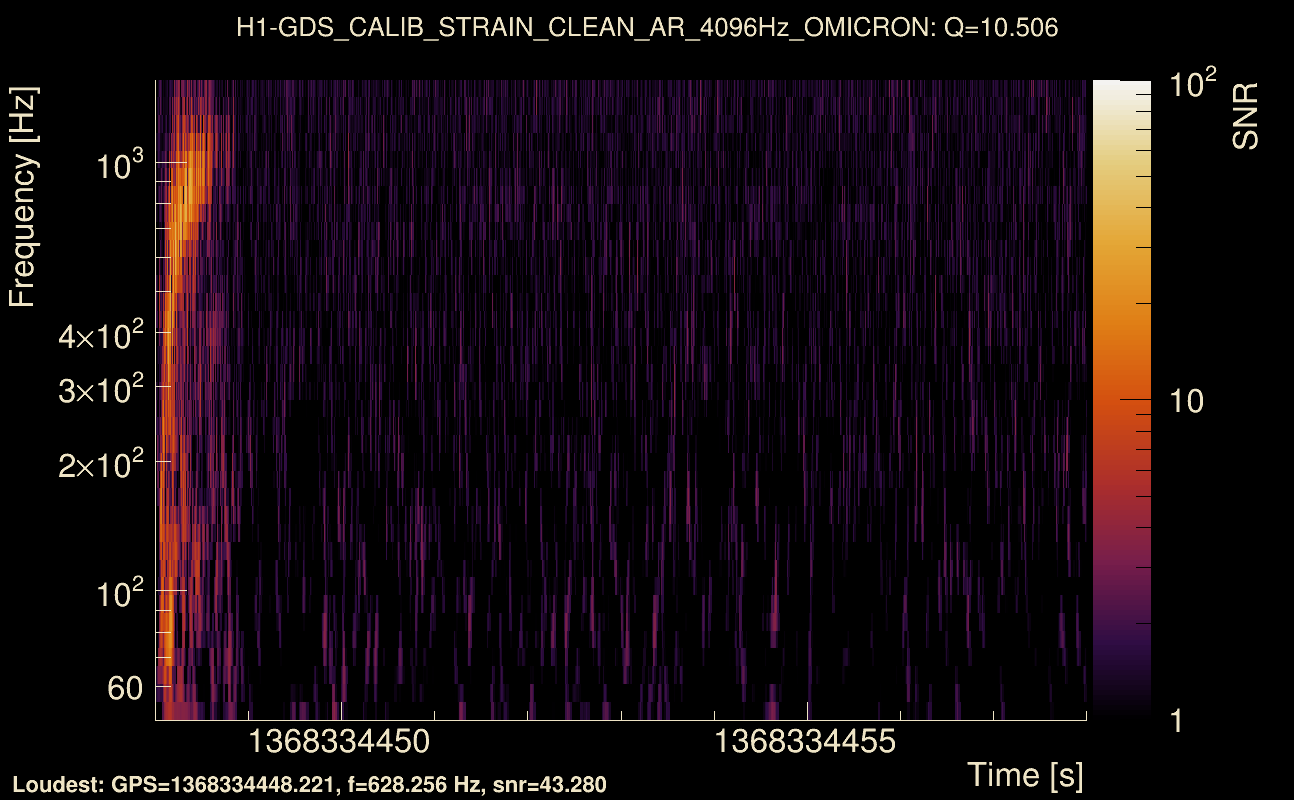
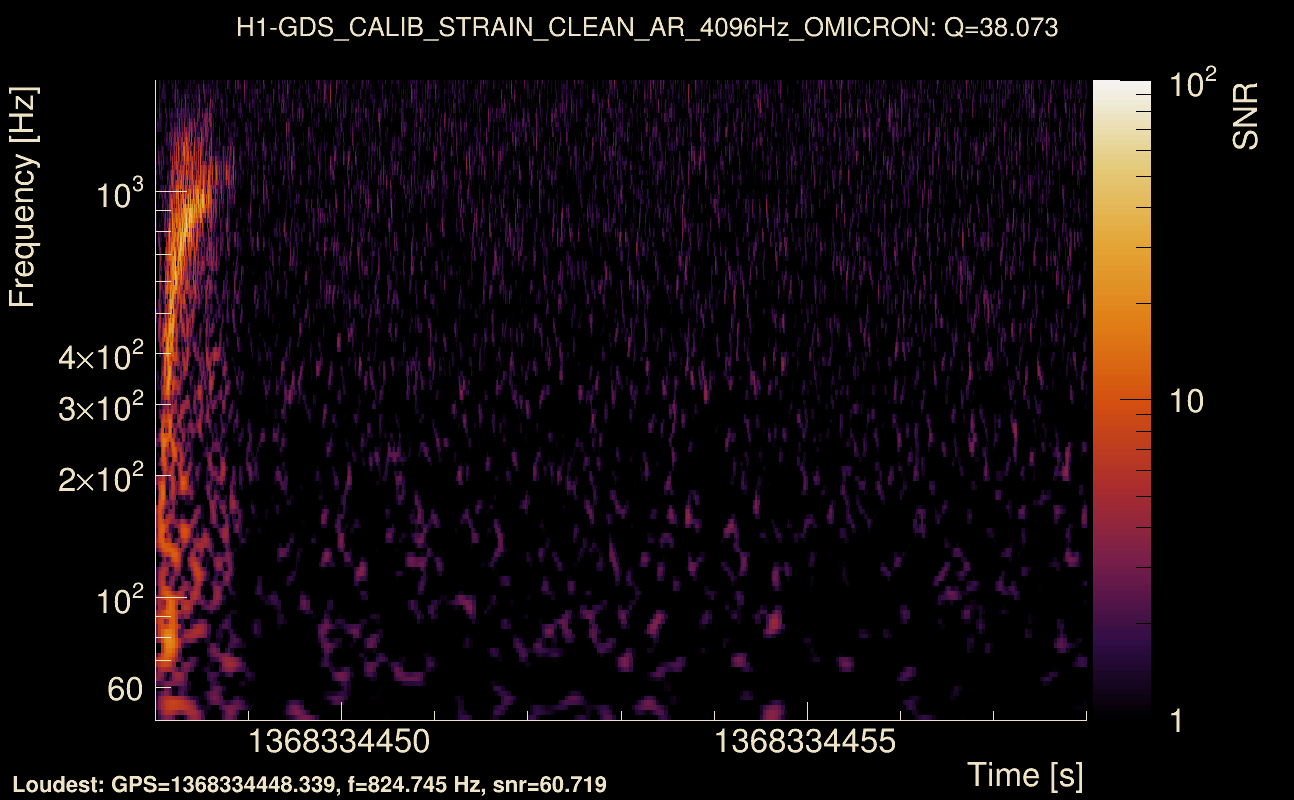
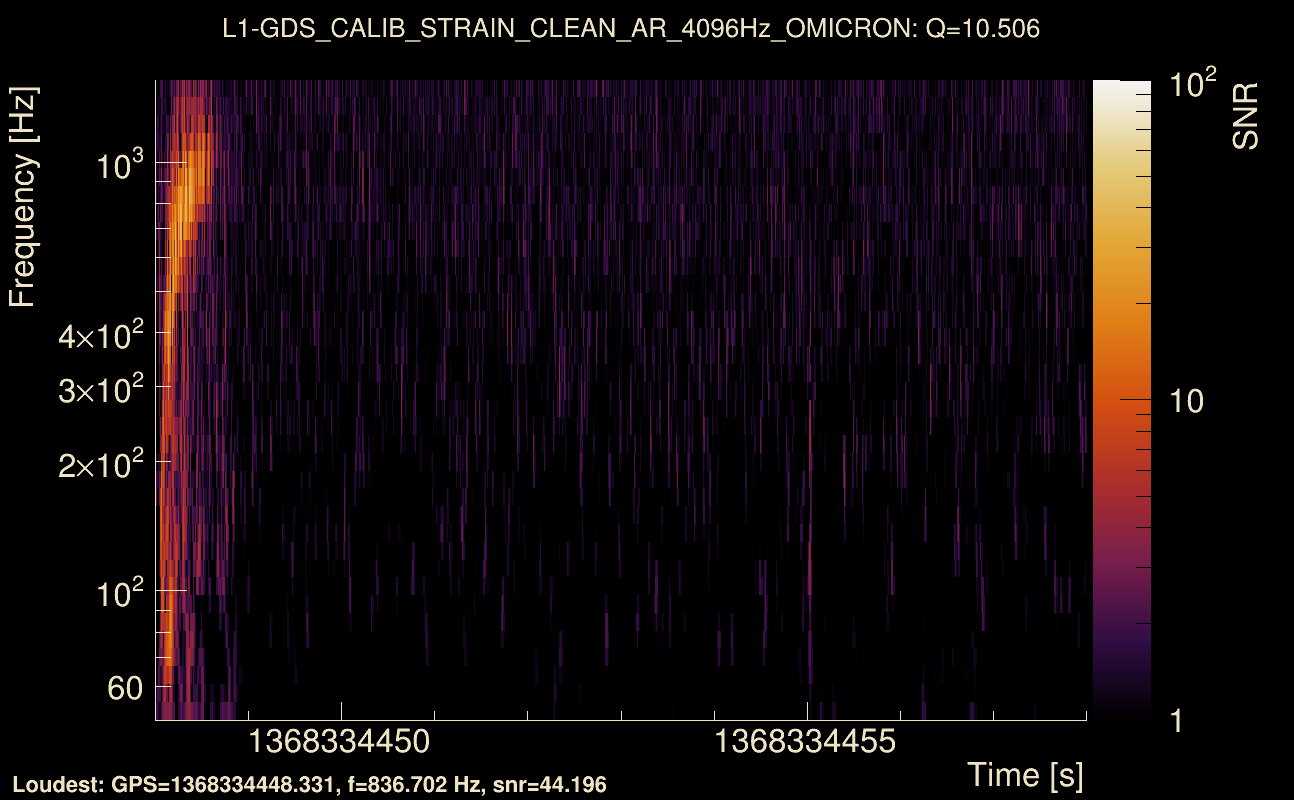
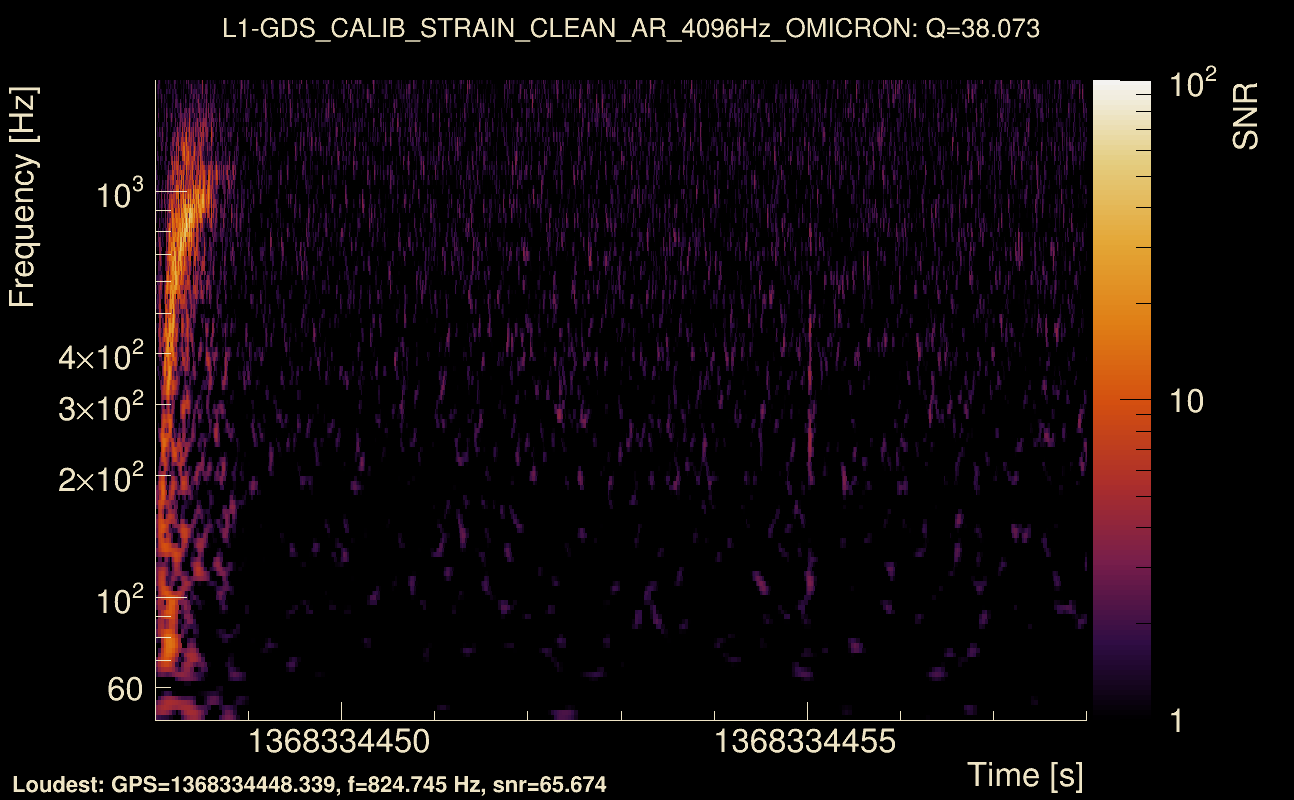
| Event time t(H1): | GPS = 1368334448 (Wed May 17 04:53:50 2023 ) → GPS = 1368334458 (Wed May 17 04:54:00 2023 ) |
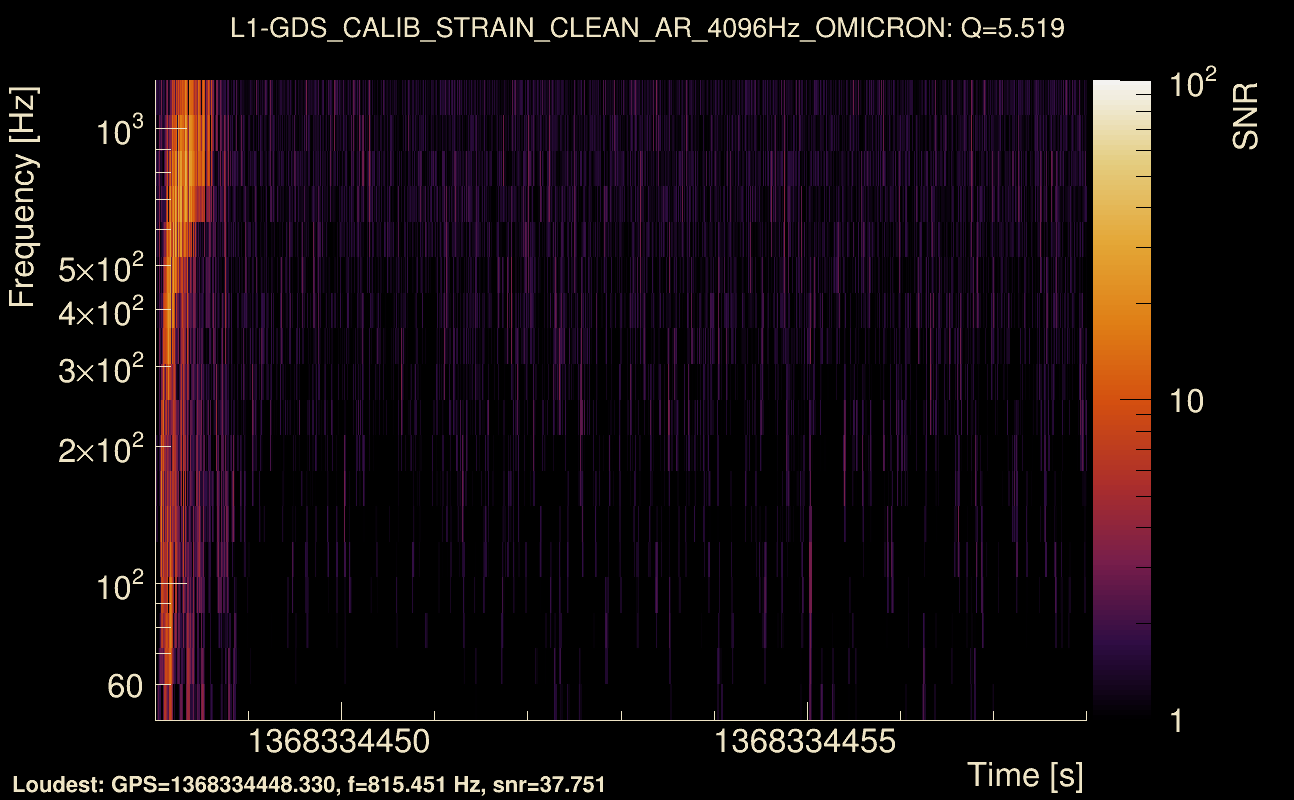
| Event time t(L1): | GPS = 1368334448 (Wed May 17 04:54:00 2023 ) → GPS = 1368334458 (Wed May 17 04:54:00 2023 ) |
| Omicron analysis time window (H1): | GPS = 1368334445 → GPS = 1368334461 |
| Omicron analysis time window (L1): | GPS = 1368334445 → GPS = 1368334461 |
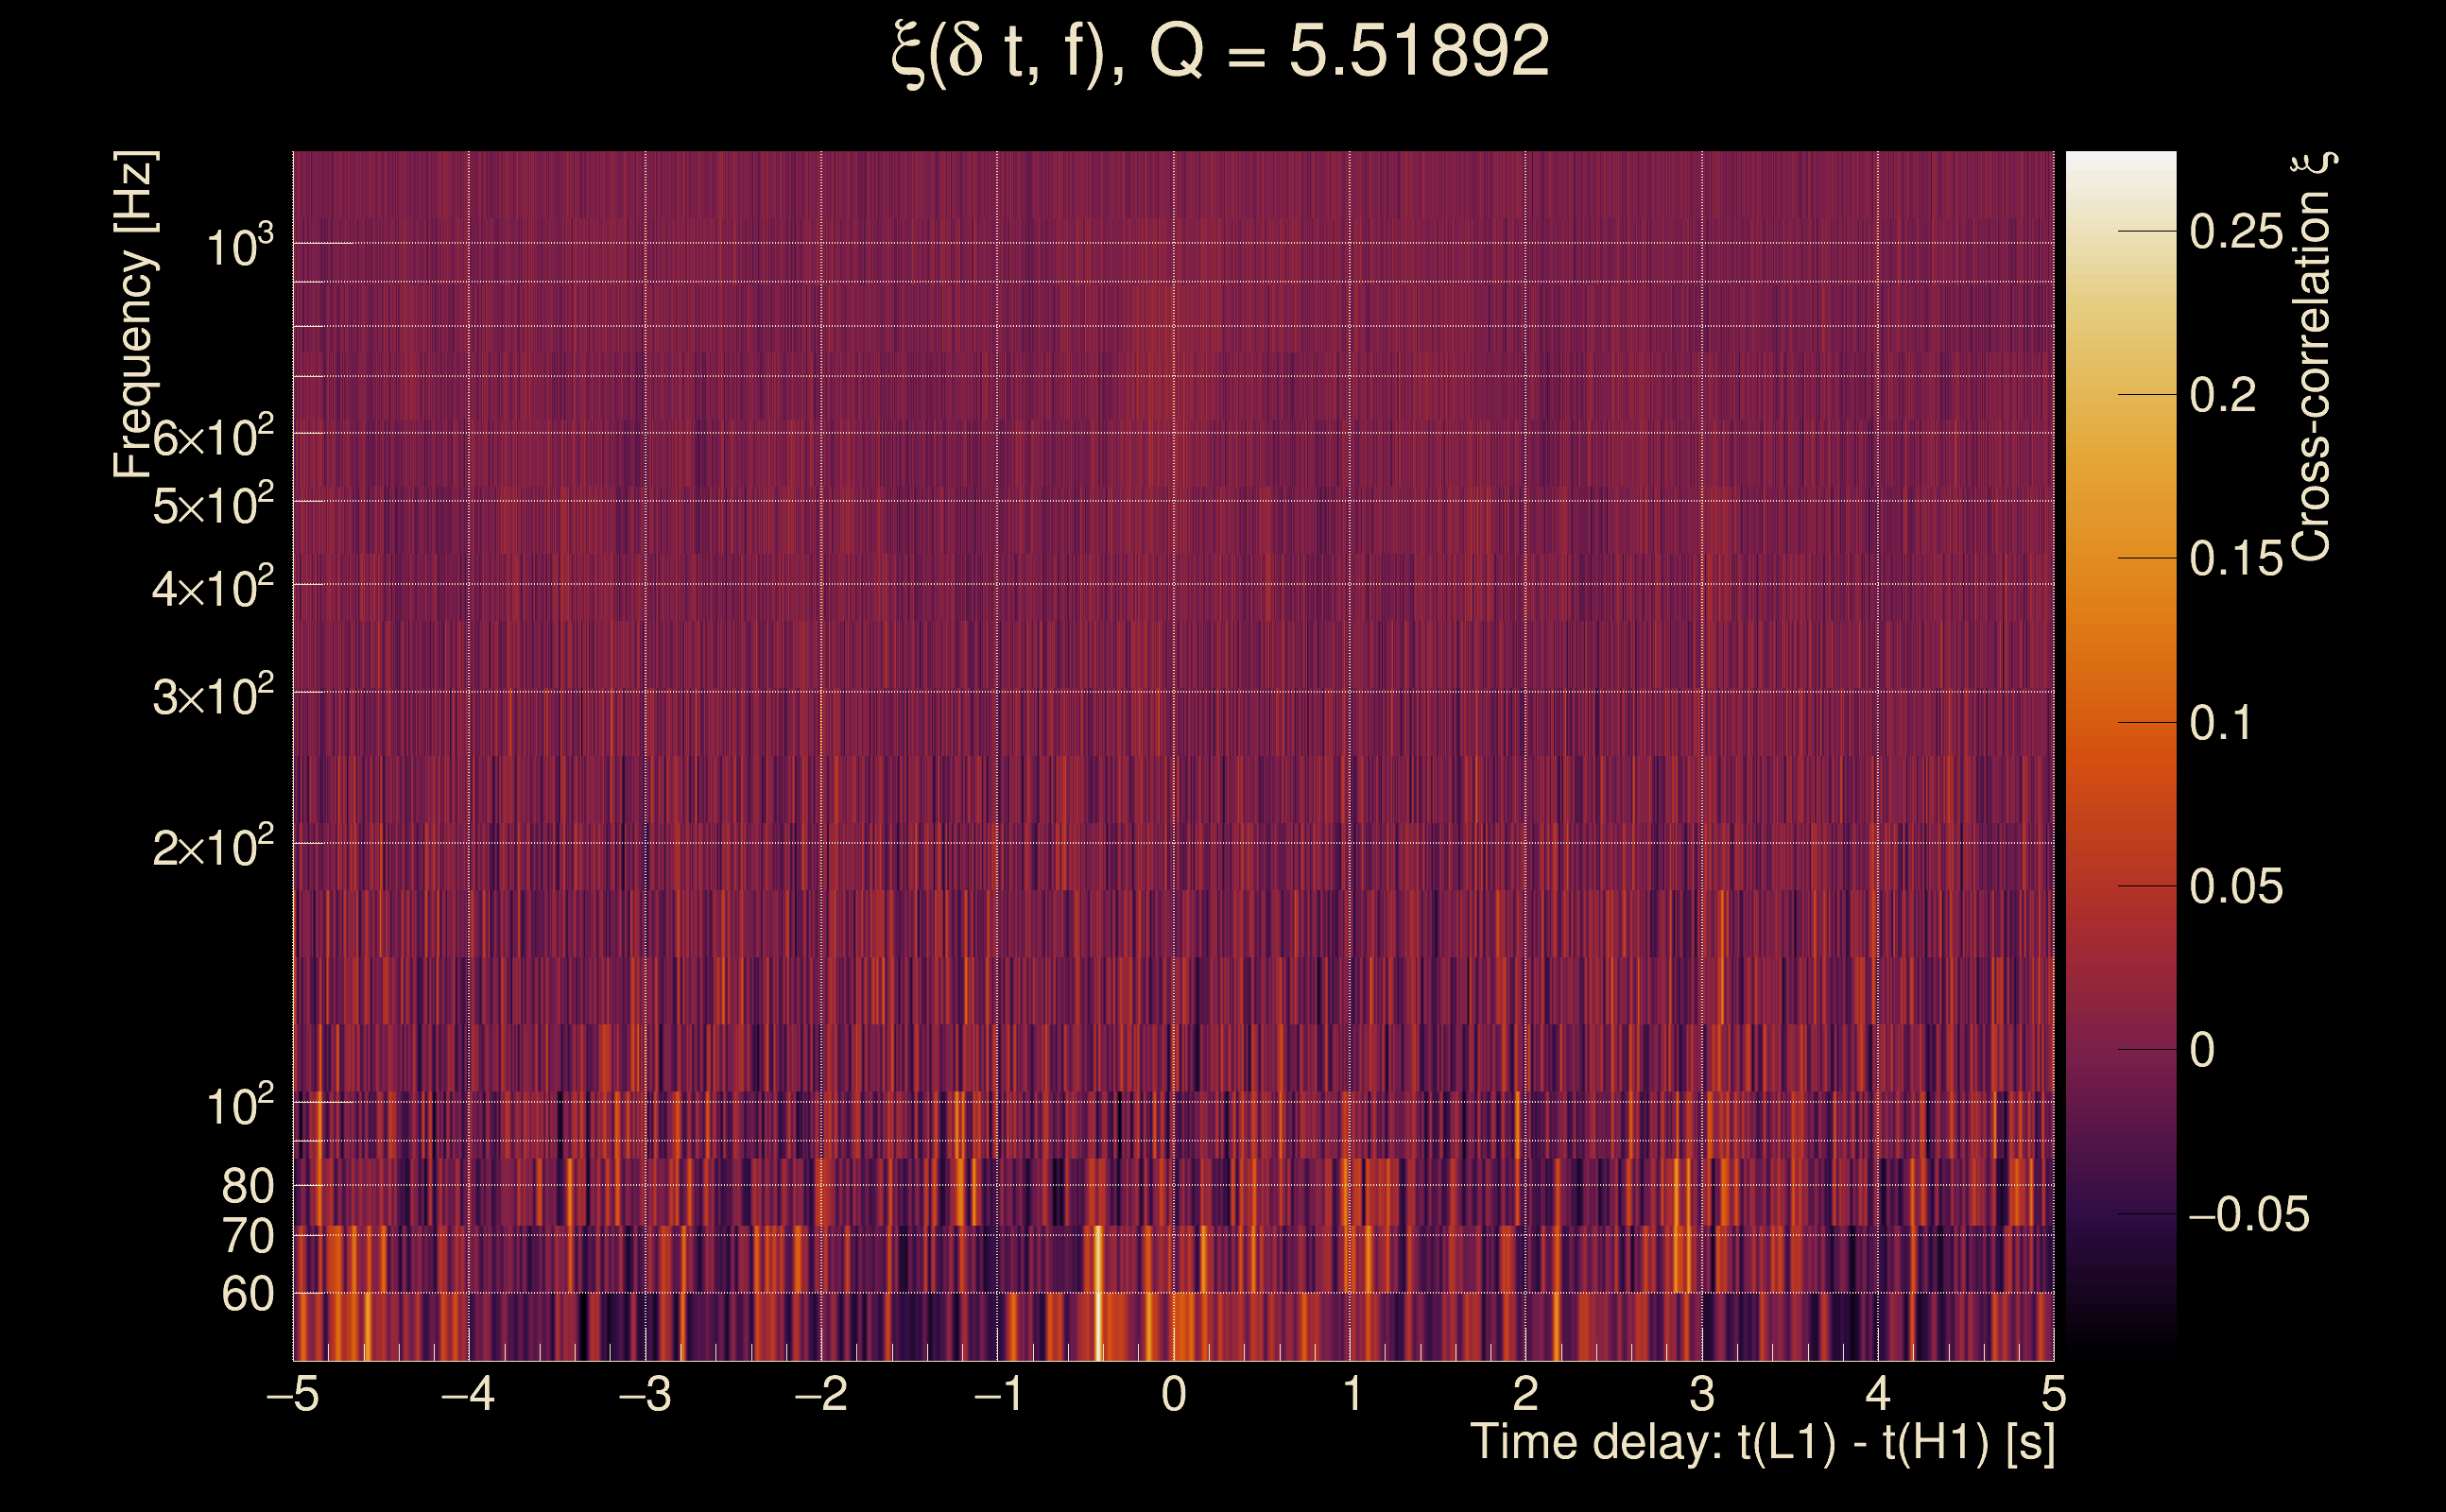
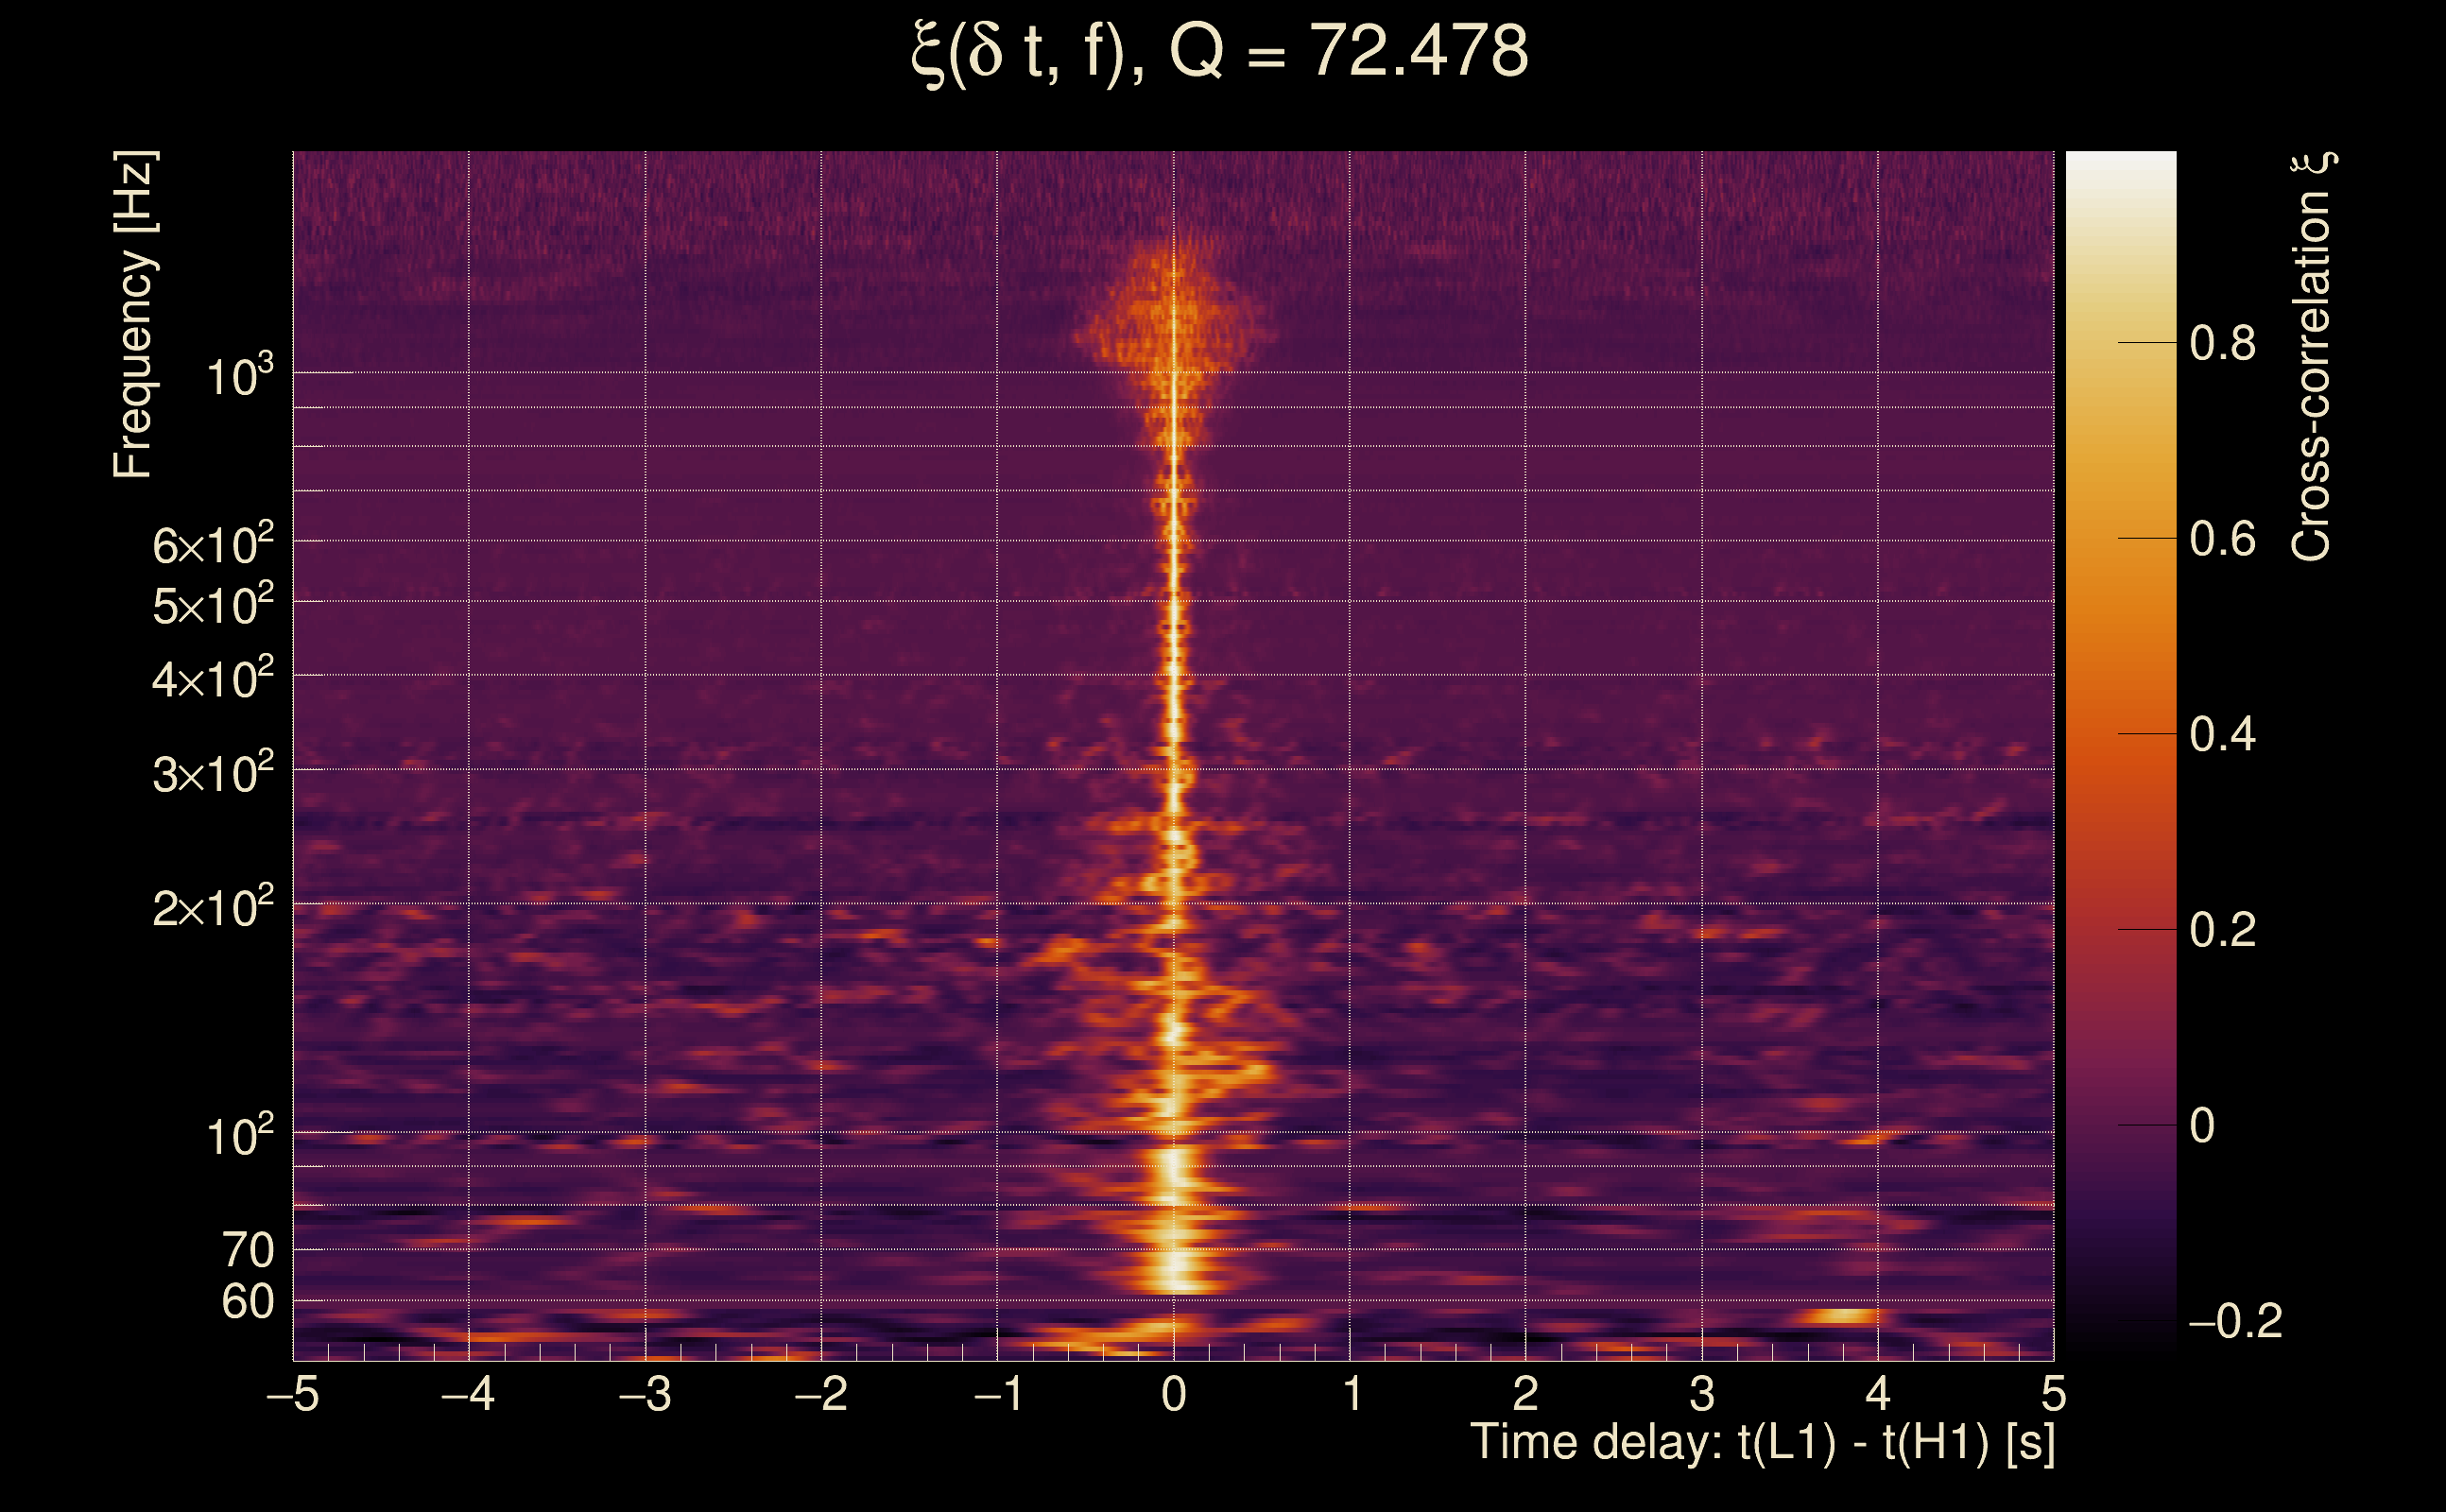
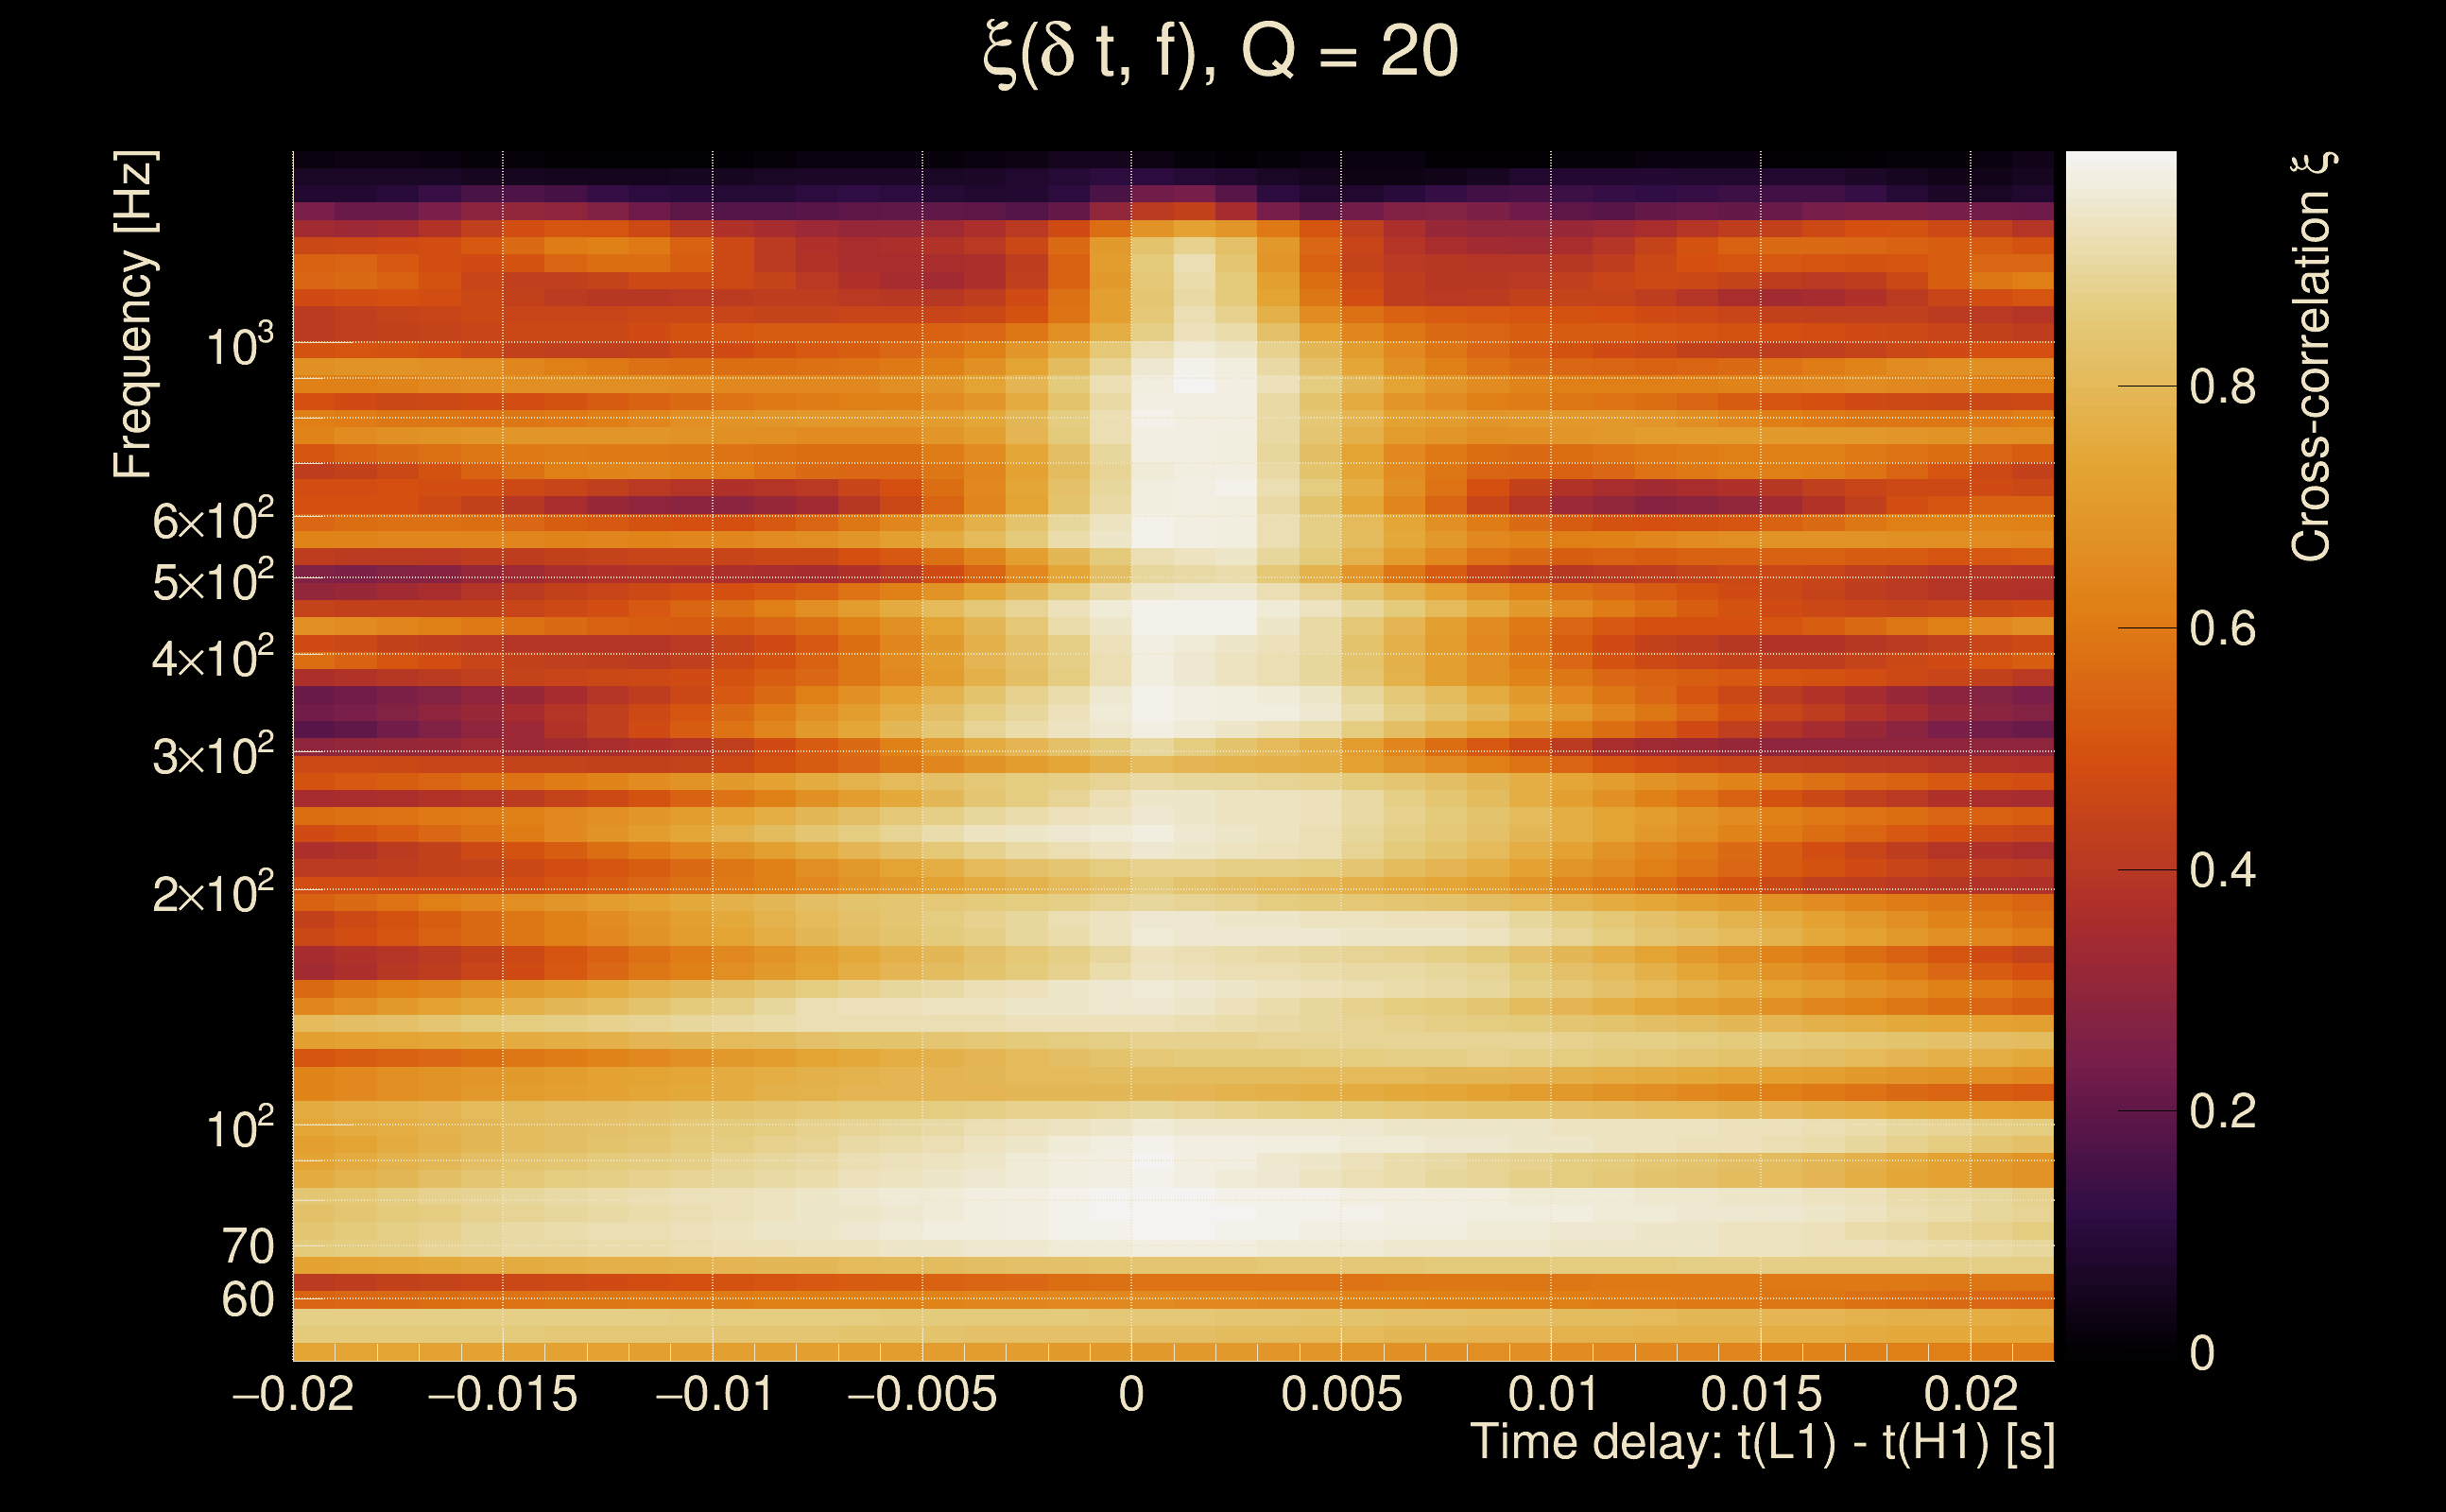
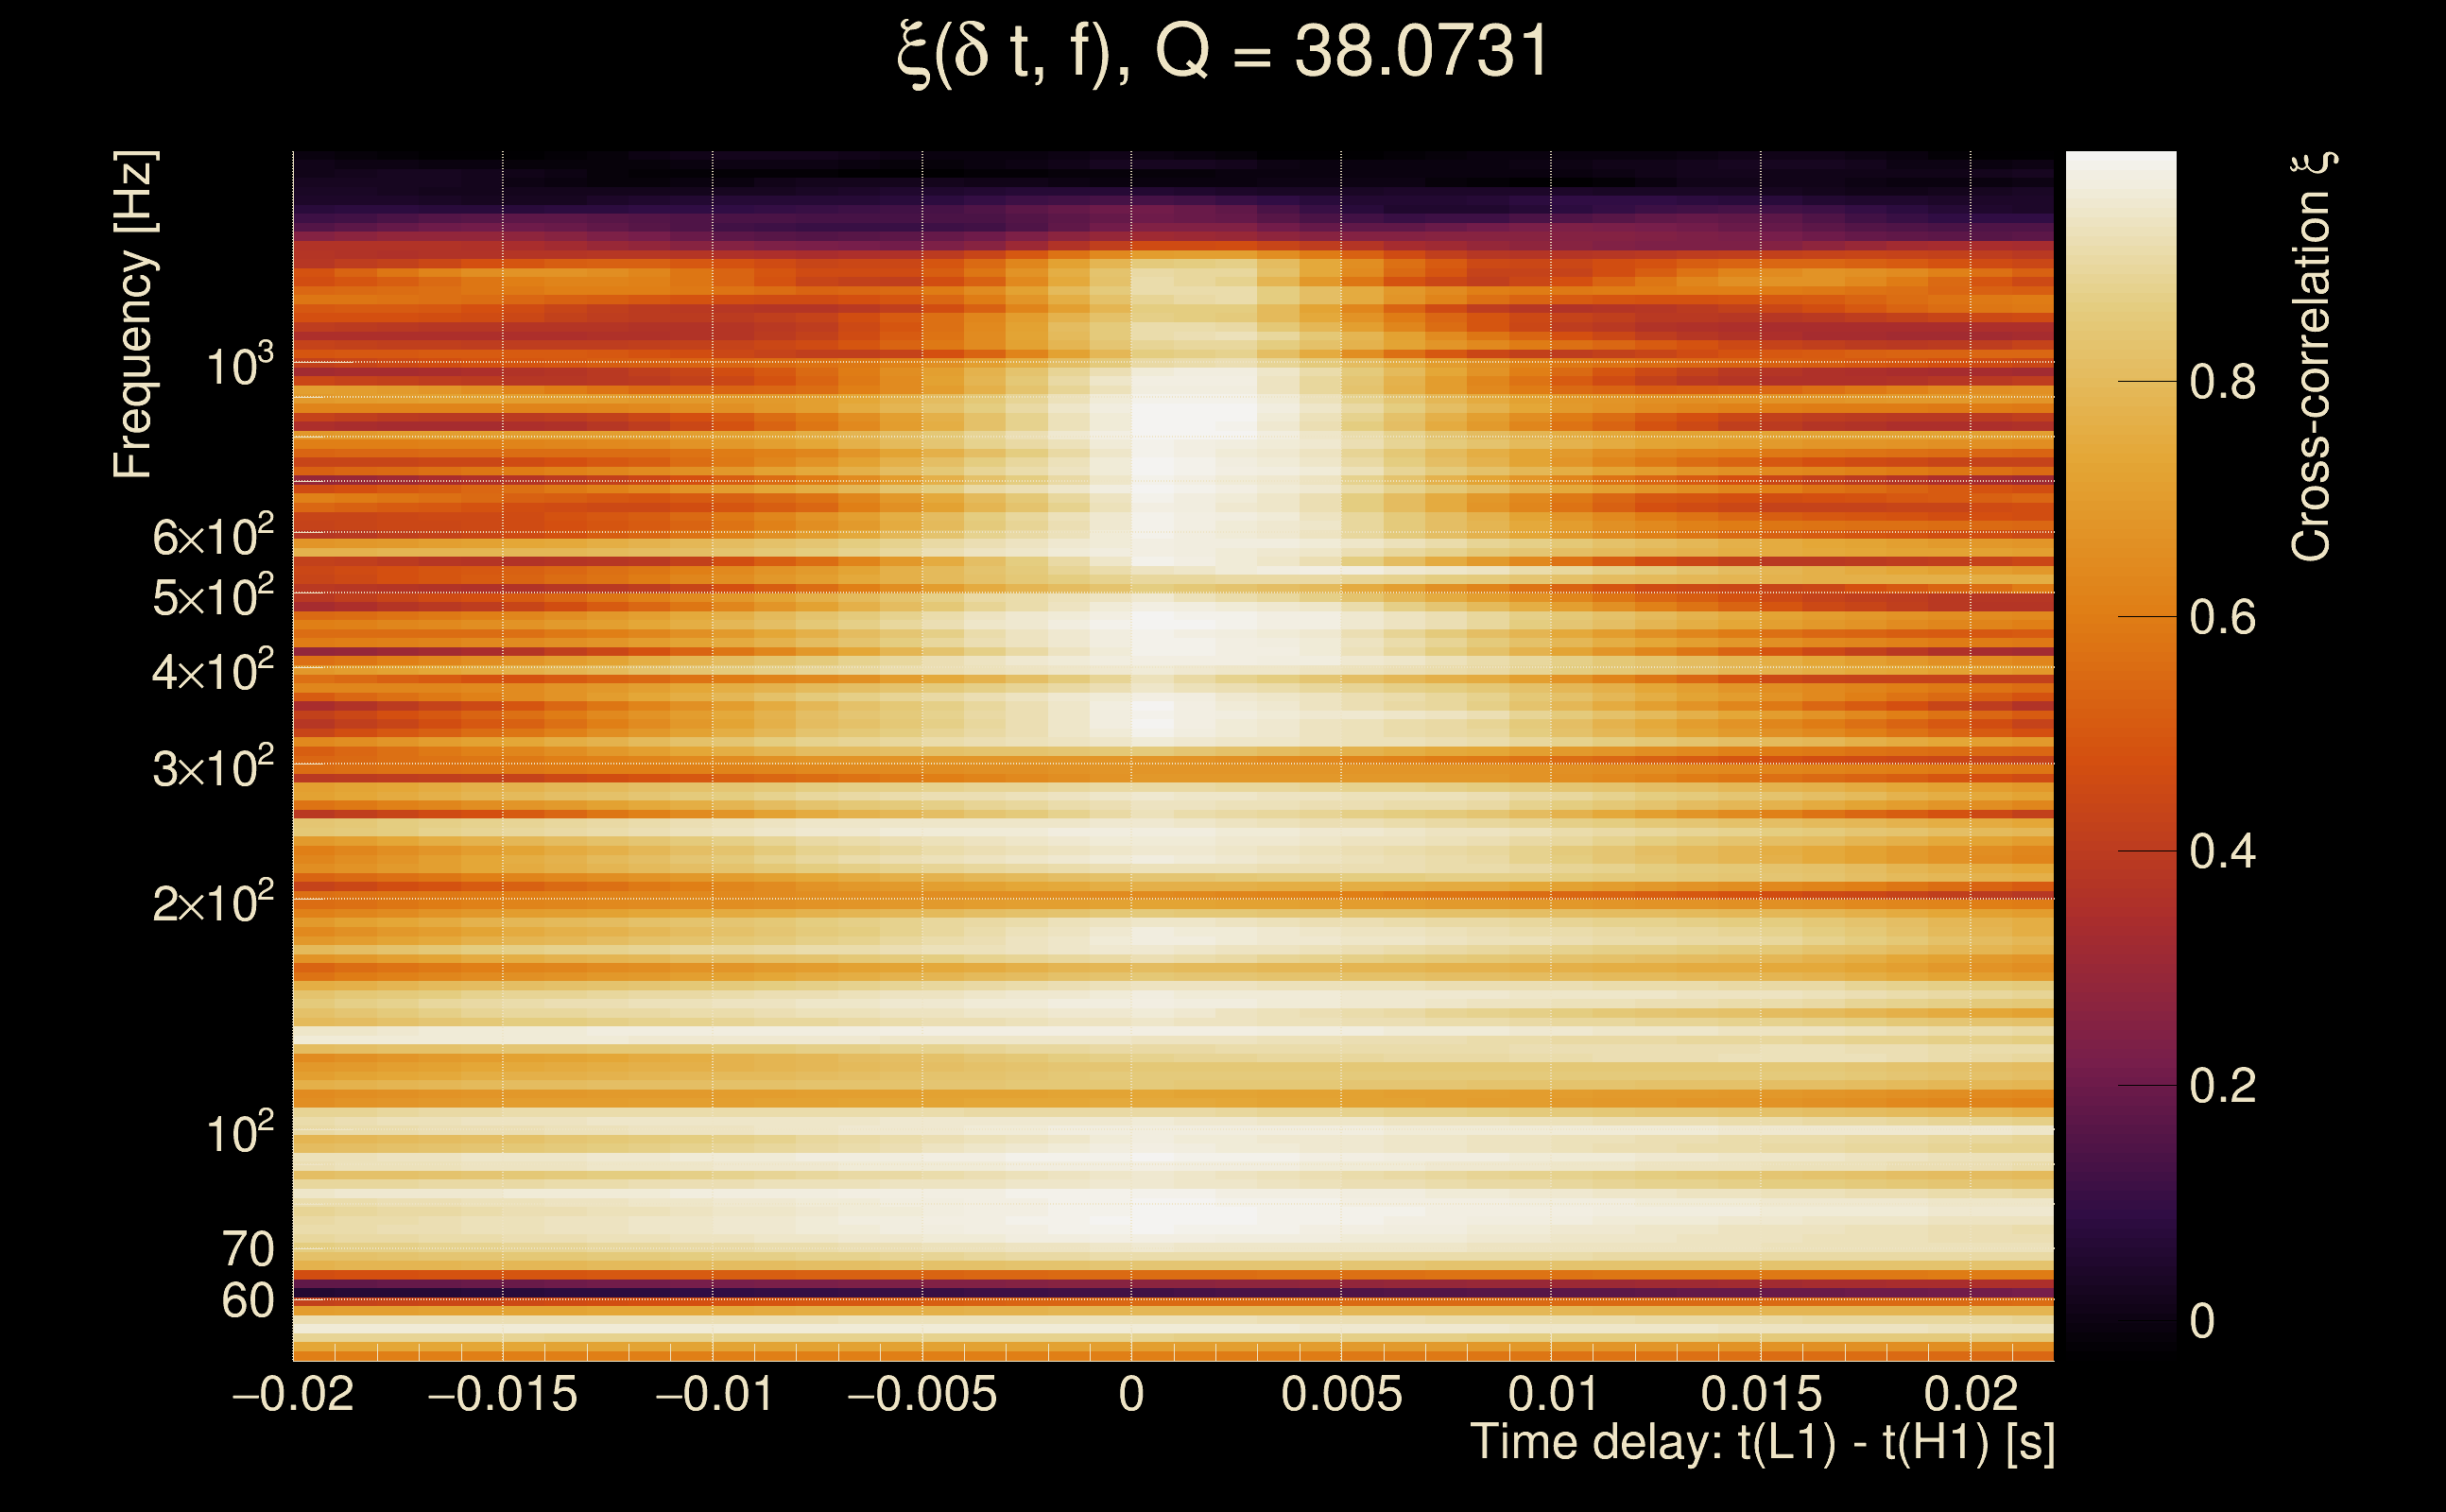
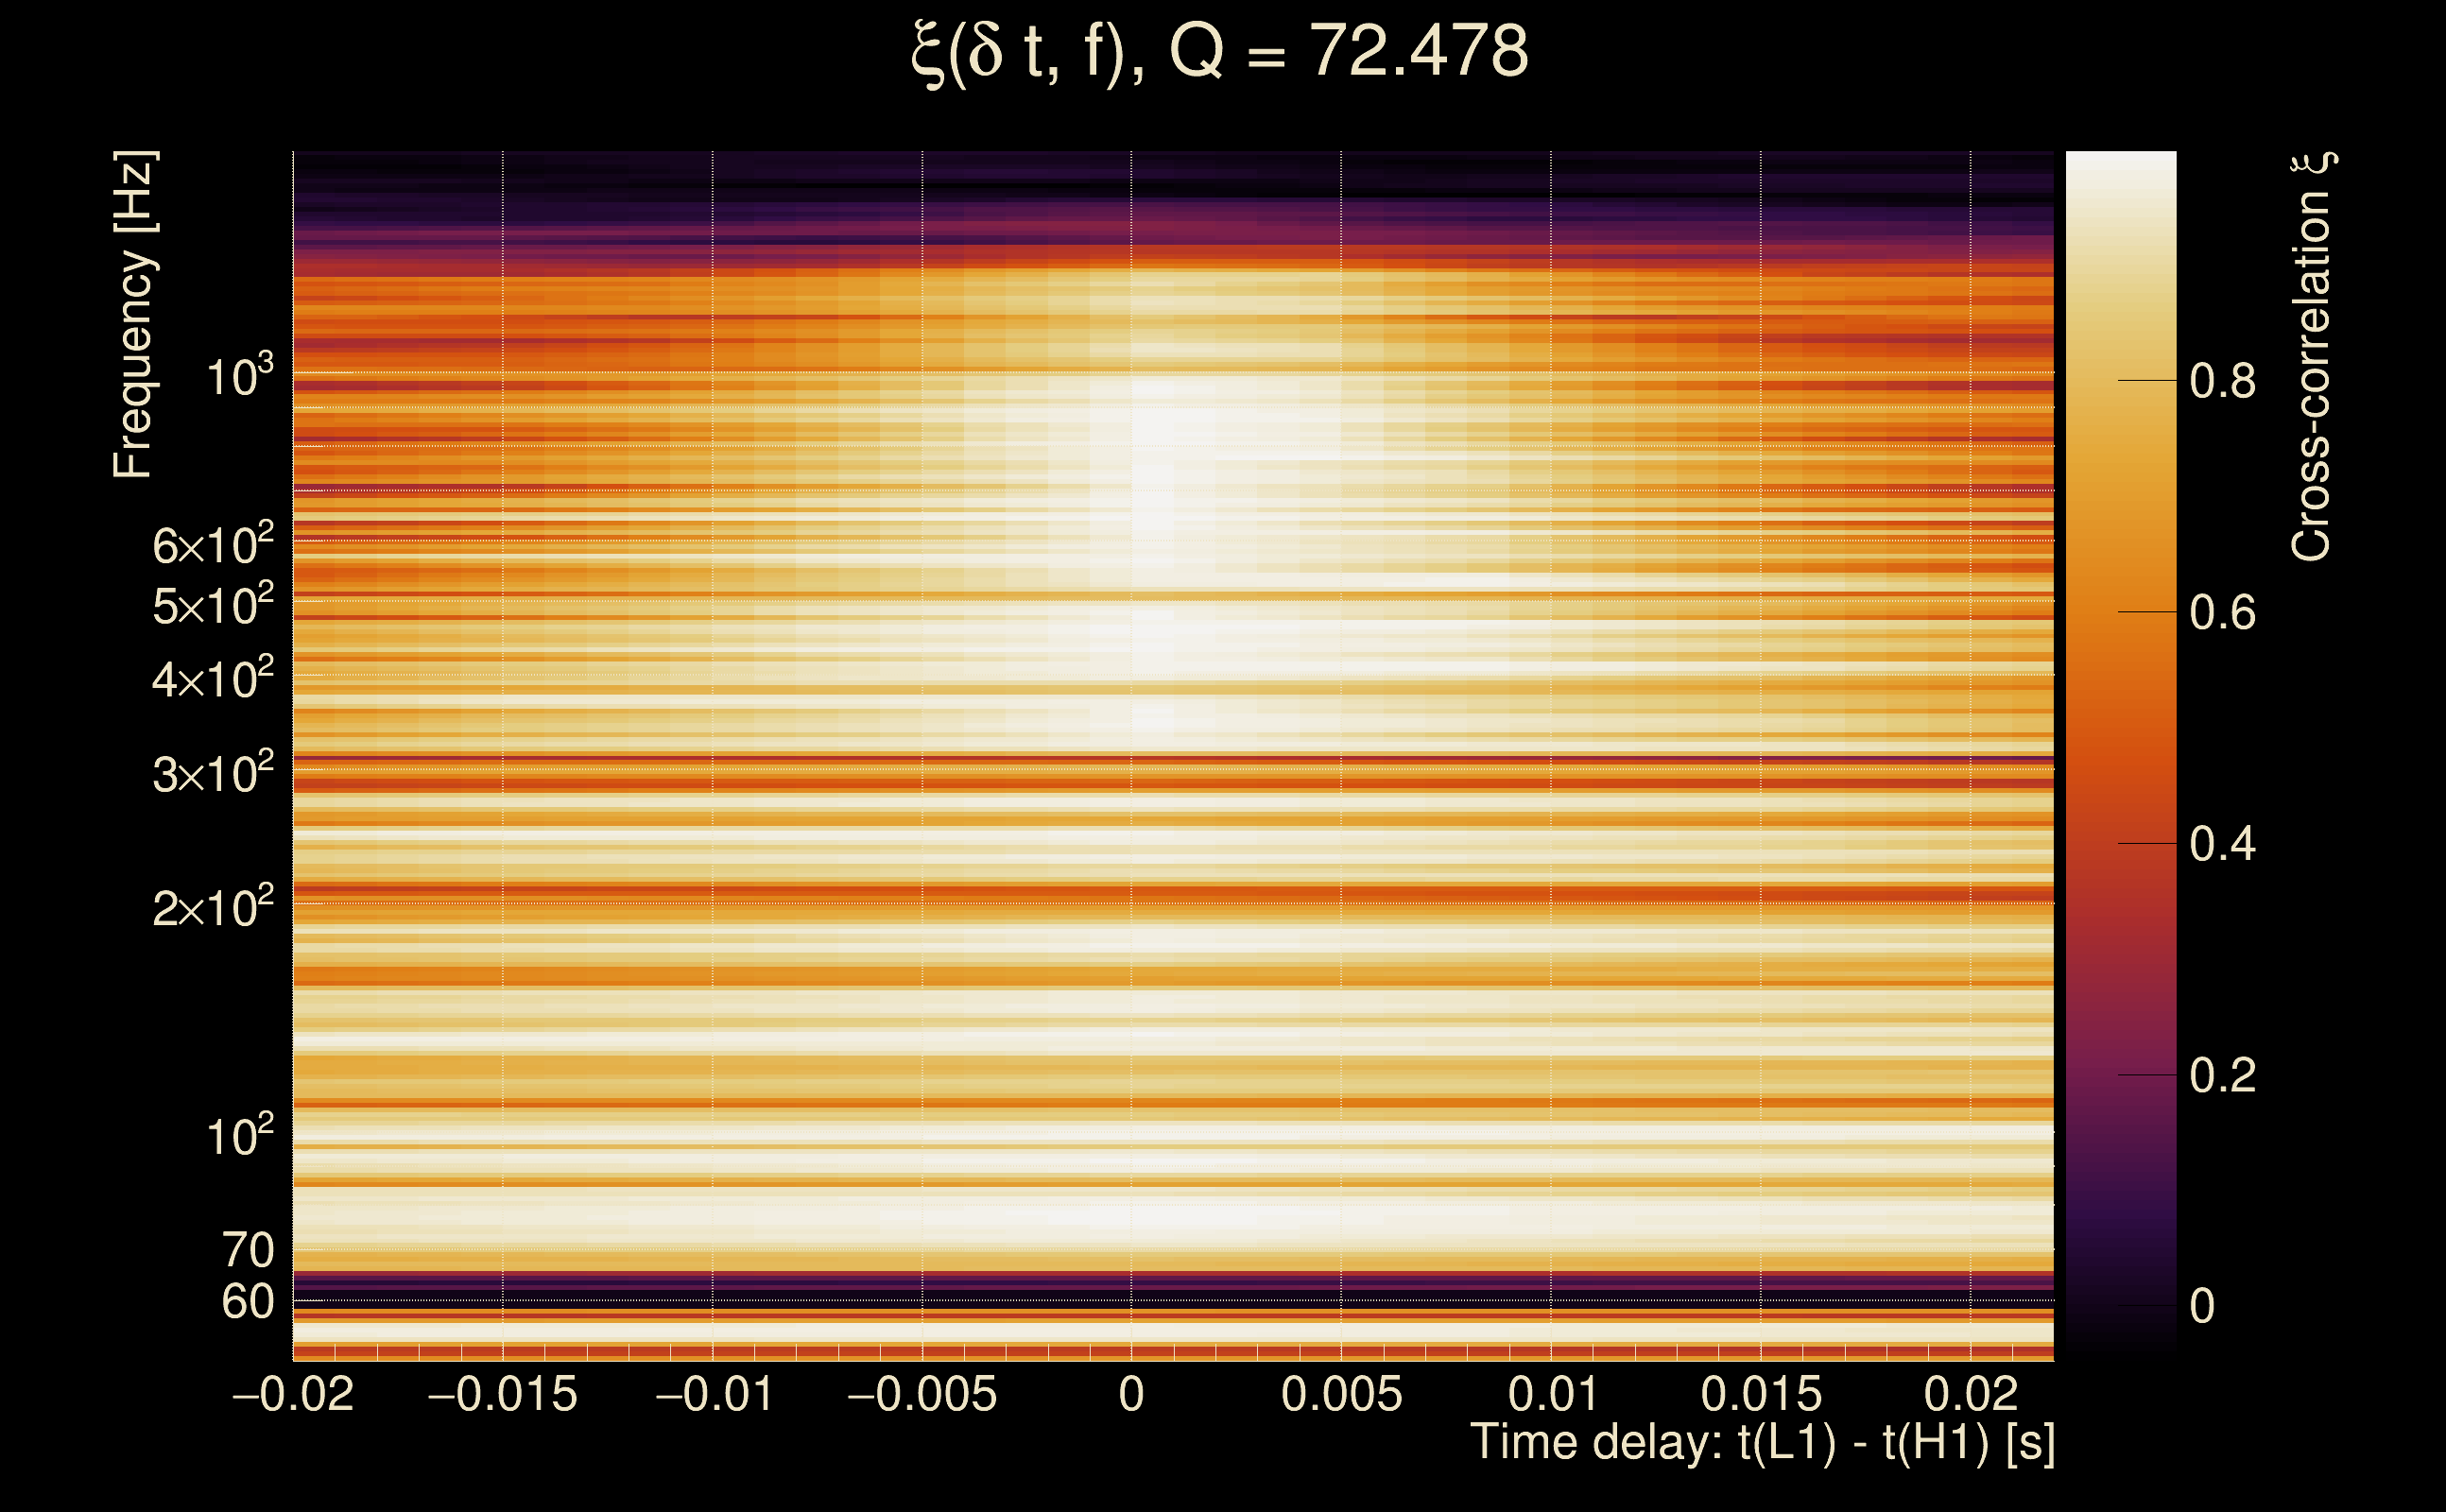
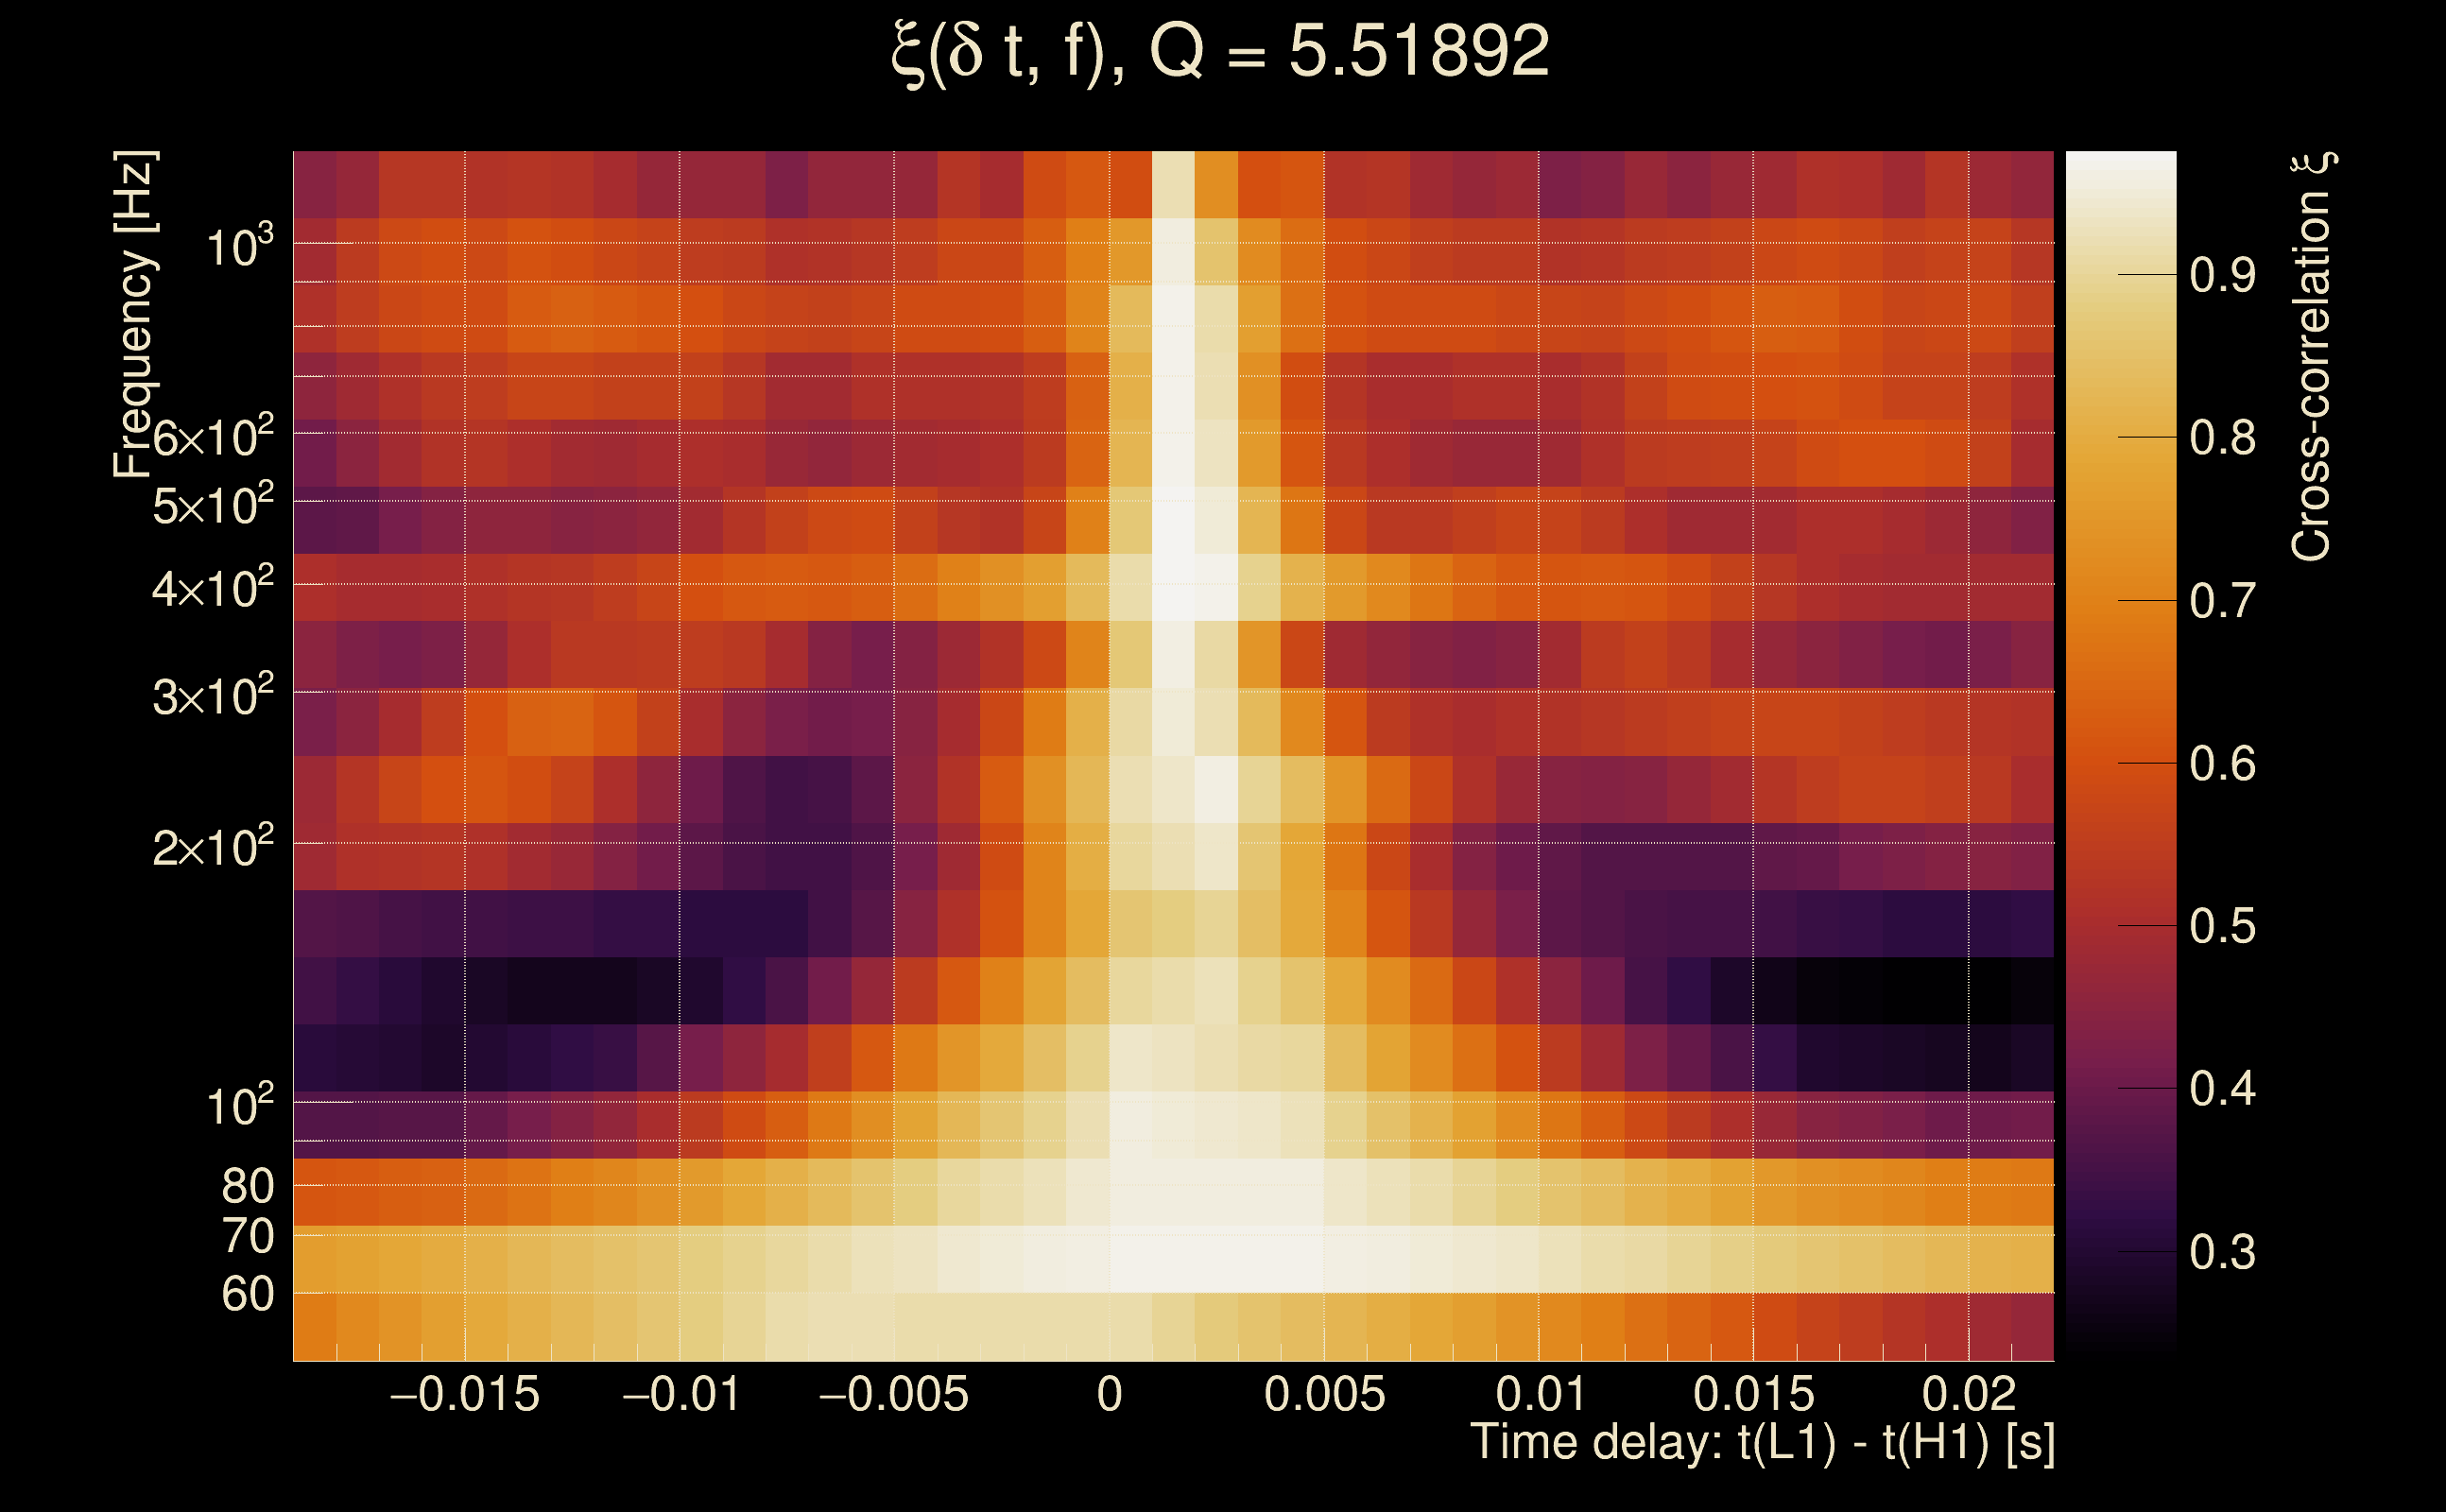
| Time delay between detectors t(L1) - t(H1): | 0.000979719 s (slice index = 108 / 217), δt_gw = 0.000979719 s |
| Time delay standard deviation: | 0.0211756 s |
| [targeted mode] Time delay probability: | 0.914991 (0.106745 sigmas), δt_target = 1.72247e+45 s |
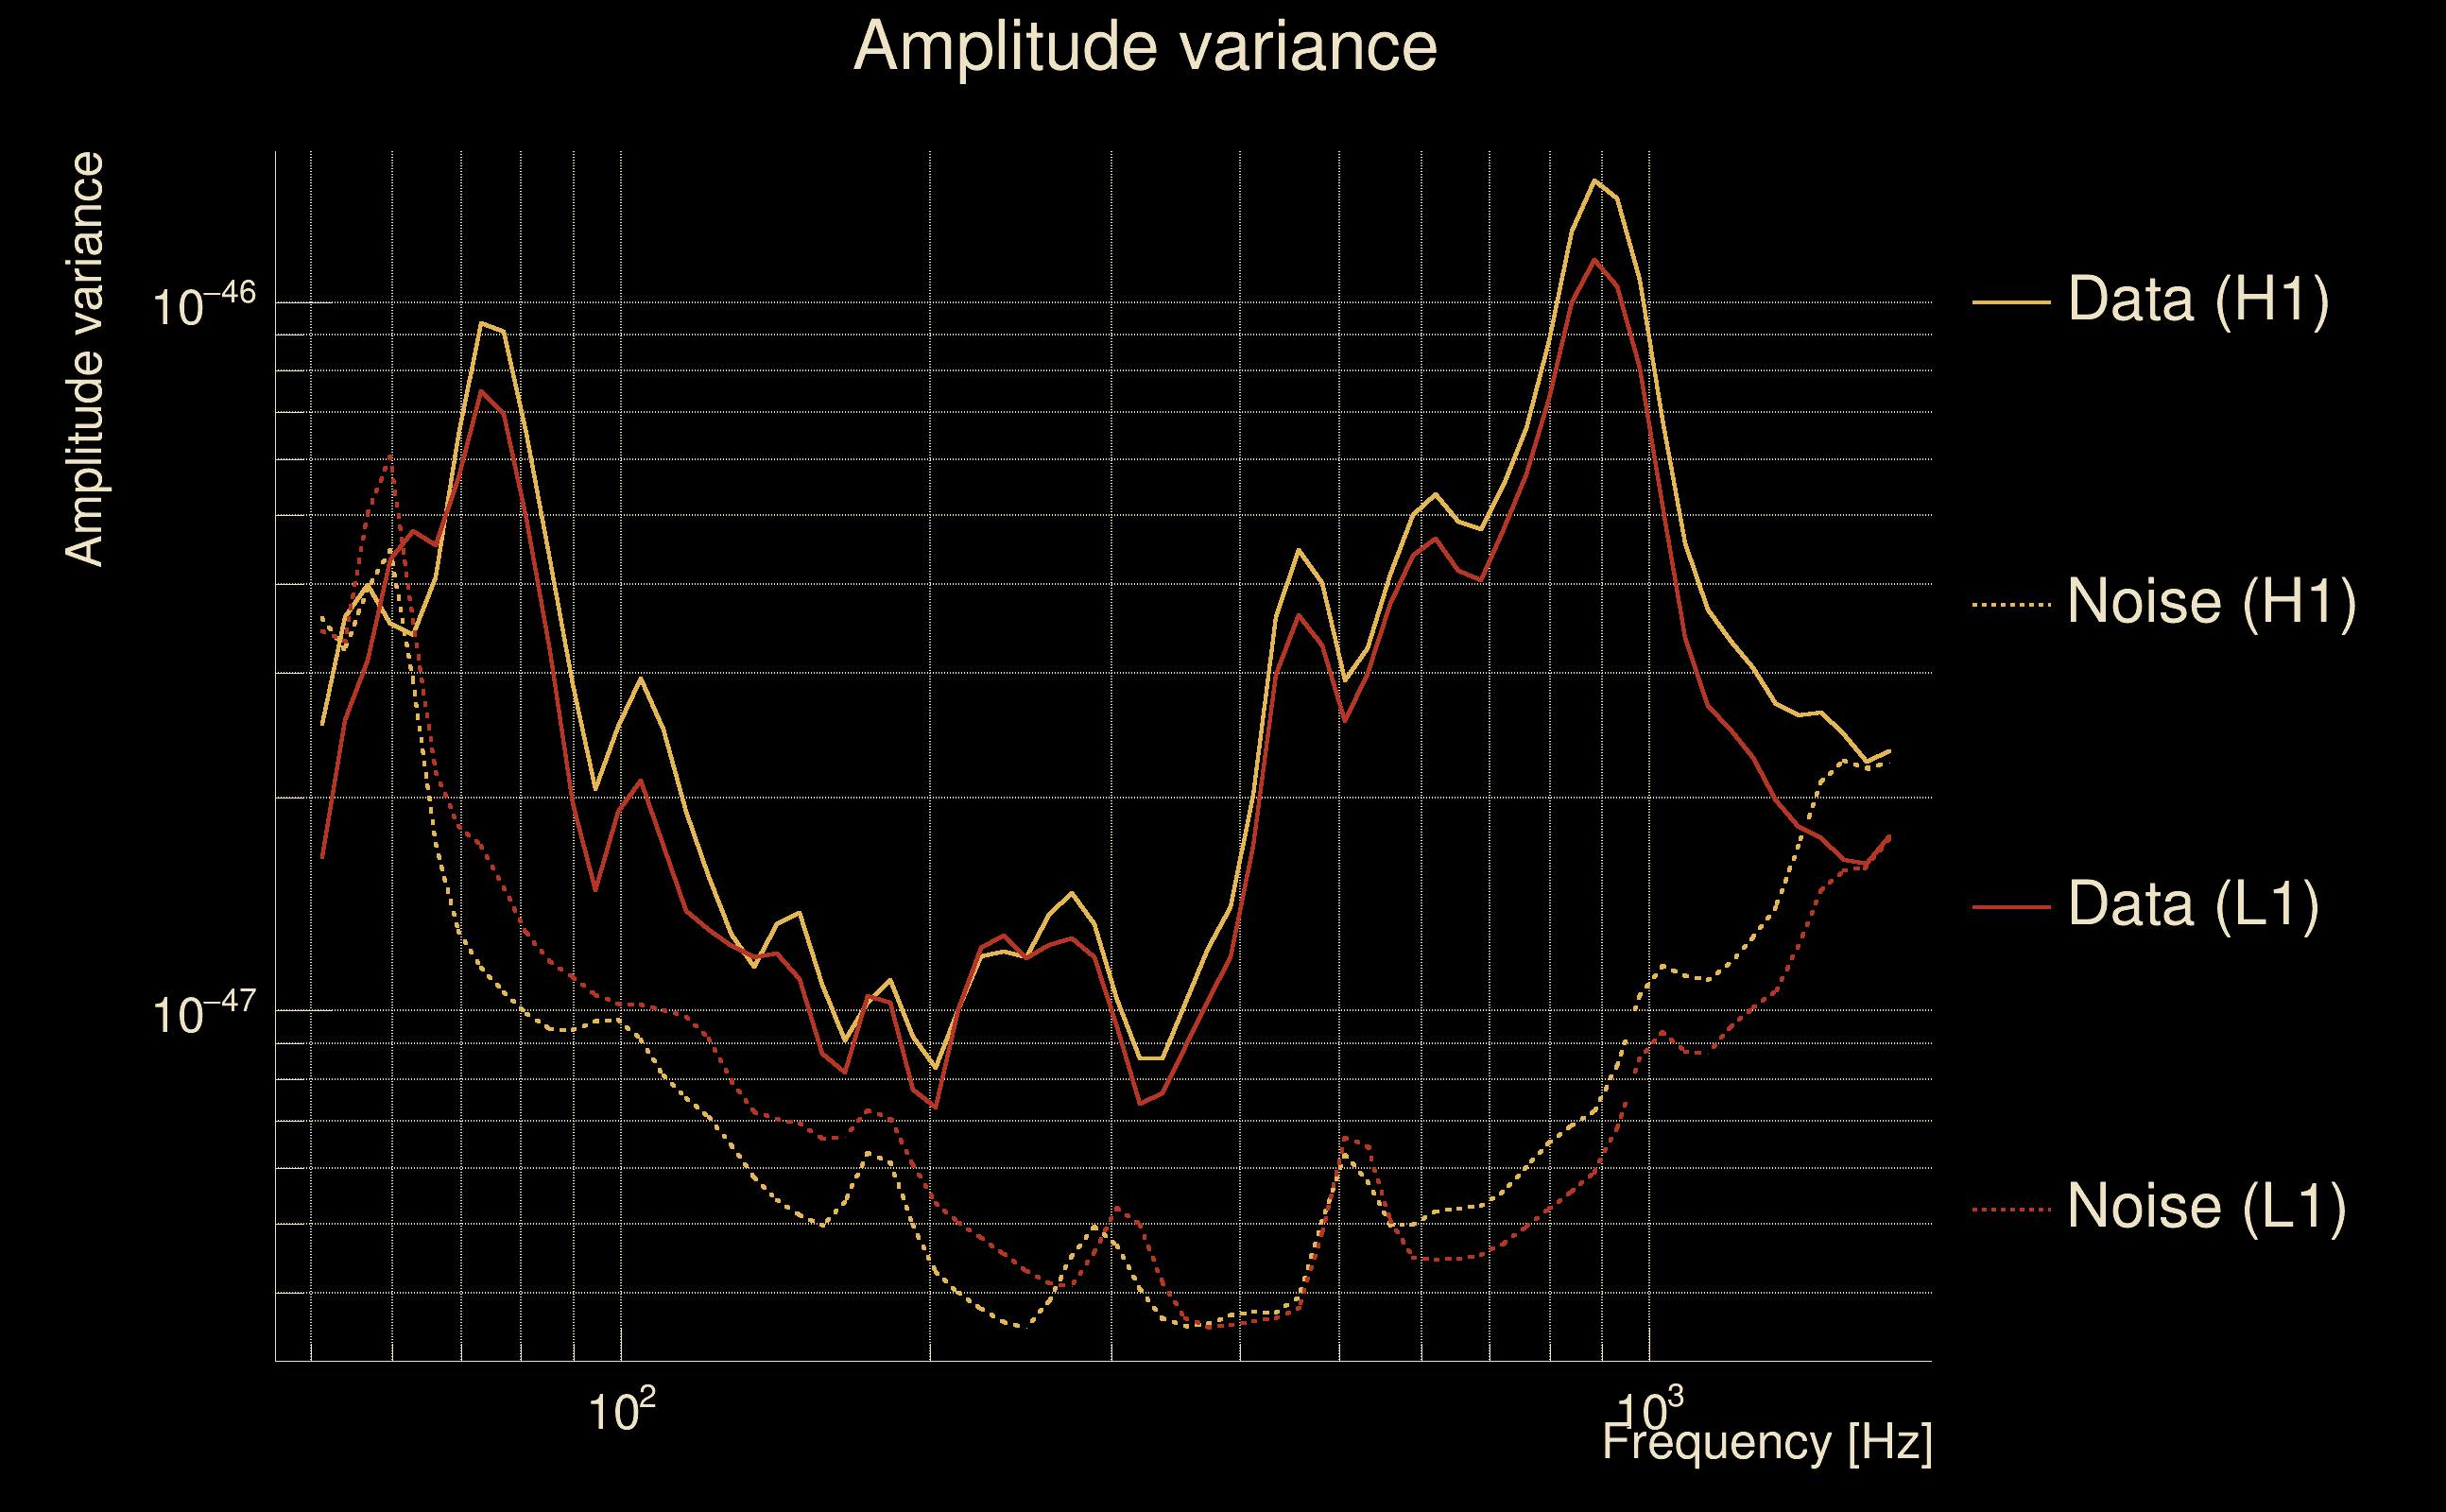
| Frequency: | 290.604 Hz |
| Ξ: | 0.922245 ± 0.0115474 (variance = 0.000133342): Q0: 0.953586, Q1: 0.932339, Q2: 0.926196, Q3: 0.92542, Q4: 0.920857 |
| Rank: | R_A = 0.922245 |
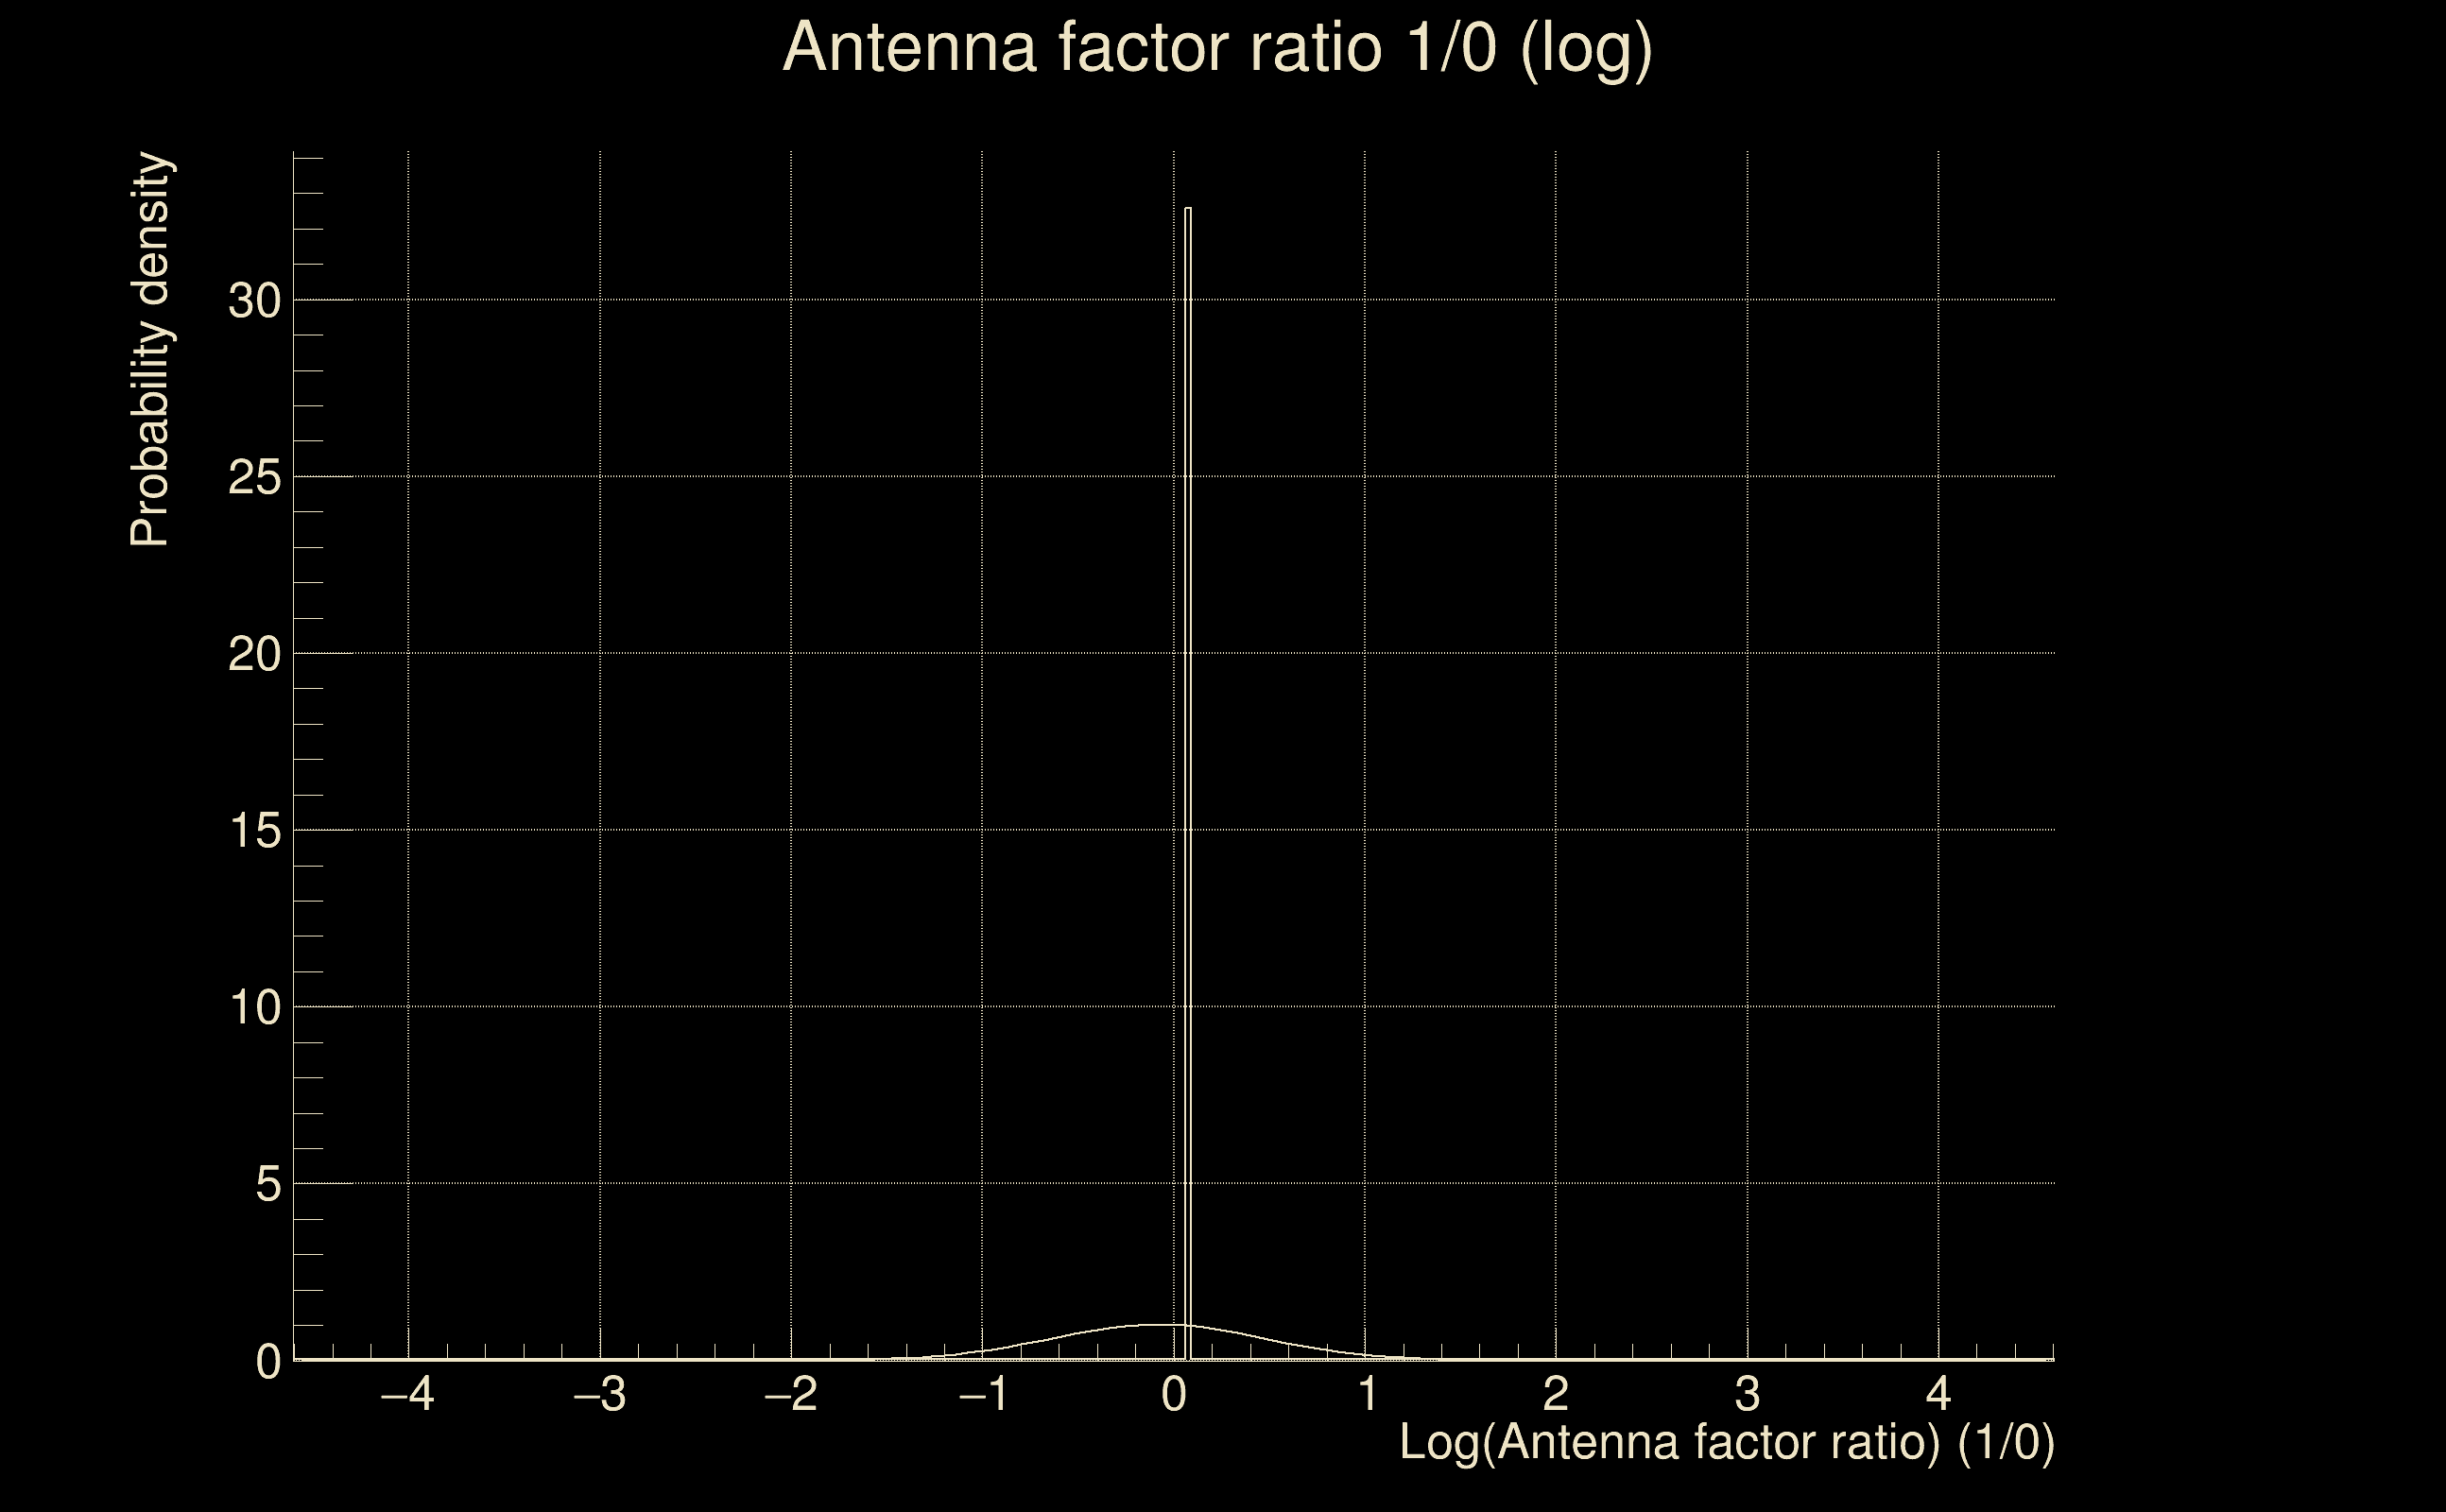
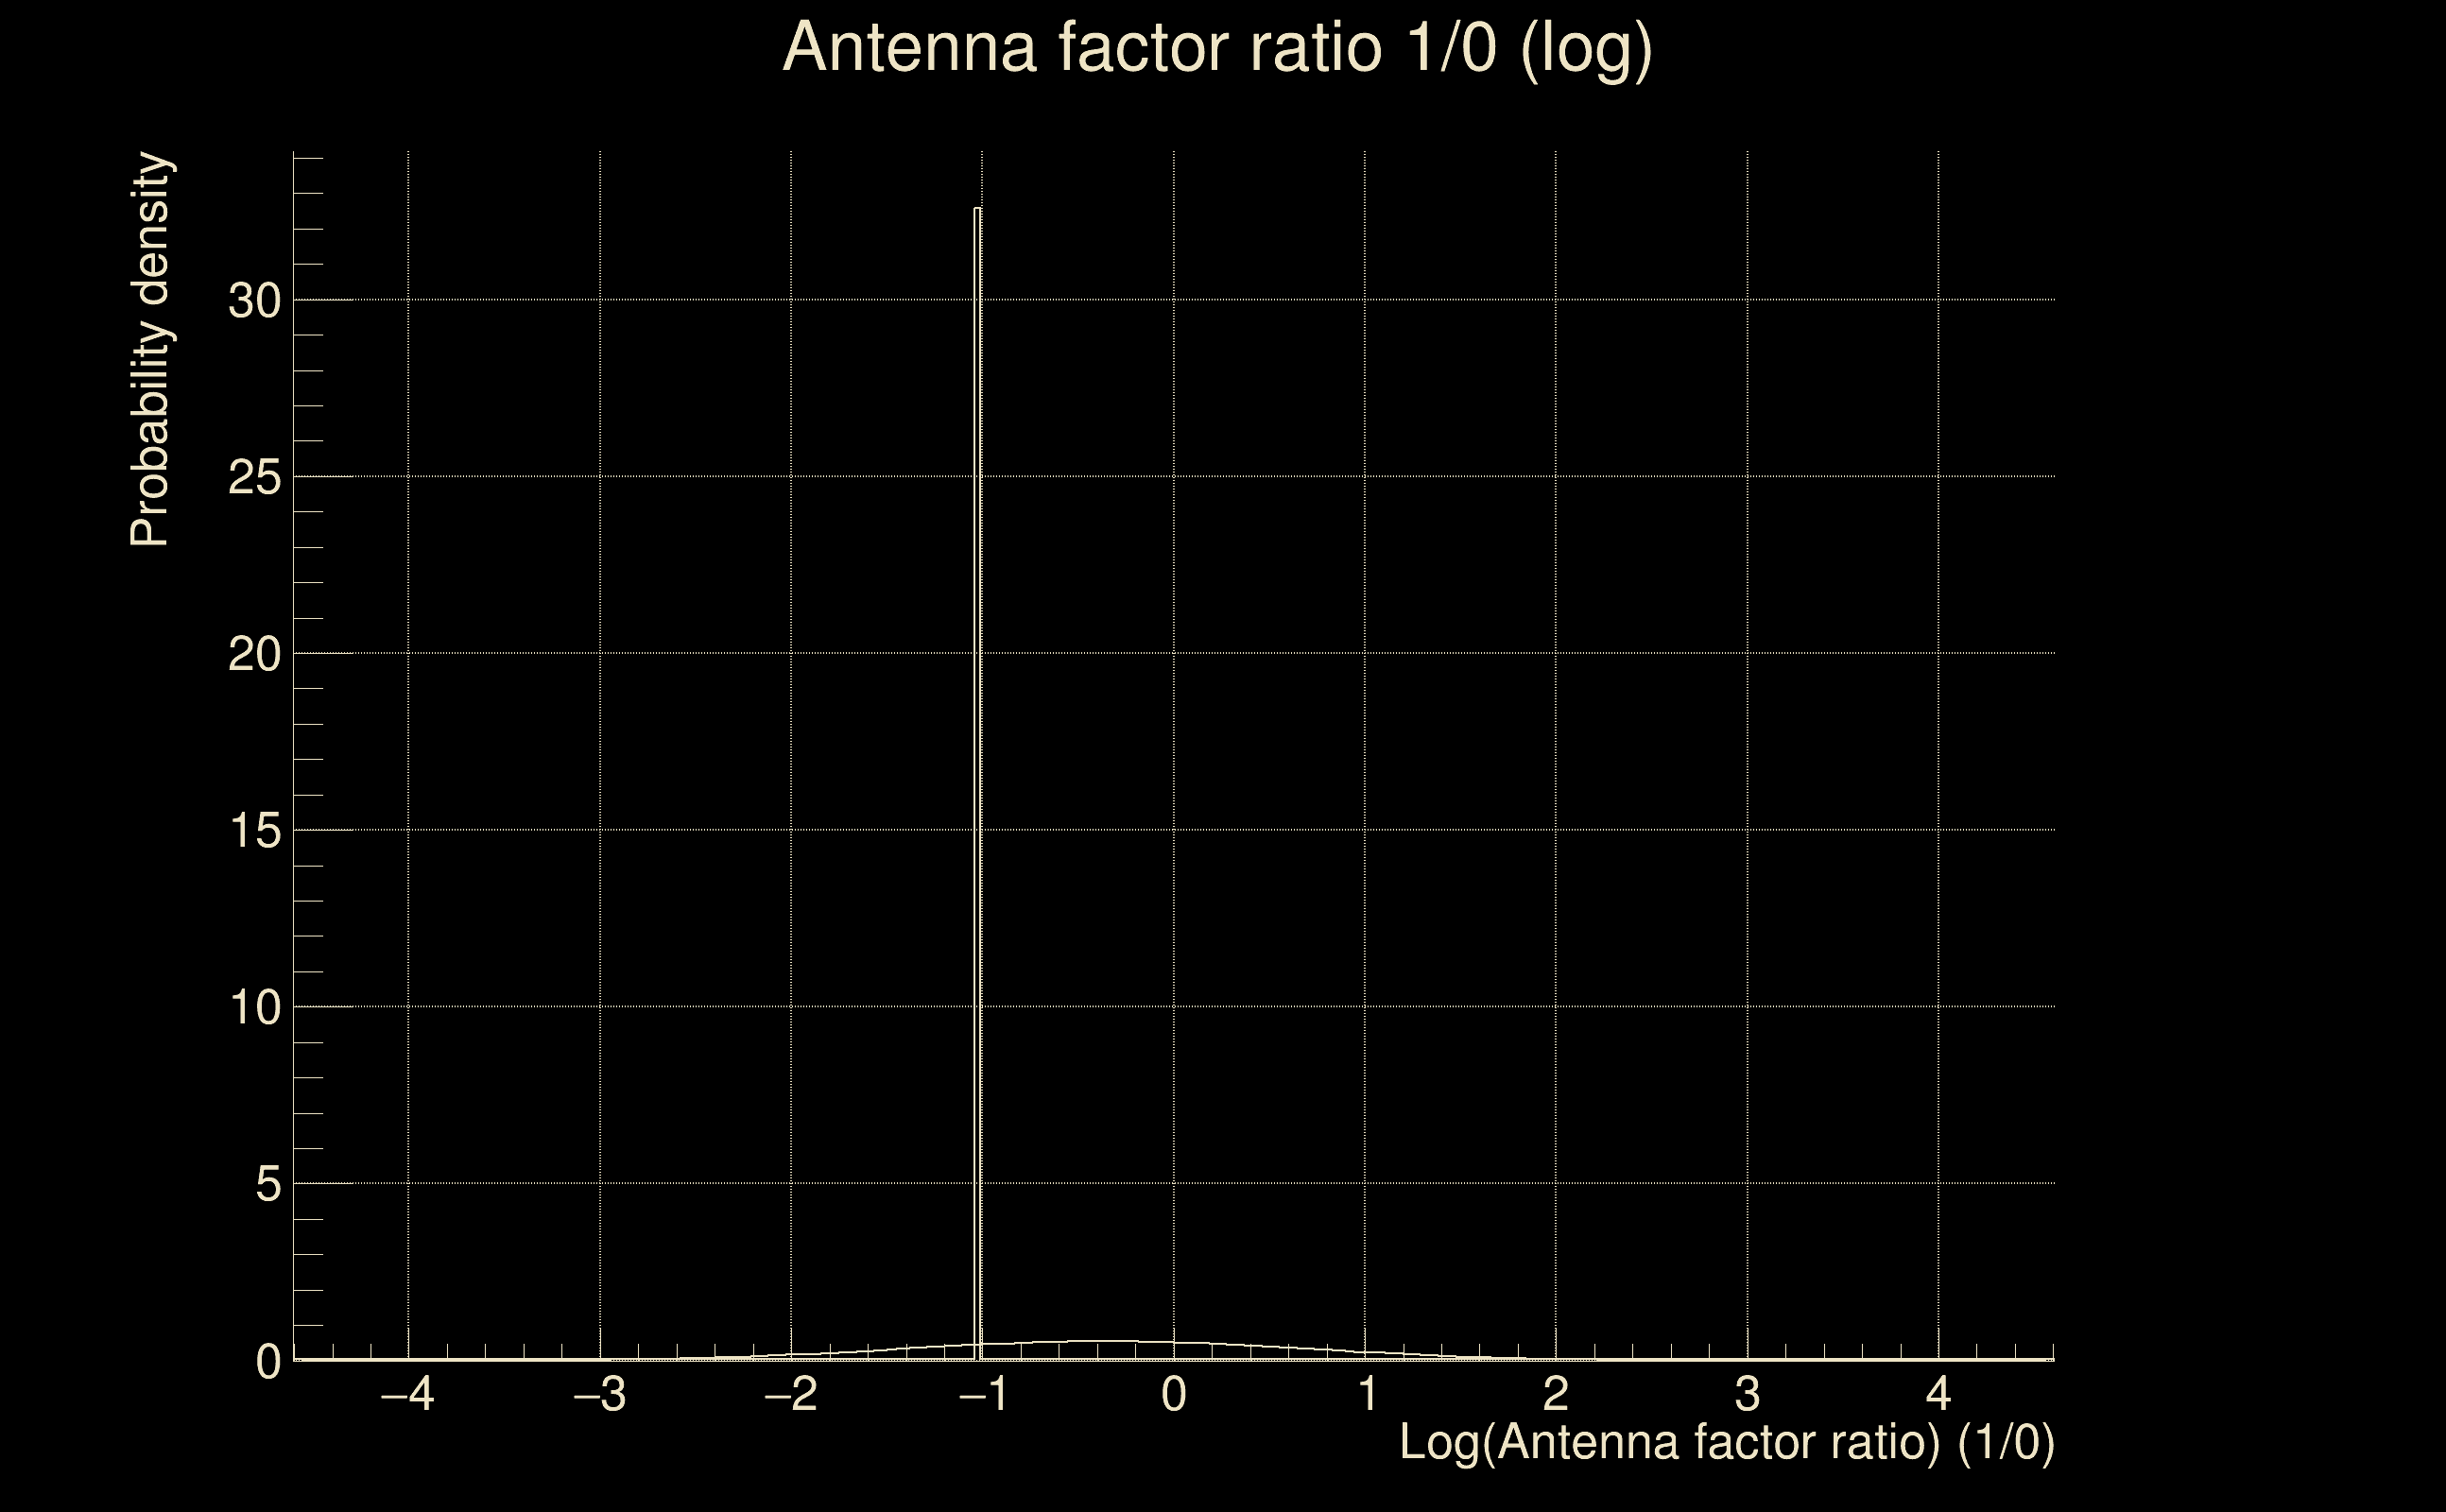
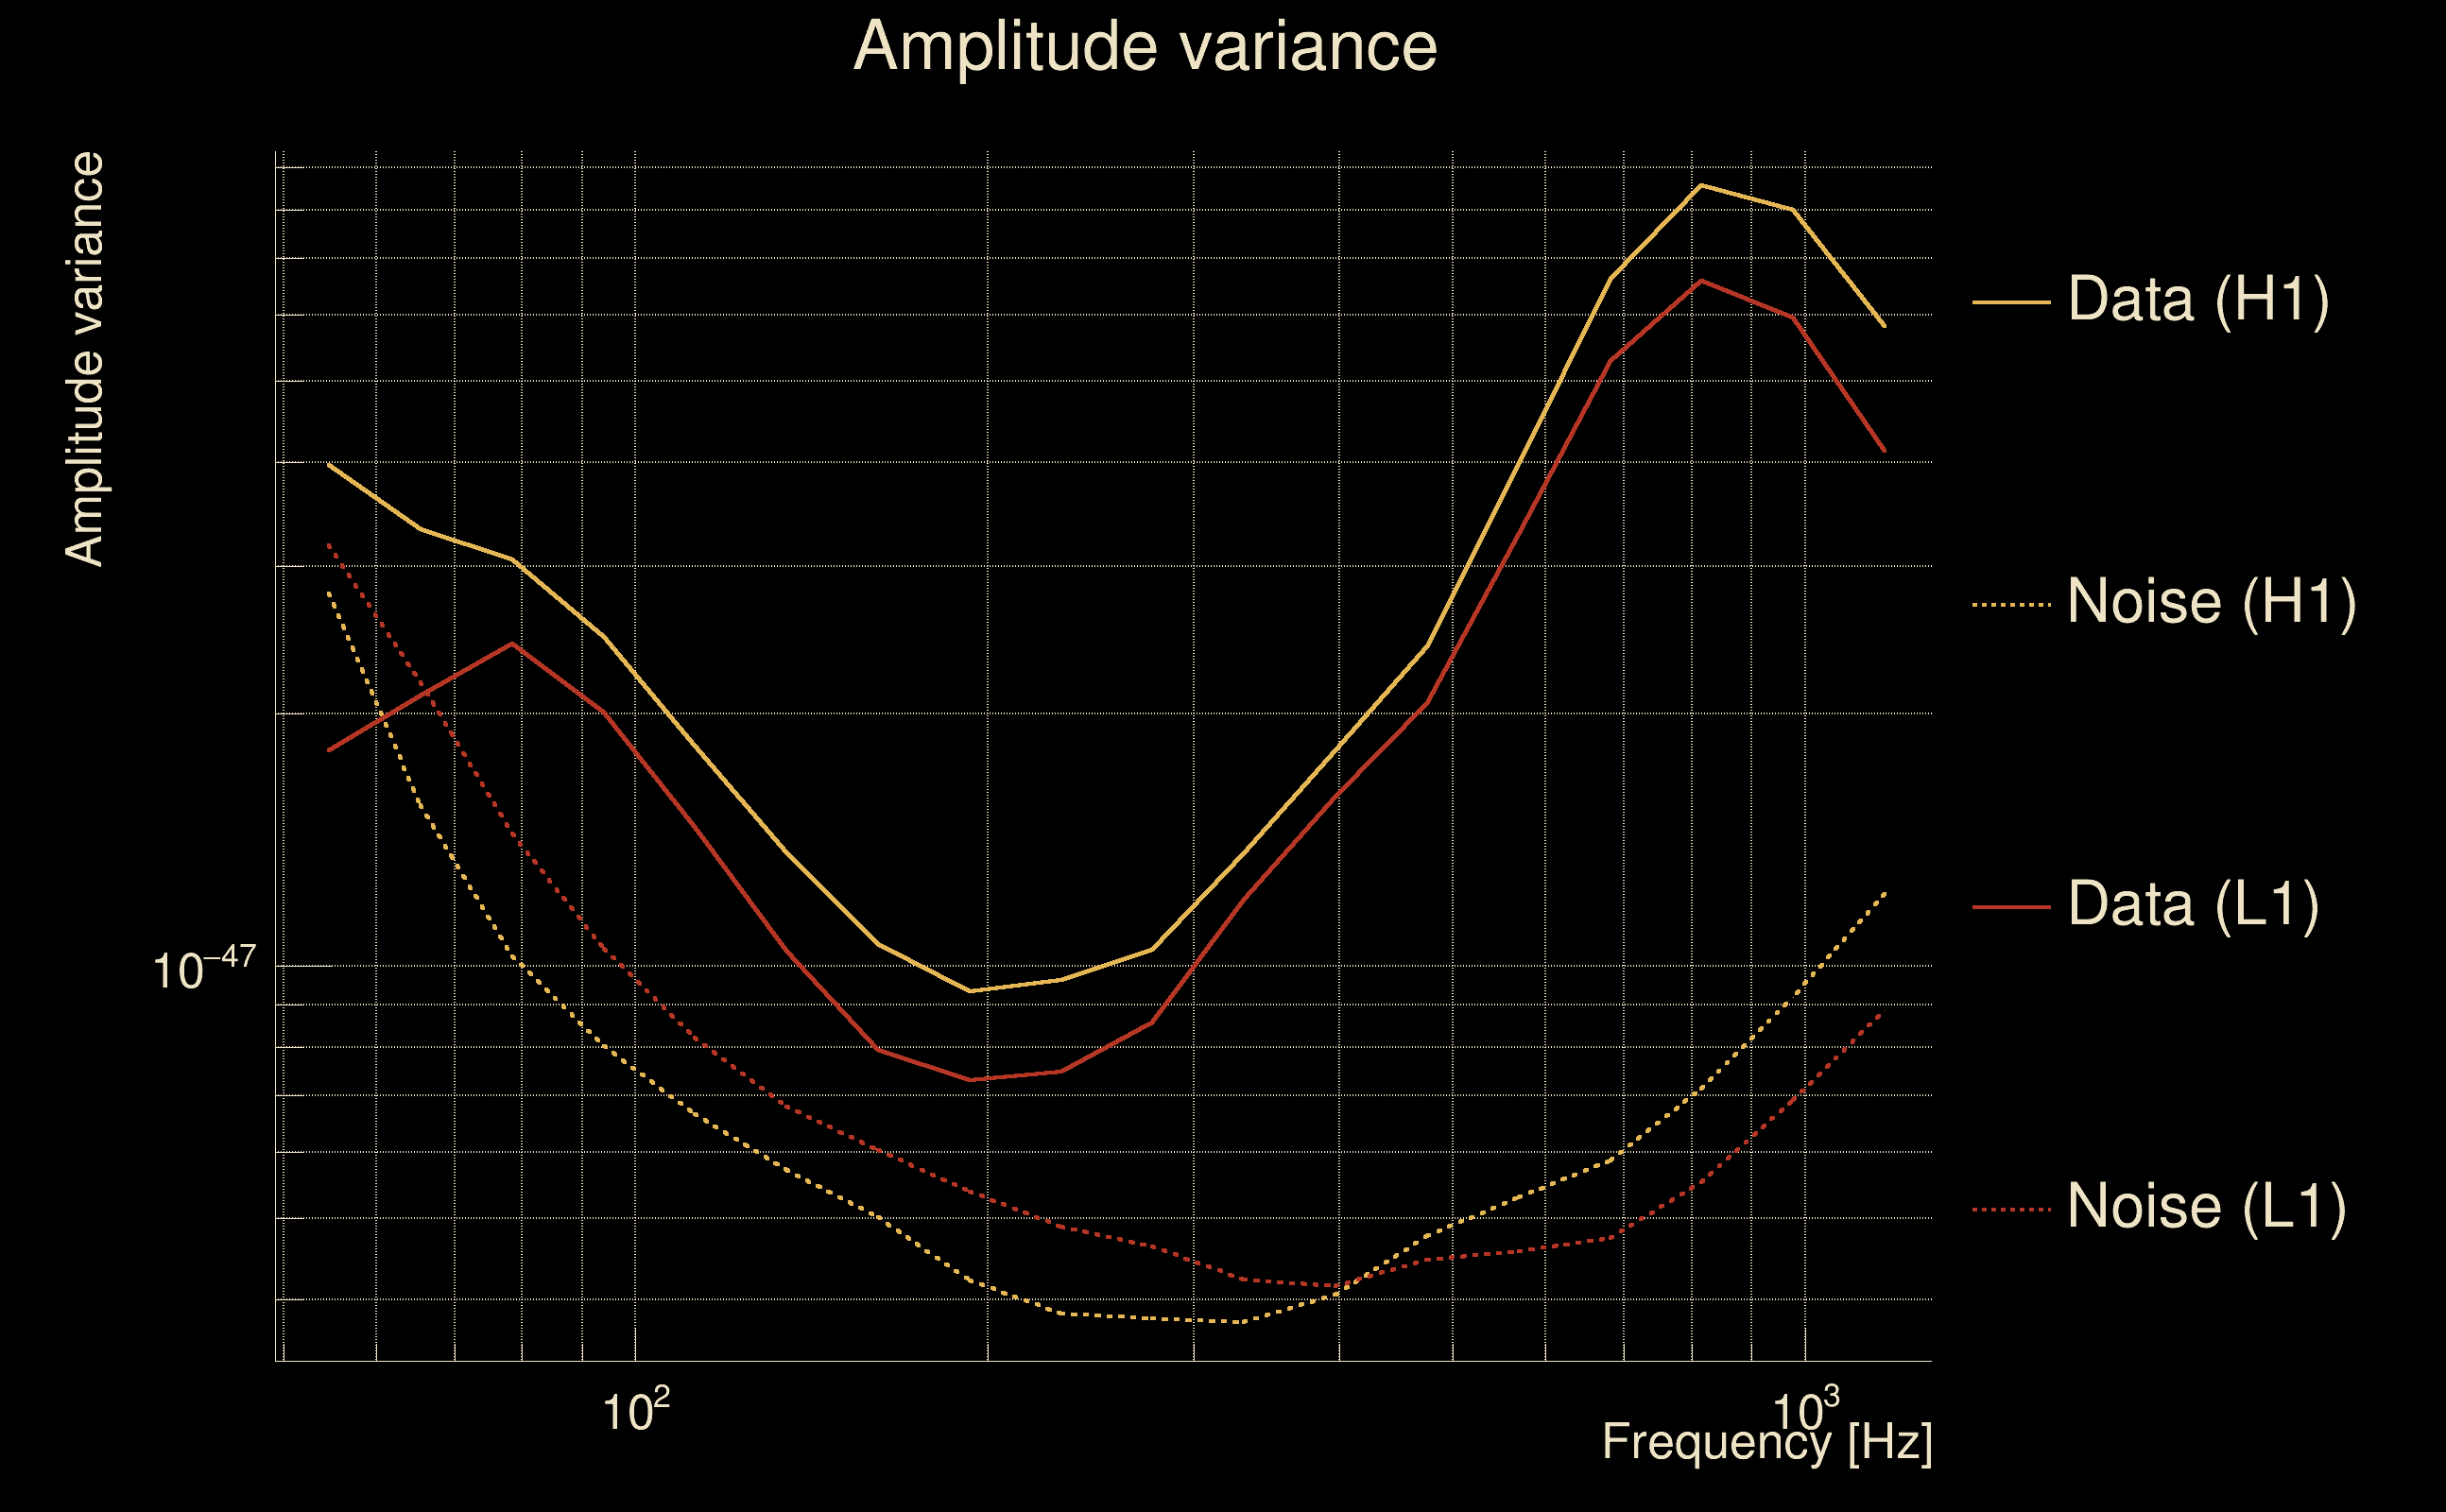
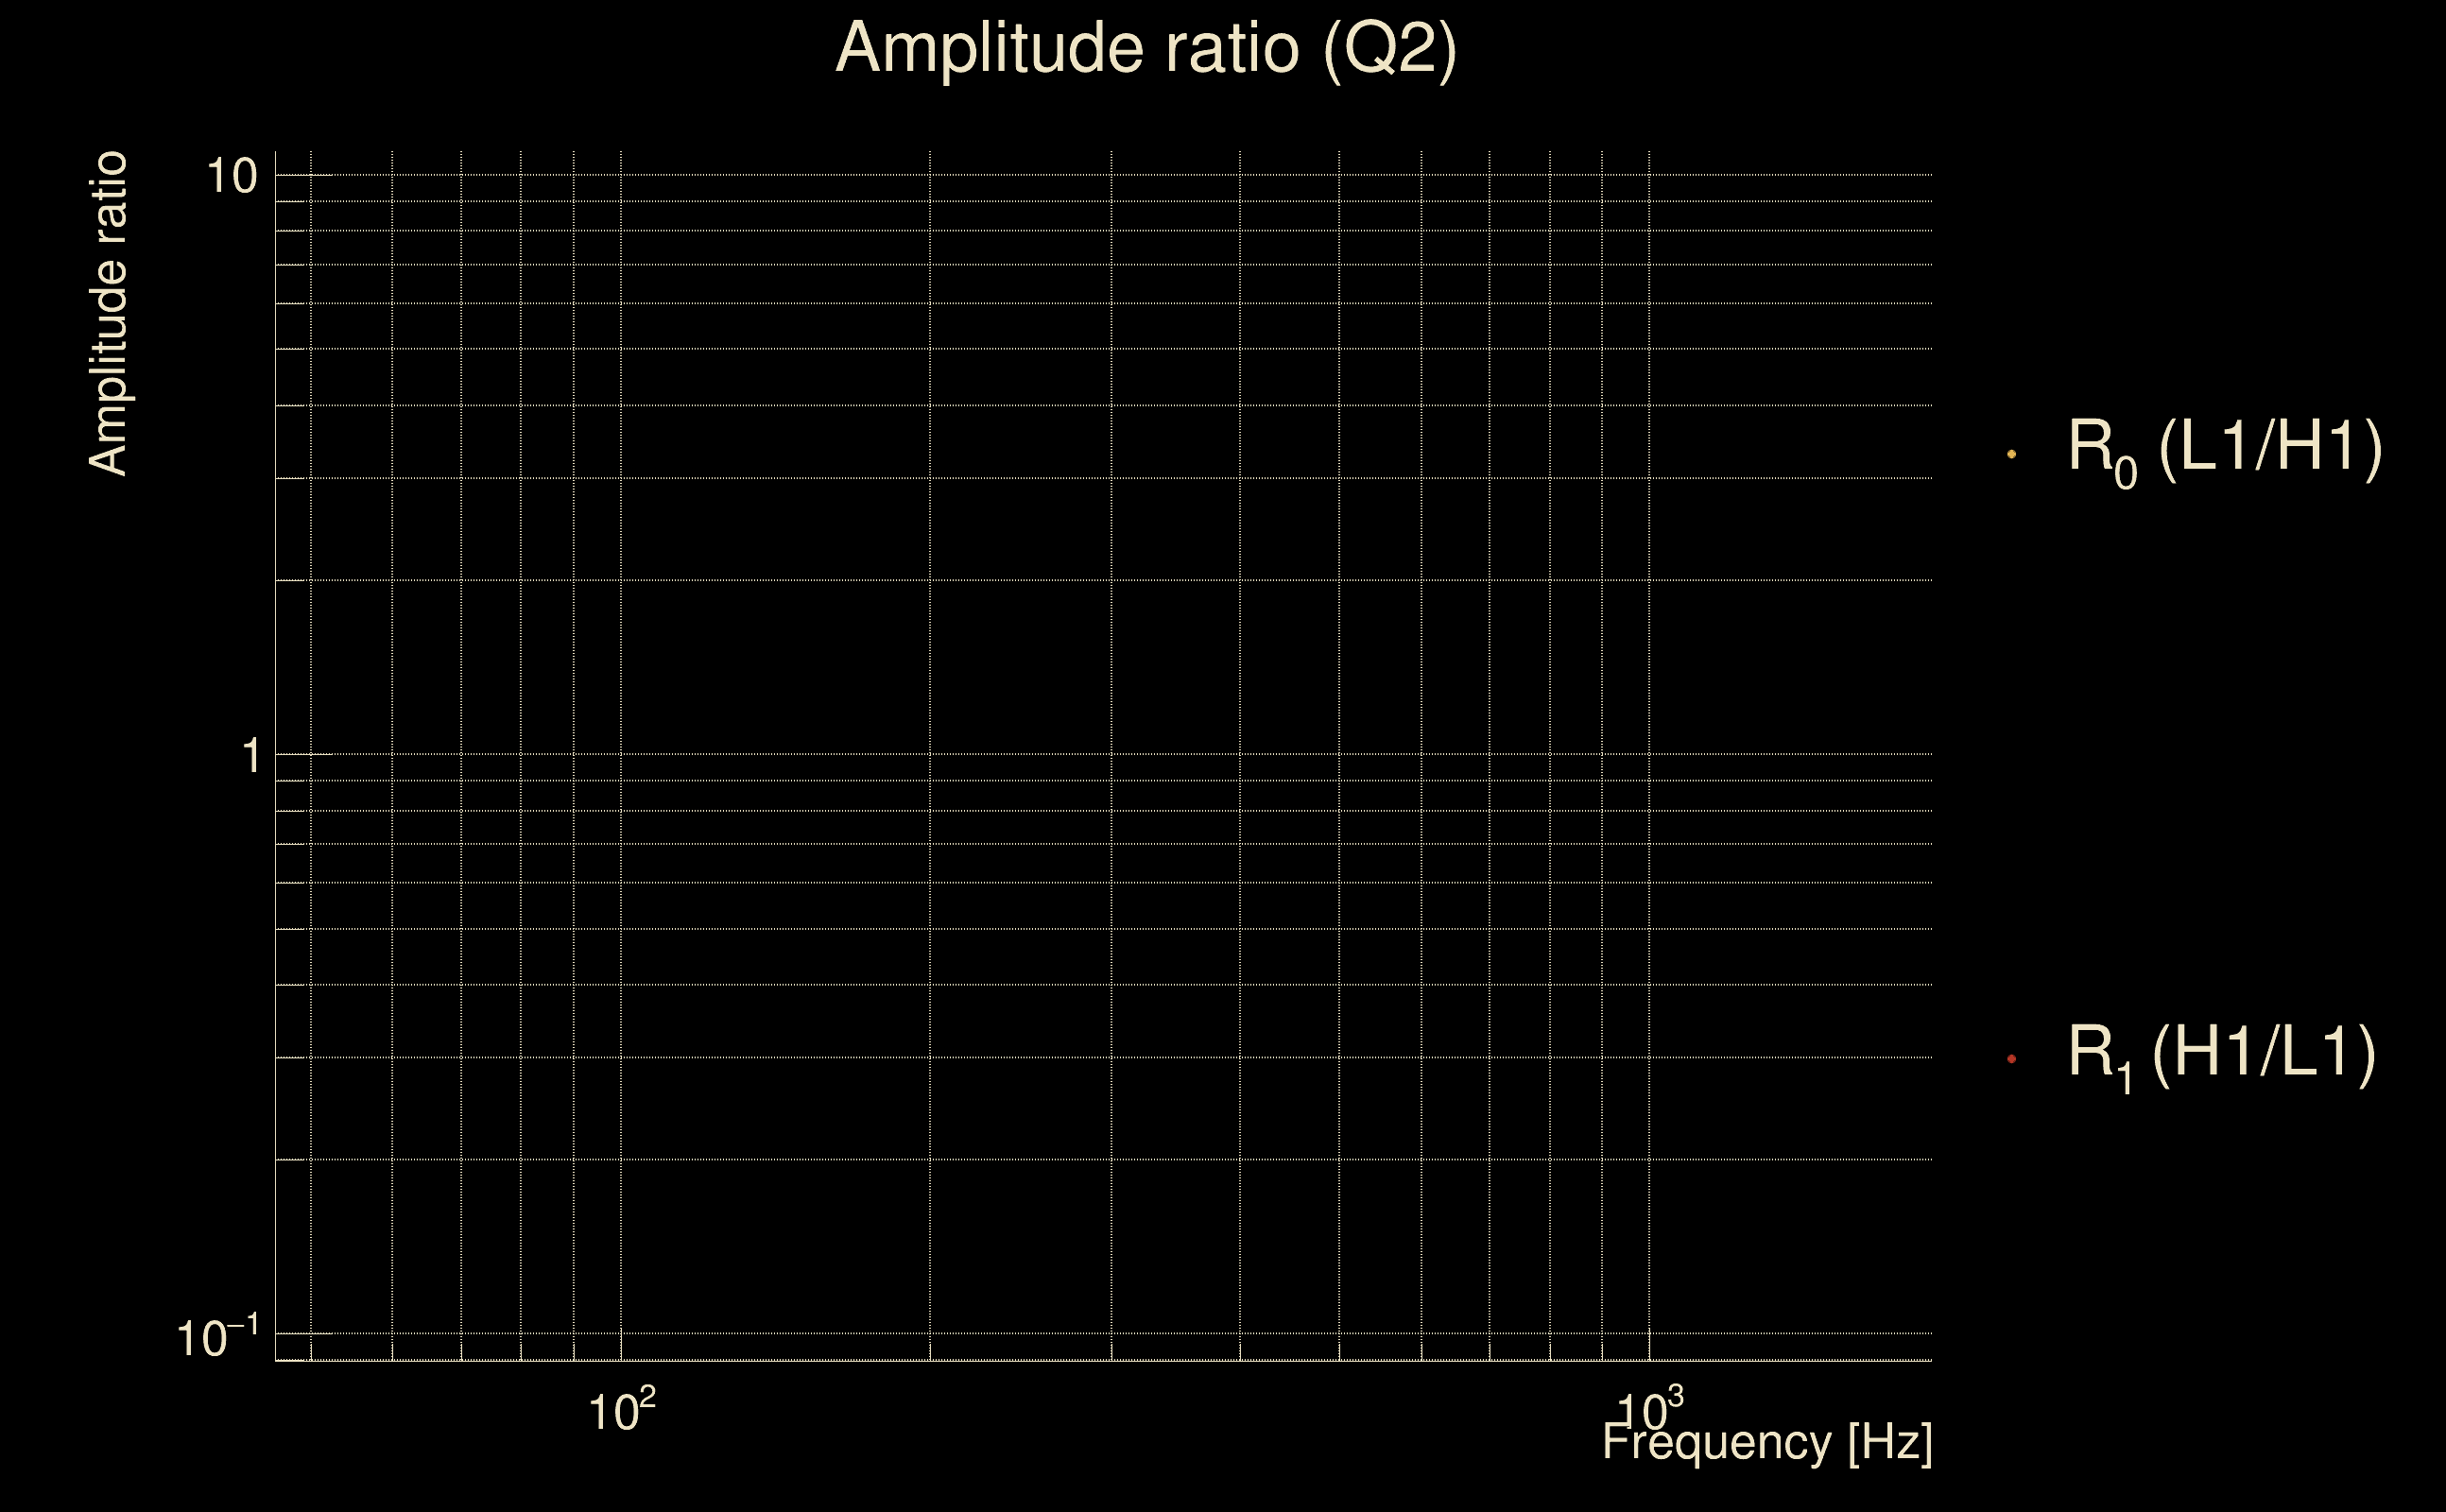
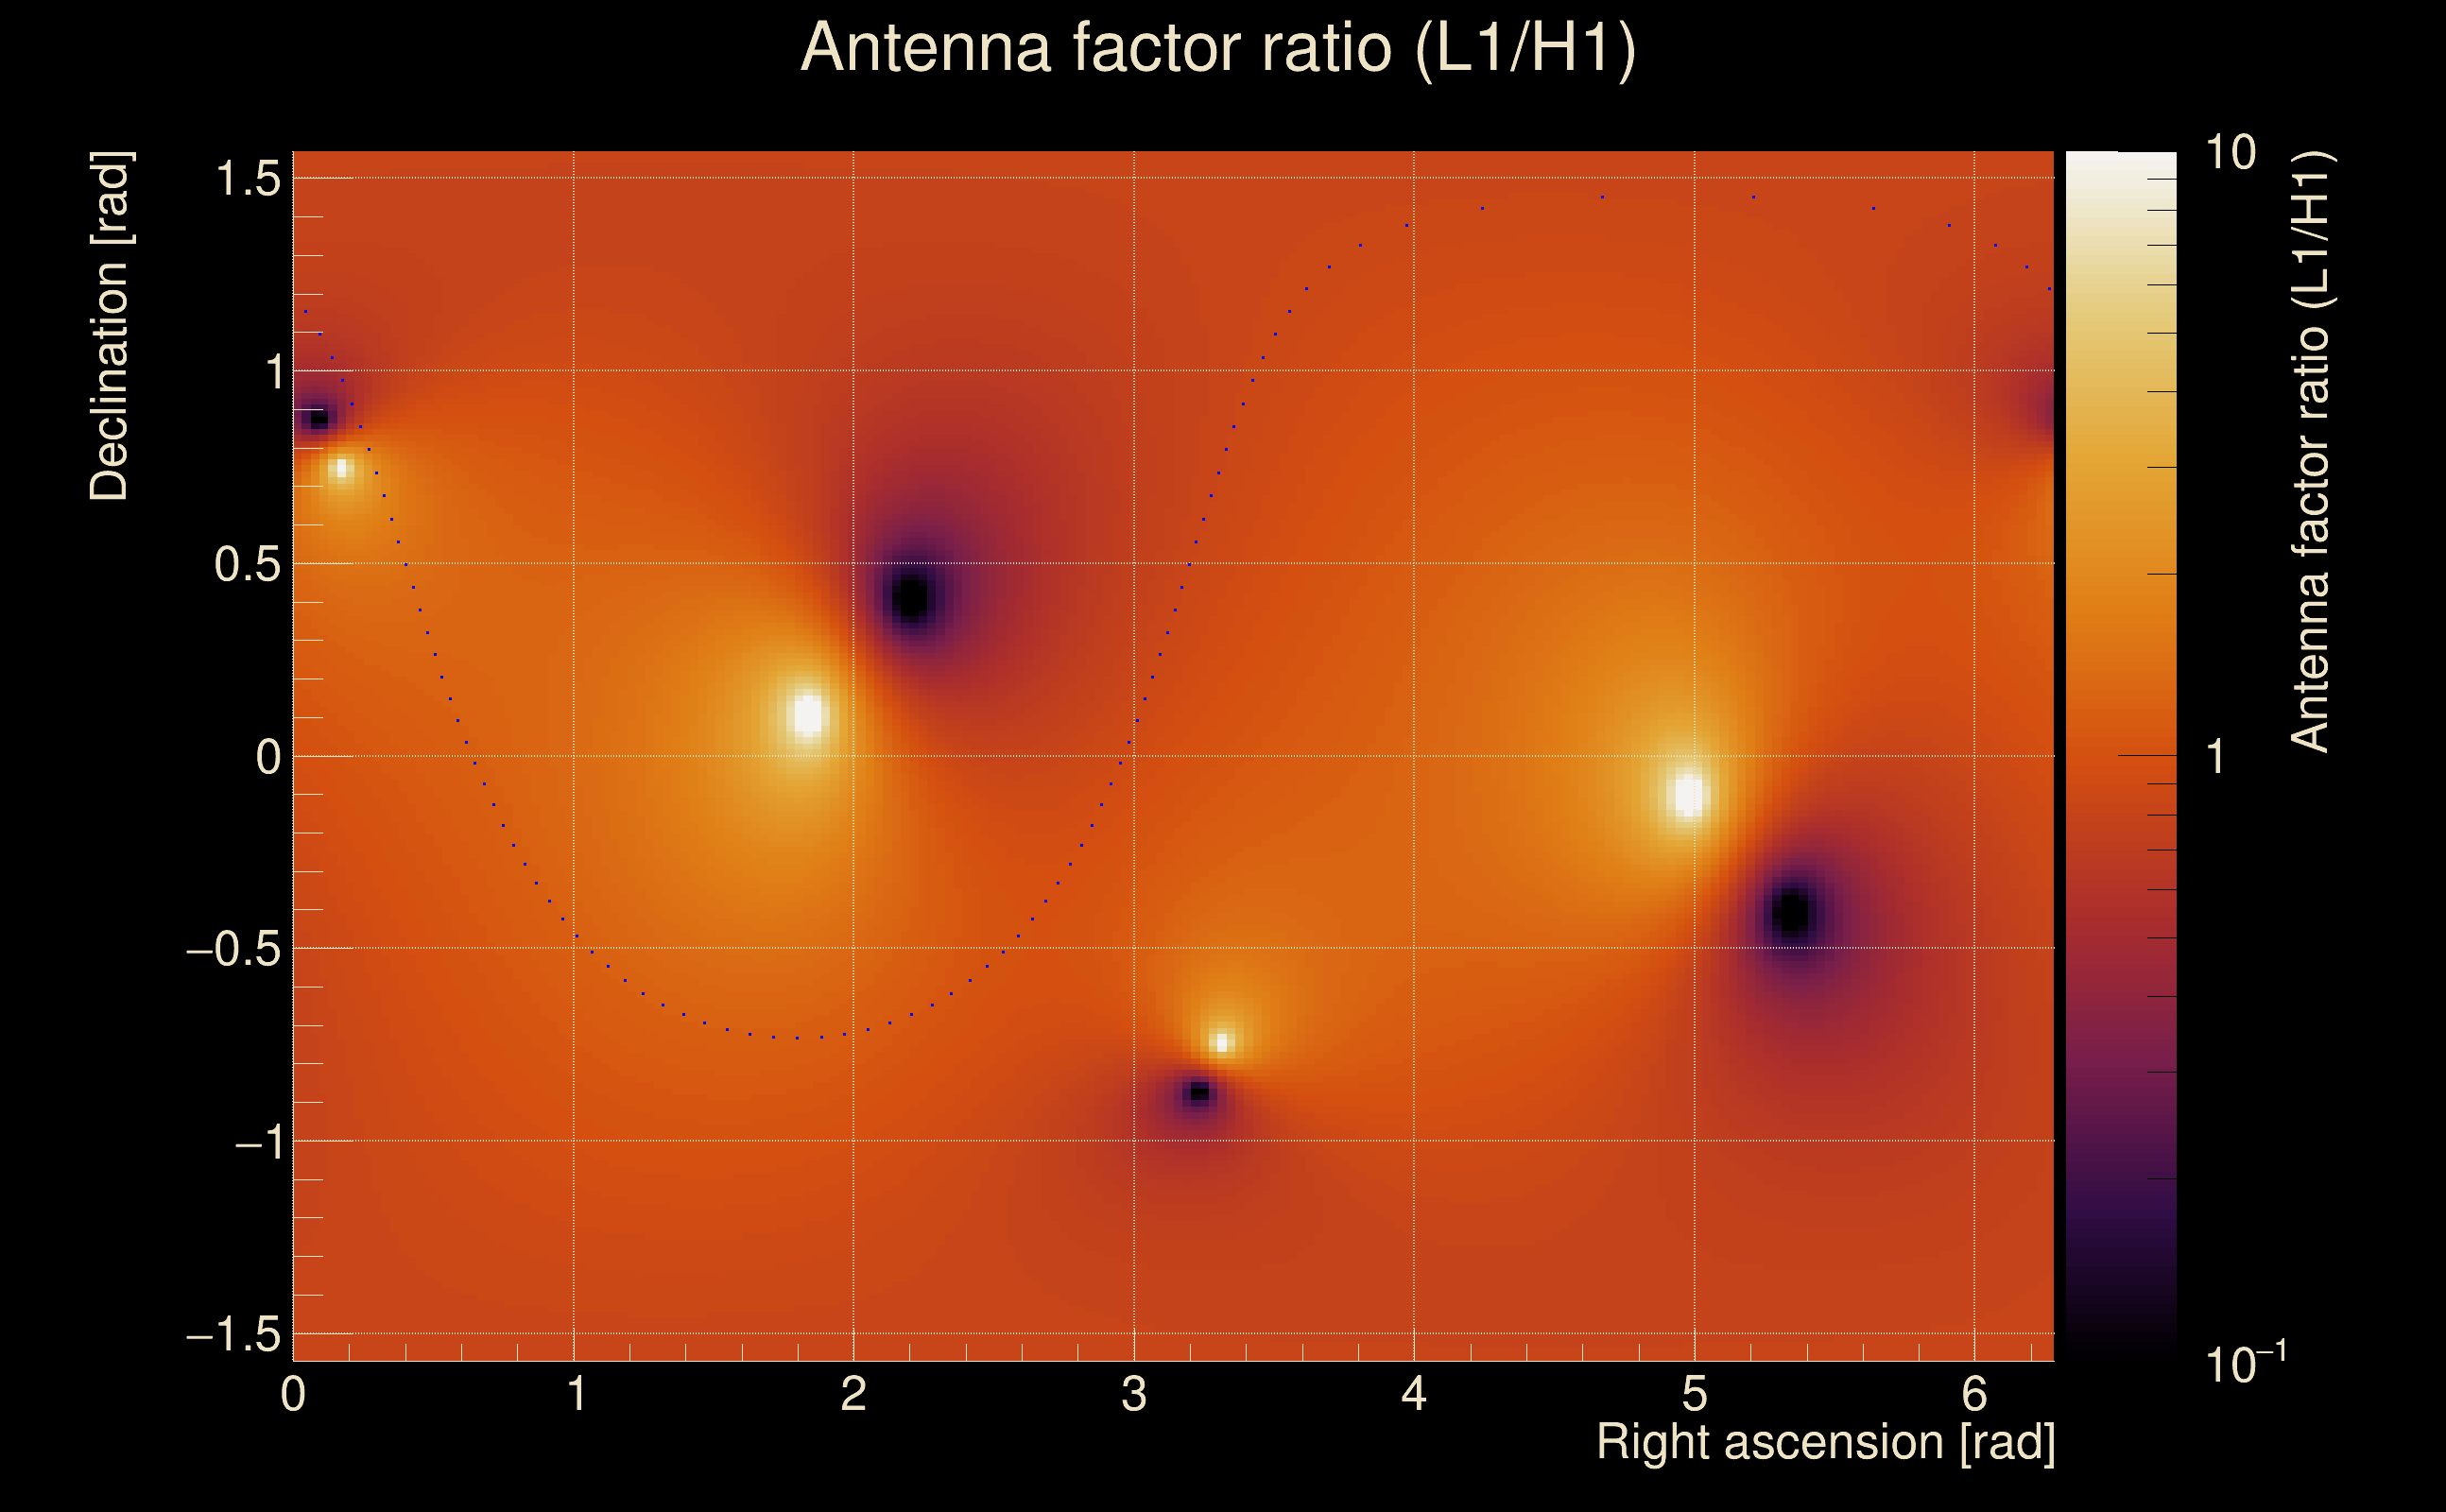
| Log of amplitude ratio (L1/H1): | -0.068774, variance = 0.153006 (L1/H1: -0.0765275, variance = 0.304038, H1/L1: 0.0620126, variance = 0.305009) |
| Amplitude ratio (L1/H1): | 0.933538 ⋇ 1.4787 (L1/H1: 0.926327 ⋇ 1.73567, H1/L1: 1.06398 ⋇ 1.7372) |
| Amplitude ratio H1|L1 compatibility (probability): | 0.985161 |
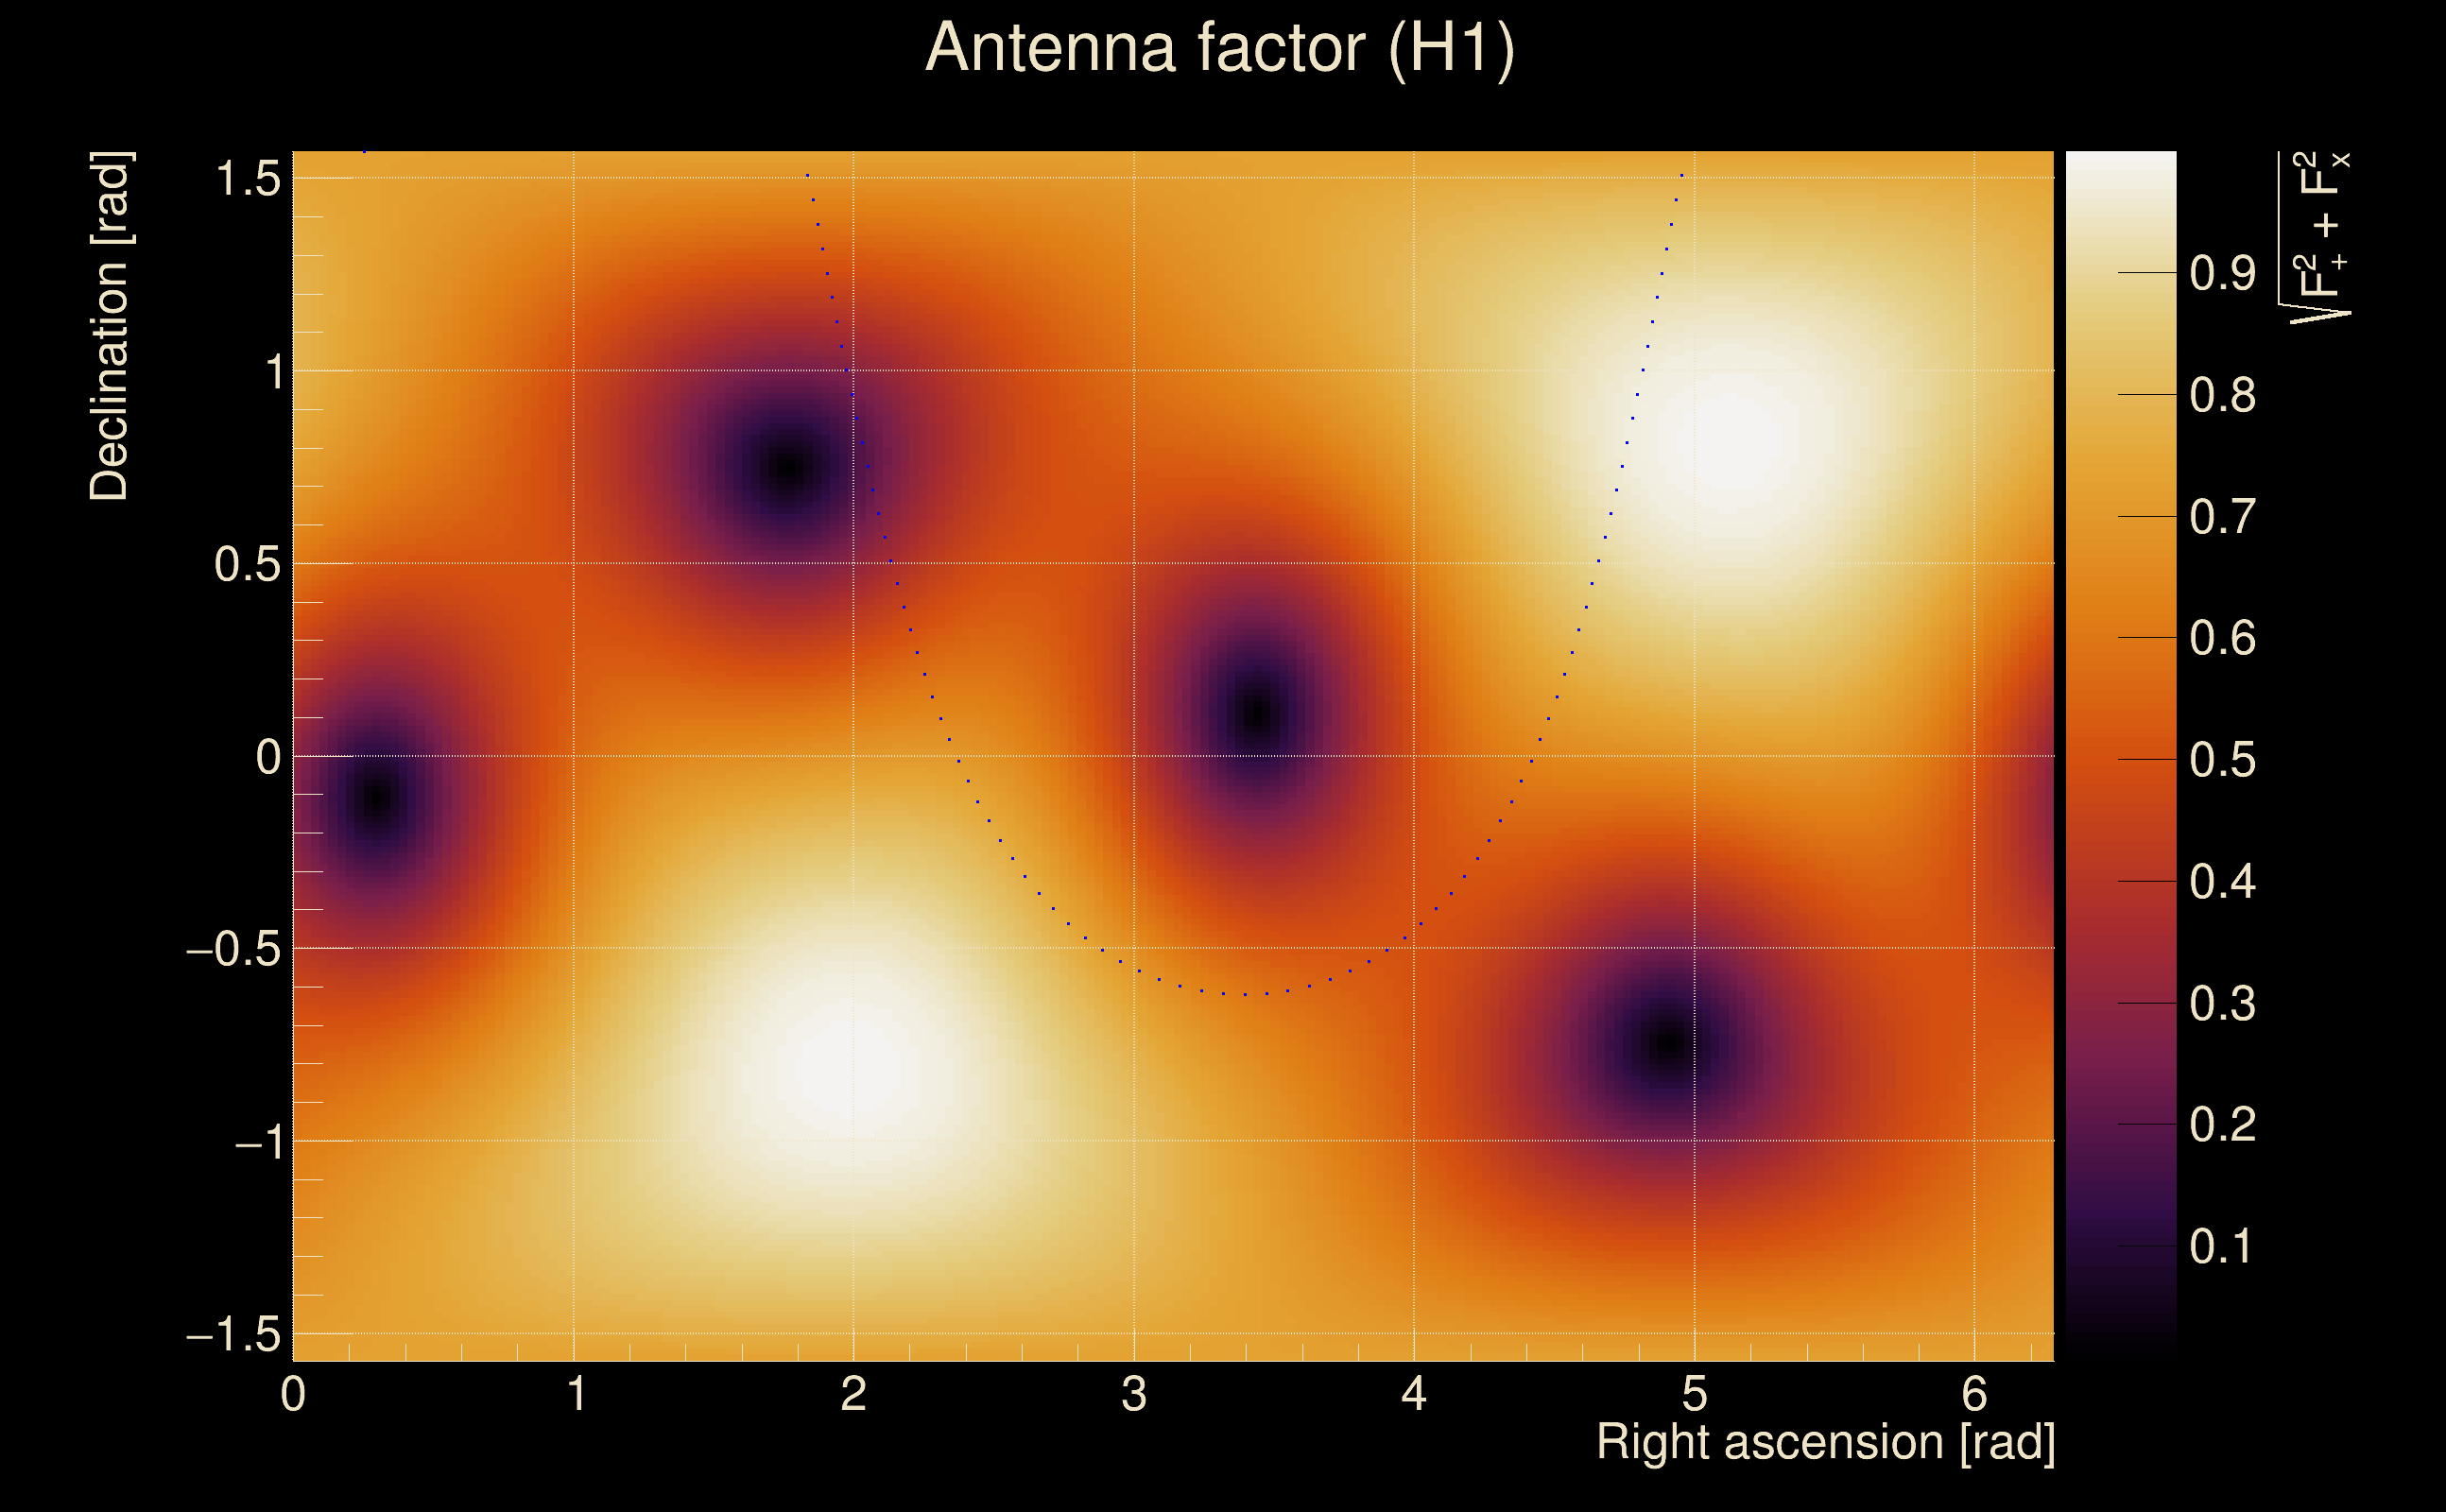
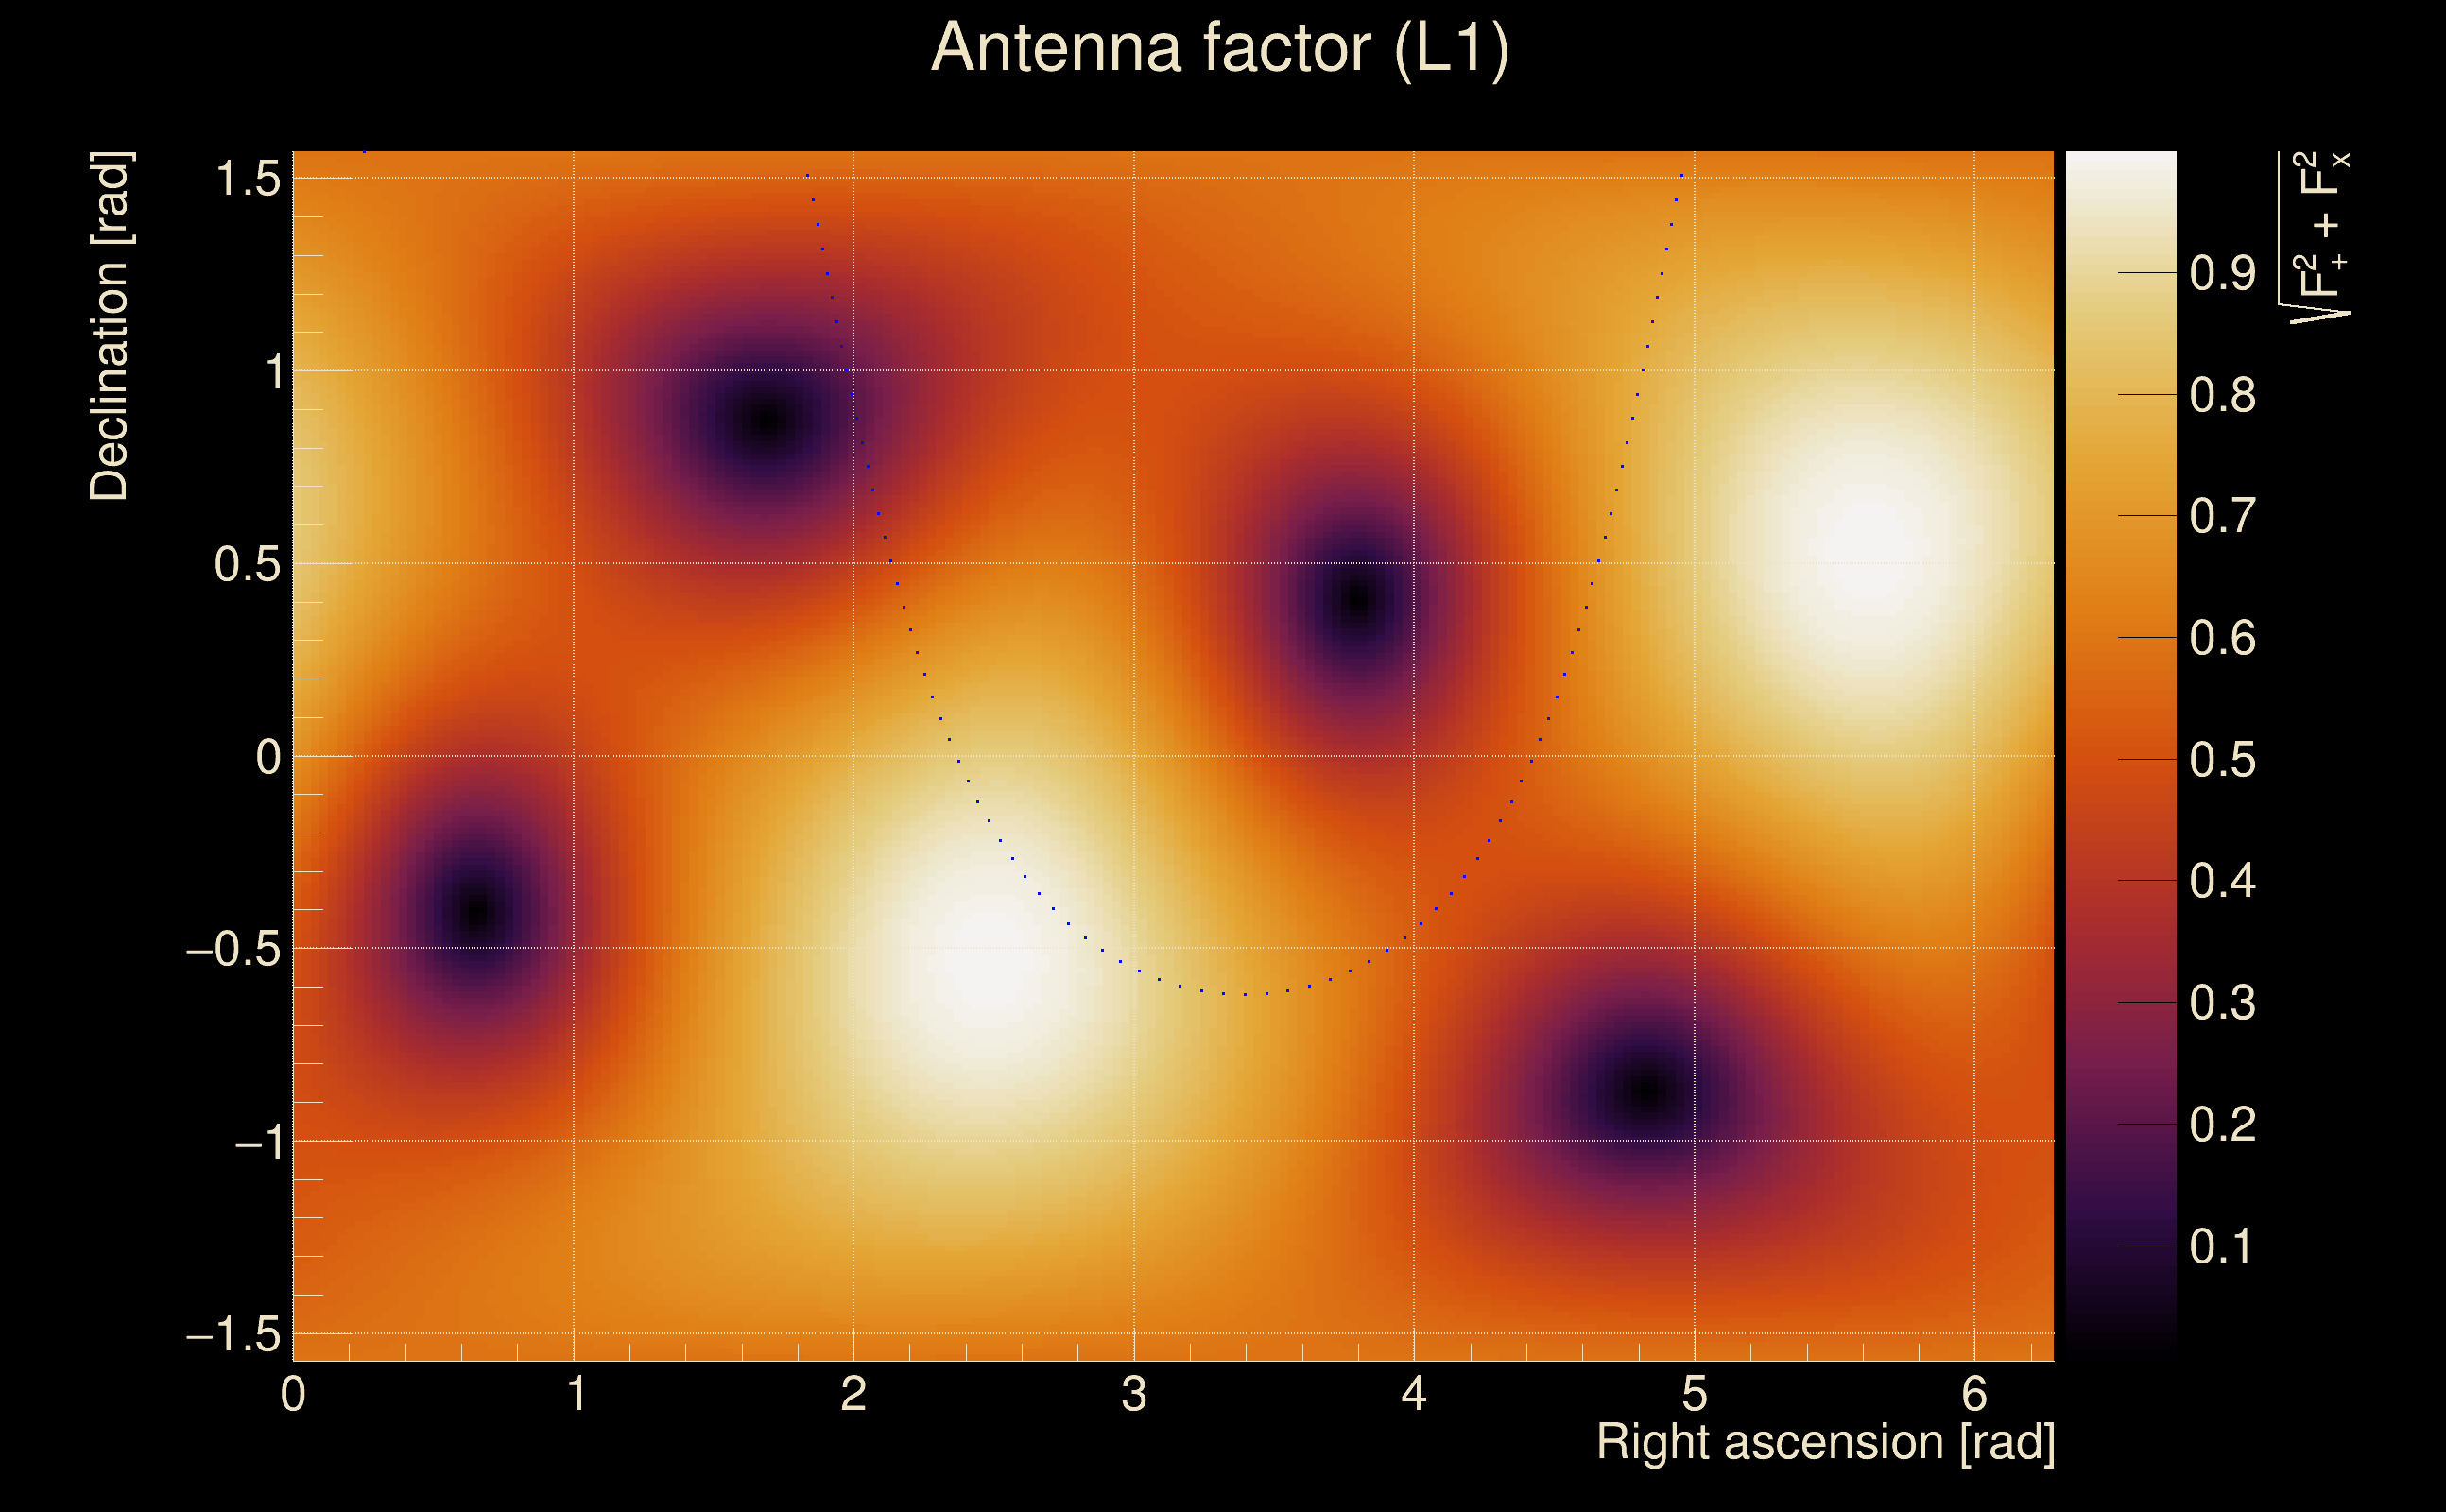
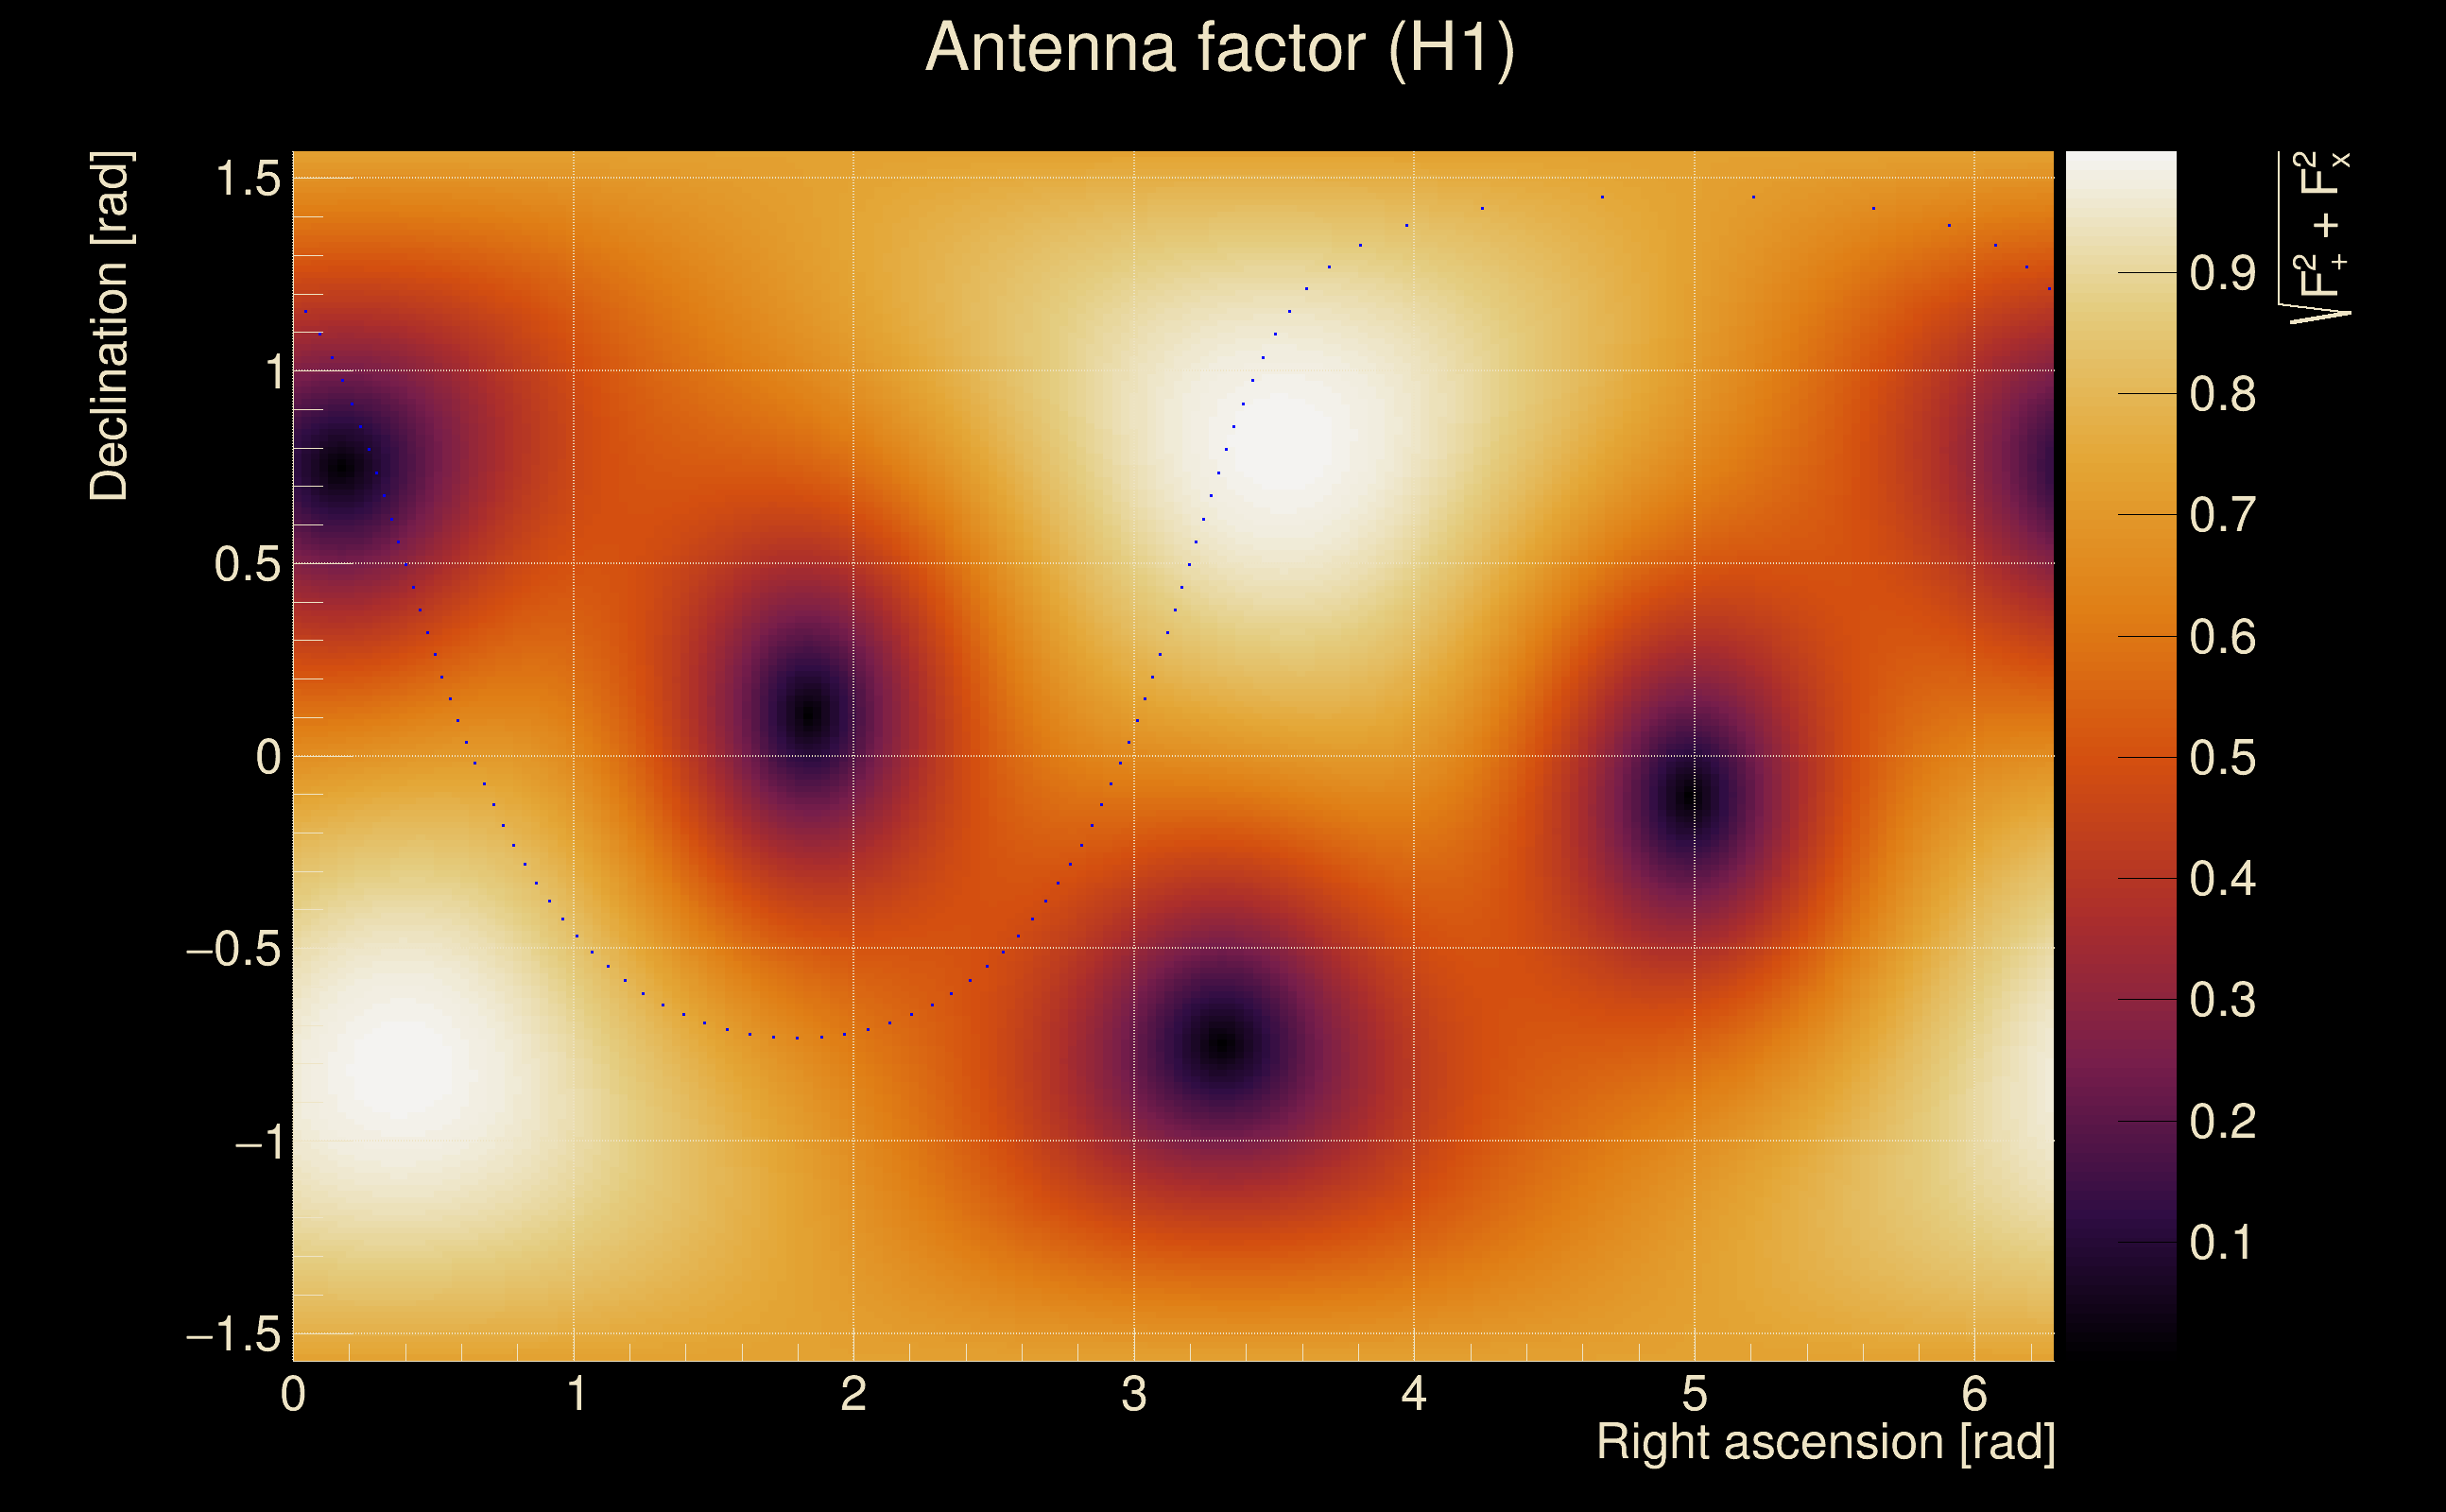
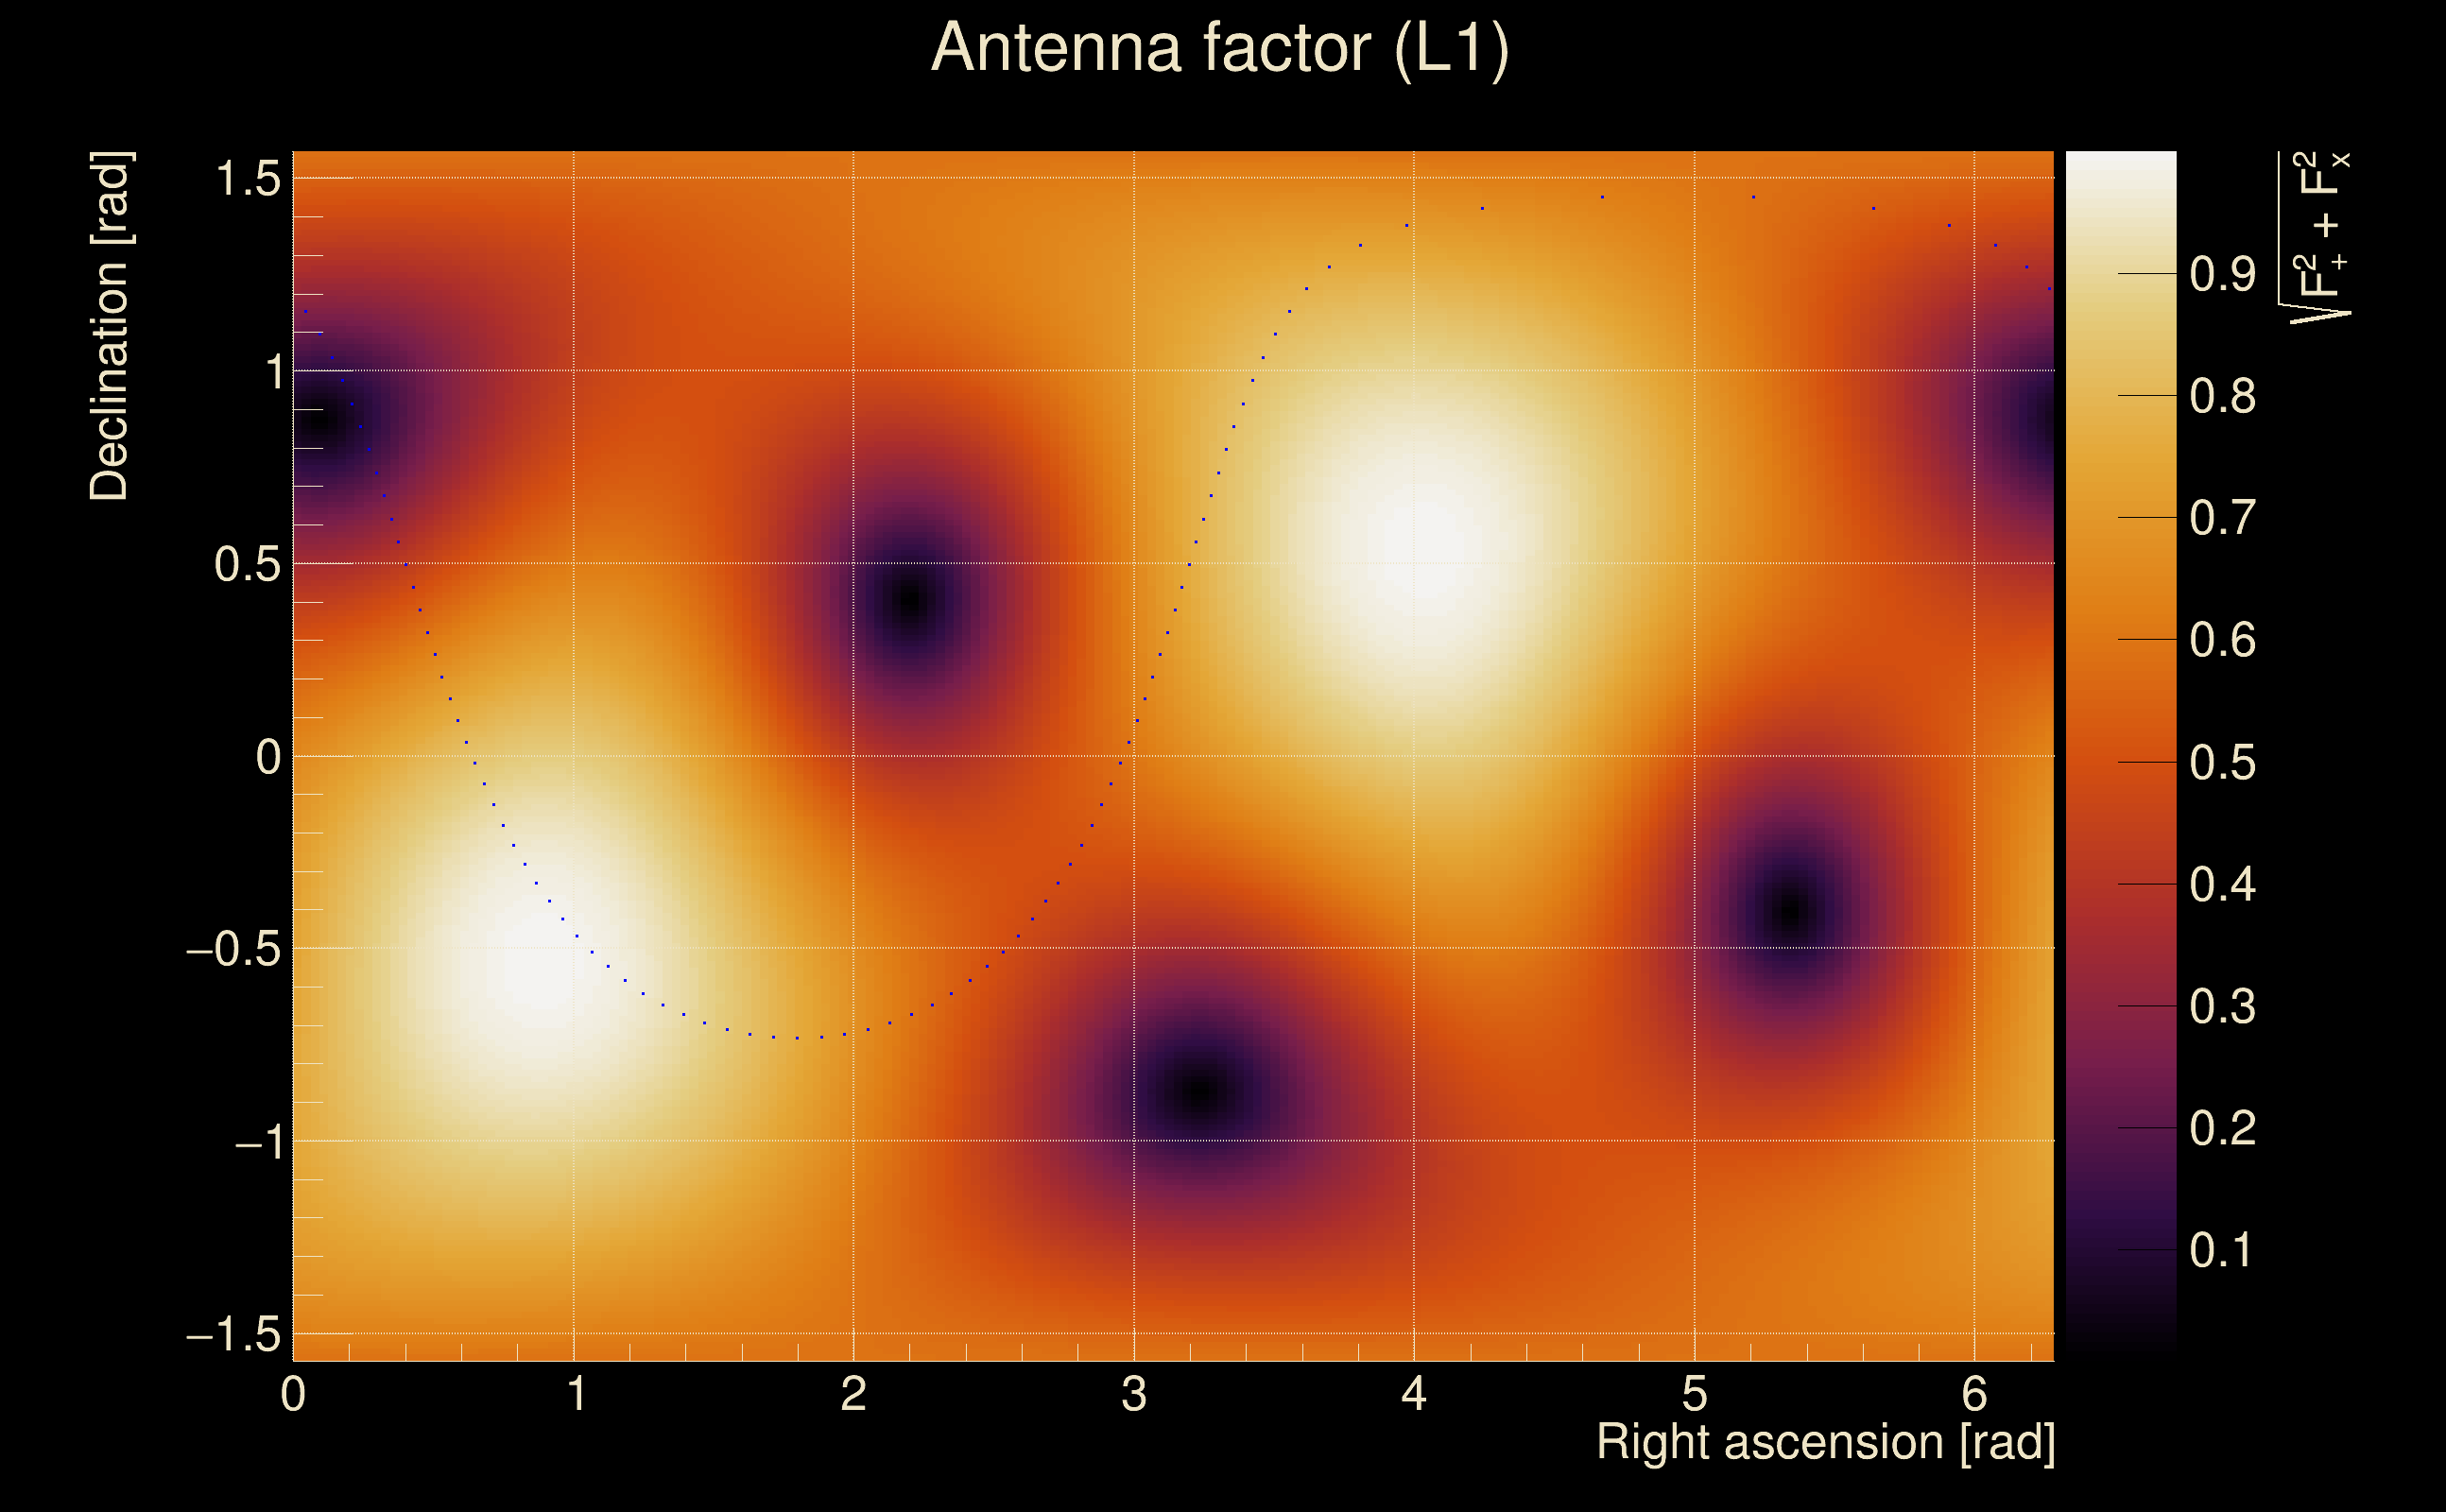
| Antenna factor probability: | 0.959934 |
| Number of rejected frequency rows: | Q0: 0 / 18, Q1: 0 / 36, Q2: 4 / 70, Q3: 15 / 134, Q4: 41 / 258 |
| Maximum signal-to-noise ratio: | H1: 60.7755, L1: 65.0813 |
| SNR variance: | H1: 3.06121, L1: 3.09679 |
| Click here for a zoomed plot | Click here for a zoomed plot | Click here for a zoomed plot | Click here for a zoomed plot | Click here for a zoomed plot |
 |
 |
 |
 |
 |
 |
 |
 |
 |
 |
 |
 |
 |
 |
 |
 |
 |
 |
 |
 |
 |
 |
 |
 |
 |
 |
 |
 |
 |
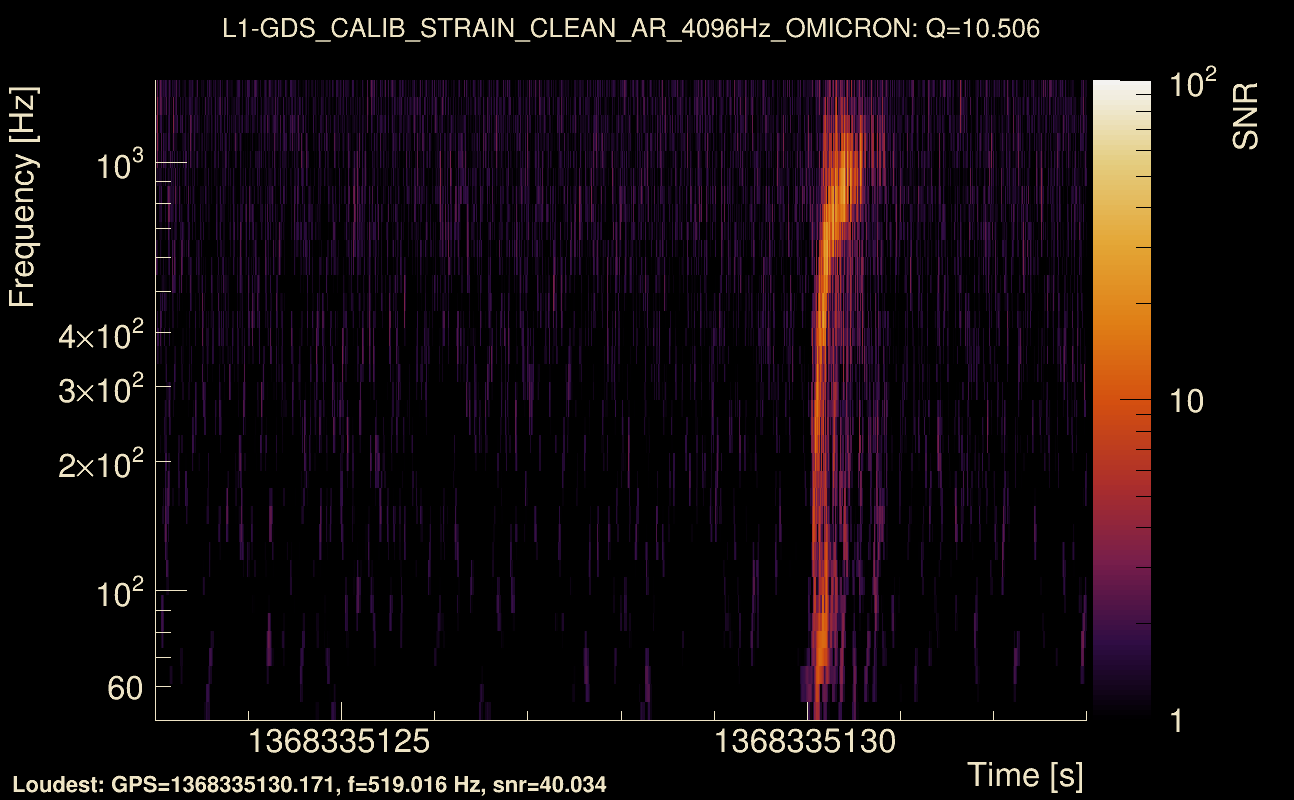
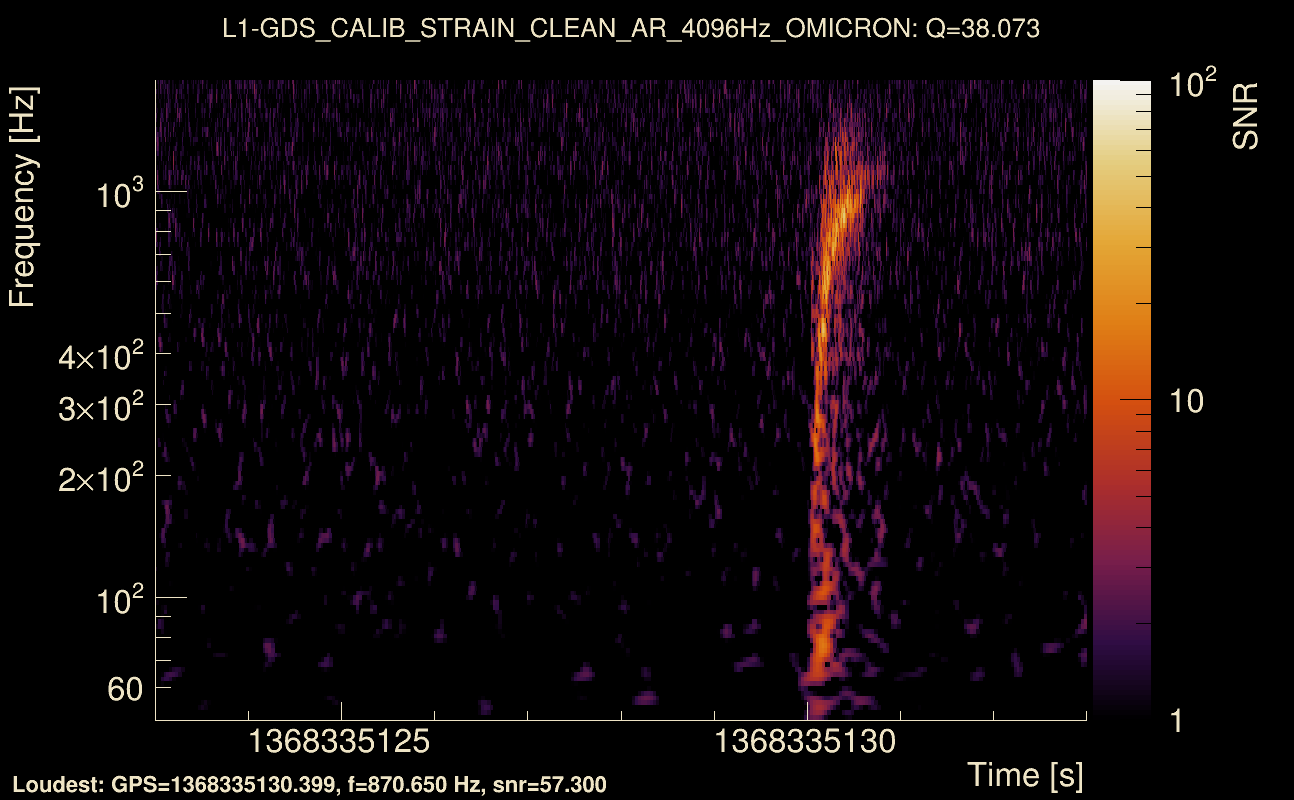
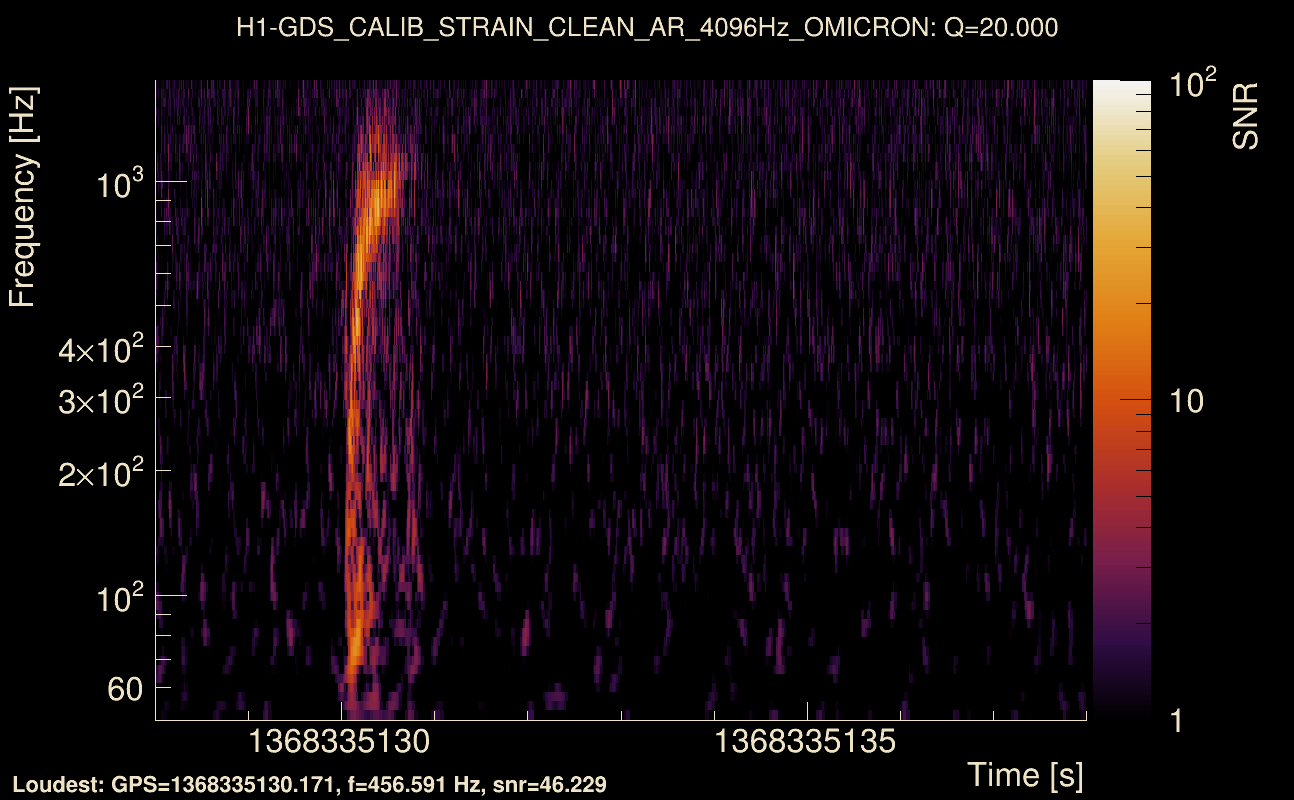
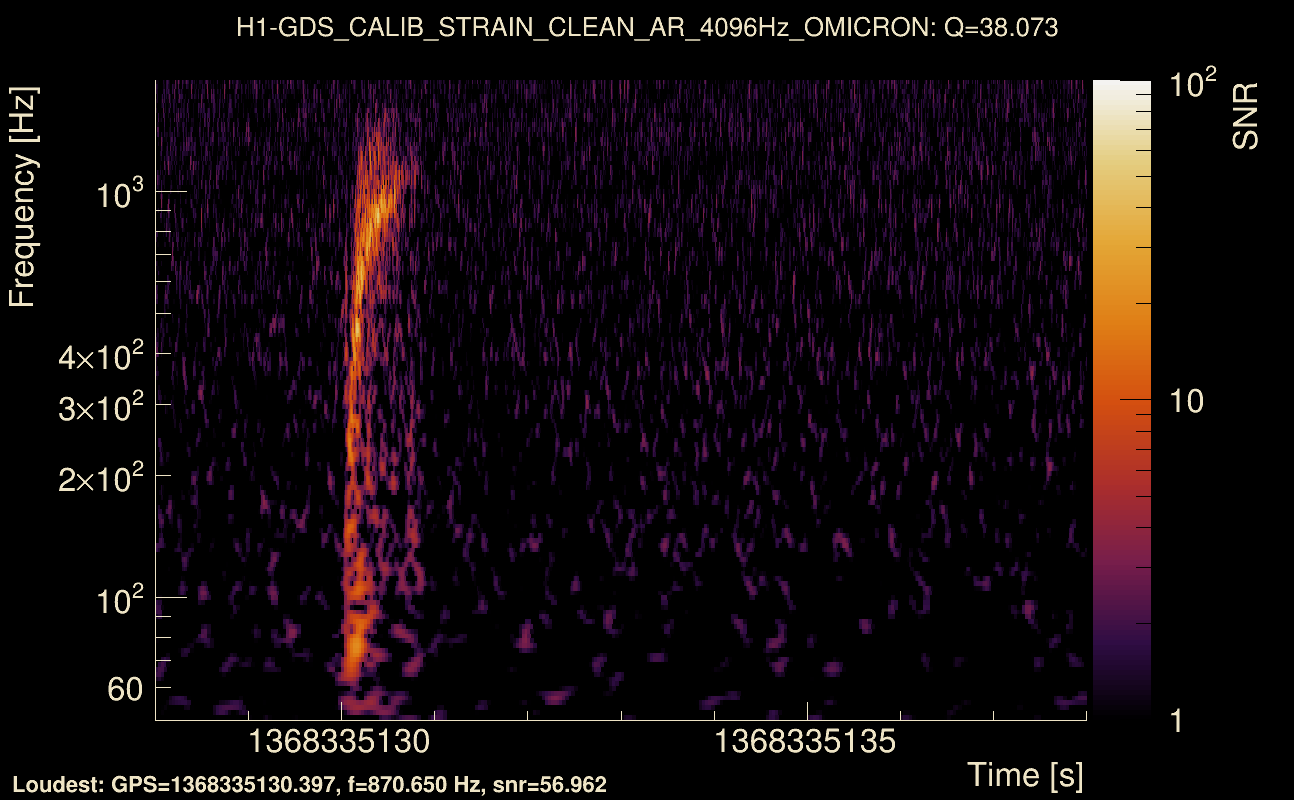
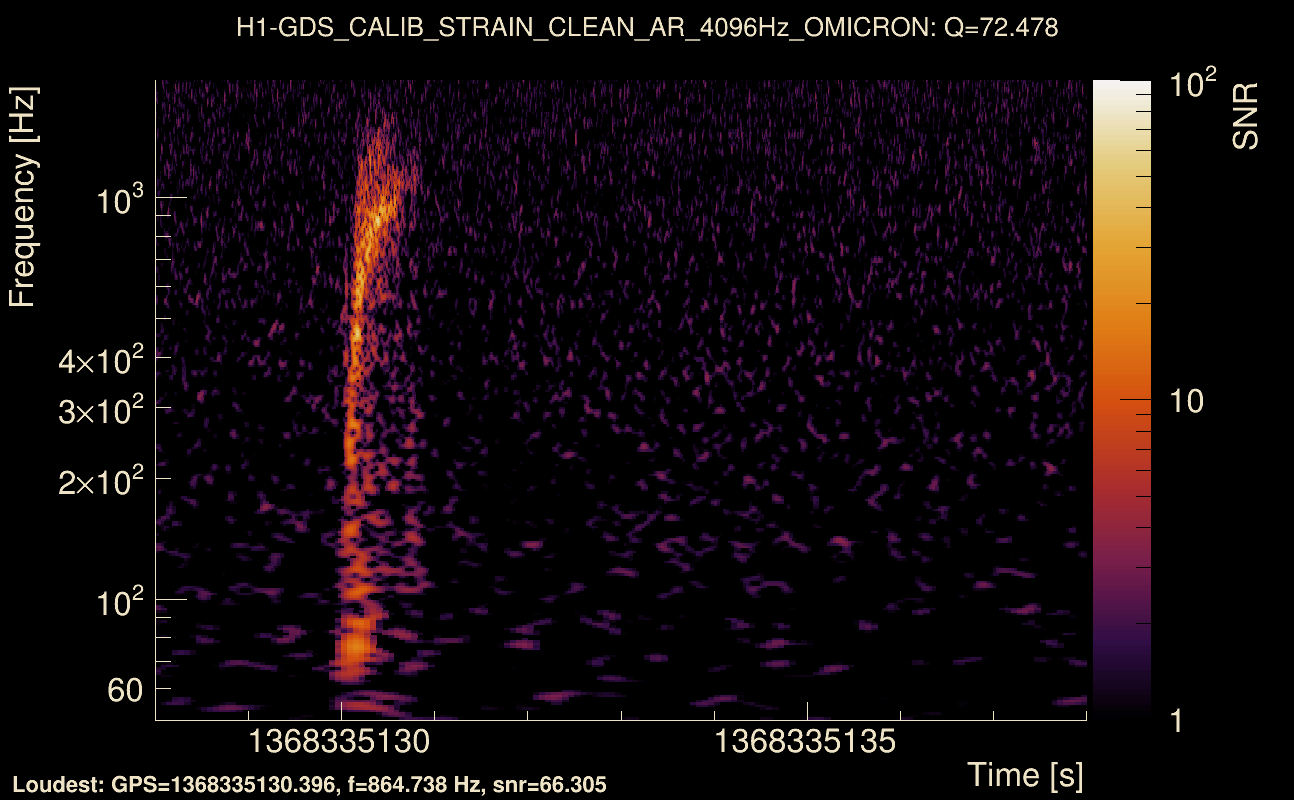
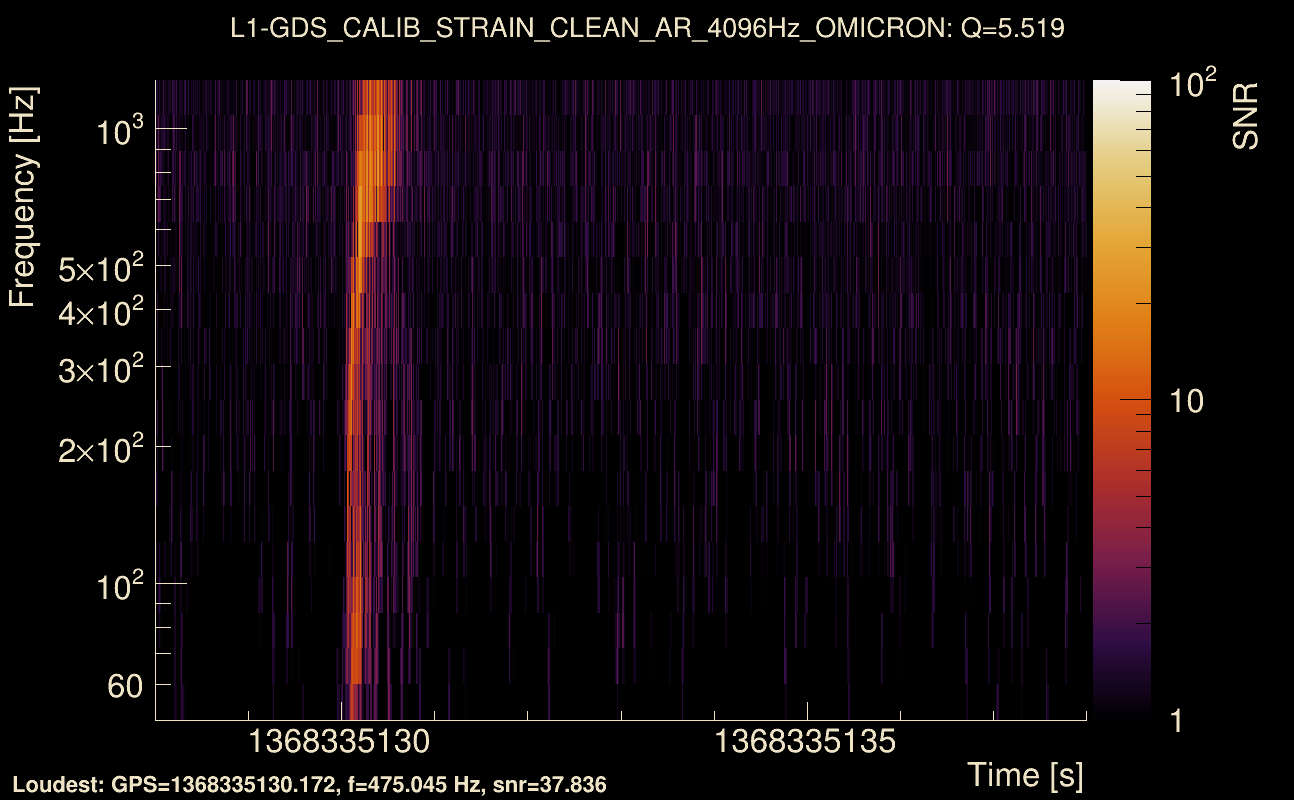
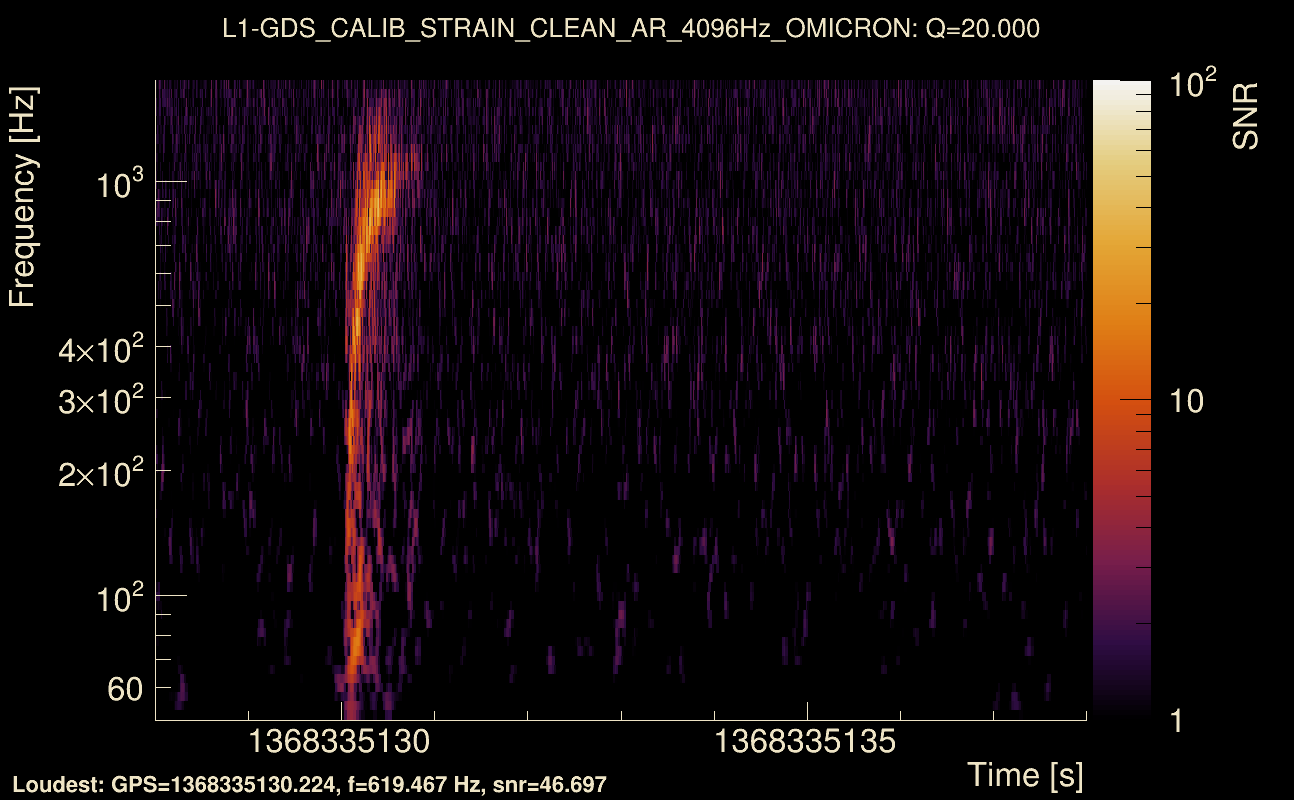
| Event time t(H1): | GPS = 1368335123 (Wed May 17 05:05:05 2023 ) → GPS = 1368335133 (Wed May 17 05:05:15 2023 ) |
| Event time t(L1): | GPS = 1368335123 (Wed May 17 05:05:15 2023 ) → GPS = 1368335133 (Wed May 17 05:05:15 2023 ) |
| Omicron analysis time window (H1): | GPS = 1368335120 → GPS = 1368335136 |
| Omicron analysis time window (L1): | GPS = 1368335120 → GPS = 1368335136 |
| Time delay between detectors t(L1) - t(H1): | 0.00107369 s (slice index = 108 / 217), δt_gw = 0.00107369 s |
| Time delay standard deviation: | 0.0244179 s |
| [targeted mode] Time delay probability: | 0.768947 (0.293752 sigmas), δt_target = 0.00161266 s |
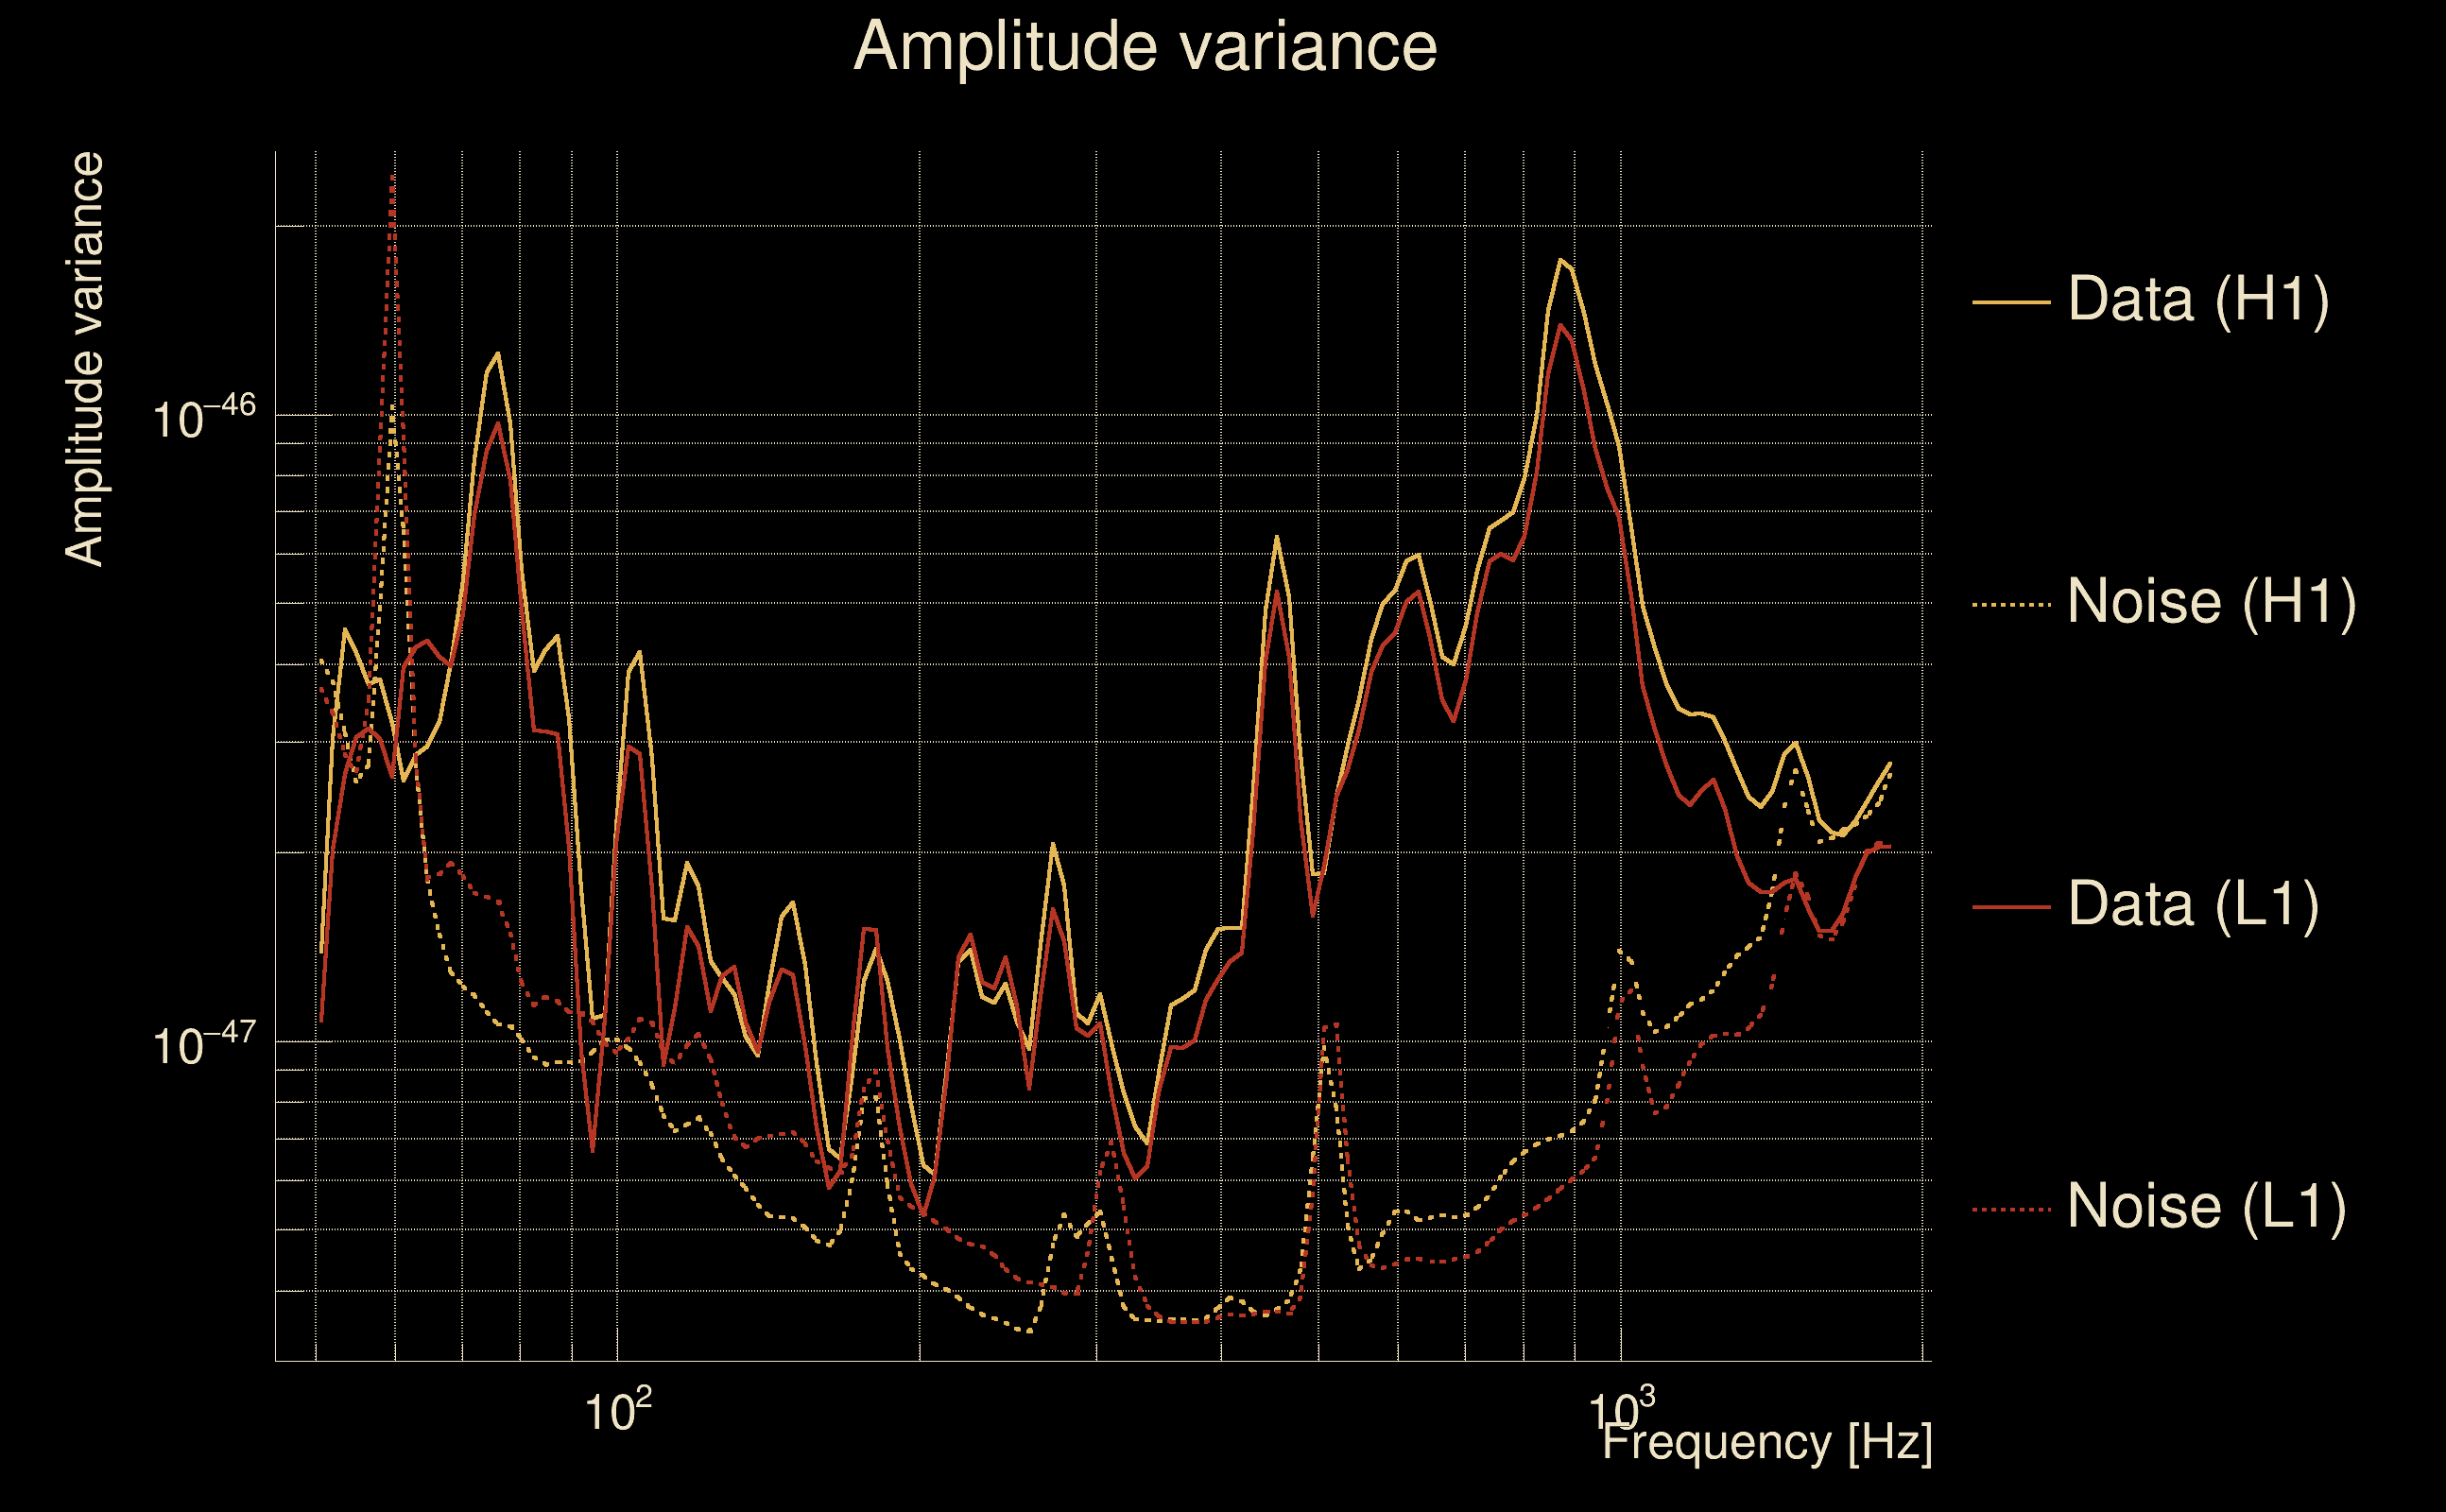
| Frequency: | 287.263 Hz |
| Ξ: | 0.921576 ± 0.0125674 (variance = 0.00015794): Q0: 0.952187, Q1: 0.940889, Q2: 0.932291, Q3: 0.921237, Q4: 0.918152 |
| Rank: | R_A = 0.921576 |
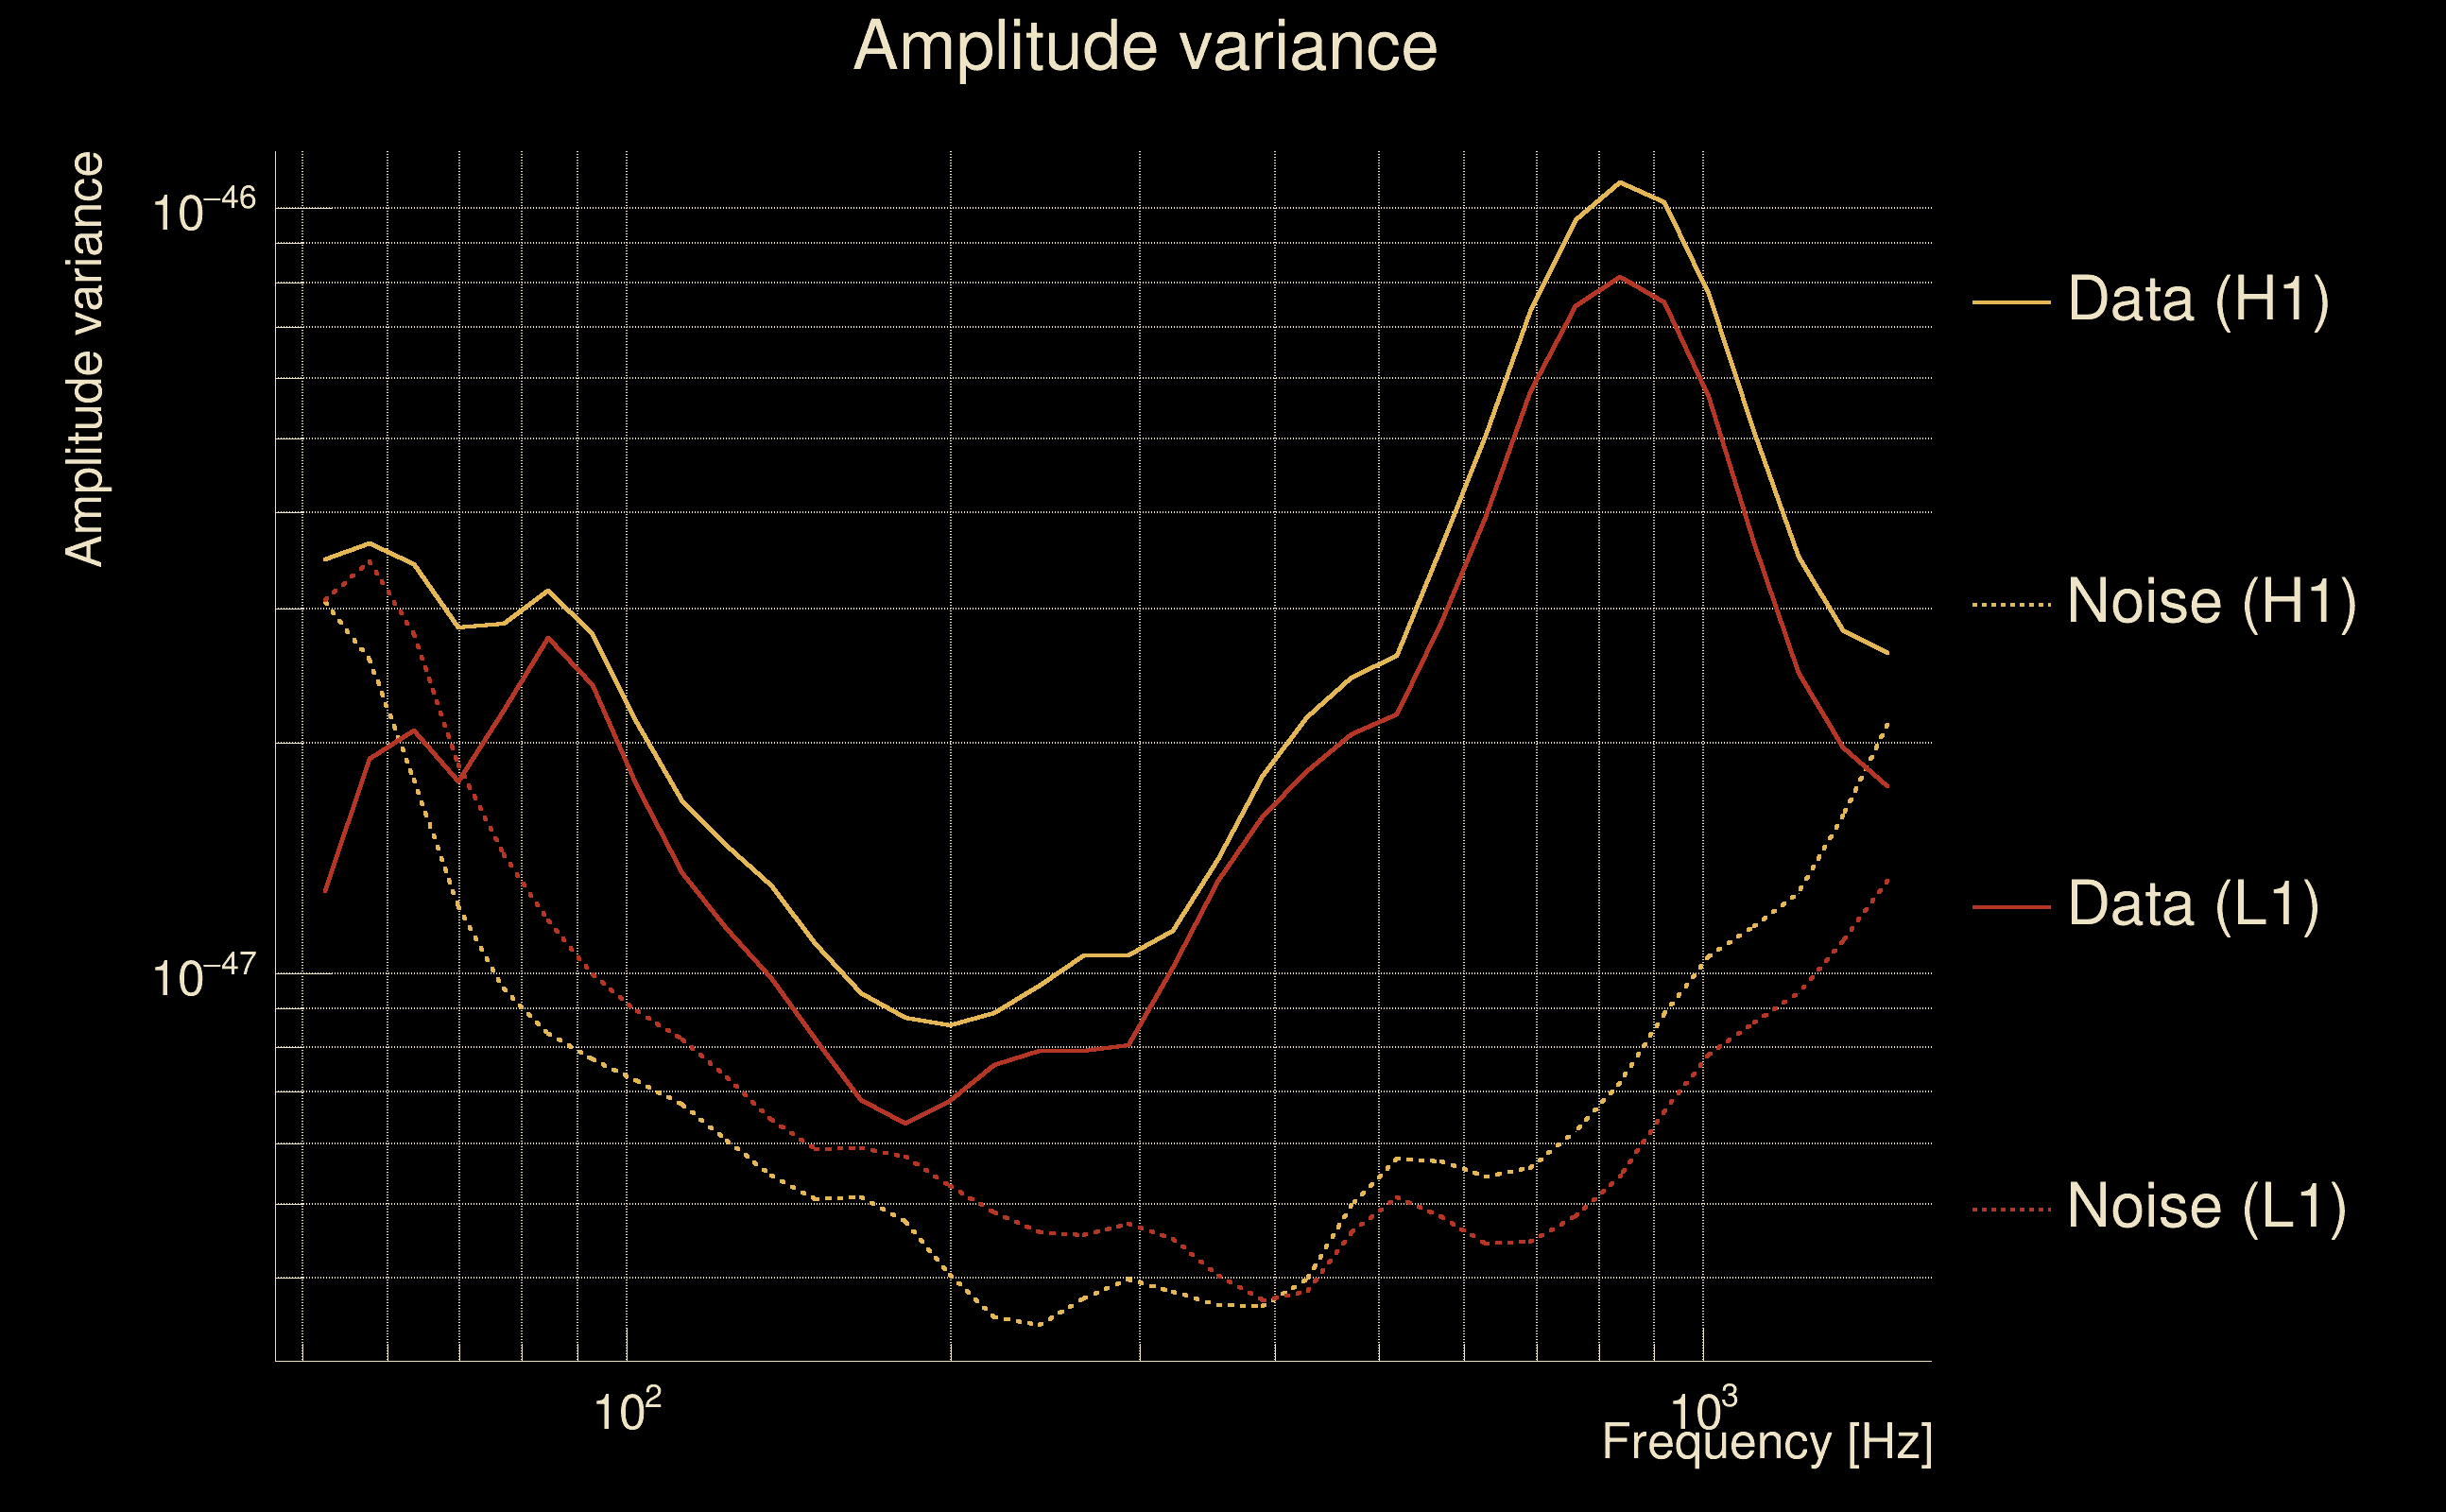
| Log of amplitude ratio (L1/H1): | -0.0768491, variance = 0.154042 (L1/H1: -0.107117, variance = 0.306974, H1/L1: 0.0495635, variance = 0.30749) |
| Amplitude ratio (L1/H1): | 0.92603 ⋇ 1.48065 (L1/H1: 0.898421 ⋇ 1.74029, H1/L1: 1.05081 ⋇ 1.7411) |
| Amplitude ratio H1|L1 compatibility (probability): | 0.941471 |
| Antenna factor probability: | 0.964236 |
| Number of rejected frequency rows: | Q0: 0 / 18, Q1: 1 / 36, Q2: 2 / 70, Q3: 11 / 134, Q4: 51 / 258 |
| Maximum signal-to-noise ratio: | H1: 64.9698, L1: 68.4278 |
| SNR variance: | H1: 0.523588, L1: 0.514297 |
| Click here for a zoomed plot | Click here for a zoomed plot | Click here for a zoomed plot | Click here for a zoomed plot | Click here for a zoomed plot |
 |
 |
 |
 |
 |
 |
 |
 |
 |
 |
 |
 |
 |
 |
 |
 |
 |
 |
 |
 |
 |
 |
 |
 |
 |
 |
 |
 |
 |
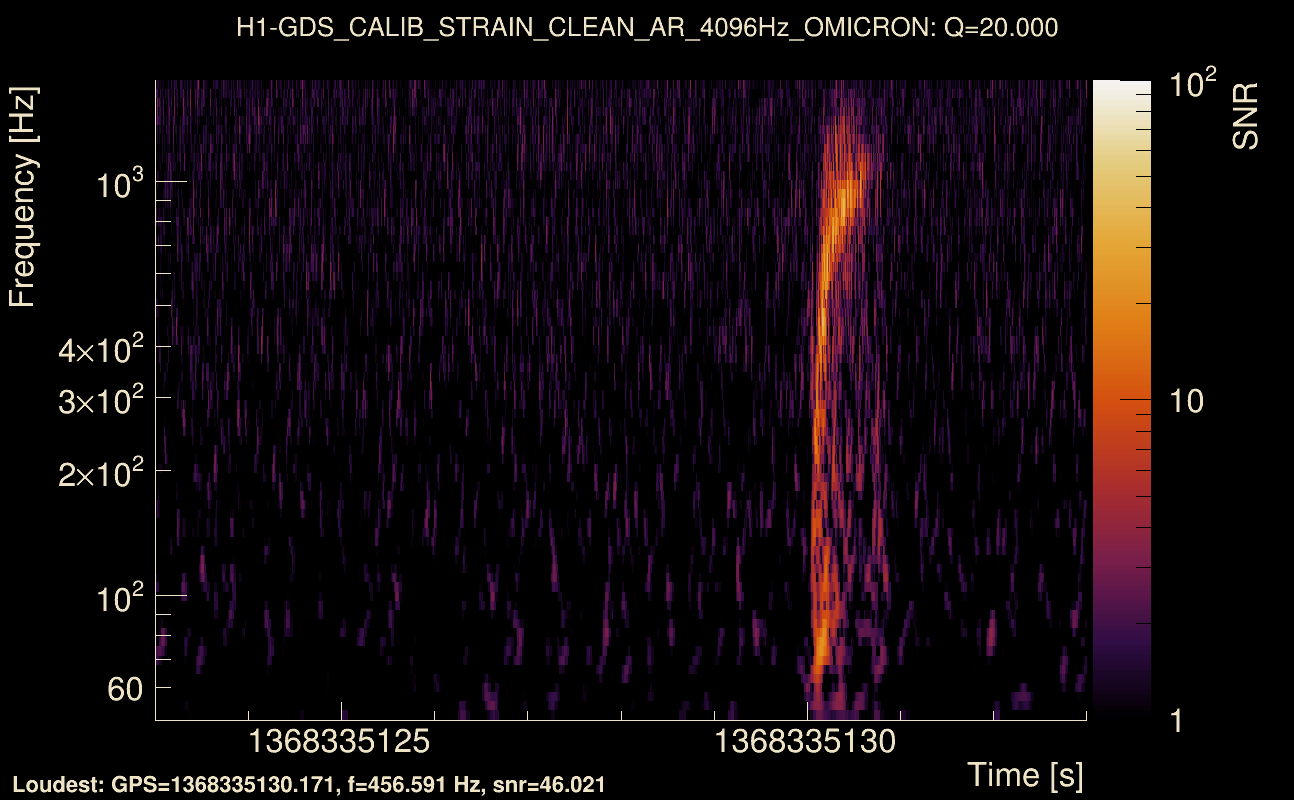
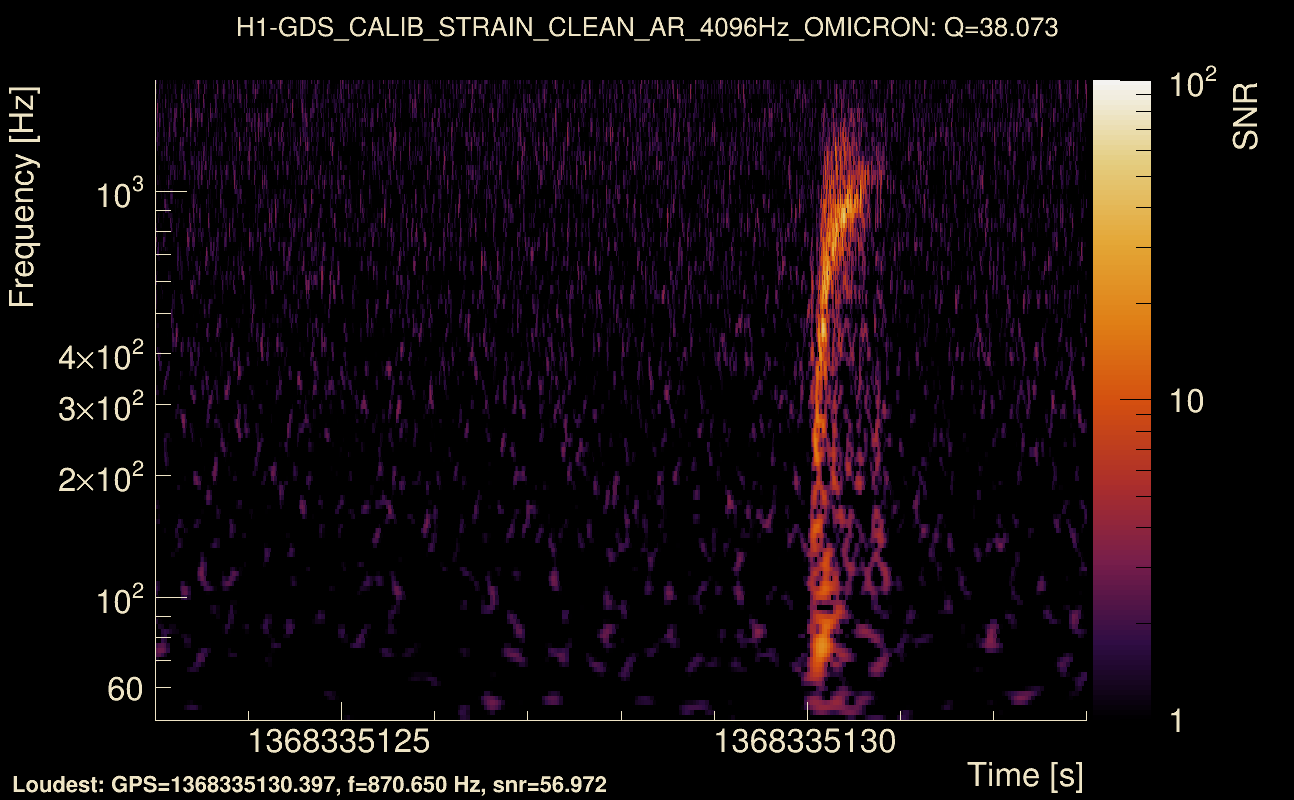
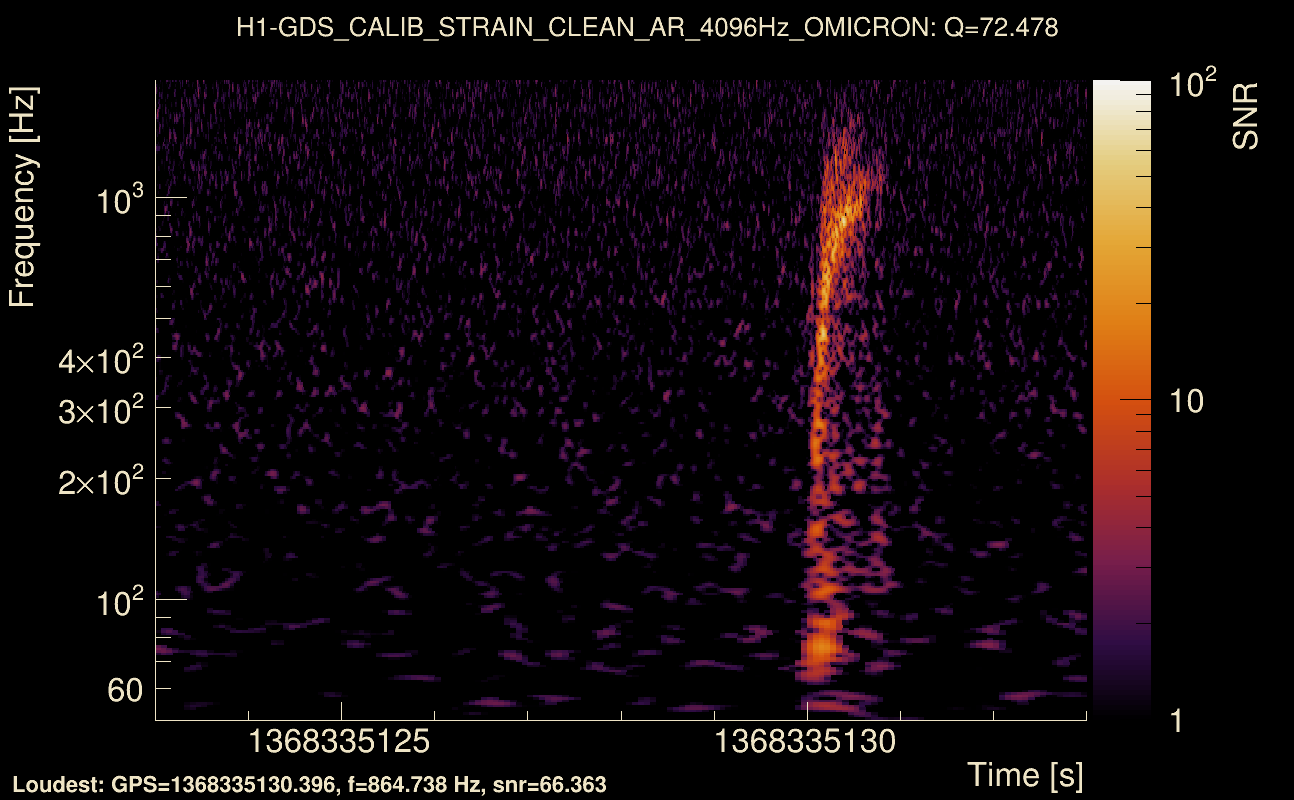
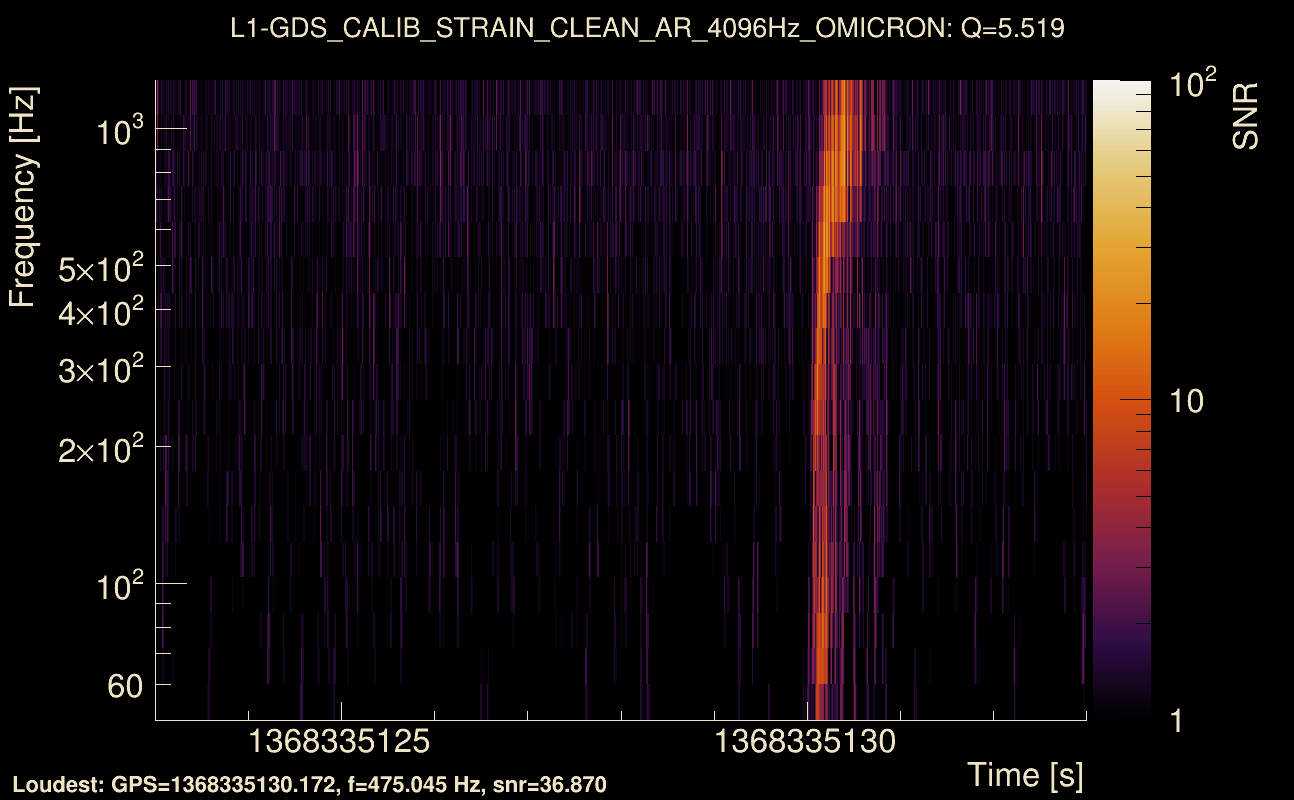
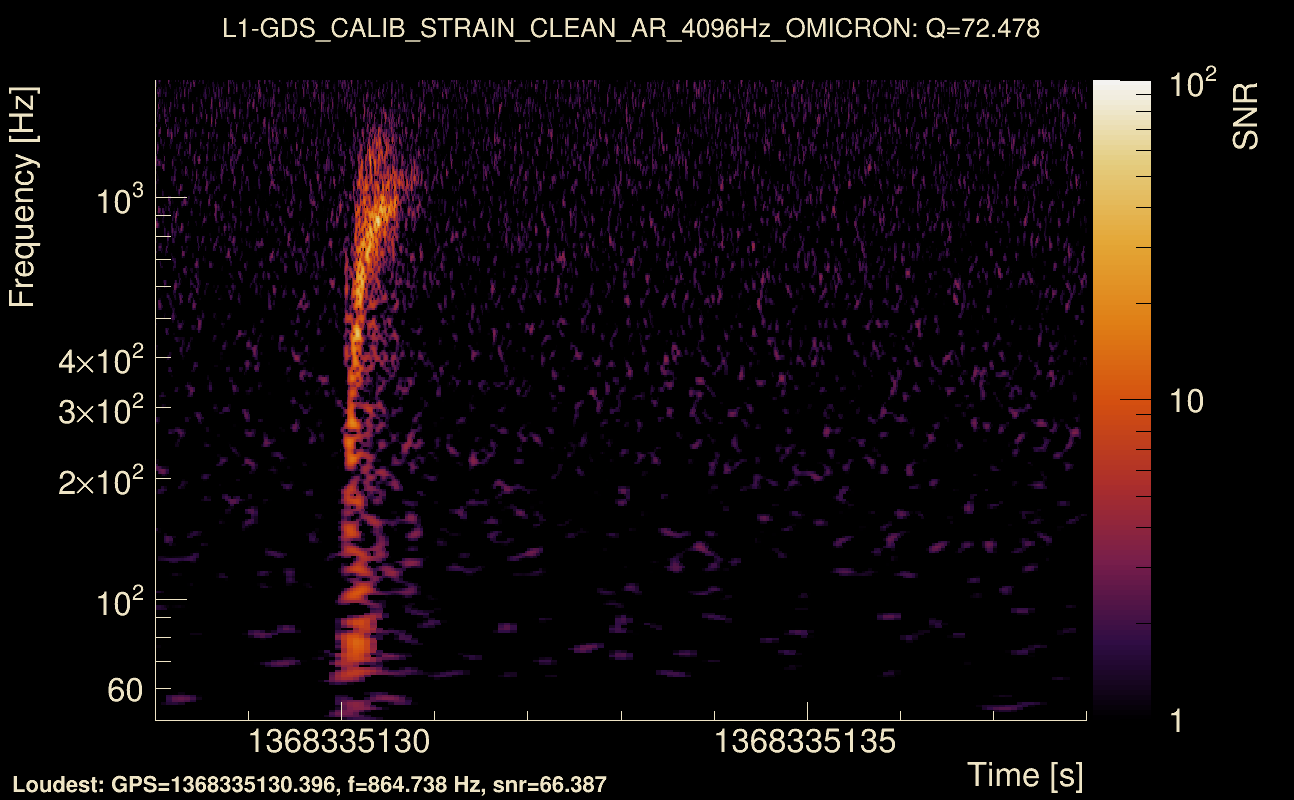
| Event time t(H1): | GPS = 1368335128 (Wed May 17 05:05:10 2023 ) → GPS = 1368335138 (Wed May 17 05:05:20 2023 ) |
| Event time t(L1): | GPS = 1368335128 (Wed May 17 05:05:20 2023 ) → GPS = 1368335138 (Wed May 17 05:05:20 2023 ) |
| Omicron analysis time window (H1): | GPS = 1368335125 → GPS = 1368335141 |
| Omicron analysis time window (L1): | GPS = 1368335125 → GPS = 1368335141 |
| Time delay between detectors t(L1) - t(H1): | 0.00105742 s (slice index = 108 / 217), δt_gw = 0.00105742 s |
| Time delay standard deviation: | 0.0229063 s |
| [targeted mode] Time delay probability: | 0.712885 (0.367984 sigmas), δt_target = 0.00130081 s |
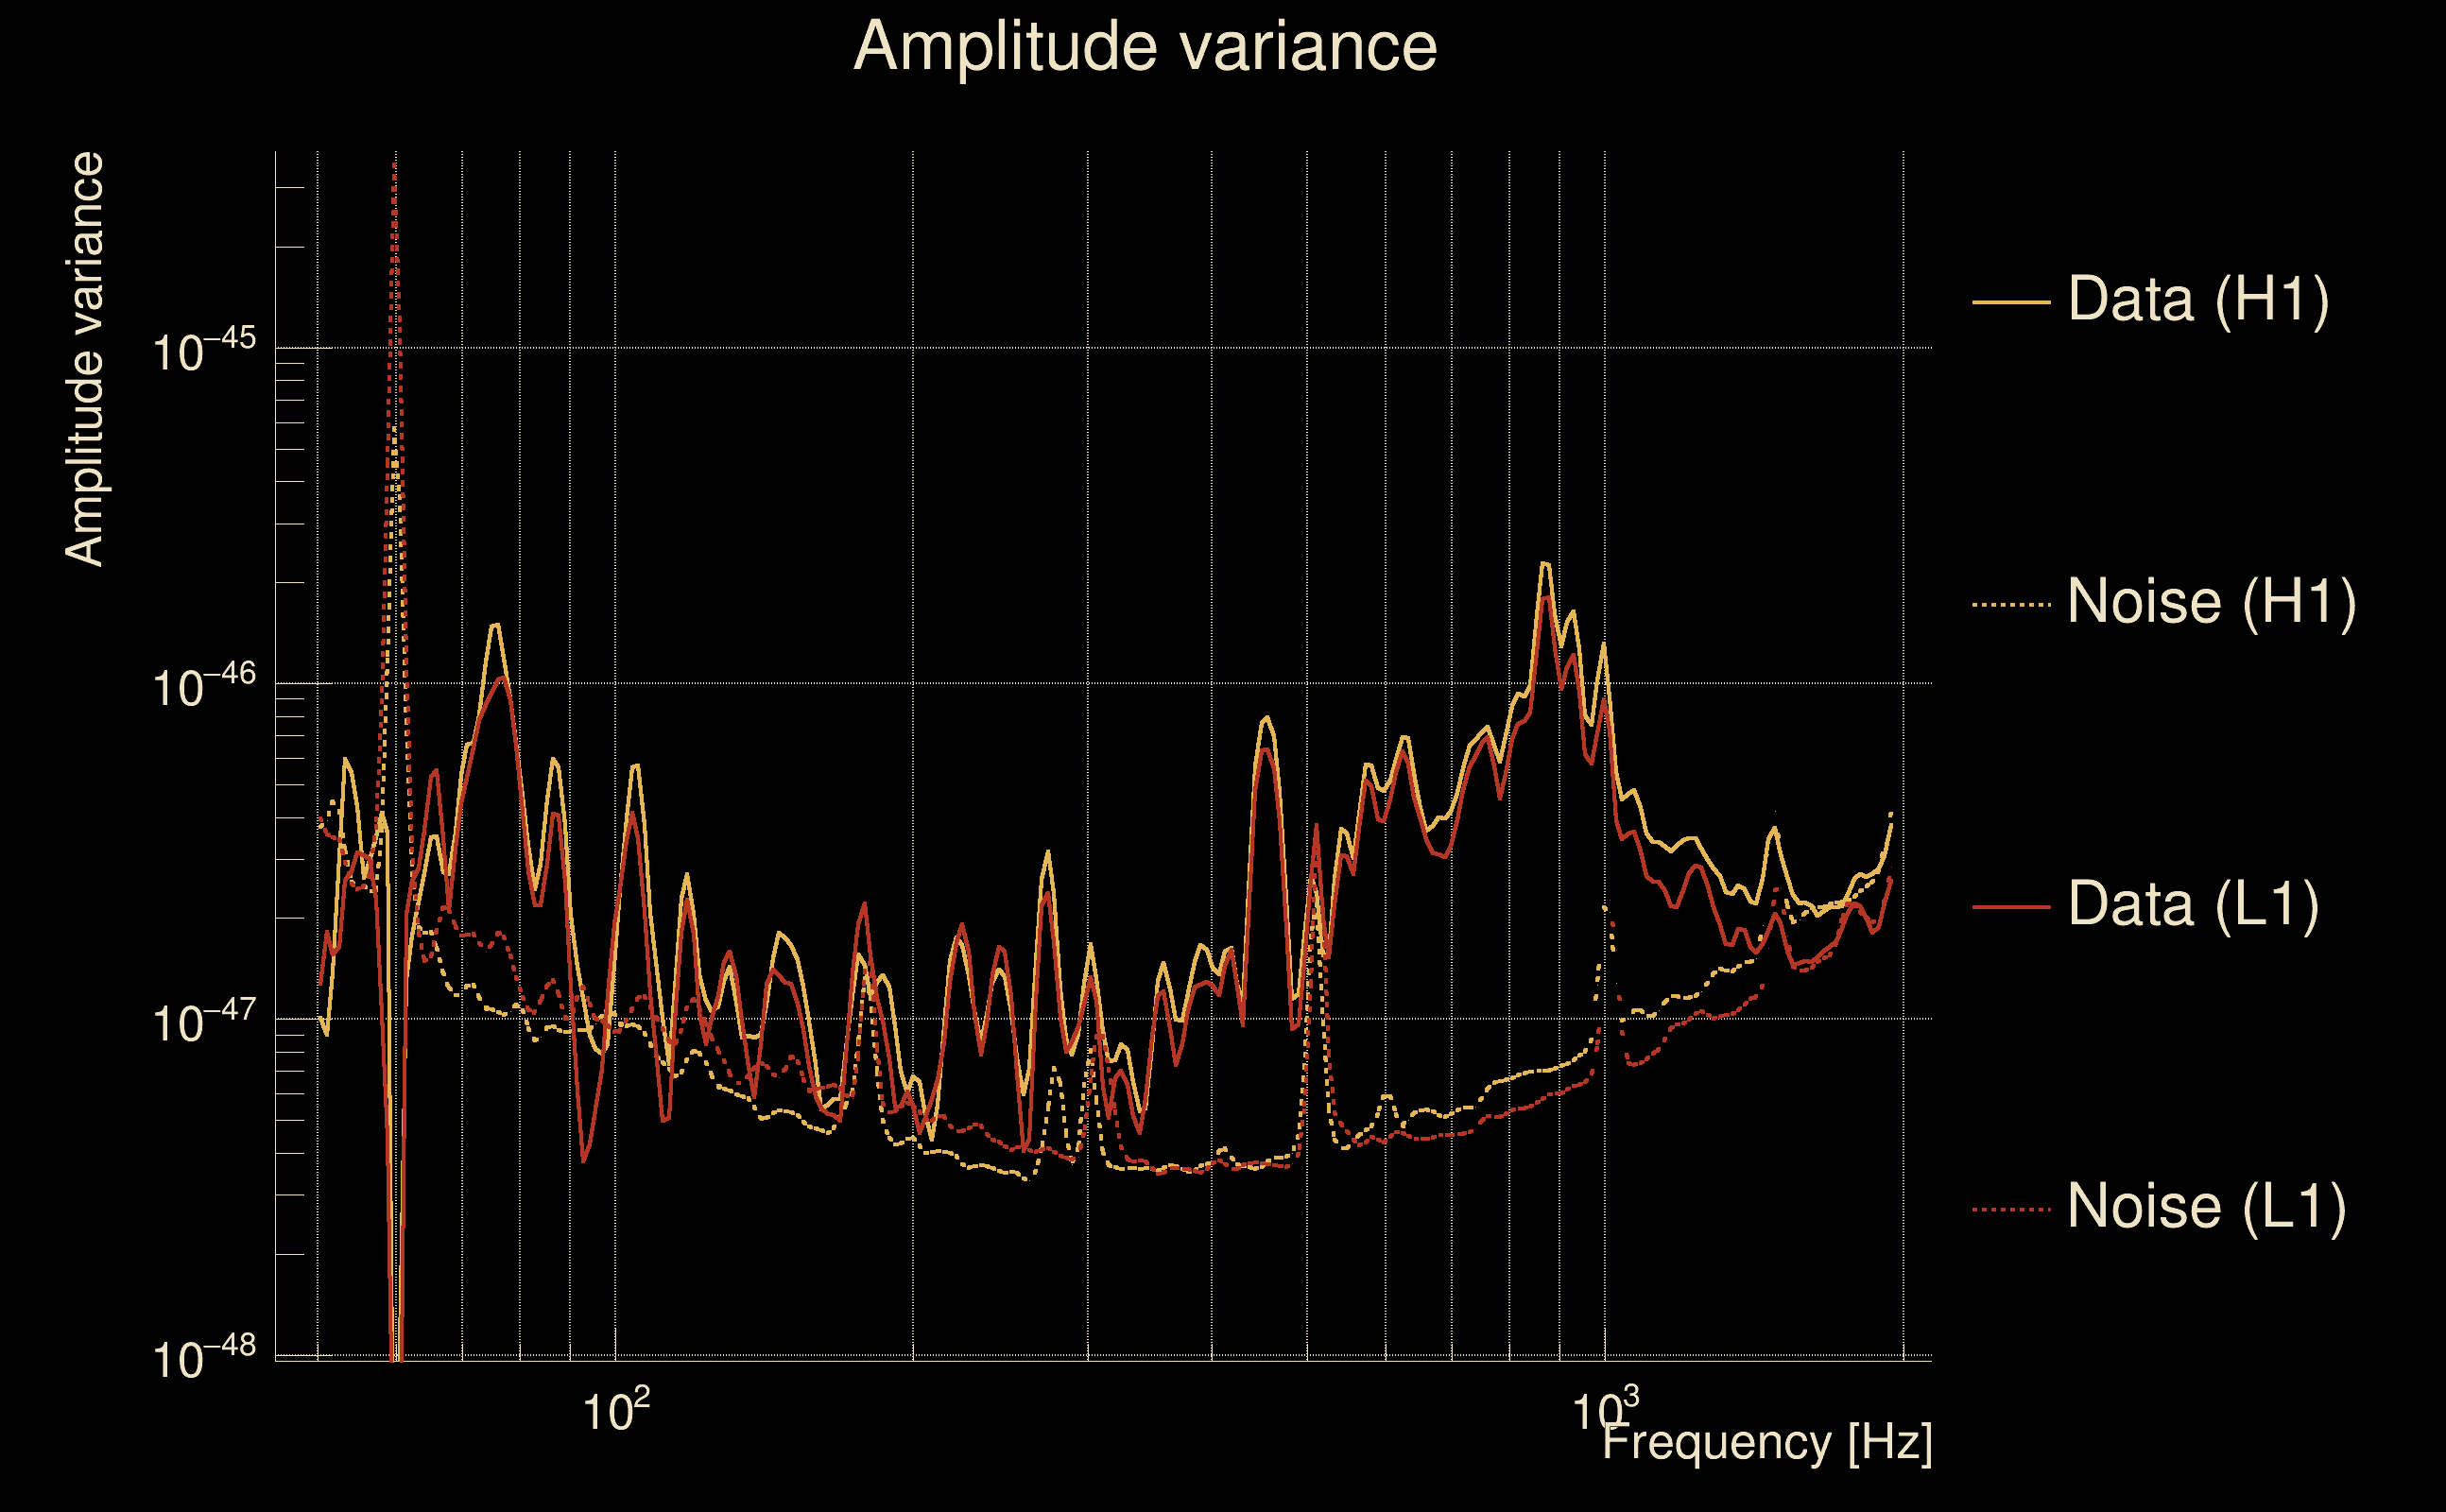
| Frequency: | 287.476 Hz |
| Ξ: | 0.921346 ± 0.0129605 (variance = 0.000167973): Q0: 0.9519, Q1: 0.940593, Q2: 0.932212, Q3: 0.919638, Q4: 0.917246 |
| Rank: | R_A = 0.921346 |
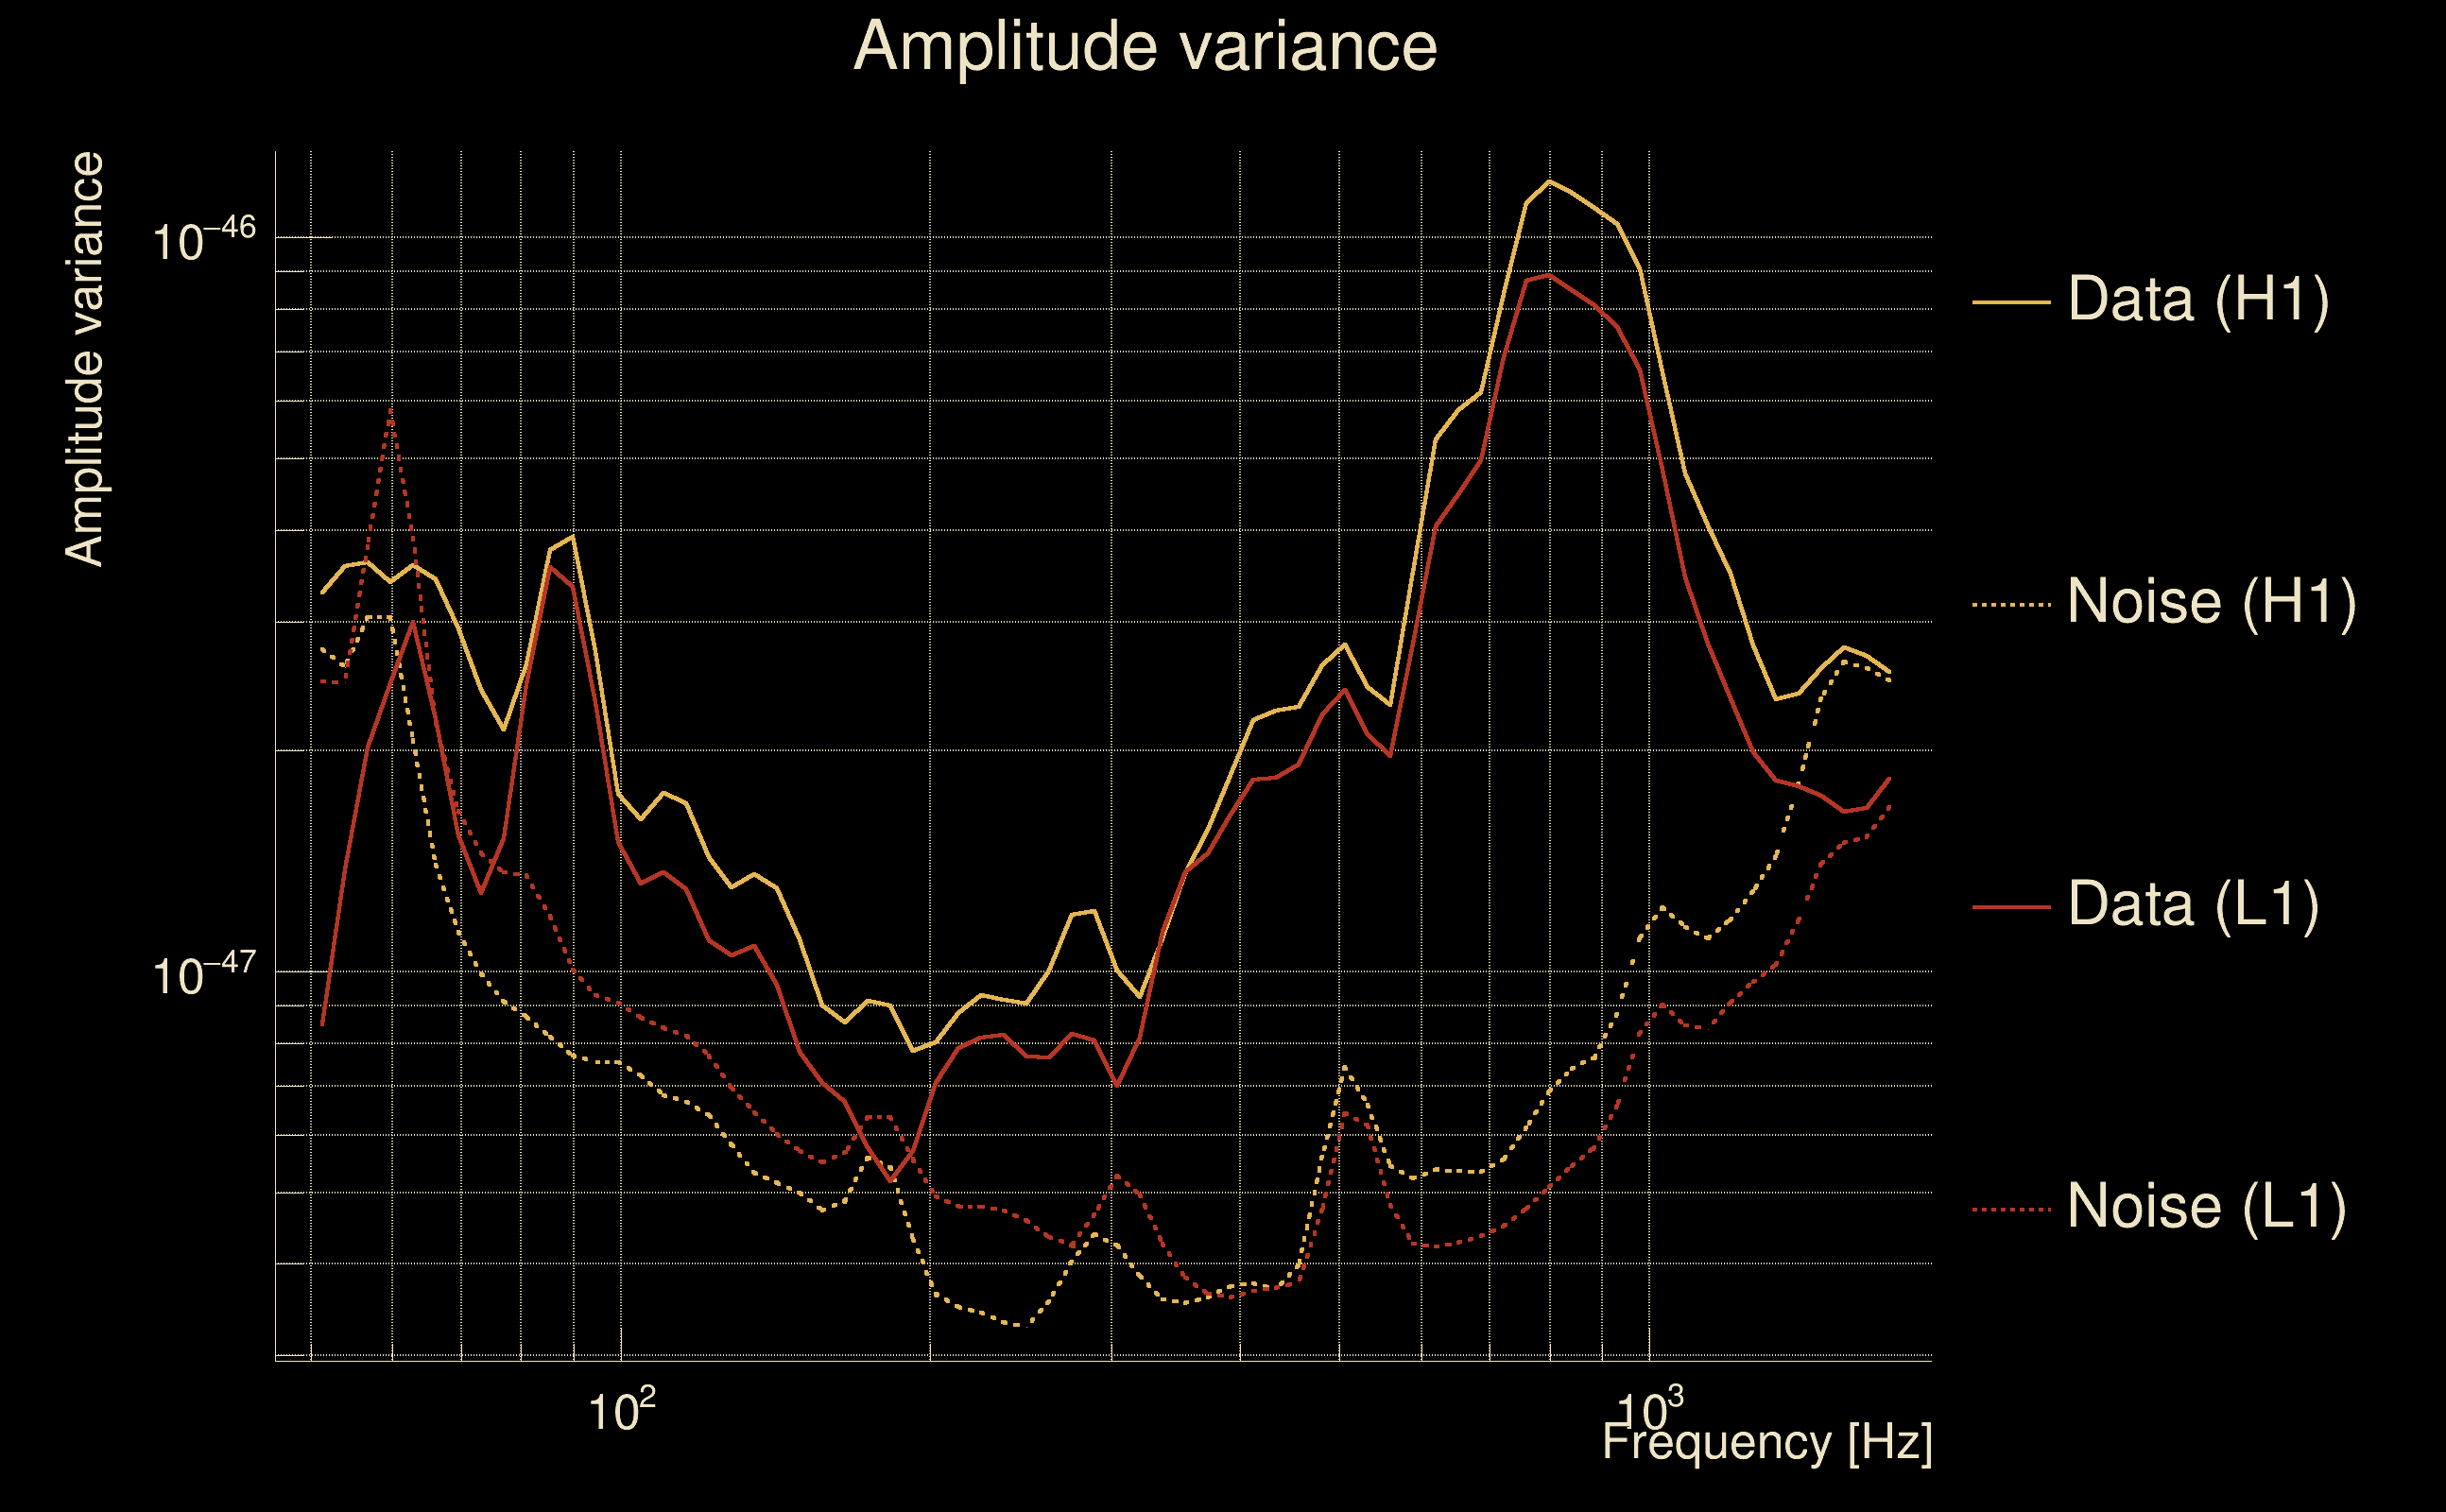
| Log of amplitude ratio (L1/H1): | -0.0792482, variance = 0.154334 (L1/H1: -0.11608, variance = 0.30638, H1/L1: 0.0452015, variance = 0.309741) |
| Amplitude ratio (L1/H1): | 0.923811 ⋇ 1.4812 (L1/H1: 0.890404 ⋇ 1.73936, H1/L1: 1.04624 ⋇ 1.74463) |
| Amplitude ratio H1|L1 compatibility (probability): | 0.92805 |
| Antenna factor probability: | 0.959558 |
| Number of rejected frequency rows: | Q0: 0 / 18, Q1: 1 / 36, Q2: 2 / 70, Q3: 11 / 134, Q4: 50 / 258 |
| Maximum signal-to-noise ratio: | H1: 64.9259, L1: 67.5294 |
| SNR variance: | H1: 2.76055, L1: 2.85565 |
| Click here for a zoomed plot | Click here for a zoomed plot | Click here for a zoomed plot | Click here for a zoomed plot | Click here for a zoomed plot |
 |
 |
 |
 |
 |
 |
 |
 |
 |
 |
 |
 |
 |
 |
 |
 |
 |
 |
 |
 |
 |
 |
 |
 |
 |
 |
 |
 |
 |
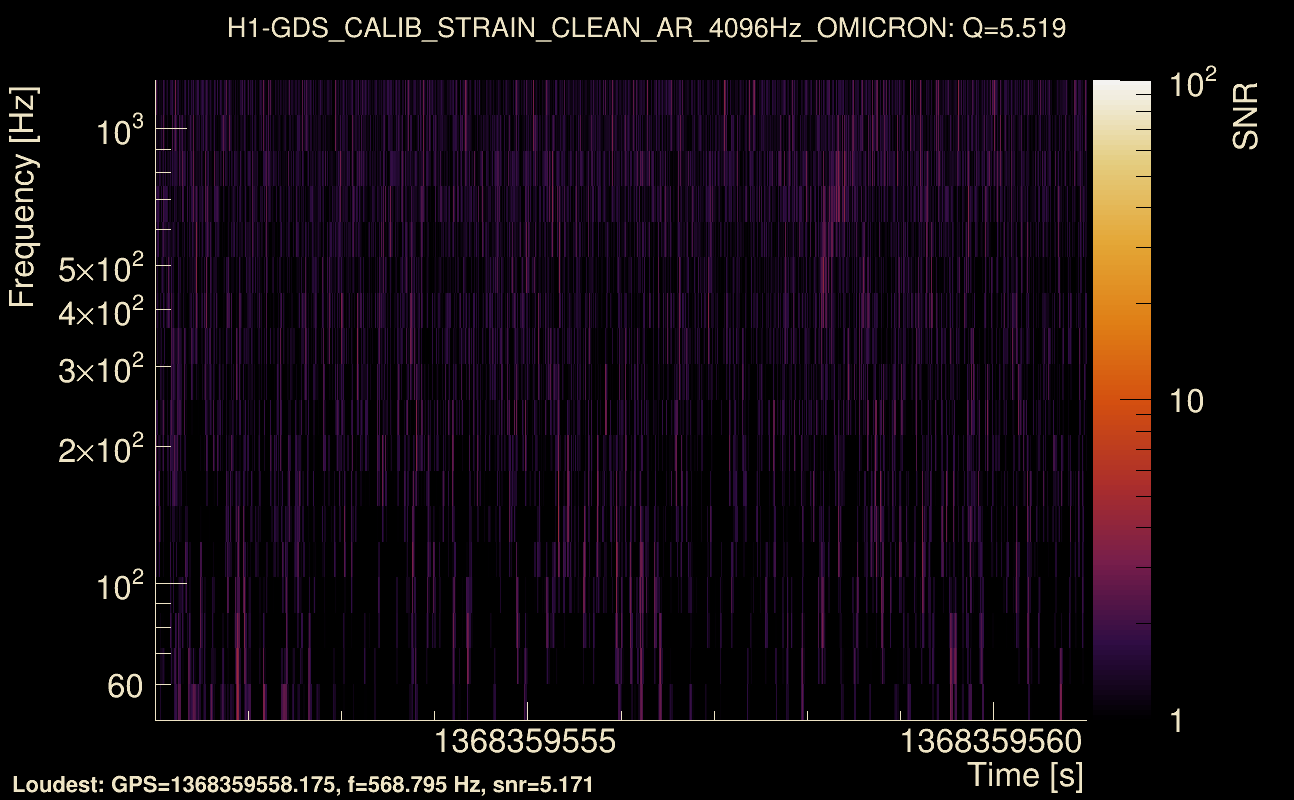
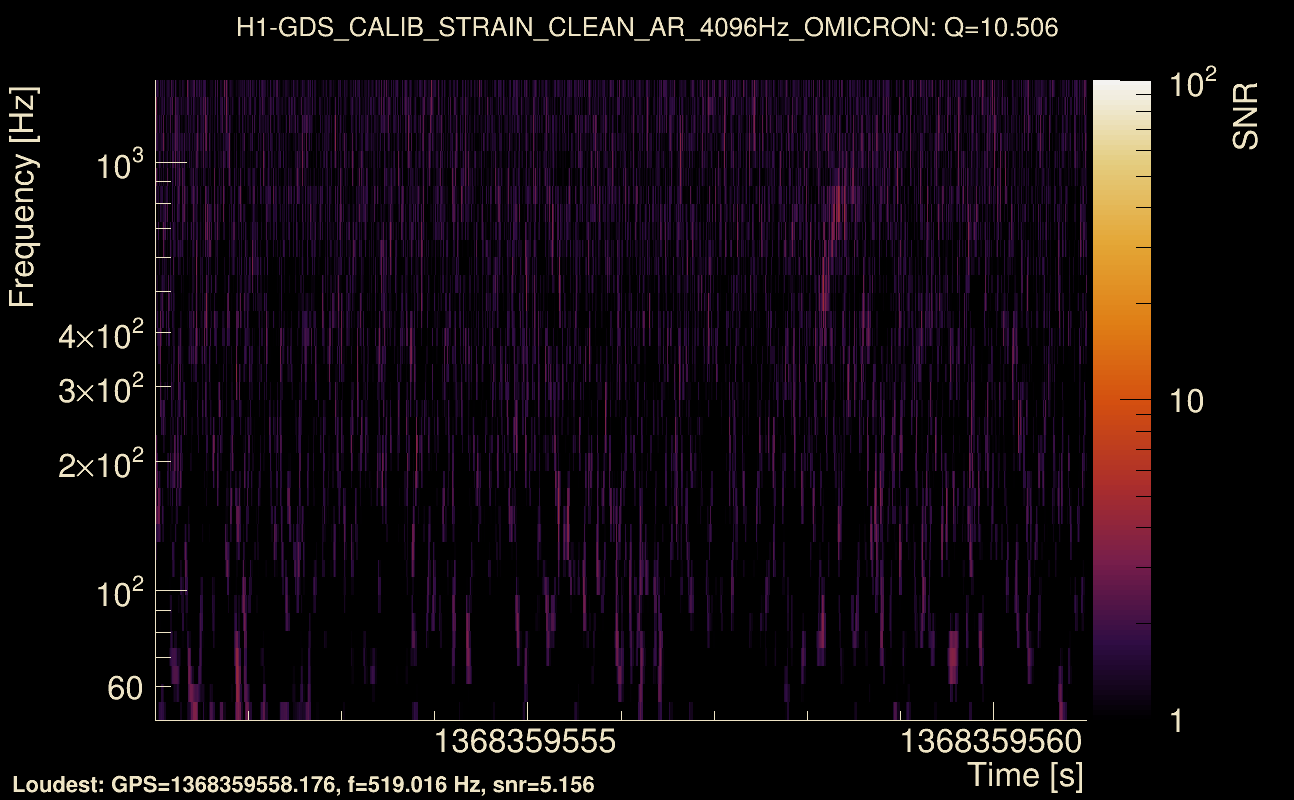
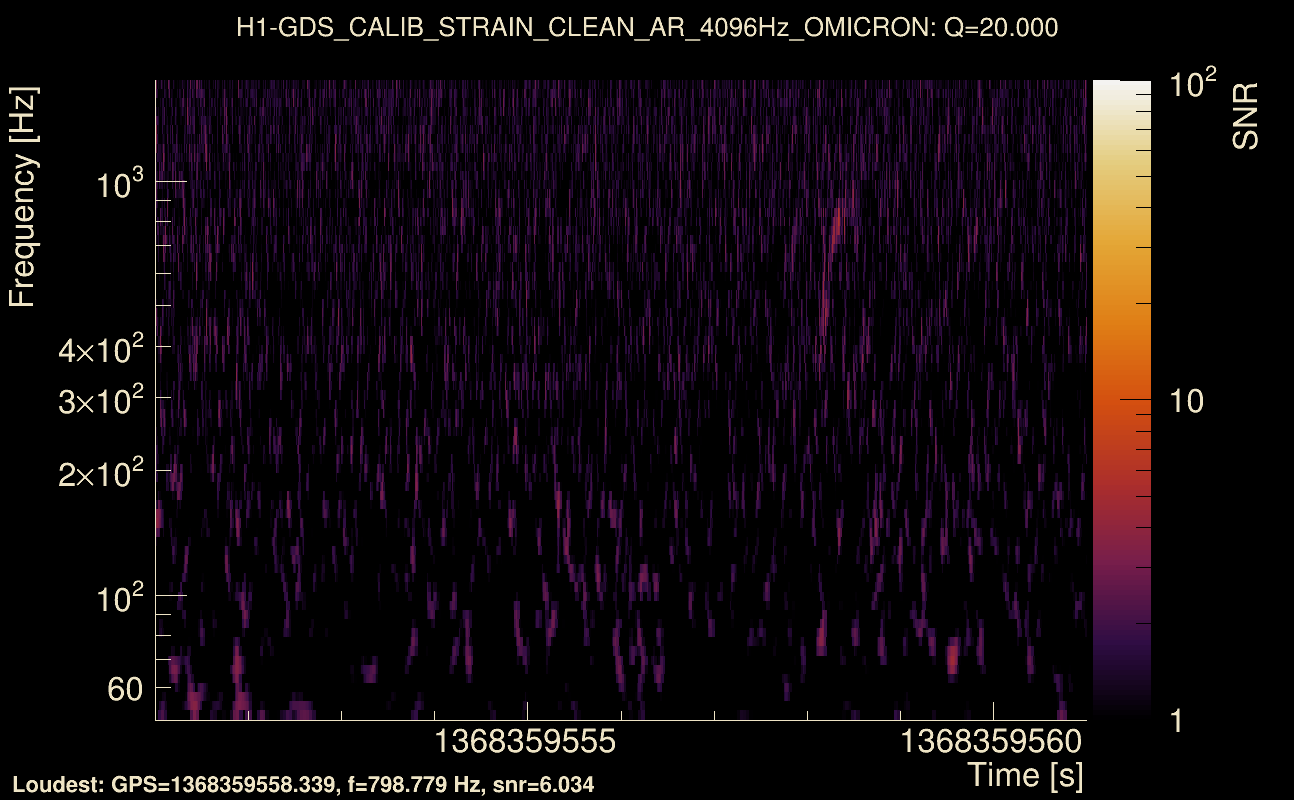
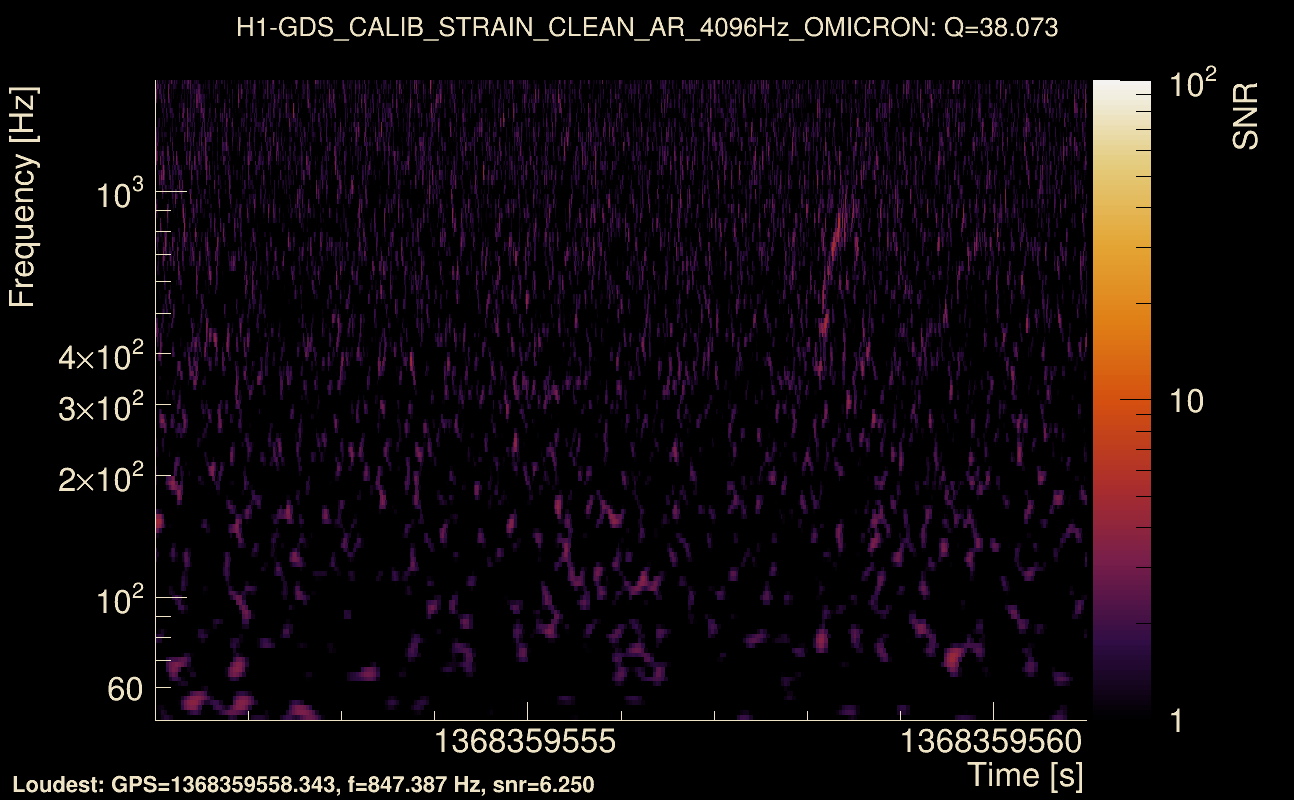
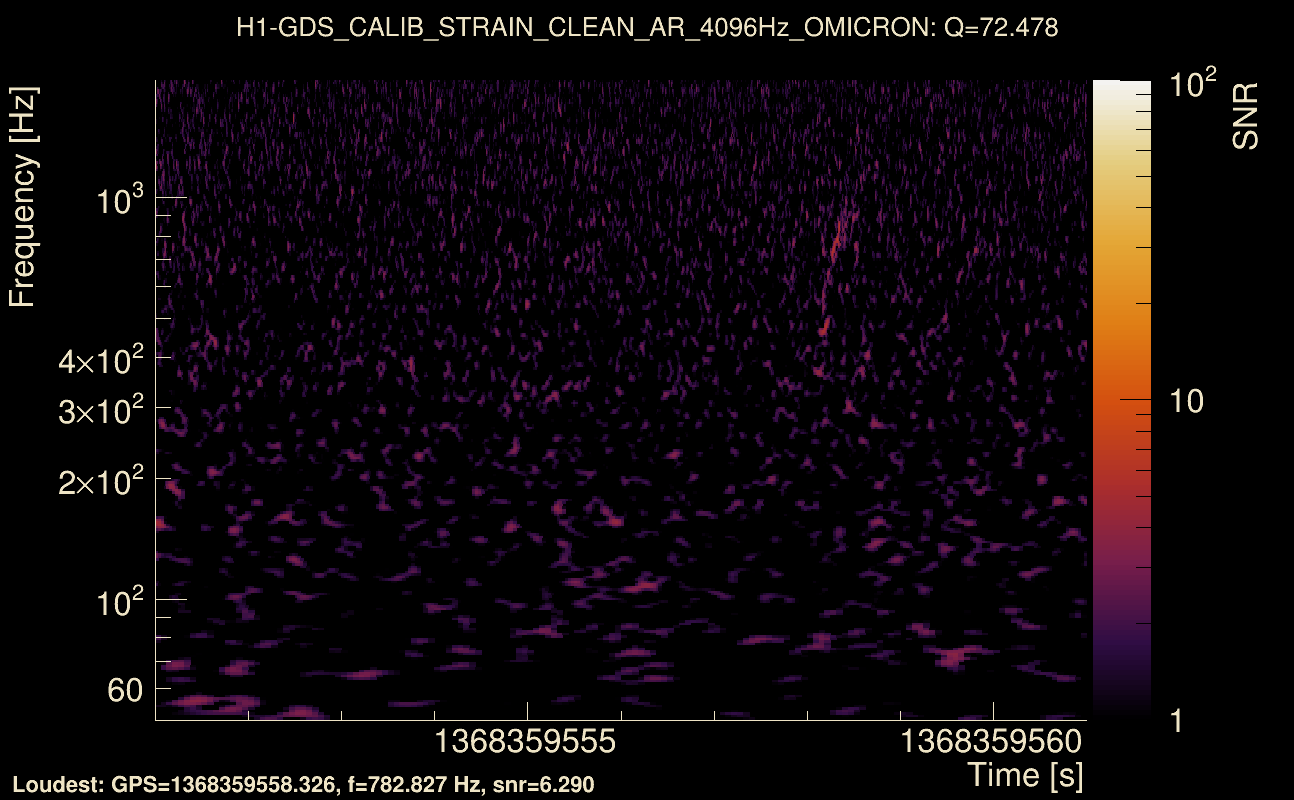
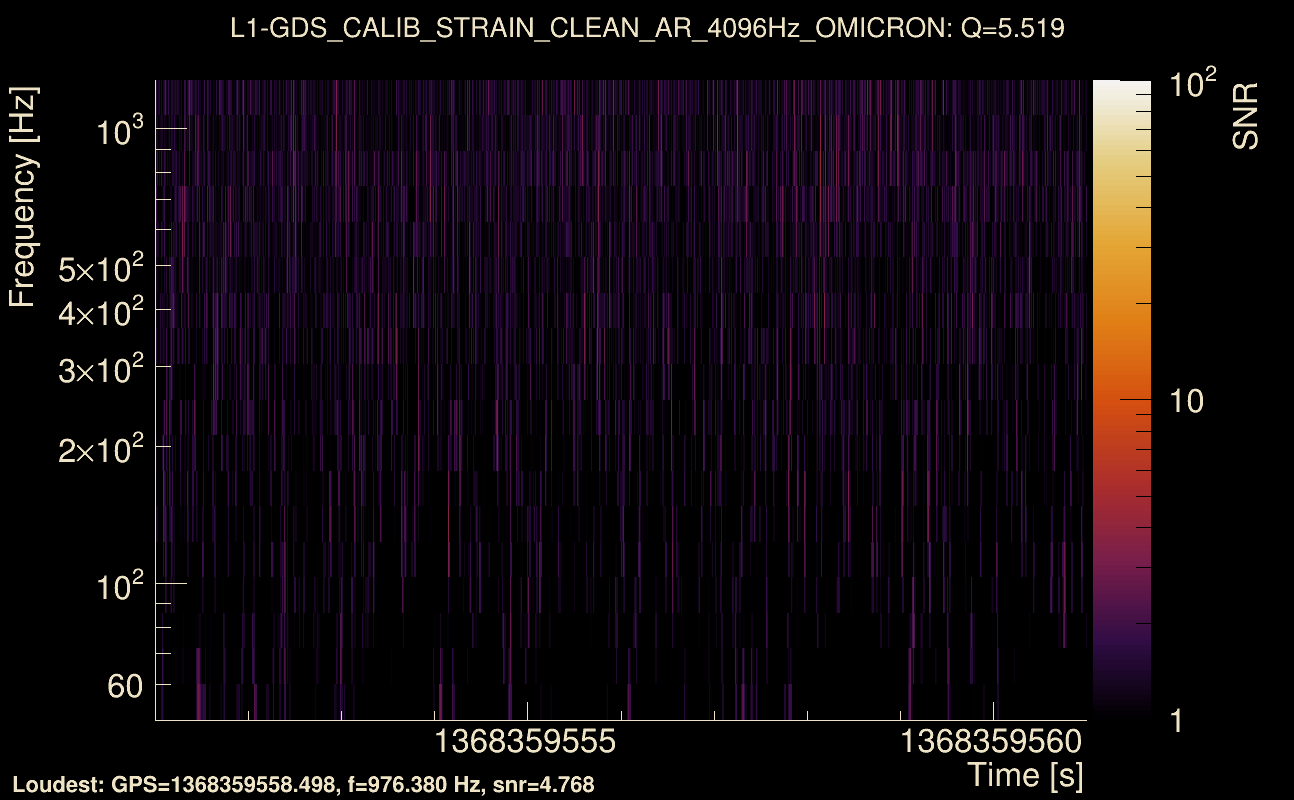
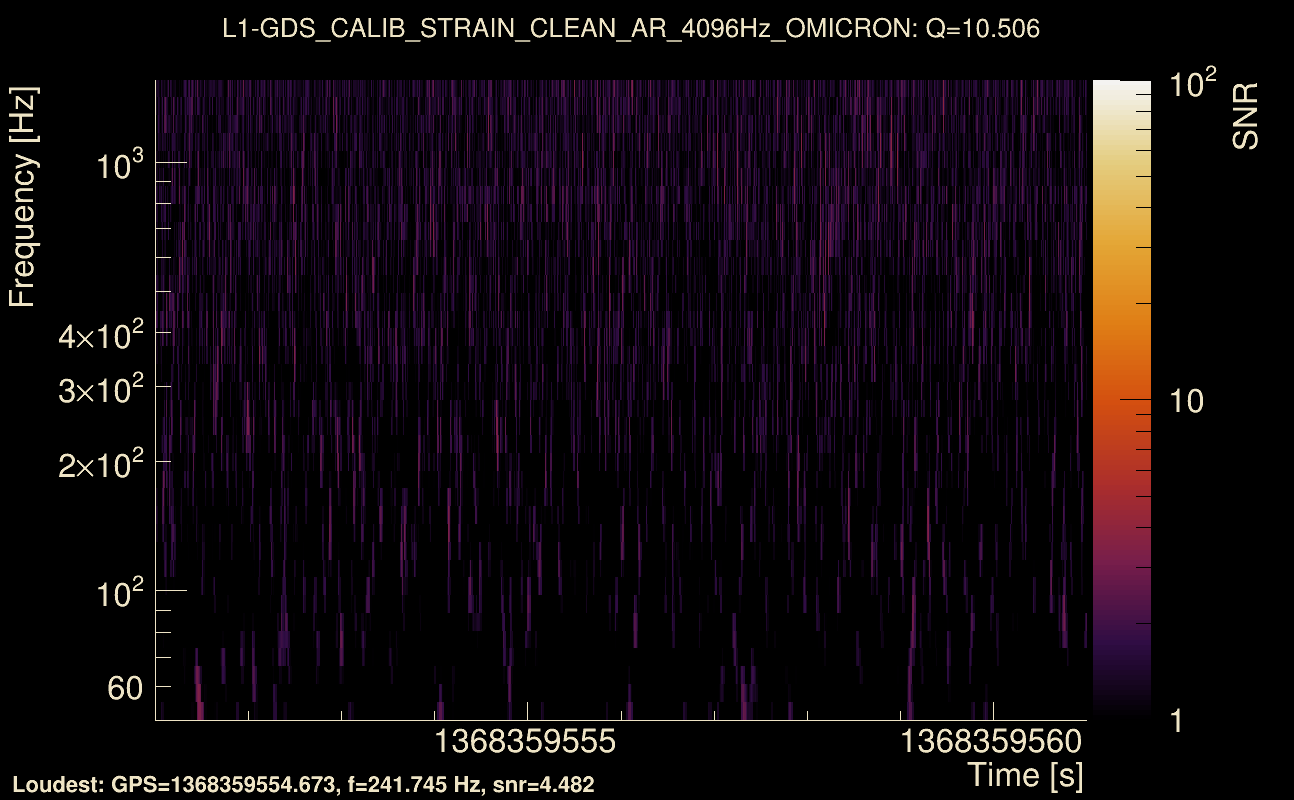
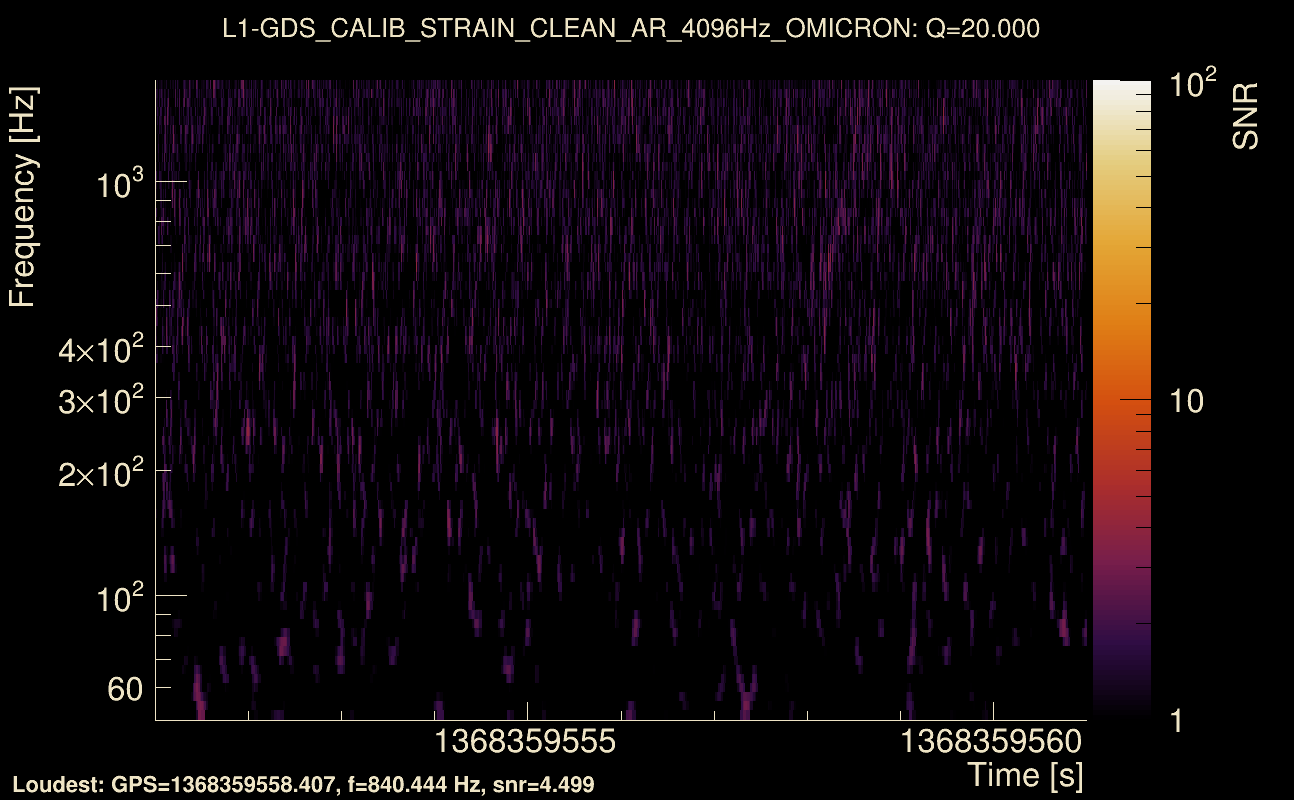
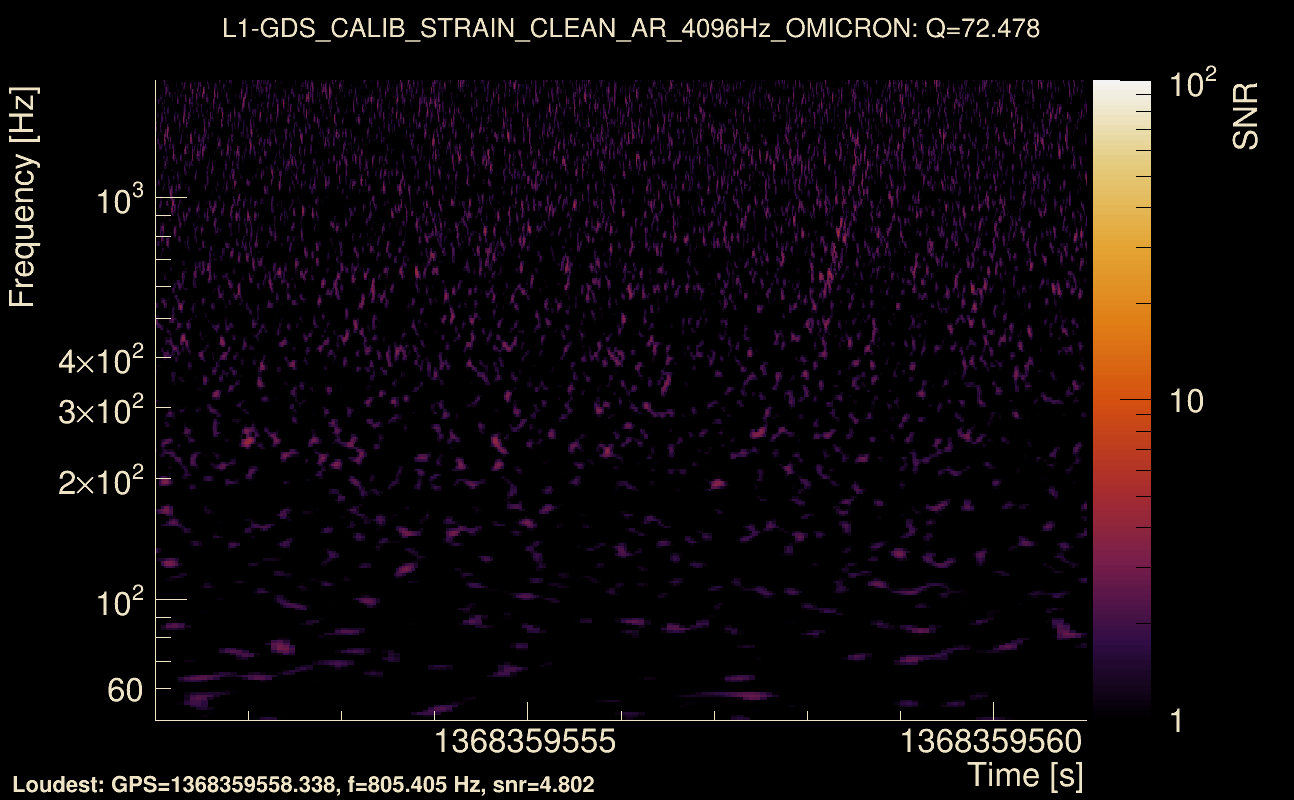
| Event time t(H1): | GPS = 1368359551 (Wed May 17 11:52:13 2023 ) → GPS = 1368359561 (Wed May 17 11:52:23 2023 ) |
| Event time t(L1): | GPS = 1368359551 (Wed May 17 11:52:23 2023 ) → GPS = 1368359561 (Wed May 17 11:52:23 2023 ) |
| Omicron analysis time window (H1): | GPS = 1368359548 → GPS = 1368359564 |
| Omicron analysis time window (L1): | GPS = 1368359548 → GPS = 1368359564 |
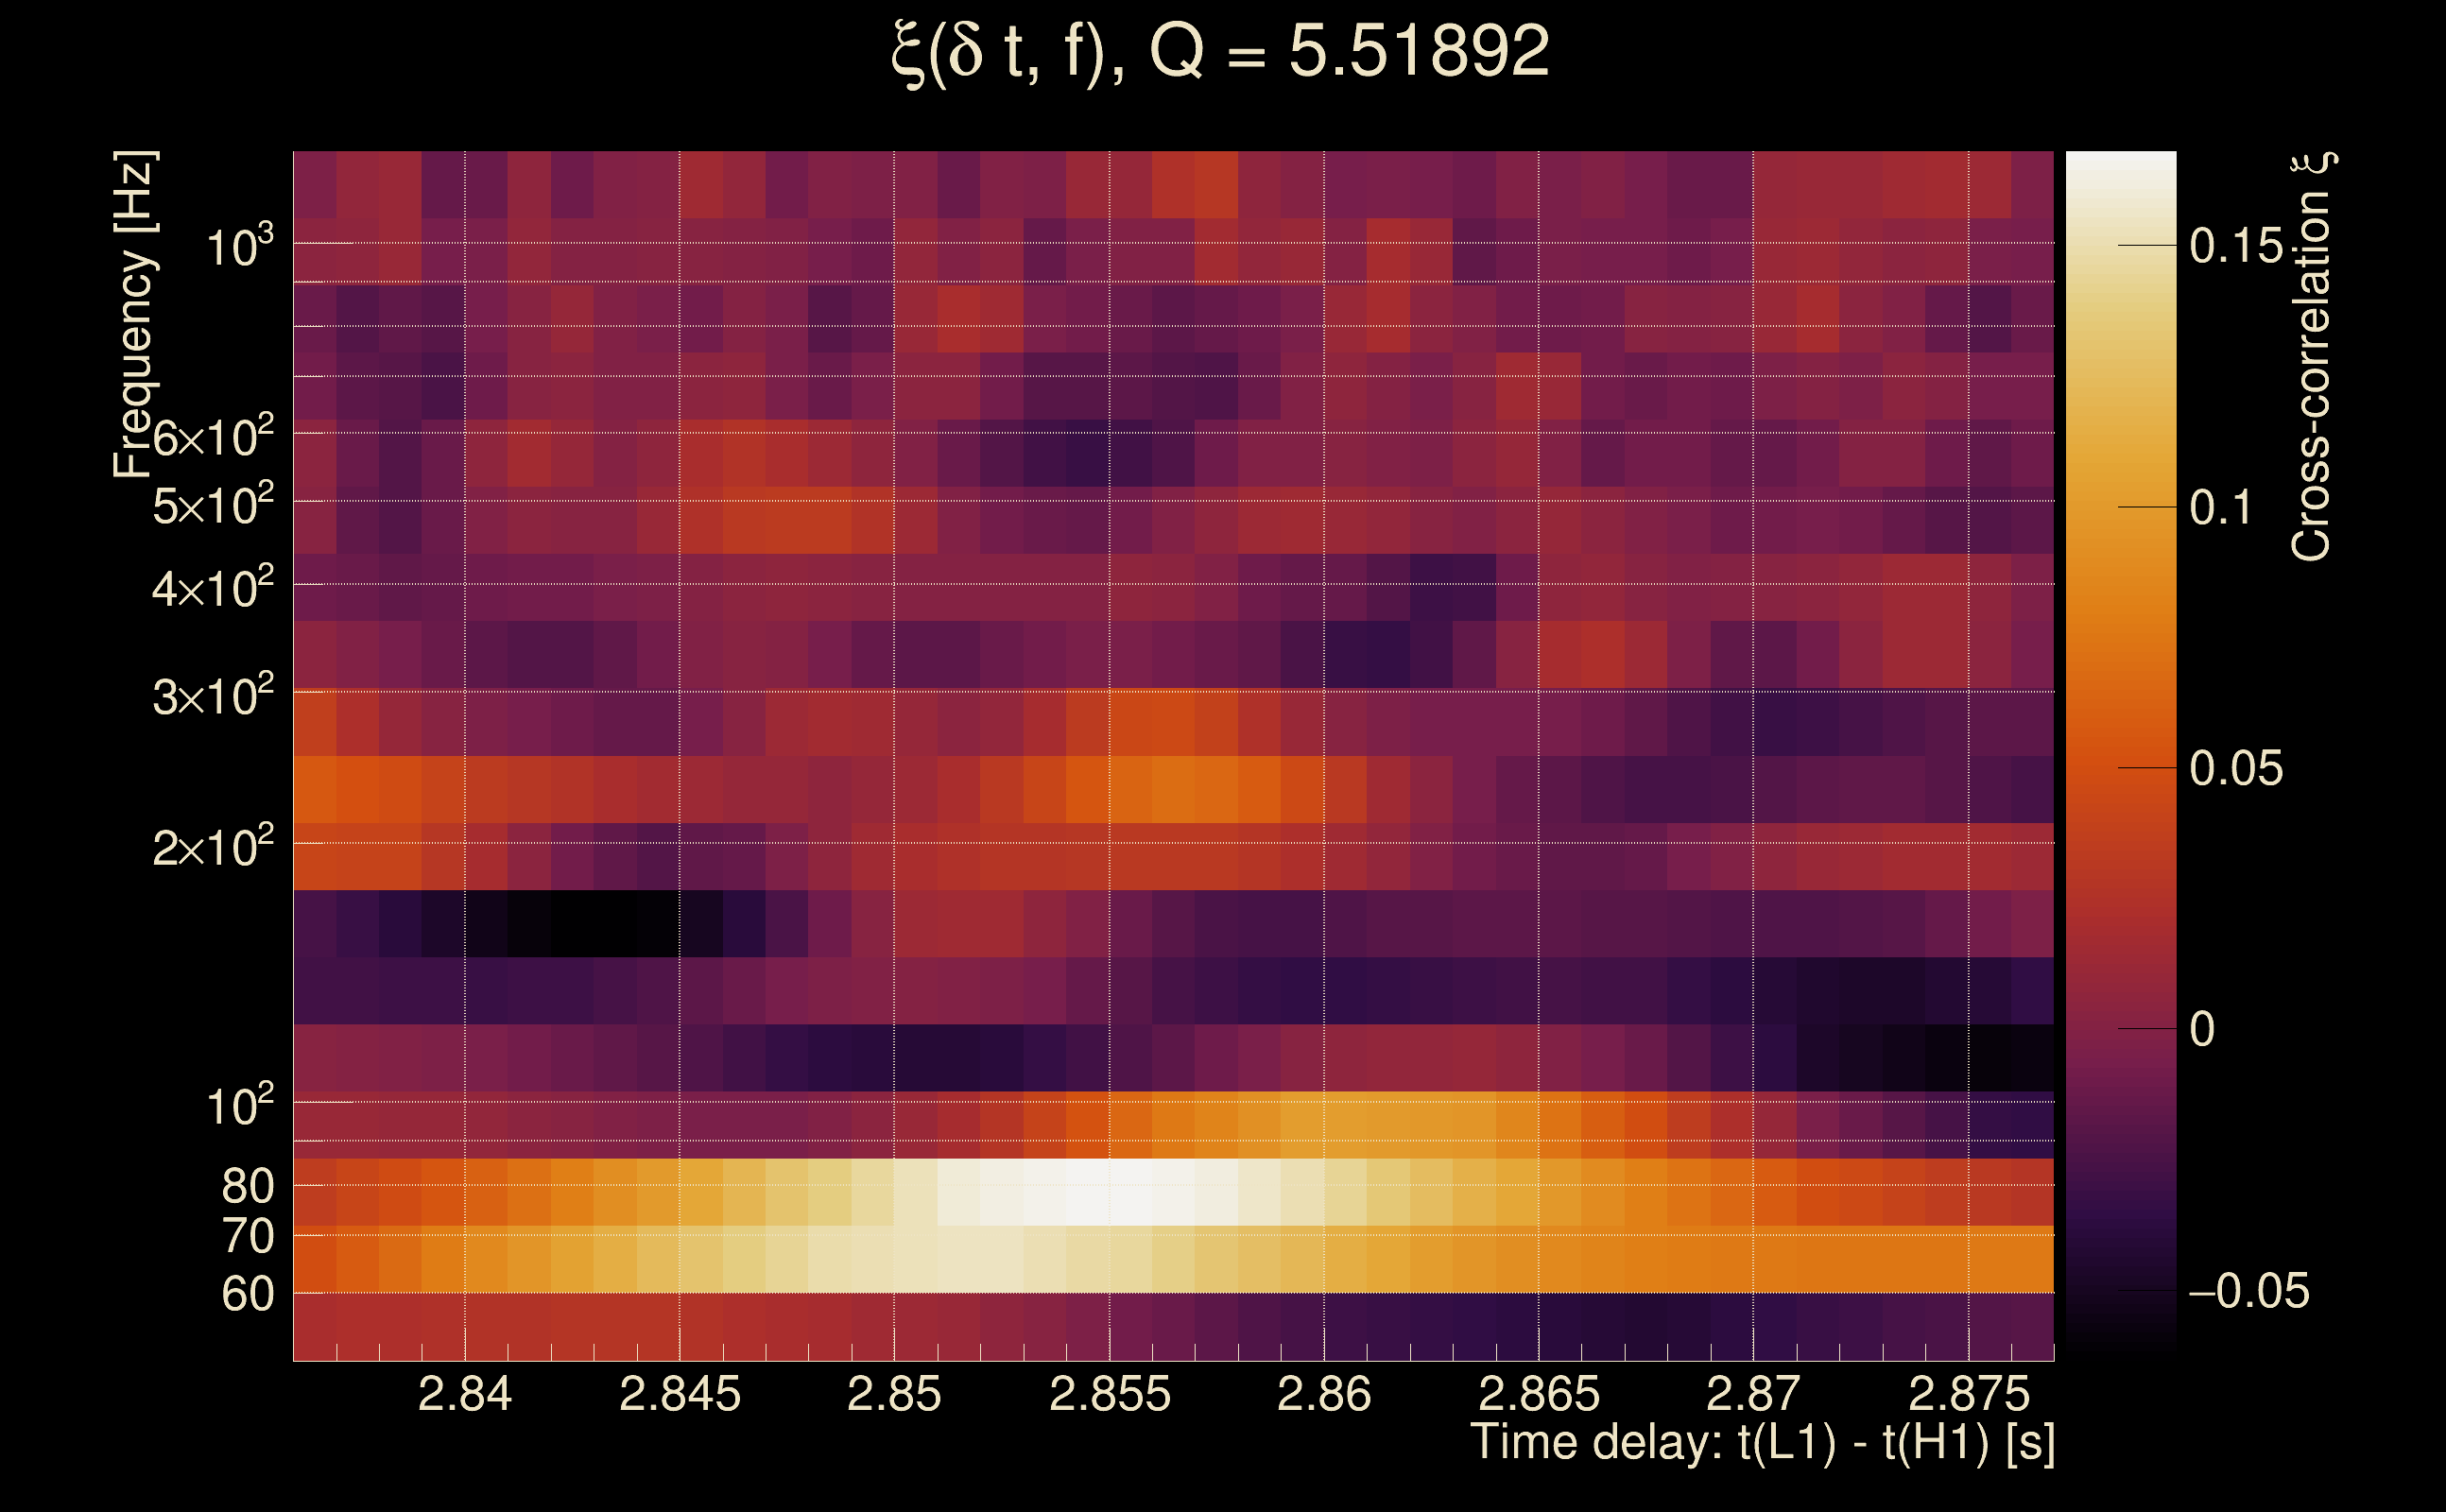
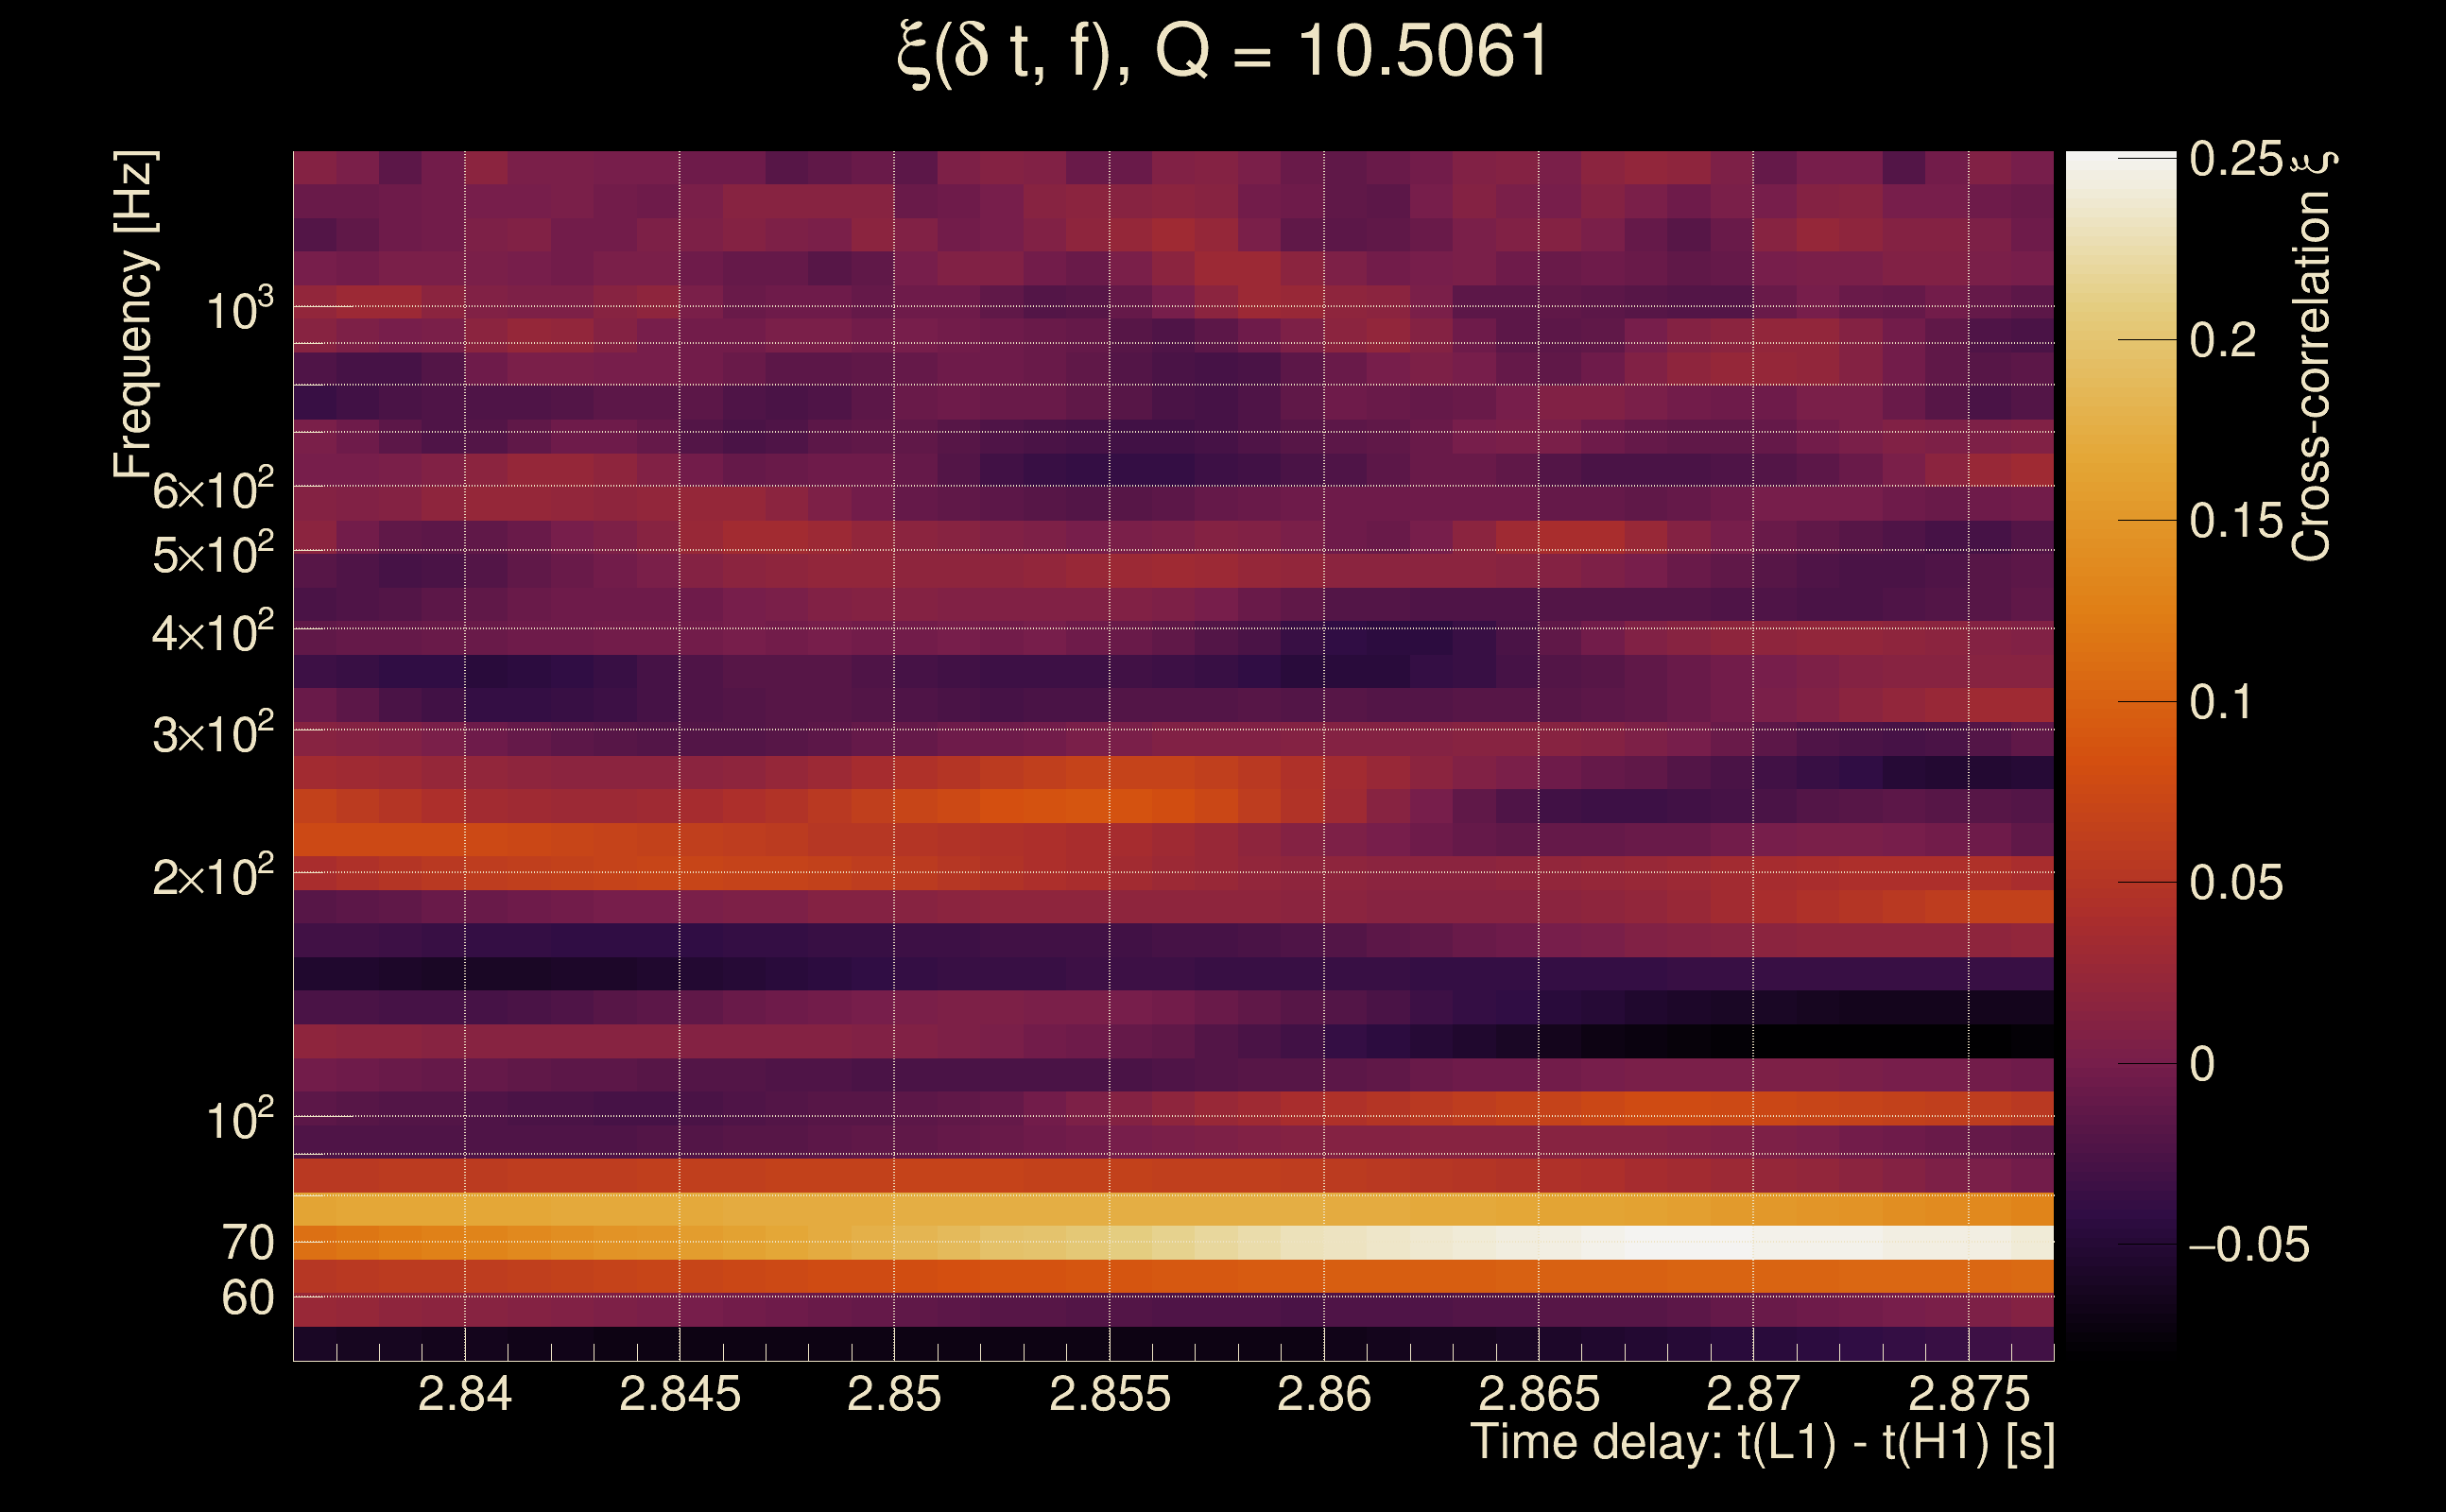
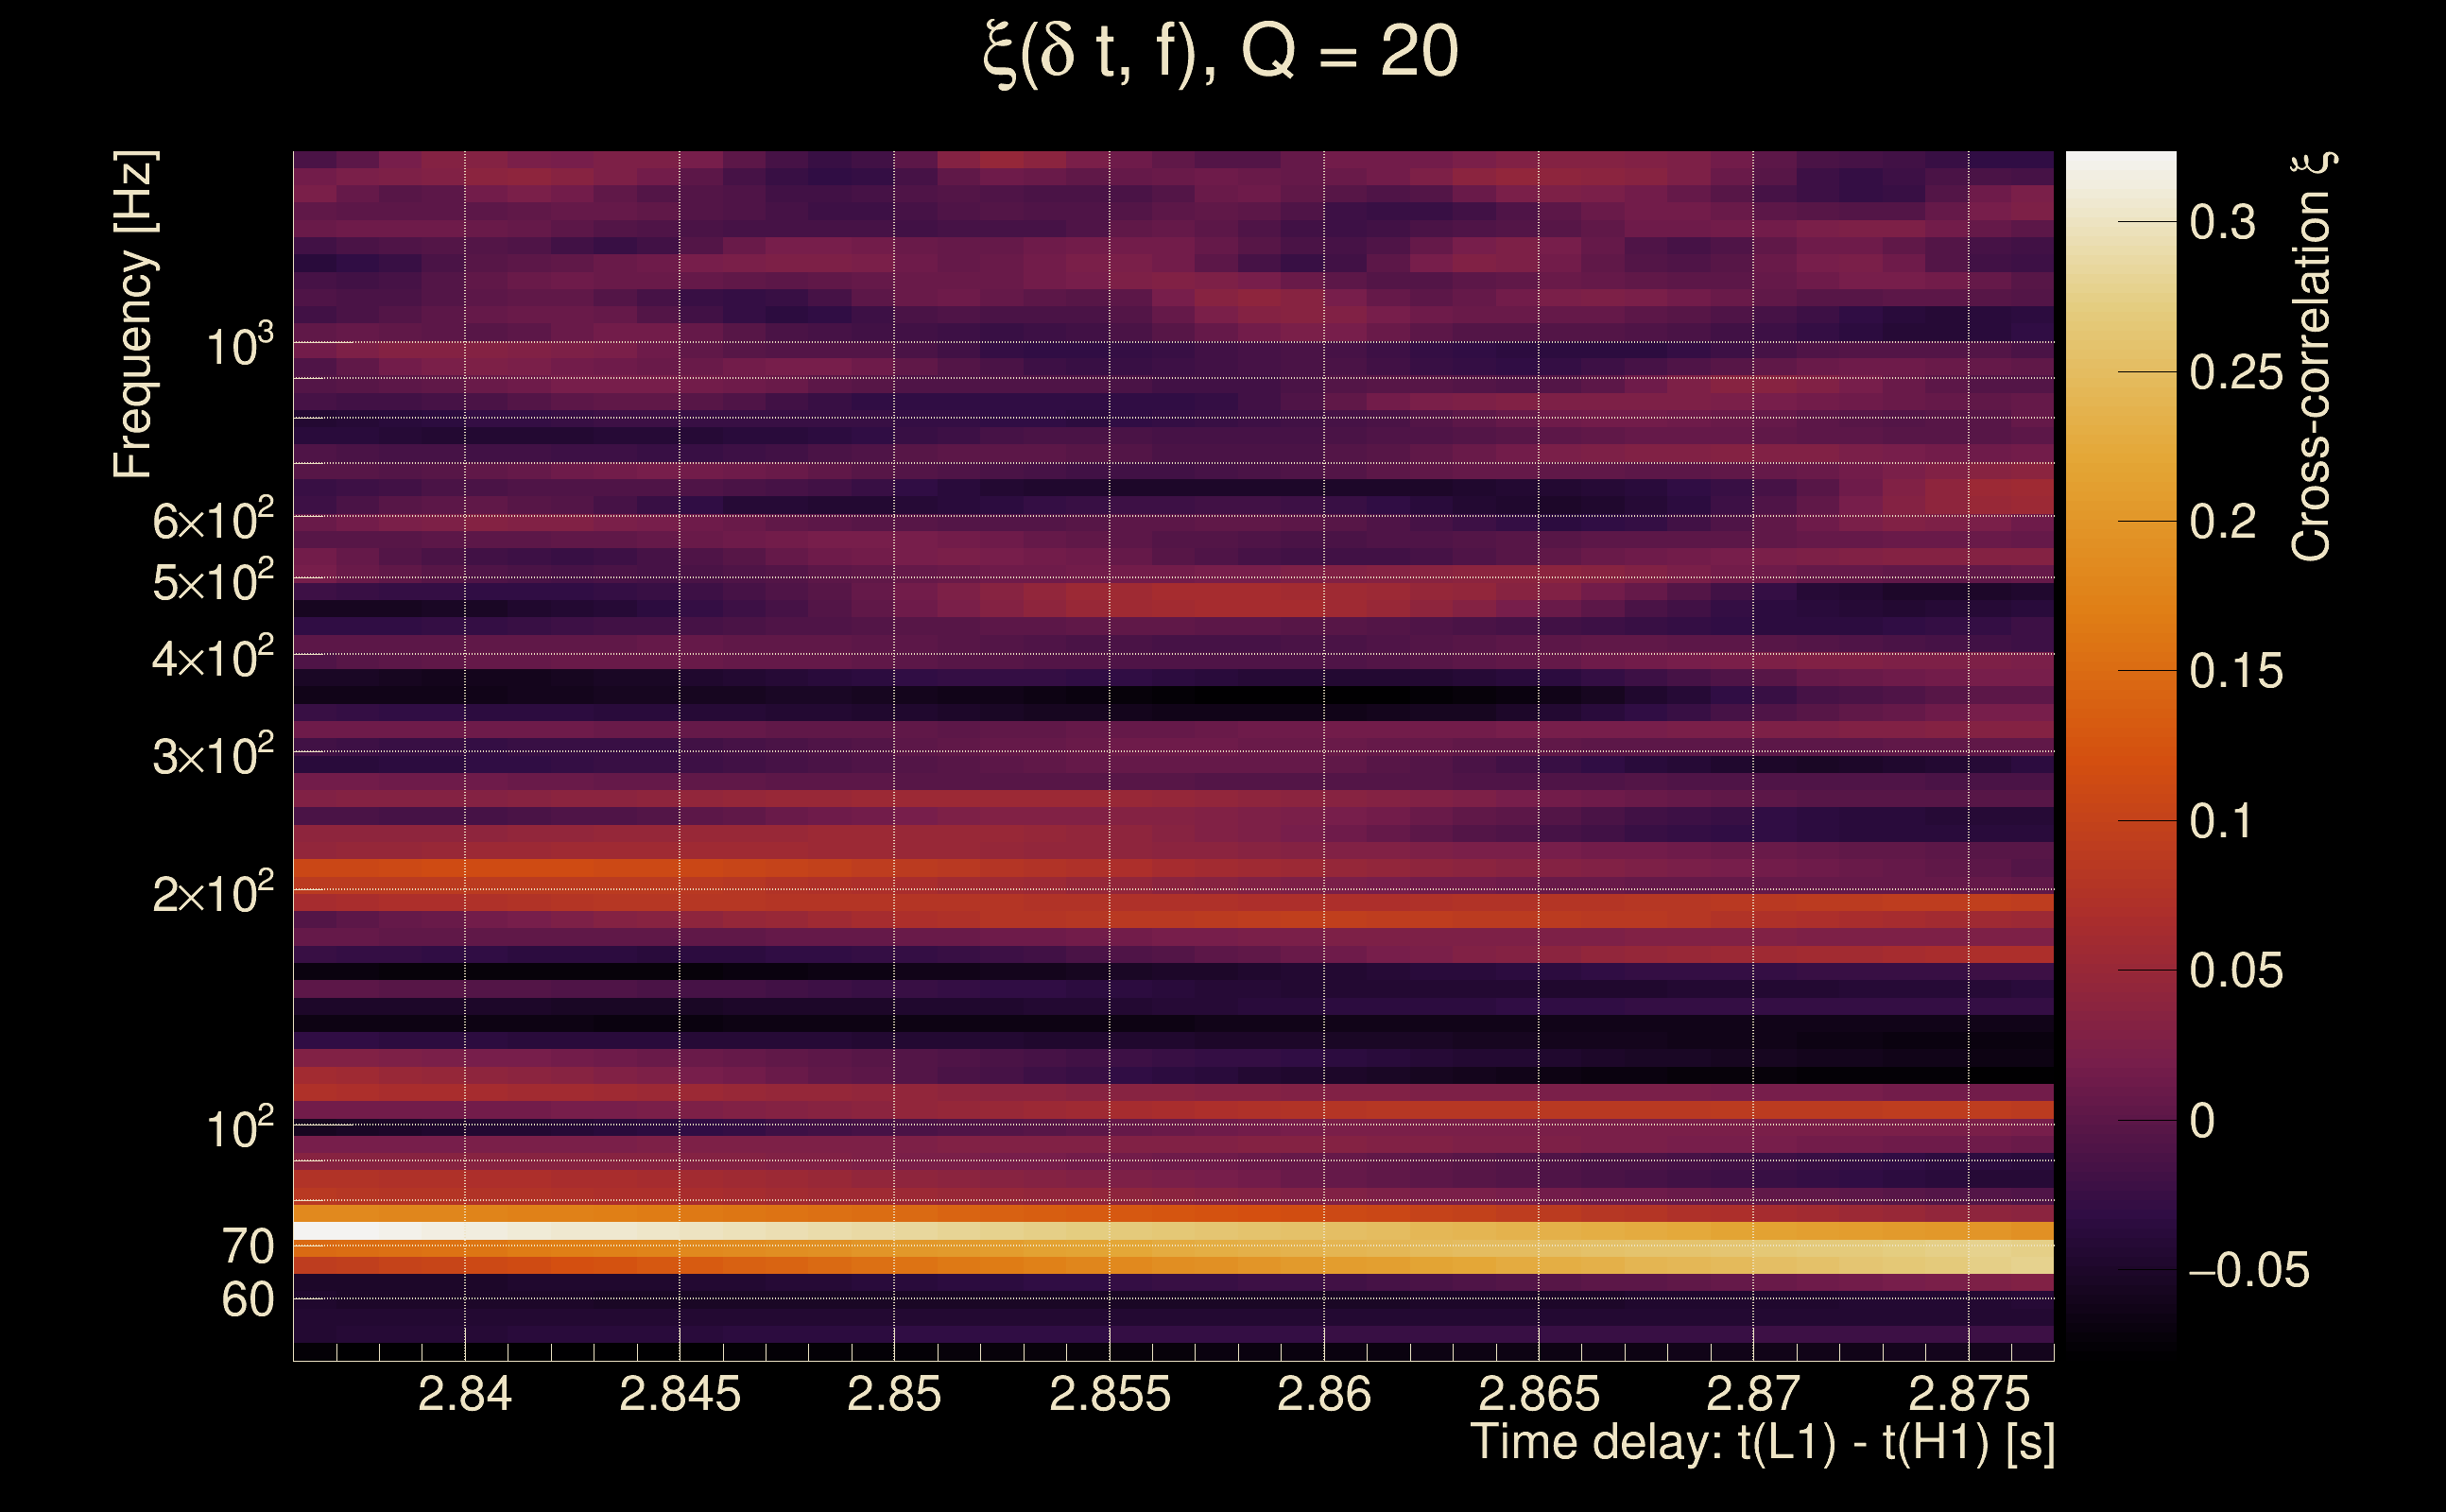
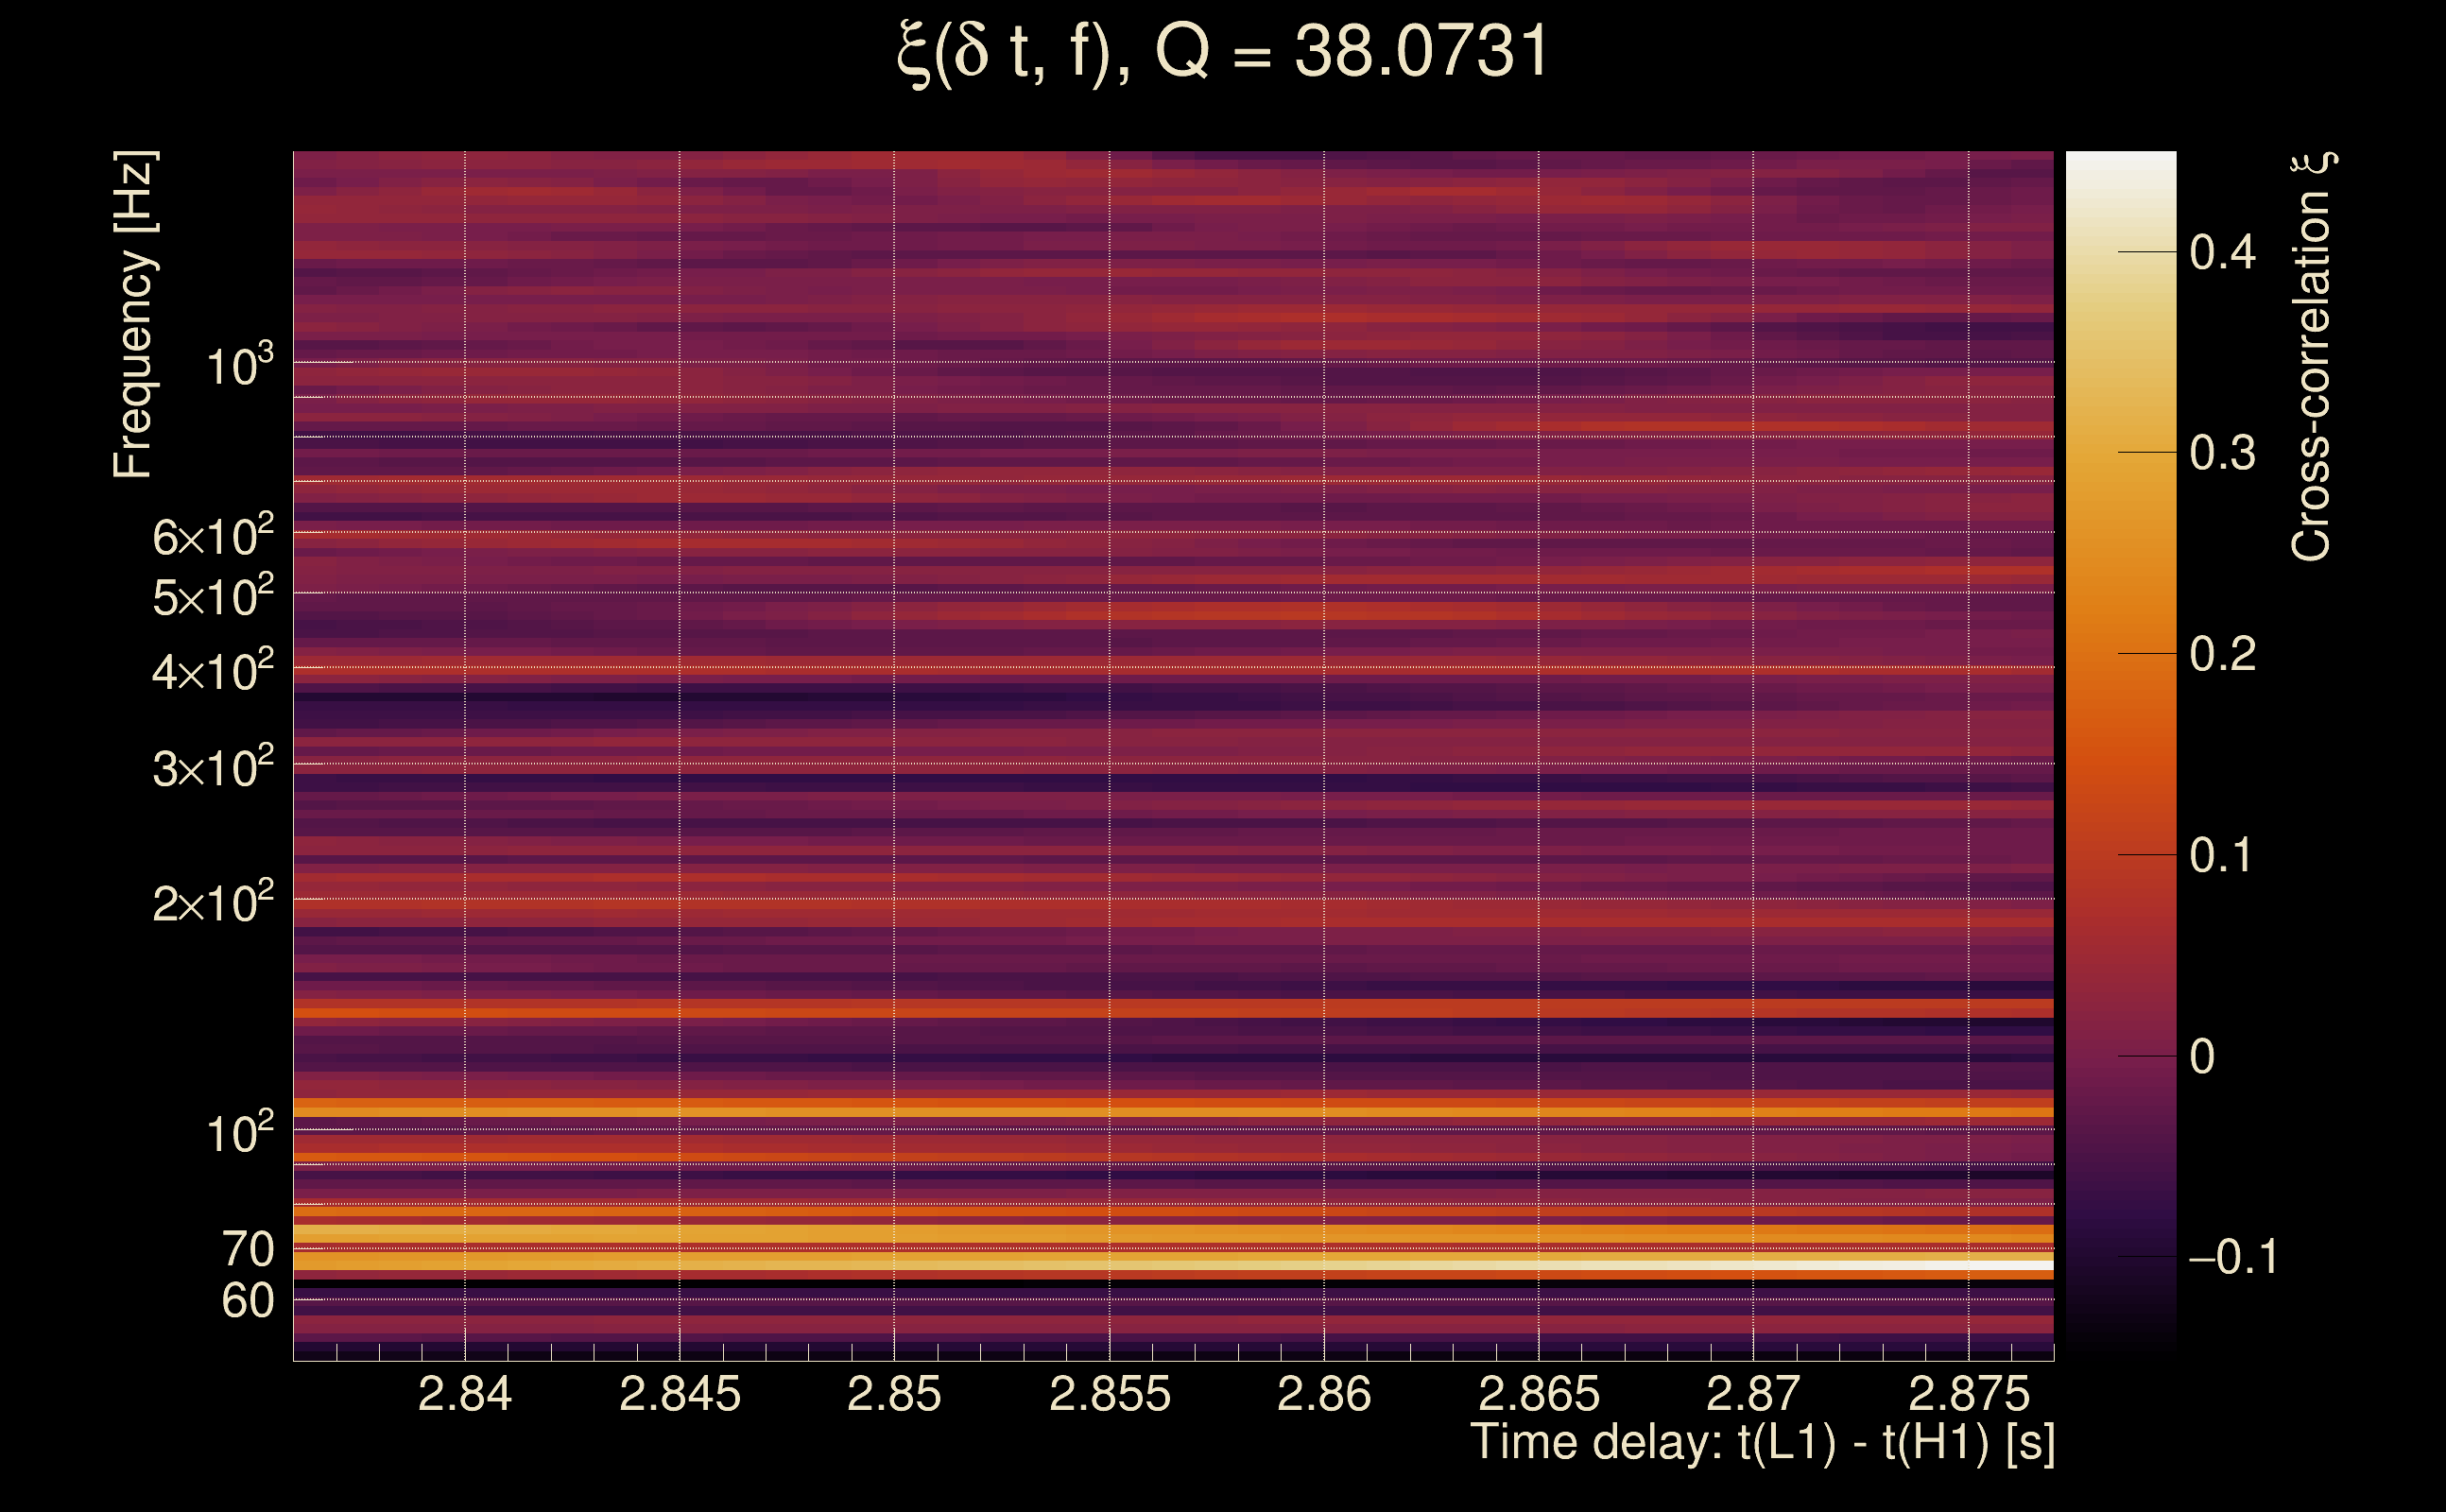
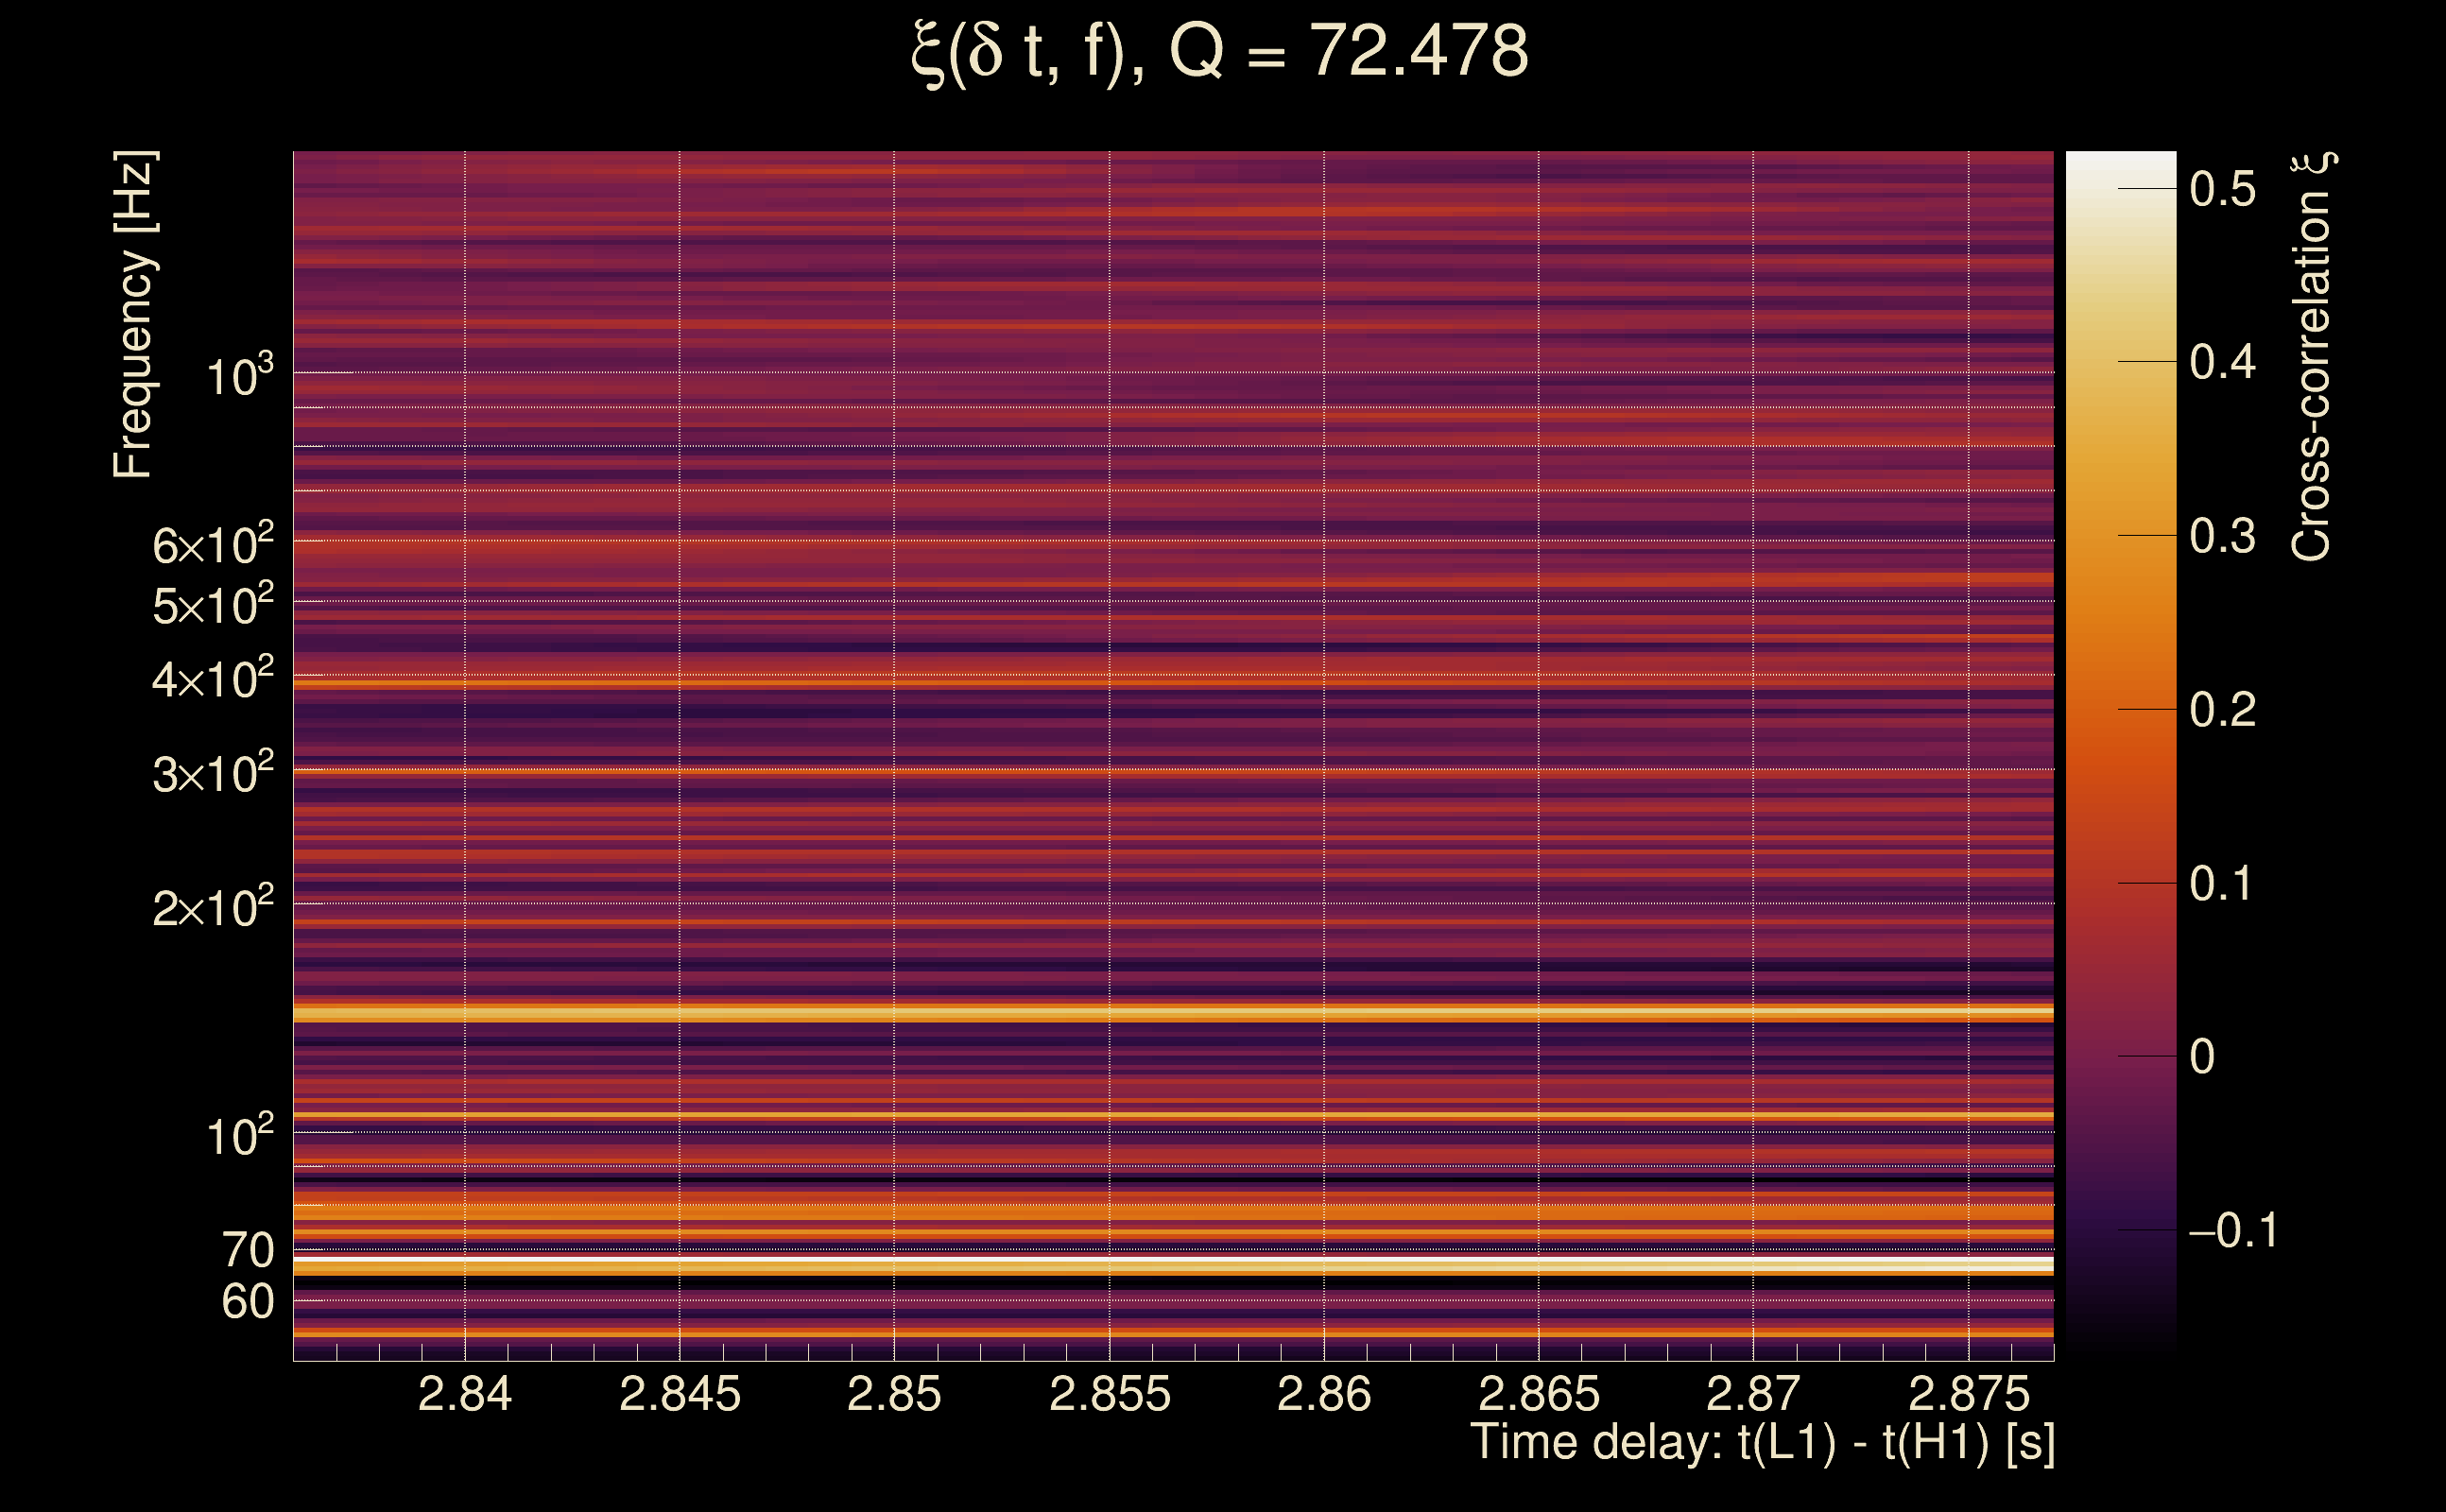
| Time delay between detectors t(L1) - t(H1): | 2.85659 s (slice index = 46 / 217), δt_gw = 0.00459158 s |
| Time delay standard deviation: | 0.0758938 s |
| [targeted mode] Time delay probability: | 0.474991 (0.714382 sigmas), δt_target = 0.00129843 s |
| Frequency: | 119.801 Hz |
| Ξ: | 0.0488927 ± 0.0394404 (variance = 0.00155555): Q0: 0.122912, Q1: 0.173156, Q2: 0.0821626, Q3: 0.15602, Q4: 0.0728343 |
| Rank: | R_A = 0.0488927 |
| Log of amplitude ratio (L1/H1): | -0.379945, variance = 0.551551 (L1/H1: -0.778064, variance = 0.976196, H1/L1: -0.35229, variance = 1.14393) |
| Amplitude ratio (L1/H1): | 0.683899 ⋇ 2.10153 (L1/H1: 0.459294 ⋇ 2.68593, H1/L1: 0.703076 ⋇ 2.91406) |
| Amplitude ratio H1|L1 compatibility (probability): | 0.437567 |
| Antenna factor probability: | 0.969667 |
| Number of rejected frequency rows: | Q0: 7 / 18, Q1: 29 / 36, Q2: 64 / 70, Q3: 121 / 134, Q4: 253 / 258 |
| Maximum signal-to-noise ratio: | H1: 6.61888, L1: 4.88052 |
| SNR variance: | H1: 0.557303, L1: 0.531703 |
| Click here for a zoomed plot | Click here for a zoomed plot | Click here for a zoomed plot | Click here for a zoomed plot | Click here for a zoomed plot |
 |
 |
 |
 |
 |
 |
 |
 |
 |
 |
 |
 |
 |
 |
 |
 |
 |
 |
 |
 |
 |
 |
 |
 |
 |
 |
 |
 |
 |
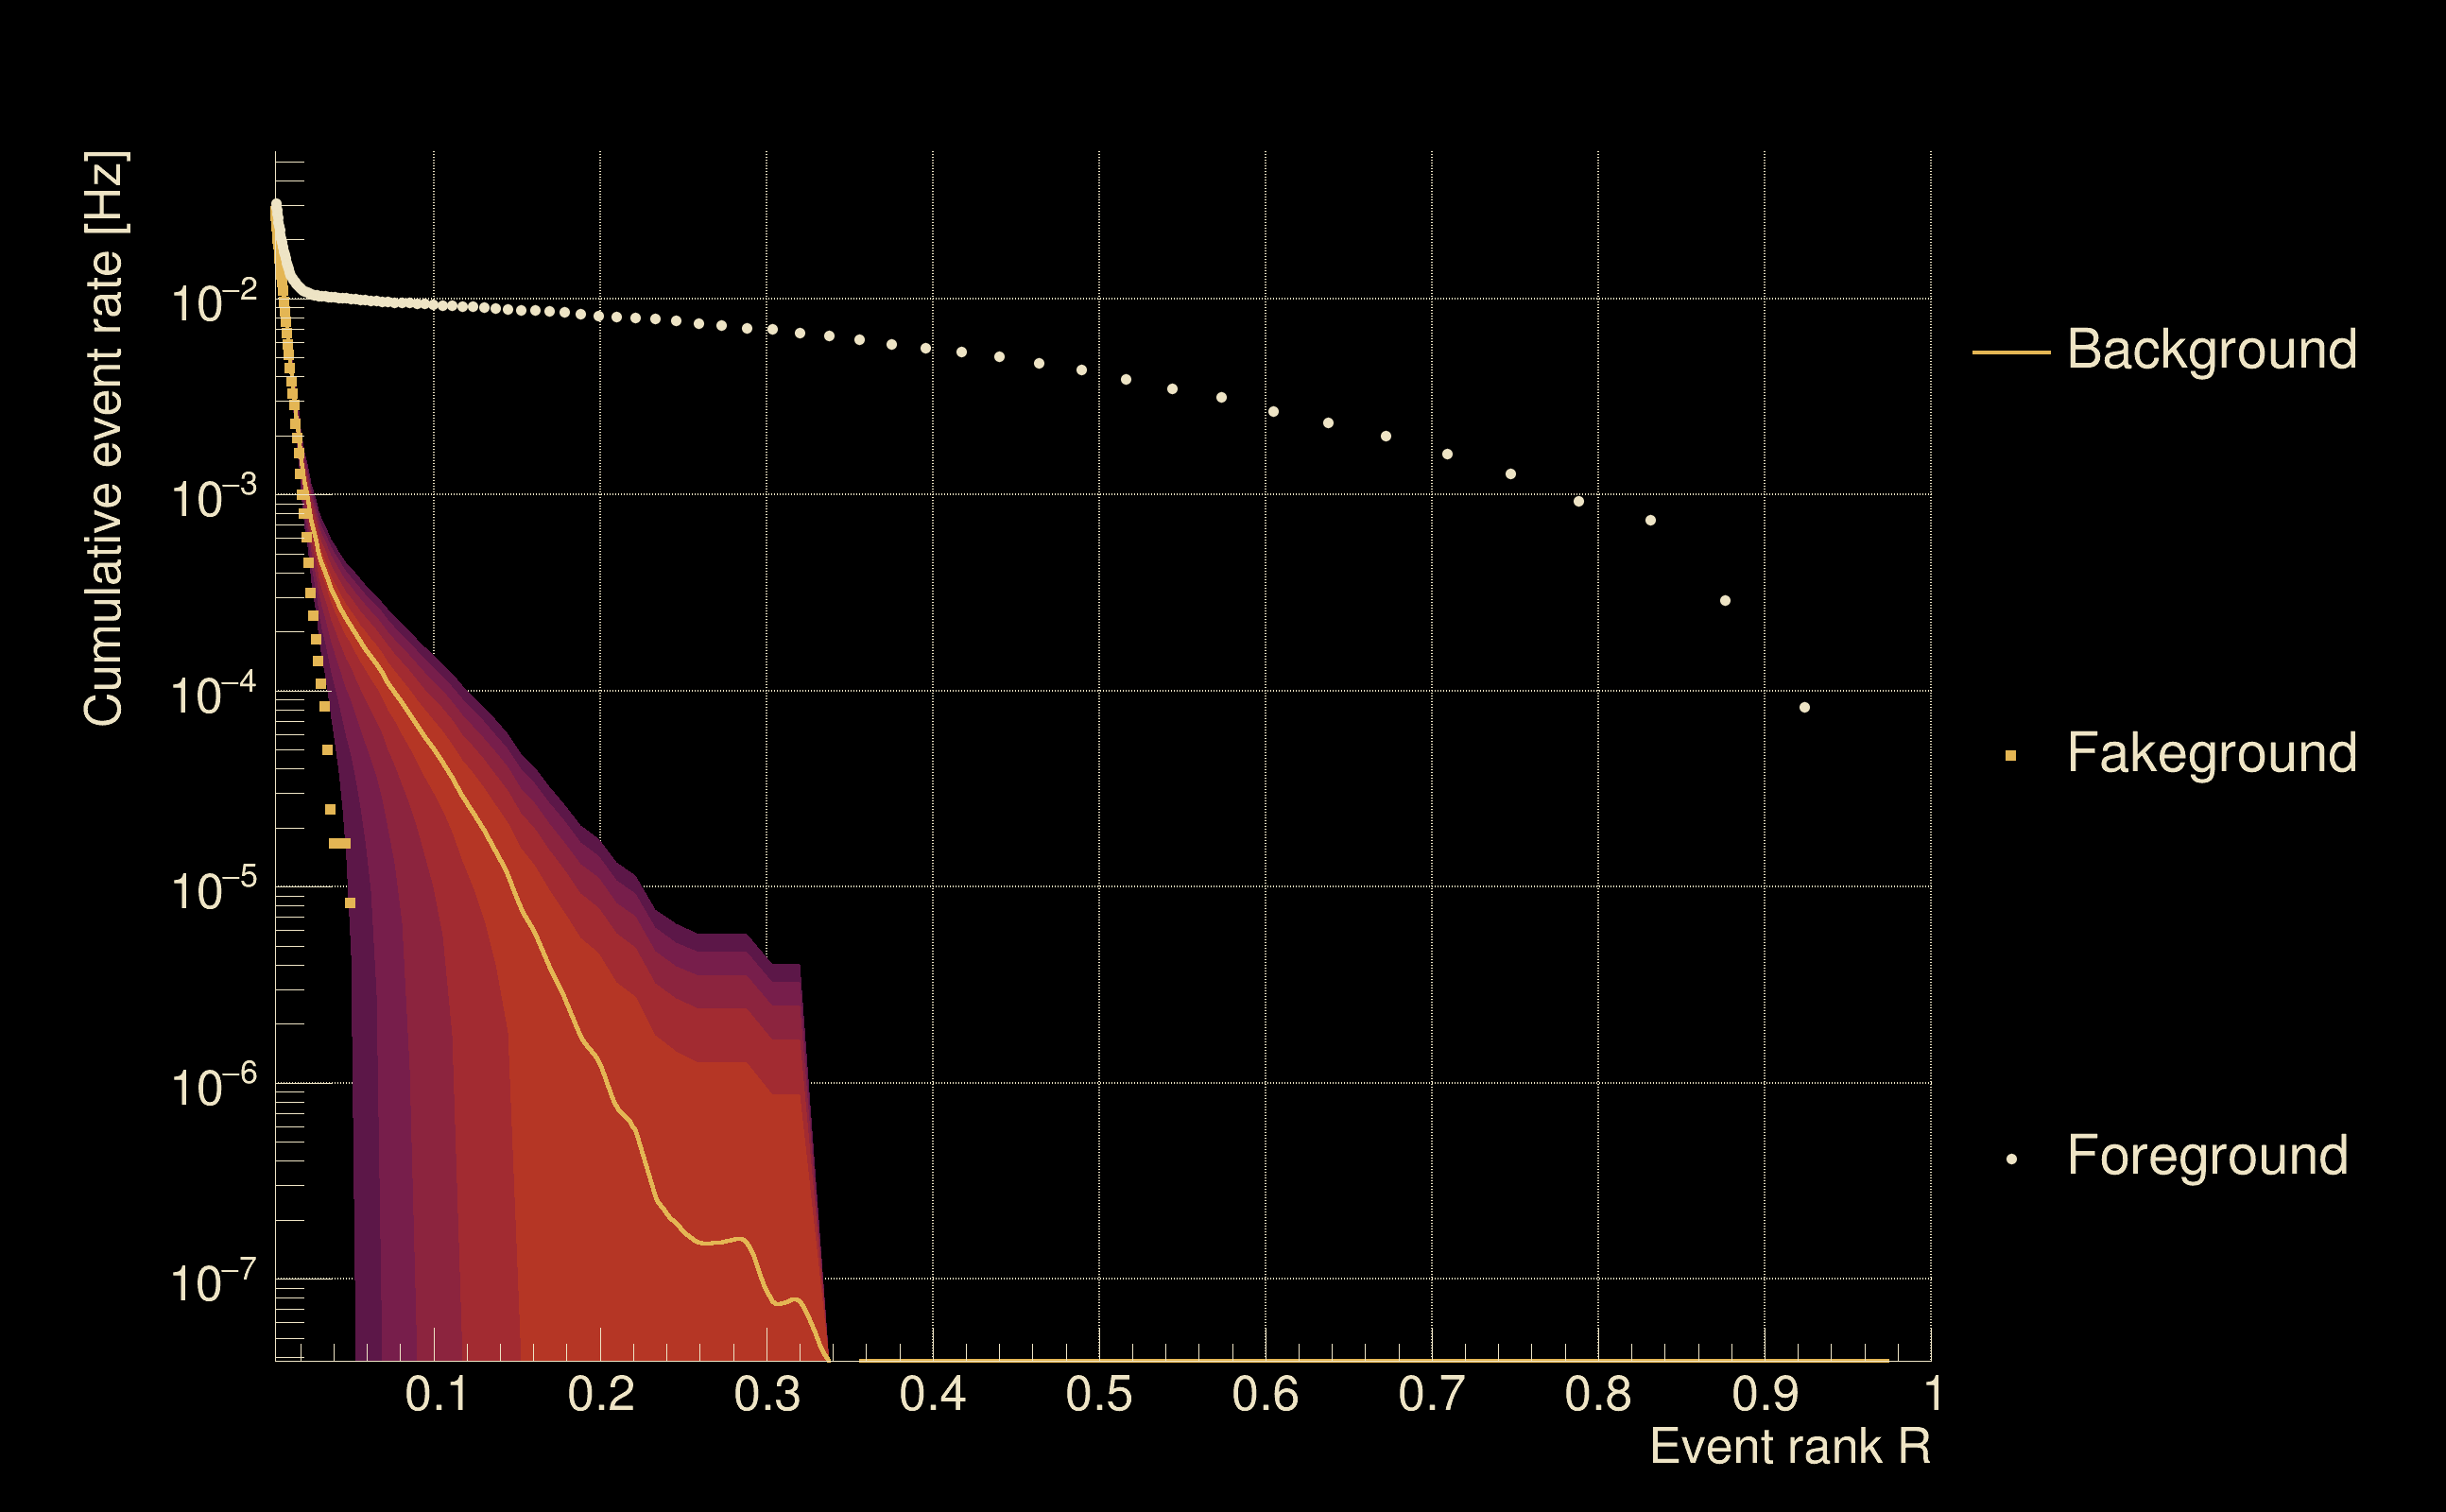
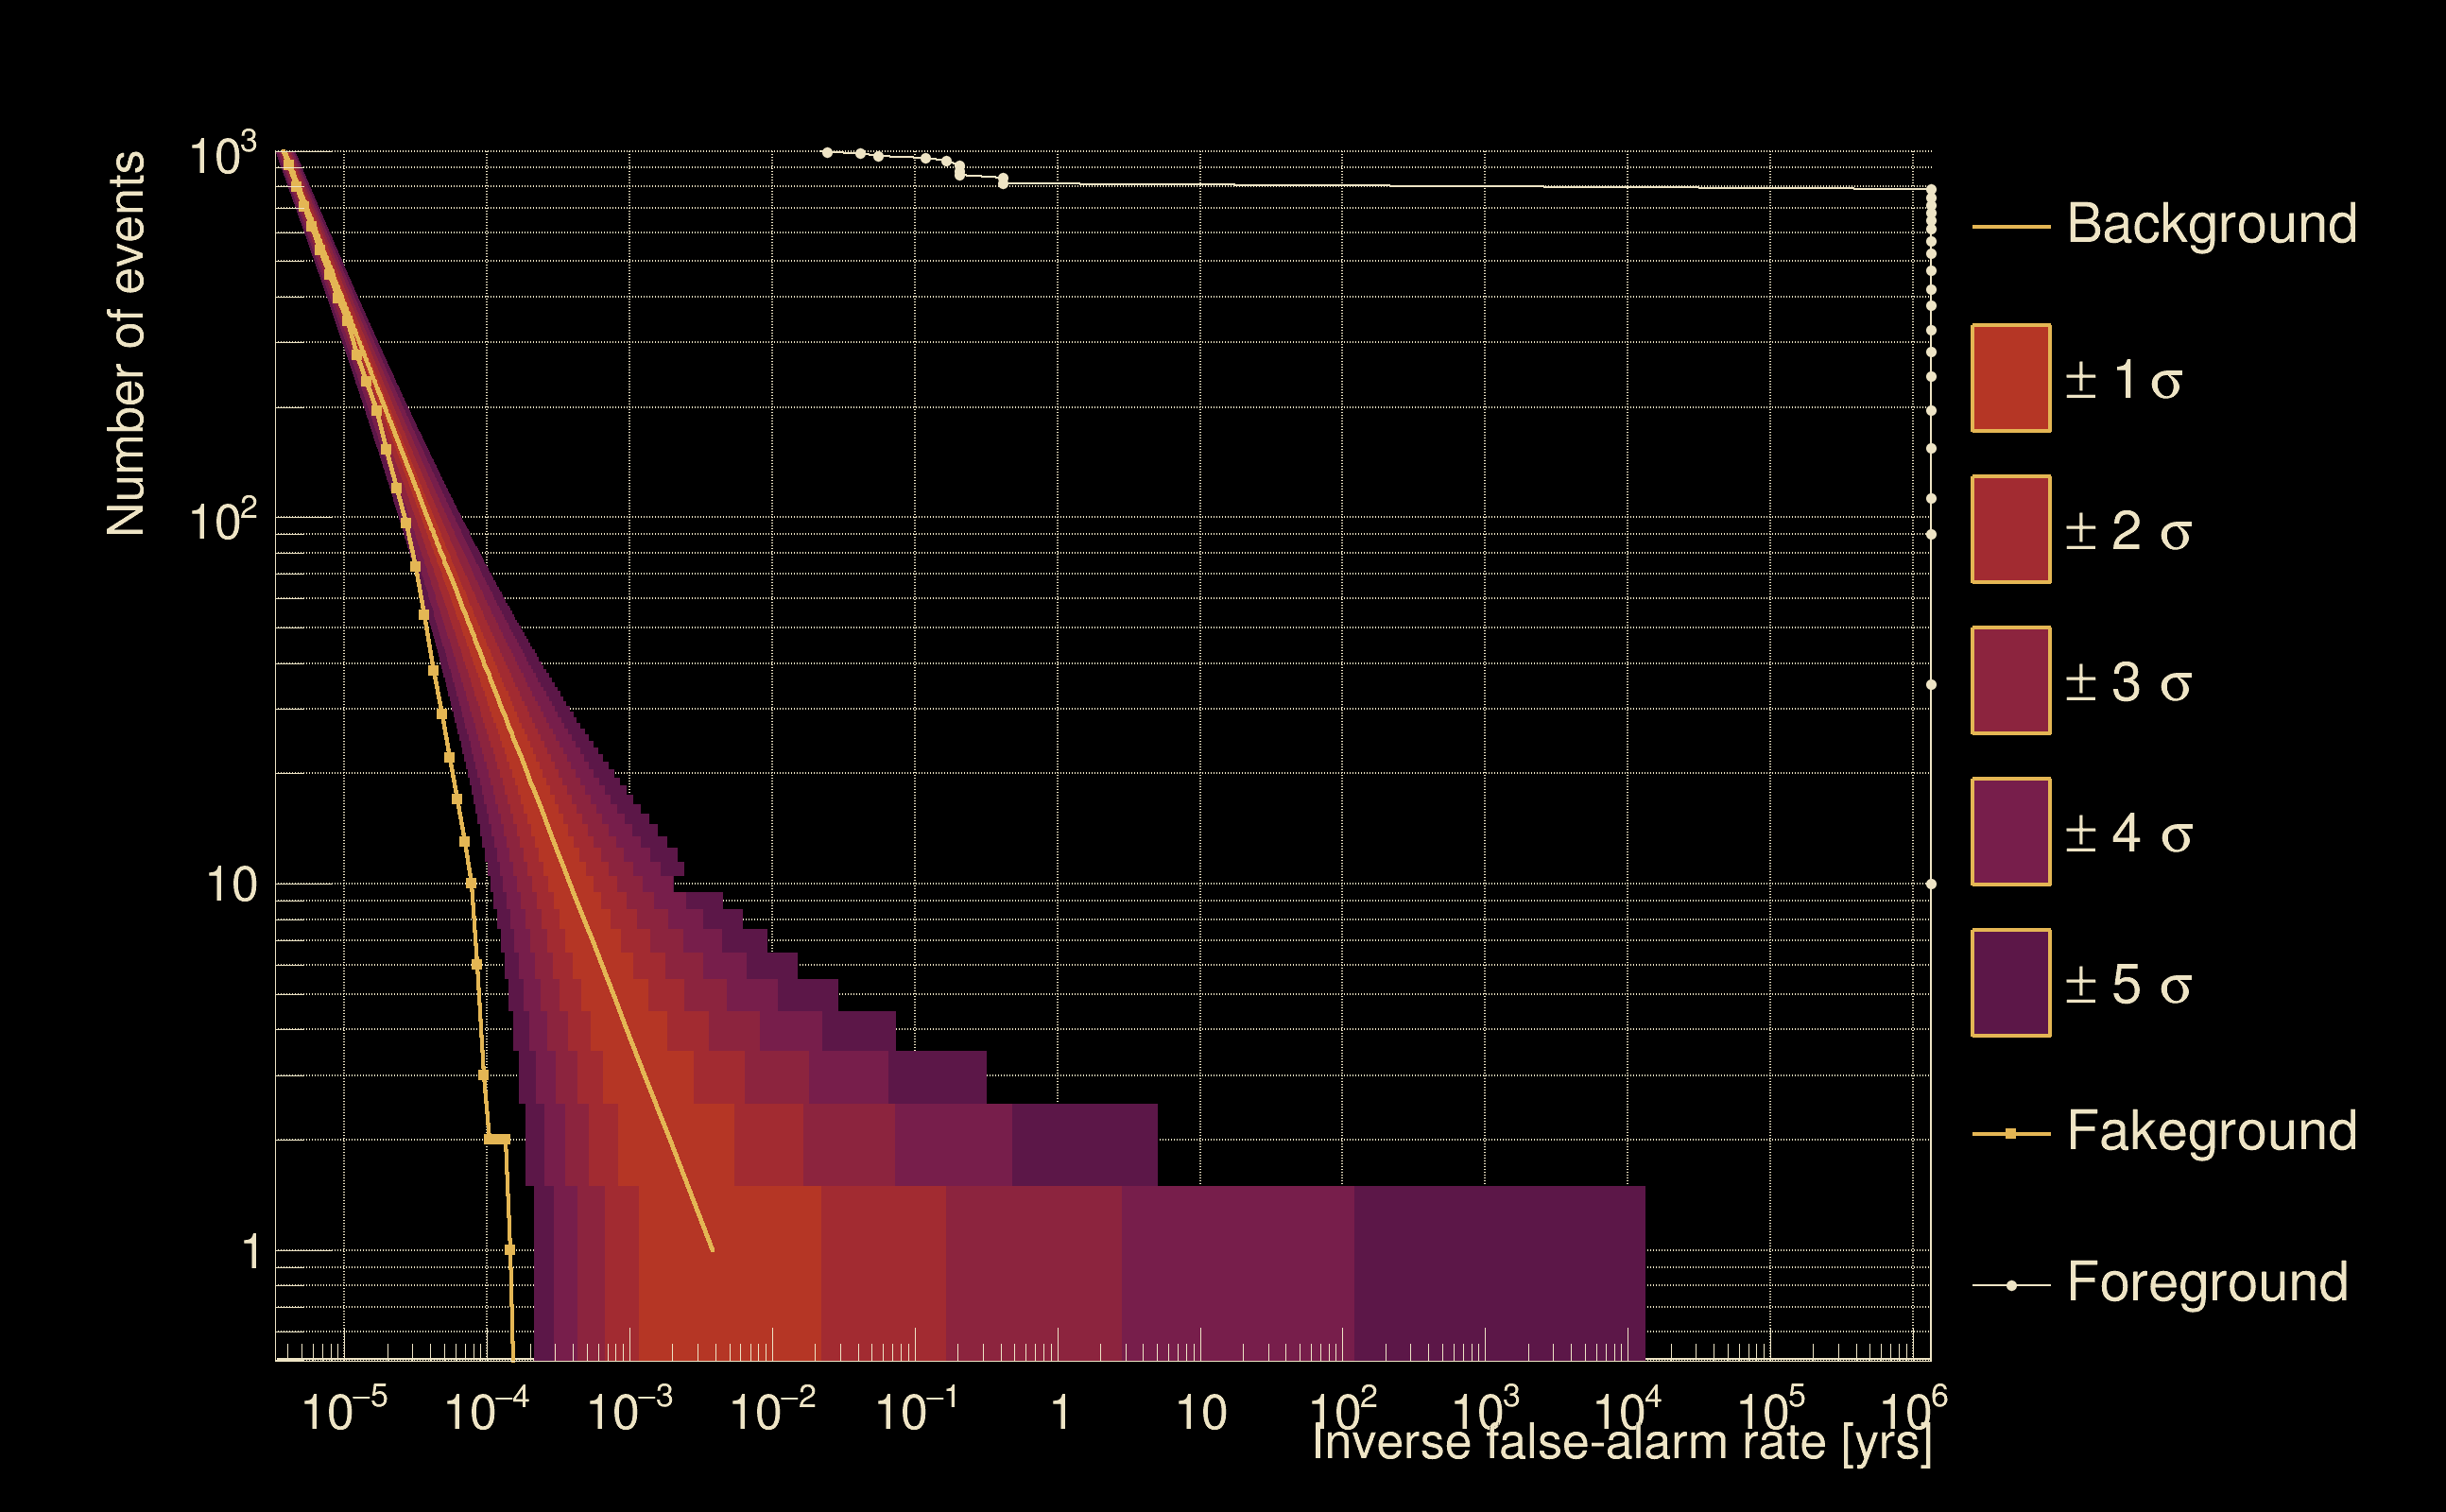
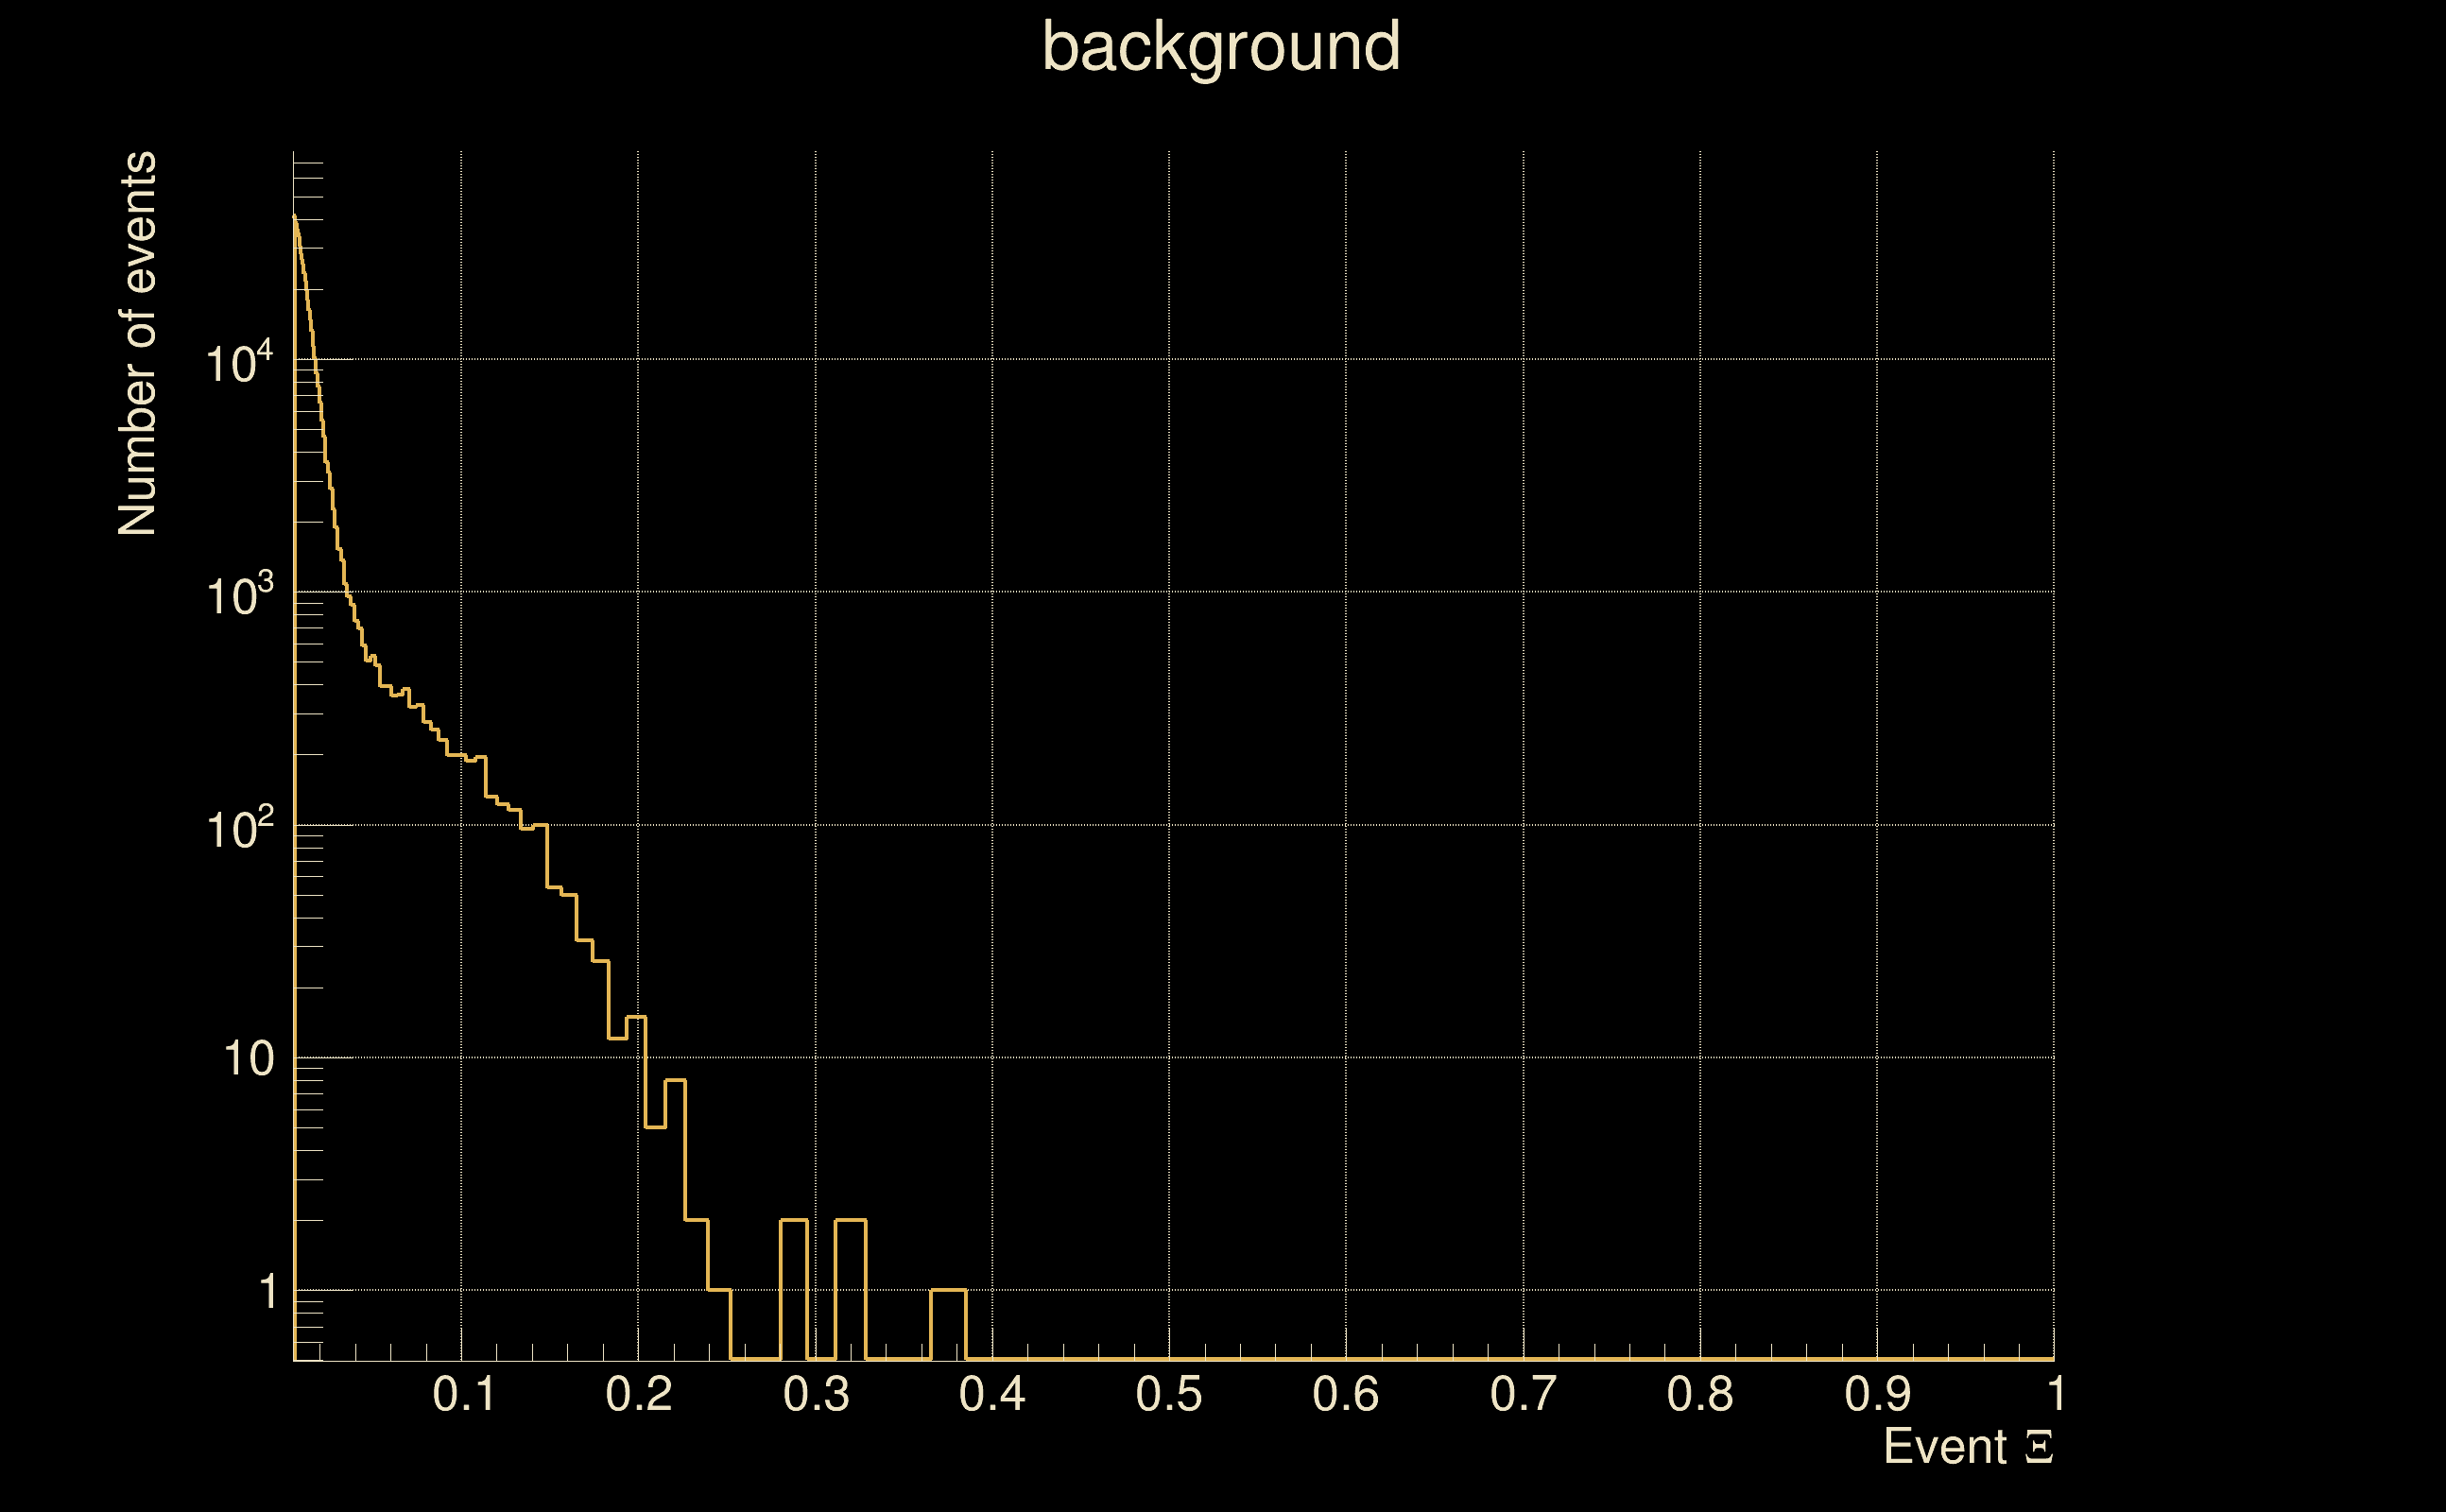
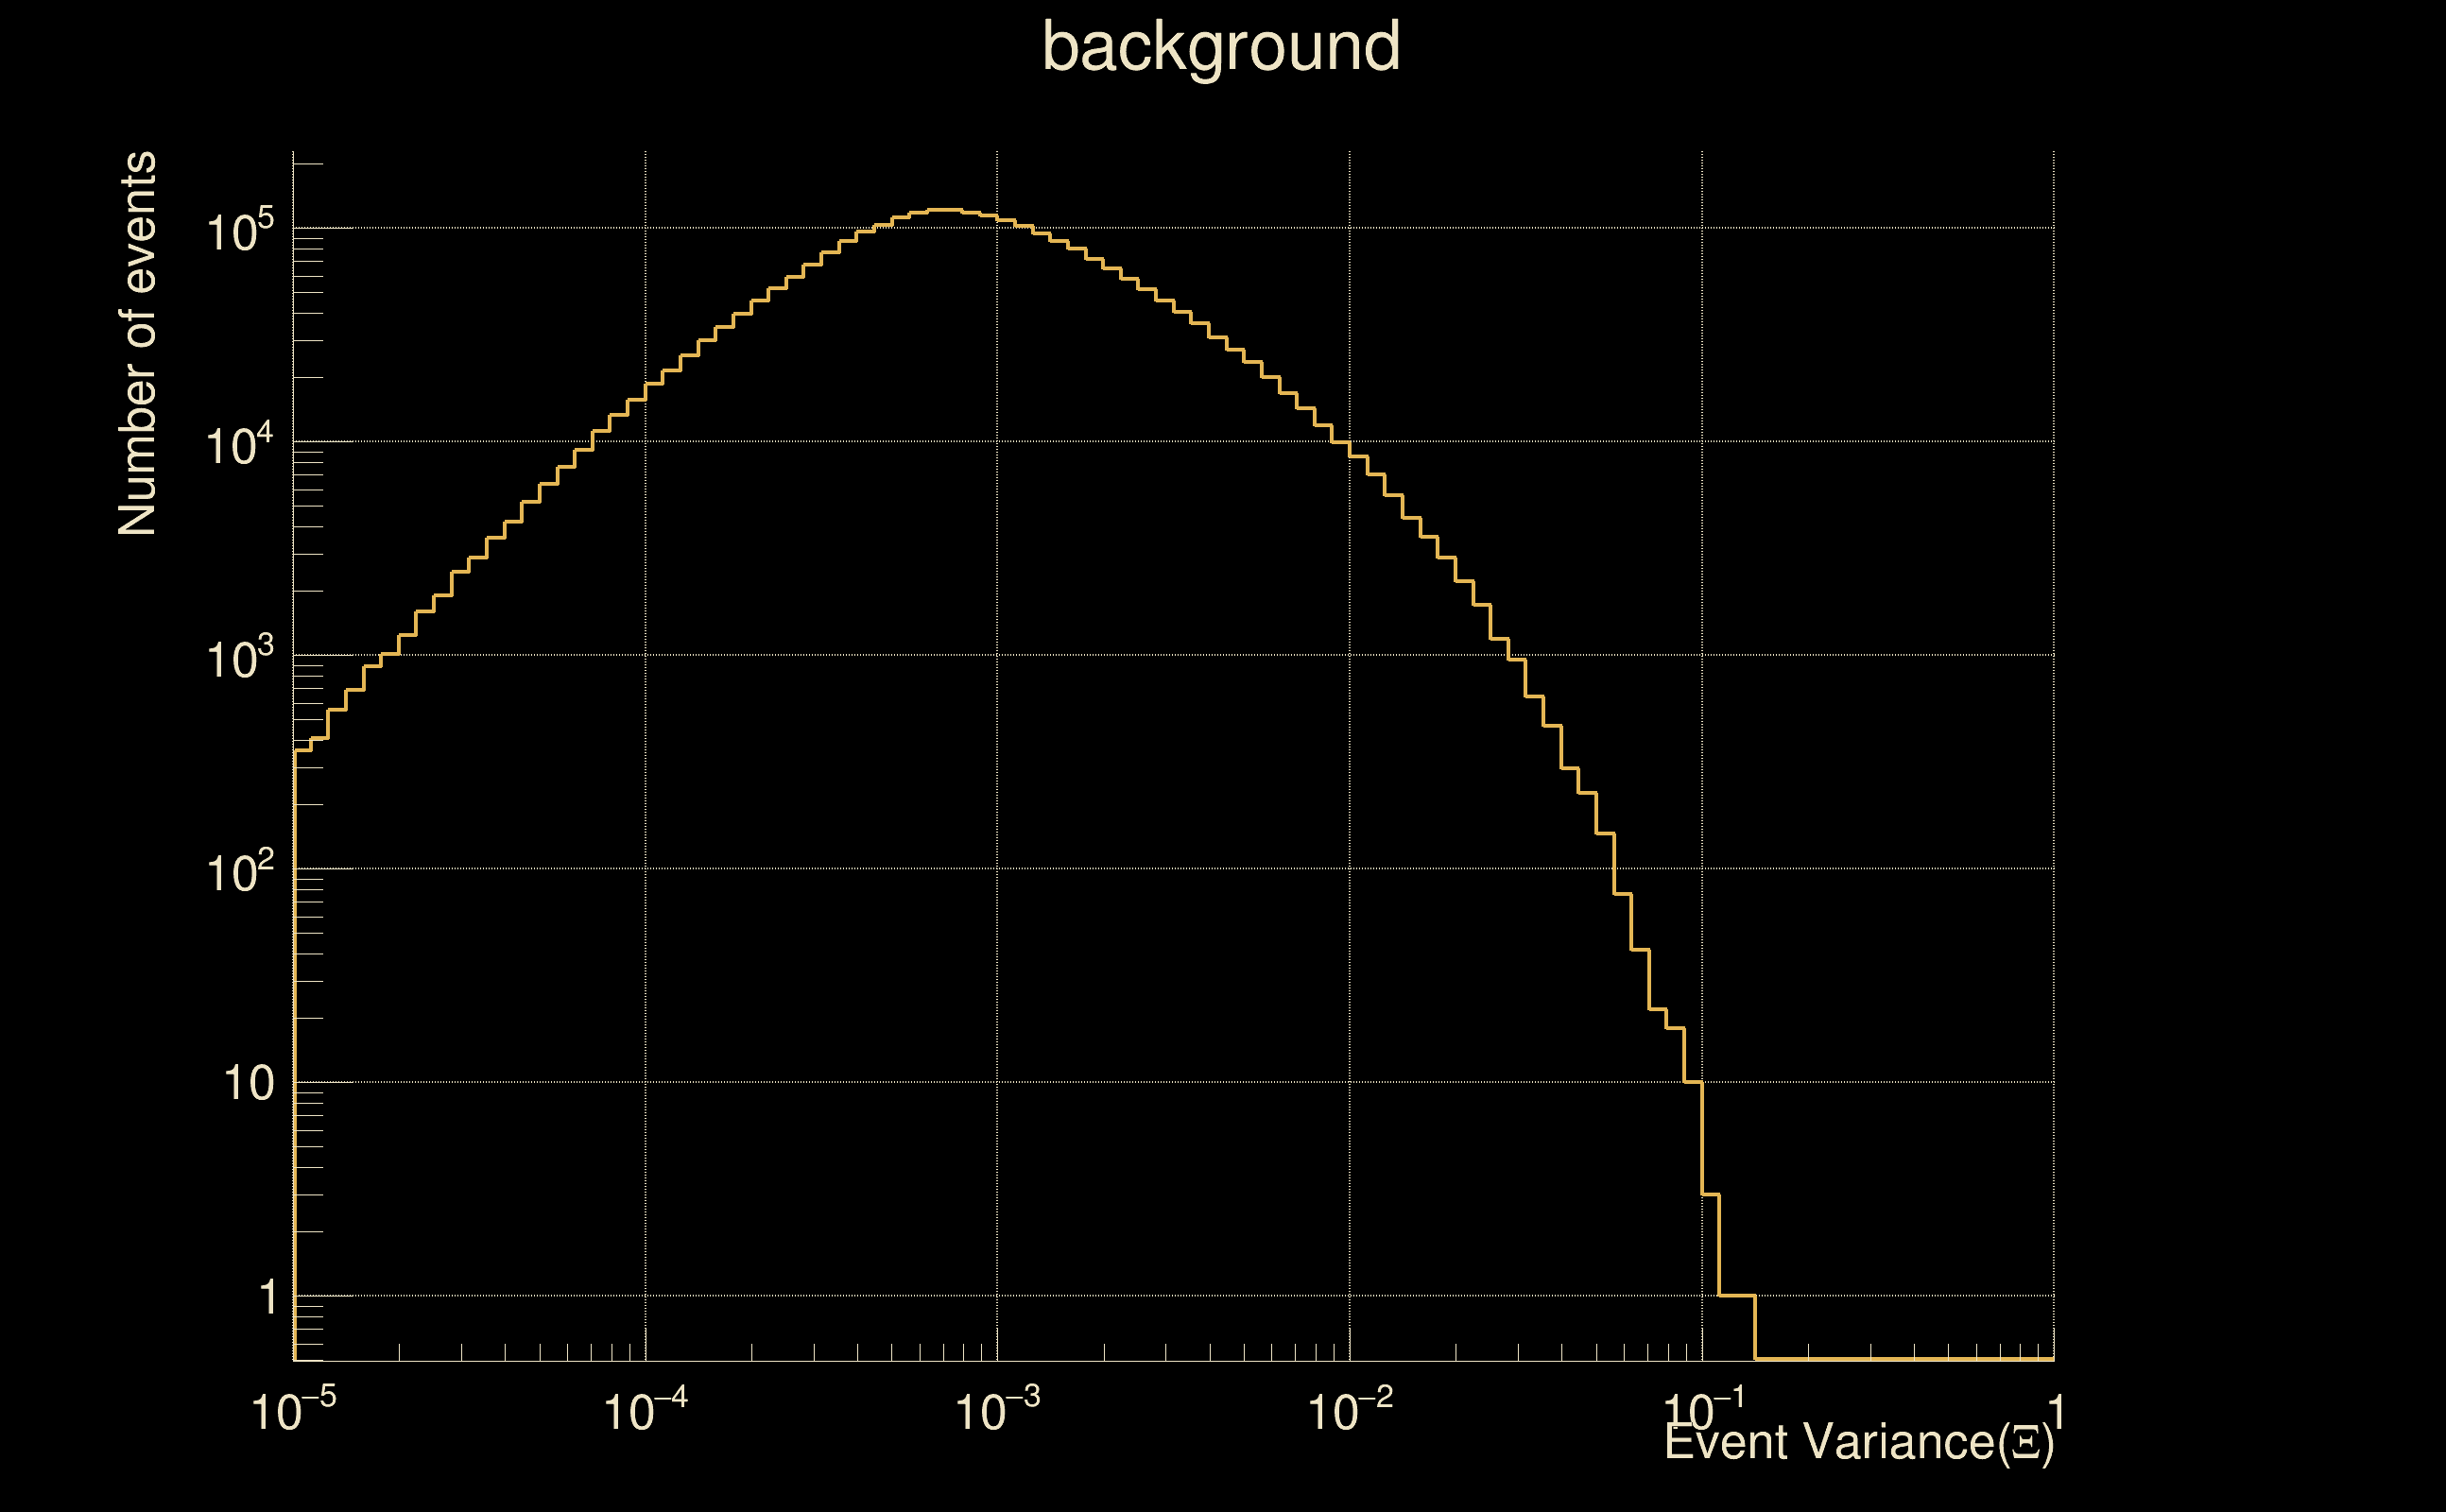
| Detection threshold: | R > 0.172388 |
| False-alarm rate above that detection threshold: | 2.95337e-06 |
| Alternative threshold at 1/1000 yrs: | R > 0.320207 |
| Alternative threshold at 1/100 yrs: | R > 0.320207 |
| Alternative threshold at 1/10 yrs: | R > 0.320207 |
| Alternative threshold at 1/1 yr: | R > 0.320207 |
| Alternative threshold at 1/1 d: | R > 0.14464 |
 |
|
 |
 |
 |
 |
 |
 |
 |
 |
 |
 |
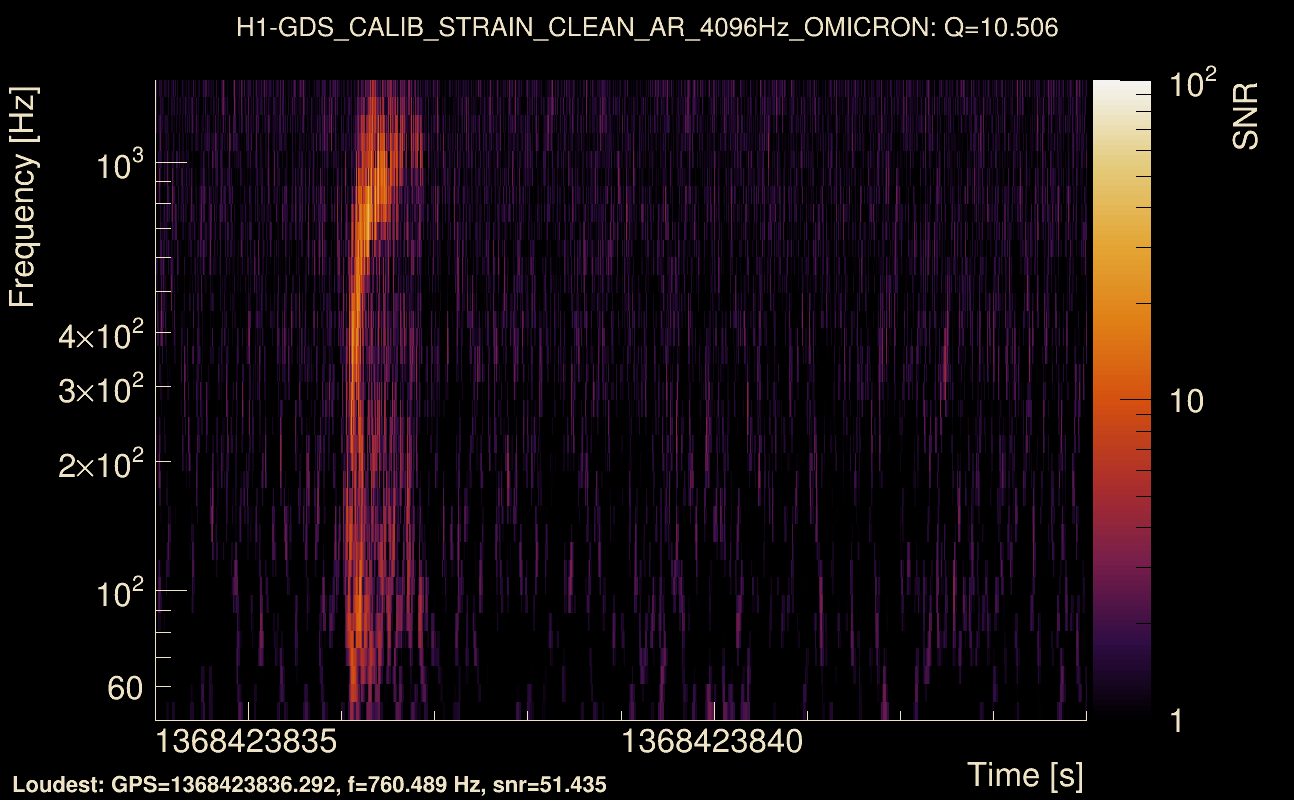
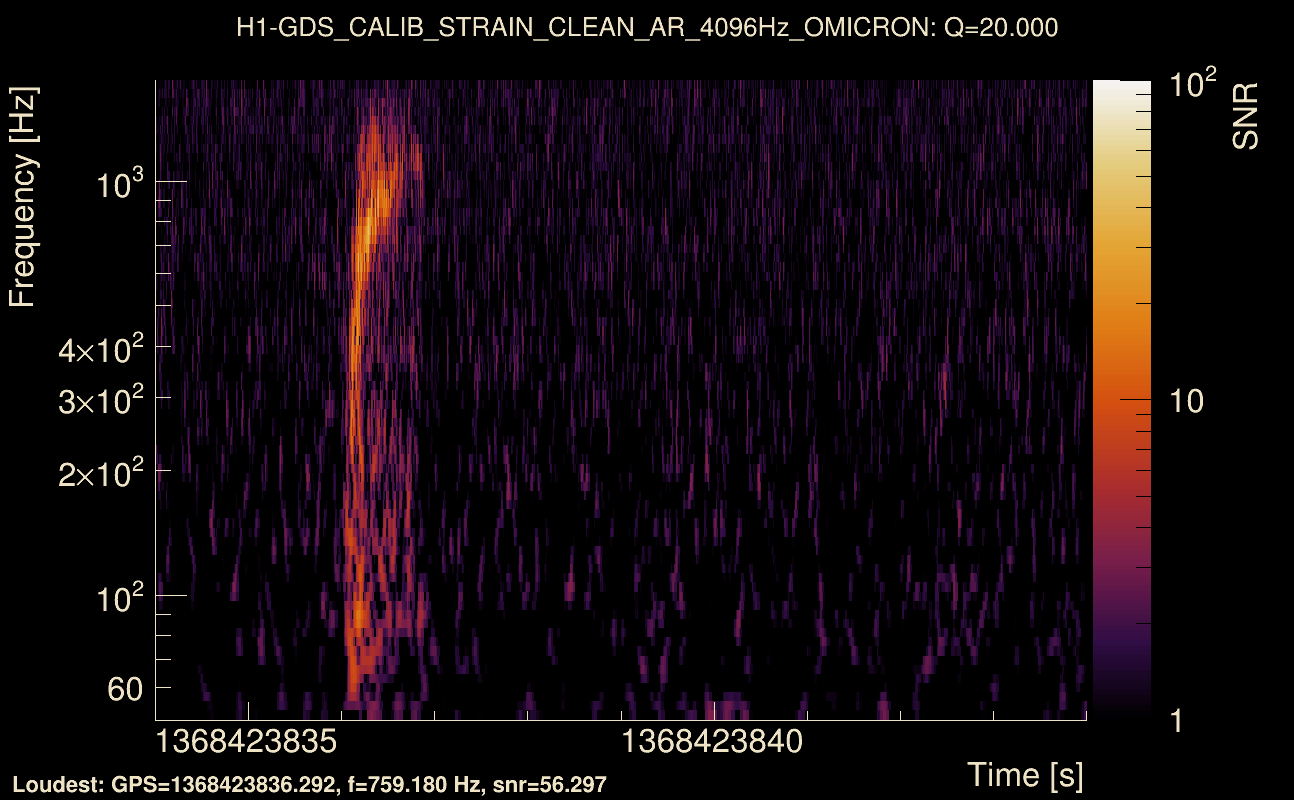
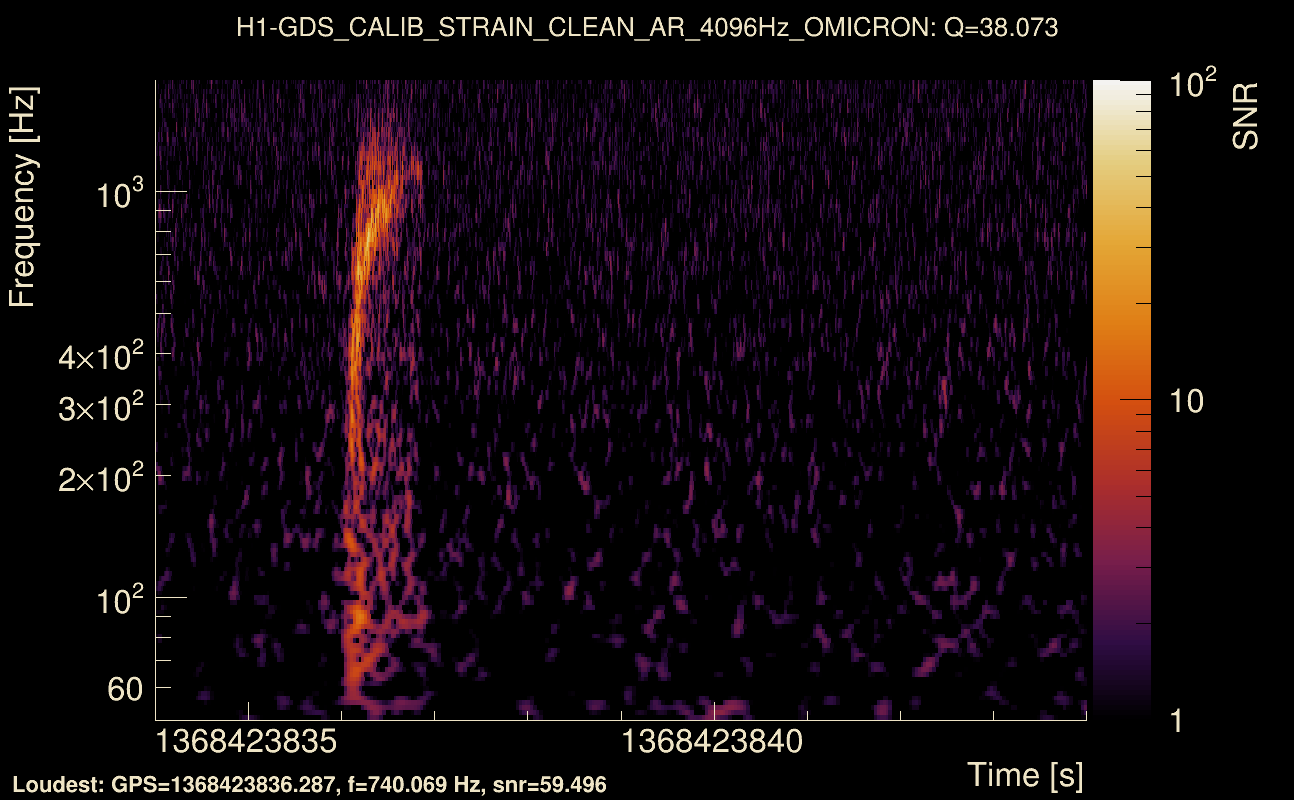
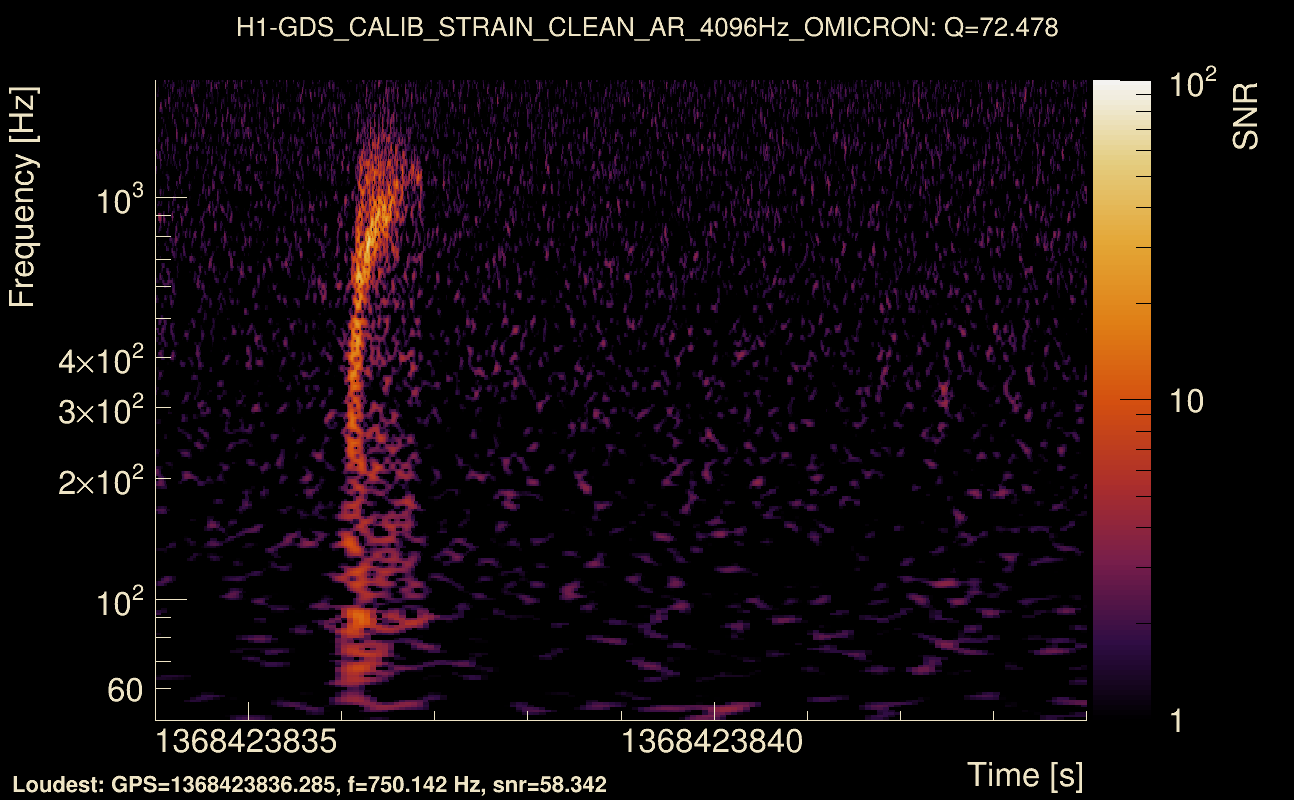
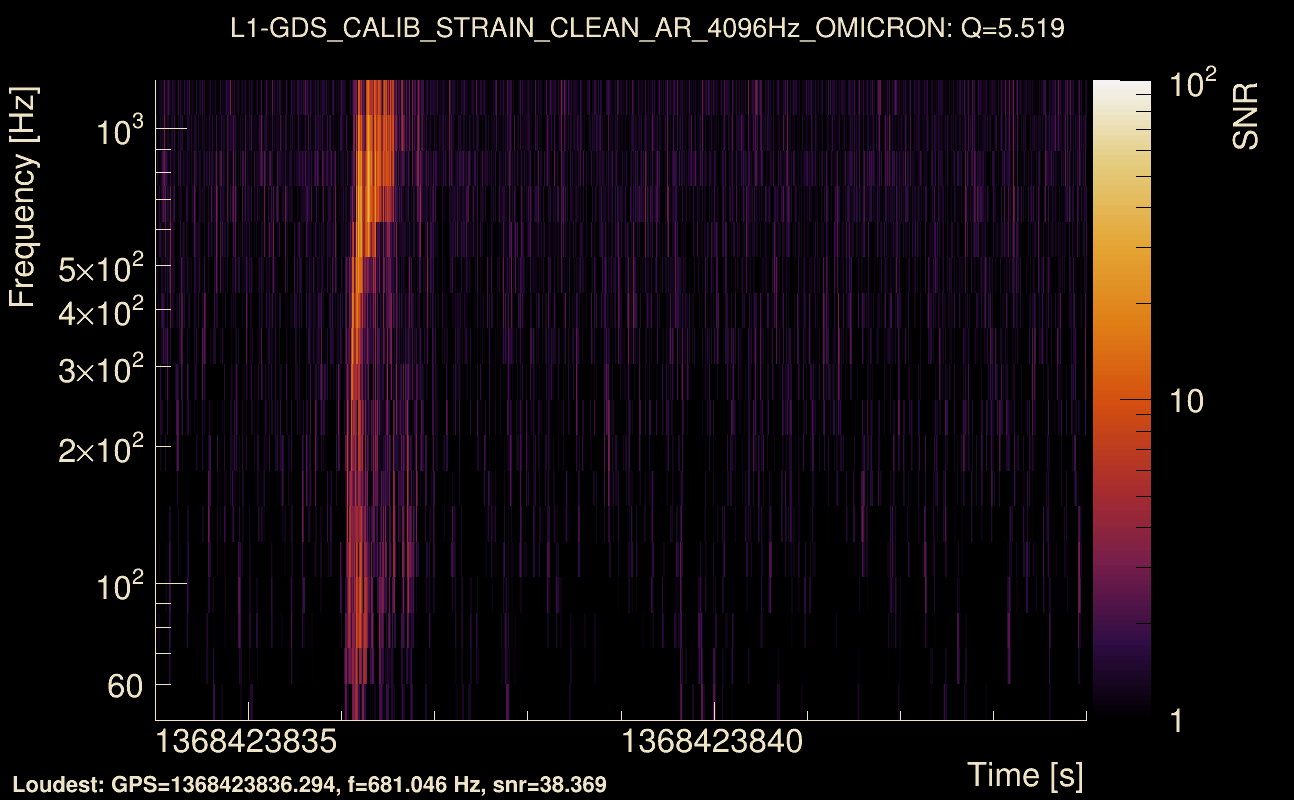
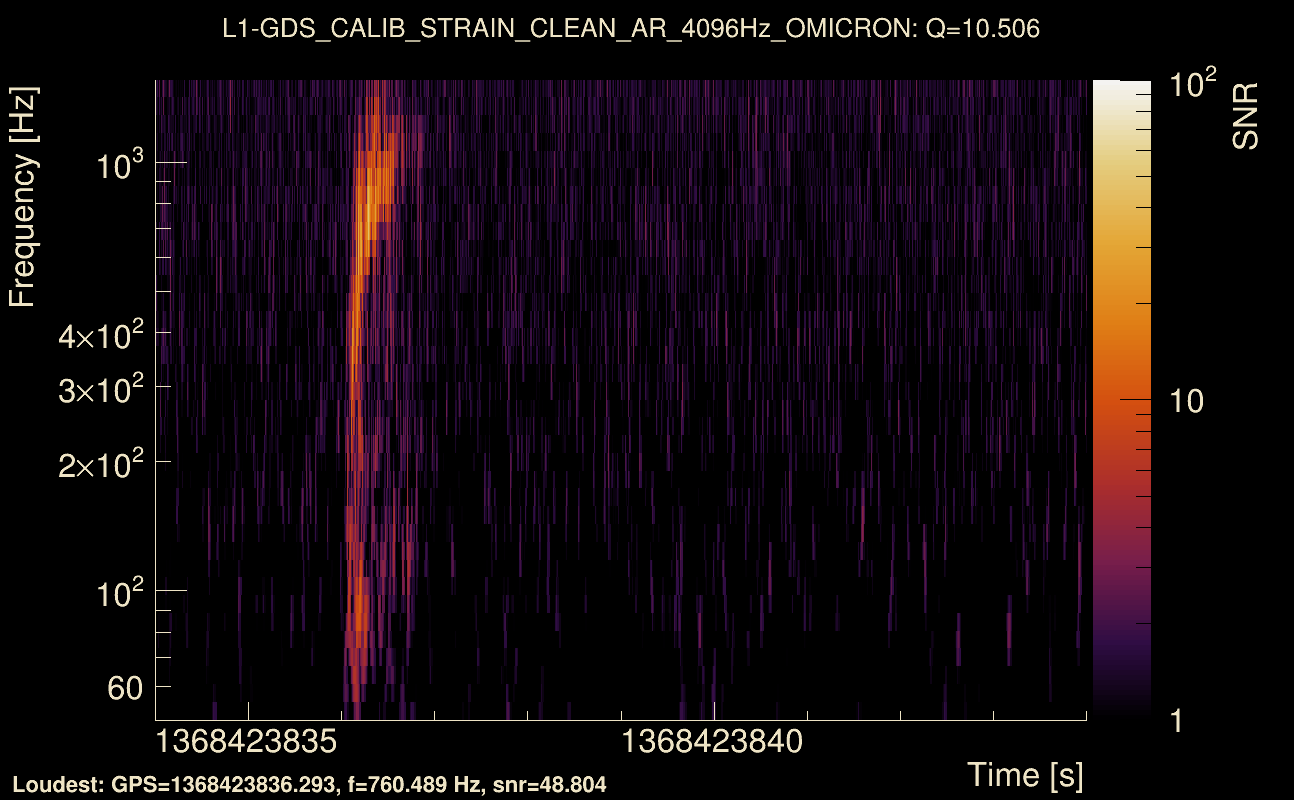
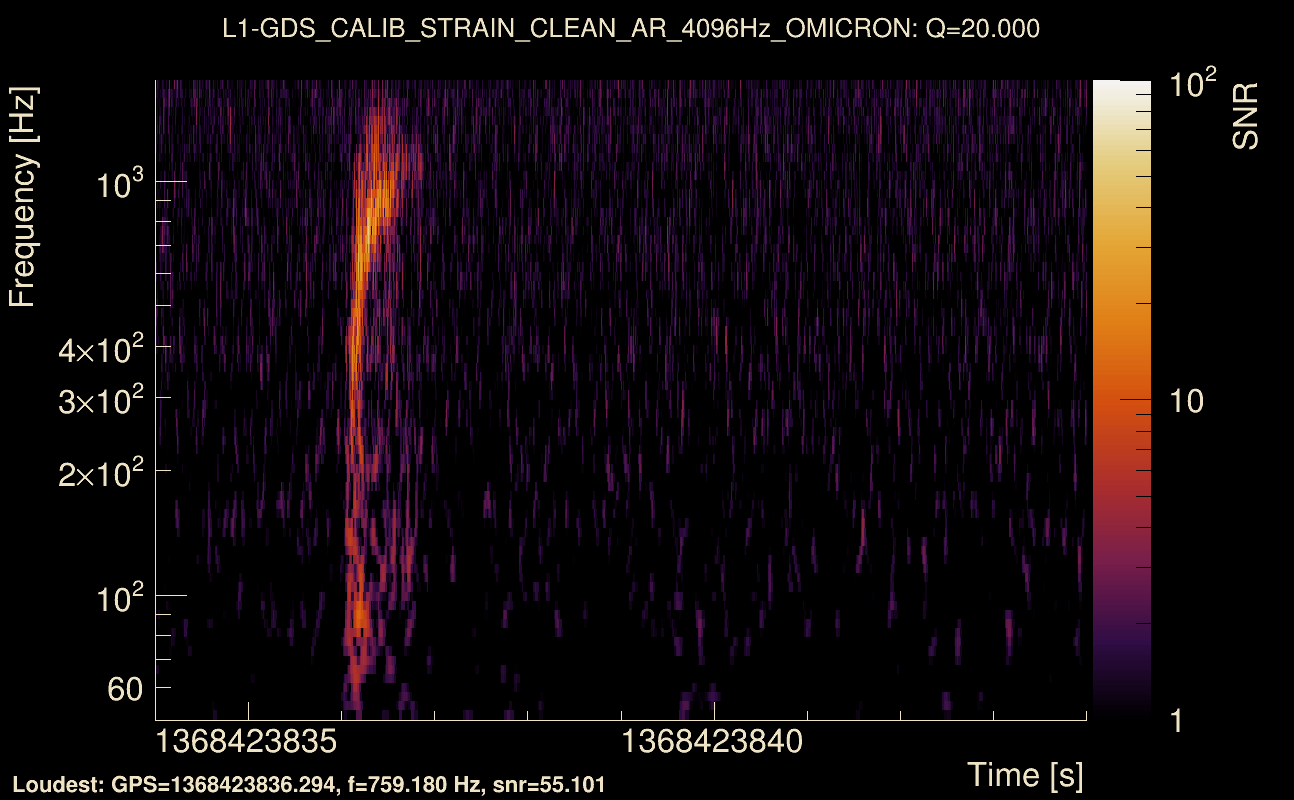
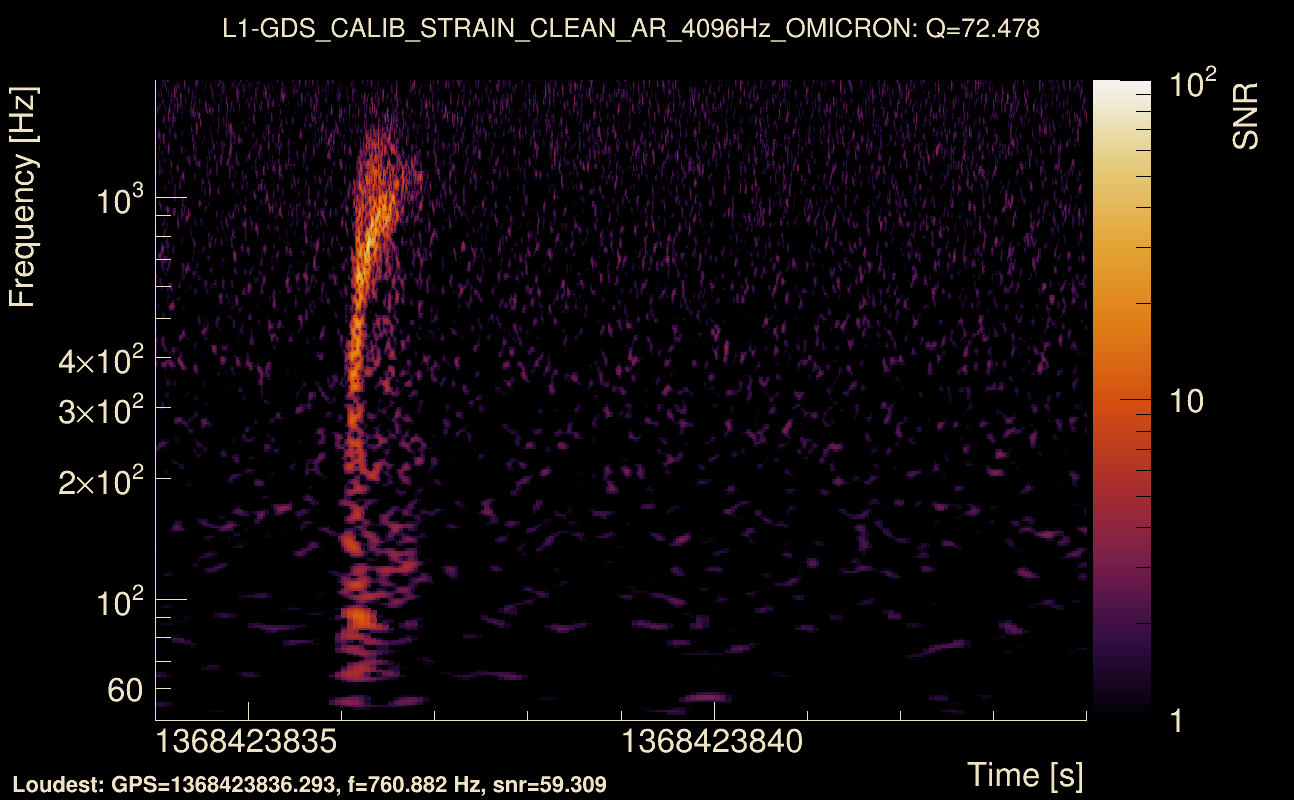
| Event time t(H1): | GPS = 1368423834 (Thu May 18 05:43:36 2023 ) → GPS = 1368423844 (Thu May 18 05:43:46 2023 ) |
| Event time t(L1): | GPS = 1368423834 (Thu May 18 05:43:46 2023 ) → GPS = 1368423844 (Thu May 18 05:43:46 2023 ) |
| Omicron analysis time window (H1): | GPS = 1368423831 → GPS = 1368423847 |
| Omicron analysis time window (L1): | GPS = 1368423831 → GPS = 1368423847 |
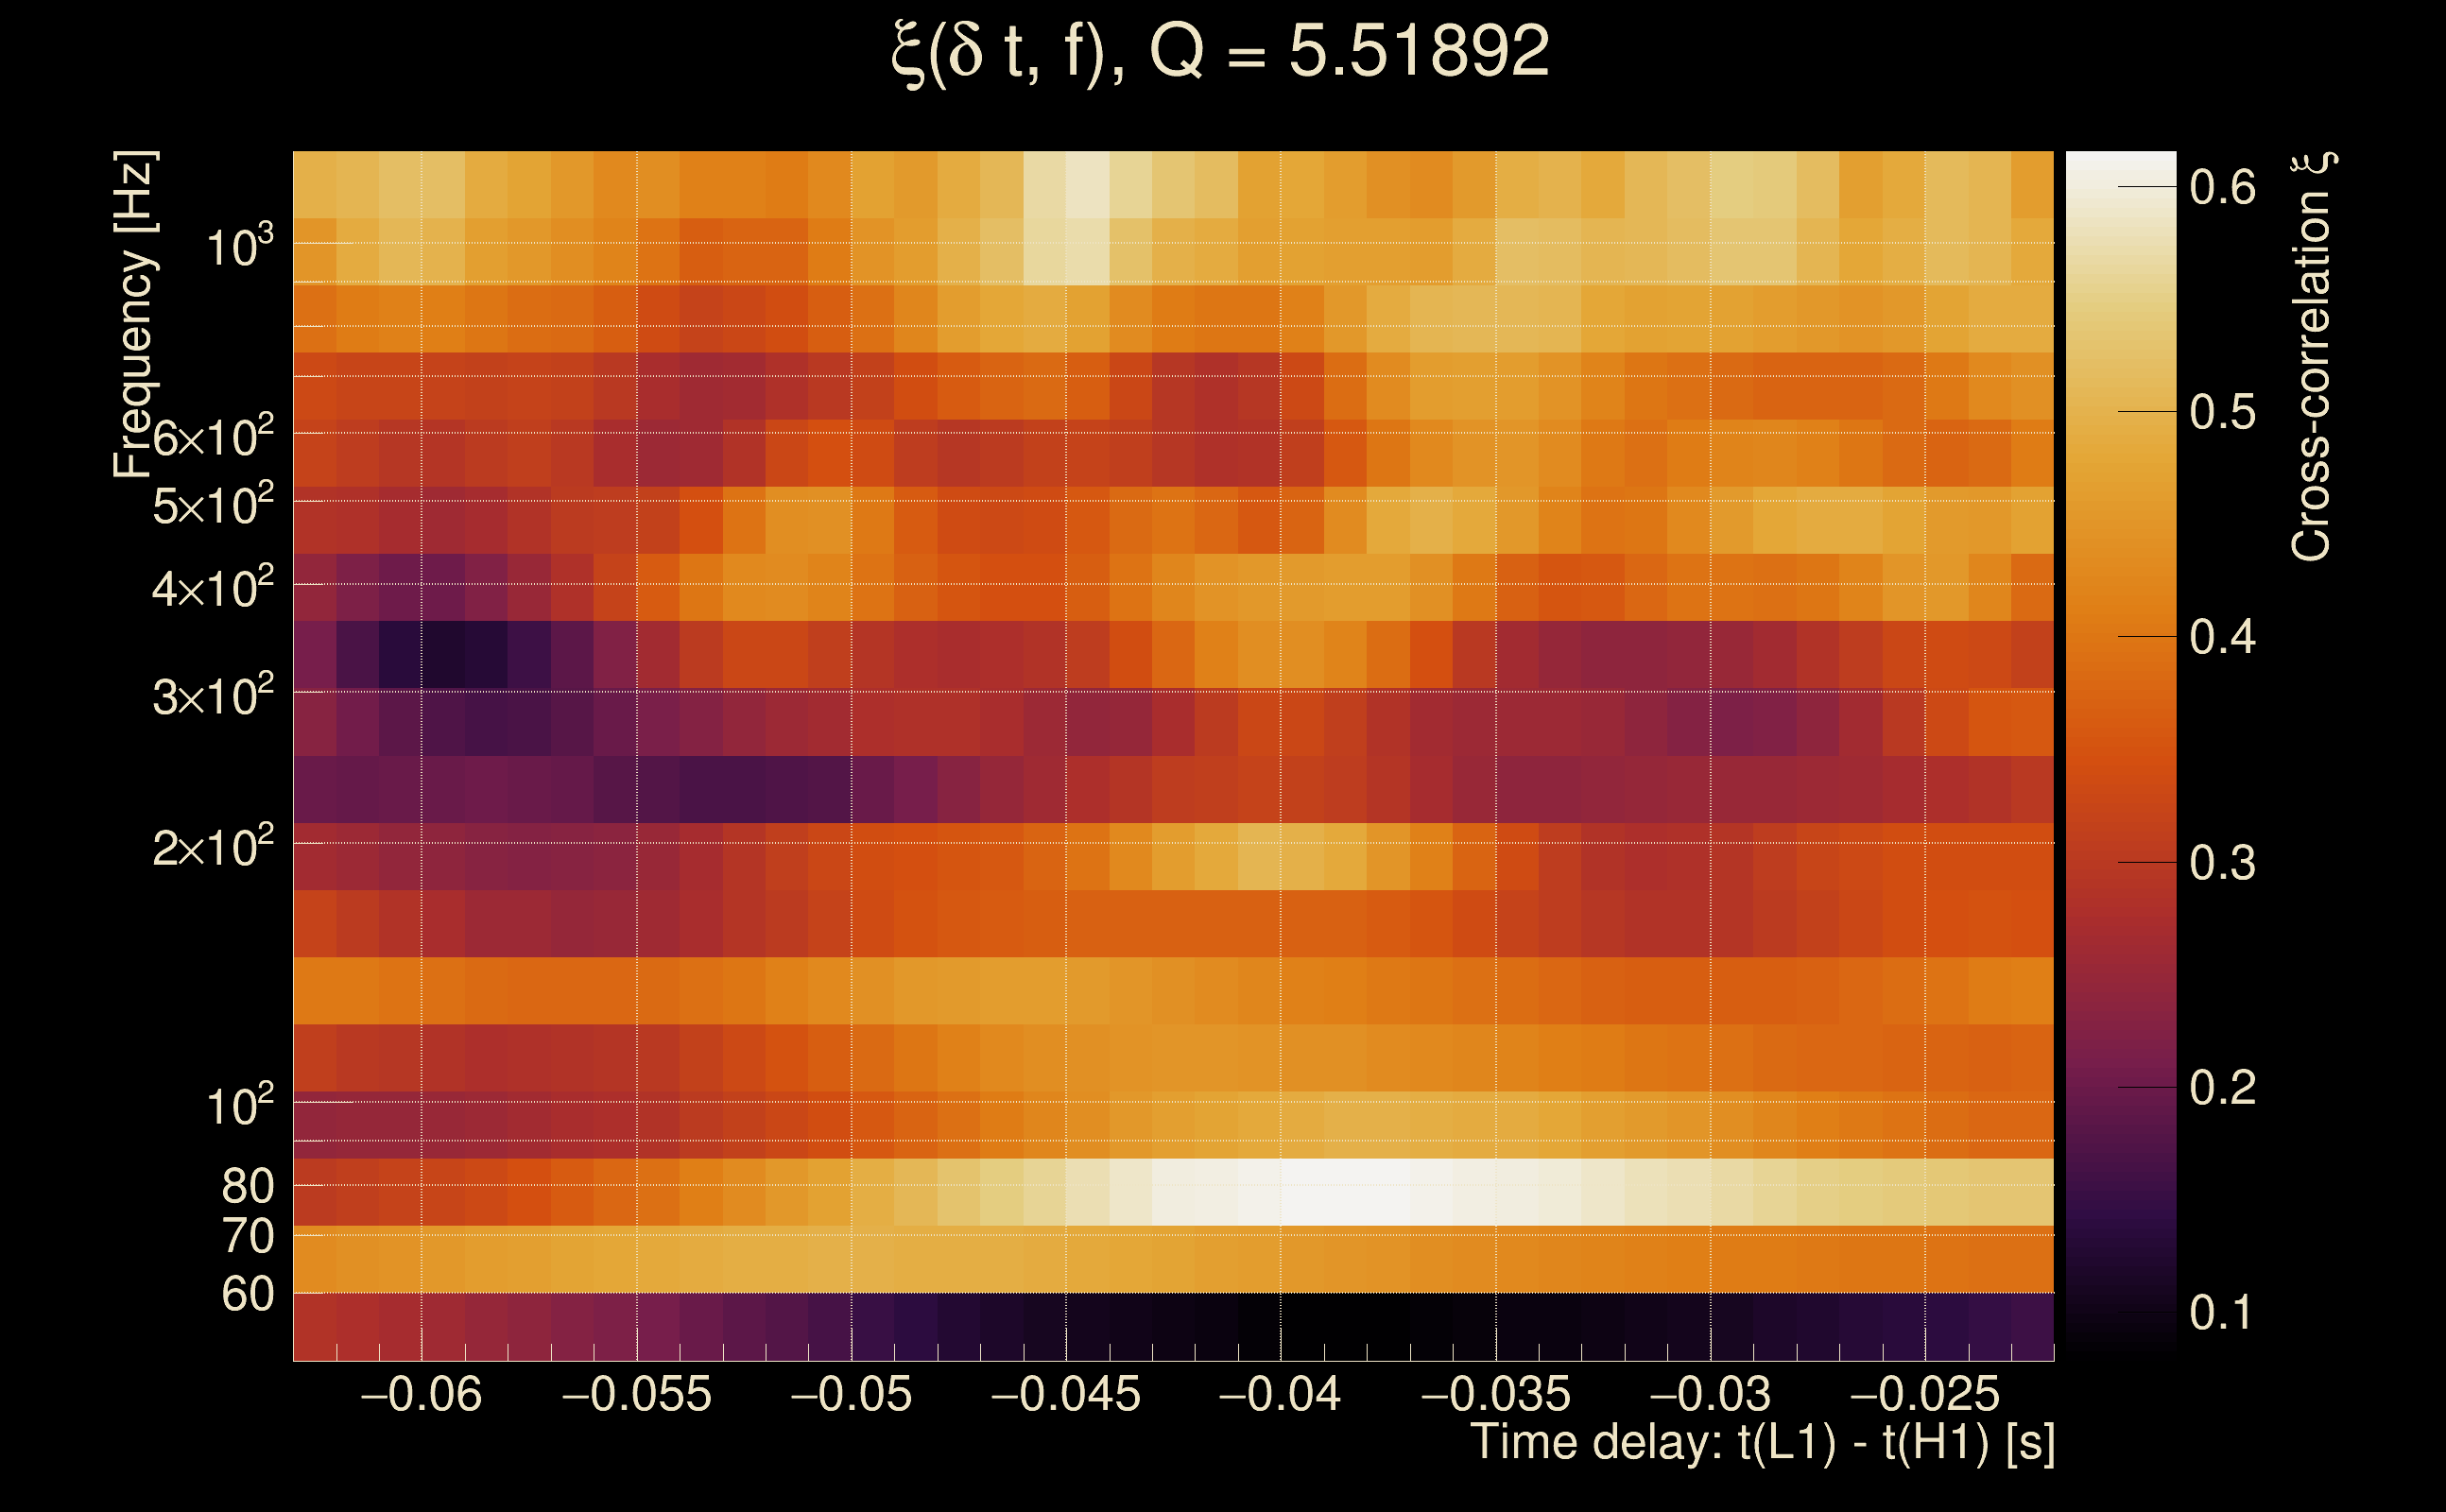
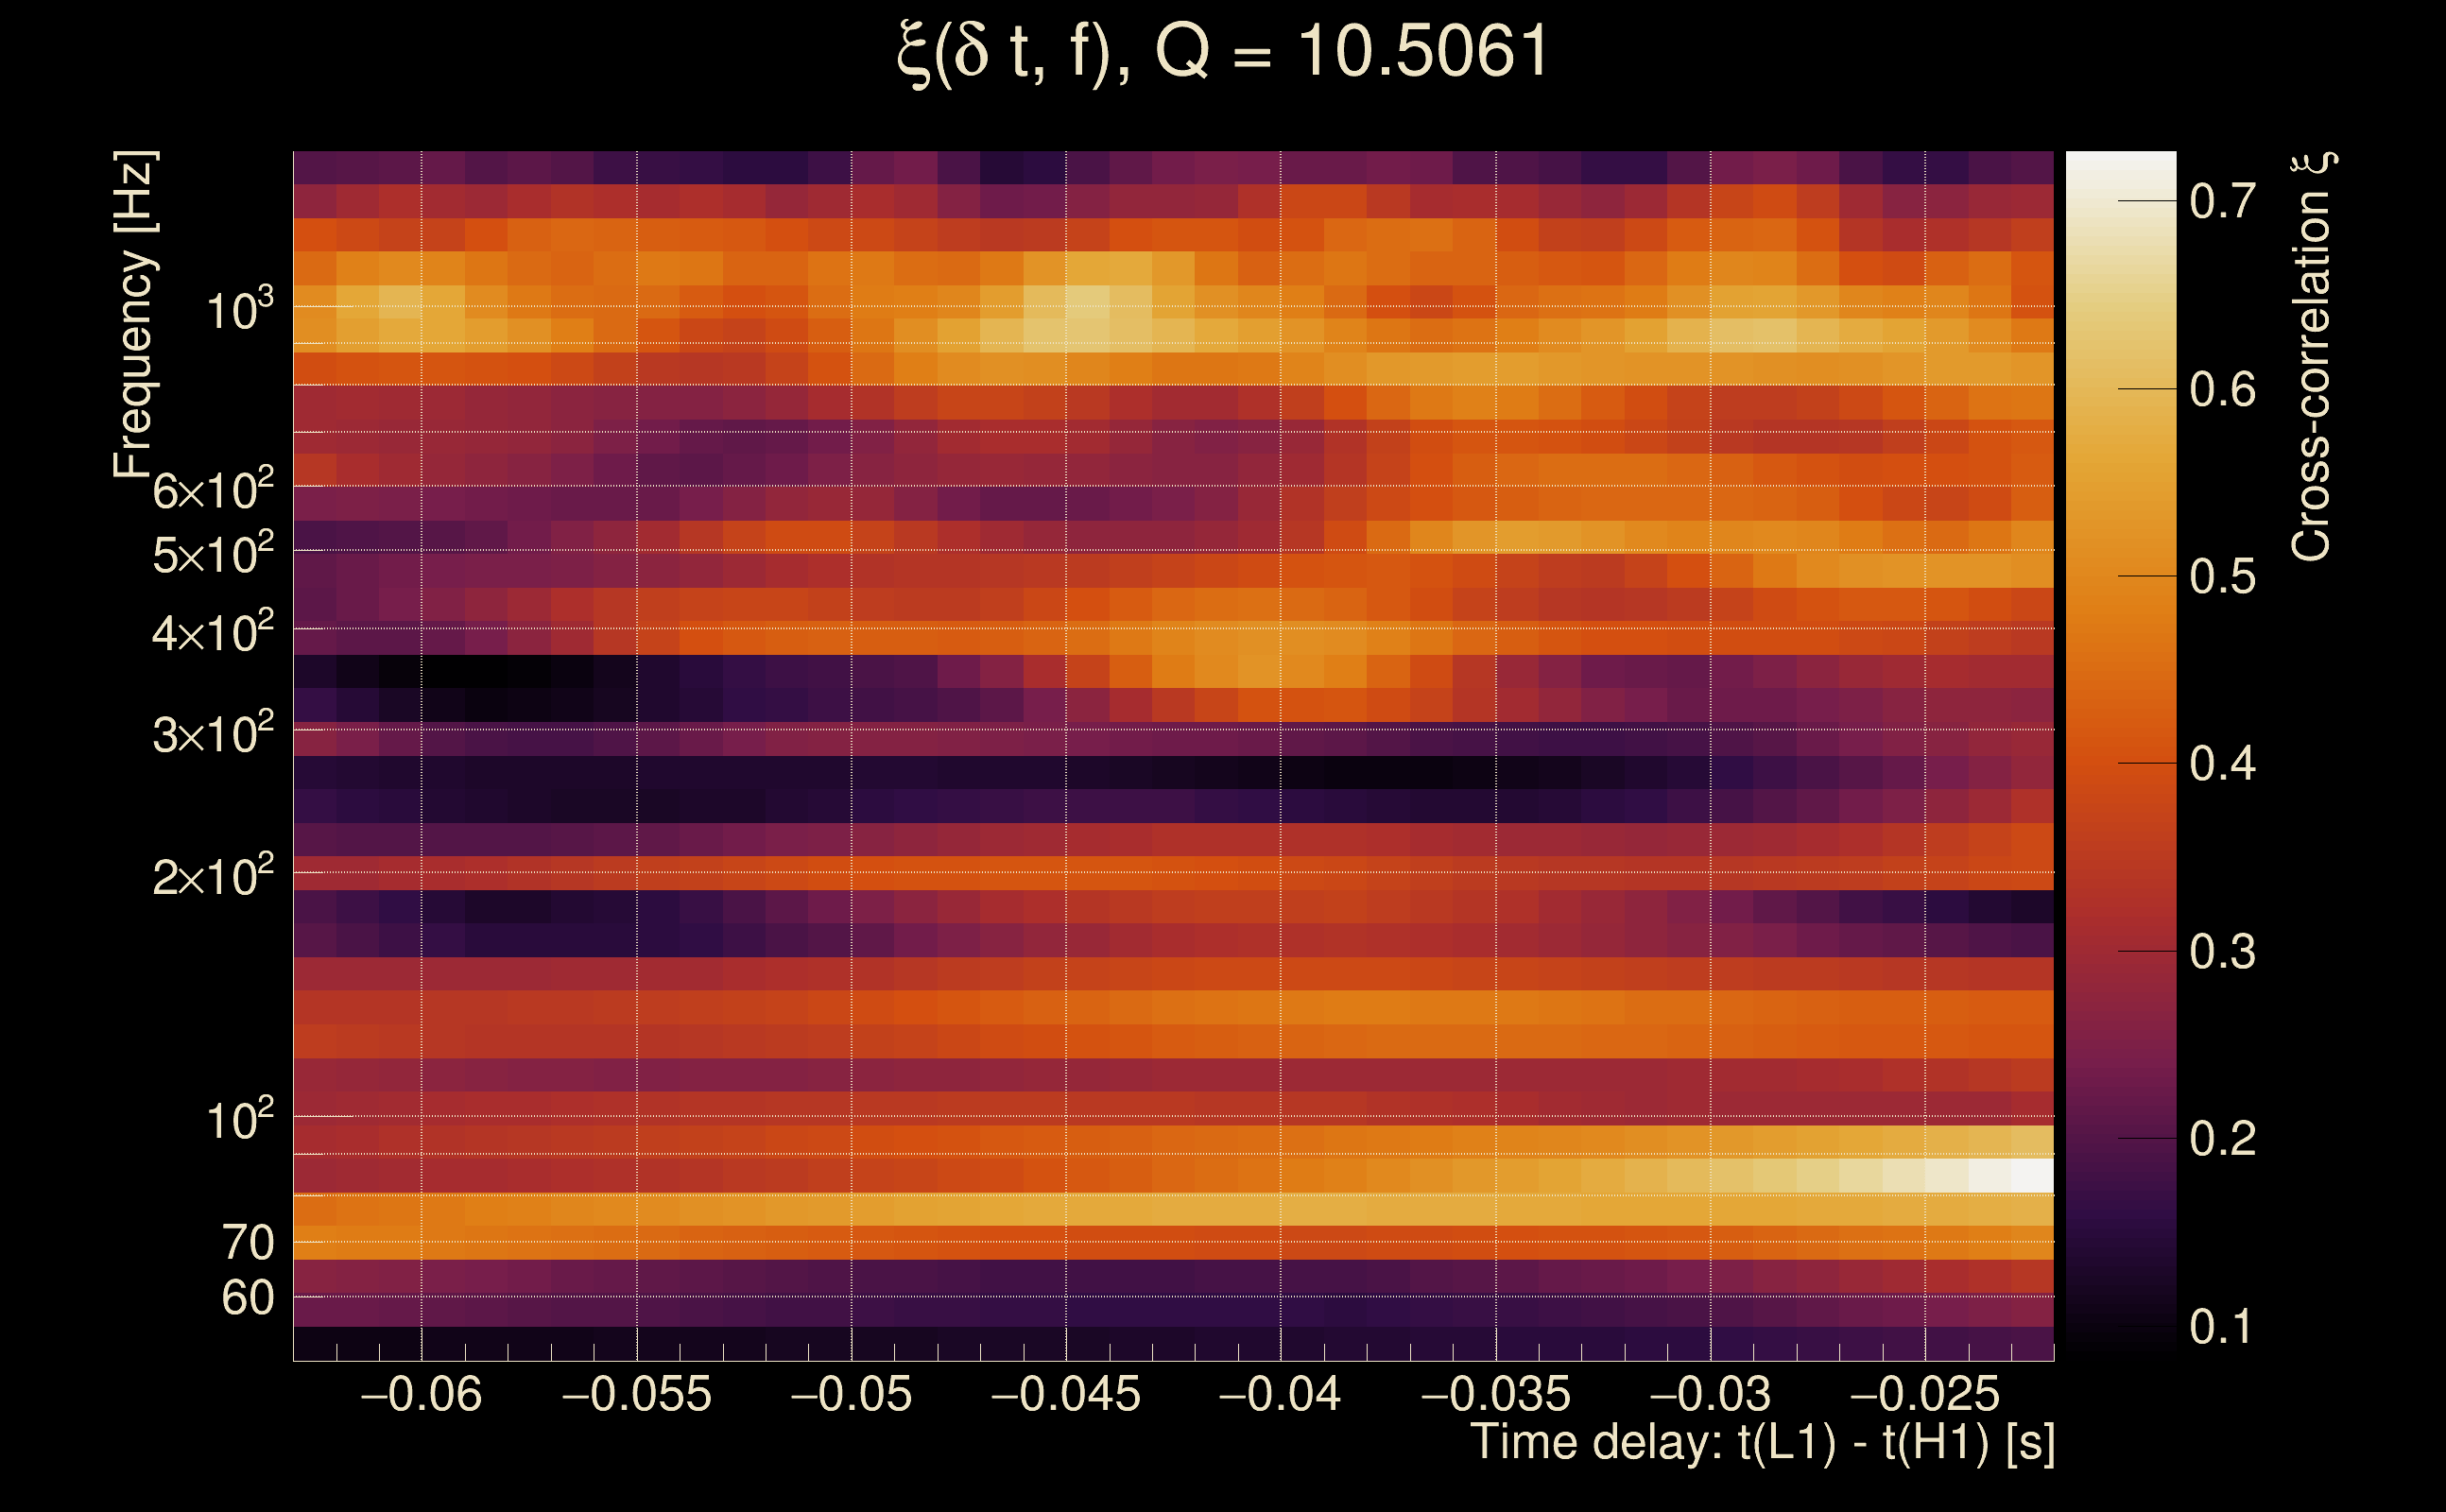
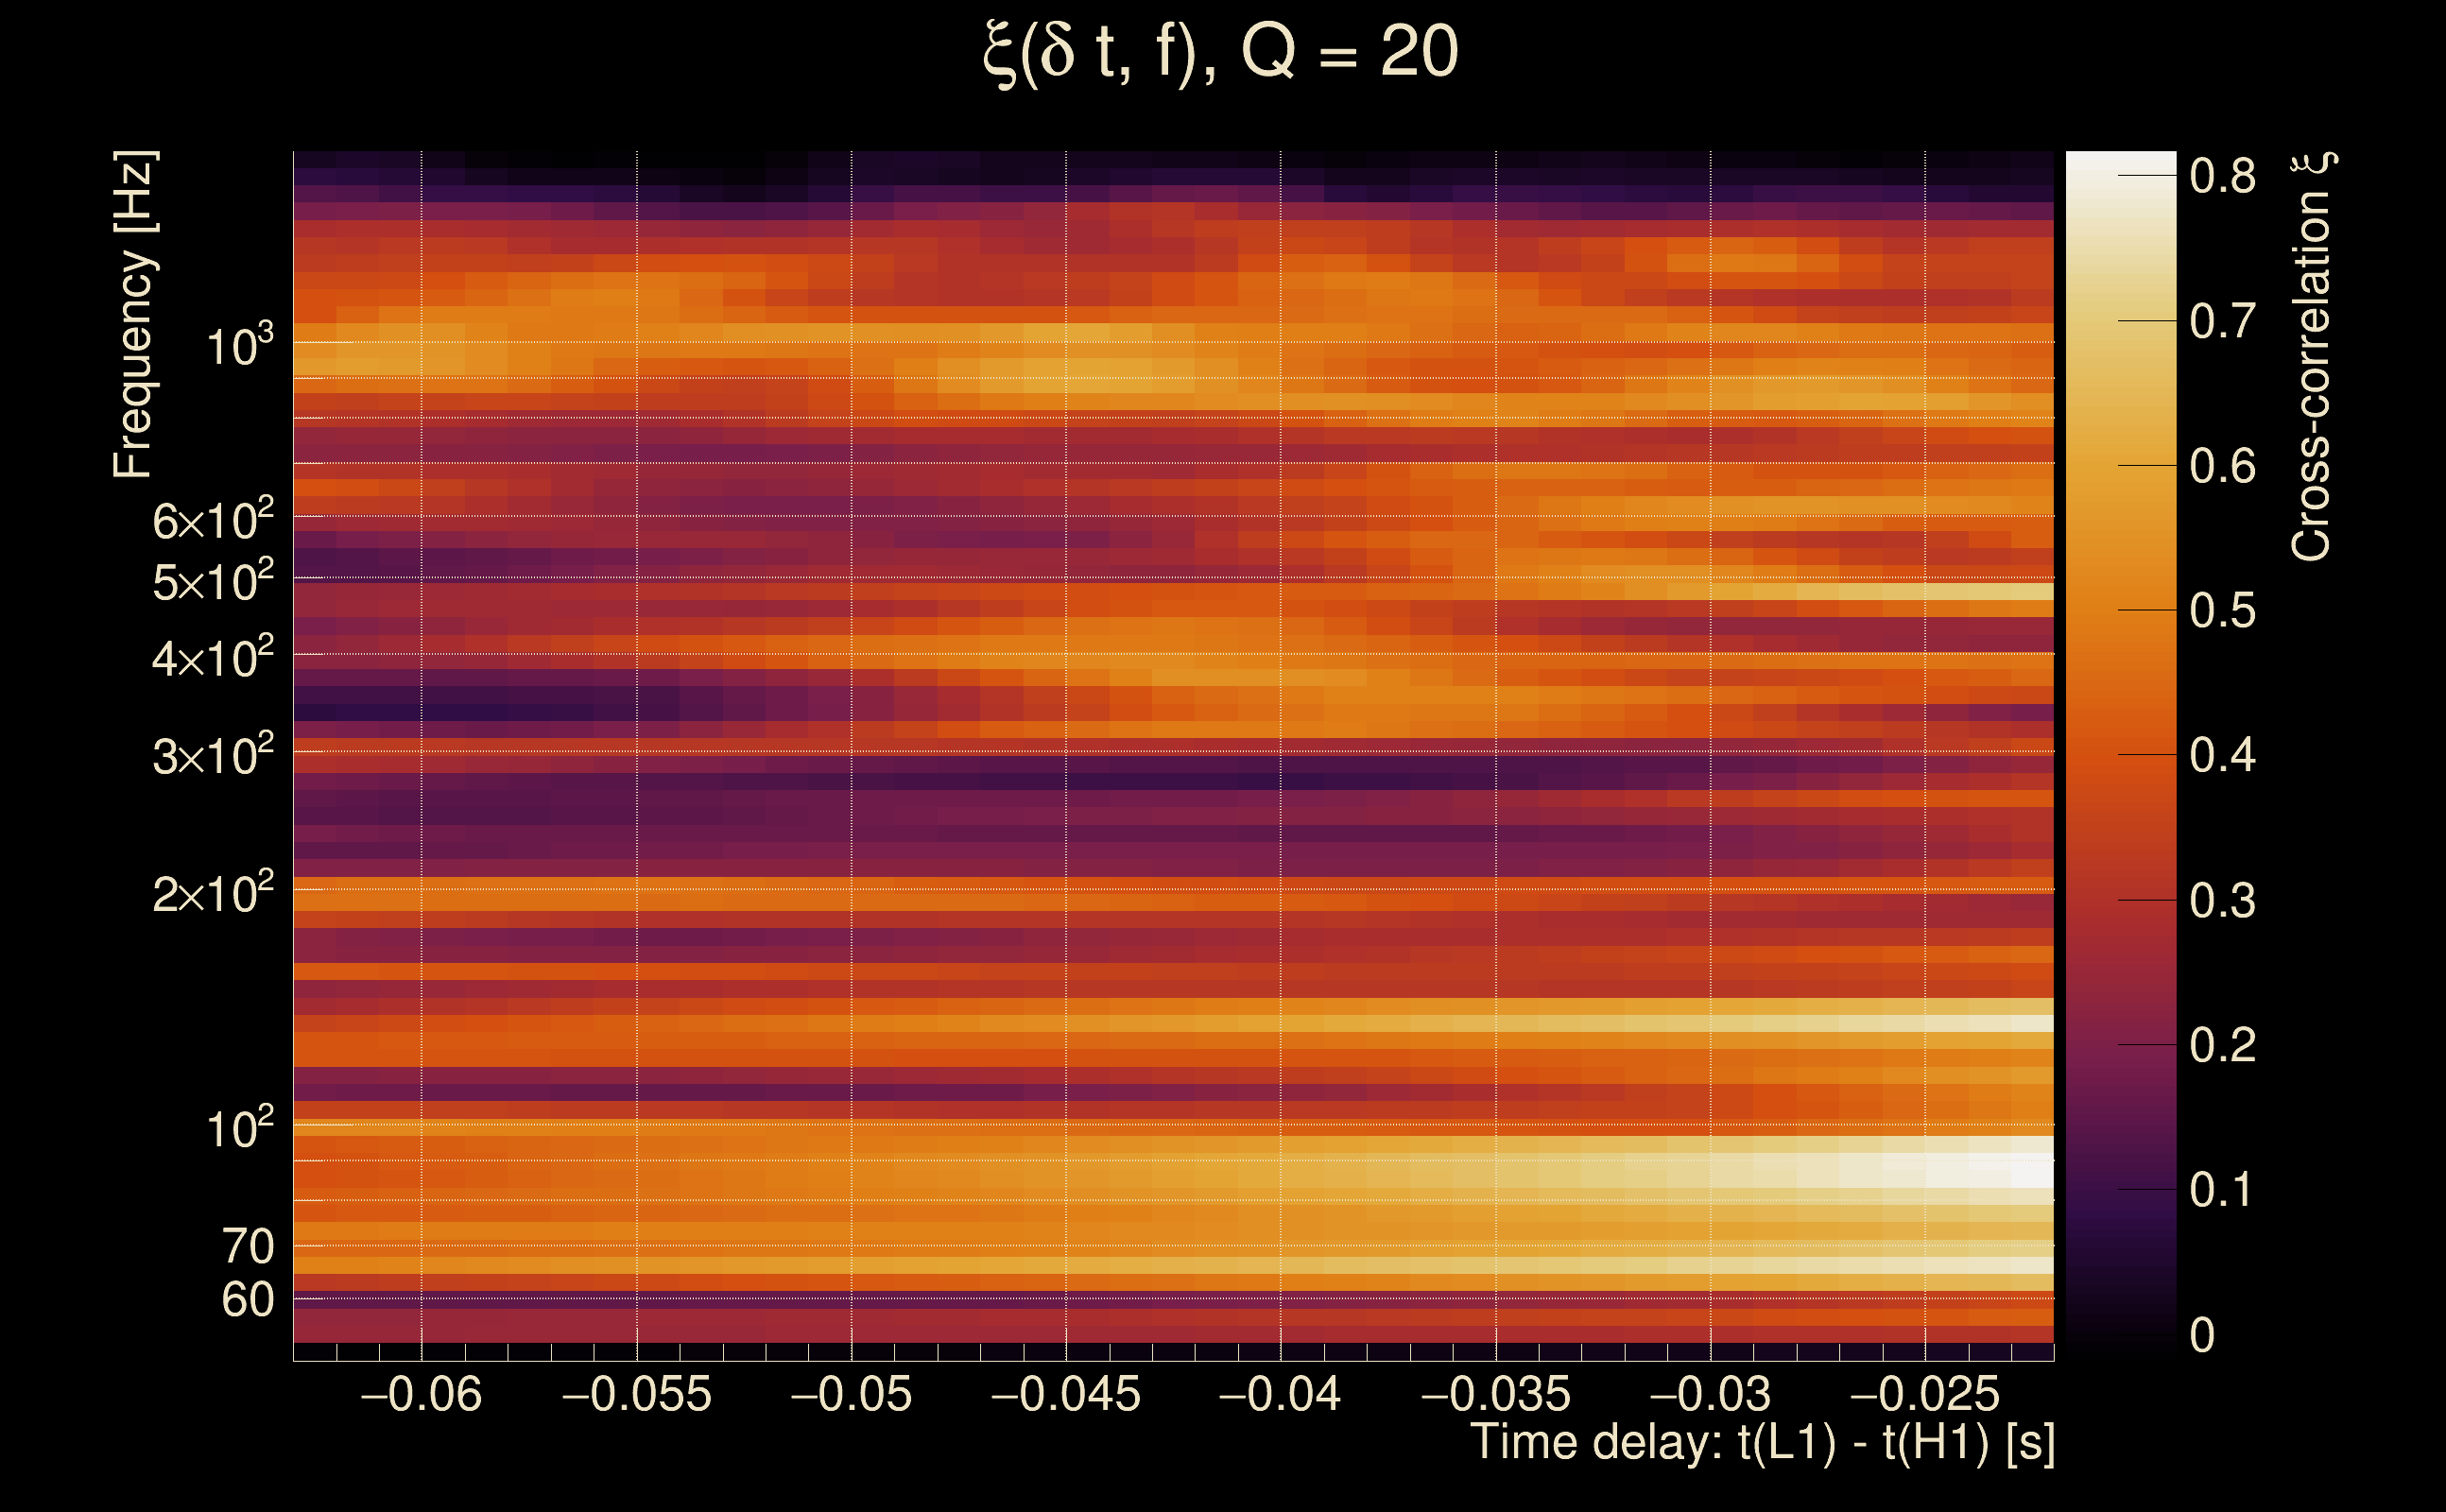
| Time delay between detectors t(L1) - t(H1): | -0.0424643 s (slice index = 109 / 217), δt_gw = 0.00353572 s |
| Time delay standard deviation: | 0.0677297 s |
| [targeted mode] Time delay probability: | 0.759871 (0.305651 sigmas), δt_target = -0.00957727 s |
| Frequency: | 384.288 Hz |
| Ξ: | 0.317847 ± 0.0105219 (variance = 0.000110711): Q0: 0.492901, Q1: 0.497179, Q2: 0.498991, Q3: 0.511902, Q4: 0.521242 |
| Rank: | R_A = 0.317847 |
| Log of amplitude ratio (L1/H1): | -0.138034, variance = 0.153787 (L1/H1: -0.462505, variance = 0.304756, H1/L1: -0.192823, variance = 0.310445) |
| Amplitude ratio (L1/H1): | 0.871069 ⋇ 1.48017 (L1/H1: 0.629704 ⋇ 1.7368, H1/L1: 0.824628 ⋇ 1.74574) |
| Amplitude ratio H1|L1 compatibility (probability): | 0.403433 |
| Antenna factor probability: | 0.924767 |
| Number of rejected frequency rows: | Q0: 2 / 18, Q1: 17 / 36, Q2: 50 / 70, Q3: 107 / 134, Q4: 233 / 258 |
| Maximum signal-to-noise ratio: | H1: 59.9591, L1: 59.3776 |
| SNR variance: | H1: 2.28823, L1: 2.1284 |
| Click here for a zoomed plot | Click here for a zoomed plot | Click here for a zoomed plot | Click here for a zoomed plot | Click here for a zoomed plot |
 |
 |
 |
 |
 |
 |
 |
 |
 |
 |
 |
 |
 |
 |
 |
 |
 |
 |
 |
 |
 |
 |
 |
 |
 |
 |
 |
 |
 |
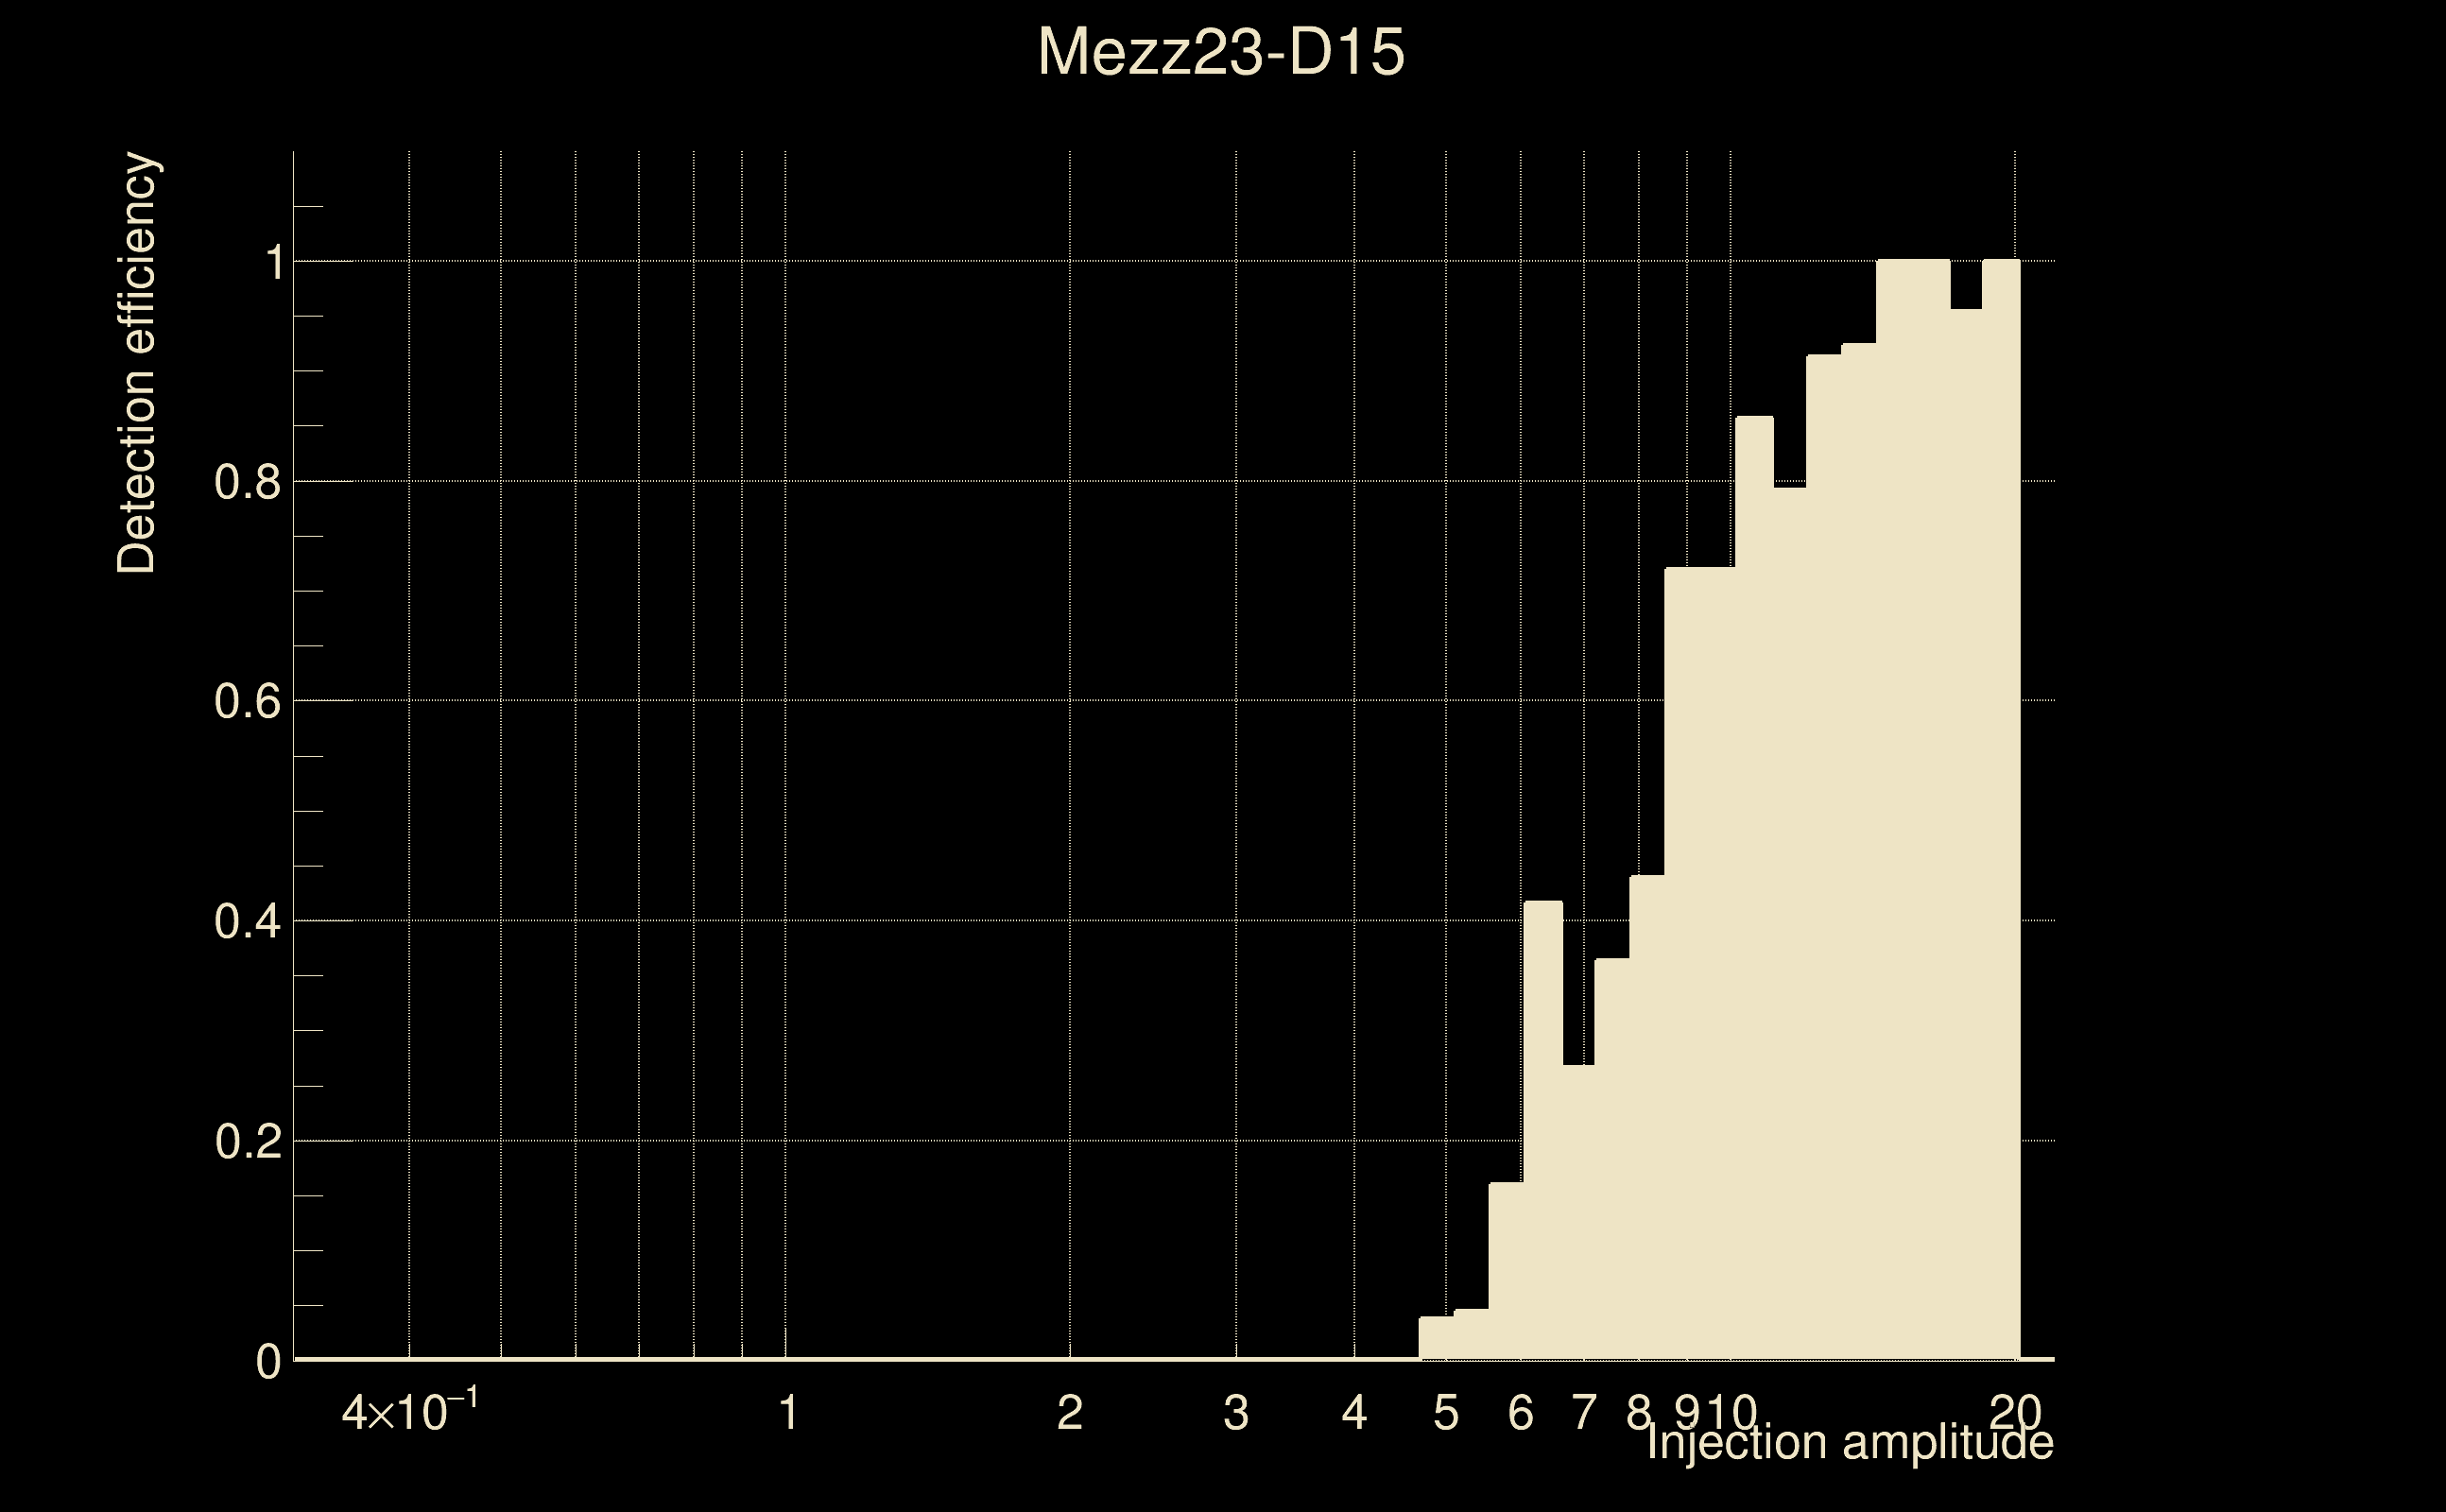
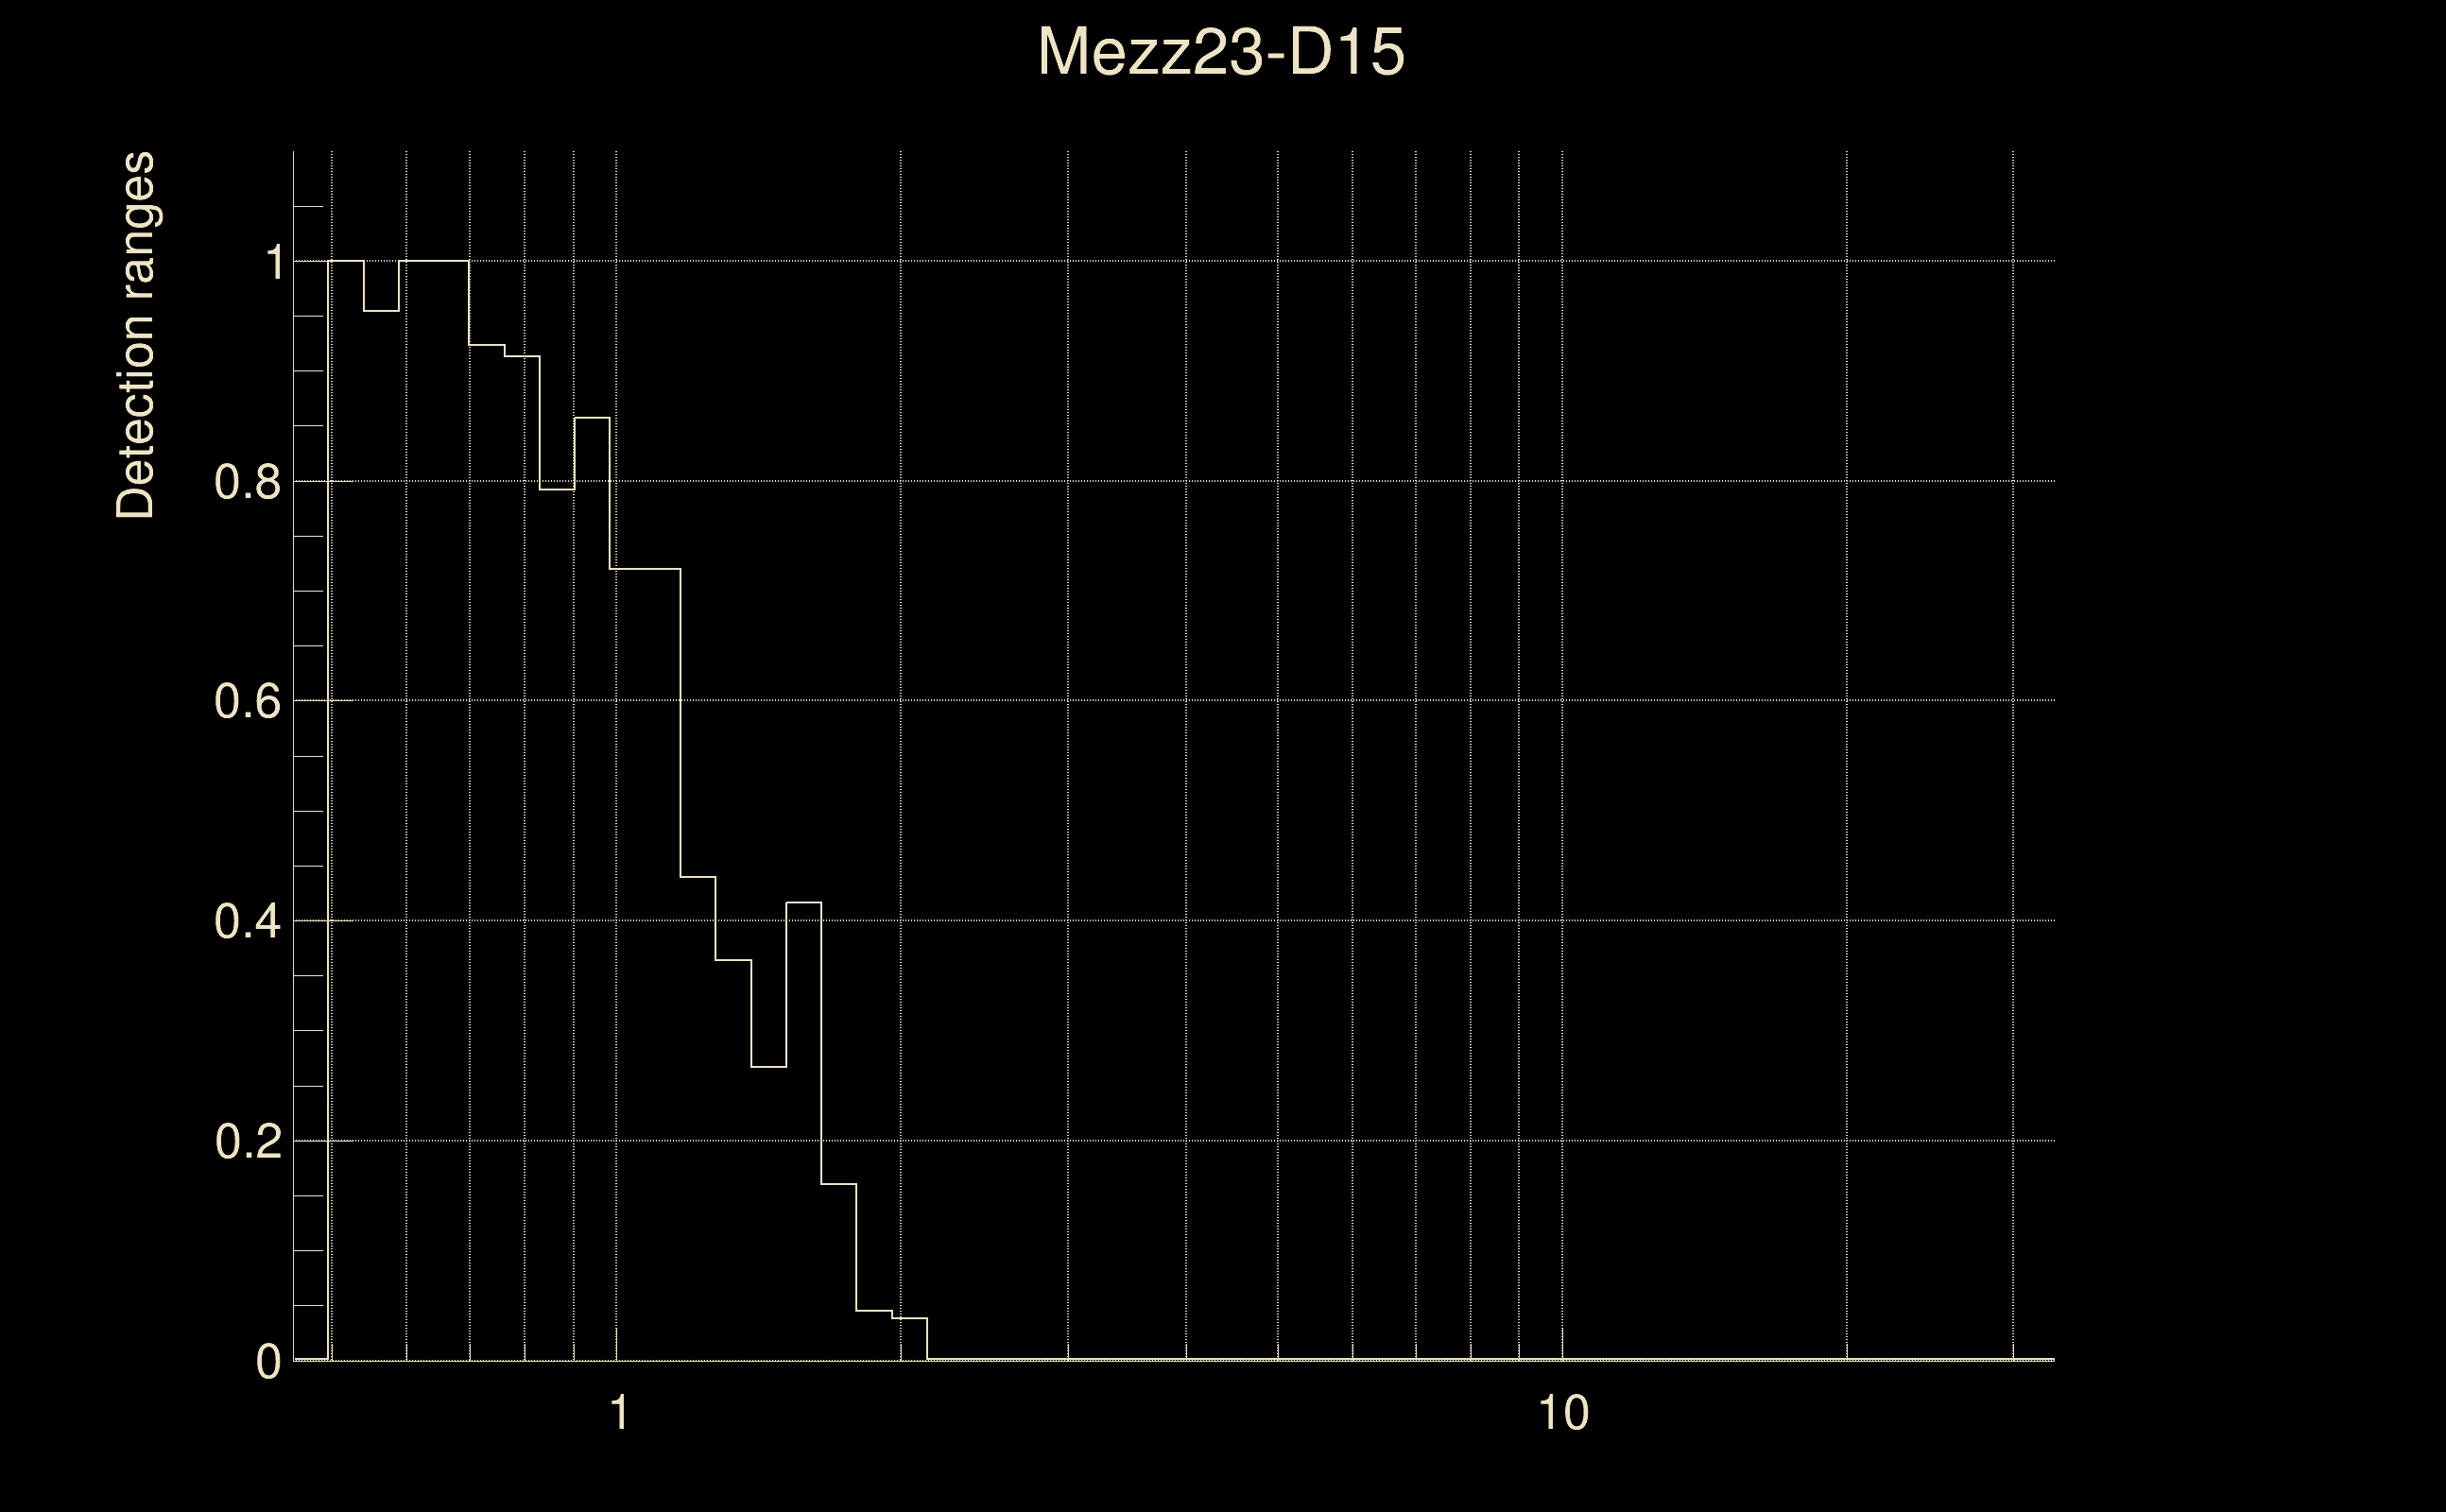
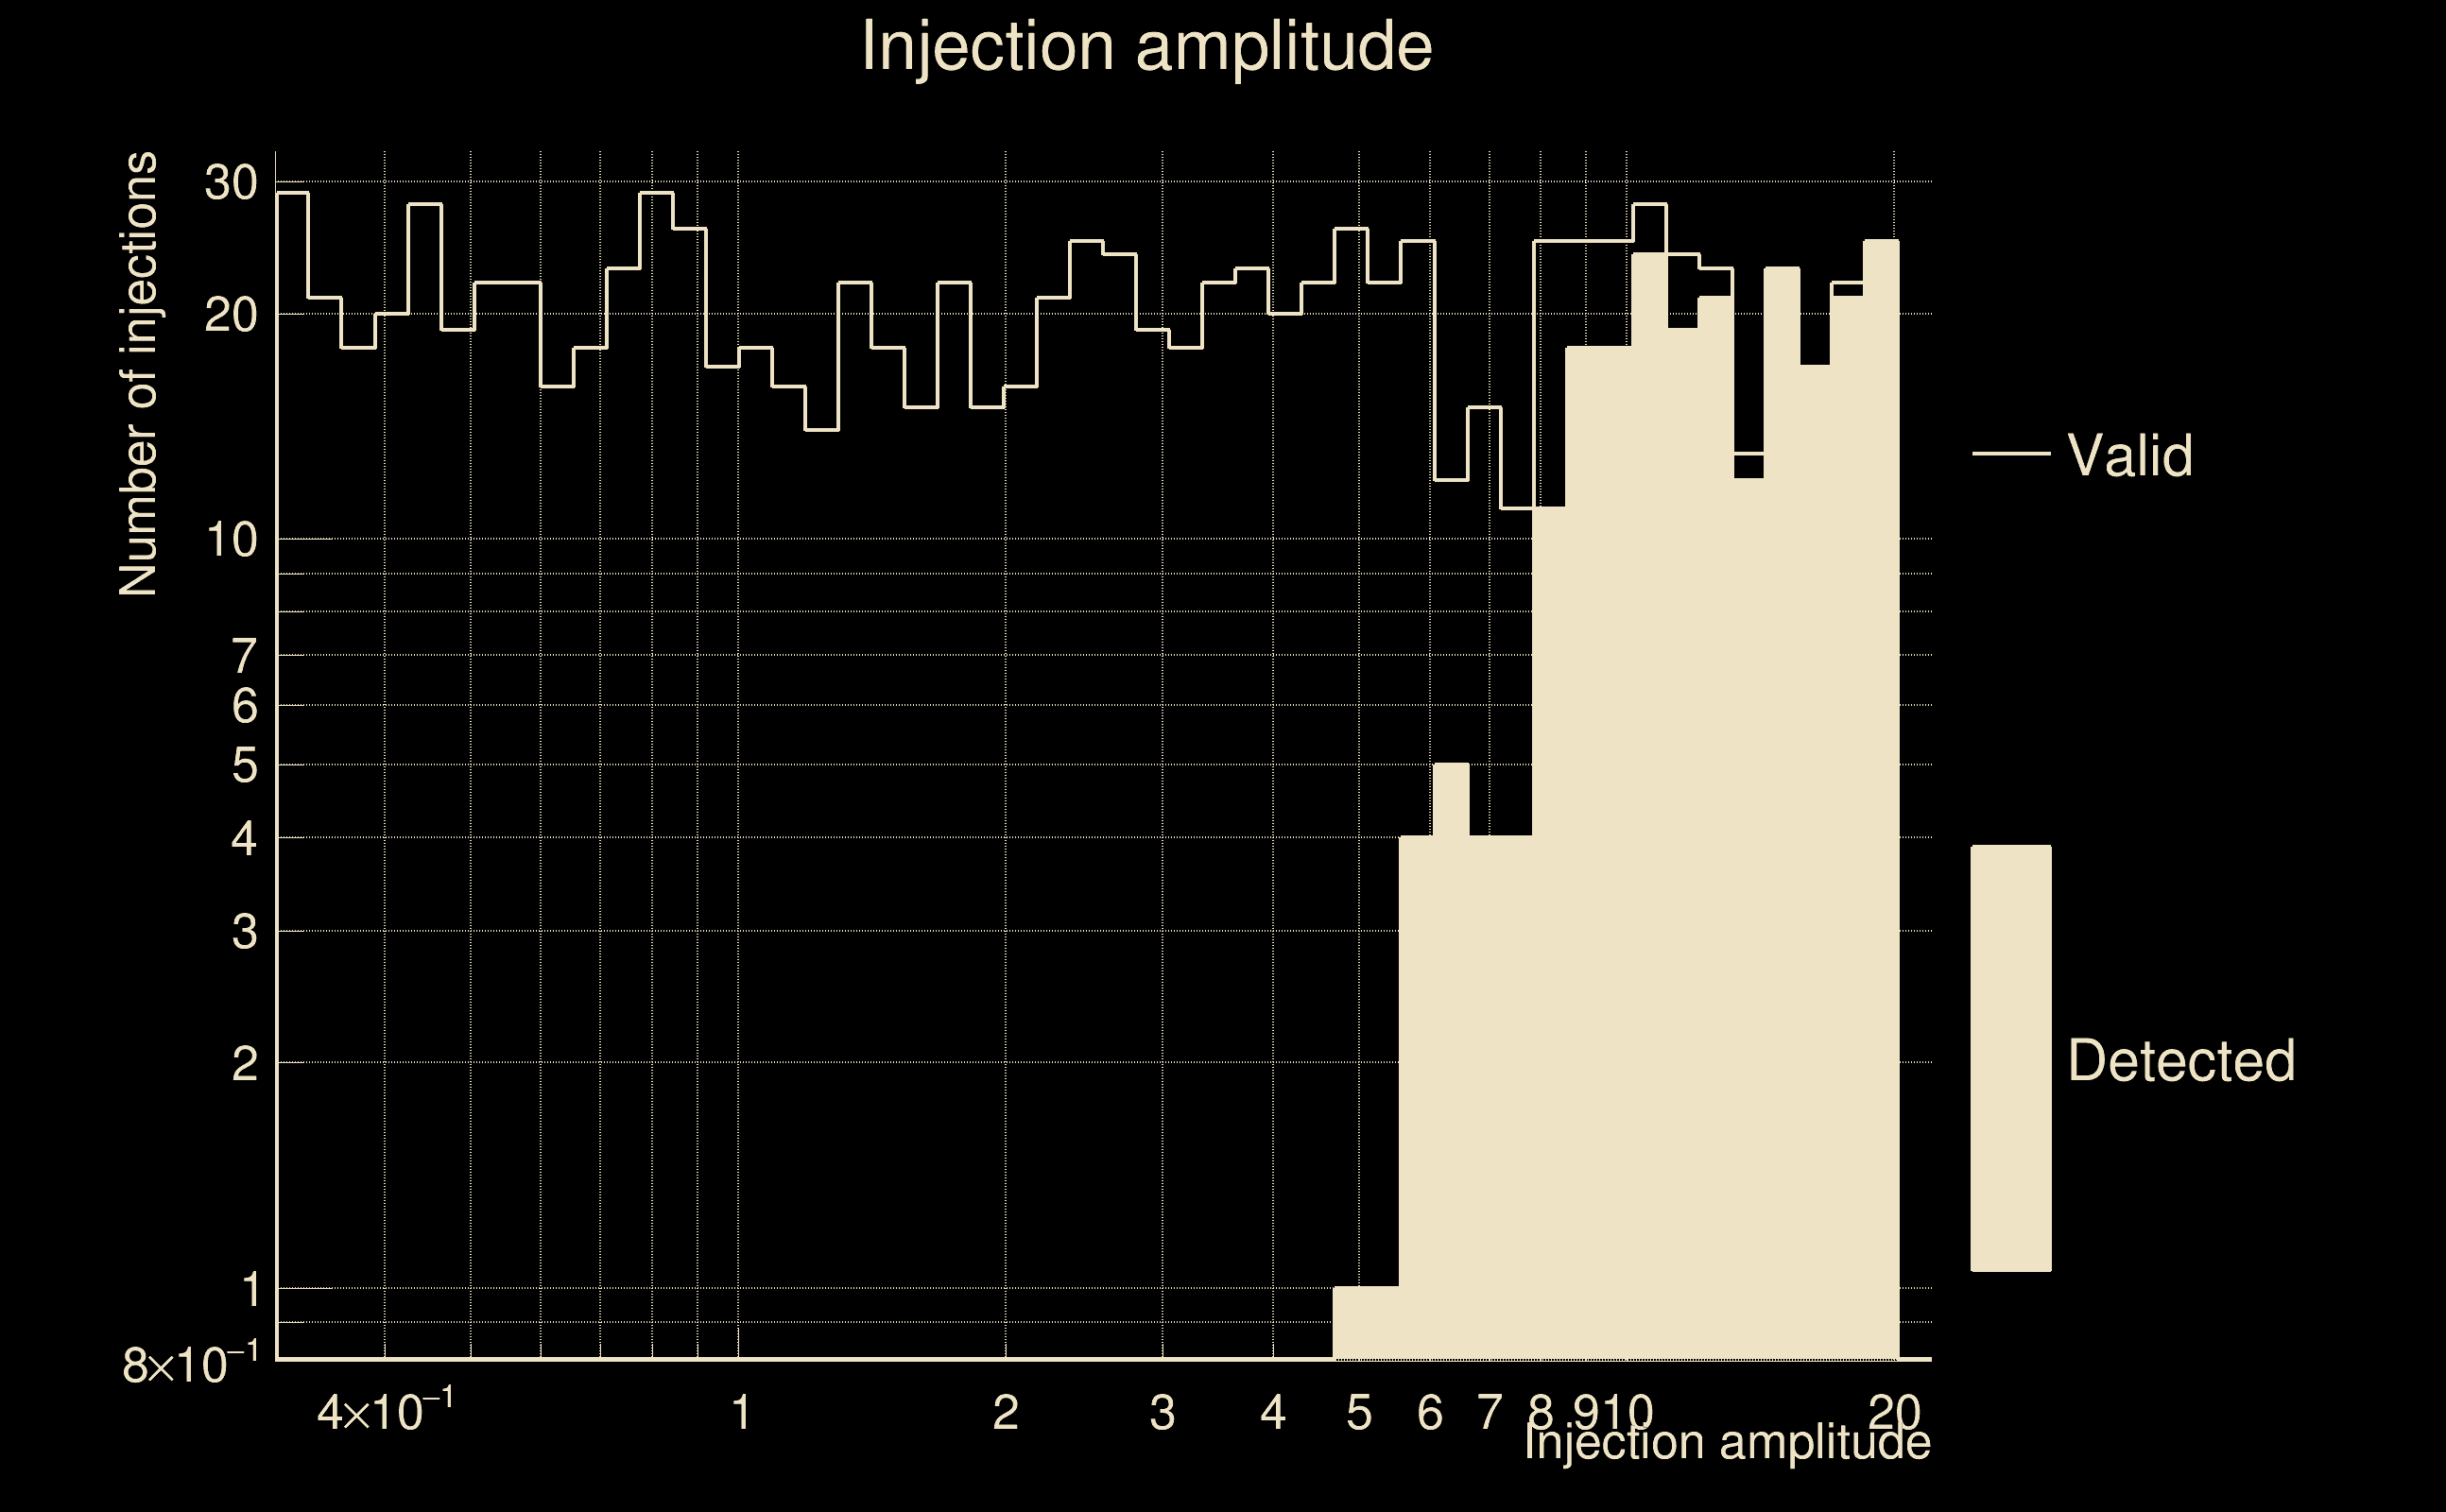
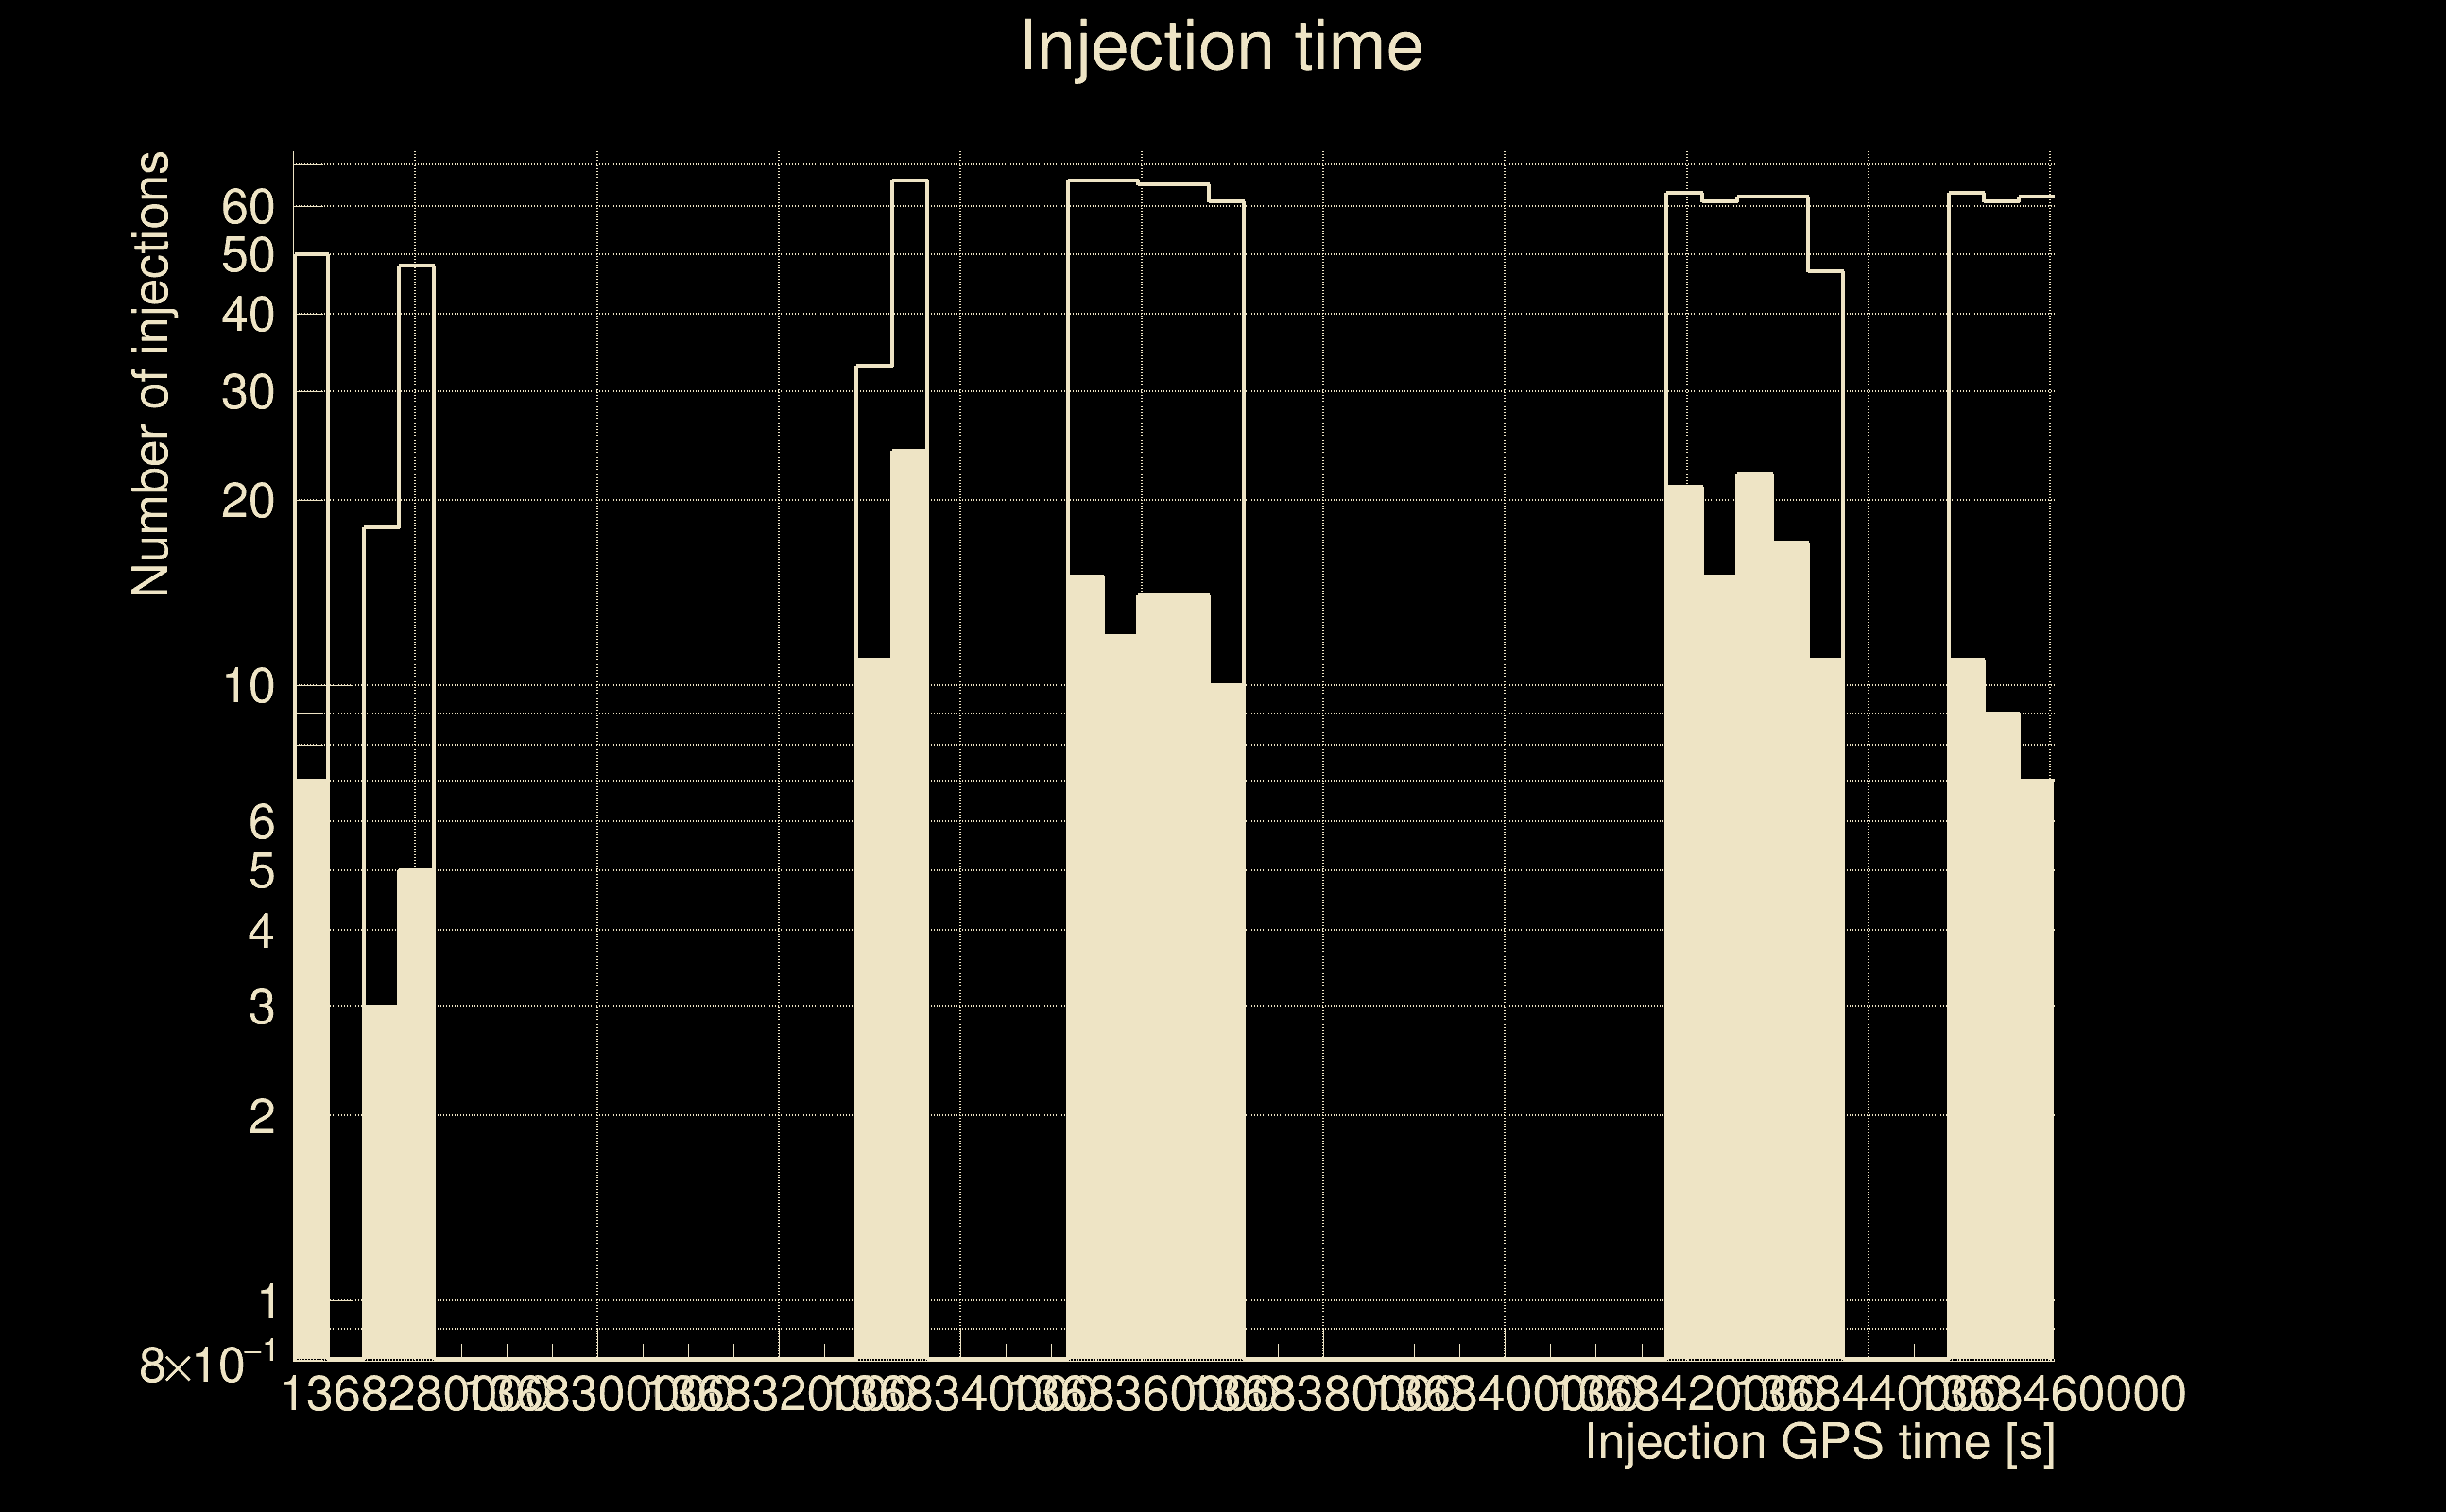
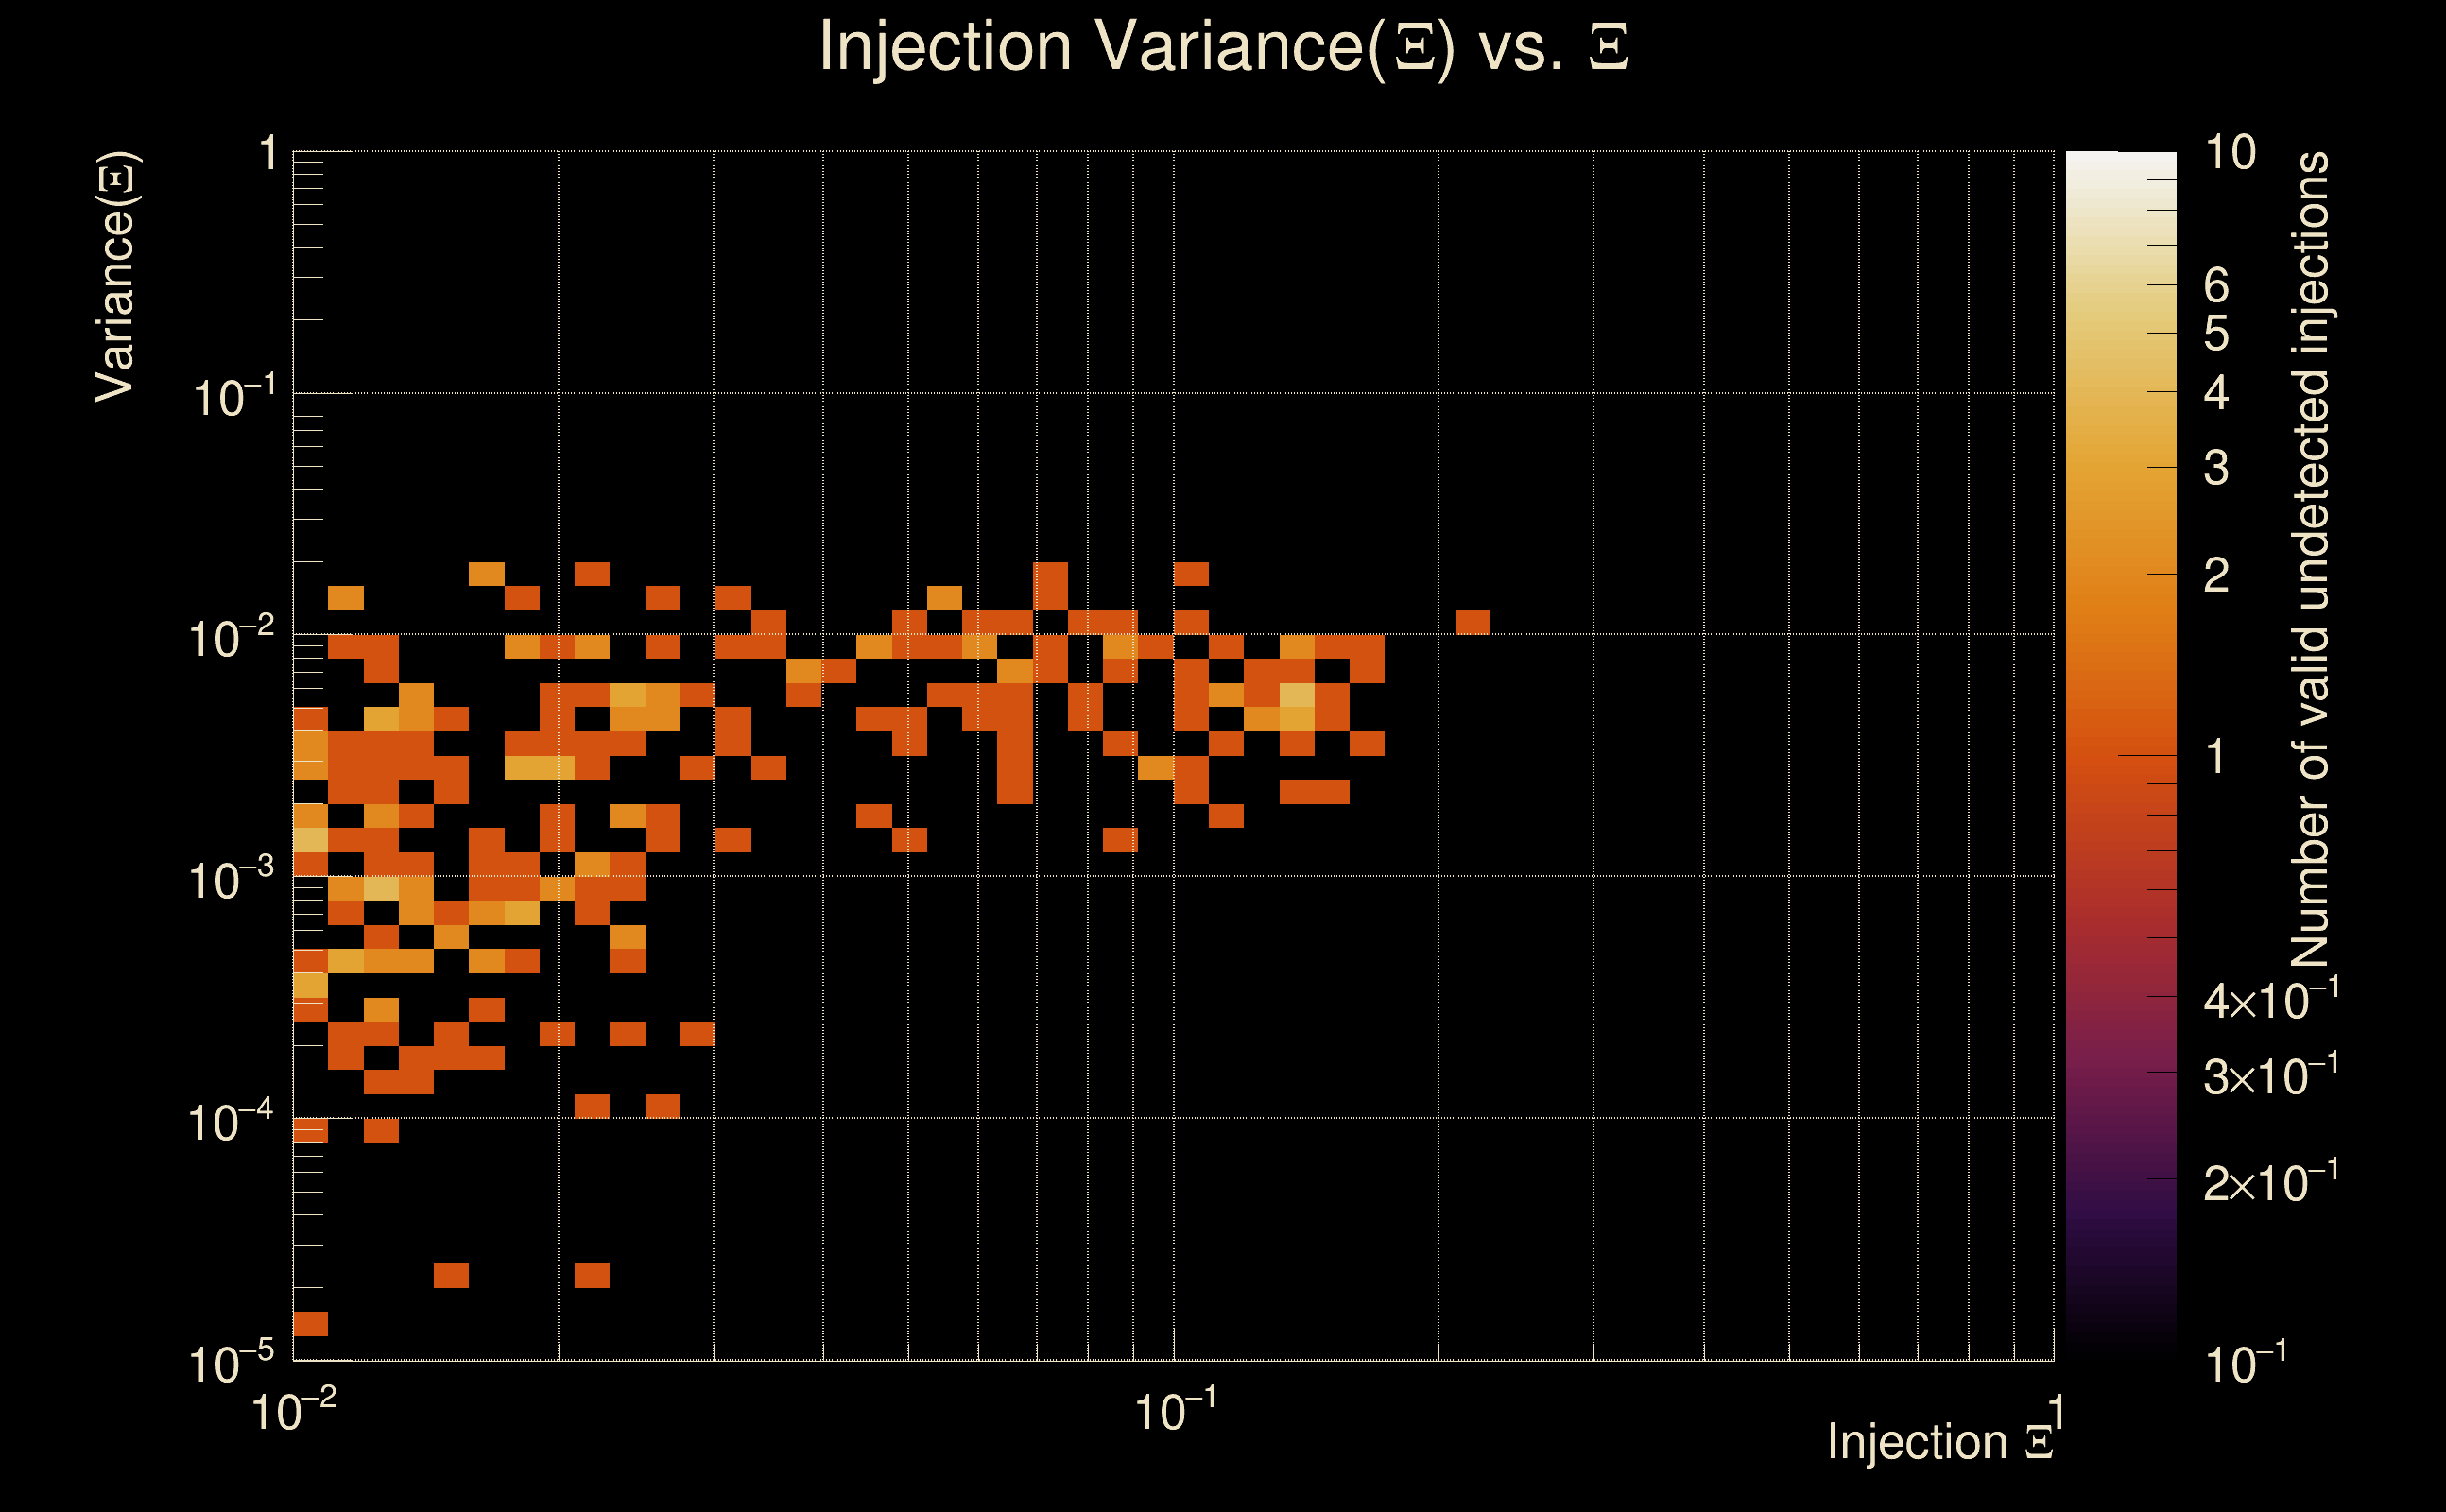
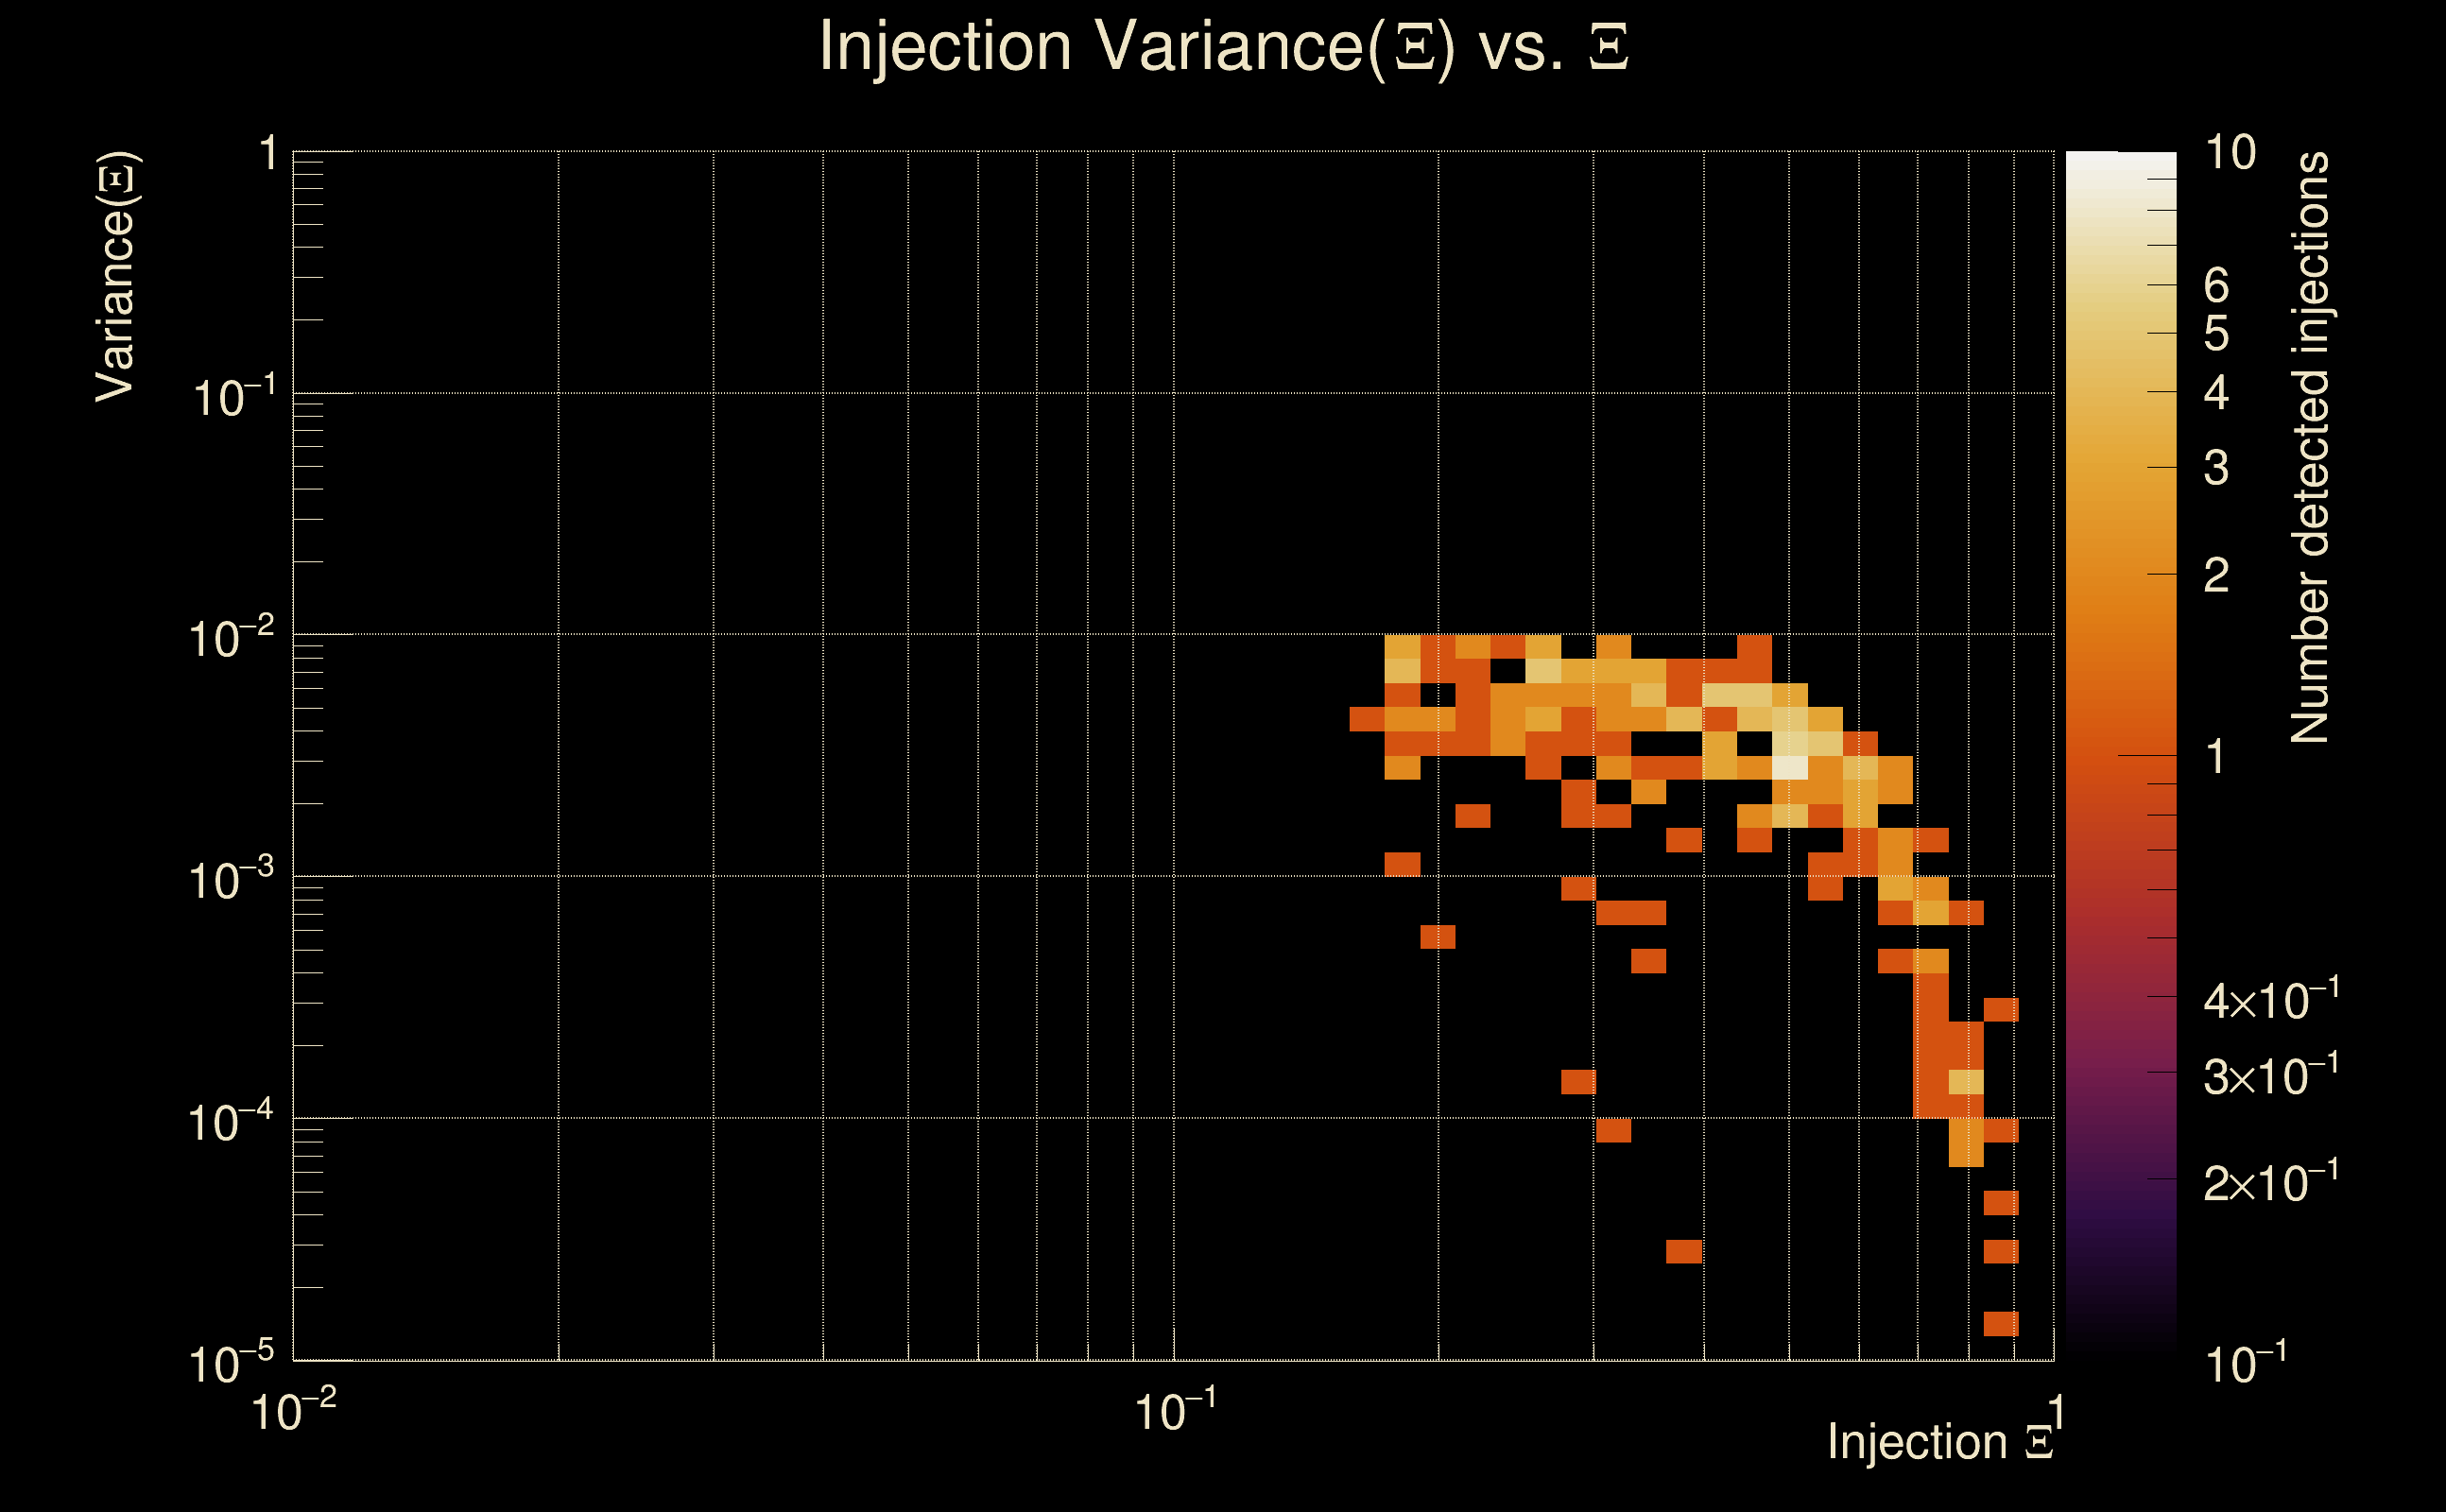
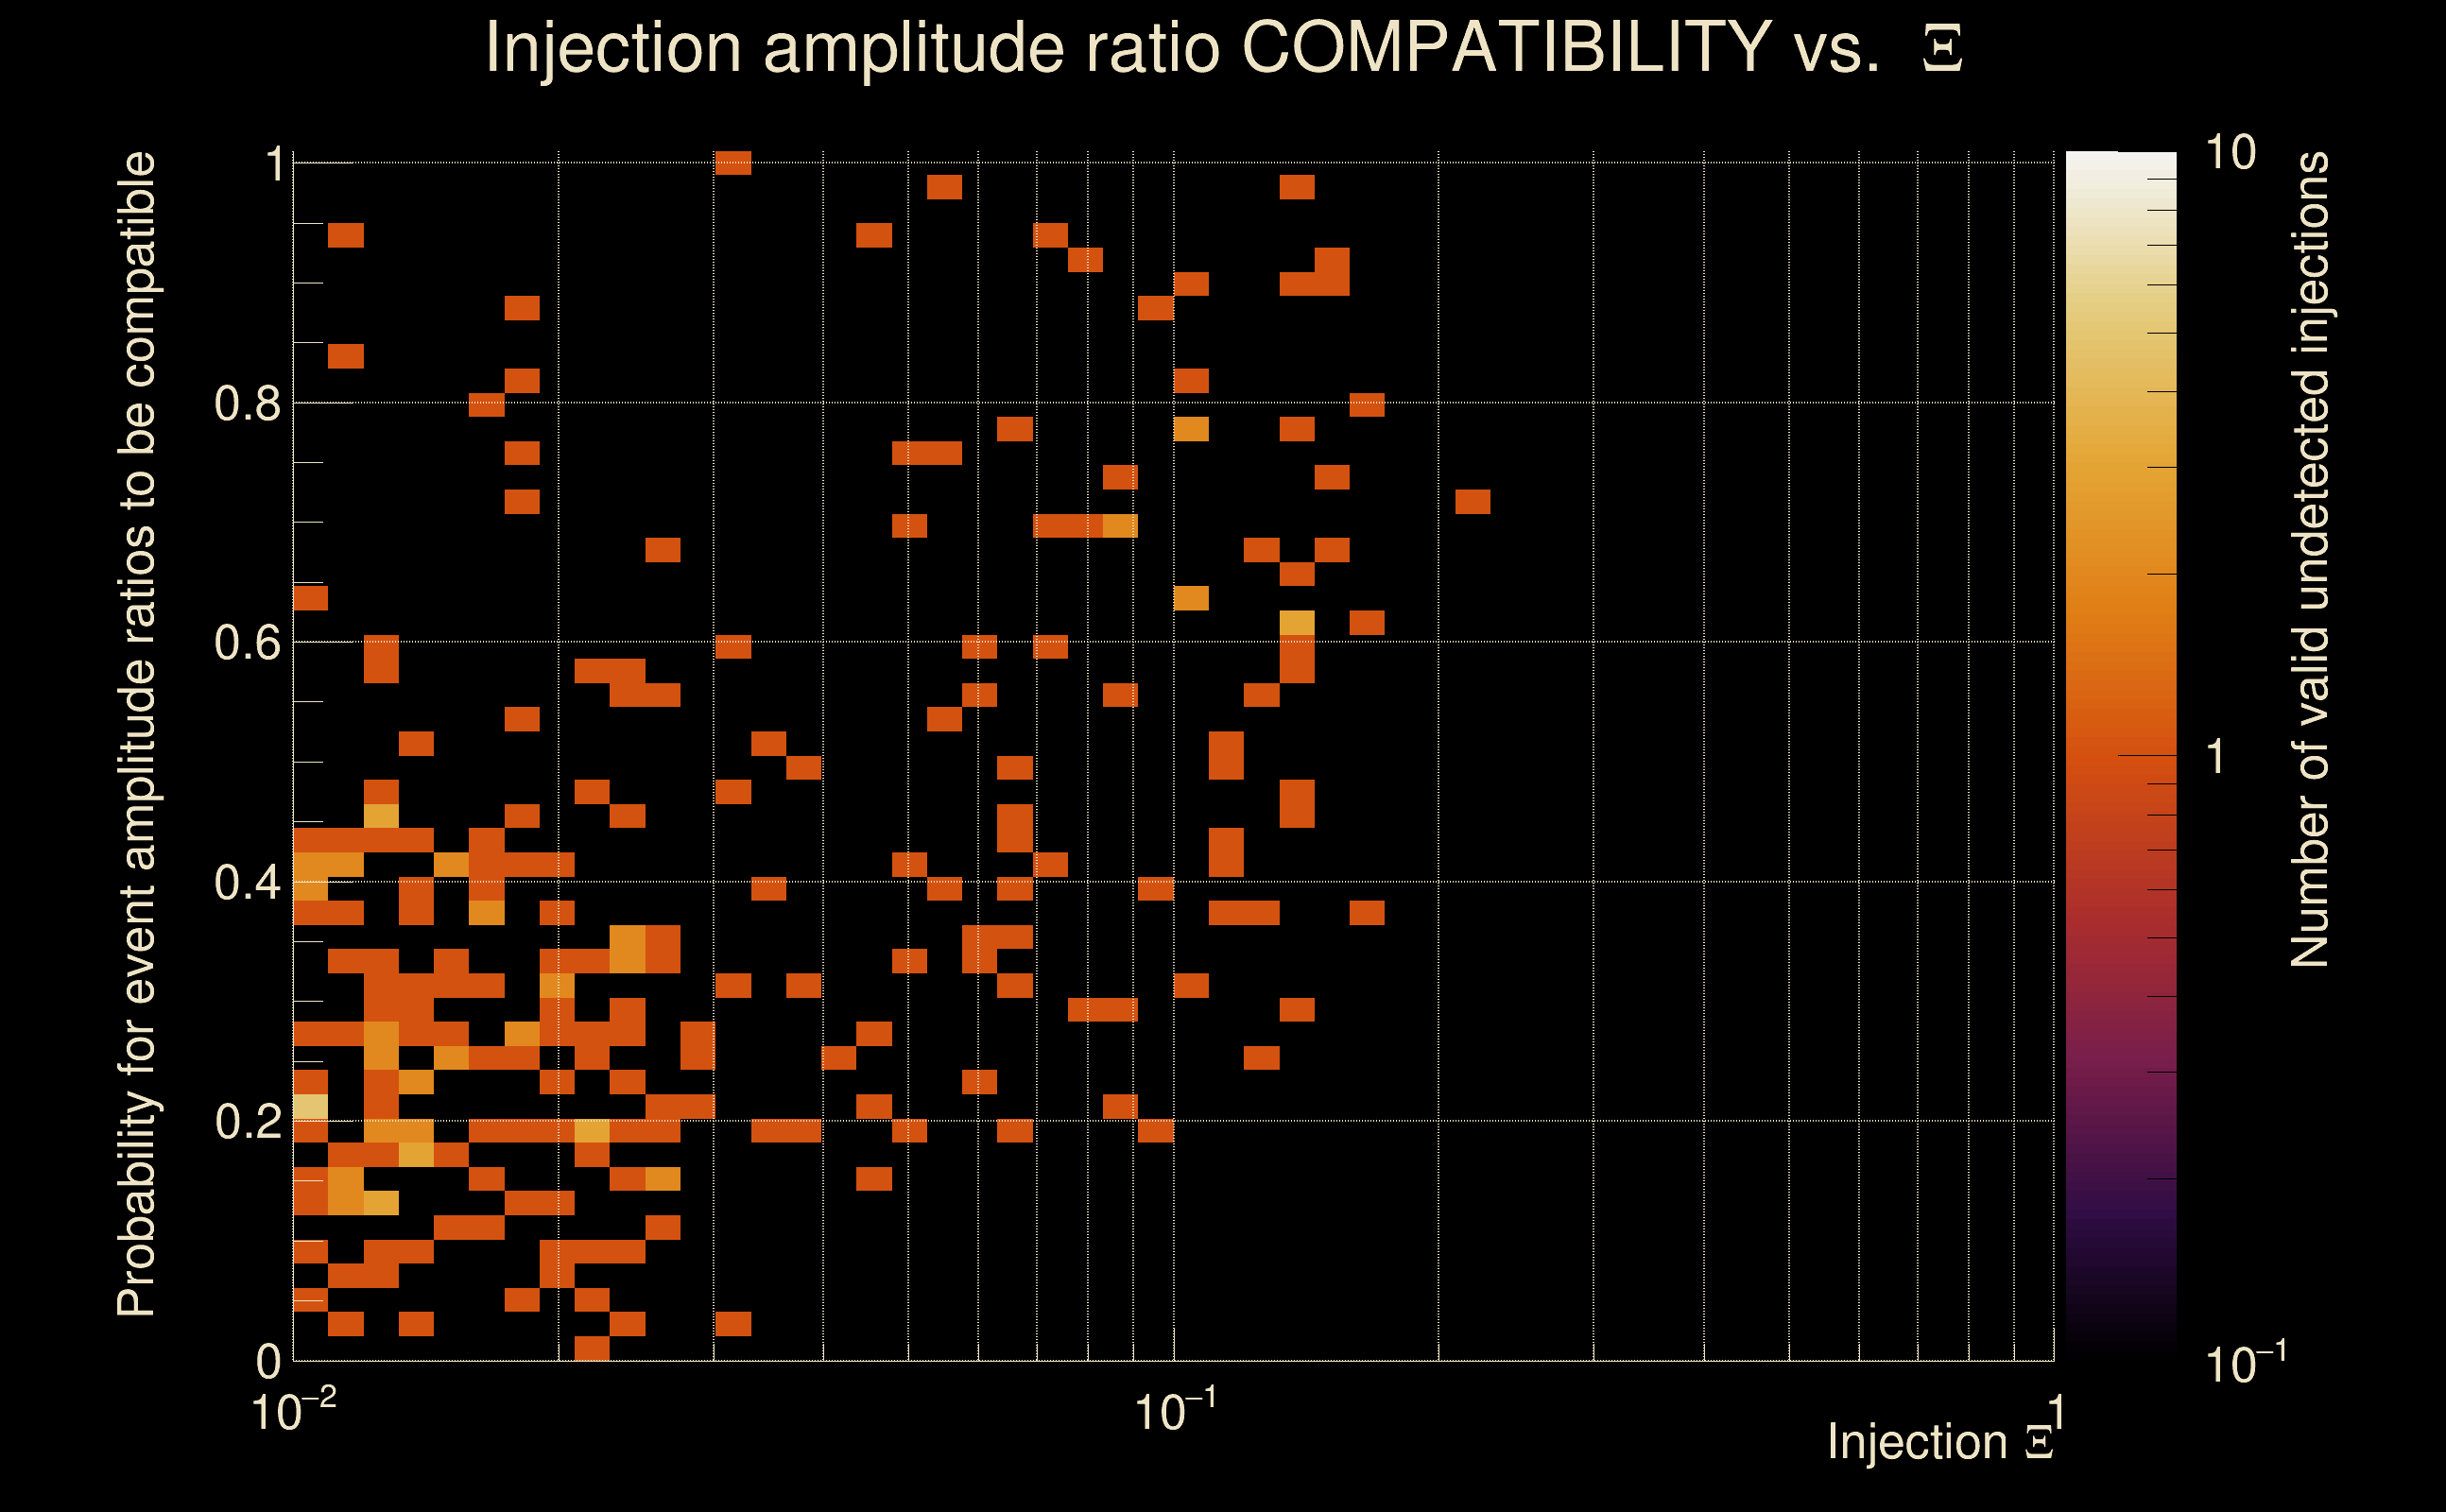
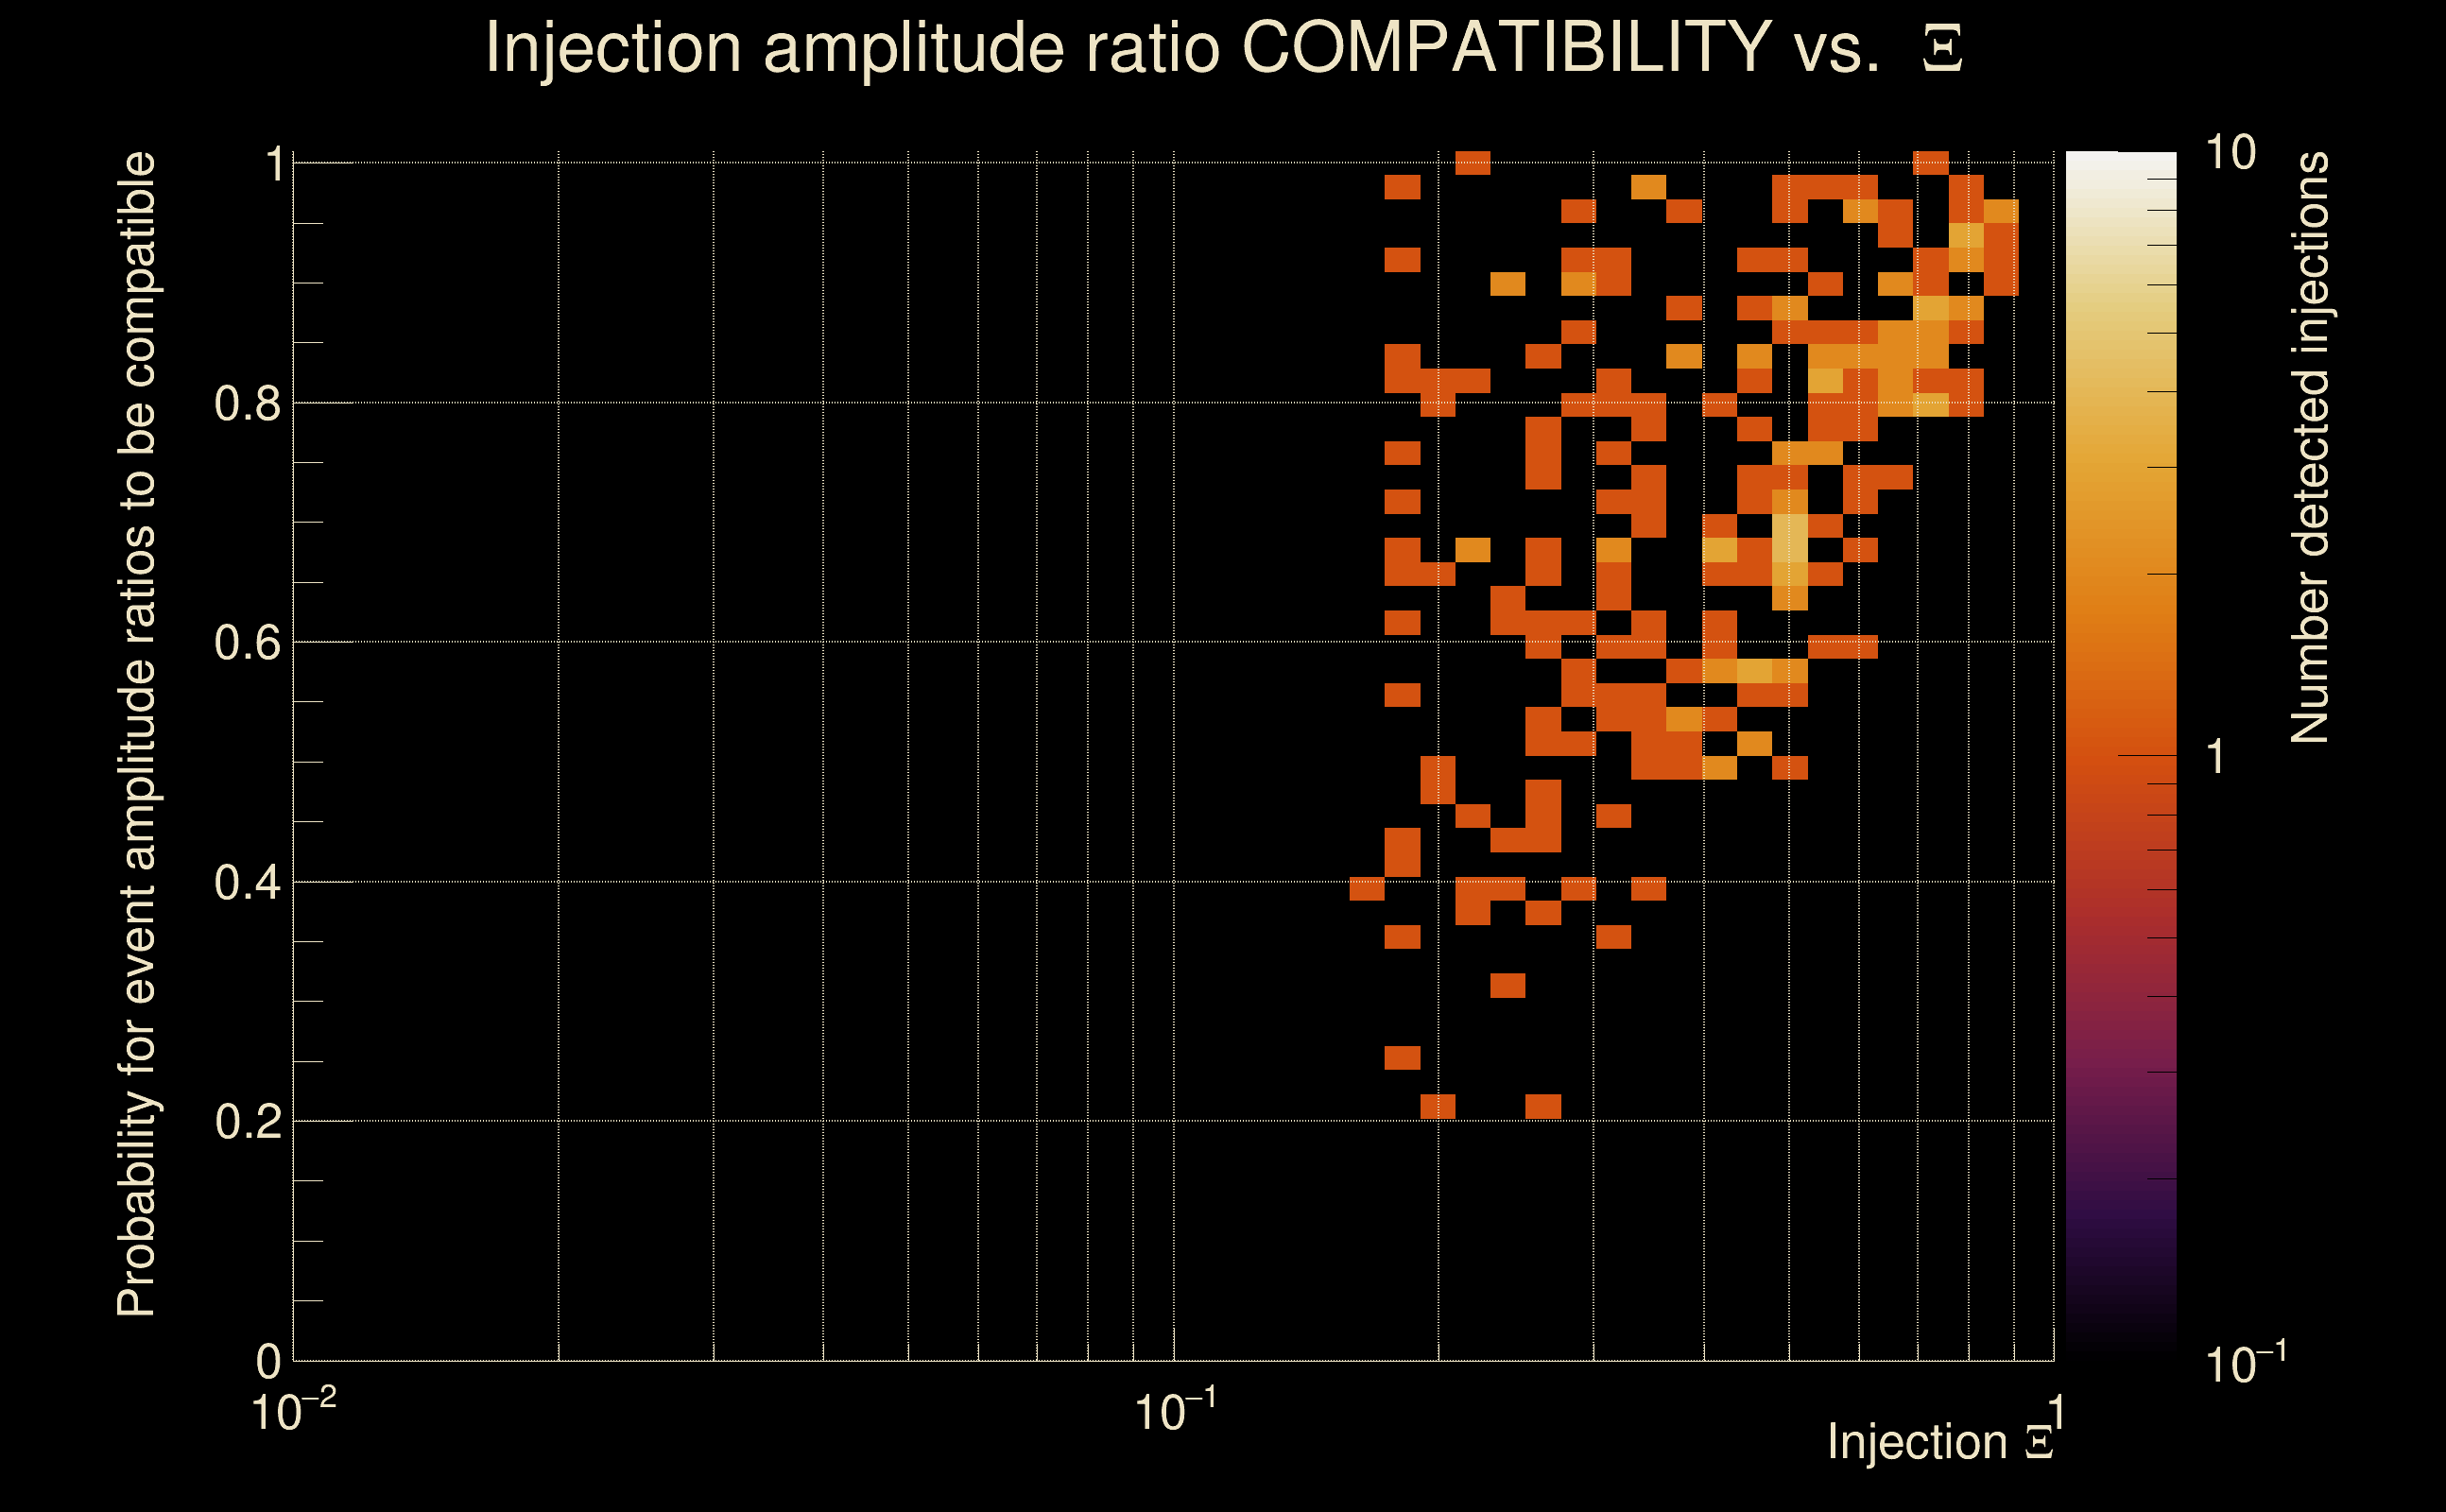
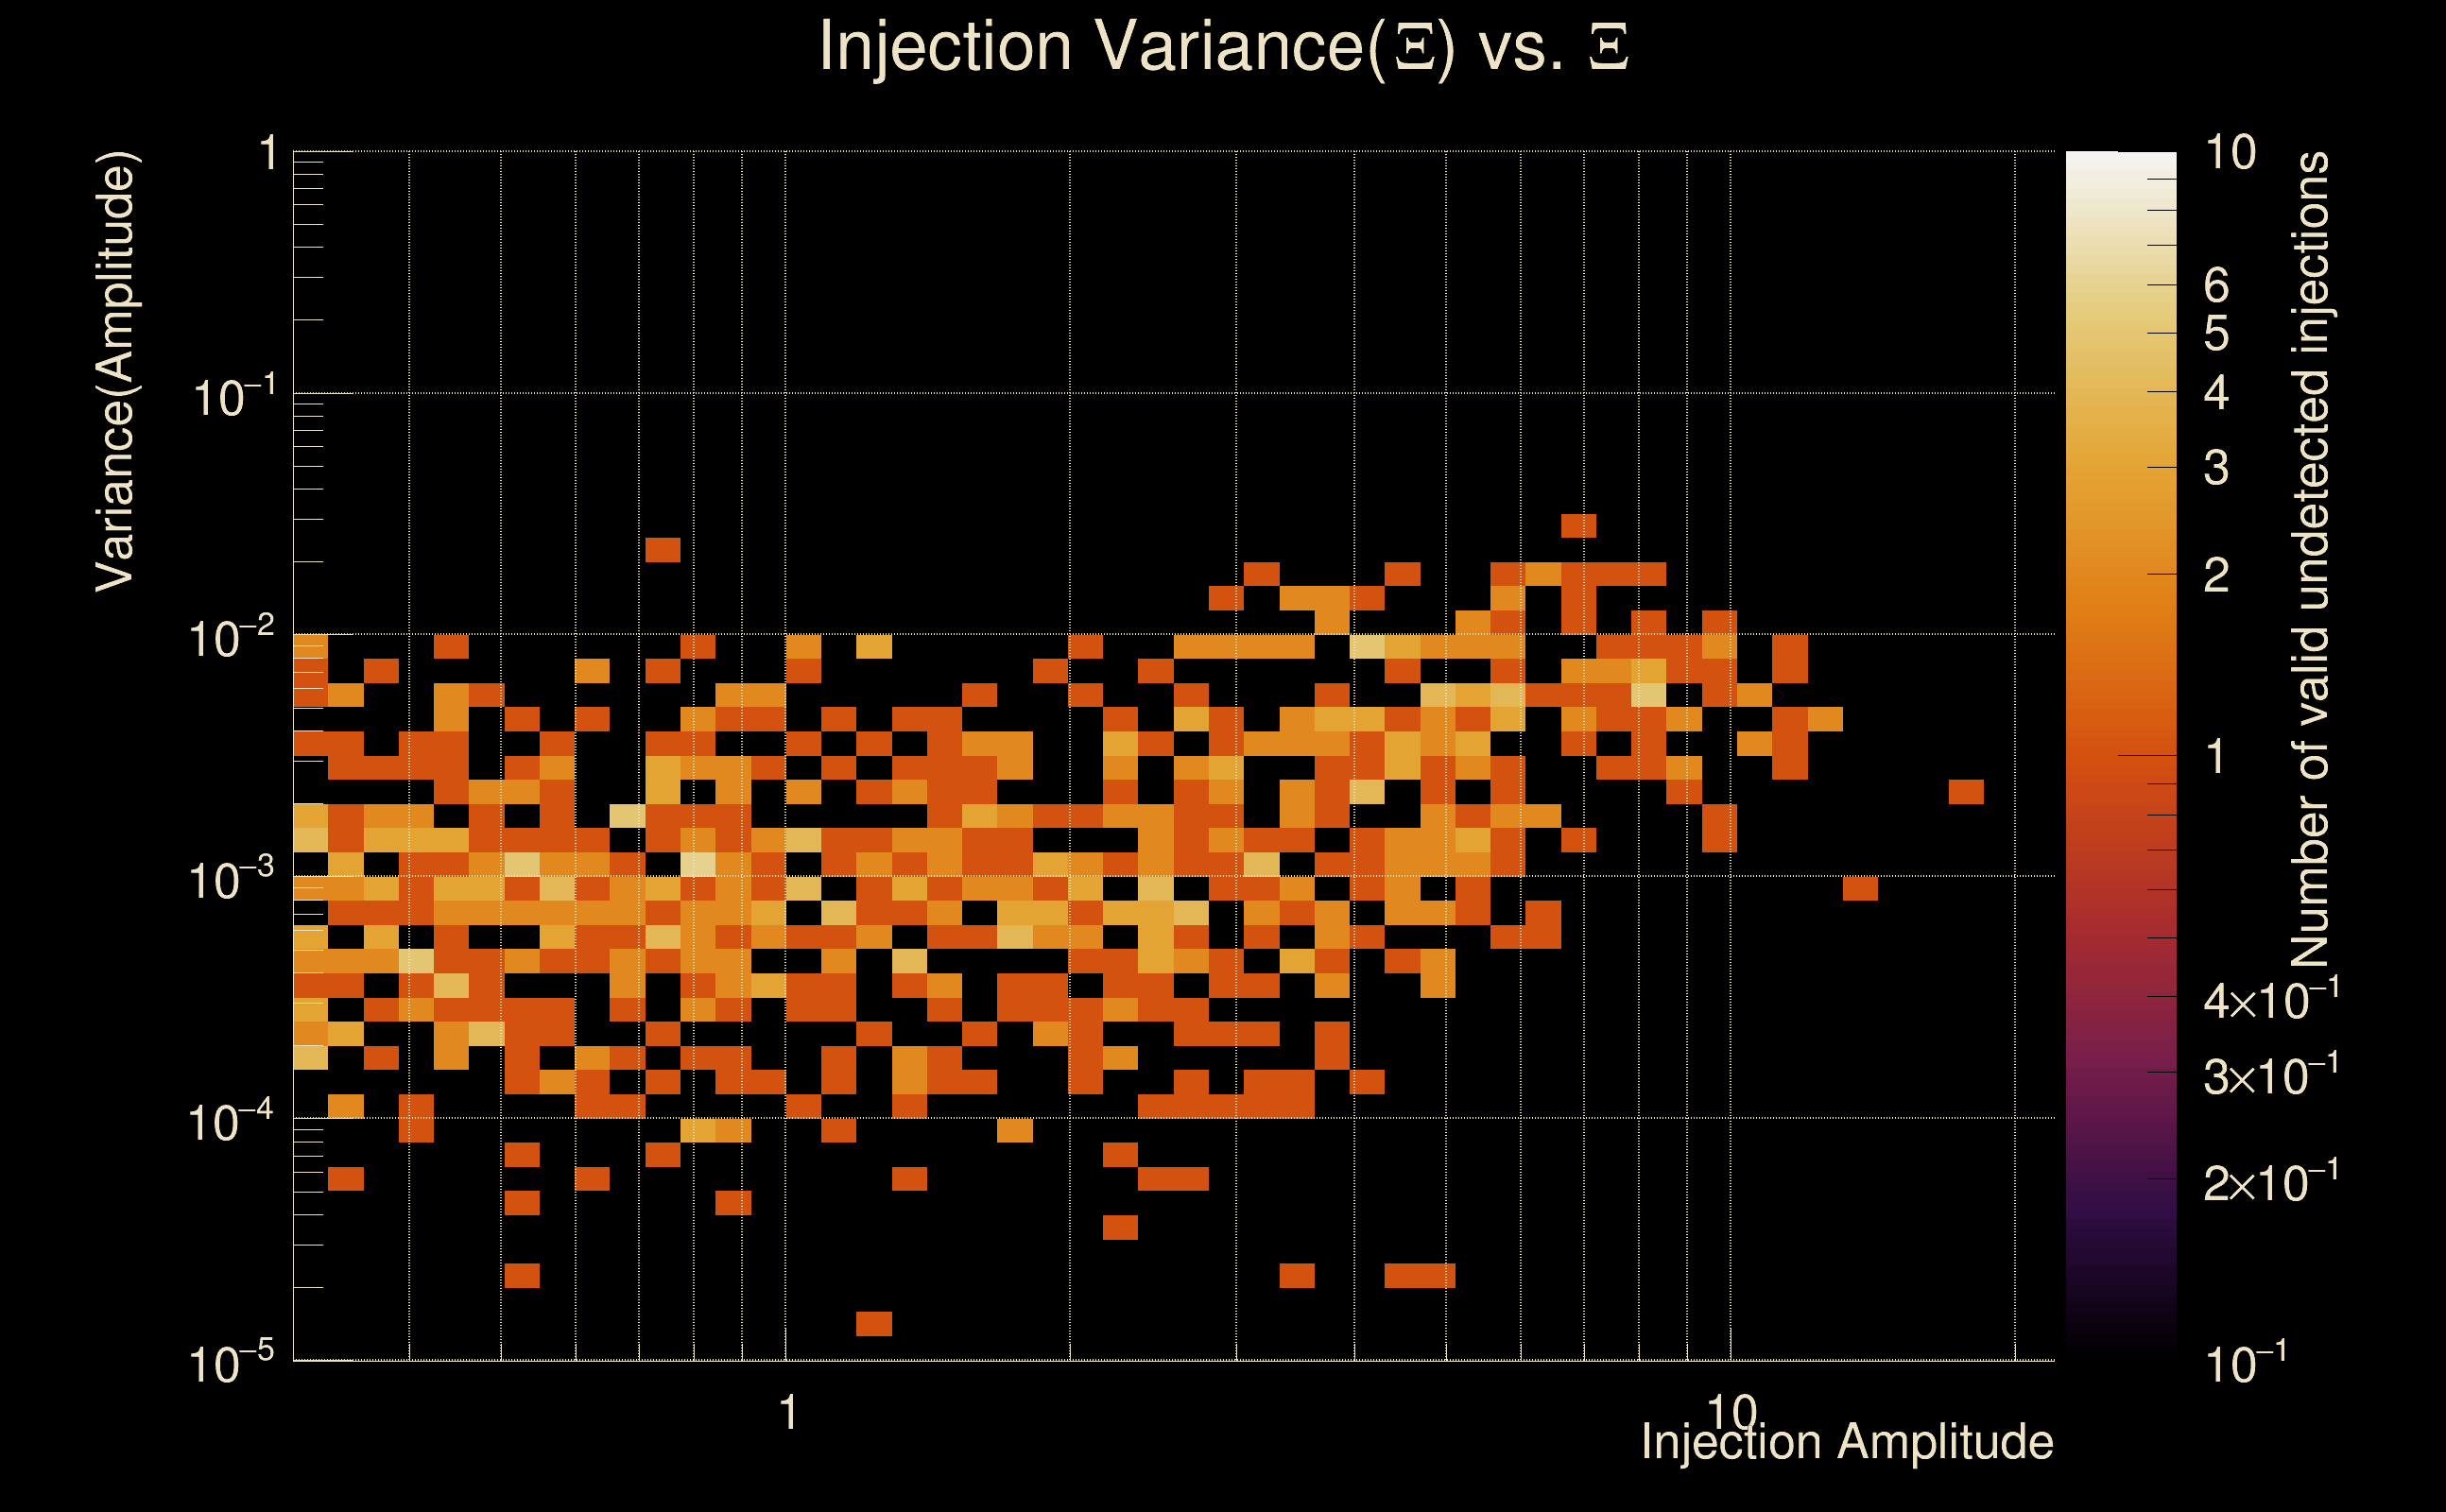
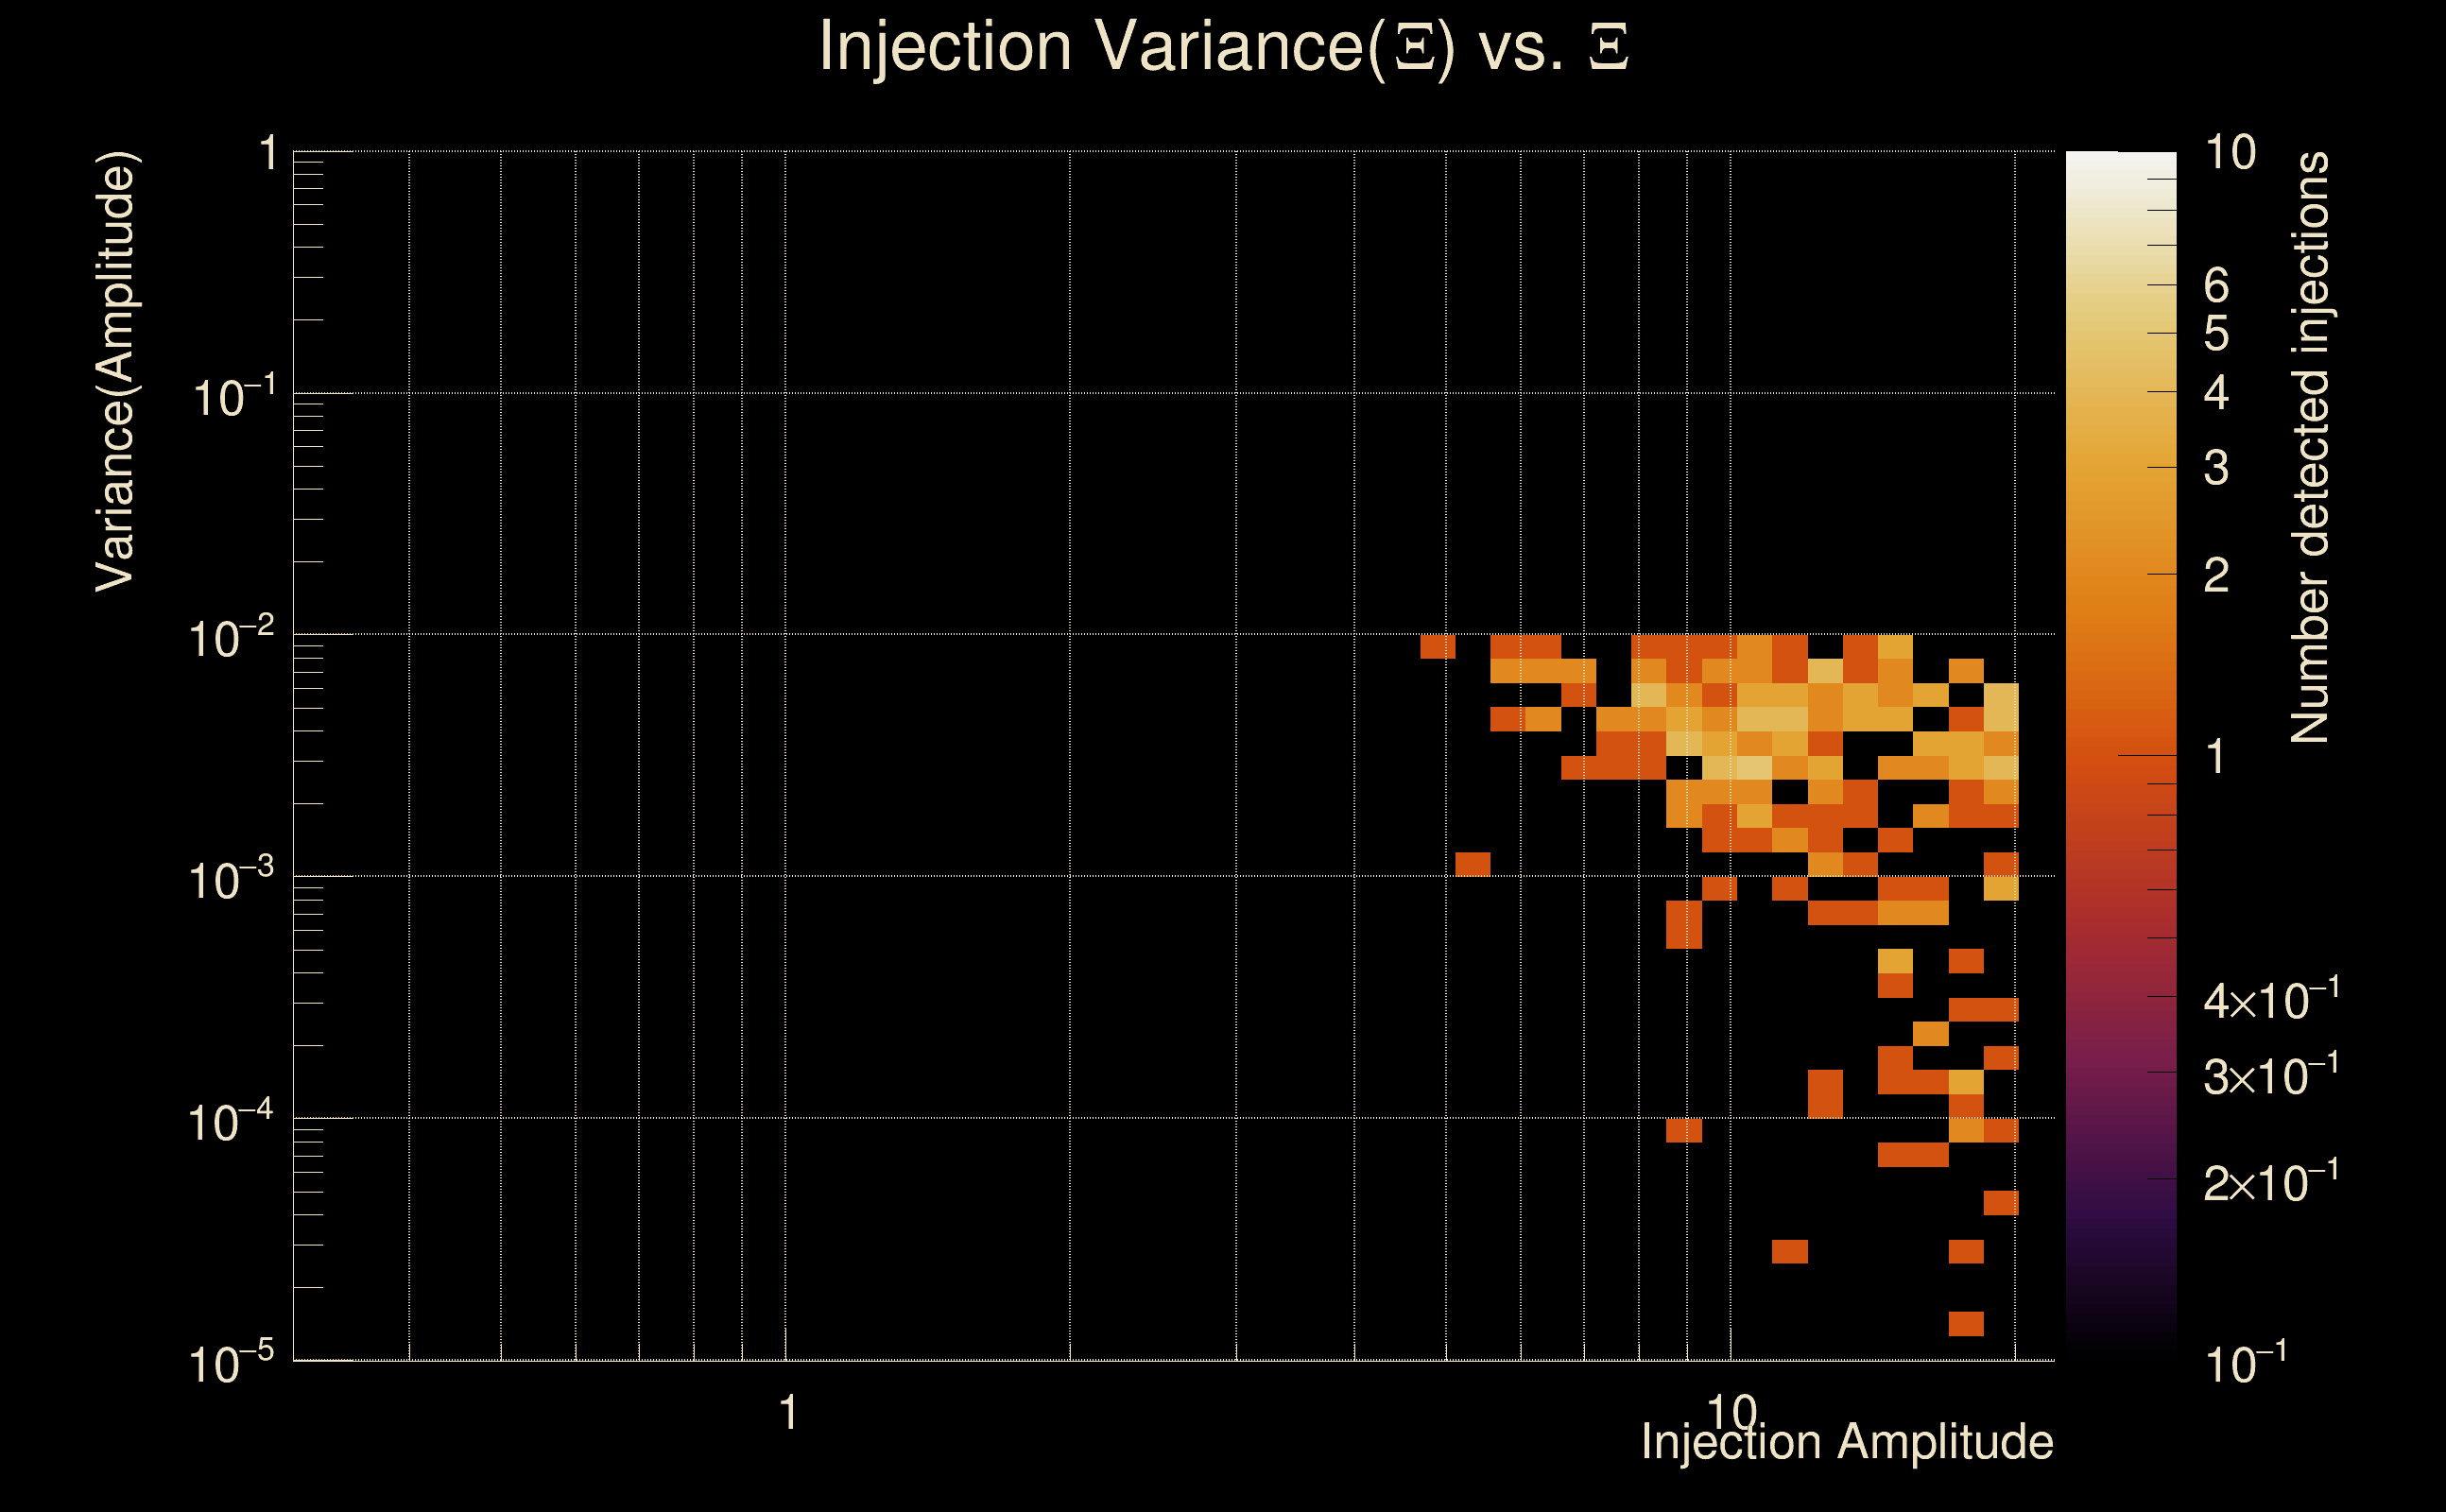
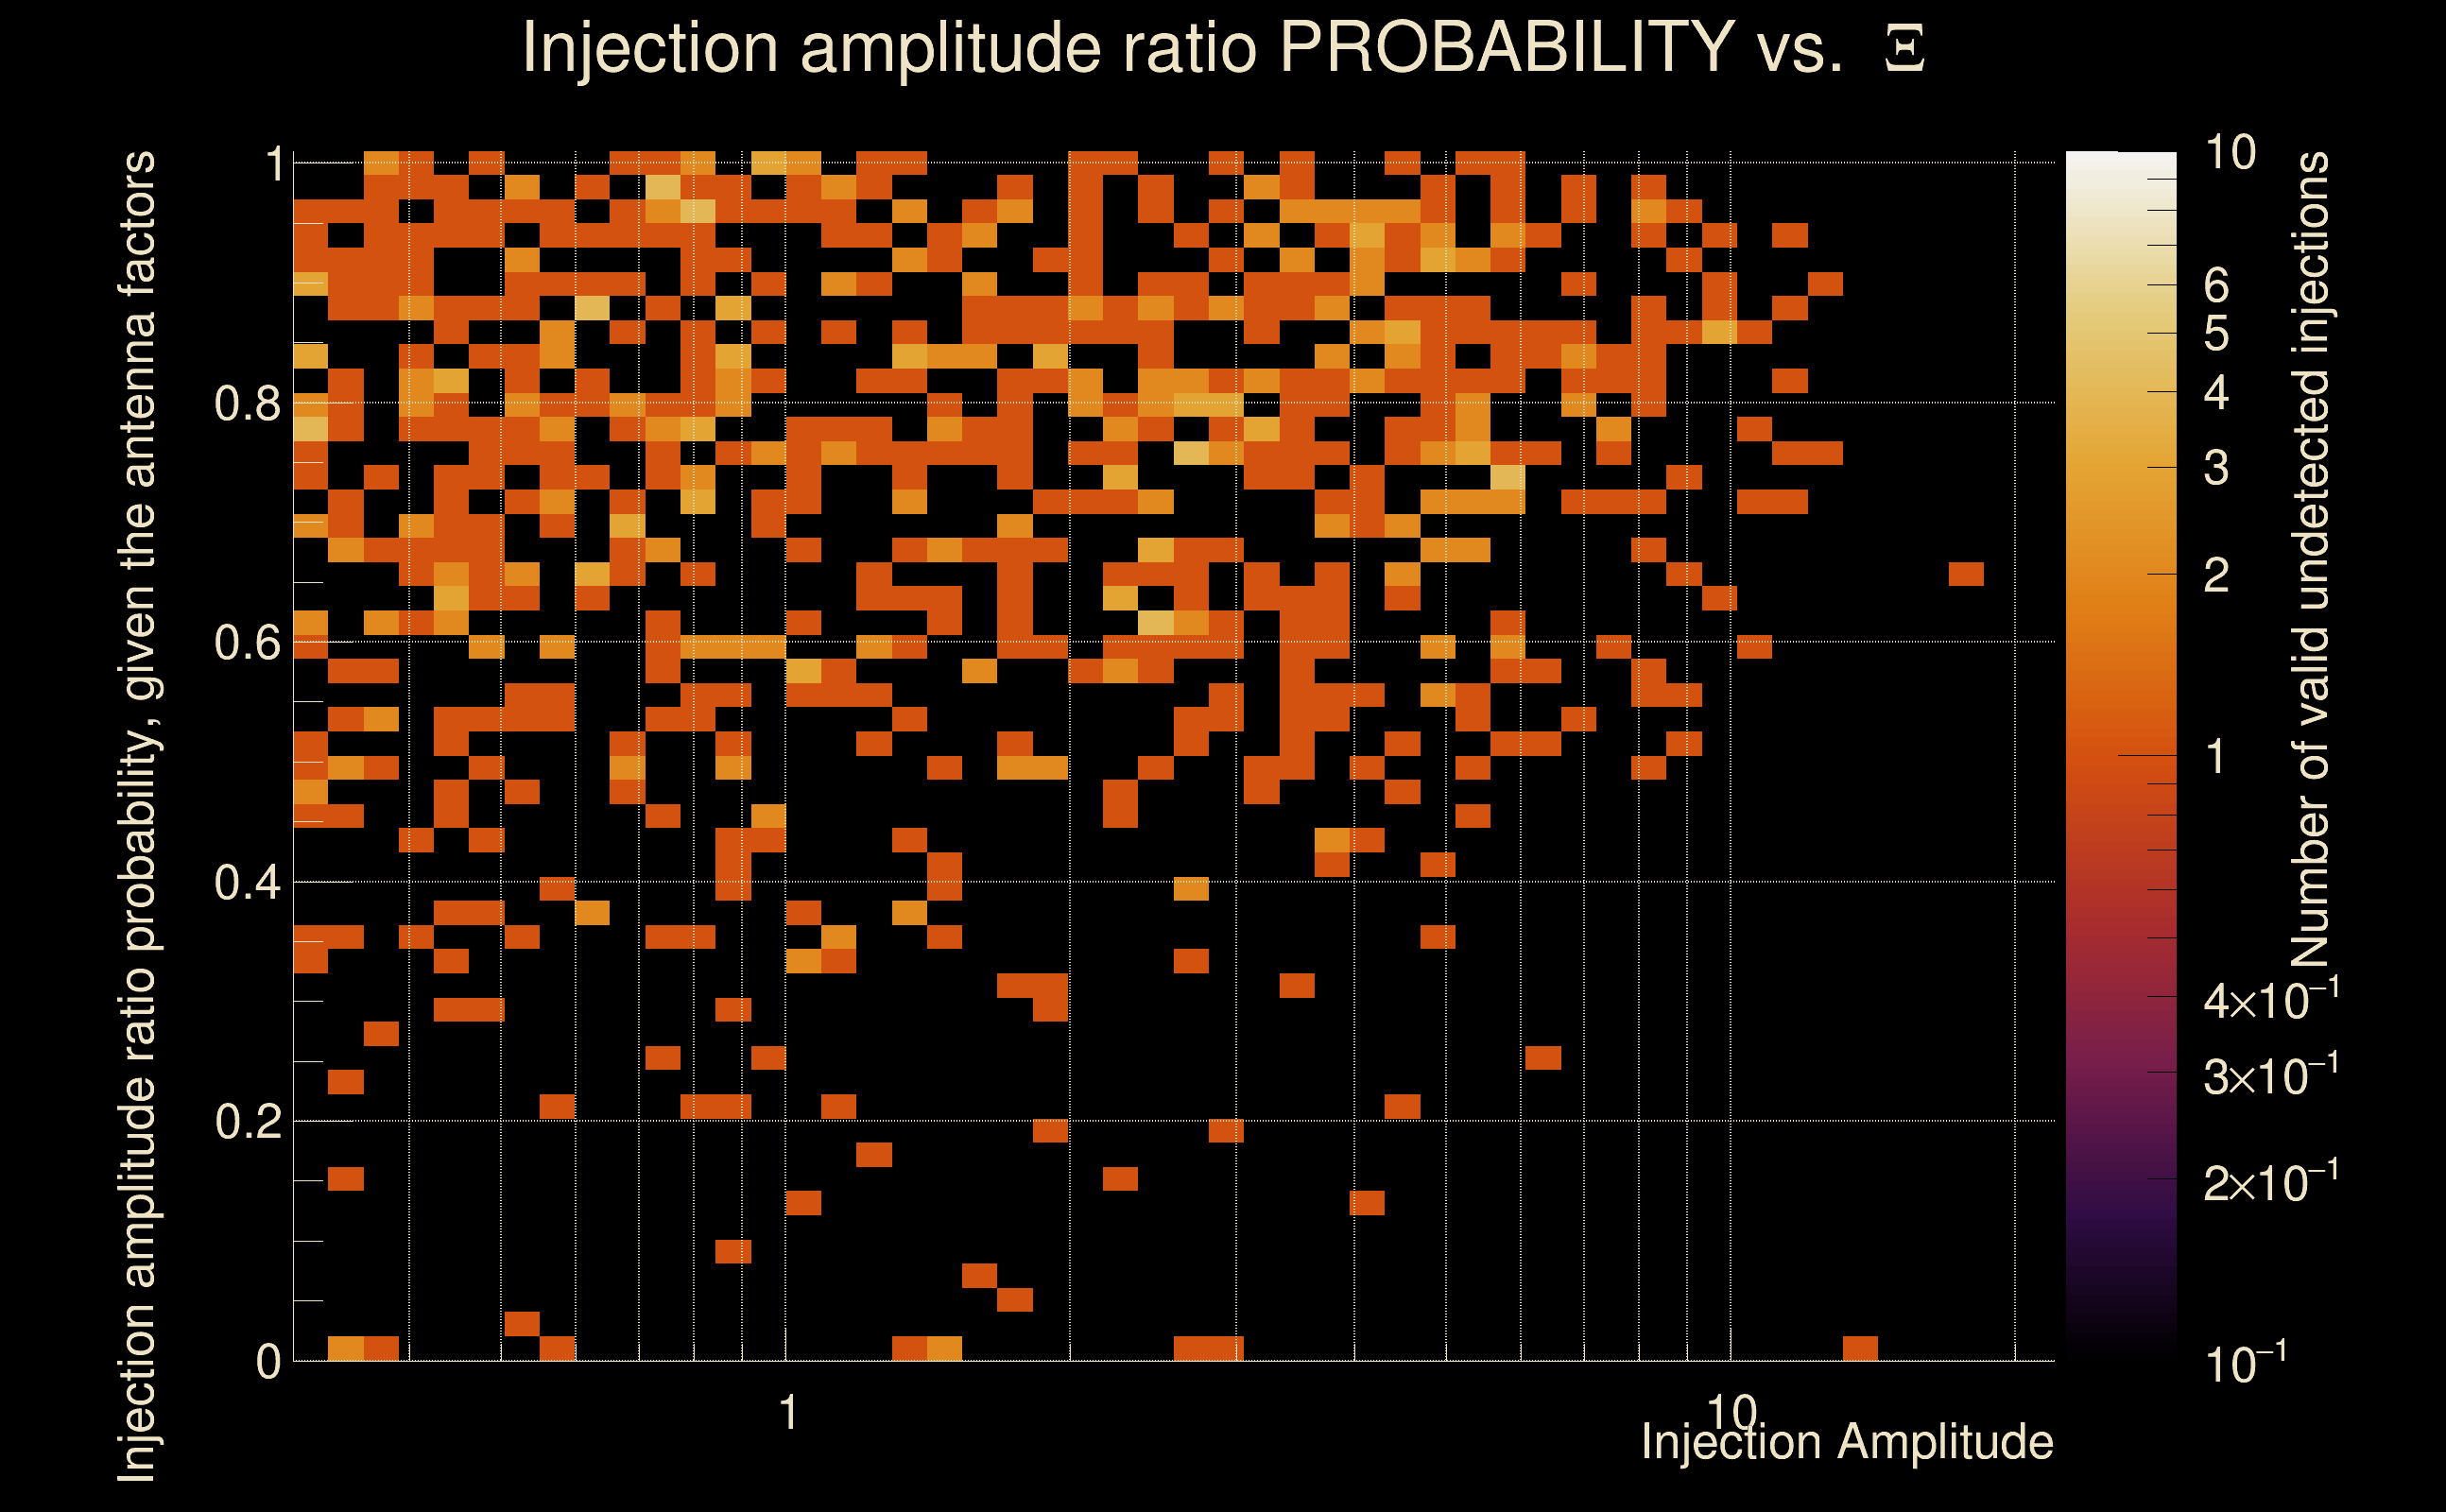
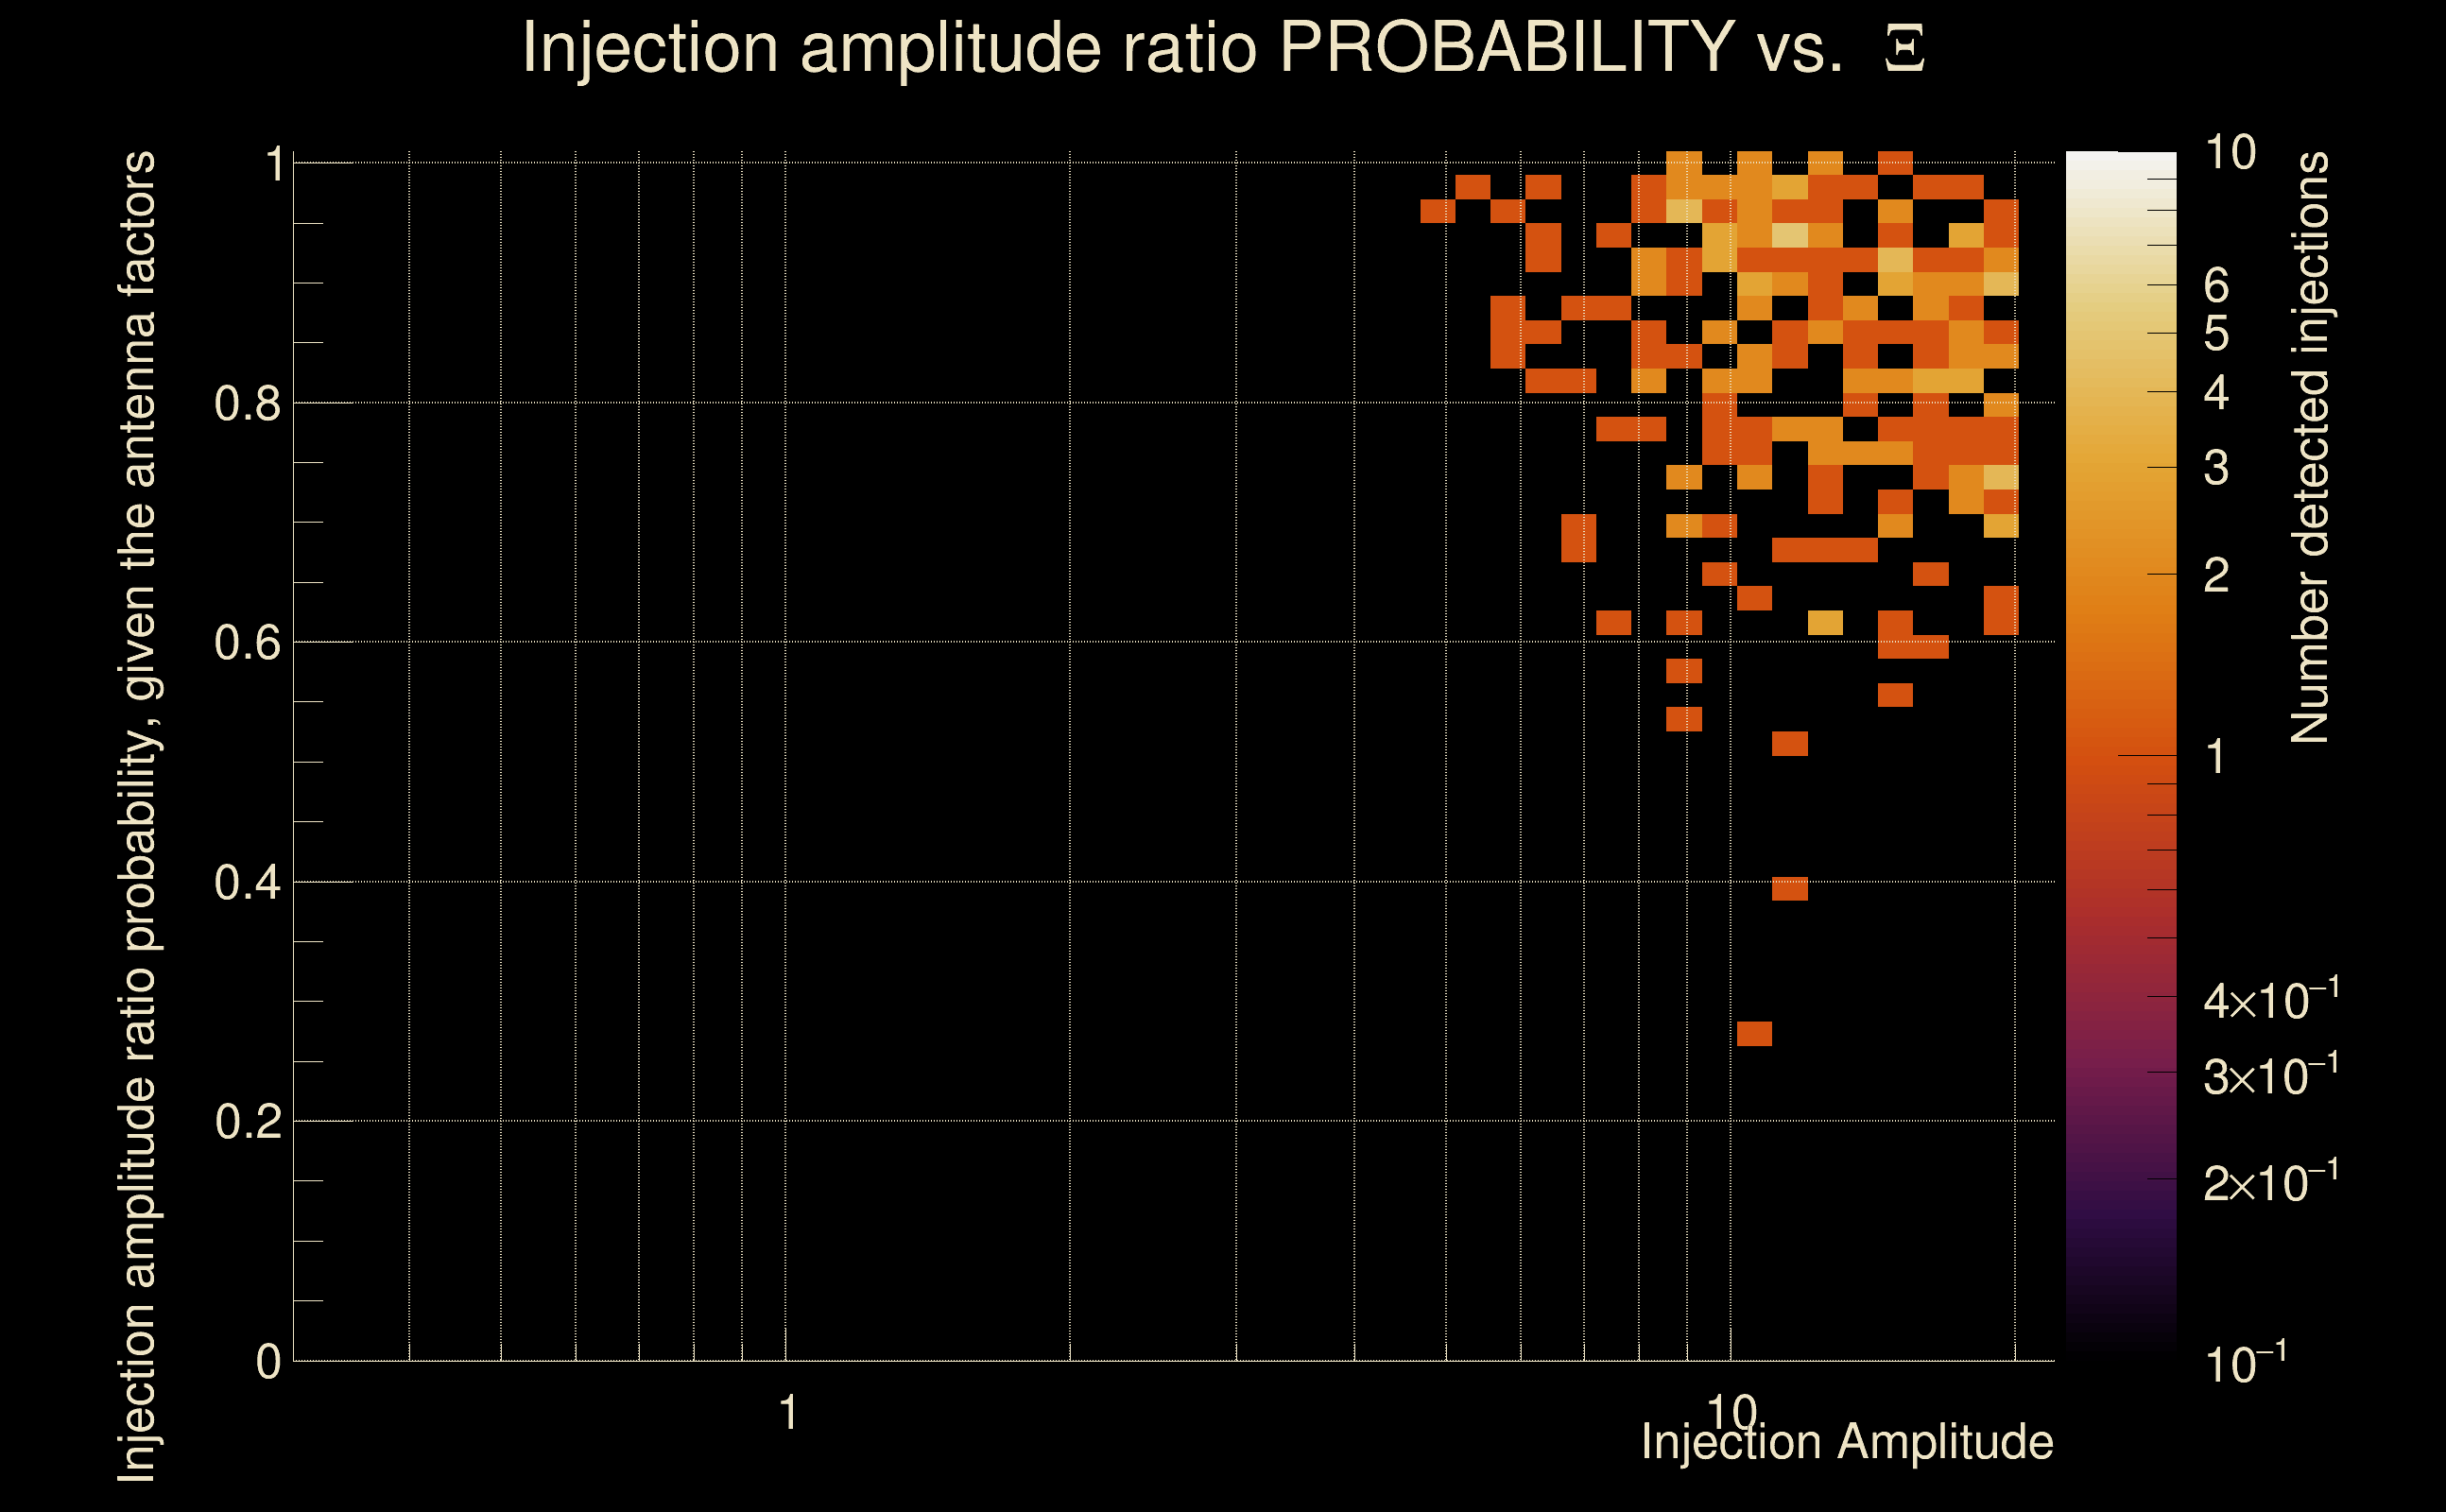
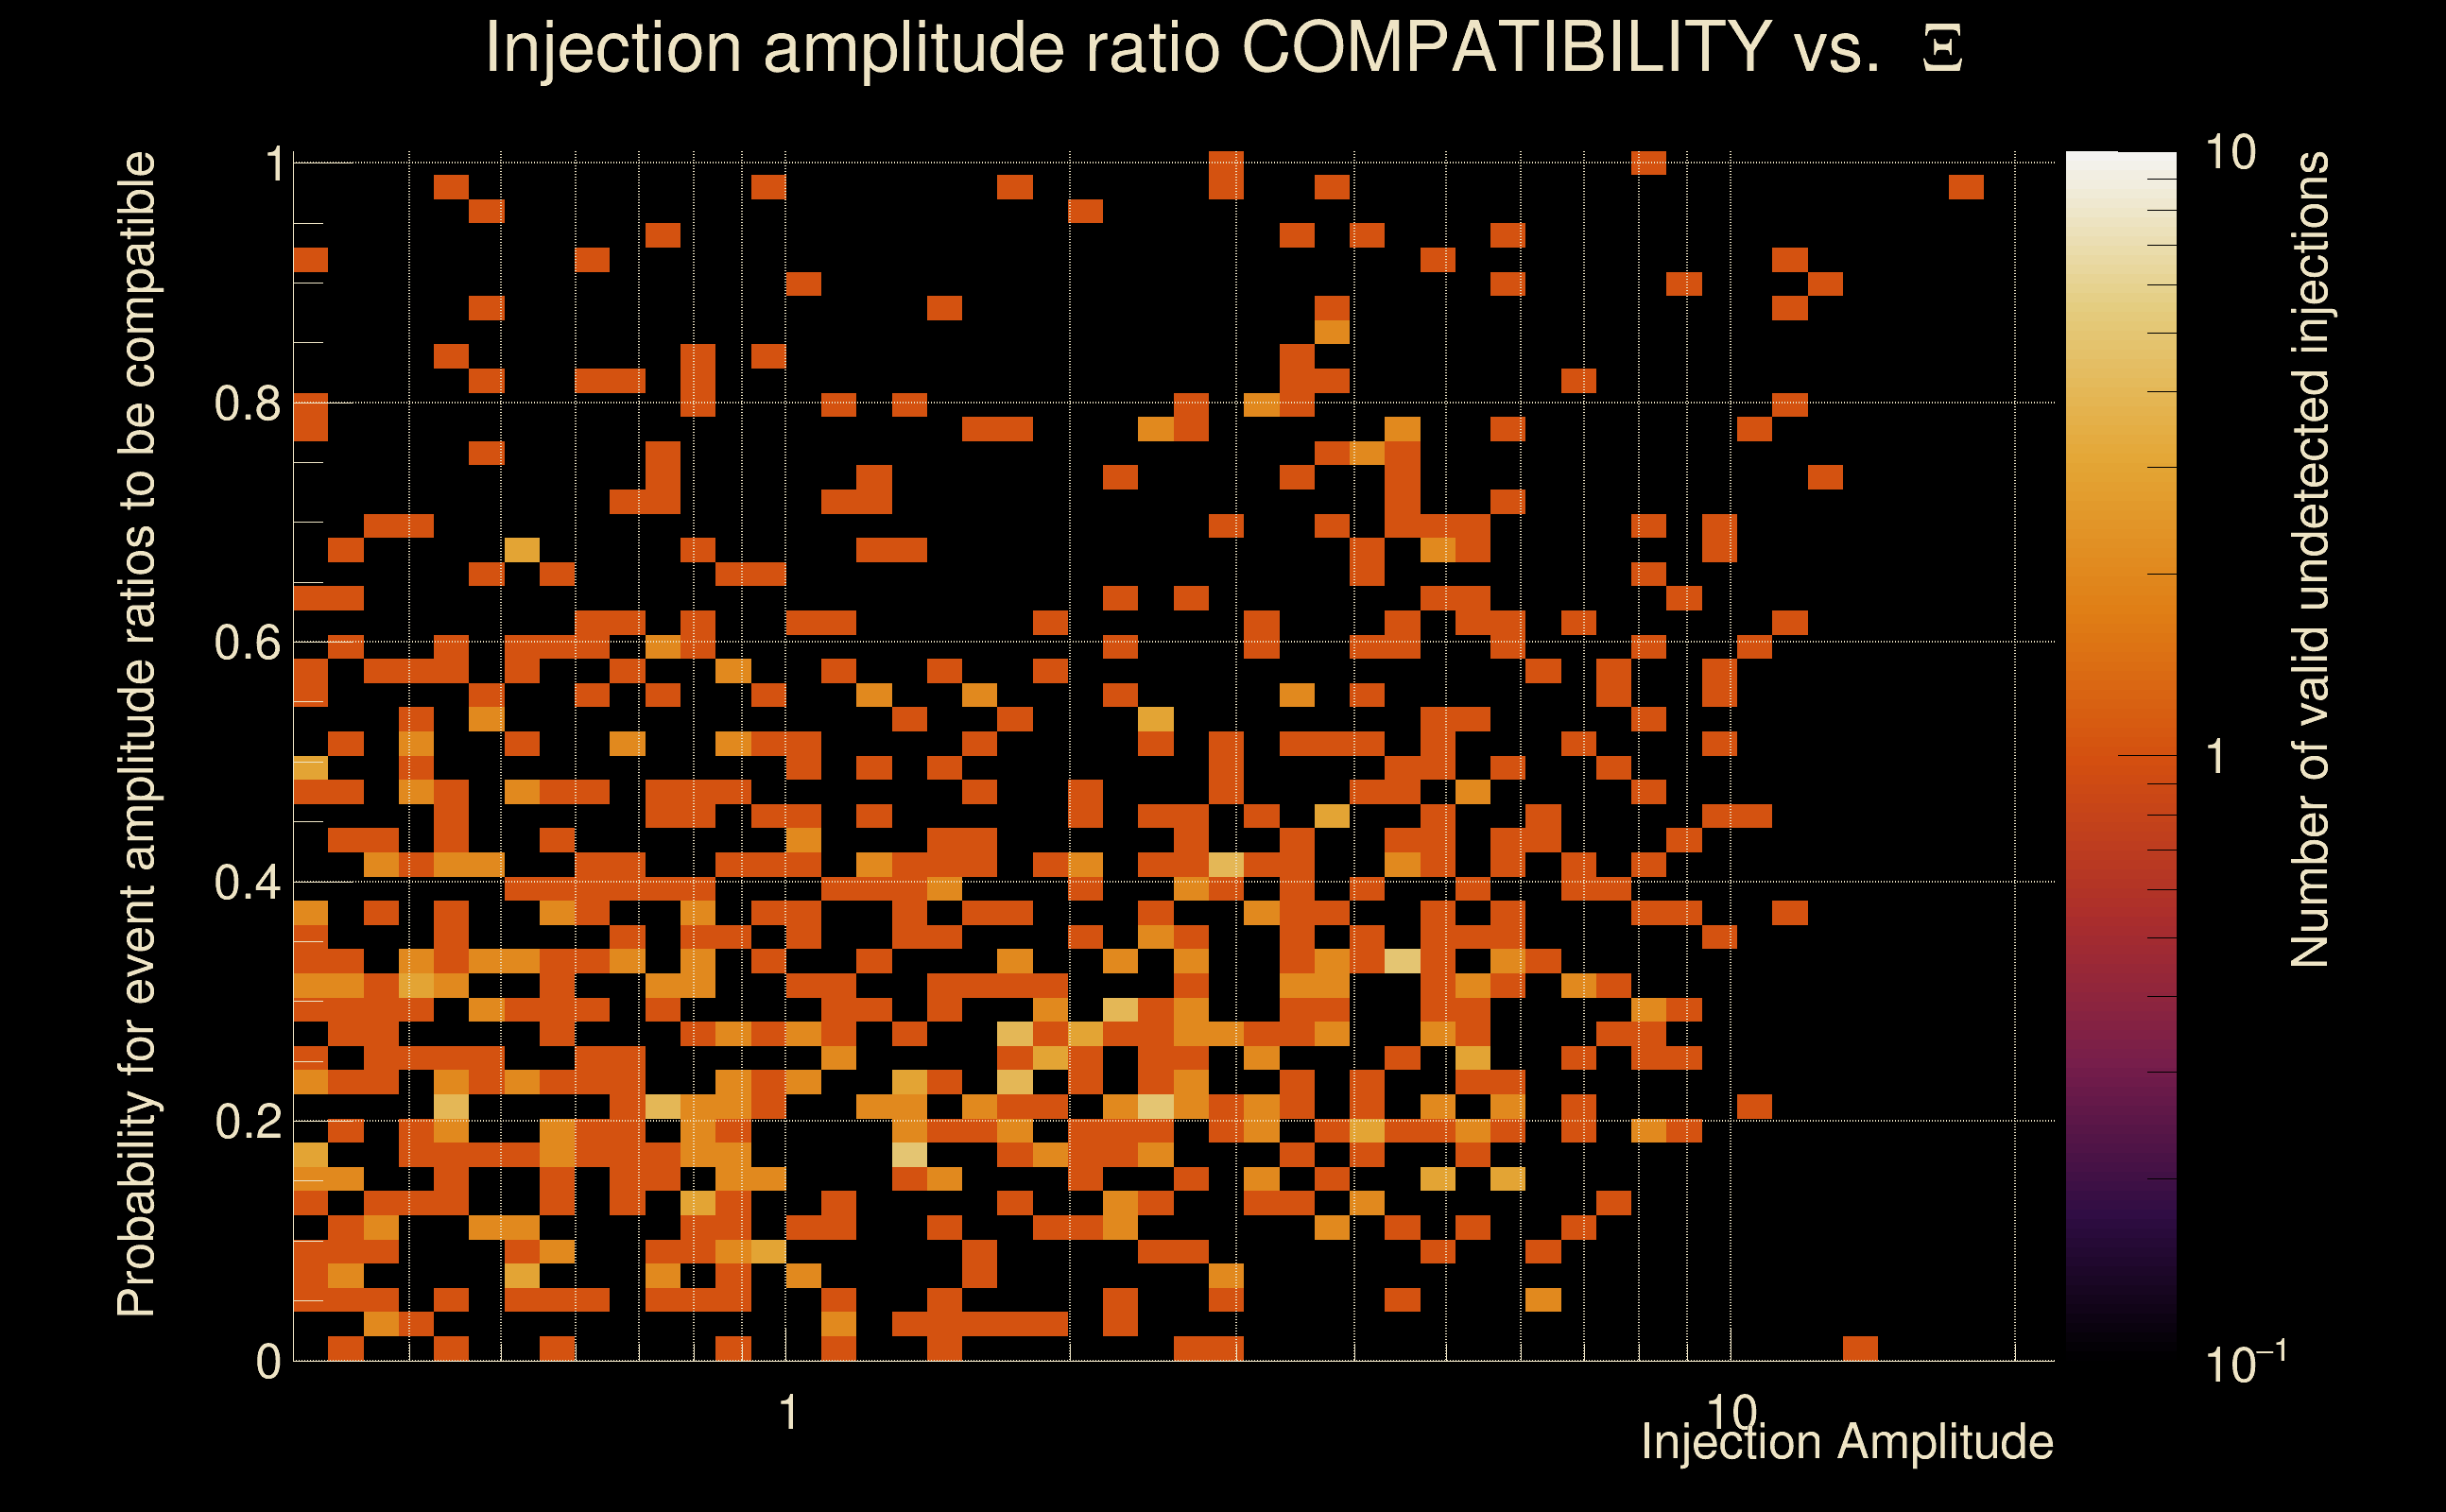
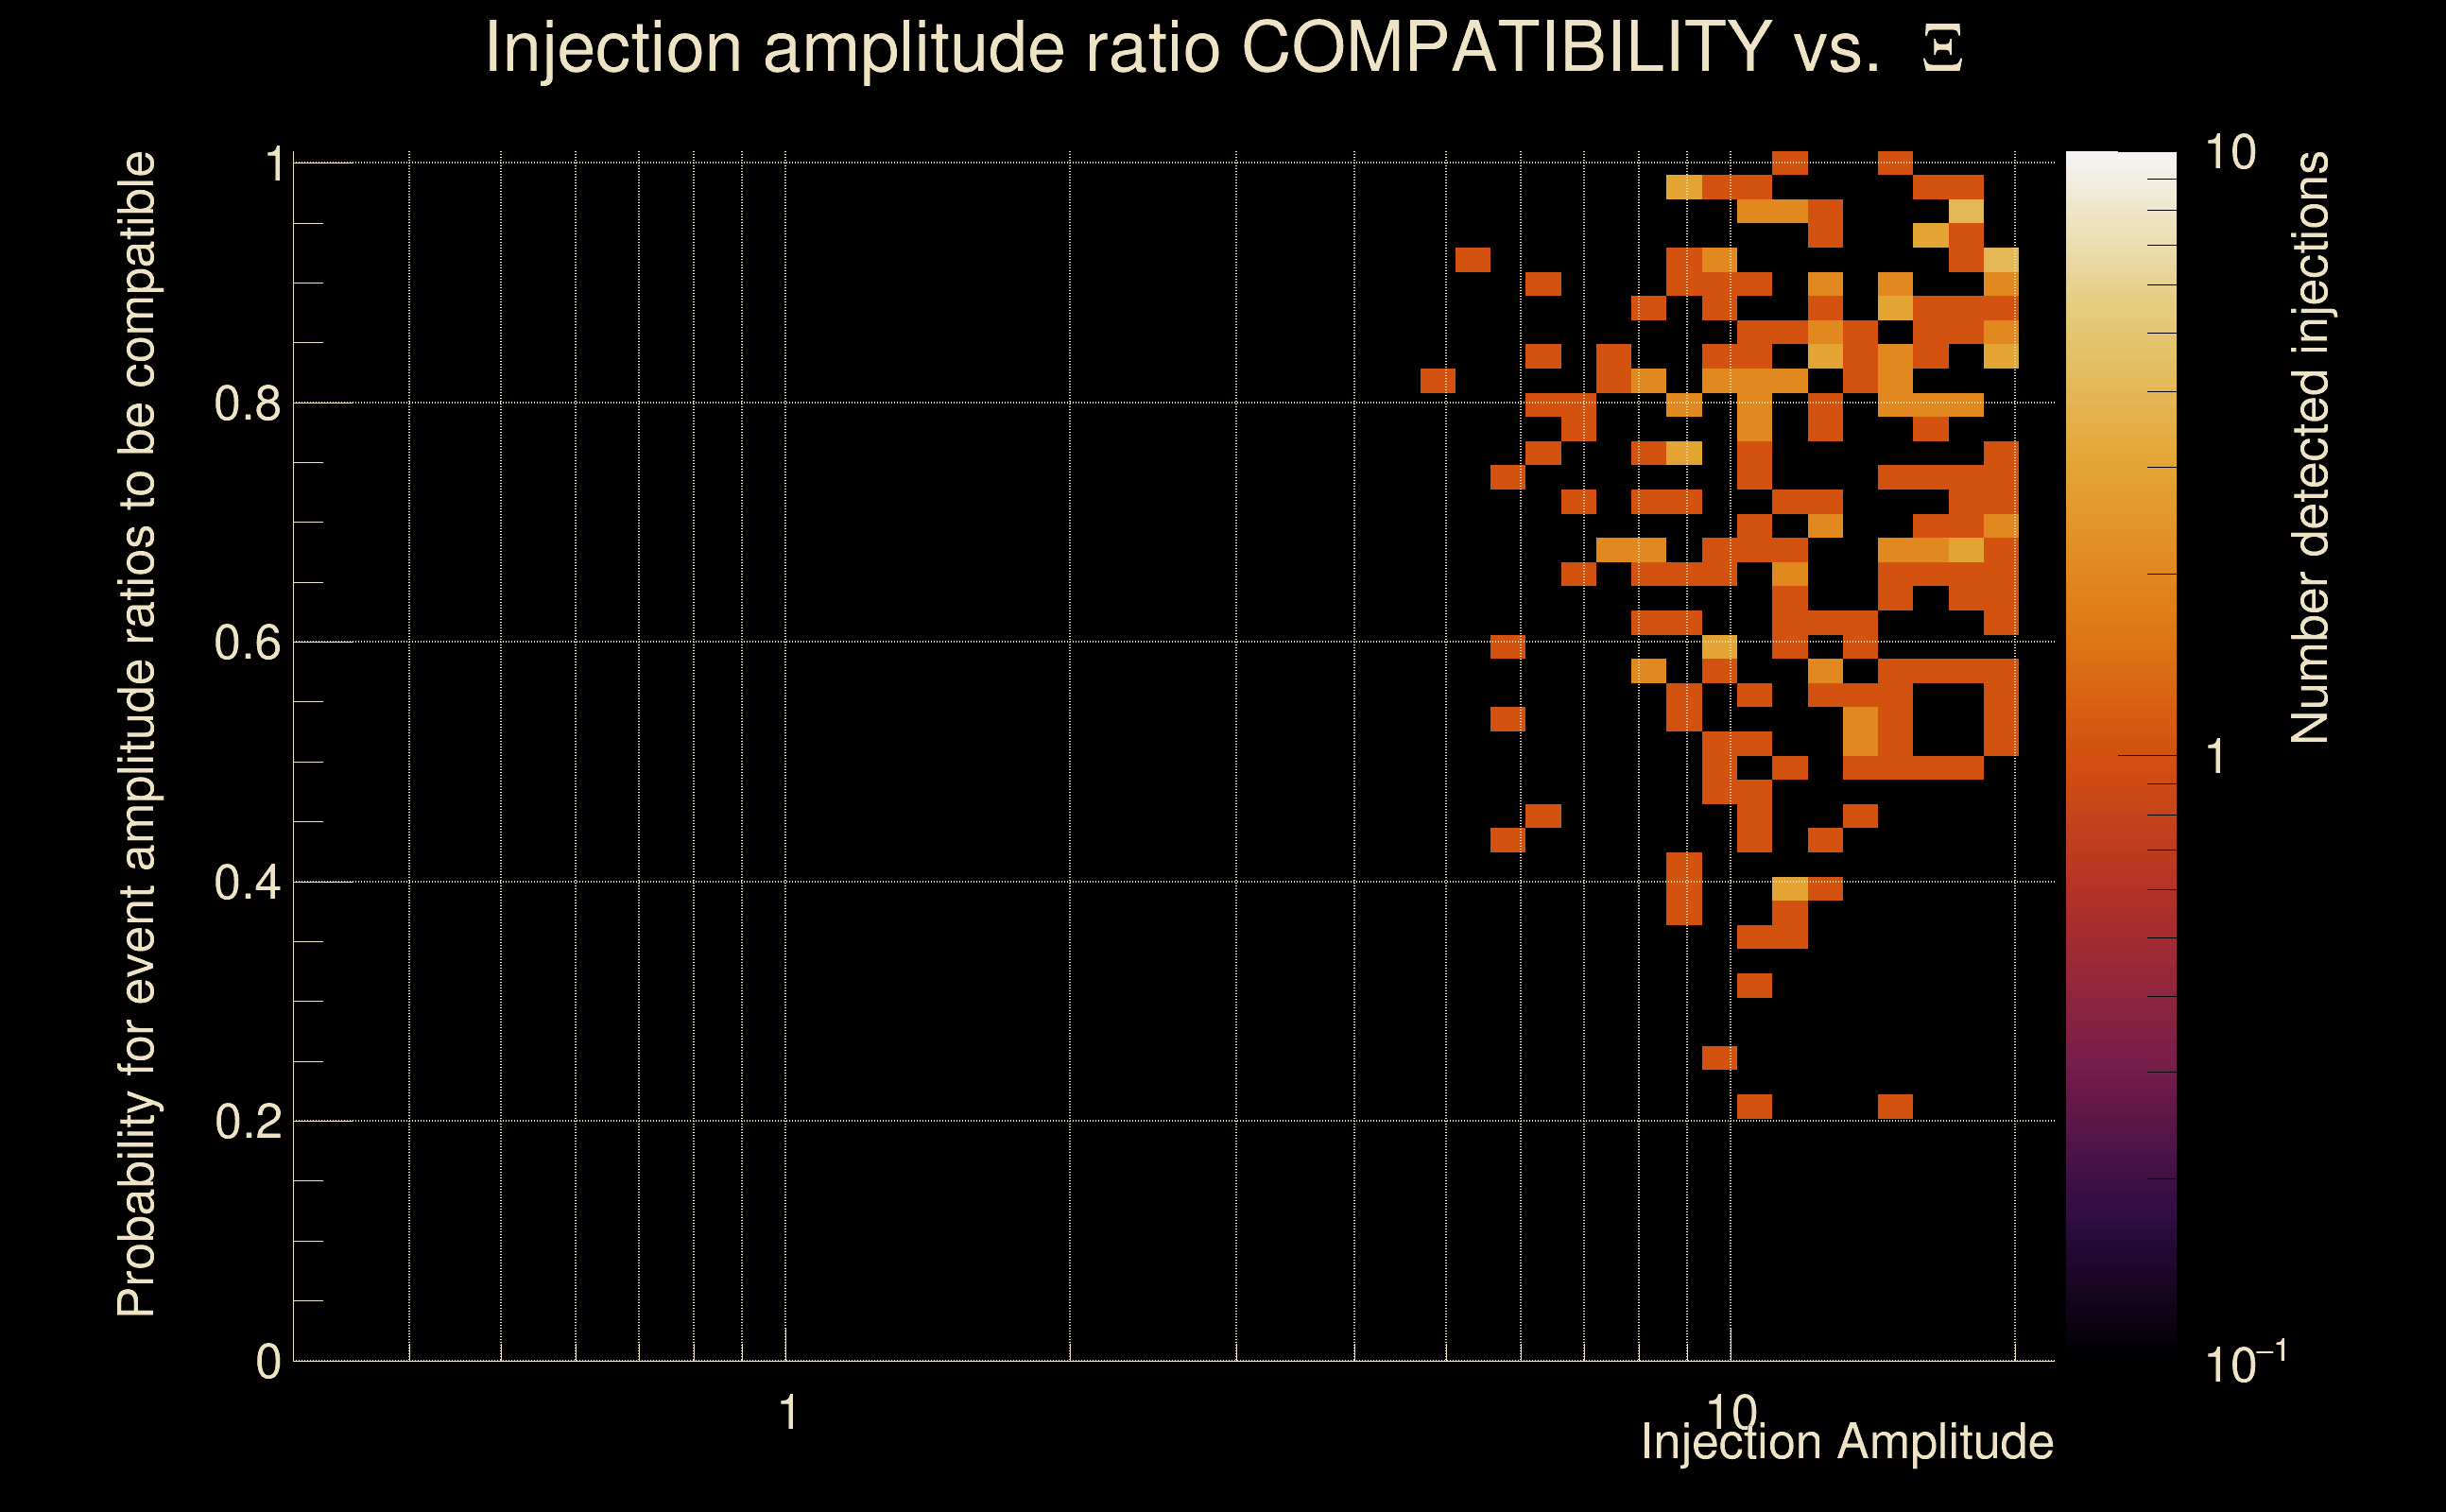
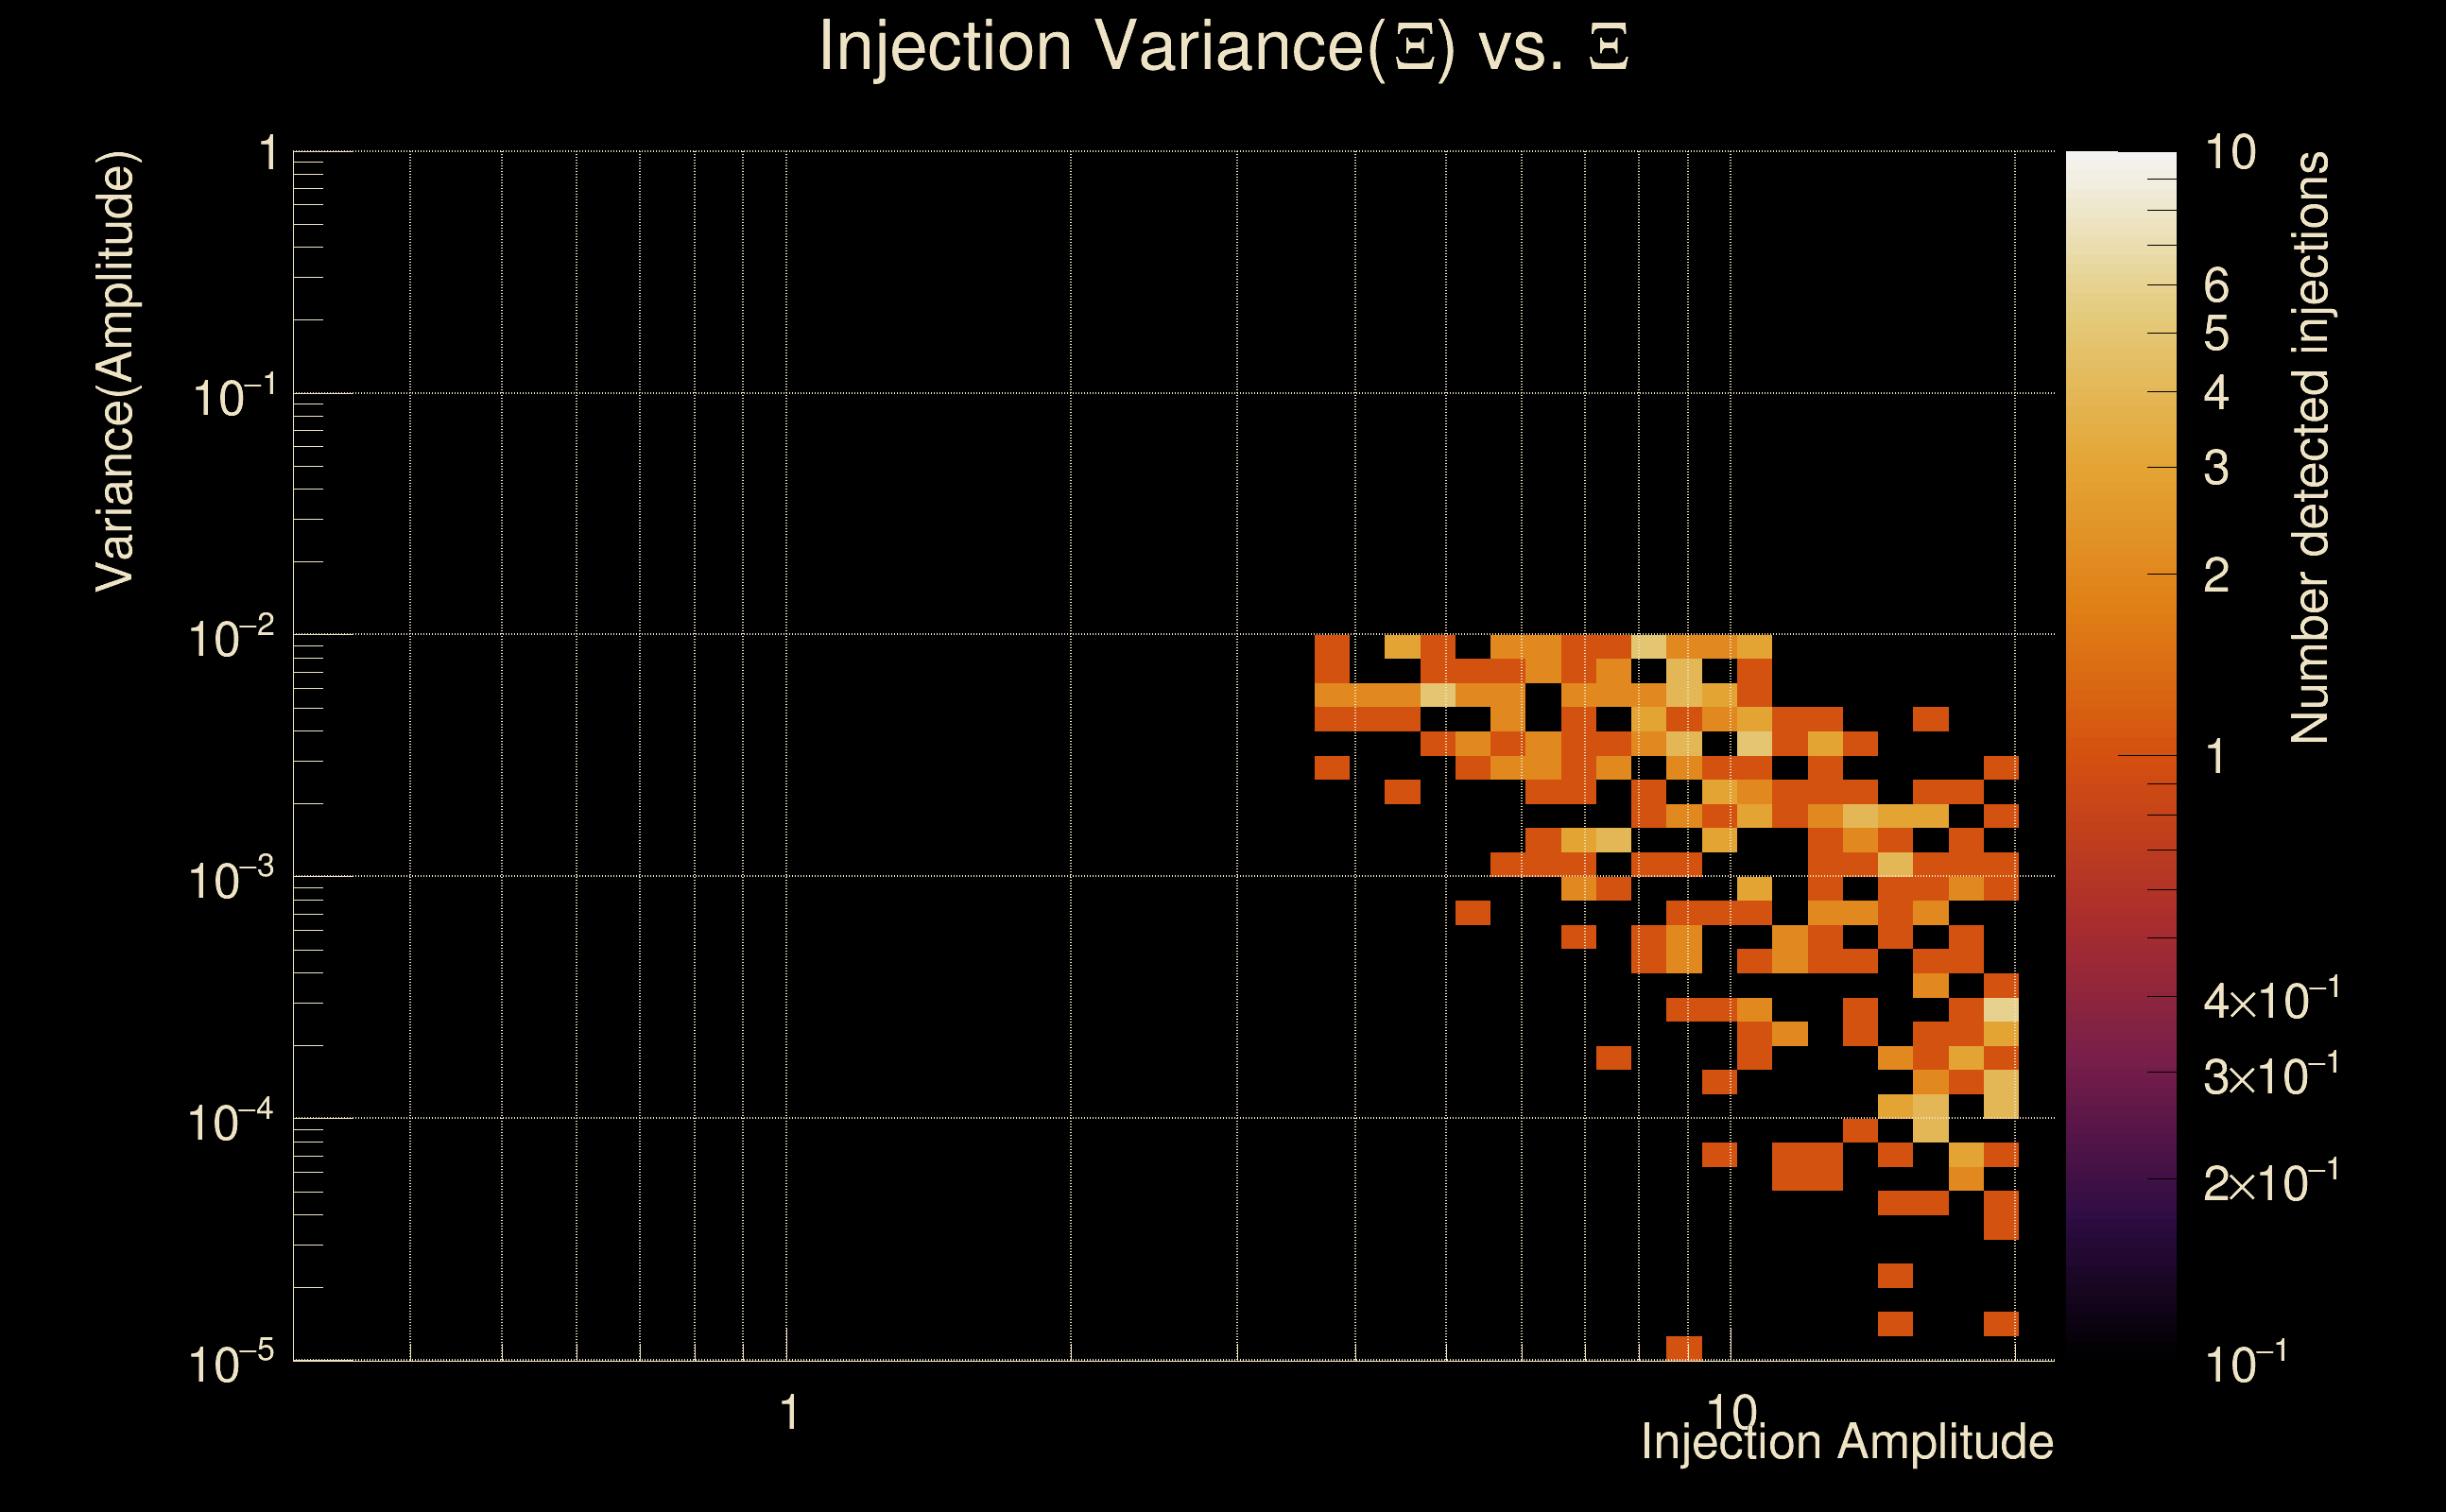
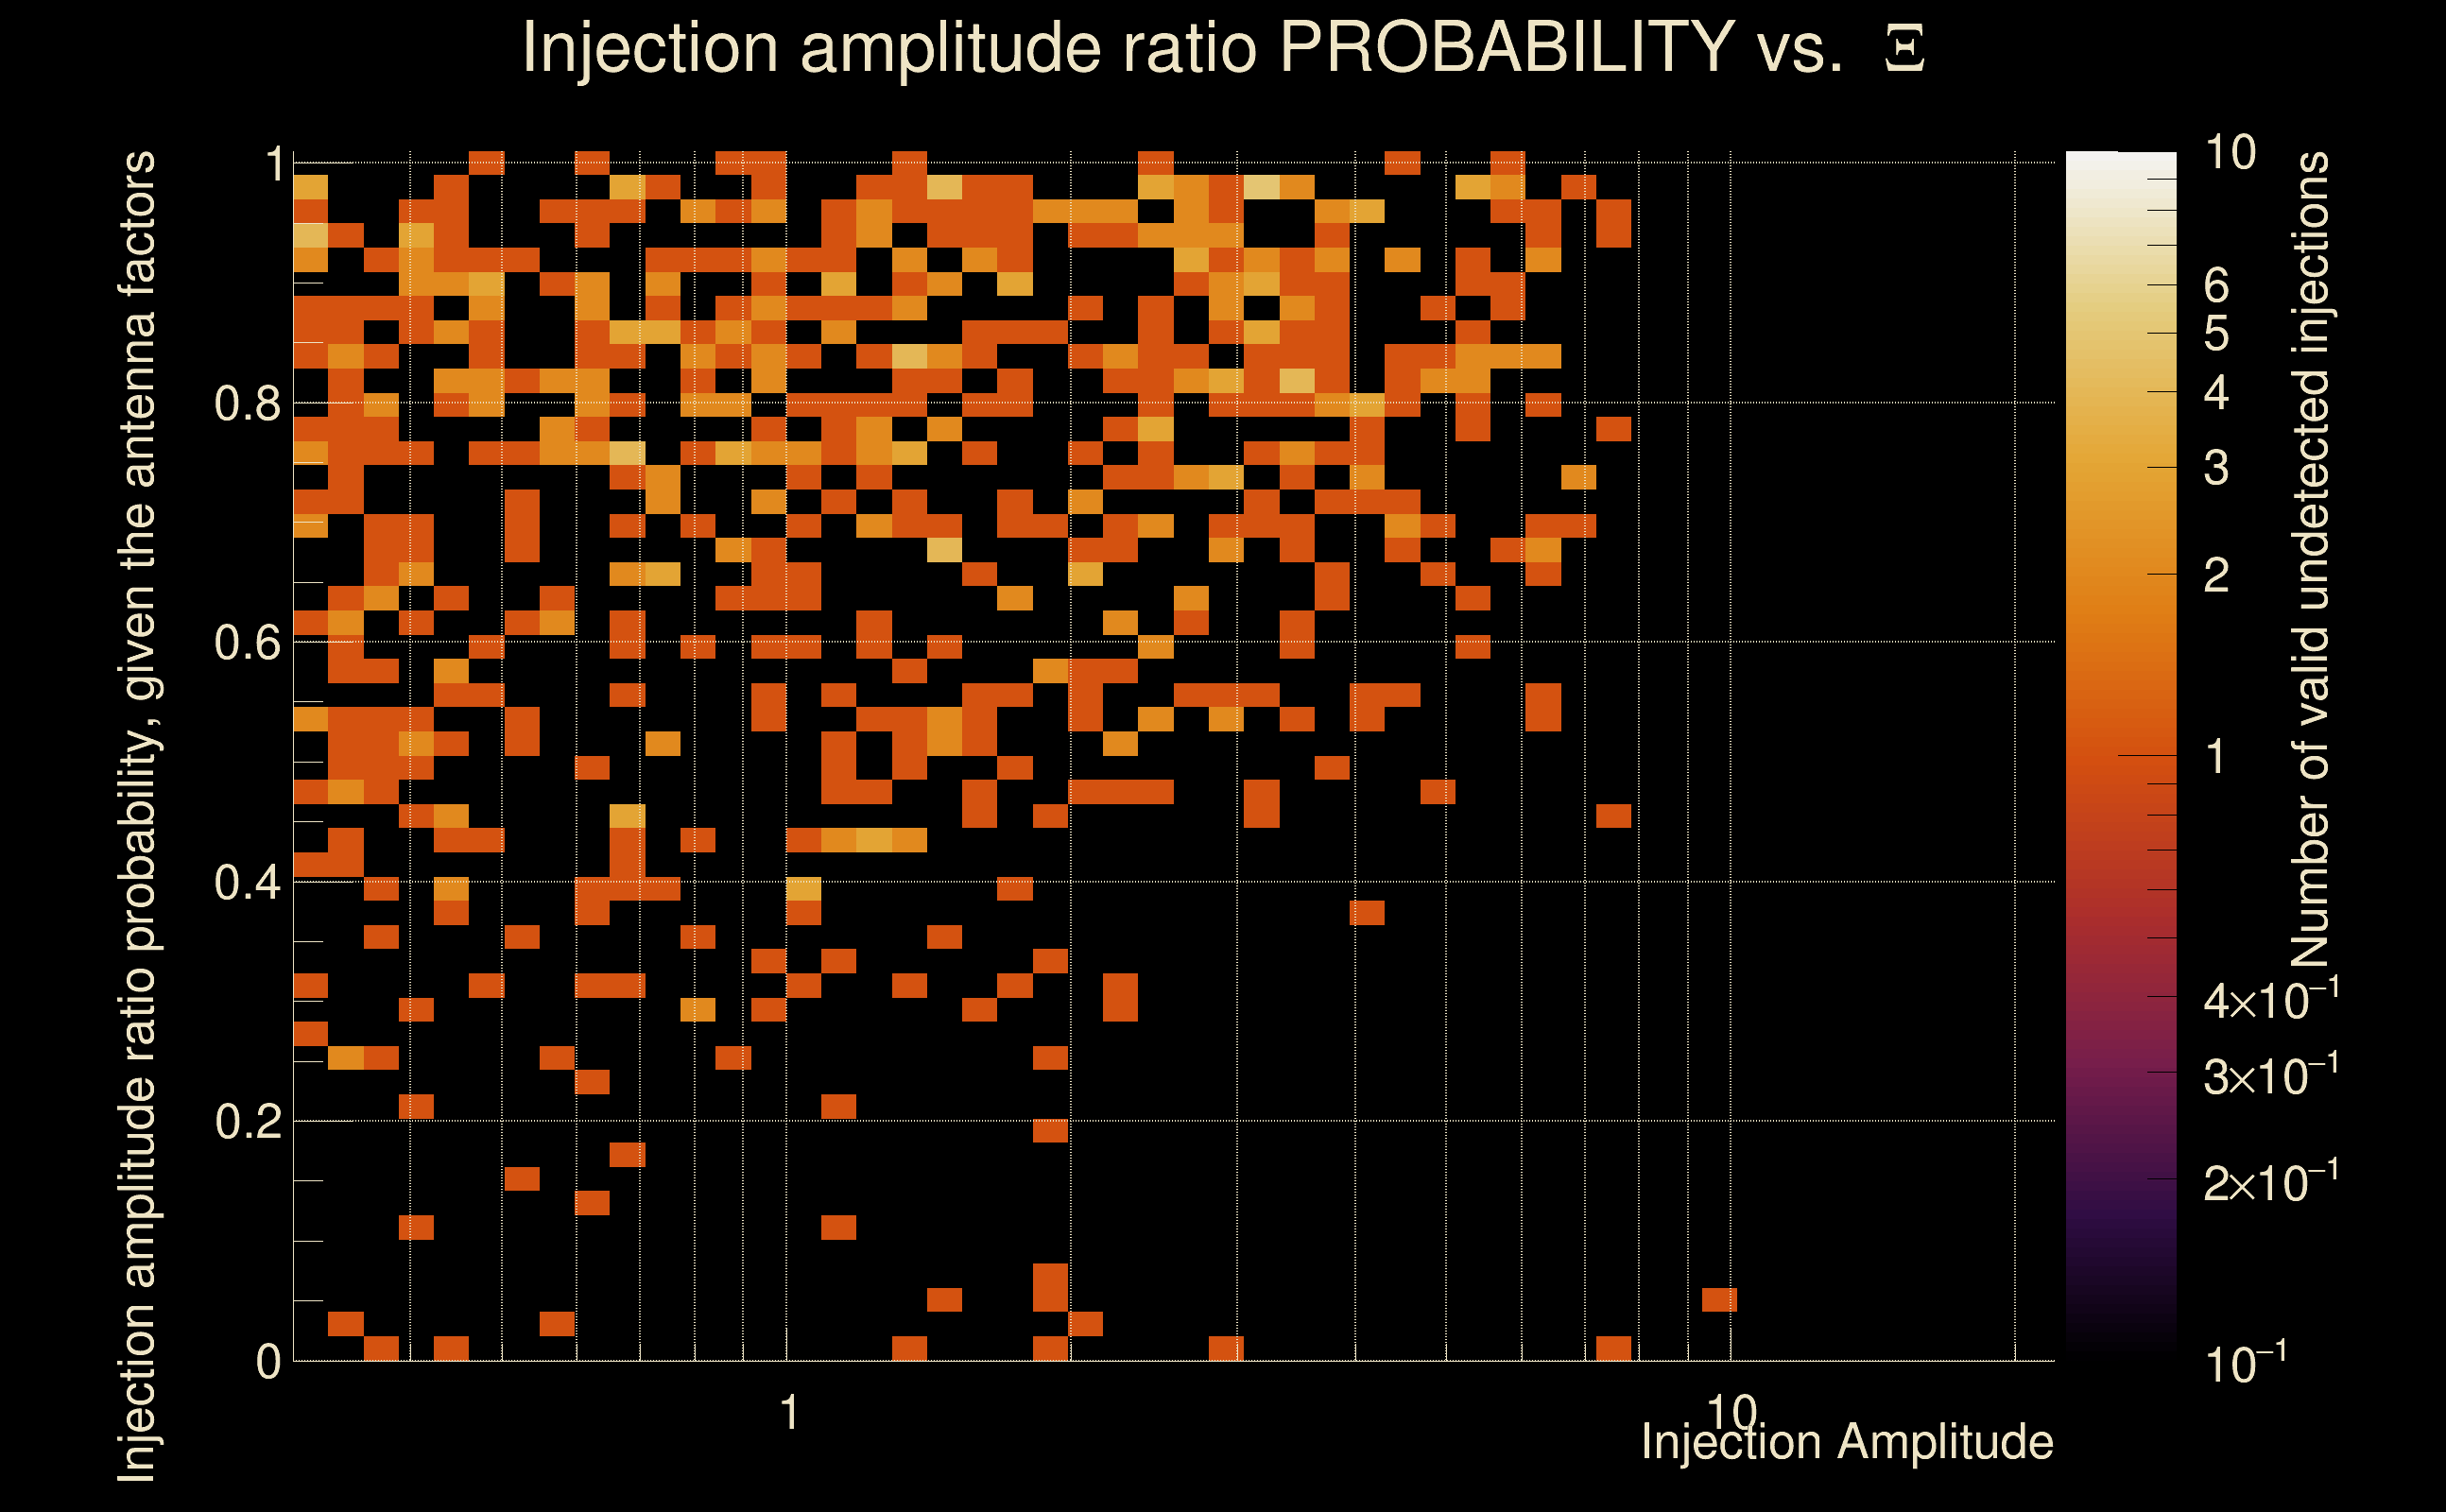
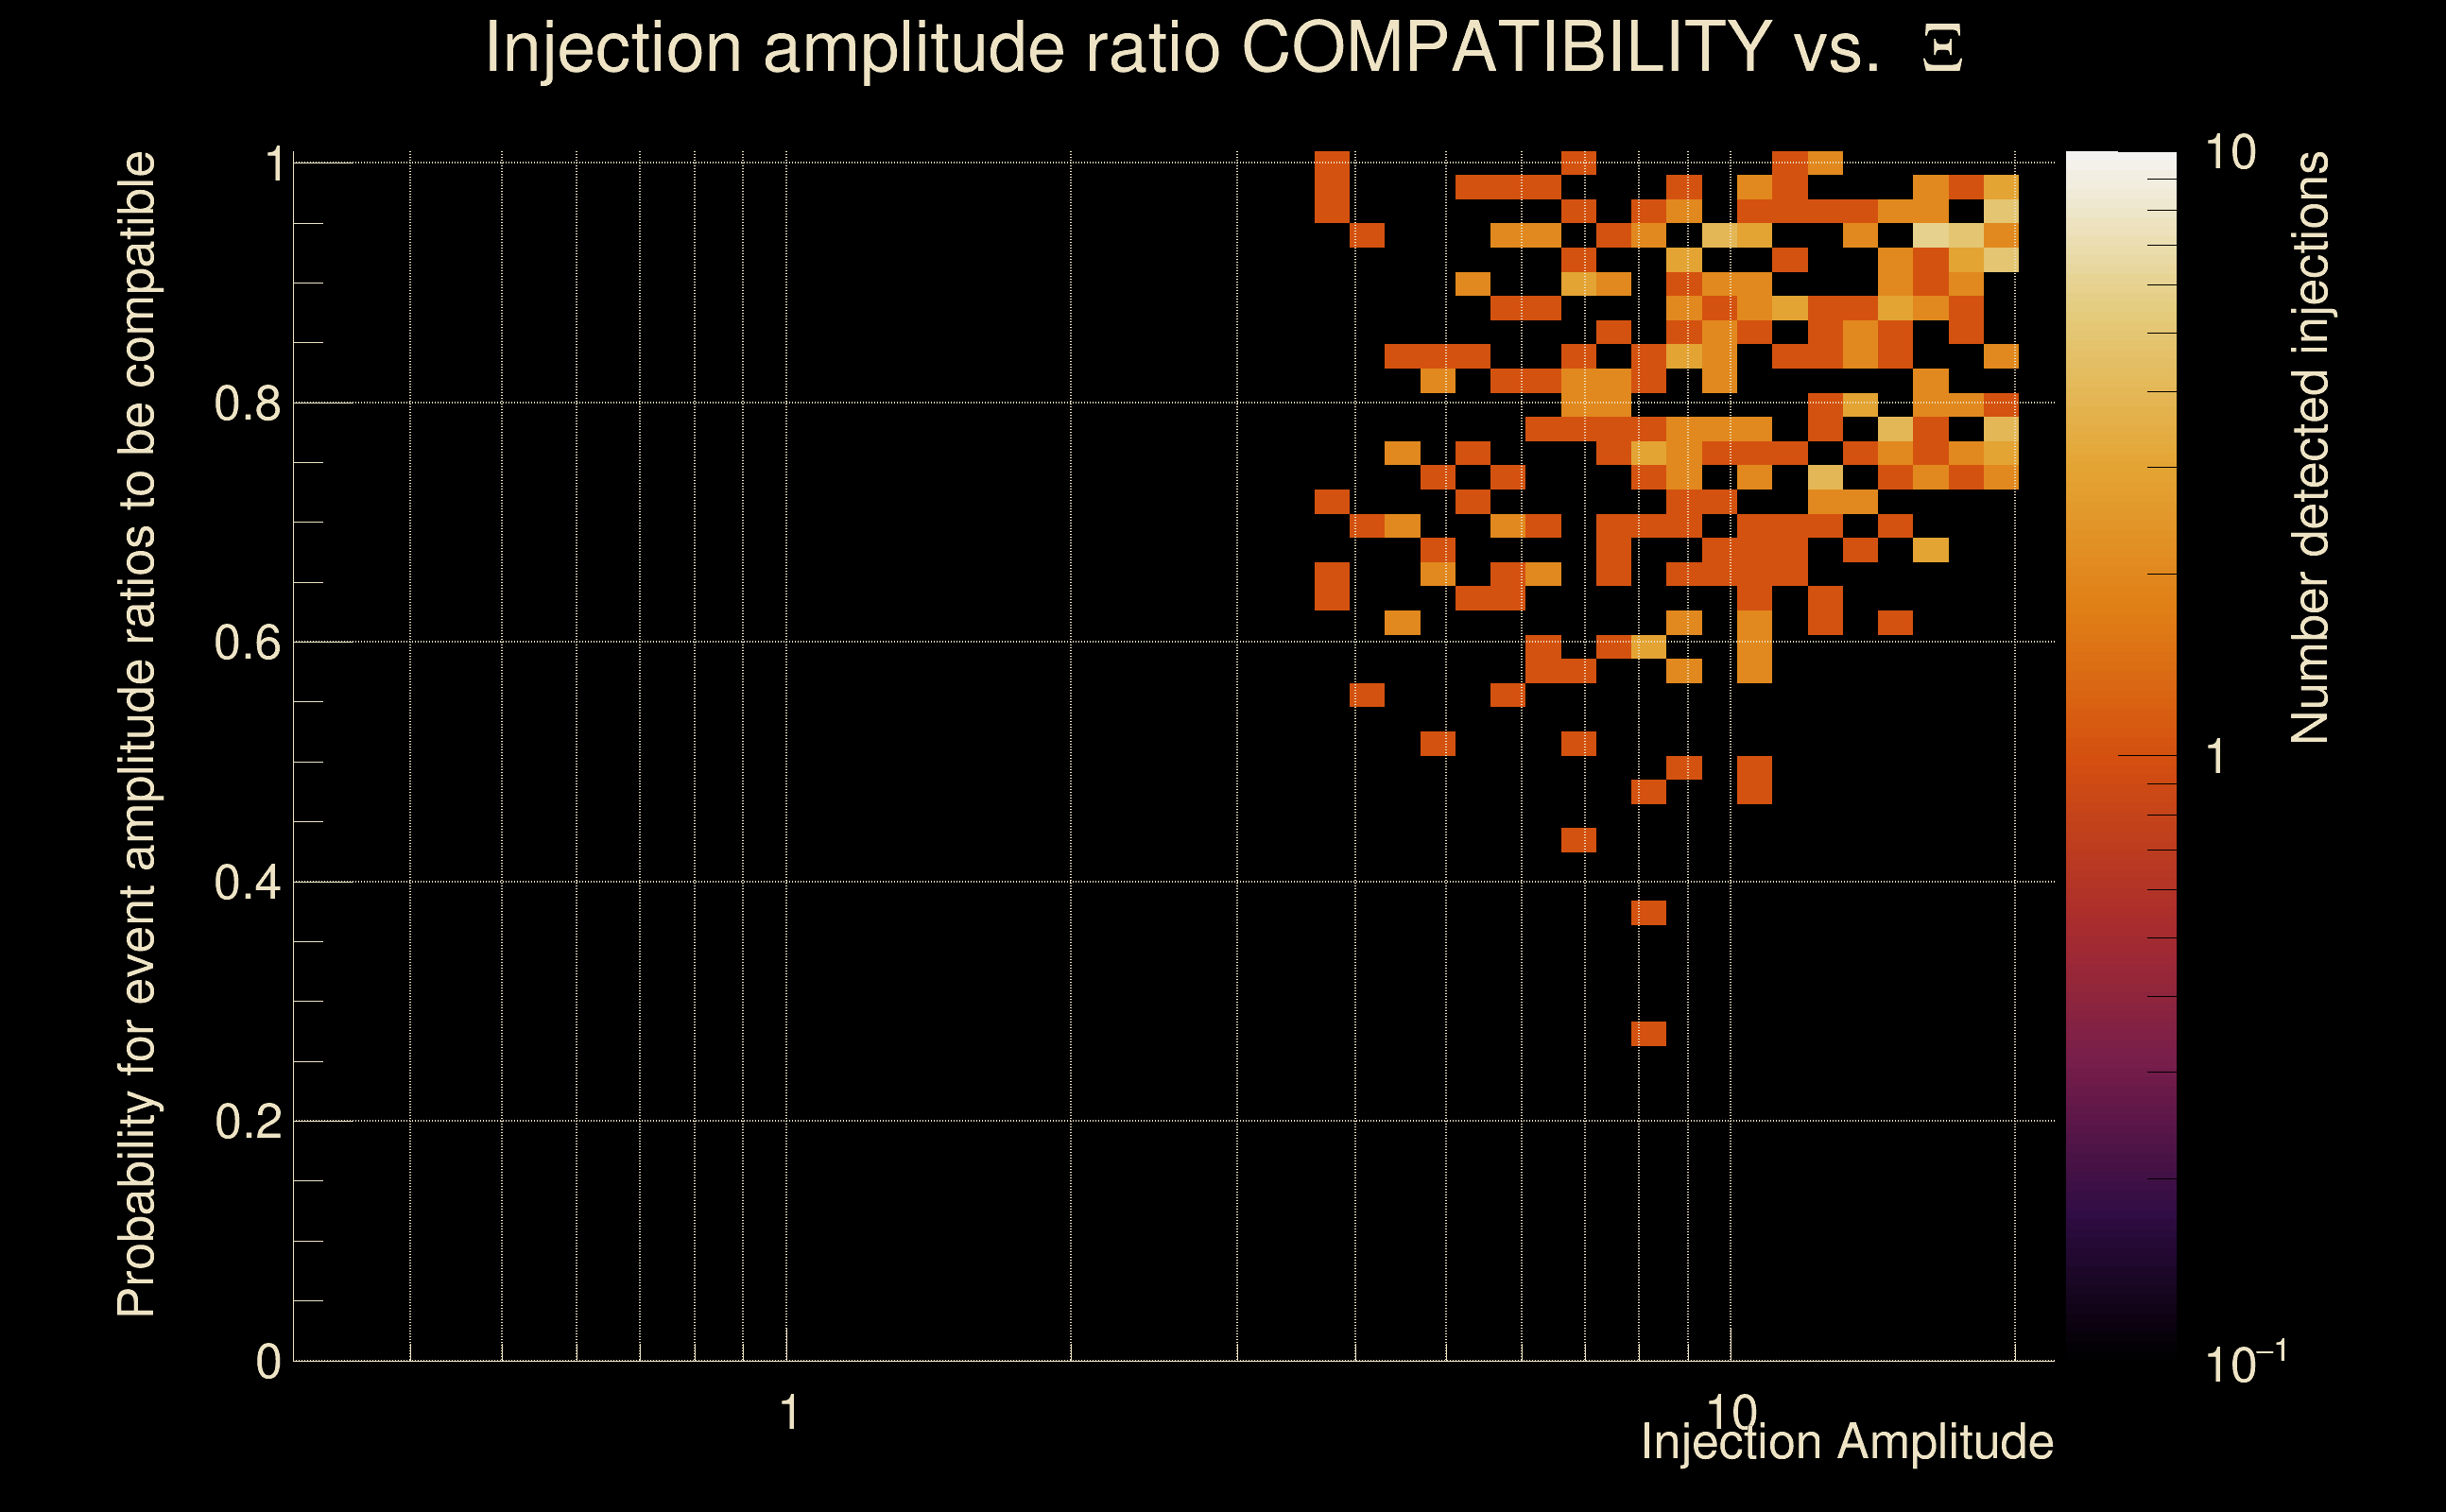
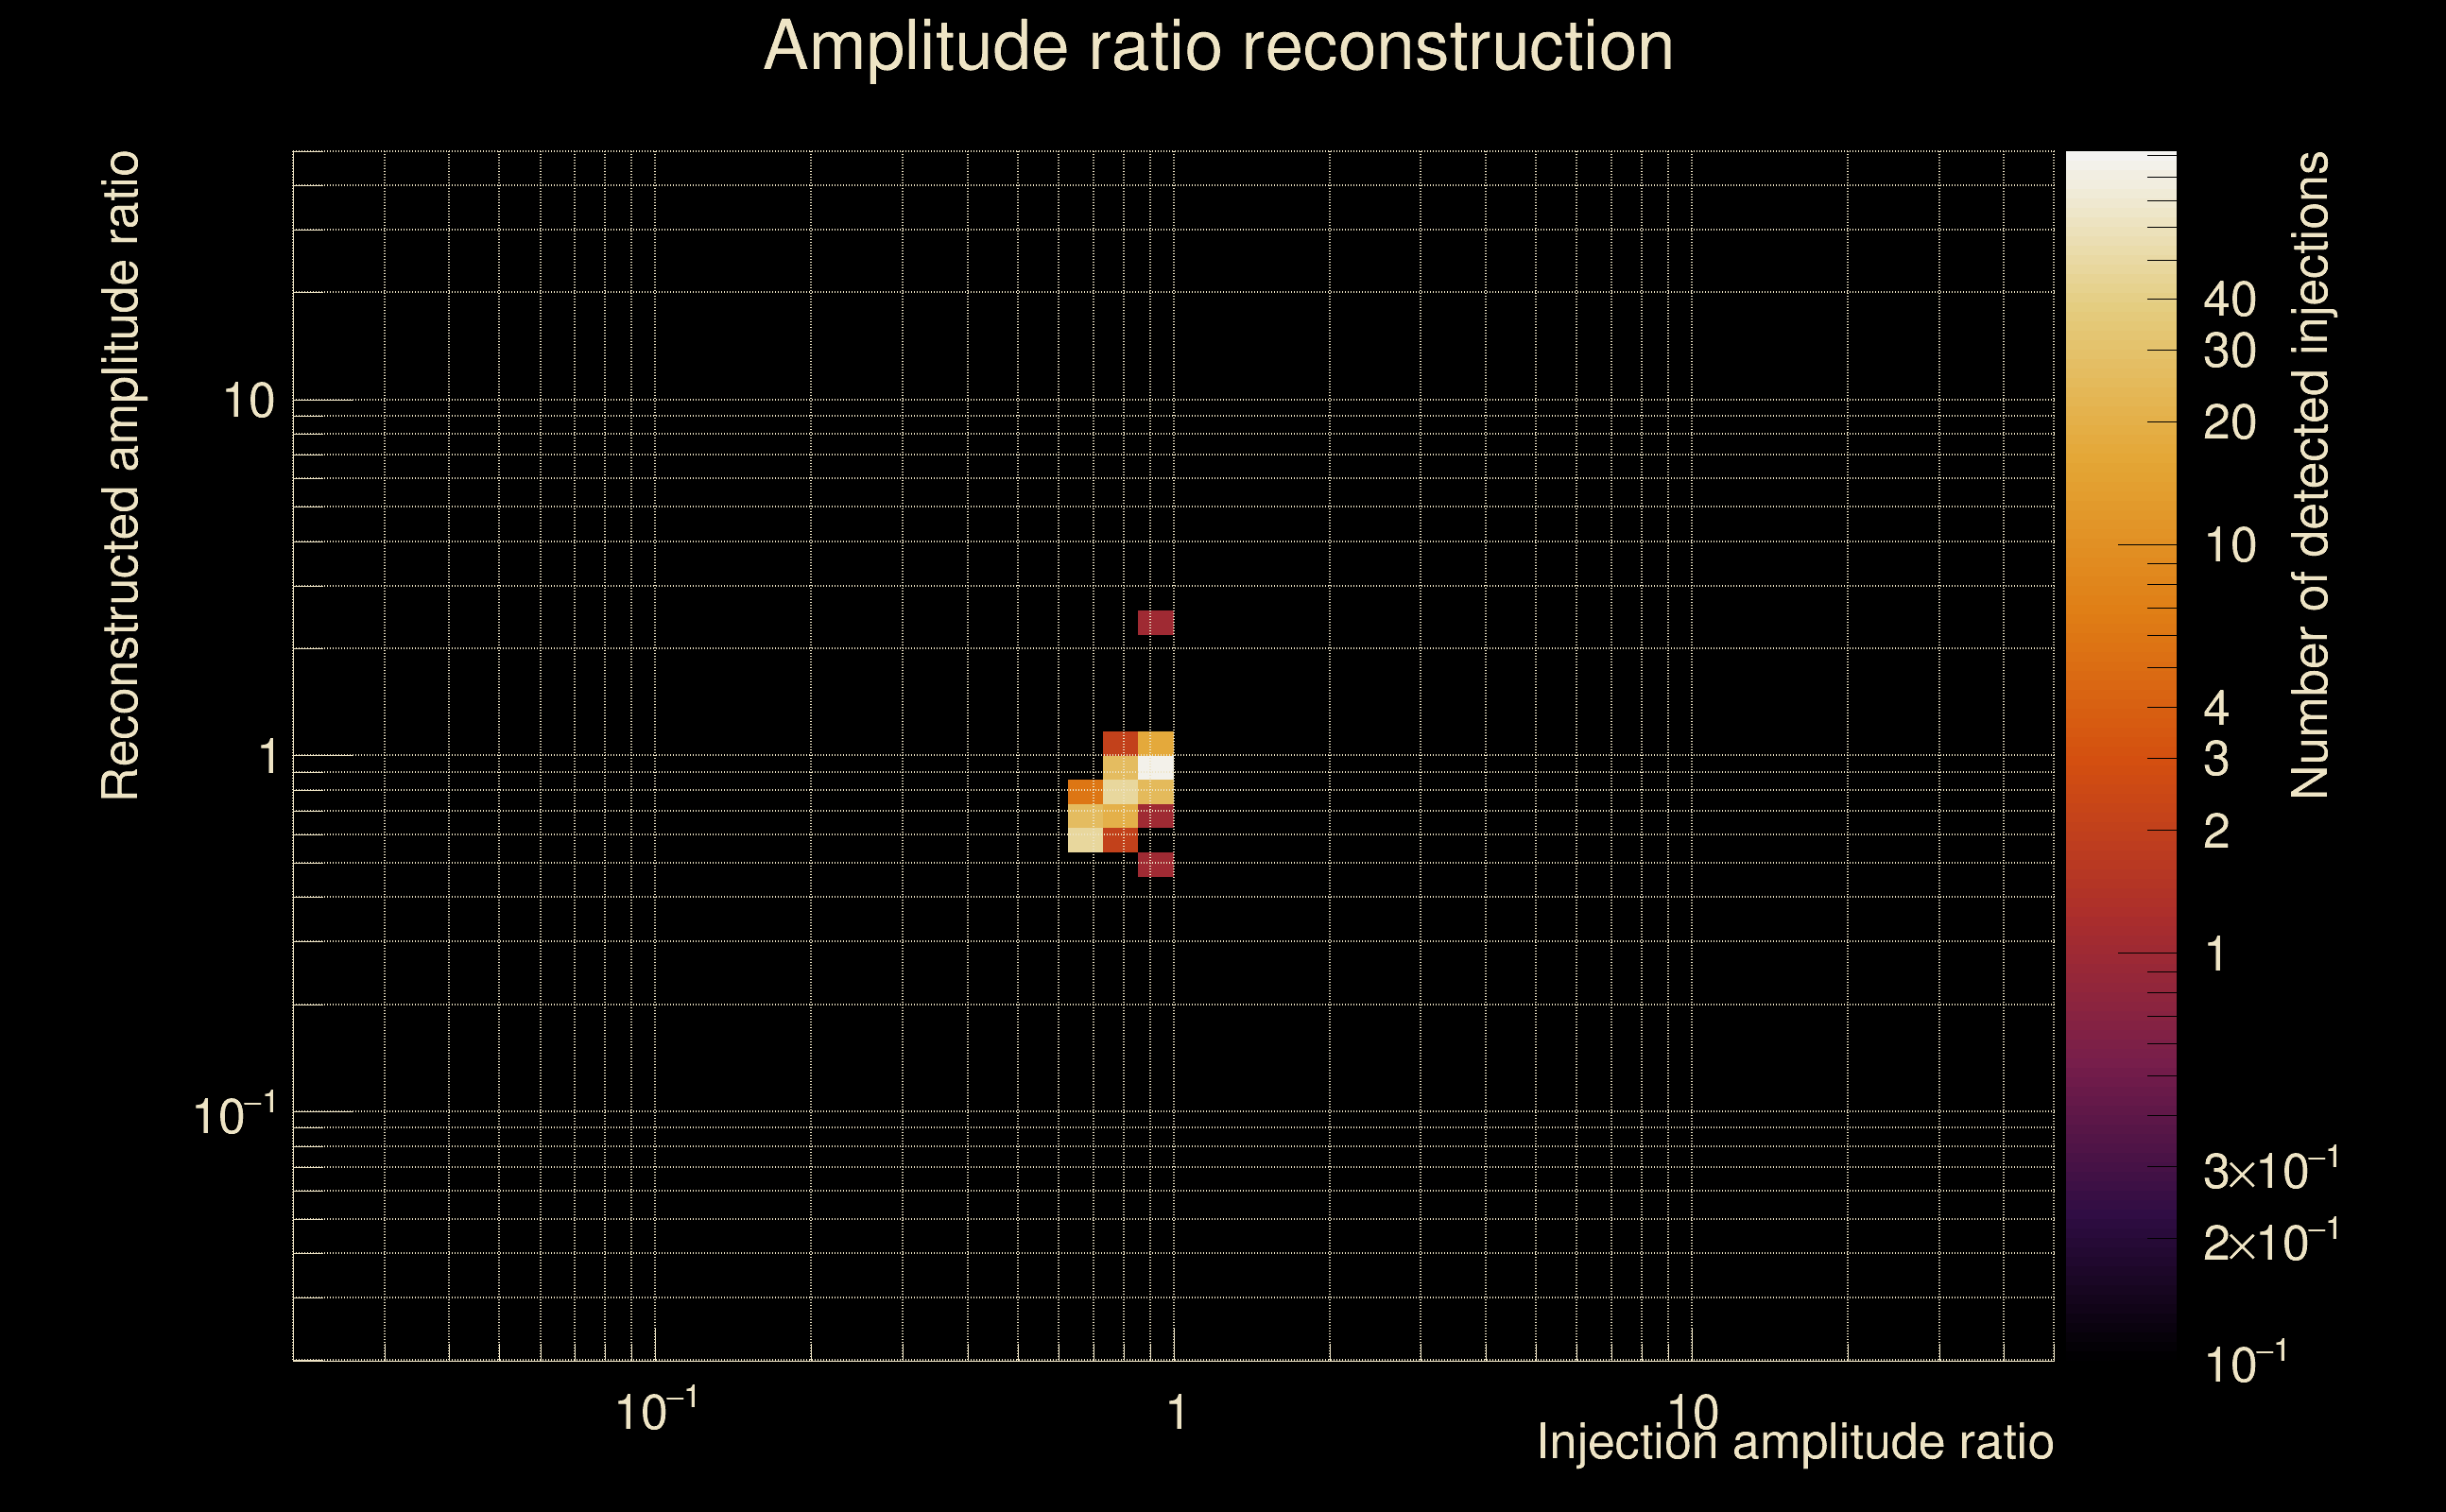
| Number of injections (total/valid/detected): | 1162 / 1019 / 228 |
| List of missed injections: | ./Mezz23-D15_missed.txt |
| Injection amplitude at 90% detection efficiency: | 12.4789 |
| Injection amplitude at 50% detection efficiency: | 8.35609 |
| Injection amplitude at 10% detection efficiency: | 5.56677 |
 |
 |
 |
 |
 |
 |
 |
|
 |
 |
|
 |
 |
|
 |
 |
|
 |
 |
|
 |
 |
|
 |
 |
|
 |
 |
|
 |
 |
 |
 |
 |
 |
 |
 |
 |
 |
 |
 |
 |
 |
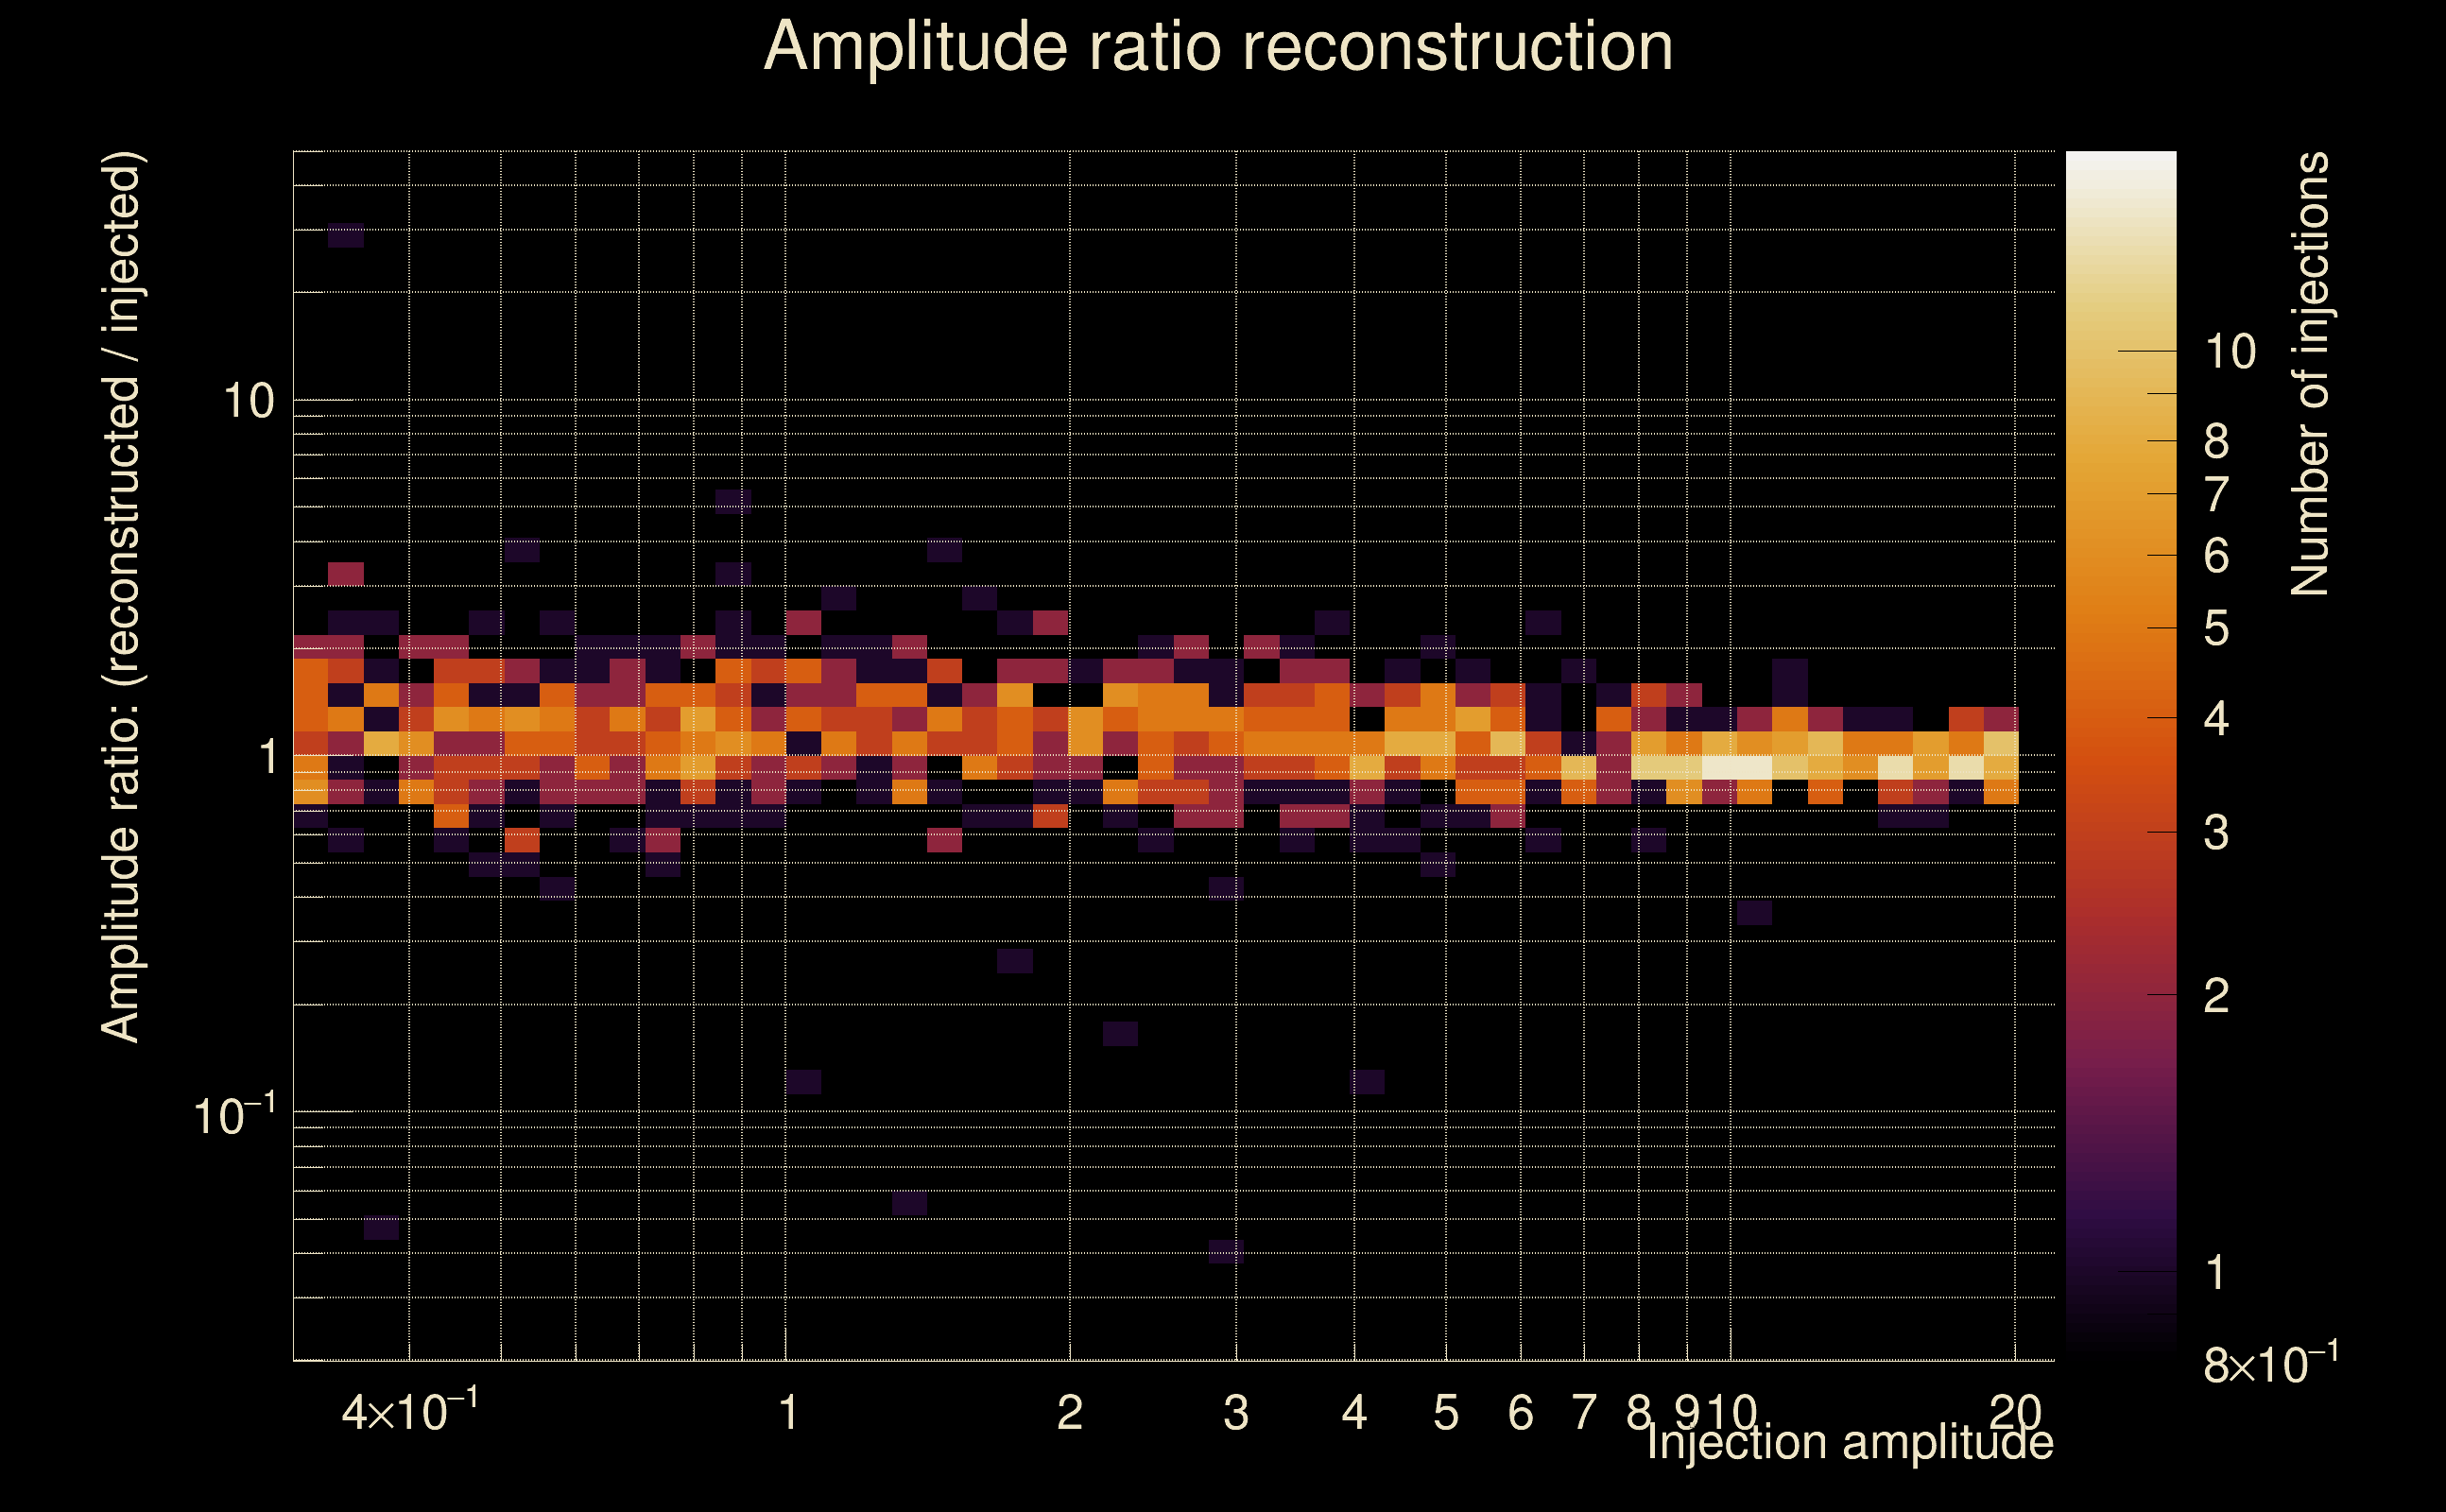 |
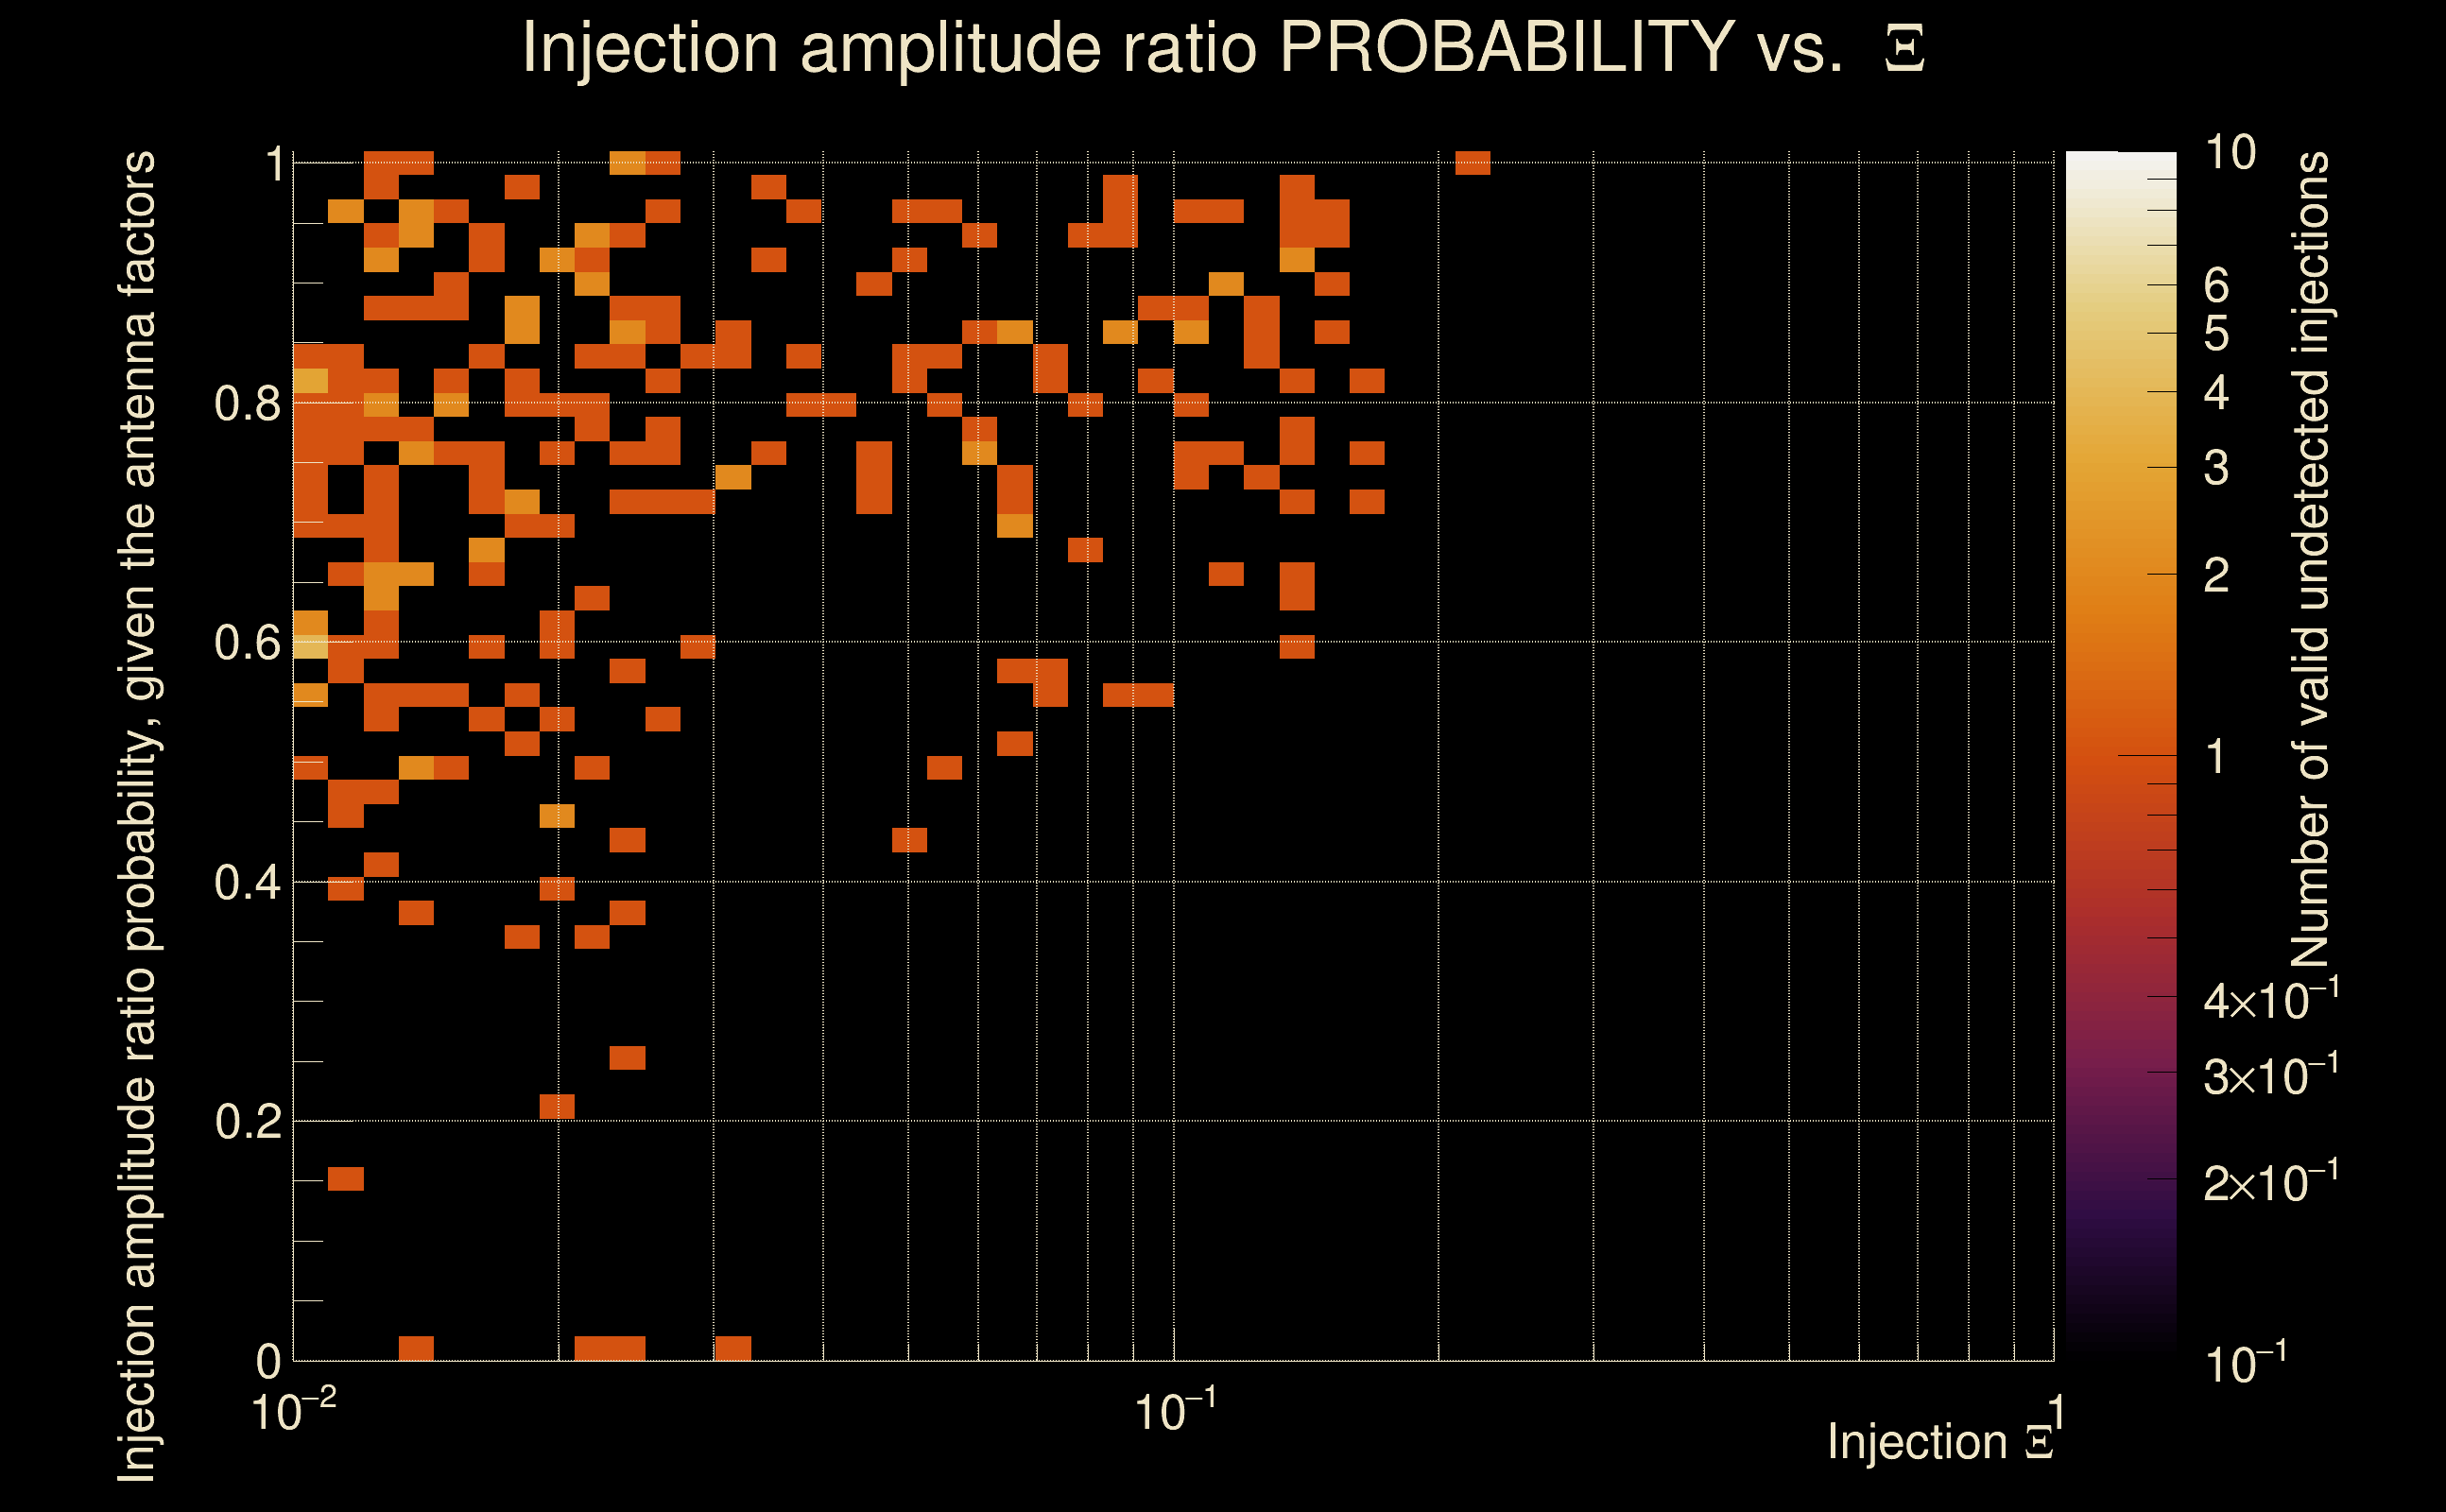
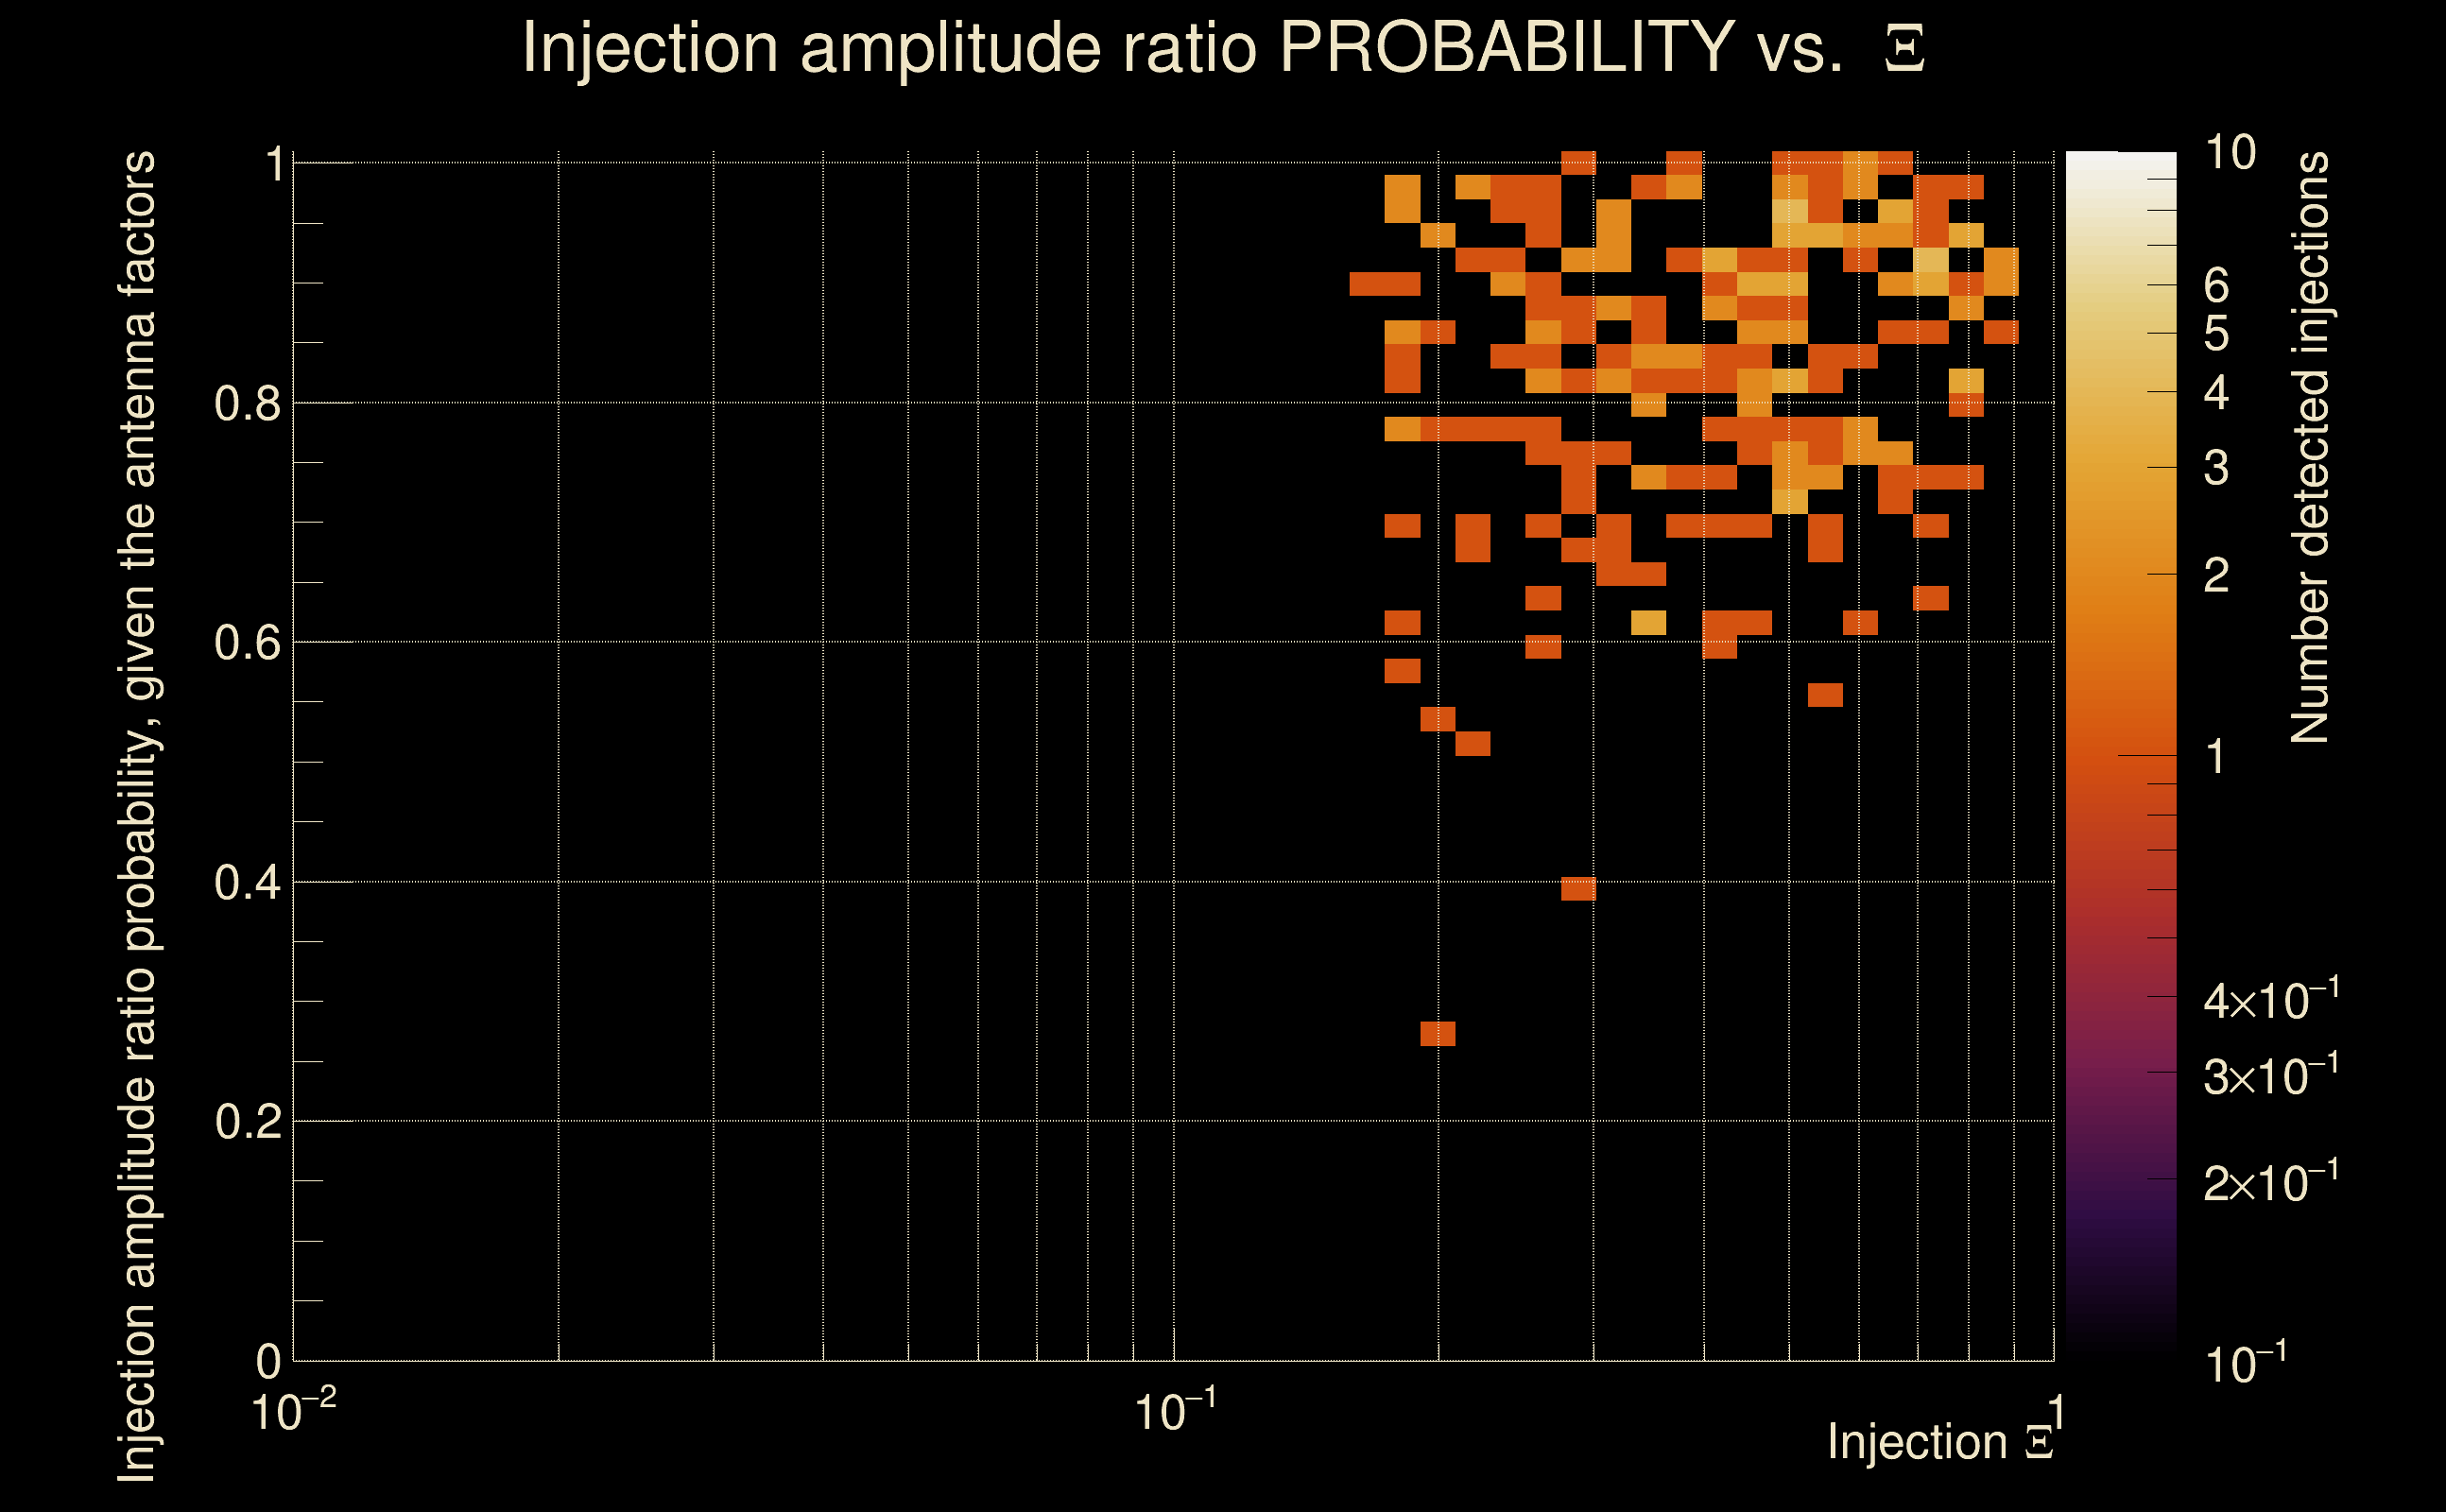
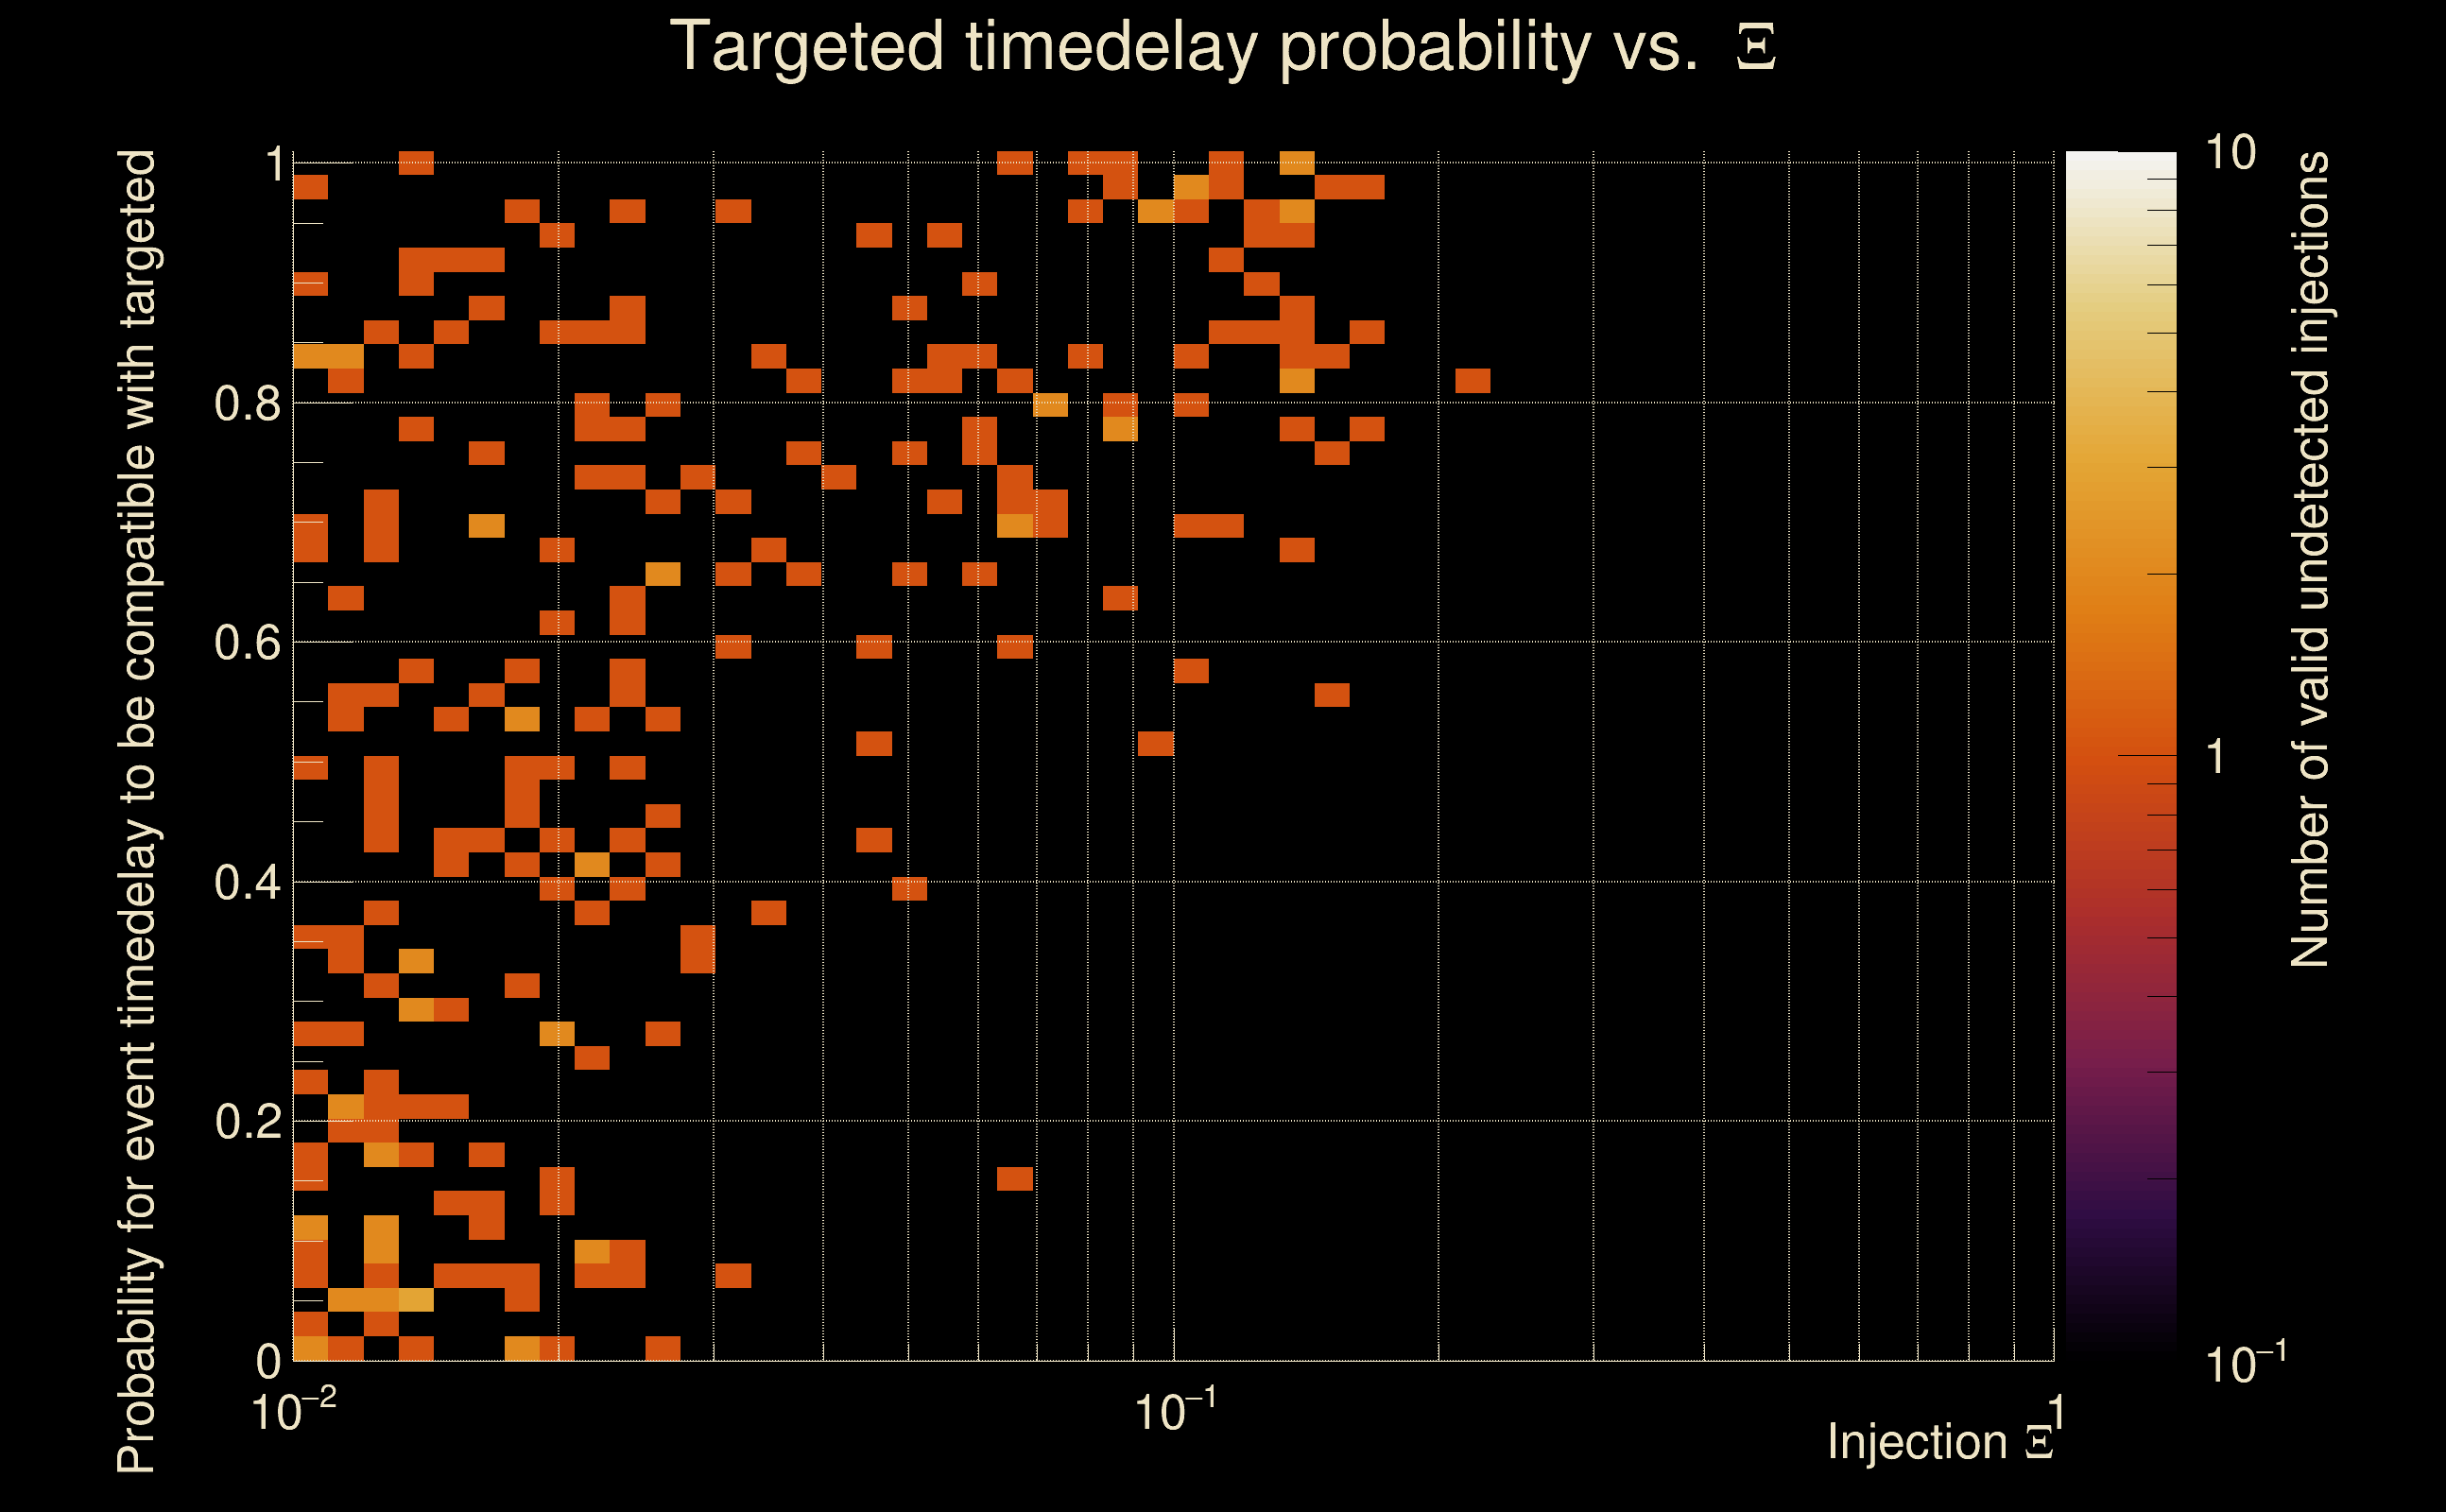
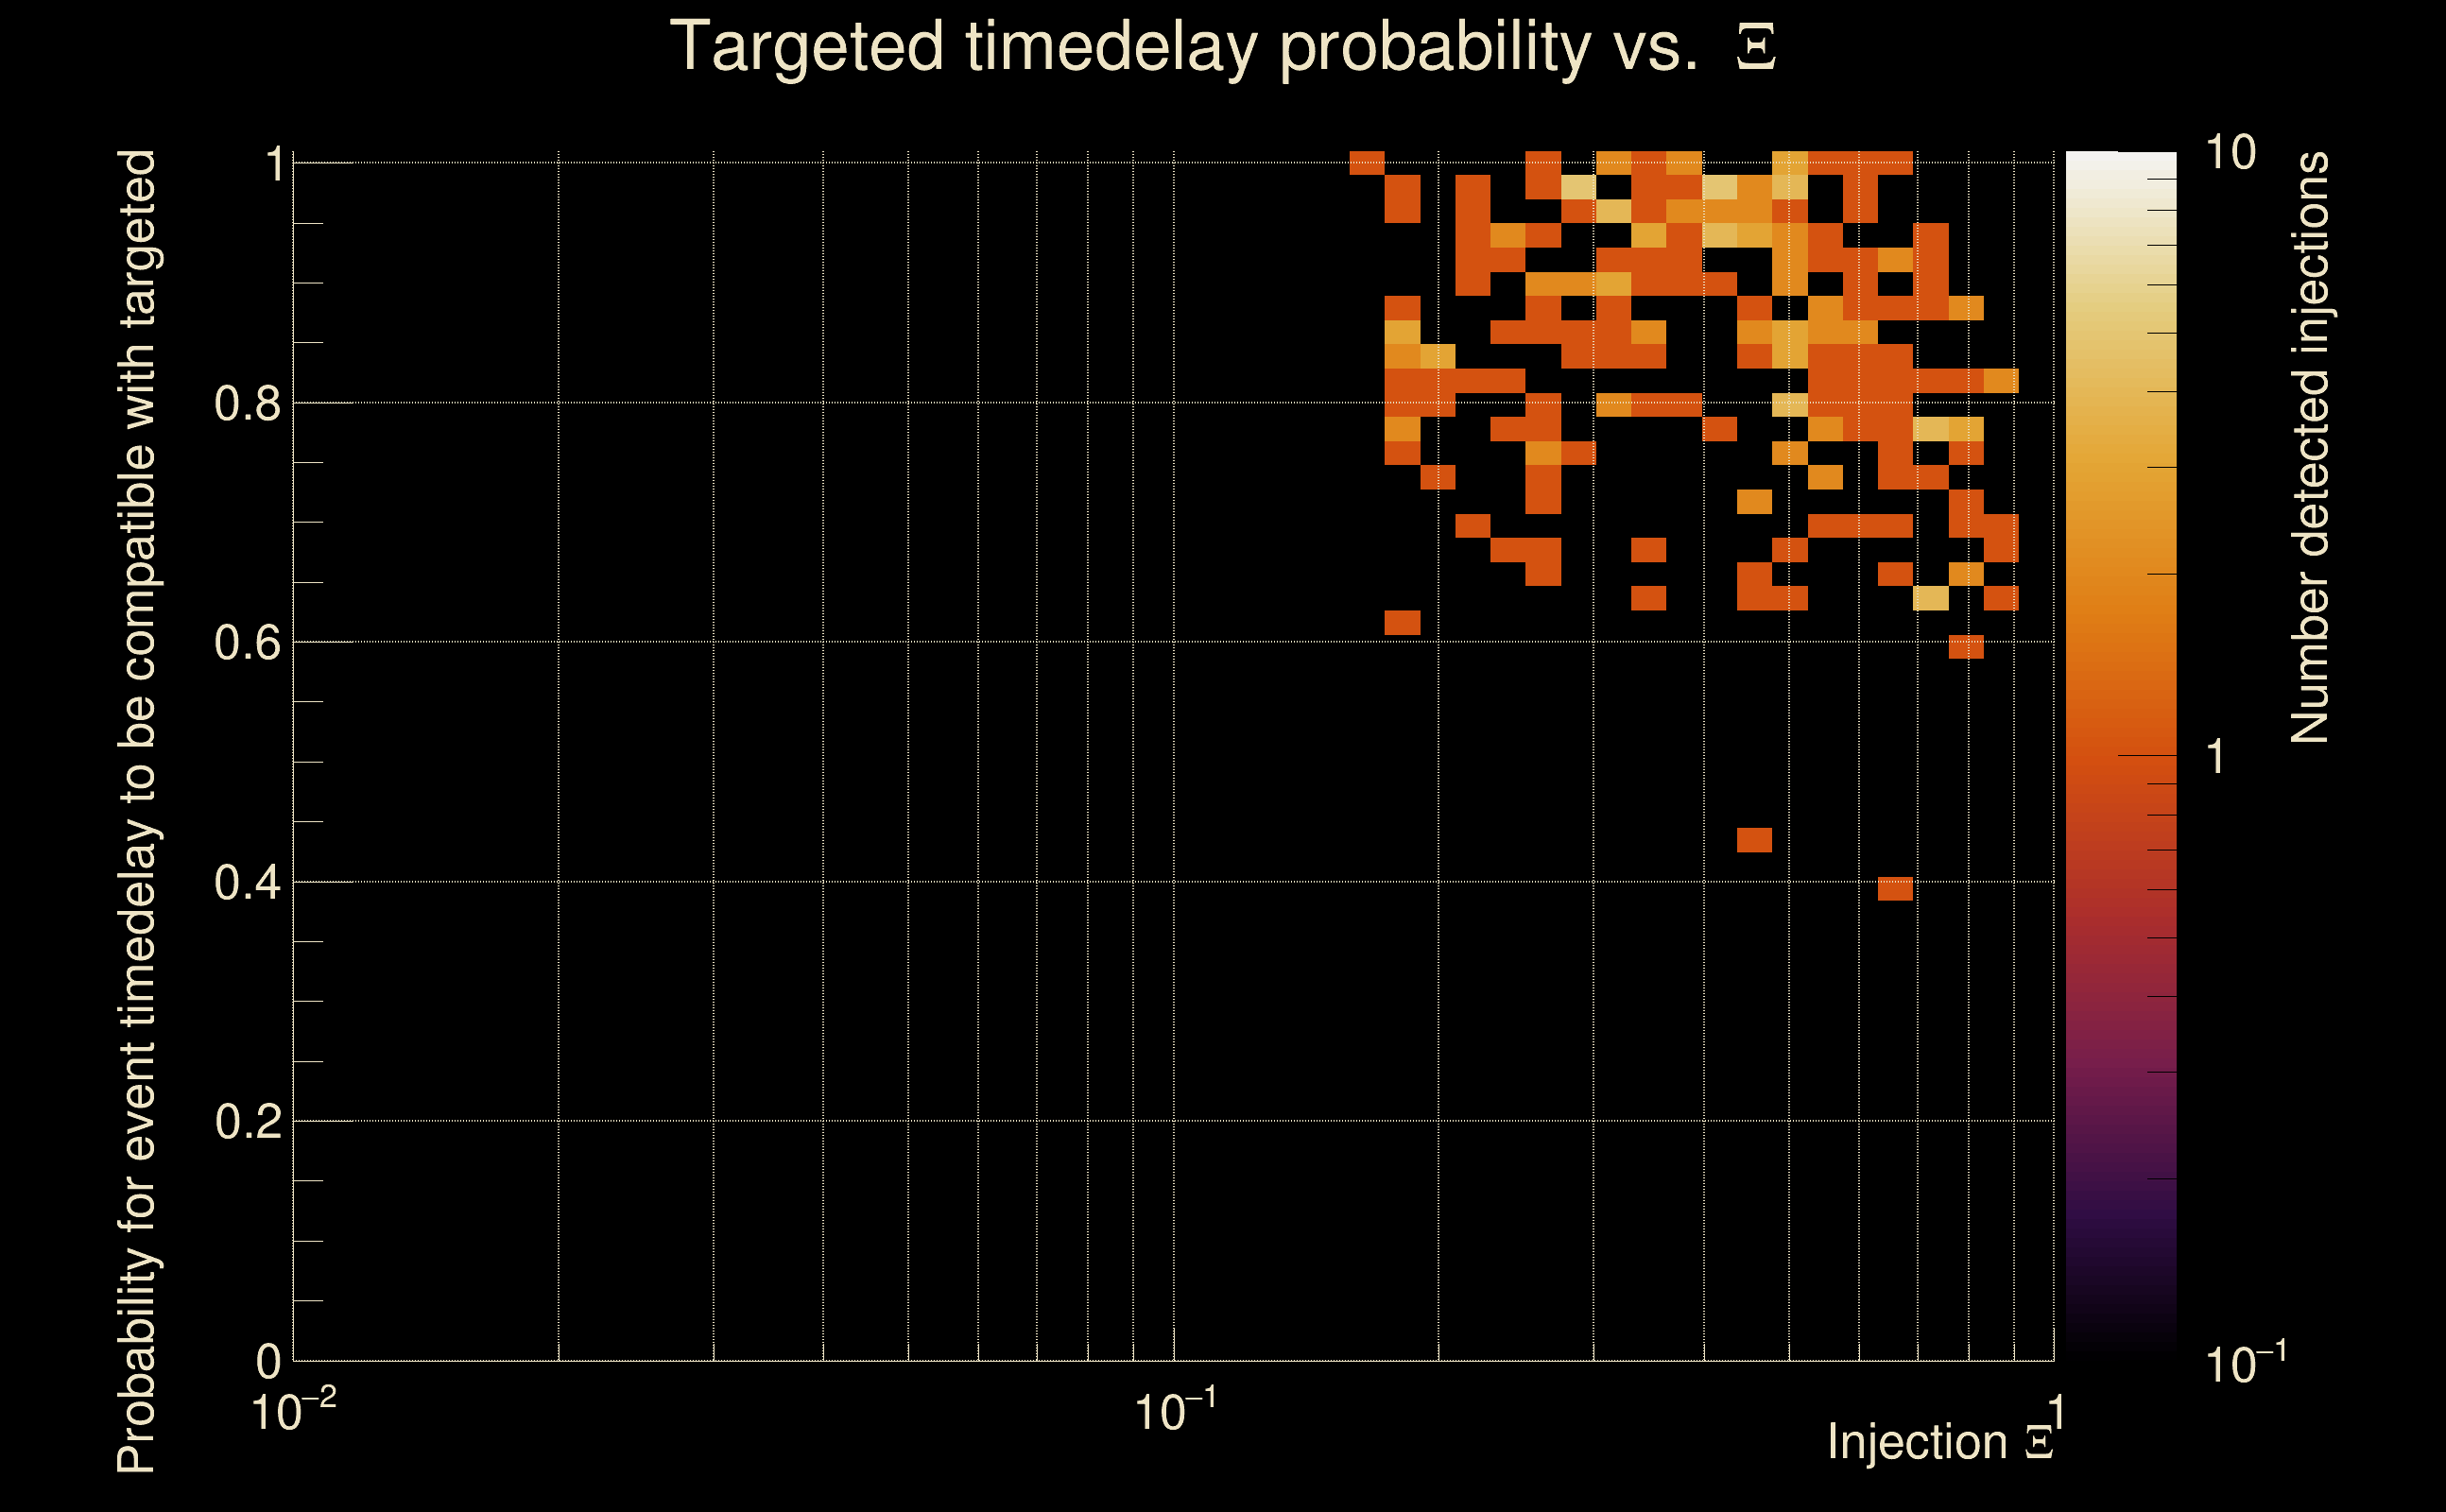
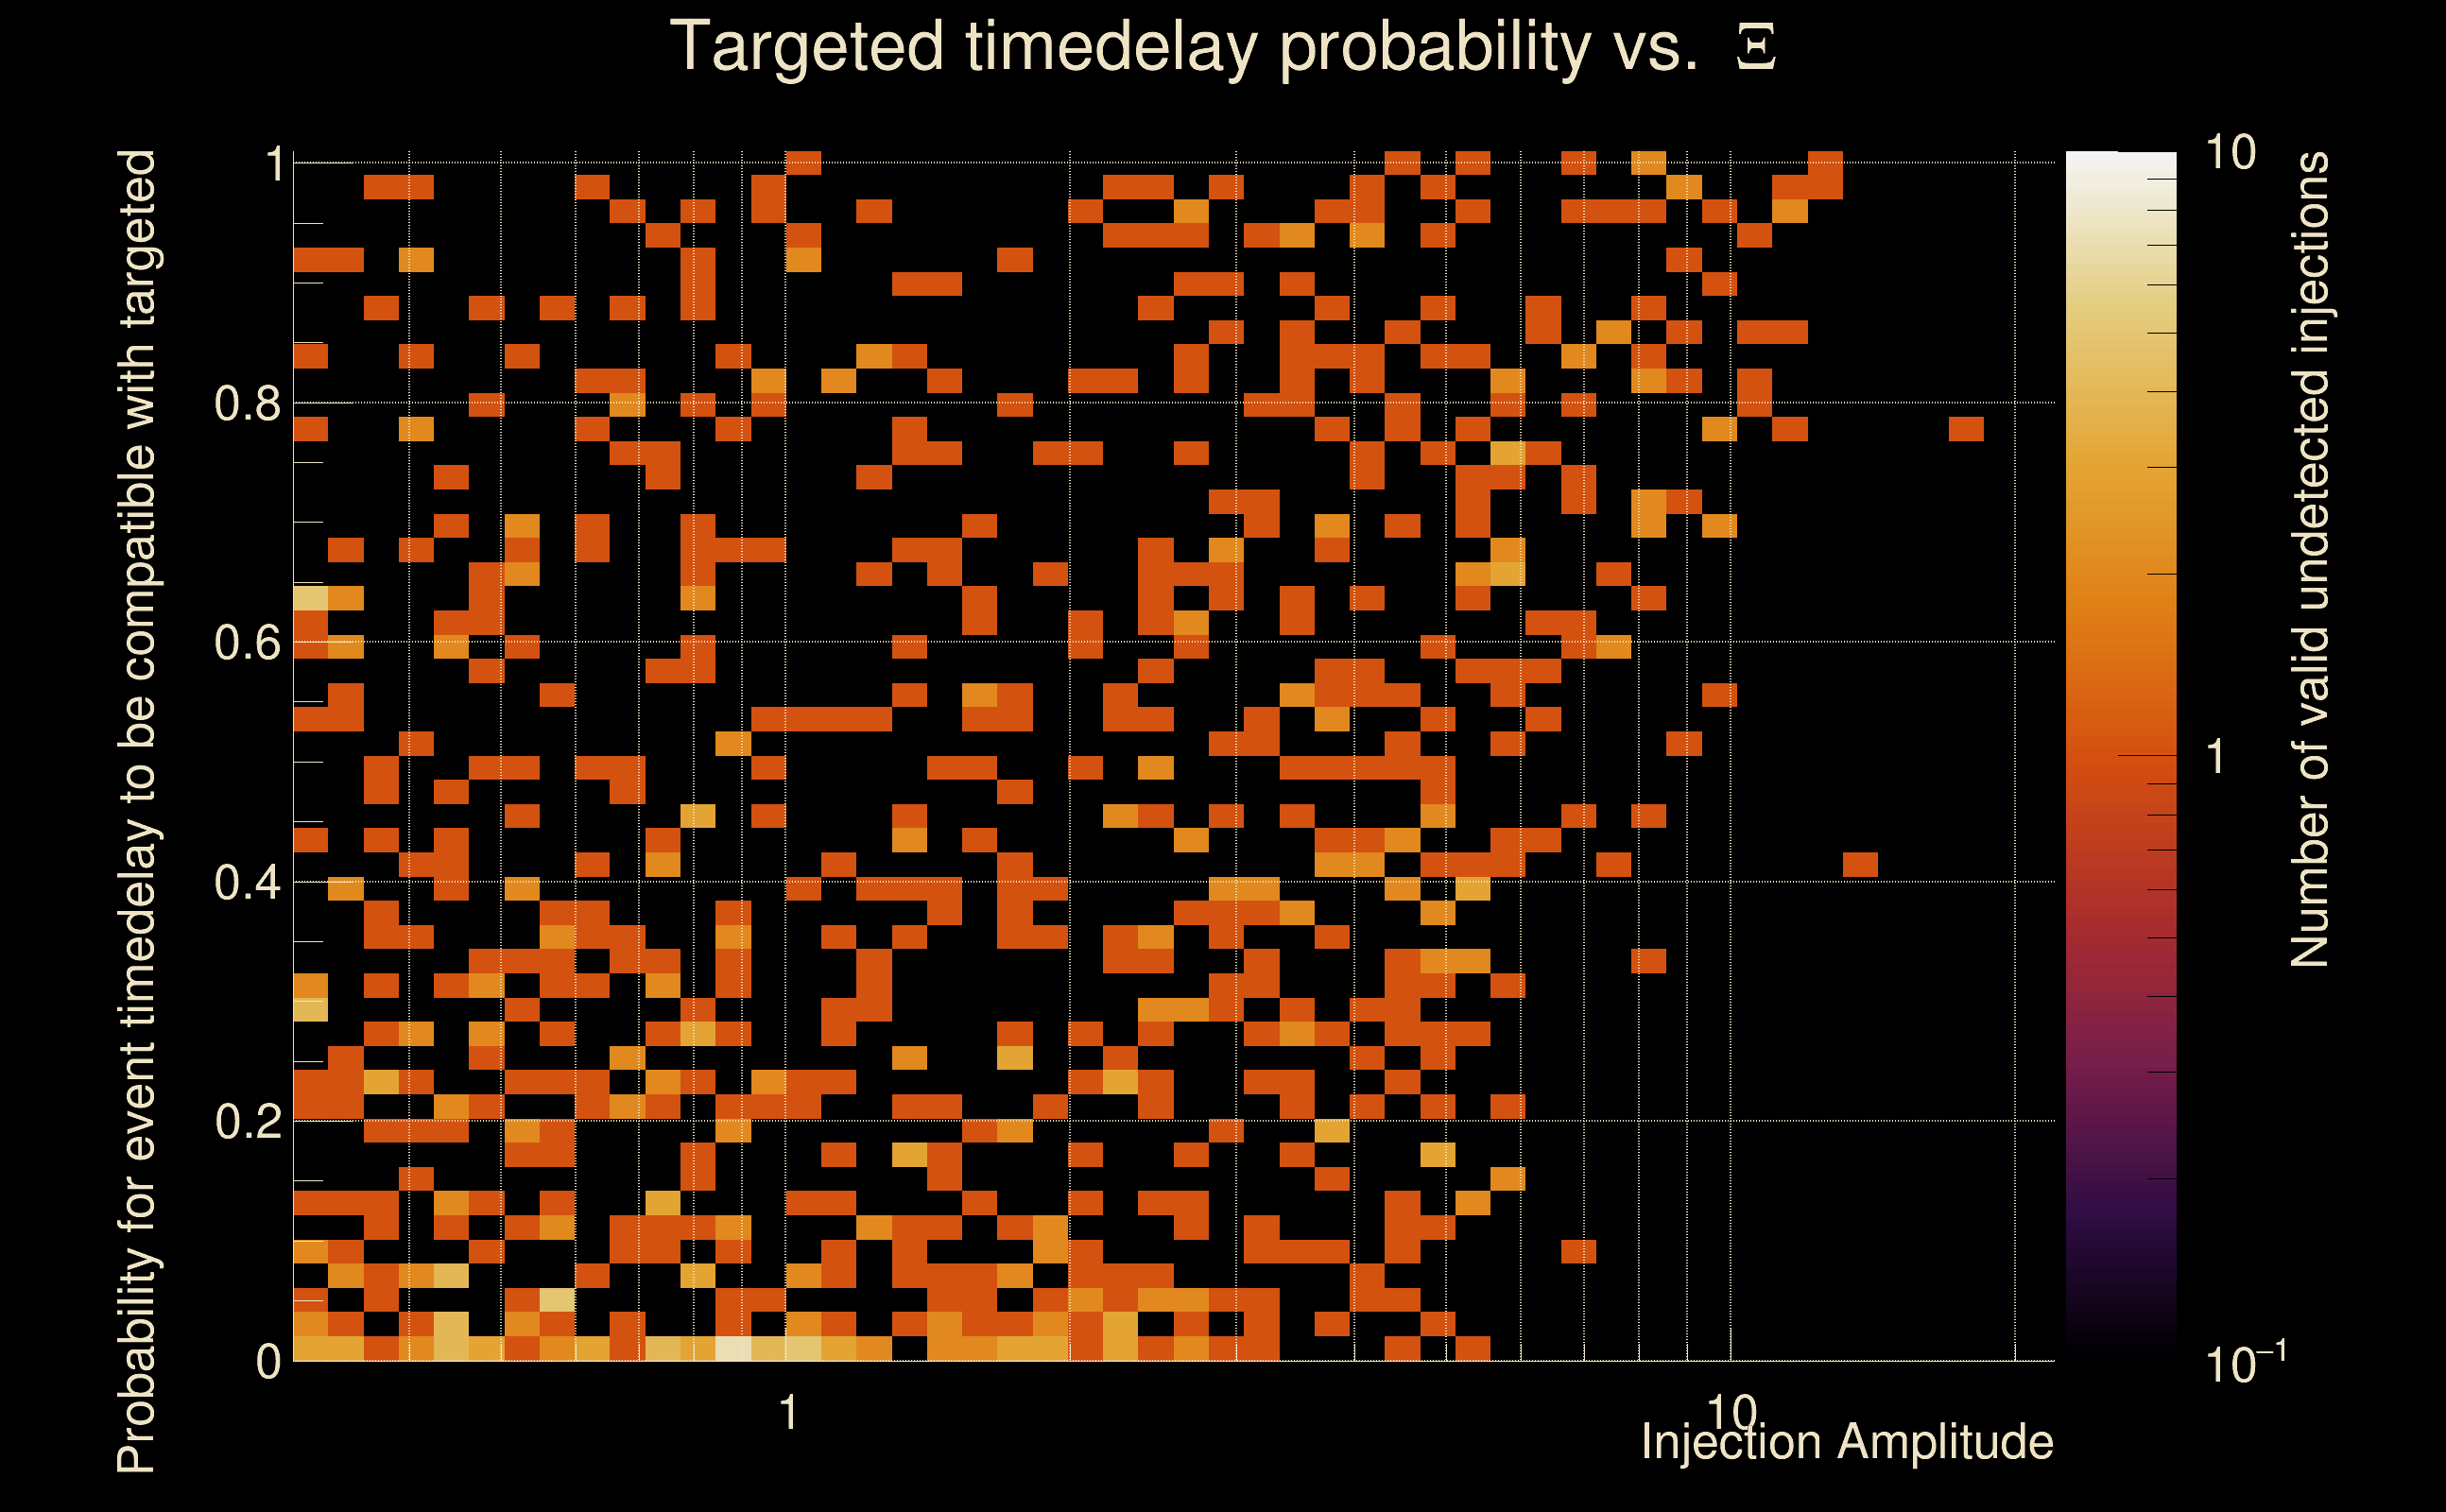
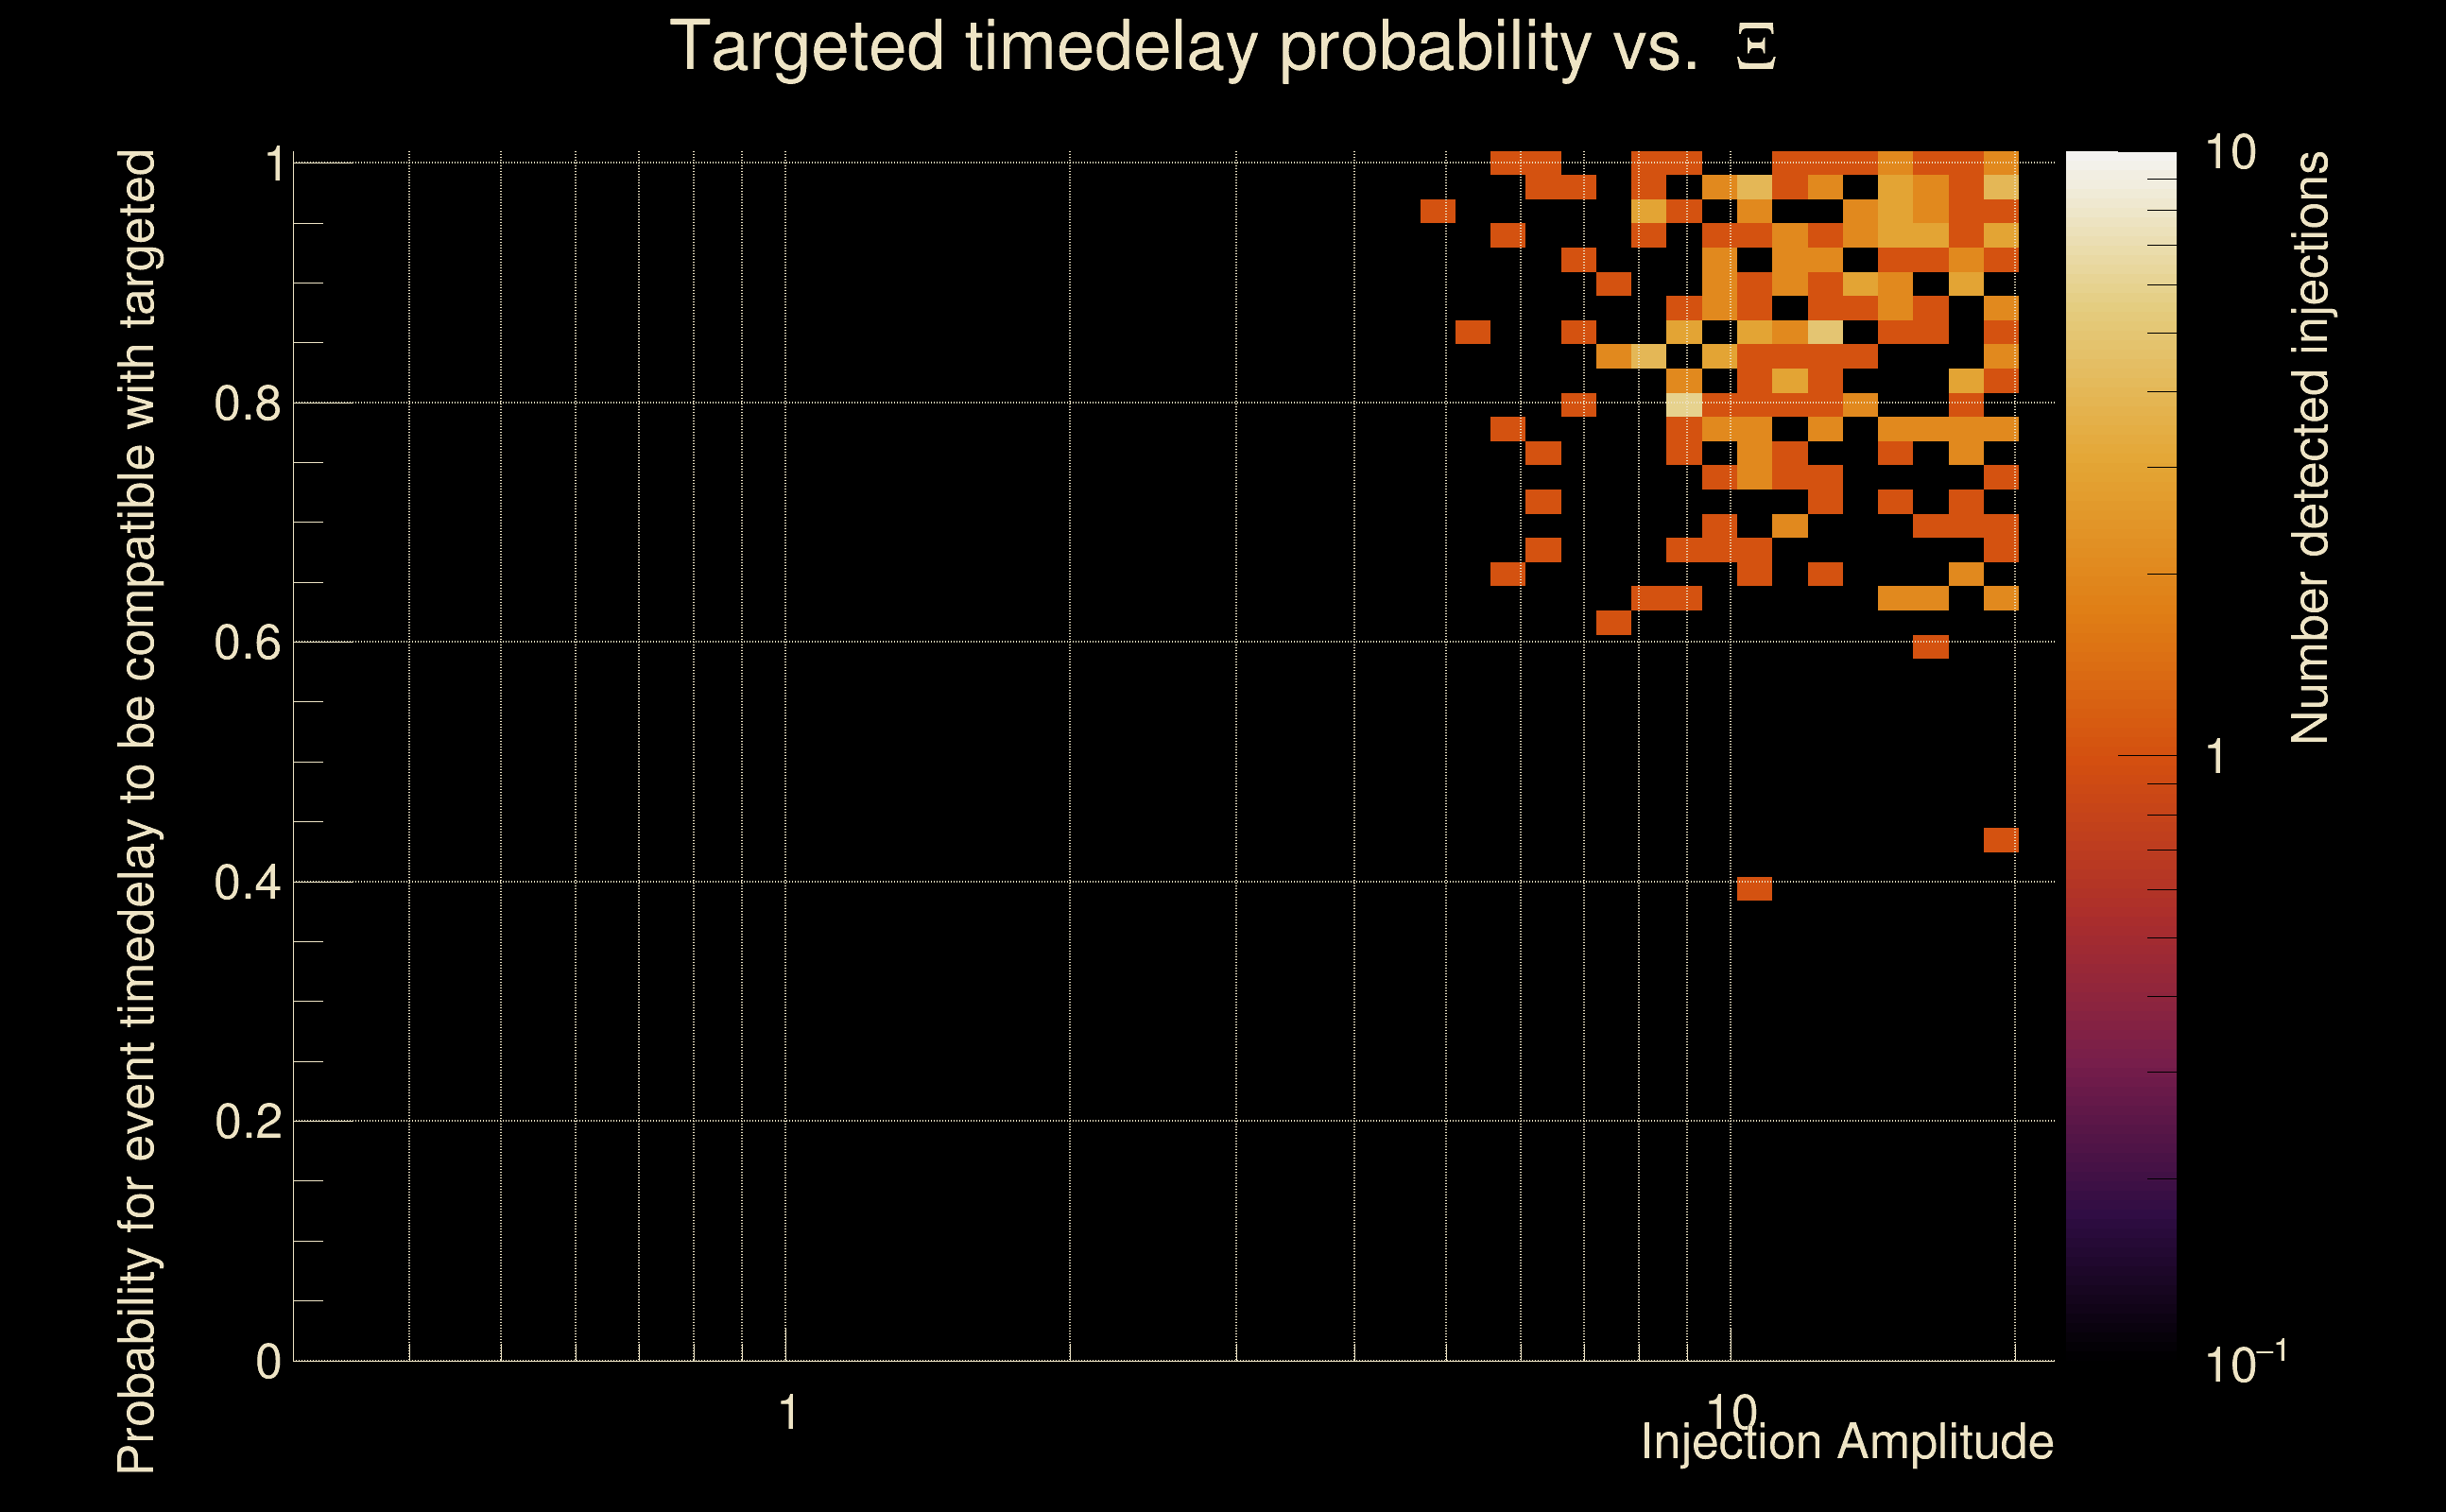
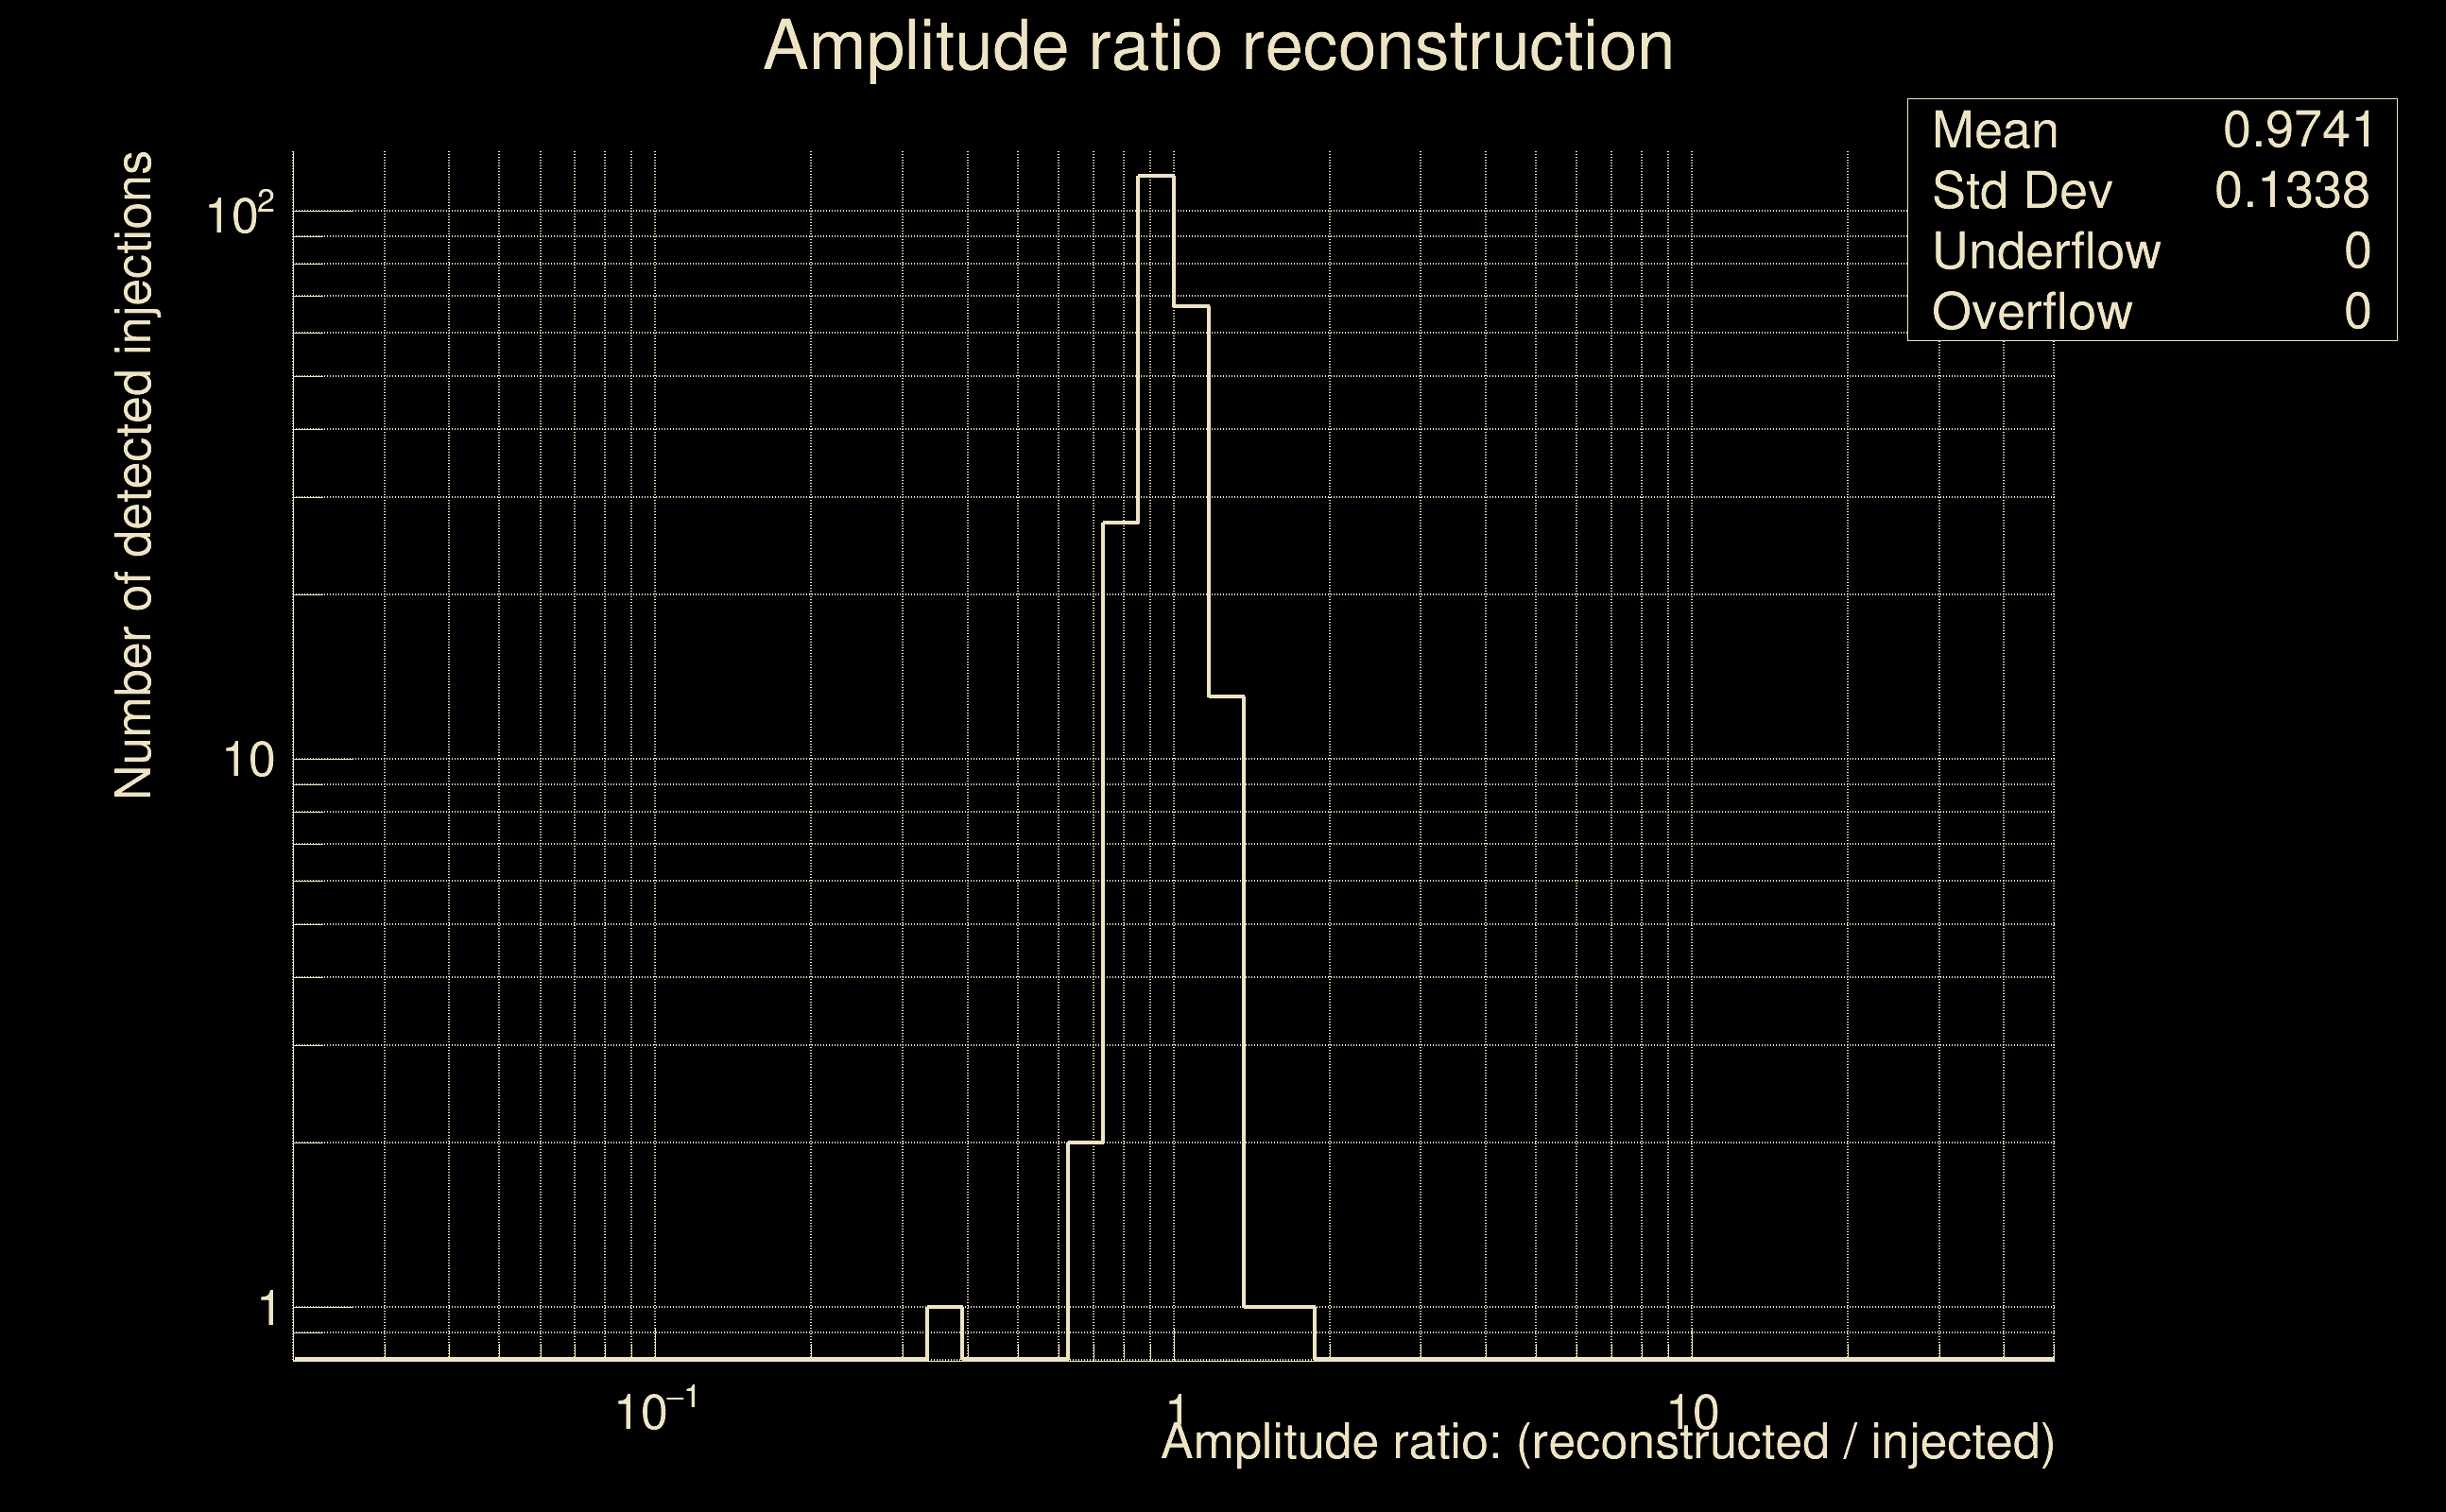
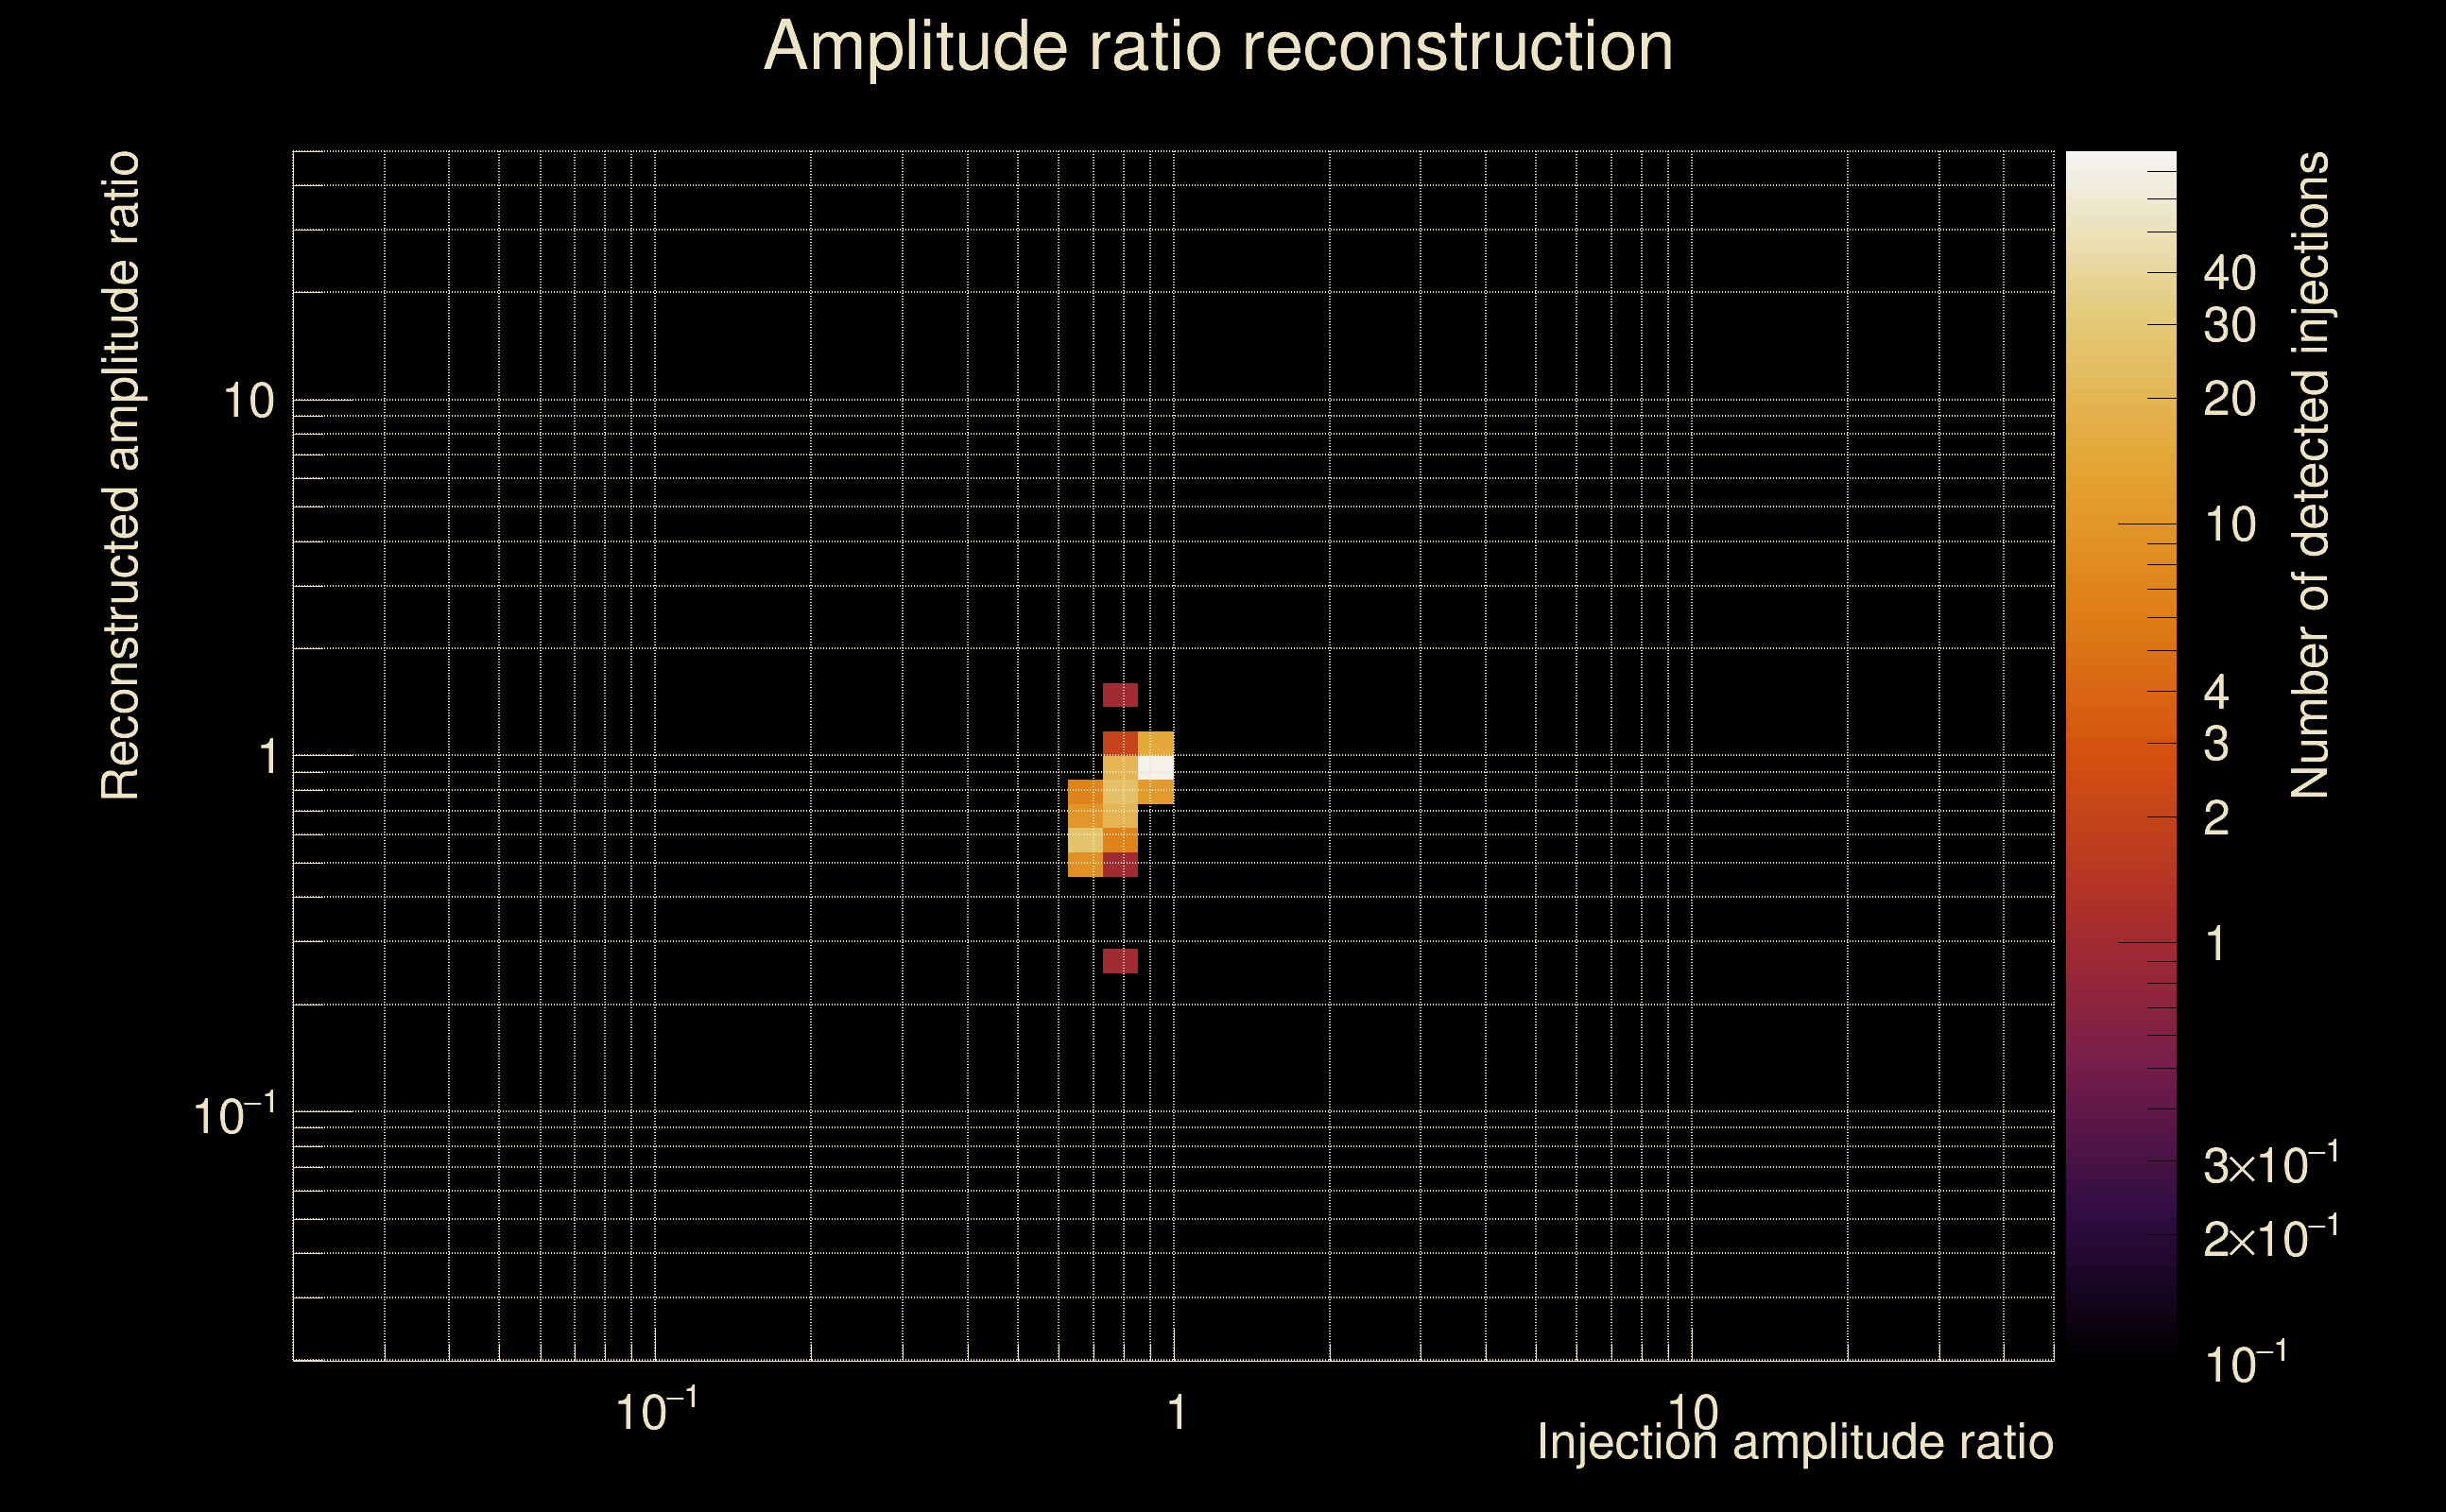
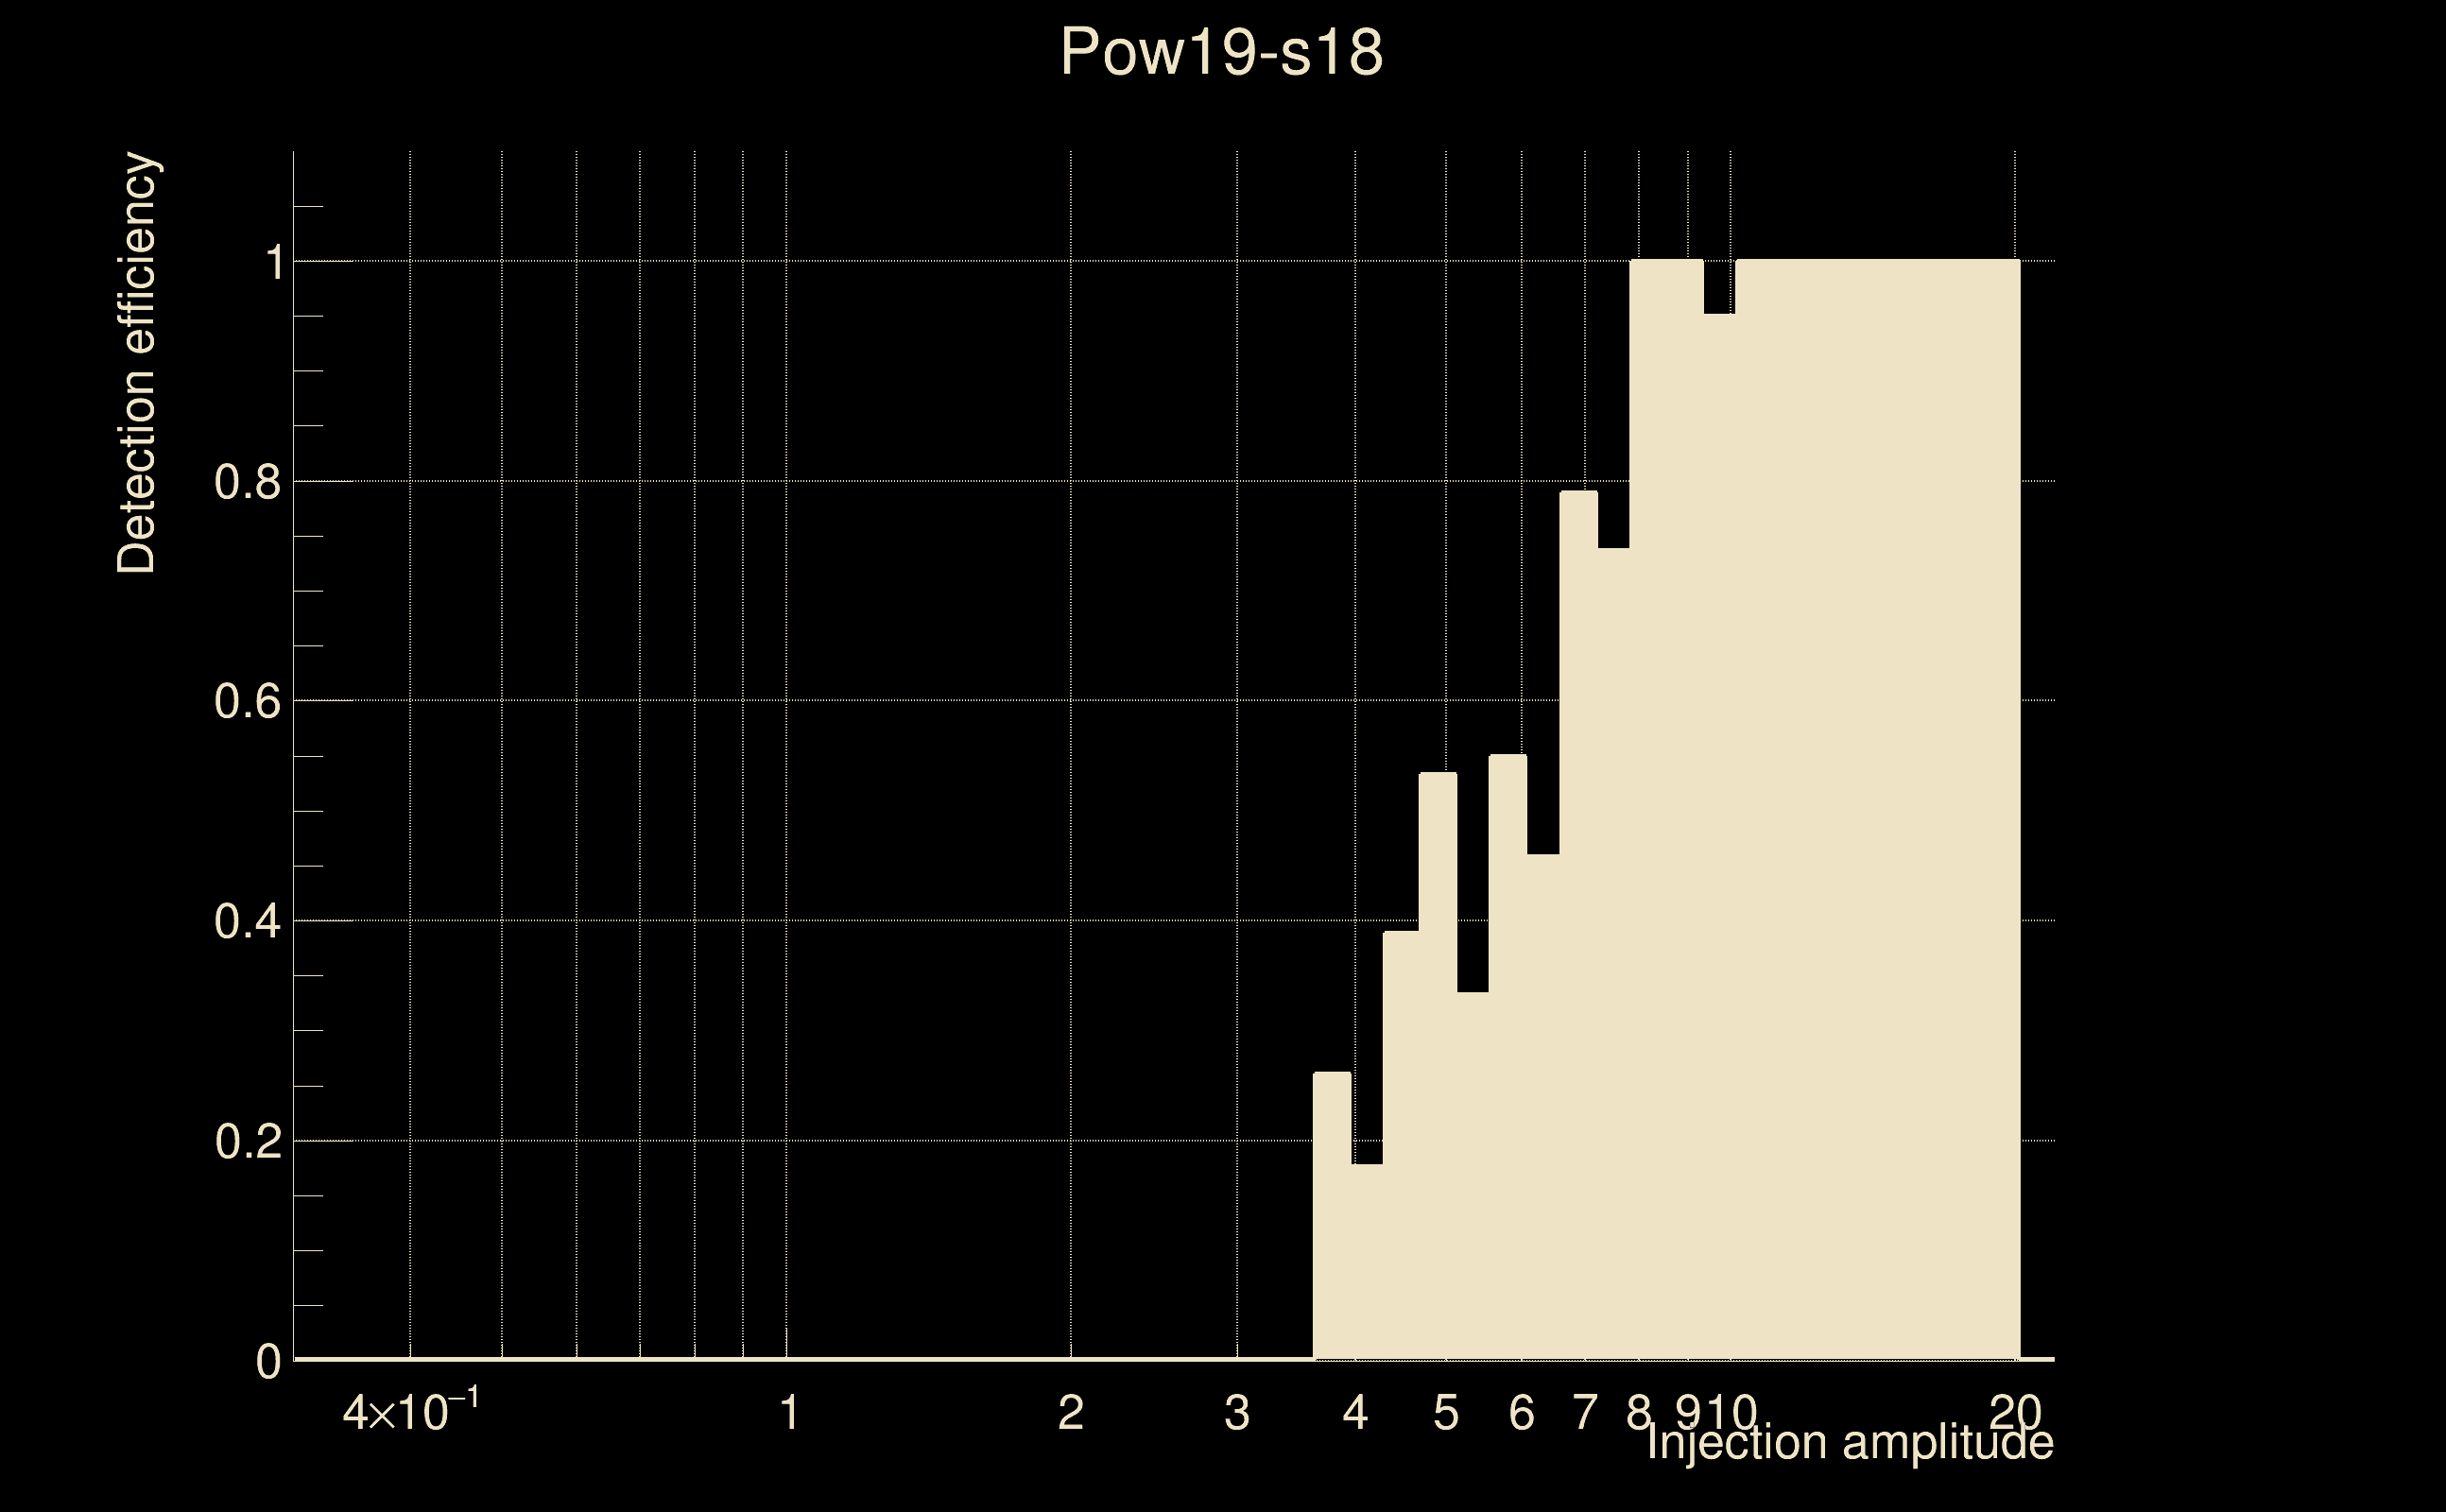
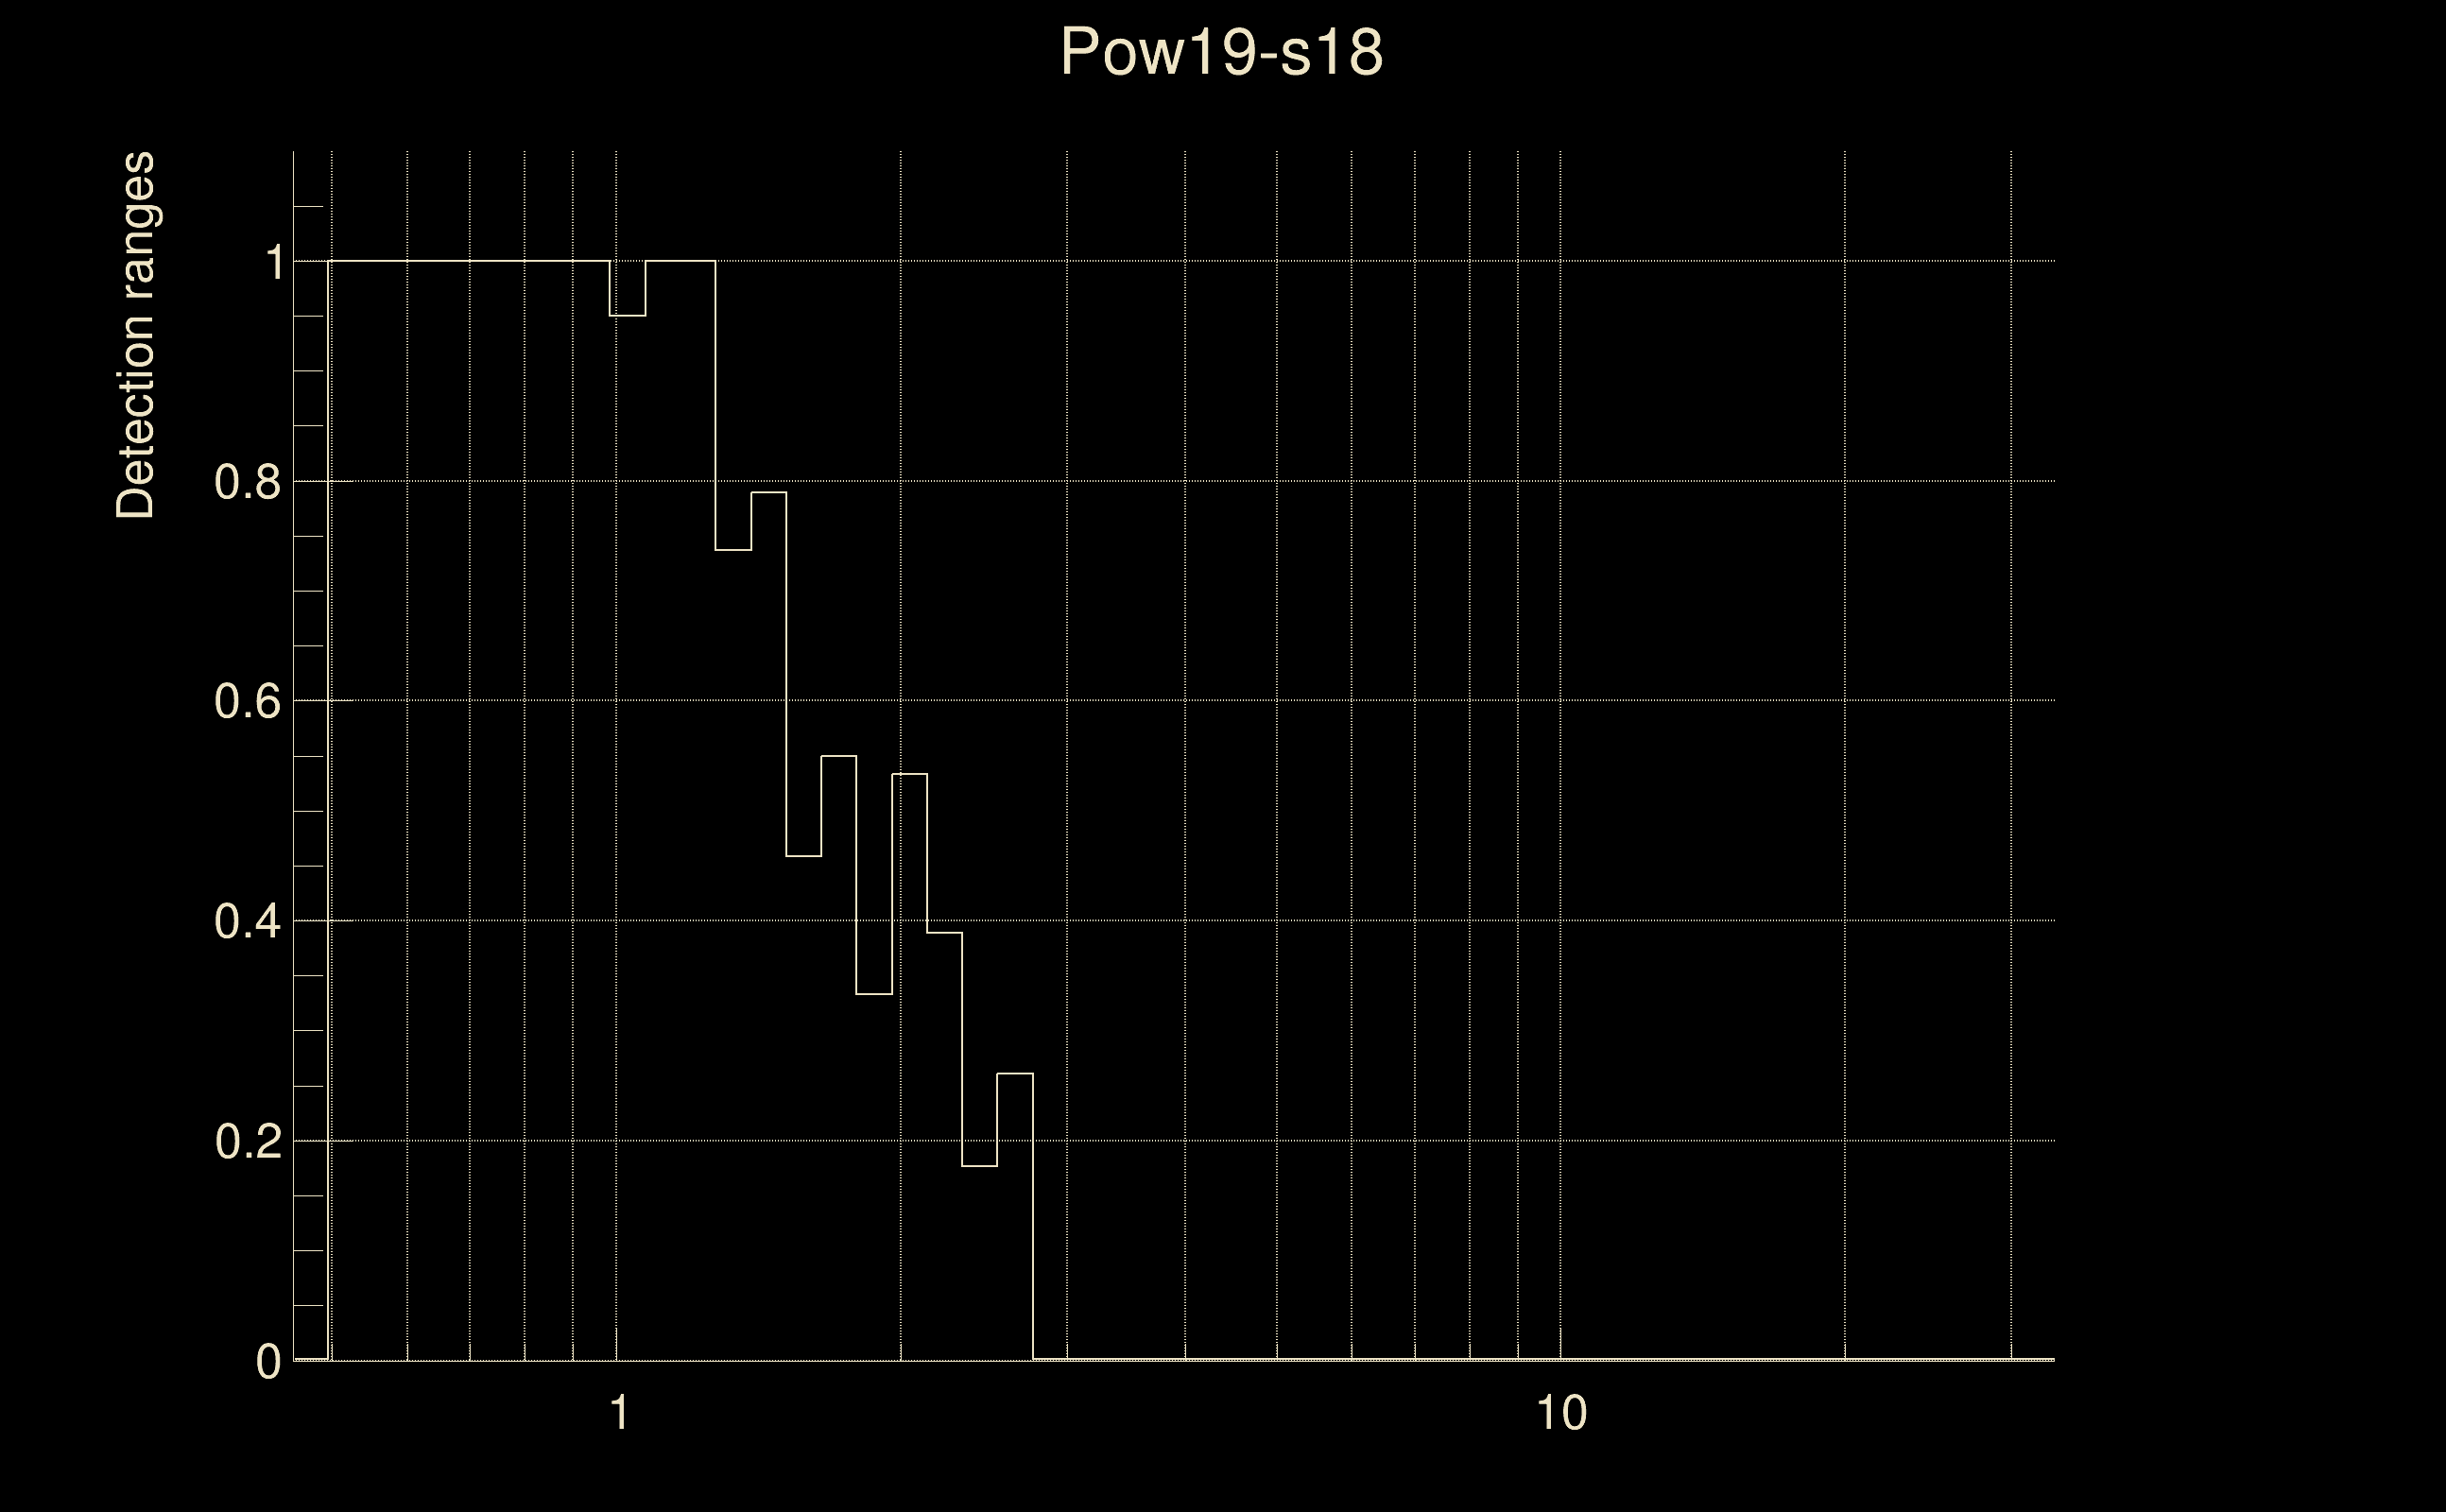
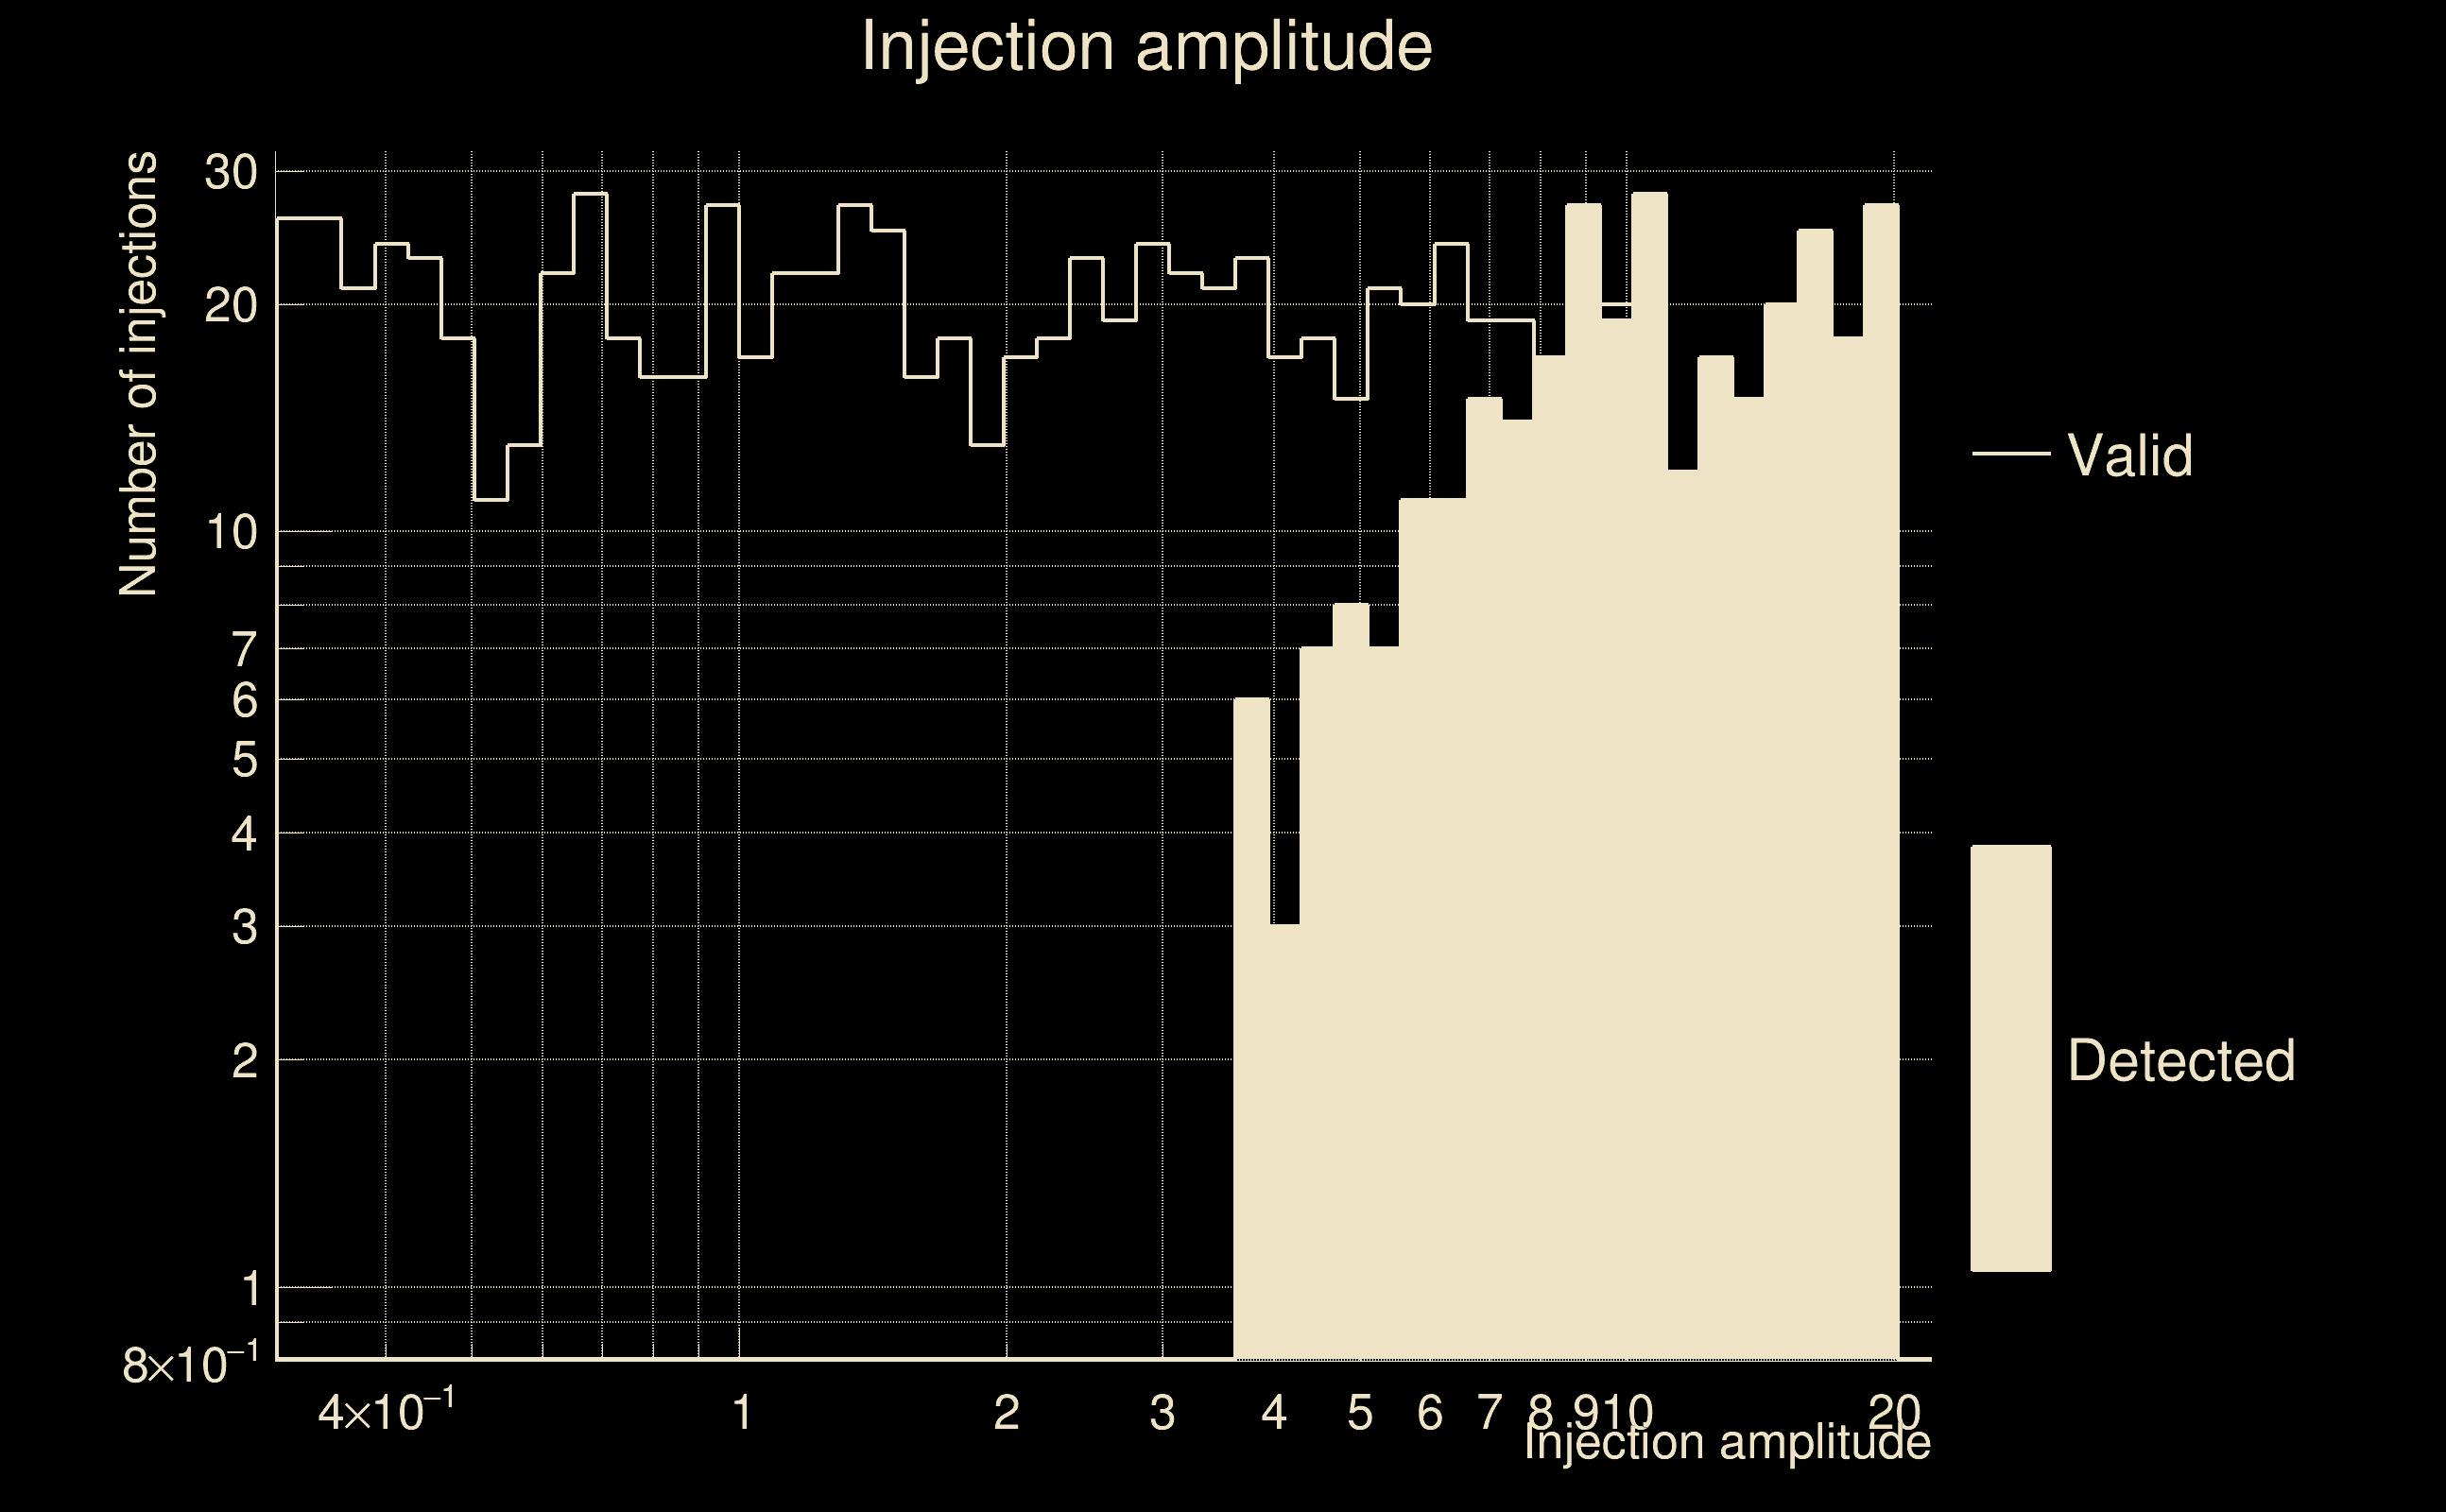
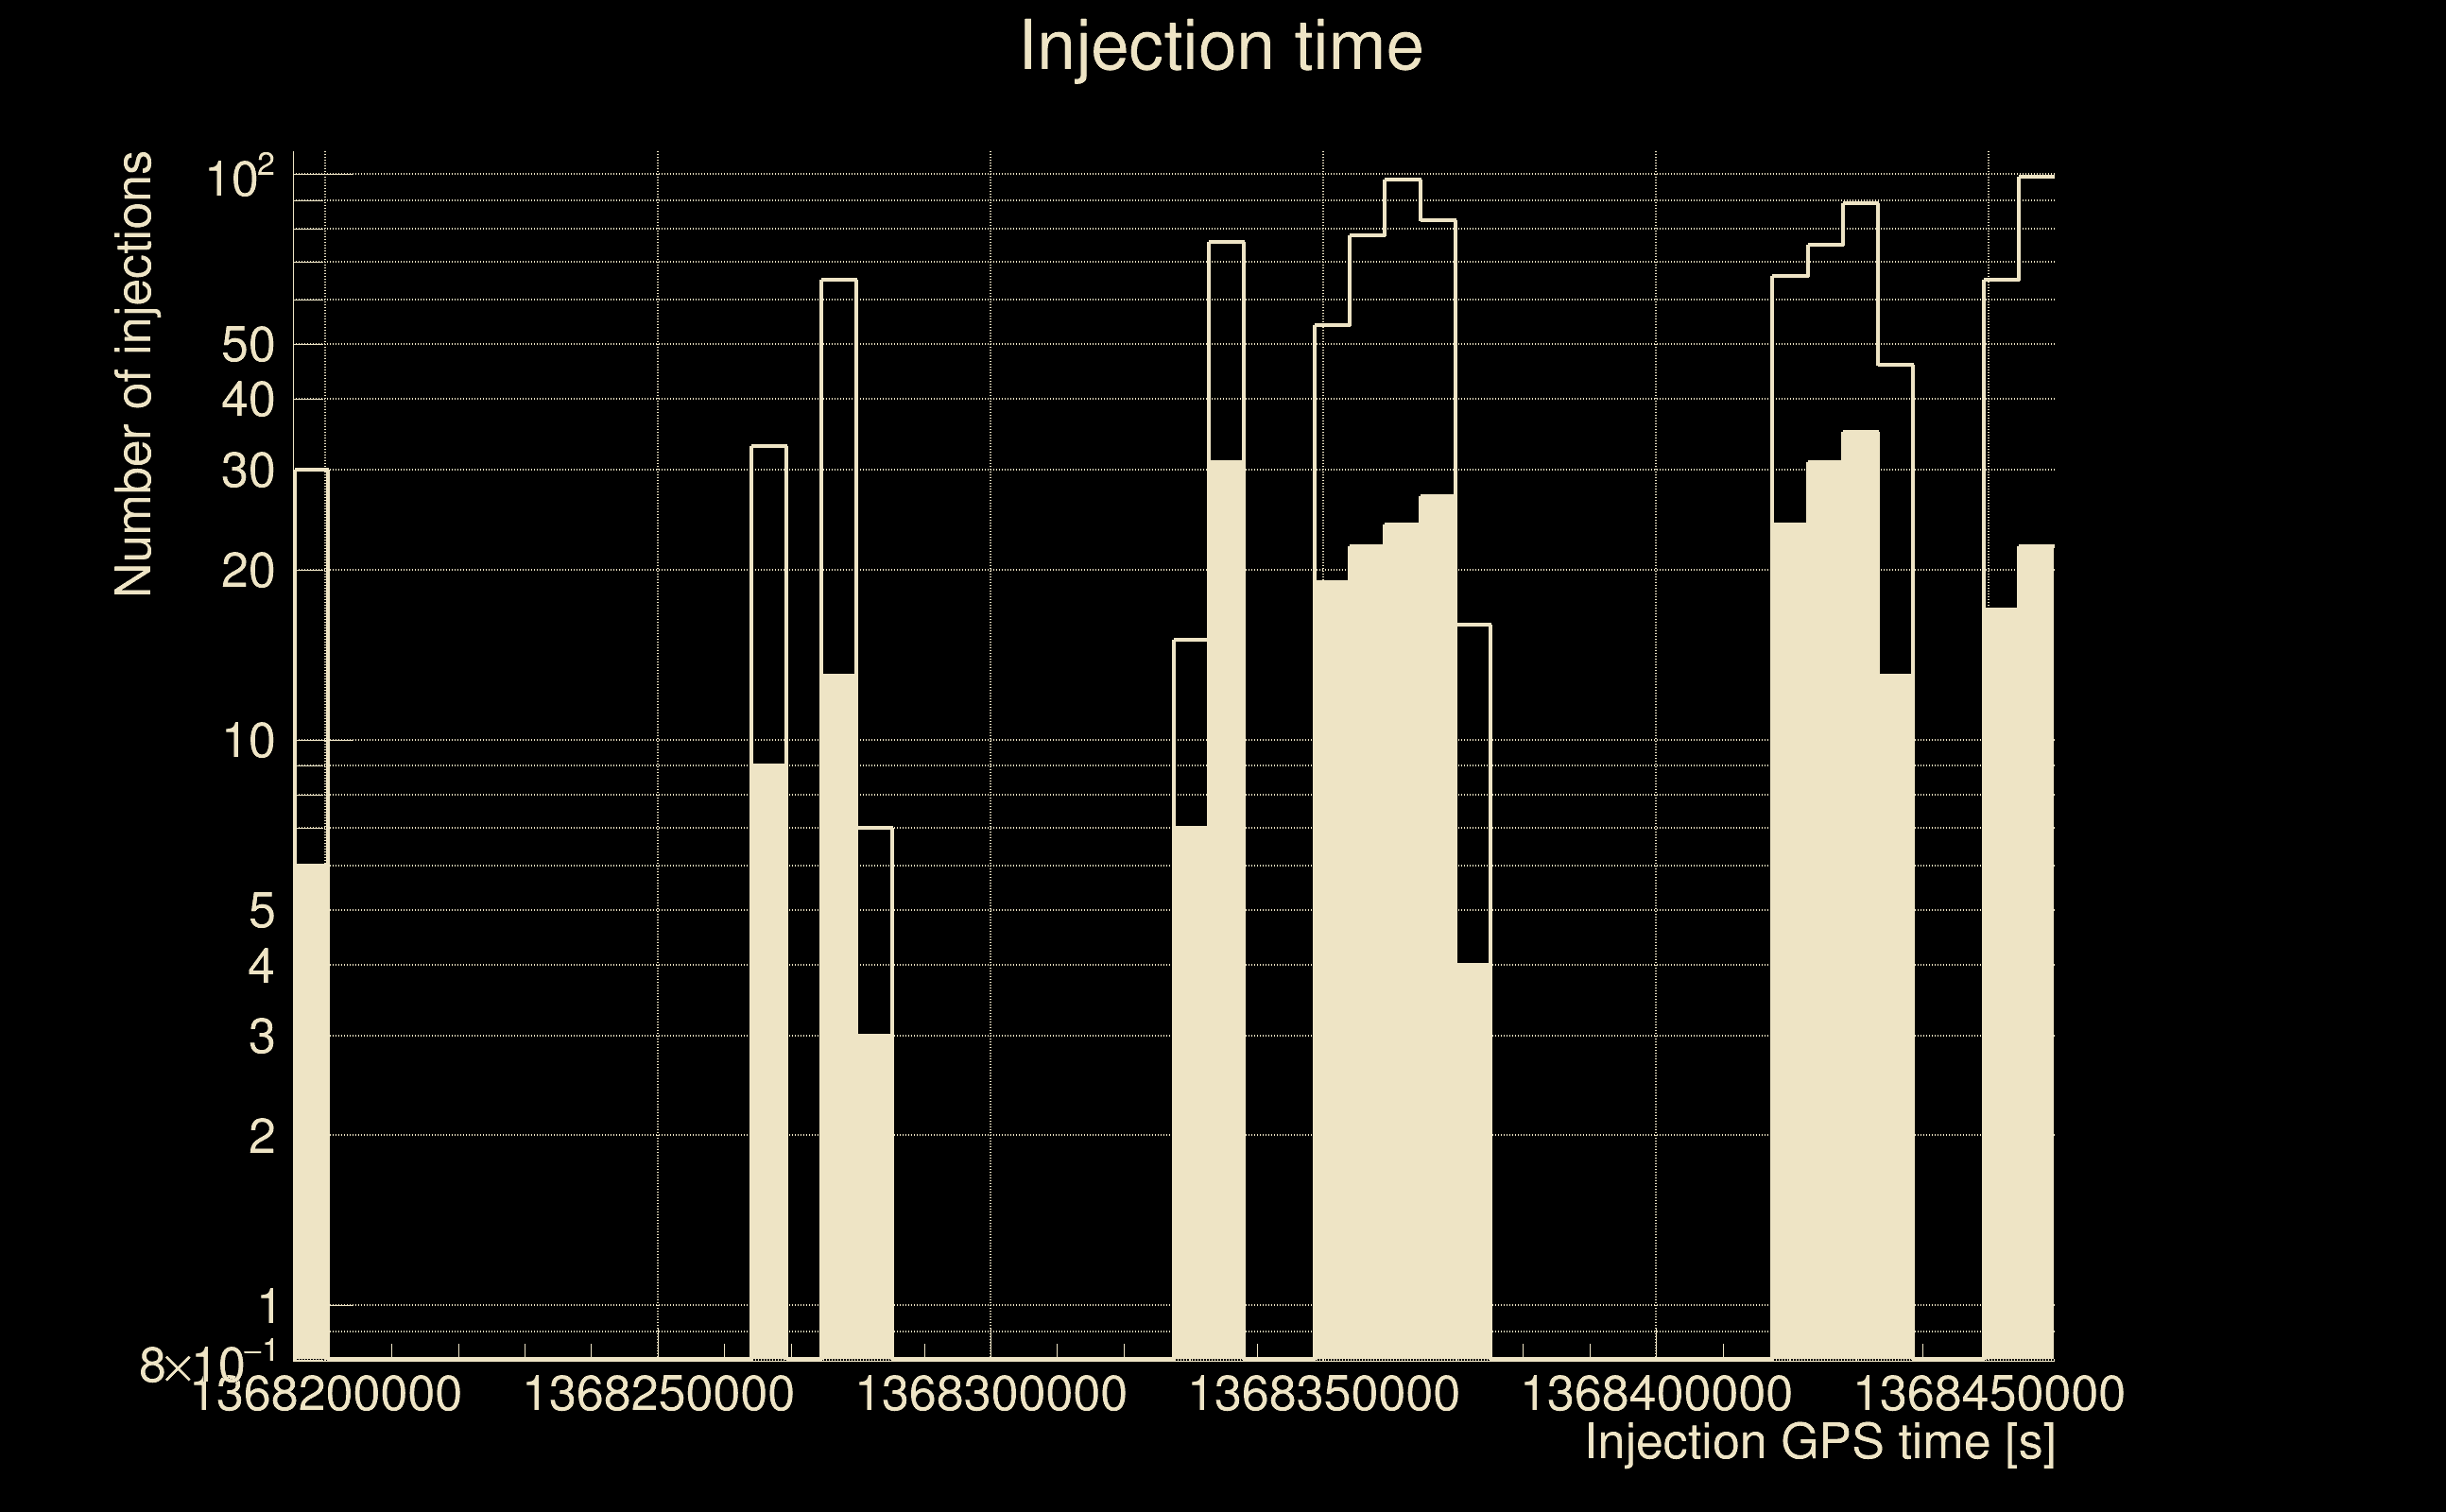
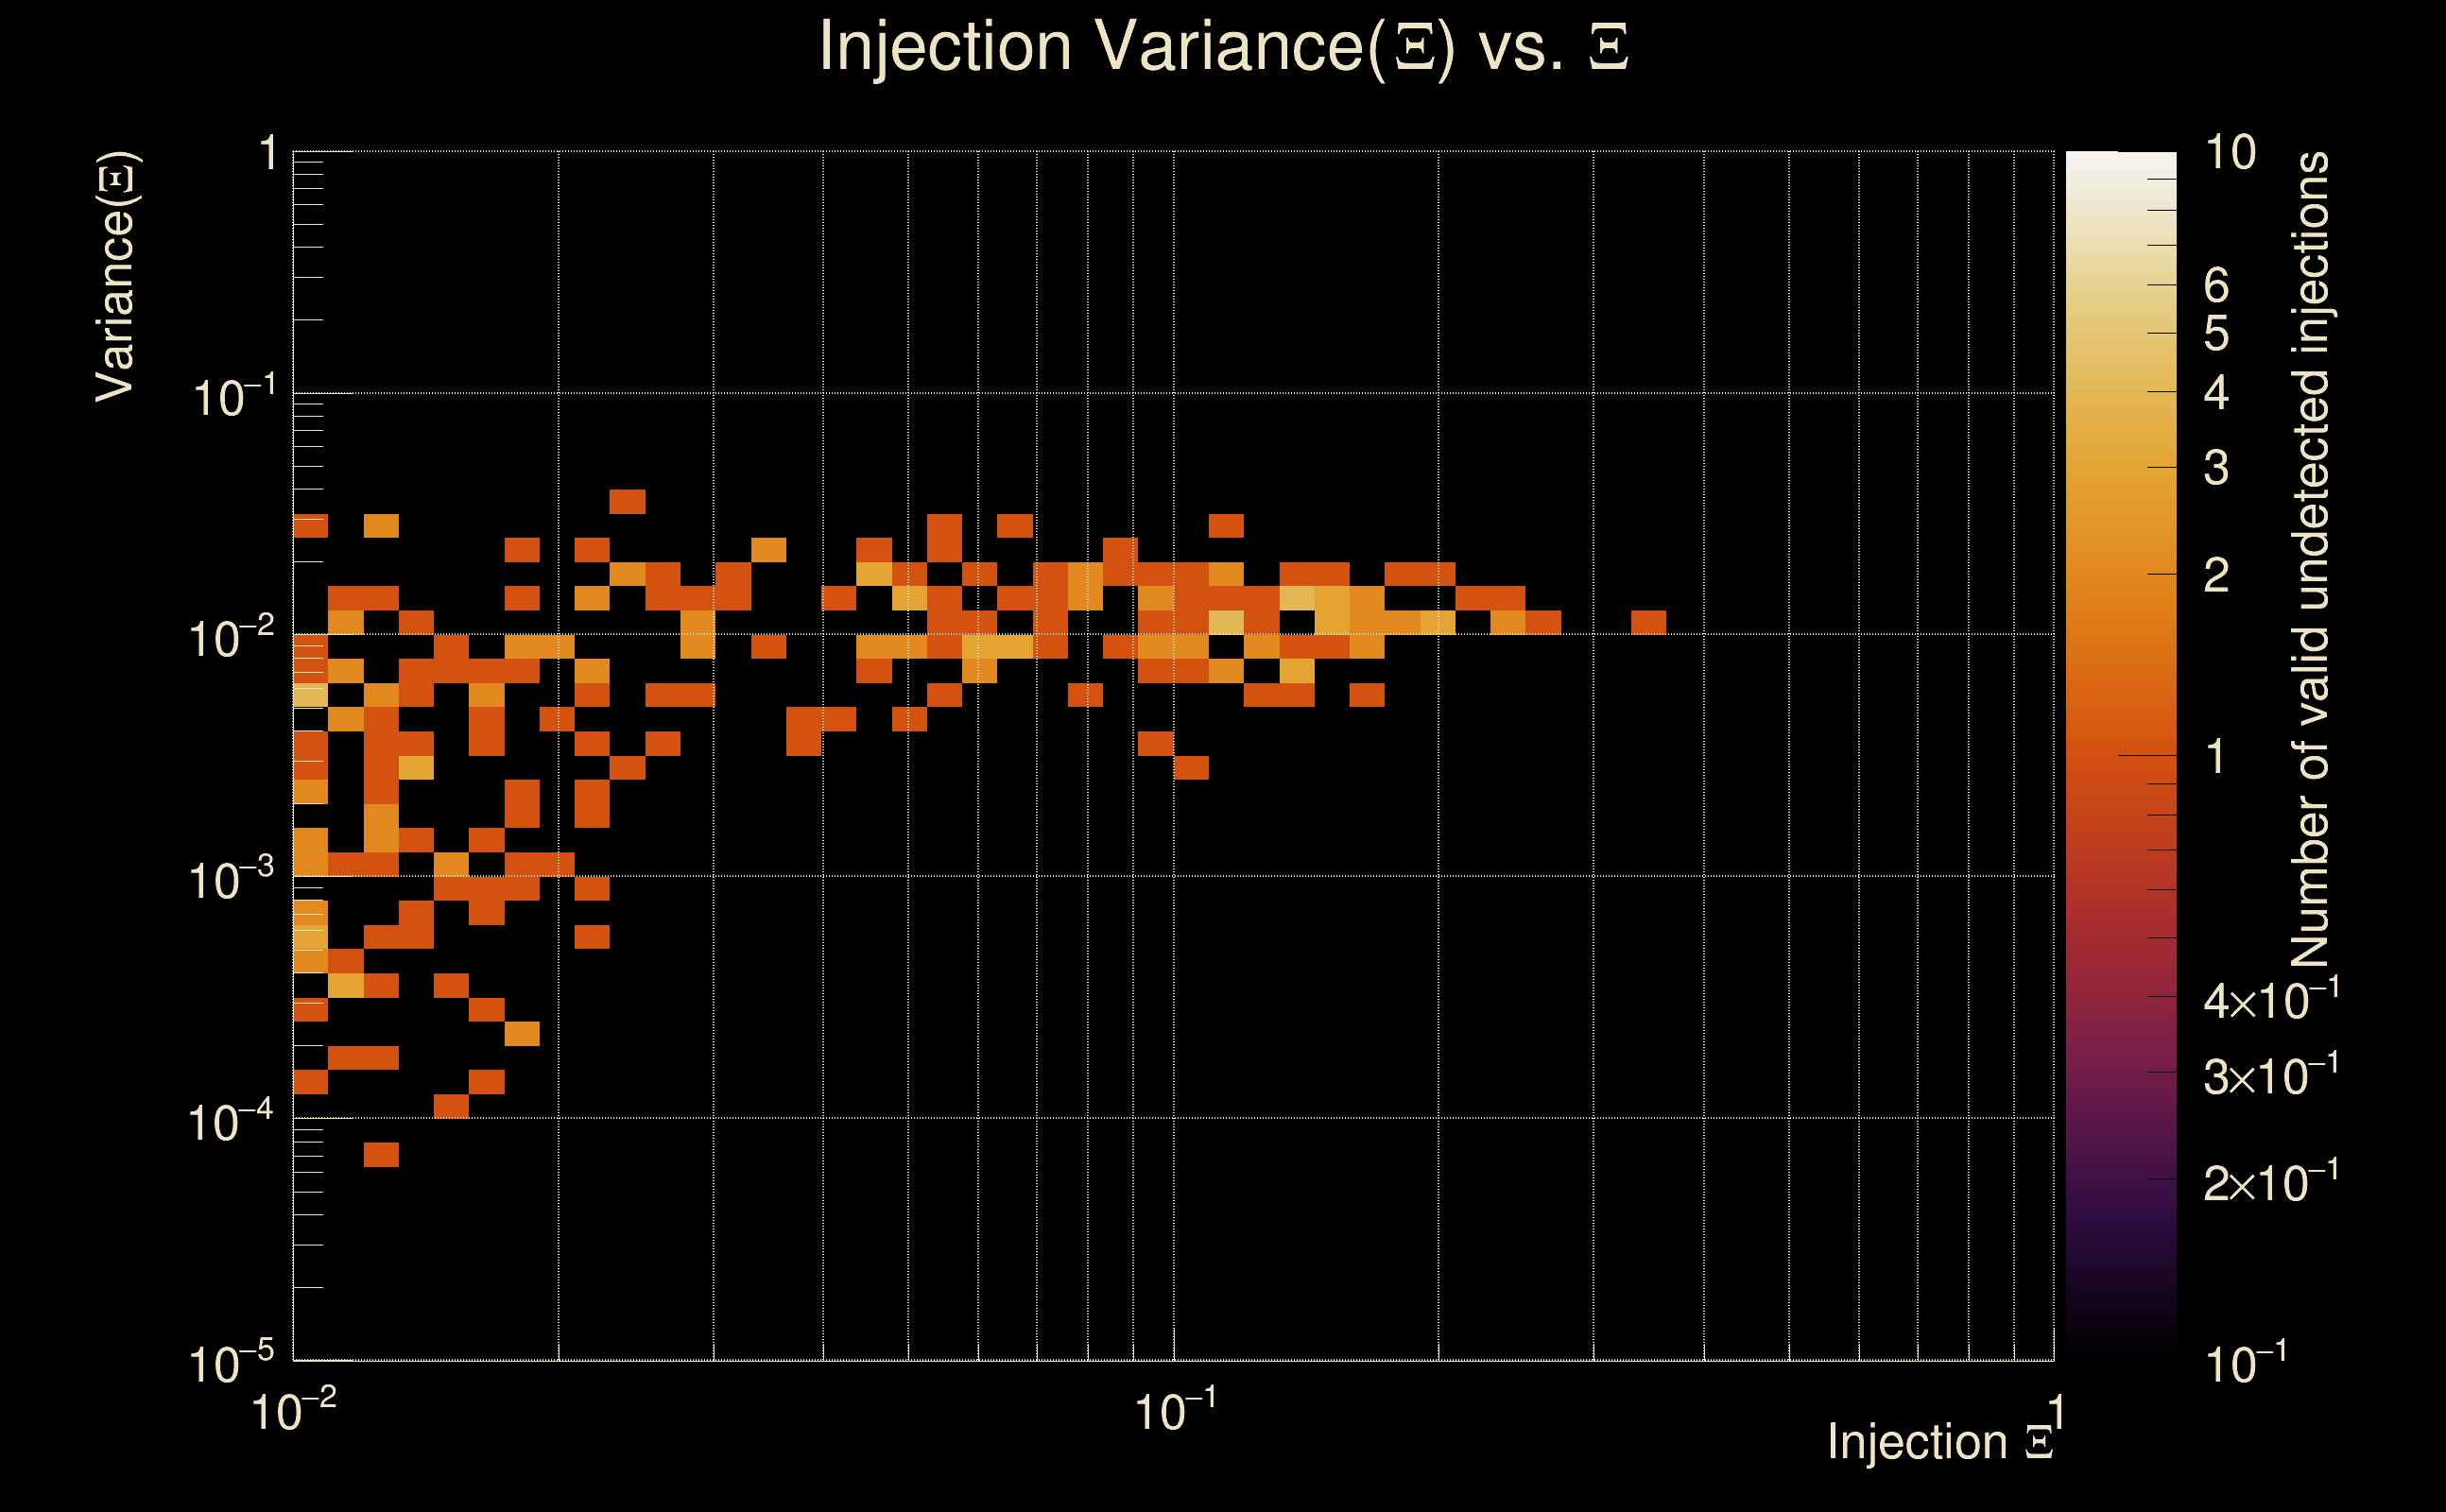
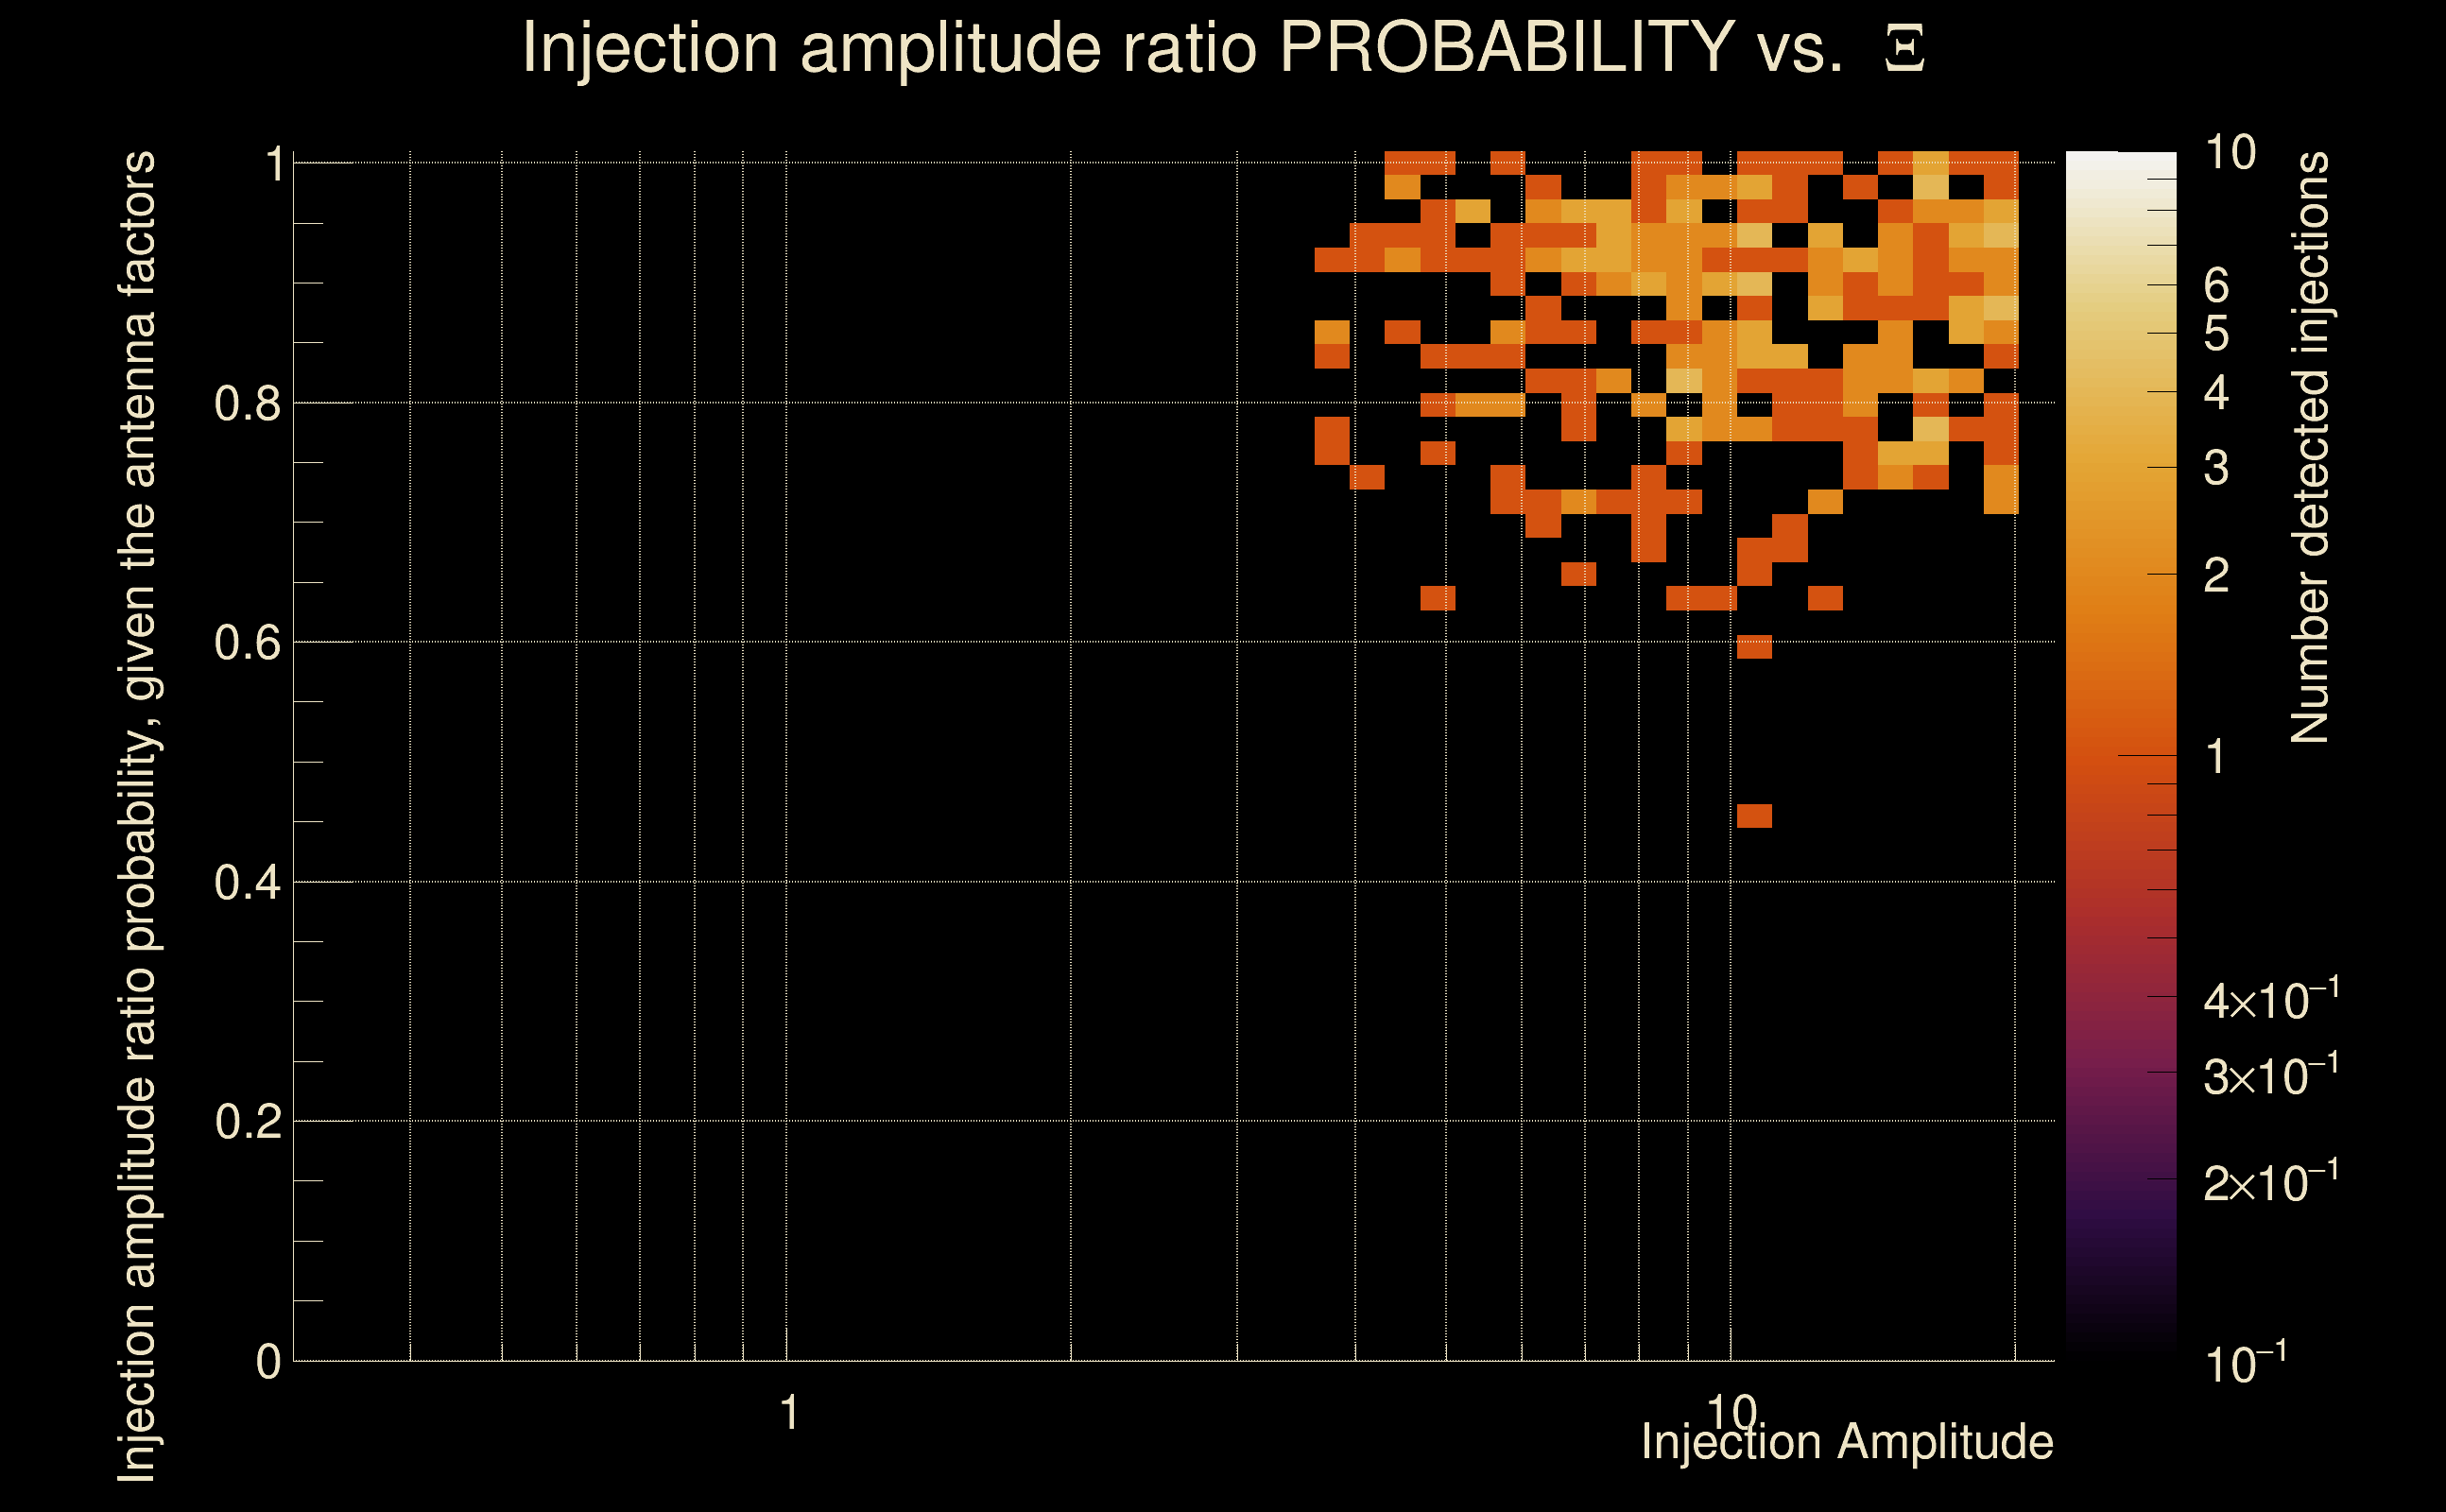
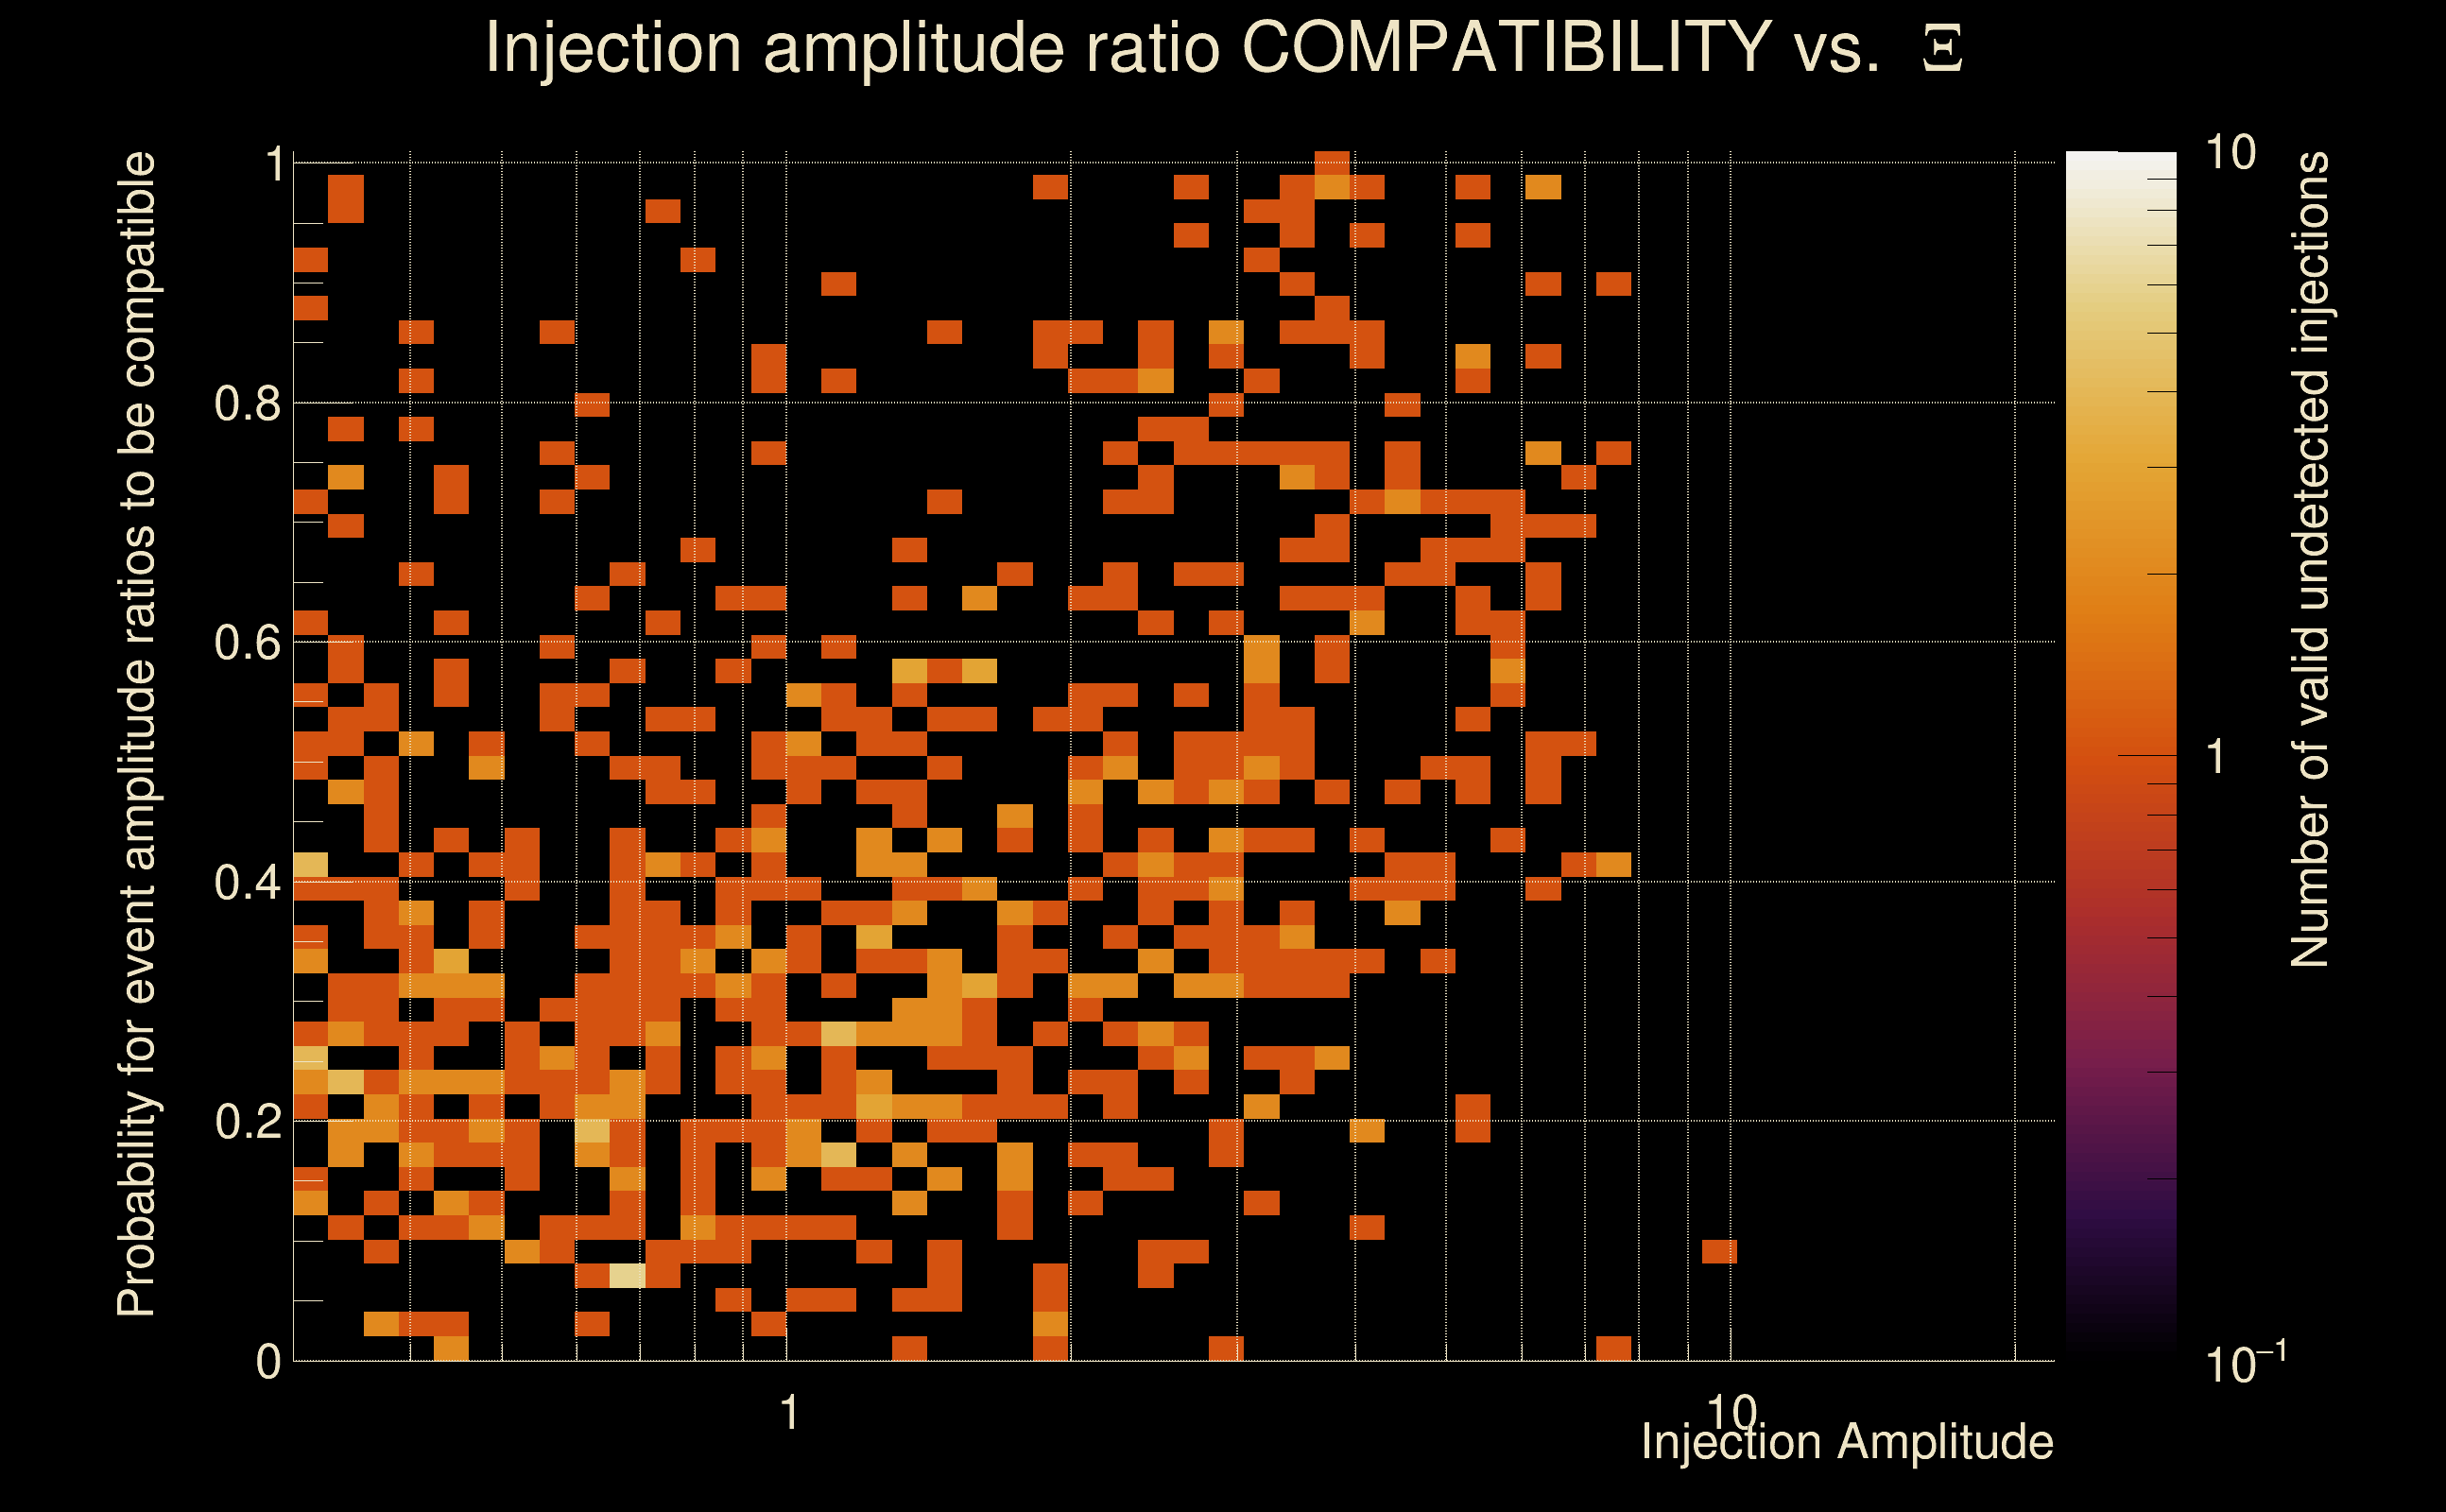
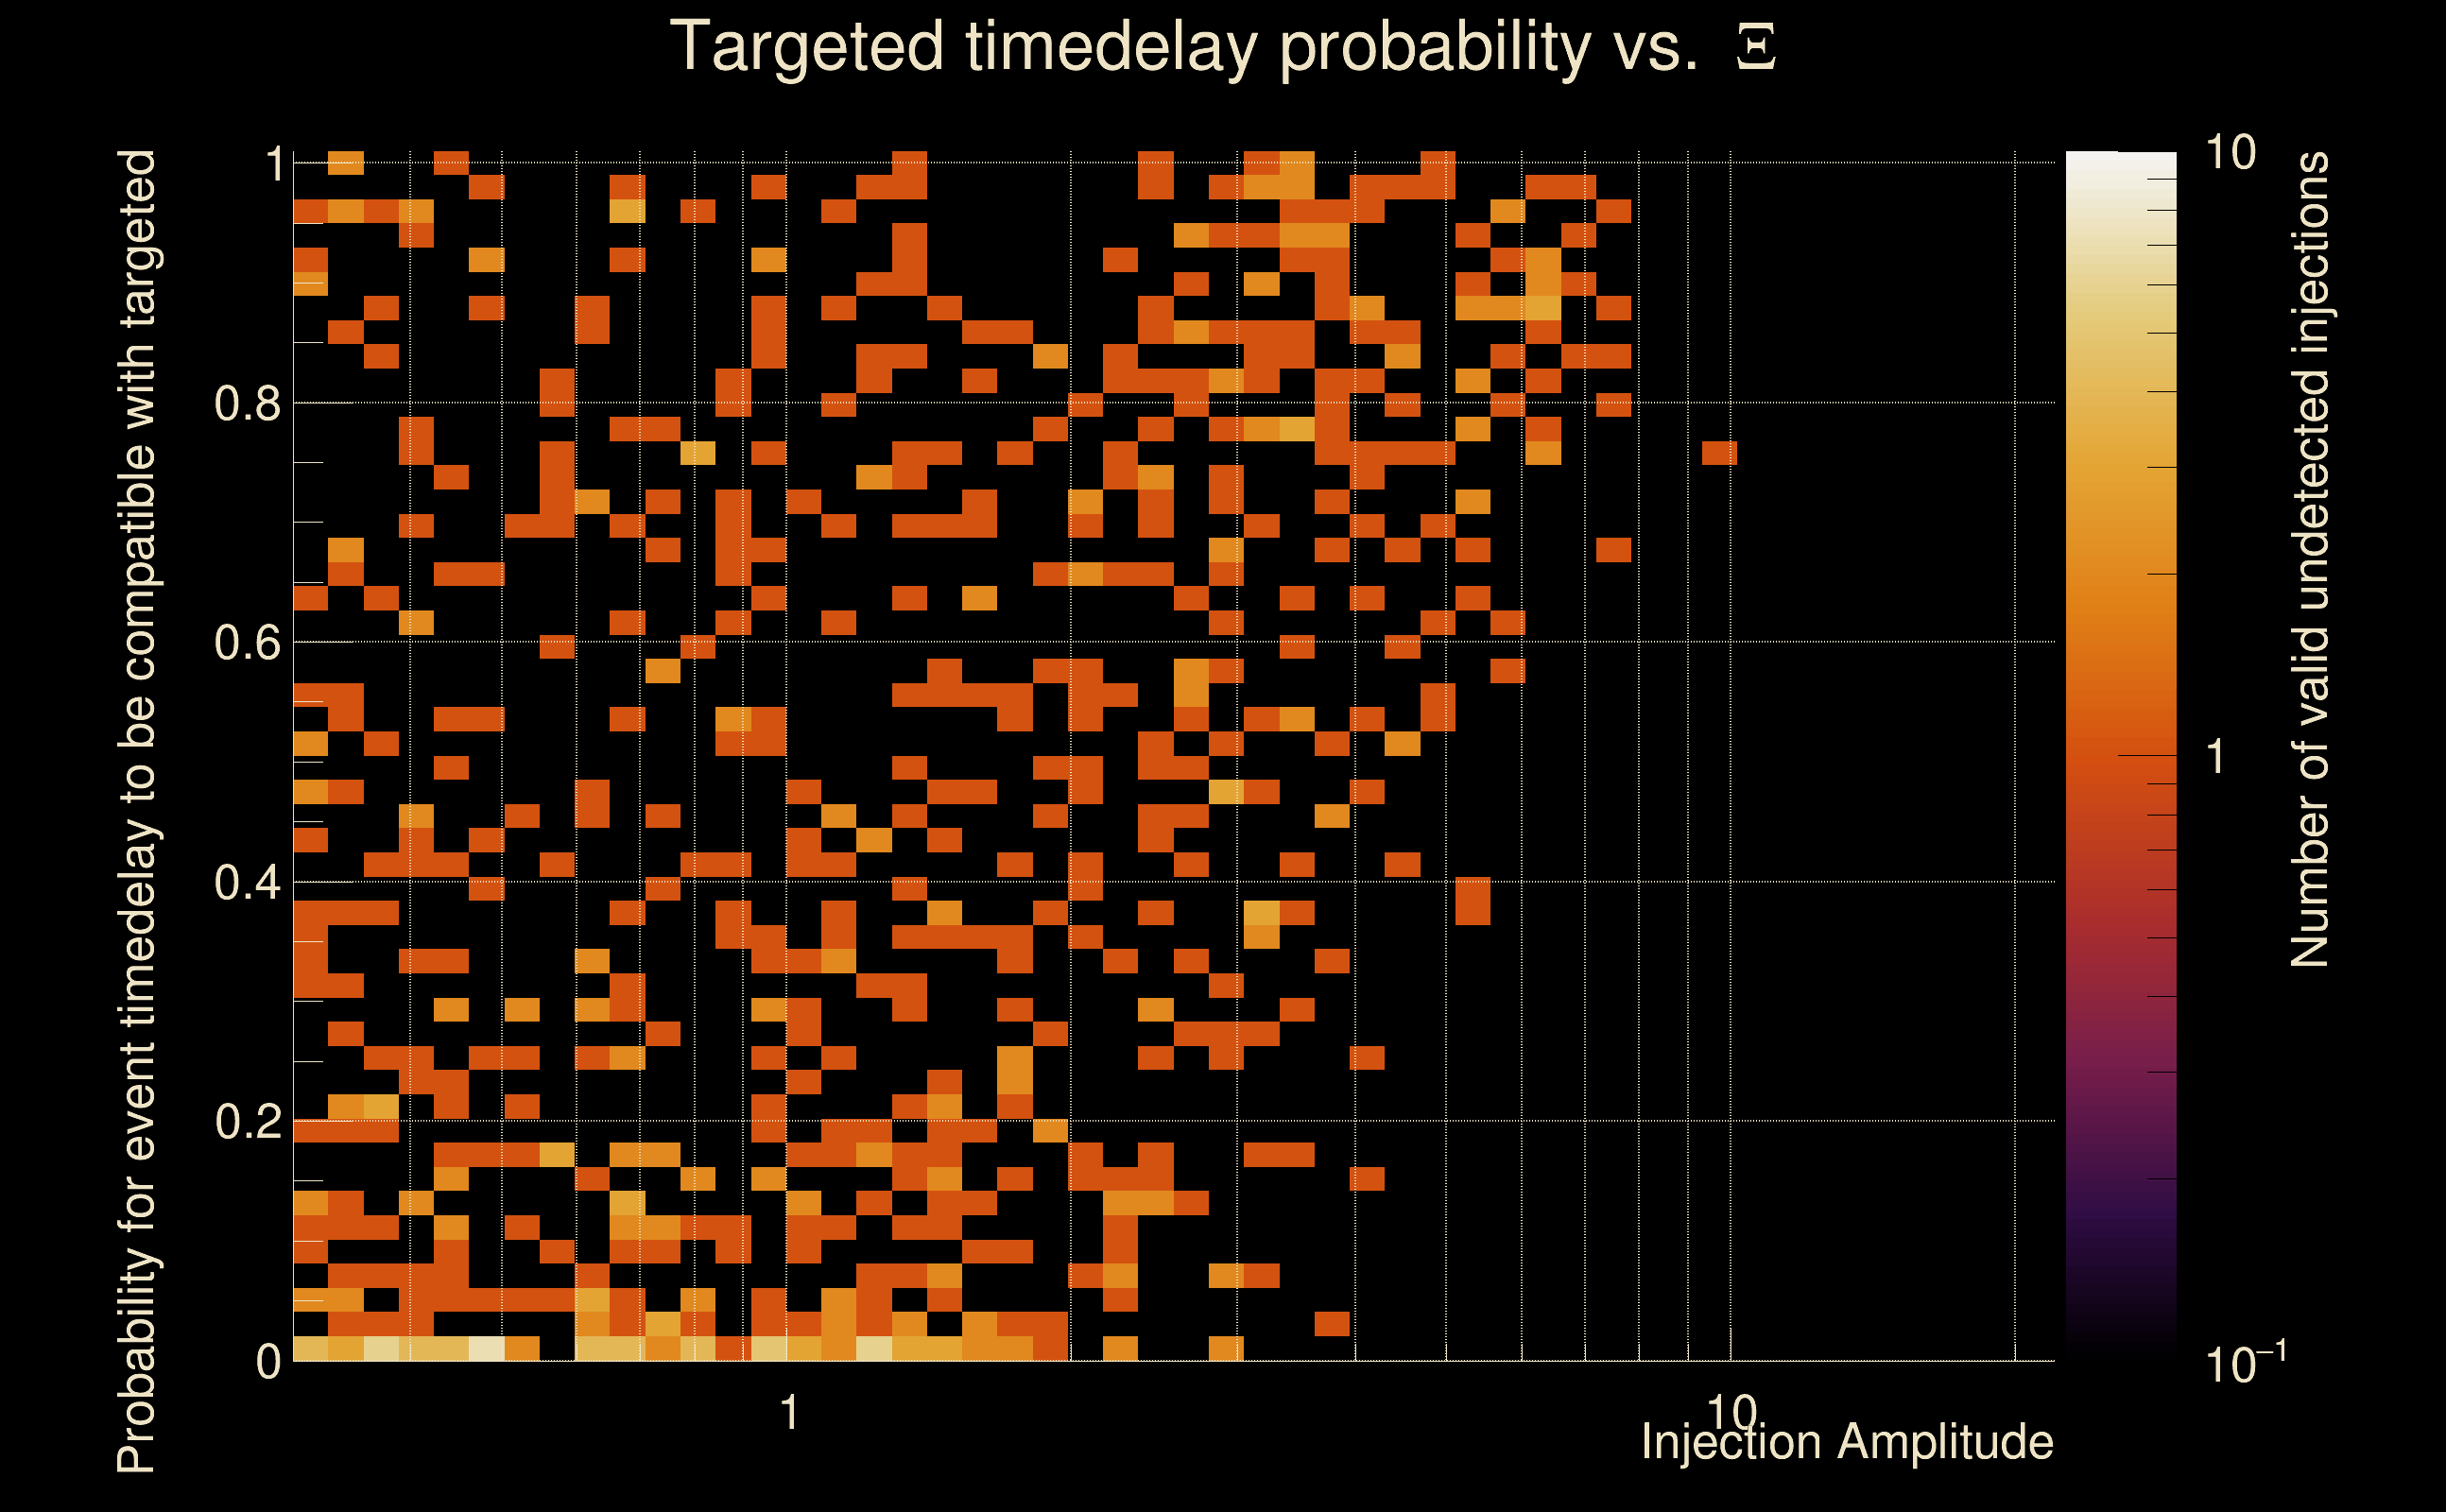
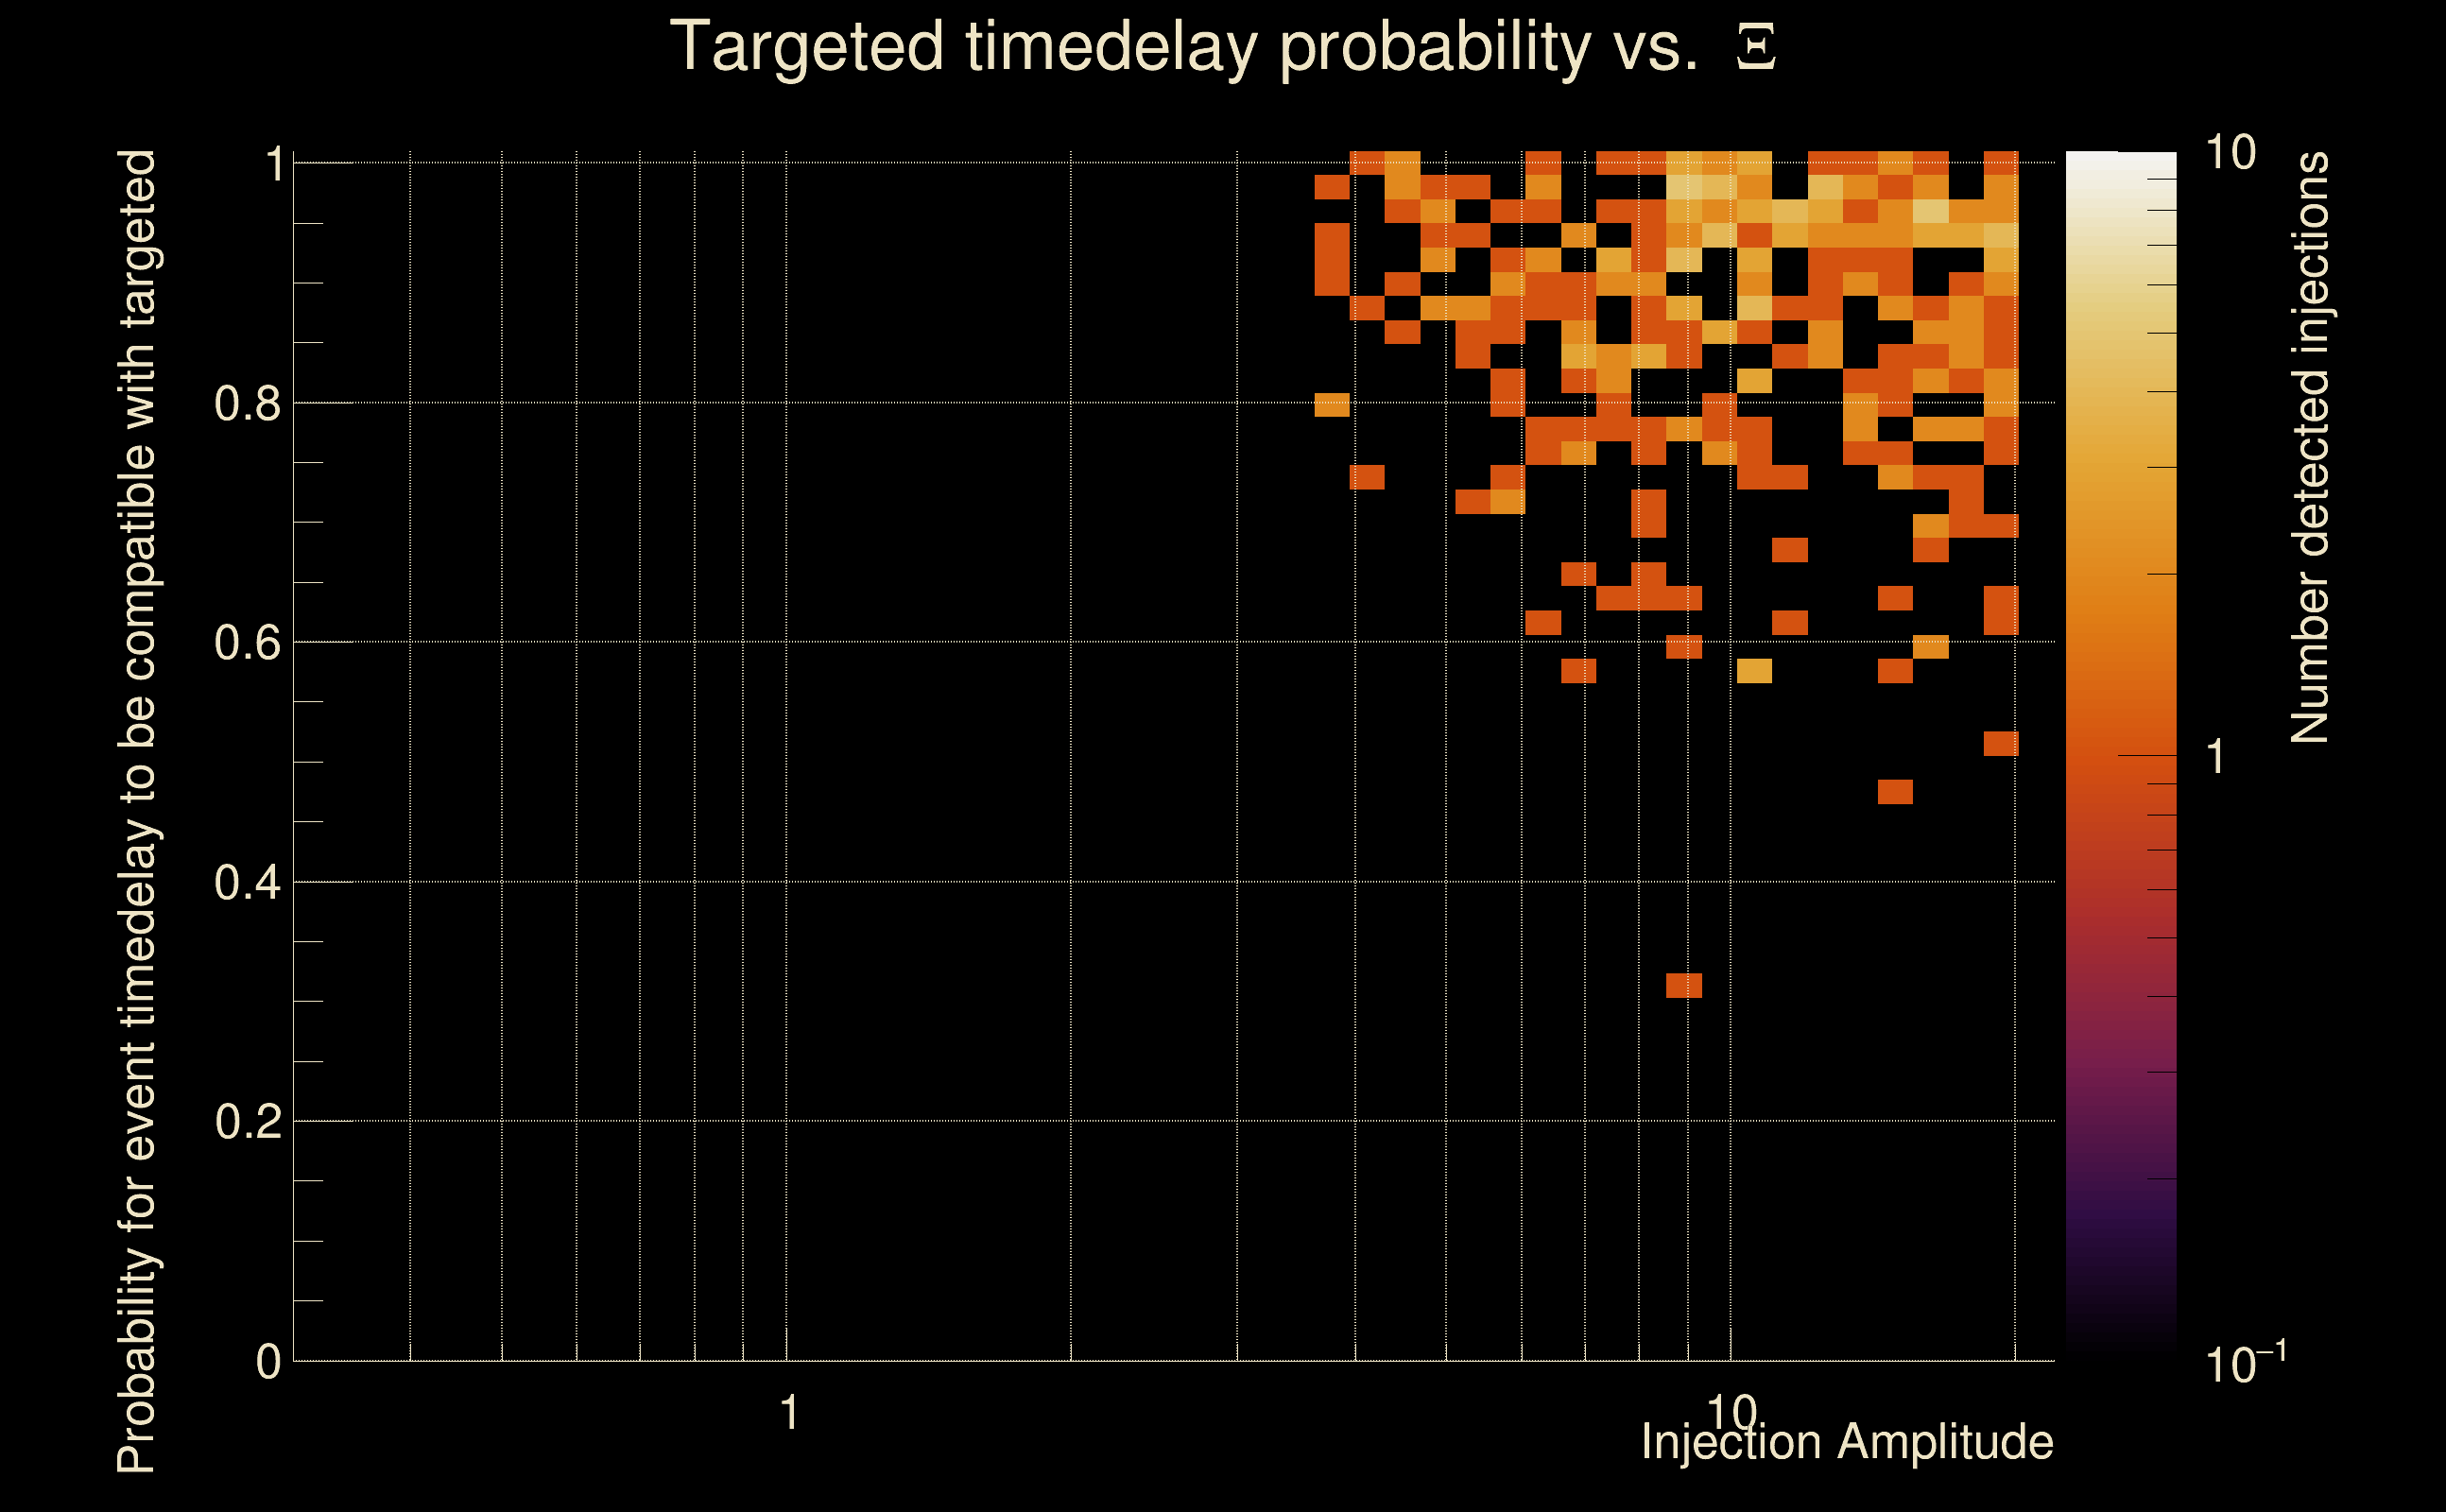
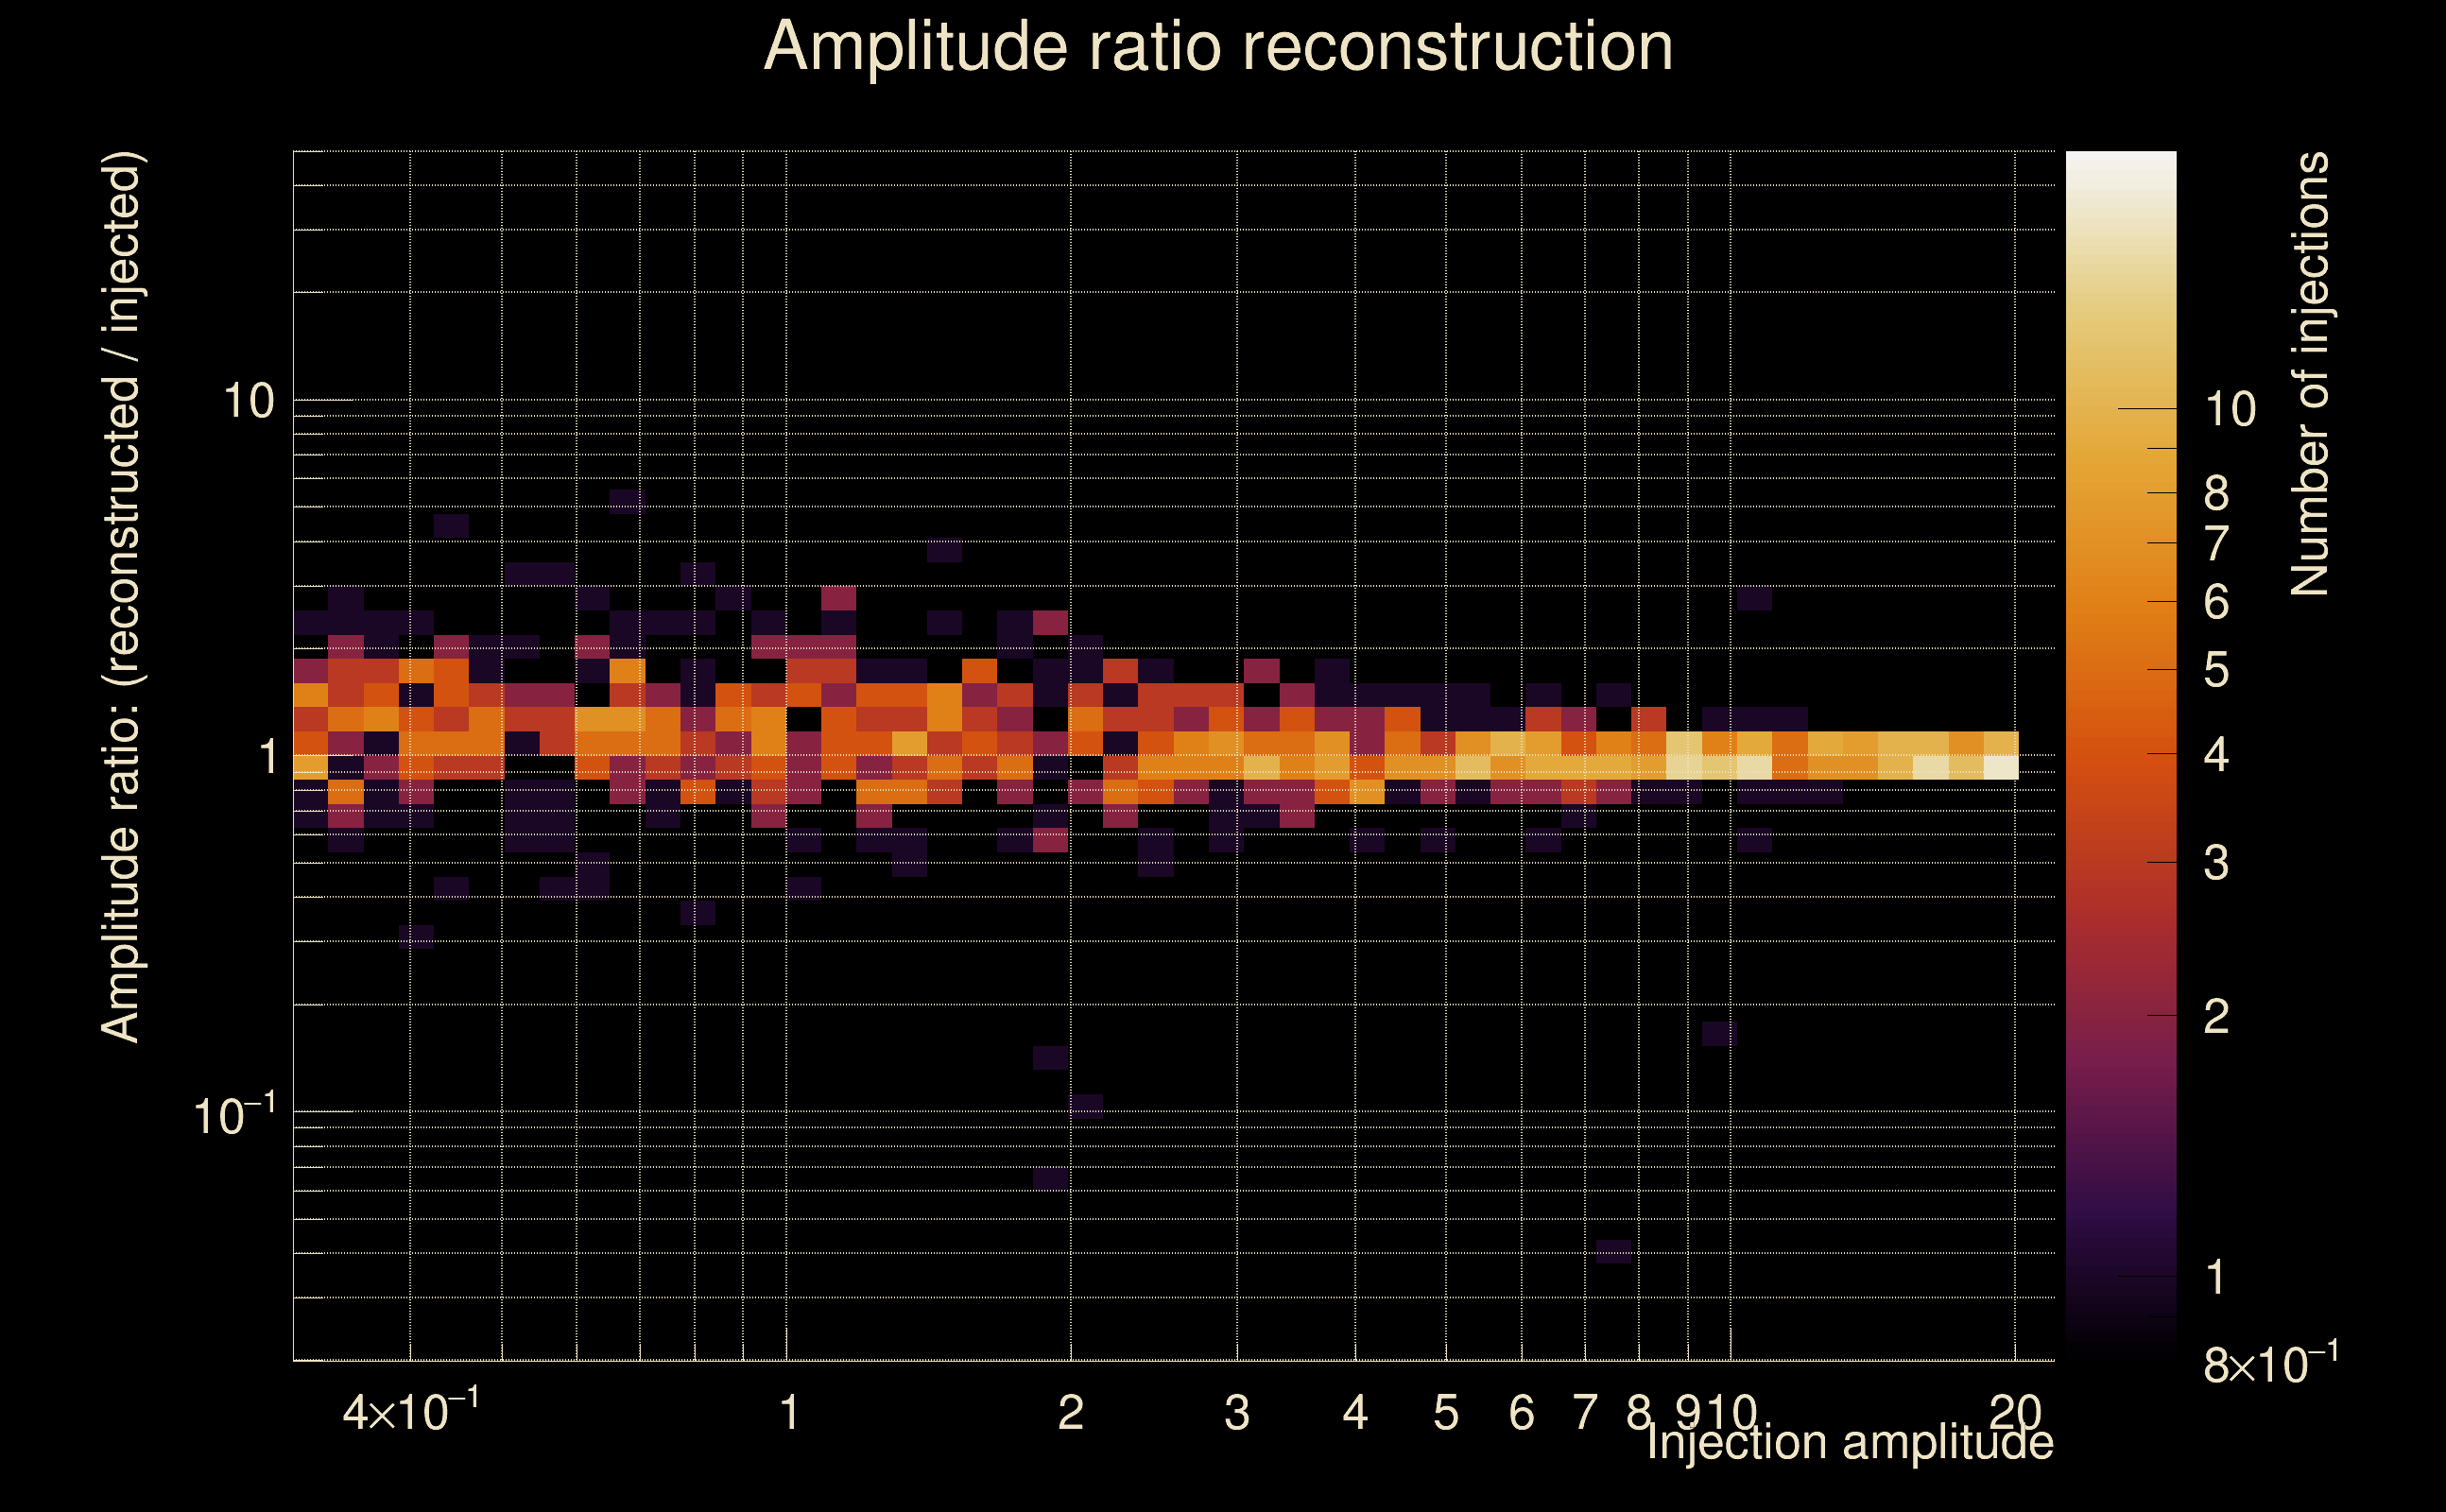
| Number of injections (total/valid/detected): | 1116 / 995 / 307 |
| List of missed injections: | ./Pow19-s18_missed.txt |
| Injection amplitude at 90% detection efficiency: | 7.93777 |
| Injection amplitude at 50% detection efficiency: | 6.40444 |
| Injection amplitude at 10% detection efficiency: | 3.59098 |
 |
 |
 |
 |
 |
 |
 |
|
 |
 |
|
 |
 |
|
 |
 |
|
 |
 |
|
 |
 |
|
 |
 |
|
 |
 |
|
 |
 |
 |
 |
 |
 |
 |
 |
 |
 |
 |
 |
 |
 |
 |
| florent.robinet@ijclab.in2p3.fr |