| Omicron version: | 4.2.0: documentation gitlab repository |
| Omicron run by: | unknown |
| Report produced on: | Thu Nov 27 17:10:42 2025 UTC |
| Ox option file: | TargIxf_injpt1_tC_options.txt |
| Omicron option files: | detector 0, detector 1 |
| Detector channel names: | H1:GDS-CALIB_STRAIN_CLEAN_AR_4096Hz, L1:GDS-CALIB_STRAIN_CLEAN_AR_4096Hz |
| Omicron analysis time window and overlap: | 16 s, 6 s |
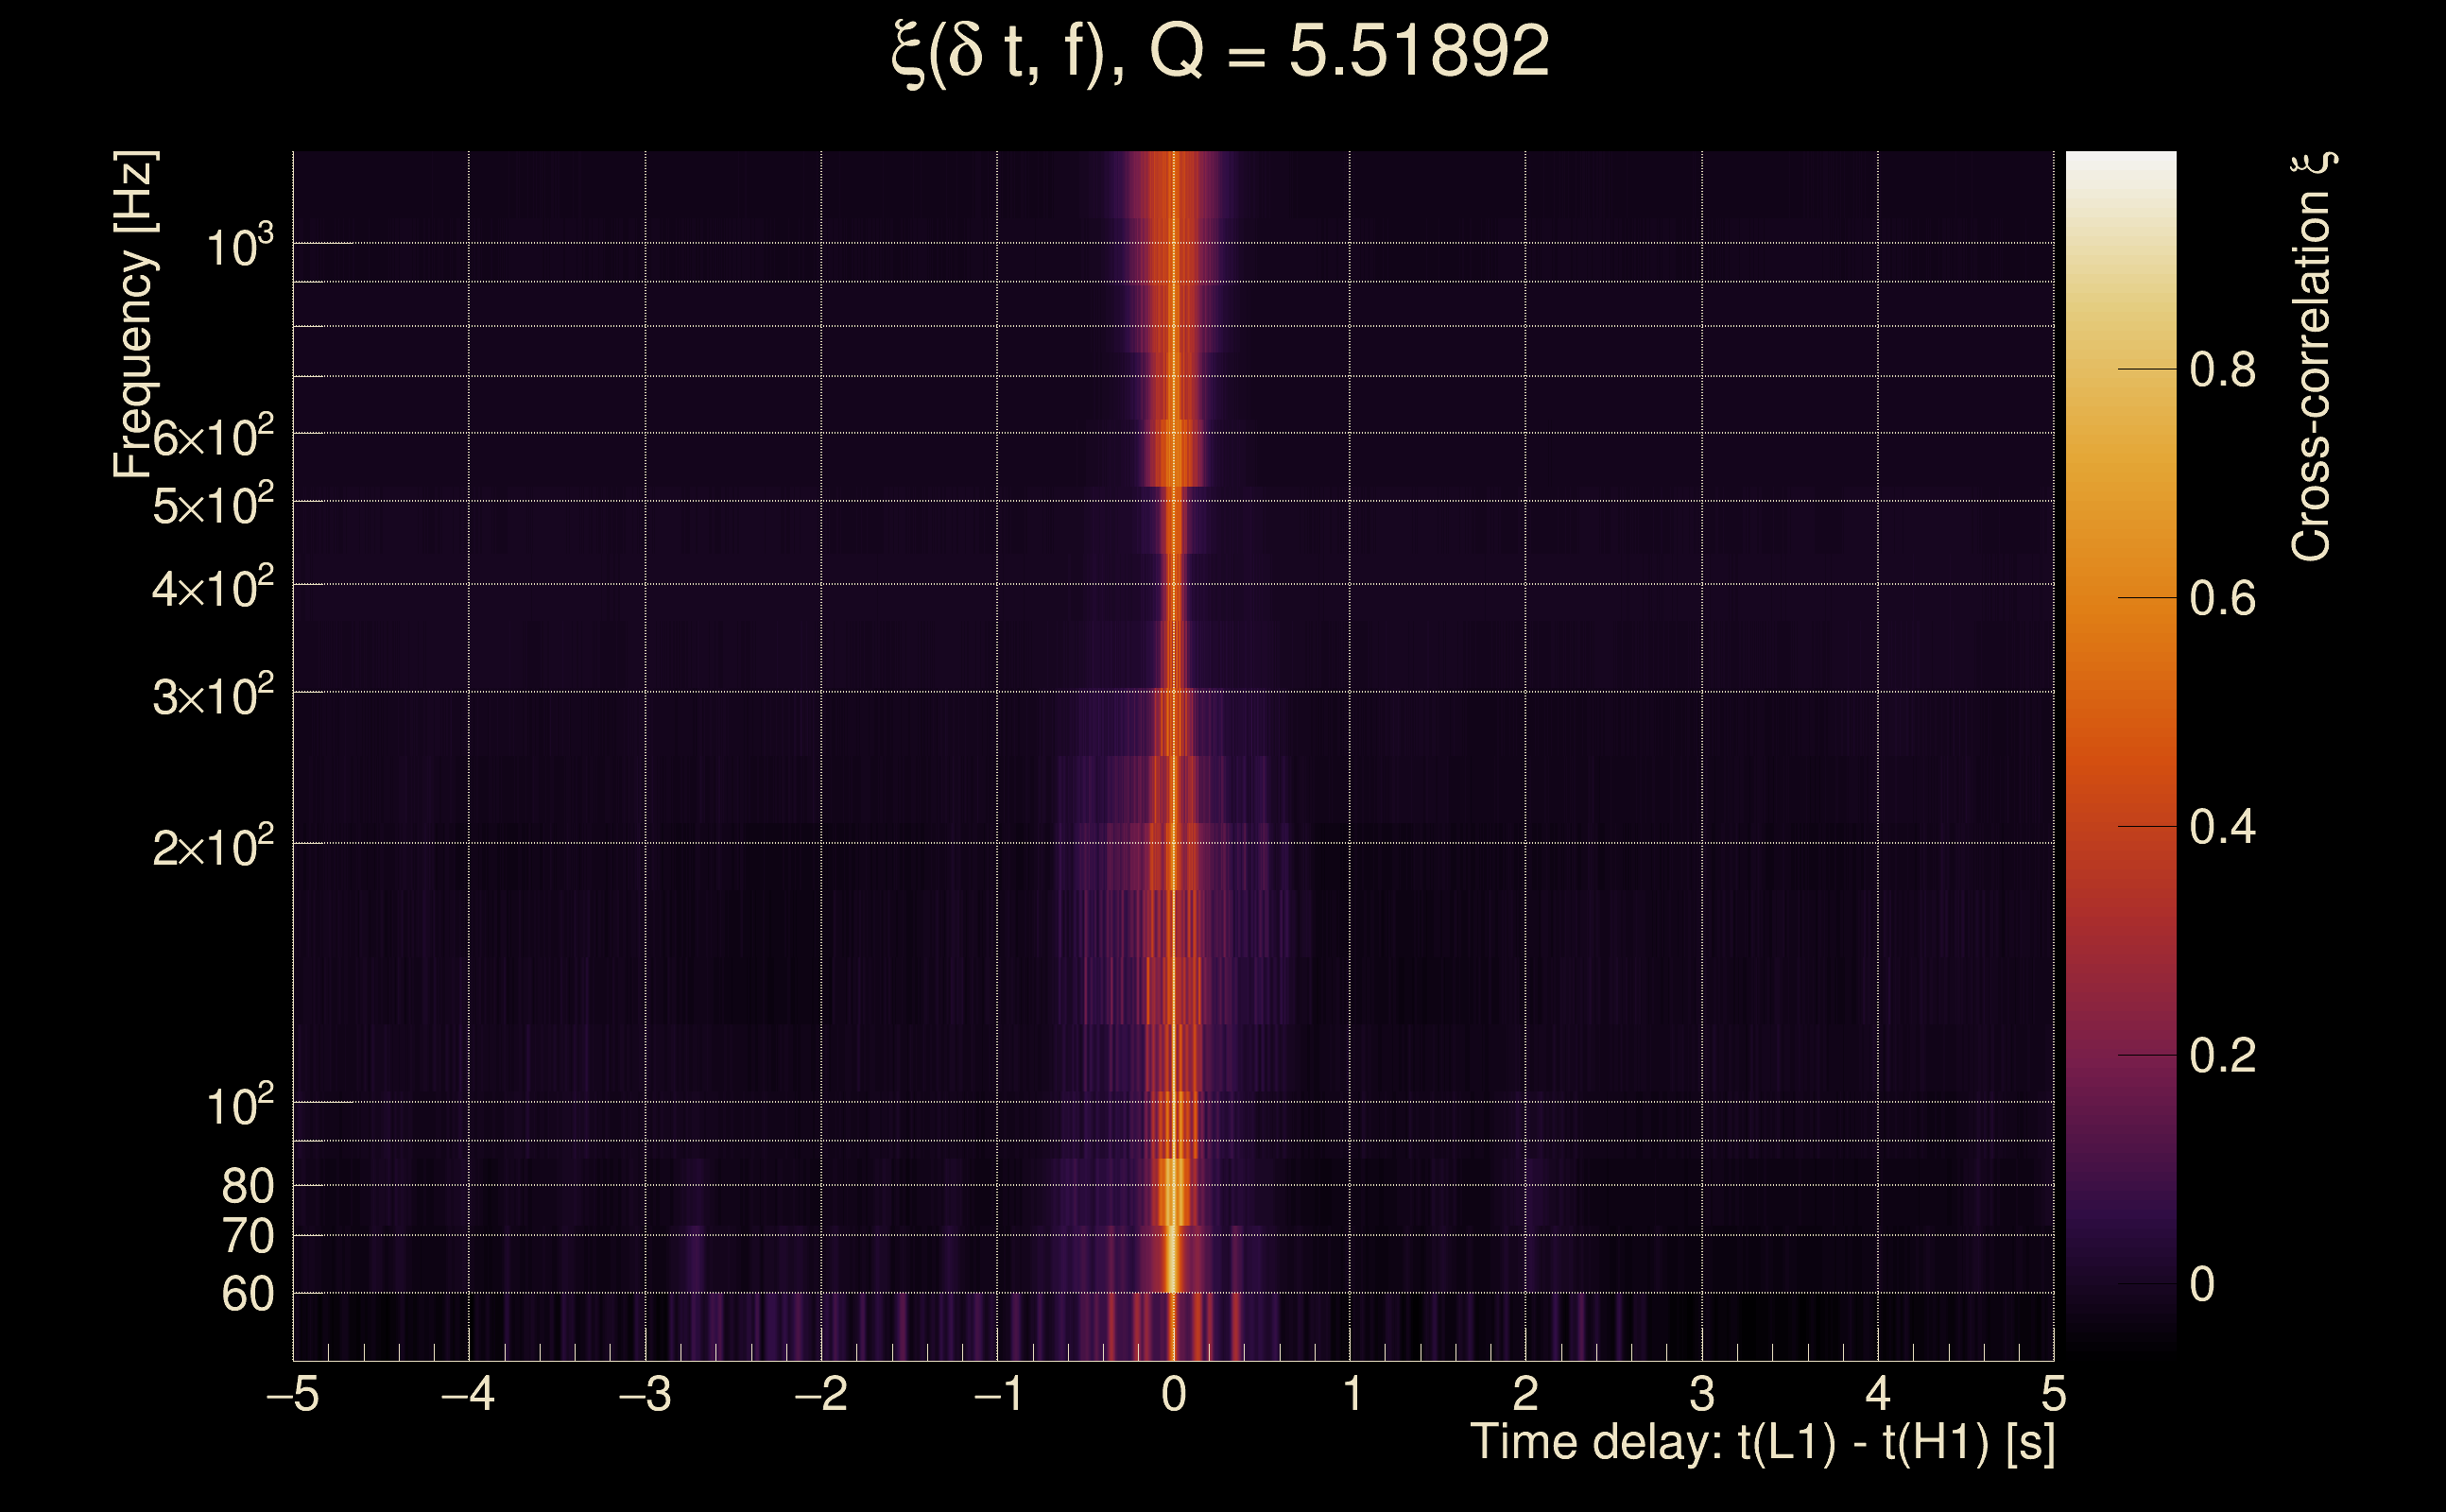
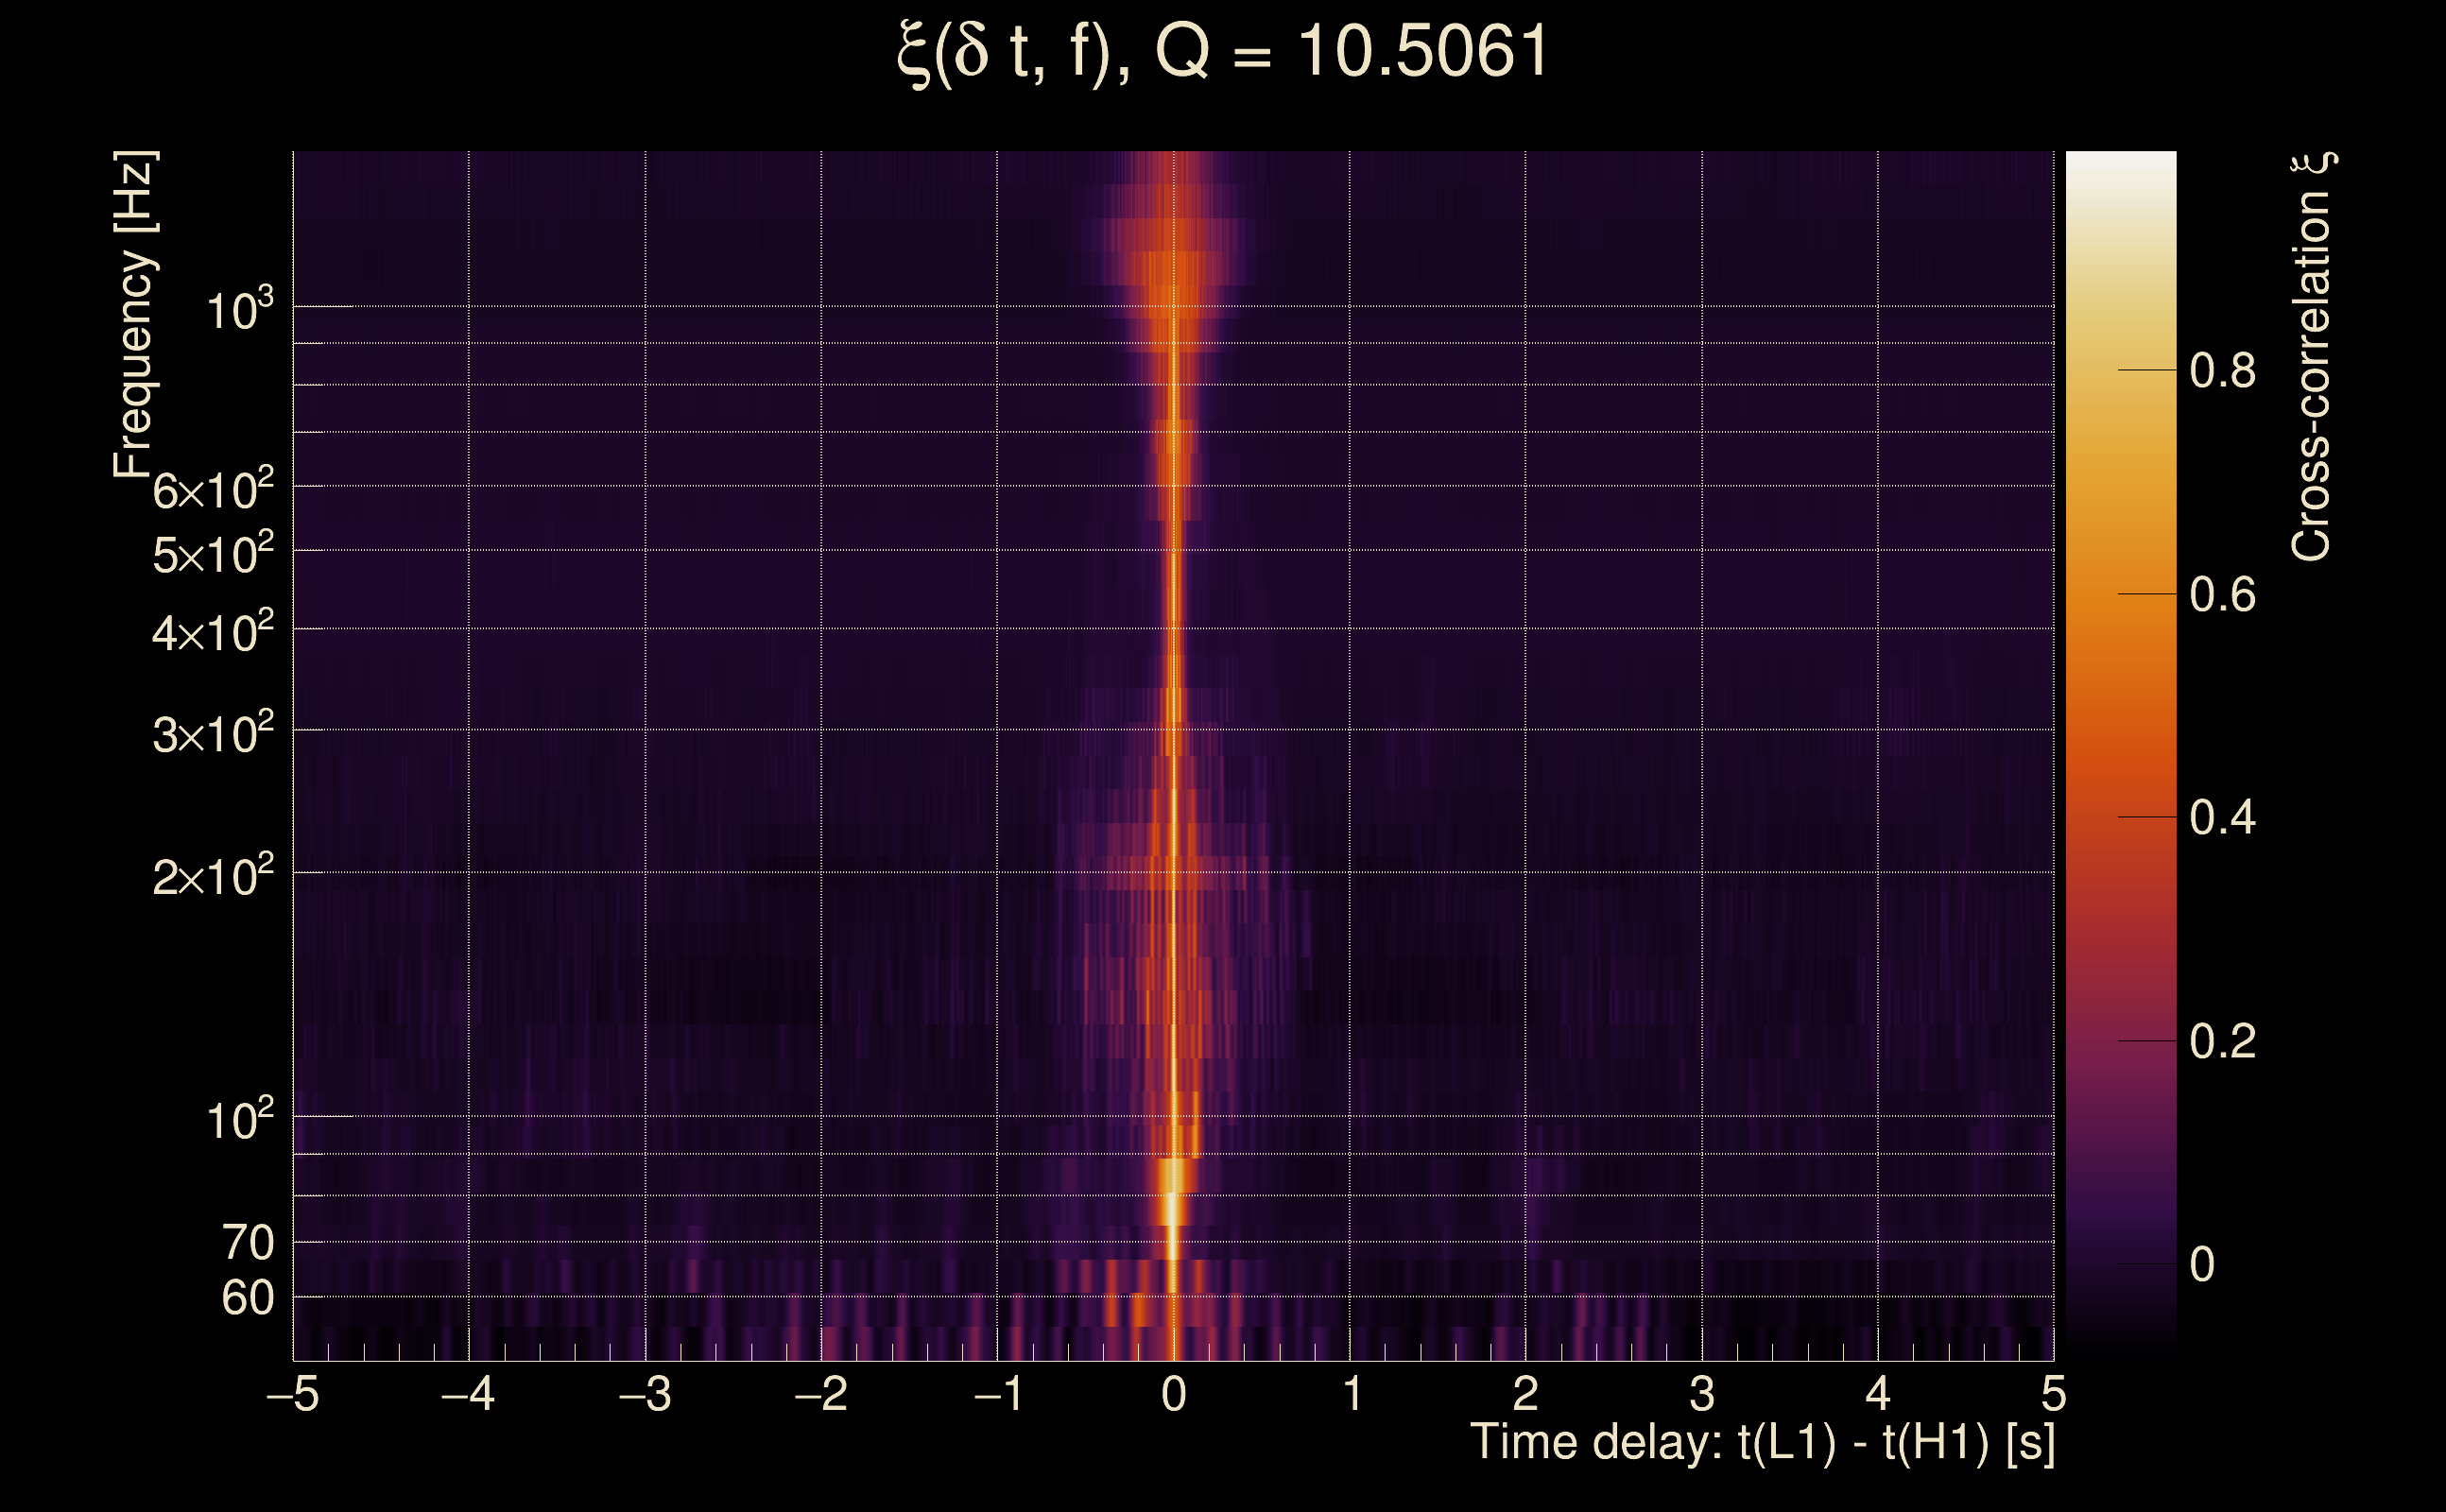
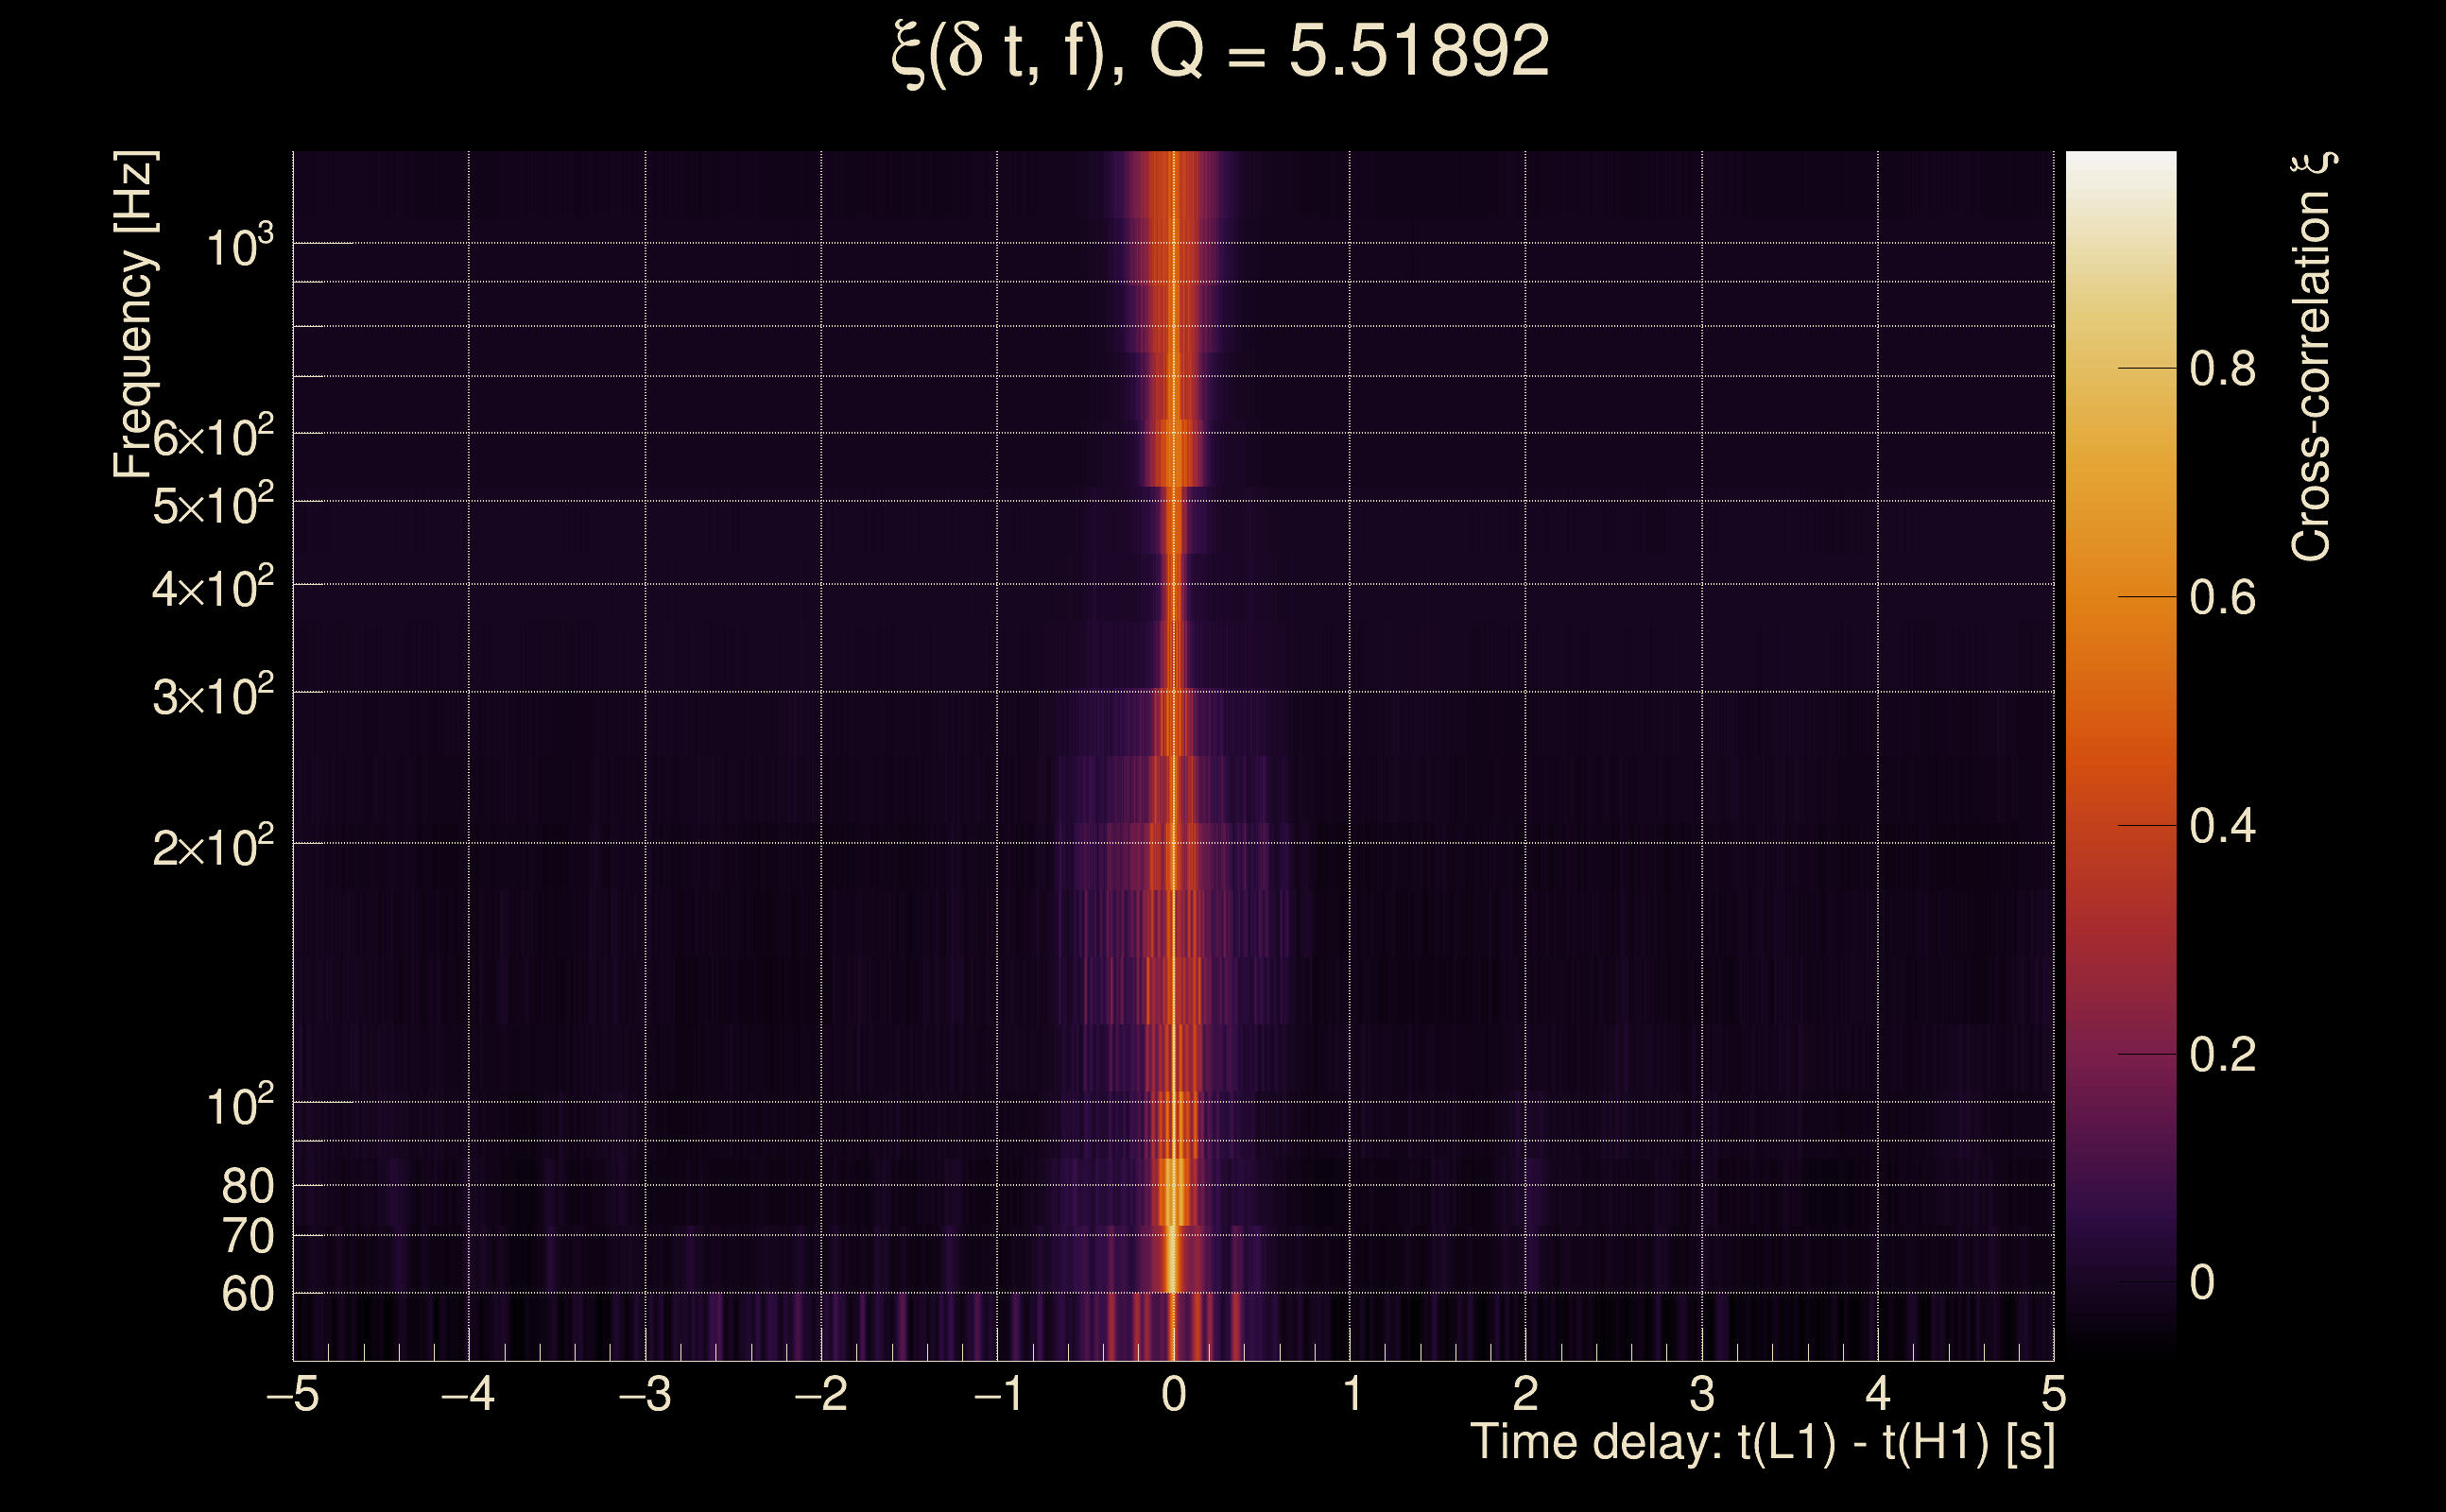
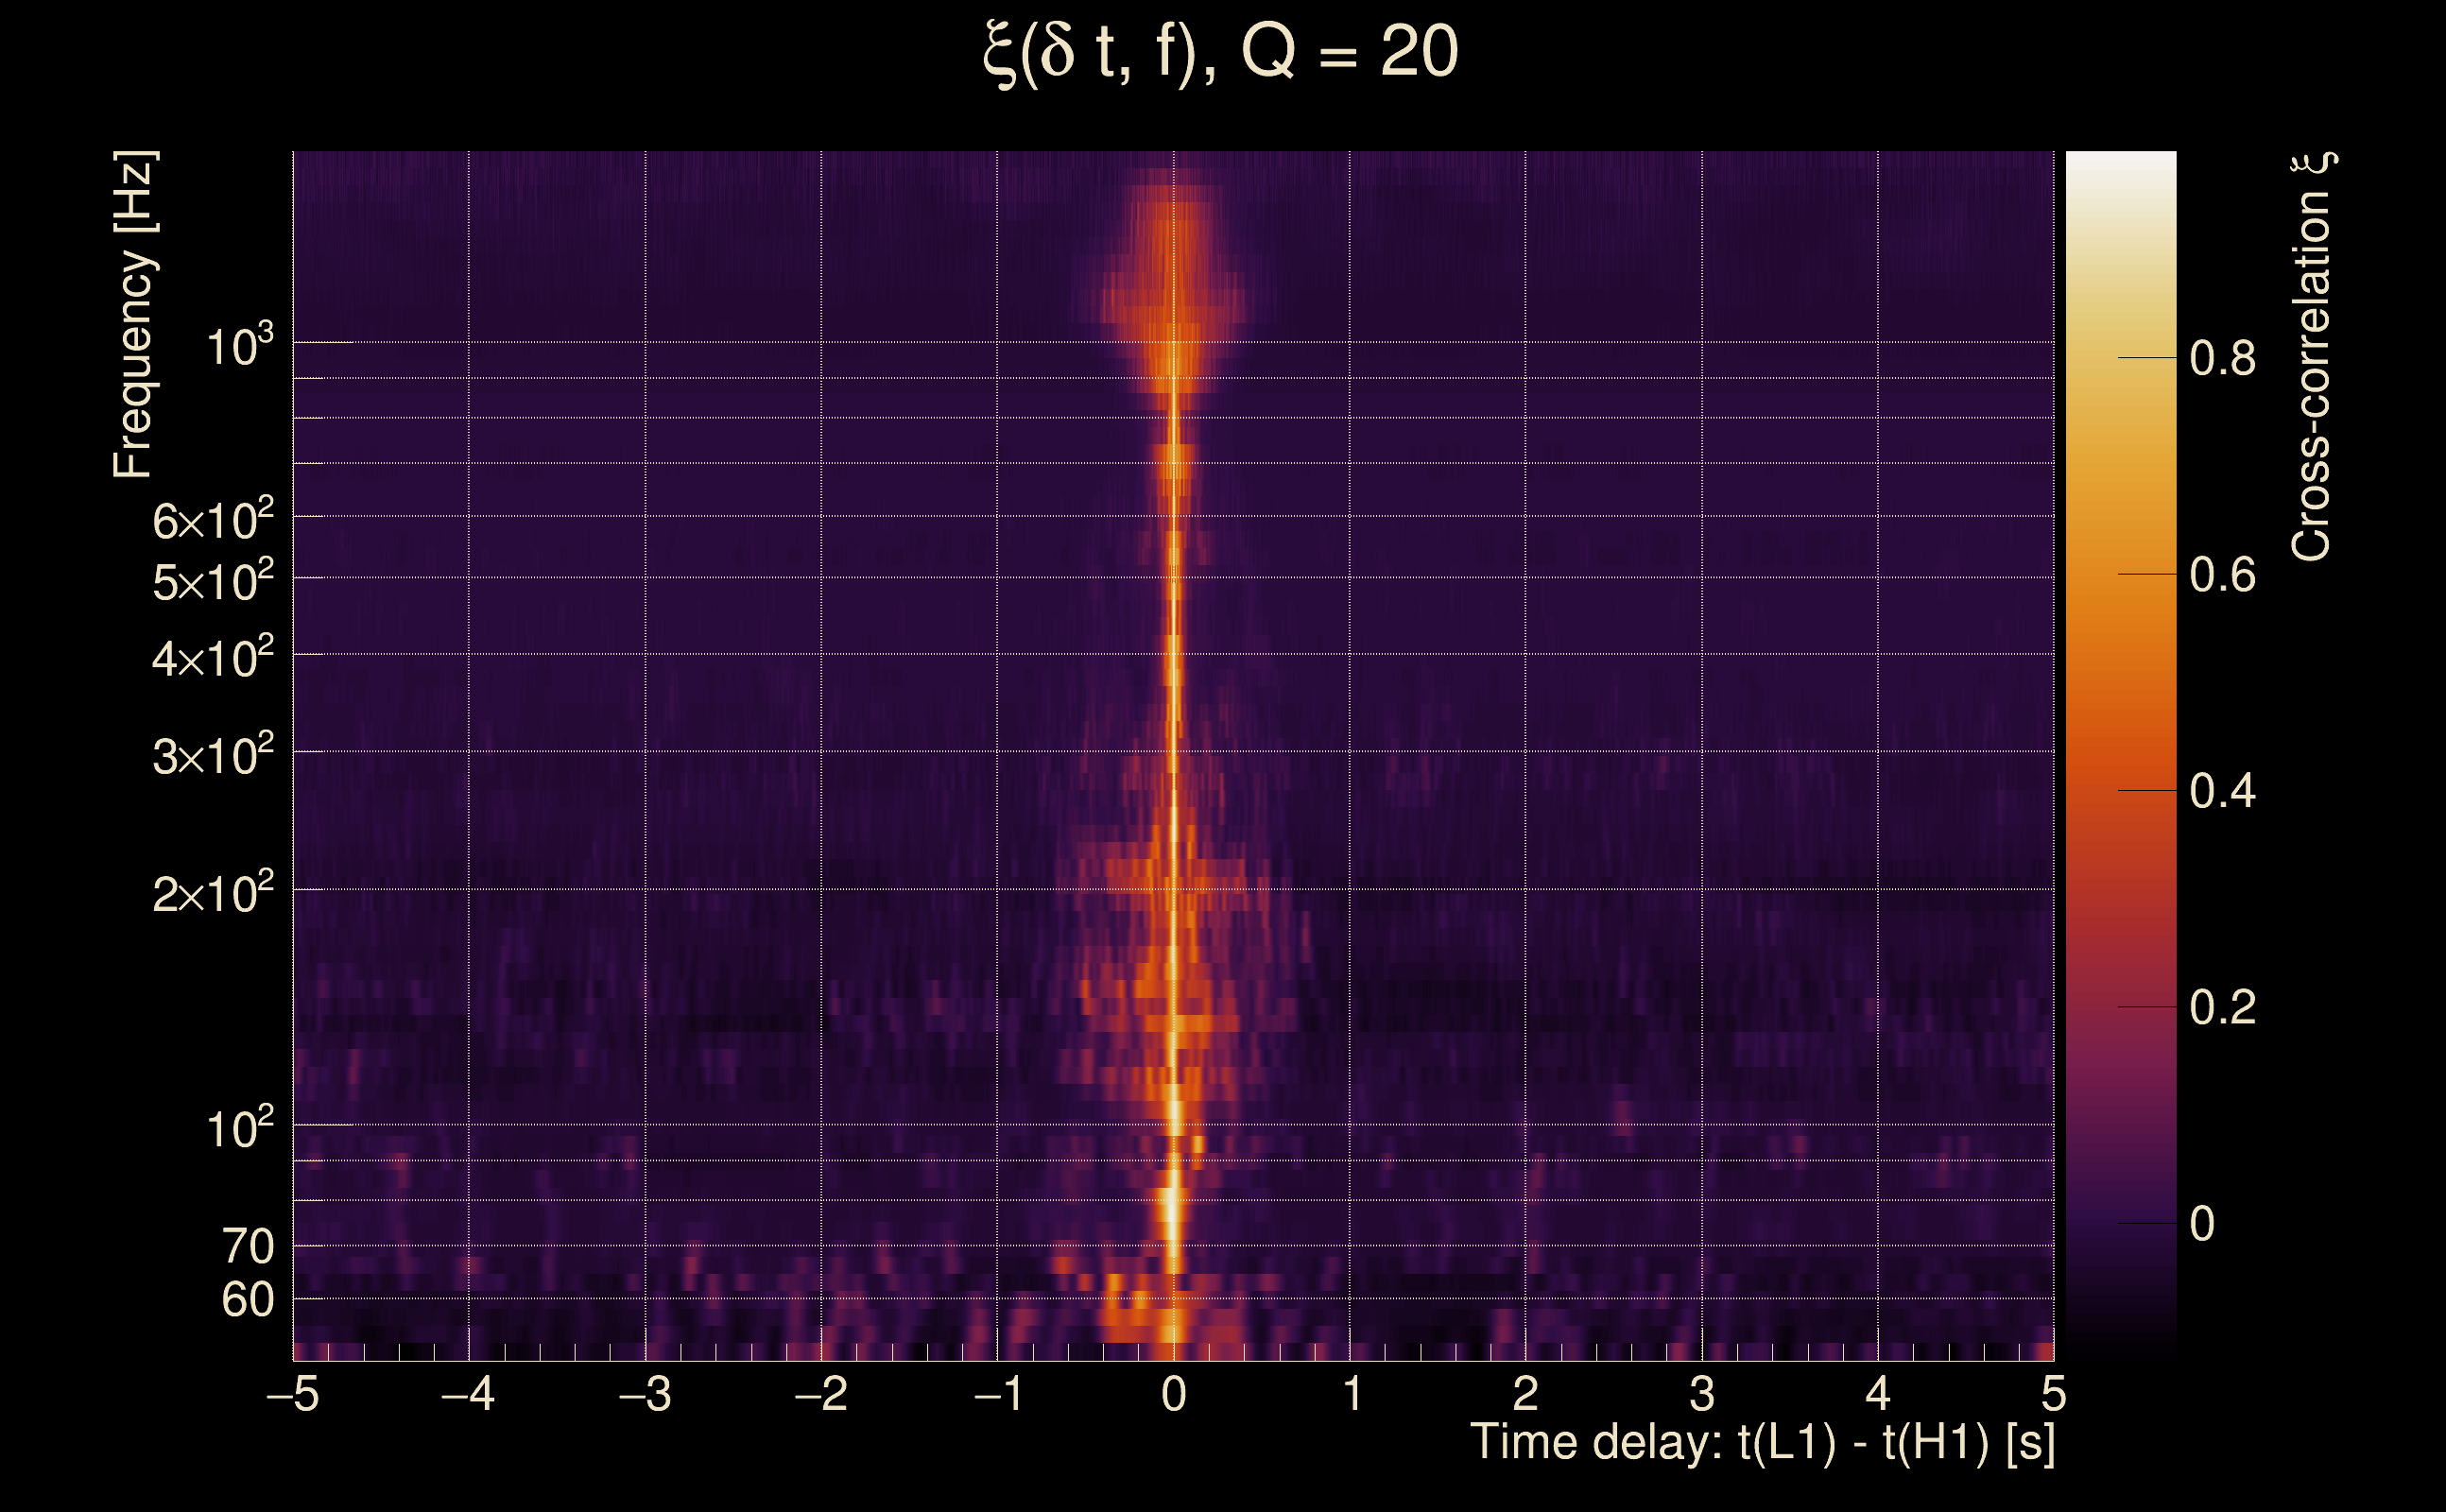
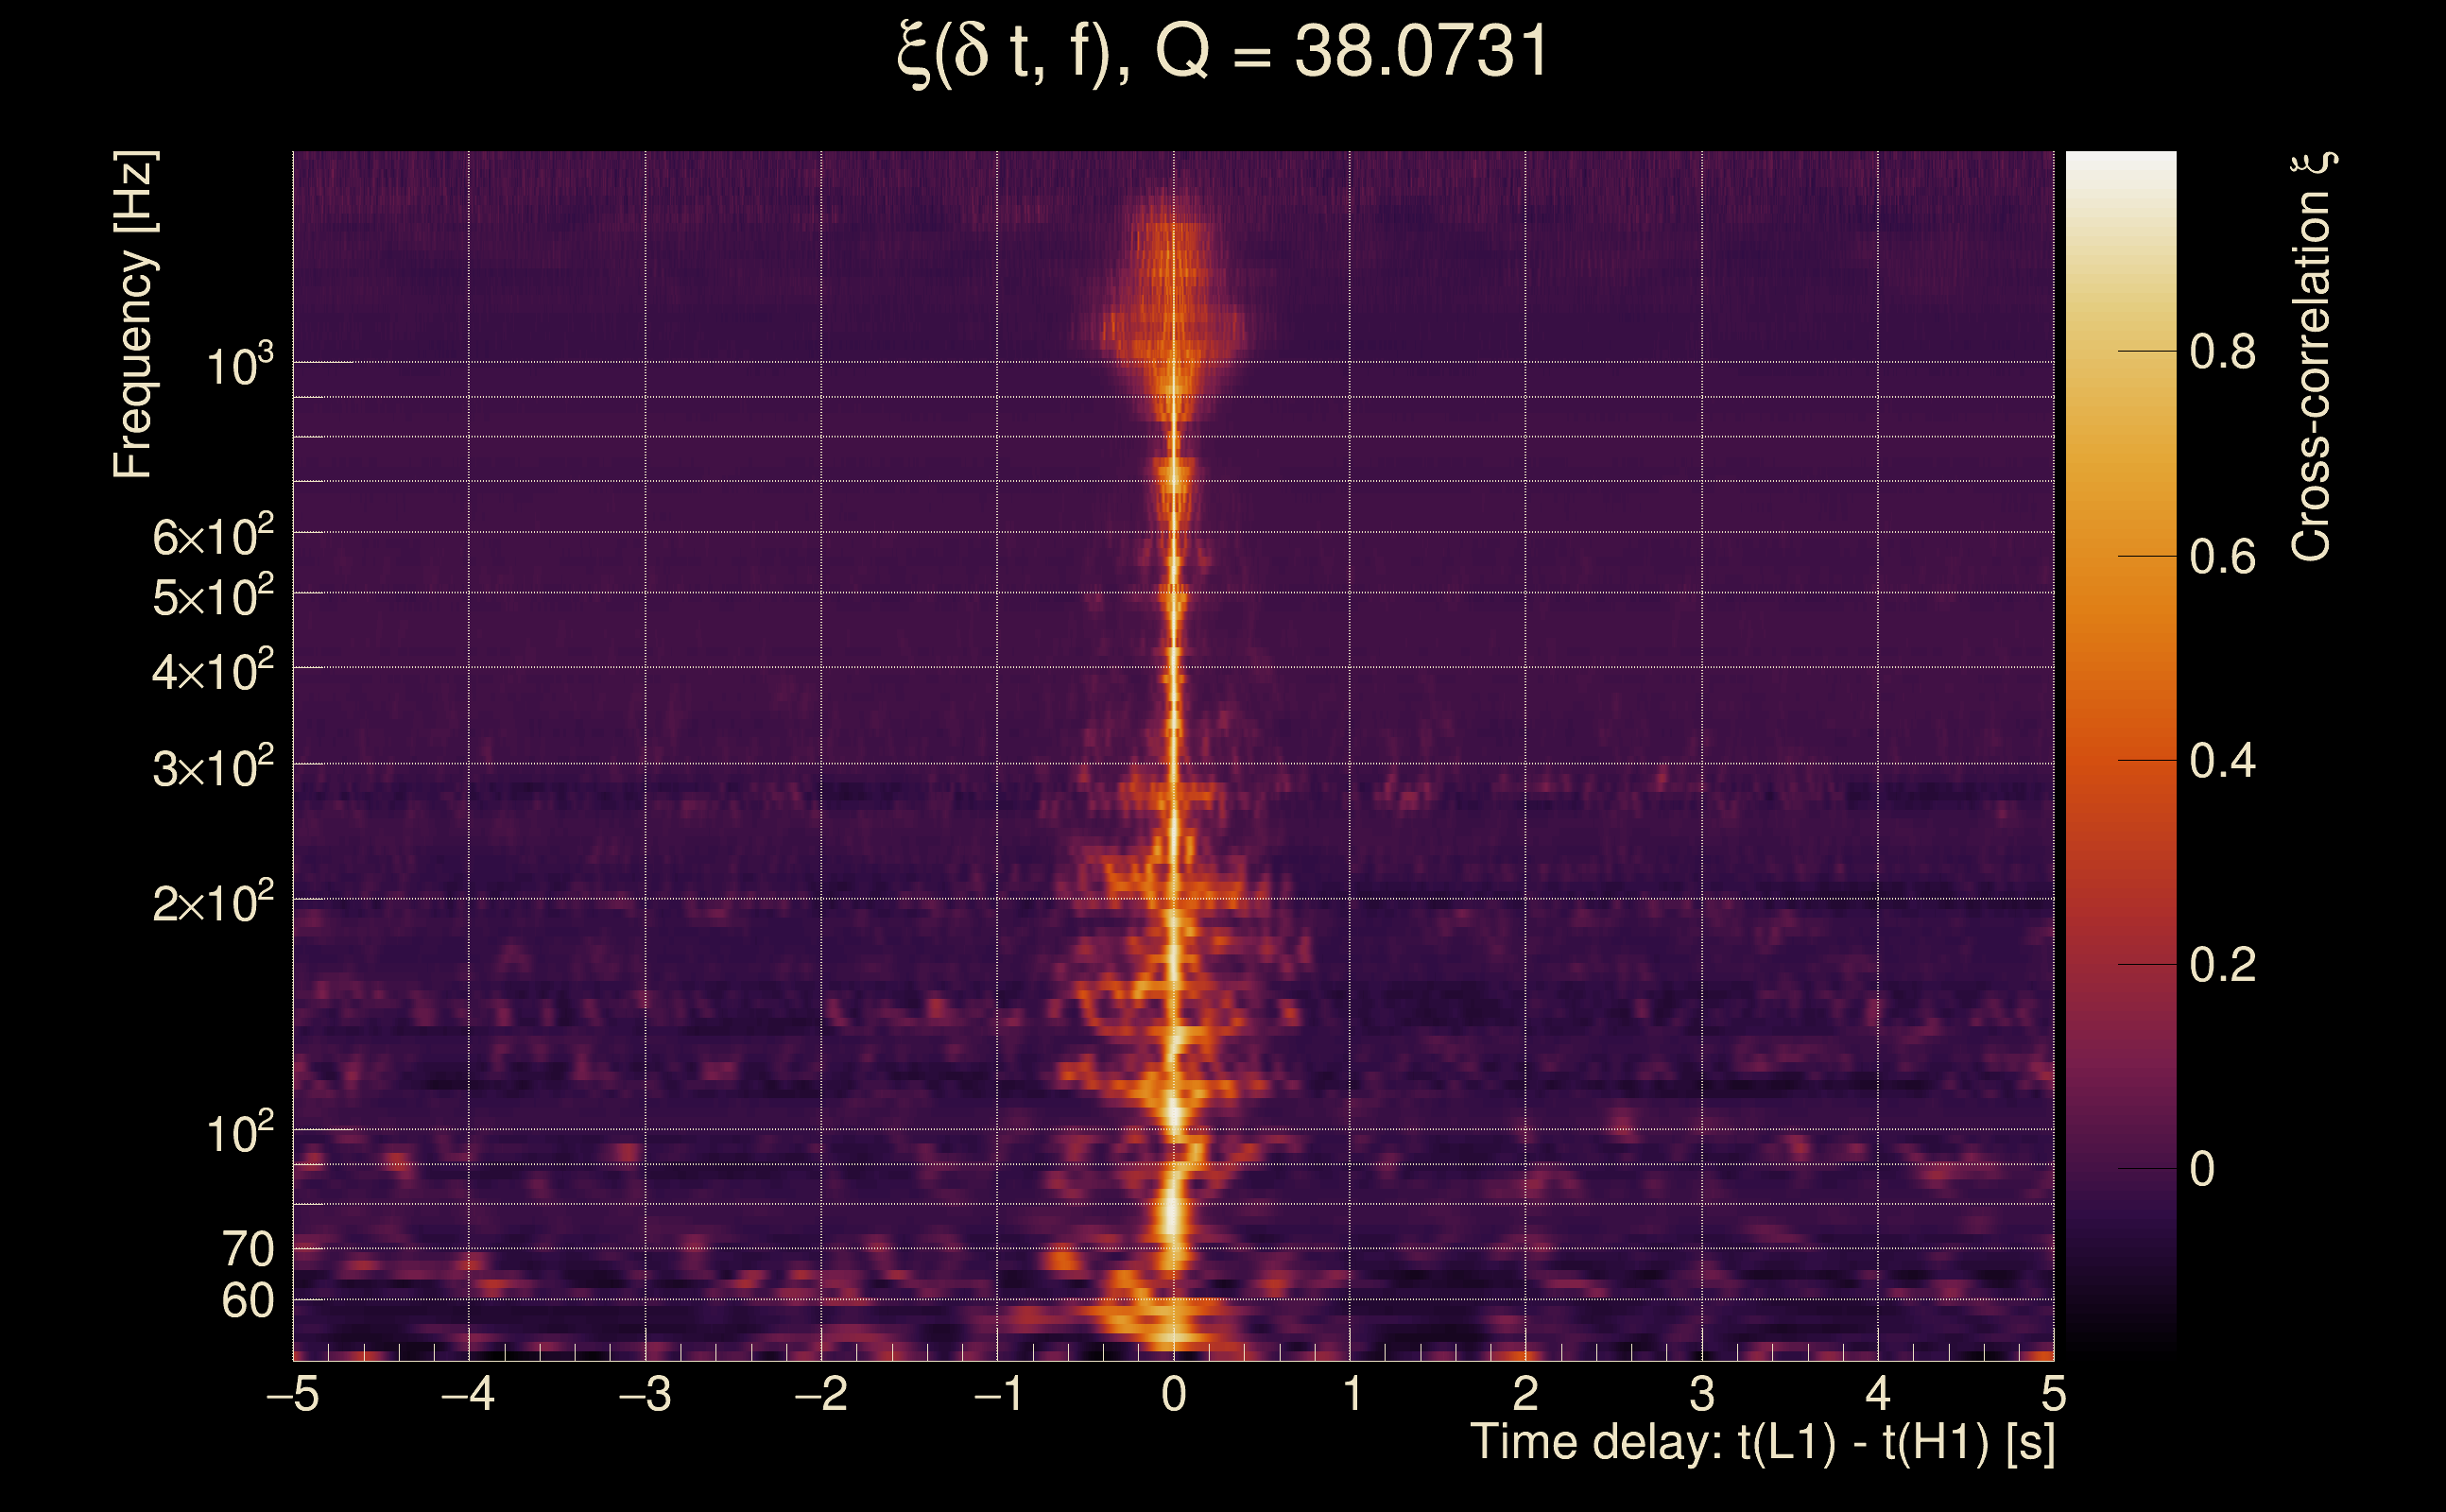
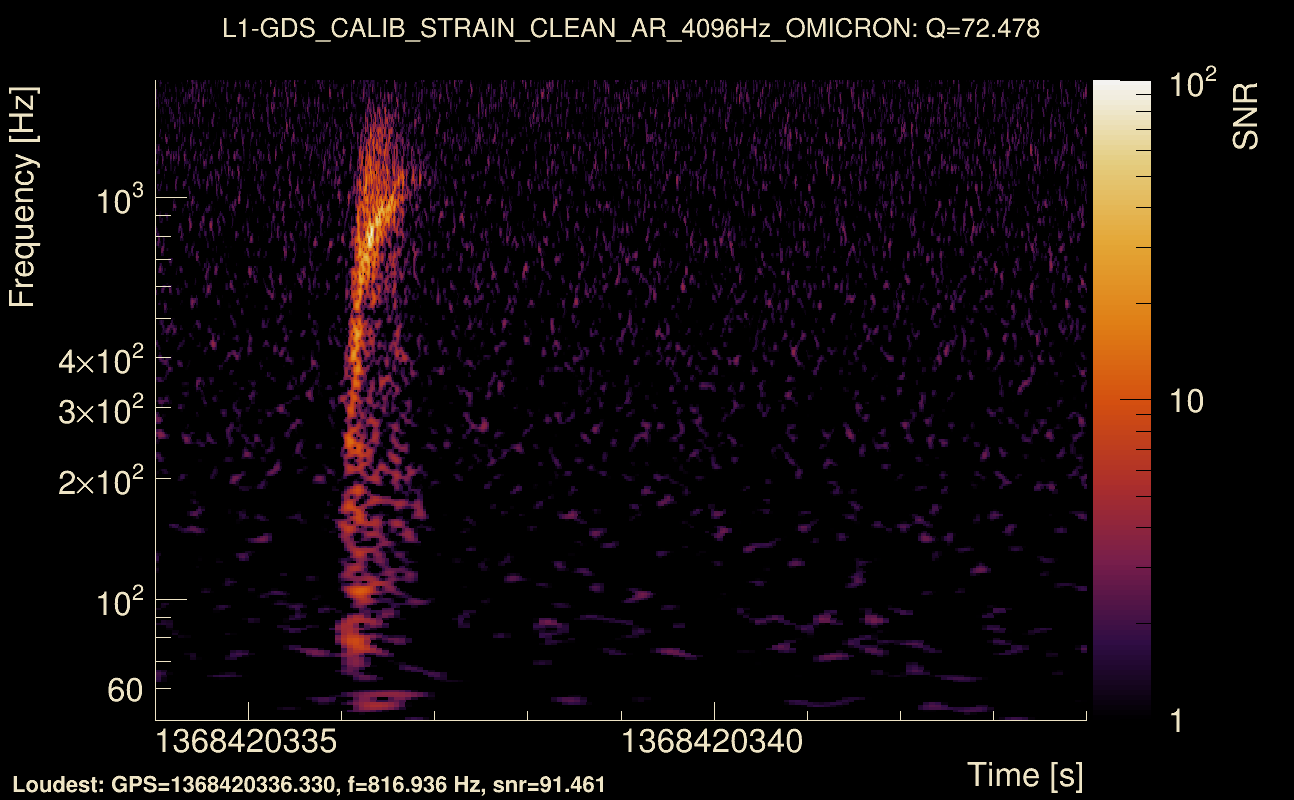
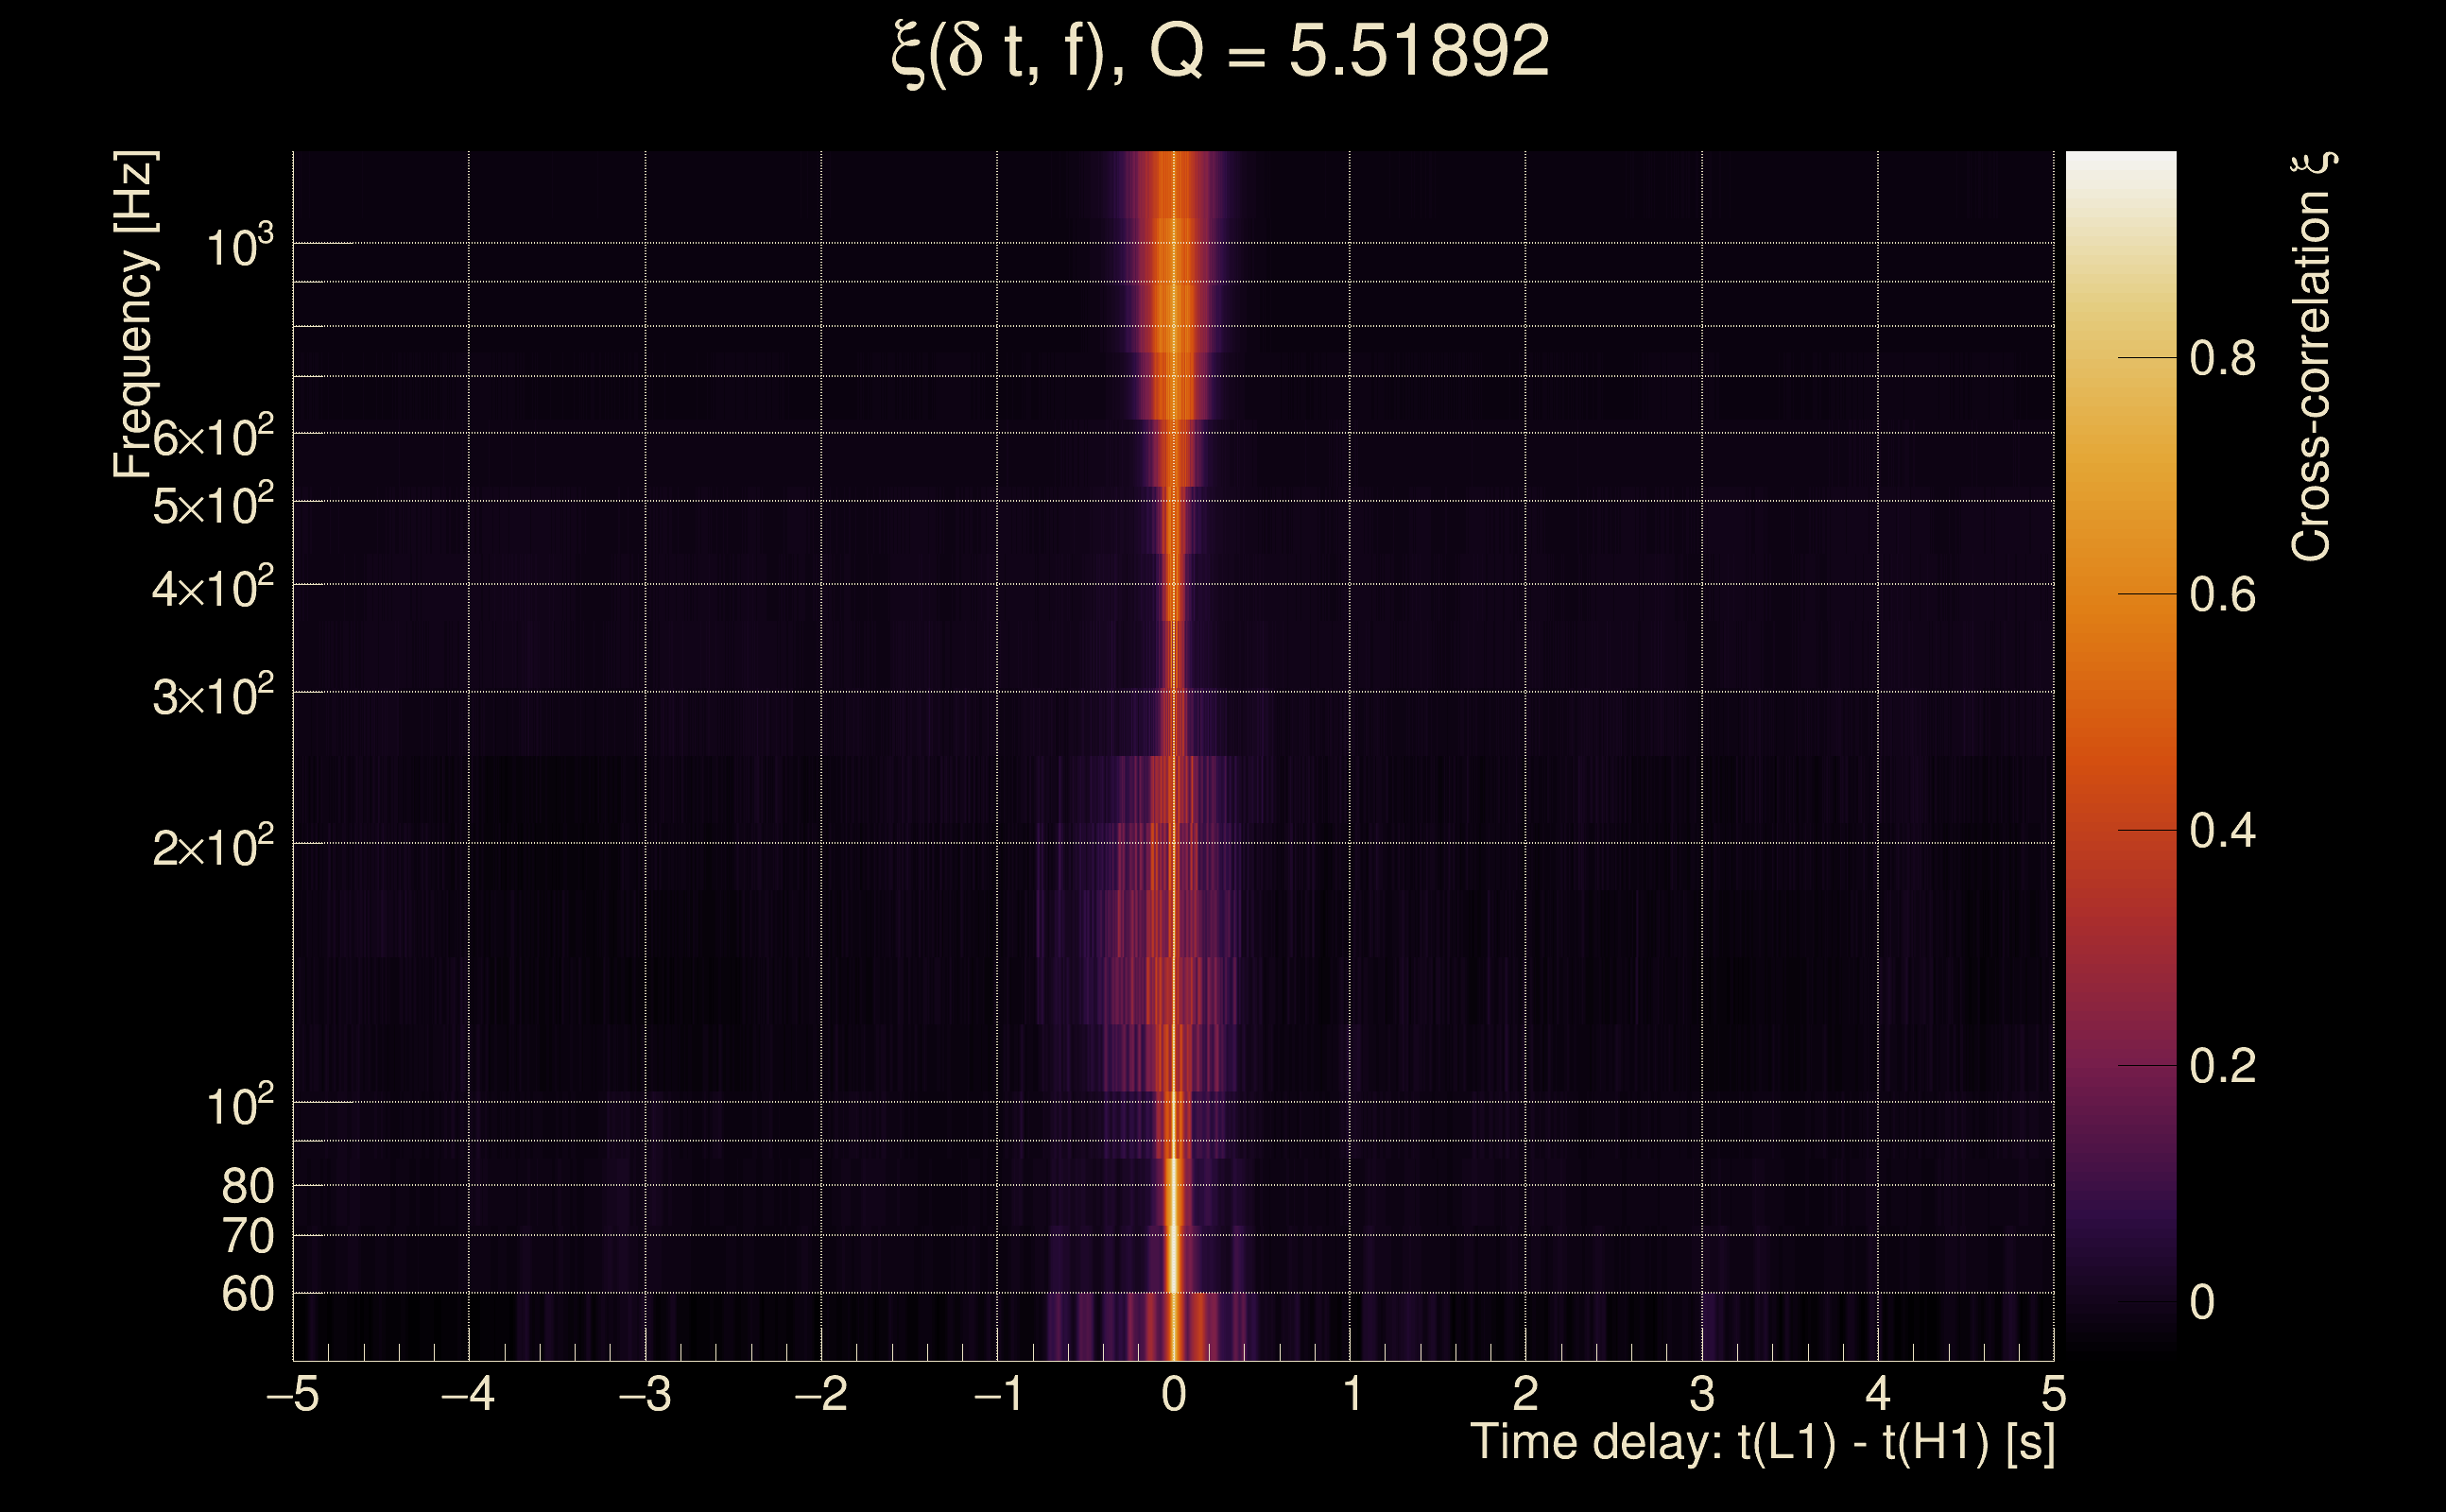
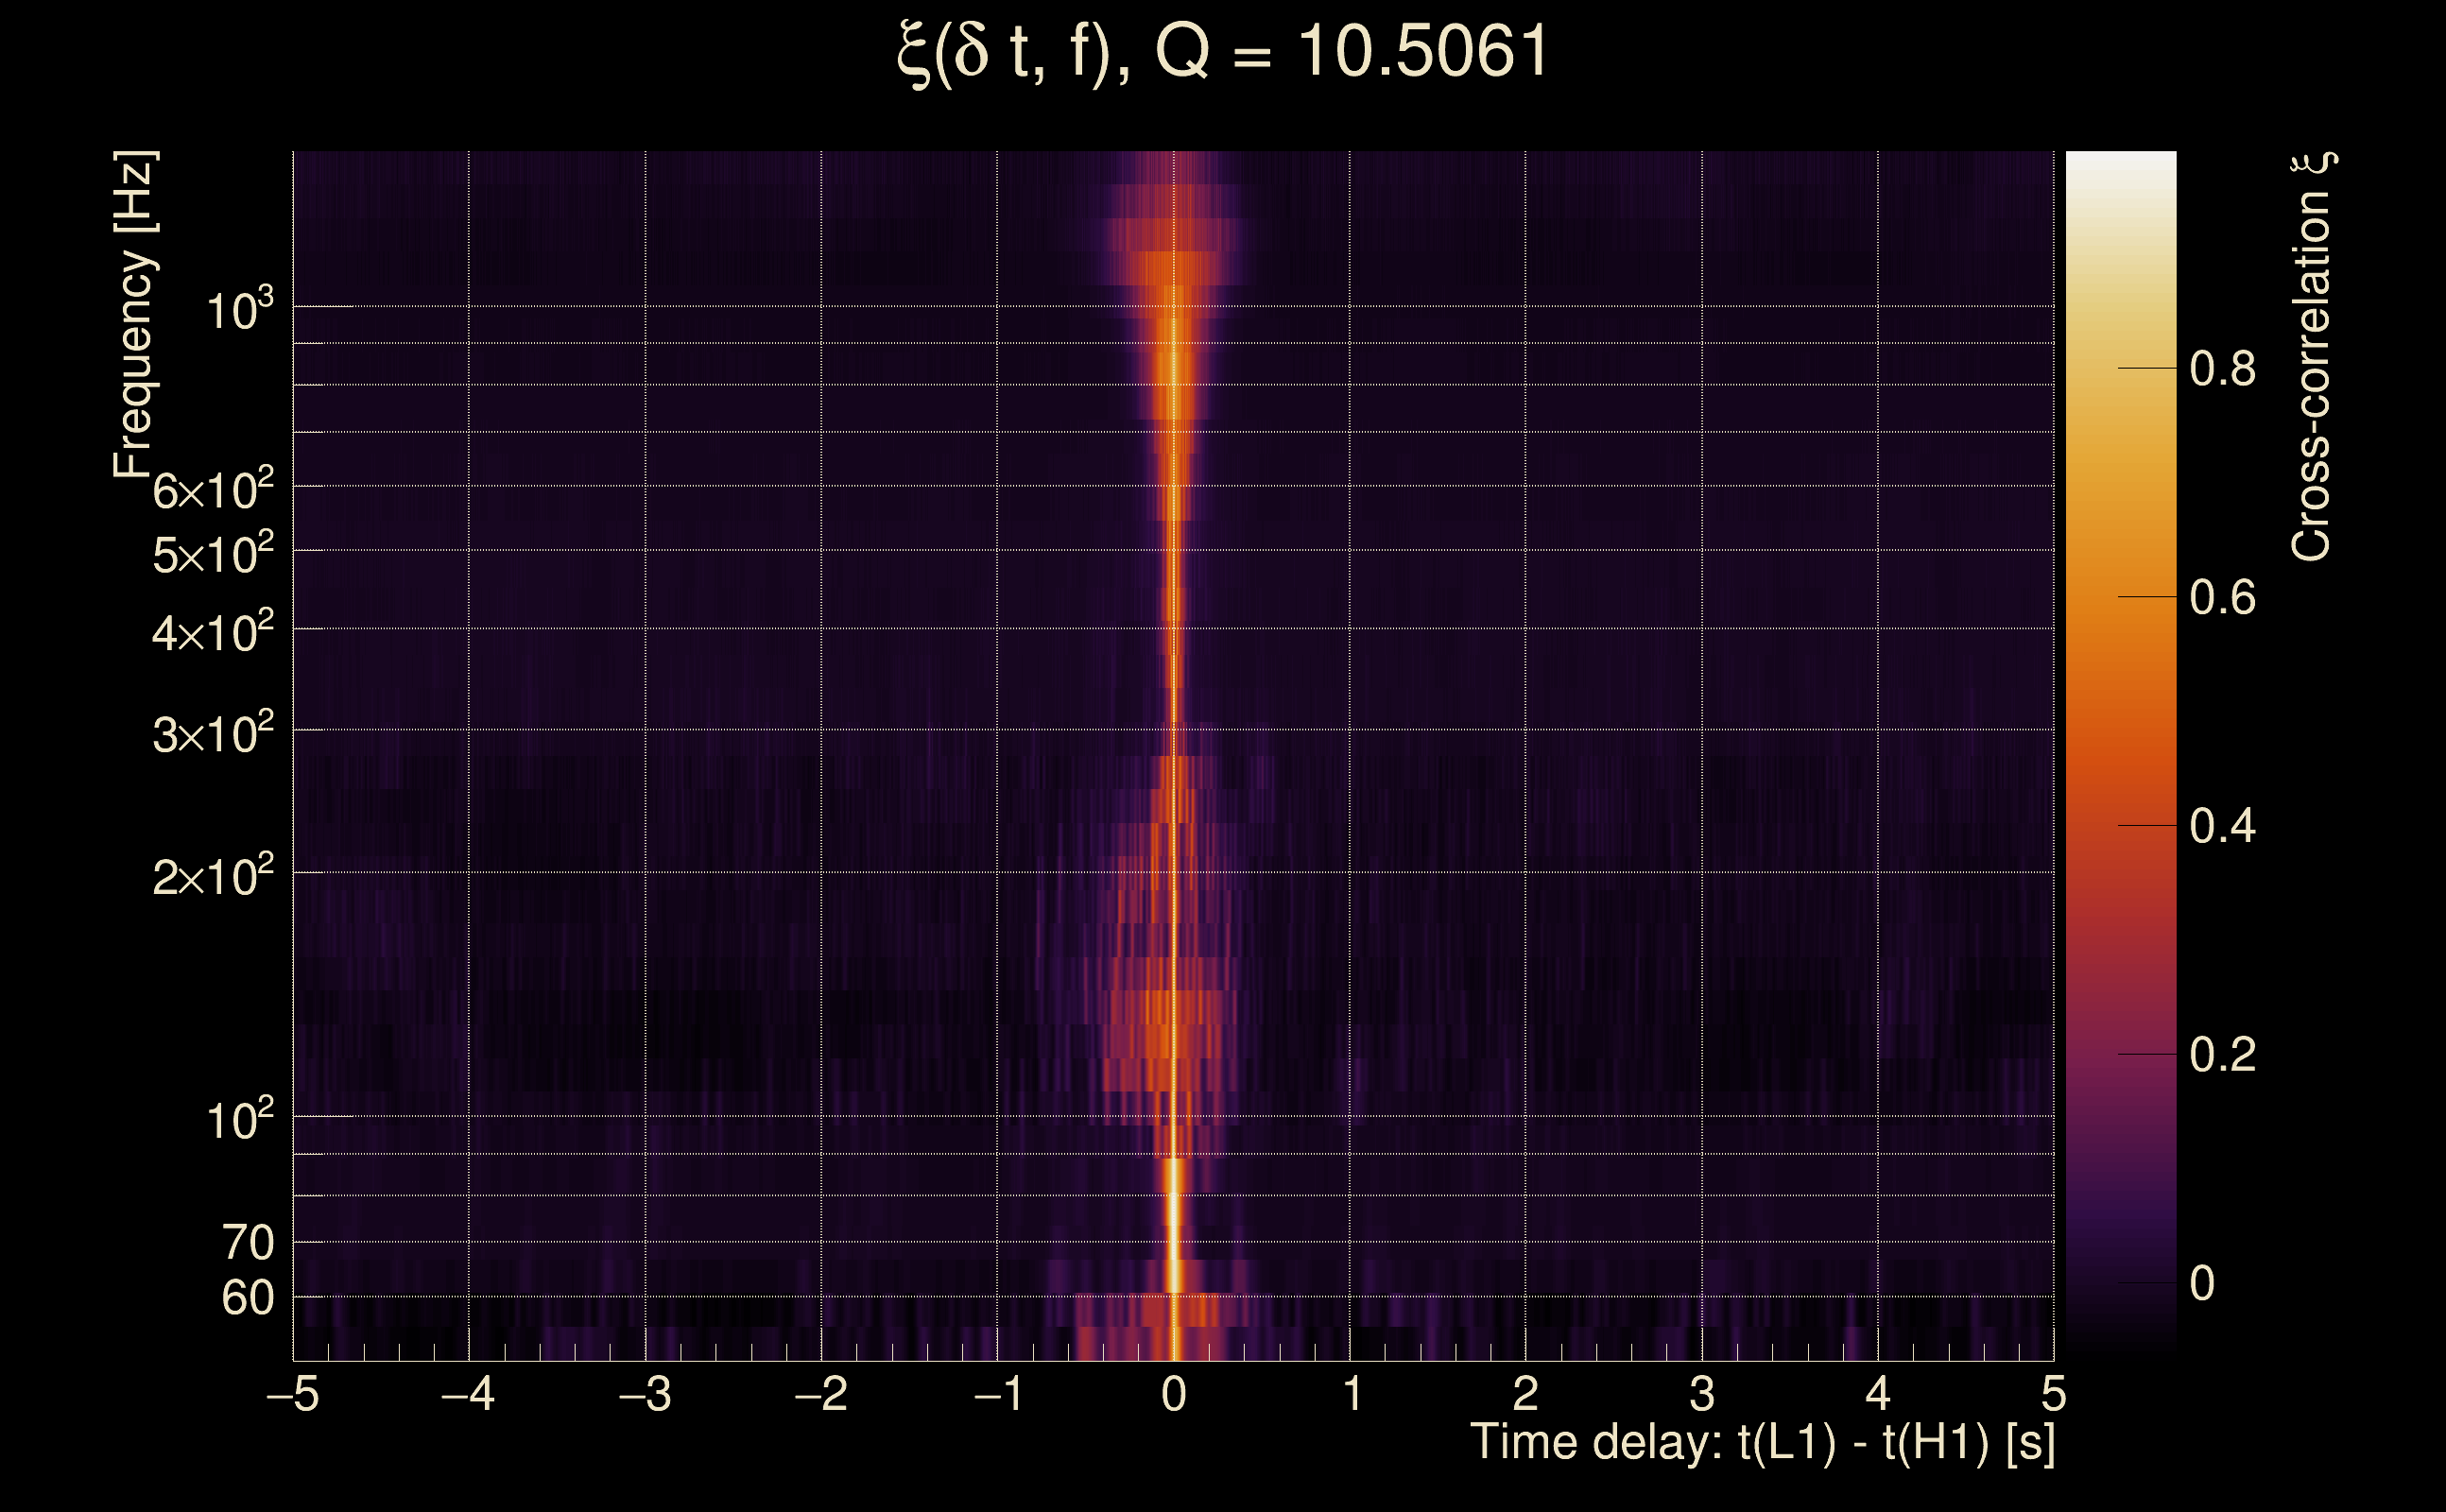
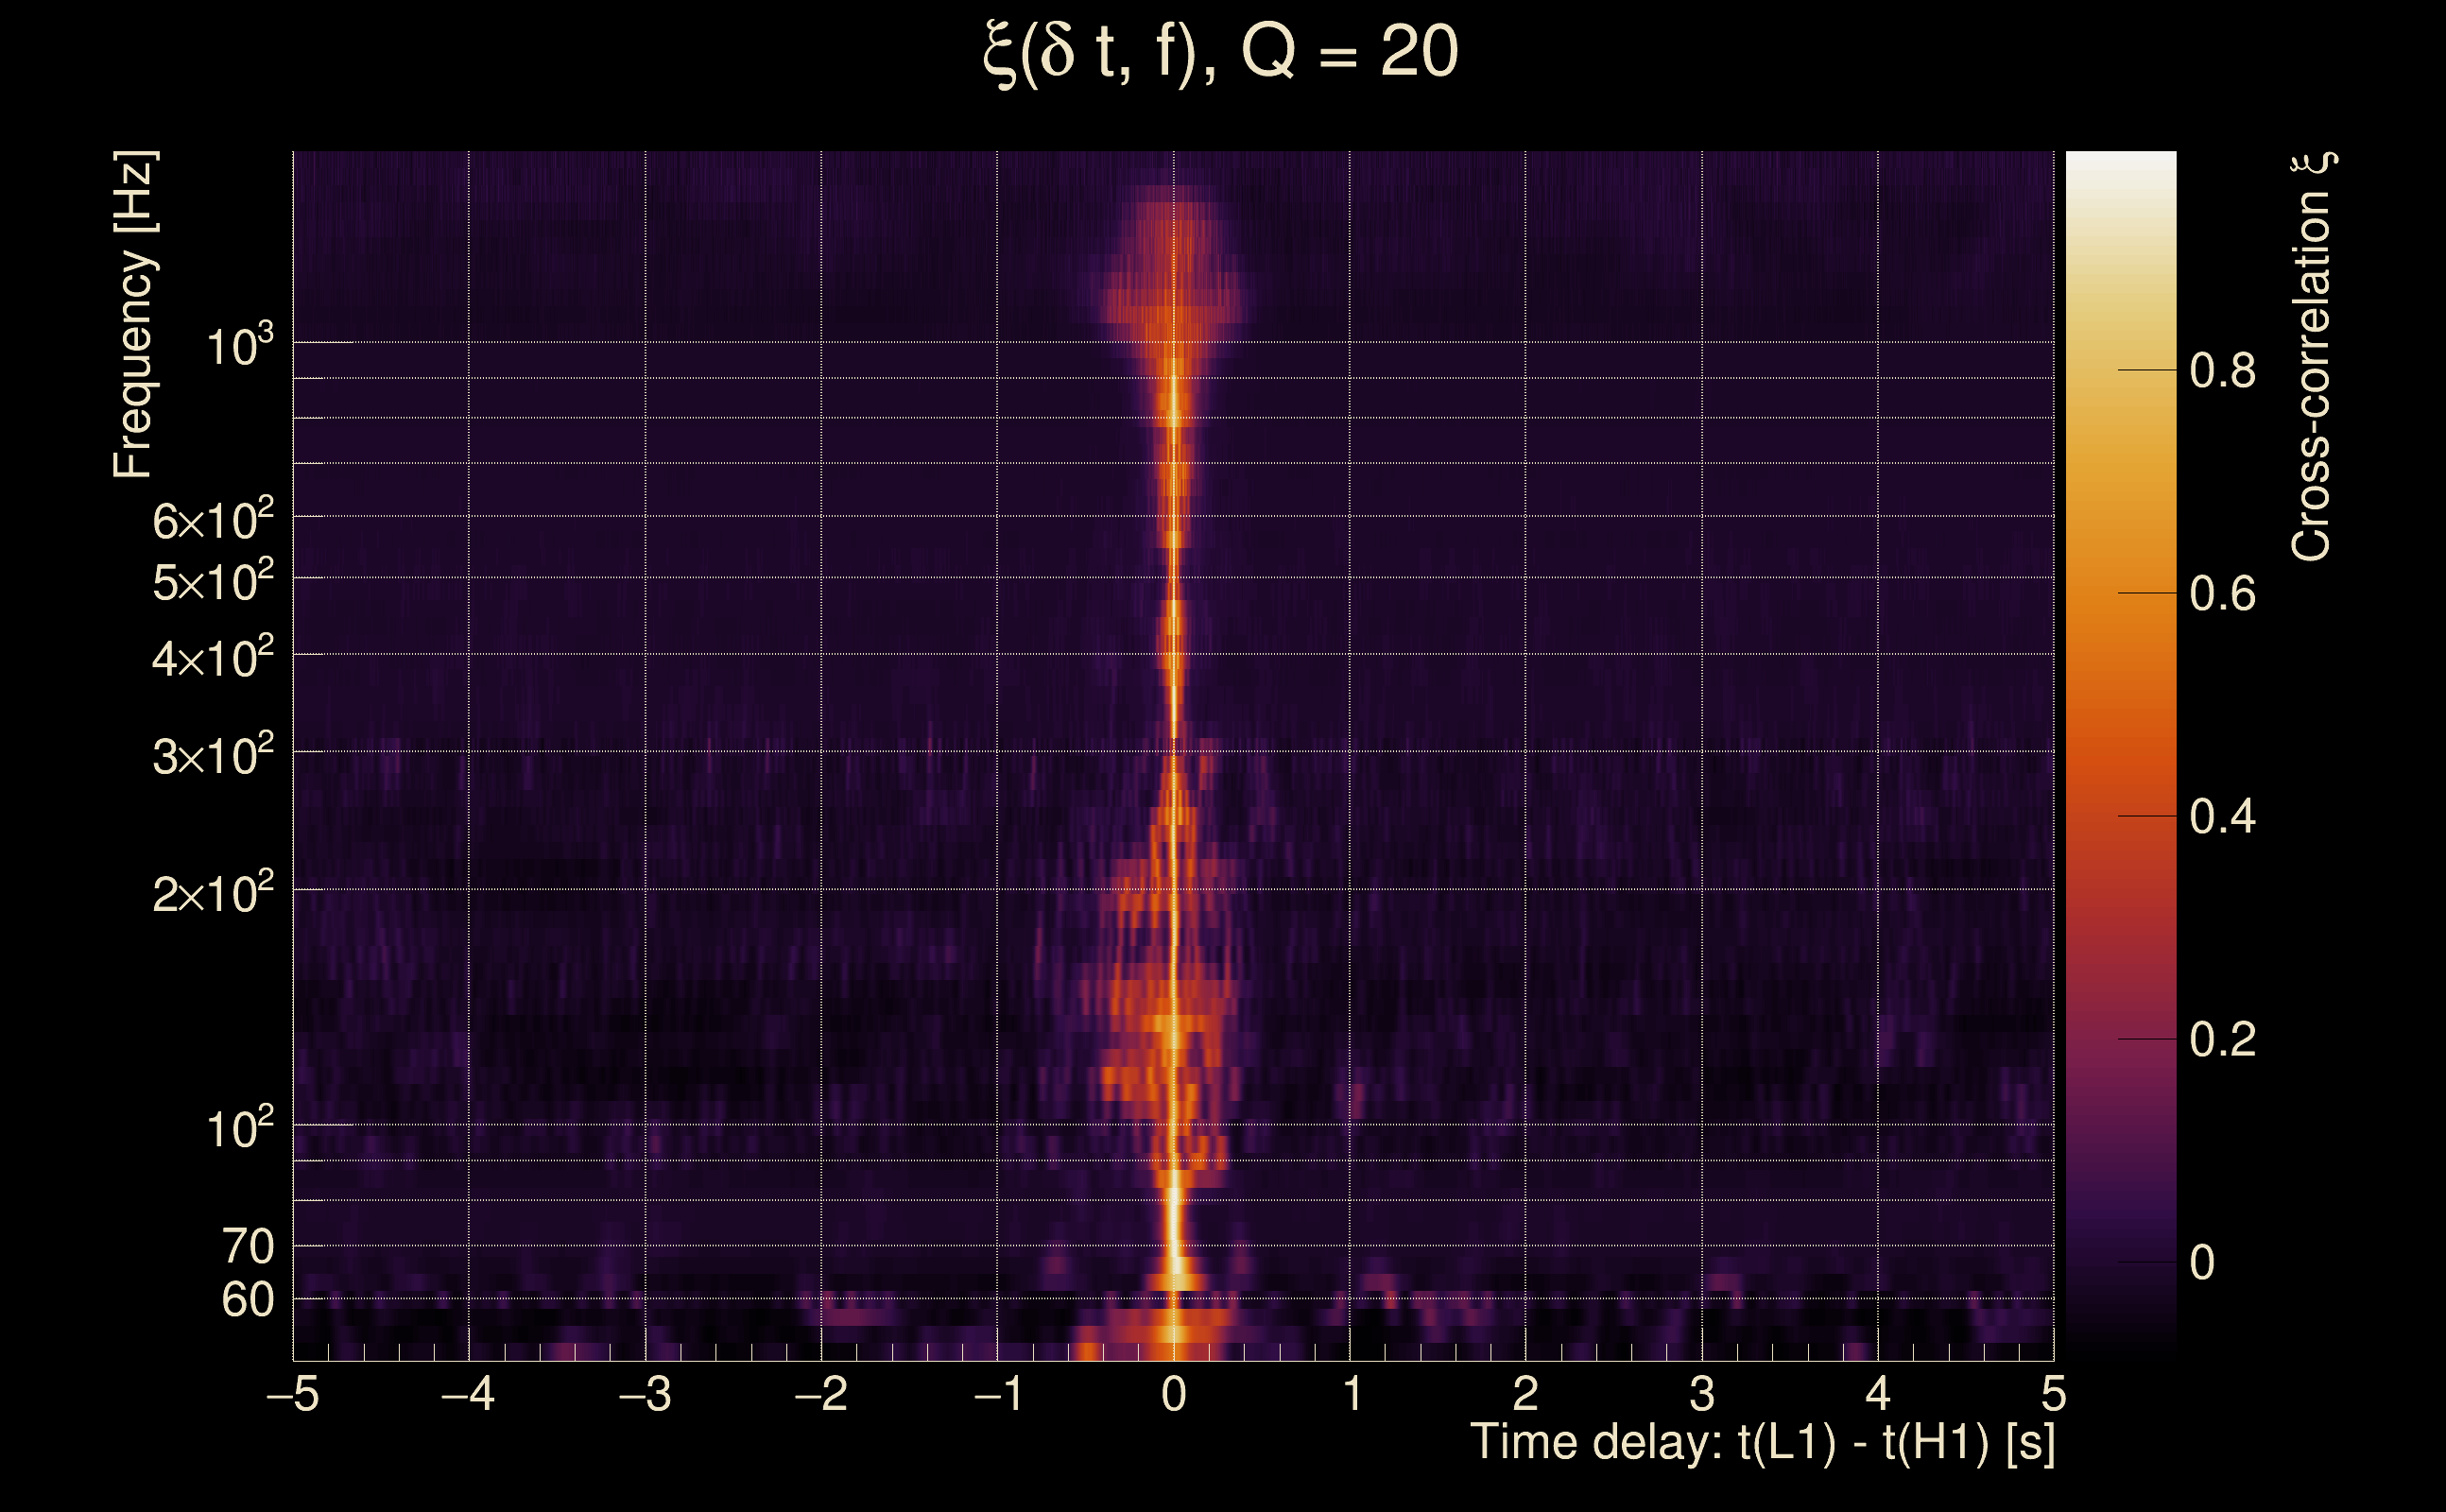
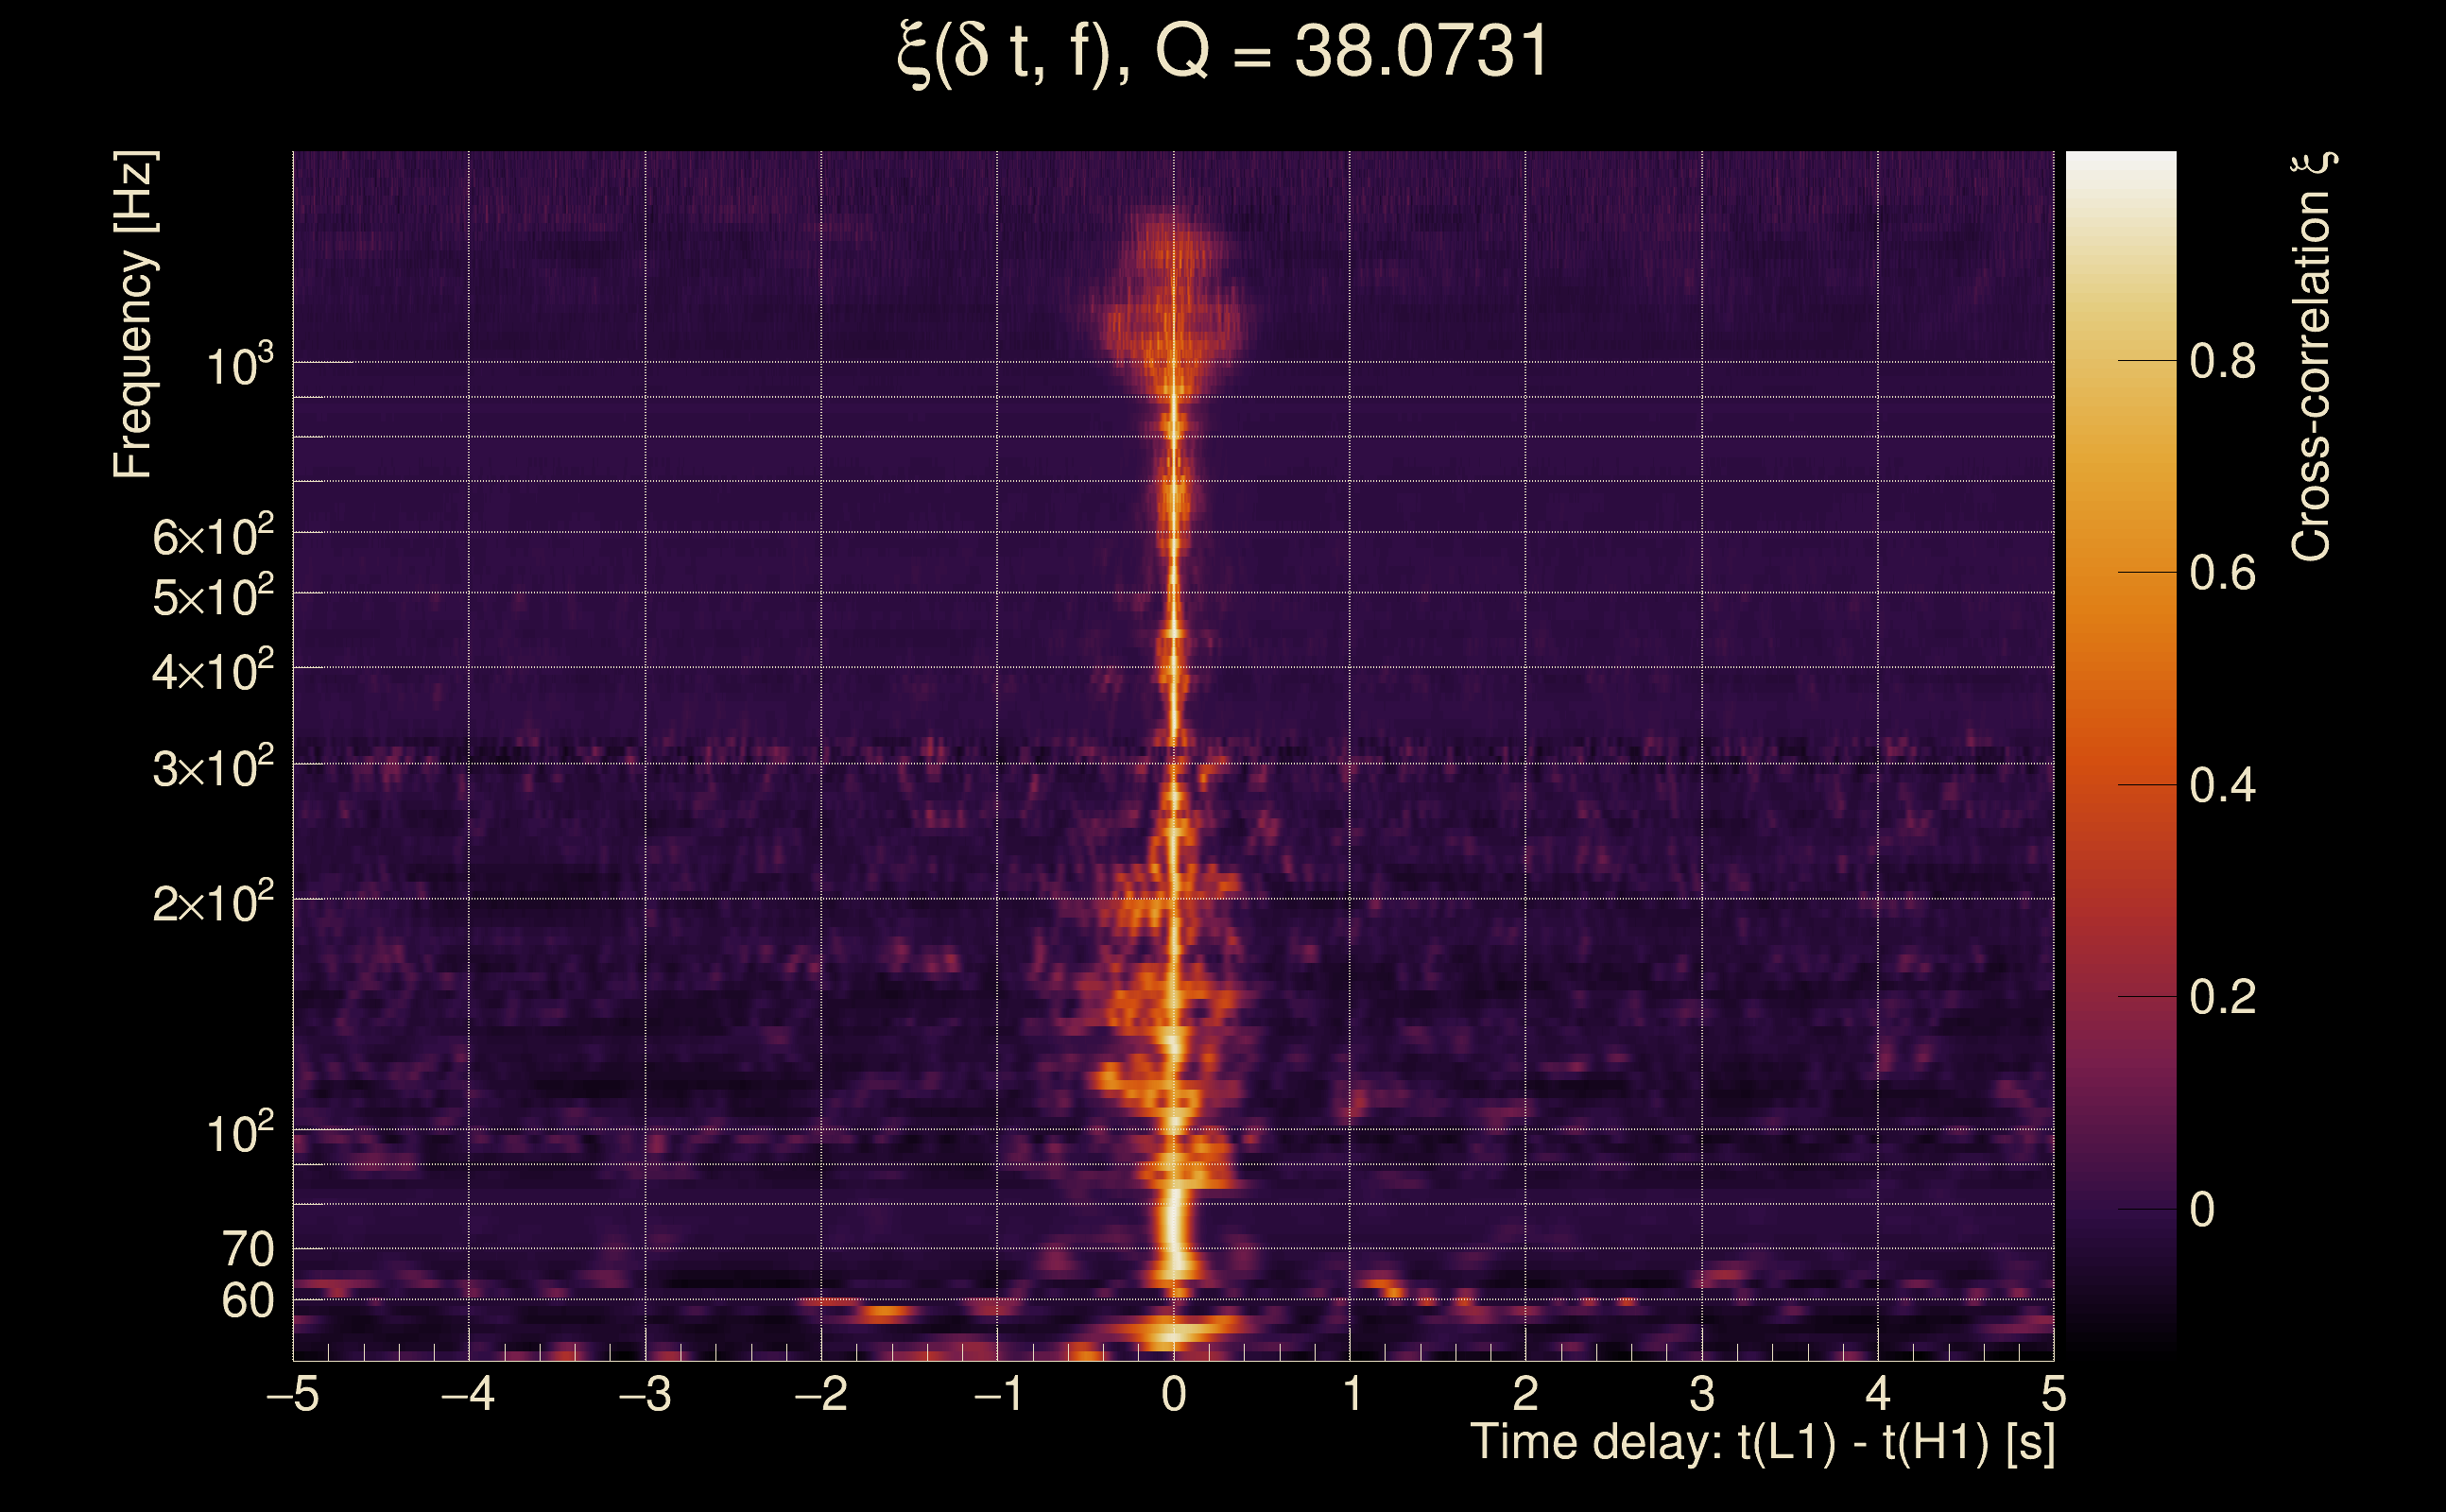
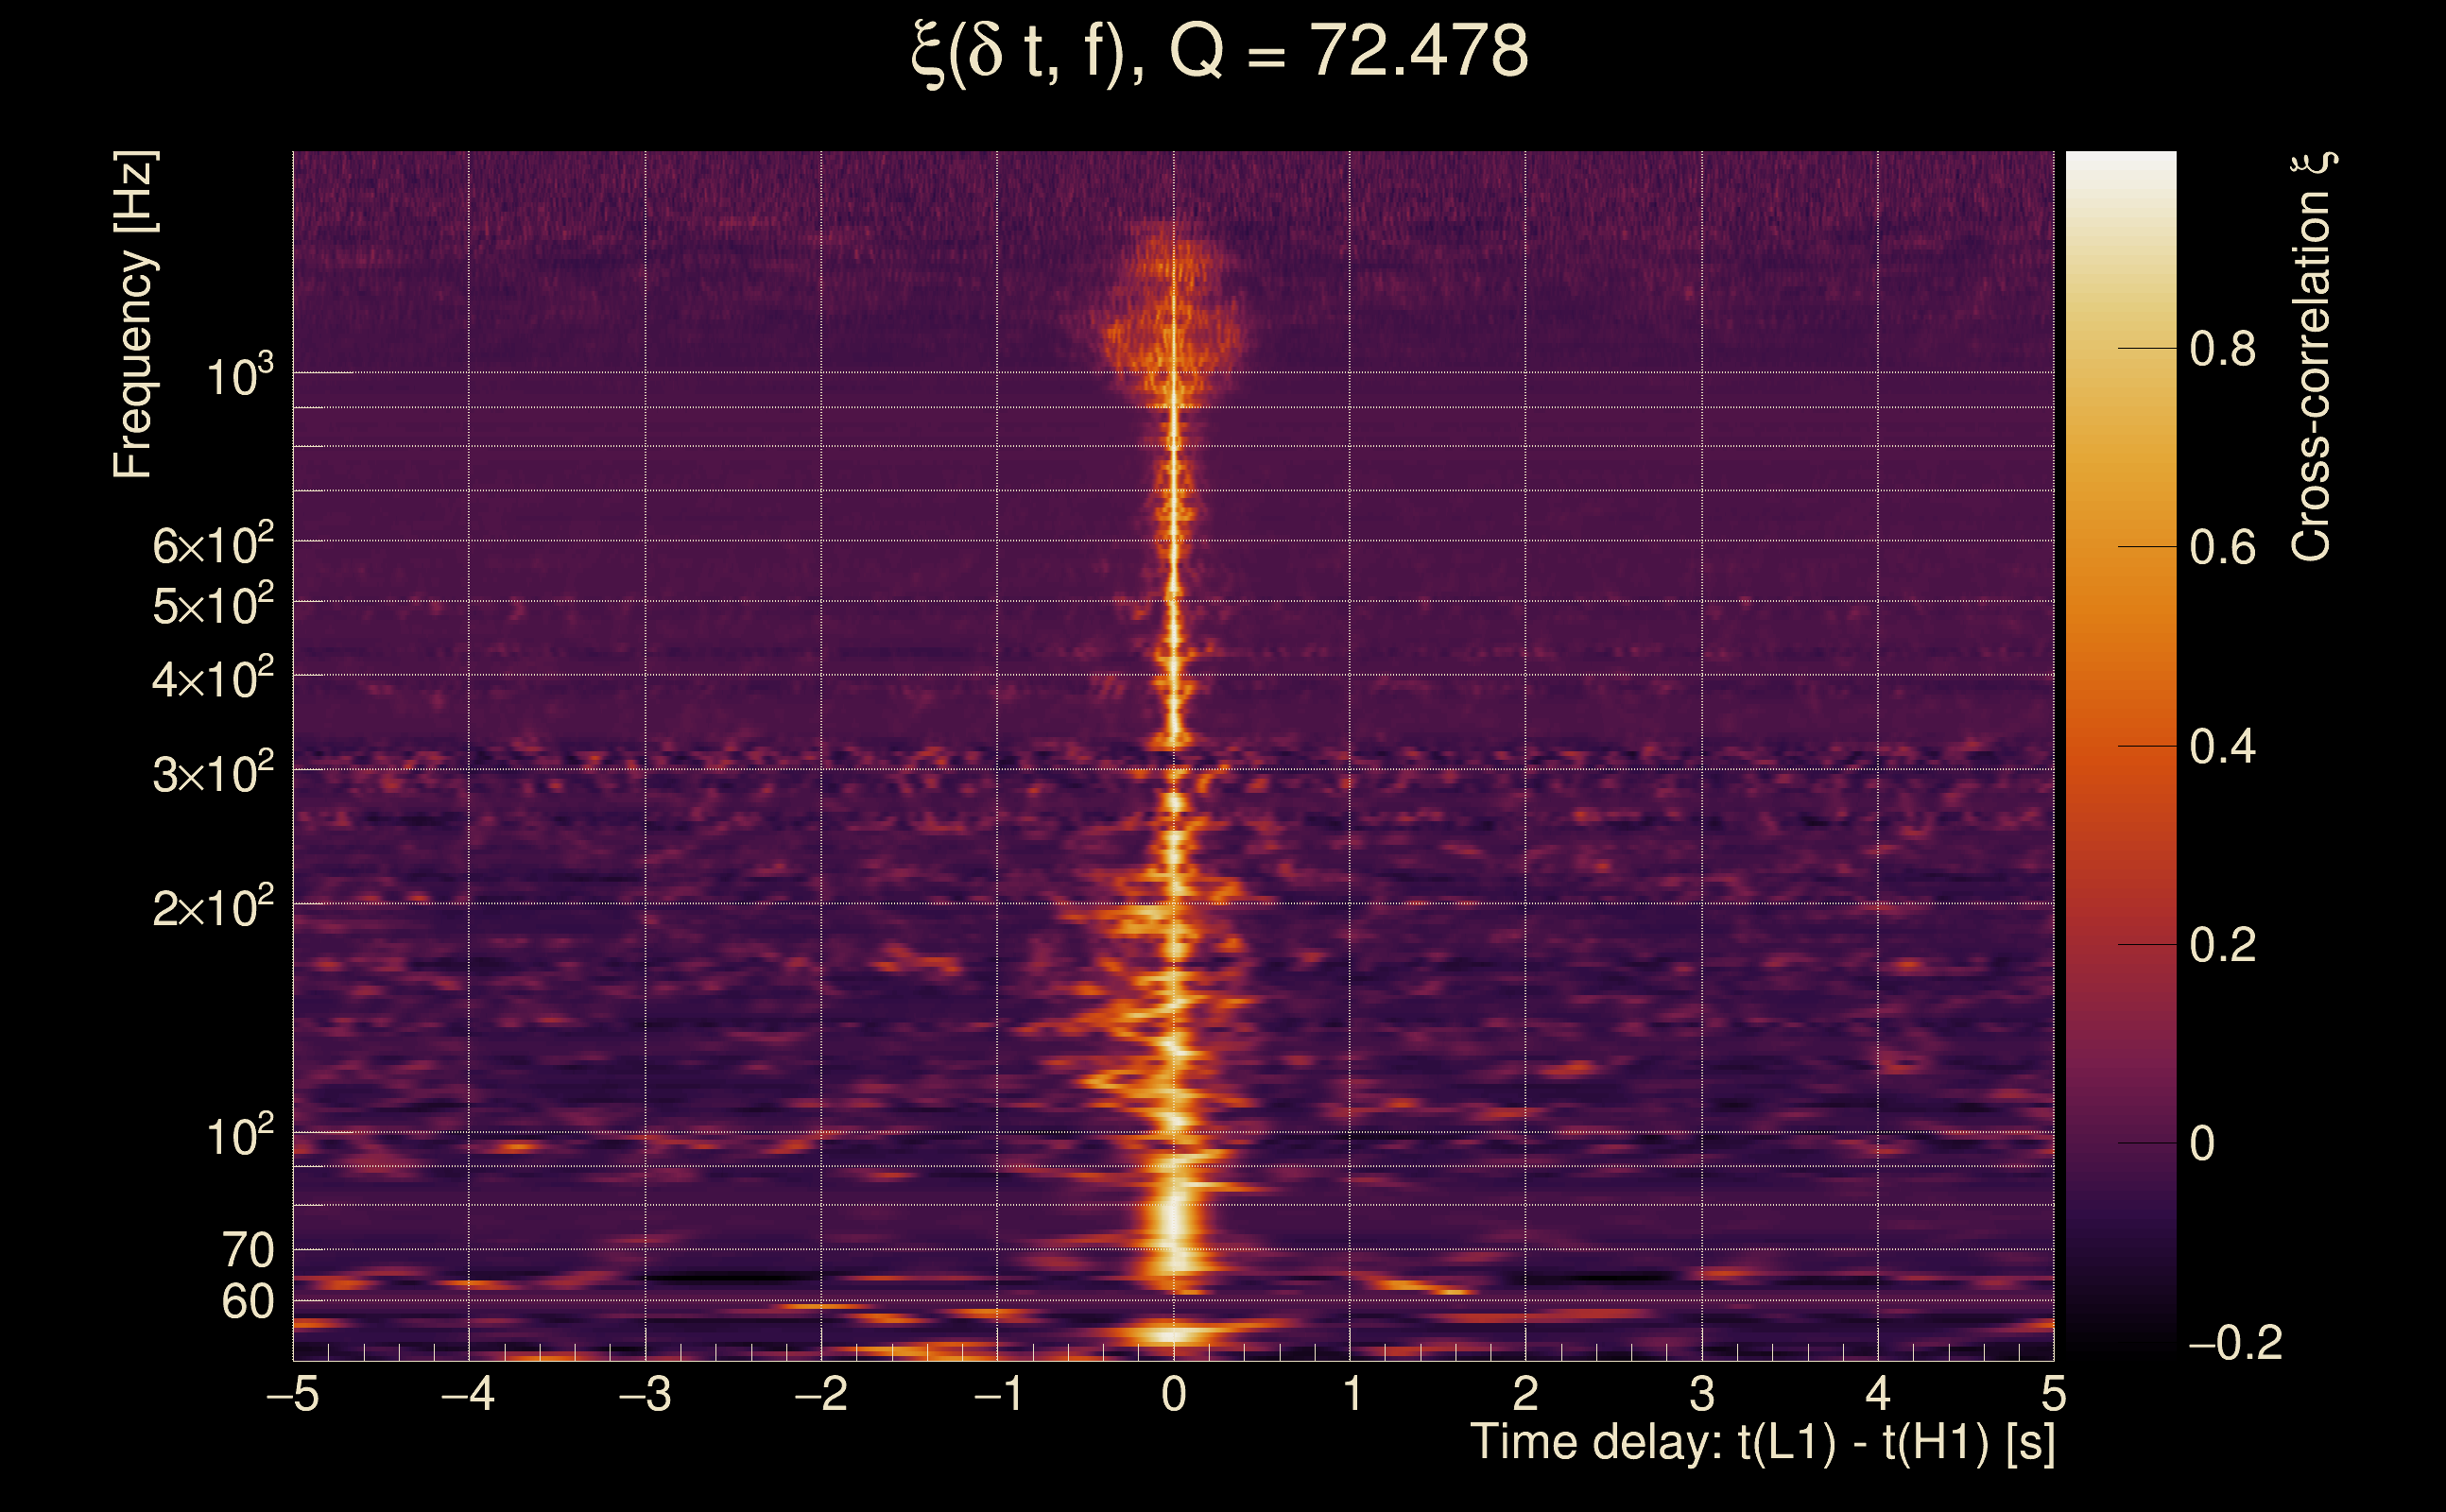
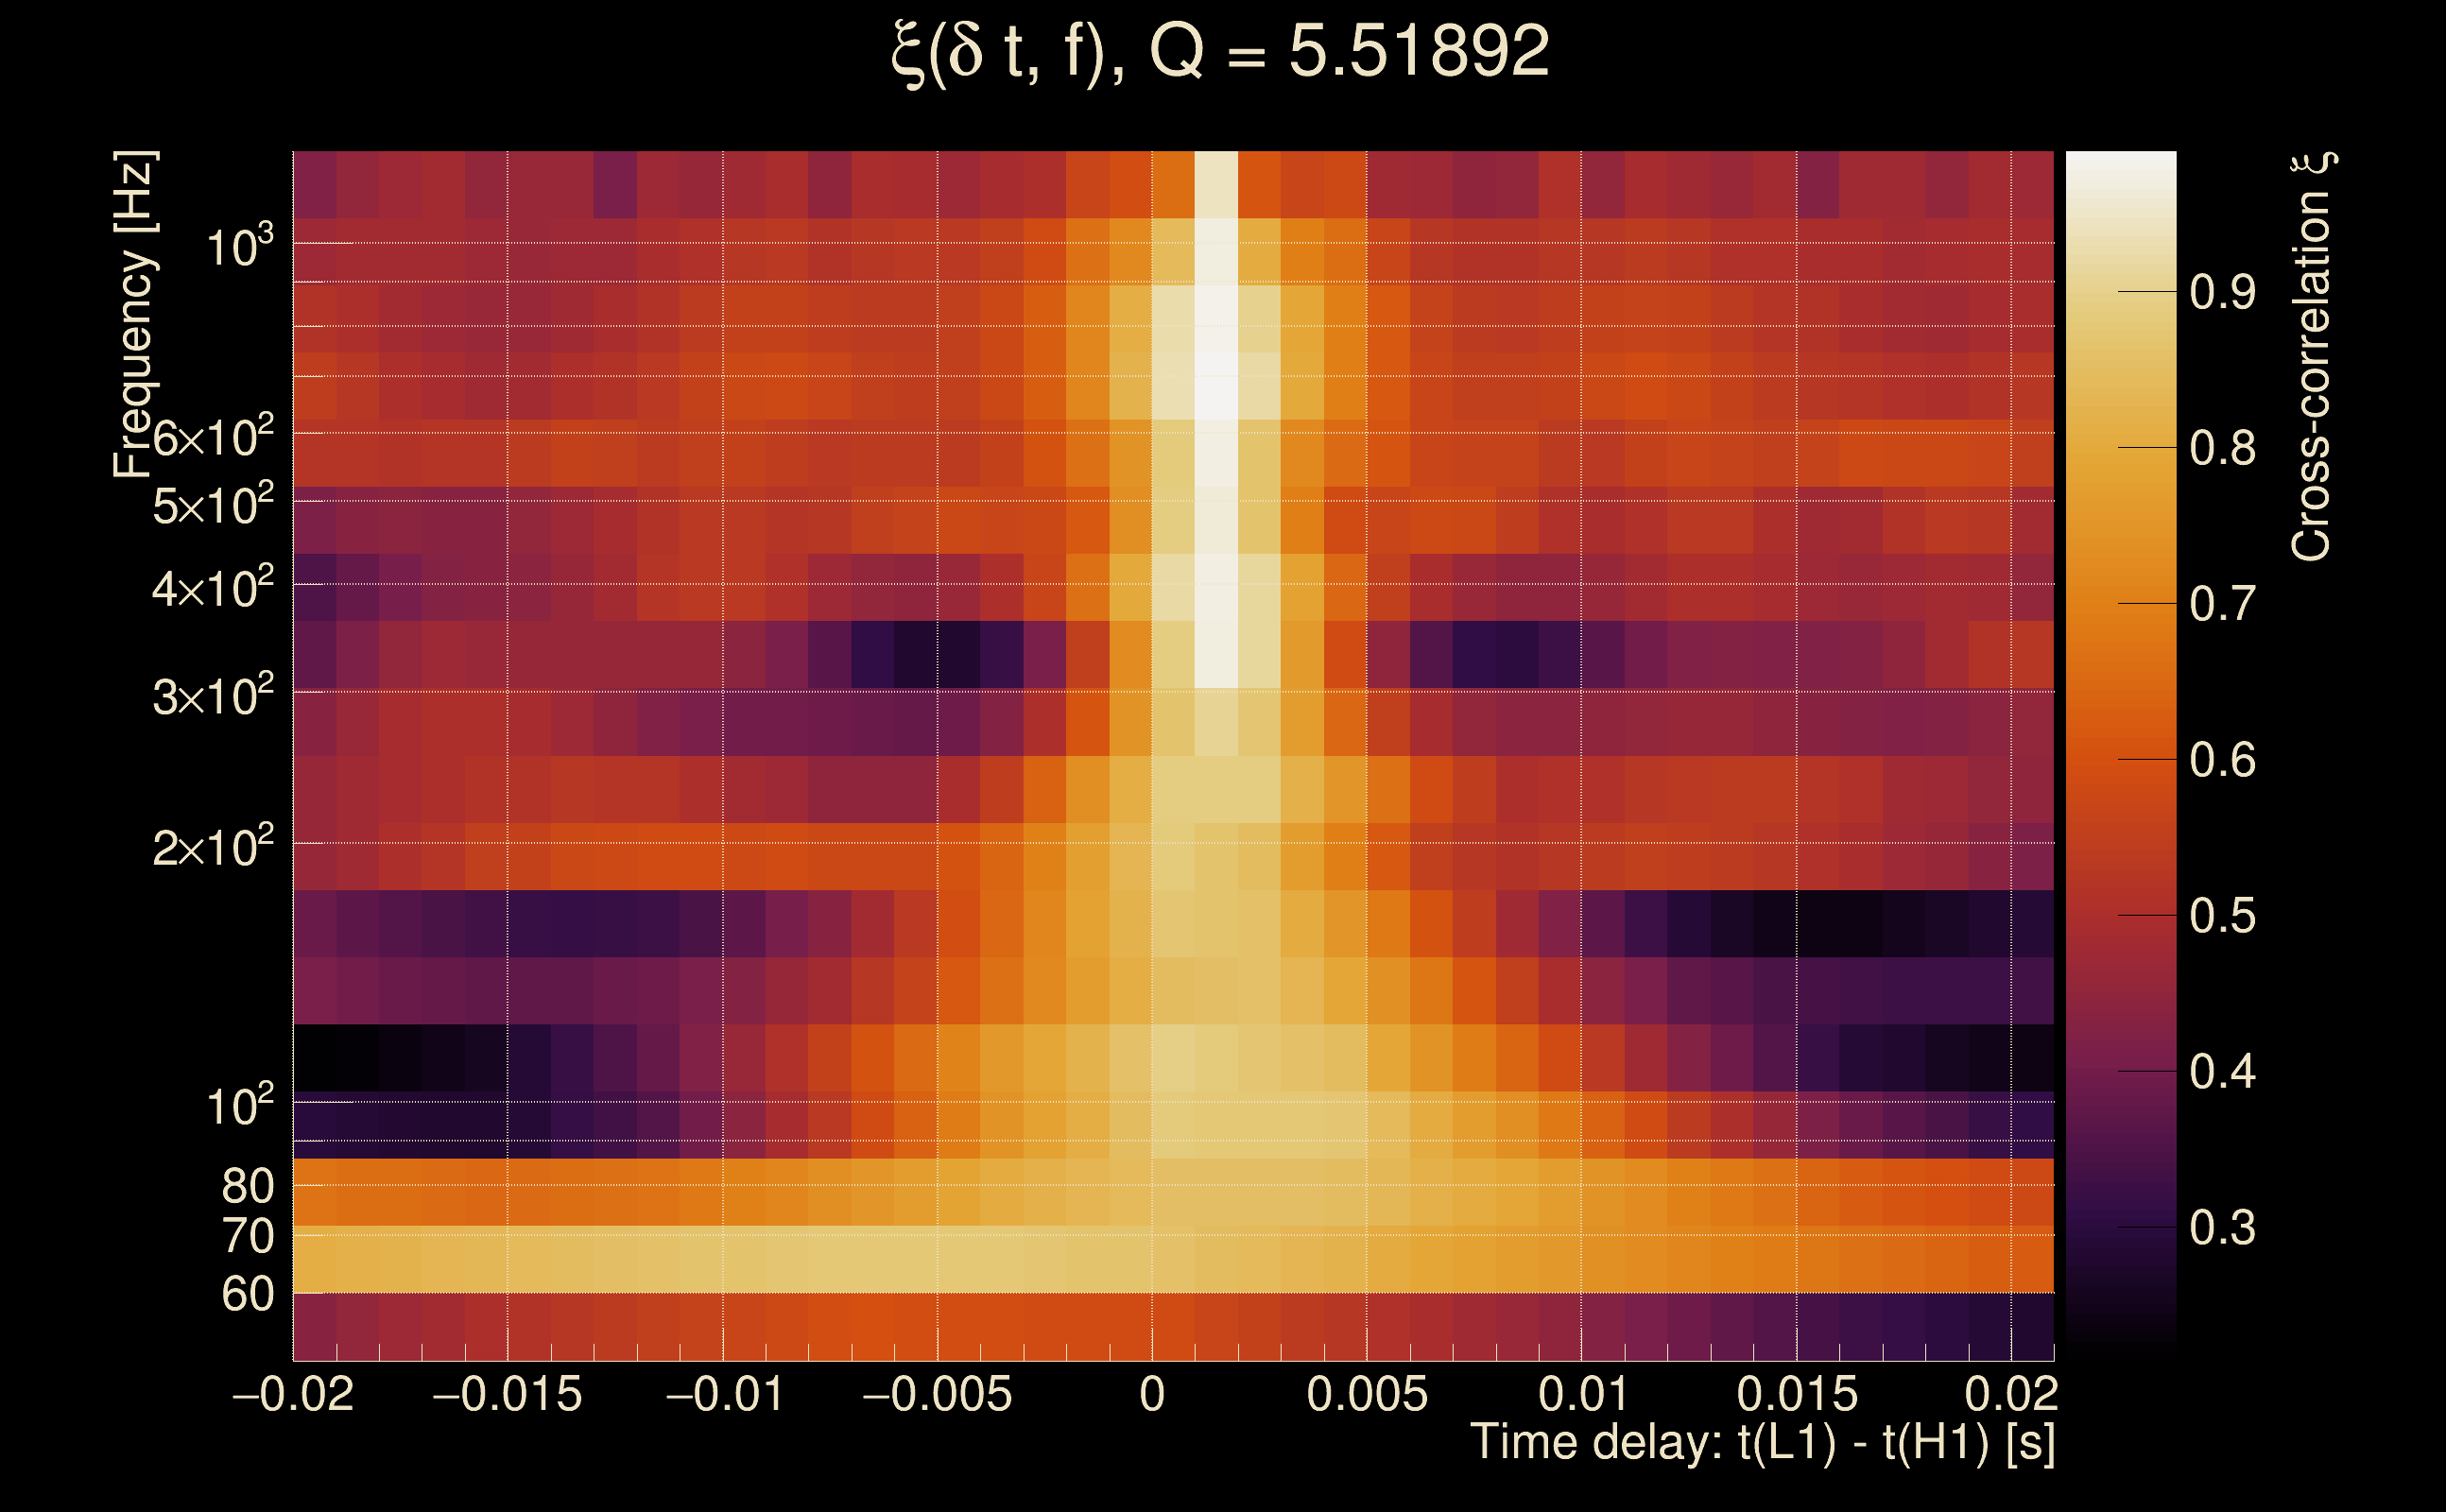
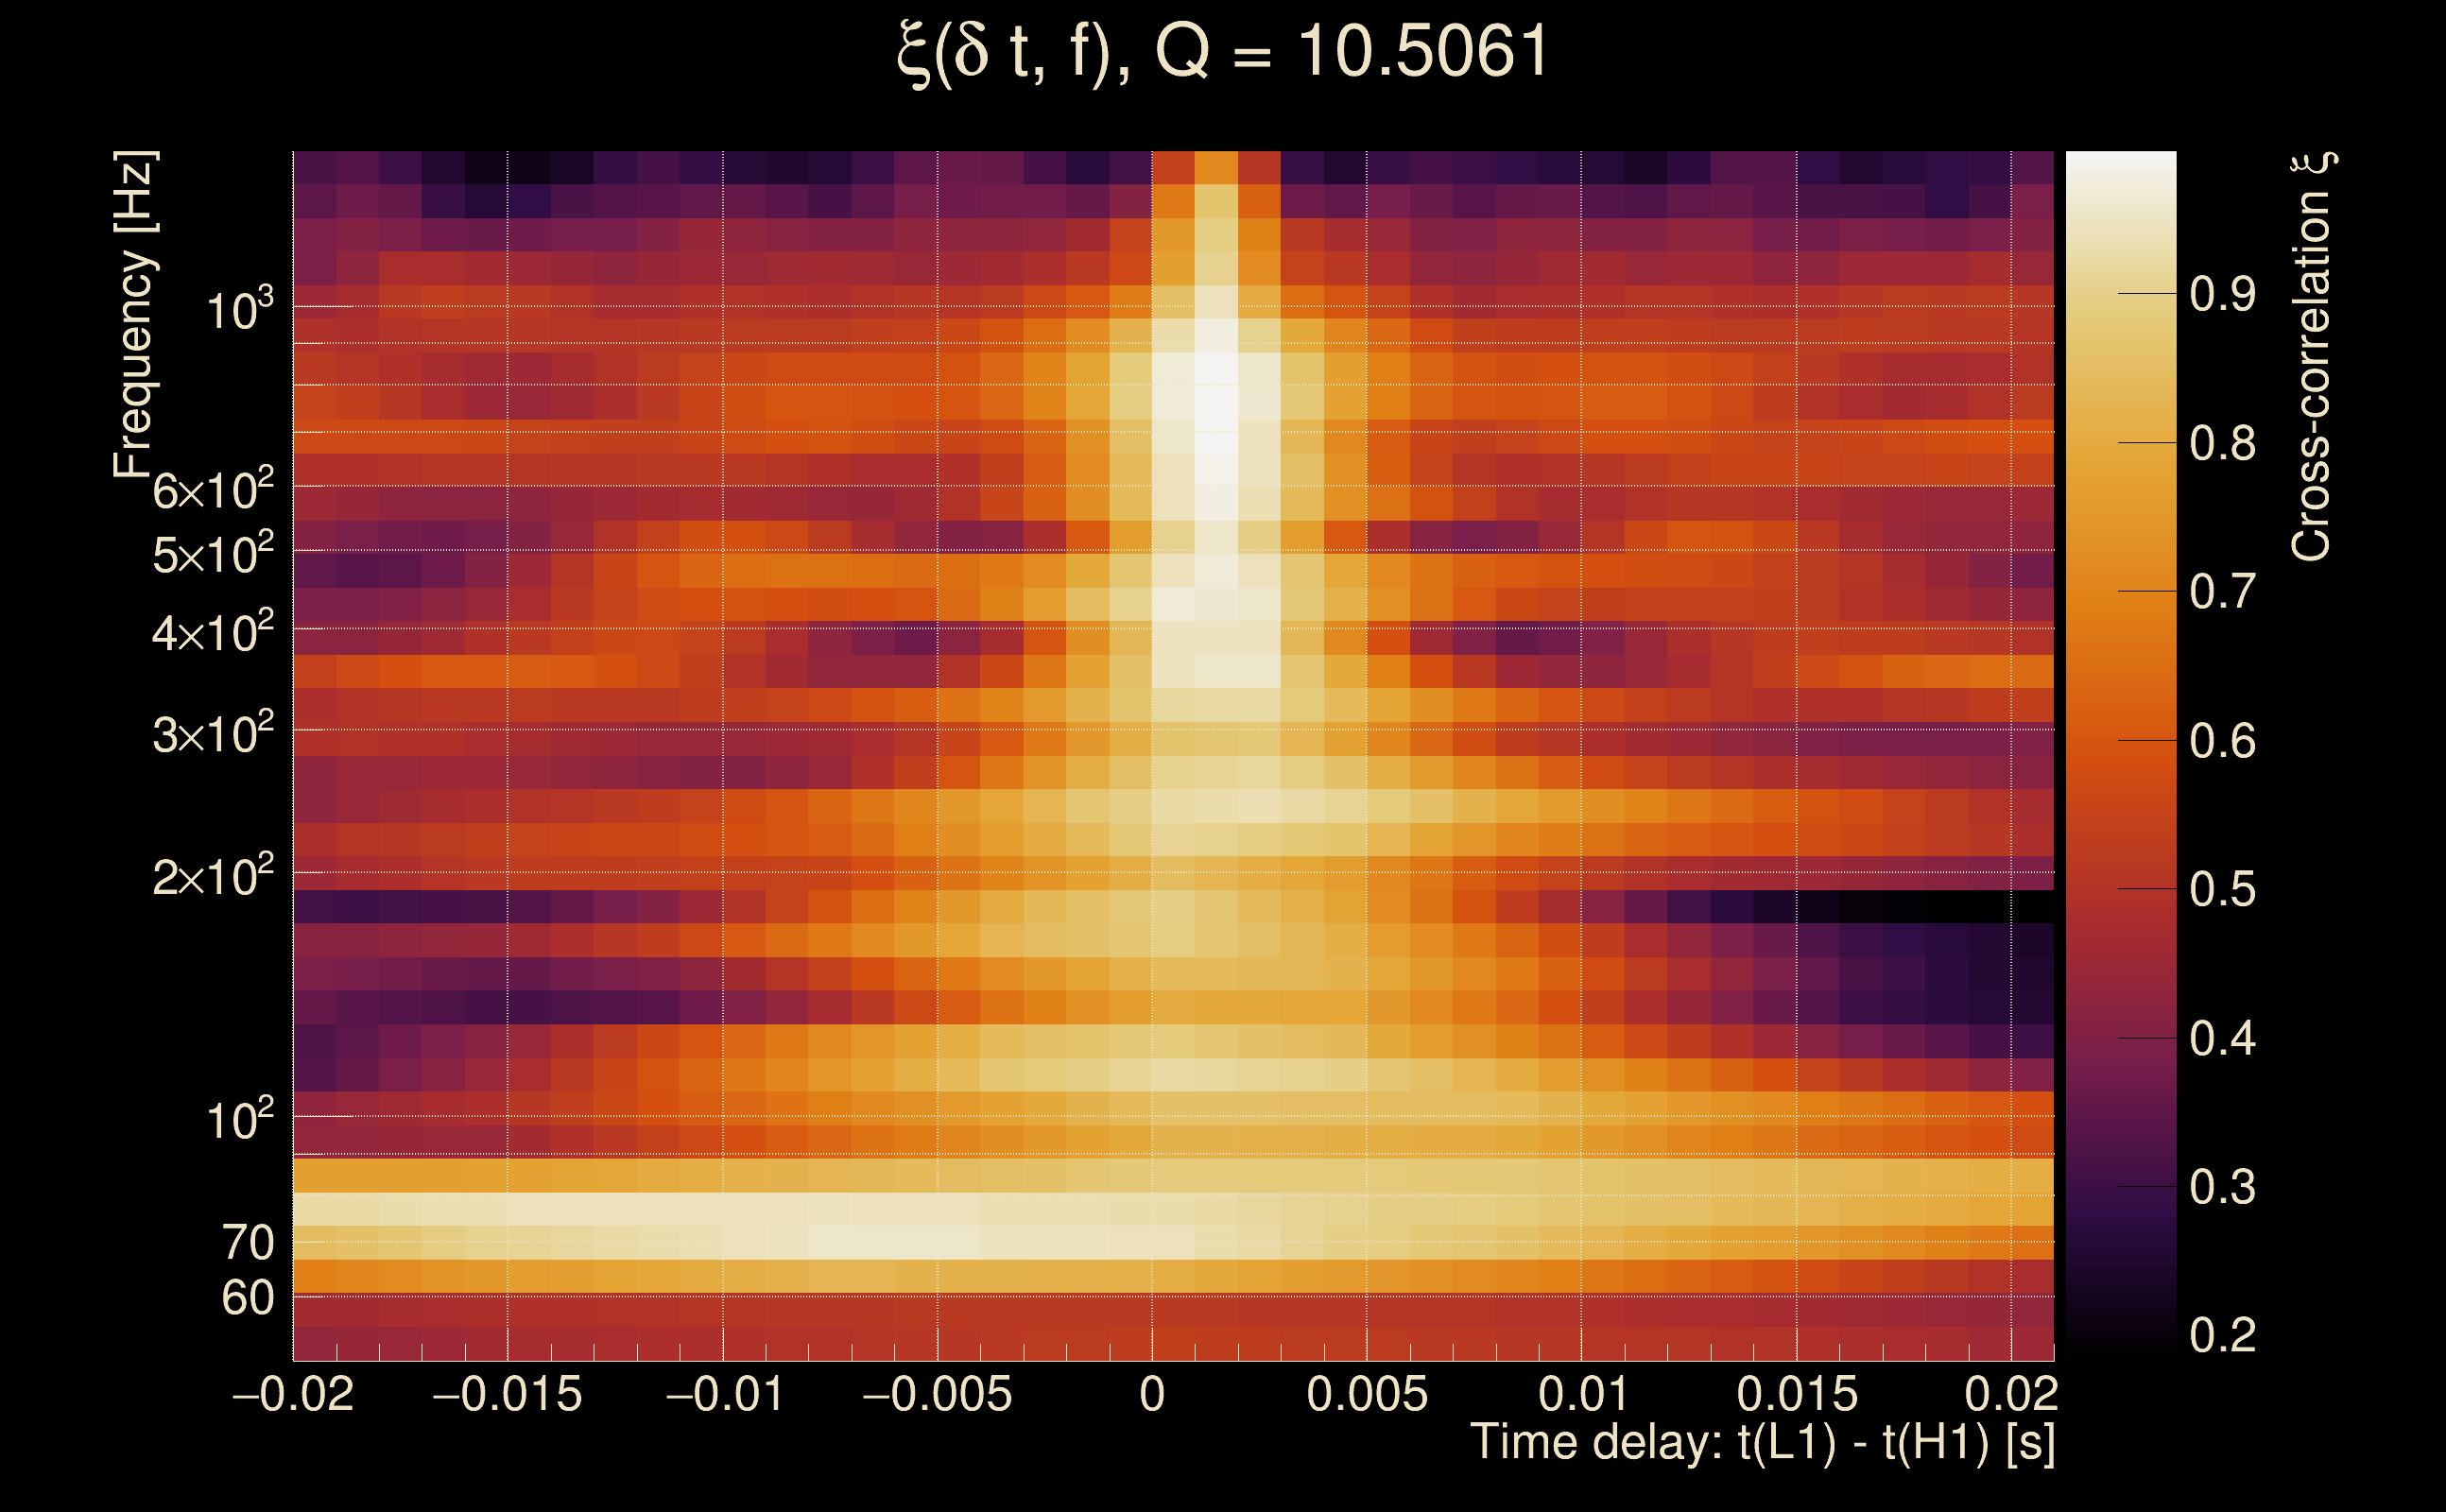
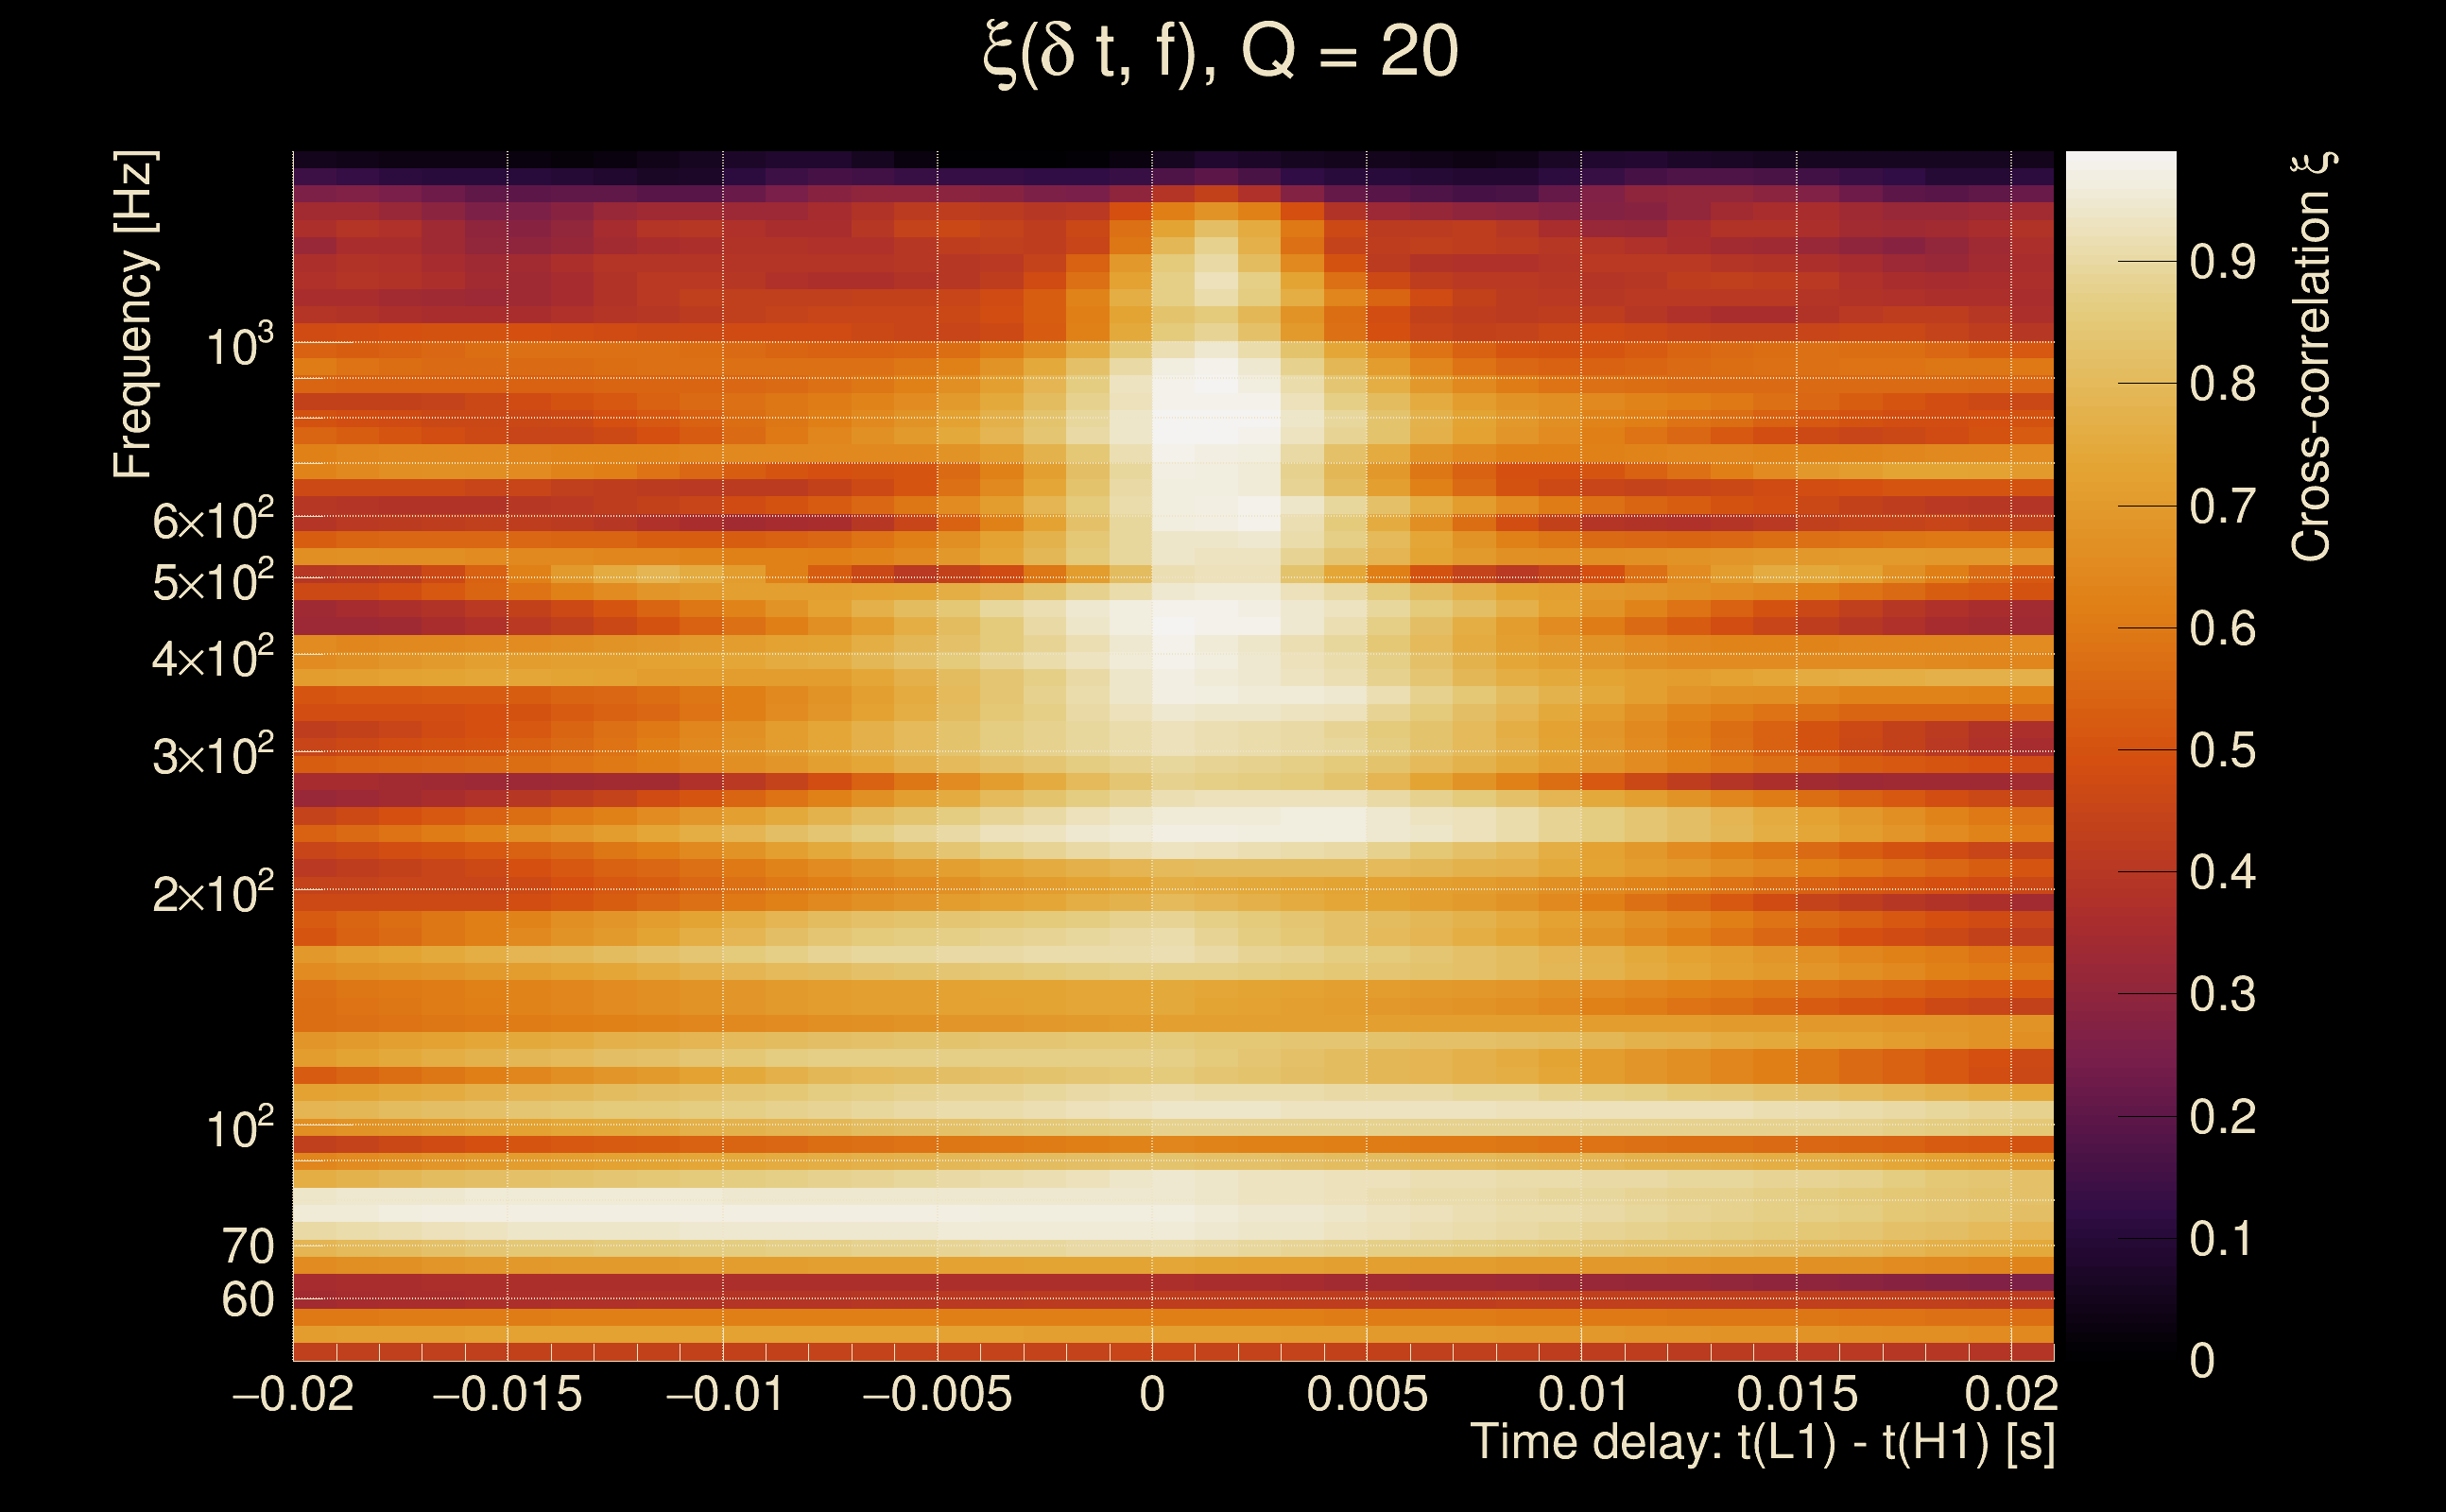
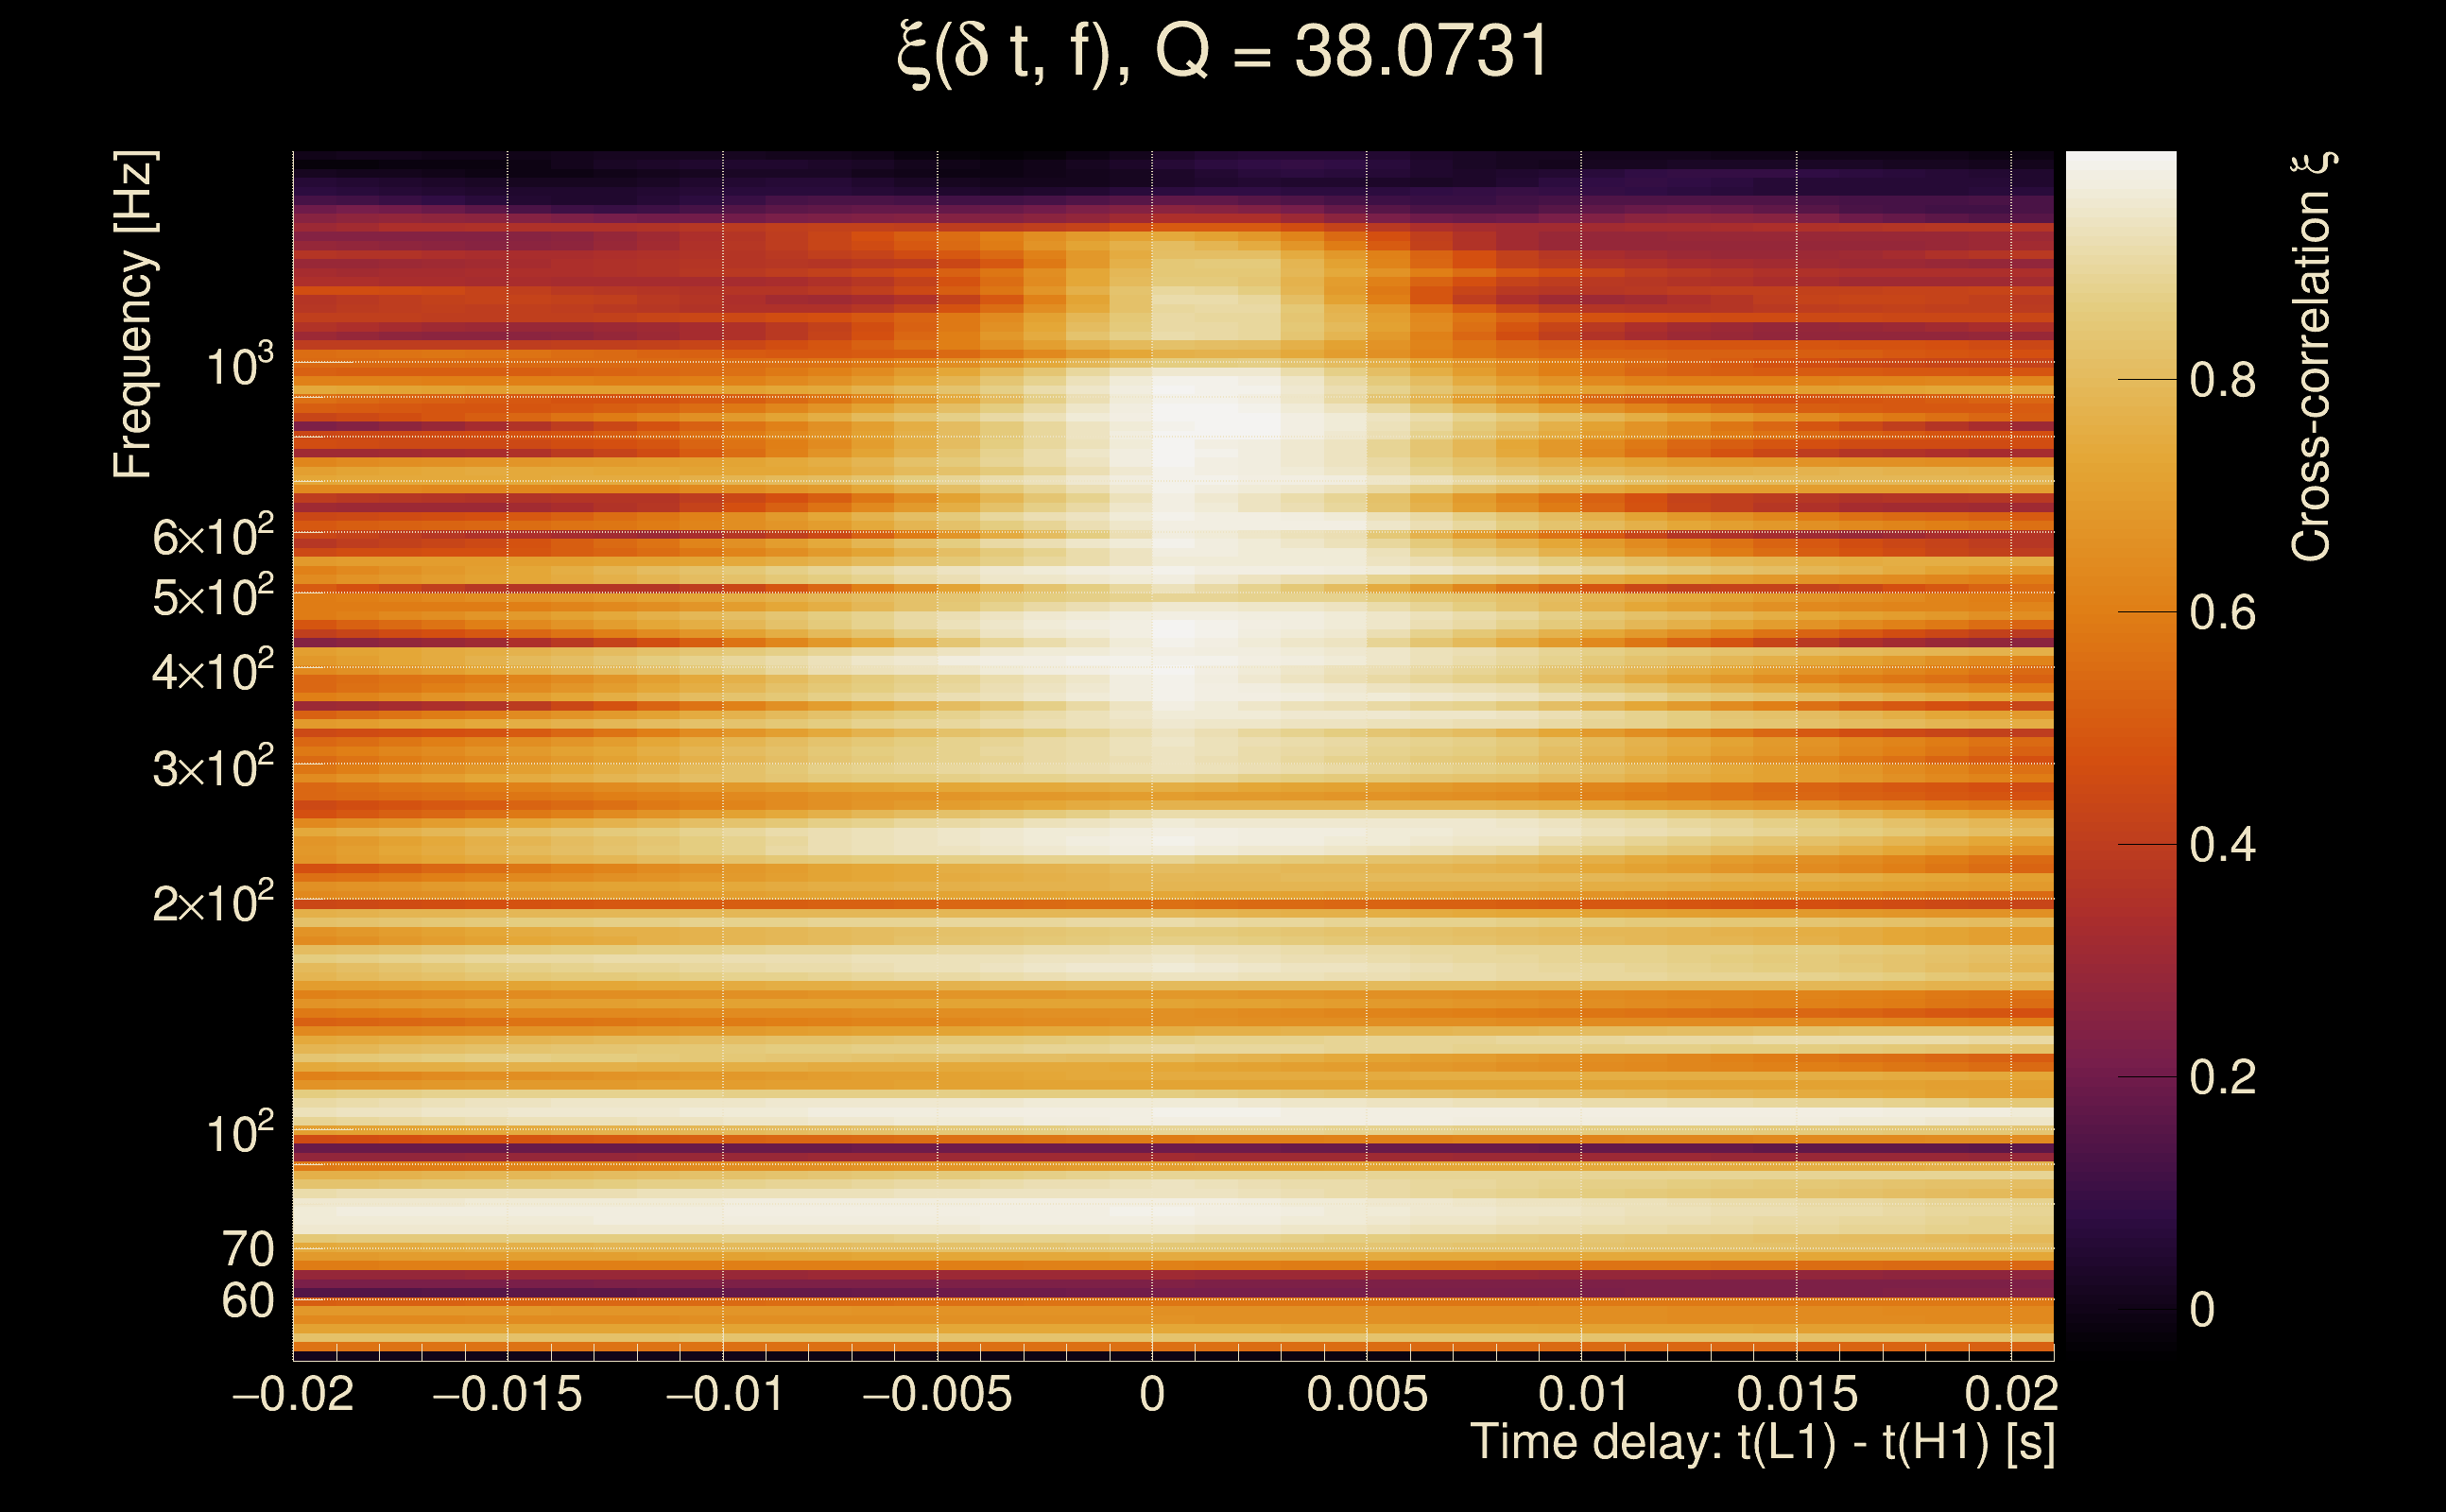
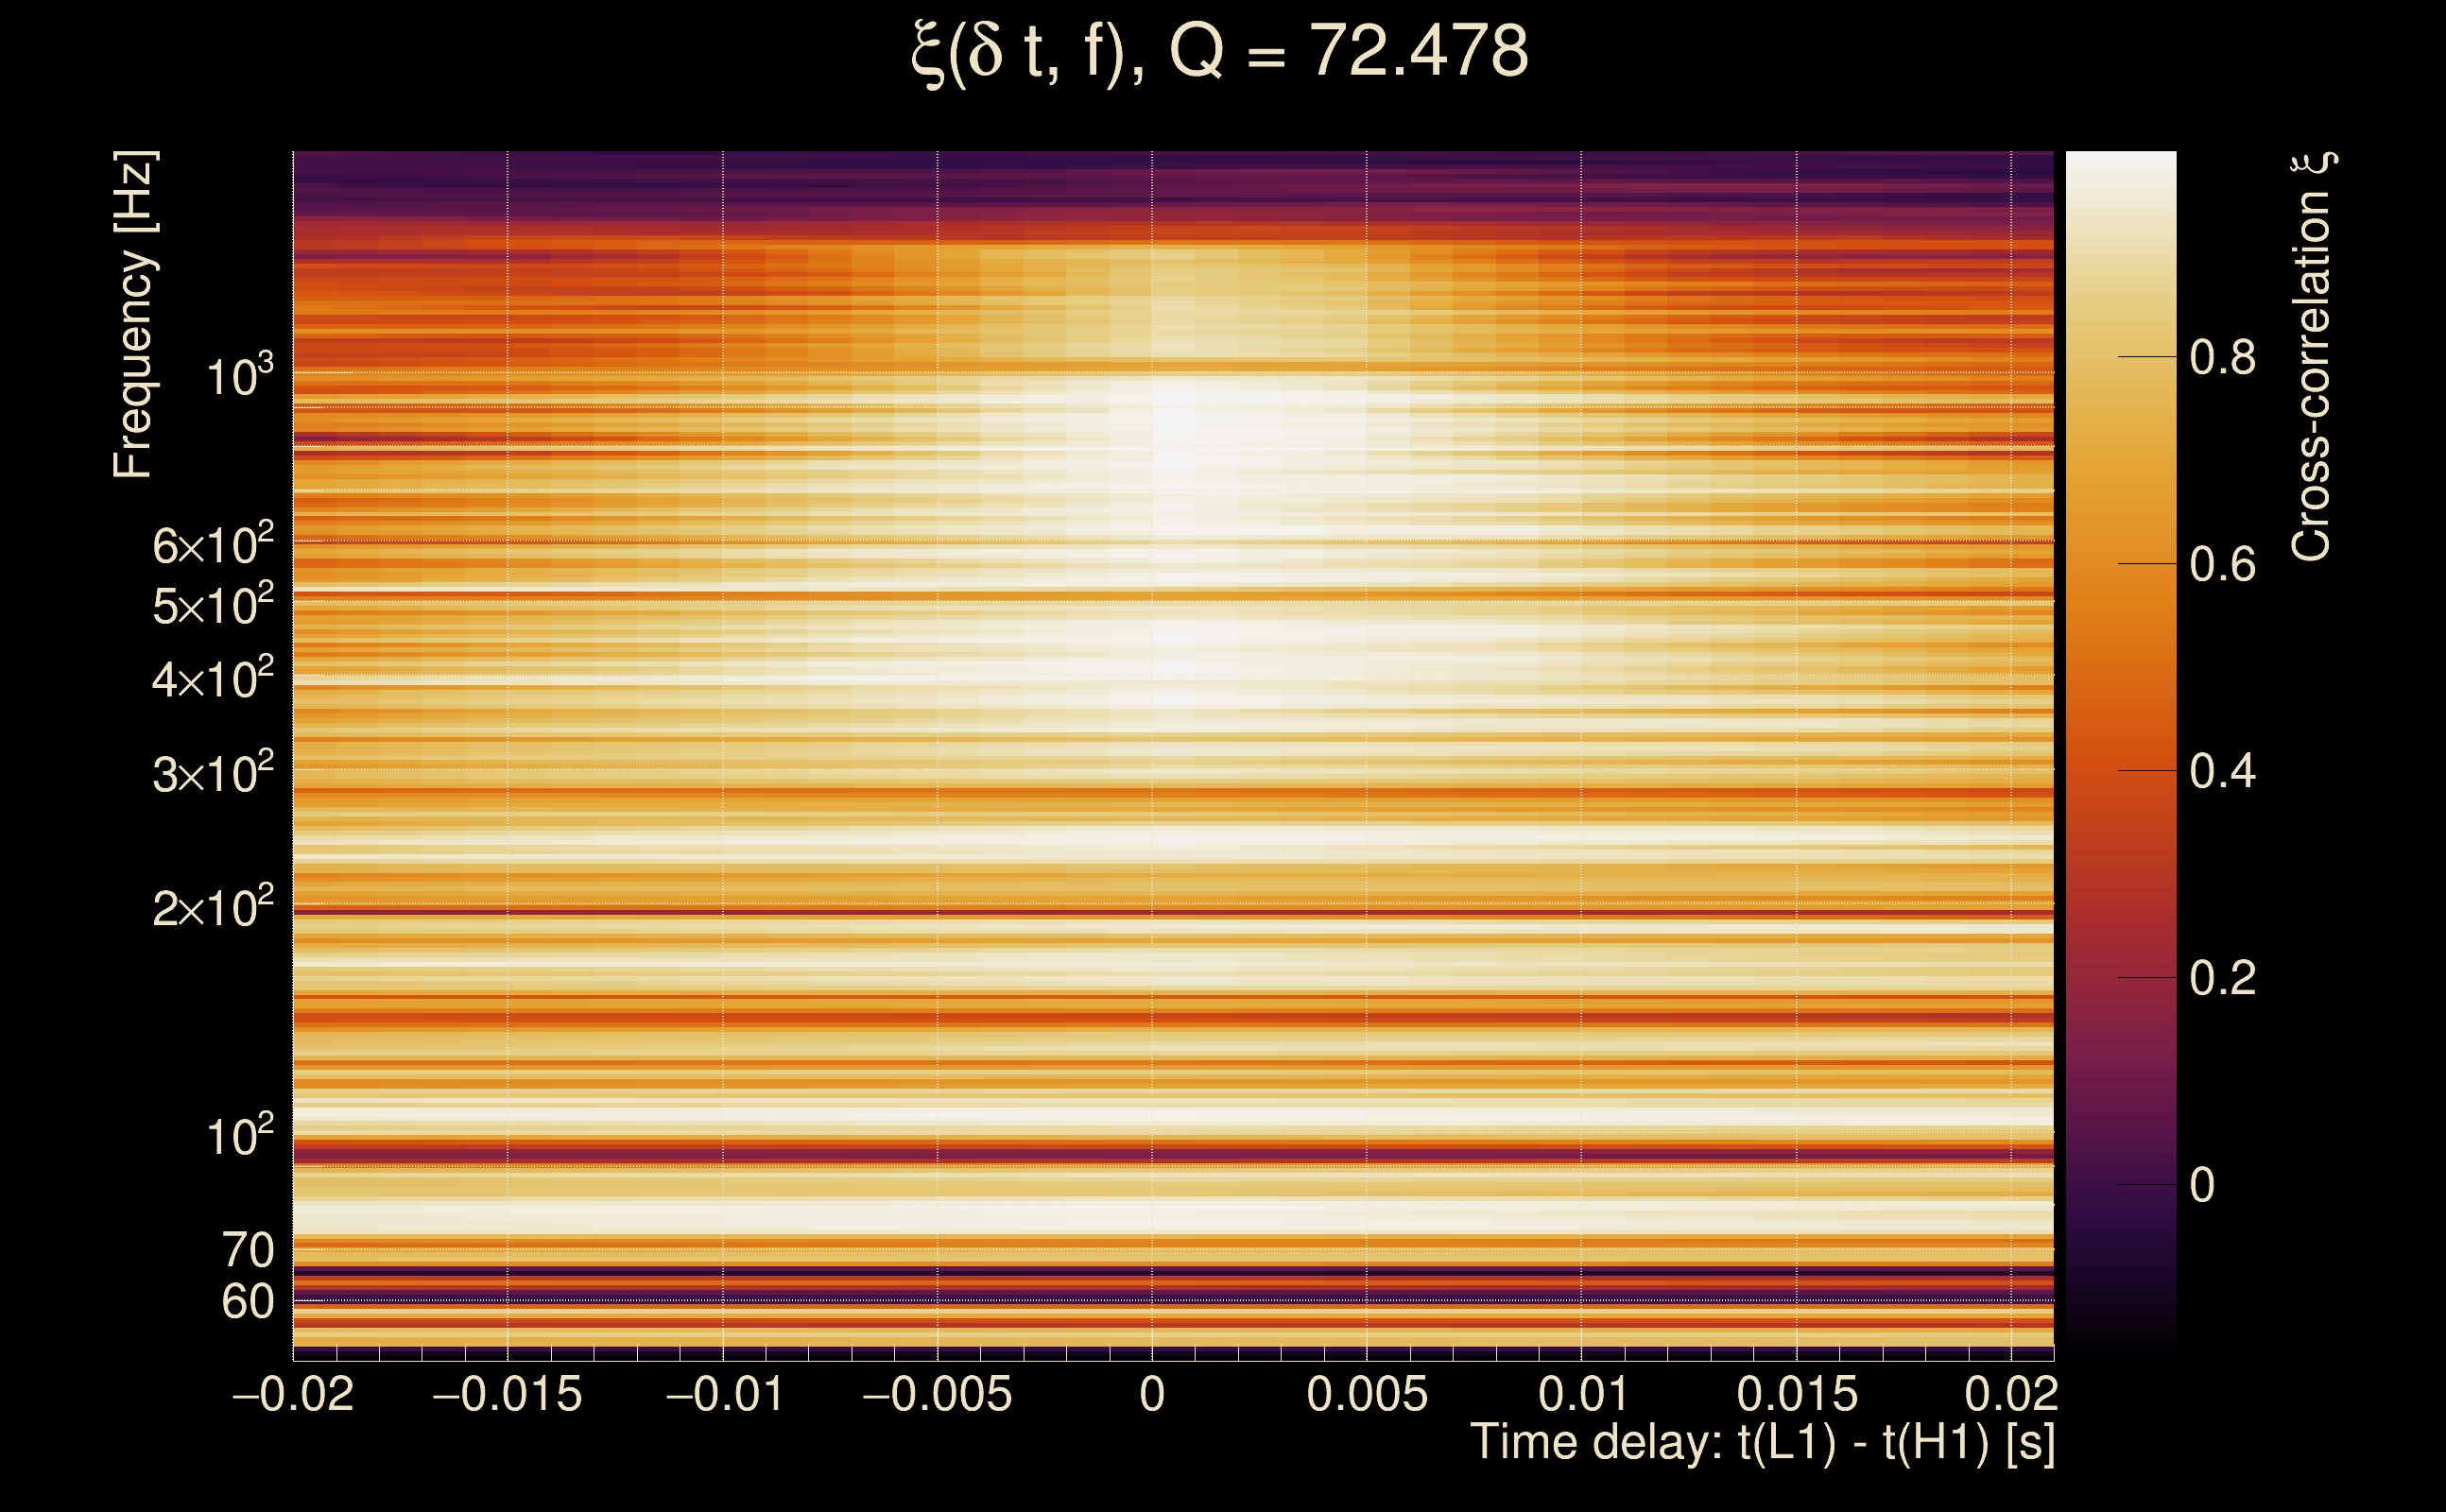
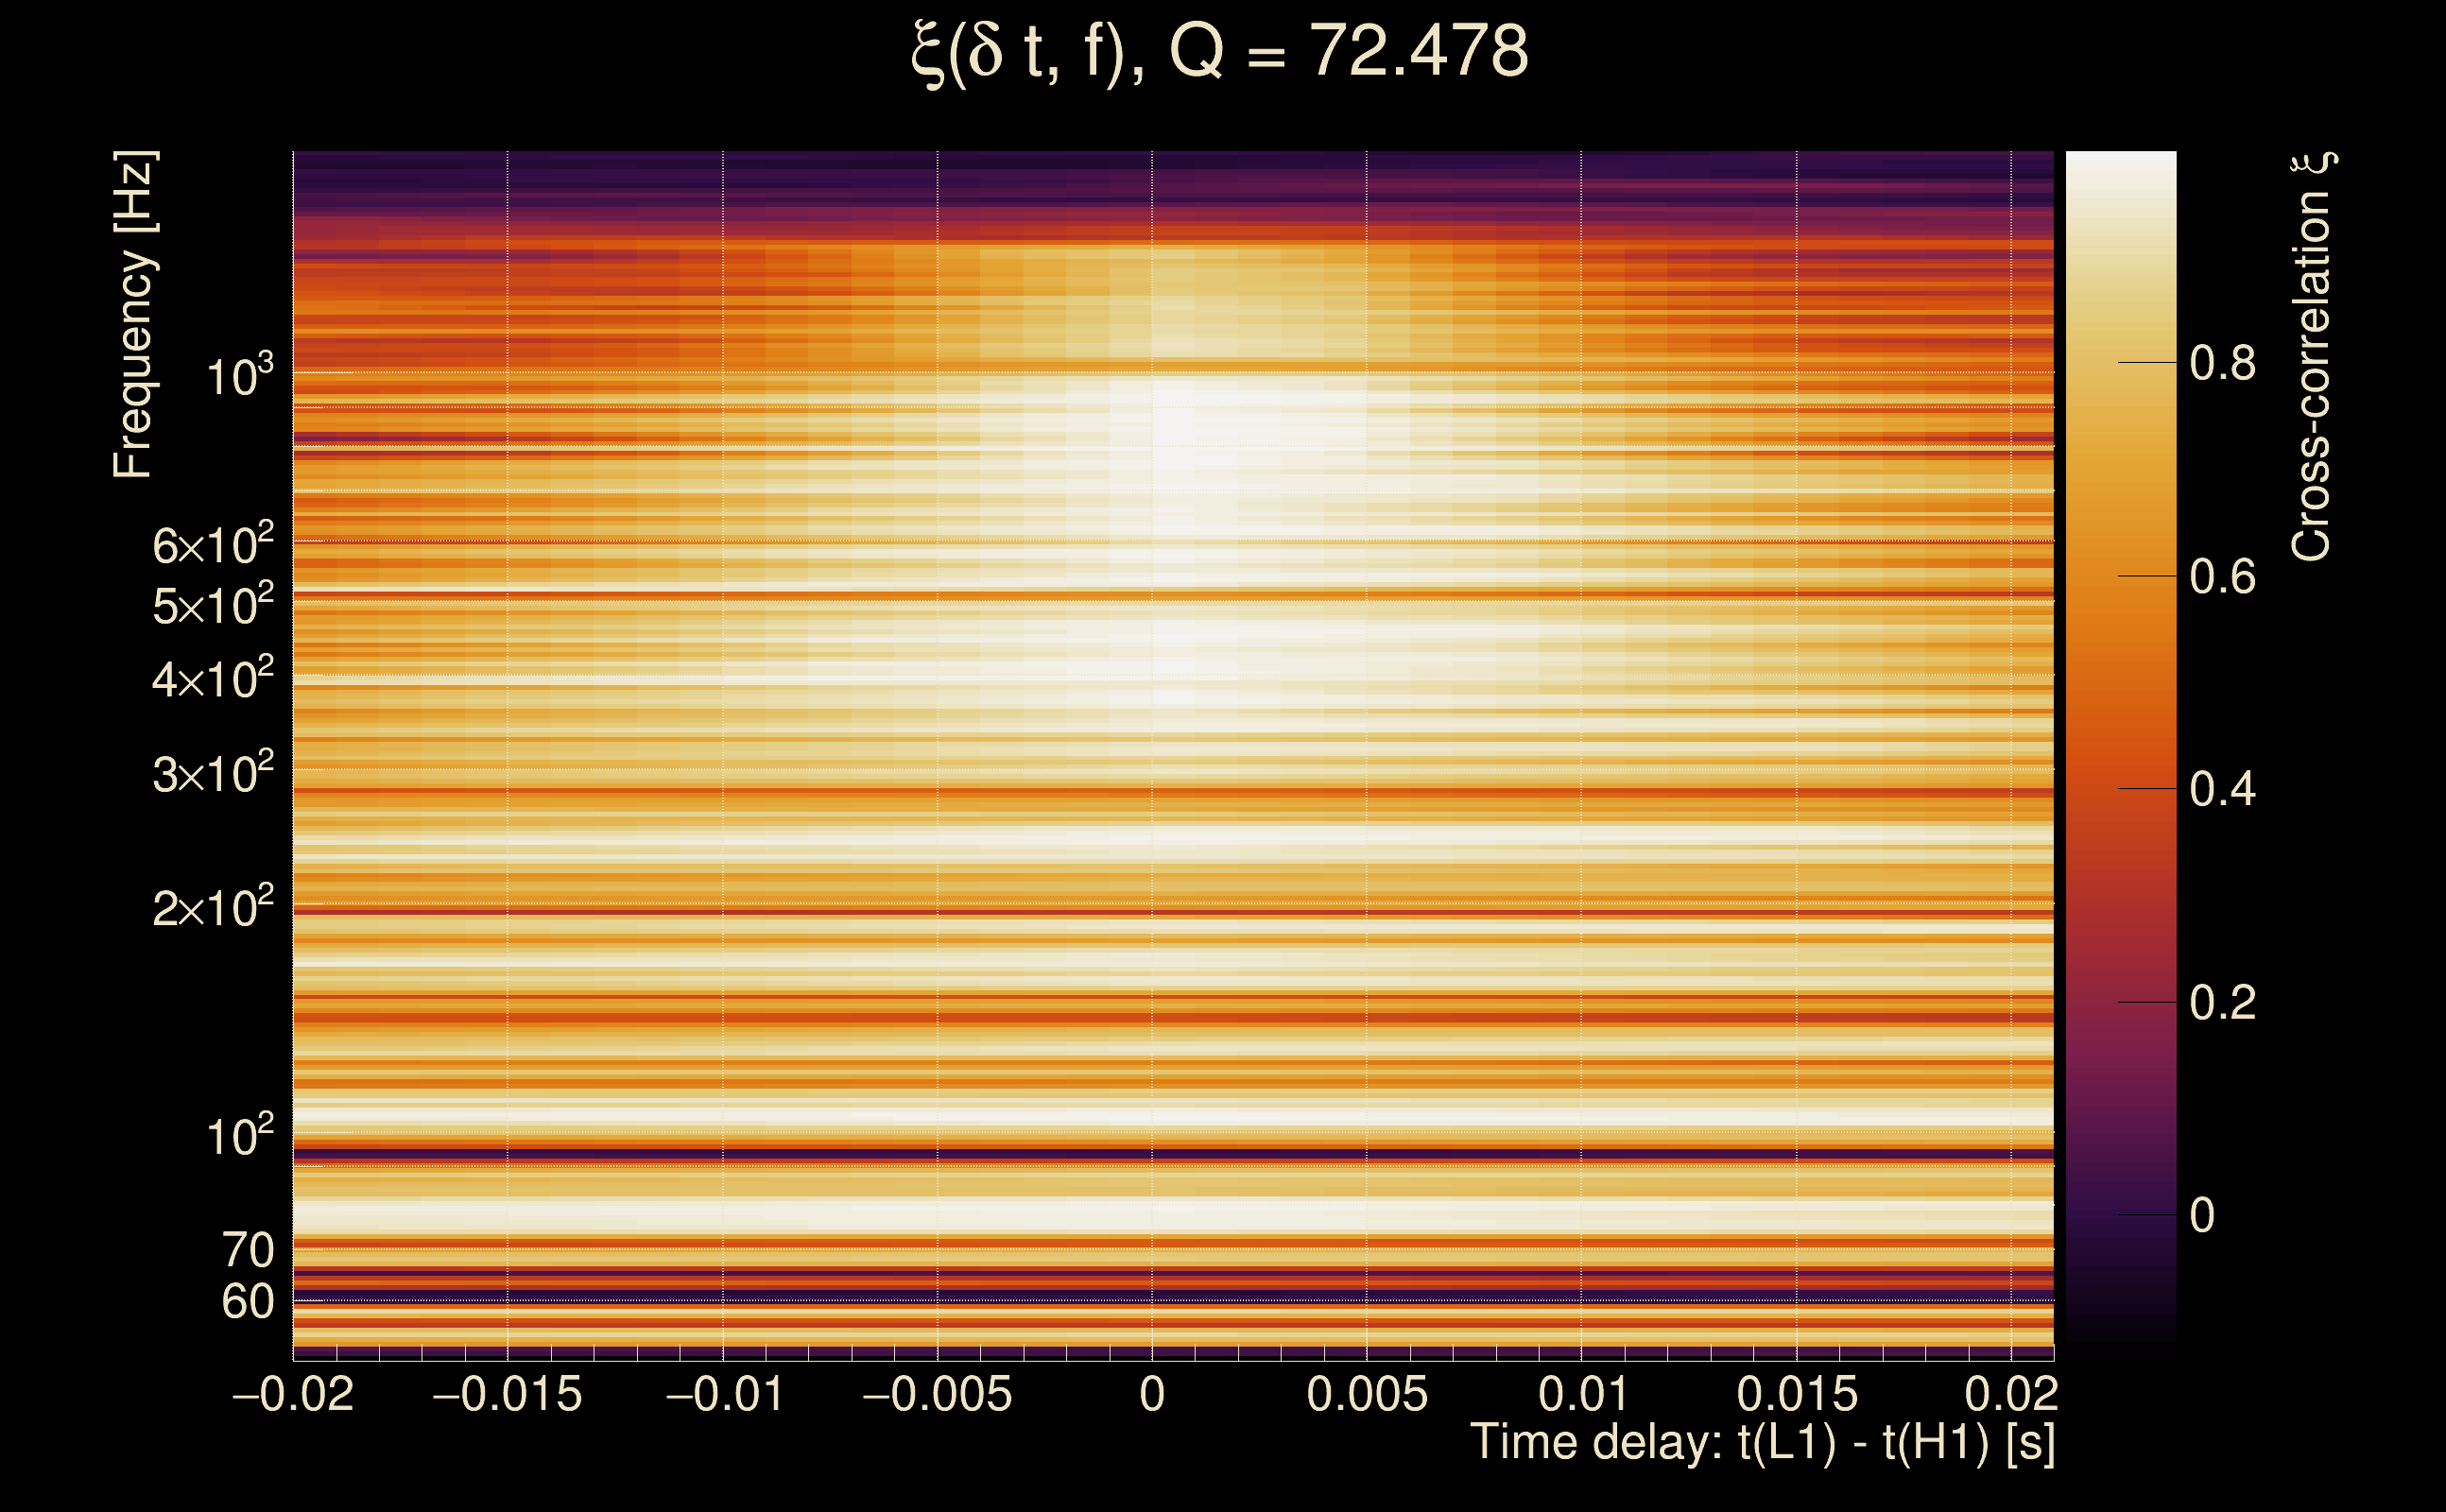
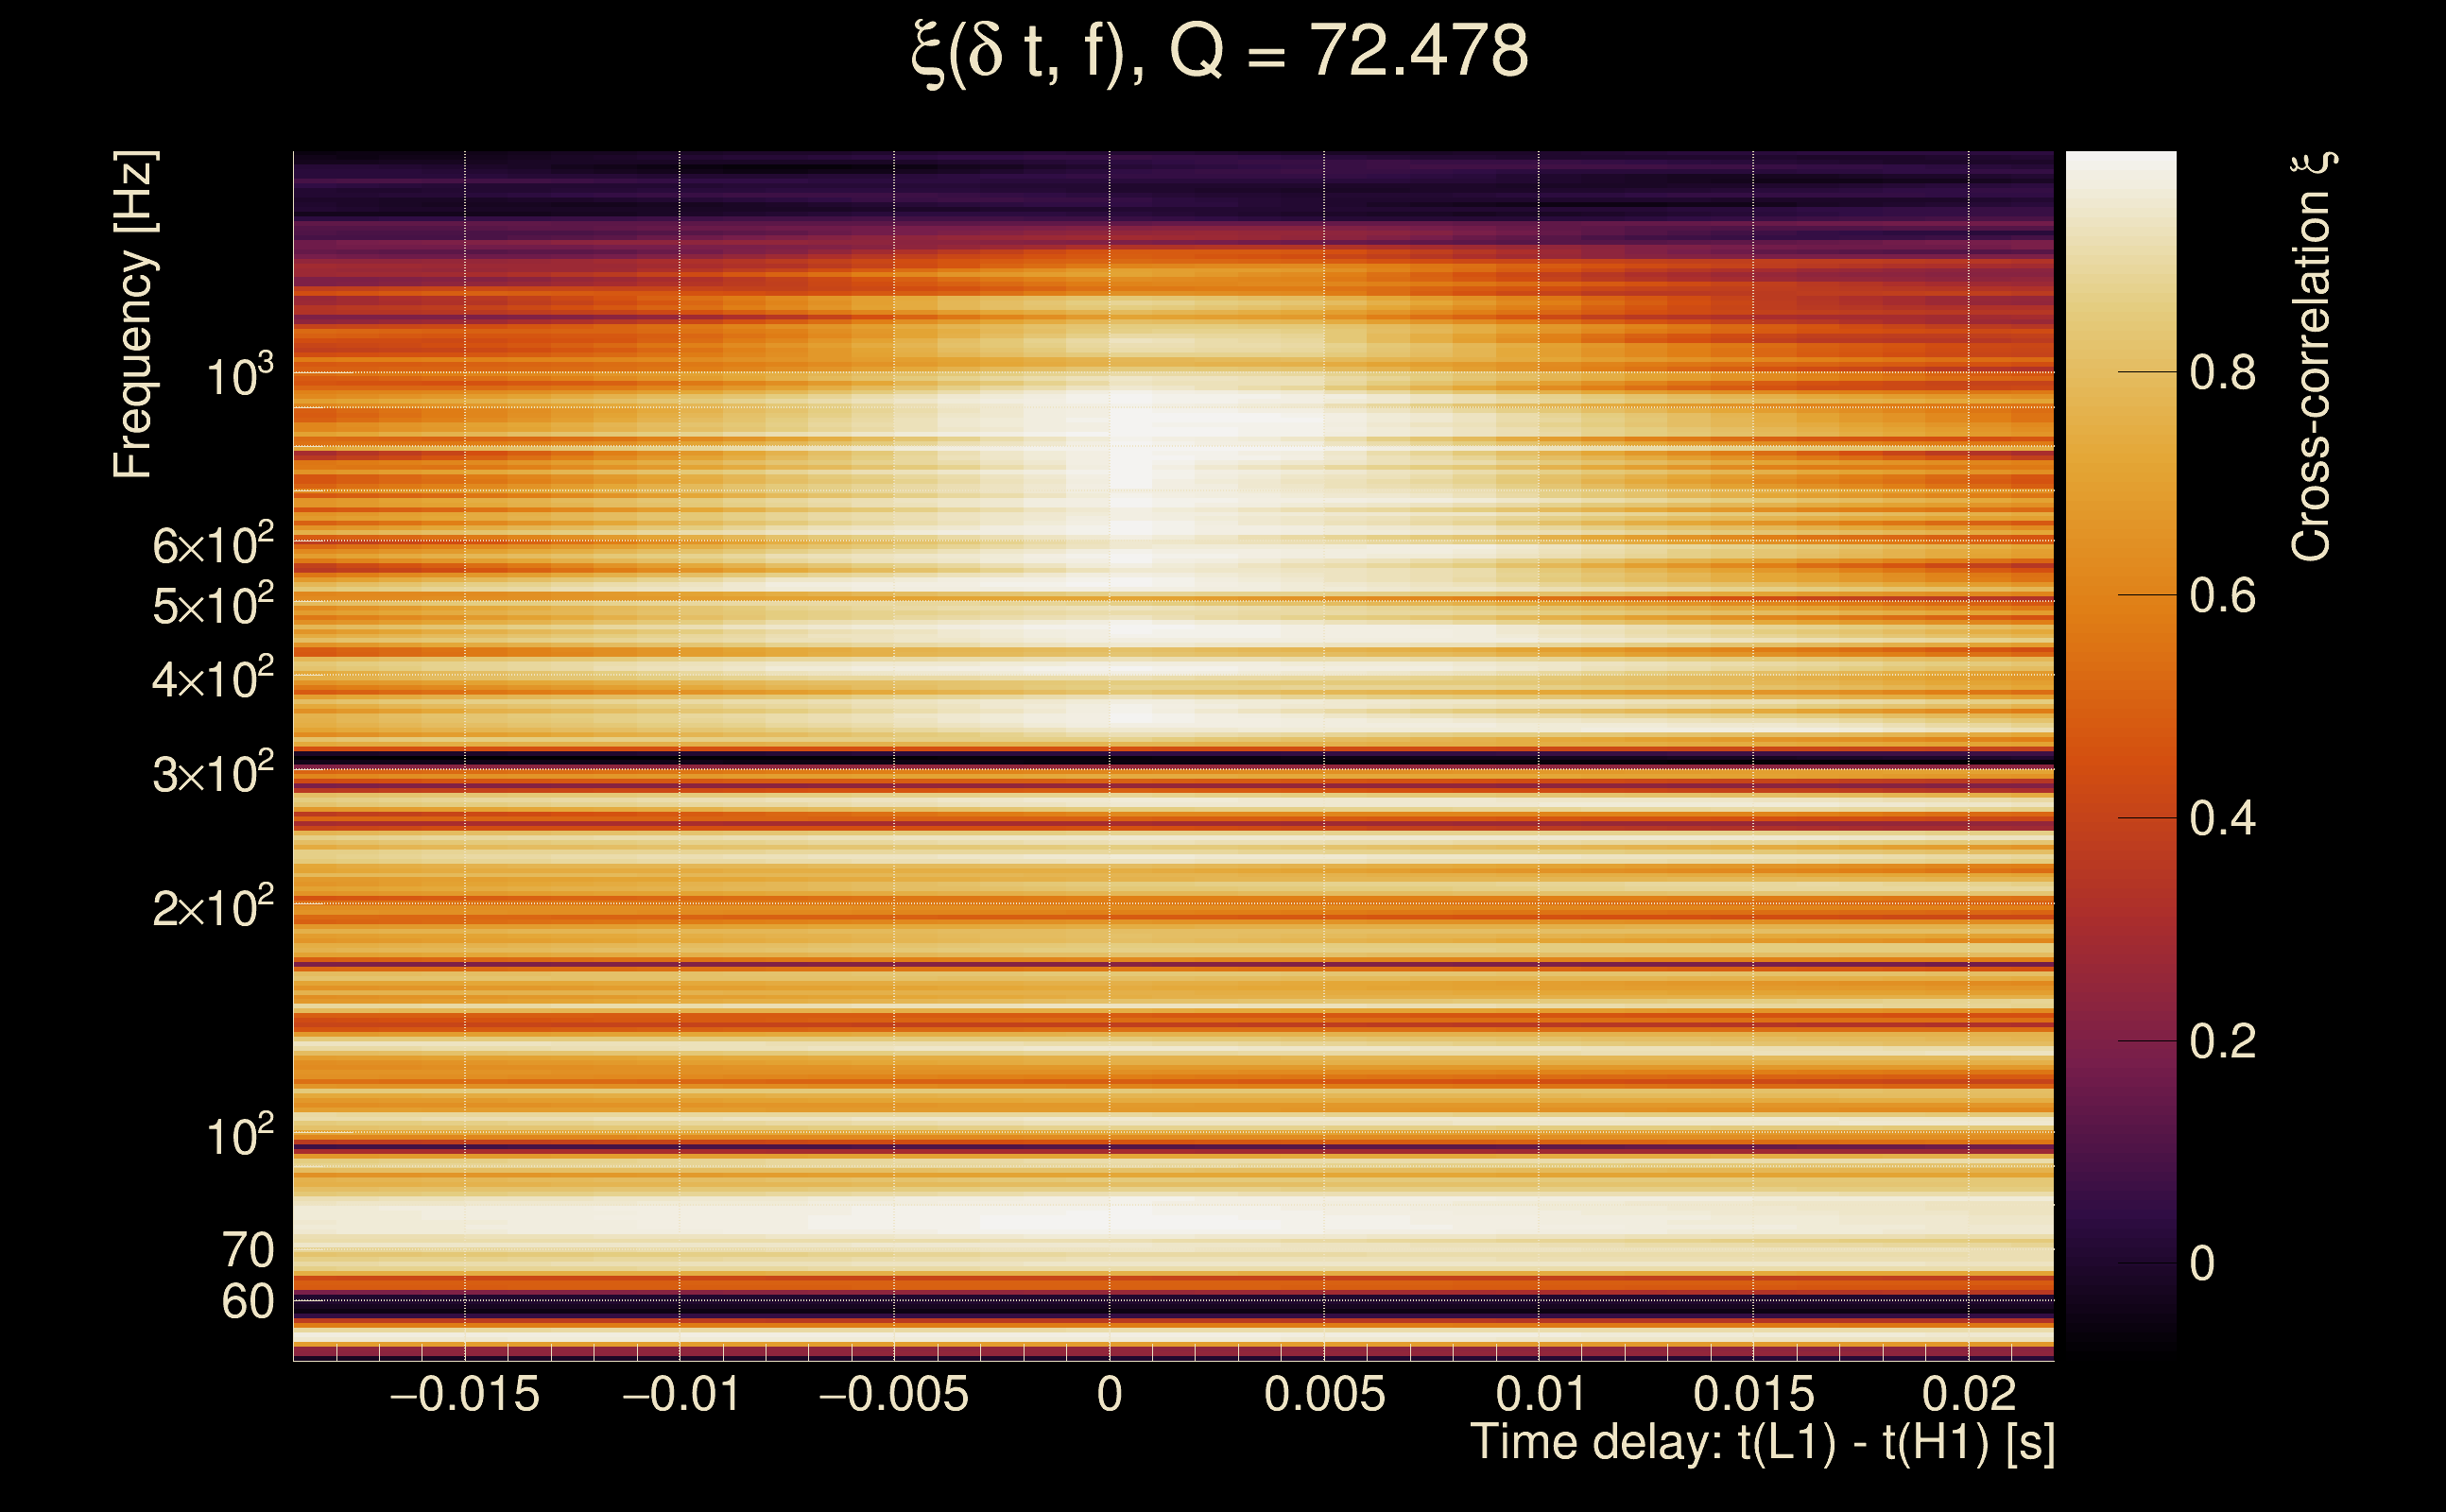
| Number of Q planes: | 5 (Q = 5.51892 → Q = 72.478) |
| Omicron frequency range: | 50 Hz → 1958.38 Hz |
| Light travel time between detectors: | 0.0100128 s |
| Slice extra-time (calibration uncertainty + slice veto): | 0.0129872 s |
| Number of time-delay bins in a cross-correlation map: | 10000 |
| Number of slices in a cross-correlation map: | 217 |
| Number of time-delay bins in a slice: | 46 |
| SNR gating: | < 100 (detector 0), < 100 (detector 1) |
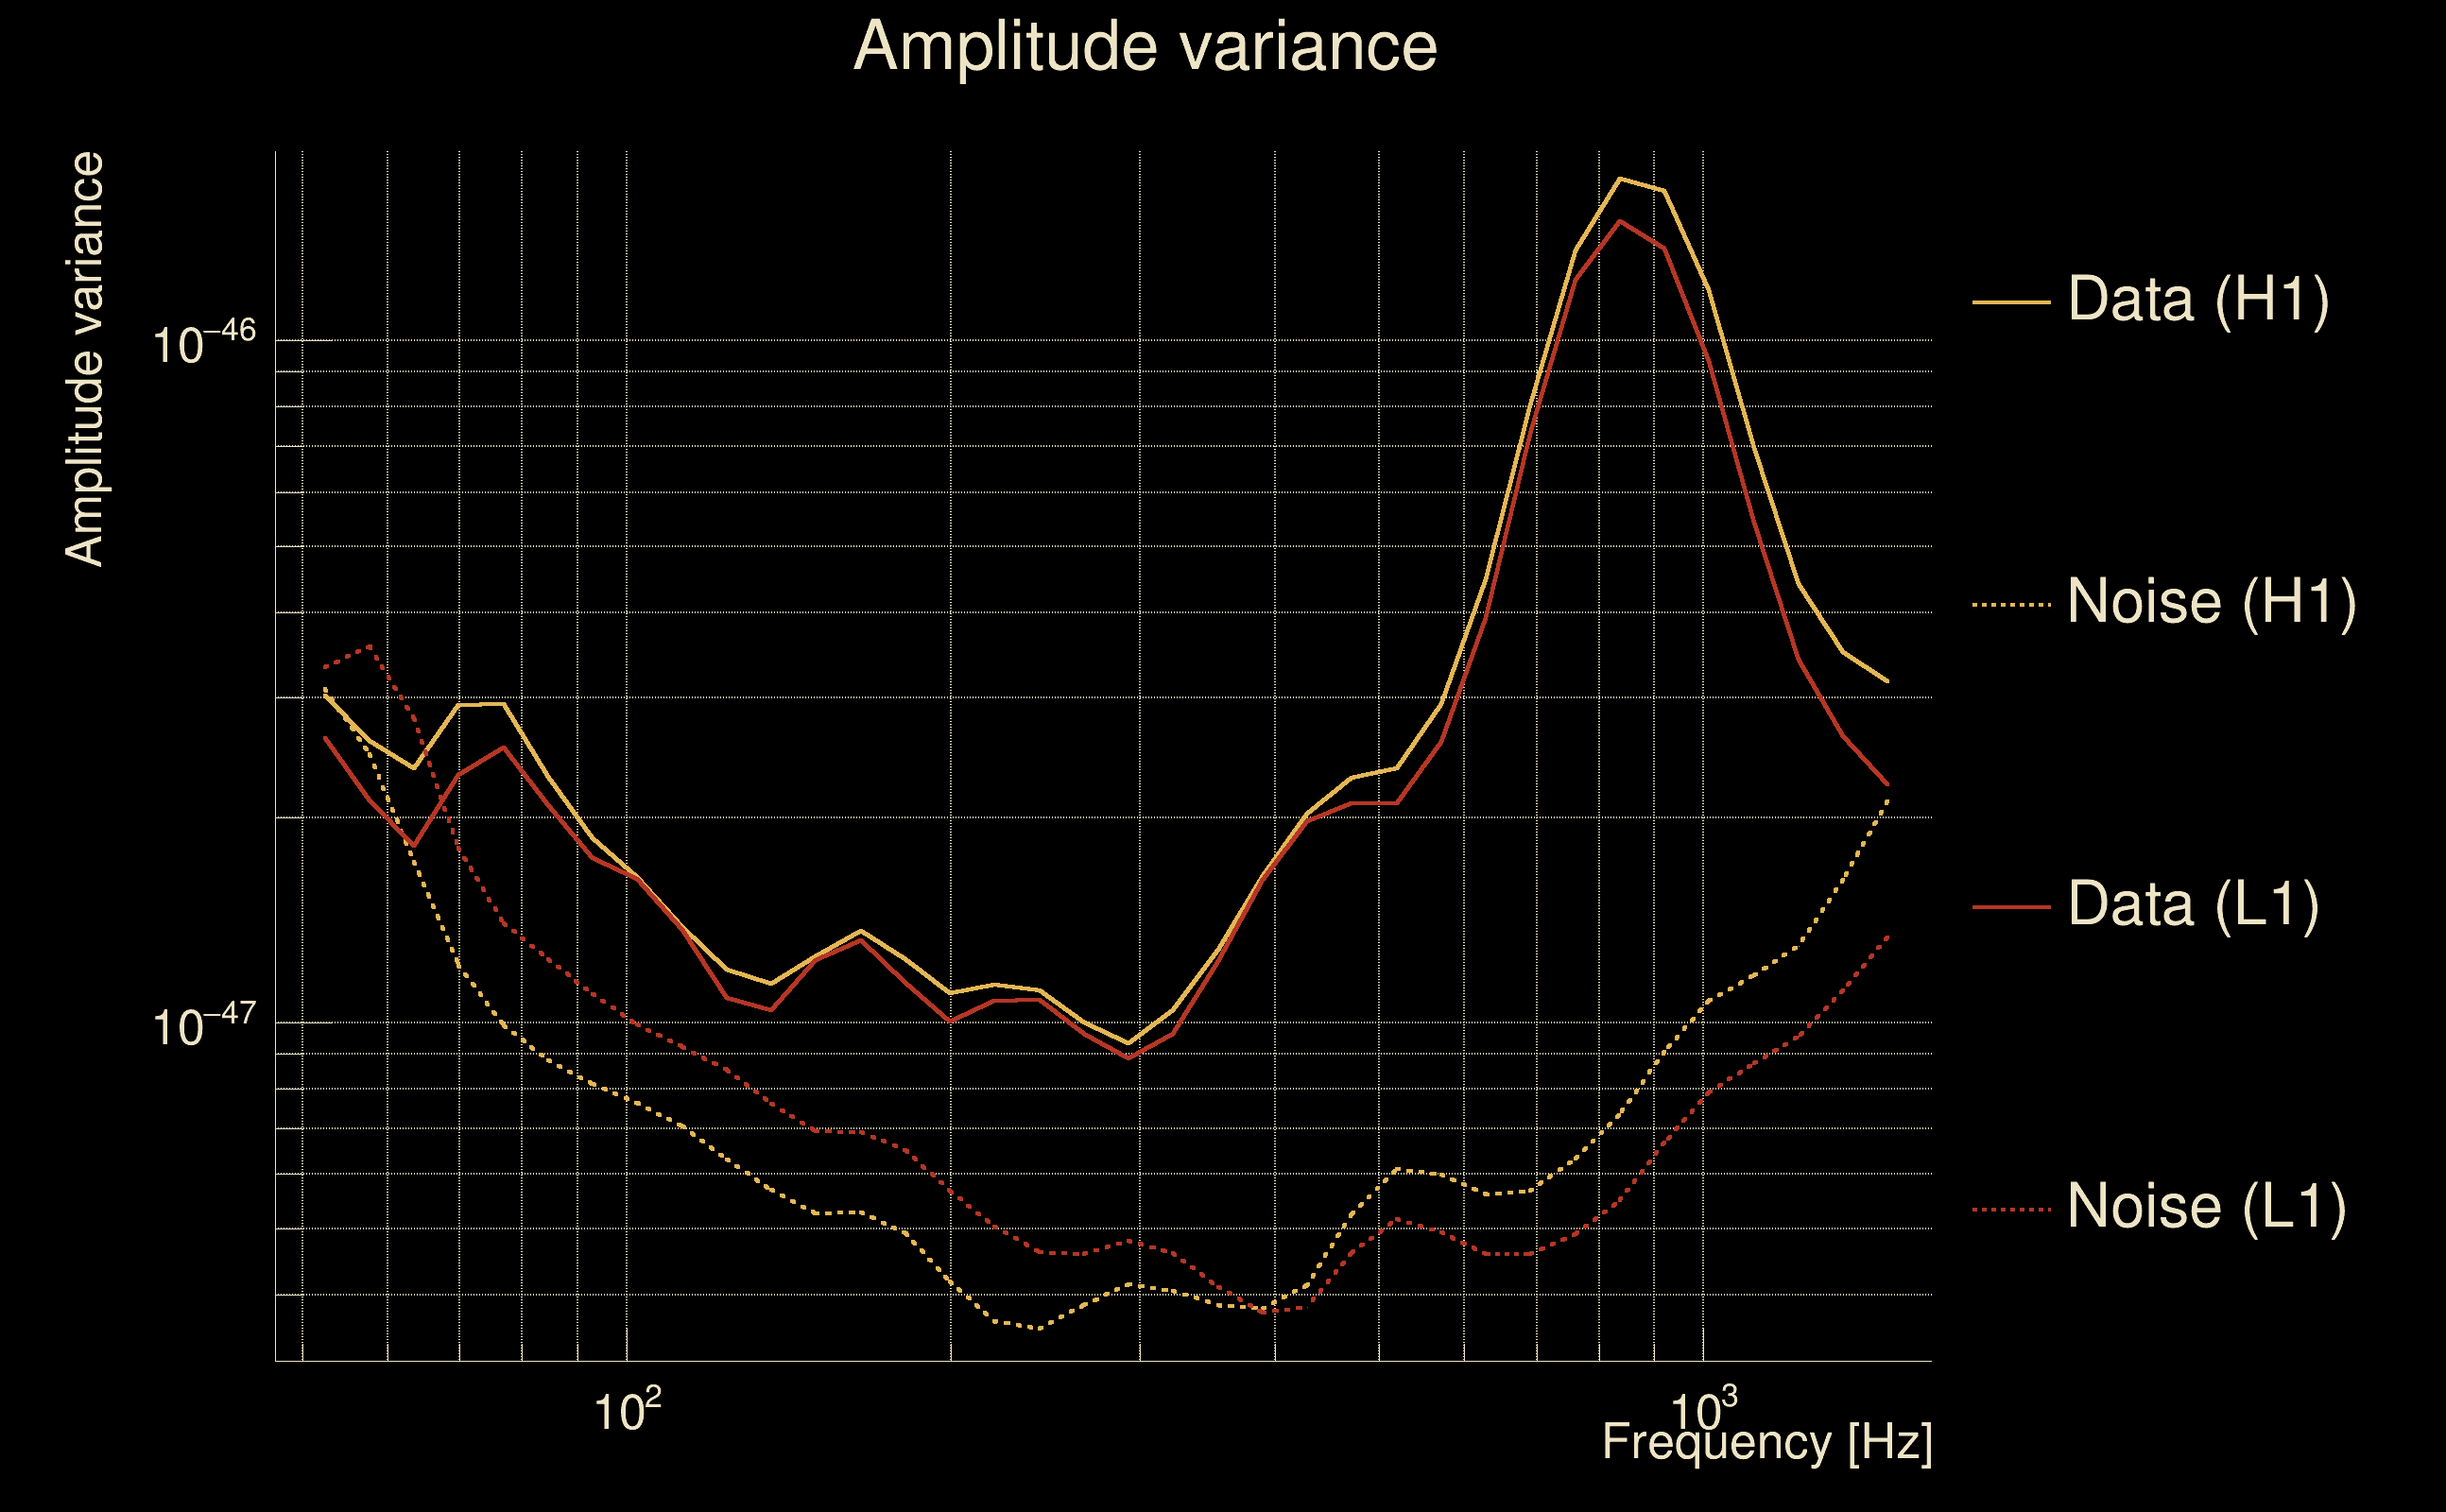
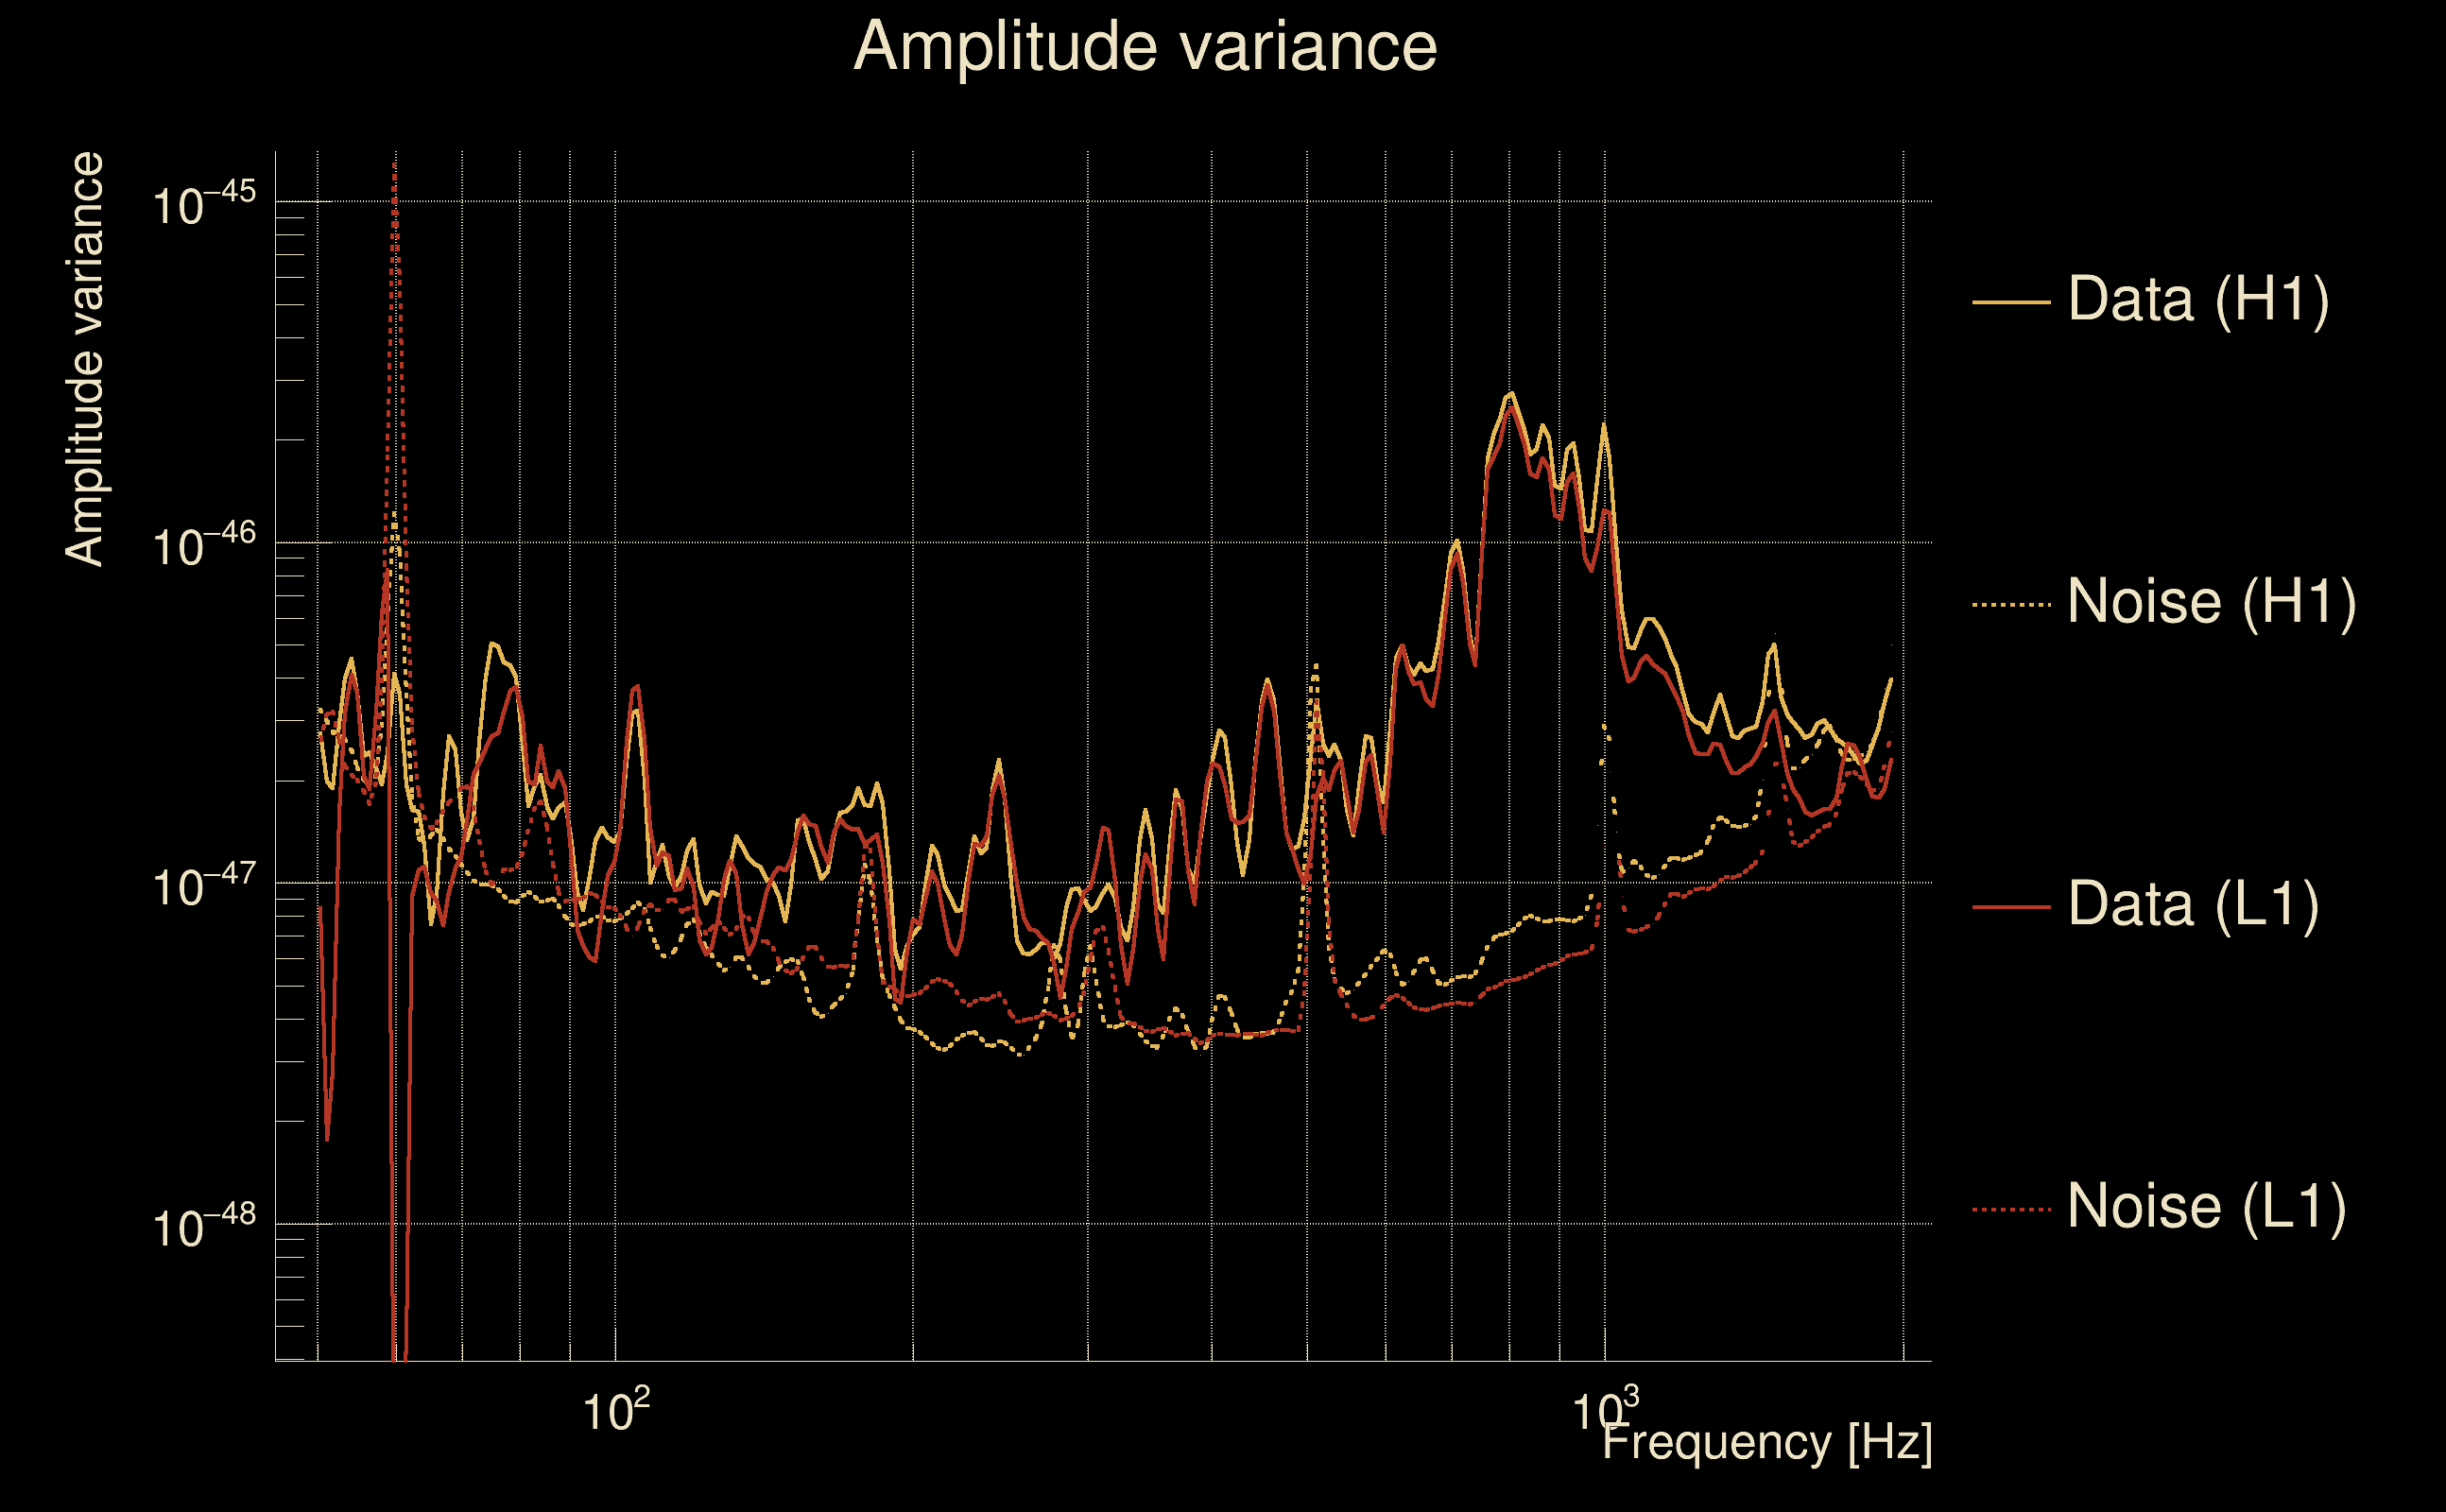
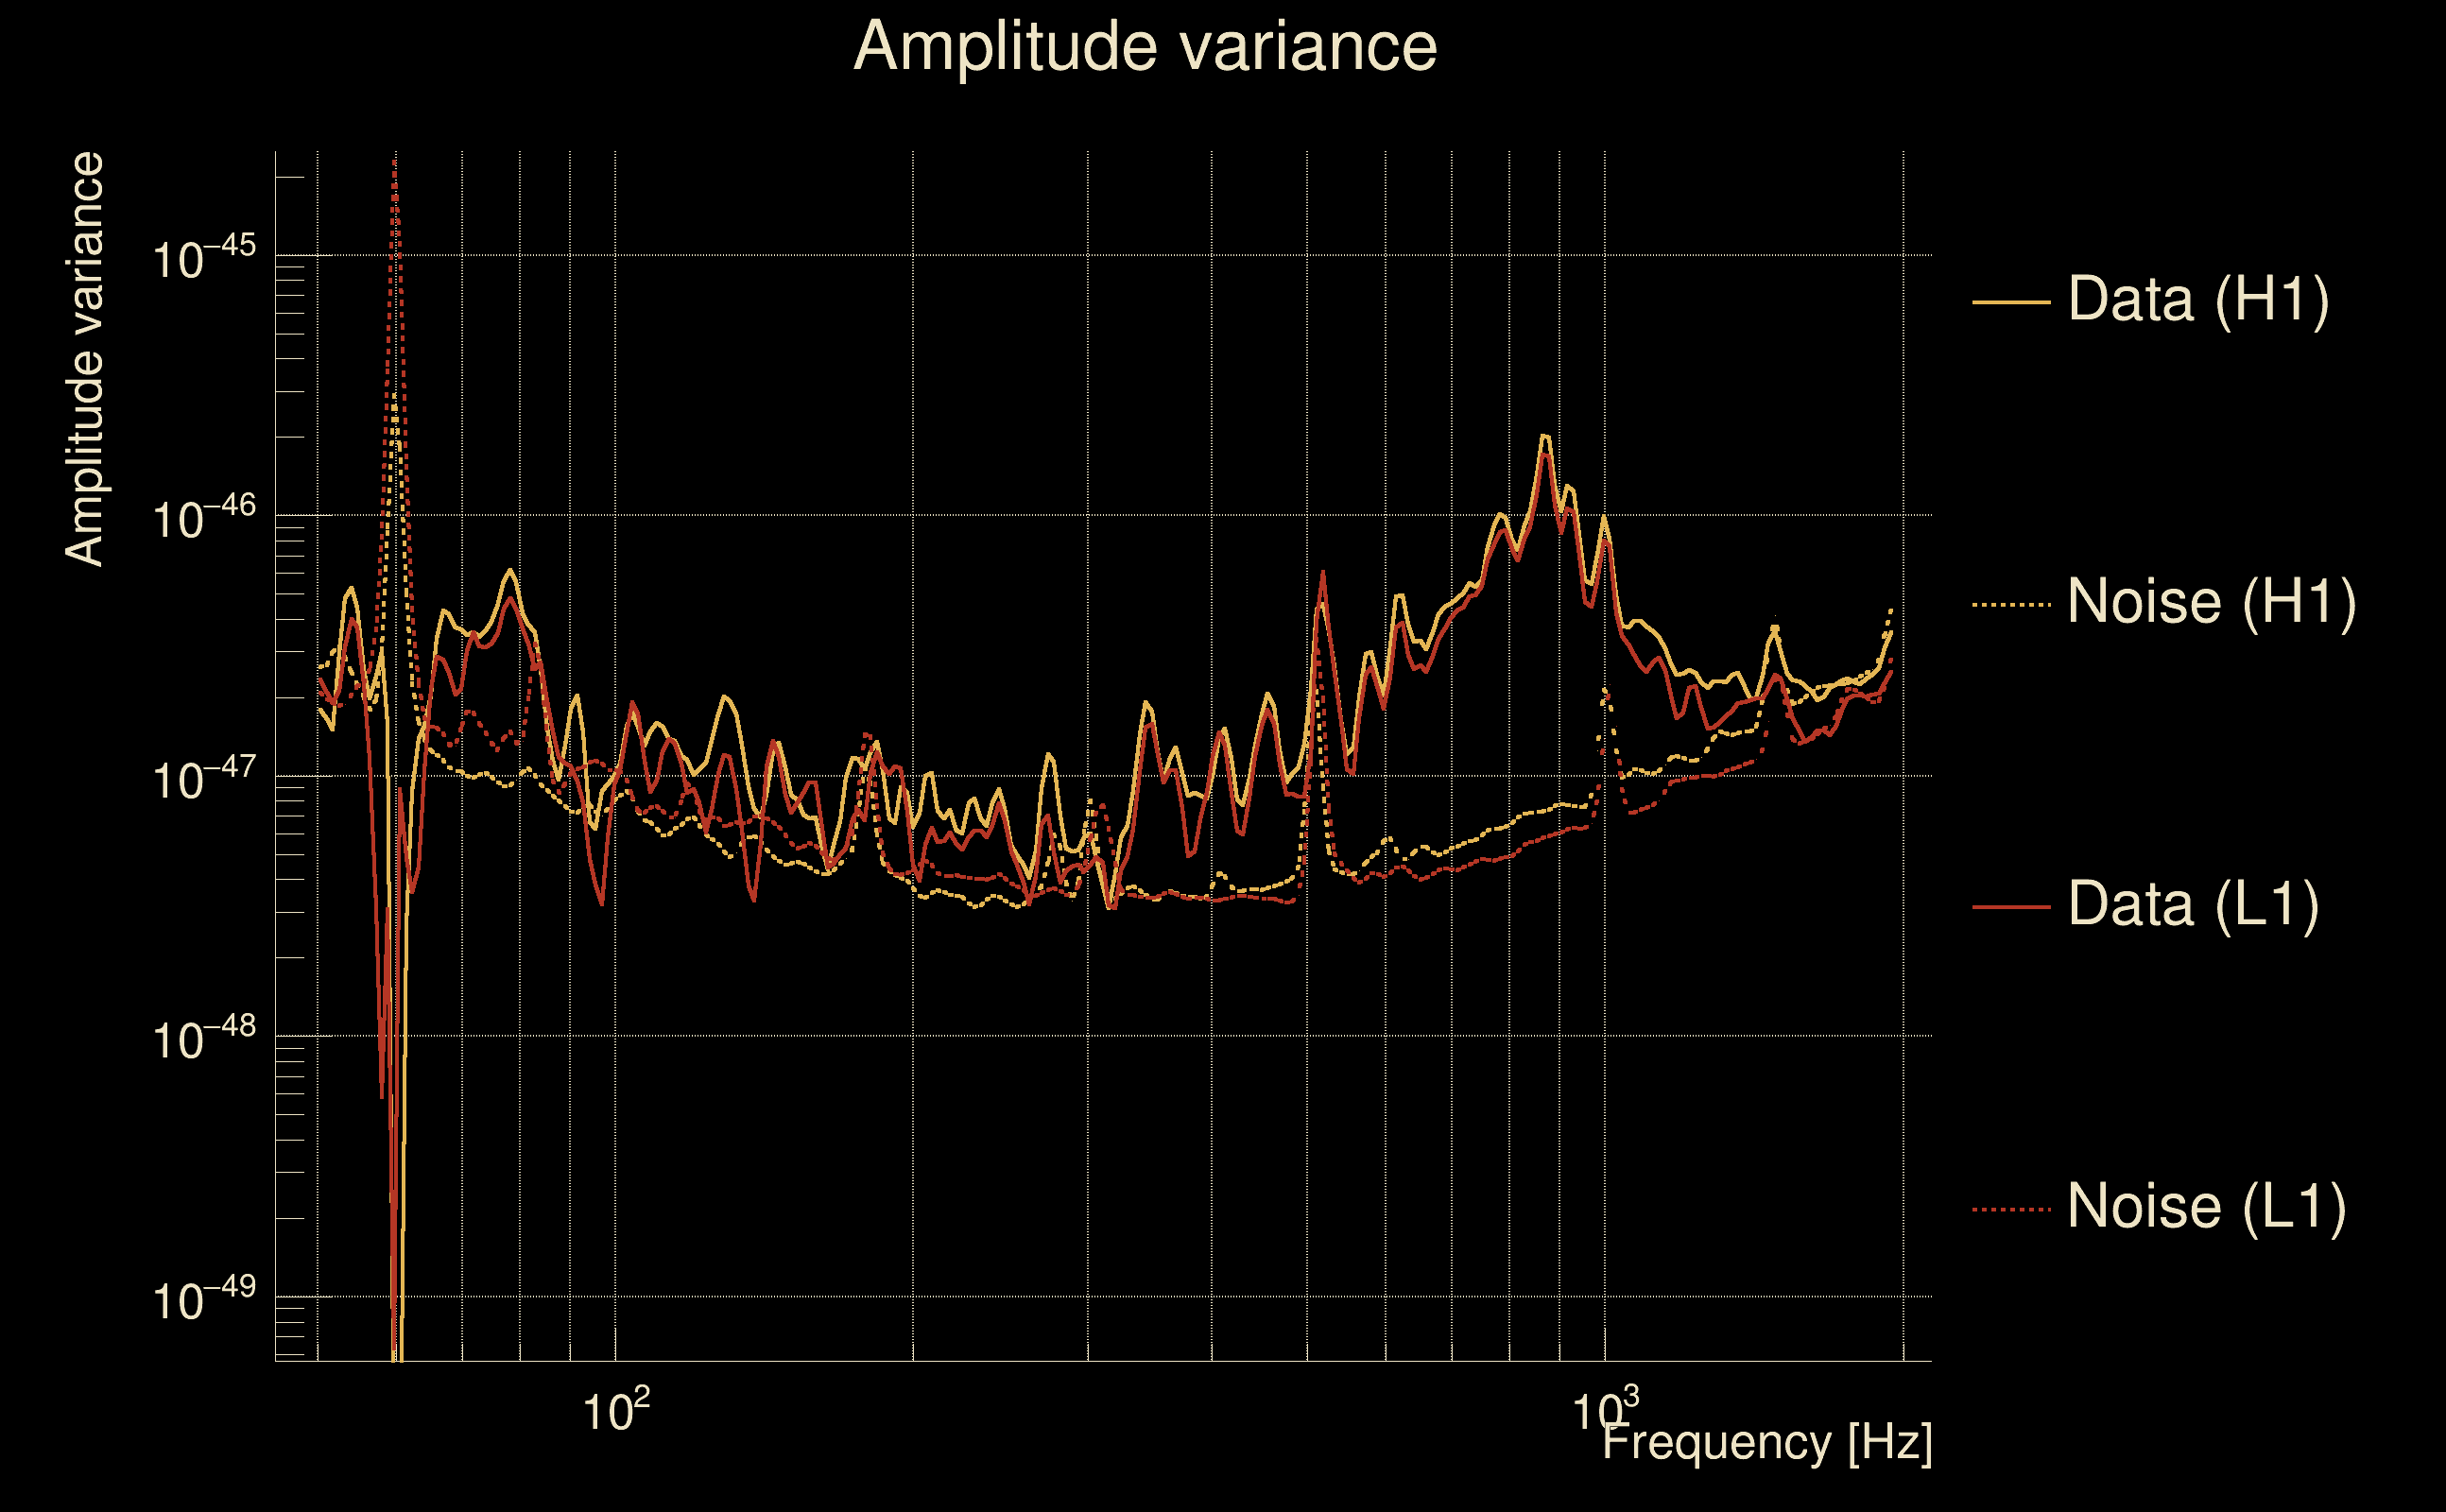
| Amplitude spectrograms: | normalization = 1e-22, power index = 2 |
| White noise SNR variance: | 0.523175 (after applying a correction factor = 1) |
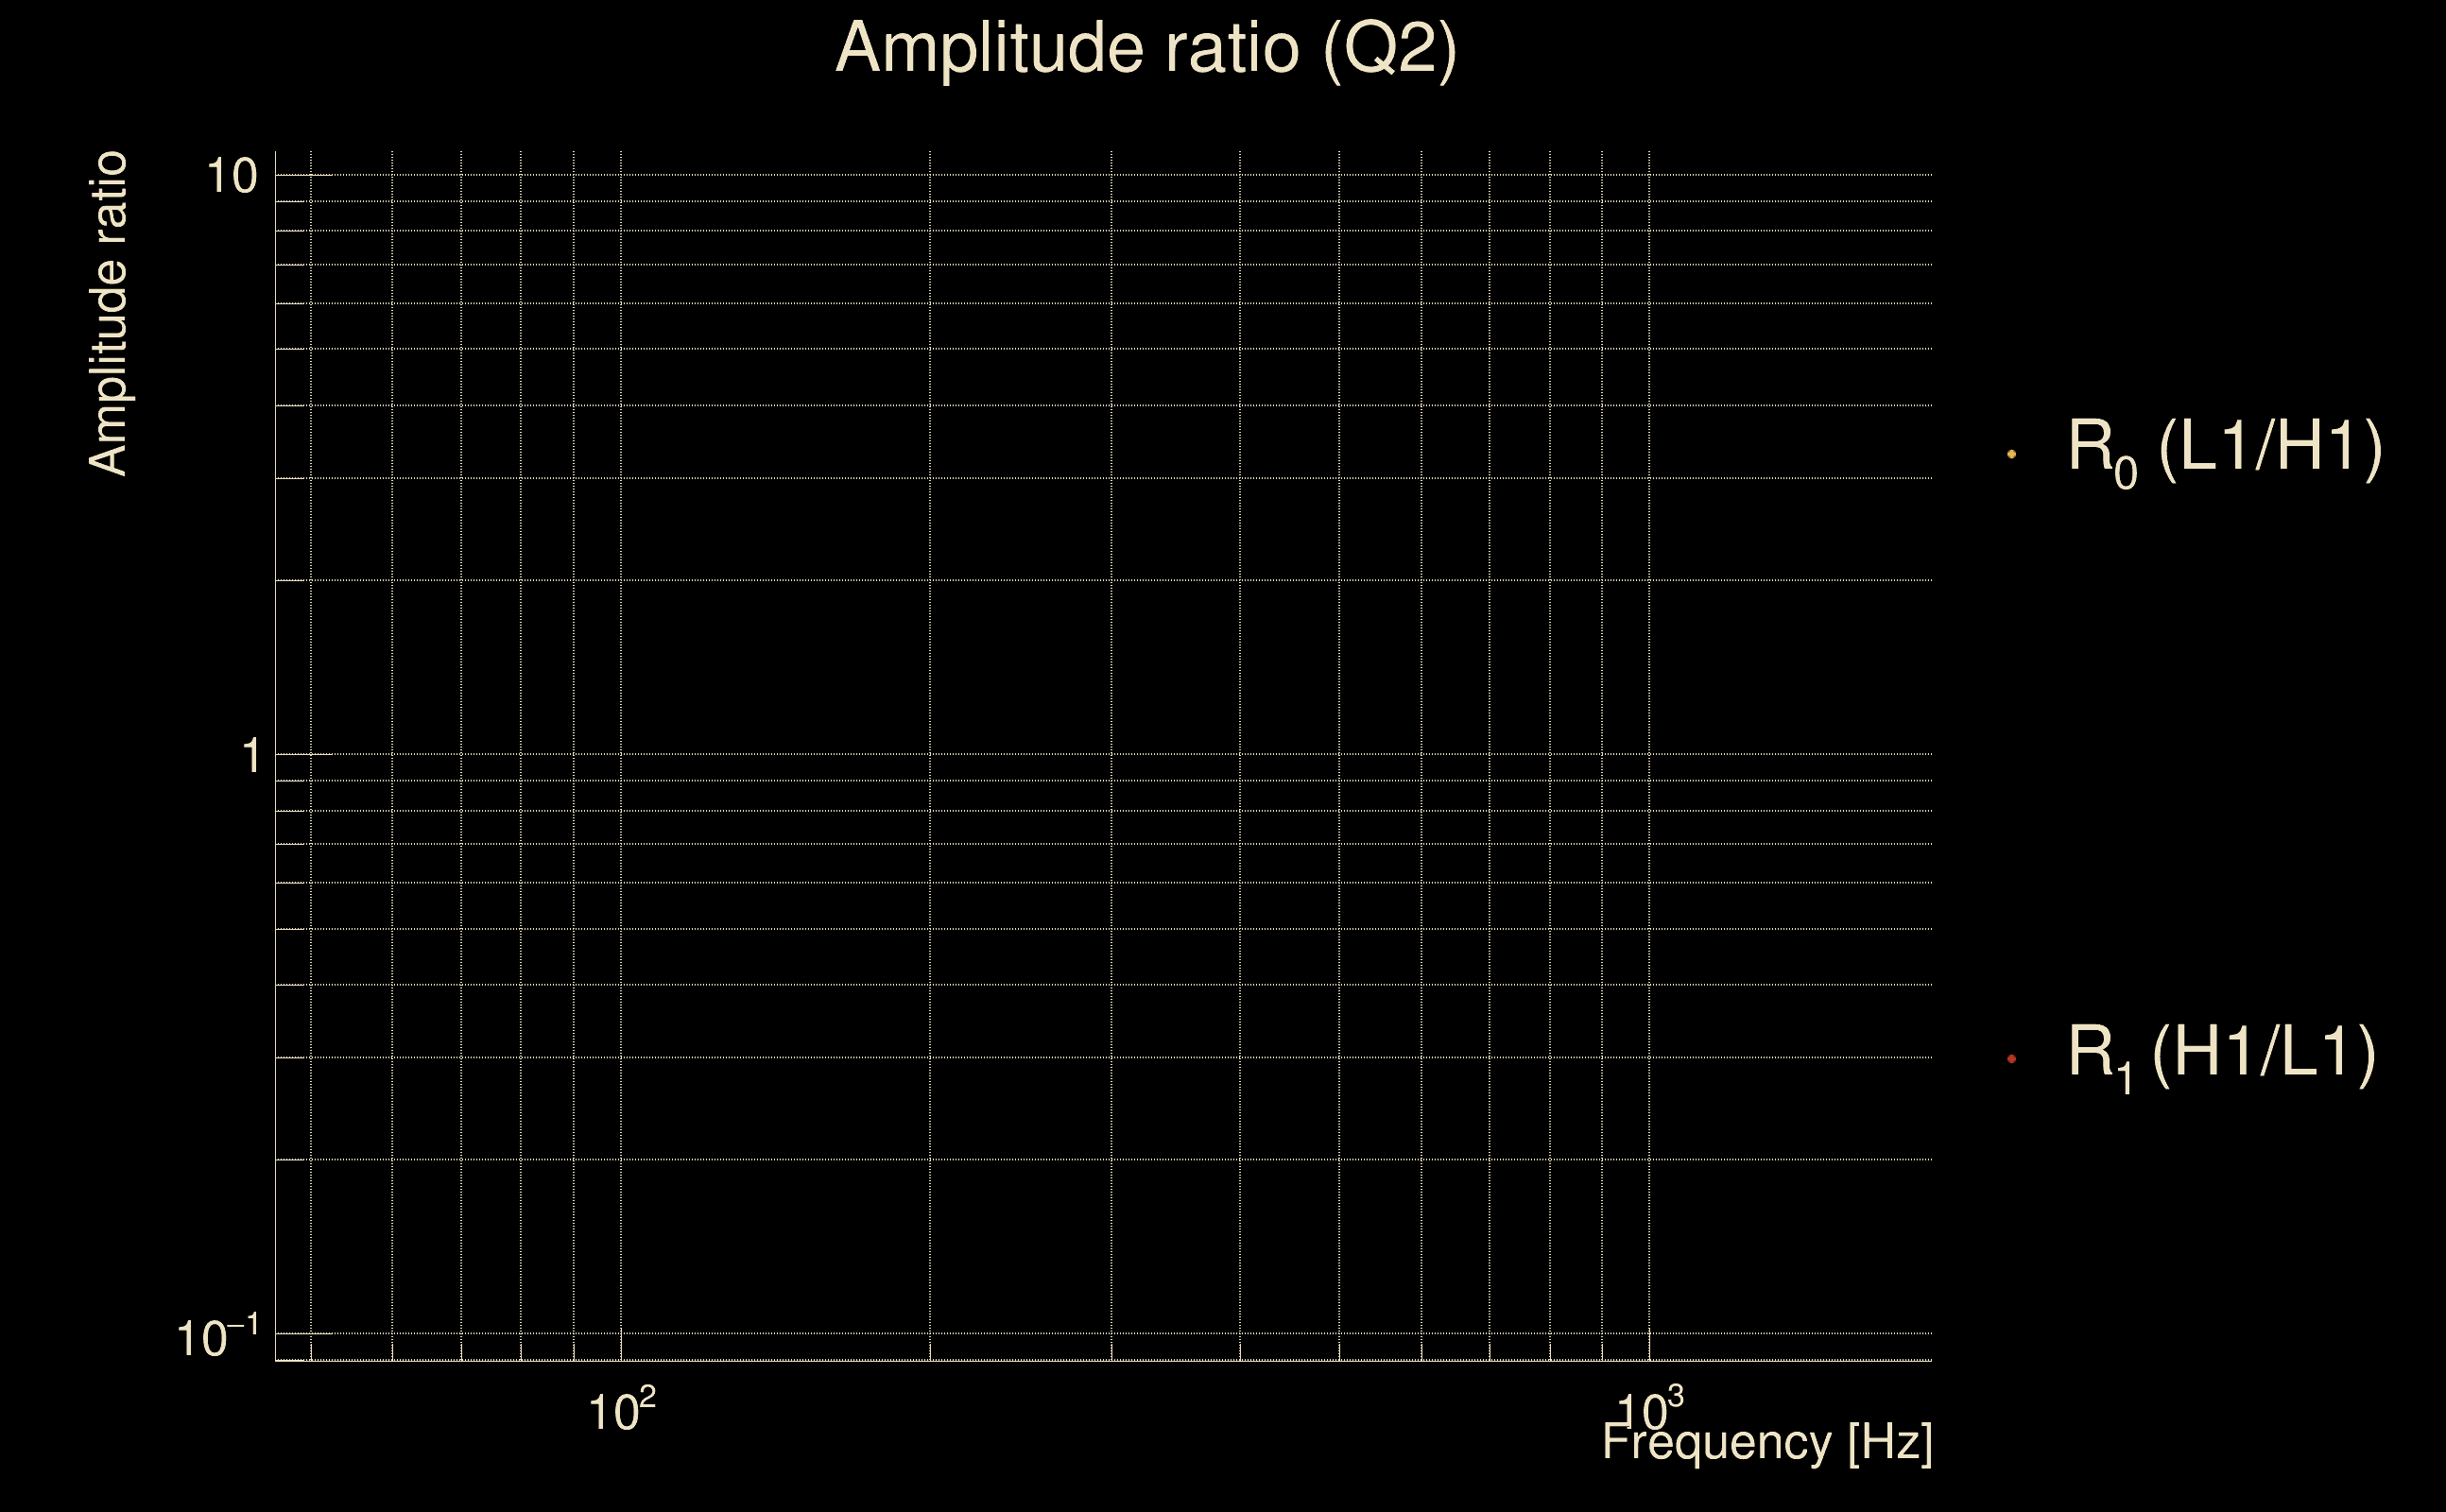
| Amplitude ratio confidence level: | 3 sigma |
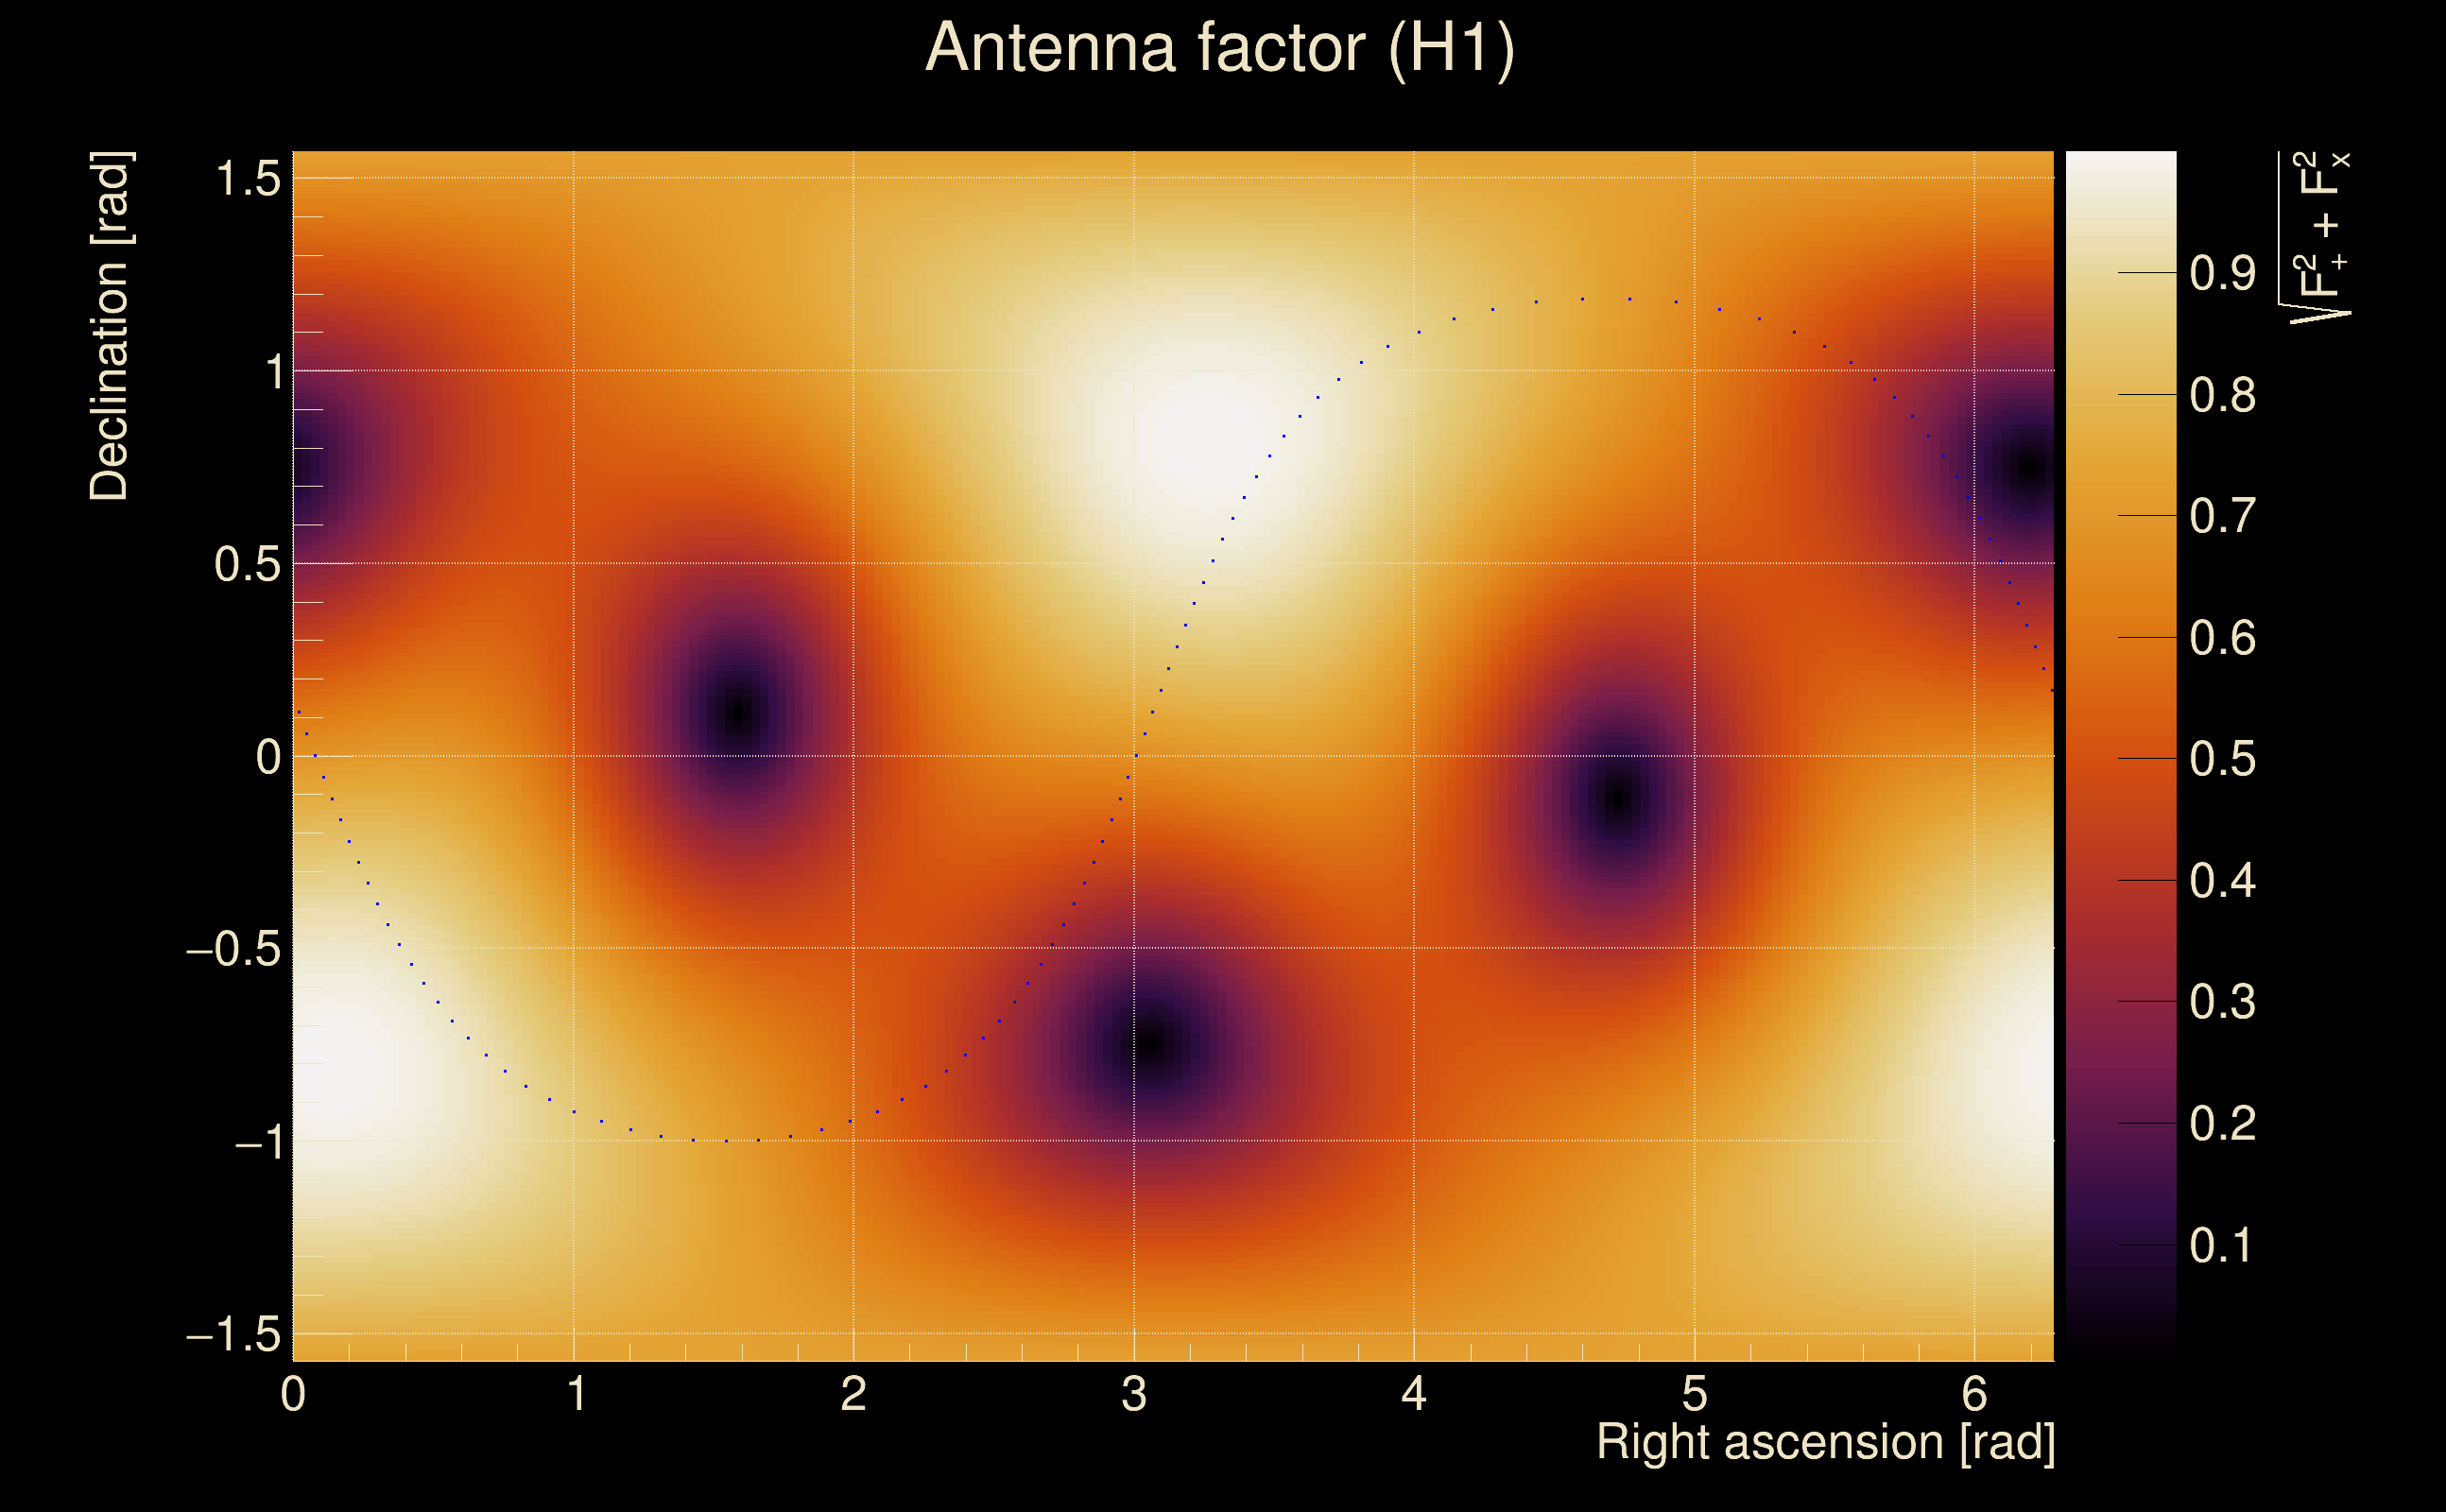
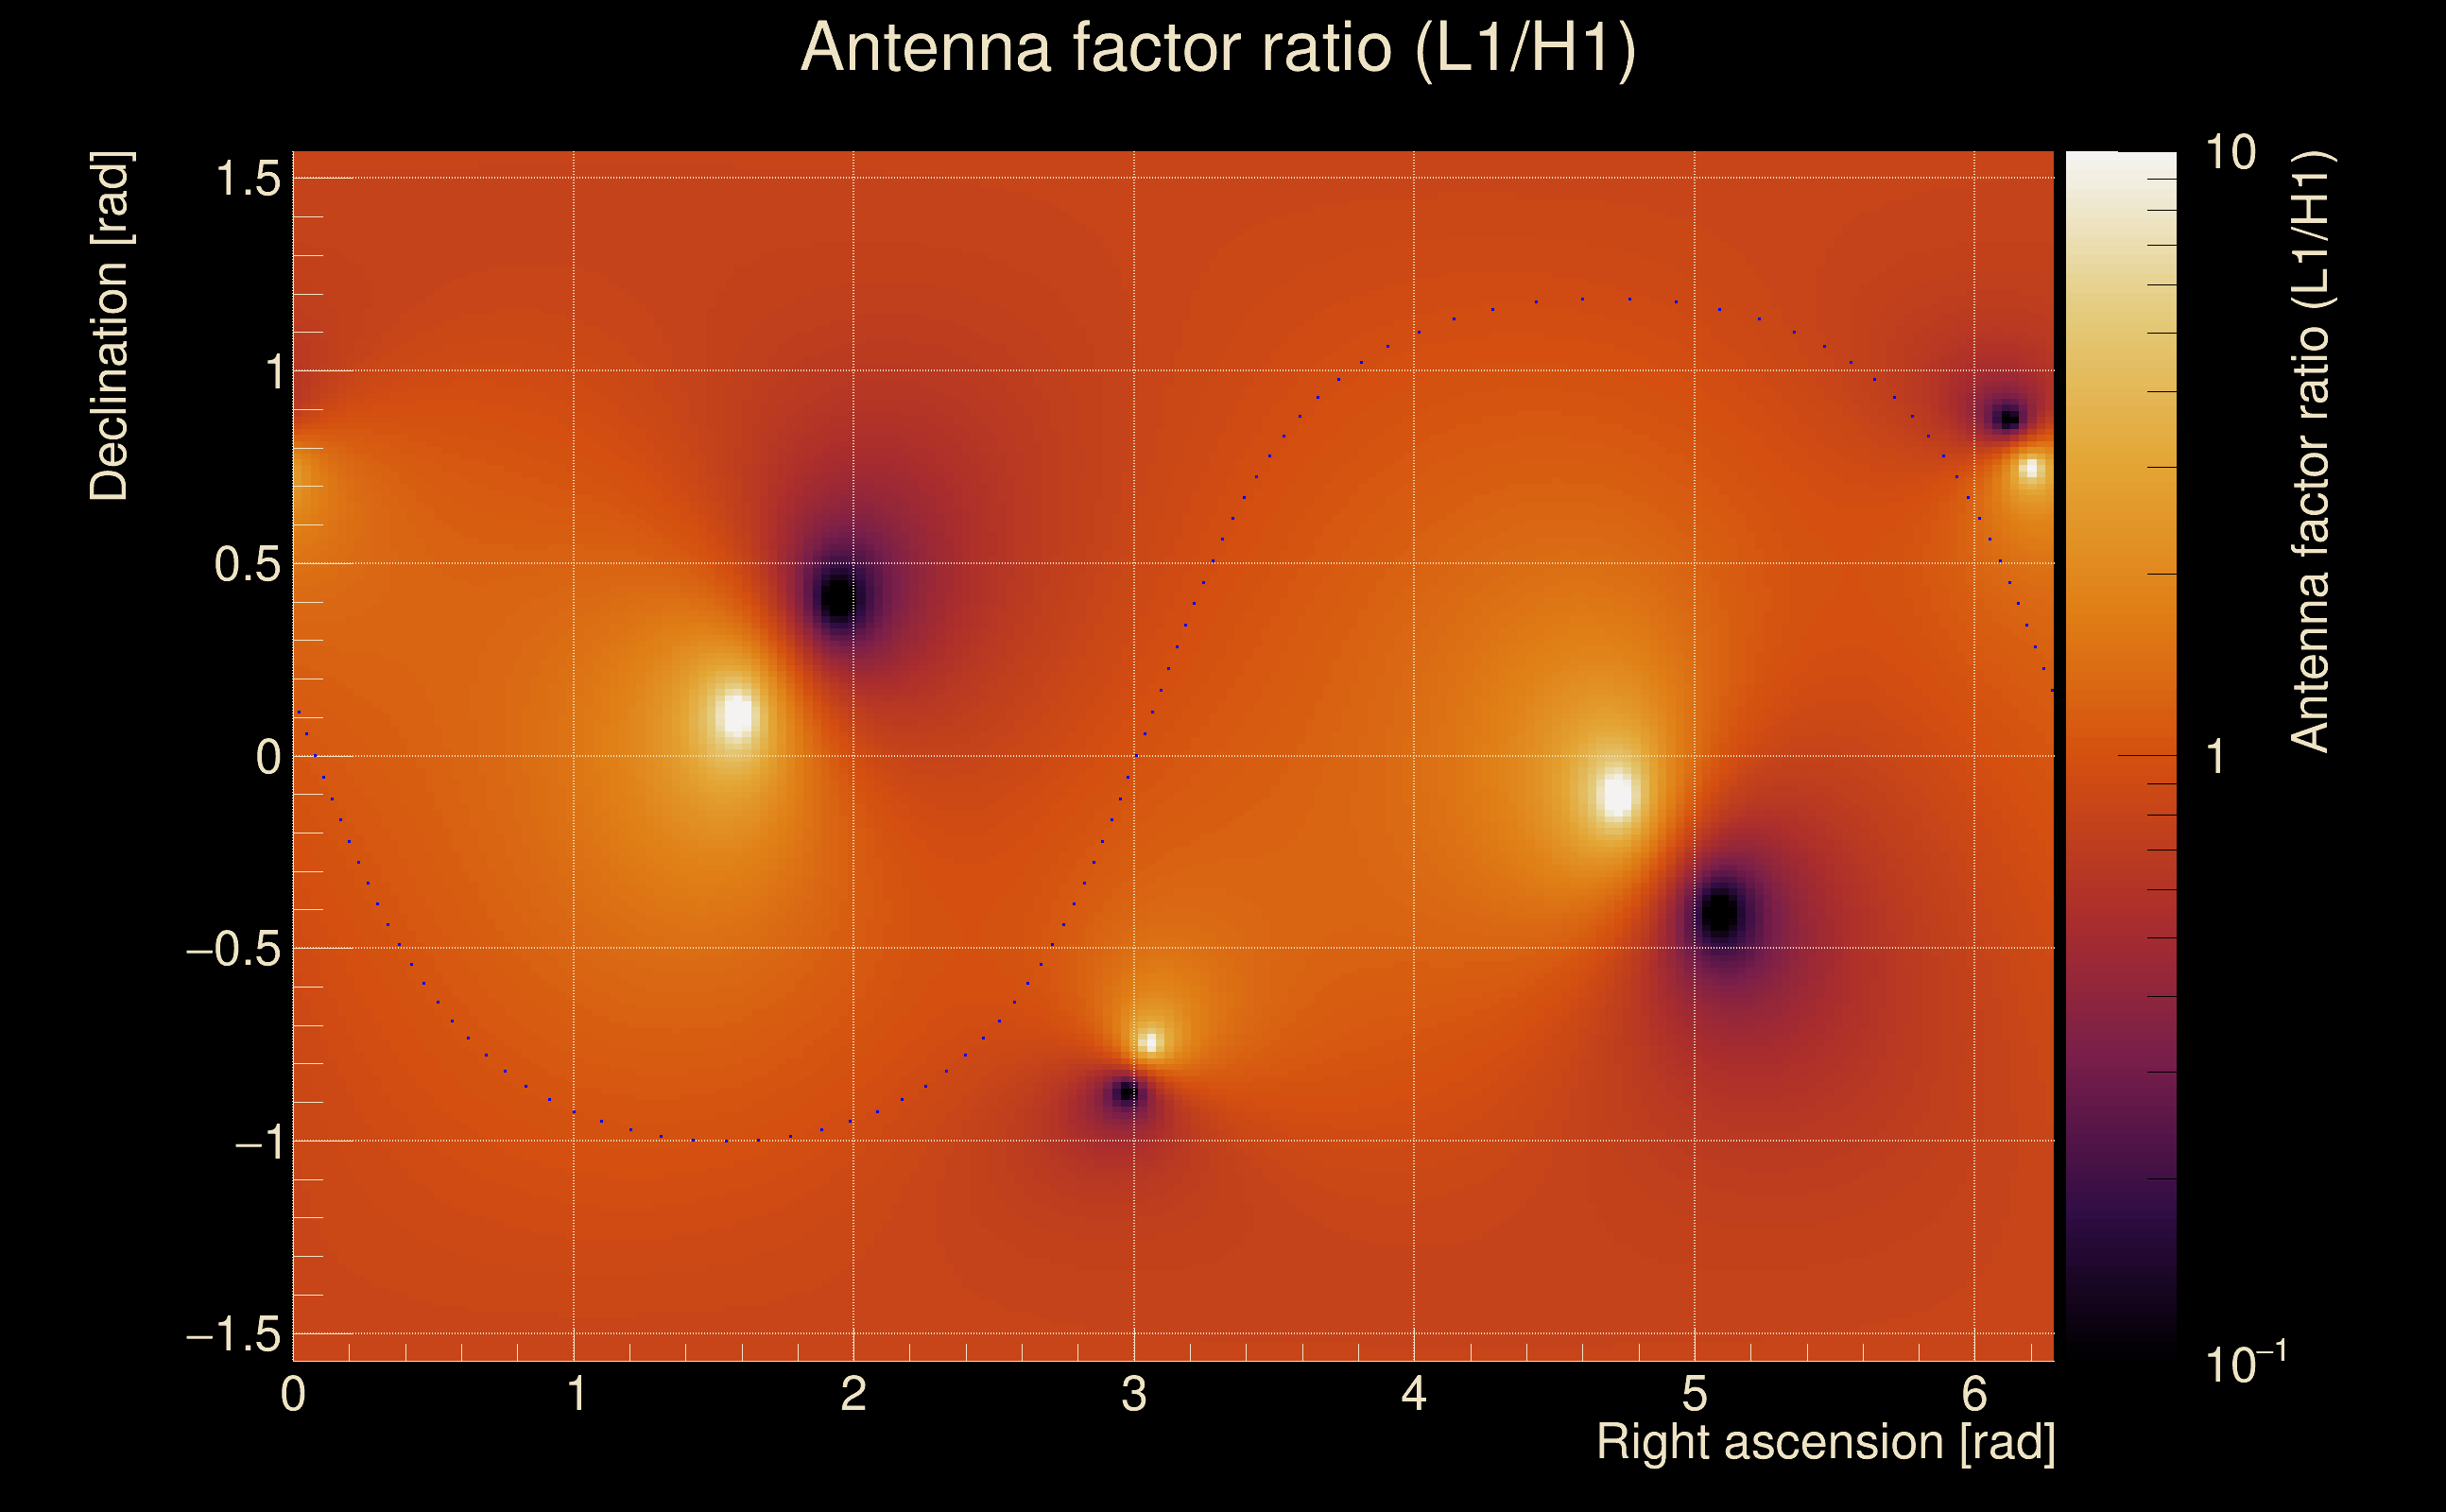
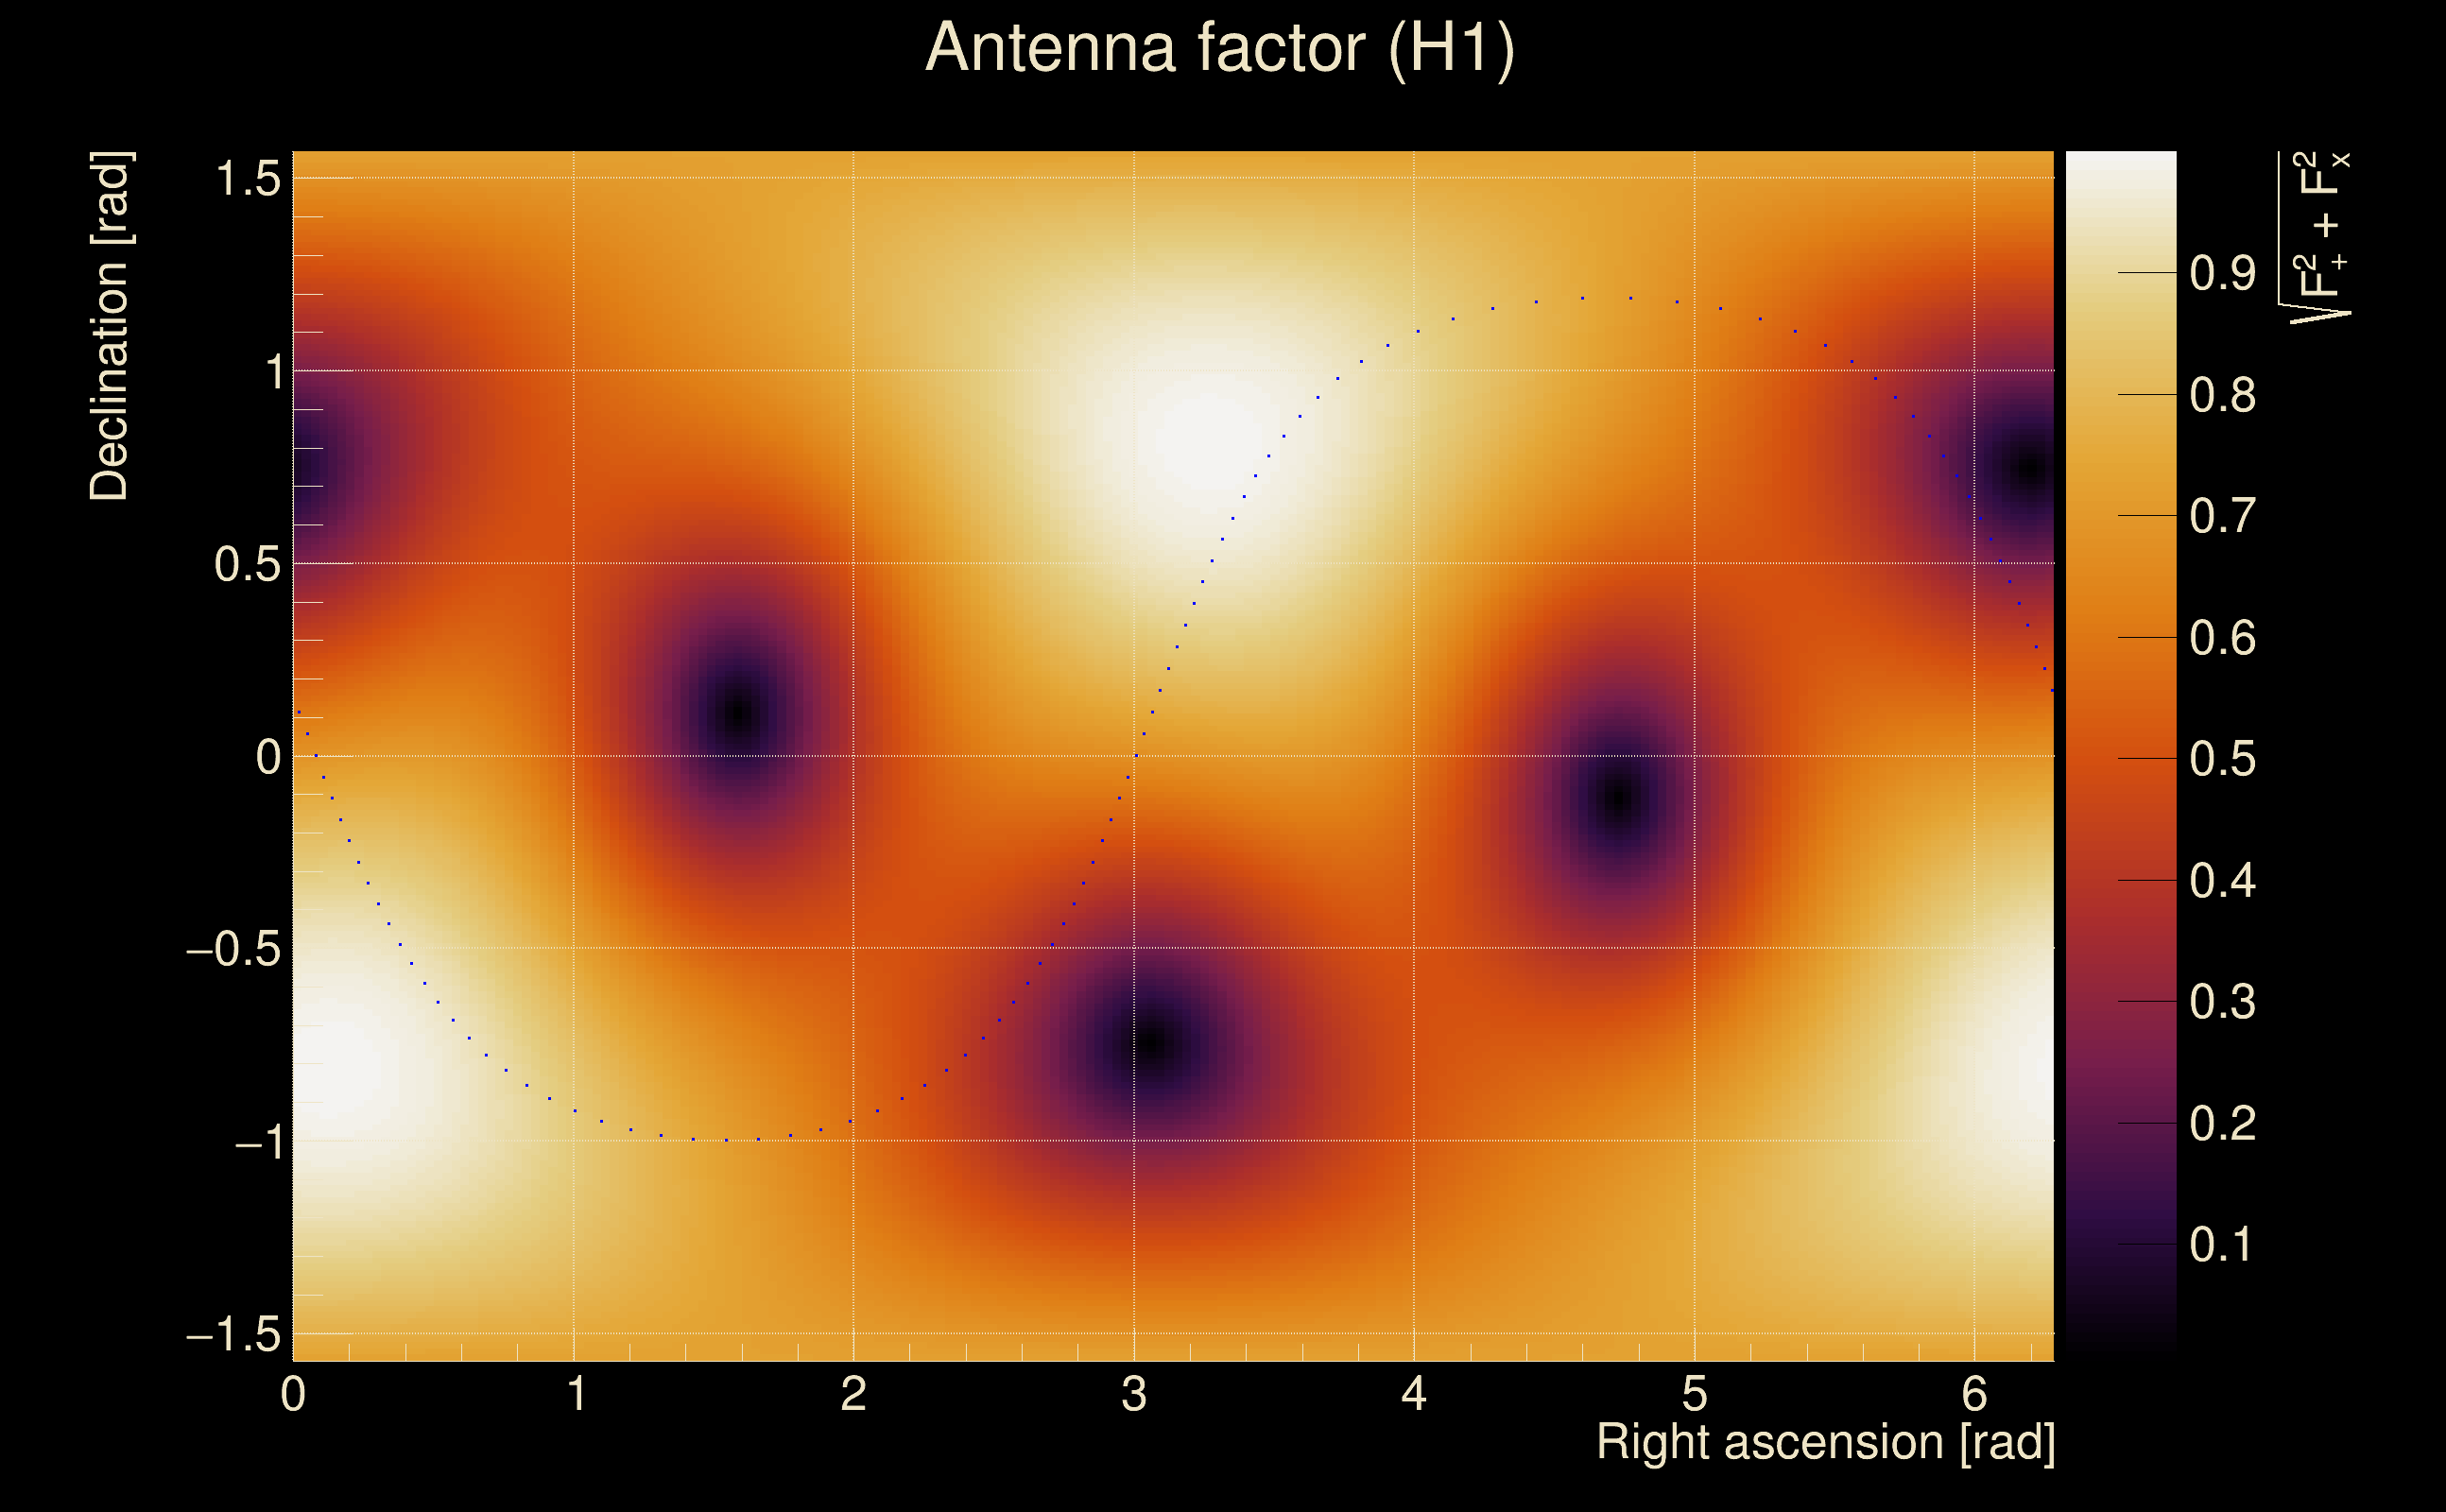
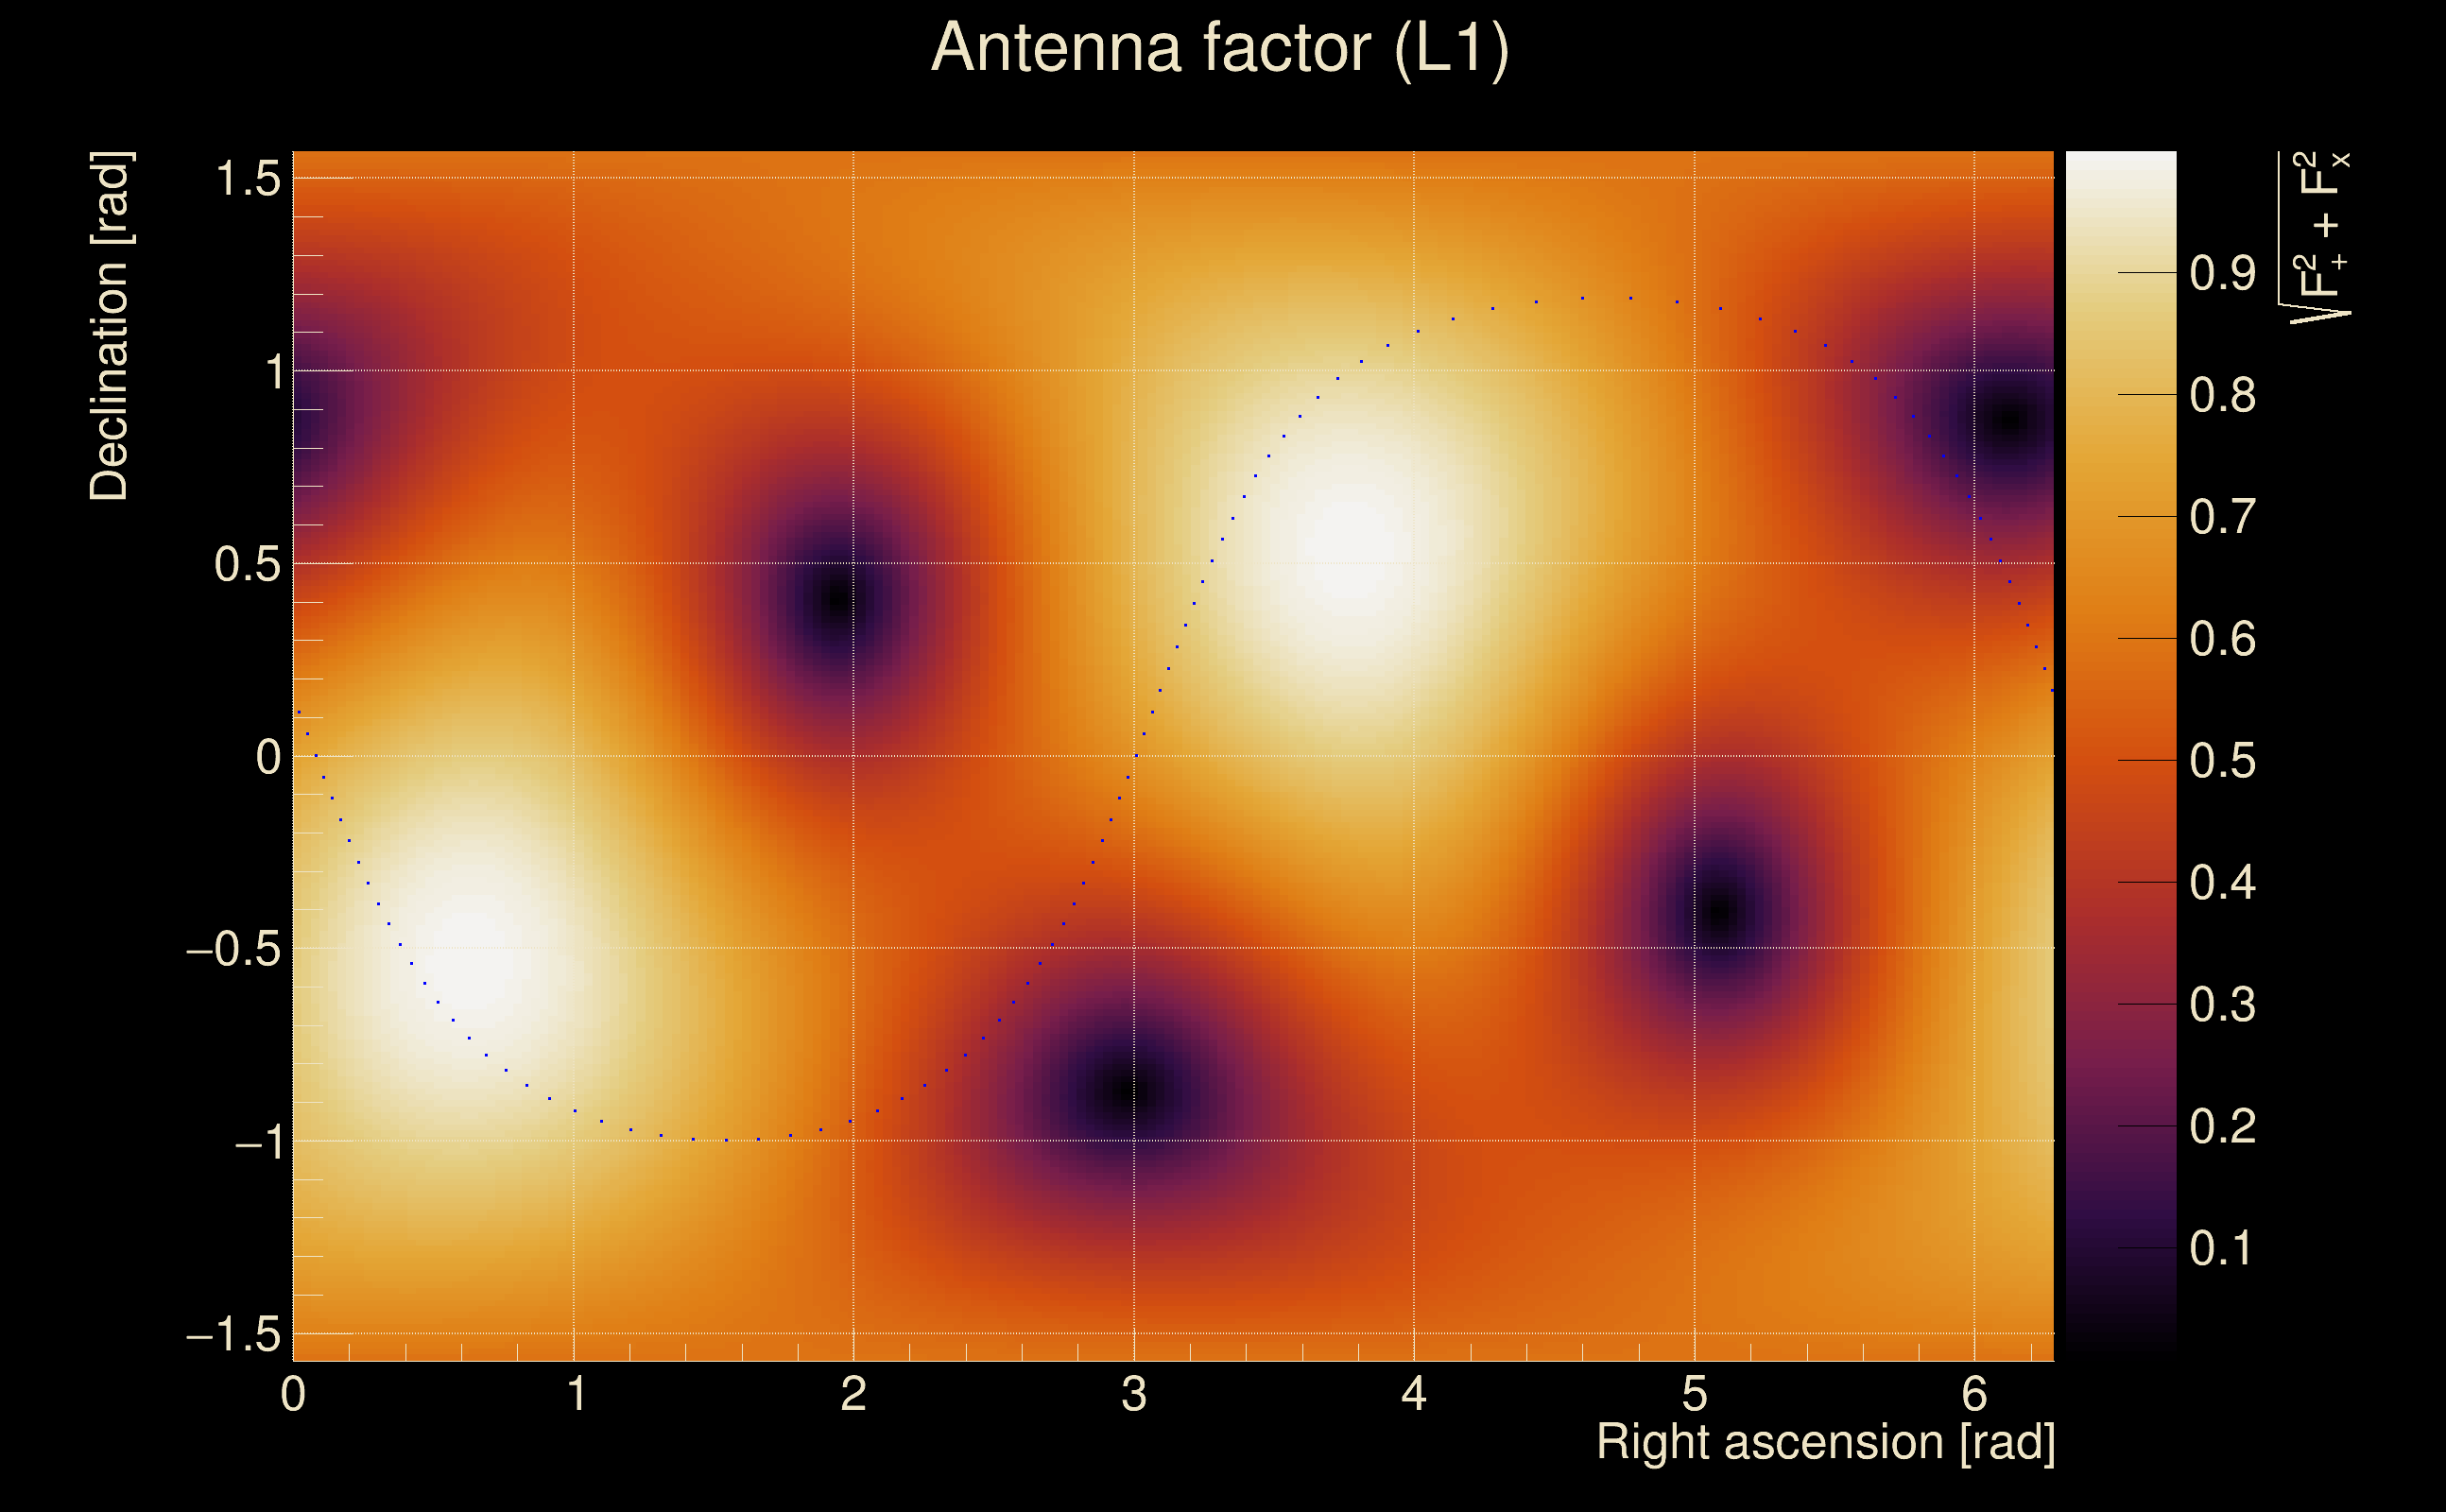
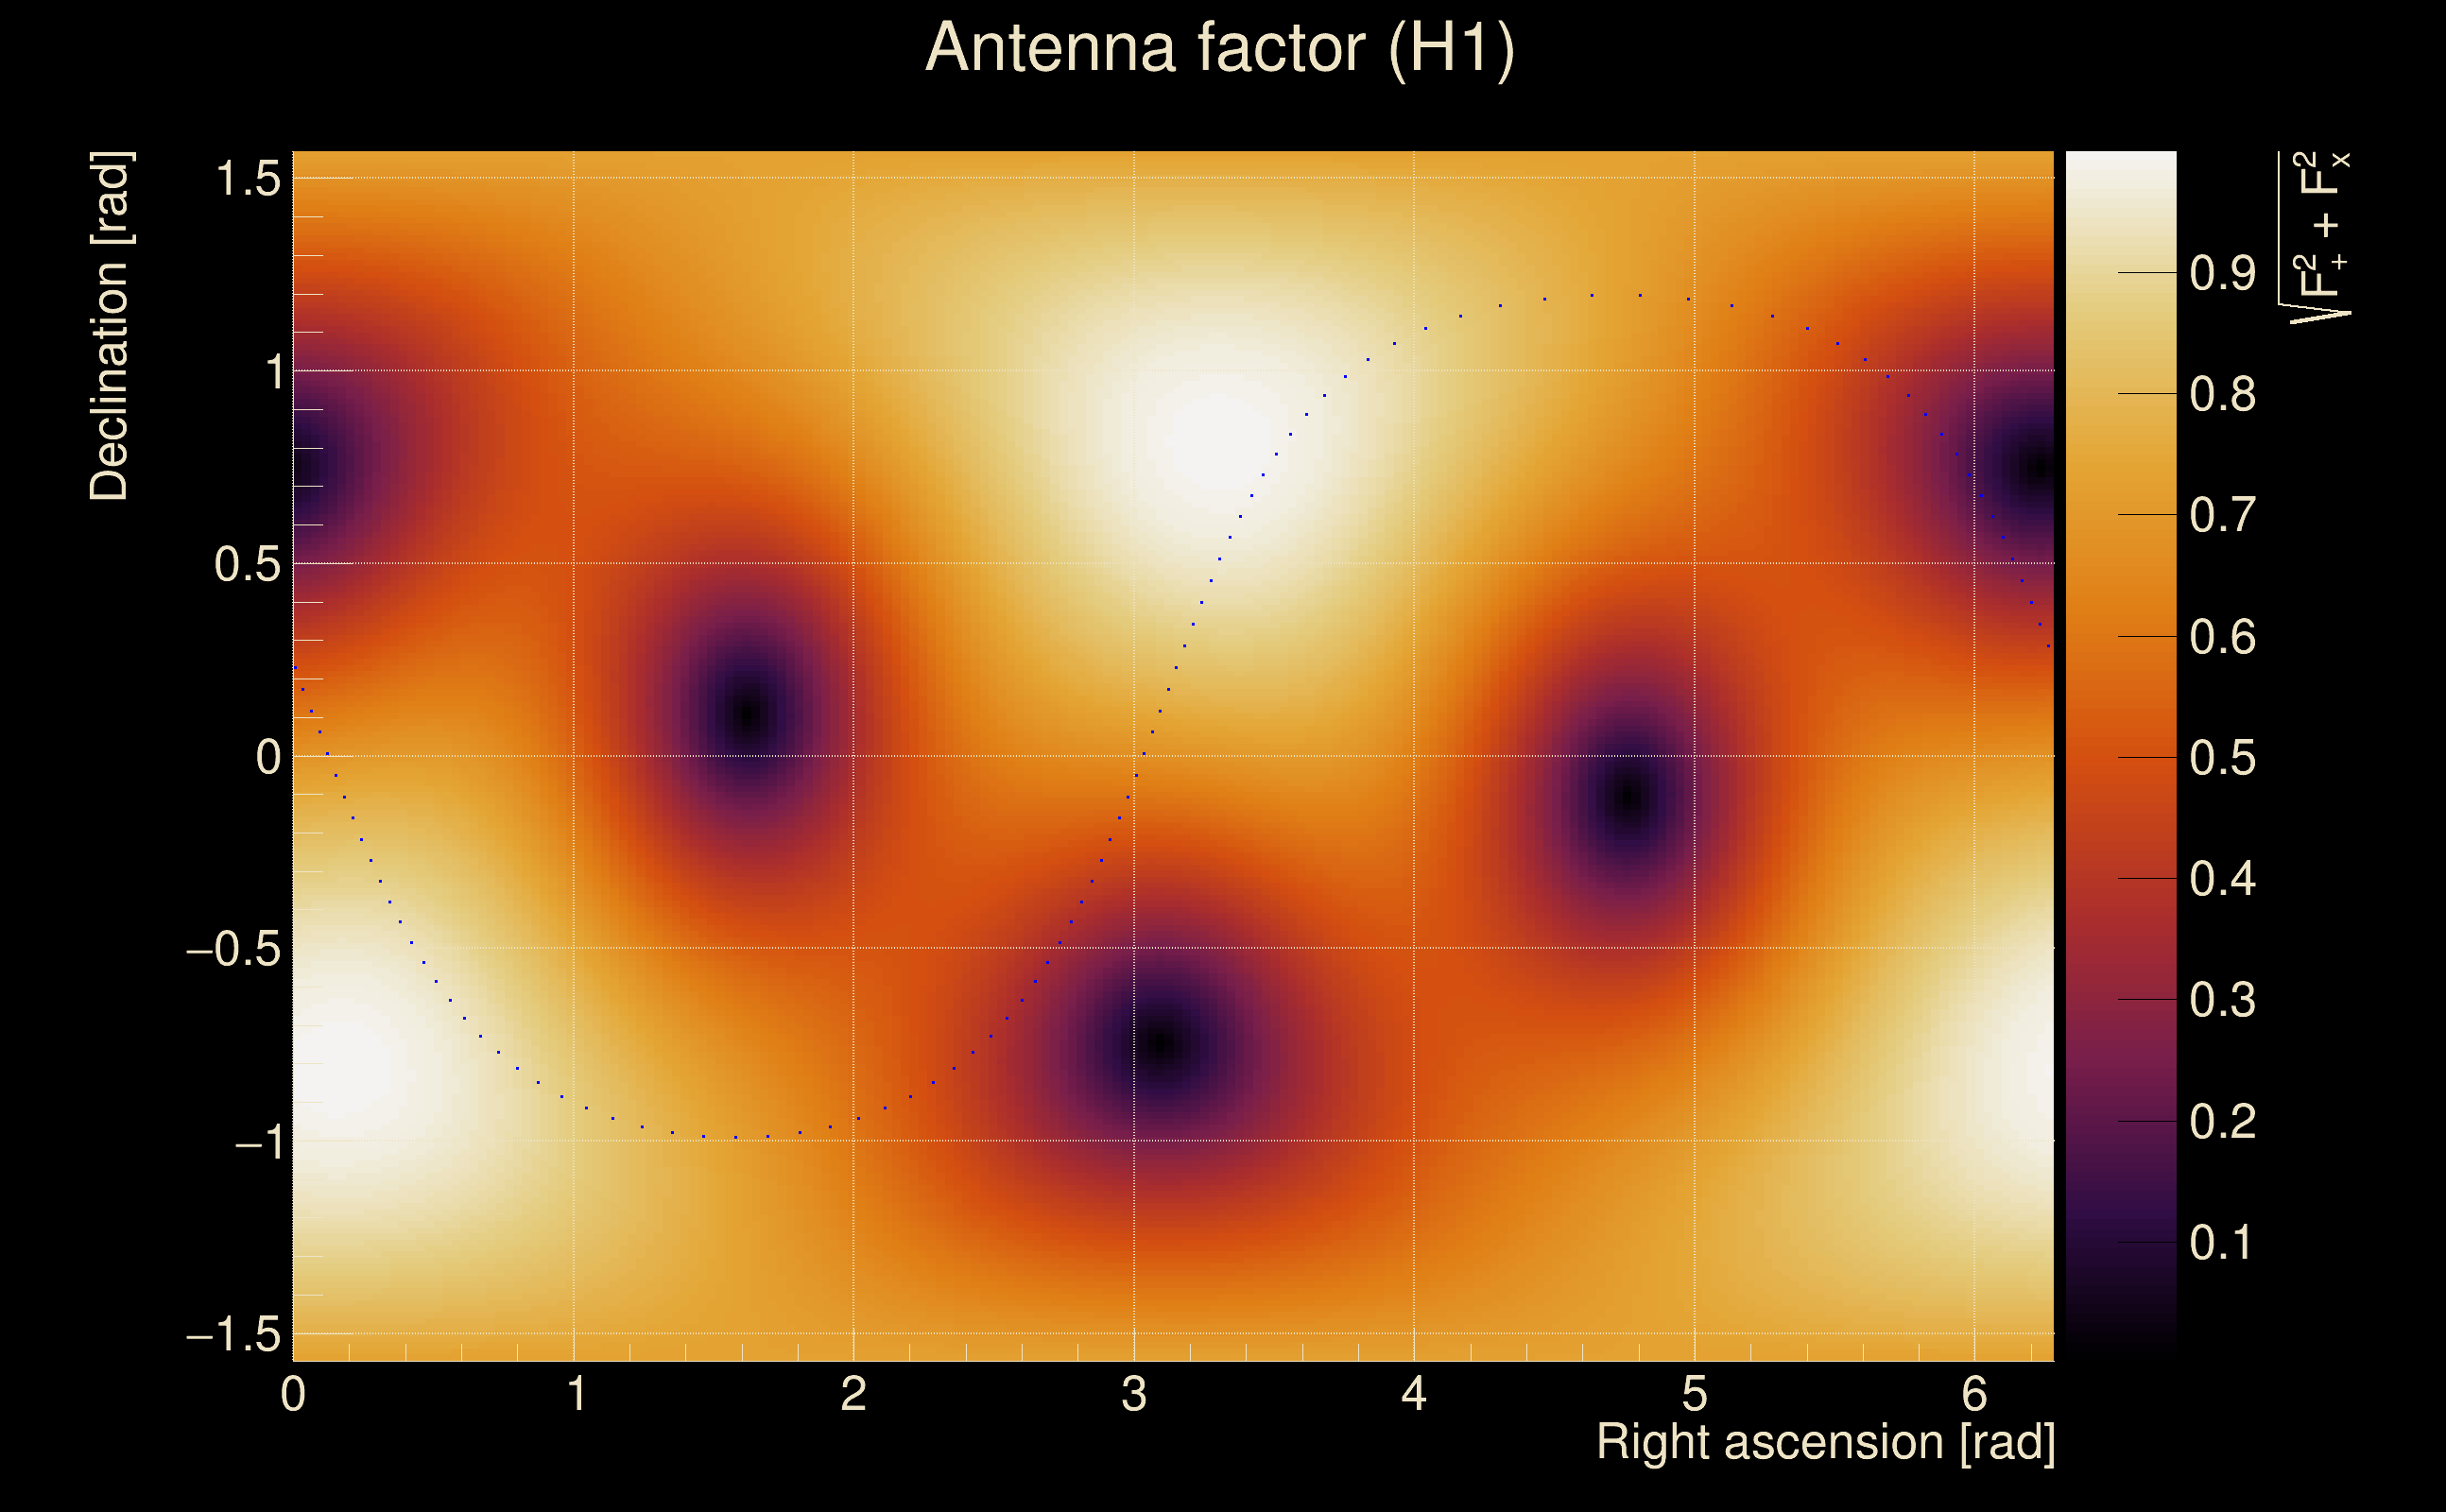
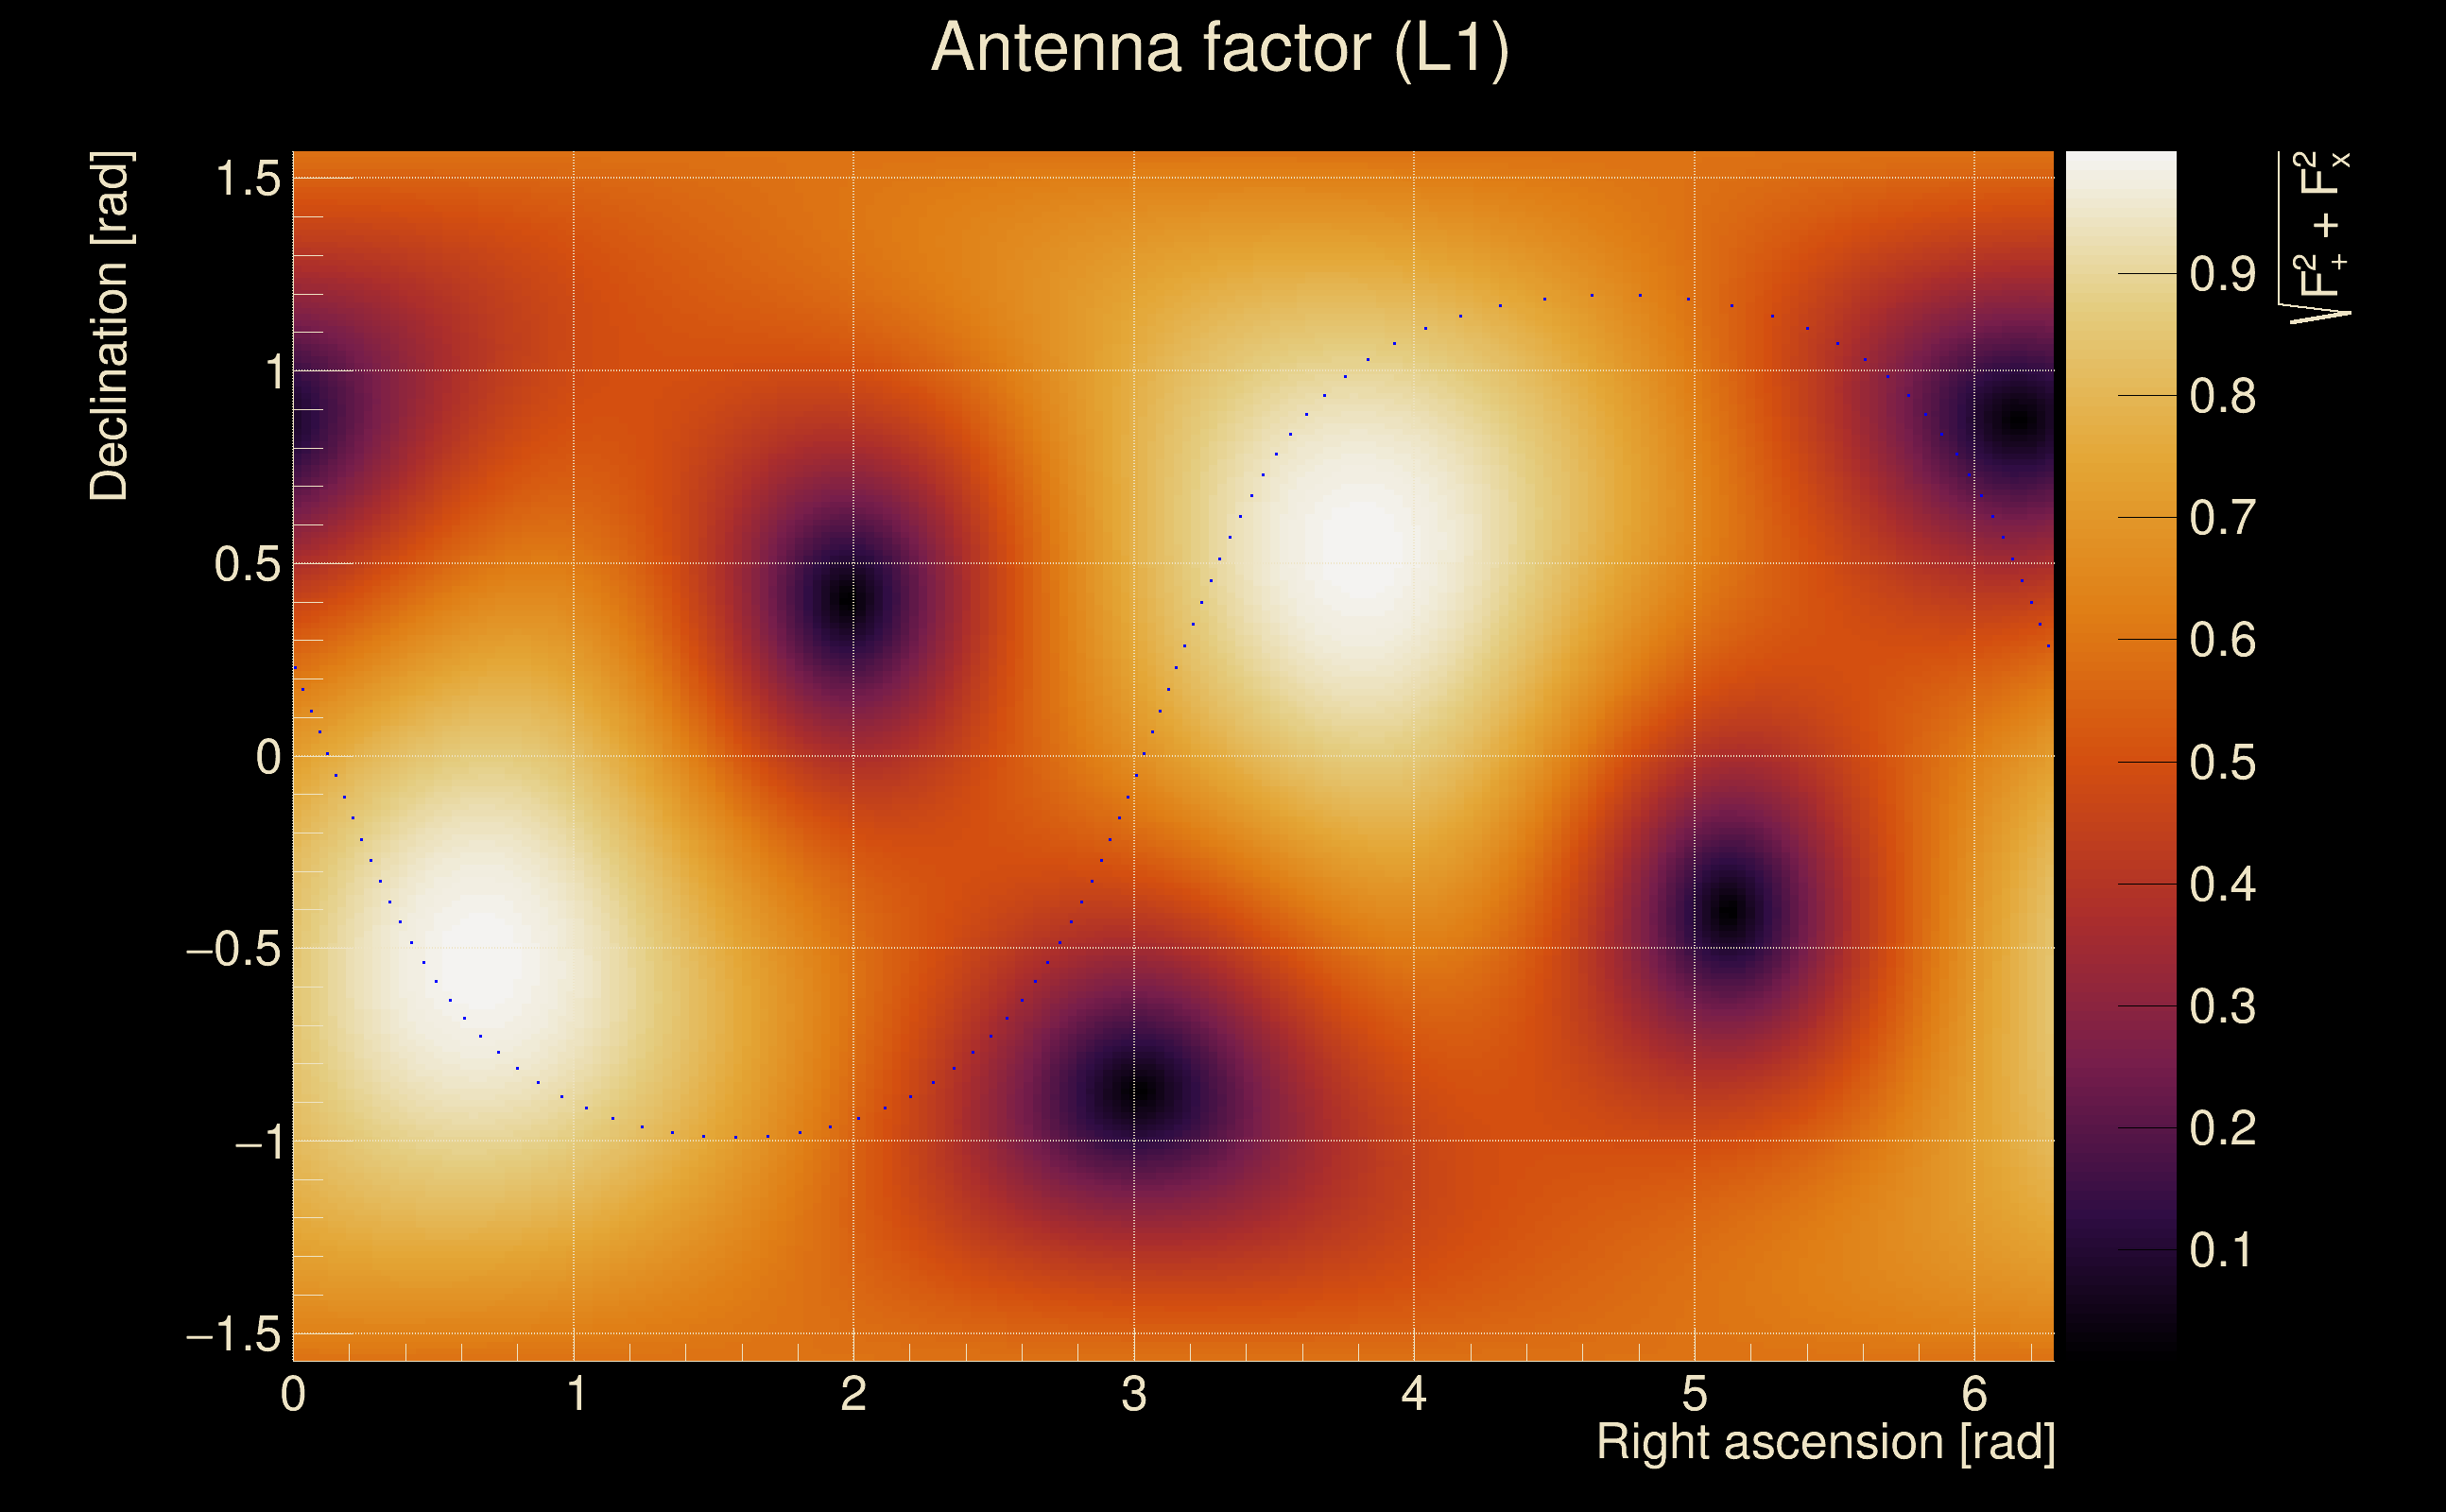
| Target sky positon: | Ra: 3.68109, Dec: 0.94792 [rad] |
| List of input Ox files: | TargIxf_injpt1_tC_file_list.txt (71 files) |
| Analysis result file: | TargIxf_injpt1_tC_results-1.root |
| Slice selected for the the fakeground: | slice index=119 (-0.506 s), time lag = 0 s |
| Foreground | Fakeground | Background | ||
|---|---|---|---|---|
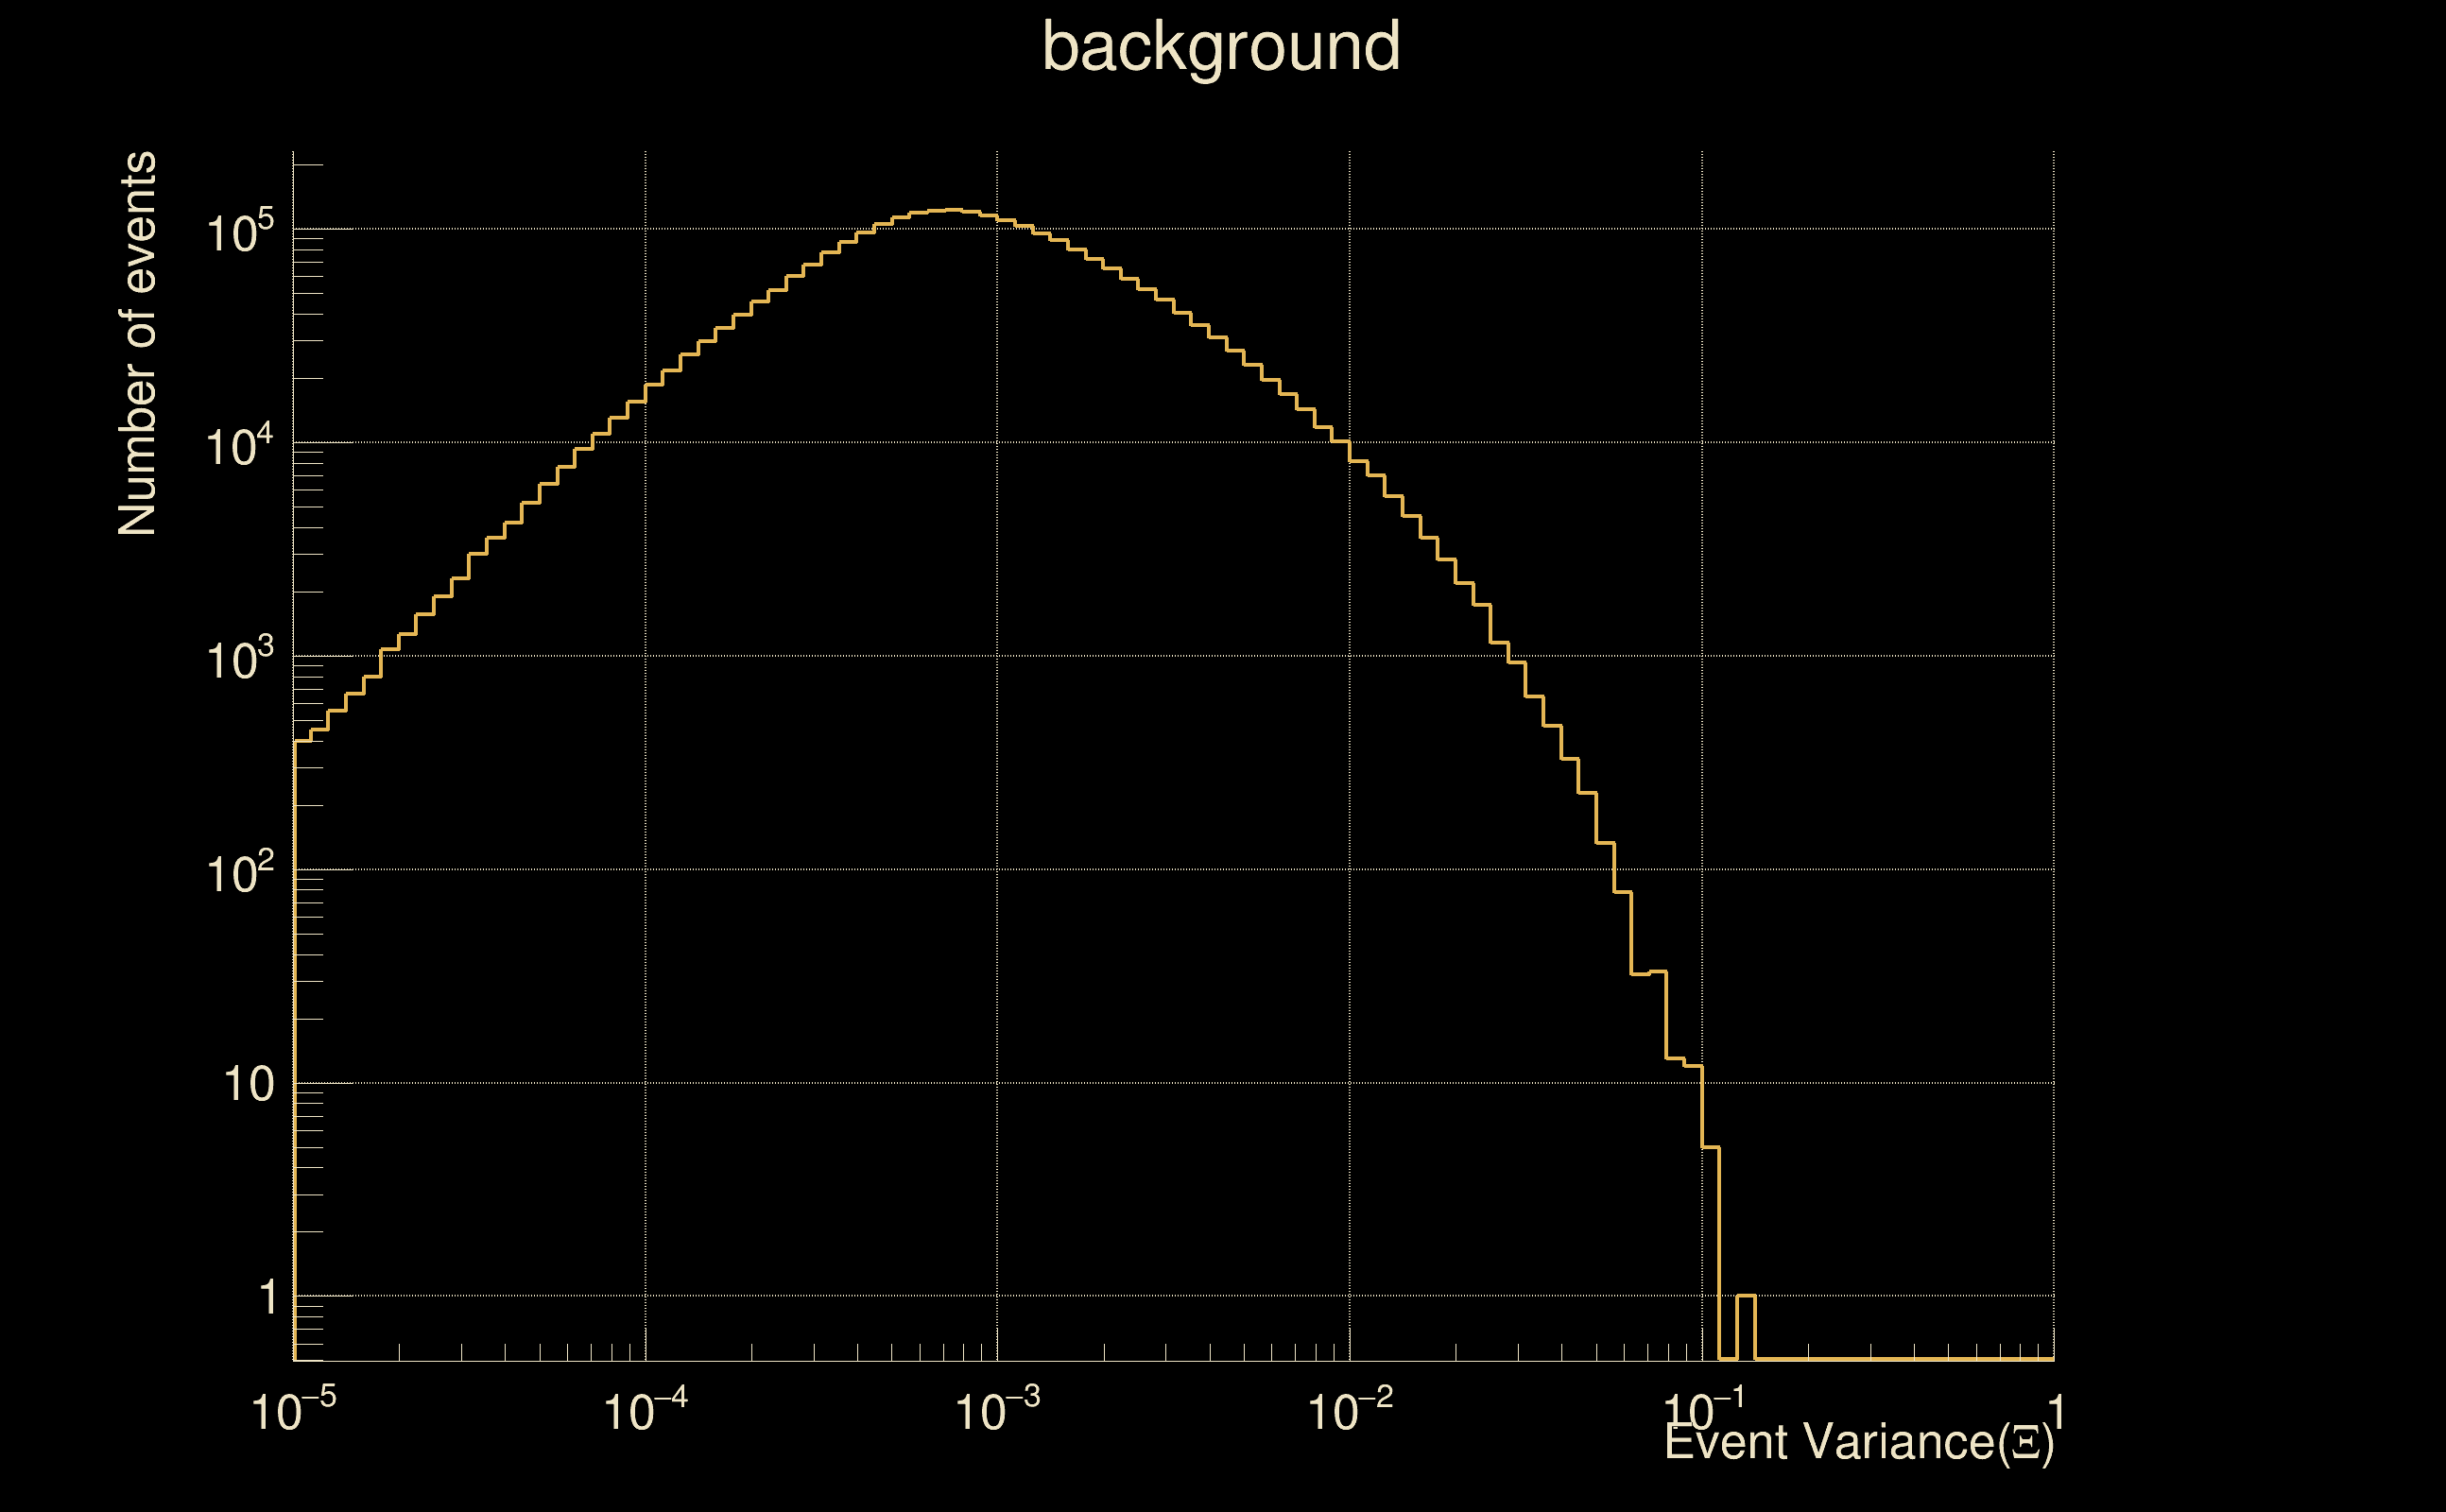
| Number of processed ox events | 12111 | 12111 | 2603865 | |
| Start Date (detector 0) | Mon May 15 14:13:25 2023 UTC | Mon May 15 14:13:25 2023 UTC | Mon May 15 14:13:25 2023 UTC | |
| End Date (detector 0) | Thu May 18 15:54:40 2023 UTC | Thu May 18 15:54:40 2023 UTC | Thu May 18 15:54:40 2023 UTC | |
| Start GPS (detector 0) | 1368195223 | 1368195223 | 1368195223 | |
| End GPS (detector 0) | 1368460498 | 1368460498 | 1368460498 | |
| Used livetime (detector 0) | 60875 s | 60875 s | 60875 s | |
| Start Date (detector 1) | Mon May 15 14:13:25 2023 UTC | Mon May 15 14:13:25 2023 UTC | Mon May 15 14:13:25 2023 UTC | |
| End Date (detector 1) | Thu May 18 15:54:40 2023 UTC | Thu May 18 15:54:40 2023 UTC | Thu May 18 15:54:40 2023 UTC | |
| Start GPS (detector 1) | 1368195223 | 1368195223 | 1368195223 | |
| End GPS (detector 1) | 1368460498 | 1368460498 | 1368460498 | |
| Used livetime (detector 1) | 60875 s | 60875 s | 60875 s | |
| Cumulative livetime | 121110 s | 121110 s | 26038650 s | |
| 0 years, 1 days, 9 hours, 38 min, 30 s | 0 years, 1 days, 9 hours, 38 min, 30 s | 0 years, 301 days, 8 hours, 57 min, 30 s |
|
|
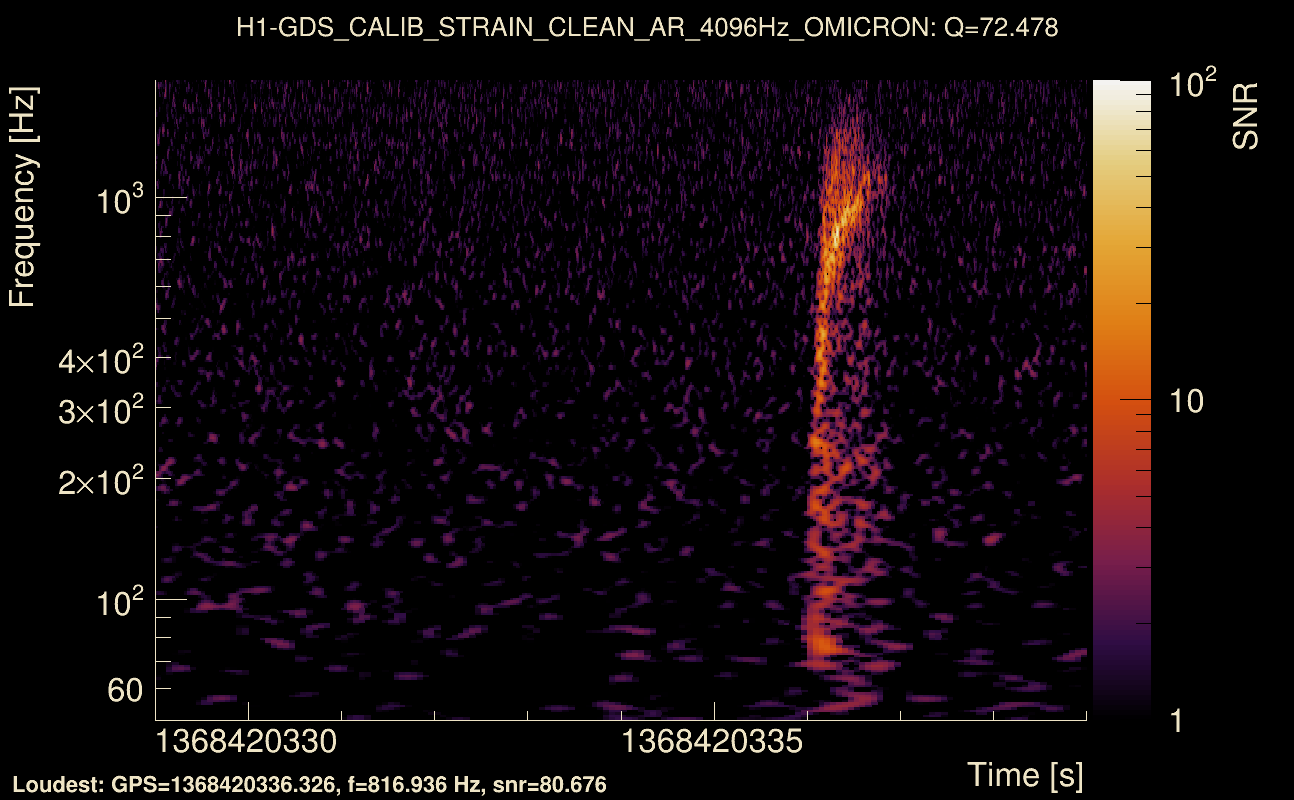
| Event time t(H1): | GPS = 1368420329 (Thu May 18 04:45:11 2023 ) → GPS = 1368420339 (Thu May 18 04:45:21 2023 ) |
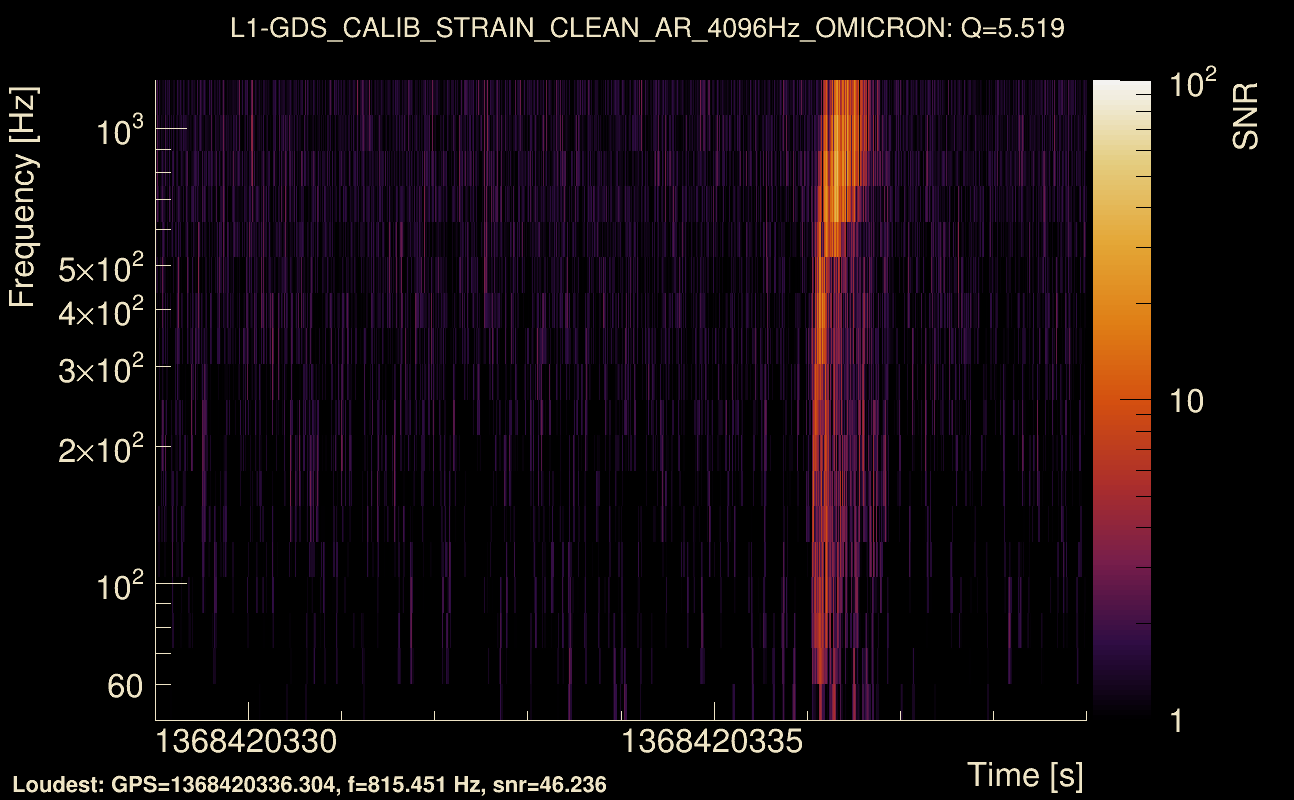
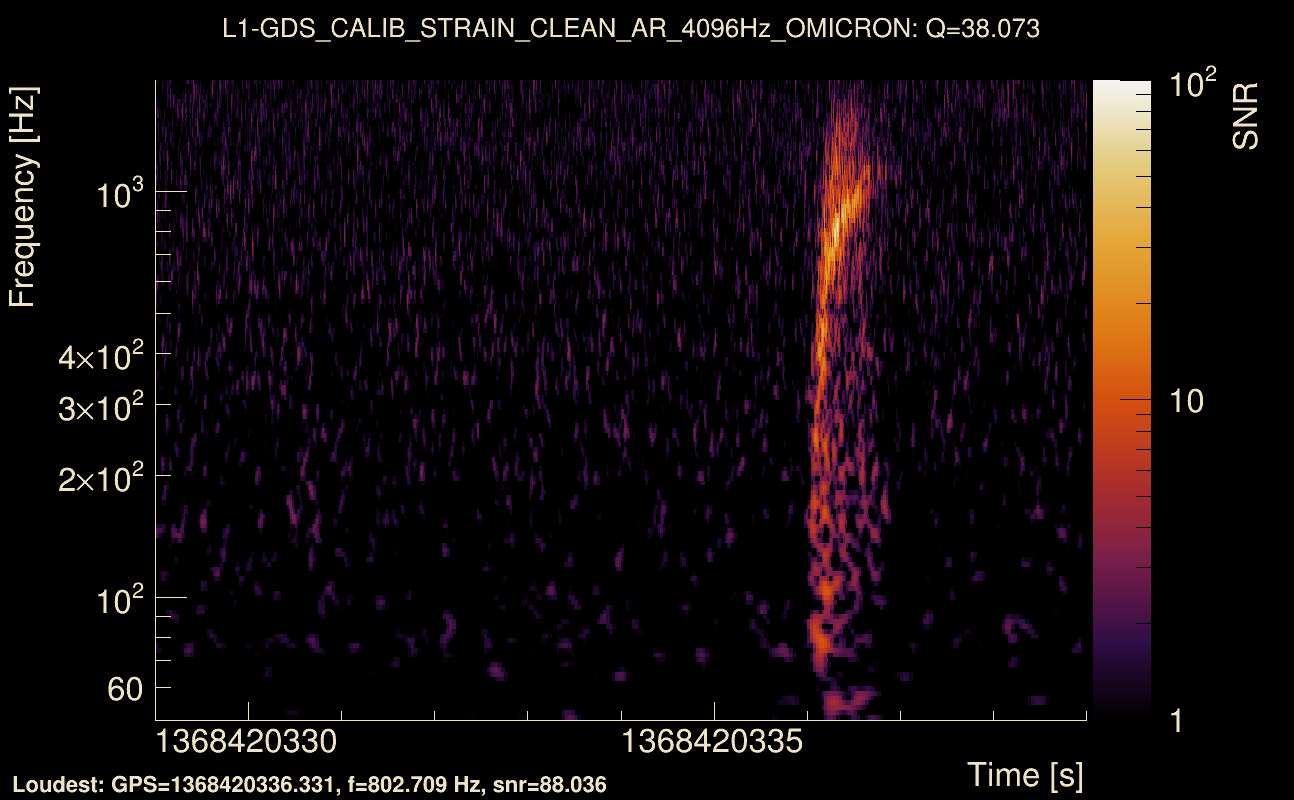
| Event time t(L1): | GPS = 1368420329 (Thu May 18 04:45:21 2023 ) → GPS = 1368420339 (Thu May 18 04:45:21 2023 ) |
| Omicron analysis time window (H1): | GPS = 1368420326 → GPS = 1368420342 |
| Omicron analysis time window (L1): | GPS = 1368420326 → GPS = 1368420342 |
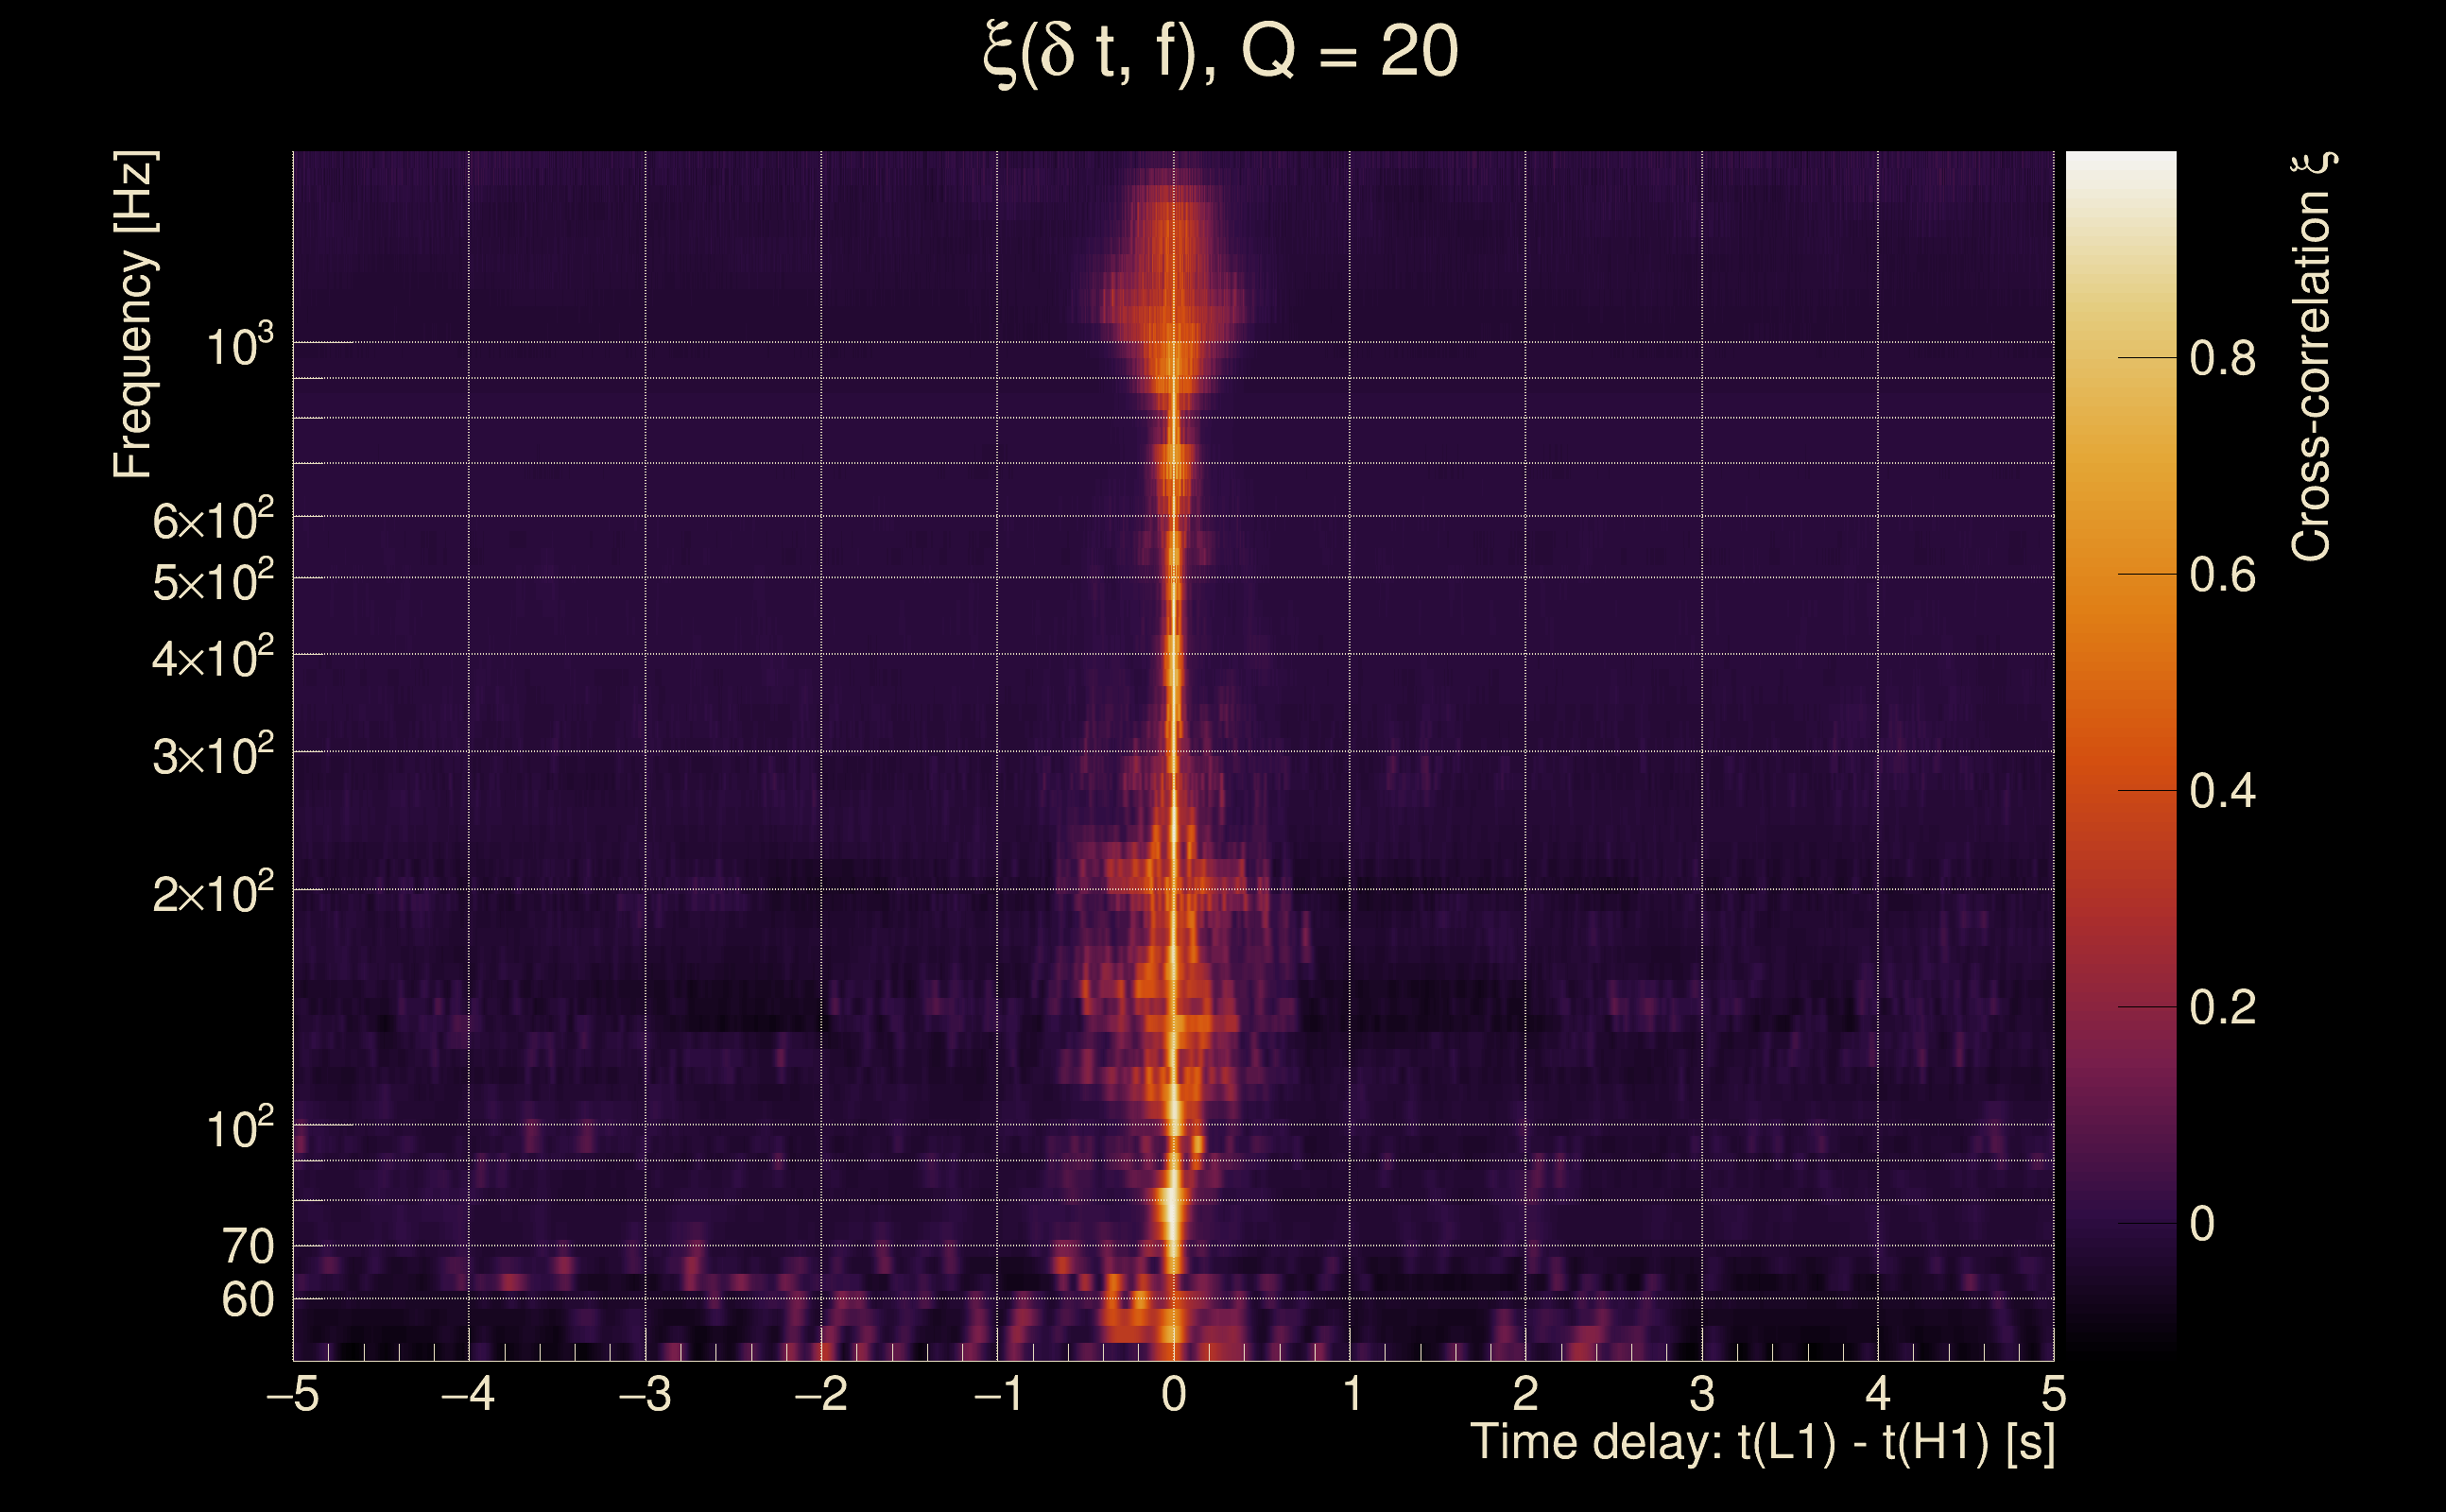
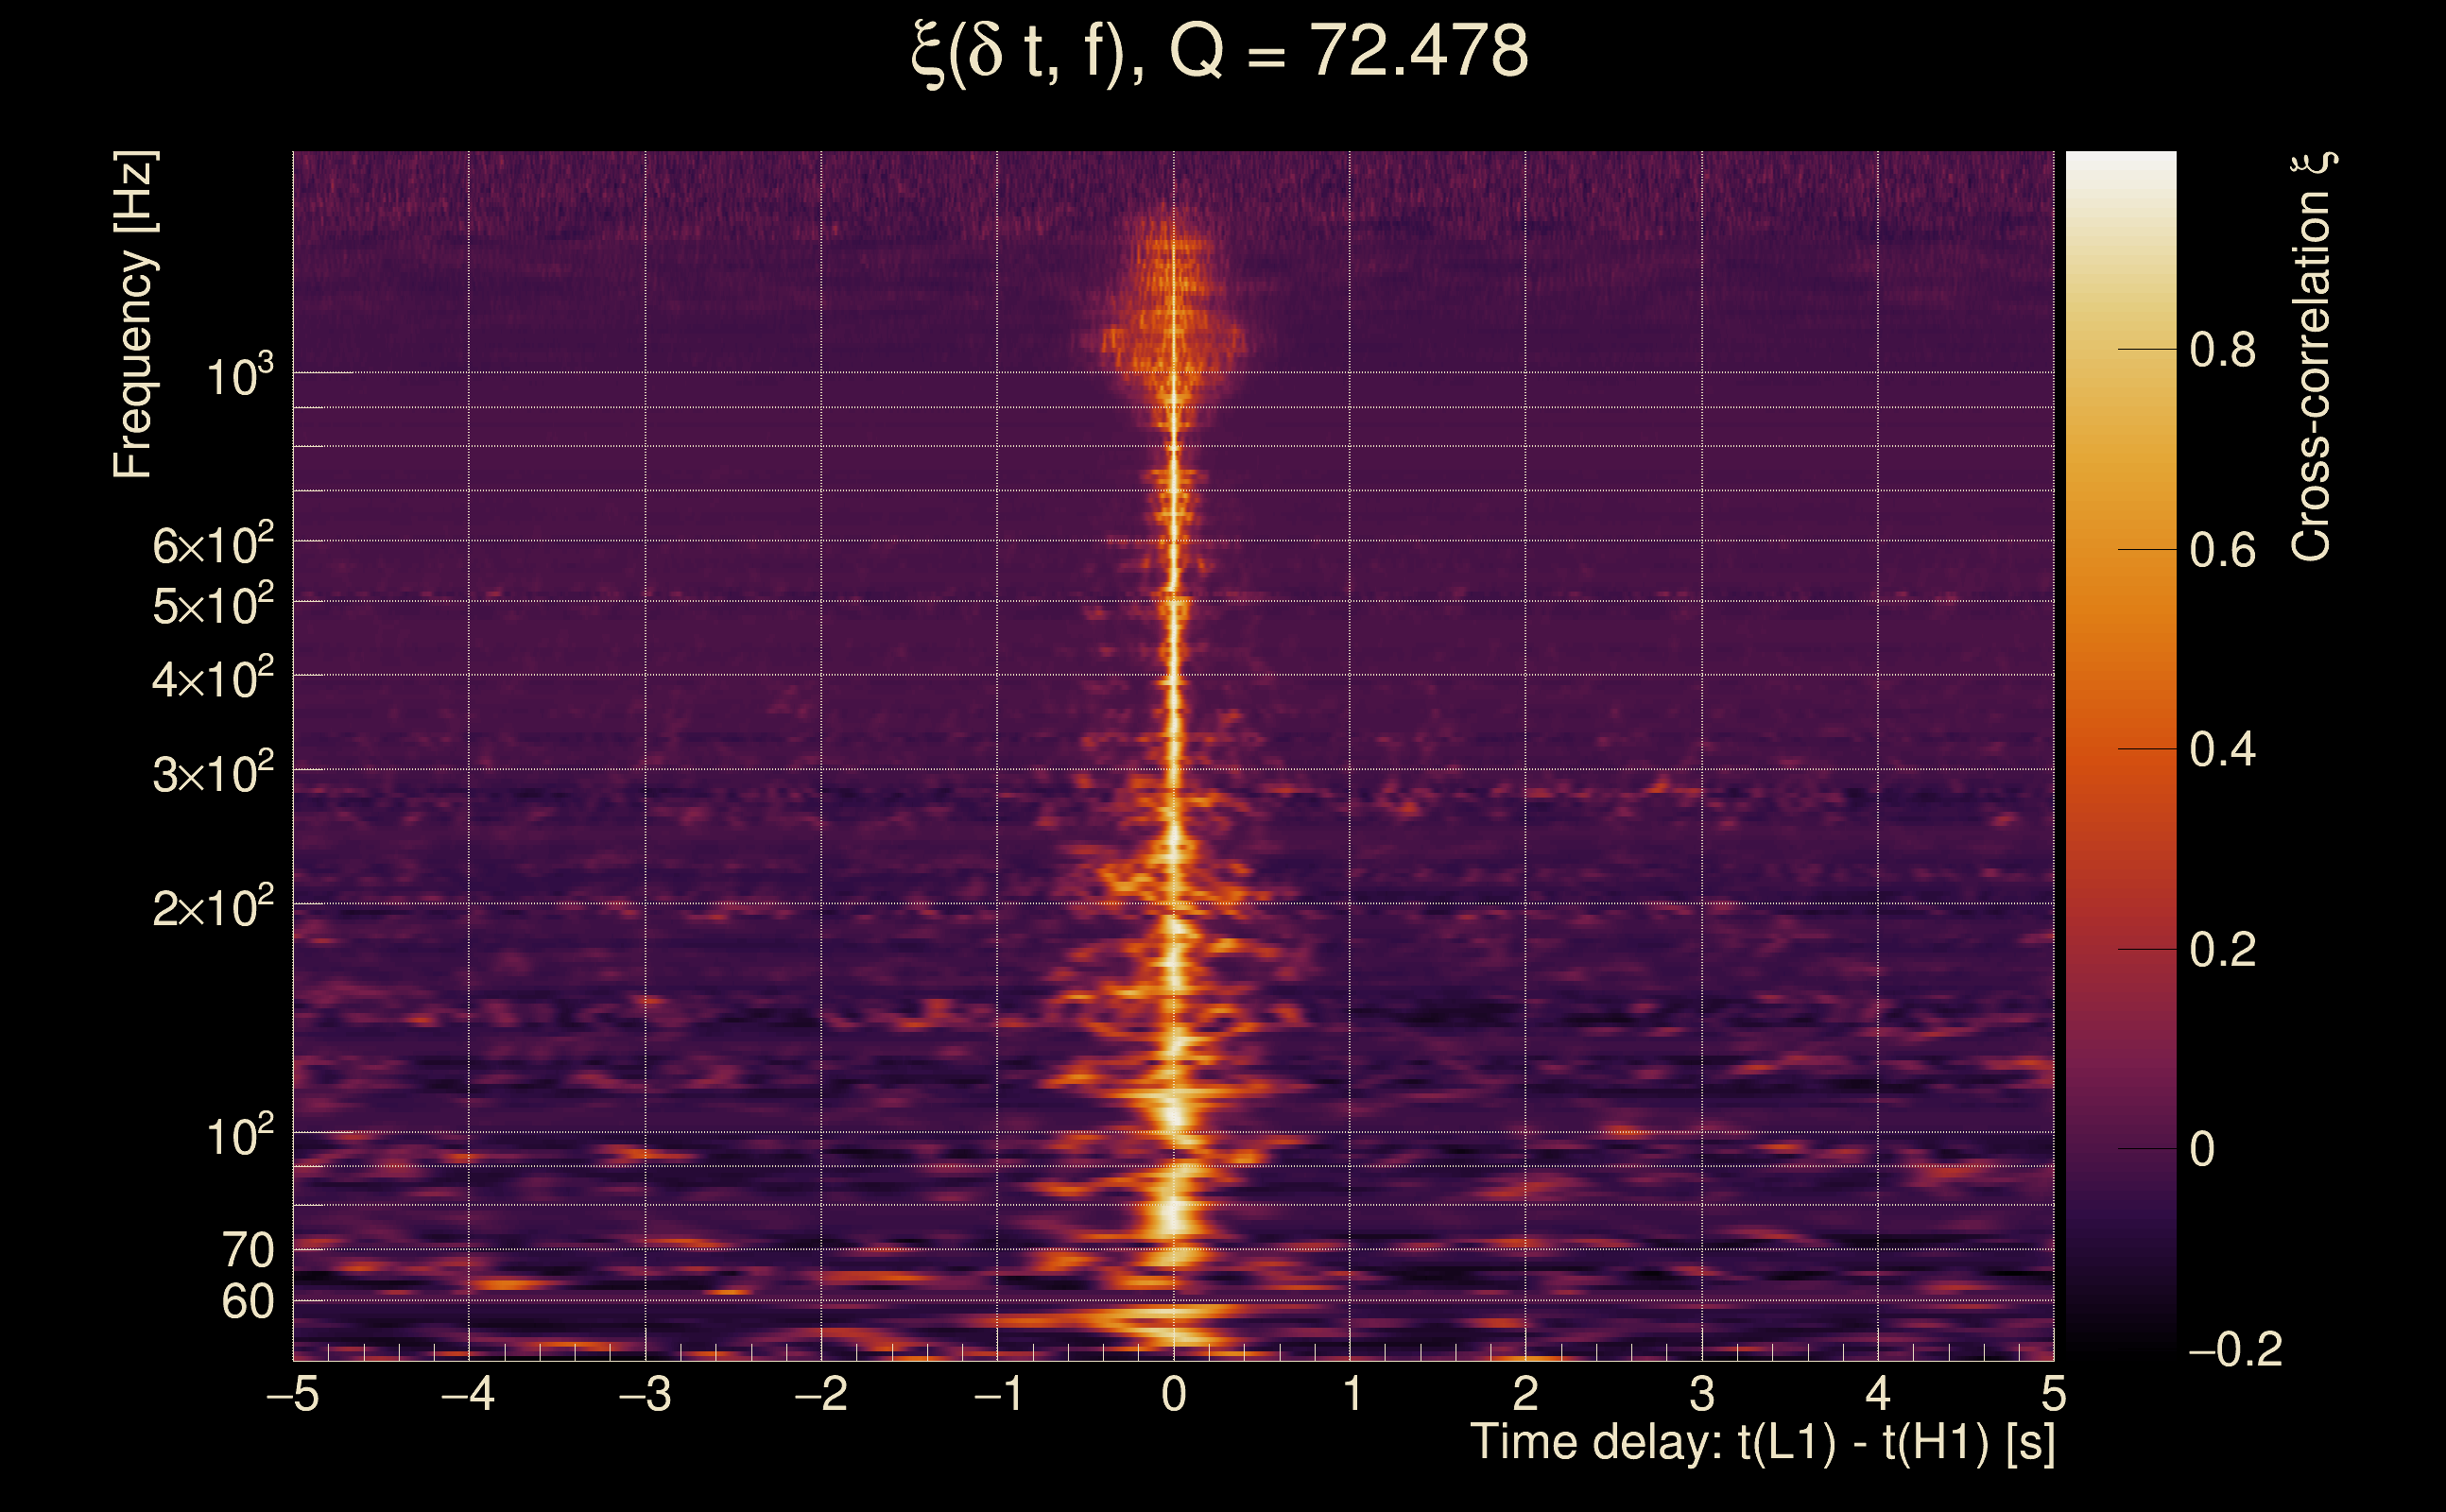
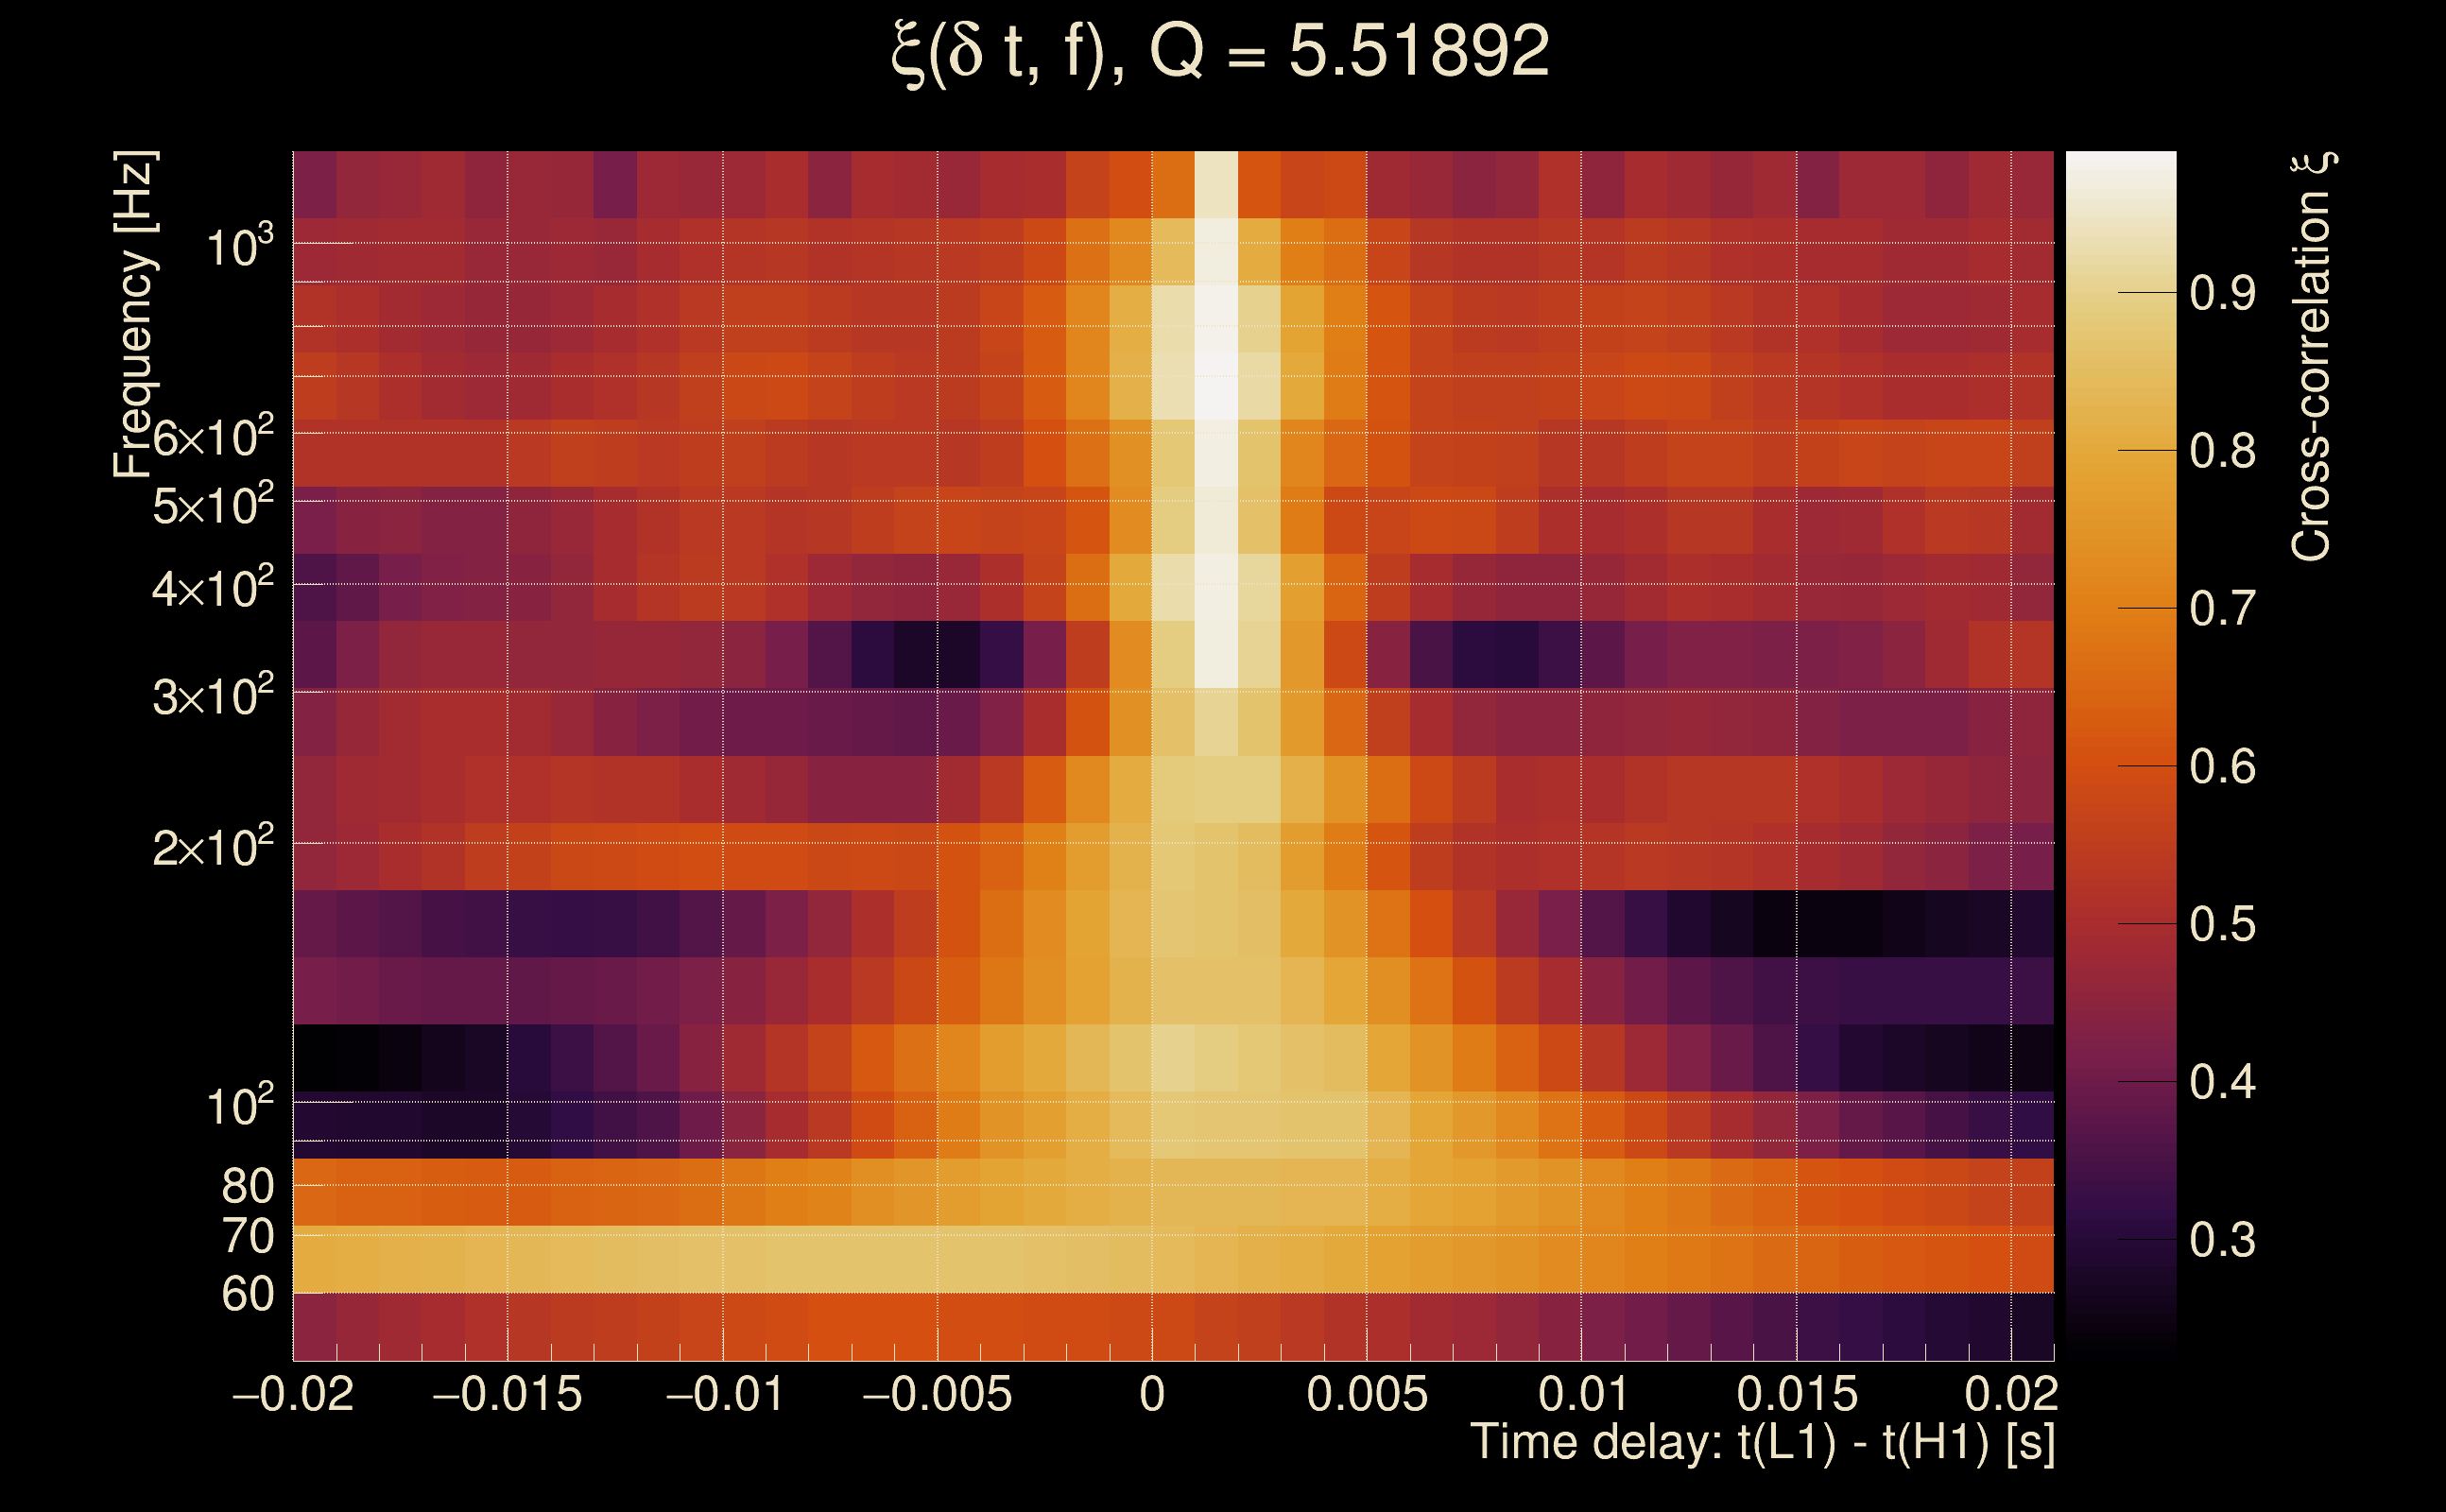
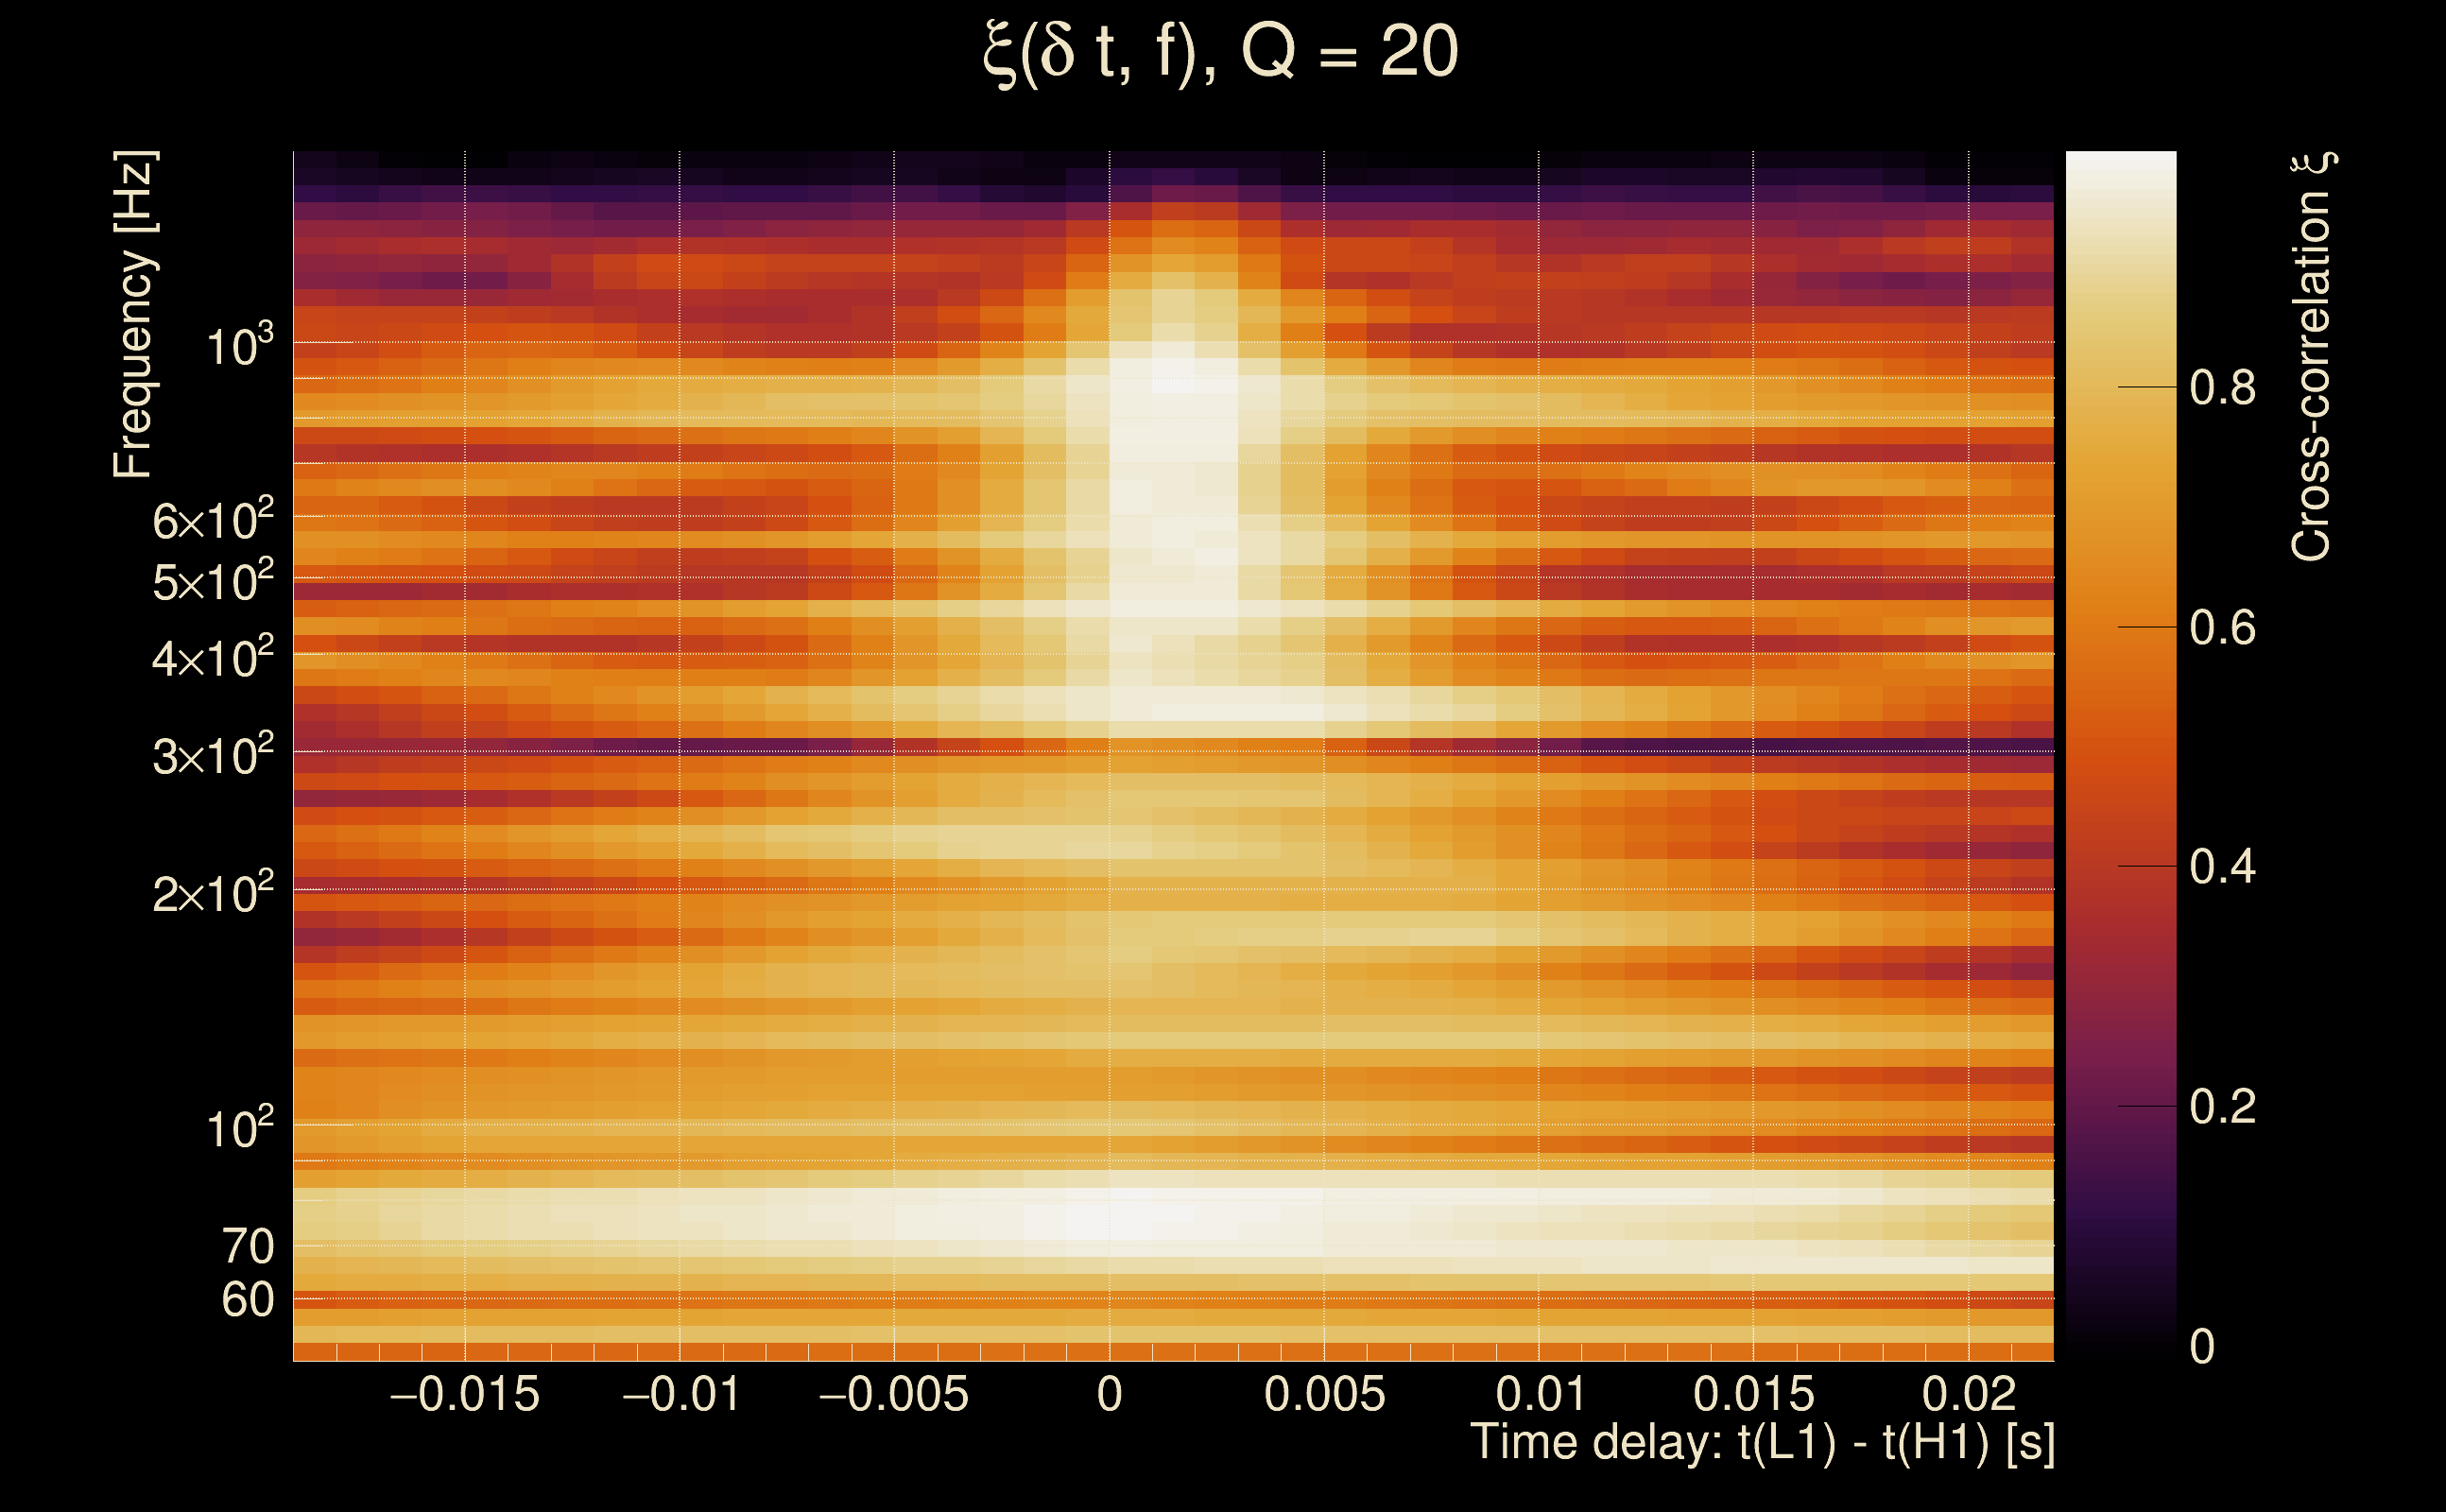
| Time delay between detectors t(L1) - t(H1): | 0.000942973 s (slice index = 108 / 217), δt_gw = 0.000942973 s |
| Time delay uncertainty: | 0.00049665 s |
| [targeted mode] Time delay probability: | 0.989614 (0.0130175 sigmas), δt_target = 1.72247e+45 s |
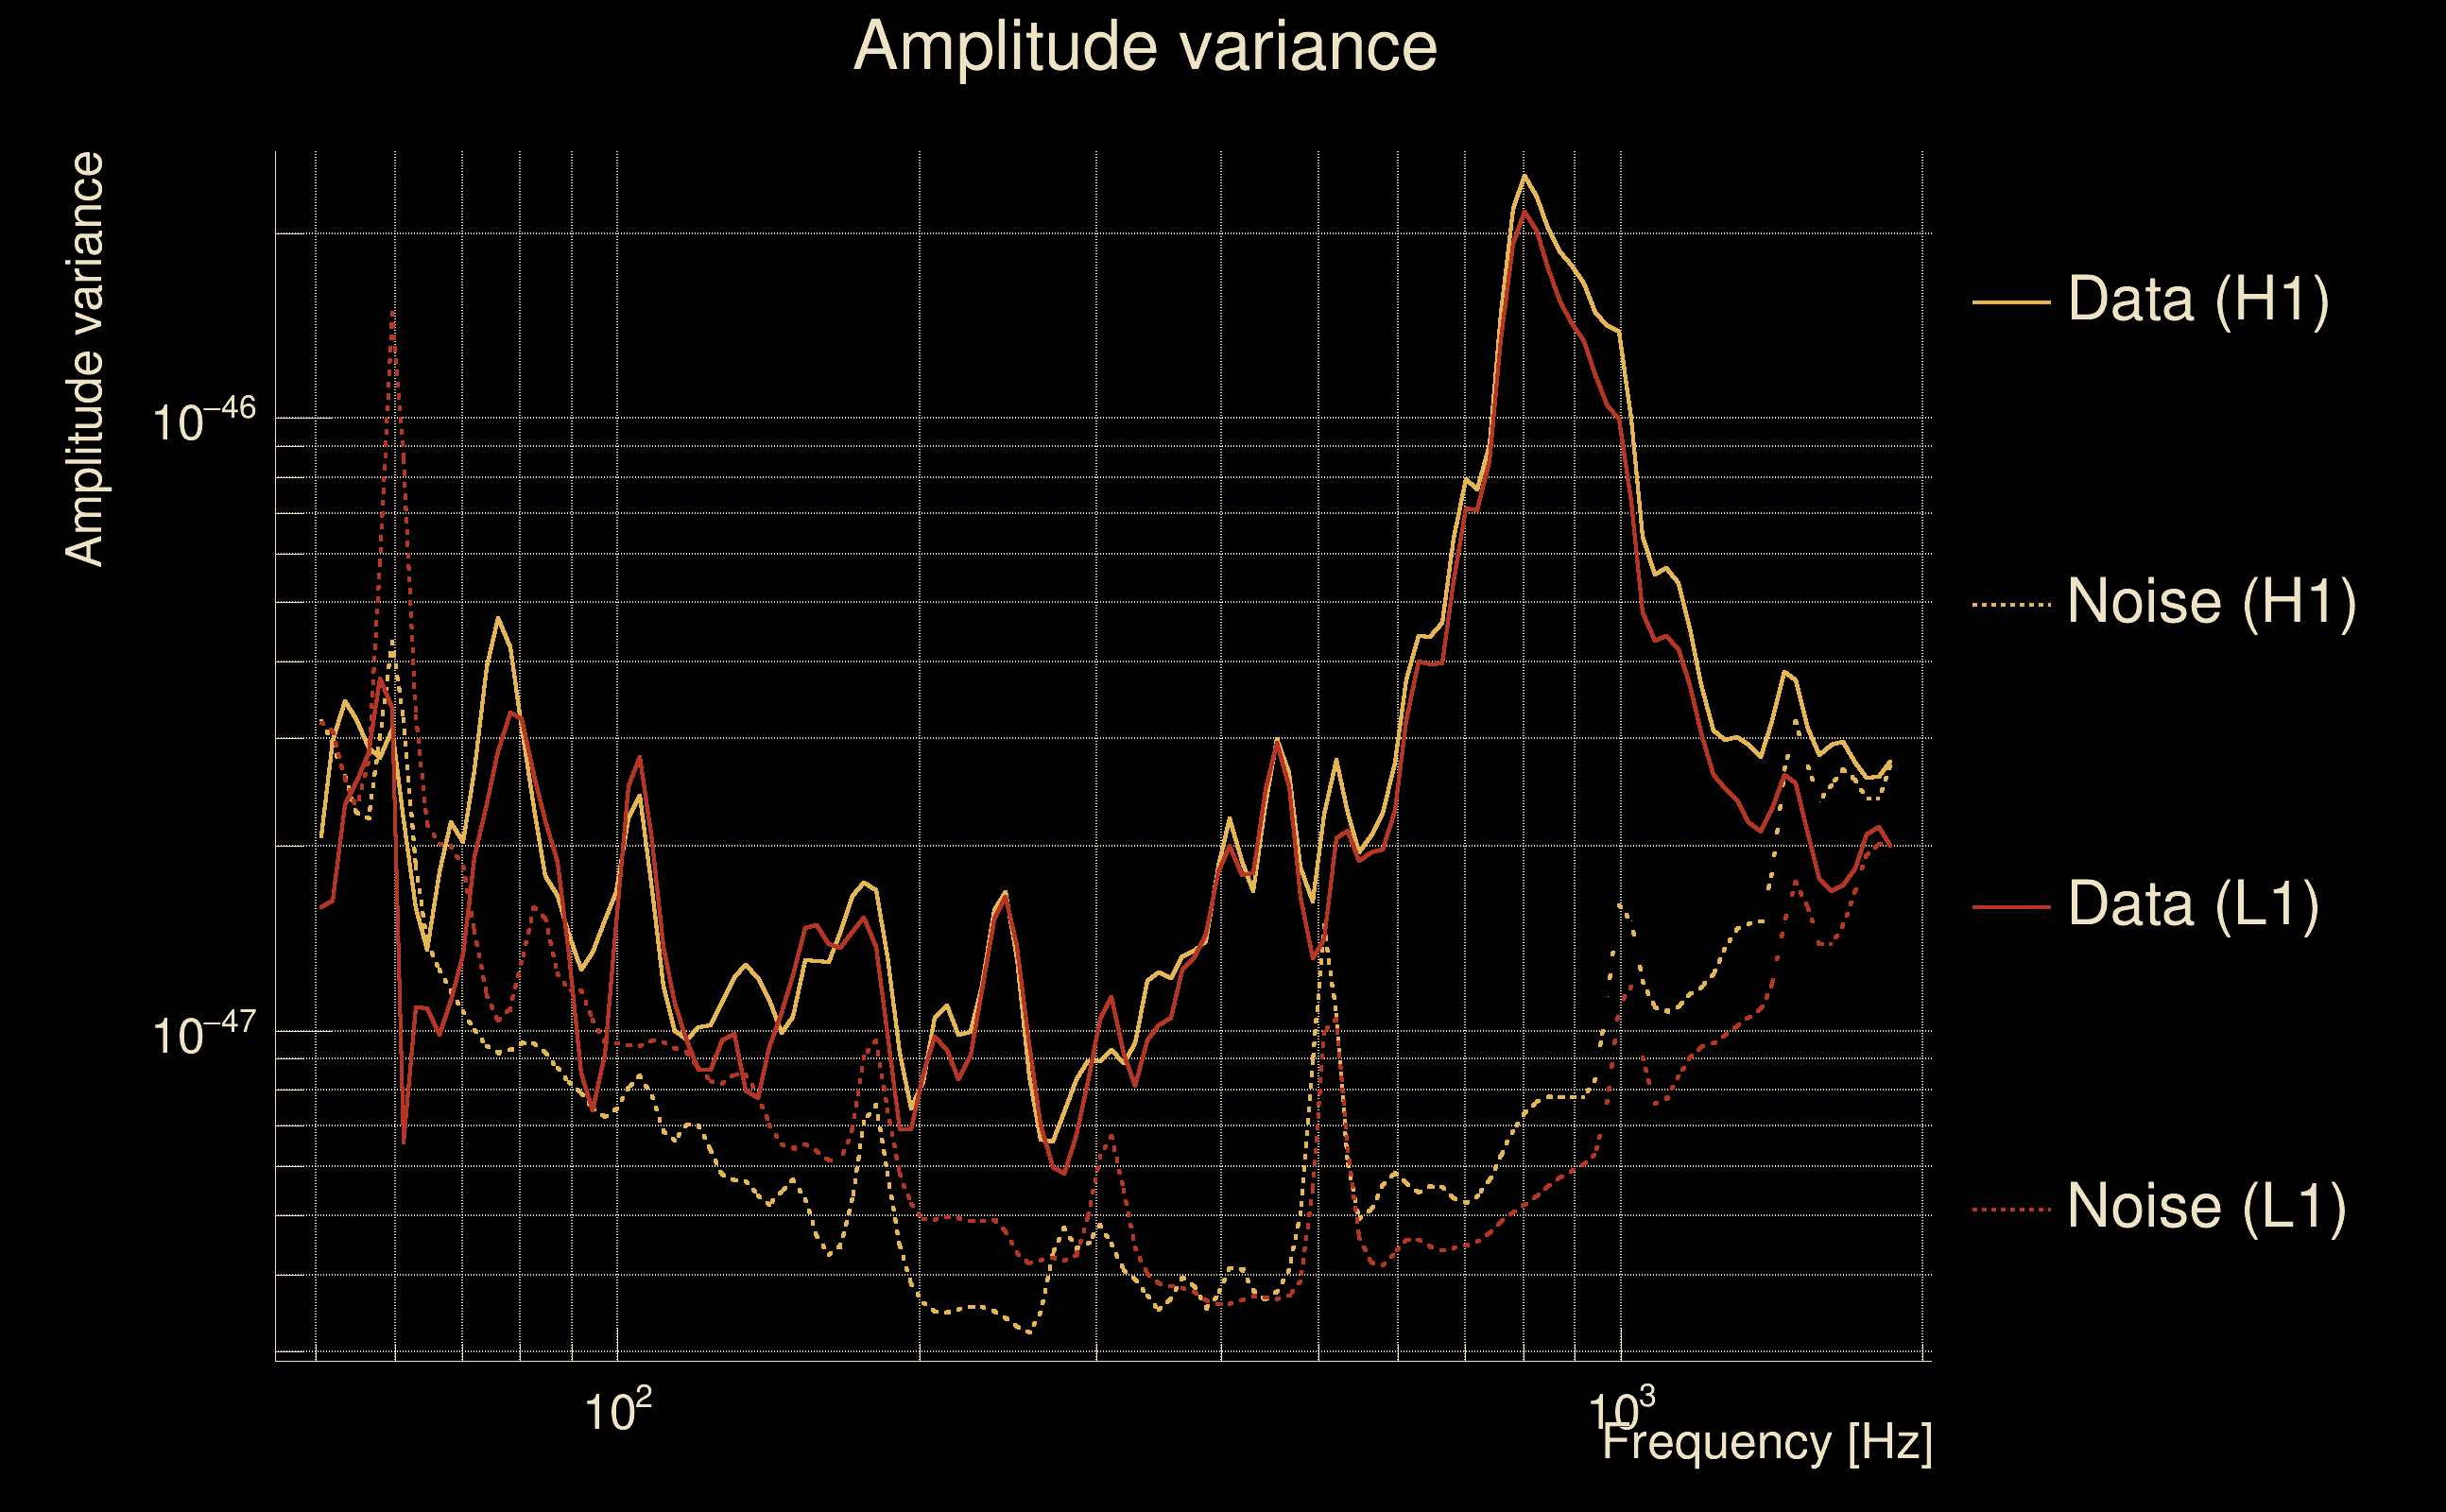
| Frequency: | 315.733 Hz |
| Ξ: | 0.885191 ± 0.00885601 (variance = 7.84289e-05): Q0: 0.908735, Q1: 0.8993, Q2: 0.884148, Q3: 0.891629, Q4: 0.904576 |
| Rank: | R_A = 0.82078 |
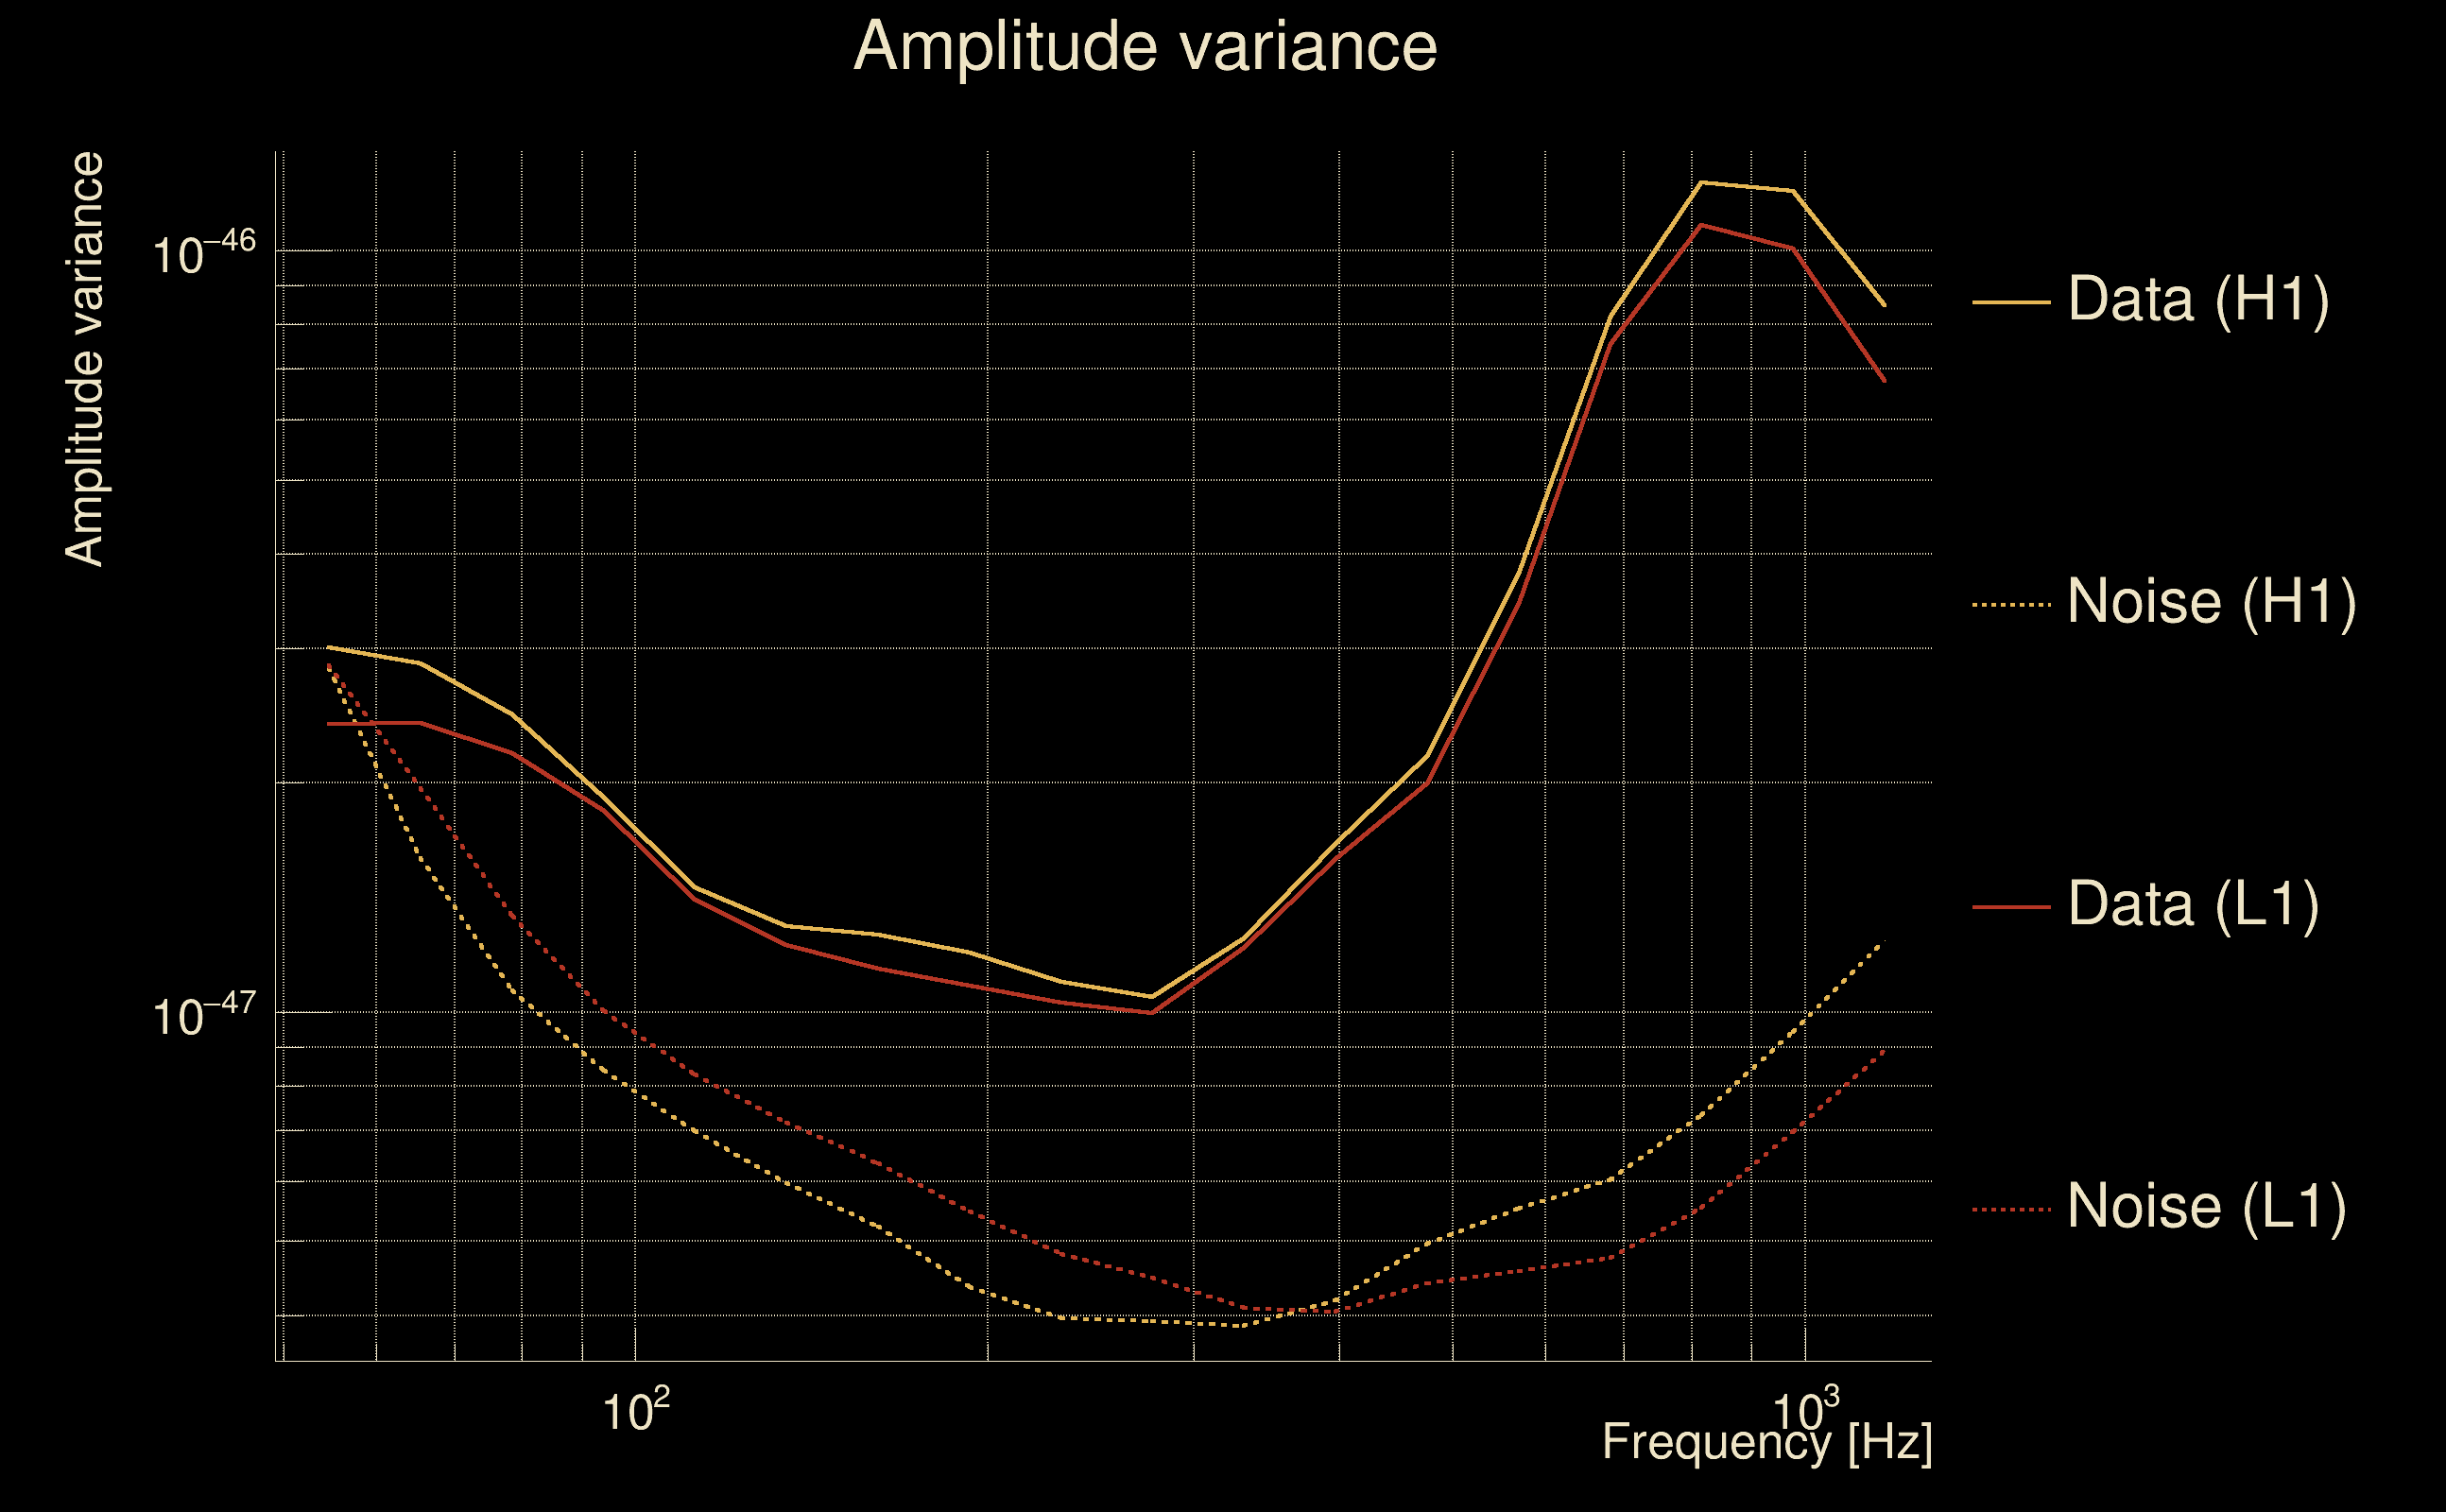
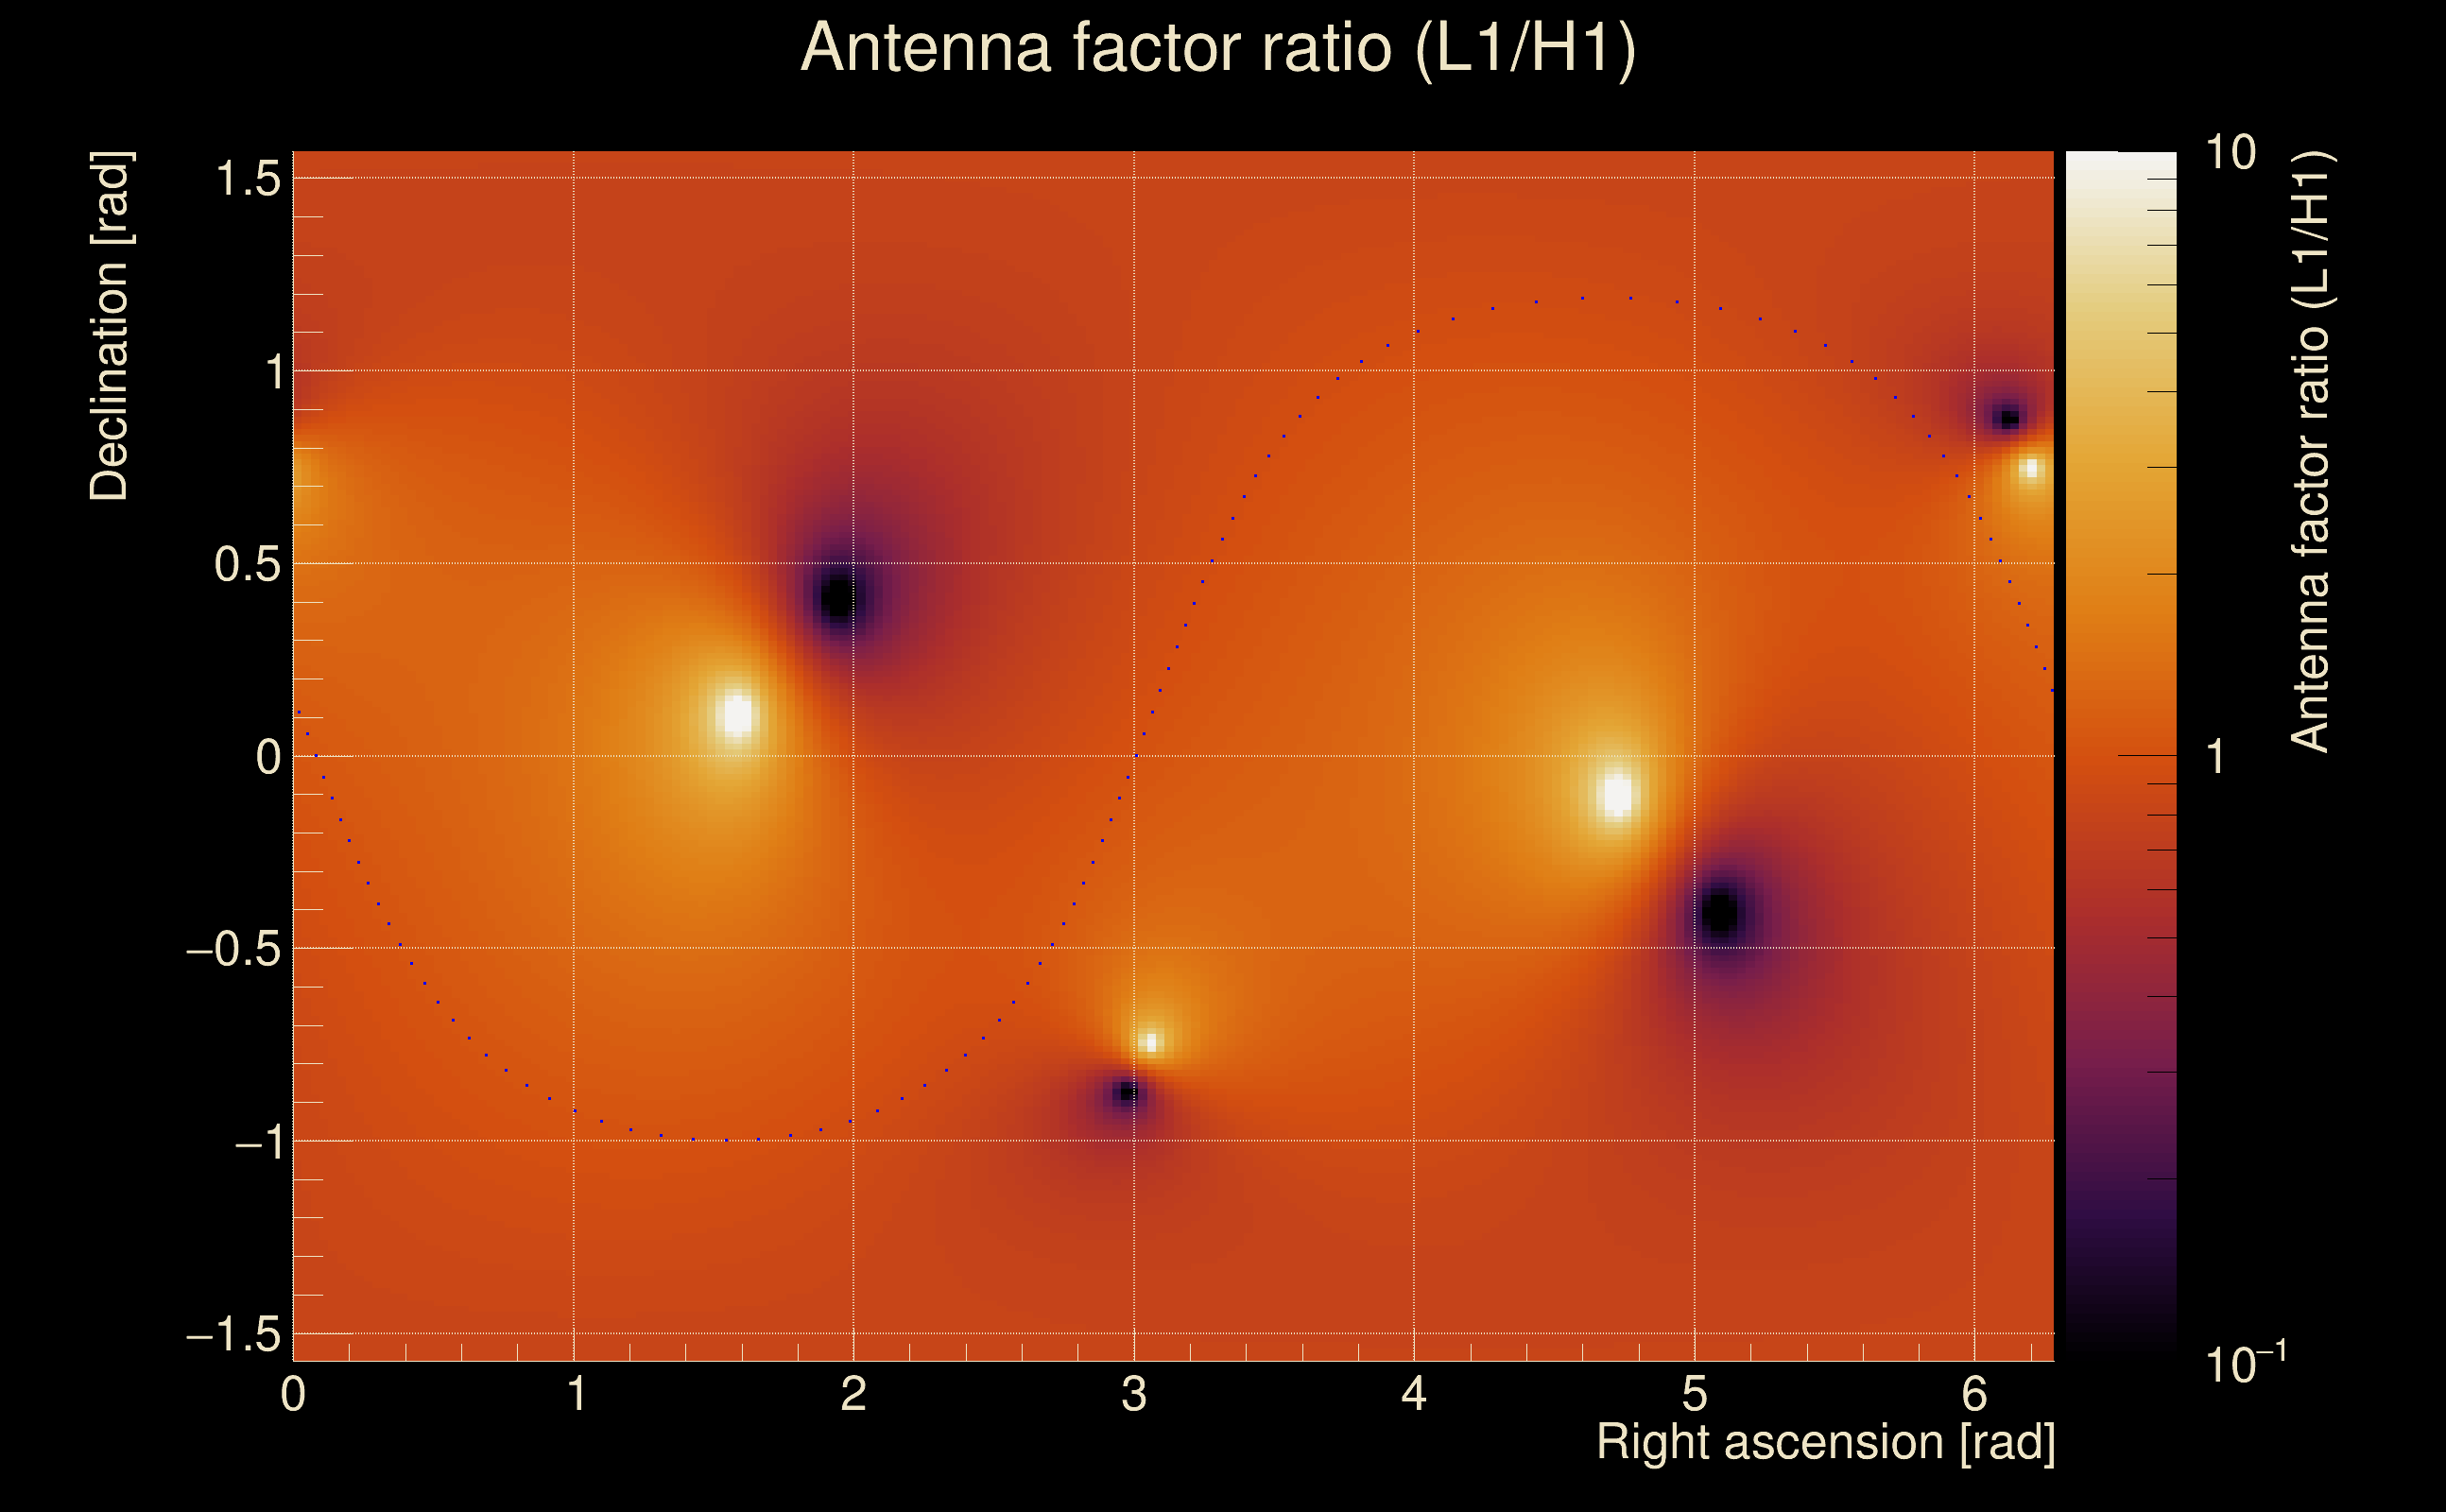
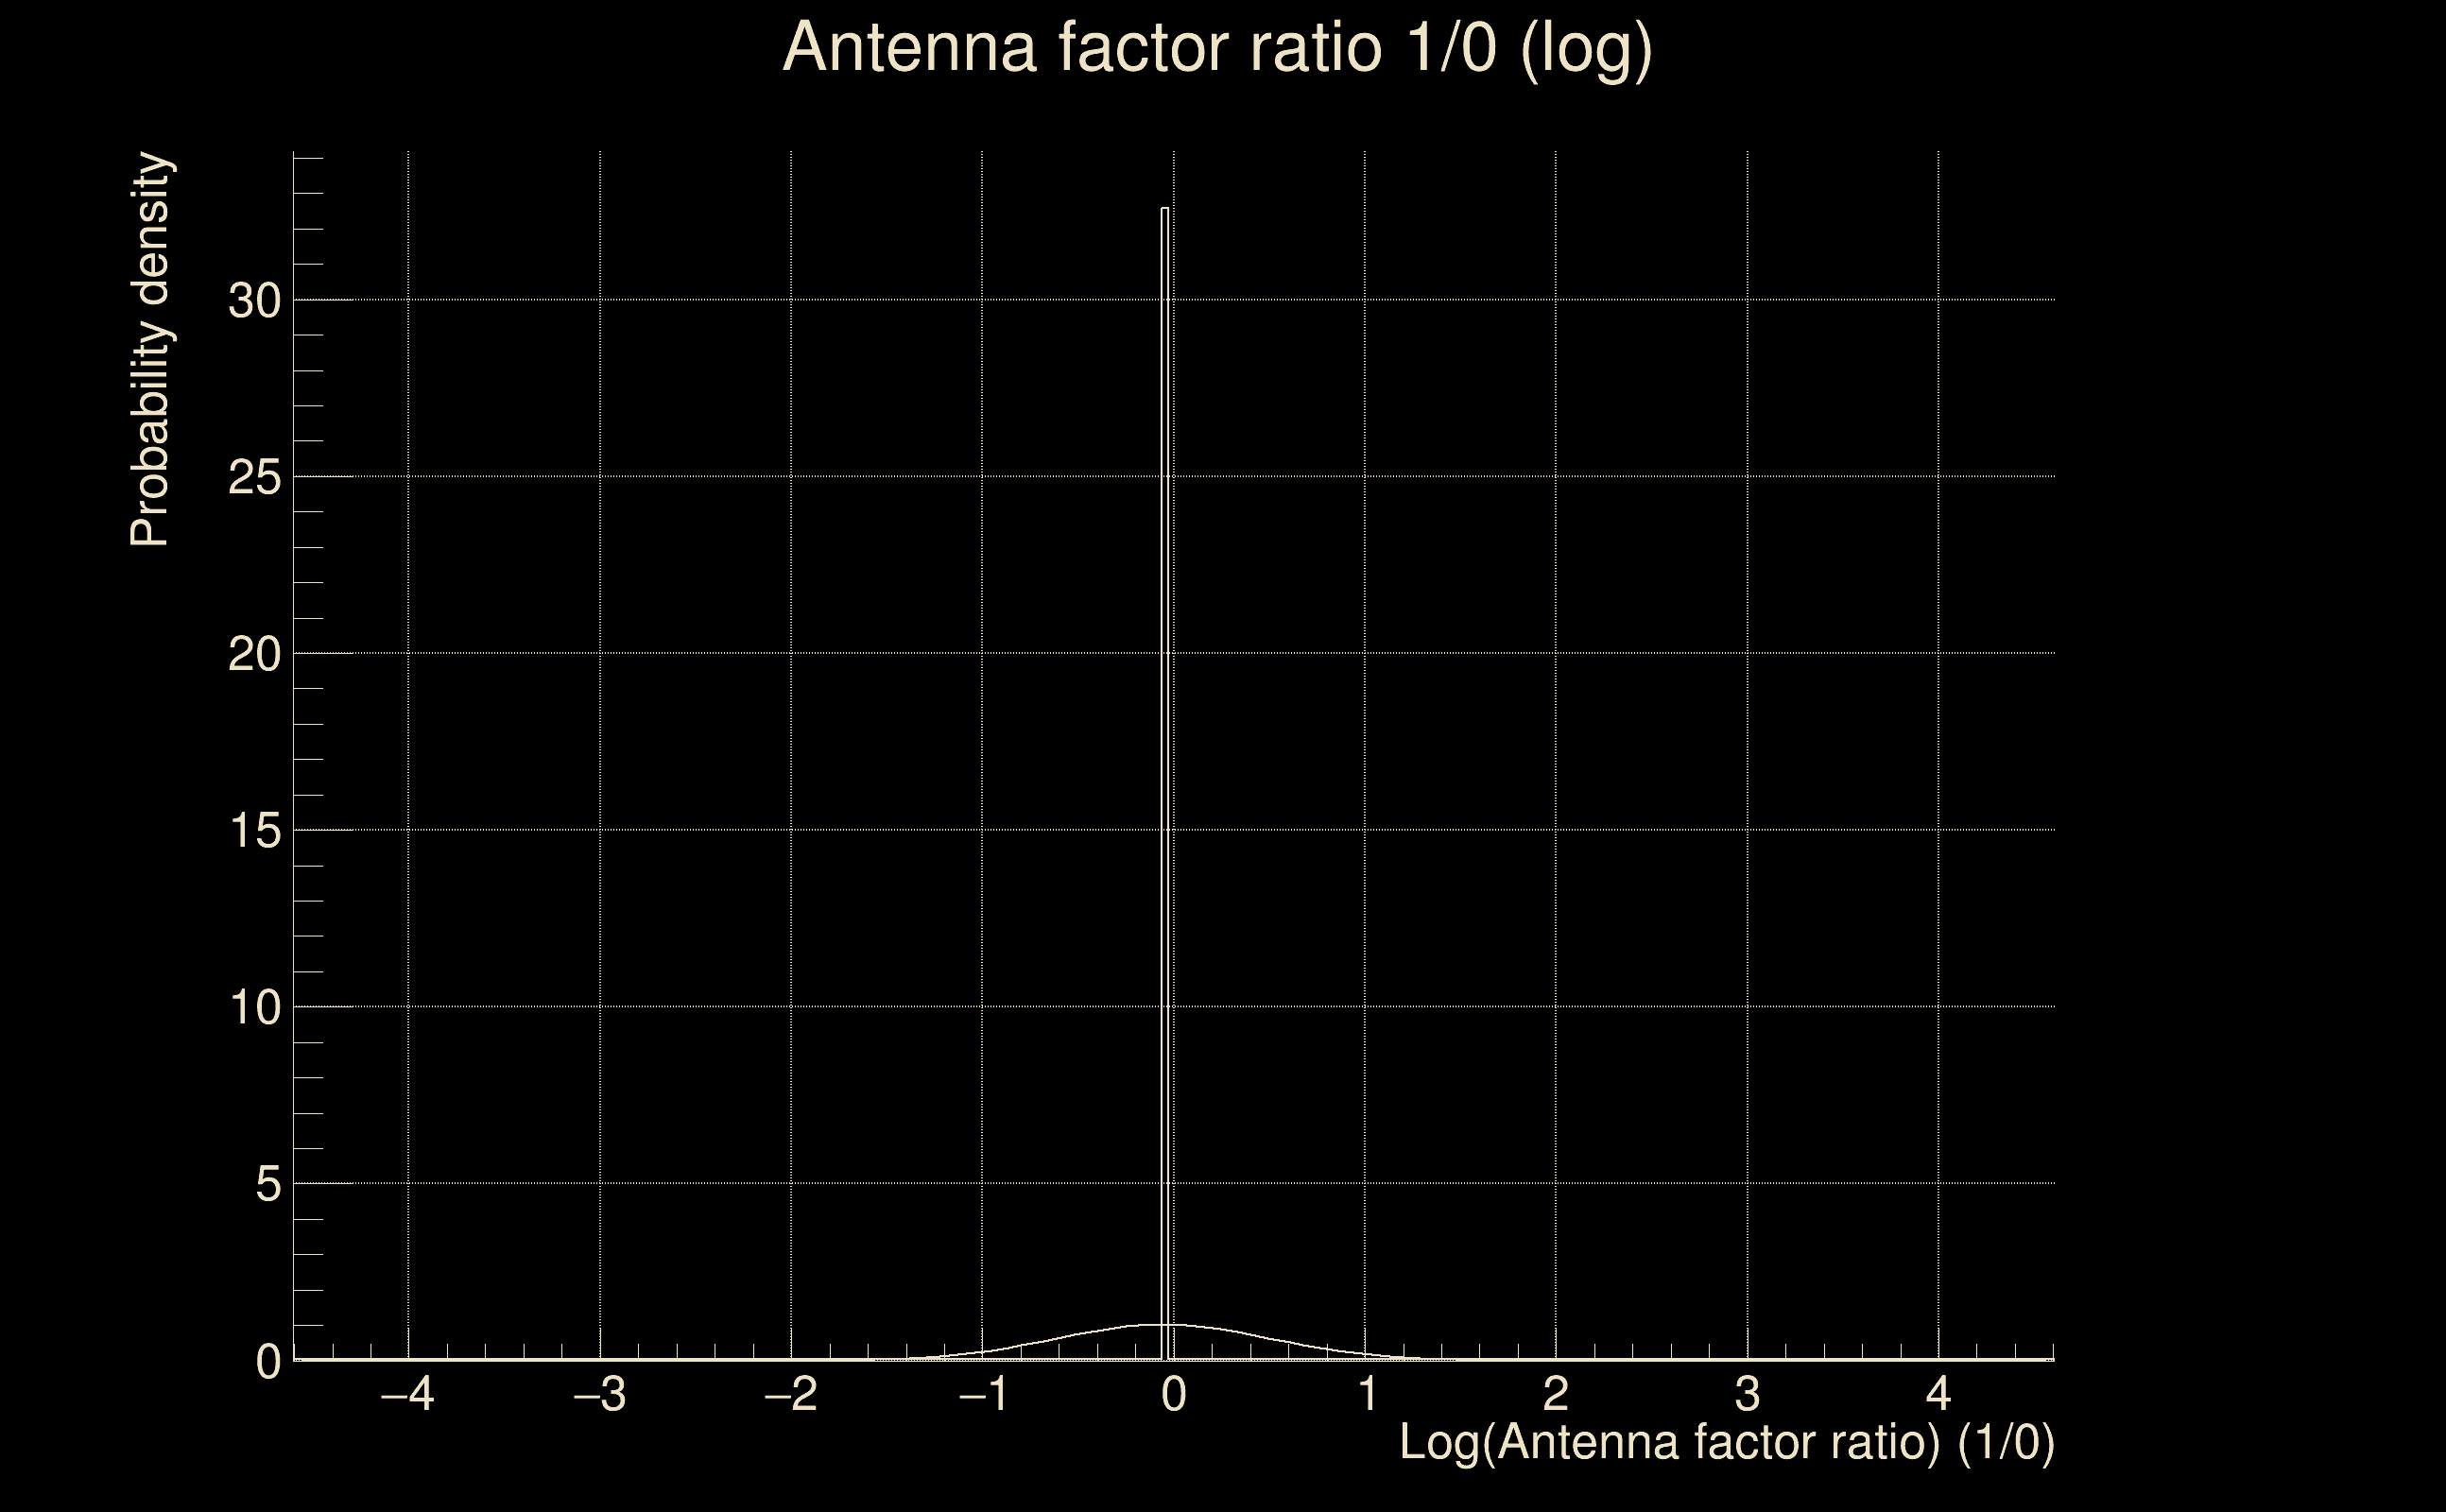
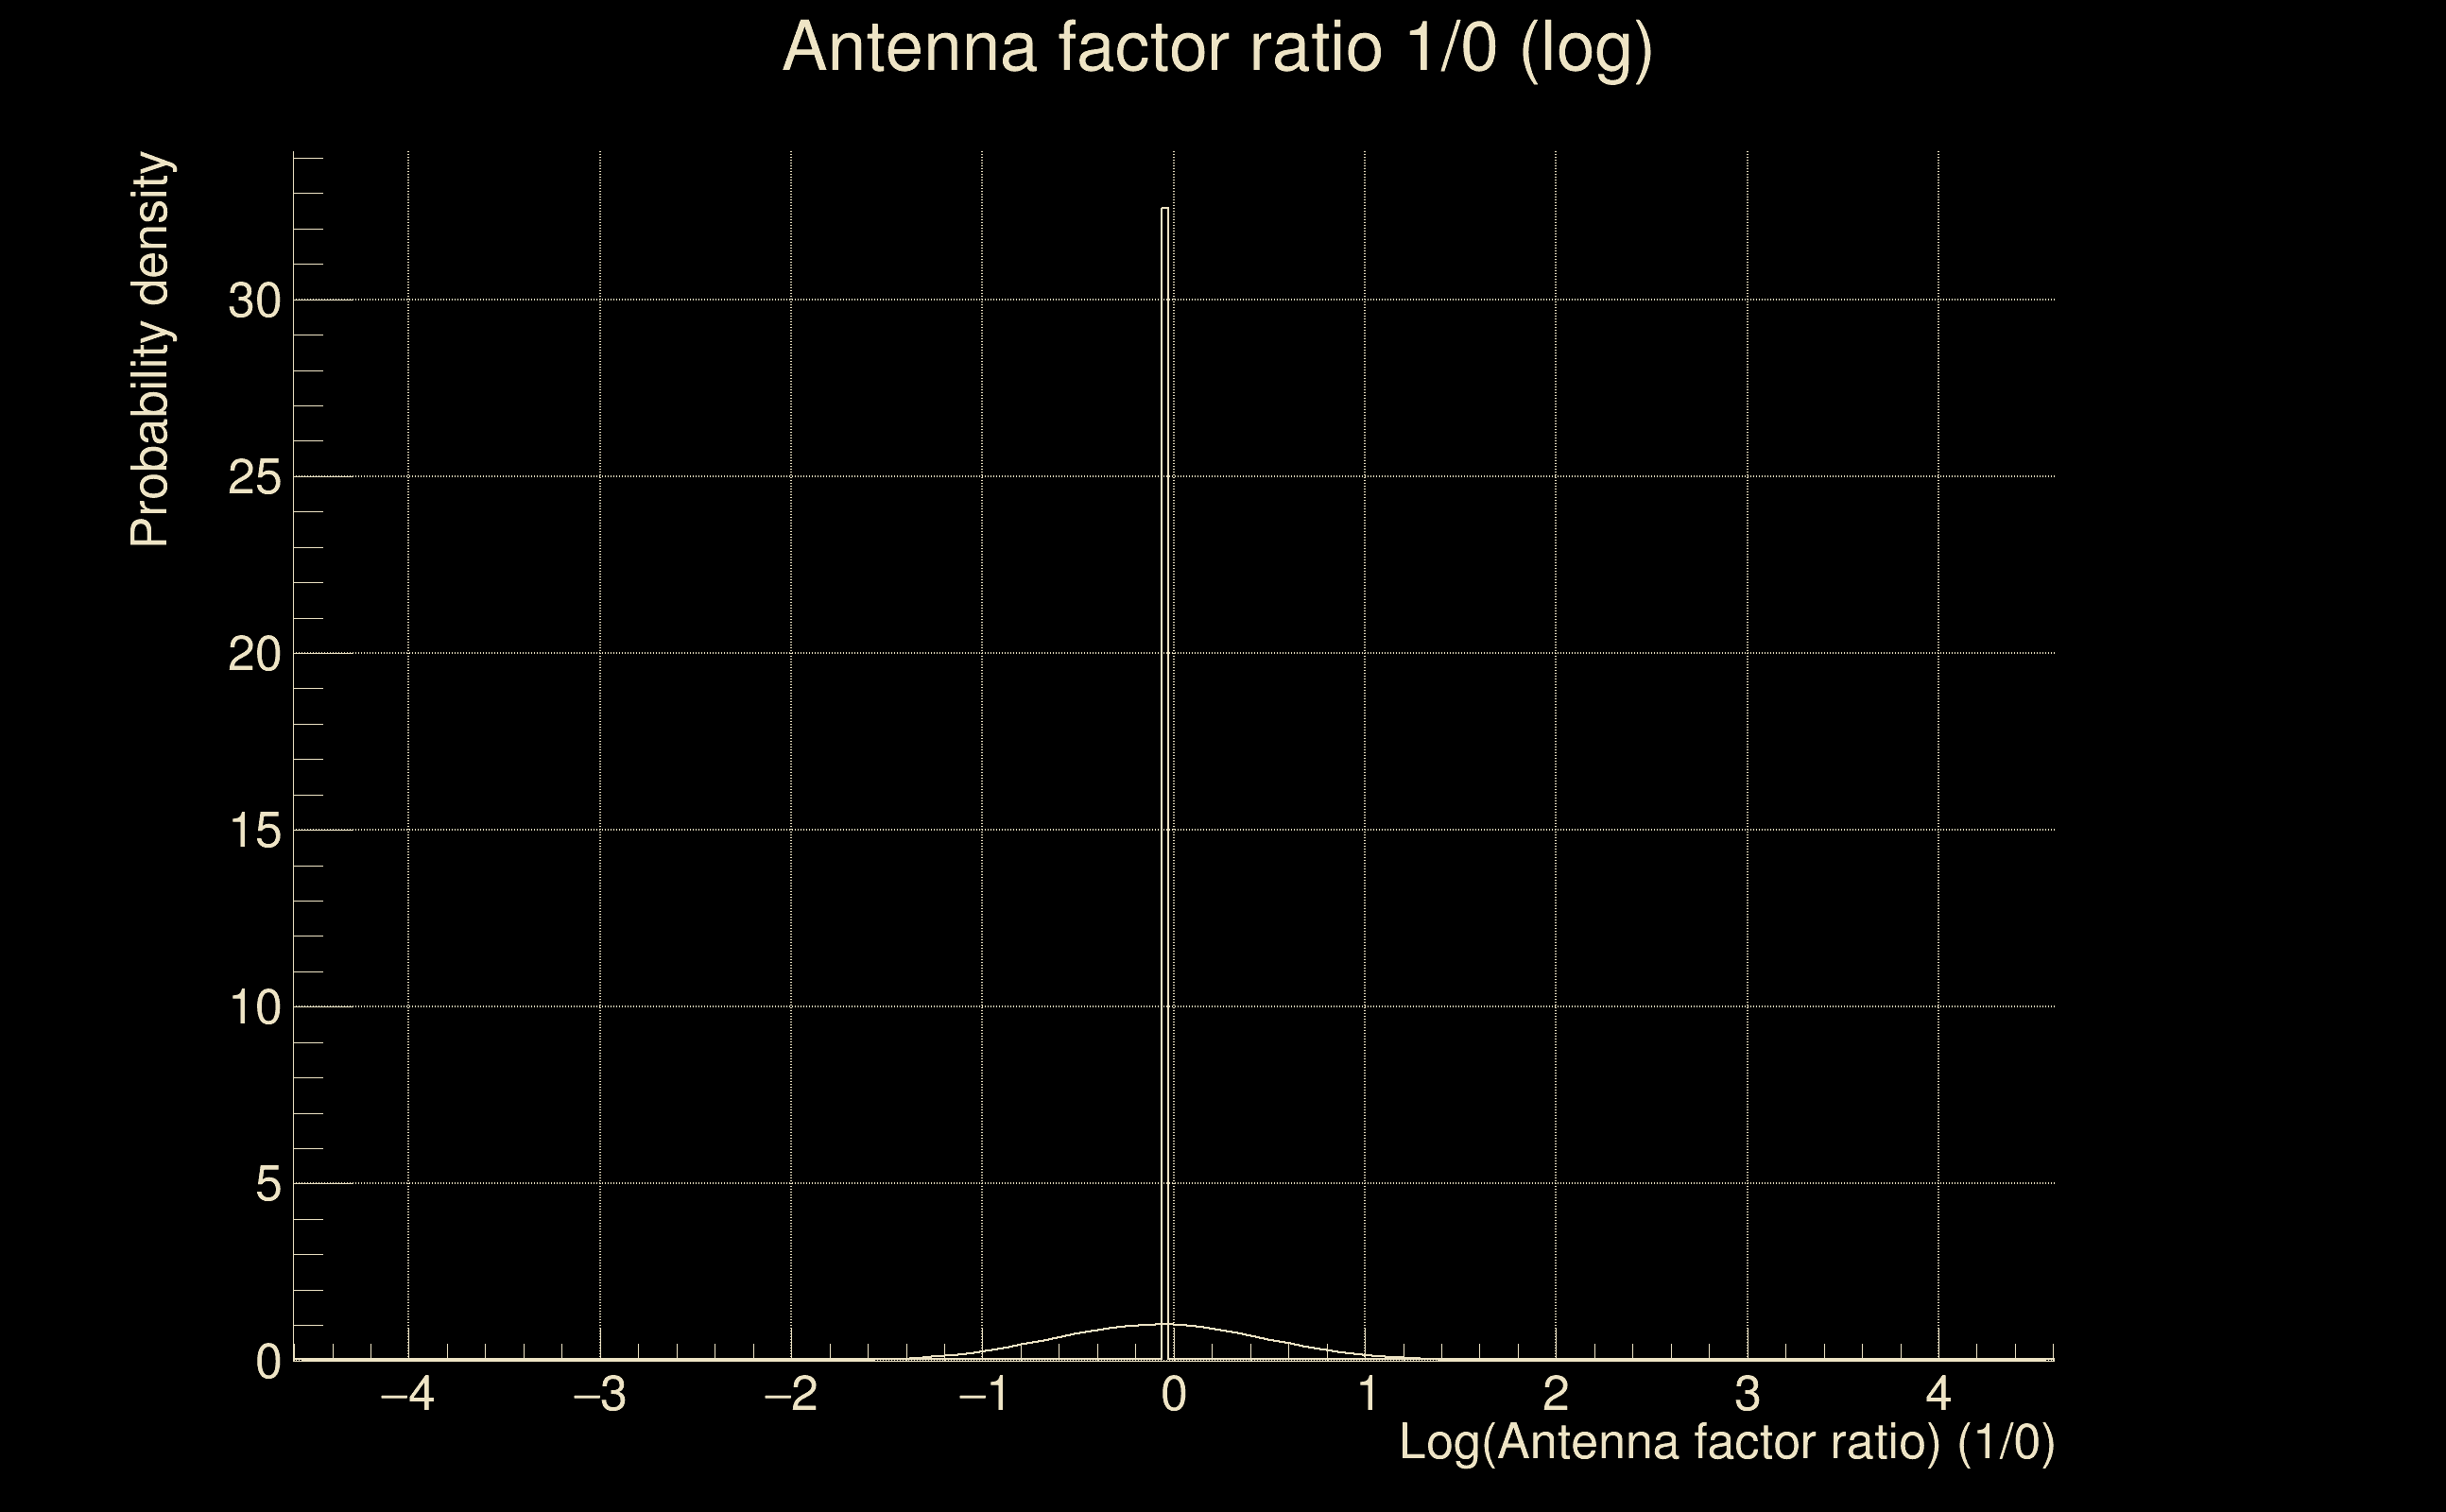
| Log of amplitude ratio (L1/H1): | -0.0506107, variance = 0.156242 (L1/H1: -0.0798754, variance = 0.307989, H1/L1: 0.0284904, variance = 0.305741) |
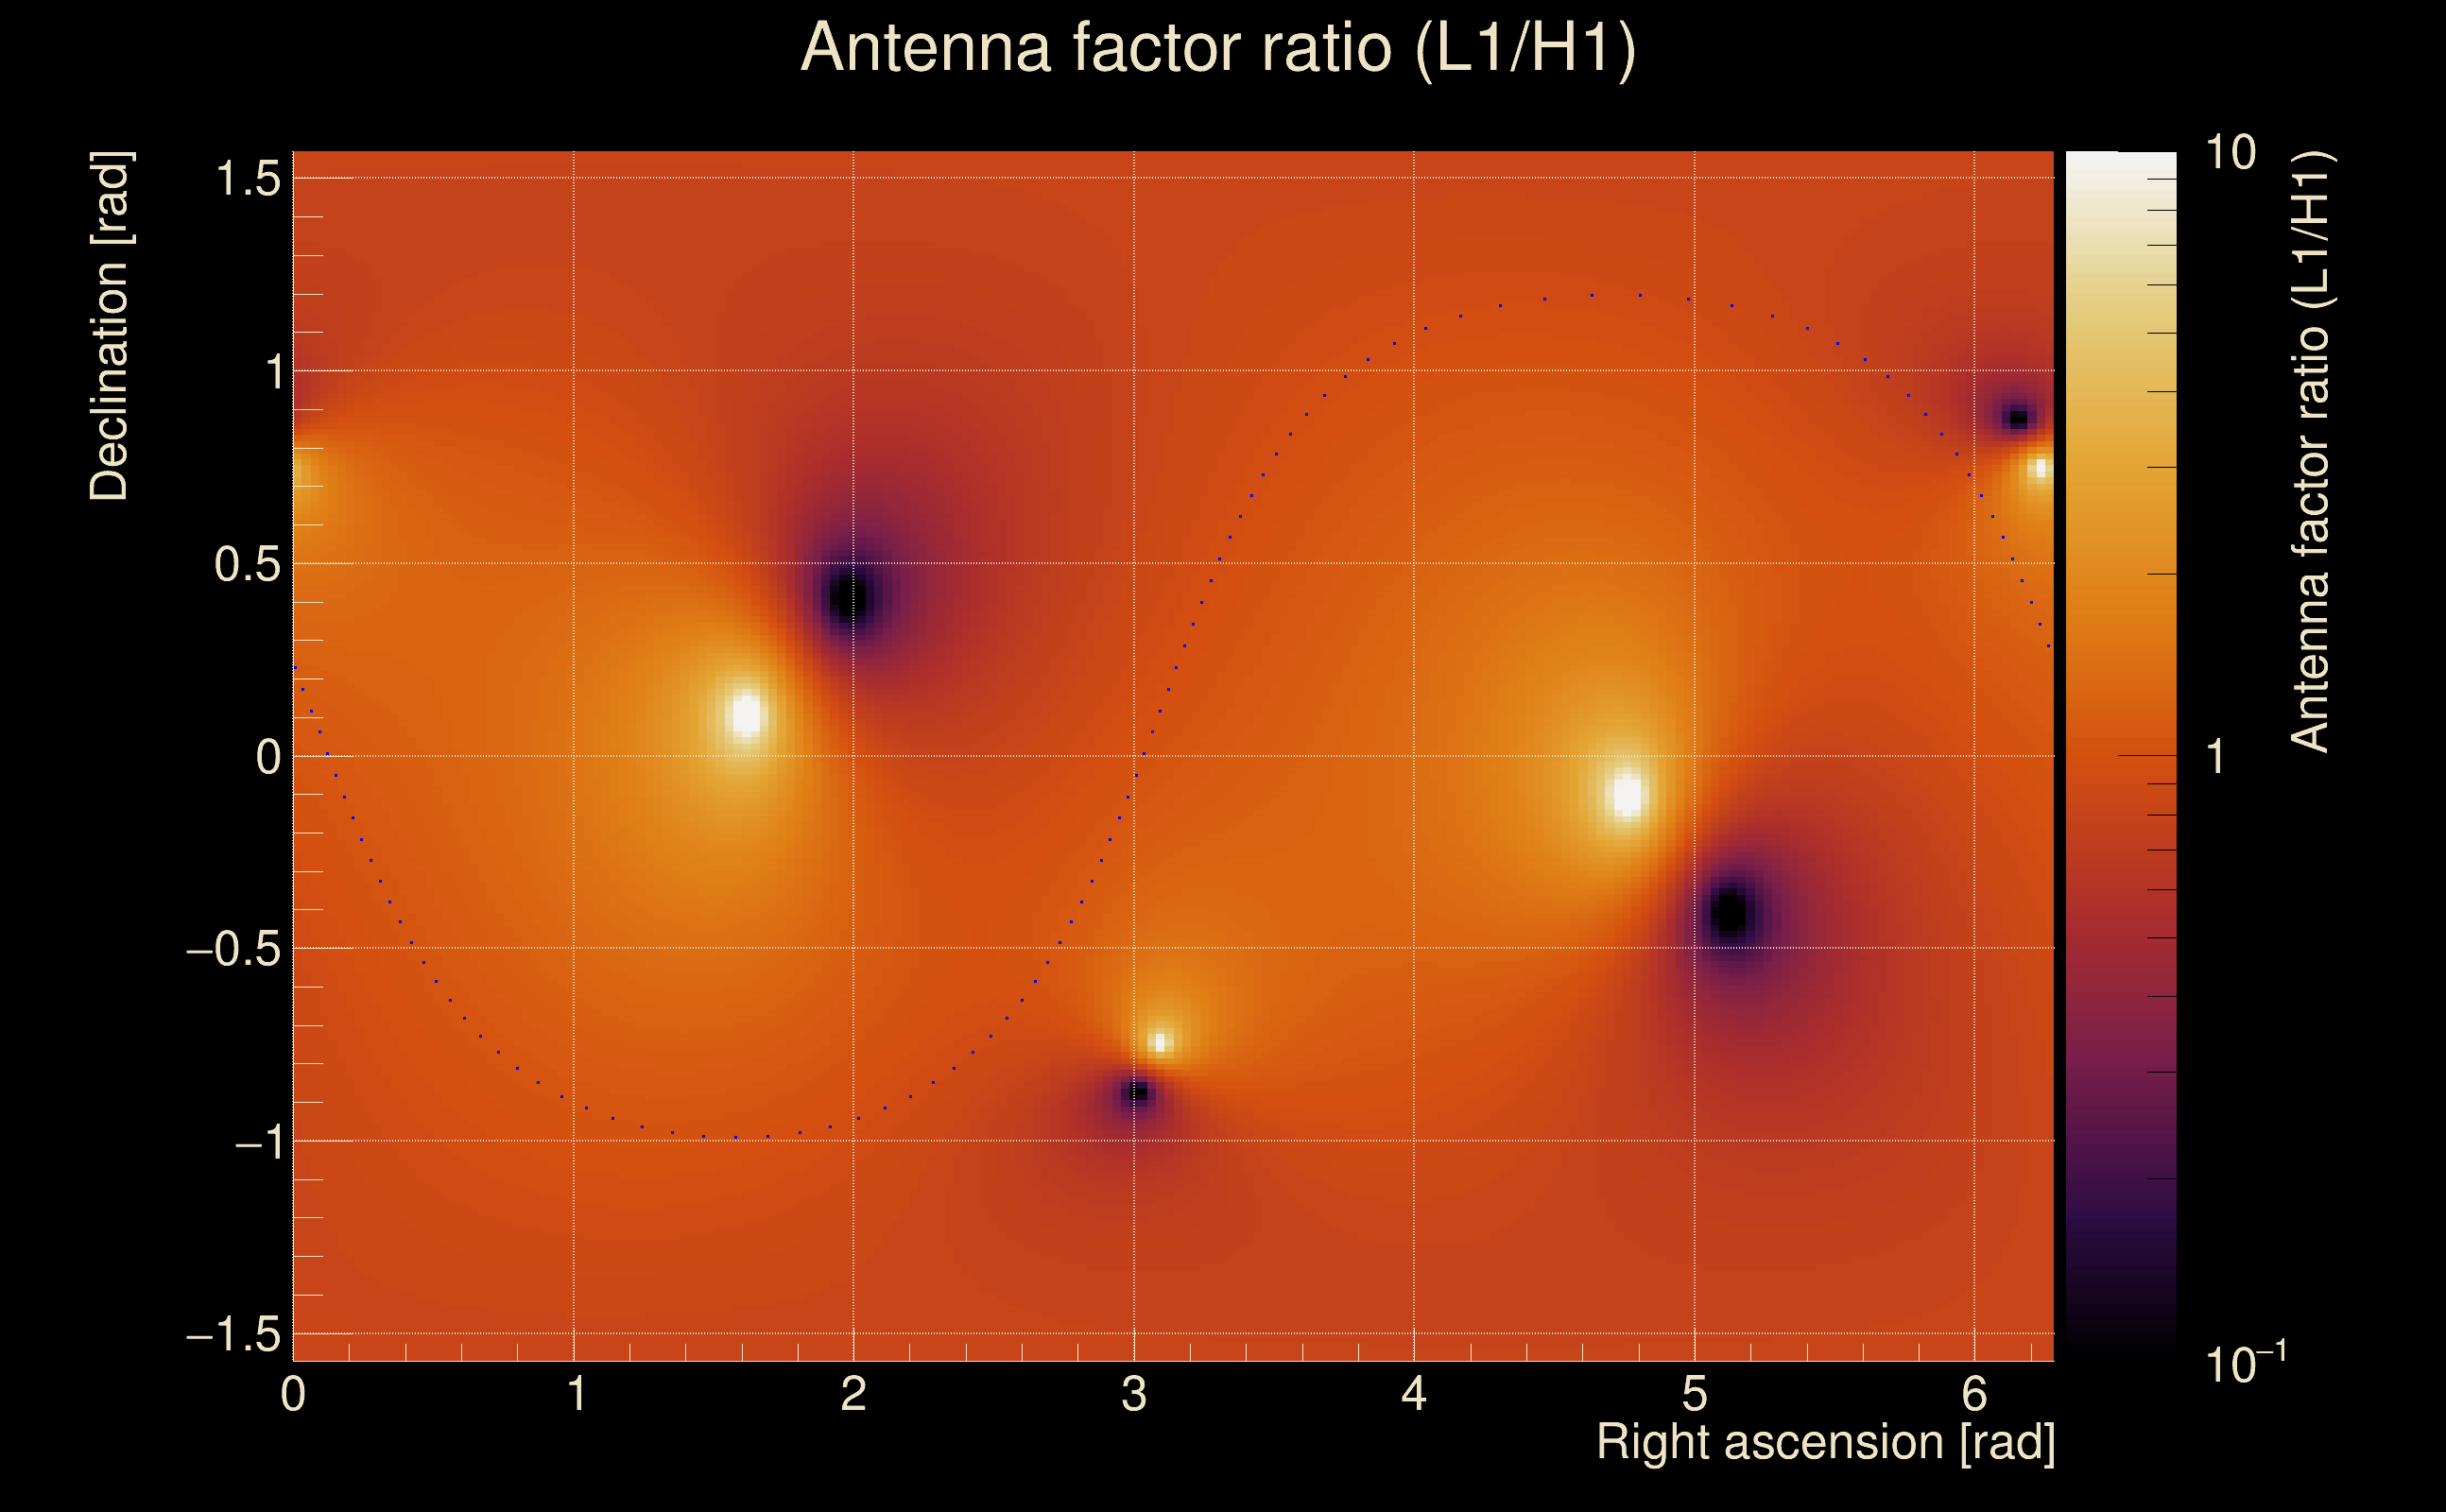
| Amplitude ratio (L1/H1): | 0.950649 ⋇ 1.48479 (L1/H1: 0.923231 ⋇ 1.74188, H1/L1: 1.0289 ⋇ 1.73835) |
| Amplitude ratio H1|L1 compatibility (probability): | 0.947703 |
| Antenna factor probability: | 0.988671 |
| Number of rejected frequency rows: | Q0: 0 / 18, Q1: 0 / 36, Q2: 2 / 70, Q3: 13 / 134, Q4: 59 / 258 |
| Maximum signal-to-noise ratio: | H1: 80.6796, L1: 92.7986 |
| SNR variance: | H1: 0.487329, L1: 0.512789 |
| Click here for a zoomed plot | Click here for a zoomed plot | Click here for a zoomed plot | Click here for a zoomed plot | Click here for a zoomed plot |
 |
 |
 |
 |
 |
 |
 |
 |
 |
 |
 |
 |
 |
 |
 |
 |
 |
 |
 |
 |
 |
 |
 |
 |
 |
 |
 |
 |
 |
| Event time t(H1): | GPS = 1368420334 (Thu May 18 04:45:16 2023 ) → GPS = 1368420344 (Thu May 18 04:45:26 2023 ) |
| Event time t(L1): | GPS = 1368420334 (Thu May 18 04:45:26 2023 ) → GPS = 1368420344 (Thu May 18 04:45:26 2023 ) |
| Omicron analysis time window (H1): | GPS = 1368420331 → GPS = 1368420347 |
| Omicron analysis time window (L1): | GPS = 1368420331 → GPS = 1368420347 |
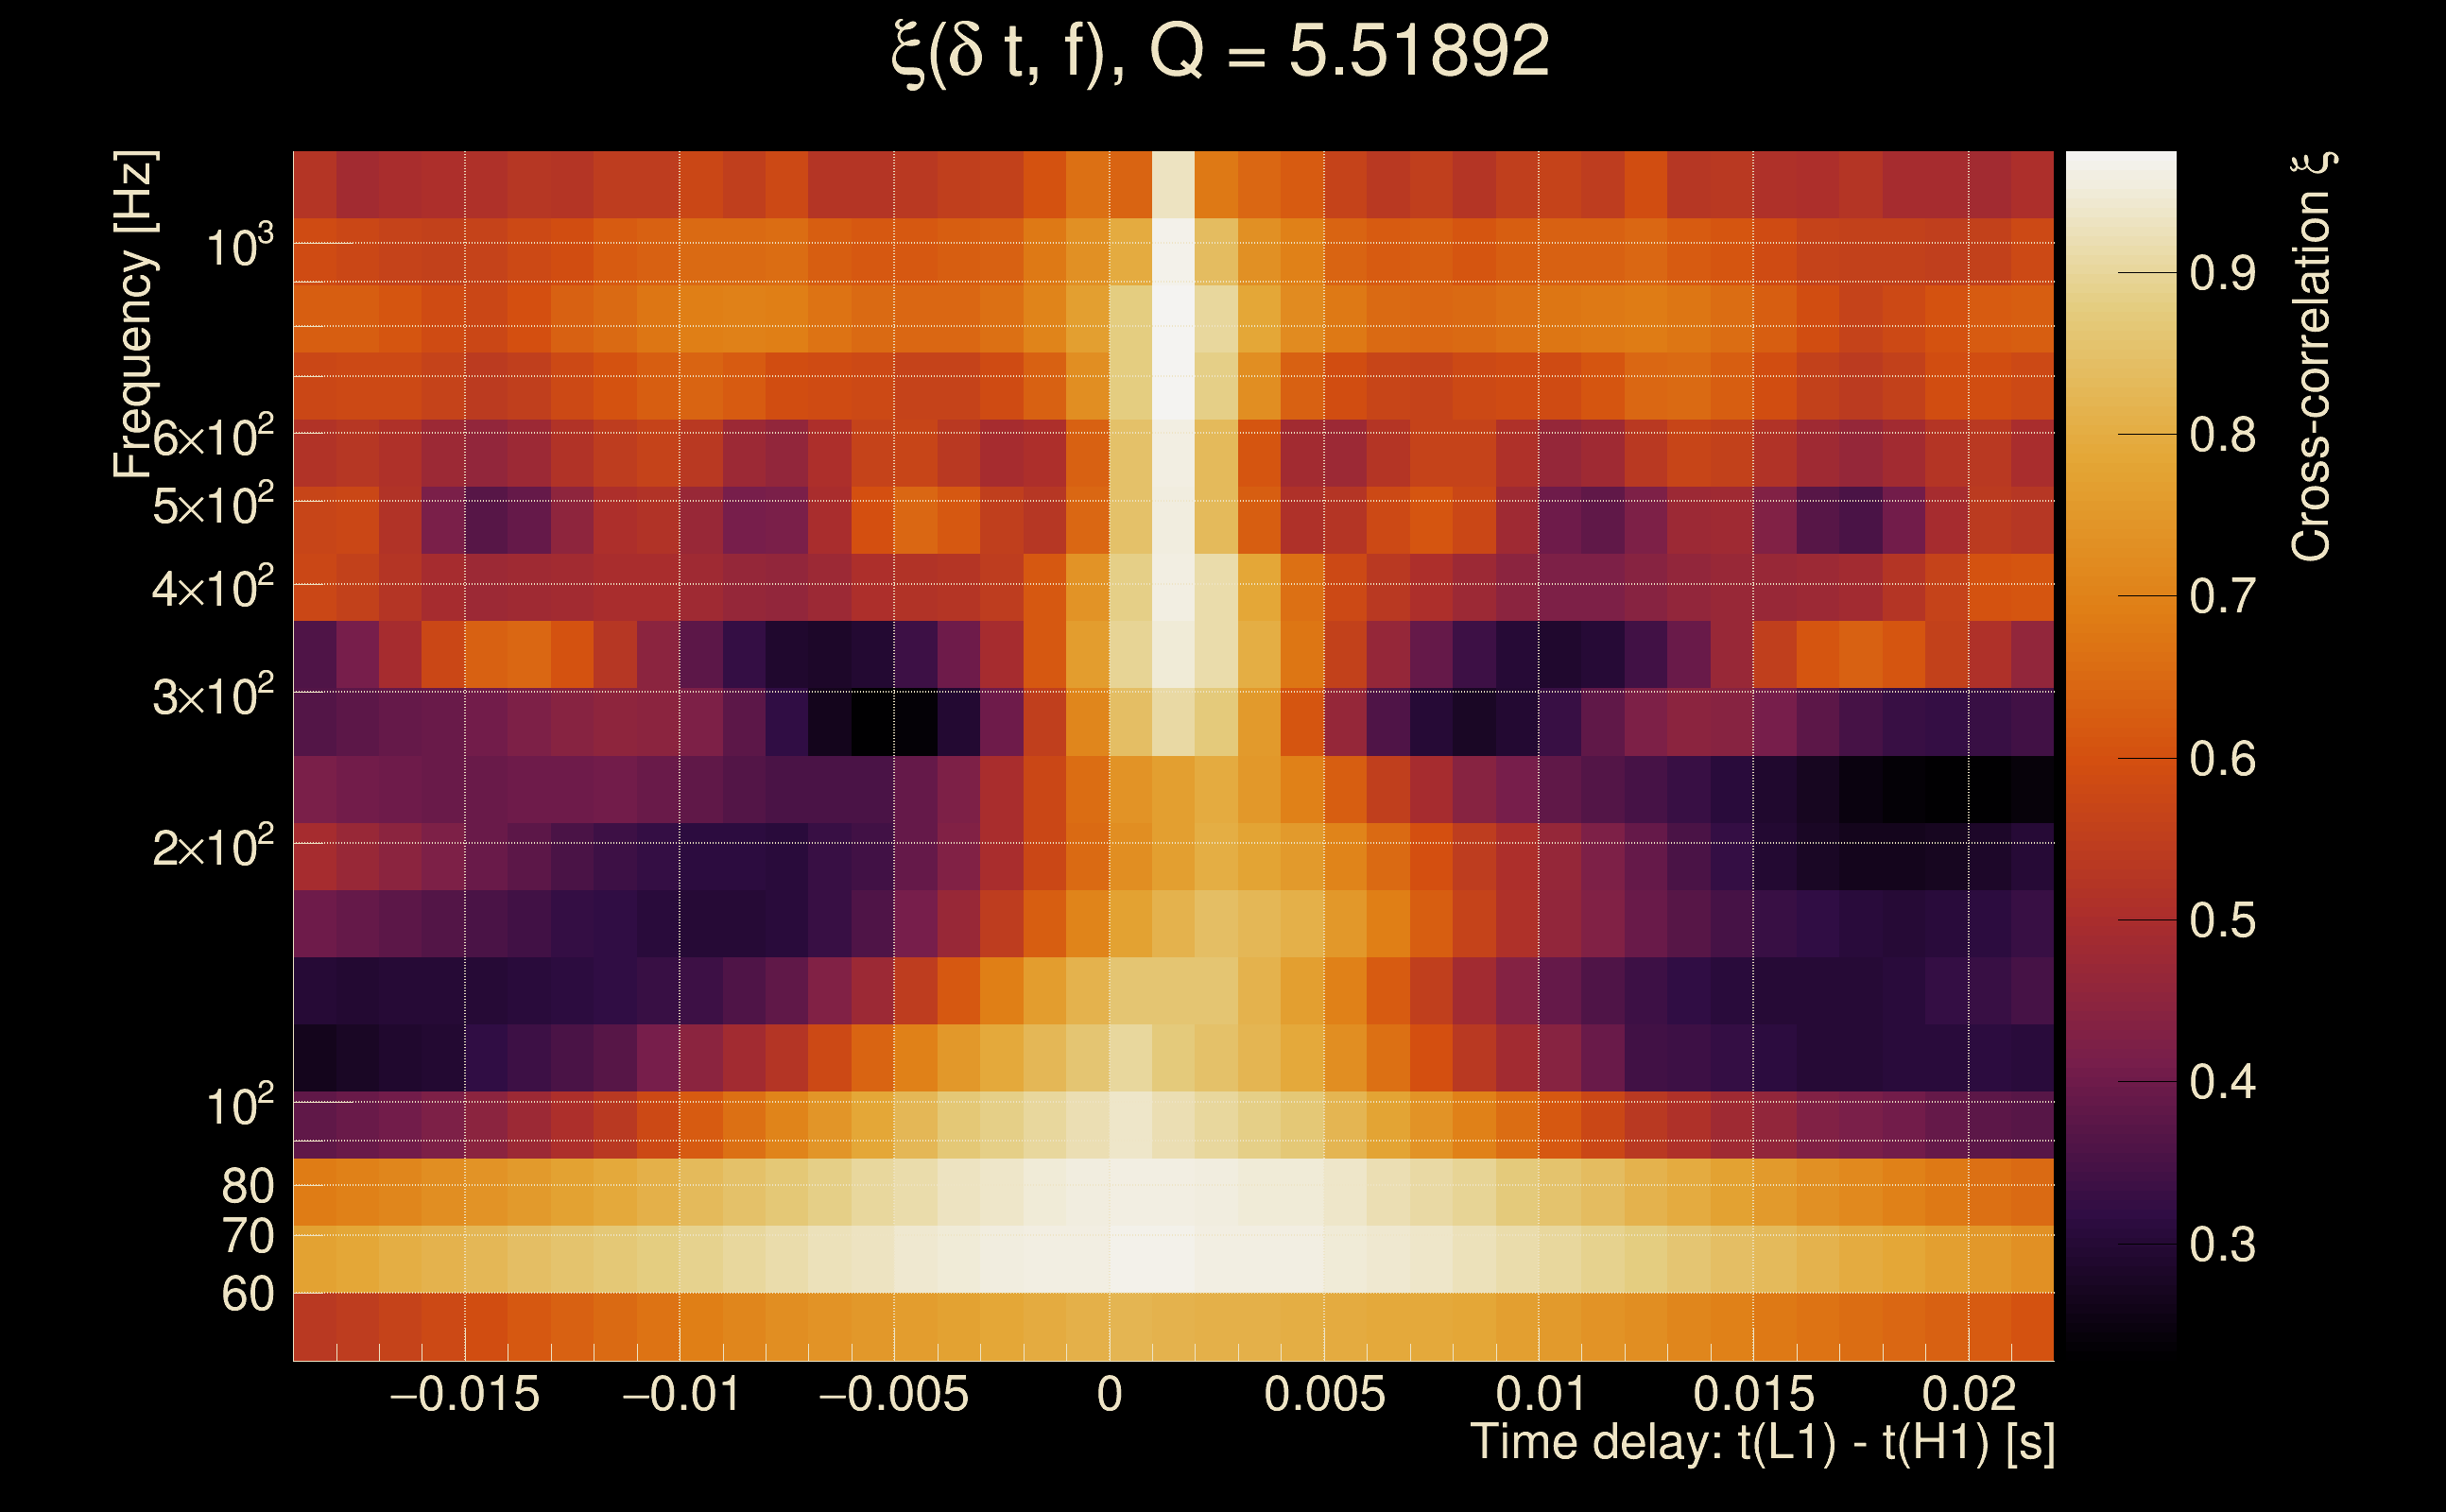
| Time delay between detectors t(L1) - t(H1): | 0.00095052 s (slice index = 108 / 217), δt_gw = 0.00095052 s |
| Time delay uncertainty: | 0.000495116 s |
| [targeted mode] Time delay probability: | 0.980111 (0.0249301 sigmas), δt_target = 0.000936508 s |
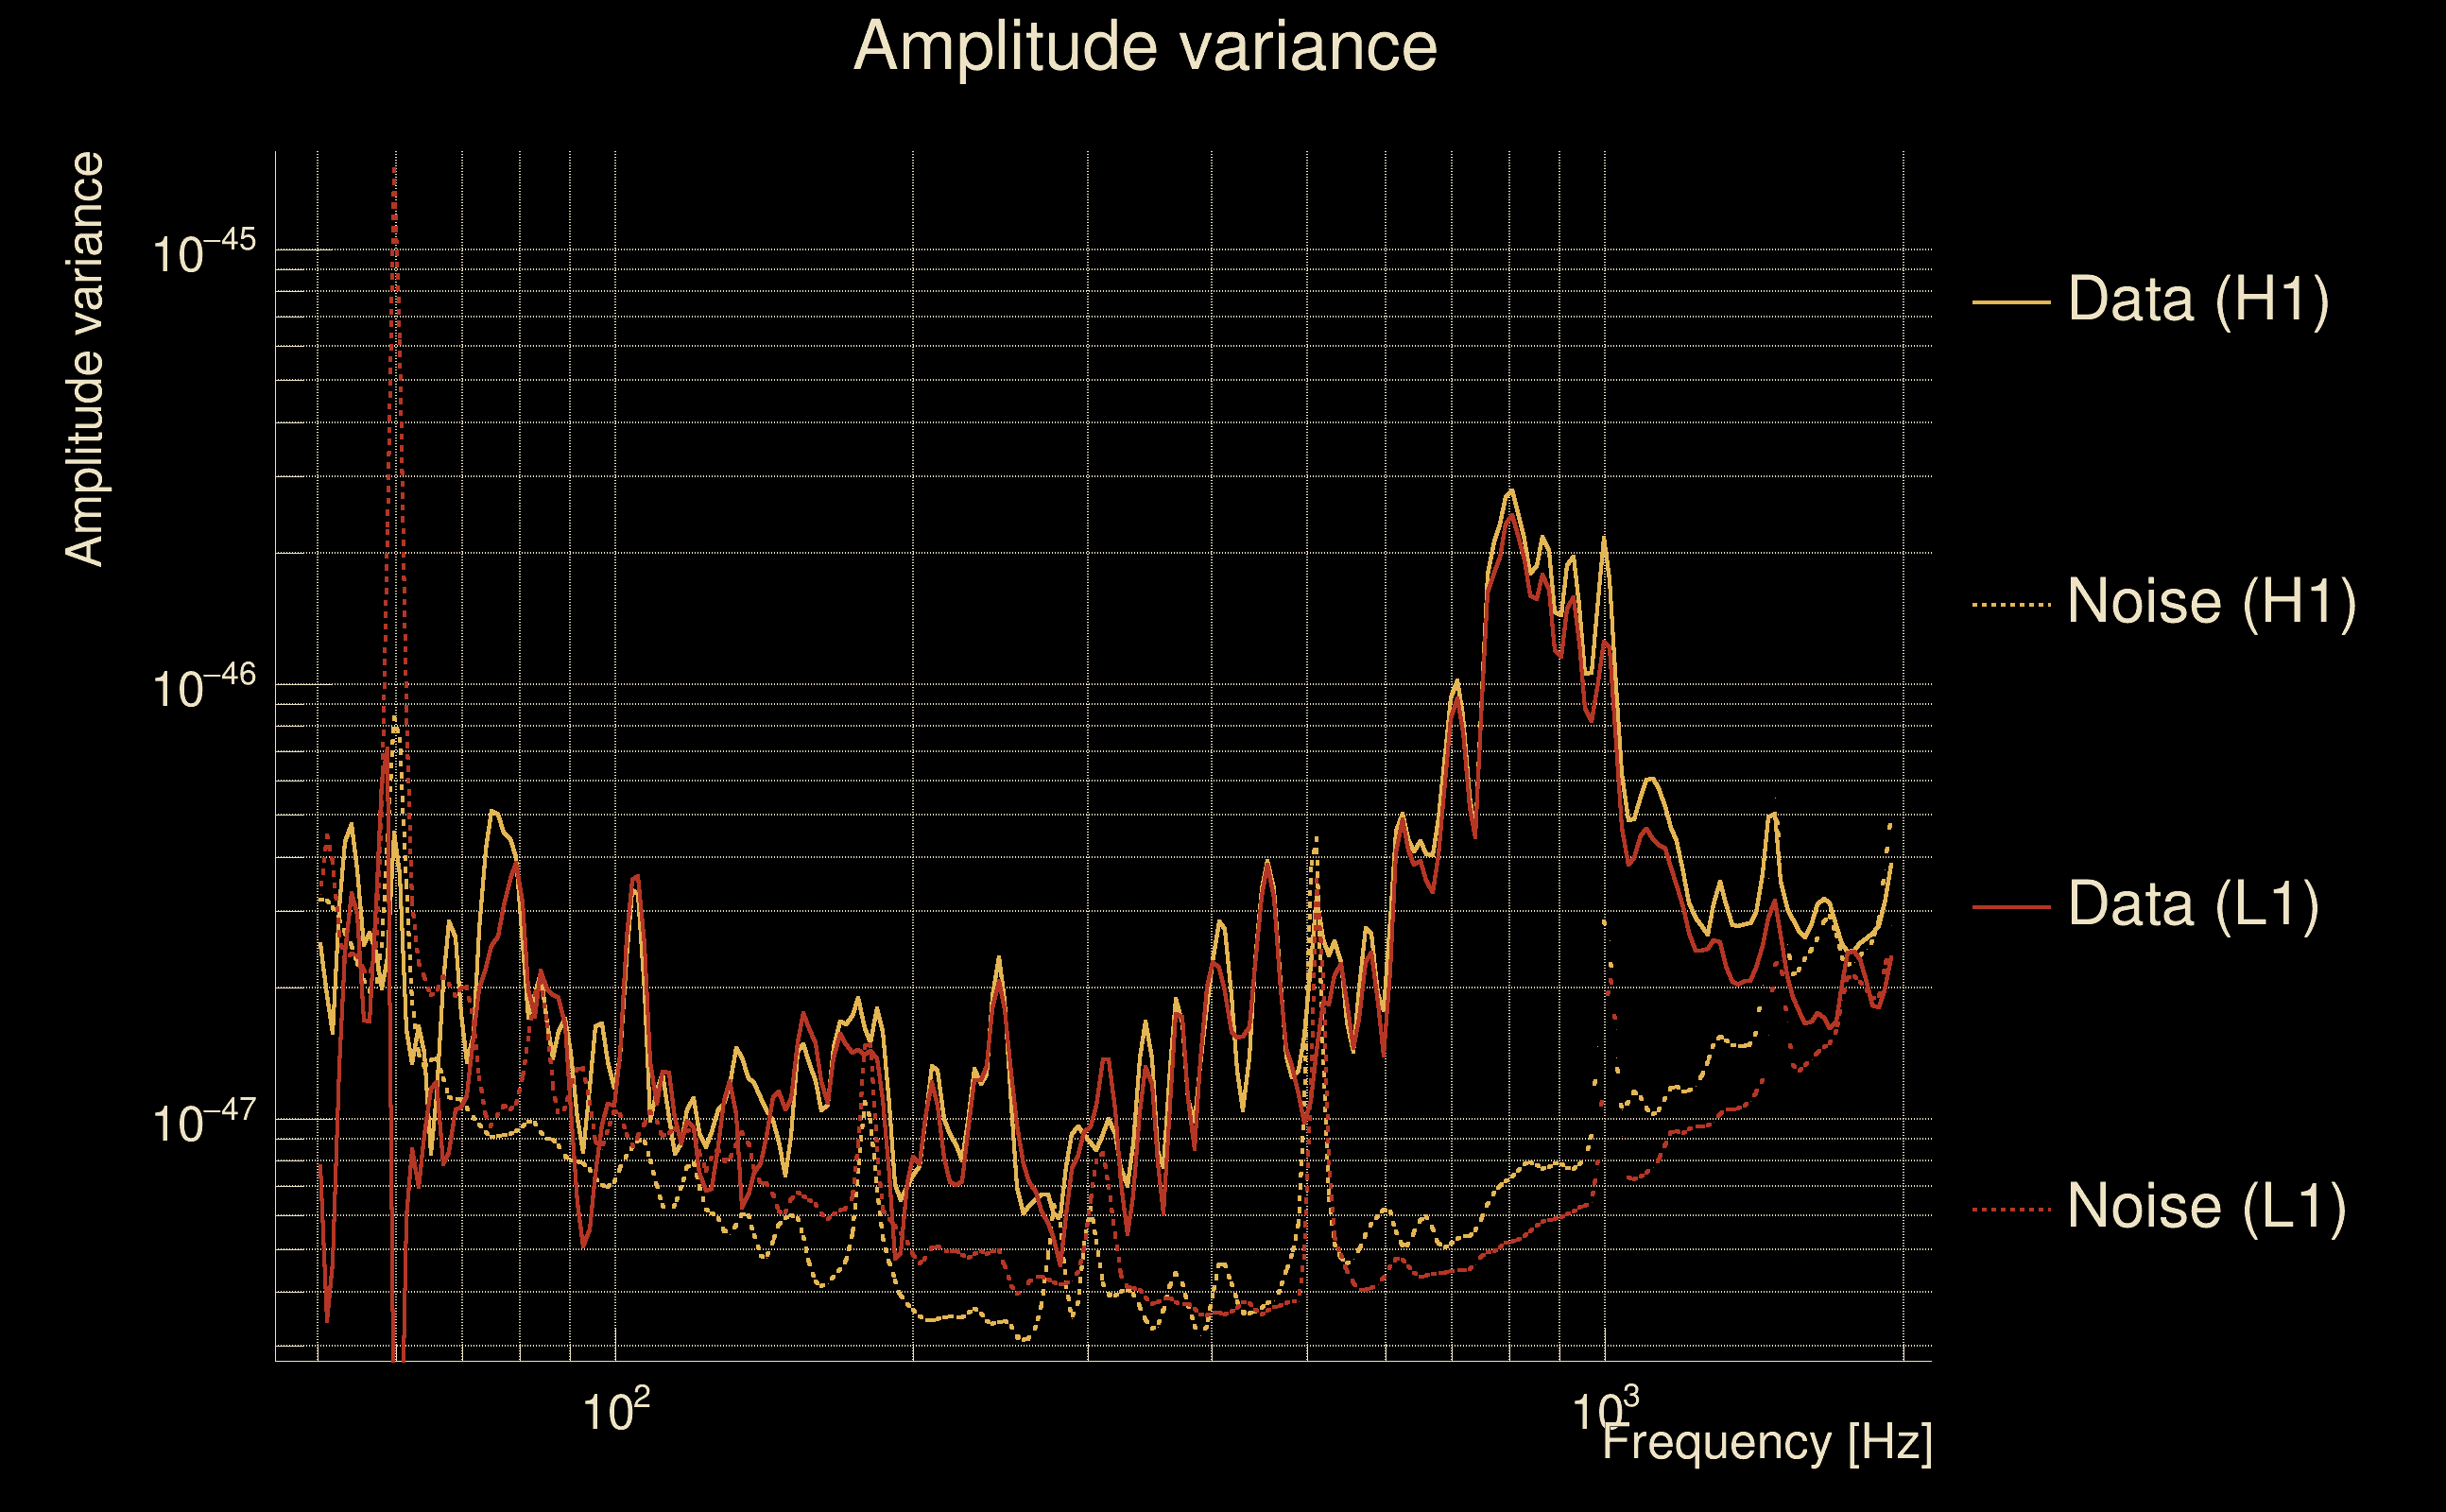
| Frequency: | 315.926 Hz |
| Ξ: | 0.883754 ± 0.00825862 (variance = 6.82048e-05): Q0: 0.909572, Q1: 0.899886, Q2: 0.886028, Q3: 0.896174, Q4: 0.90635 |
| Rank: | R_A = 0.813654 |
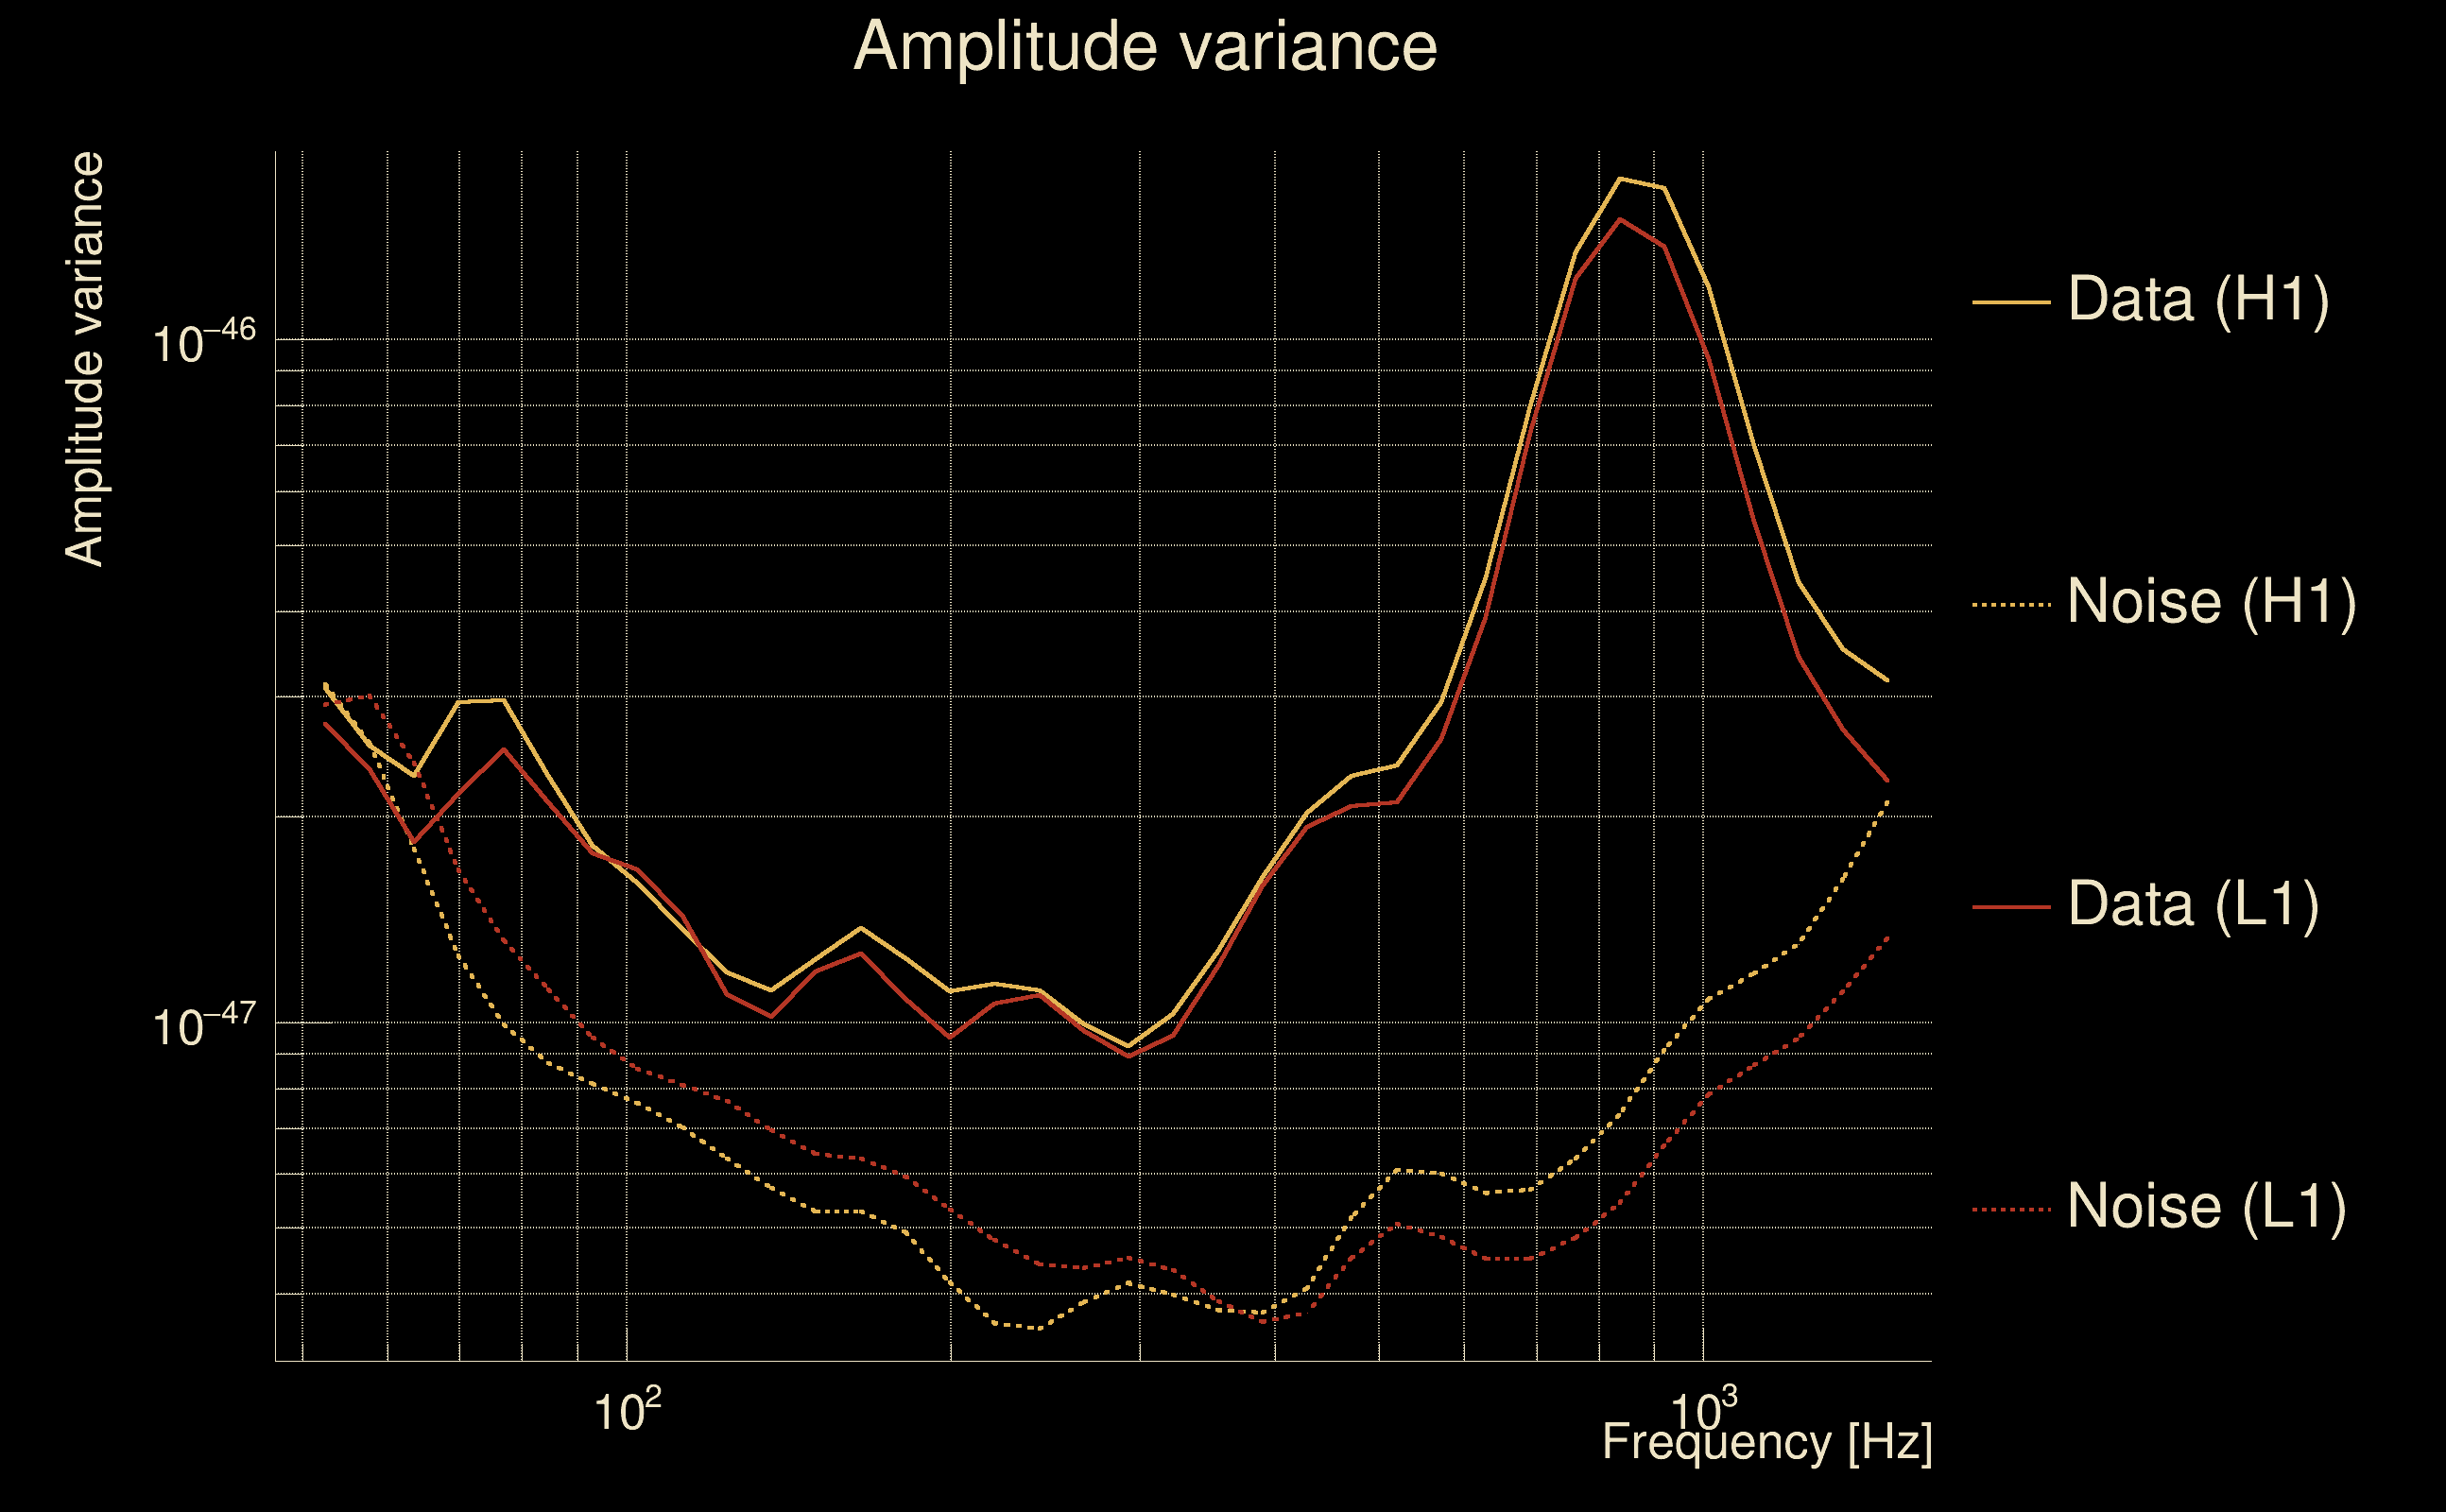
| Log of amplitude ratio (L1/H1): | -0.0544981, variance = 0.15616 (L1/H1: -0.0781827, variance = 0.309804, H1/L1: 0.0364908, variance = 0.304801) |
| Amplitude ratio (L1/H1): | 0.94696 ⋇ 1.48464 (L1/H1: 0.924795 ⋇ 1.74473, H1/L1: 1.03716 ⋇ 1.73688) |
| Amplitude ratio H1|L1 compatibility (probability): | 0.957588 |
| Antenna factor probability: | 0.980967 |
| Number of rejected frequency rows: | Q0: 0 / 18, Q1: 0 / 36, Q2: 2 / 70, Q3: 17 / 134, Q4: 65 / 258 |
| Maximum signal-to-noise ratio: | H1: 80.1329, L1: 91.9009 |
| SNR variance: | H1: 2.66421, L1: 2.93311 |
| Click here for a zoomed plot | Click here for a zoomed plot | Click here for a zoomed plot | Click here for a zoomed plot | Click here for a zoomed plot |
 |
 |
 |
 |
 |
 |
 |
 |
 |
 |
 |
 |
 |
 |
 |
 |
 |
 |
 |
 |
 |
 |
 |
 |
 |
 |
 |
 |
 |
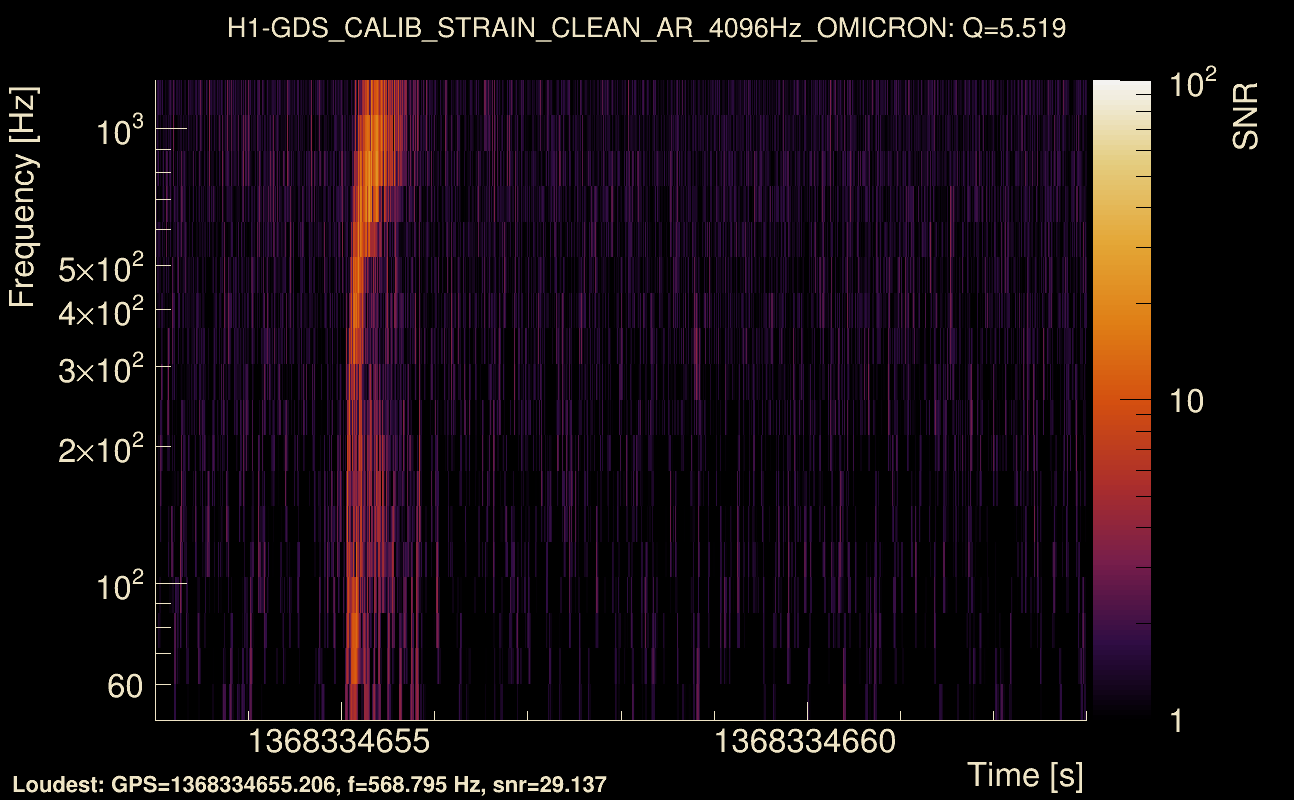
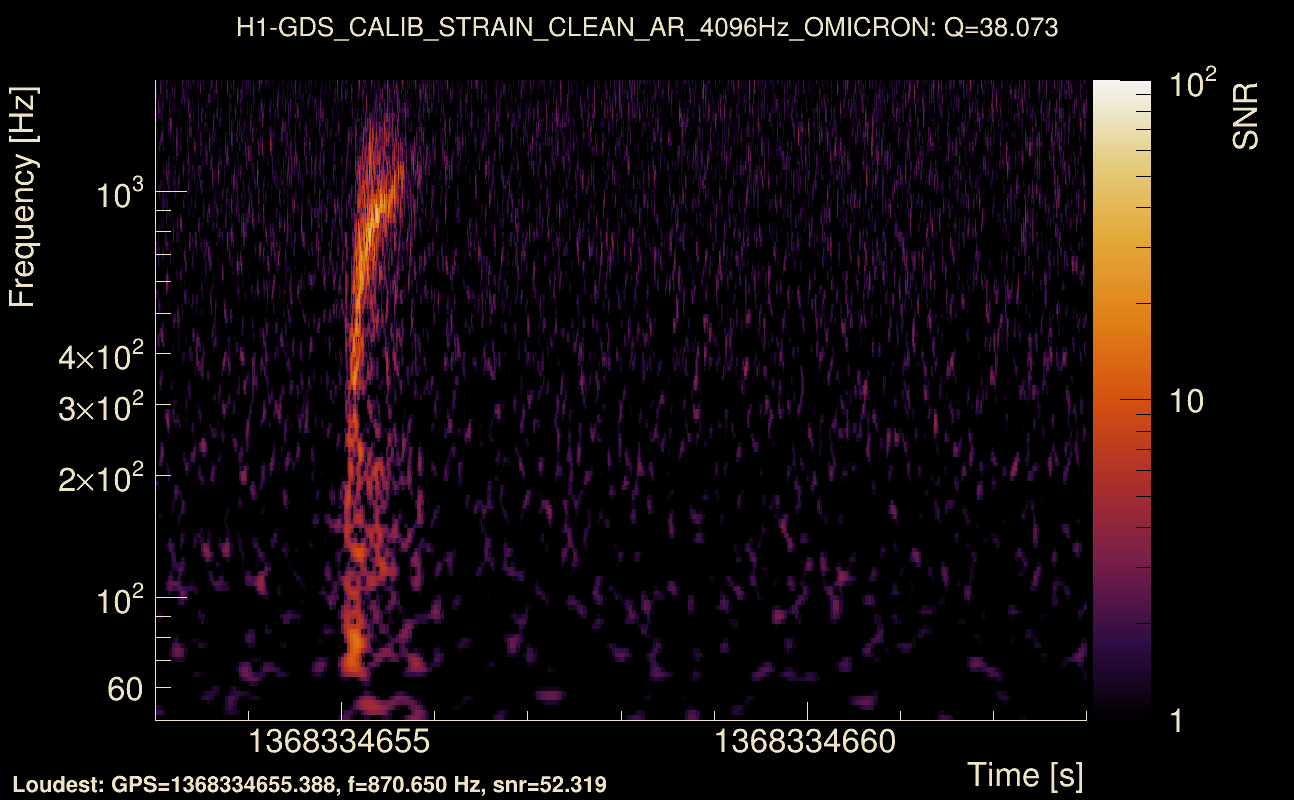
| Event time t(H1): | GPS = 1368334653 (Wed May 17 04:57:15 2023 ) → GPS = 1368334663 (Wed May 17 04:57:25 2023 ) |
| Event time t(L1): | GPS = 1368334653 (Wed May 17 04:57:25 2023 ) → GPS = 1368334663 (Wed May 17 04:57:25 2023 ) |
| Omicron analysis time window (H1): | GPS = 1368334650 → GPS = 1368334666 |
| Omicron analysis time window (L1): | GPS = 1368334650 → GPS = 1368334666 |
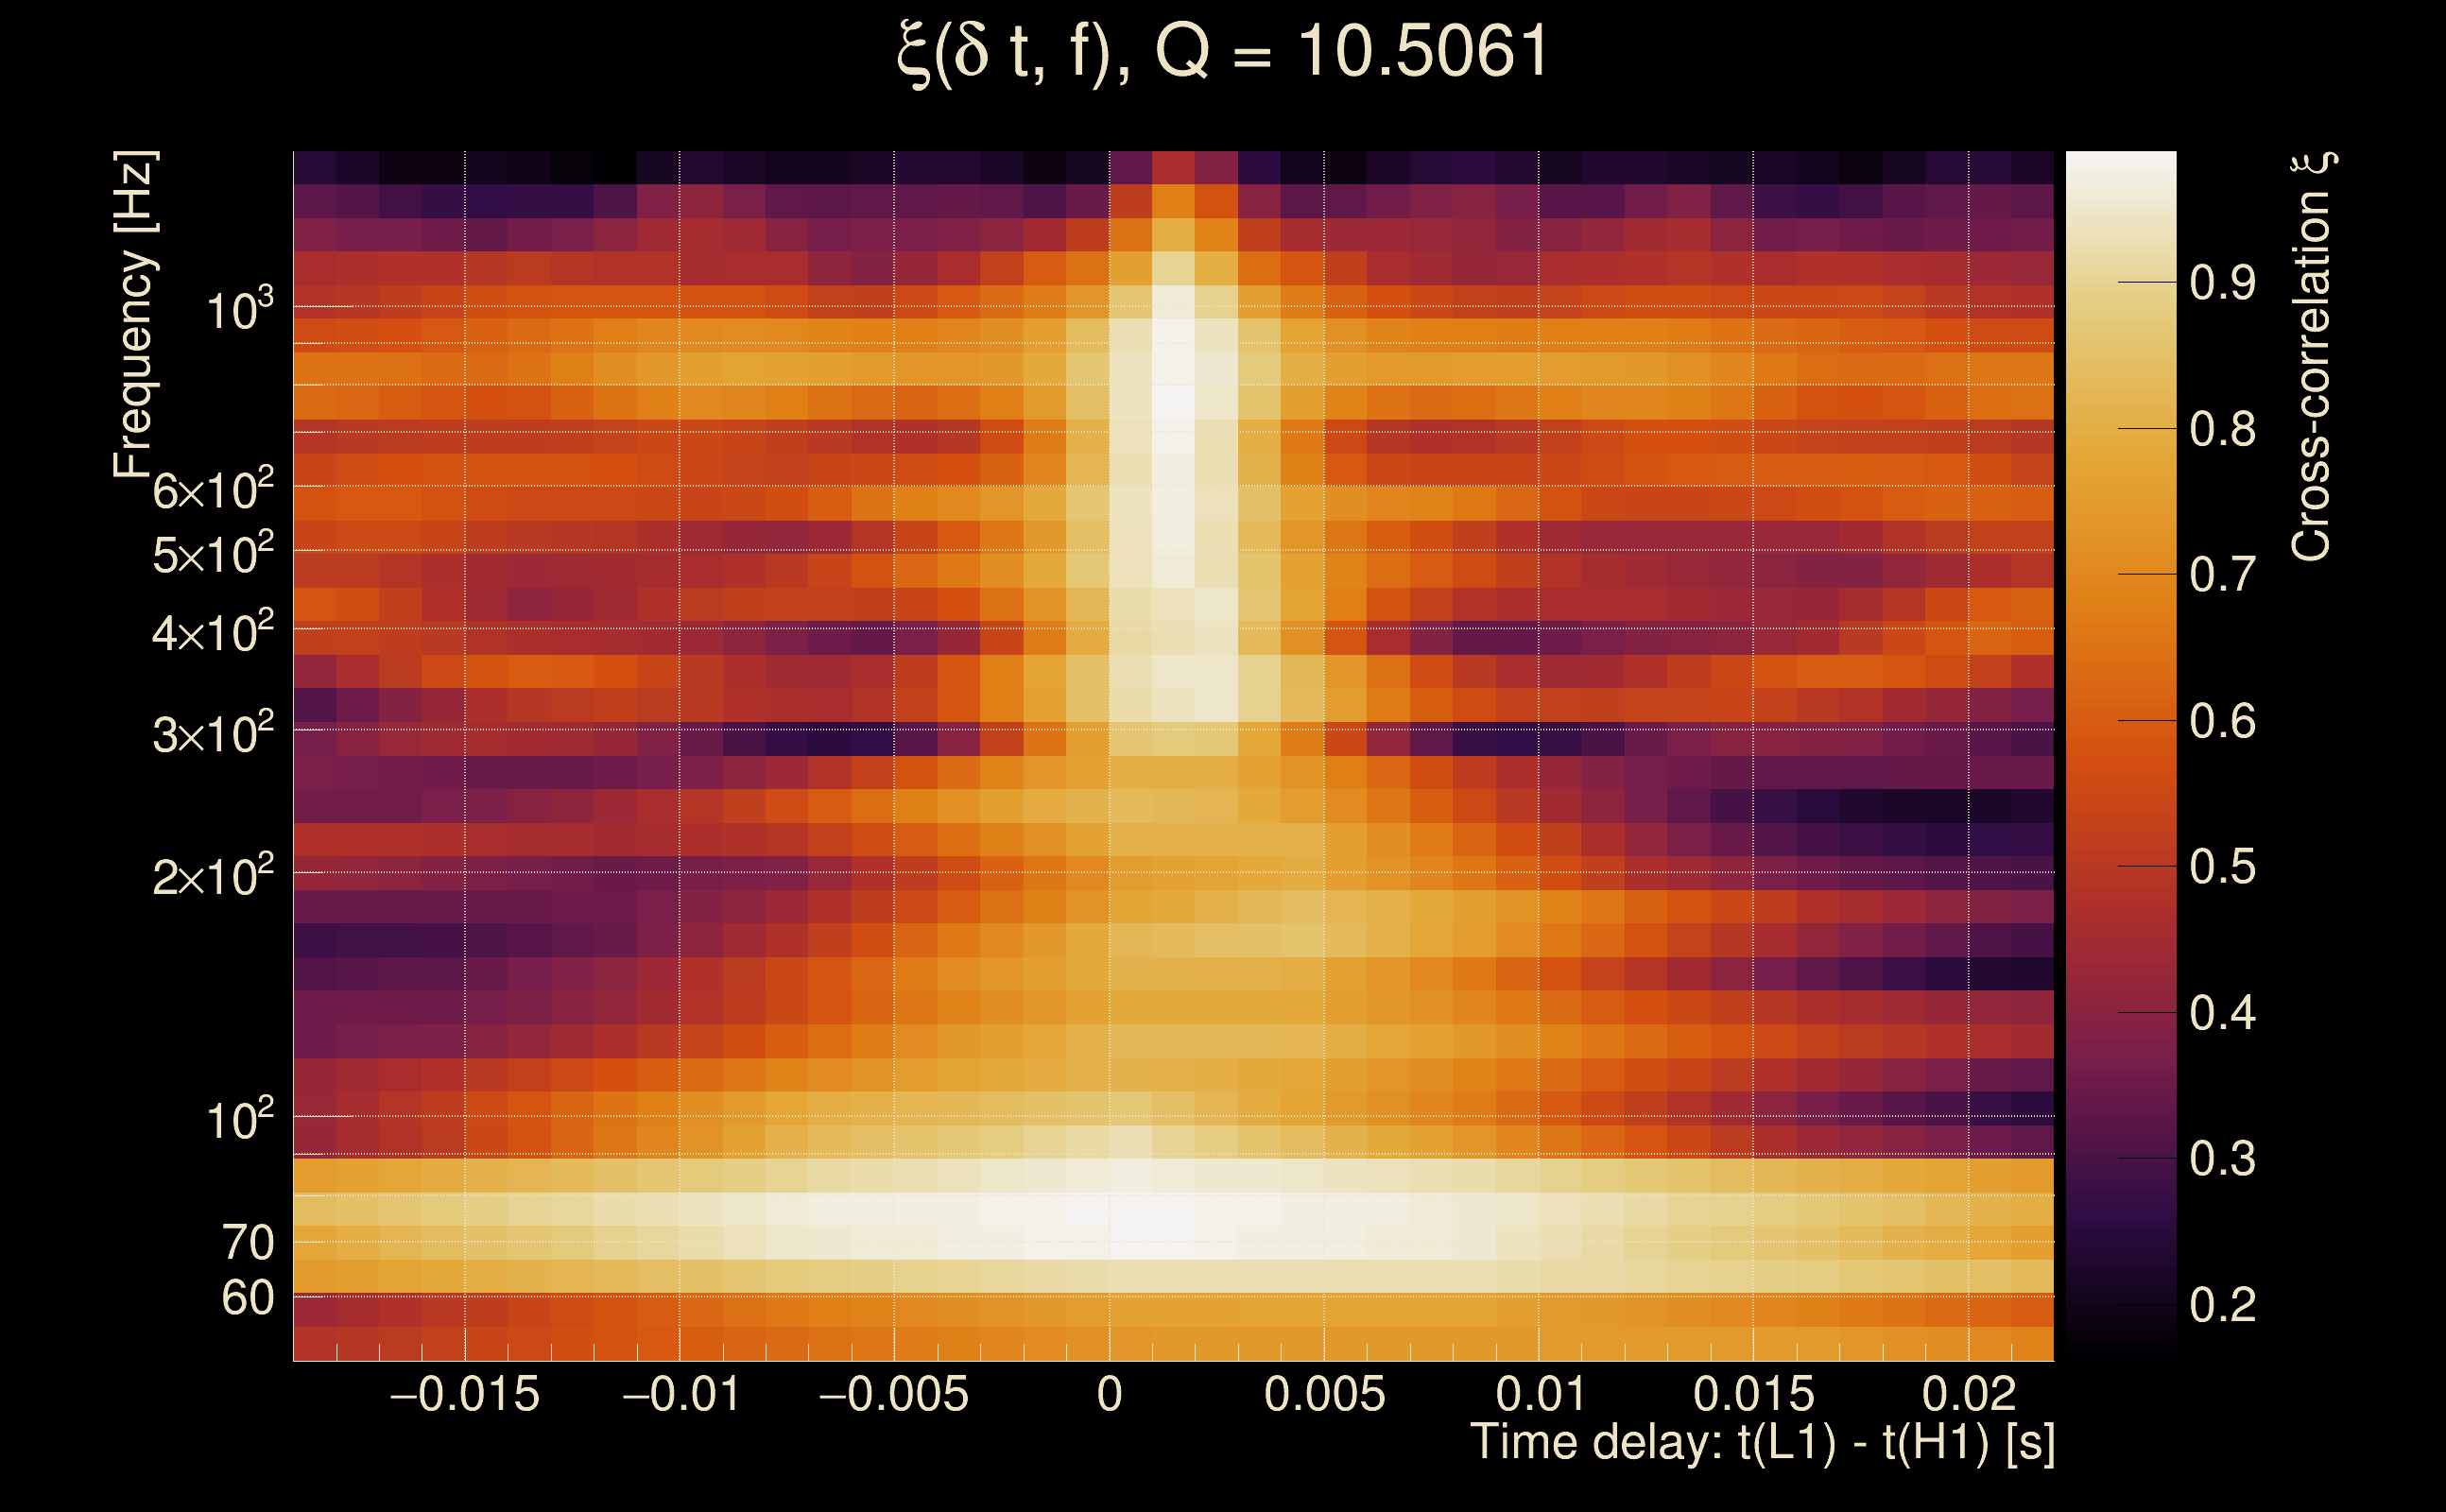
| Time delay between detectors t(L1) - t(H1): | 0.00103402 s (slice index = 108 / 217), δt_gw = 0.00103402 s |
| Time delay uncertainty: | 0.000494625 s |
| [targeted mode] Time delay probability: | 0.903314 (0.121476 sigmas), δt_target = 0.000938177 s |
| Frequency: | 305.249 Hz |
| Ξ: | 0.864948 ± 0.0142078 (variance = 0.000201862): Q0: 0.911181, Q1: 0.890047, Q2: 0.870064, Q3: 0.876935, Q4: 0.892888 |
| Rank: | R_A = 0.71974 |
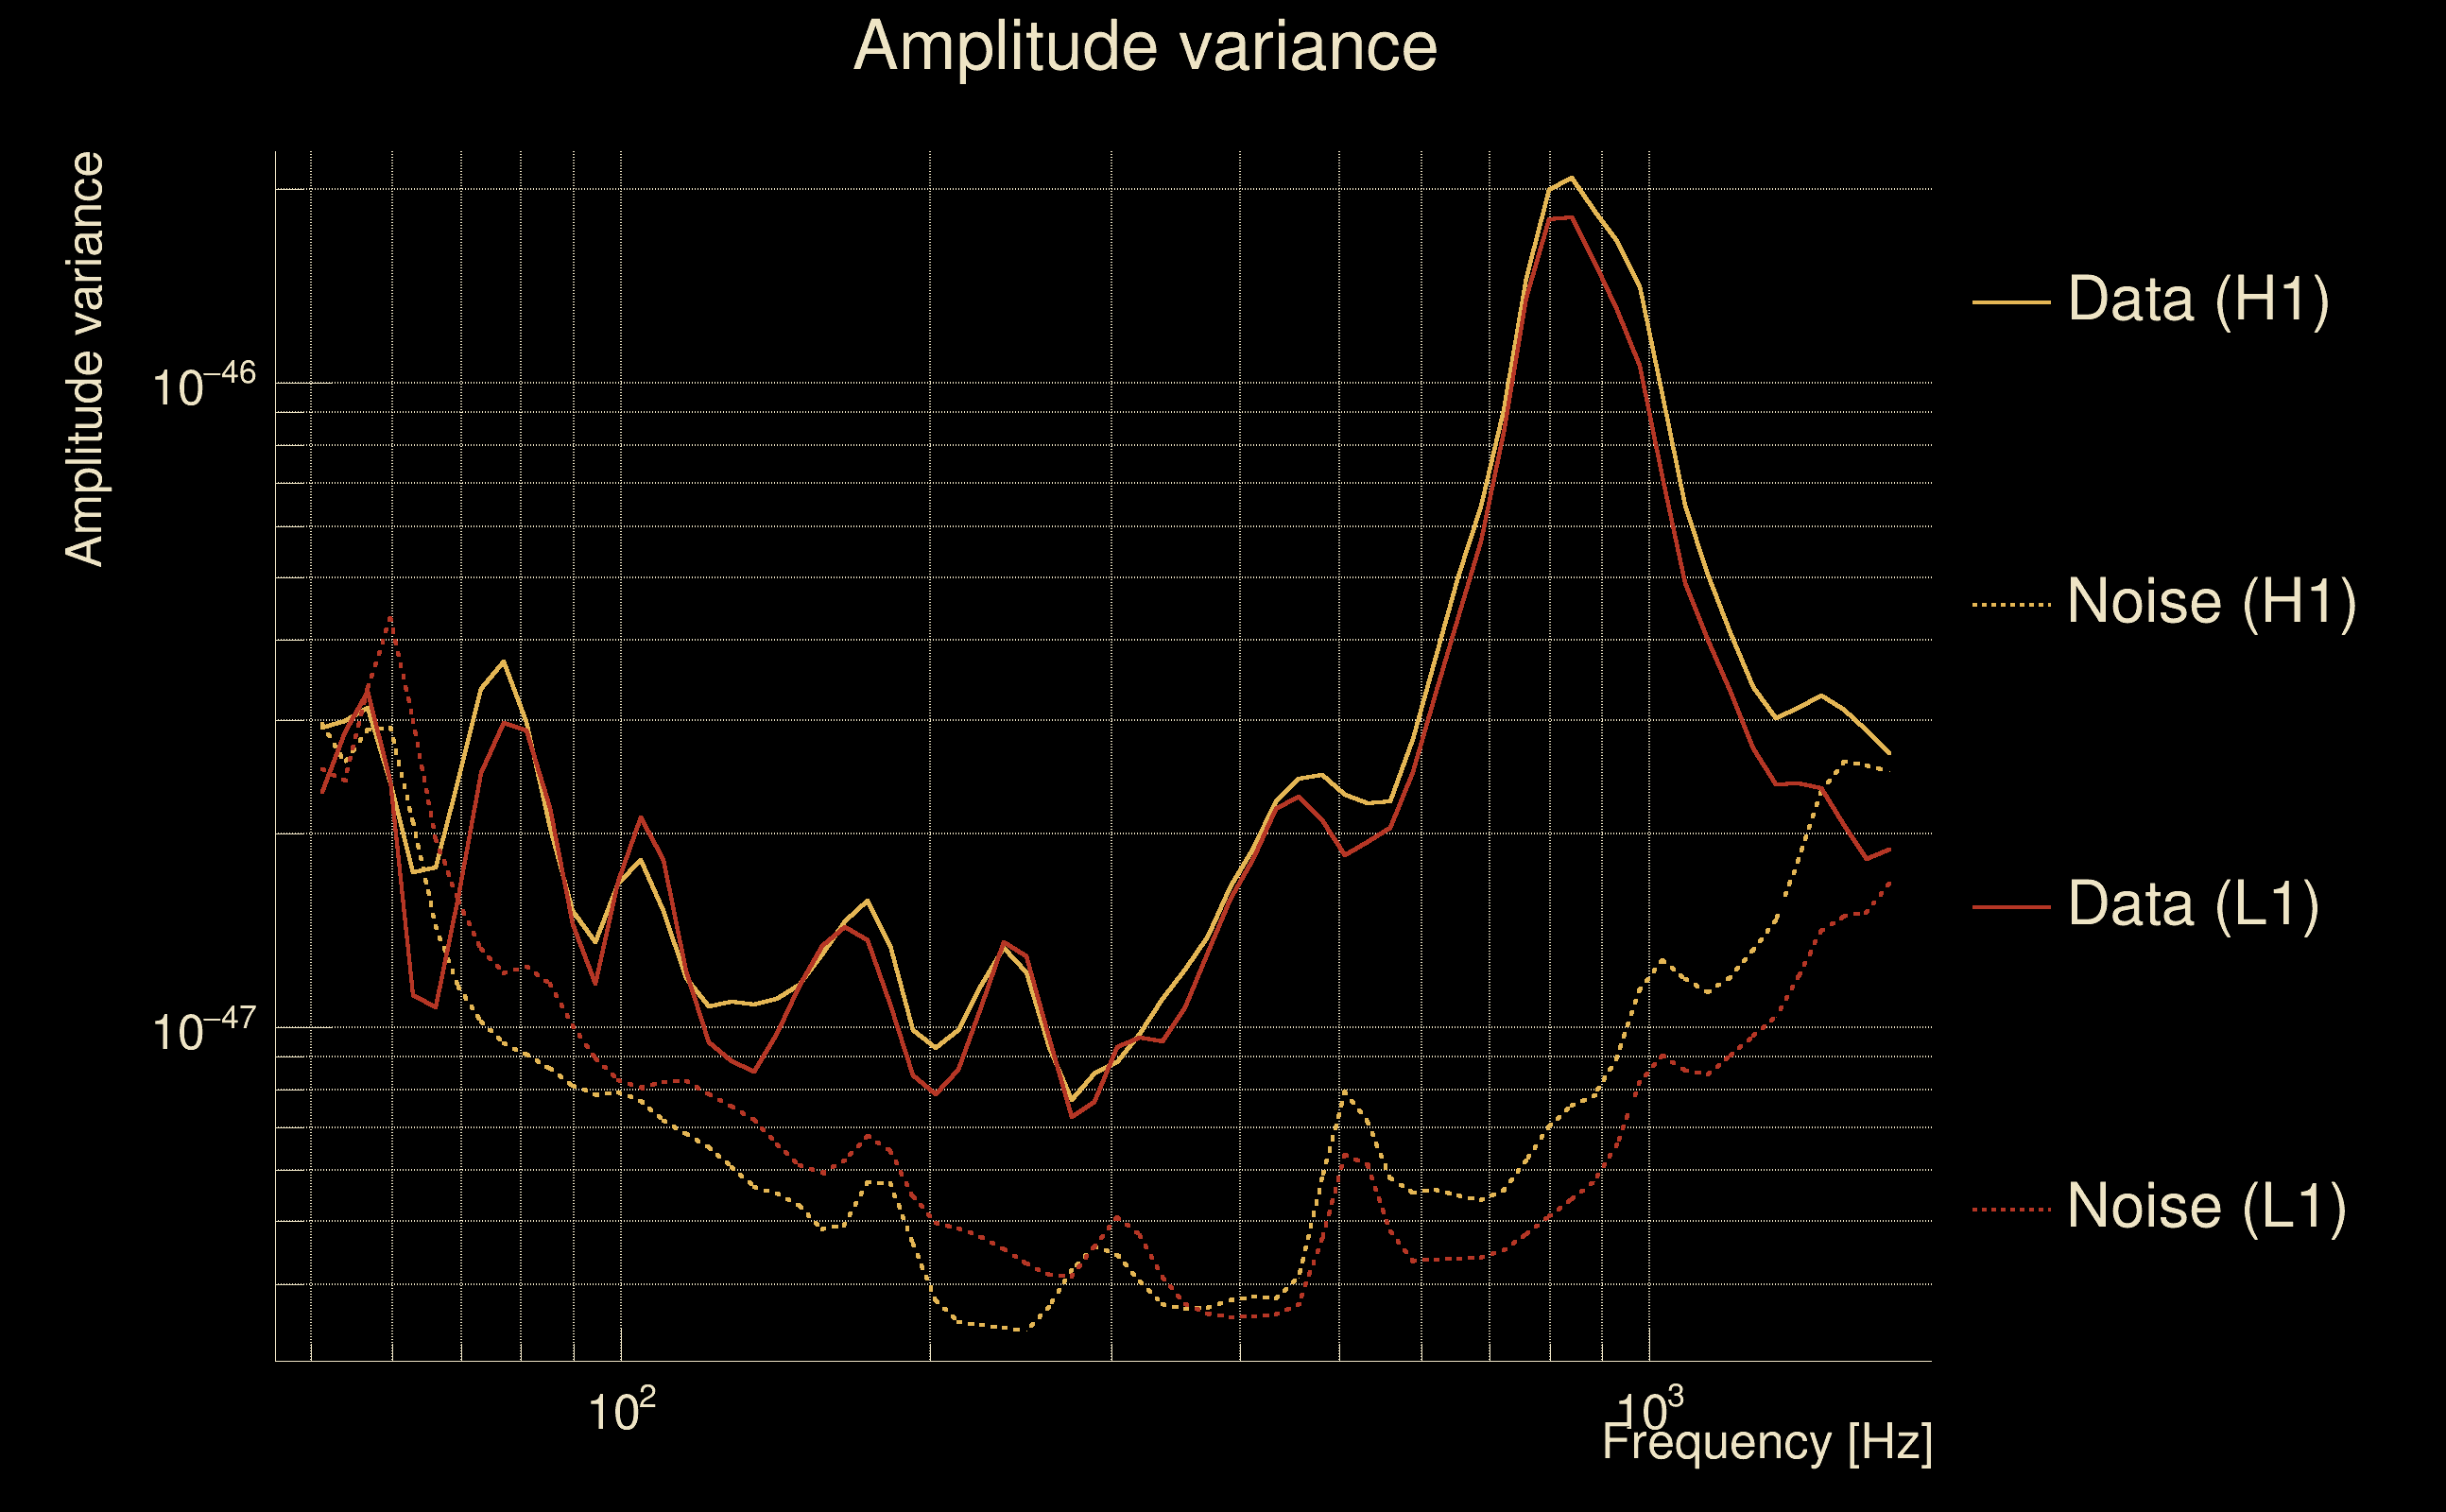
| Log of amplitude ratio (L1/H1): | -0.0793346, variance = 0.153542 (L1/H1: -0.0915363, variance = 0.305203, H1/L1: 0.0670808, variance = 0.308977) |
| Amplitude ratio (L1/H1): | 0.923731 ⋇ 1.47971 (L1/H1: 0.912528 ⋇ 1.73751, H1/L1: 1.06938 ⋇ 1.74343) |
| Amplitude ratio H1|L1 compatibility (probability): | 0.975106 |
| Antenna factor probability: | 0.944703 |
| Number of rejected frequency rows: | Q0: 0 / 18, Q1: 1 / 36, Q2: 3 / 70, Q3: 23 / 134, Q4: 89 / 258 |
| Maximum signal-to-noise ratio: | H1: 62.8624, L1: 62.7287 |
| SNR variance: | H1: 1.93979, L1: 2.01109 |
| Click here for a zoomed plot | Click here for a zoomed plot | Click here for a zoomed plot | Click here for a zoomed plot | Click here for a zoomed plot |
 |
 |
 |
 |
 |
 |
 |
 |
 |
 |
 |
 |
 |
 |
 |
 |
 |
 |
 |
 |
 |
 |
 |
 |
 |
 |
 |
 |
 |
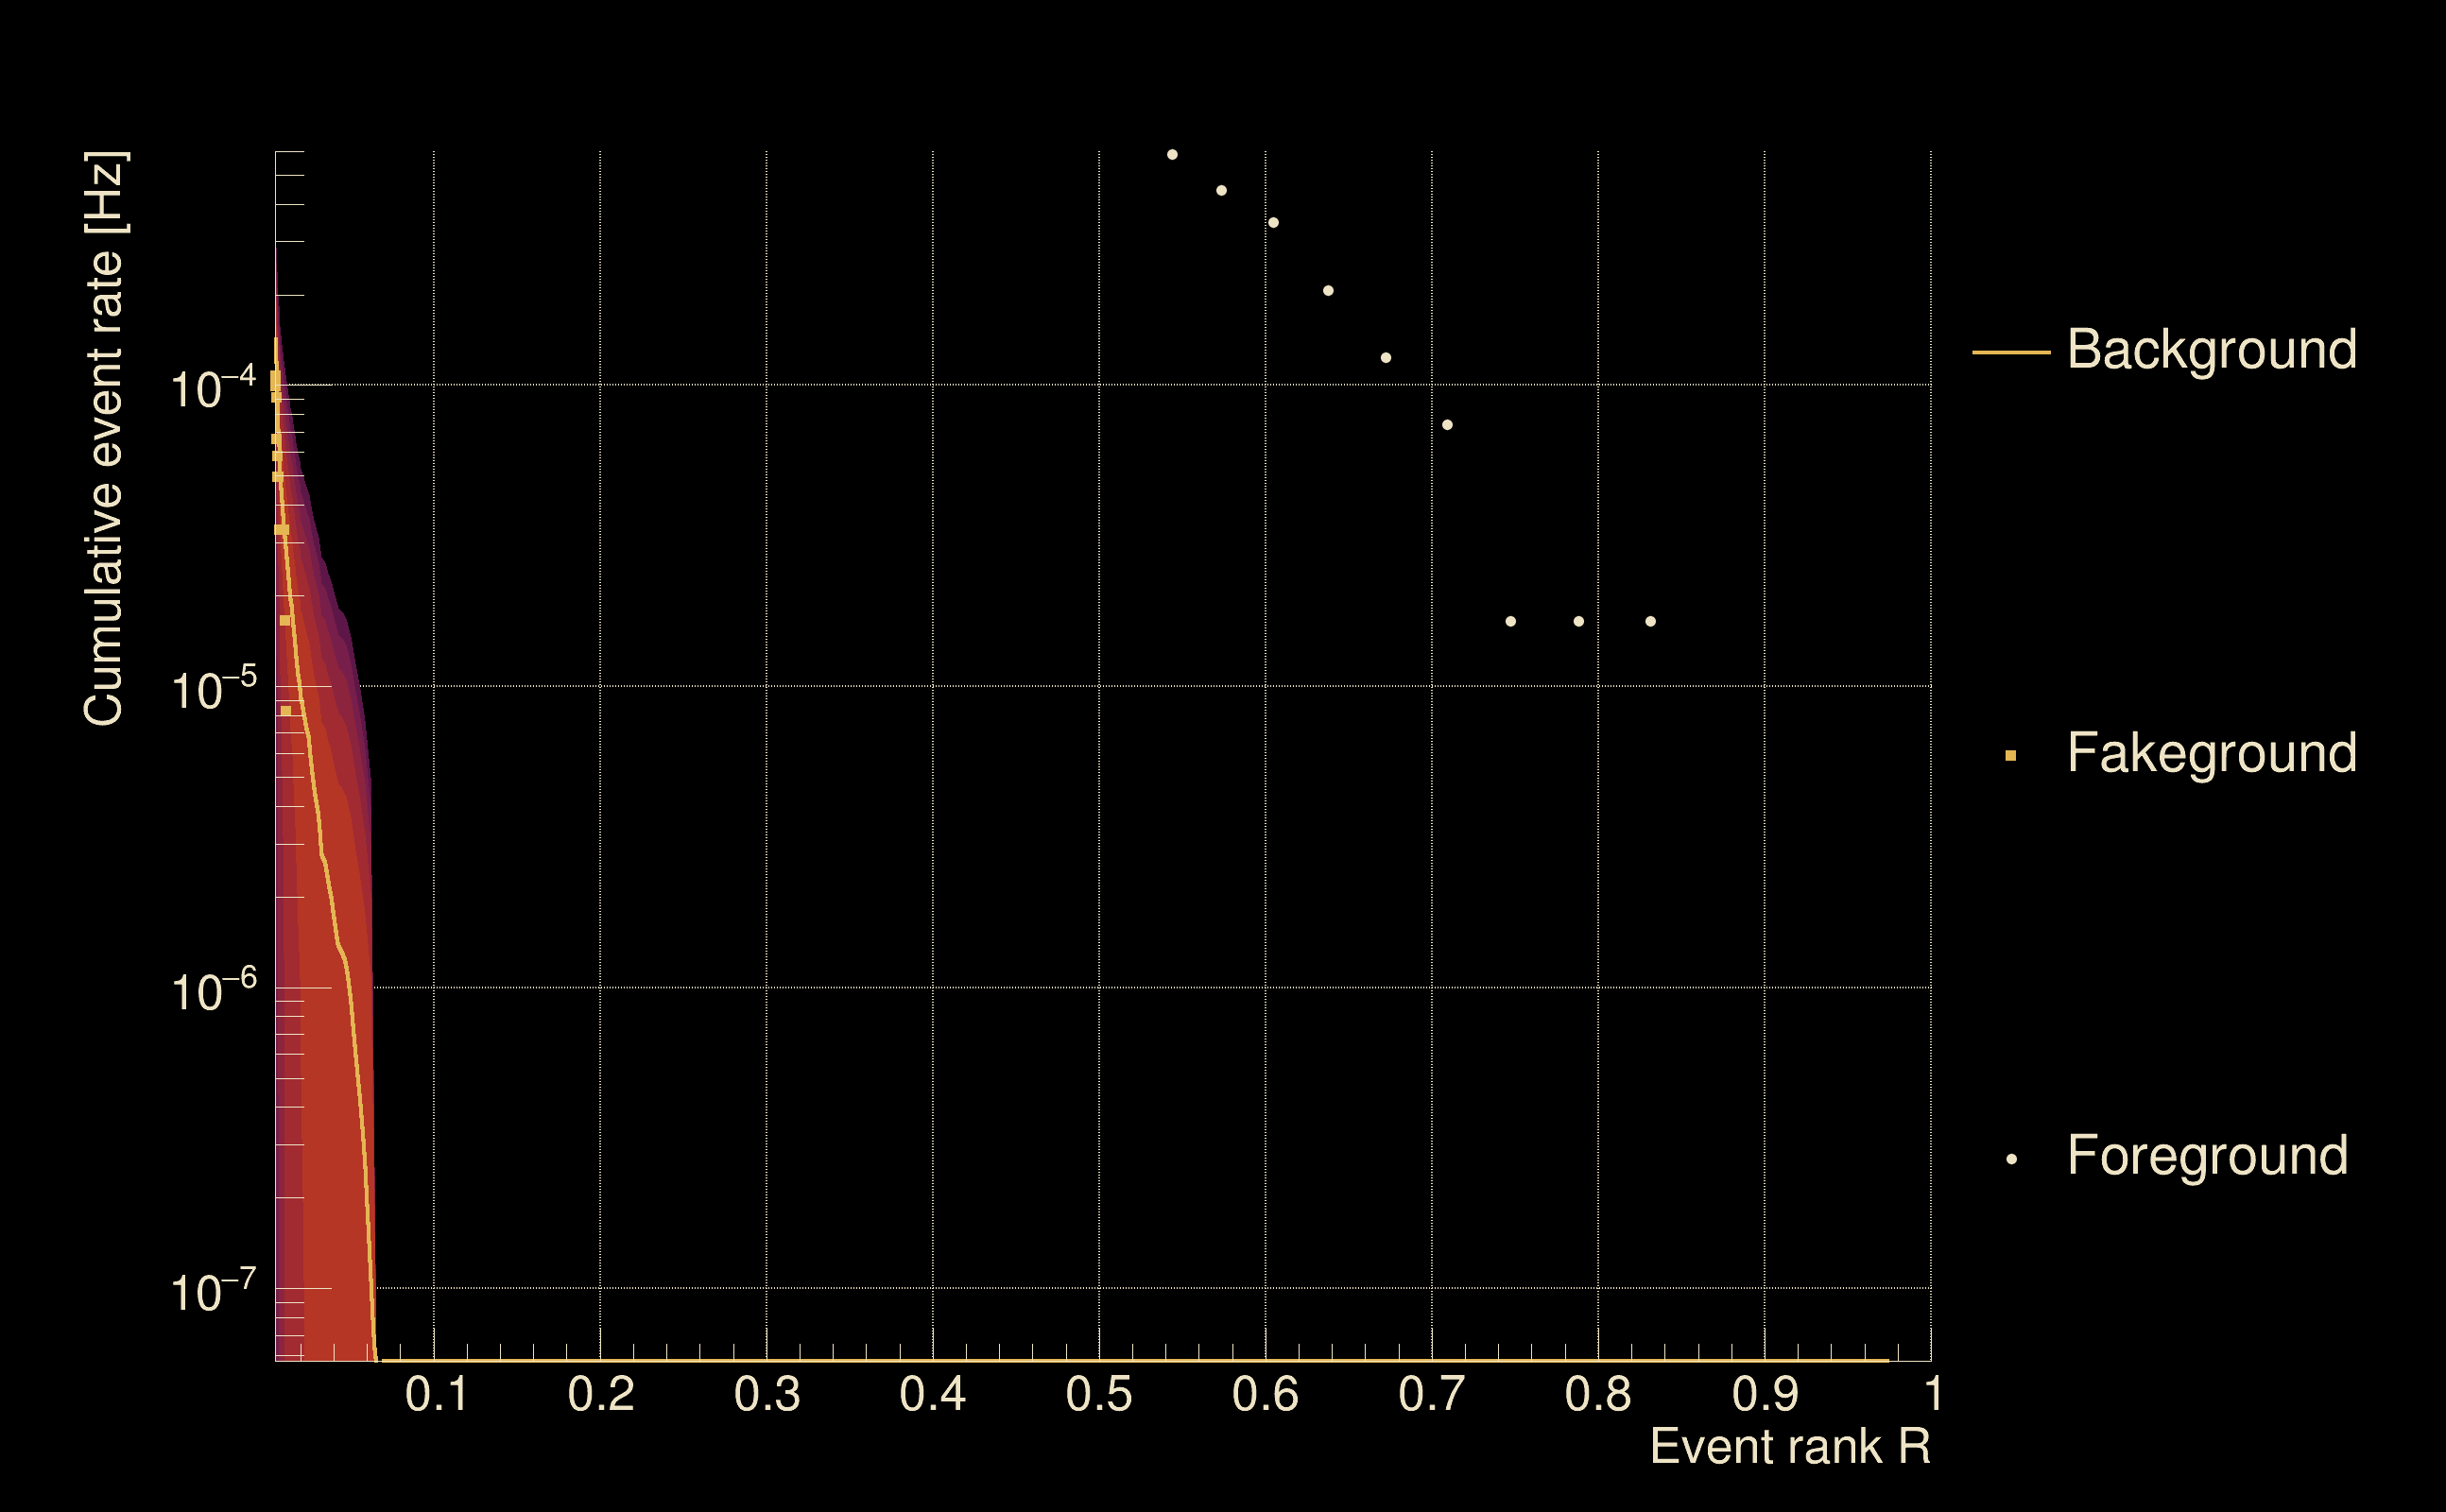
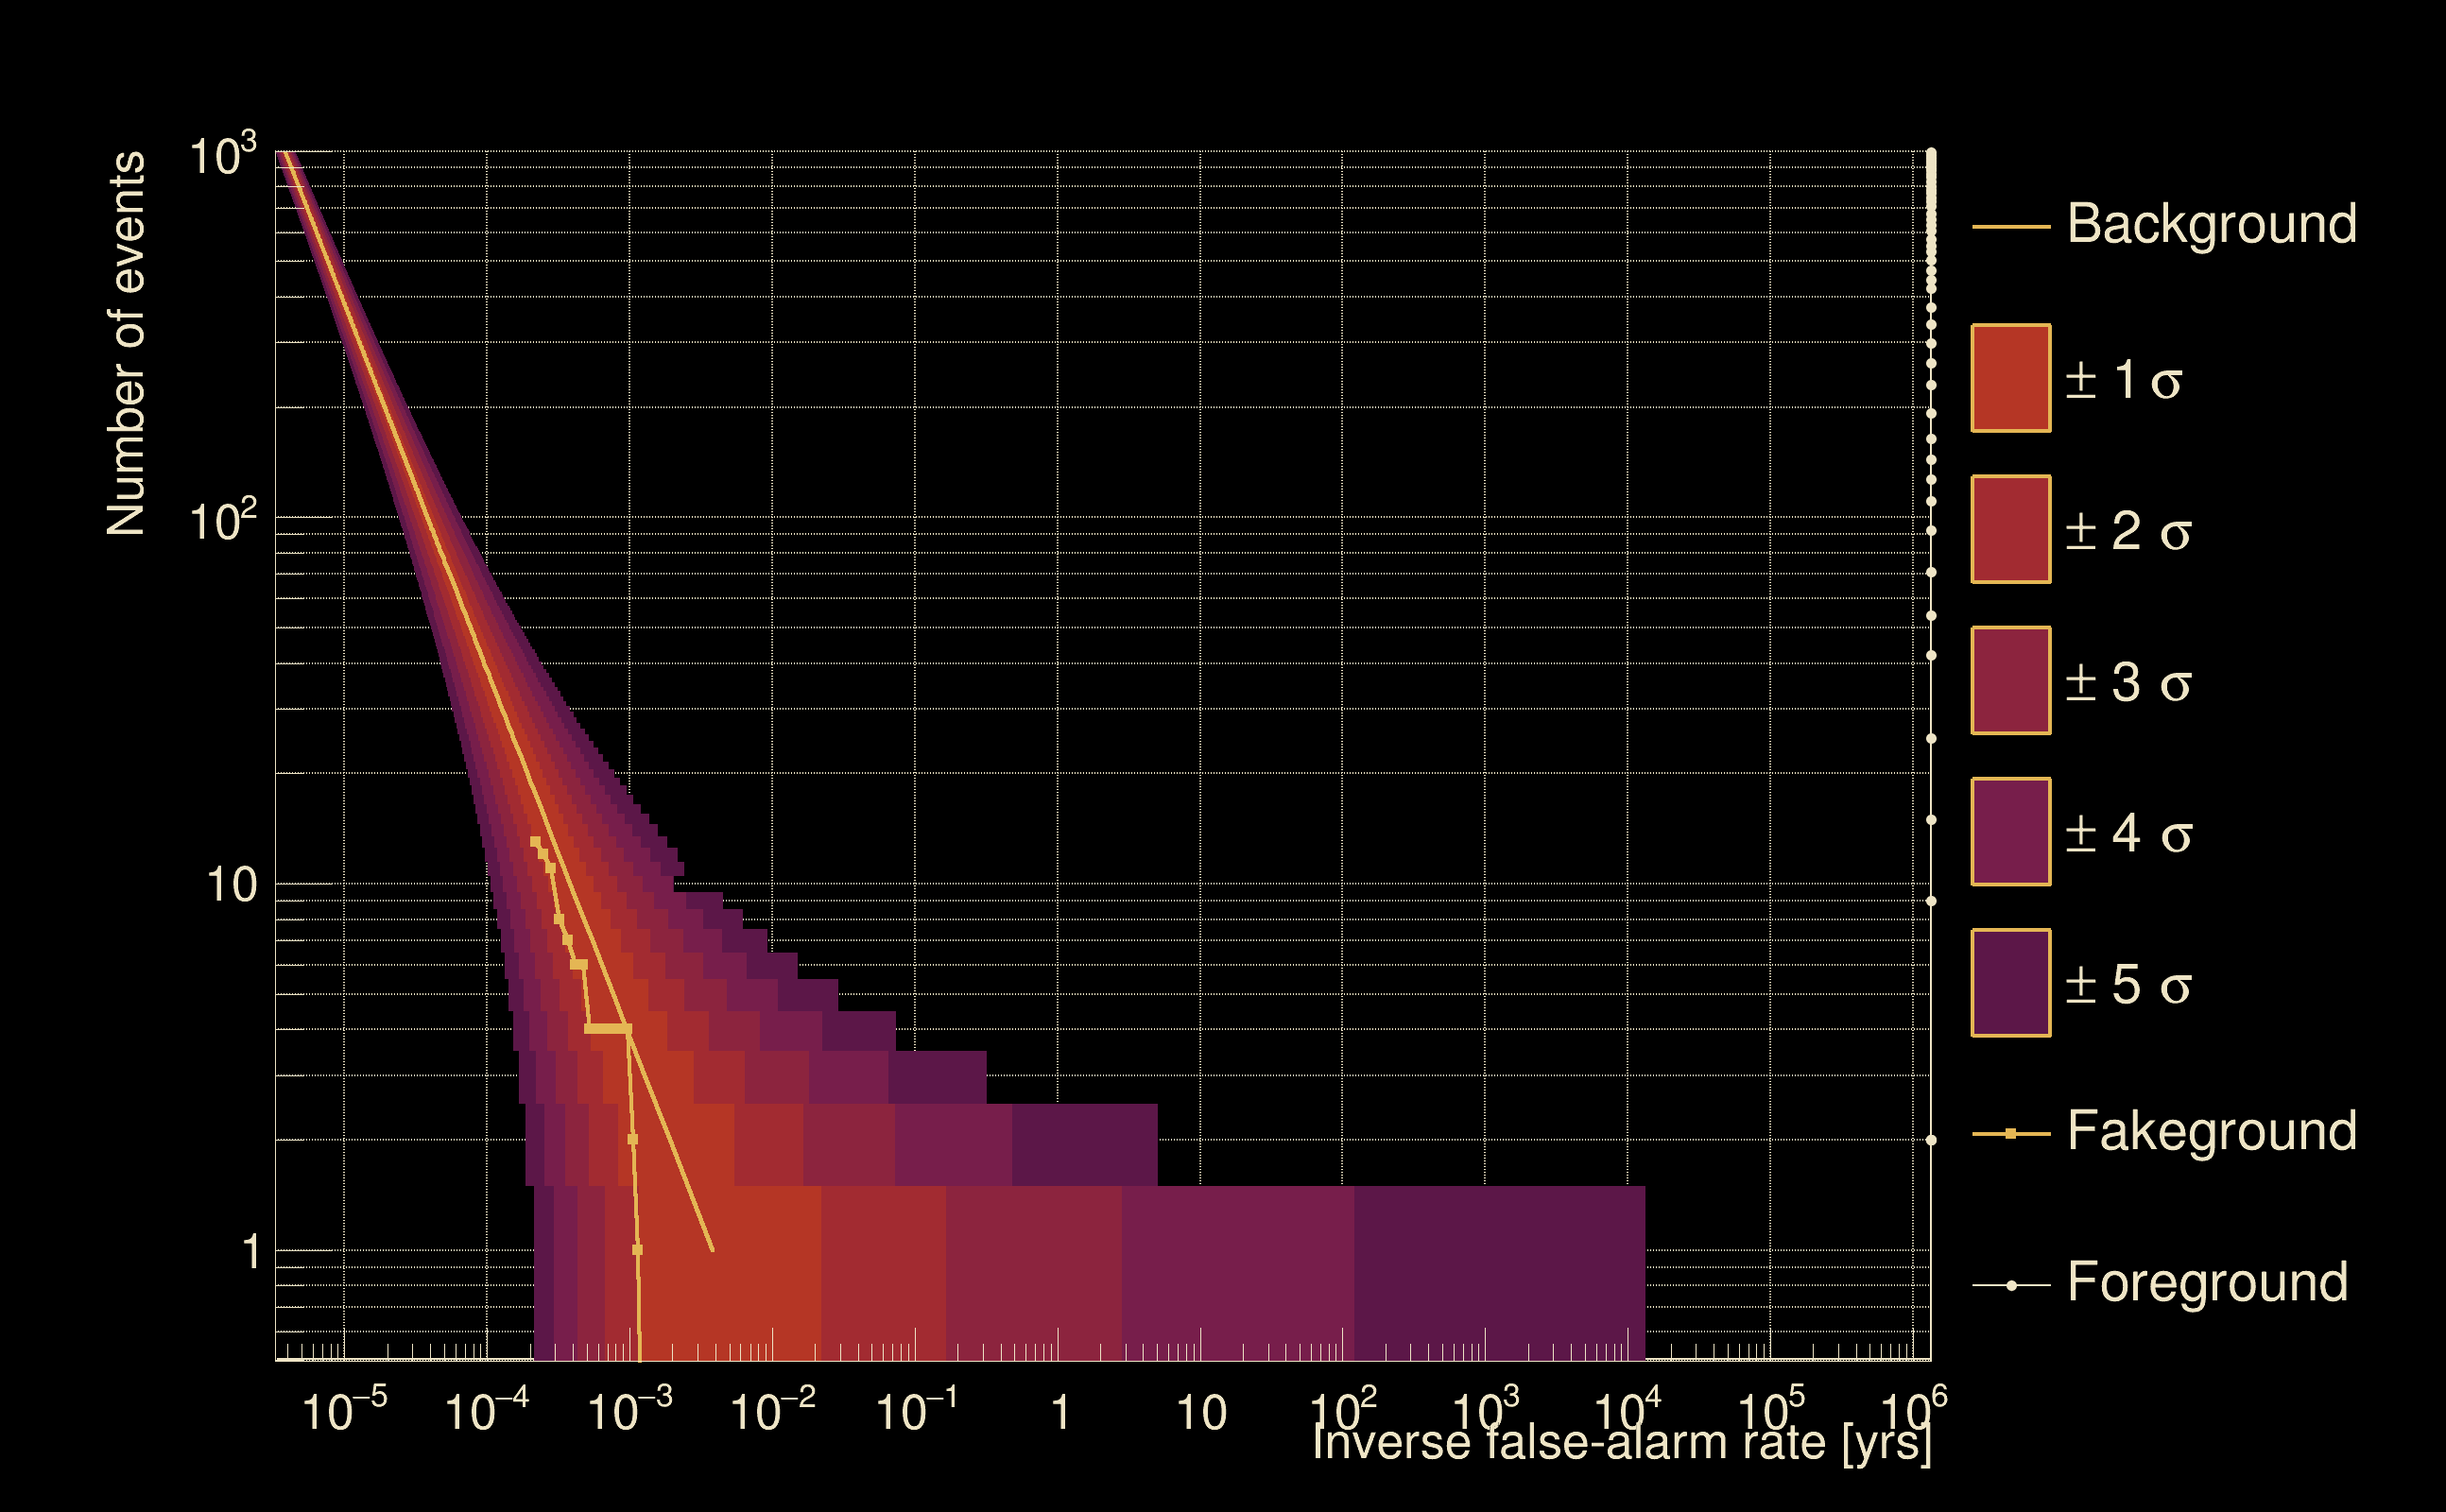
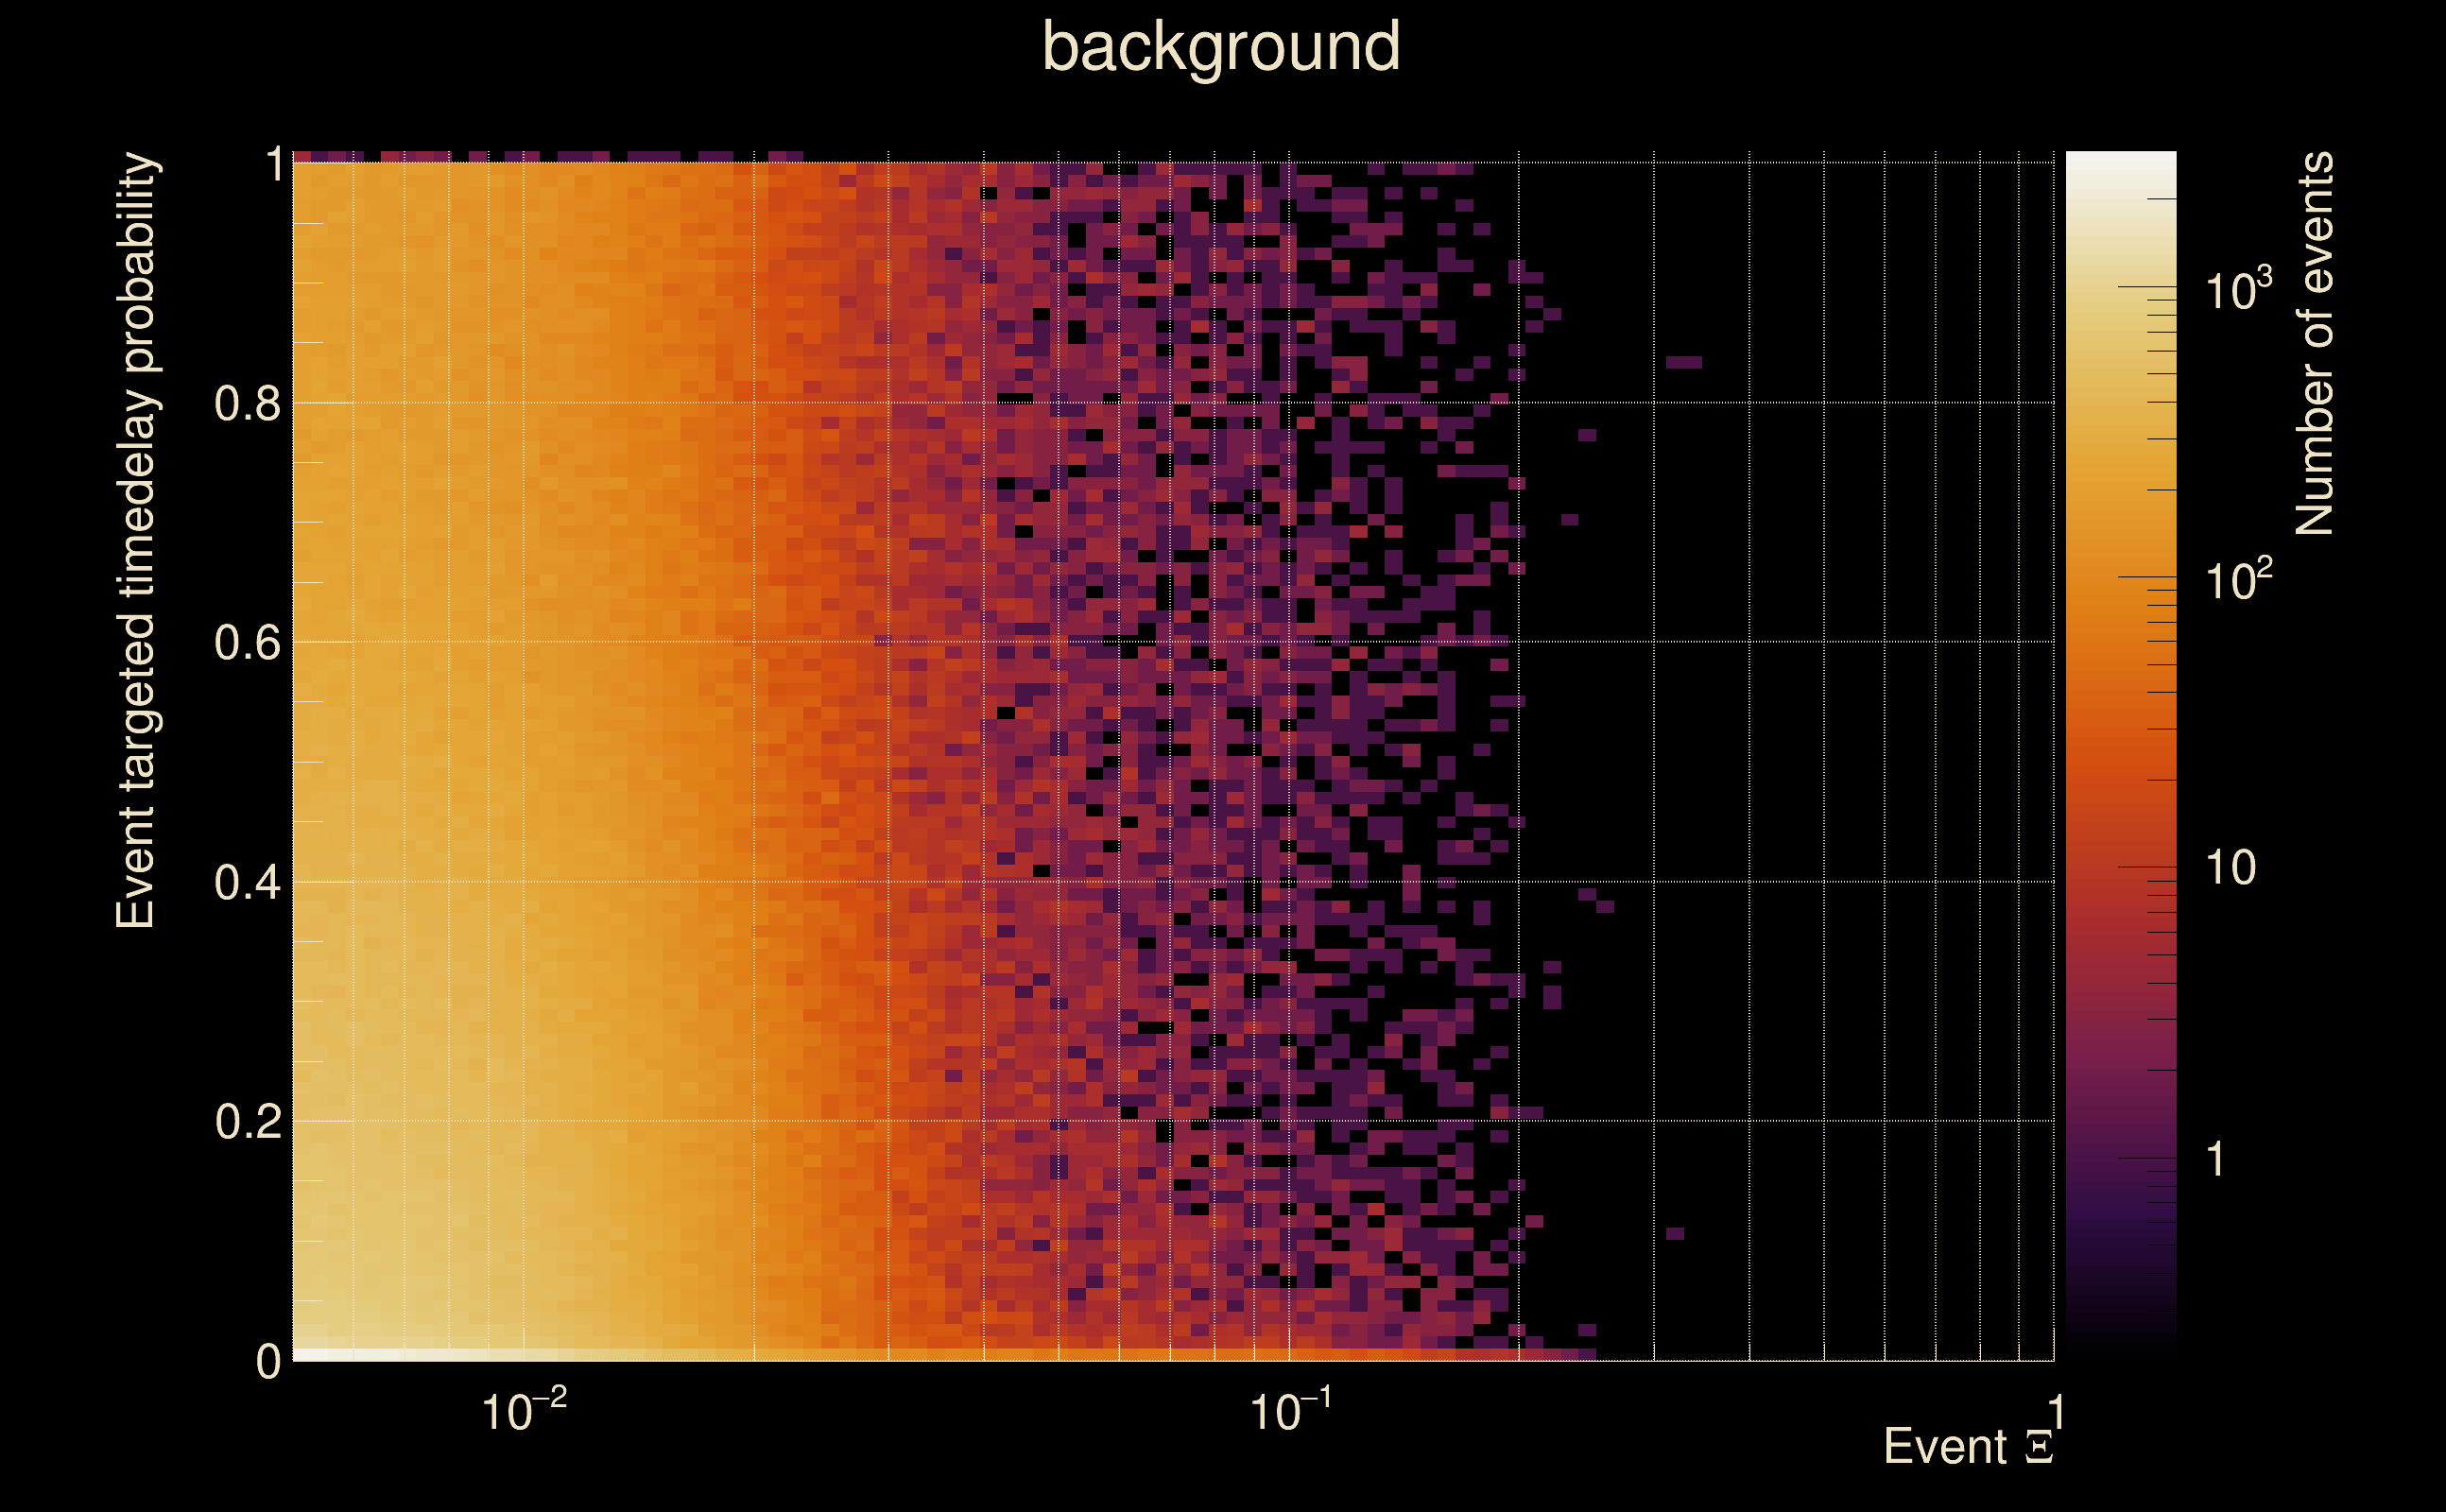
| Detection threshold: | R > 0.06196 |
| False-alarm rate above that detection threshold: | 5.76067e-08 |
| Alternative threshold at 1/1000 yrs: | R > 0.06196 |
| Alternative threshold at 1/100 yrs: | R > 0.06196 |
| Alternative threshold at 1/10 yrs: | R > 0.06196 |
| Alternative threshold at 1/1 yr: | R > 0.06196 |
| Alternative threshold at 1/1 d: | R > 0.0174005 |
 |
|
 |
 |
 |
 |
 |
 |
 |
 |
 |
 |
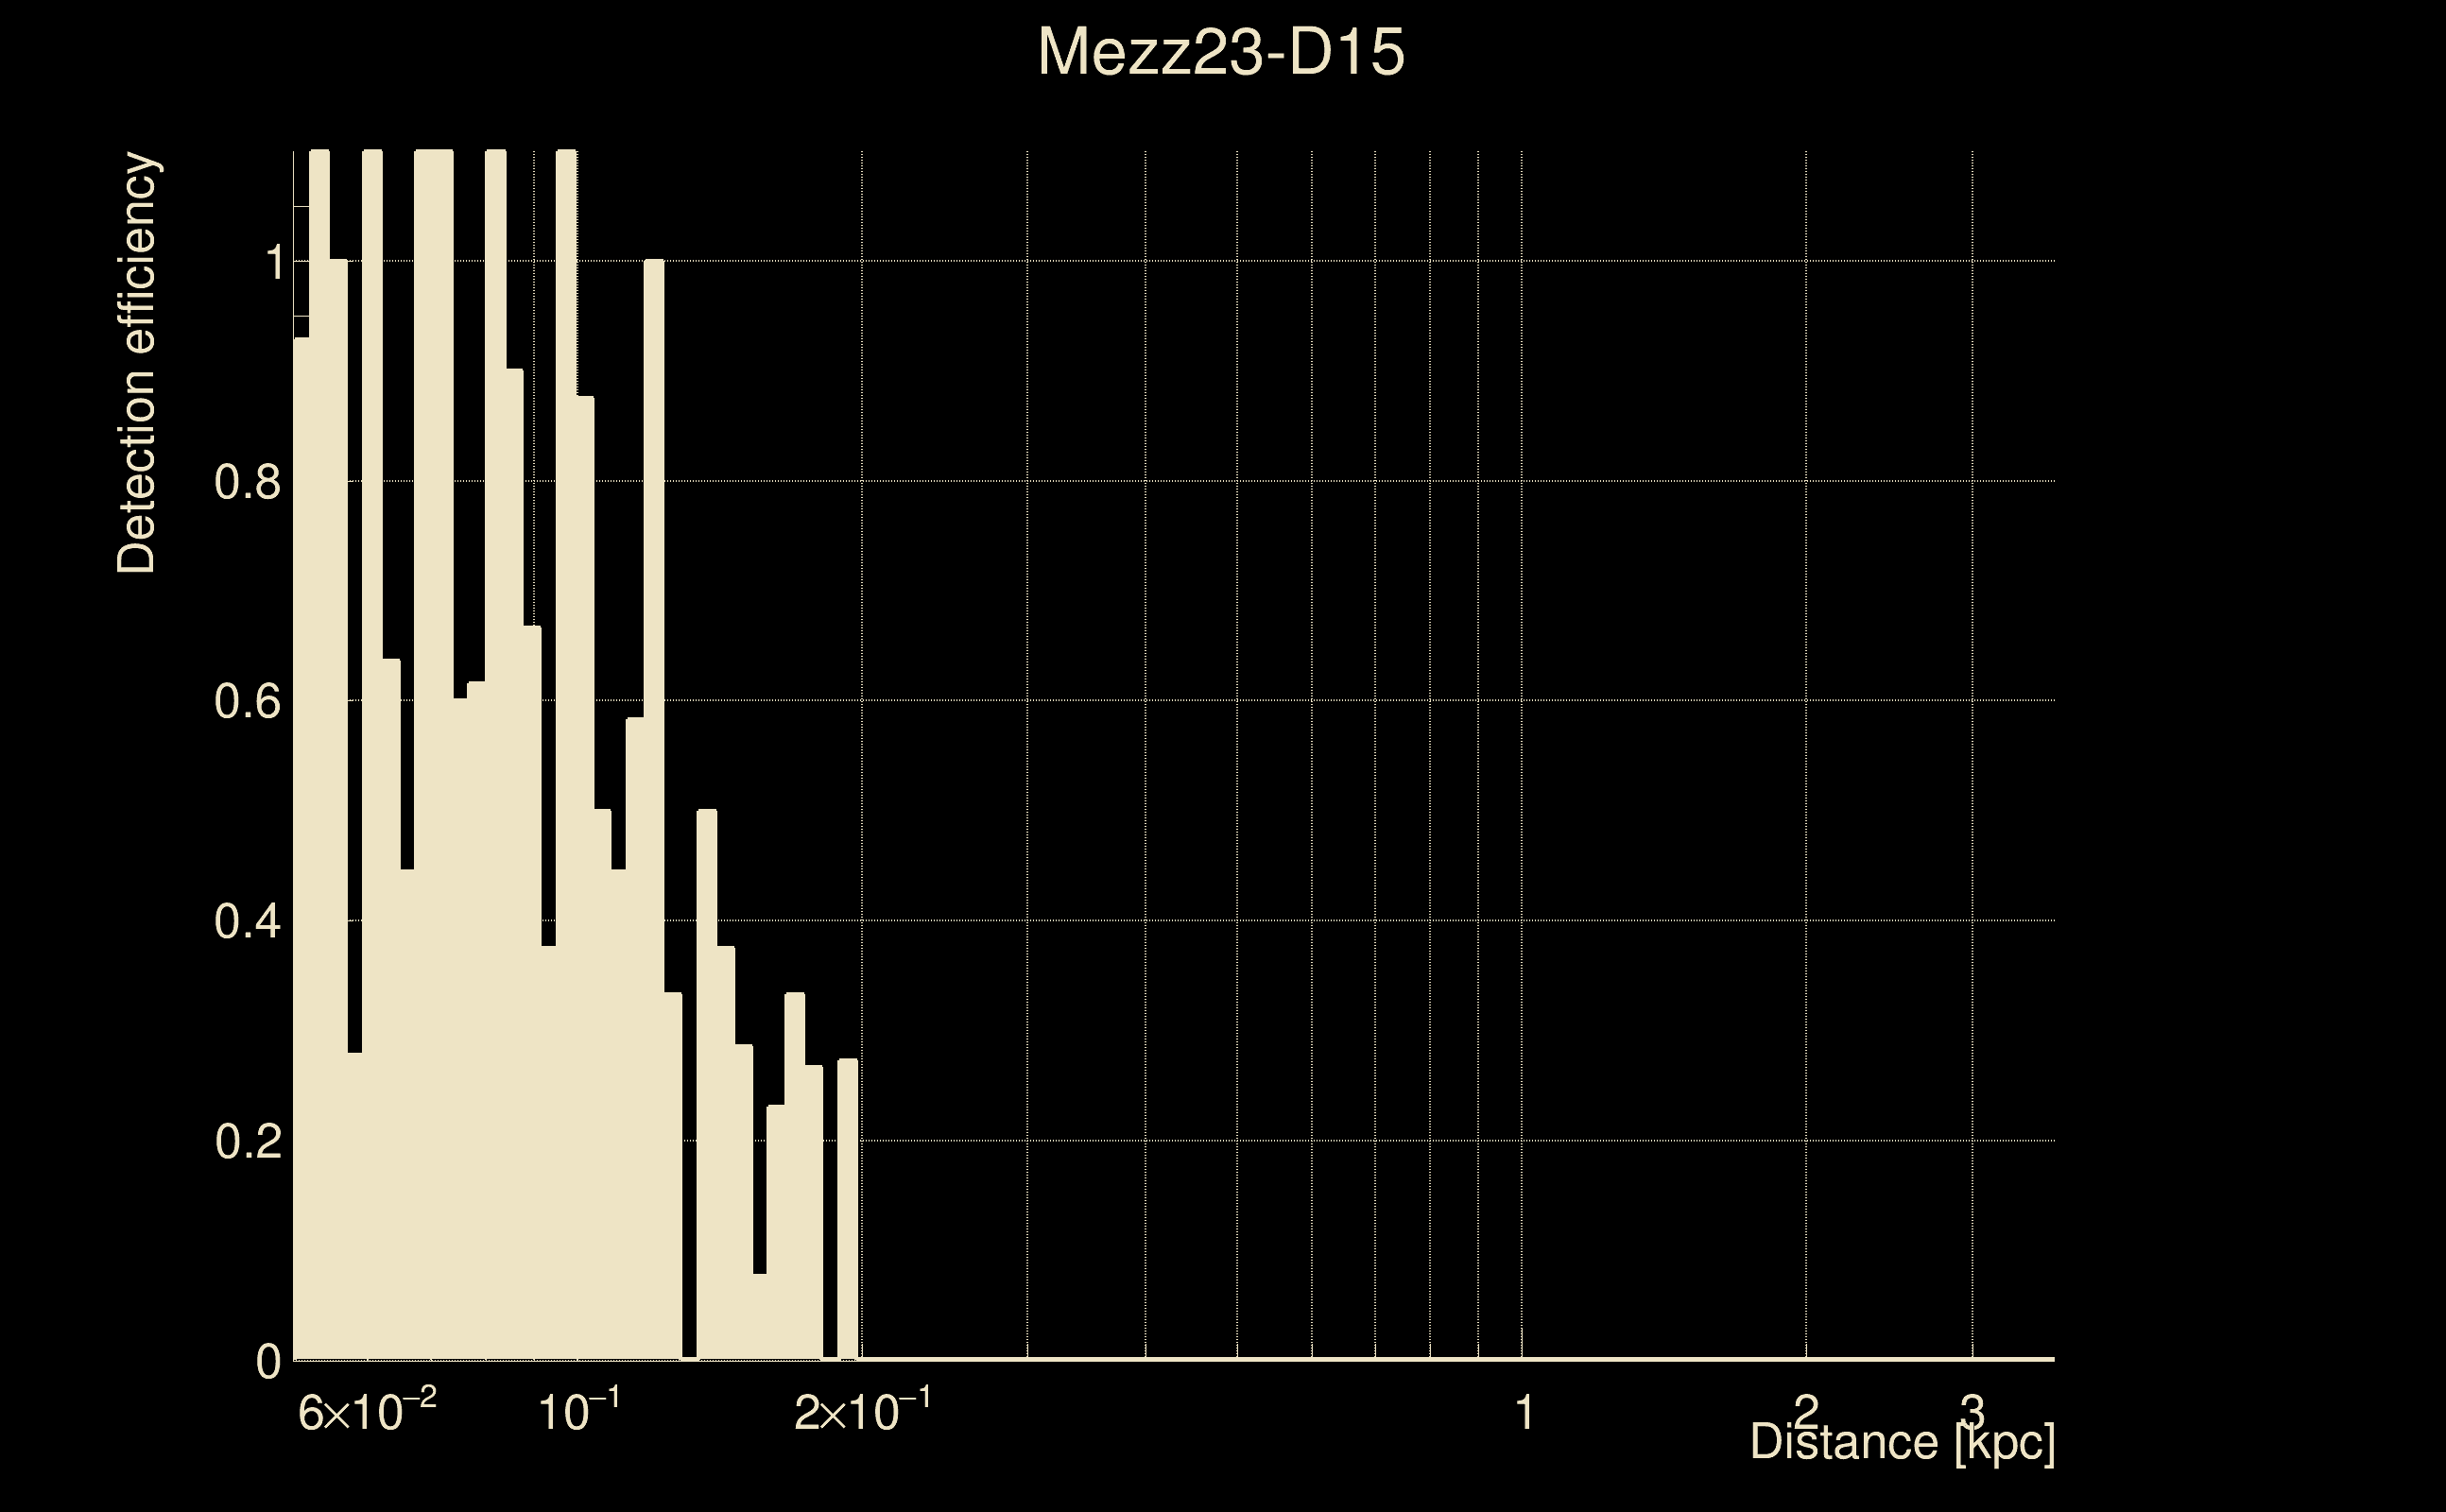
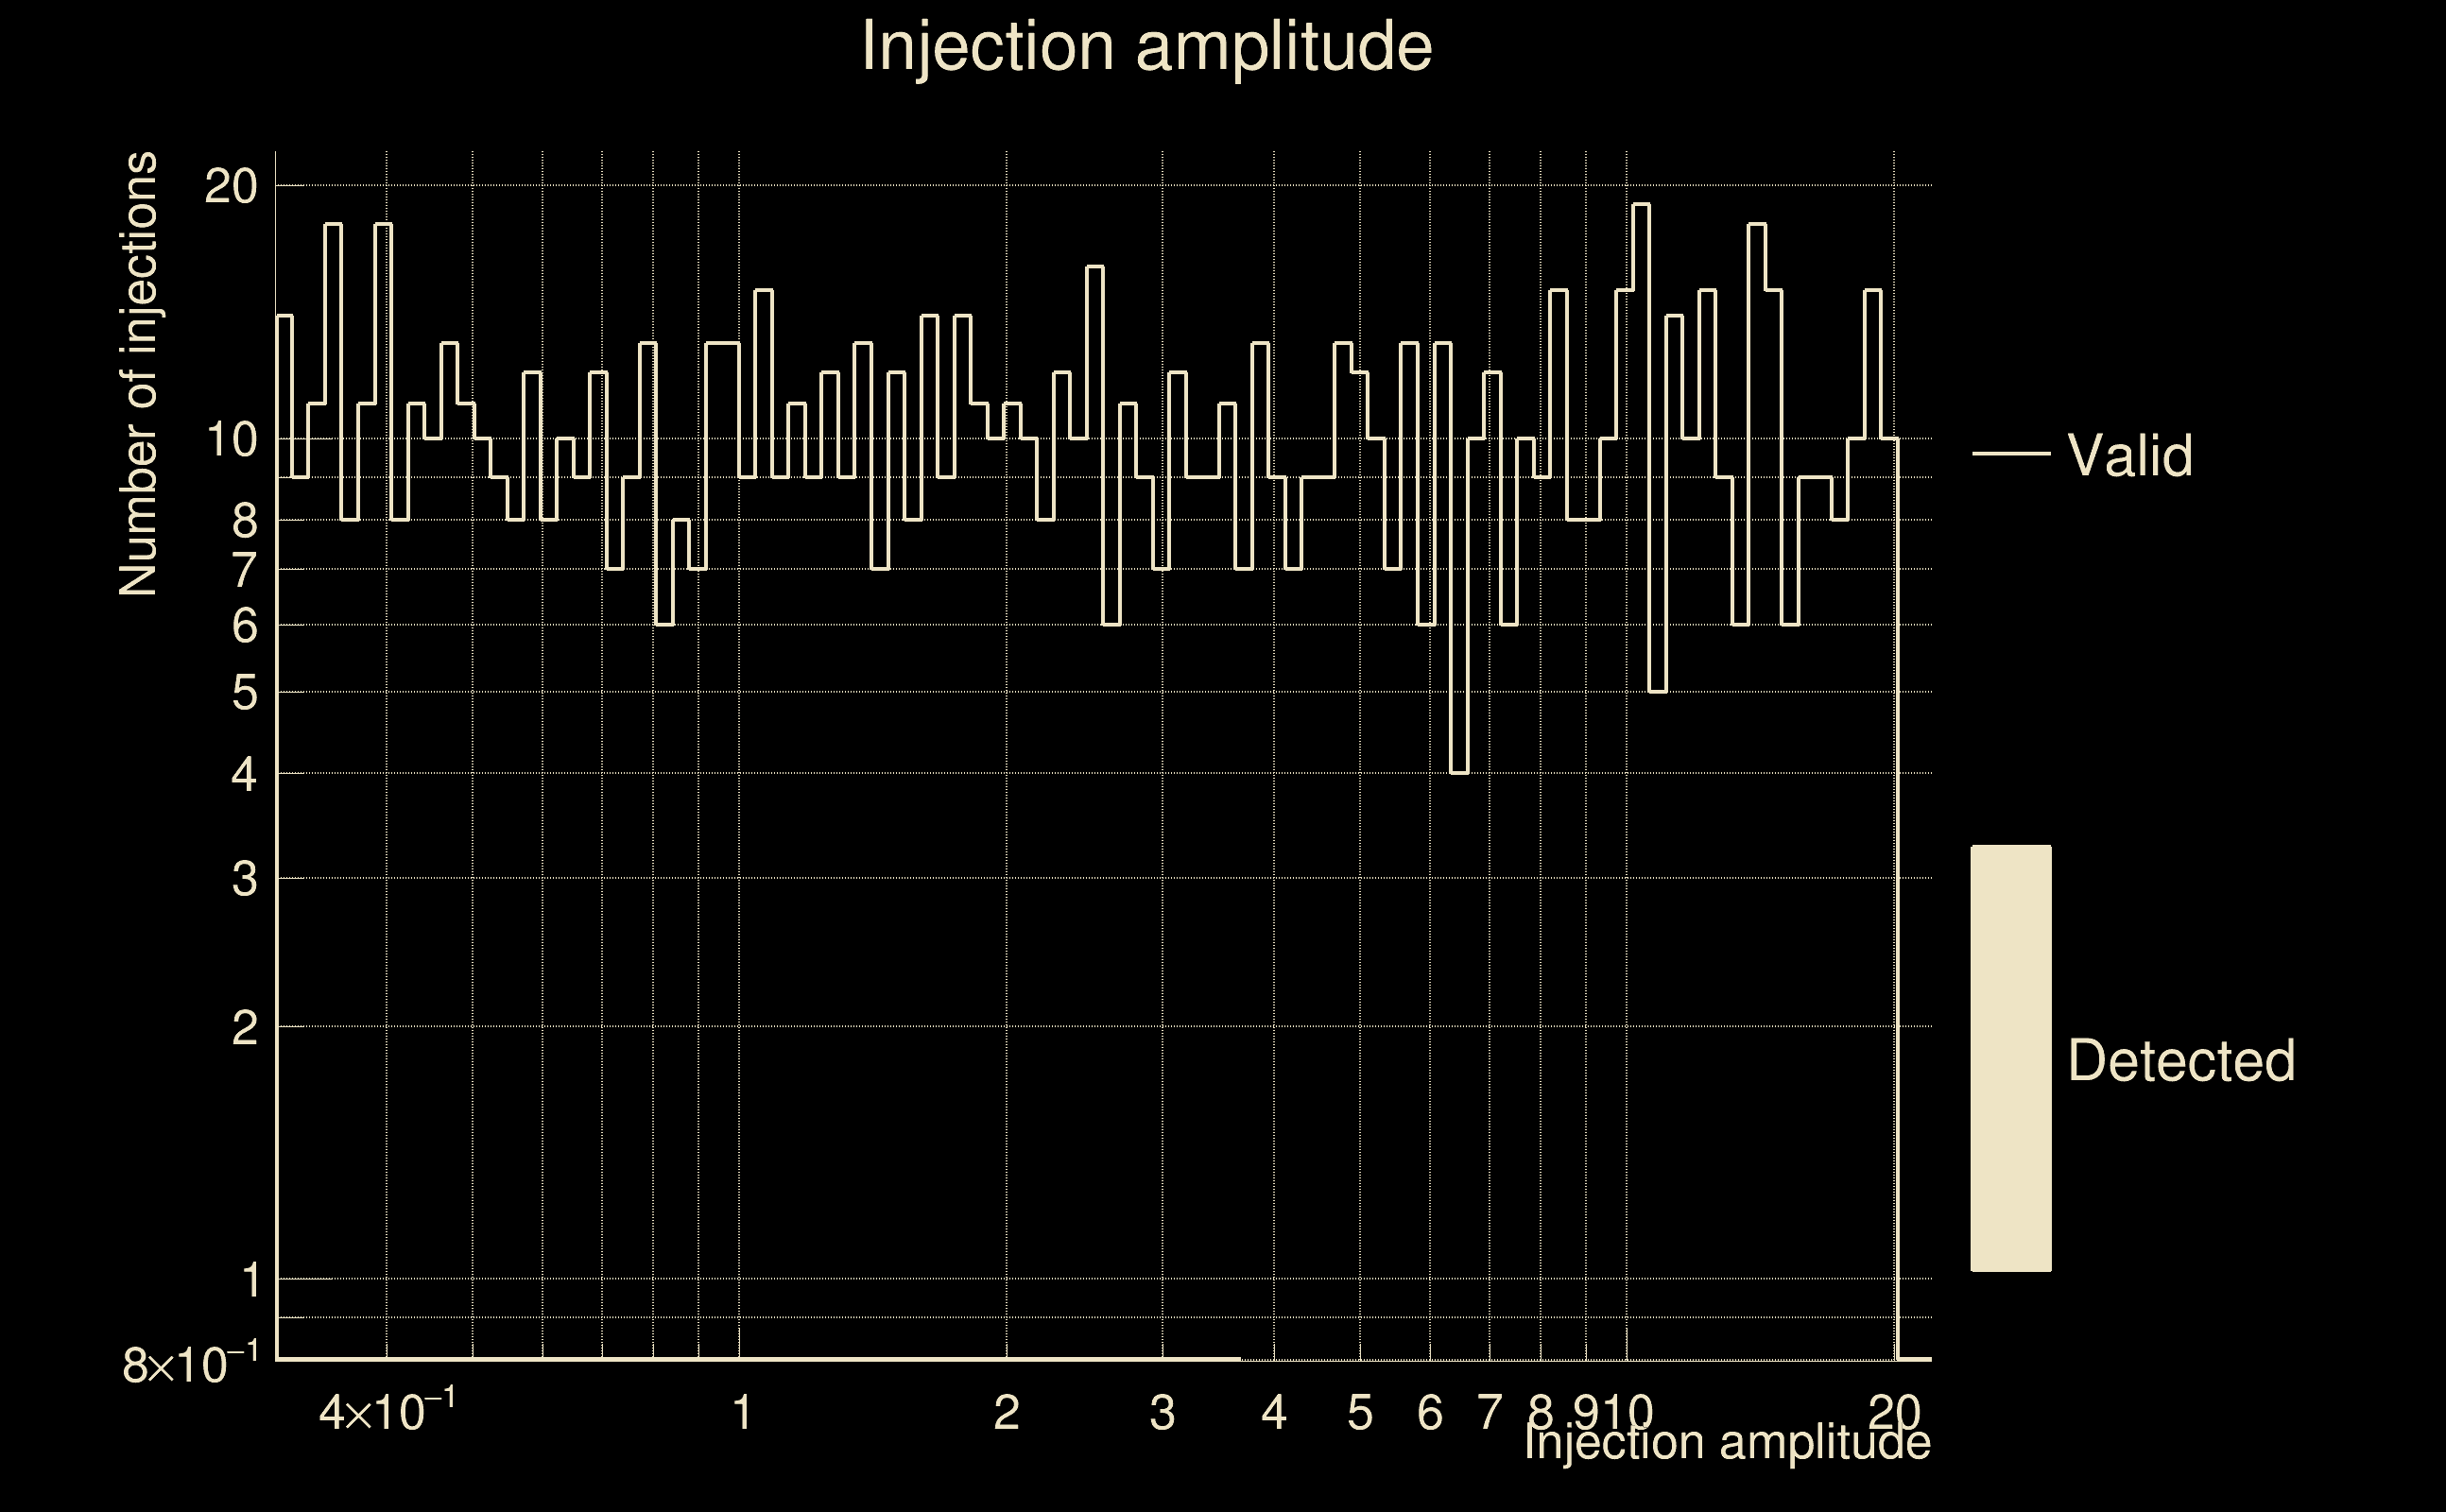
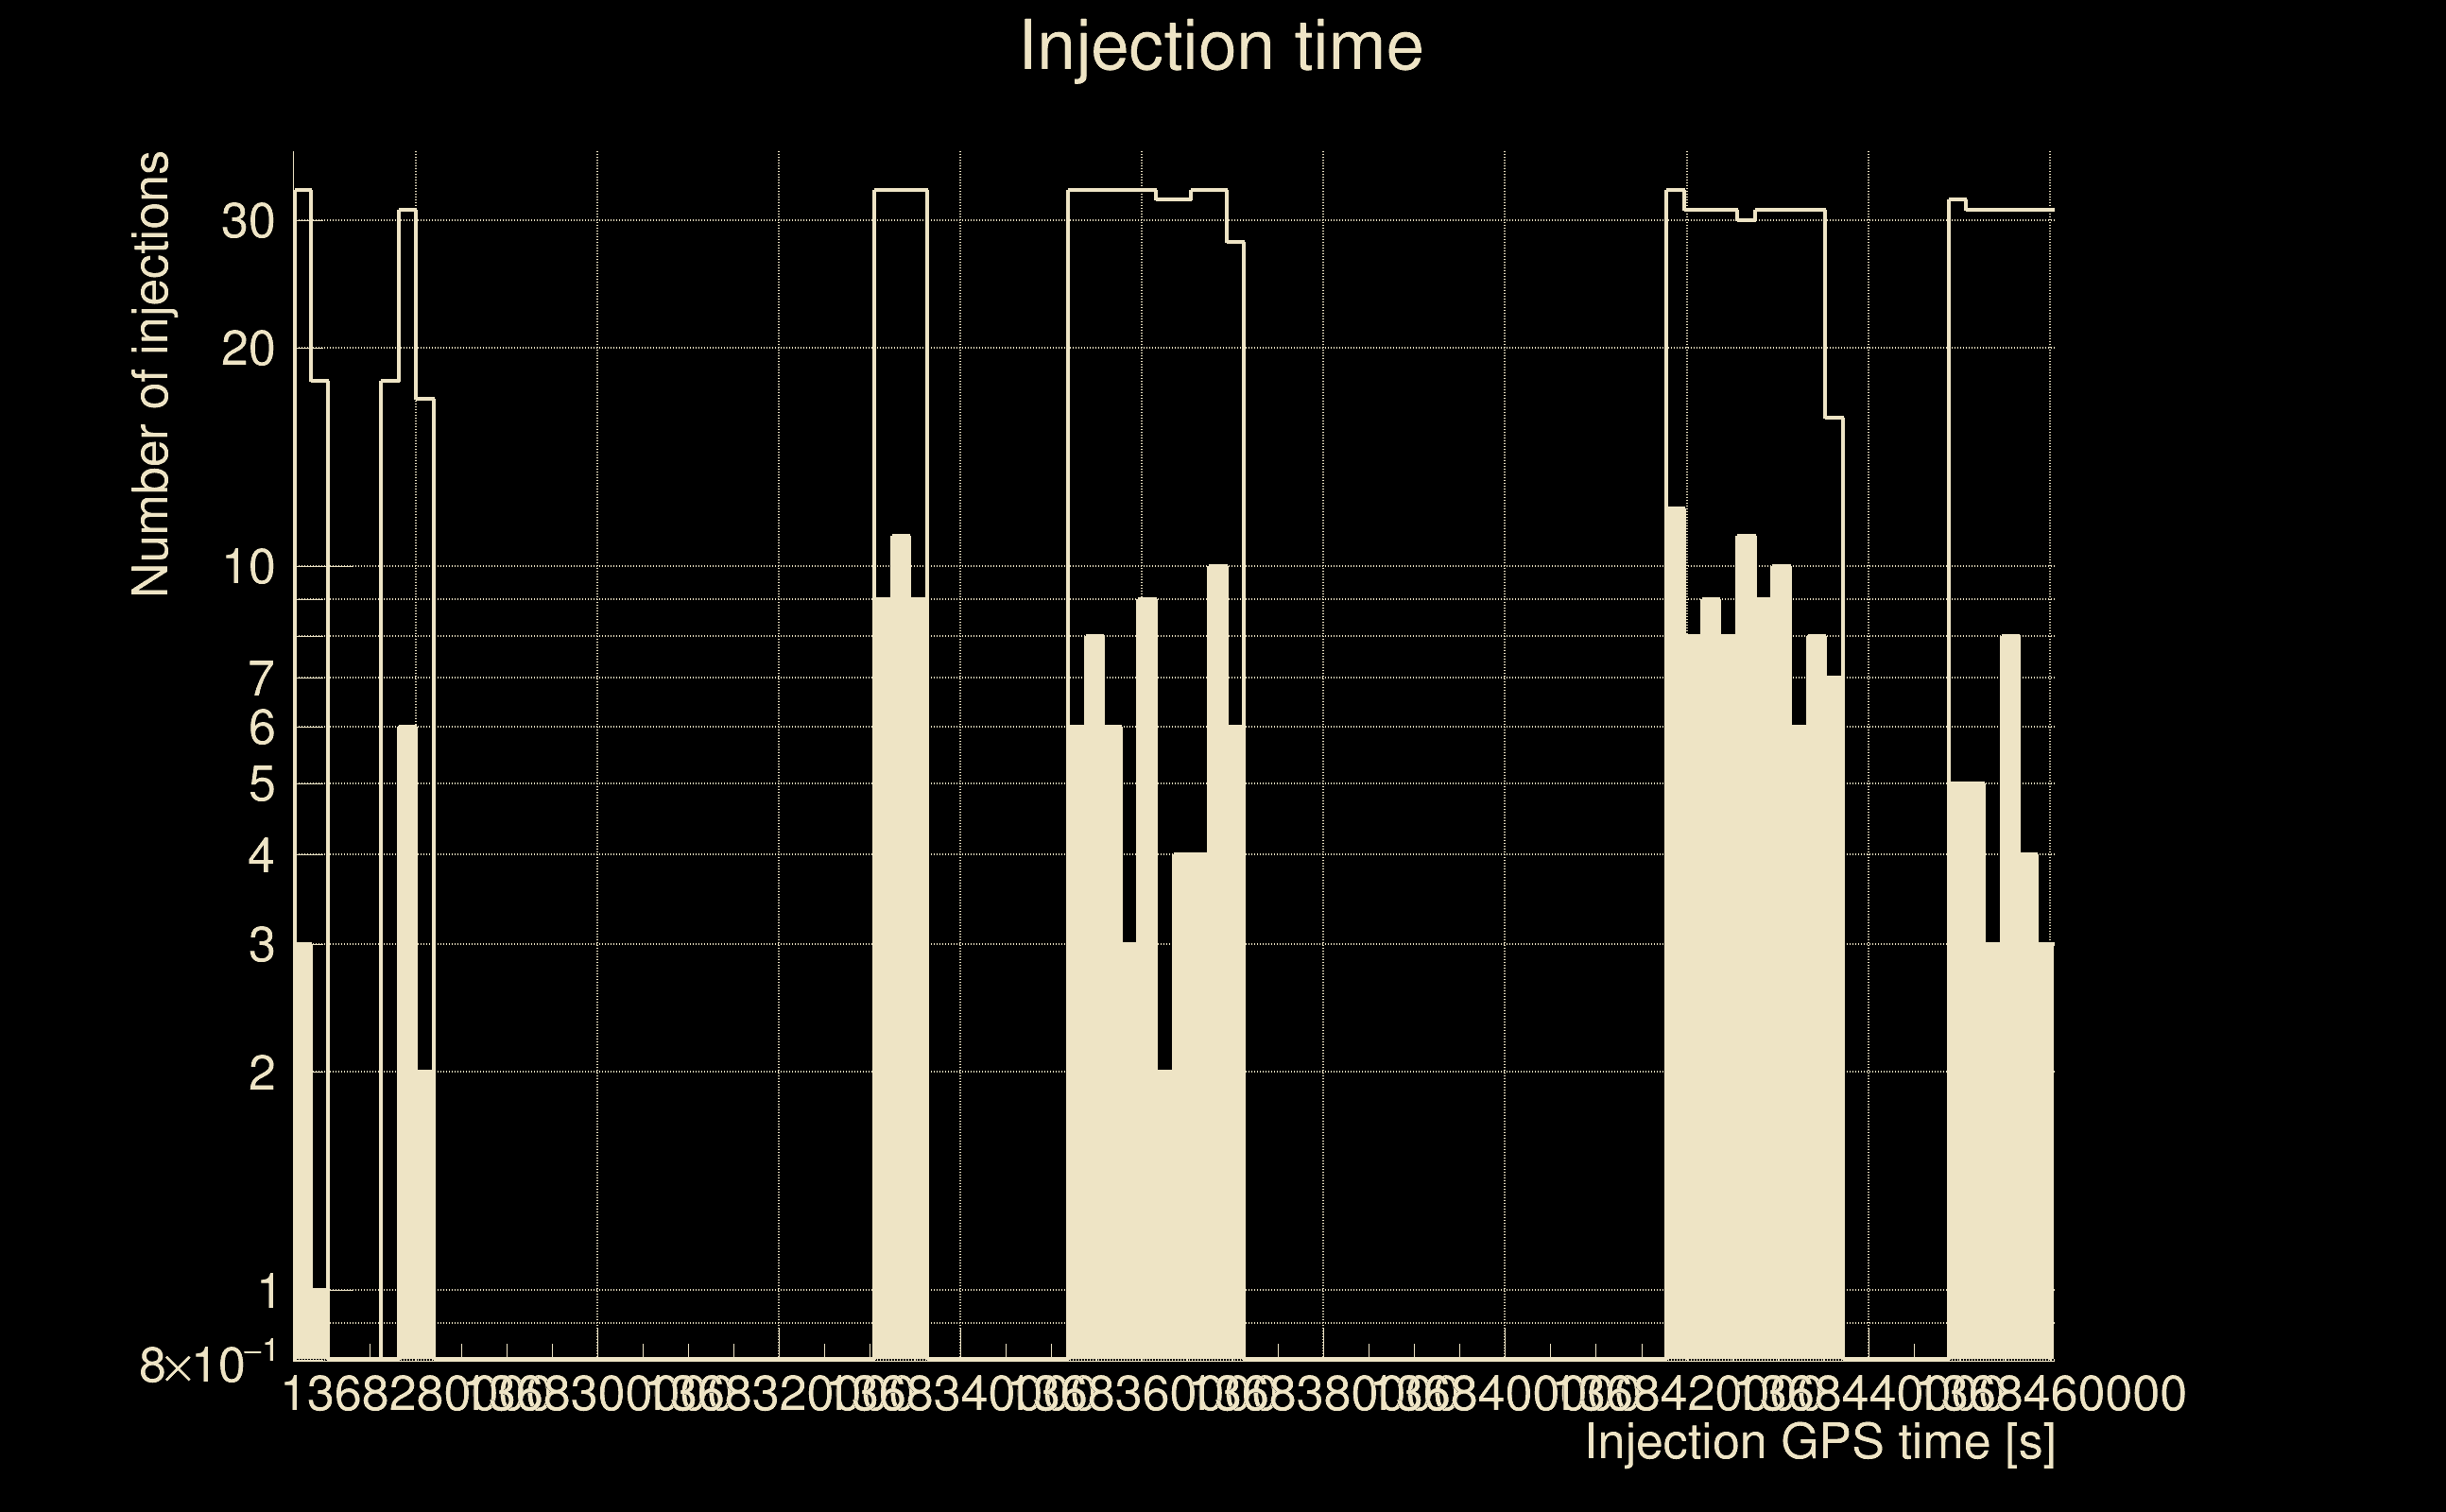
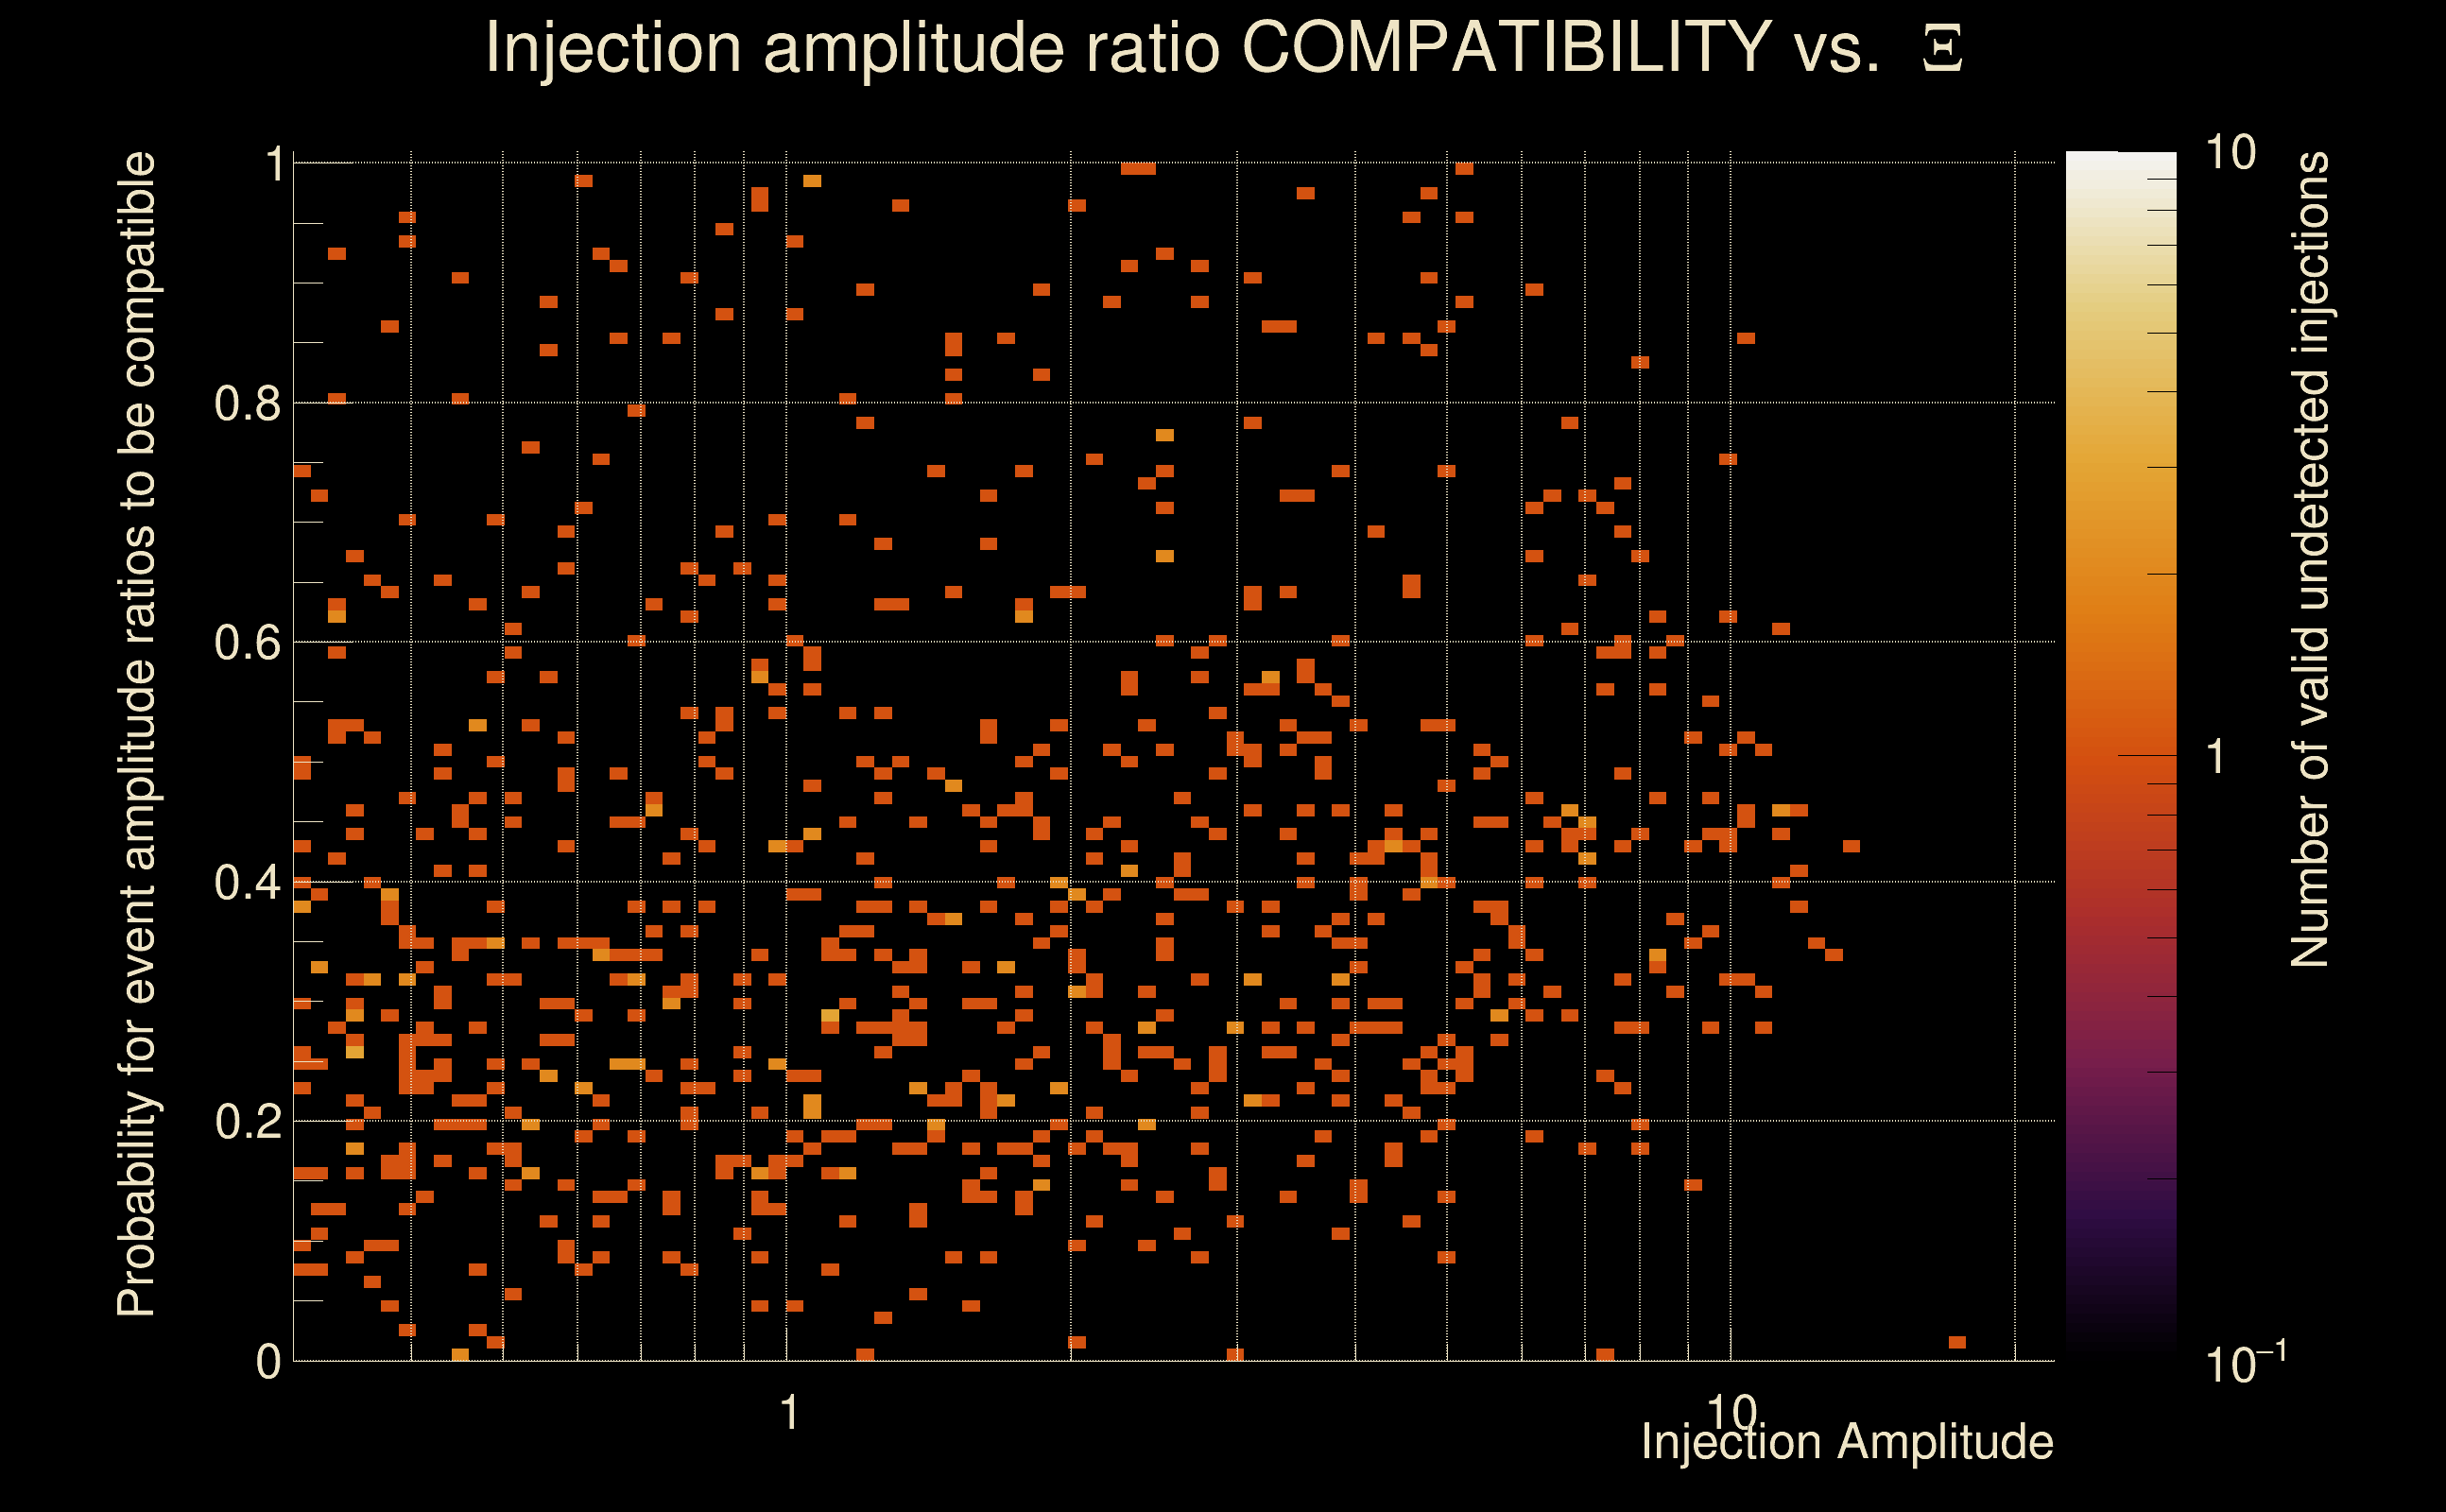
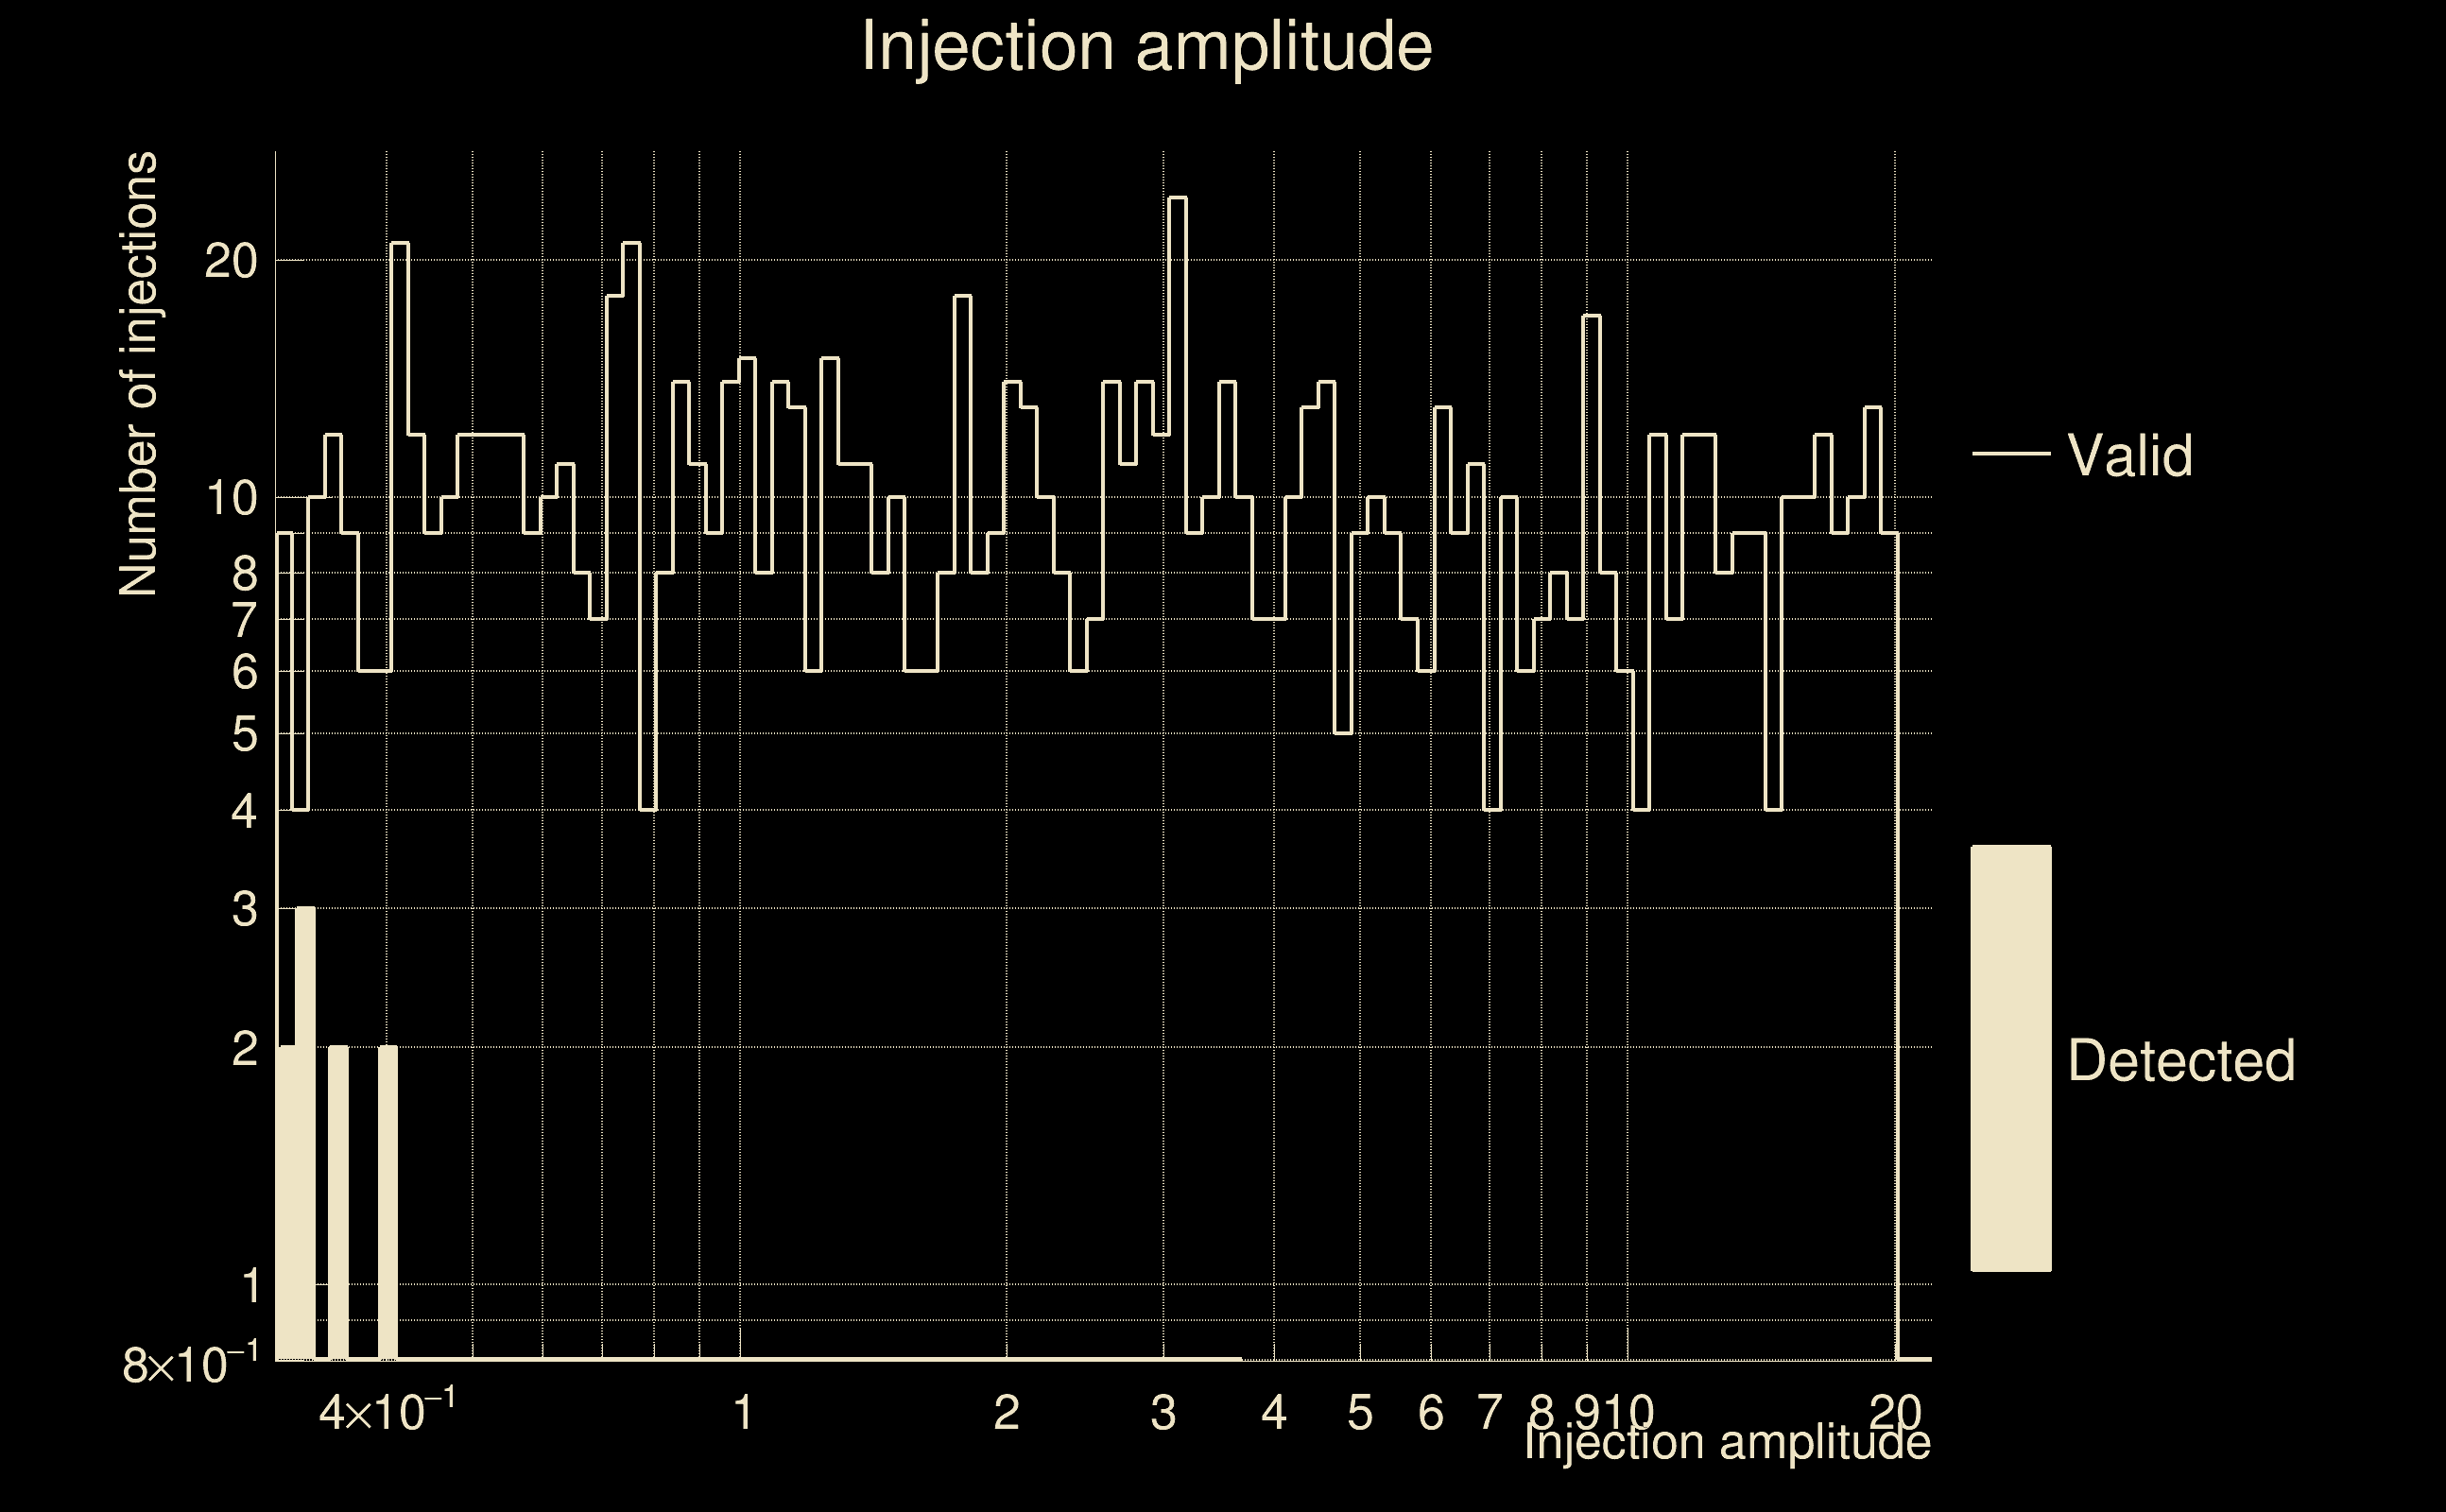
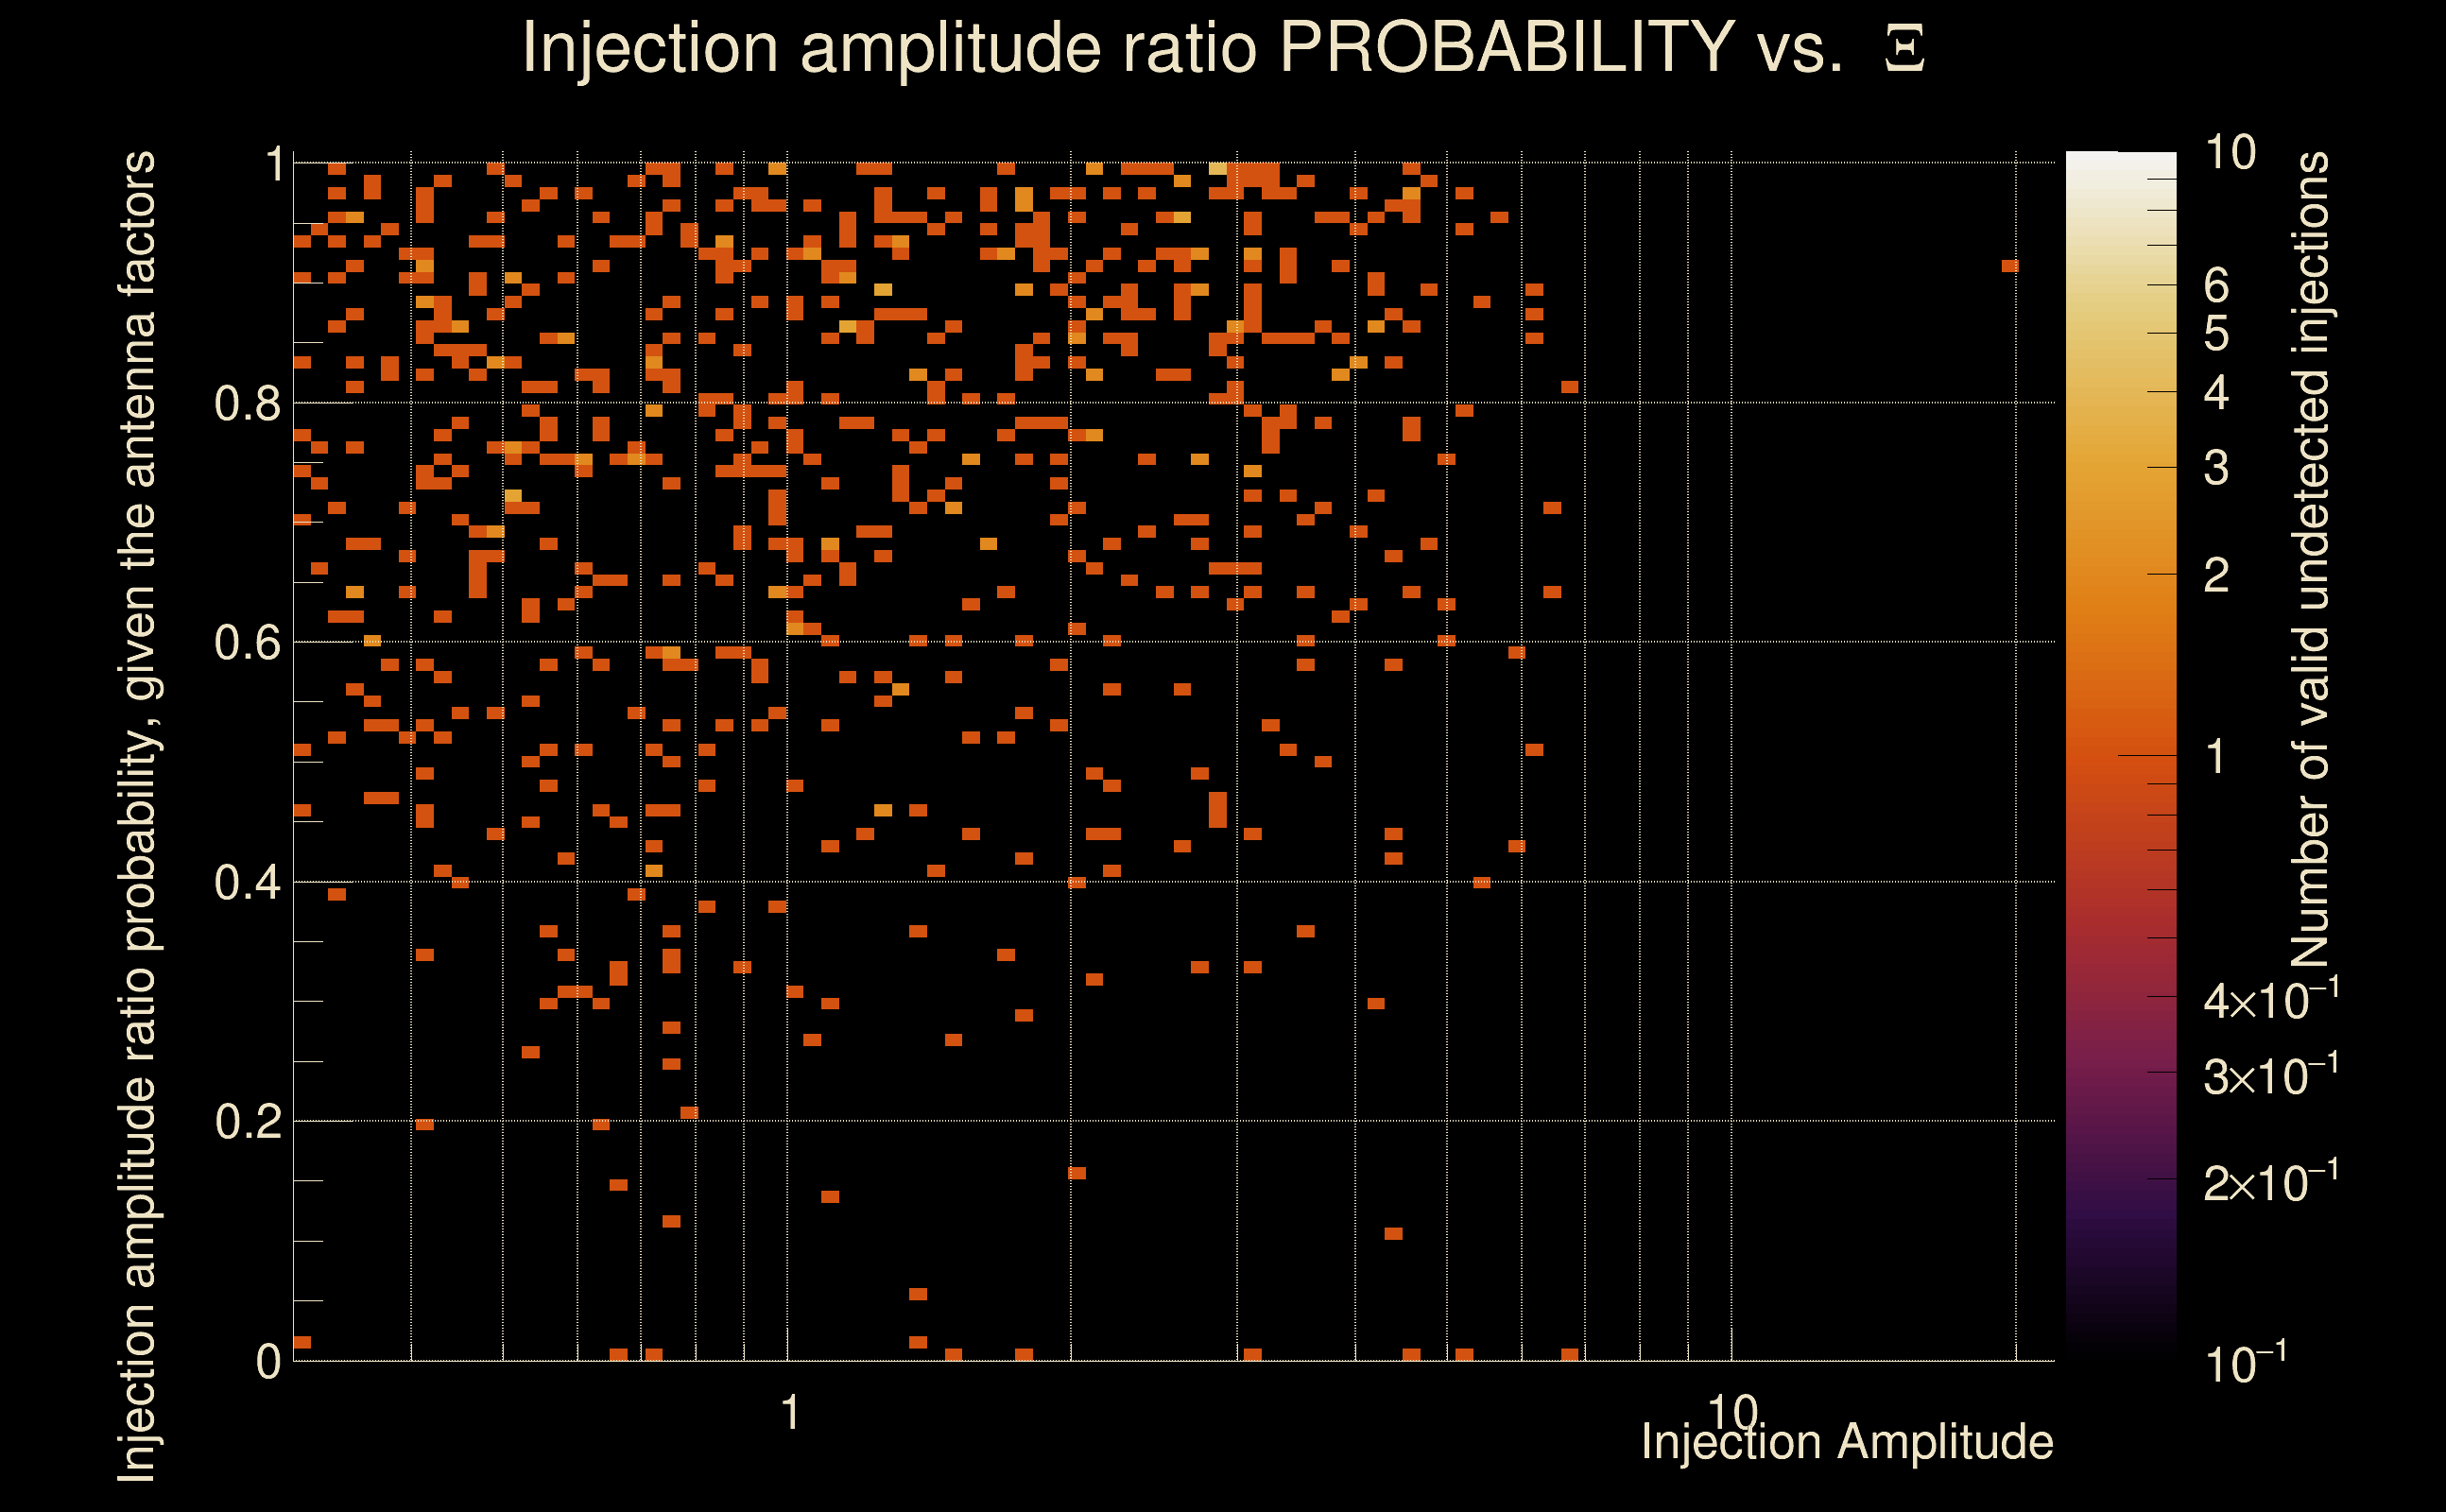
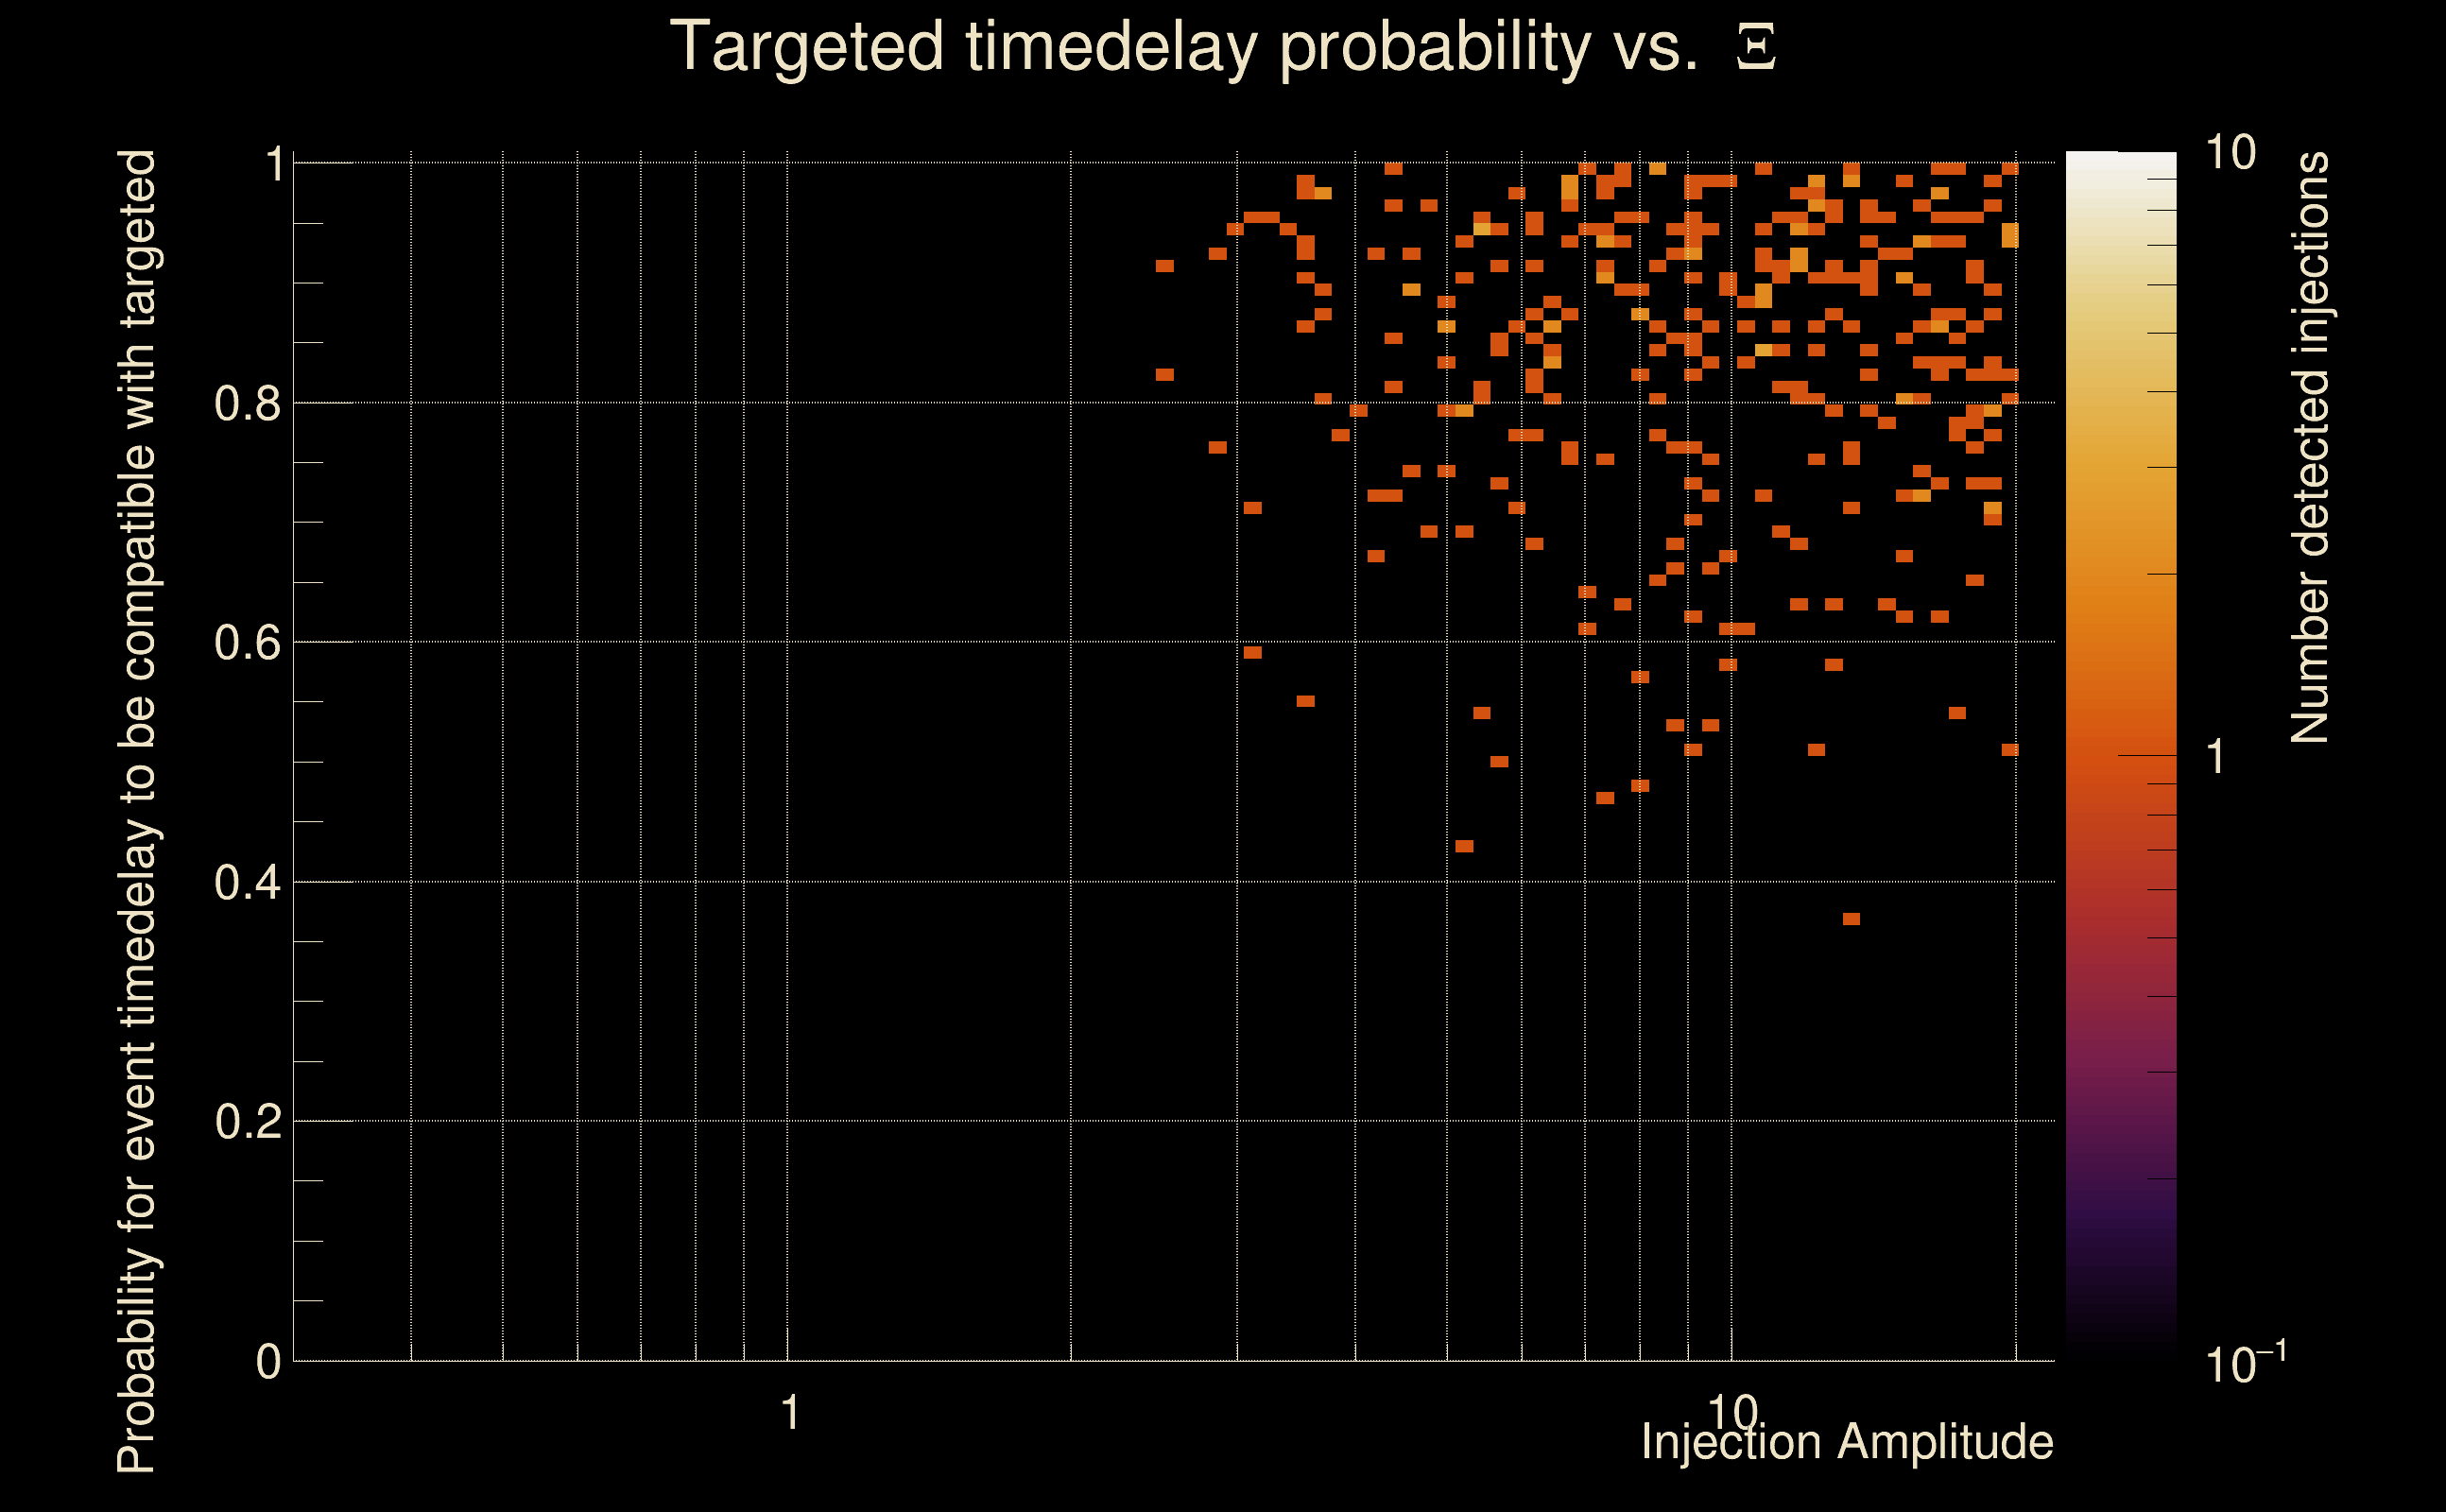
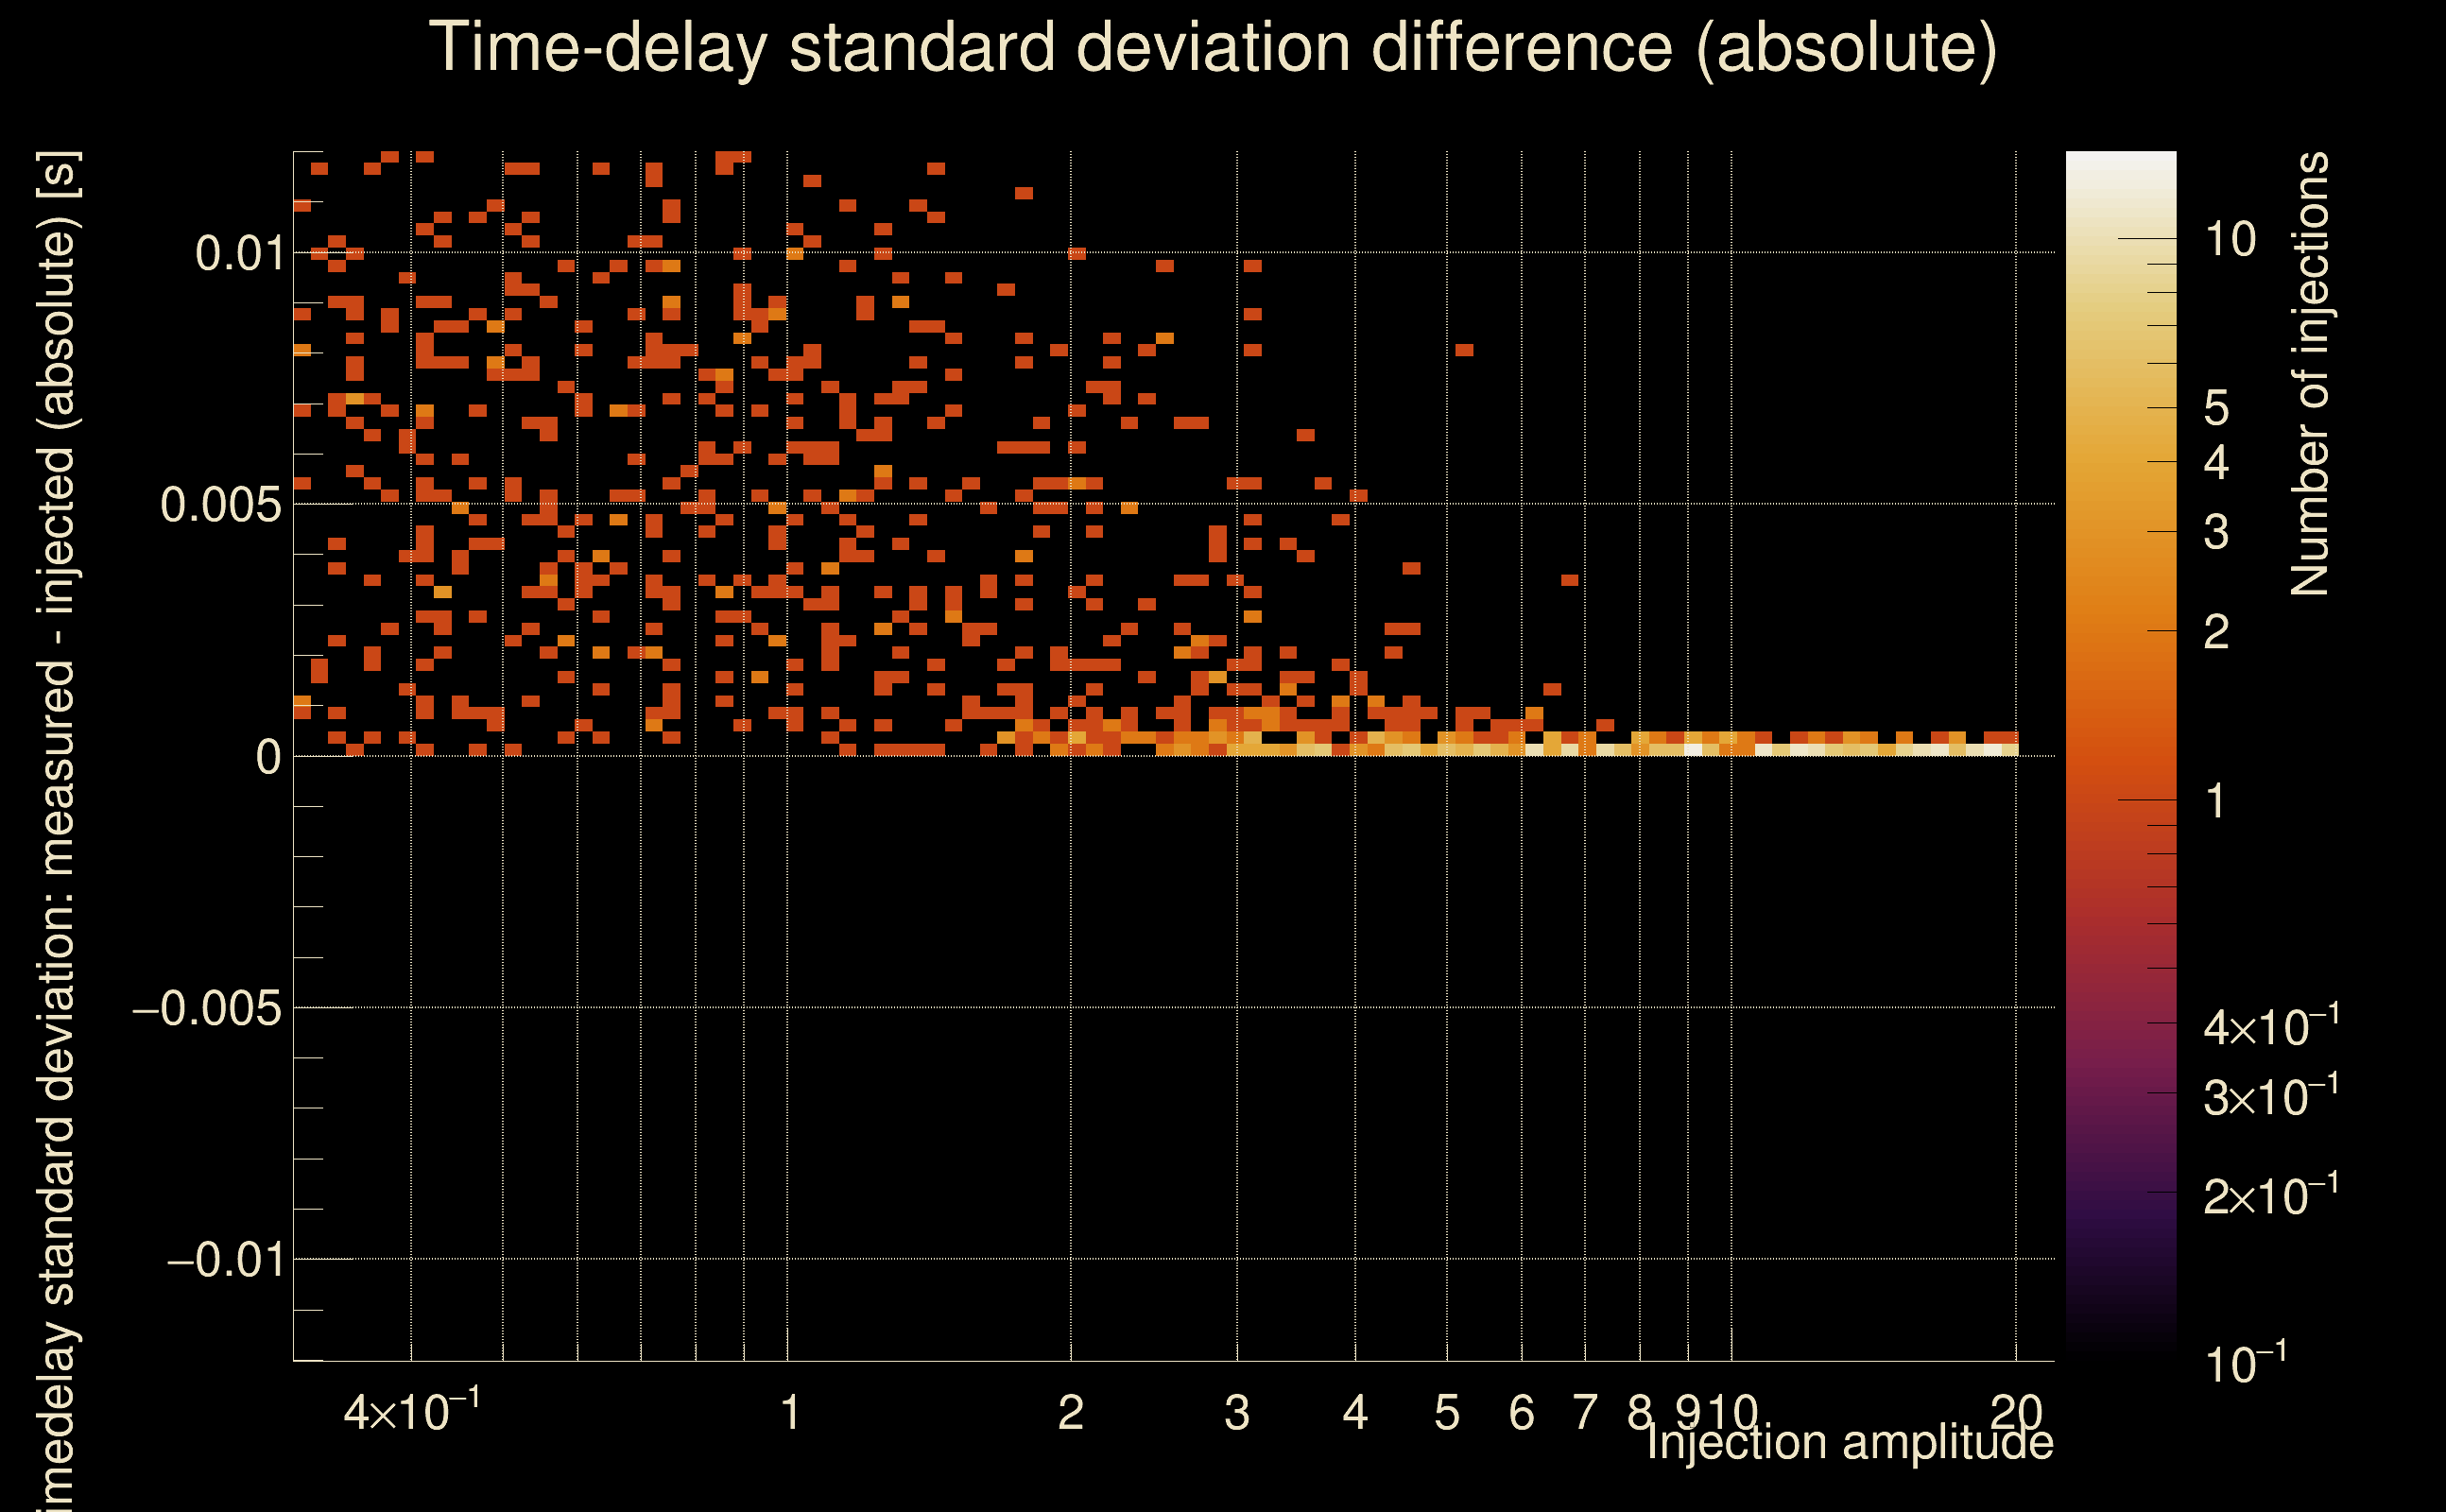
| Number of injections (total/valid/detected): | 1162 / 1022 / 215 |
| List of missed injections: | ./Mezz23-D15_missed.txt |
| Injection amplitude at 90% detection efficiency: | 0.401155 |
| Injection amplitude at 50% detection efficiency: | 0.397298 |
| Injection amplitude at 10% detection efficiency: | -1 |
 |
 |
 |
 |
 |
 |
|
 |
 |
|
 |
 |
|
 |
 |
|
 |
 |
|
 |
 |
|
 |
 |
|
 |
 |
|
 |
 |
 |
 |
 |
 |
 |
 |
 |
 |
 |
 |
 |
 |
 |
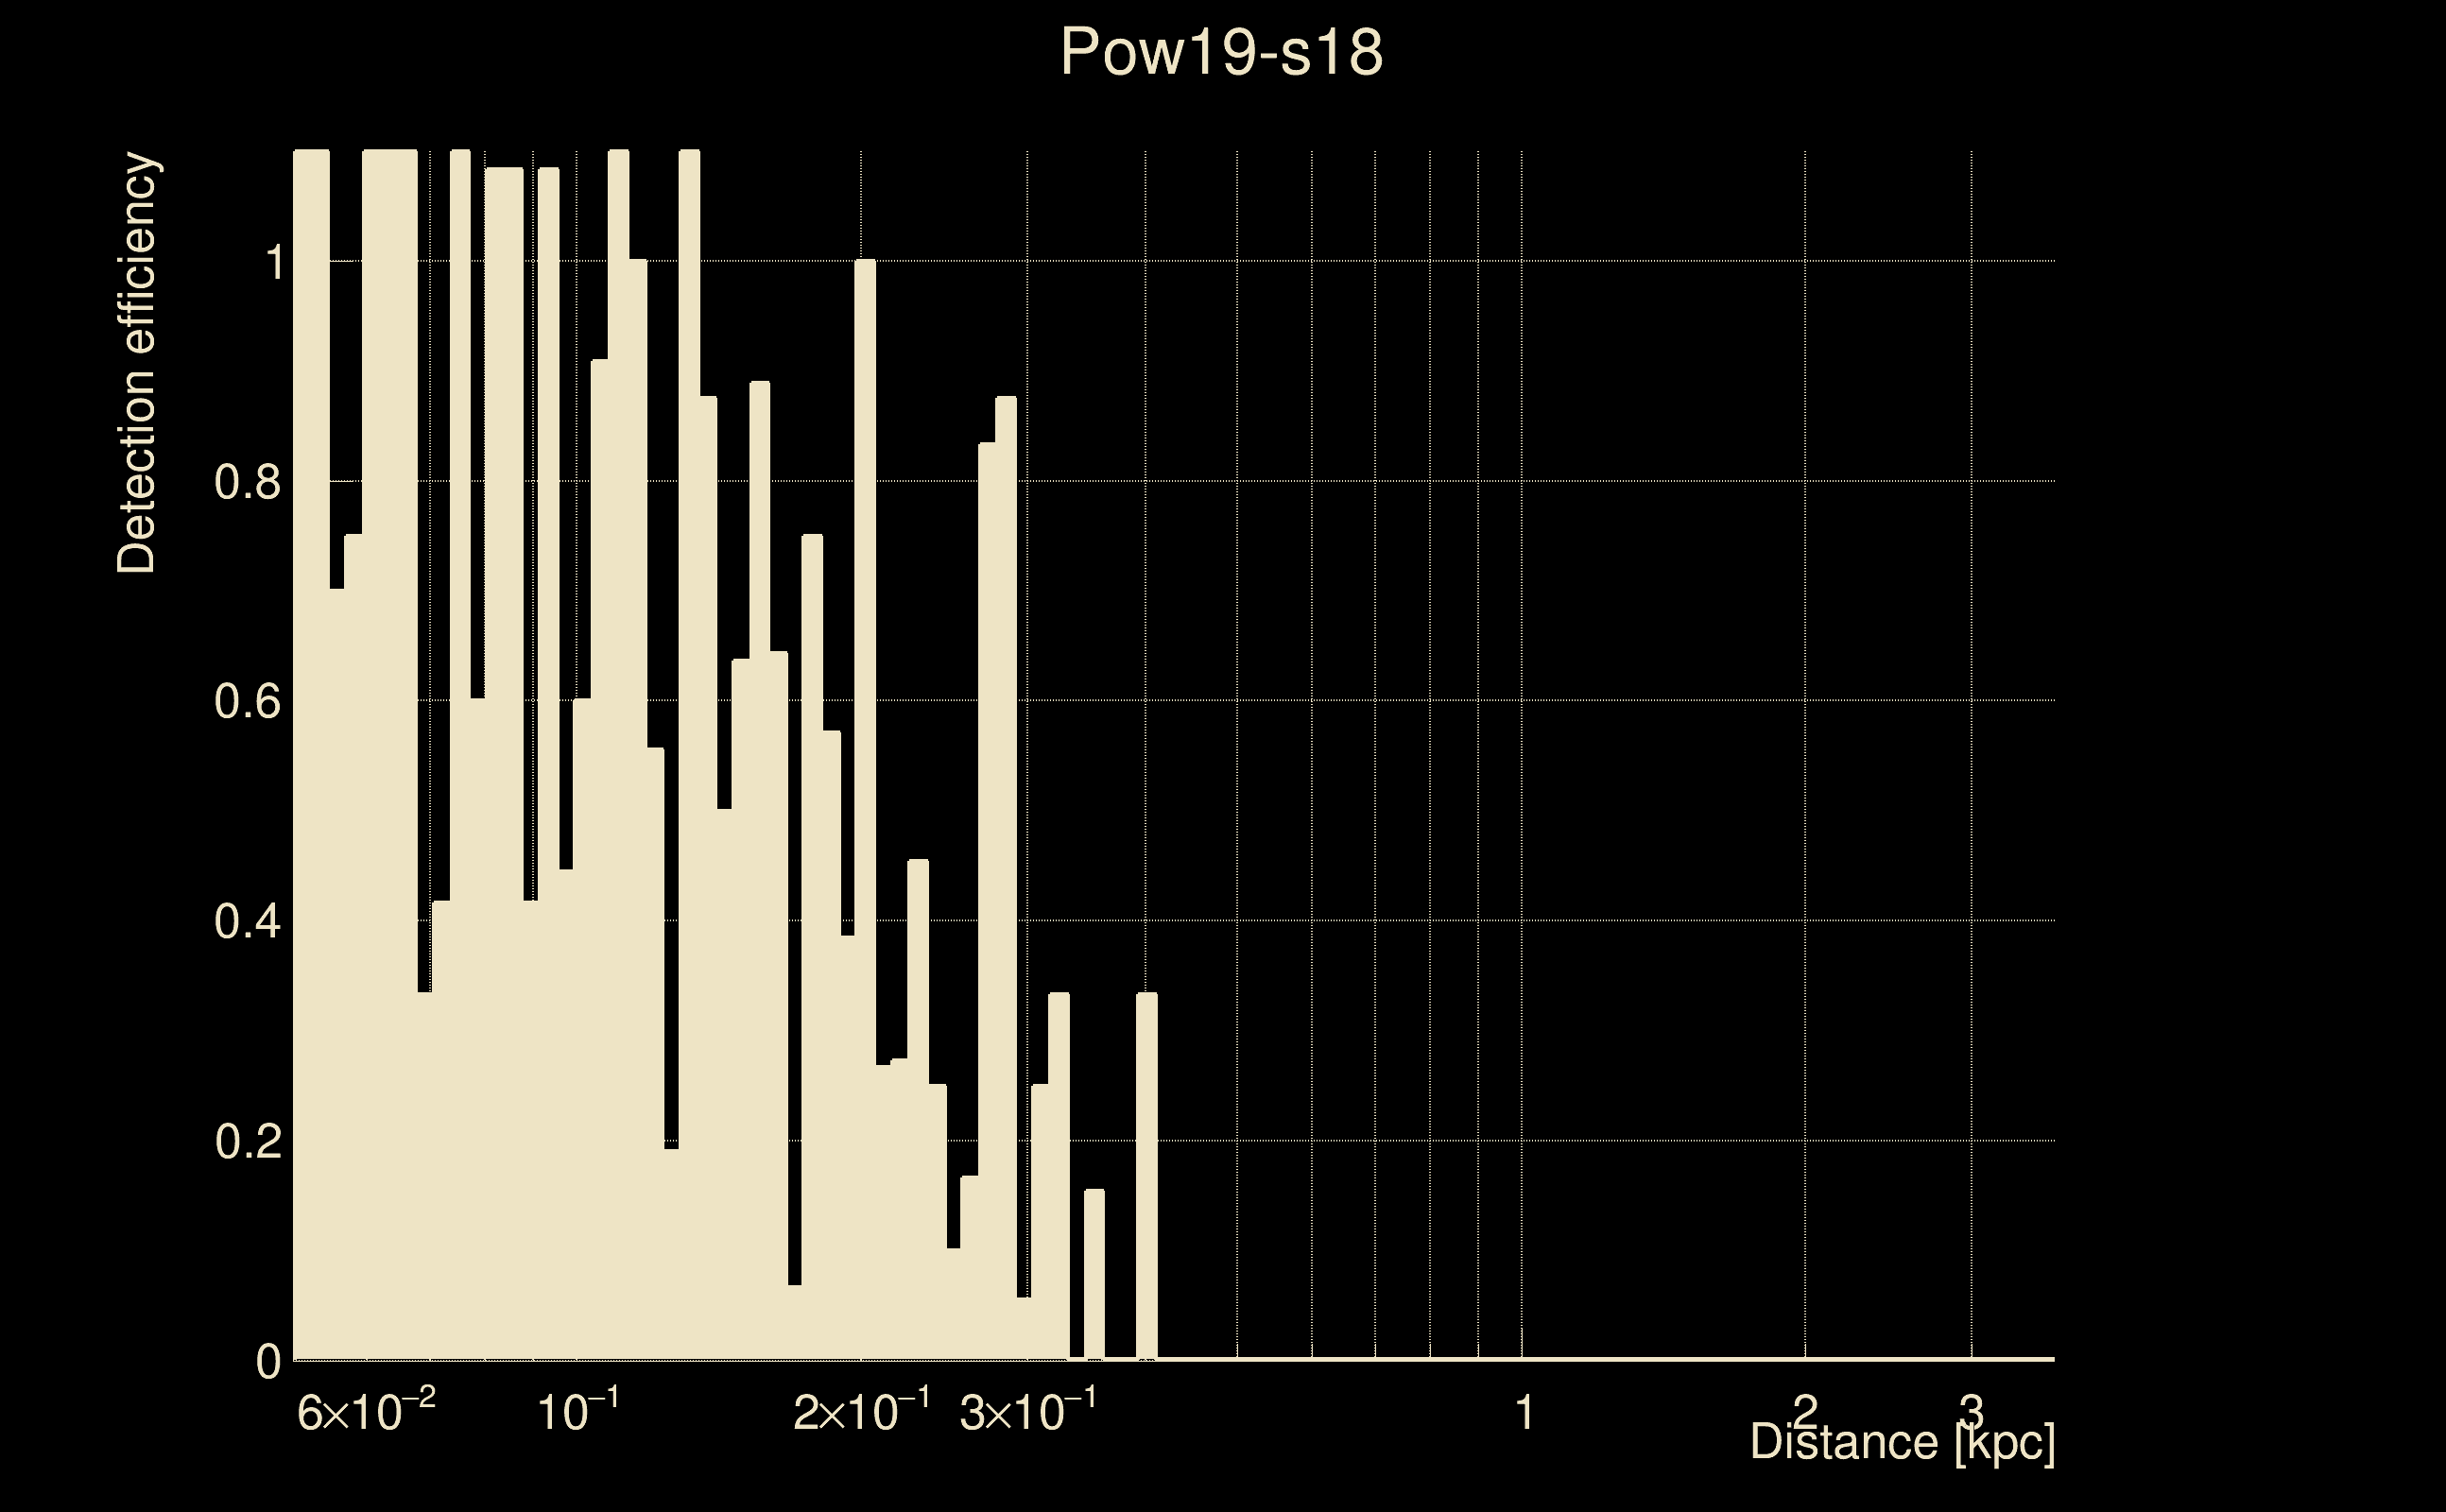
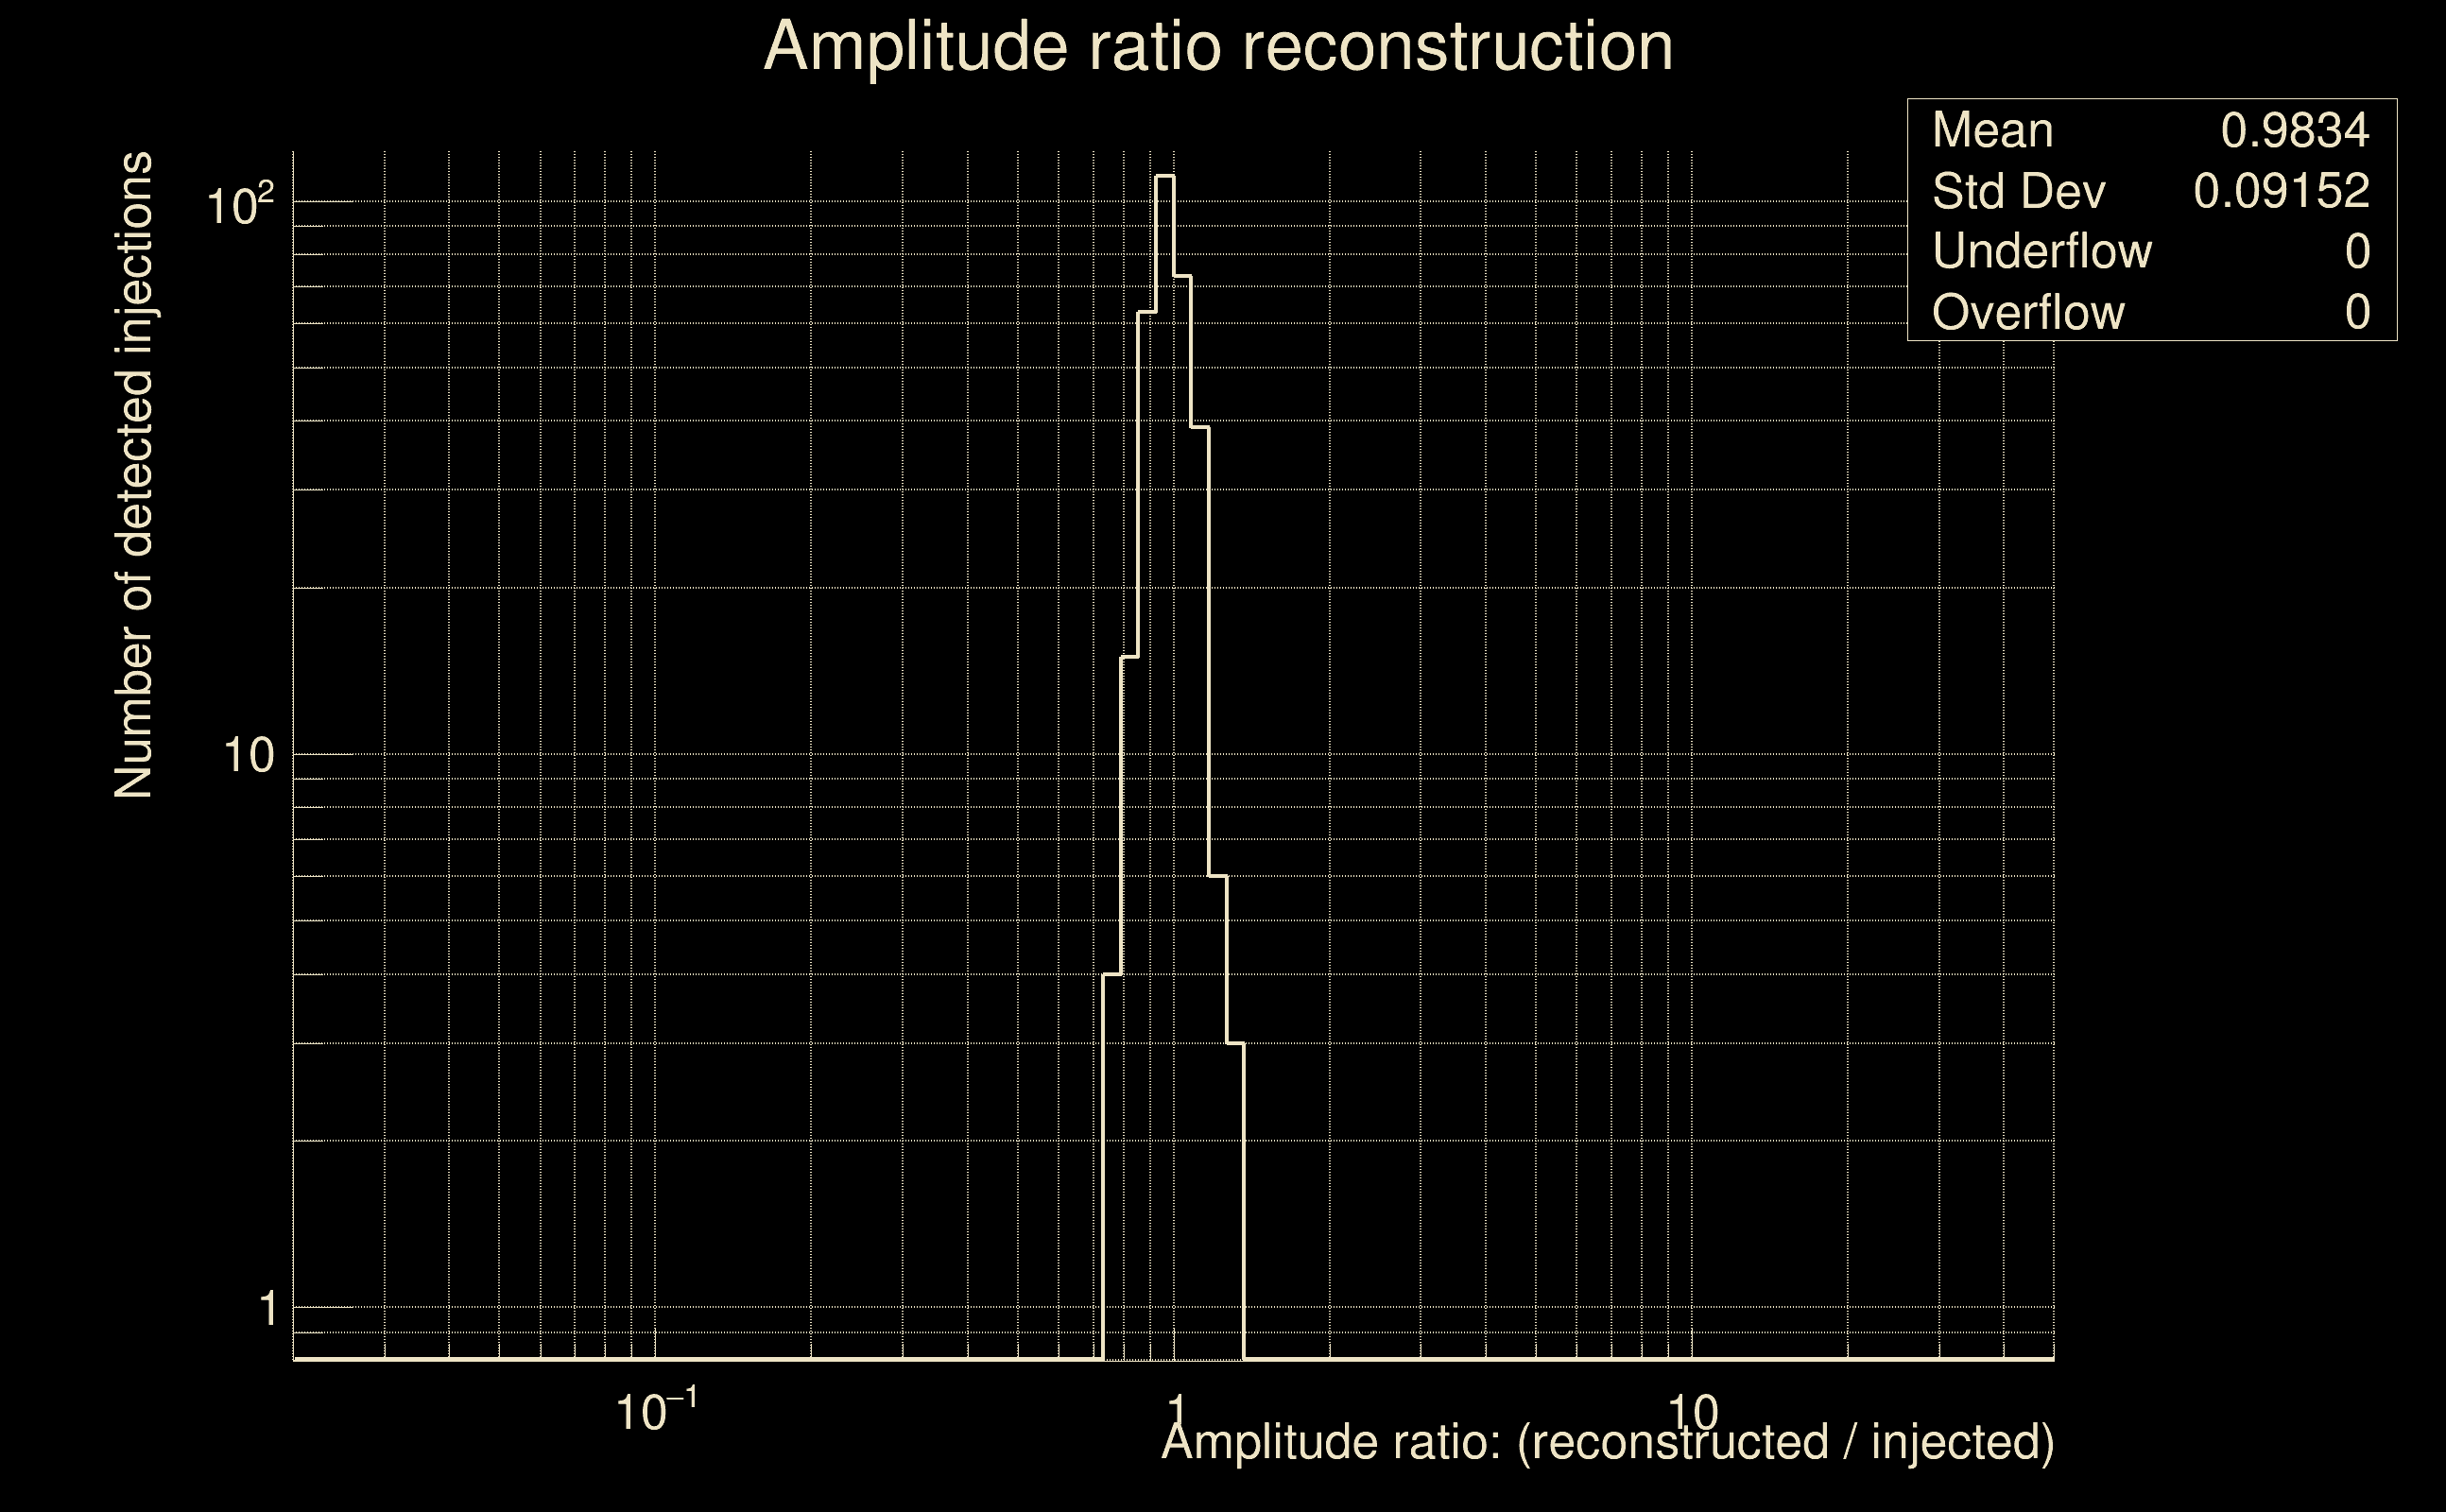
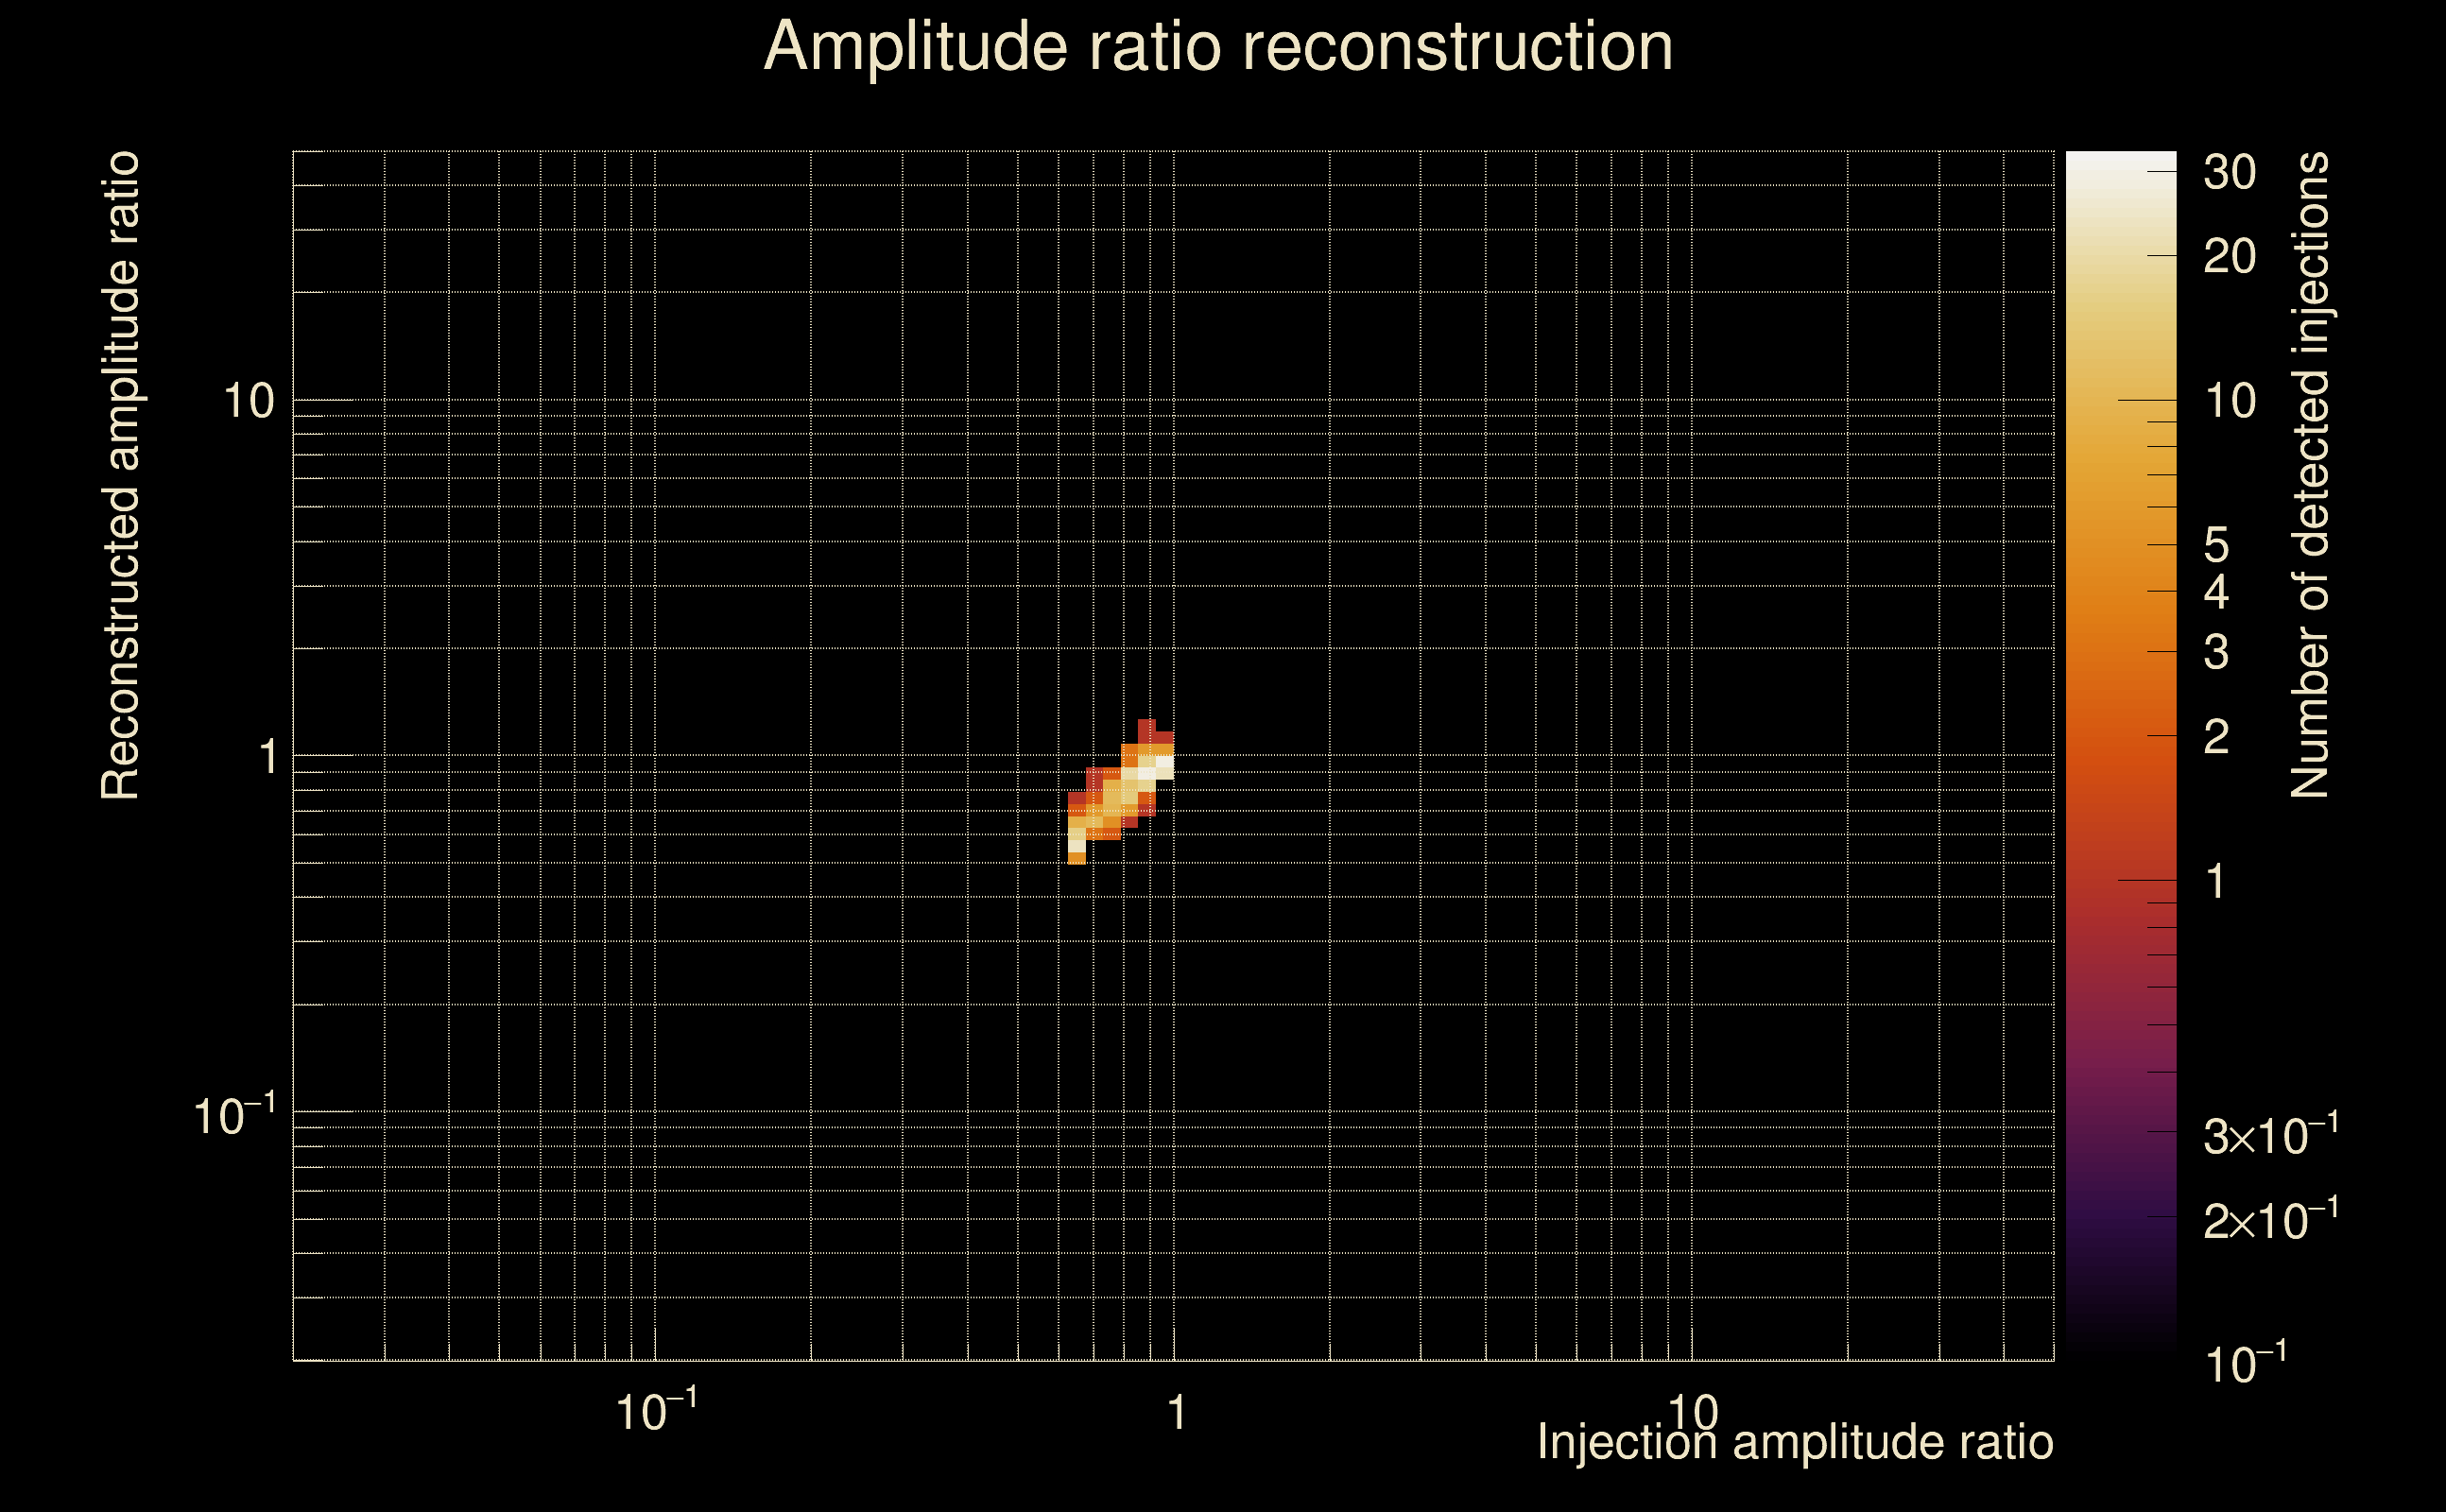
| Number of injections (total/valid/detected): | 1116 / 995 / 314 |
| List of missed injections: | ./Pow19-s18_missed.txt |
| Injection amplitude at 90% detection efficiency: | -1 |
| Injection amplitude at 50% detection efficiency: | -1 |
| Injection amplitude at 10% detection efficiency: | -1 |
 |
 |
 |
 |
 |
 |
|
 |
 |
|
 |
 |
|
 |
 |
|
 |
 |
|
 |
 |
|
 |
 |
|
 |
 |
|
 |
 |
 |
 |
 |
 |
 |
 |
 |
 |
 |
 |
 |
 |
 |
| florent.robinet@ijclab.in2p3.fr |