| Omicron version: | 4.2.0: documentation gitlab repository |
| Omicron run by: | unknown |
| Report produced on: | Thu Nov 27 17:10:42 2025 UTC |
| Ox option file: | TargIxf_injpt1_tB_options.txt |
| Omicron option files: | detector 0, detector 1 |
| Detector channel names: | H1:GDS-CALIB_STRAIN_CLEAN_AR_4096Hz, L1:GDS-CALIB_STRAIN_CLEAN_AR_4096Hz |
| Omicron analysis time window and overlap: | 16 s, 6 s |
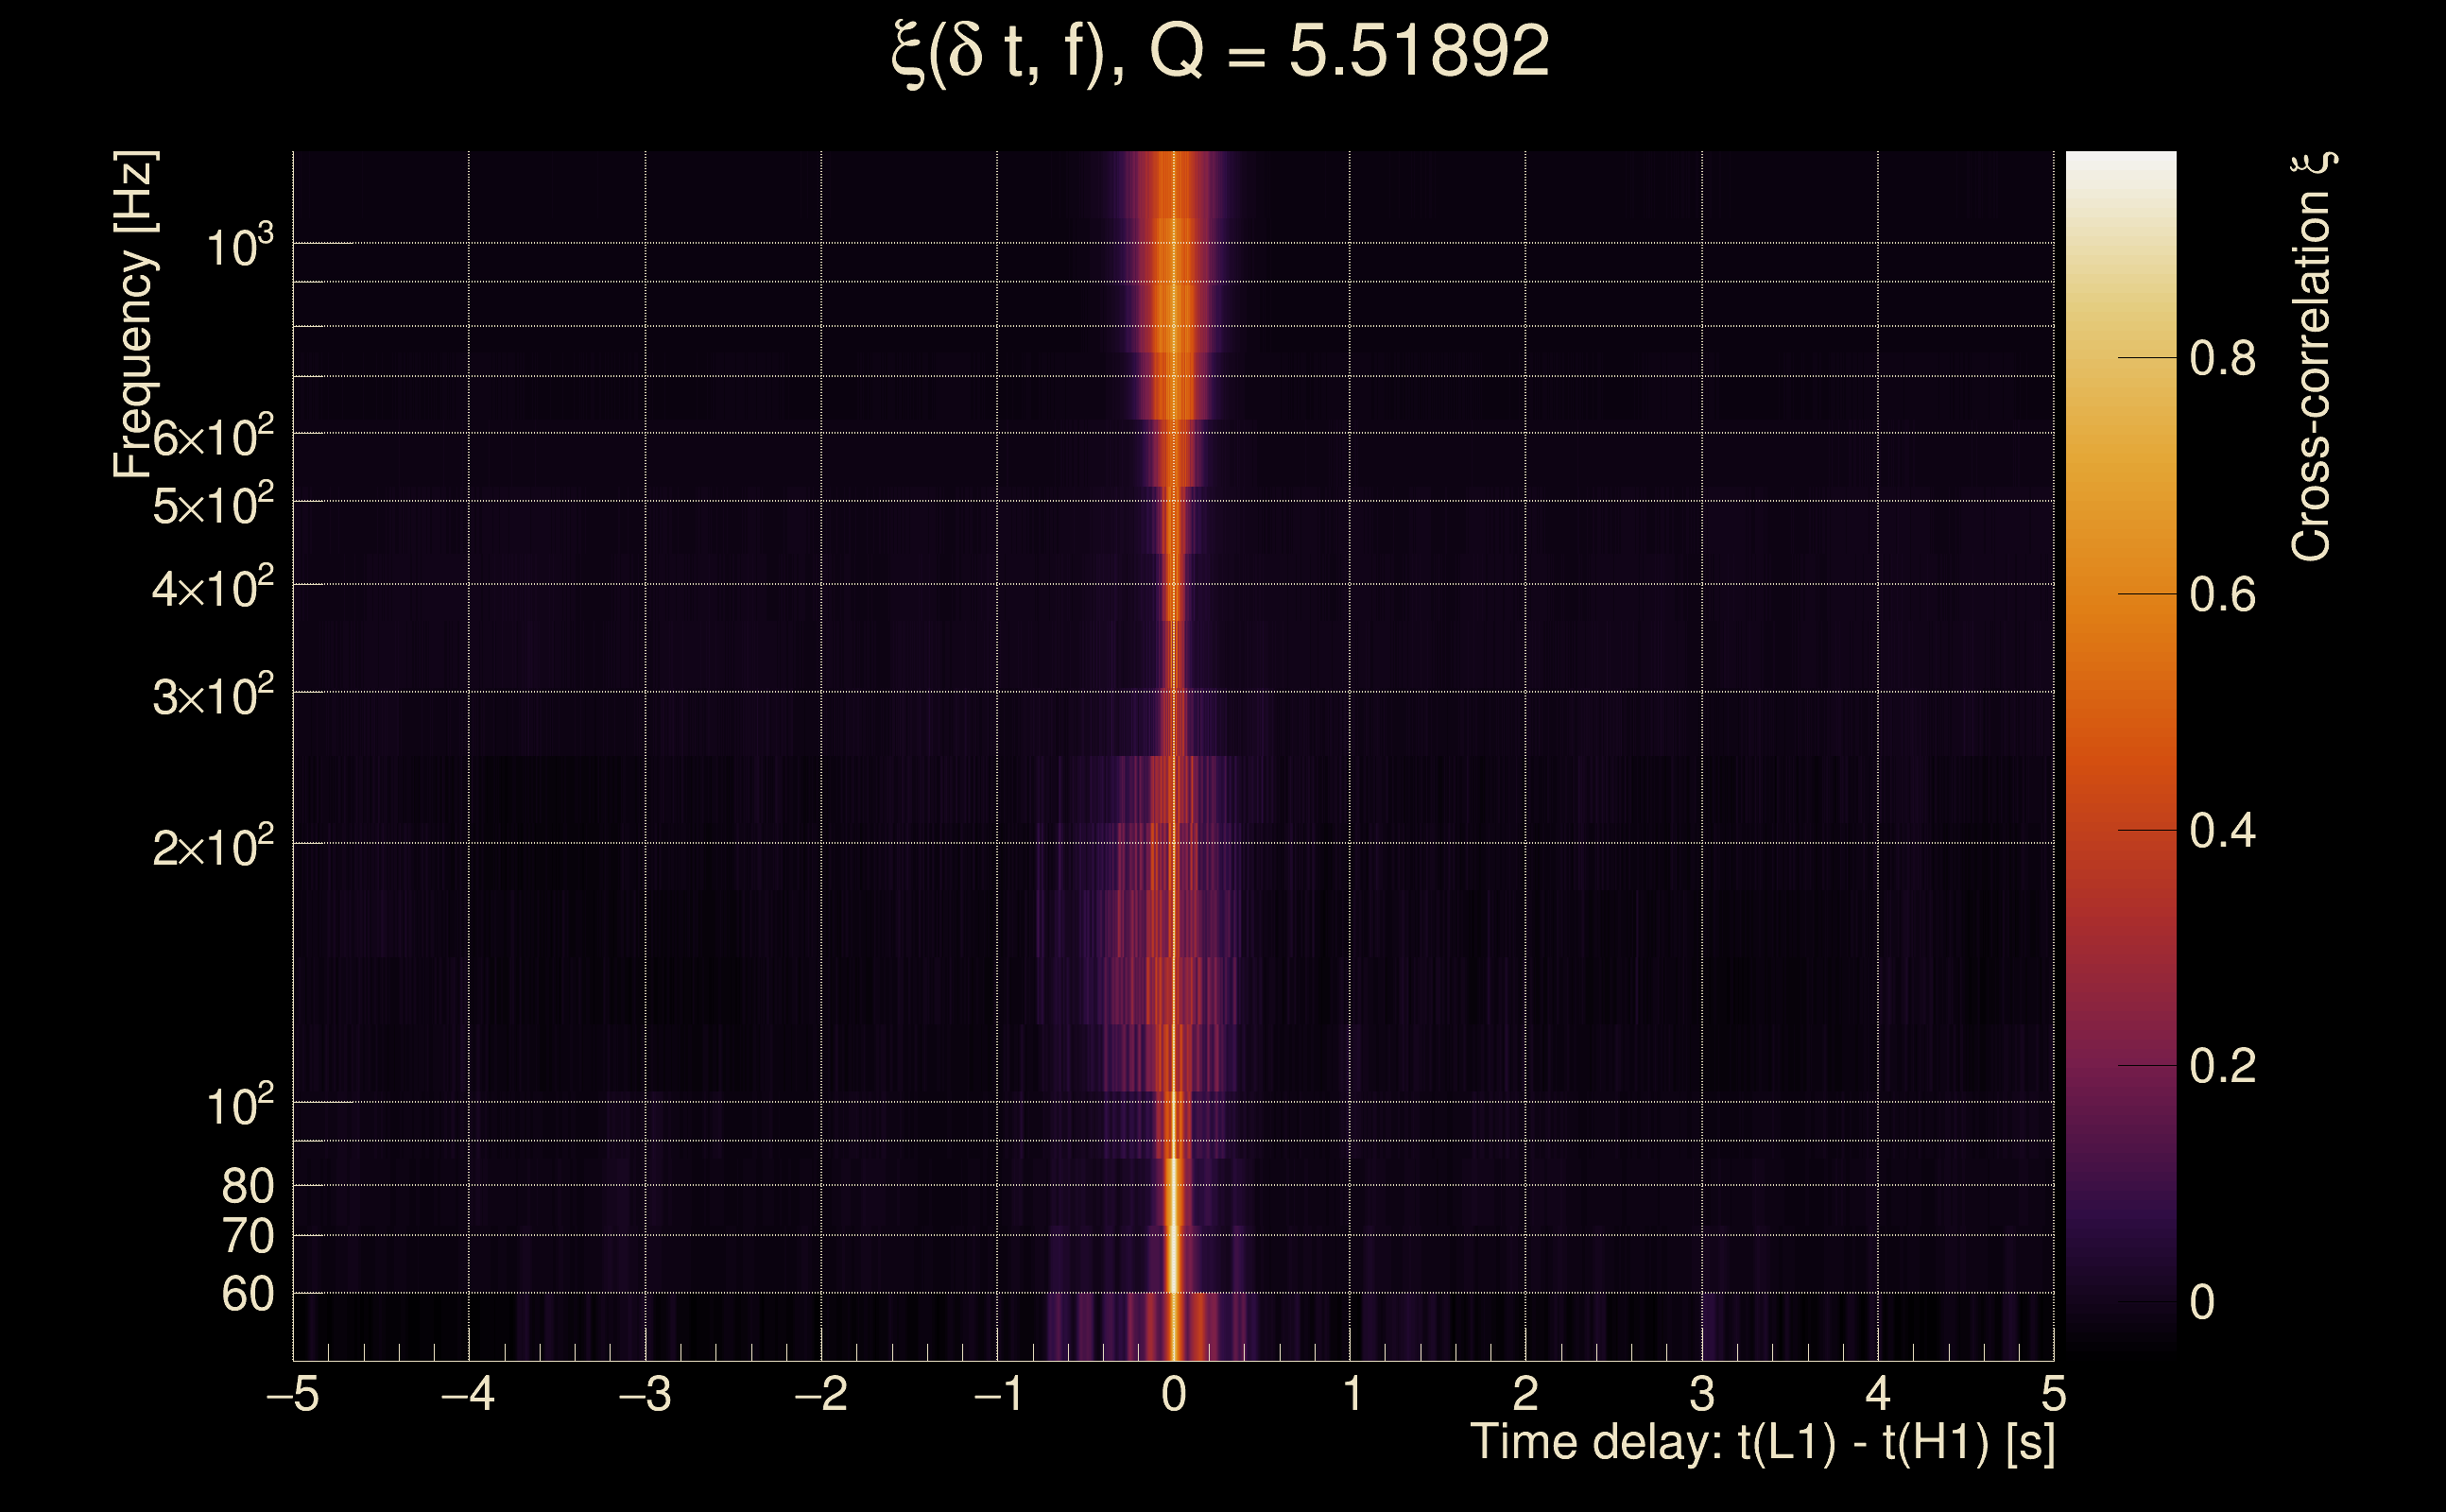
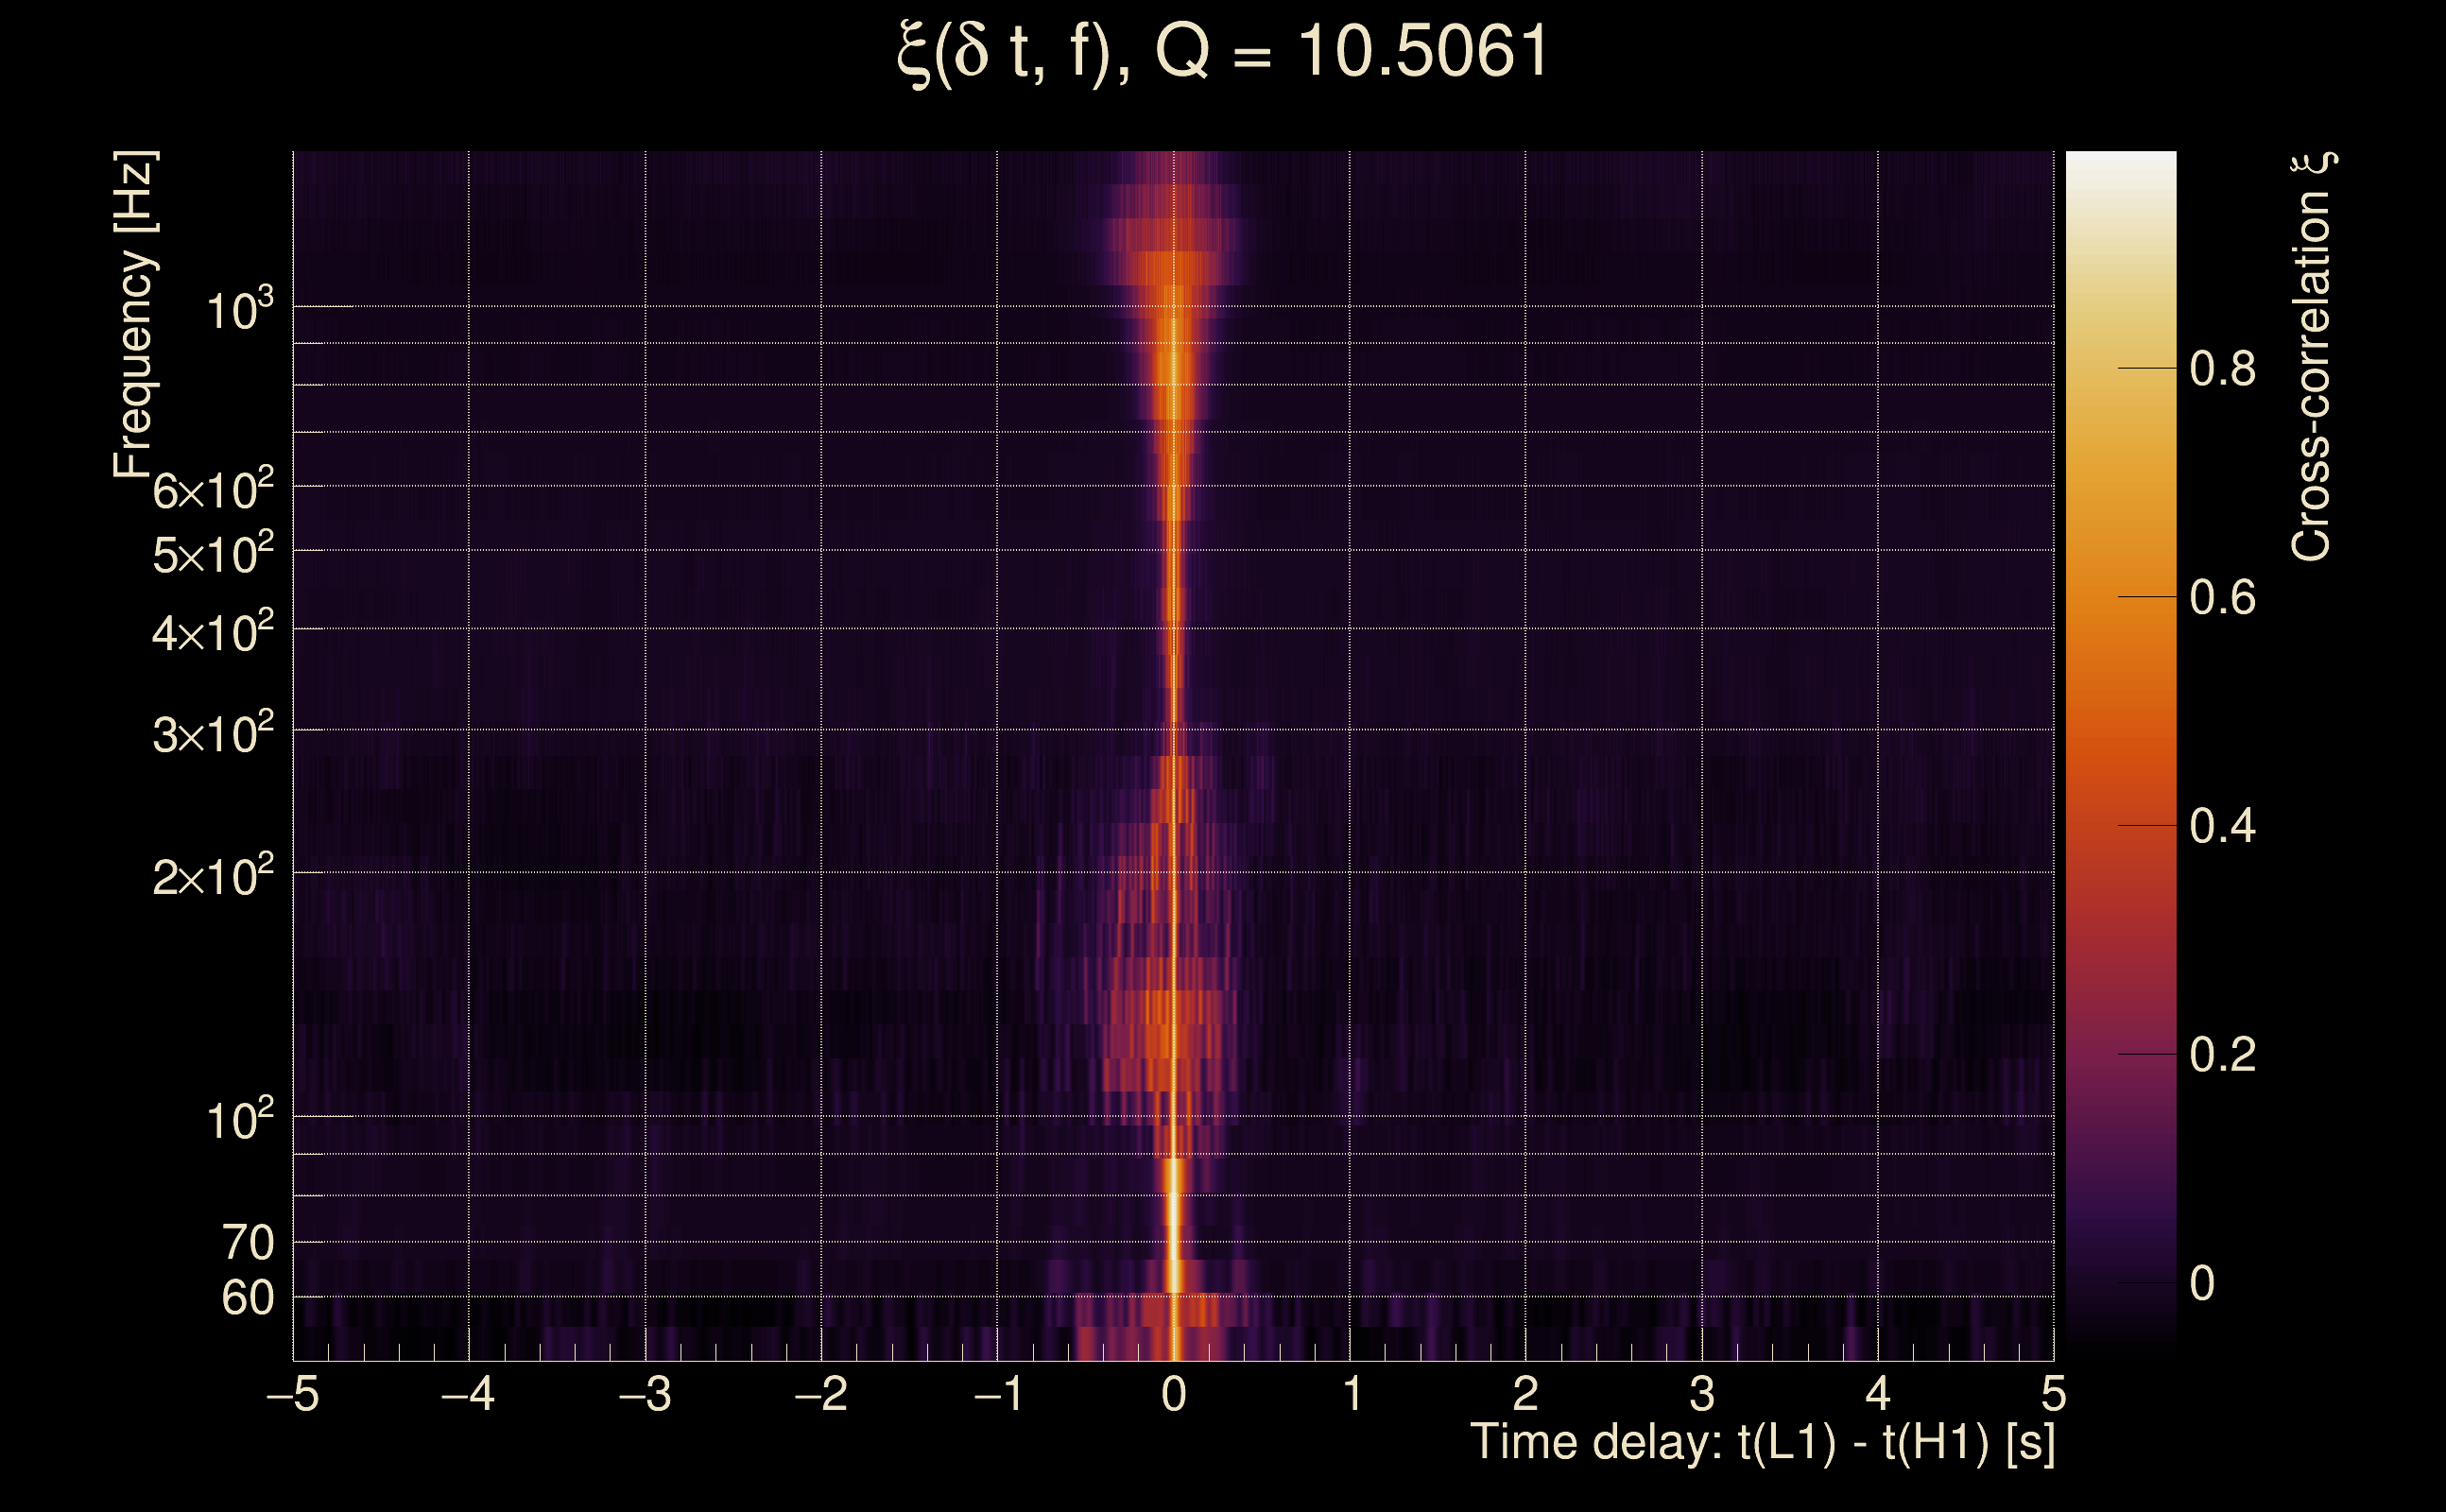
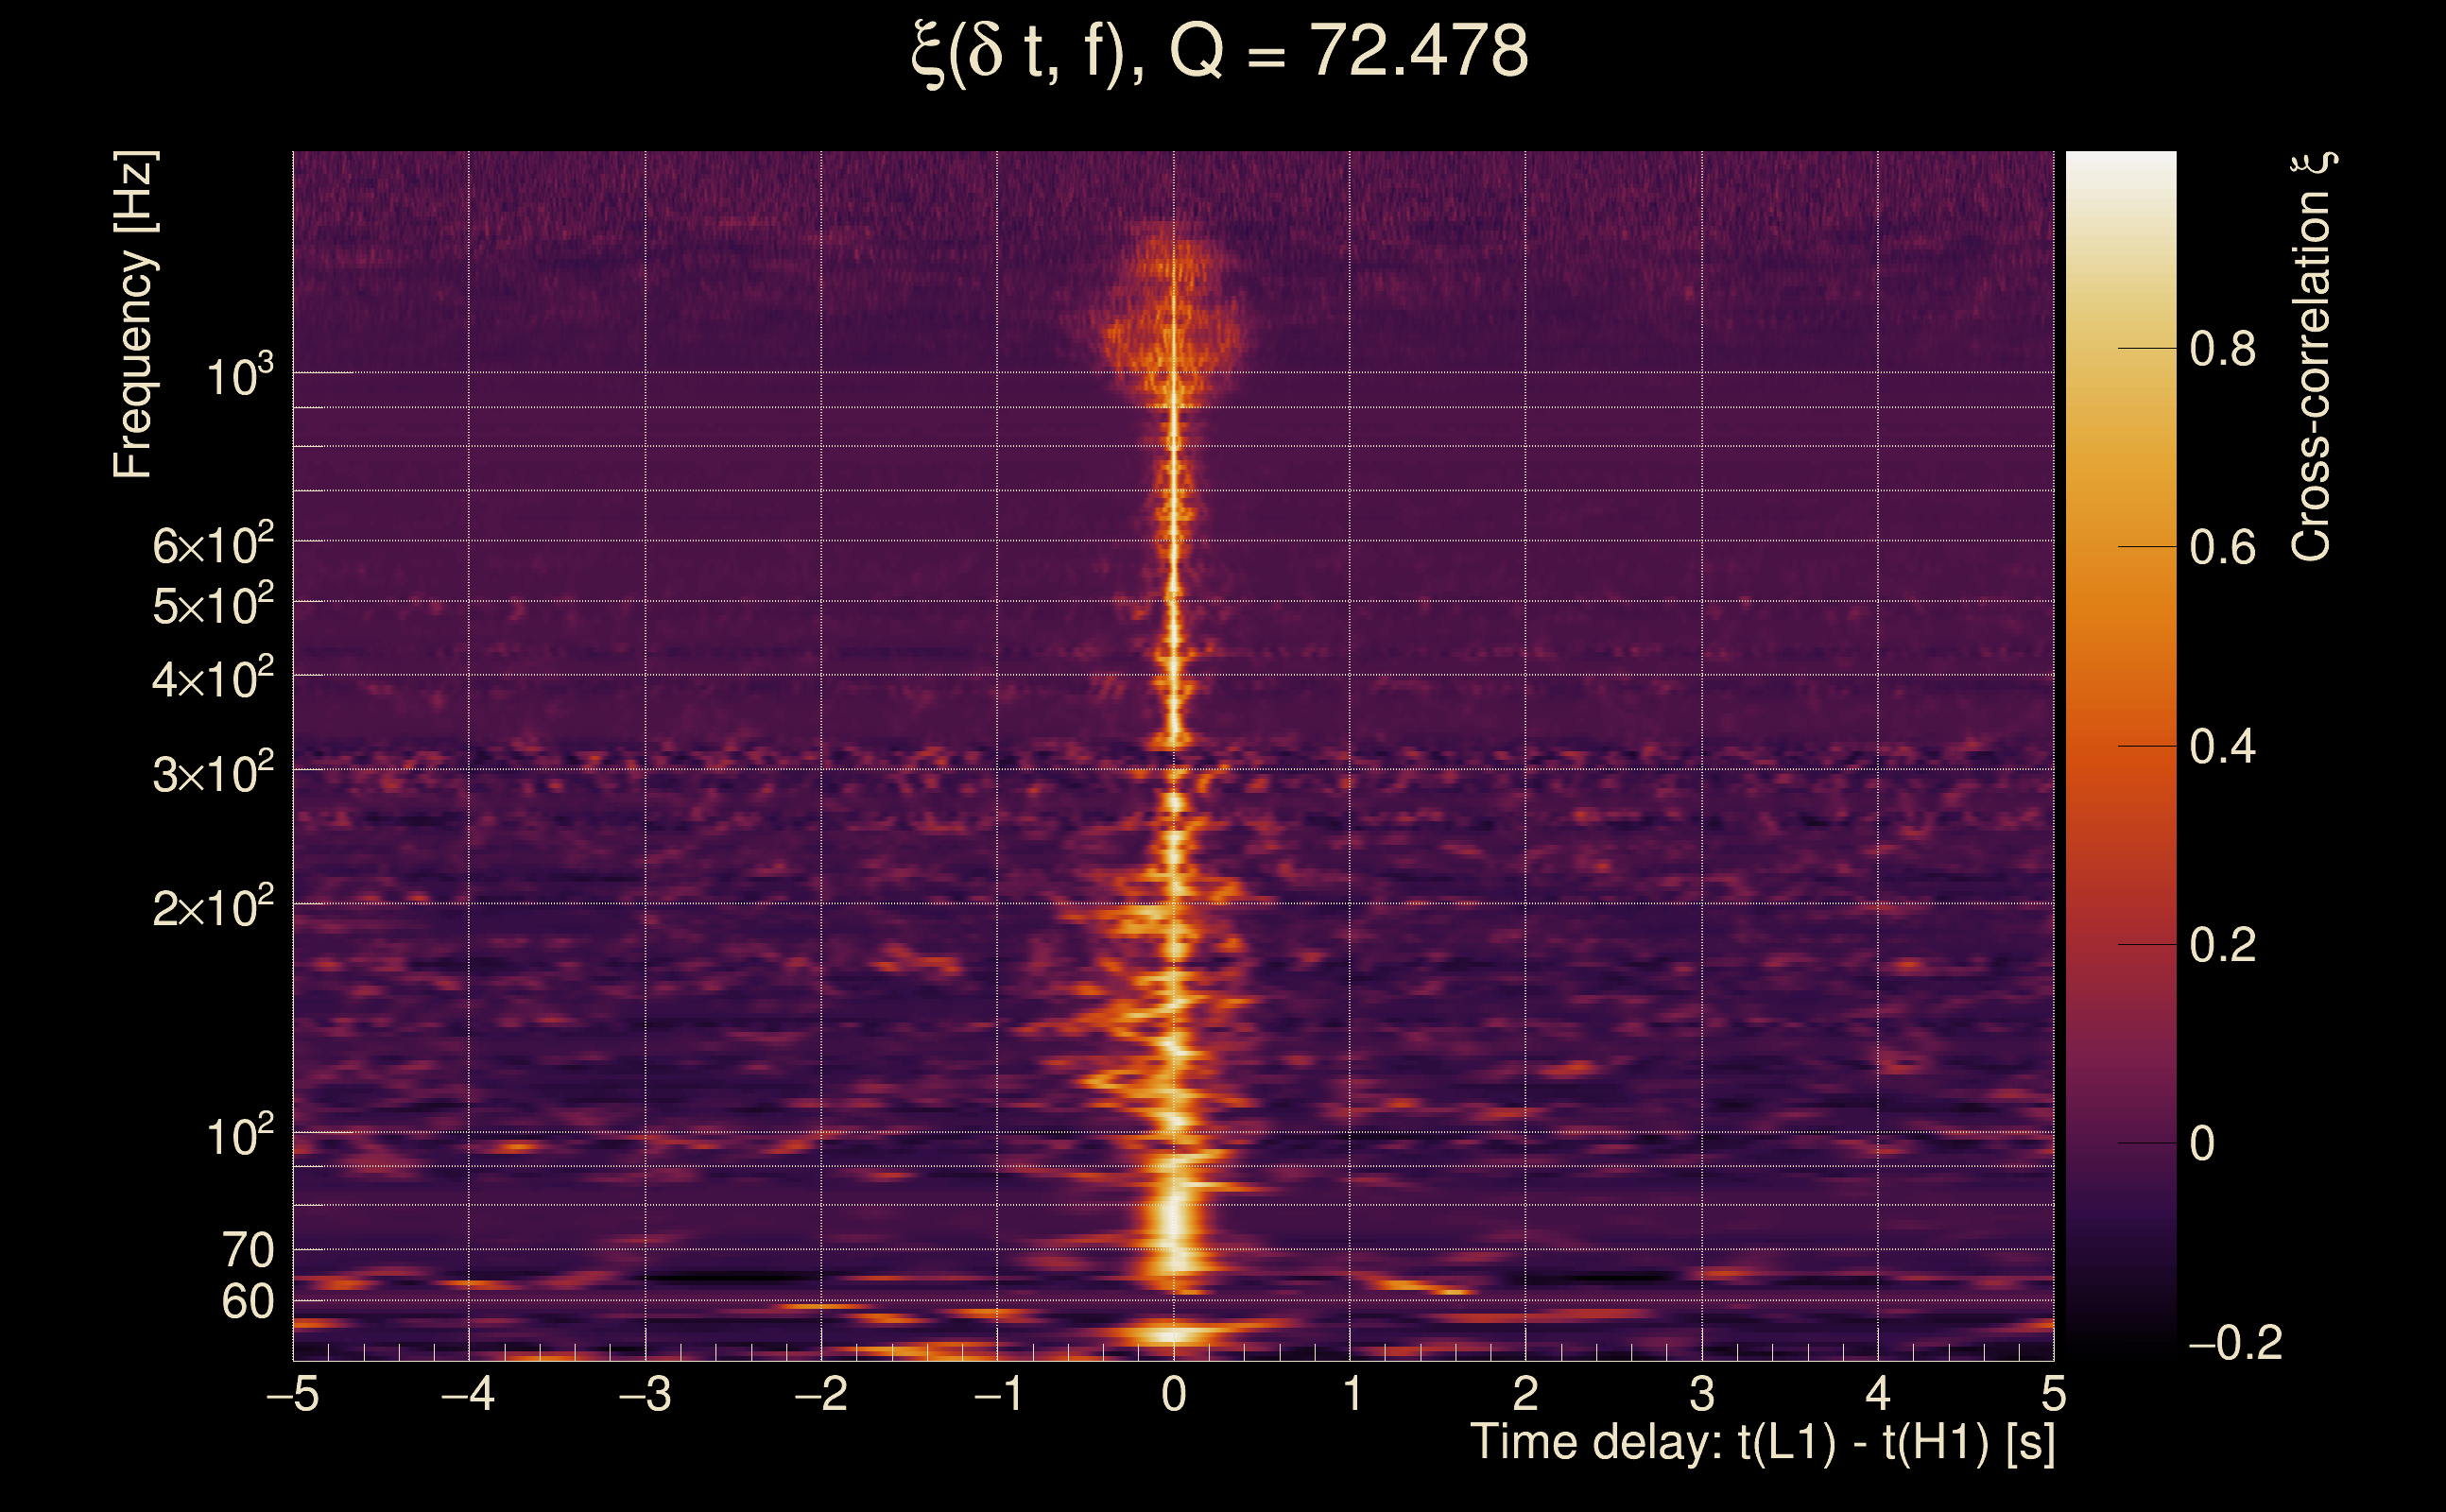
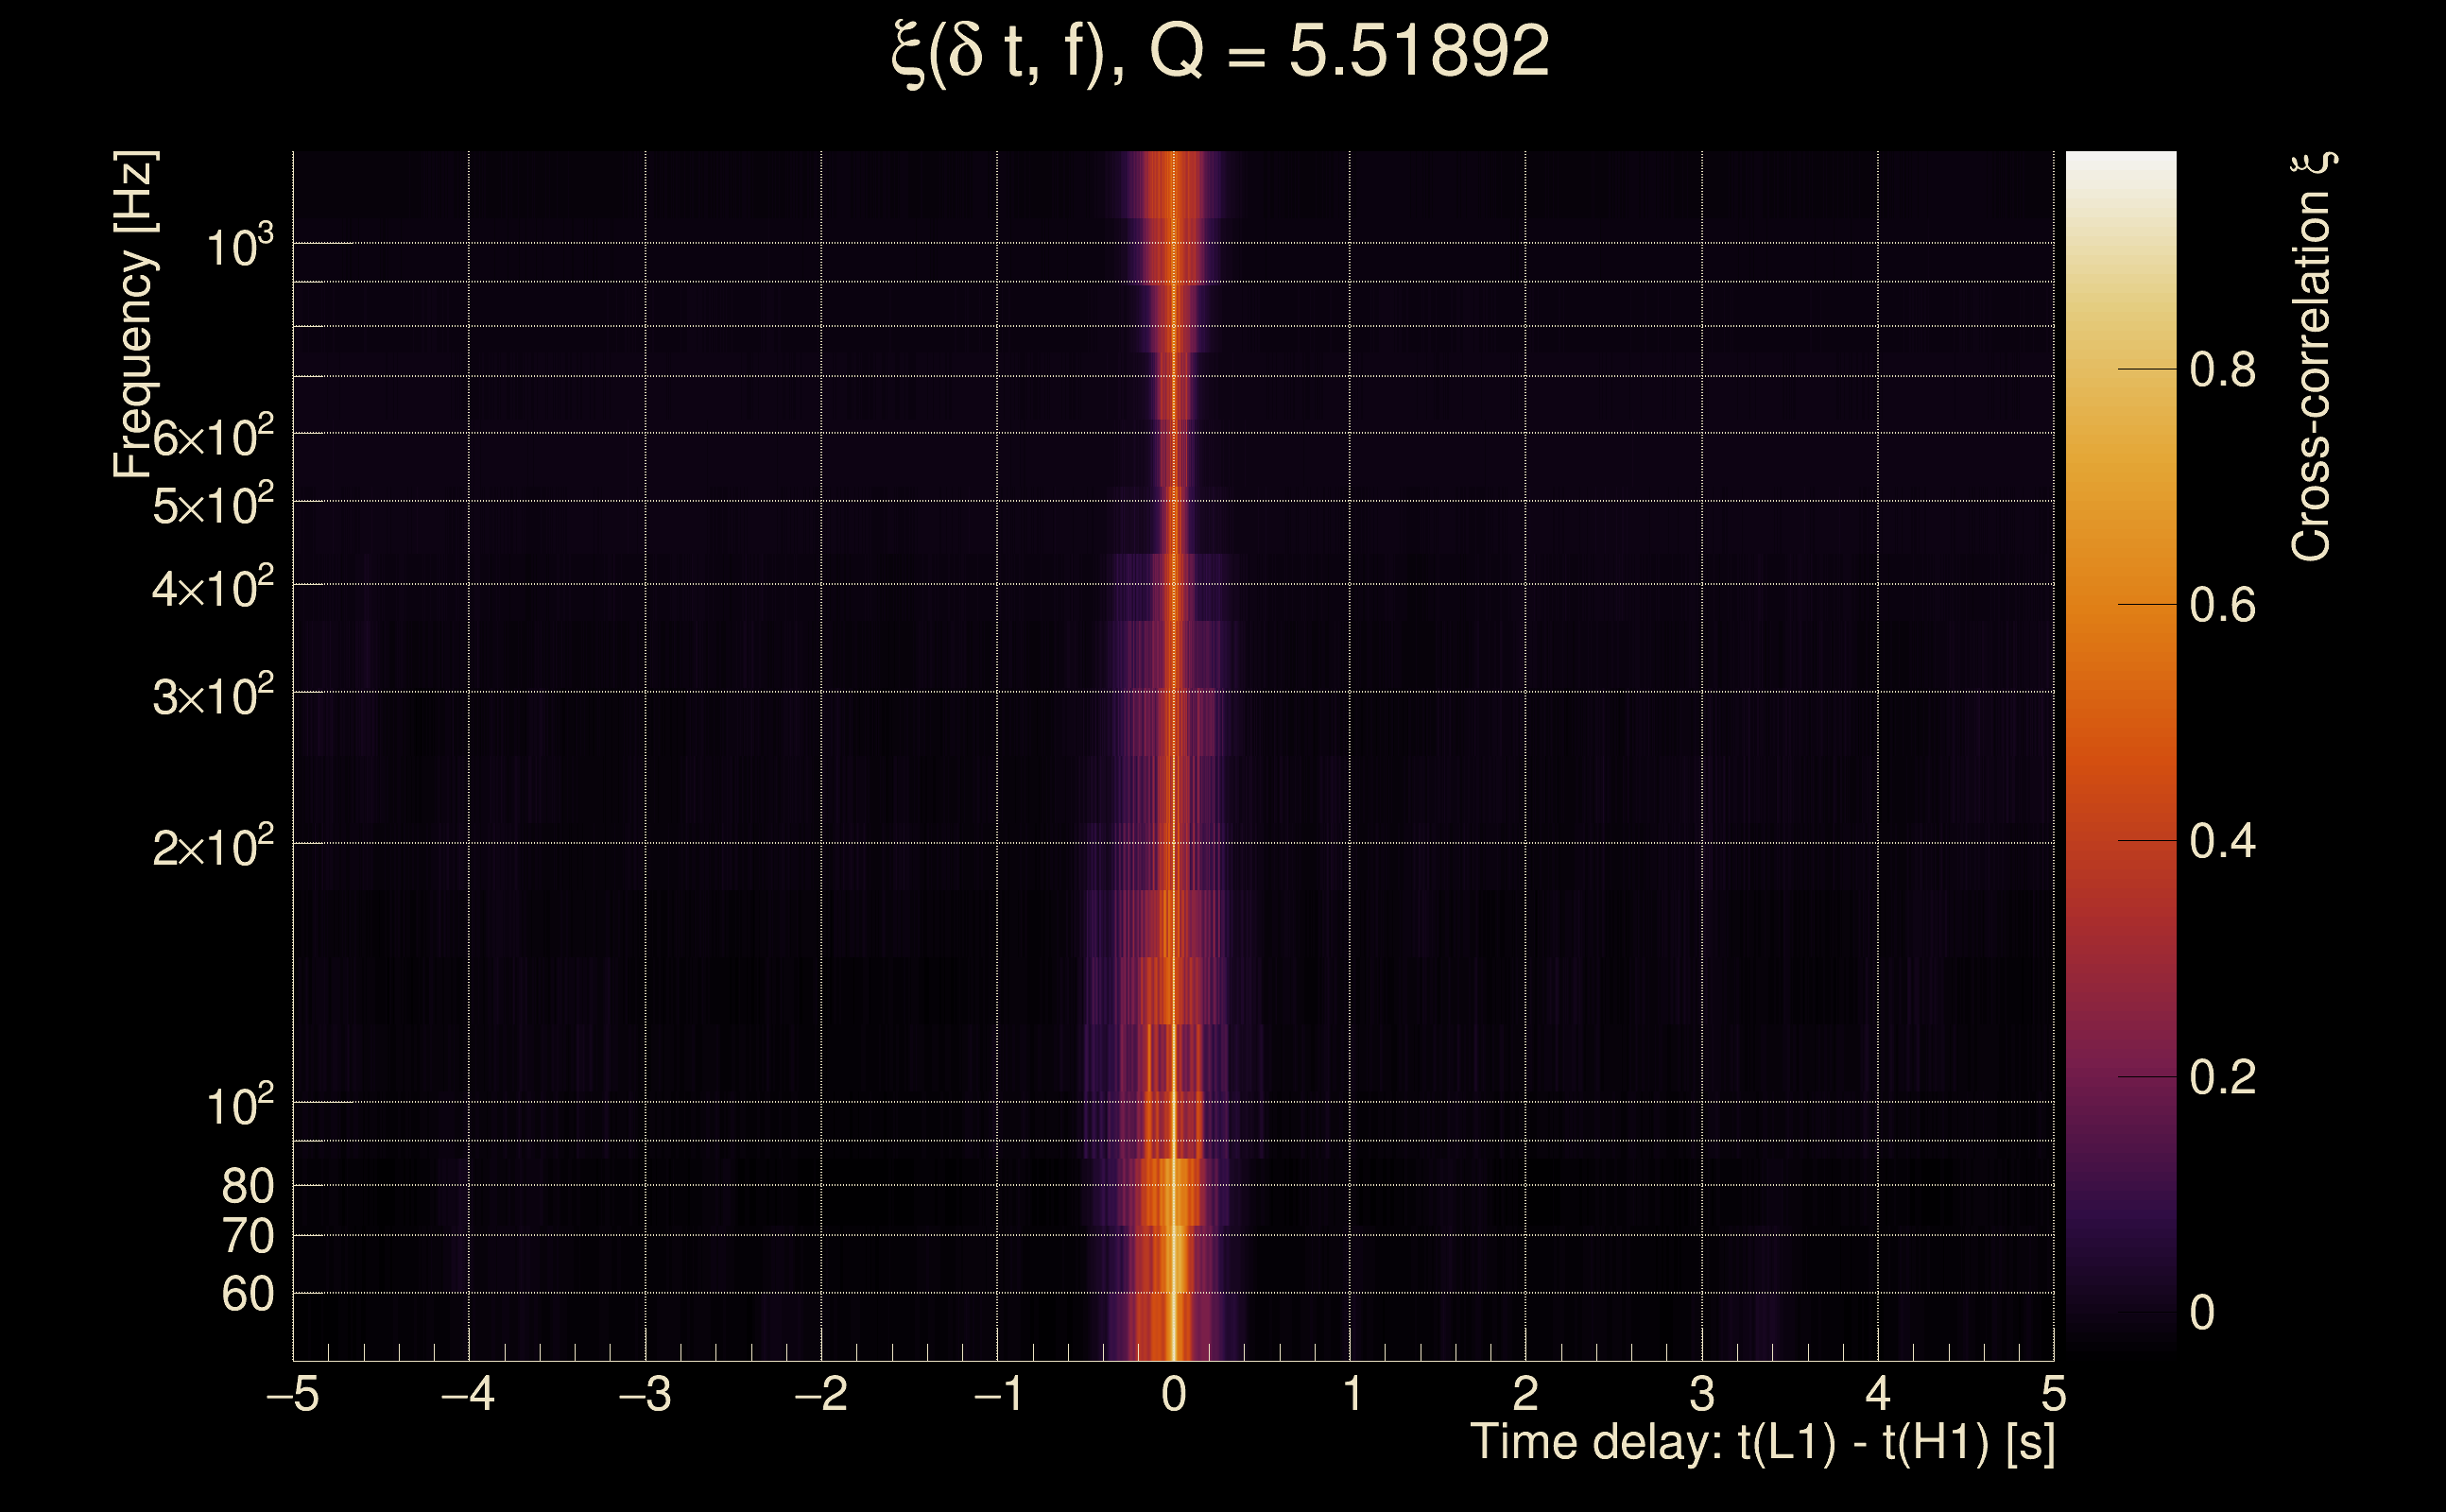
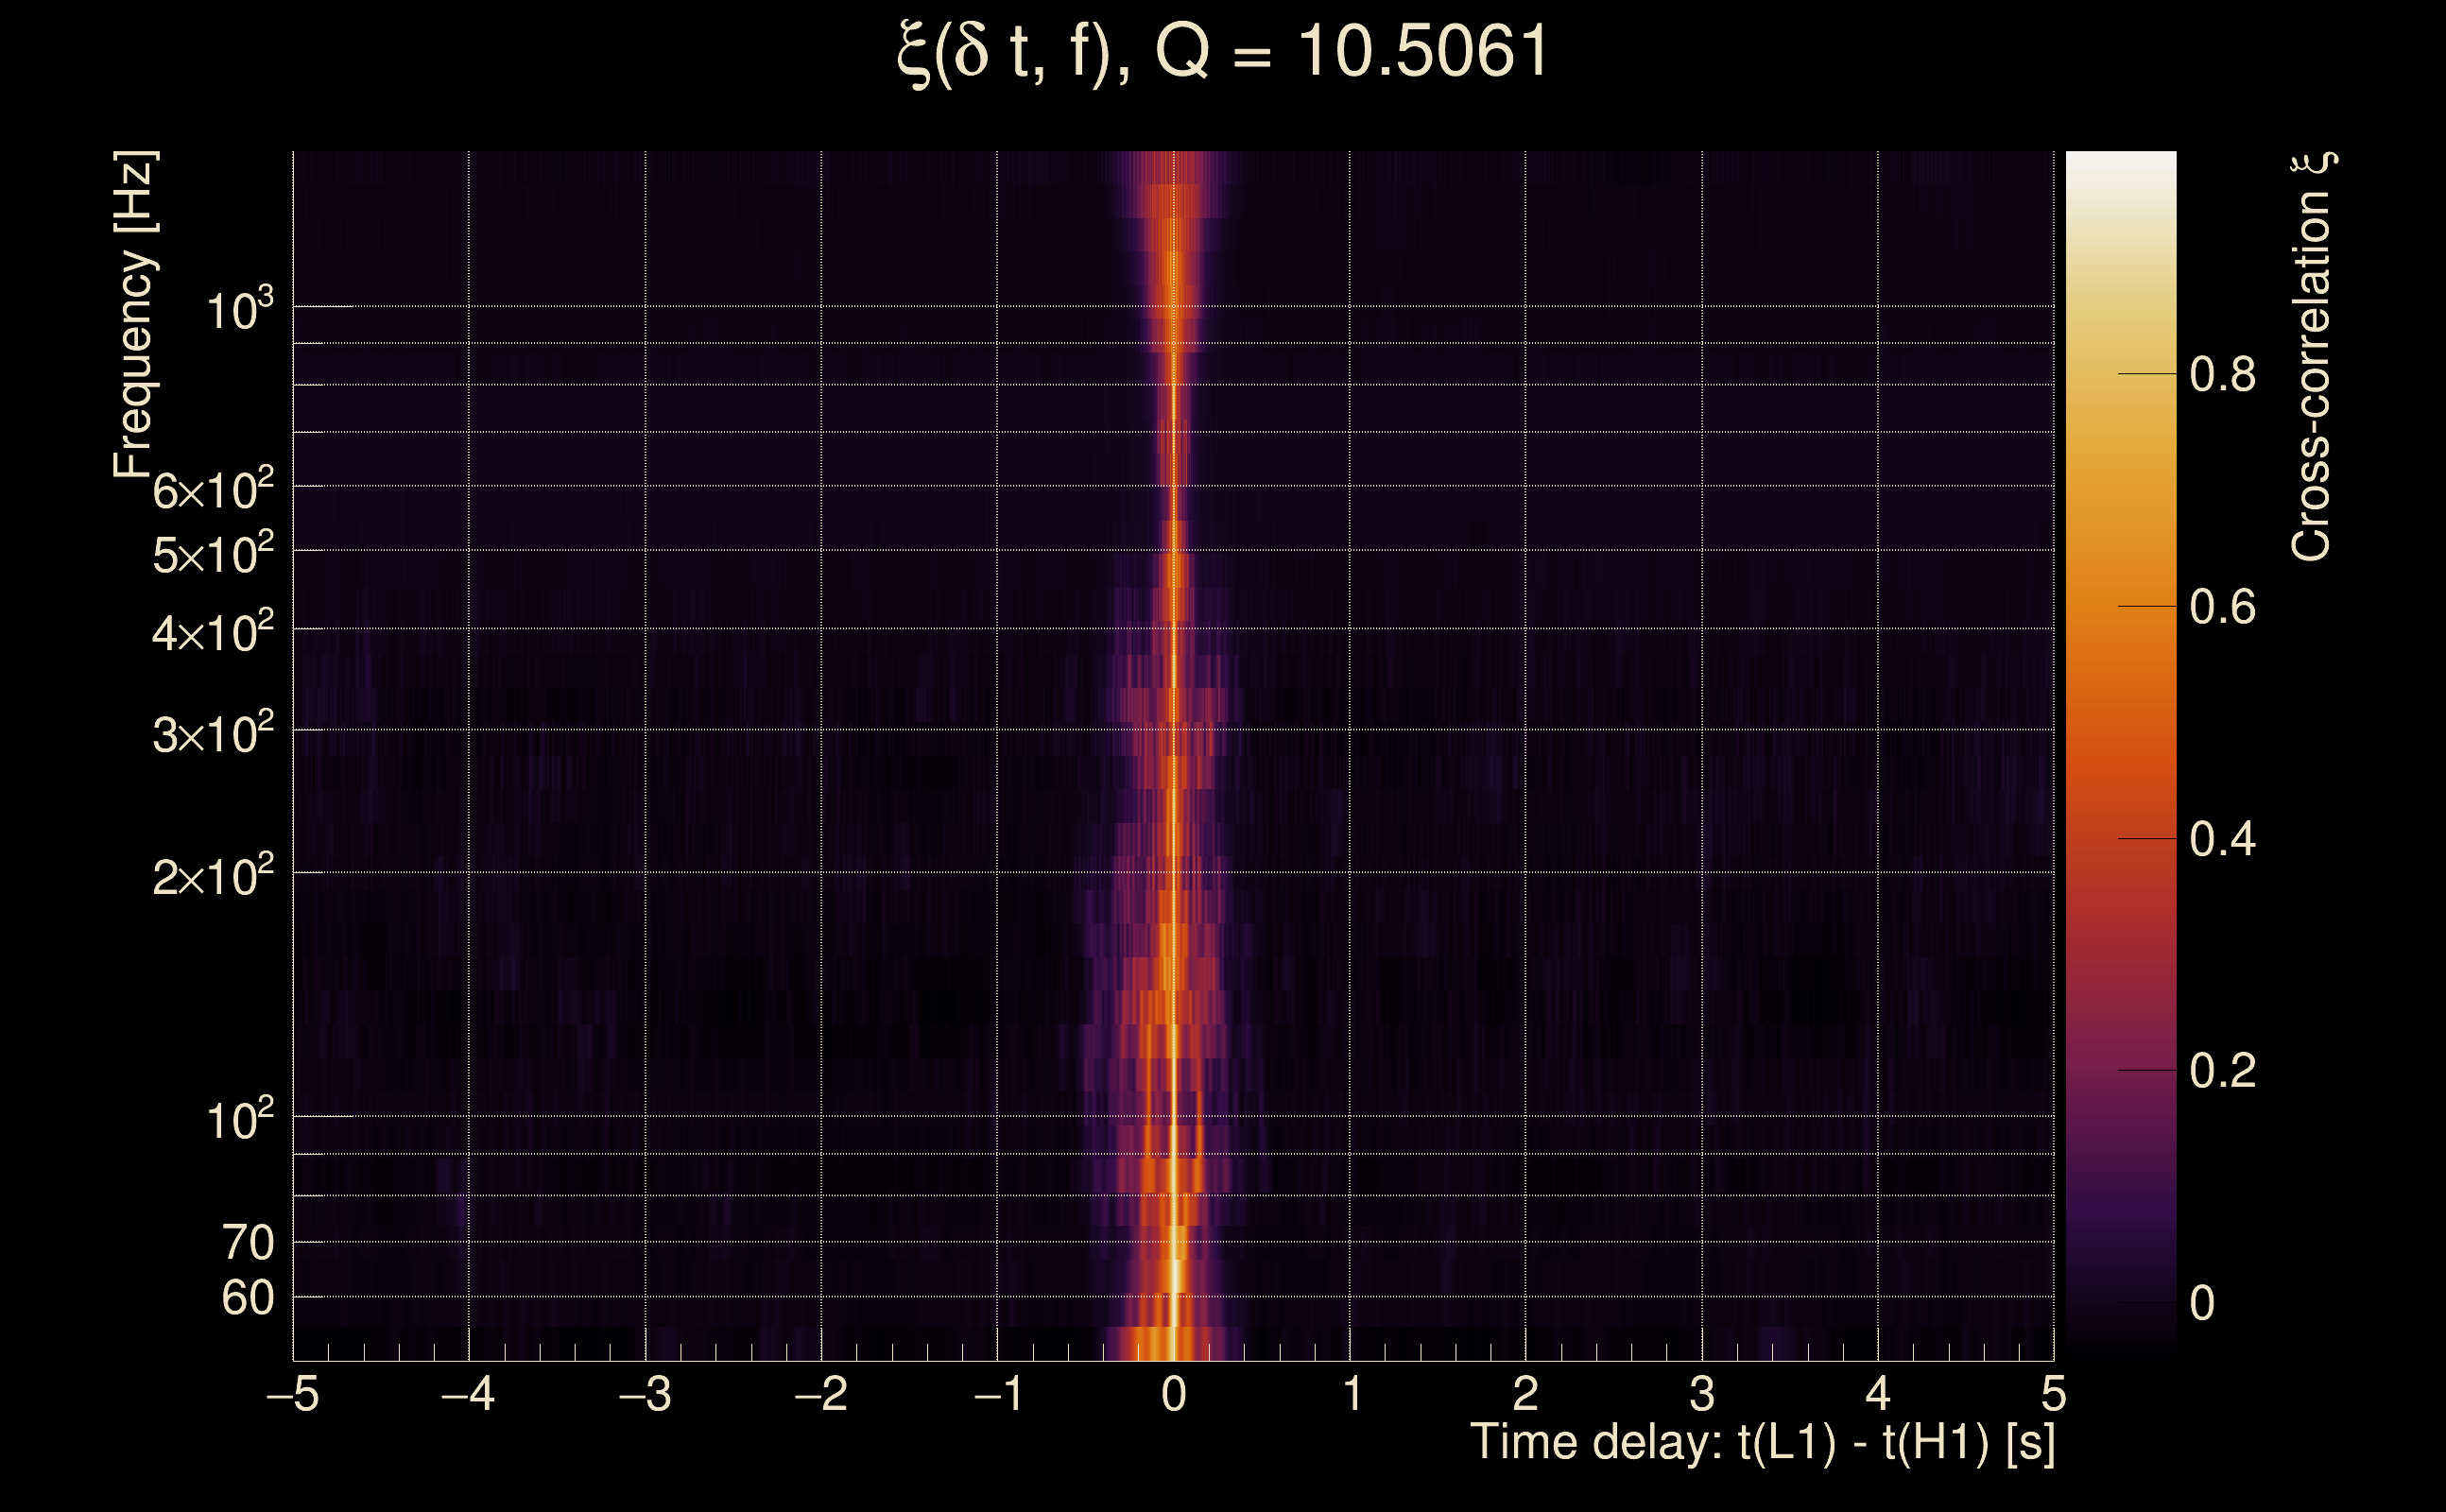
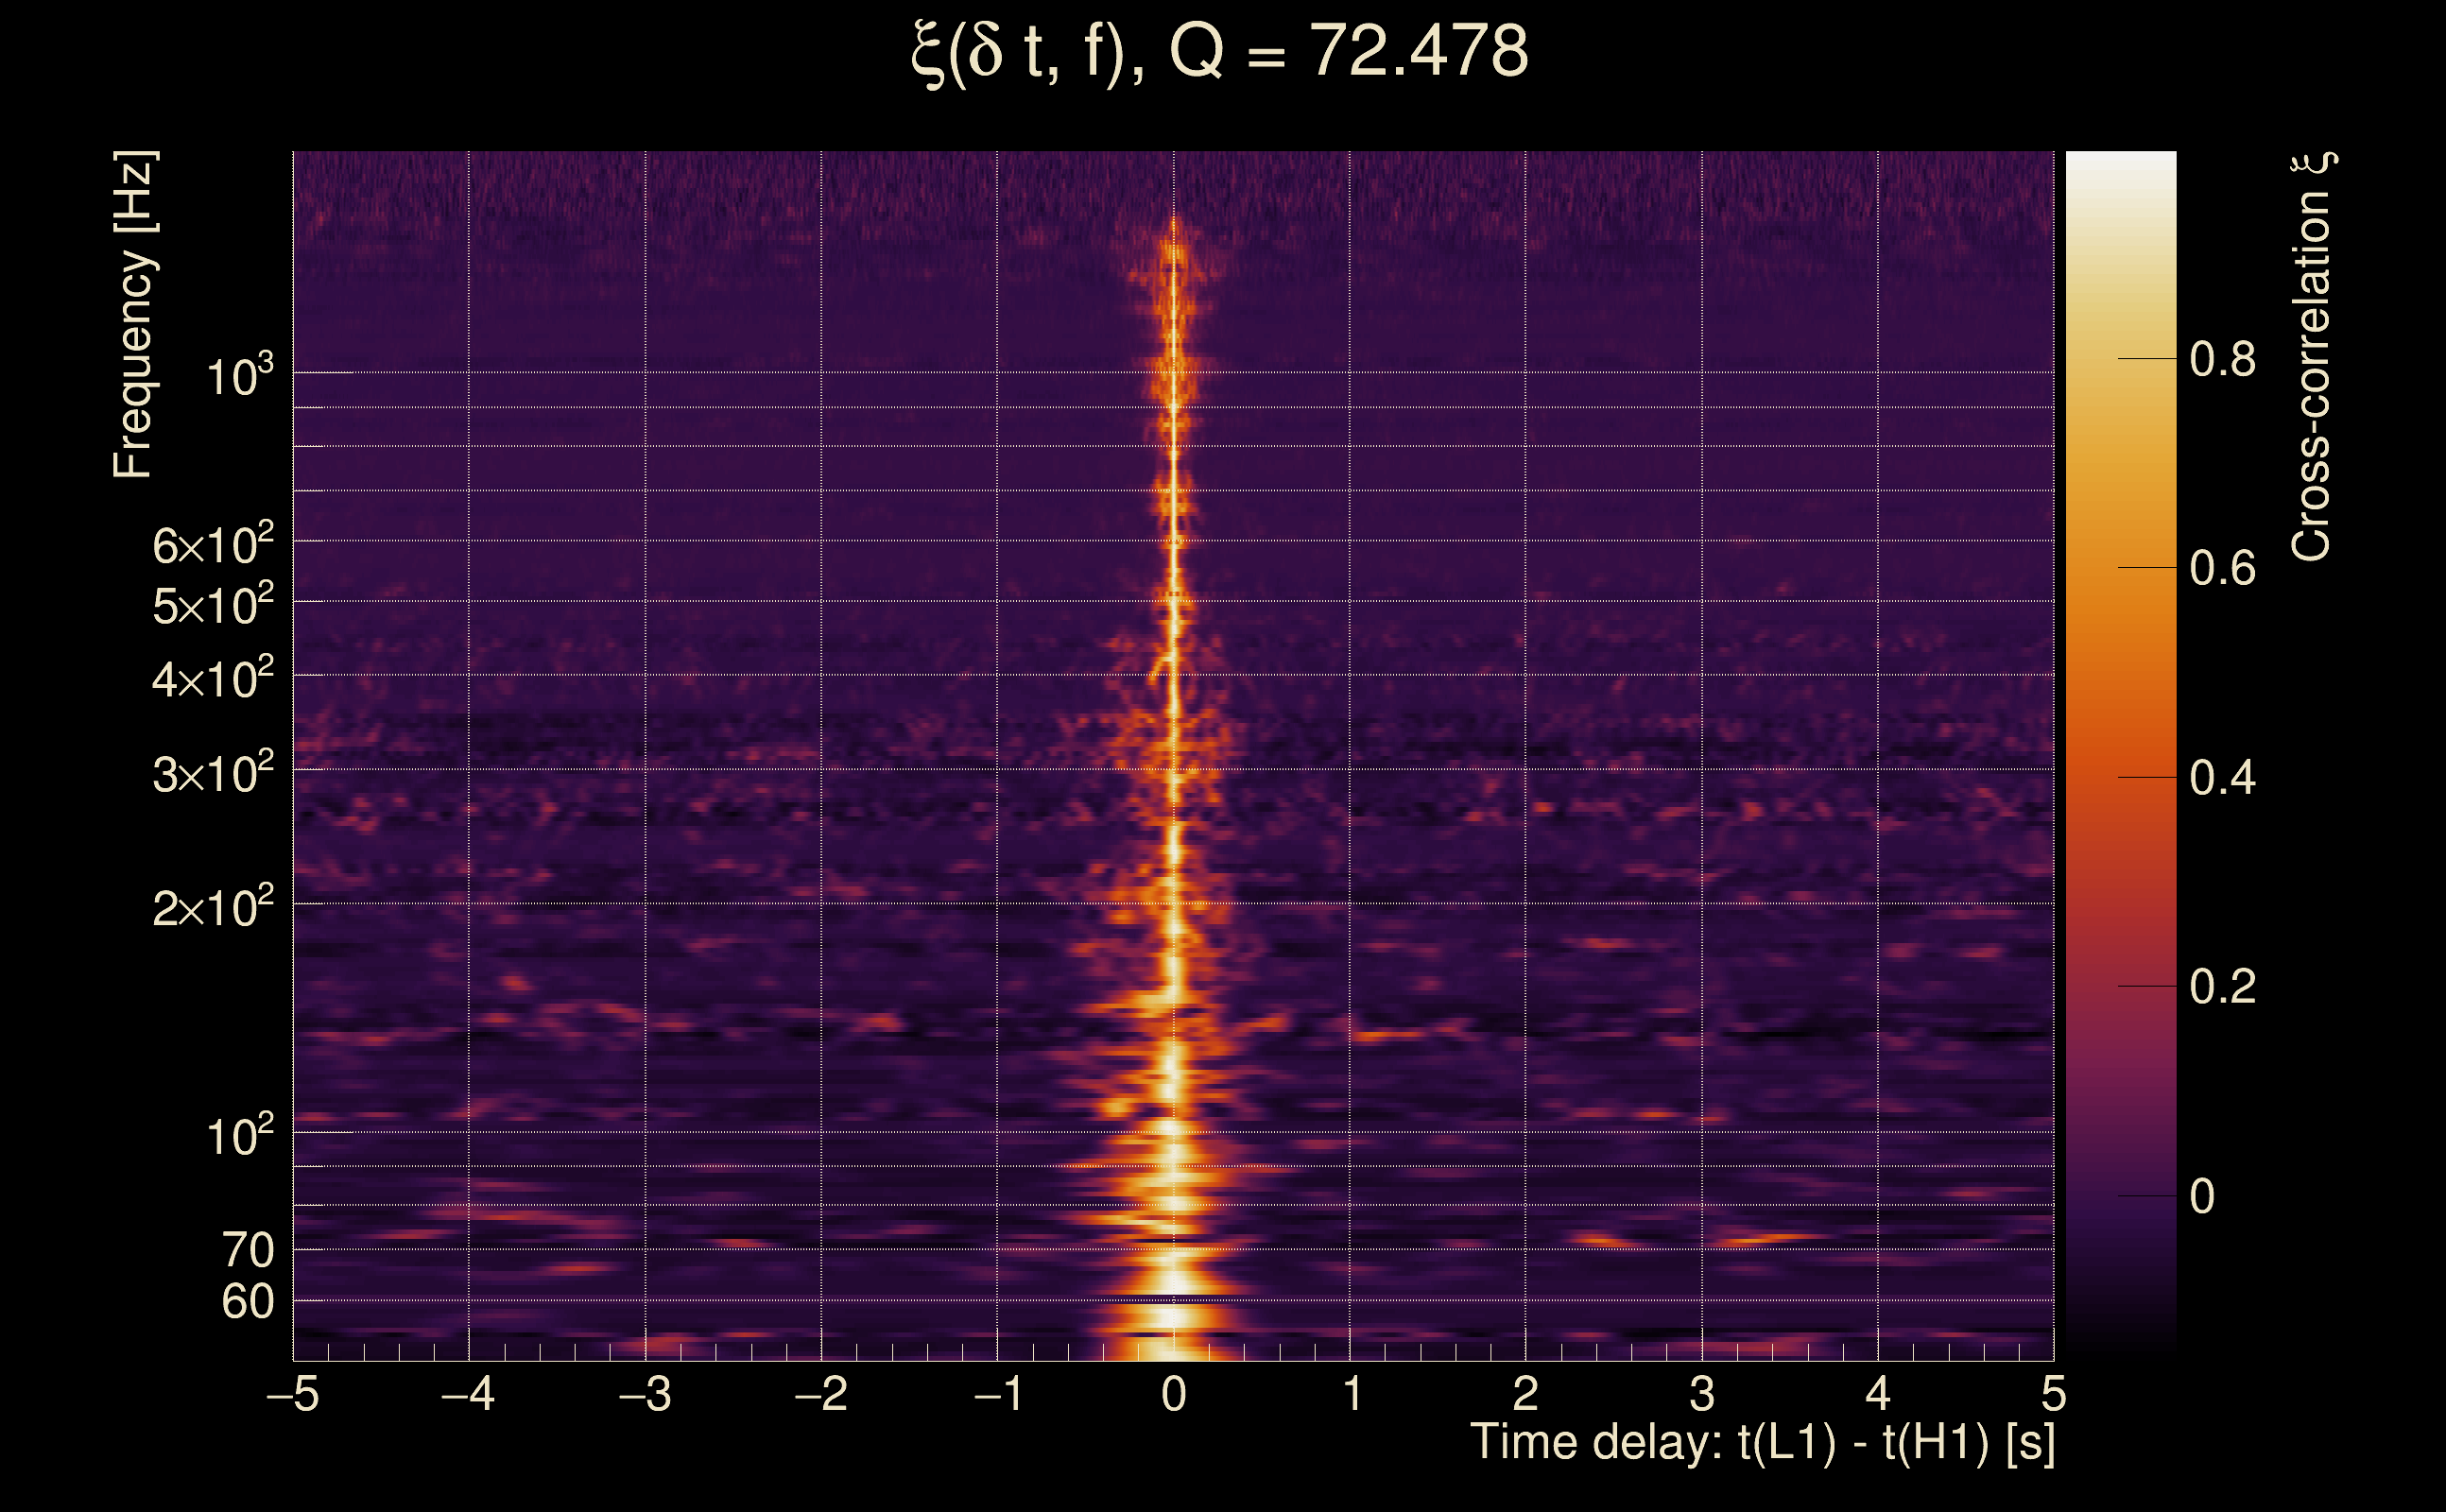
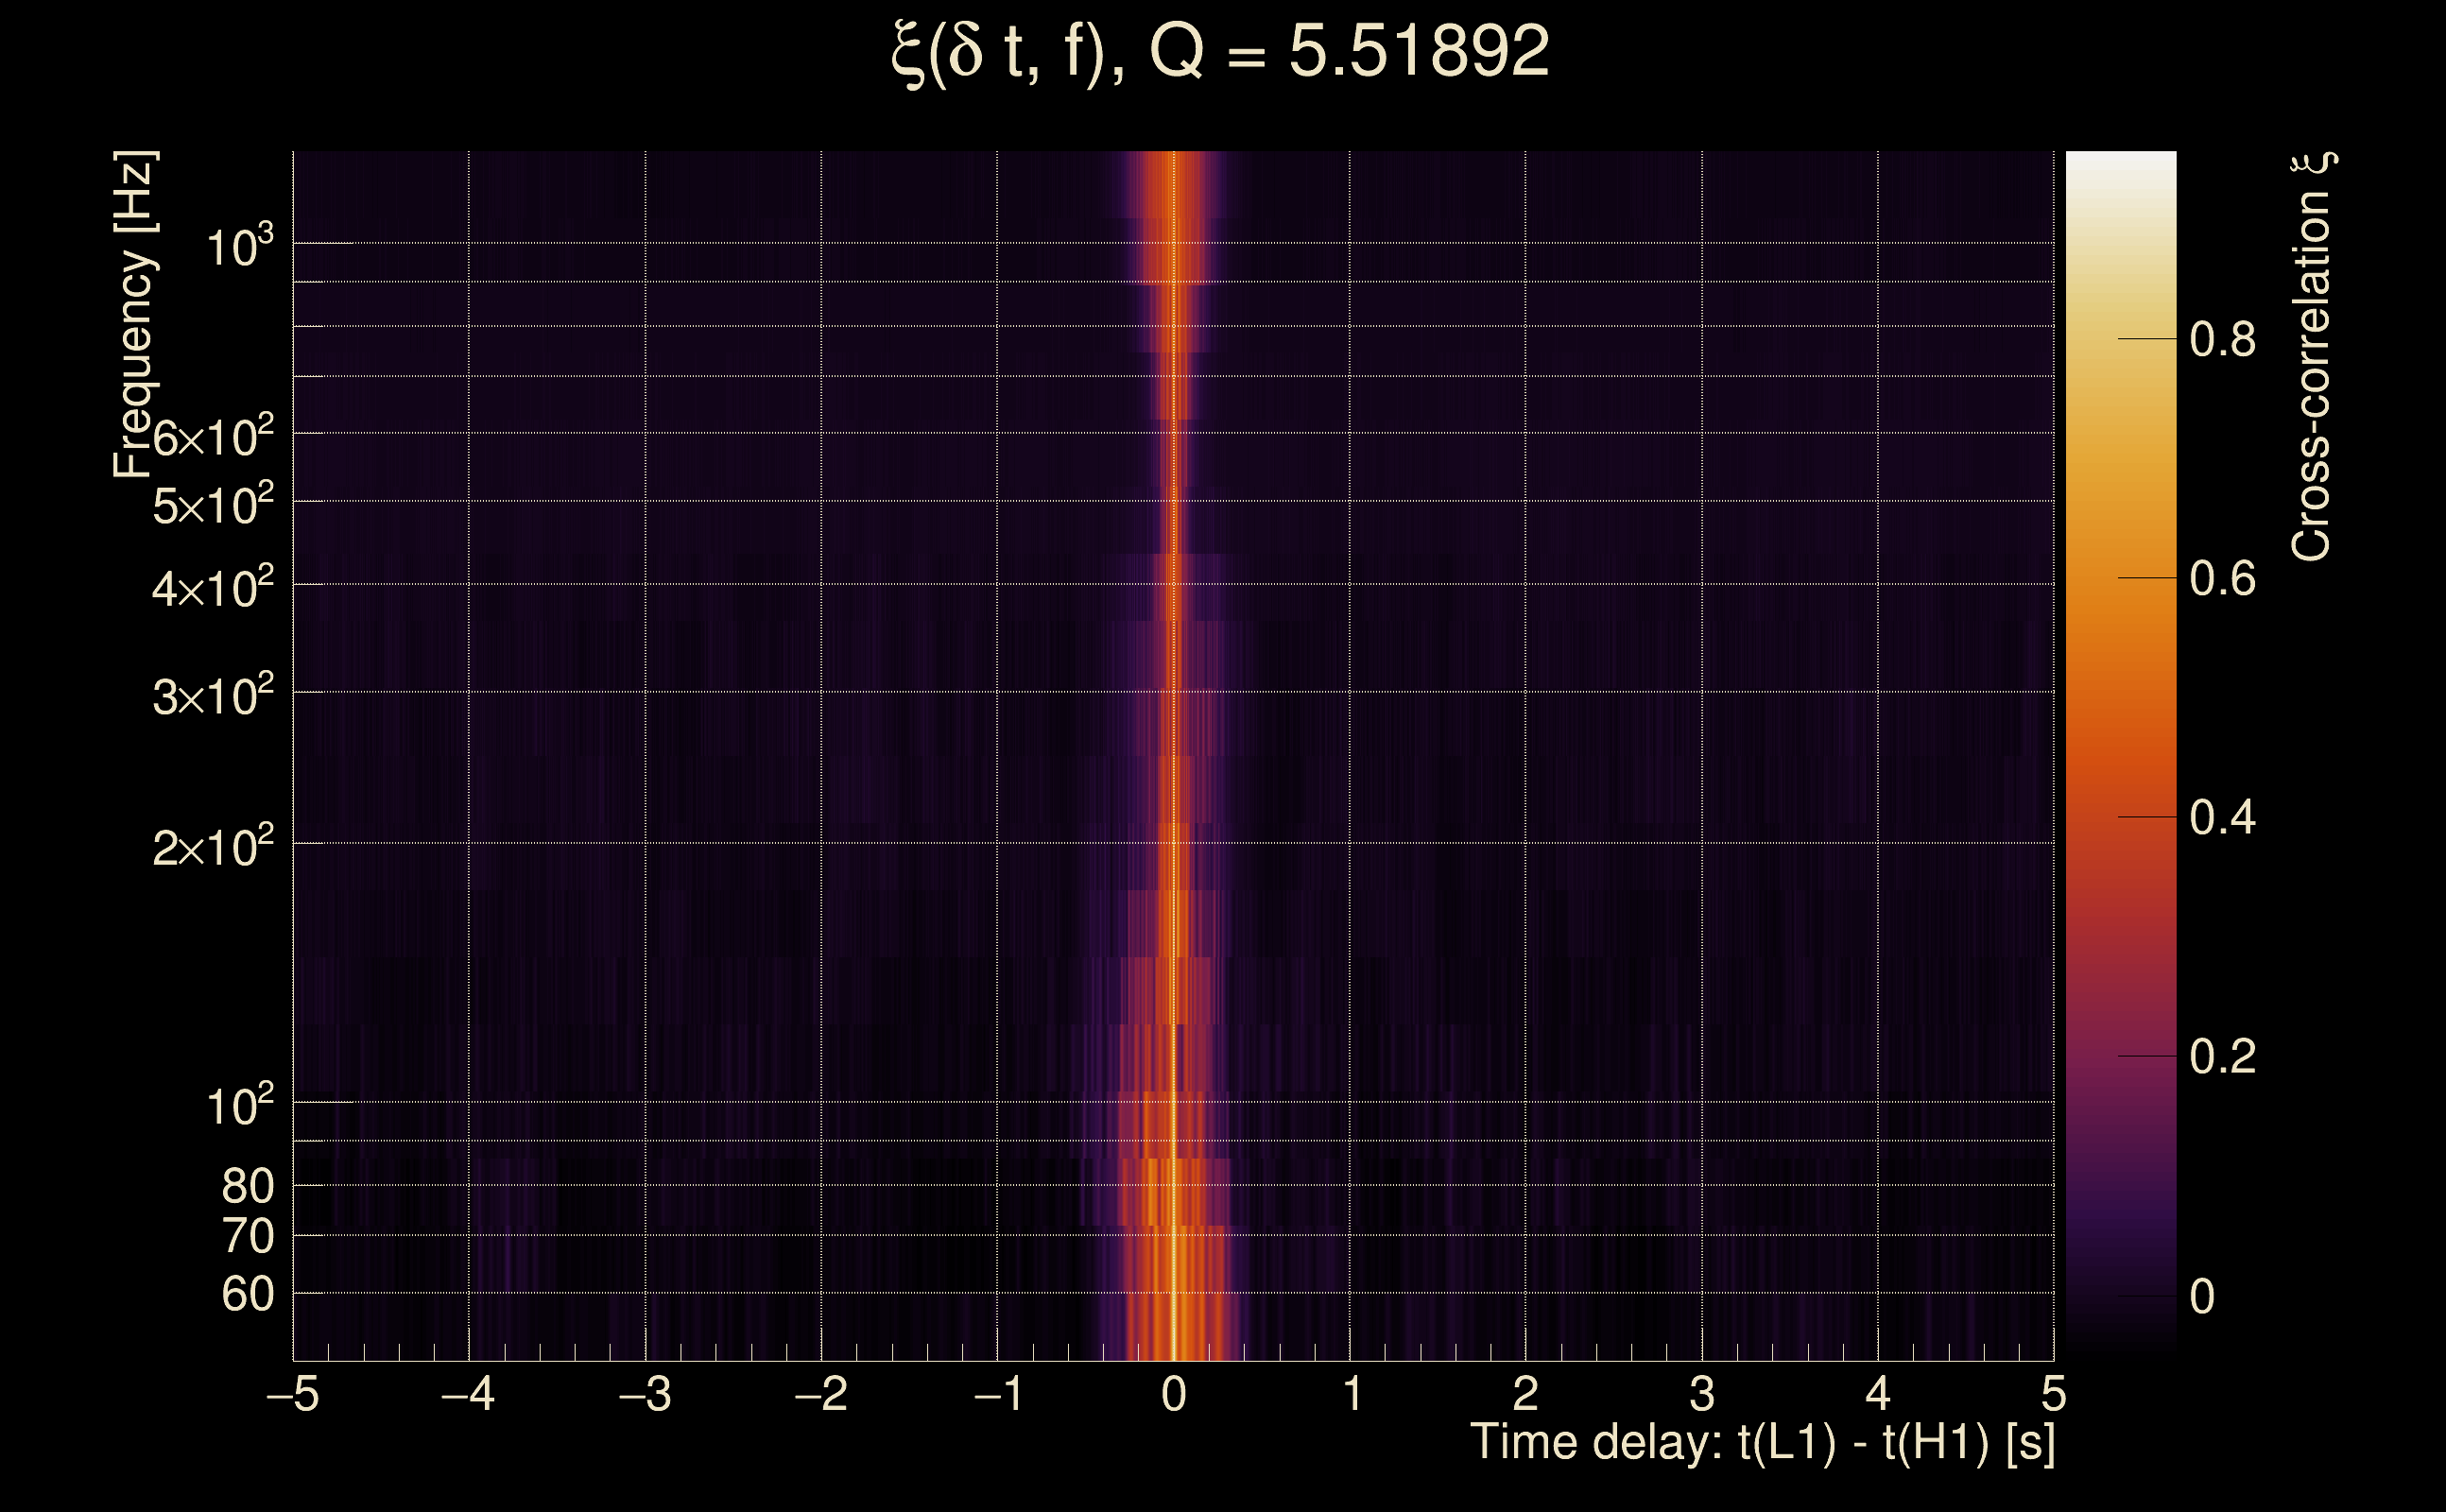
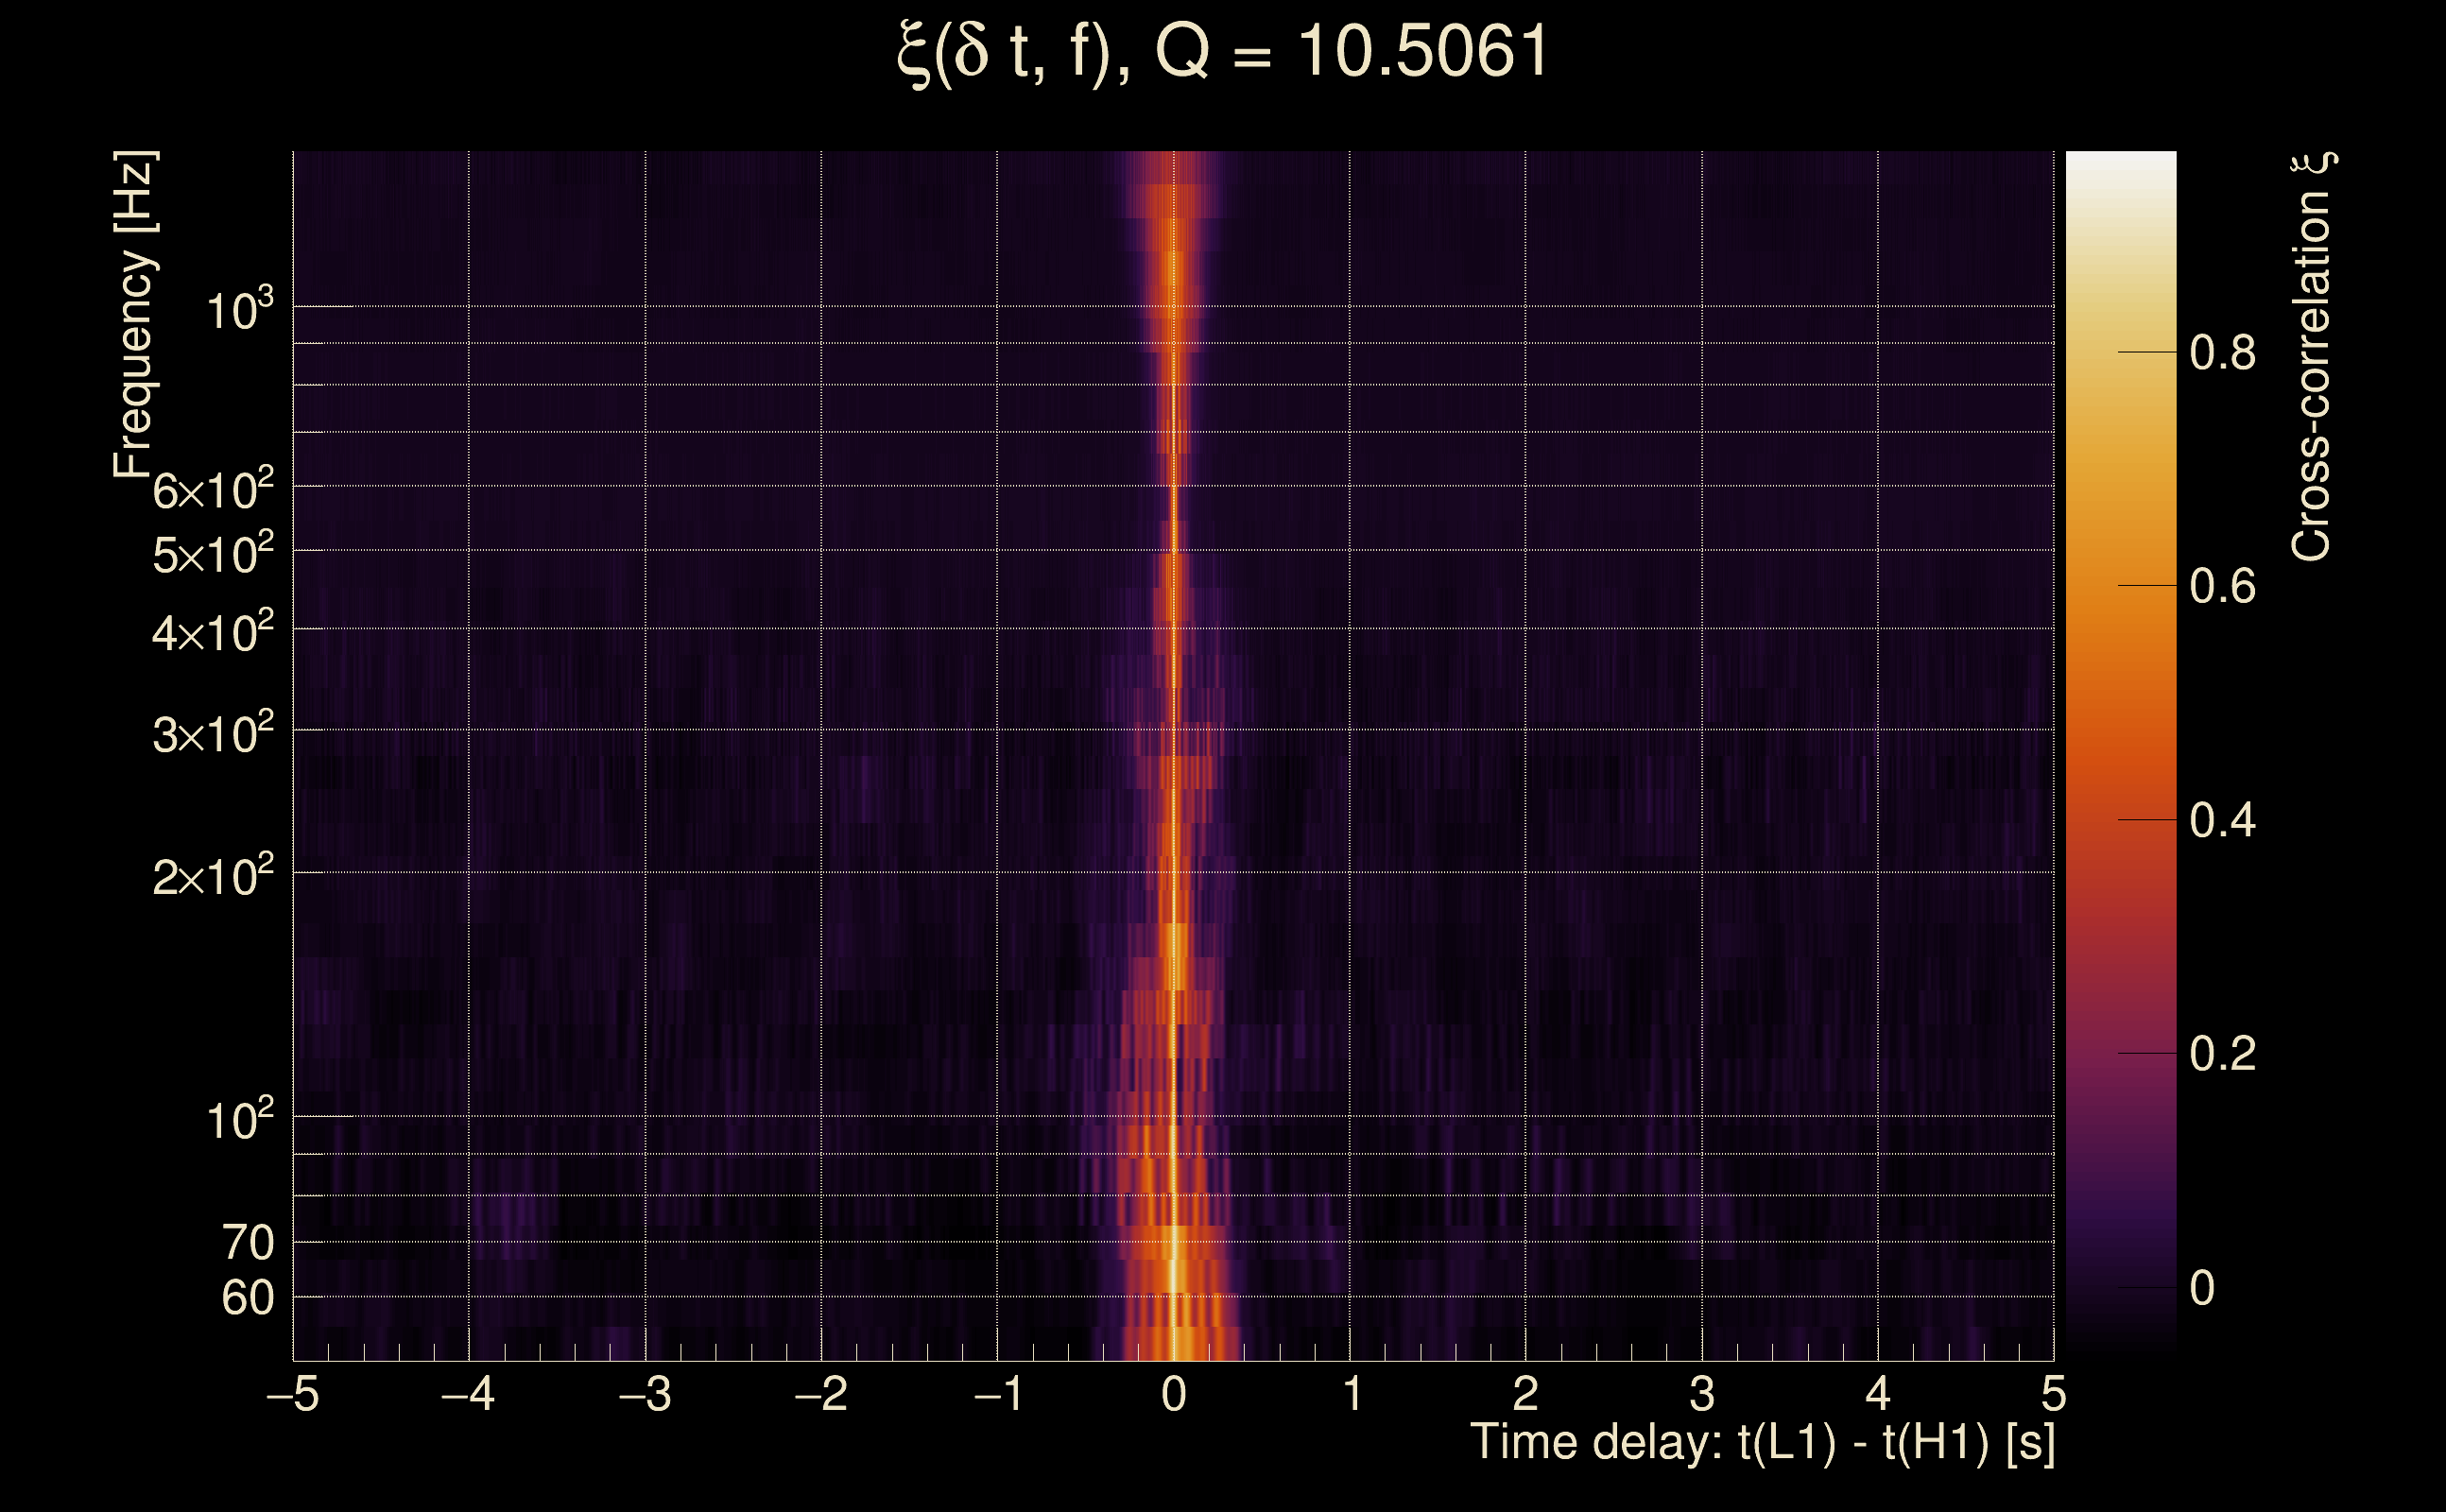
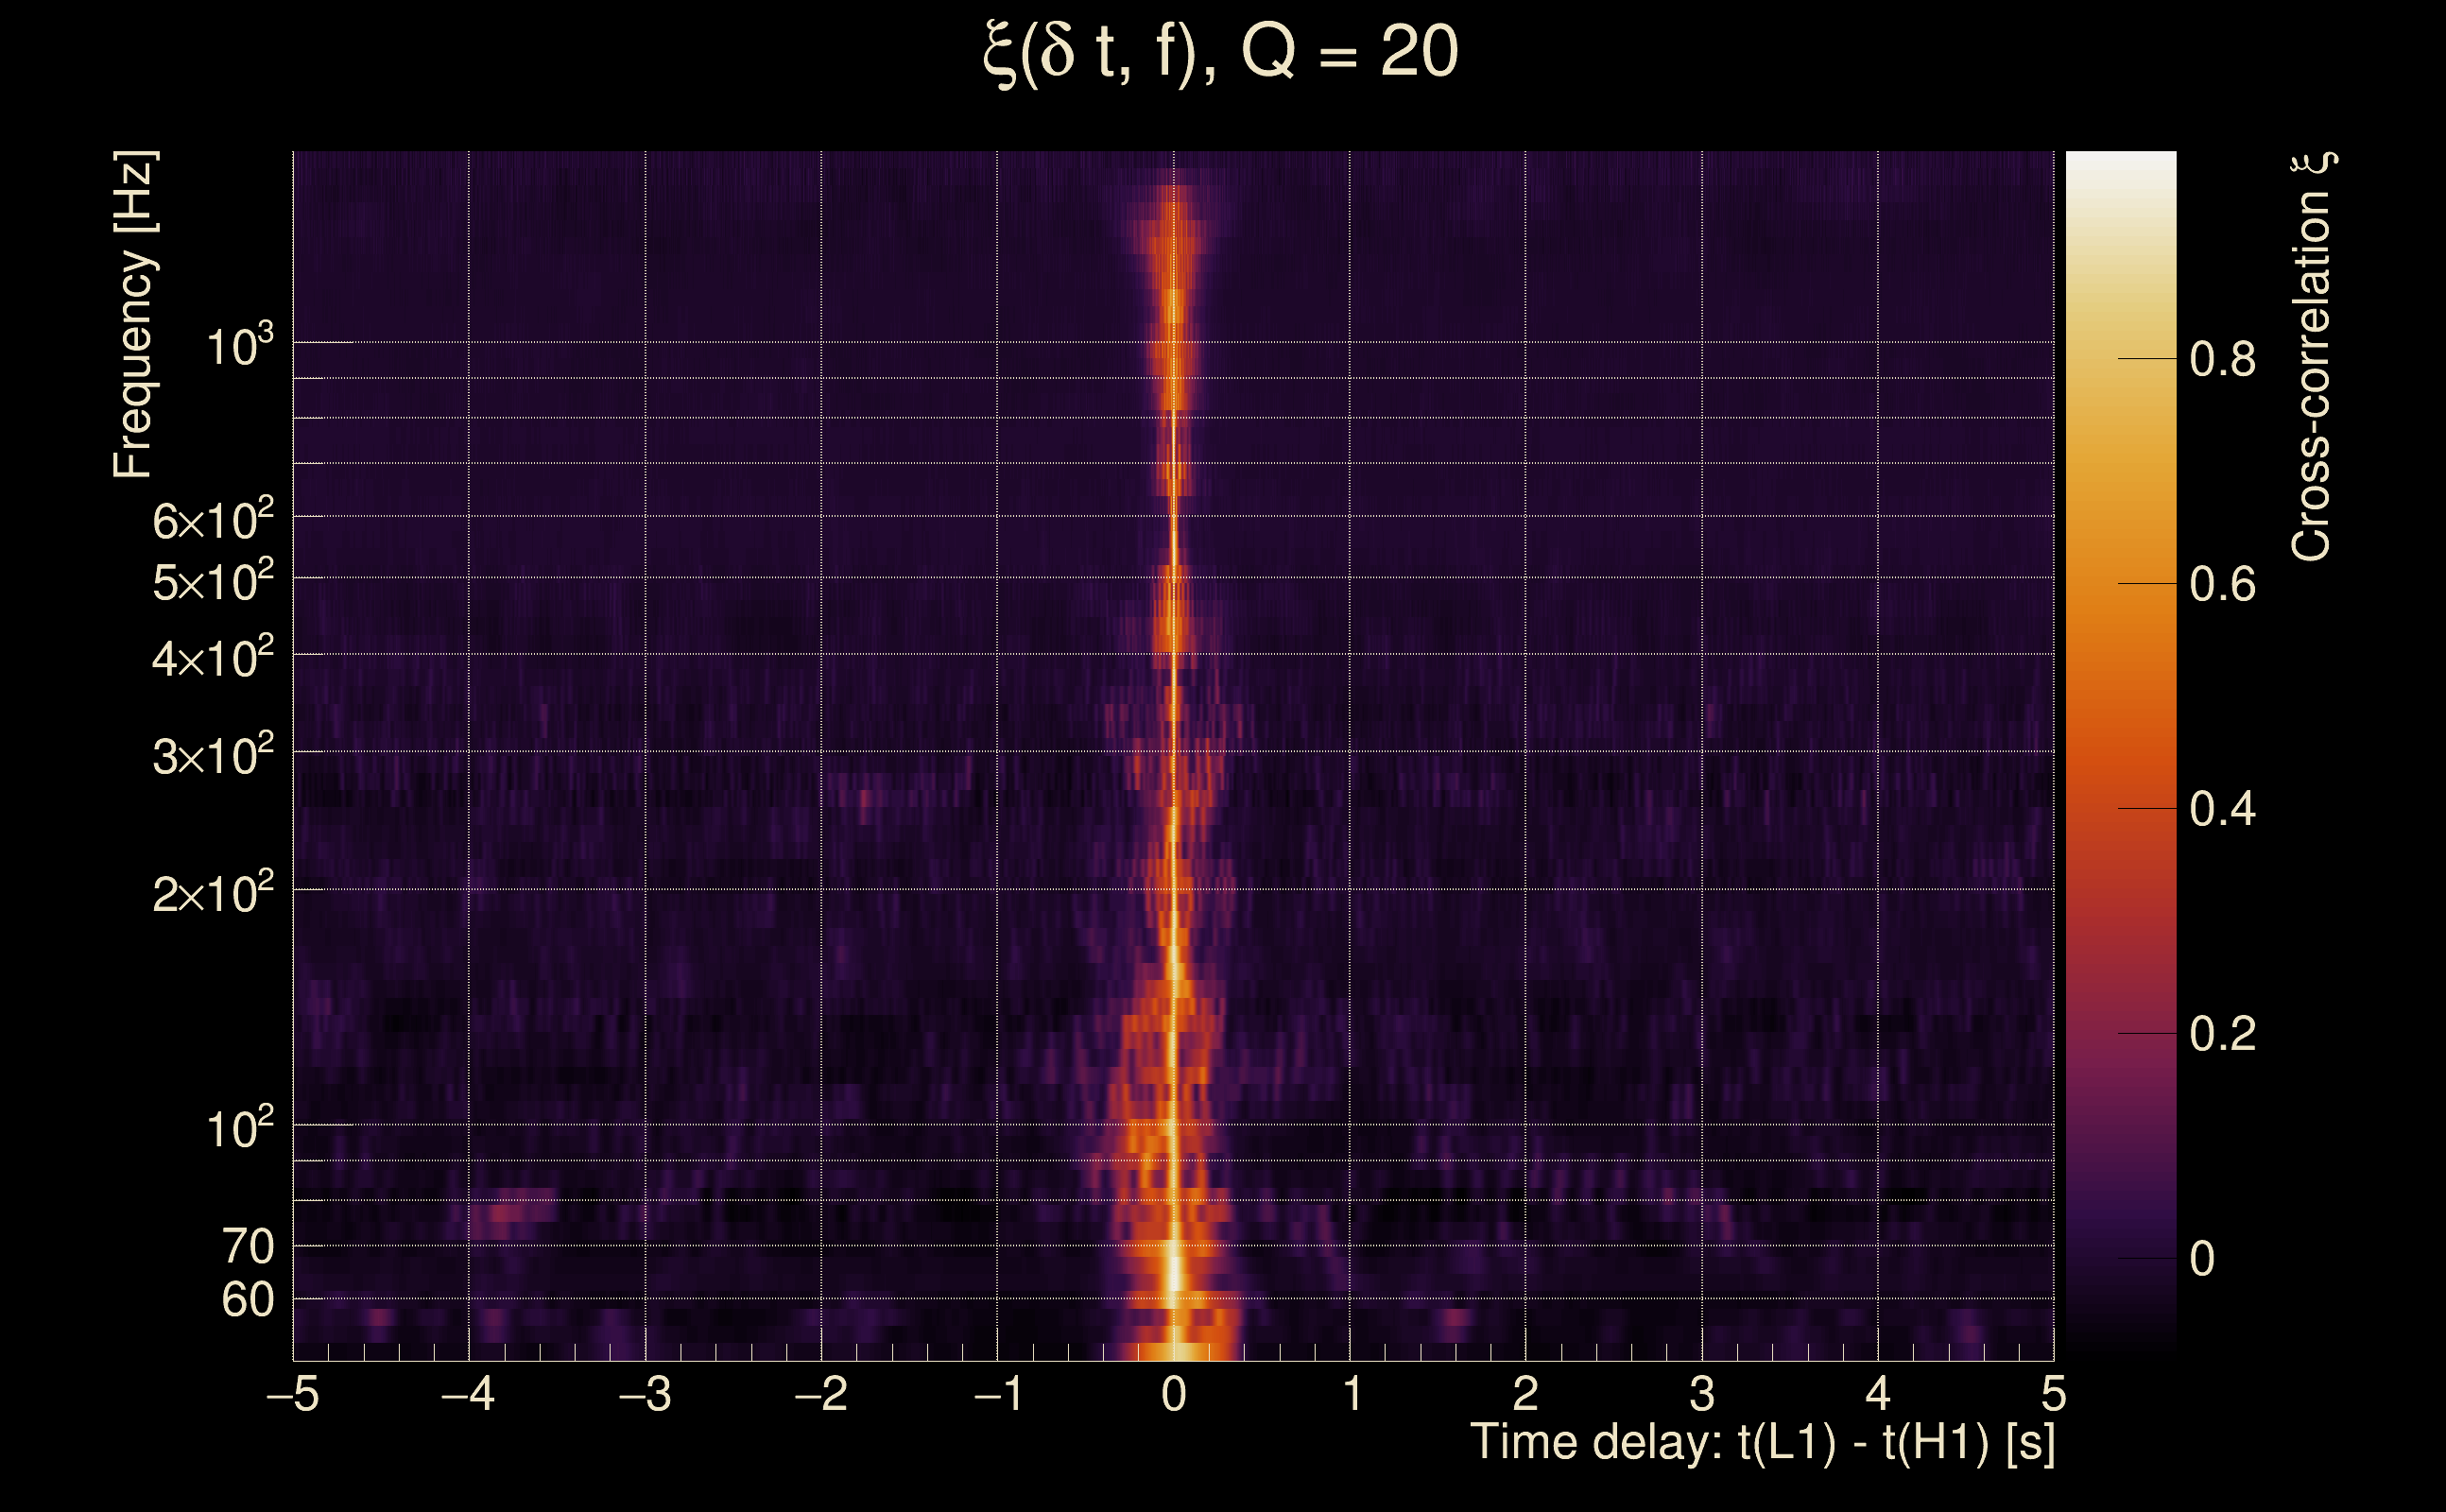
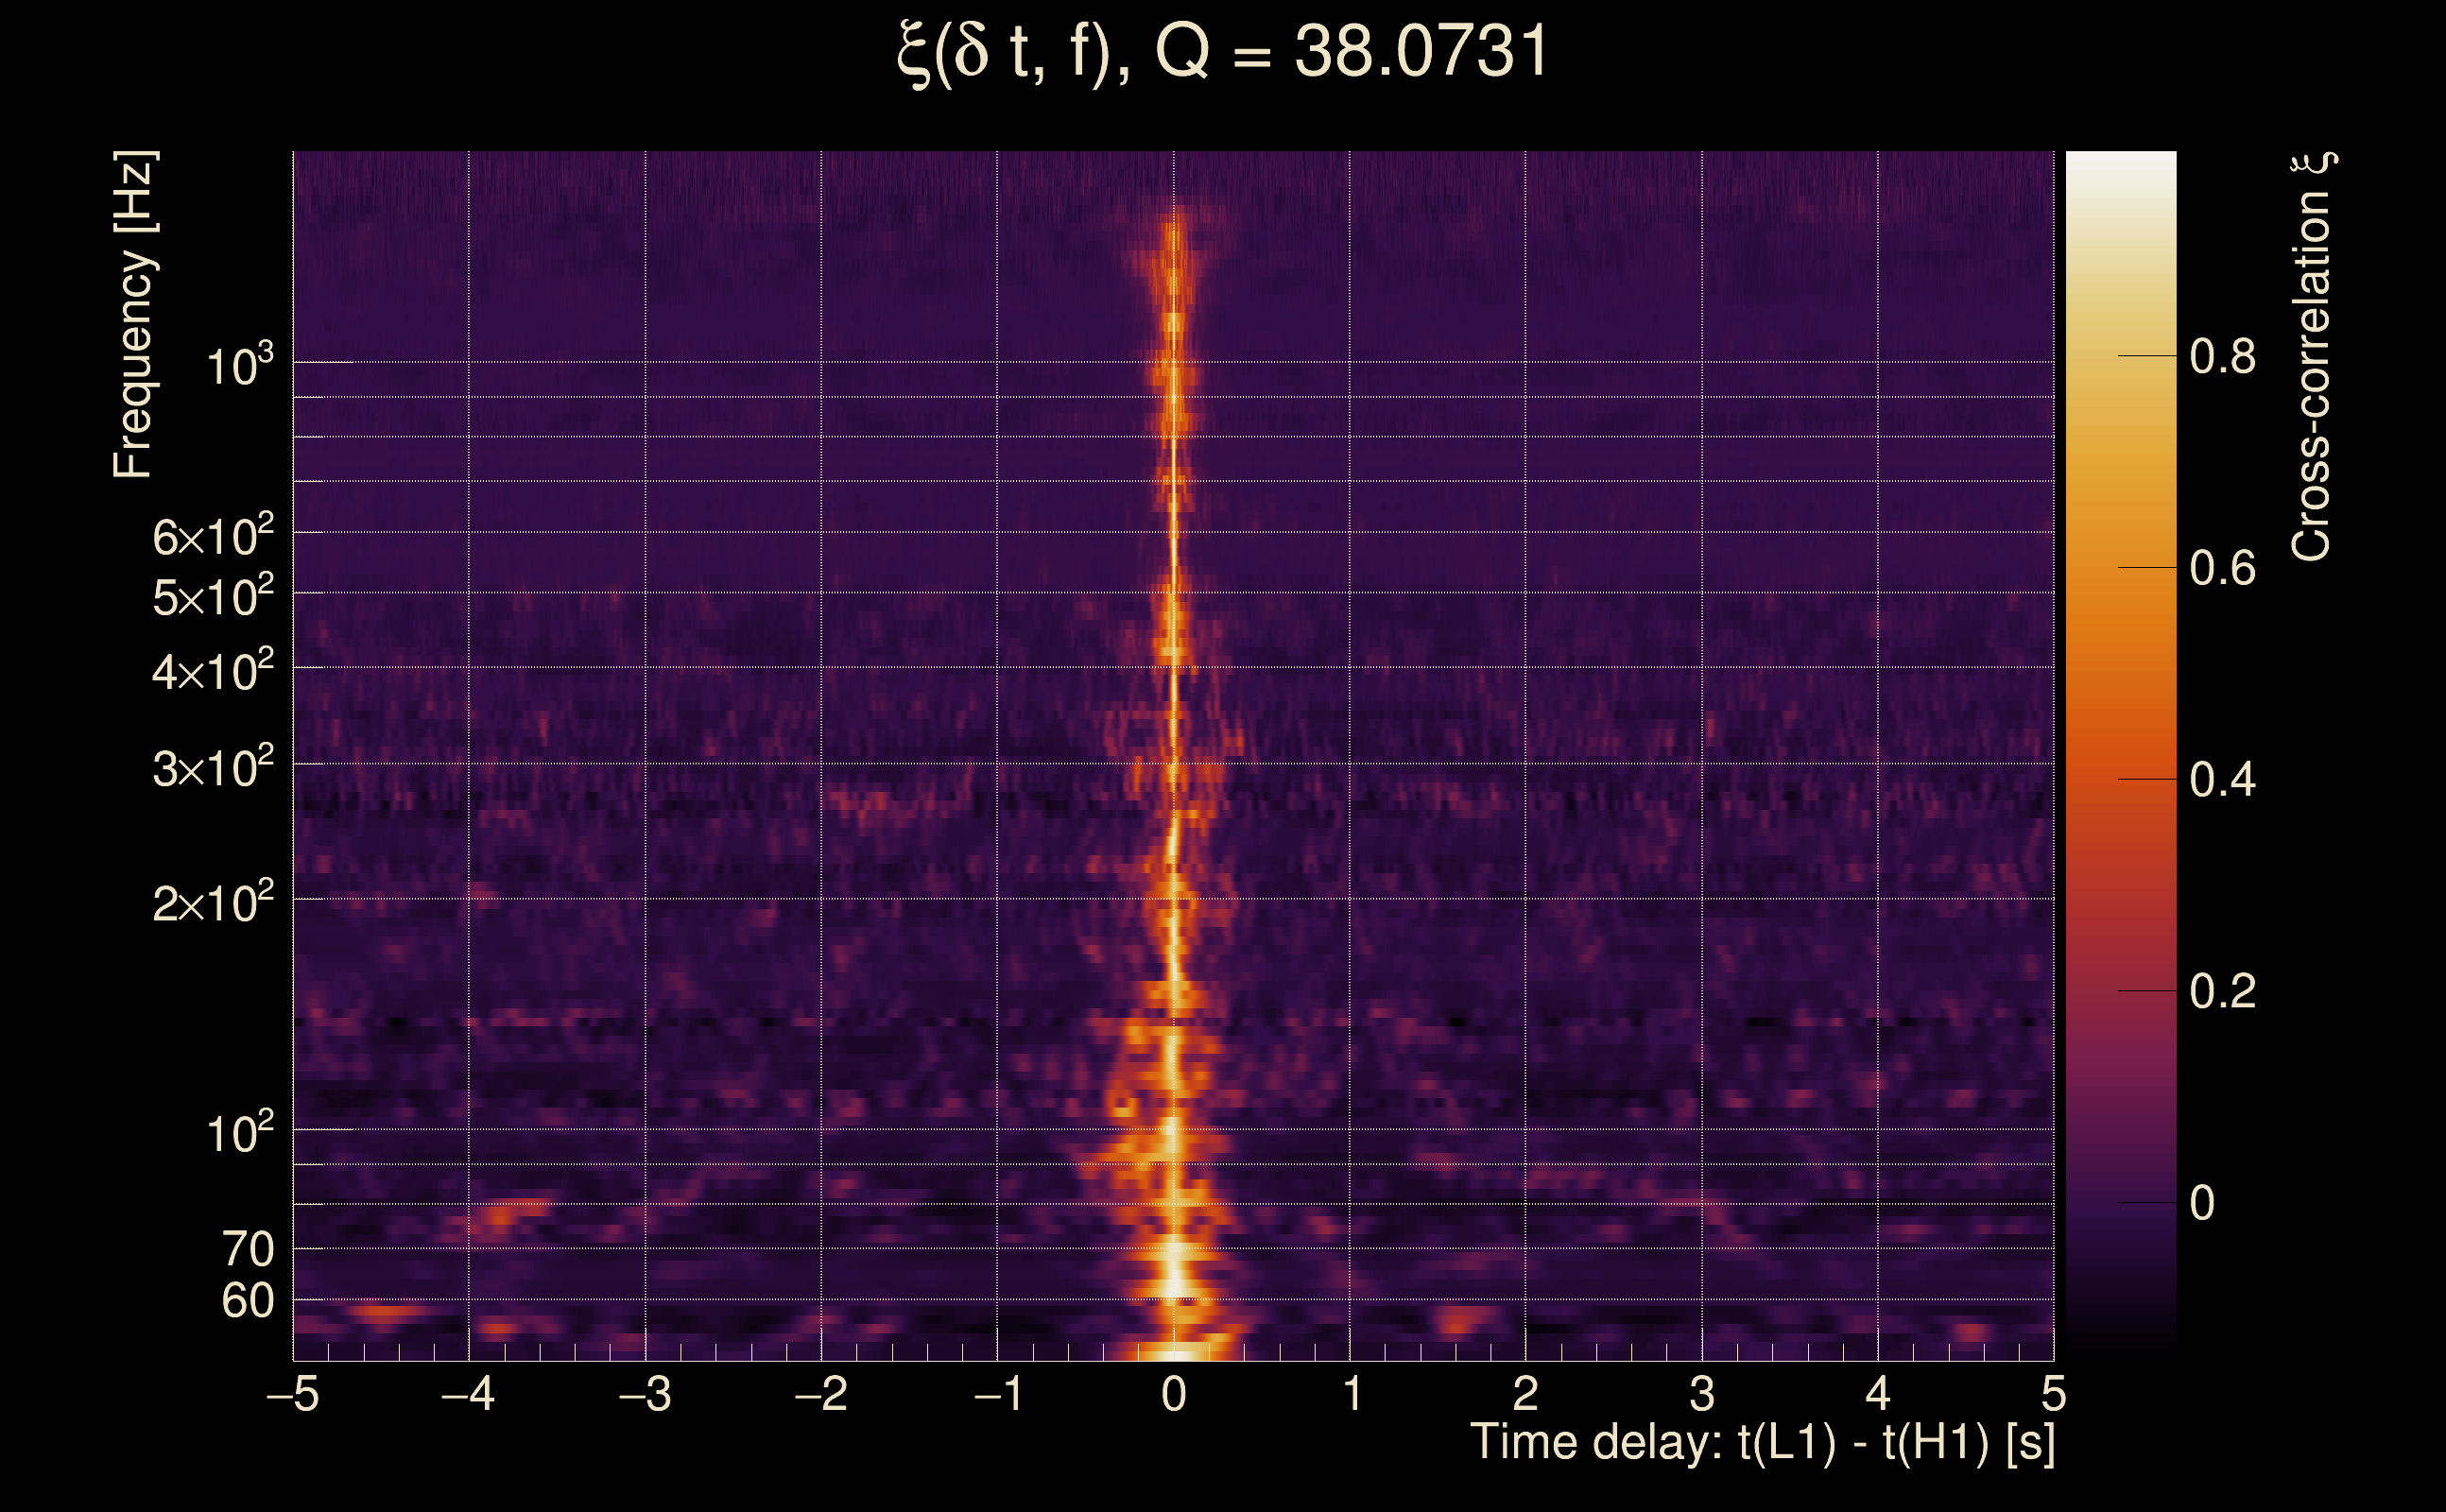
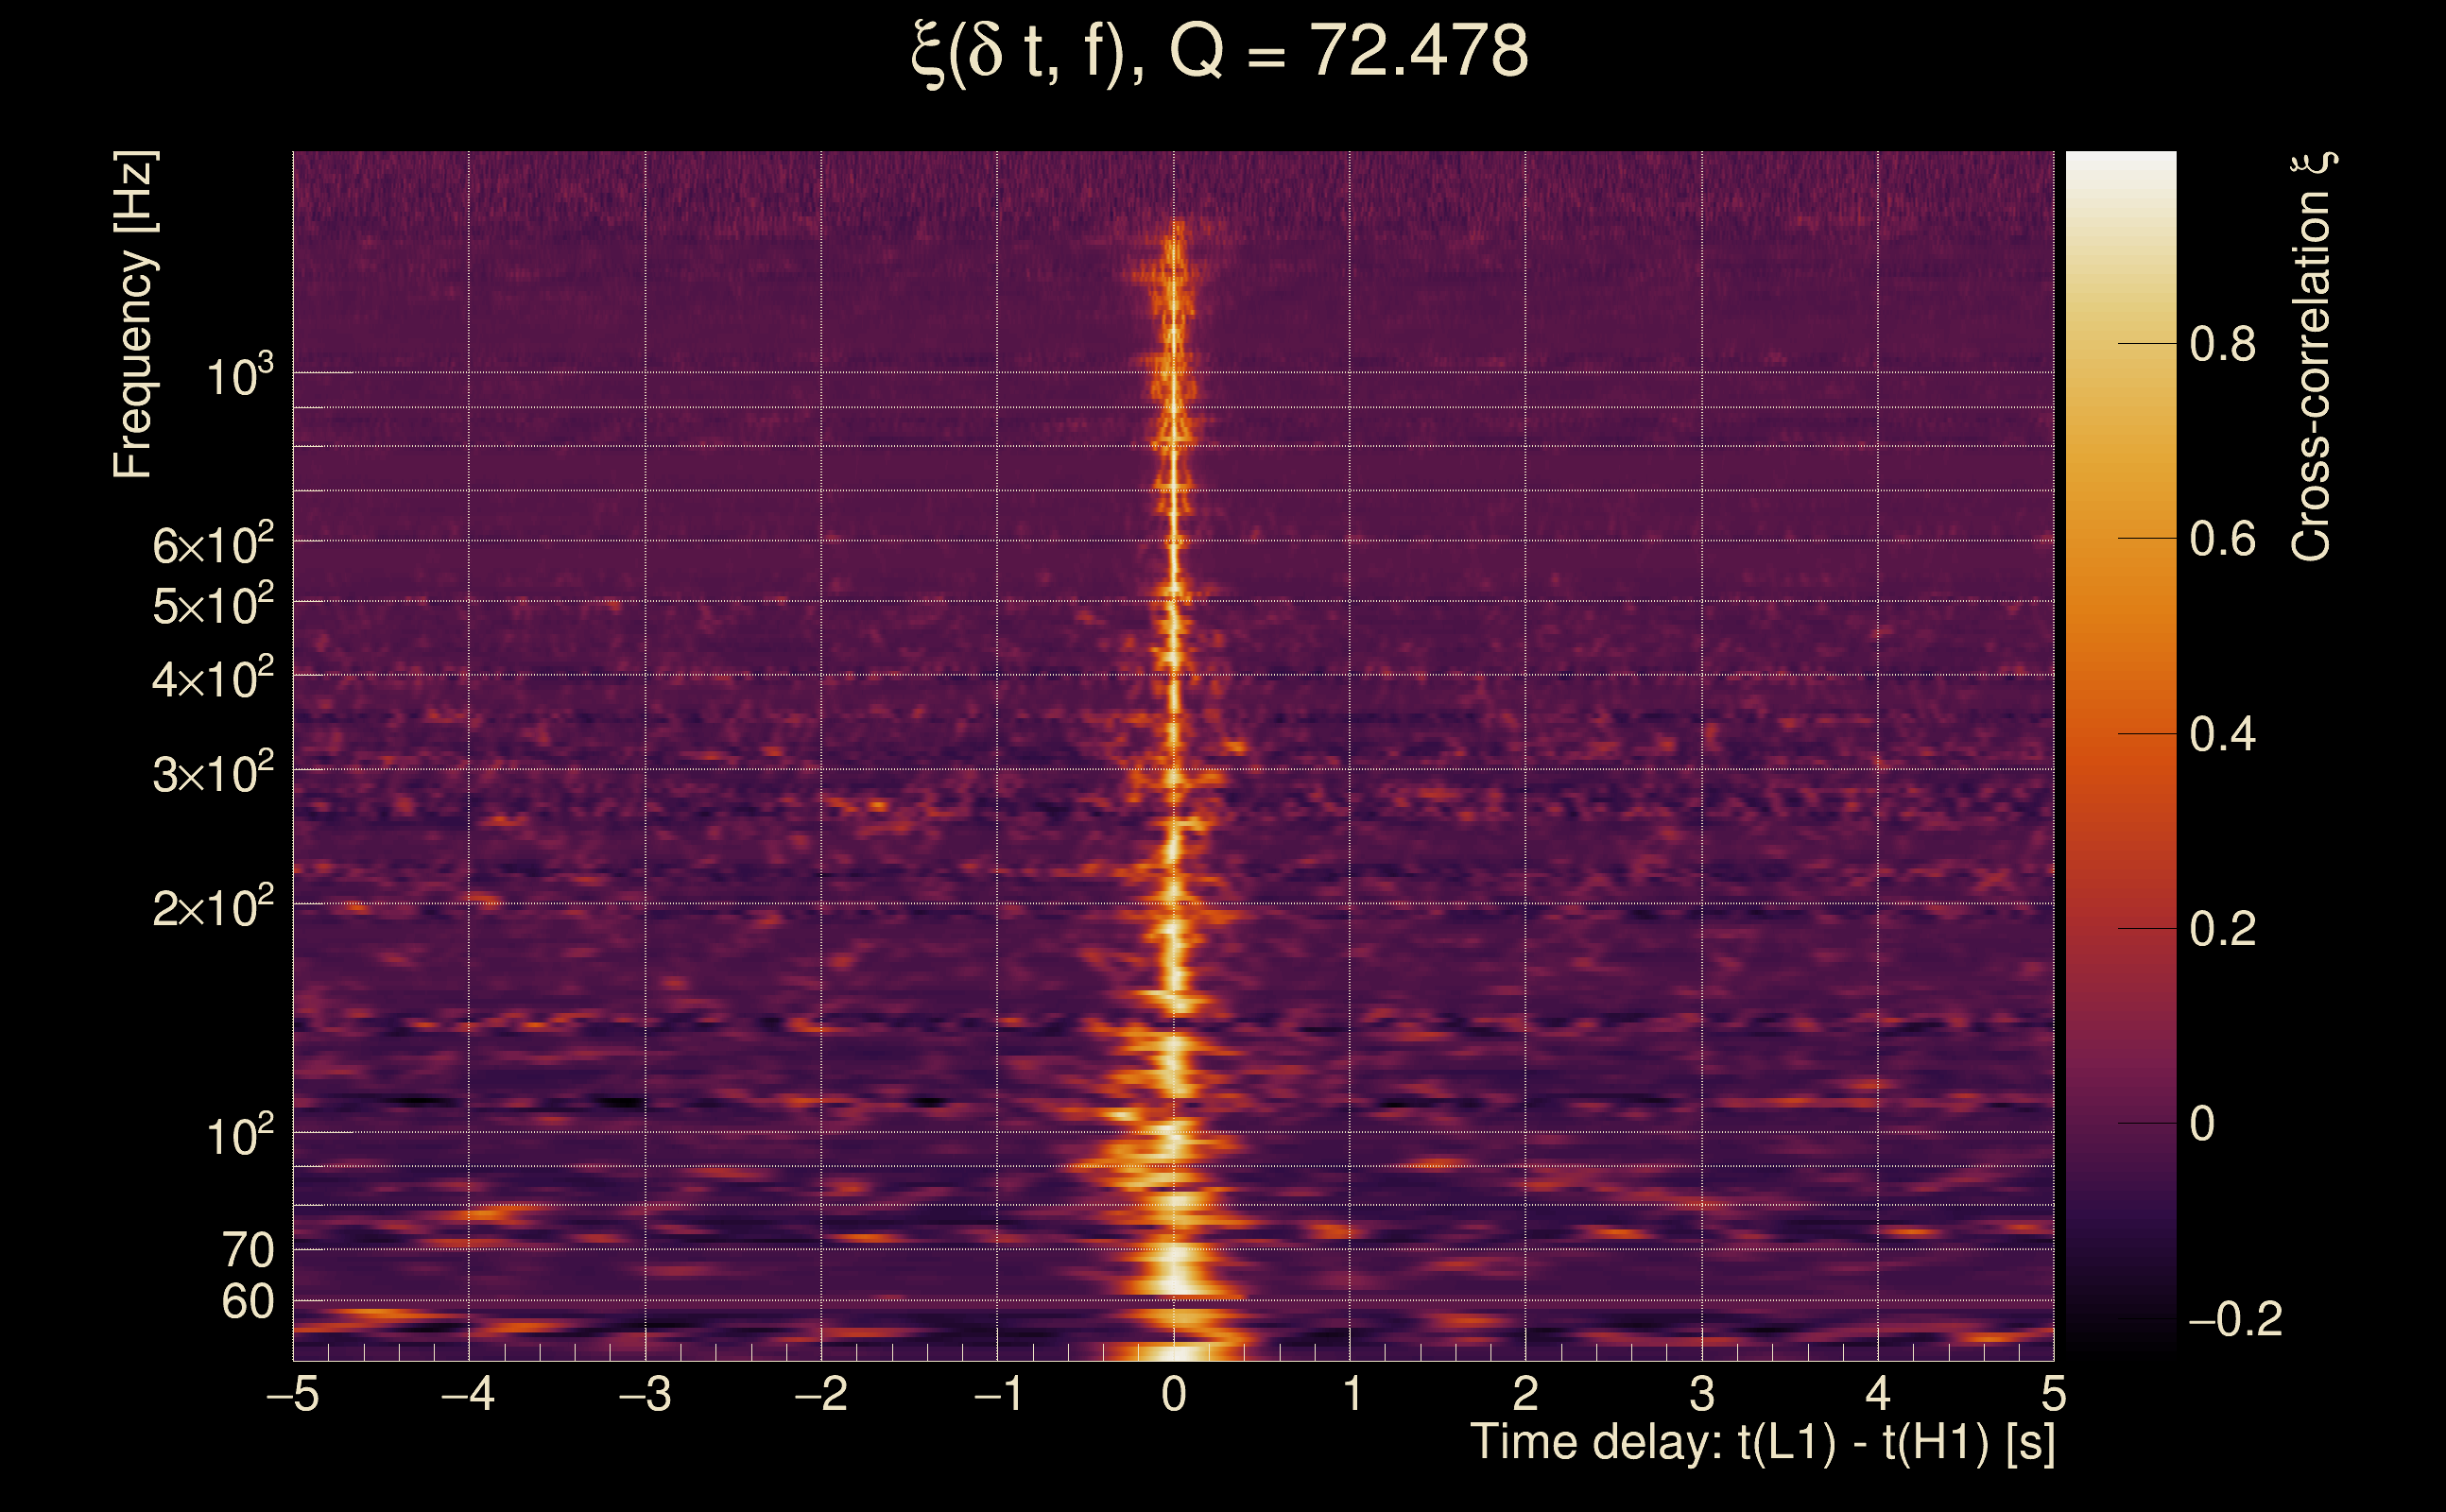
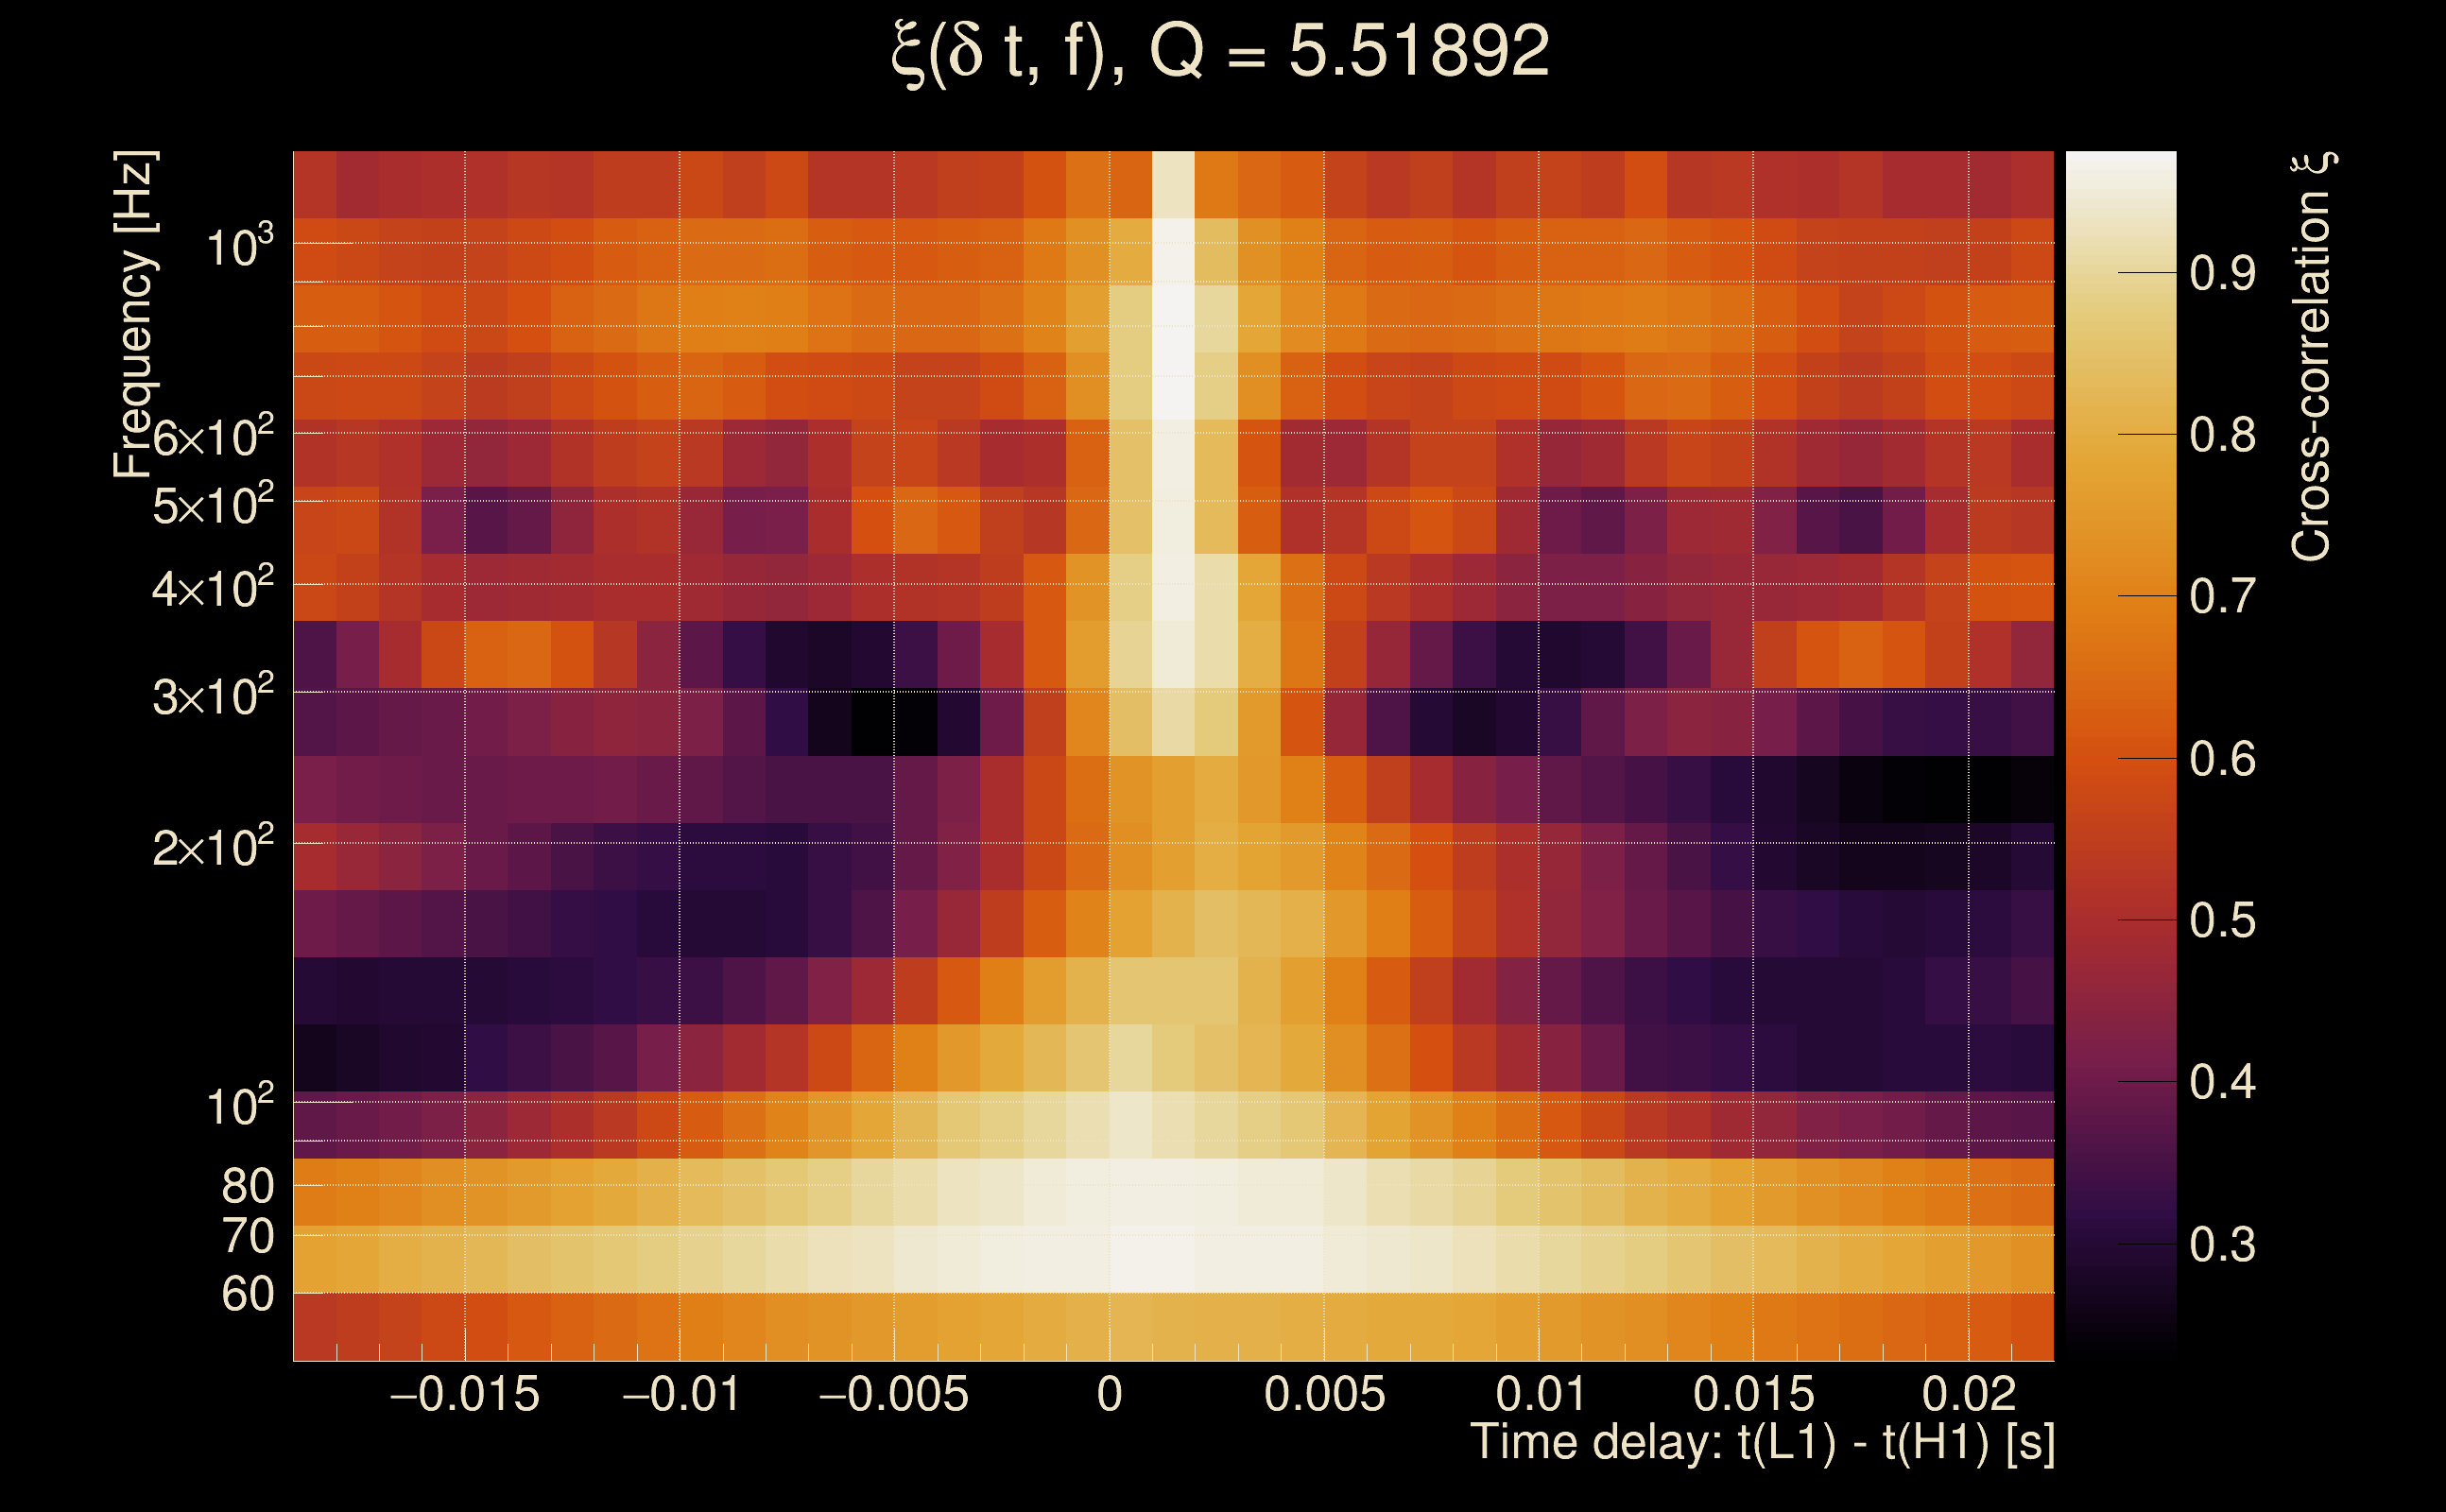
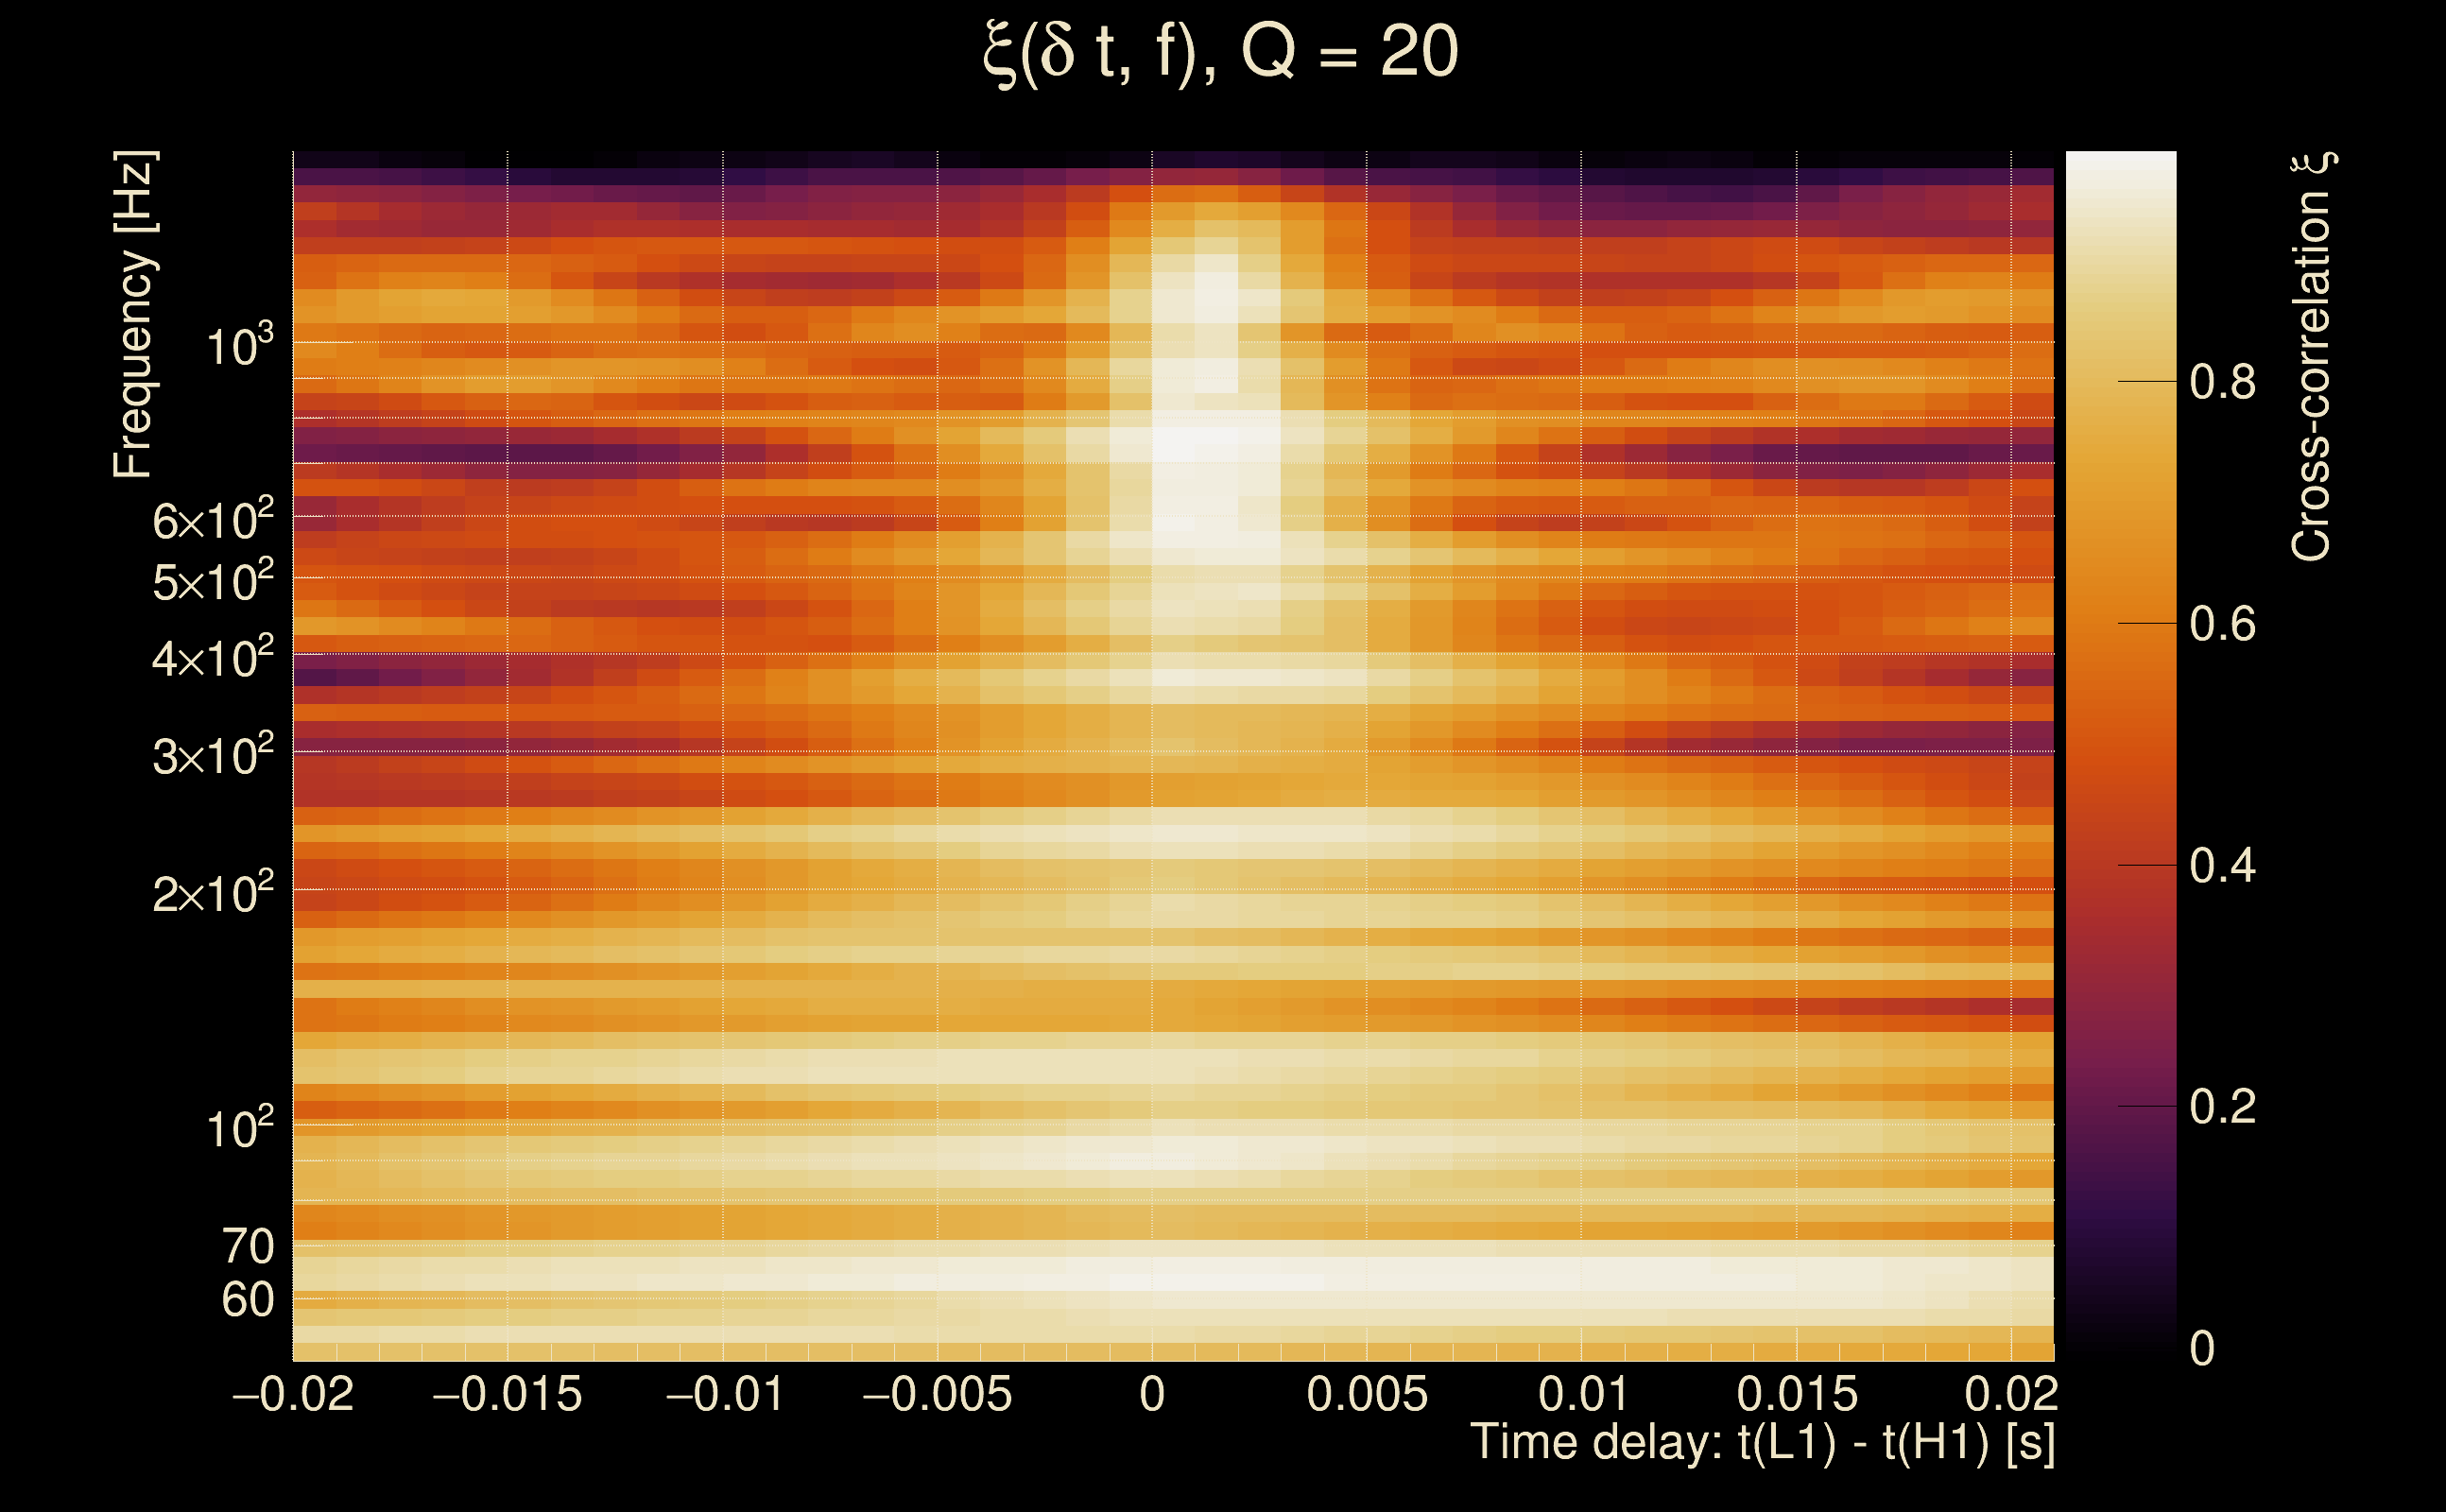
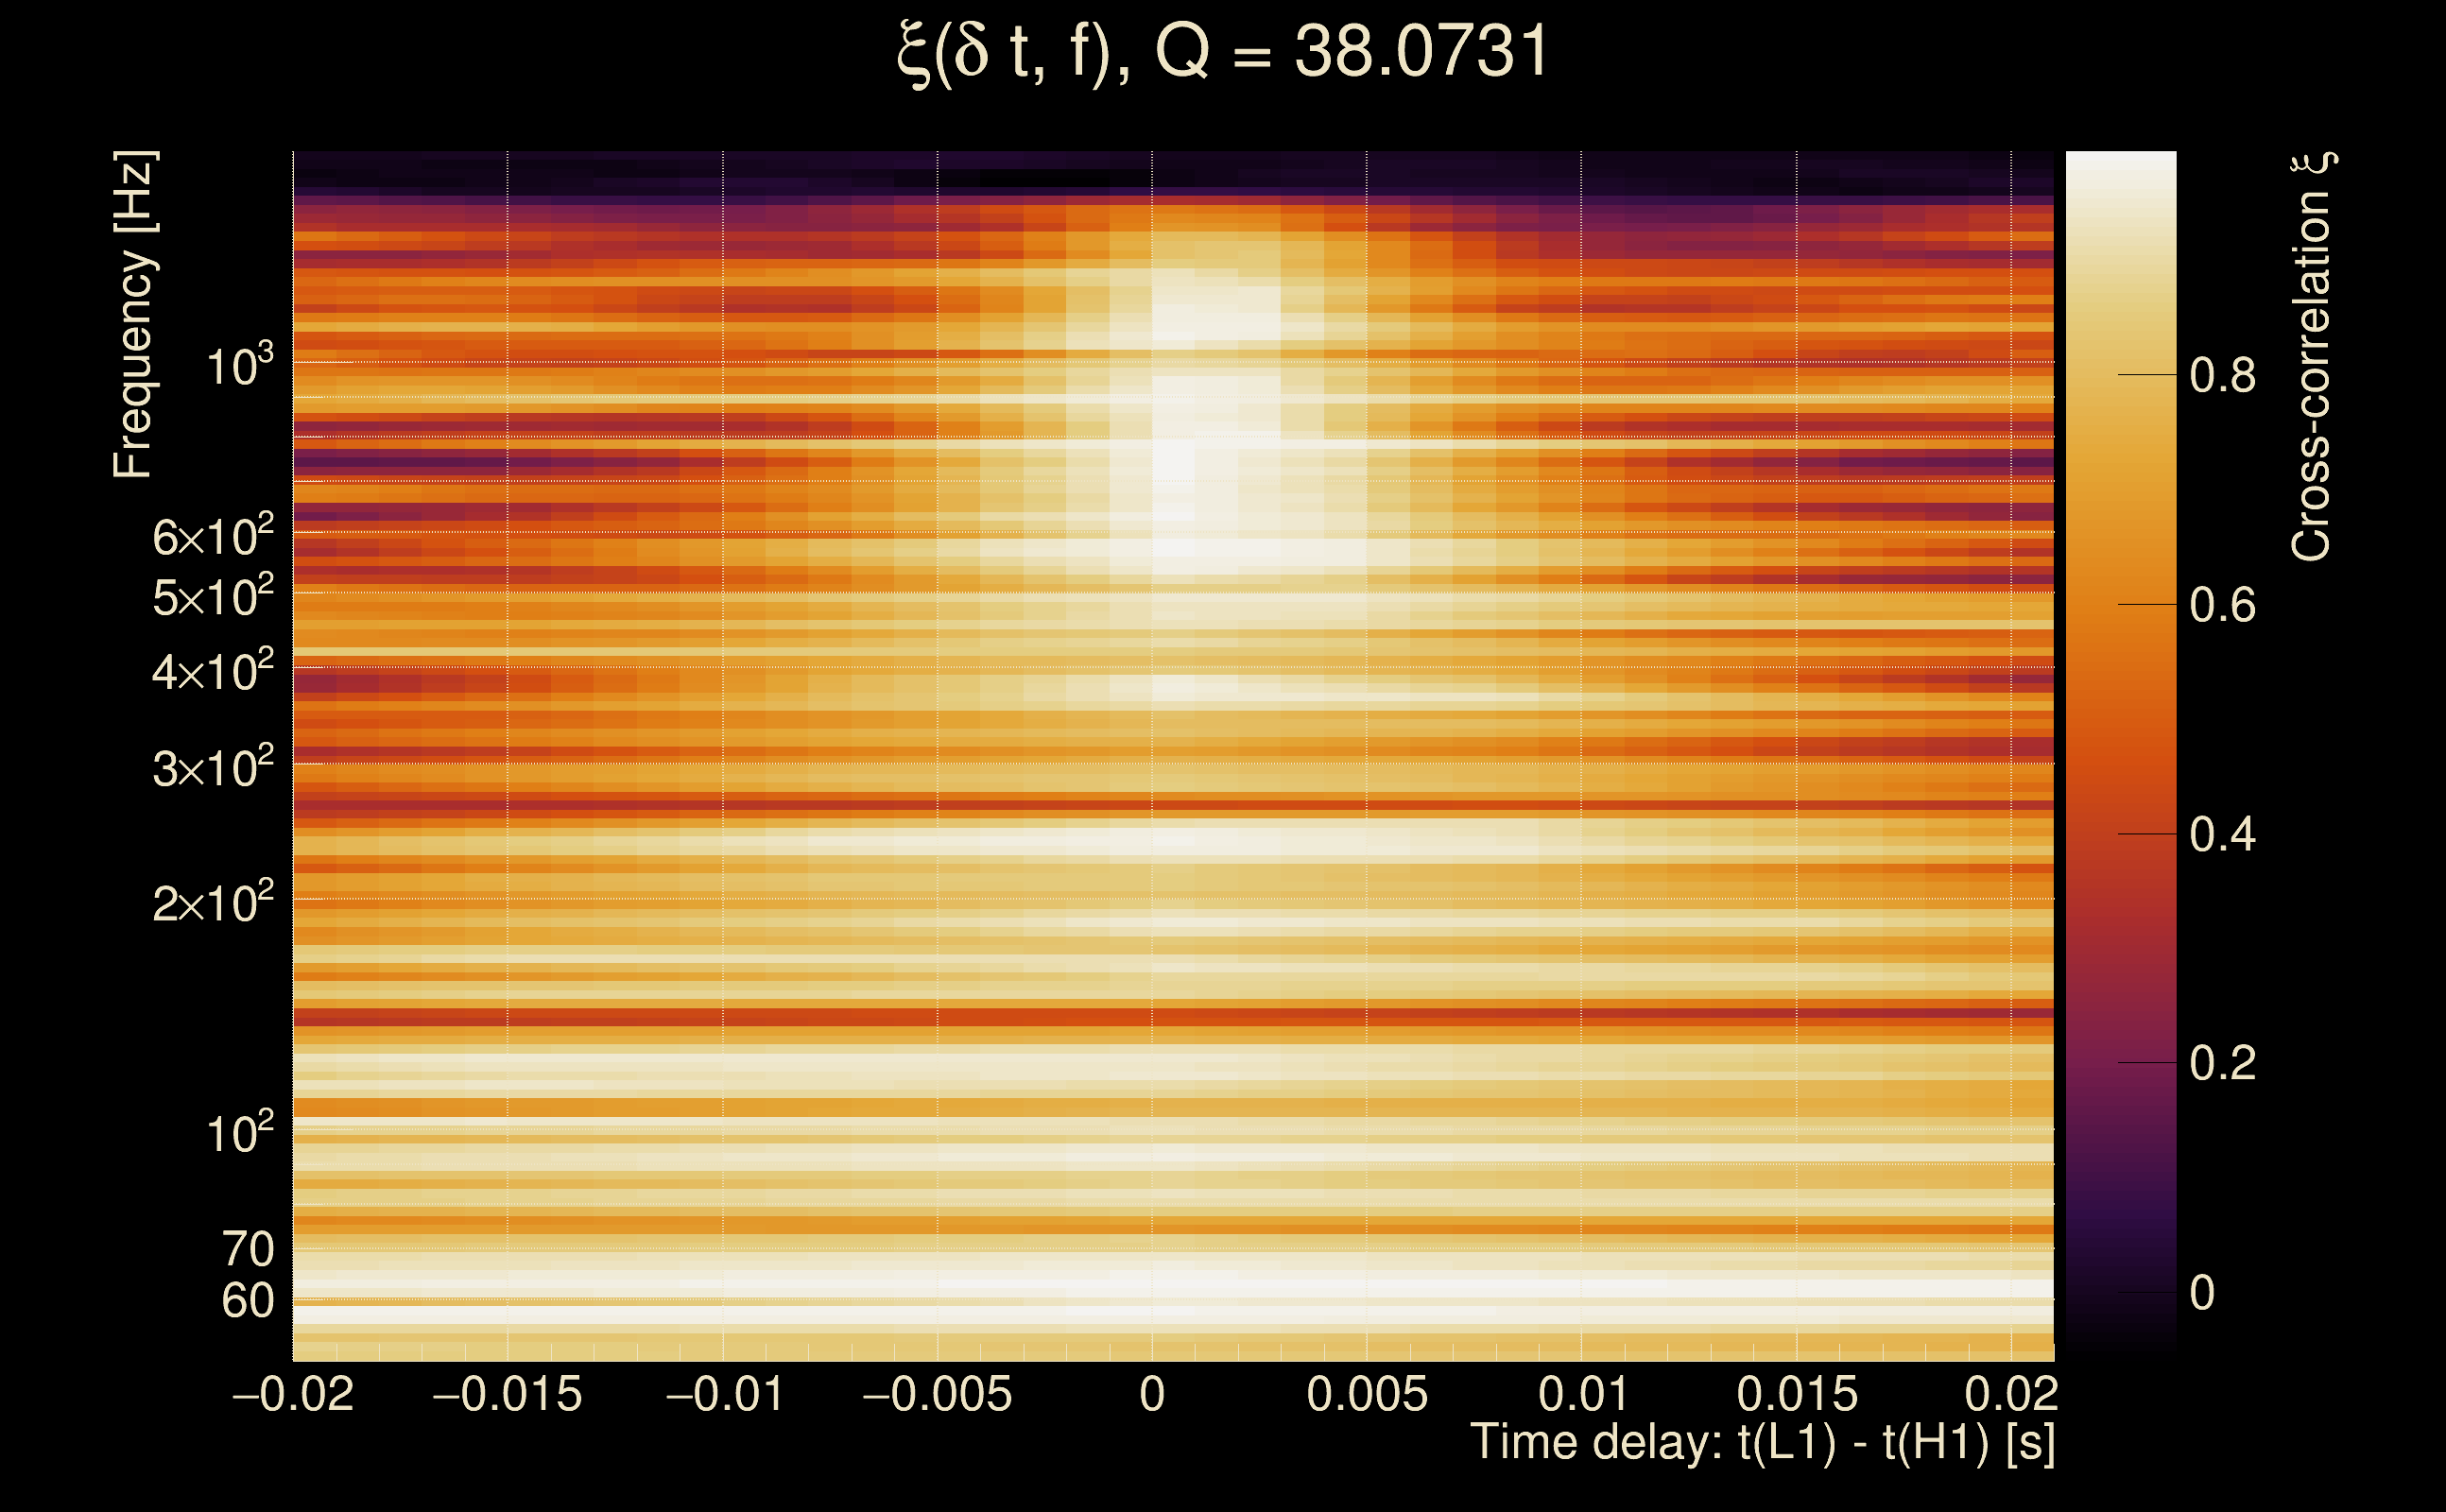
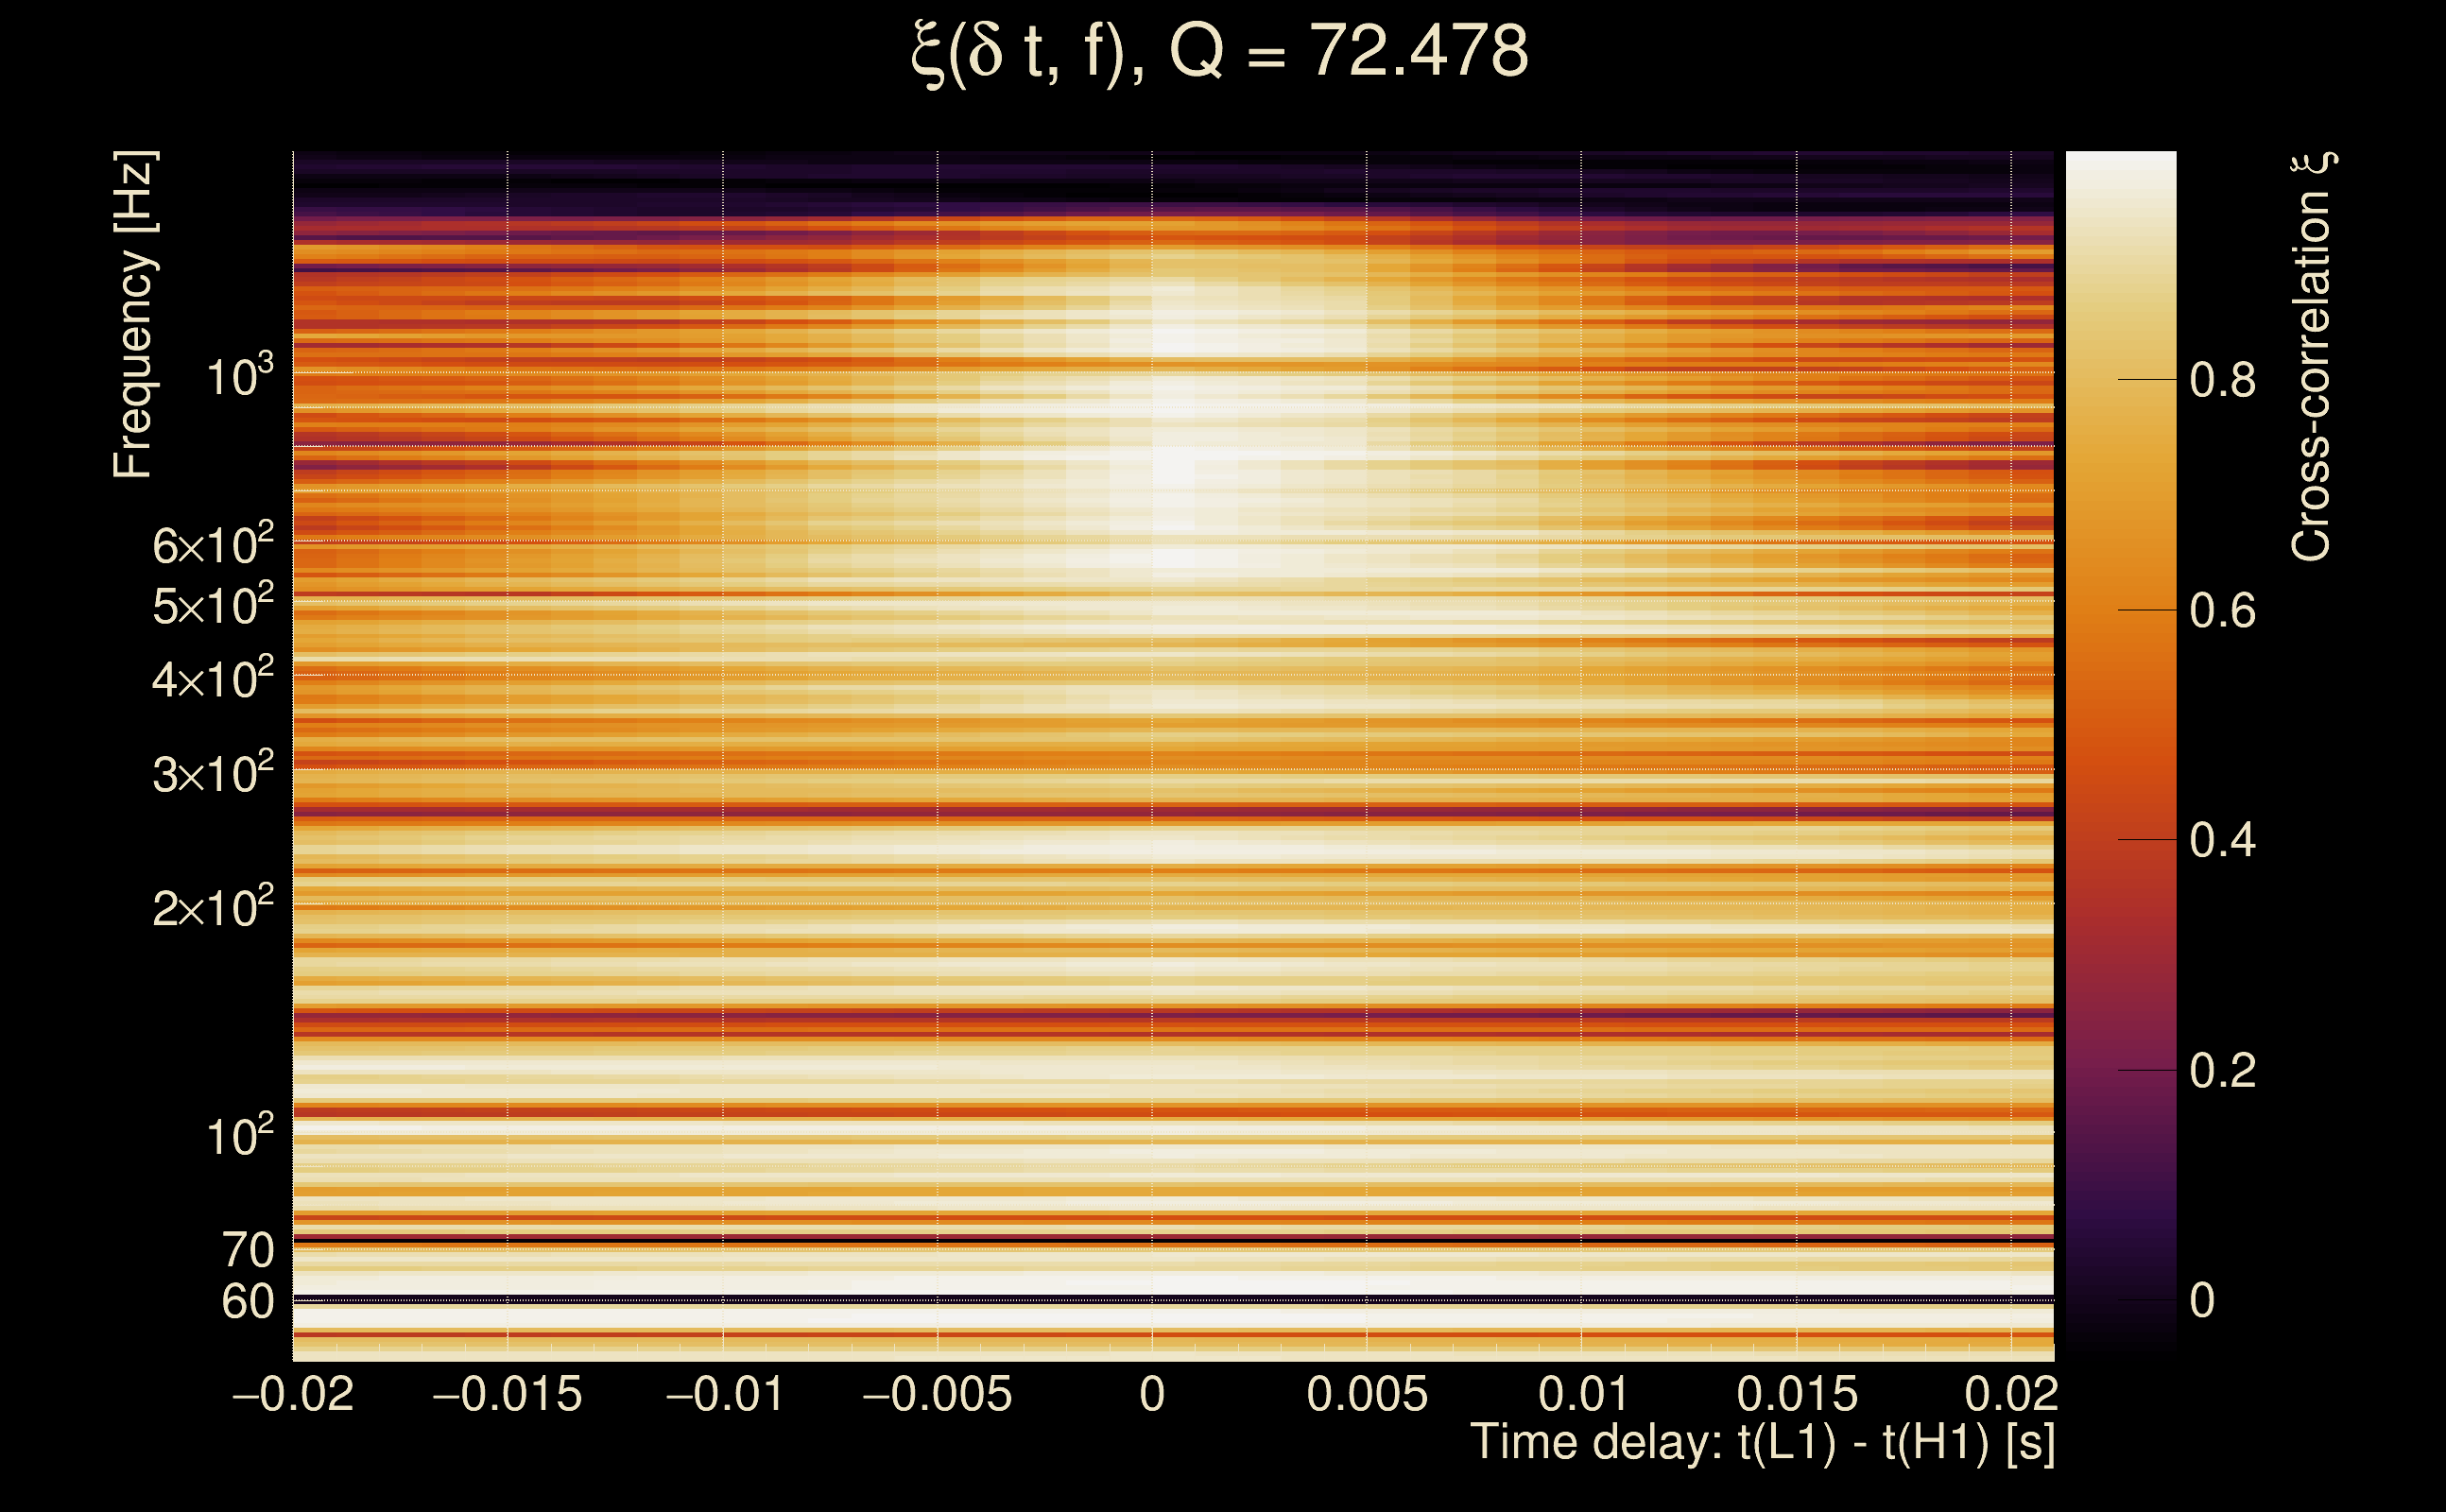
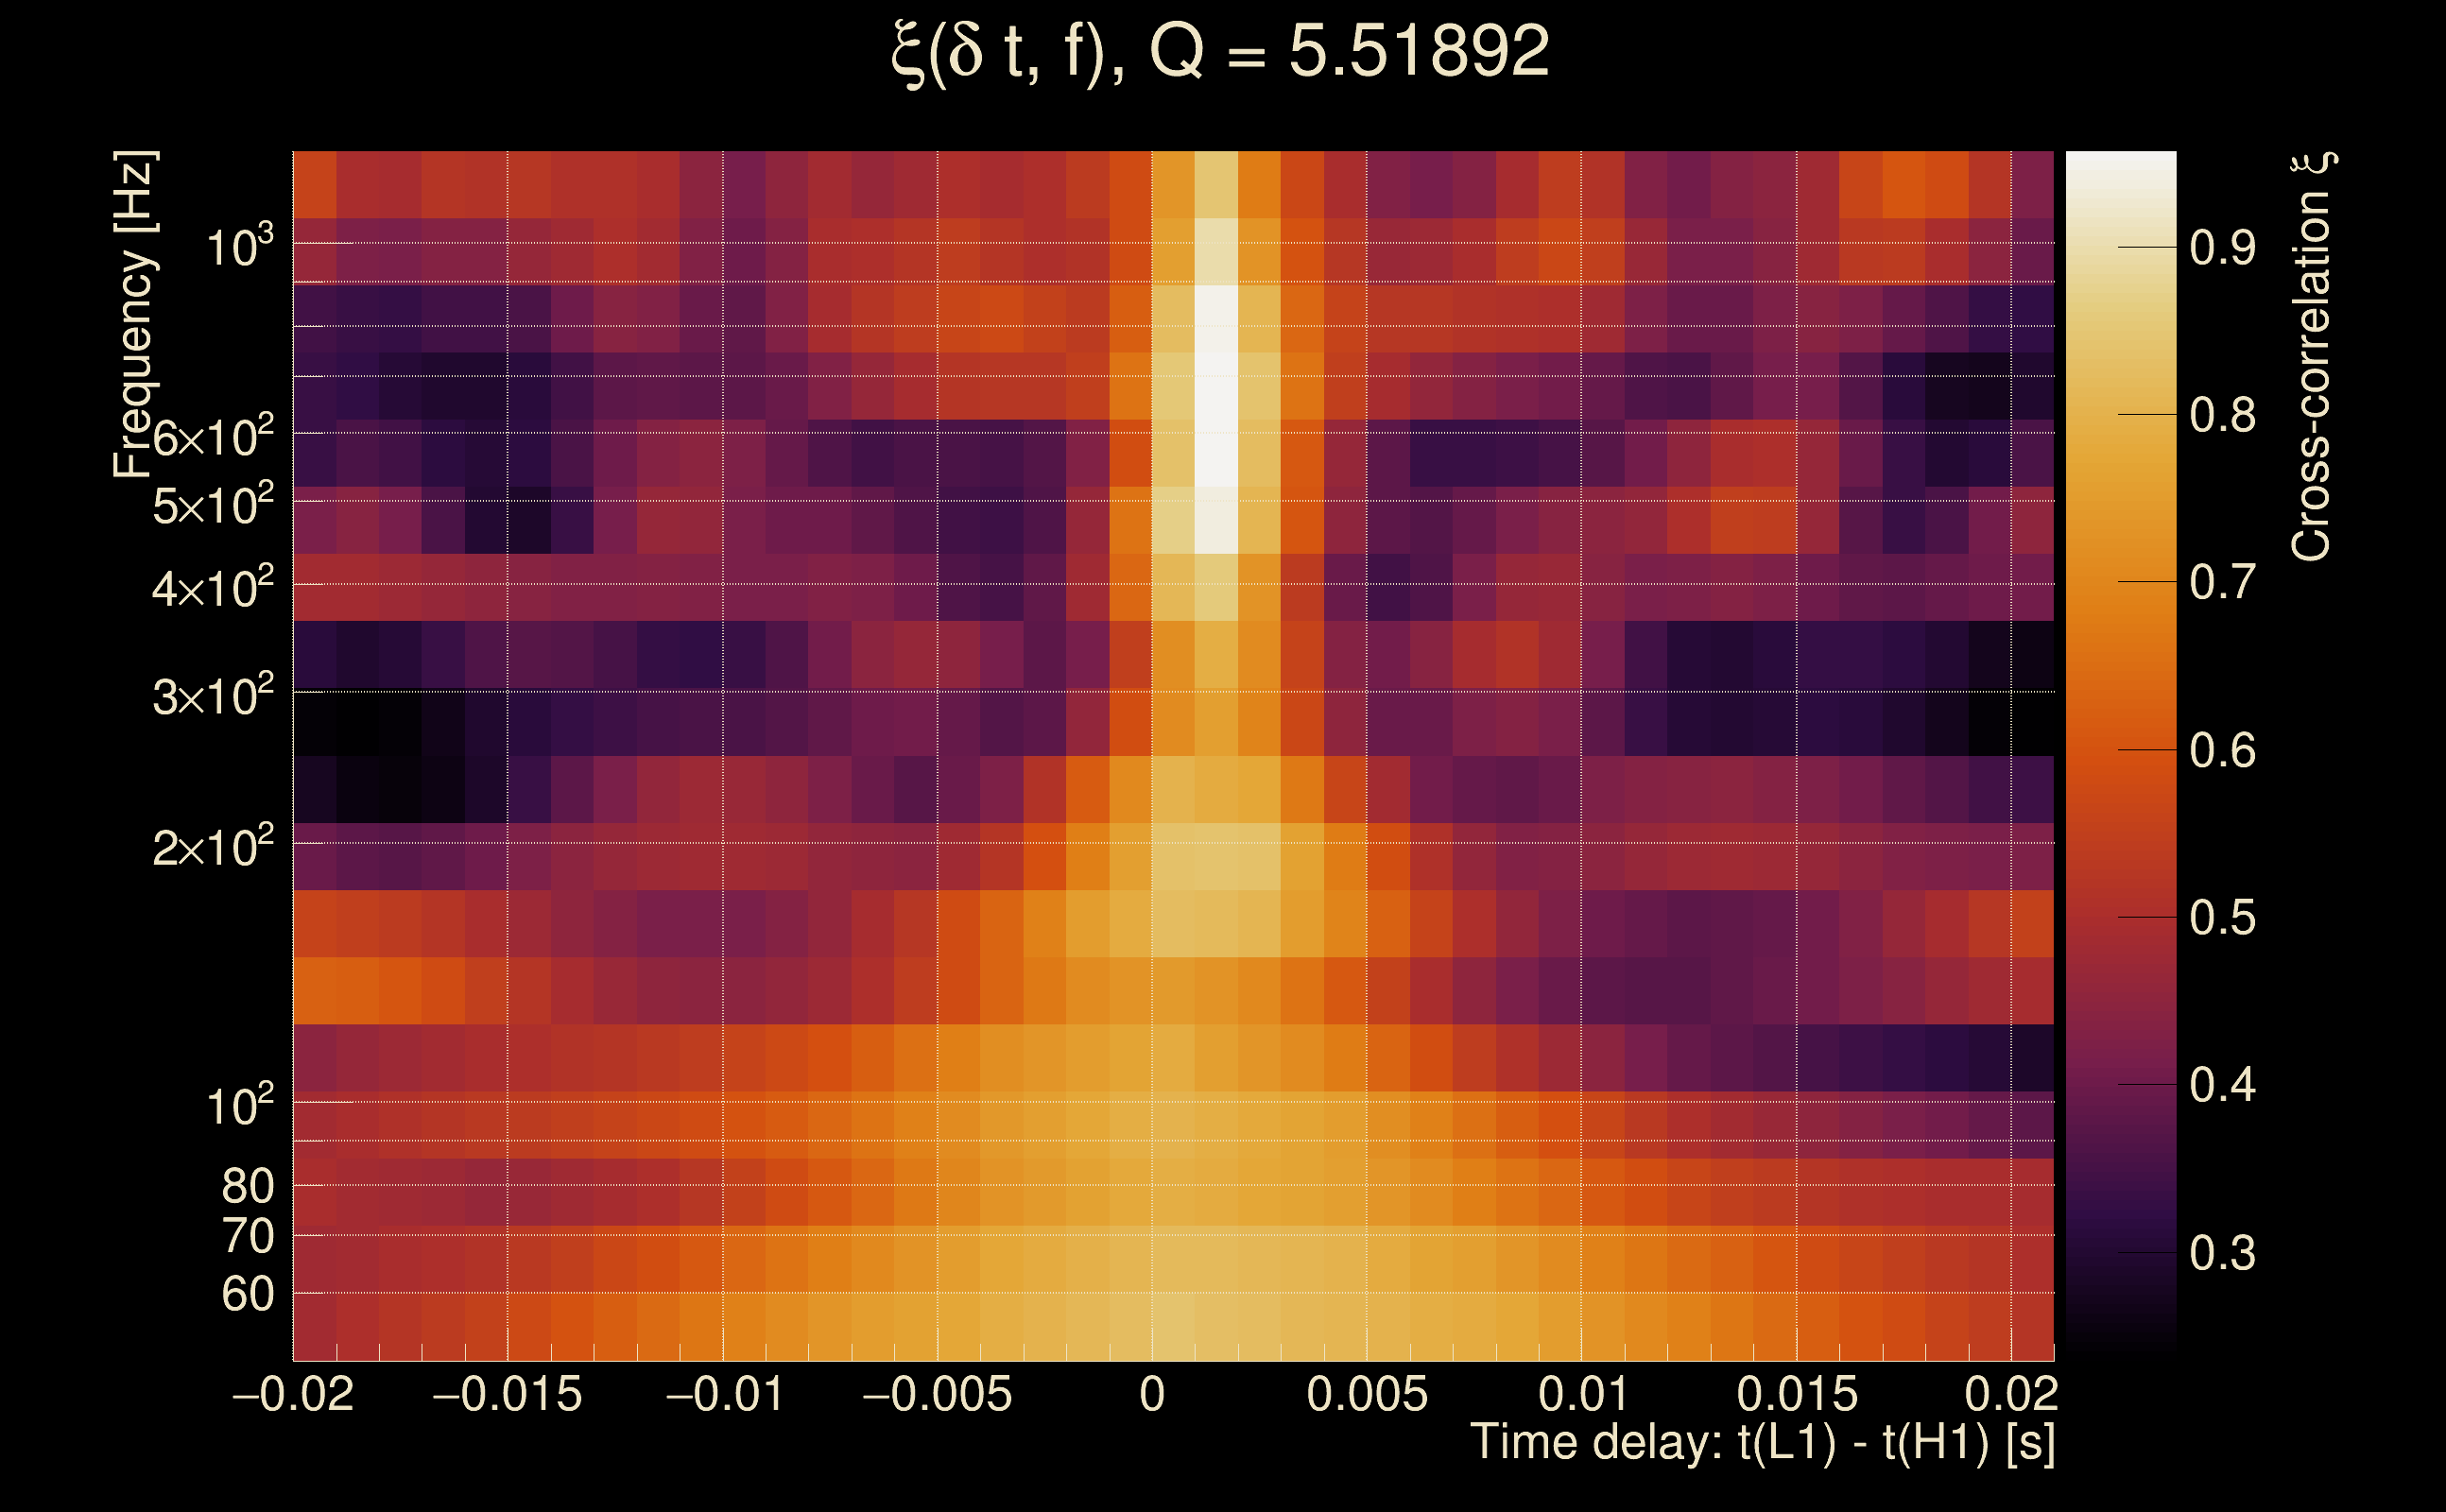
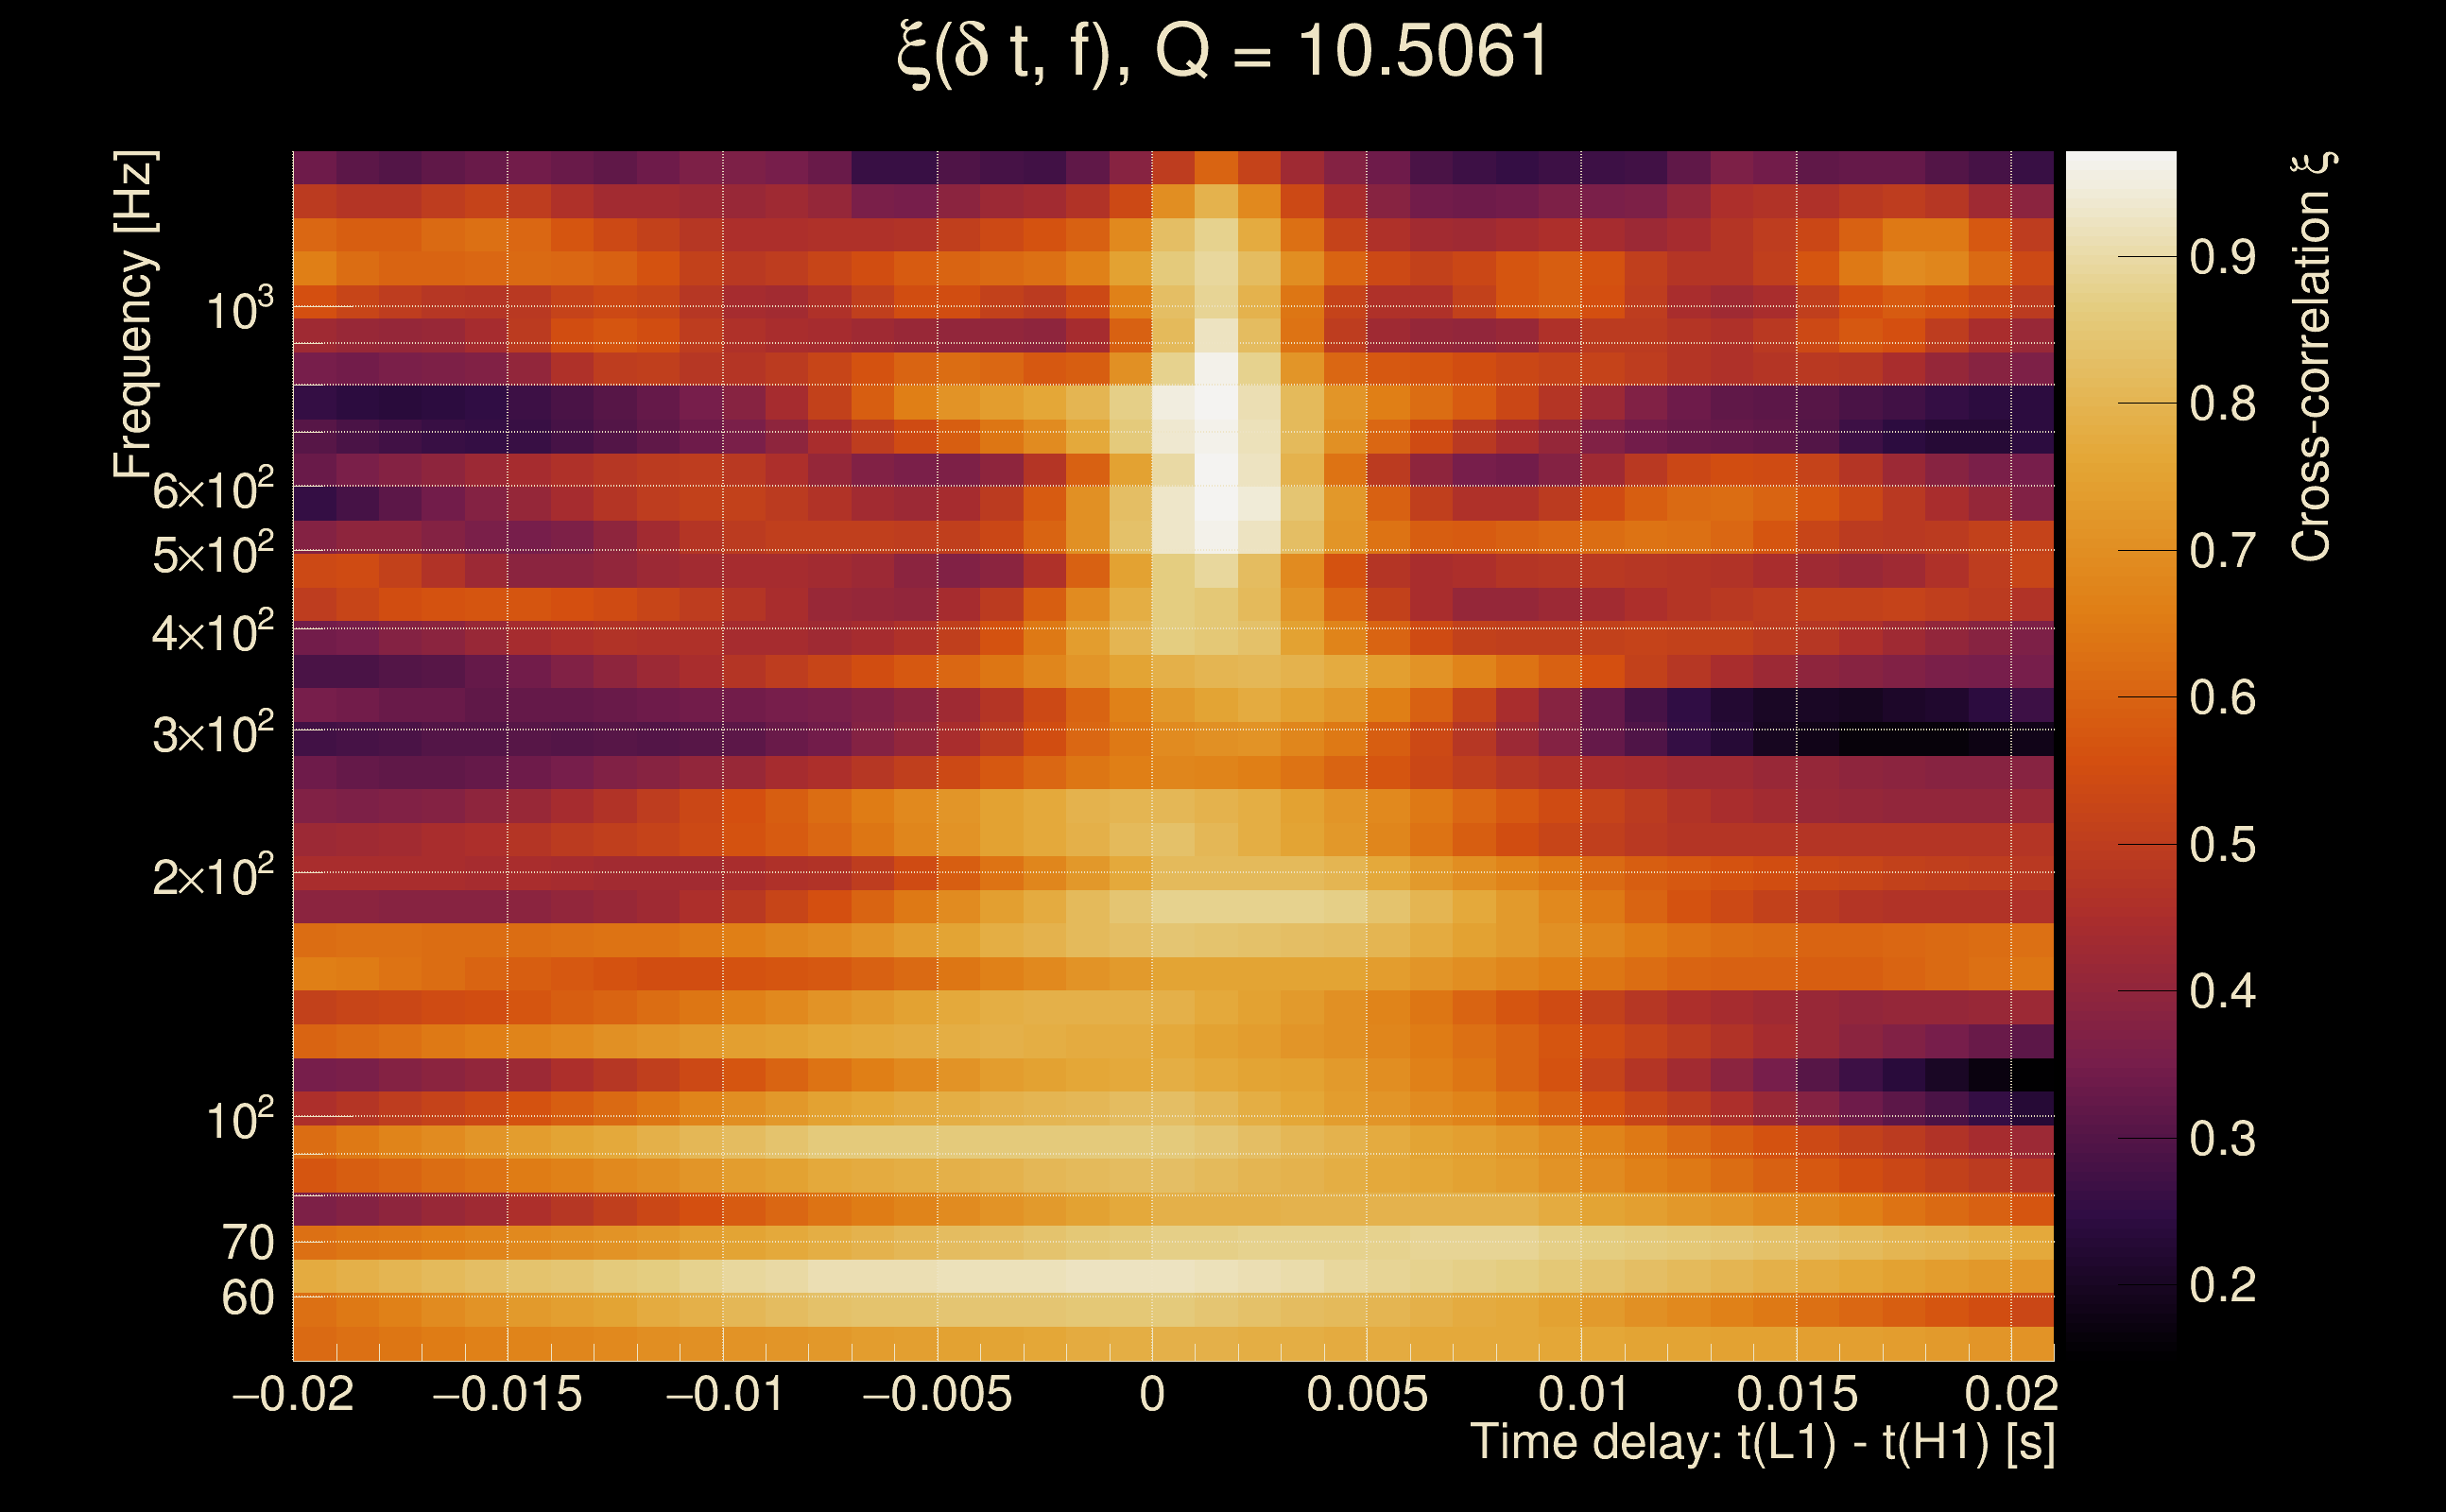
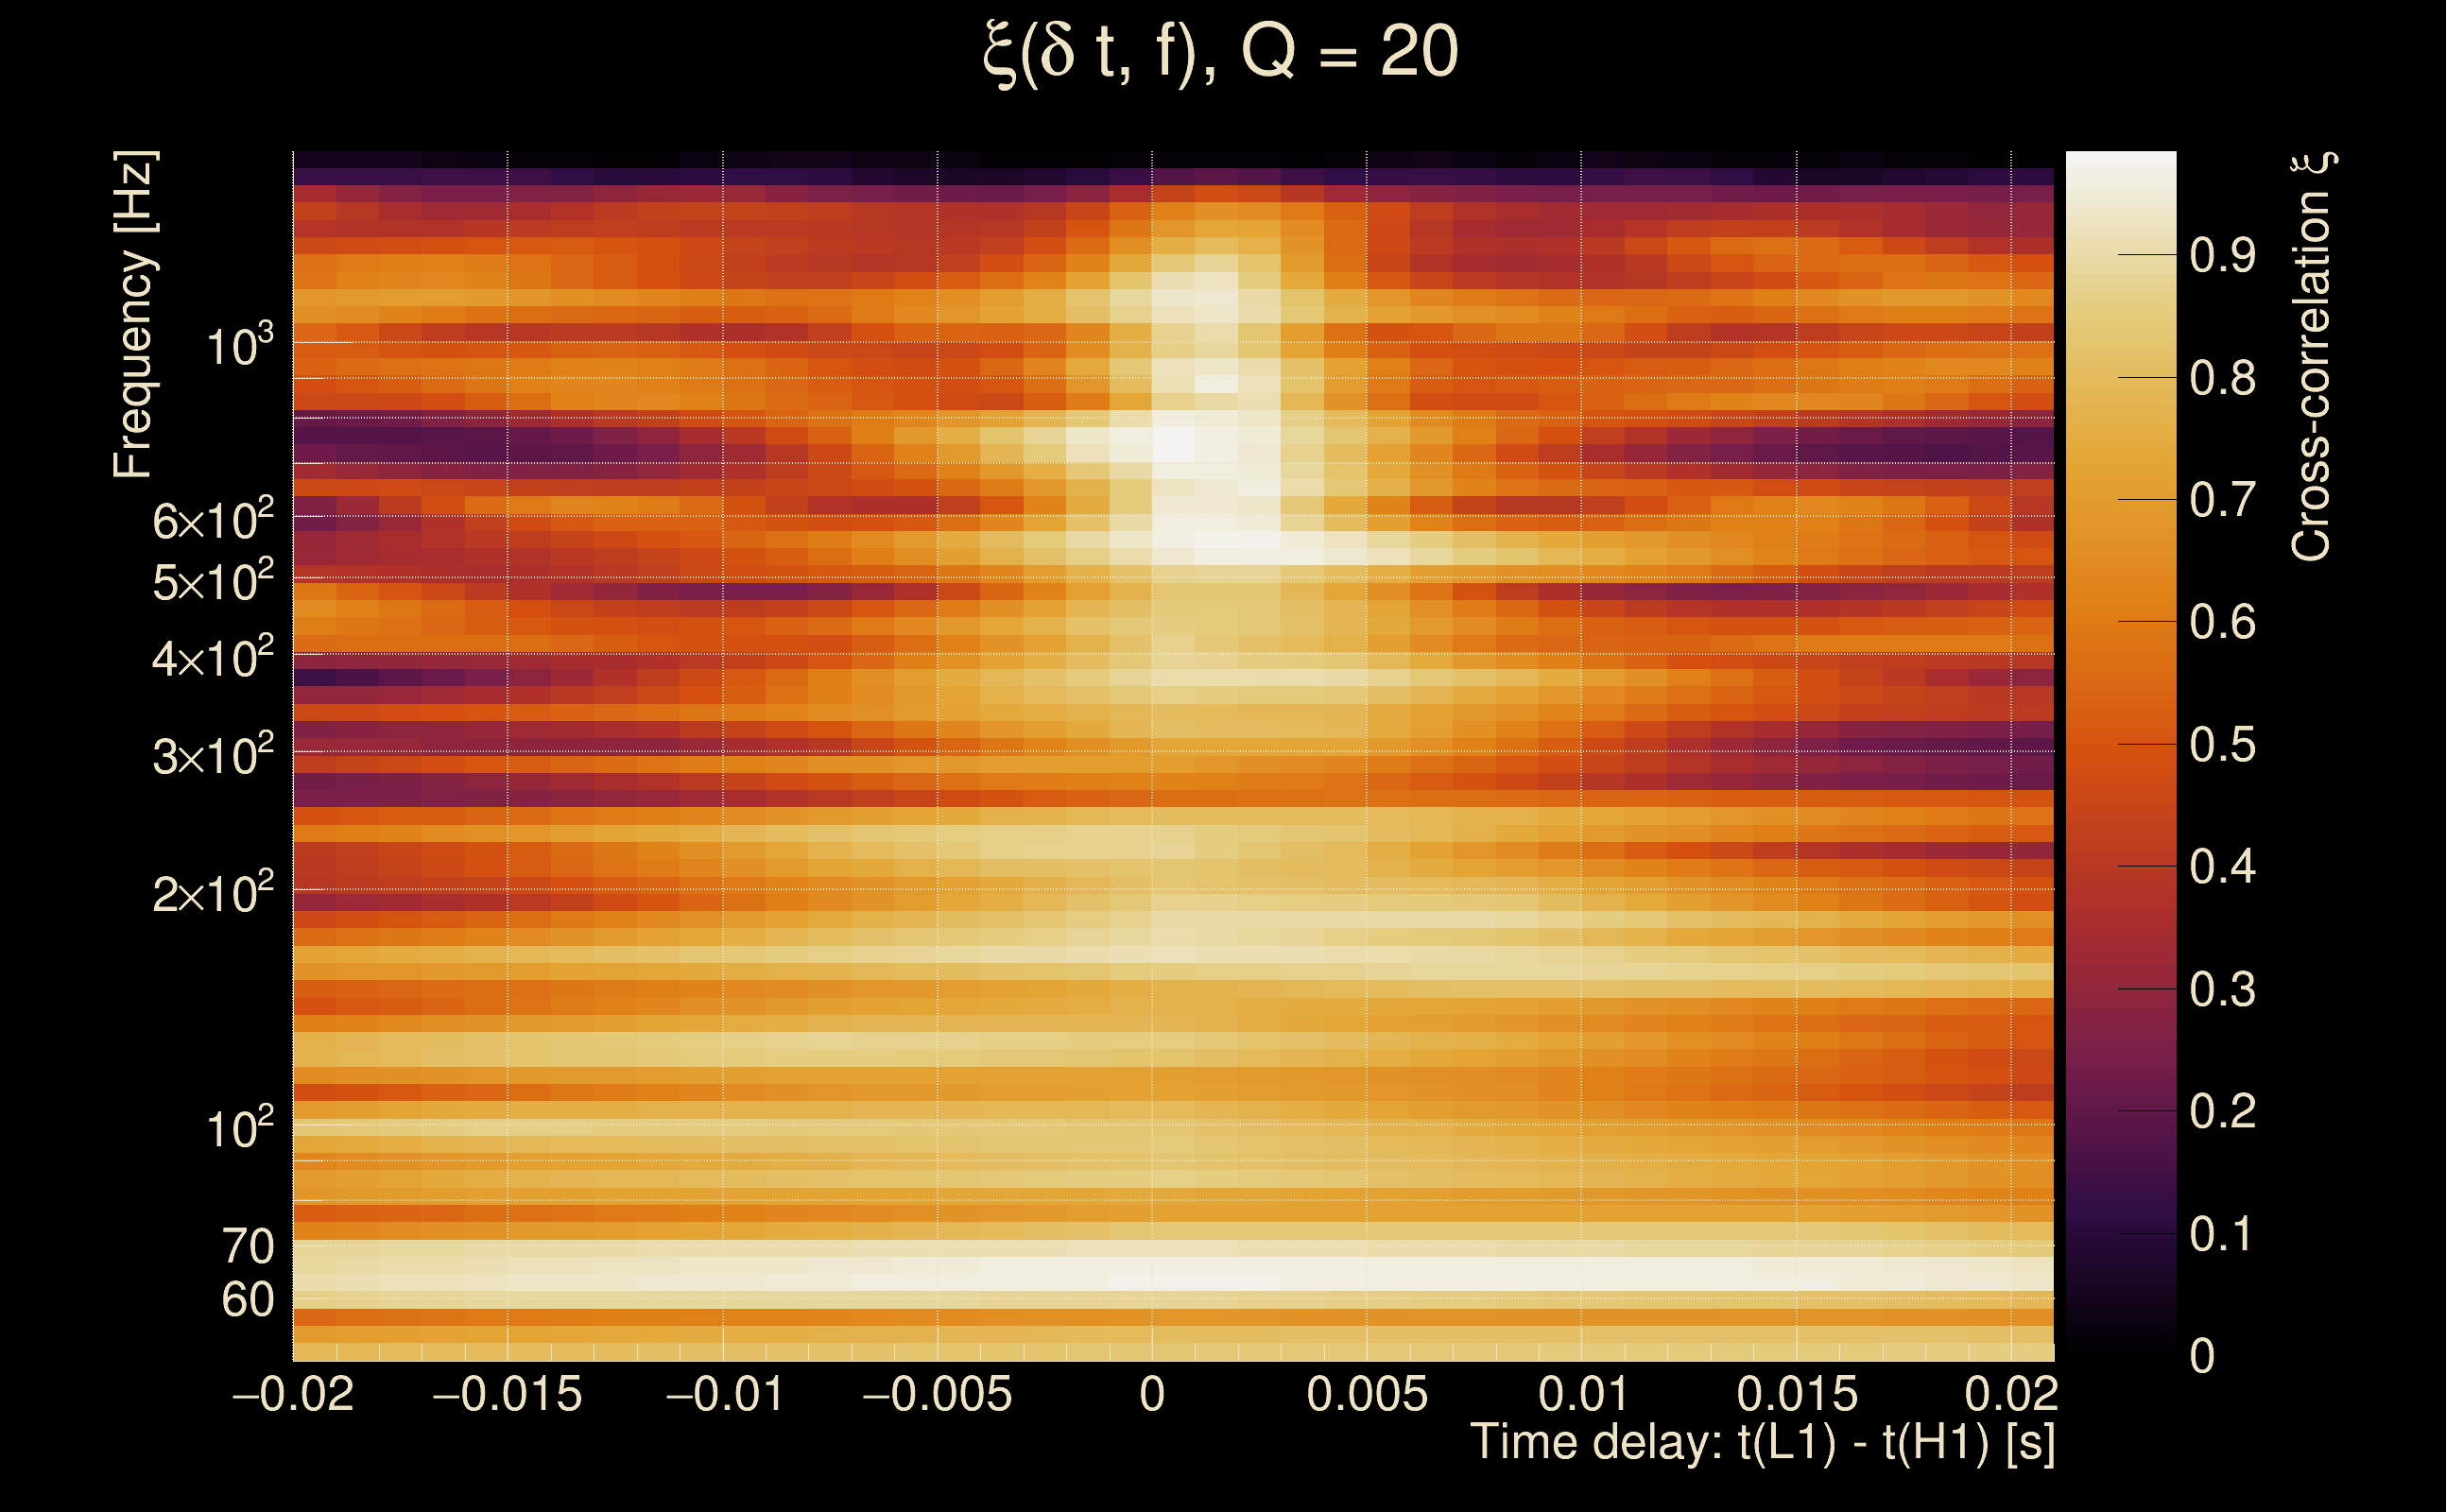
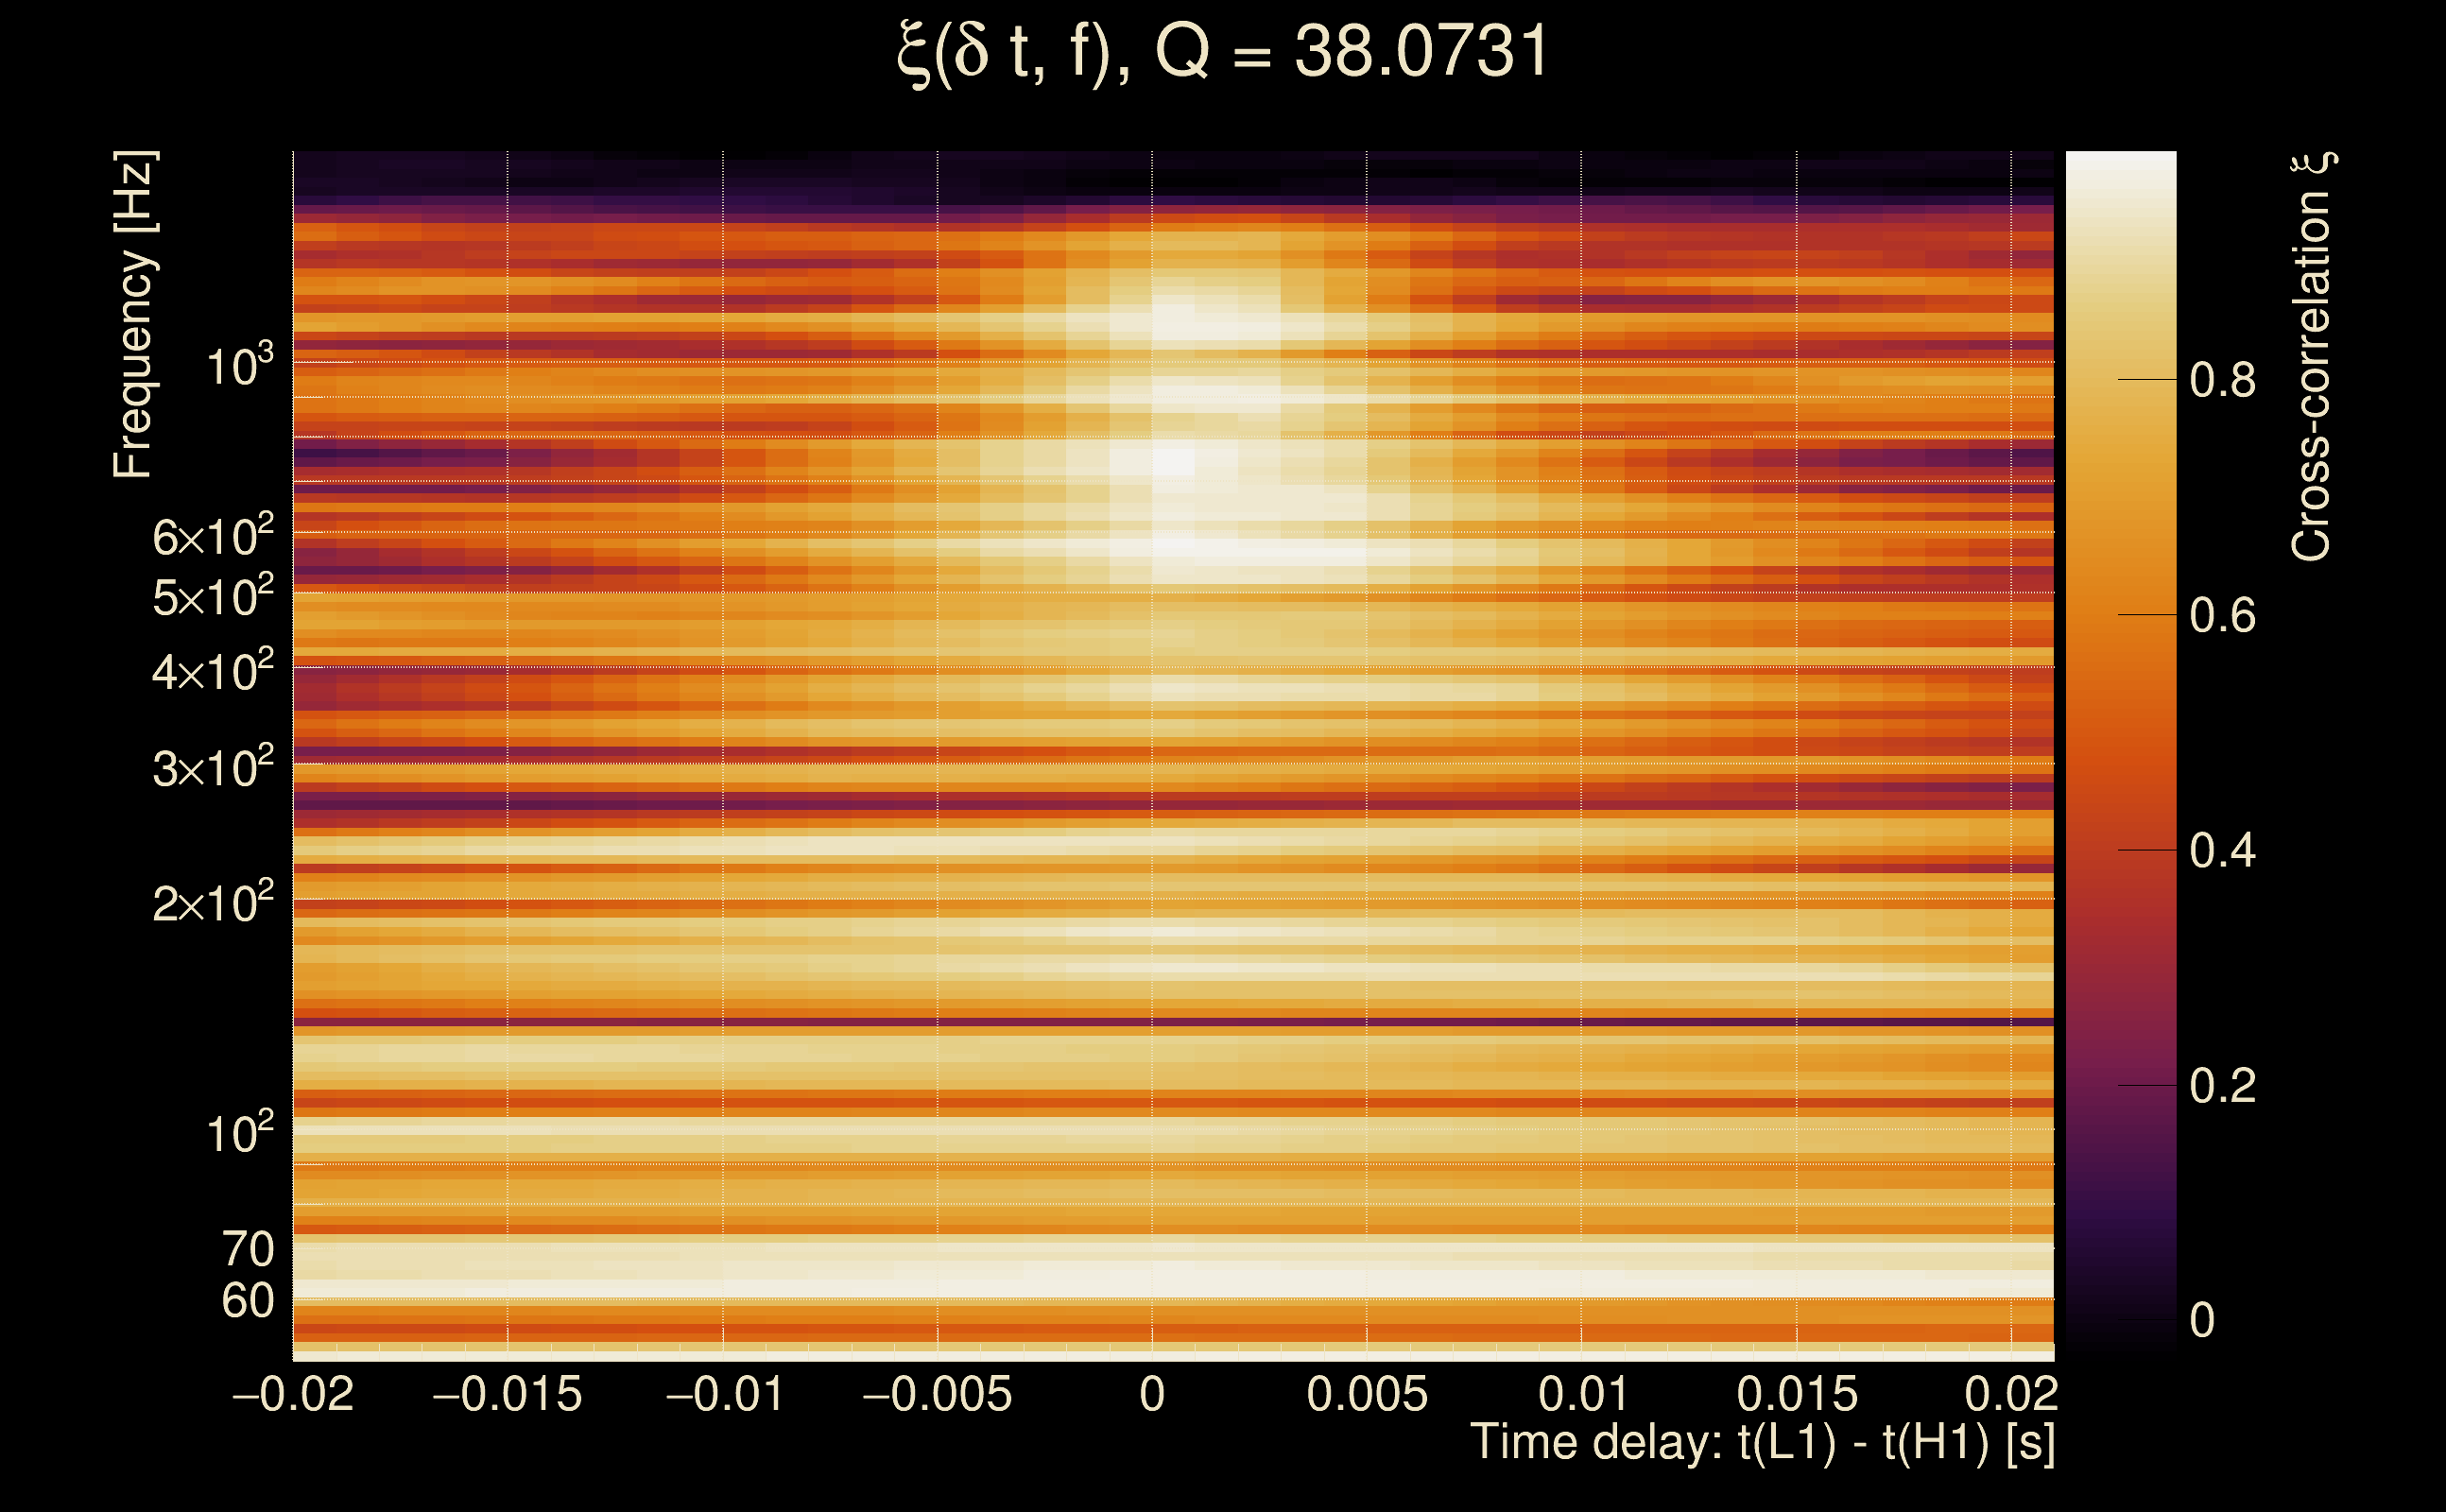
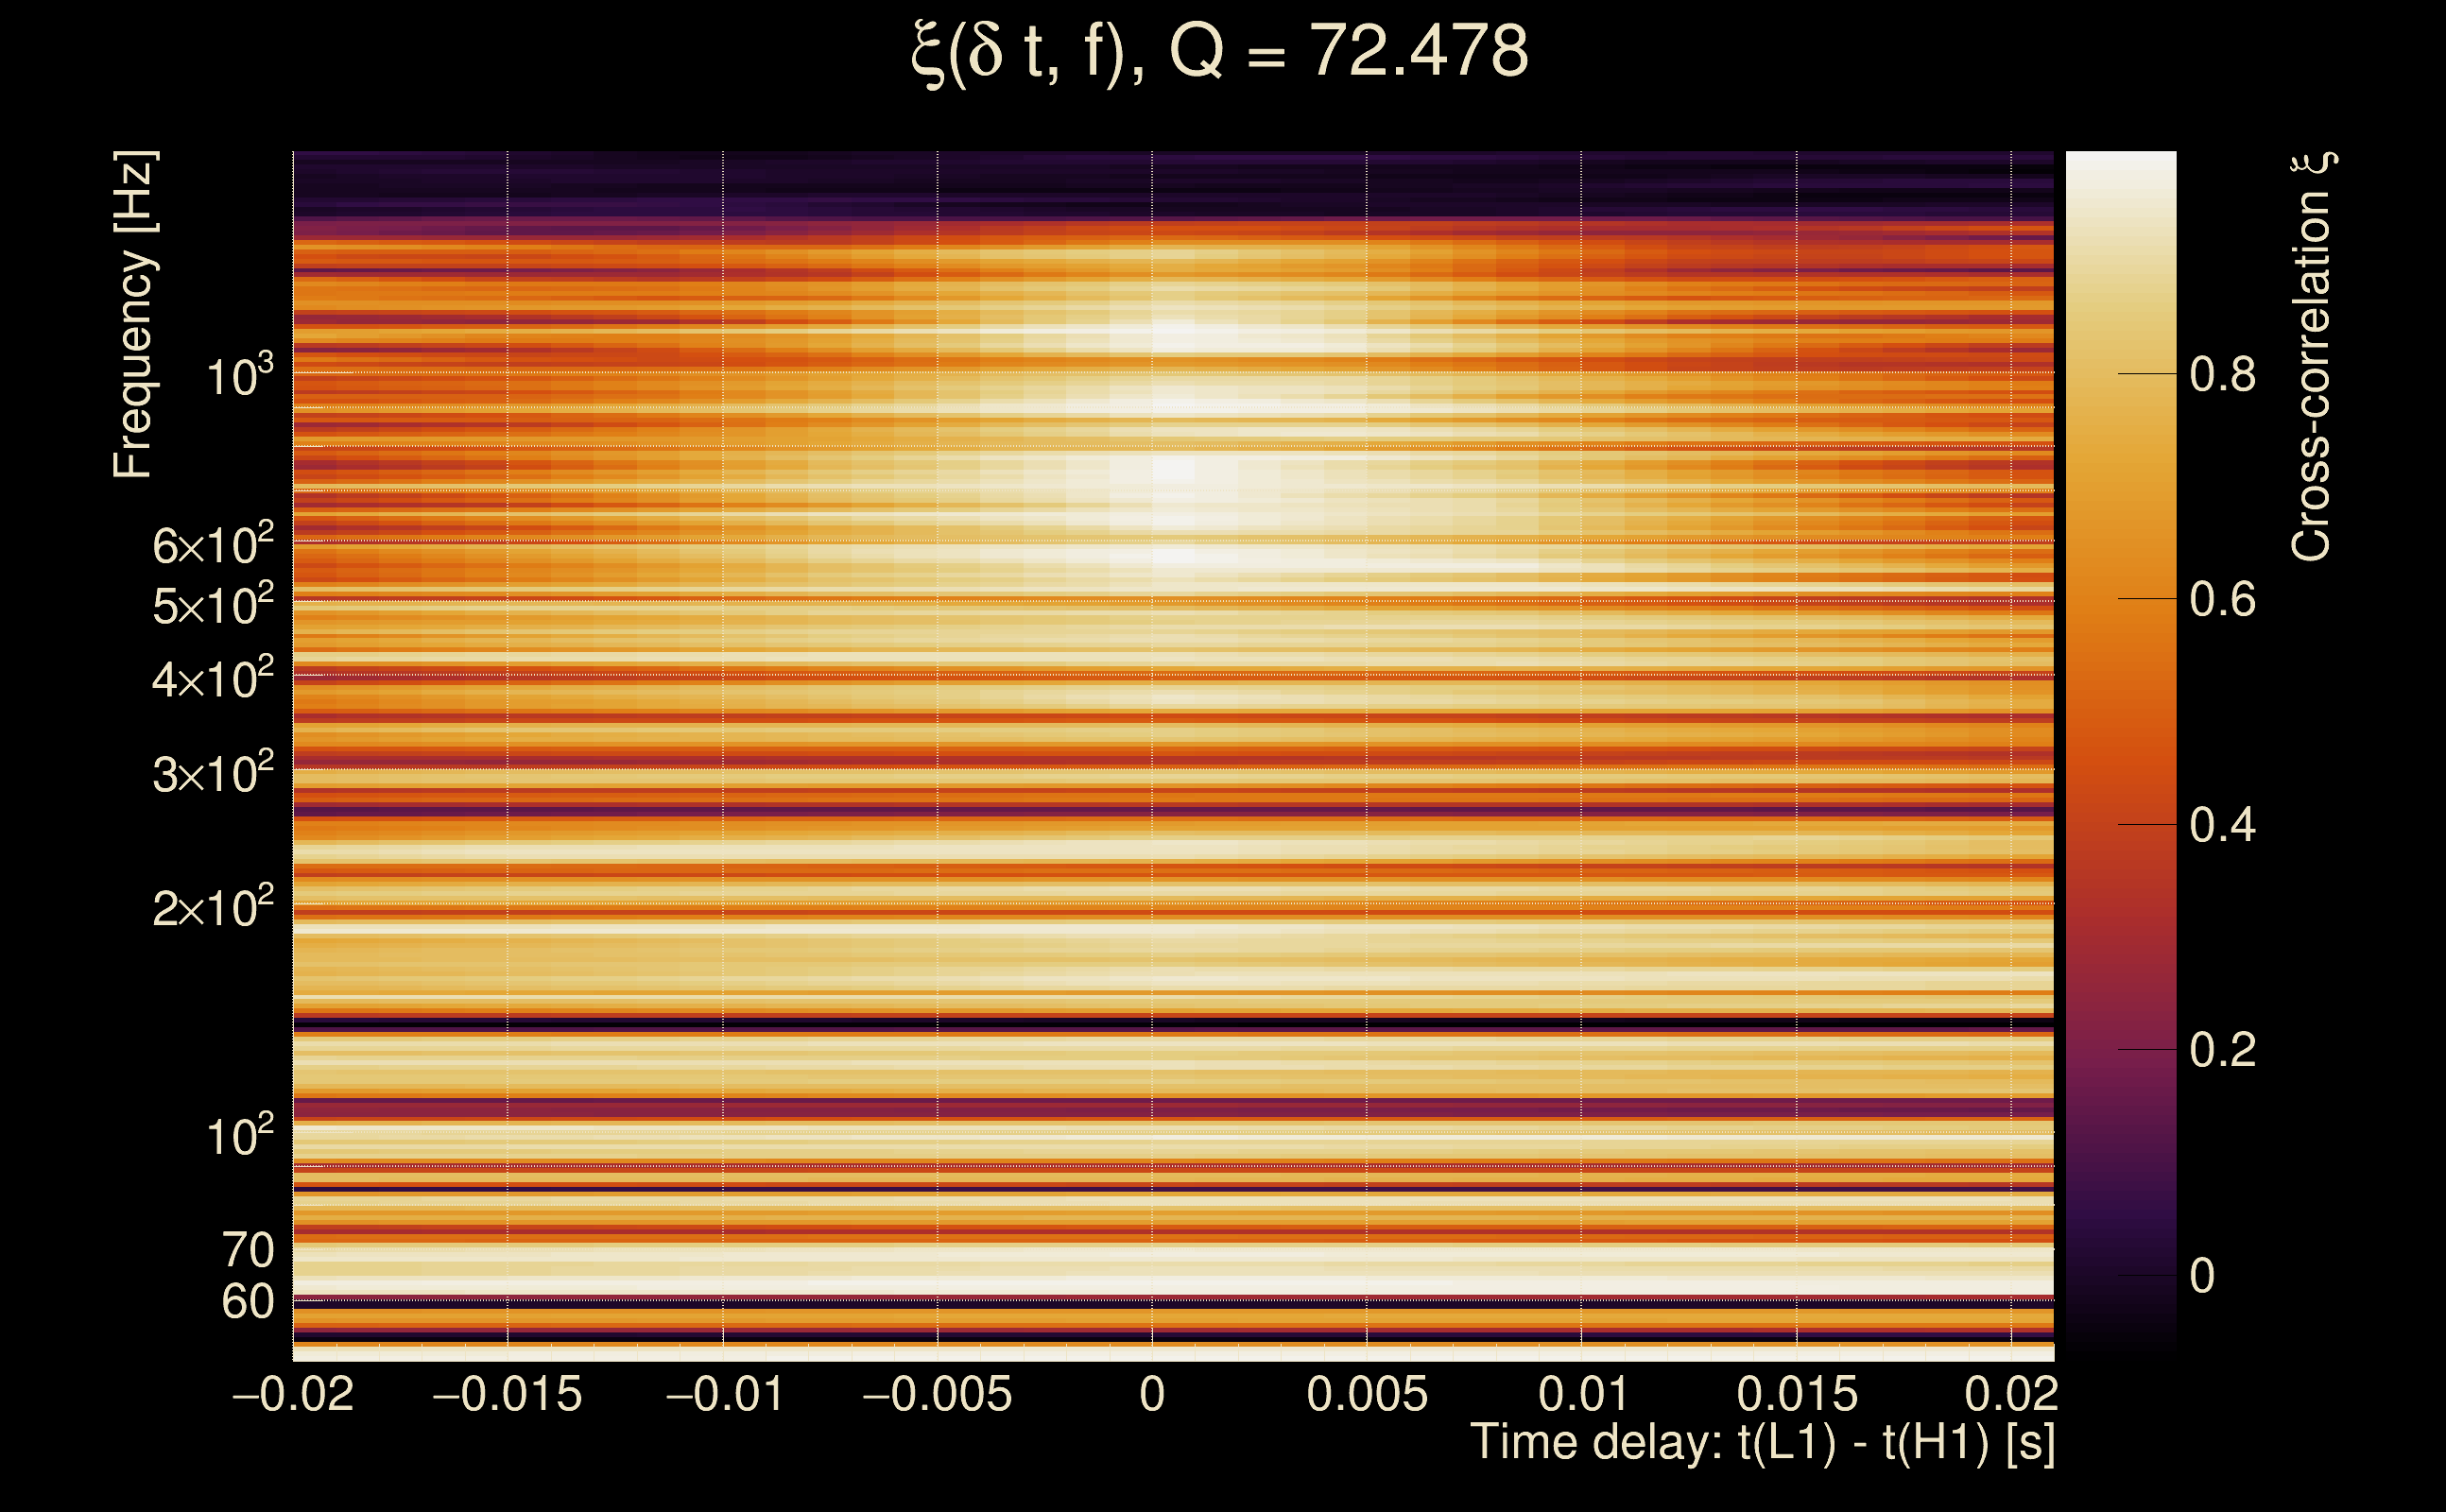
| Number of Q planes: | 5 (Q = 5.51892 → Q = 72.478) |
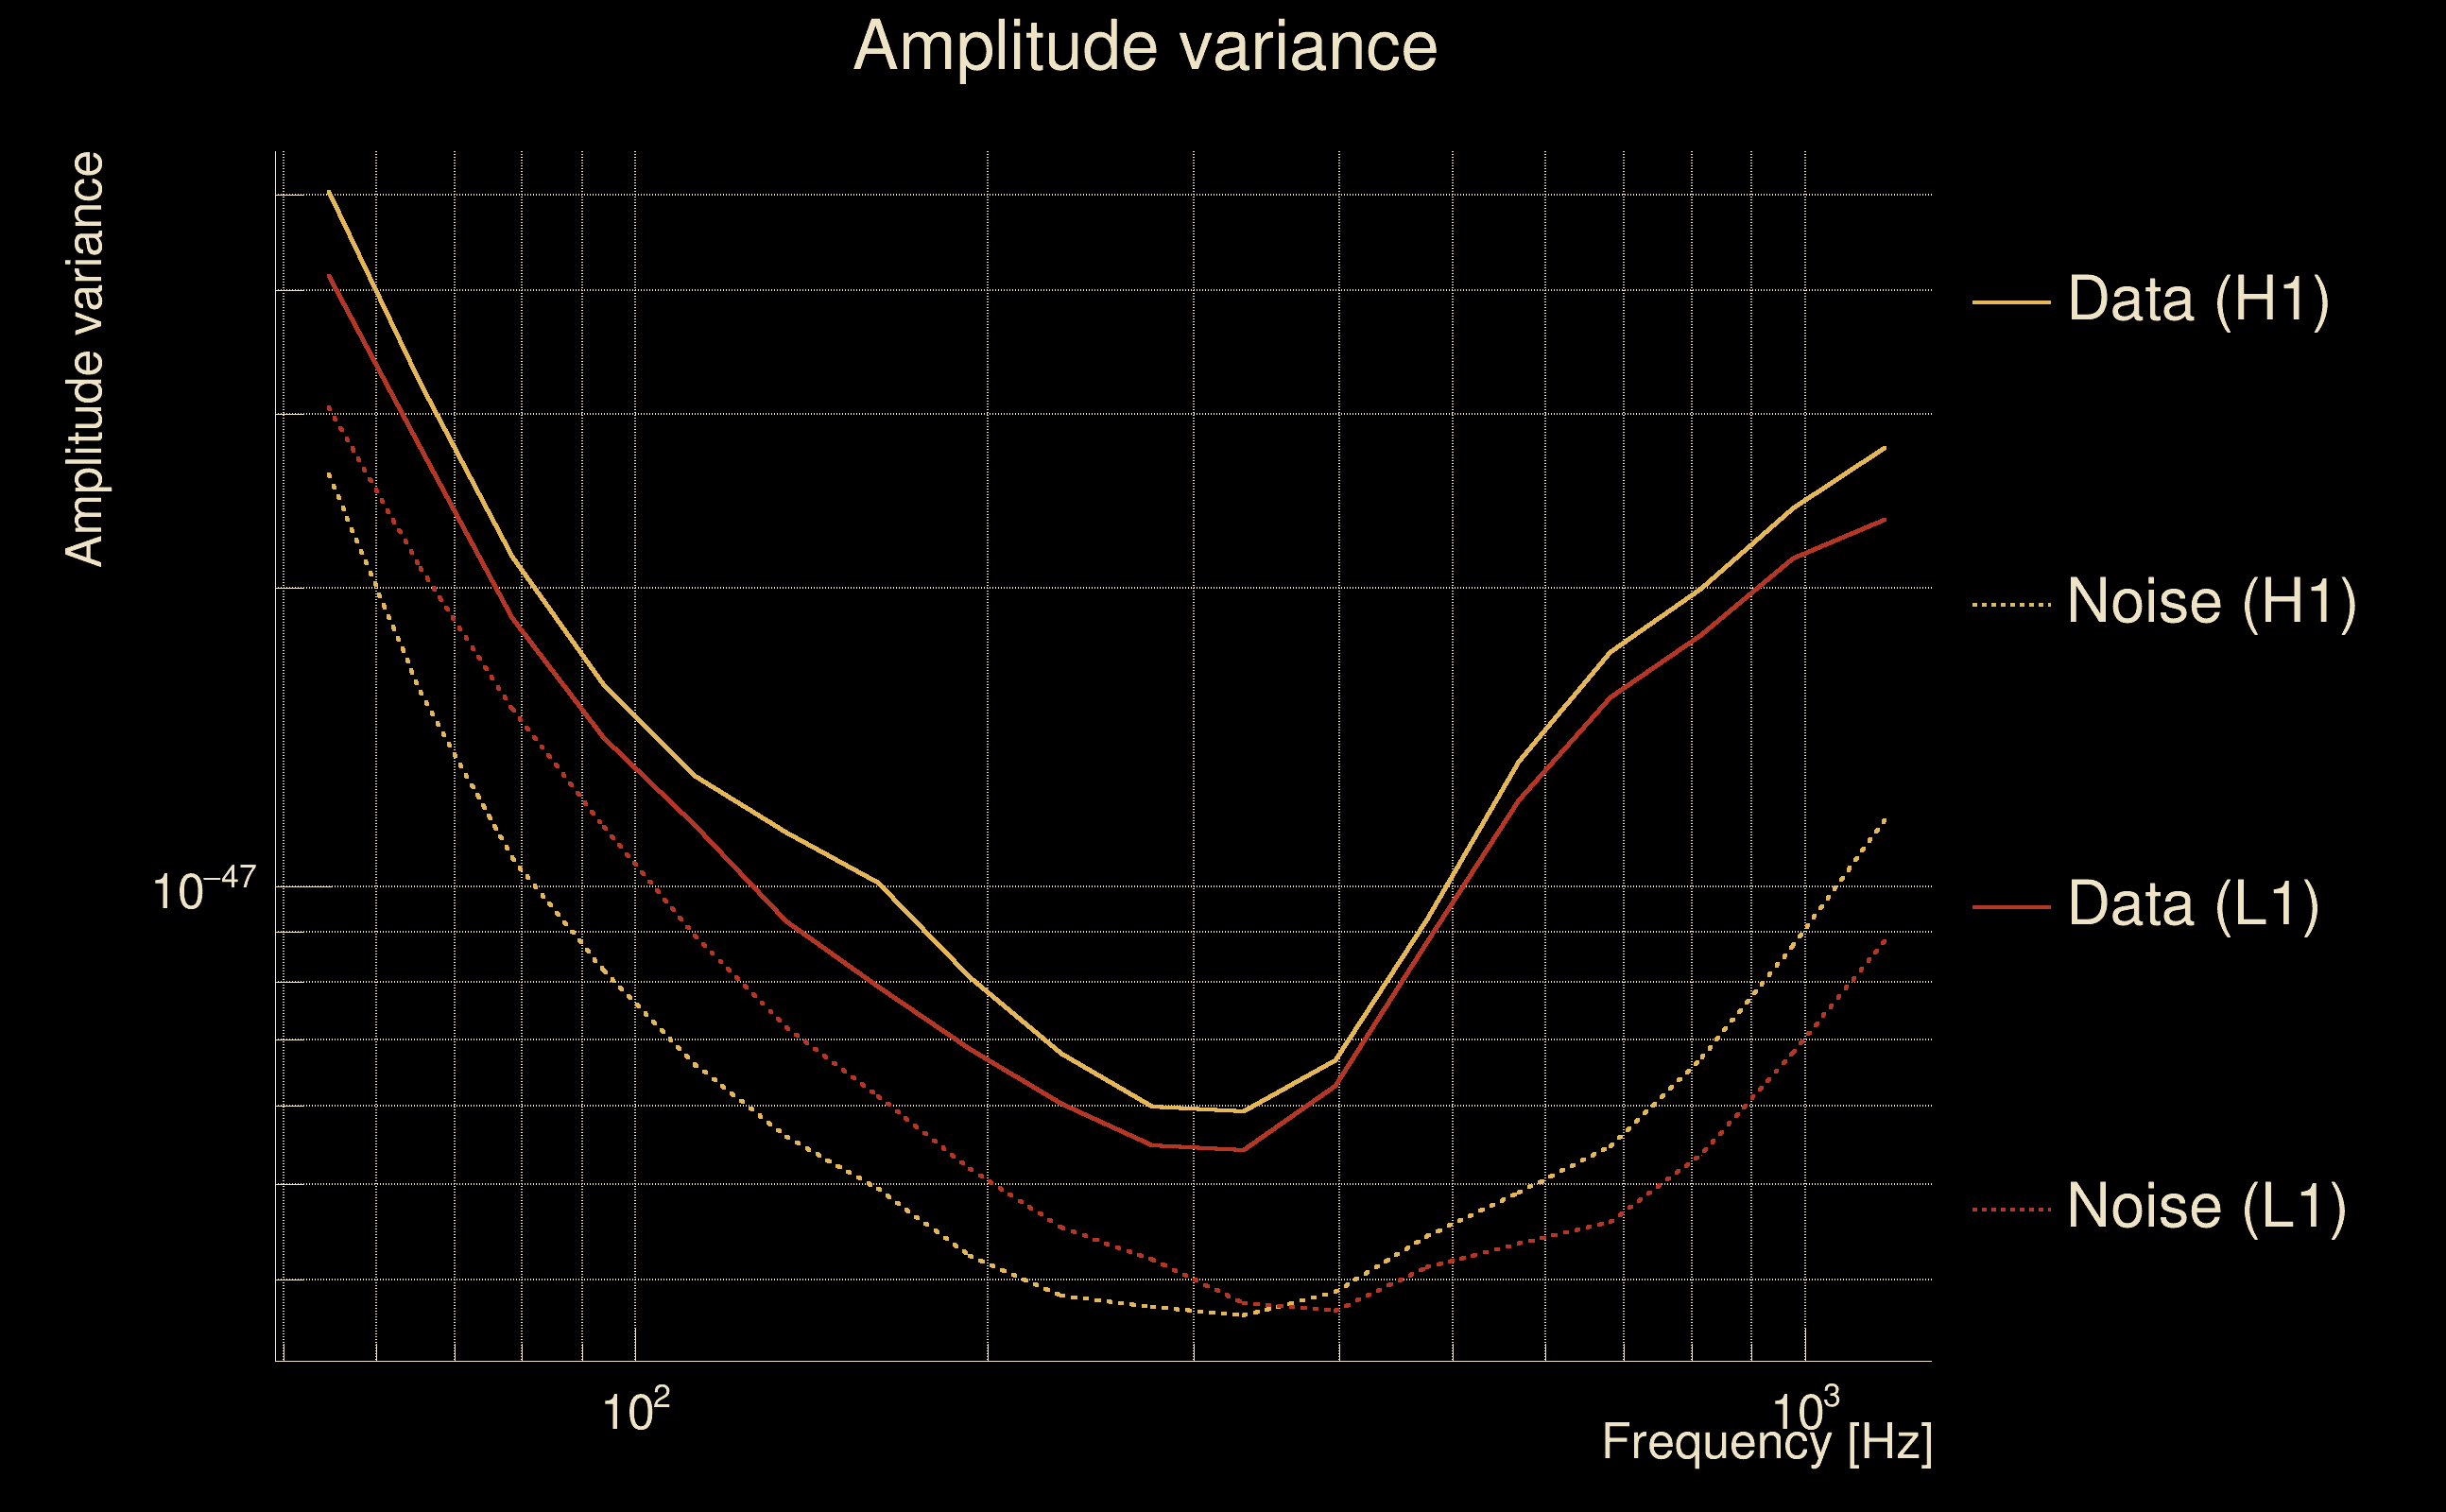
| Omicron frequency range: | 50 Hz → 1958.38 Hz |
| Light travel time between detectors: | 0.0100128 s |
| Slice extra-time (calibration uncertainty + slice veto): | 0.0129872 s |
| Number of time-delay bins in a cross-correlation map: | 10000 |
| Number of slices in a cross-correlation map: | 217 |
| Number of time-delay bins in a slice: | 46 |
| SNR gating: | < 100 (detector 0), < 100 (detector 1) |
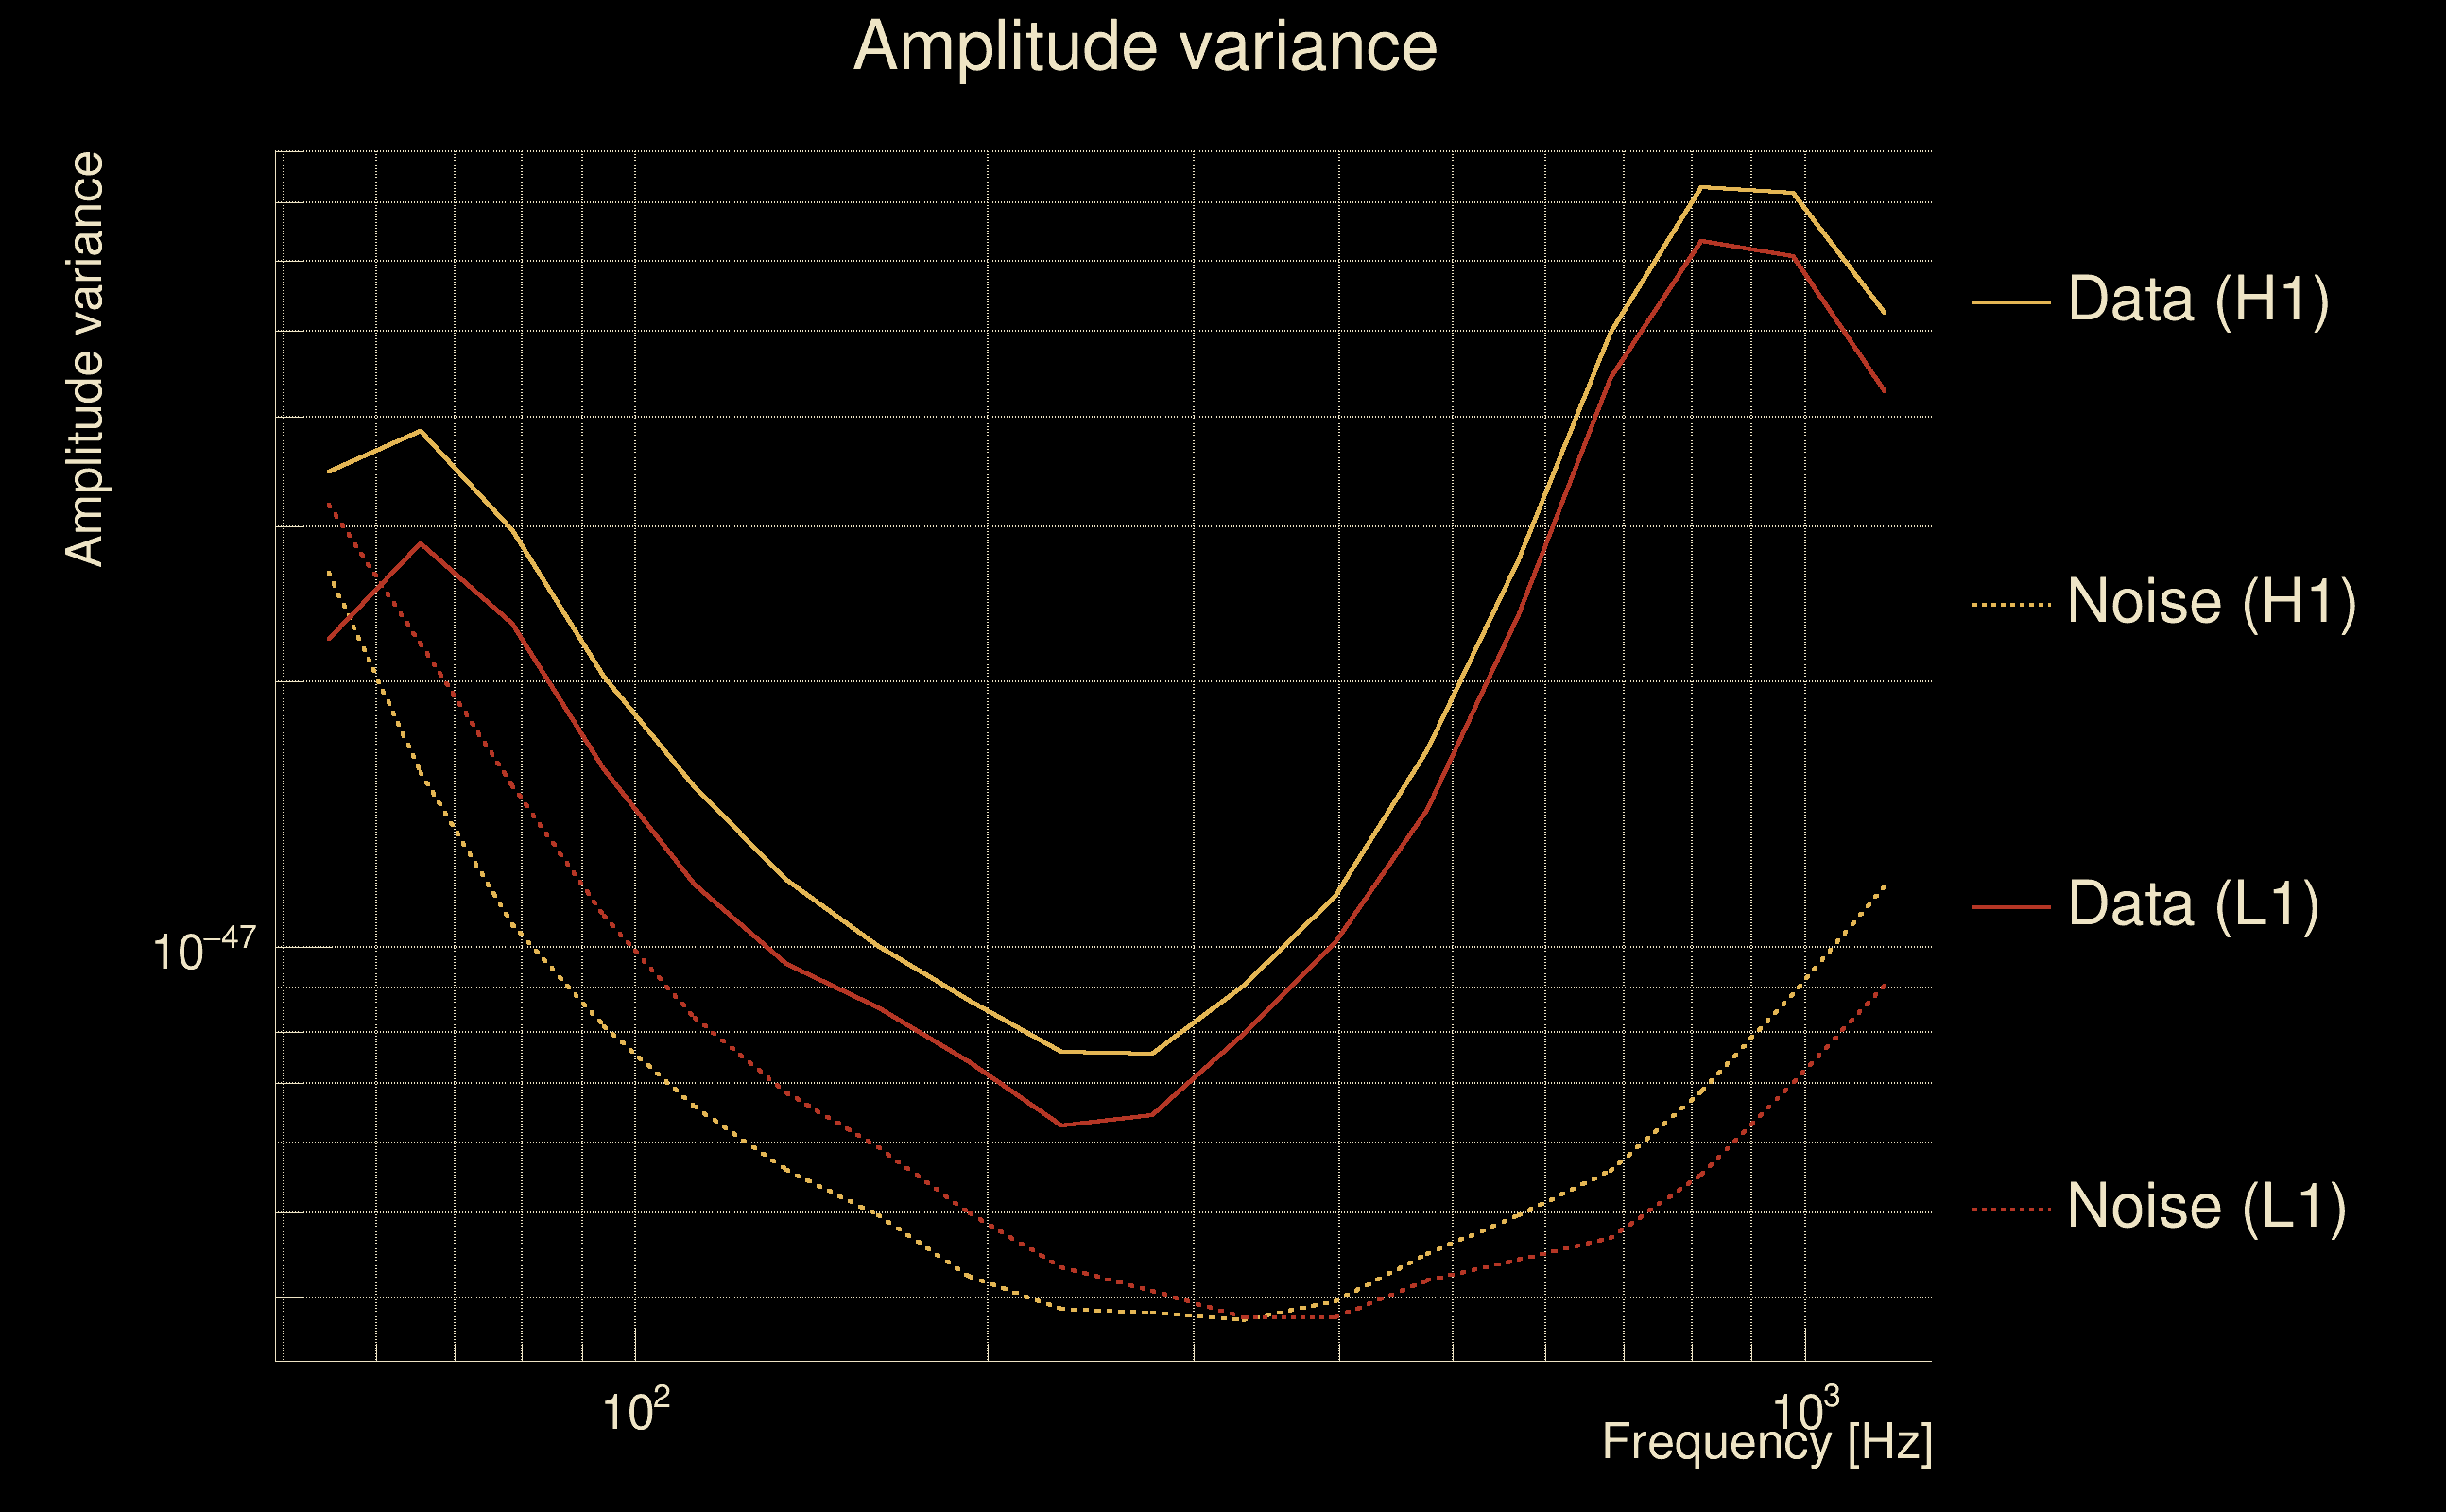
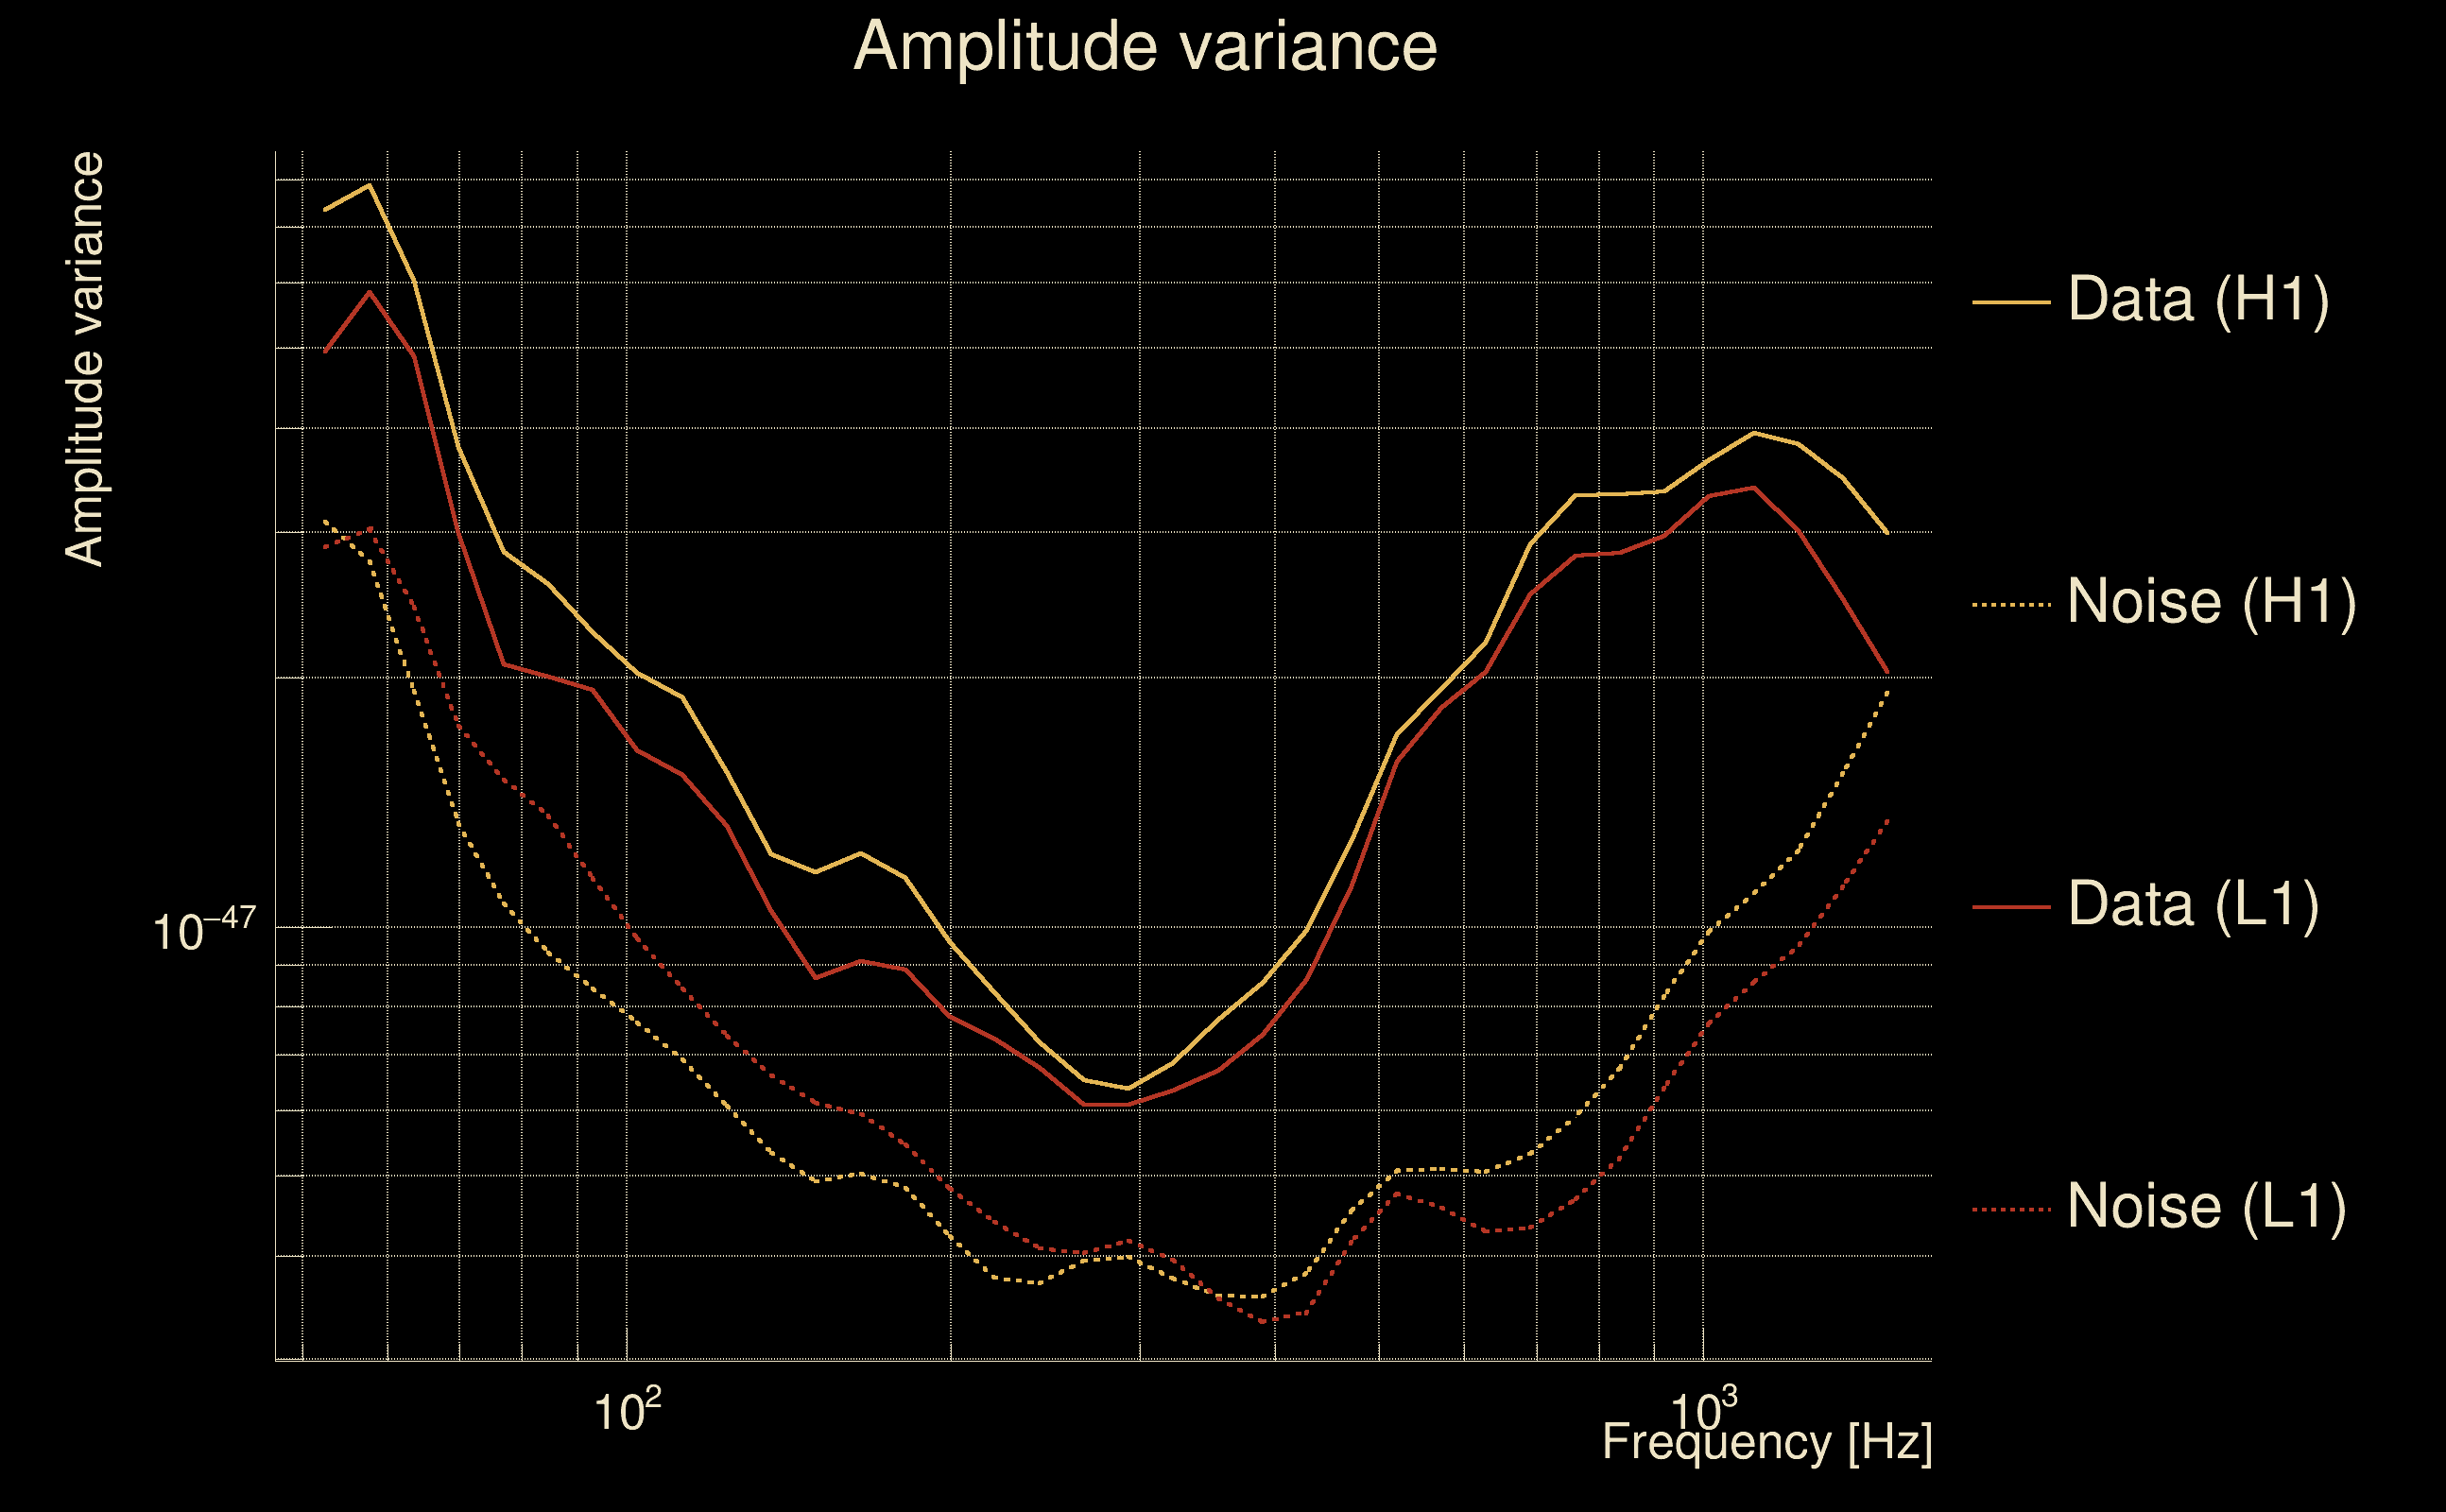
| Amplitude spectrograms: | normalization = 1e-22, power index = 2 |
| White noise SNR variance: | 0.523175 (after applying a correction factor = 1) |
| Amplitude ratio confidence level: | 3 sigma |
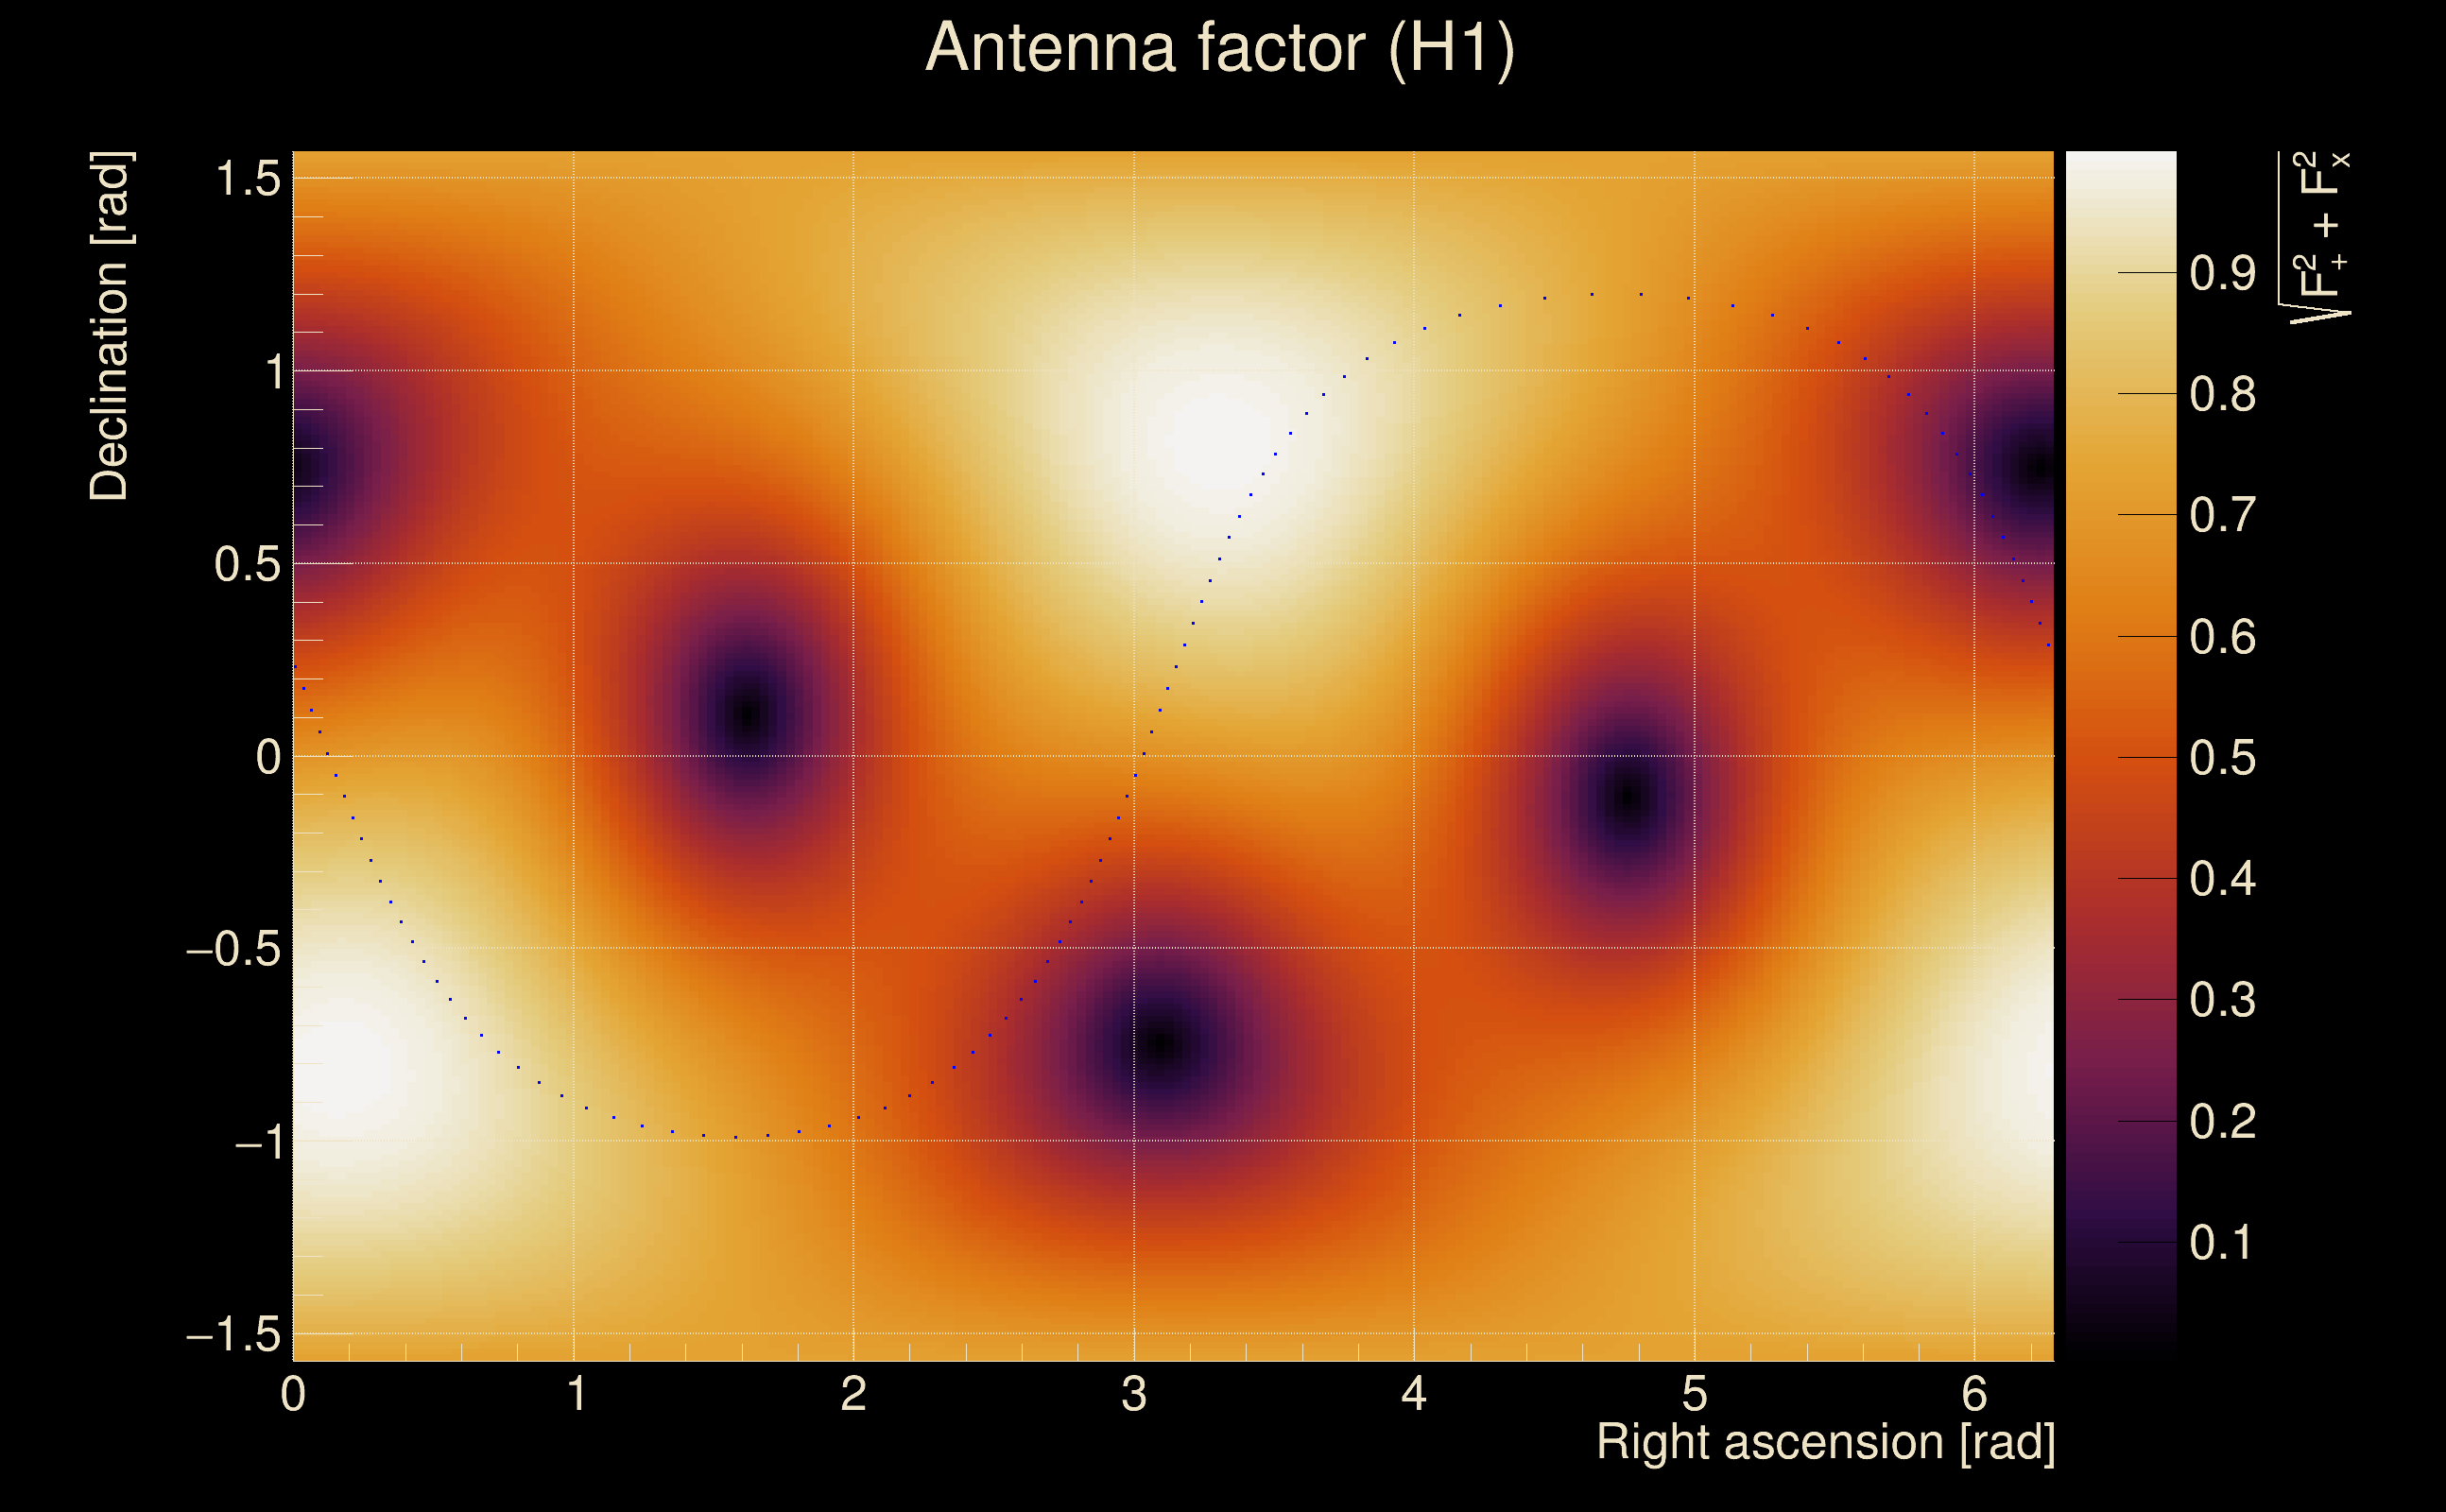
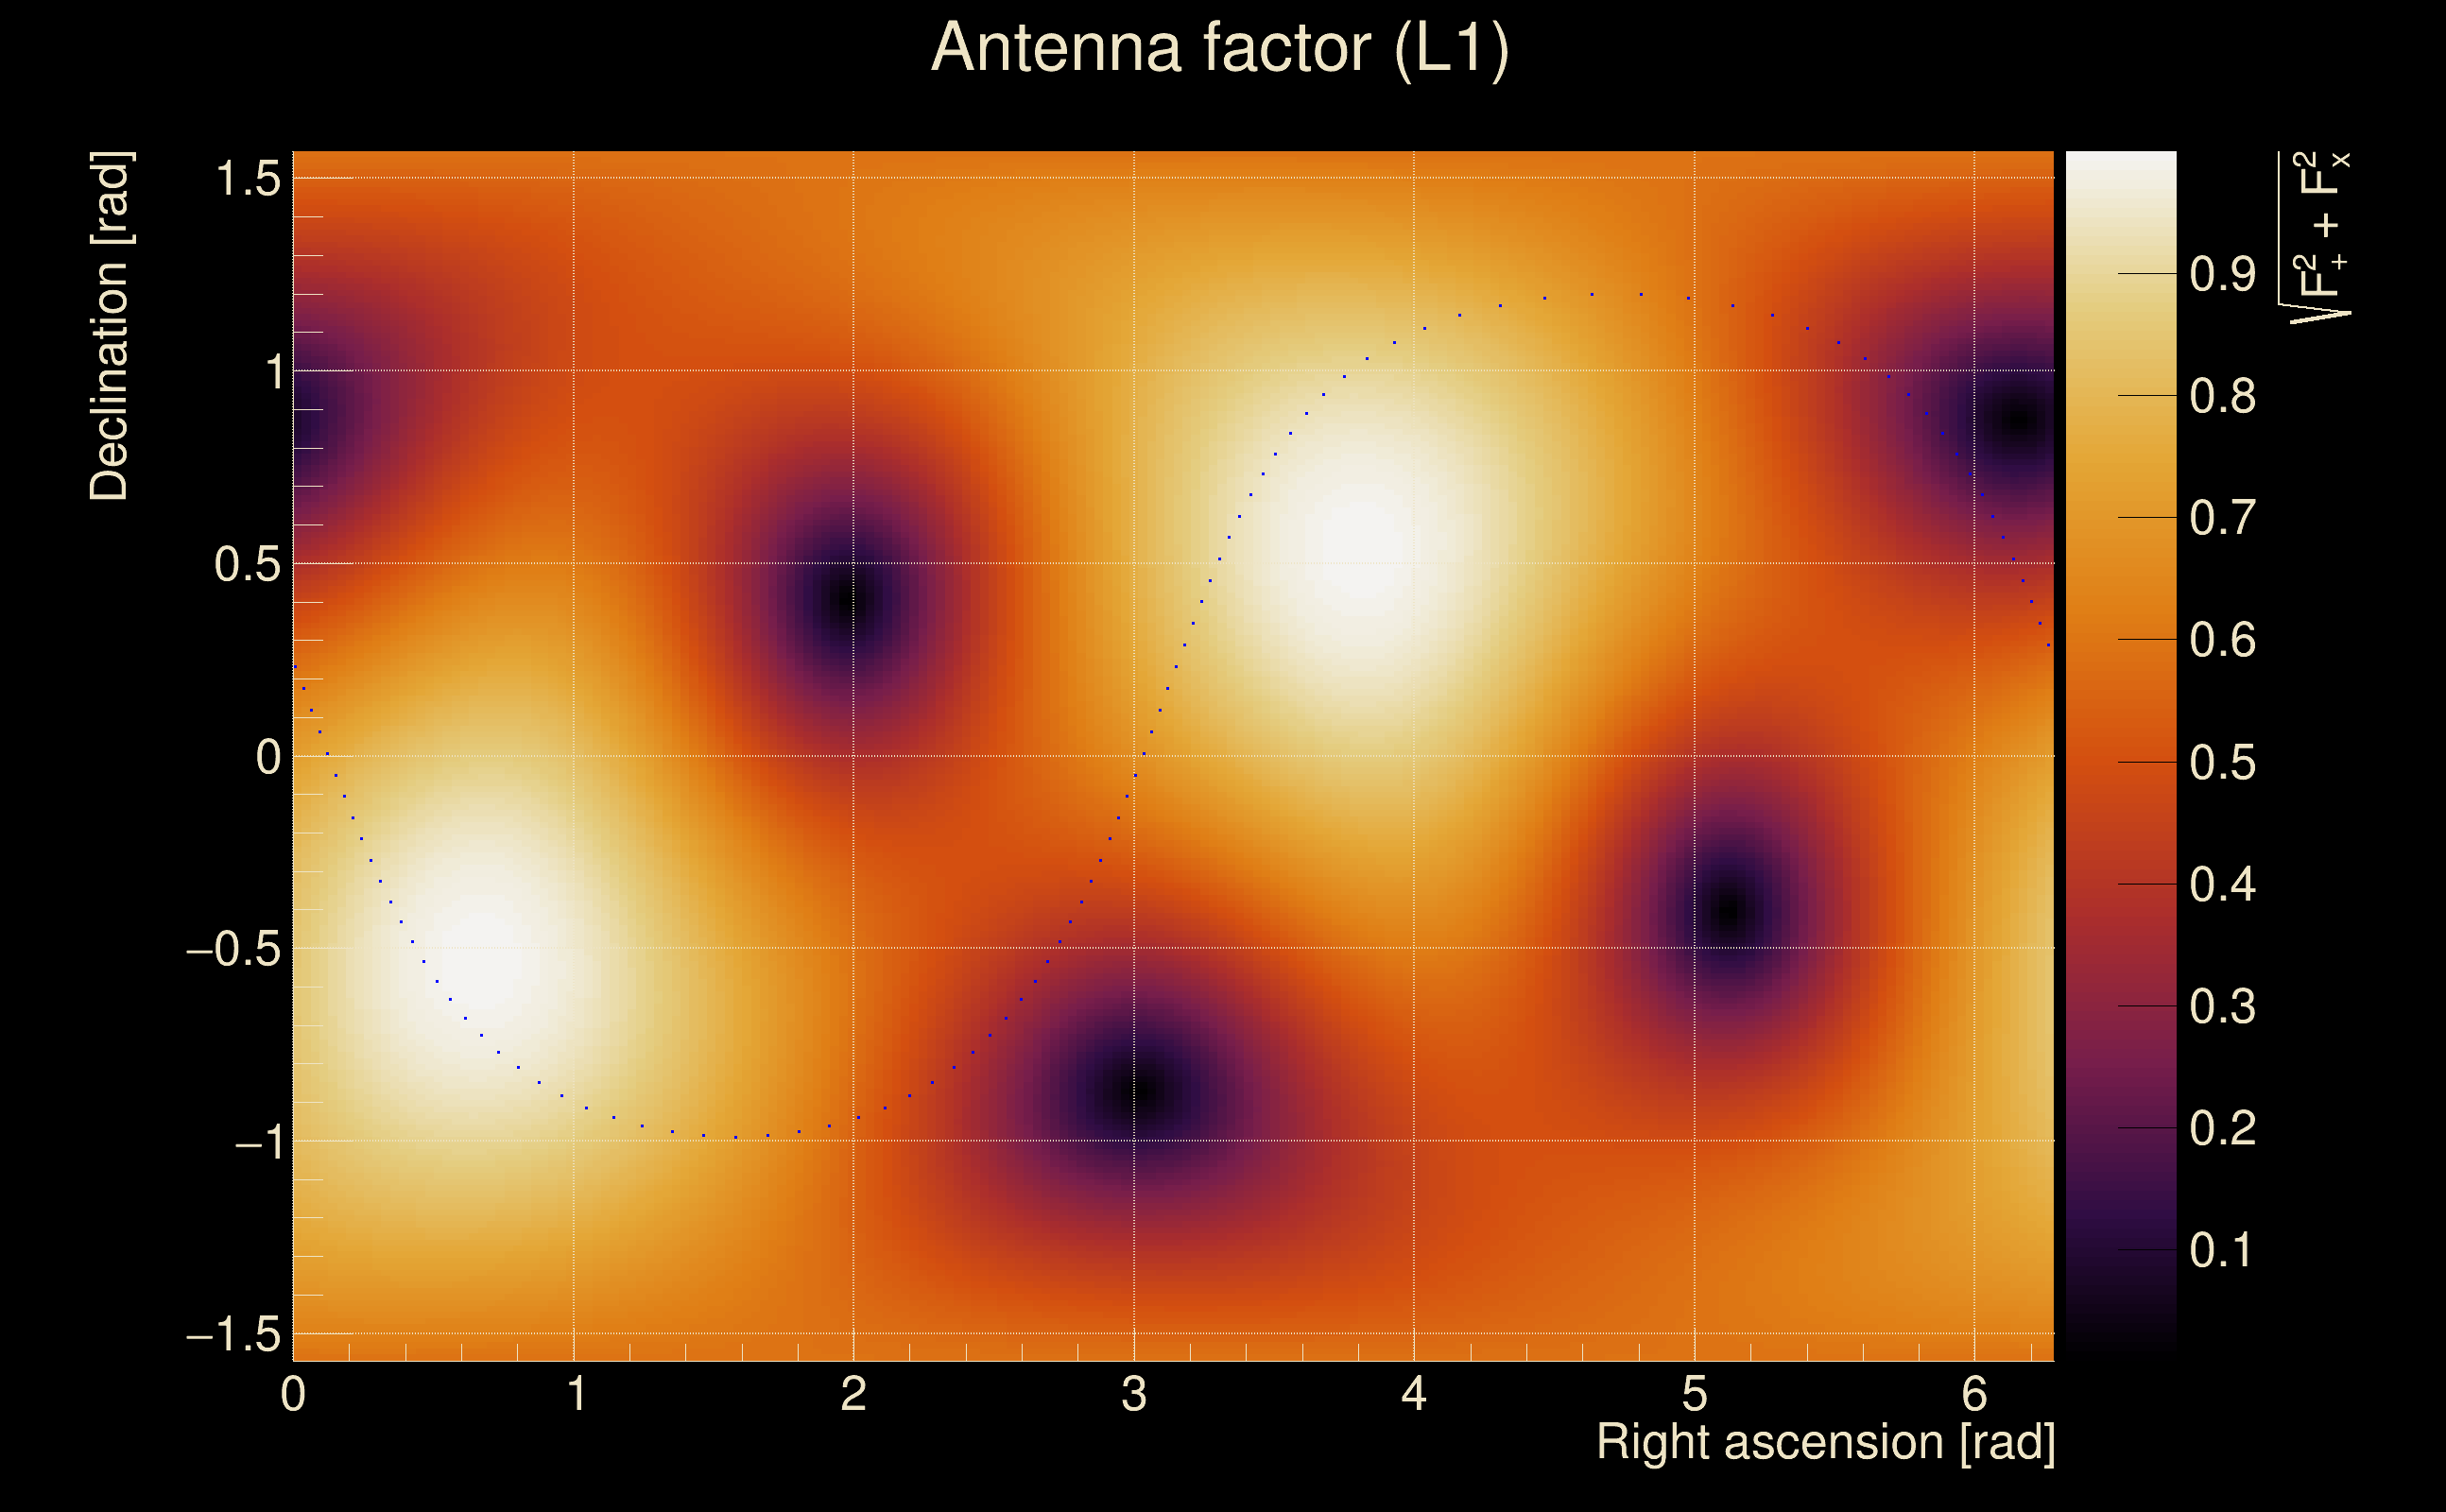
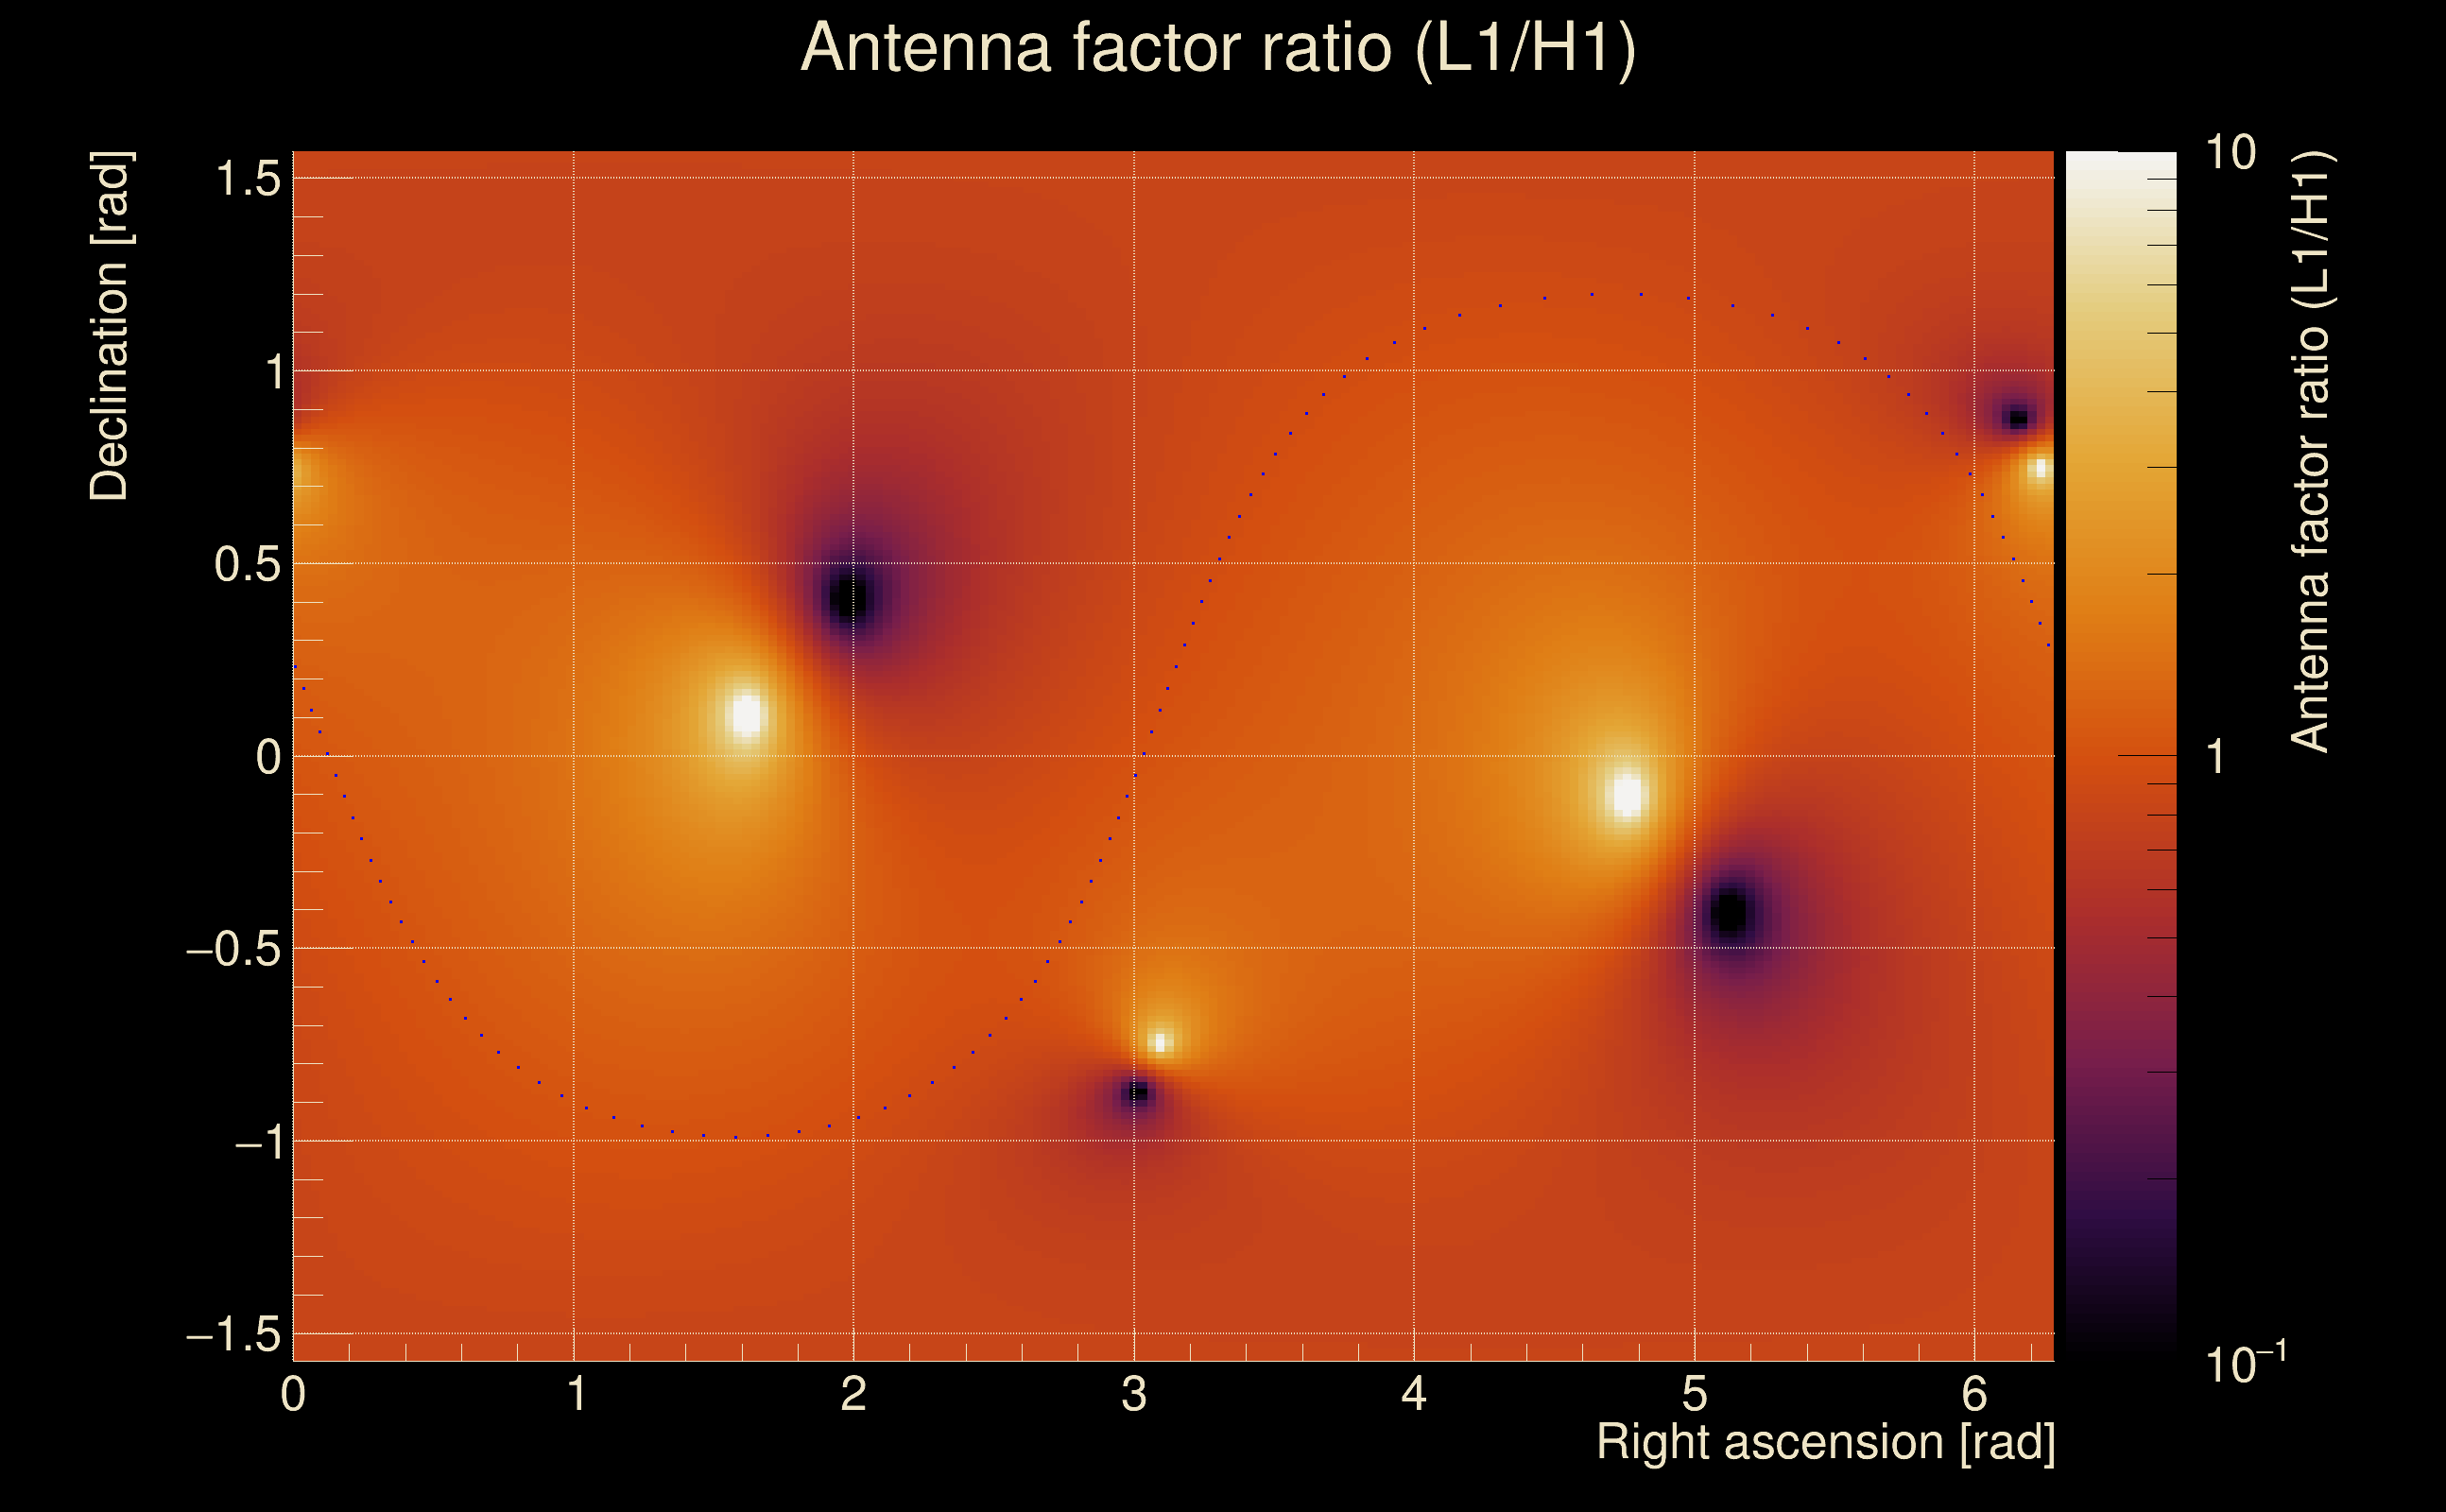
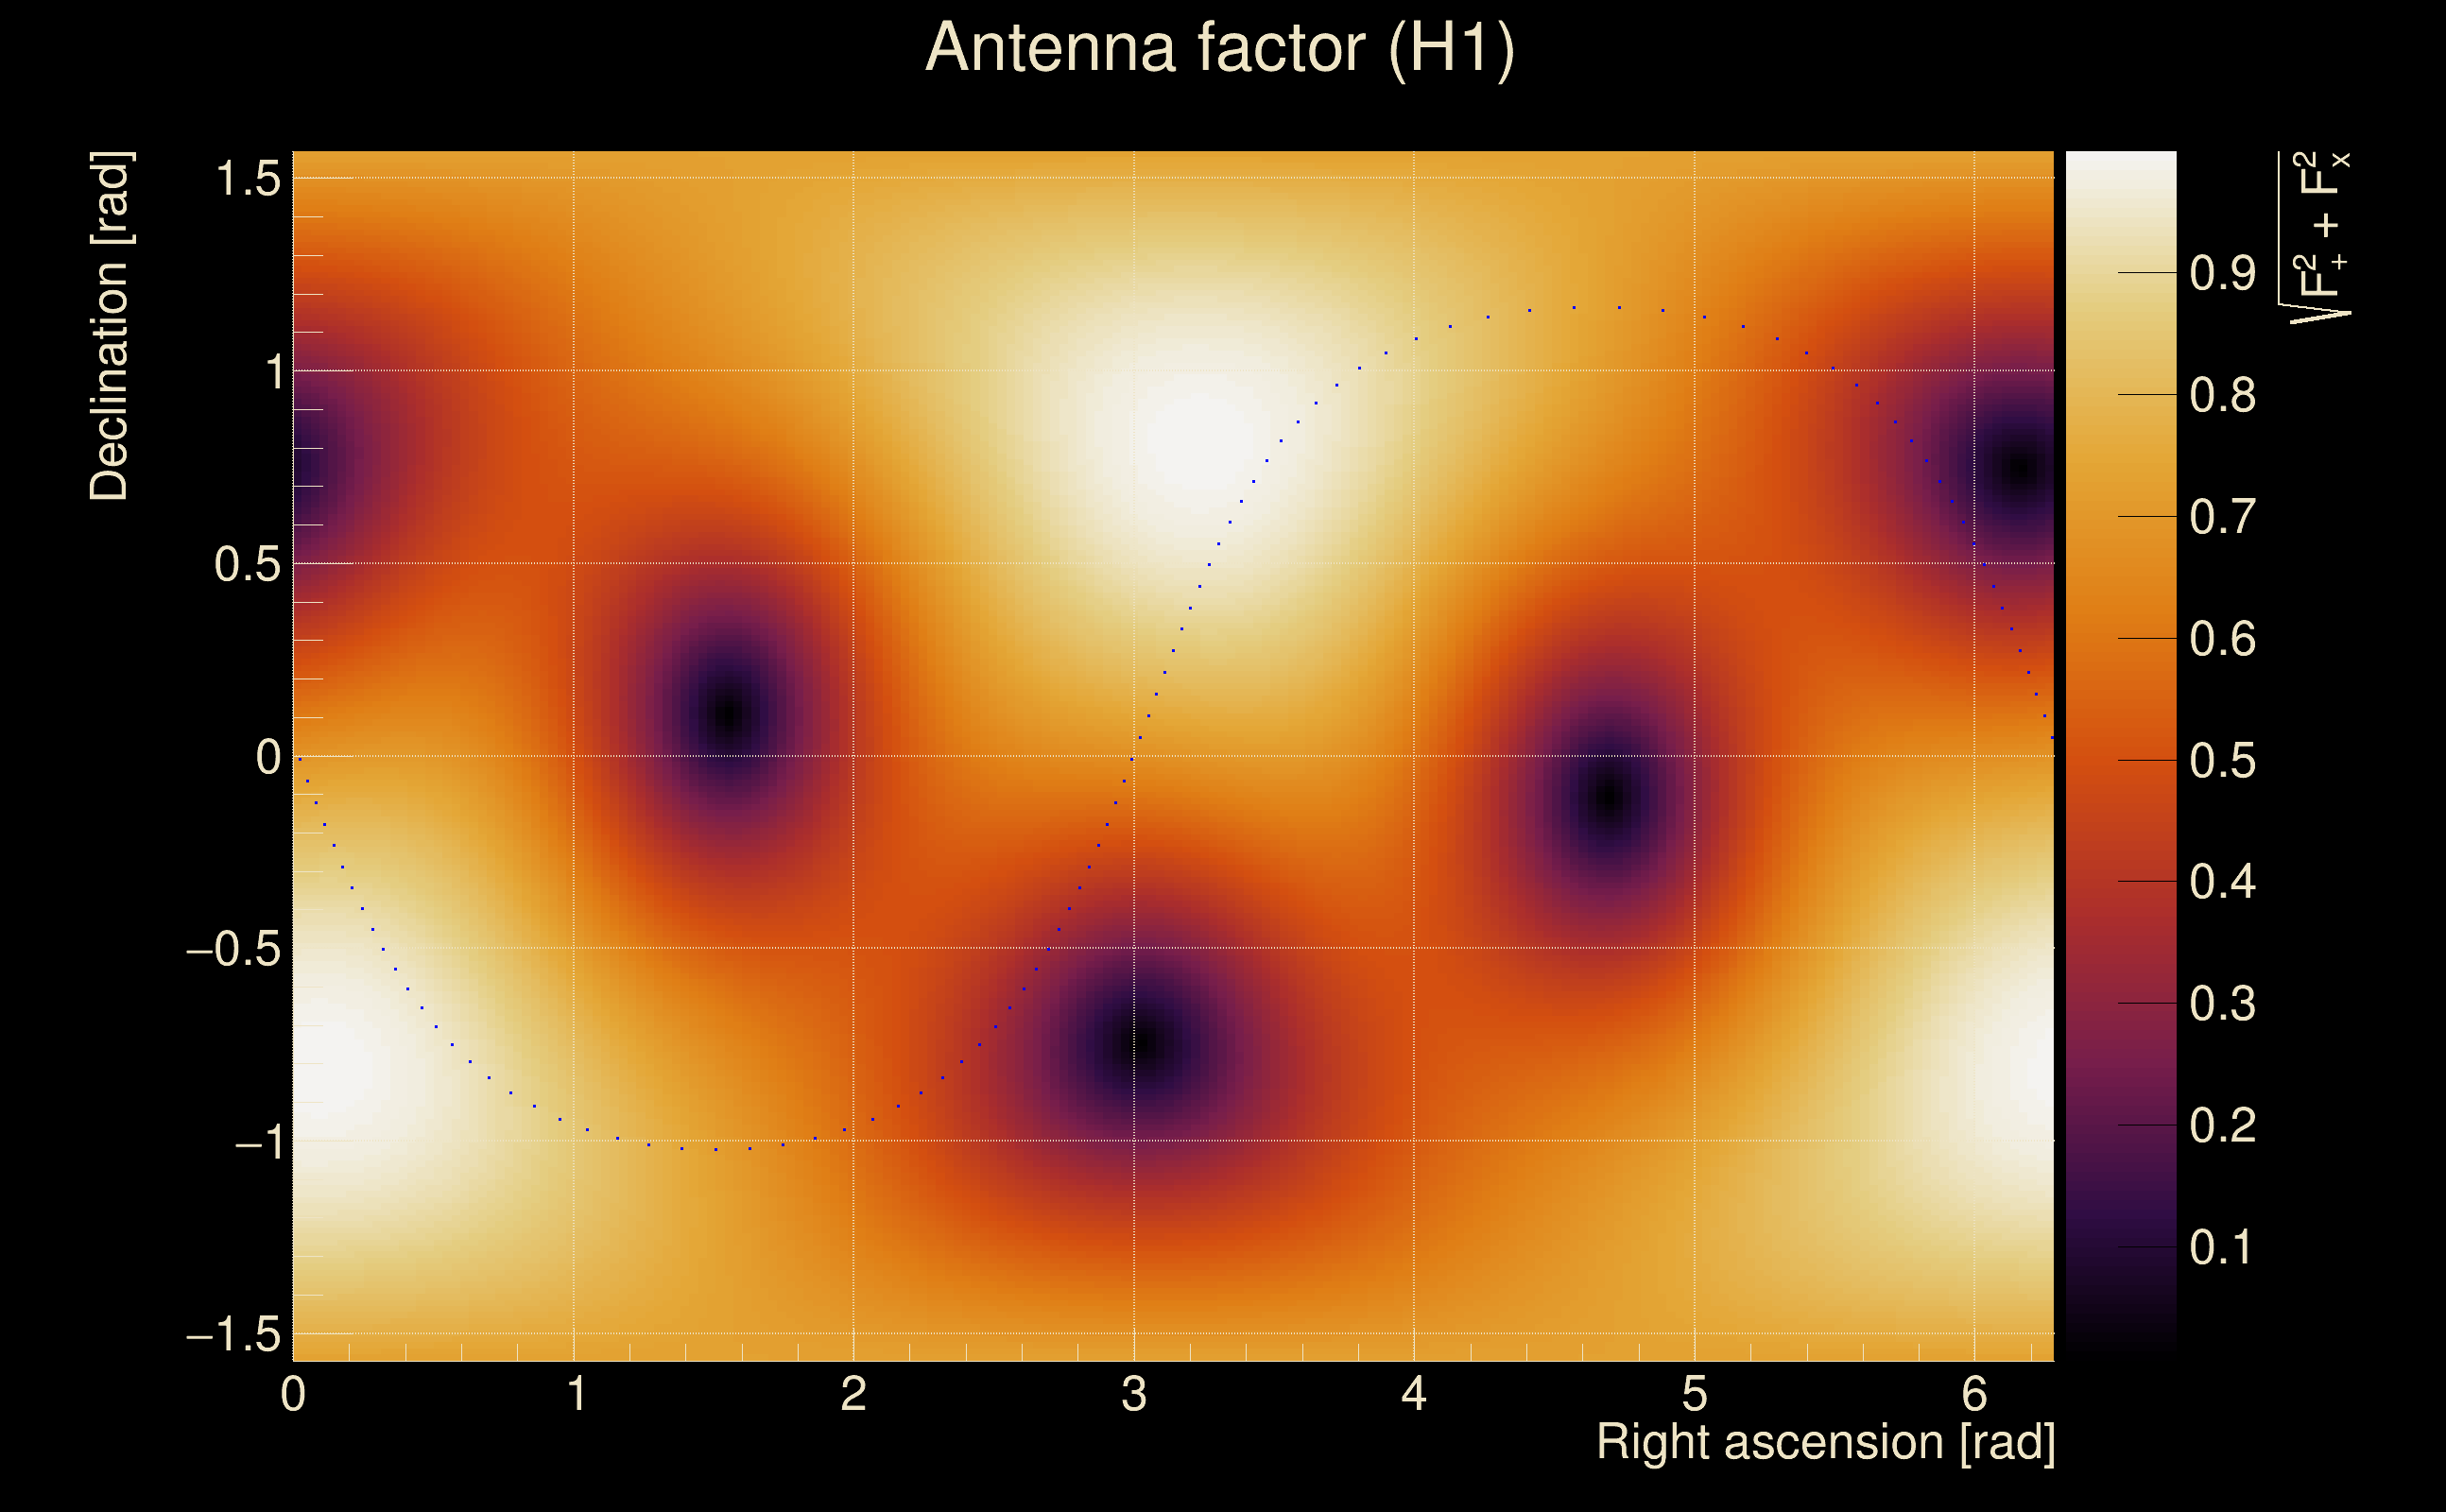
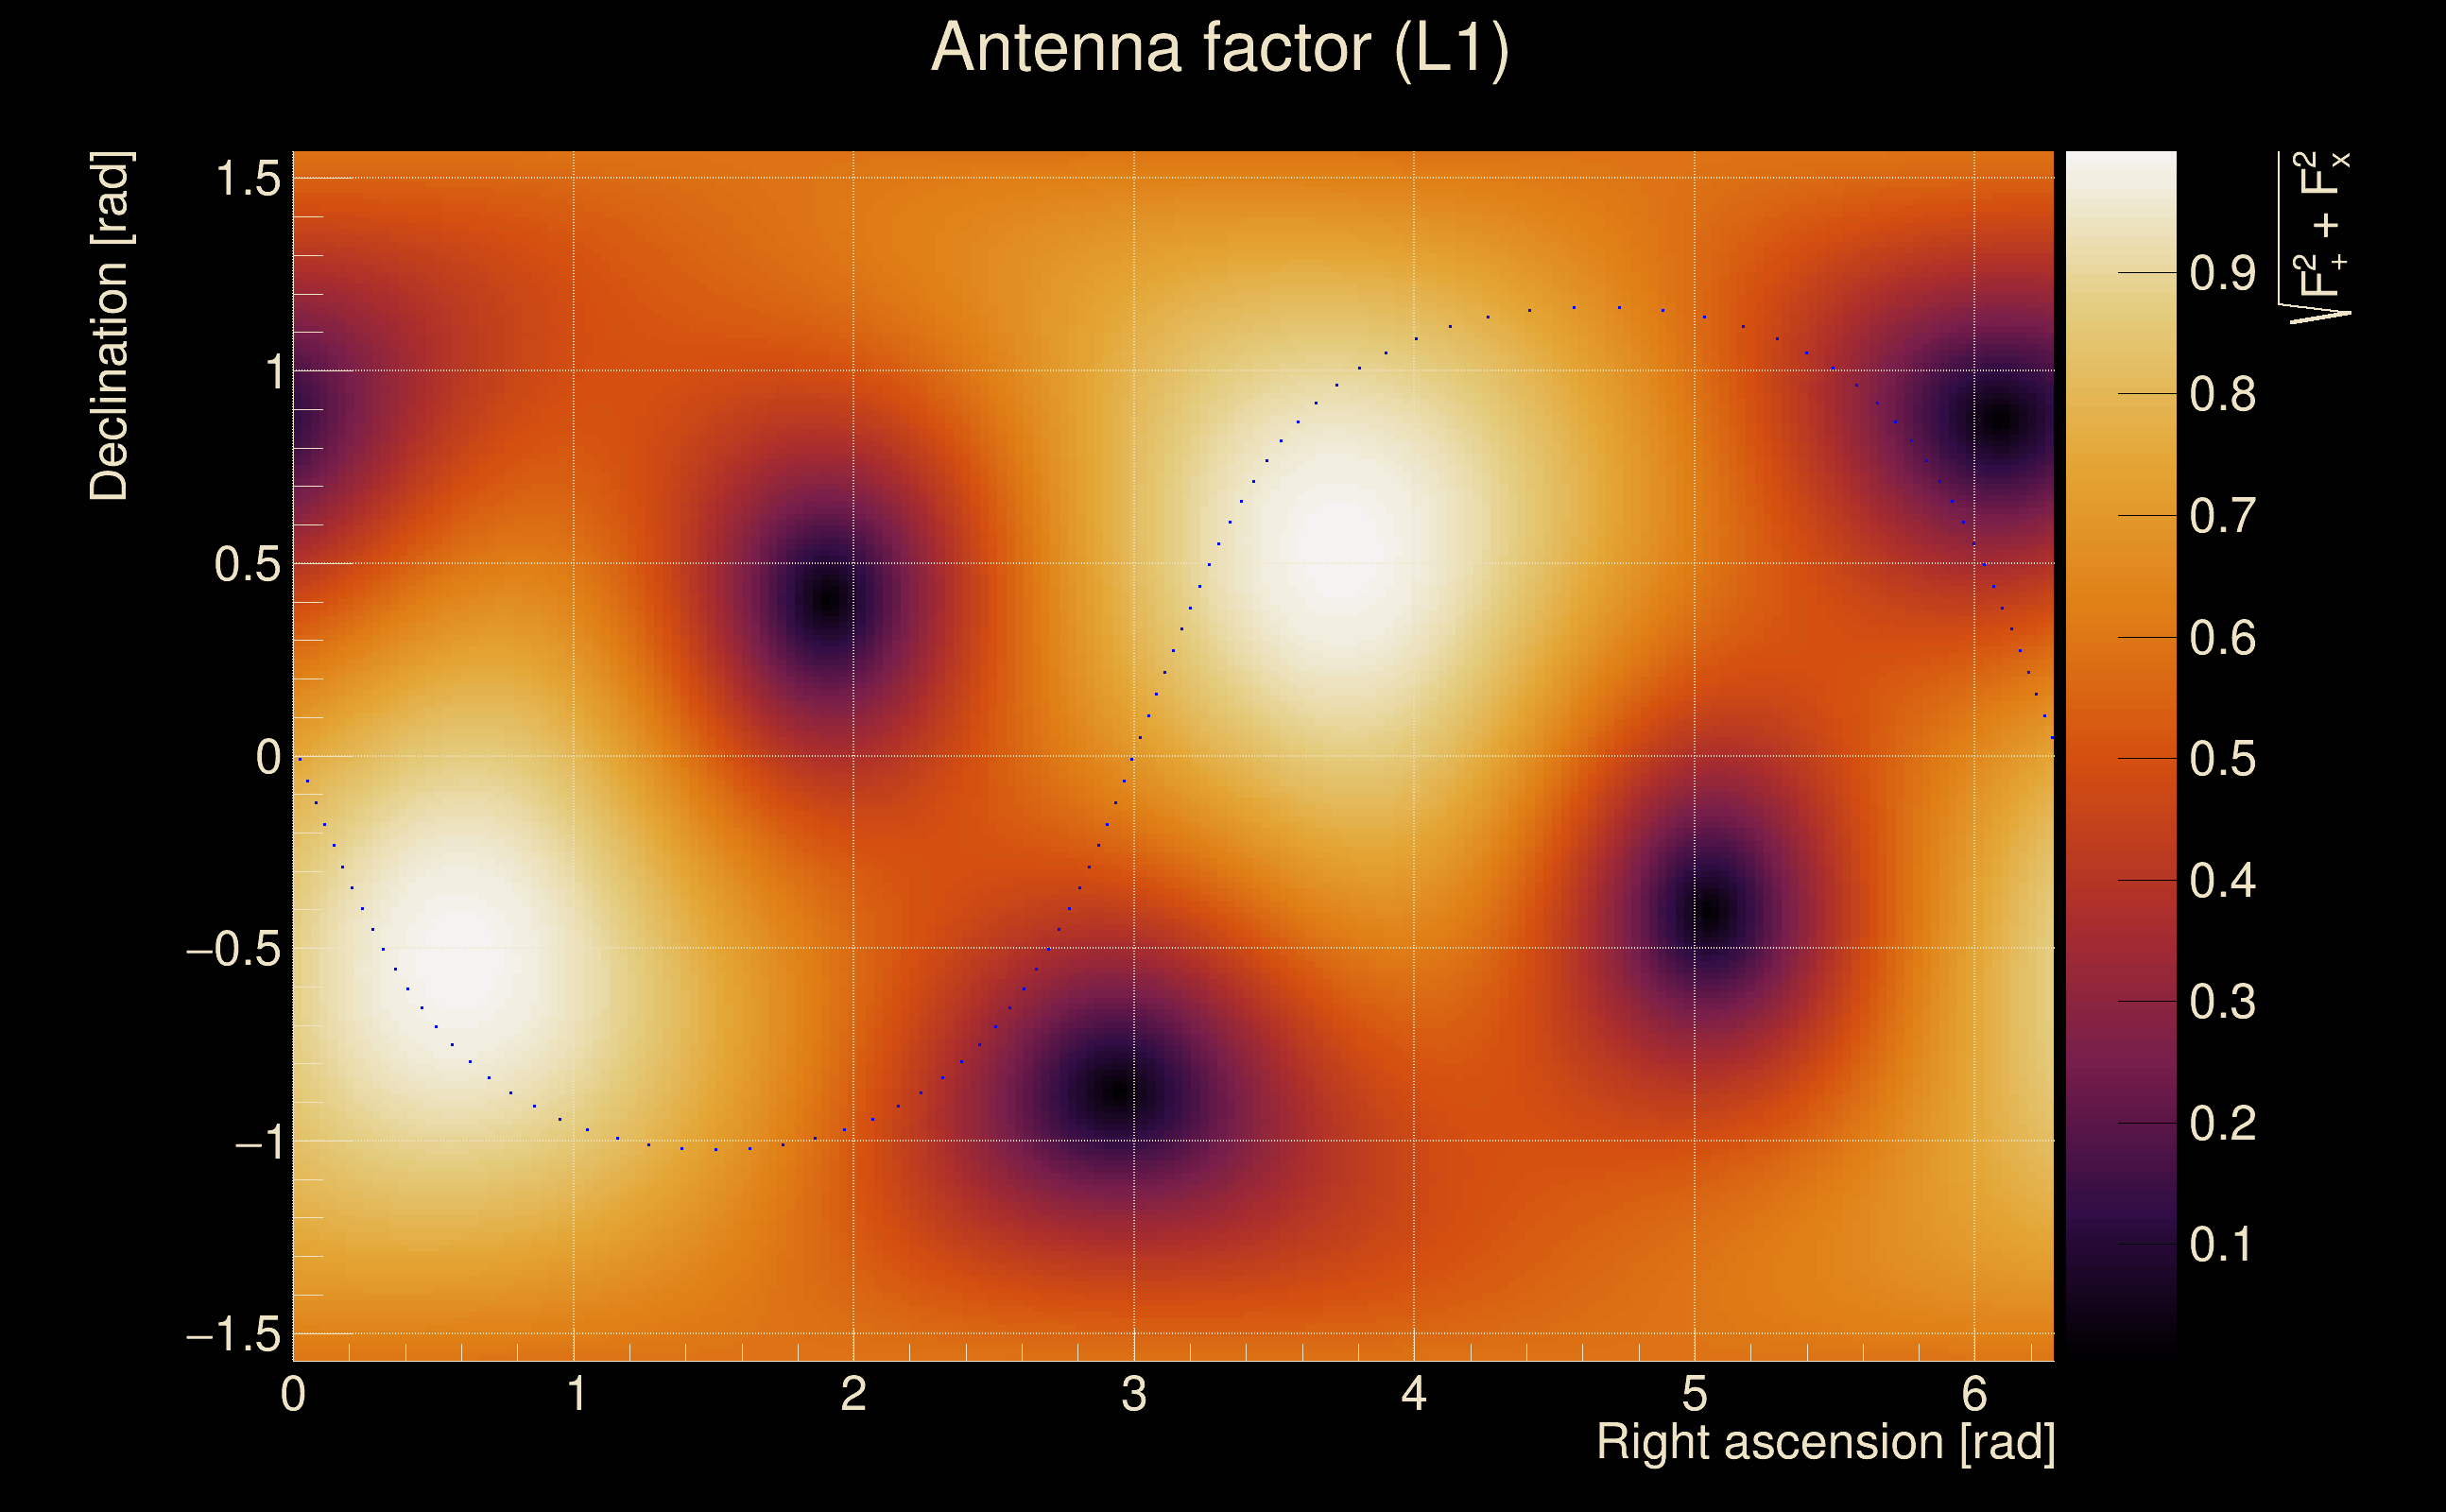
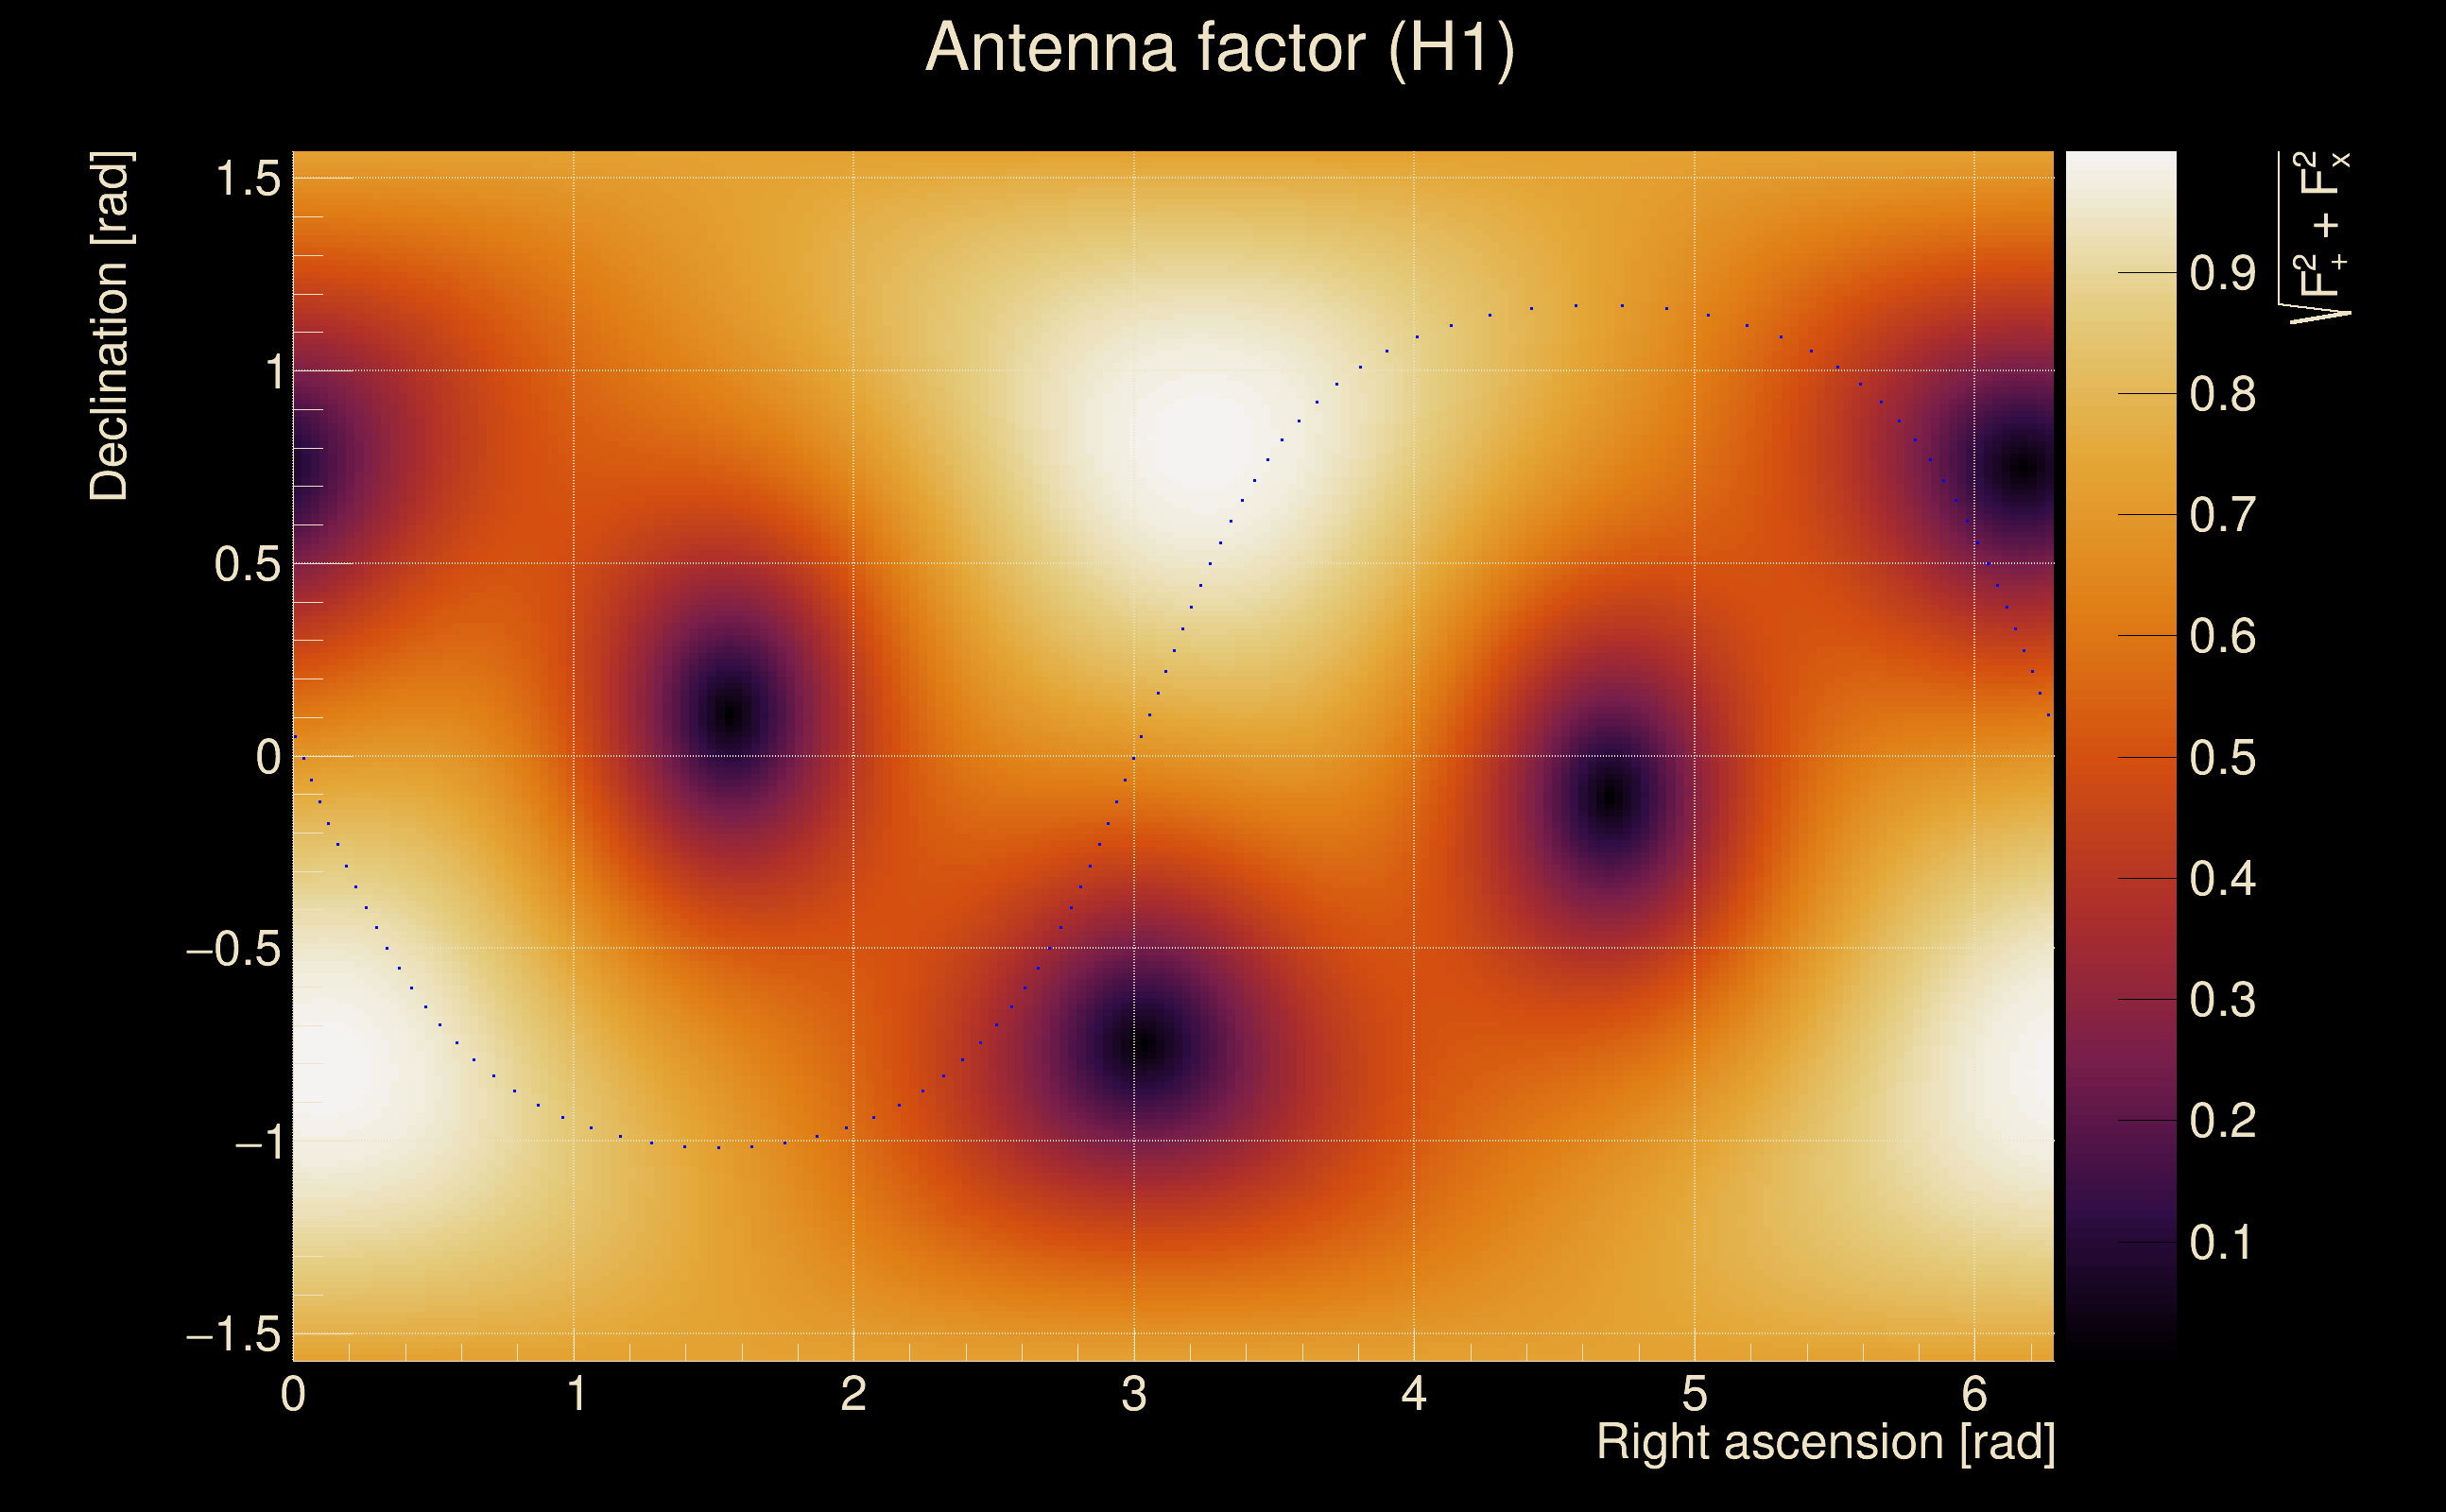
| Target sky positon: | Ra: 3.68109, Dec: 0.94792 [rad] |
| List of input Ox files: | TargIxf_injpt1_tB_file_list.txt (71 files) |
| Analysis result file: | TargIxf_injpt1_tB_results-1.root |
| Slice selected for the the fakeground: | slice index=59 (2.254 s), time lag = 0 s |
| Foreground | Fakeground | Background | ||
|---|---|---|---|---|
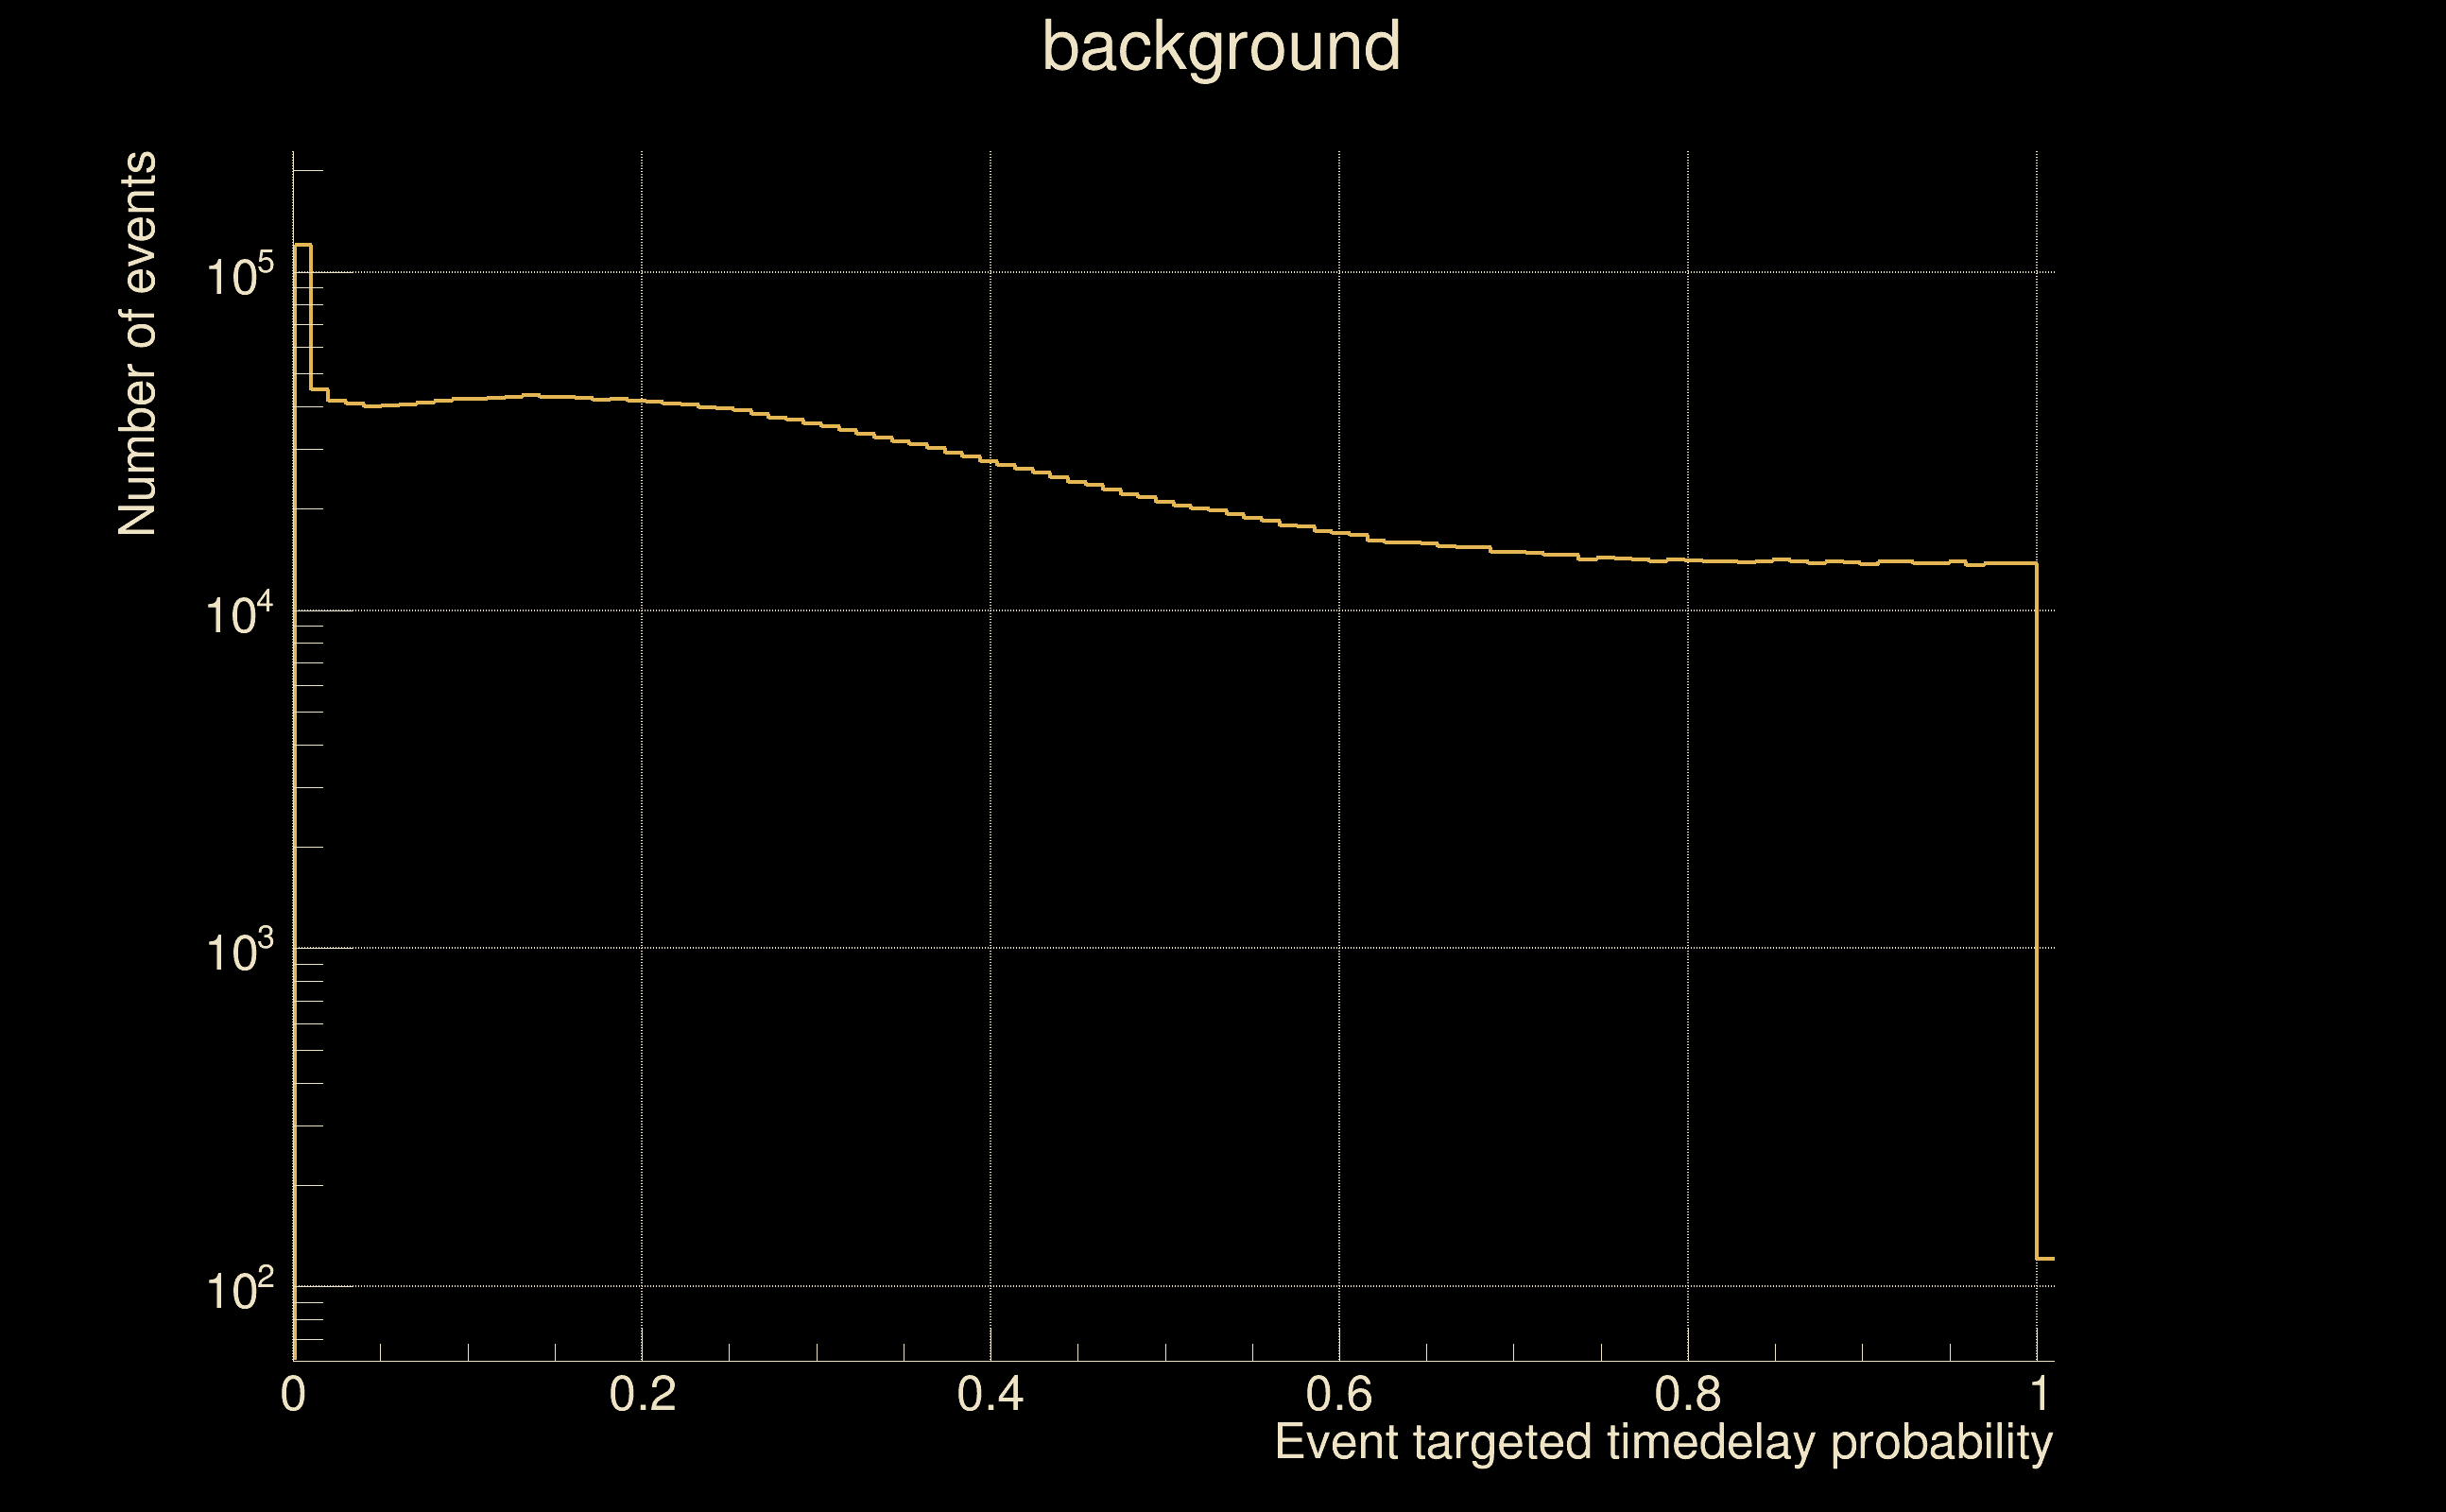
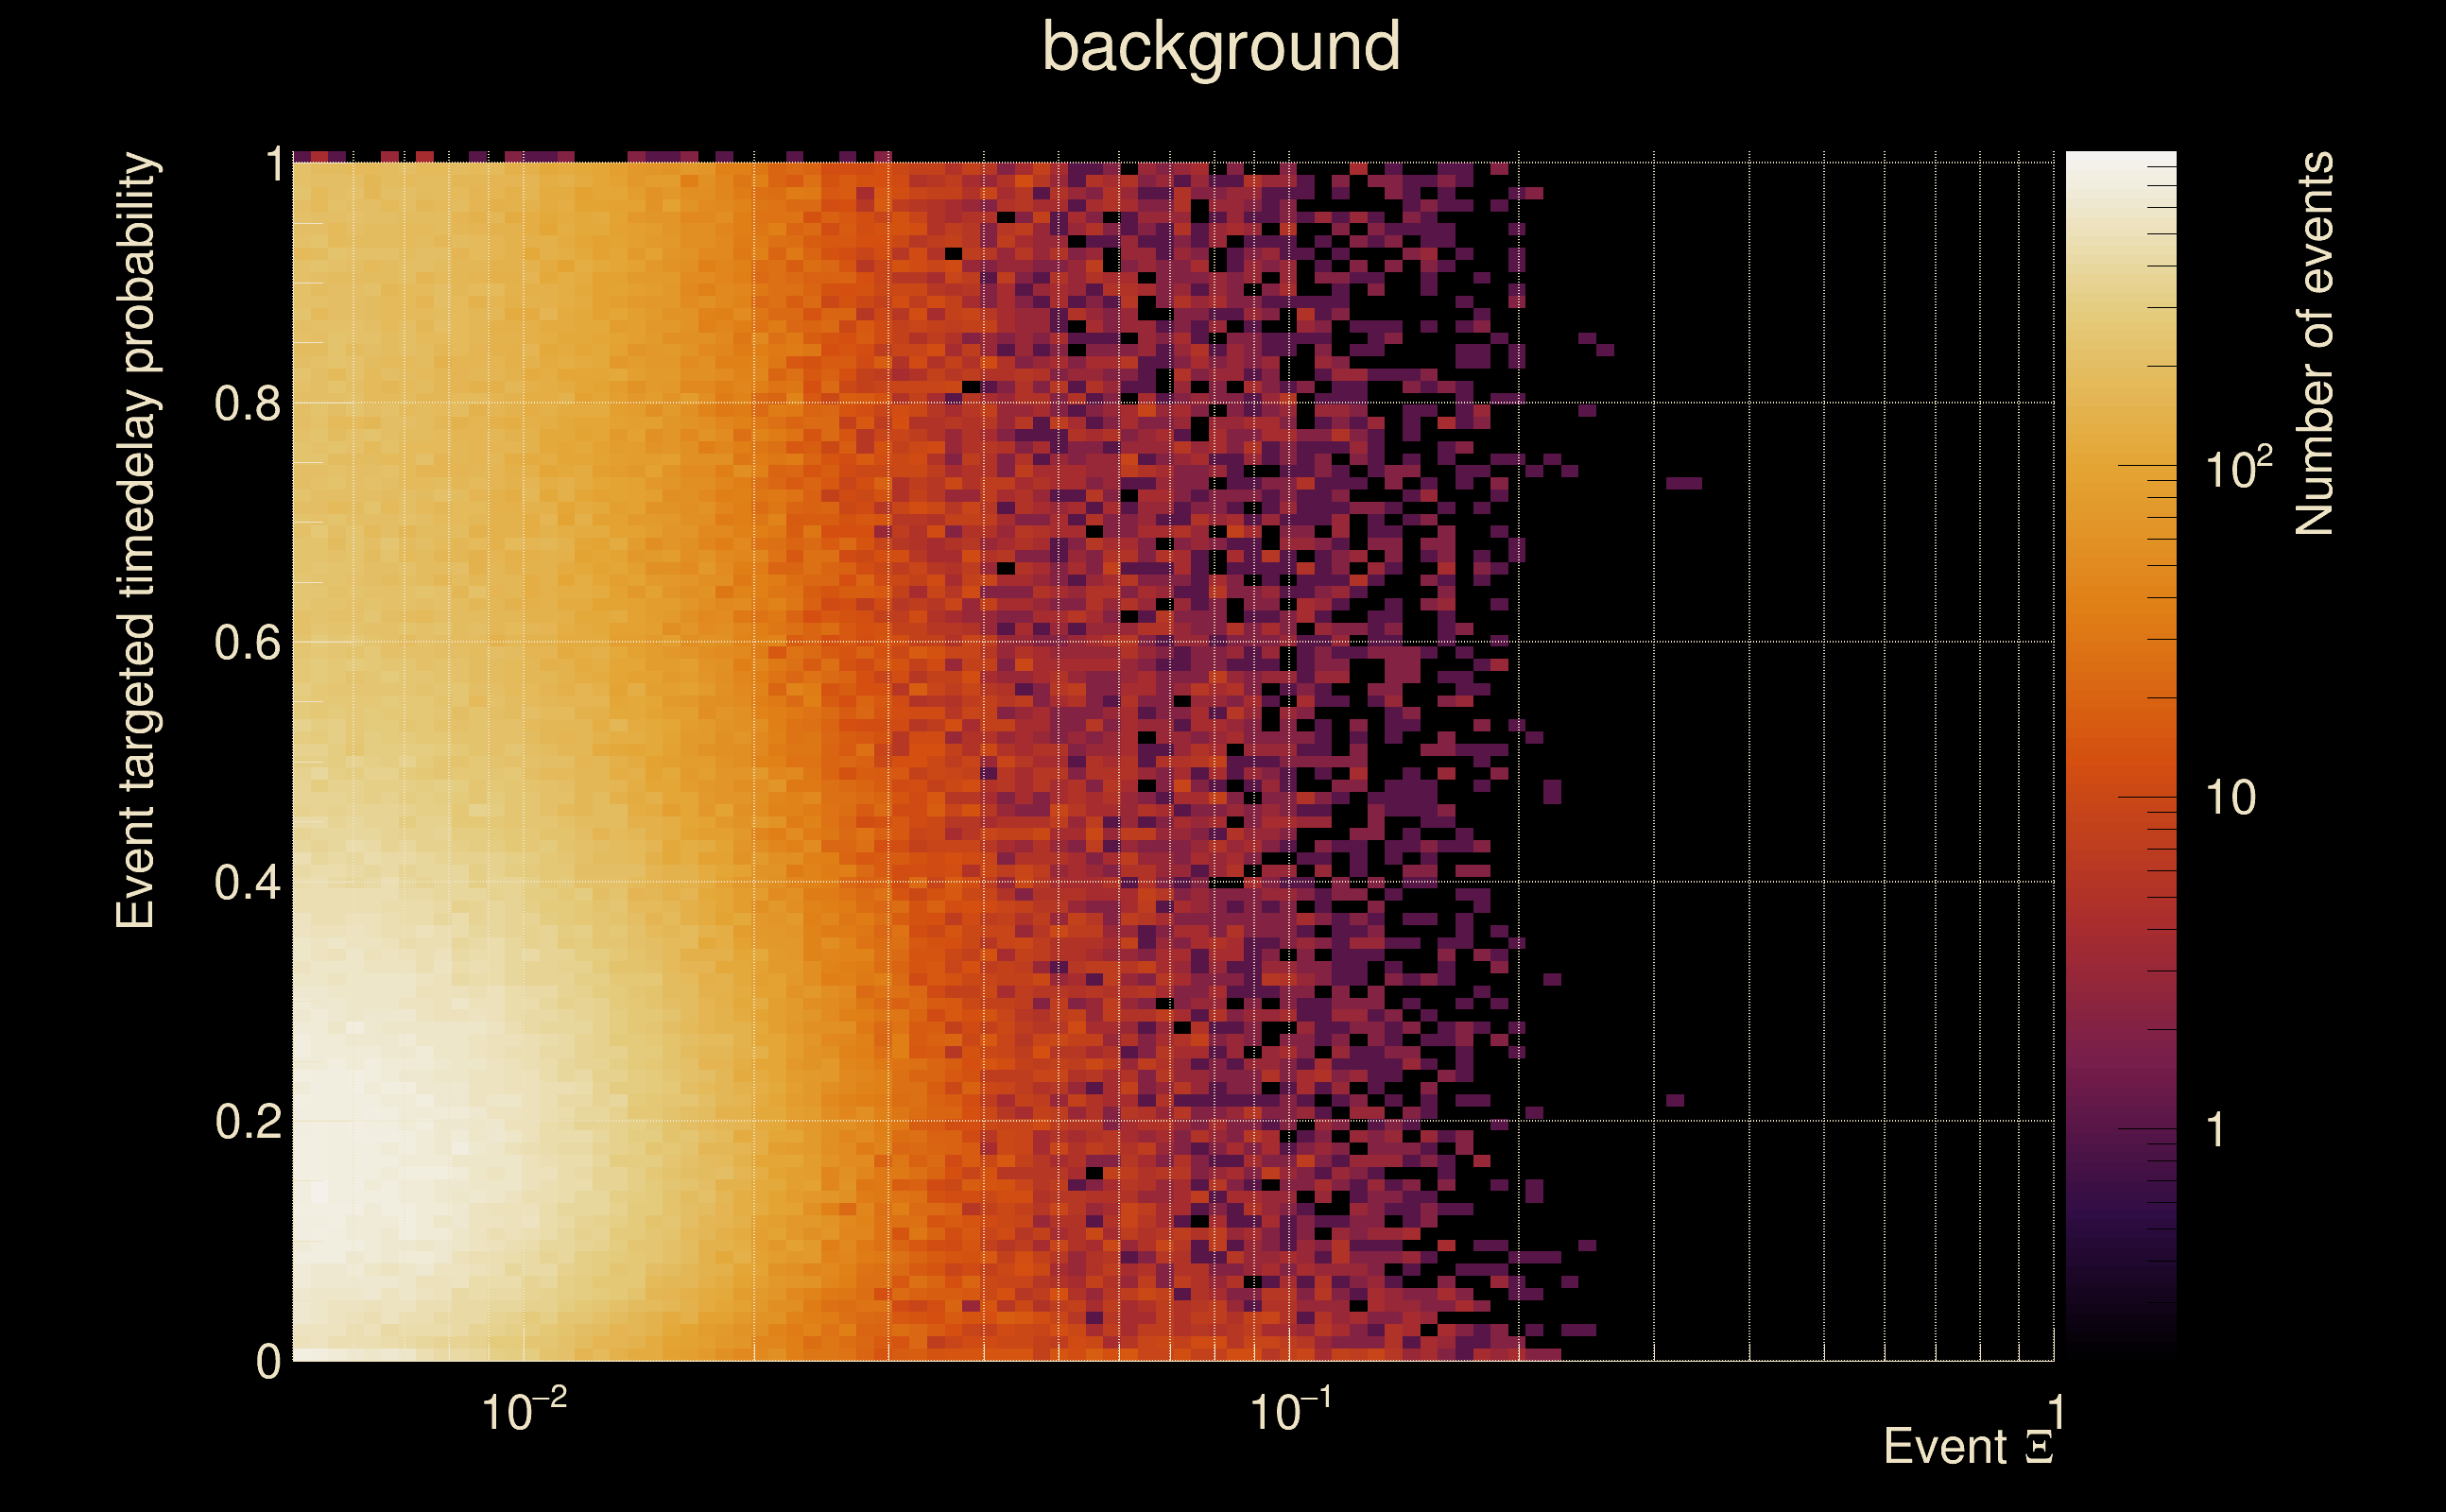
| Number of processed ox events | 12111 | 12111 | 2603865 | |
| Start Date (detector 0) | Mon May 15 14:13:25 2023 UTC | Mon May 15 14:13:25 2023 UTC | Mon May 15 14:13:25 2023 UTC | |
| End Date (detector 0) | Thu May 18 15:54:40 2023 UTC | Thu May 18 15:54:40 2023 UTC | Thu May 18 15:54:40 2023 UTC | |
| Start GPS (detector 0) | 1368195223 | 1368195223 | 1368195223 | |
| End GPS (detector 0) | 1368460498 | 1368460498 | 1368460498 | |
| Used livetime (detector 0) | 60875 s | 60875 s | 60875 s | |
| Start Date (detector 1) | Mon May 15 14:13:25 2023 UTC | Mon May 15 14:13:25 2023 UTC | Mon May 15 14:13:25 2023 UTC | |
| End Date (detector 1) | Thu May 18 15:54:40 2023 UTC | Thu May 18 15:54:40 2023 UTC | Thu May 18 15:54:40 2023 UTC | |
| Start GPS (detector 1) | 1368195223 | 1368195223 | 1368195223 | |
| End GPS (detector 1) | 1368460498 | 1368460498 | 1368460498 | |
| Used livetime (detector 1) | 60875 s | 60875 s | 60875 s | |
| Cumulative livetime | 121110 s | 121110 s | 26038650 s | |
| 0 years, 1 days, 9 hours, 38 min, 30 s | 0 years, 1 days, 9 hours, 38 min, 30 s | 0 years, 301 days, 8 hours, 57 min, 30 s |
|
|
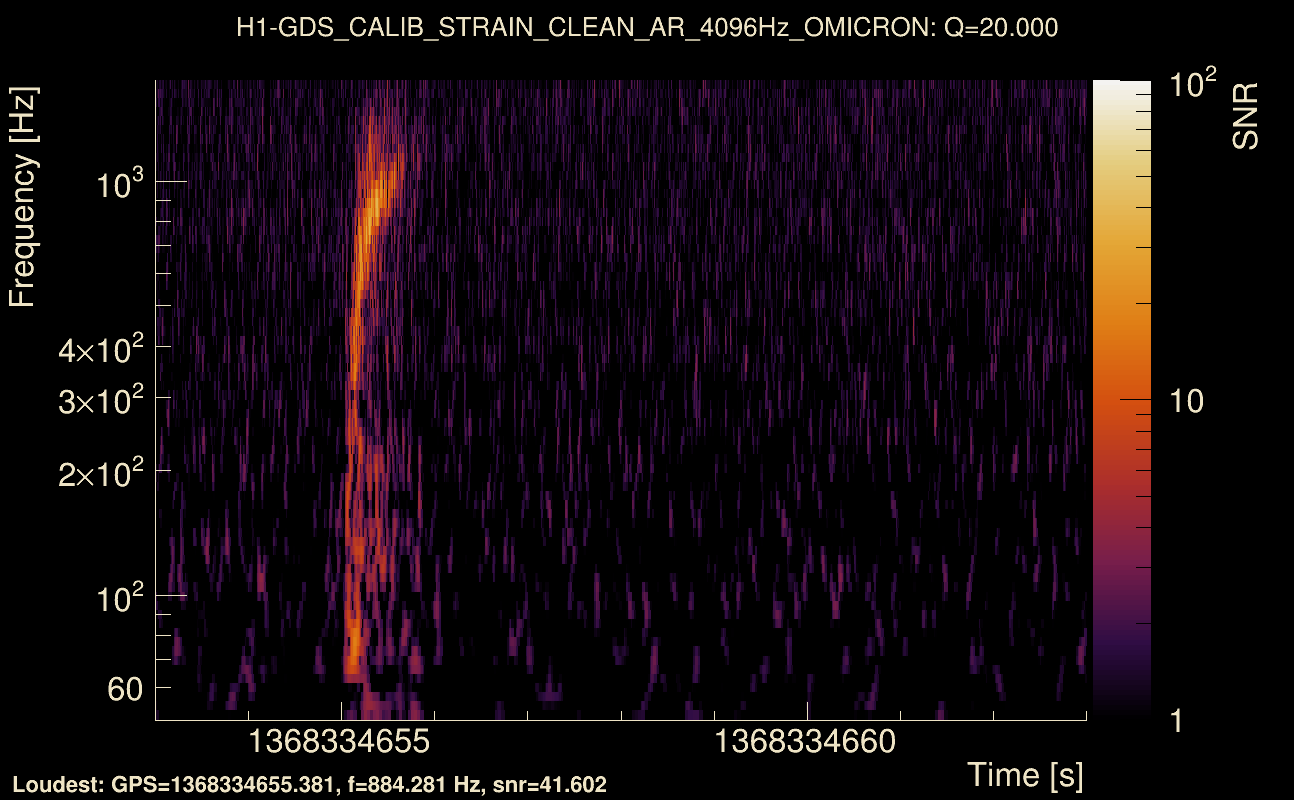
| Event time t(H1): | GPS = 1368334653 (Wed May 17 04:57:15 2023 ) → GPS = 1368334663 (Wed May 17 04:57:25 2023 ) |
| Event time t(L1): | GPS = 1368334653 (Wed May 17 04:57:25 2023 ) → GPS = 1368334663 (Wed May 17 04:57:25 2023 ) |
| Omicron analysis time window (H1): | GPS = 1368334650 → GPS = 1368334666 |
| Omicron analysis time window (L1): | GPS = 1368334650 → GPS = 1368334666 |
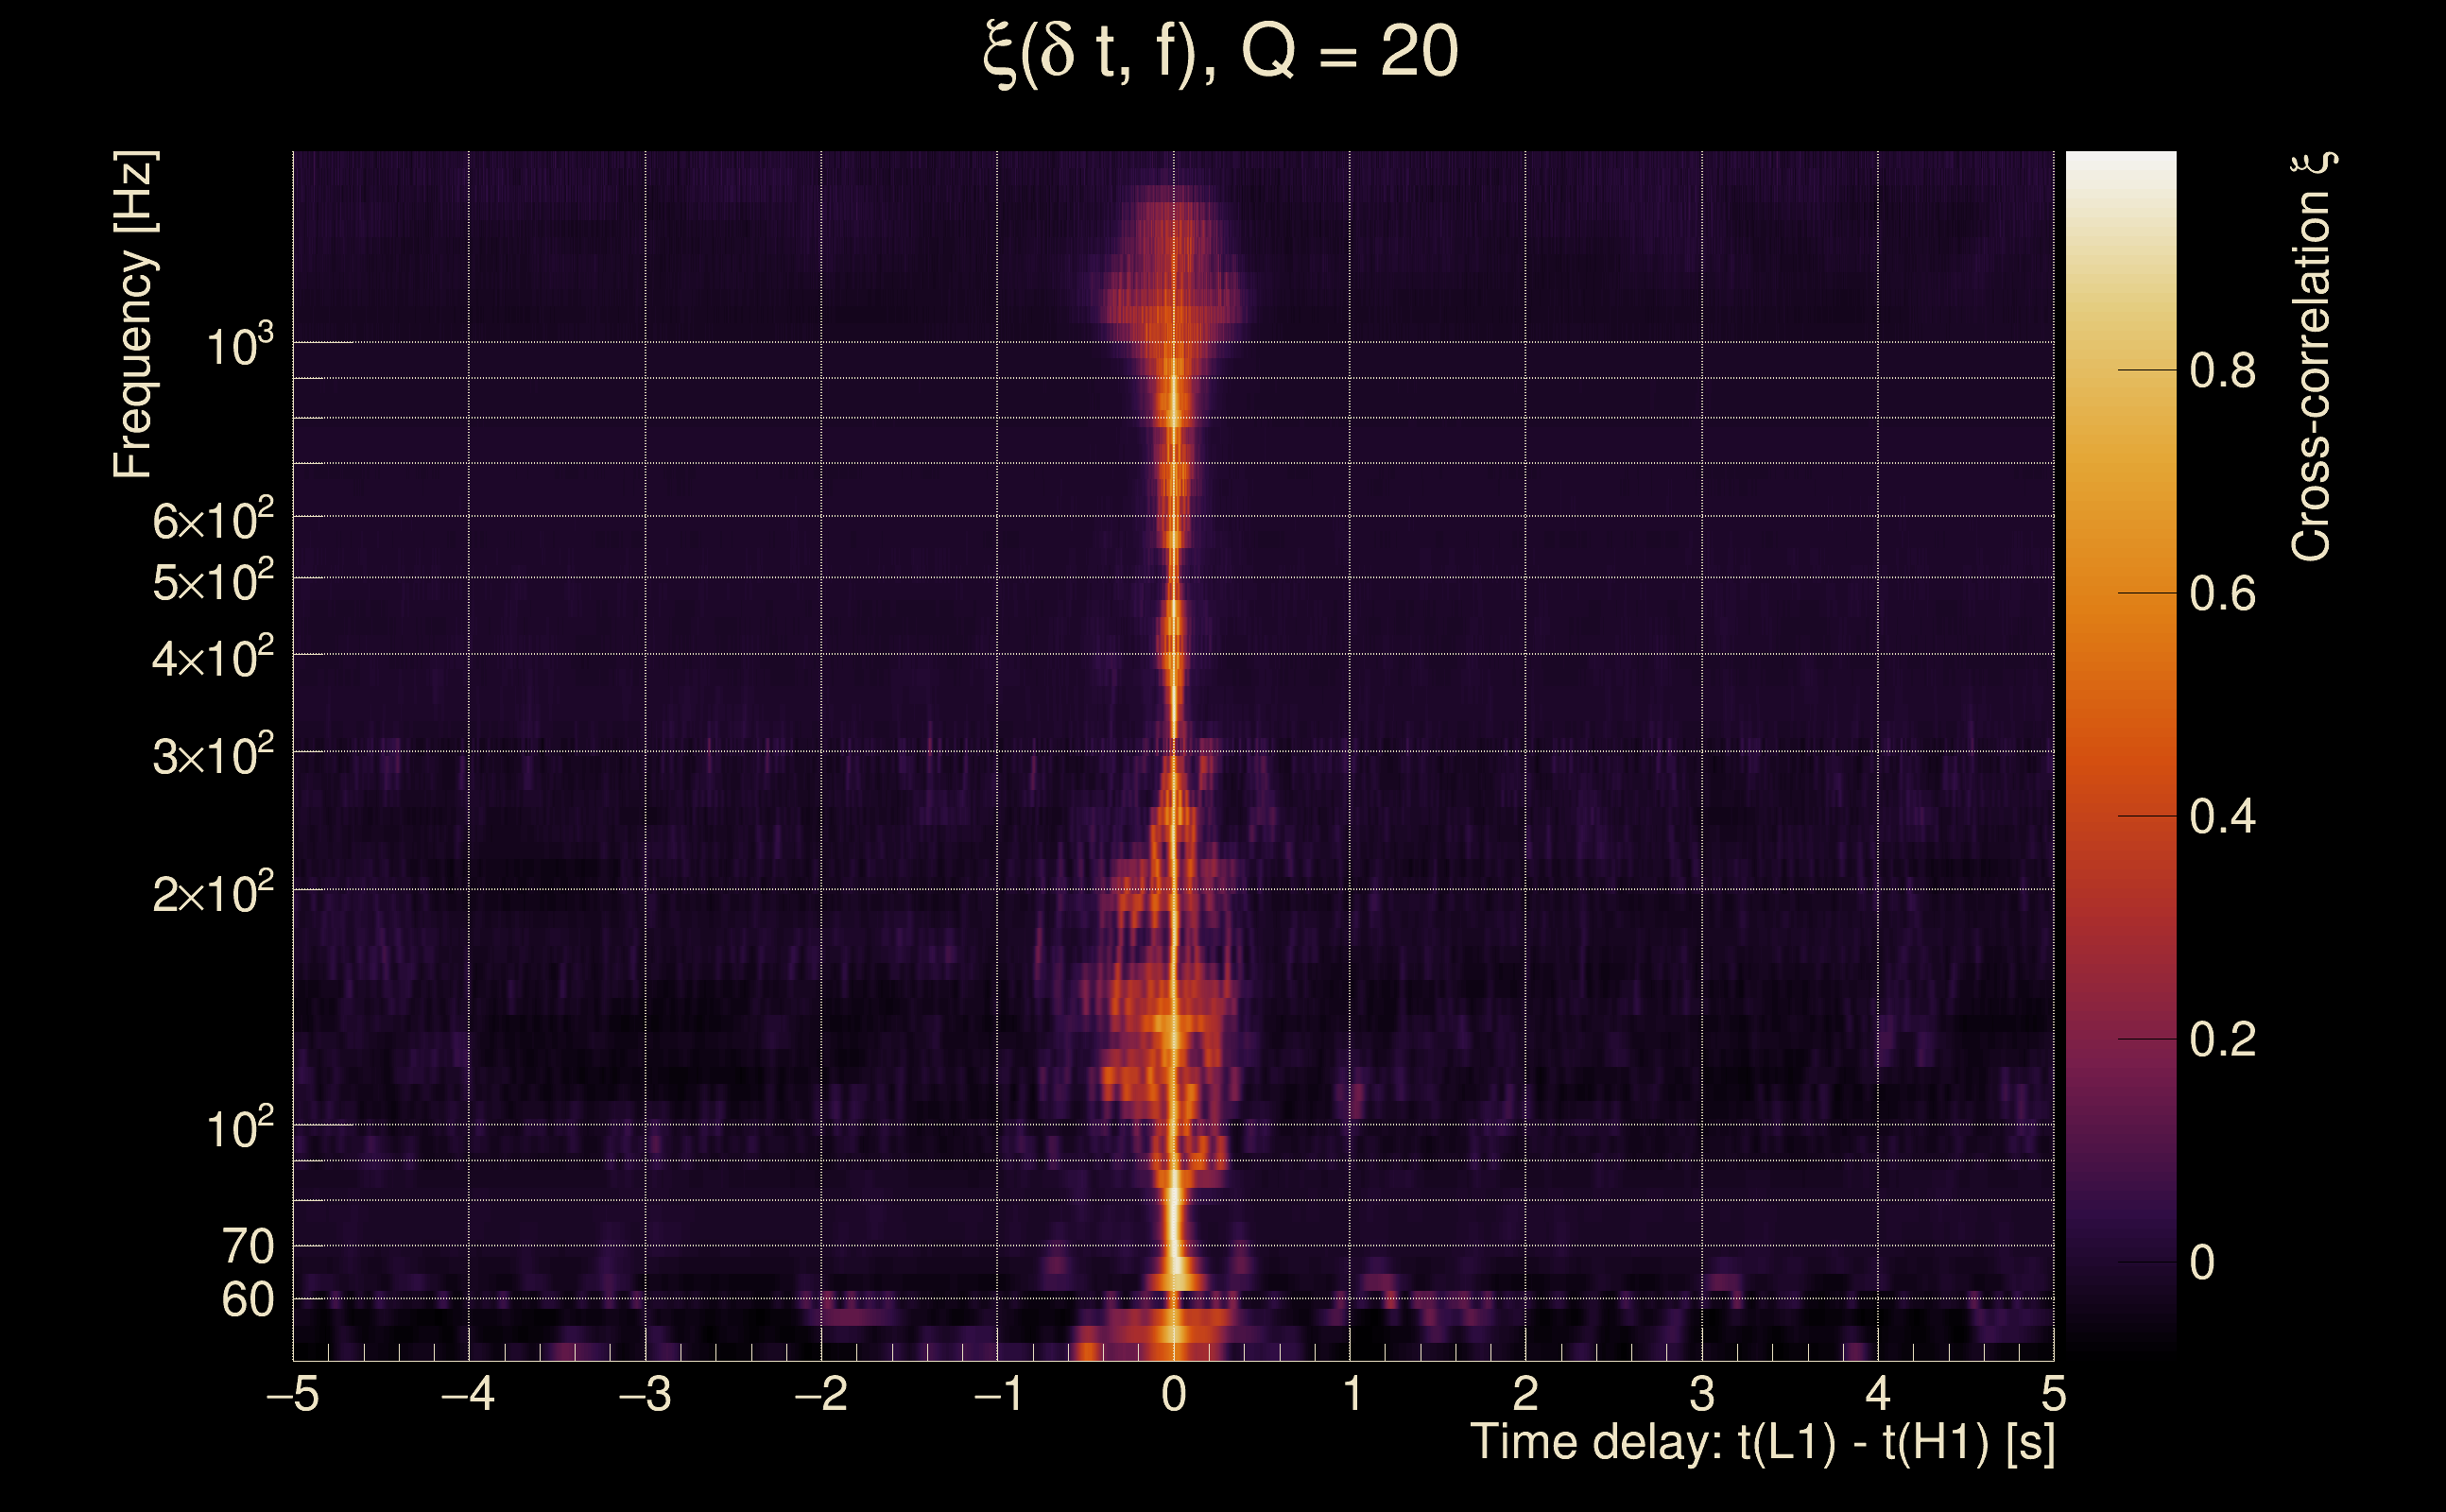
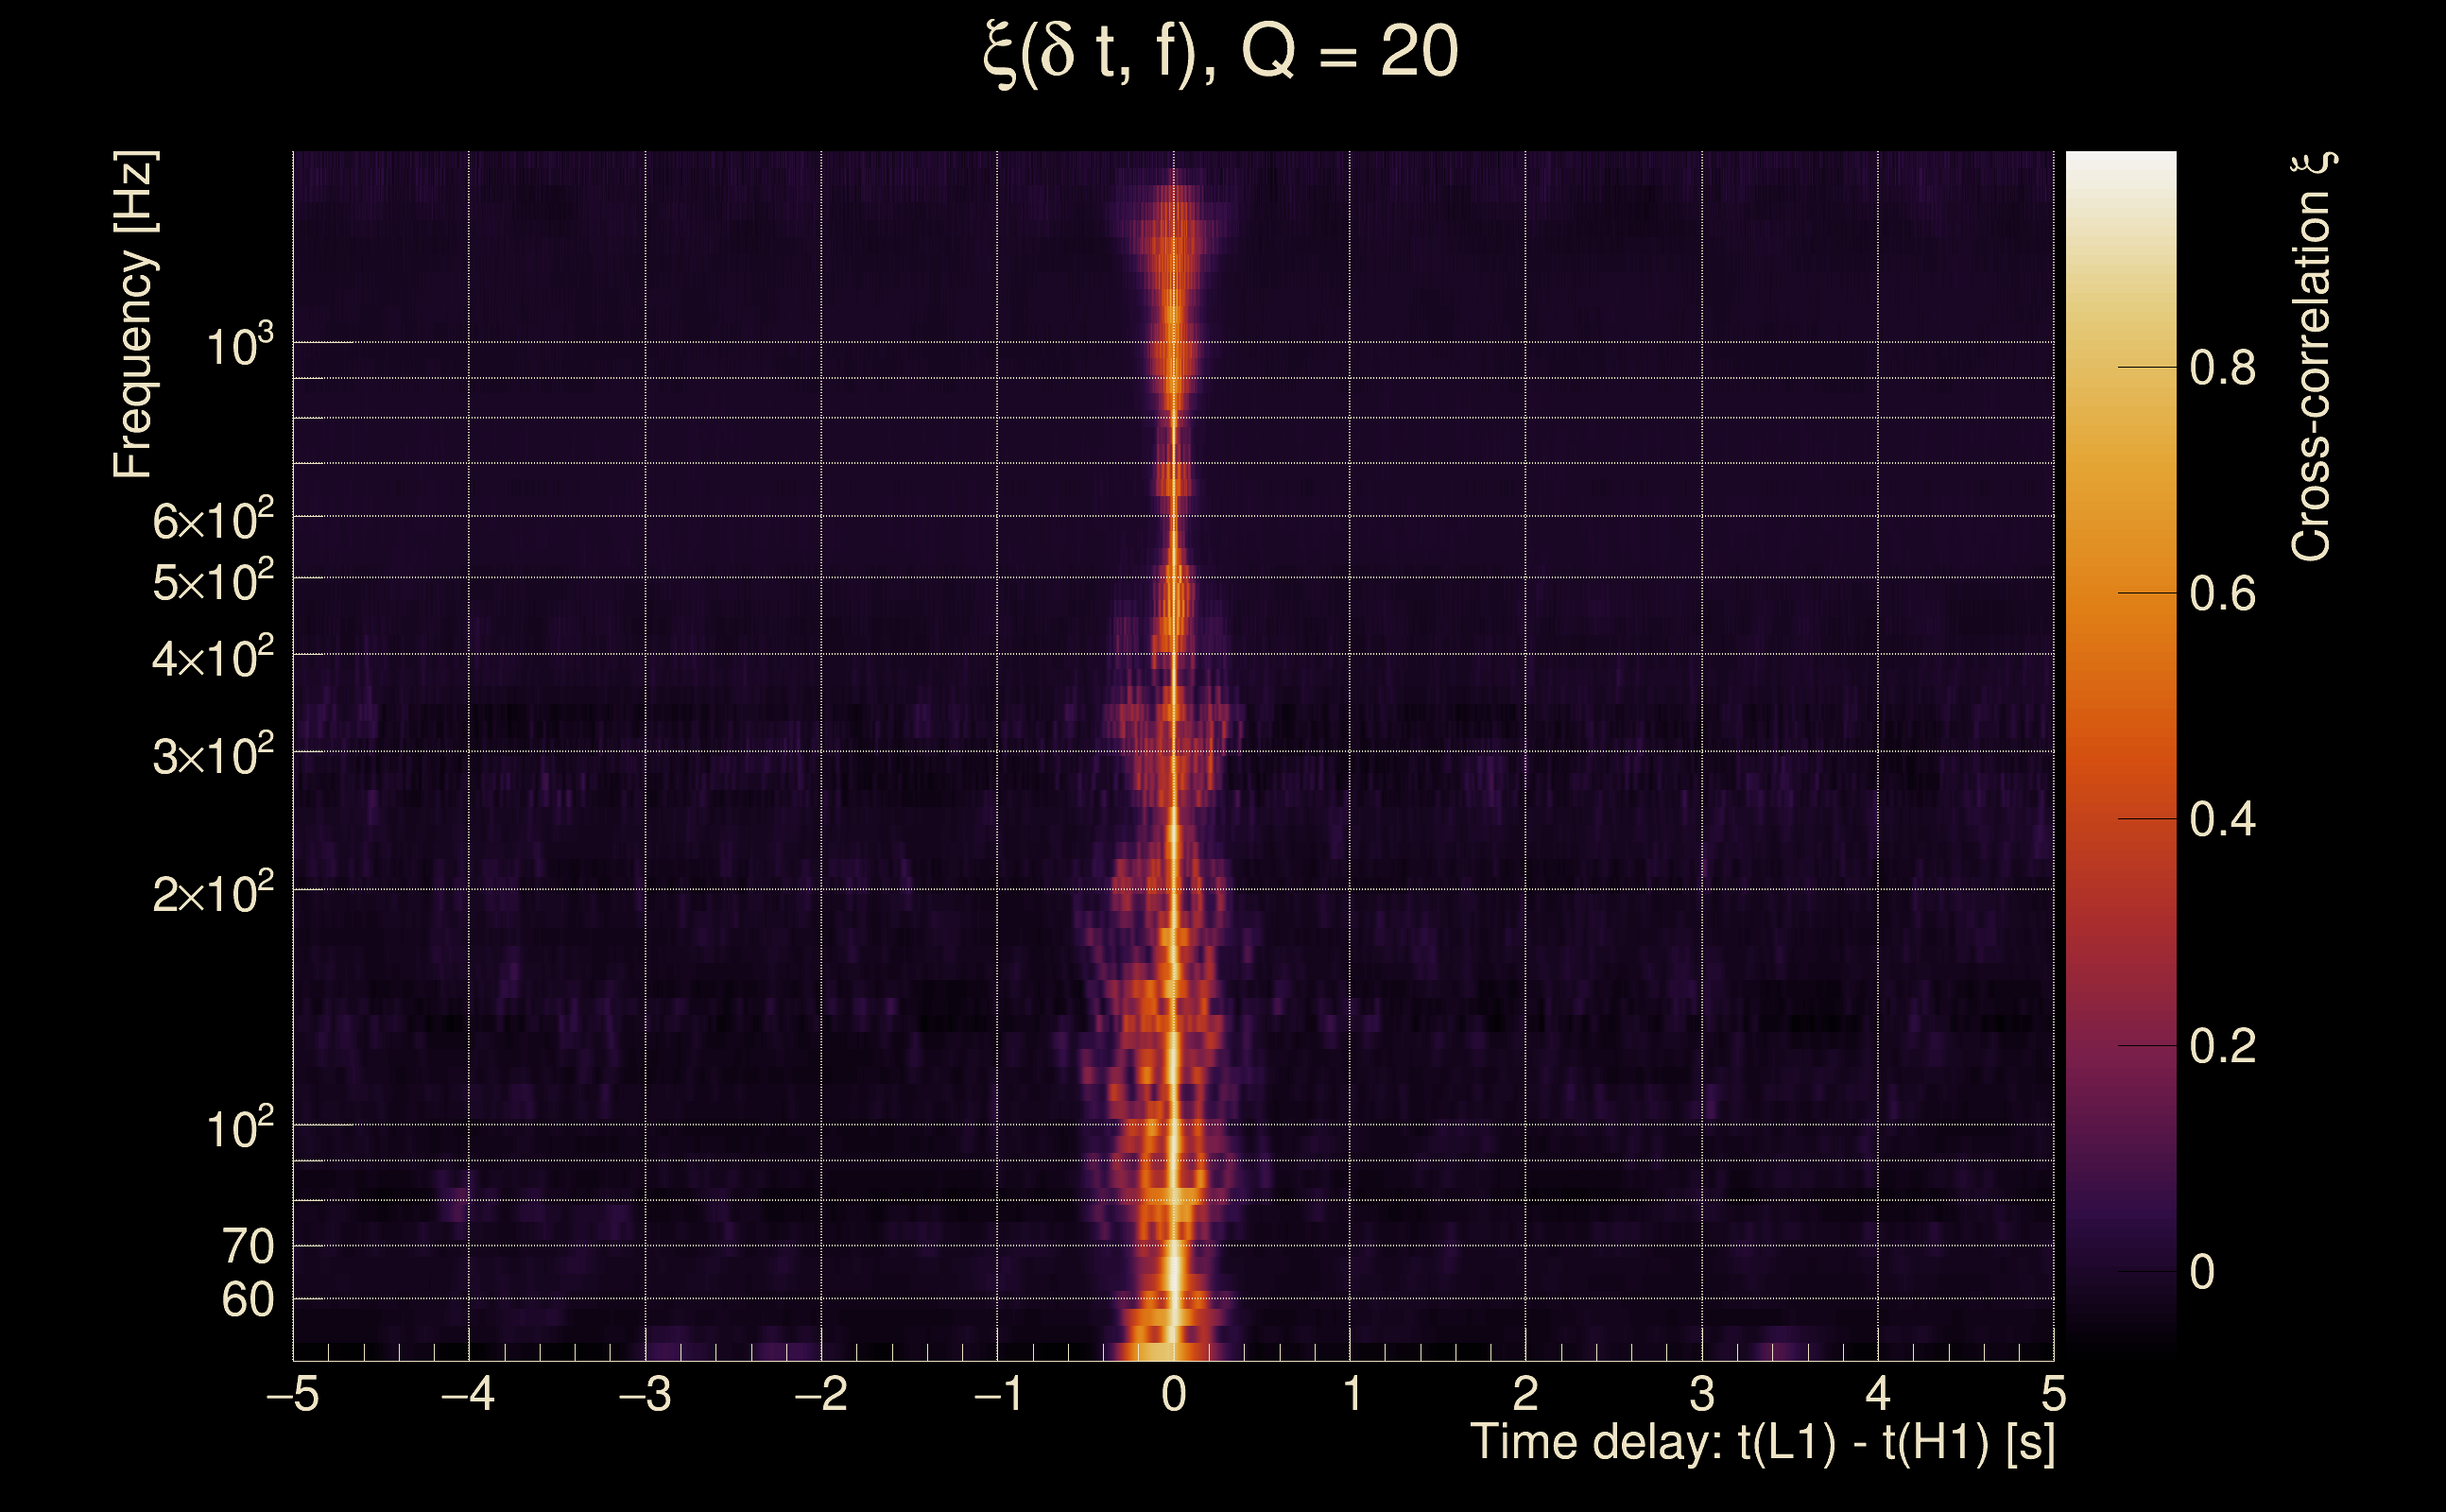
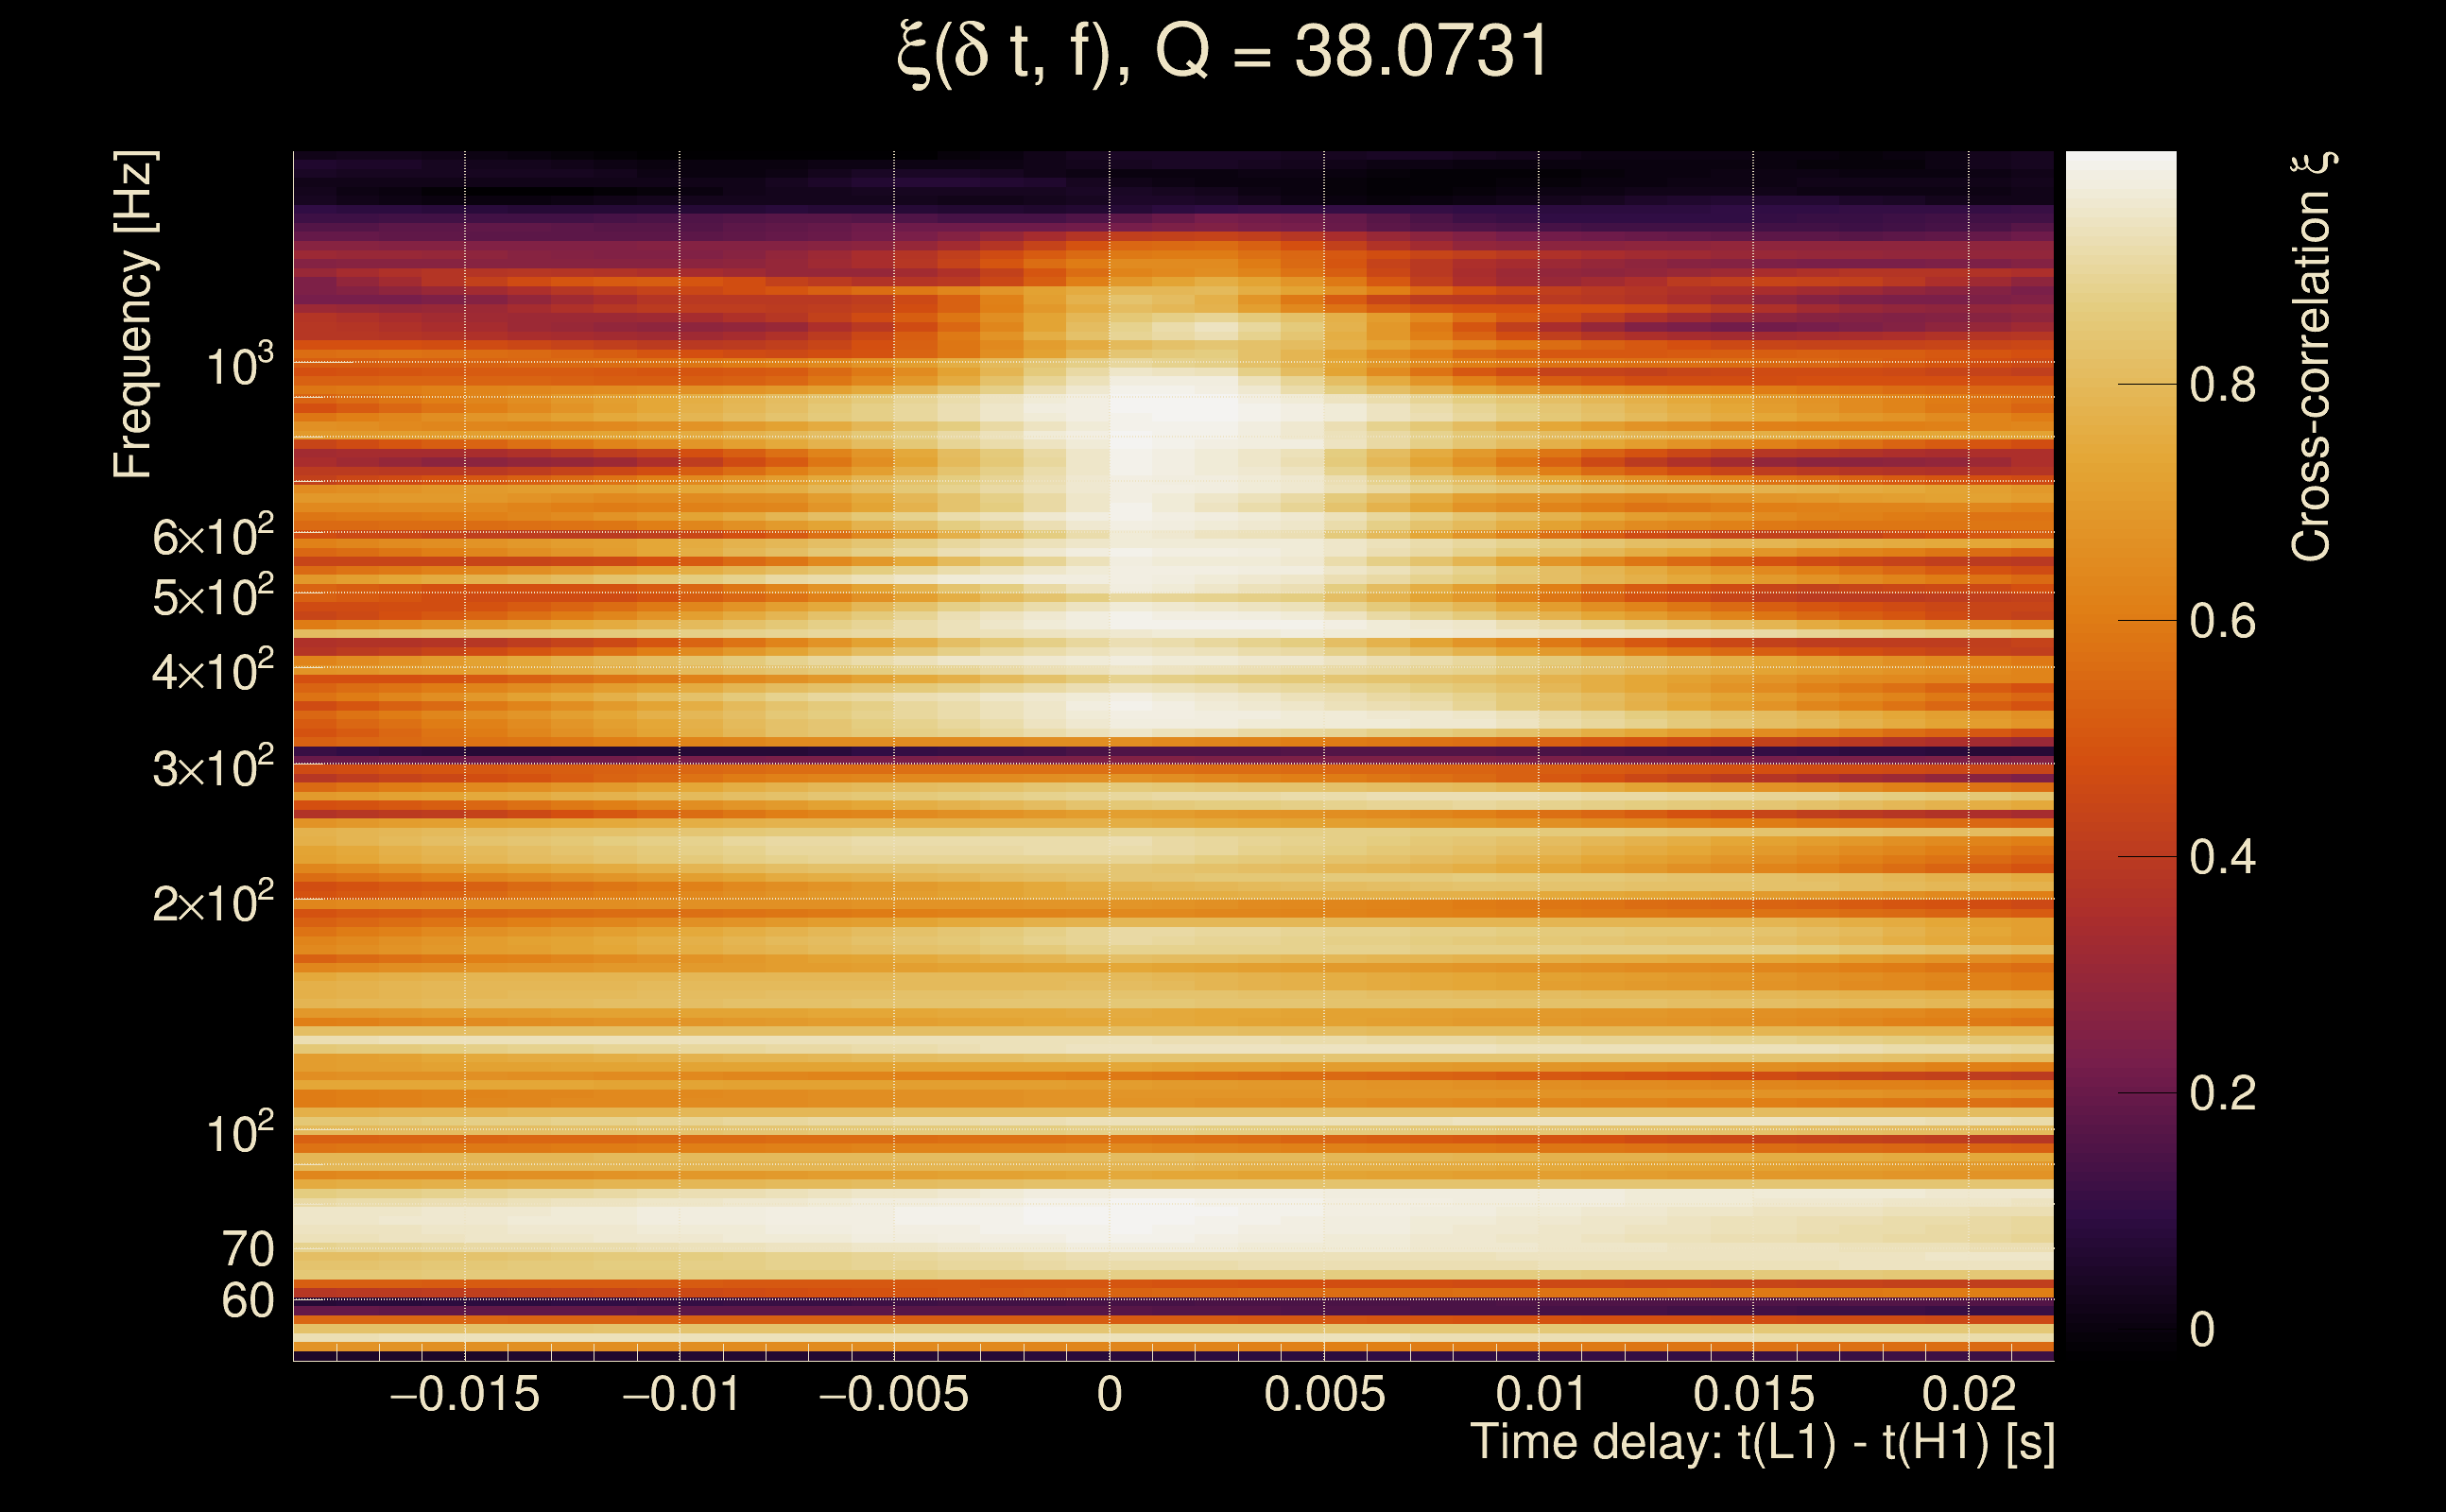
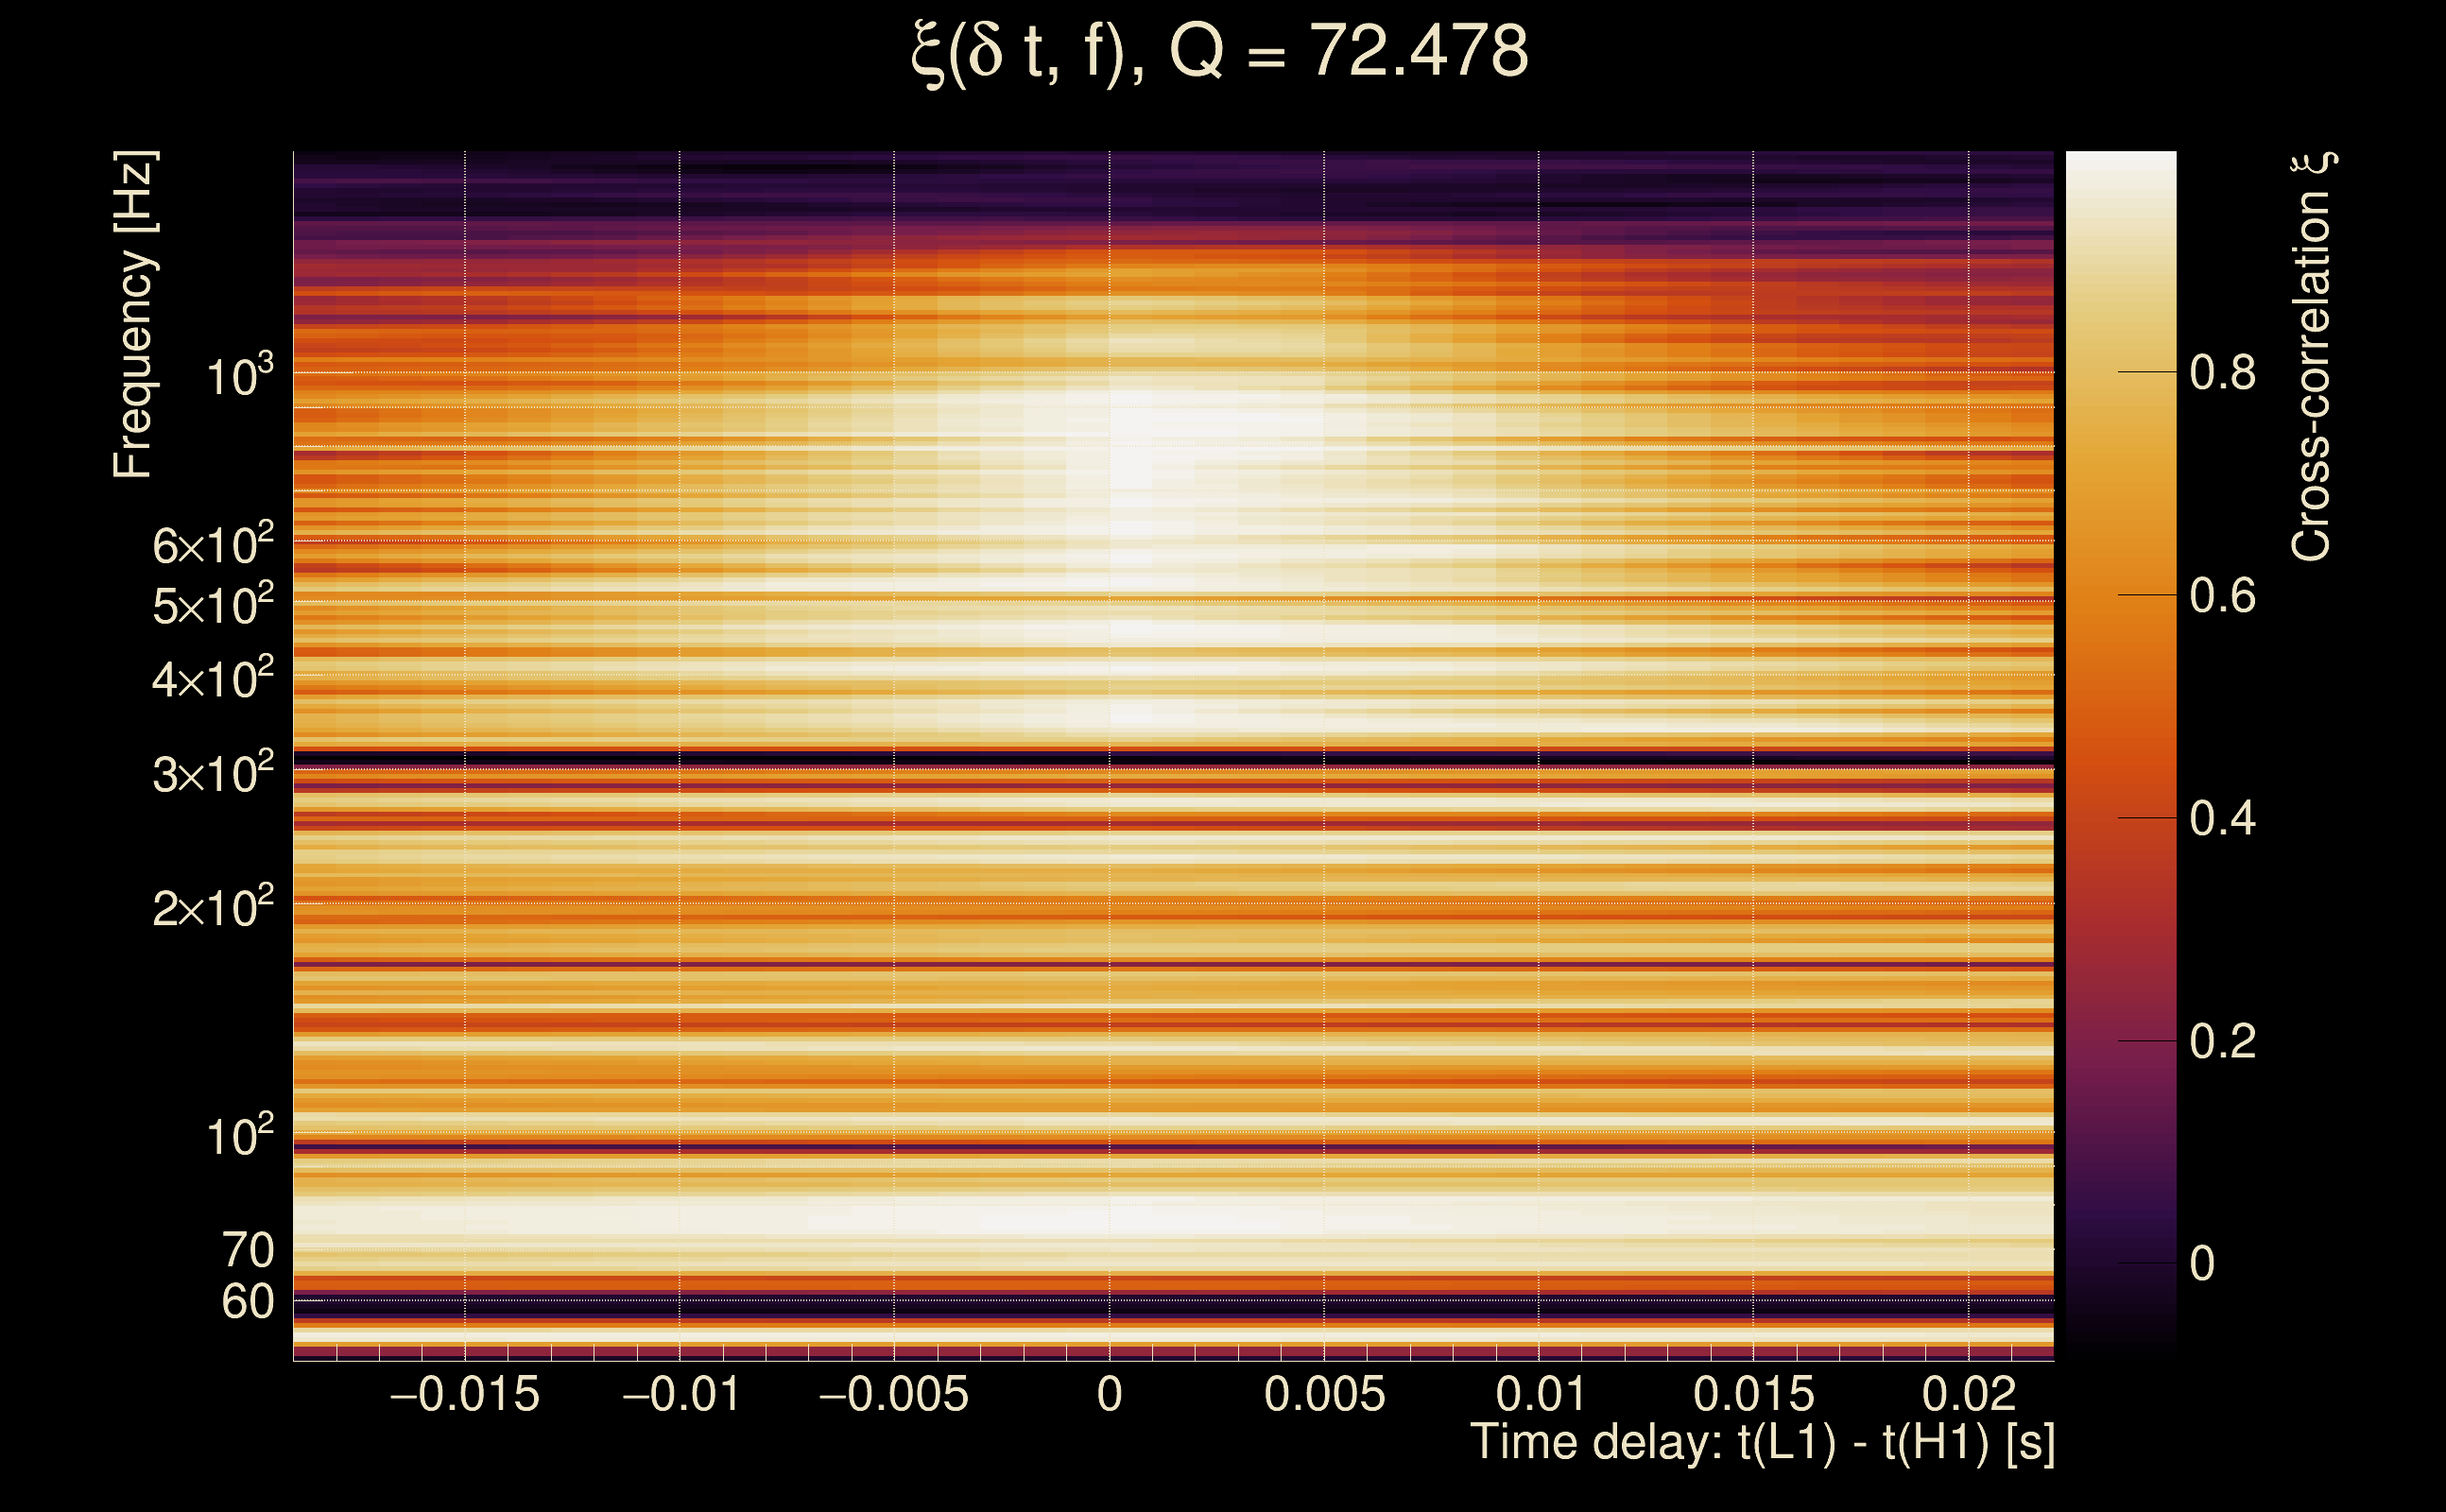
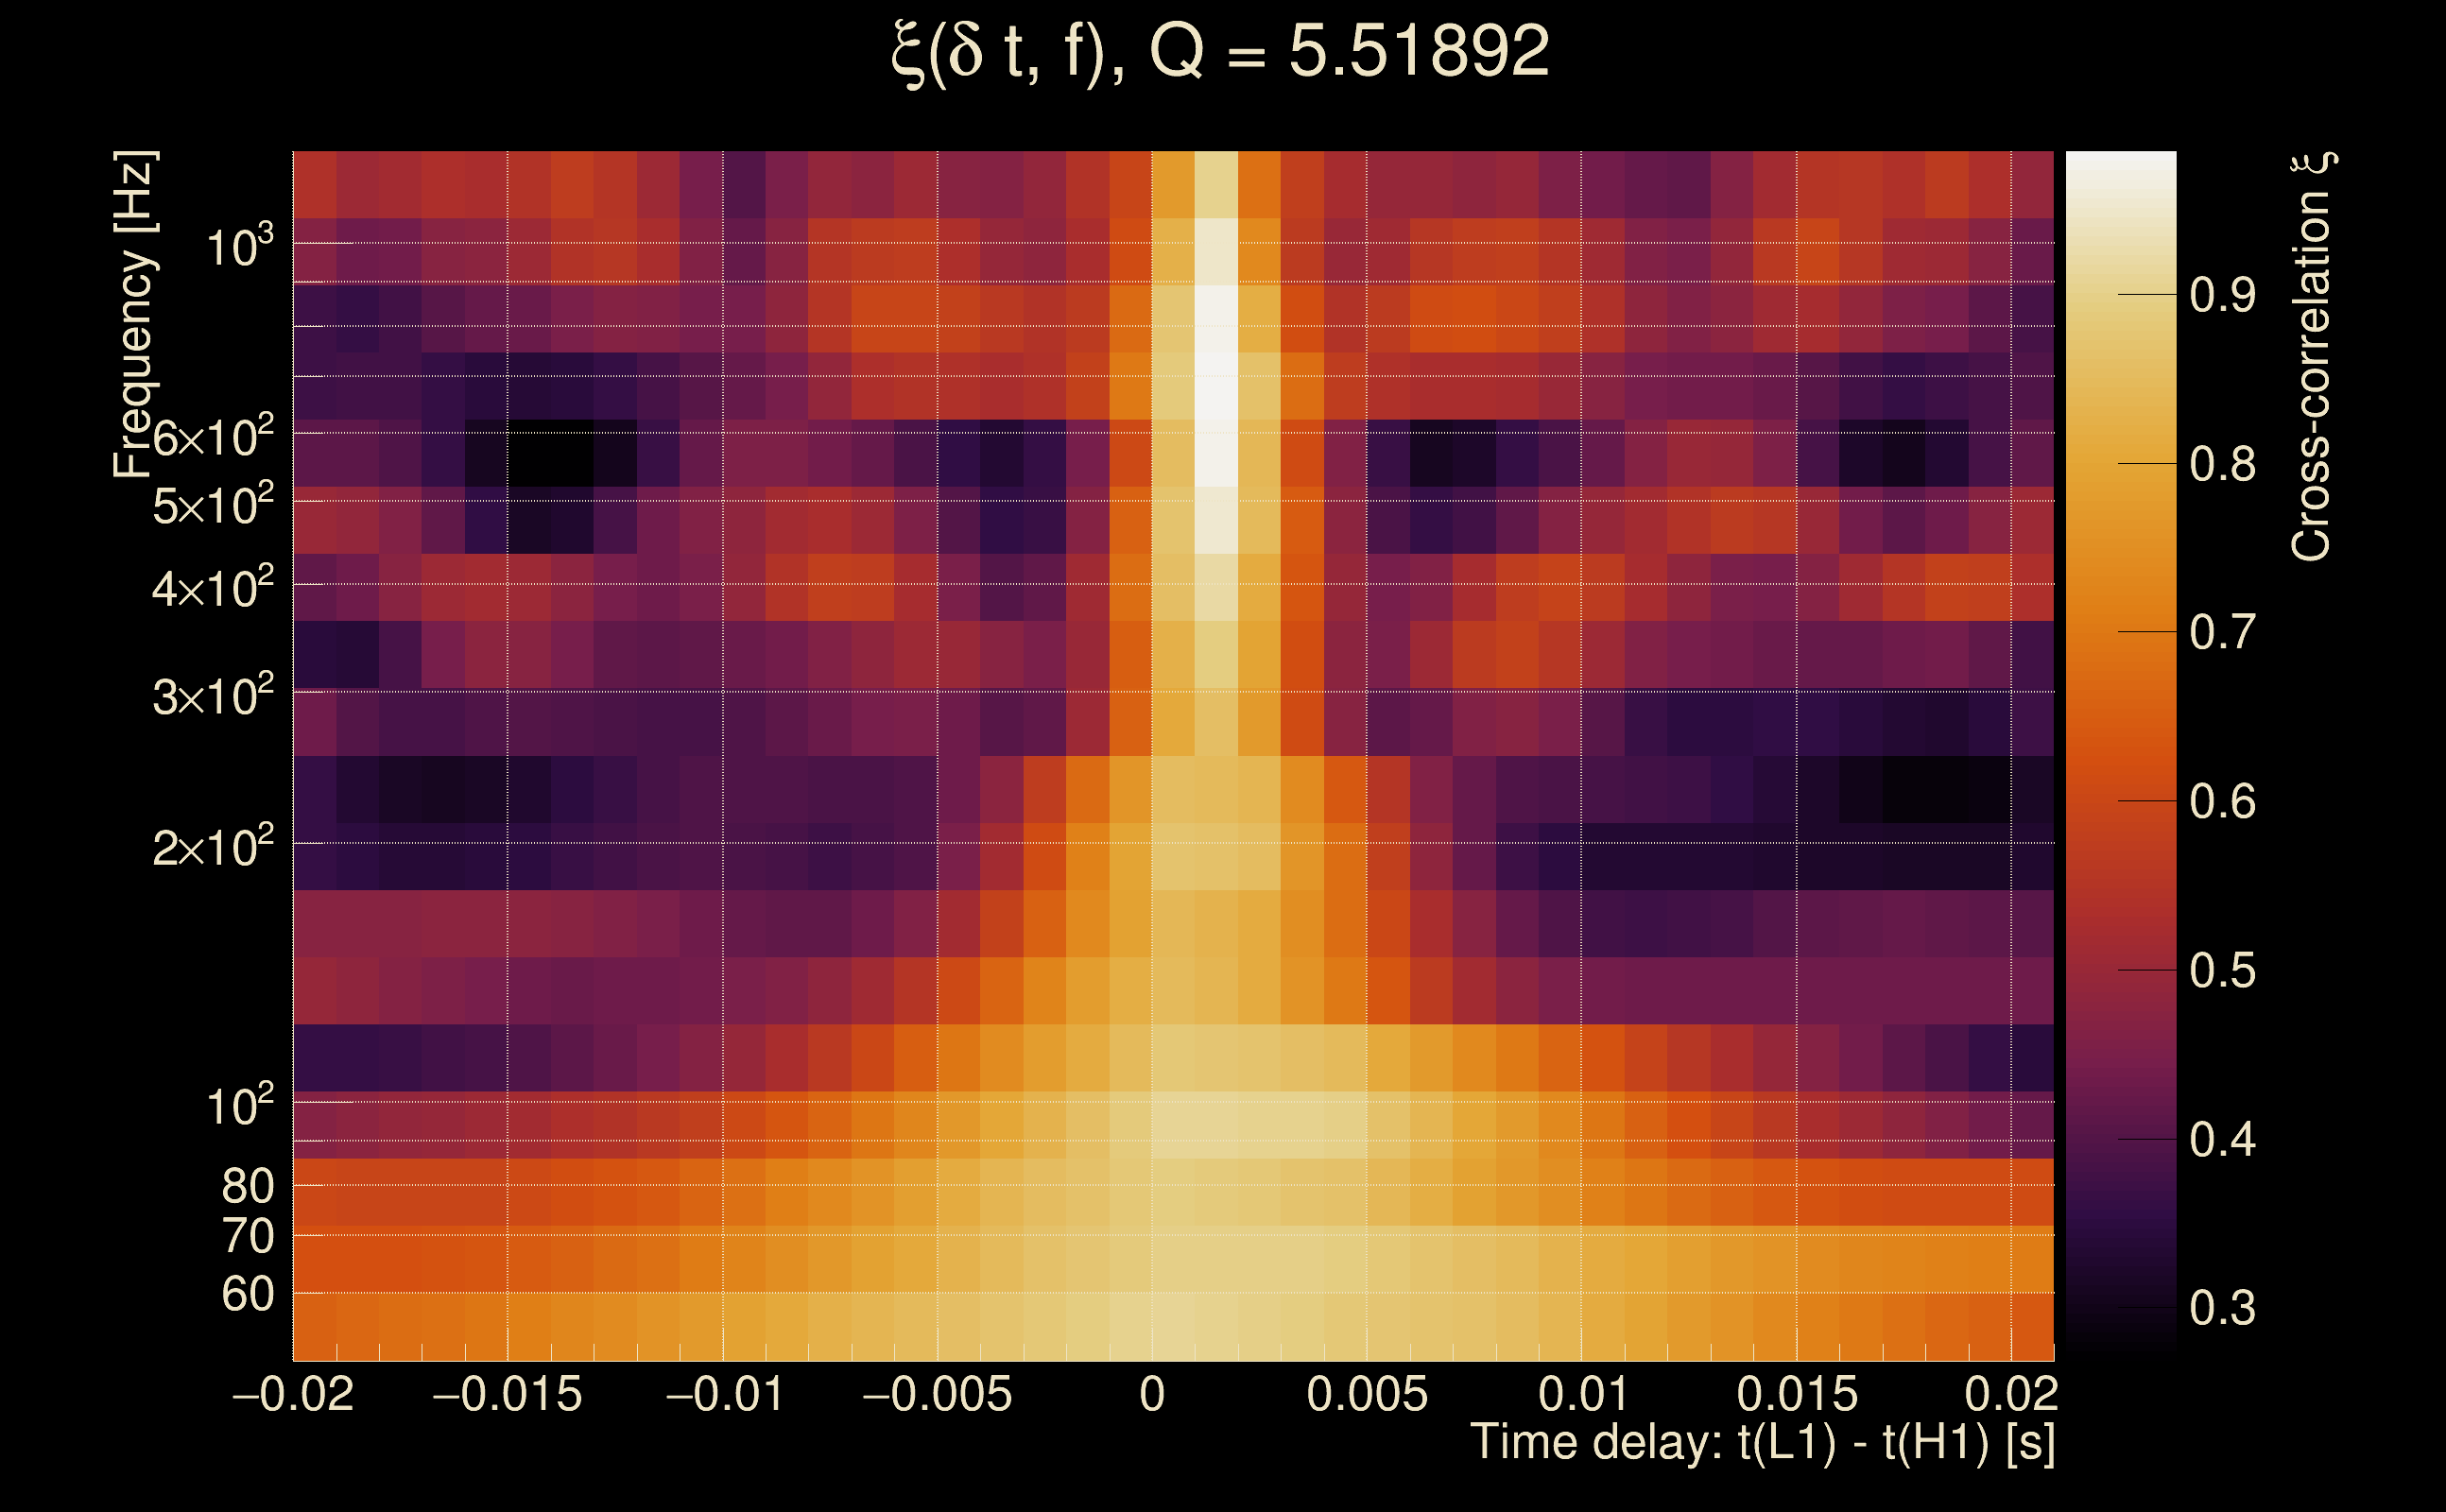
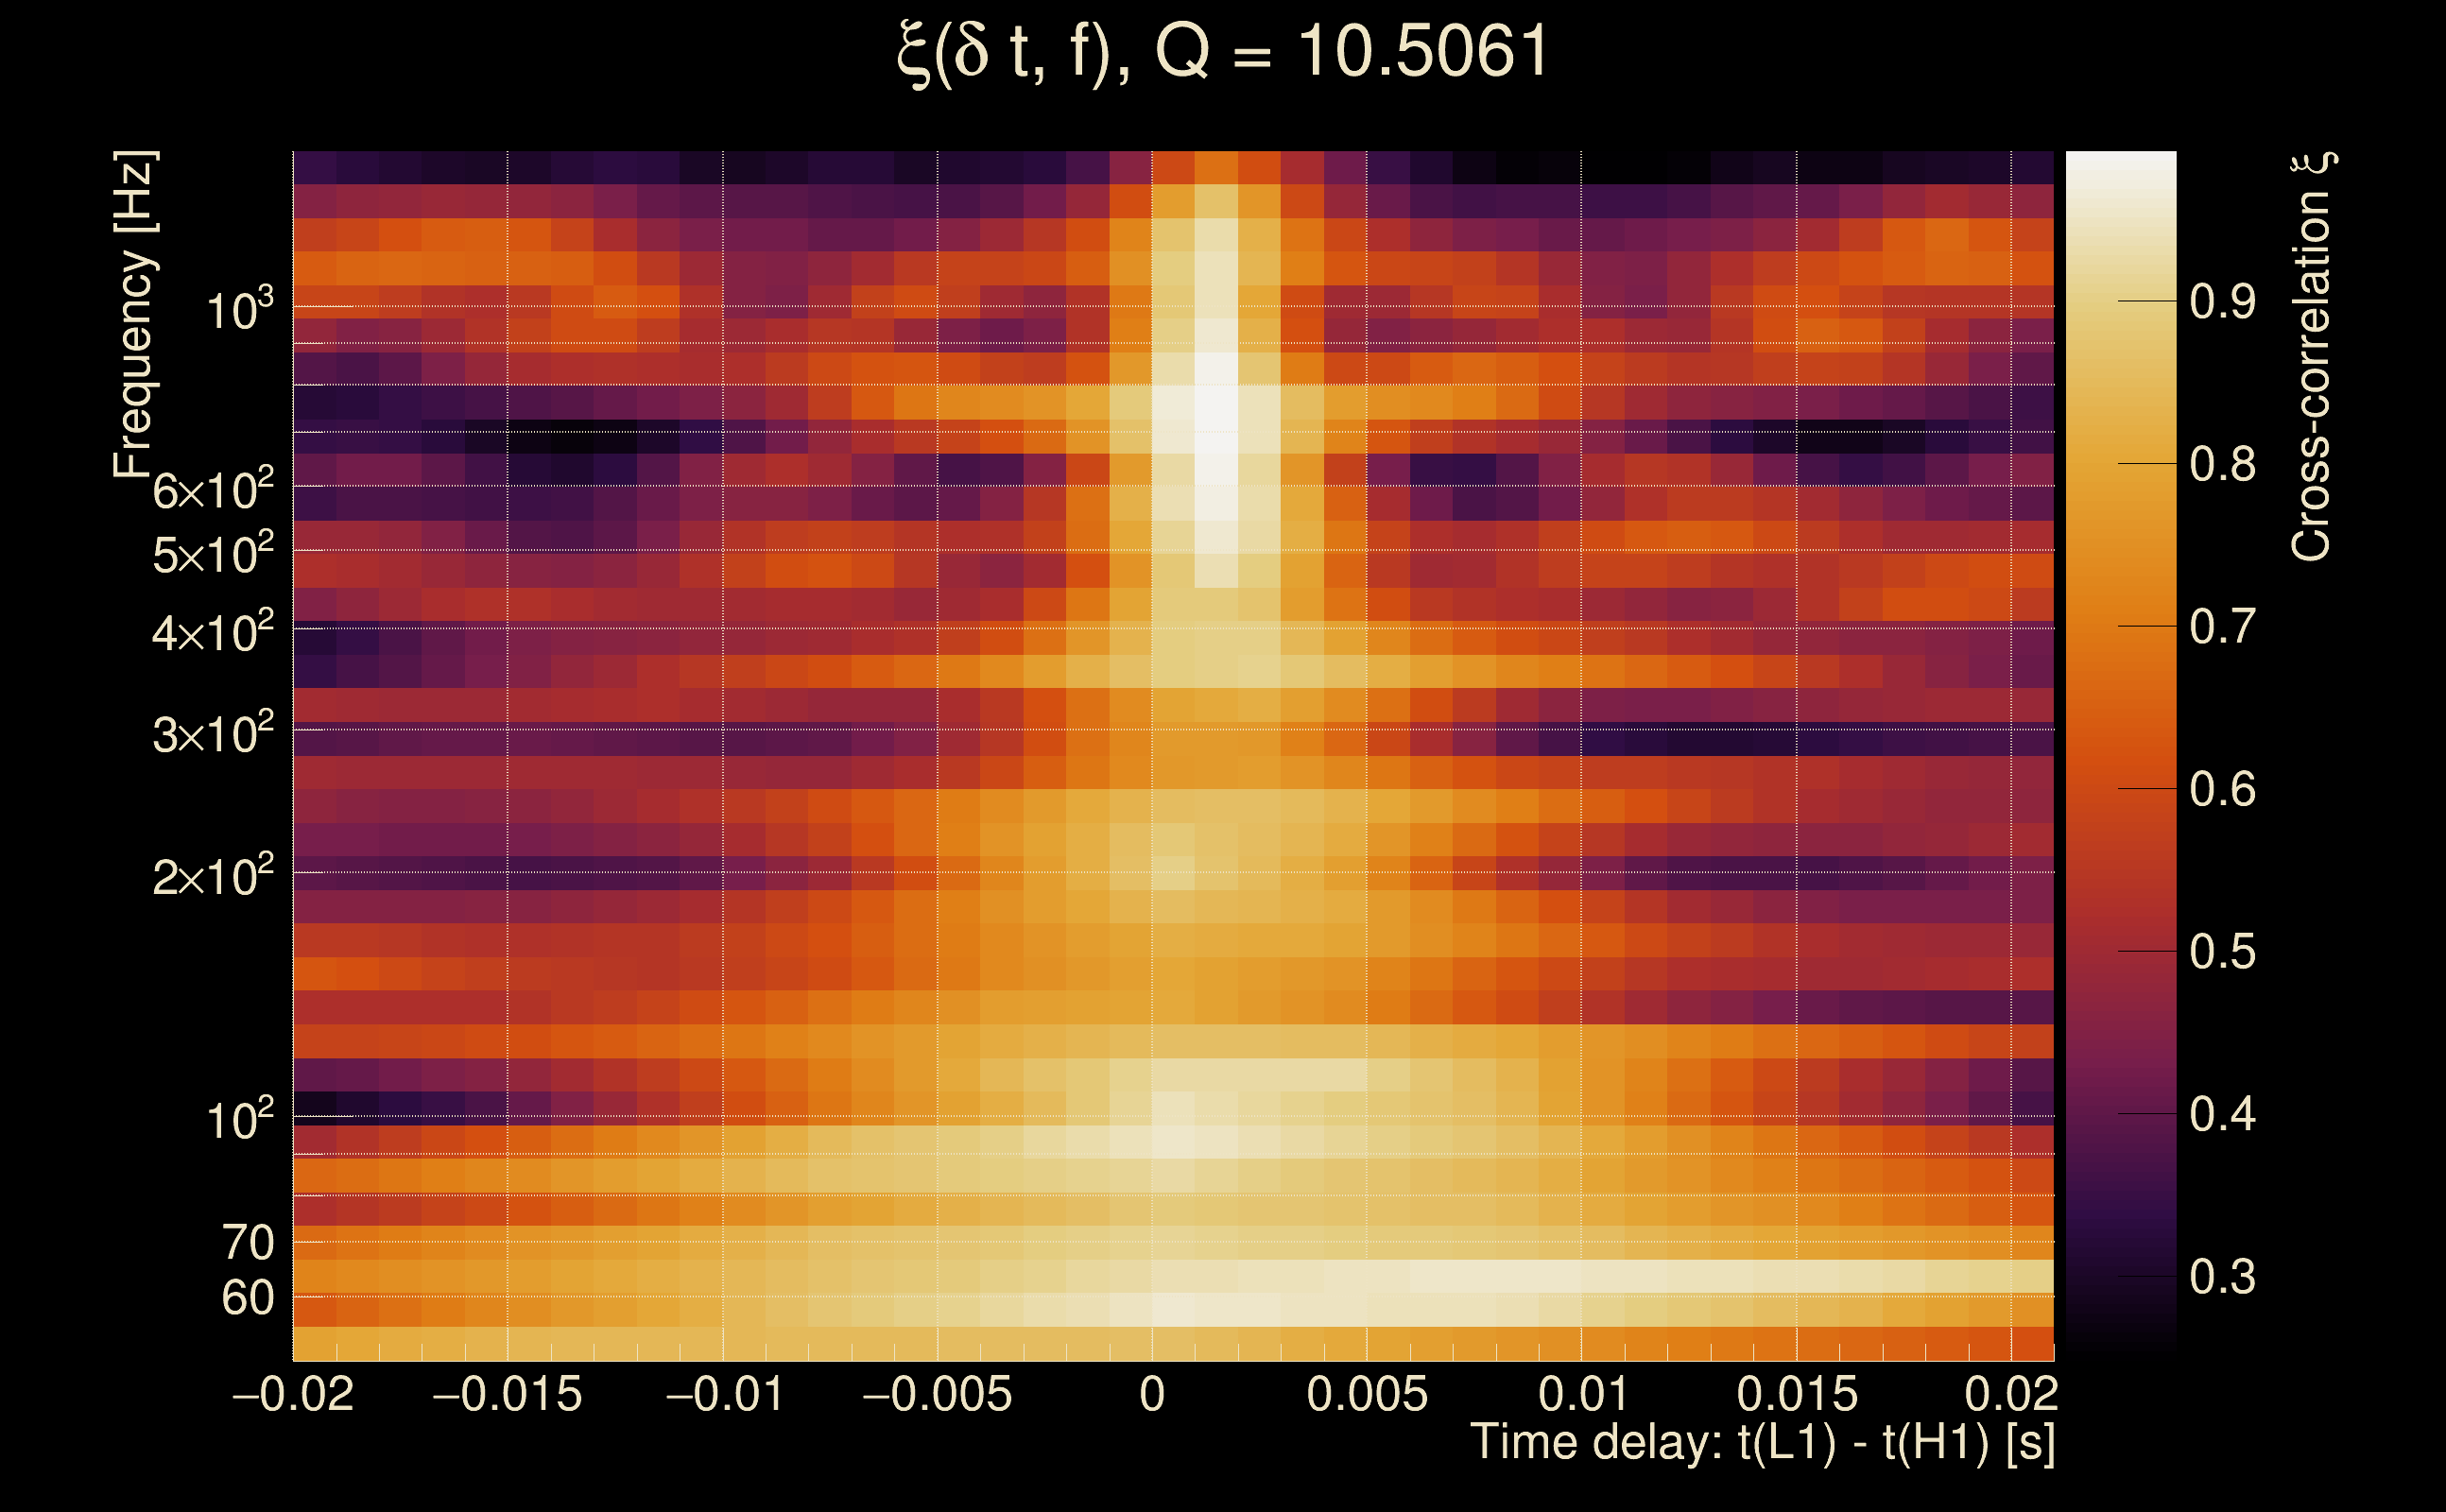
| Time delay between detectors t(L1) - t(H1): | 0.00104924 s (slice index = 108 / 217), δt_gw = 0.00104924 s |
| Time delay uncertainty: | 0.00122125 s |
| [targeted mode] Time delay probability: | 0.970699 (0.0367313 sigmas), δt_target = 1.72247e+45 s |
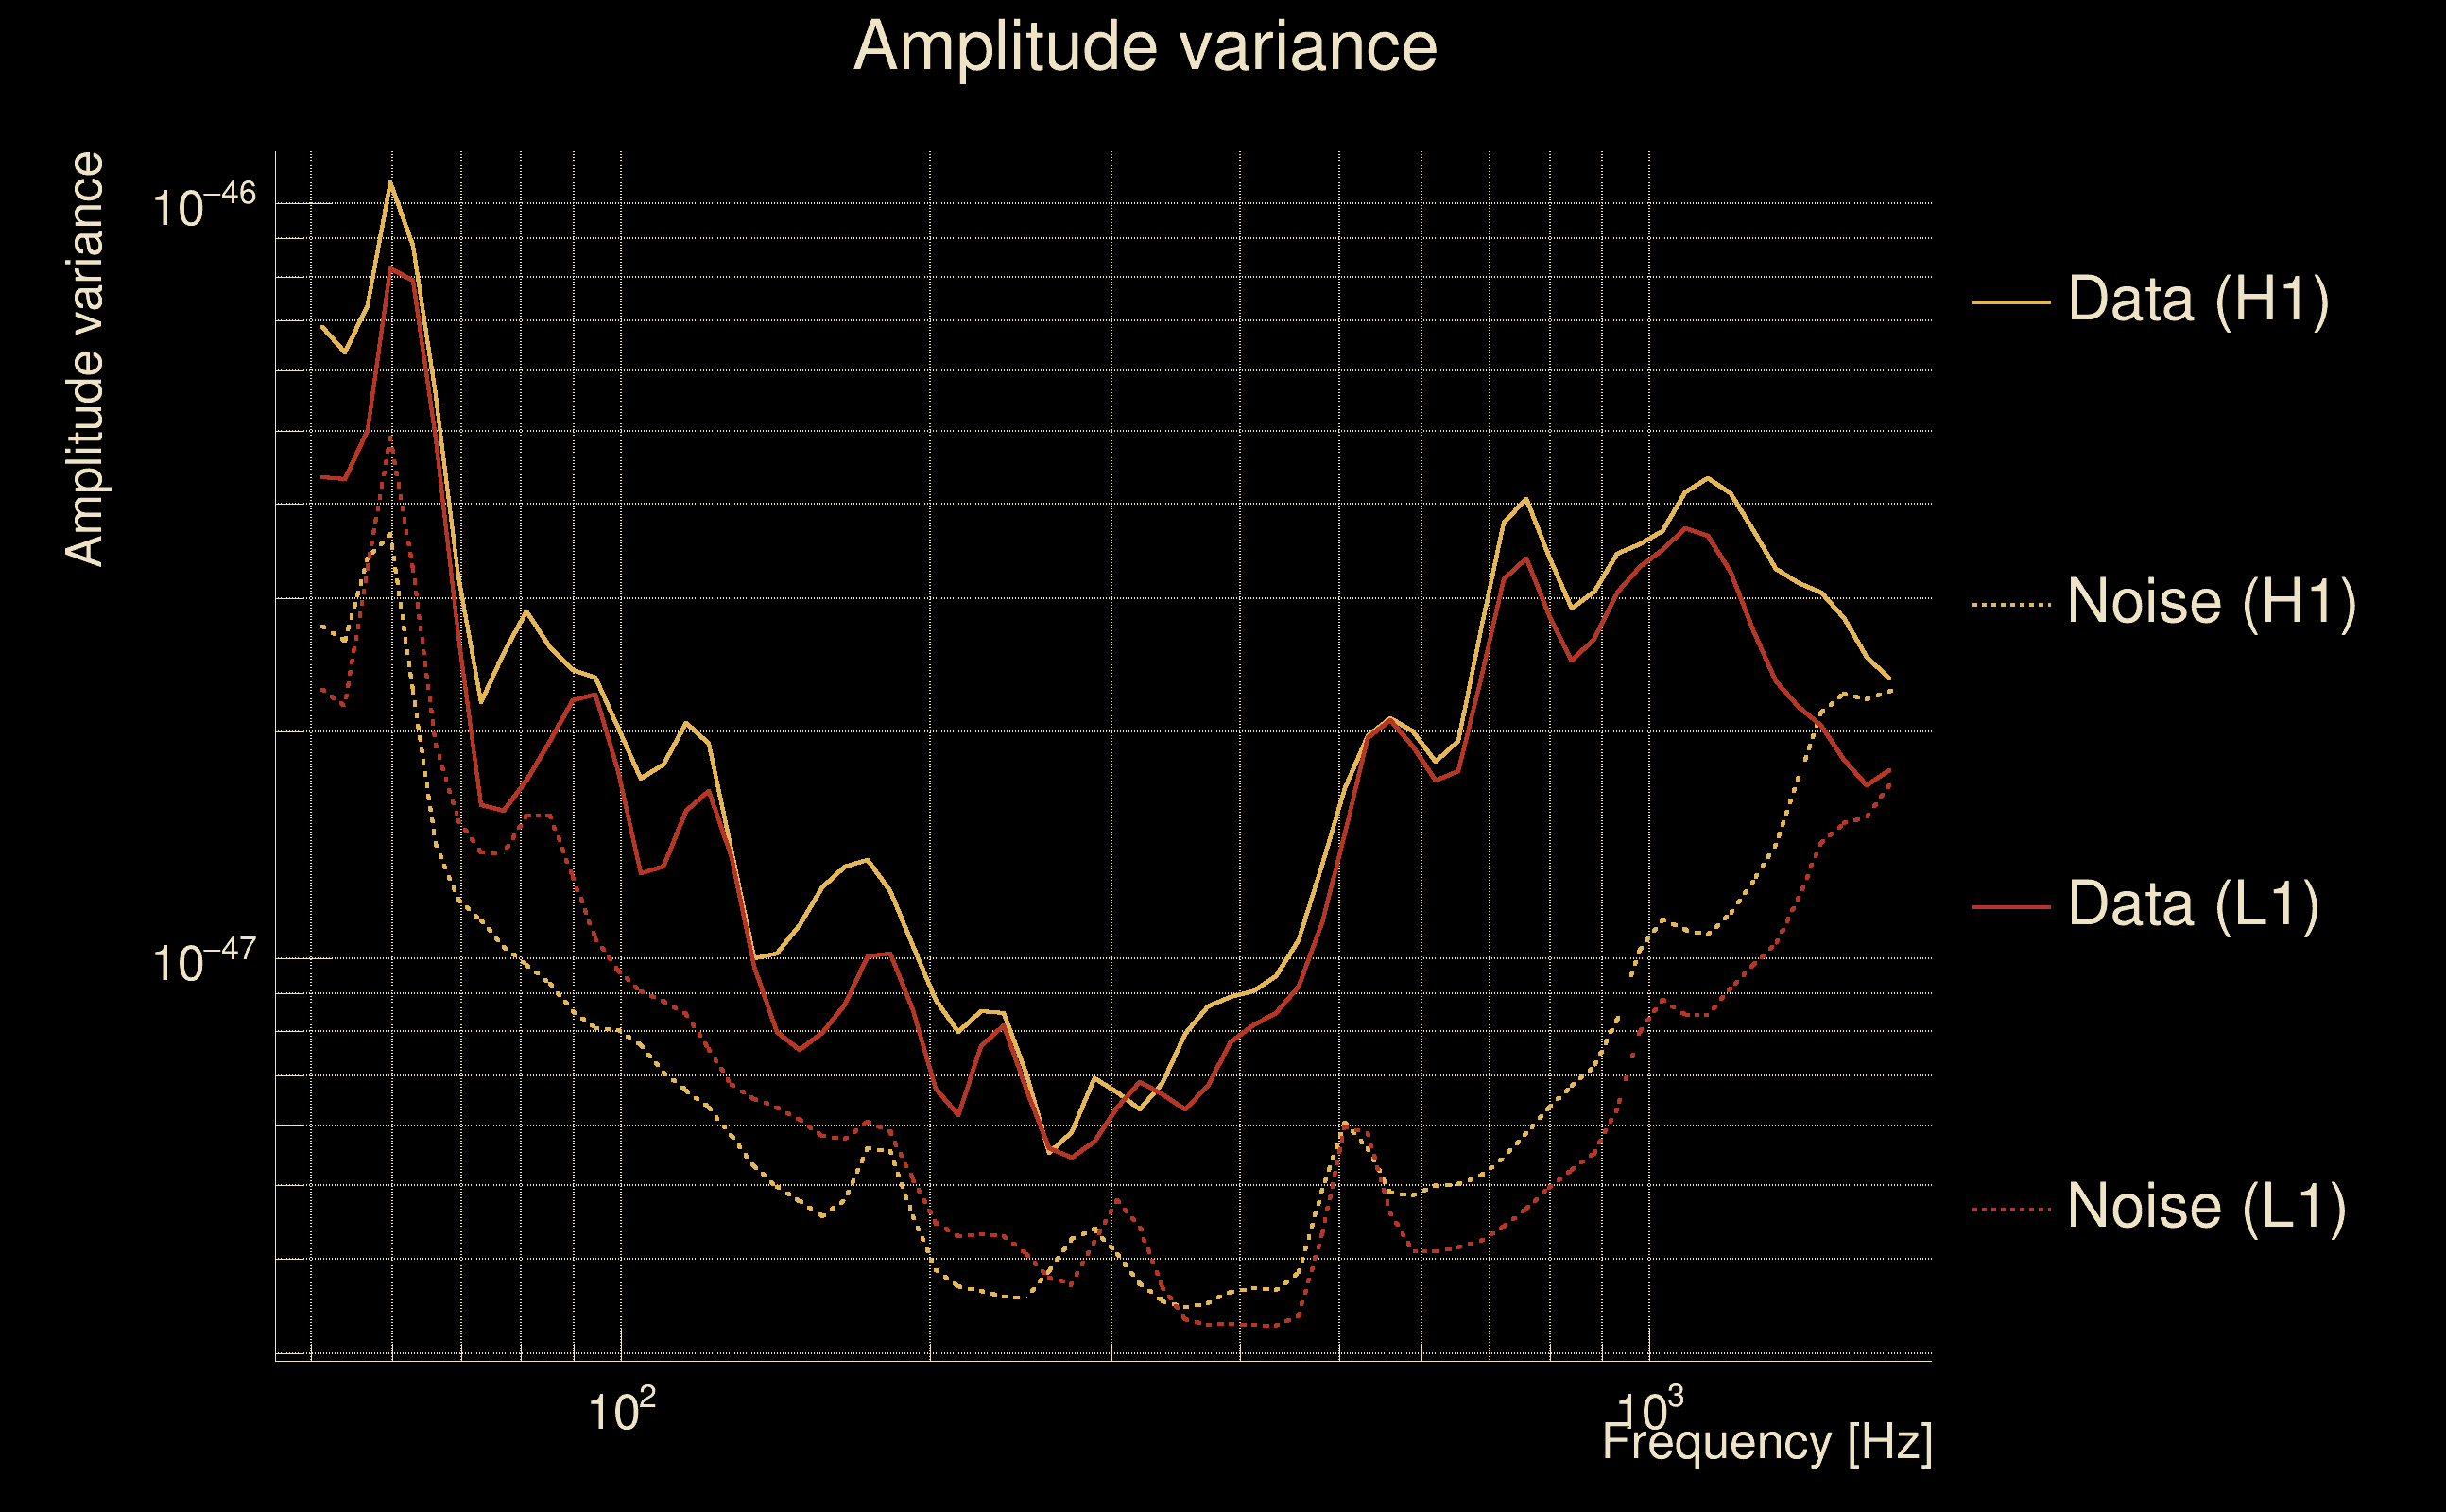
| Frequency: | 305.249 Hz |
| Ξ: | 0.864948 ± 0.0142078 (variance = 0.000201862): Q0: 0.911181, Q1: 0.890047, Q2: 0.870064, Q3: 0.876935, Q4: 0.892888 |
| Rank: | R_A = 0.773431 |
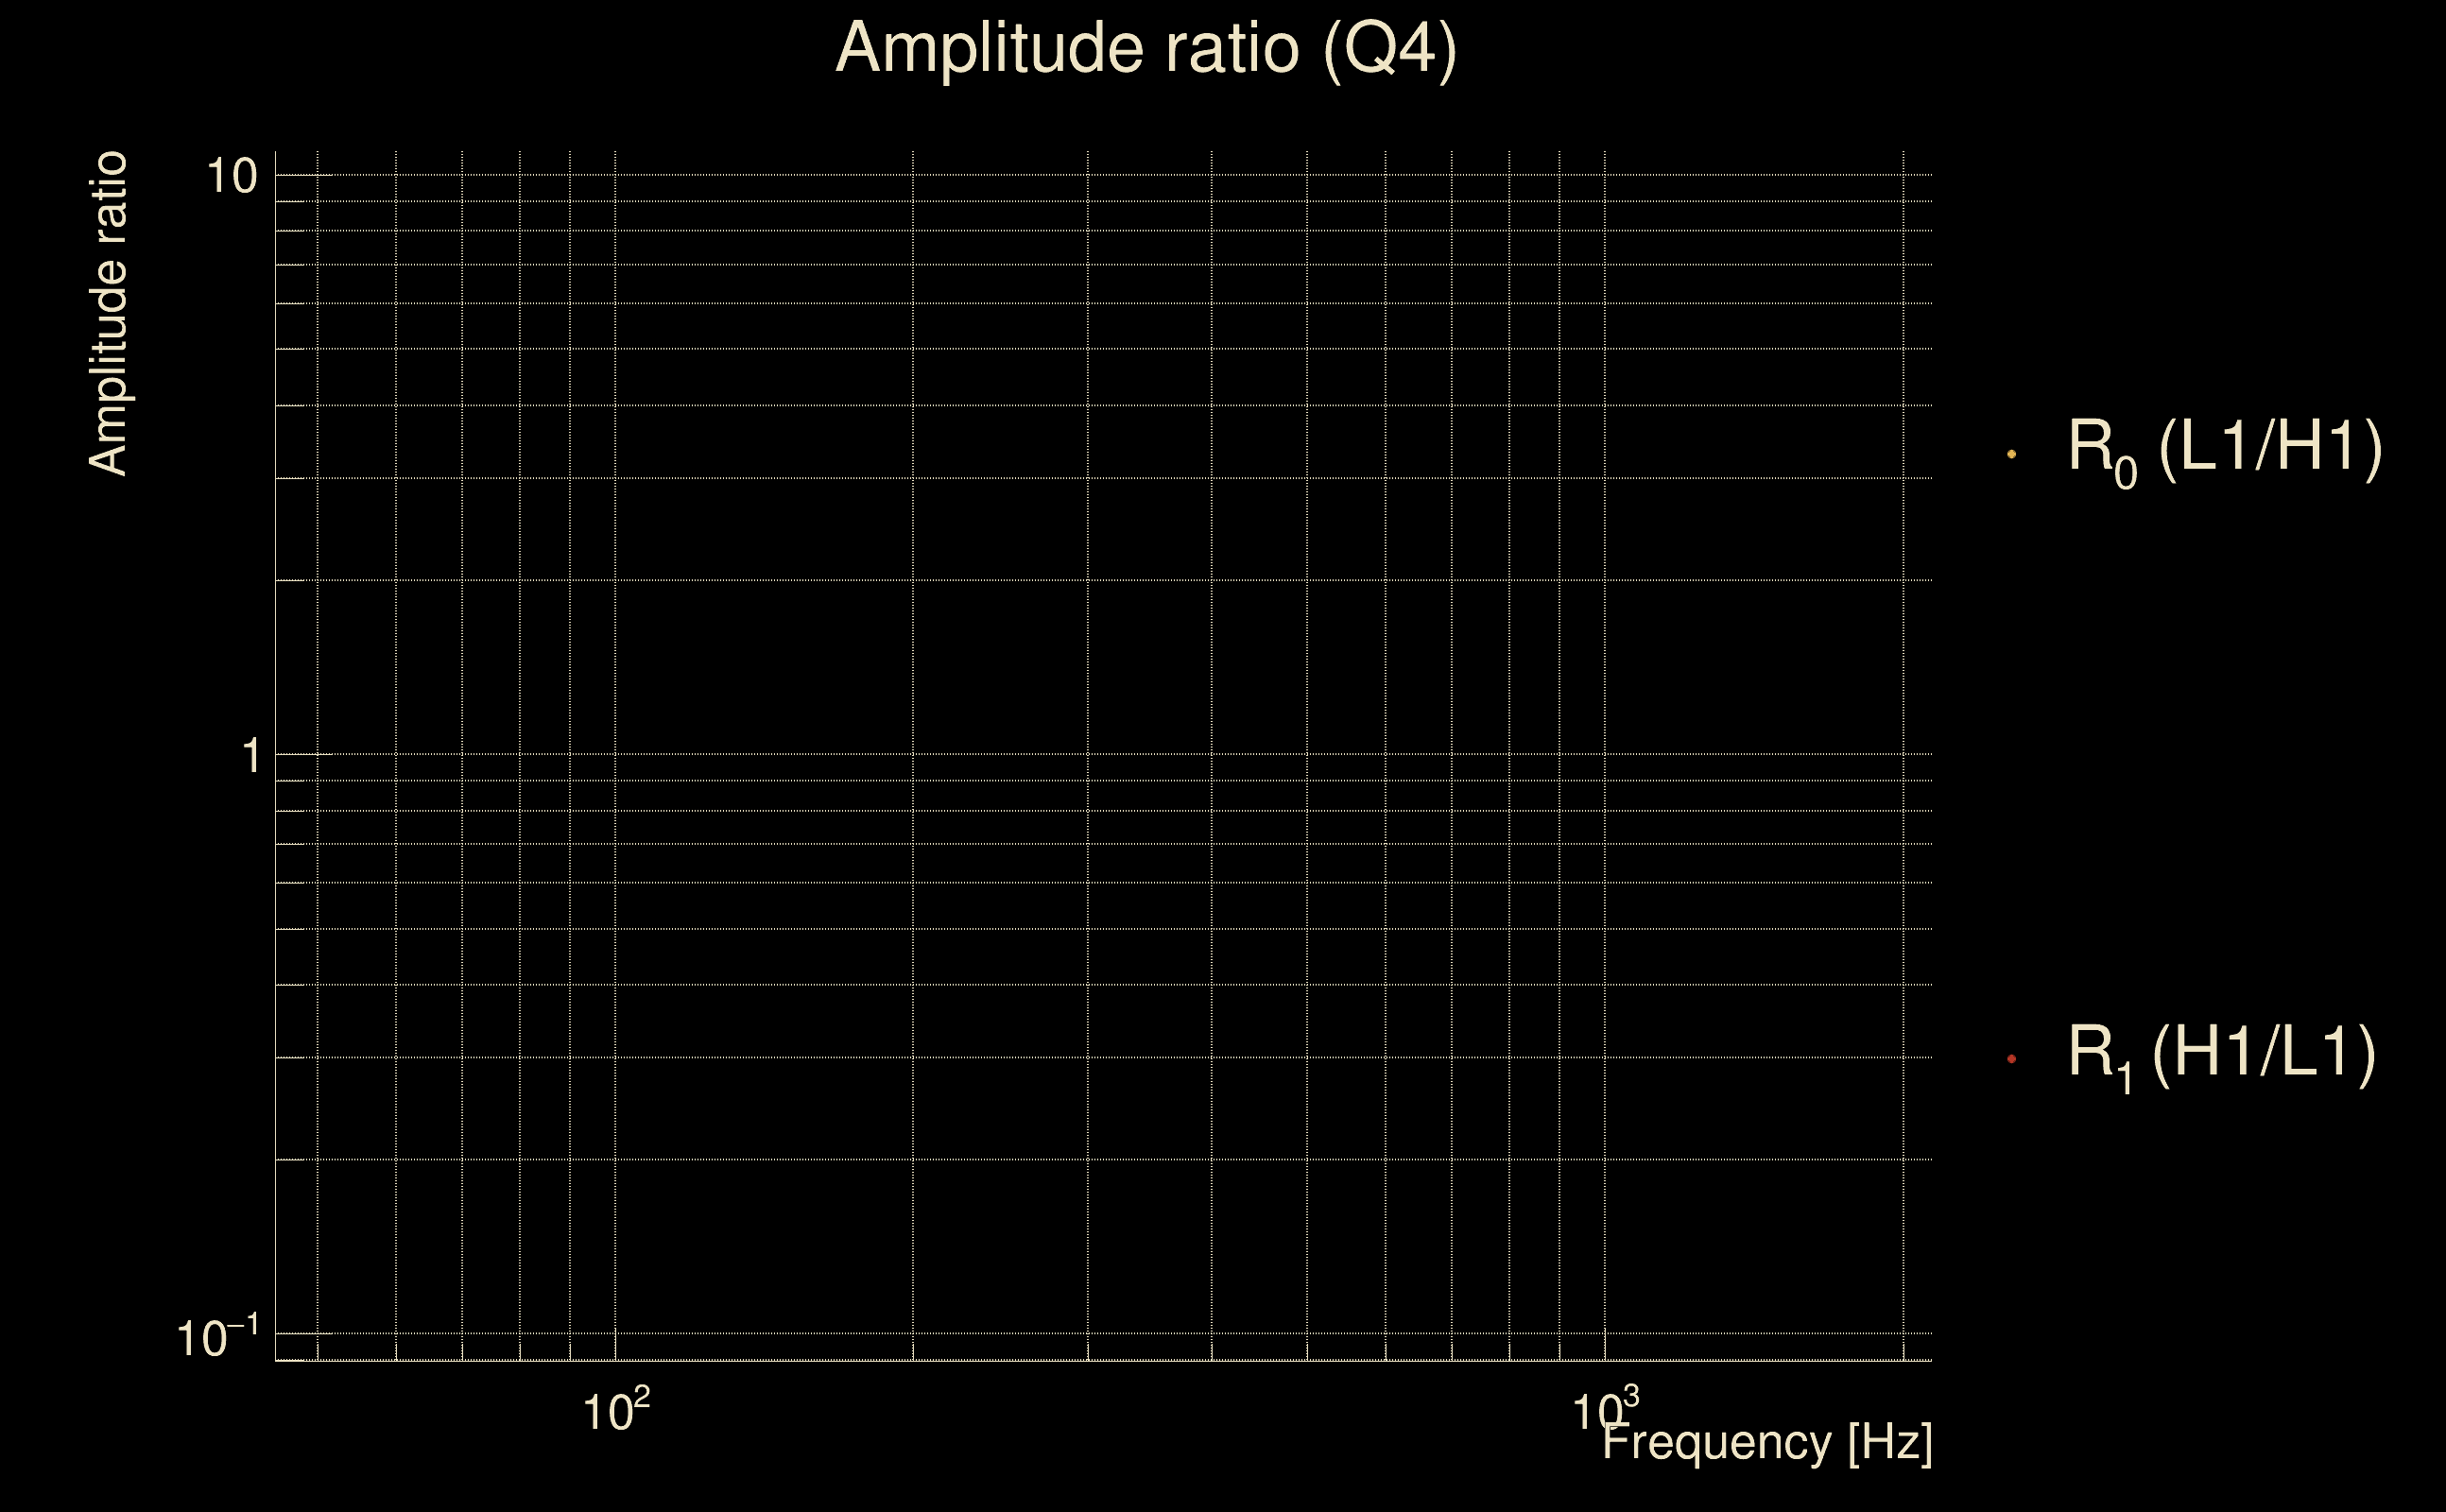
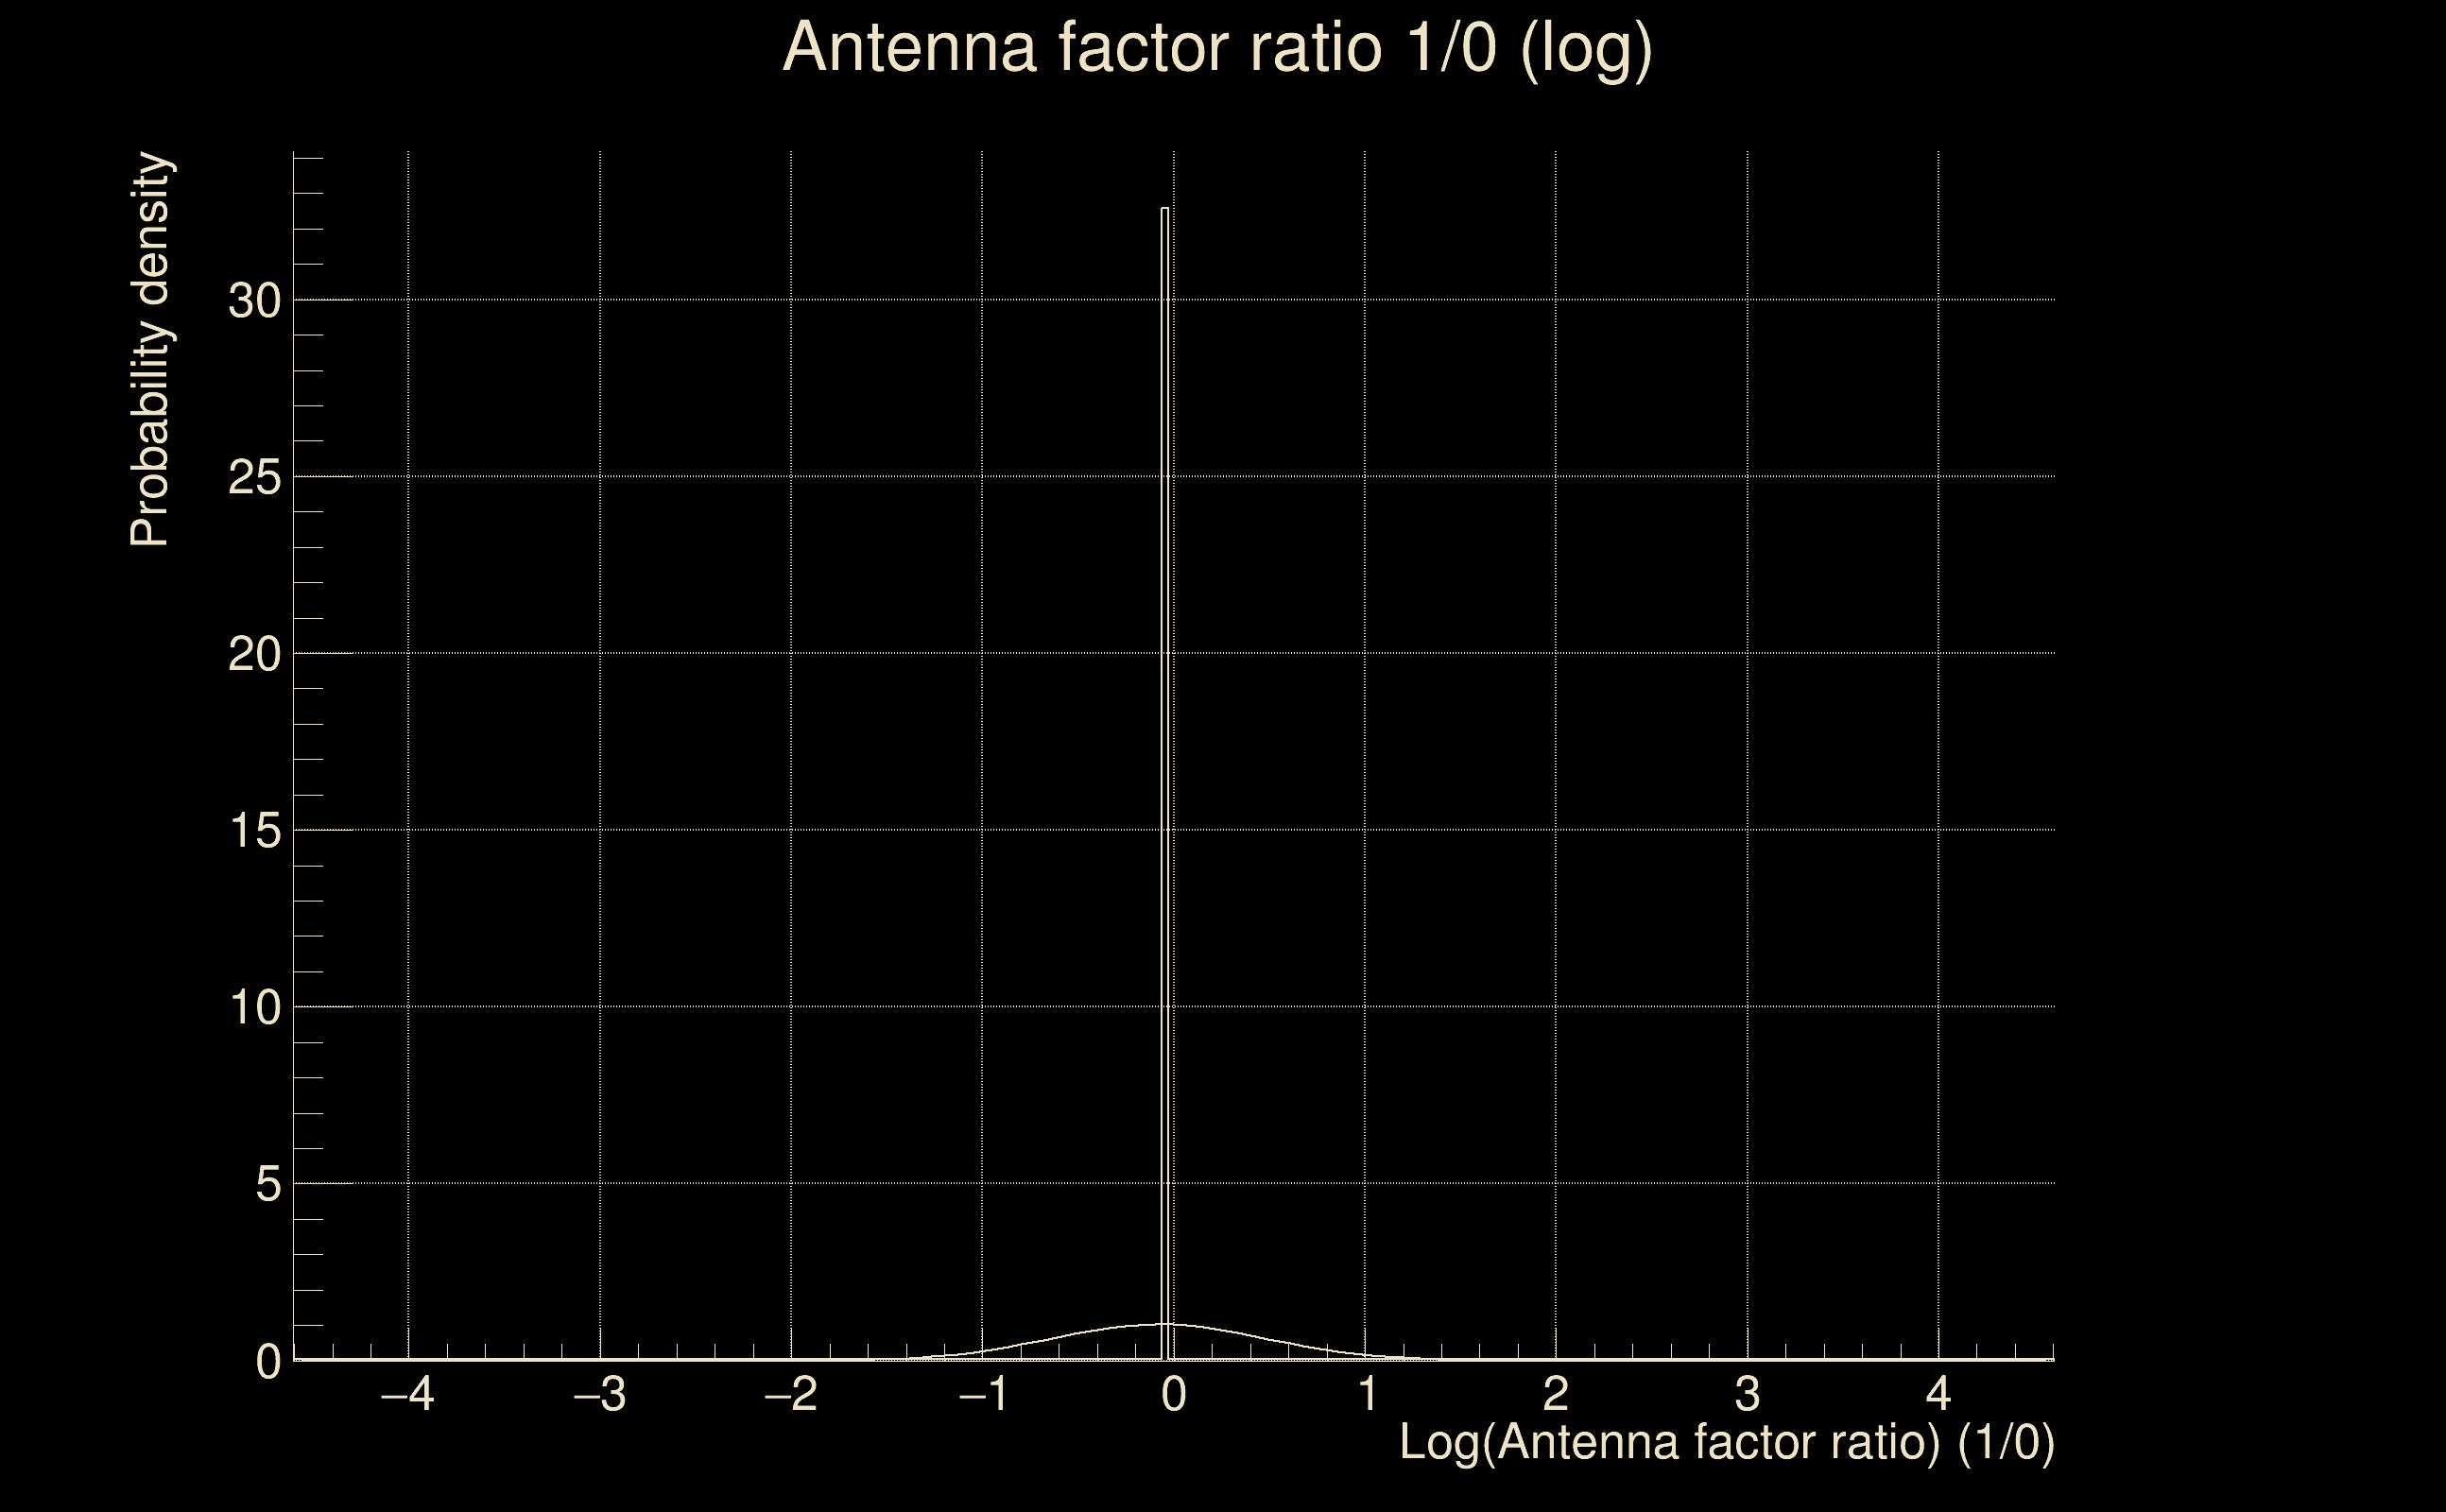
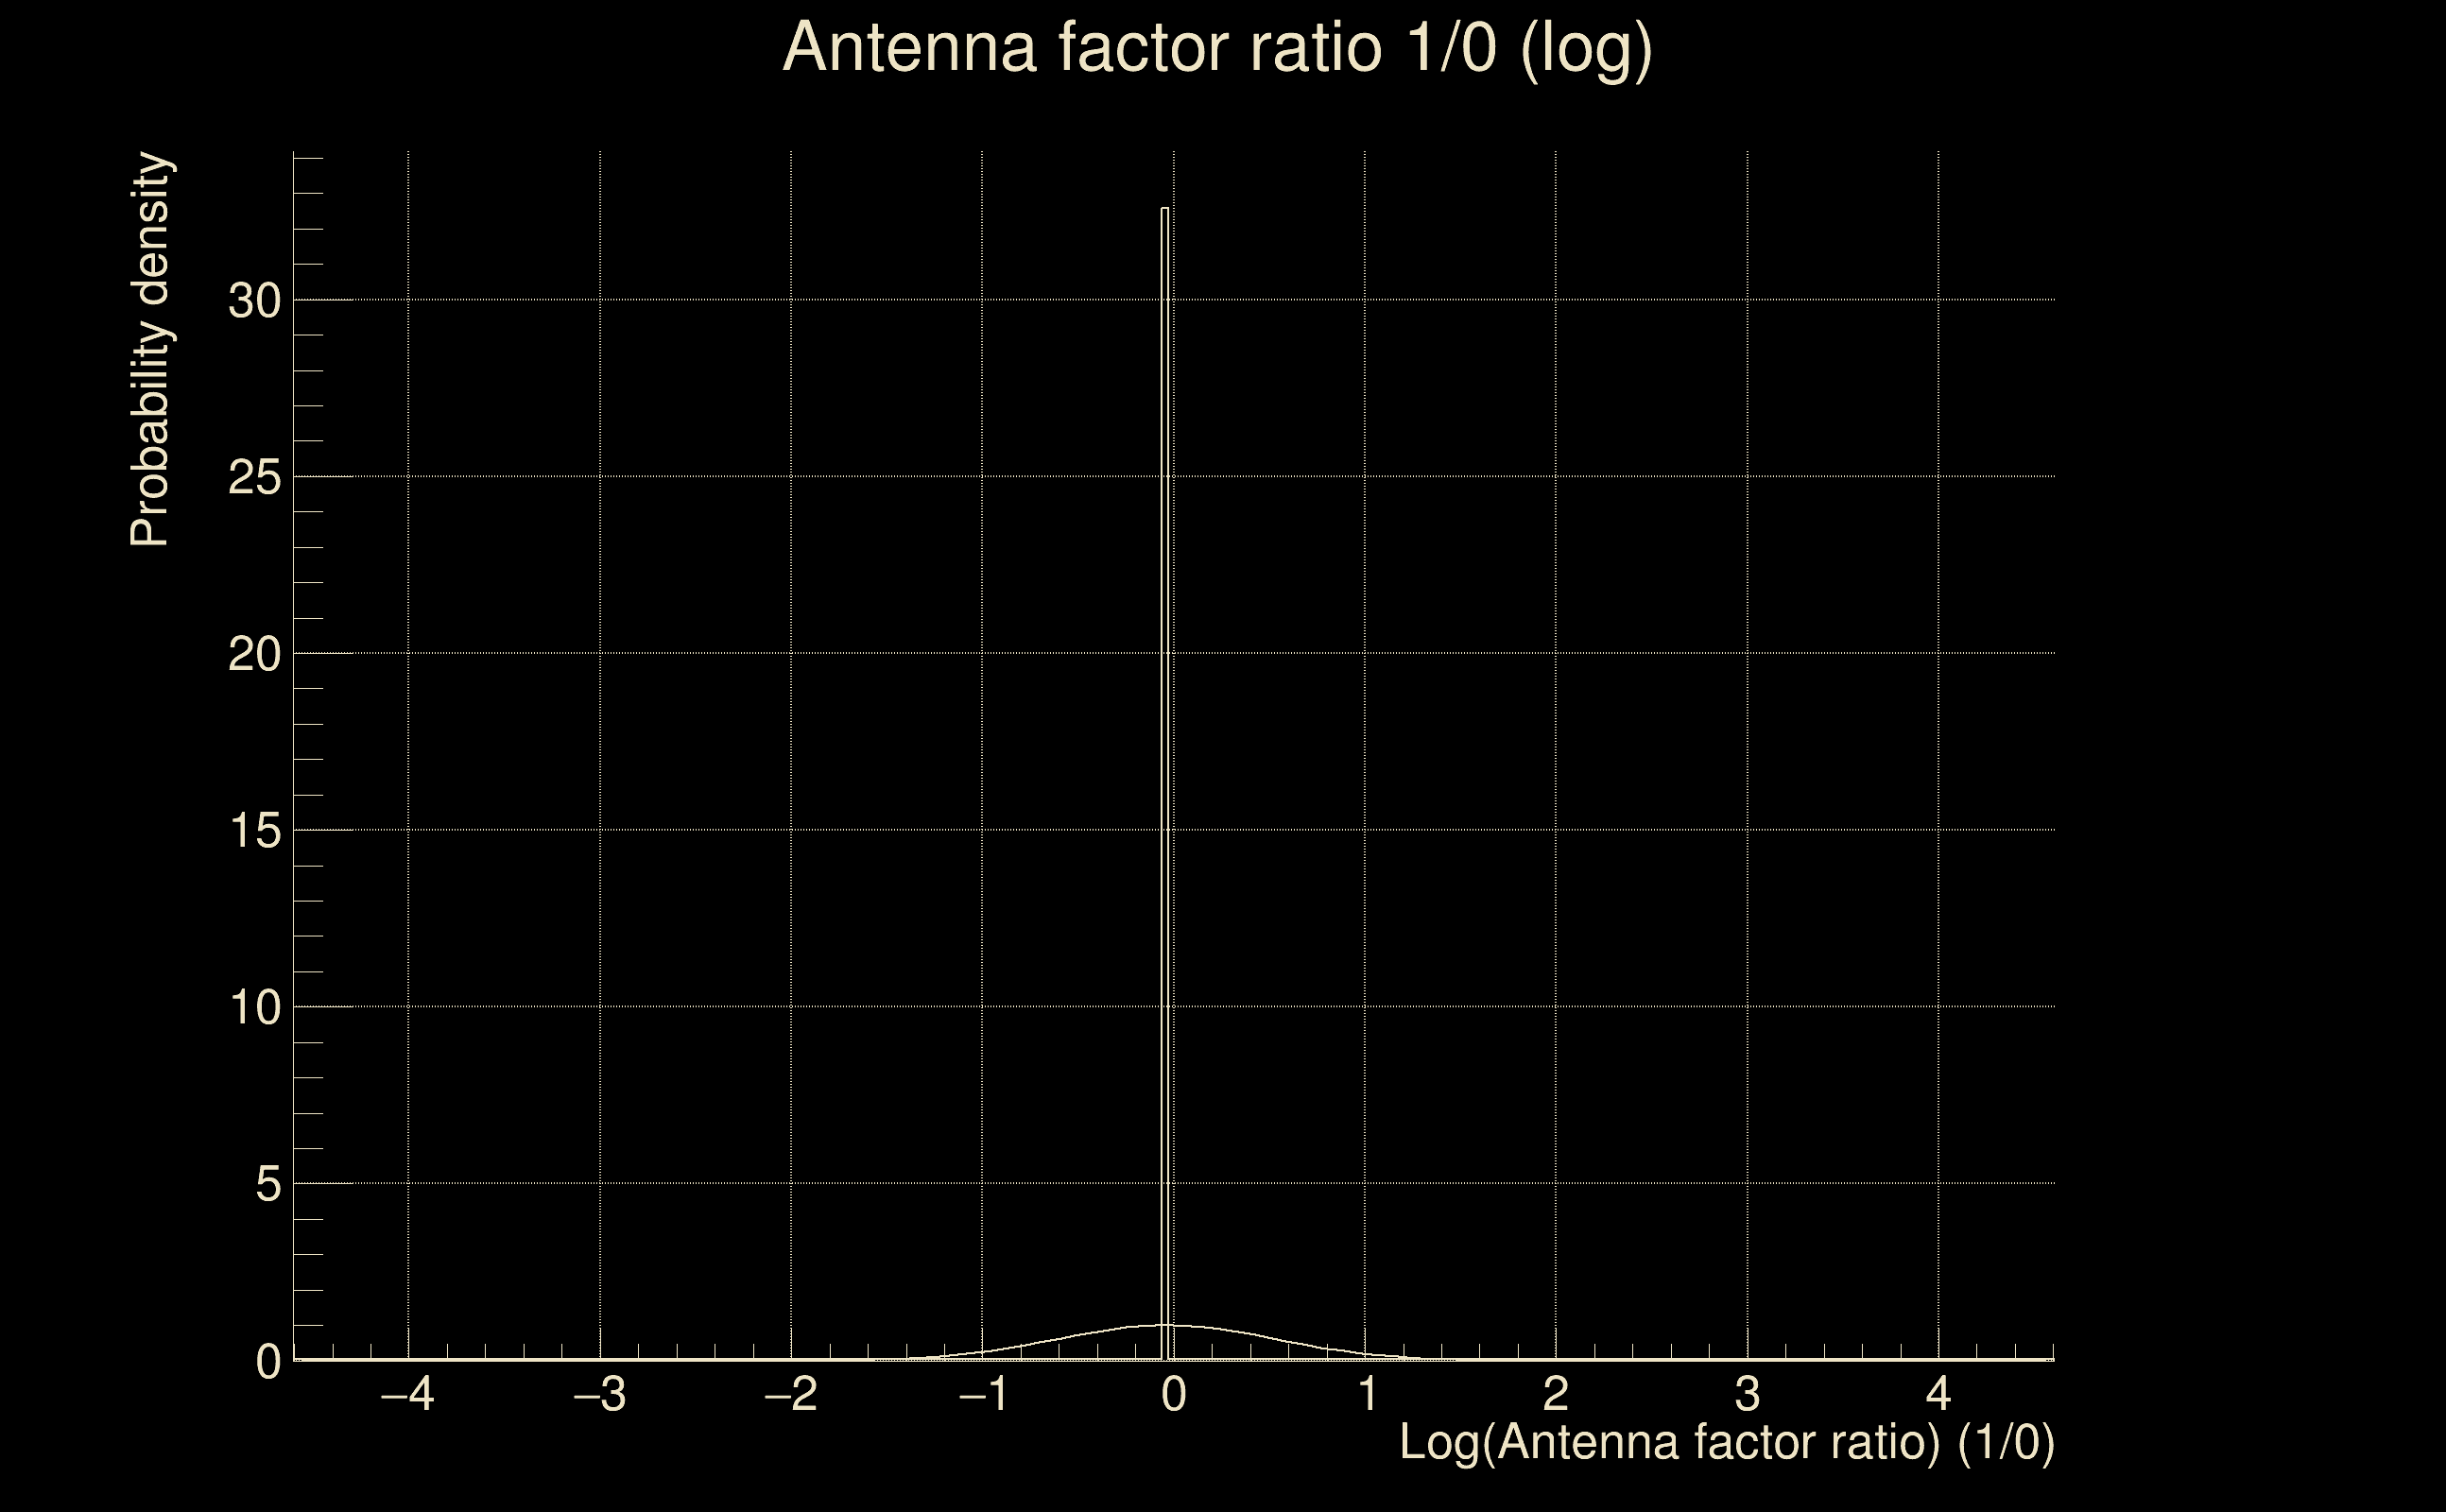
| Log of amplitude ratio (L1/H1): | -0.0793346, variance = 0.153542 (L1/H1: -0.0915363, variance = 0.305203, H1/L1: 0.0670808, variance = 0.308977) |
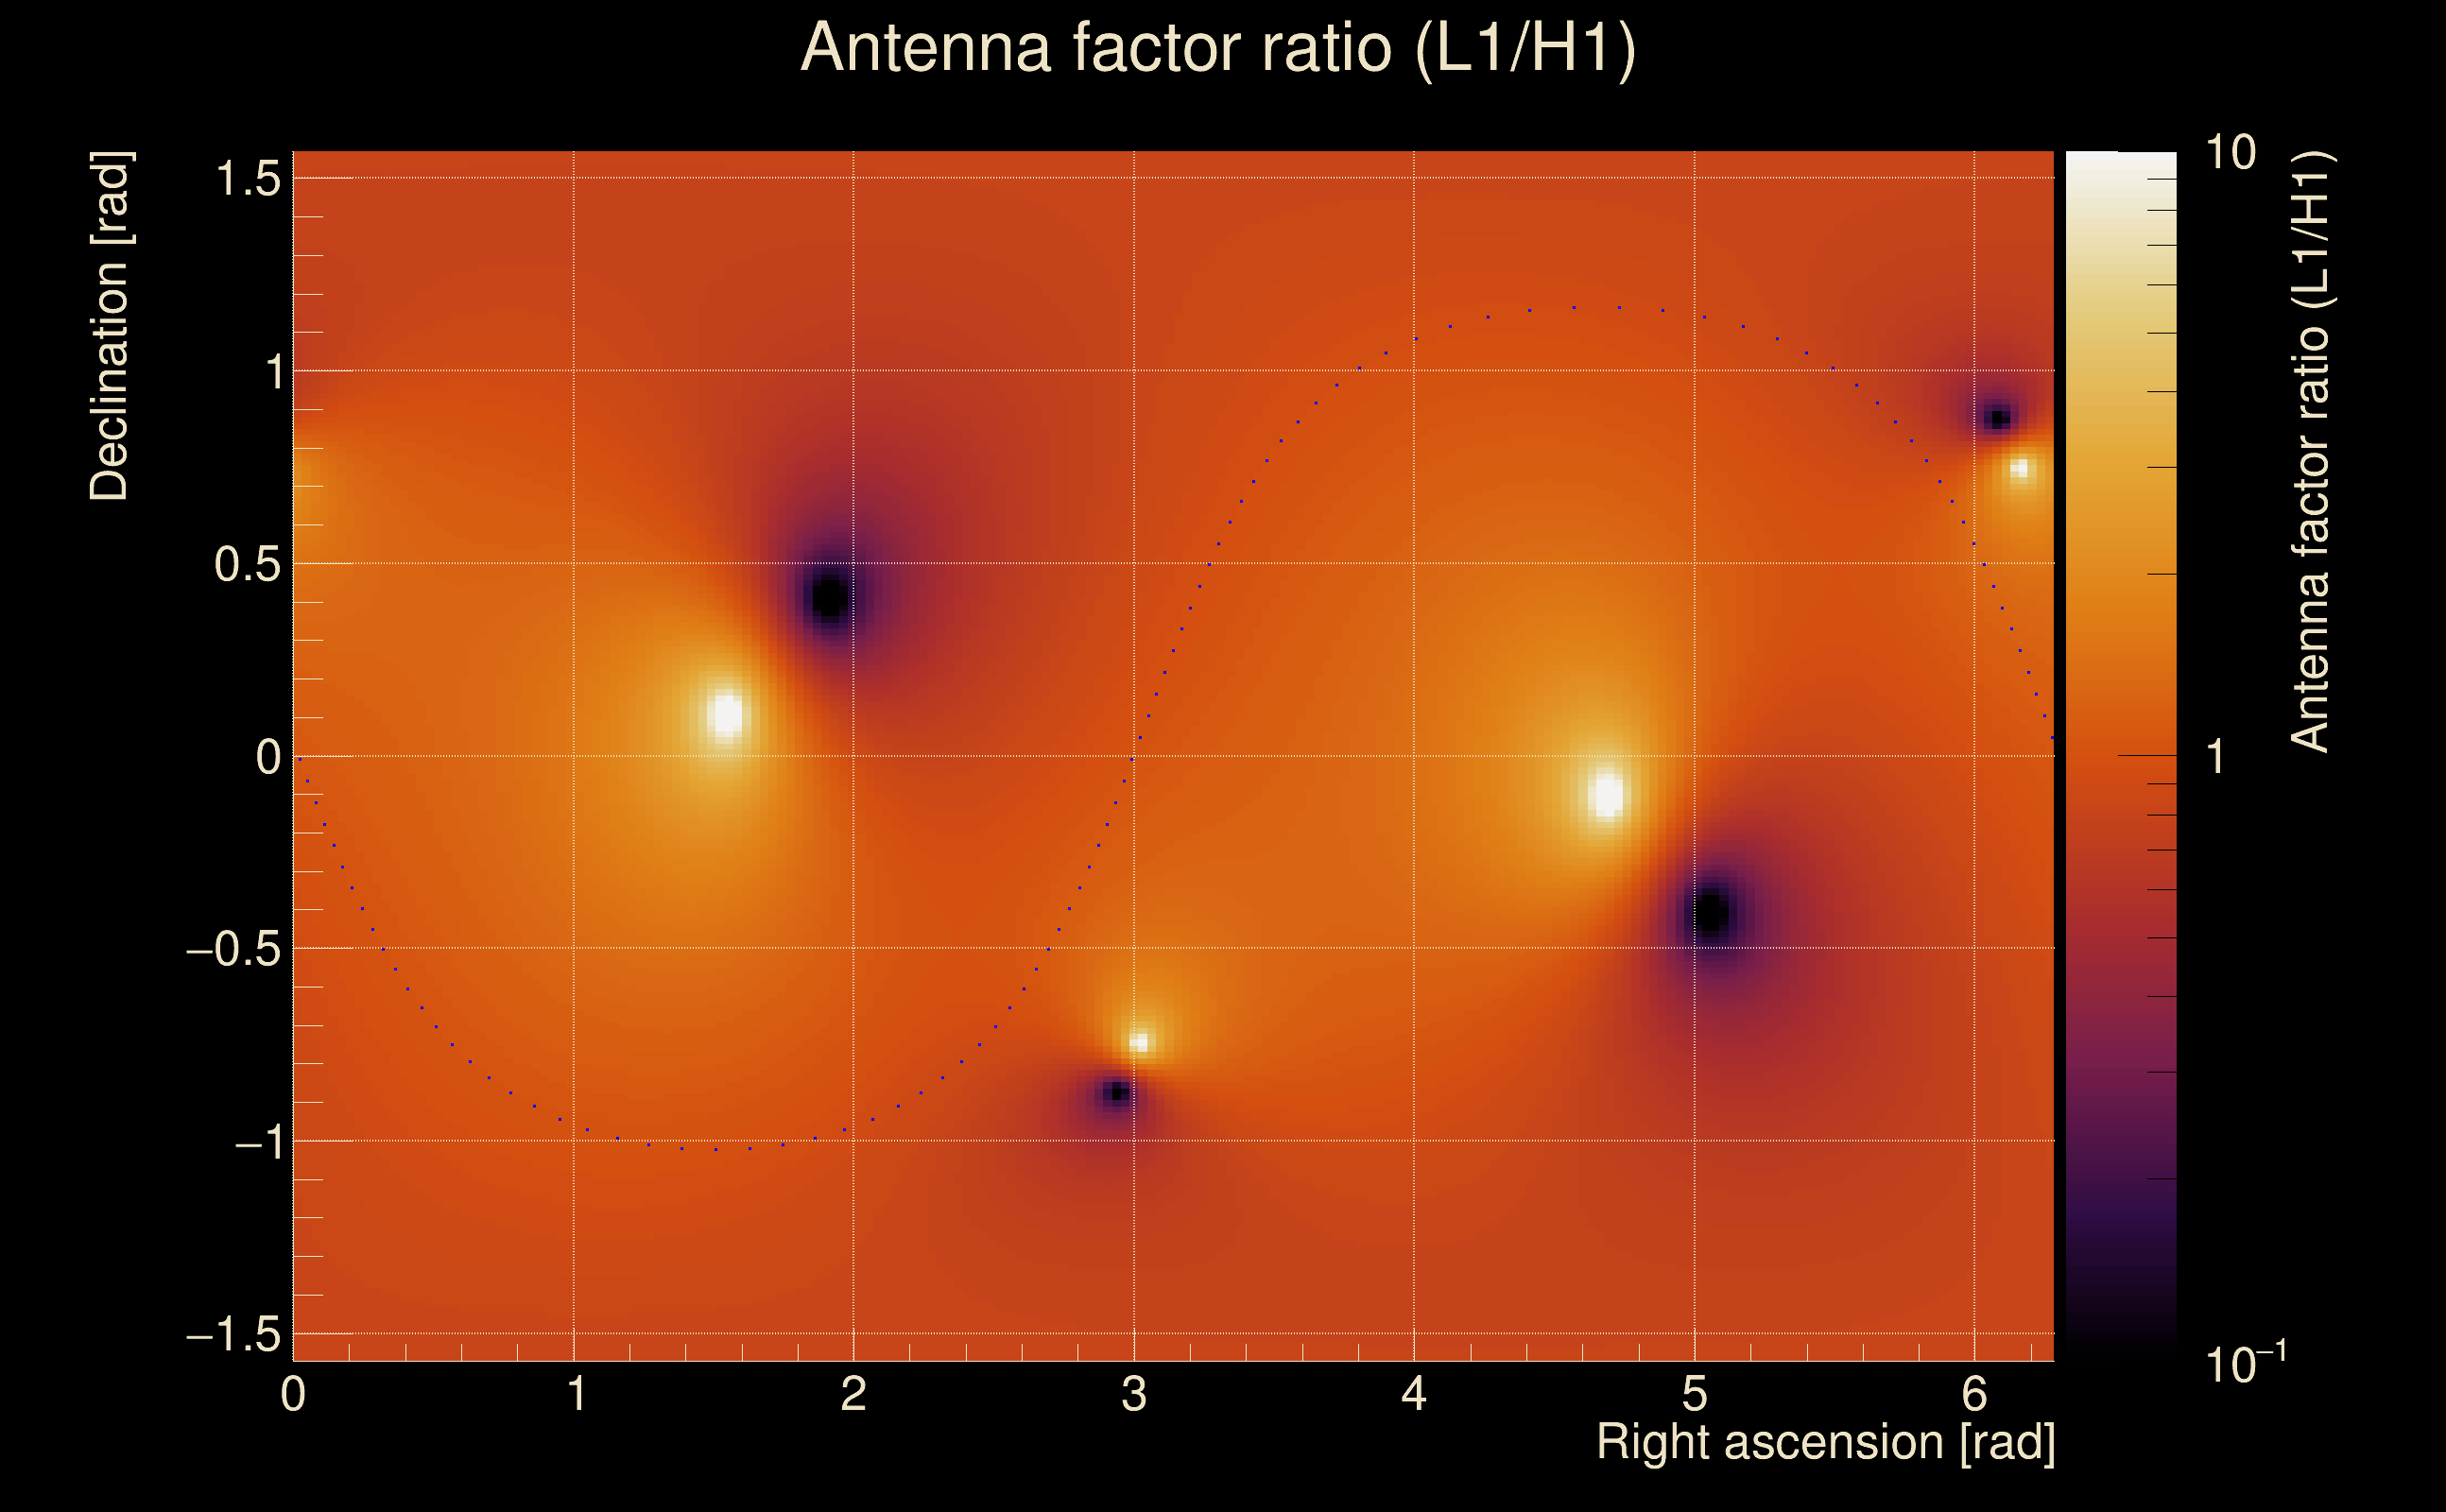
| Amplitude ratio (L1/H1): | 0.923731 ⋇ 1.47971 (L1/H1: 0.912528 ⋇ 1.73751, H1/L1: 1.06938 ⋇ 1.74343) |
| Amplitude ratio H1|L1 compatibility (probability): | 0.975106 |
| Antenna factor probability: | 0.944703 |
| Number of rejected frequency rows: | Q0: 0 / 18, Q1: 1 / 36, Q2: 3 / 70, Q3: 23 / 134, Q4: 89 / 258 |
| Maximum signal-to-noise ratio: | H1: 62.8624, L1: 62.7287 |
| SNR variance: | H1: 1.93979, L1: 2.01109 |
| Click here for a zoomed plot | Click here for a zoomed plot | Click here for a zoomed plot | Click here for a zoomed plot | Click here for a zoomed plot |
 |
 |
 |
 |
 |
 |
 |
 |
 |
 |
 |
 |
 |
 |
 |
 |
 |
 |
 |
 |
 |
 |
 |
 |
 |
 |
 |
 |
 |
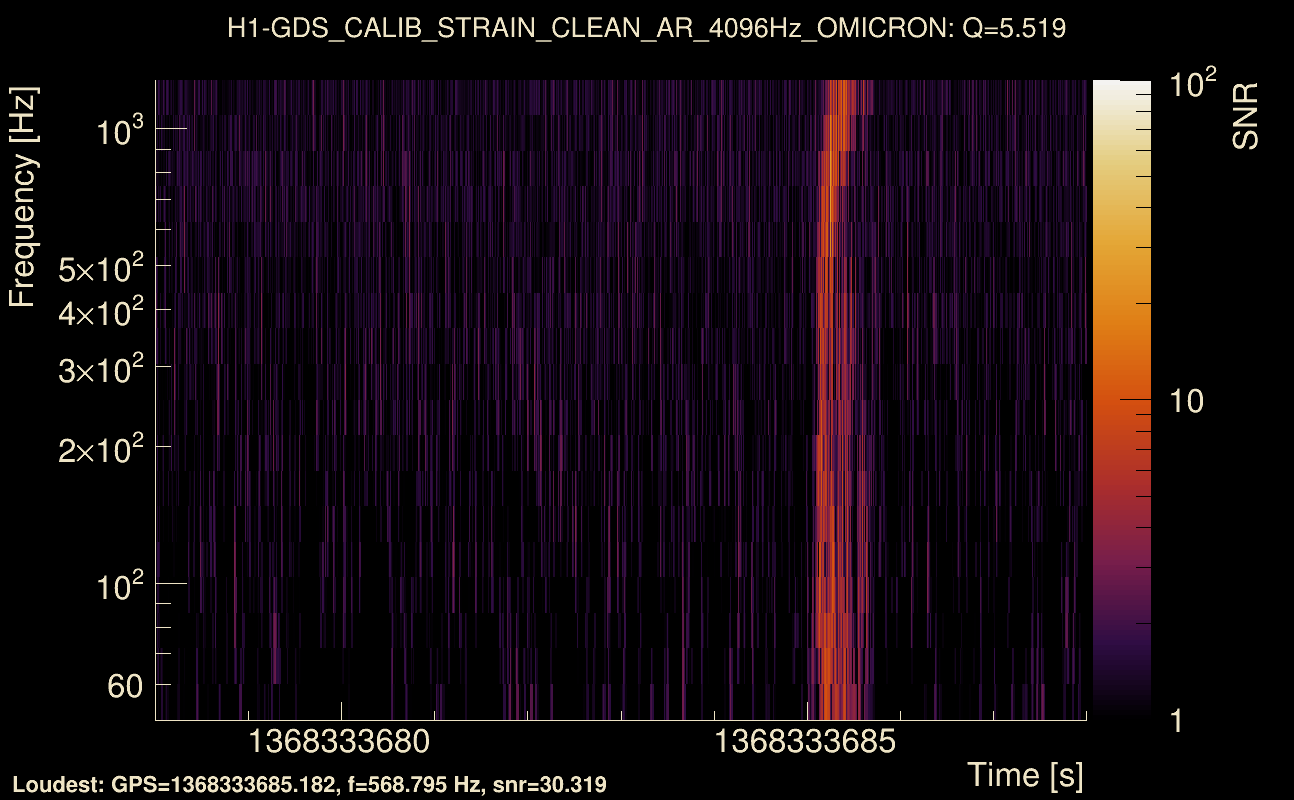
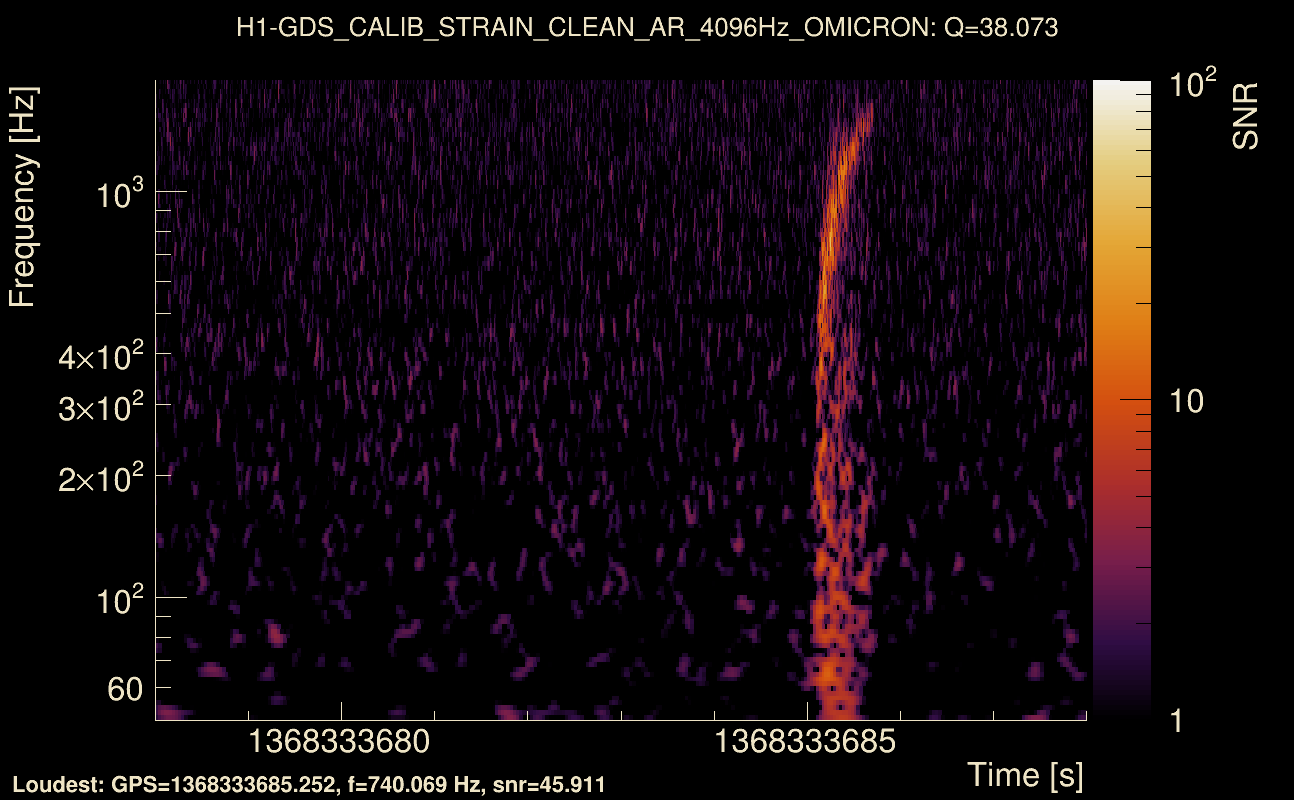
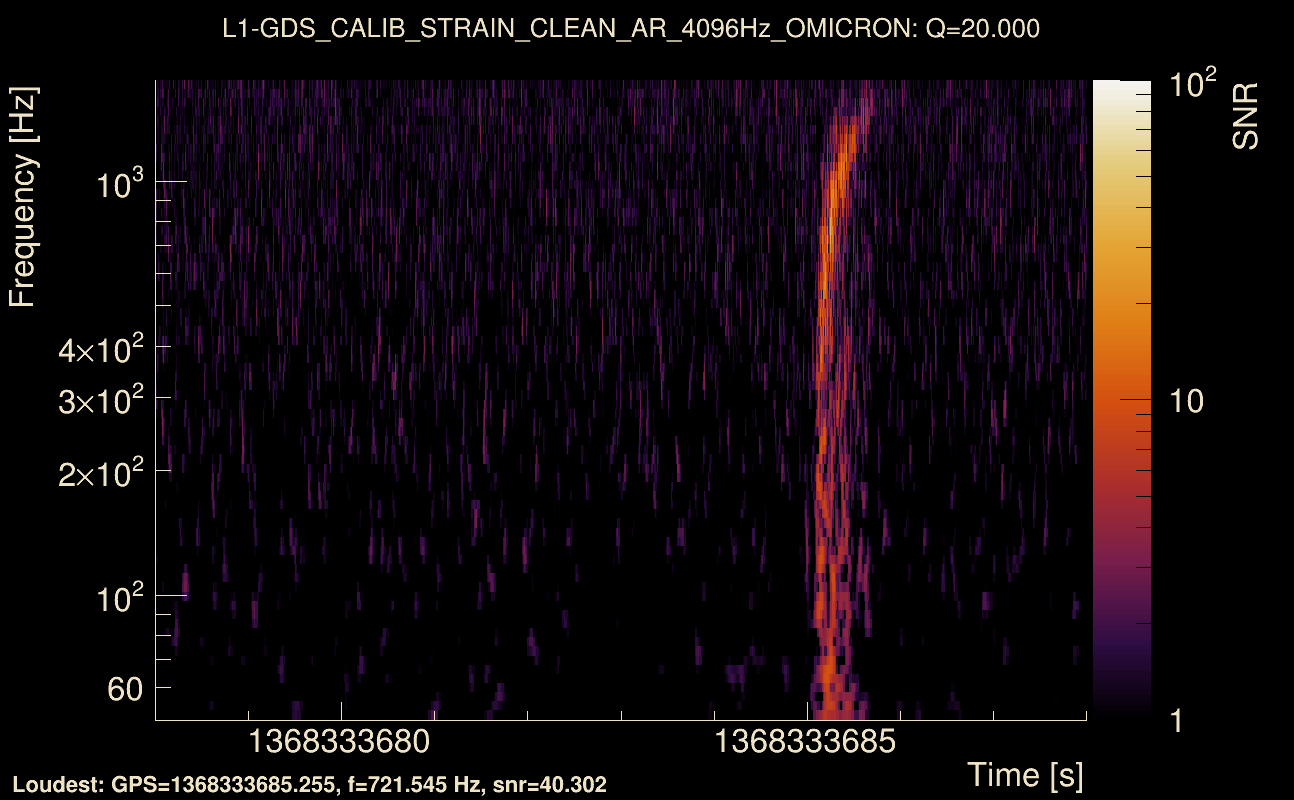
| Event time t(H1): | GPS = 1368333678 (Wed May 17 04:41:00 2023 ) → GPS = 1368333688 (Wed May 17 04:41:10 2023 ) |
| Event time t(L1): | GPS = 1368333678 (Wed May 17 04:41:10 2023 ) → GPS = 1368333688 (Wed May 17 04:41:10 2023 ) |
| Omicron analysis time window (H1): | GPS = 1368333675 → GPS = 1368333691 |
| Omicron analysis time window (L1): | GPS = 1368333675 → GPS = 1368333691 |
| Time delay between detectors t(L1) - t(H1): | 0.000729244 s (slice index = 108 / 217), δt_gw = 0.000729244 s |
| Time delay uncertainty: | 0.00095626 s |
| [targeted mode] Time delay probability: | 0.955397 (0.0559302 sigmas), δt_target = 0.0010941 s |
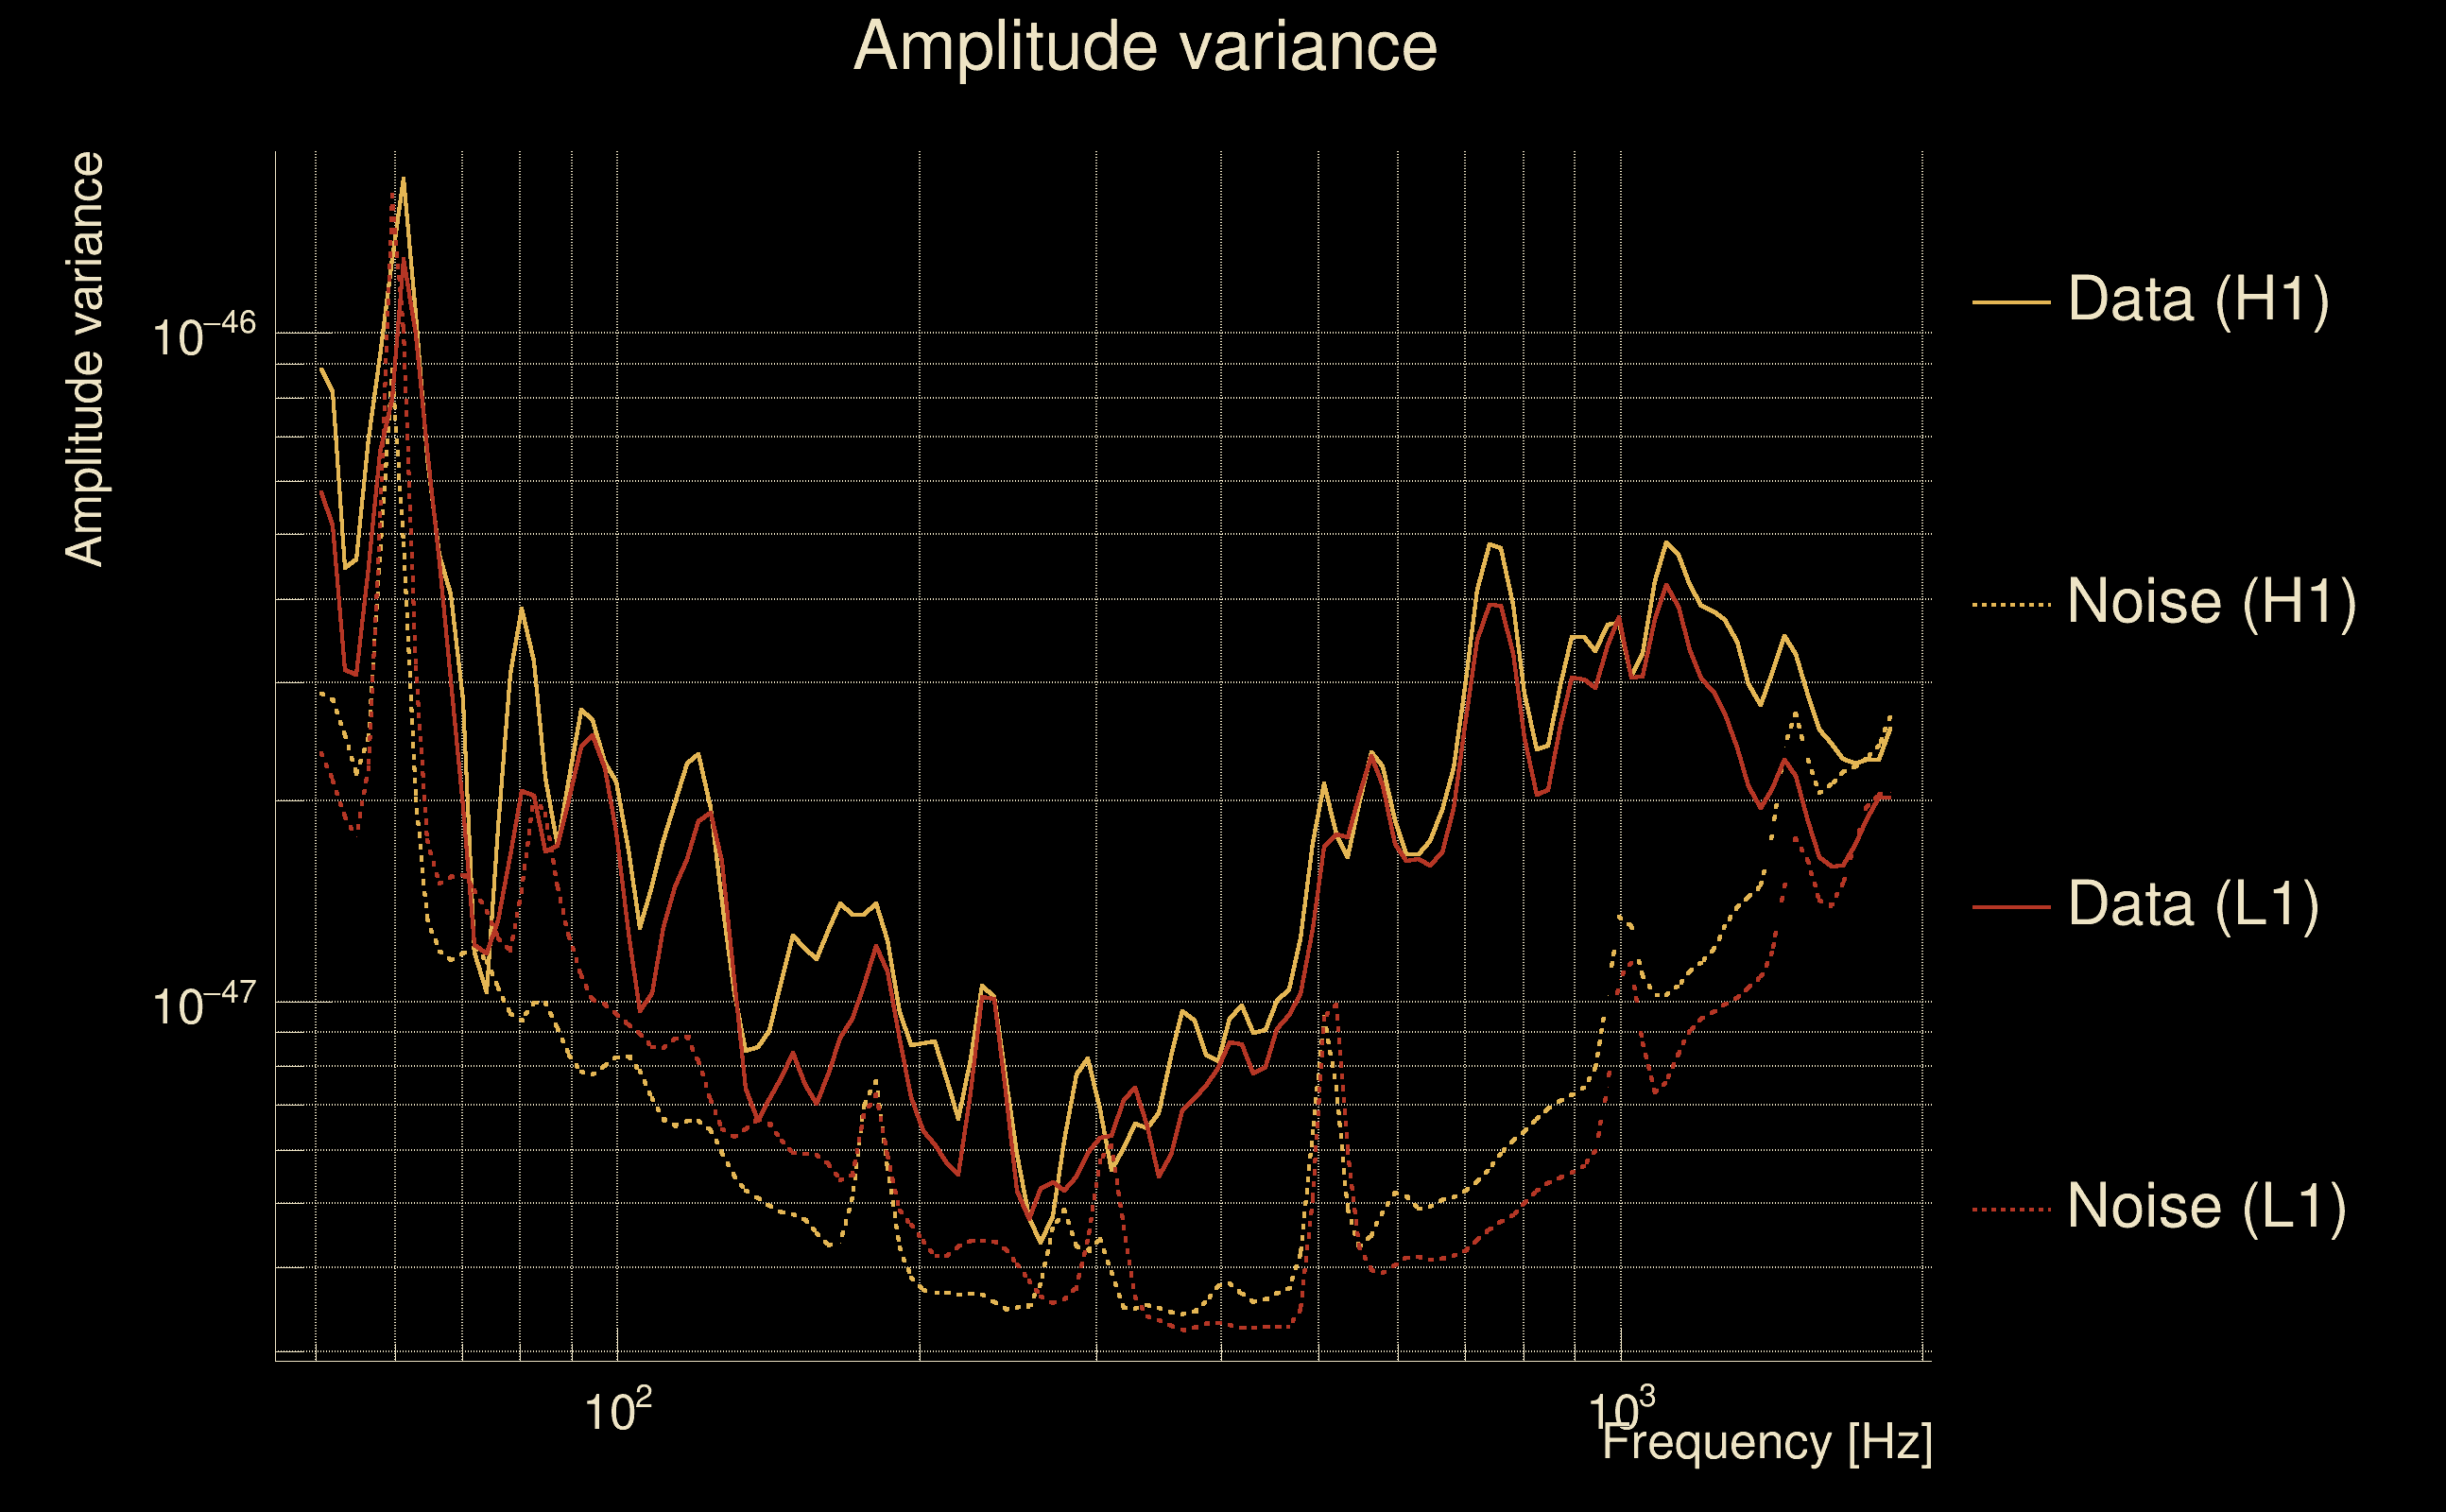
| Frequency: | 296.357 Hz |
| Ξ: | 0.887383 ± 0.00503447 (variance = 2.53459e-05): Q0: 0.910465, Q1: 0.903745, Q2: 0.898425, Q3: 0.898702, Q4: 0.896594 |
| Rank: | R_A = 0.768638 |
| Log of amplitude ratio (L1/H1): | -0.0809868, variance = 0.155714 (L1/H1: -0.0846785, variance = 0.312301, H1/L1: 0.077335, variance = 0.310554) |
| Amplitude ratio (L1/H1): | 0.922206 ⋇ 1.4838 (L1/H1: 0.918808 ⋇ 1.74864, H1/L1: 1.0804 ⋇ 1.74591) |
| Amplitude ratio H1|L1 compatibility (probability): | 0.992576 |
| Antenna factor probability: | 0.913404 |
| Number of rejected frequency rows: | Q0: 0 / 18, Q1: 0 / 36, Q2: 3 / 70, Q3: 15 / 134, Q4: 53 / 258 |
| Maximum signal-to-noise ratio: | H1: 45.4461, L1: 45.6934 |
| SNR variance: | H1: 0.496289, L1: 0.478774 |
| Click here for a zoomed plot | Click here for a zoomed plot | Click here for a zoomed plot | Click here for a zoomed plot | Click here for a zoomed plot |
 |
 |
 |
 |
 |
 |
 |
 |
 |
 |
 |
 |
 |
 |
 |
 |
 |
 |
 |
 |
 |
 |
 |
 |
 |
 |
 |
 |
 |
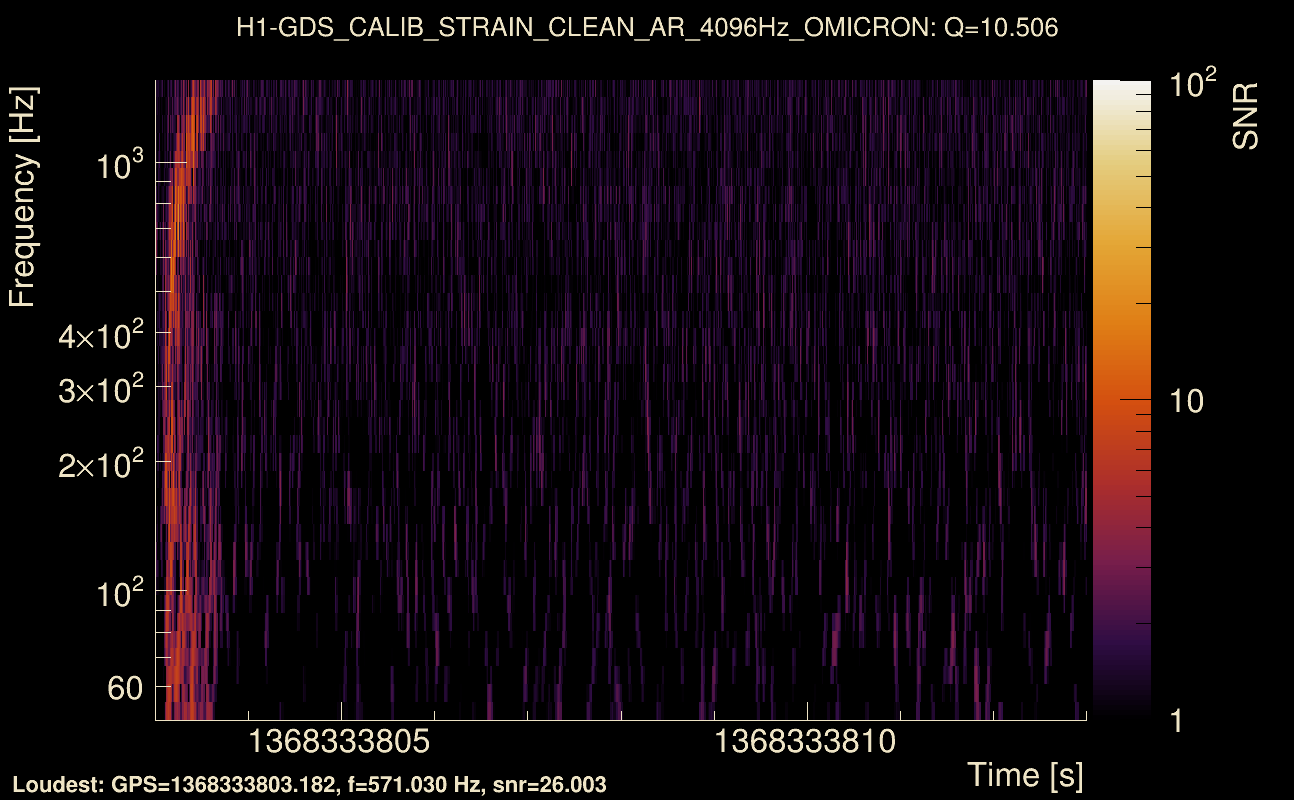
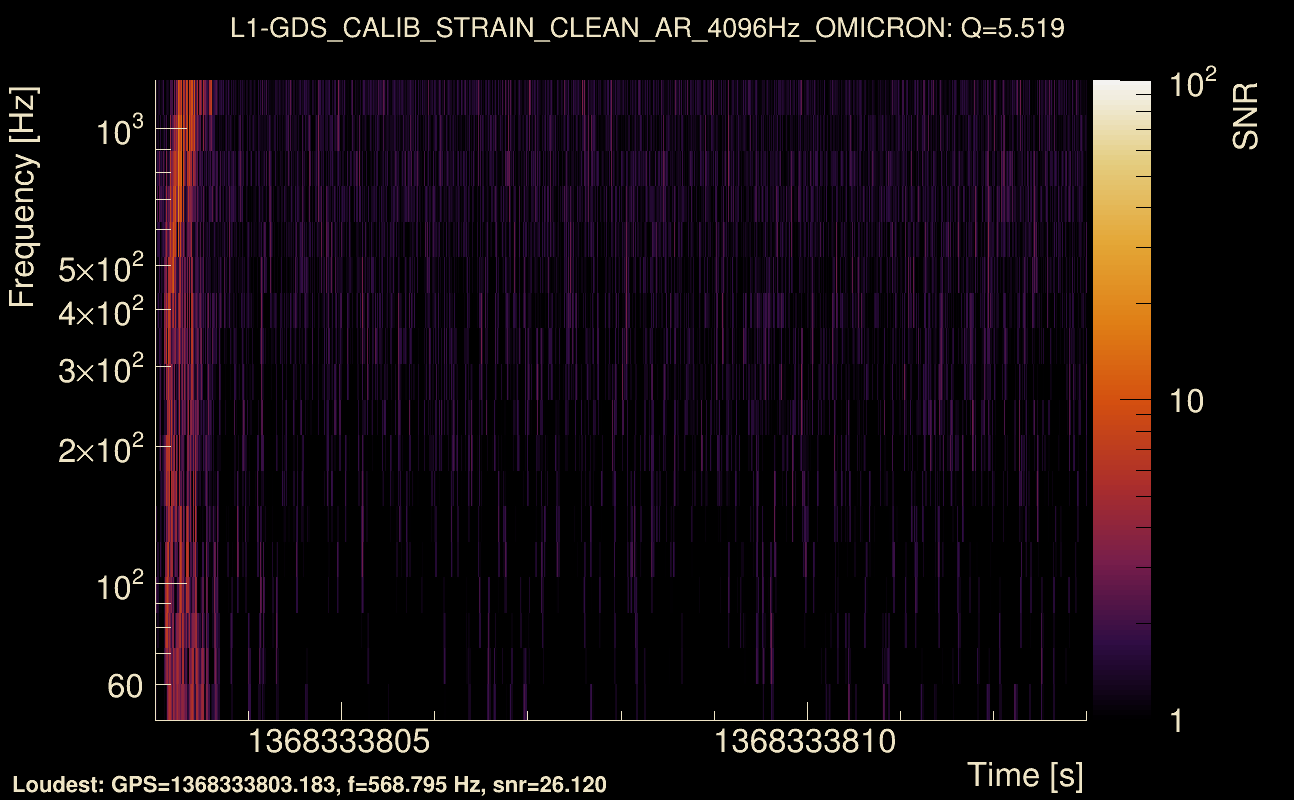
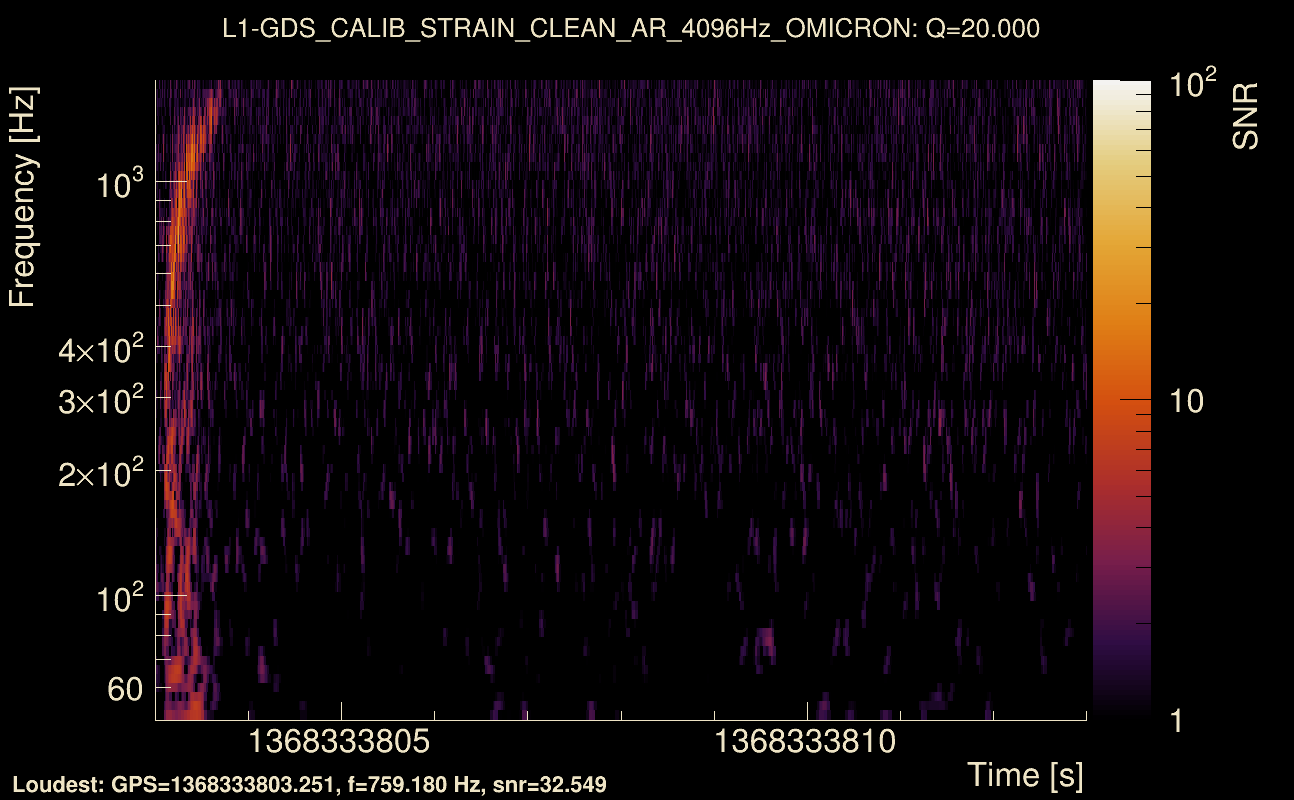
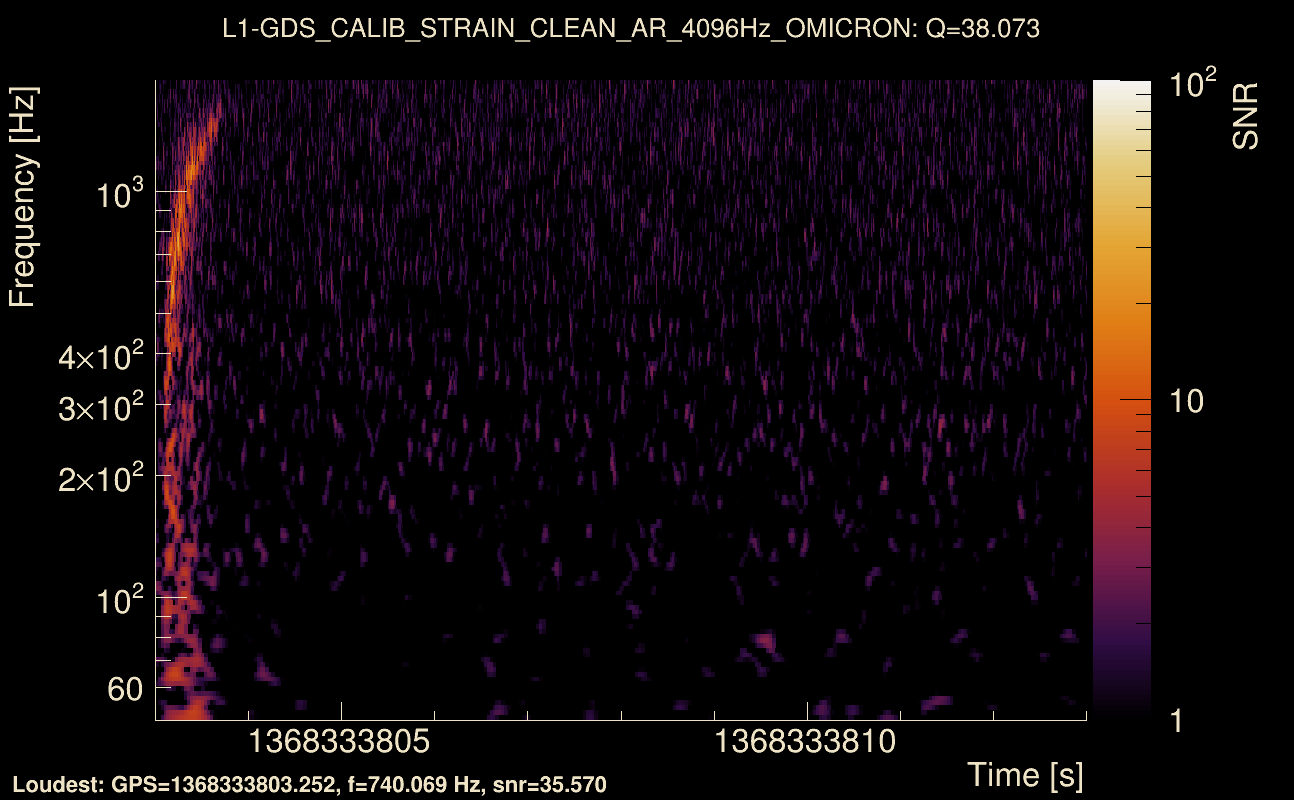
| Event time t(H1): | GPS = 1368333803 (Wed May 17 04:43:05 2023 ) → GPS = 1368333813 (Wed May 17 04:43:15 2023 ) |
| Event time t(L1): | GPS = 1368333803 (Wed May 17 04:43:15 2023 ) → GPS = 1368333813 (Wed May 17 04:43:15 2023 ) |
| Omicron analysis time window (H1): | GPS = 1368333800 → GPS = 1368333816 |
| Omicron analysis time window (L1): | GPS = 1368333800 → GPS = 1368333816 |
| Time delay between detectors t(L1) - t(H1): | 0.000765752 s (slice index = 108 / 217), δt_gw = 0.000765752 s |
| Time delay uncertainty: | 0.0013423 s |
| [targeted mode] Time delay probability: | 0.966535 (0.0419542 sigmas), δt_target = 0.000782728 s |
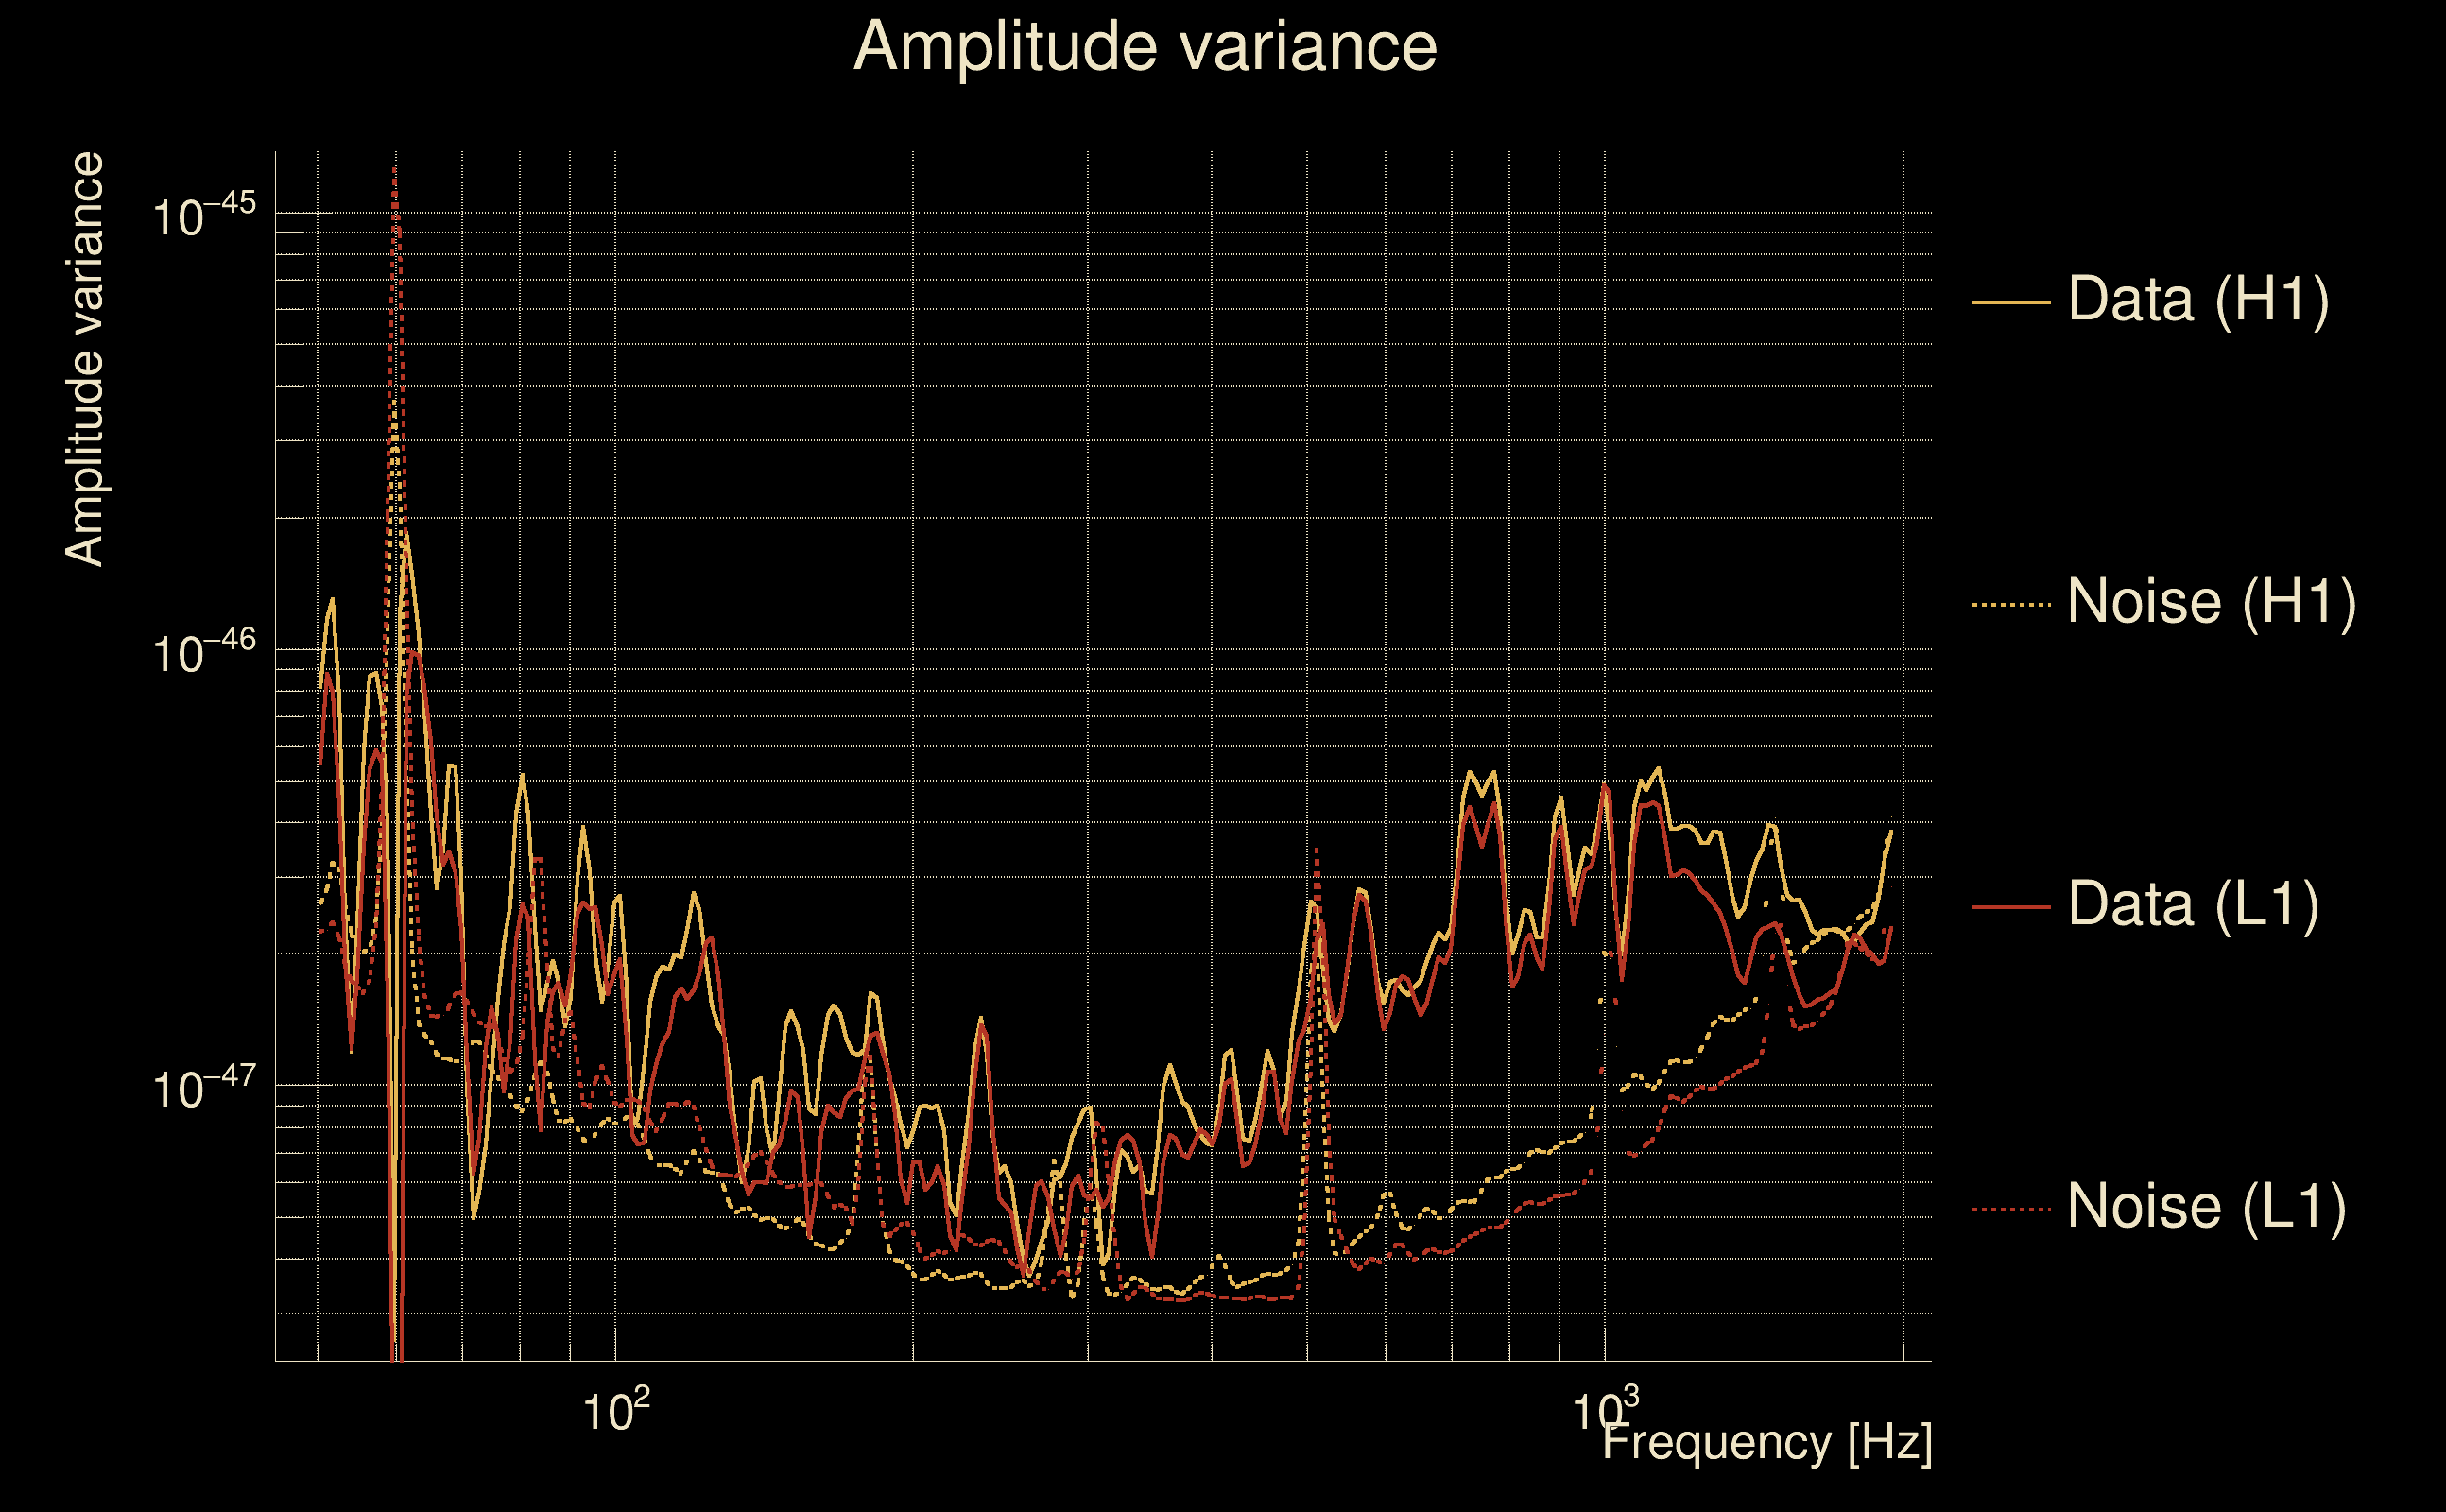
| Frequency: | 305.697 Hz |
| Ξ: | 0.828892 ± 0.00727359 (variance = 5.29051e-05): Q0: 0.849539, Q1: 0.852879, Q2: 0.857518, Q3: 0.855978, Q4: 0.870826 |
| Rank: | R_A = 0.768007 |
| Log of amplitude ratio (L1/H1): | -0.0403109, variance = 0.160391 (L1/H1: -0.0625031, variance = 0.319506, H1/L1: 0.0220447, variance = 0.316628) |
| Amplitude ratio (L1/H1): | 0.960491 ⋇ 1.49255 (L1/H1: 0.93941 ⋇ 1.75989, H1/L1: 1.02229 ⋇ 1.7554) |
| Amplitude ratio H1|L1 compatibility (probability): | 0.959544 |
| Antenna factor probability: | 0.999044 |
| Number of rejected frequency rows: | Q0: 0 / 18, Q1: 0 / 36, Q2: 4 / 70, Q3: 19 / 134, Q4: 75 / 258 |
| Maximum signal-to-noise ratio: | H1: 32.3997, L1: 35.7122 |
| SNR variance: | H1: 1.15617, L1: 1.20656 |
| Click here for a zoomed plot | Click here for a zoomed plot | Click here for a zoomed plot | Click here for a zoomed plot | Click here for a zoomed plot |
 |
 |
 |
 |
 |
 |
 |
 |
 |
 |
 |
 |
 |
 |
 |
 |
 |
 |
 |
 |
 |
 |
 |
 |
 |
 |
 |
 |
 |
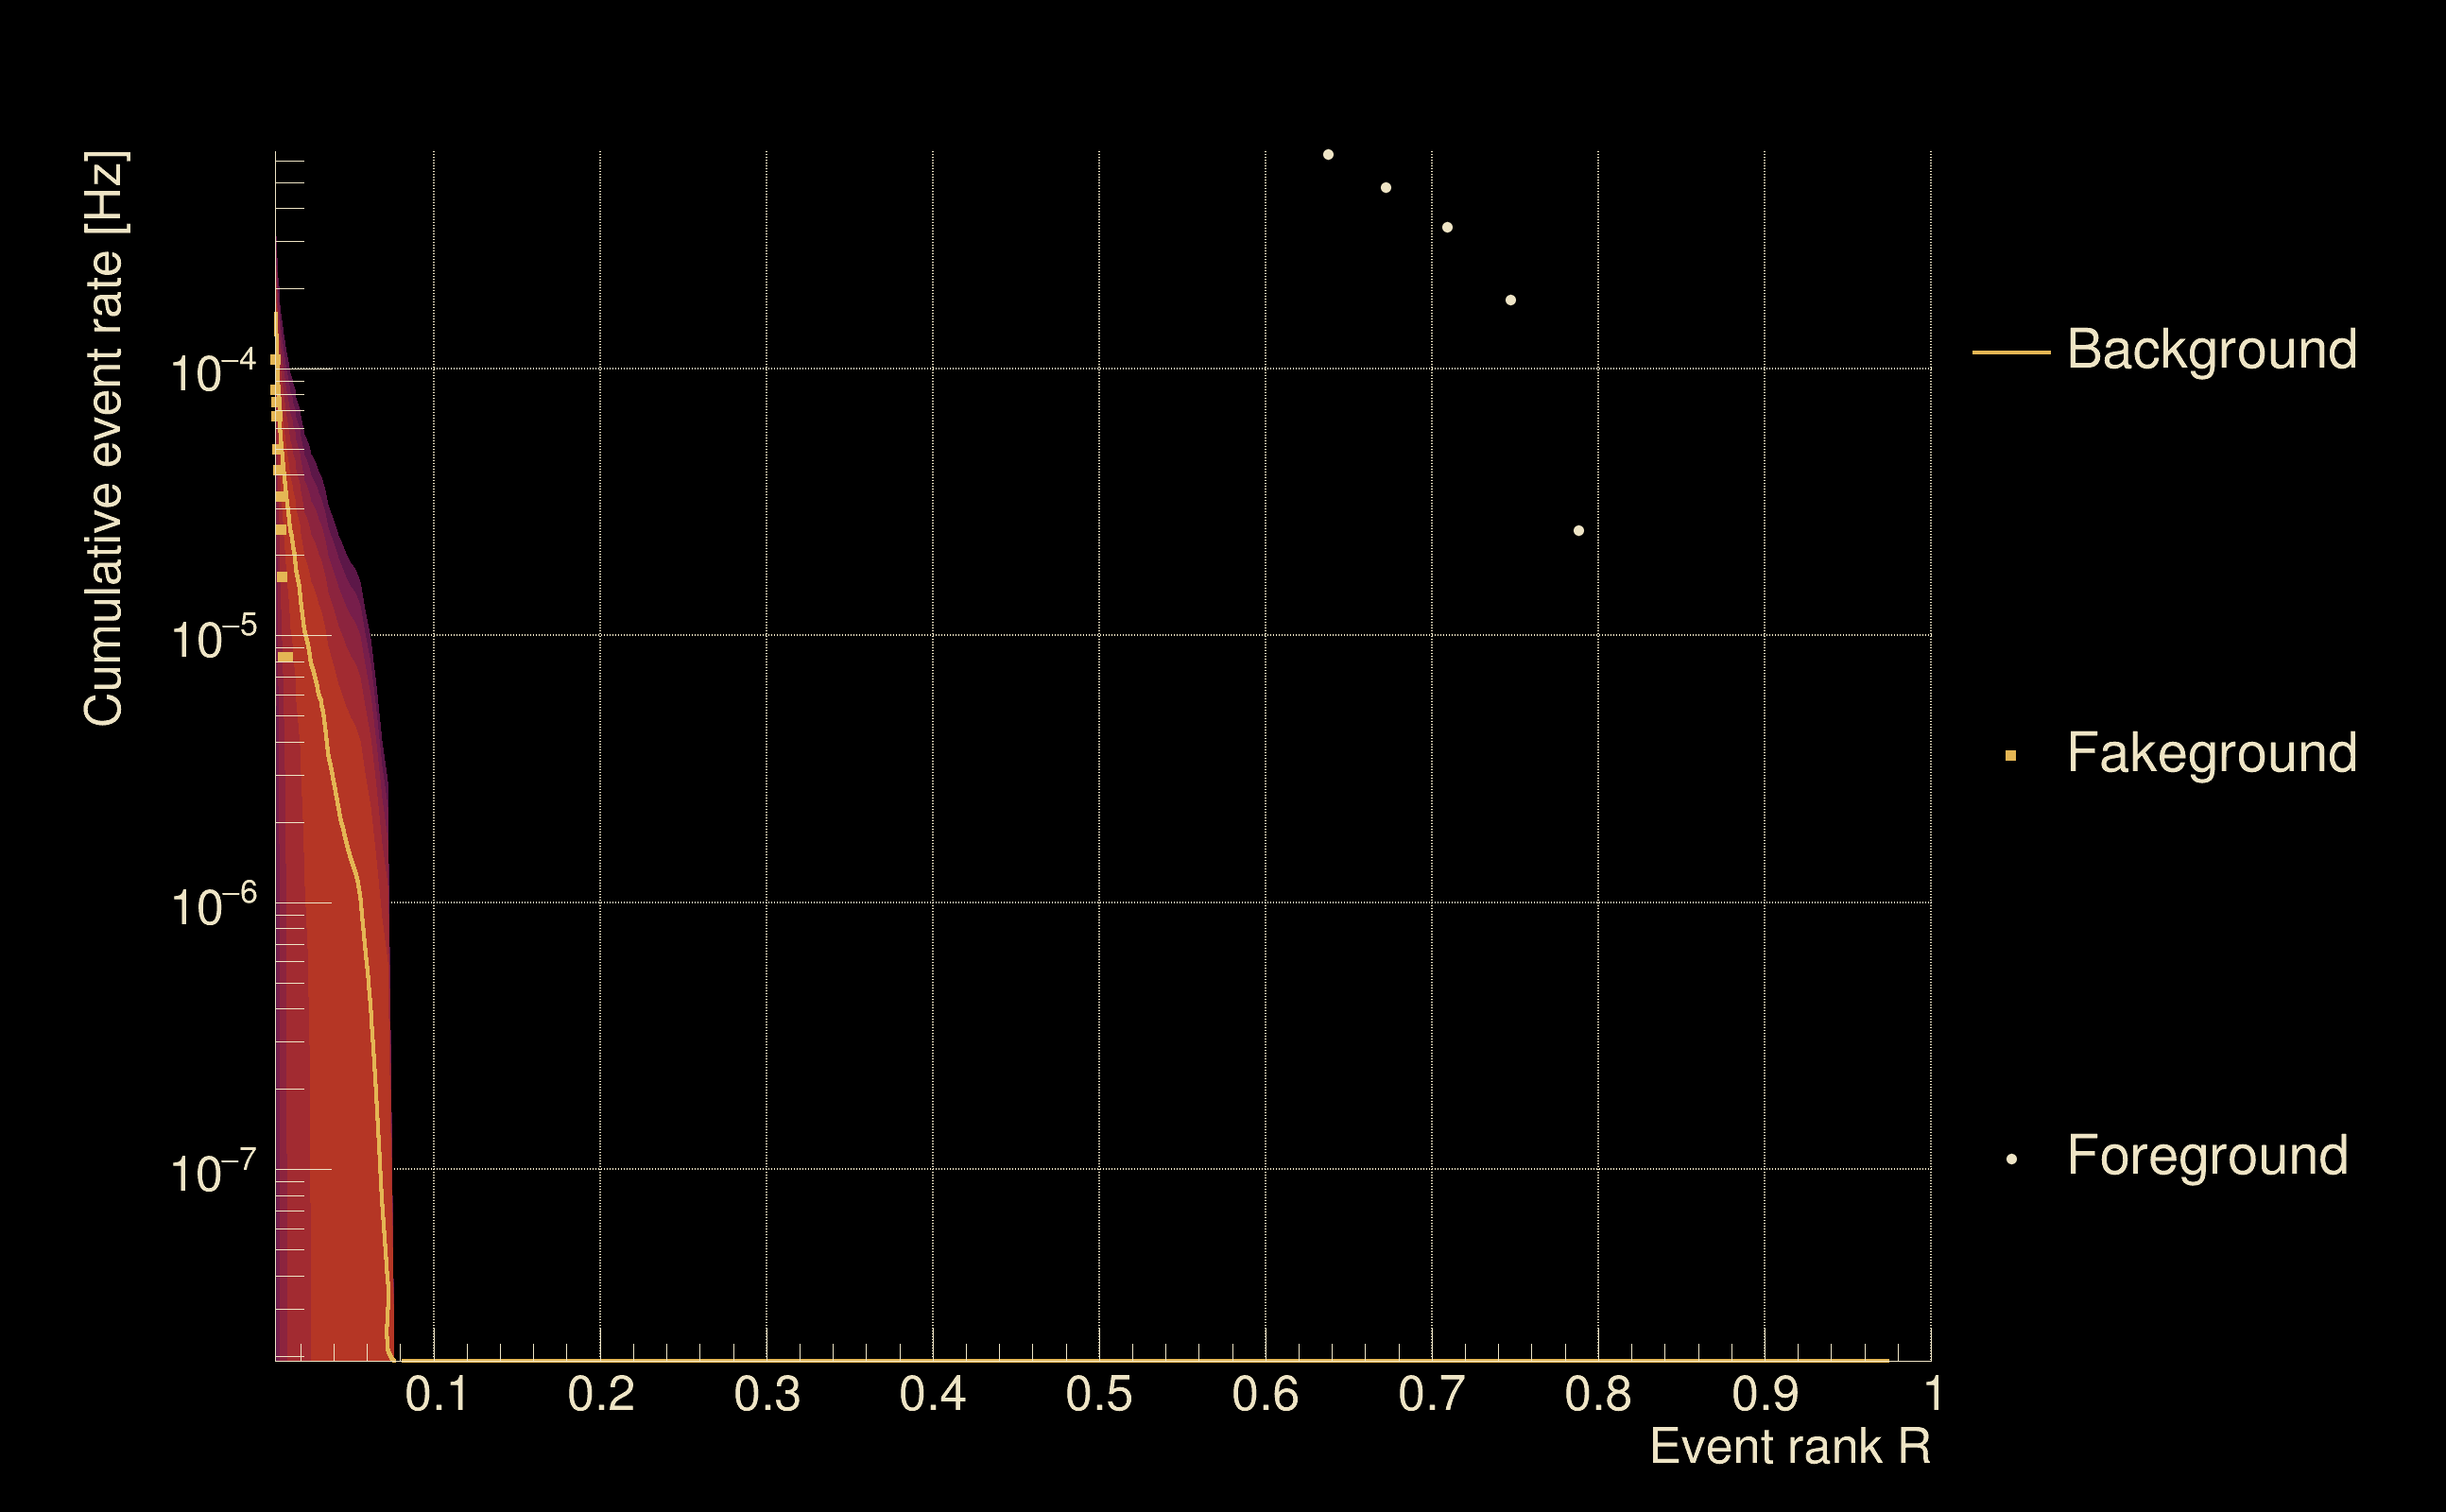
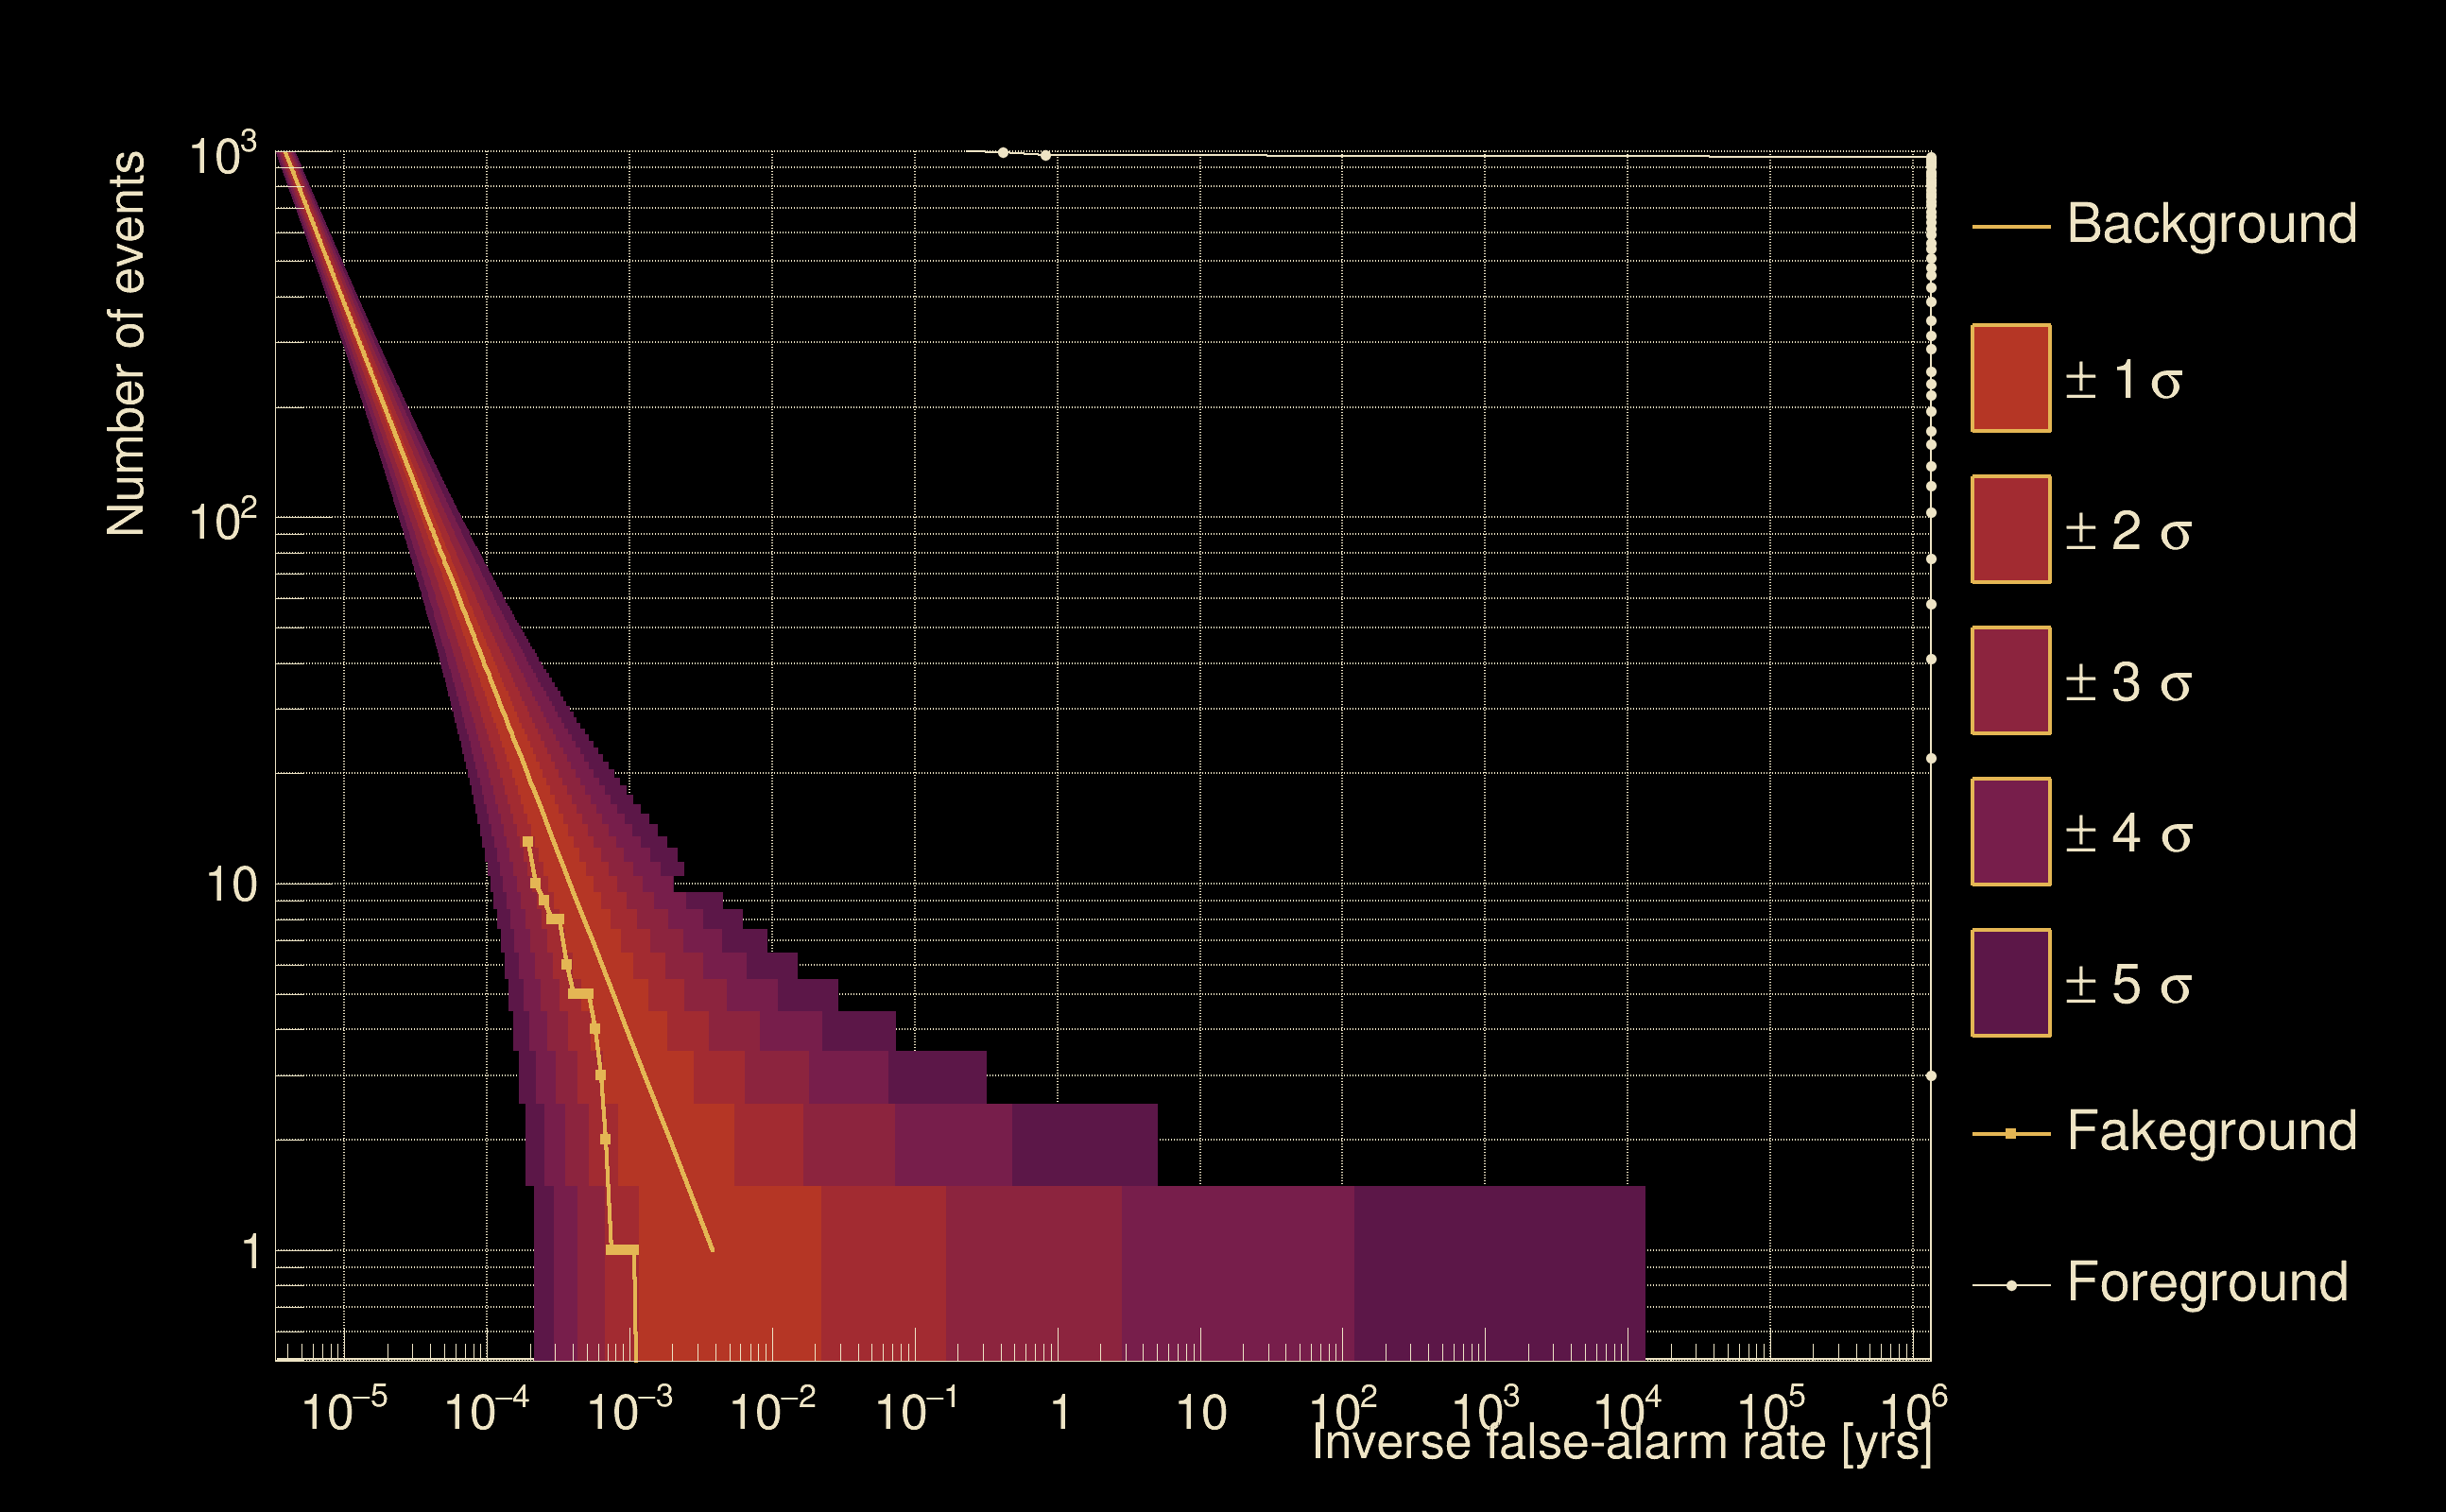
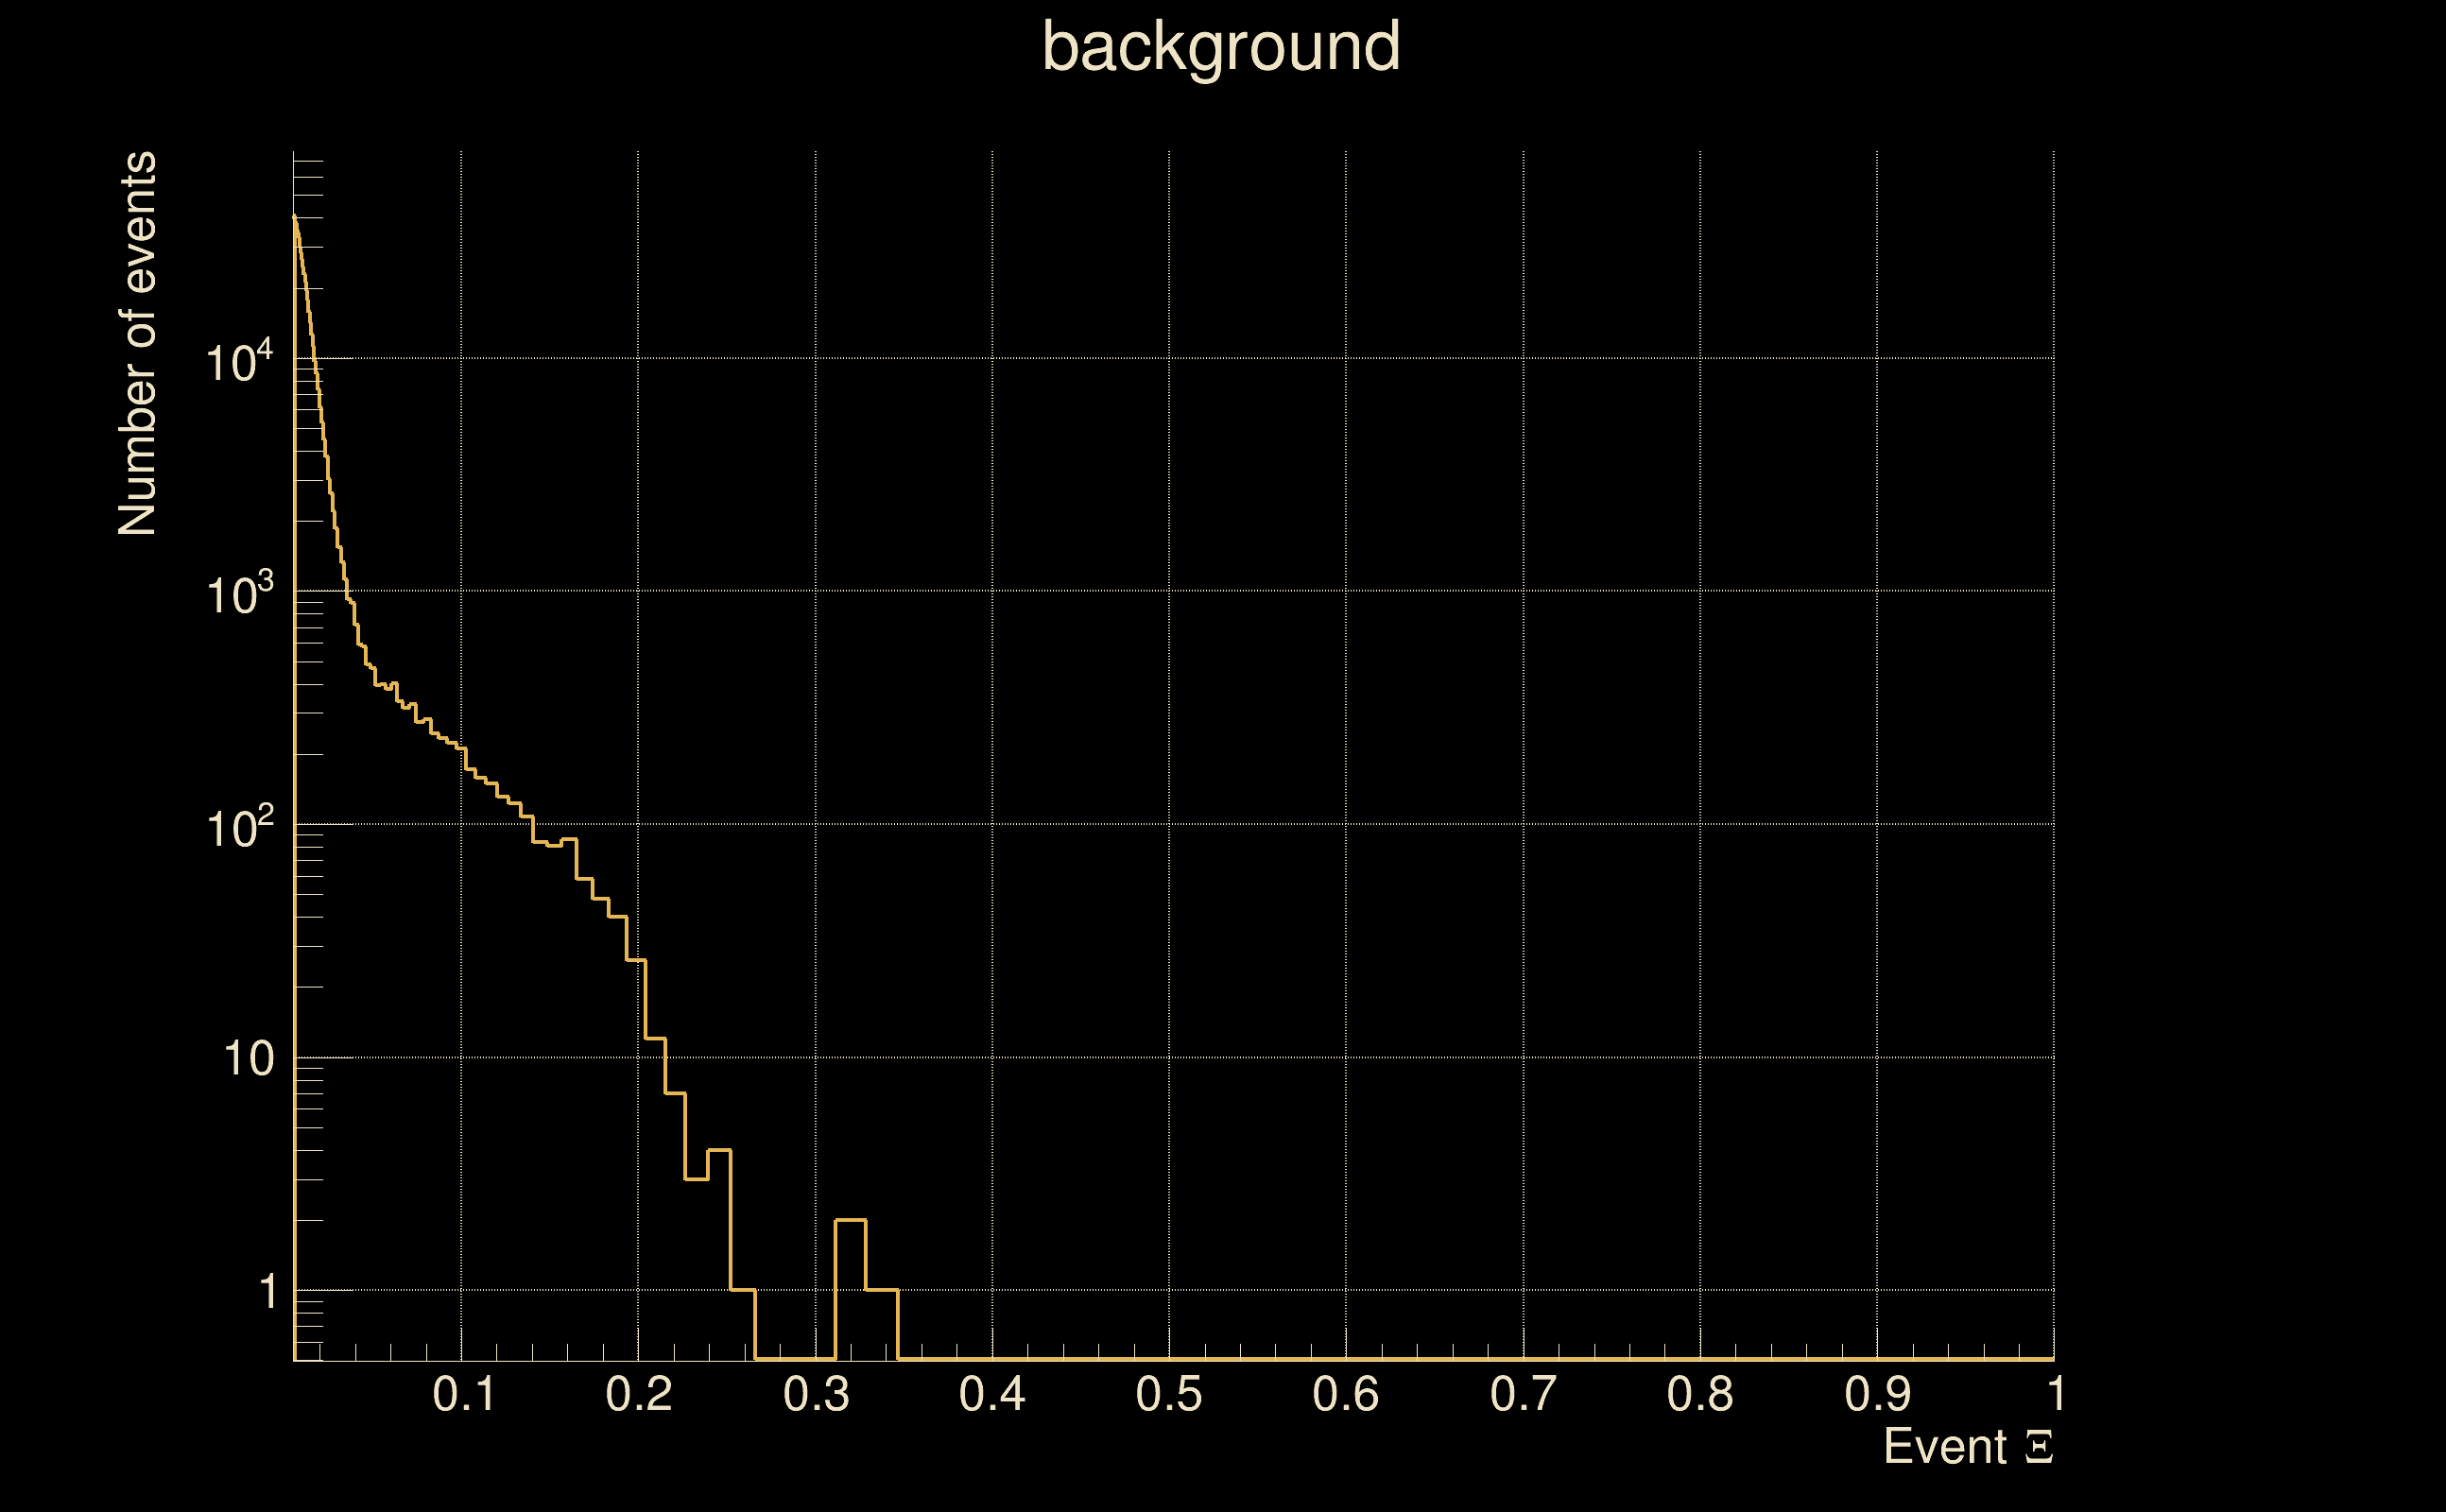
| Detection threshold: | R > 0.0726344 |
| False-alarm rate above that detection threshold: | 1.92022e-08 |
| Alternative threshold at 1/1000 yrs: | R > 0.0726344 |
| Alternative threshold at 1/100 yrs: | R > 0.0726344 |
| Alternative threshold at 1/10 yrs: | R > 0.0726344 |
| Alternative threshold at 1/1 yr: | R > 0.0726344 |
| Alternative threshold at 1/1 d: | R > 0.0214855 |
 |
|
 |
 |
 |
 |
 |
 |
 |
 |
 |
 |
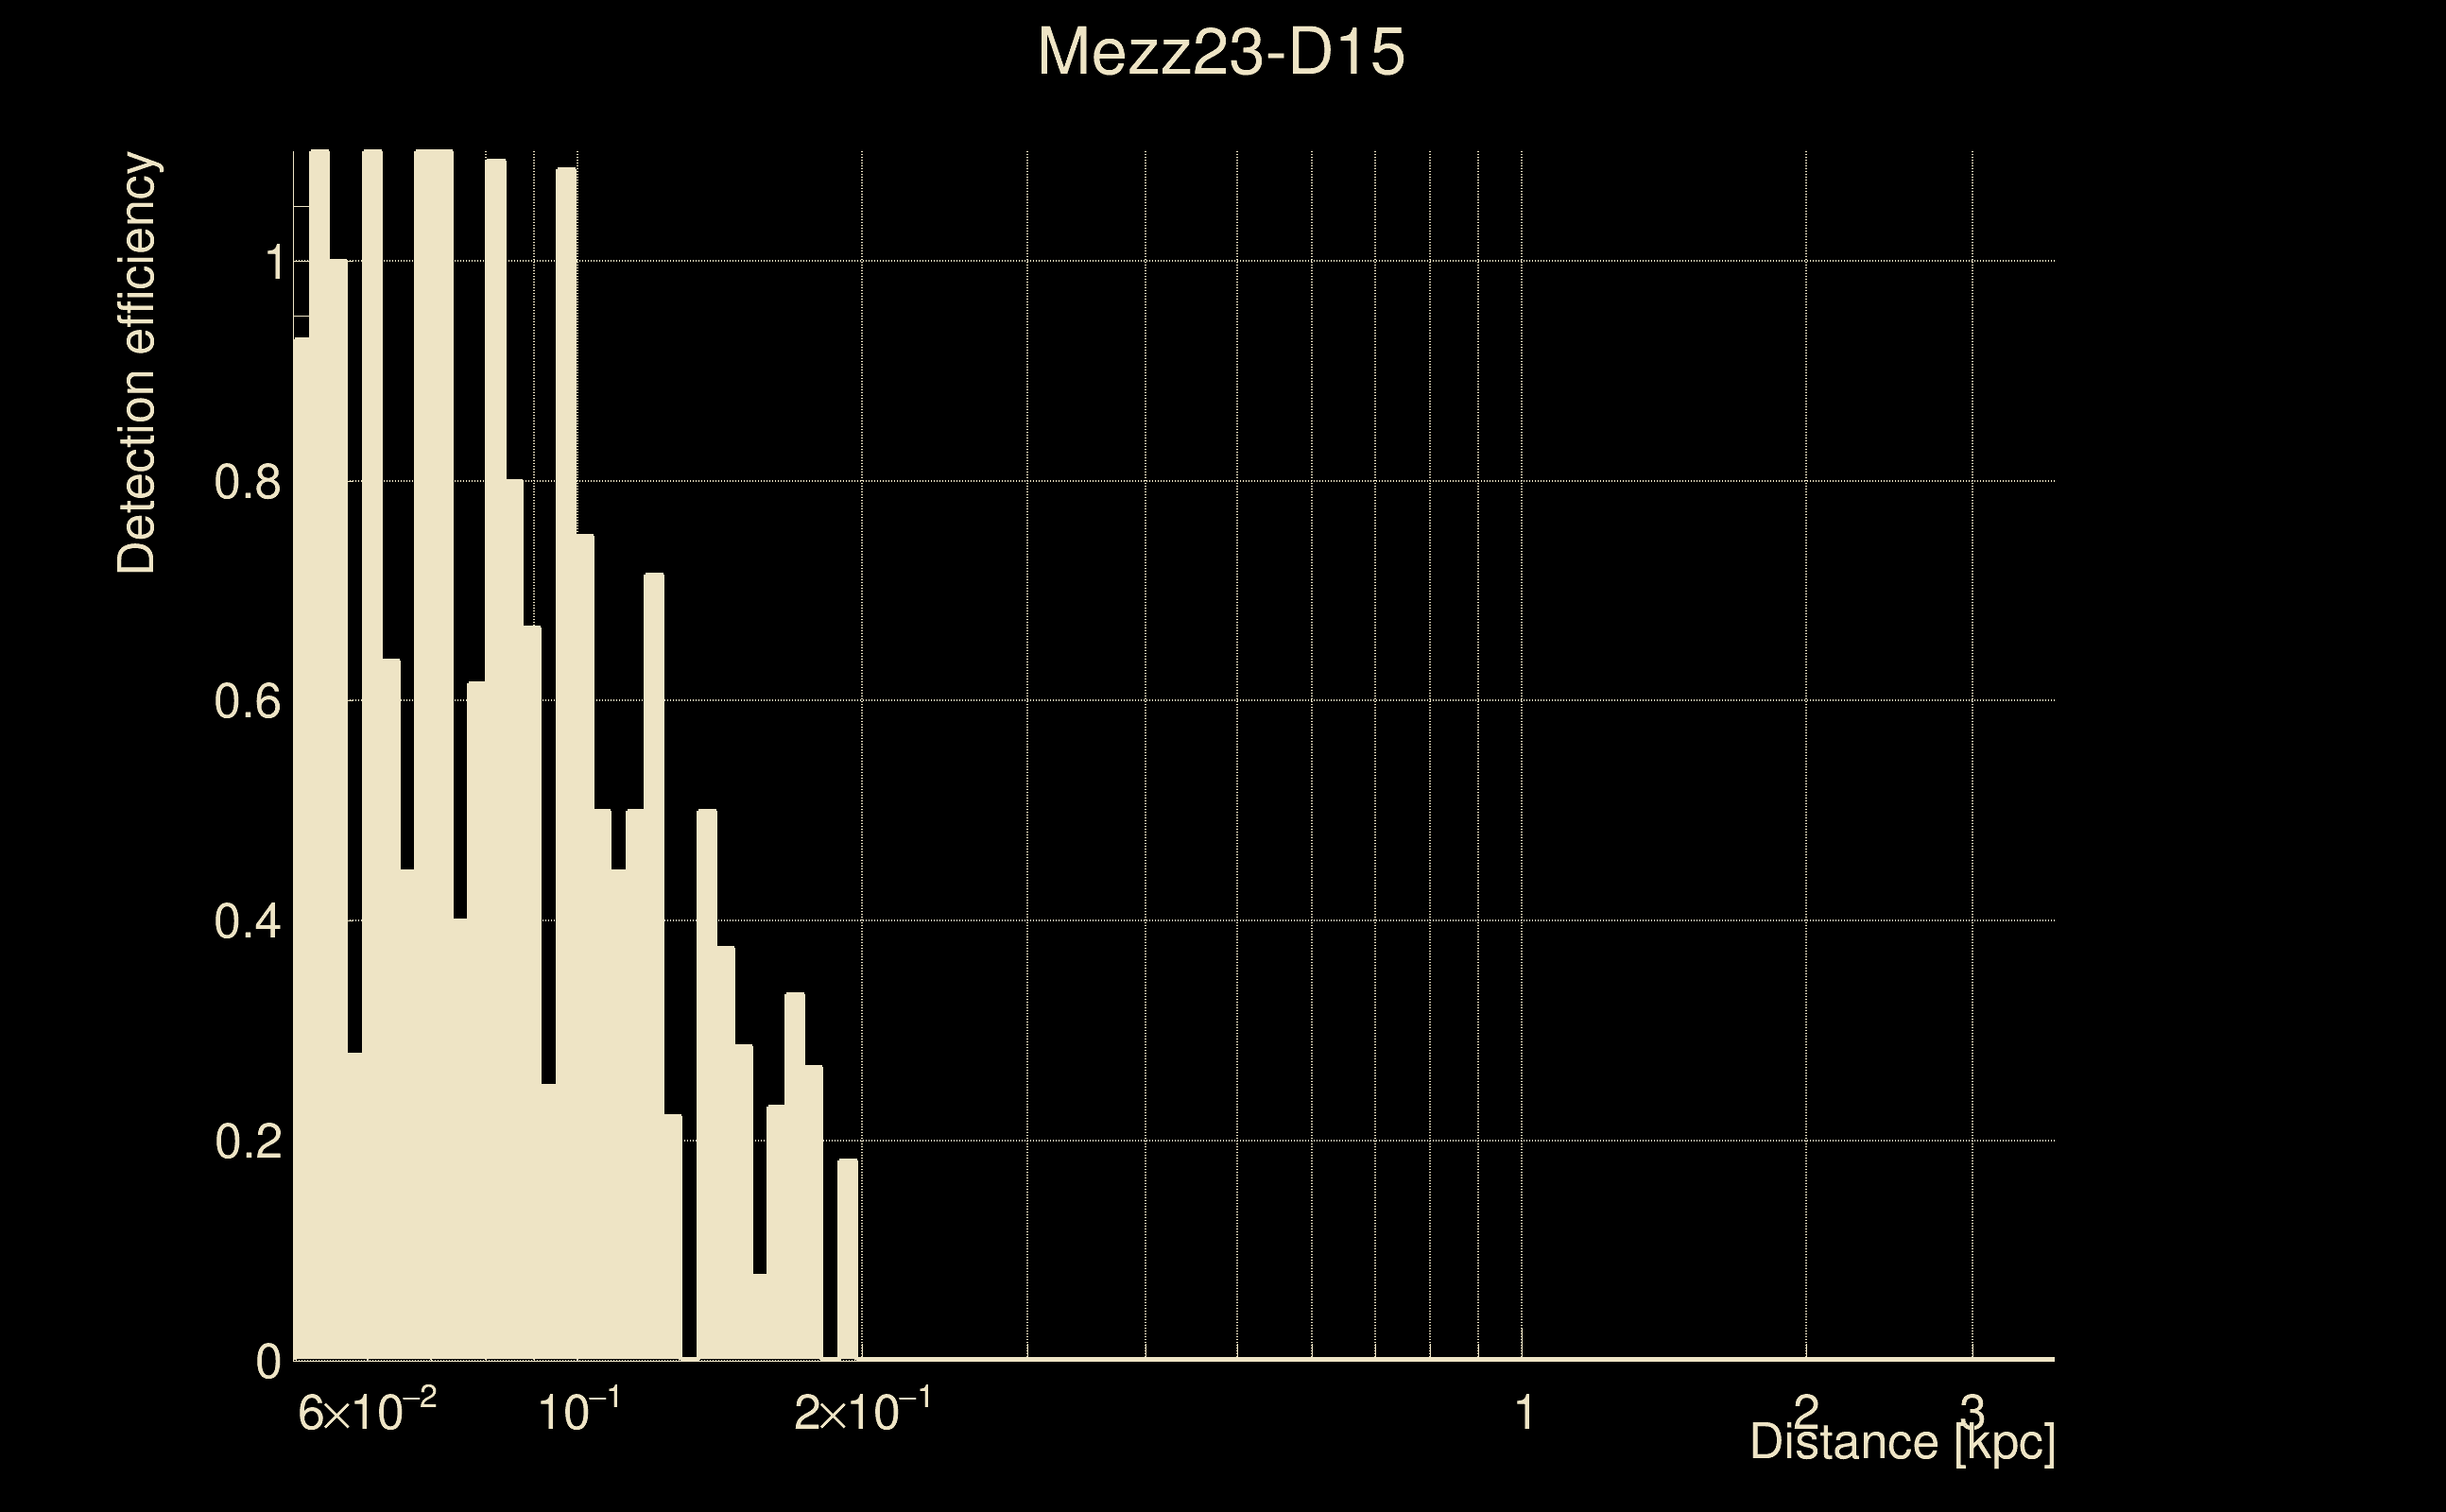
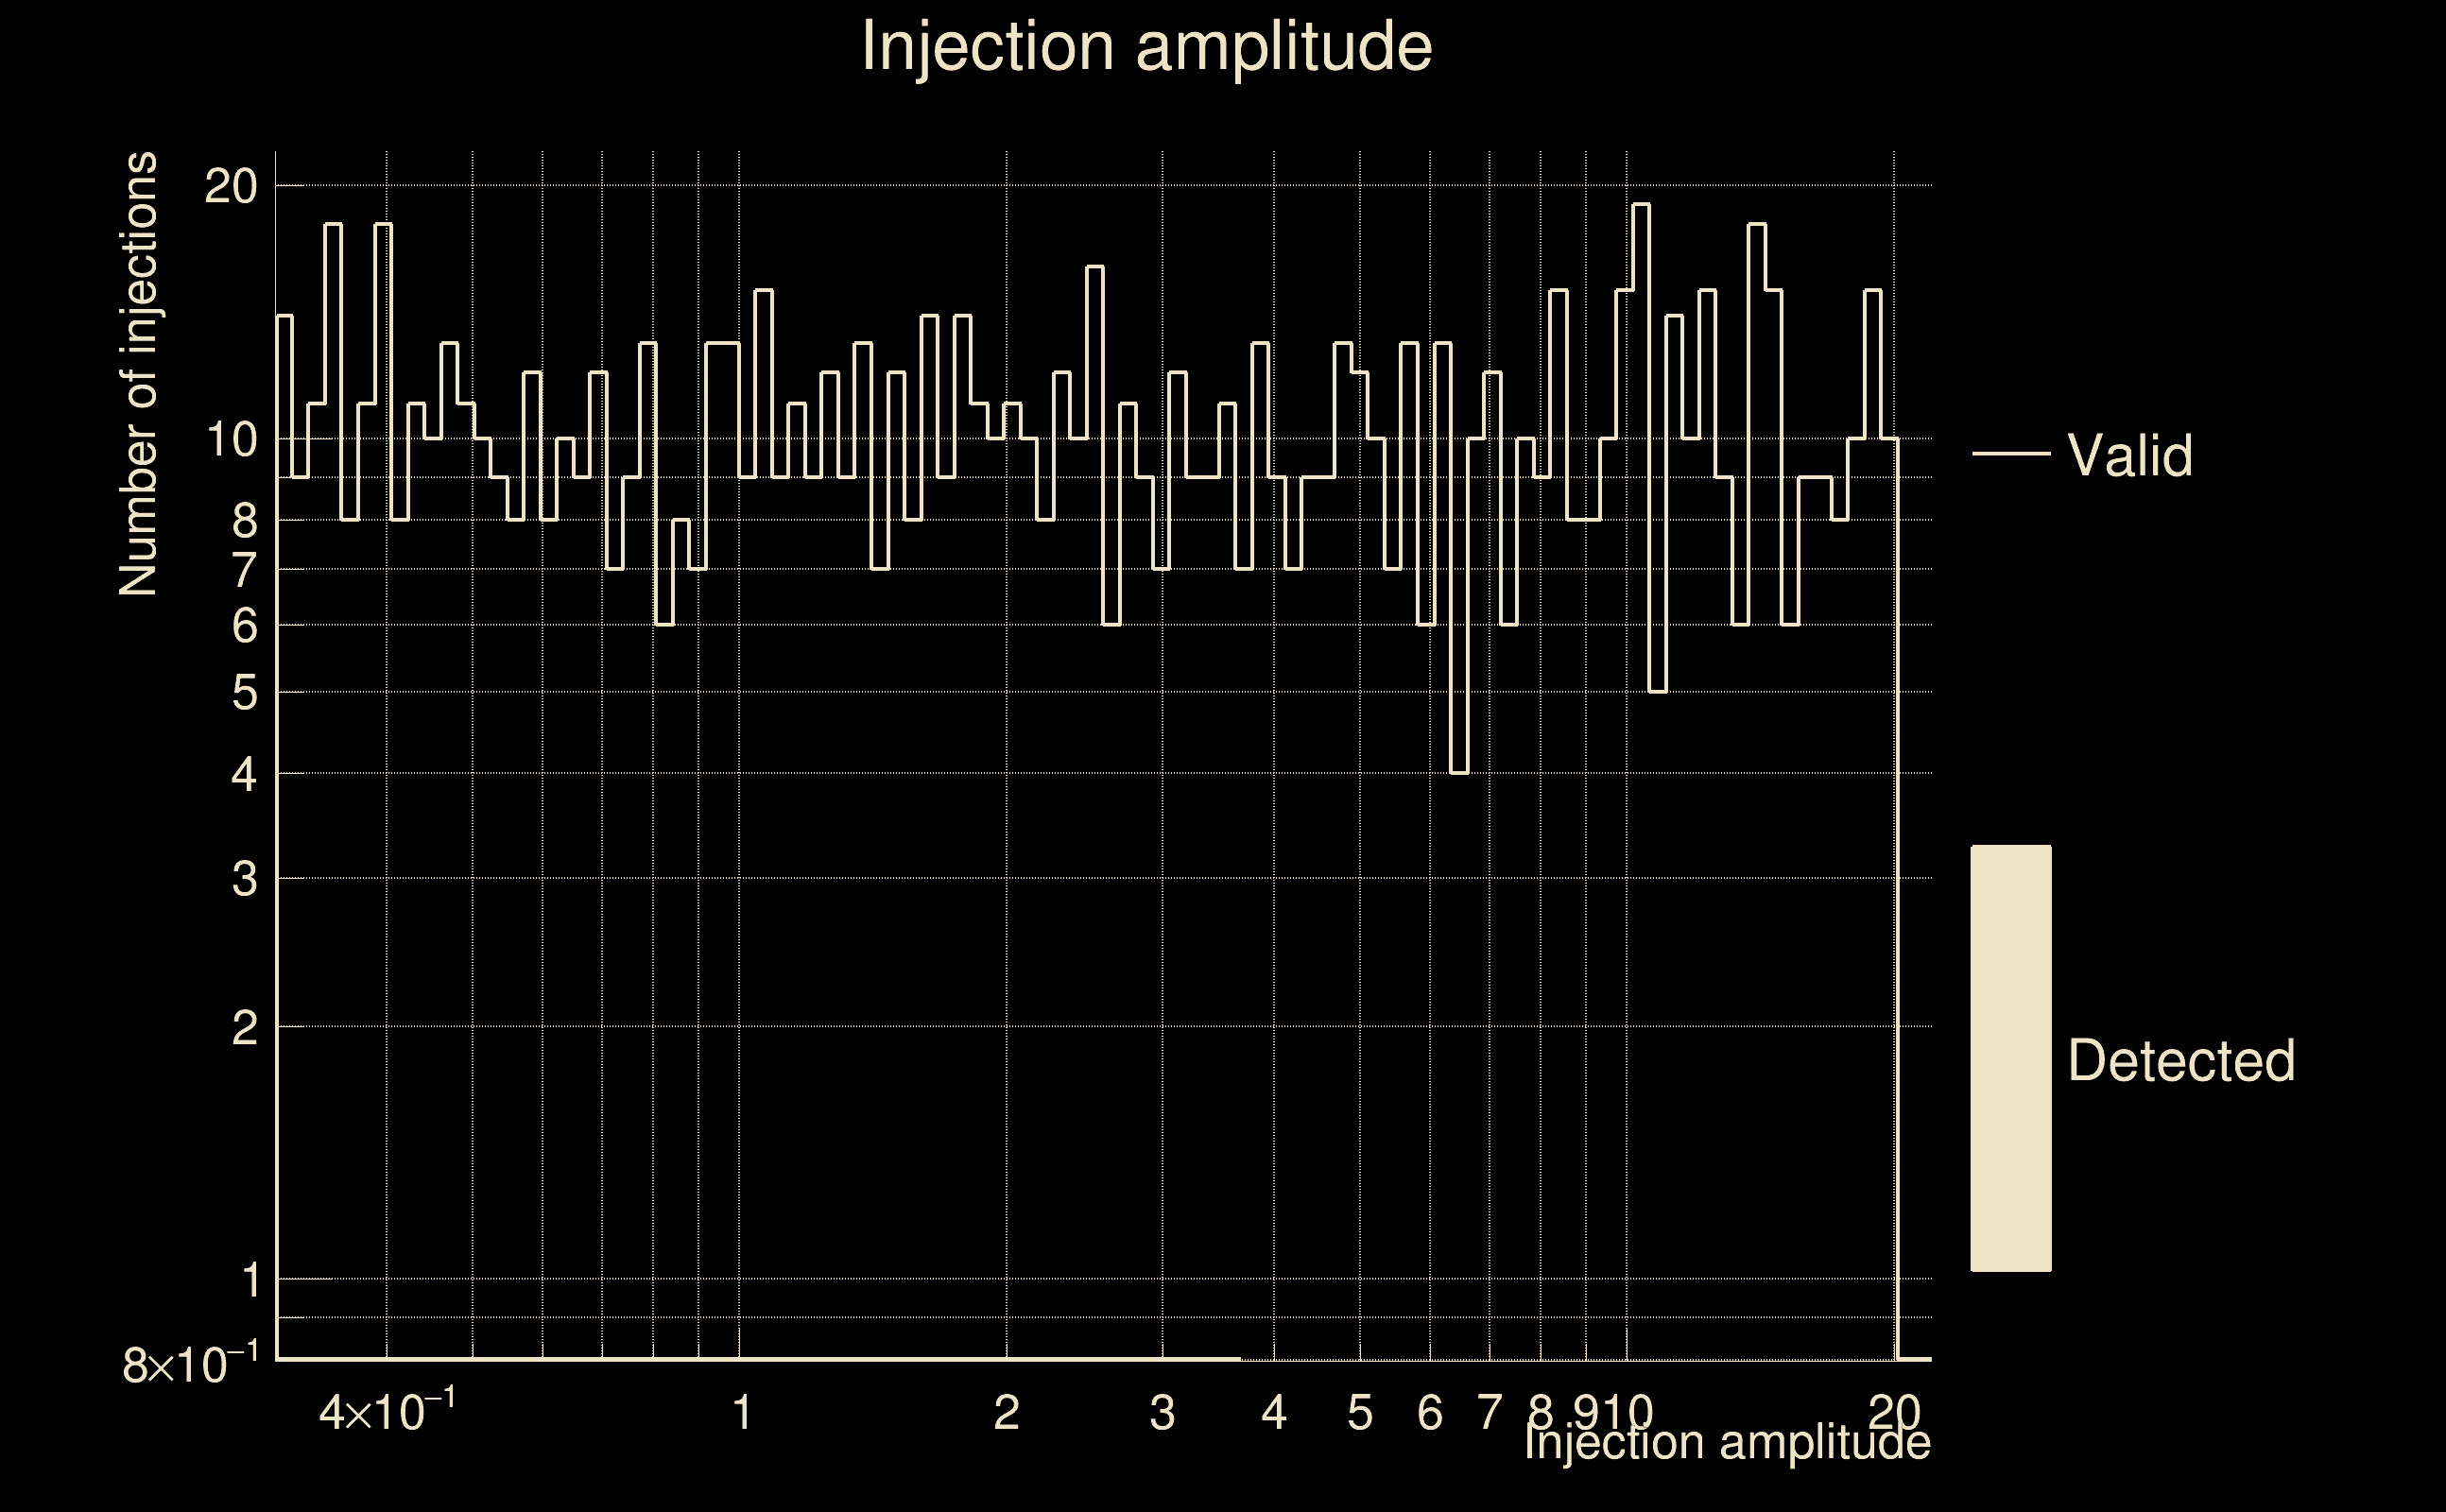
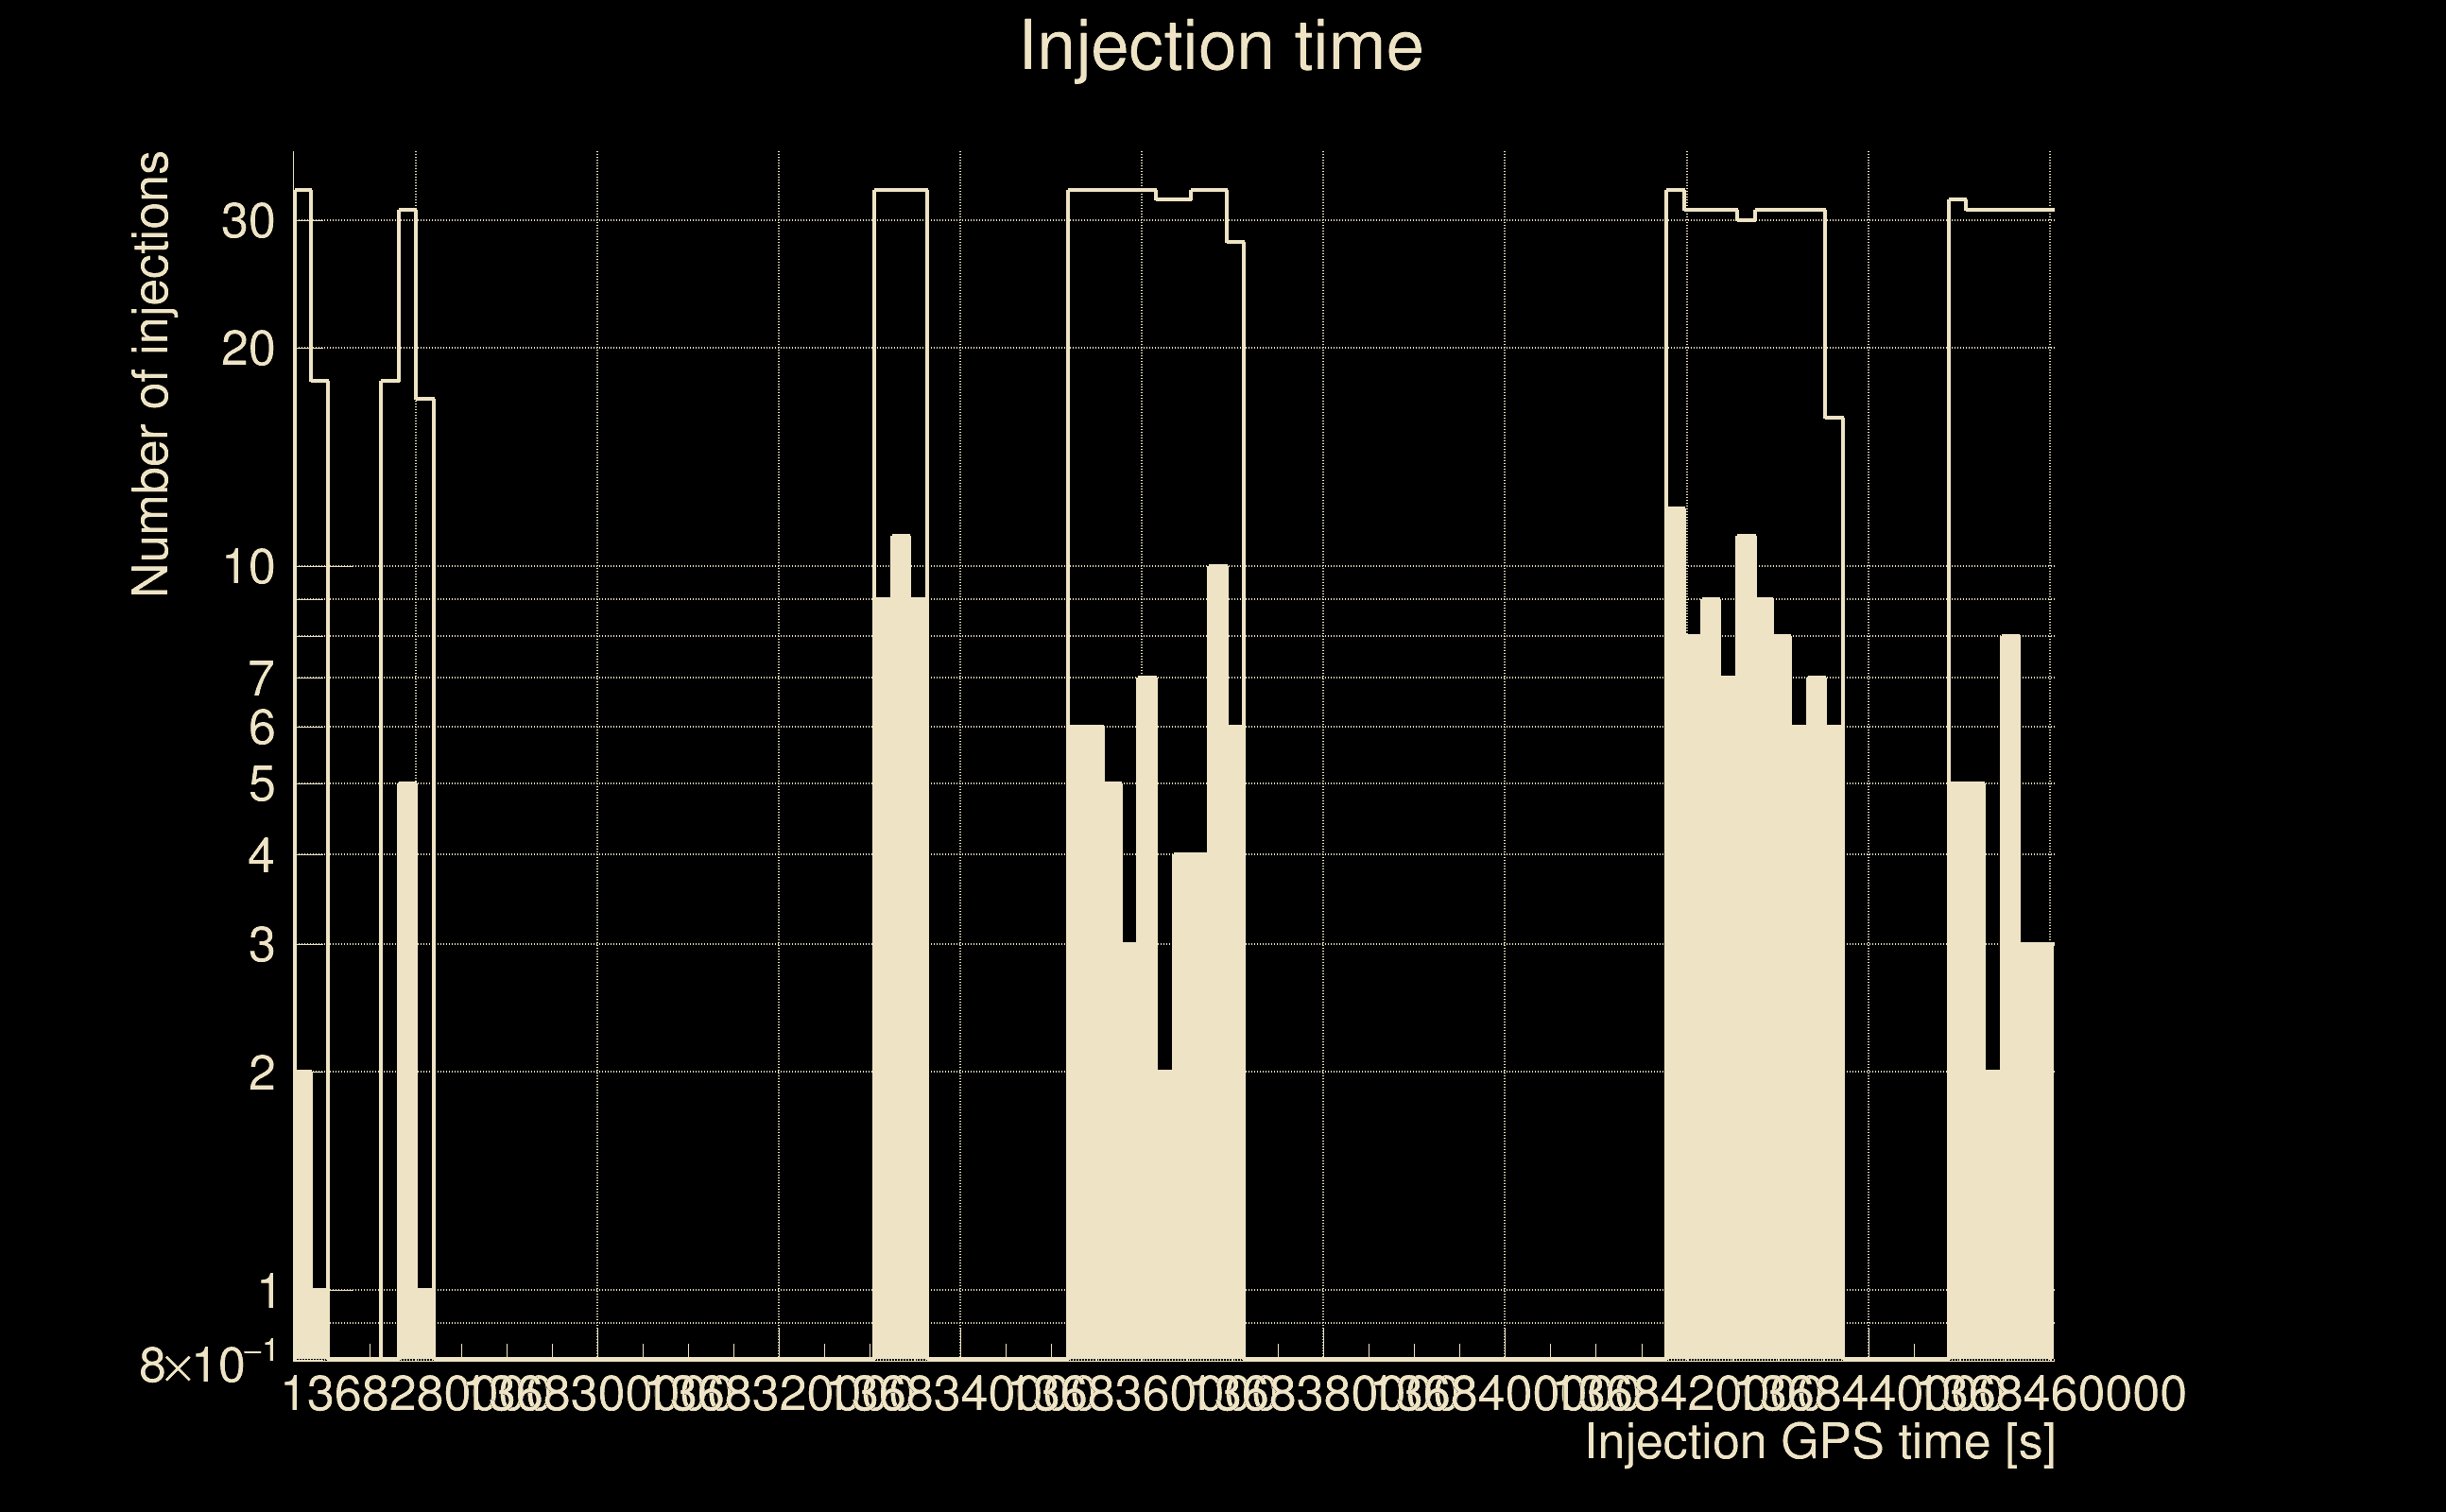
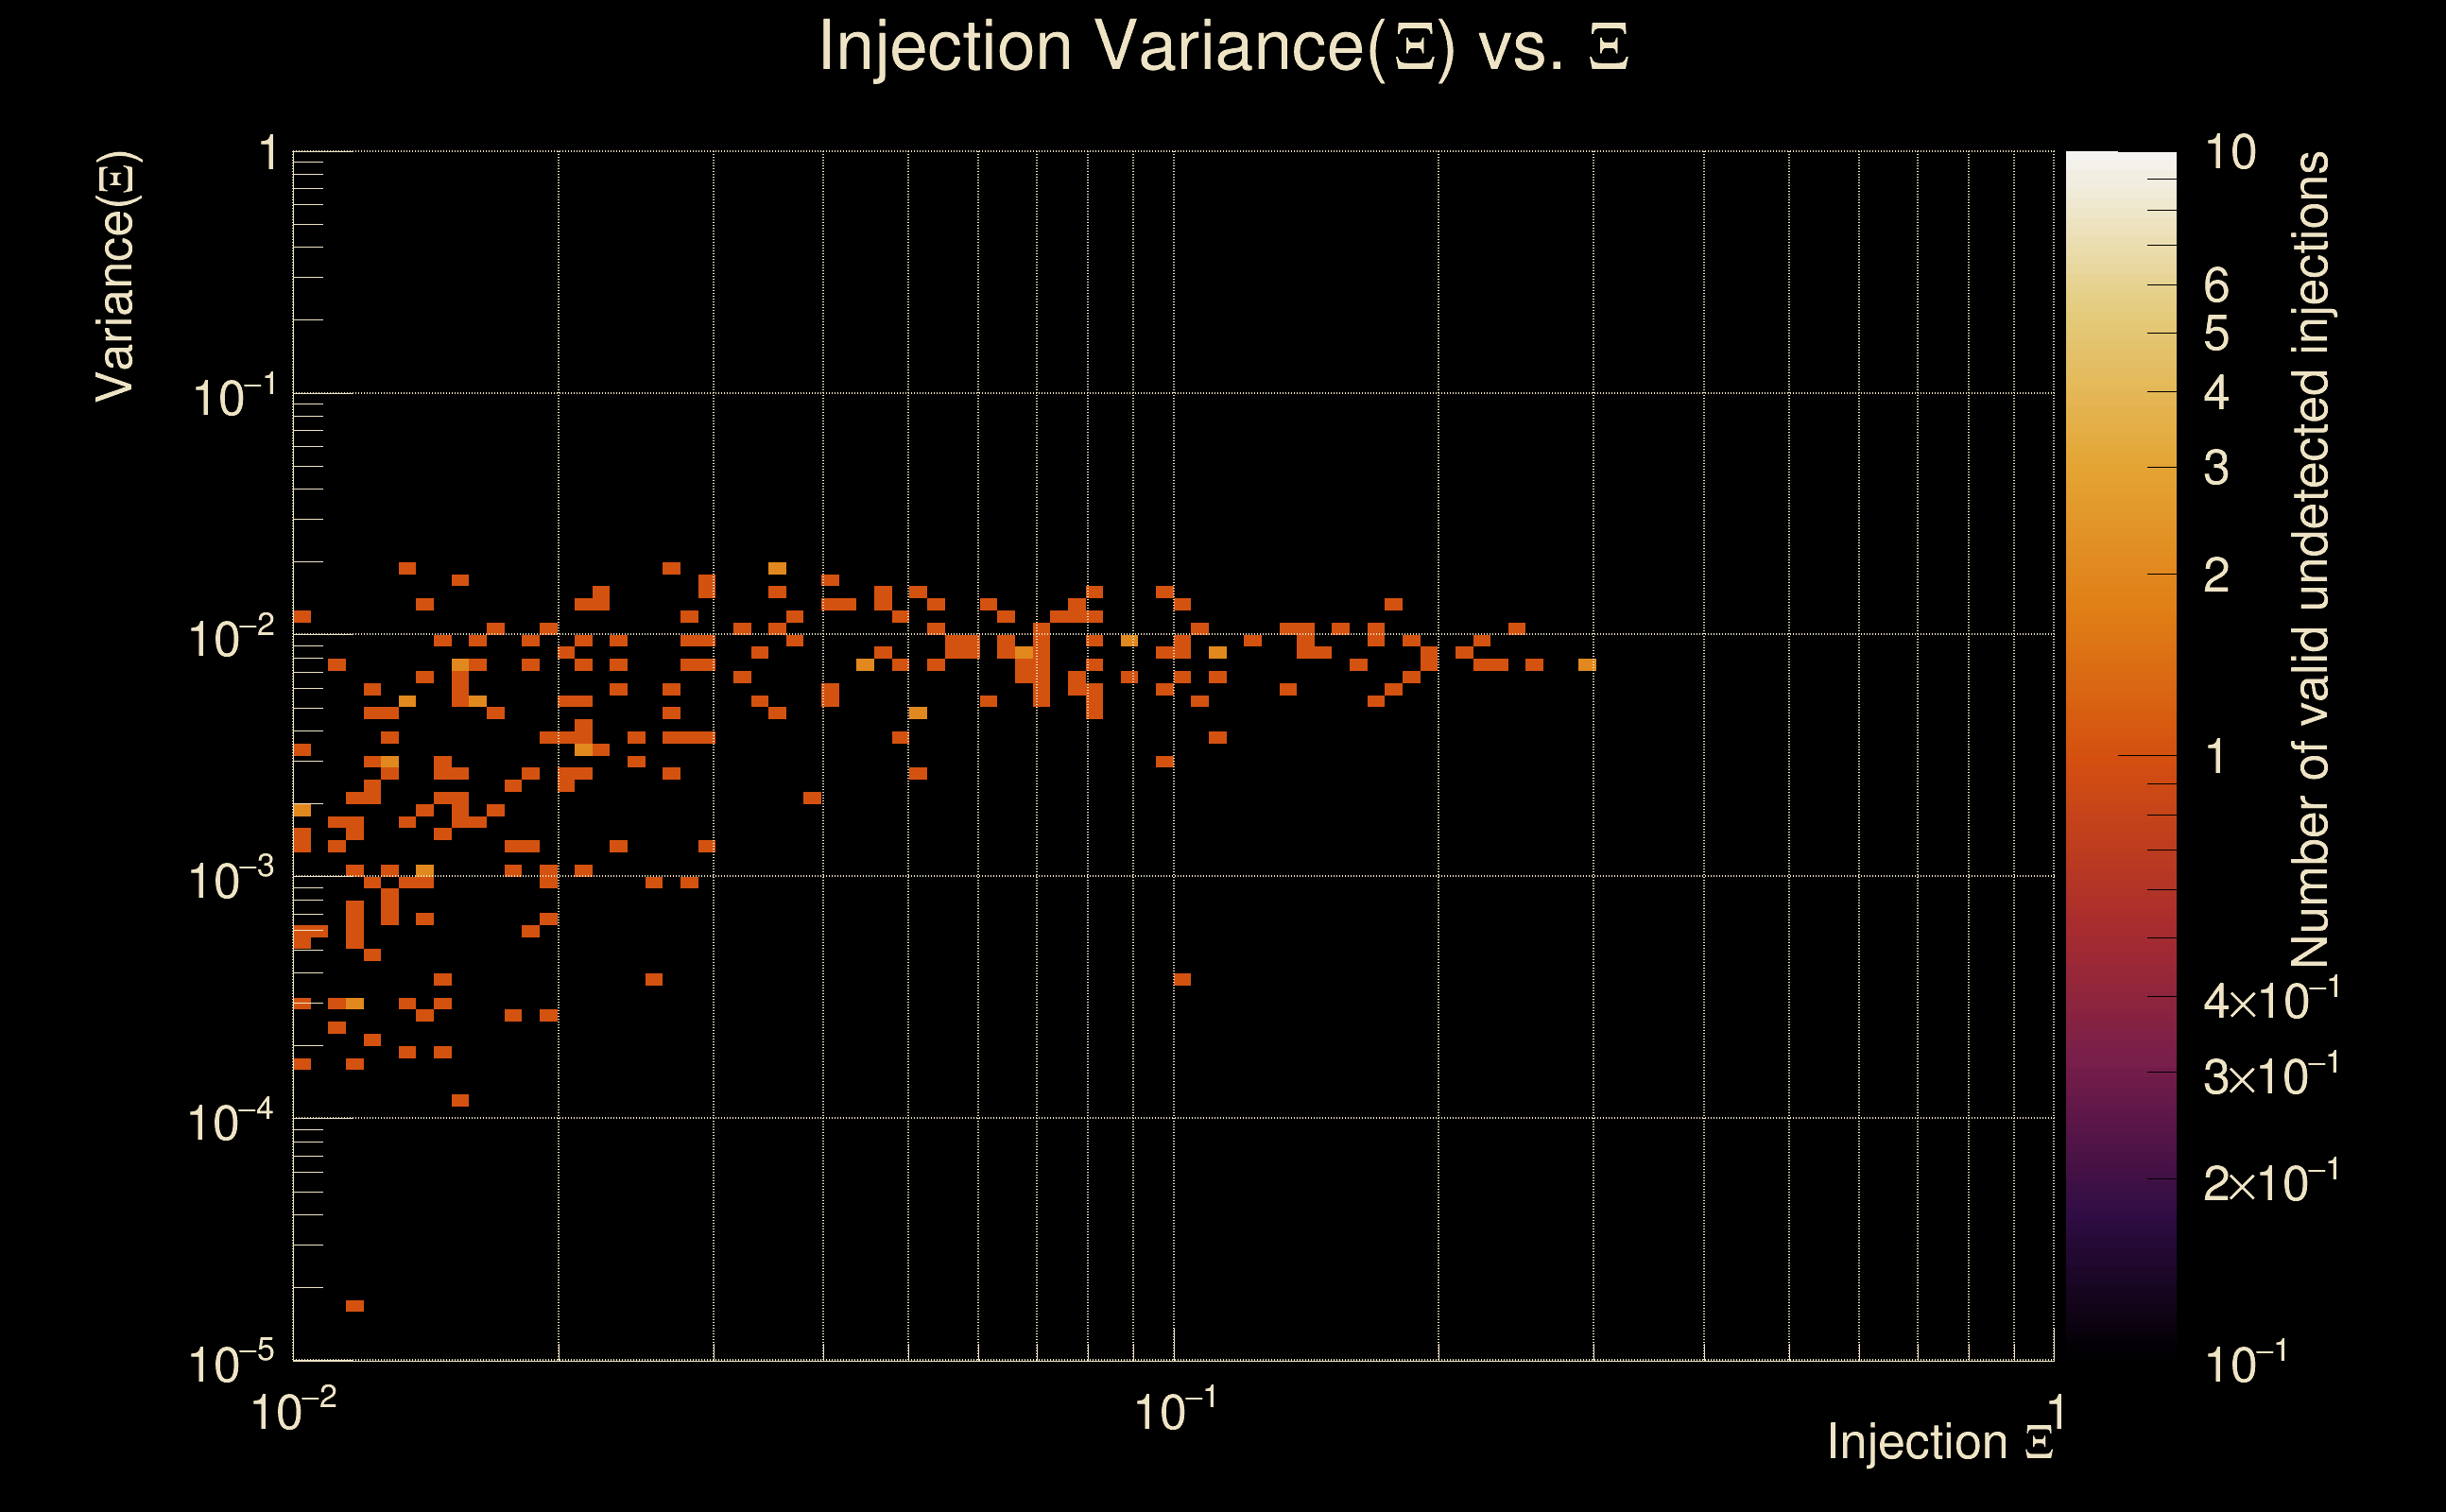
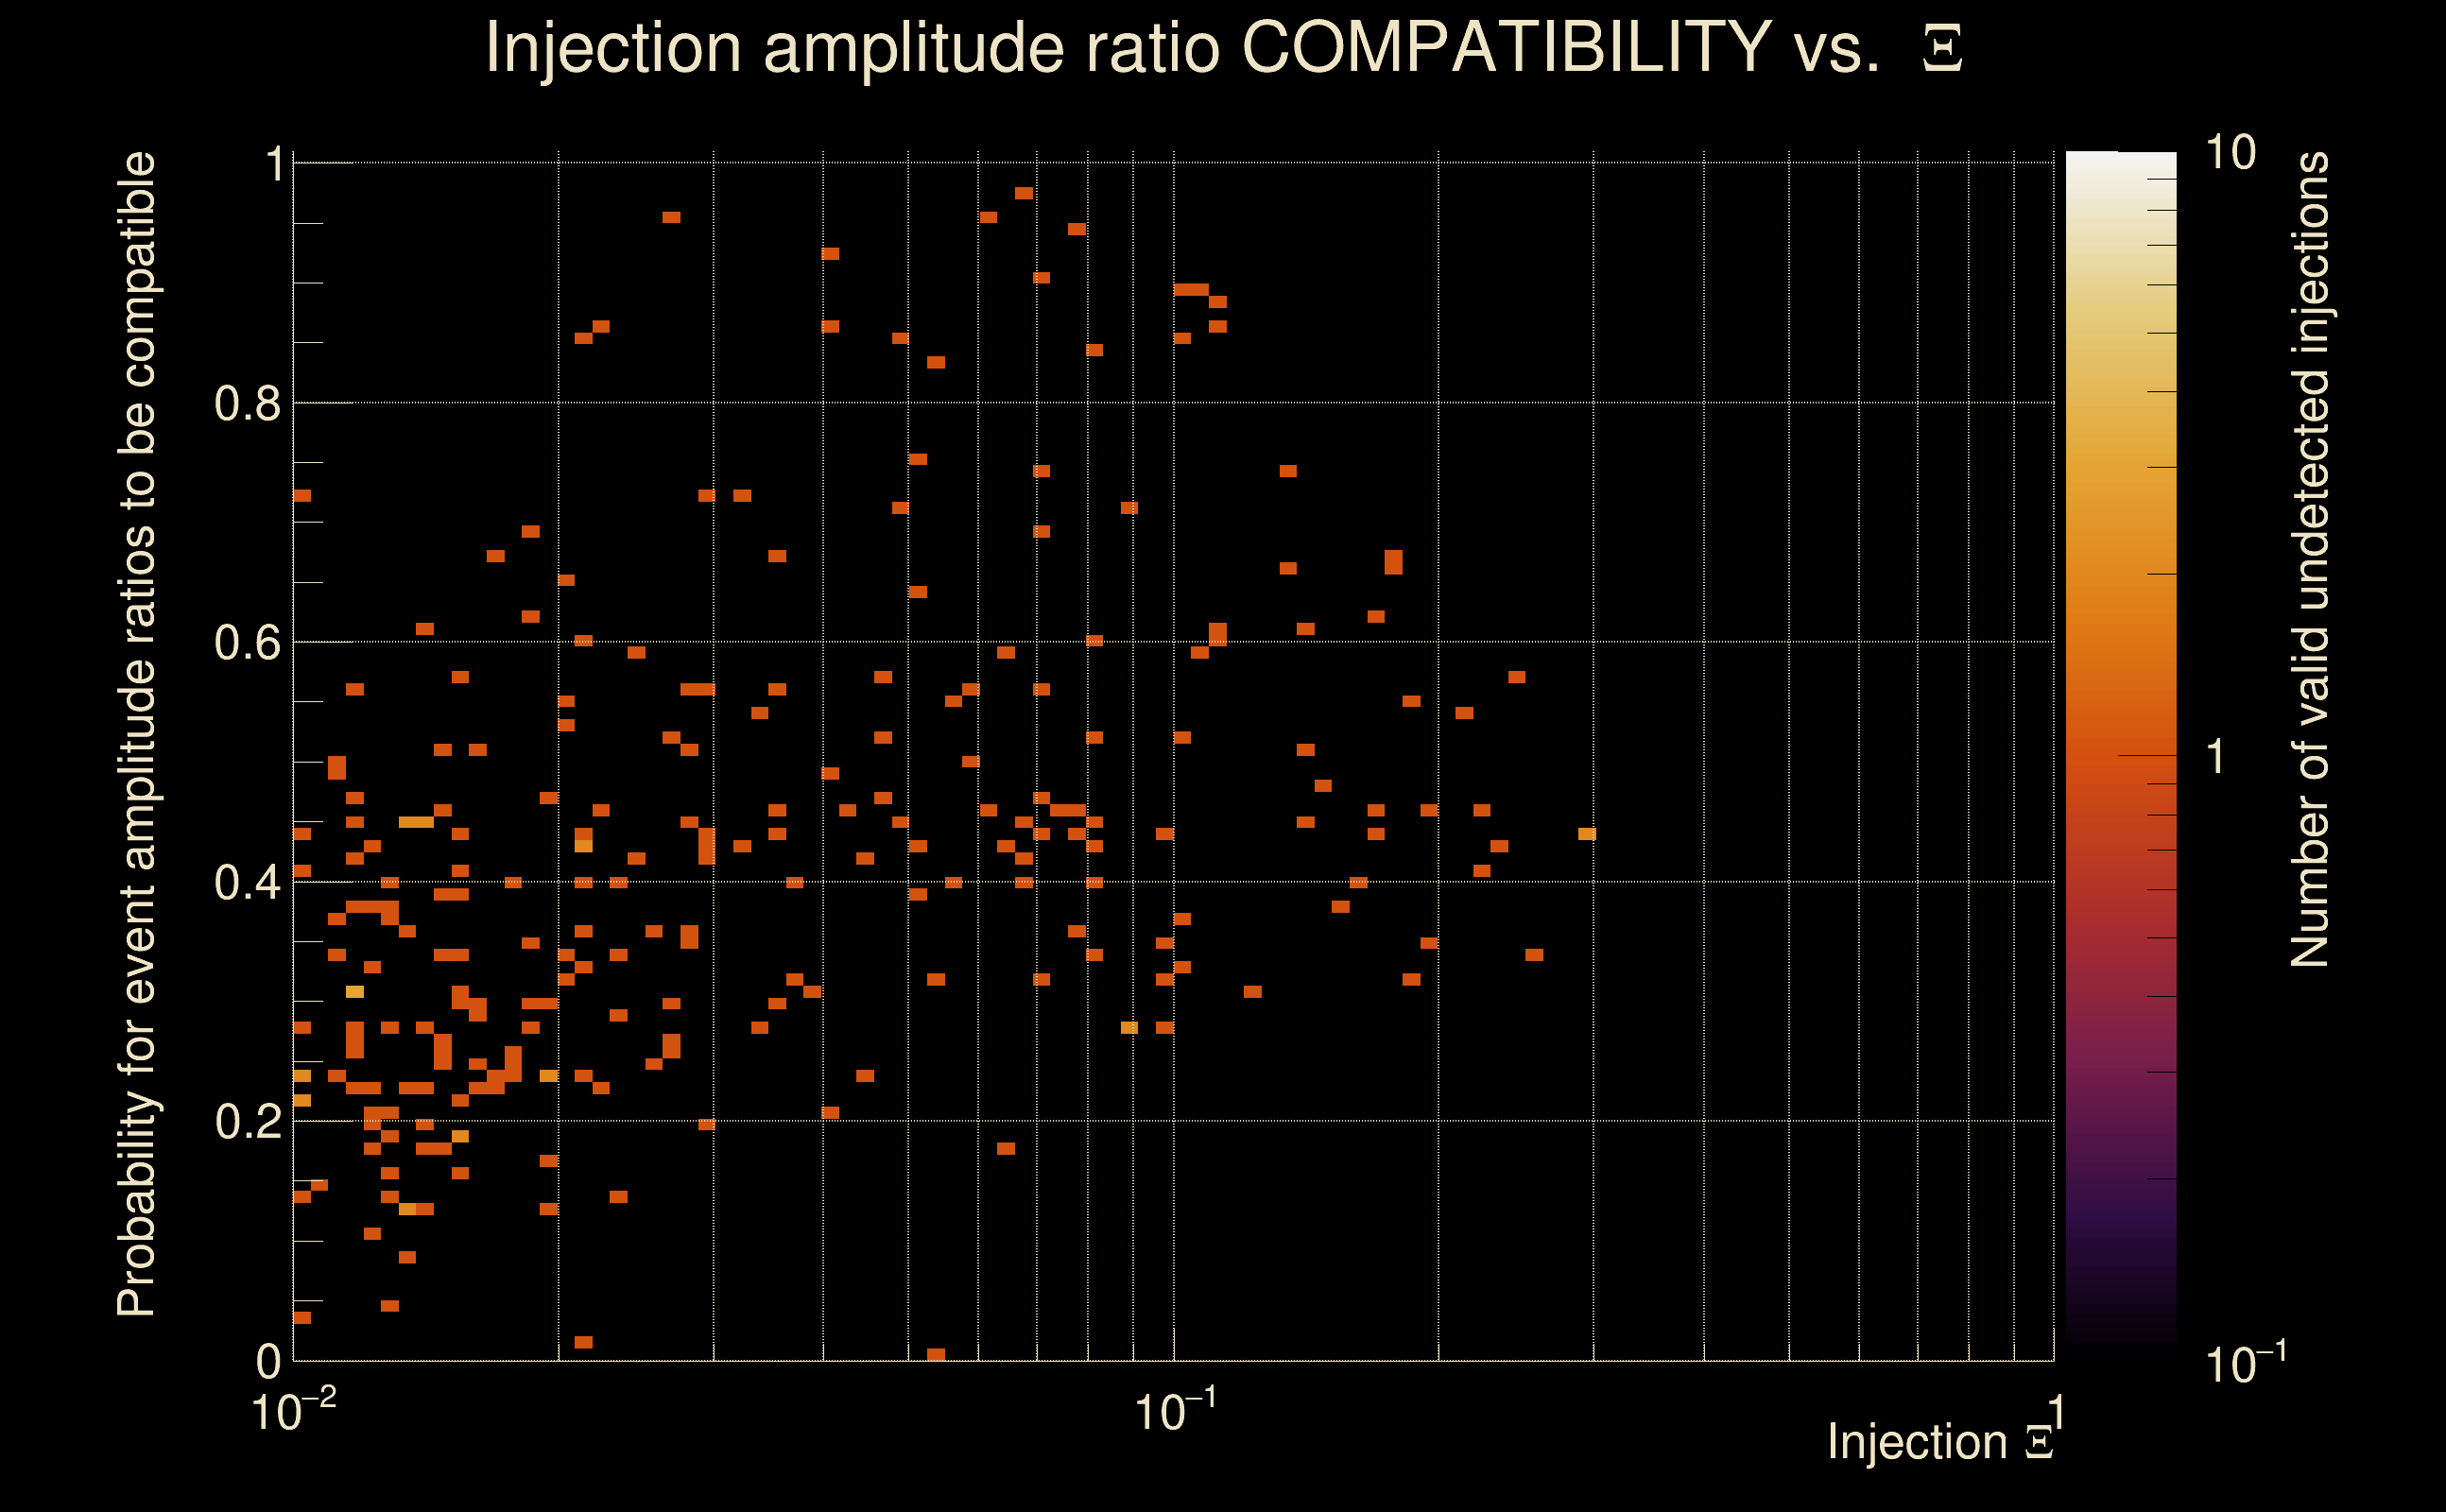
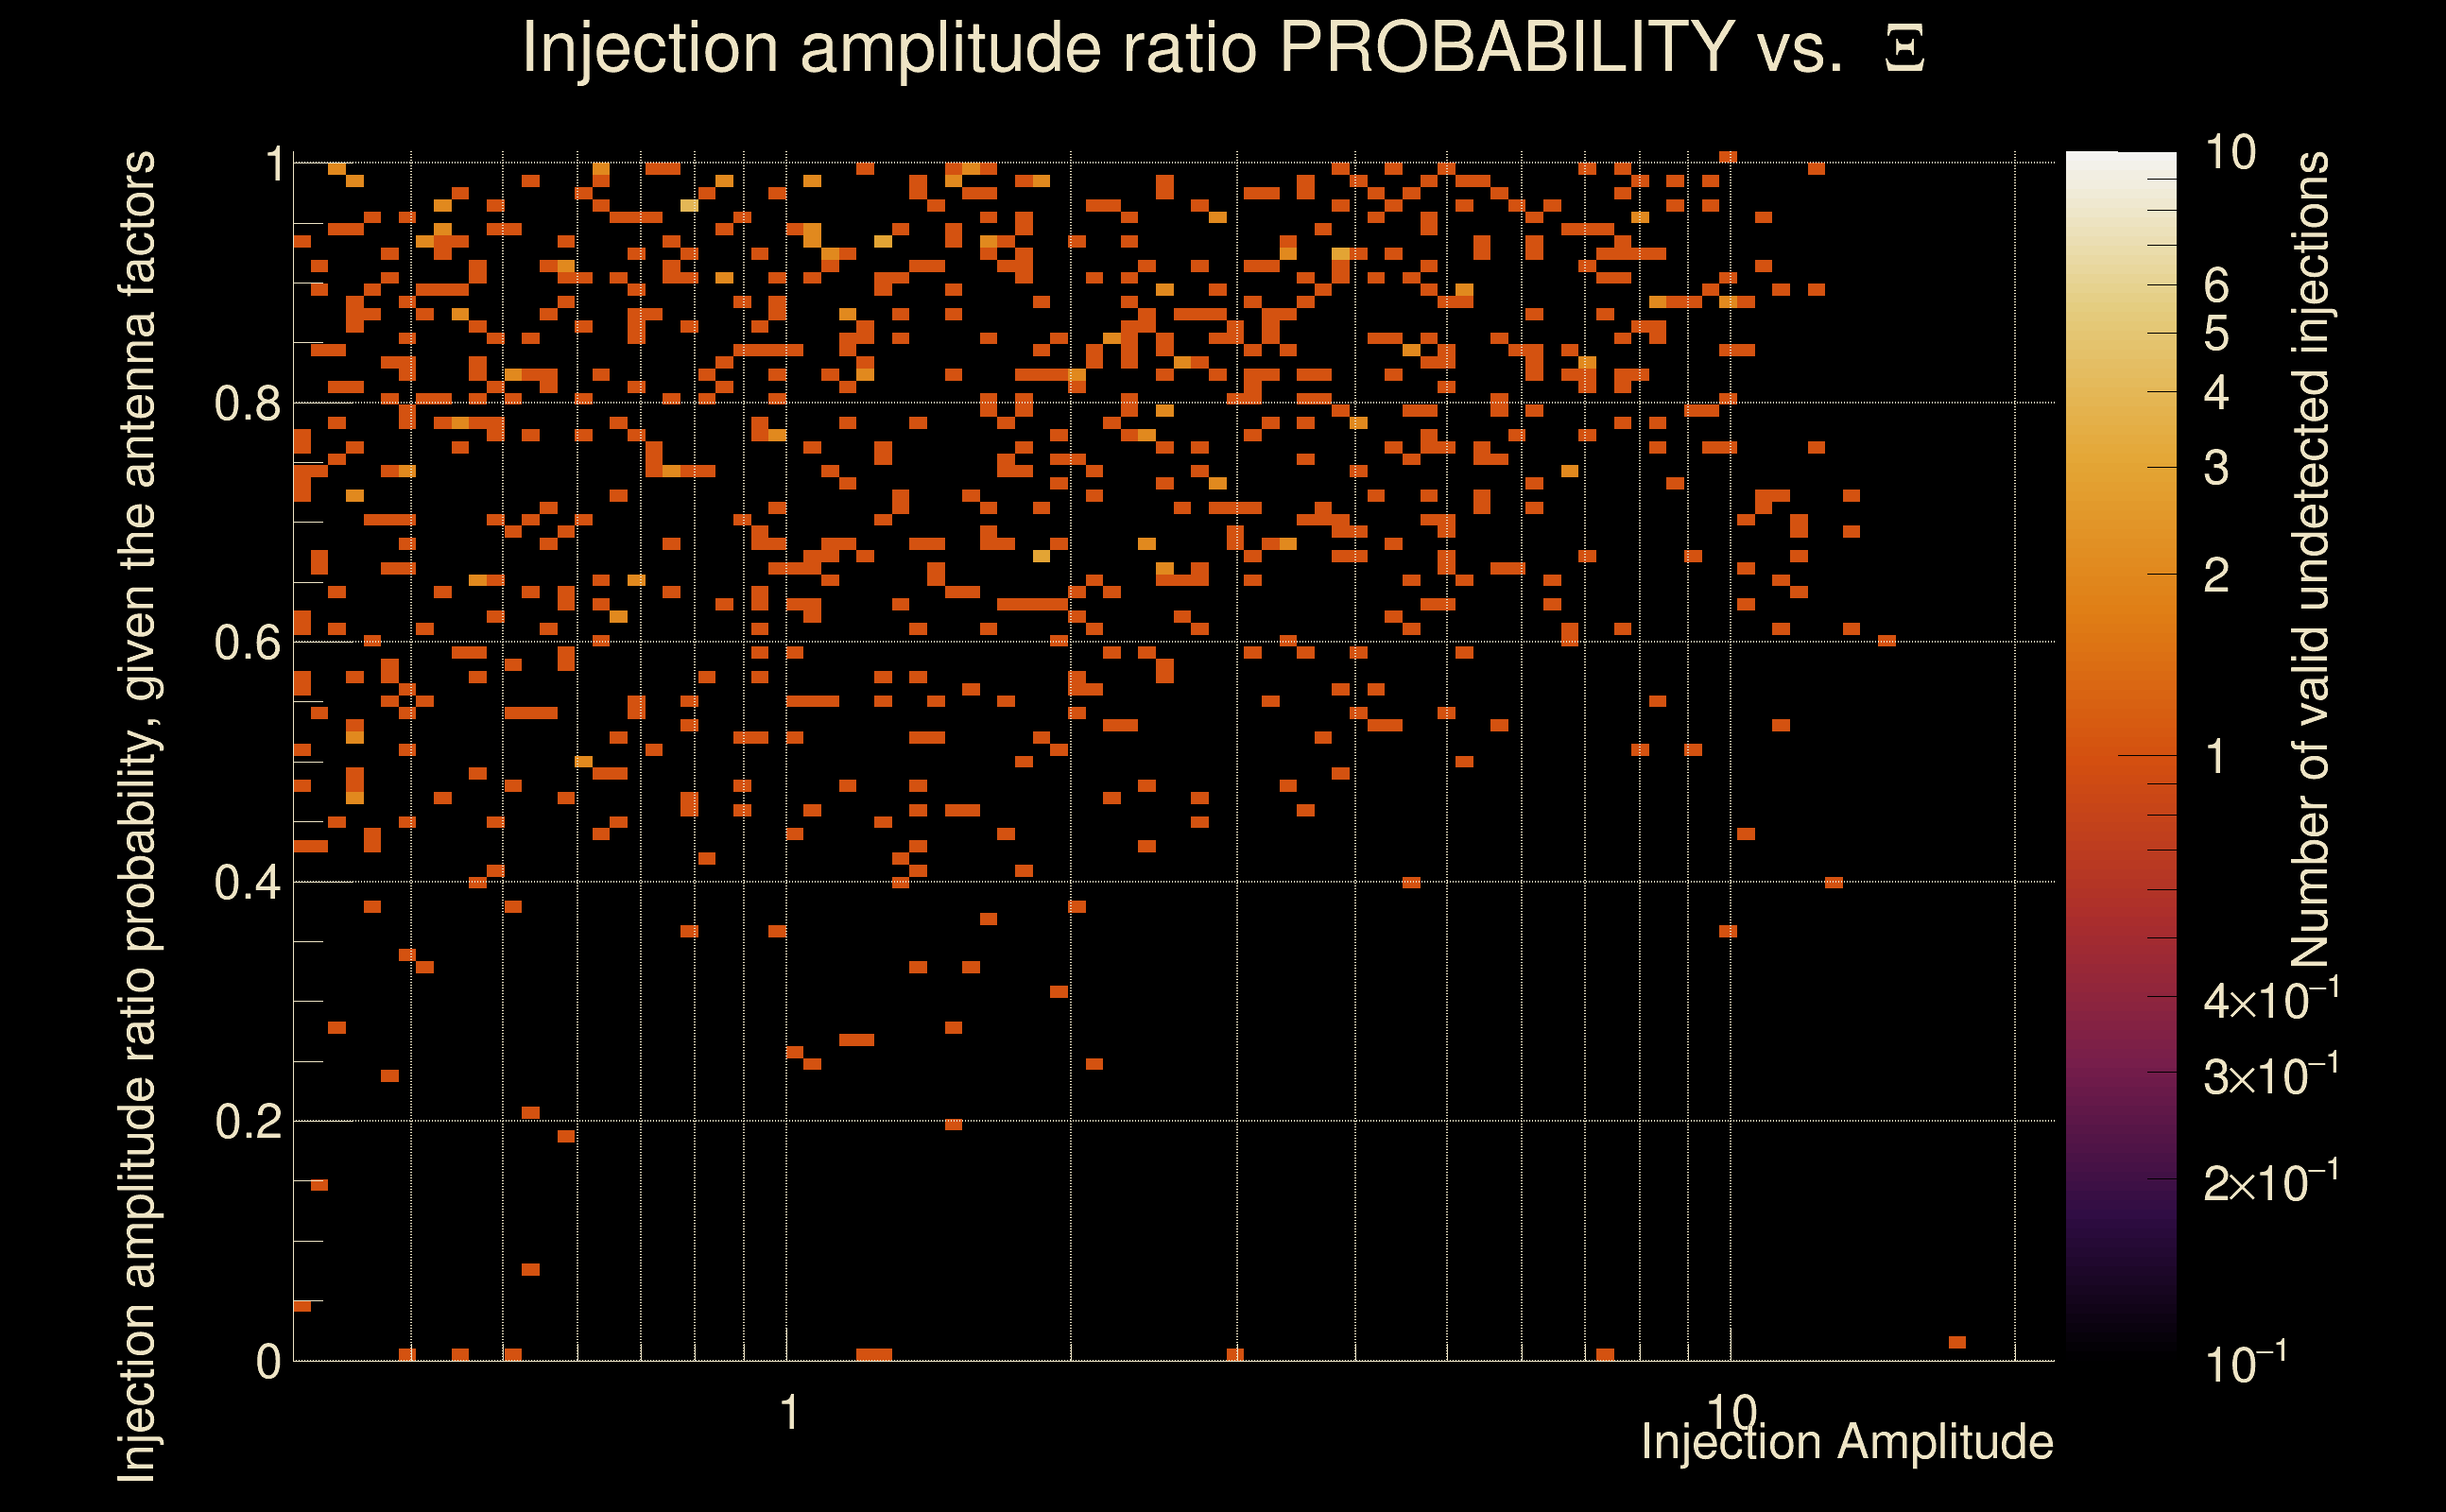
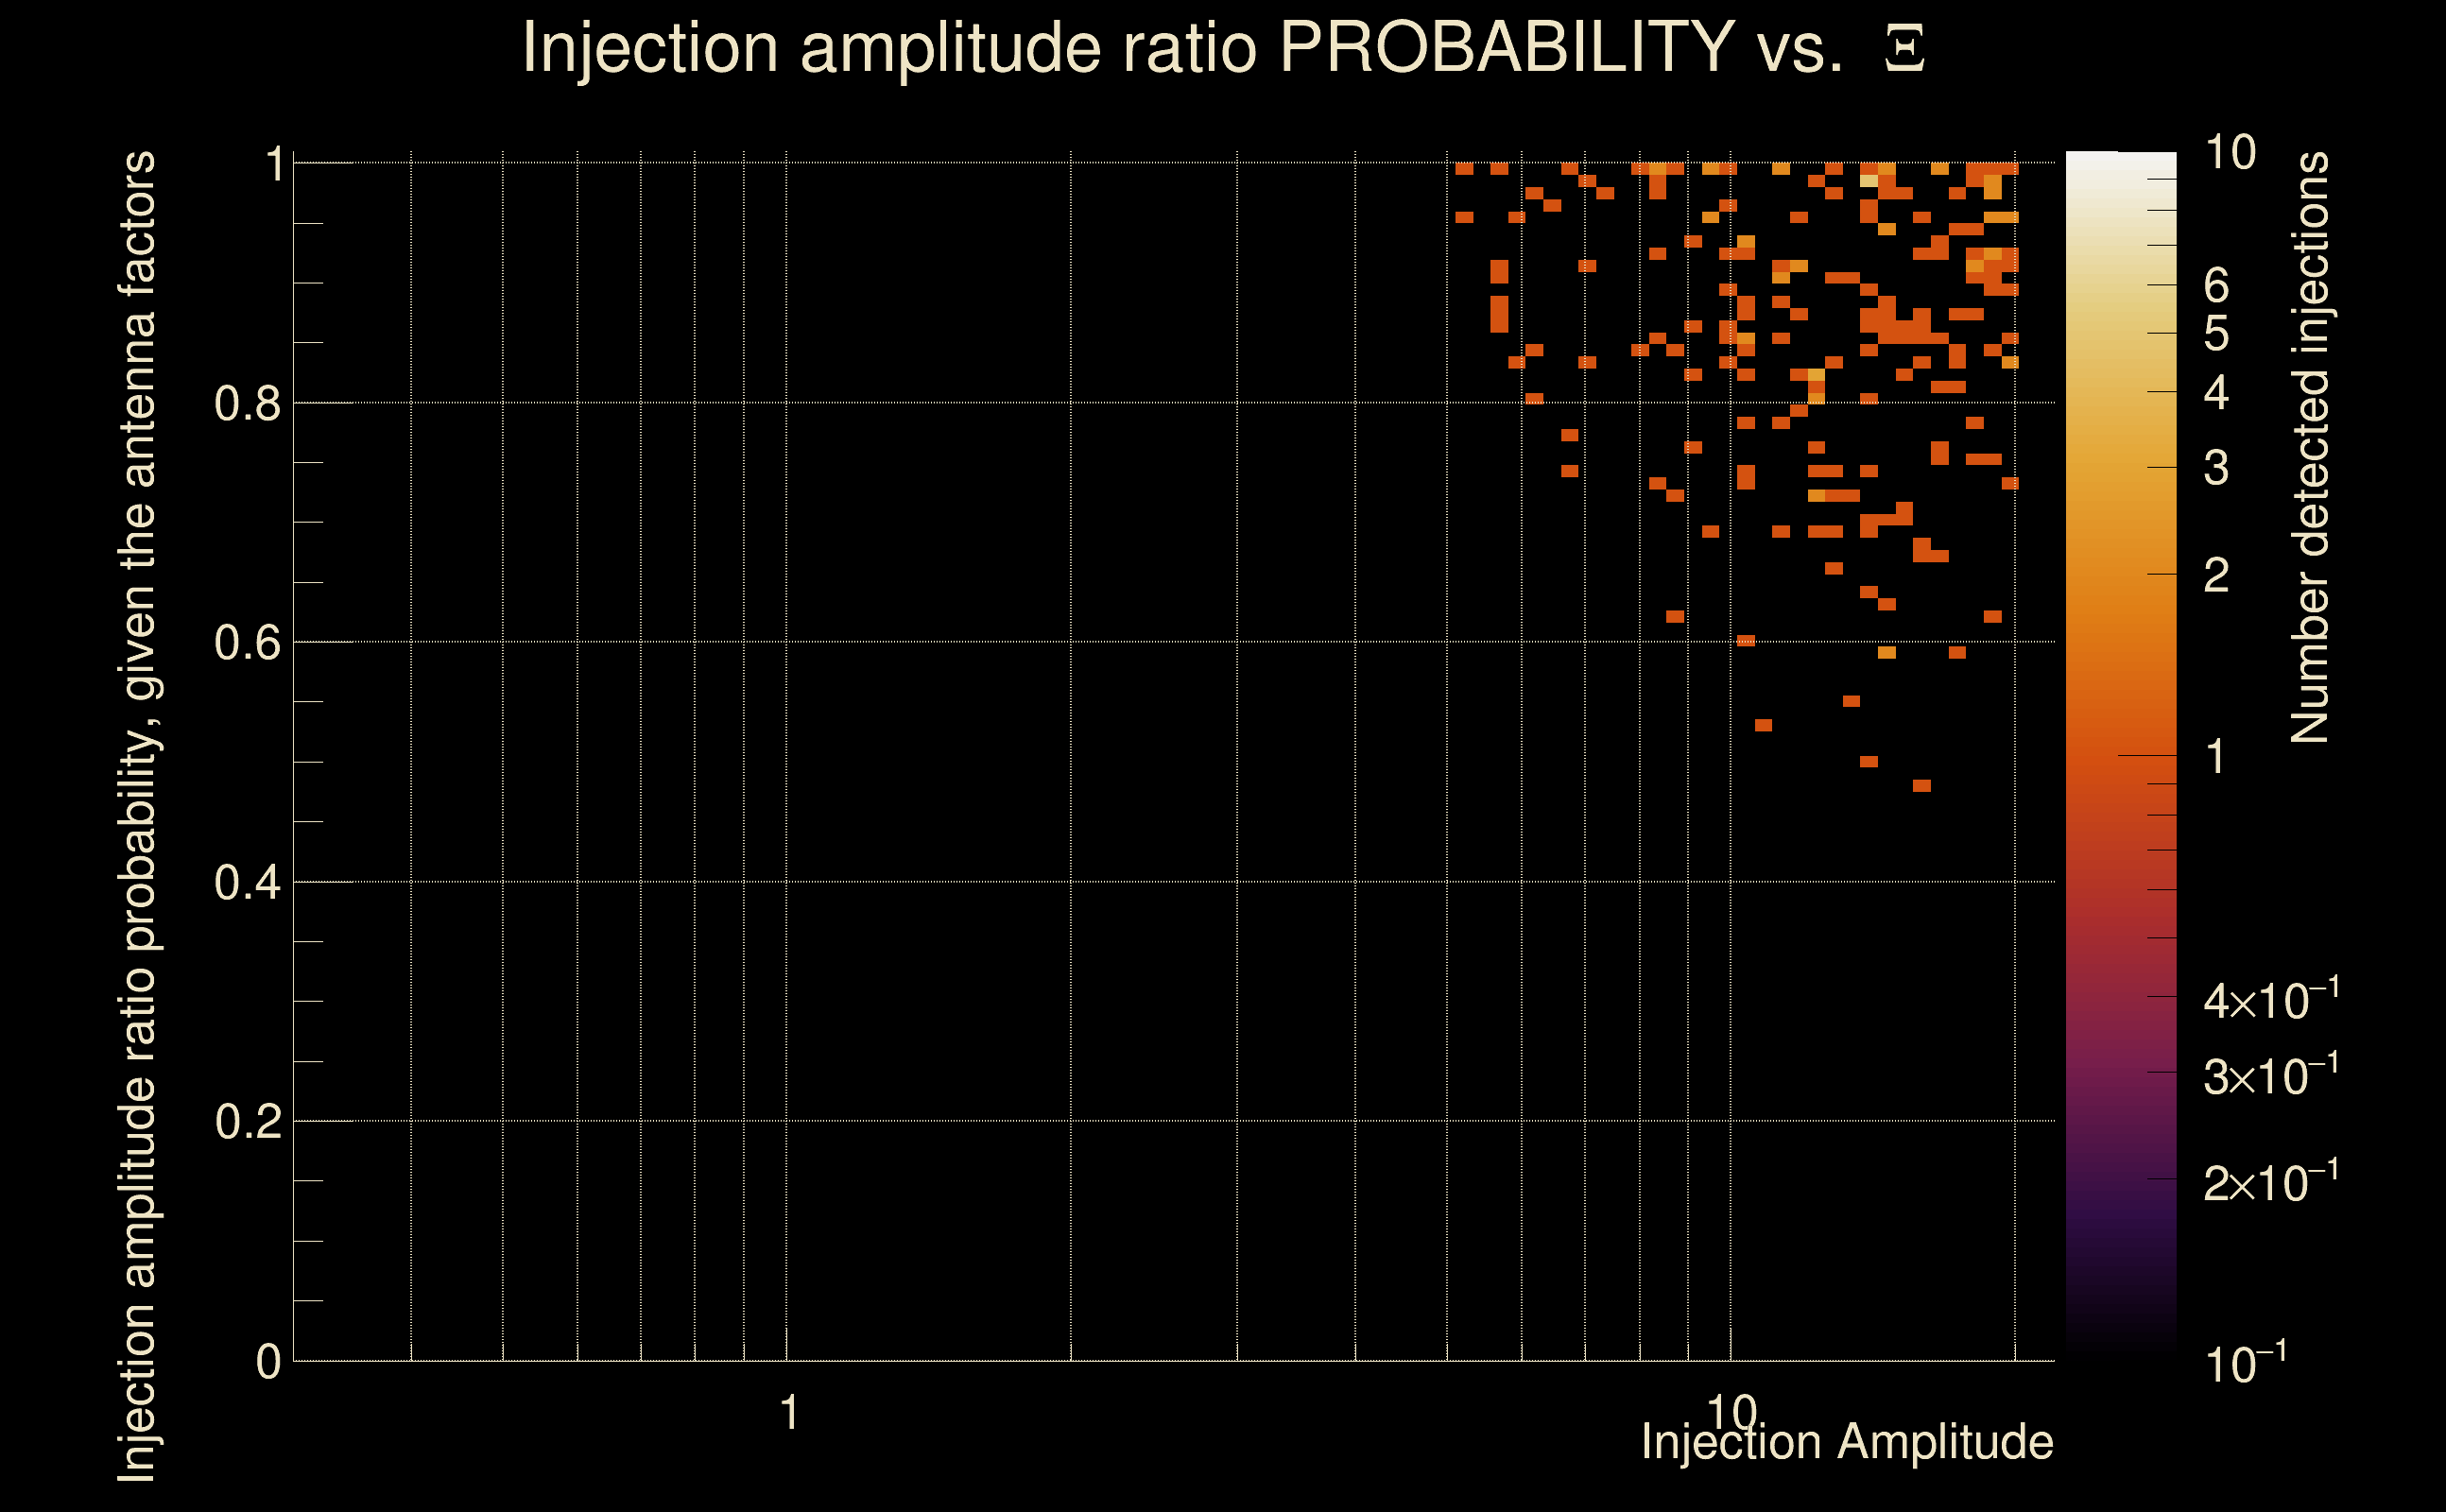
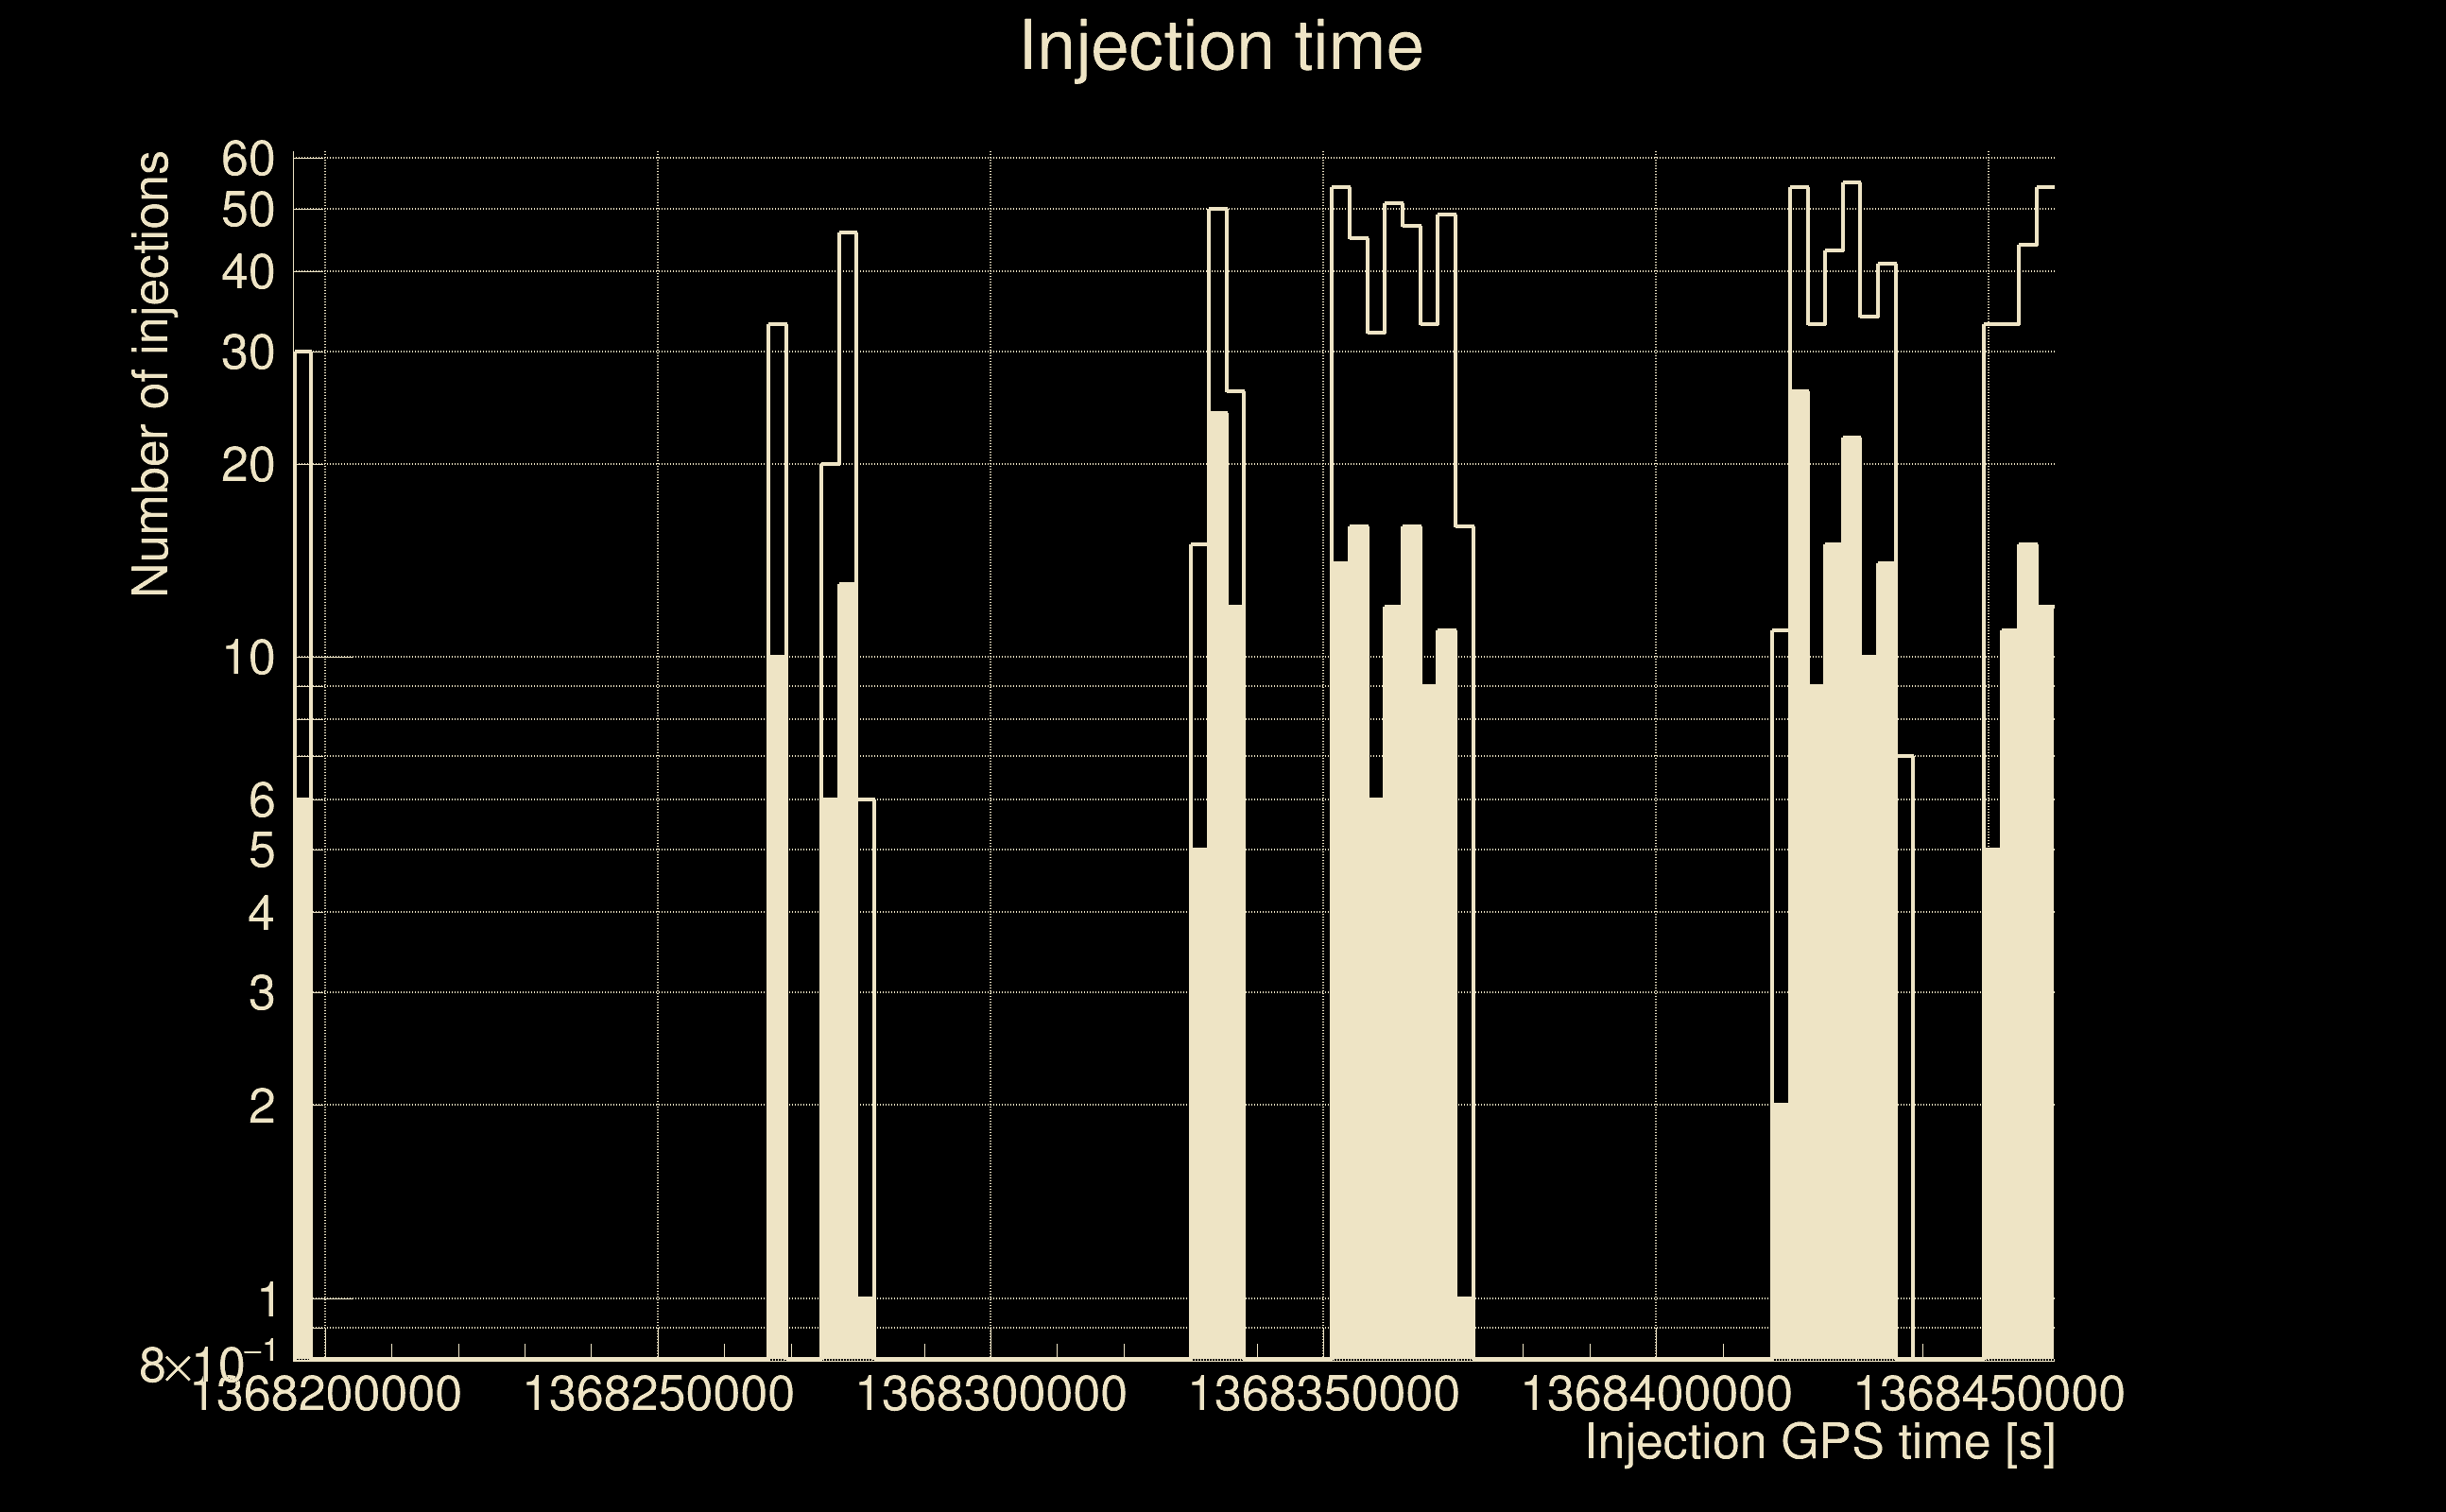
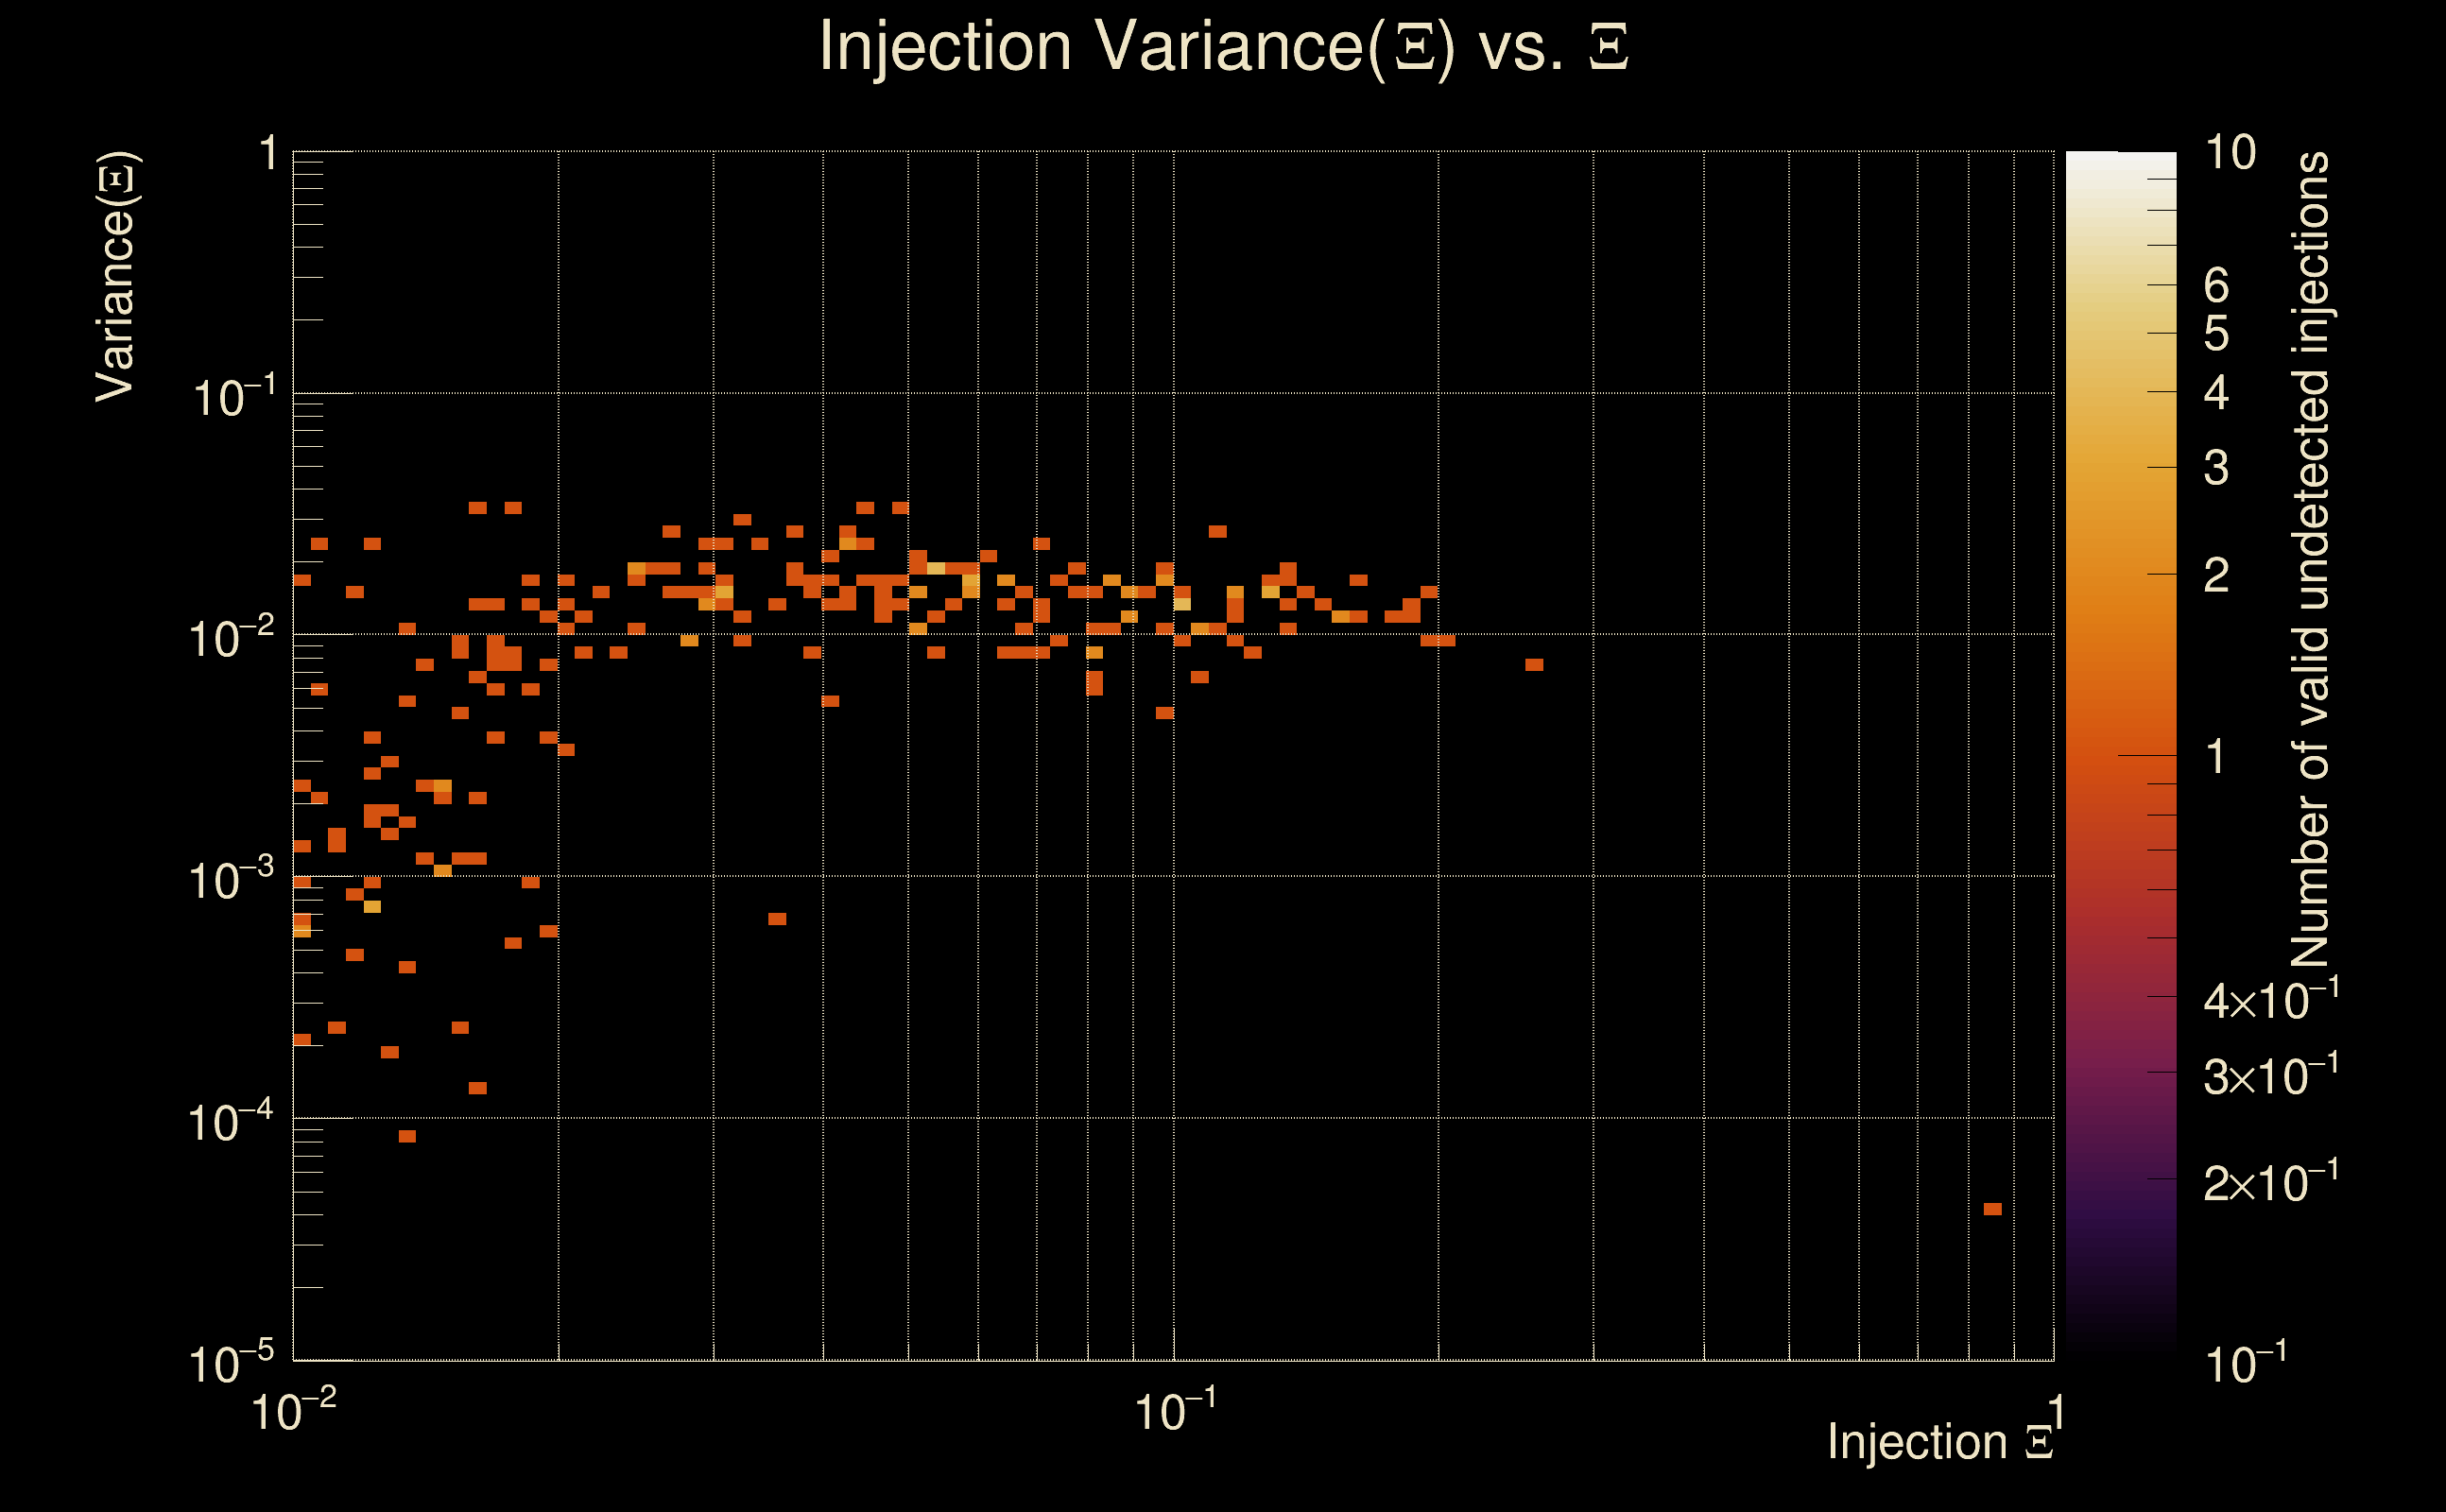
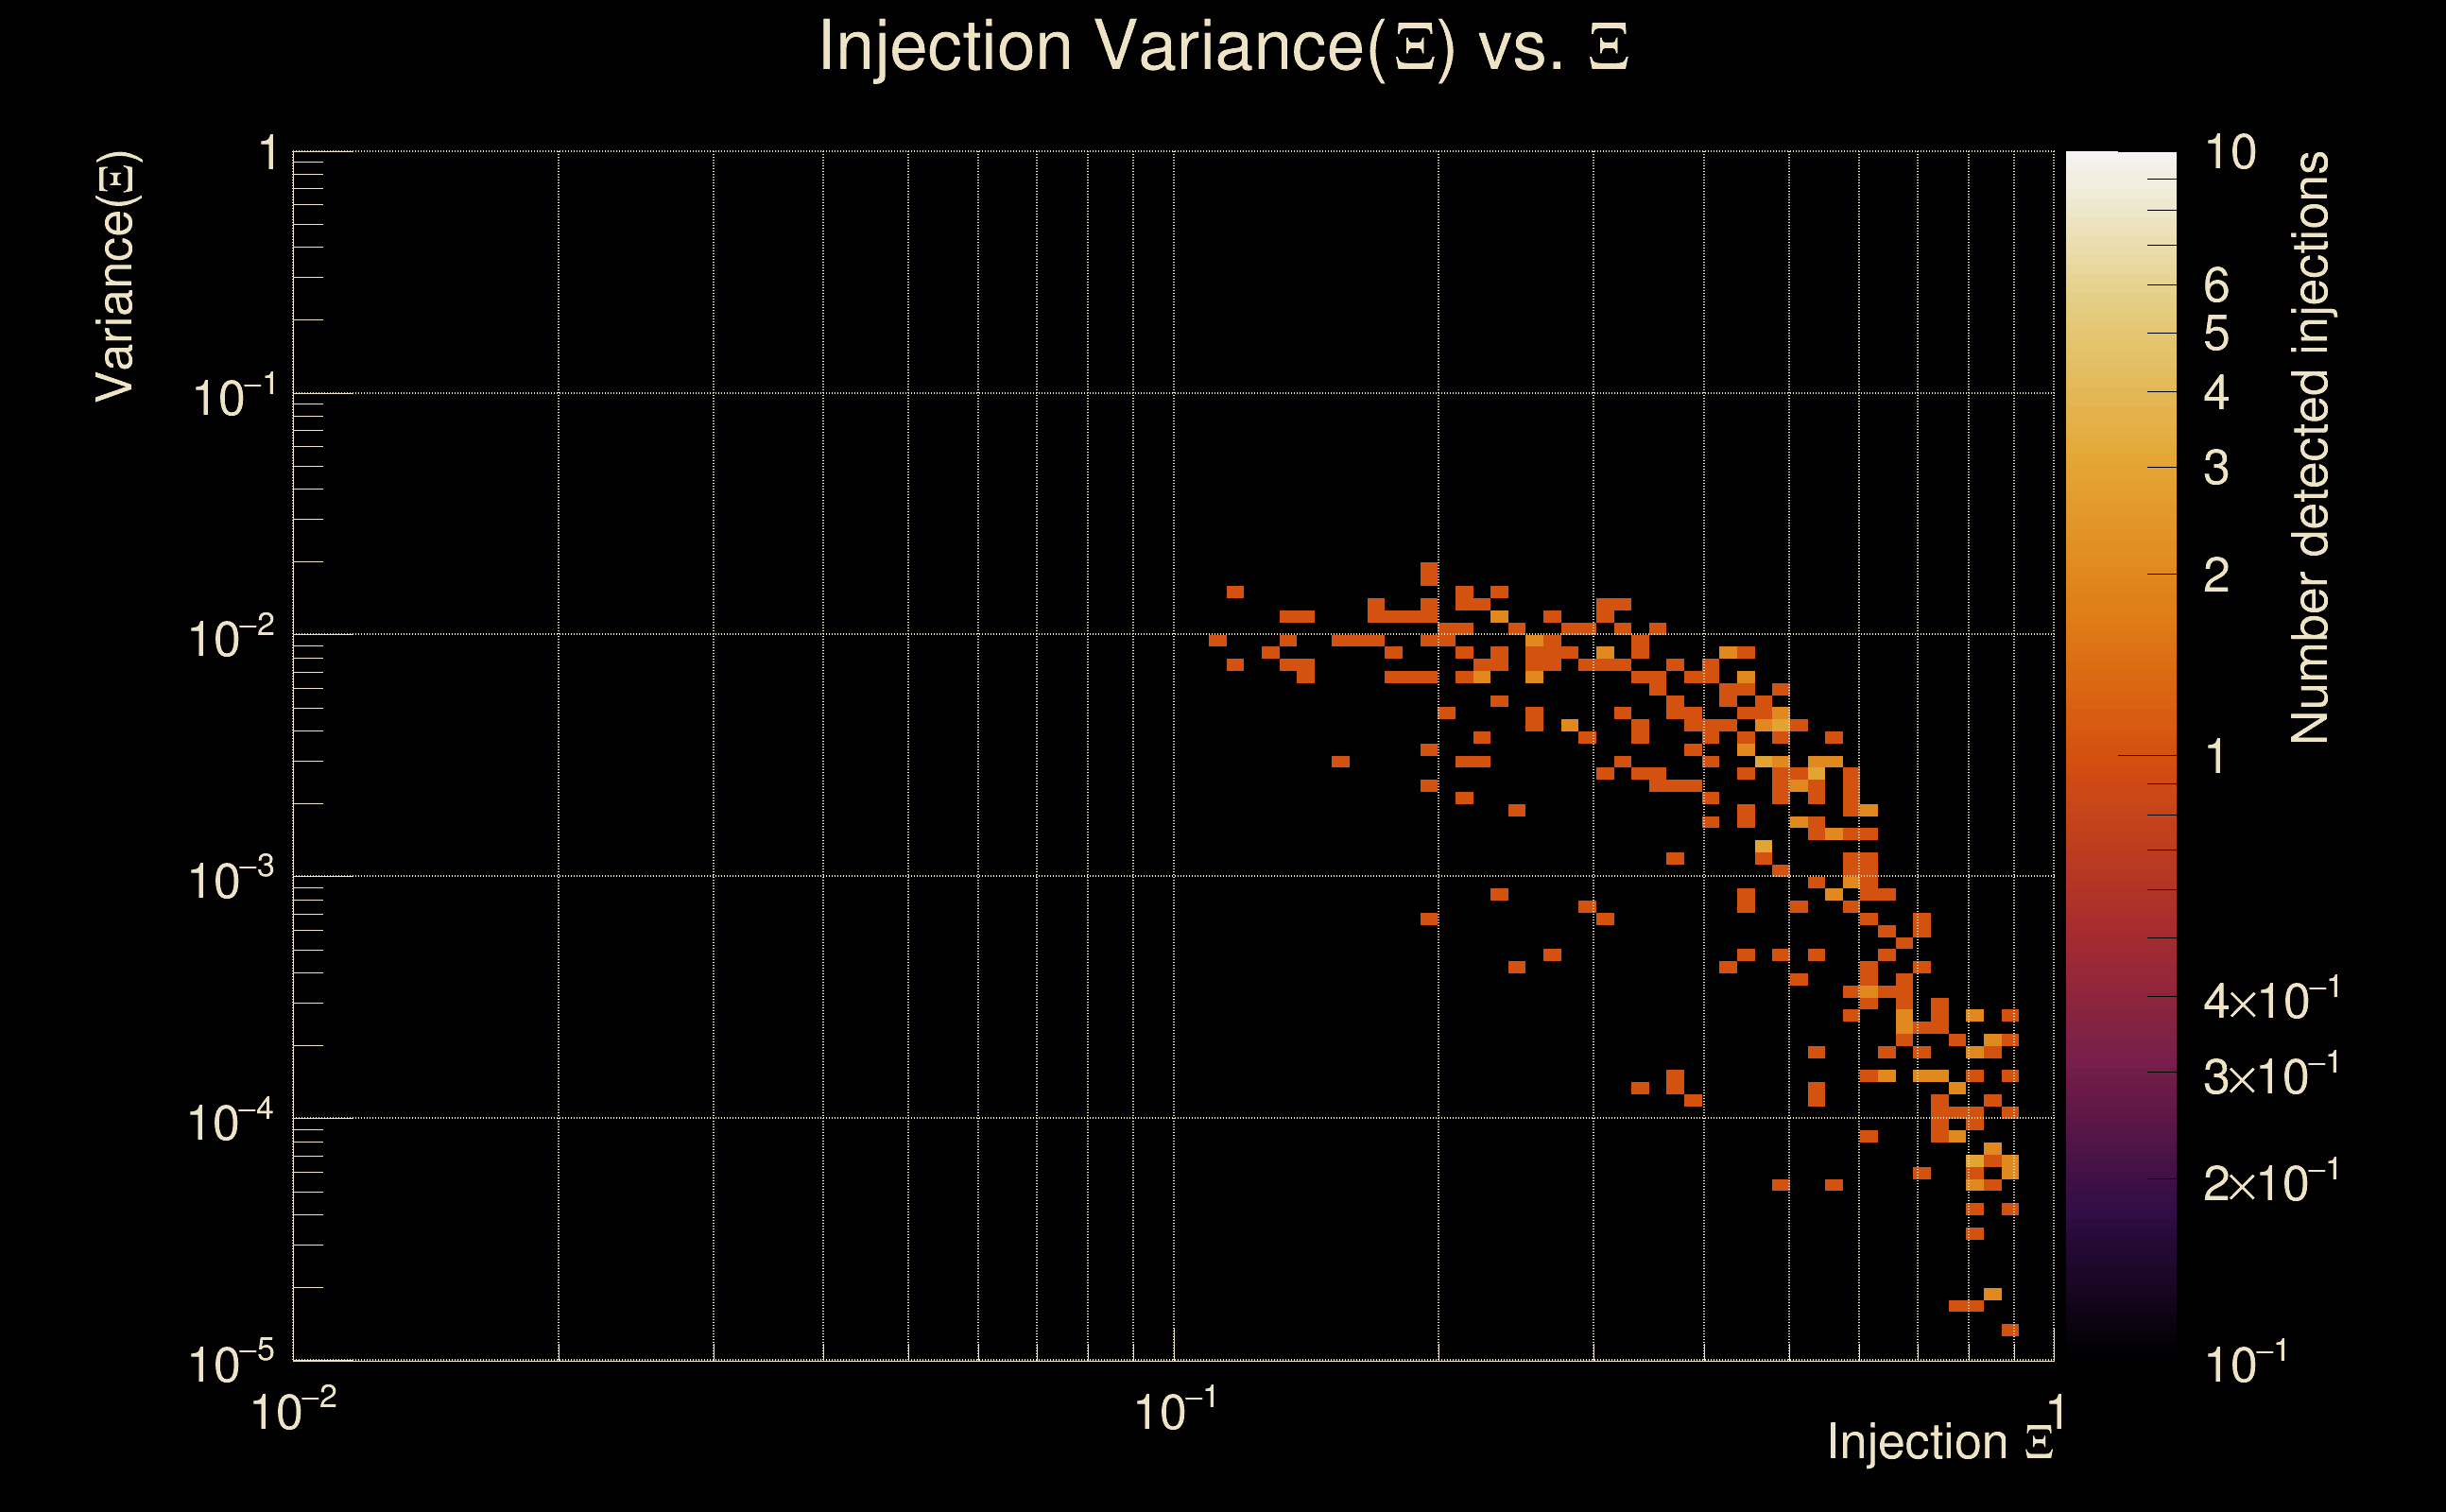
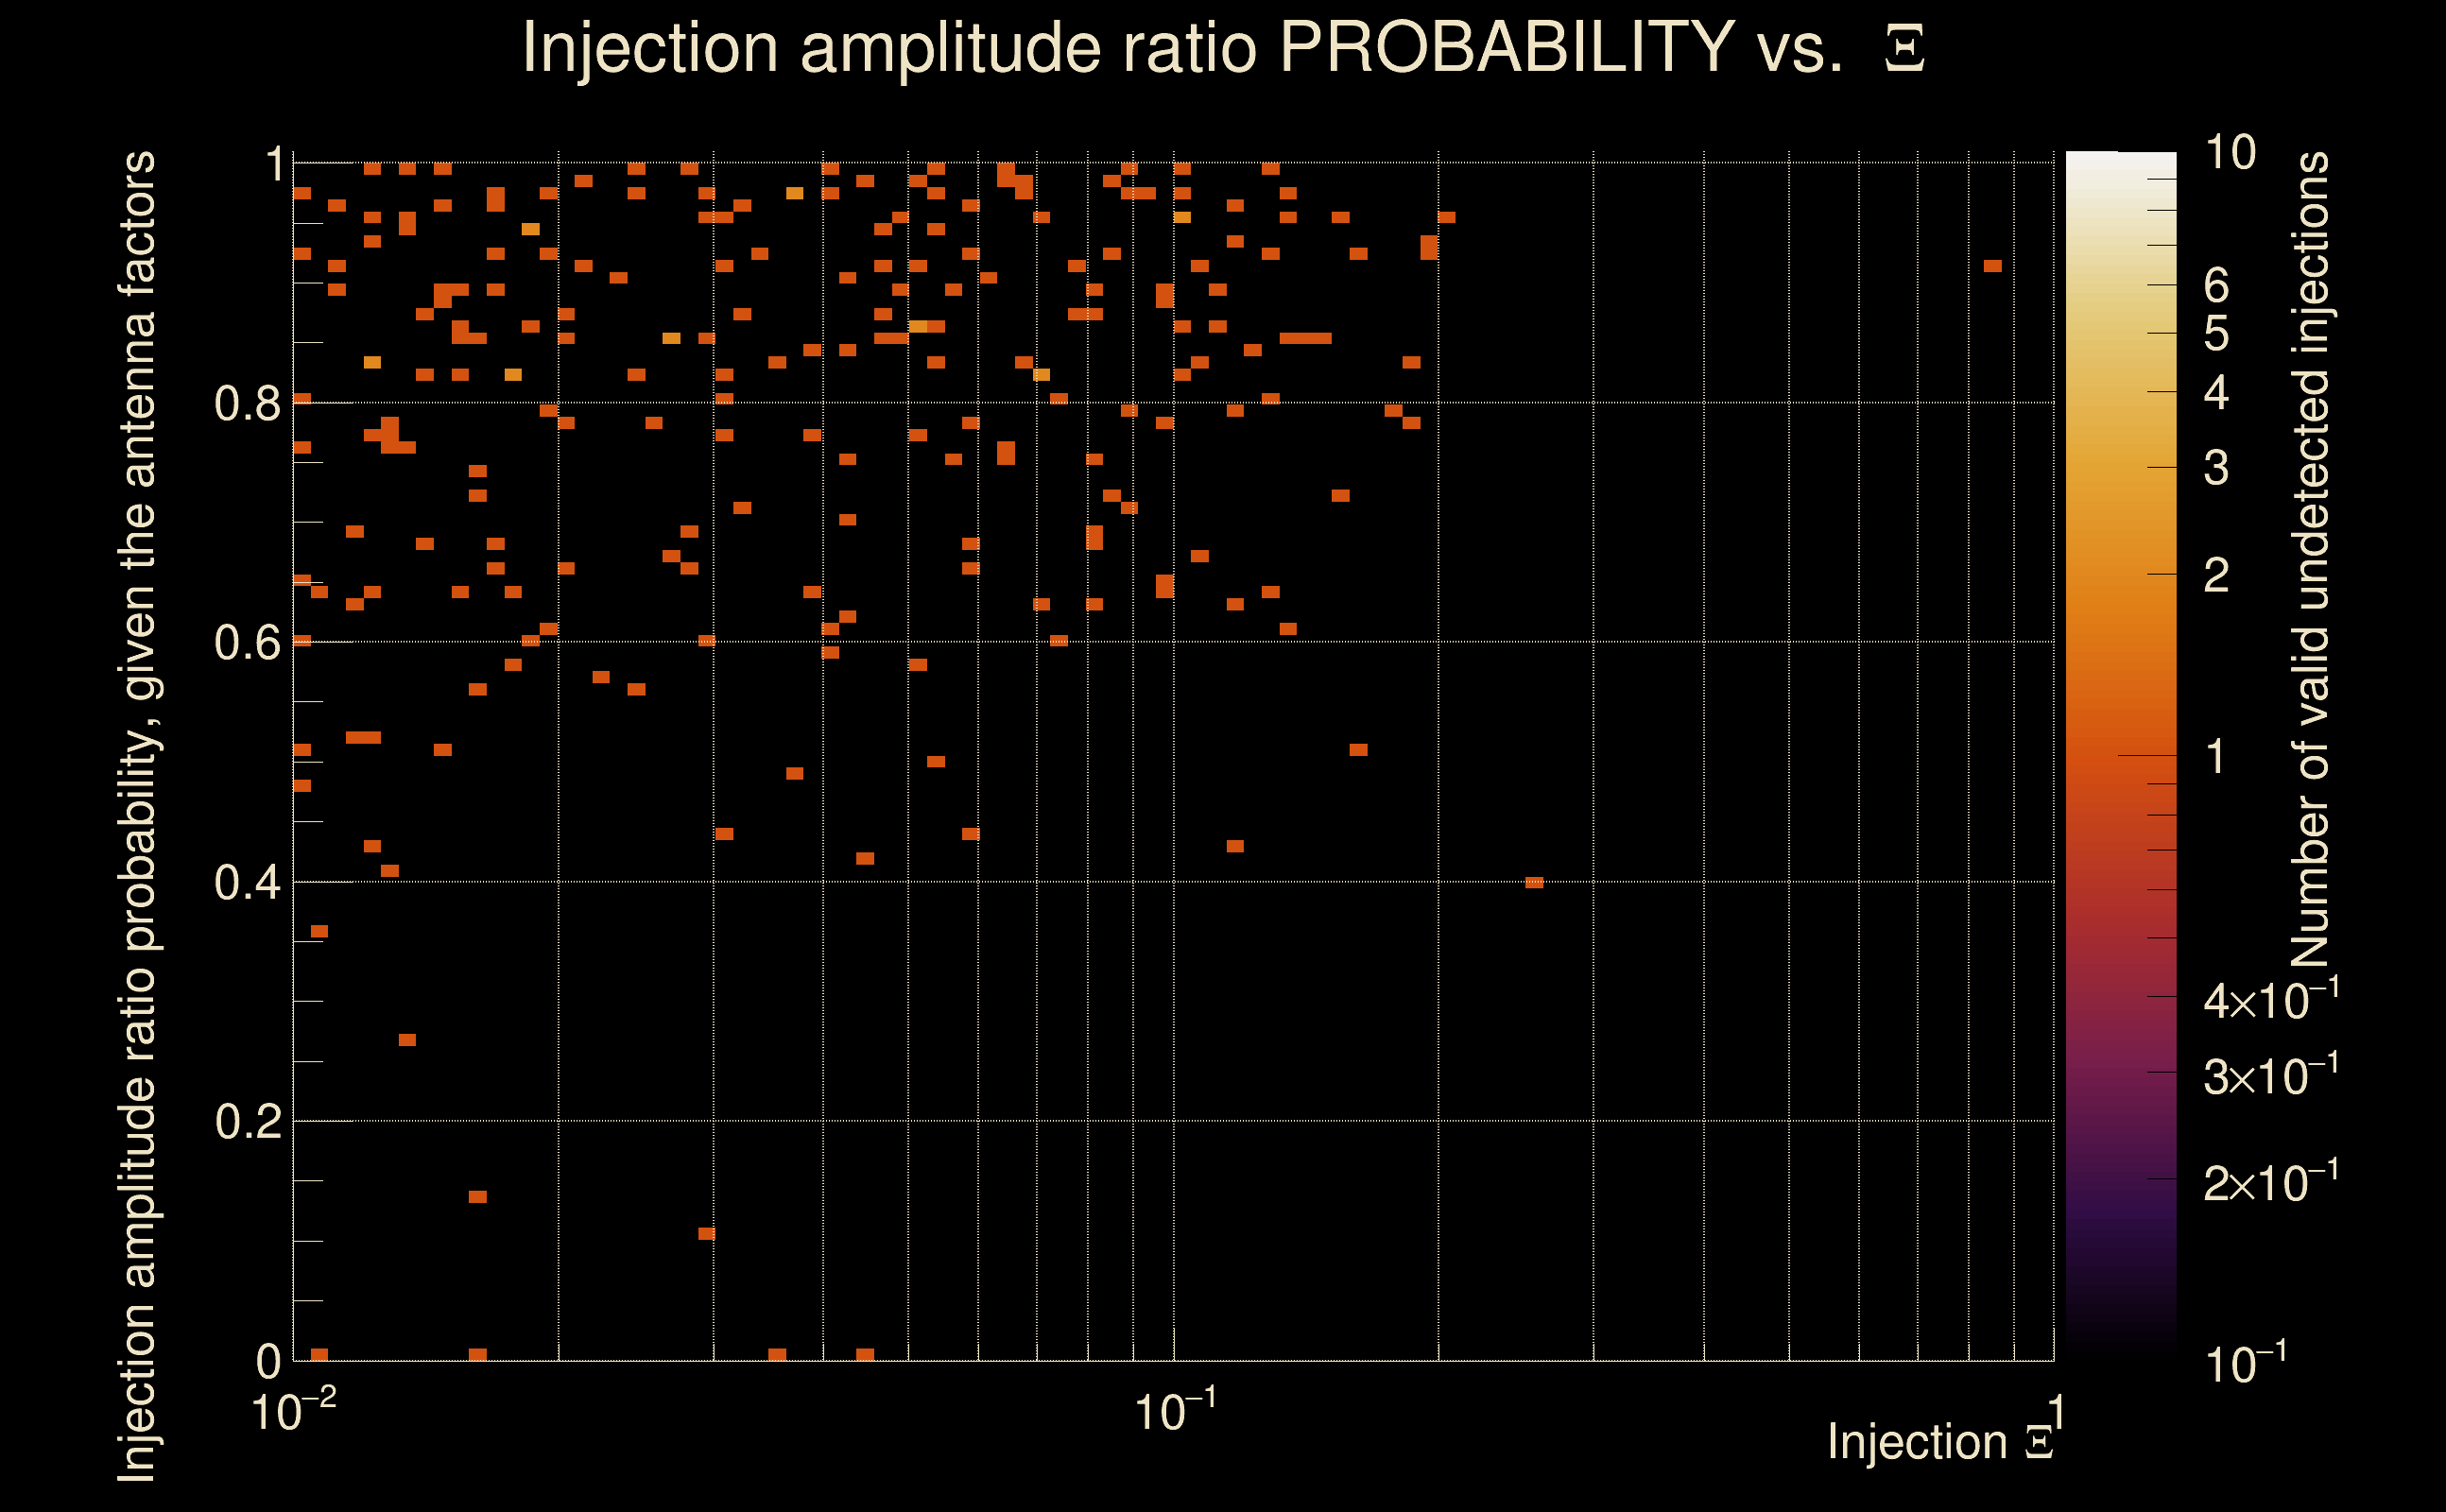
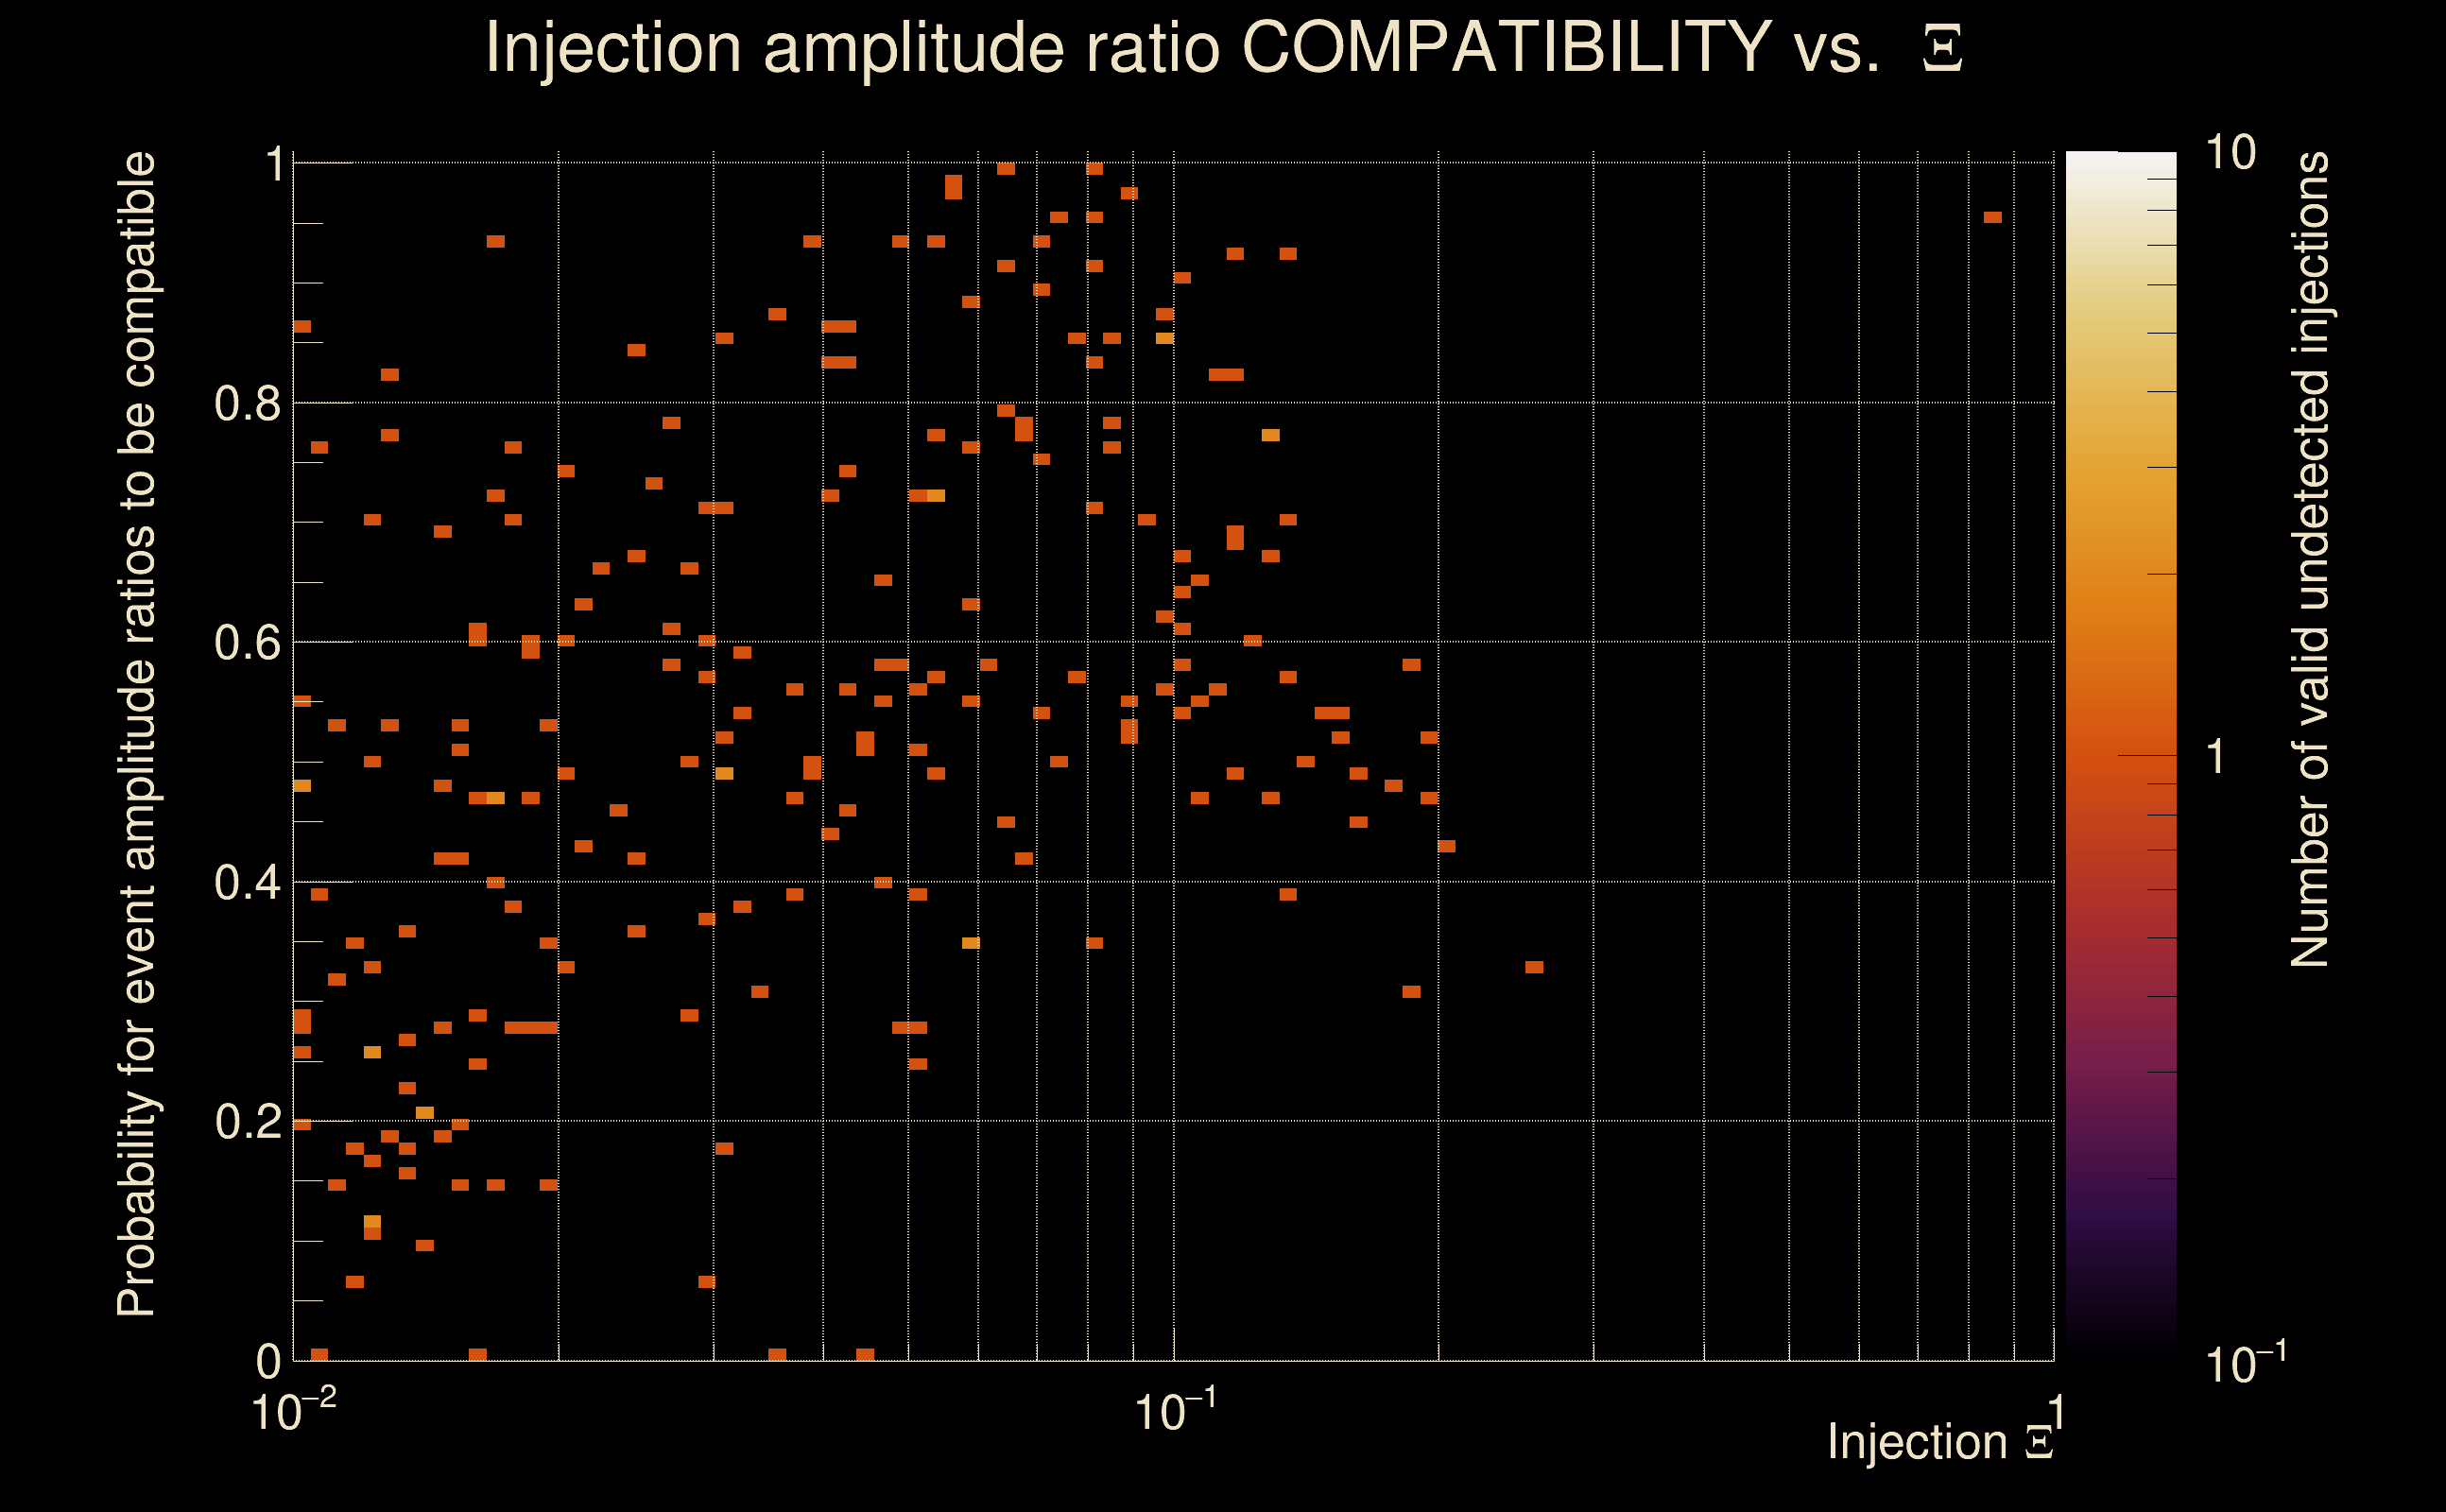
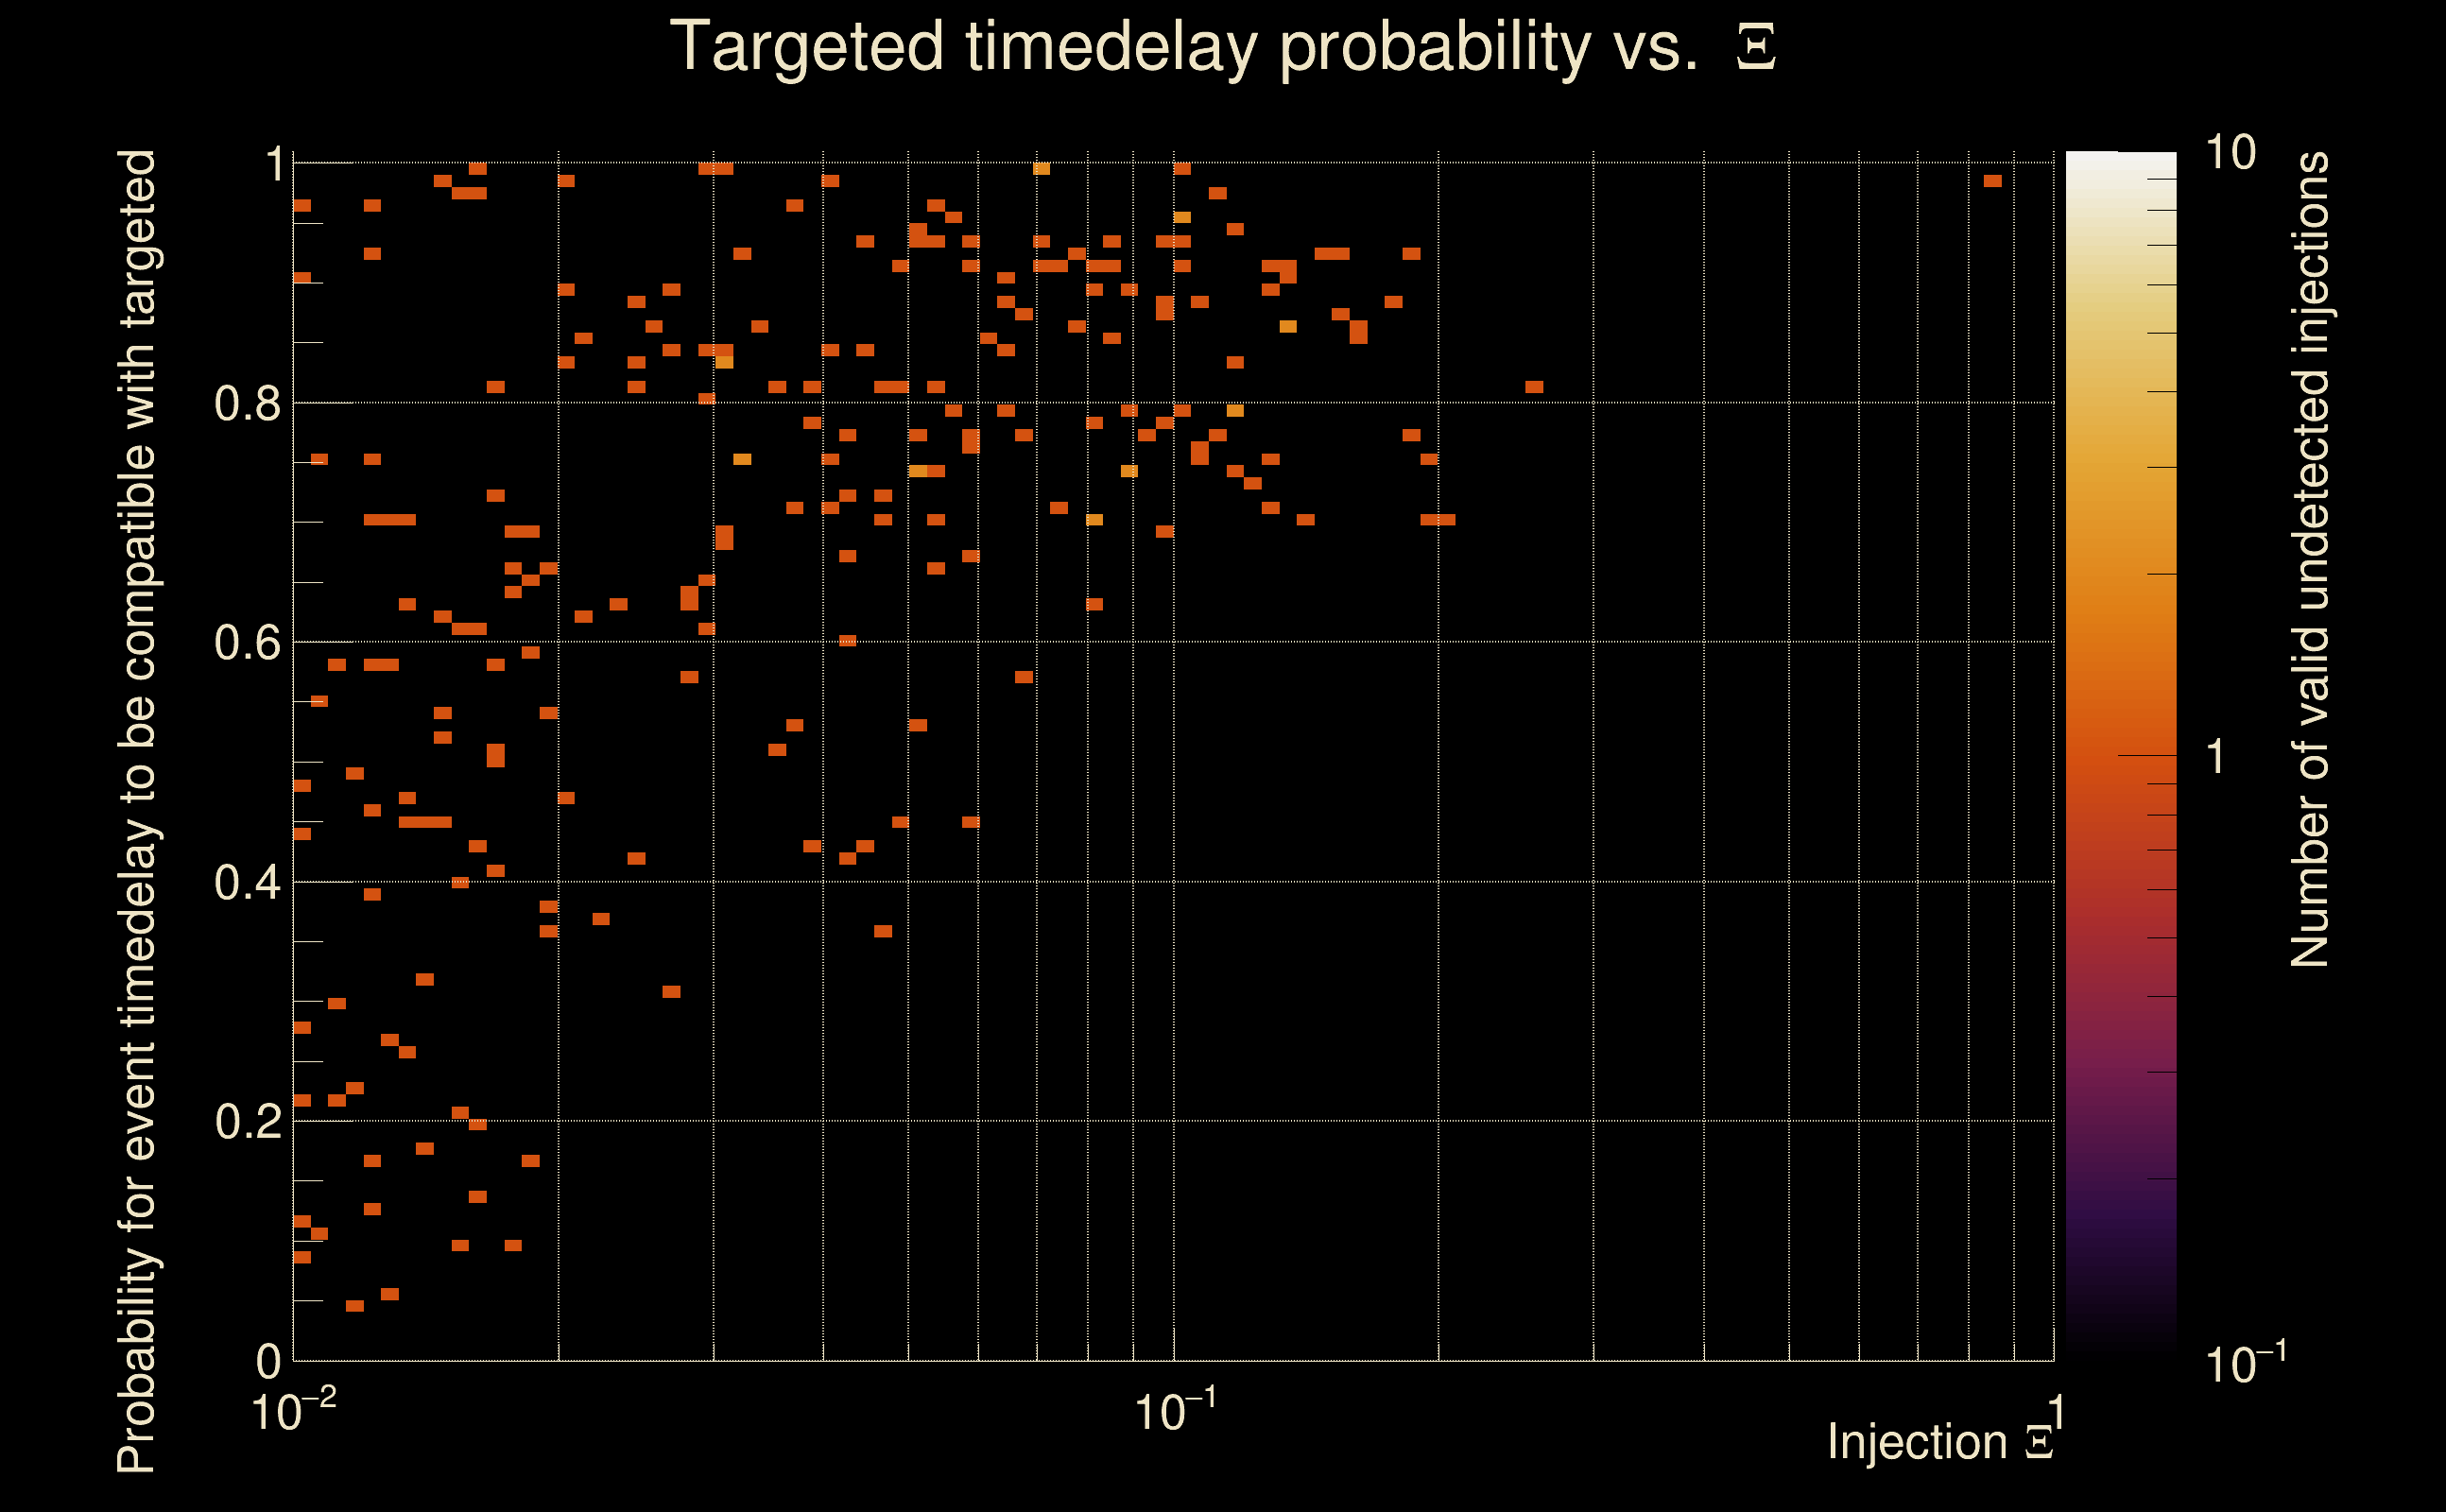
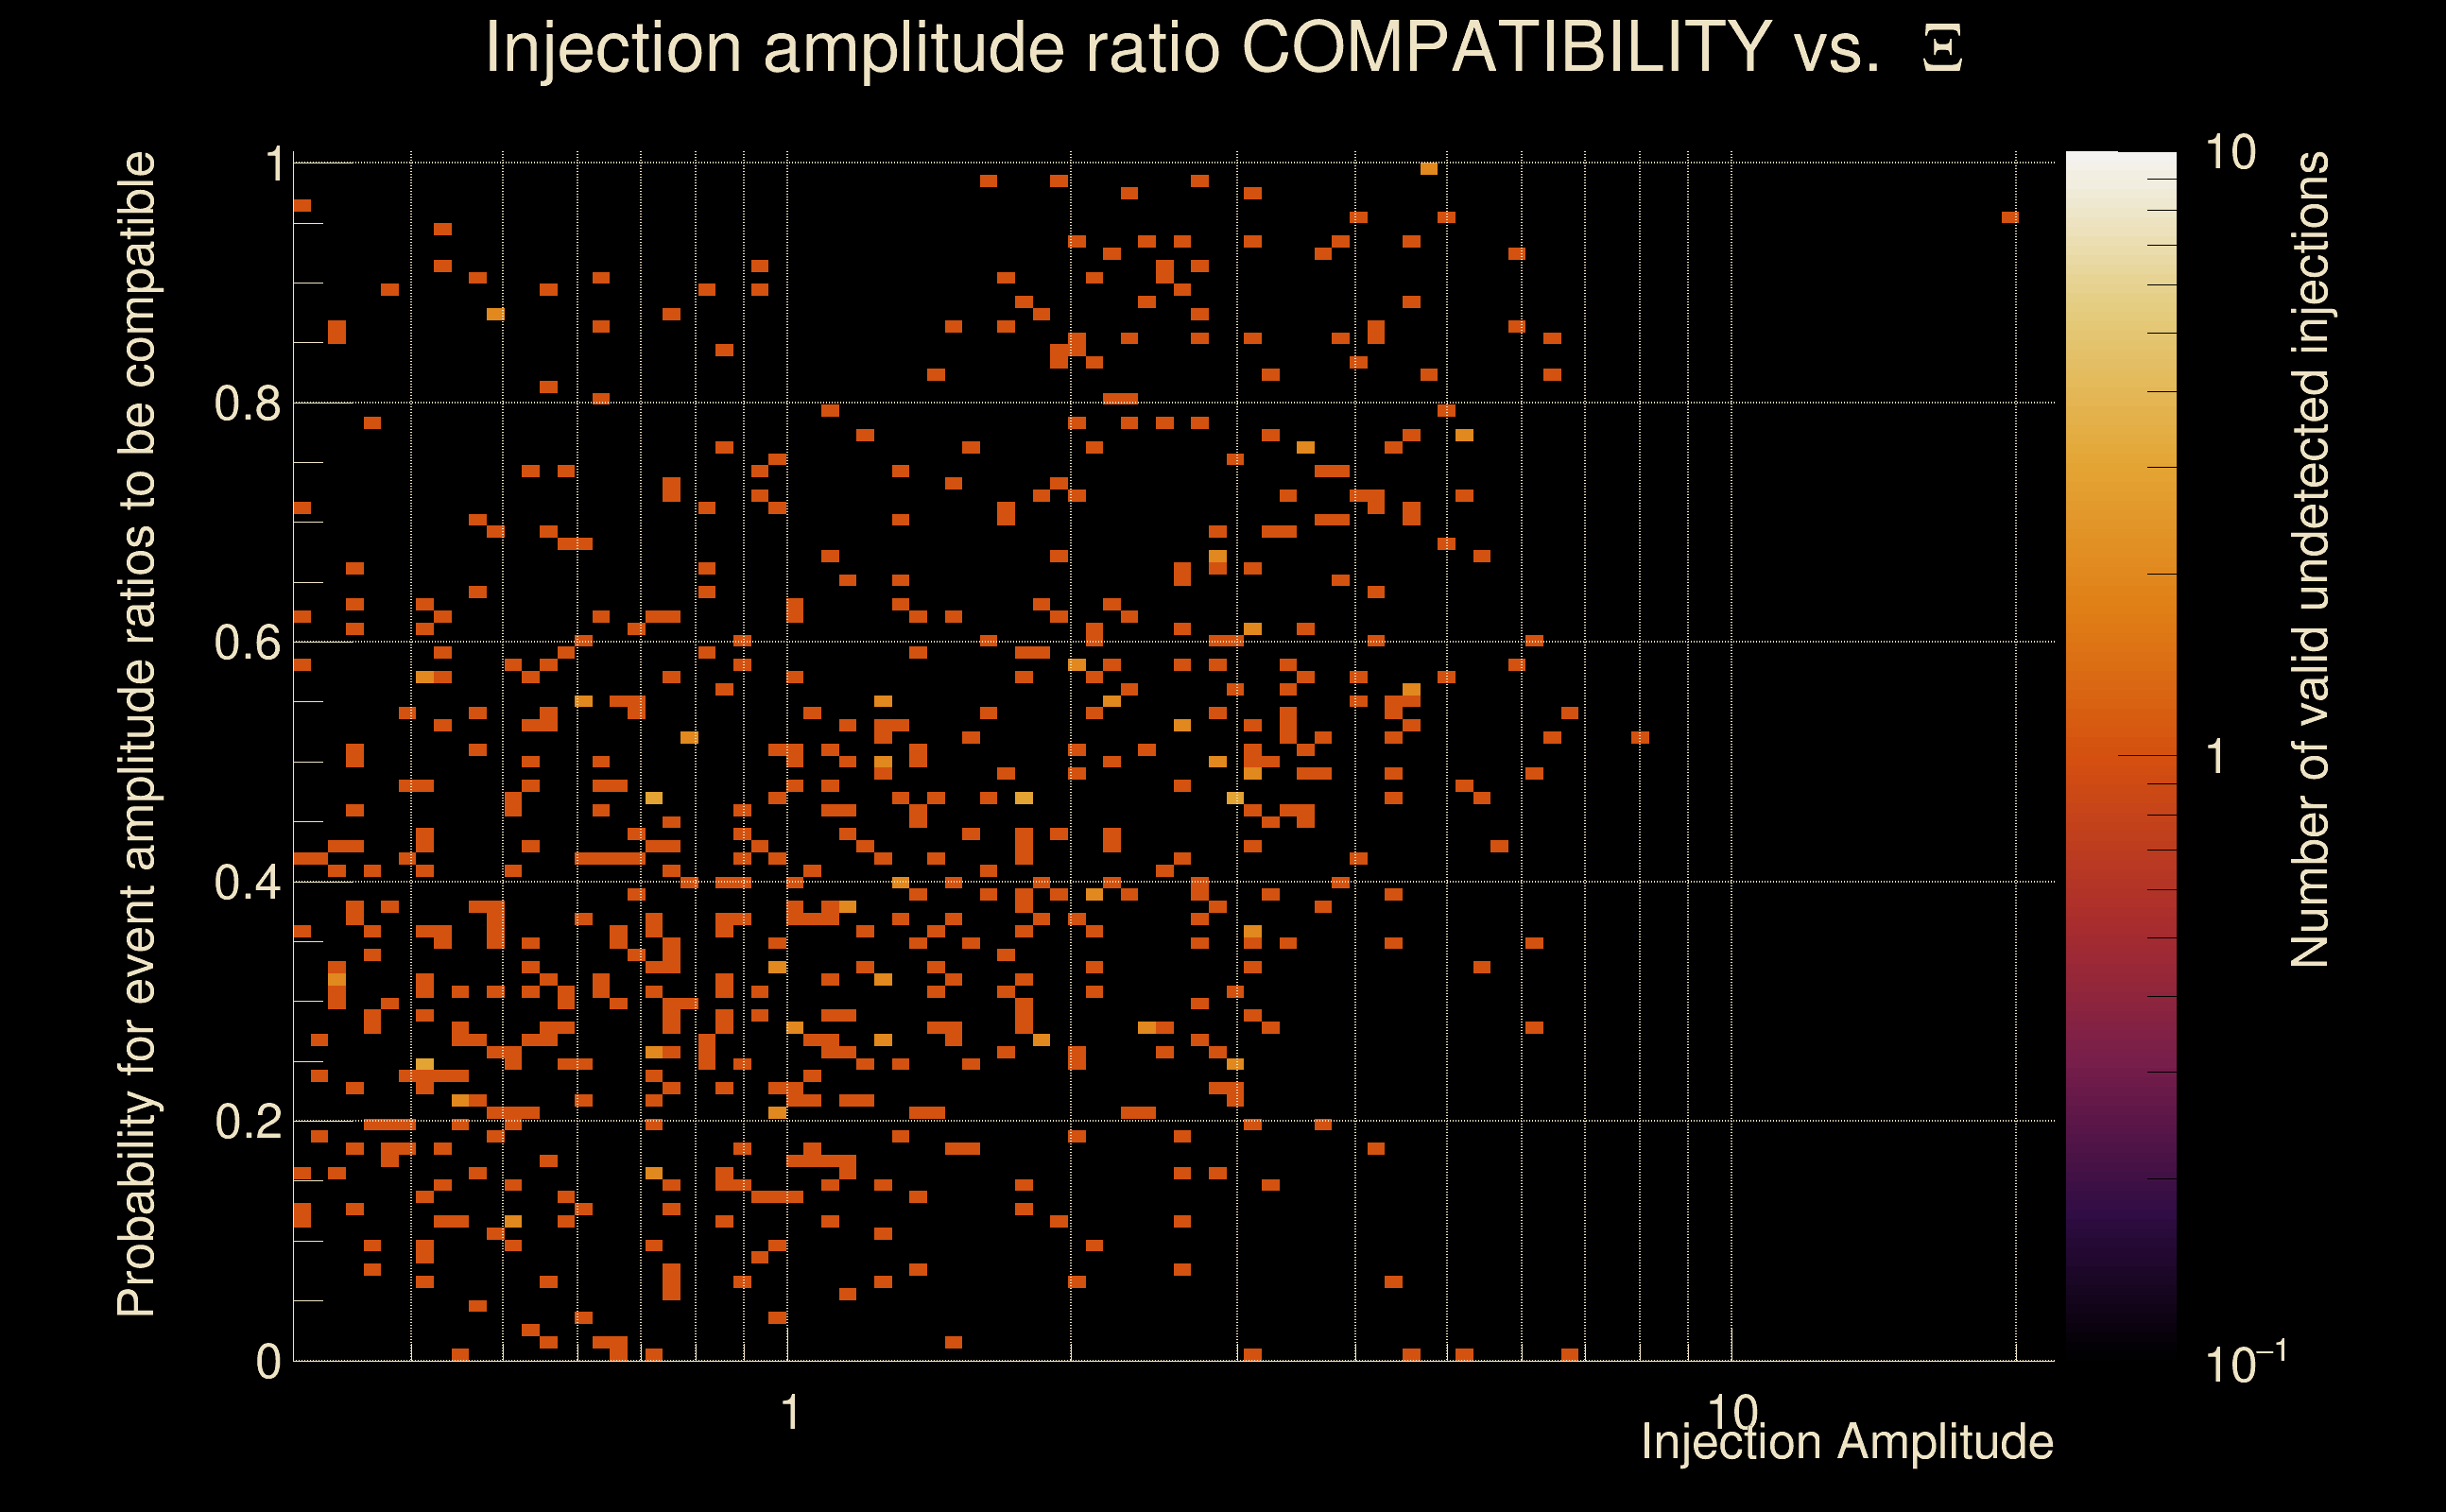
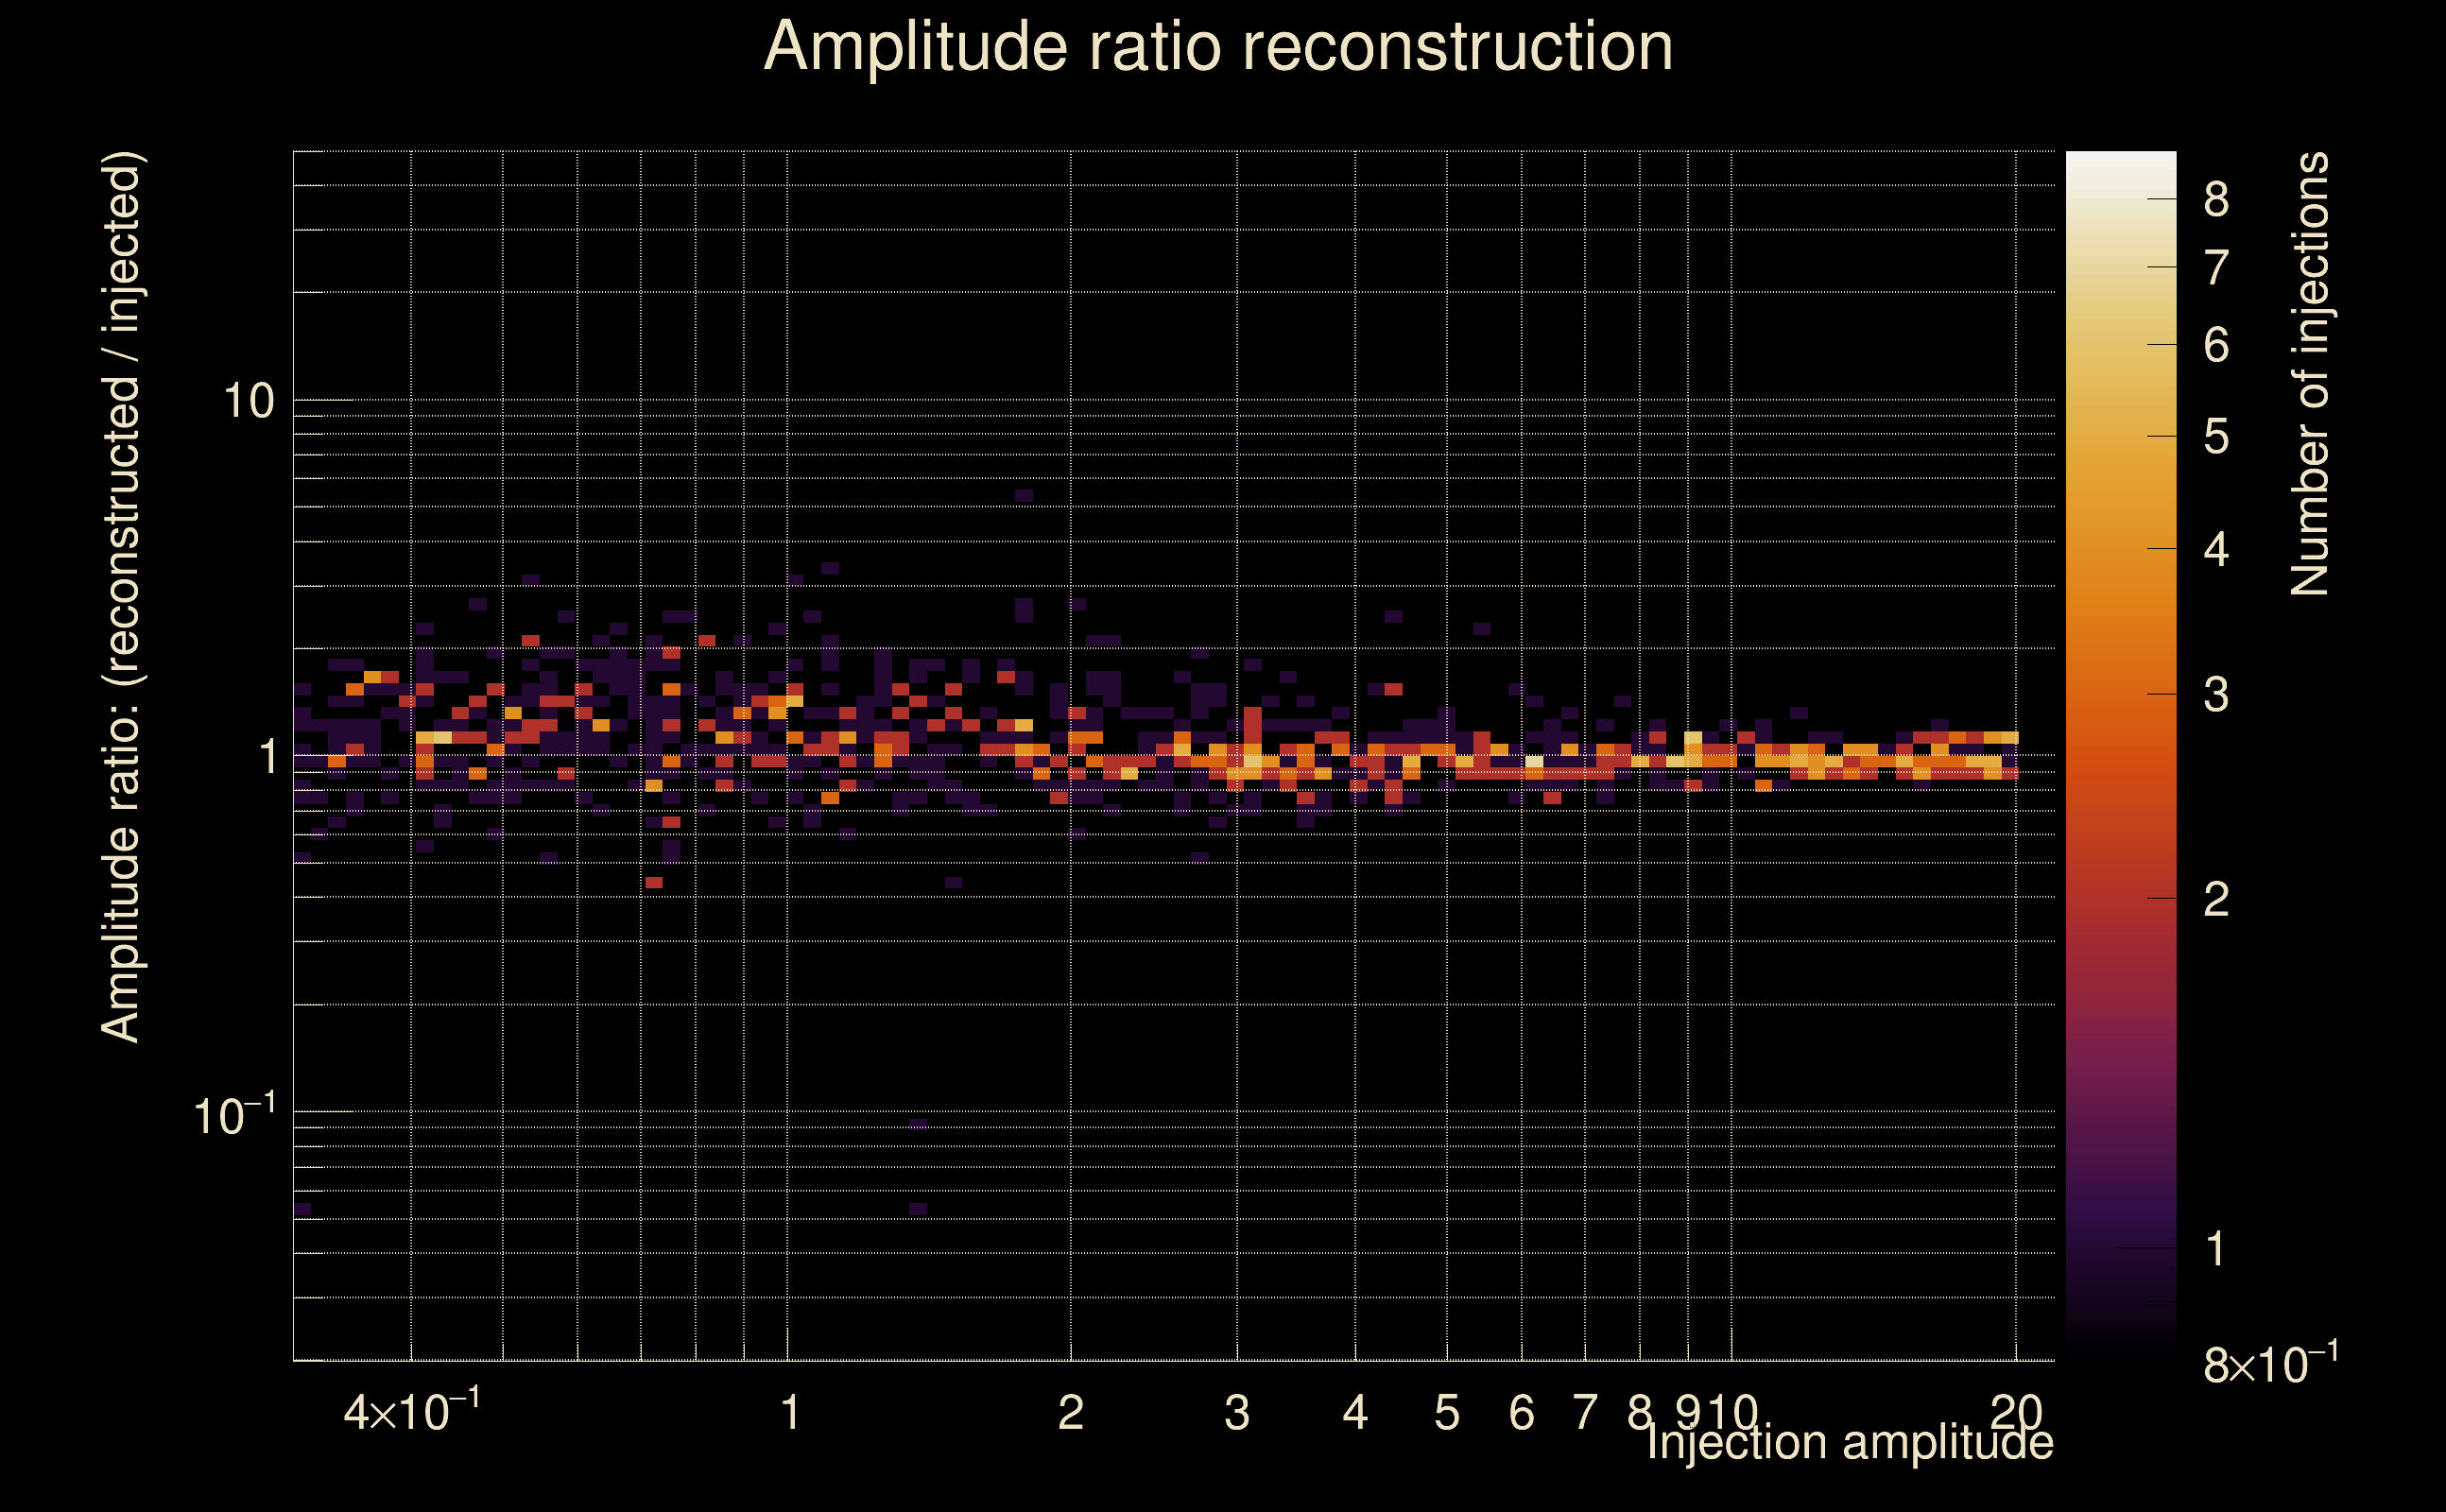
| Number of injections (total/valid/detected): | 1162 / 1022 / 200 |
| List of missed injections: | ./Mezz23-D15_missed.txt |
| Injection amplitude at 90% detection efficiency: | 0.401482 |
| Injection amplitude at 50% detection efficiency: | 0.397338 |
| Injection amplitude at 10% detection efficiency: | -1 |
 |
 |
 |
 |
 |
 |
|
 |
 |
|
 |
 |
|
 |
 |
|
 |
 |
|
 |
 |
|
 |
 |
|
 |
 |
|
 |
 |
 |
 |
 |
 |
 |
 |
 |
 |
 |
 |
 |
 |
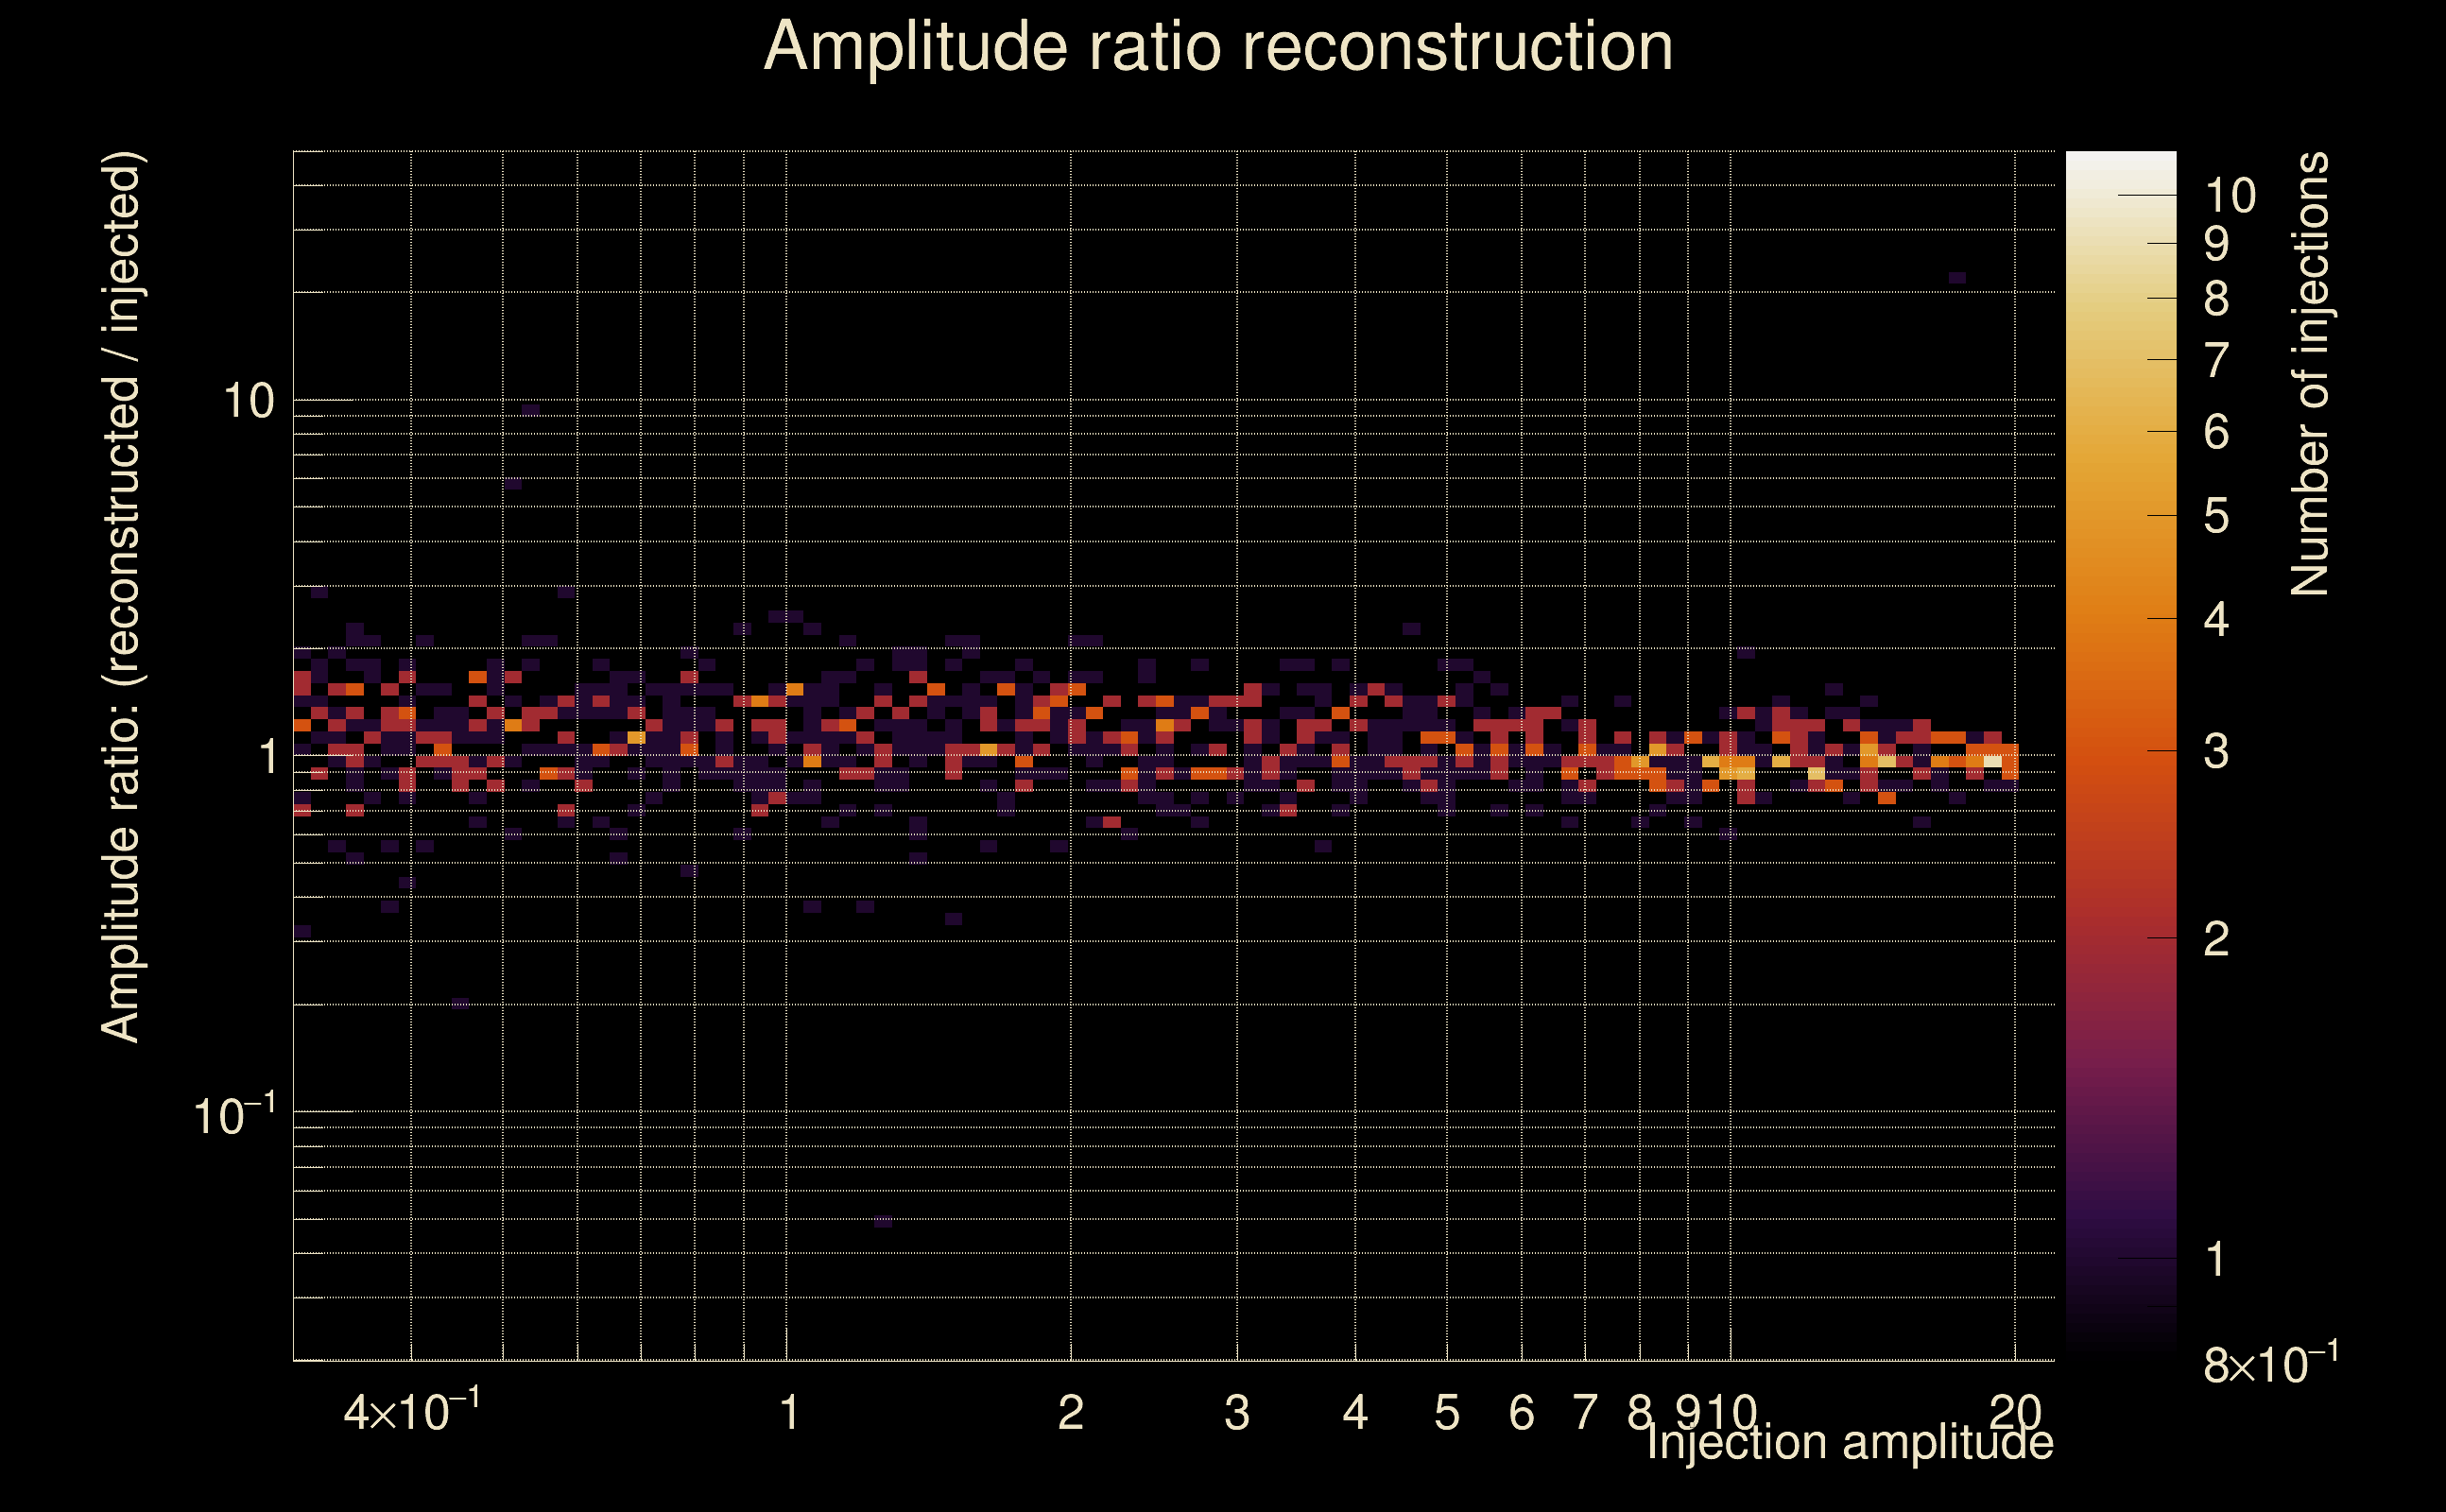 |
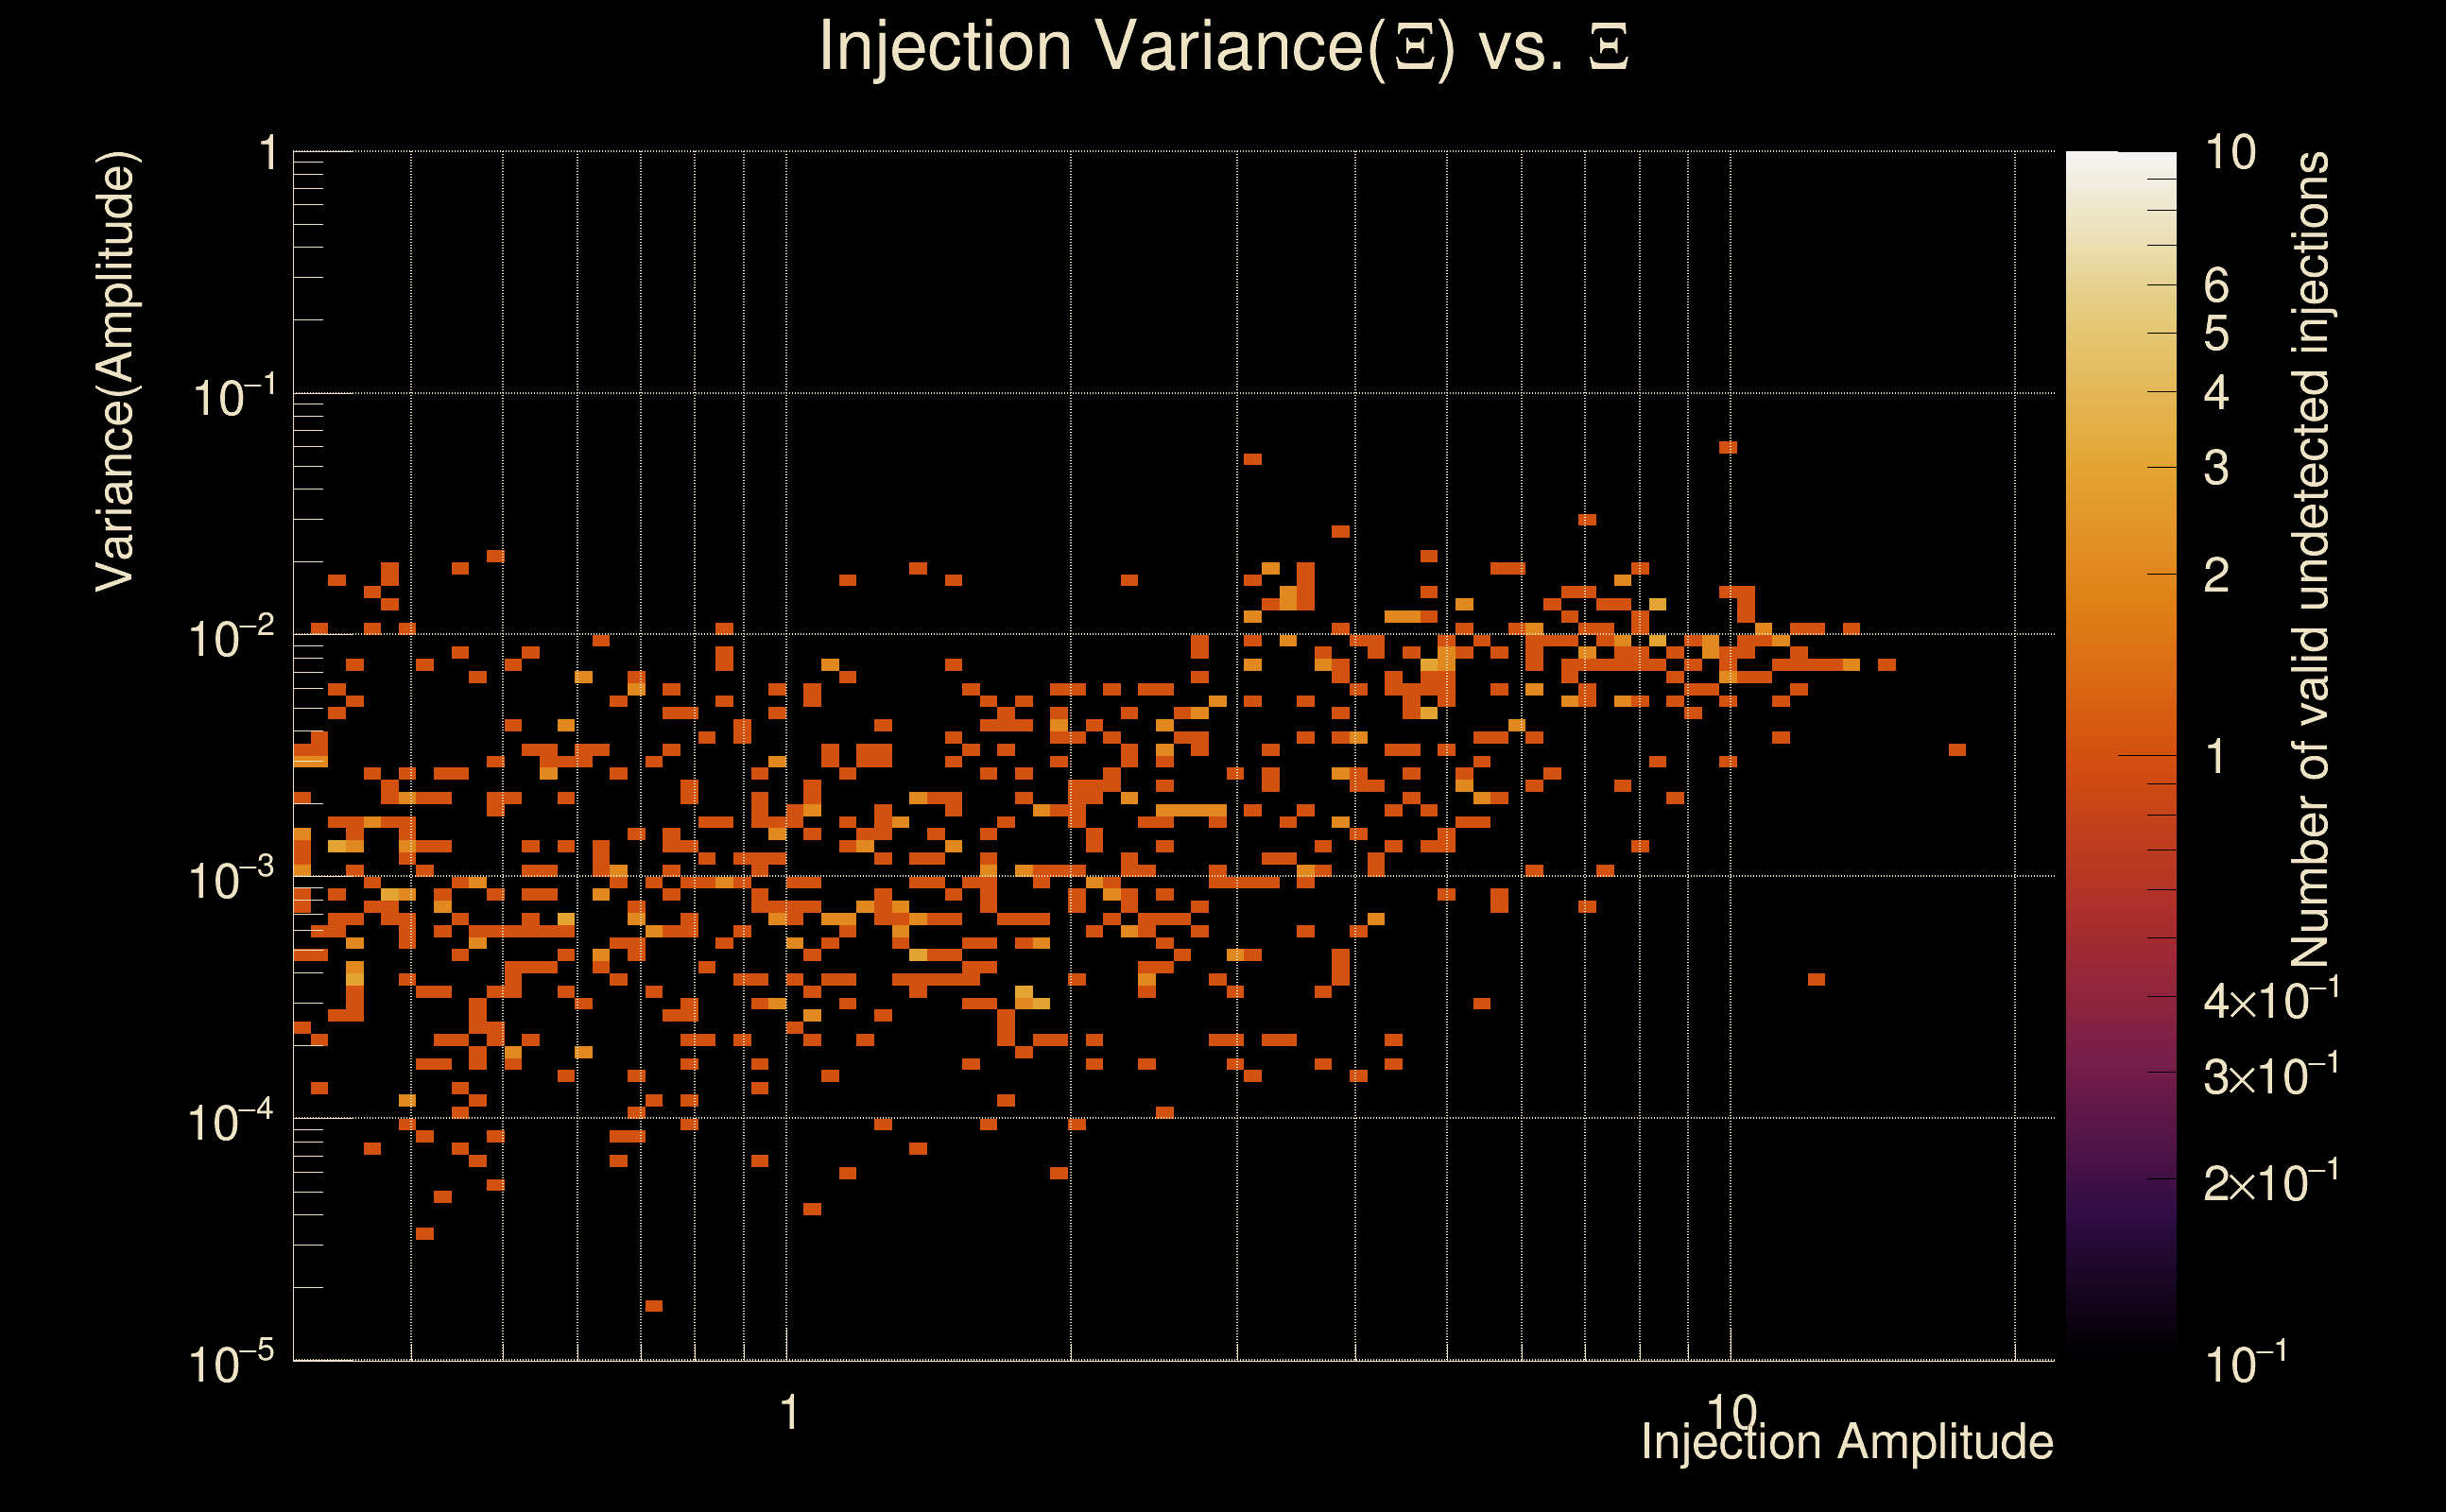
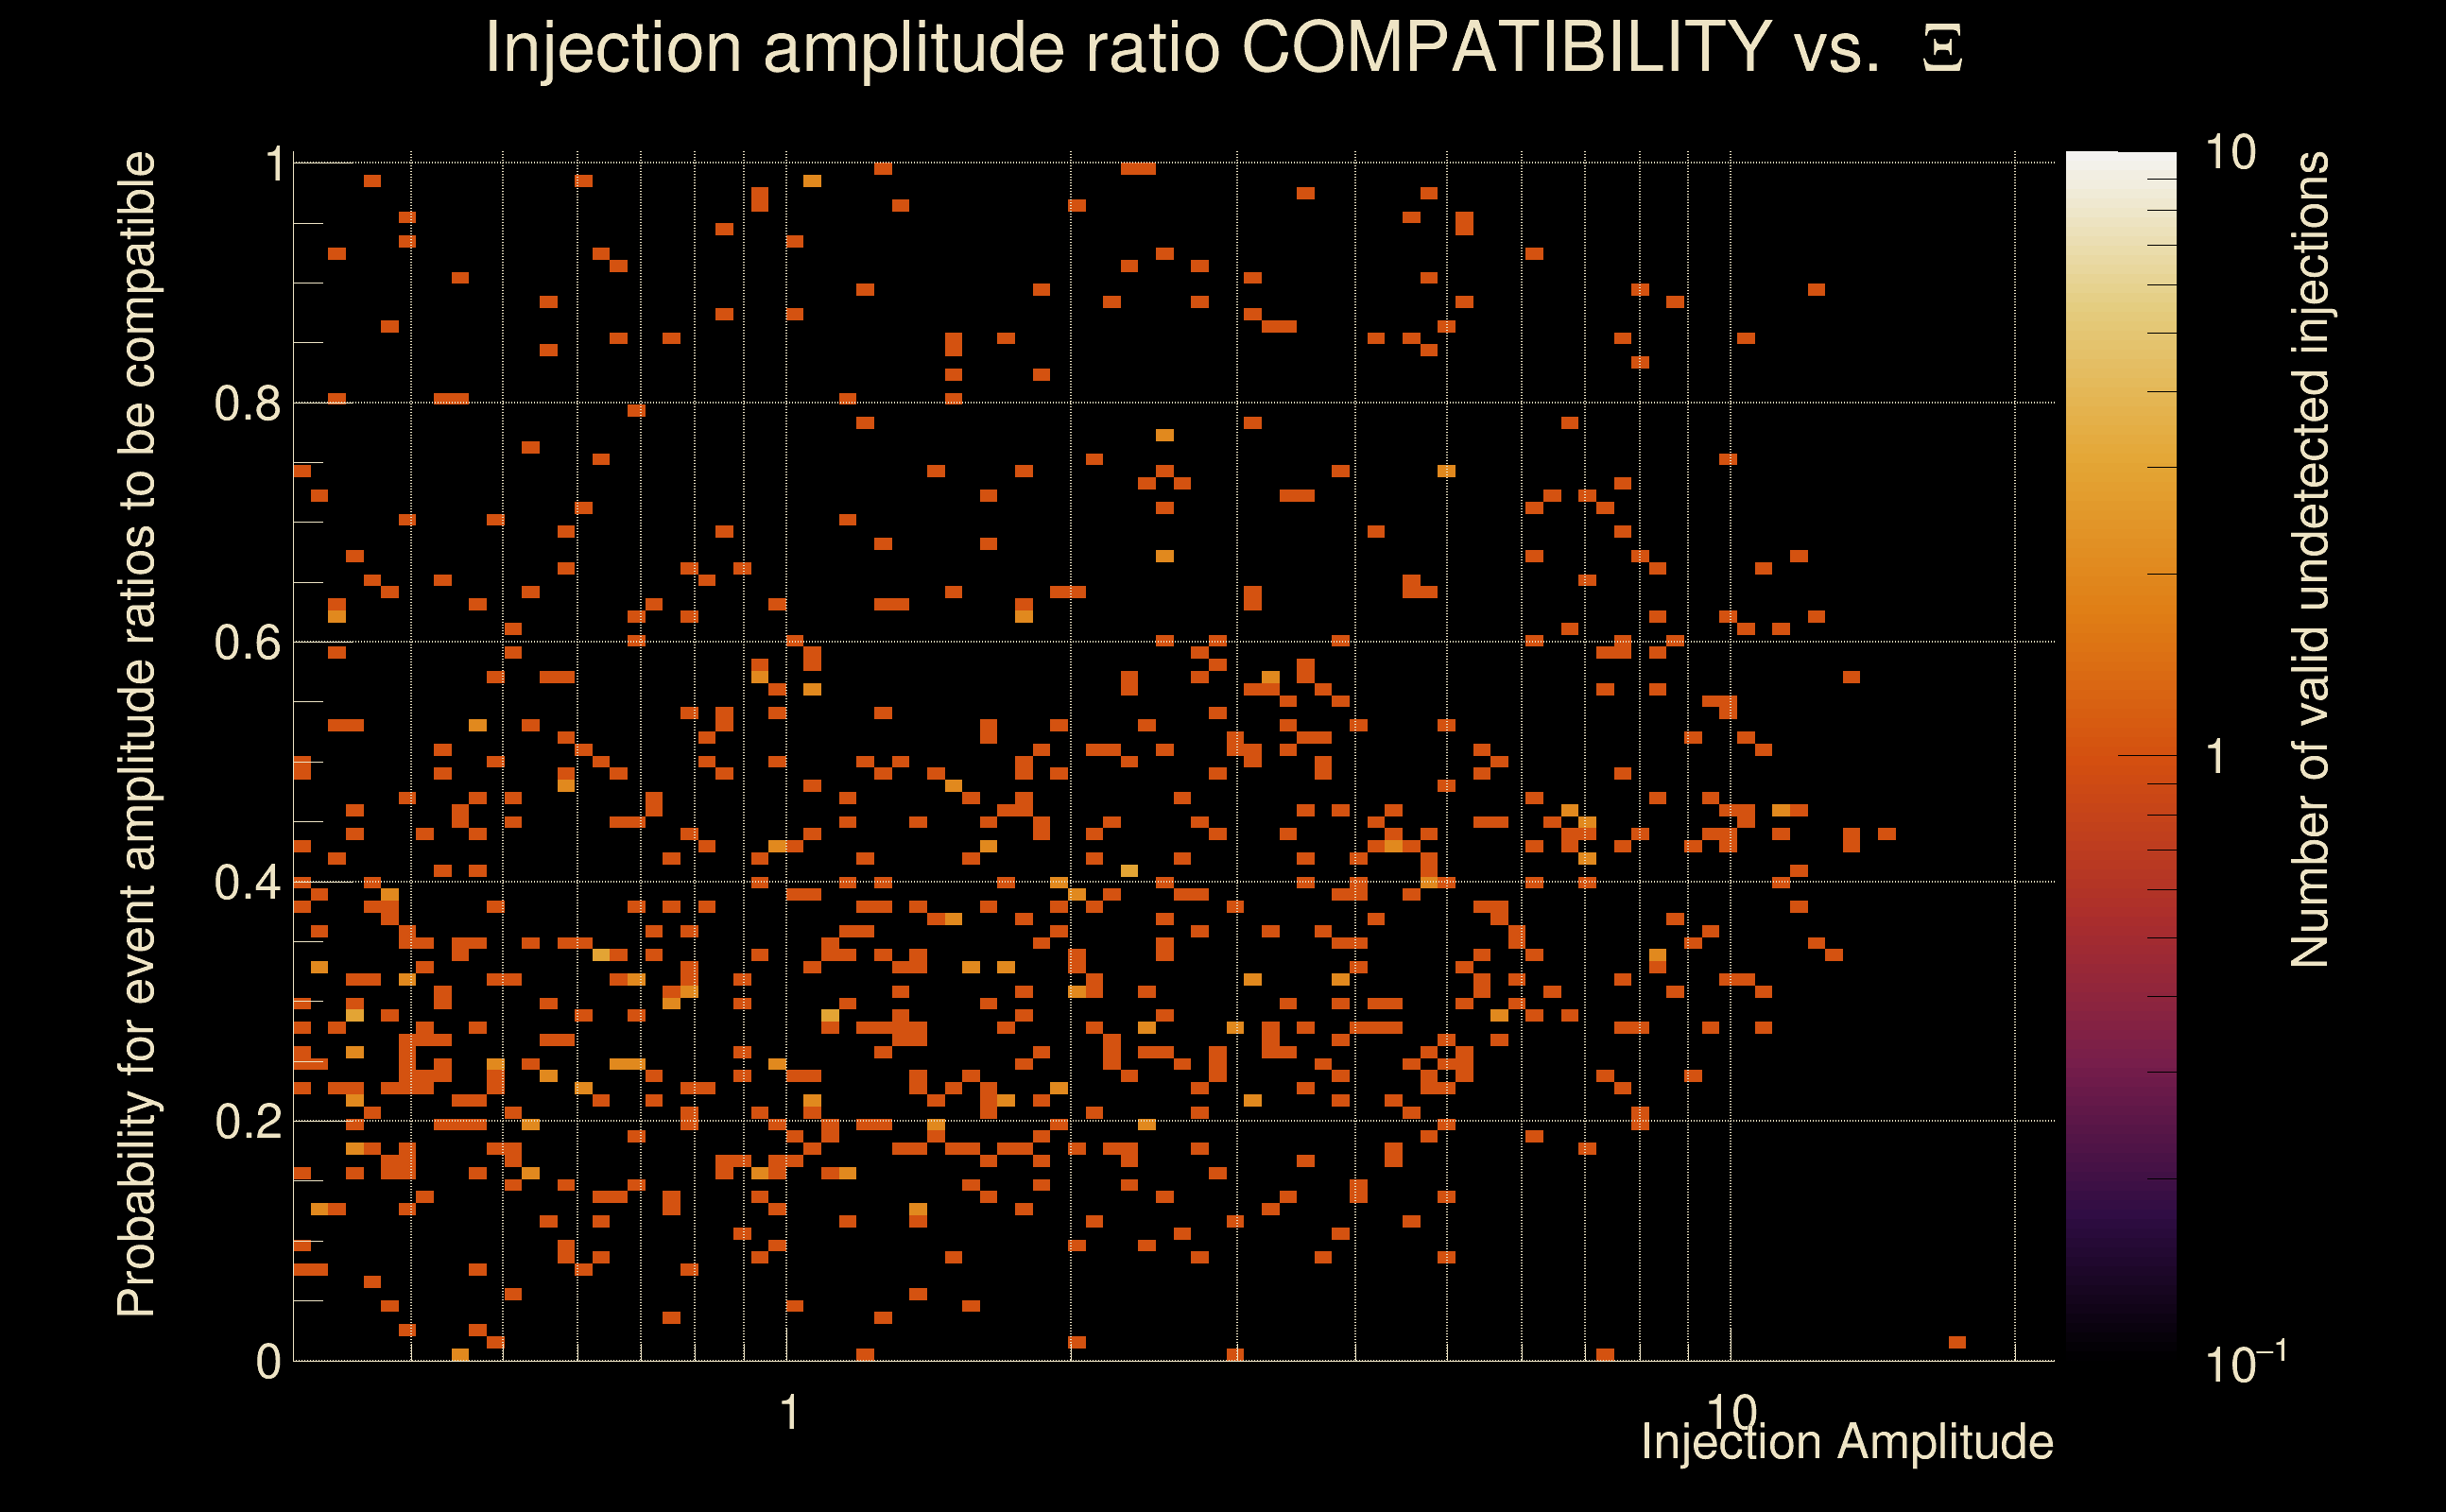
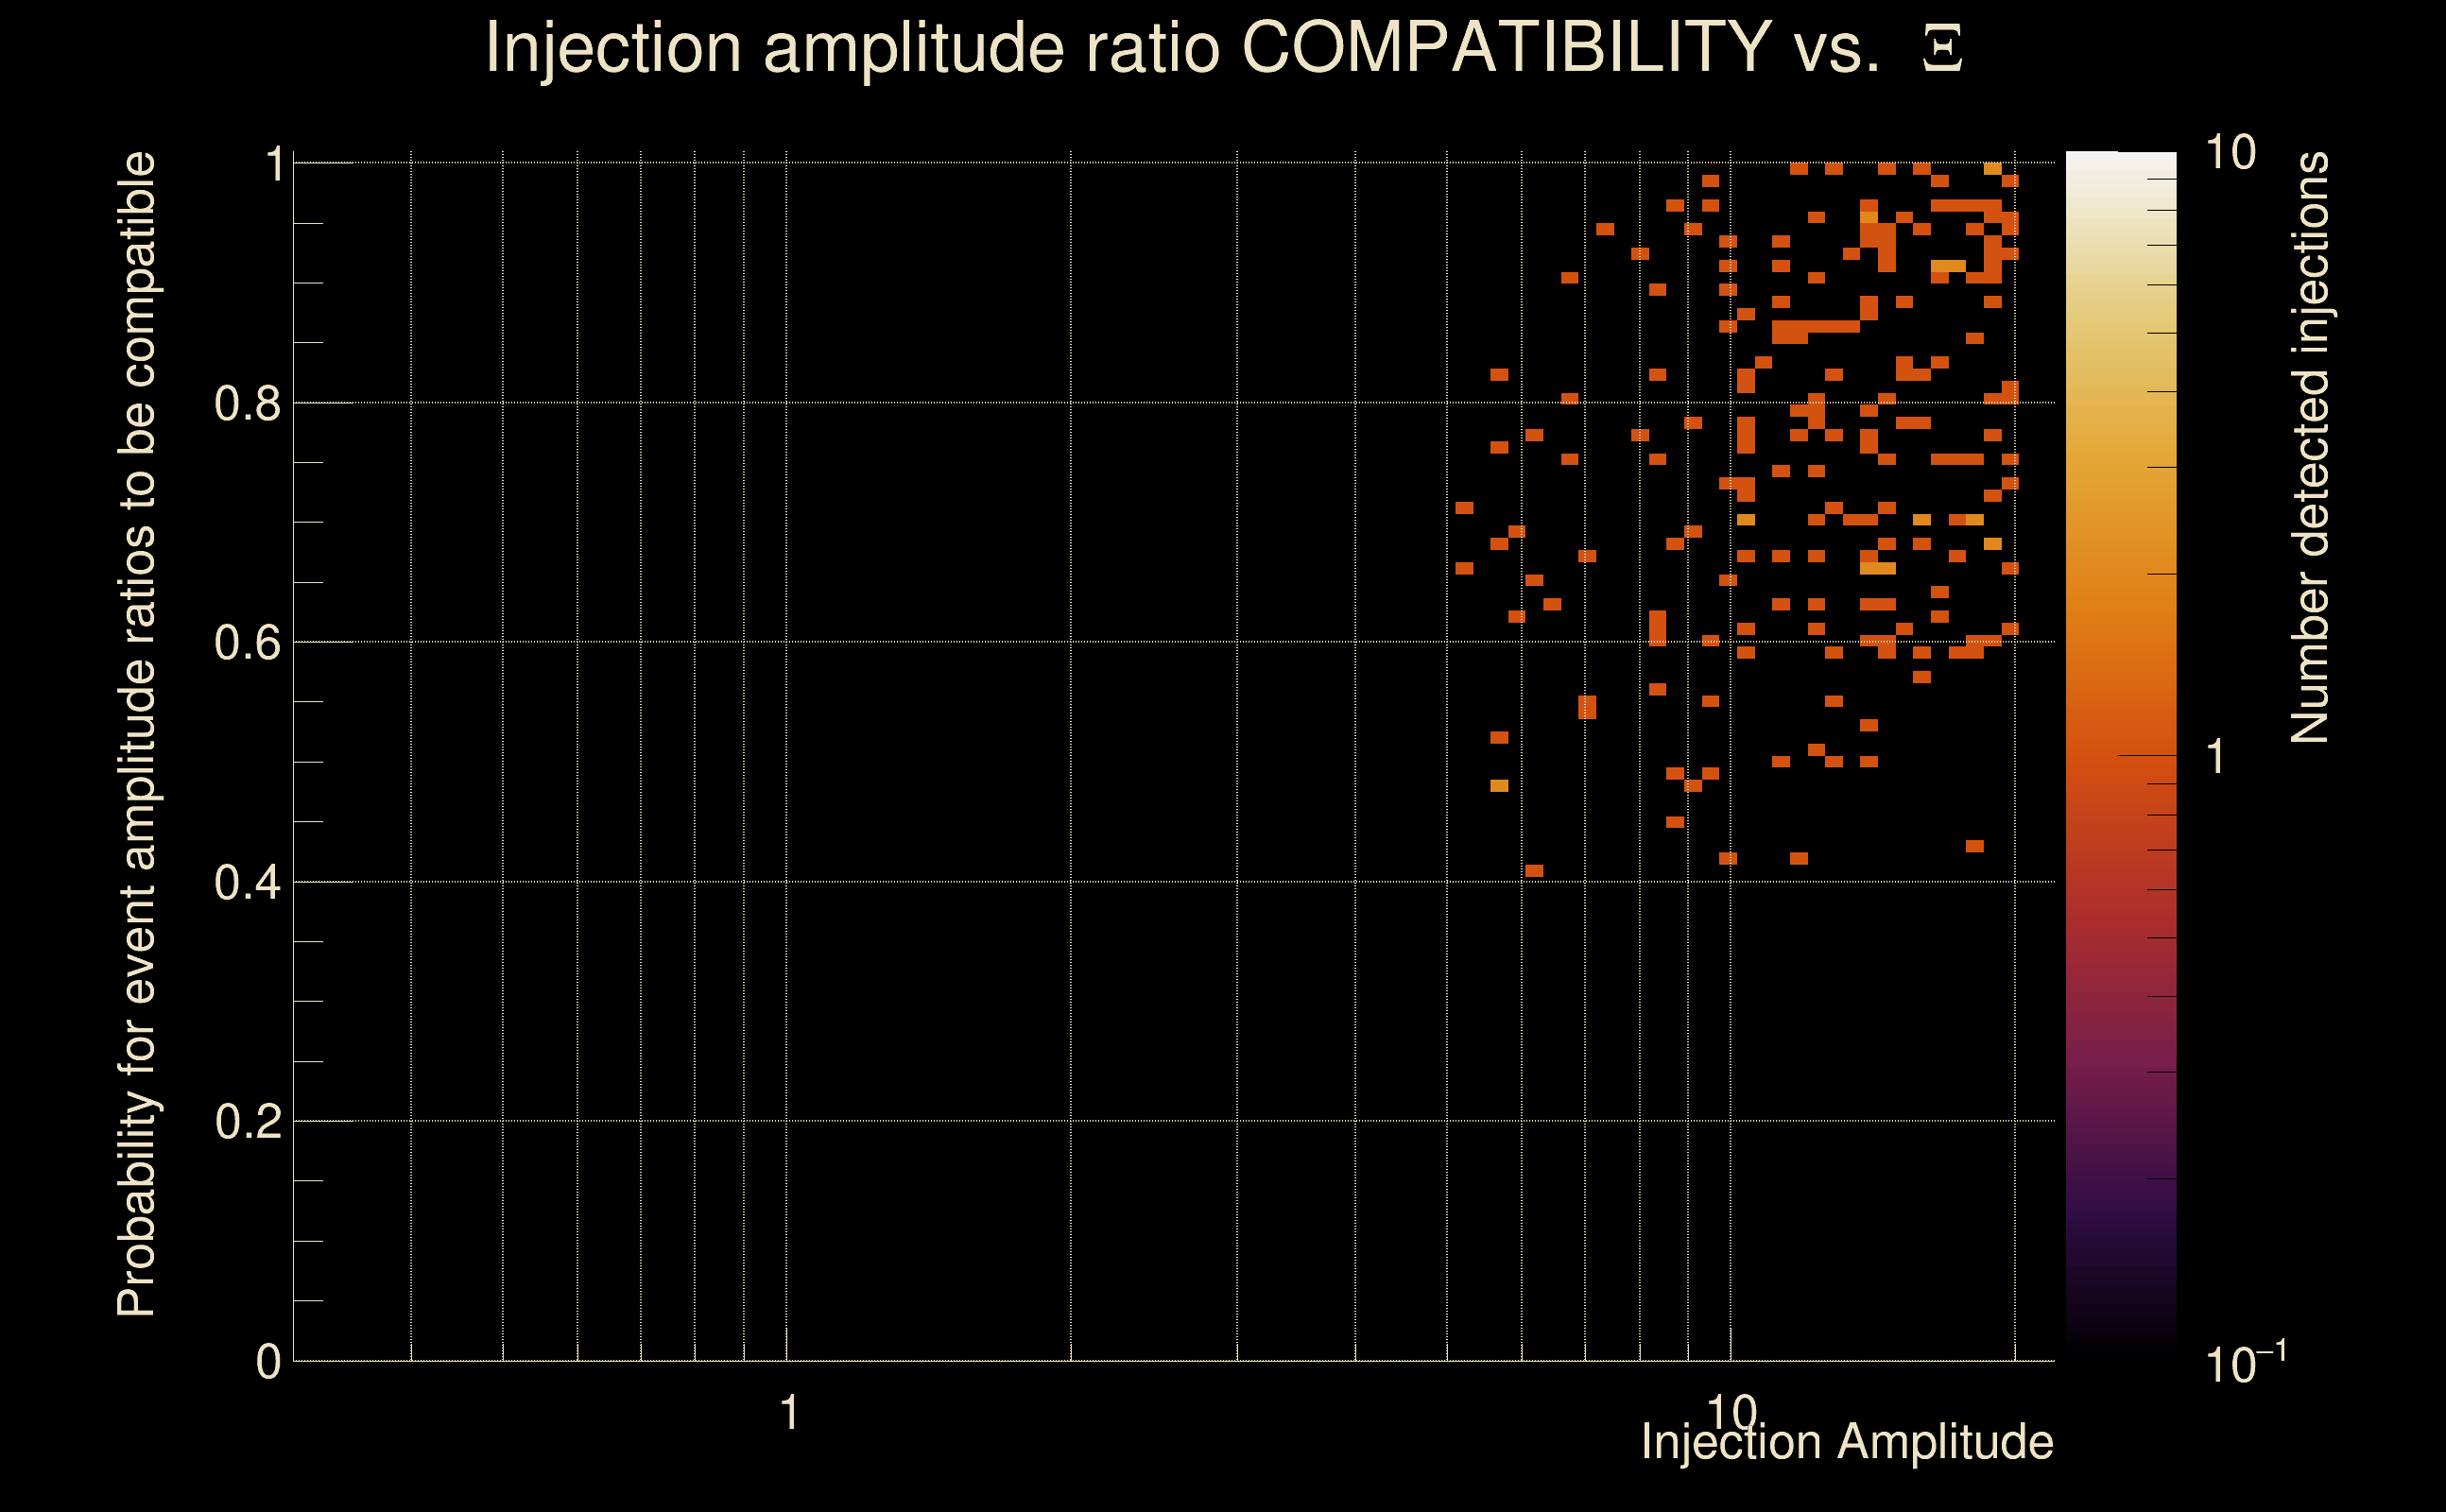
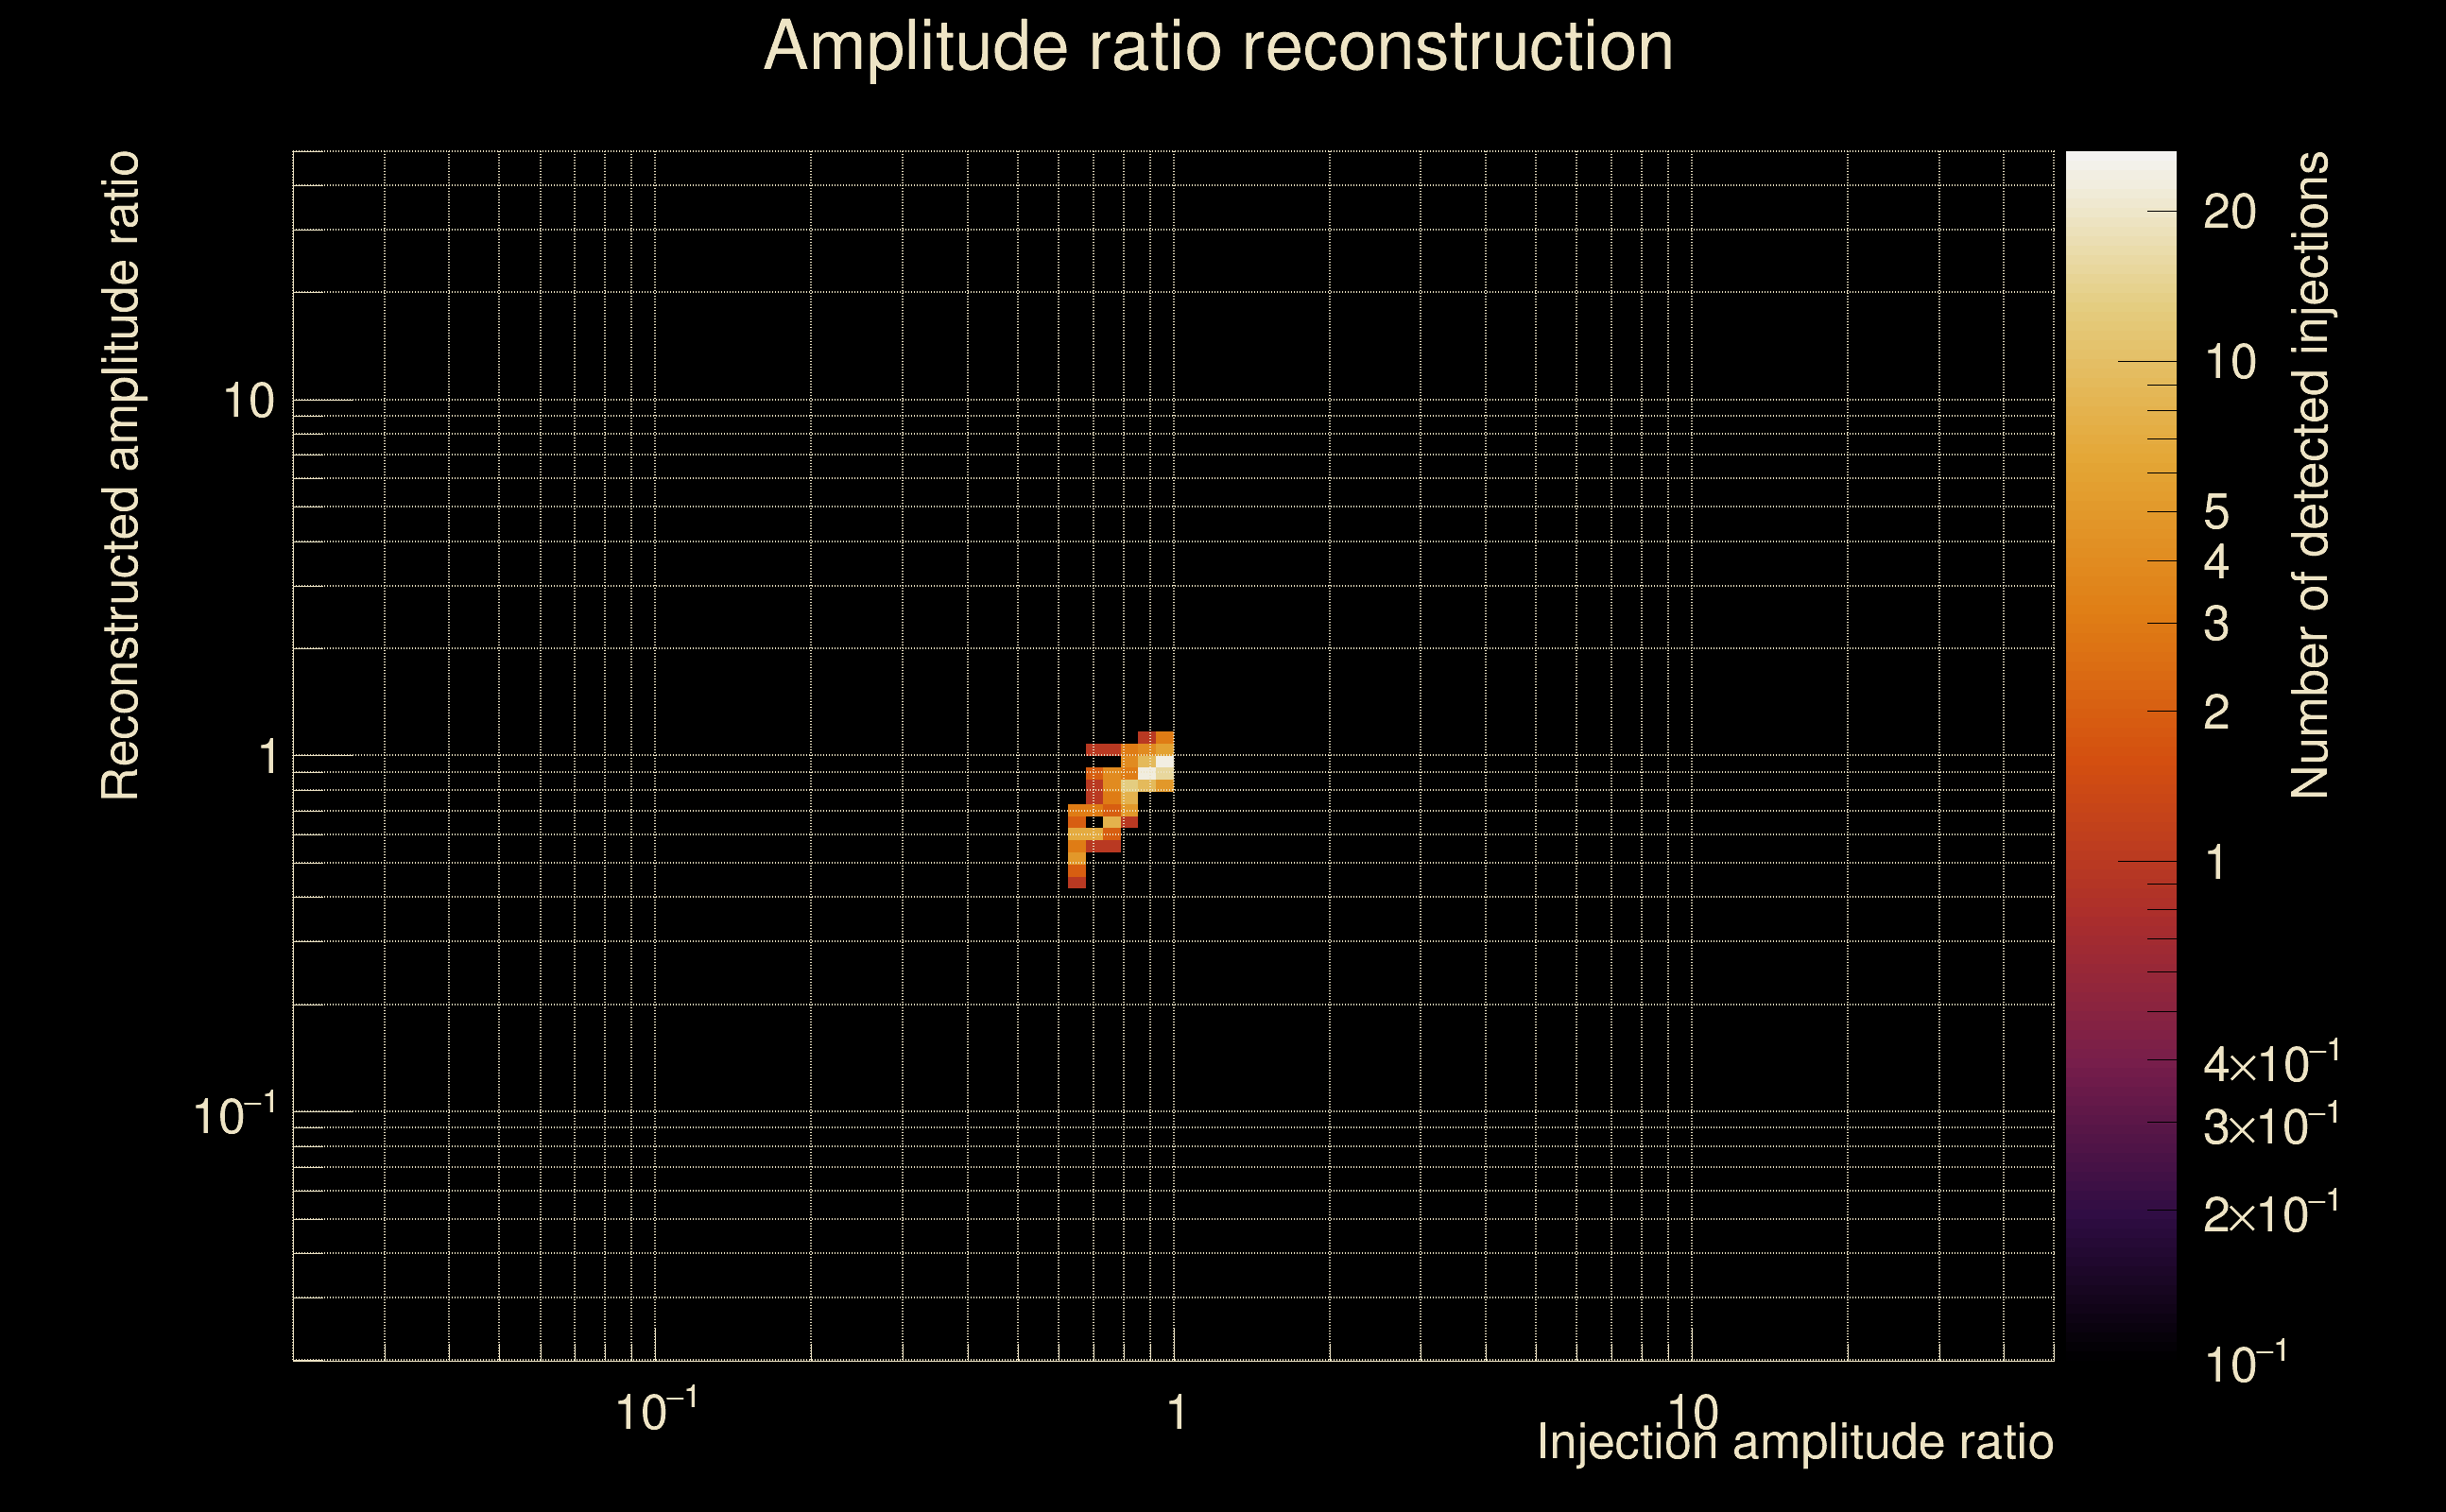
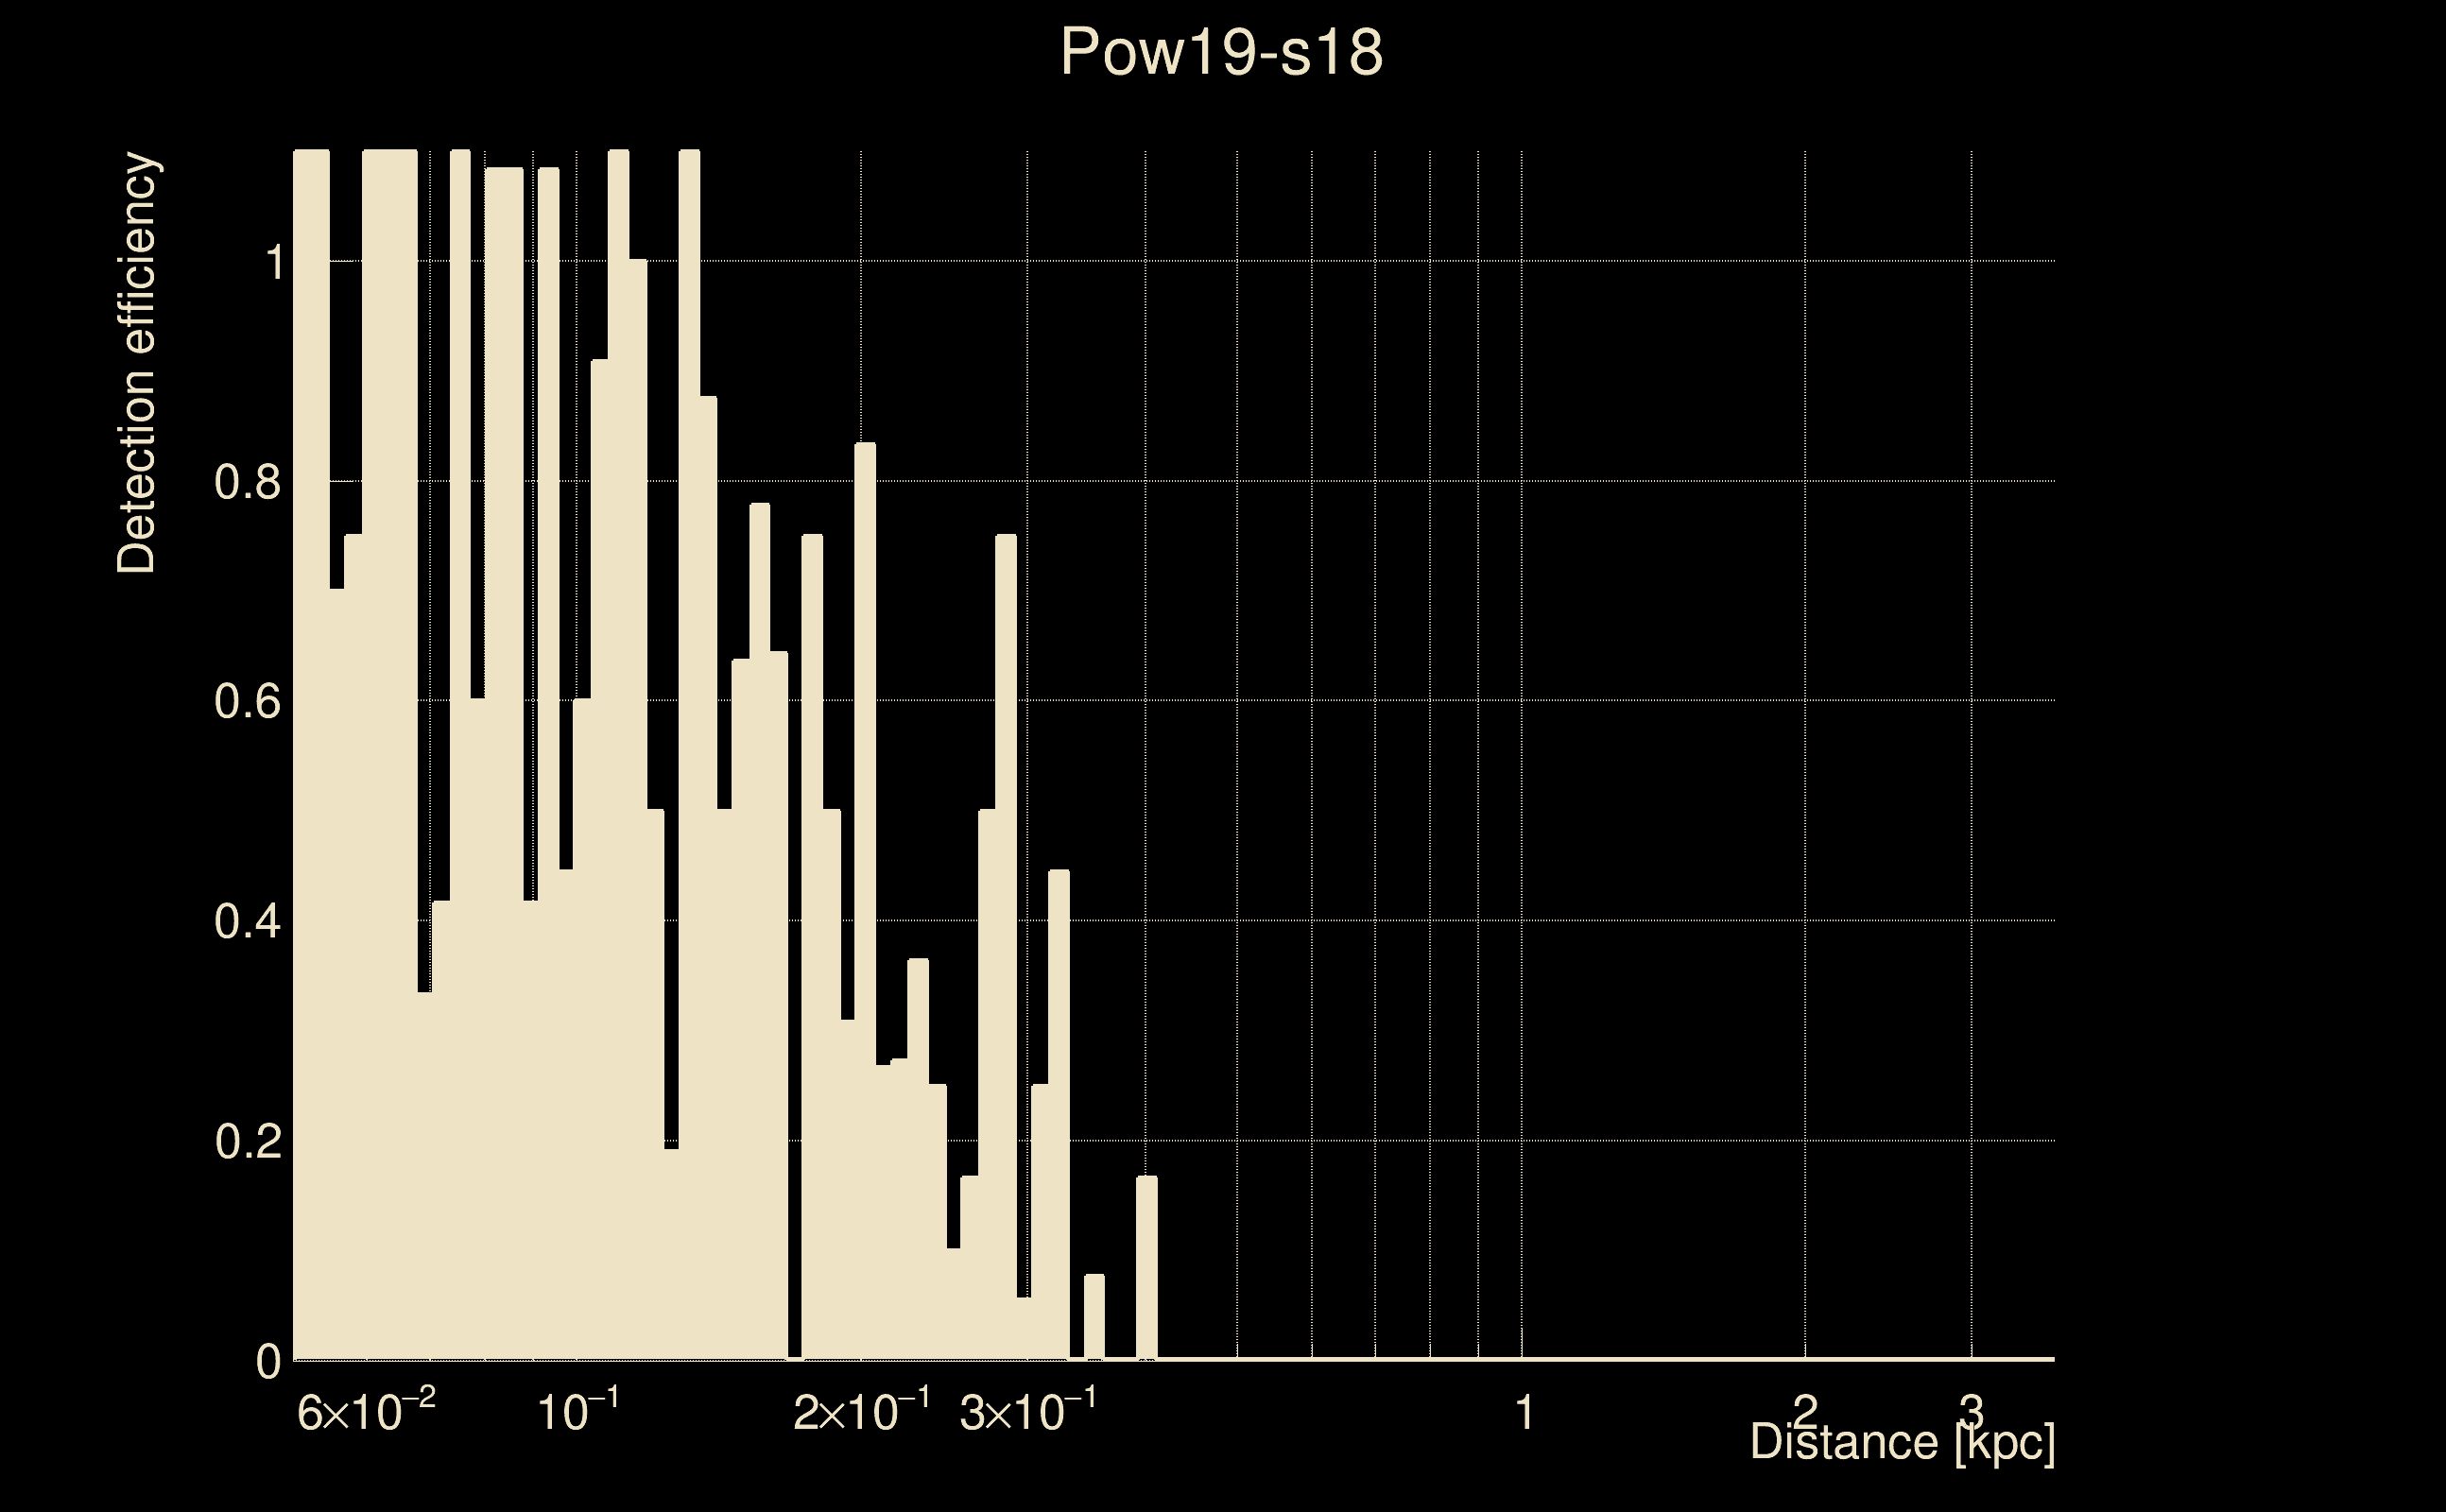
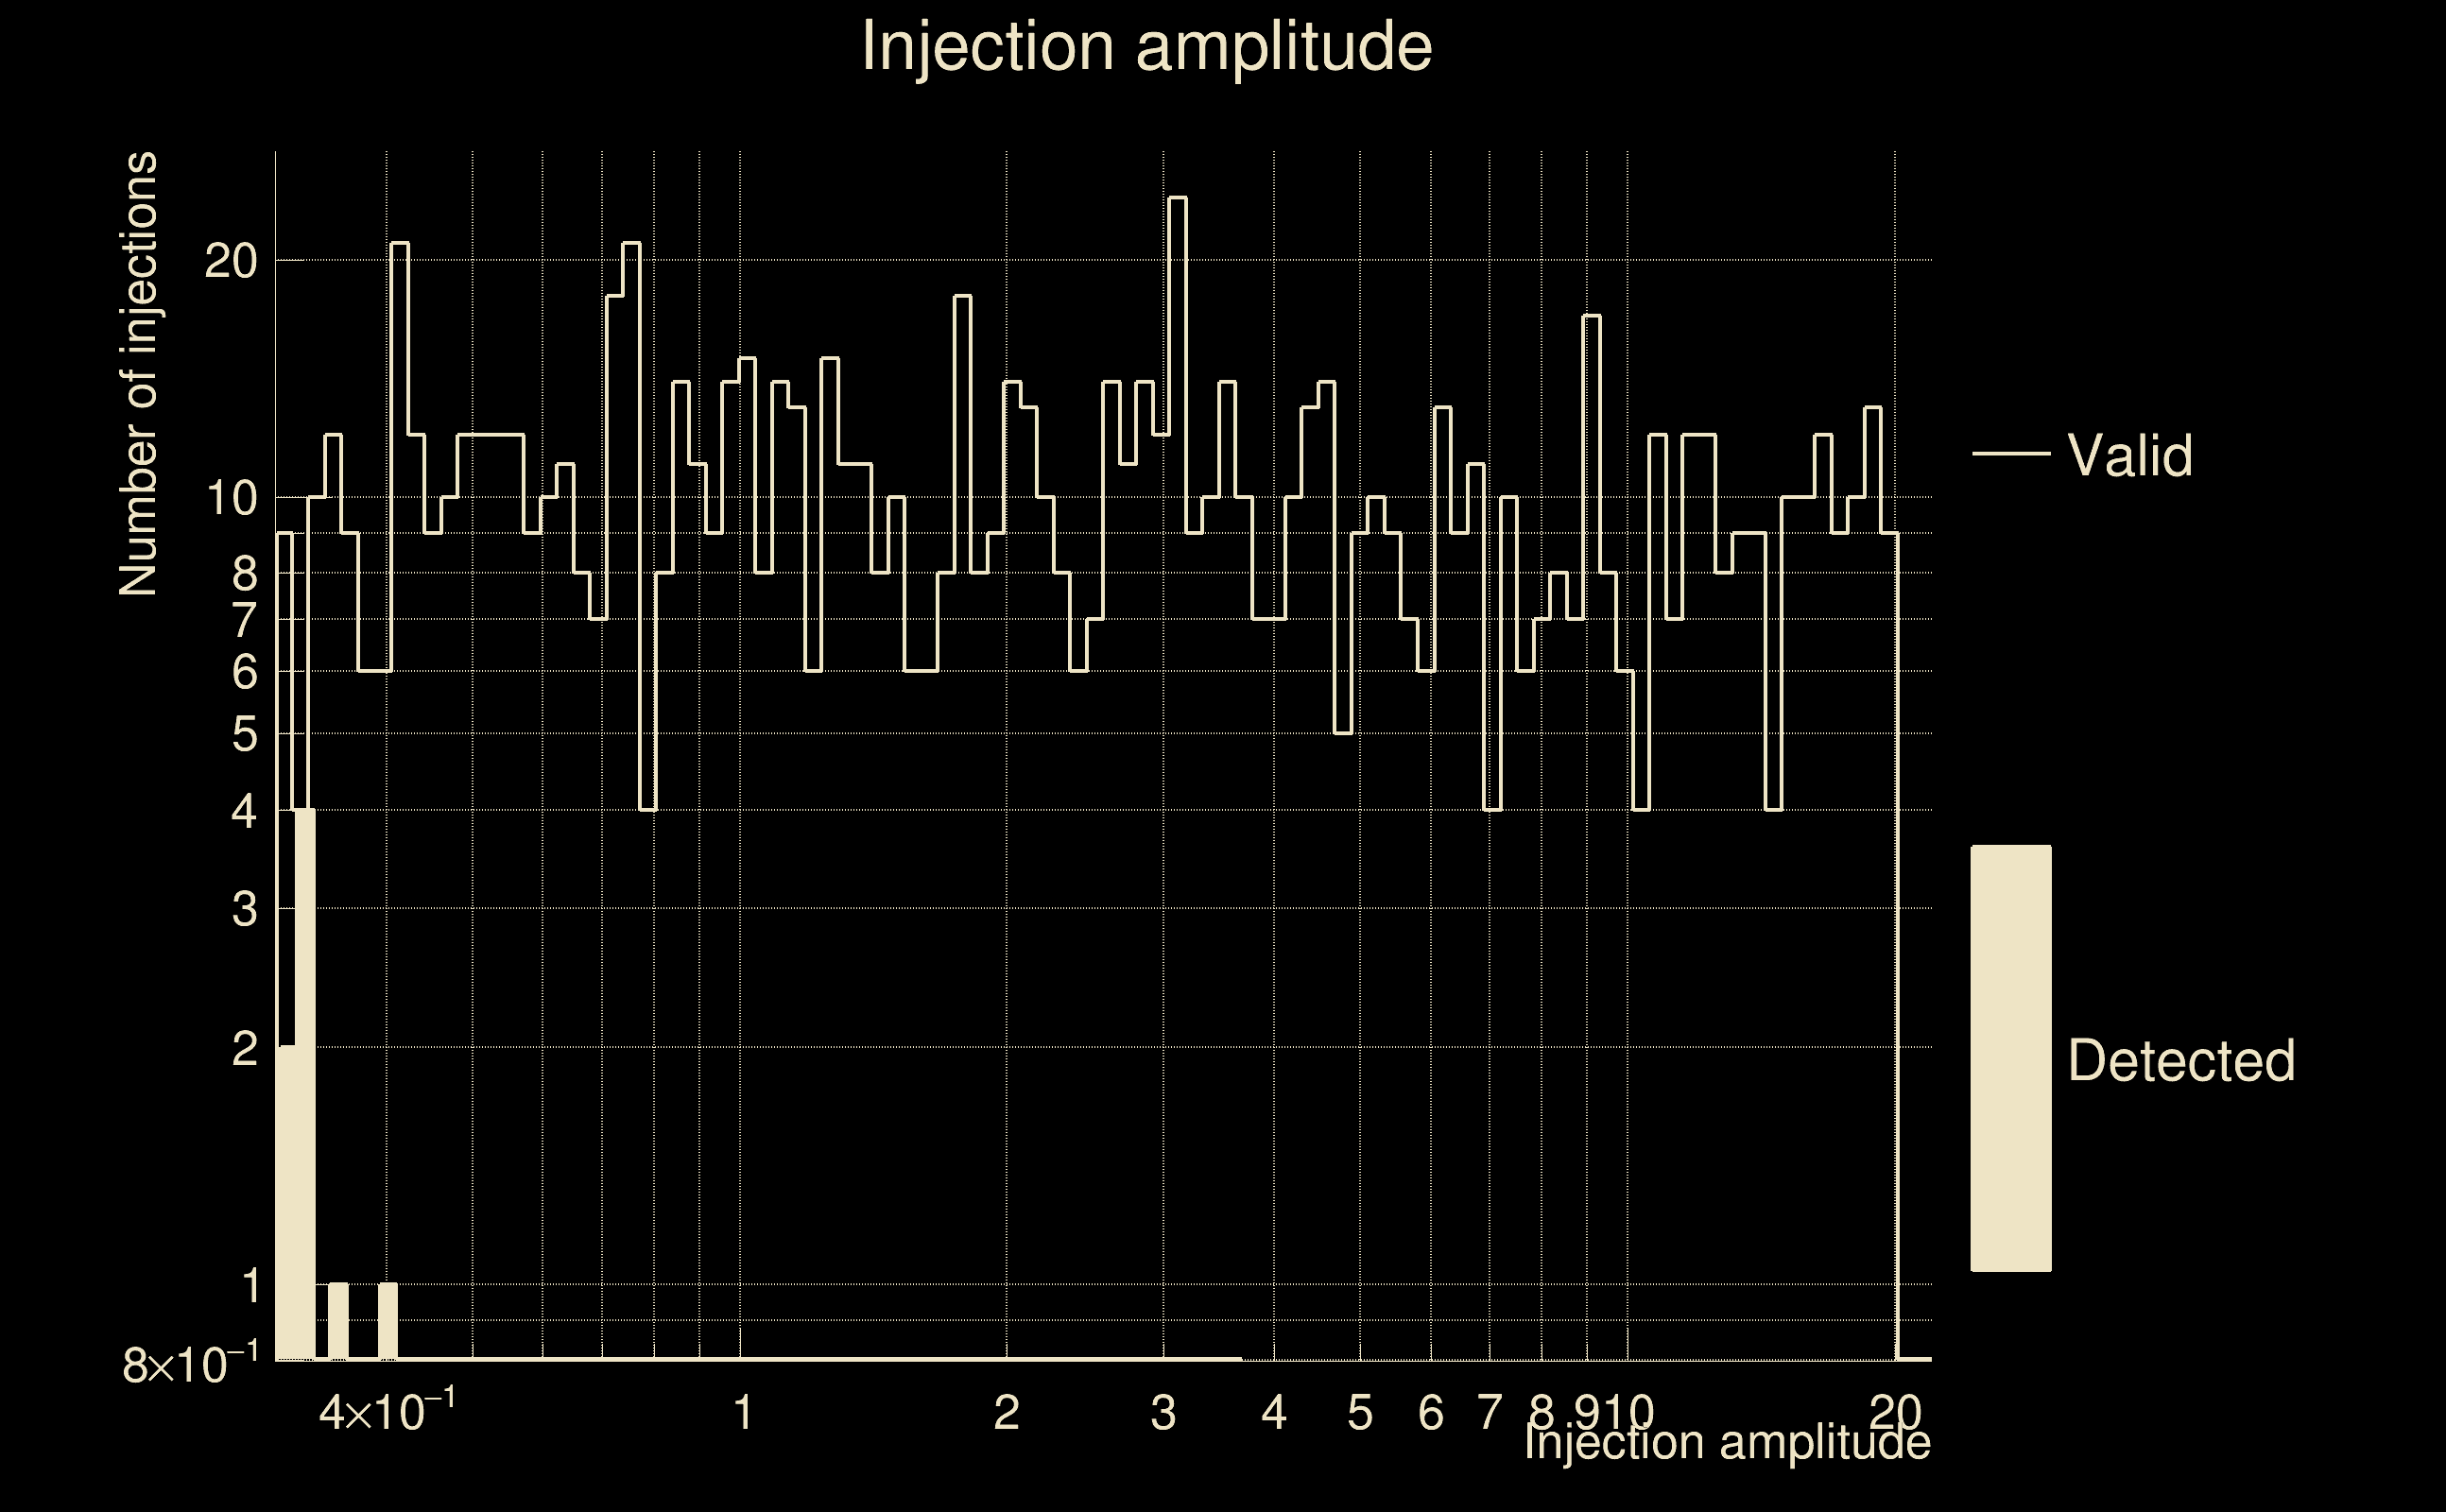
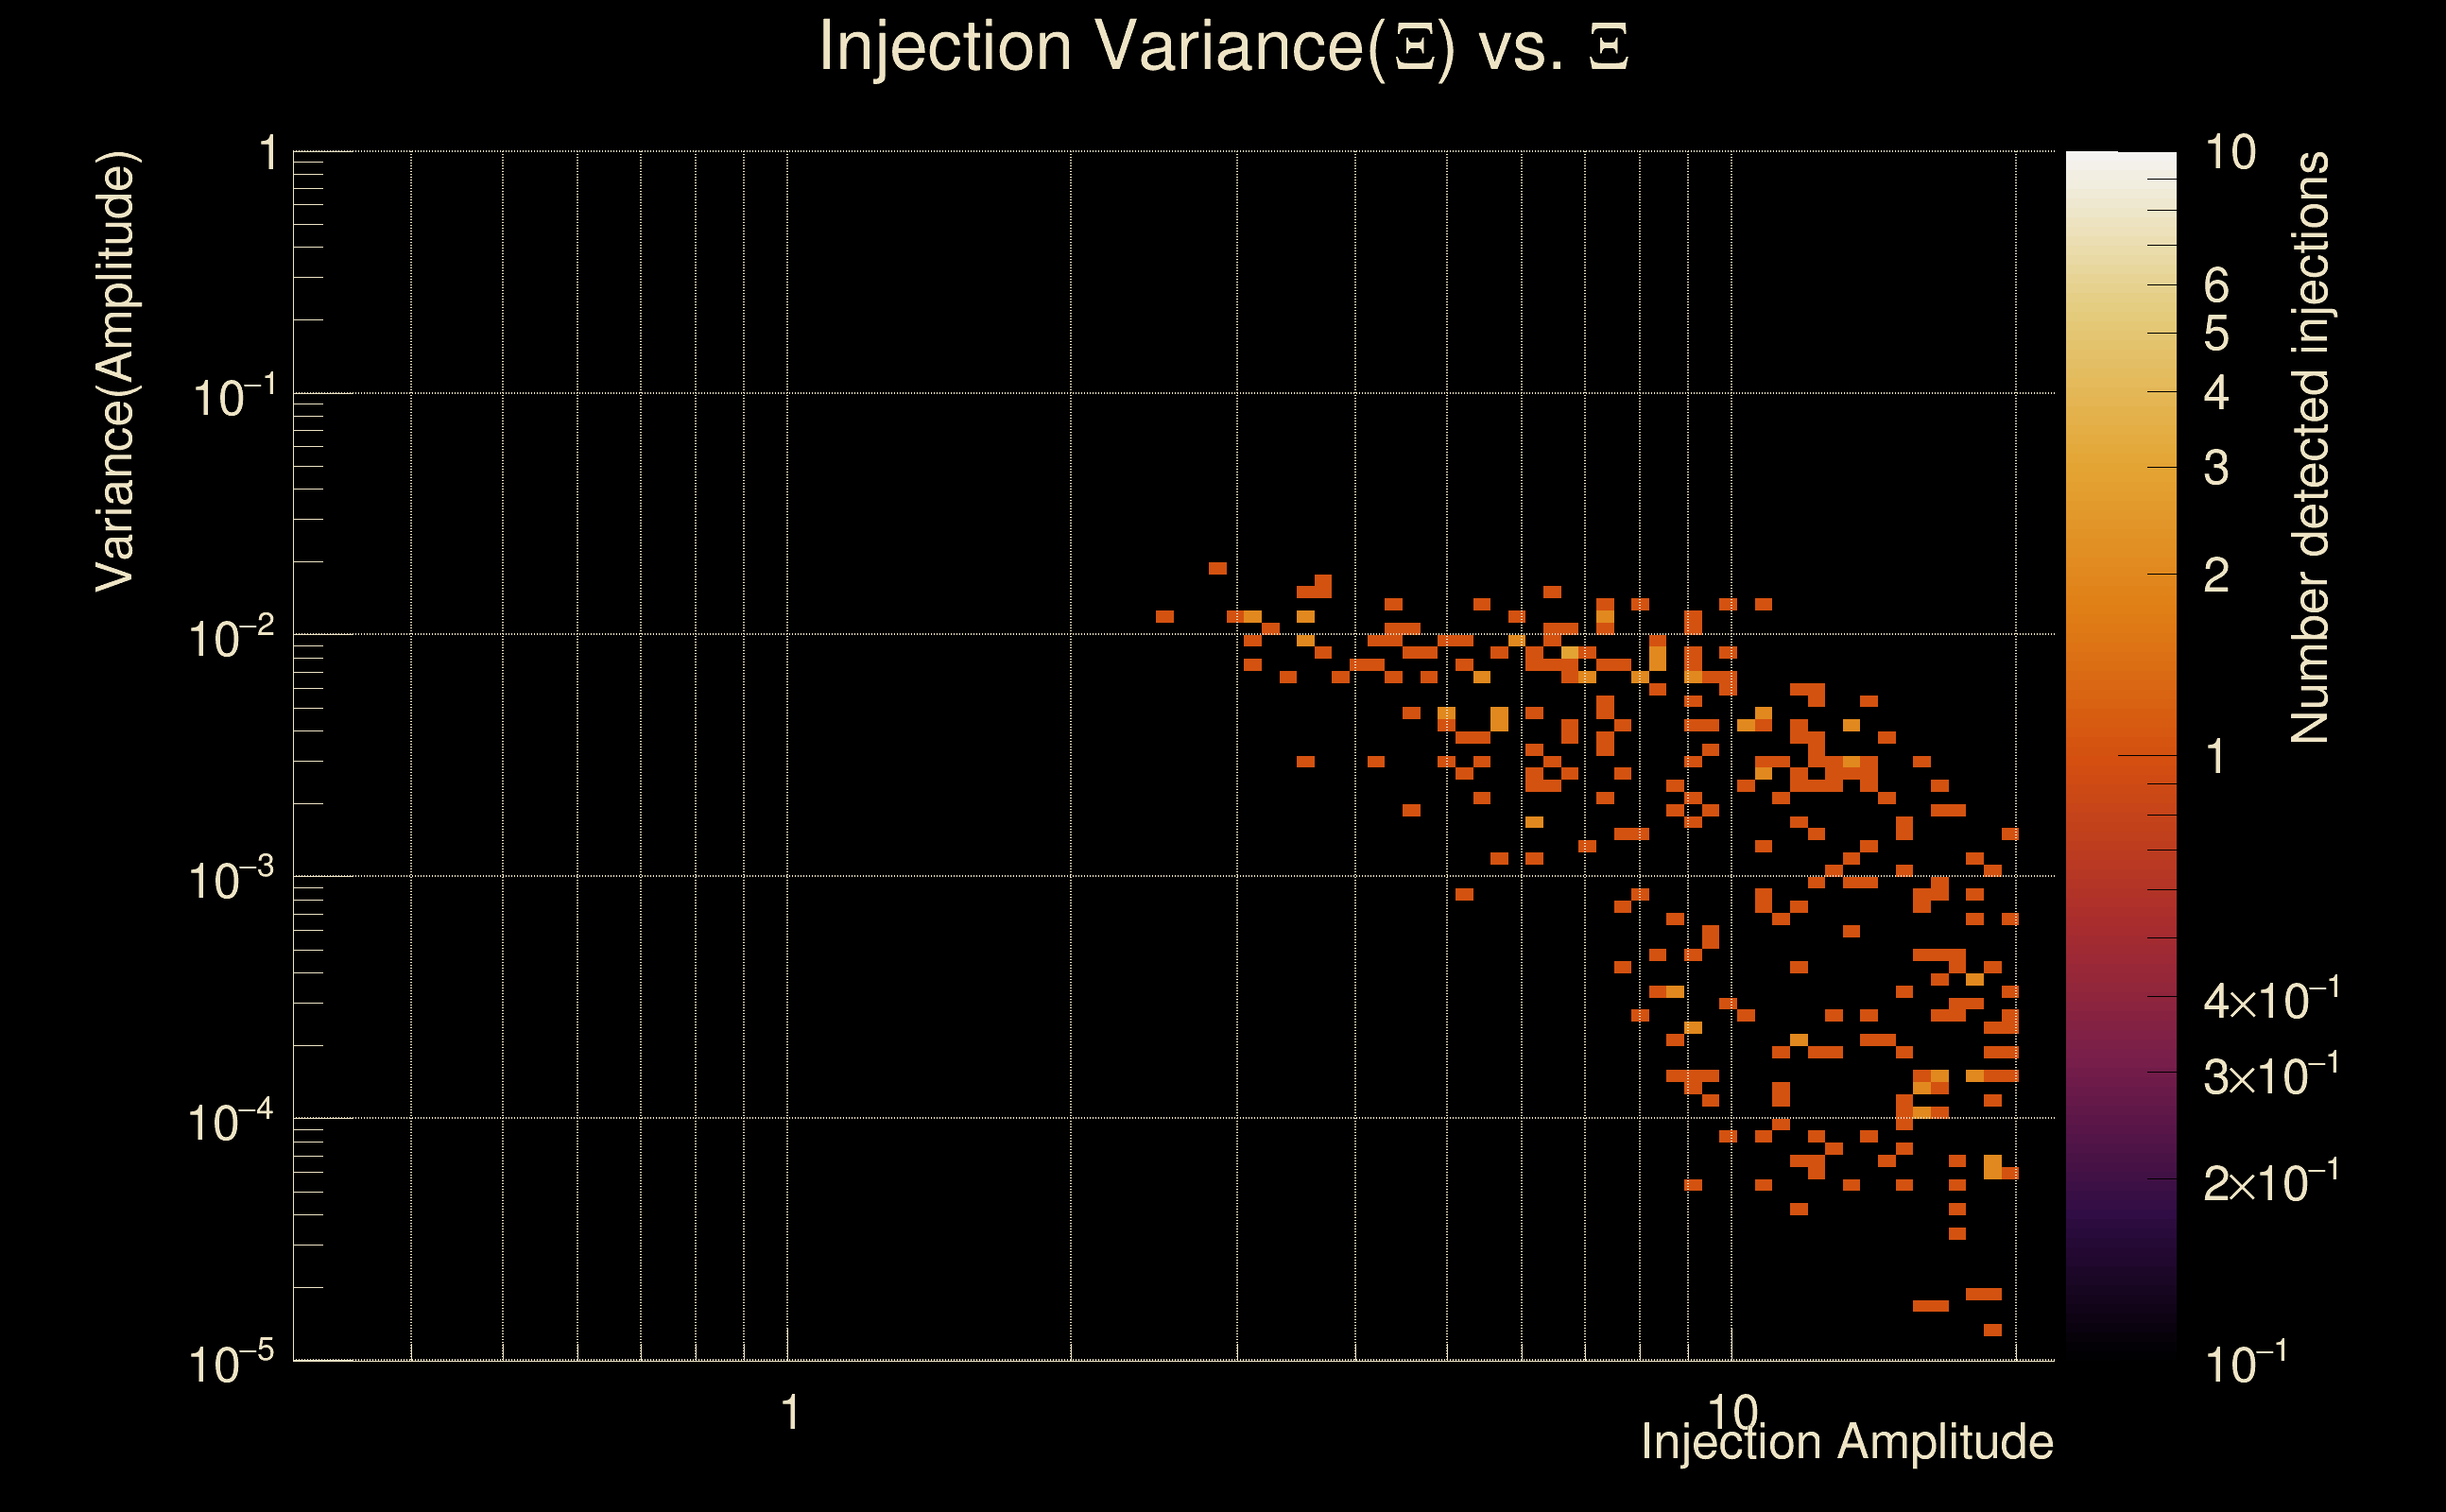
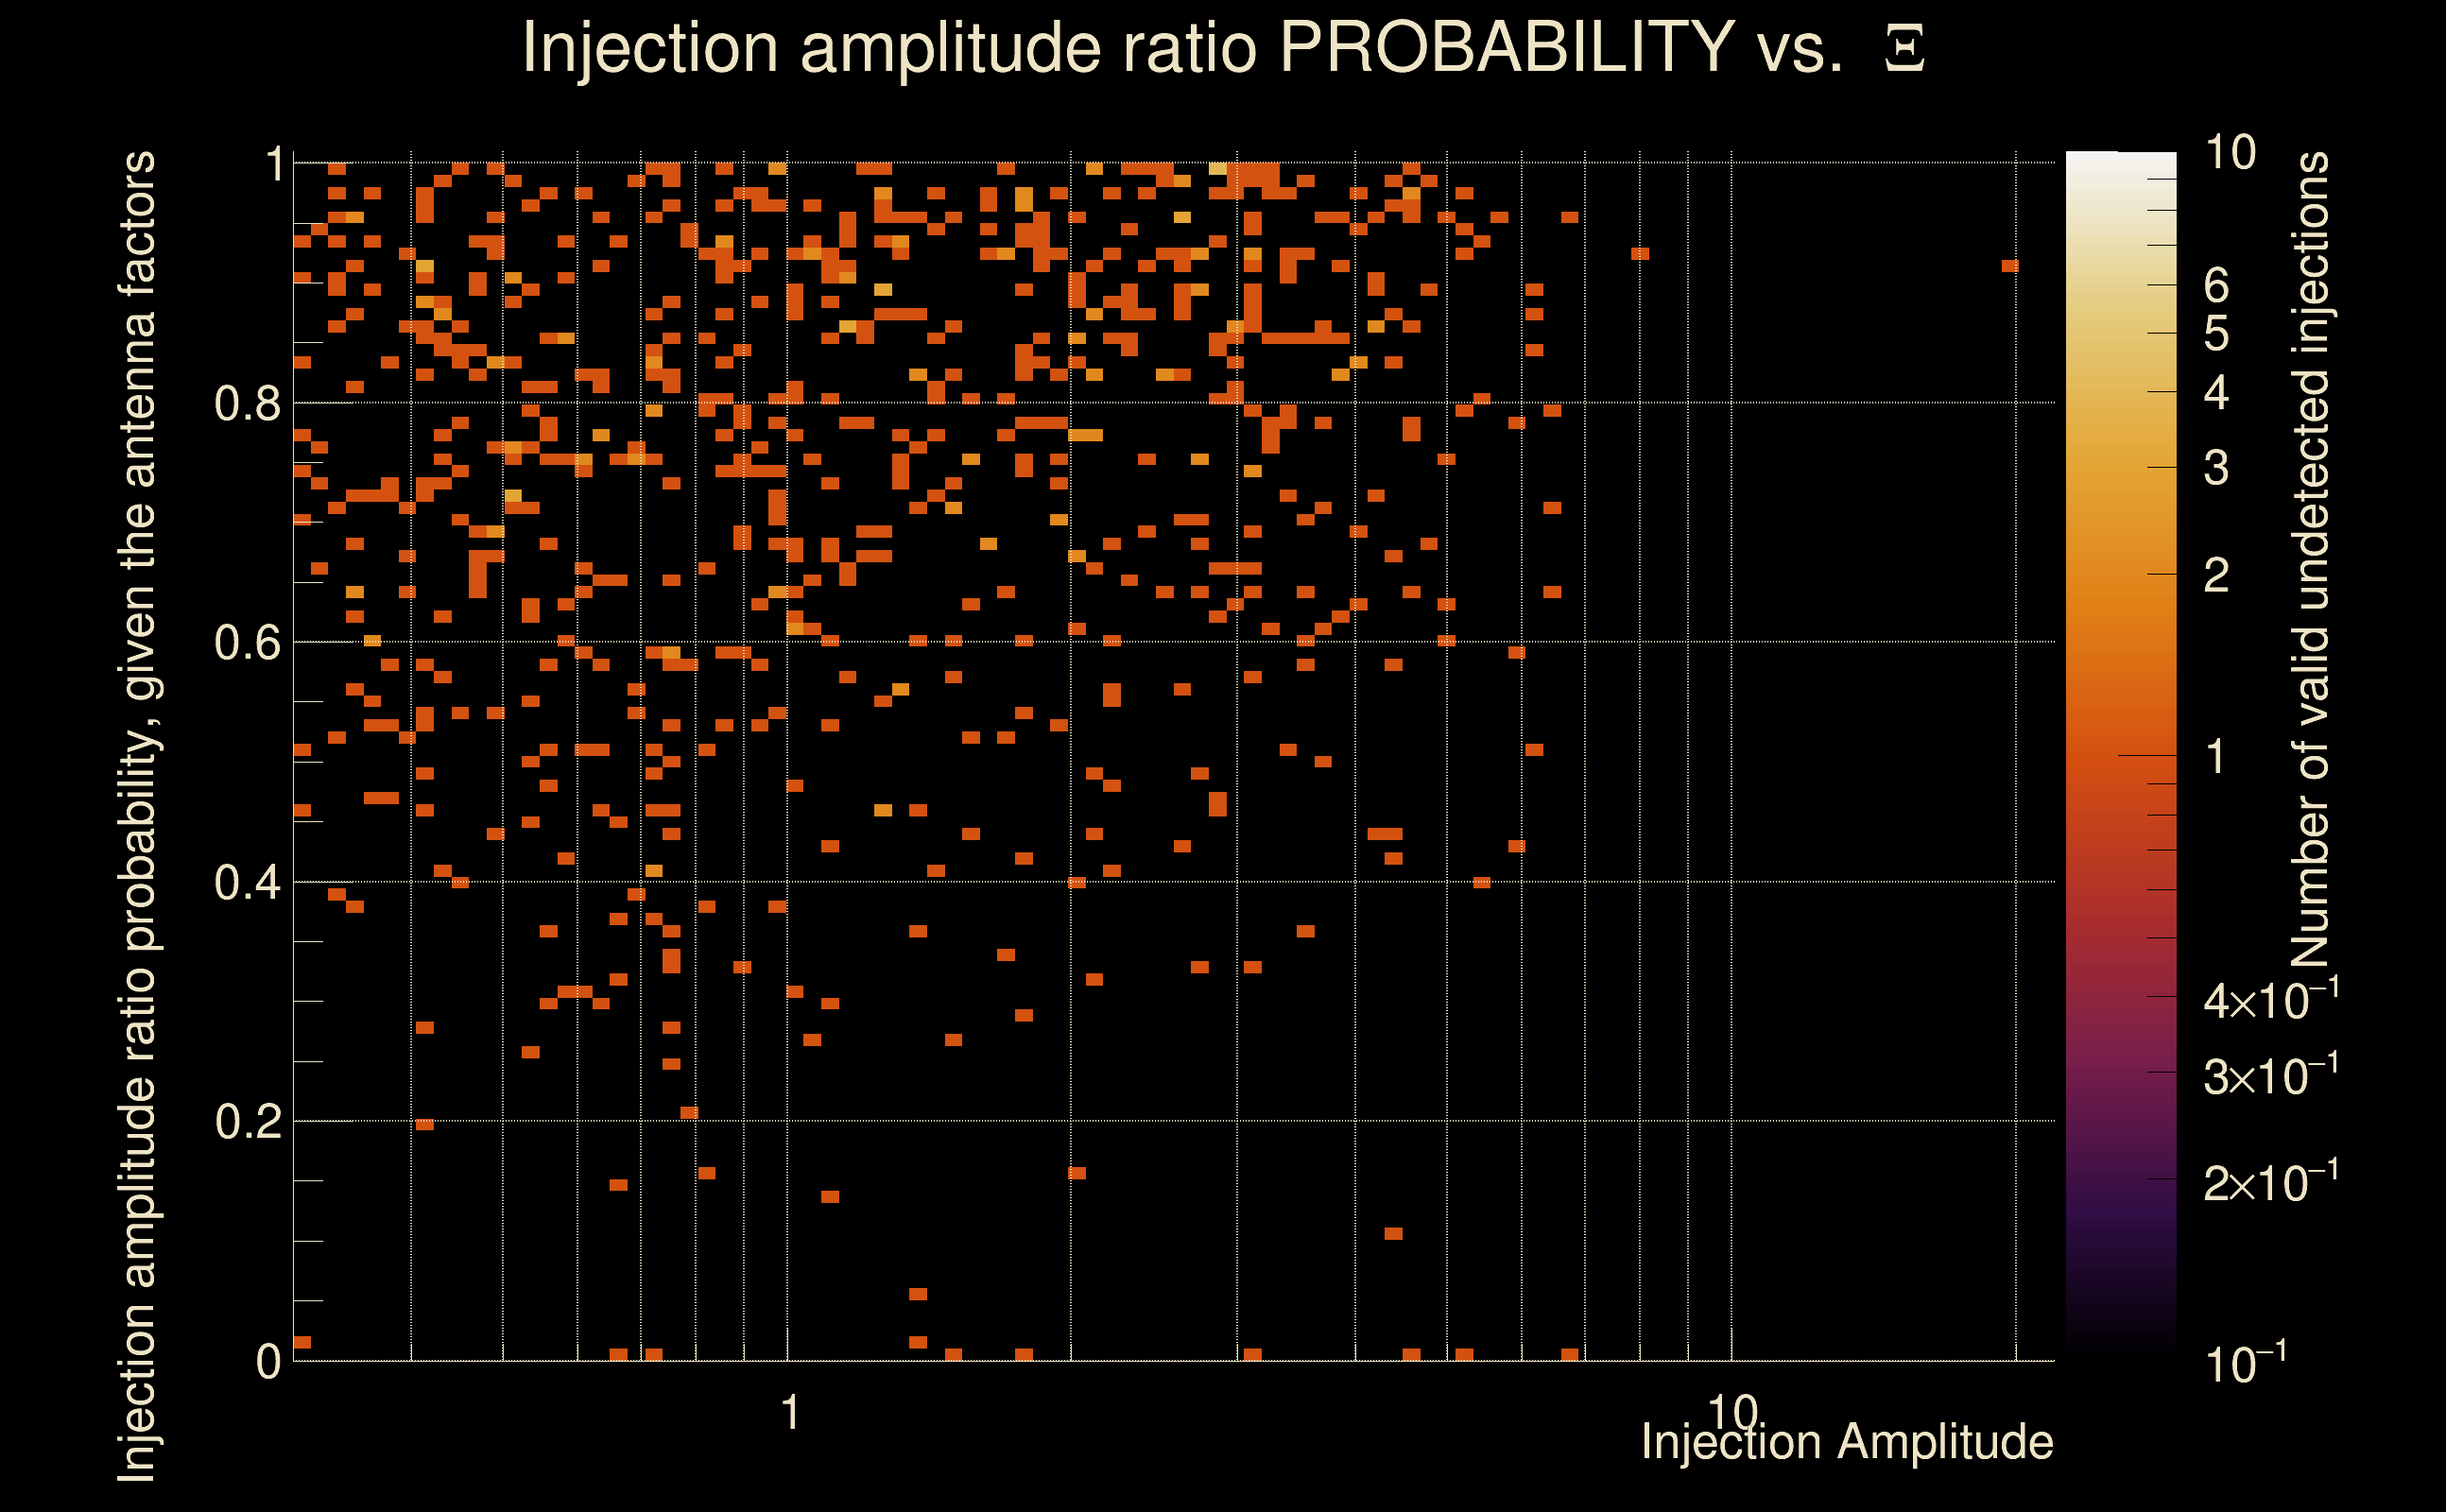
| Number of injections (total/valid/detected): | 1116 / 995 / 303 |
| List of missed injections: | ./Pow19-s18_missed.txt |
| Injection amplitude at 90% detection efficiency: | -1 |
| Injection amplitude at 50% detection efficiency: | -1 |
| Injection amplitude at 10% detection efficiency: | -1 |
 |
 |
 |
 |
 |
 |
|
 |
 |
|
 |
 |
|
 |
 |
|
 |
 |
|
 |
 |
|
 |
 |
|
 |
 |
|
 |
 |
 |
 |
 |
 |
 |
 |
 |
 |
 |
 |
 |
 |
 |
| florent.robinet@ijclab.in2p3.fr |