| Omicron version: | 4.2.0: documentation gitlab repository |
| Omicron run by: | unknown |
| Report produced on: | Mon Dec 1 13:21:23 2025 UTC |
| Ox option file: | TargIxf_injpt1_tA_options.txt |
| Omicron option files: | detector 0, detector 1 |
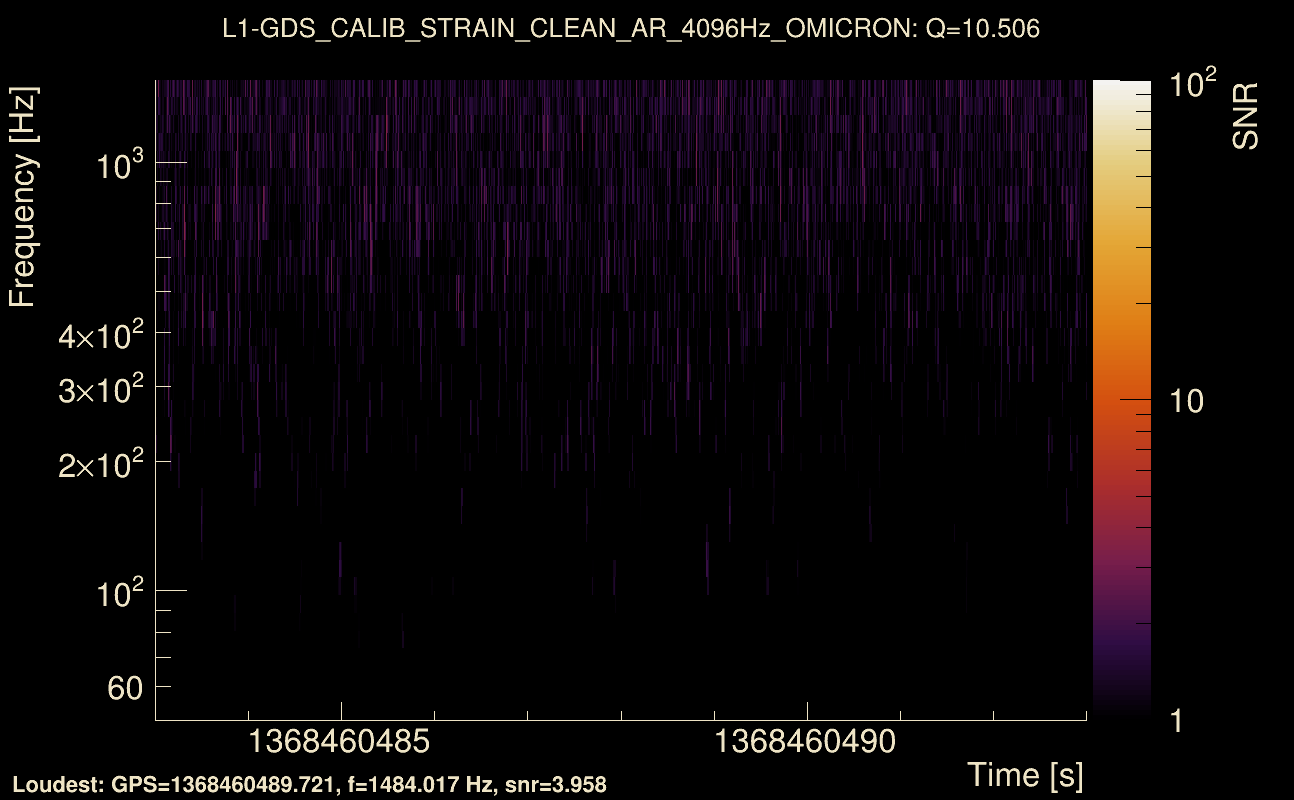
| Detector channel names: | H1:GDS-CALIB_STRAIN_CLEAN_AR_4096Hz, L1:GDS-CALIB_STRAIN_CLEAN_AR_4096Hz |
| Omicron analysis time window and overlap: | 16 s, 6 s |
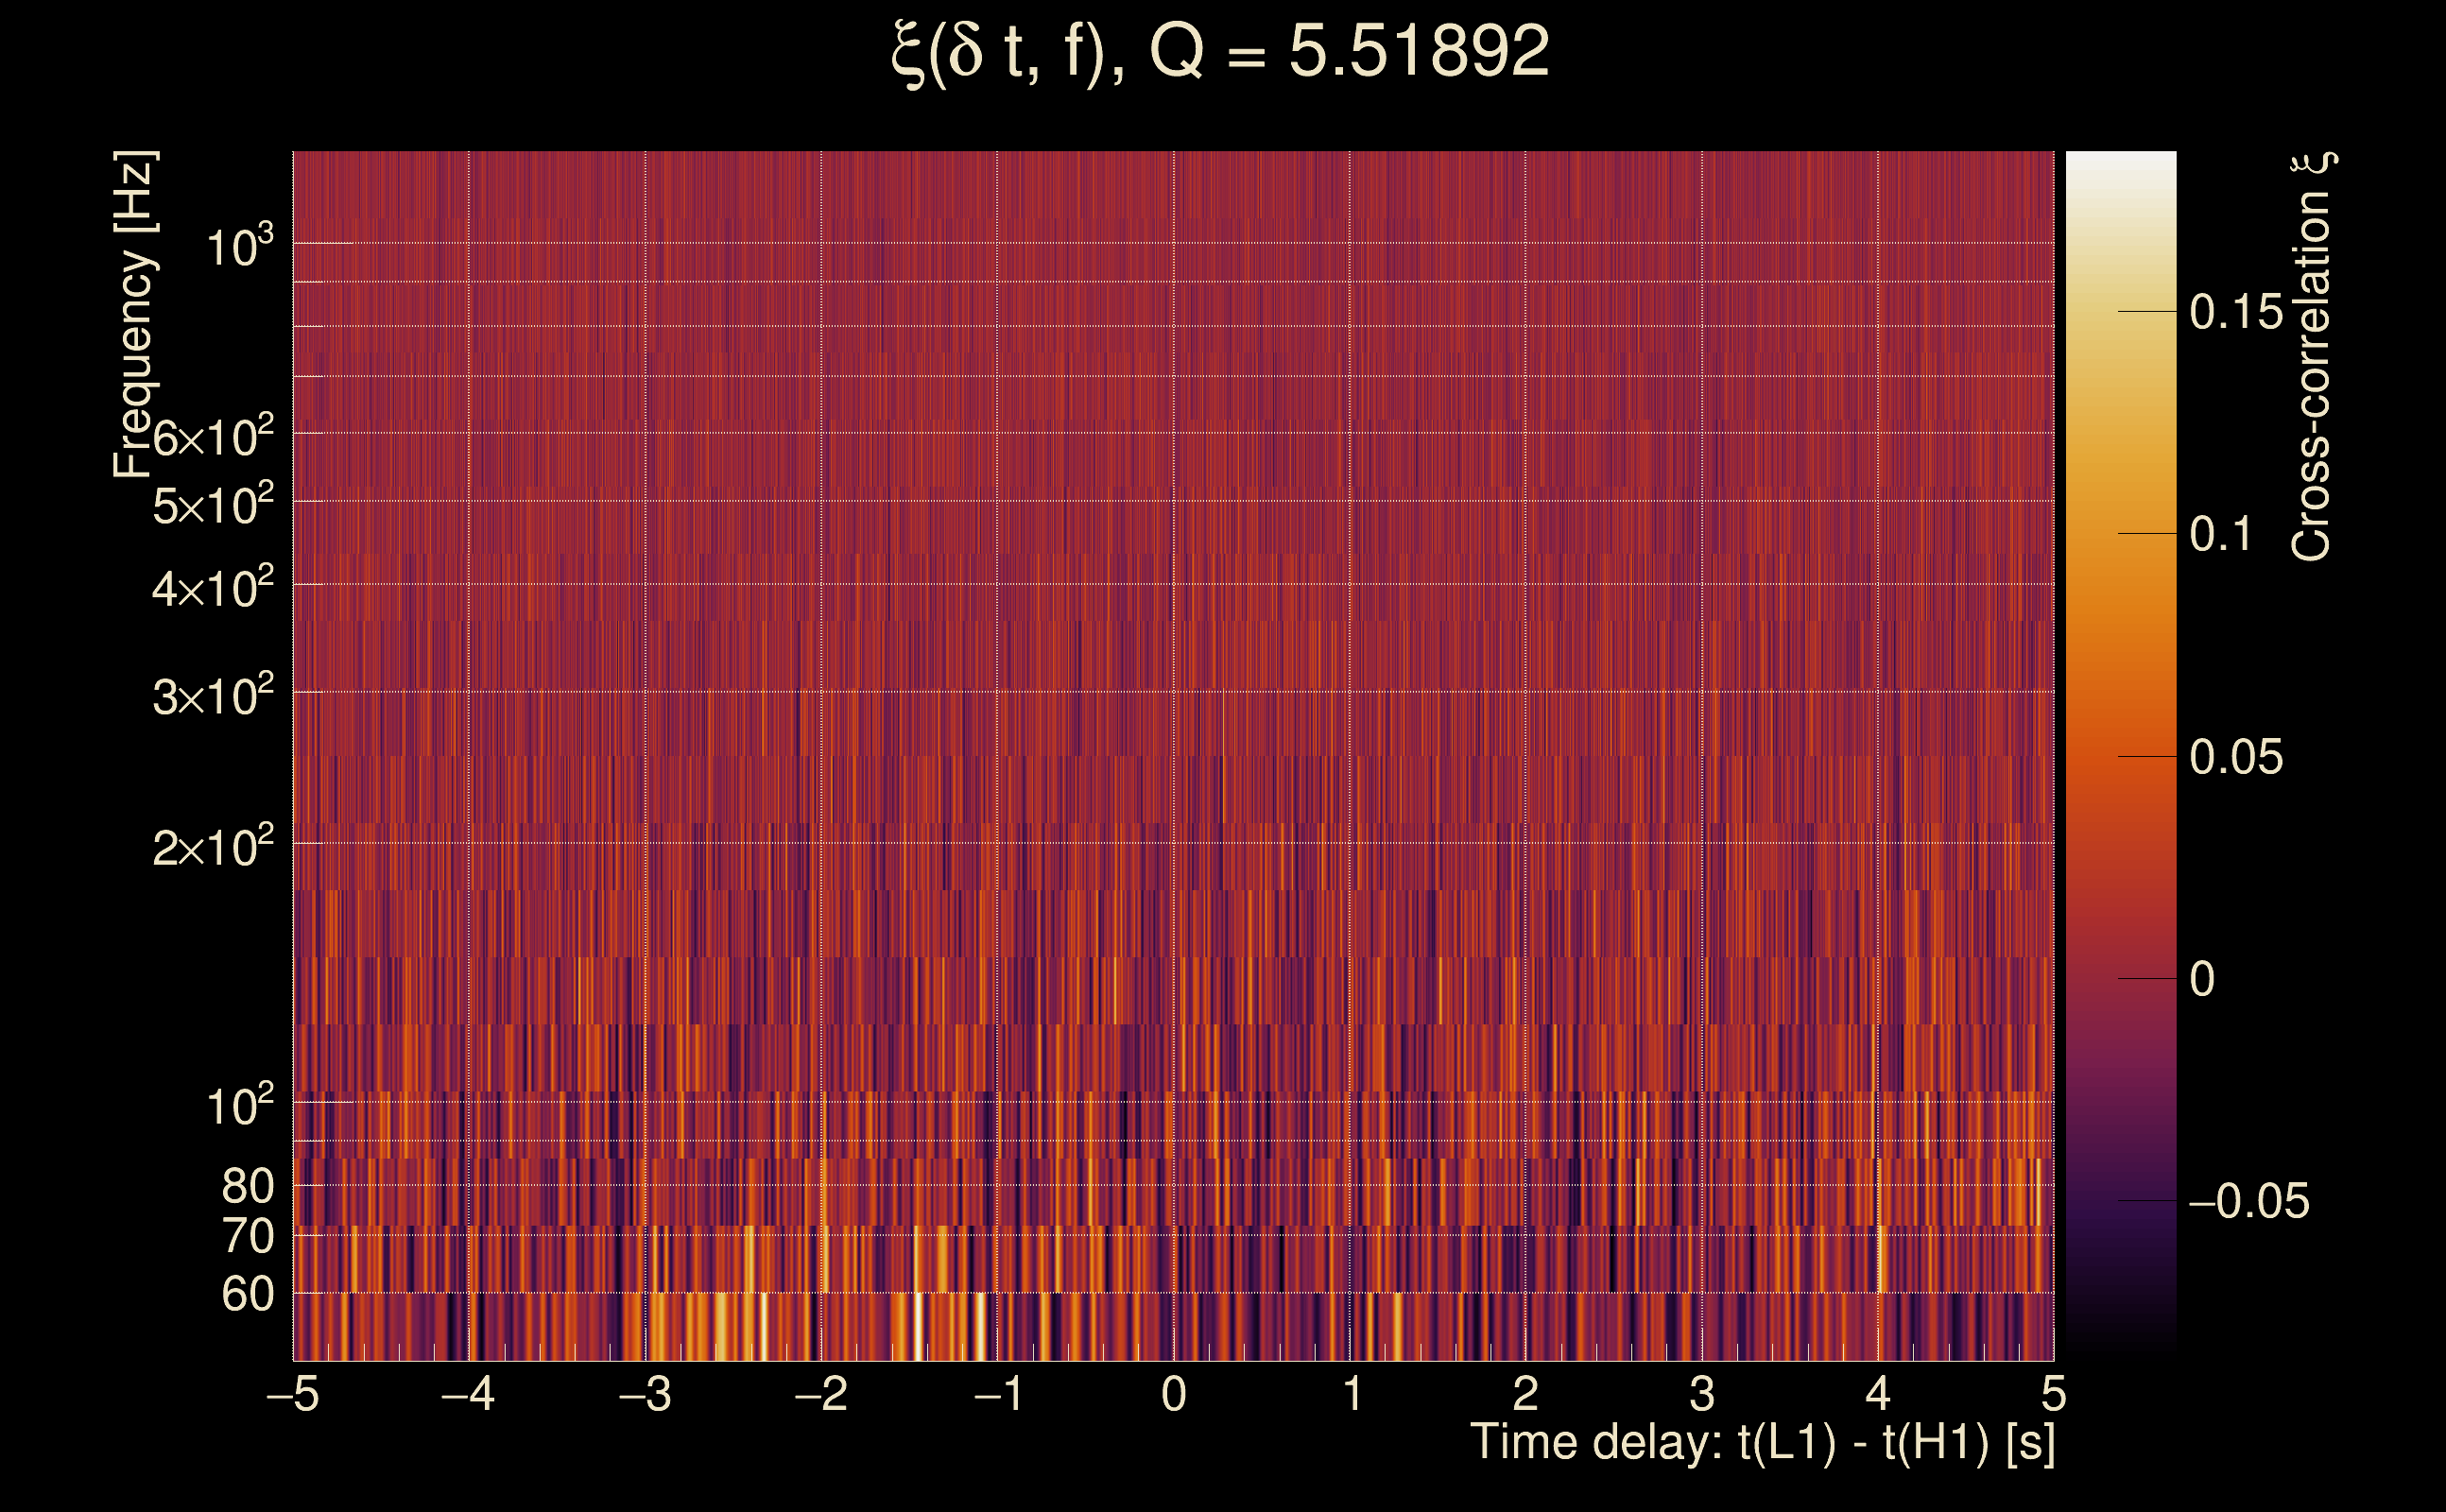
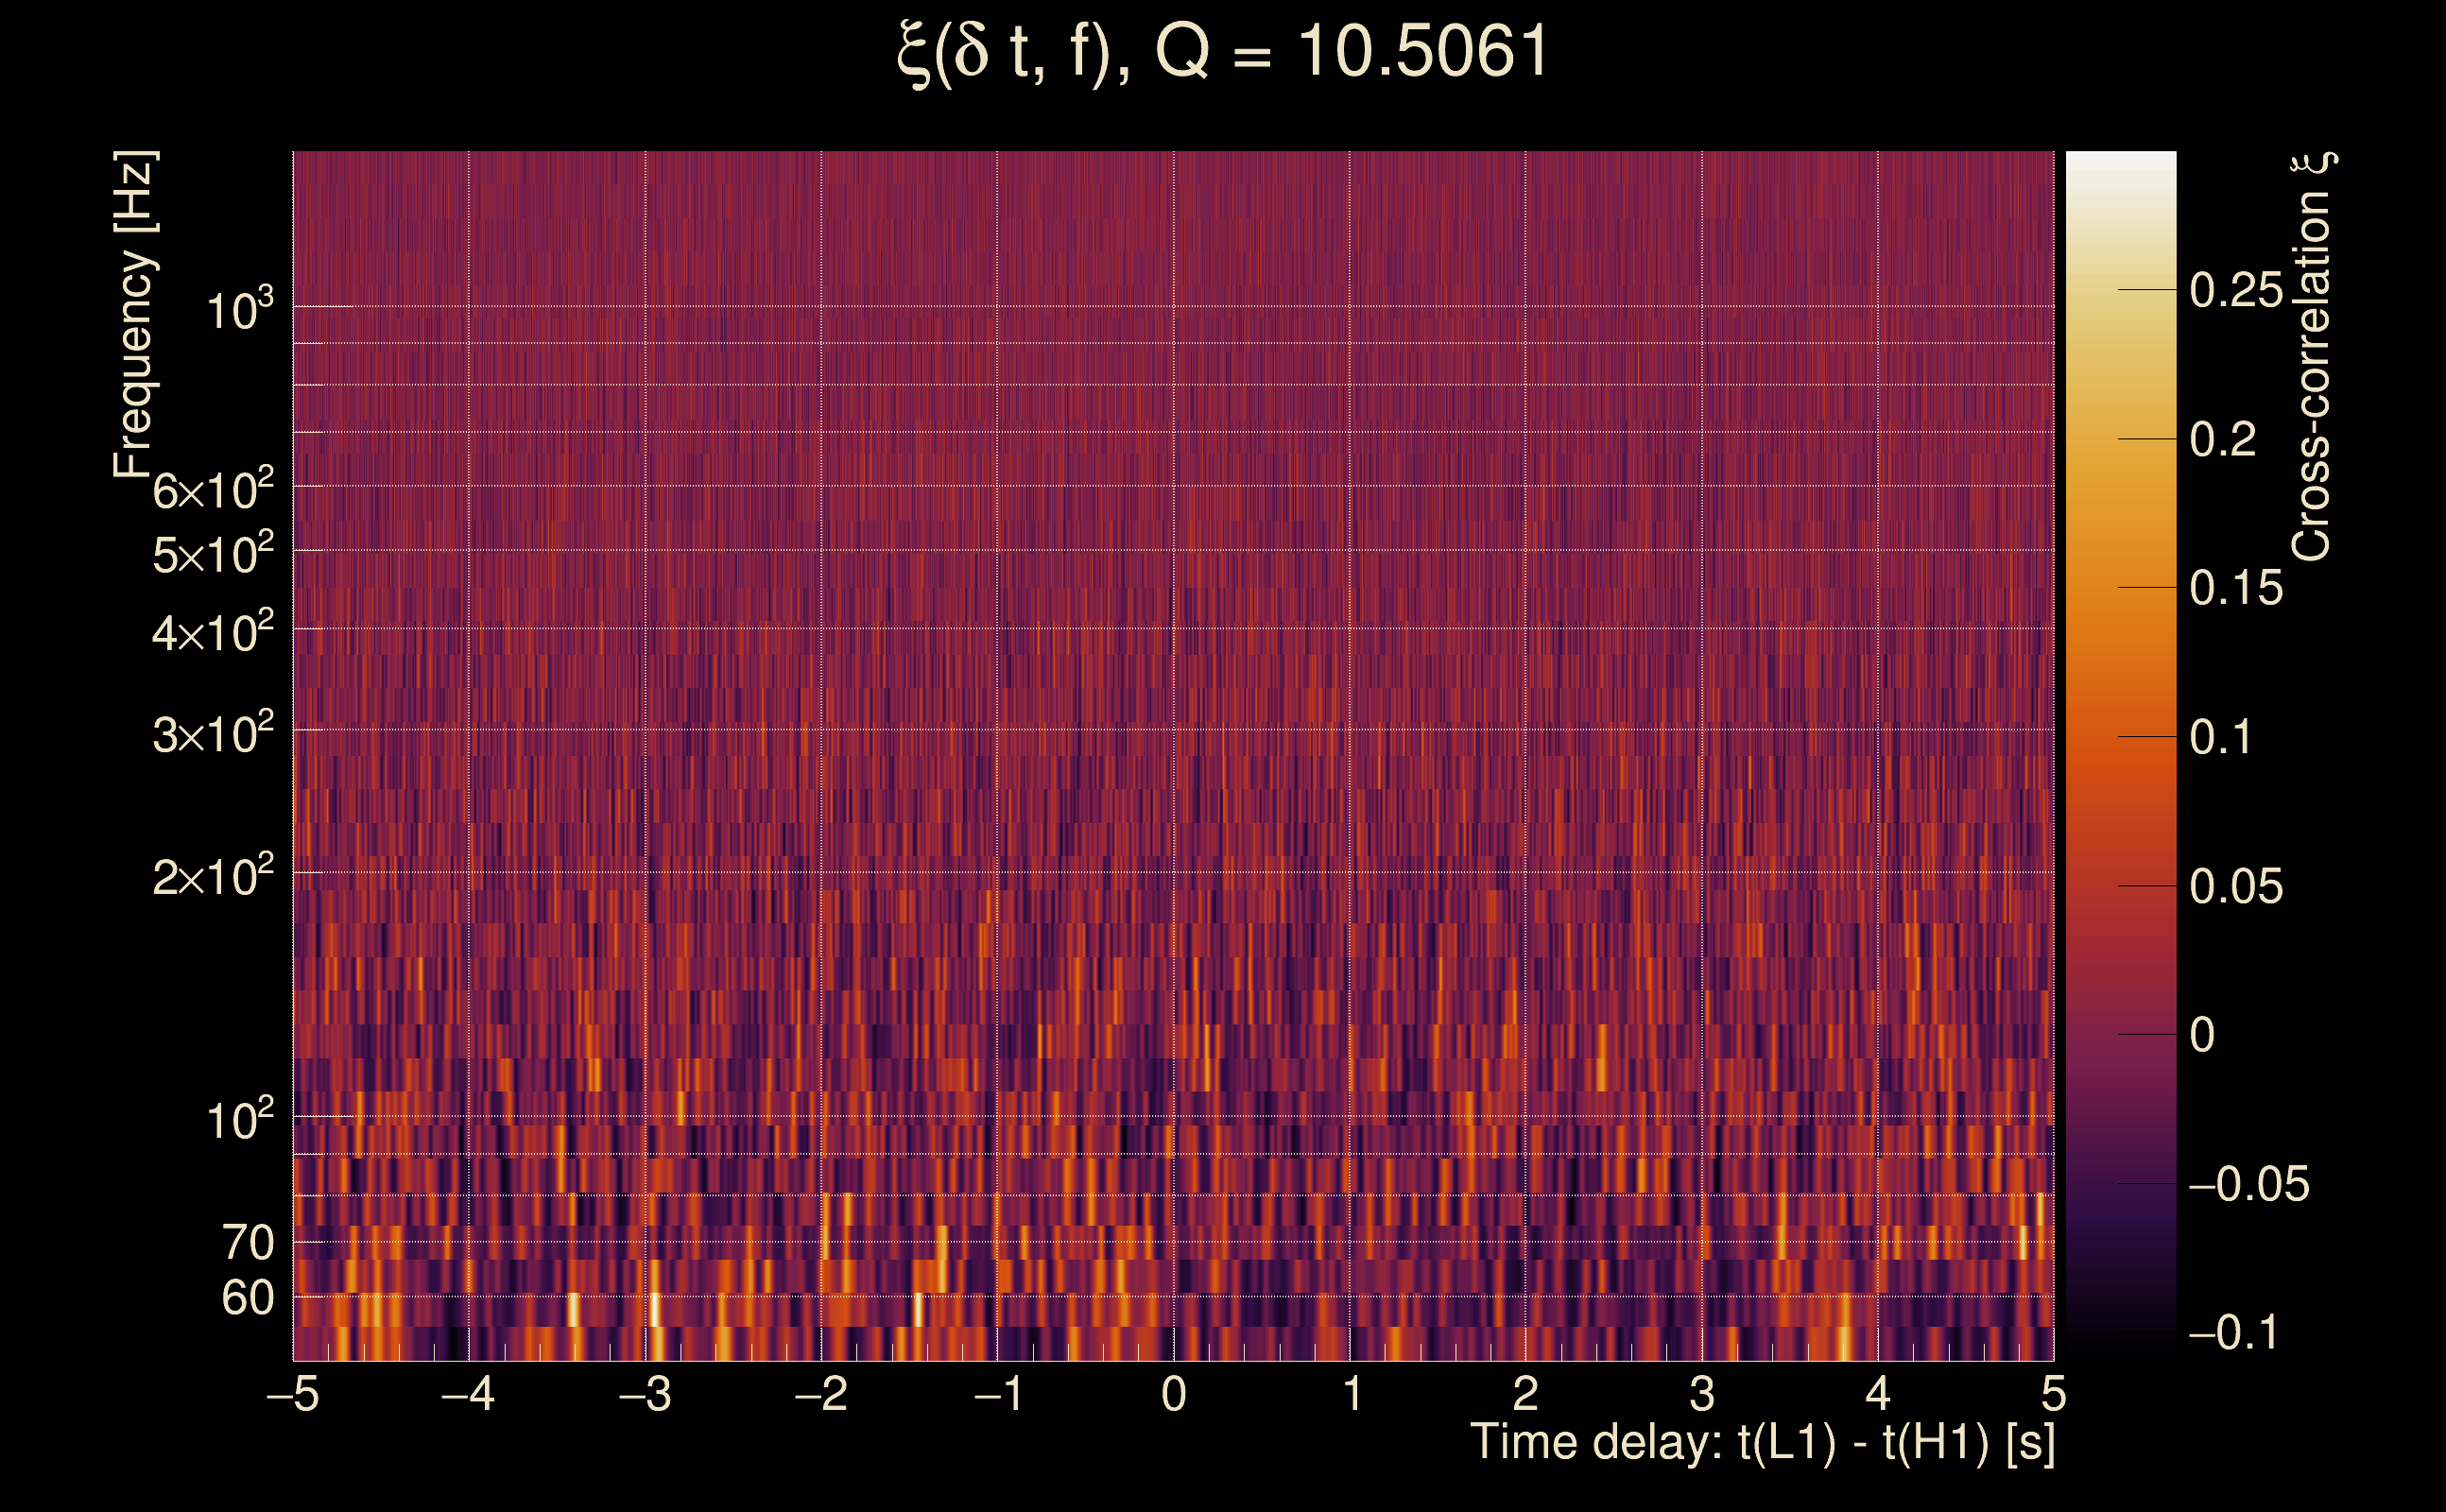
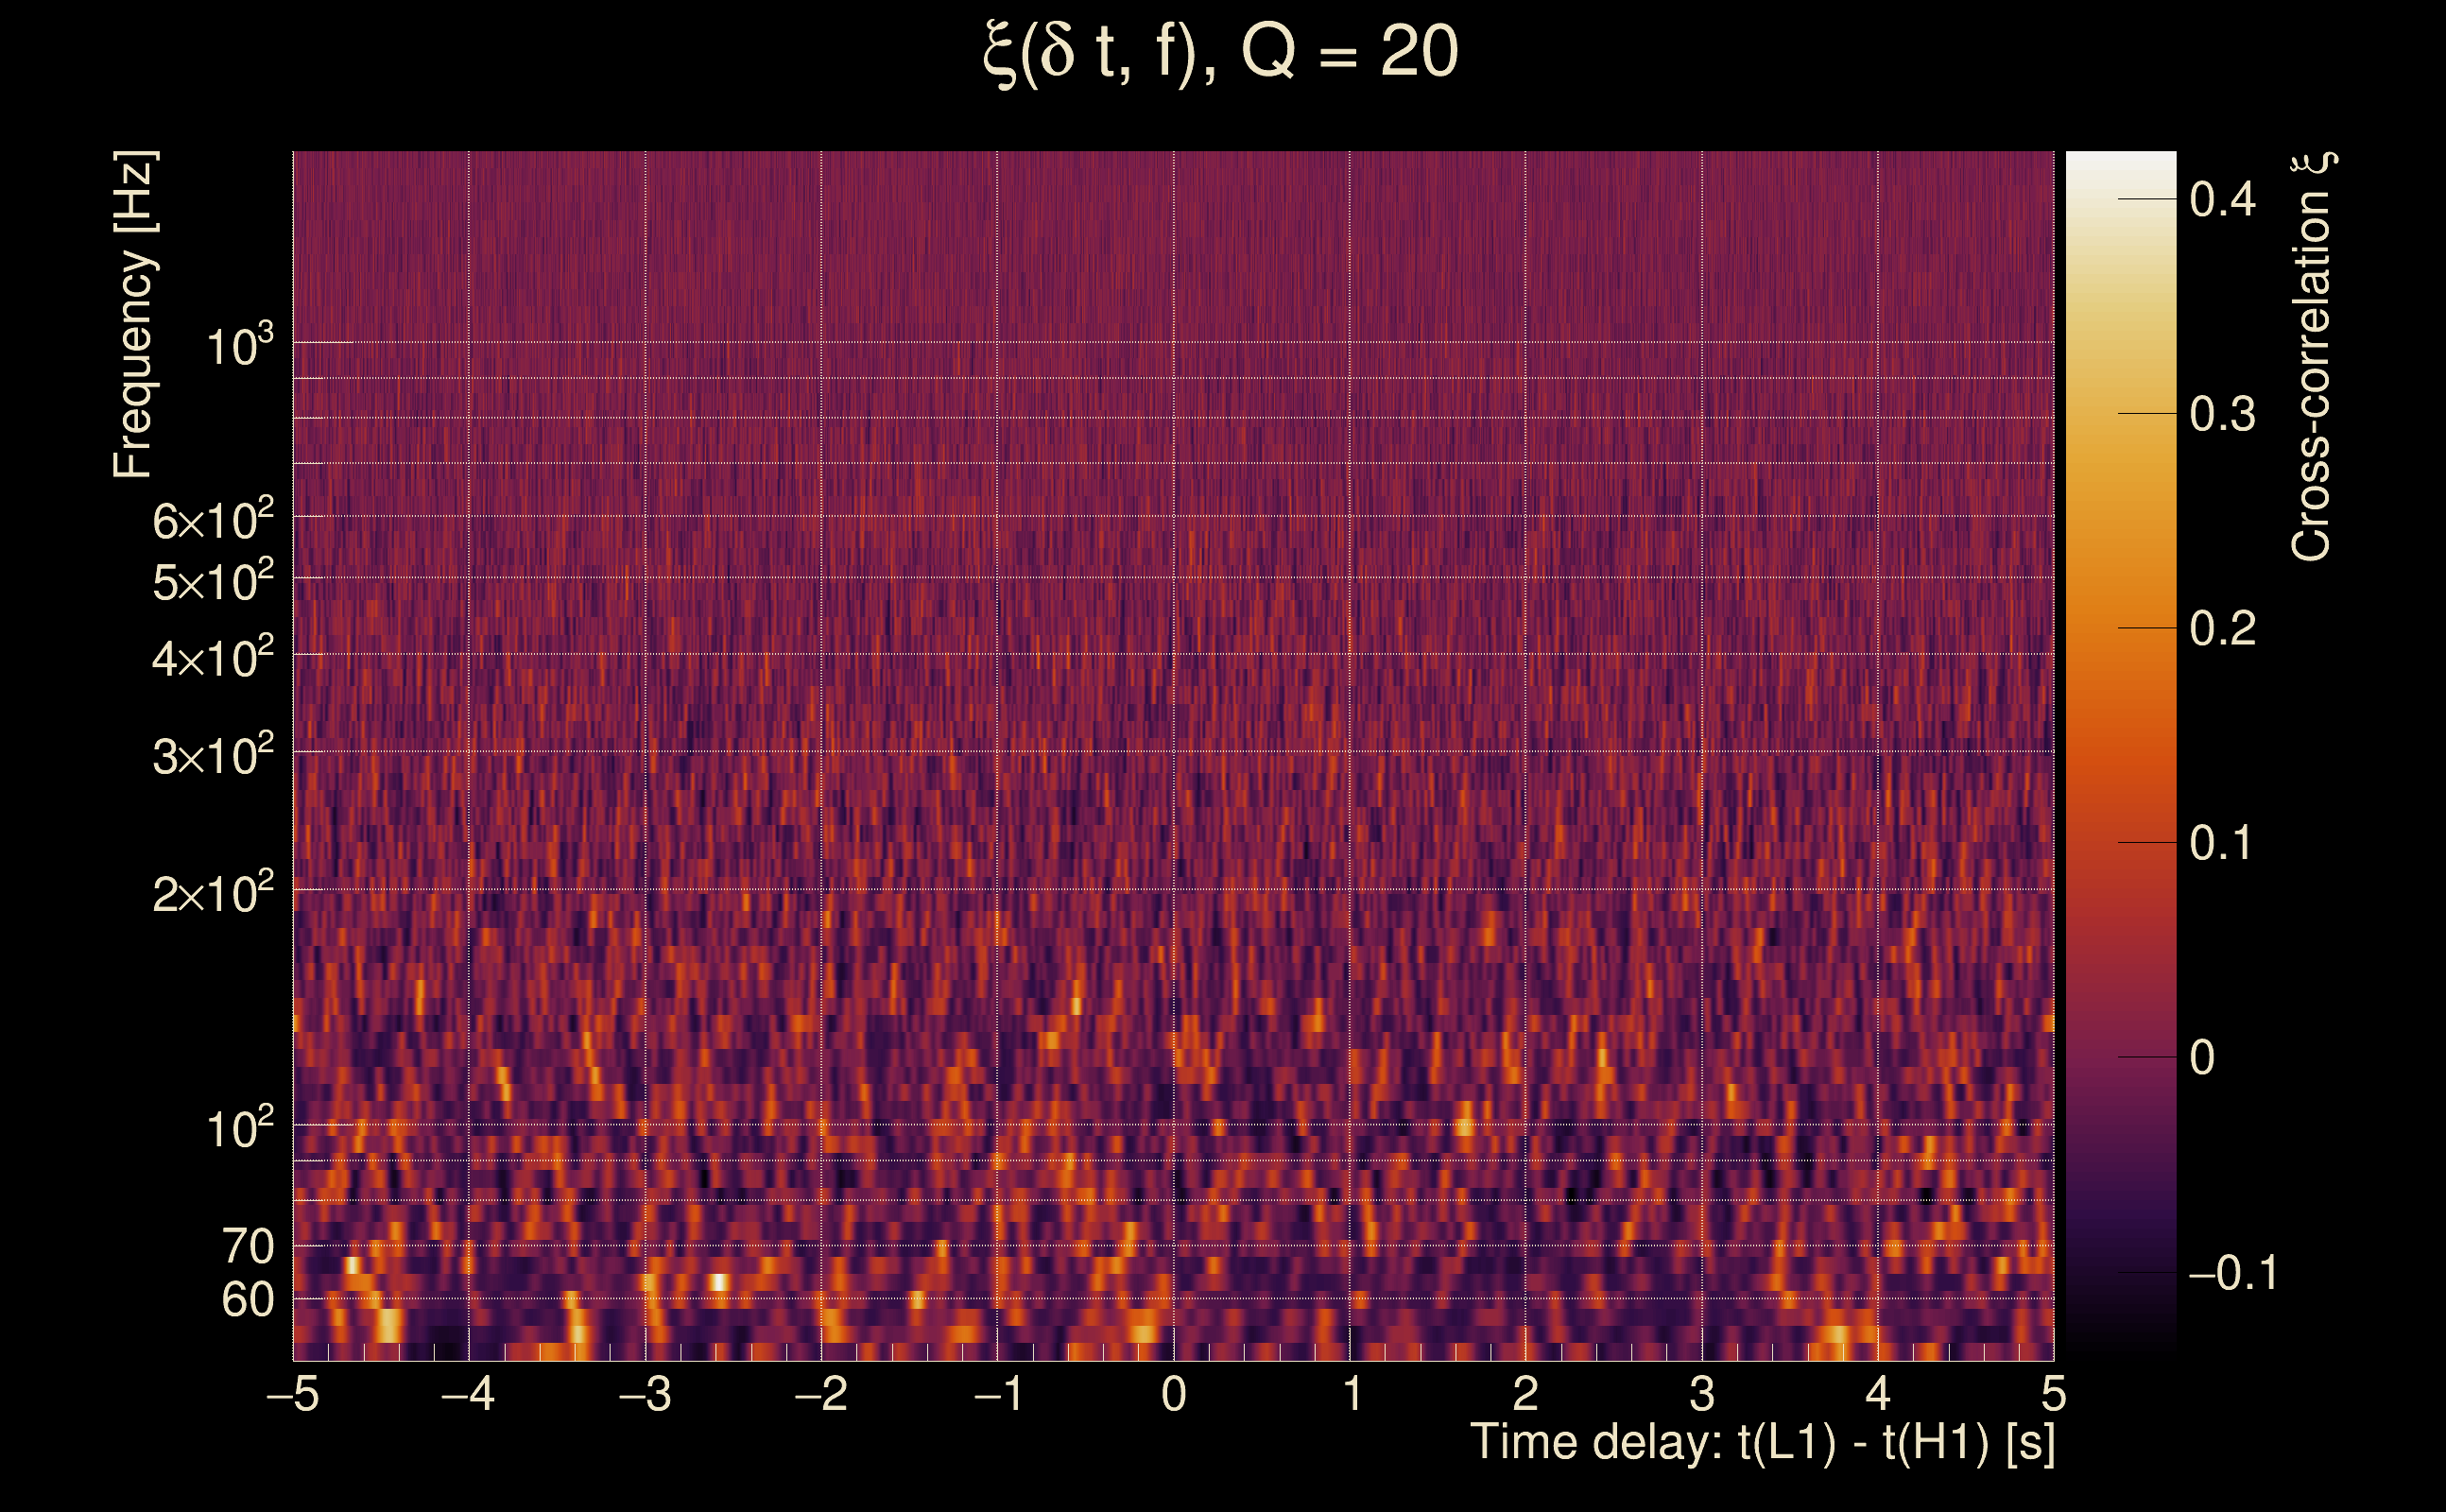
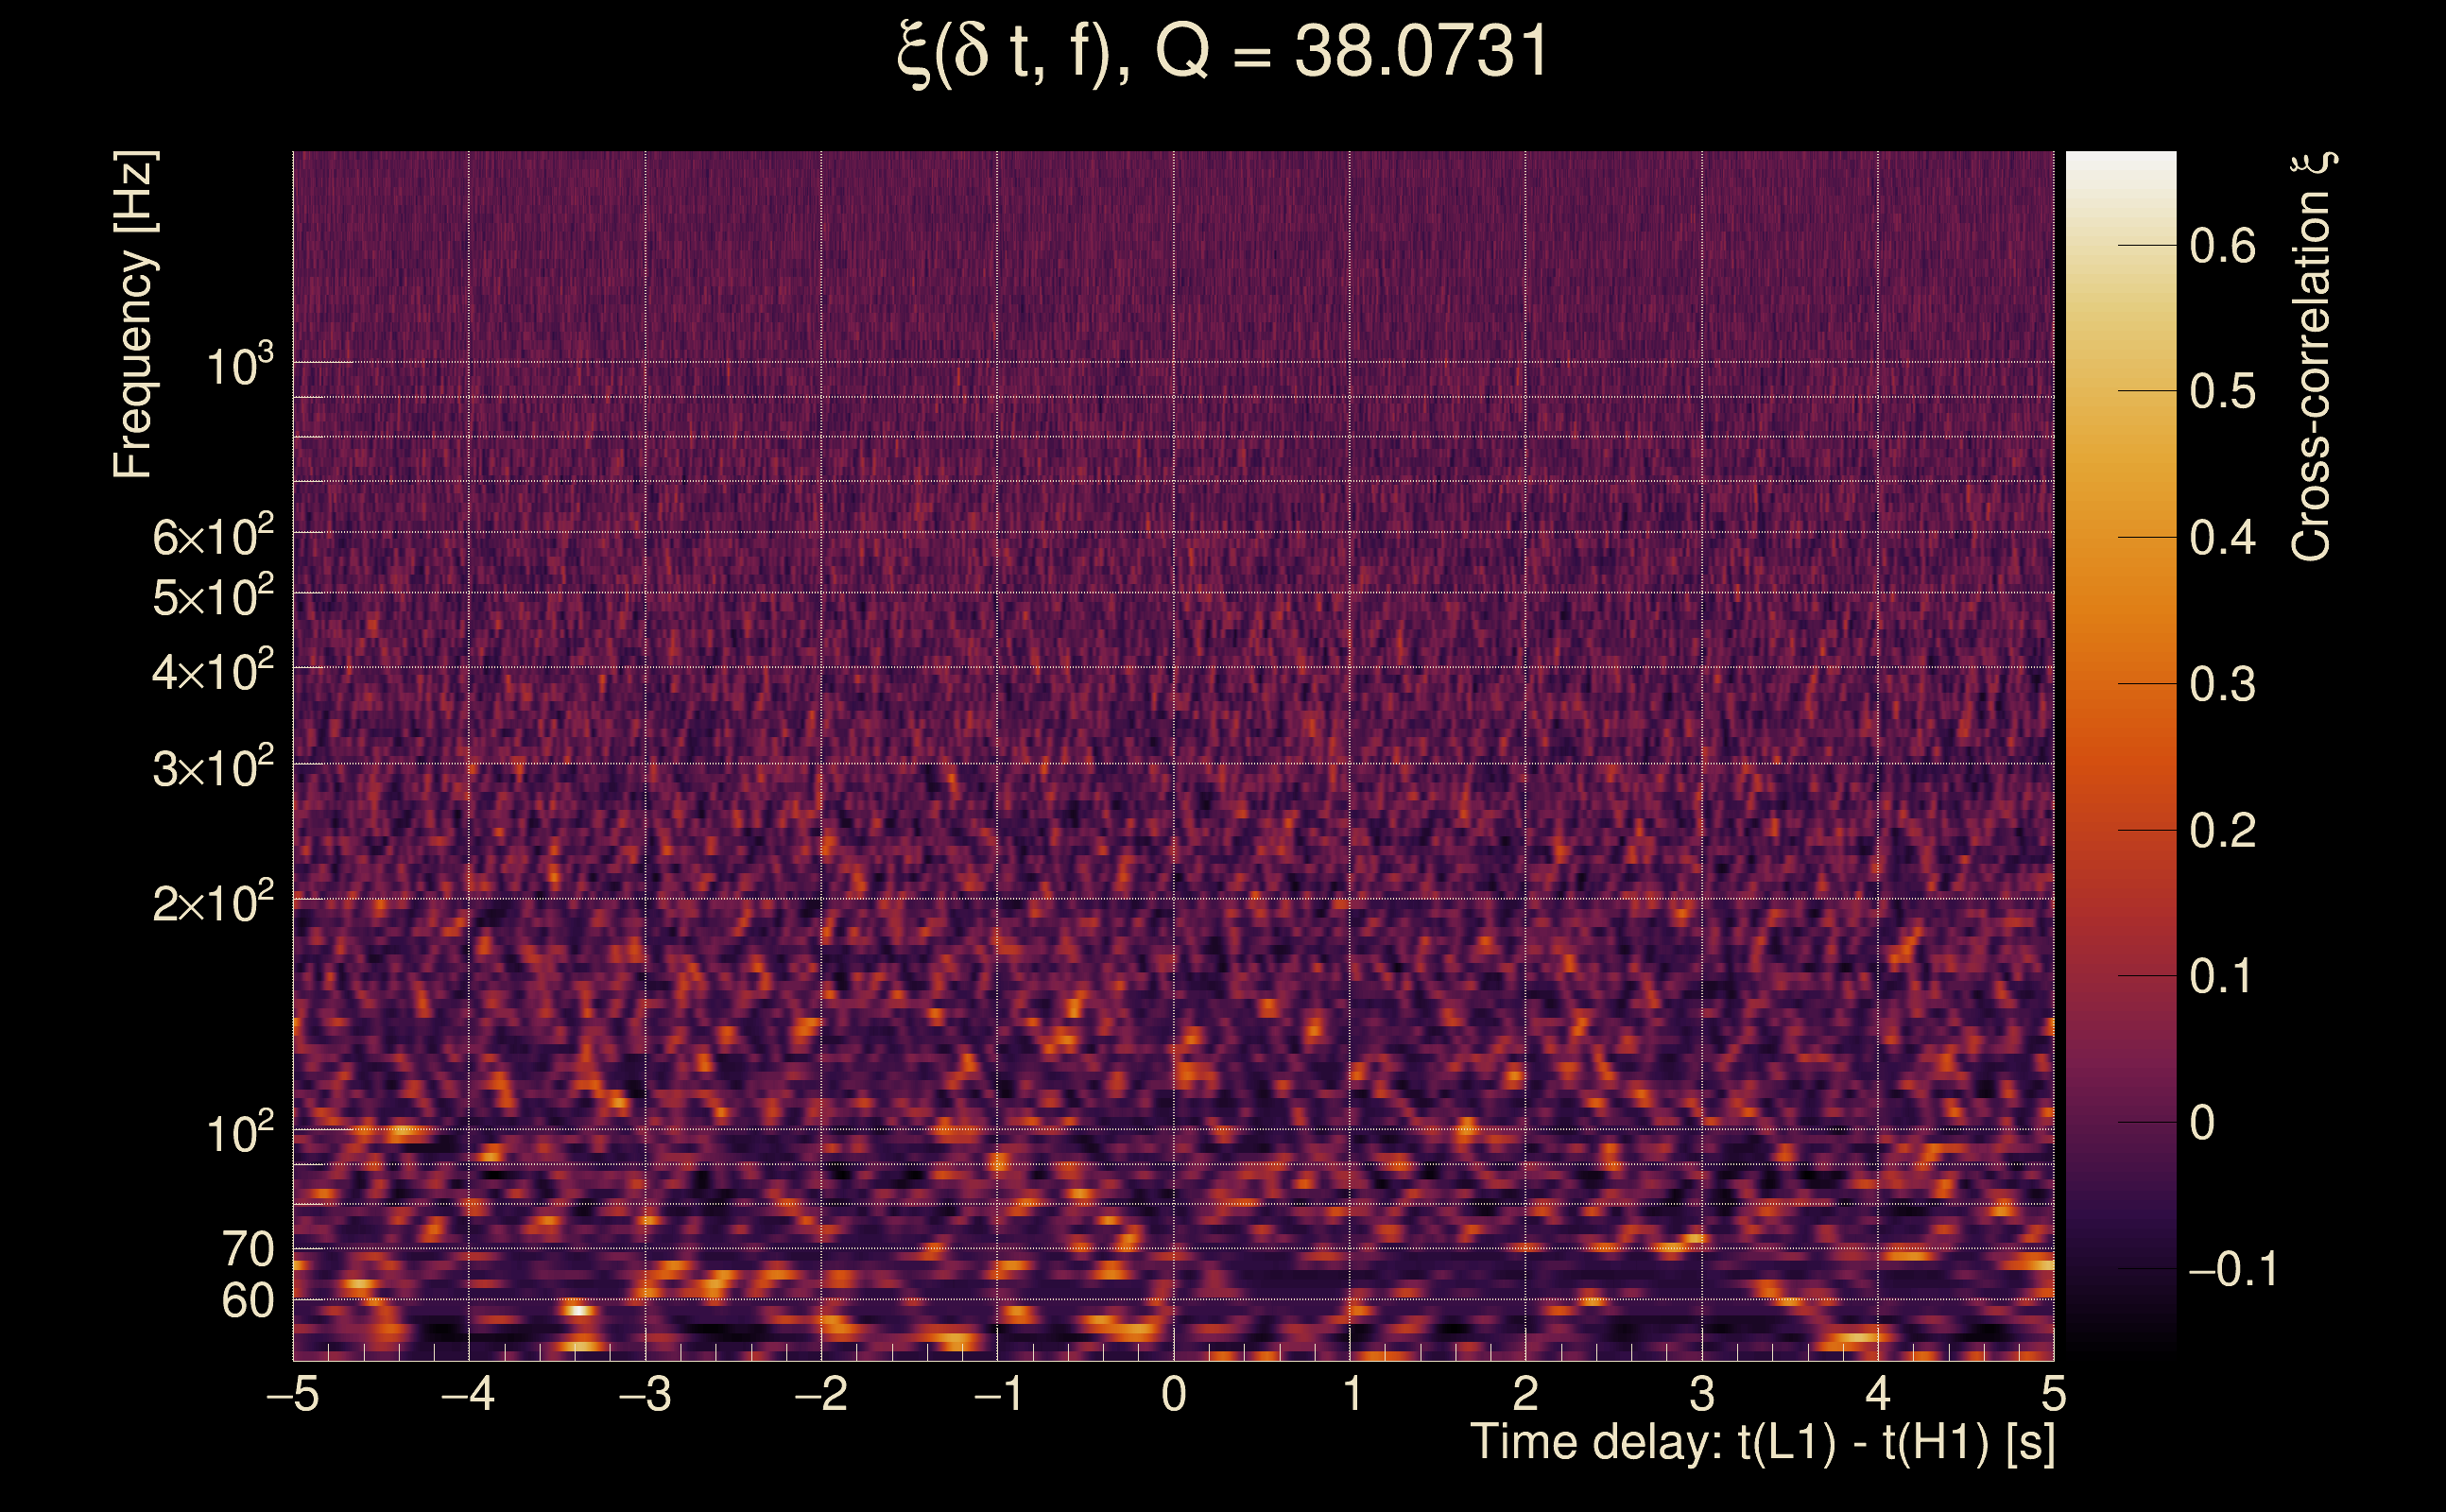
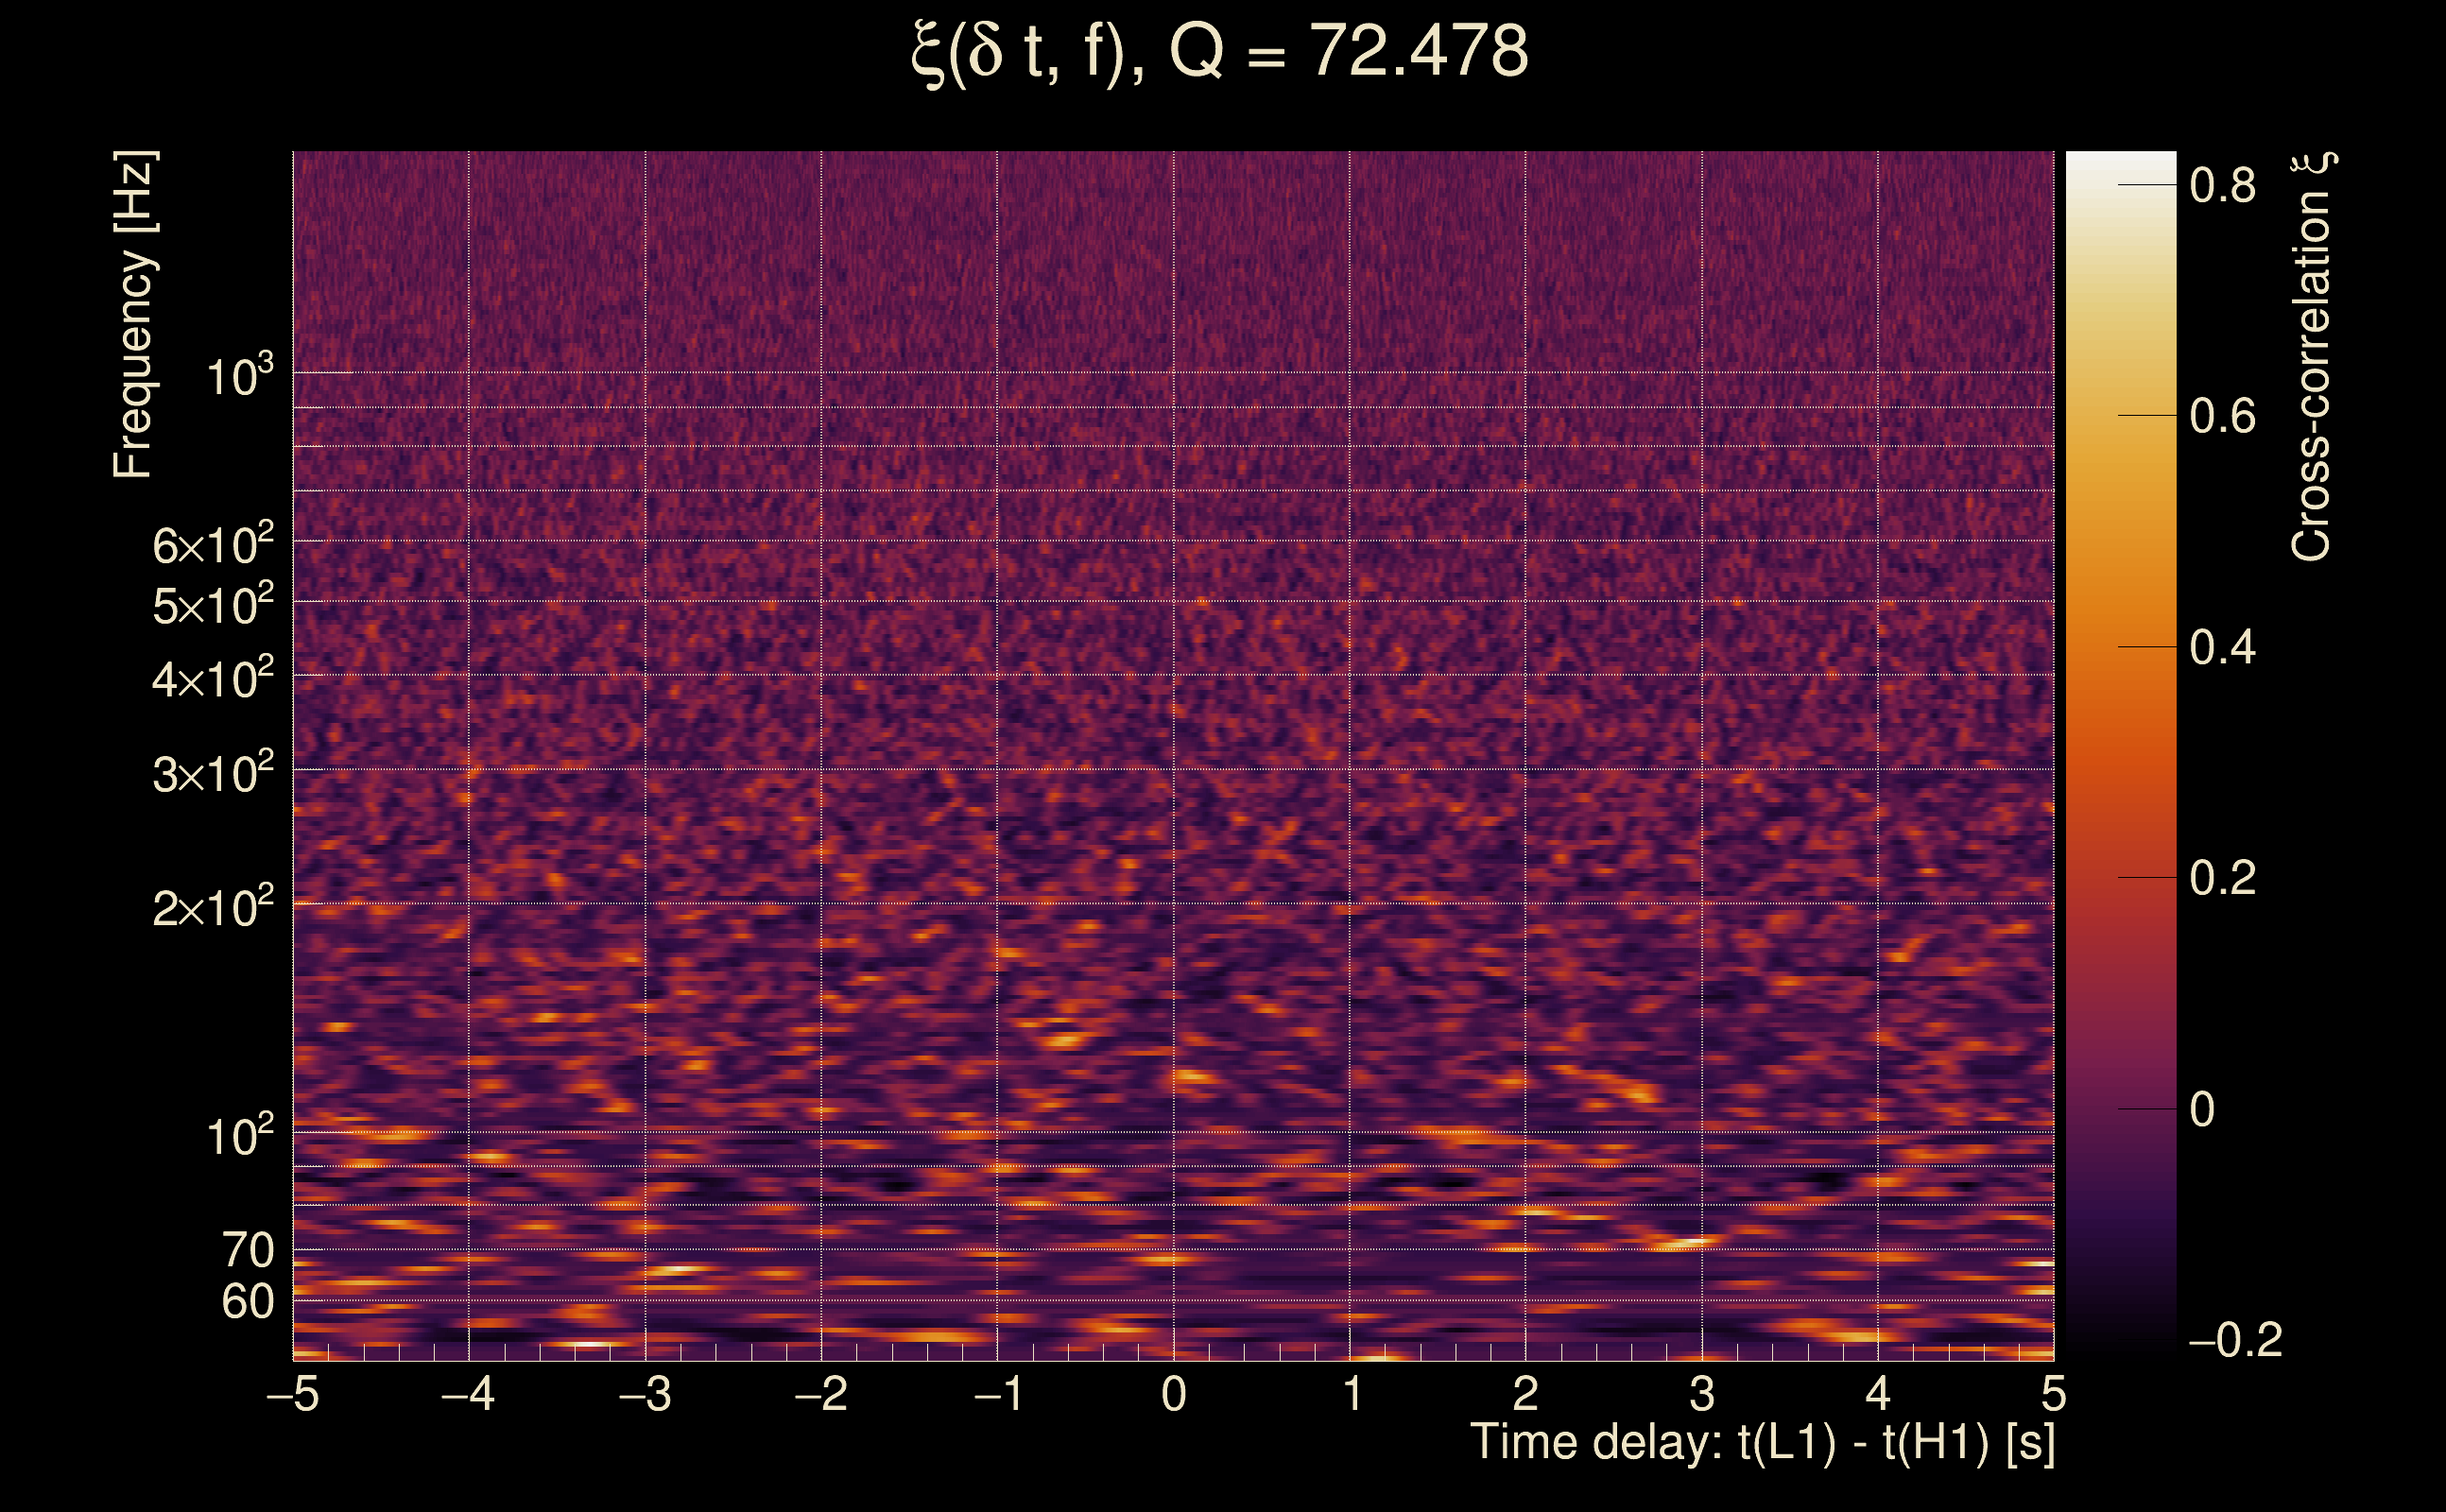
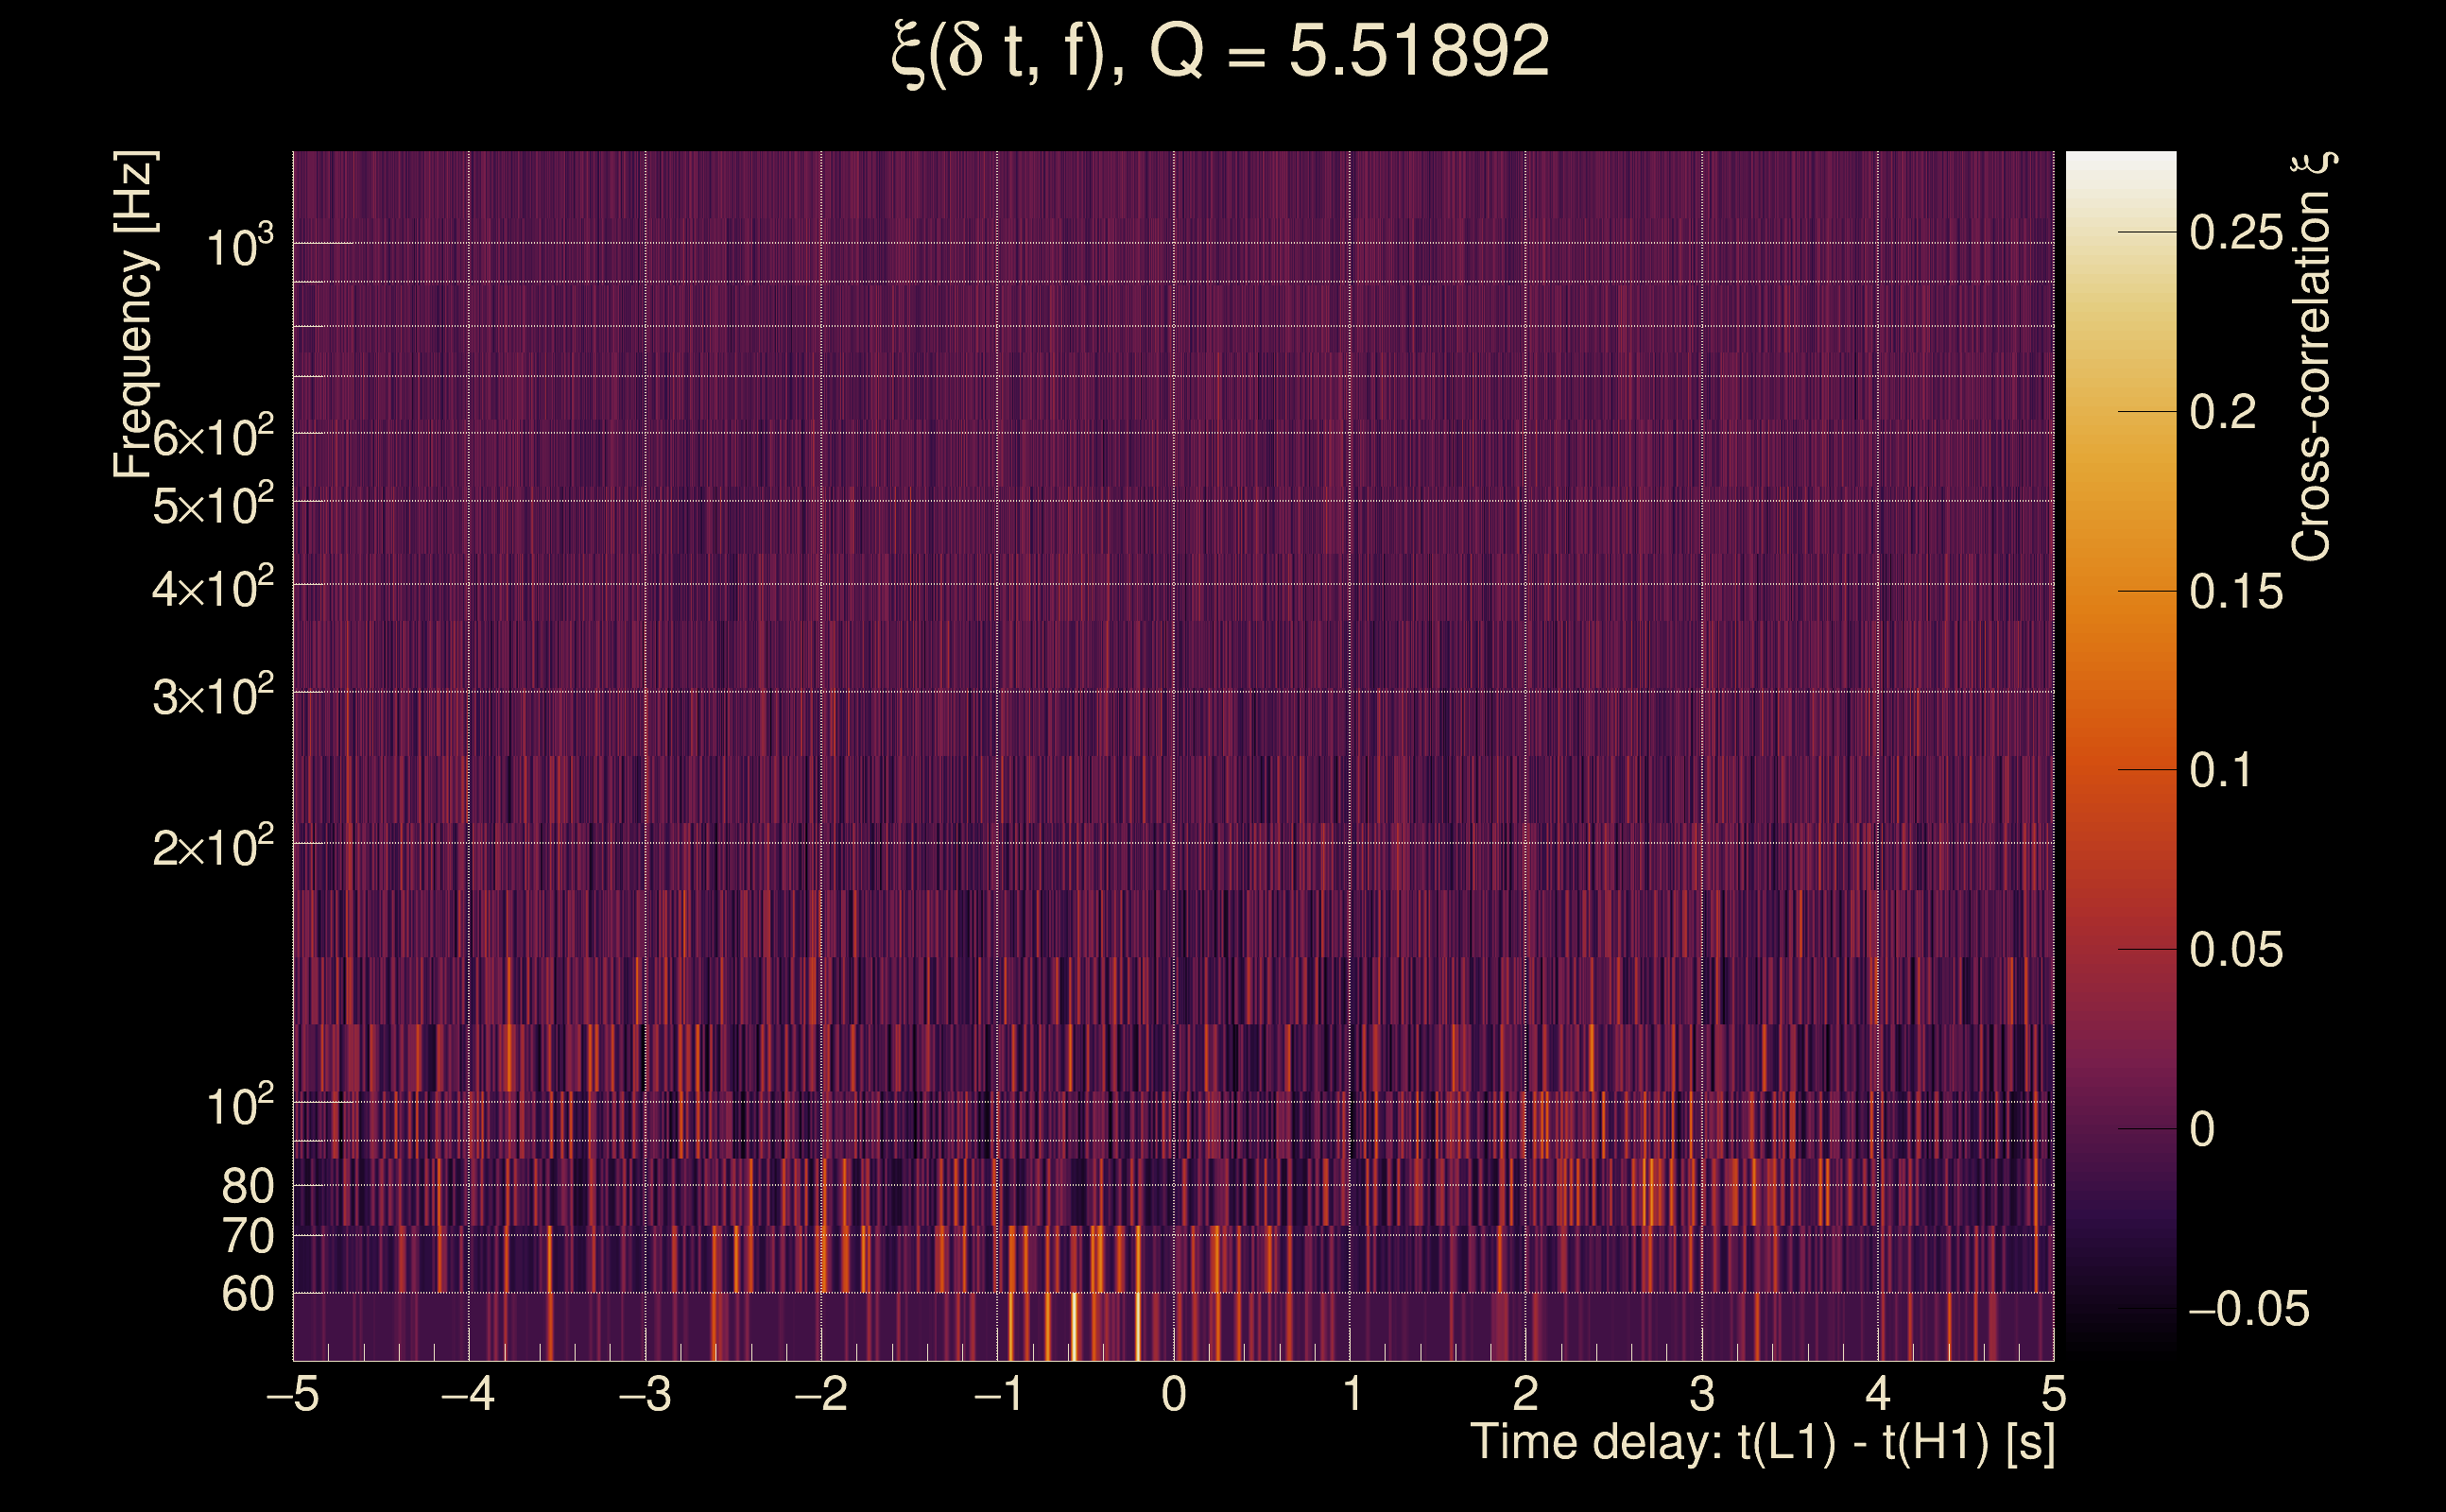
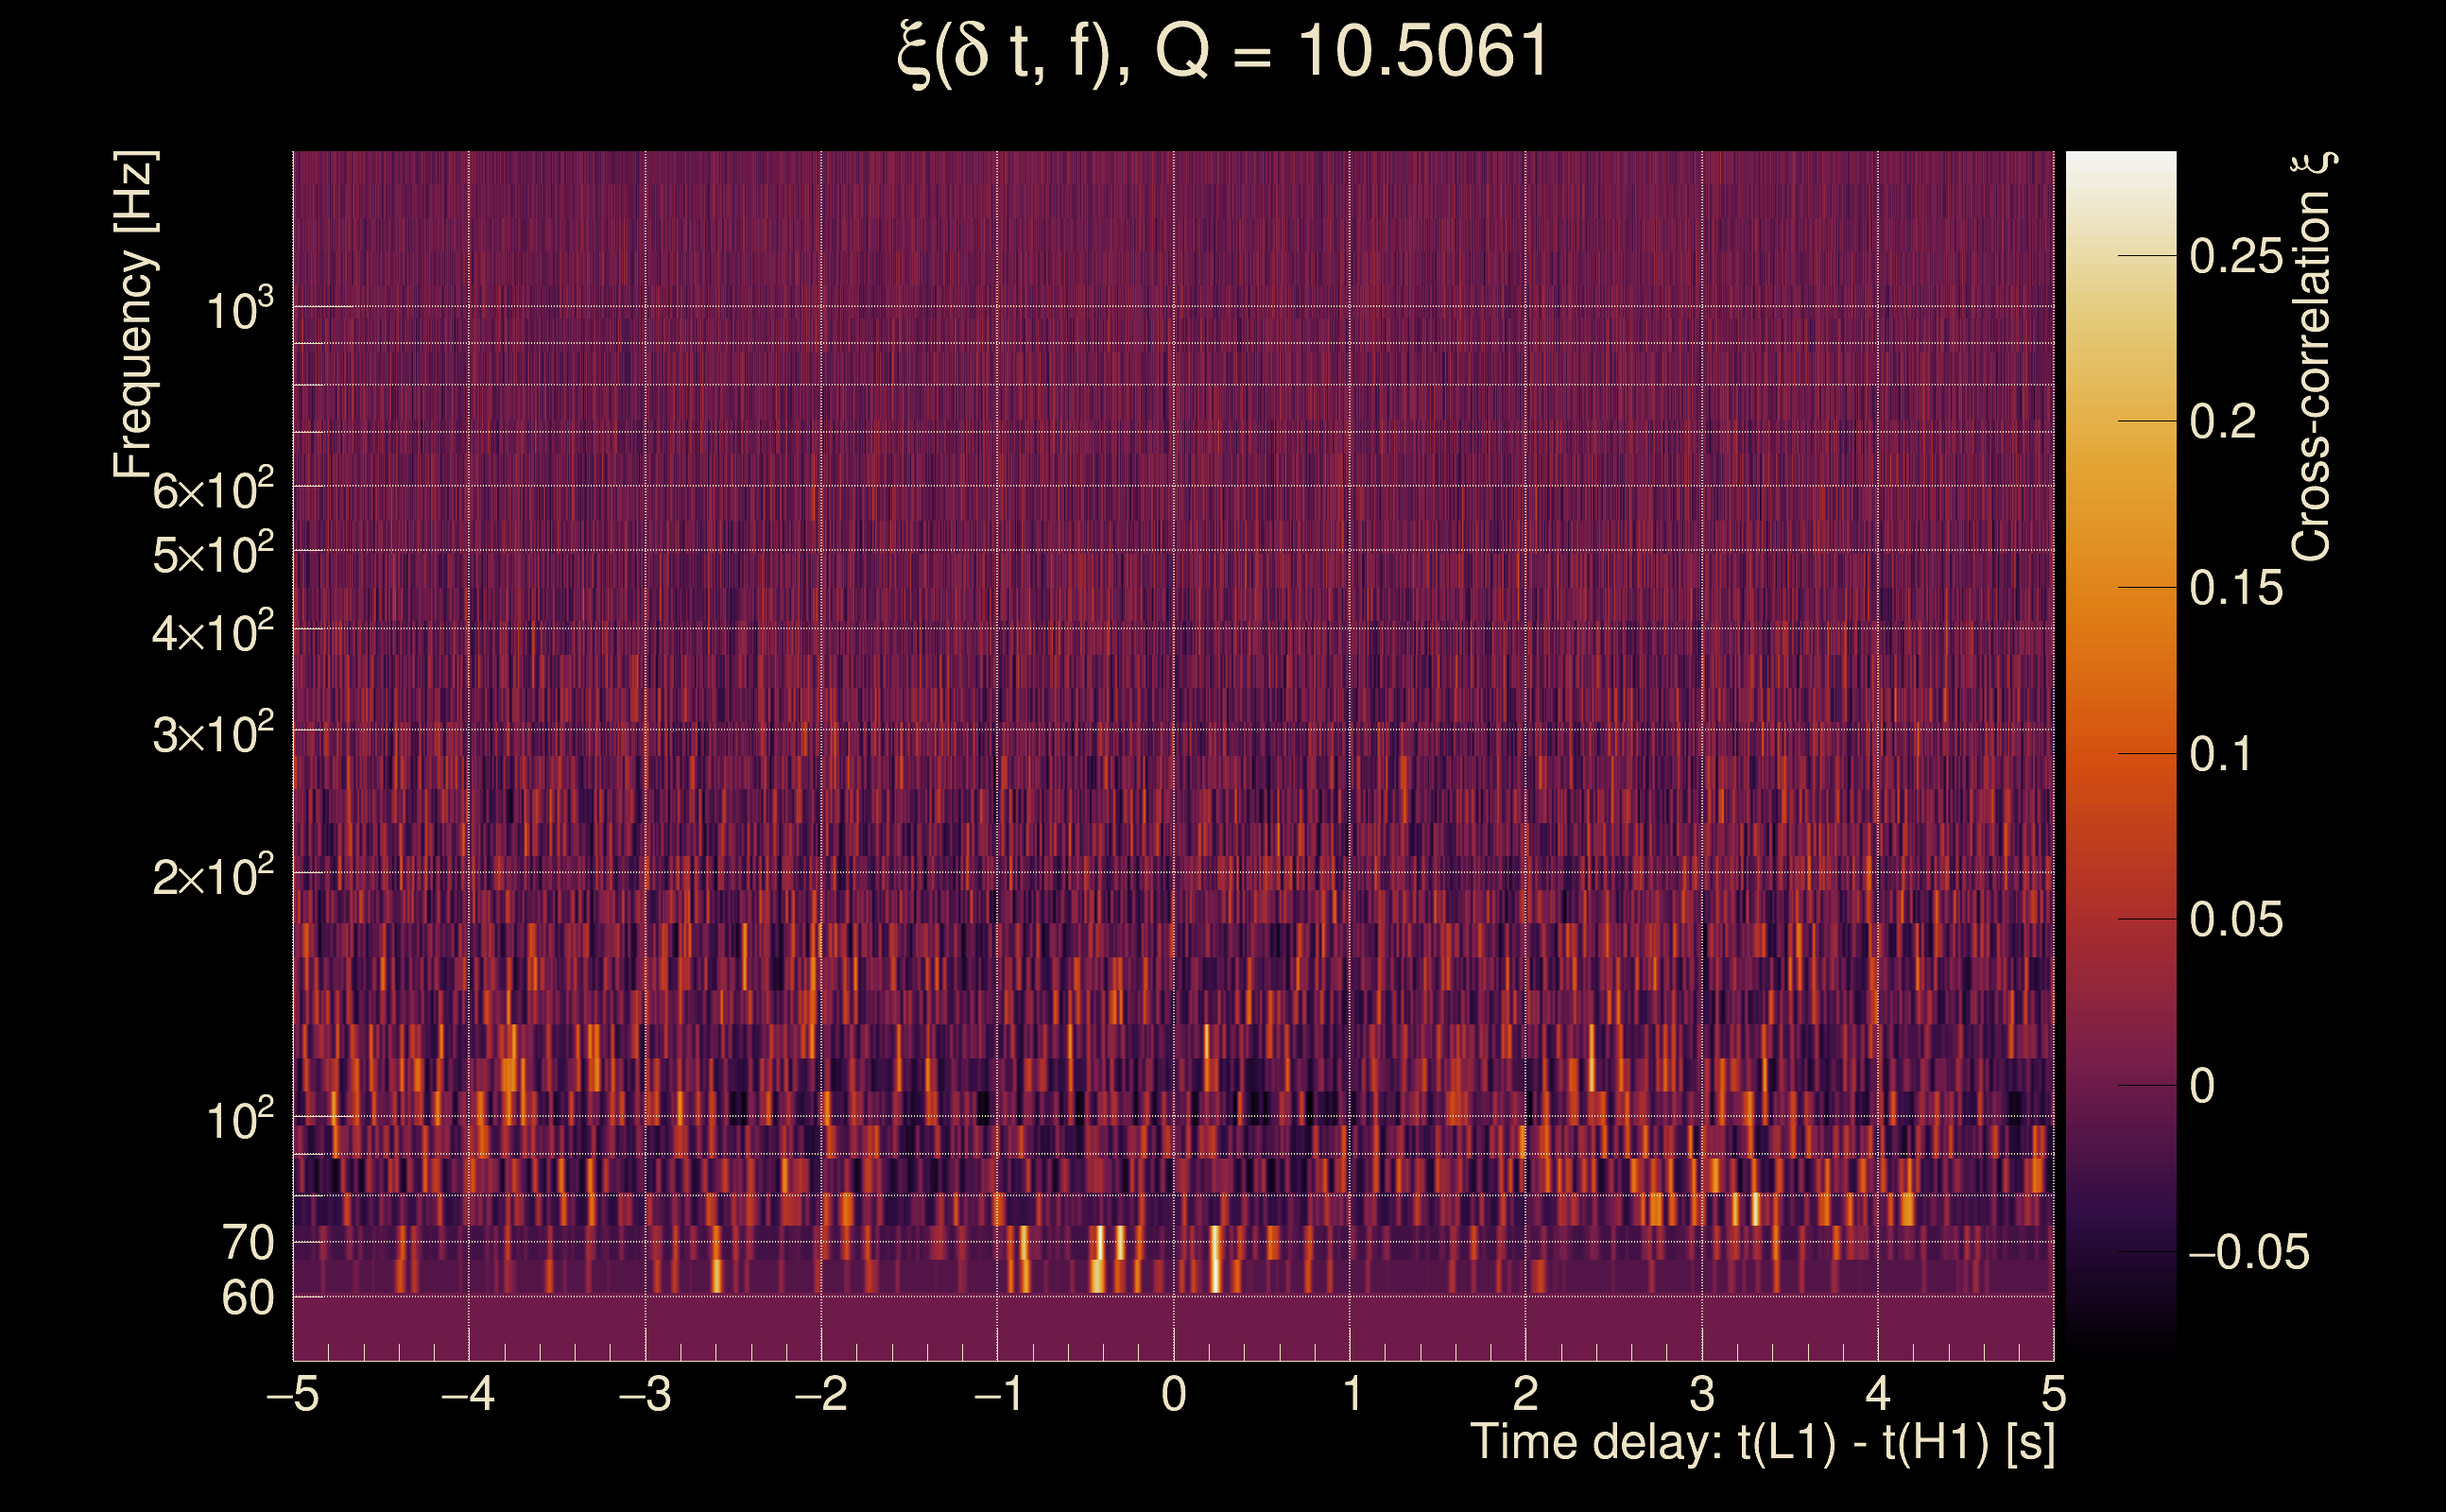
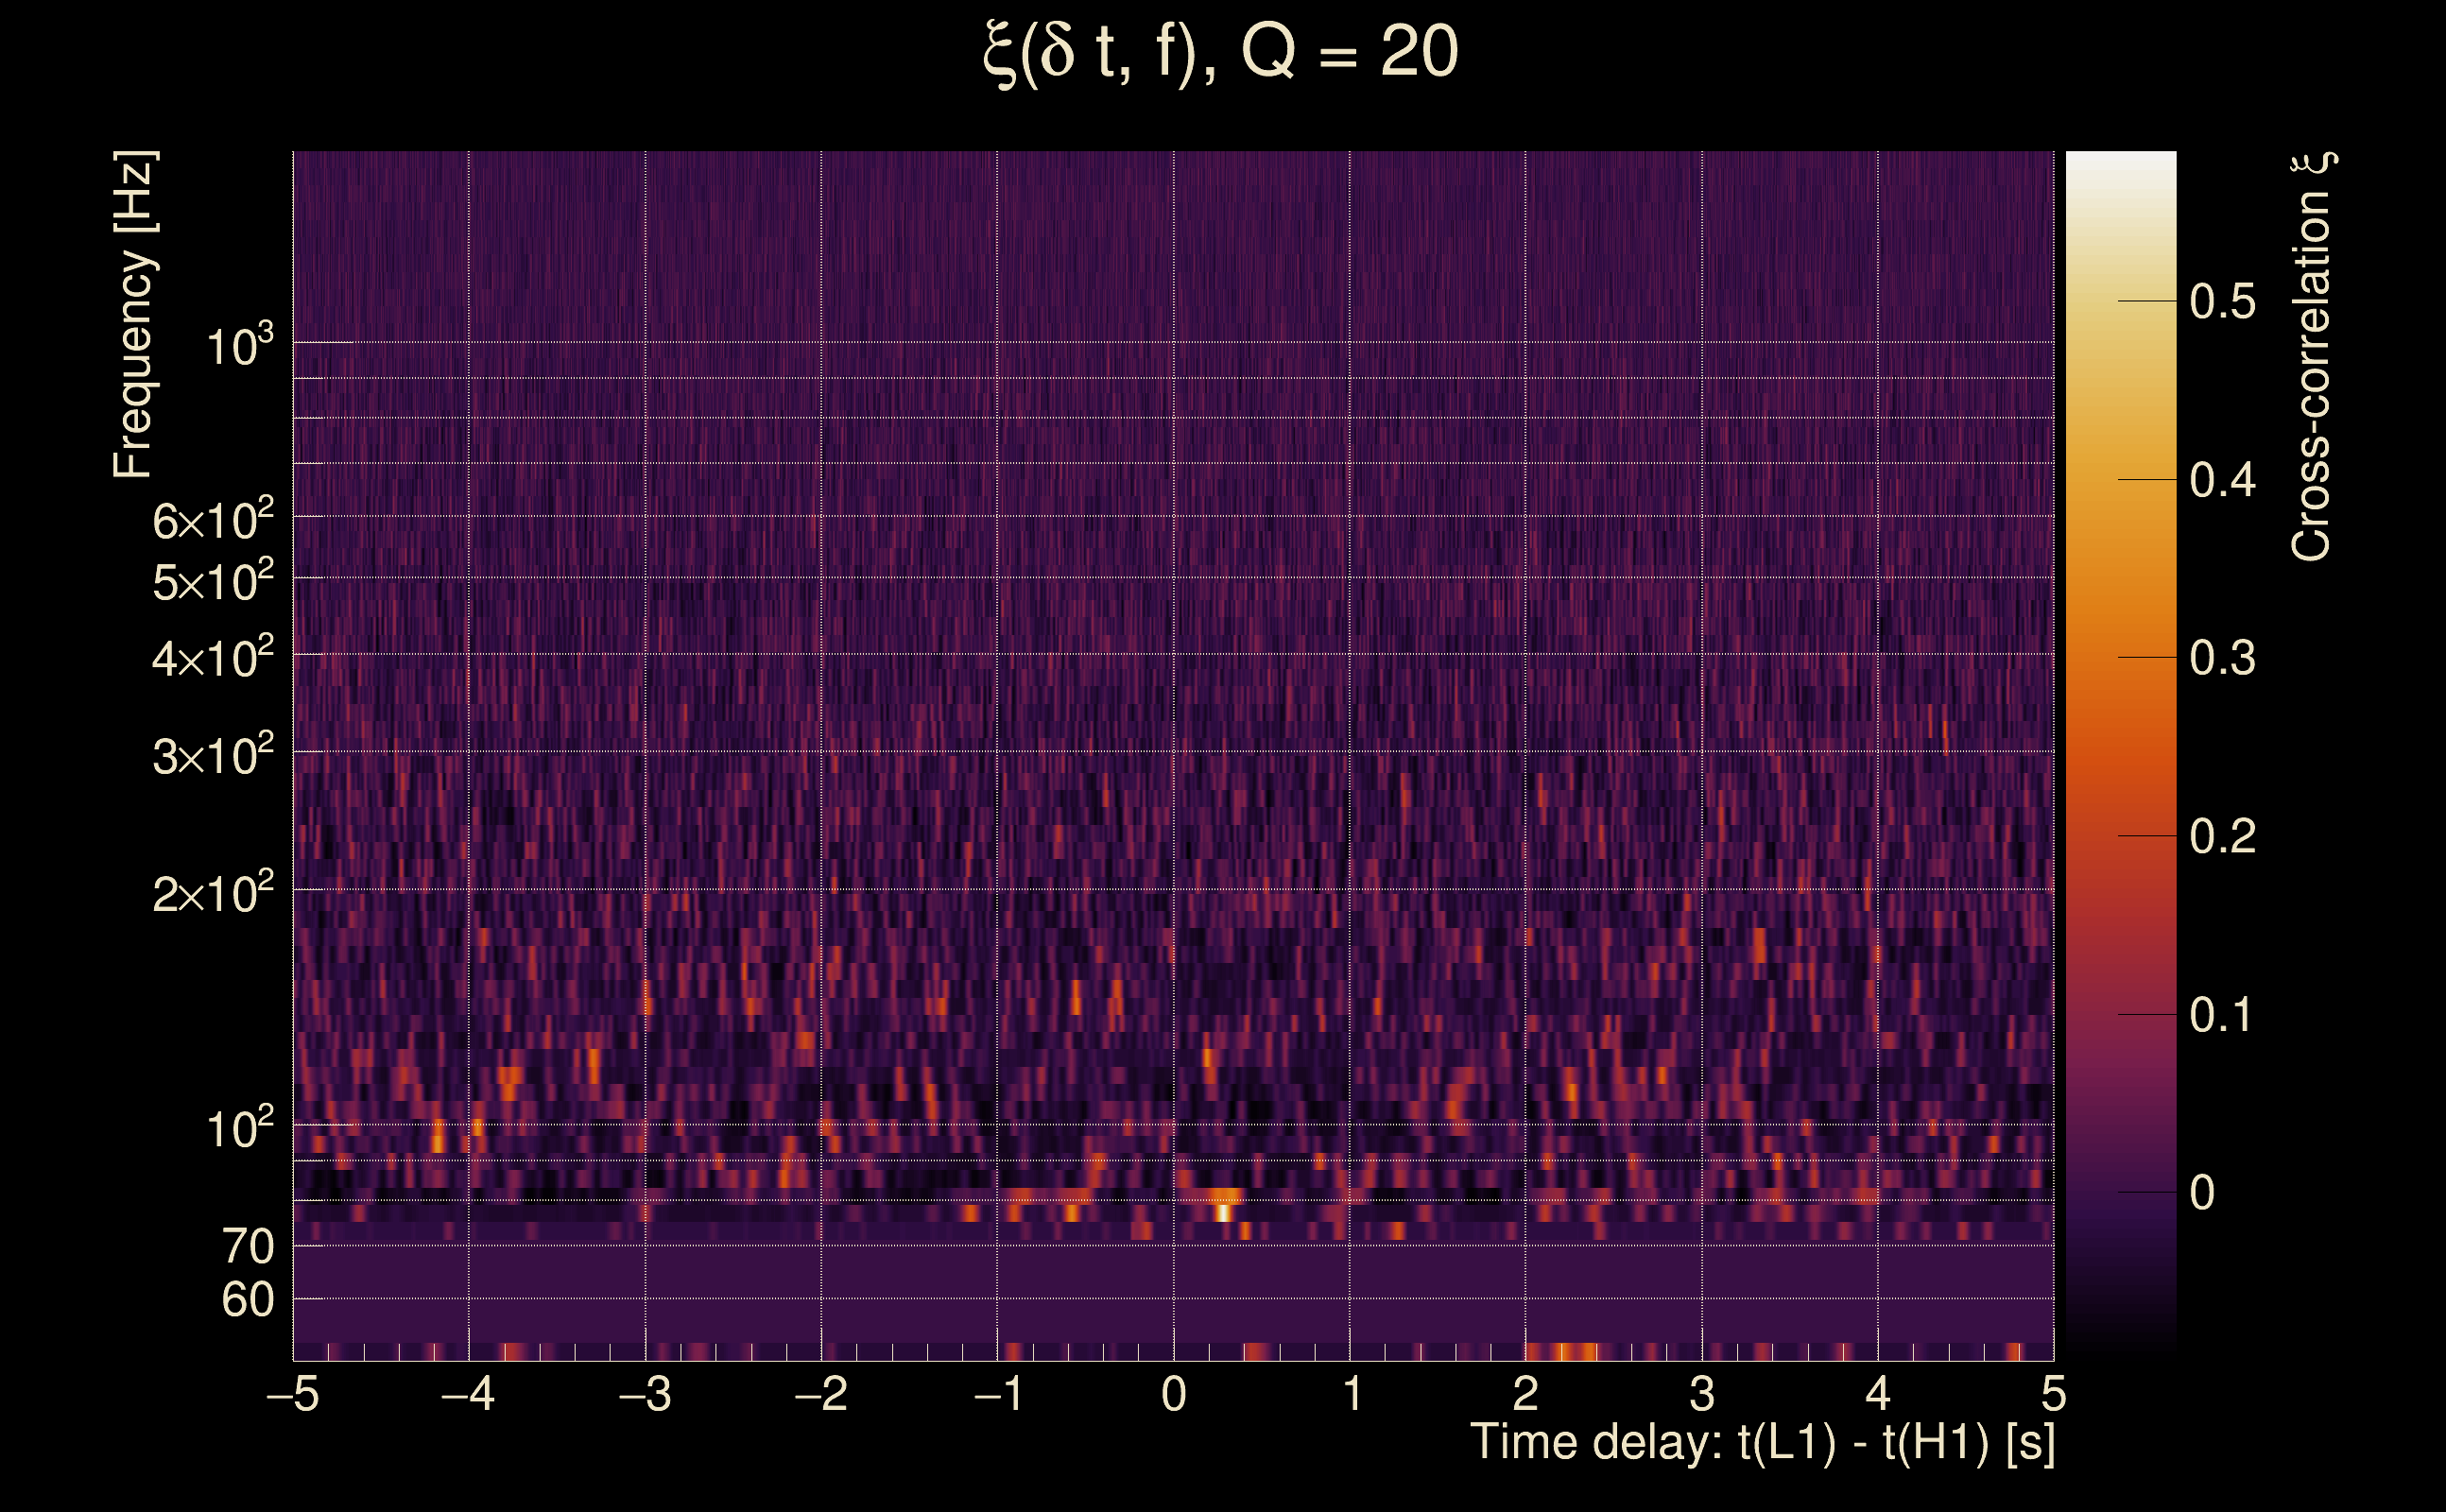
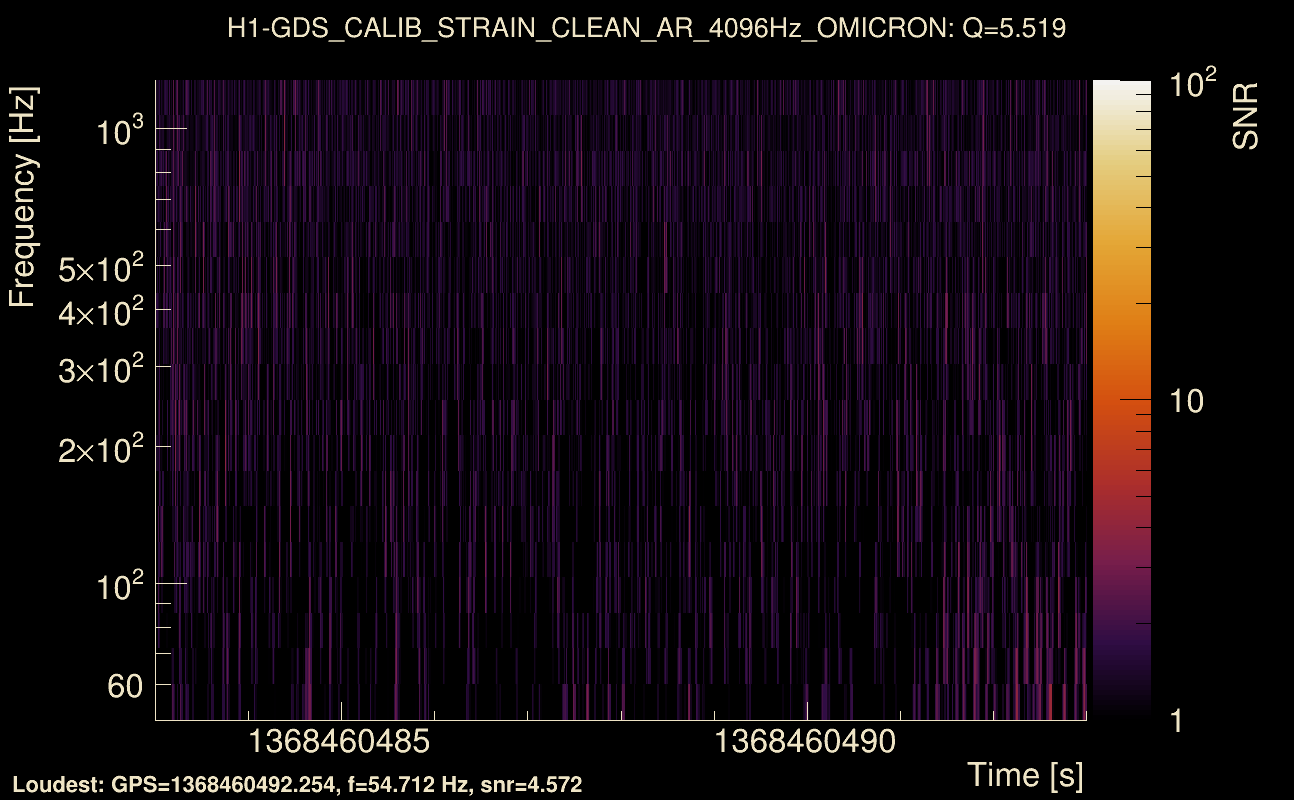
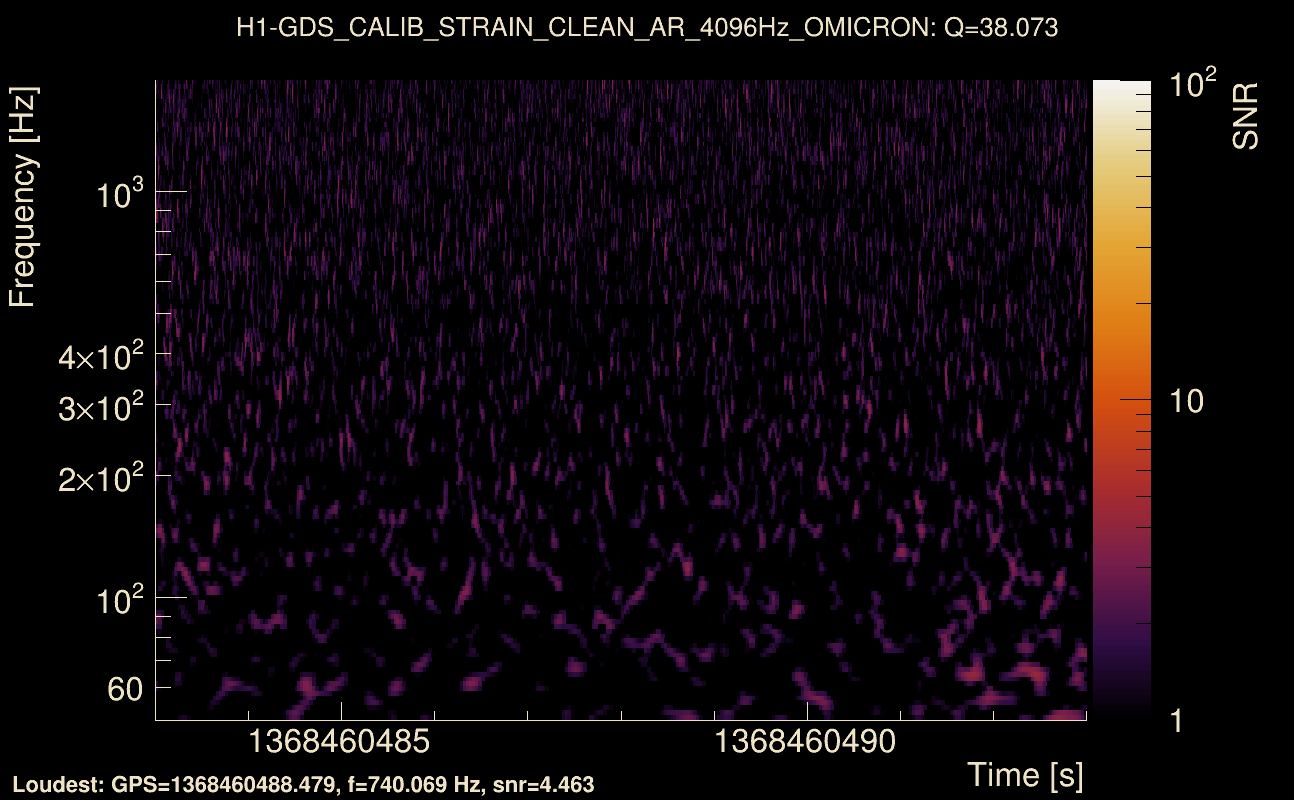
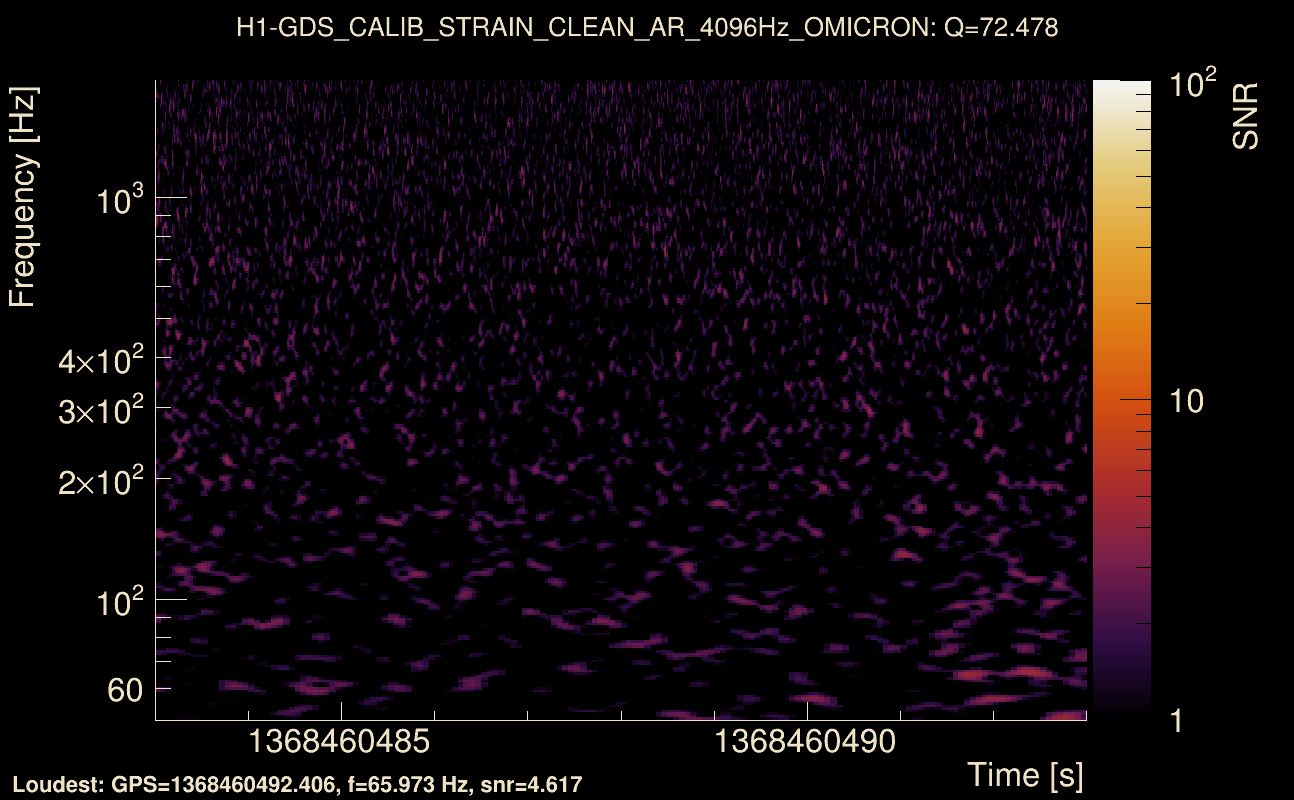
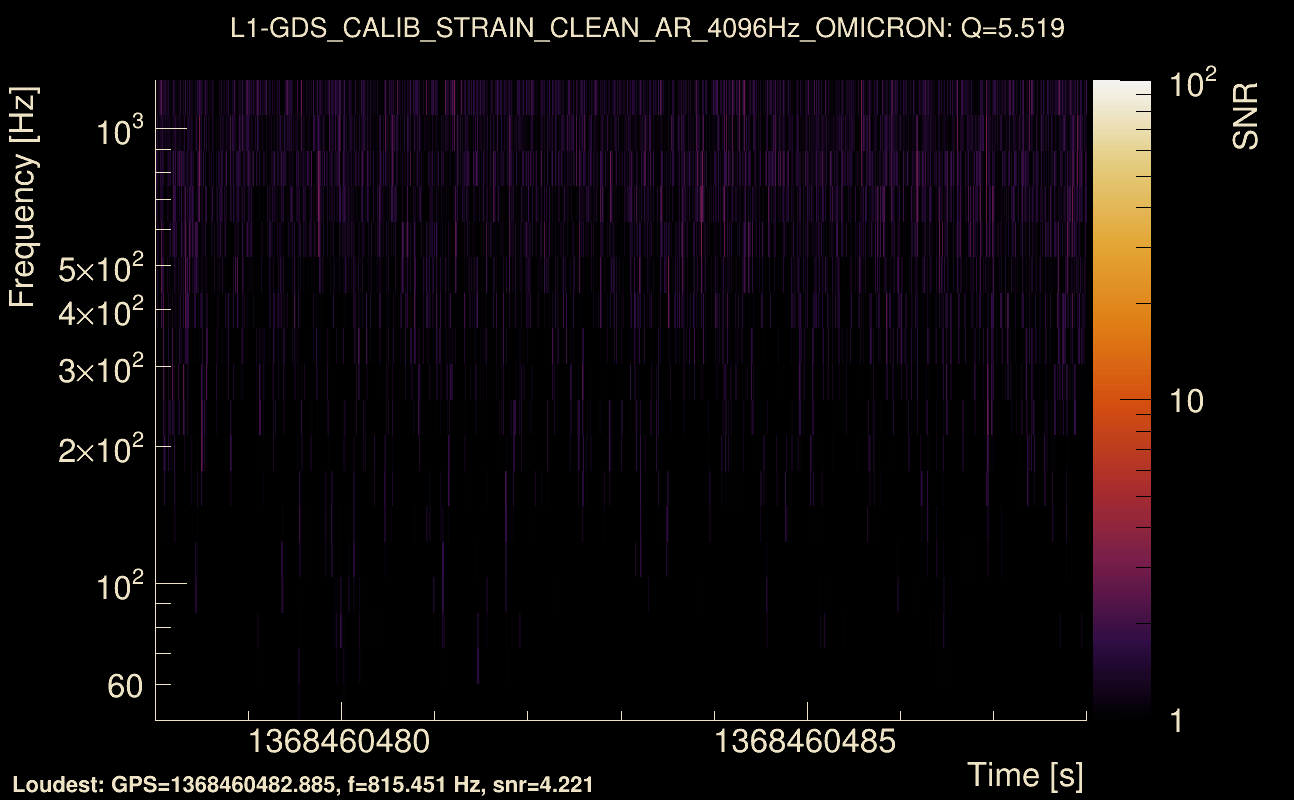
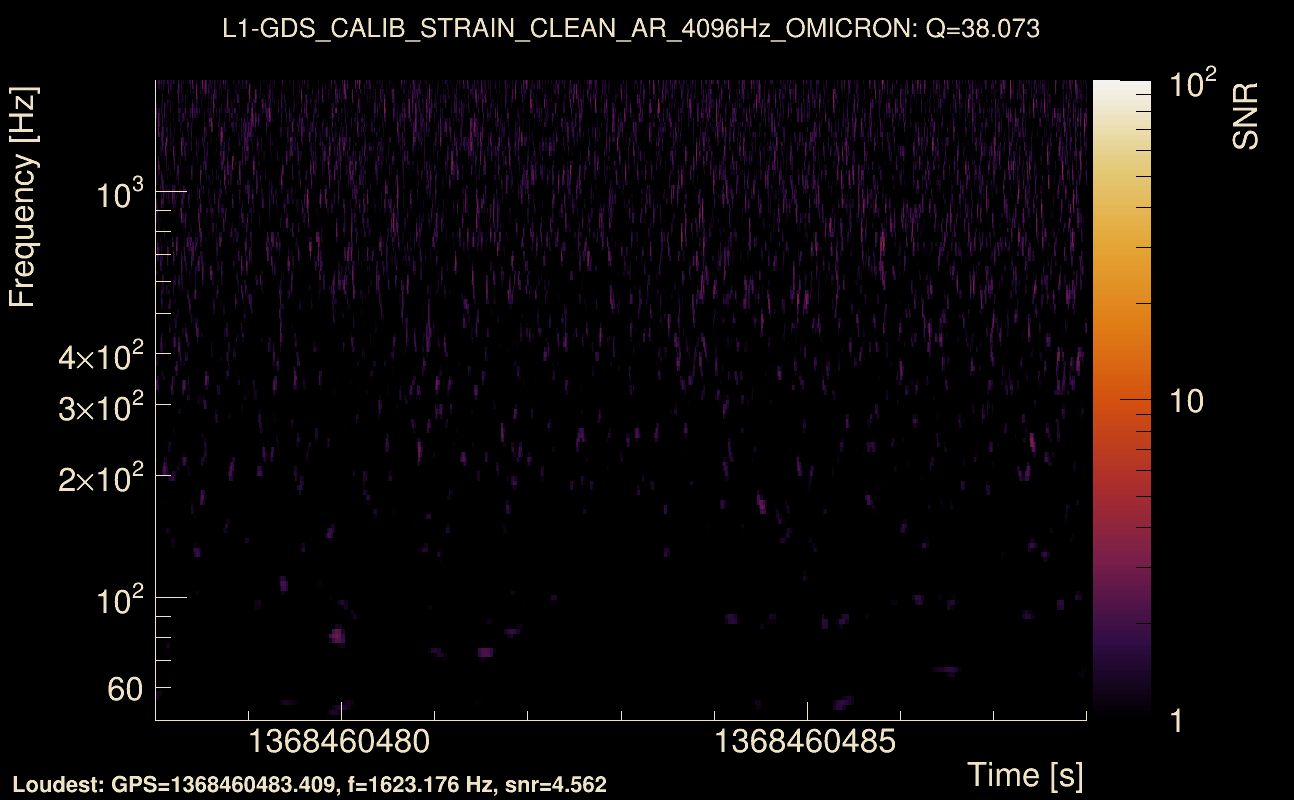
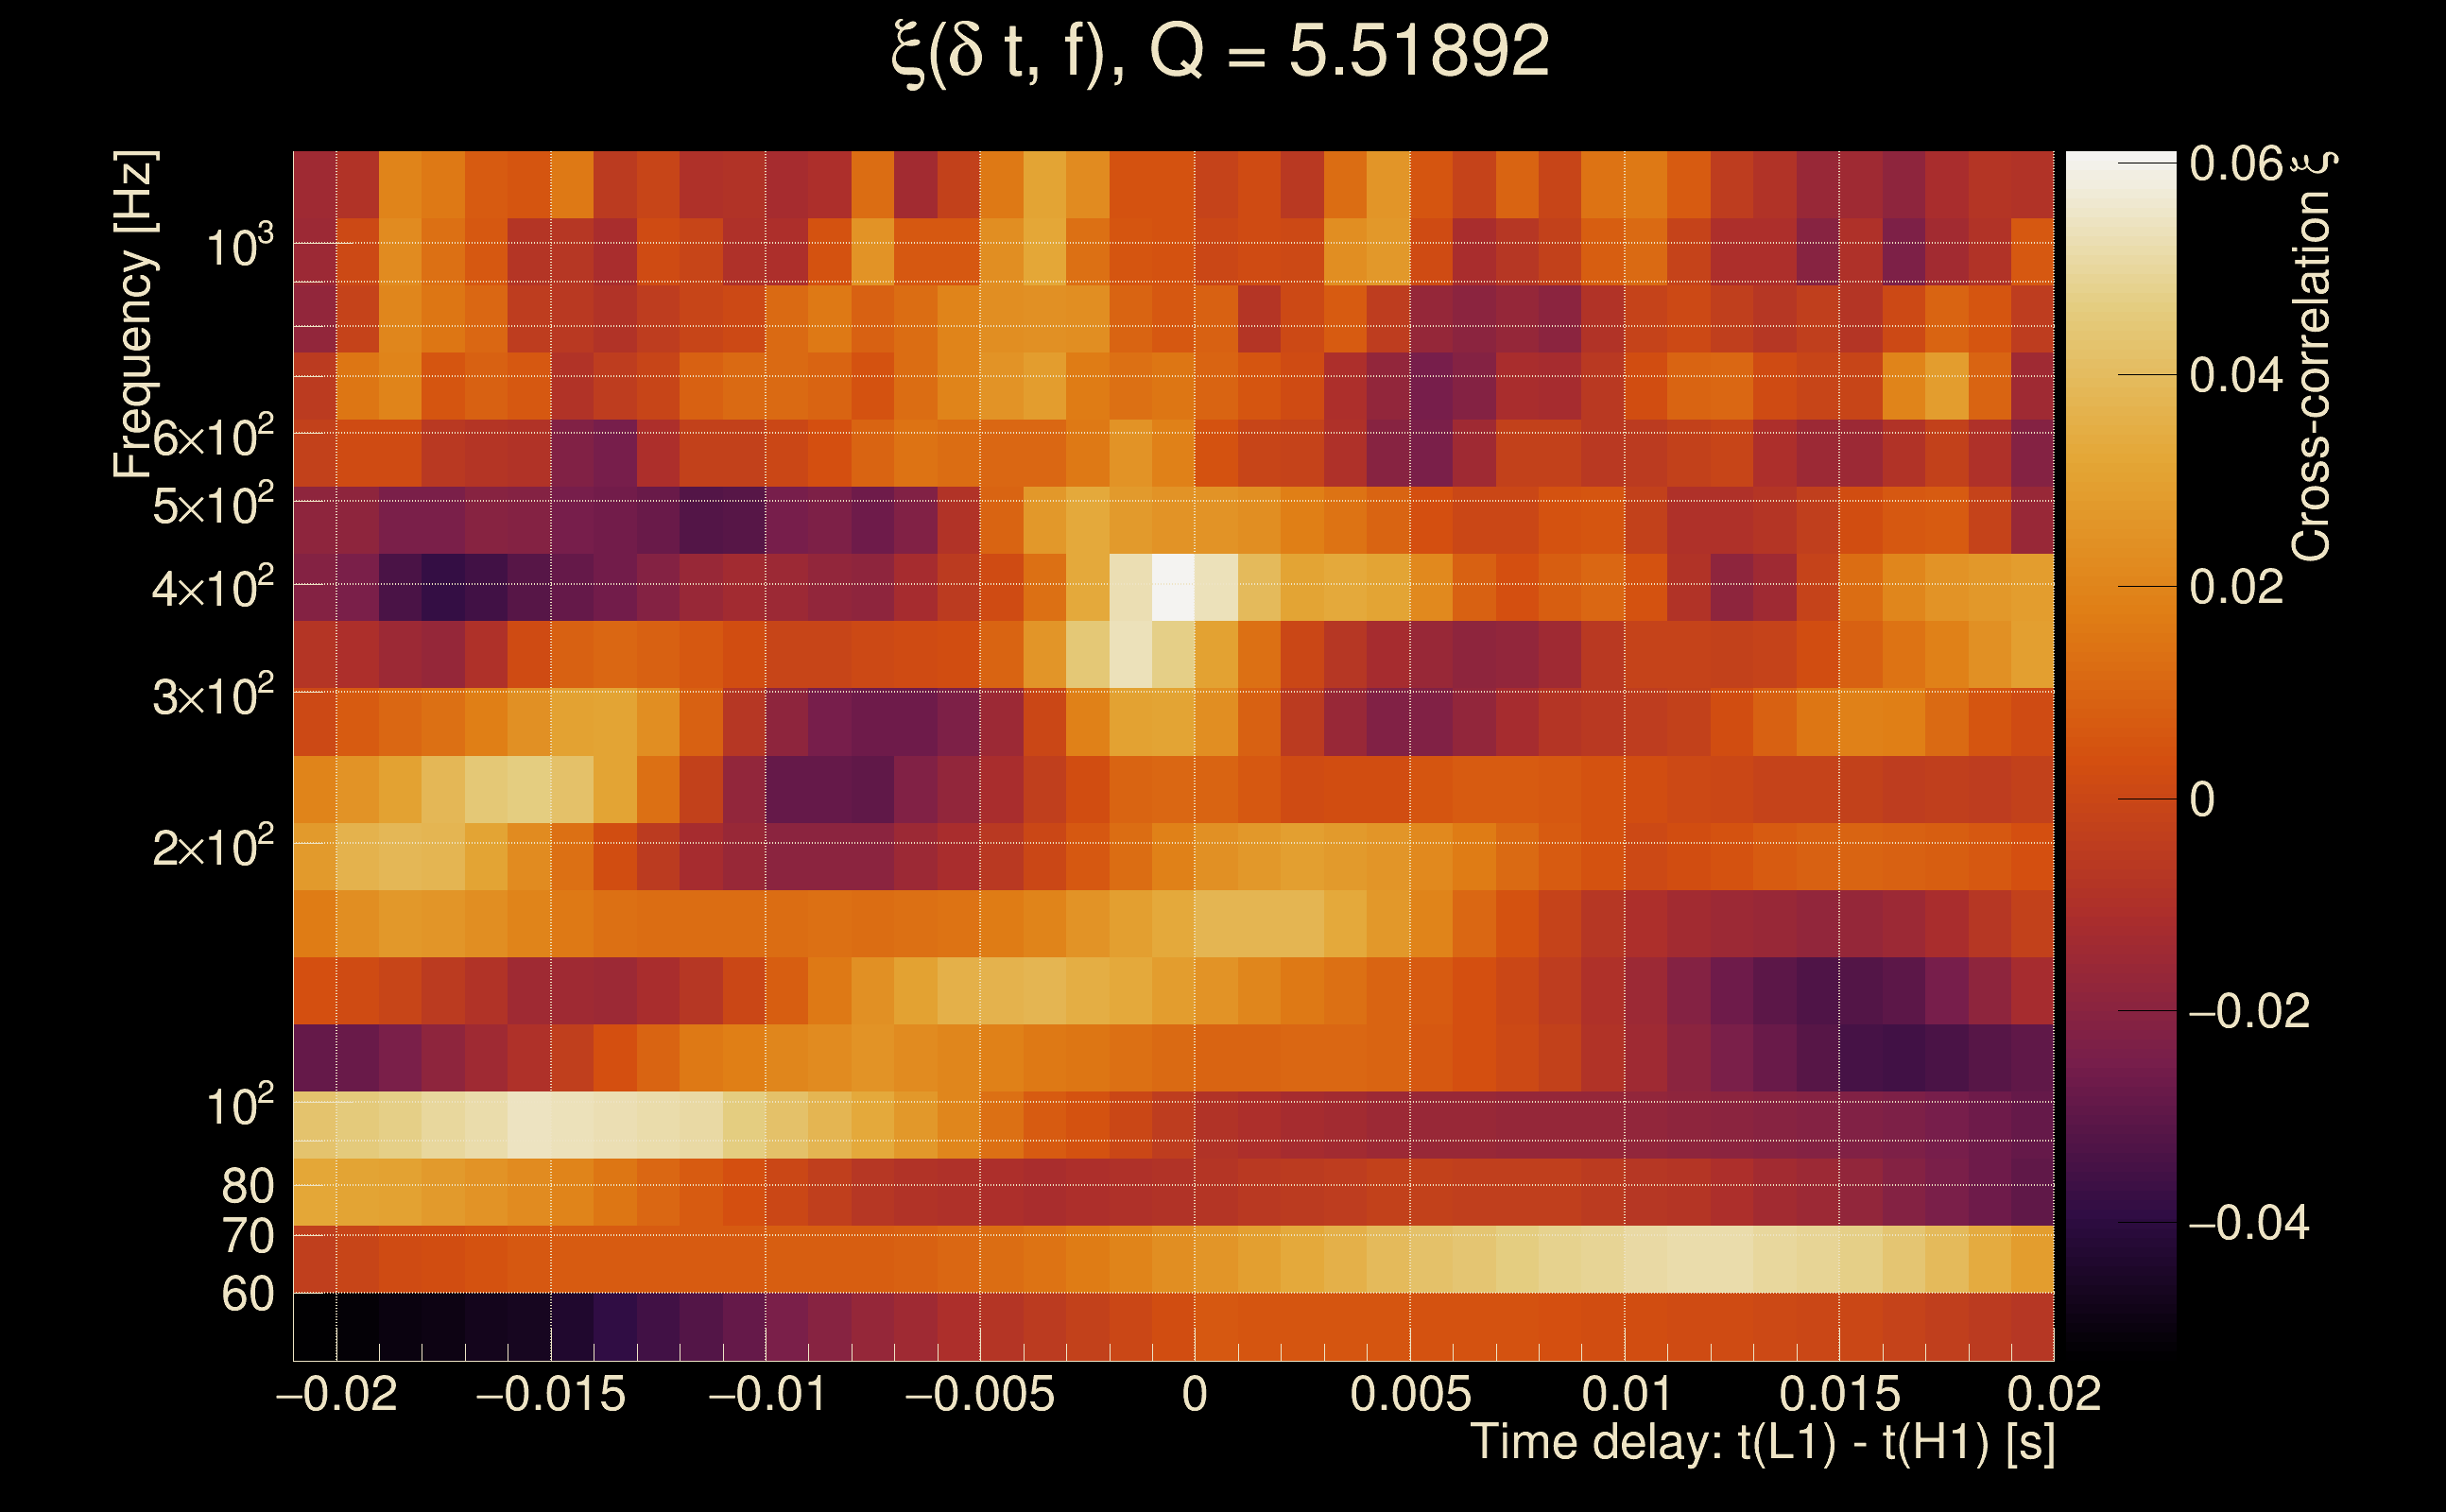
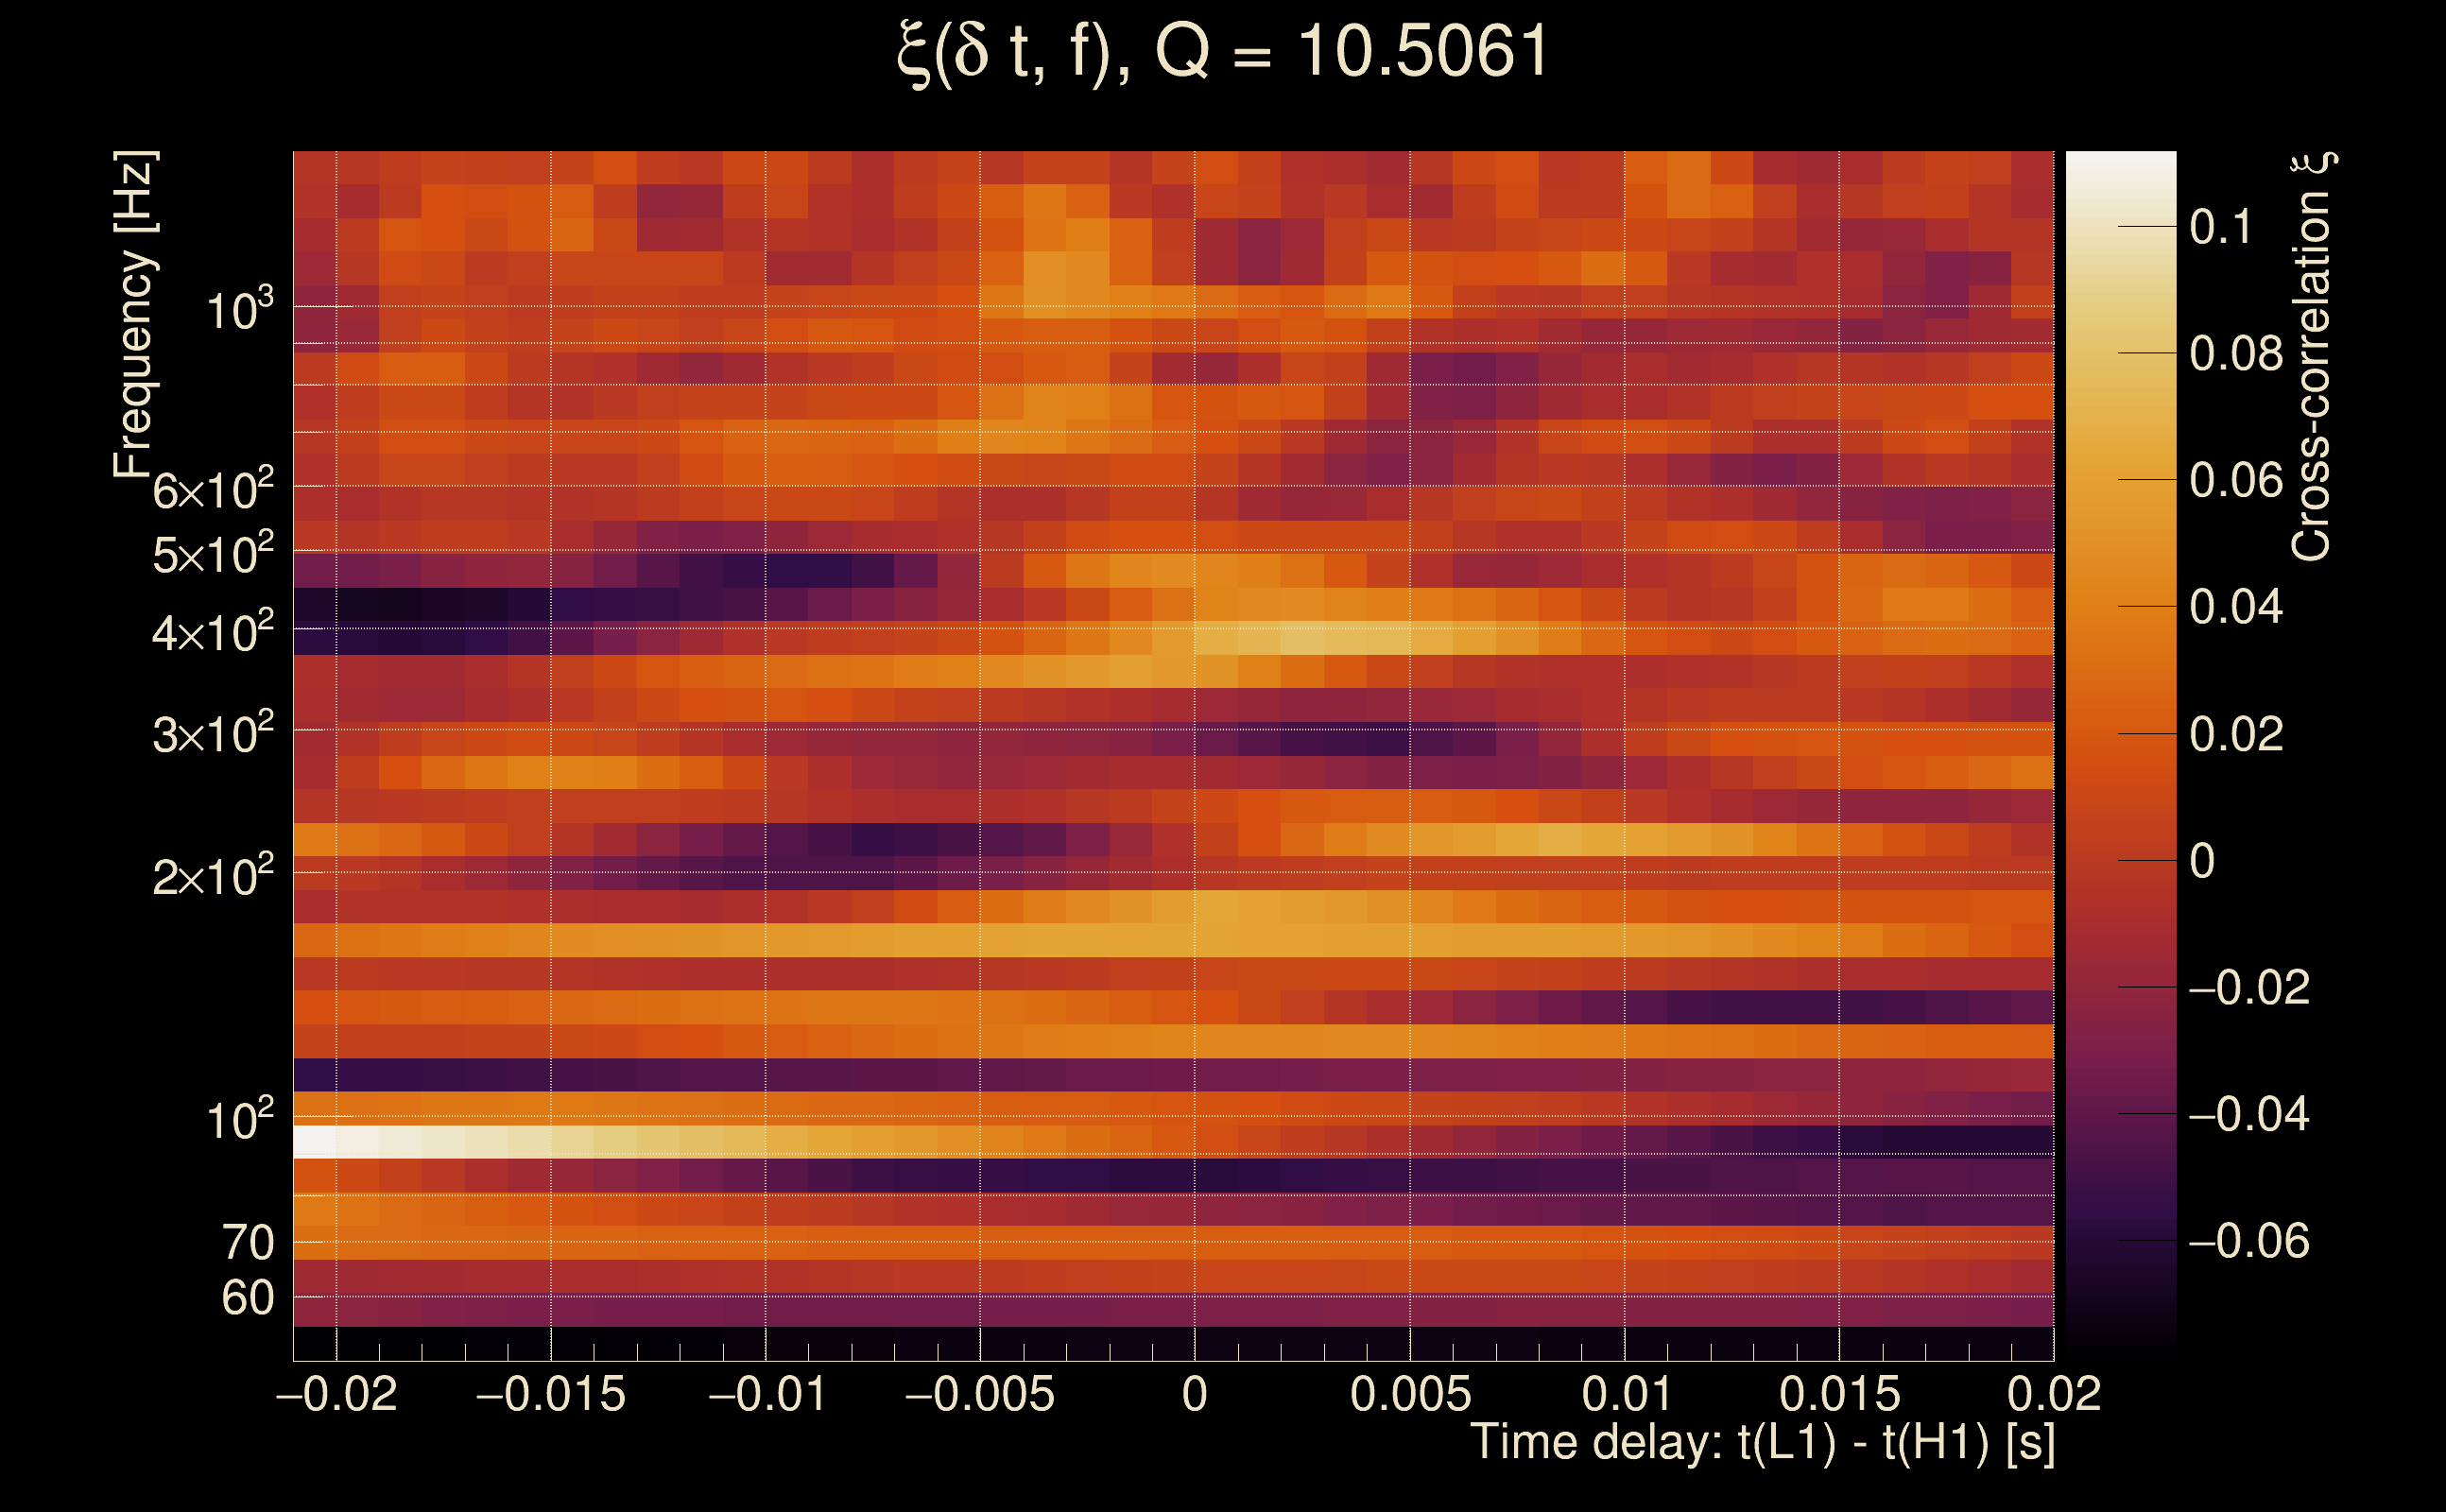
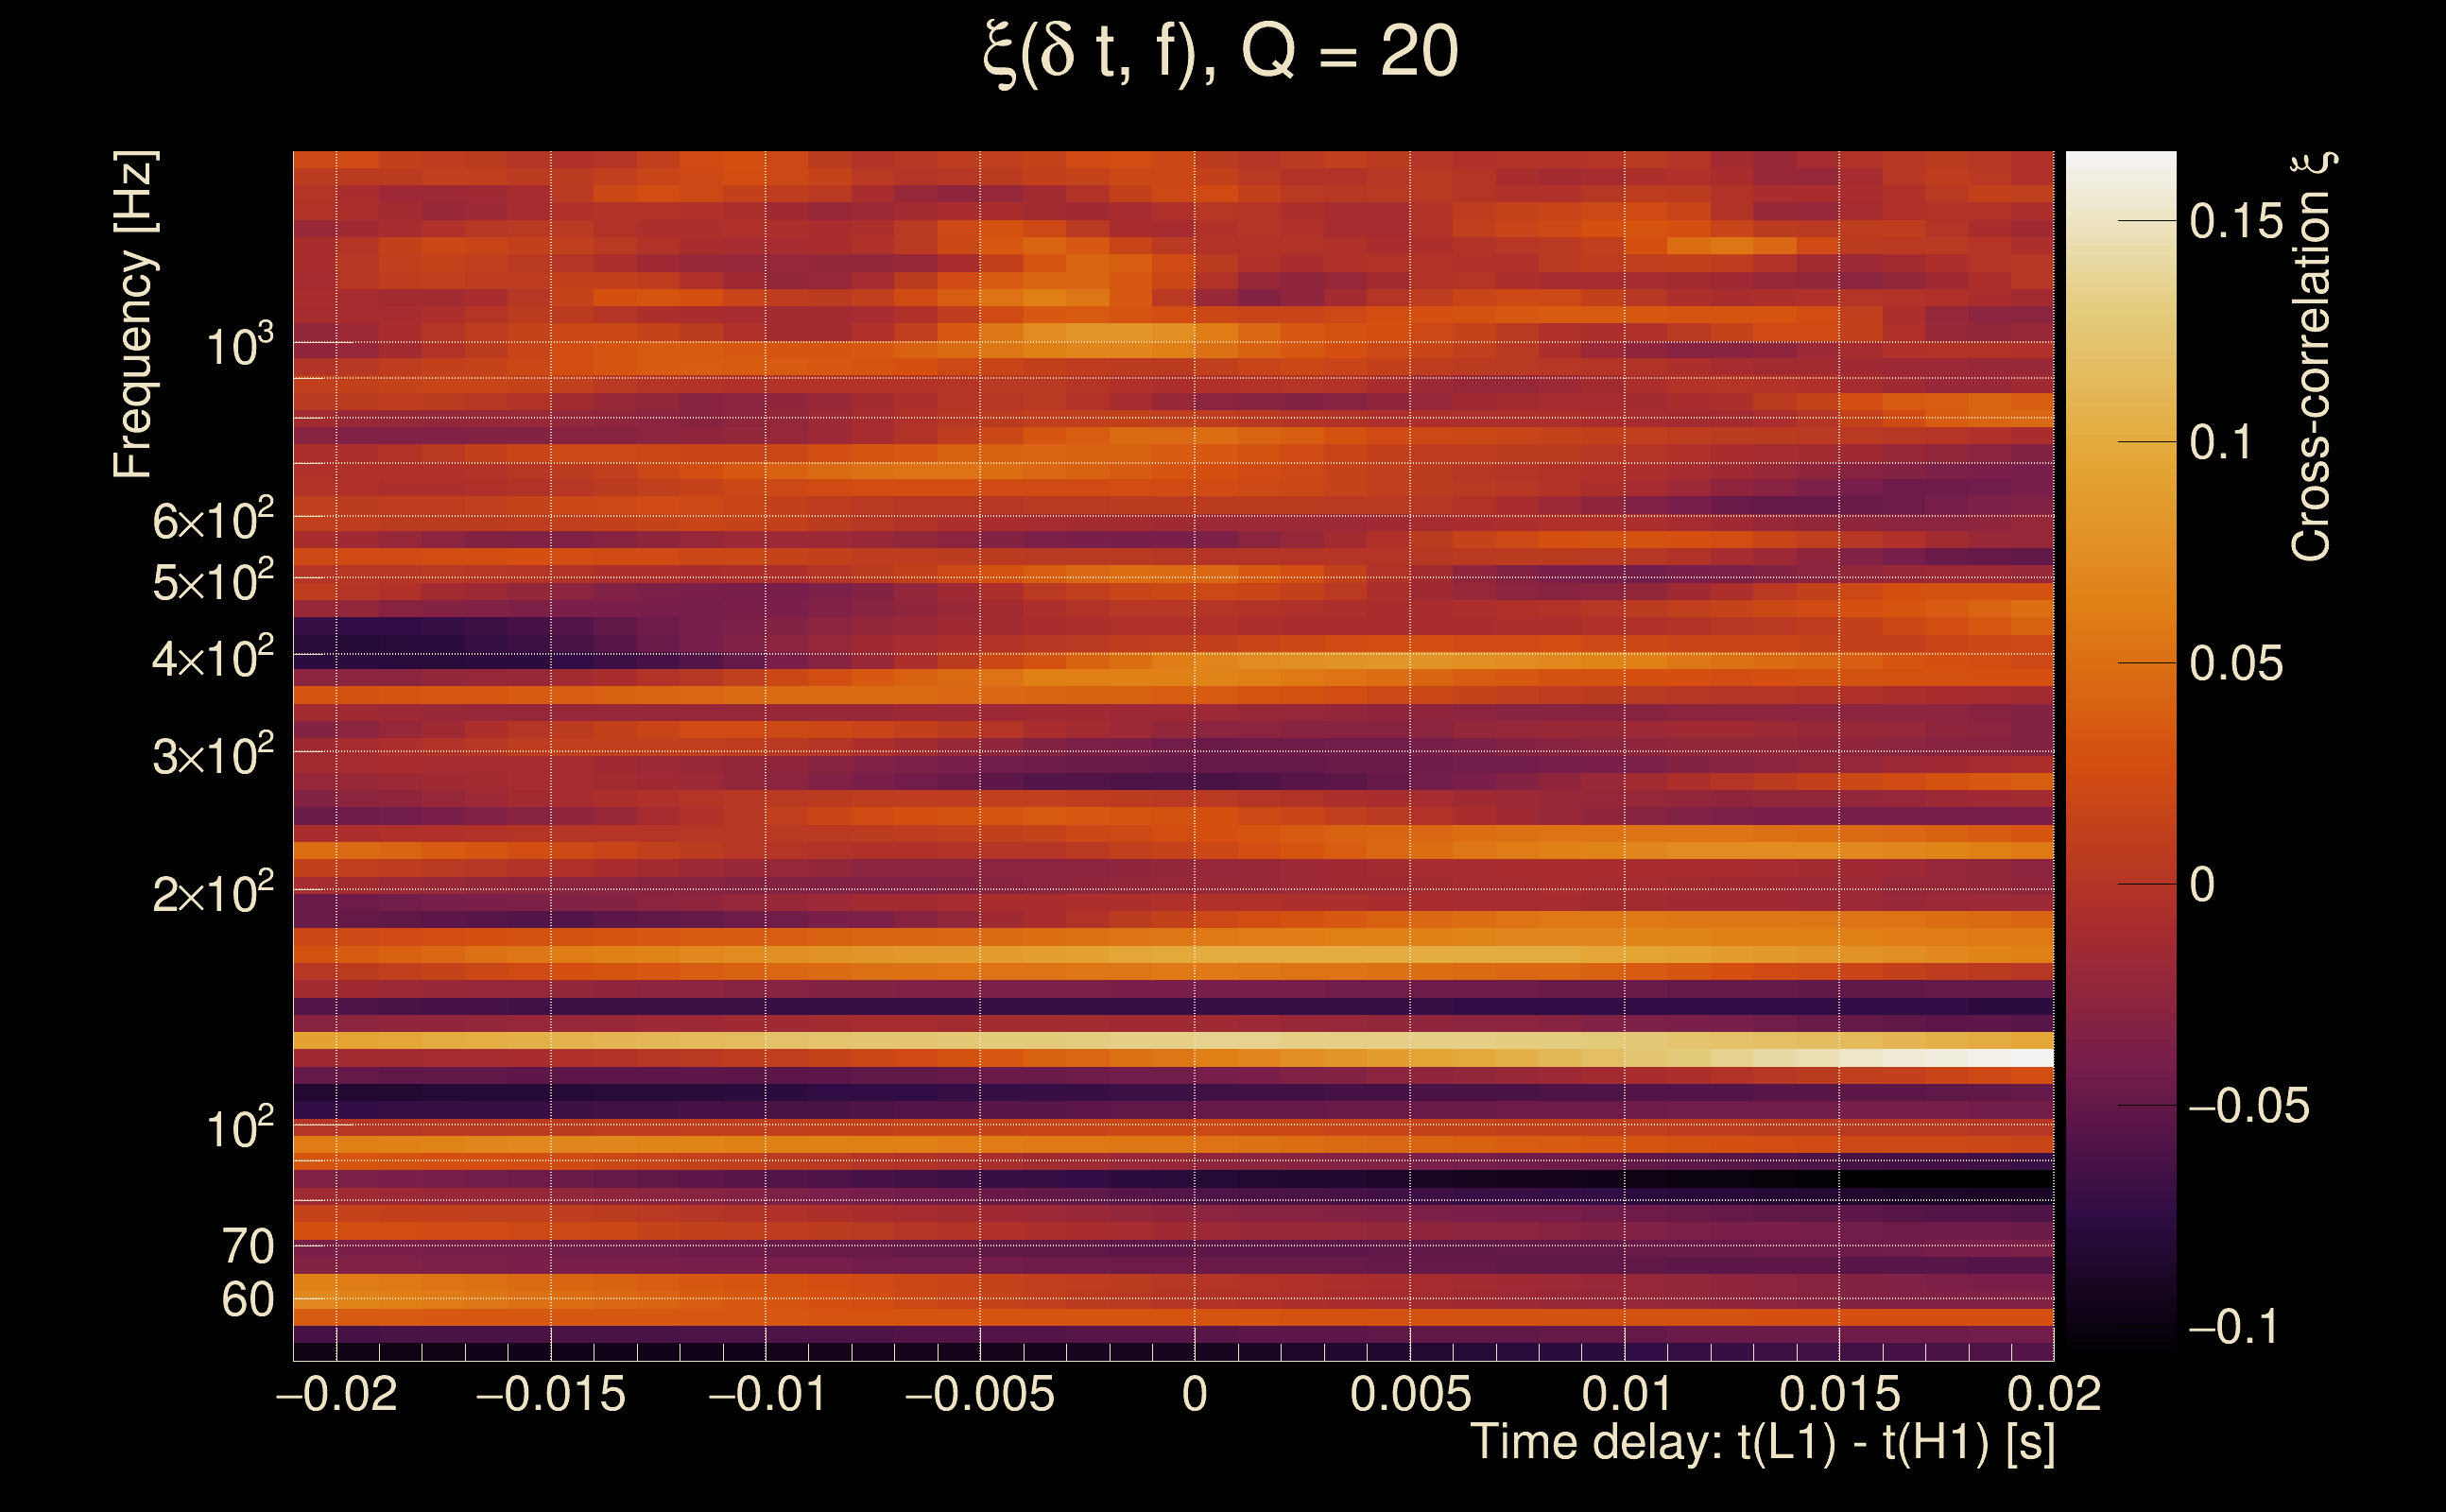
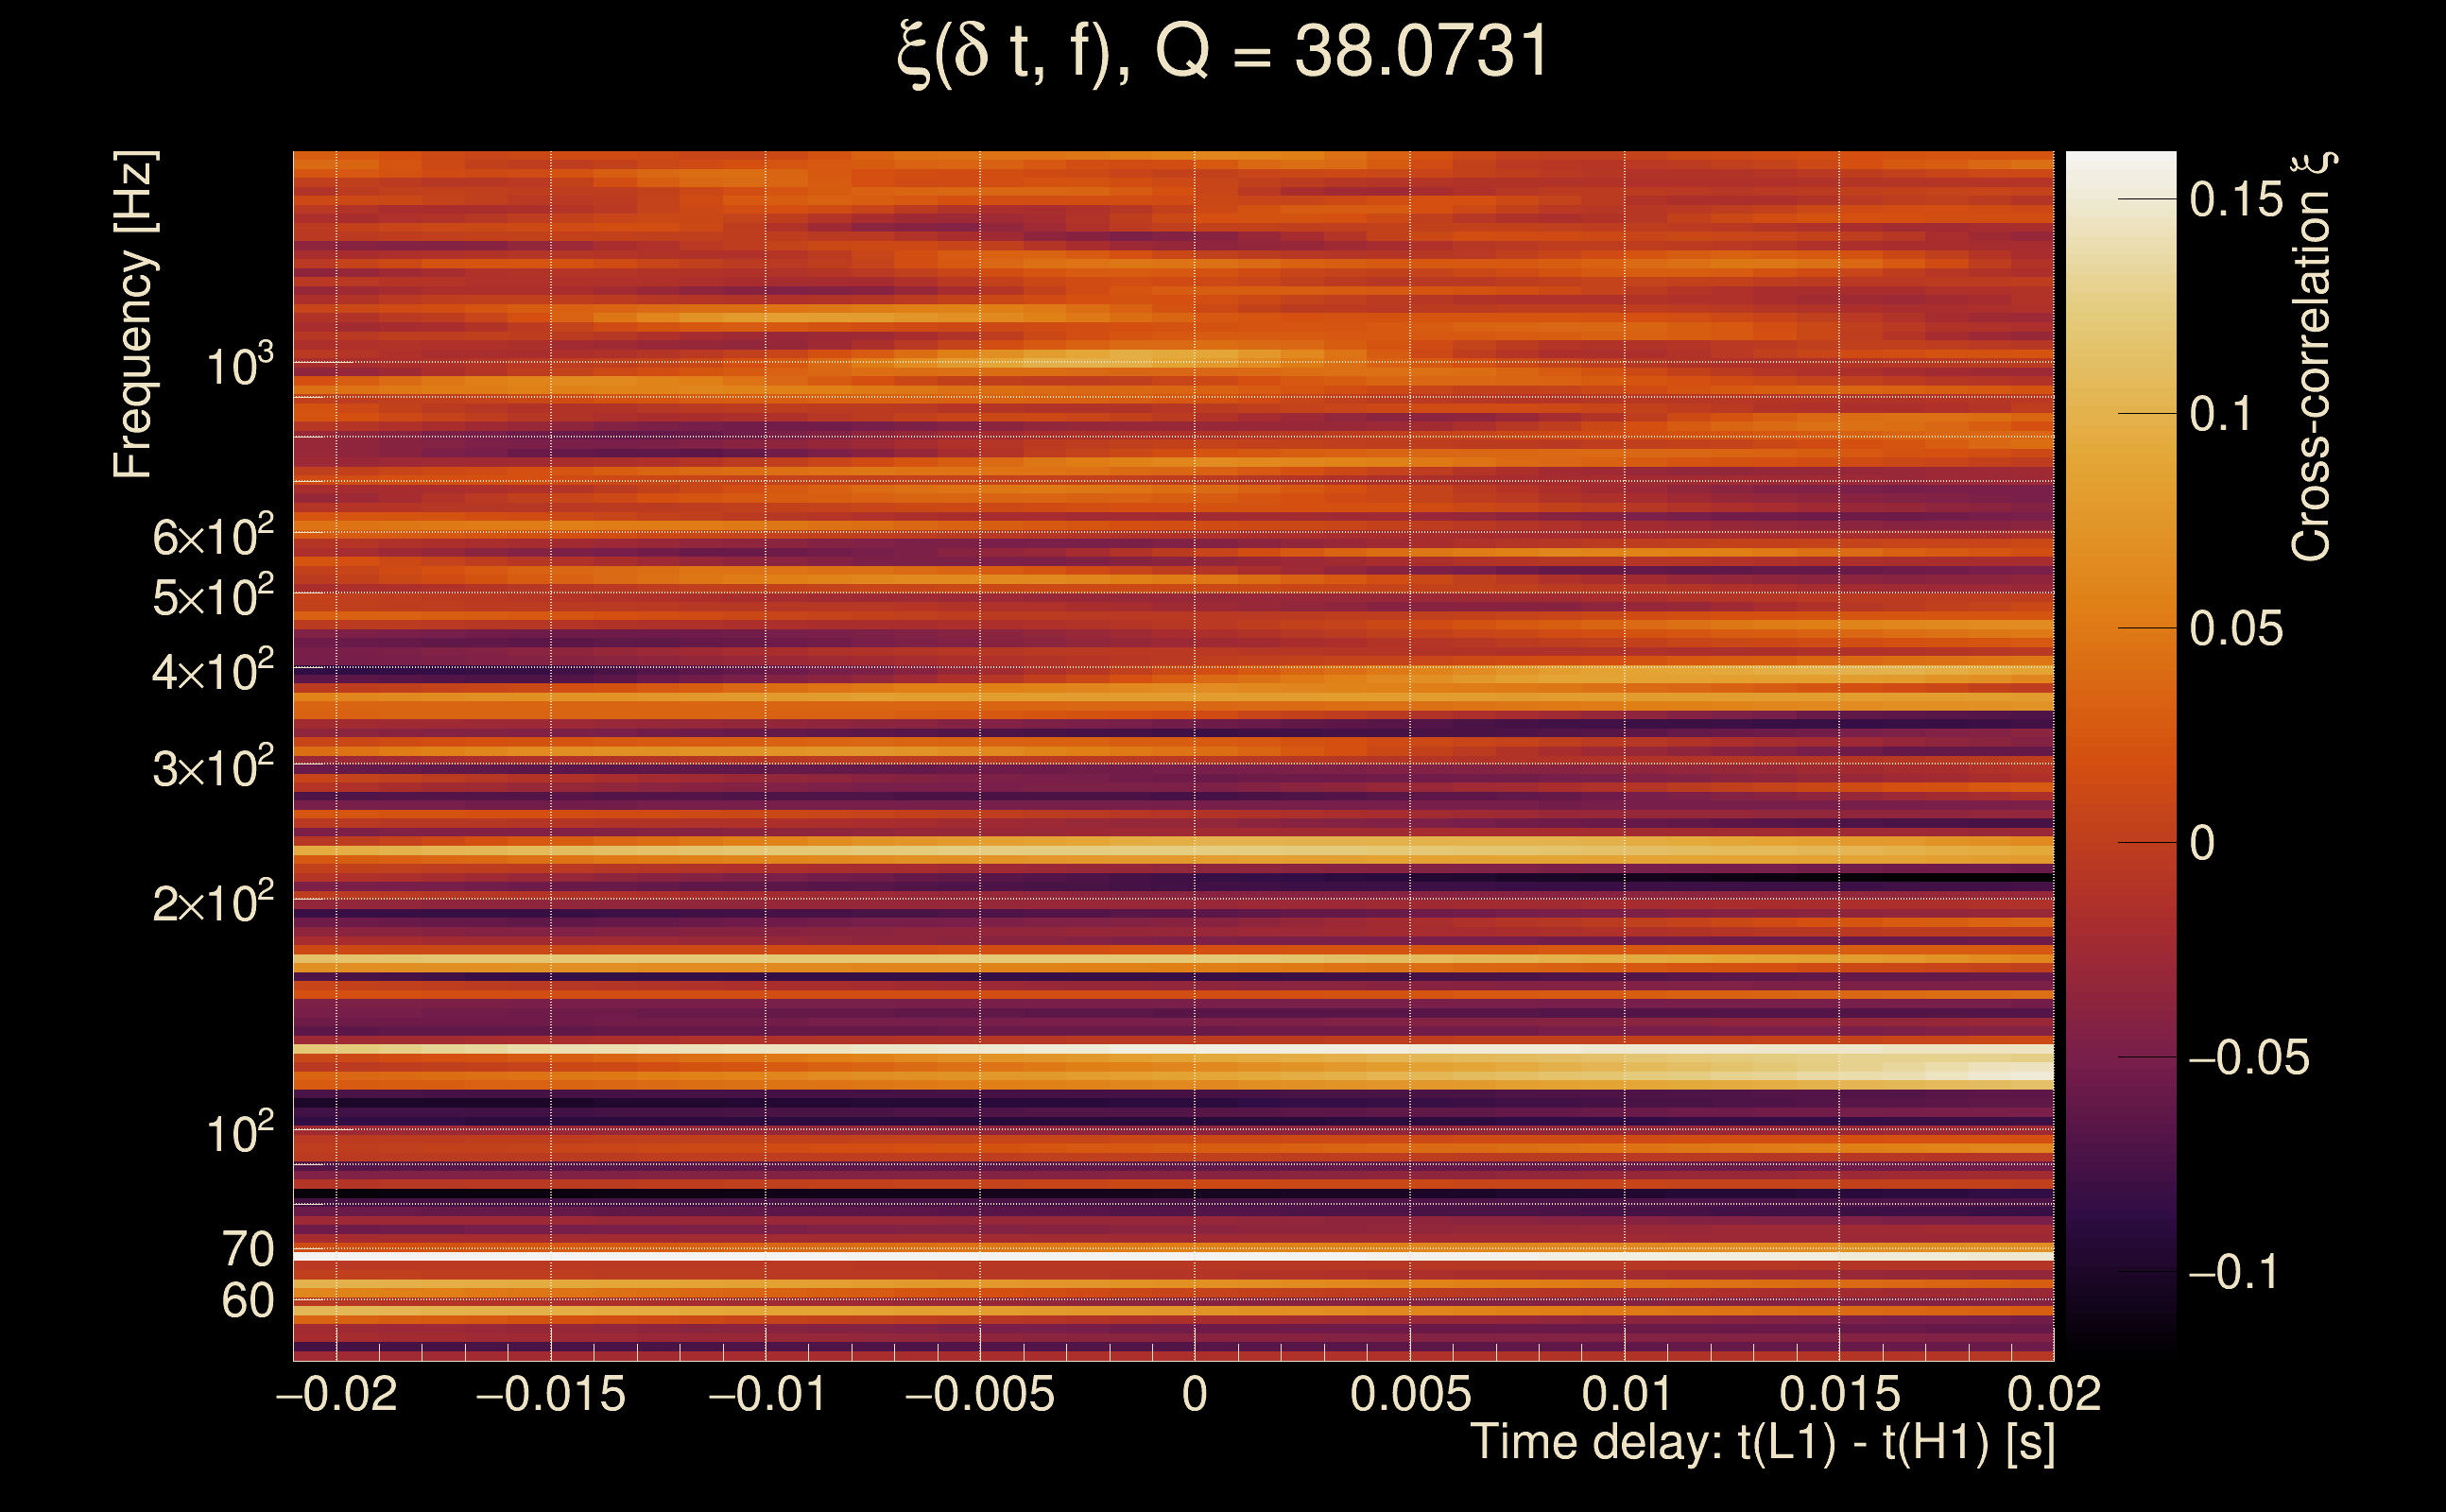
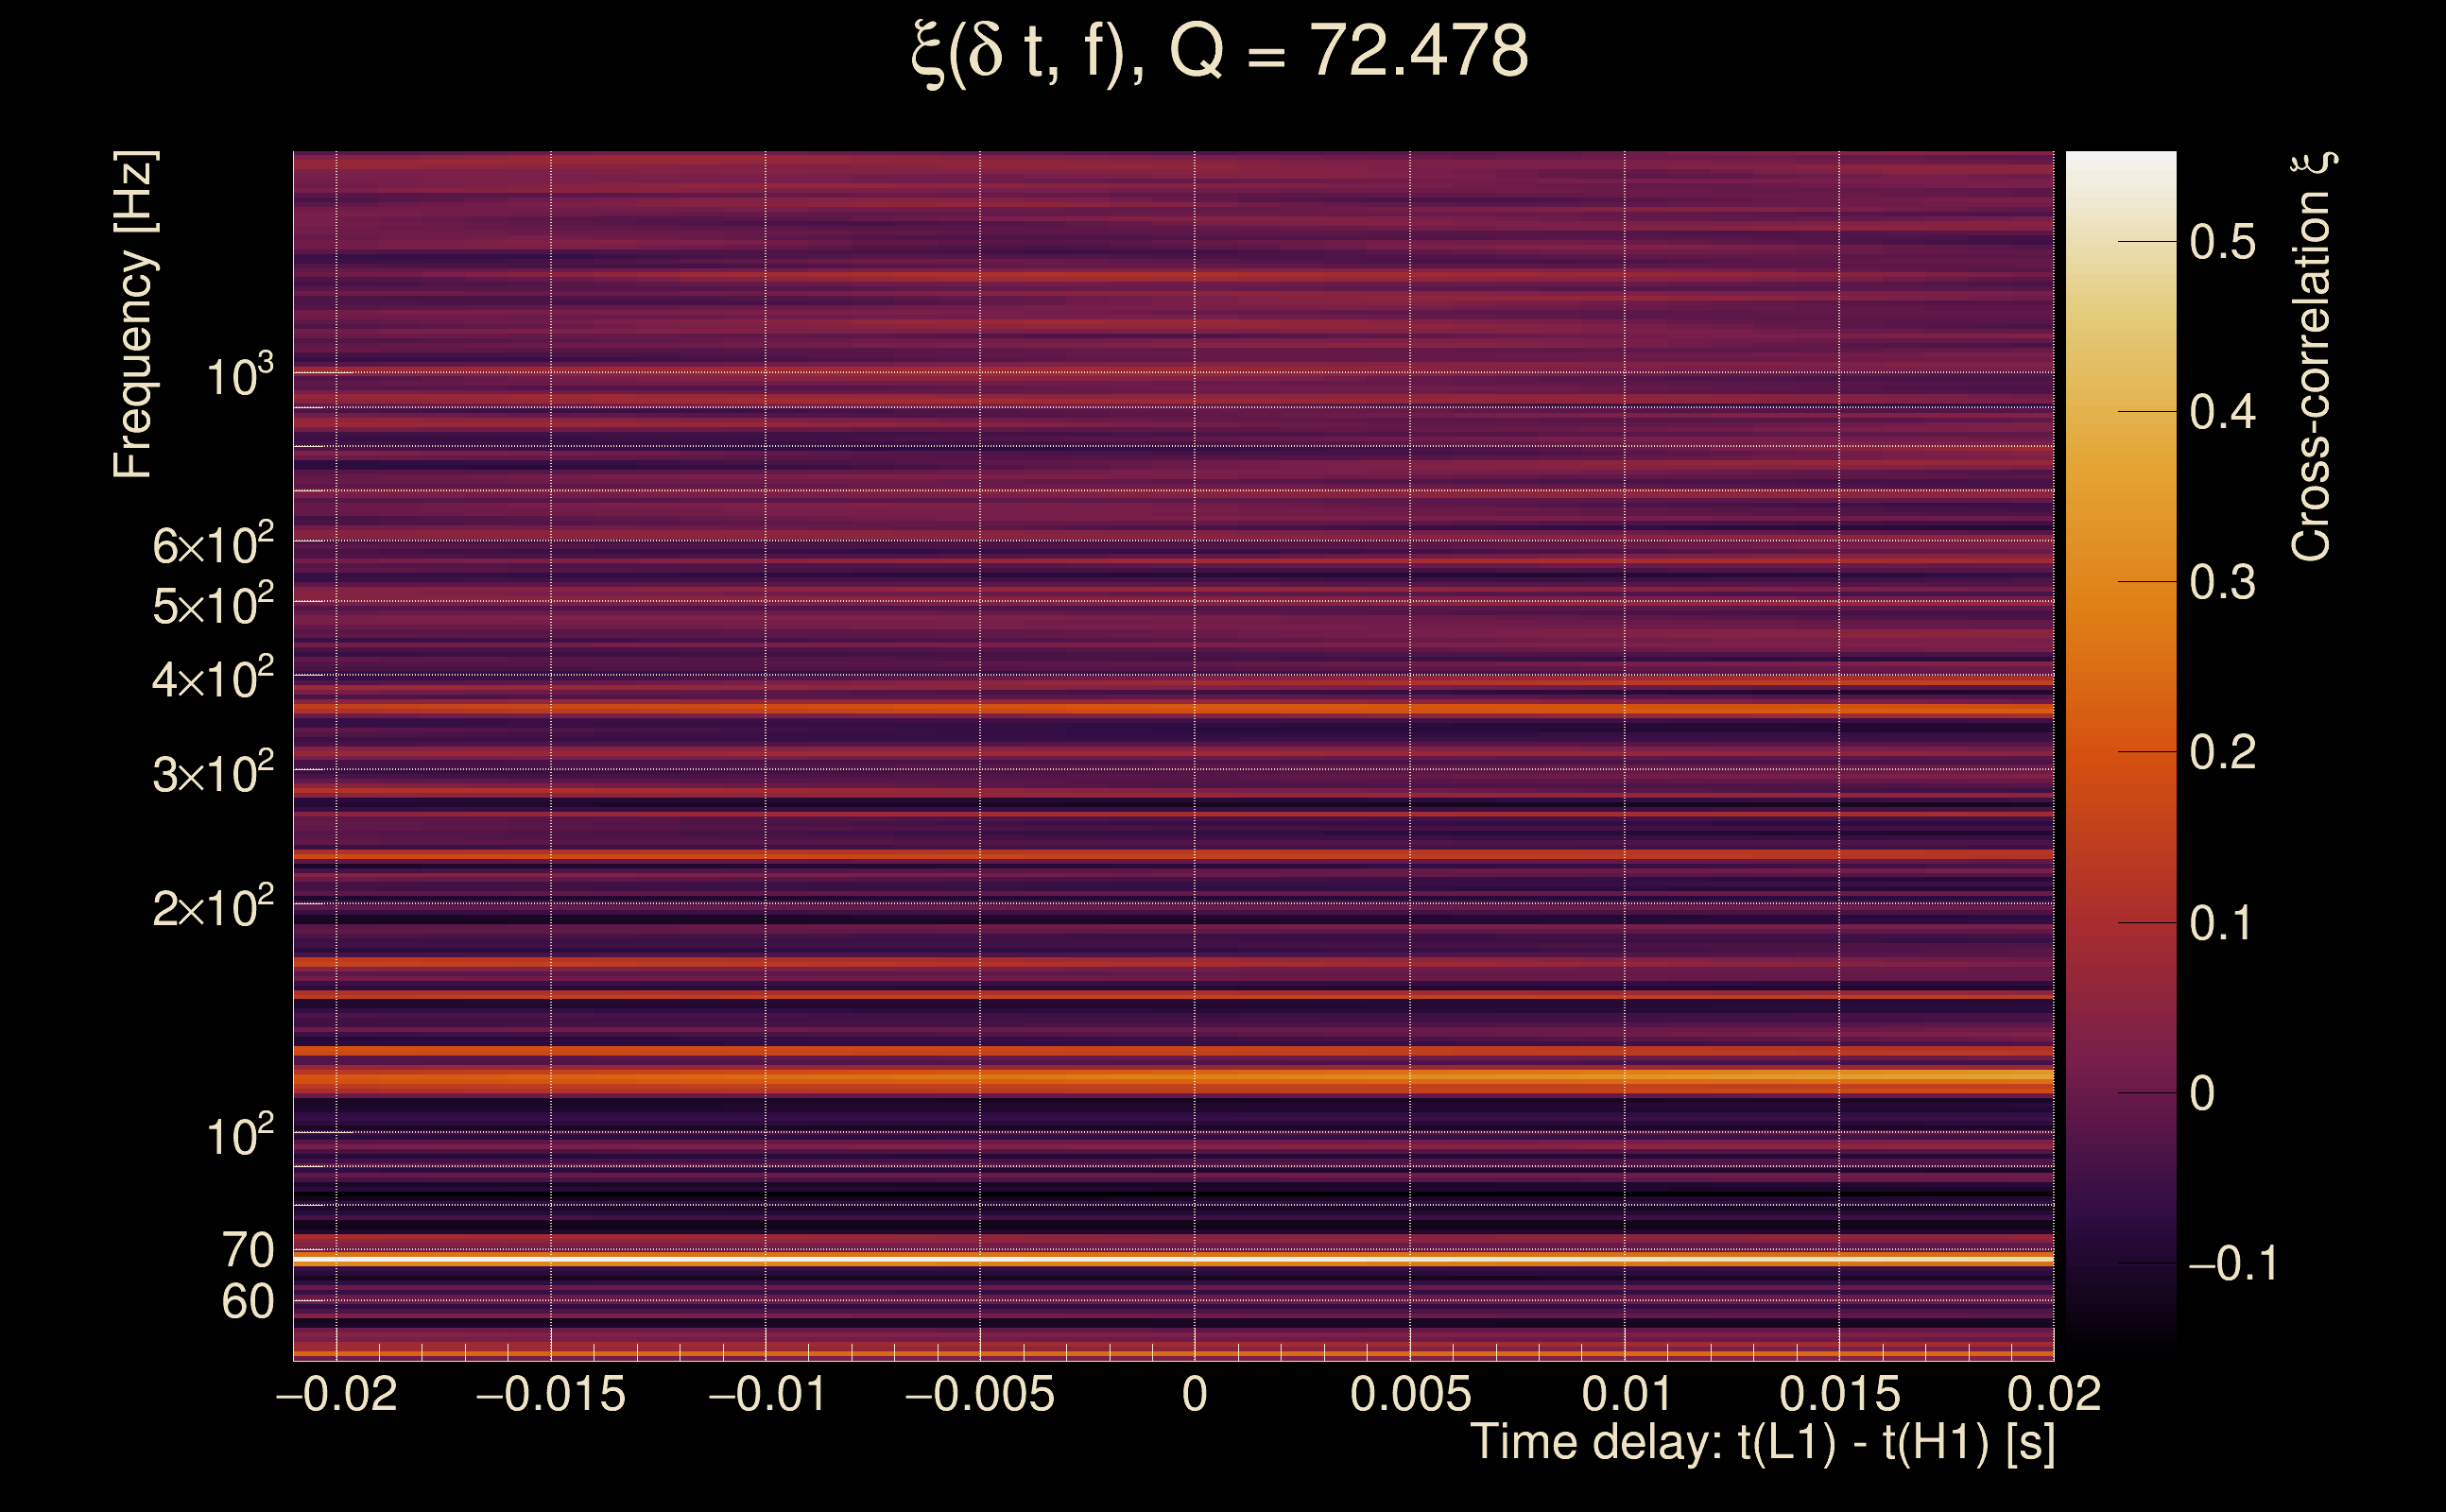
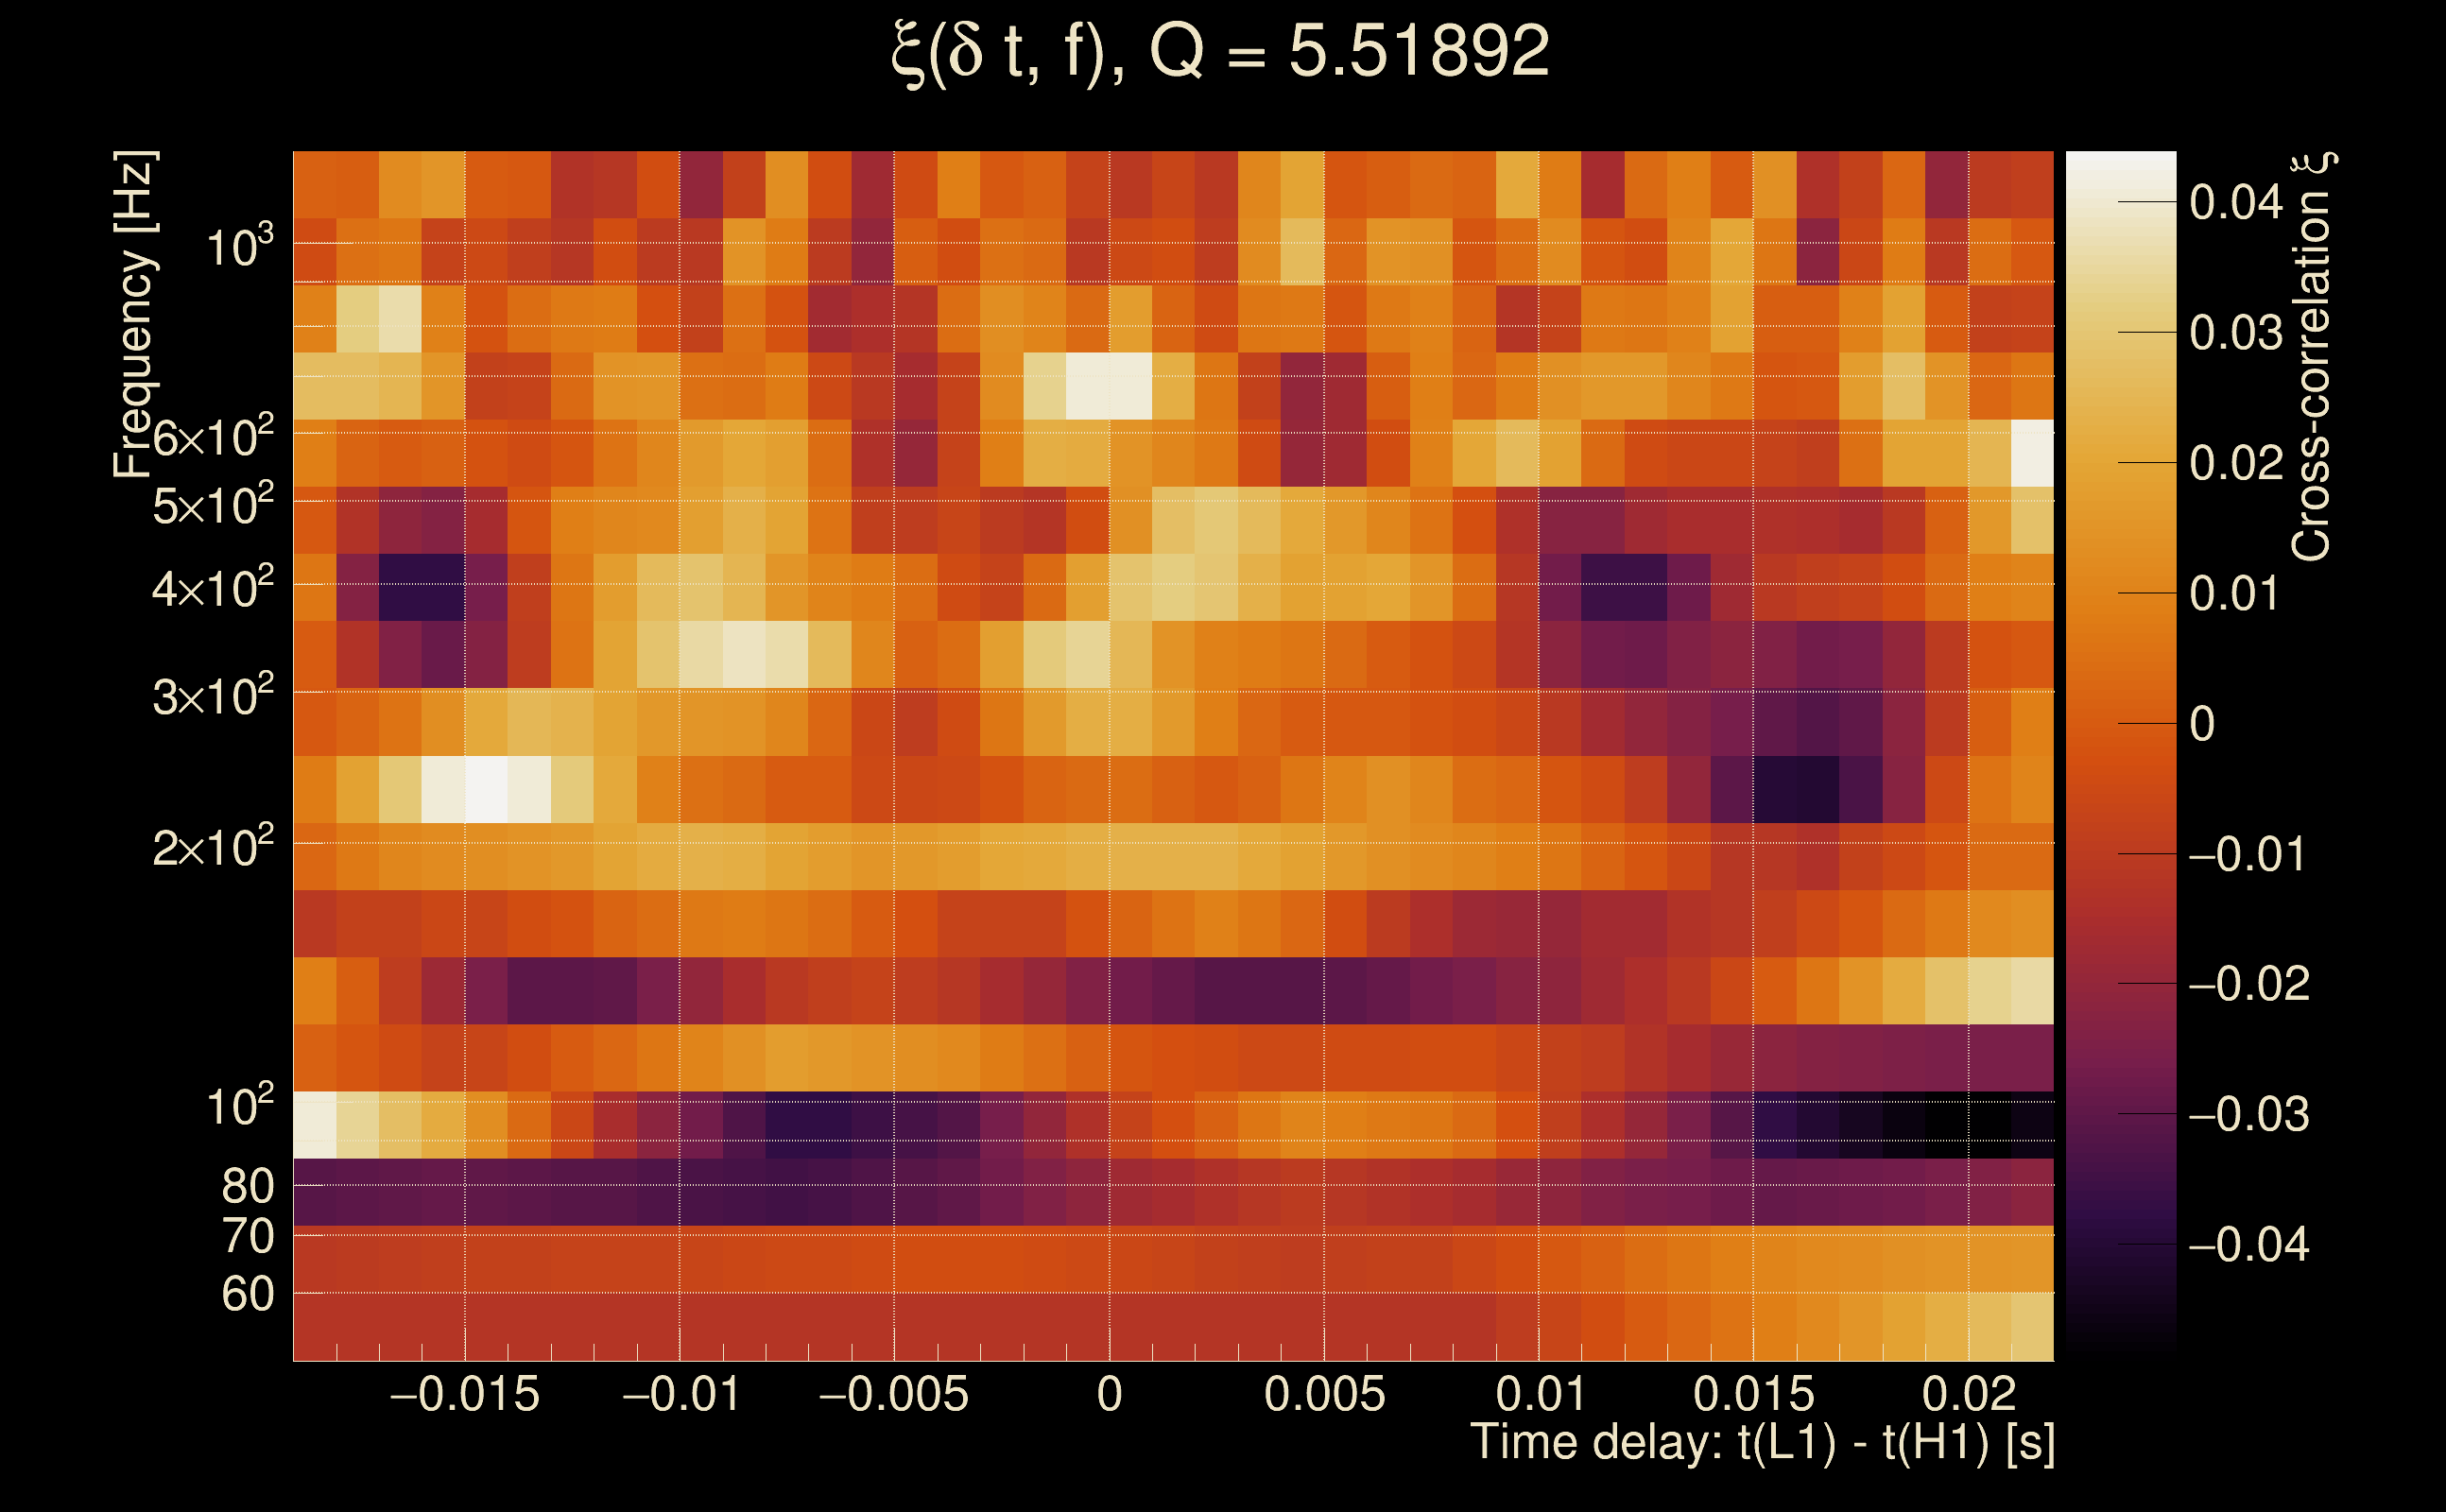
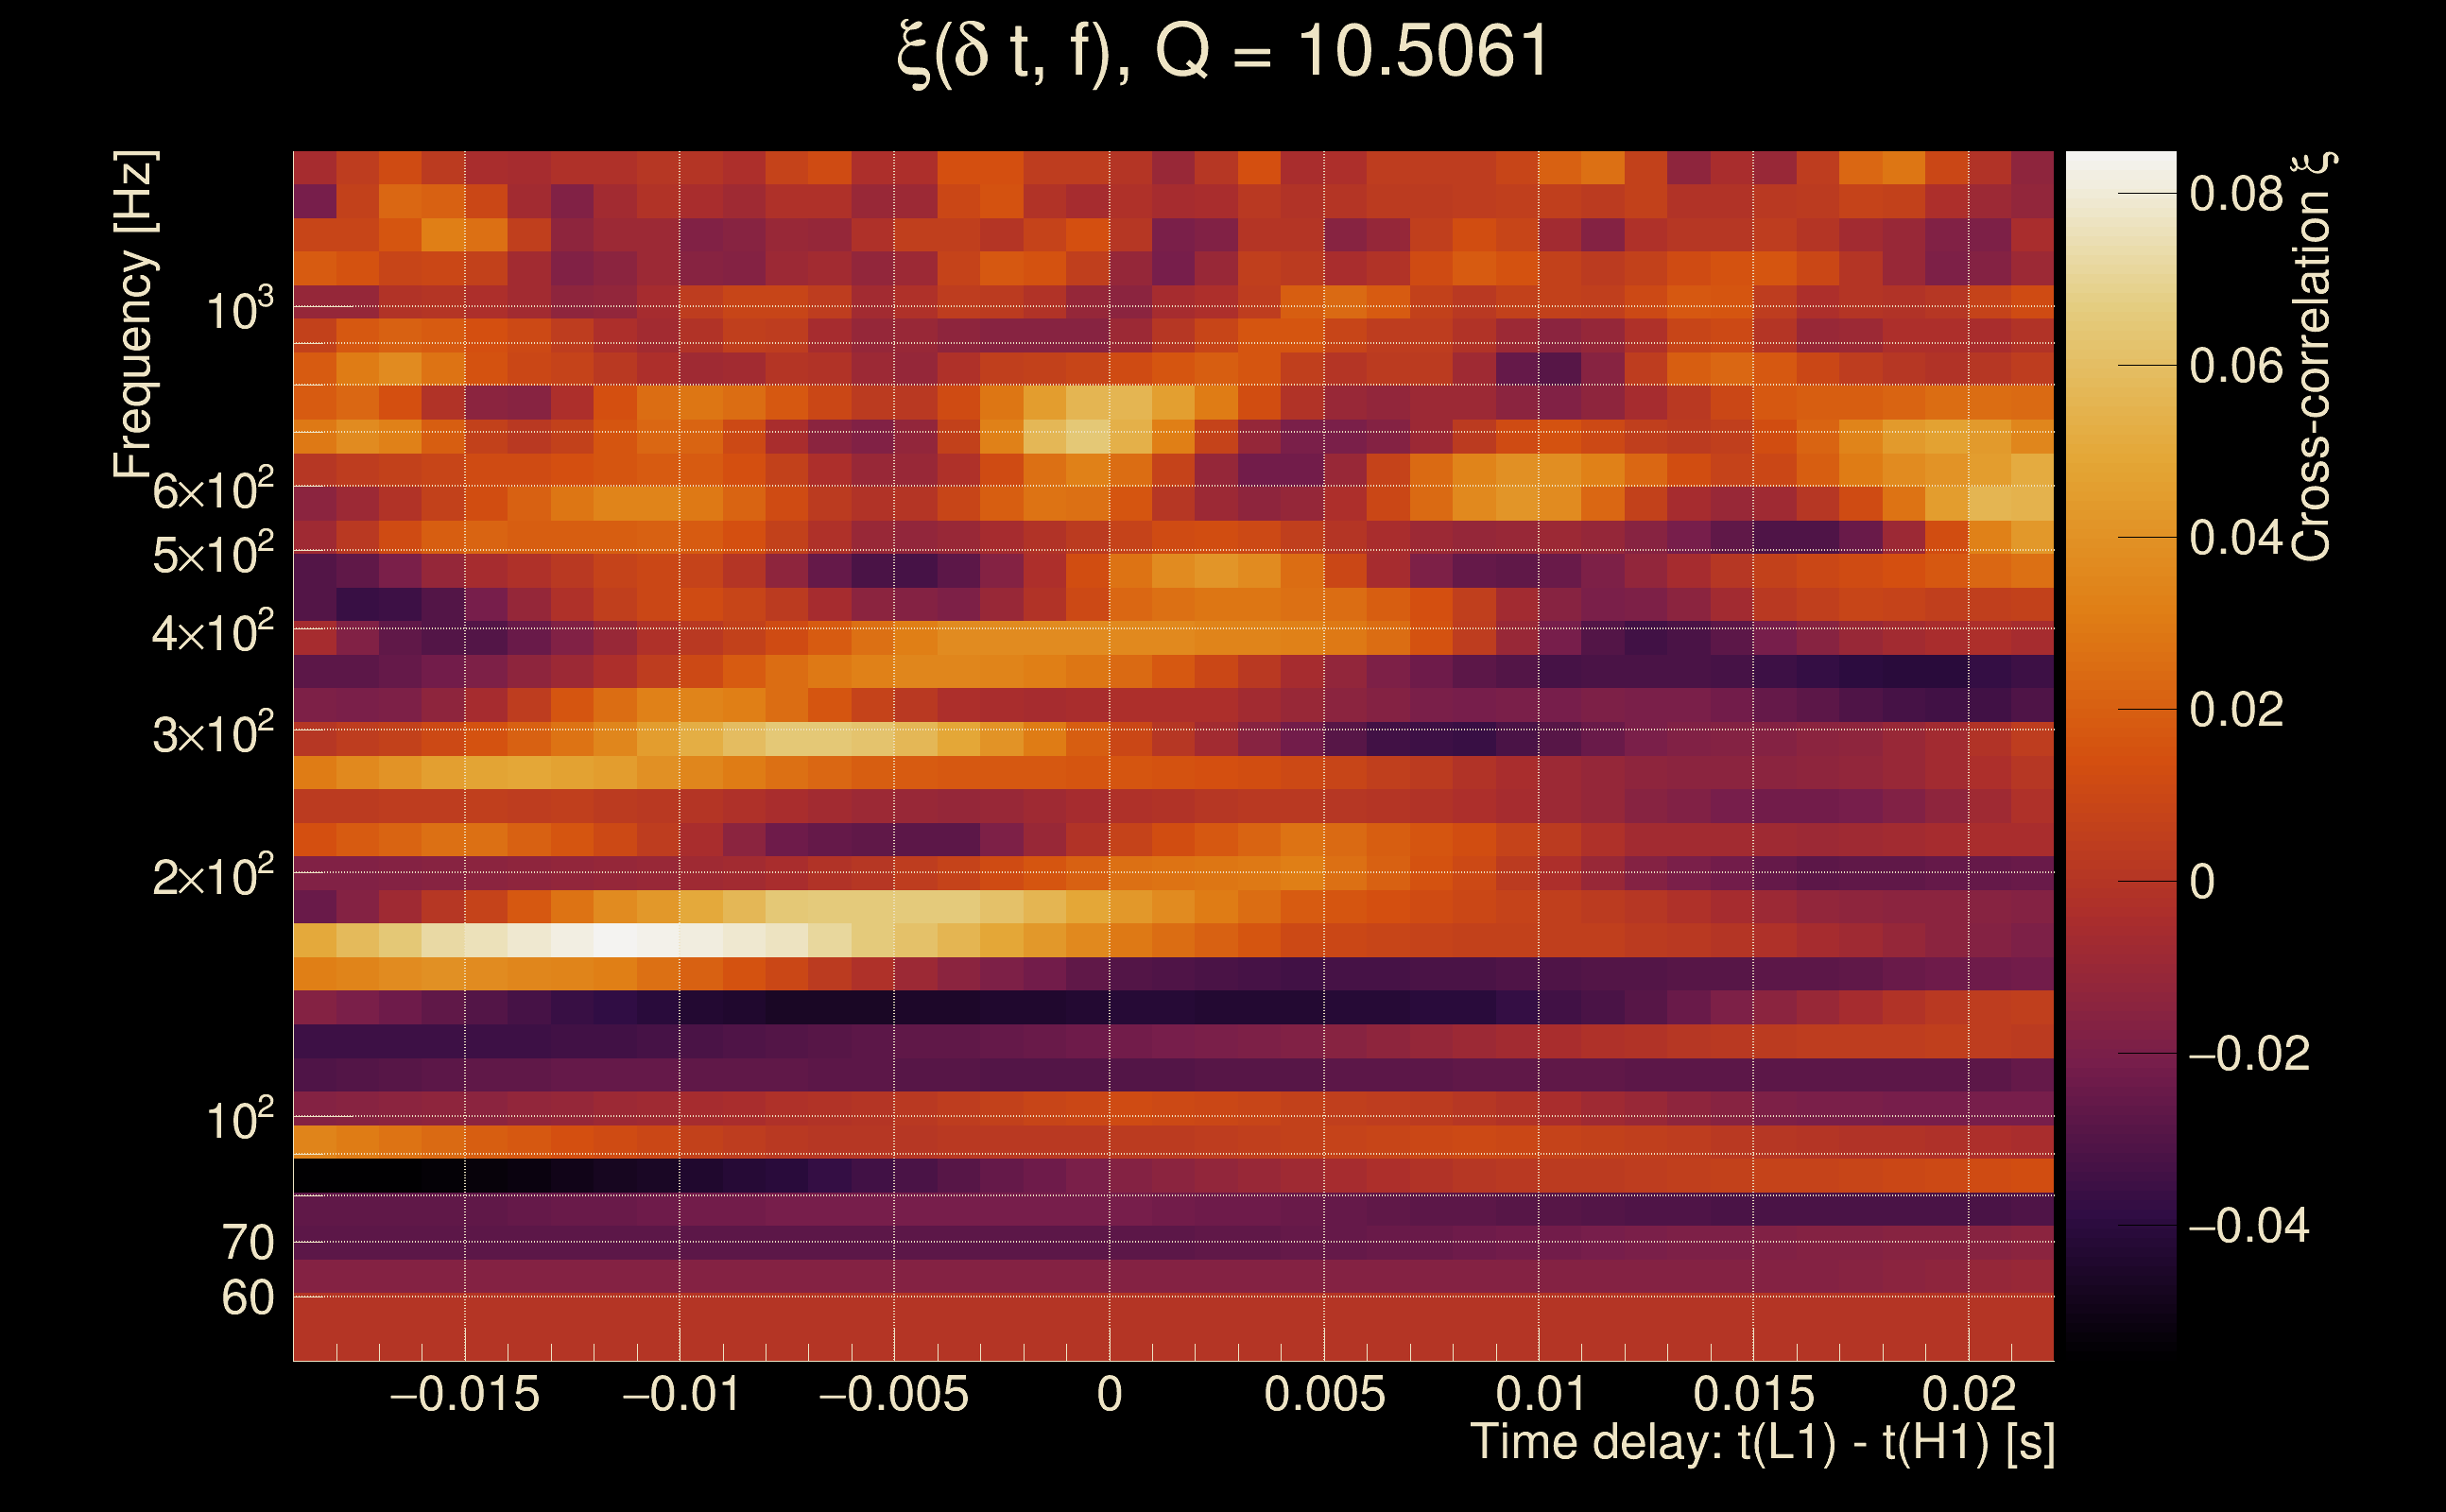
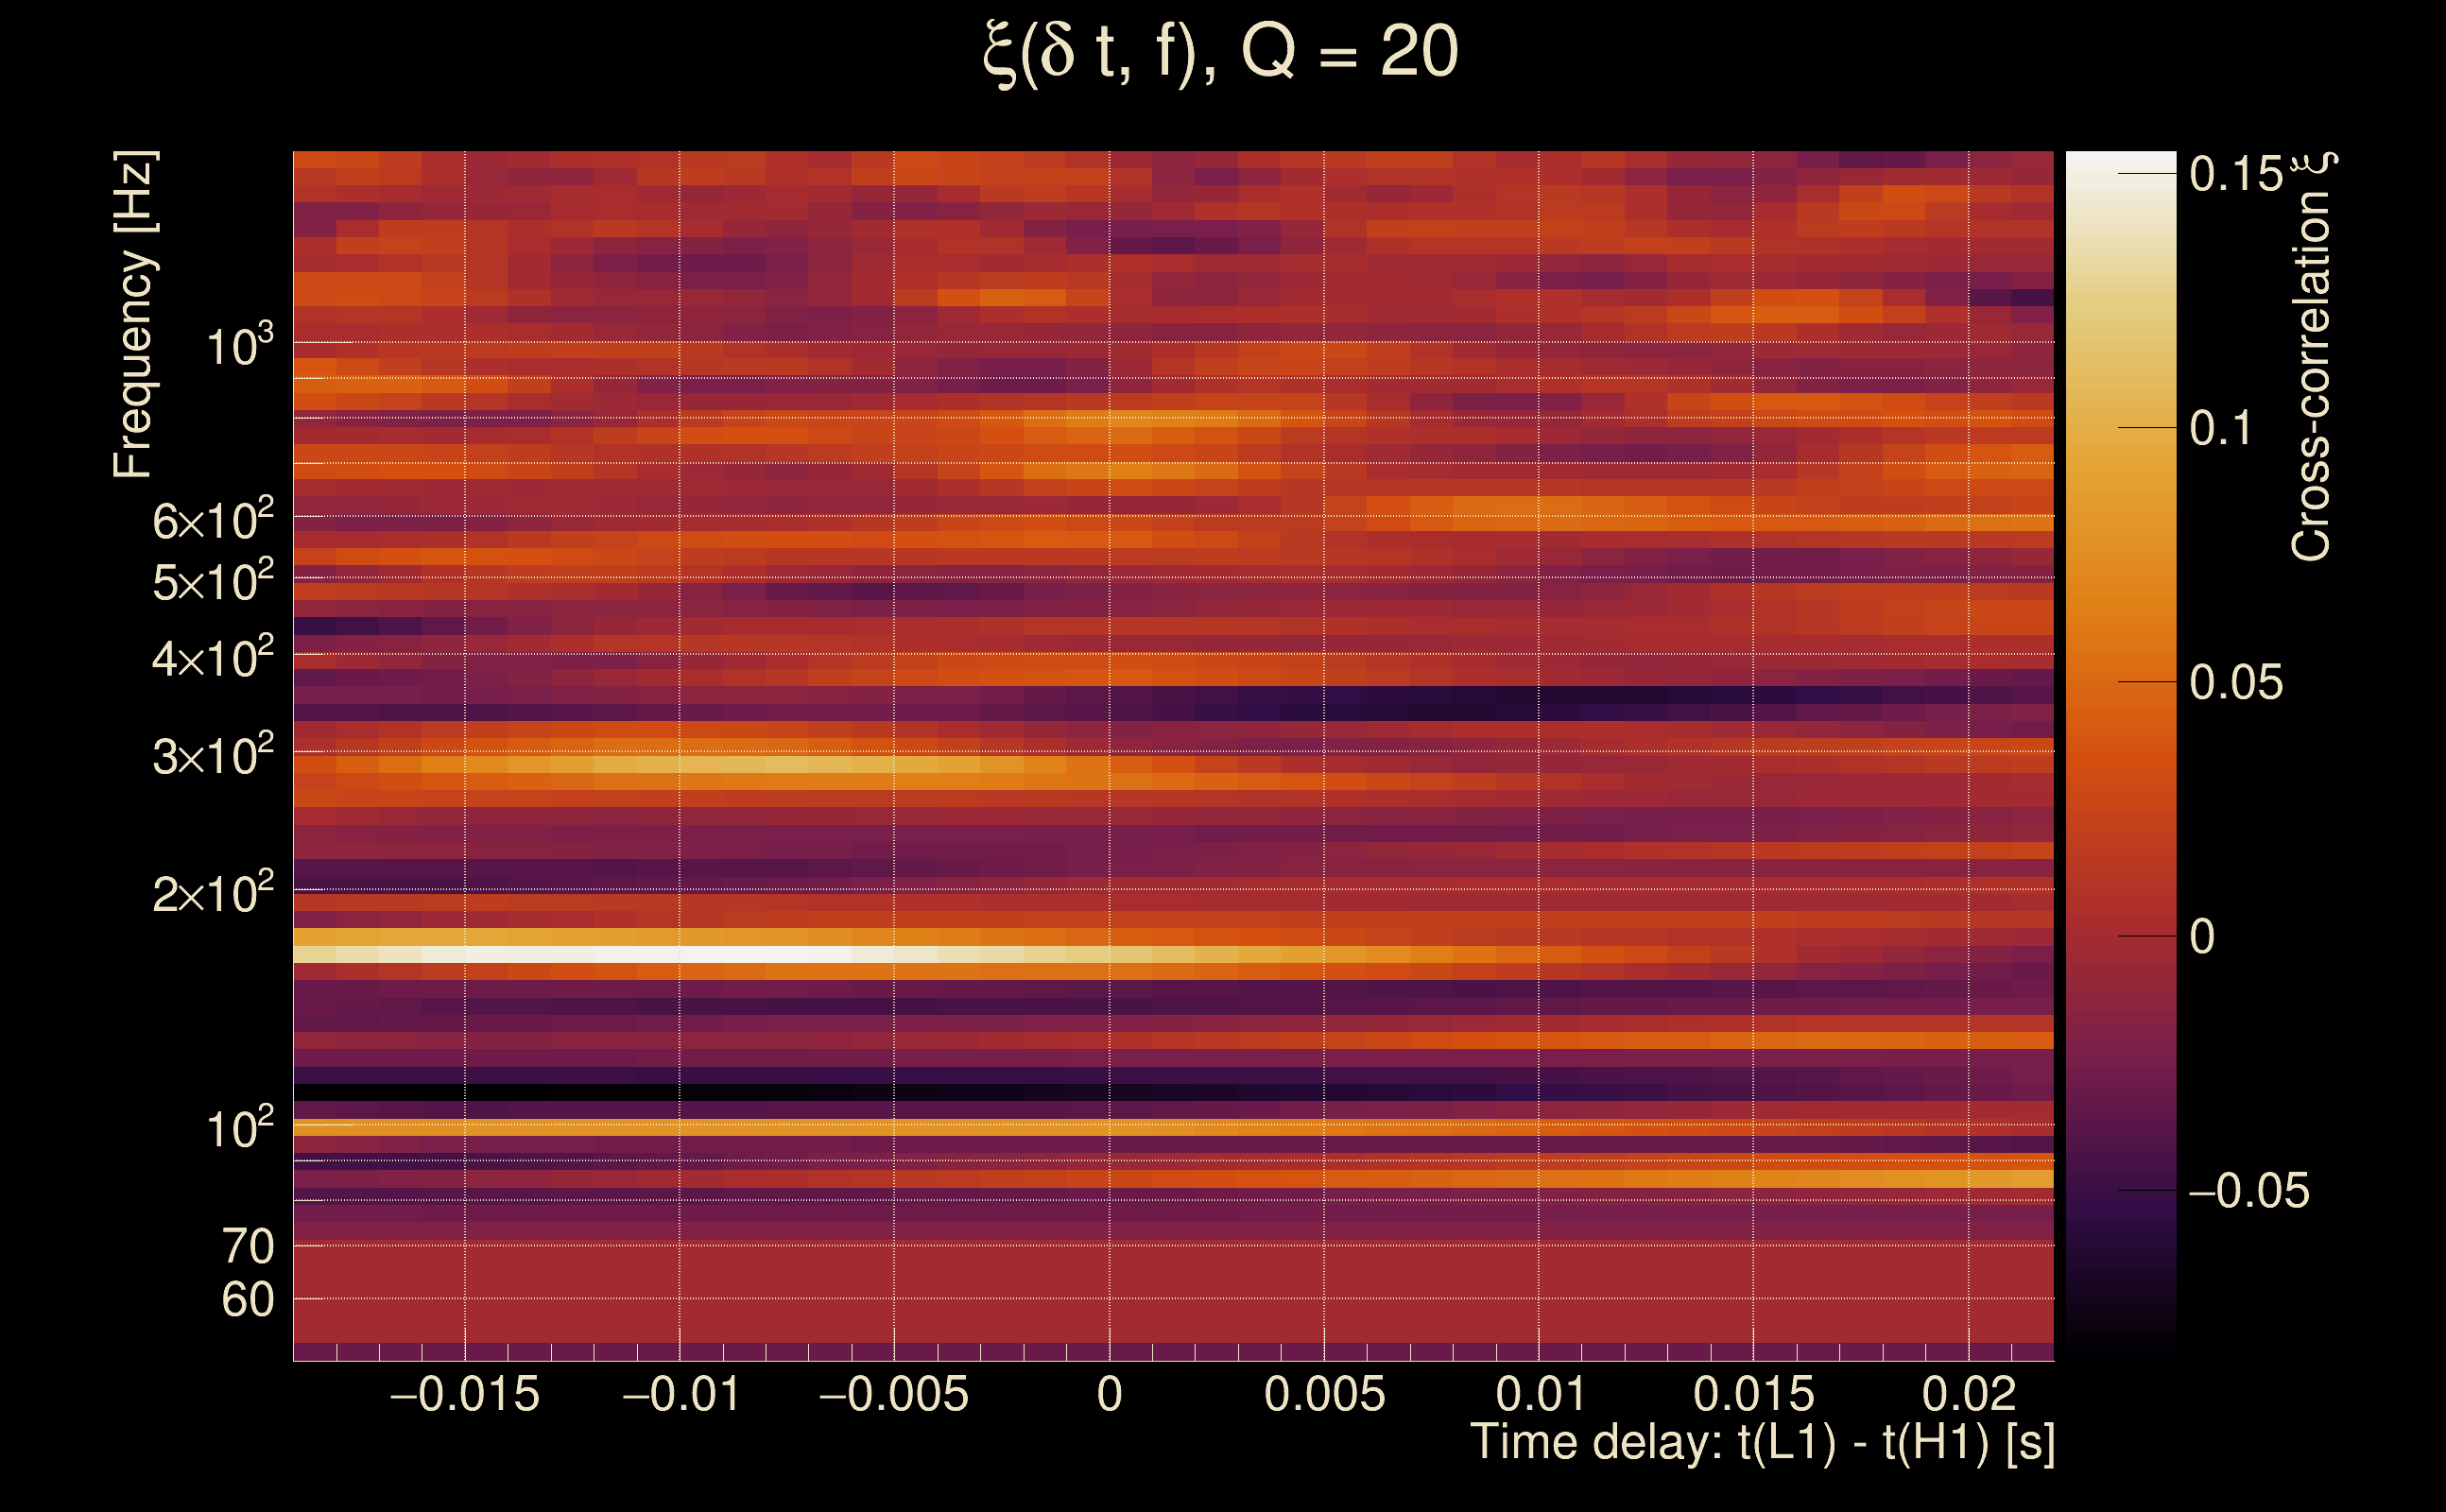
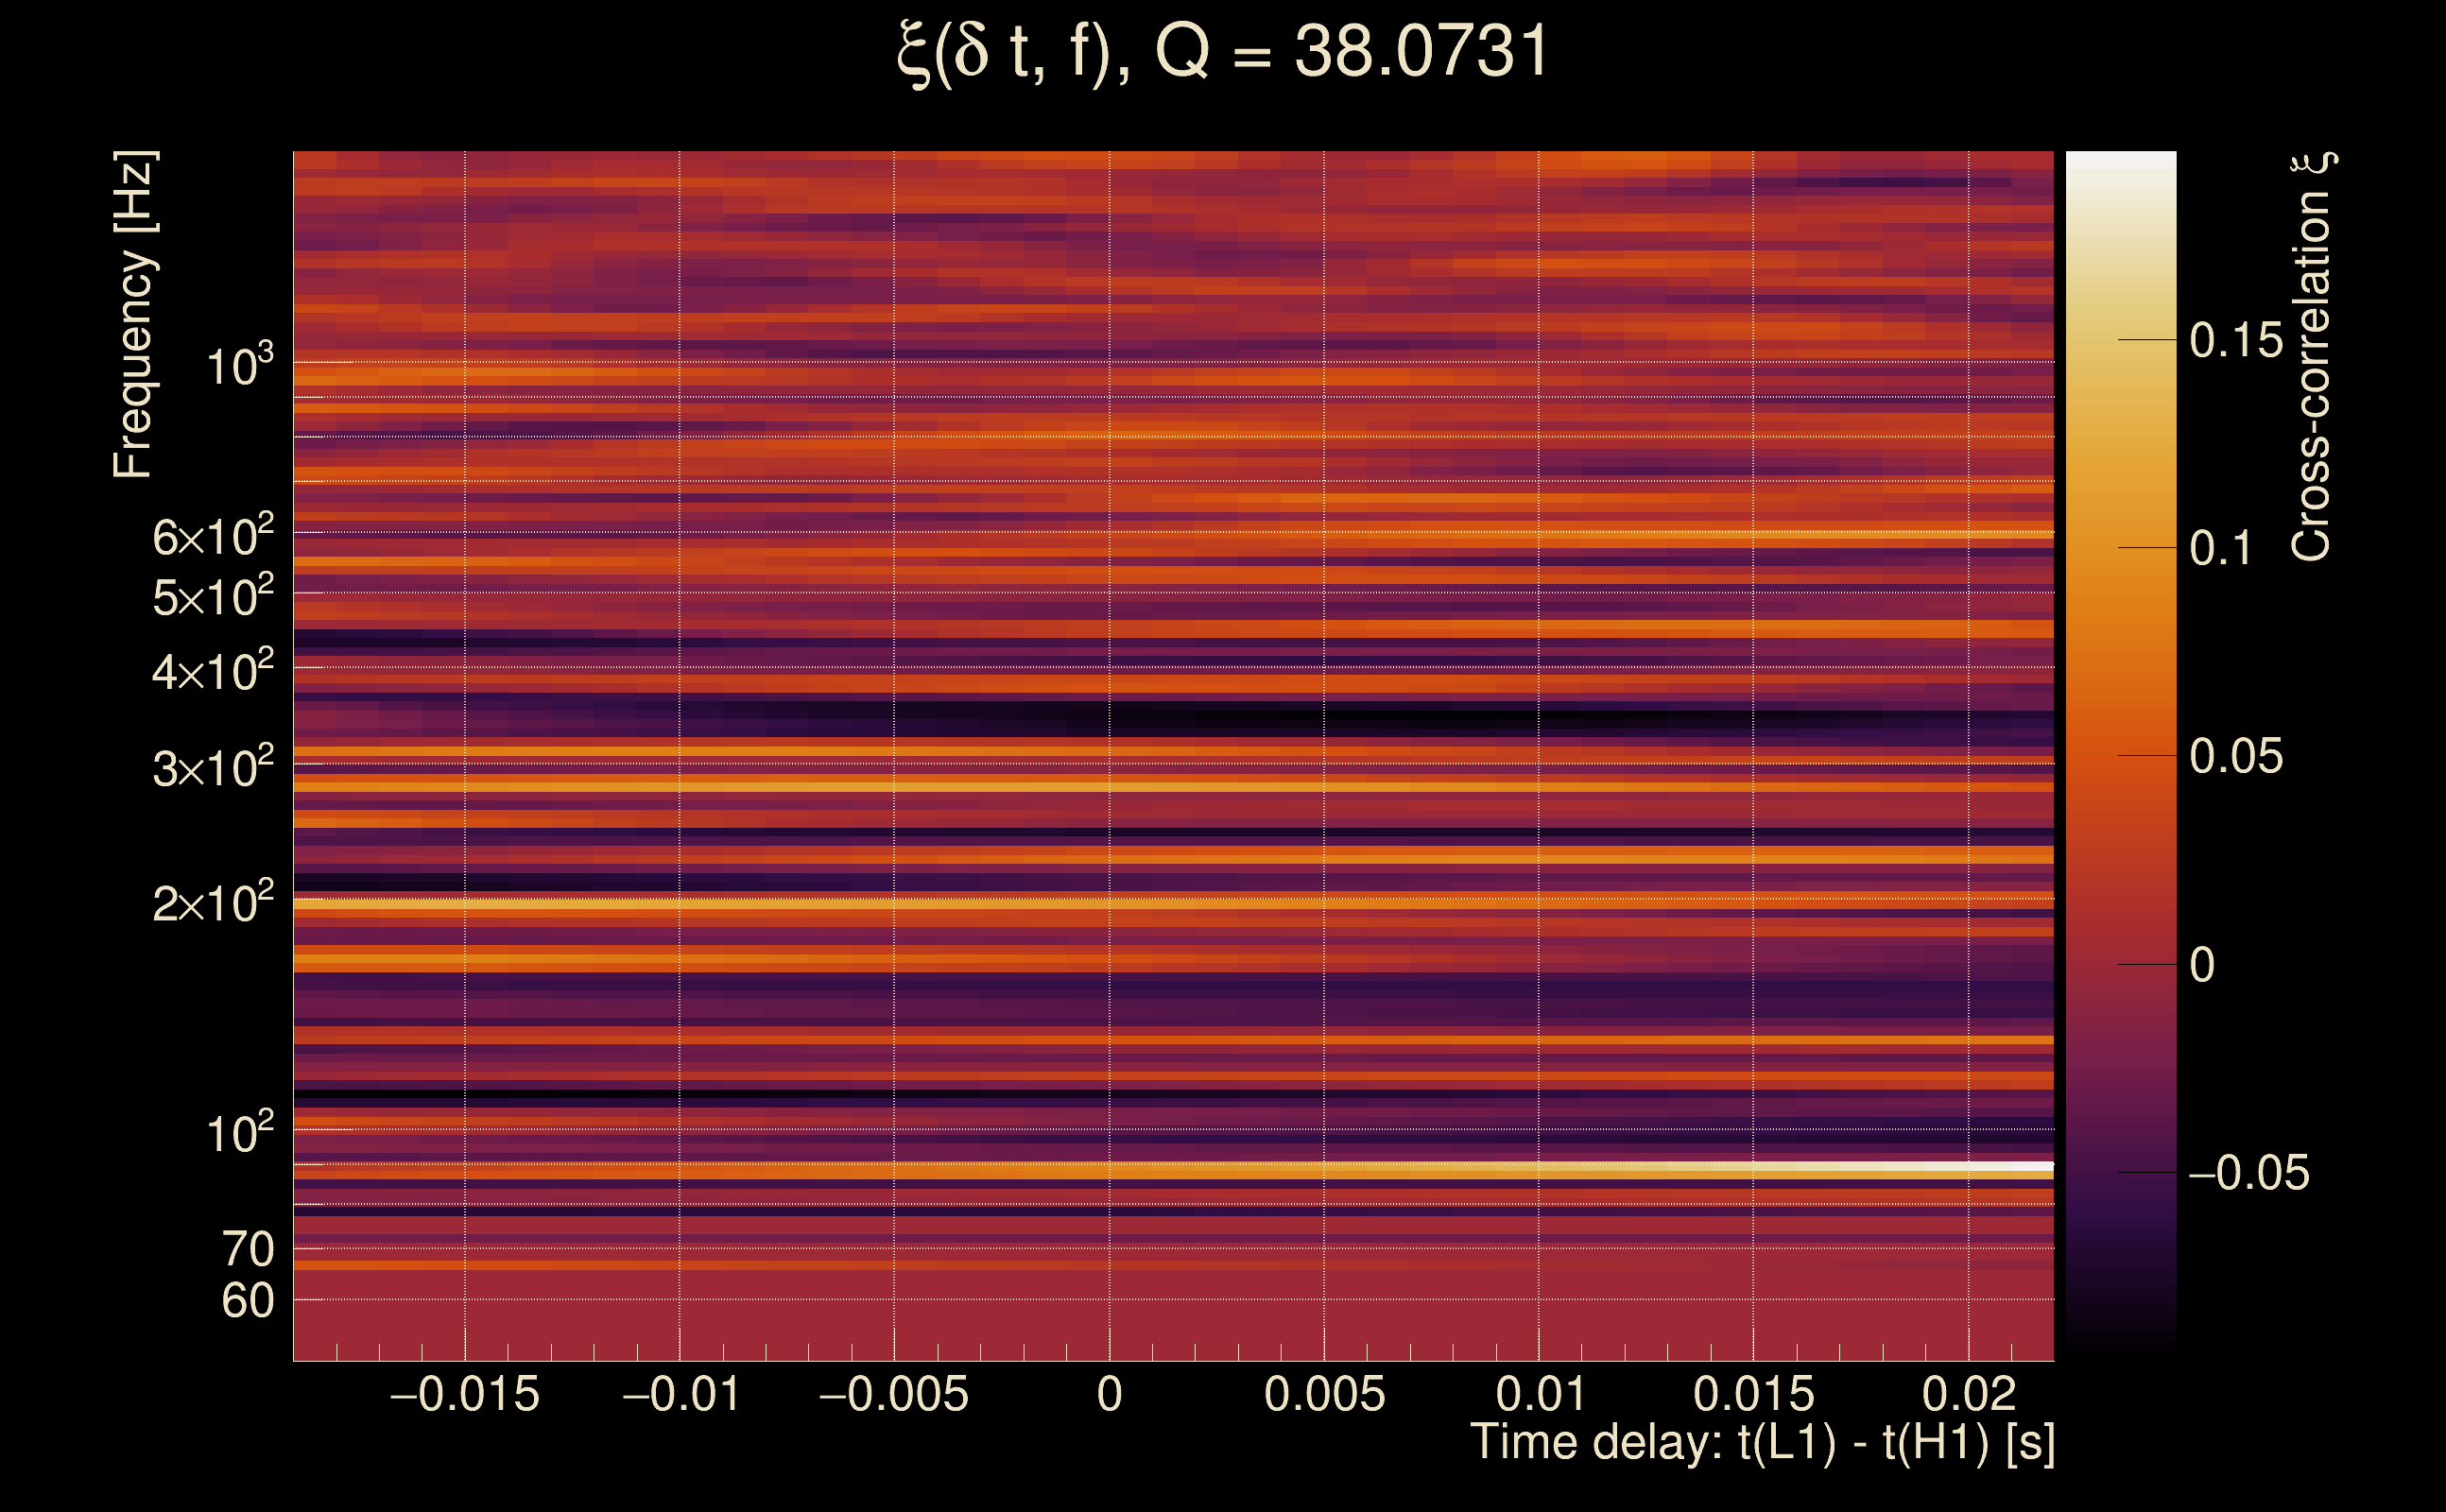
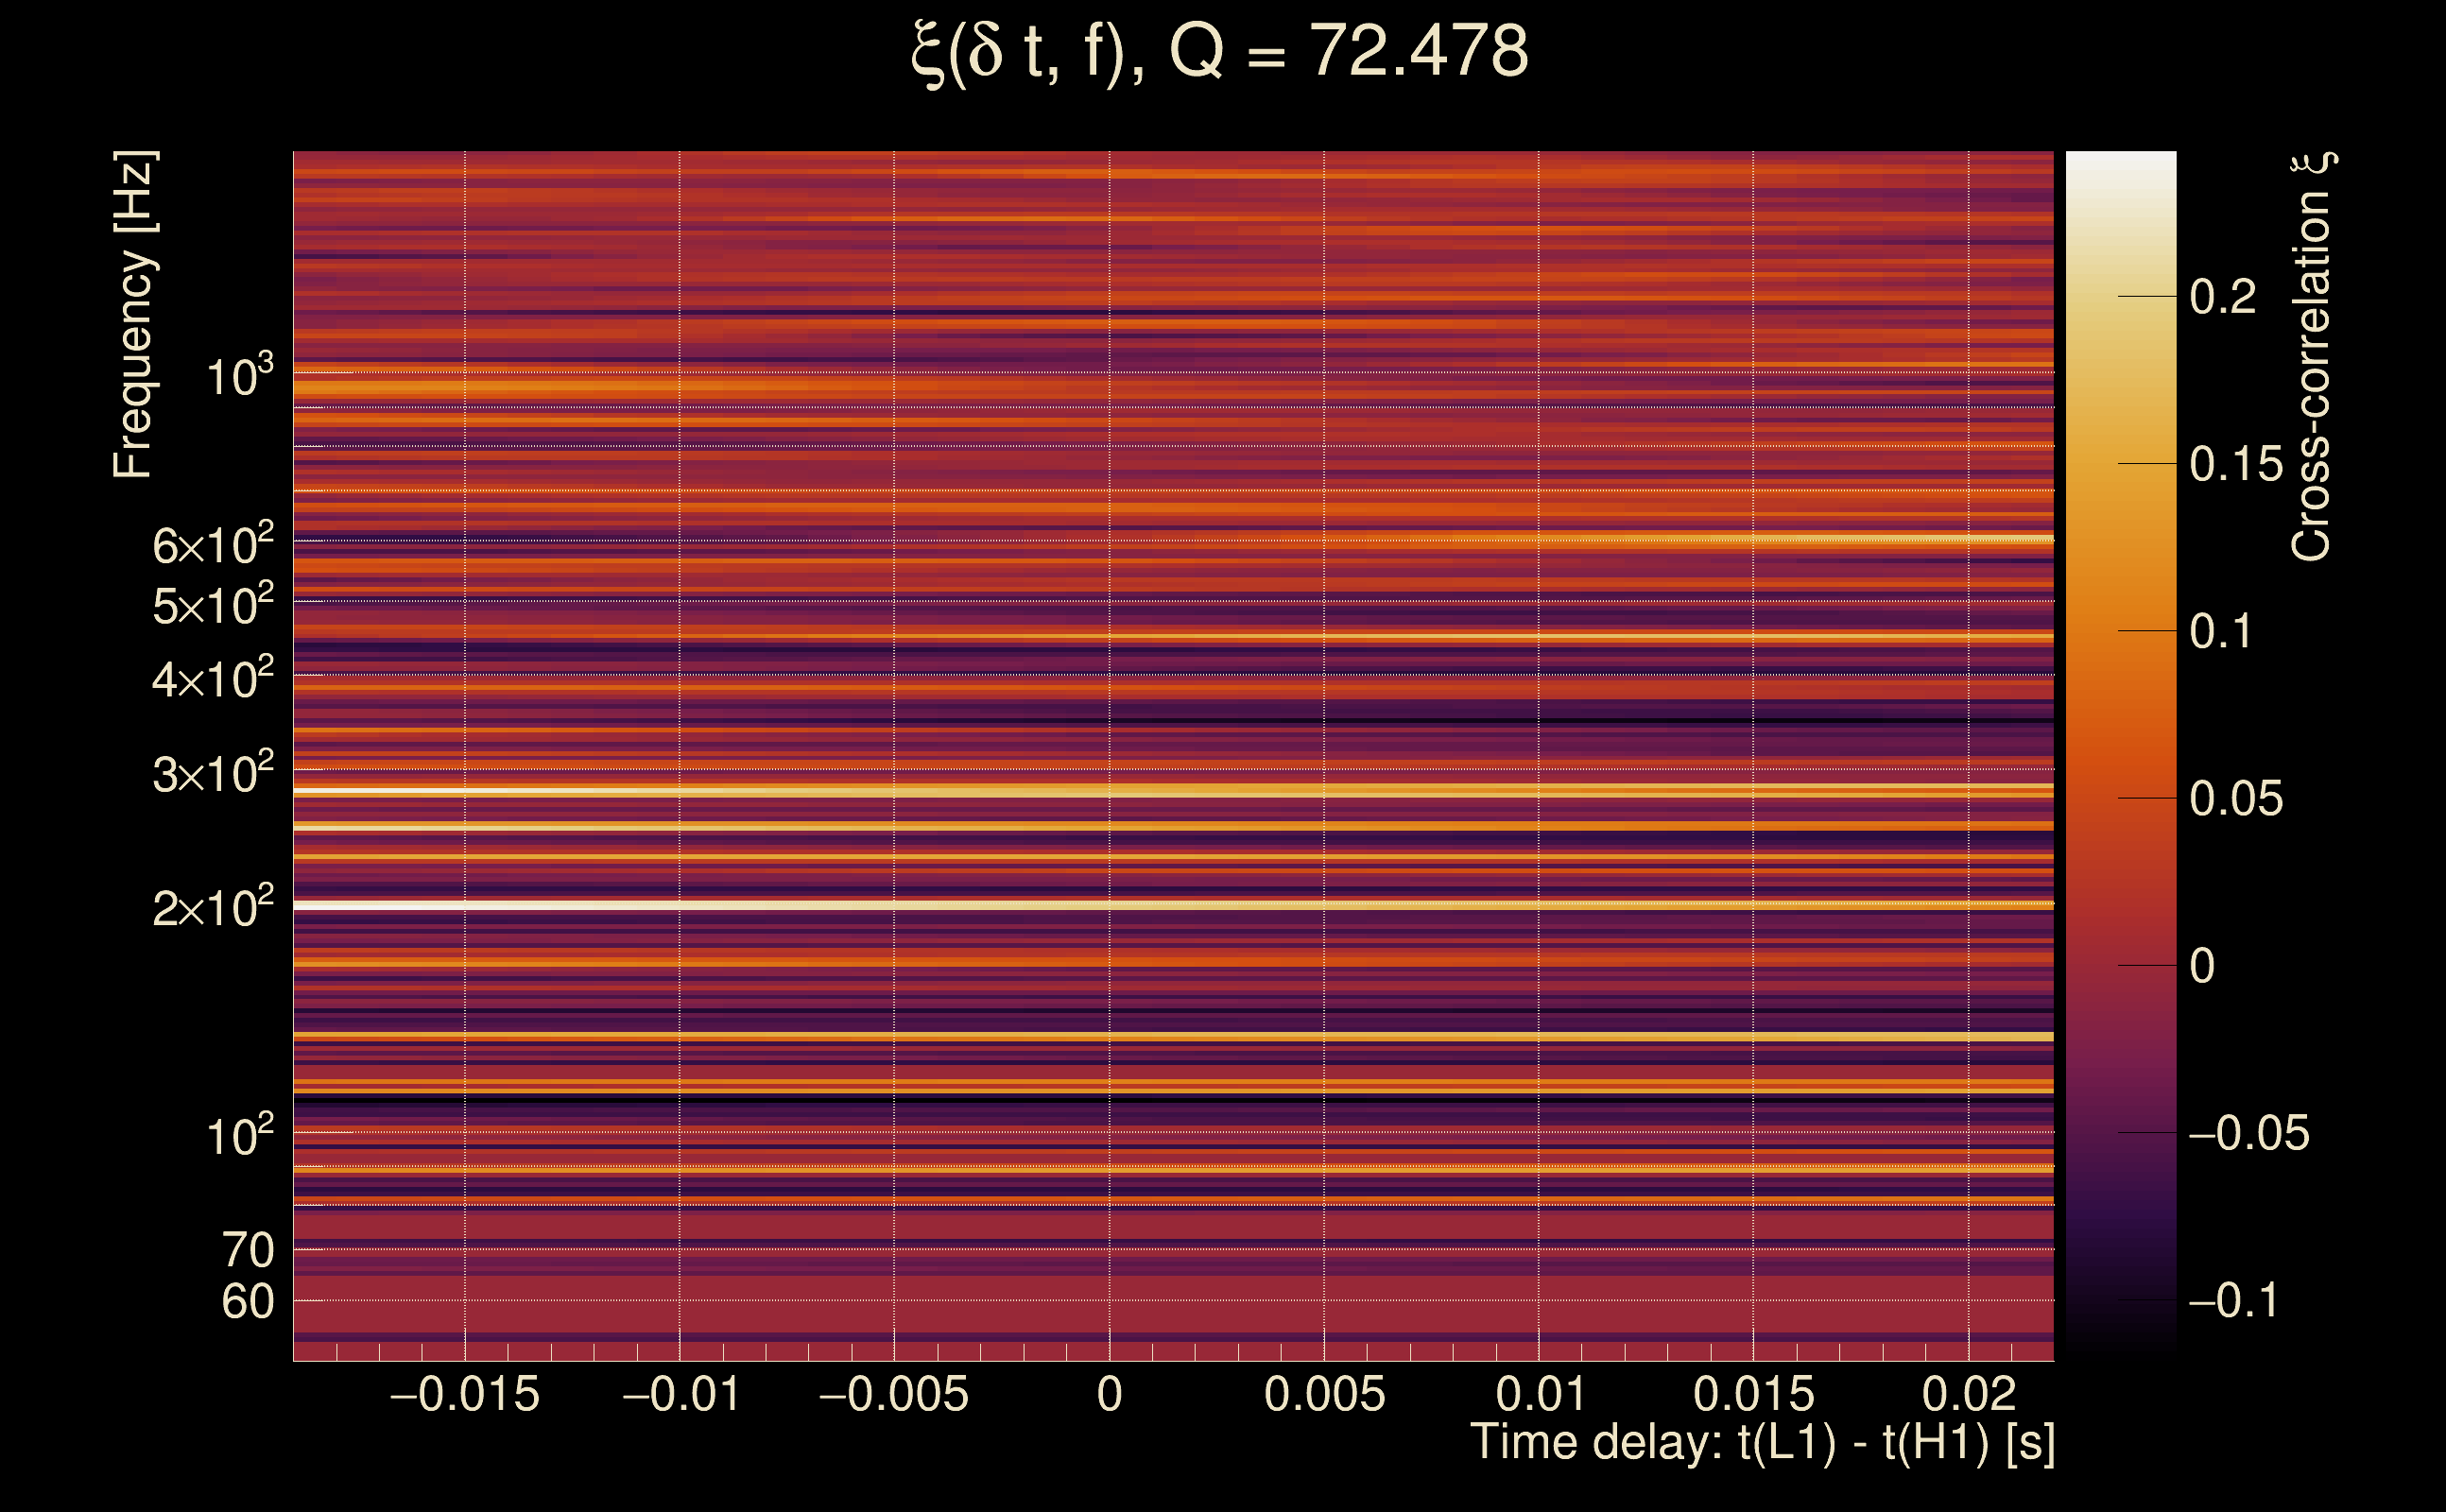
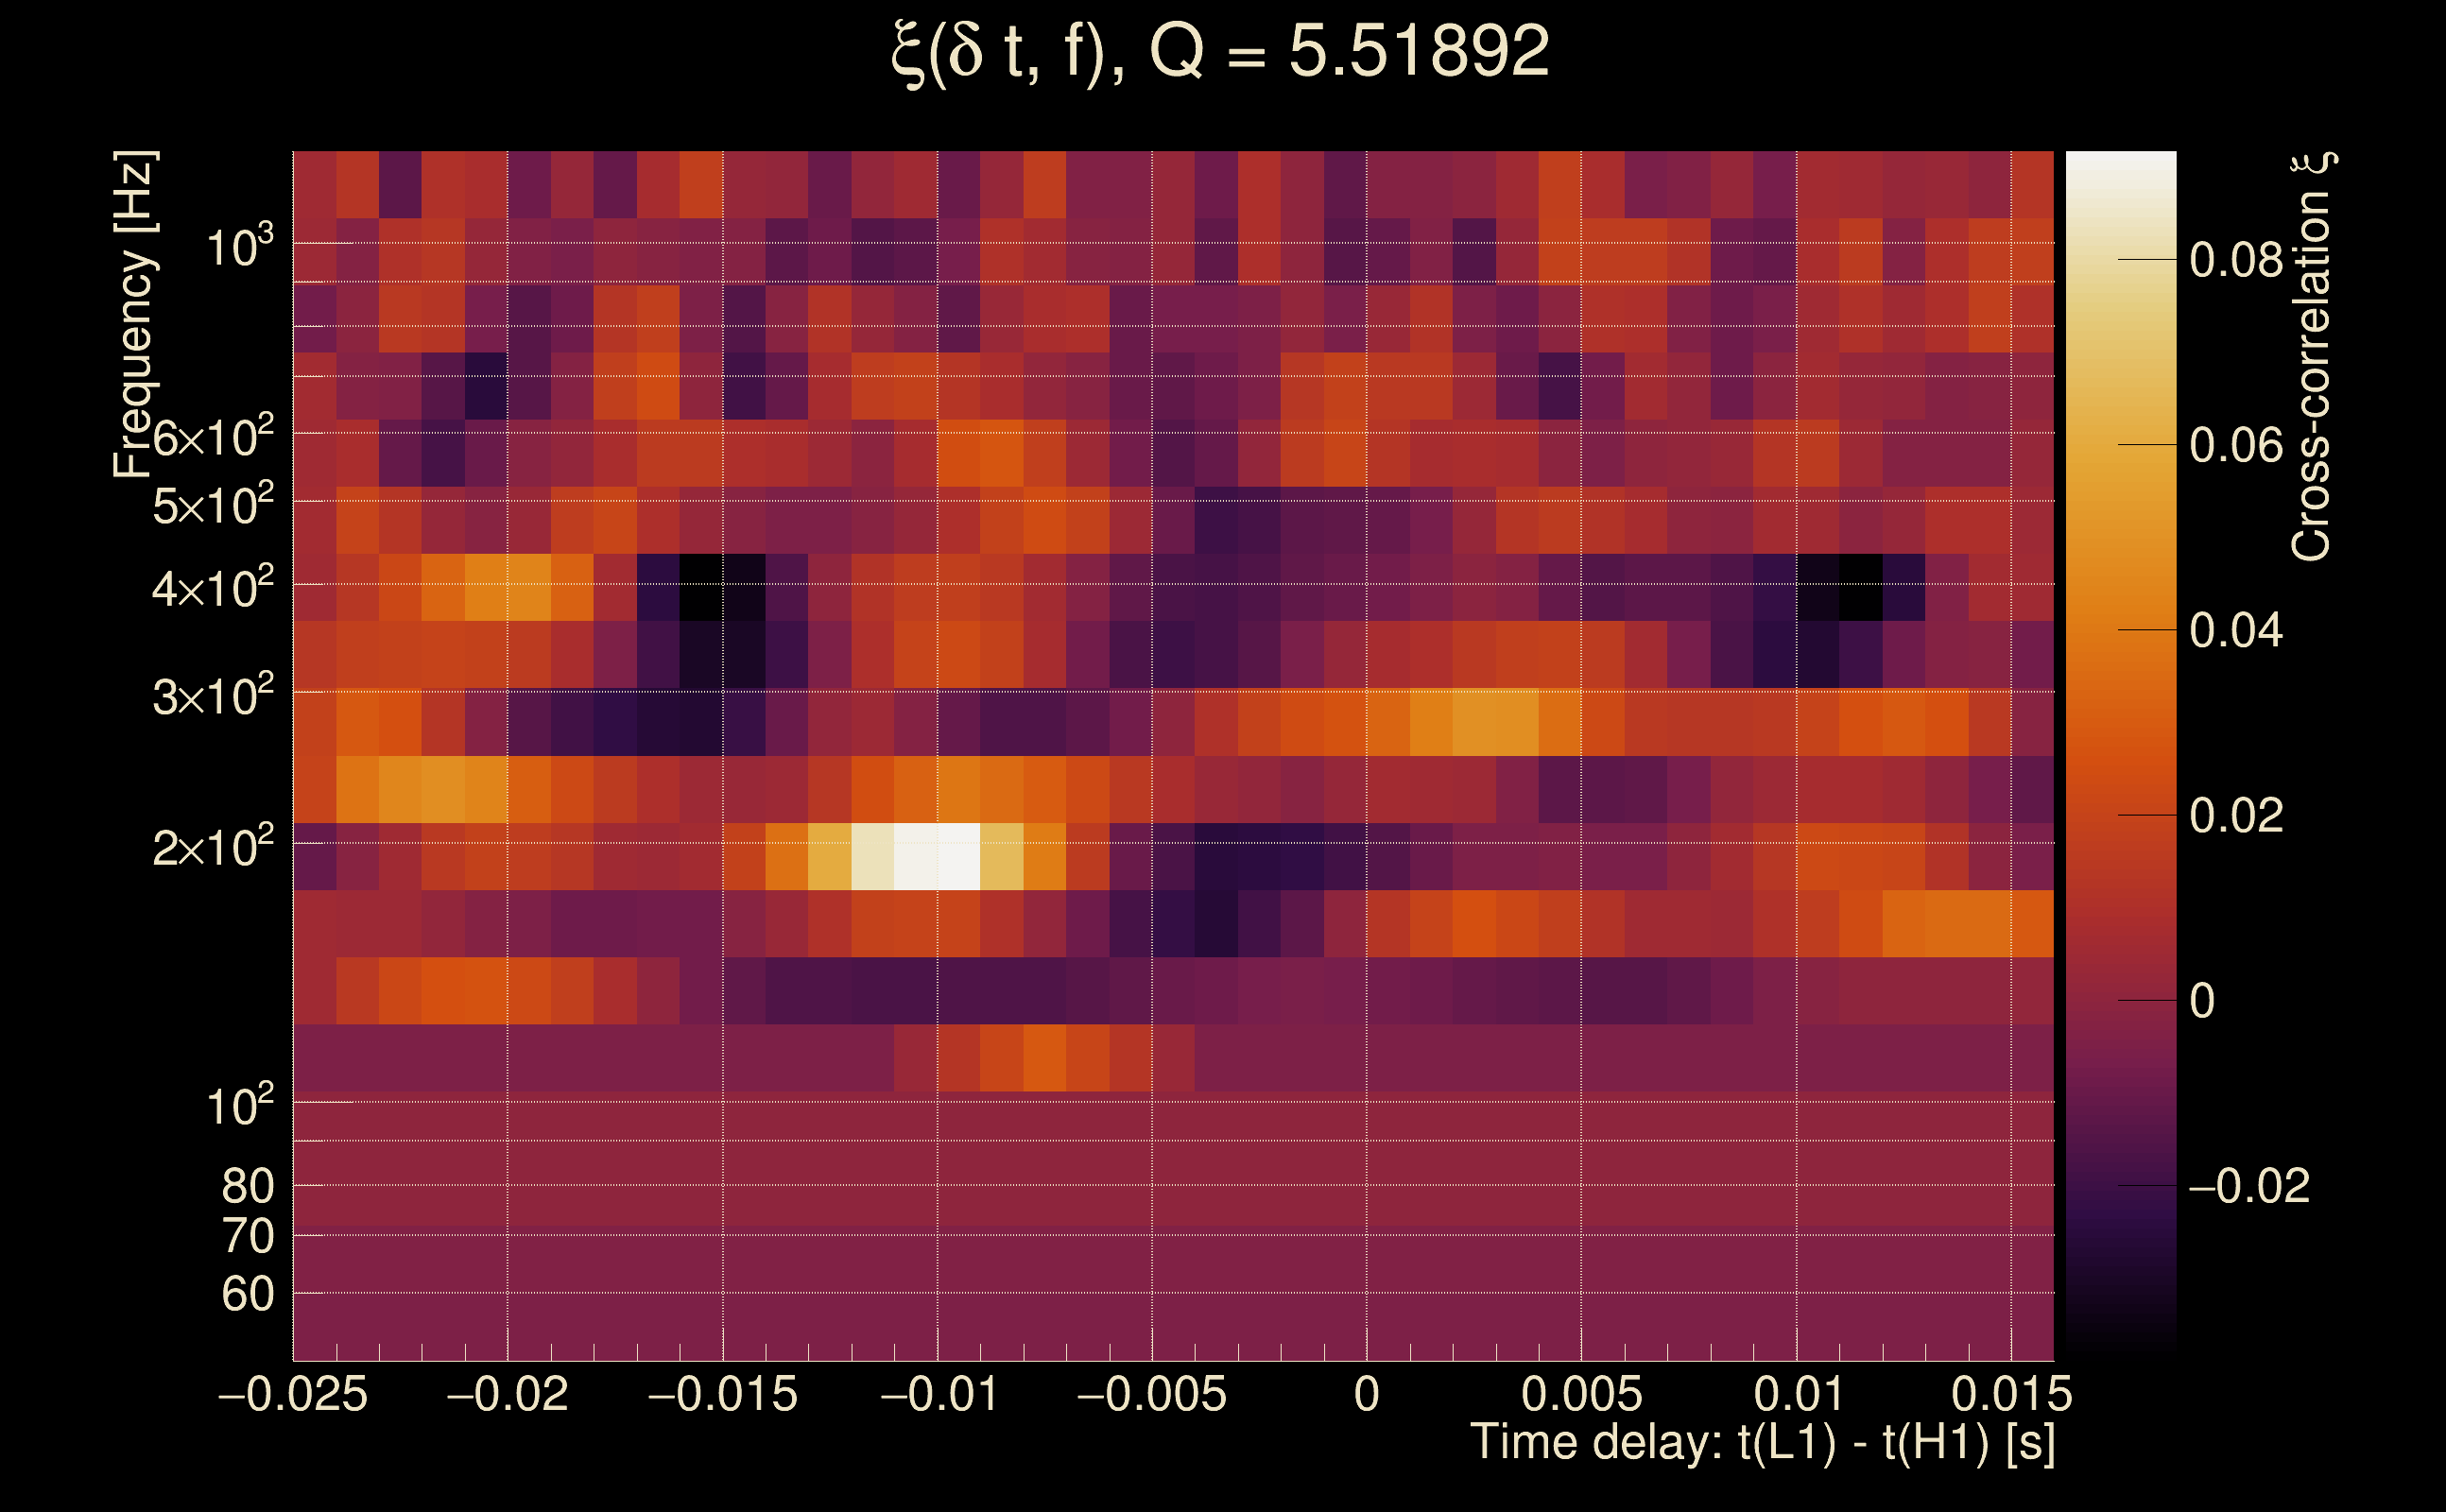
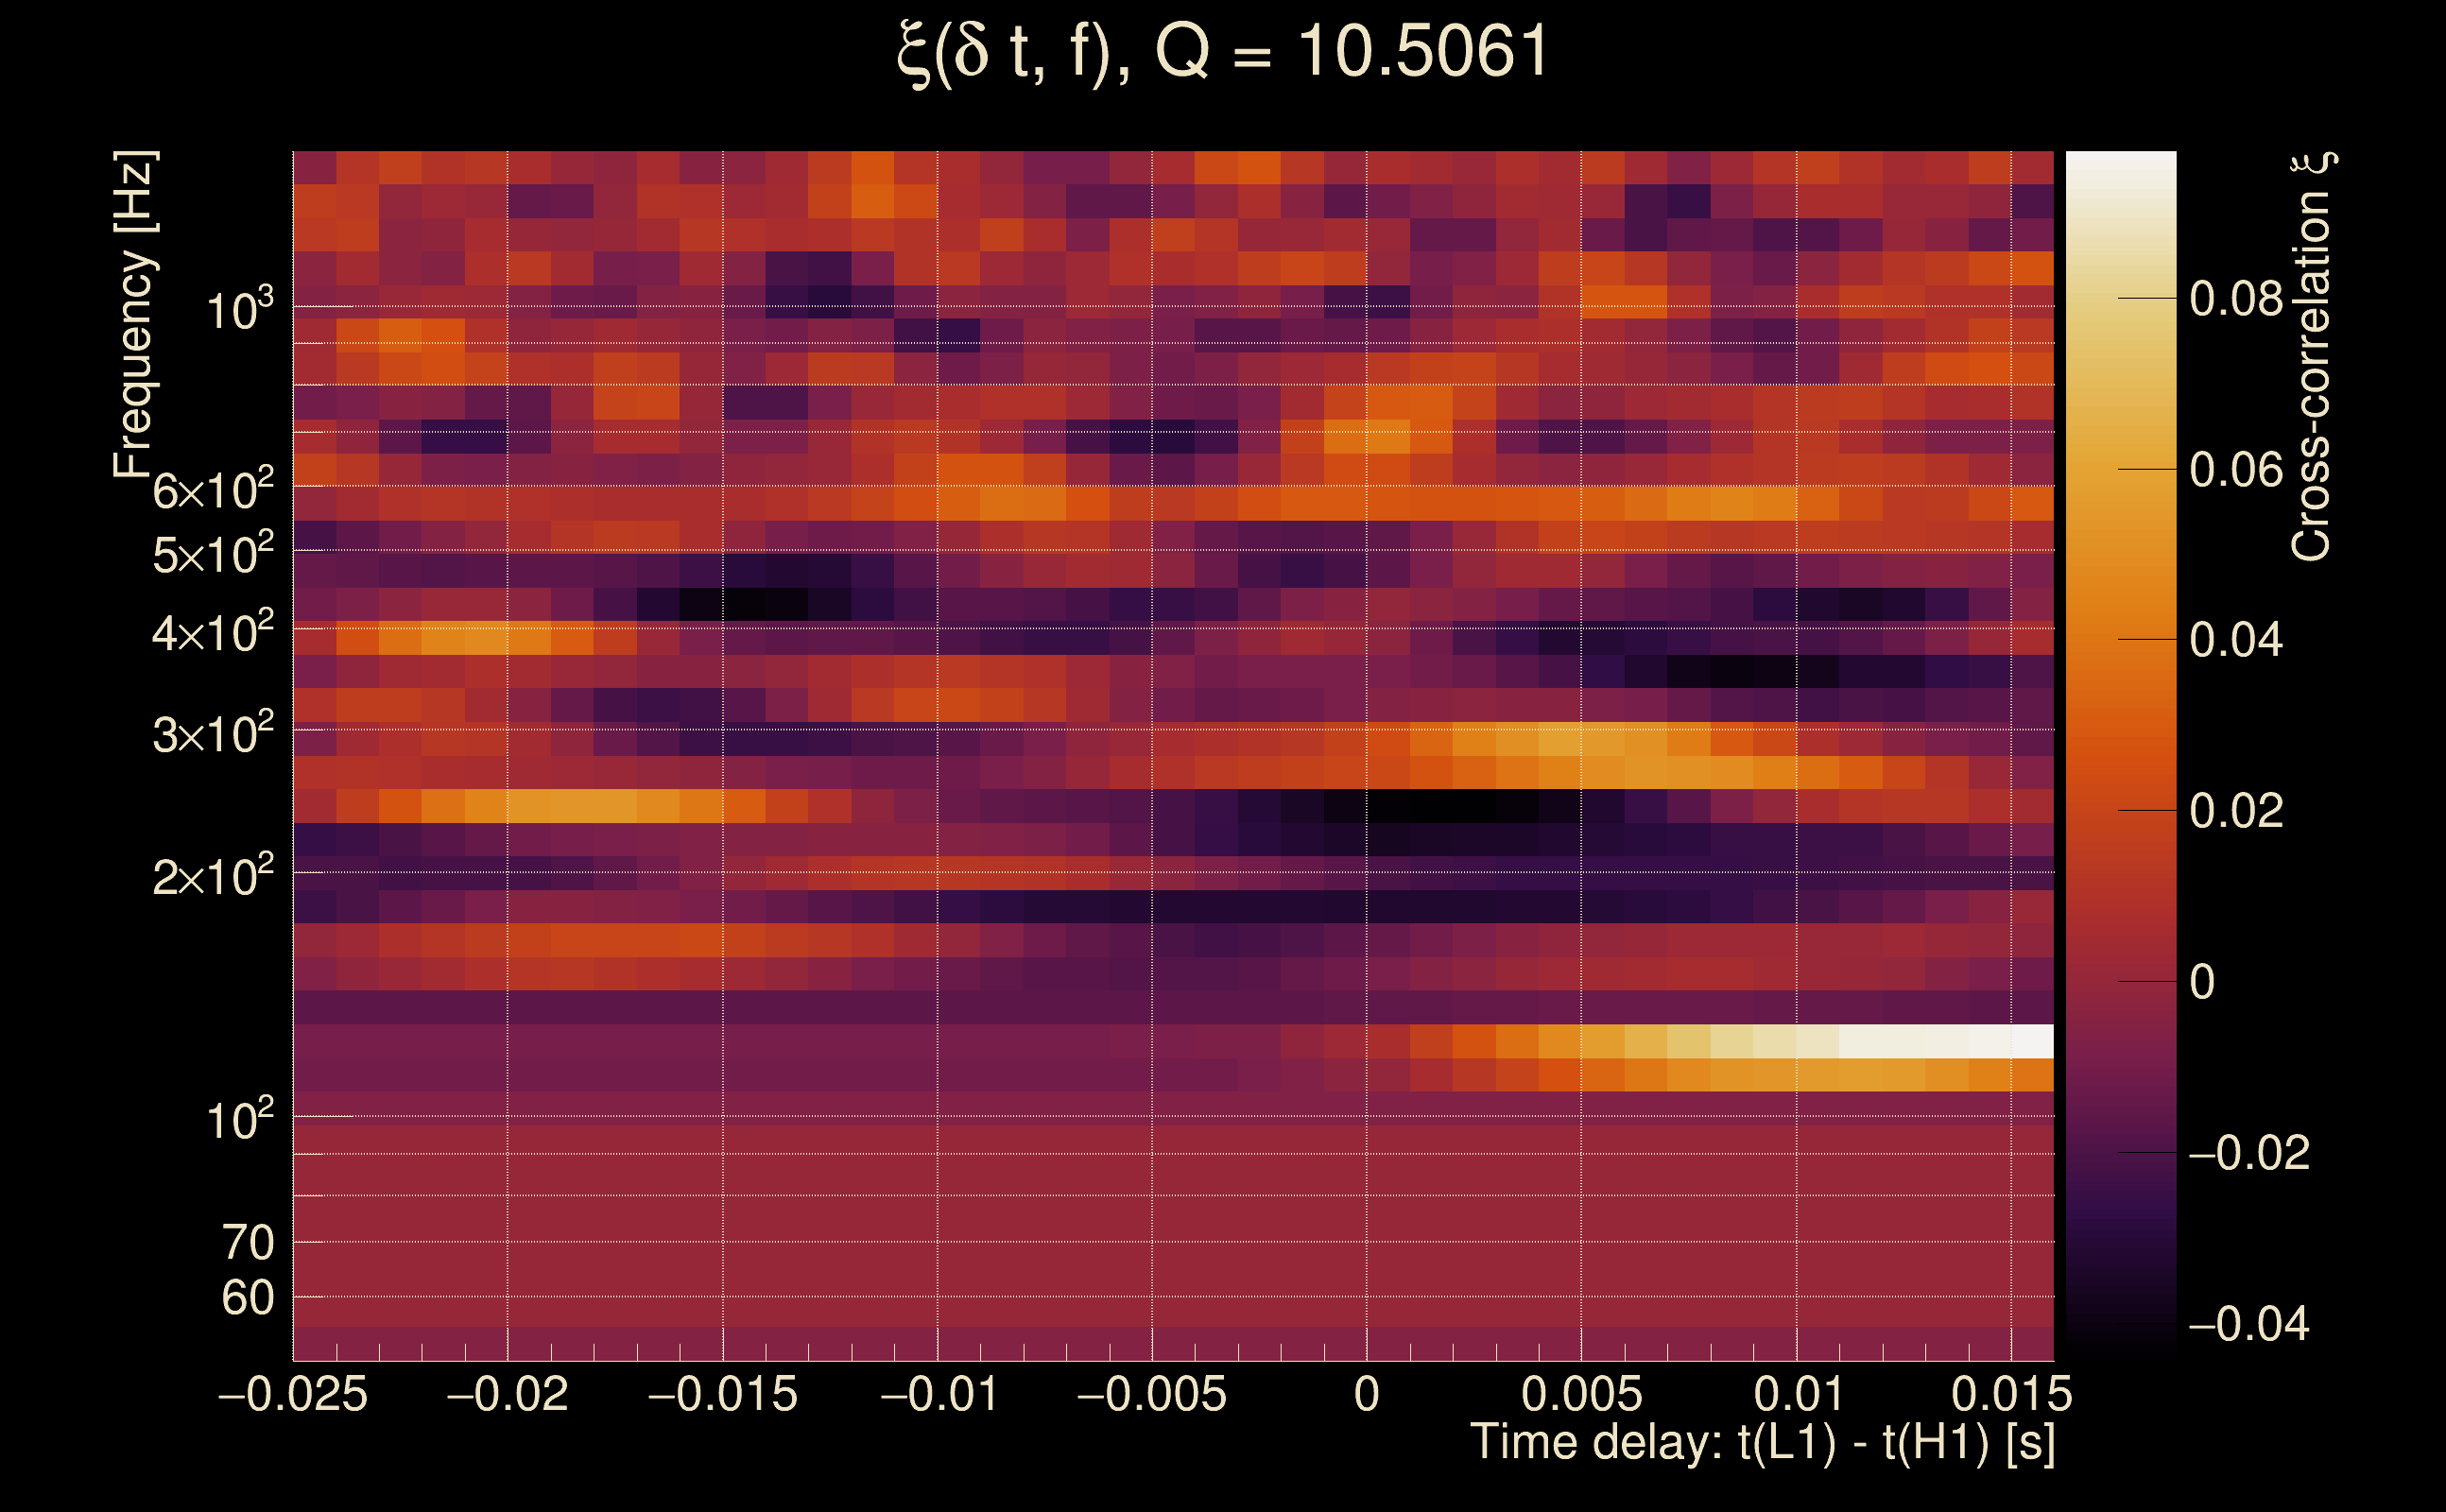
| Number of Q planes: | 5 (Q = 5.51892 → Q = 72.478) |
| Omicron frequency range: | 50 Hz → 1958.38 Hz |
| Light travel time between detectors: | 0.0100128 s |
| Slice extra-time (calibration uncertainty + slice veto): | 0.0129872 s |
| Number of time-delay bins in a cross-correlation map: | 10000 |
| Number of slices in a cross-correlation map: | 217 |
| Number of time-delay bins in a slice: | 46 |
| SNR gating: | < 100 (detector 0), < 100 (detector 1) |
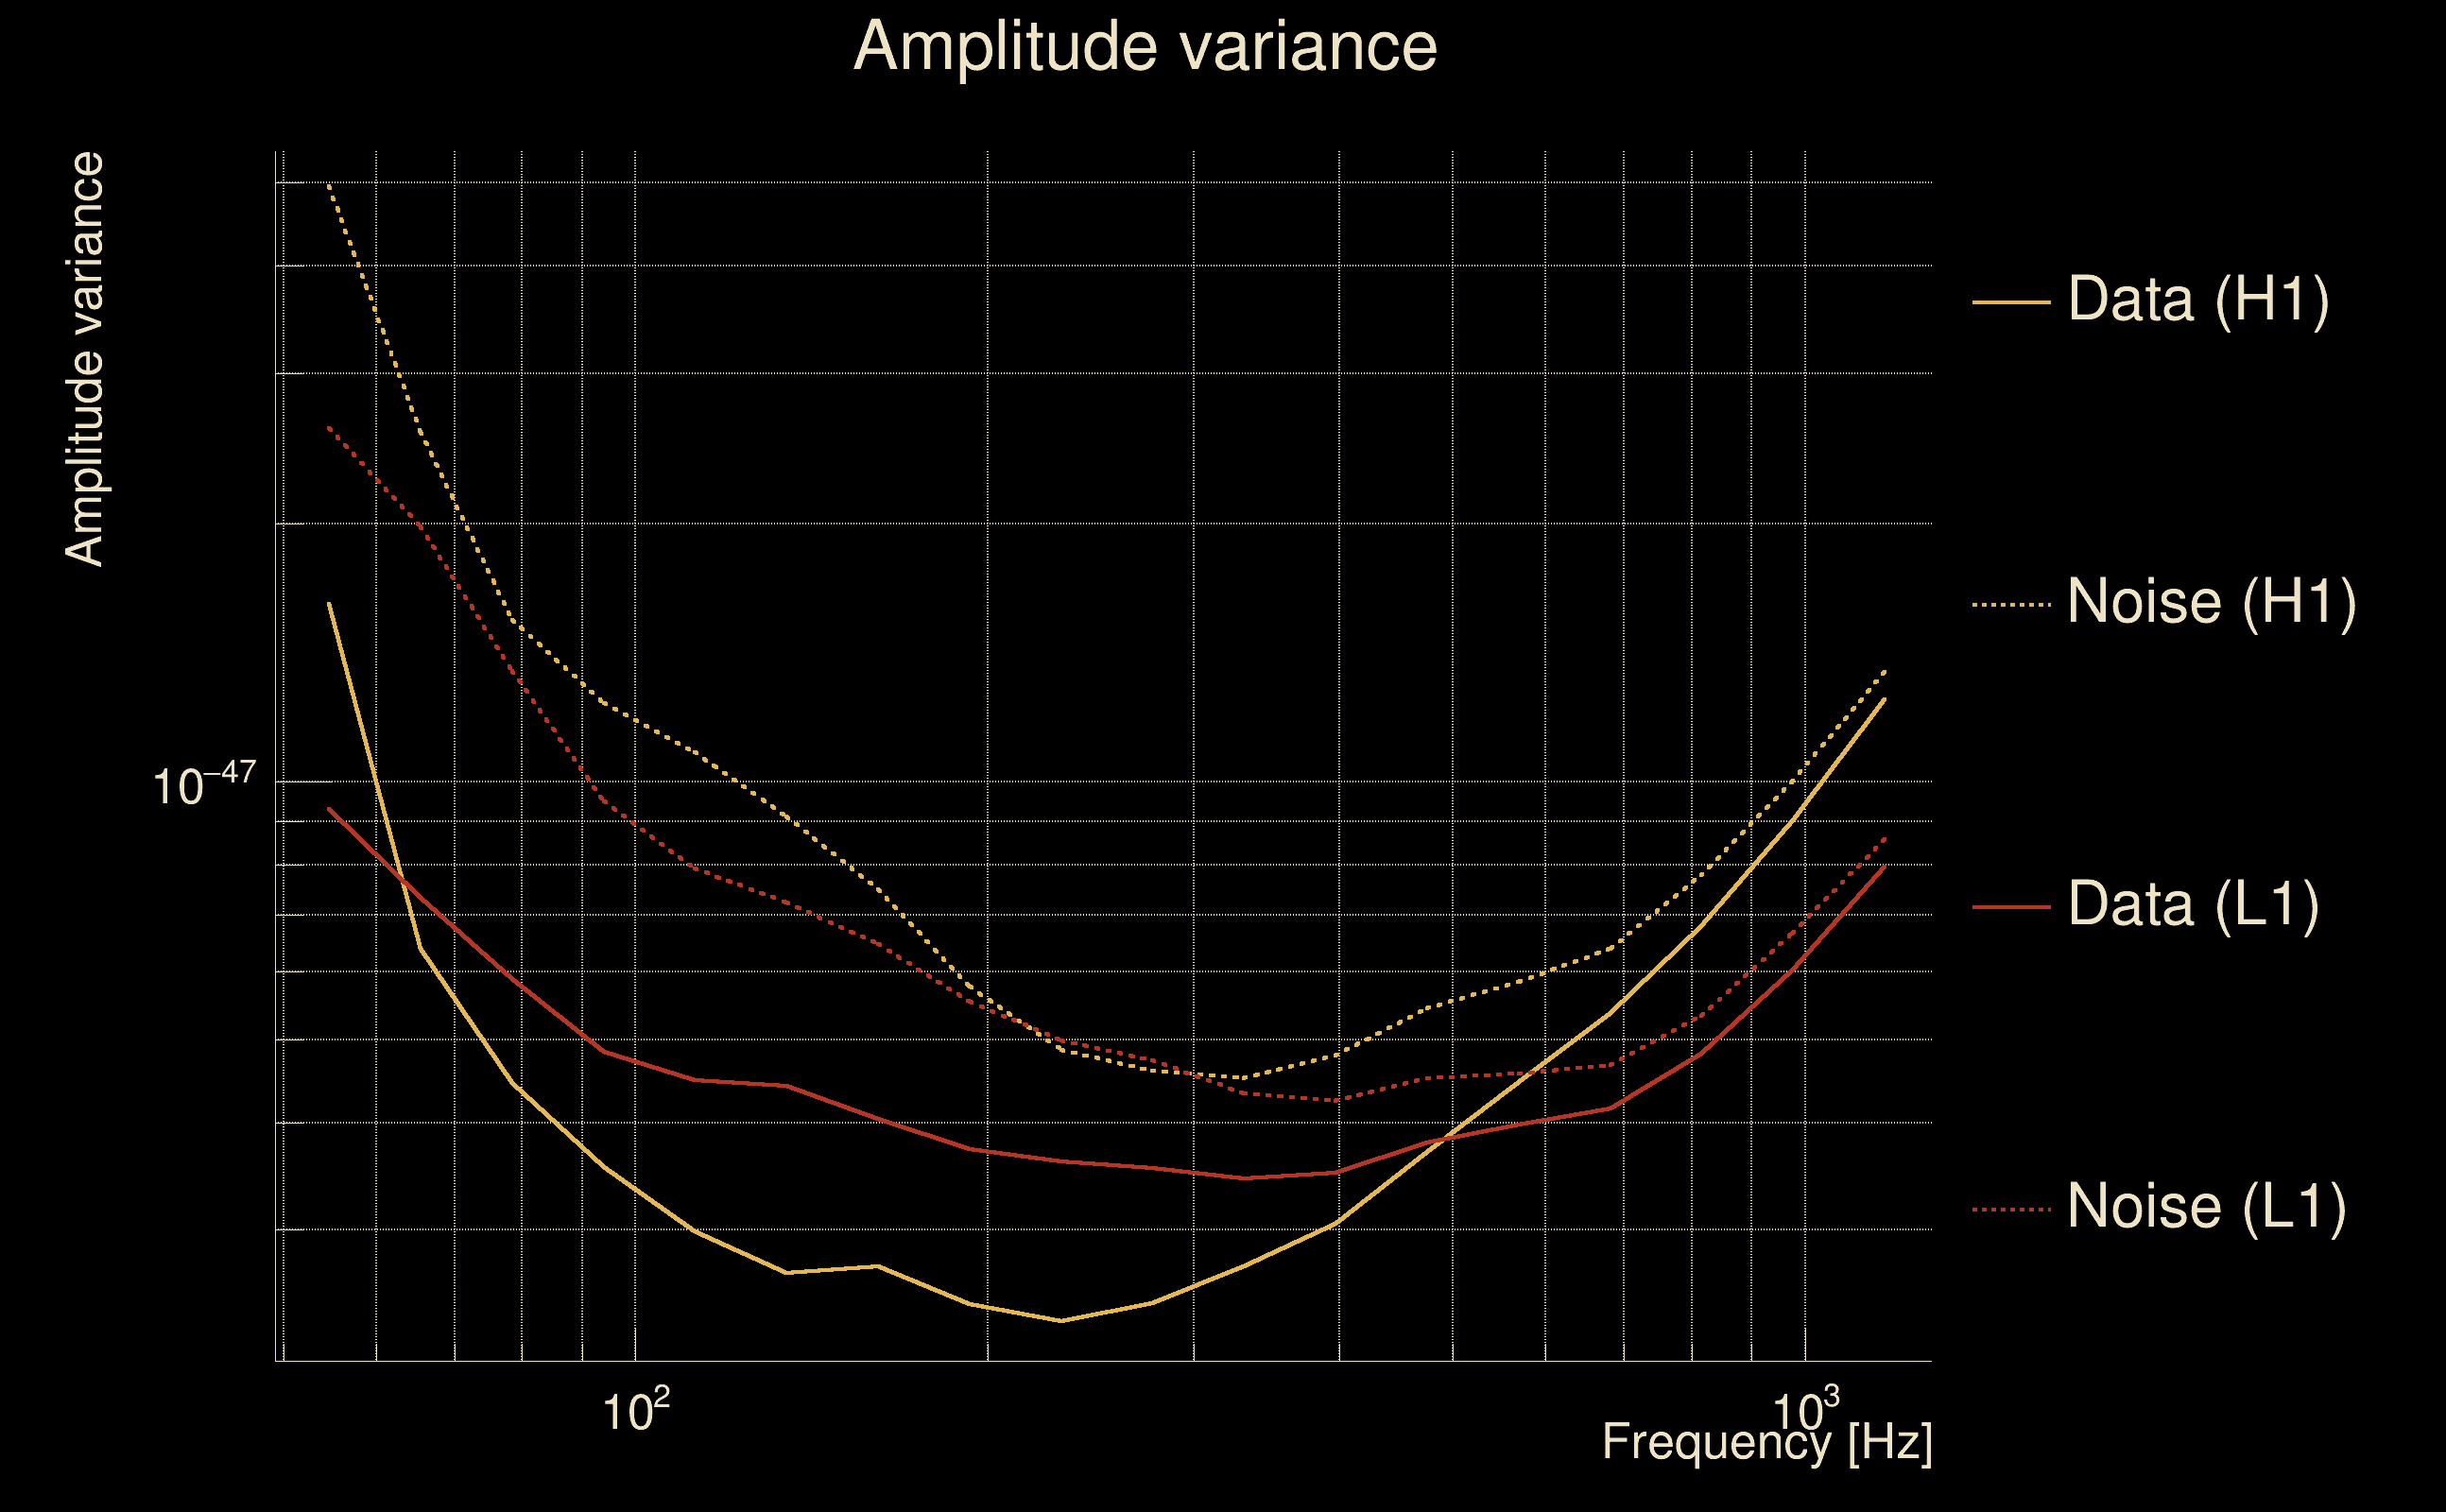
| Amplitude spectrograms: | normalization = 1e-22, power index = 2 |
| White noise SNR variance: | 0.523175 (after applying a correction factor = 1) |
| Amplitude ratio confidence level: | 3 sigma |
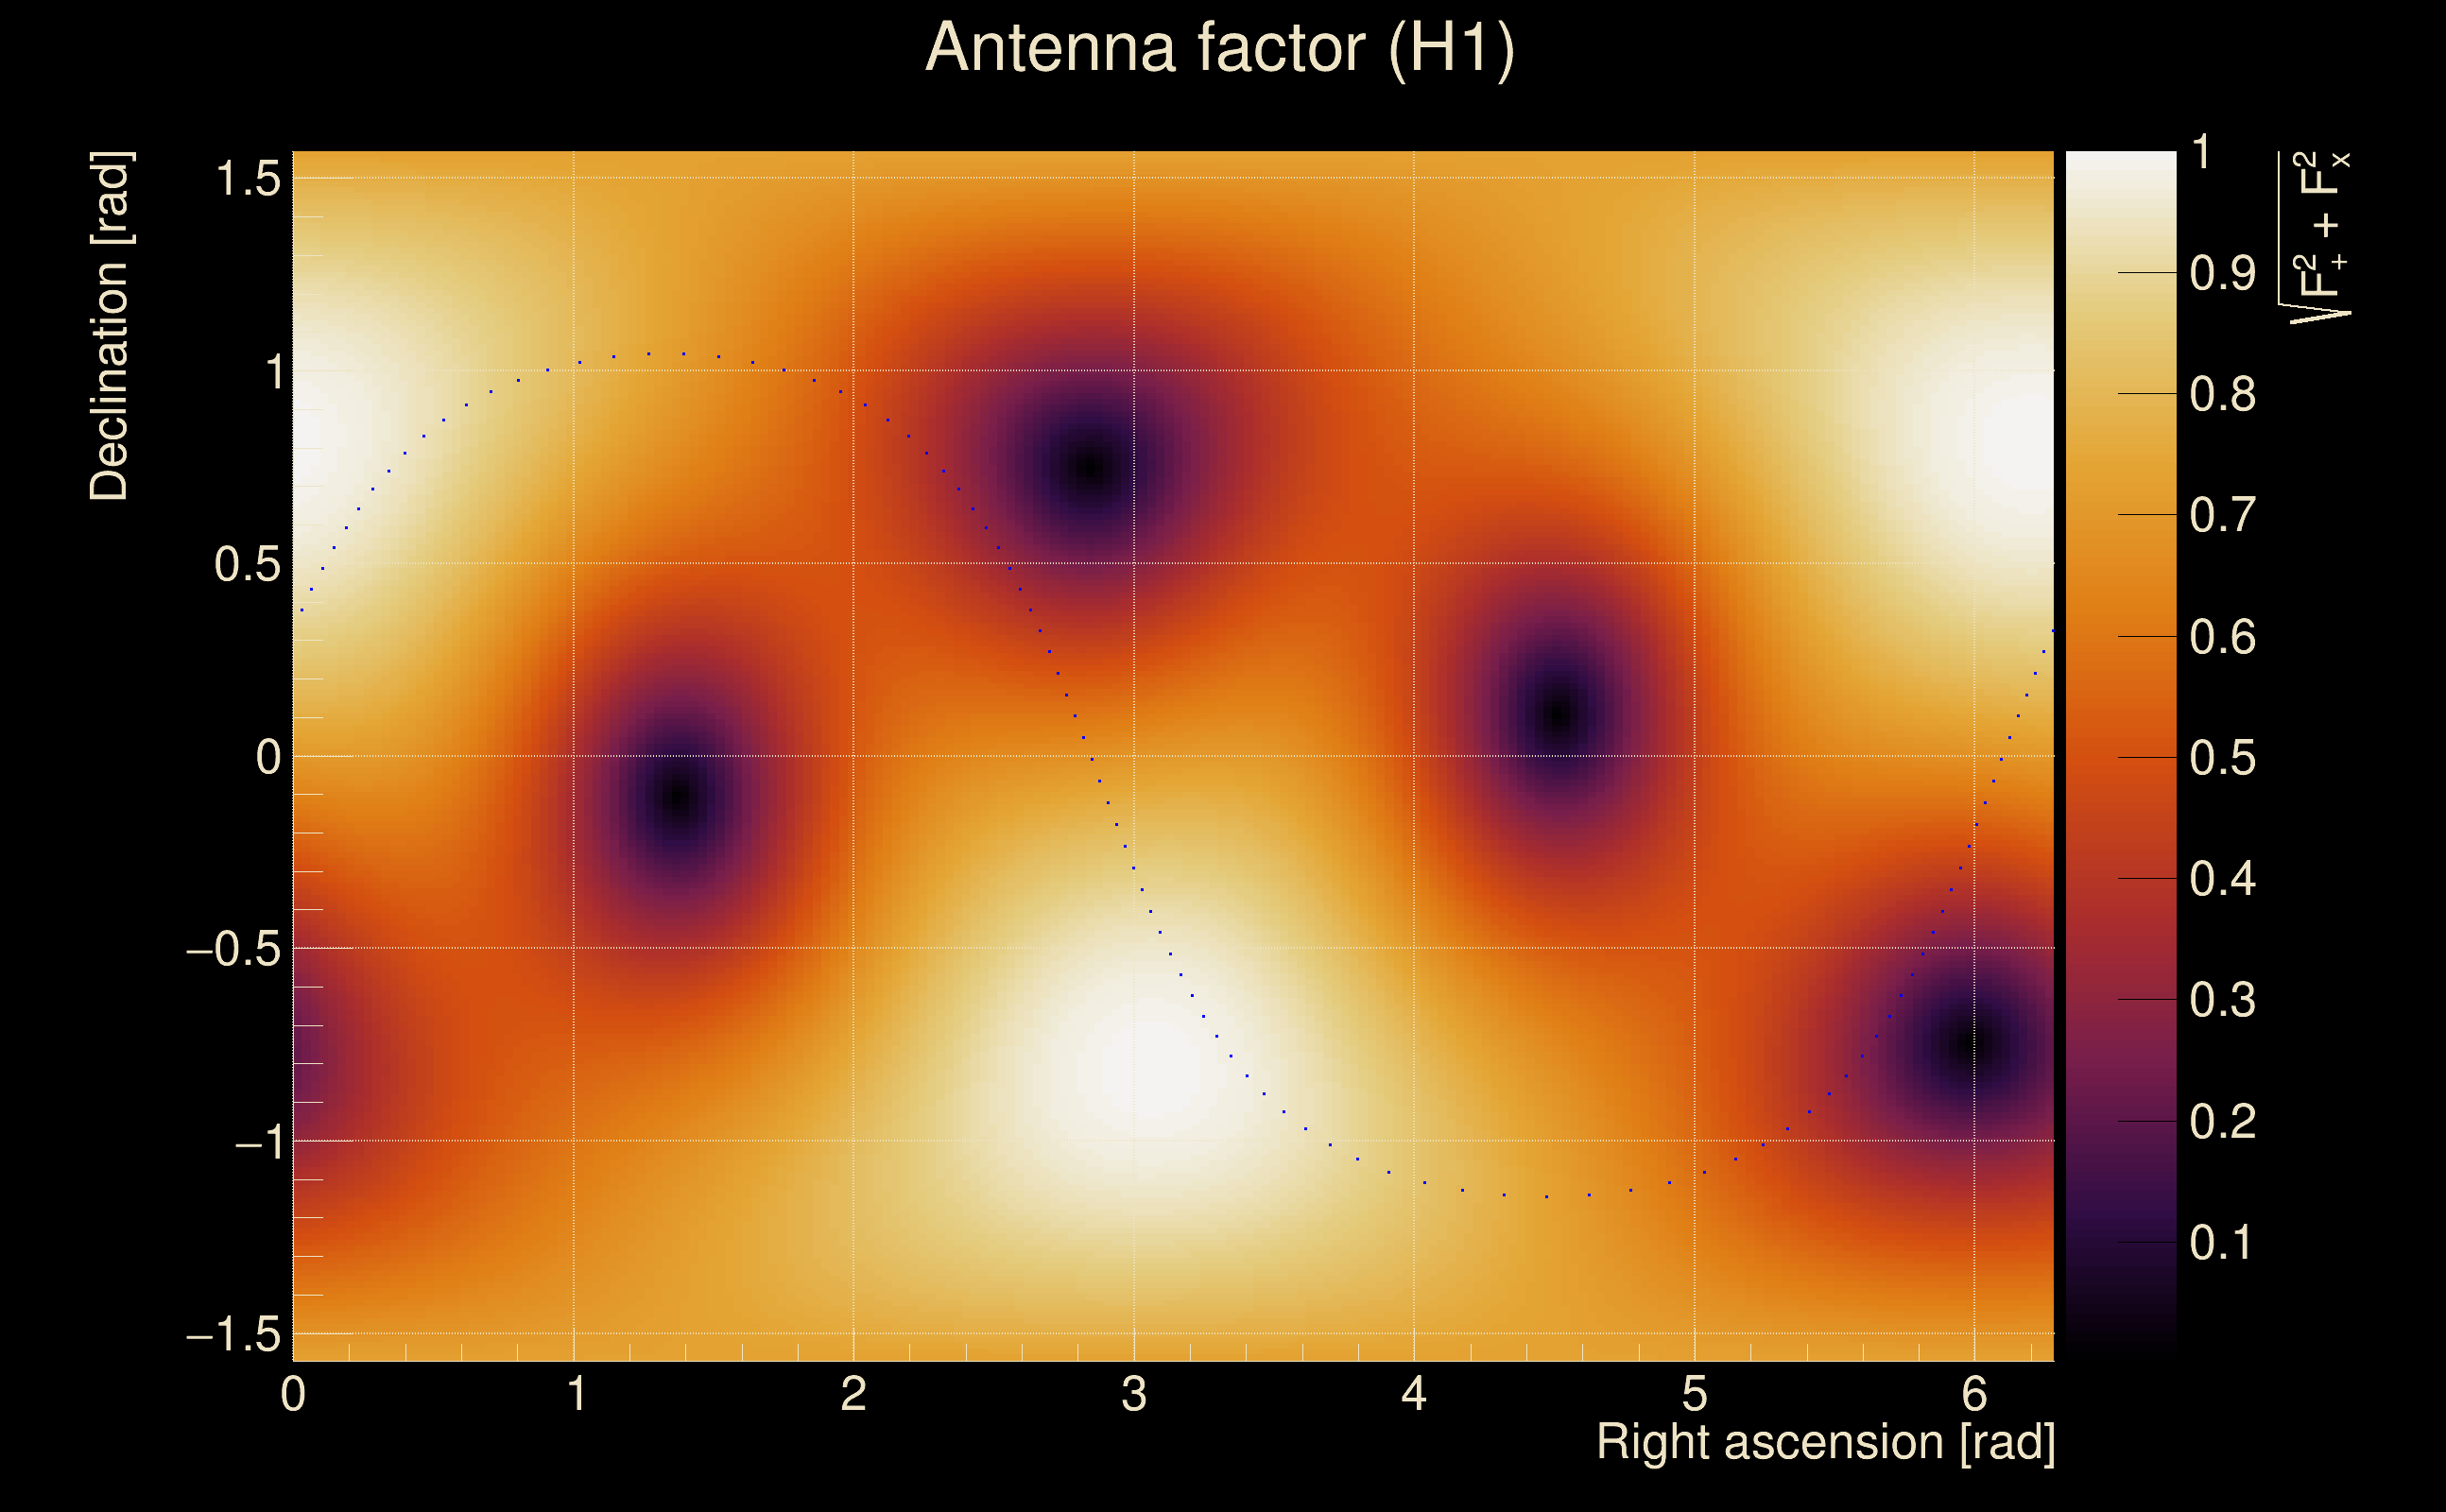
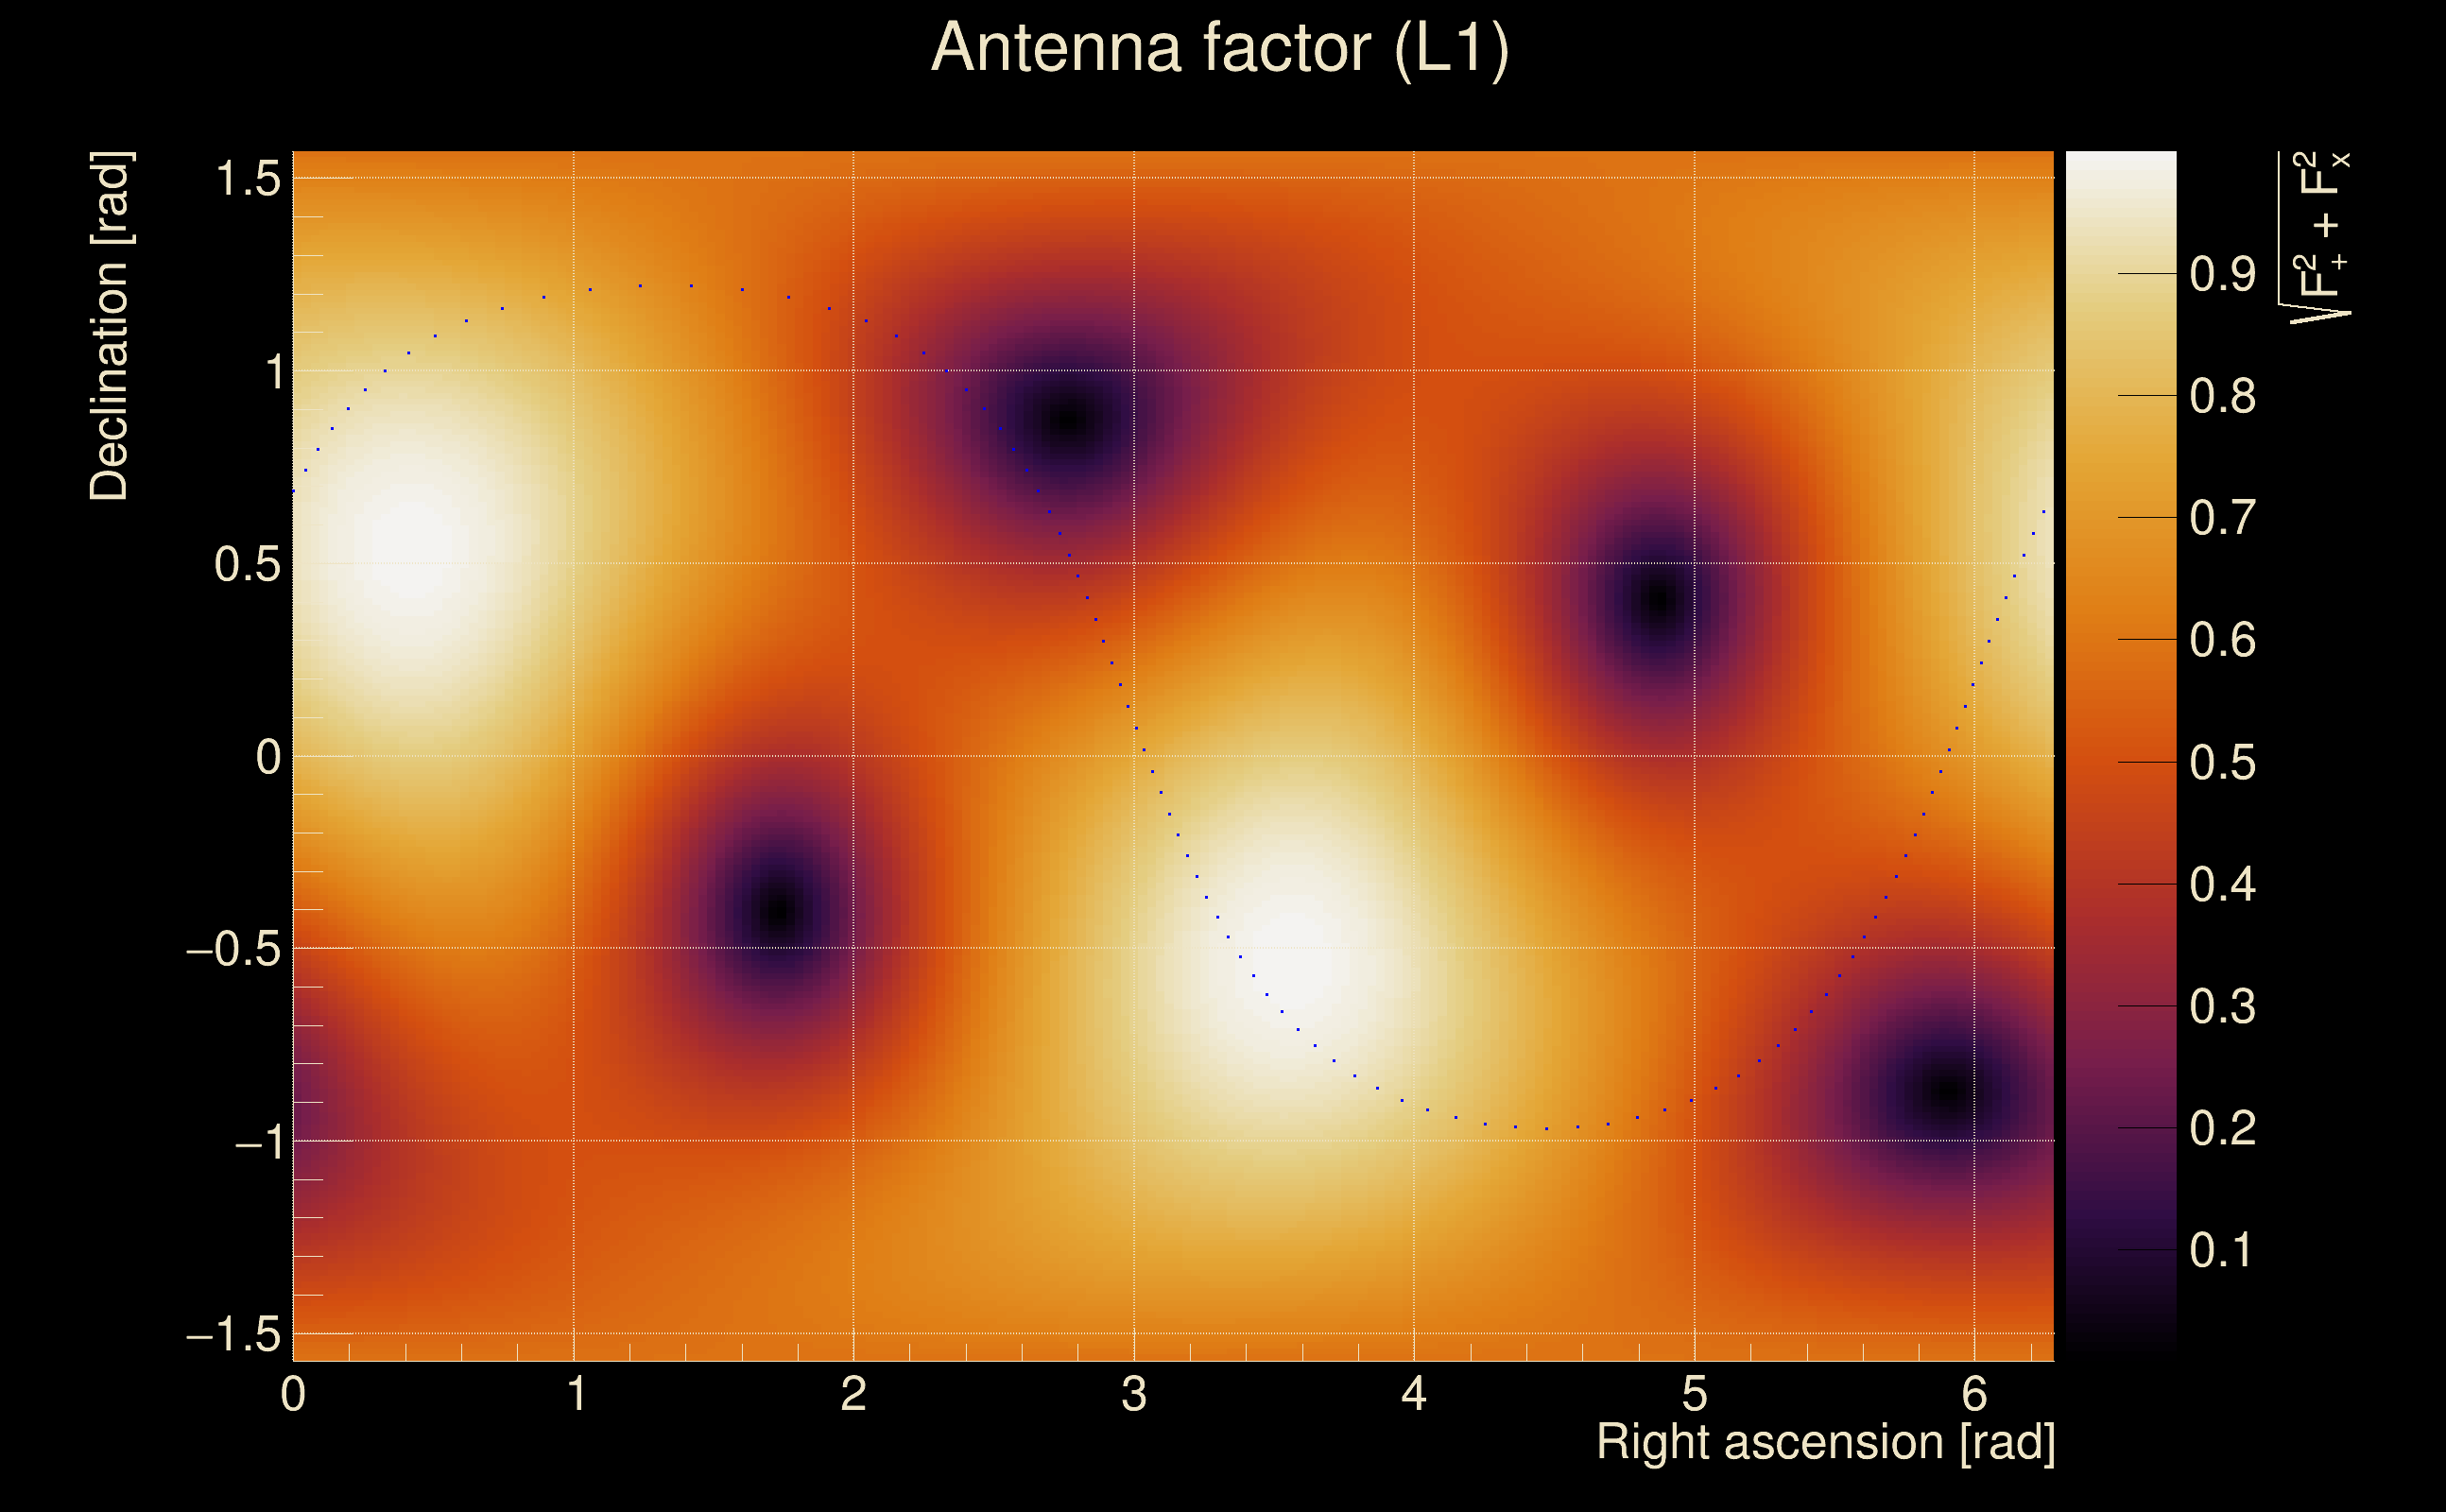
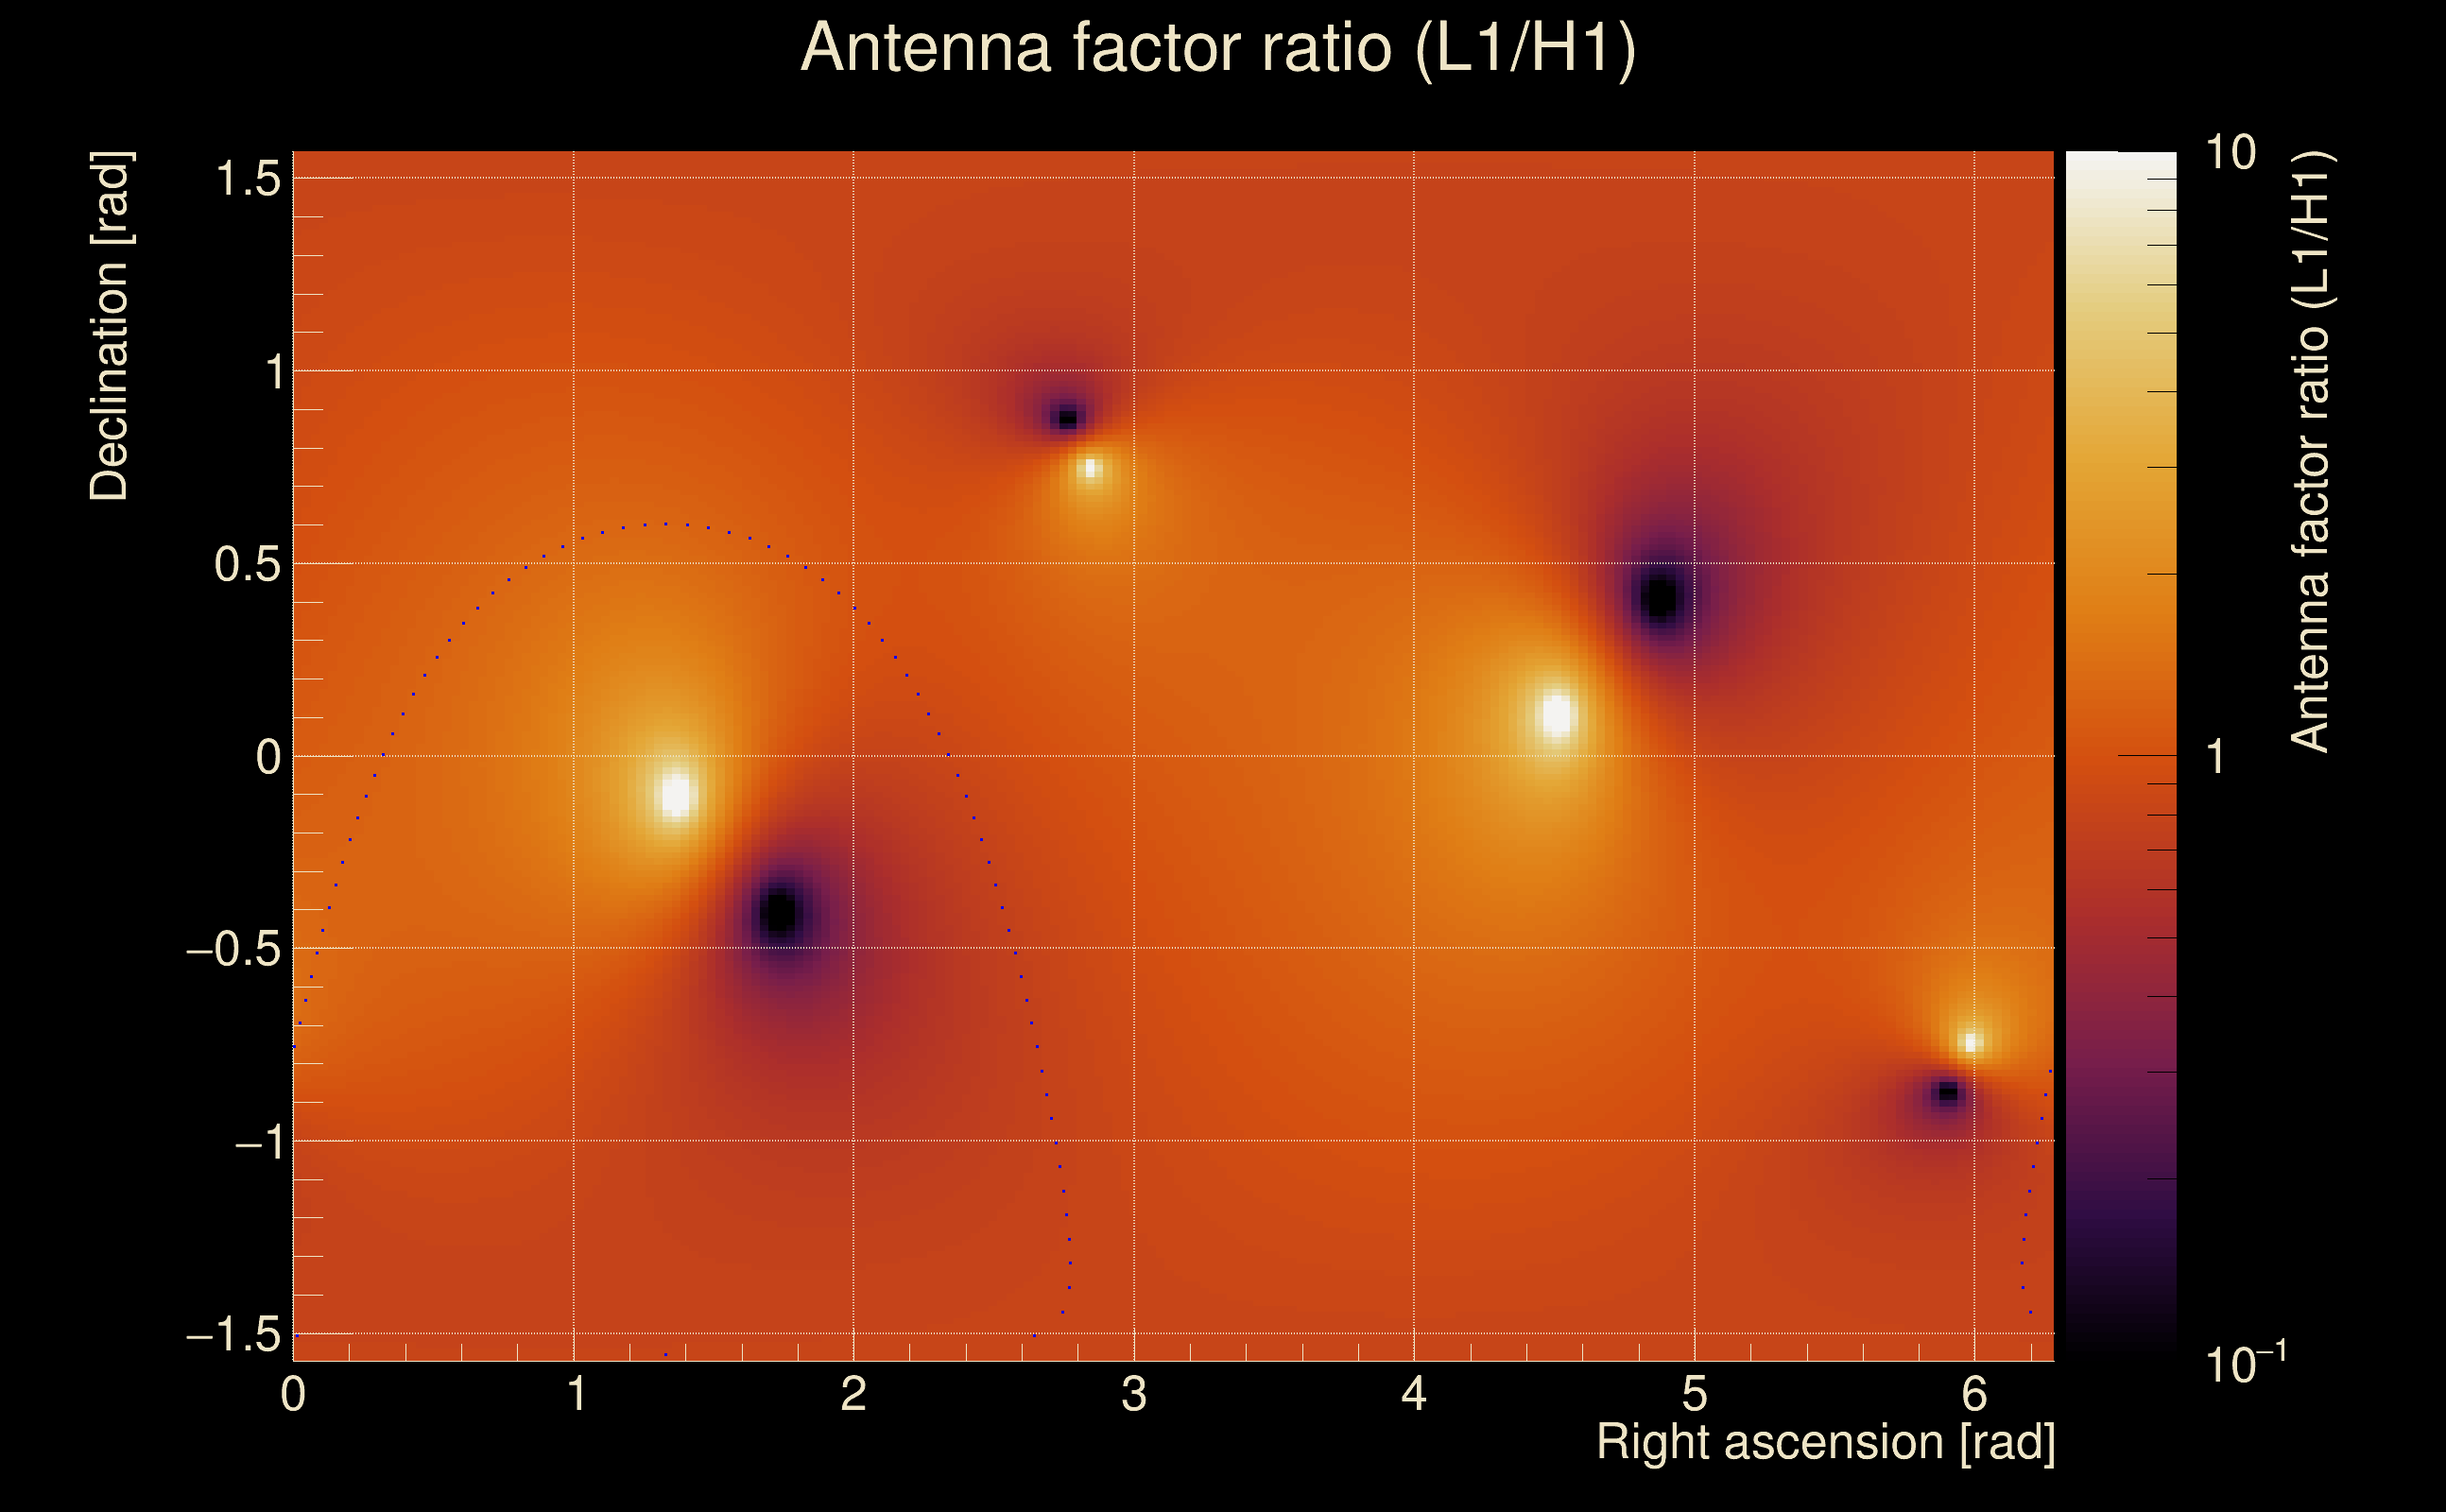
| Target sky positon: | Ra: 3.68109, Dec: 0.94792 [rad] |
| List of input Ox files: | TargIxf_injpt1_tA_file_list.txt (71 files) |
| Analysis result file: | TargIxf_injpt1_tA_results-1.root |
| Slice selected for the the fakeground: | slice index=206 (-4.508 s), time lag = 0 s |
| Foreground | Fakeground | Background | ||
|---|---|---|---|---|
| Number of processed ox events | 12111 | 12111 | 2603865 | |
| Start Date (detector 0) | Mon May 15 14:13:25 2023 UTC | Mon May 15 14:13:25 2023 UTC | Mon May 15 14:13:25 2023 UTC | |
| End Date (detector 0) | Thu May 18 15:54:40 2023 UTC | Thu May 18 15:54:40 2023 UTC | Thu May 18 15:54:40 2023 UTC | |
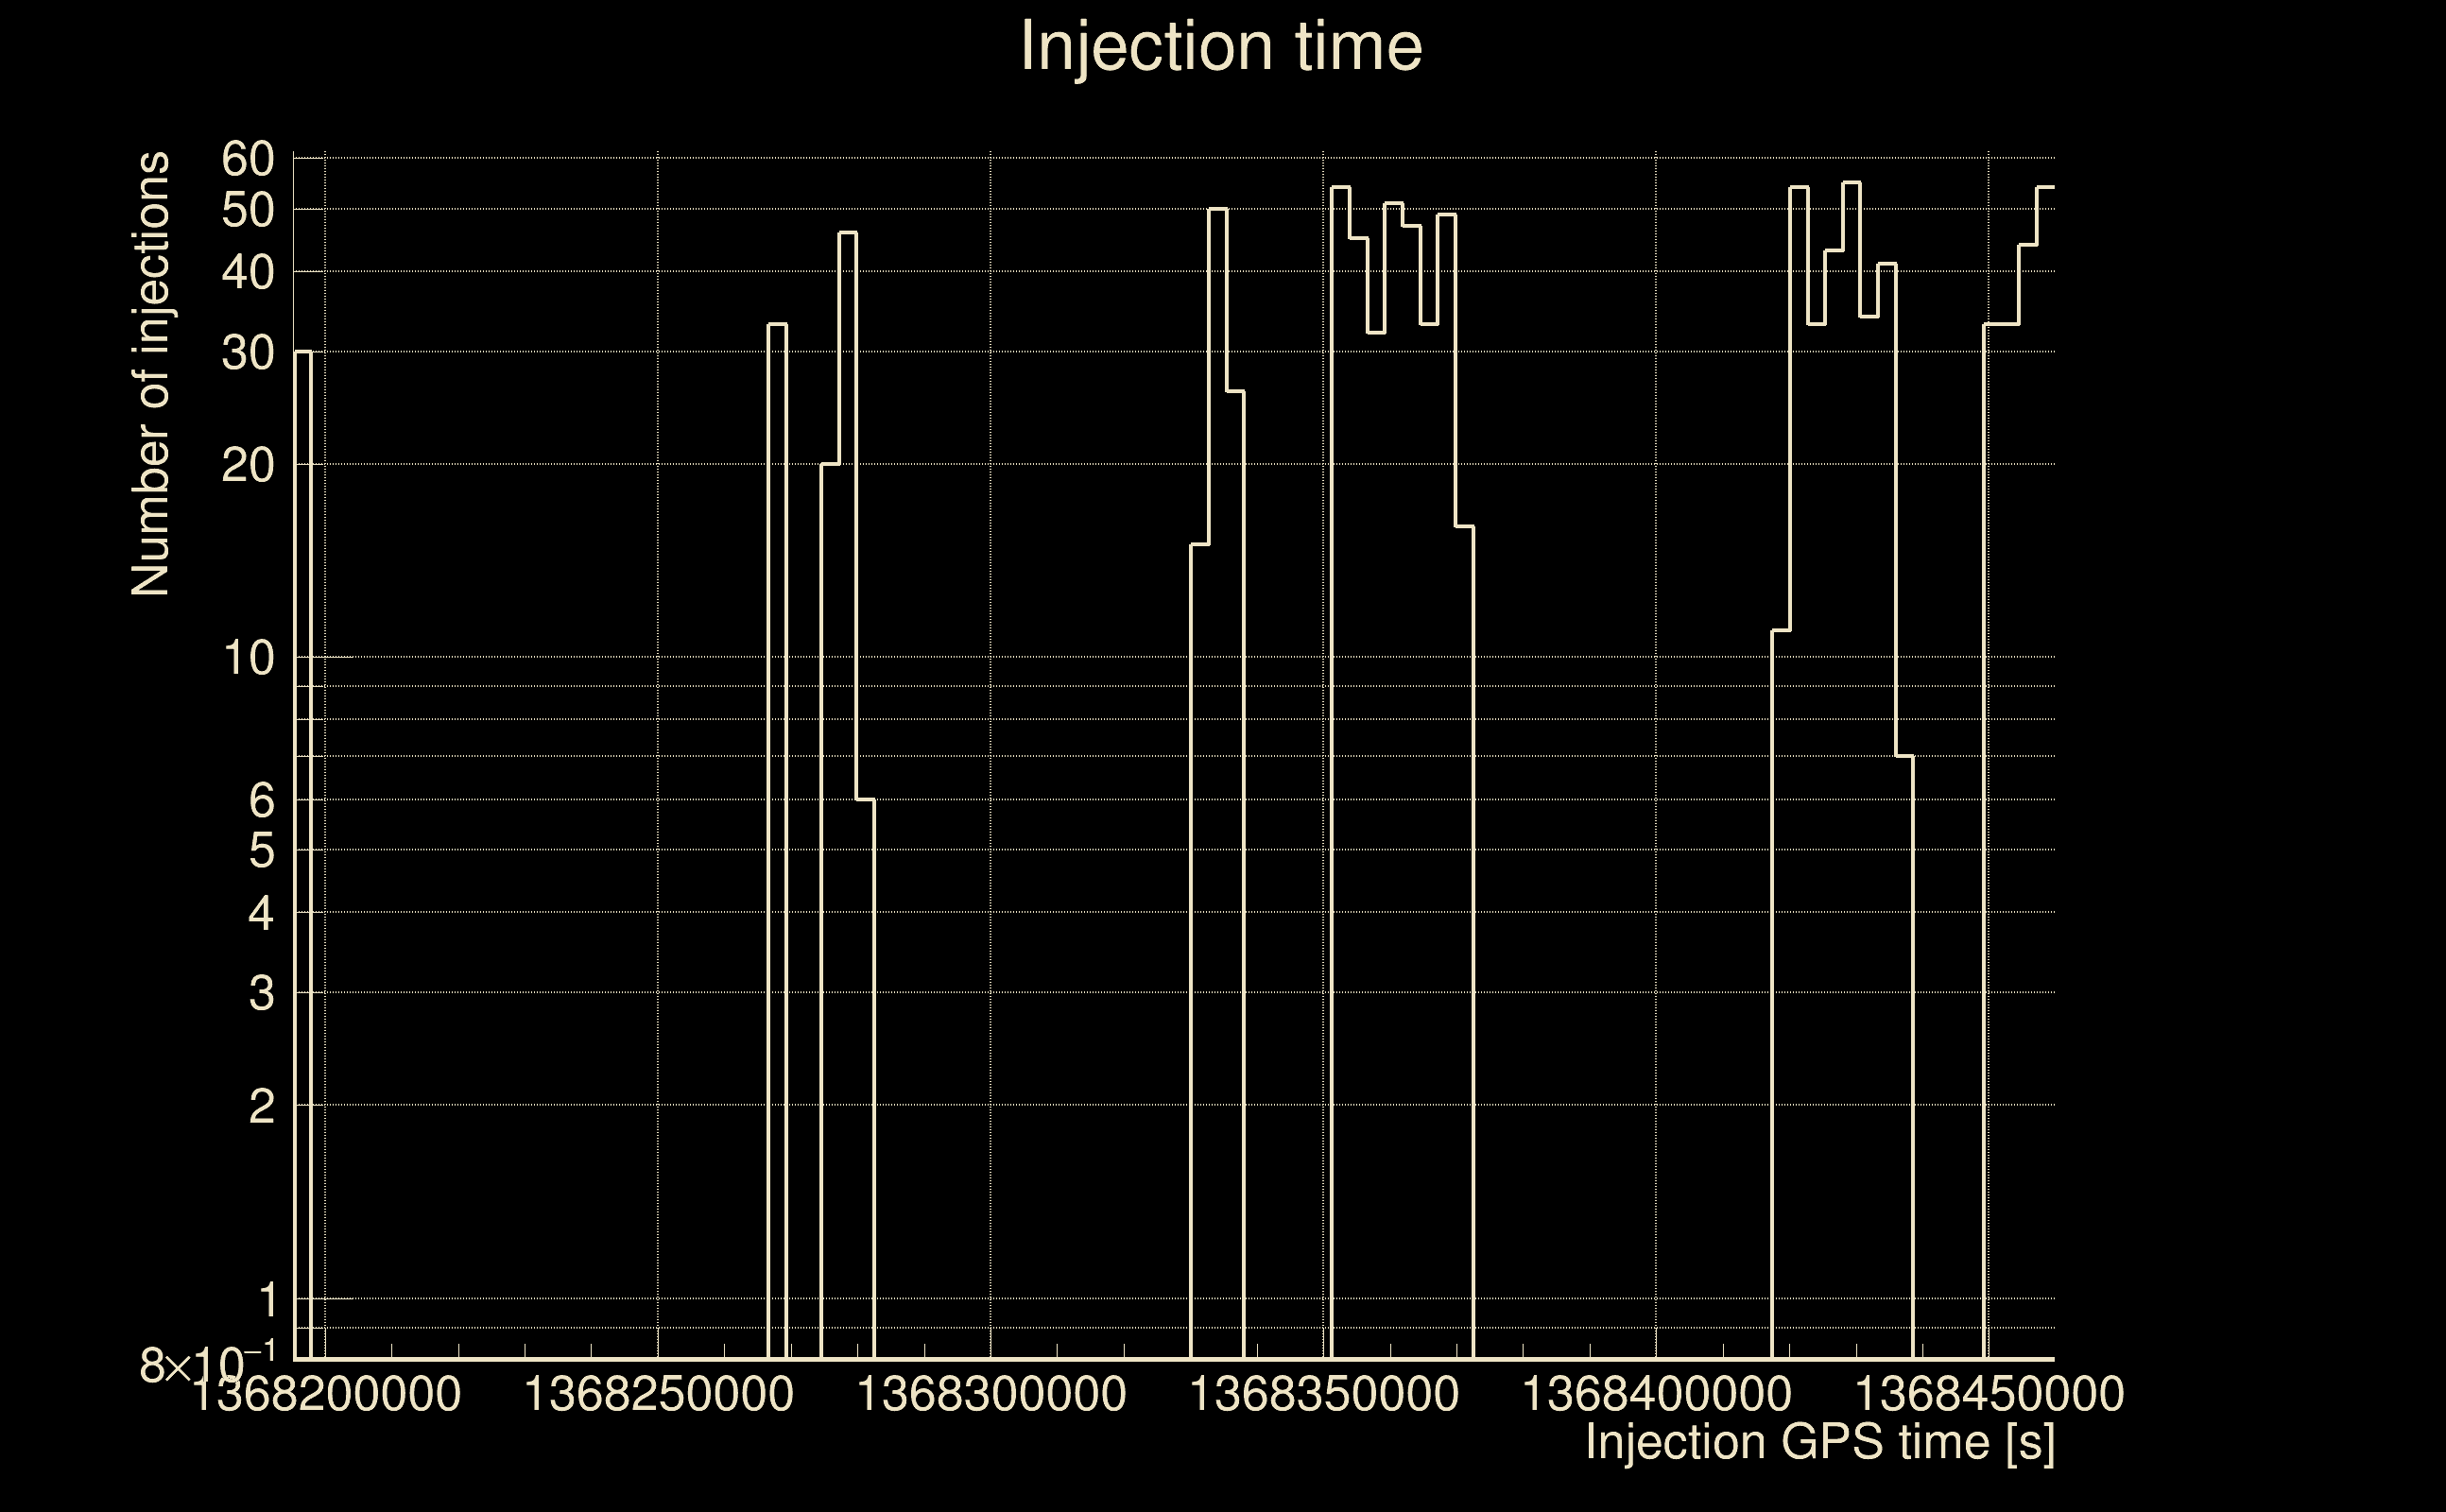
| Start GPS (detector 0) | 1368195223 | 1368195223 | 1368195223 | |
| End GPS (detector 0) | 1368460498 | 1368460498 | 1368460498 | |
| Used livetime (detector 0) | 60875 s | 60875 s | 60875 s | |
| Start Date (detector 1) | Mon May 15 14:13:25 2023 UTC | Mon May 15 14:13:25 2023 UTC | Mon May 15 14:13:25 2023 UTC | |
| End Date (detector 1) | Thu May 18 15:54:40 2023 UTC | Thu May 18 15:54:40 2023 UTC | Thu May 18 15:54:40 2023 UTC | |
| Start GPS (detector 1) | 1368195223 | 1368195223 | 1368195223 | |
| End GPS (detector 1) | 1368460498 | 1368460498 | 1368460498 | |
| Used livetime (detector 1) | 60875 s | 60875 s | 60875 s | |
| Cumulative livetime | 121110 s | 121110 s | 26038650 s | |
| 0 years, 1 days, 9 hours, 38 min, 30 s | 0 years, 1 days, 9 hours, 38 min, 30 s | 0 years, 301 days, 8 hours, 57 min, 30 s |
|
|
| Event time t(H1): | GPS = 1368460488 (Thu May 18 15:54:30 2023 ) → GPS = 1368460498 (Thu May 18 15:54:40 2023 ) |
| Event time t(L1): | GPS = 1368460488 (Thu May 18 15:54:40 2023 ) → GPS = 1368460498 (Thu May 18 15:54:40 2023 ) |
| Omicron analysis time window (H1): | GPS = 1368460485 → GPS = 1368460501 |
| Omicron analysis time window (L1): | GPS = 1368460485 → GPS = 1368460501 |
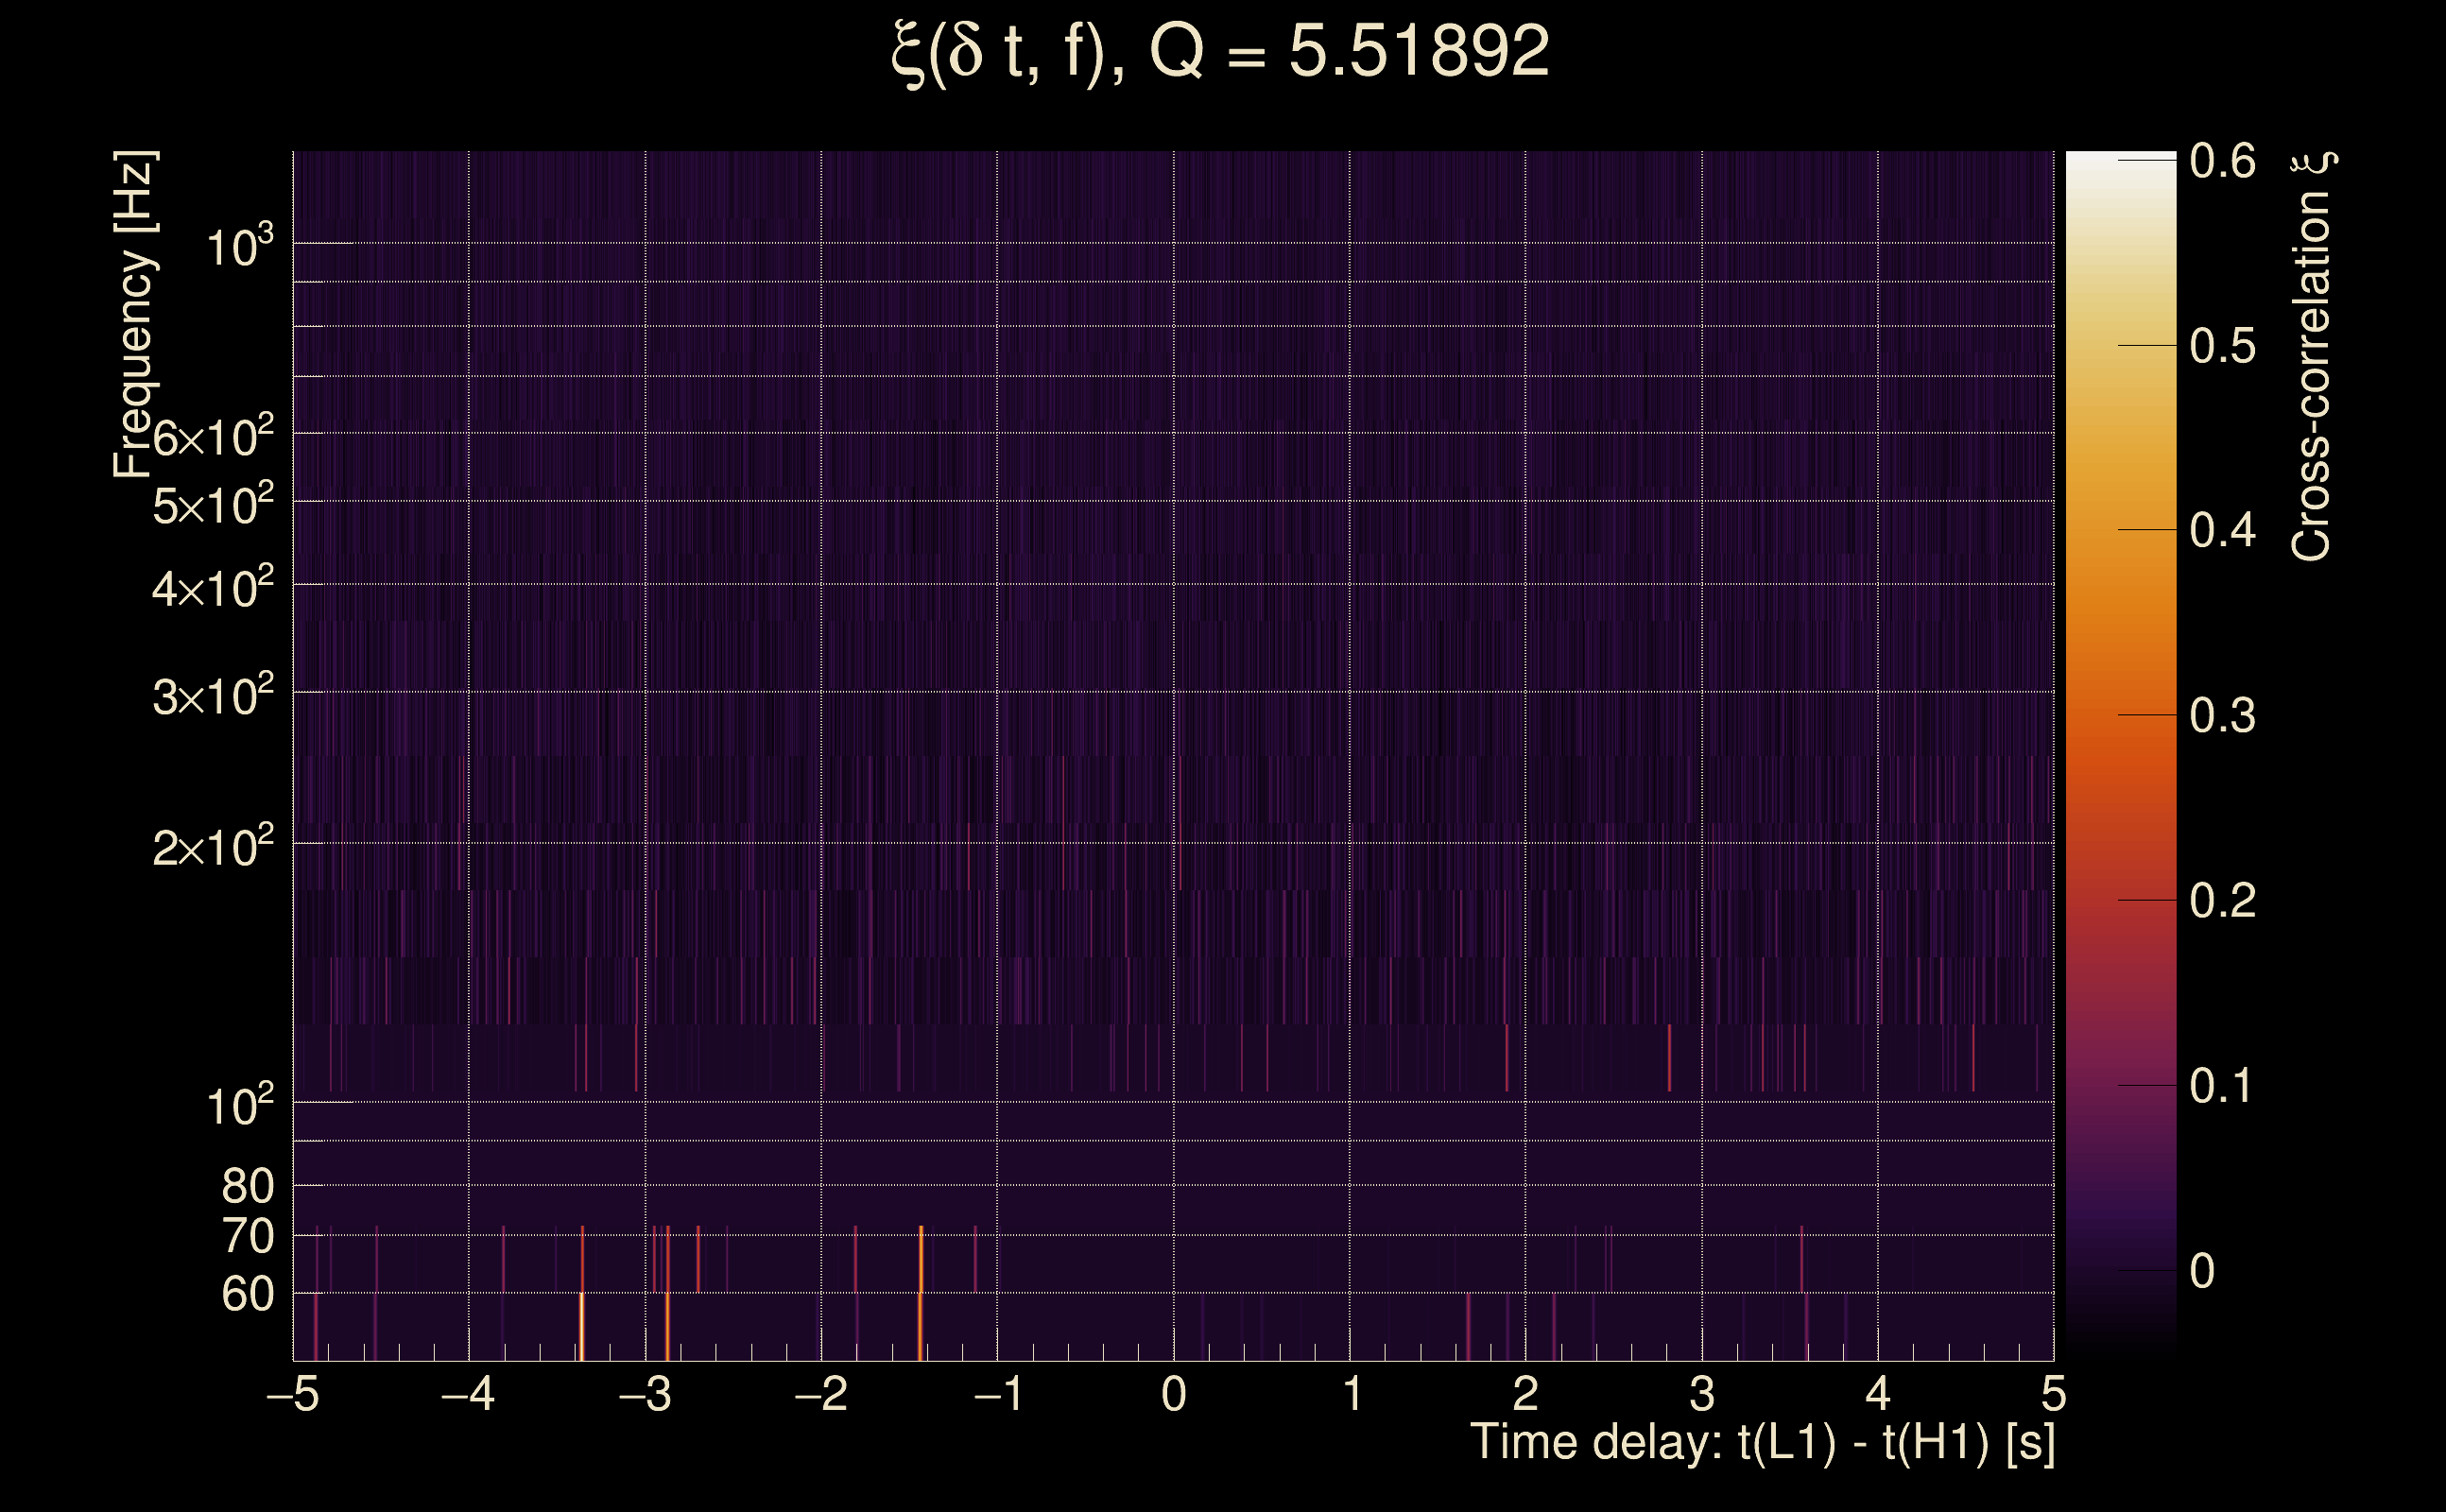
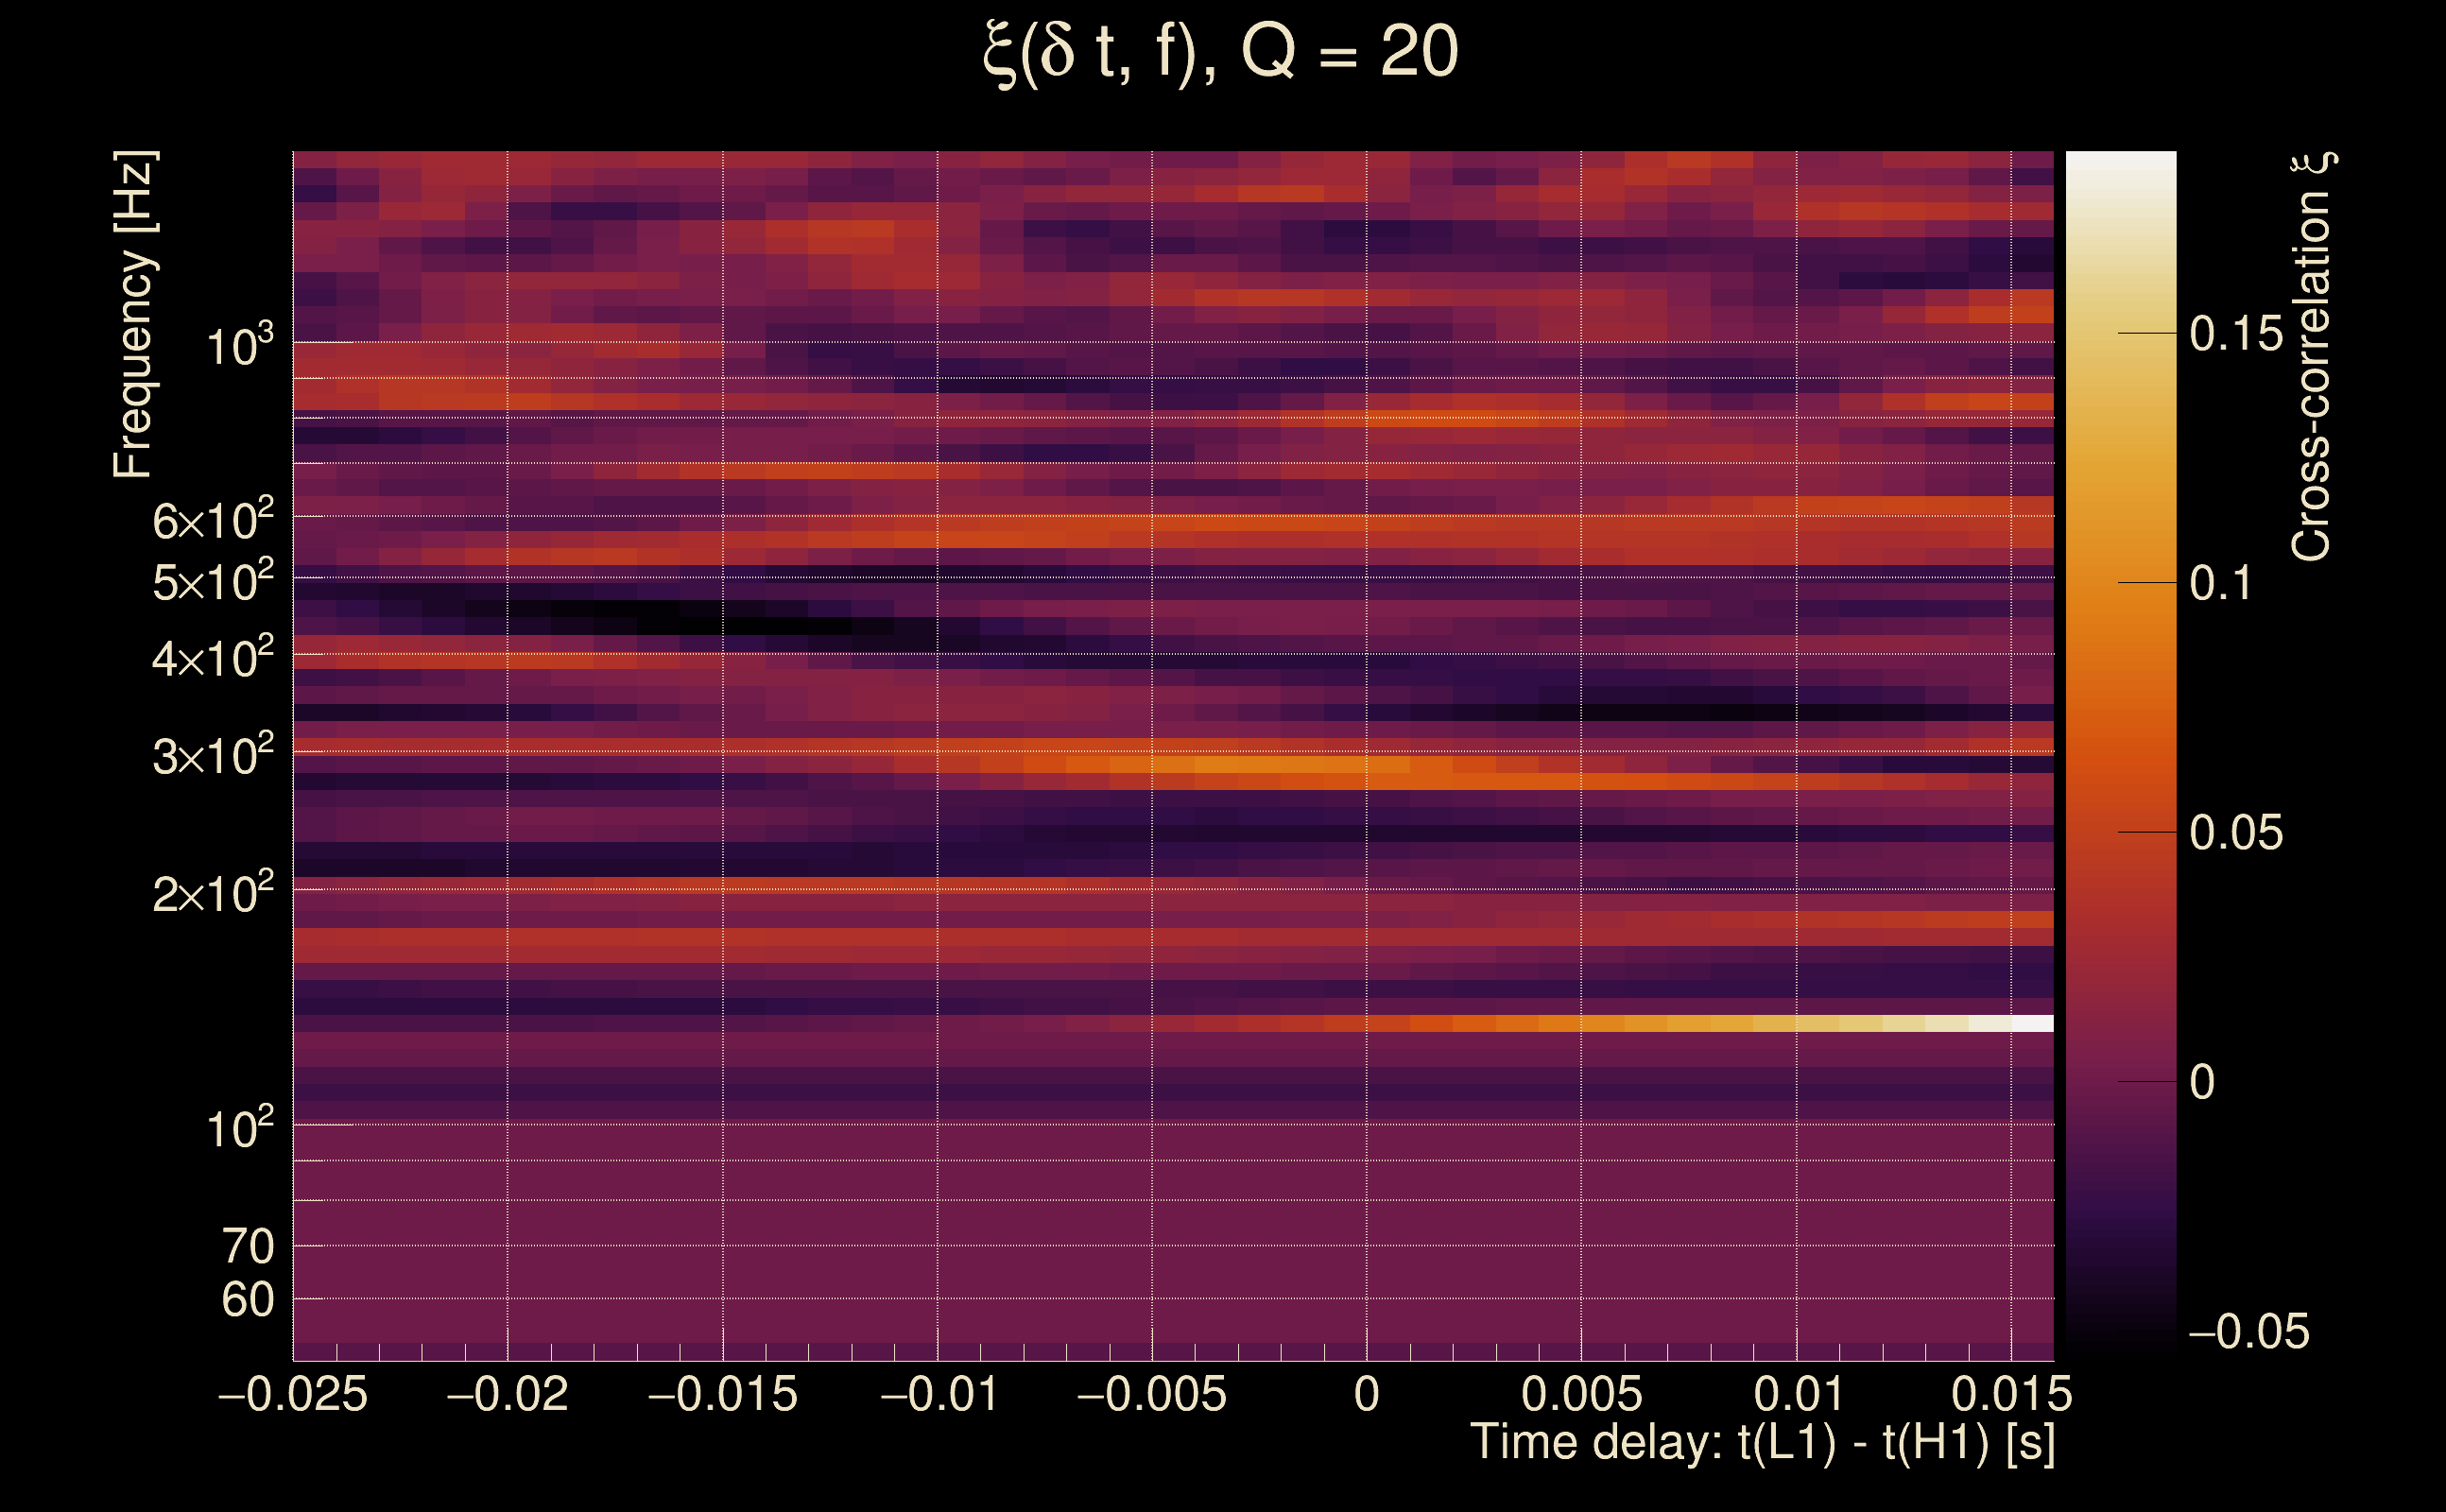
| Time delay between detectors t(L1) - t(H1): | -0.000501419 s (slice index = 108 / 217), δt_gw = -0.000501419 s |
| Time delay standard deviation: | 0 s |
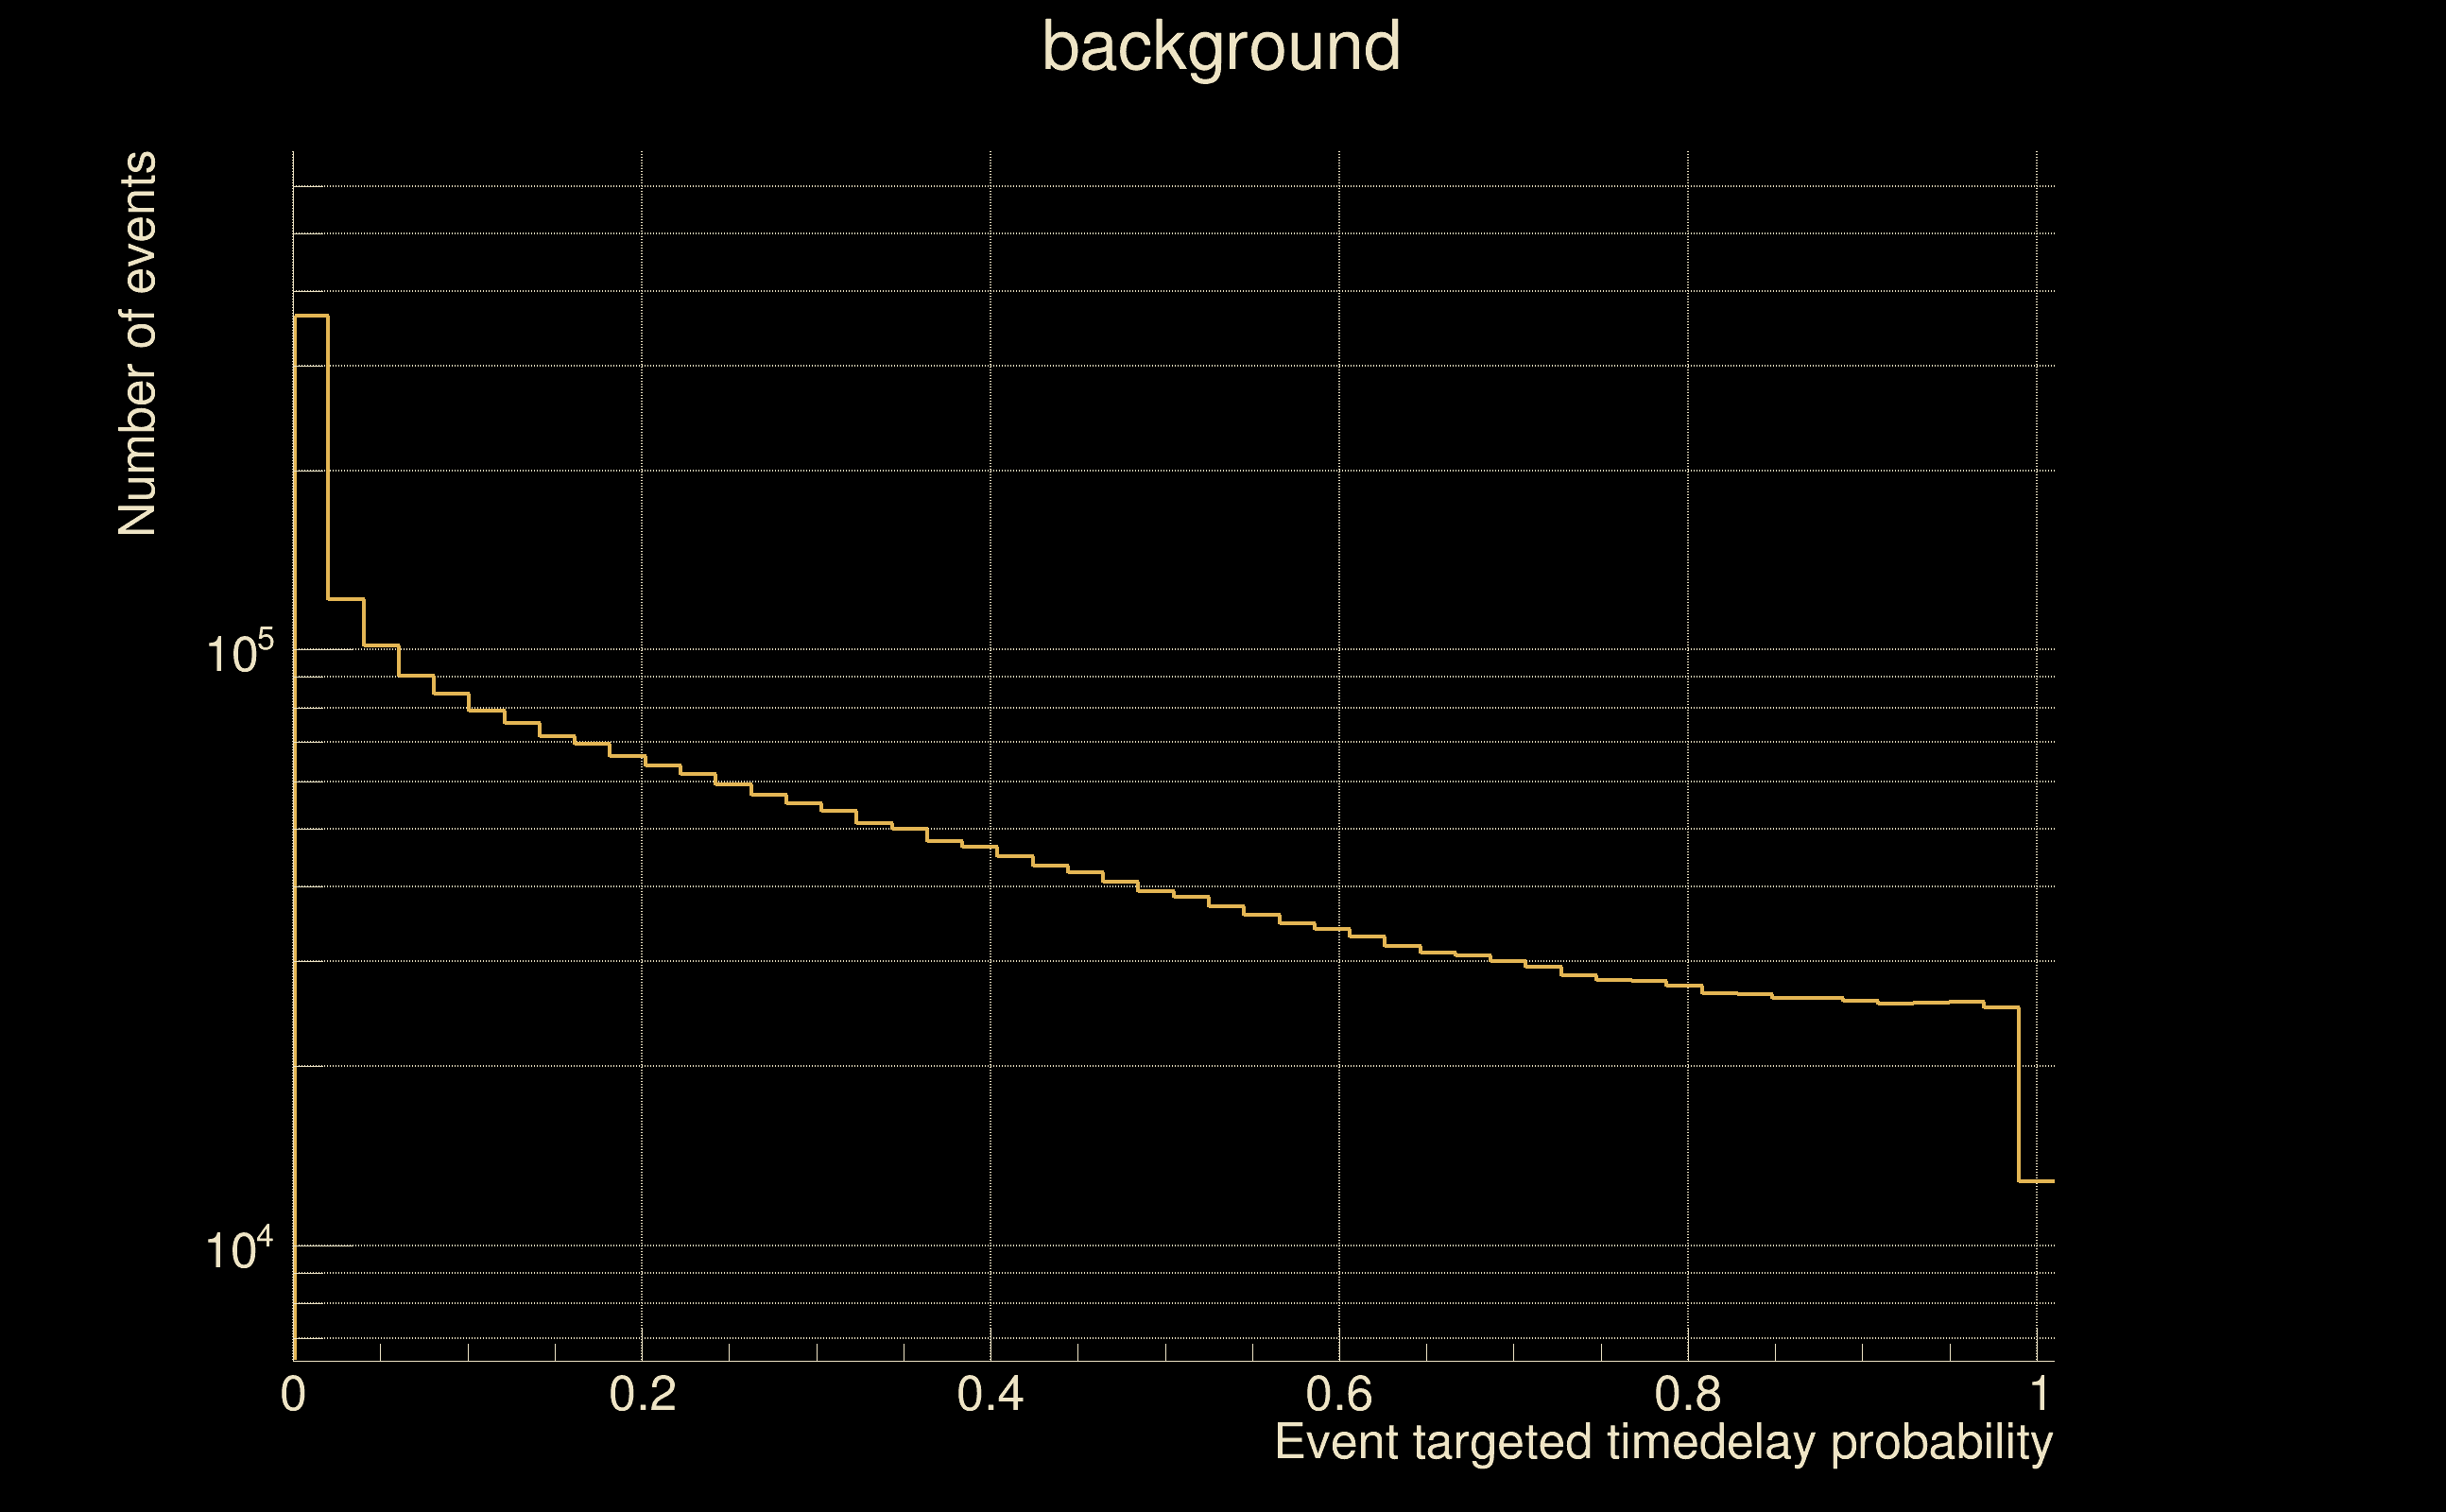
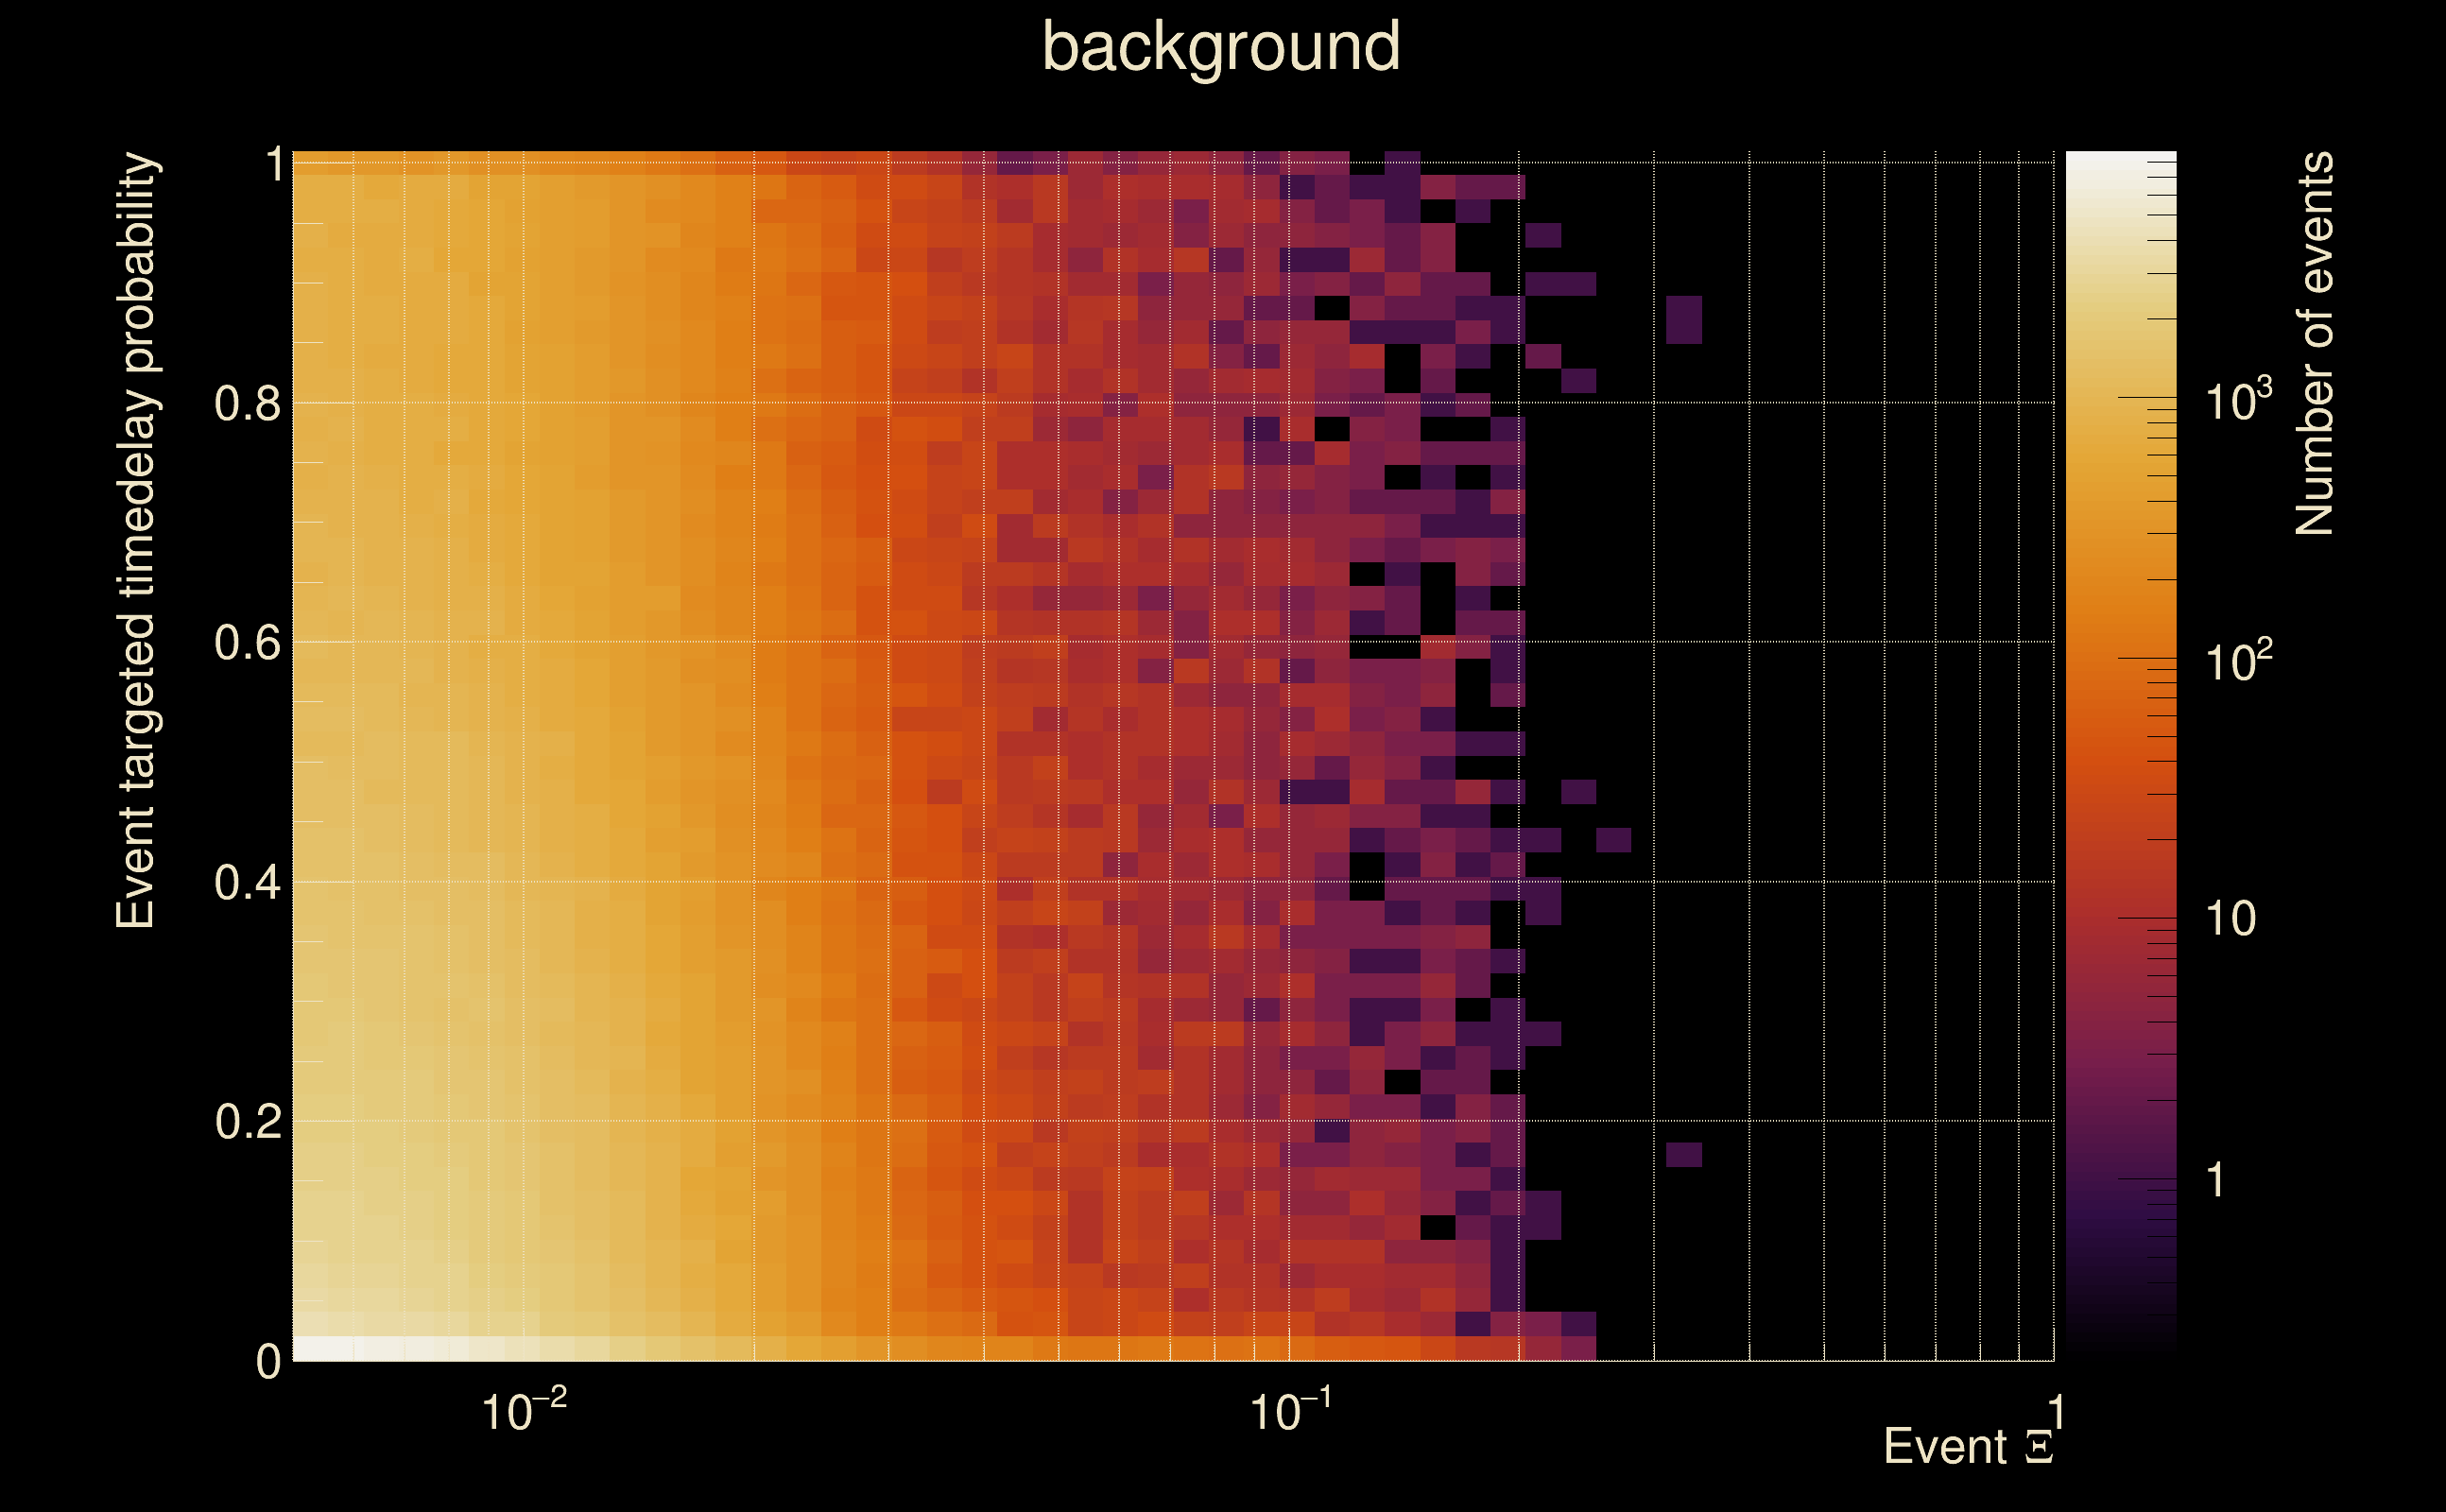
| [targeted mode] Time delay probability: | 0.290525 (1.05697 sigmas), δt_target = 1.72247e+45 s |
| Frequency: | 267.287 Hz |
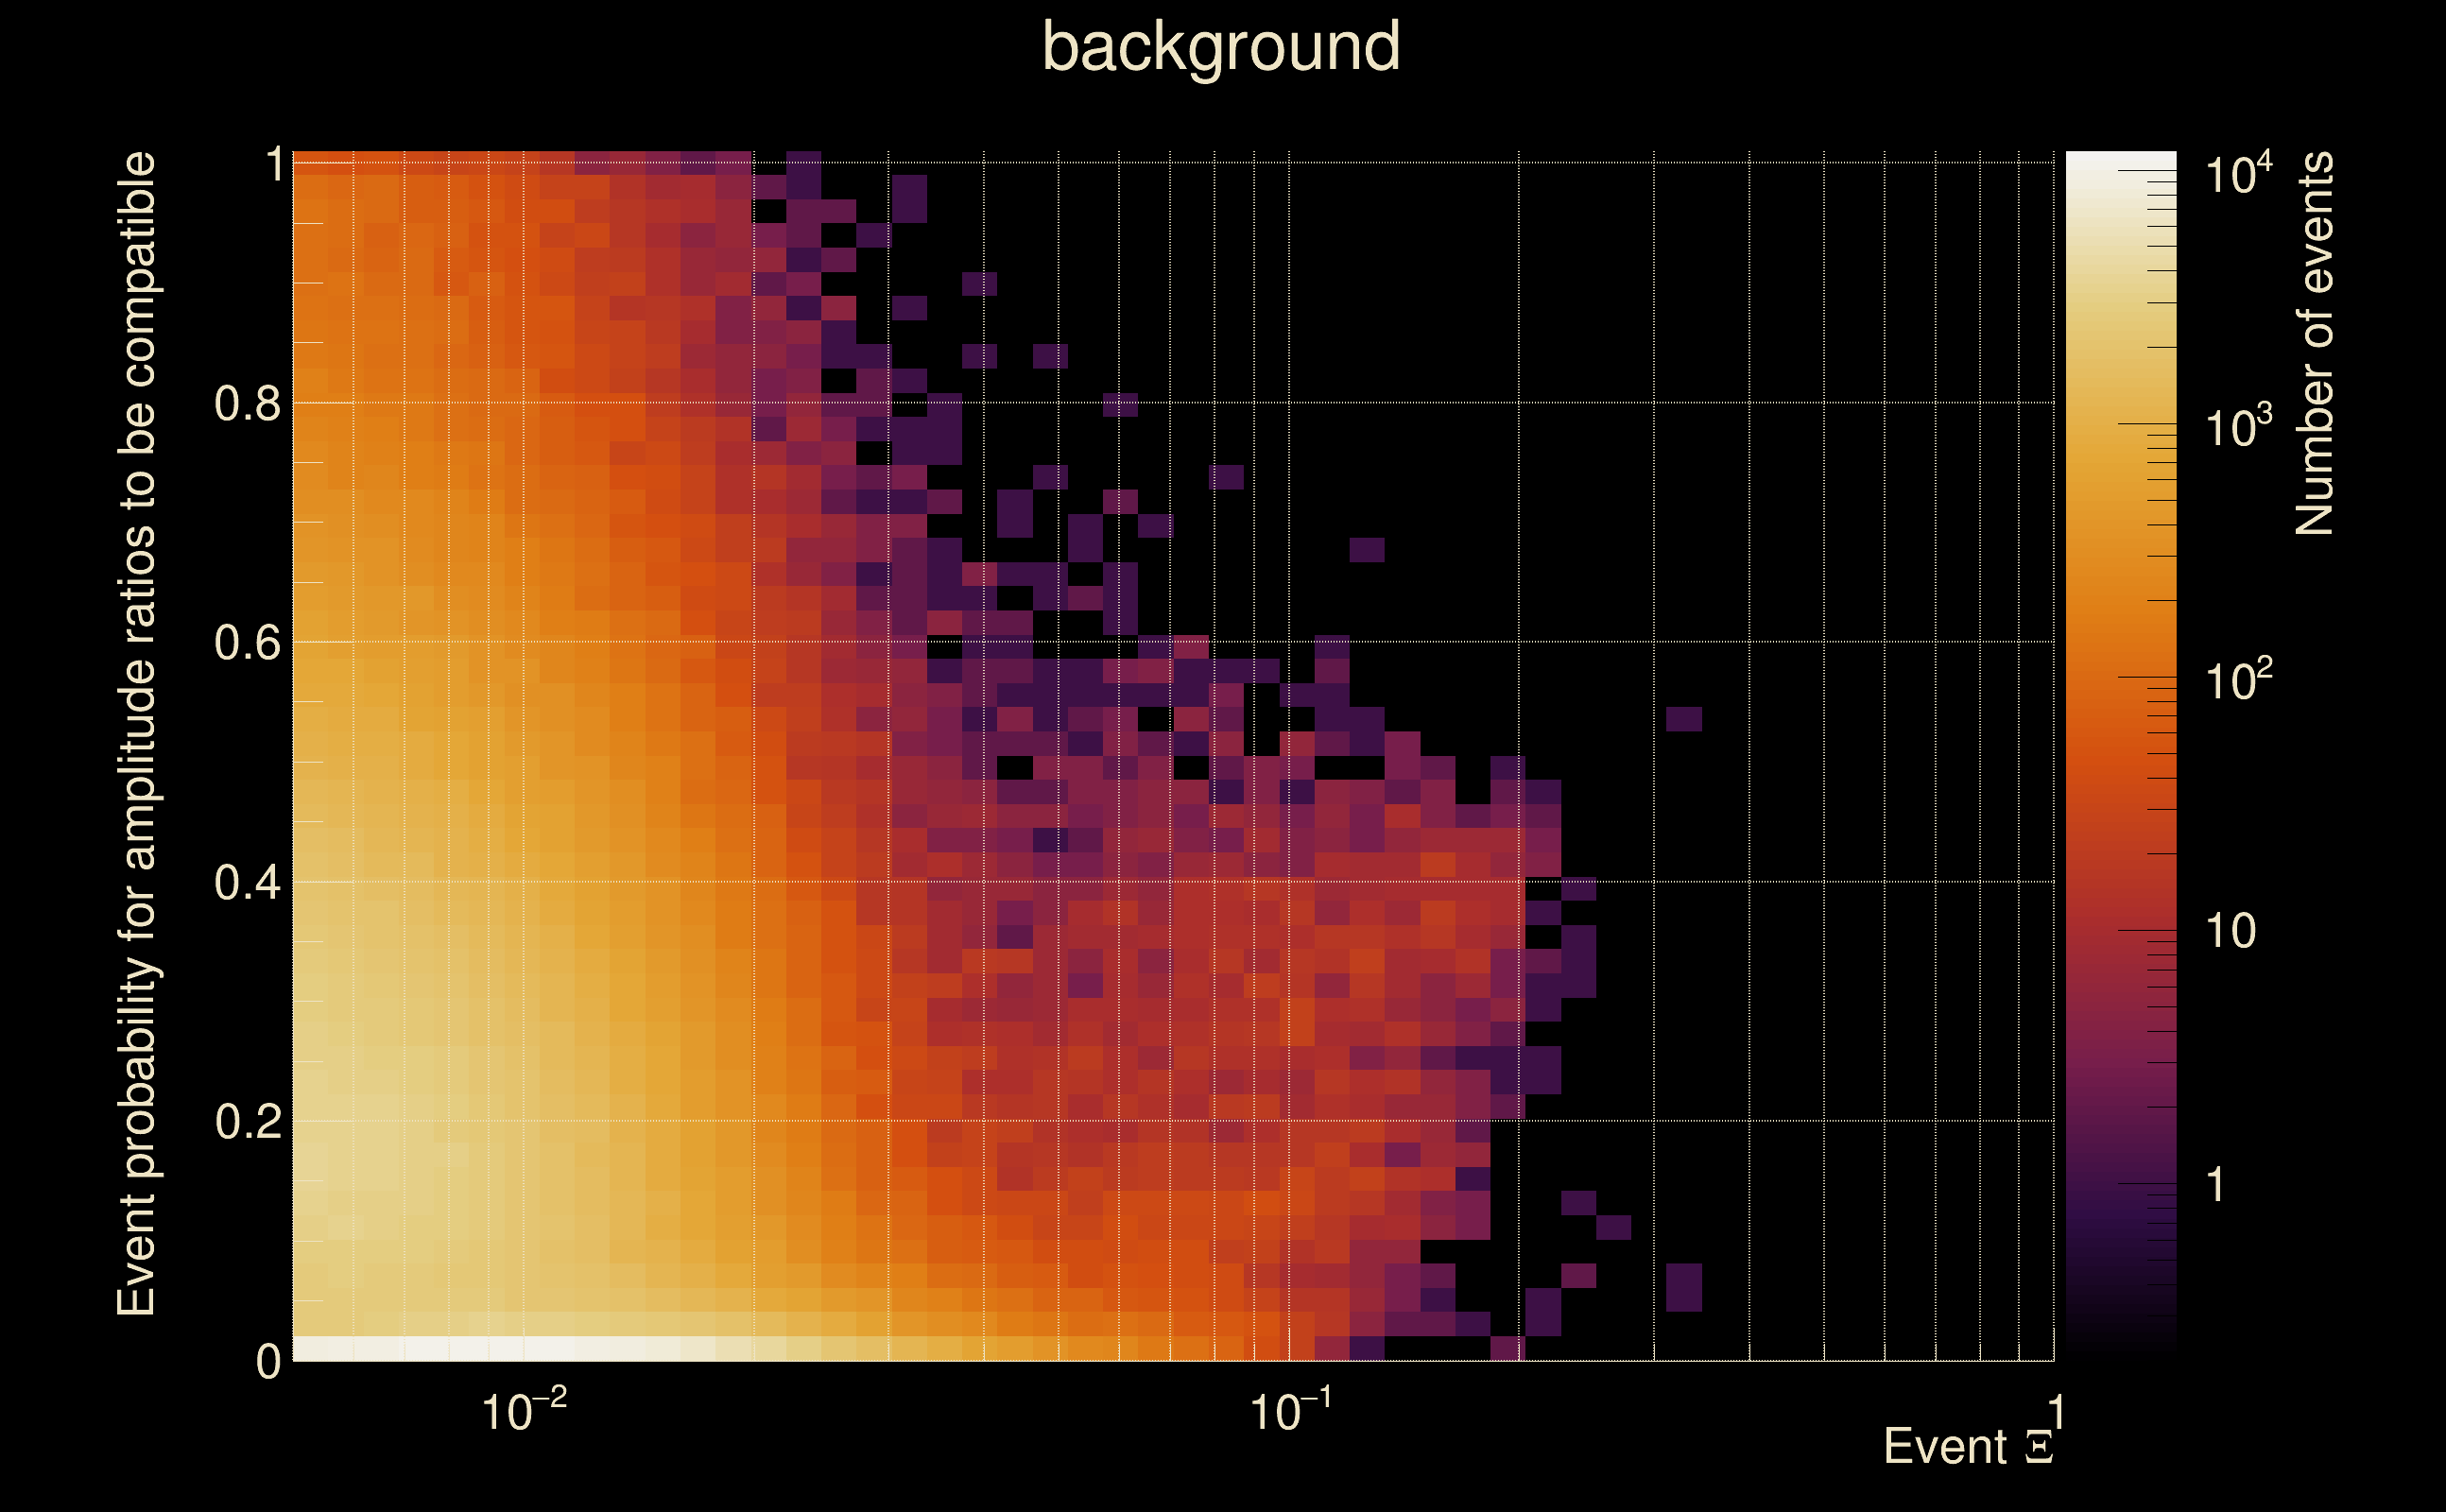
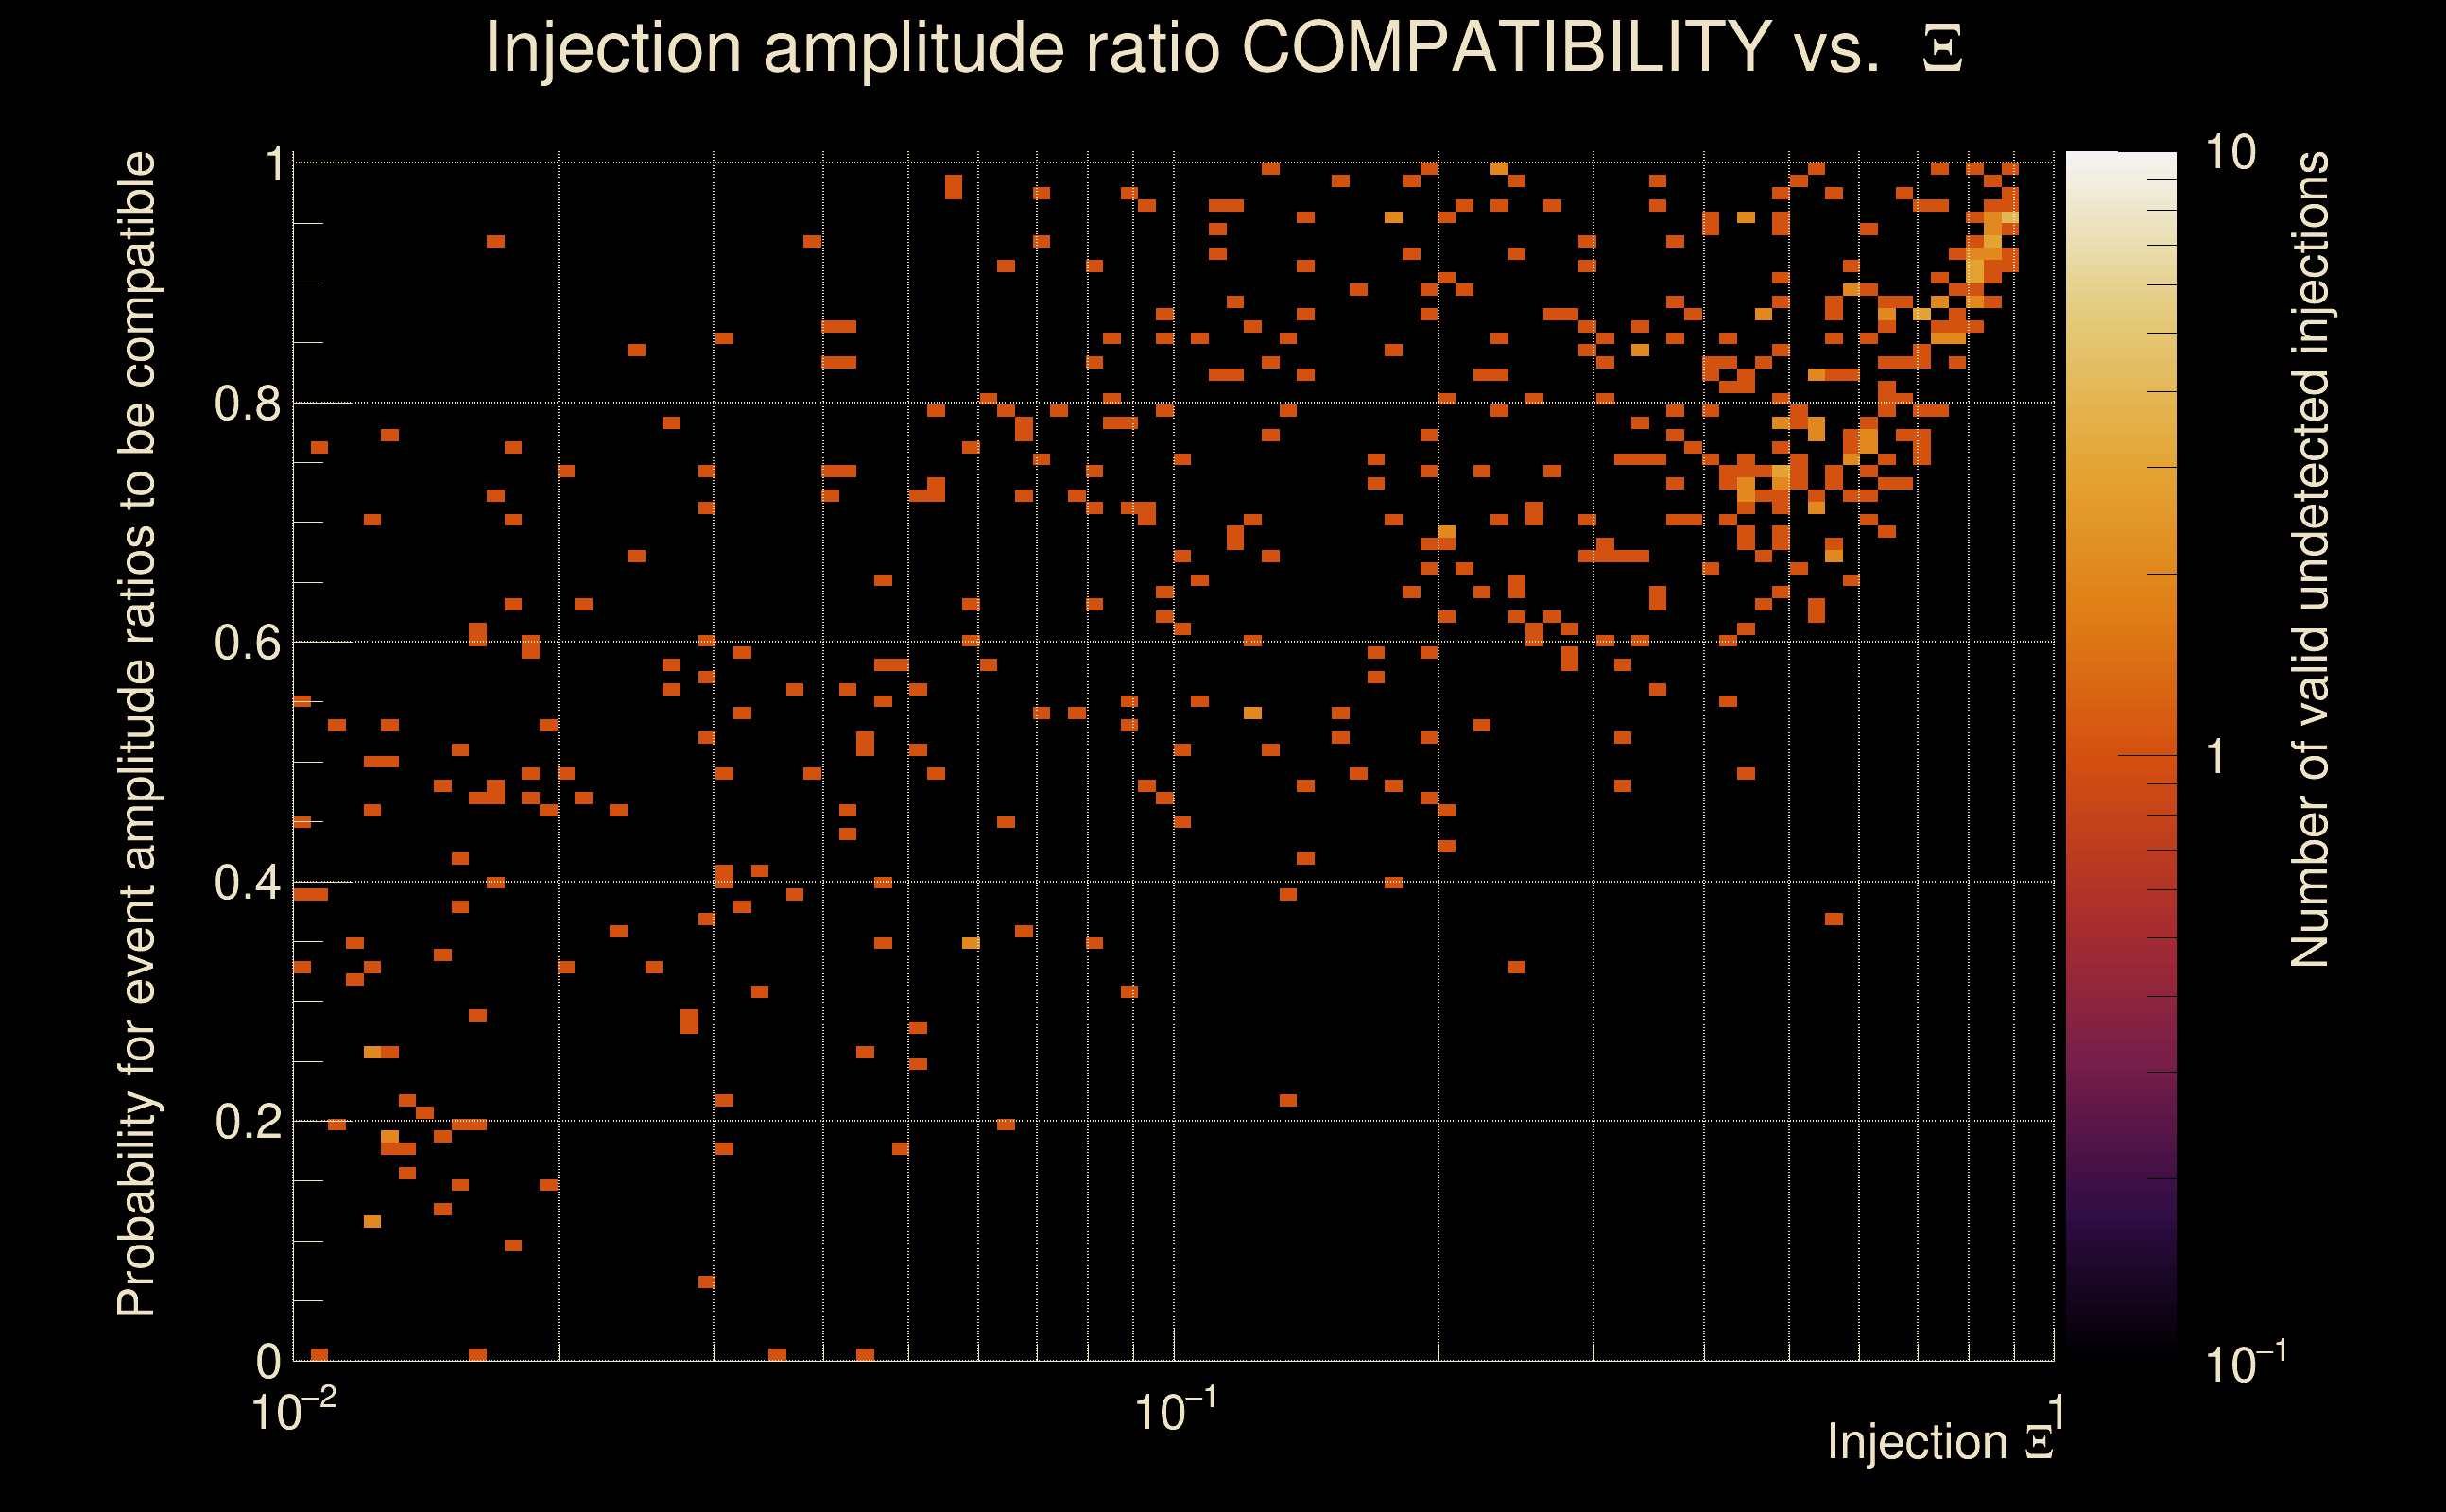
| Ξ: | 0.00499477 ± 0.0313774 (variance = 0.000984539): Q0: 0.0199376, Q1: 0.0720678, Q2: 0.0921876, Q3: 0.110391, Q4: 0.0943117 |
| Rank: | R_A = 0 |
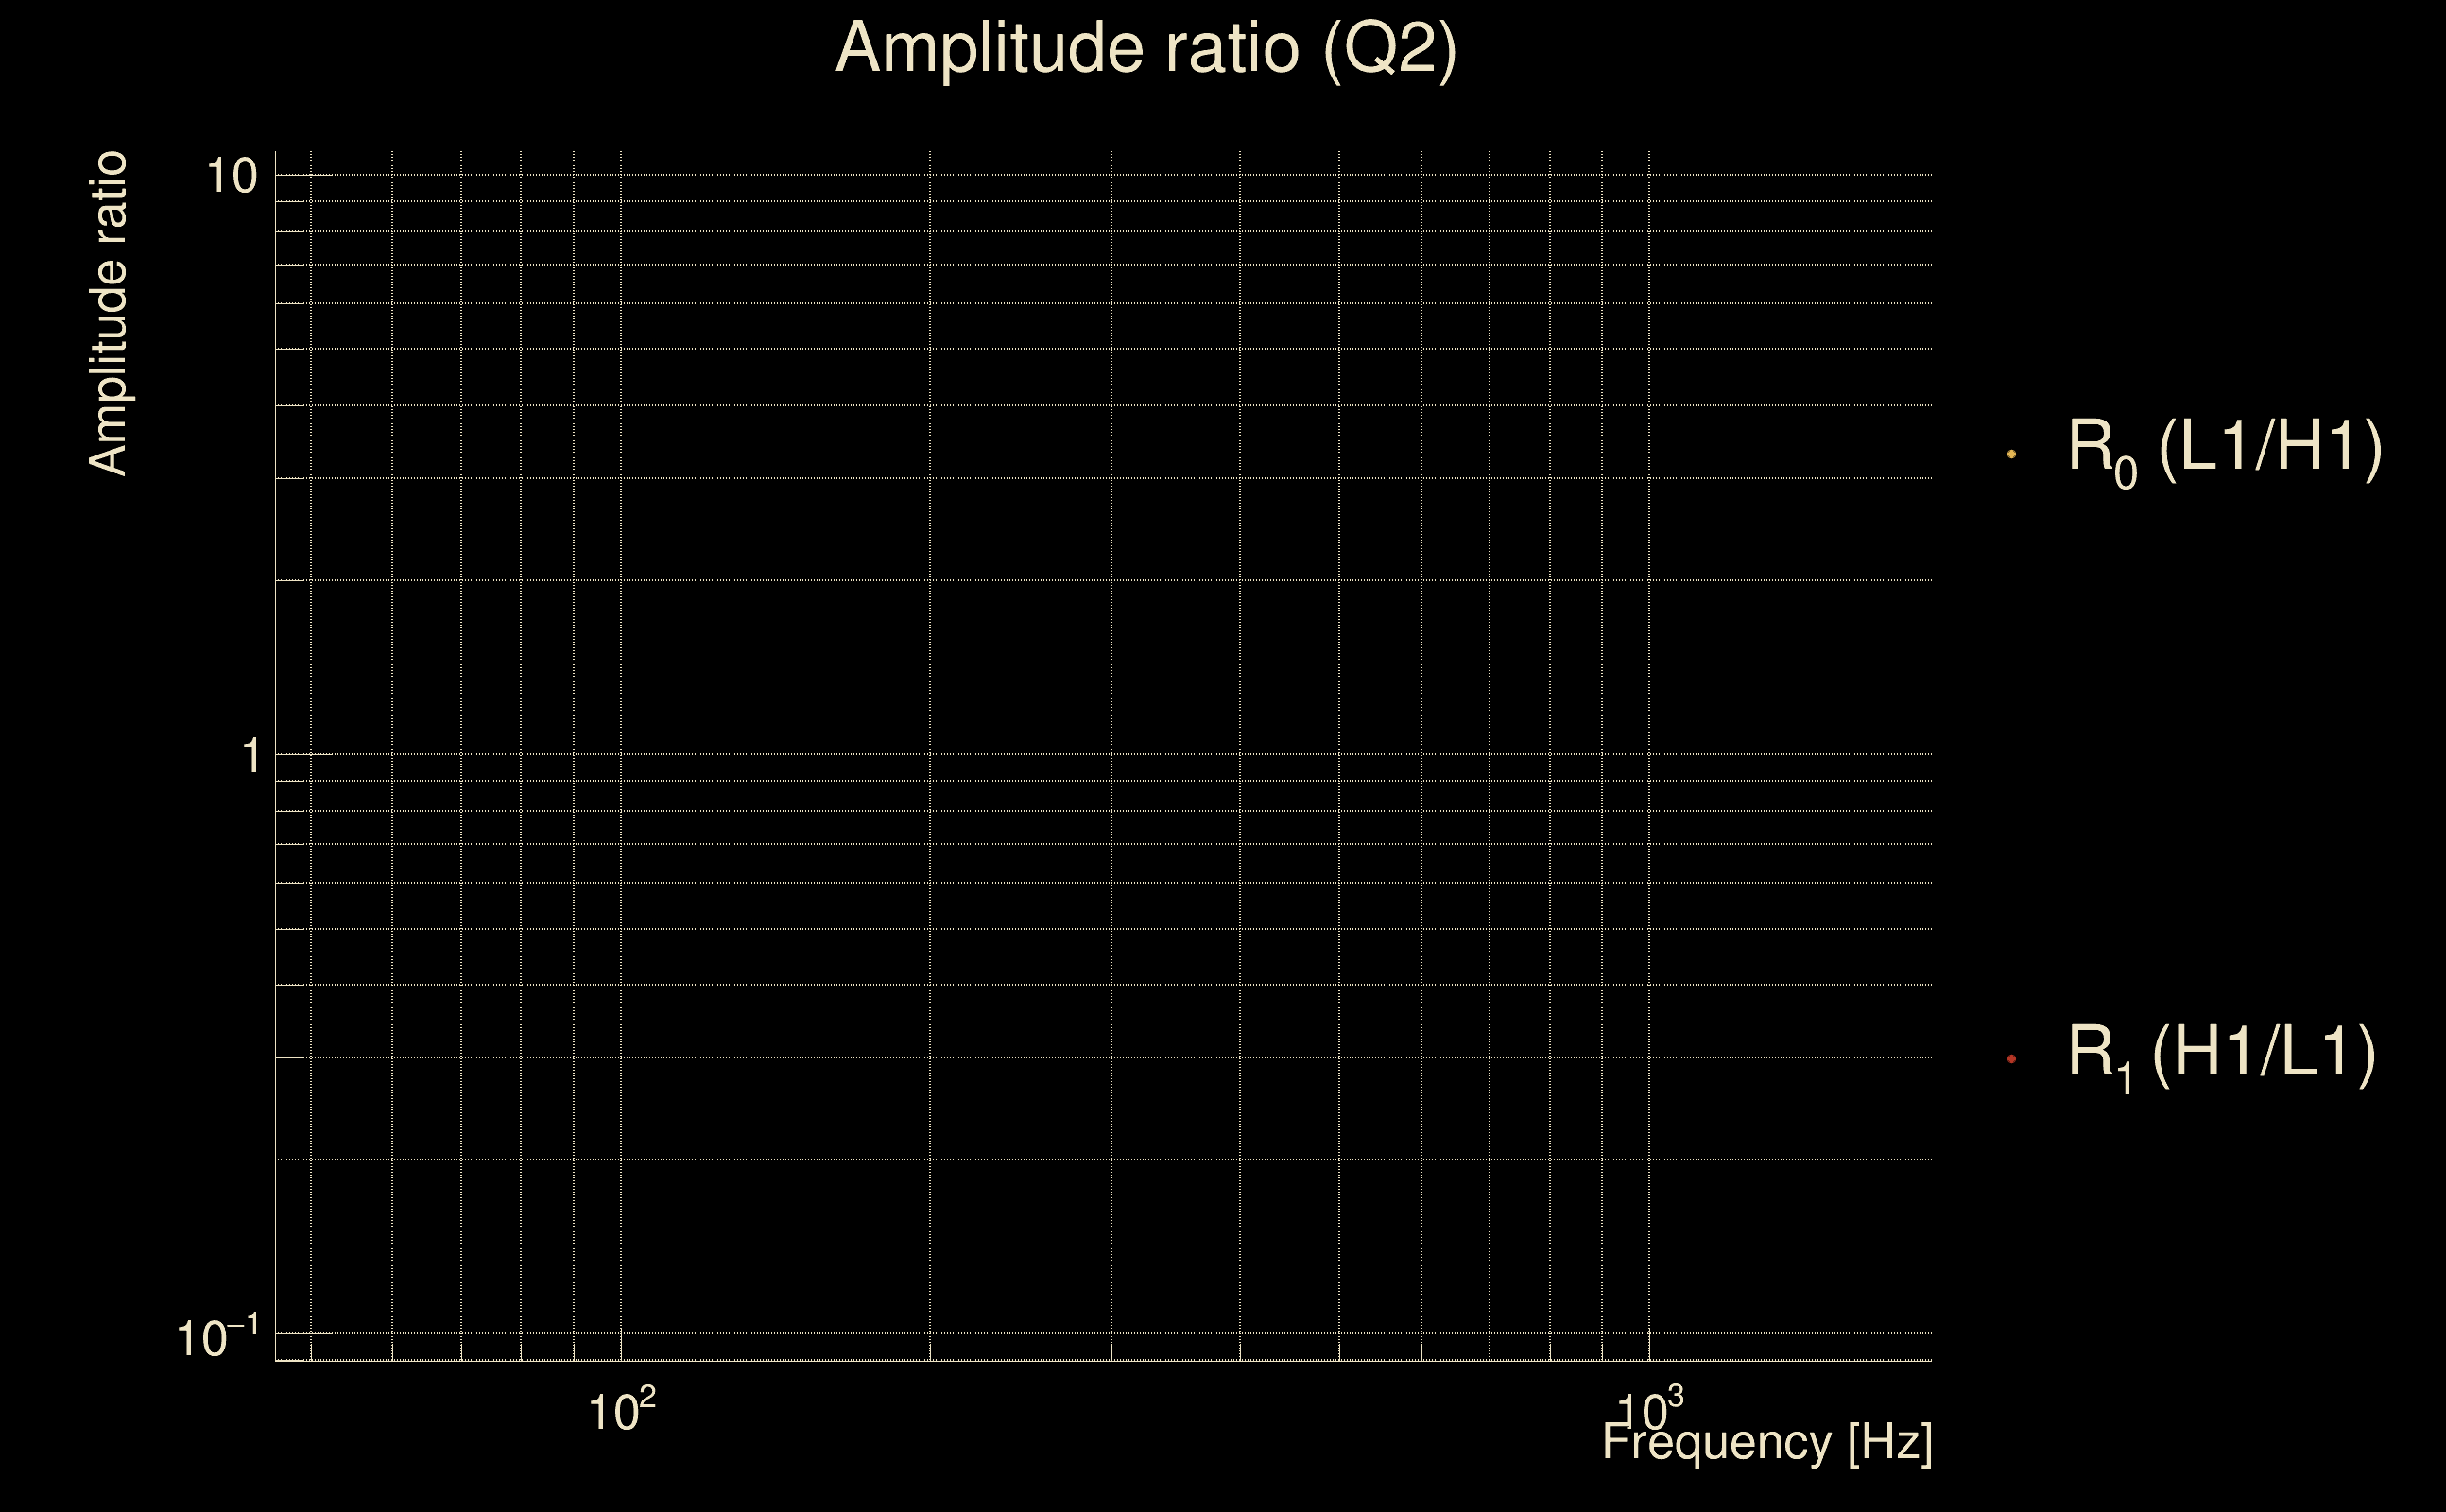
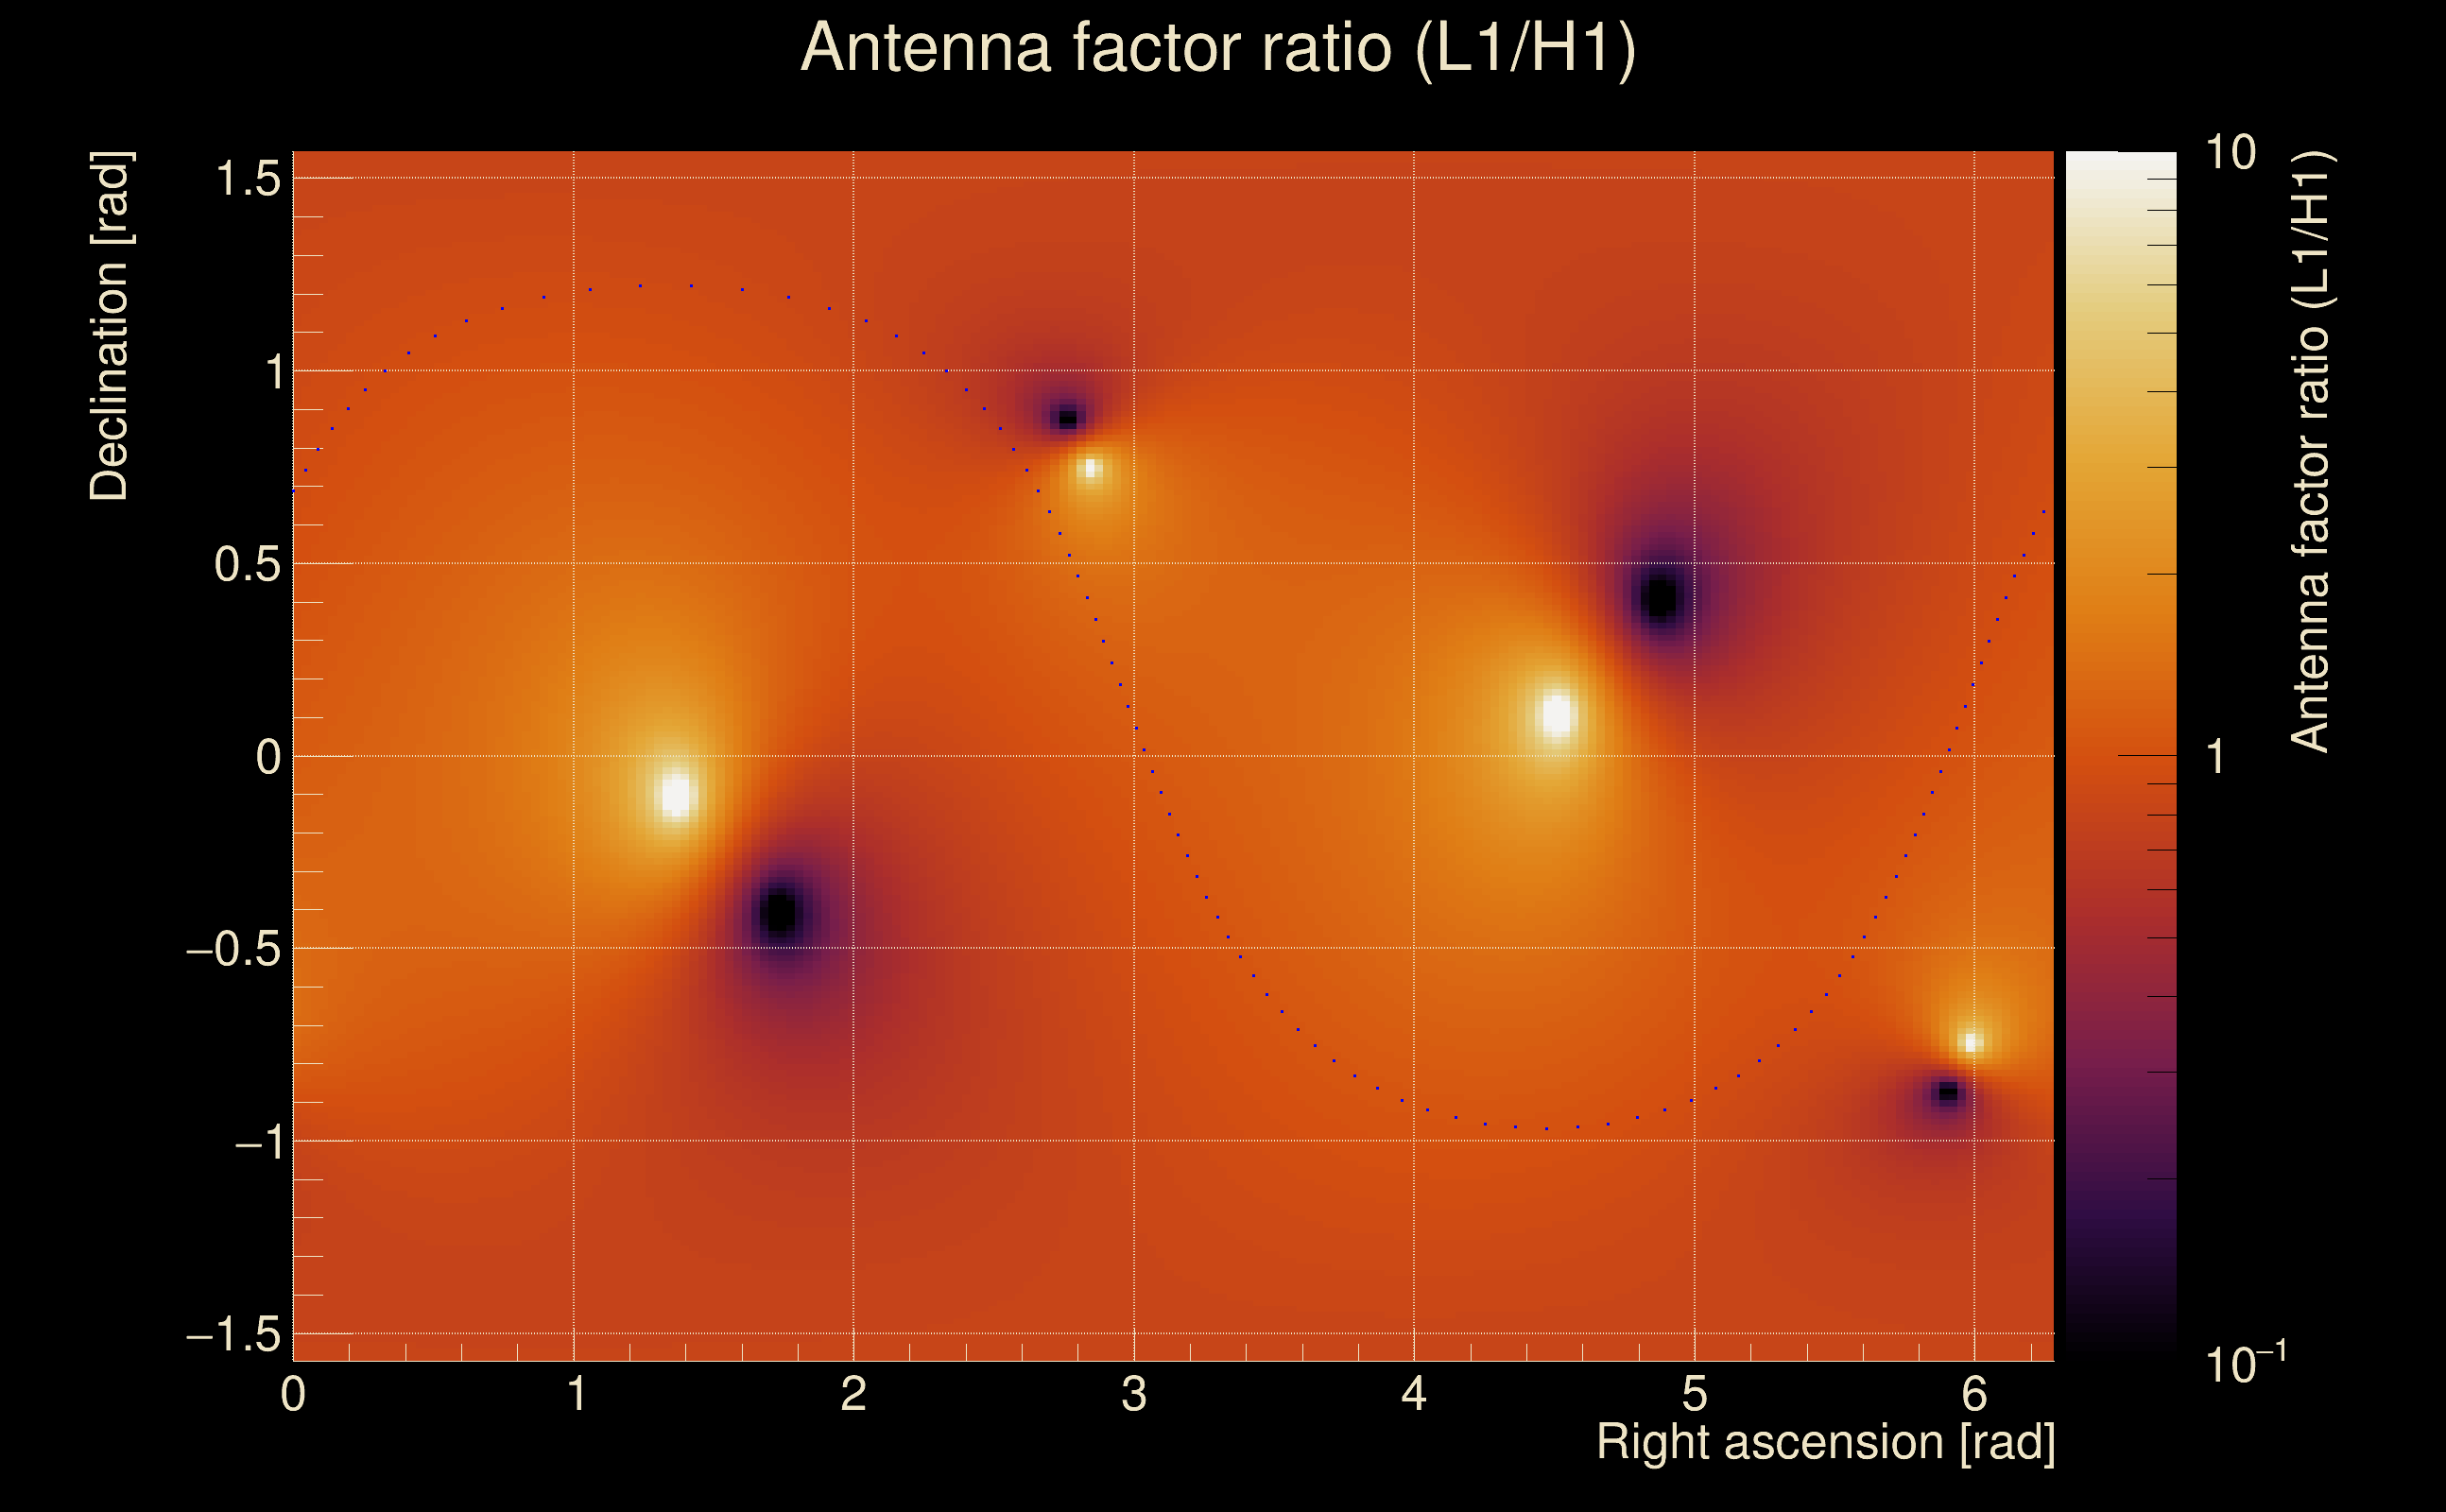
| Log of amplitude ratio (L1/H1): | 0.217539, variance = 0.817654 (L1/H1: -0.76981, variance = 1.6707, H1/L1: -1.22846, variance = 1.59774) |
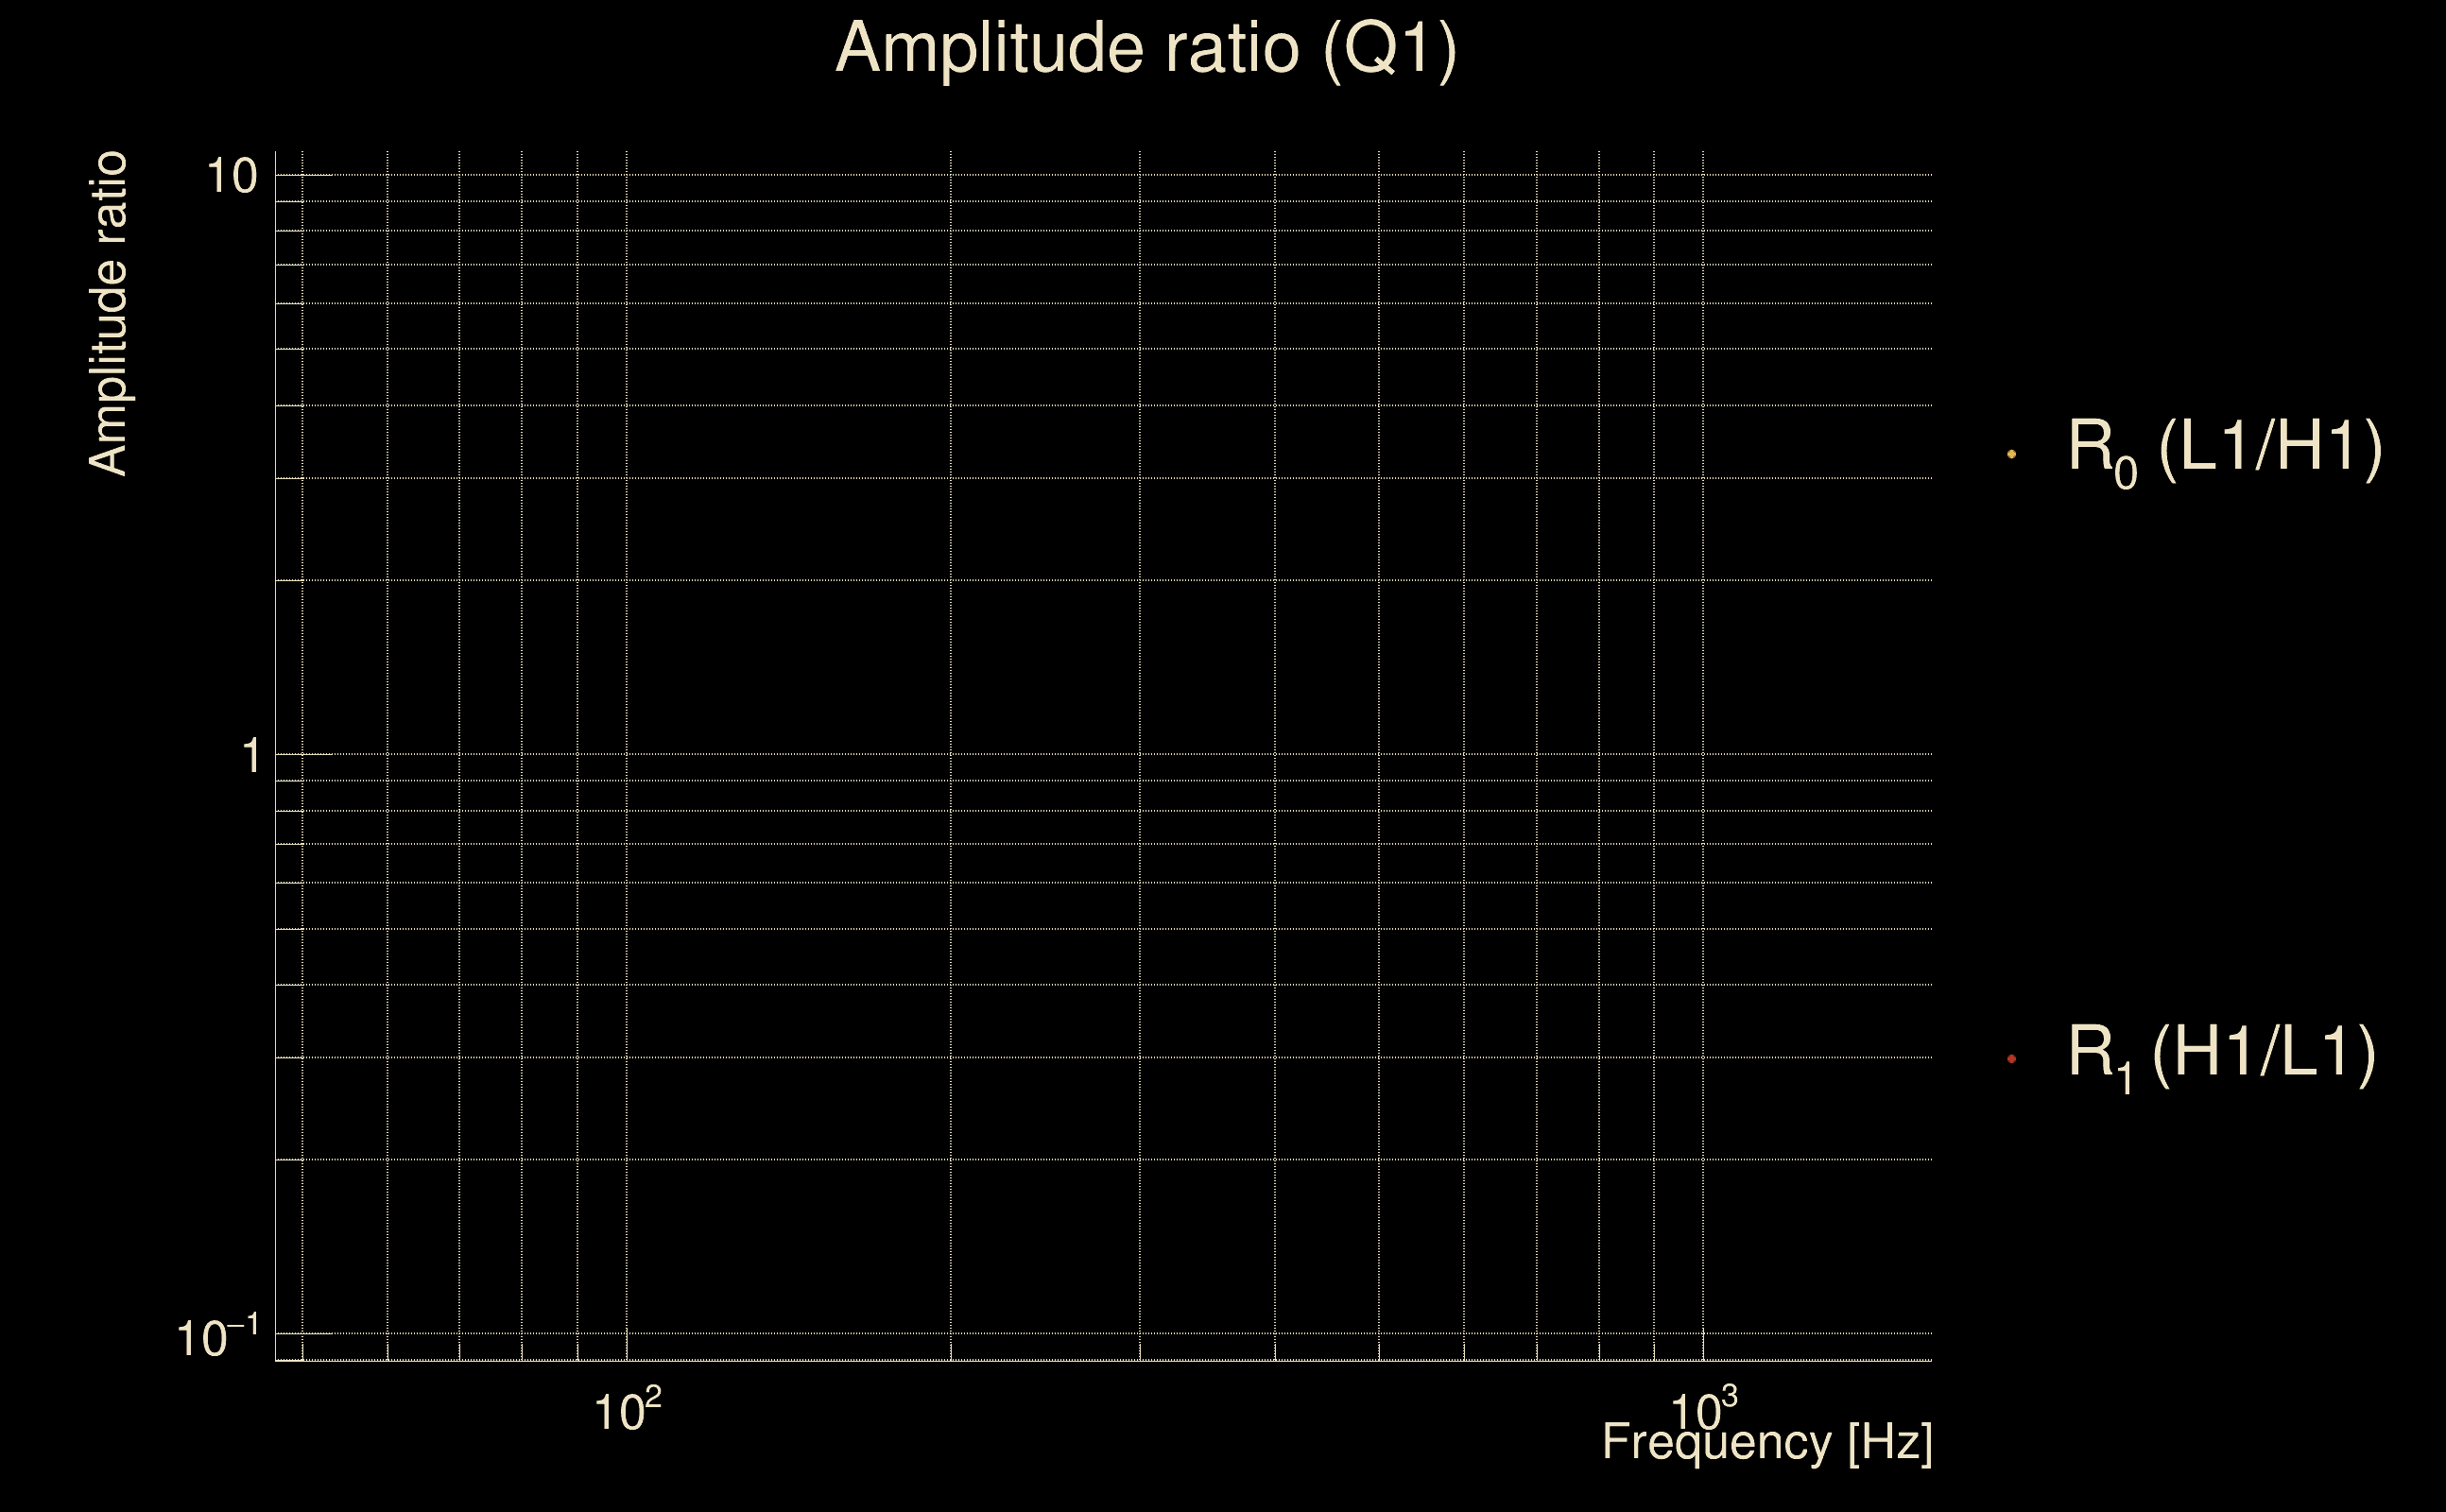
| Amplitude ratio (L1/H1): | 1.24301 ⋇ 2.47006 (L1/H1: 0.463101 ⋇ 3.64208, H1/L1: 0.292744 ⋇ 3.53961) |
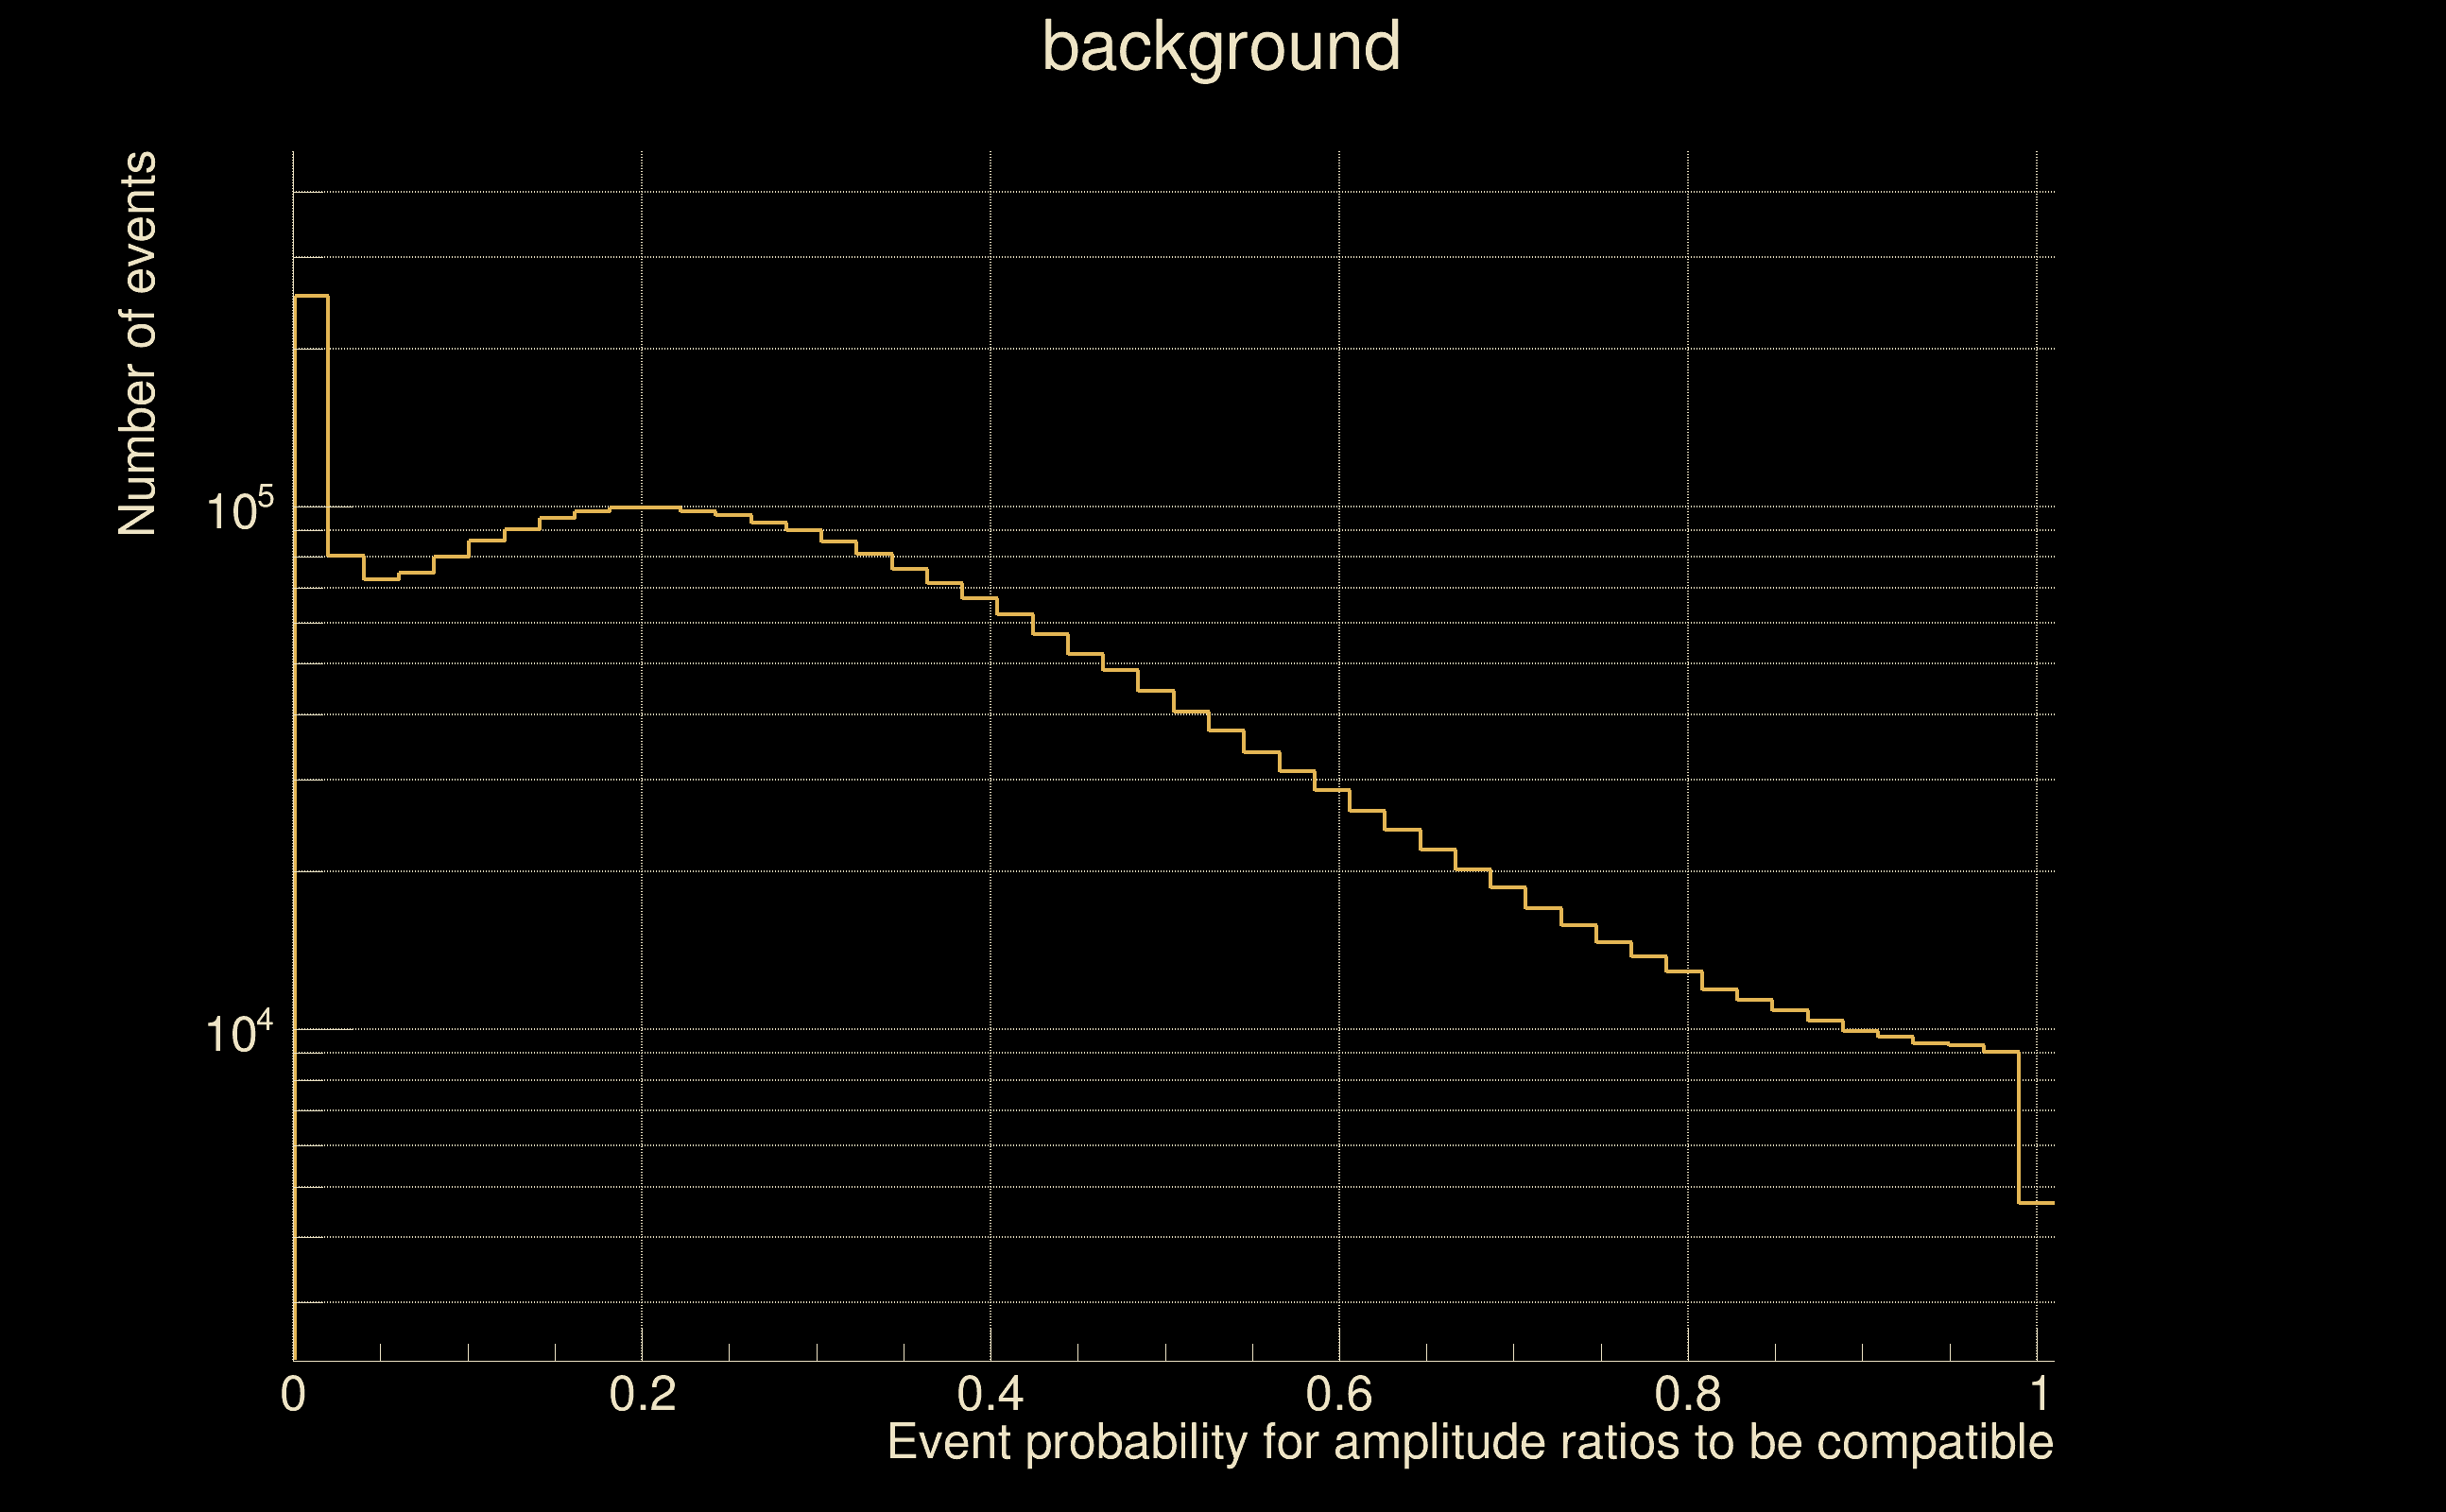
| Amplitude ratio H1|L1 compatibility (probability): | 0.269026 |
| Antenna factor probability: | 0.75686 |
| Number of rejected frequency rows: | Q0: 16 / 18, Q1: 33 / 36, Q2: 60 / 70, Q3: 126 / 134, Q4: 246 / 258 |
| Maximum signal-to-noise ratio: | H1: 5.15991, L1: 5.09941 |
| SNR variance: | H1: 0.500041, L1: 0.529824 |
| Click here for a zoomed plot | Click here for a zoomed plot | Click here for a zoomed plot | Click here for a zoomed plot | Click here for a zoomed plot |
 |
 |
 |
 |
 |
 |
 |
 |
 |
 |
 |
 |
 |
 |
 |
 |
 |
 |
 |
 |
 |
 |
 |
 |
 |
 |
 |
 |
 |
| Event time t(H1): | GPS = 1368460483 (Thu May 18 15:54:25 2023 ) → GPS = 1368460493 (Thu May 18 15:54:35 2023 ) |
| Event time t(L1): | GPS = 1368460483 (Thu May 18 15:54:35 2023 ) → GPS = 1368460493 (Thu May 18 15:54:35 2023 ) |
| Omicron analysis time window (H1): | GPS = 1368460480 → GPS = 1368460496 |
| Omicron analysis time window (L1): | GPS = 1368460480 → GPS = 1368460496 |
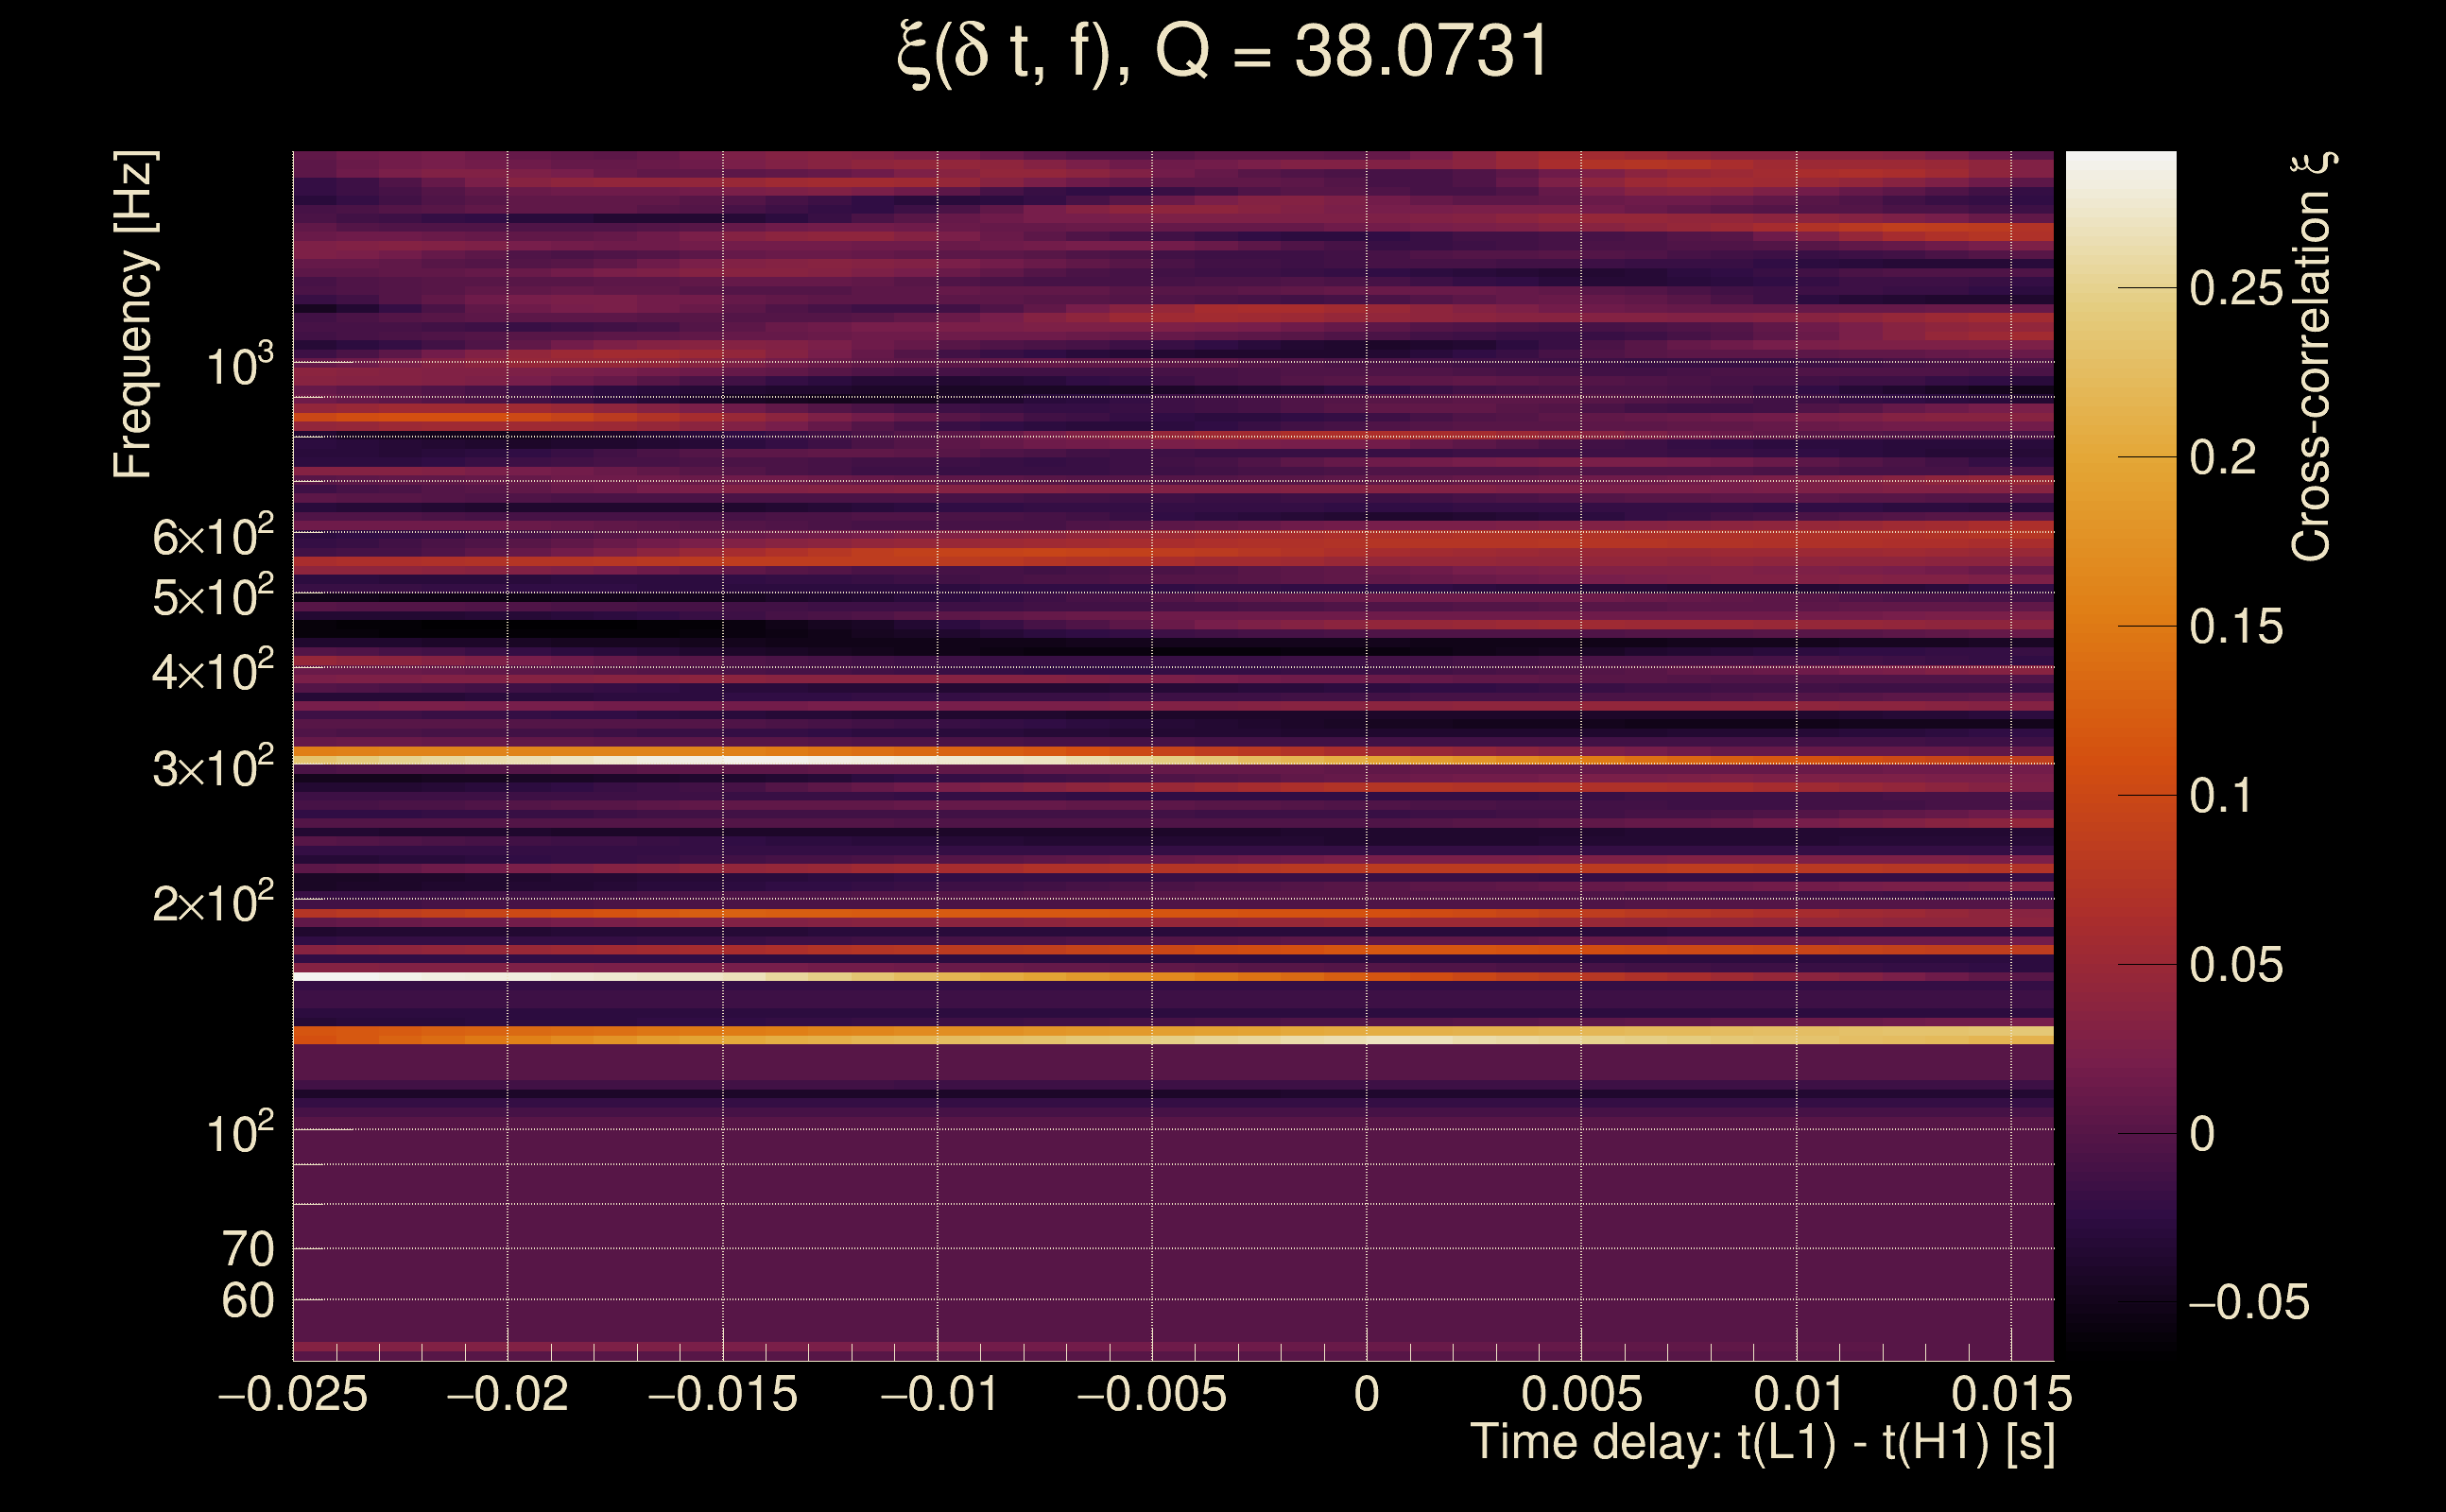
| Time delay between detectors t(L1) - t(H1): | 0.0012681 s (slice index = 108 / 217), δt_gw = 0.0012681 s |
| Time delay standard deviation: | 0 s |
| [targeted mode] Time delay probability: | 0.366368 (0.903297 sigmas), δt_target = 0.00738263 s |
| Frequency: | 286.892 Hz |
| Ξ: | 0.00516805 ± 0.0315817 (variance = 0.000997401): Q0: 0.03386, Q1: 0.0654299, Q2: 0.124078, Q3: 0.042532, Q4: 0.0602652 |
| Rank: | R_A = 0 |
| Log of amplitude ratio (L1/H1): | 0.285648, variance = 0.457978 (L1/H1: 0.0518042, variance = 0.975074, H1/L1: -0.468397, variance = 0.857985) |
| Amplitude ratio (L1/H1): | 1.33062 ⋇ 1.96745 (L1/H1: 1.05317 ⋇ 2.6844, H1/L1: 0.626005 ⋇ 2.52508) |
| Amplitude ratio H1|L1 compatibility (probability): | 0.758313 |
| Antenna factor probability: | 0.606994 |
| Number of rejected frequency rows: | Q0: 17 / 18, Q1: 31 / 36, Q2: 63 / 70, Q3: 126 / 134, Q4: 247 / 258 |
| Maximum signal-to-noise ratio: | H1: 4.4965, L1: 5.08639 |
| SNR variance: | H1: 0.490357, L1: 0.530004 |
| Click here for a zoomed plot | Click here for a zoomed plot | Click here for a zoomed plot | Click here for a zoomed plot | Click here for a zoomed plot |
 |
 |
 |
 |
 |
 |
 |
 |
 |
 |
 |
 |
 |
 |
 |
 |
 |
 |
 |
 |
 |
 |
 |
 |
 |
 |
 |
 |
 |
| Event time t(H1): | GPS = 1368460478 (Thu May 18 15:54:20 2023 ) → GPS = 1368460488 (Thu May 18 15:54:30 2023 ) |
| Event time t(L1): | GPS = 1368460478 (Thu May 18 15:54:30 2023 ) → GPS = 1368460488 (Thu May 18 15:54:30 2023 ) |
| Omicron analysis time window (H1): | GPS = 1368460475 → GPS = 1368460491 |
| Omicron analysis time window (L1): | GPS = 1368460475 → GPS = 1368460491 |
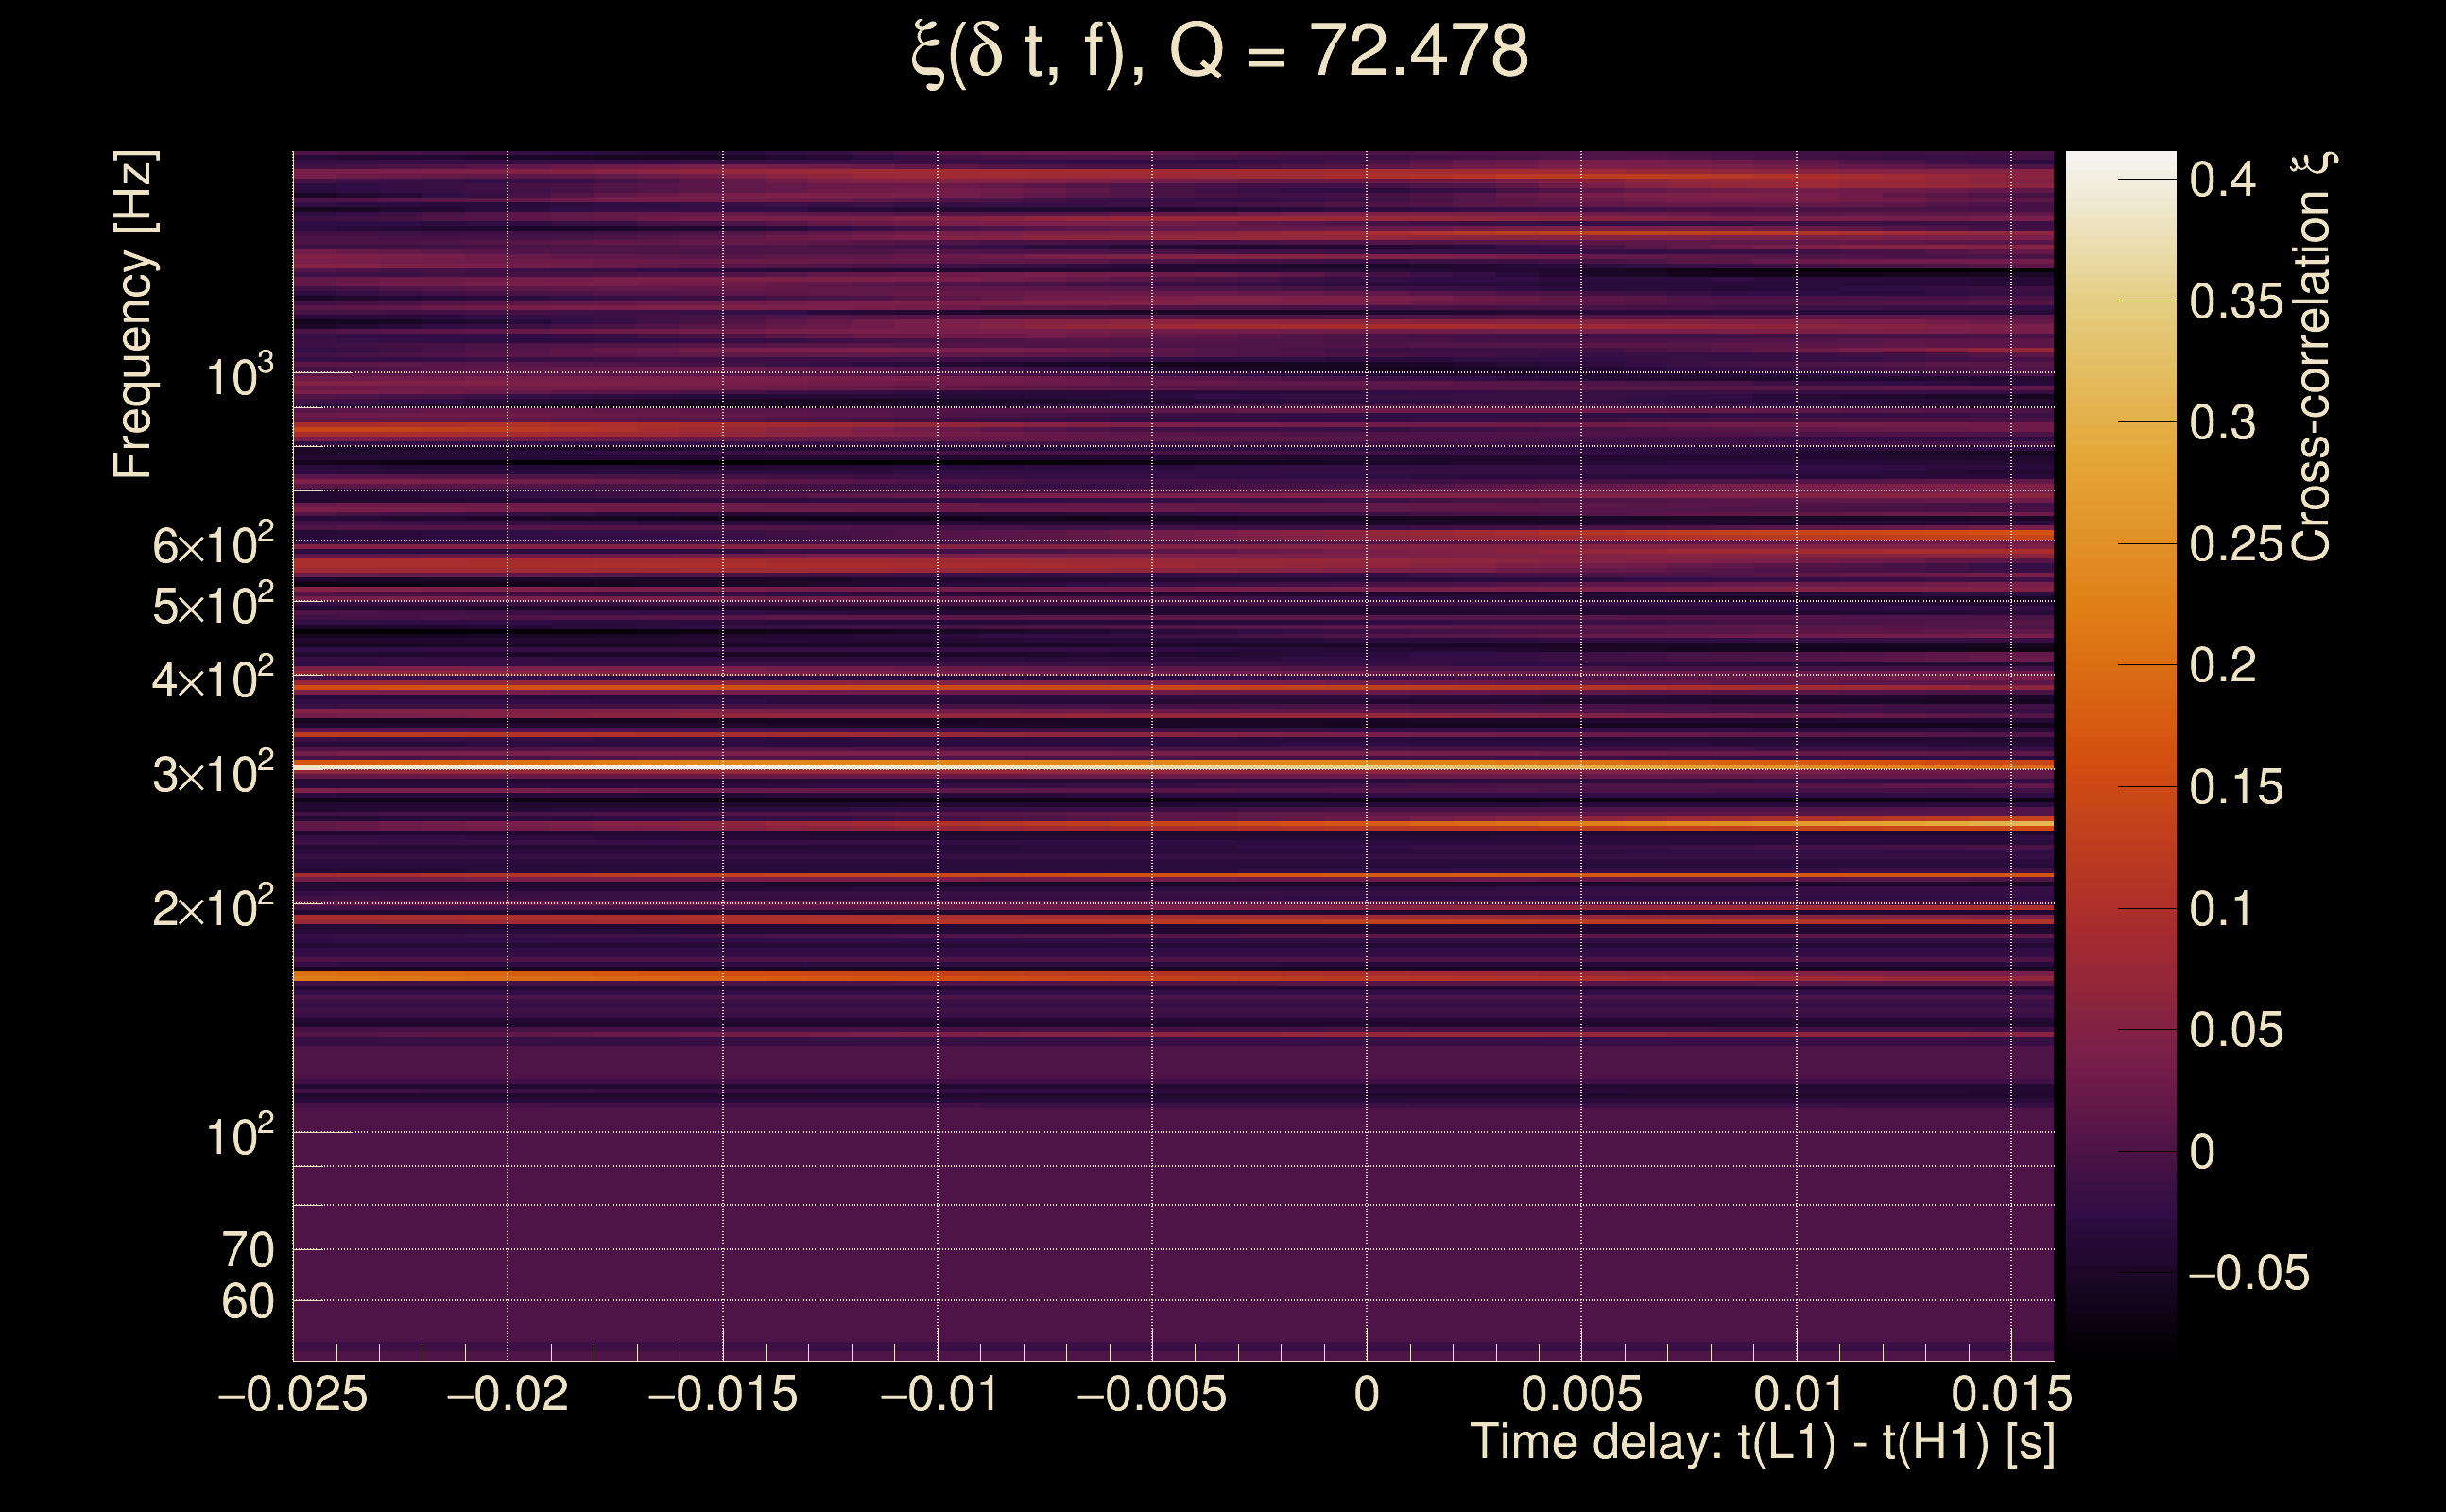
| Time delay between detectors t(L1) - t(H1): | -0.00473356 s (slice index = 108 / 217), δt_gw = -0.00473356 s |
| Time delay standard deviation: | 0 s |
| [targeted mode] Time delay probability: | 0.0166657 (2.394 sigmas), δt_target = 0.00738382 s |
| Frequency: | 395.285 Hz |
| Ξ: | 0.00150336 ± 0.0448526 (variance = 0.00201175): Q0: 0.0246011, Q1: 0, Q2: 0.0420301, Q3: 0.0806733, Q4: 0.12768 |
| Rank: | R_A = 0 |
| Log of amplitude ratio (L1/H1): | 0.147831, variance = 0.485051 (L1/H1: -0.0427627, variance = 1.03151, H1/L1: -0.30145, variance = 0.911952) |
| Amplitude ratio (L1/H1): | 1.15932 ⋇ 2.00663 (L1/H1: 0.958139 ⋇ 2.76111, H1/L1: 0.739745 ⋇ 2.59857) |
| Amplitude ratio H1|L1 compatibility (probability): | 0.804978 |
| Antenna factor probability: | 0.762681 |
| Number of rejected frequency rows: | Q0: 17 / 18, Q1: 36 / 36, Q2: 67 / 70, Q3: 127 / 134, Q4: 242 / 258 |
| Maximum signal-to-noise ratio: | H1: 4.55003, L1: 5.0681 |
| SNR variance: | H1: 0.500268, L1: 0.510191 |
| Click here for a zoomed plot | Click here for a zoomed plot | Click here for a zoomed plot | Click here for a zoomed plot | Click here for a zoomed plot |
 |
 |
 |
 |
 |
 |
 |
 |
 |
 |
 |
 |
 |
 |
 |
 |
 |
 |
 |
 |
 |
 |
 |
 |
 |
 |
 |
 |
 |
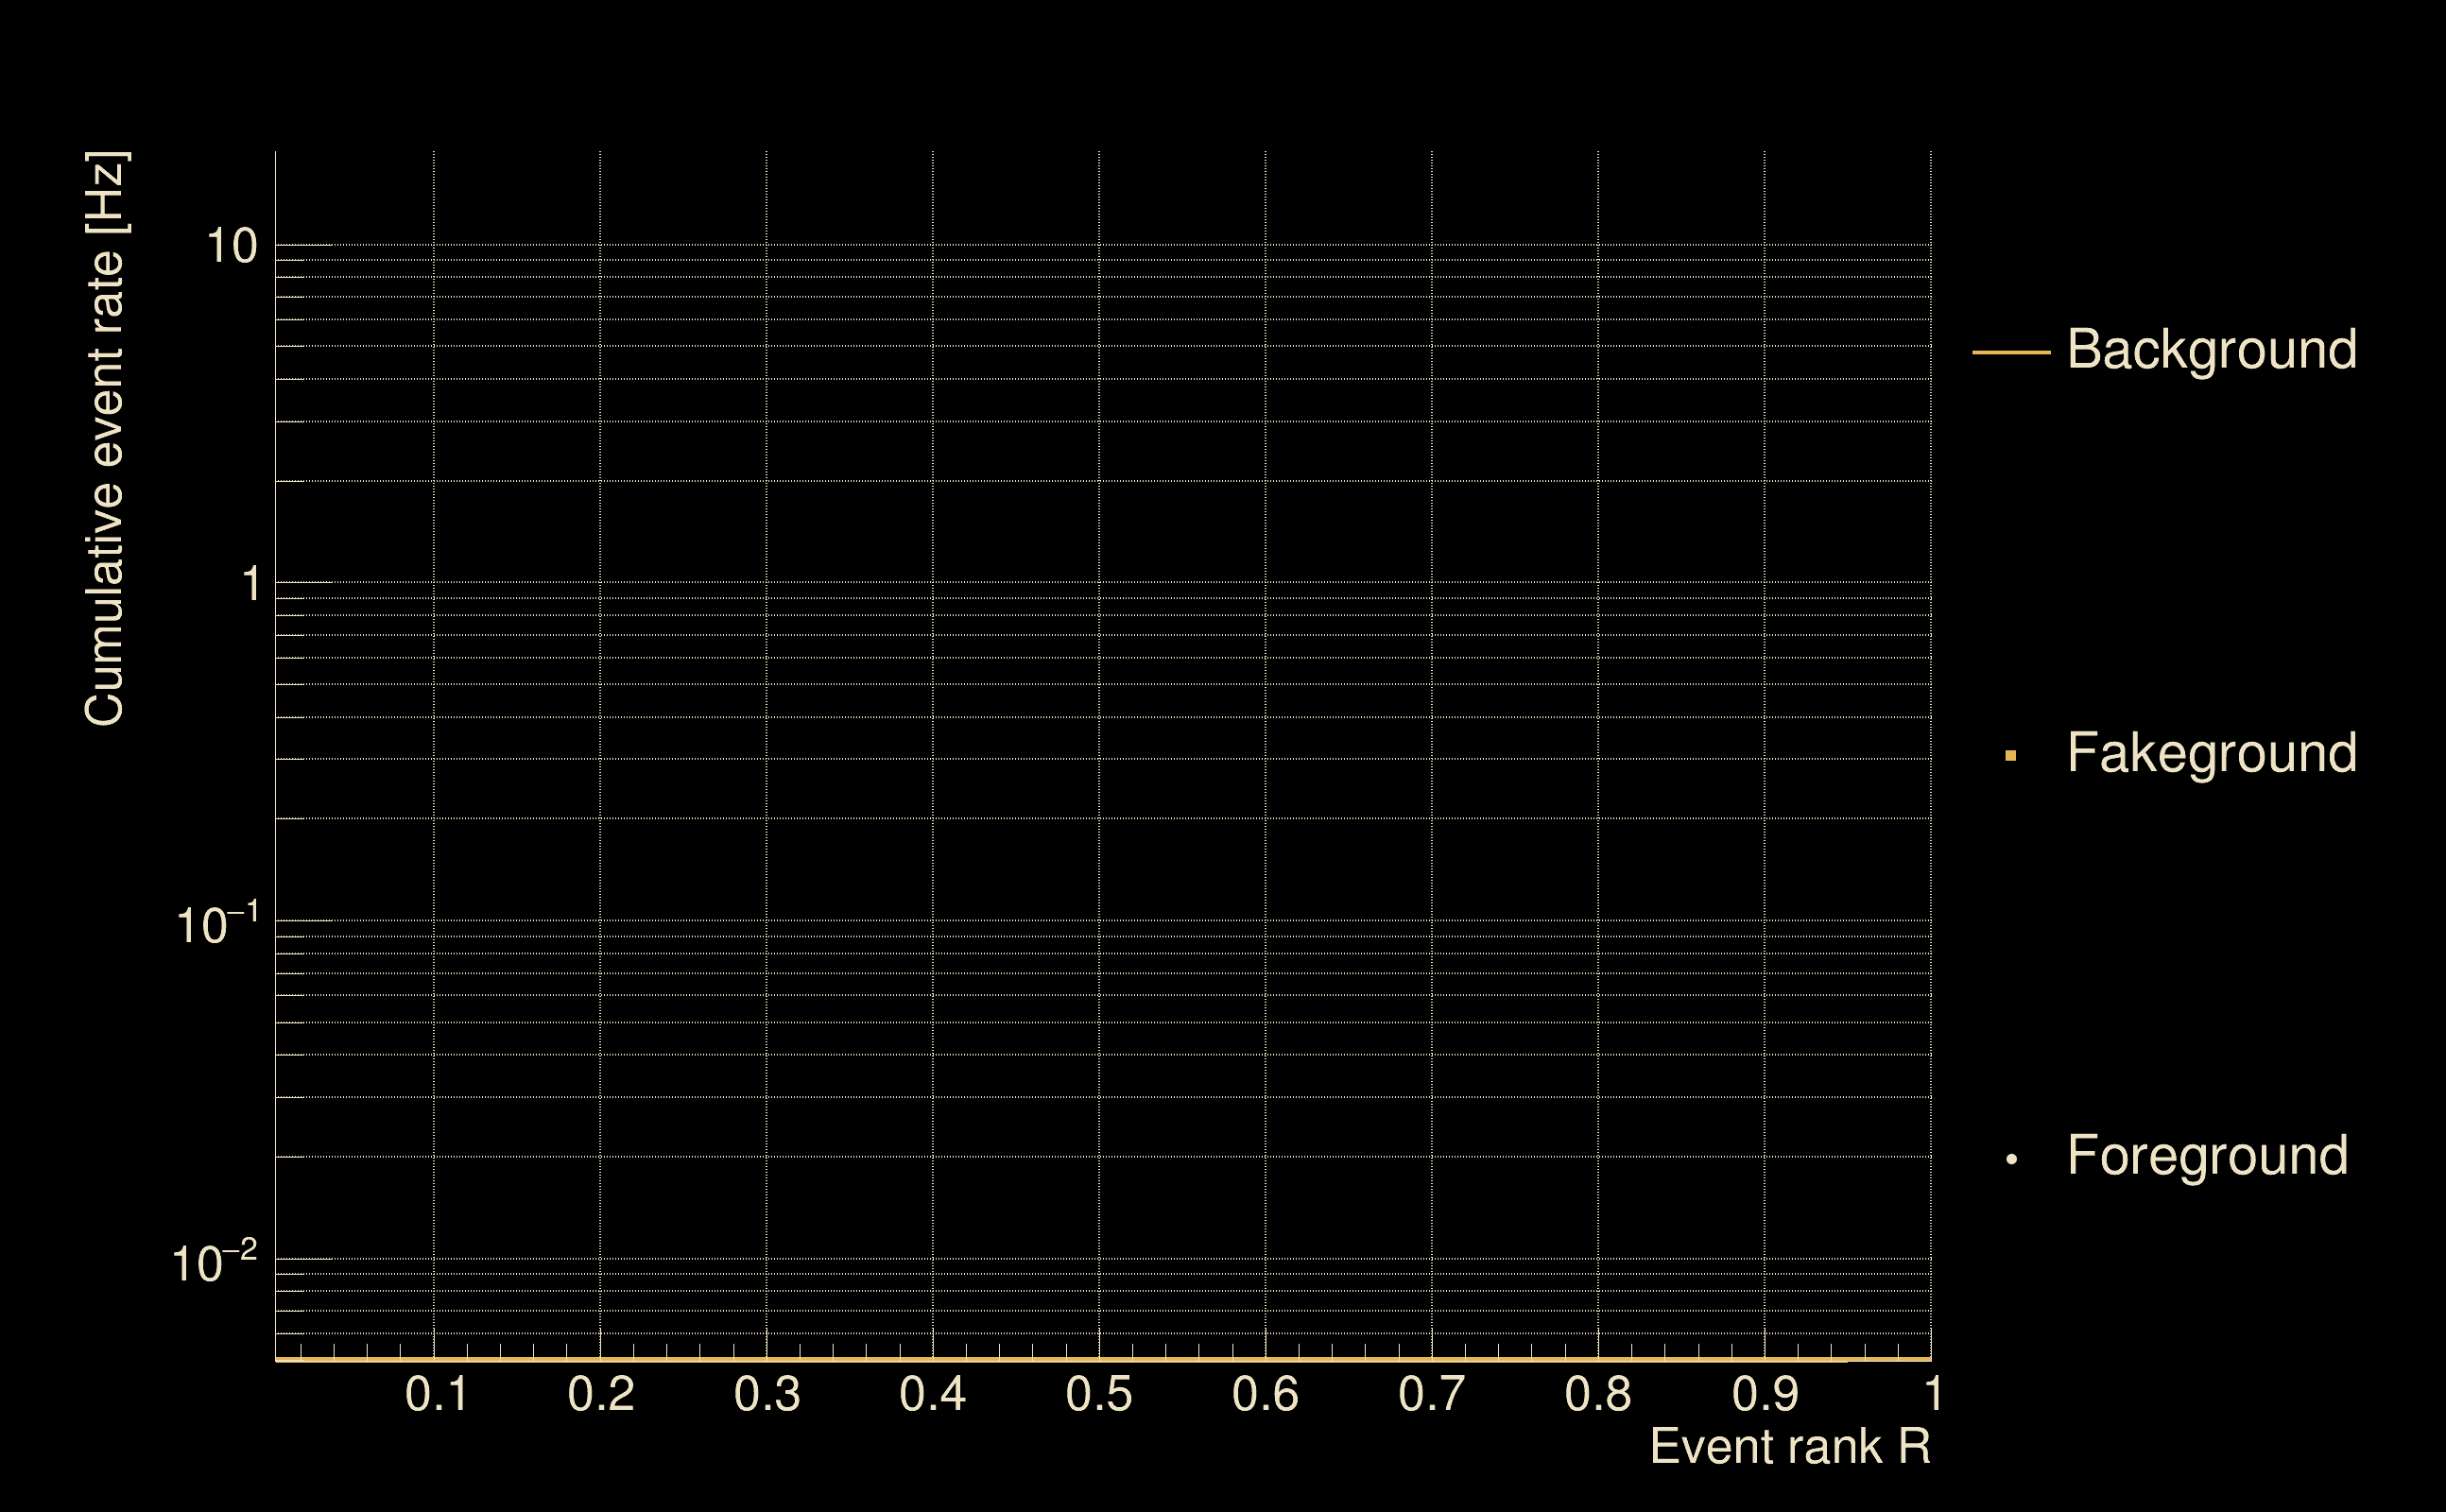
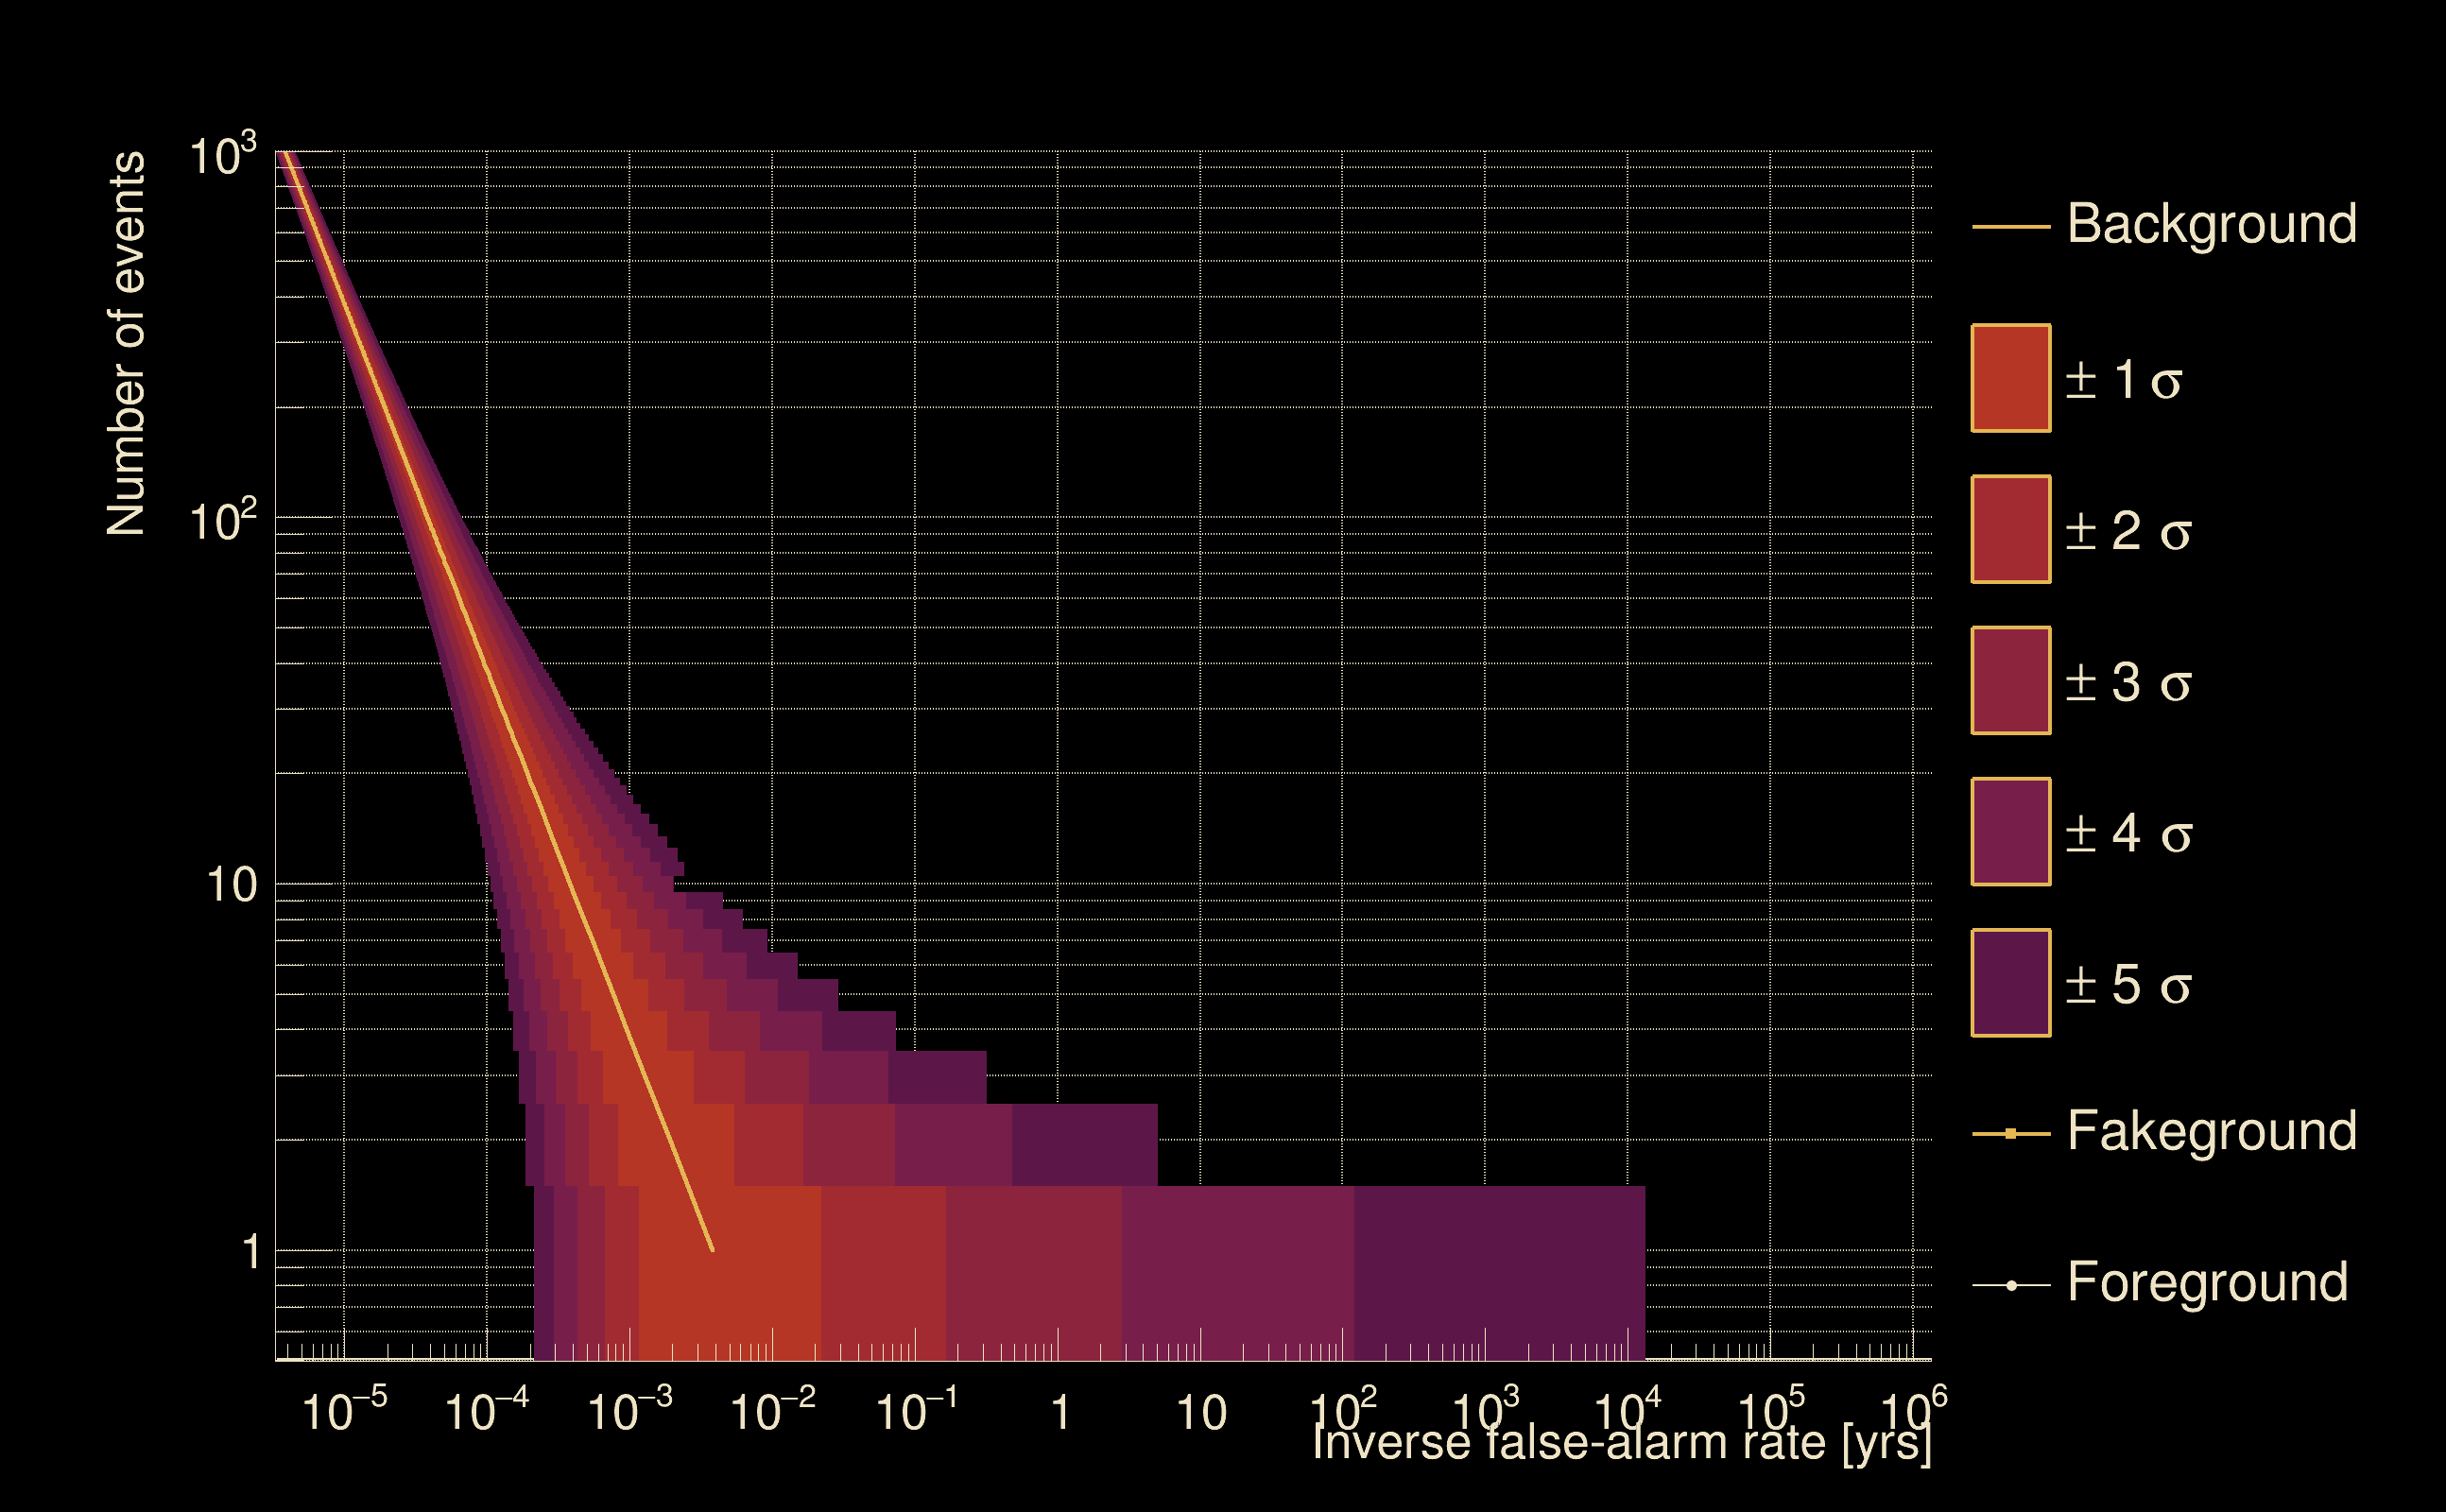
| Detection threshold: | R > 0.100762 |
| False-alarm rate above that detection threshold: | 0 |
| Alternative threshold at 1/1000 yrs: | R > -0.00495 |
| Alternative threshold at 1/100 yrs: | R > -0.00495 |
| Alternative threshold at 1/10 yrs: | R > -0.00495 |
| Alternative threshold at 1/1 yr: | R > -0.00495 |
| Alternative threshold at 1/1 d: | R > -0.00495 |
 |
|
 |
 |
 |
 |
 |
 |
 |
 |
 |
 |
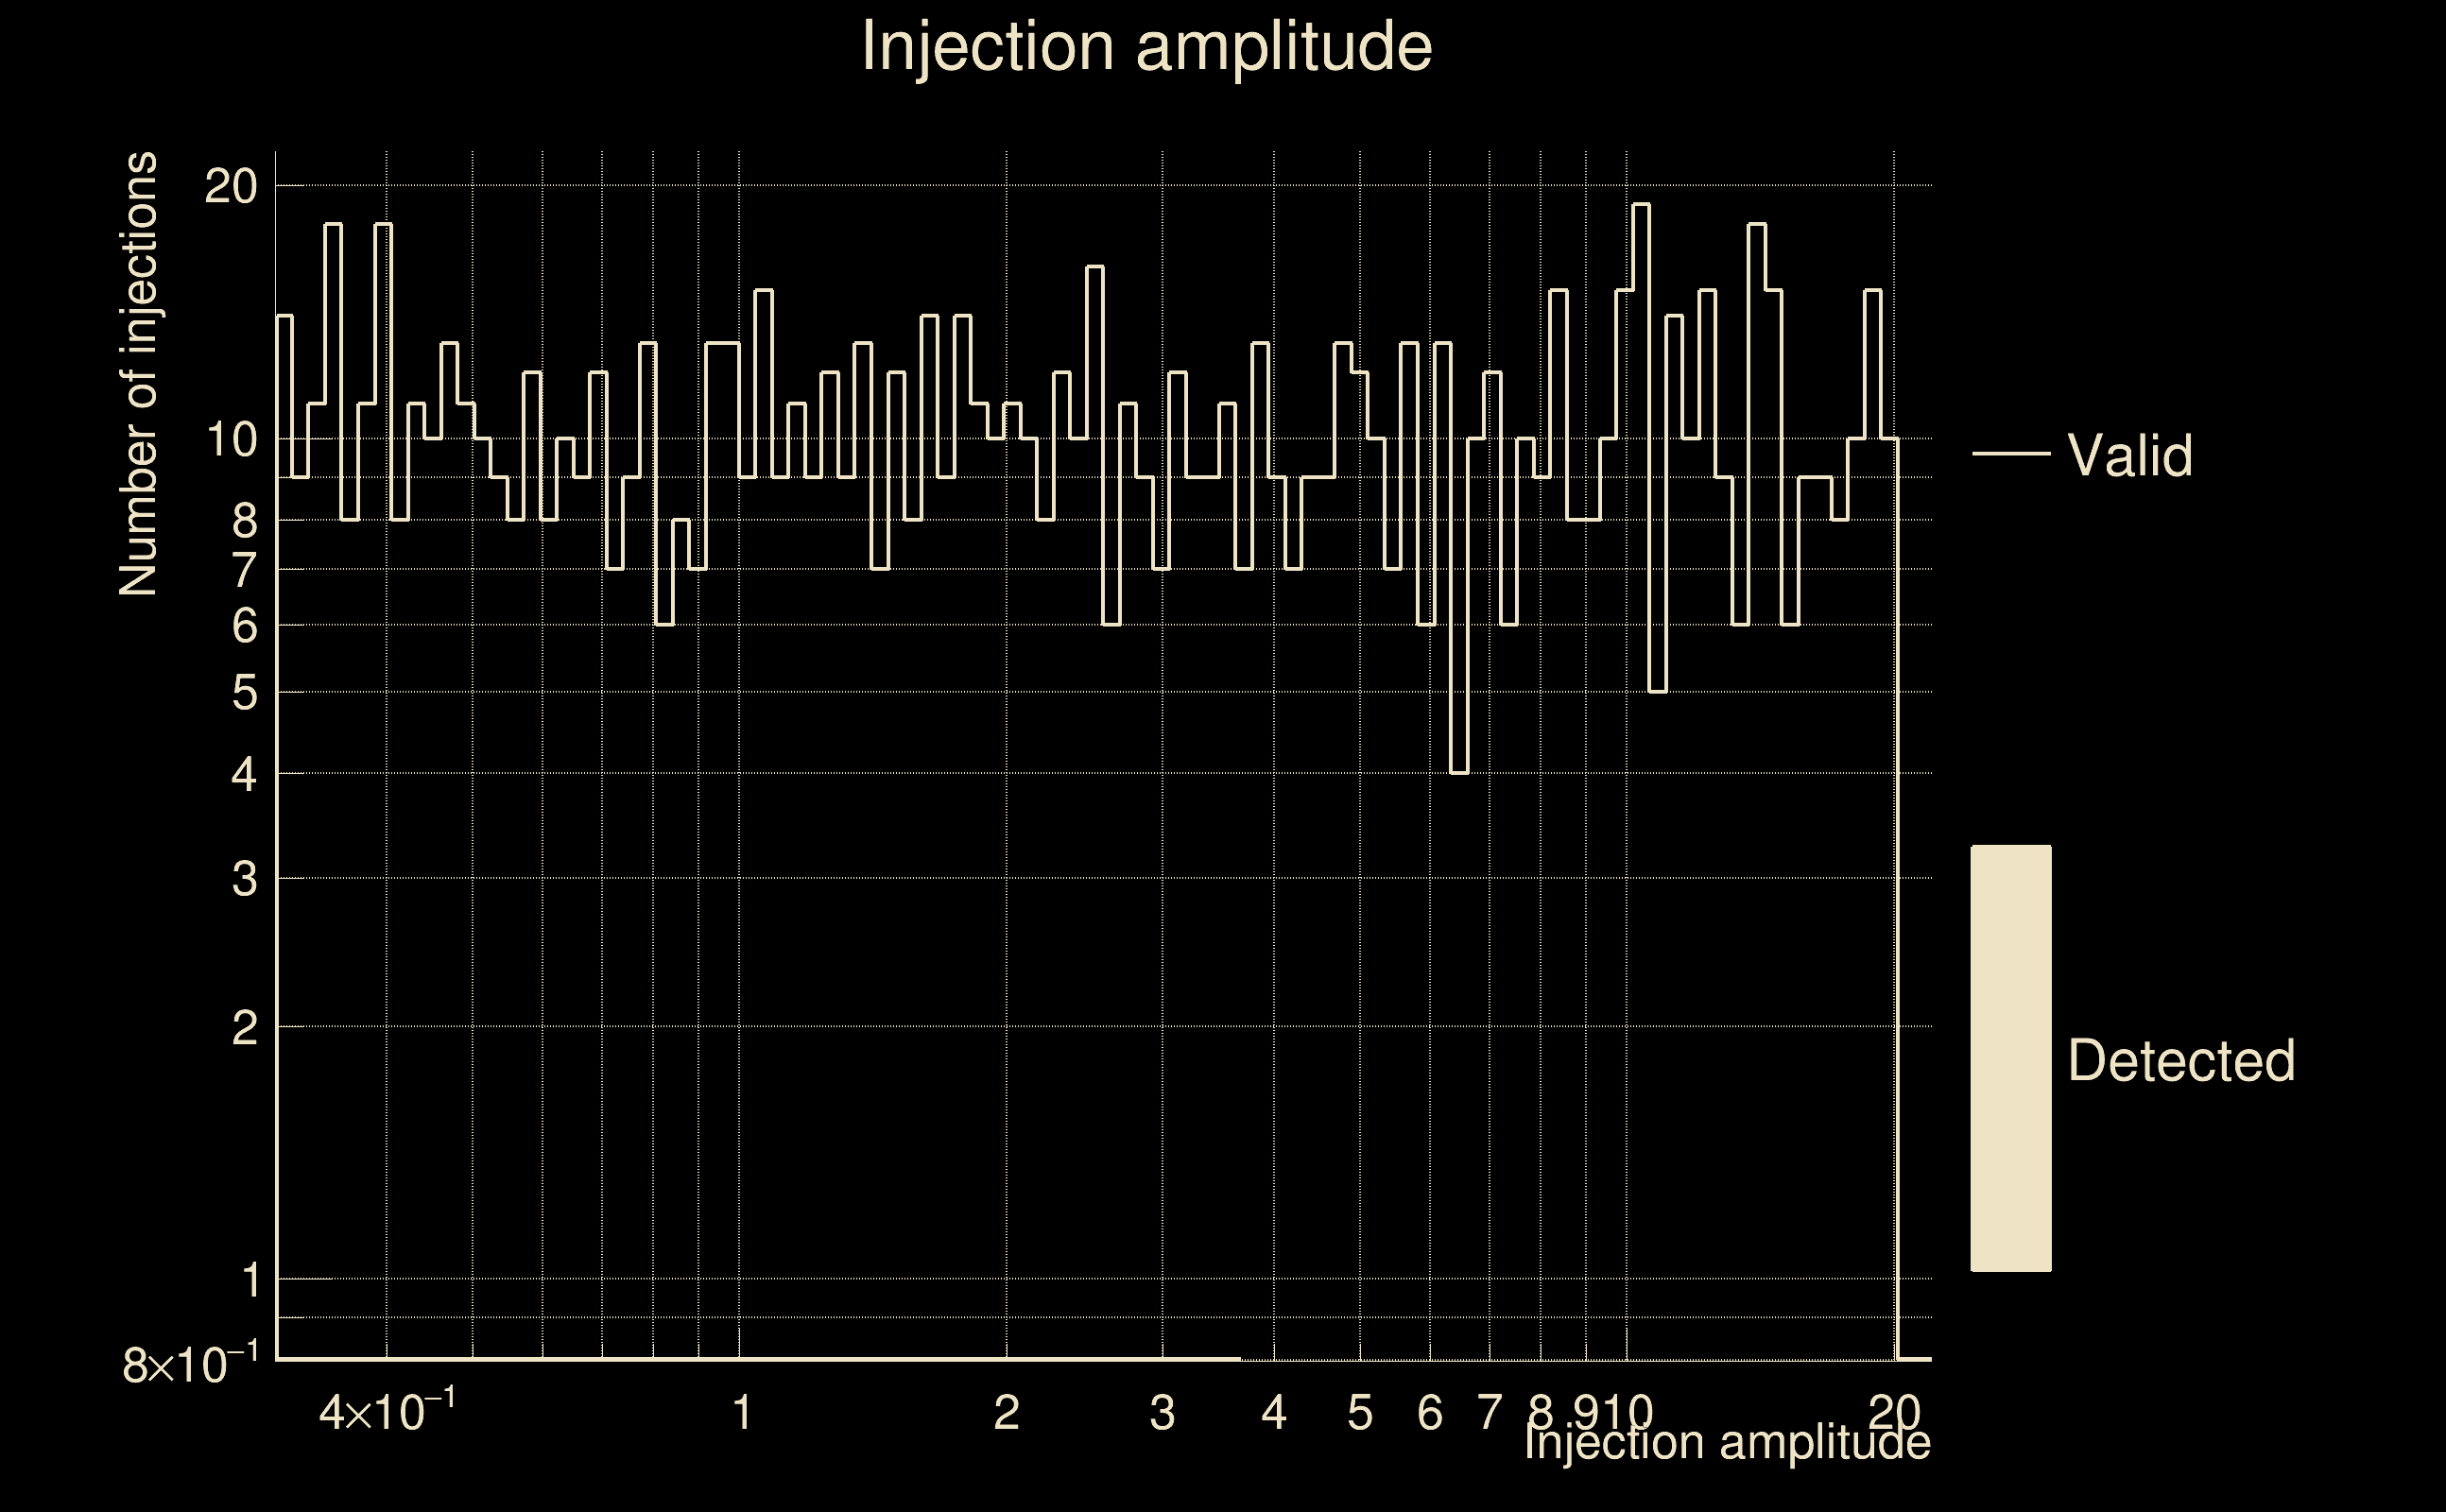
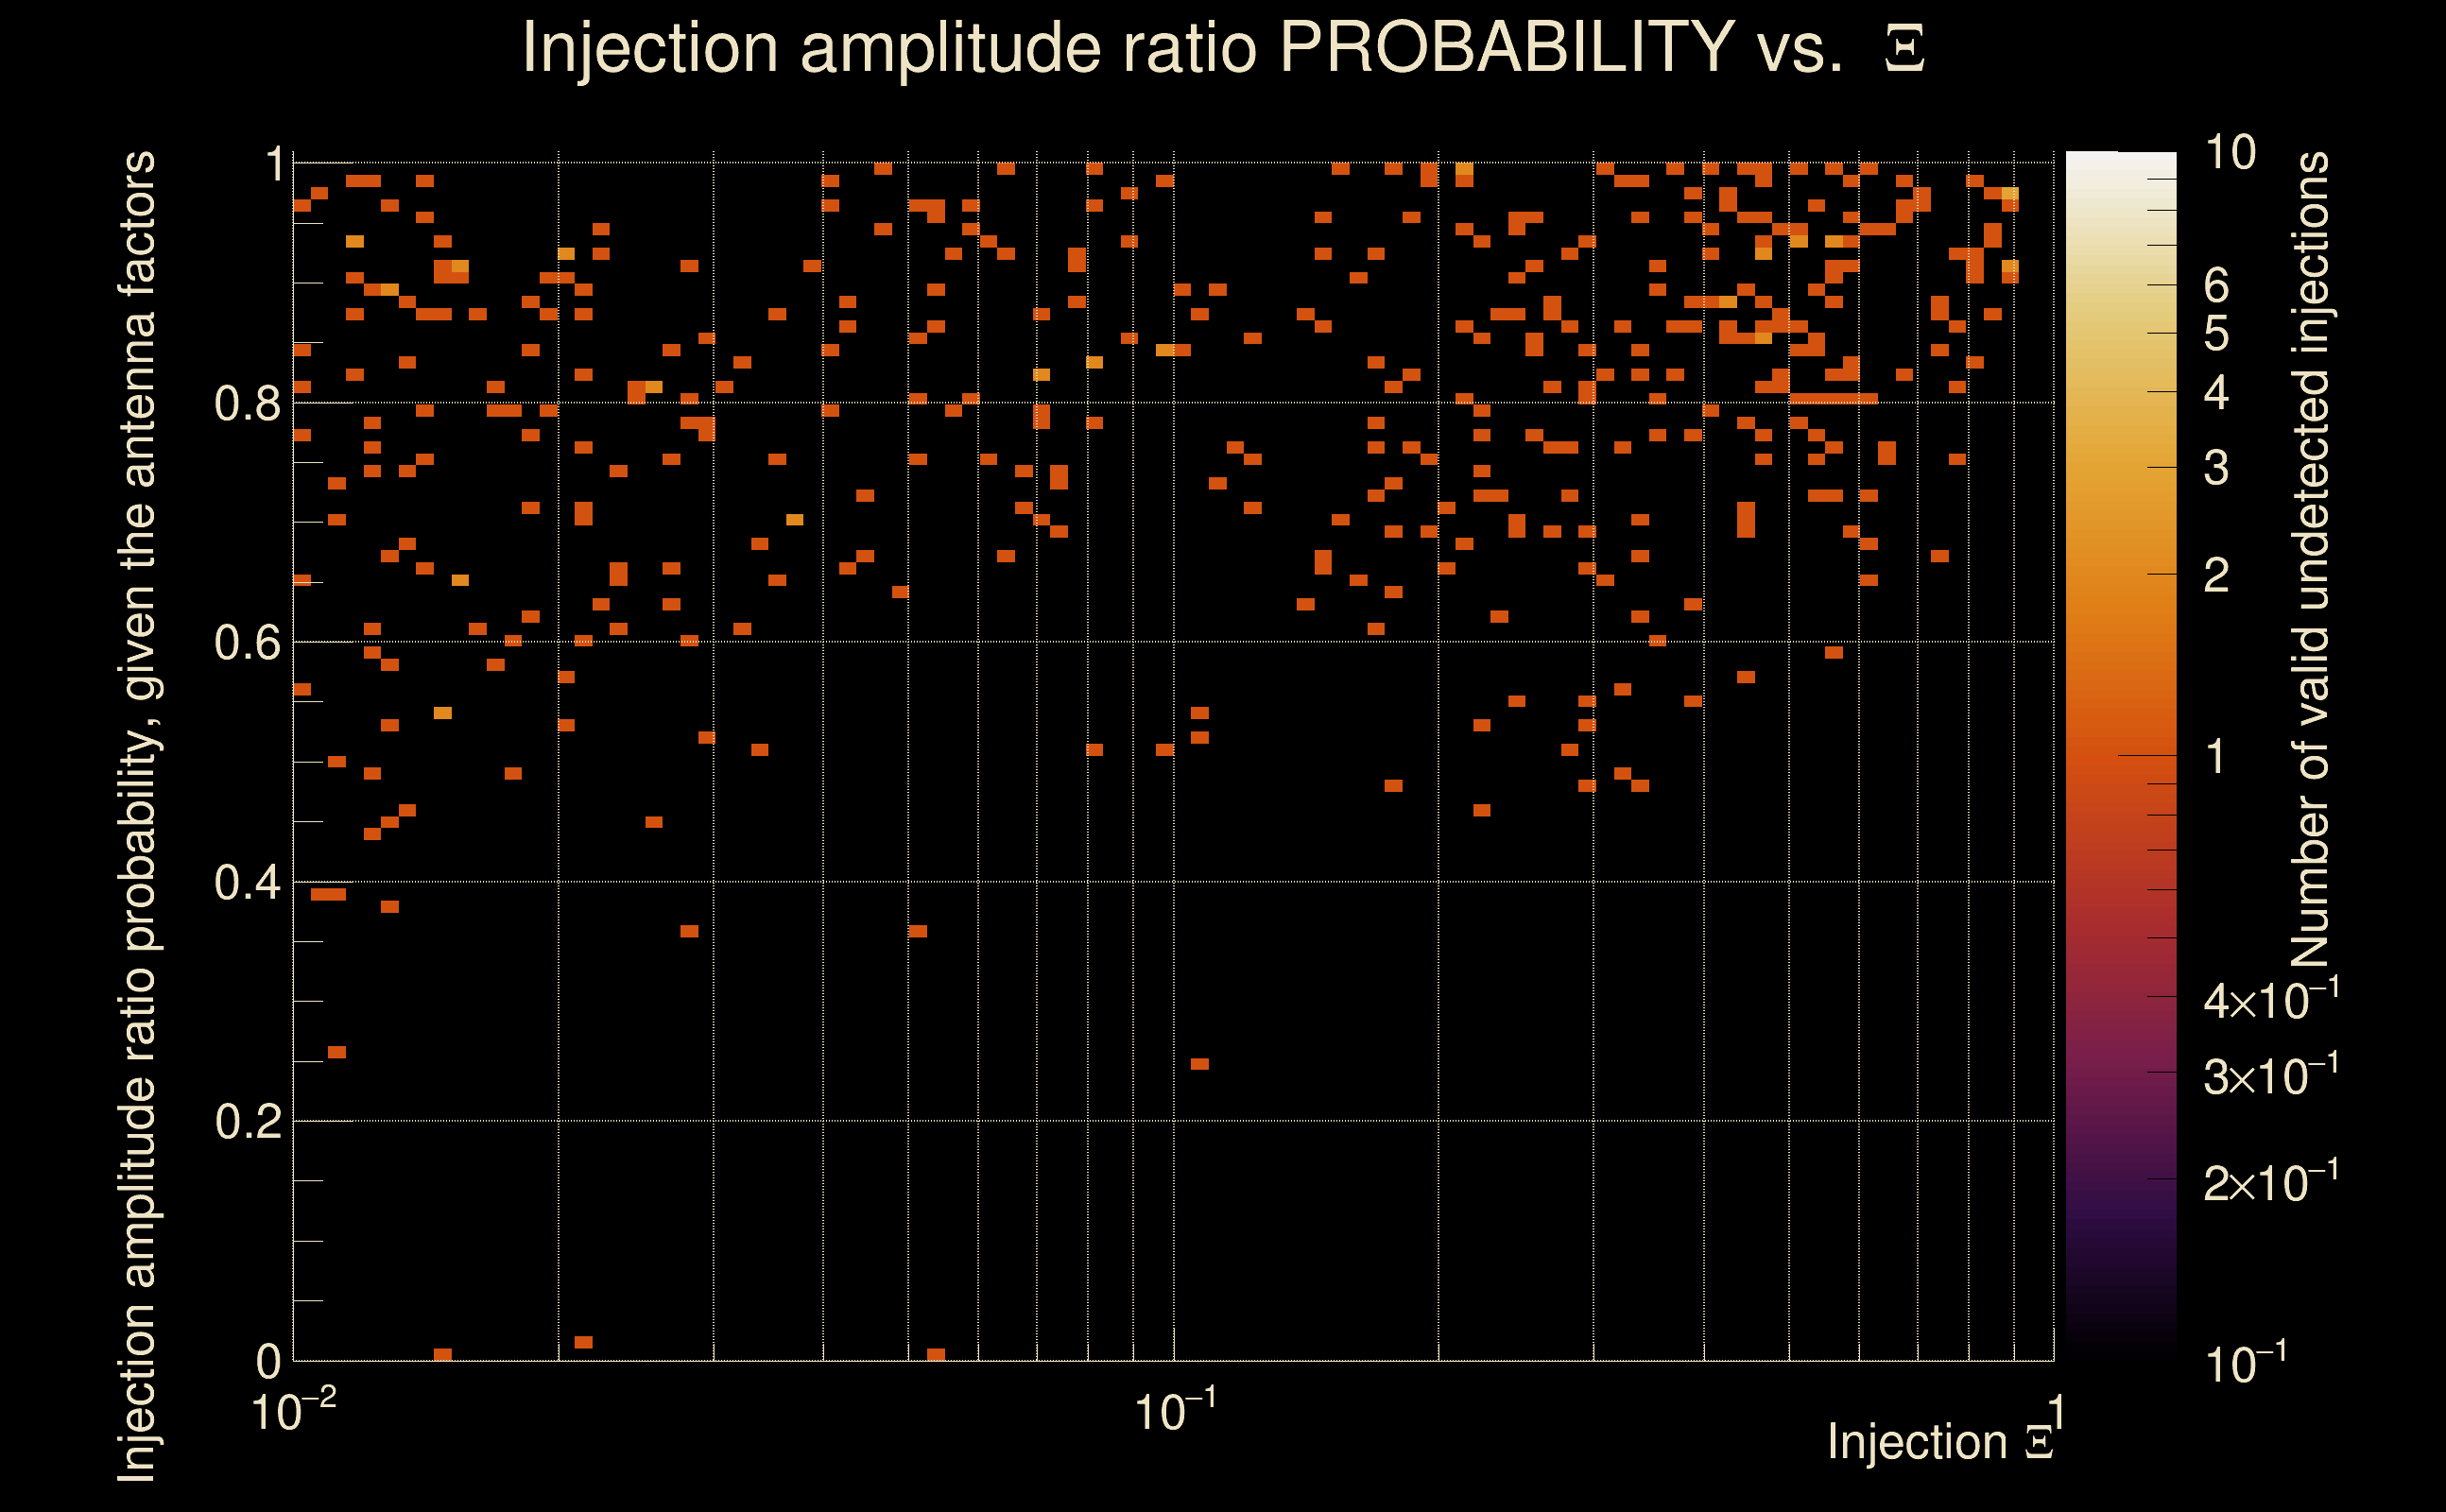
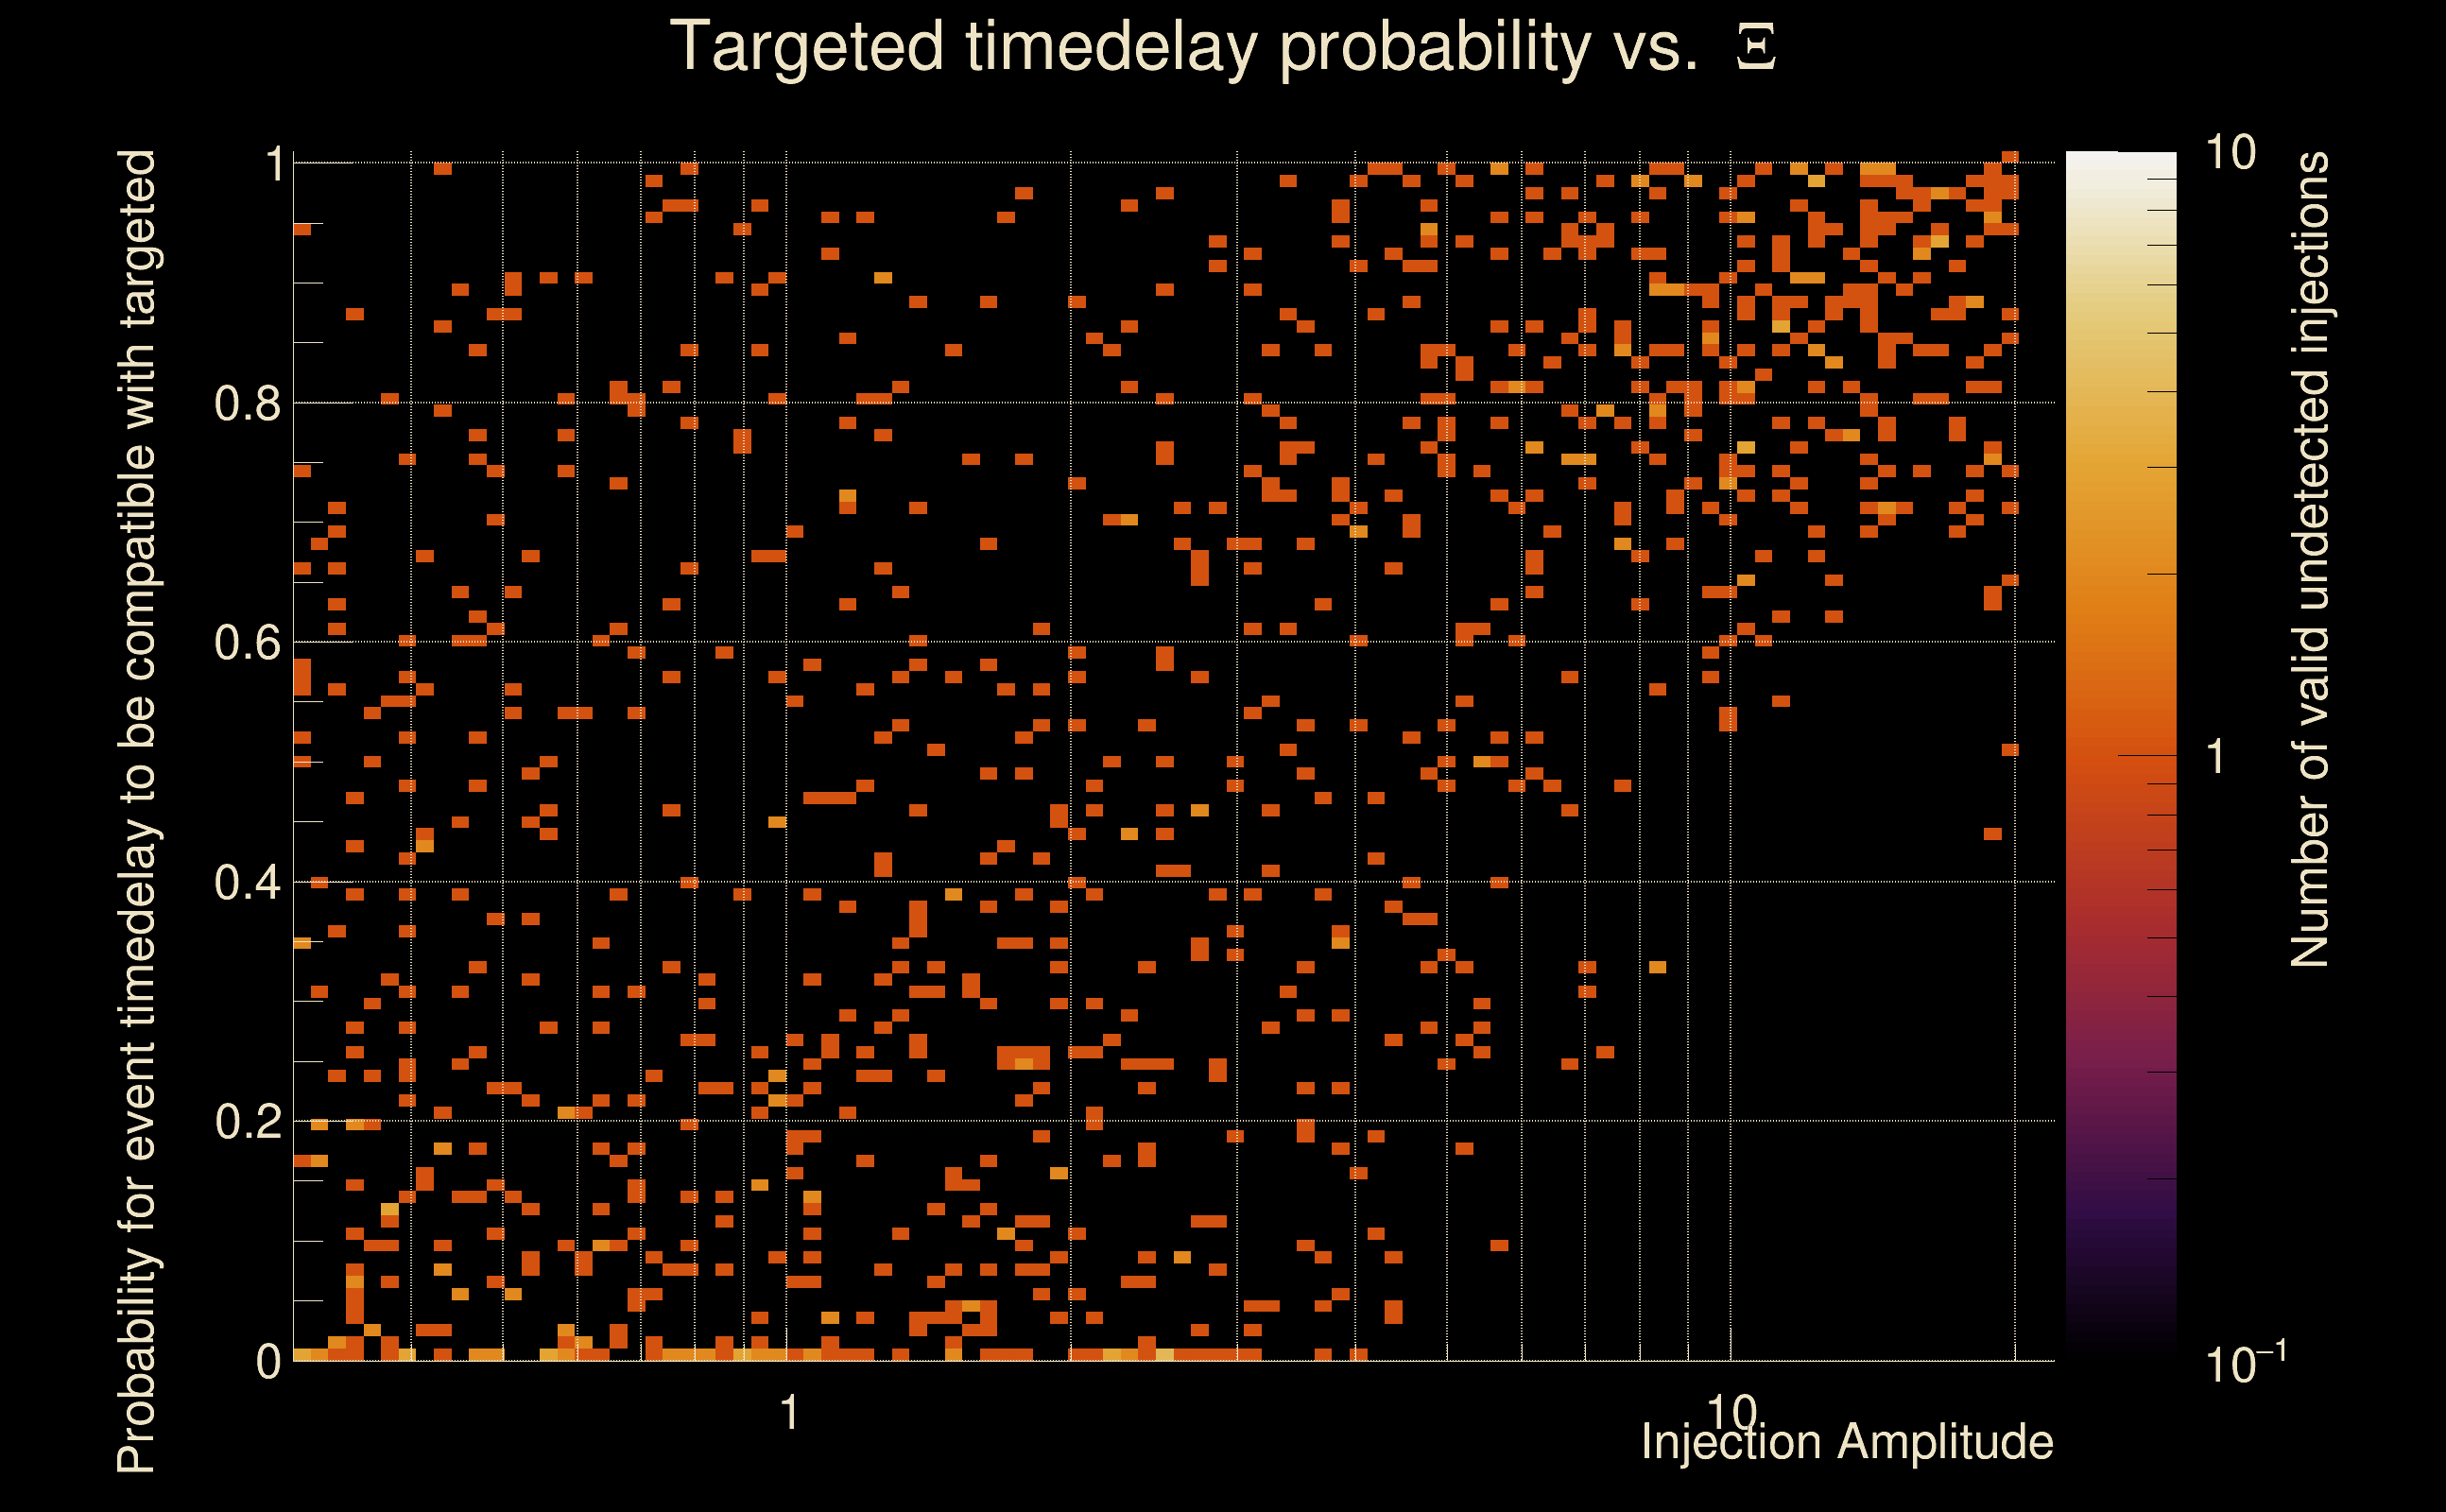
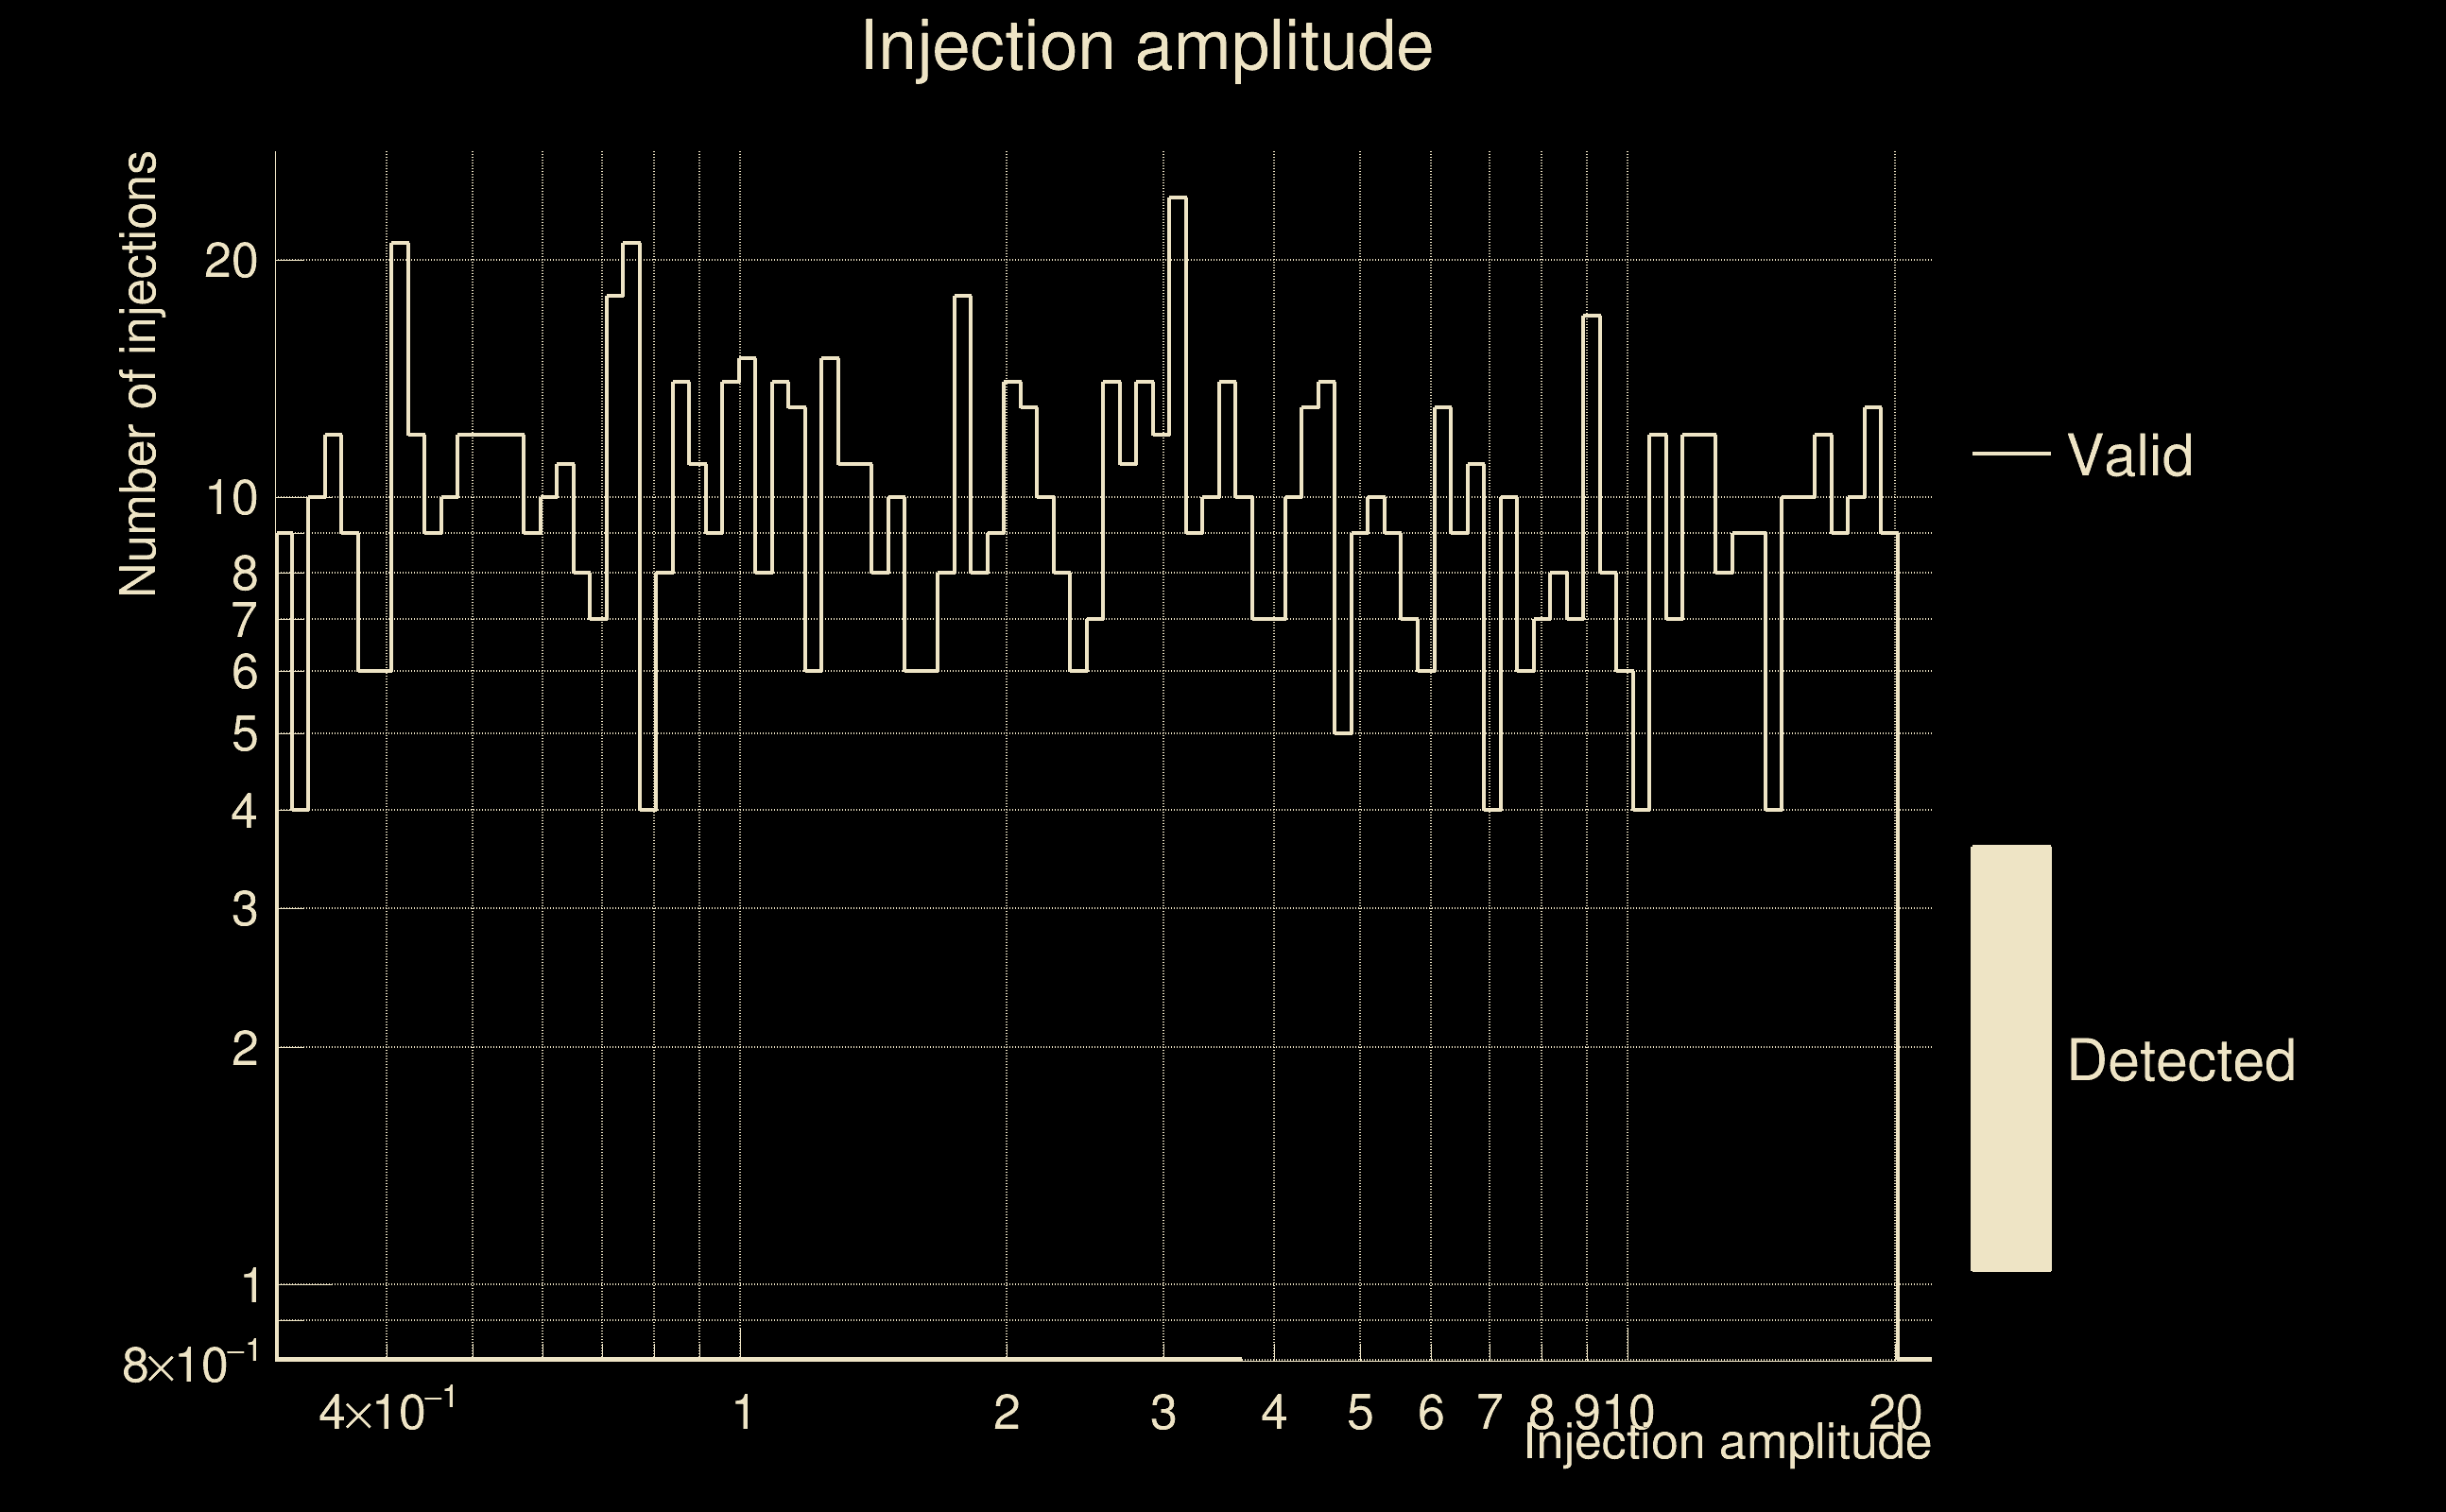
| Number of injections (total/valid/detected): | 1162 / 1022 / 0 |
| List of missed injections: | ./Mezz23-D15_missed.txt |
| Injection amplitude at 90% detection efficiency: | -1 |
| Injection amplitude at 50% detection efficiency: | -1 |
| Injection amplitude at 10% detection efficiency: | -1 |
 |
 |
 |
 |
 |
 |
|
 |
 |
|
 |
 |
|
 |
 |
|
 |
 |
|
 |
 |
|
 |
 |
|
 |
 |
|
 |
 |
 |
 |
 |
 |
 |
 |
 |
 |
 |
 |
 |
 |
 |
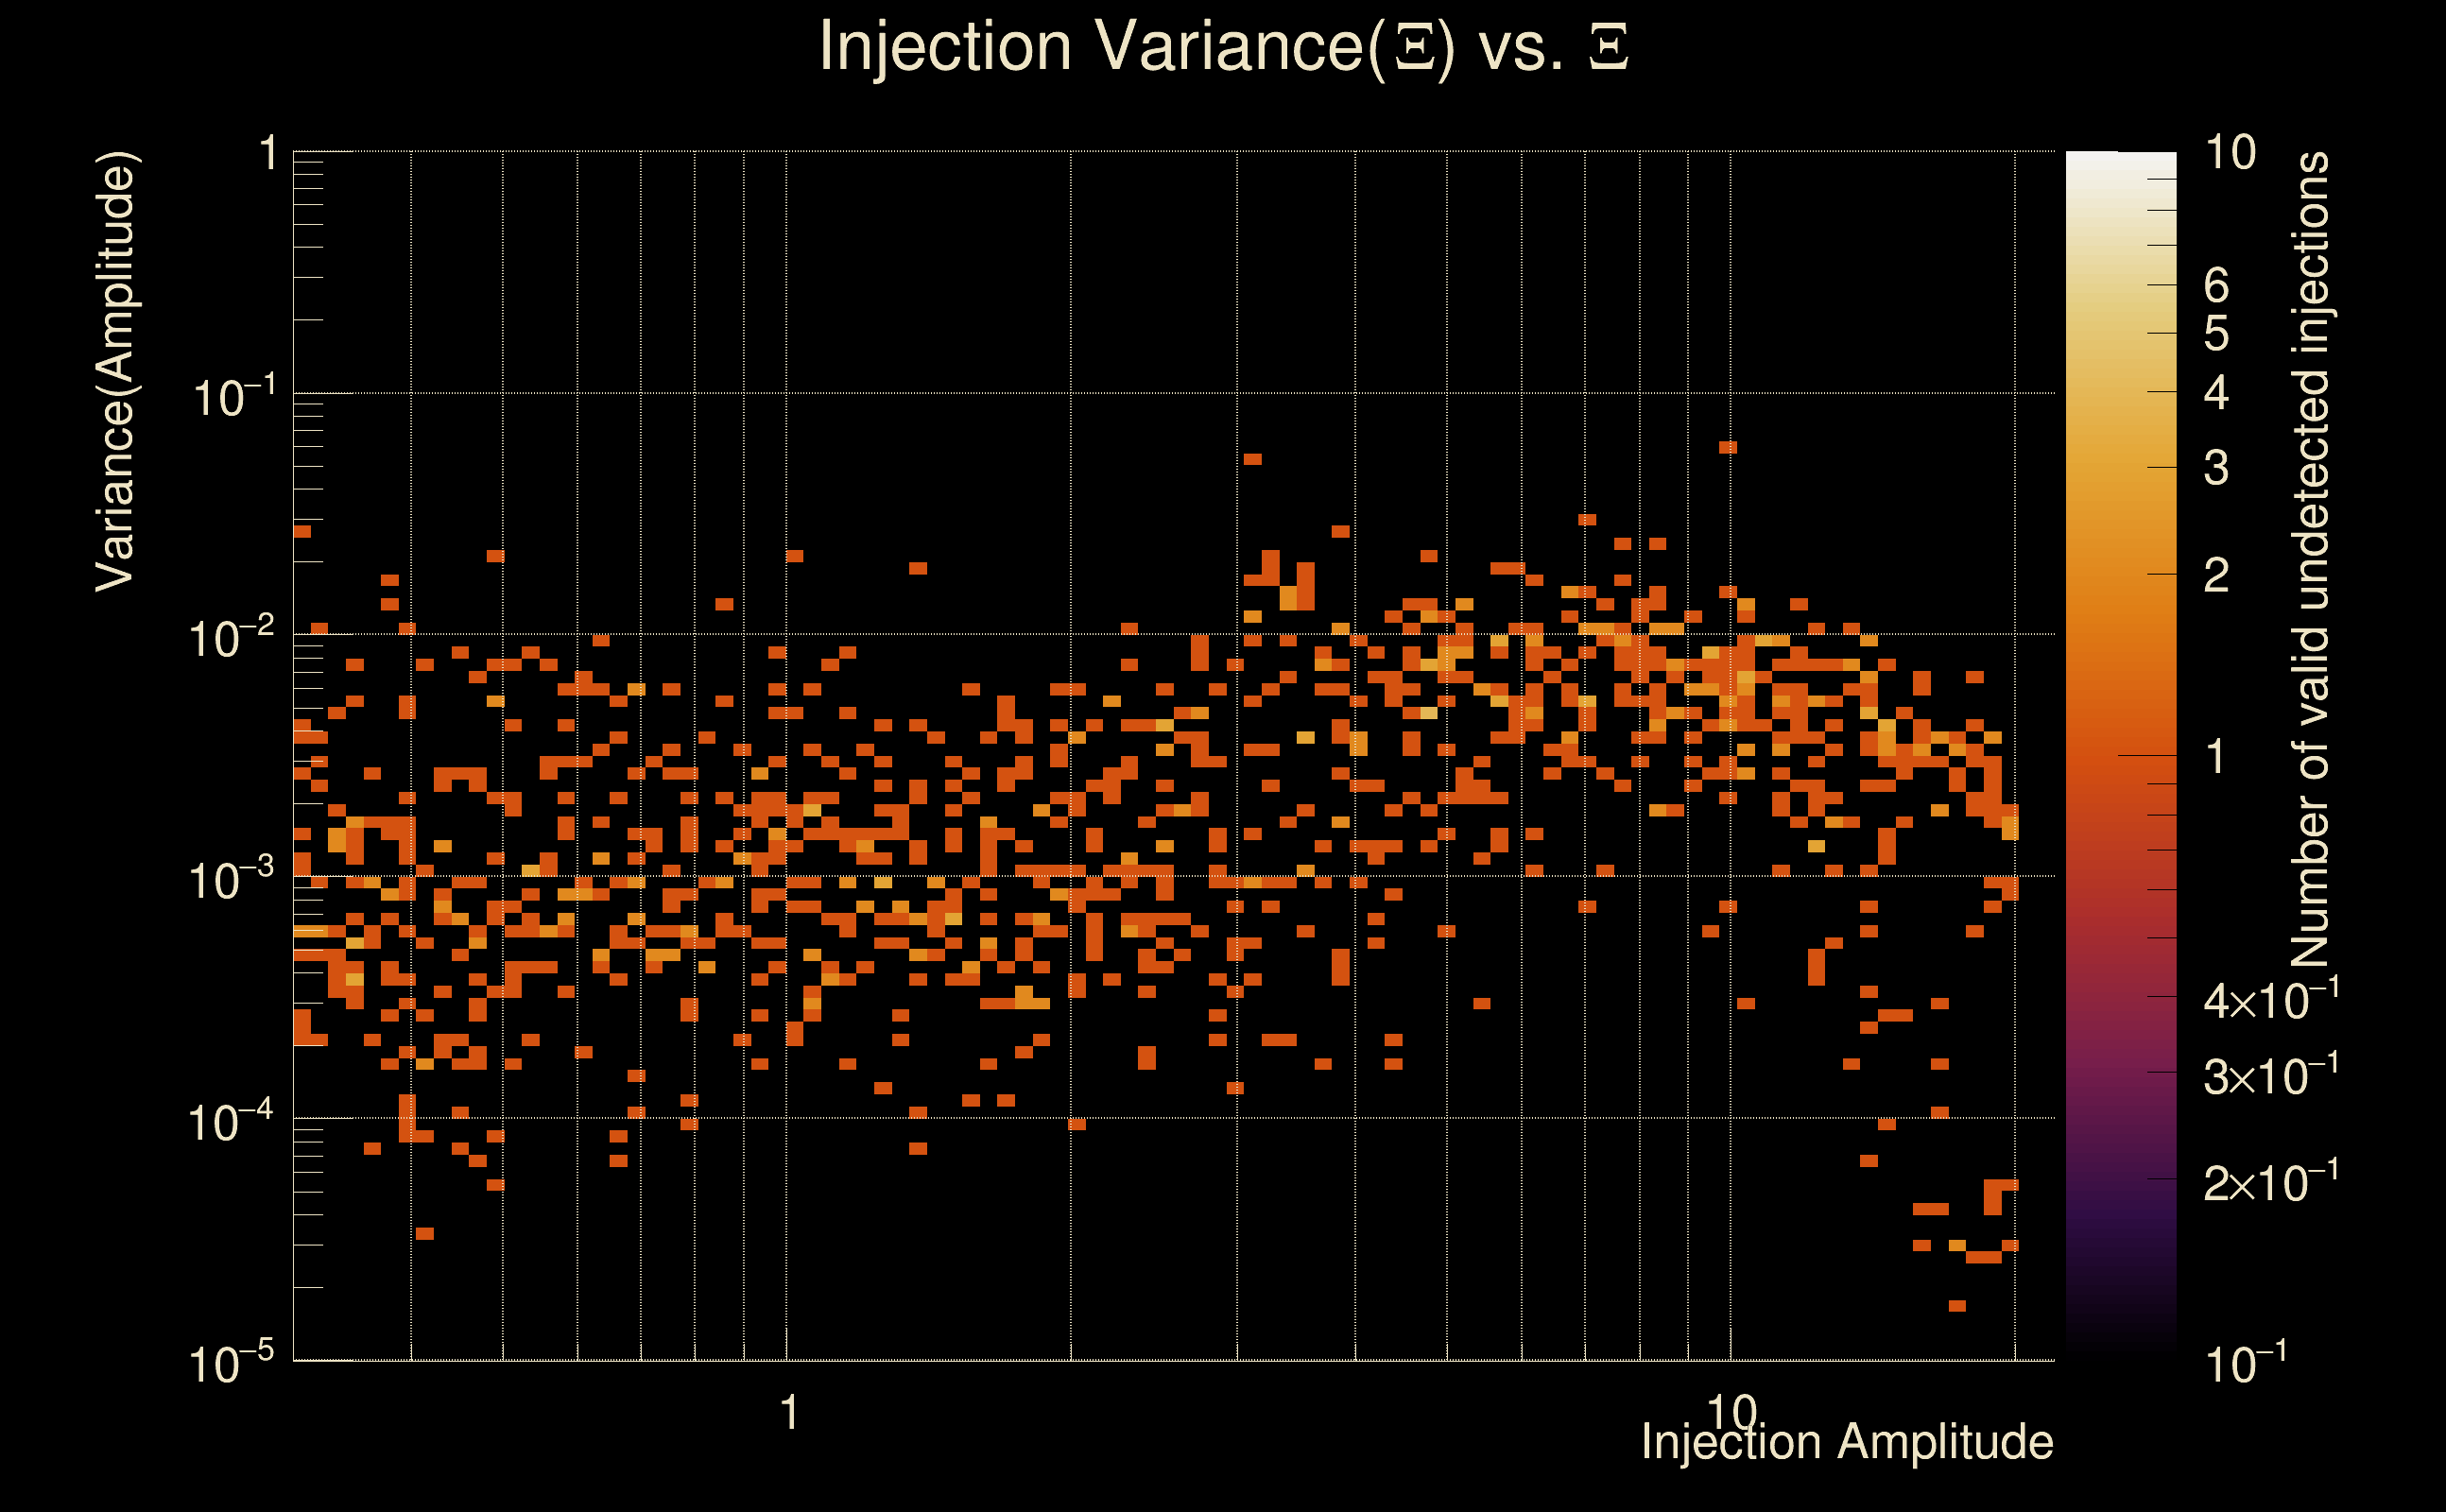
| Number of injections (total/valid/detected): | 1116 / 995 / 0 |
| List of missed injections: | ./Pow19-s18_missed.txt |
| Injection amplitude at 90% detection efficiency: | -1 |
| Injection amplitude at 50% detection efficiency: | -1 |
| Injection amplitude at 10% detection efficiency: | -1 |
 |
 |
 |
 |
 |
 |
|
 |
 |
|
 |
 |
|
 |
 |
|
 |
 |
|
 |
 |
|
 |
 |
|
 |
 |
|
 |
 |
 |
 |
 |
 |
 |
 |
 |
 |
 |
 |
 |
 |
 |
| florent.robinet@ijclab.in2p3.fr |