| Omicron version: | 4.2.0: documentation gitlab repository |
| Omicron run by: | unknown |
| Report produced on: | Thu Dec 11 15:09:14 2025 UTC |
| Ox option file: | TargIxf_injpt1_10min_2TEST_options.txt |
| Omicron option files: | detector 0, detector 1 |
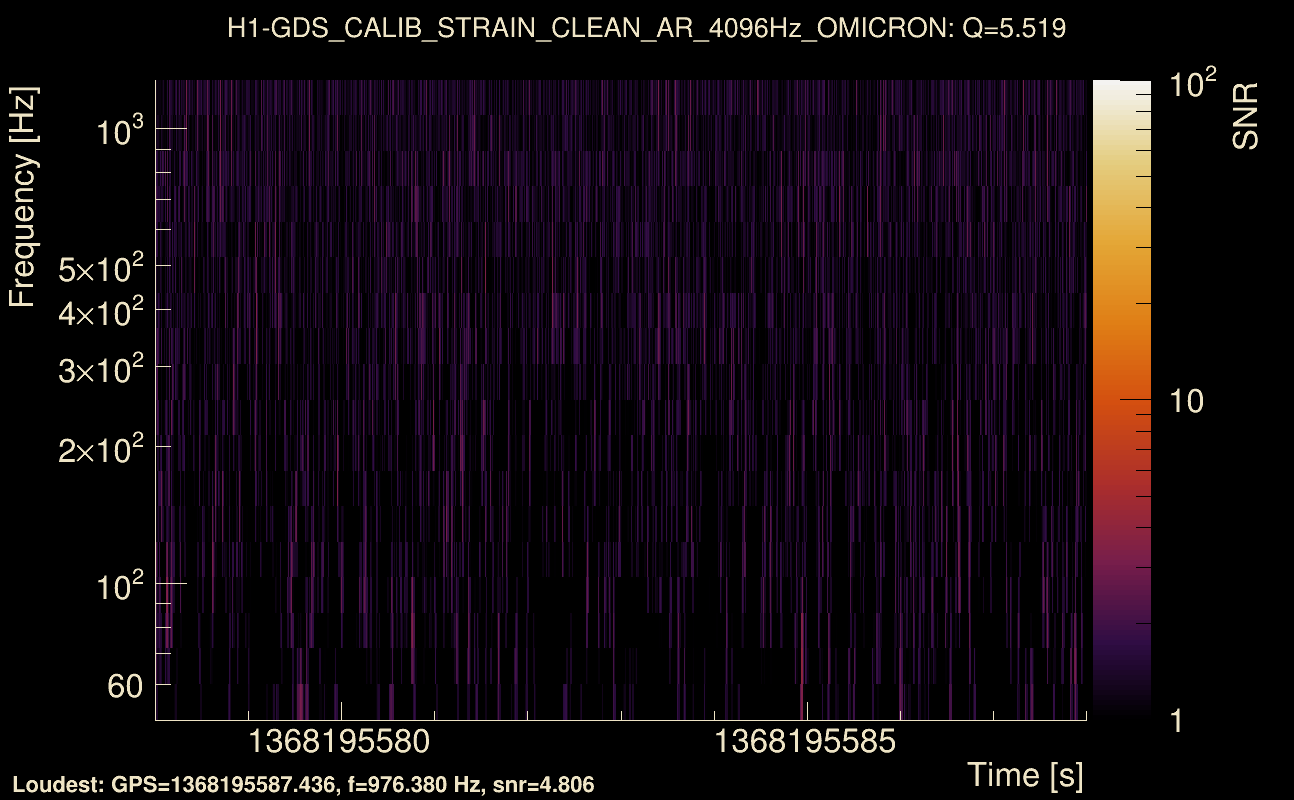
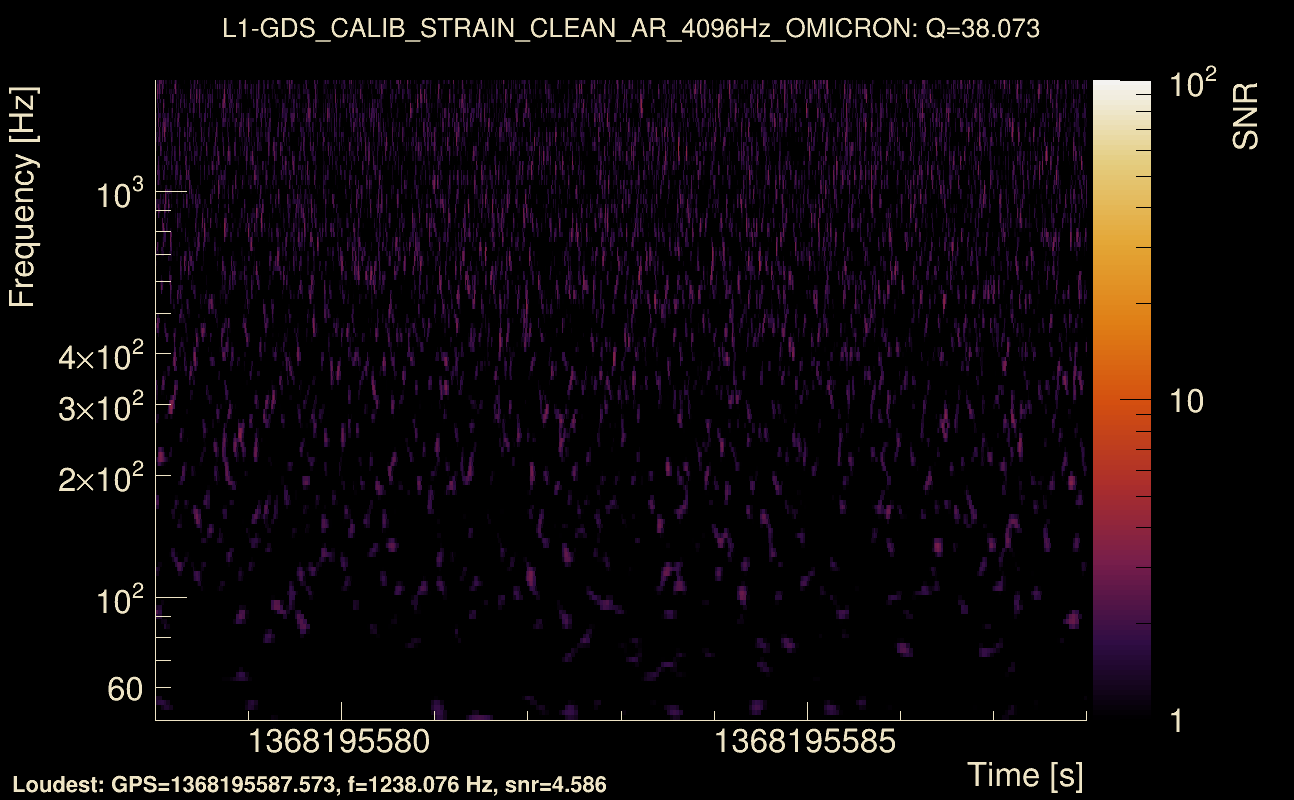
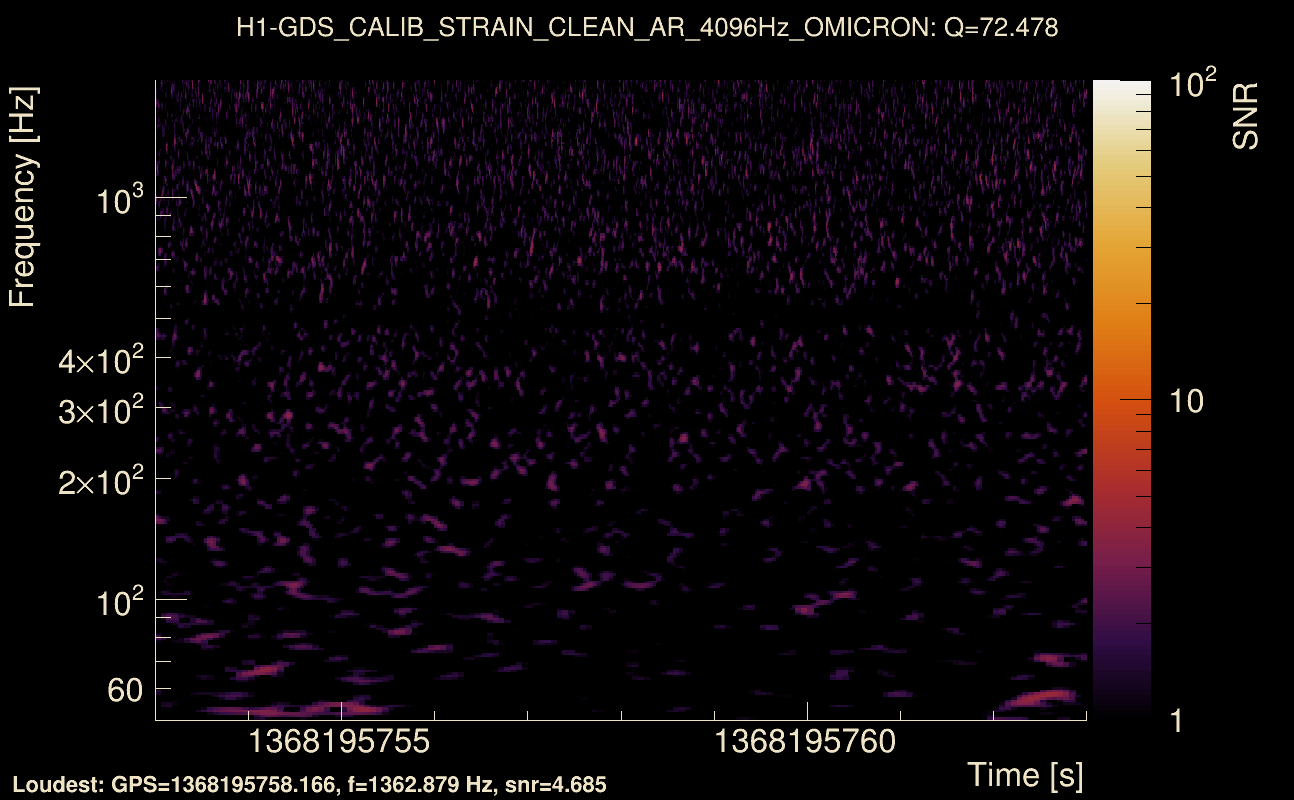
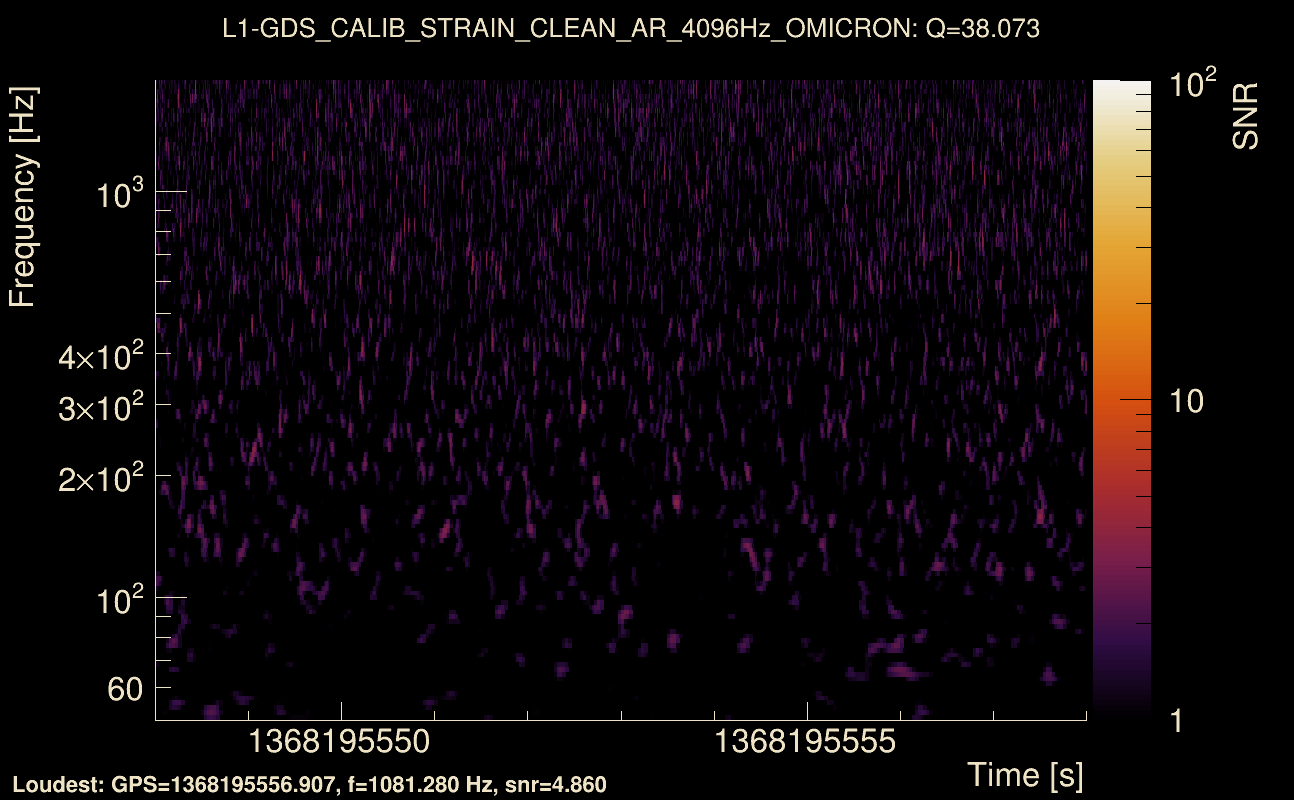
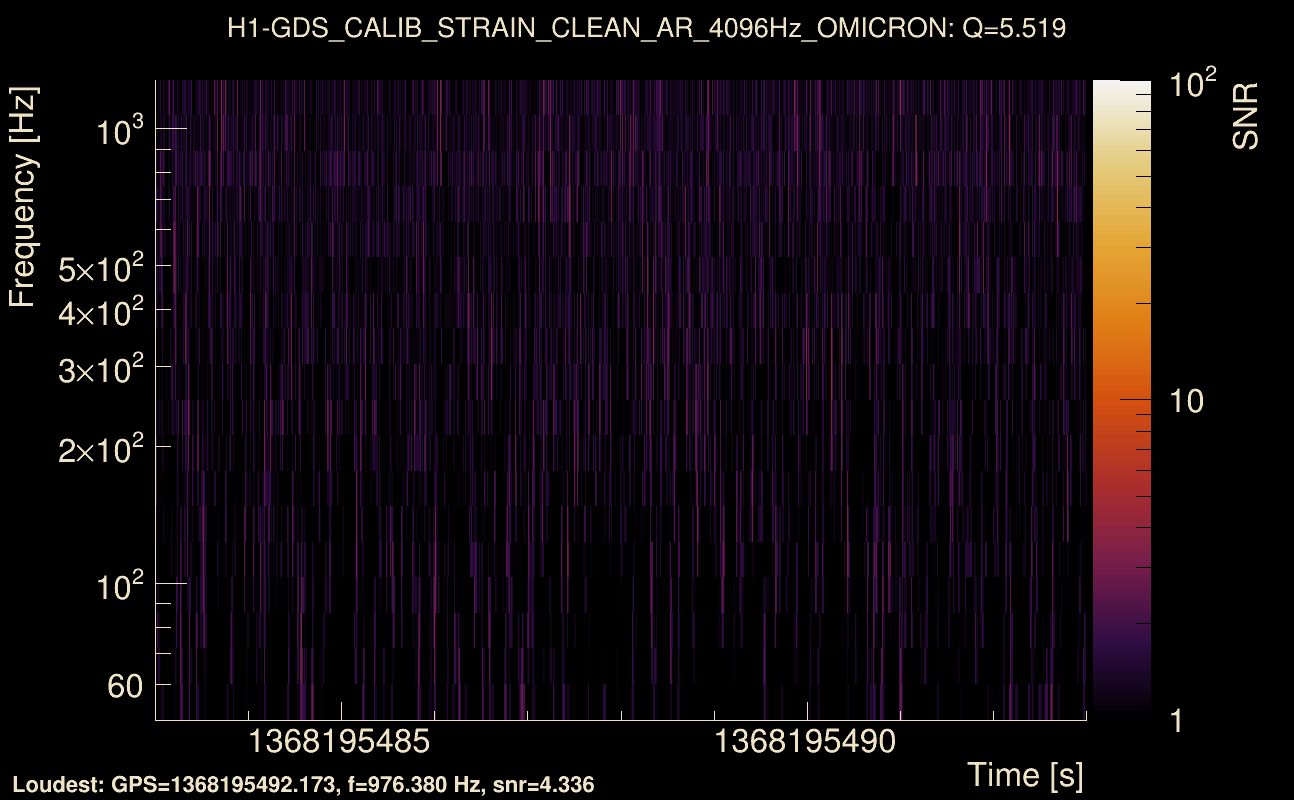
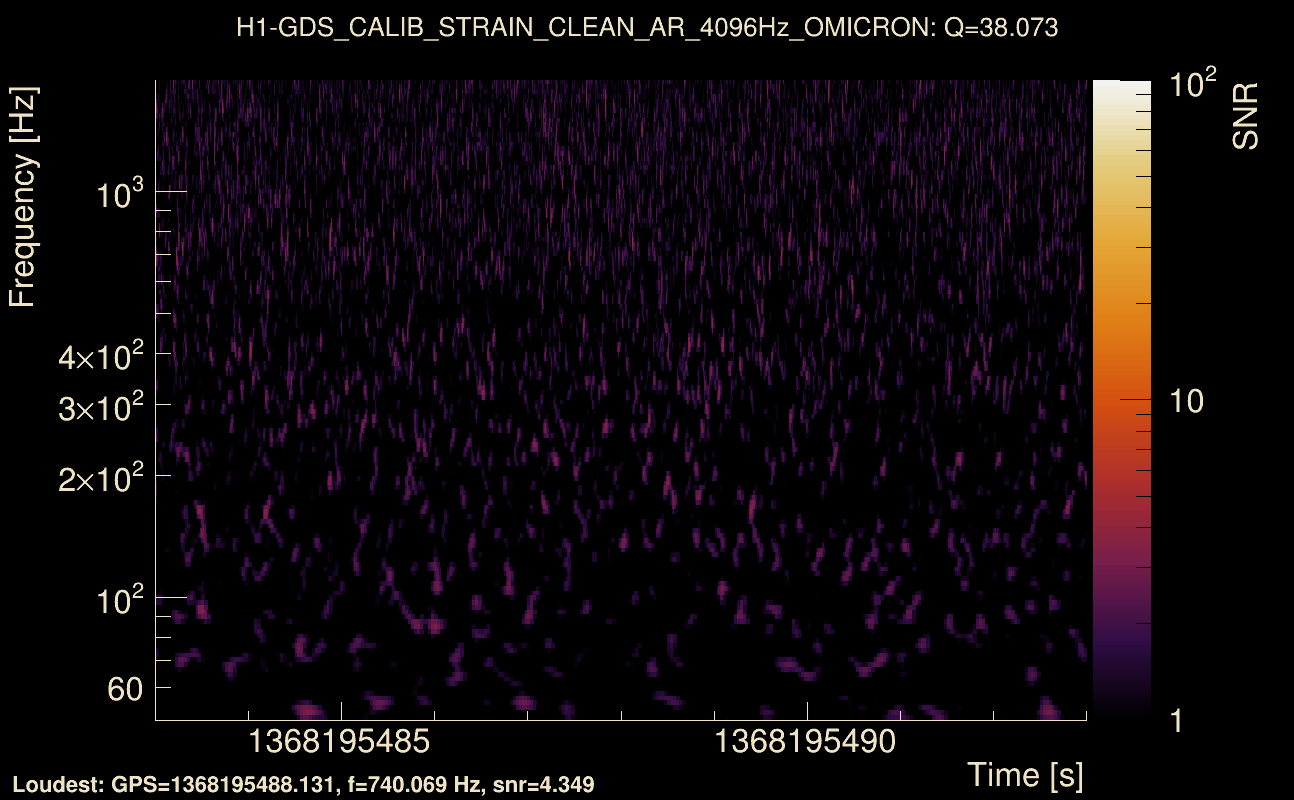
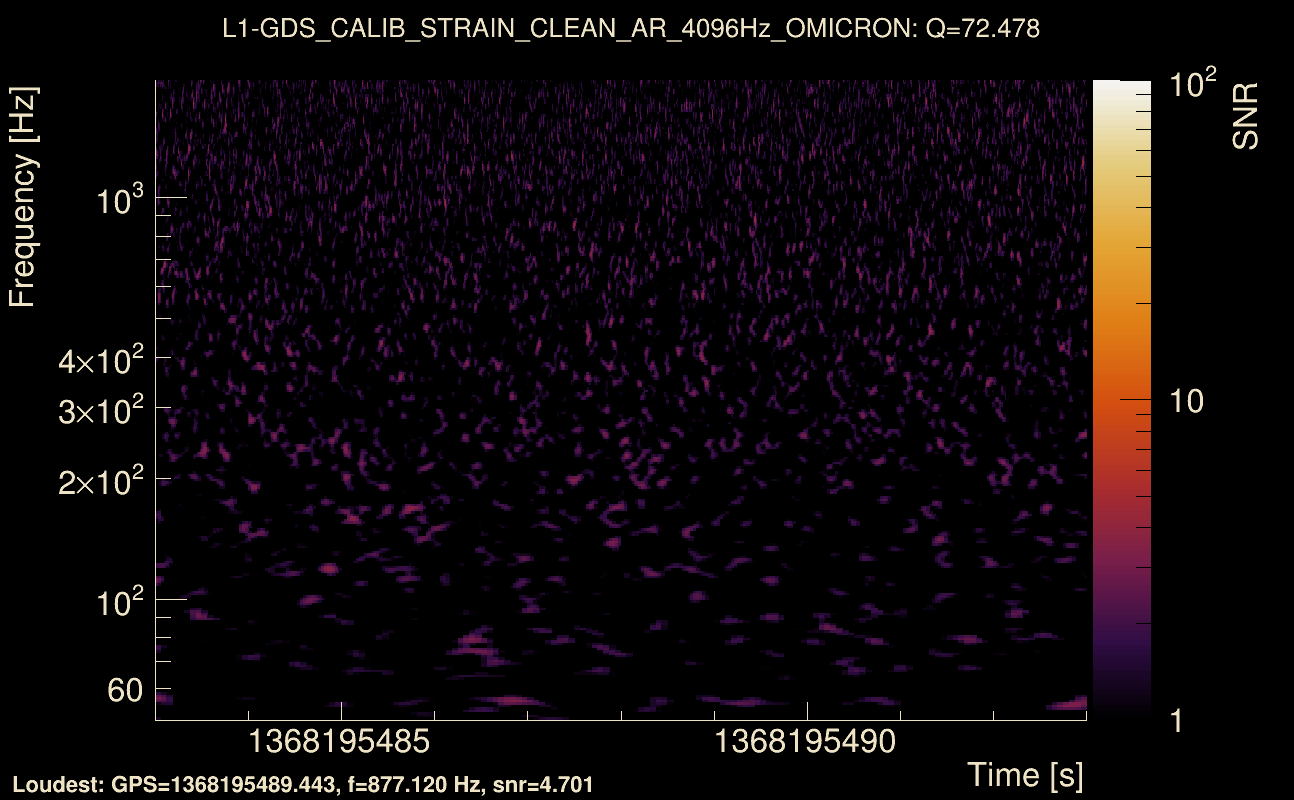
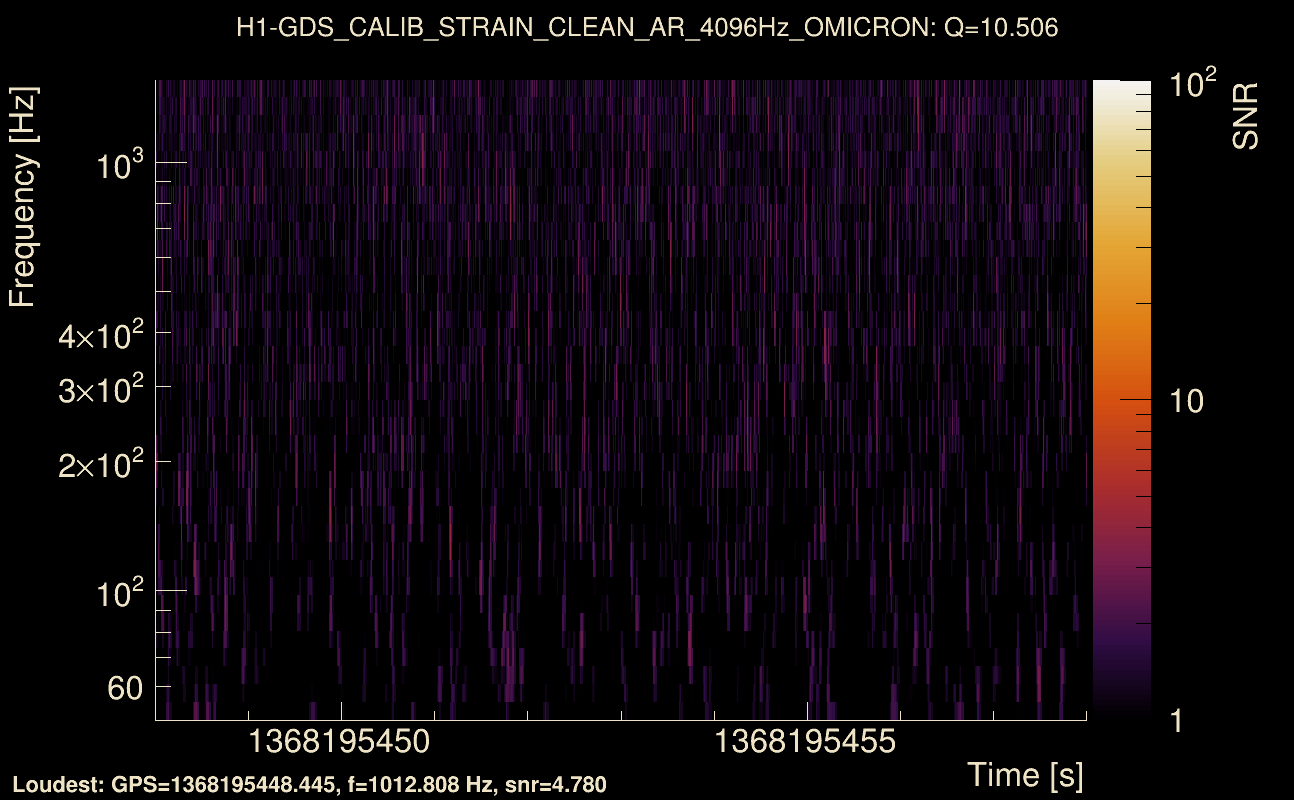
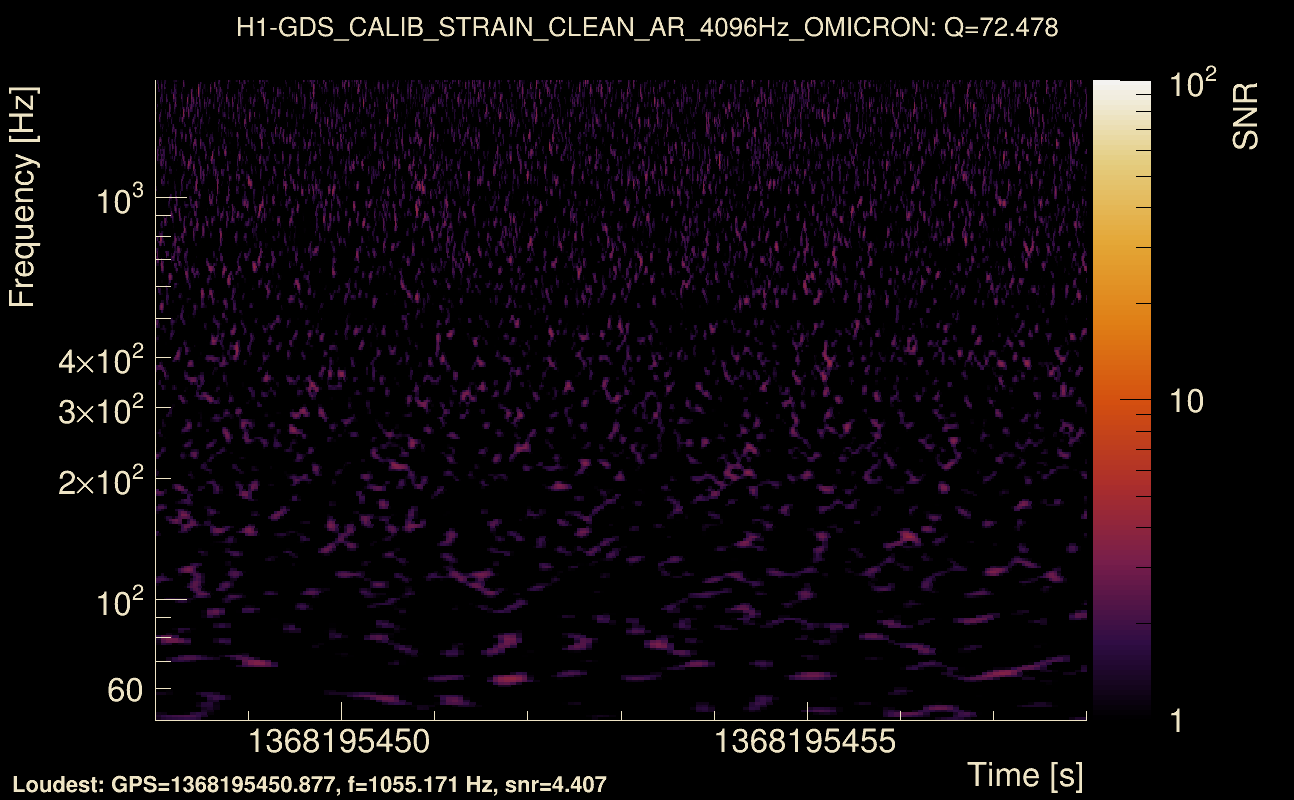
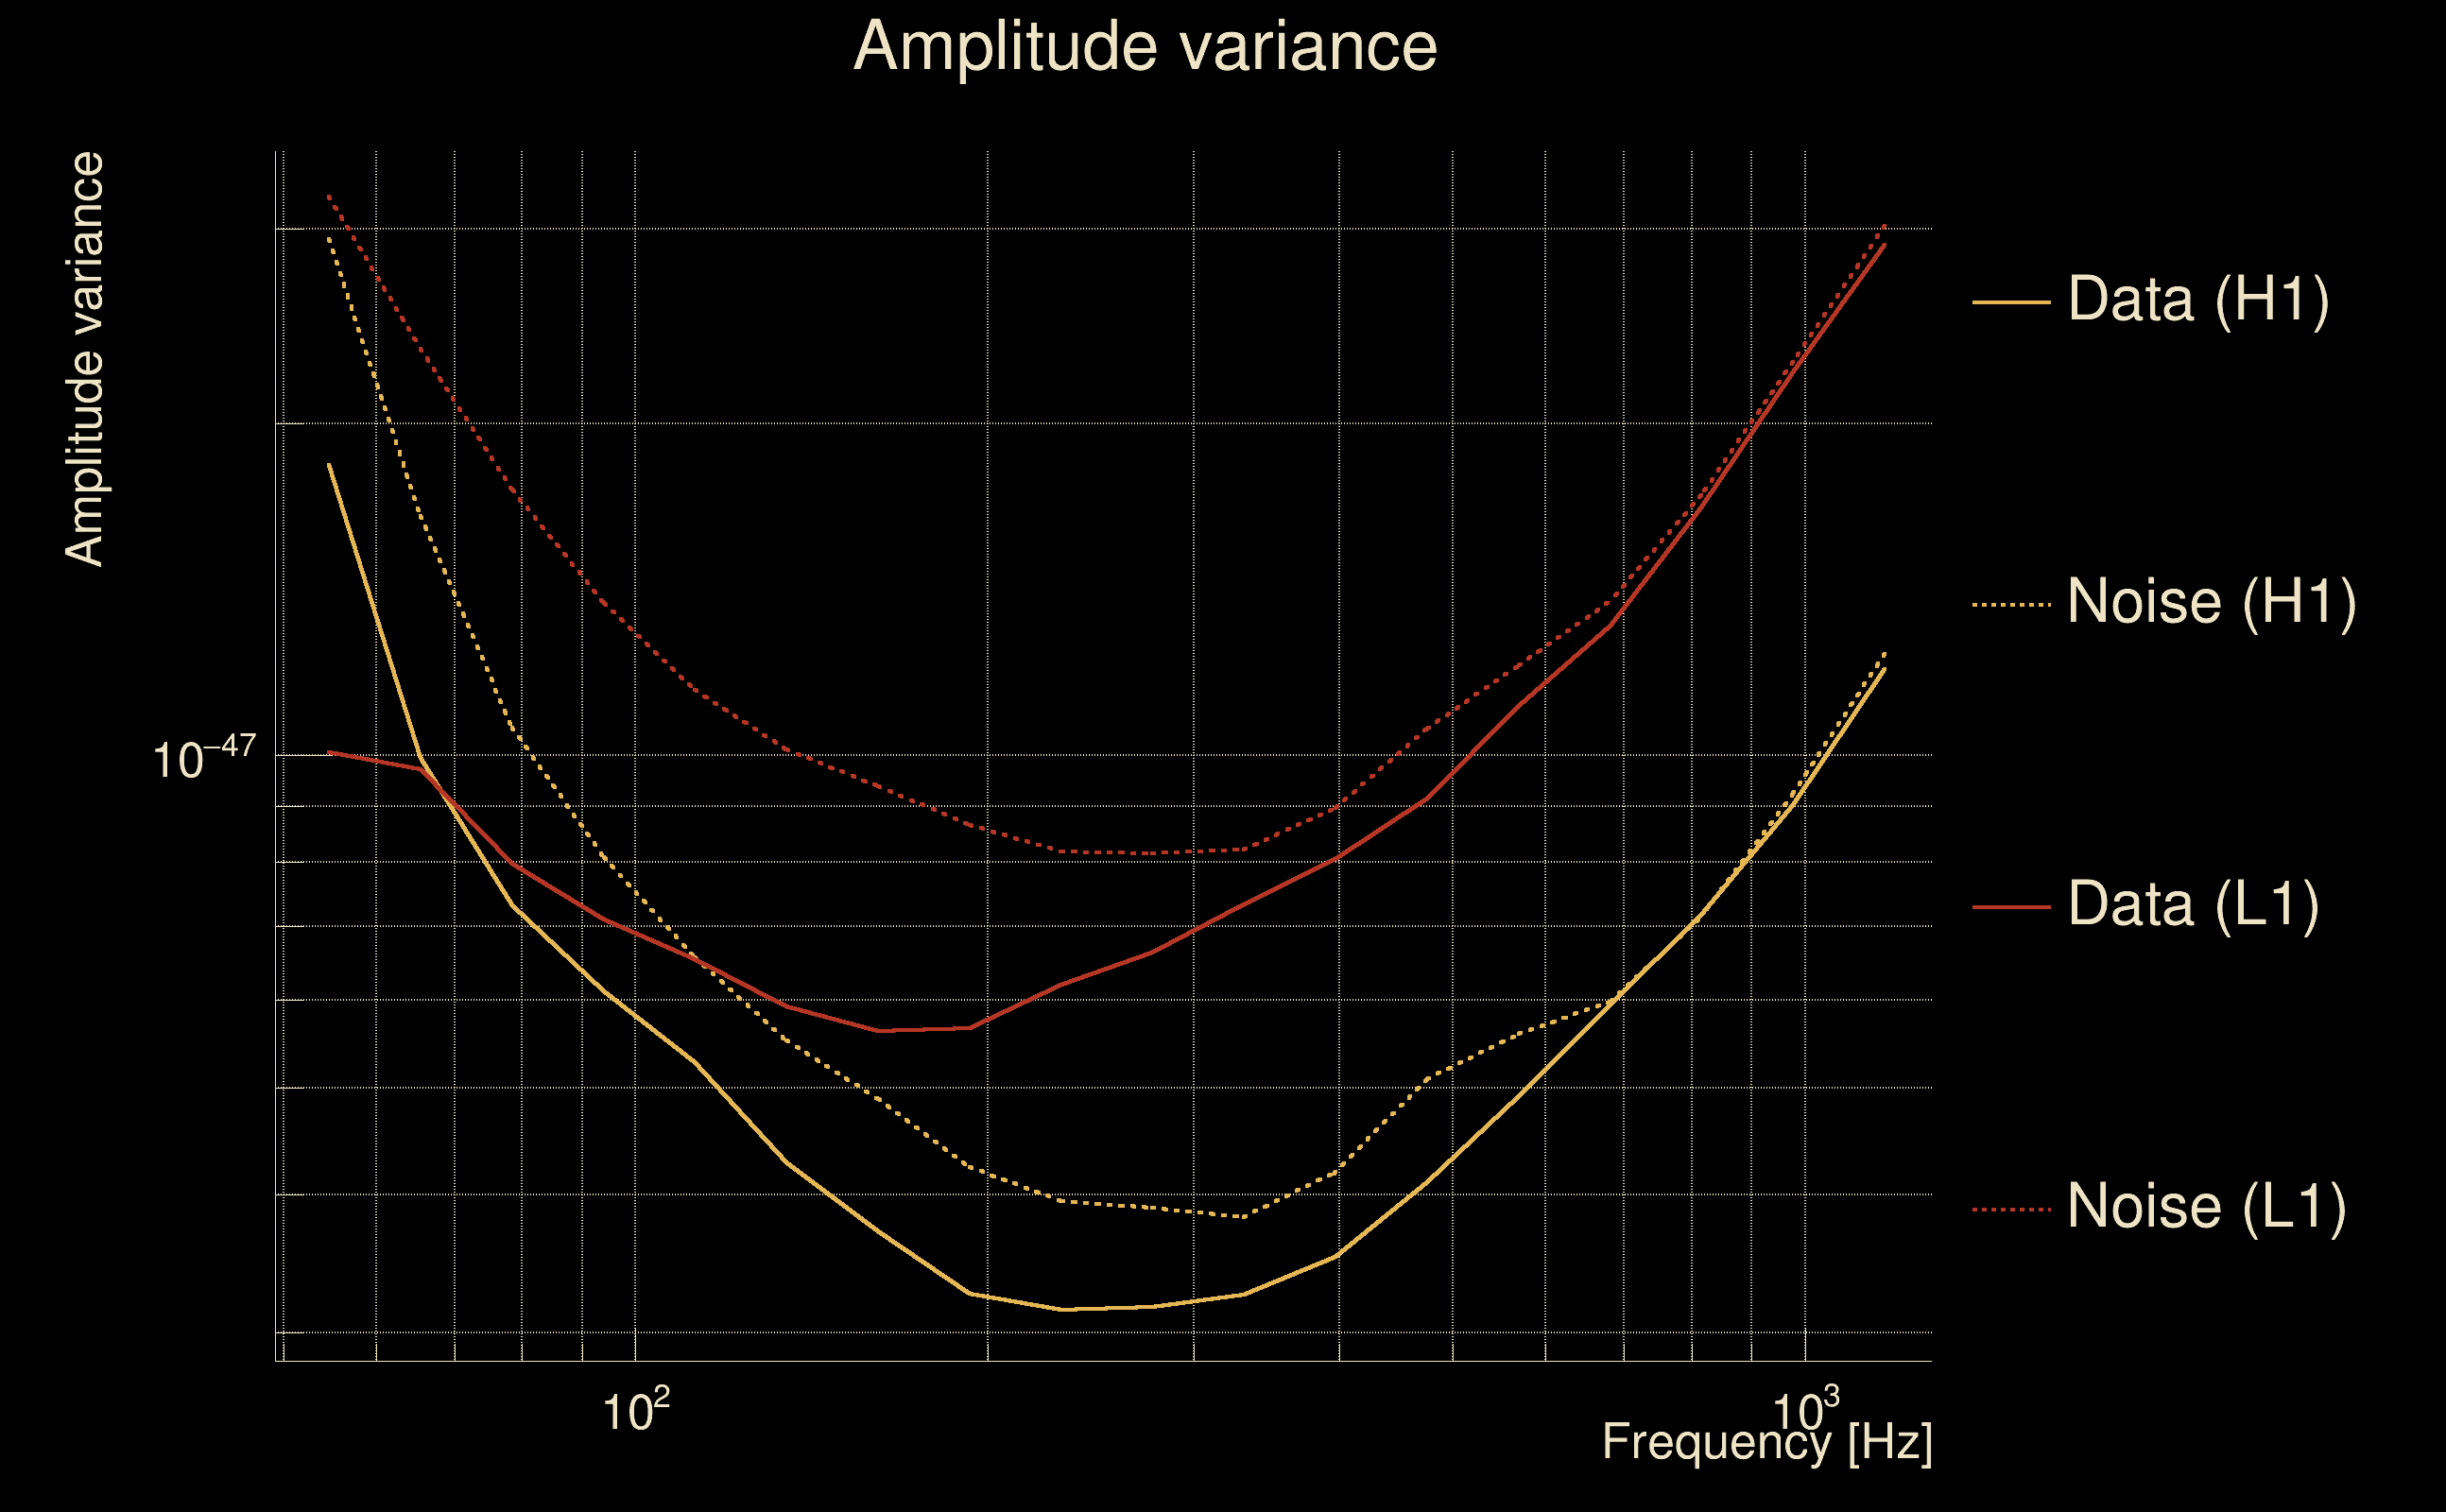
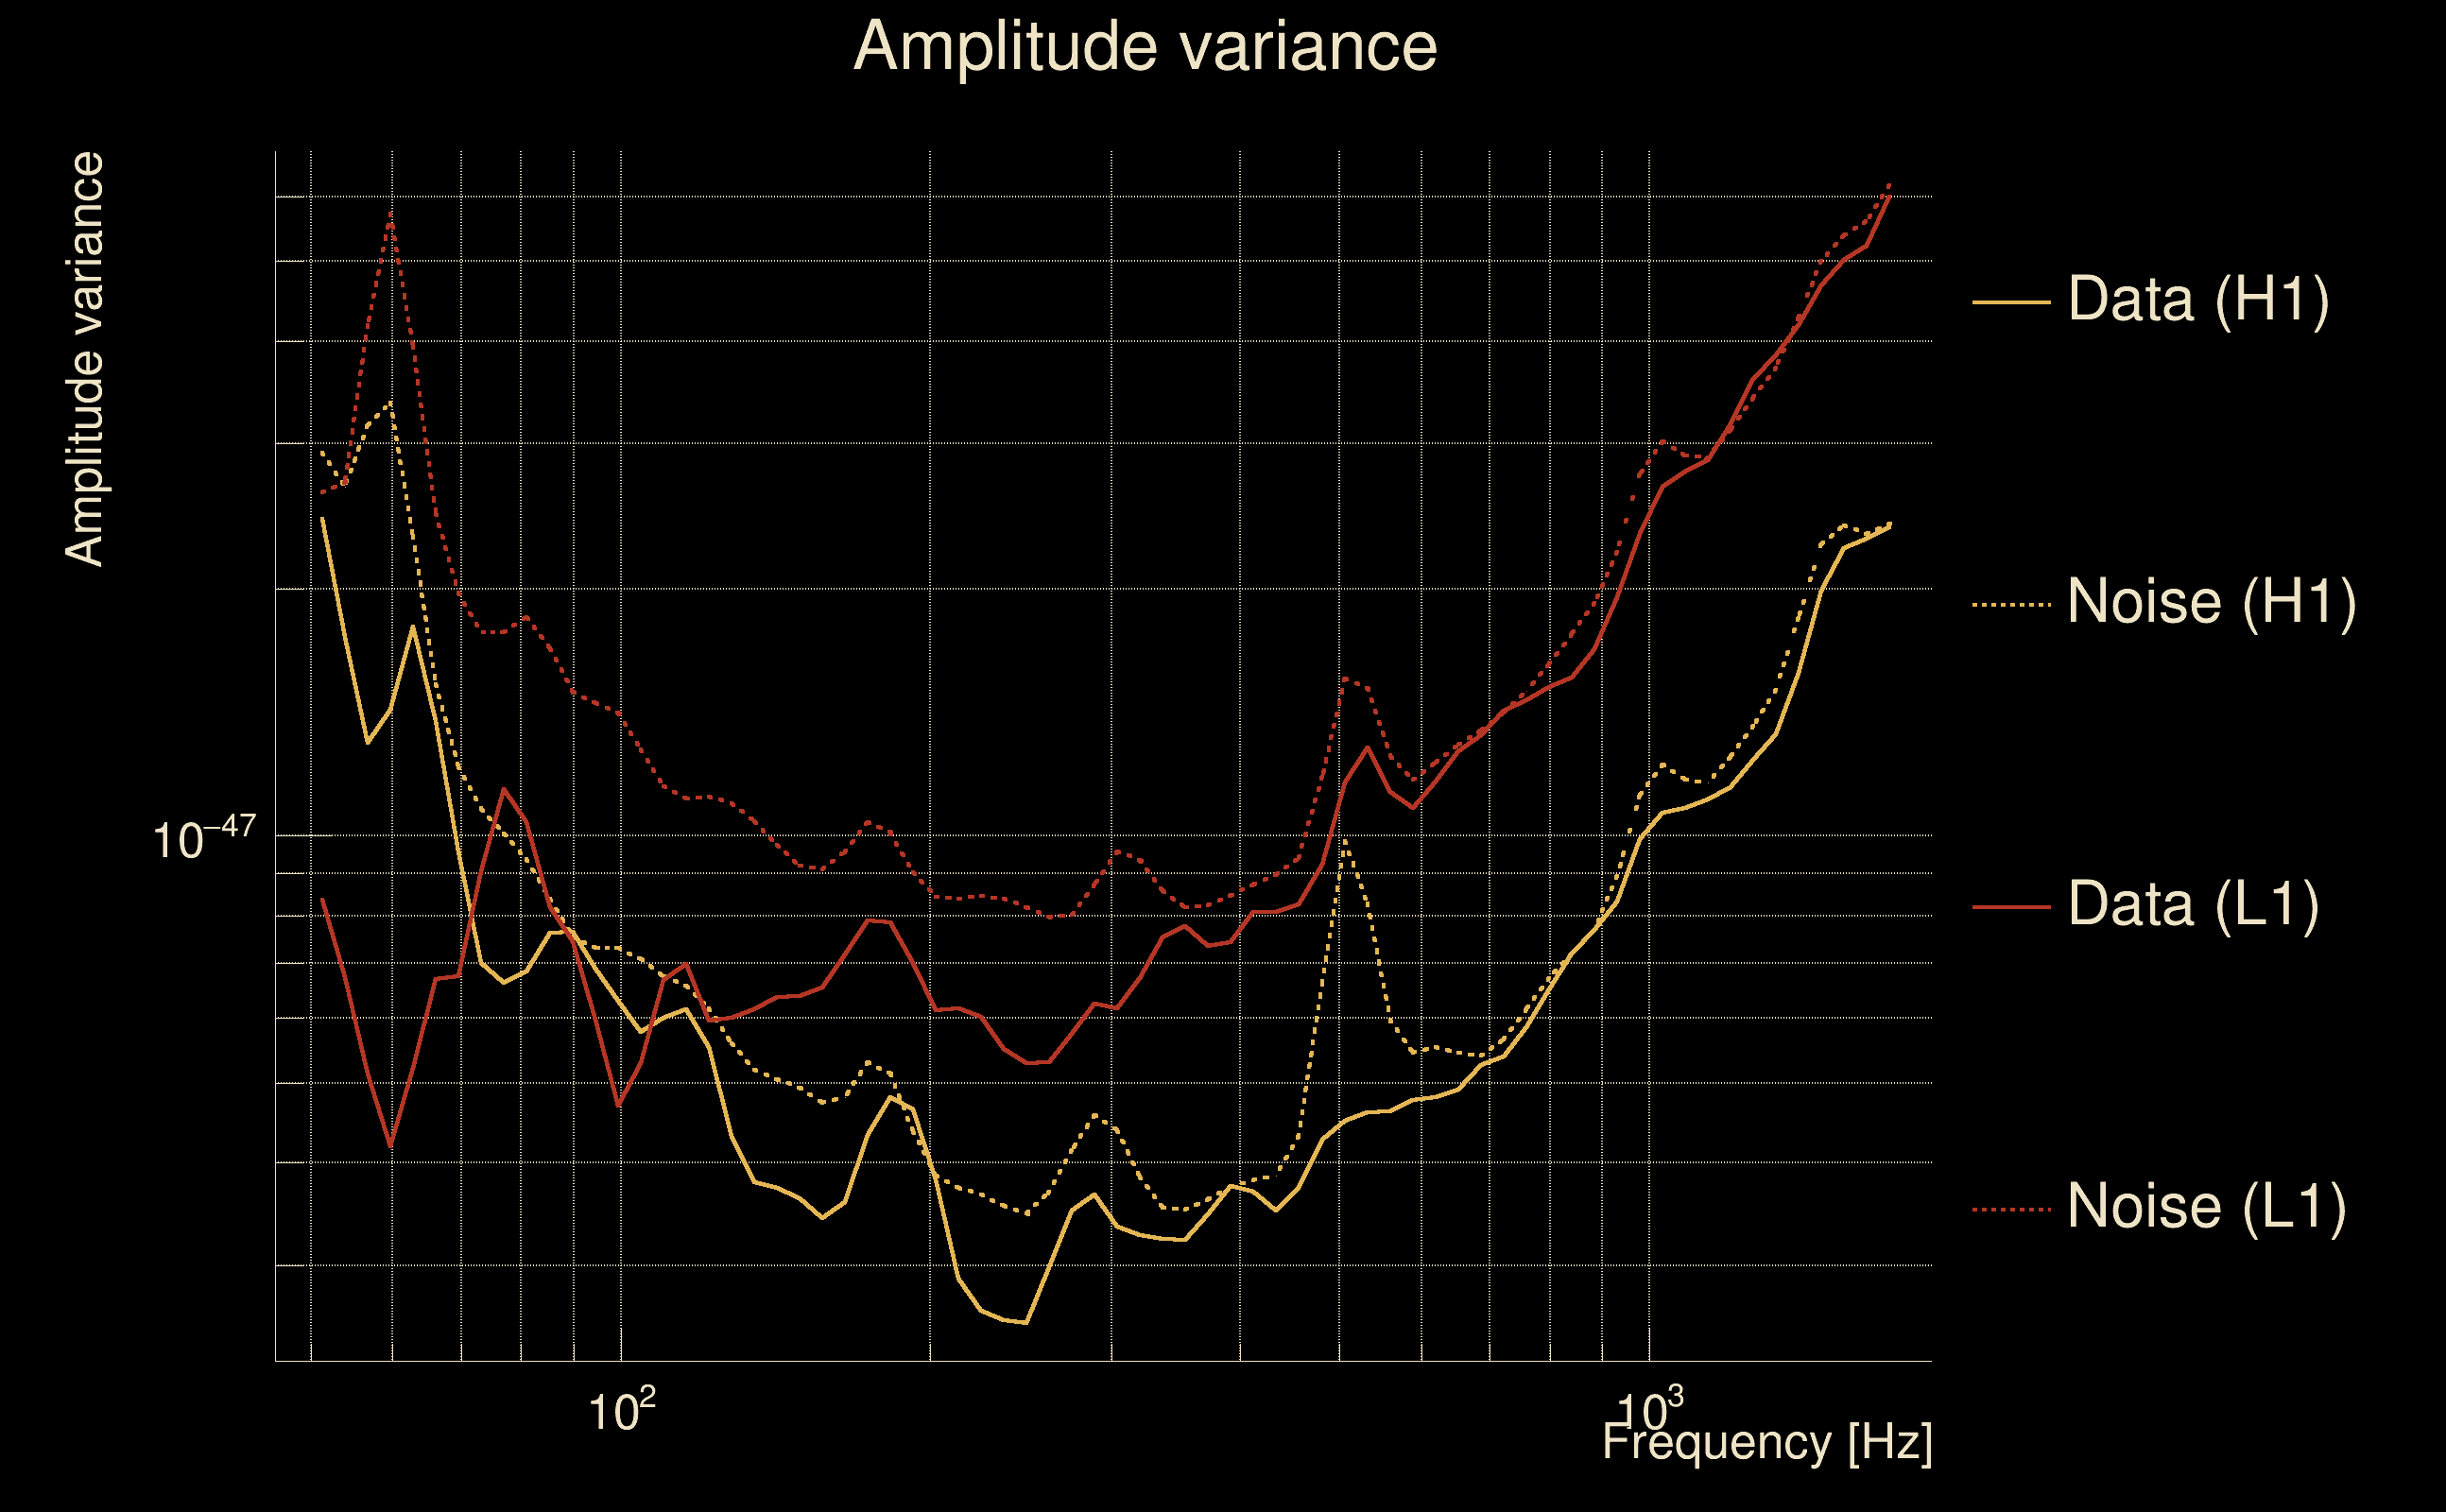
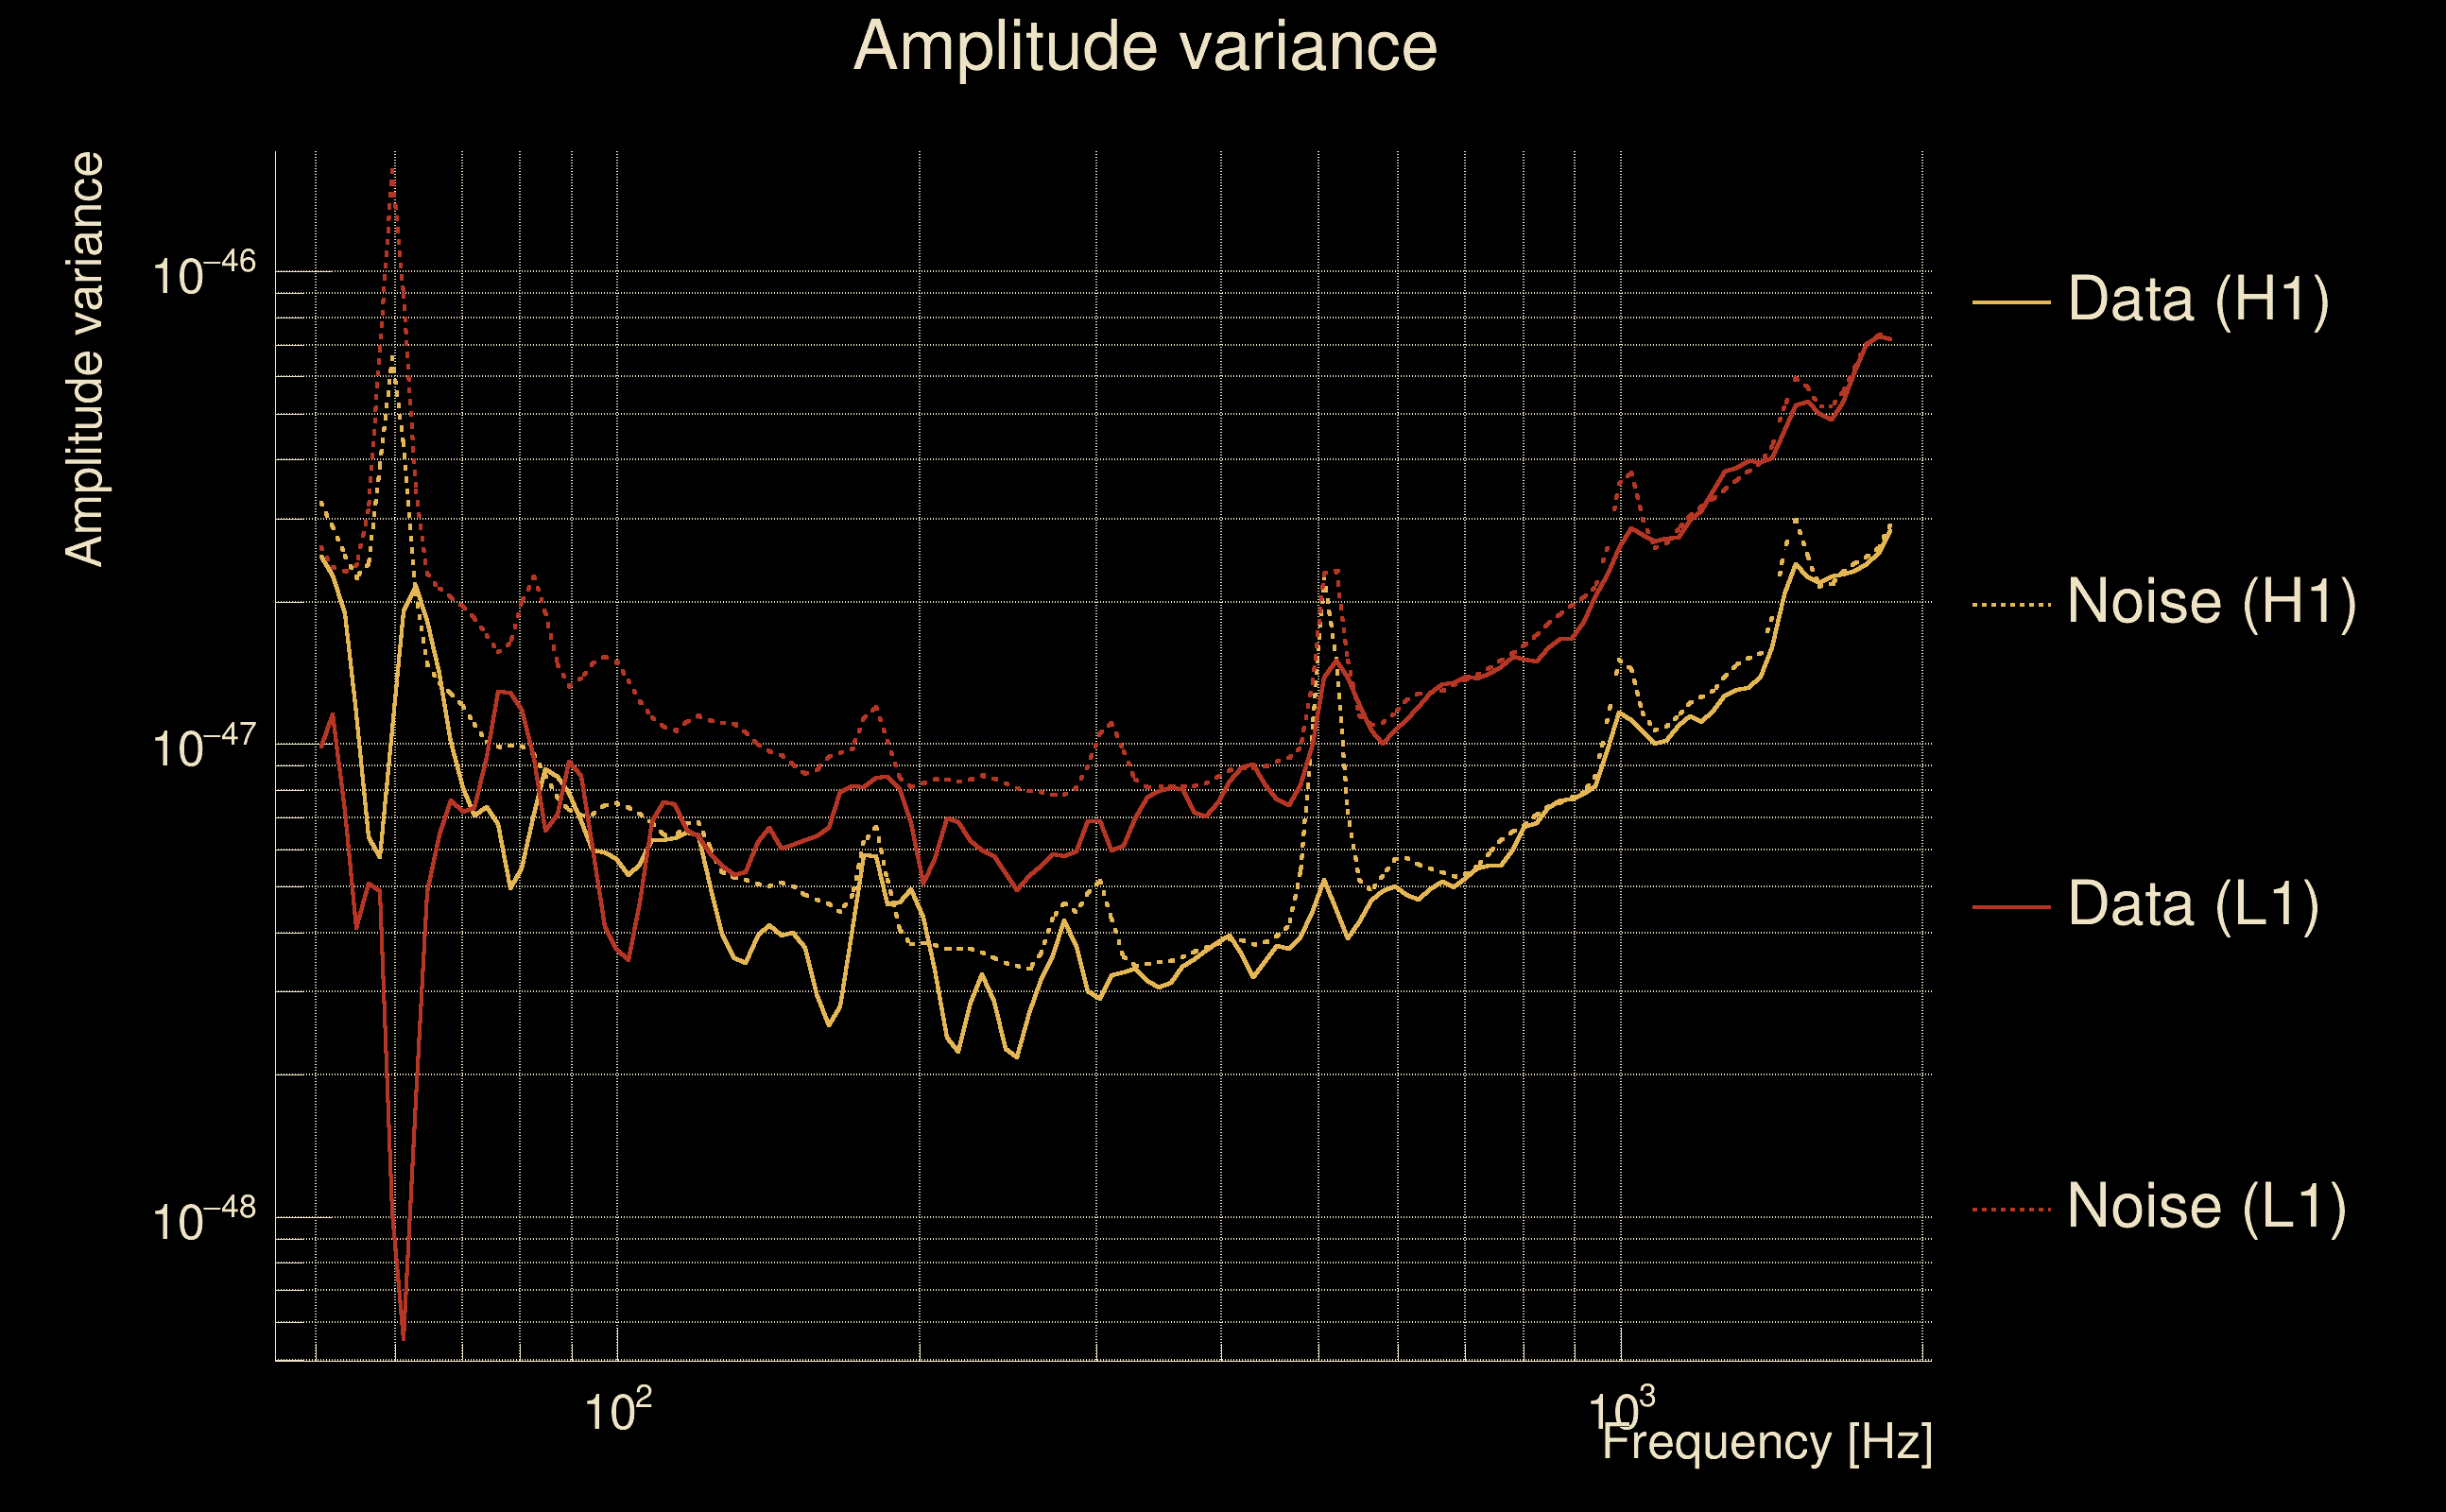
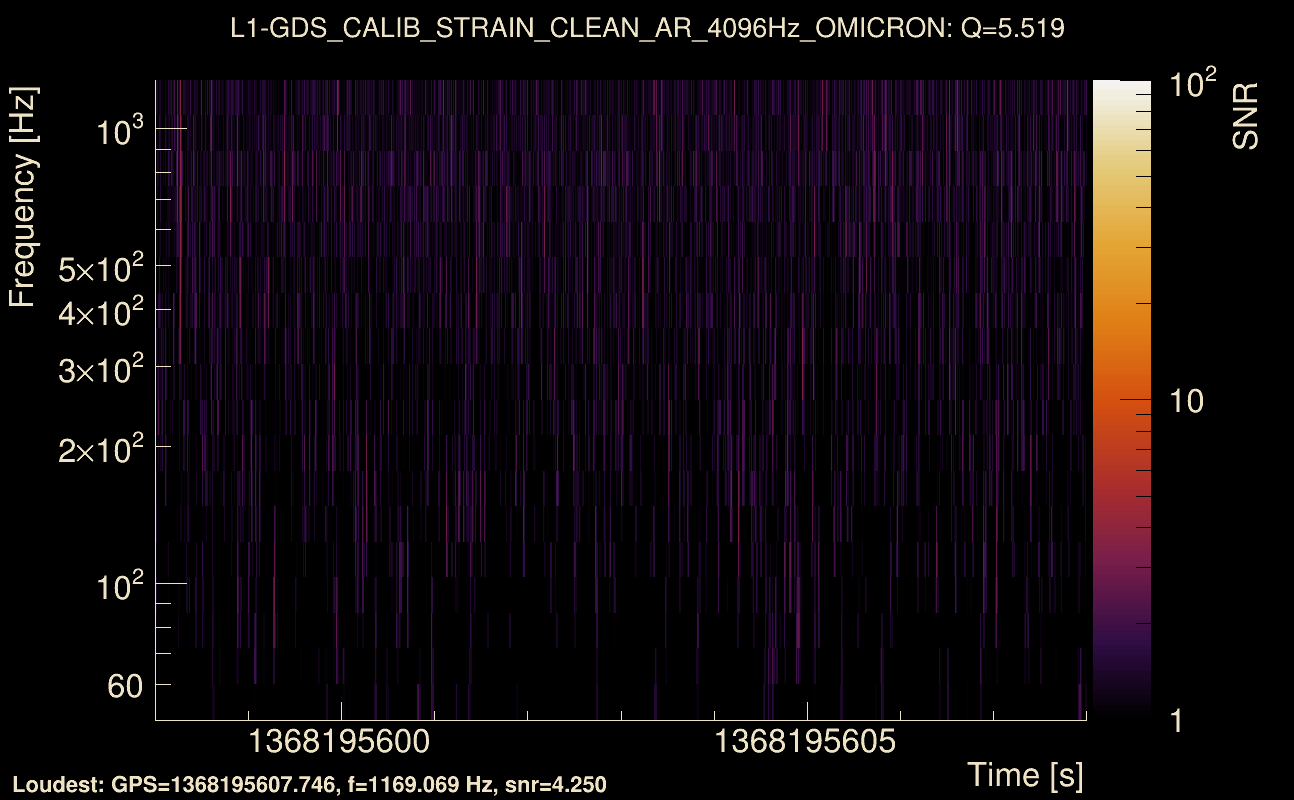
| Detector channel names: | H1:GDS-CALIB_STRAIN_CLEAN_AR_4096Hz, L1:GDS-CALIB_STRAIN_CLEAN_AR_4096Hz |
| Omicron analysis time window and overlap: | 16 s, 6 s |
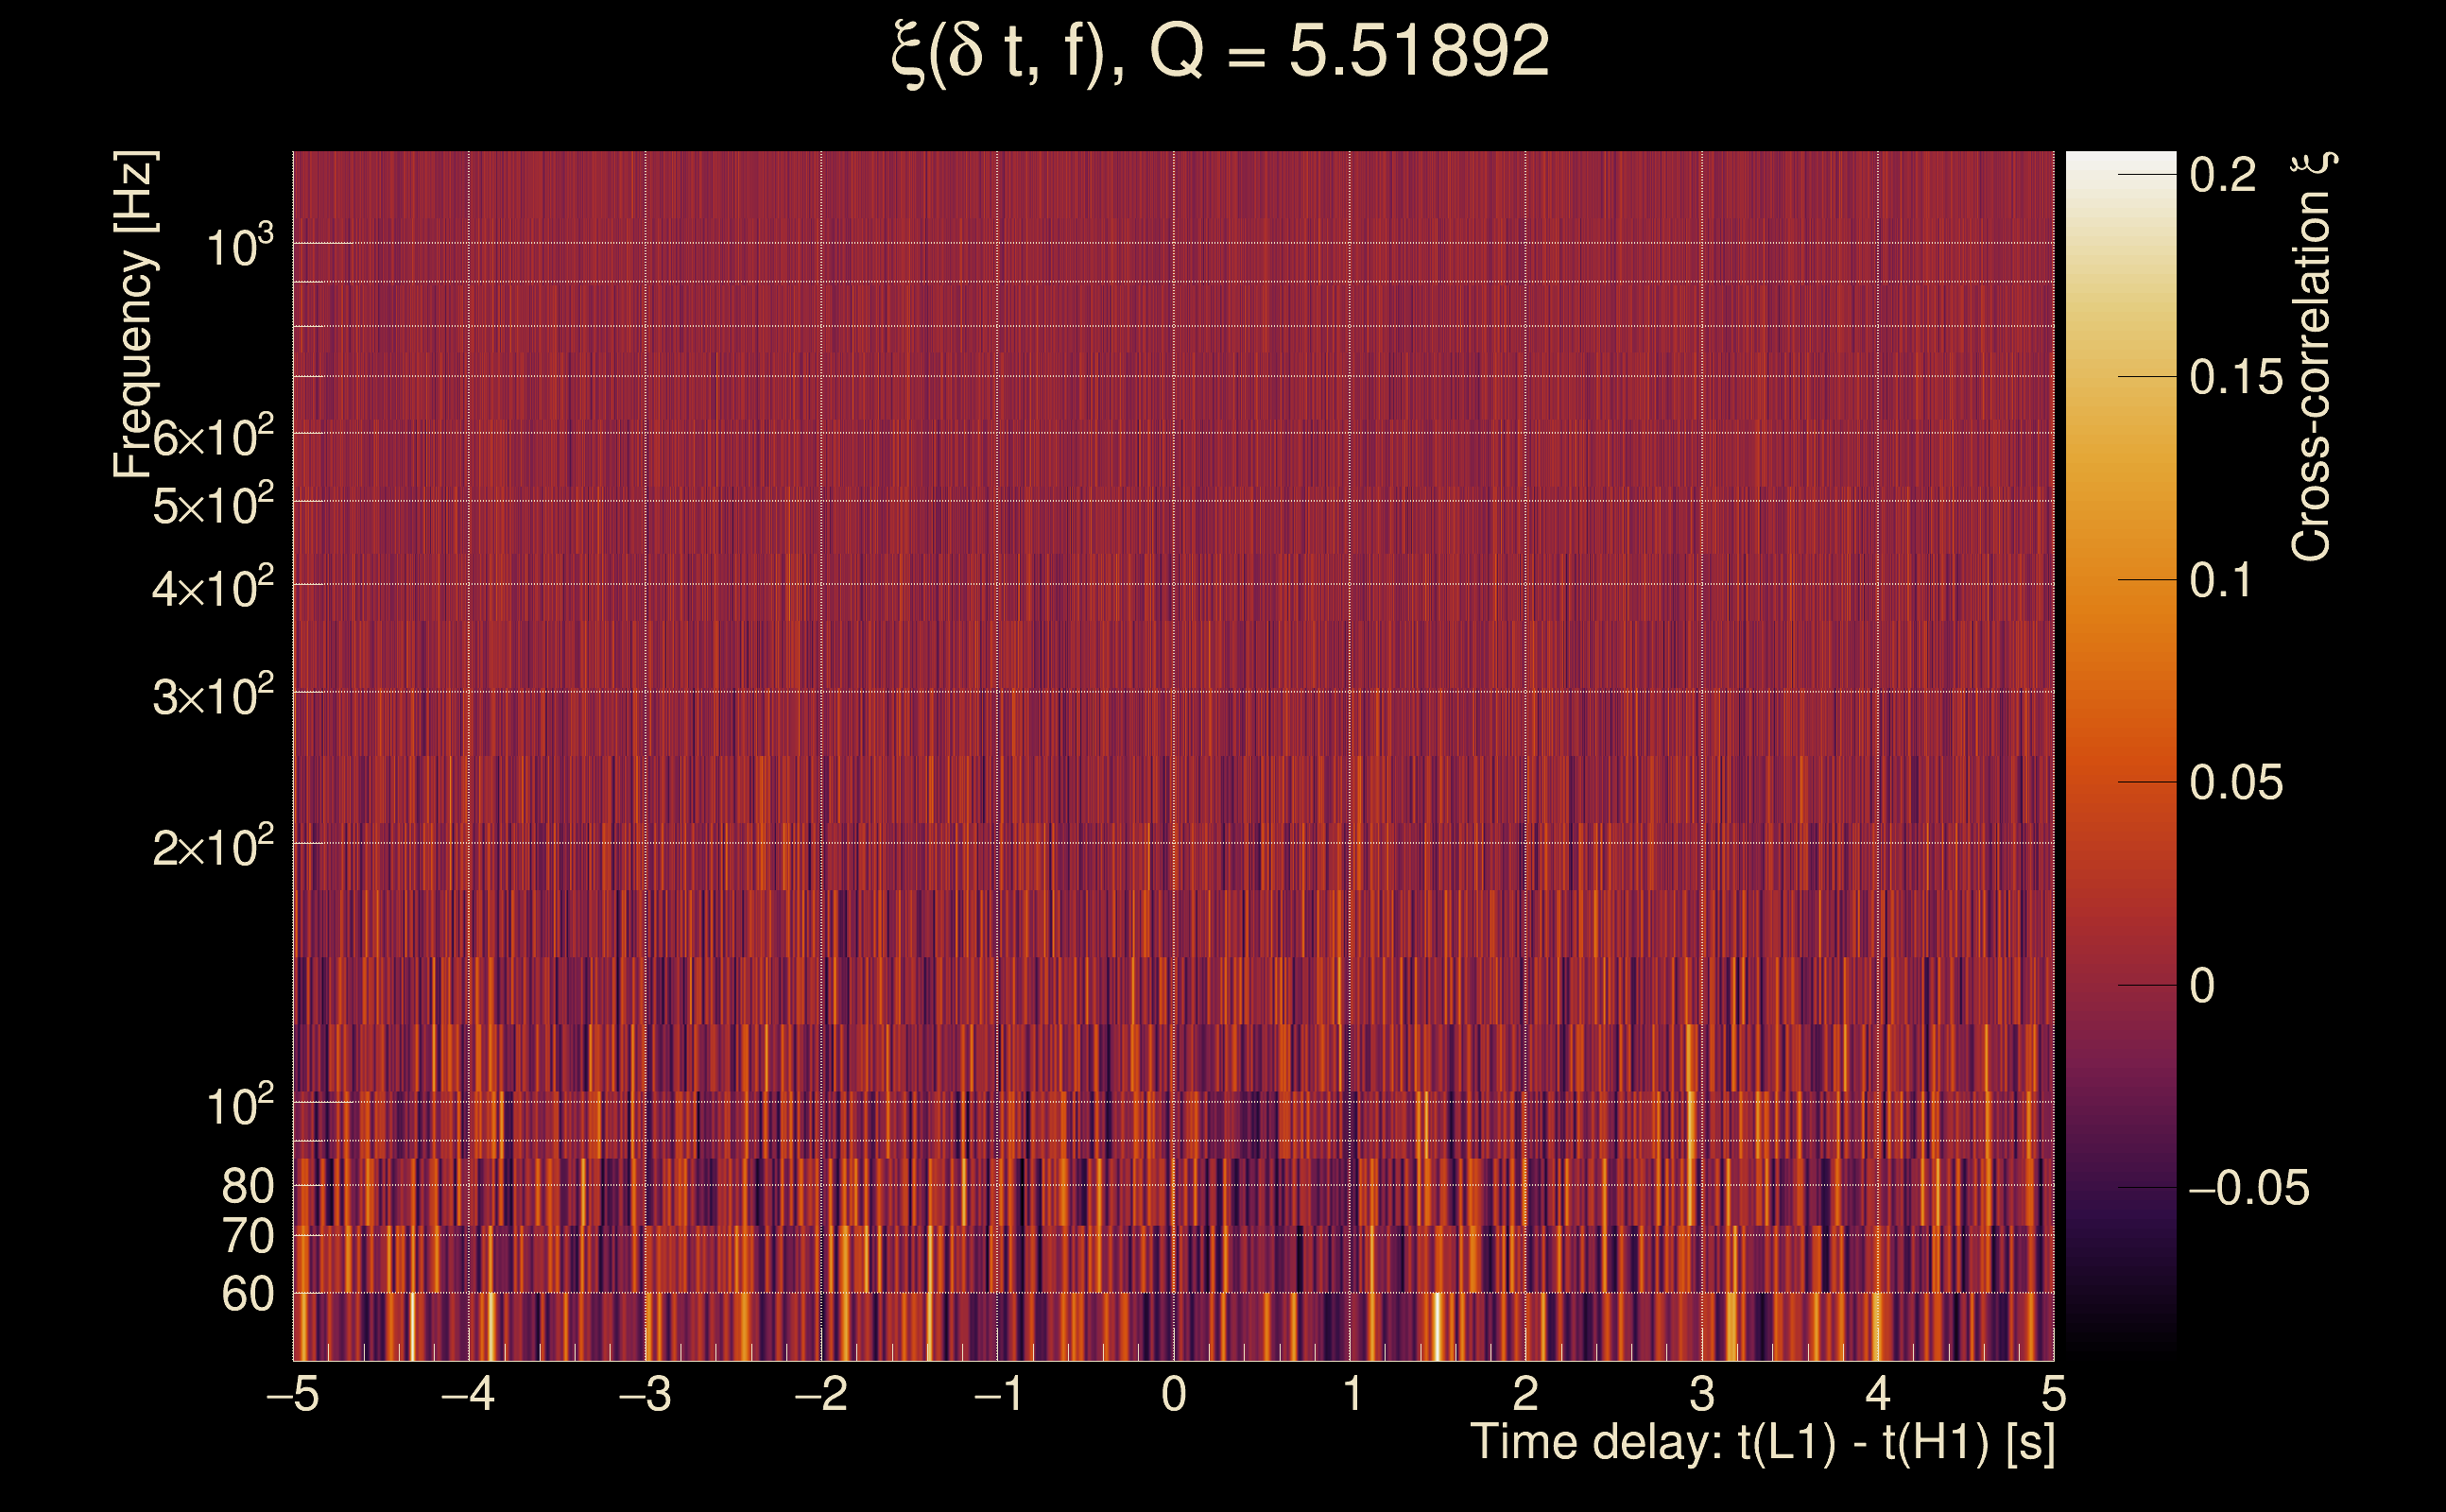
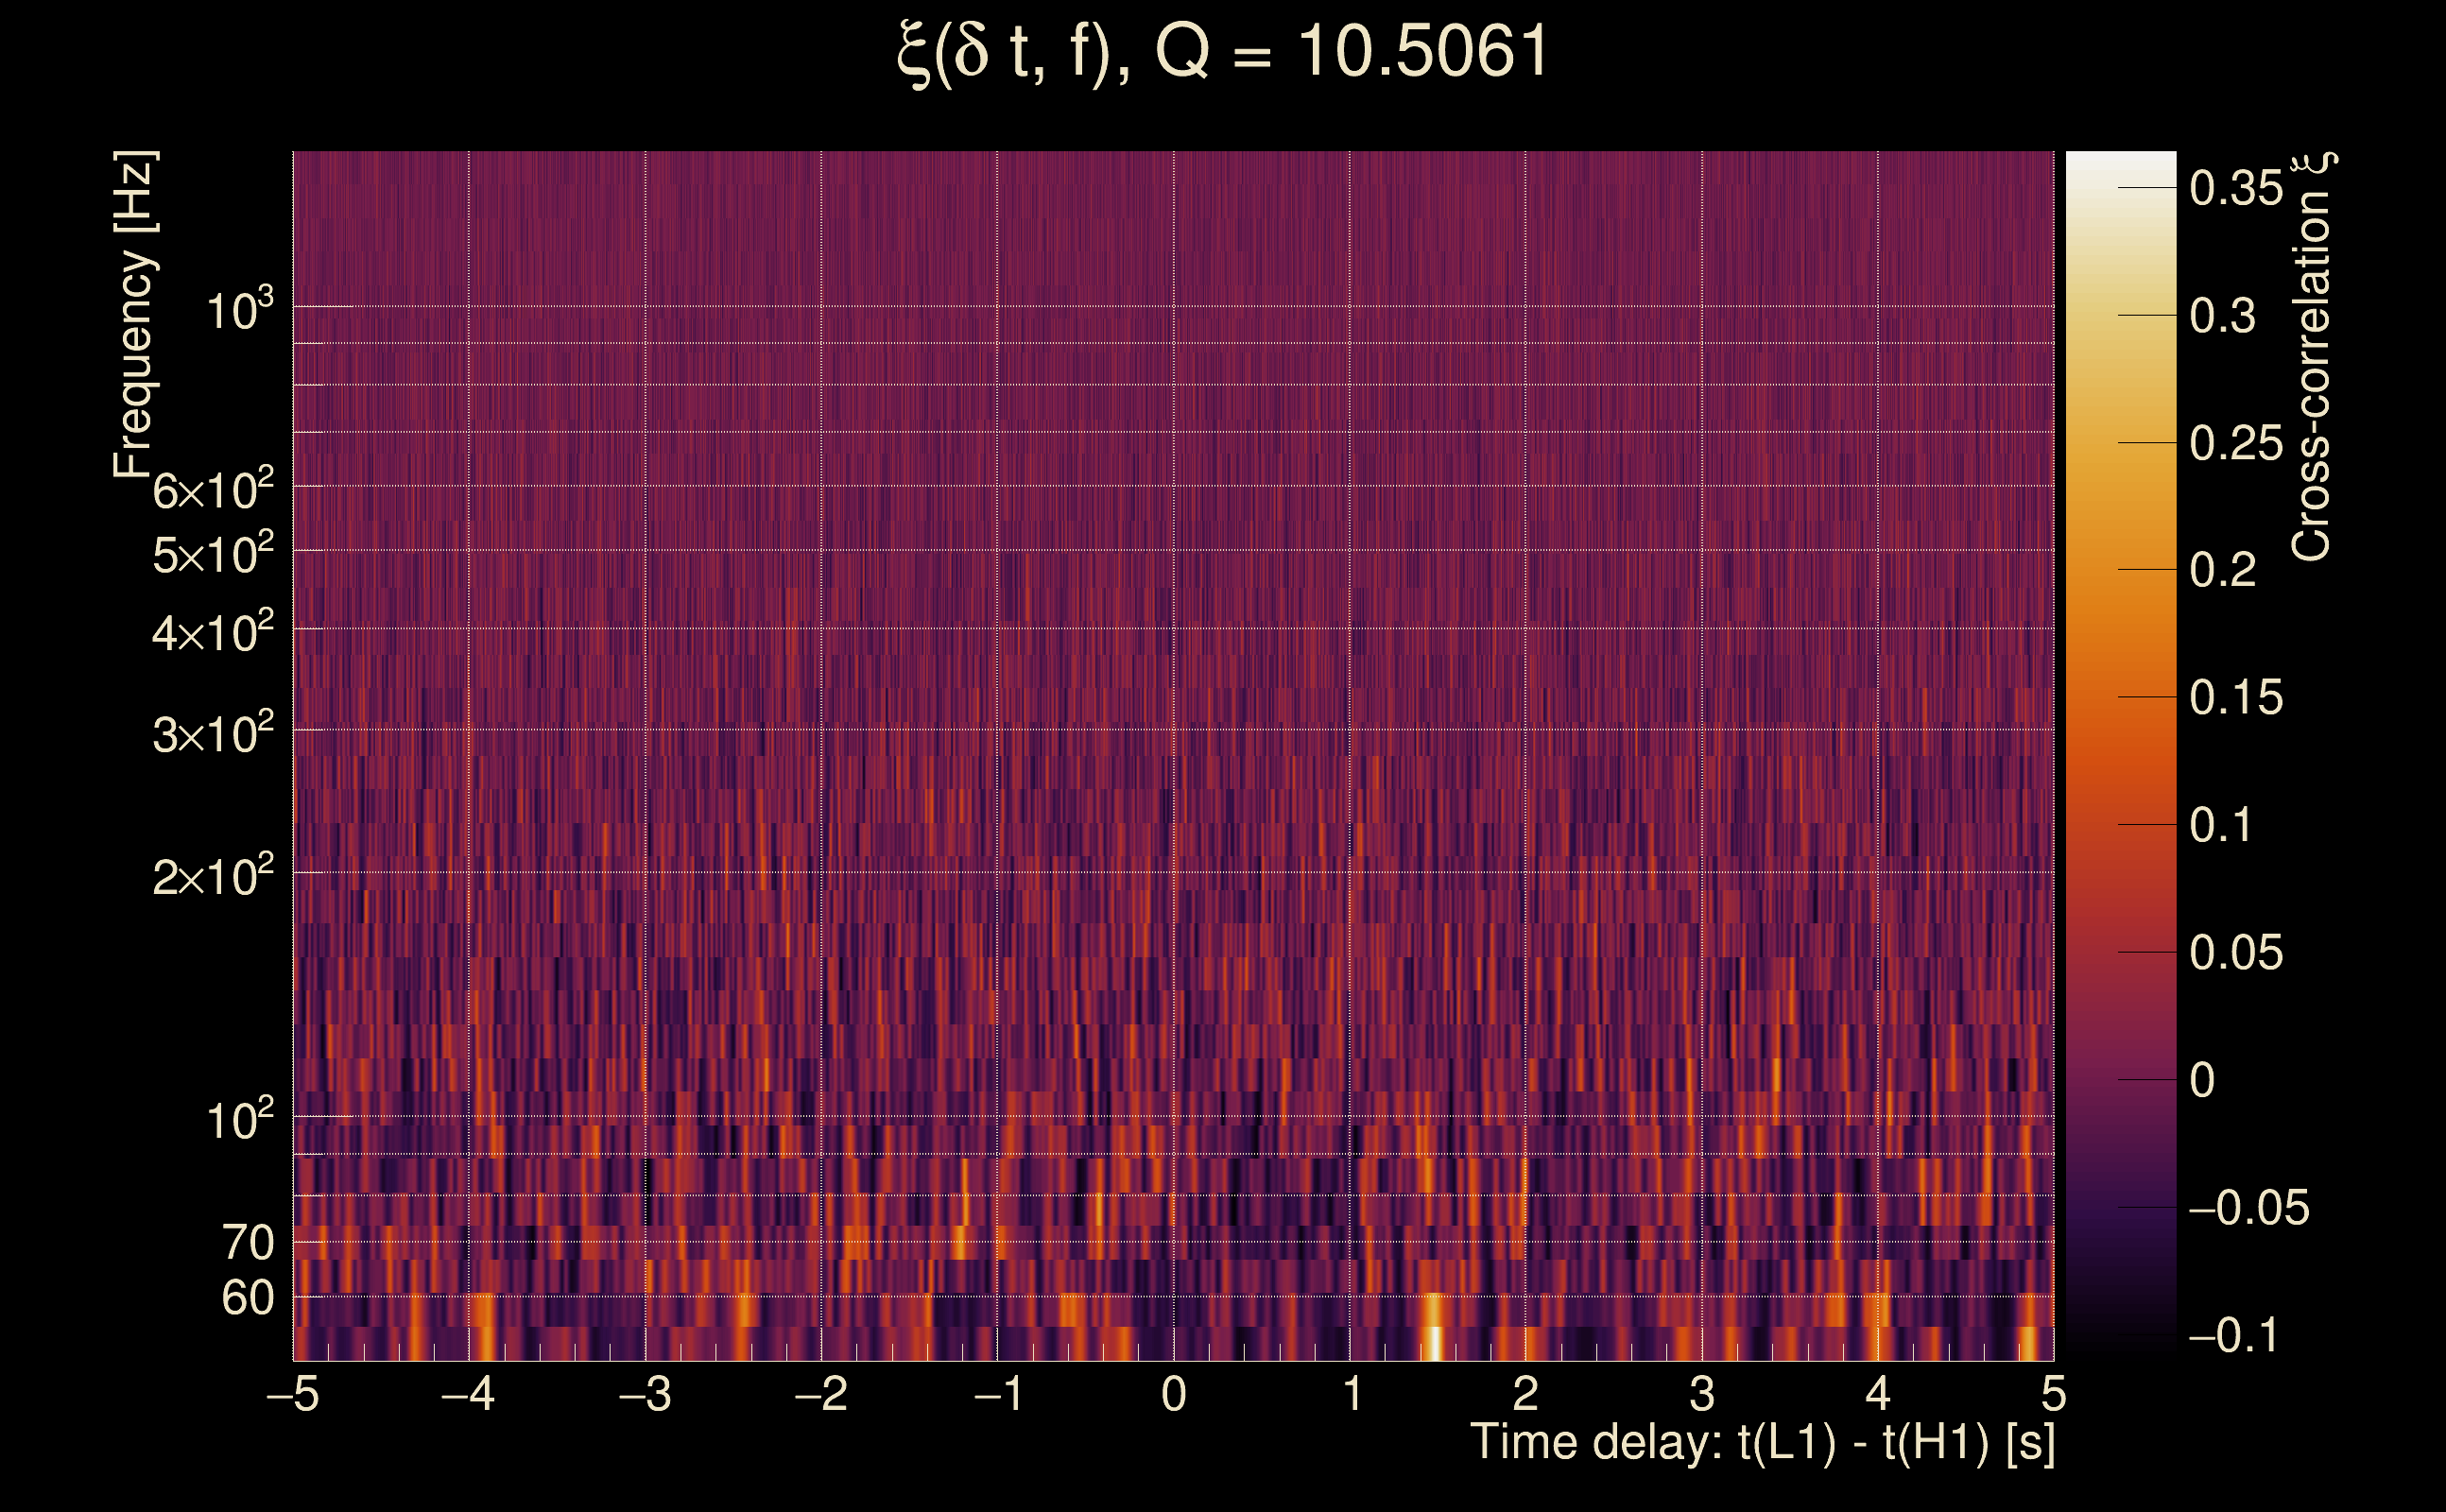
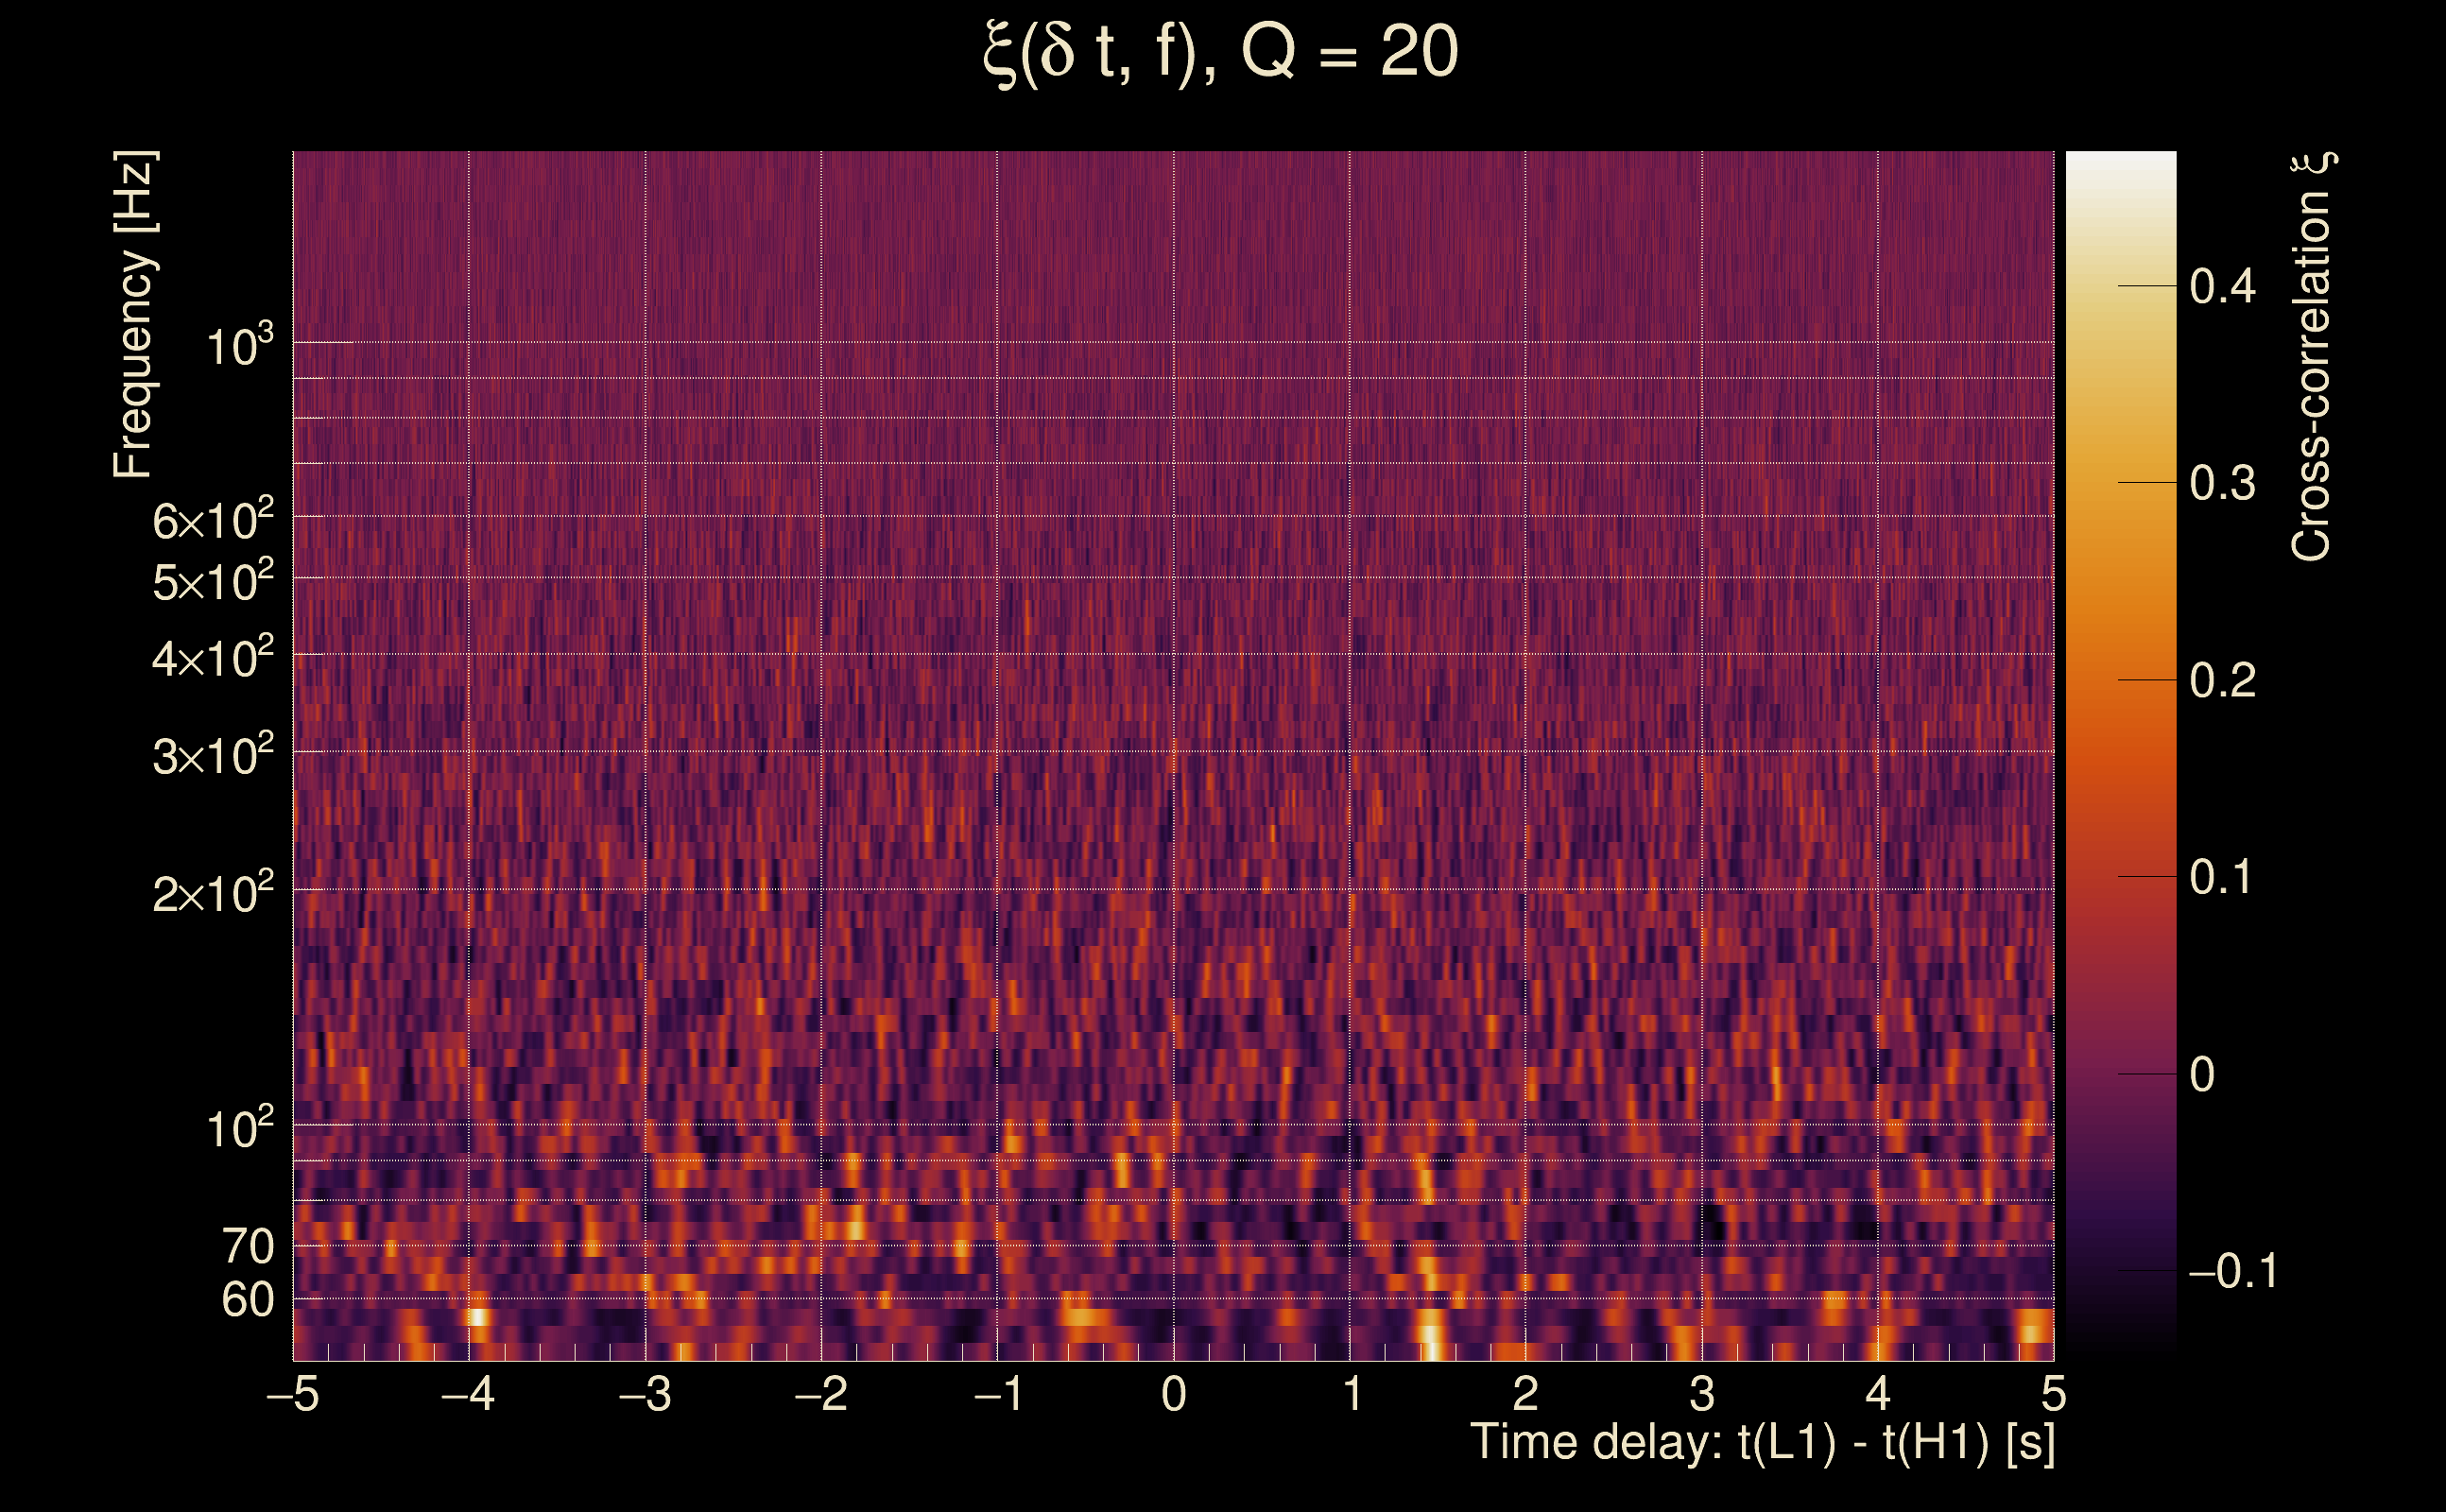
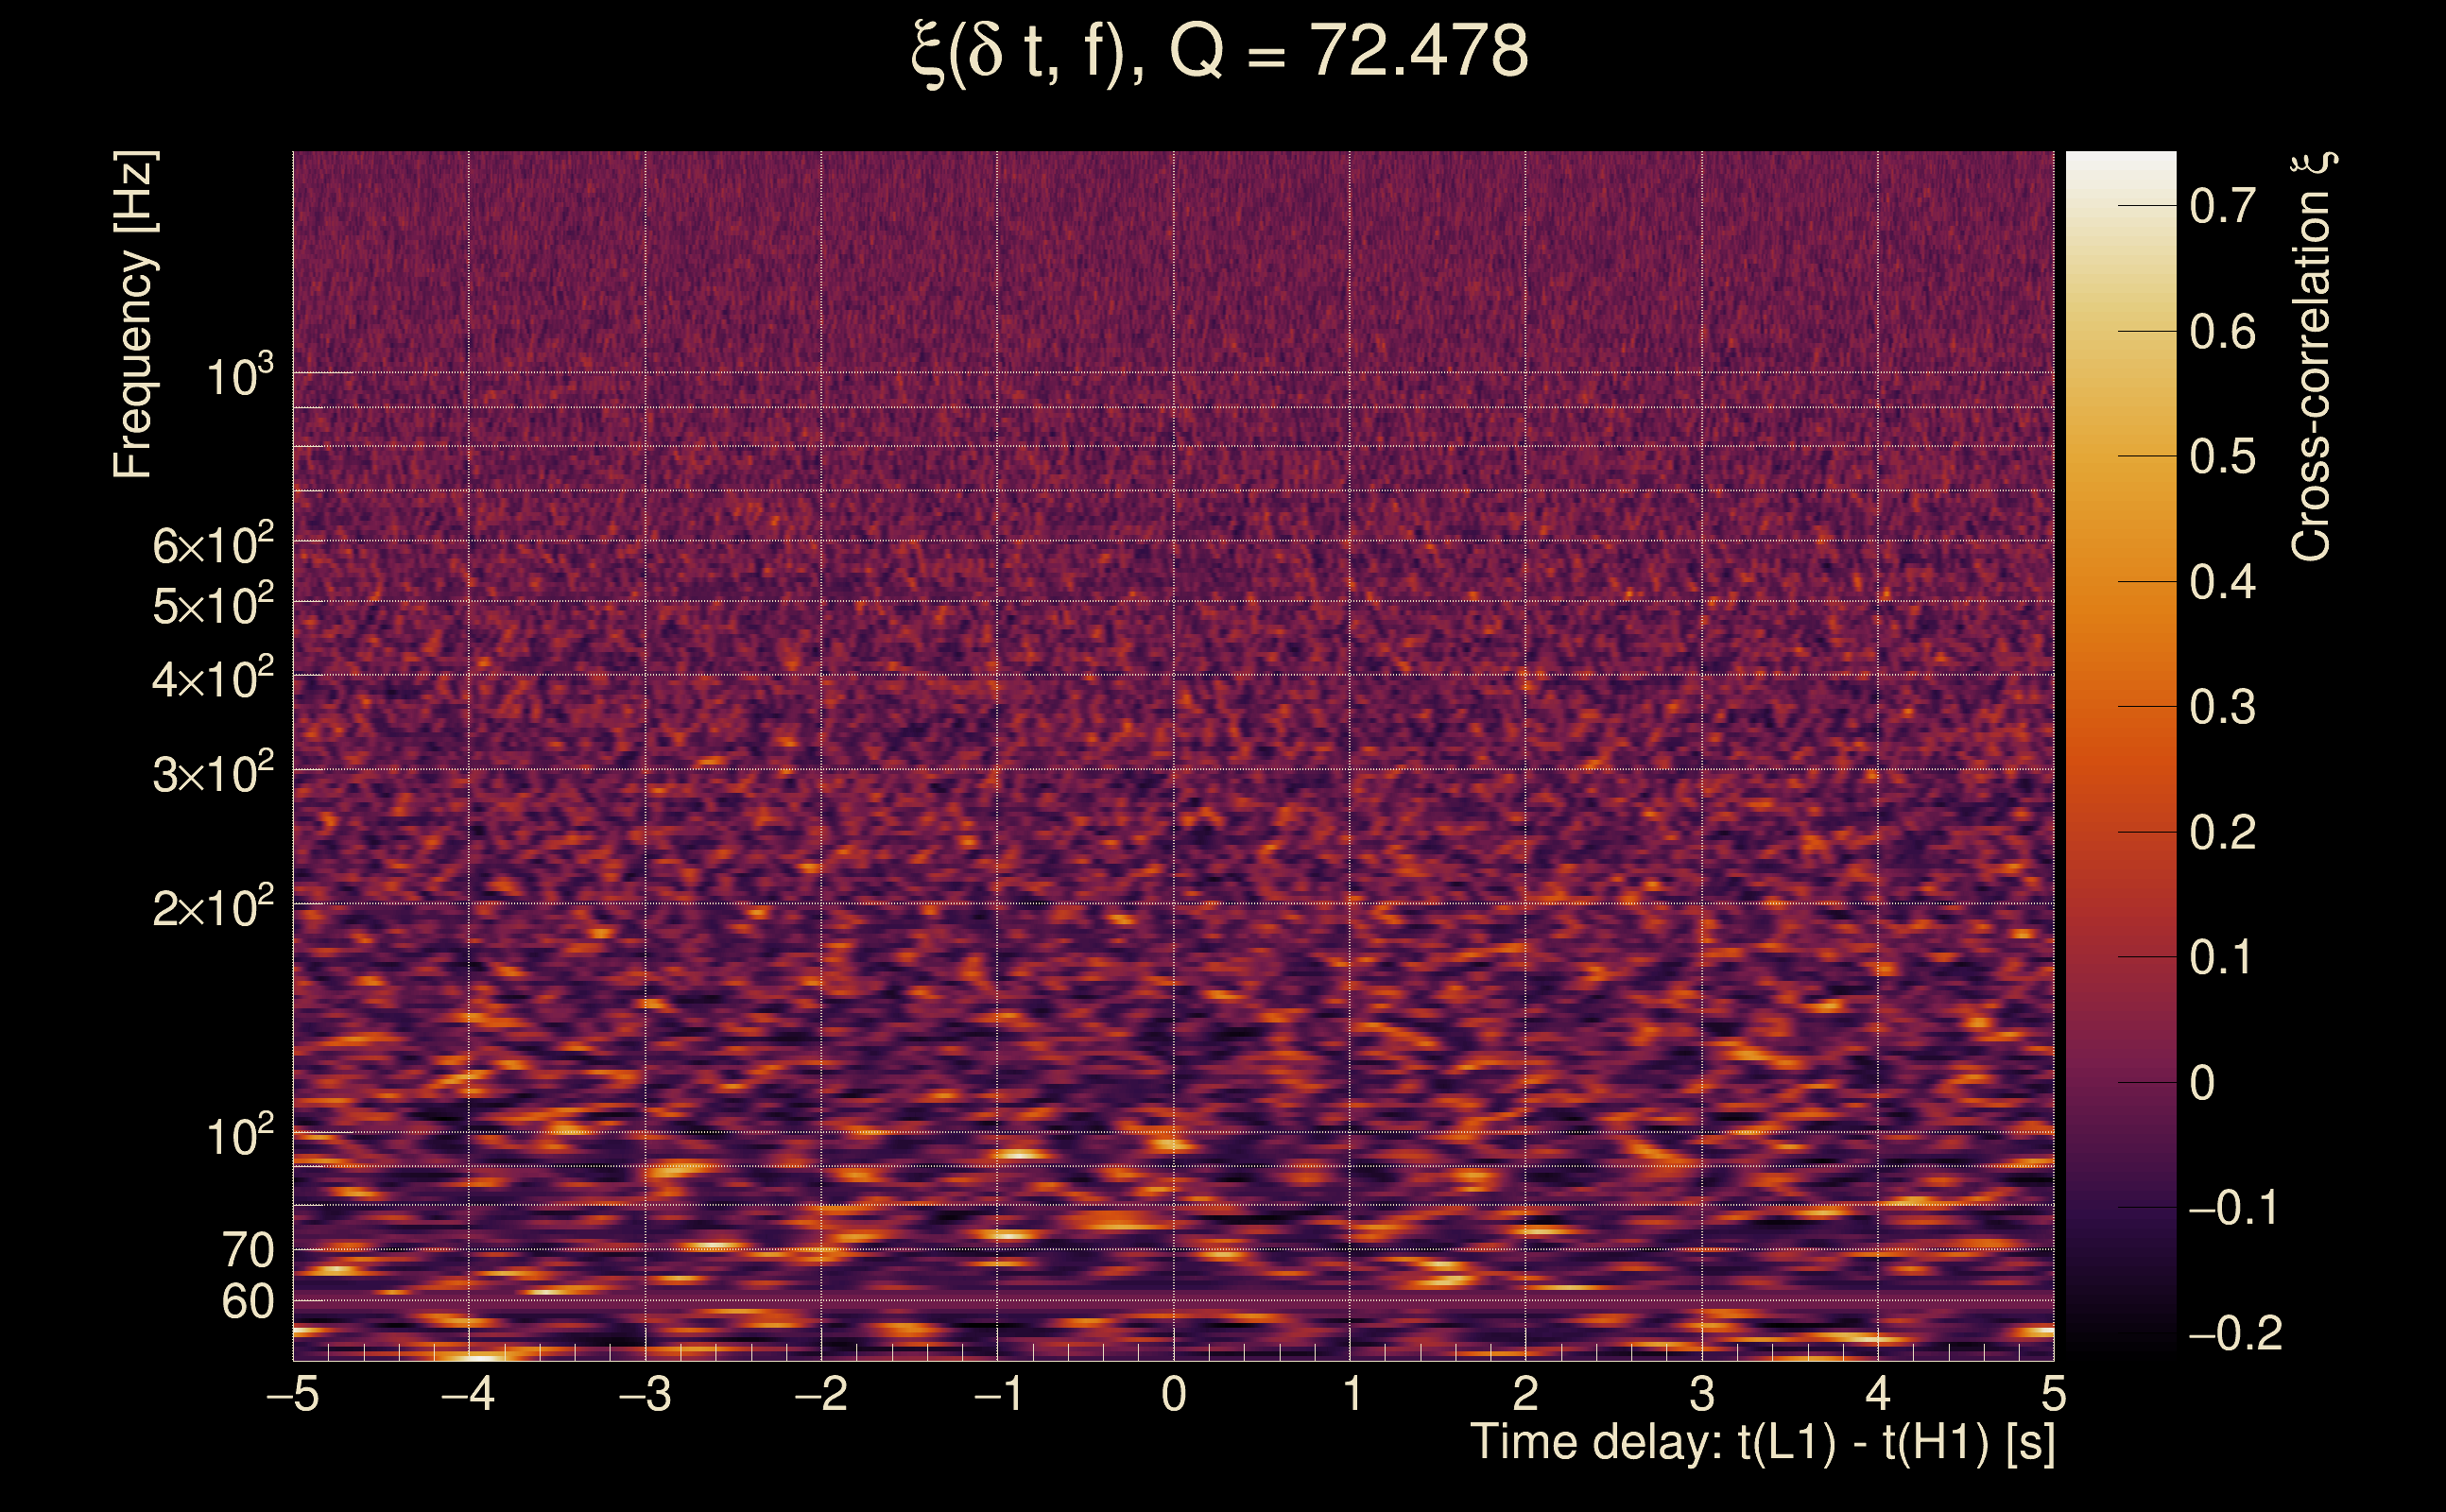
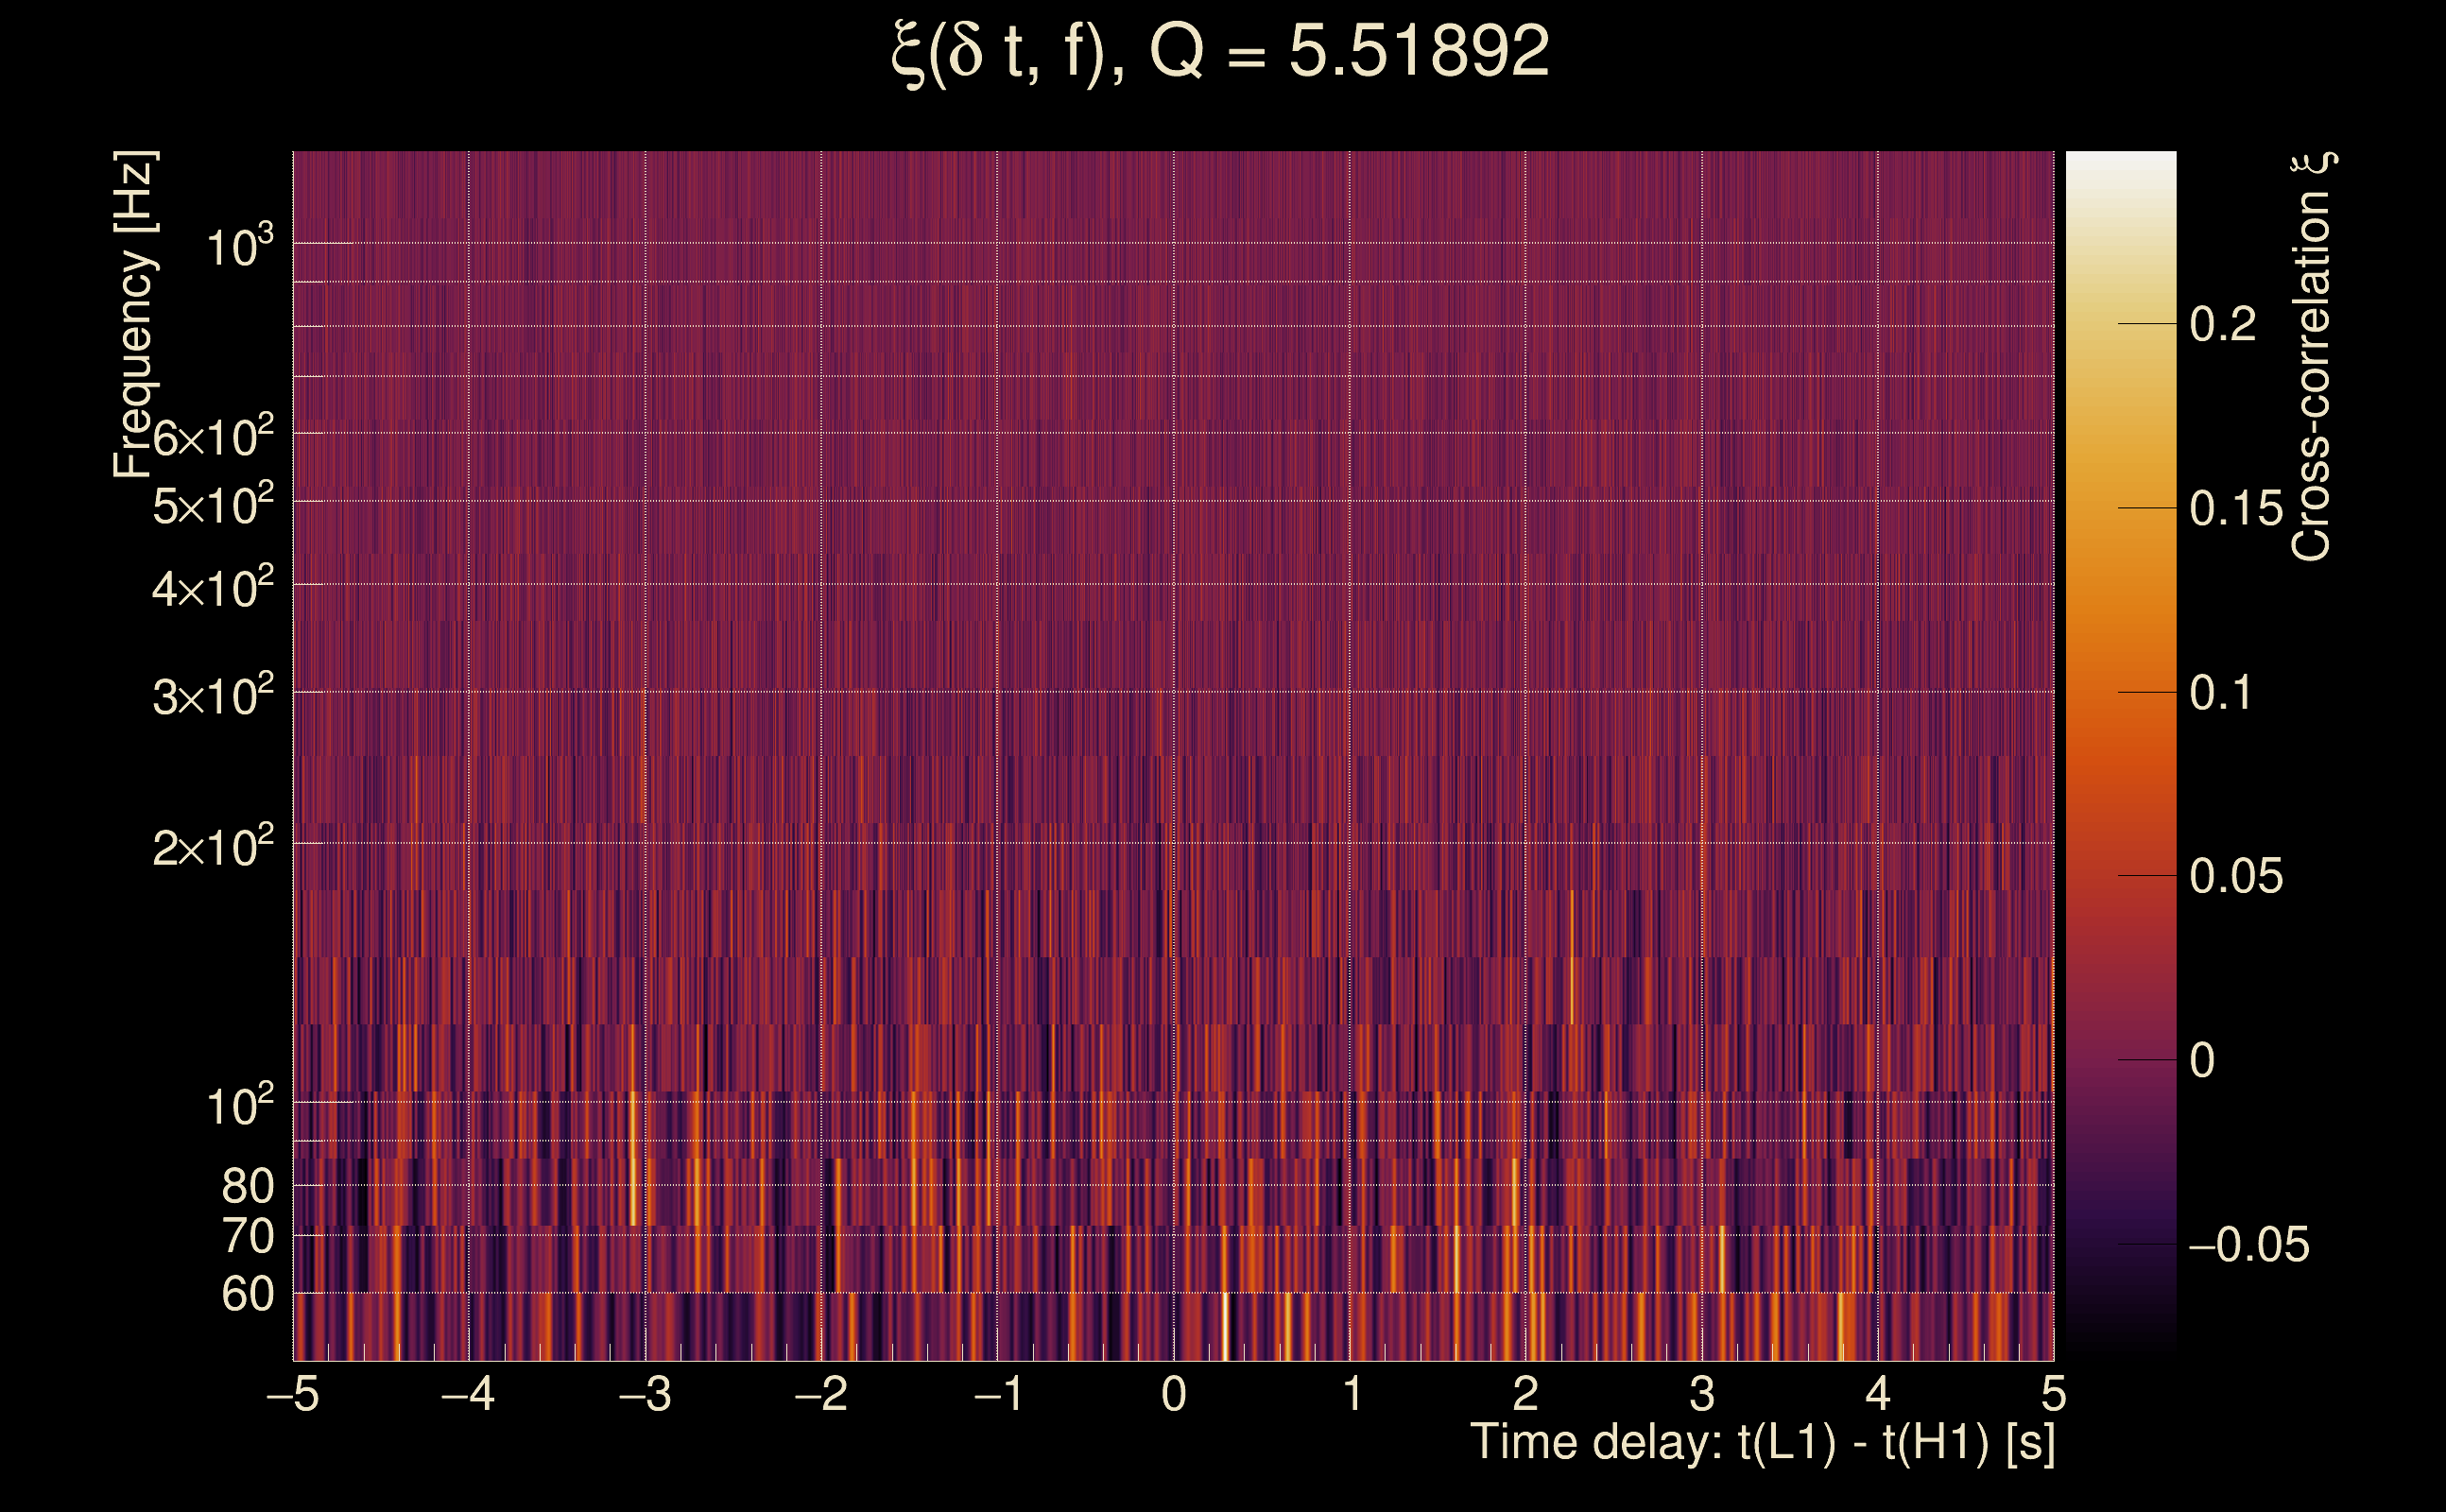
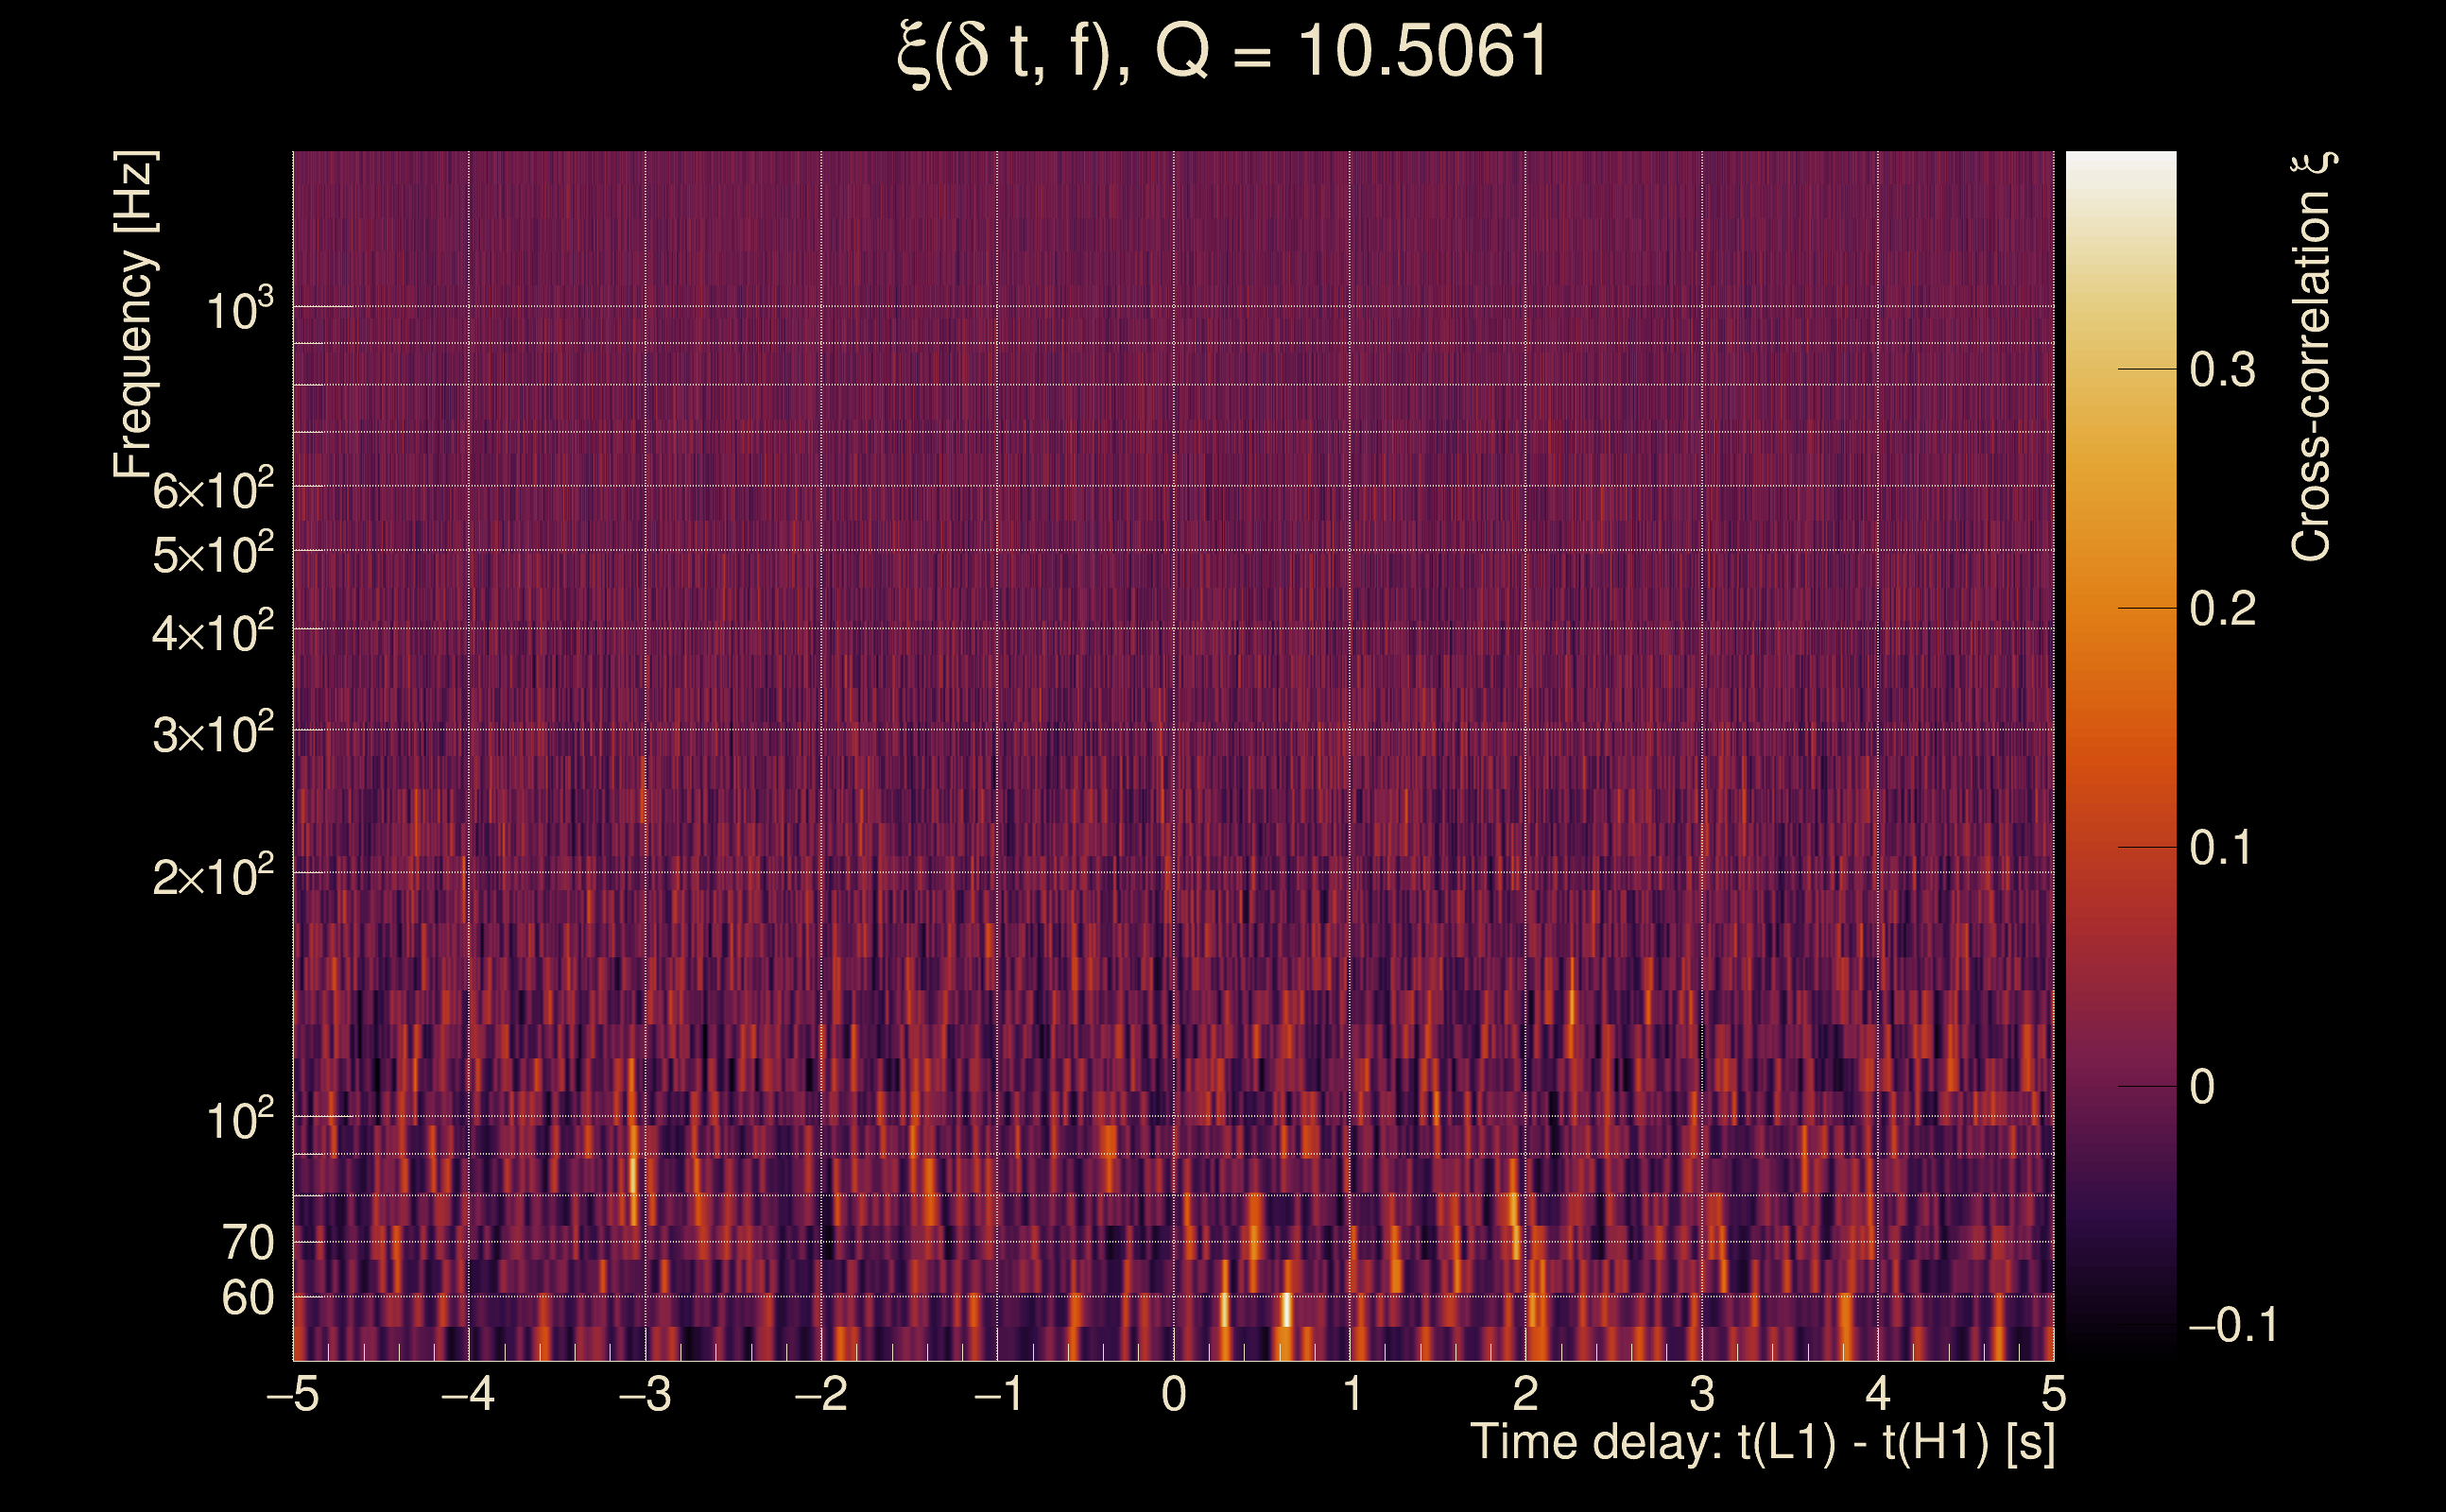
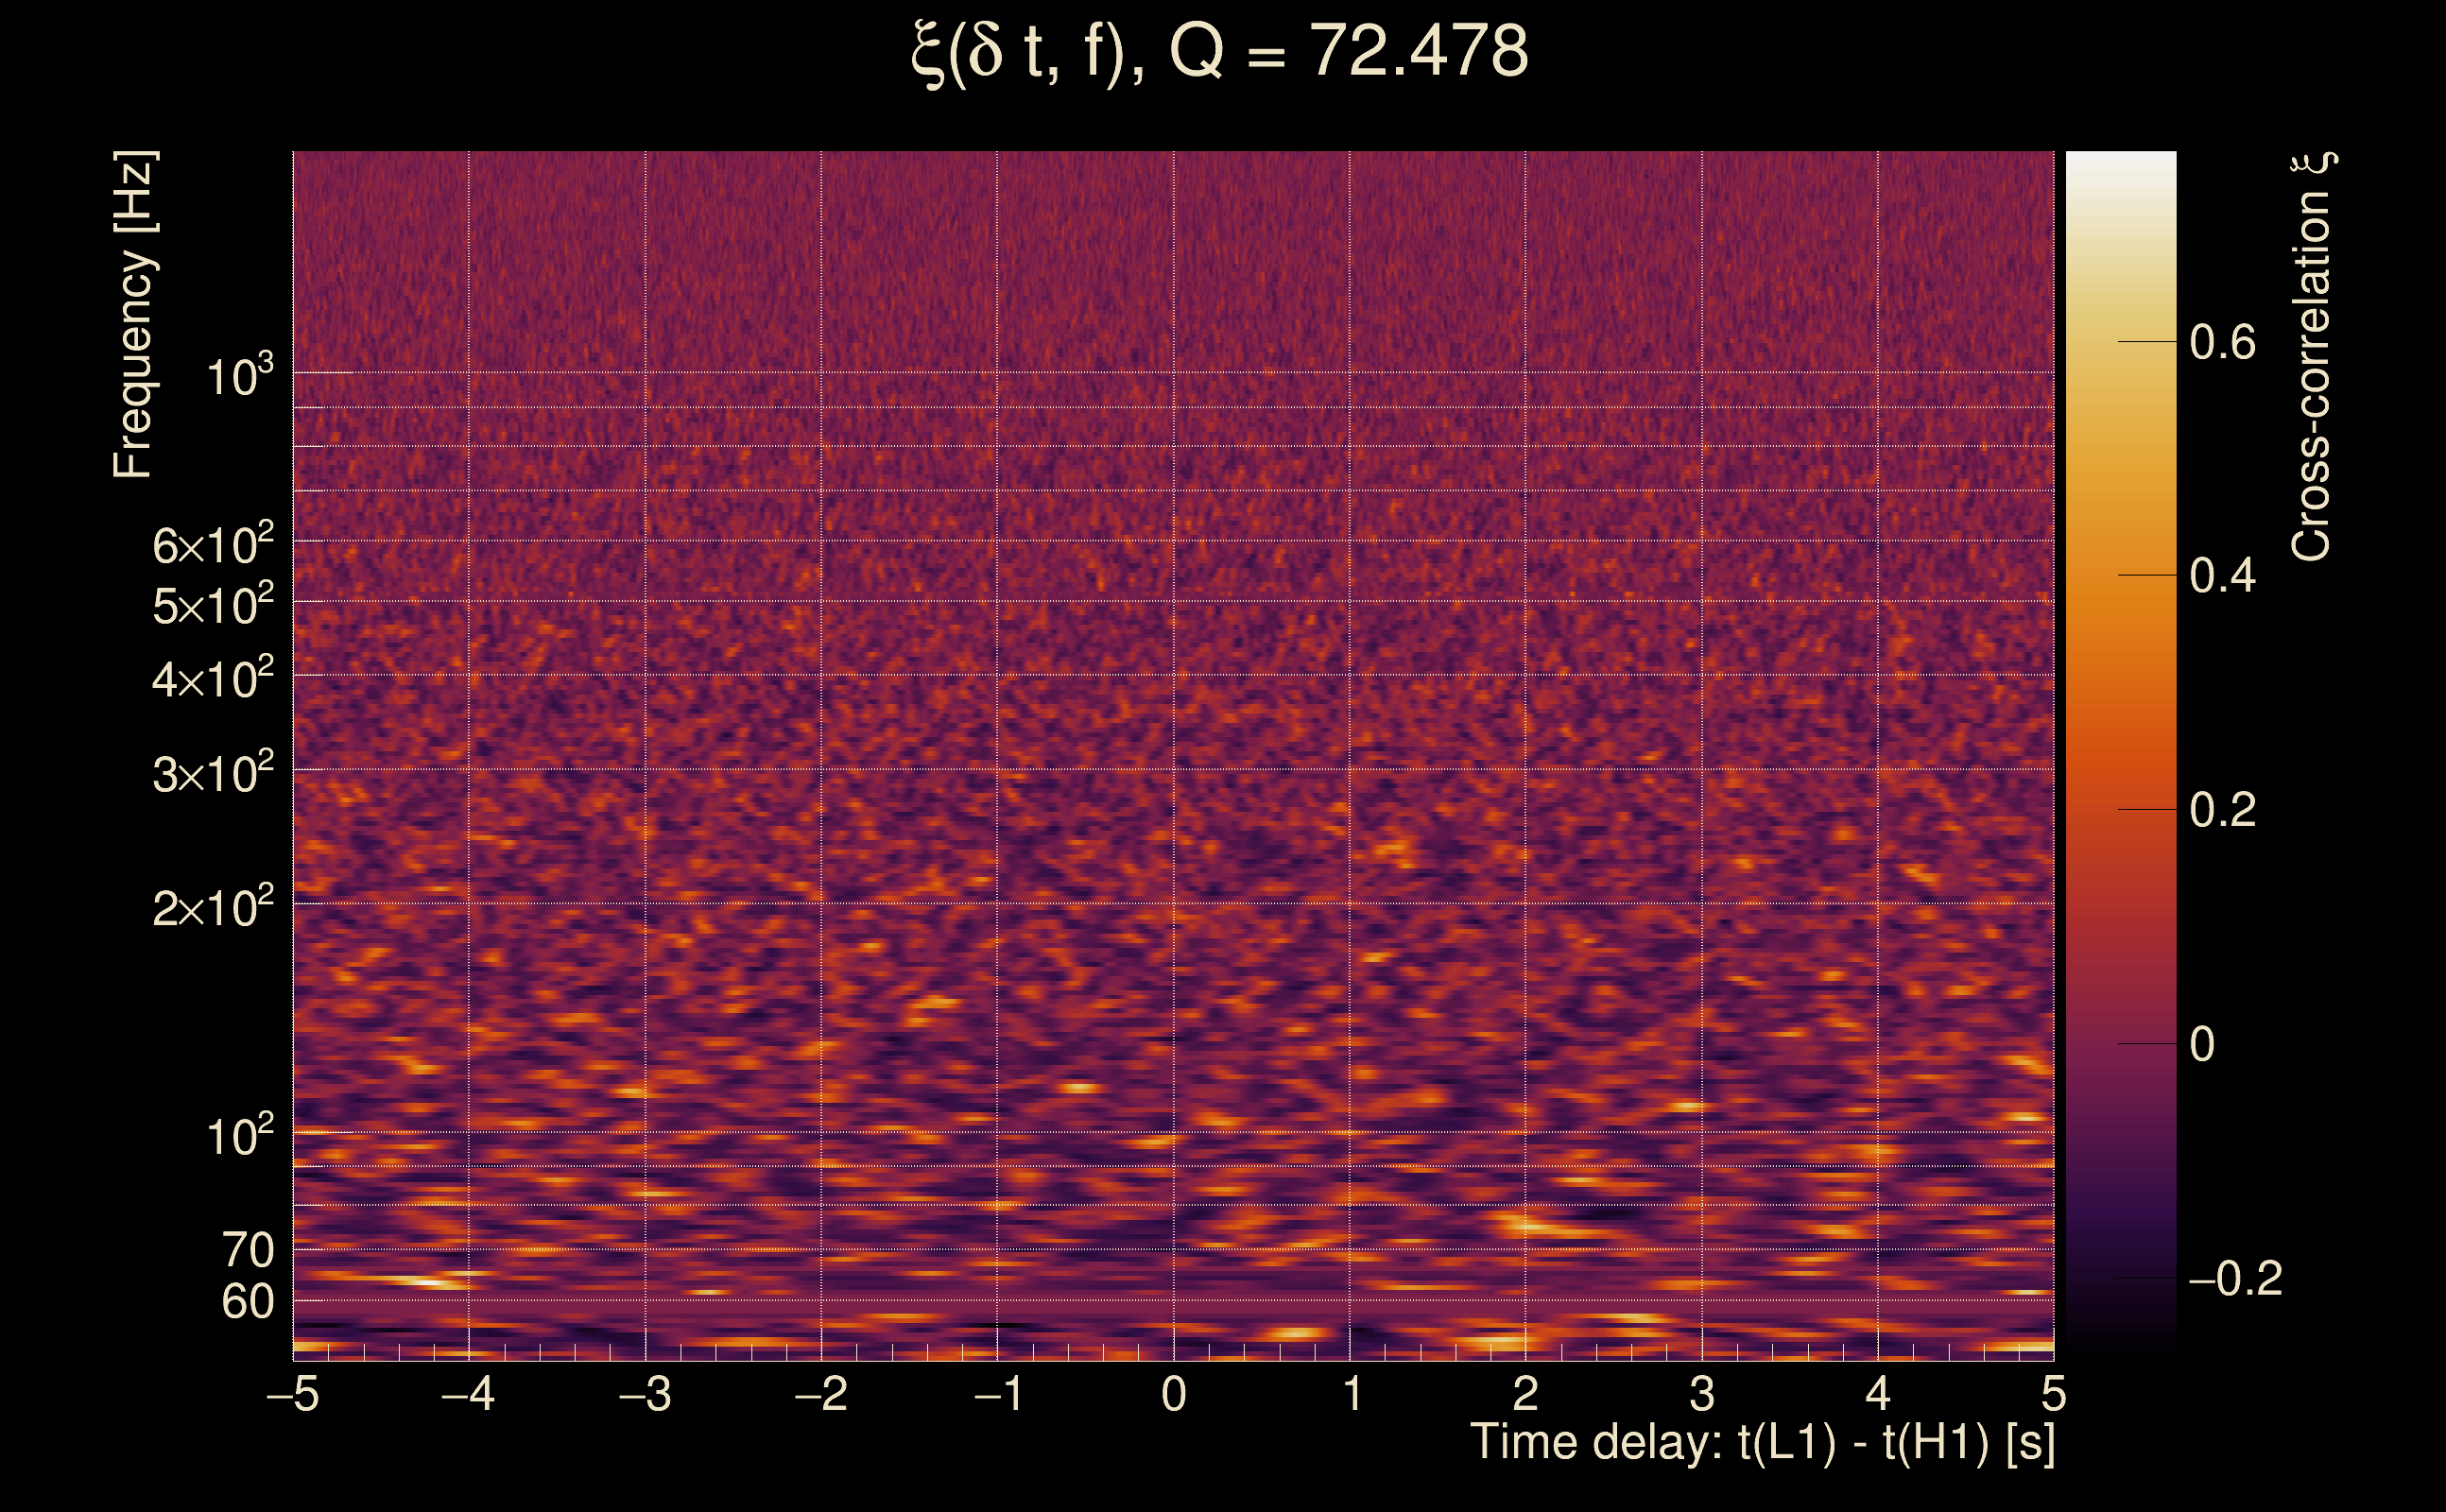
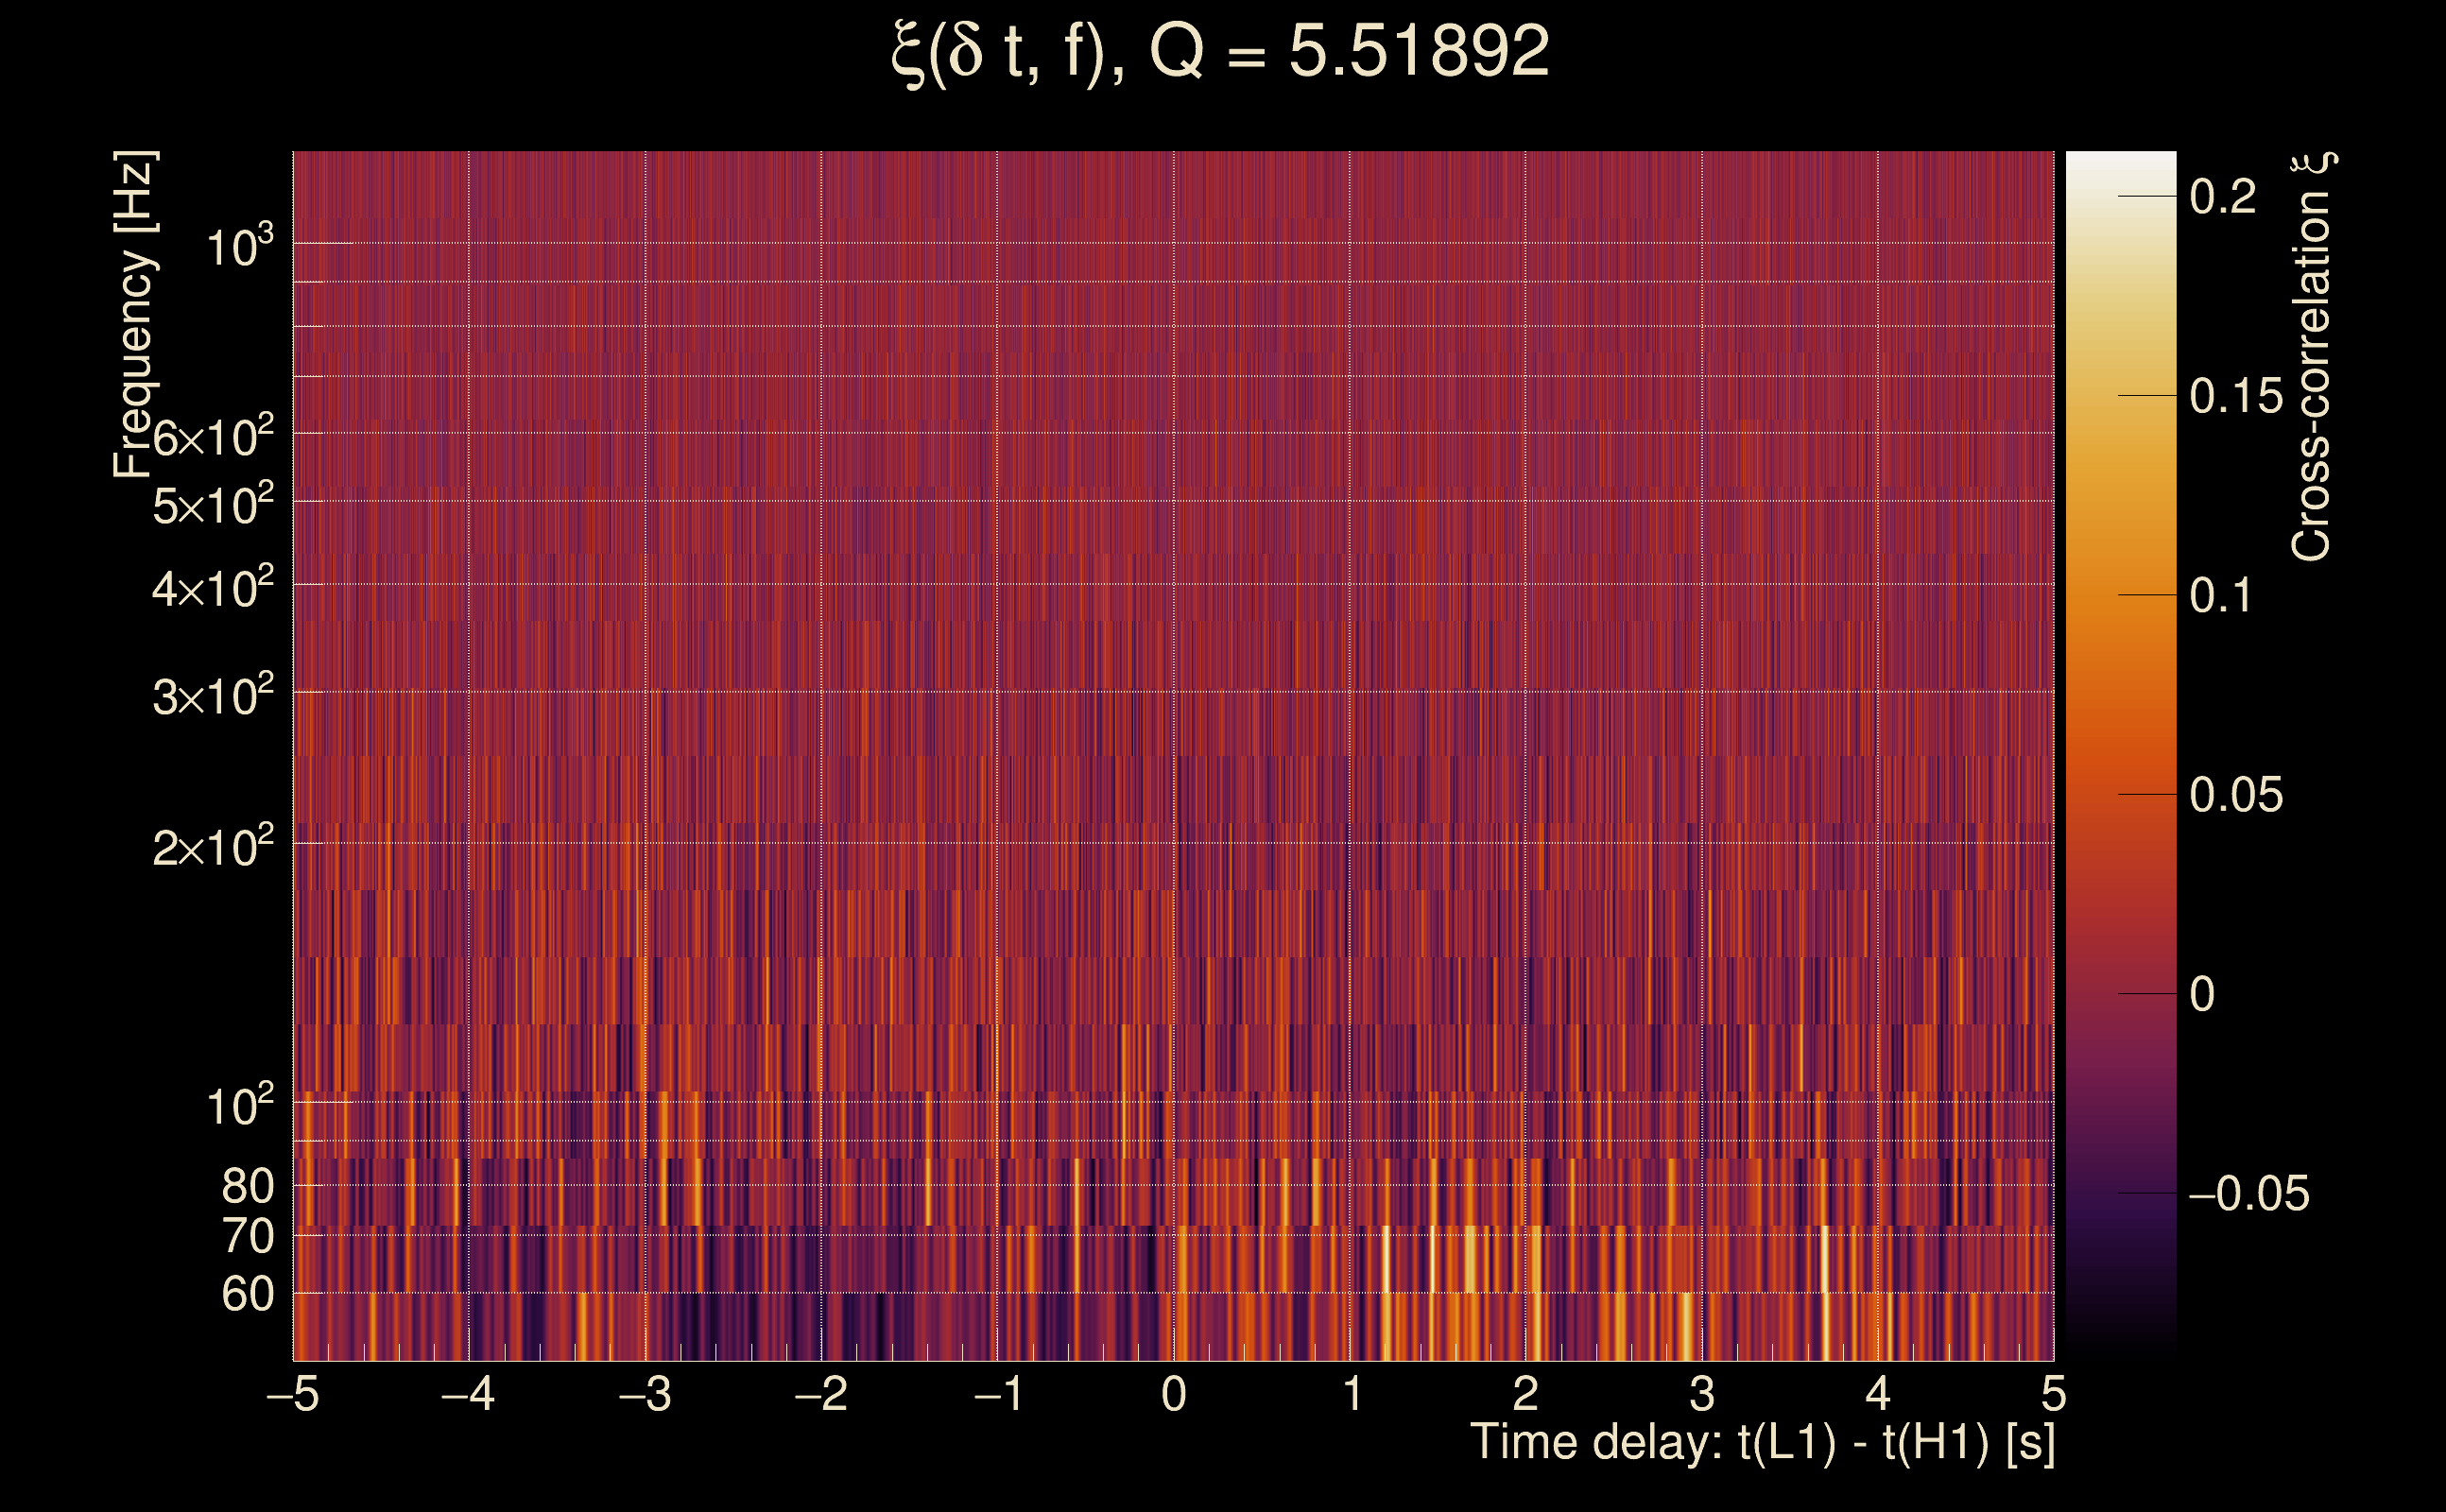
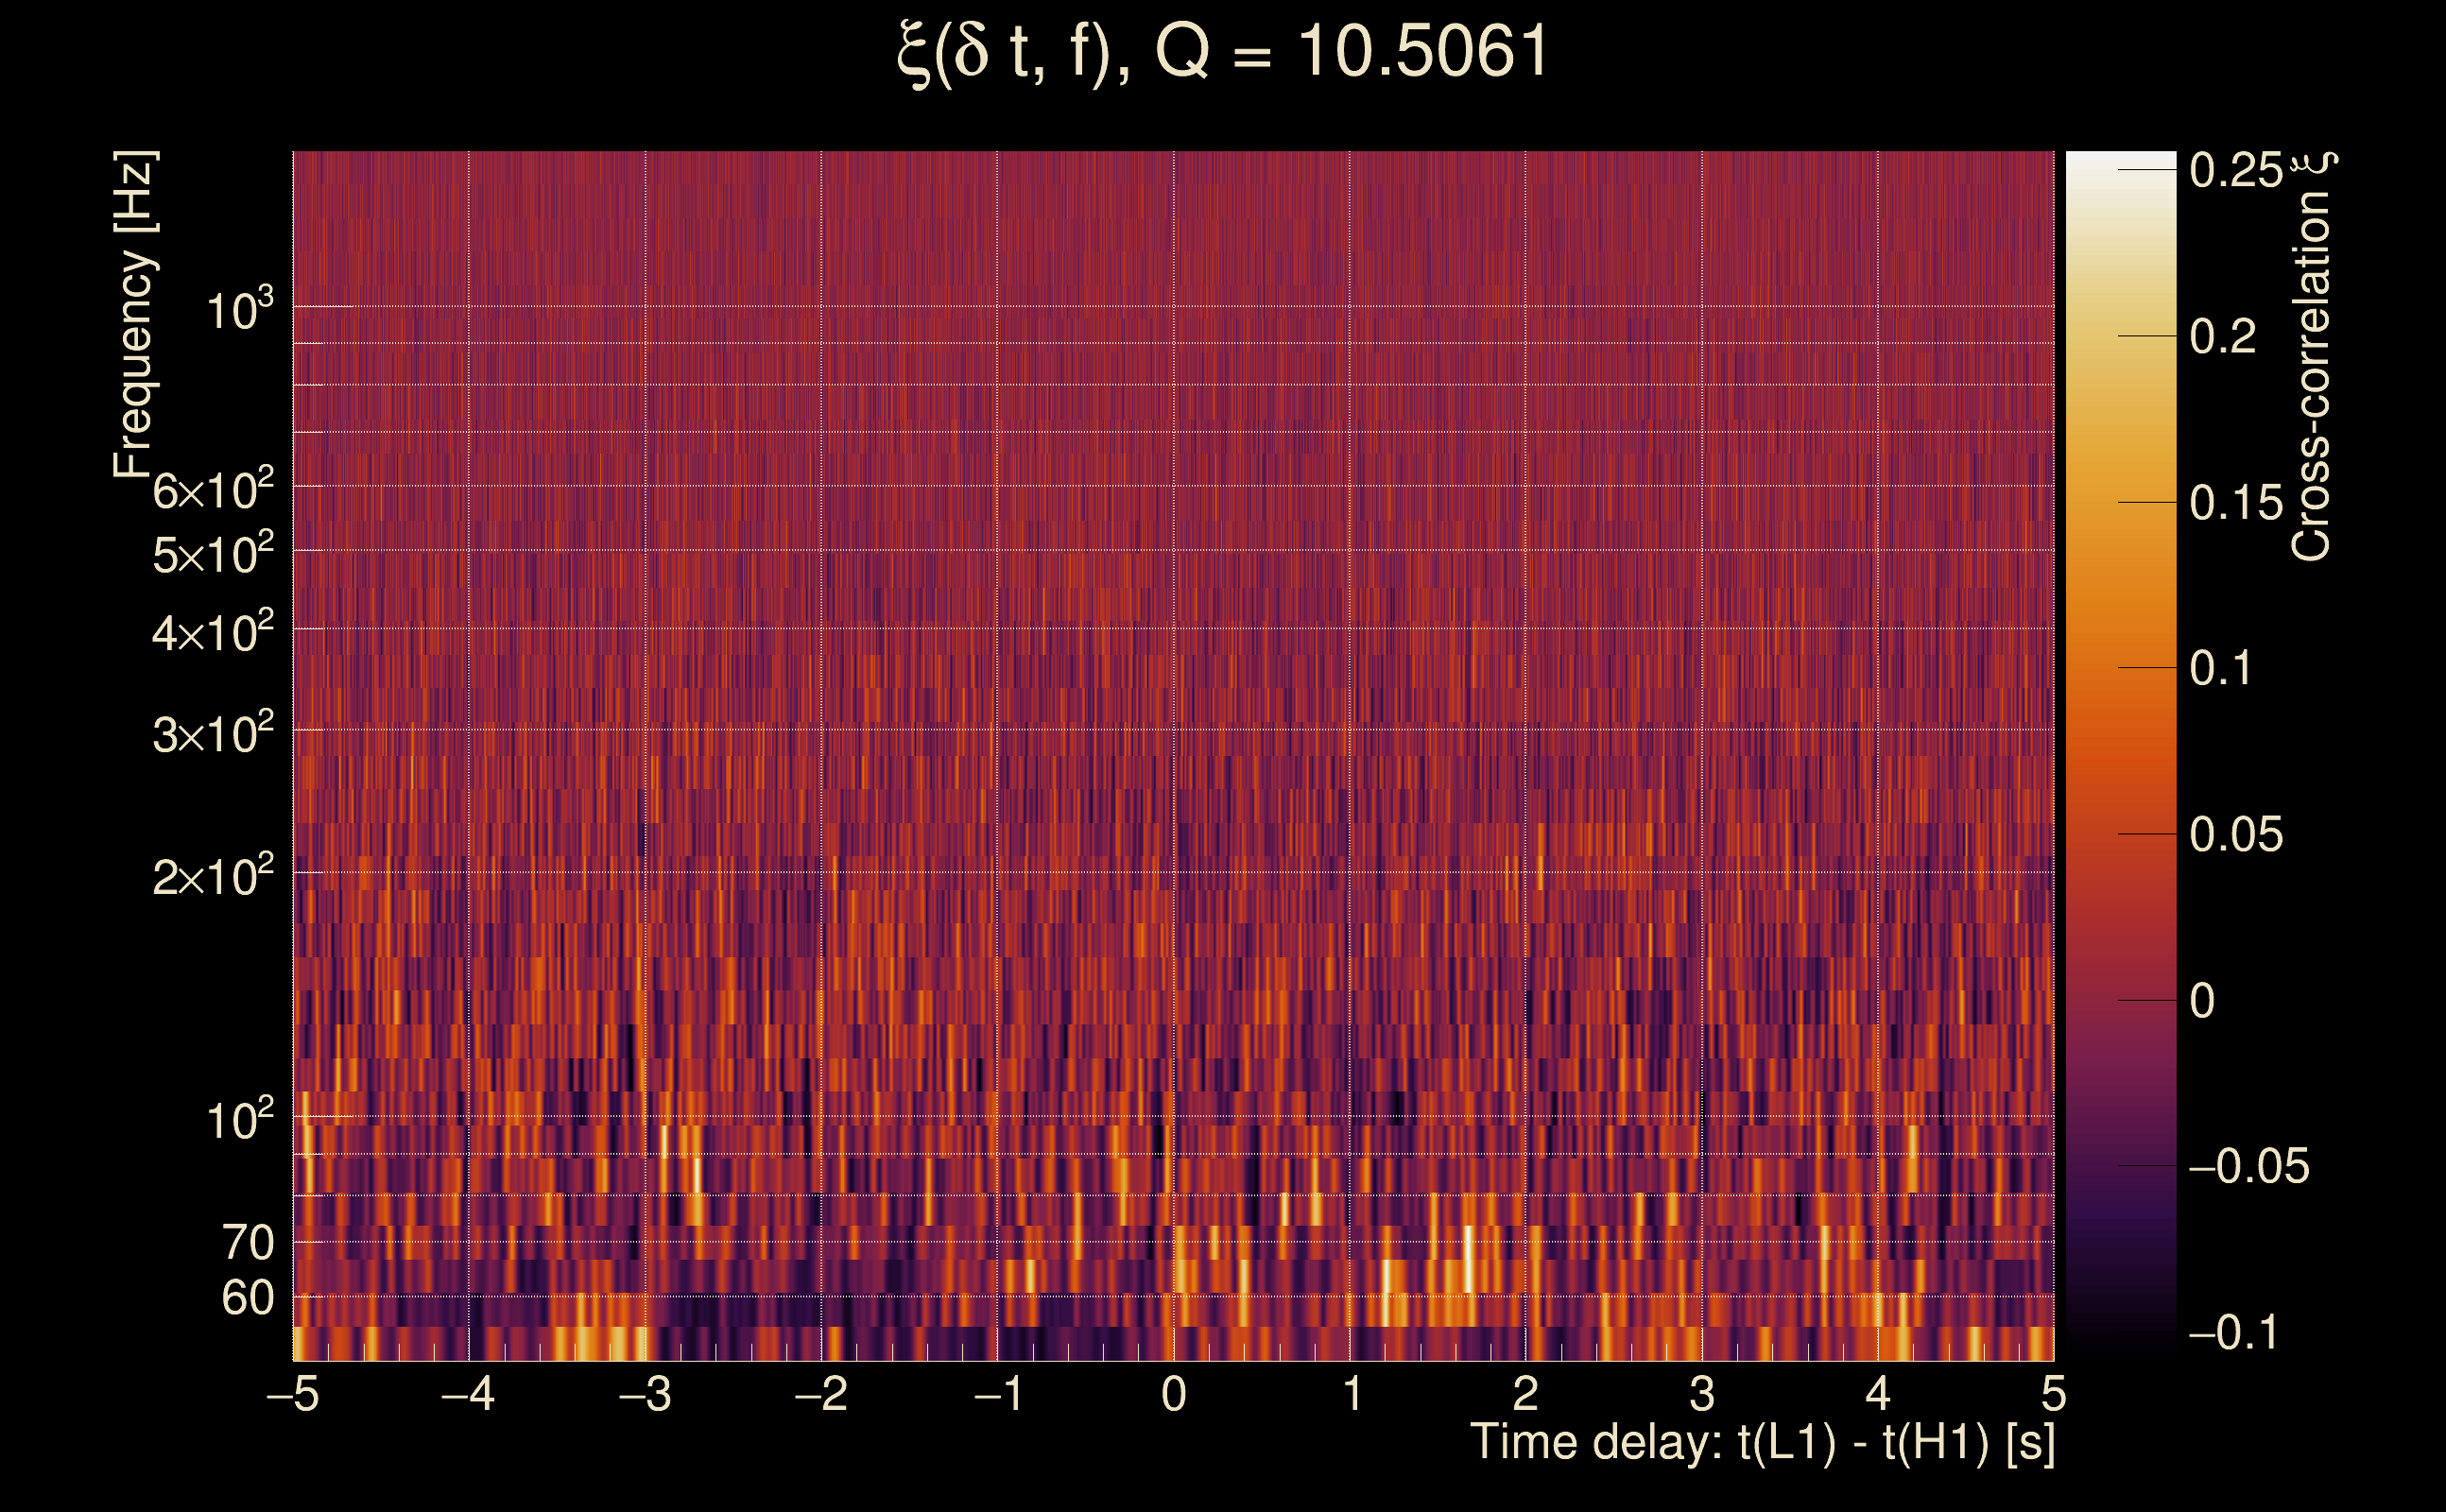
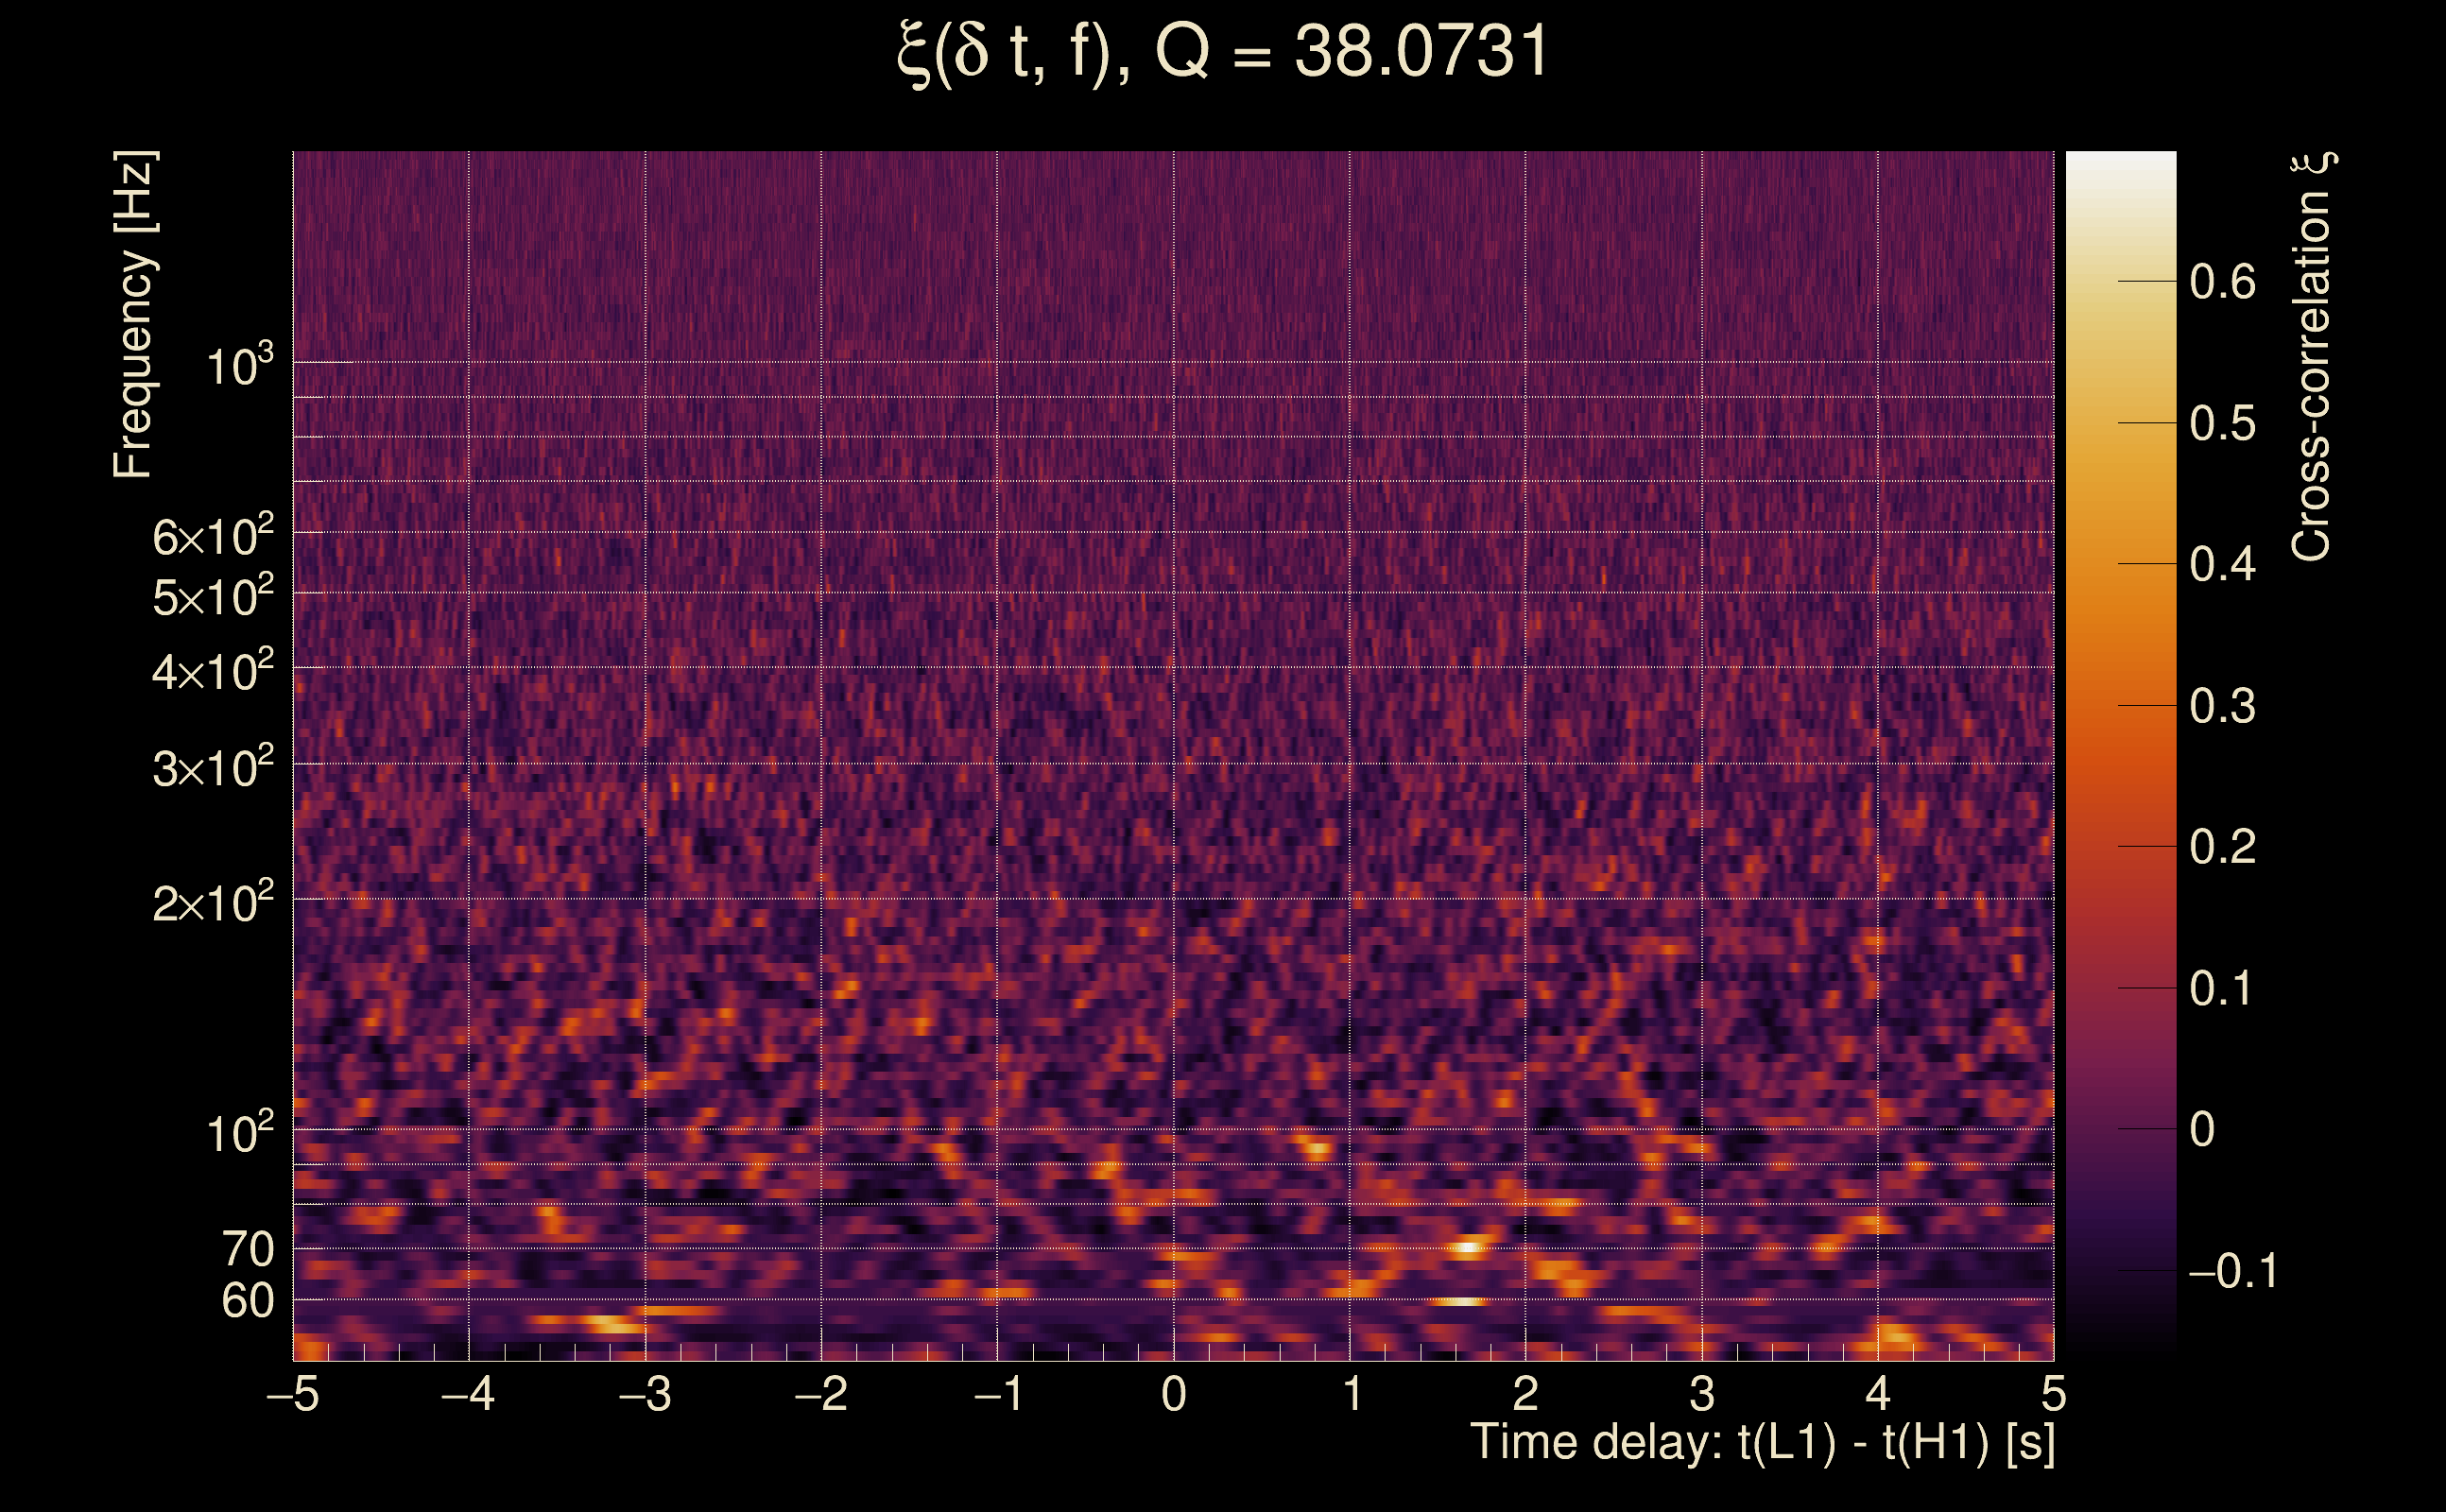
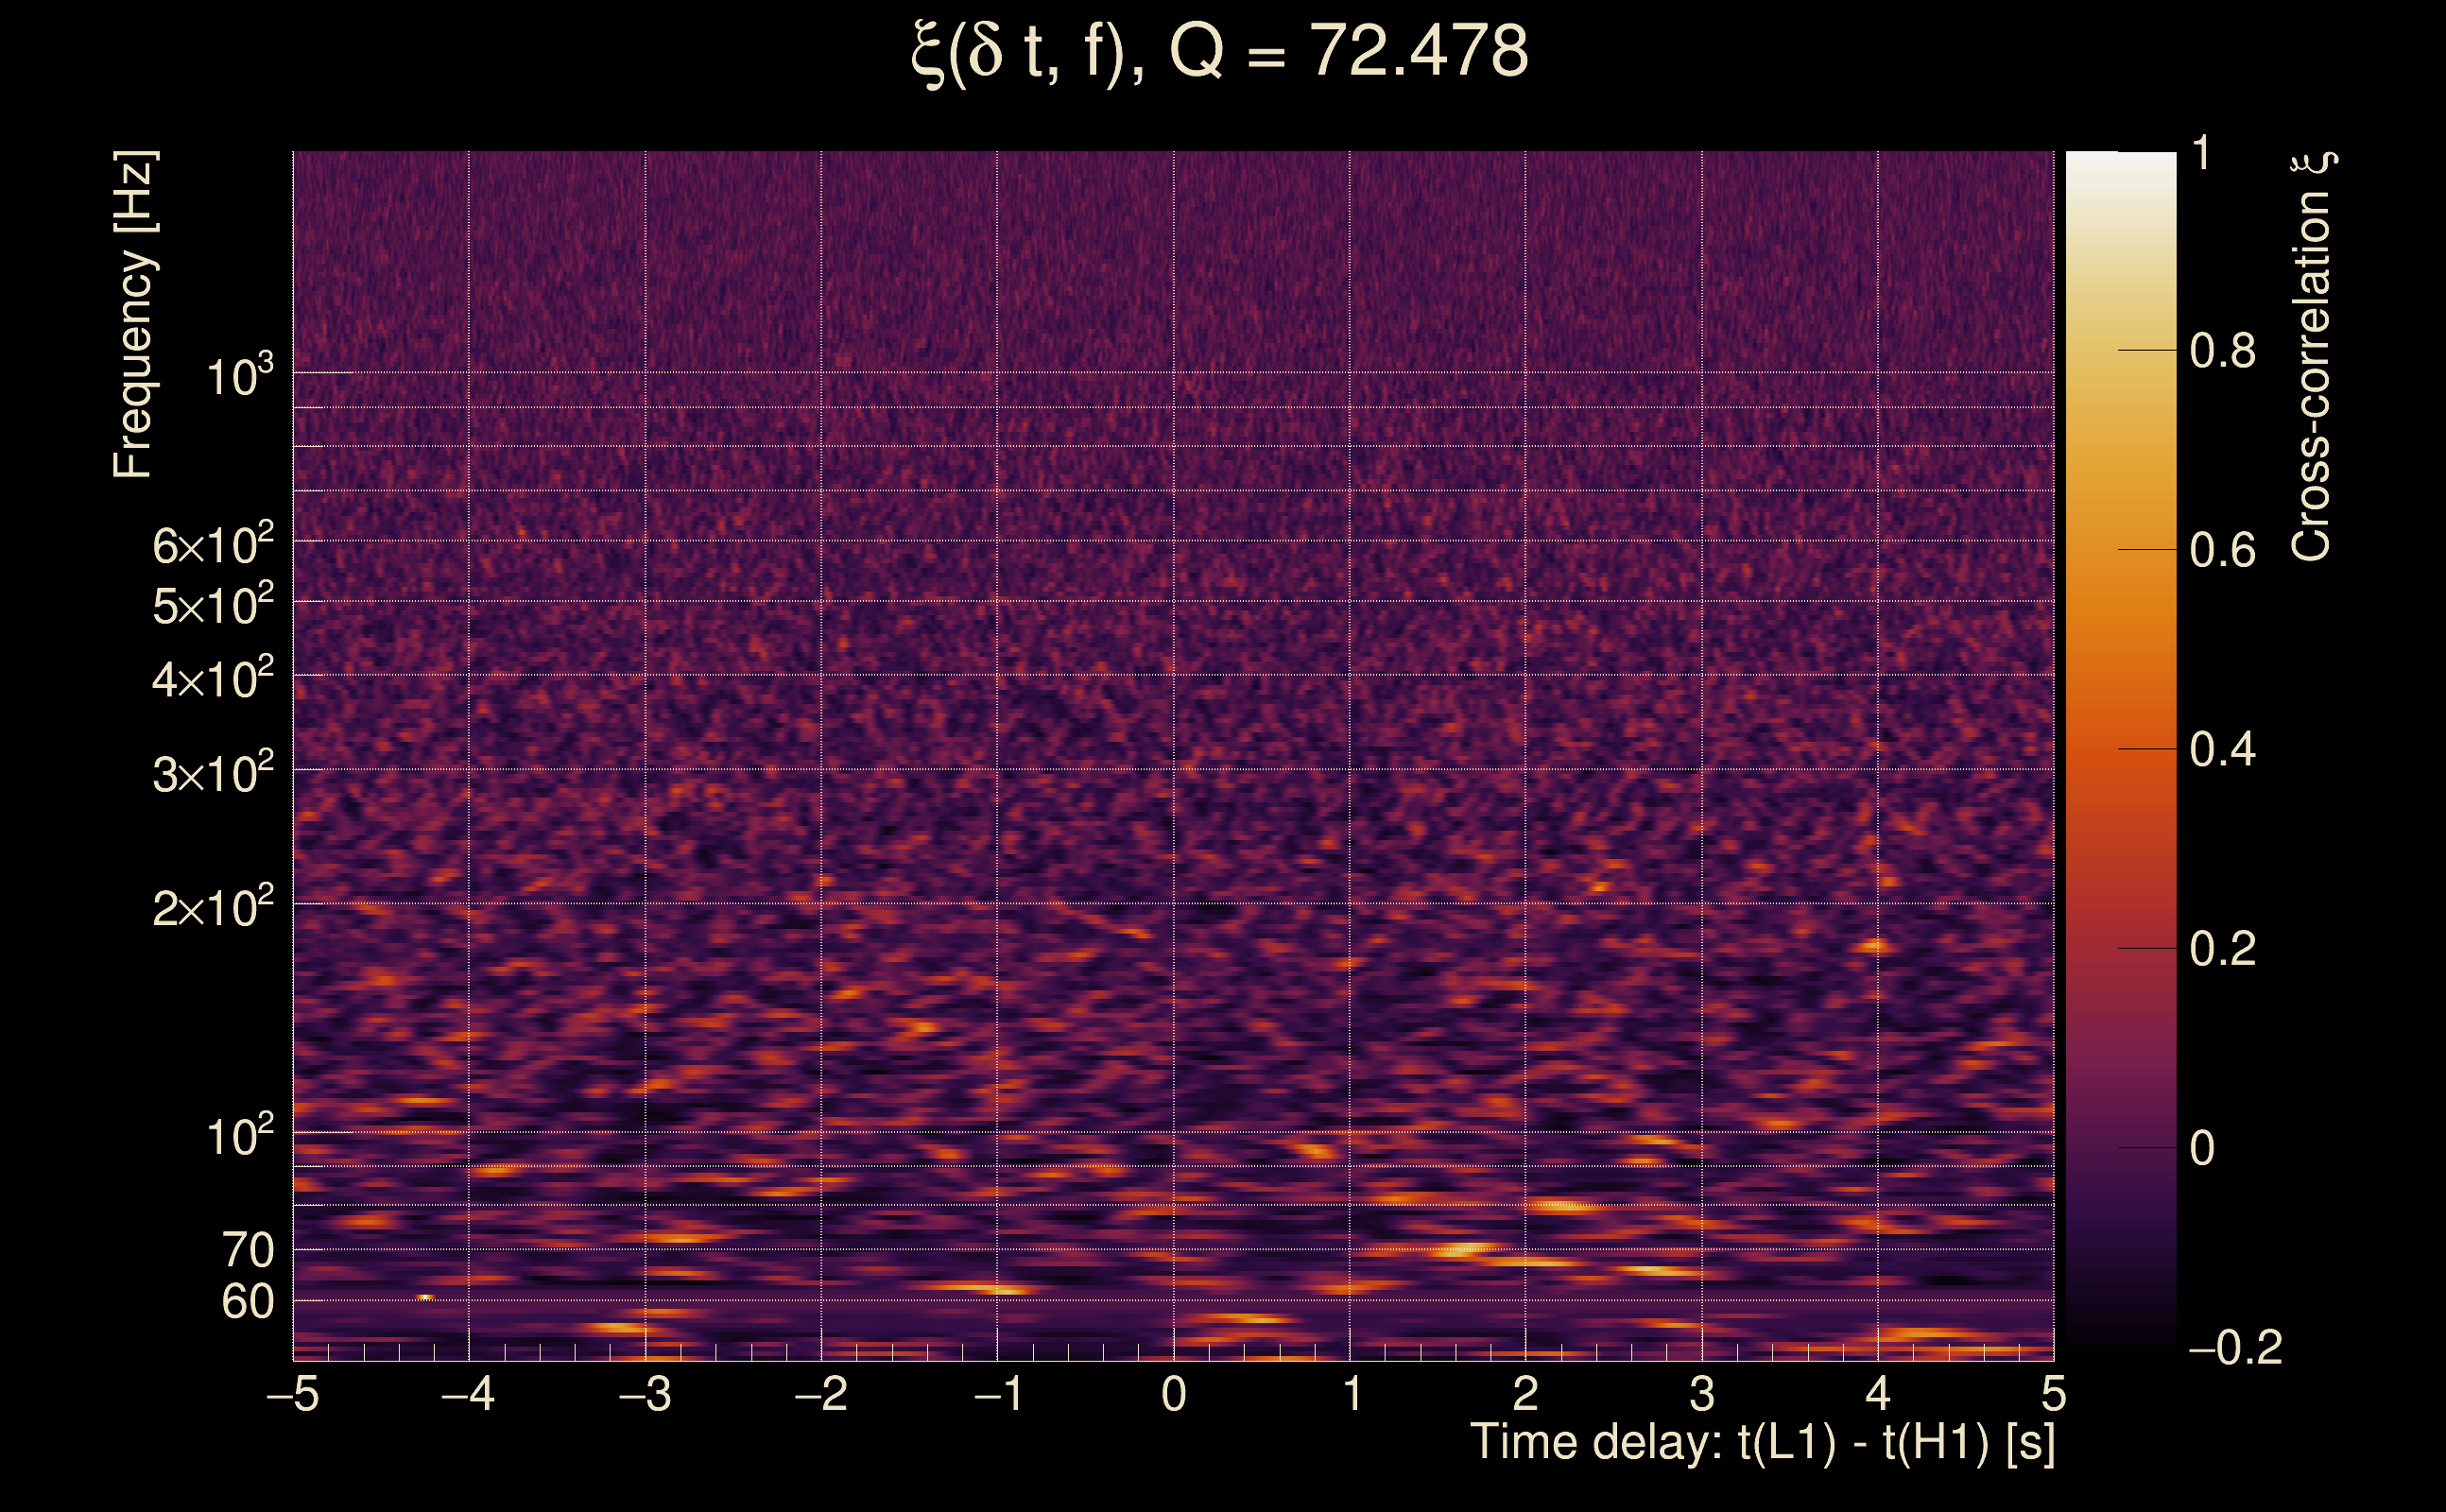
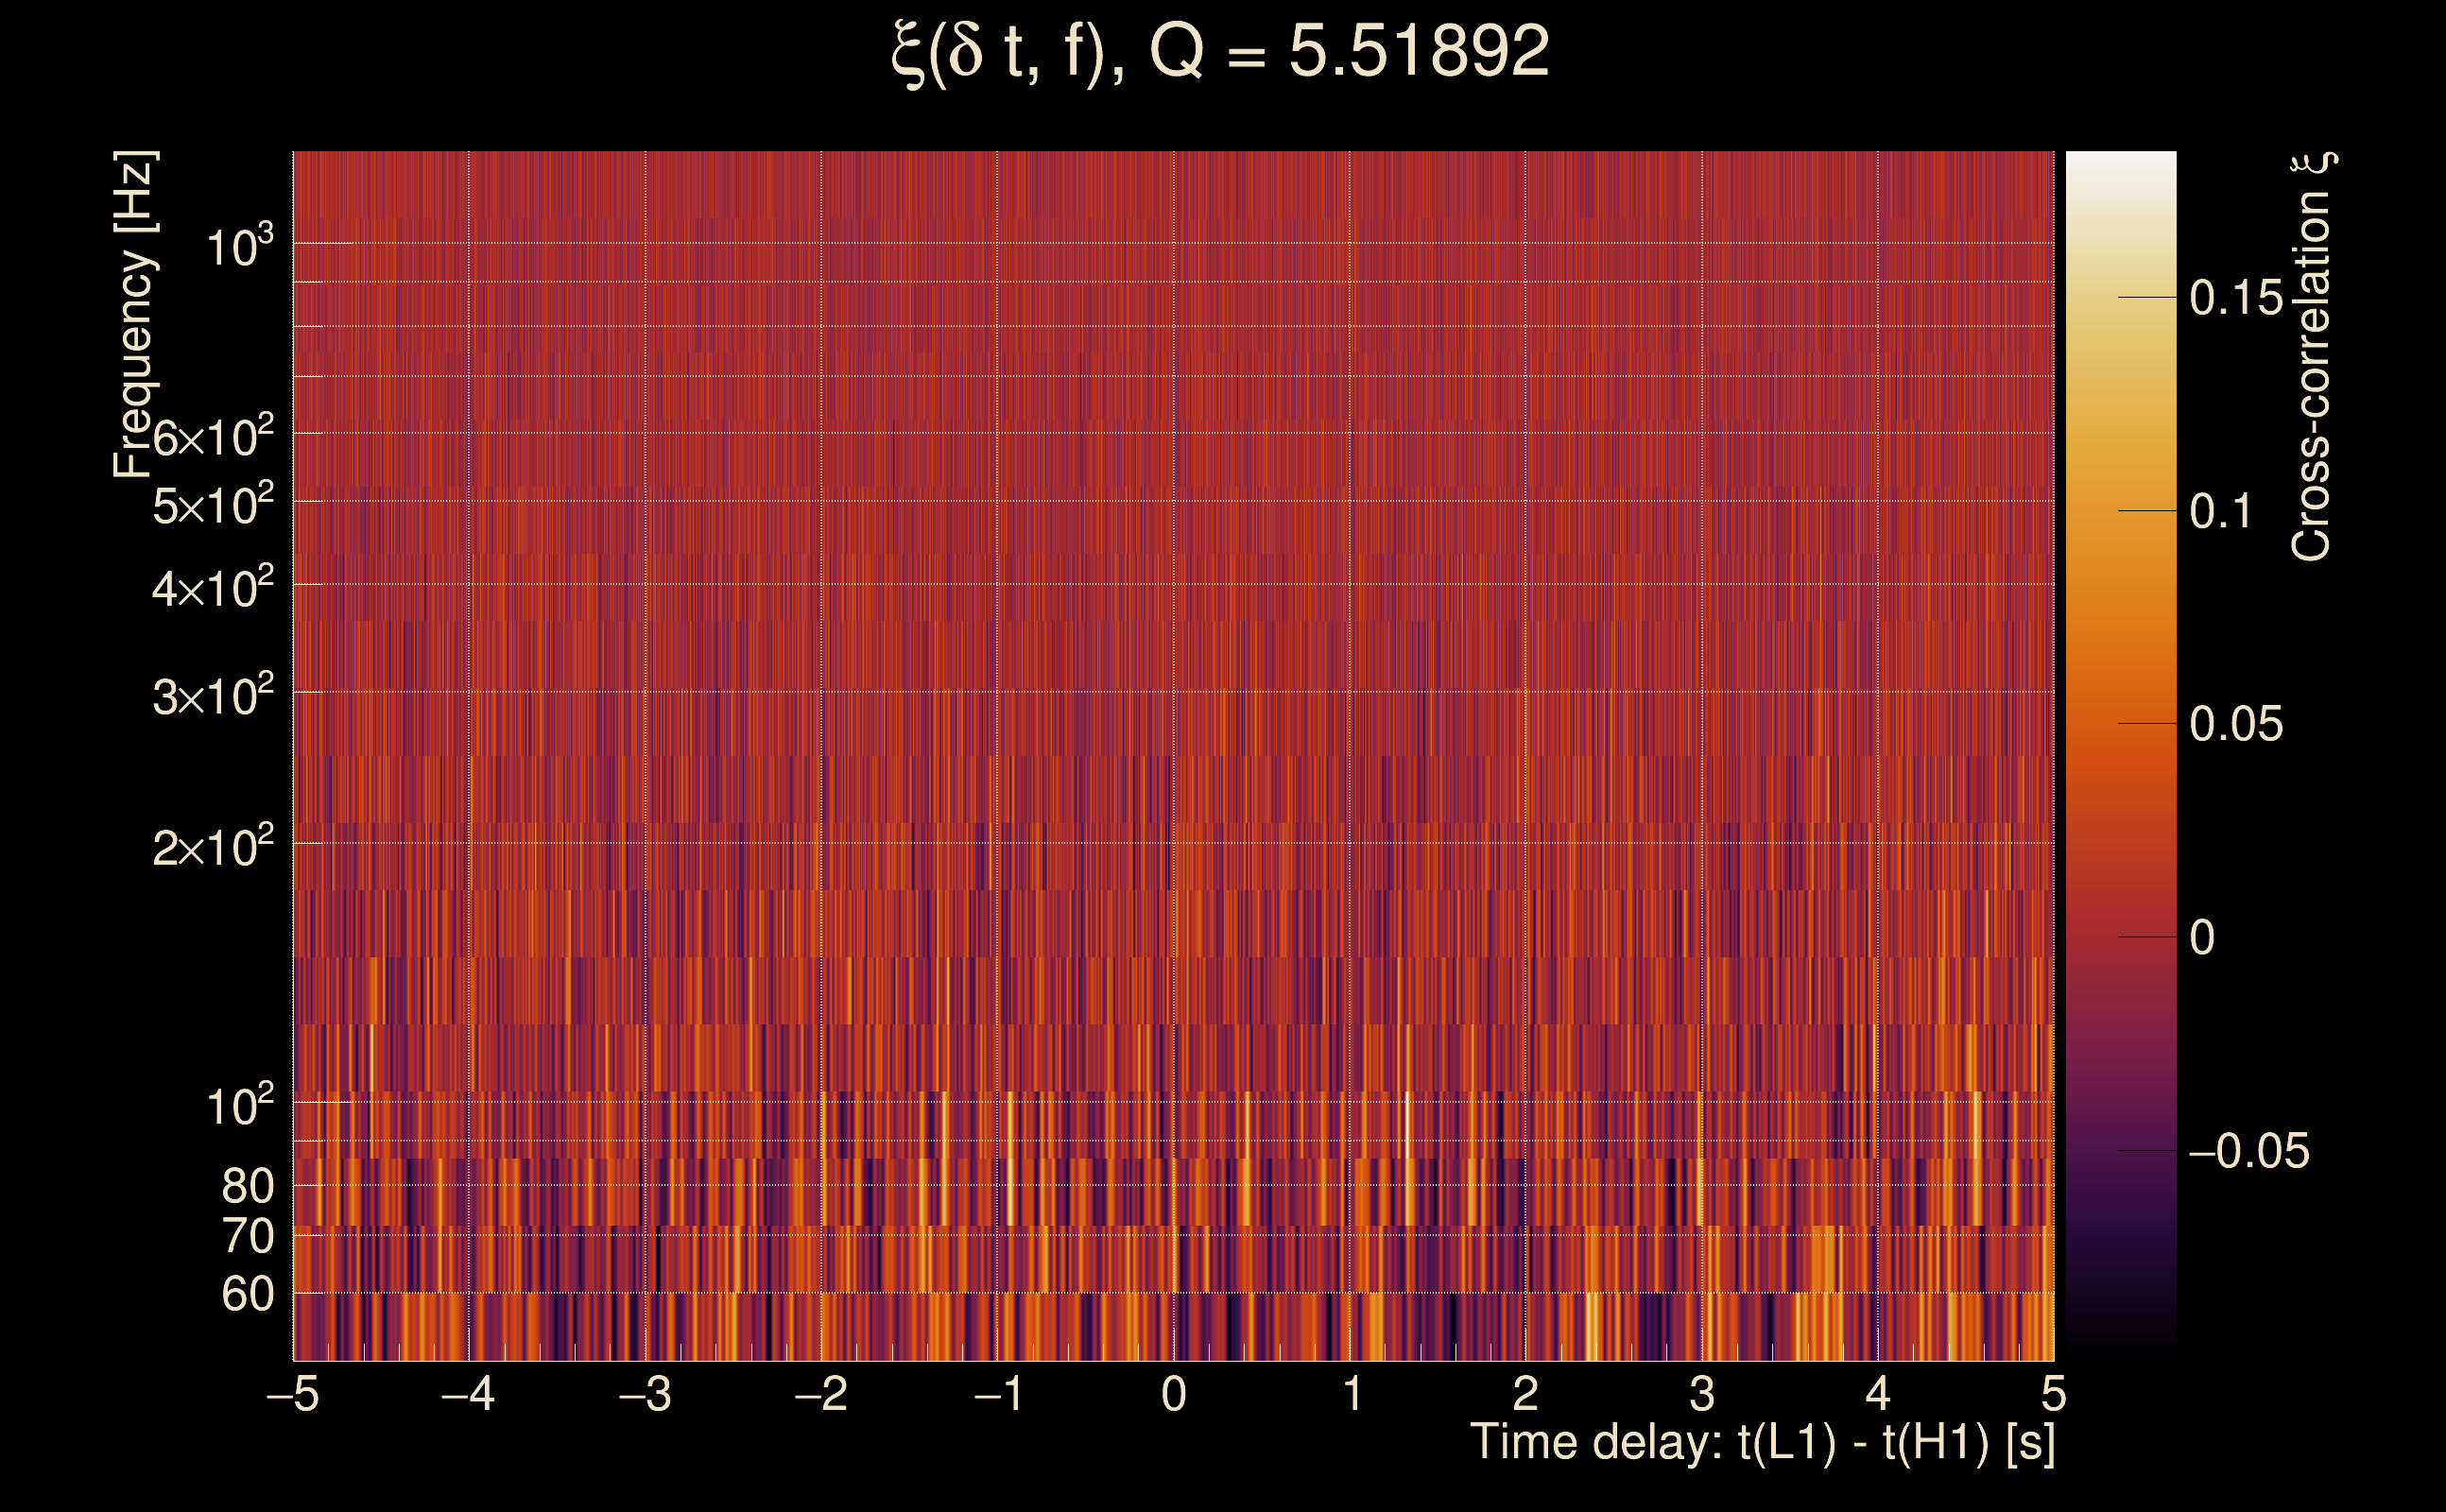
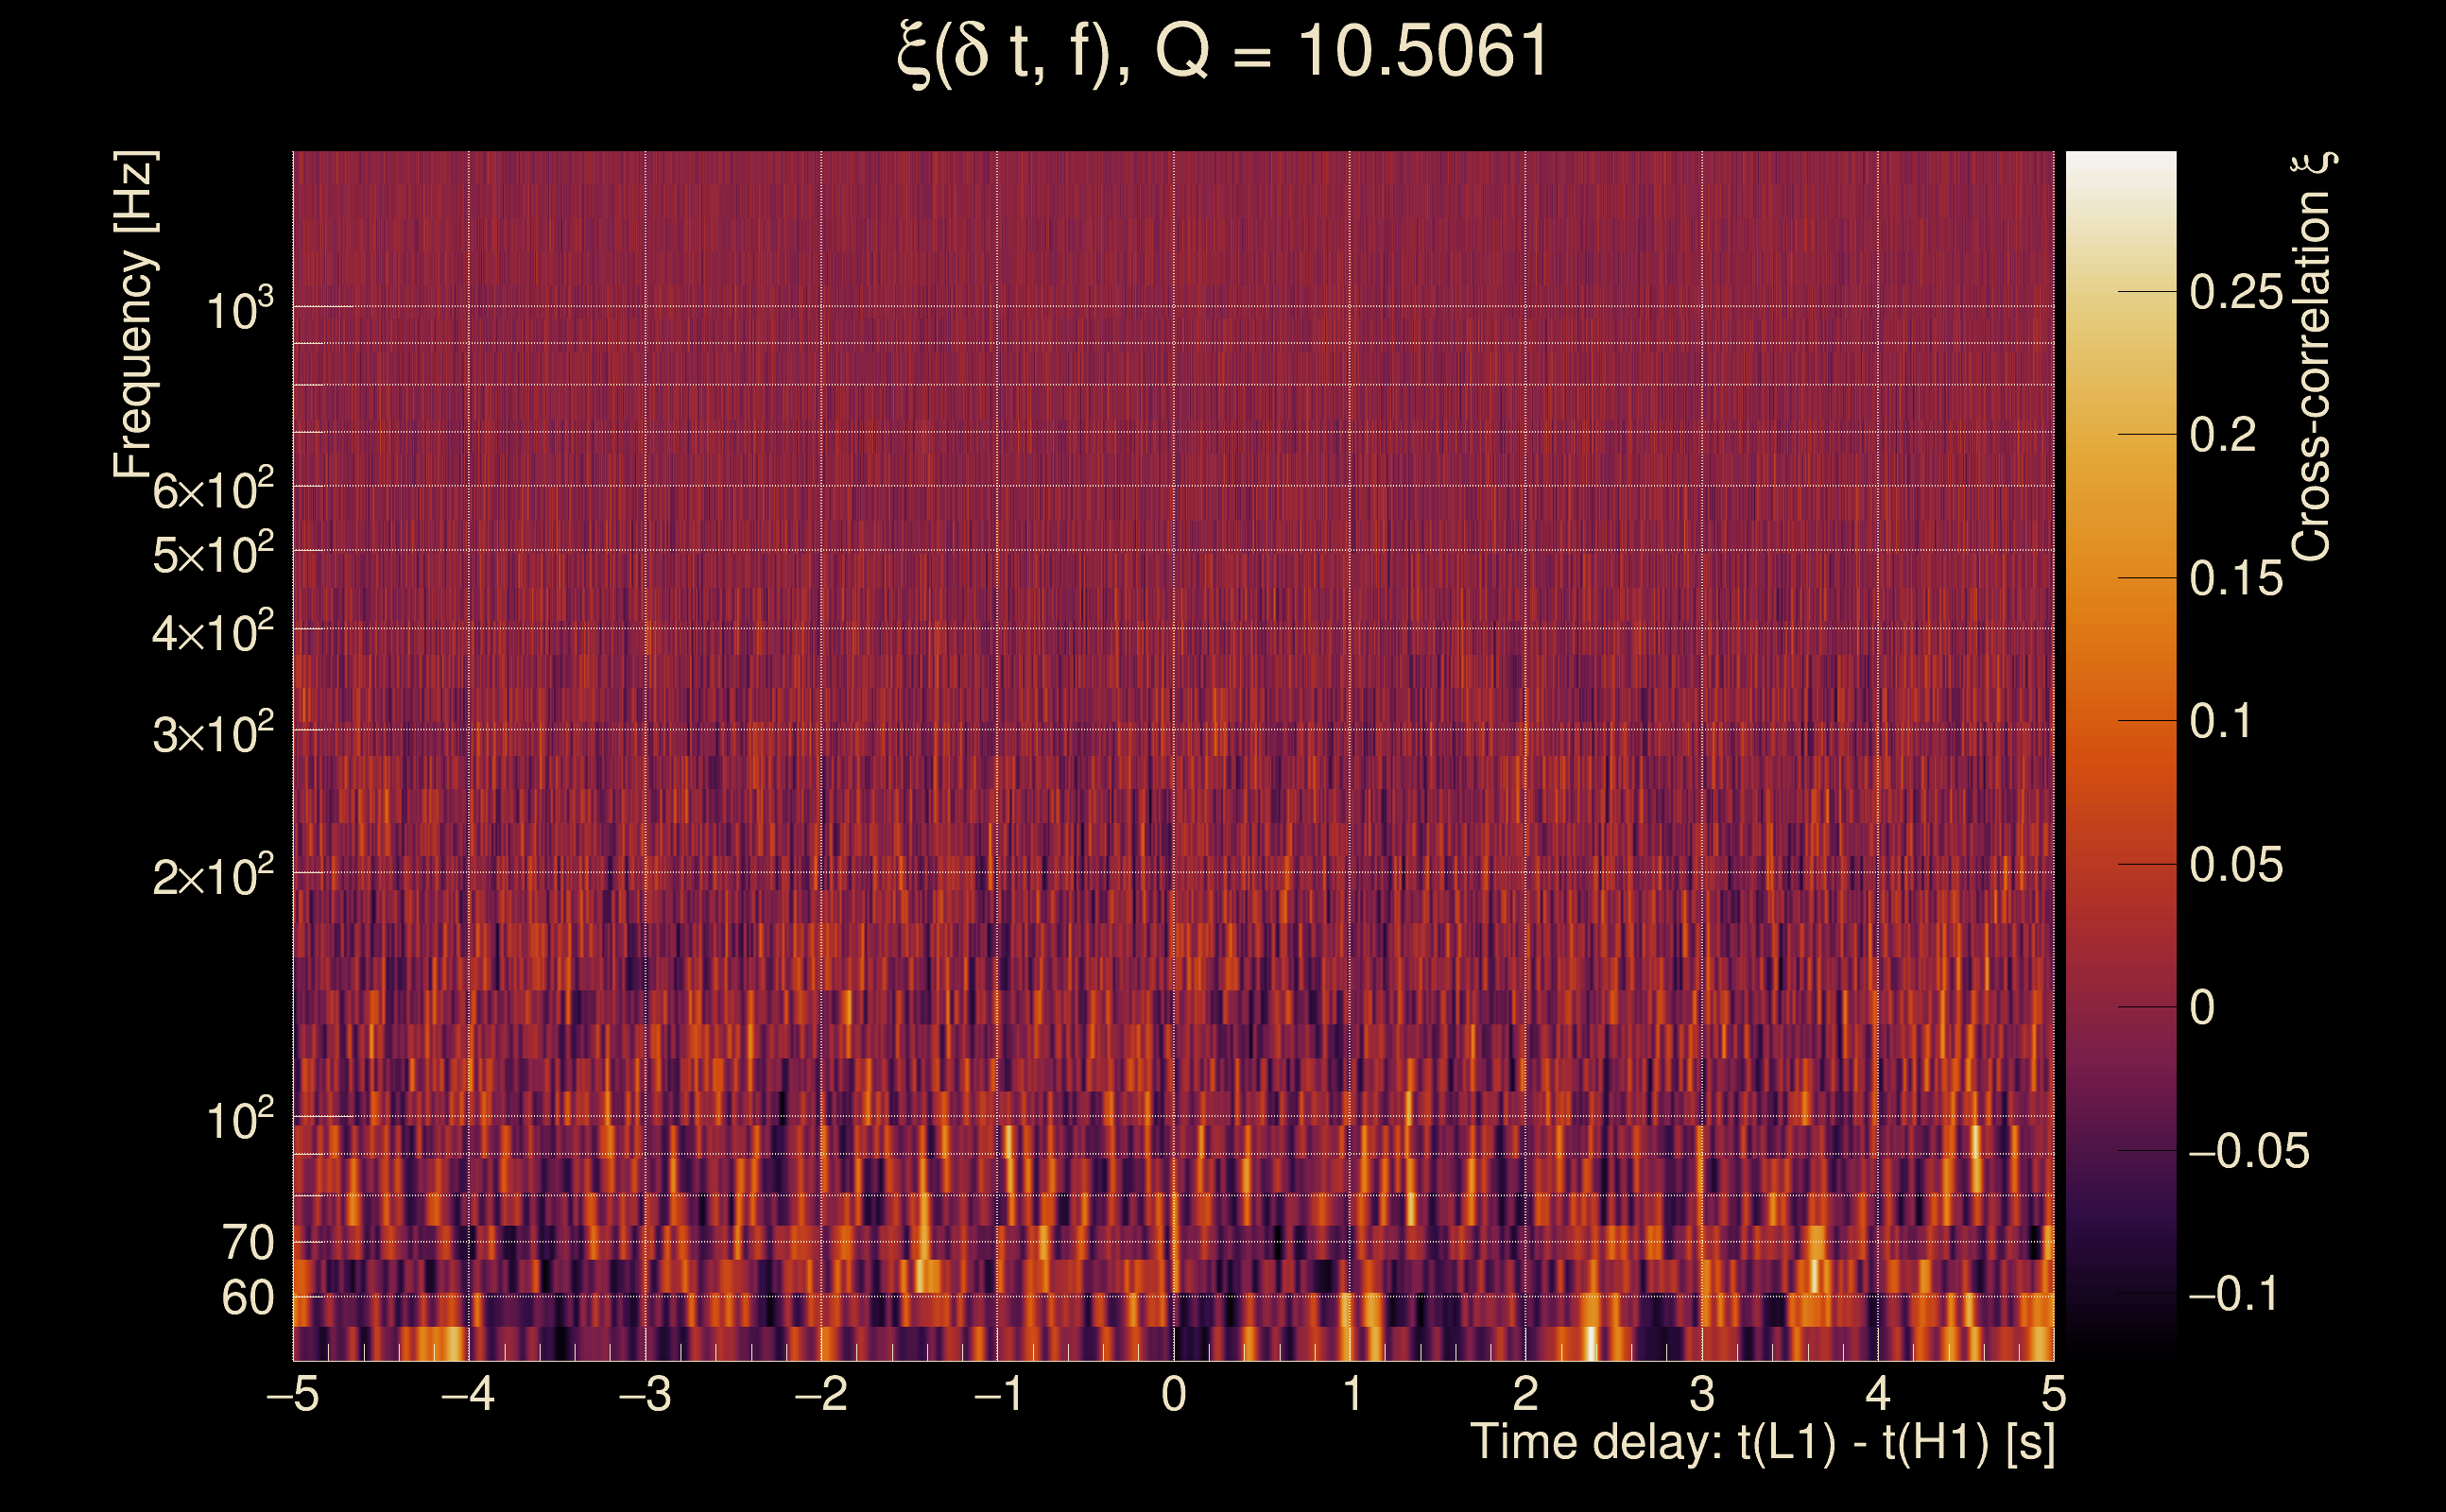
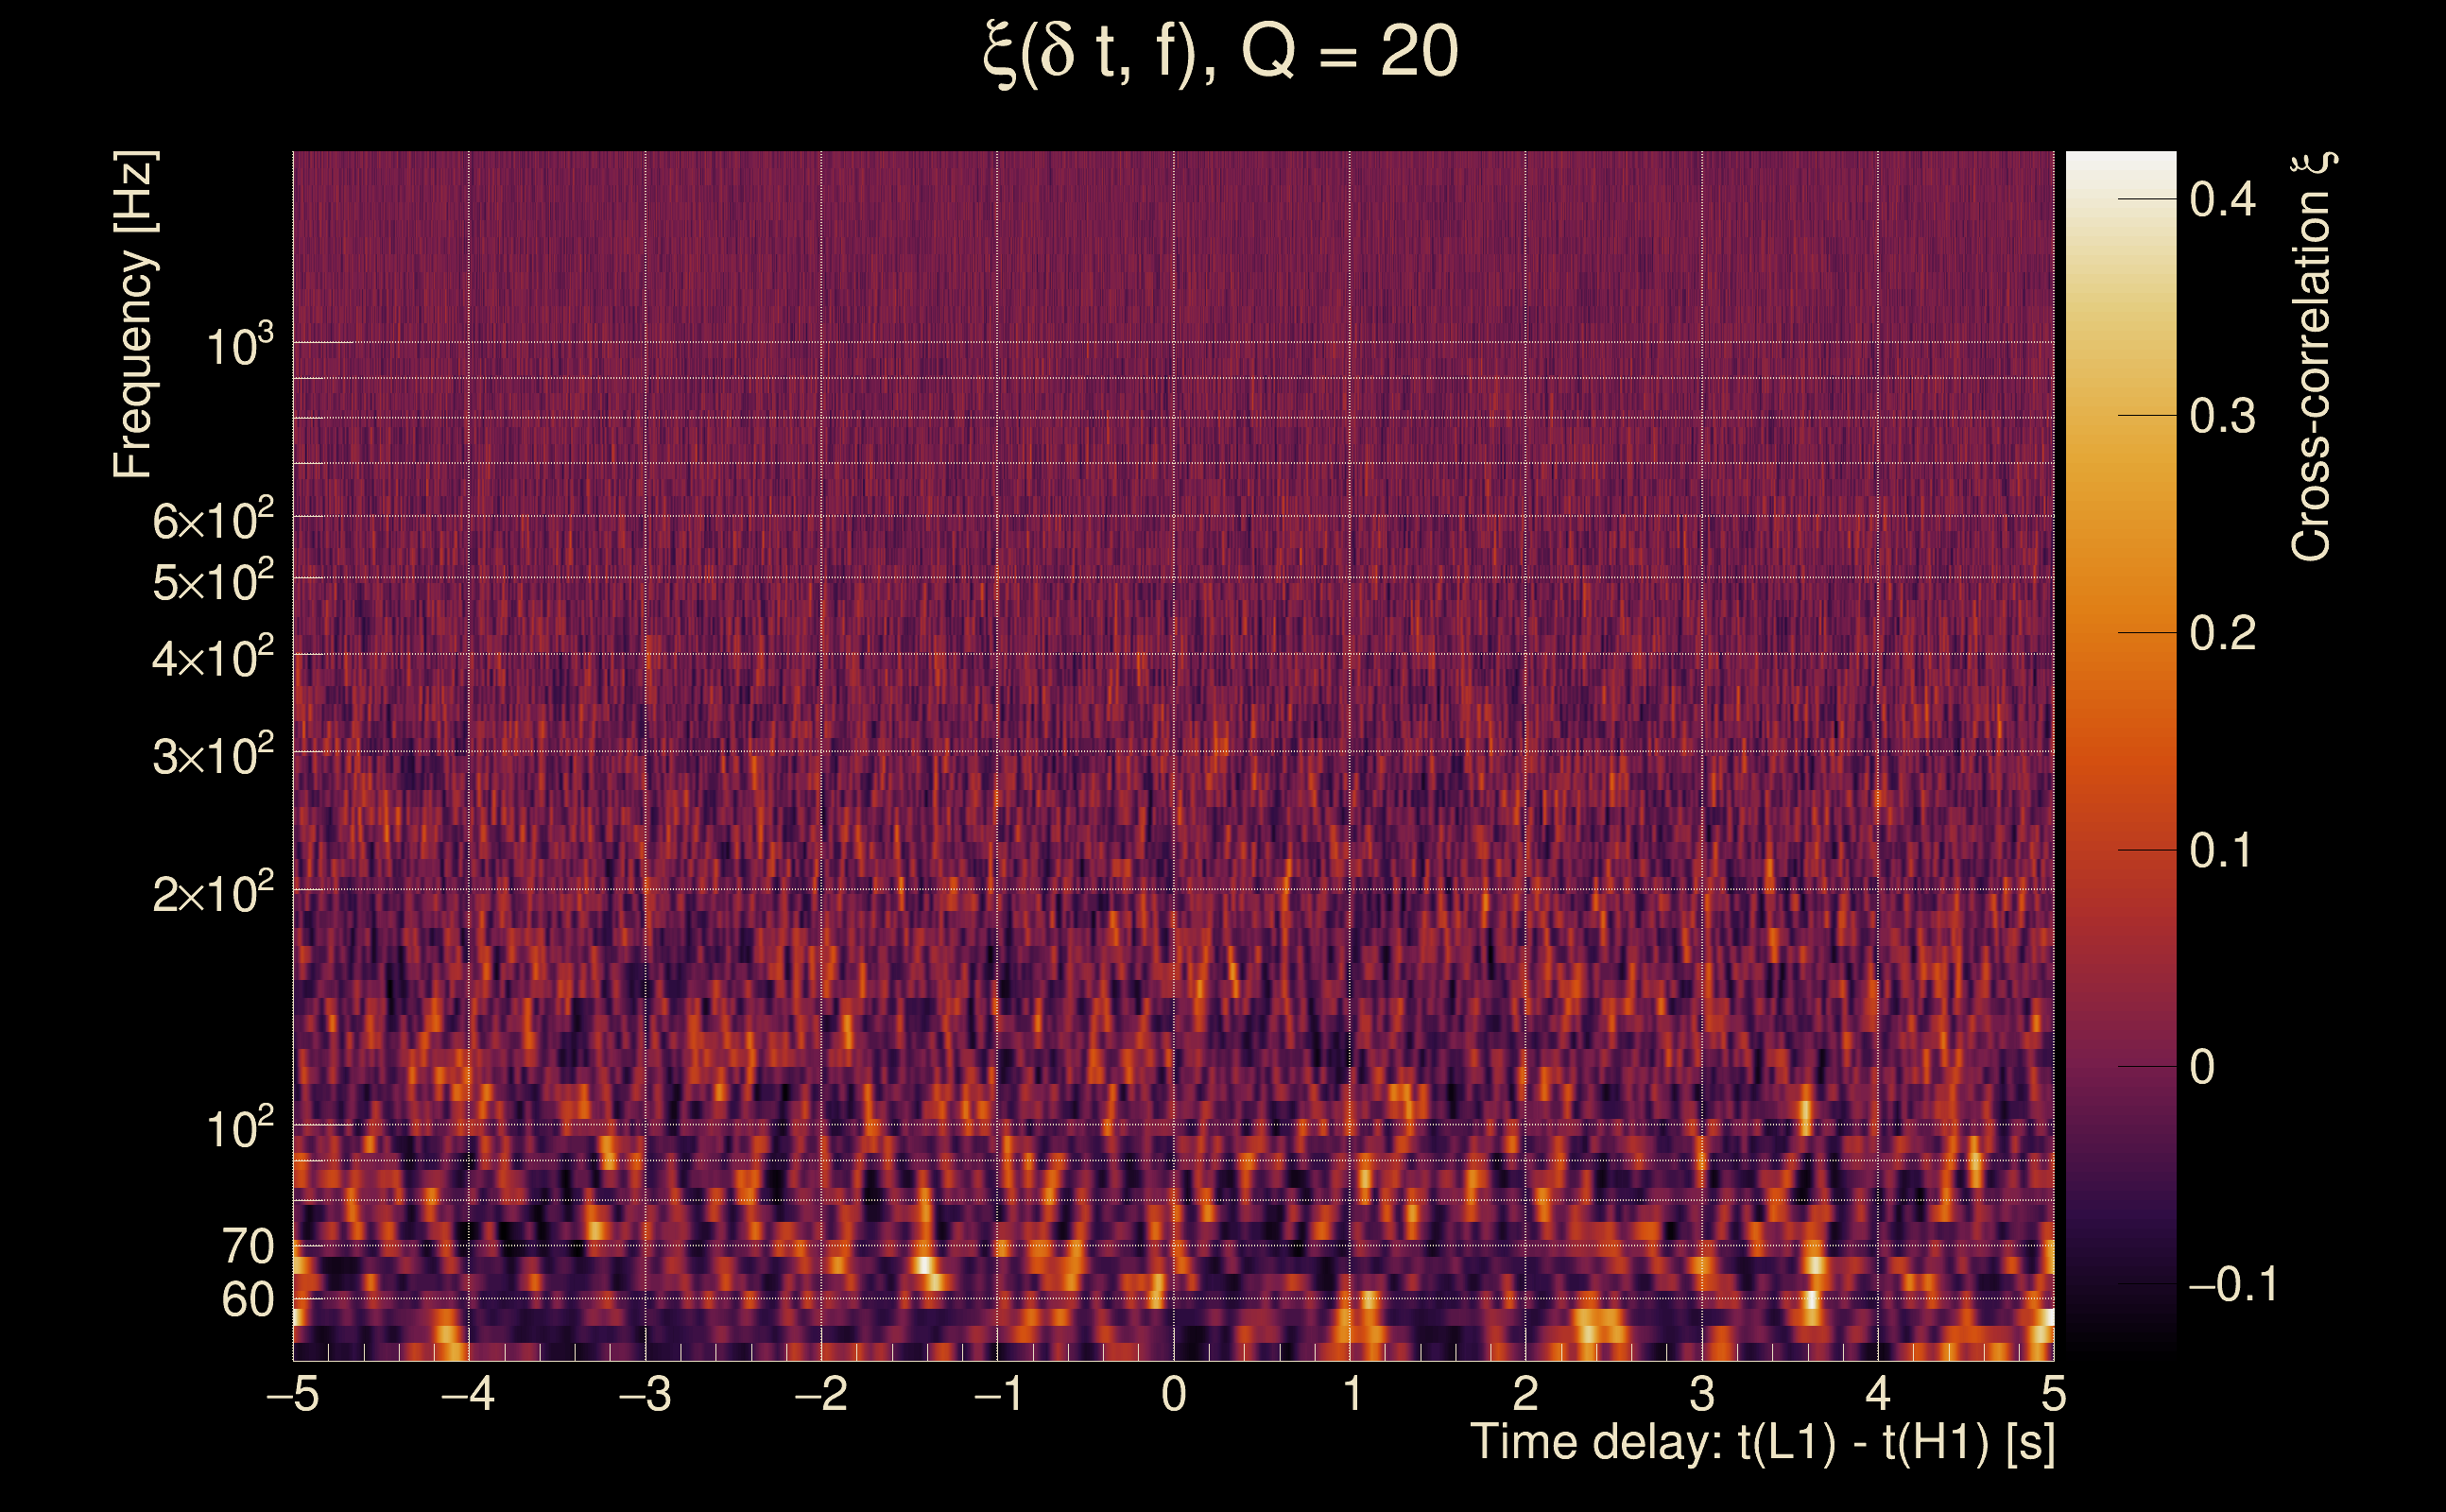
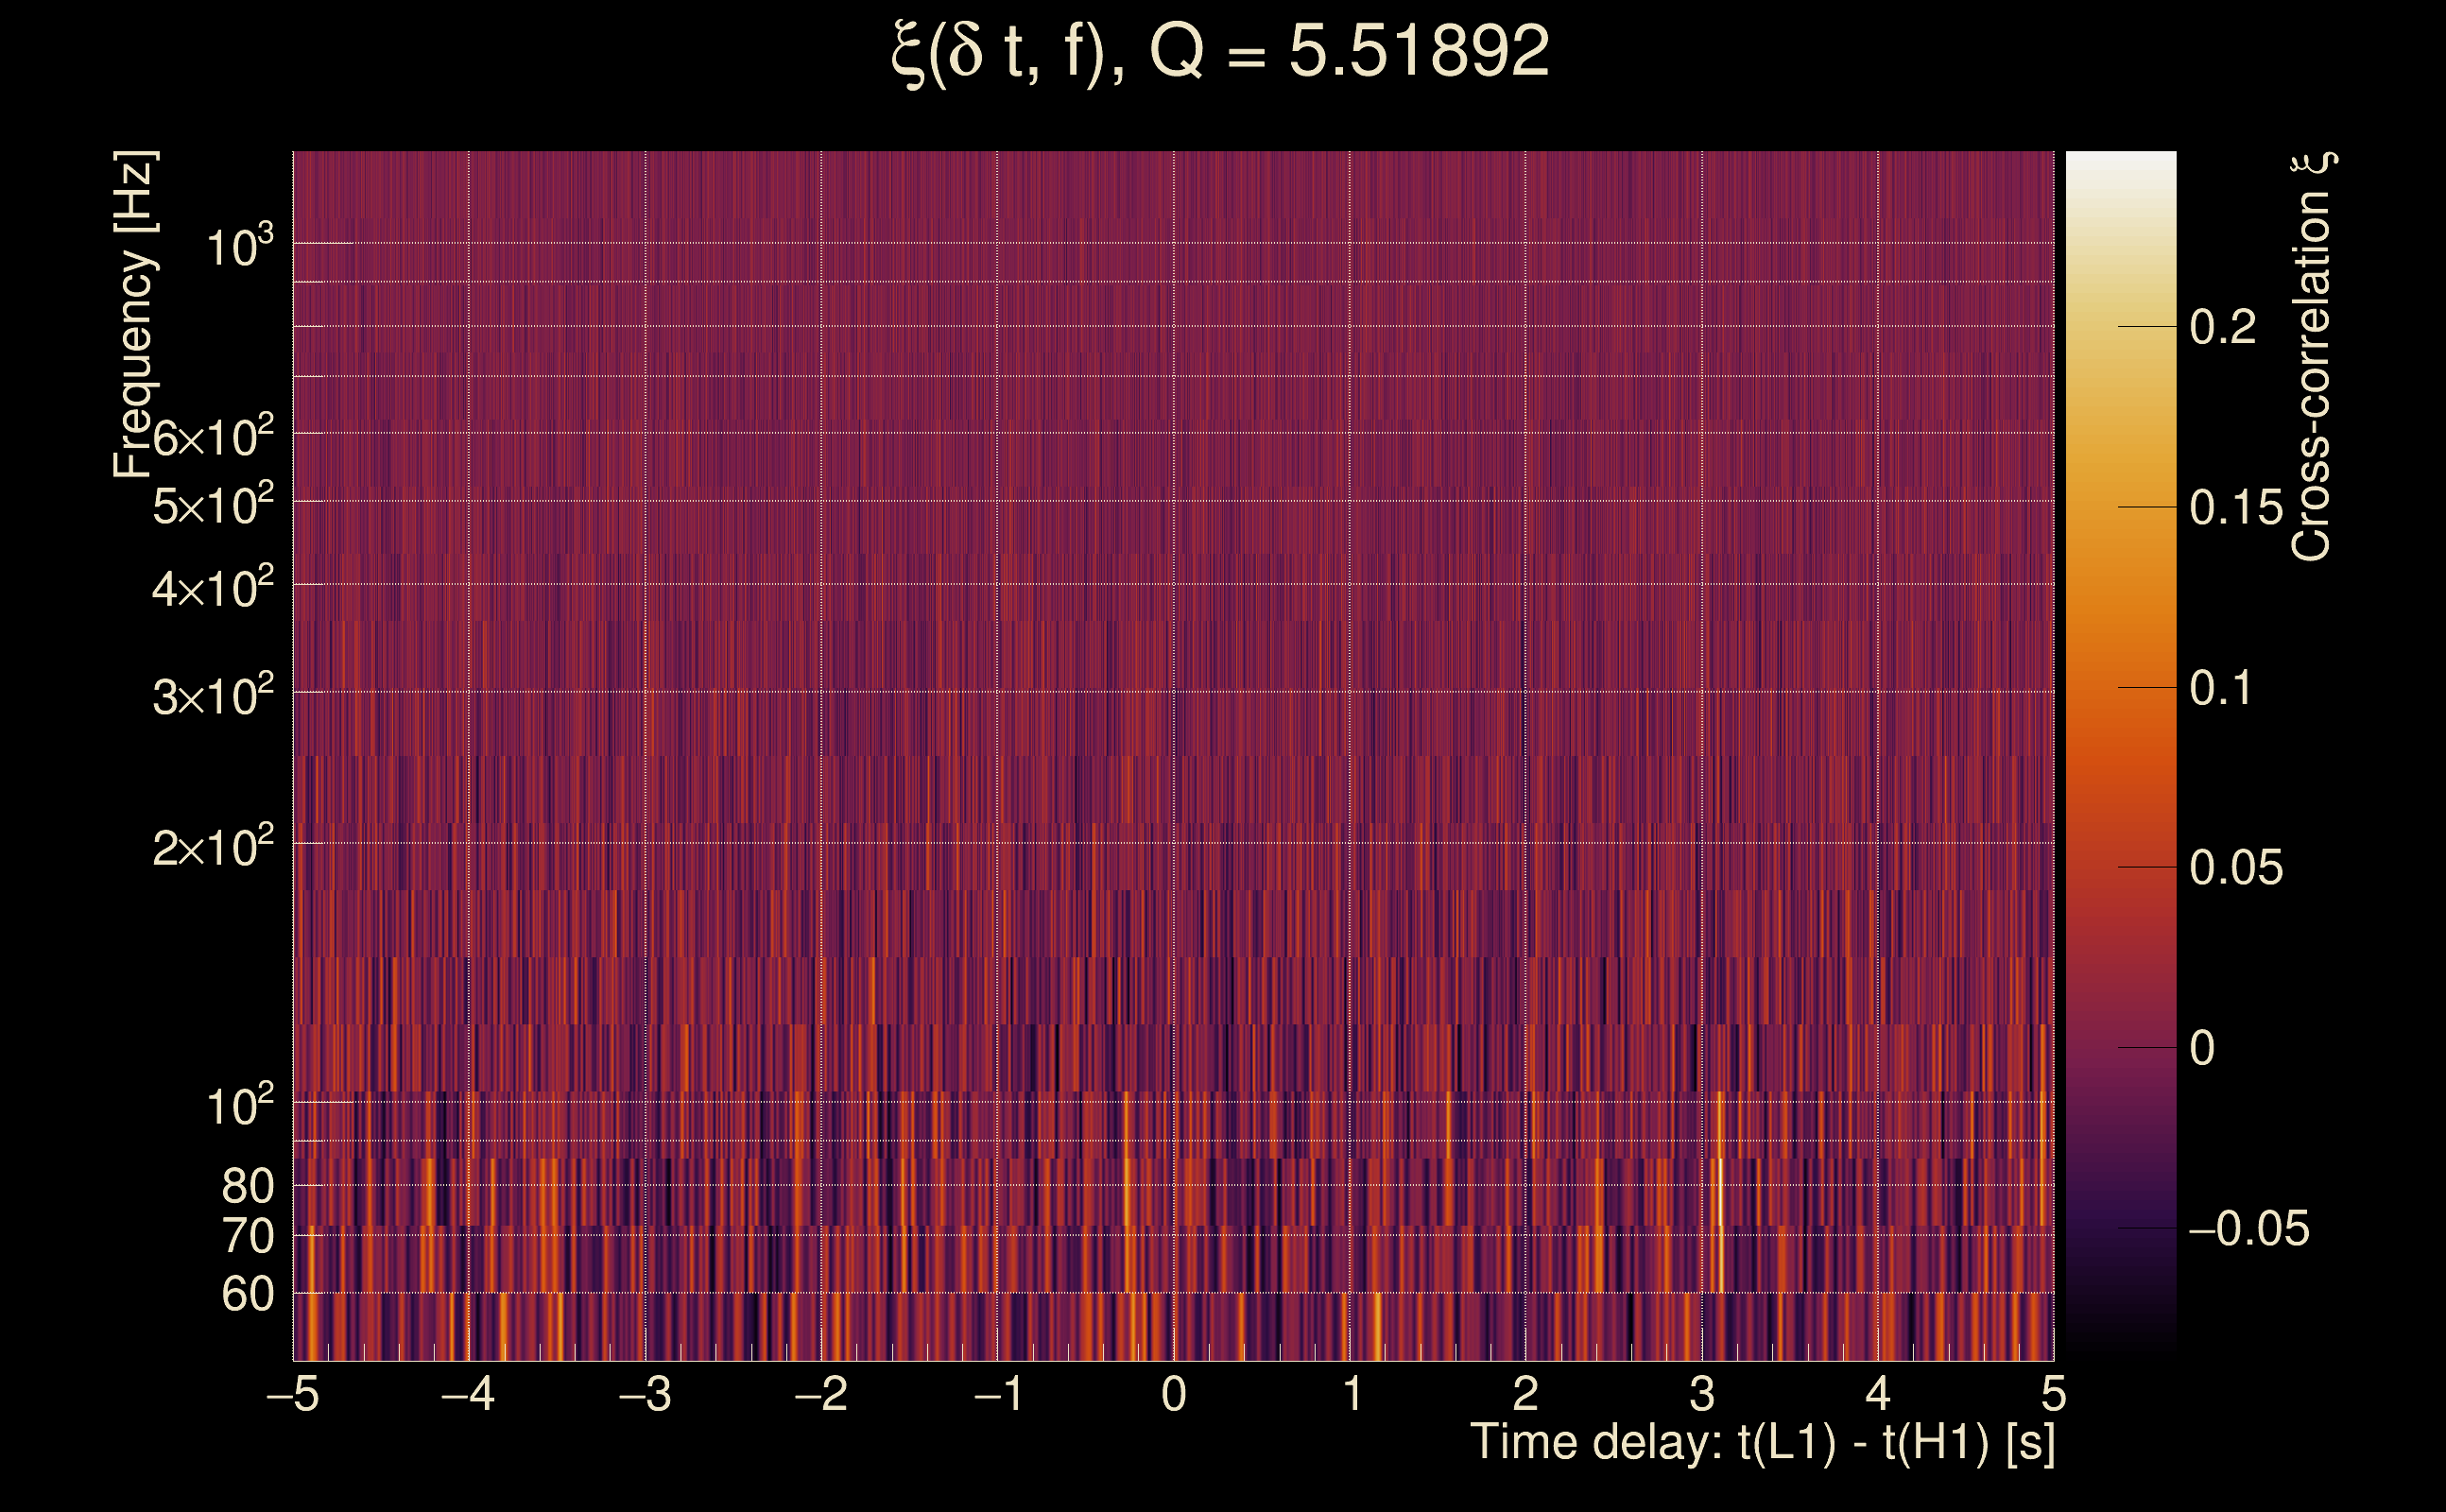
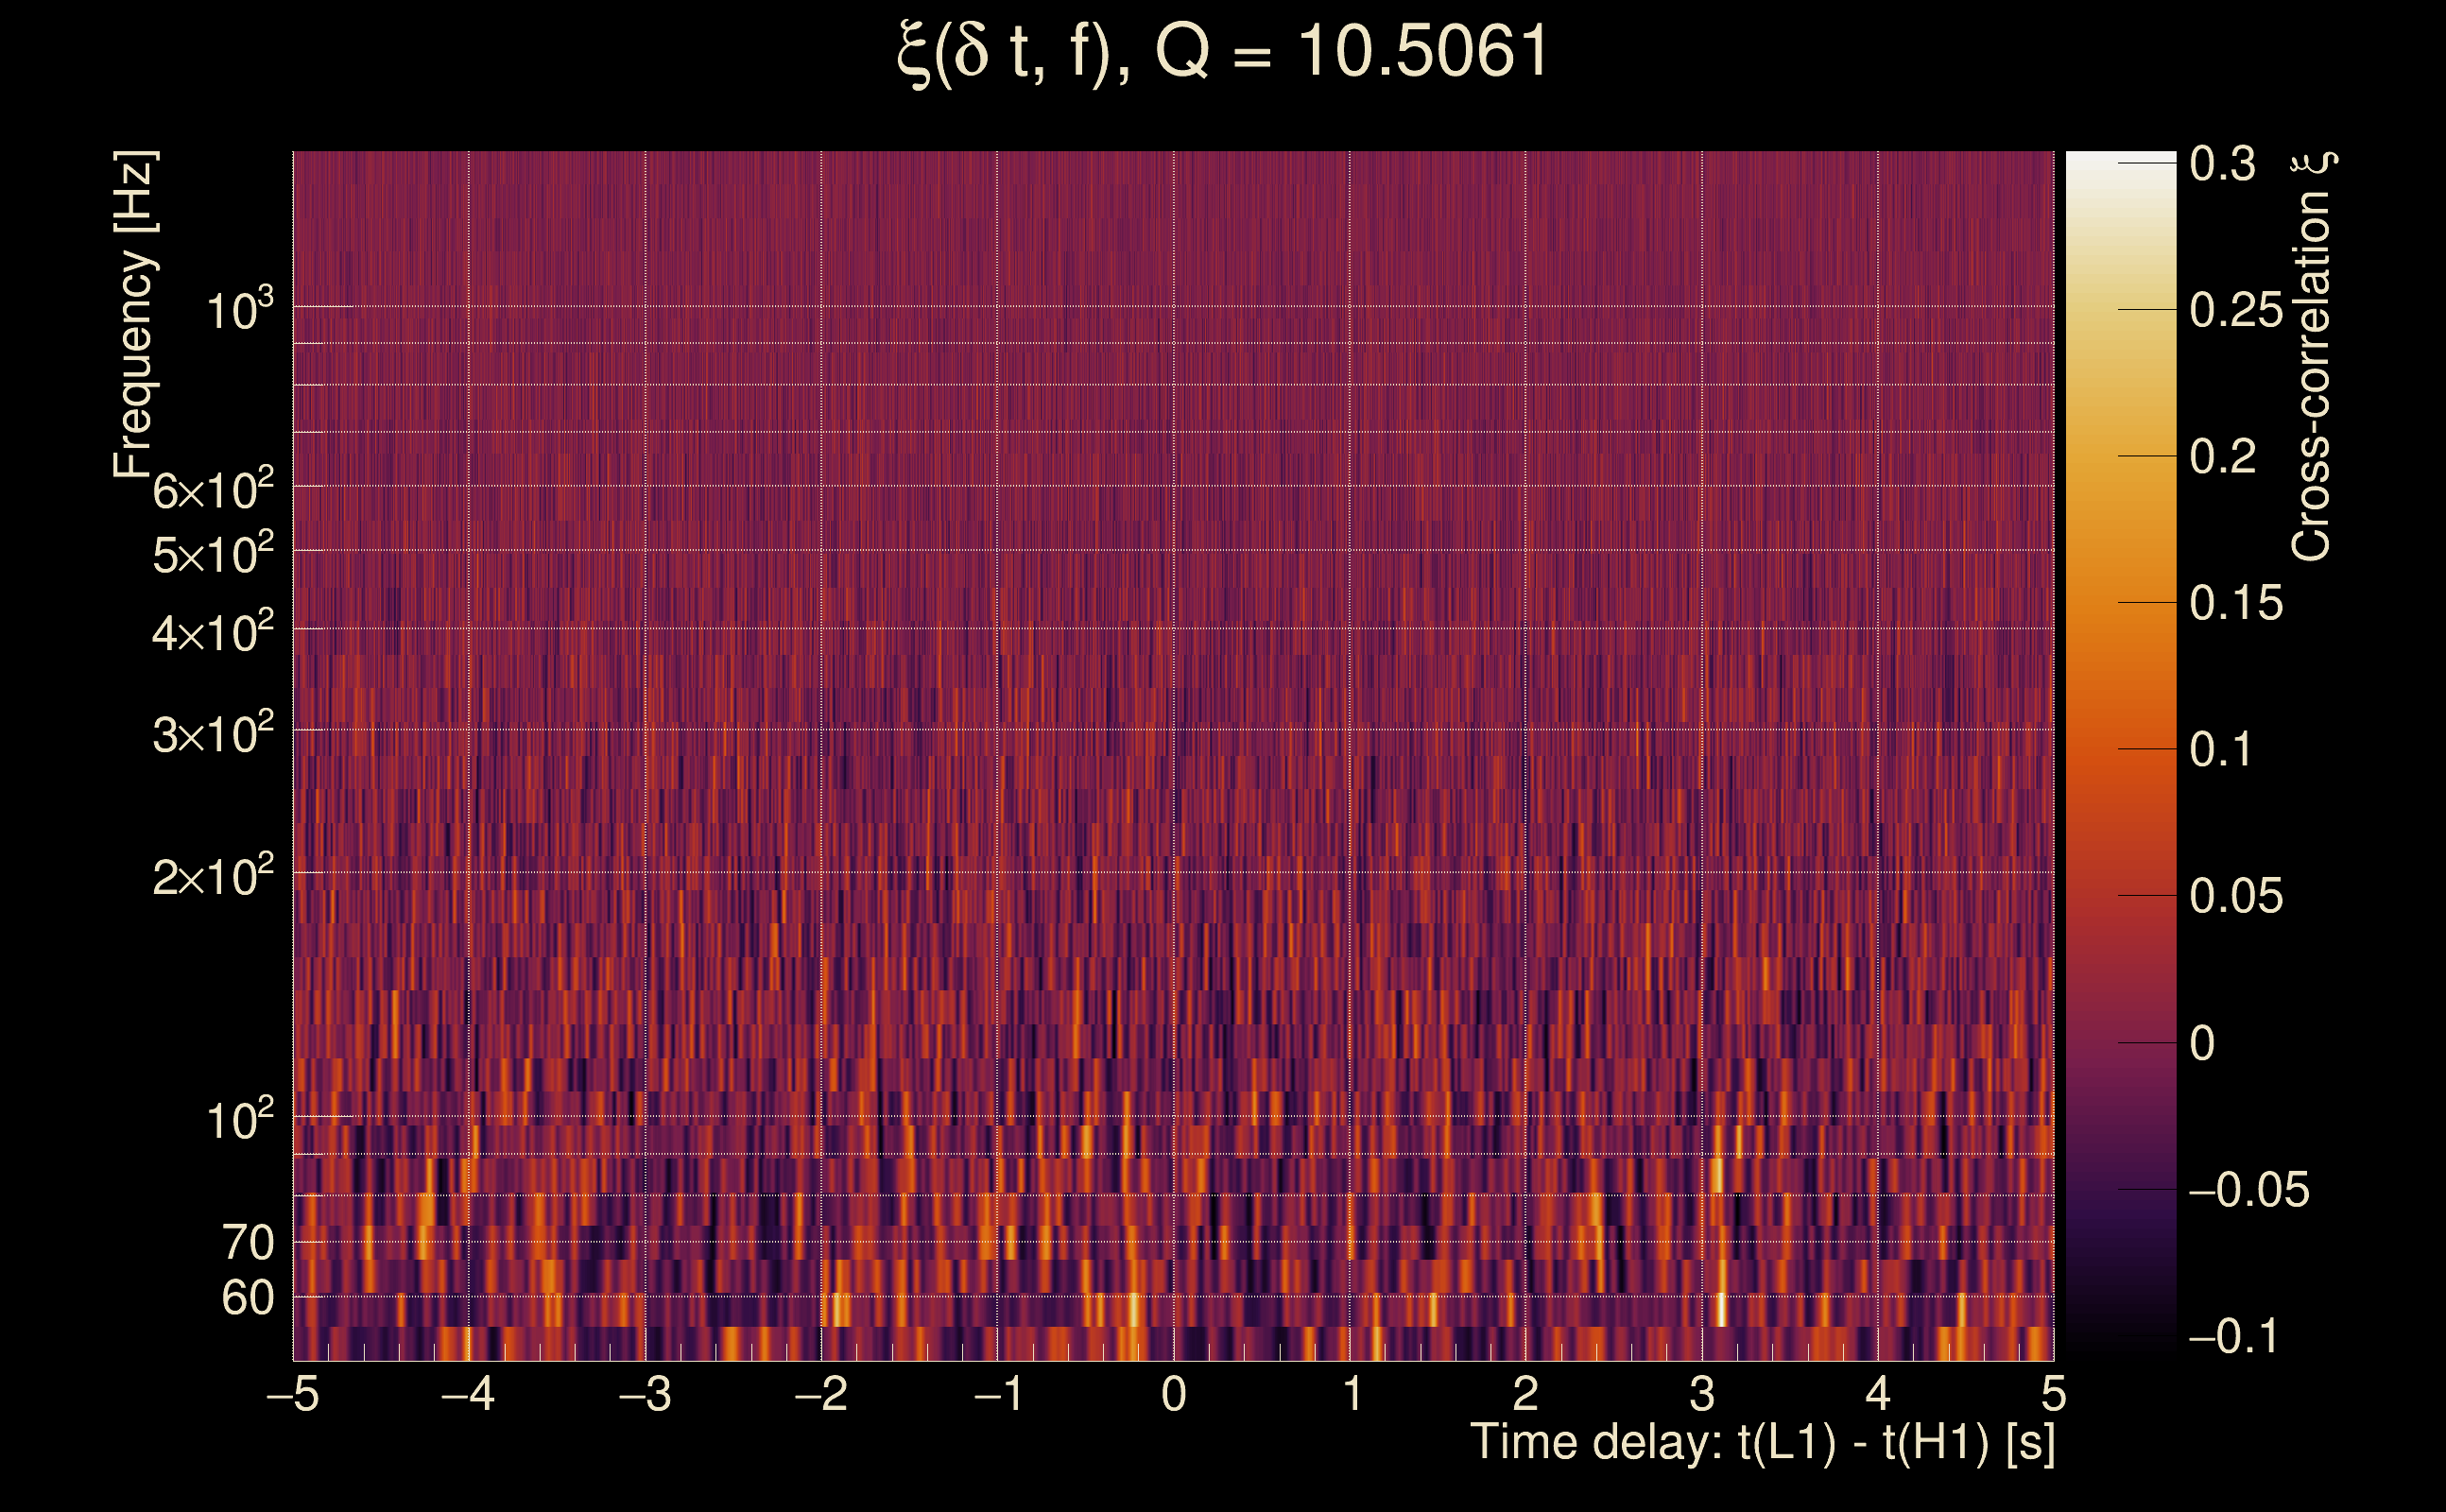
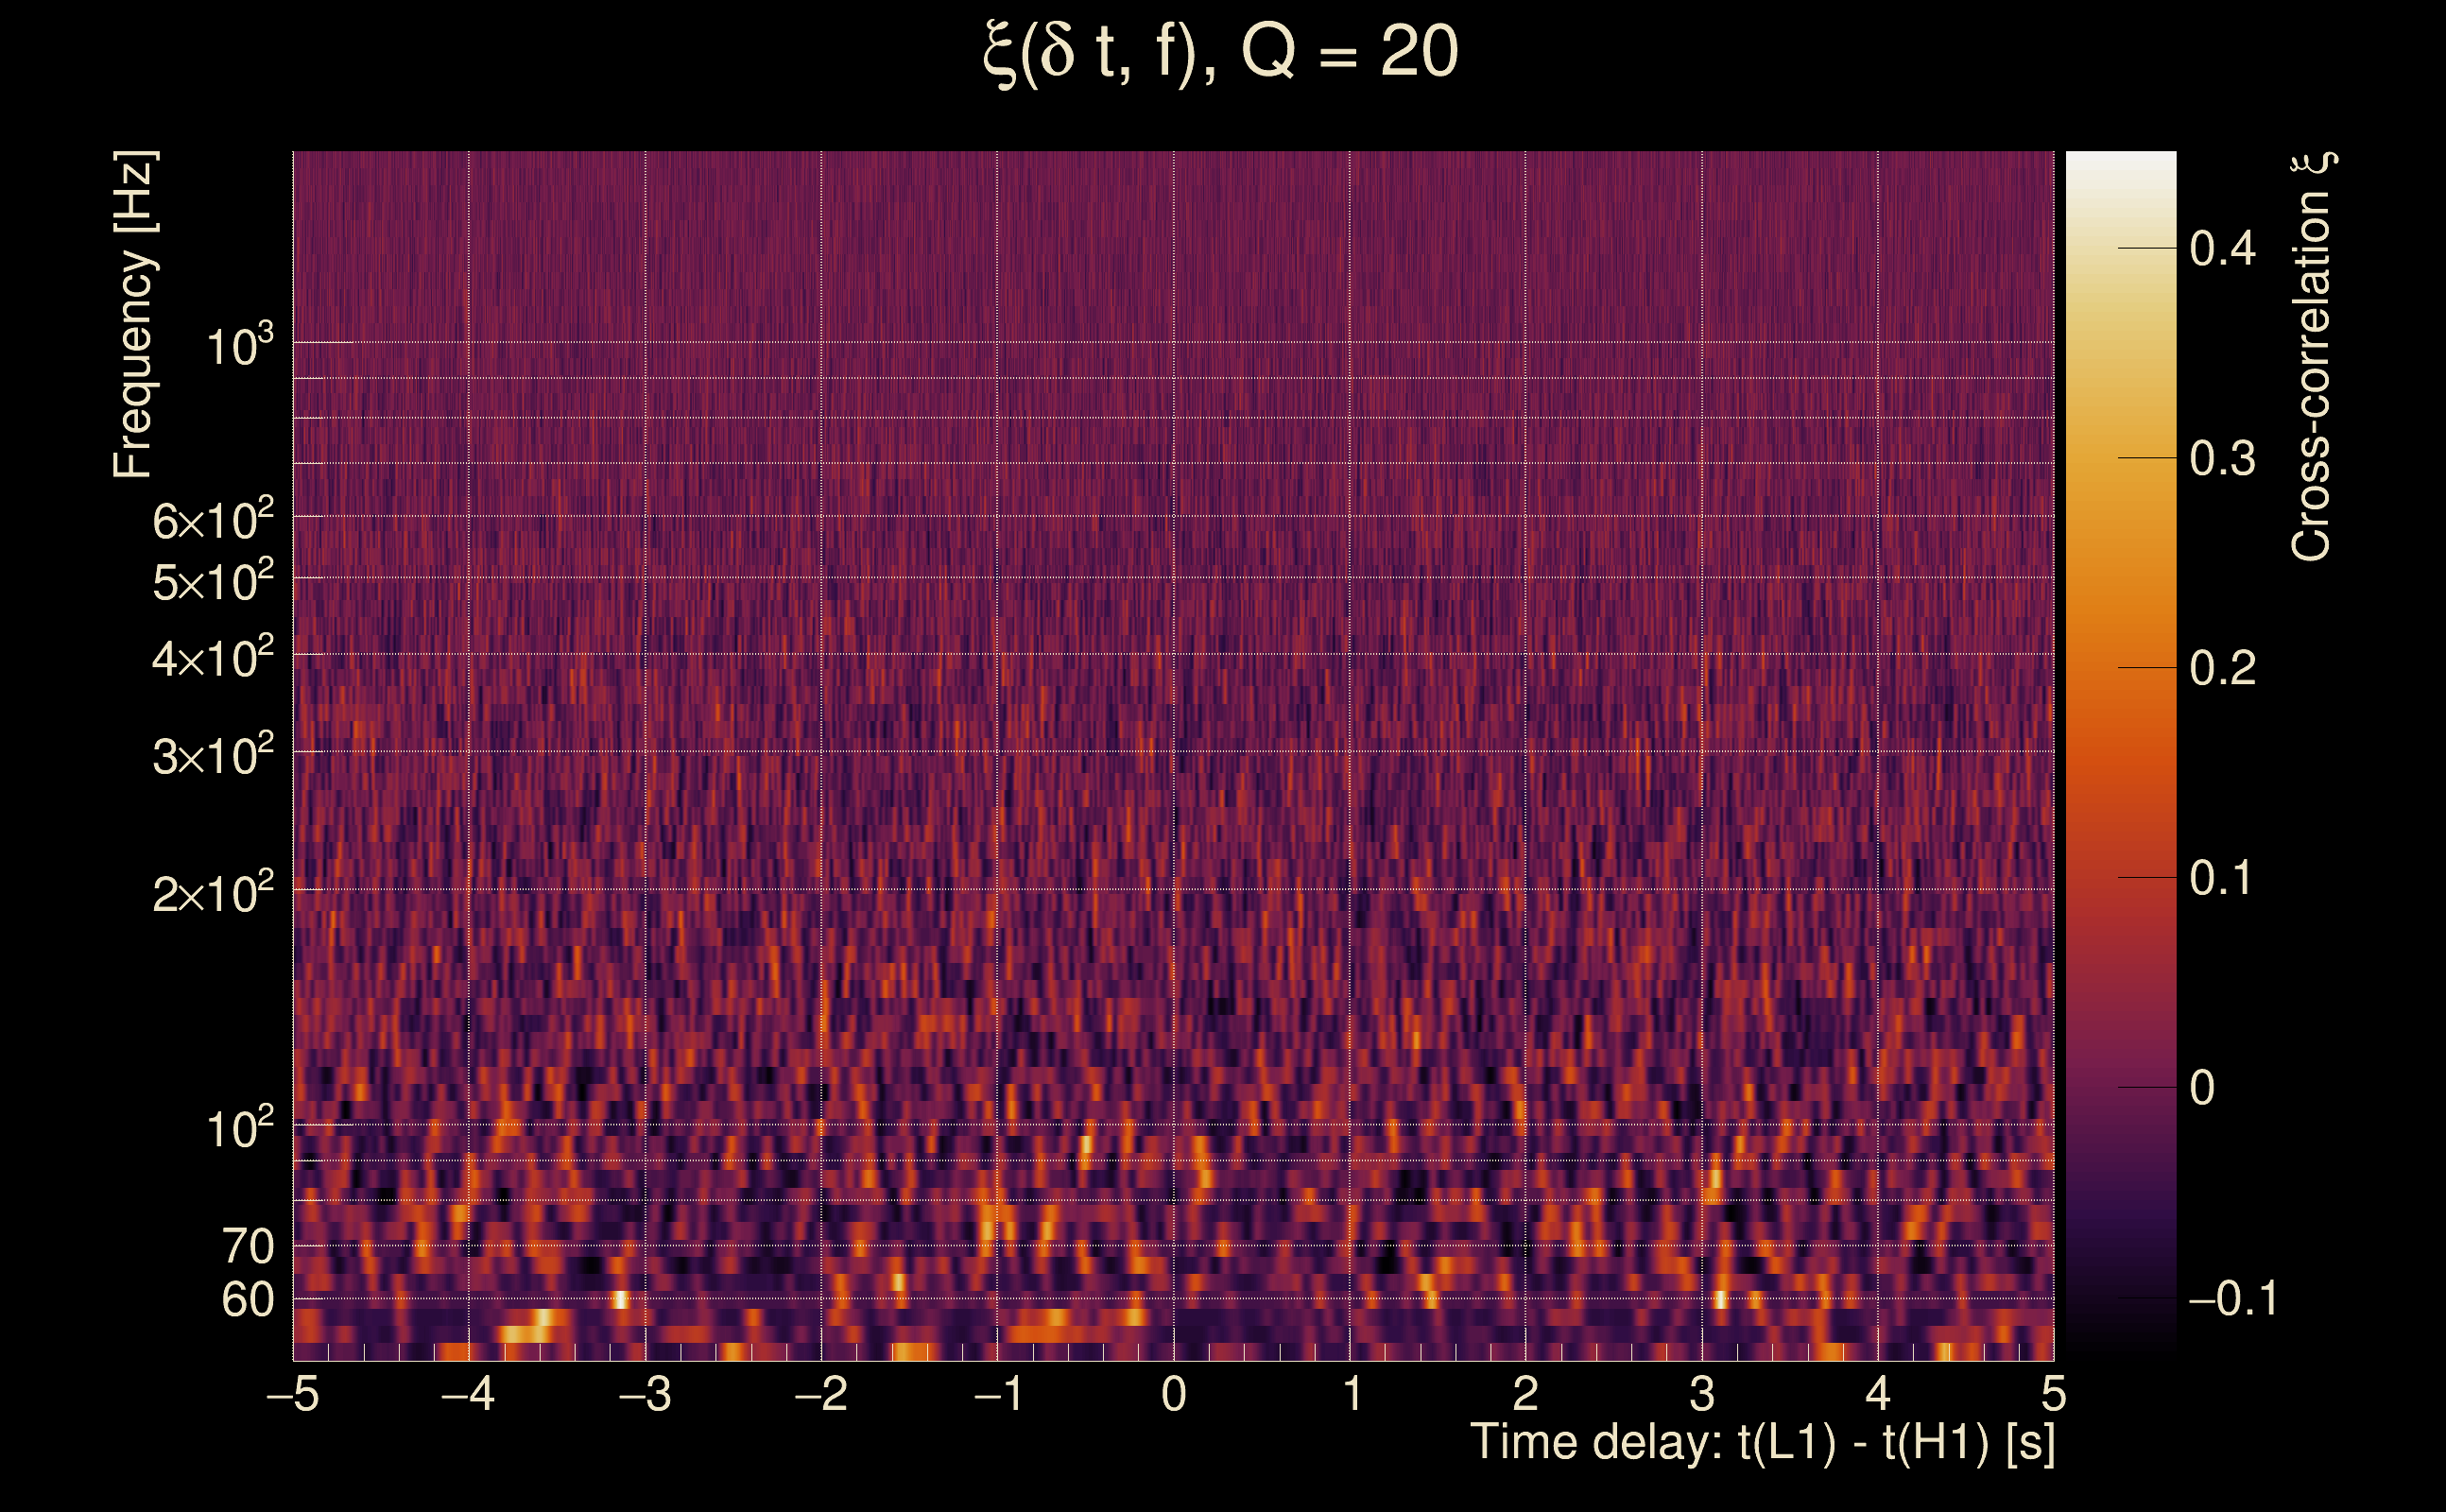
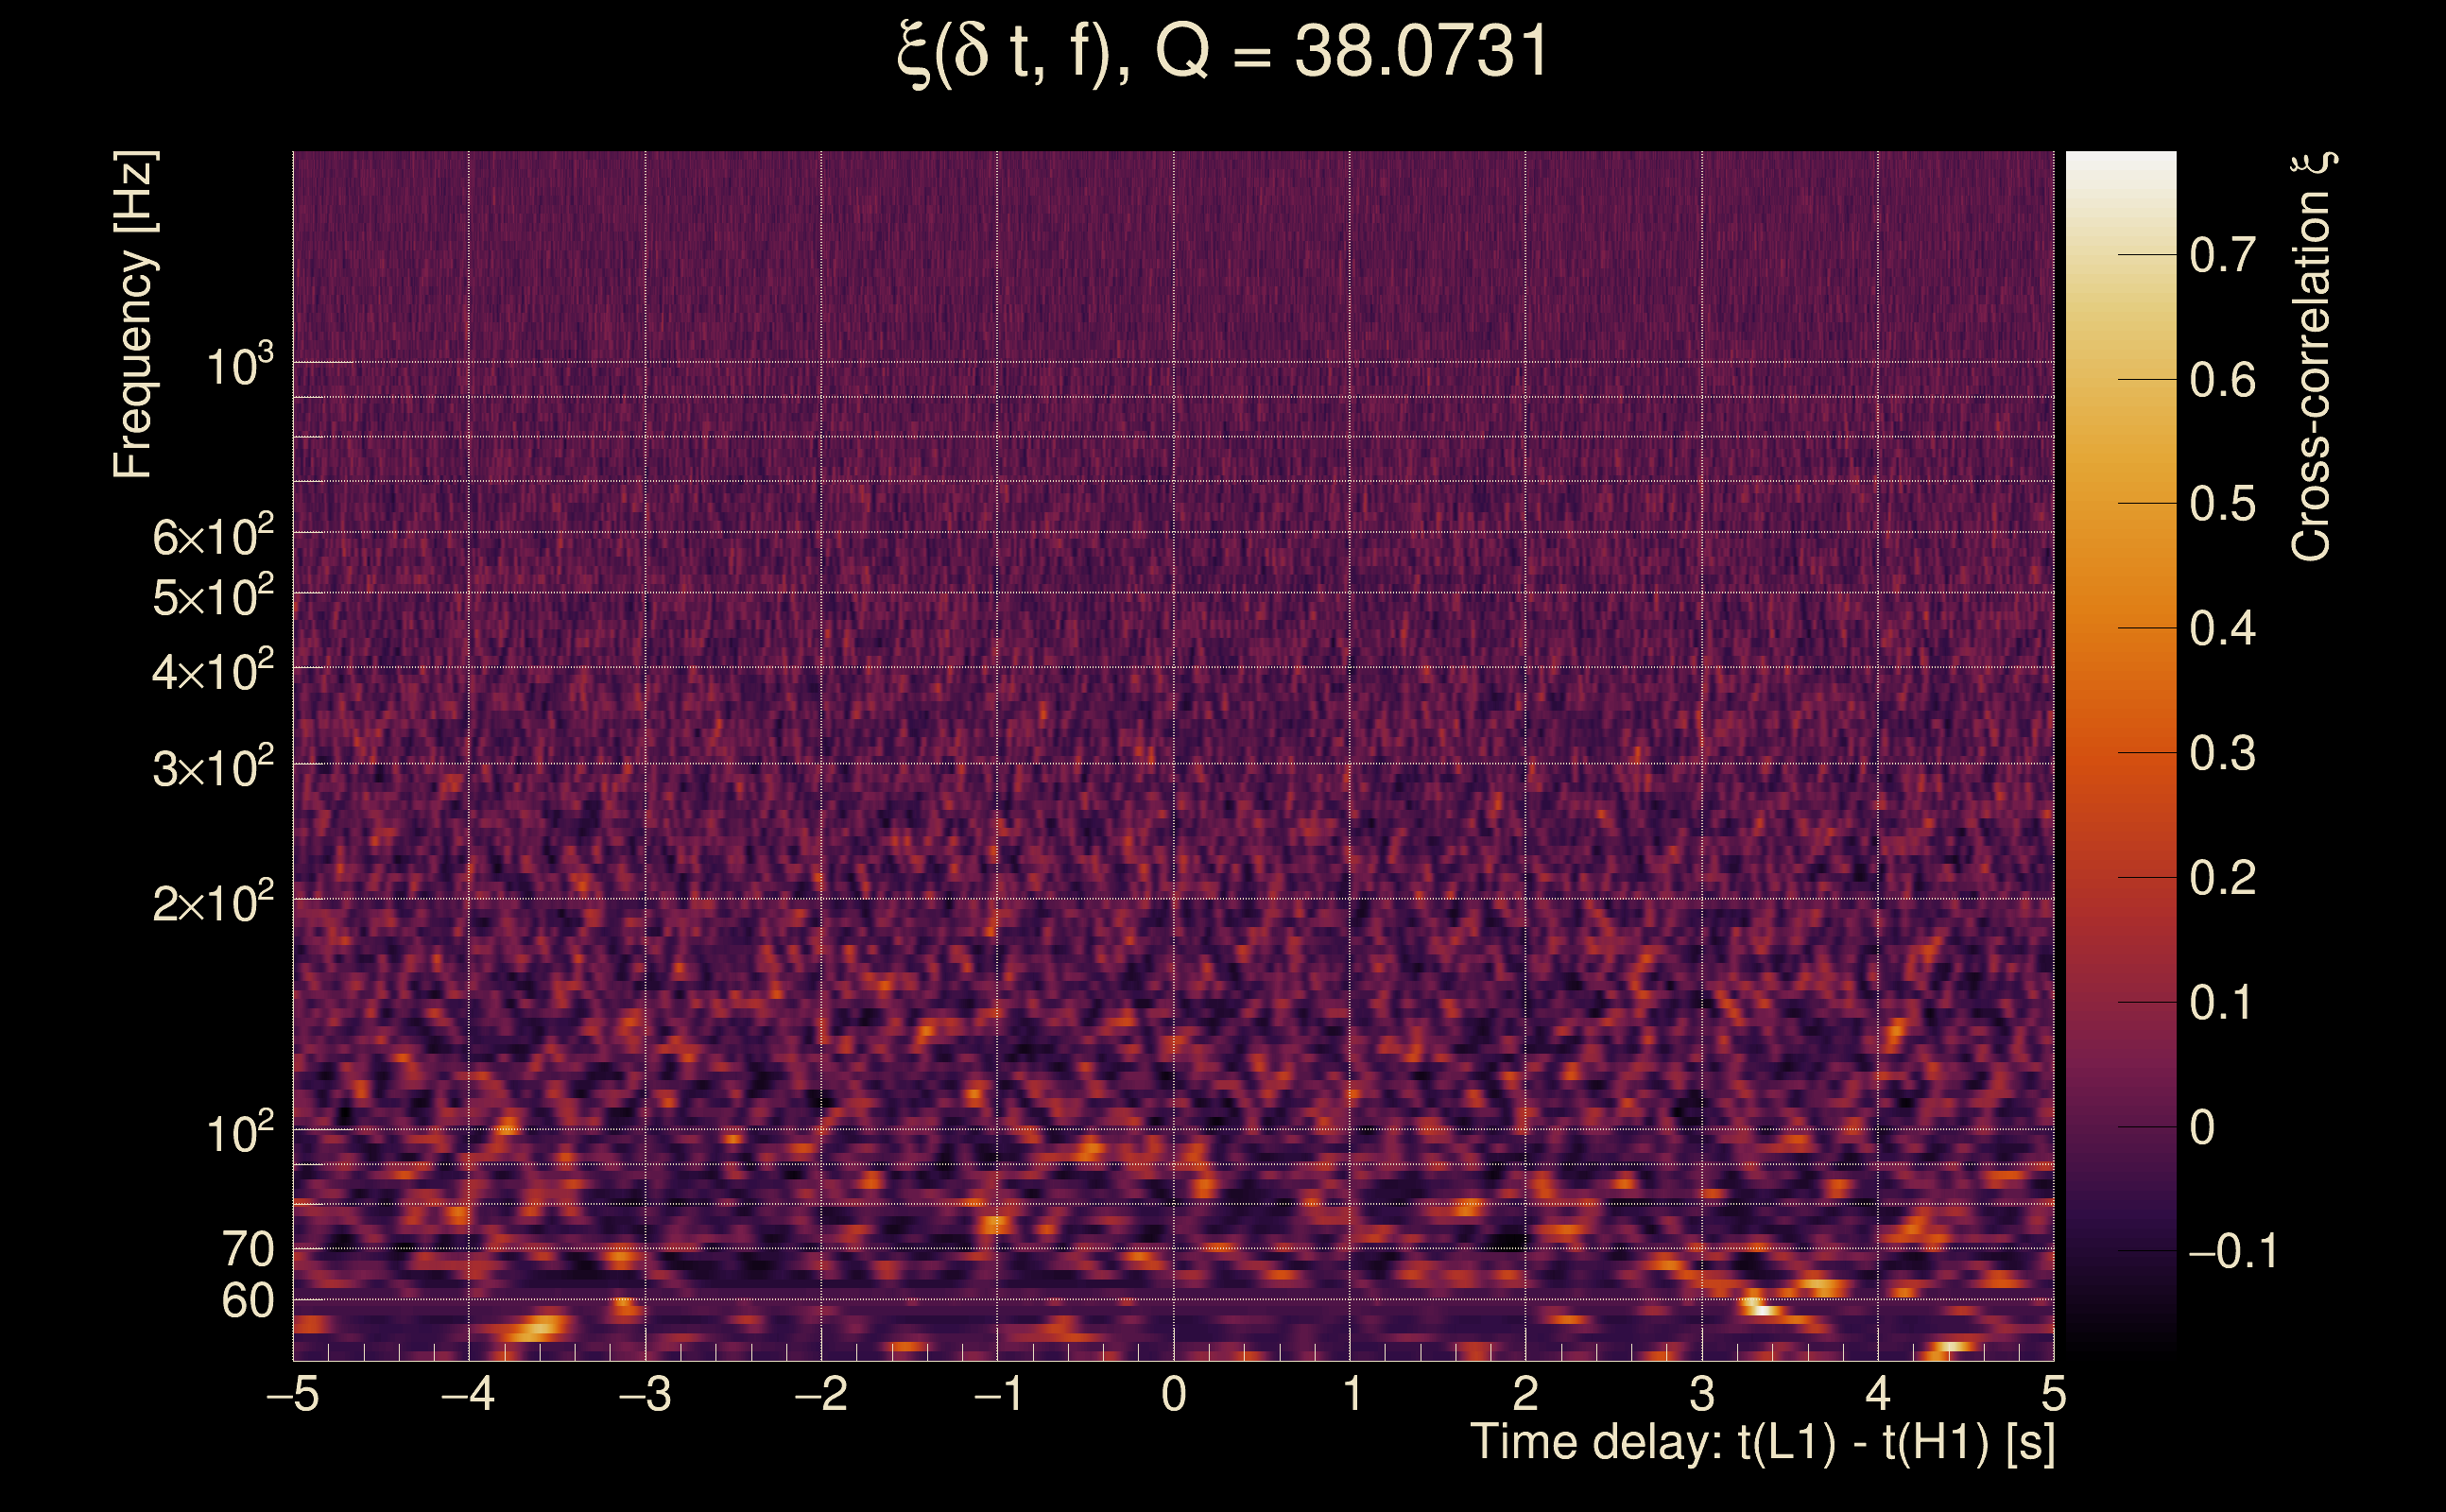
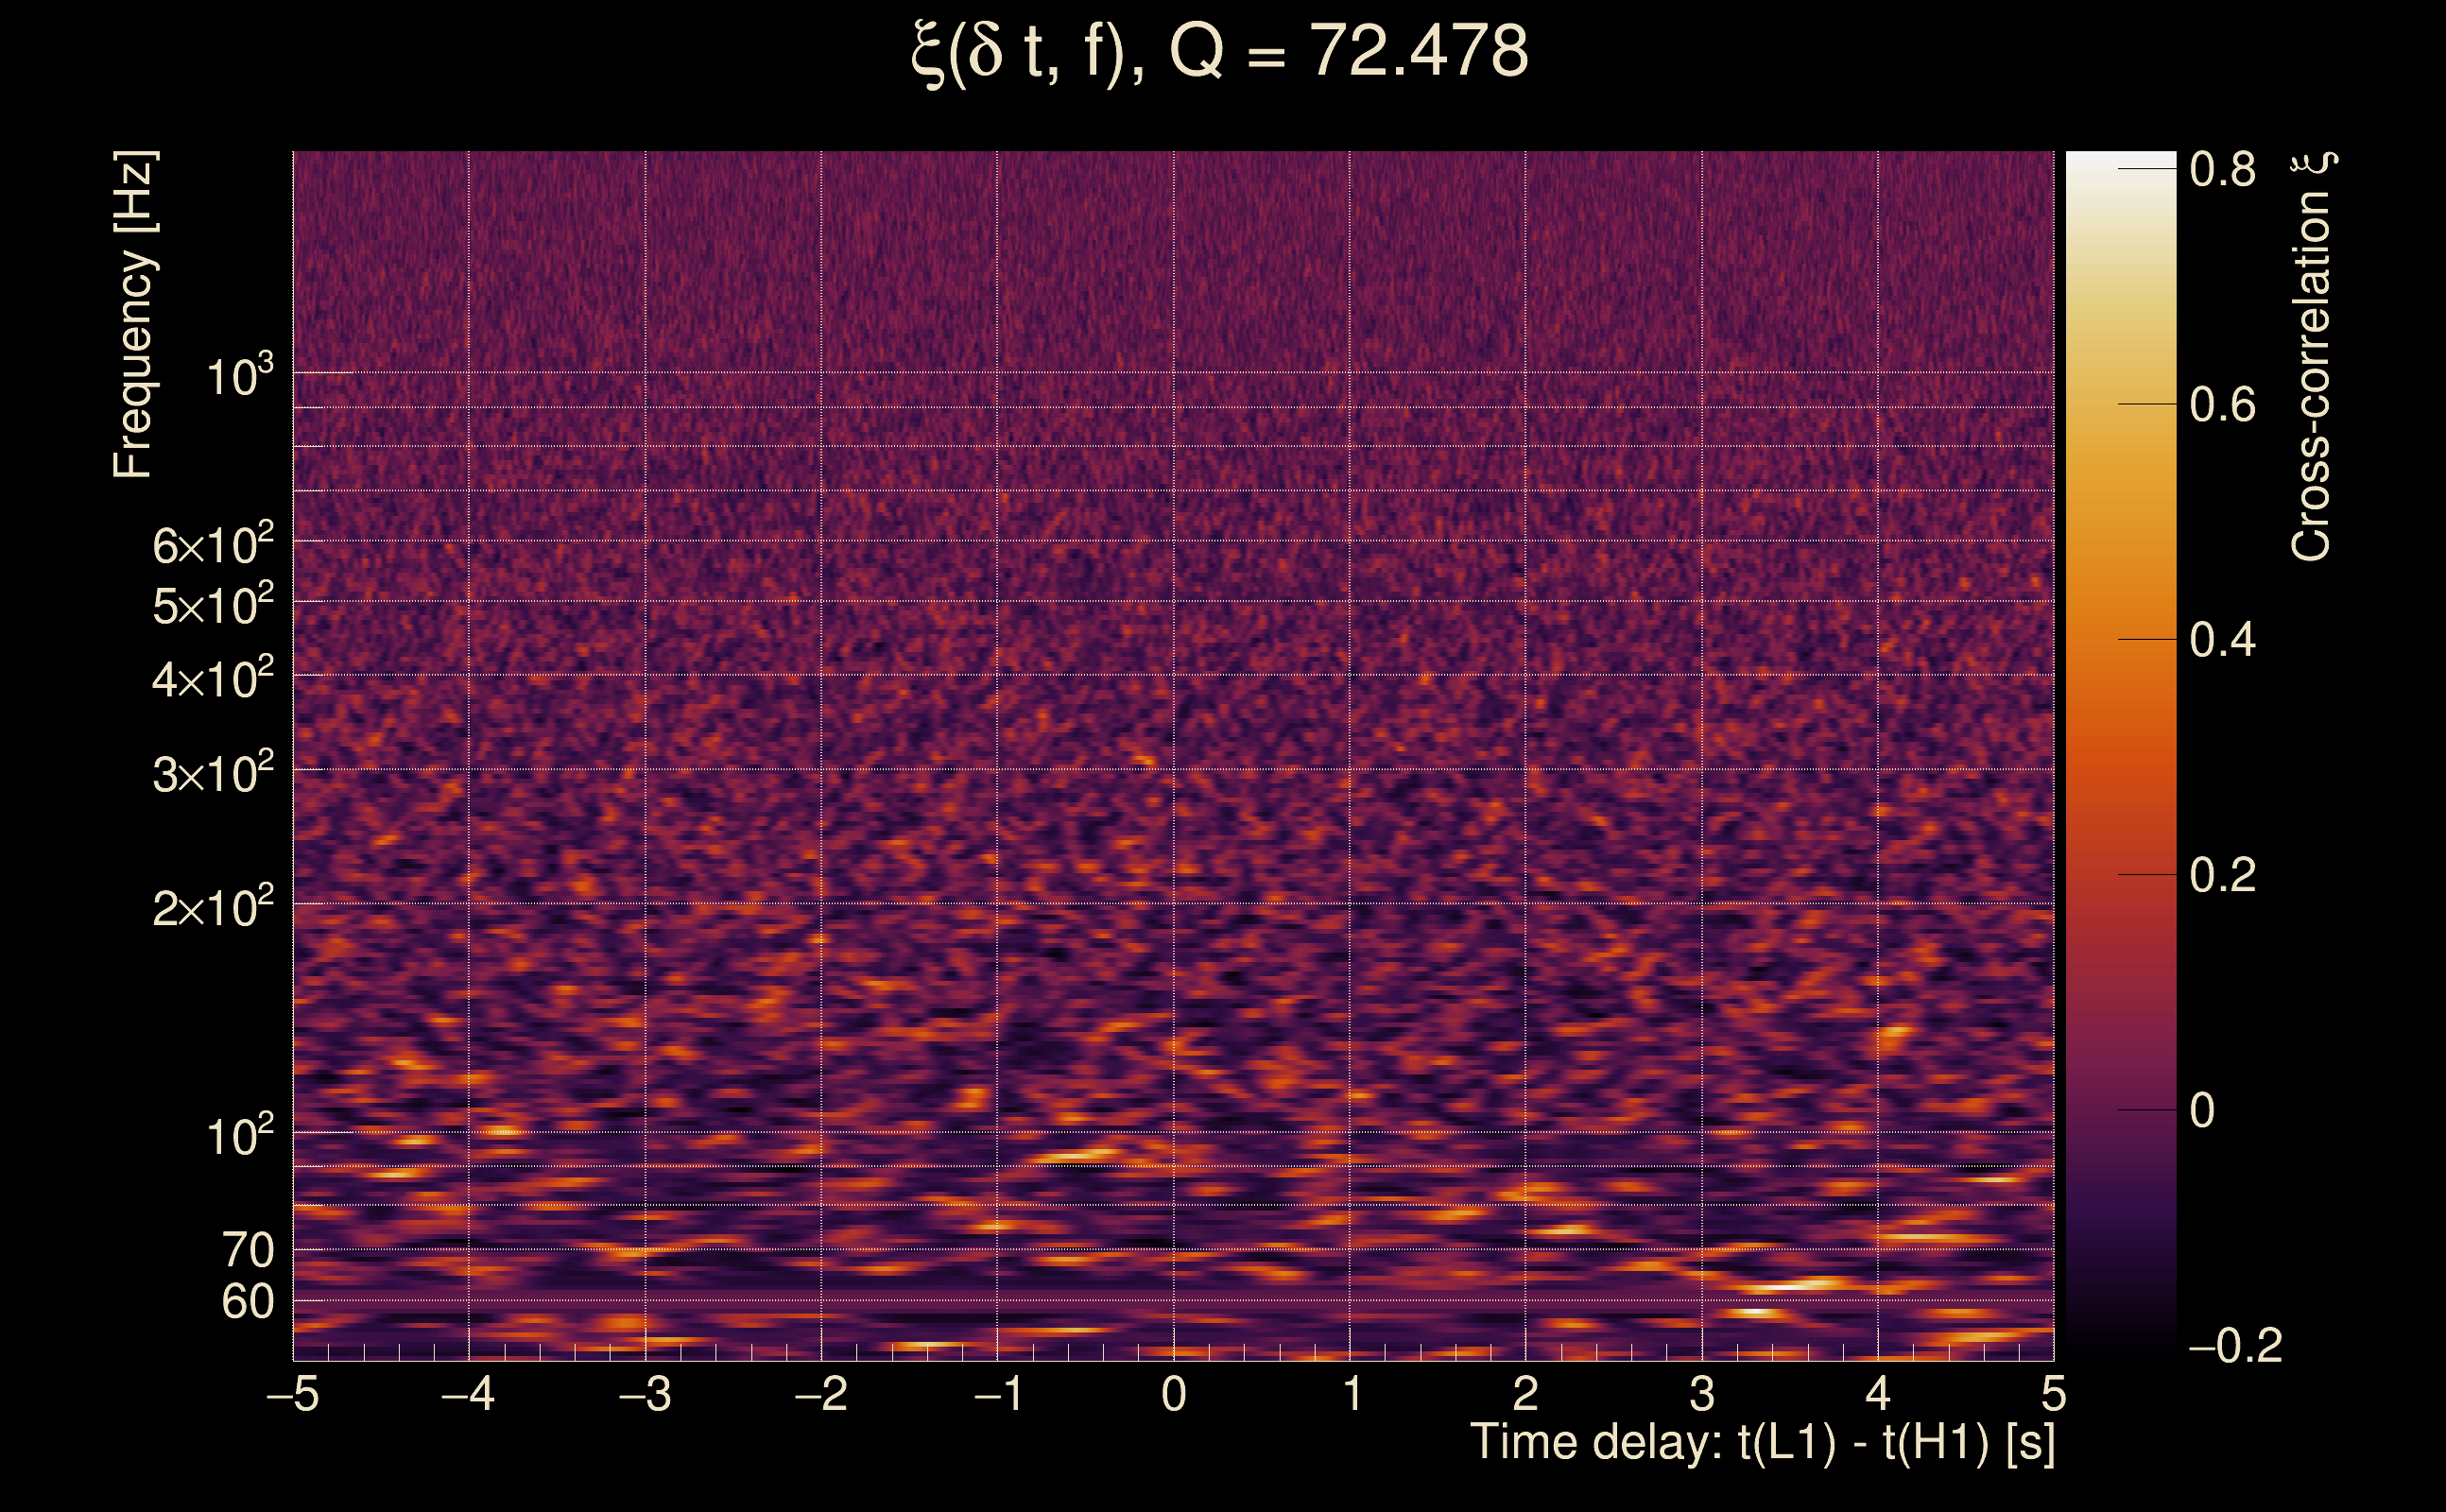
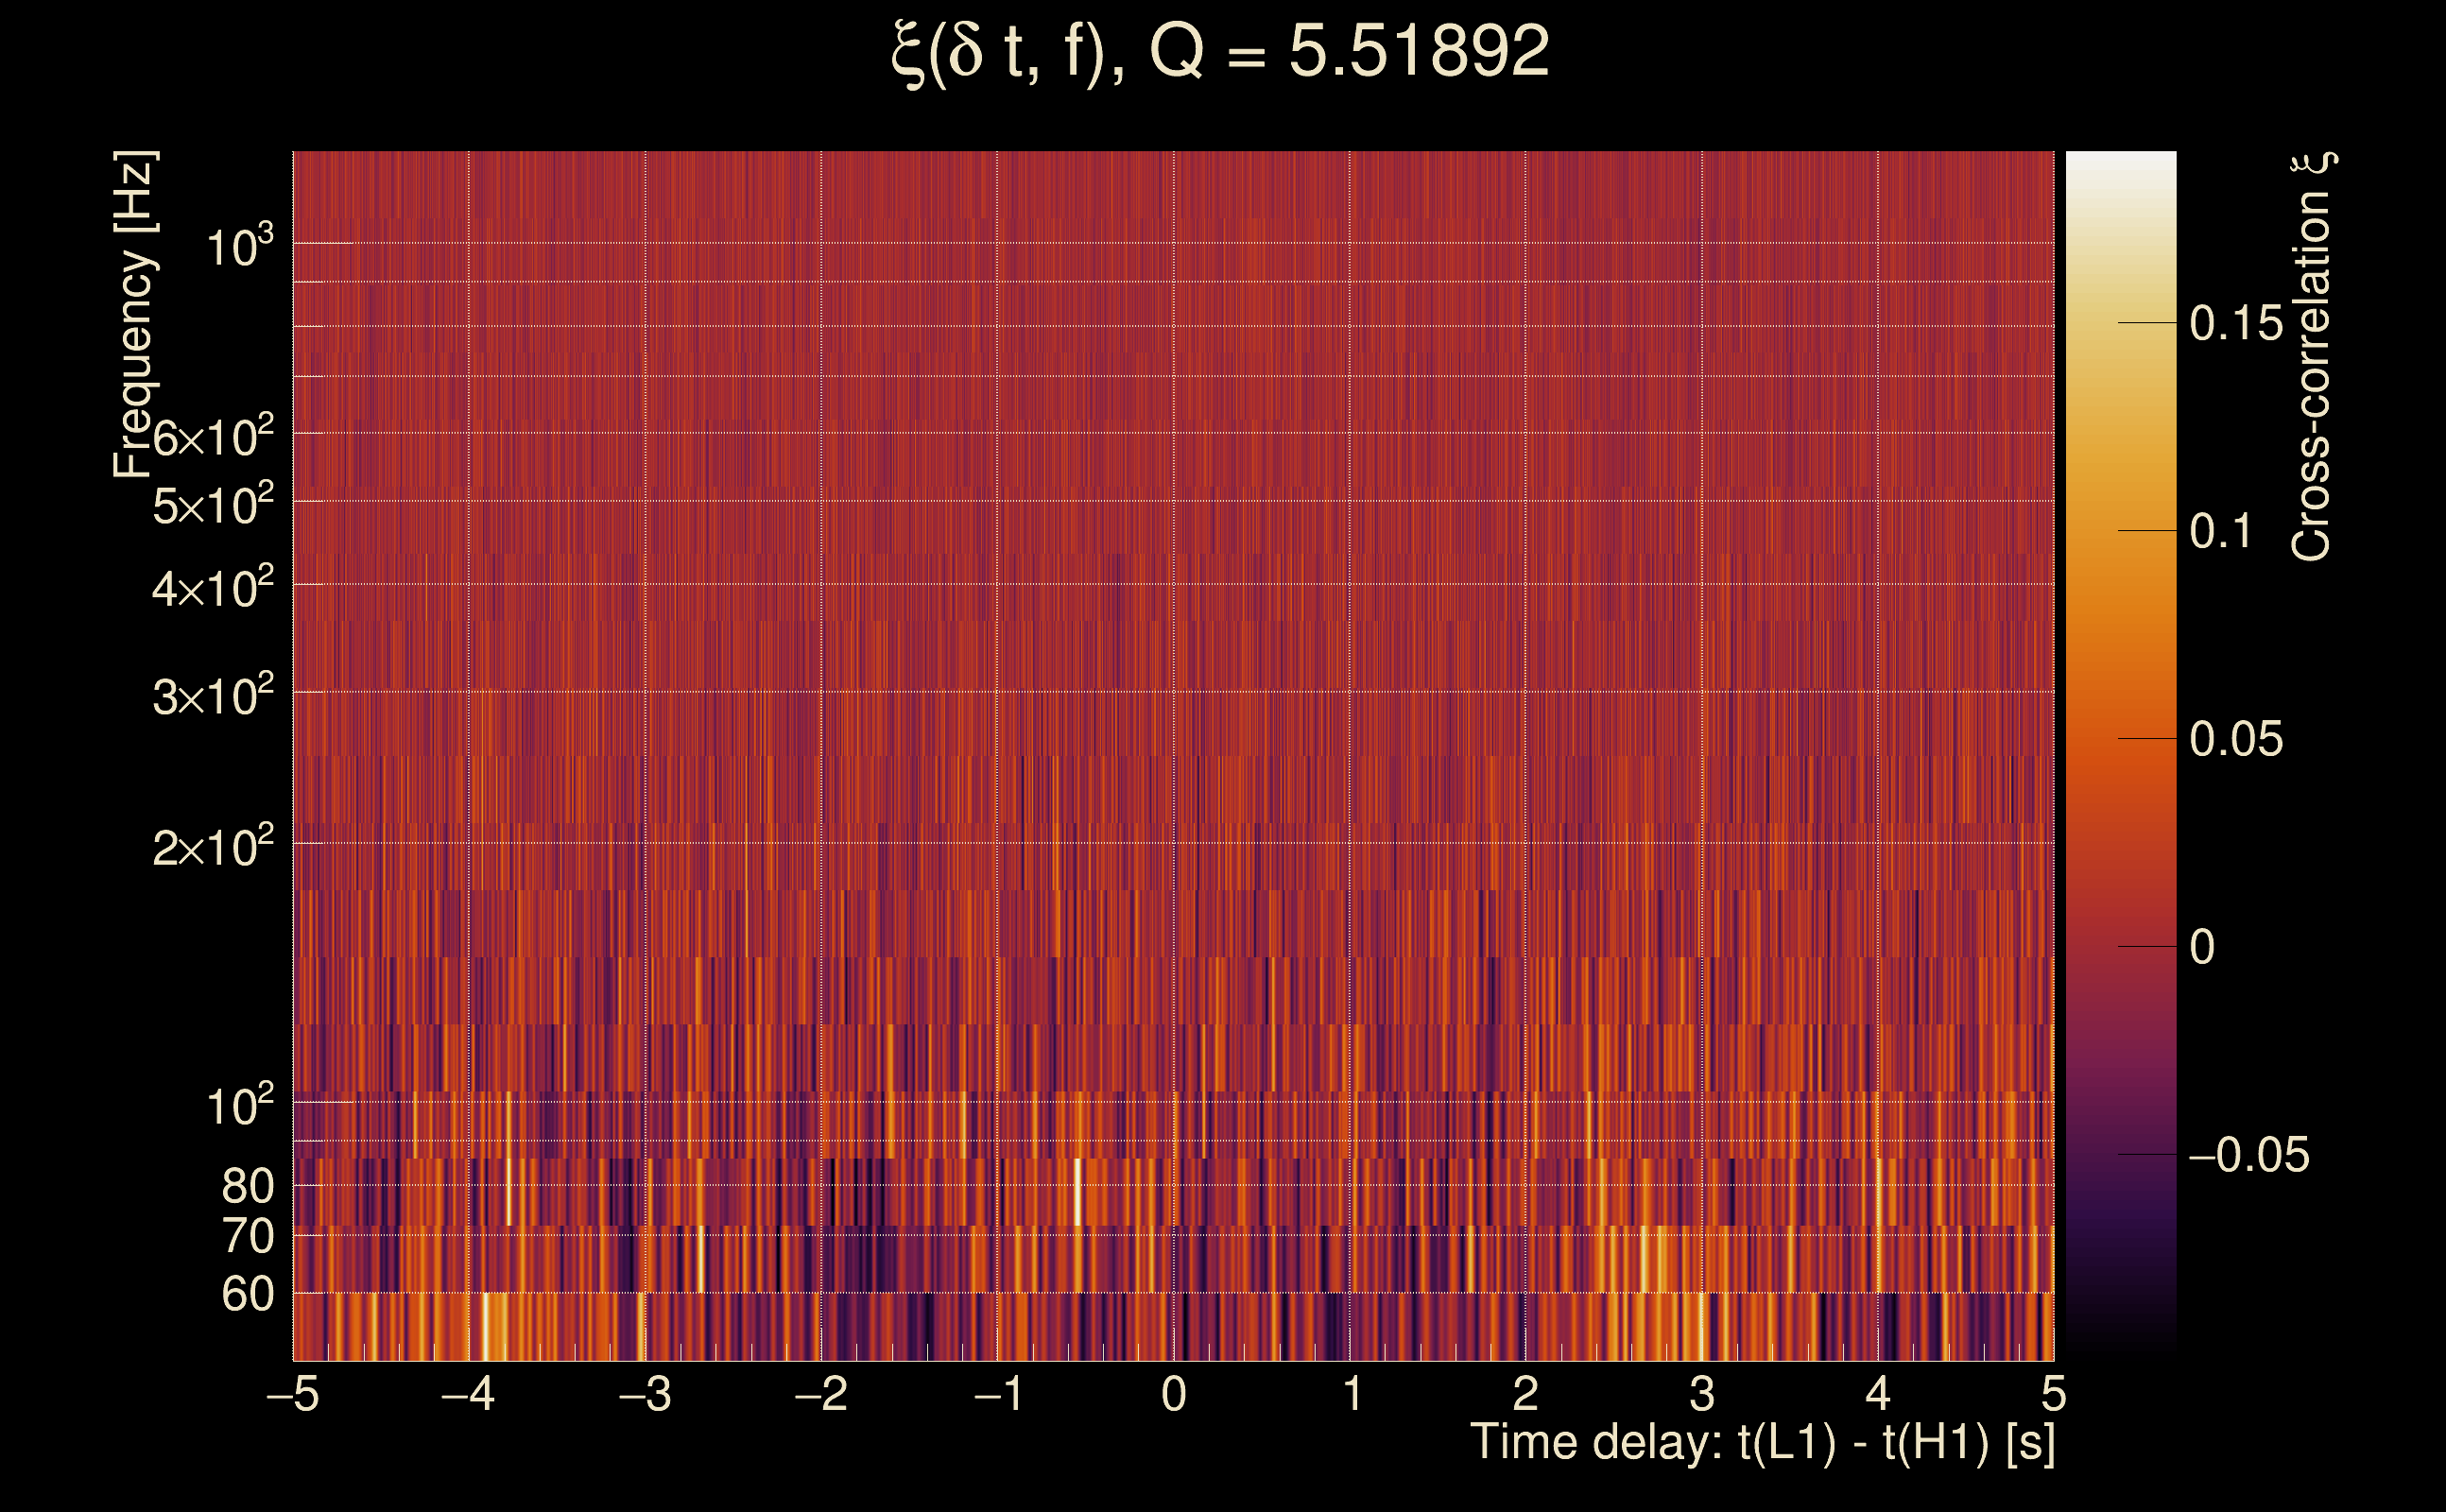
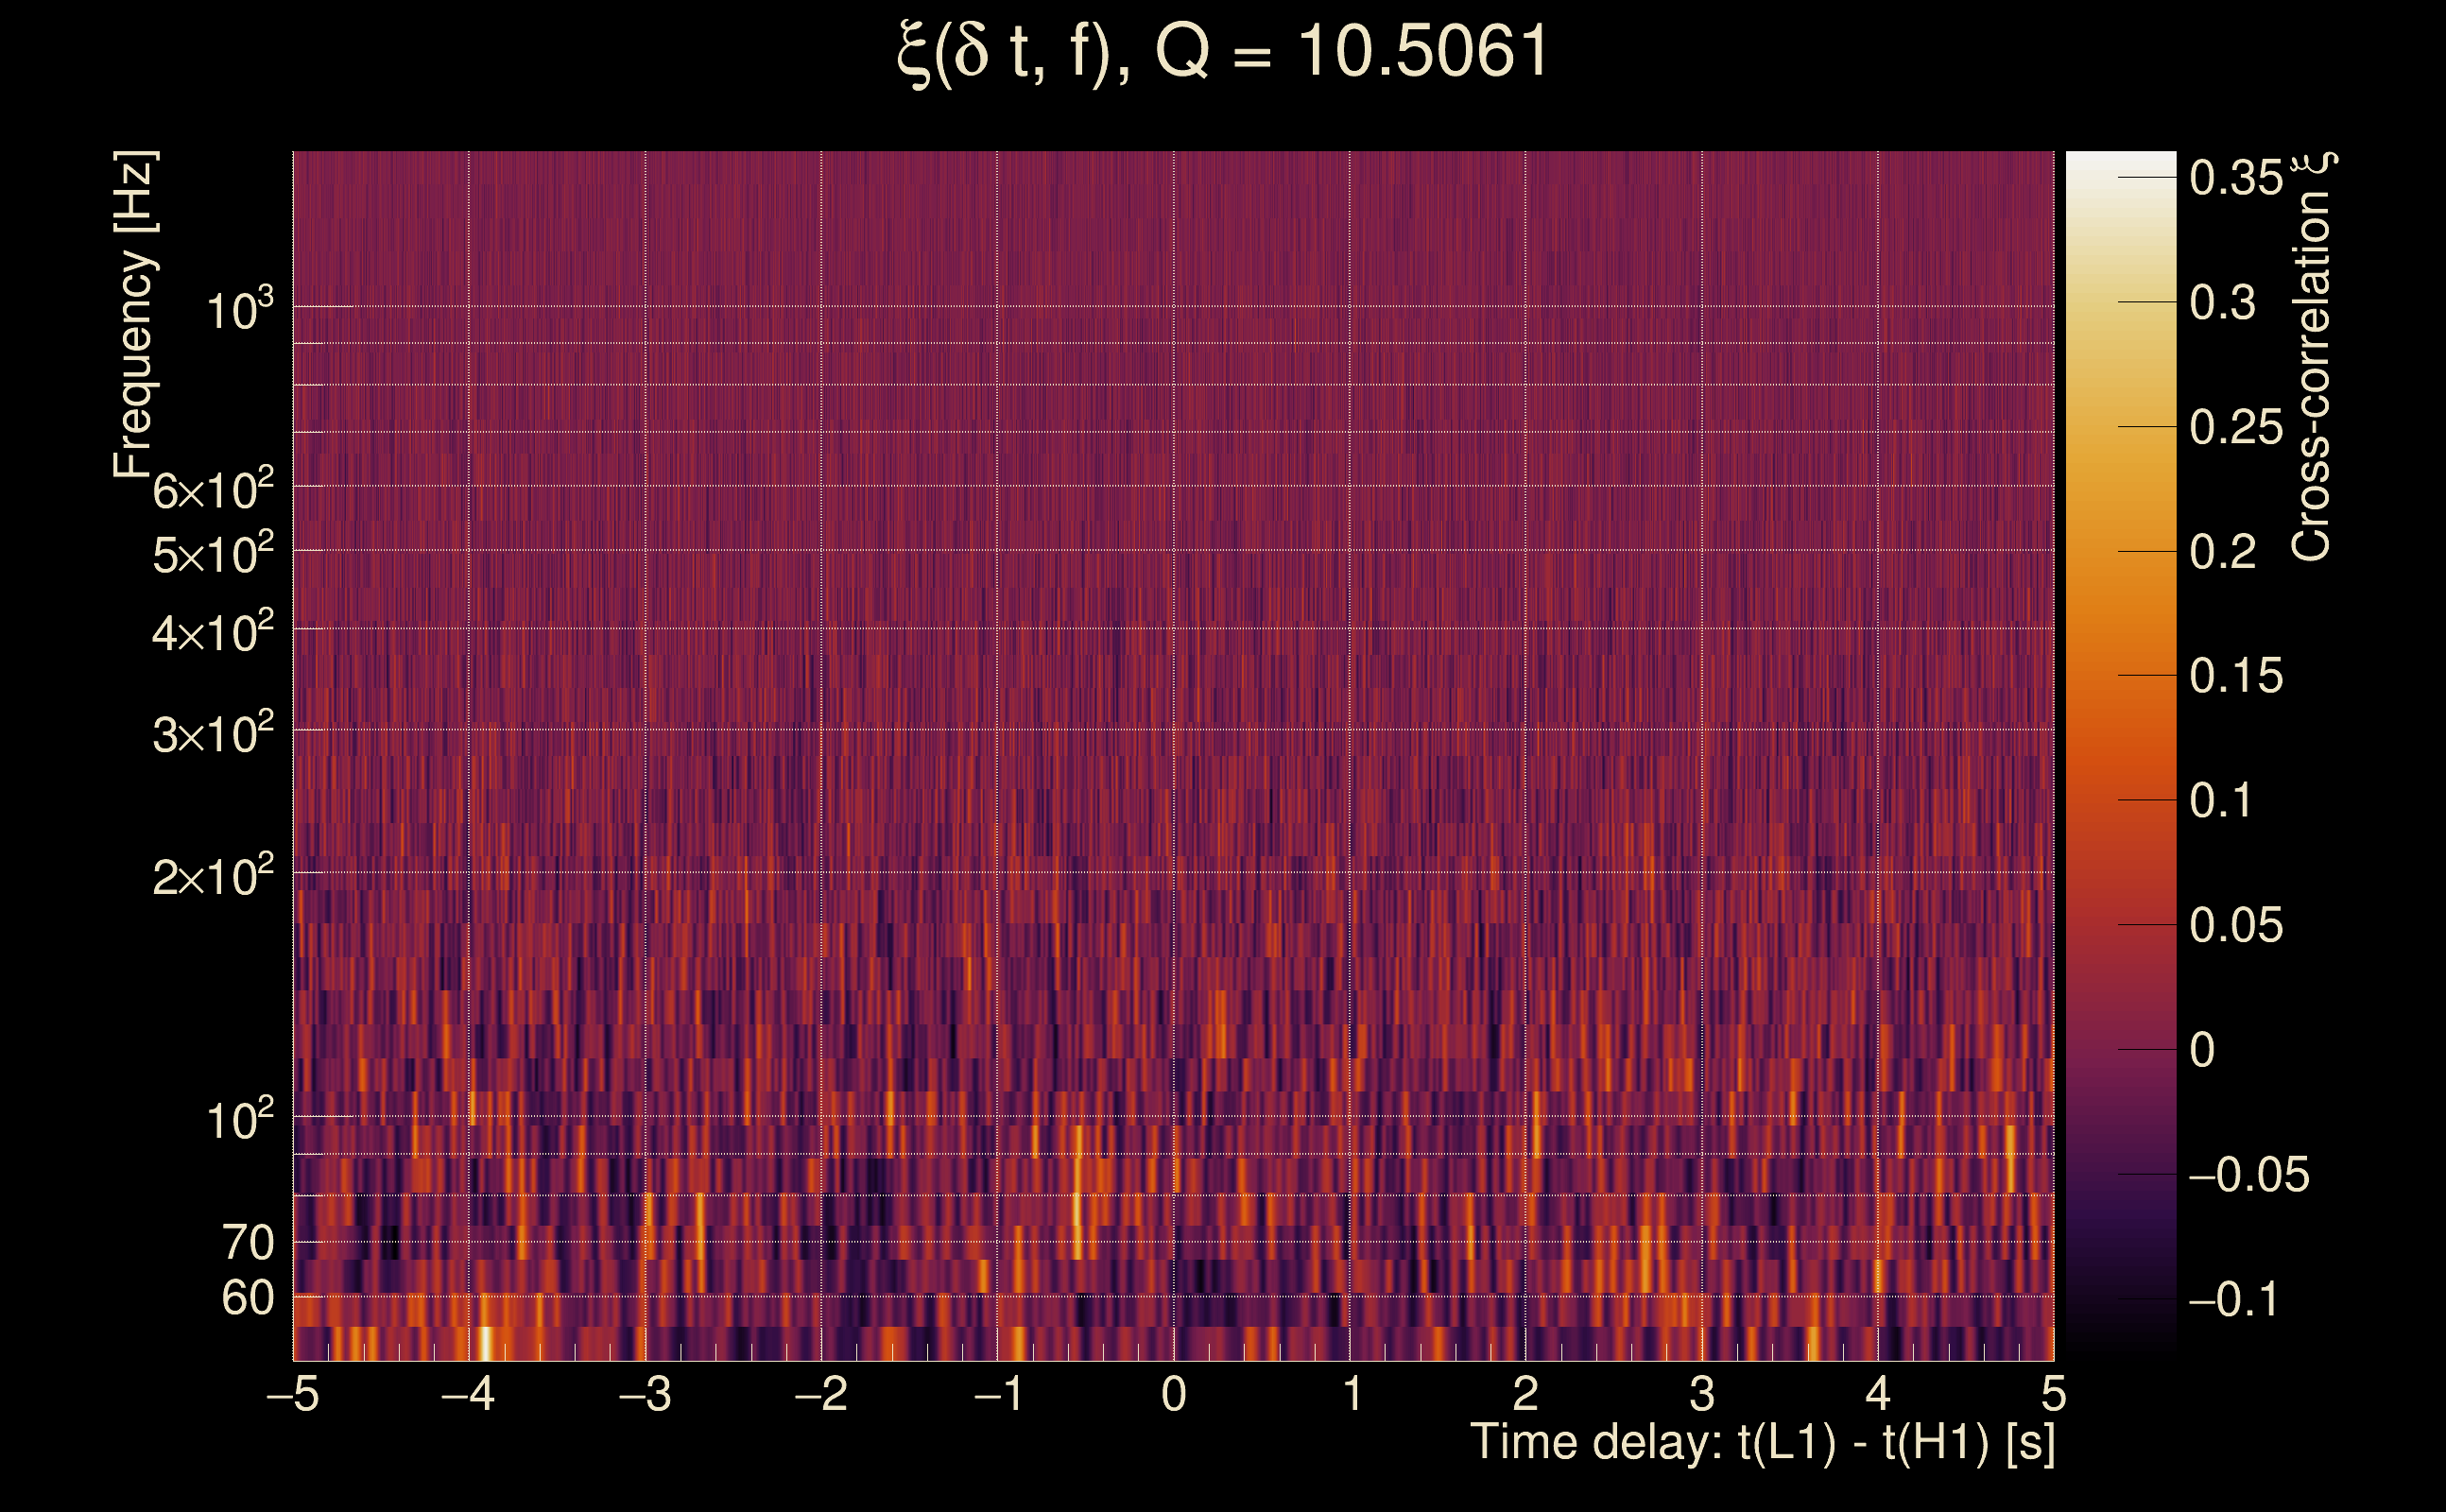
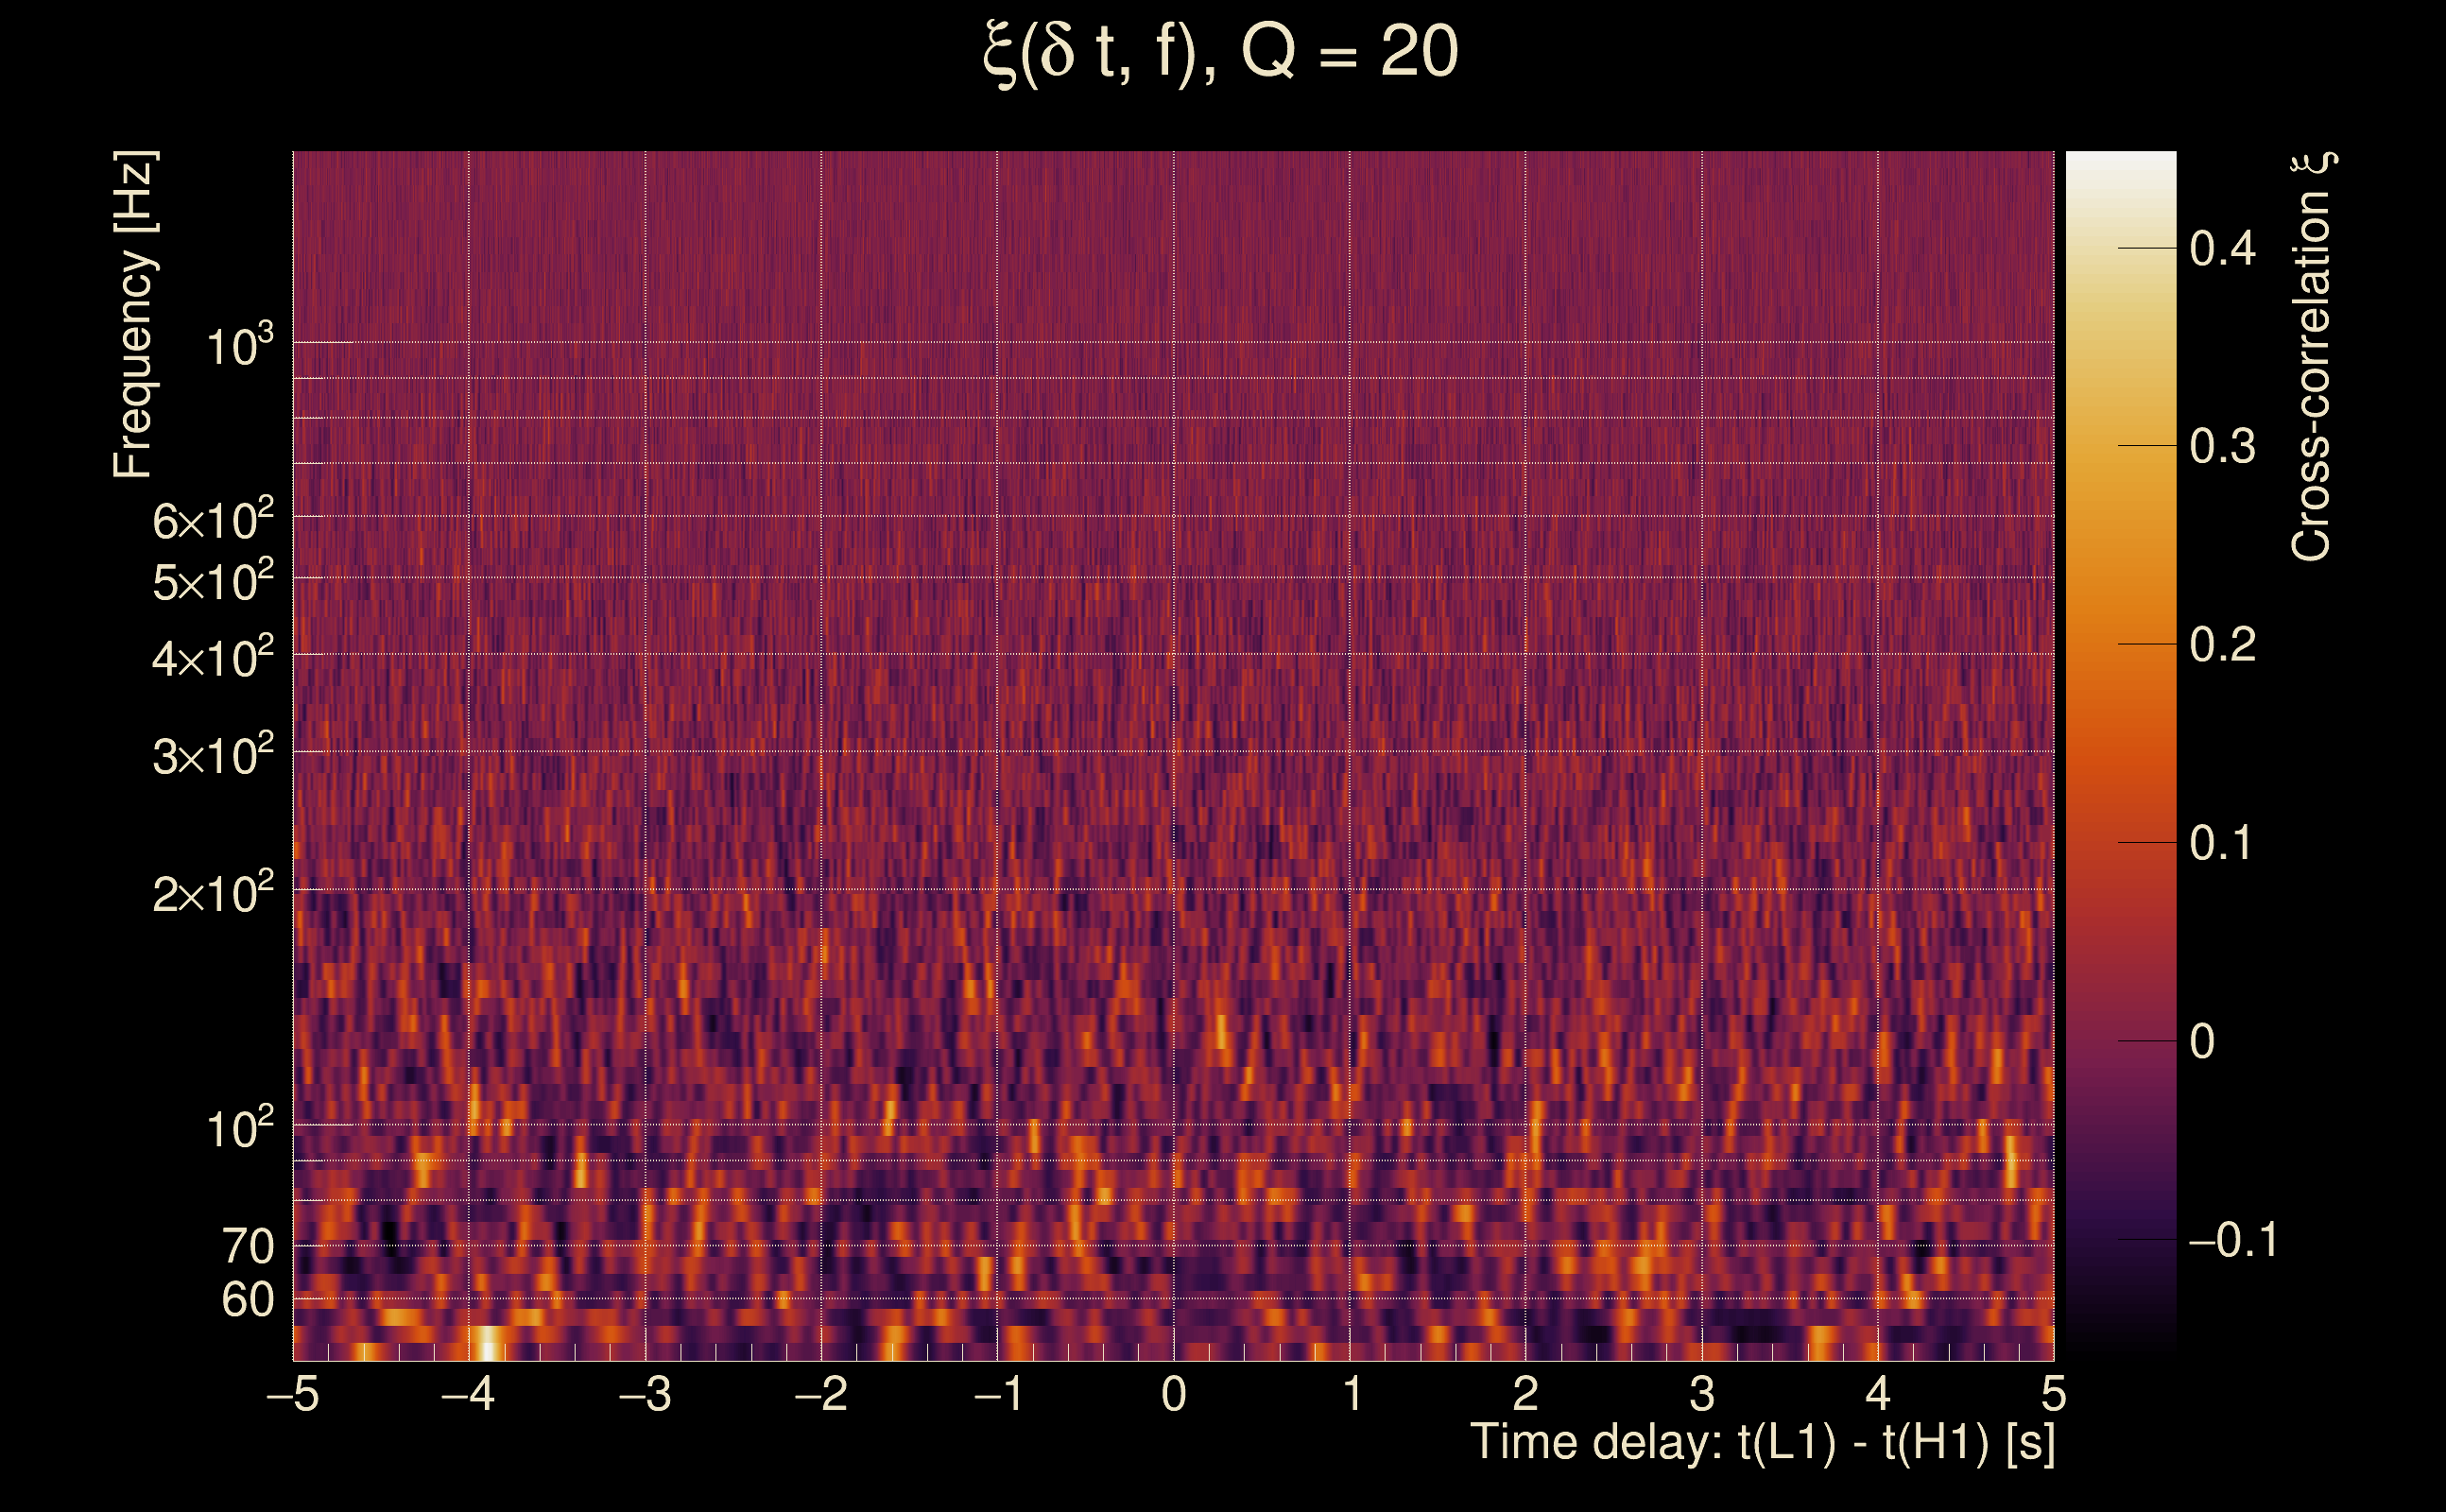
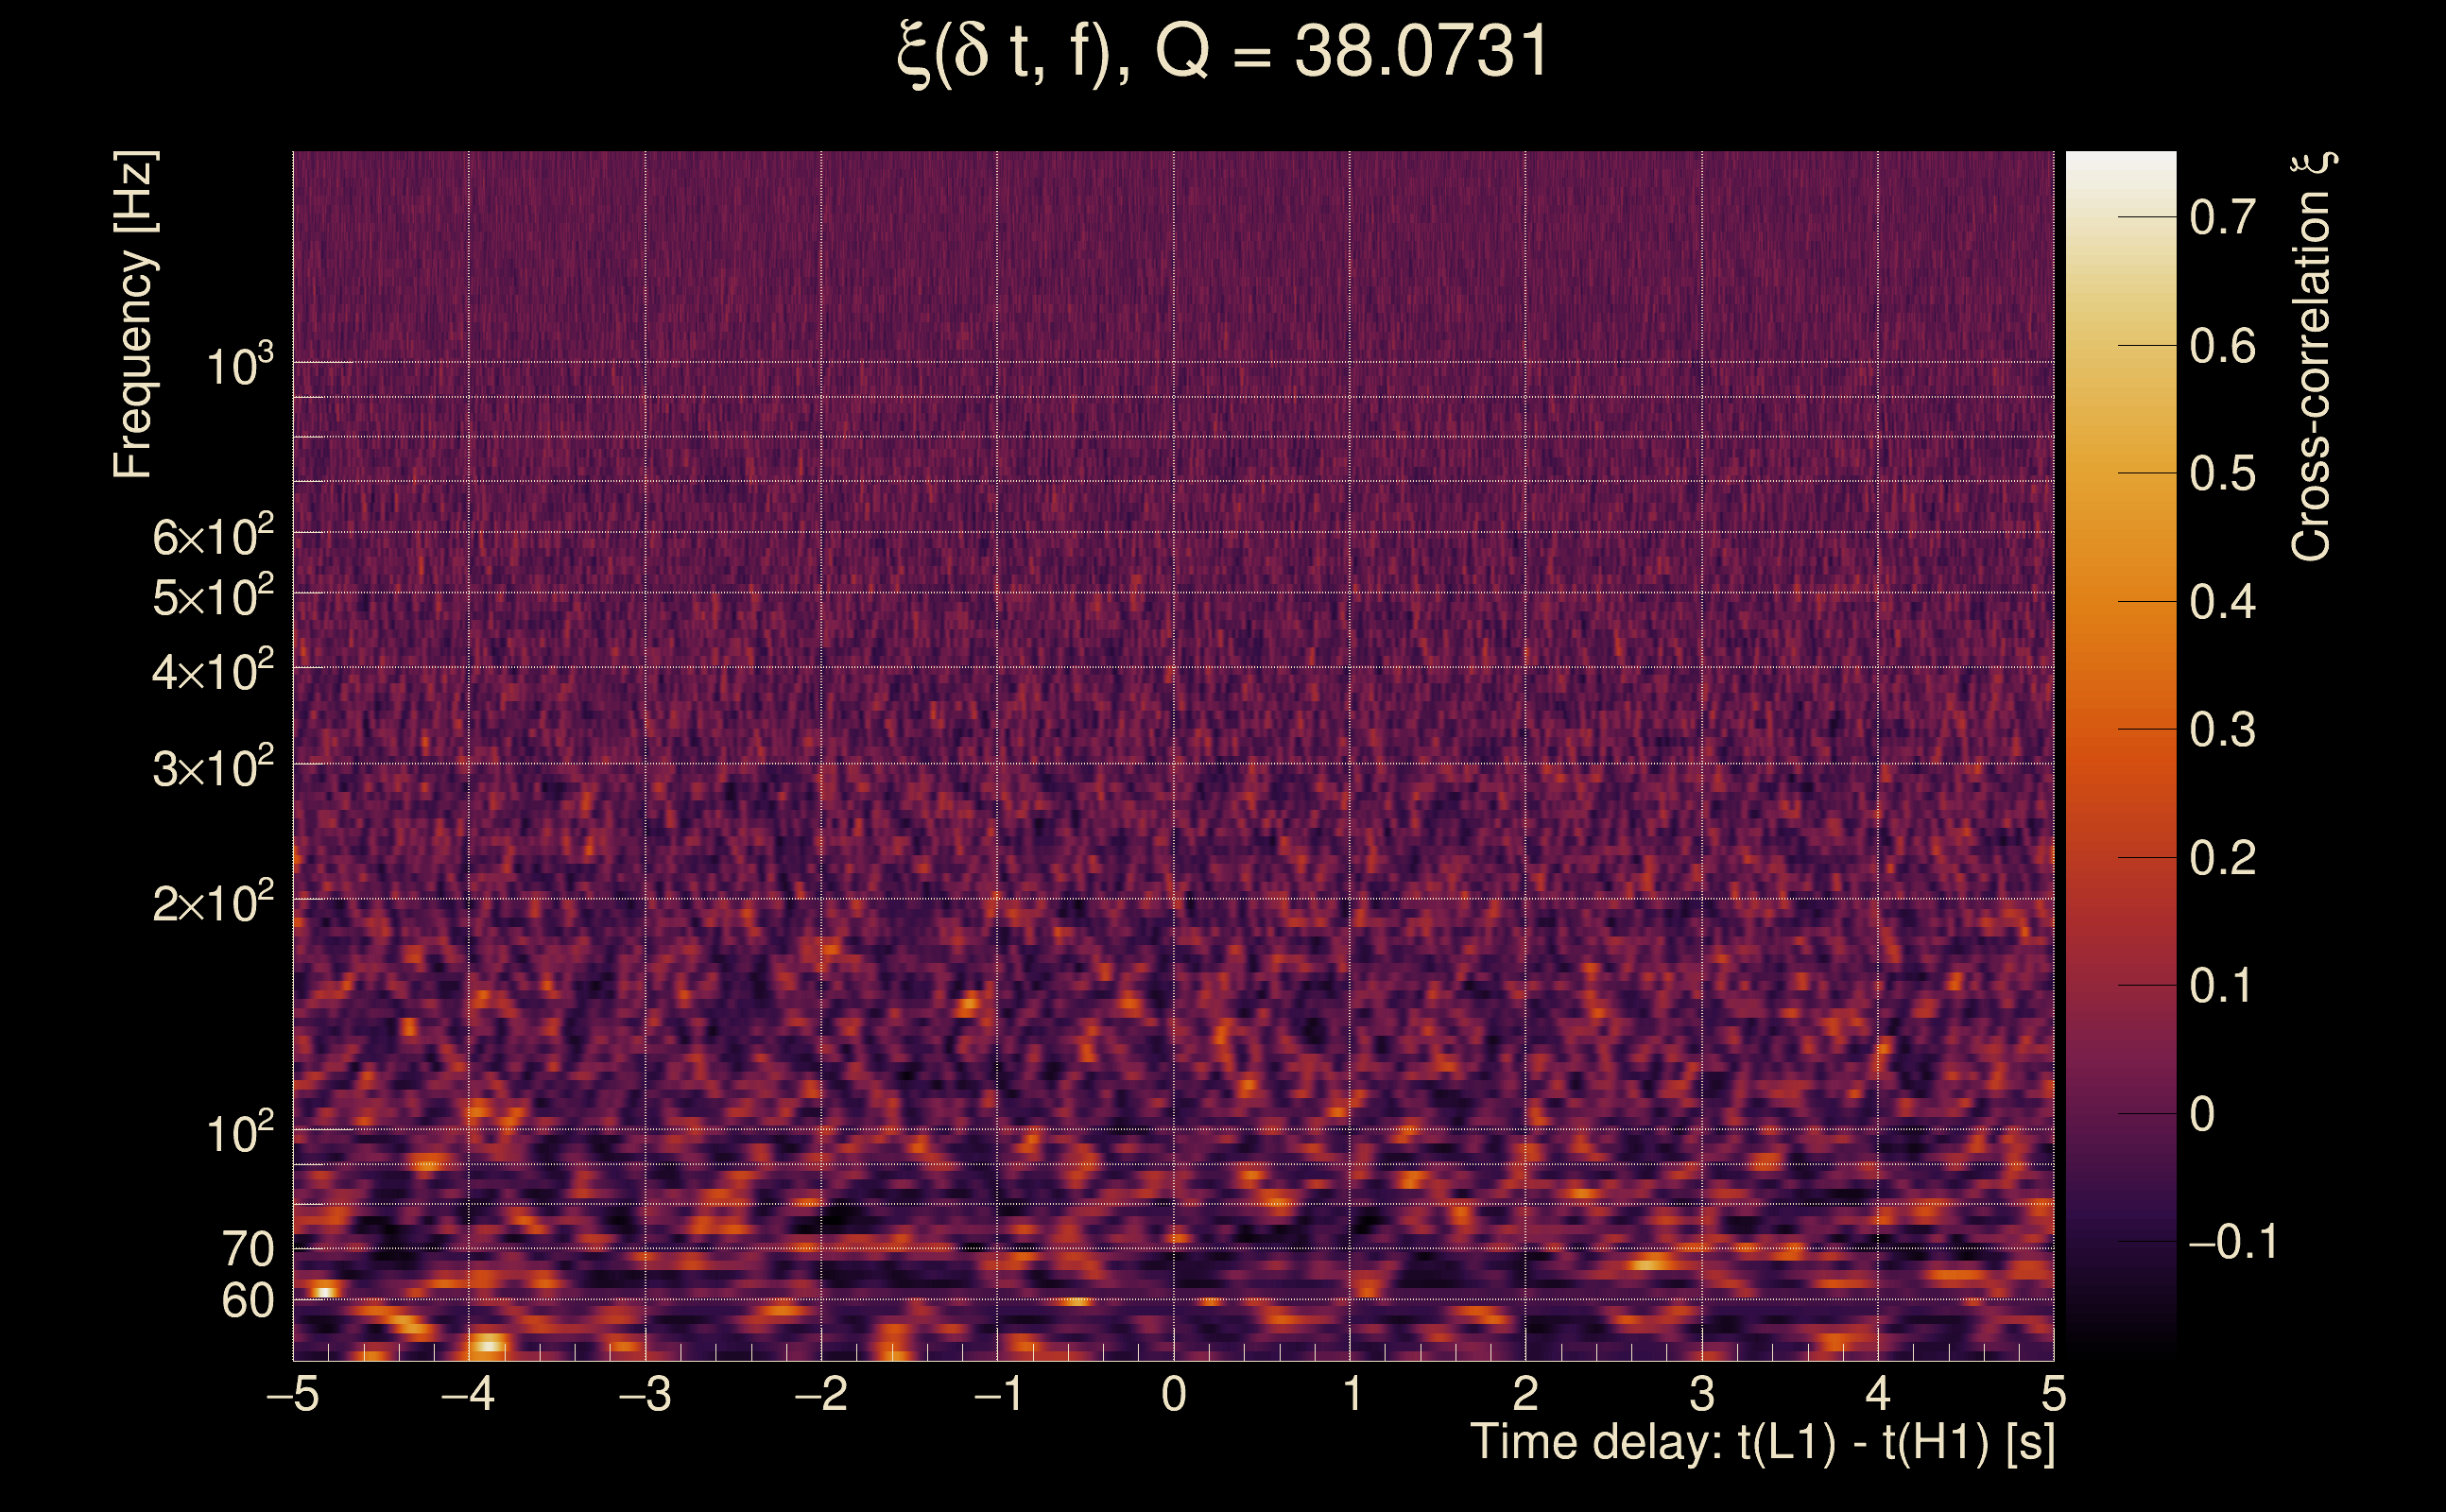
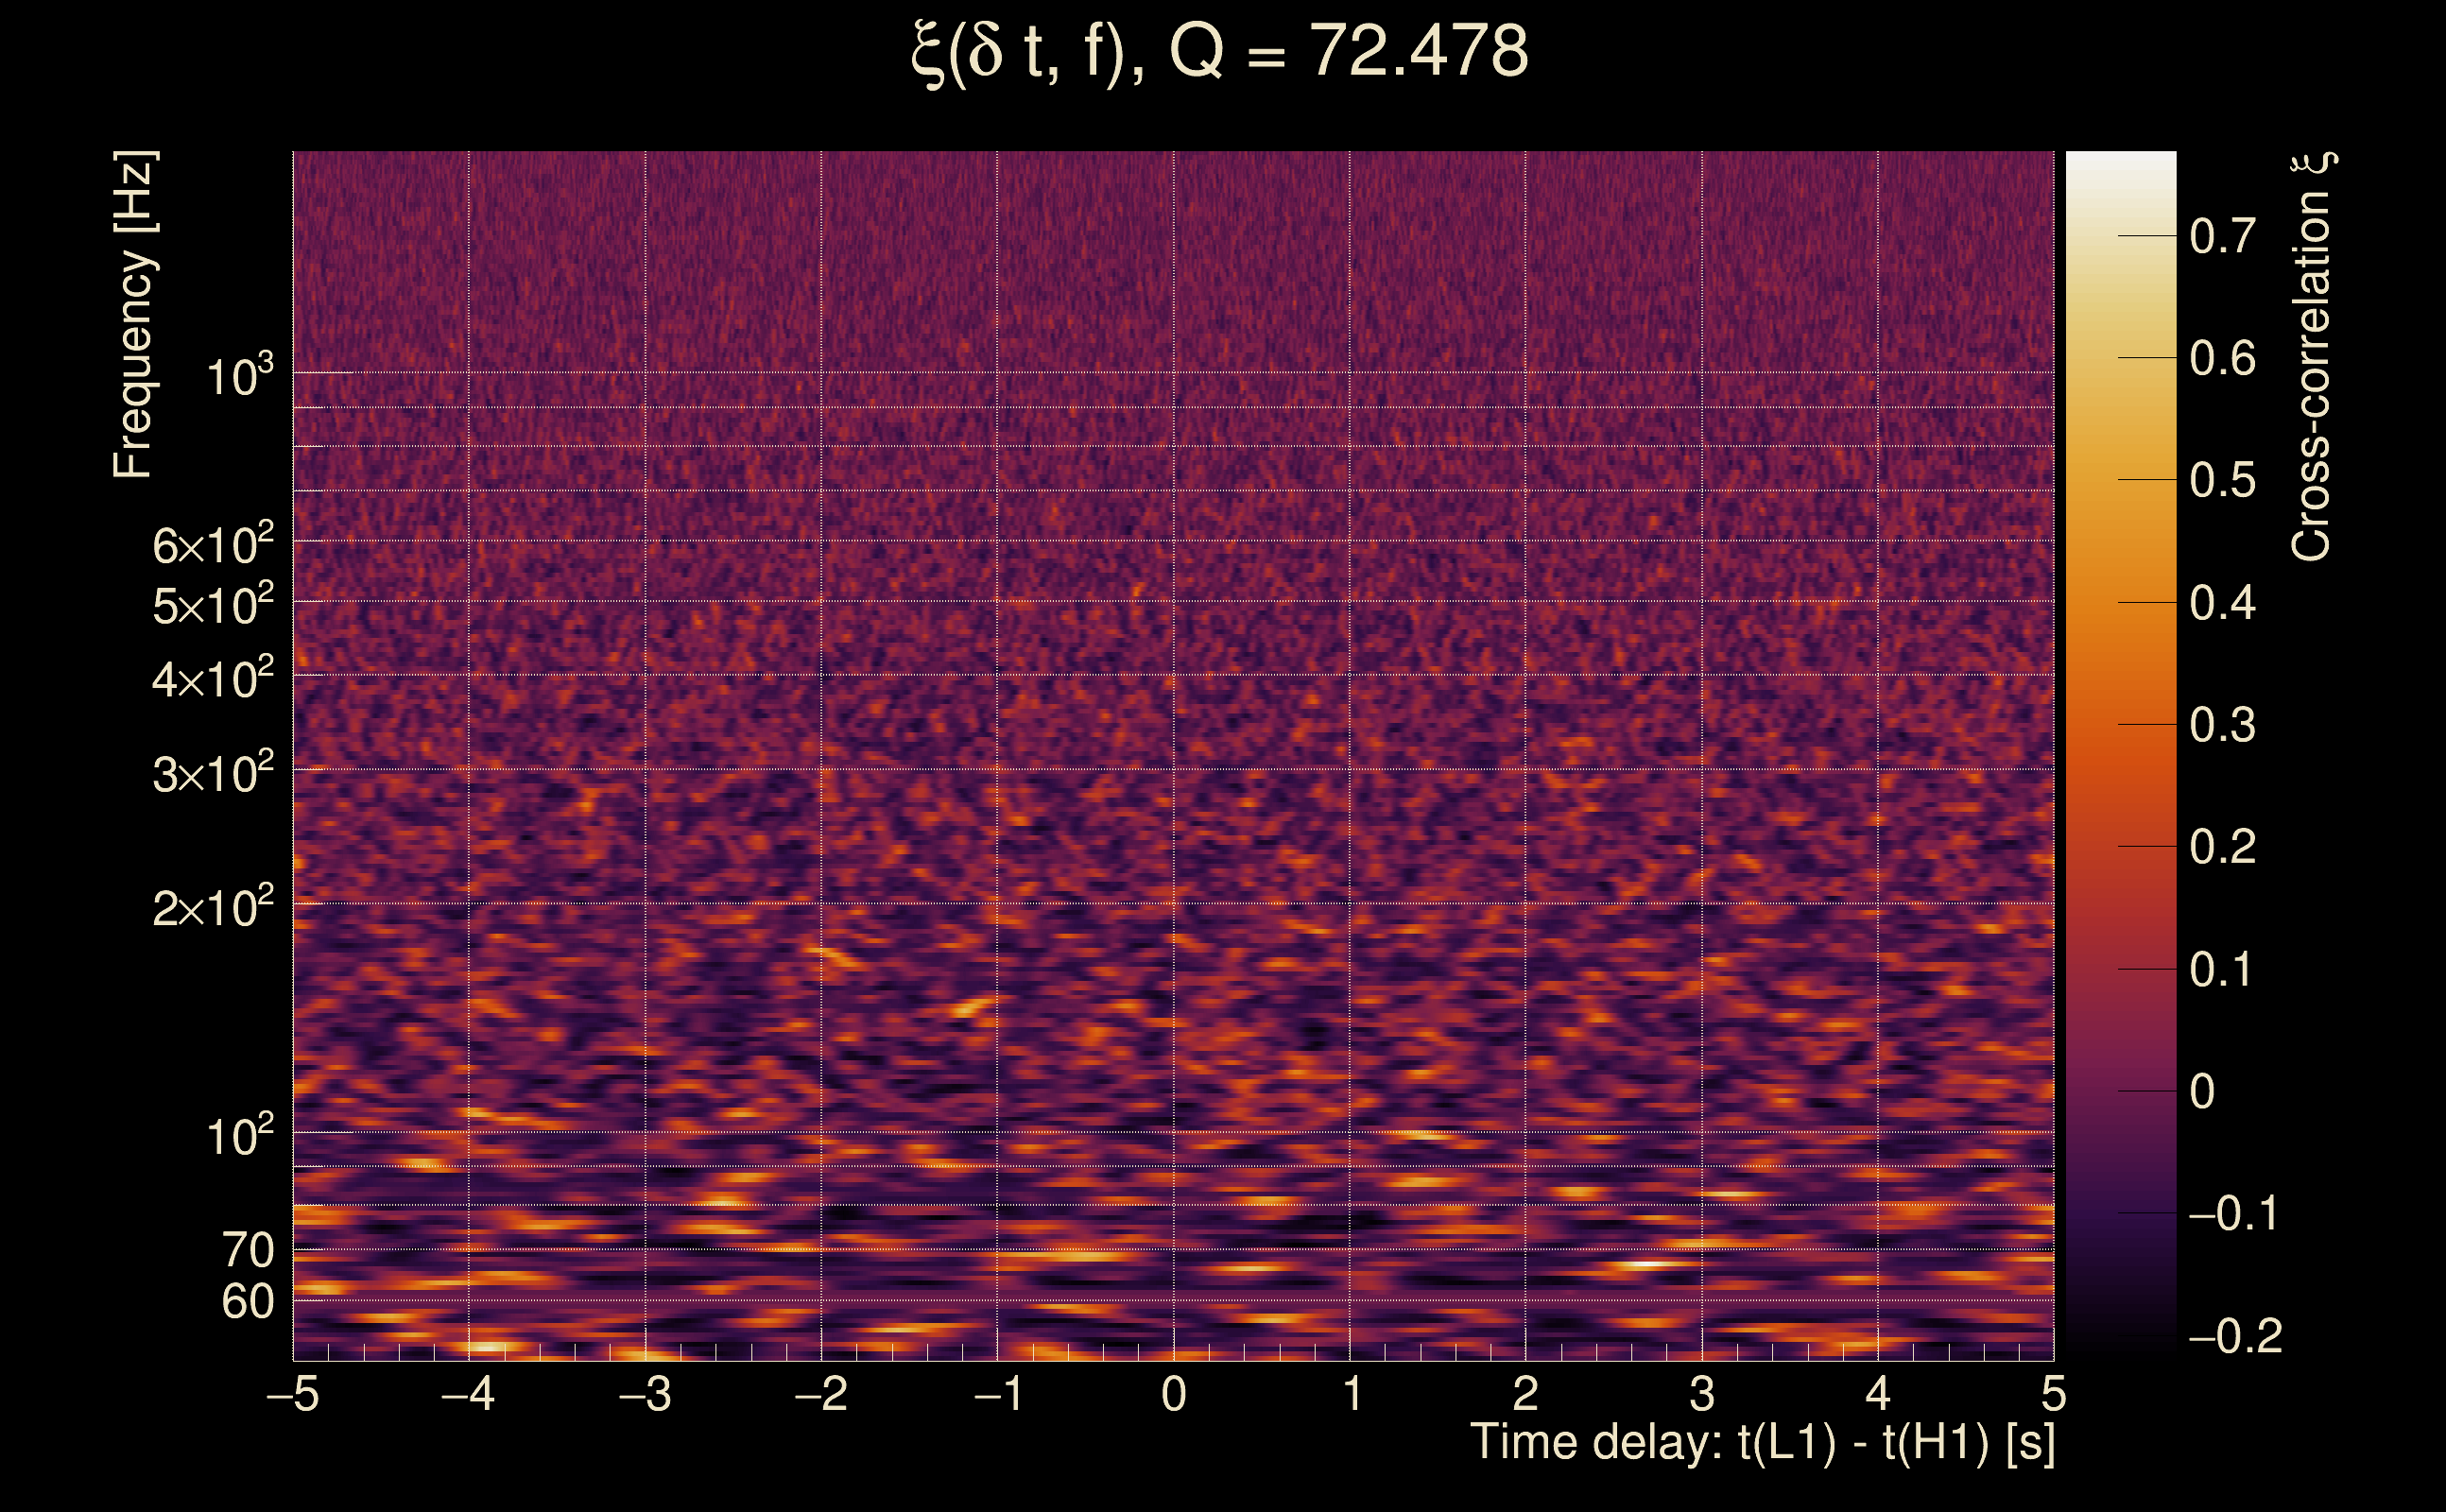
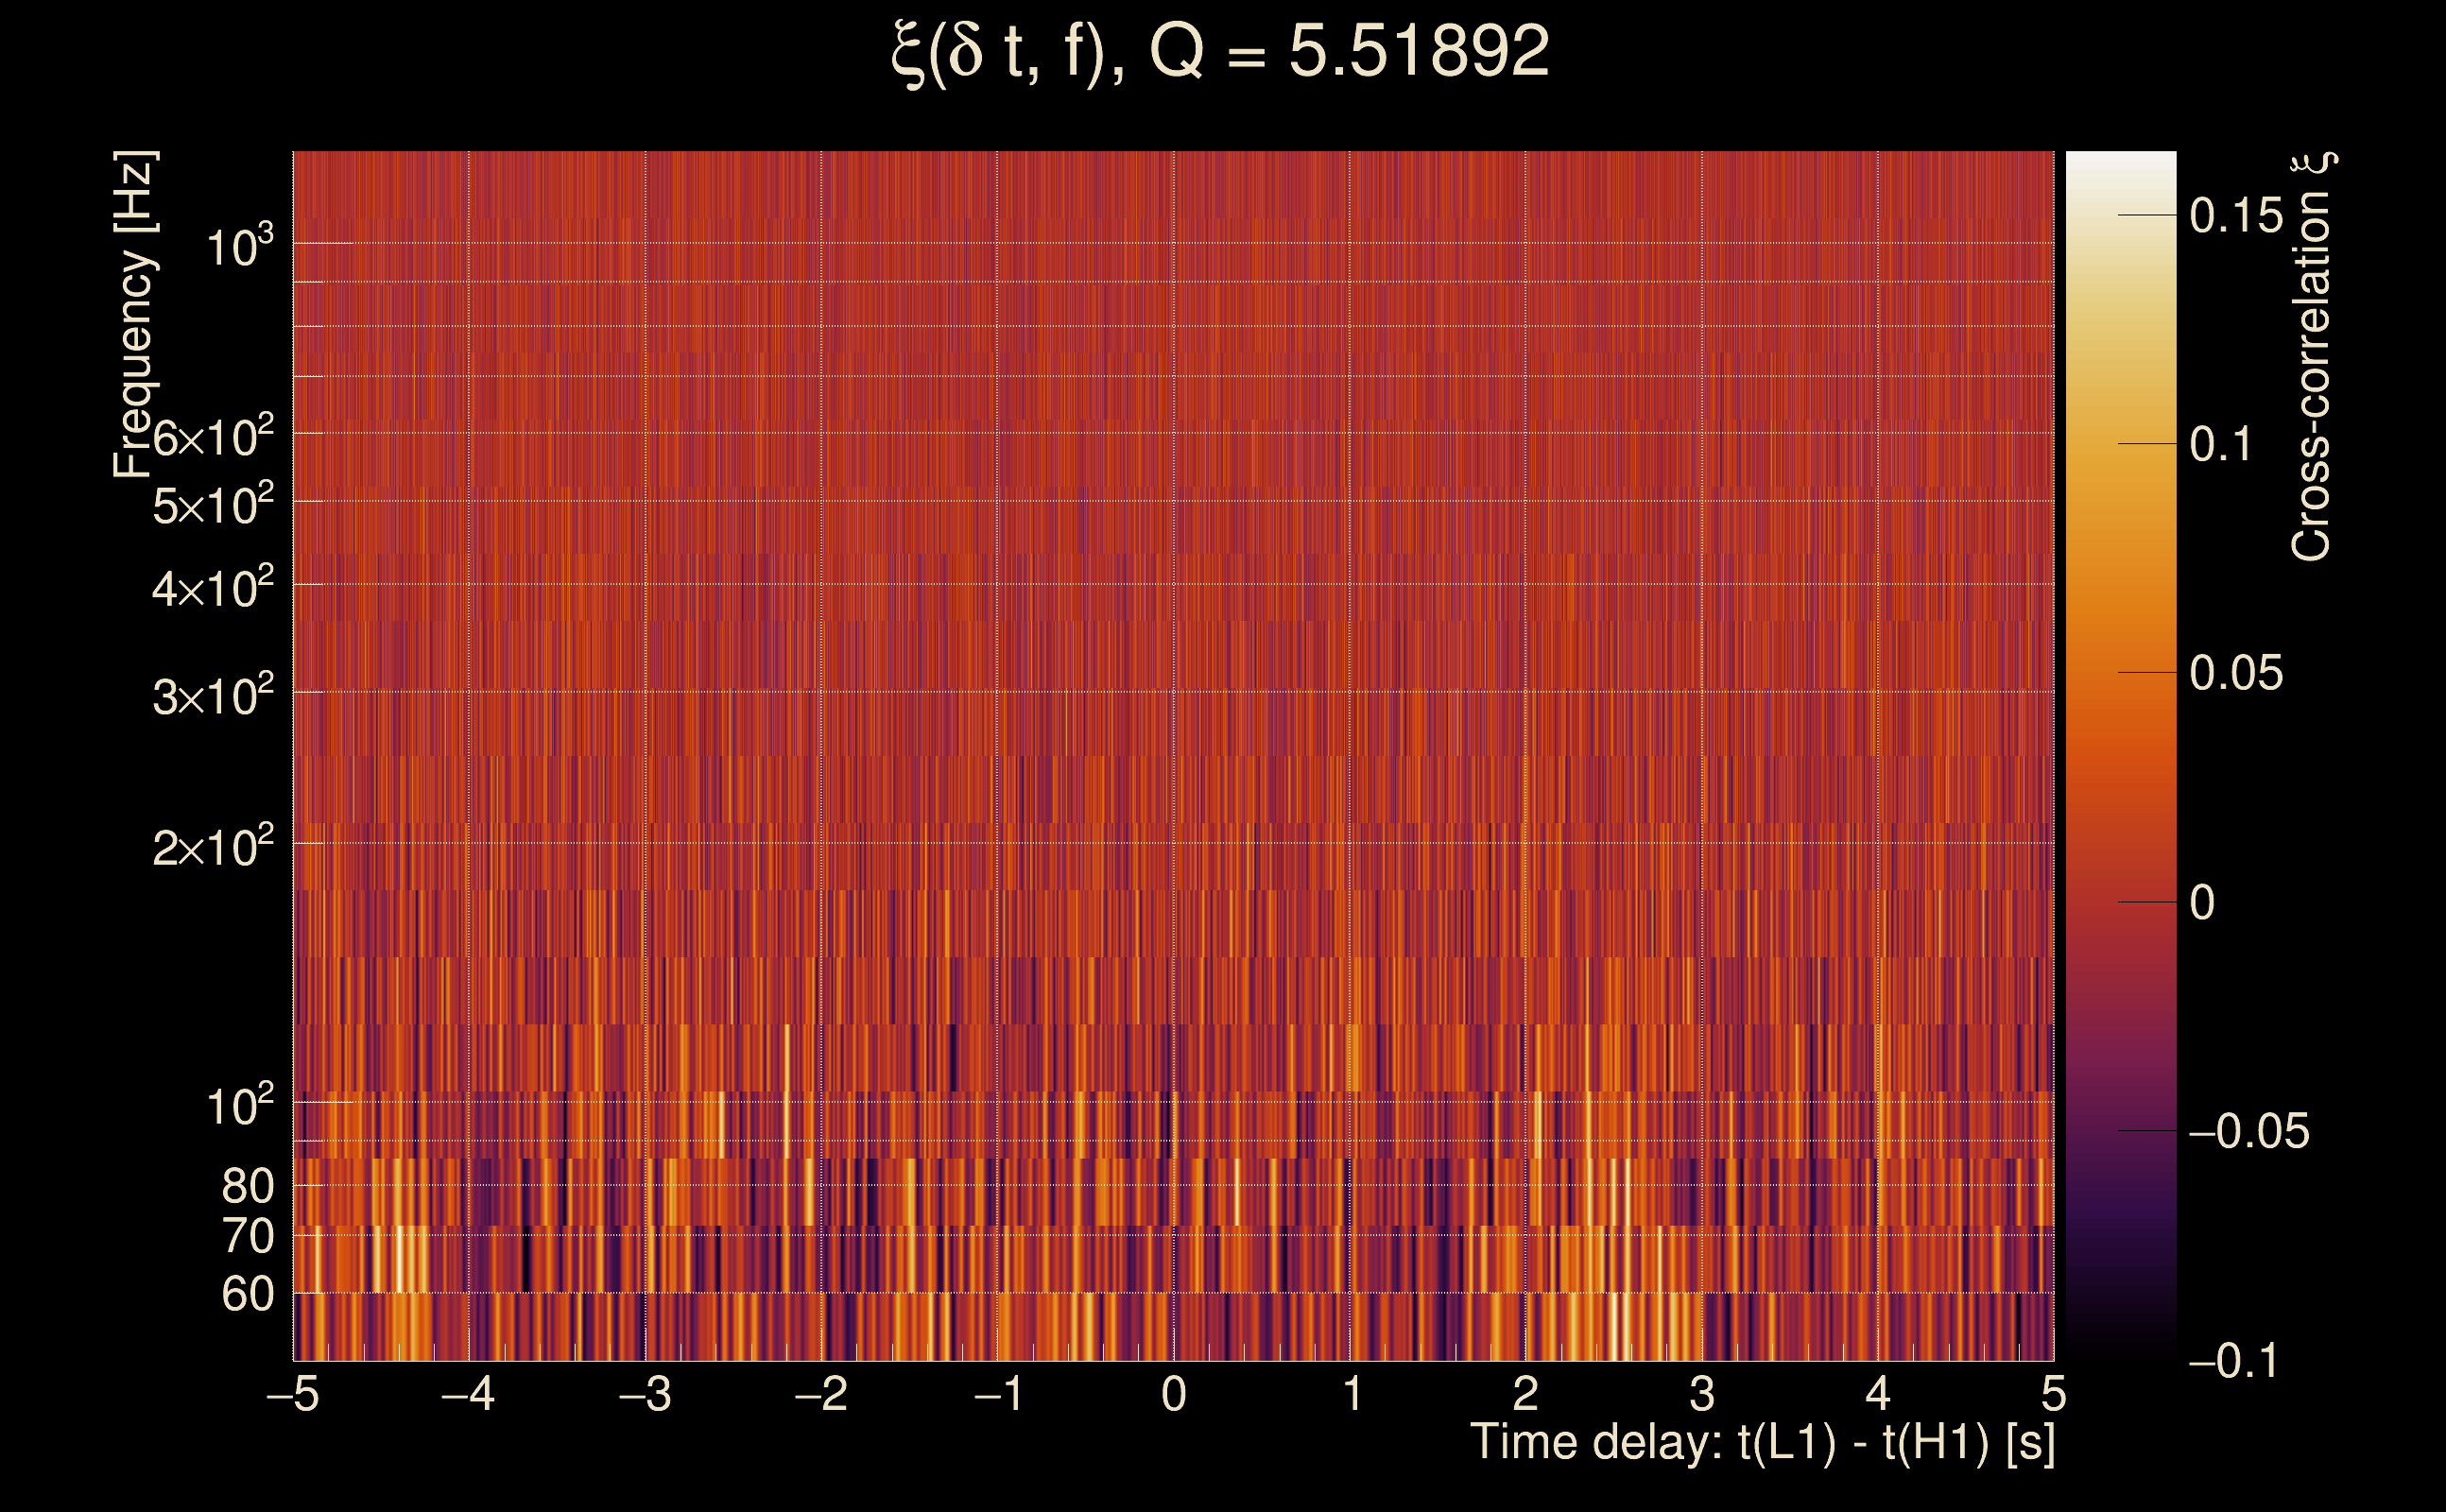
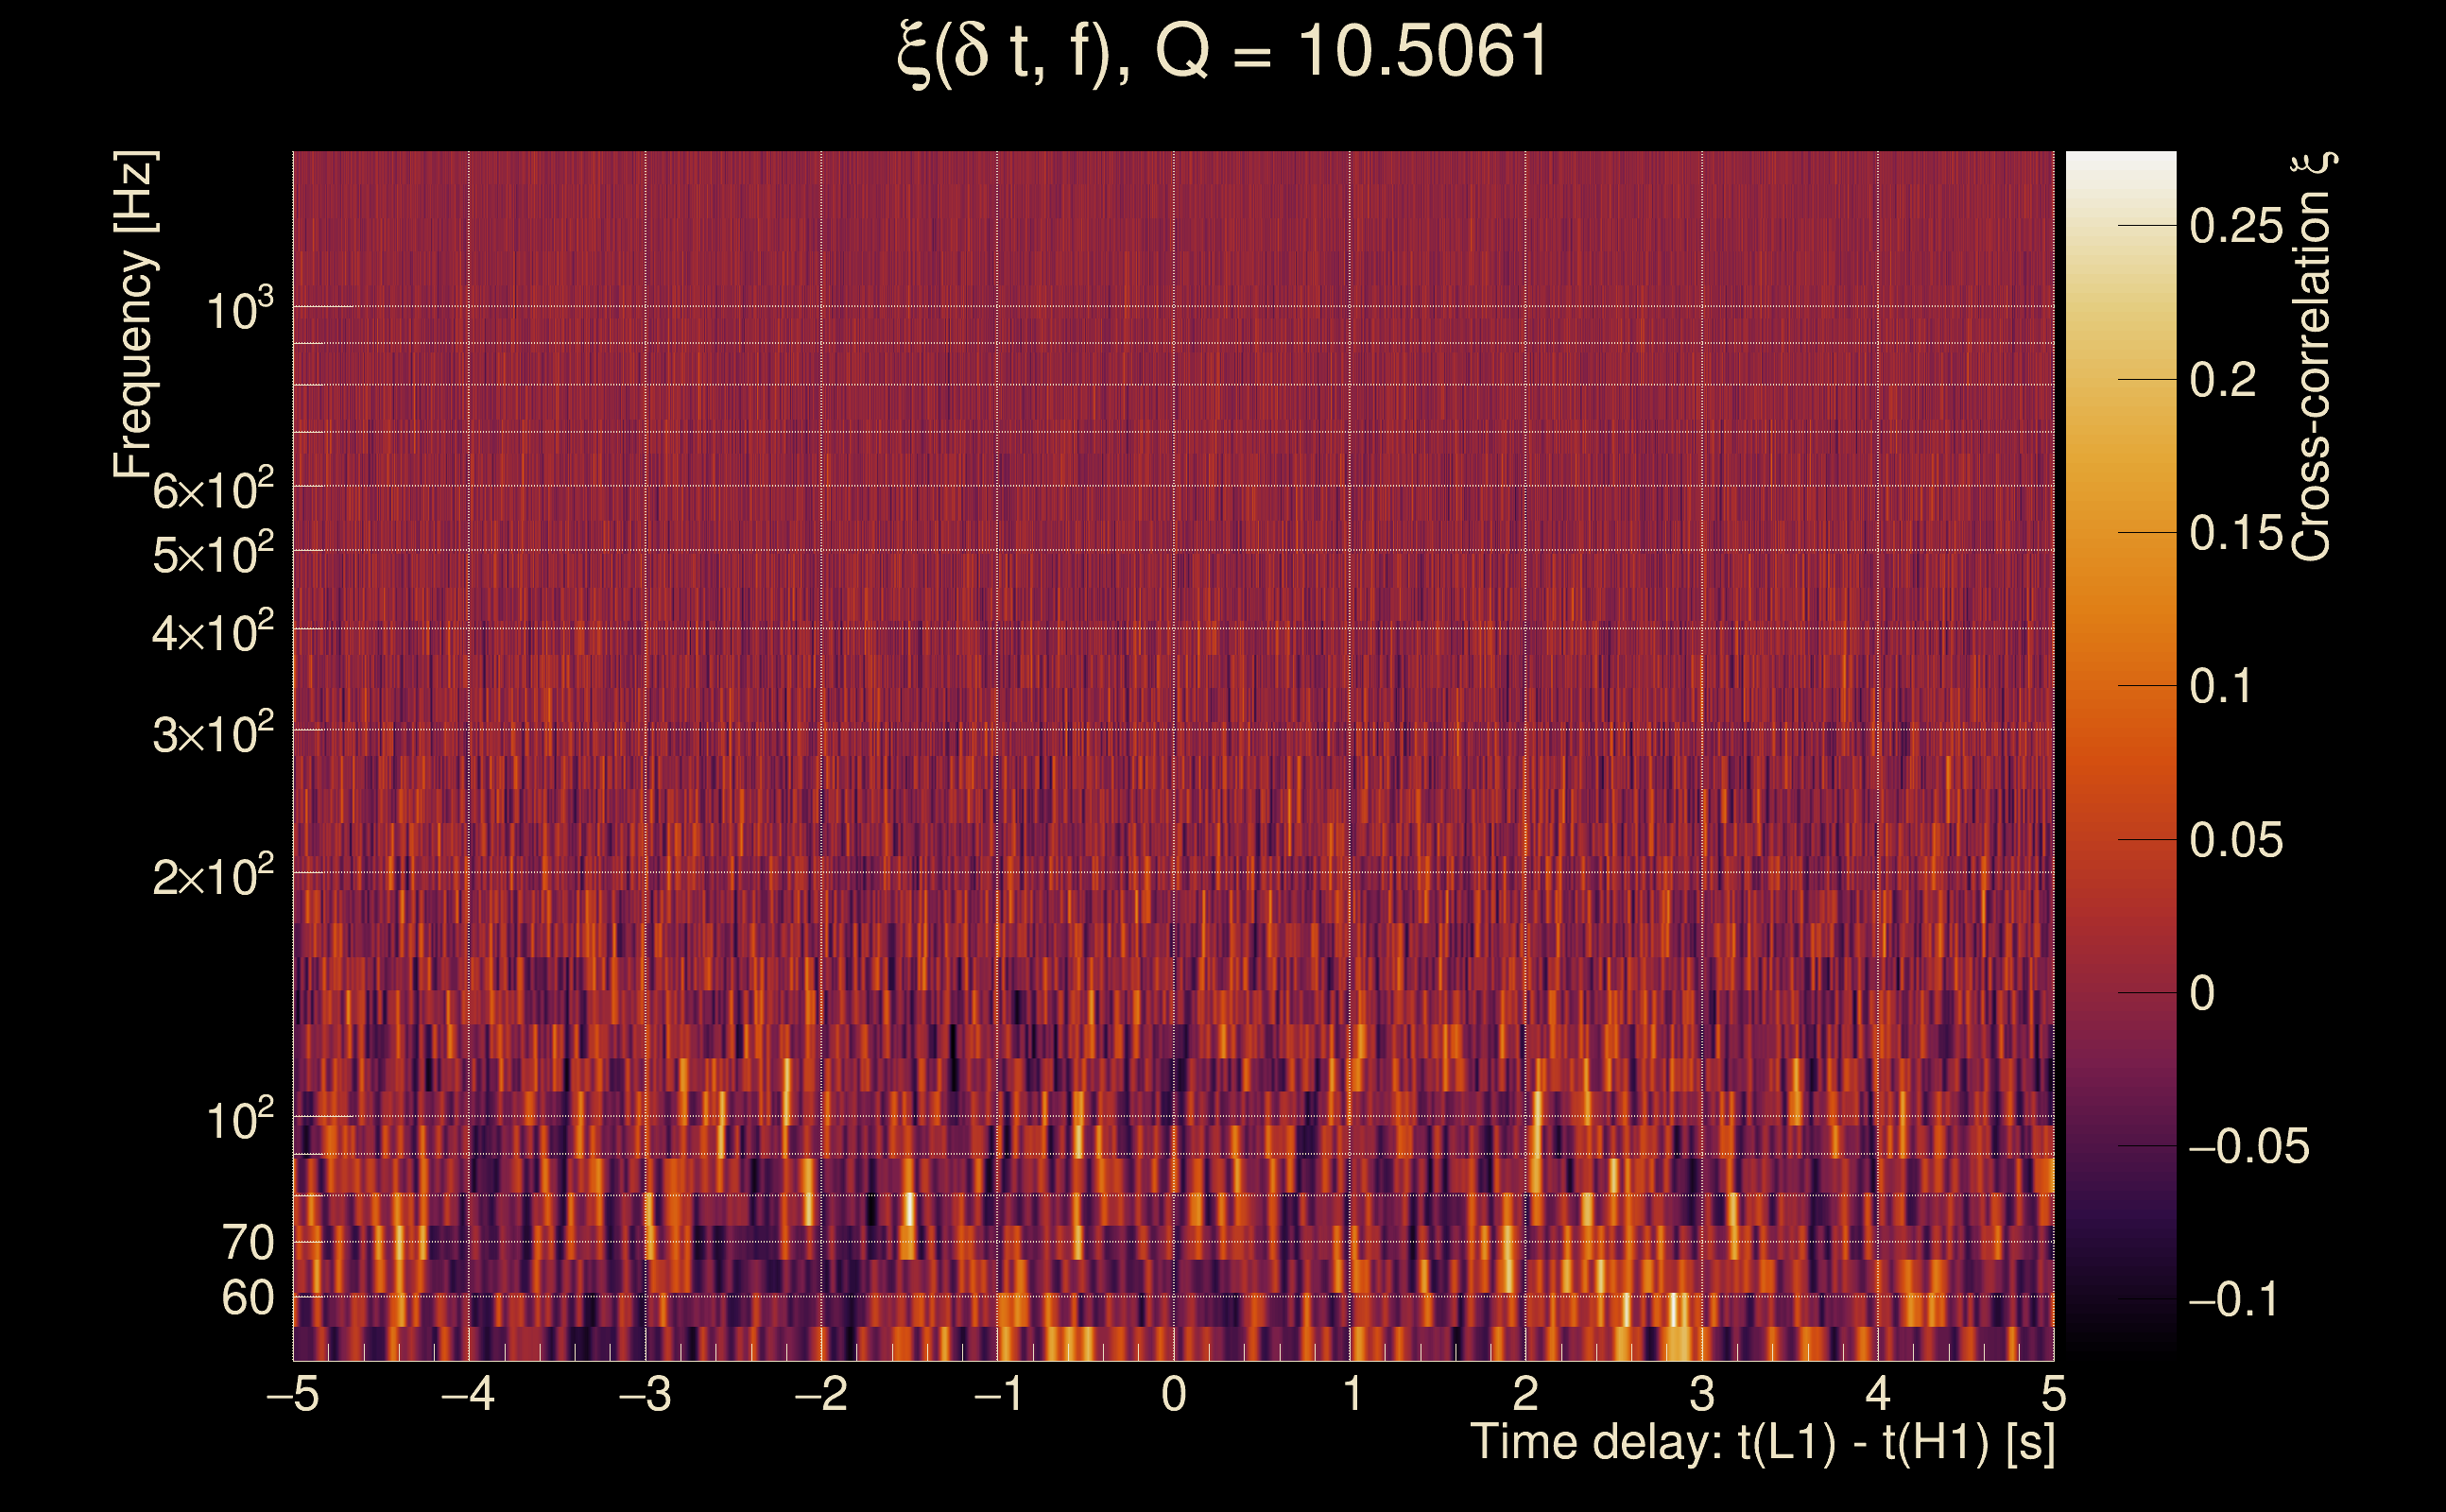
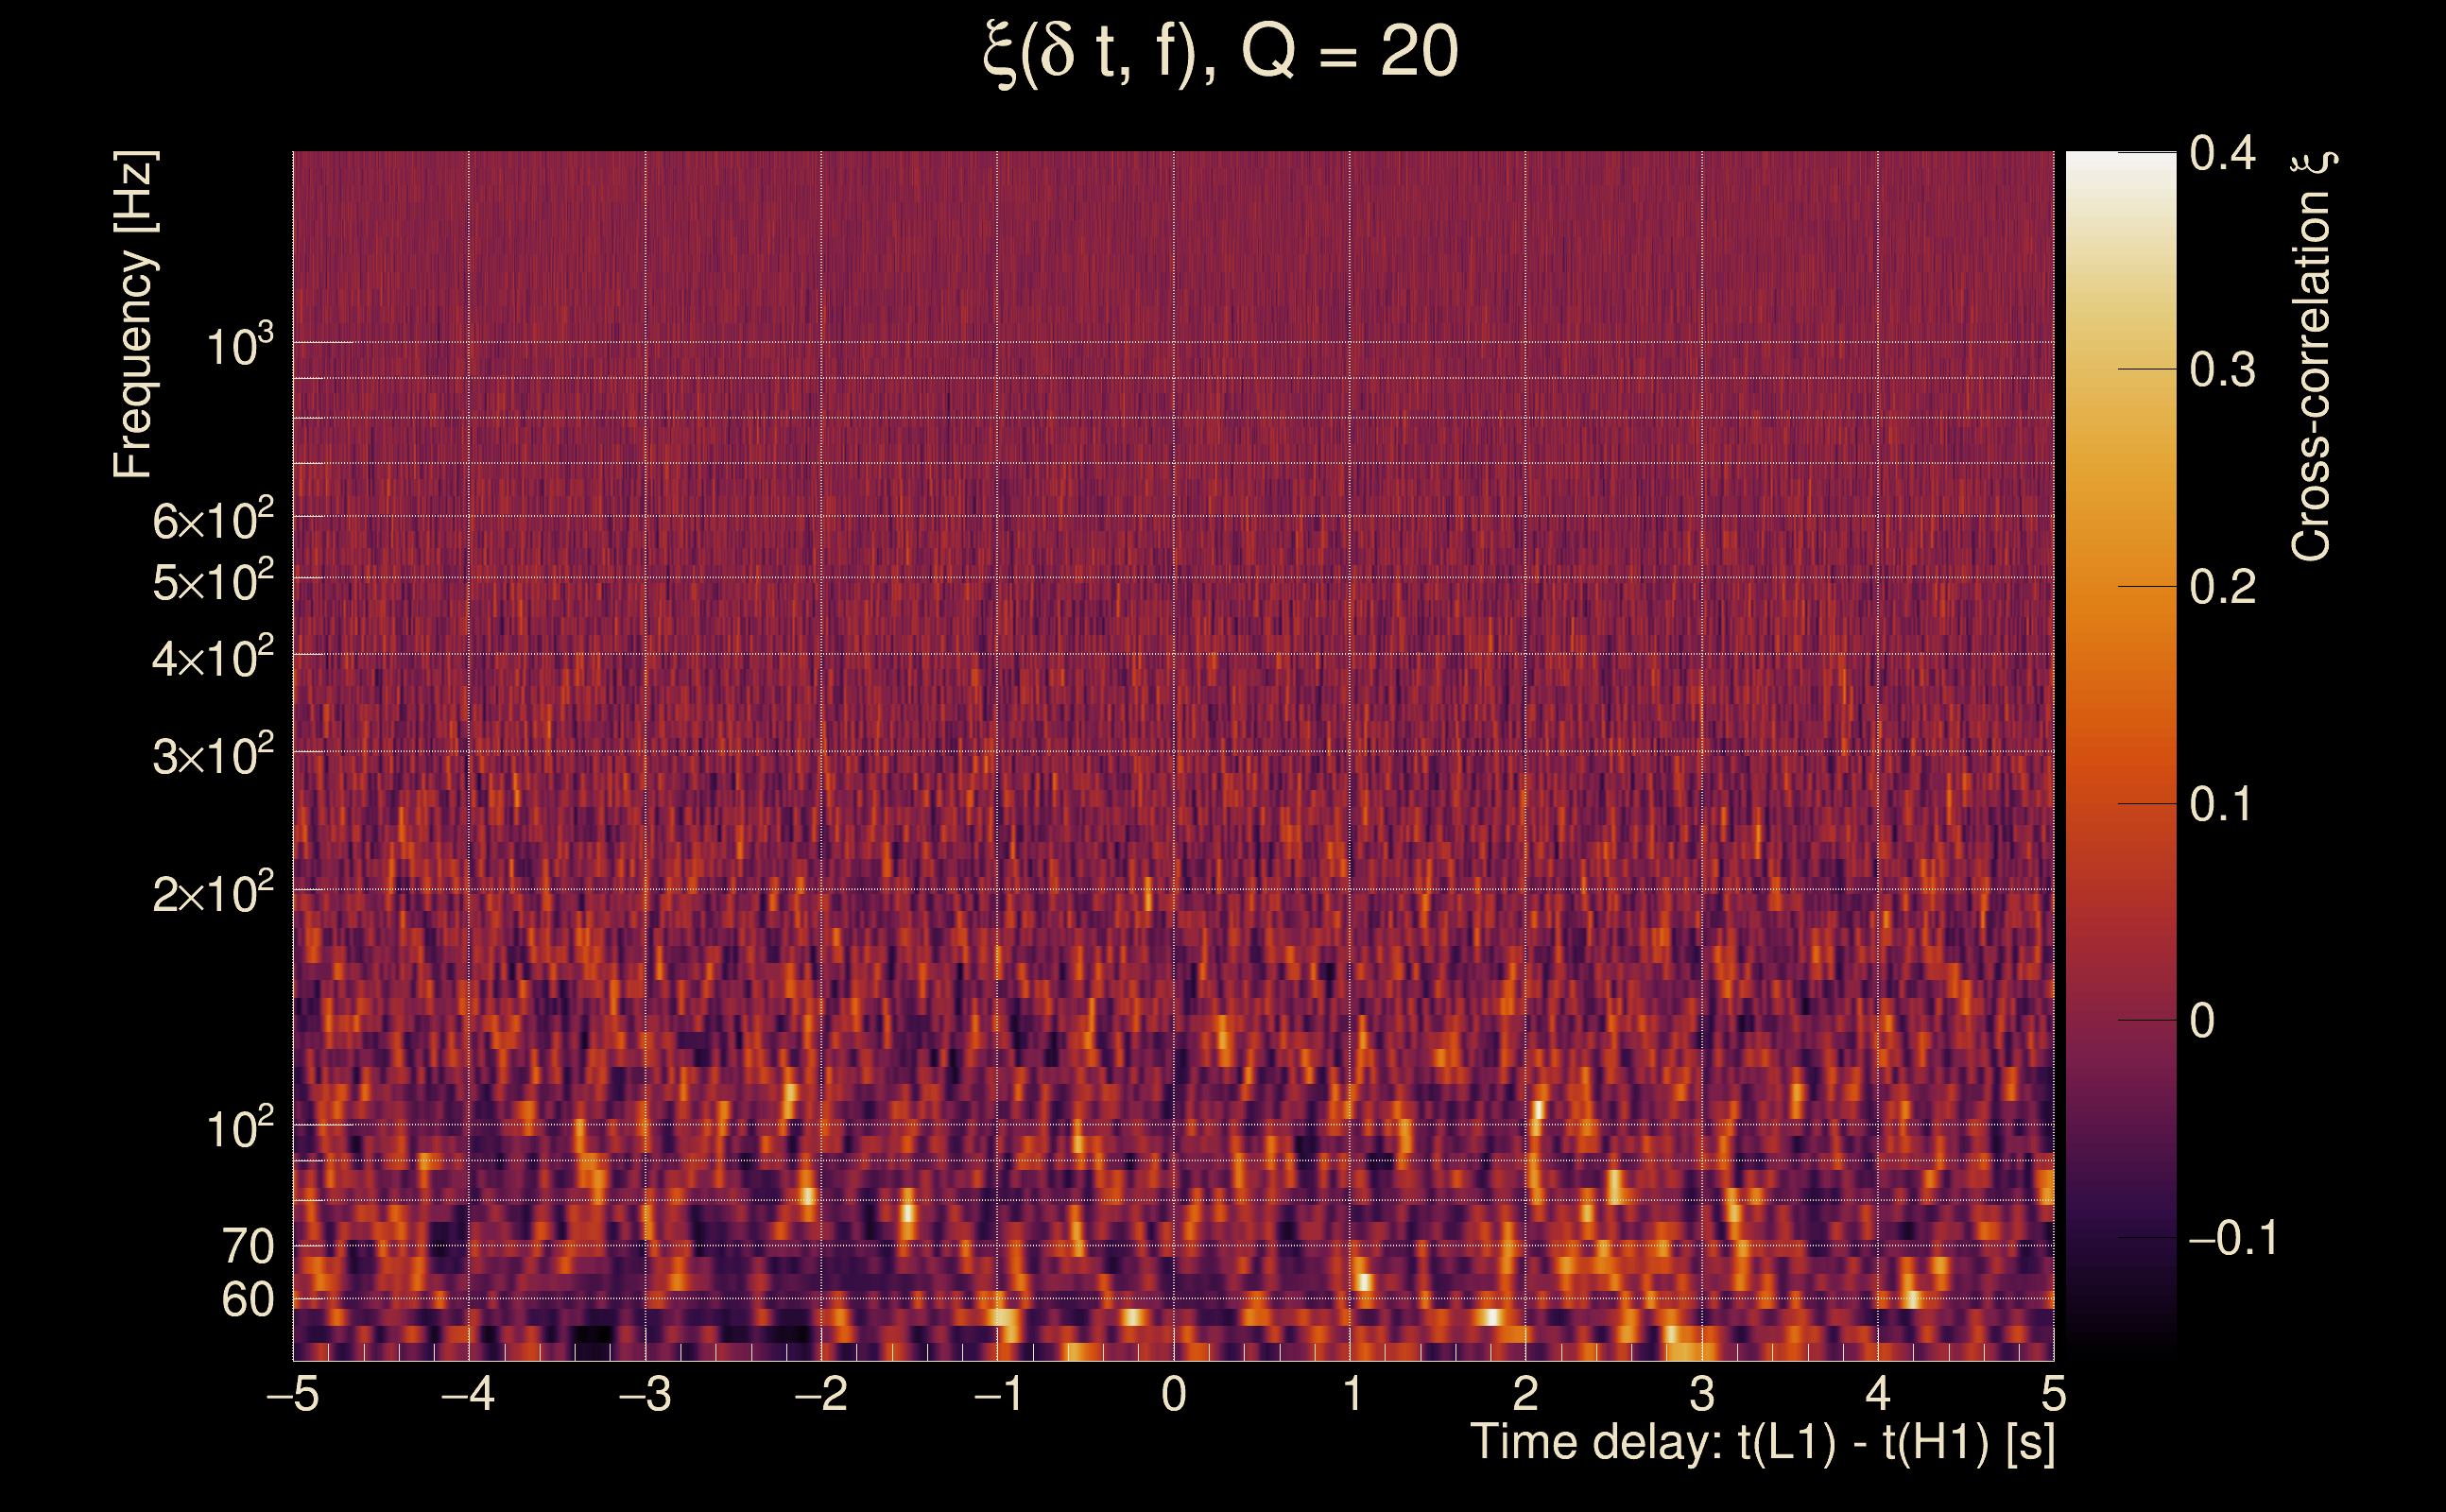
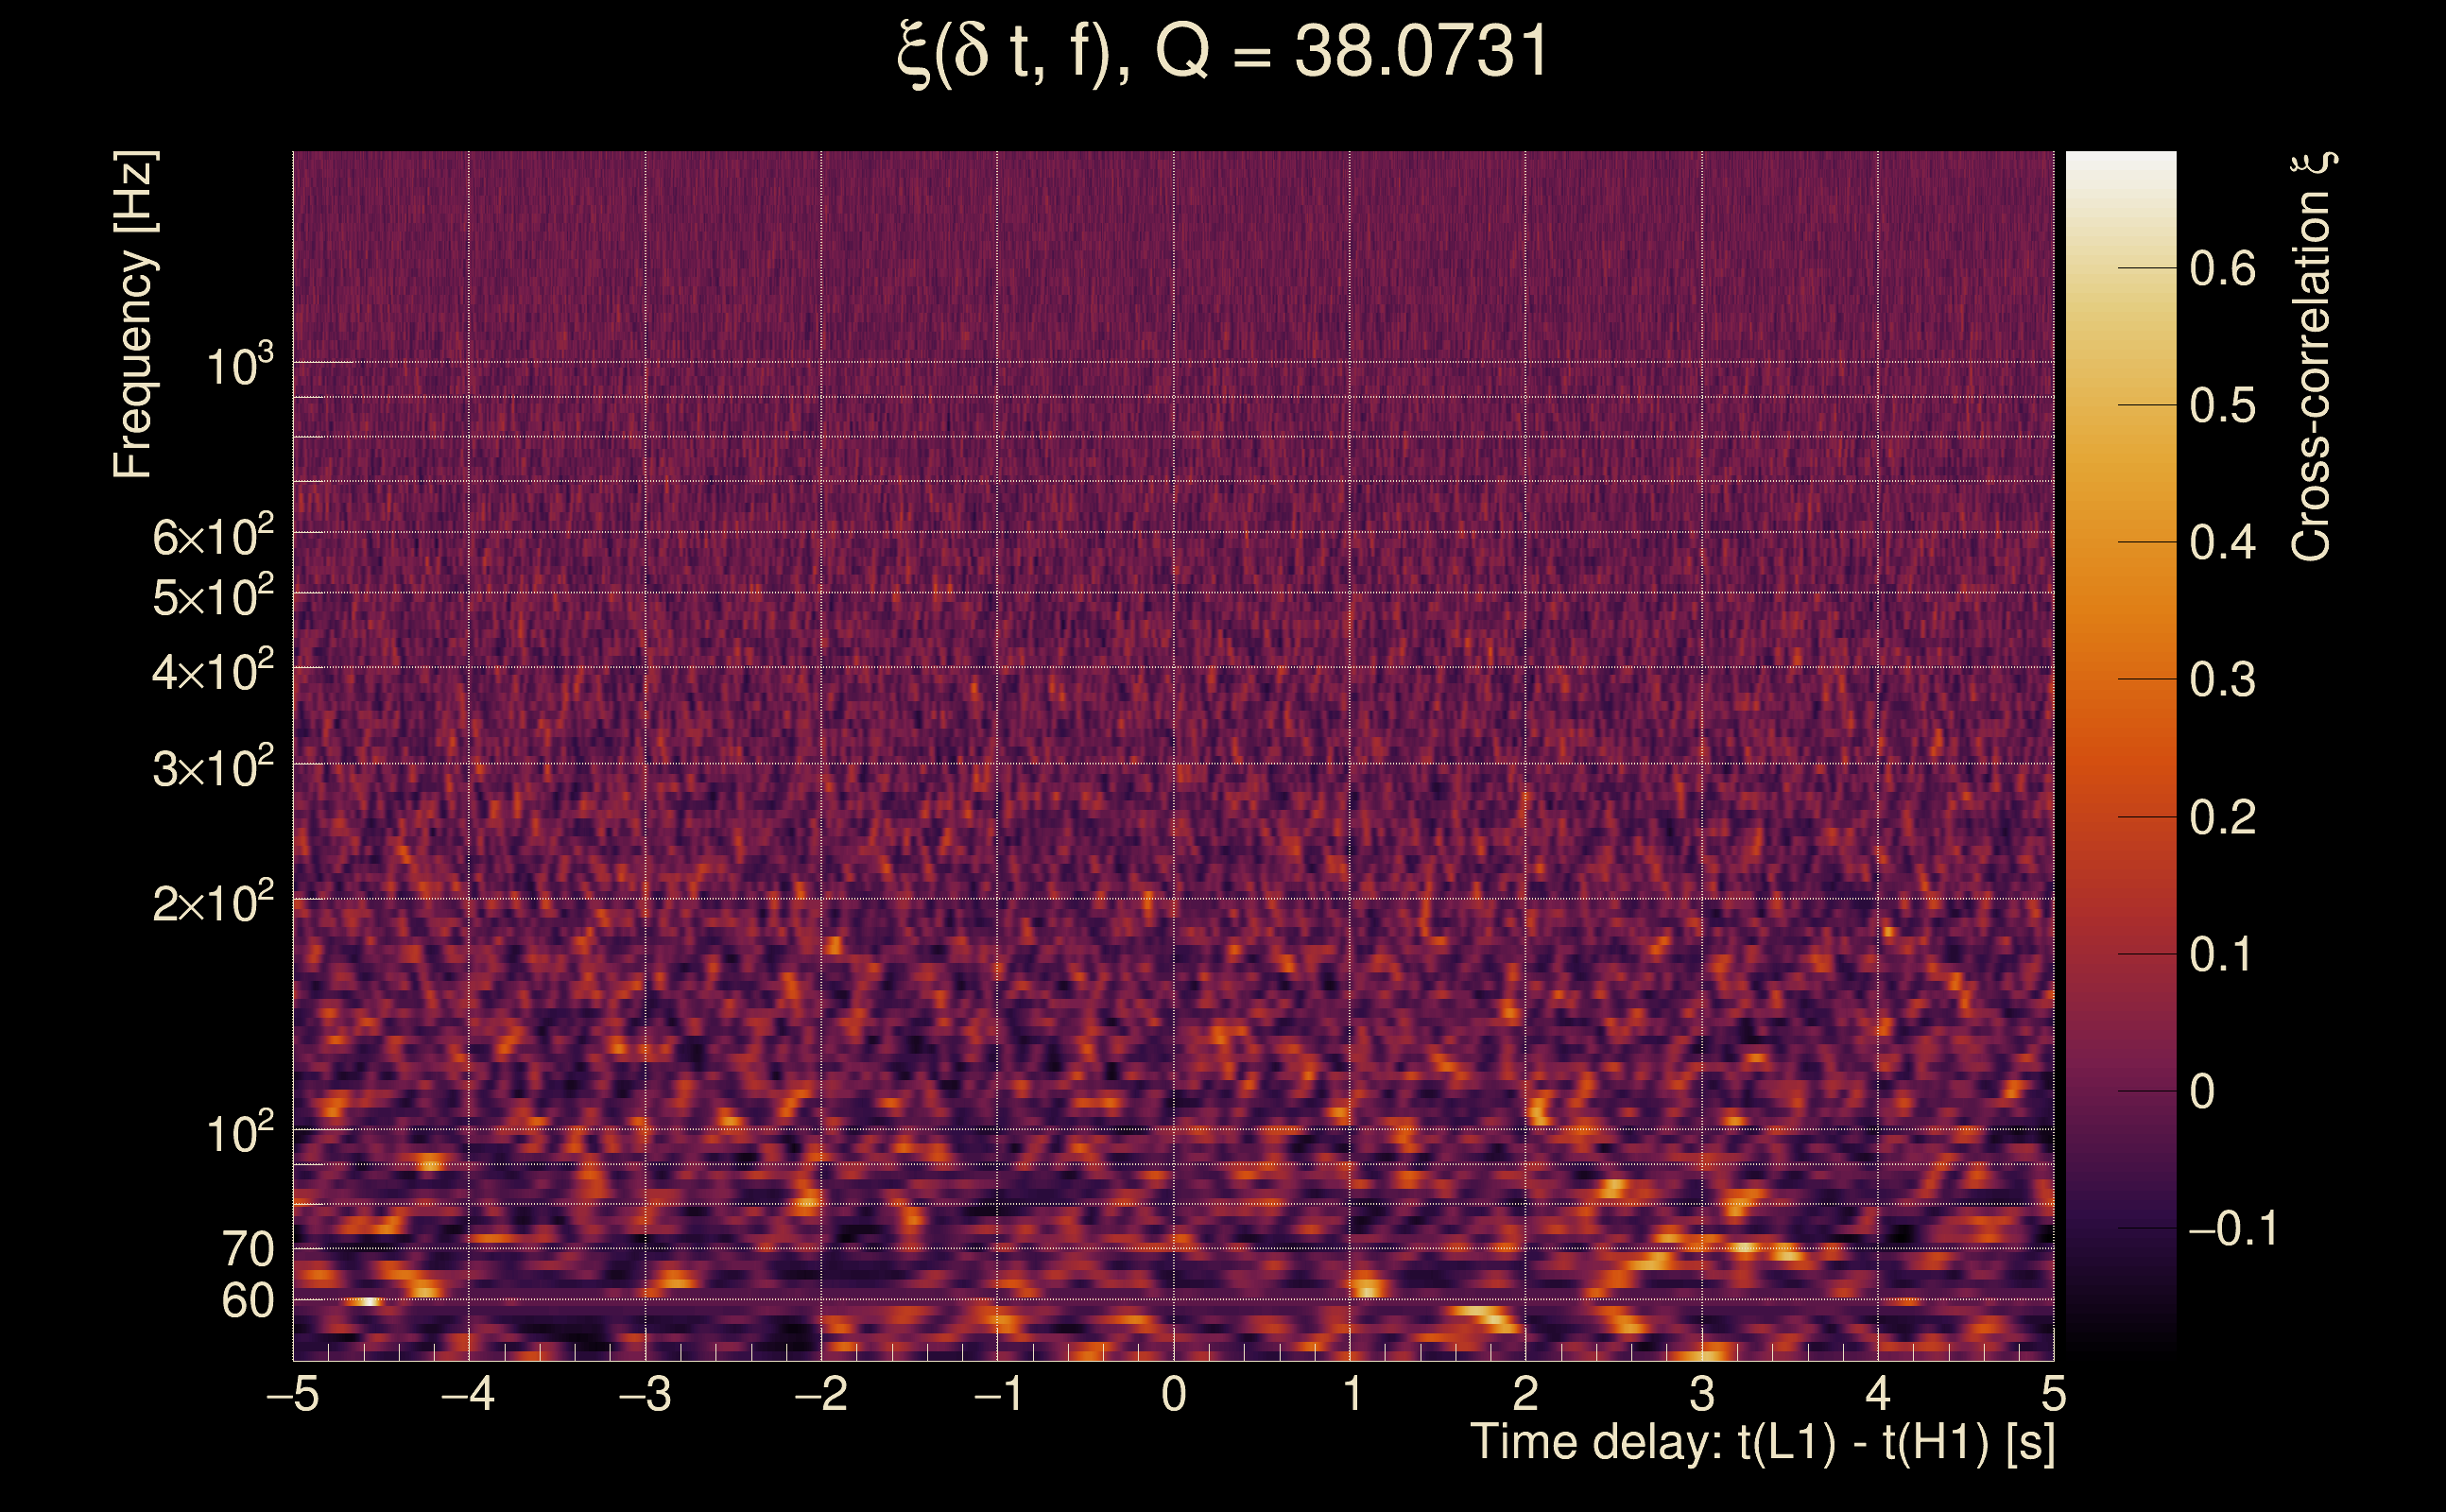
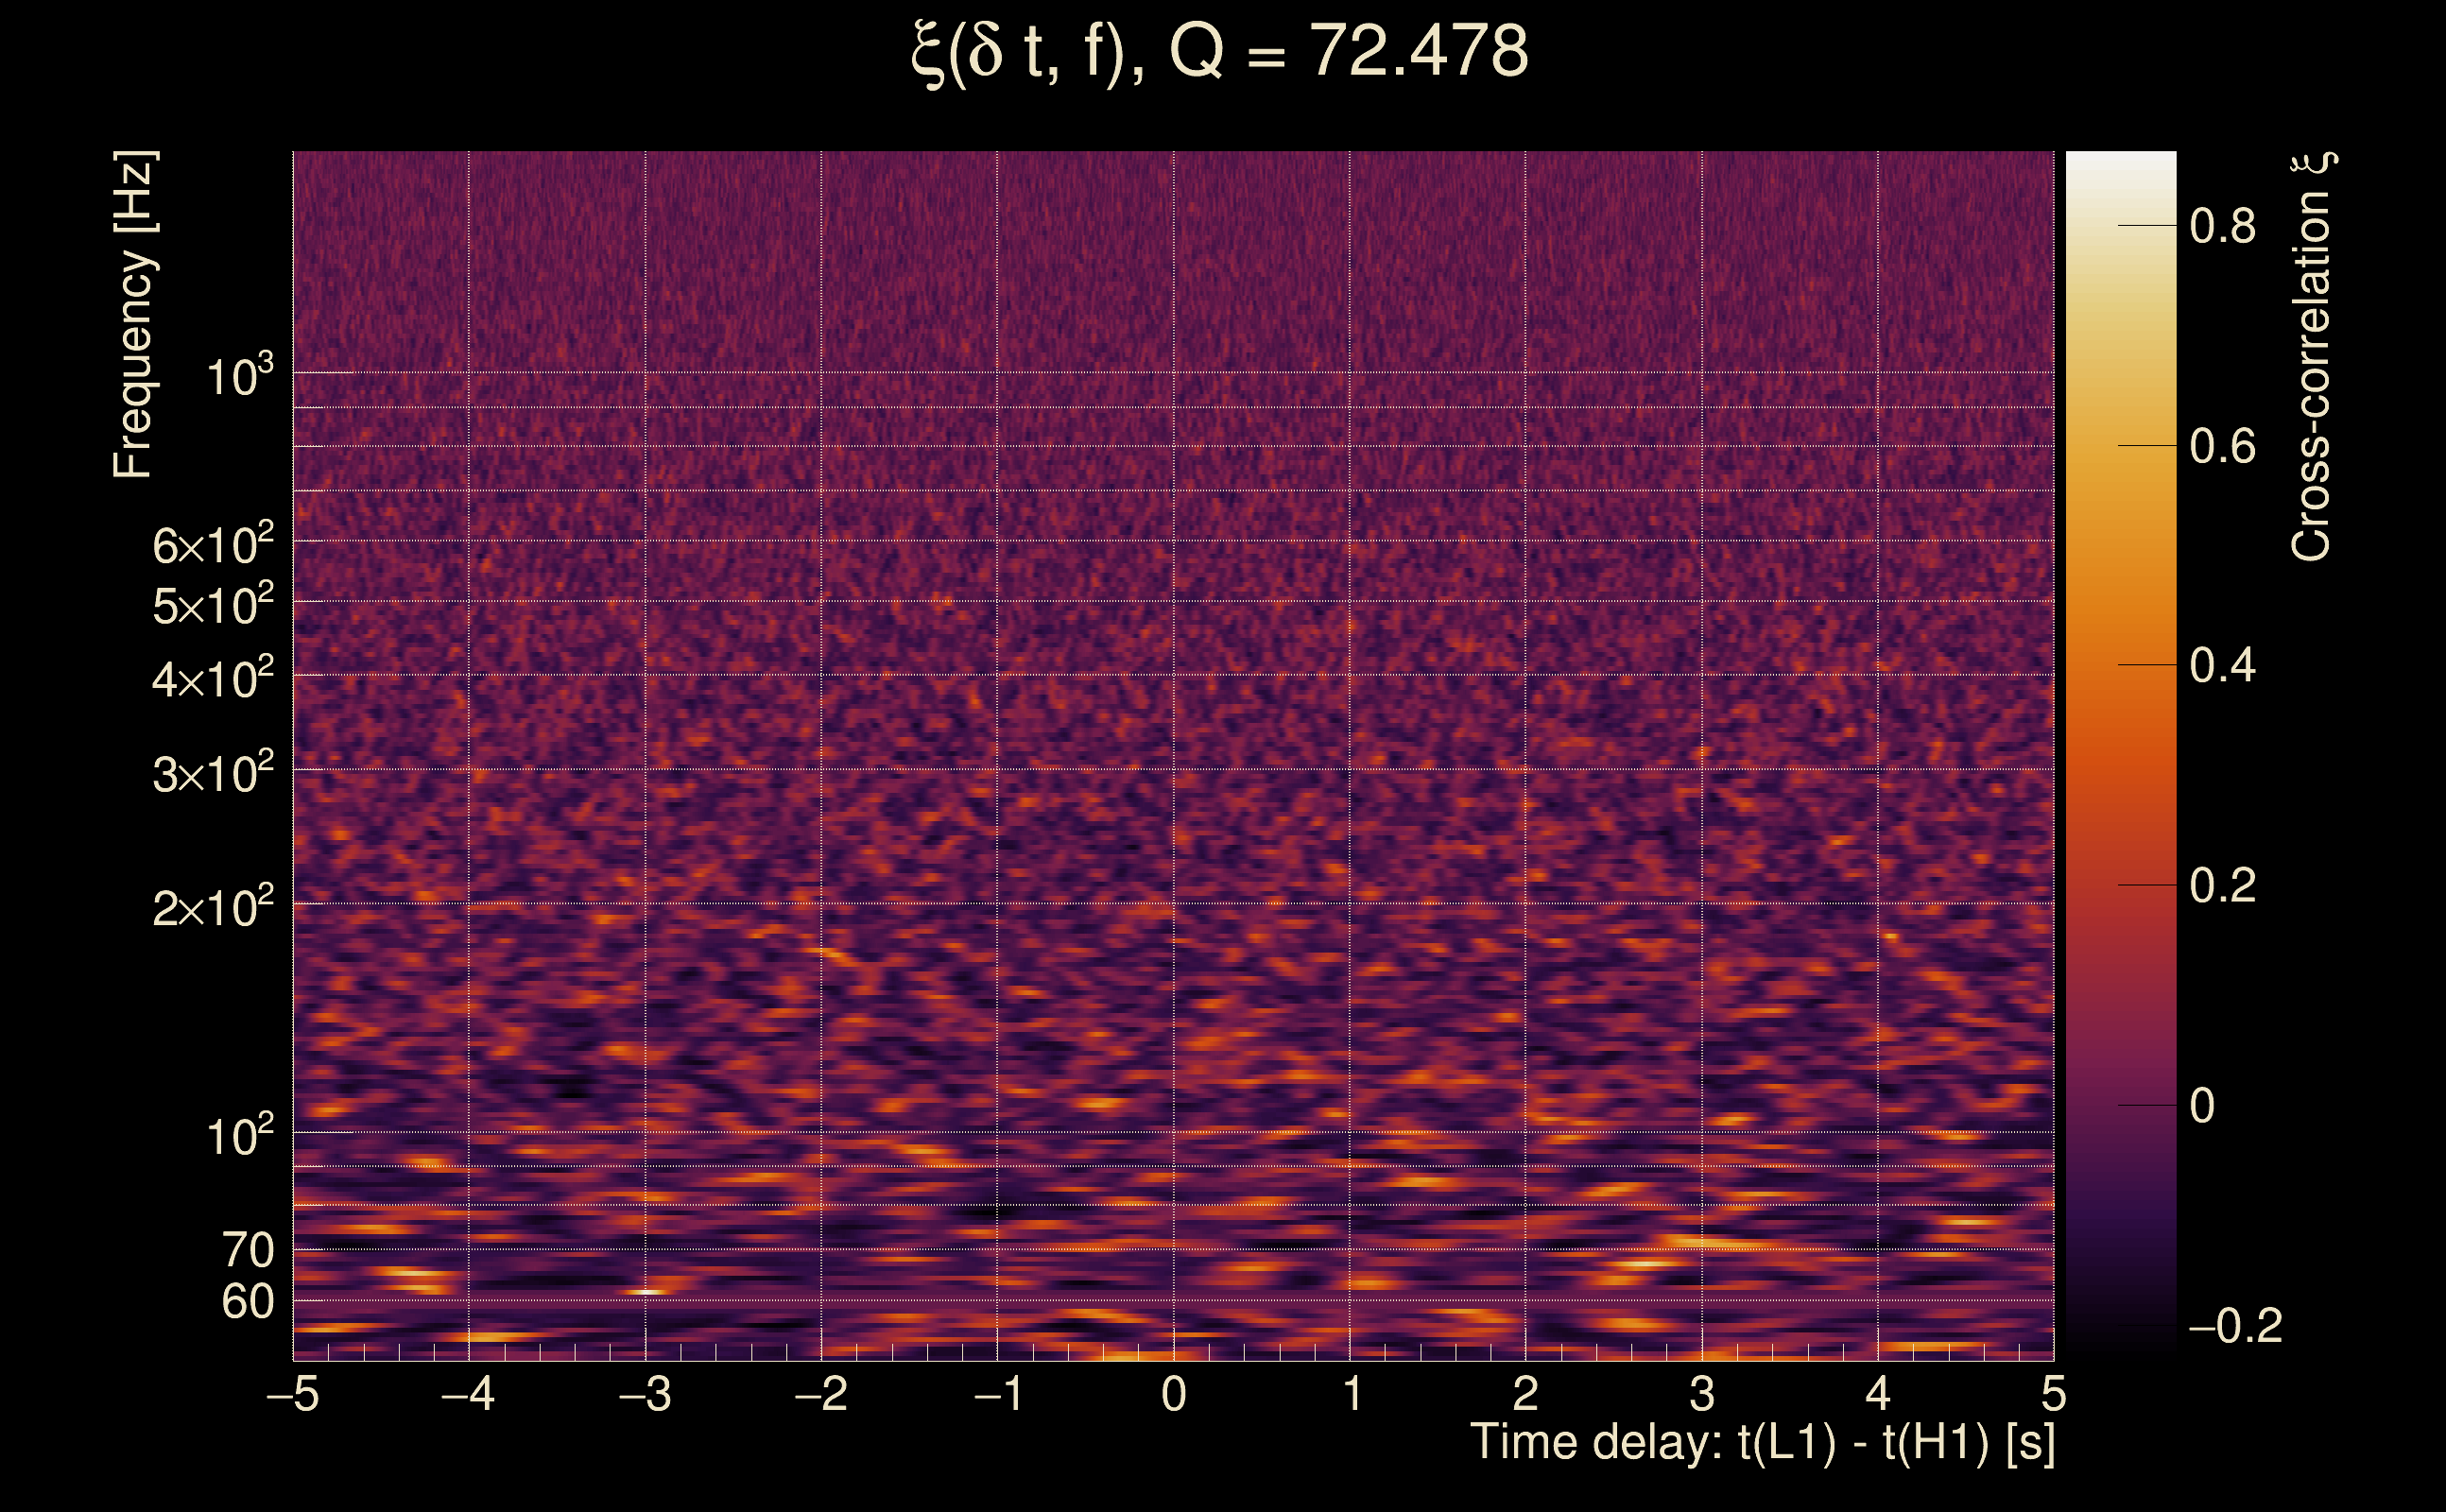
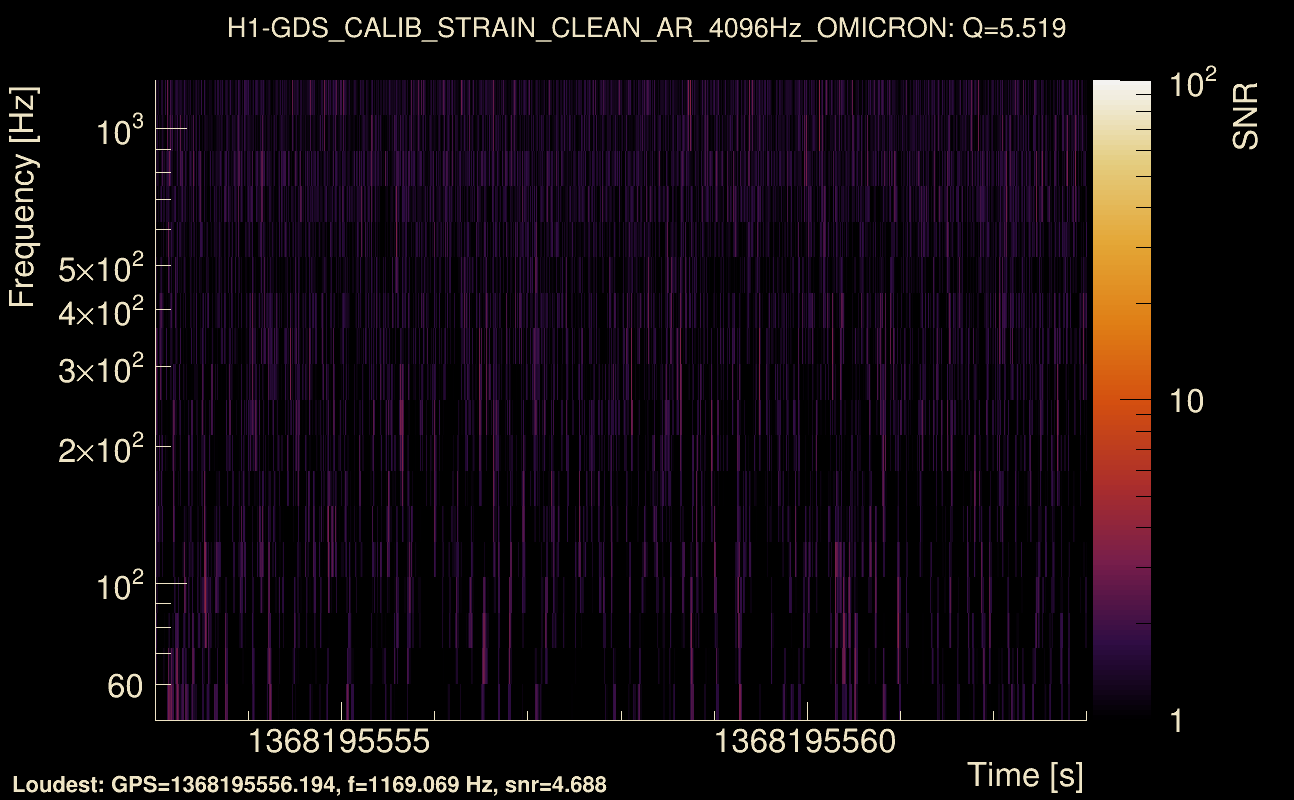
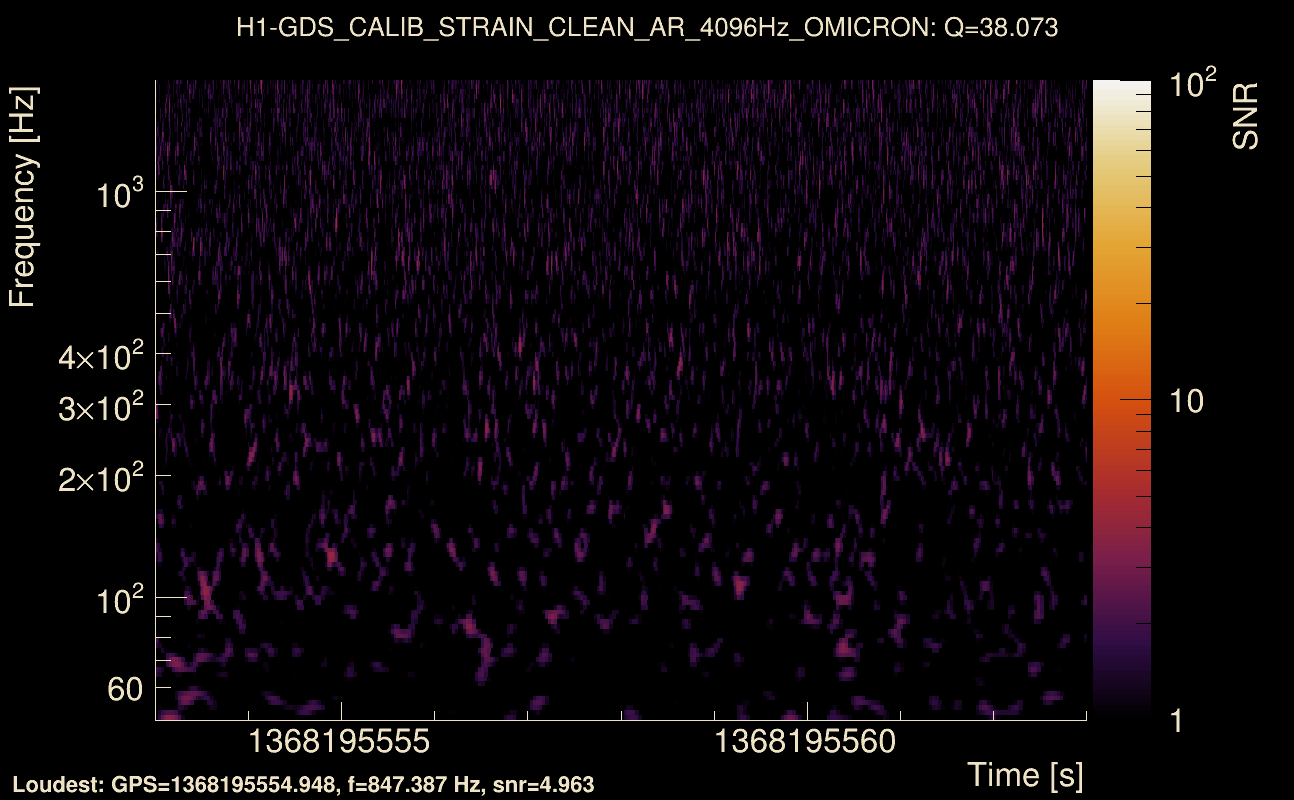
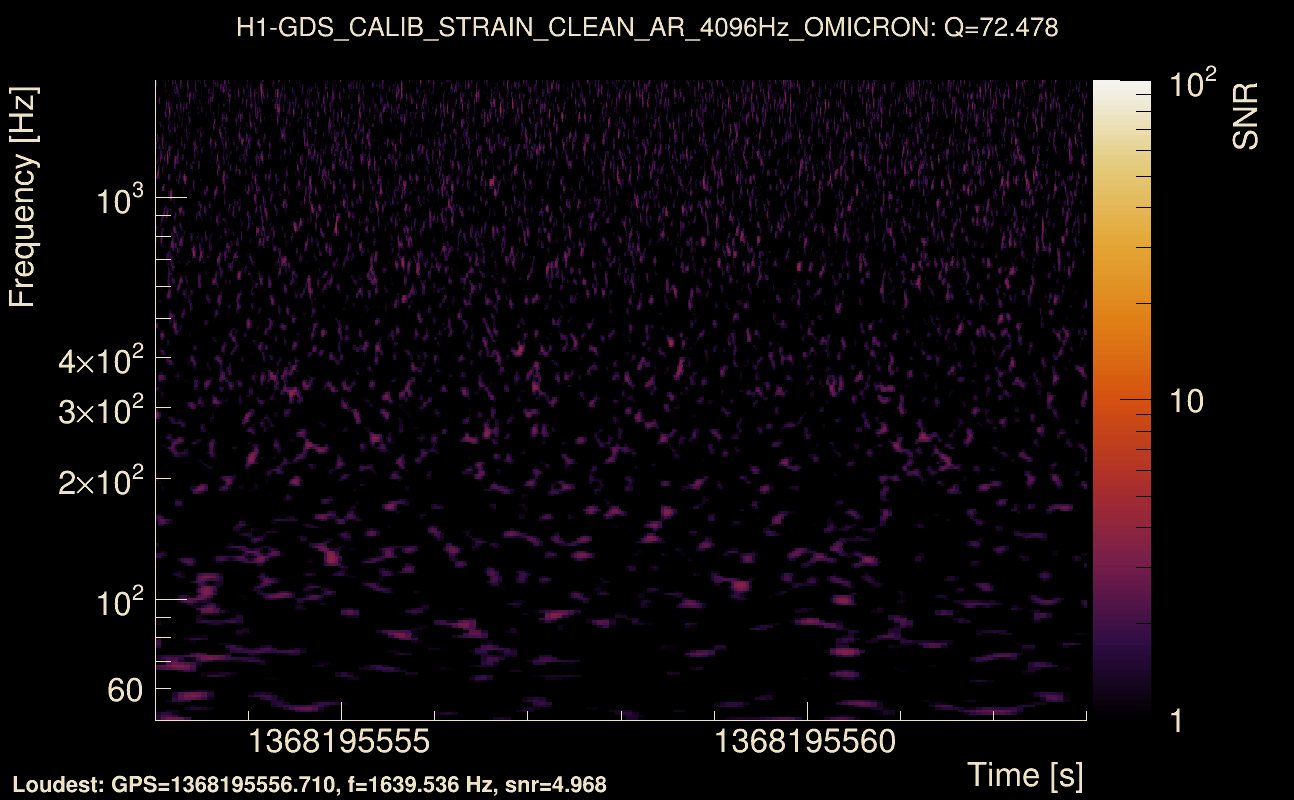
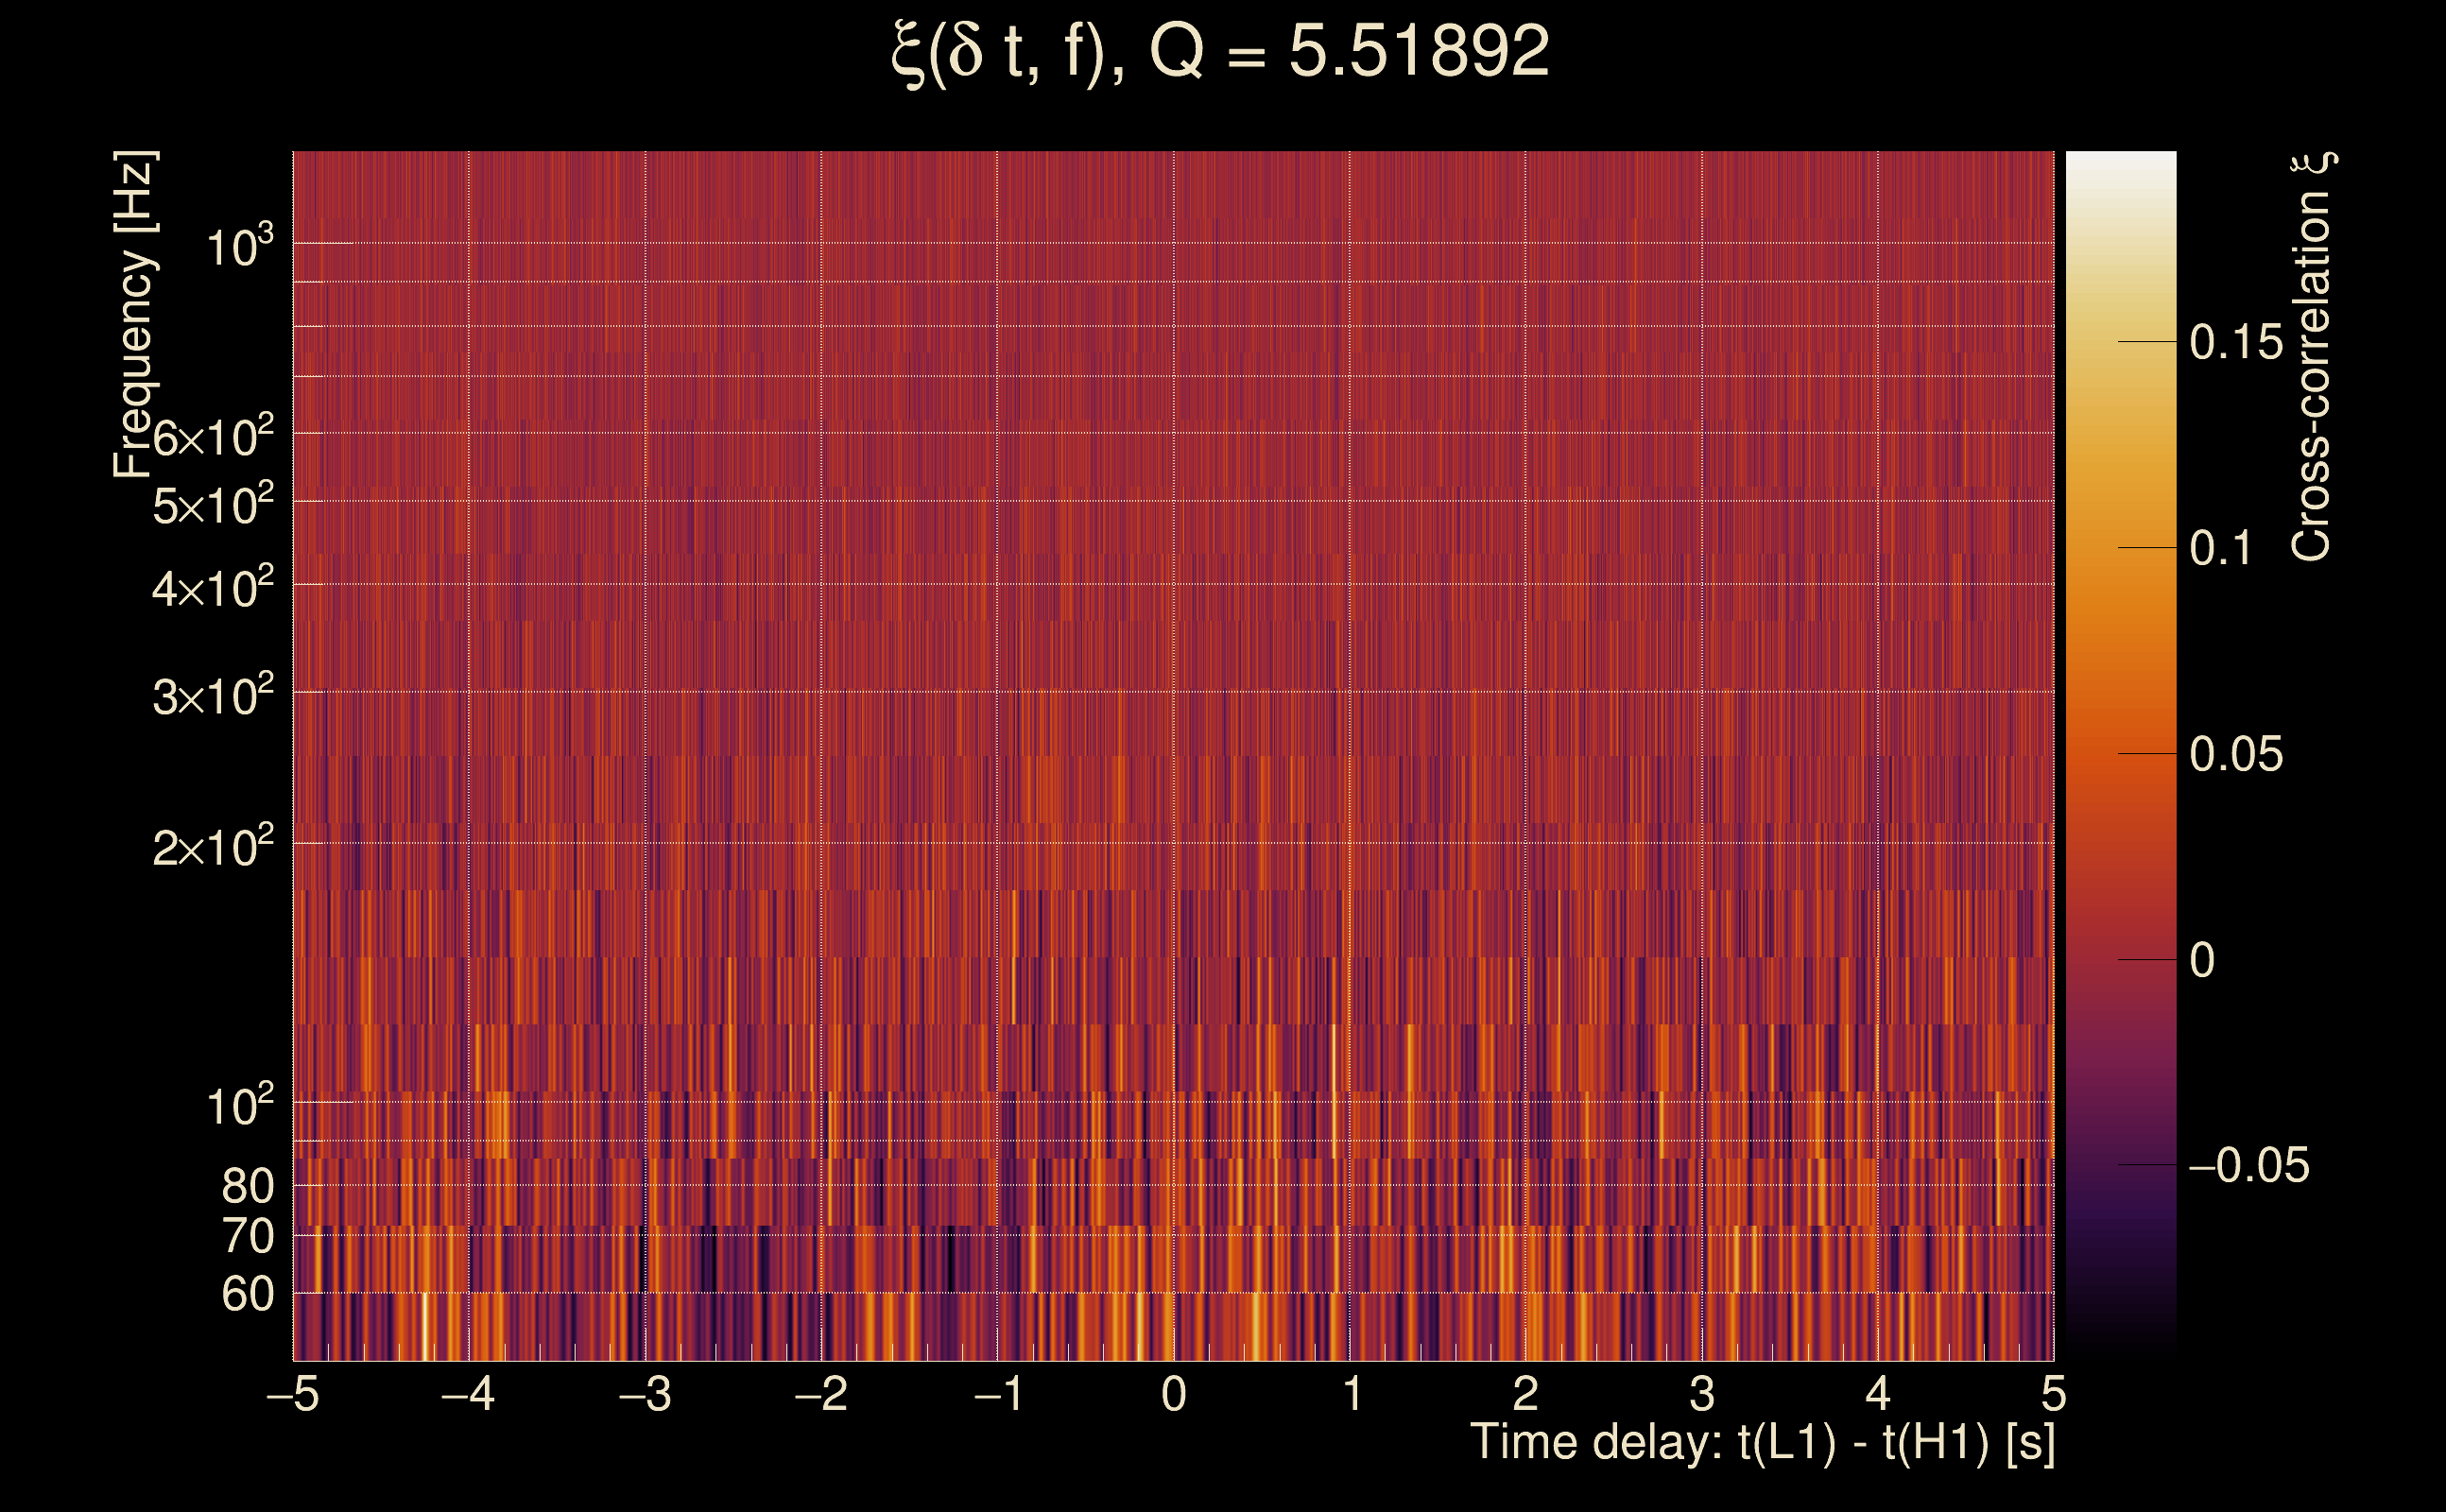
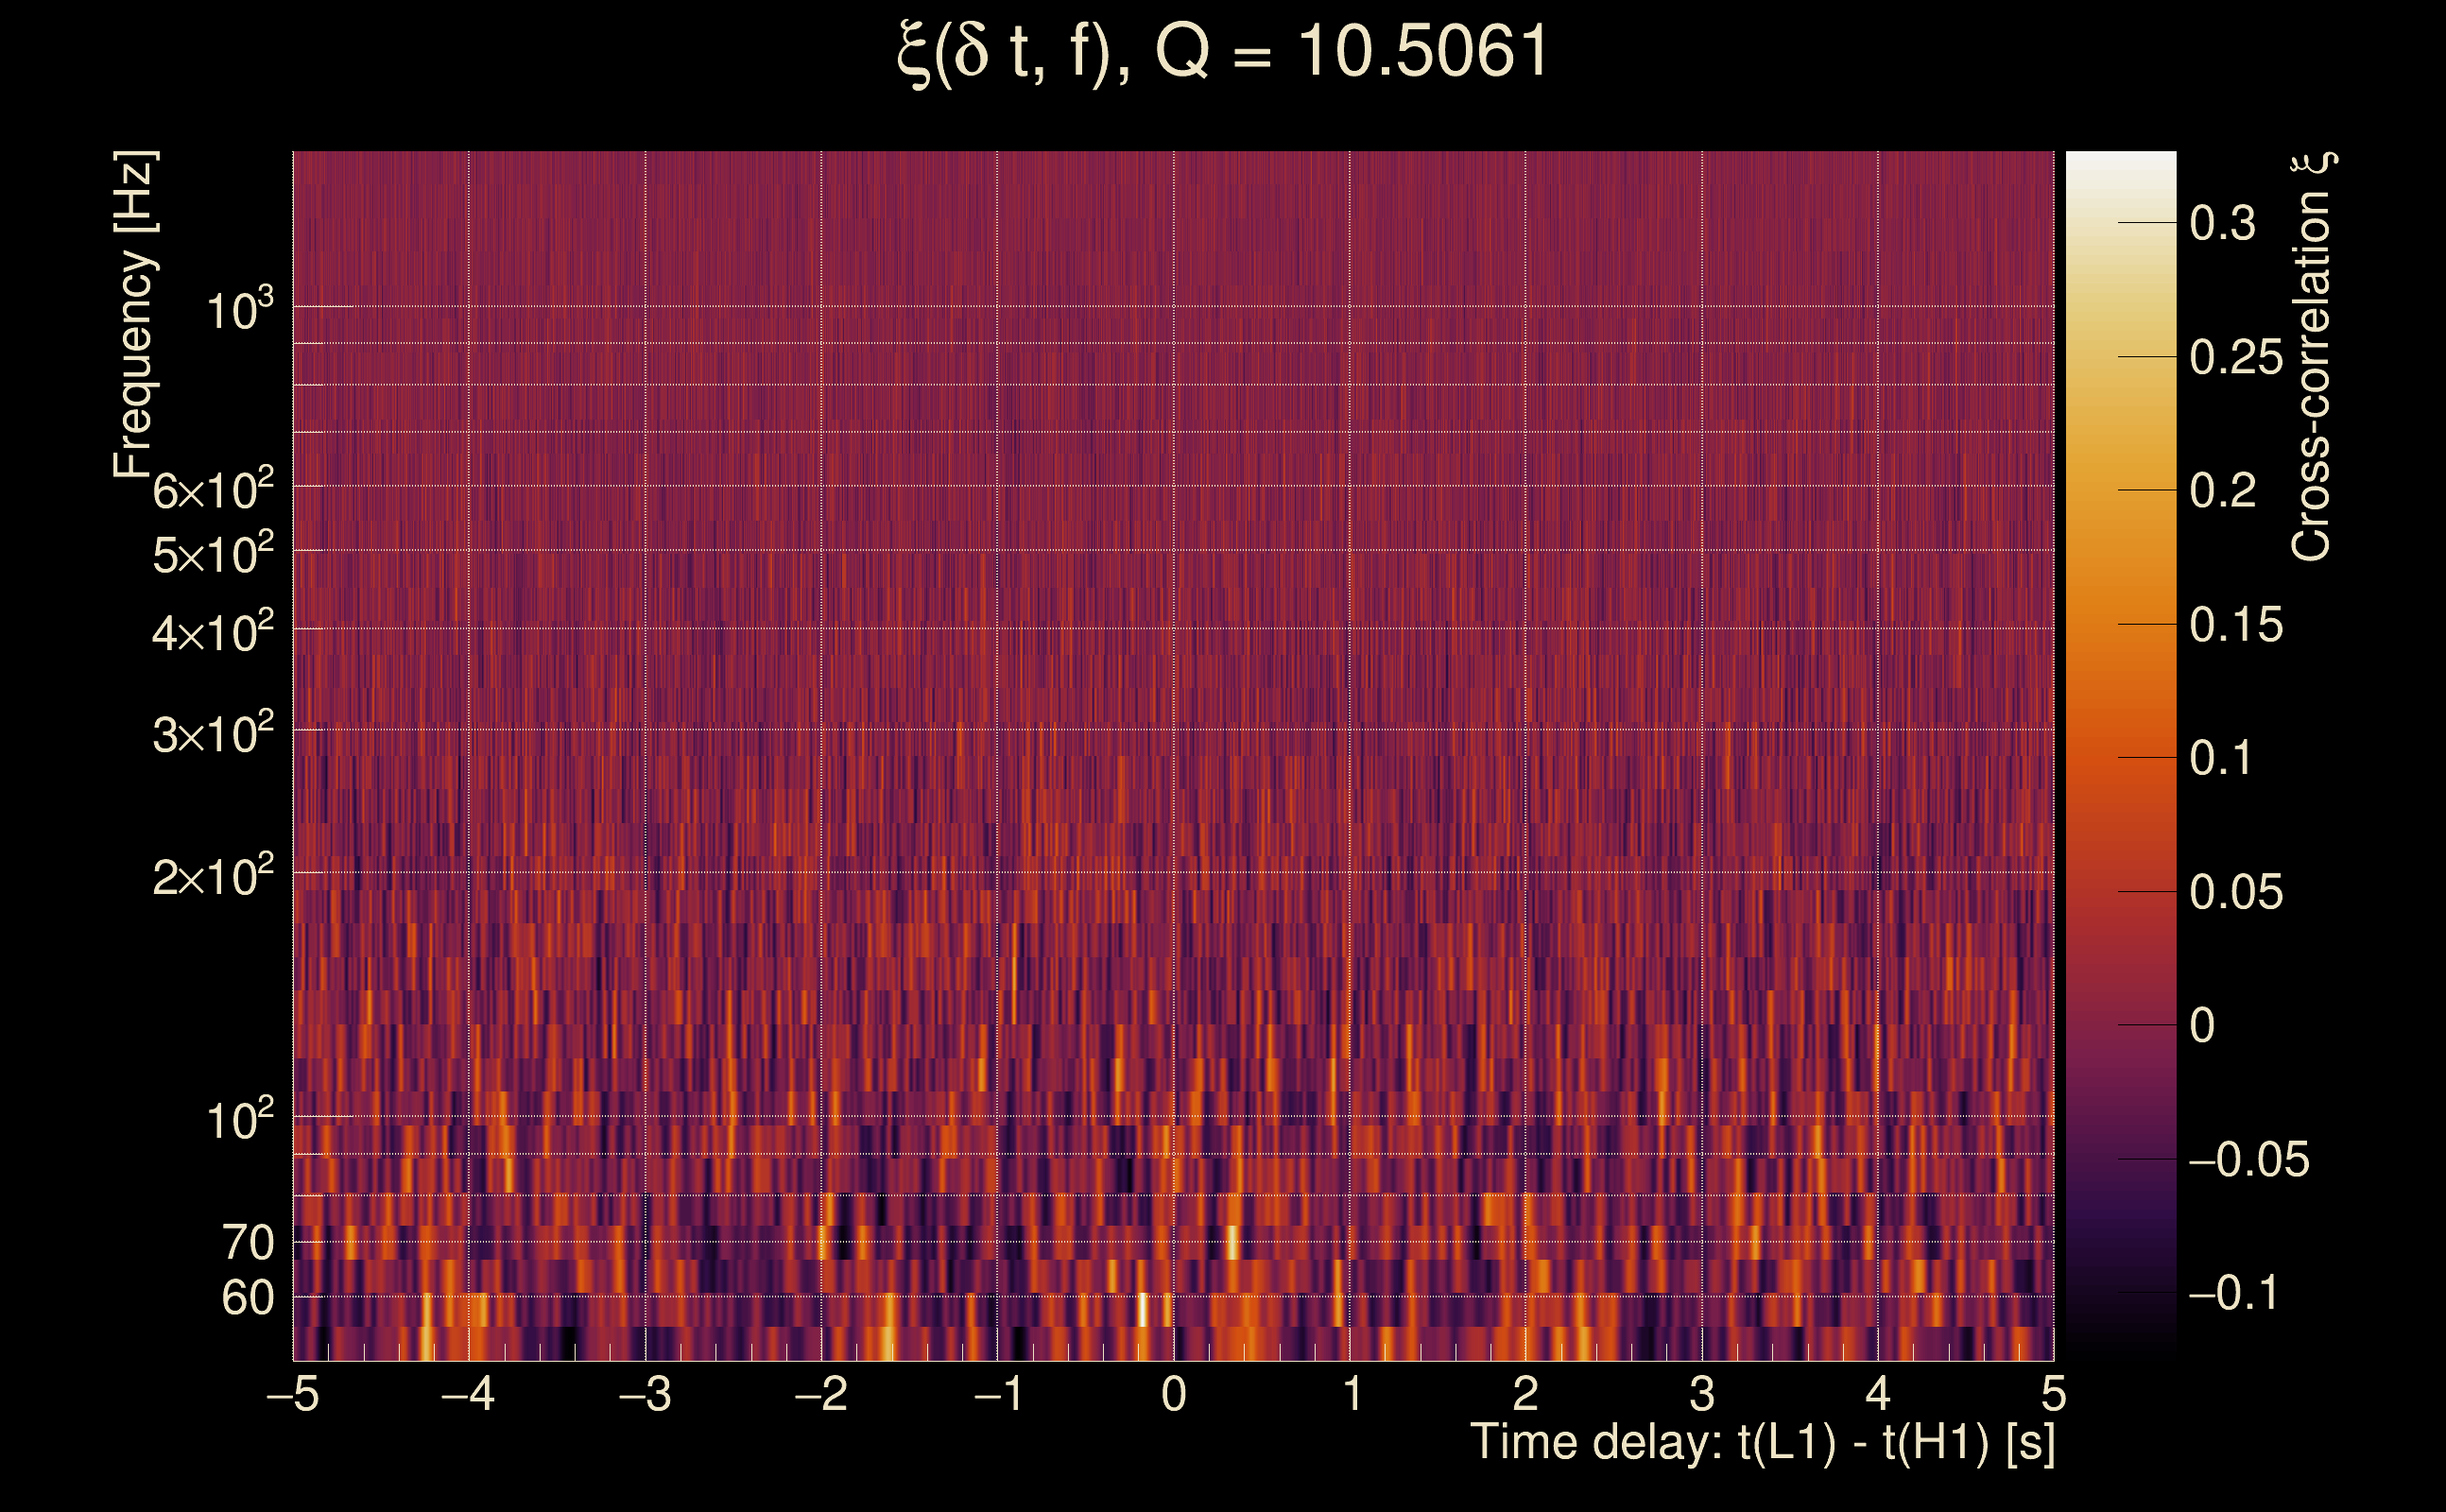
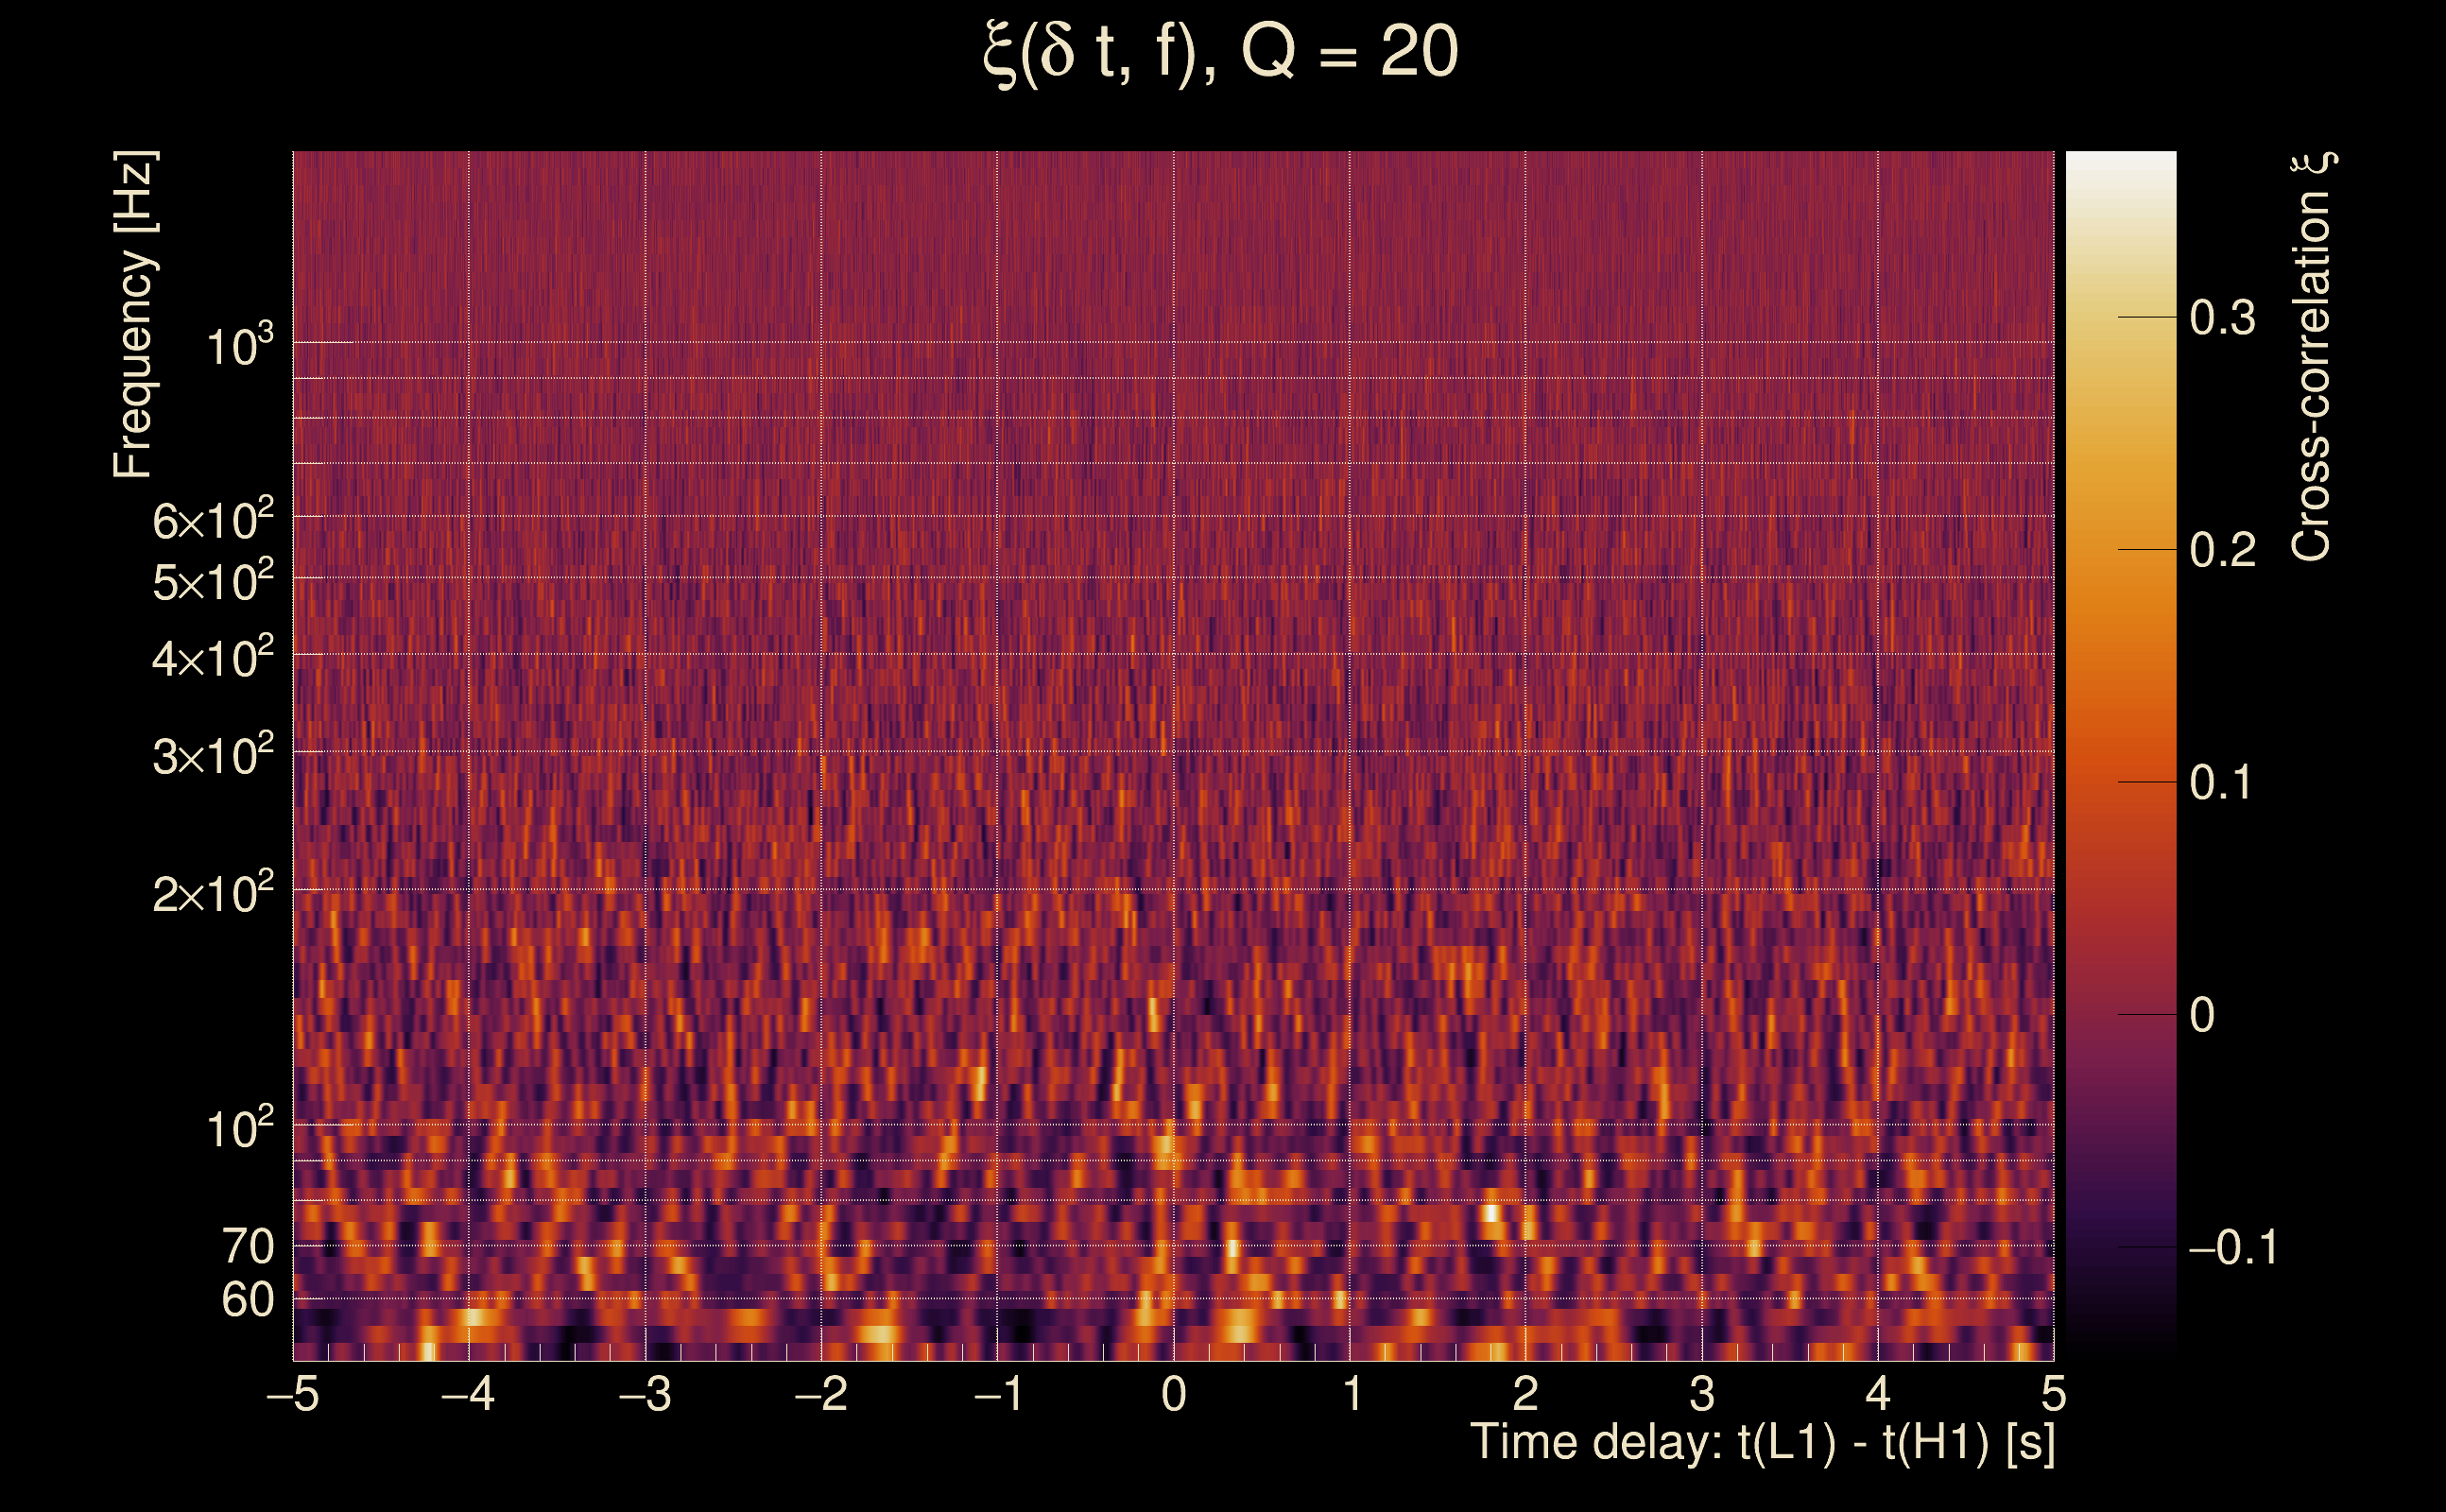
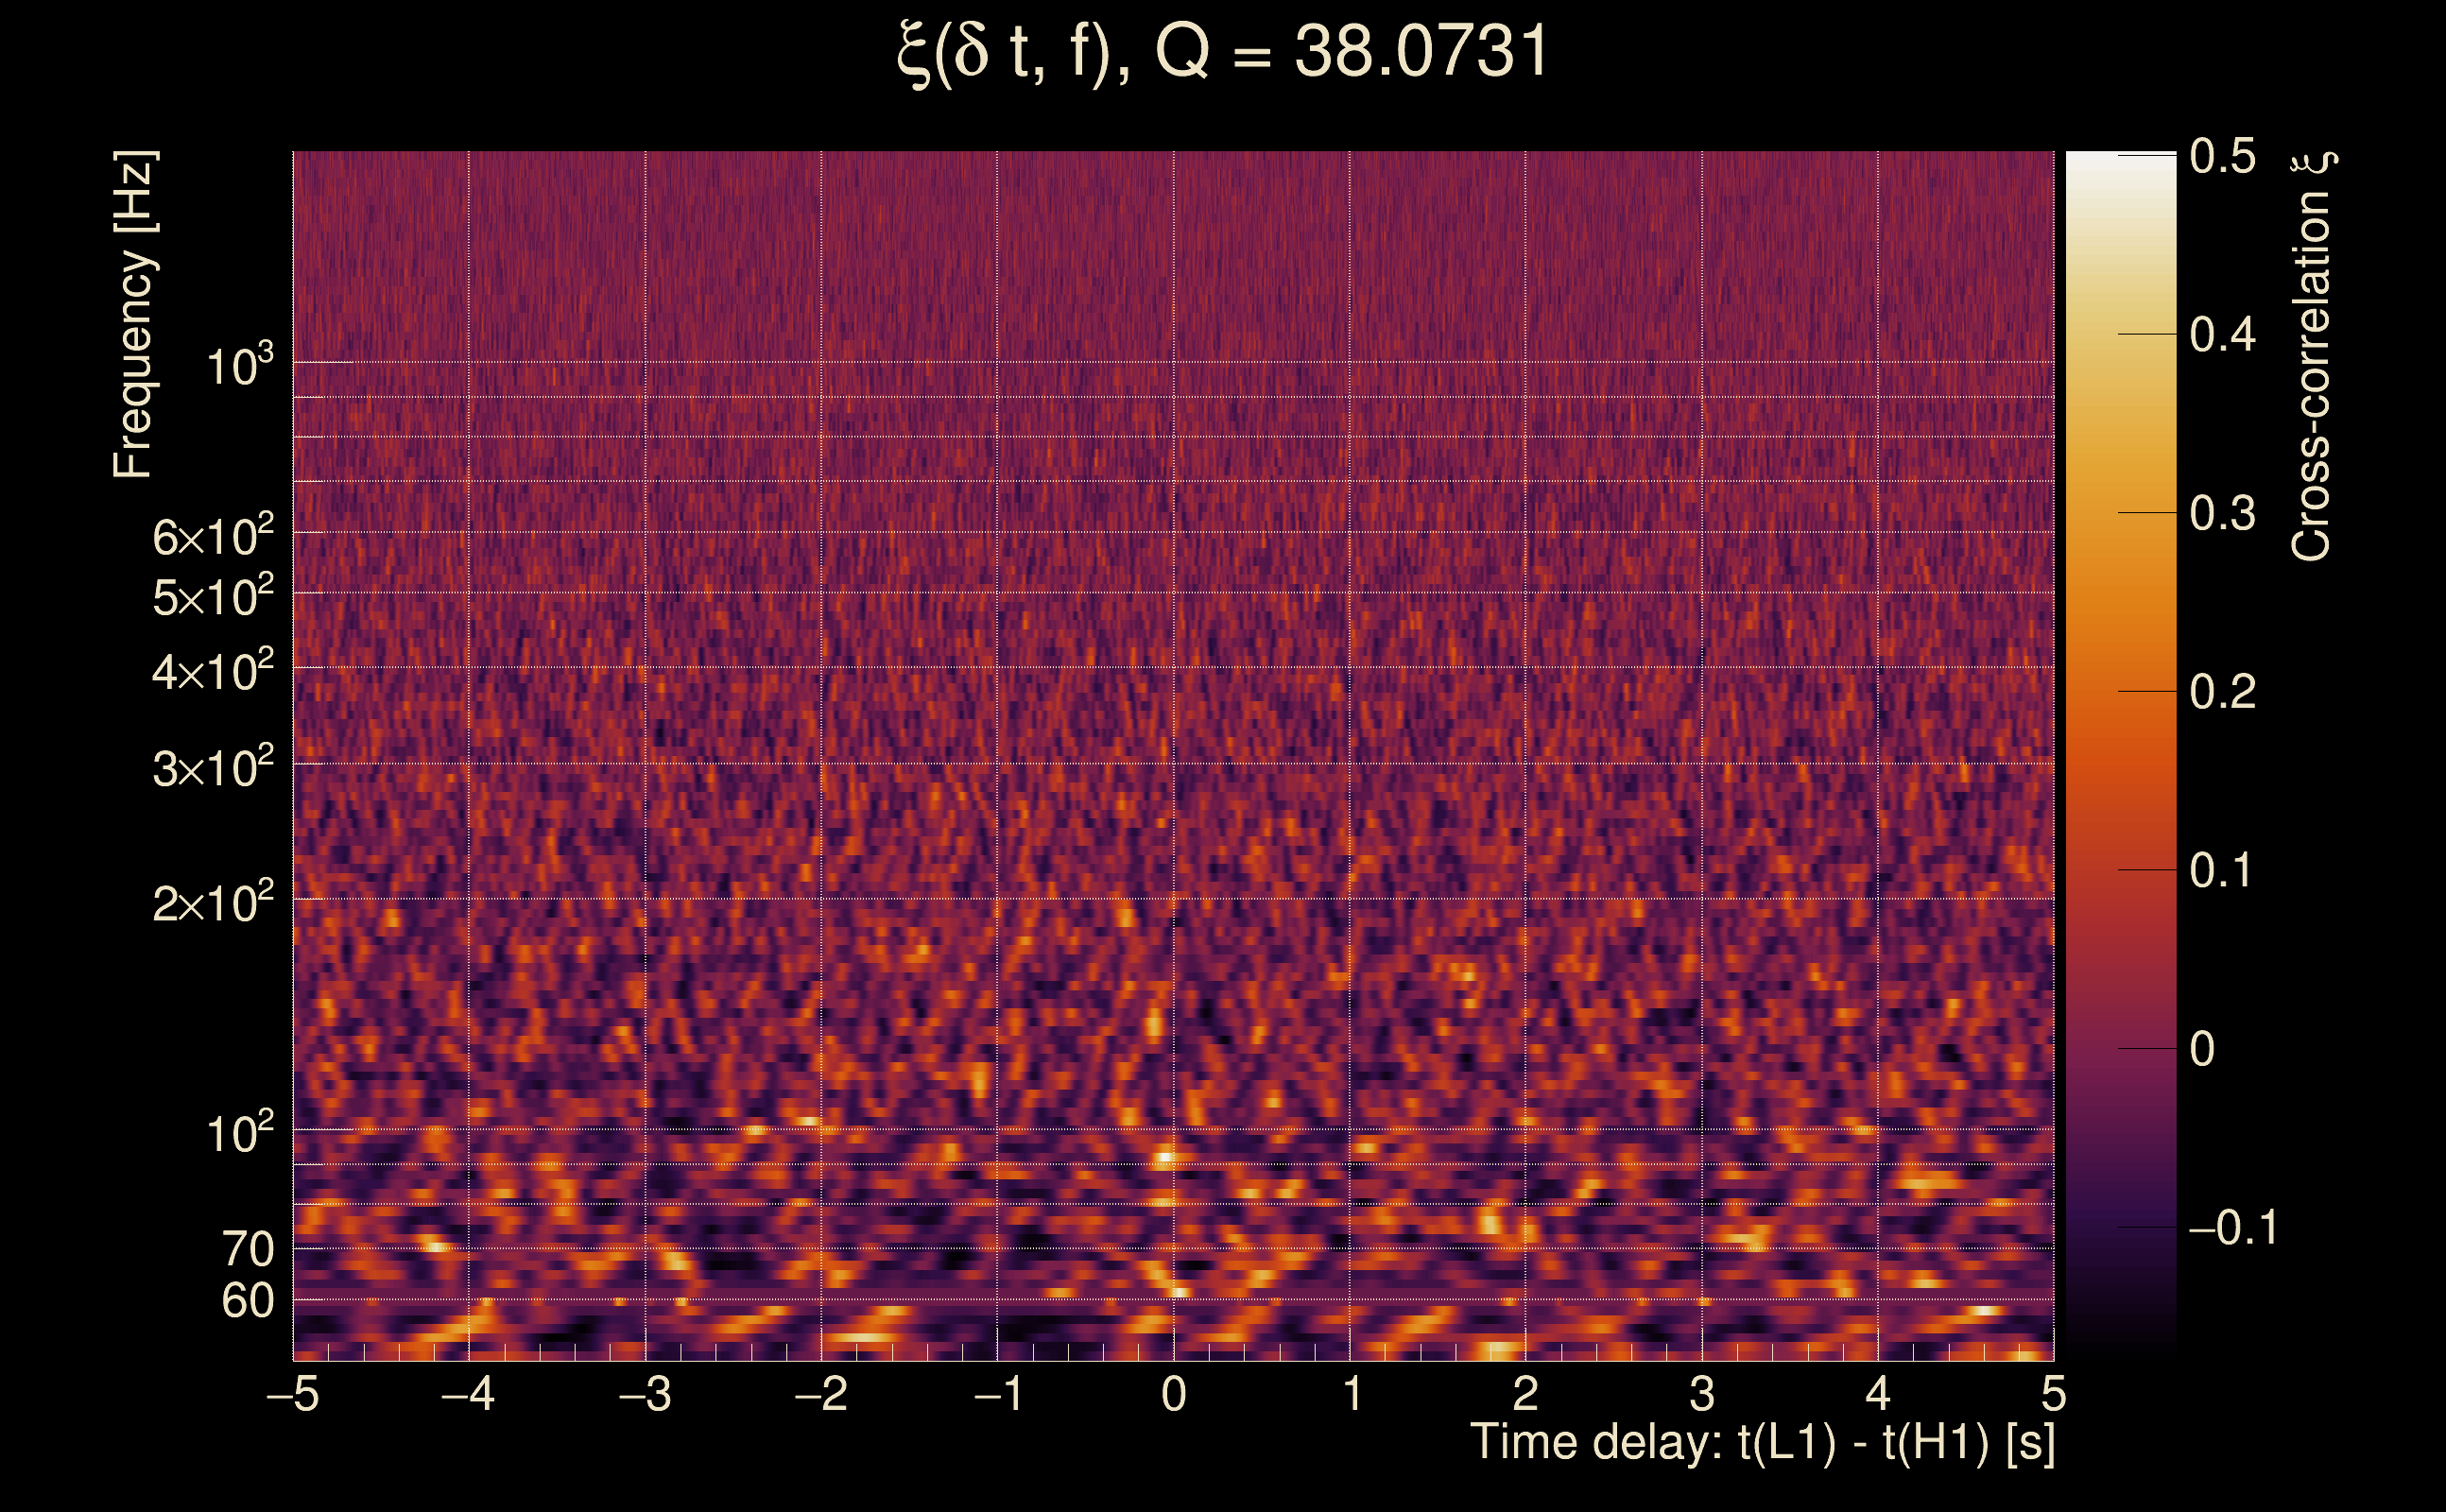
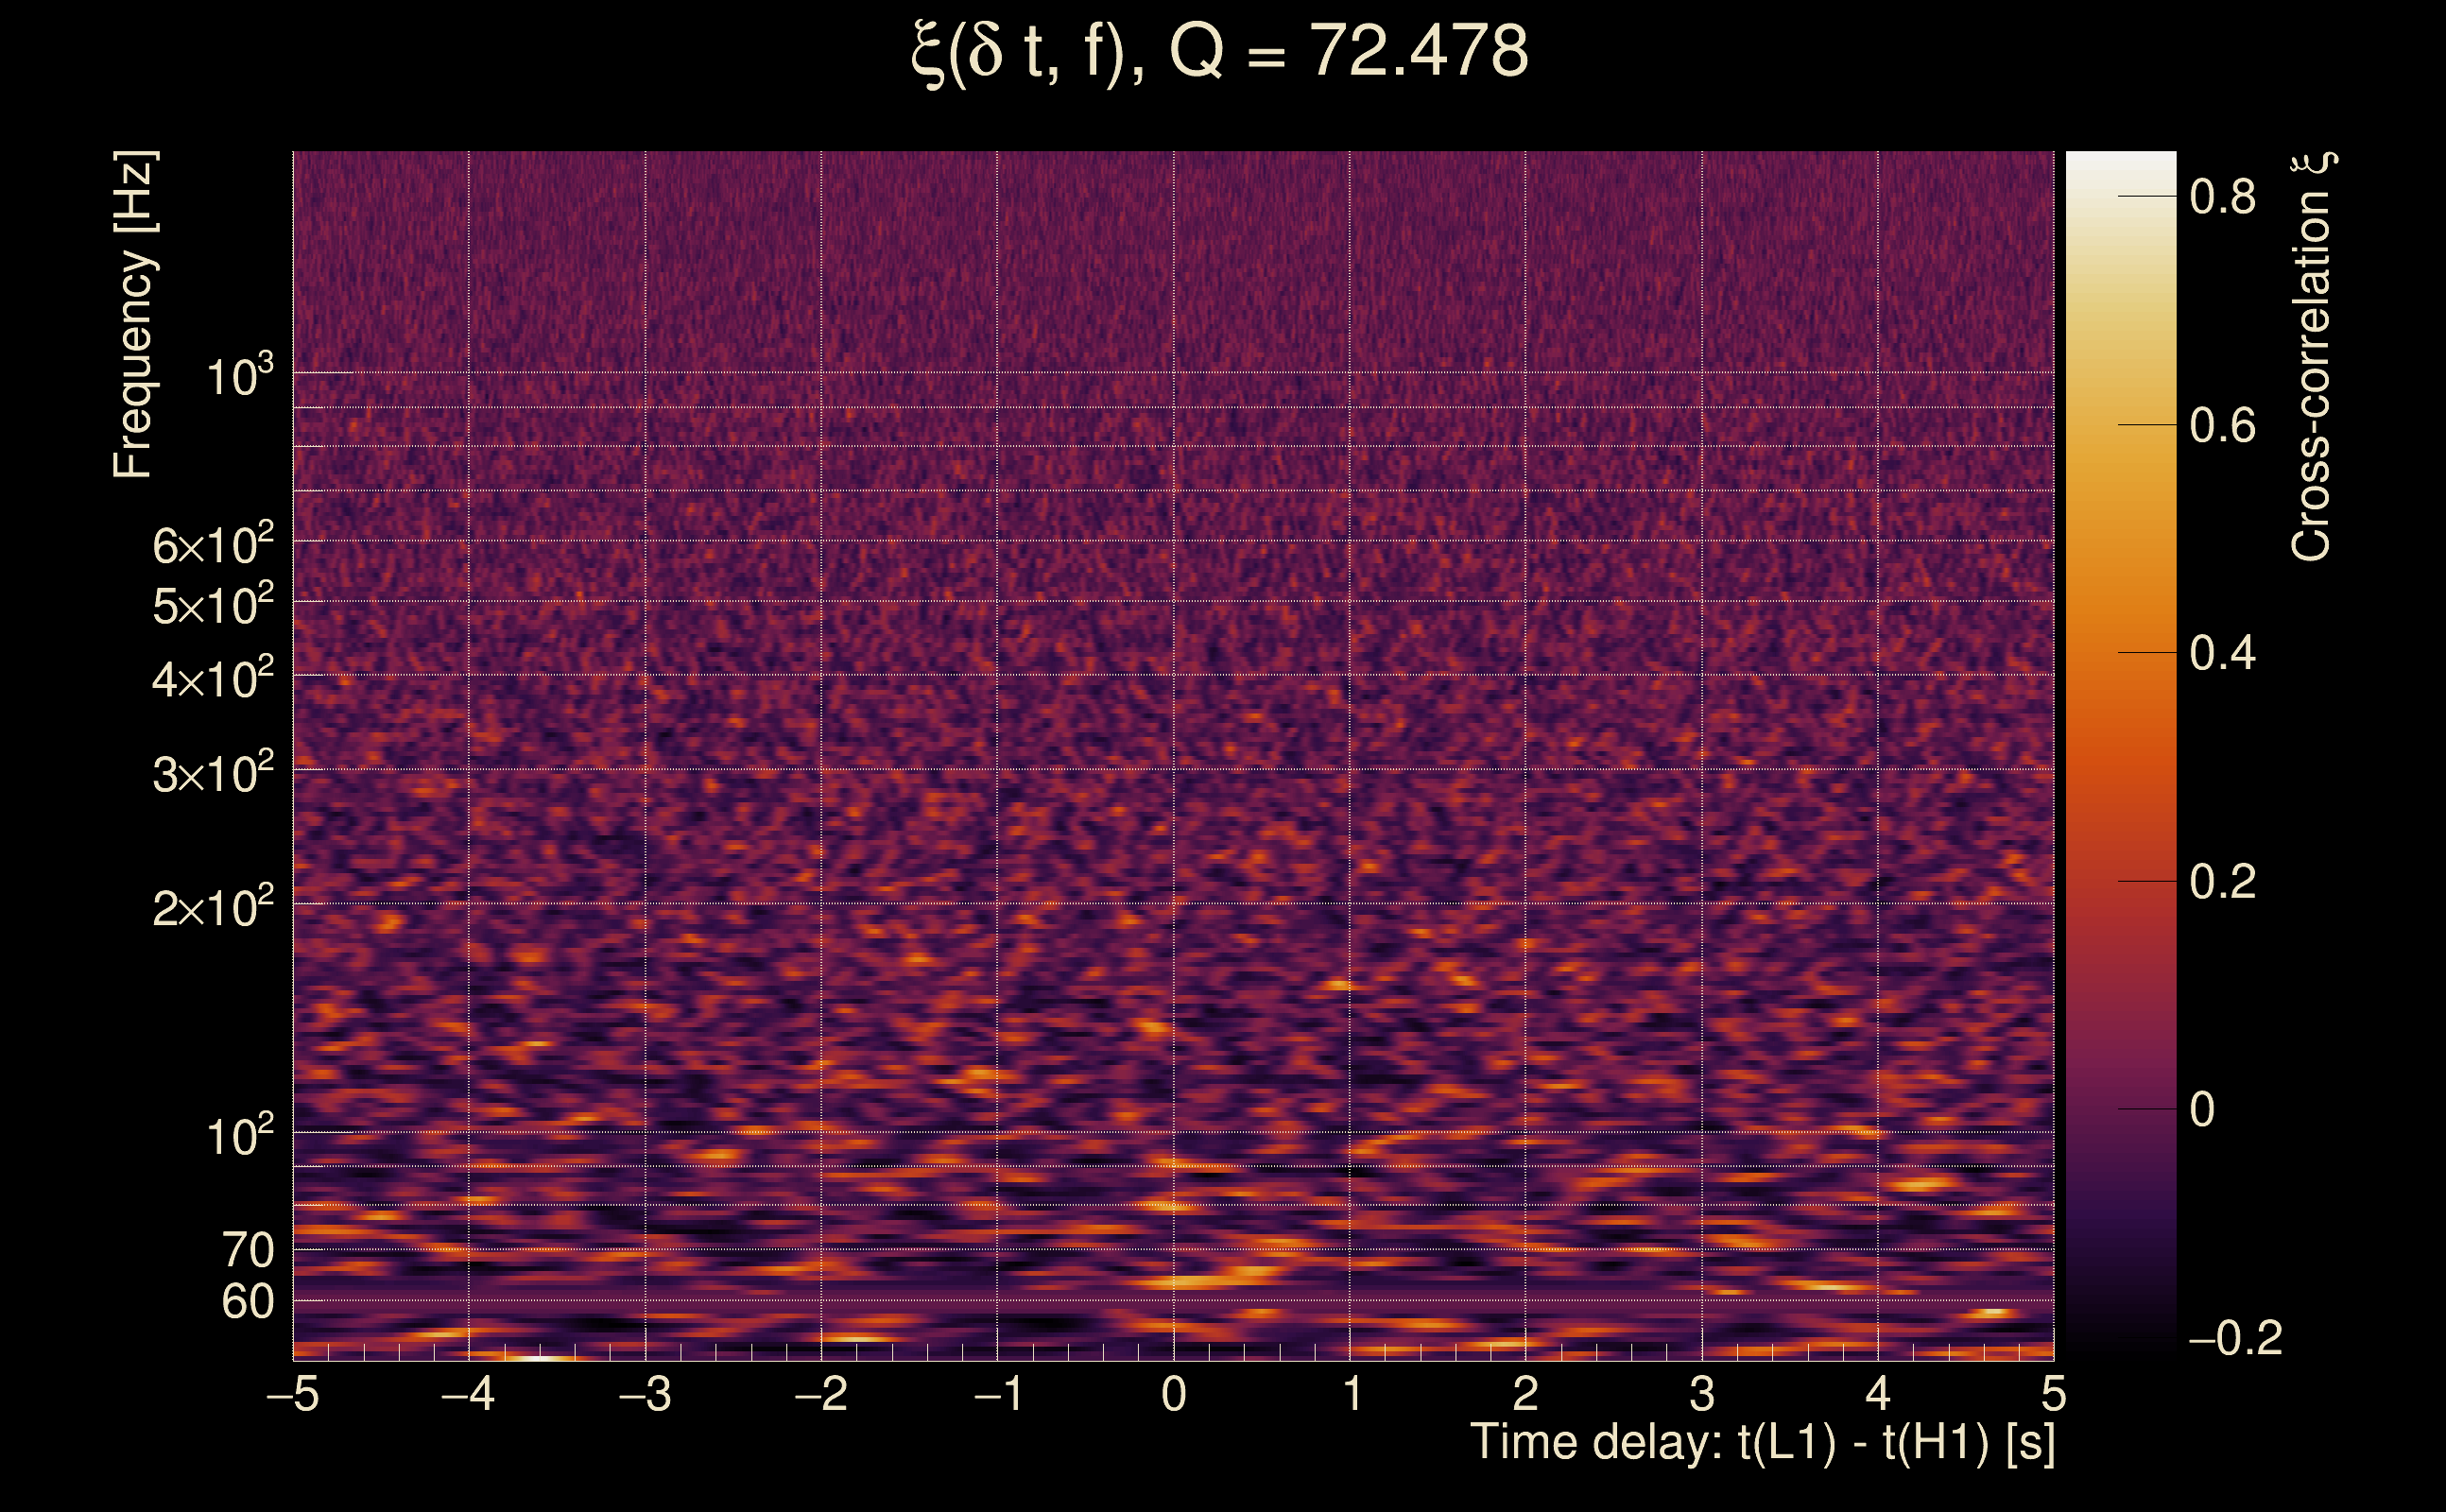
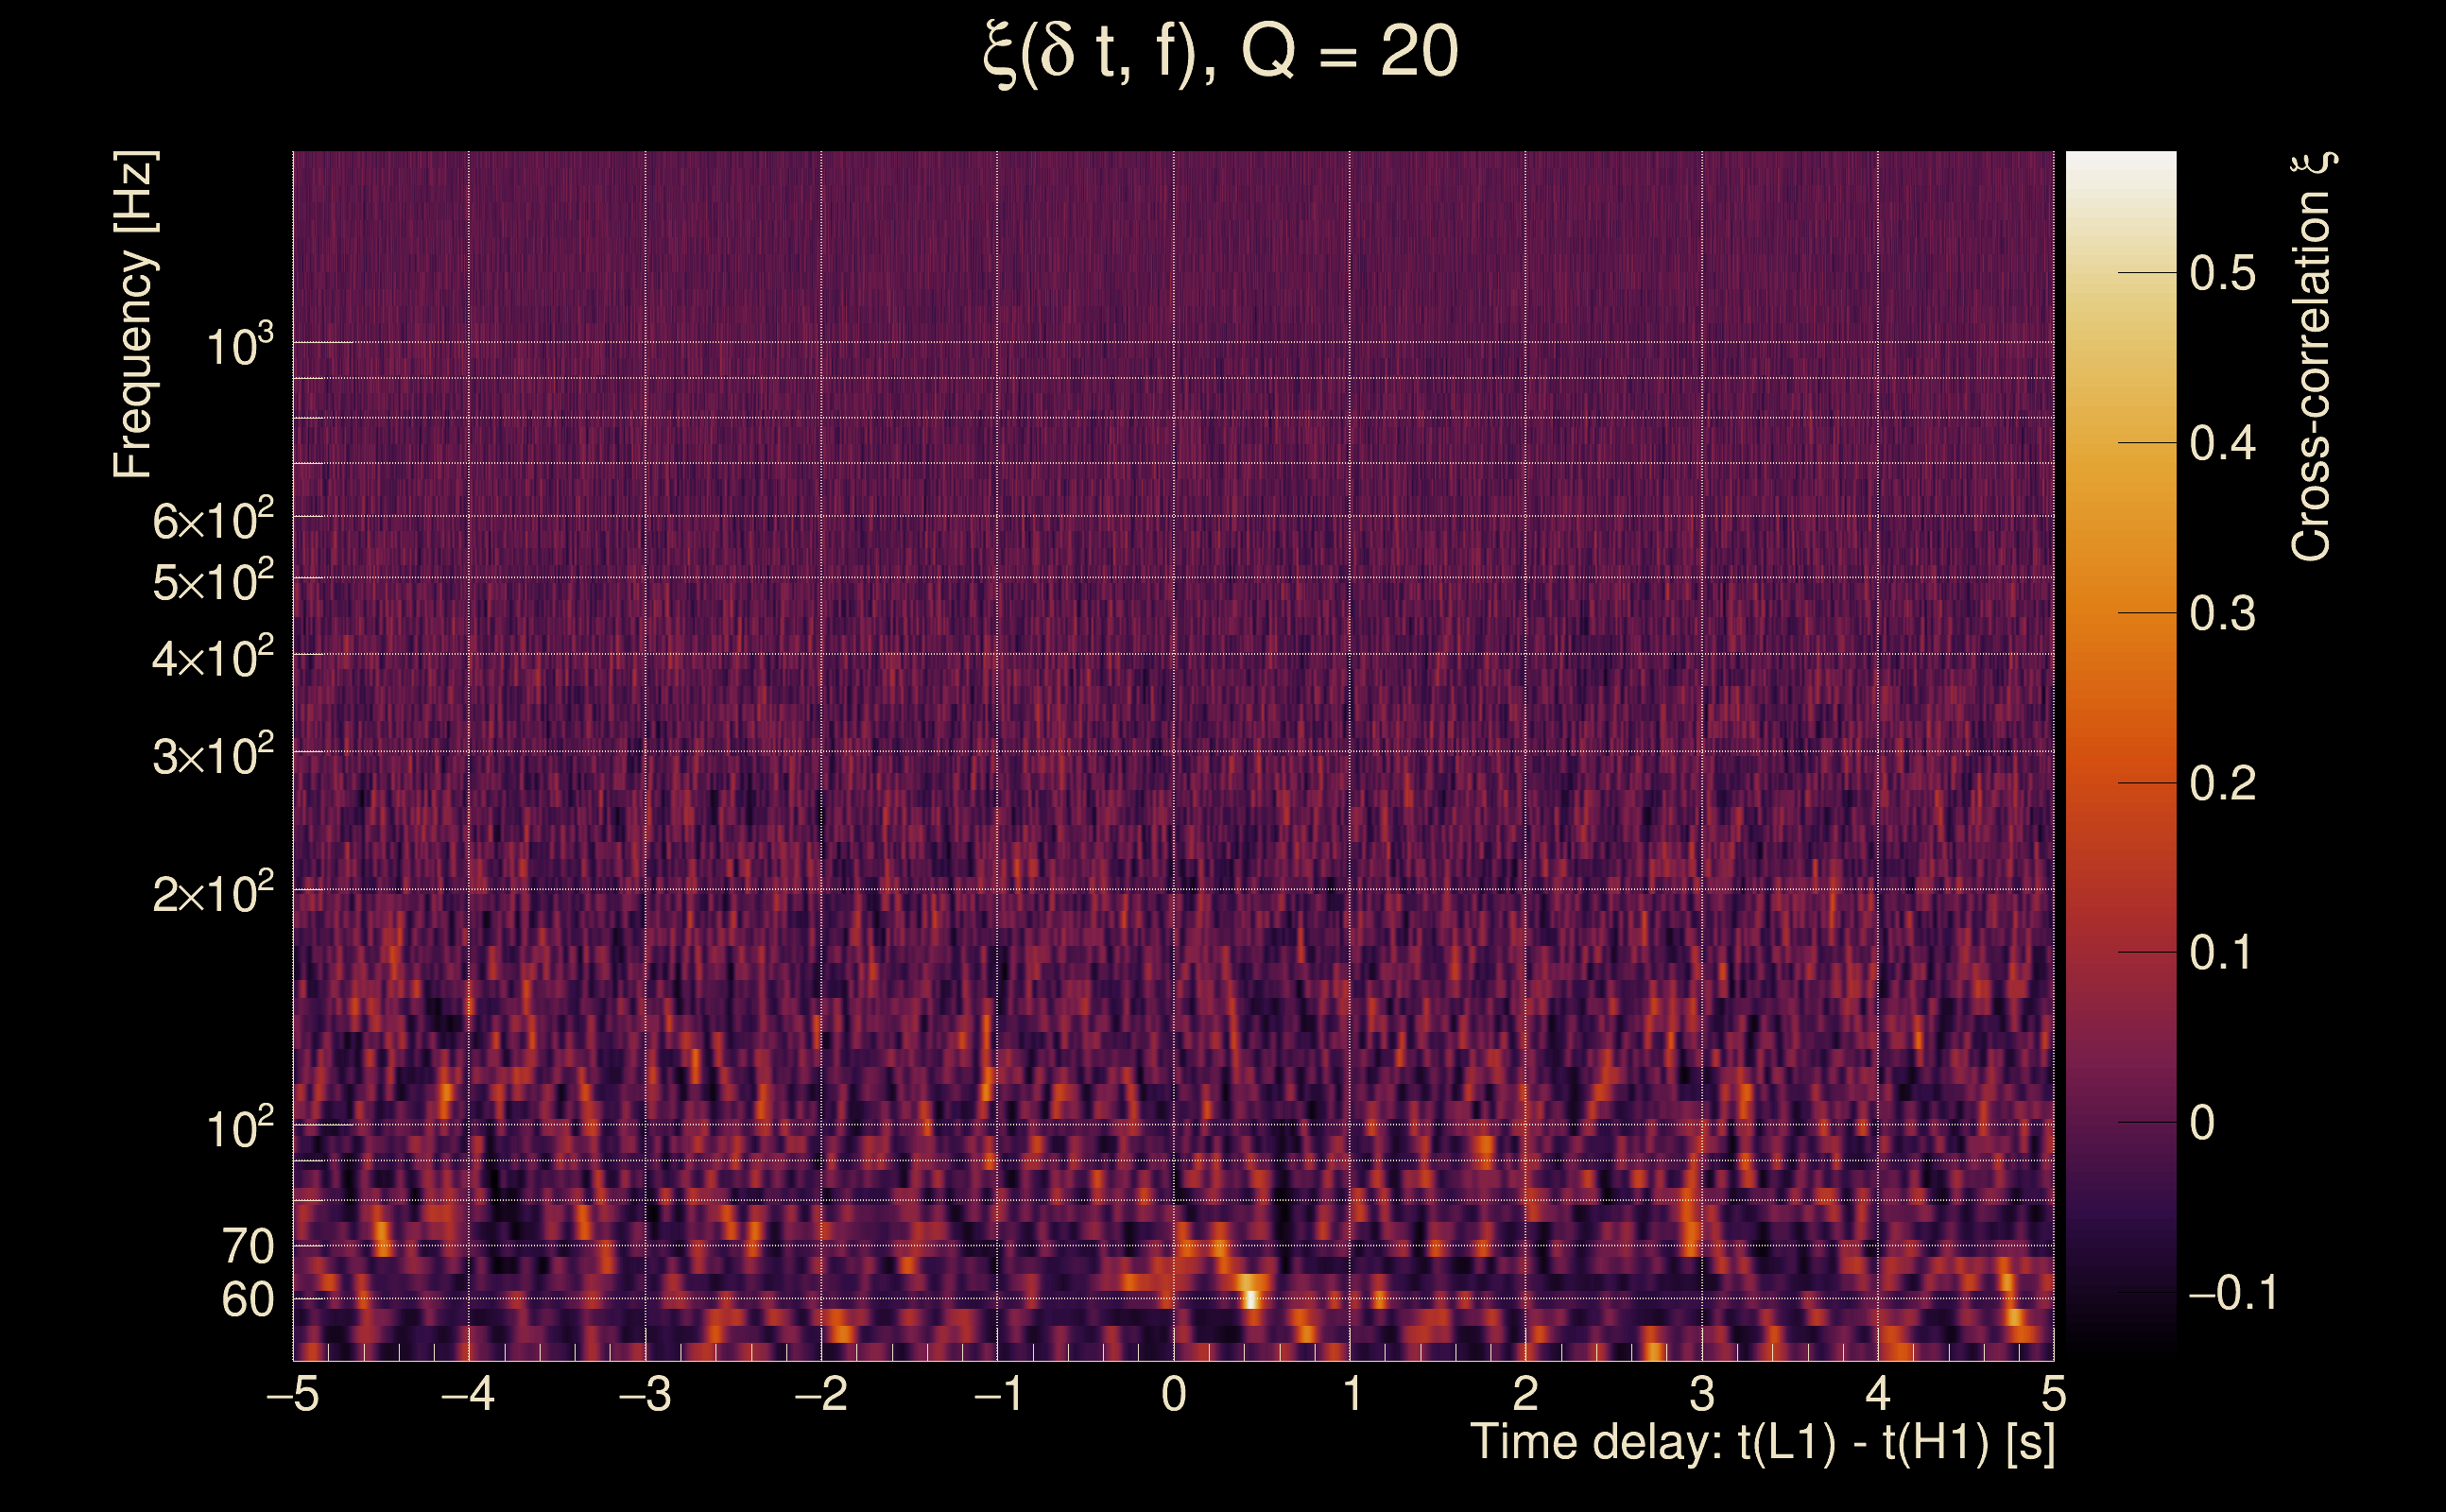
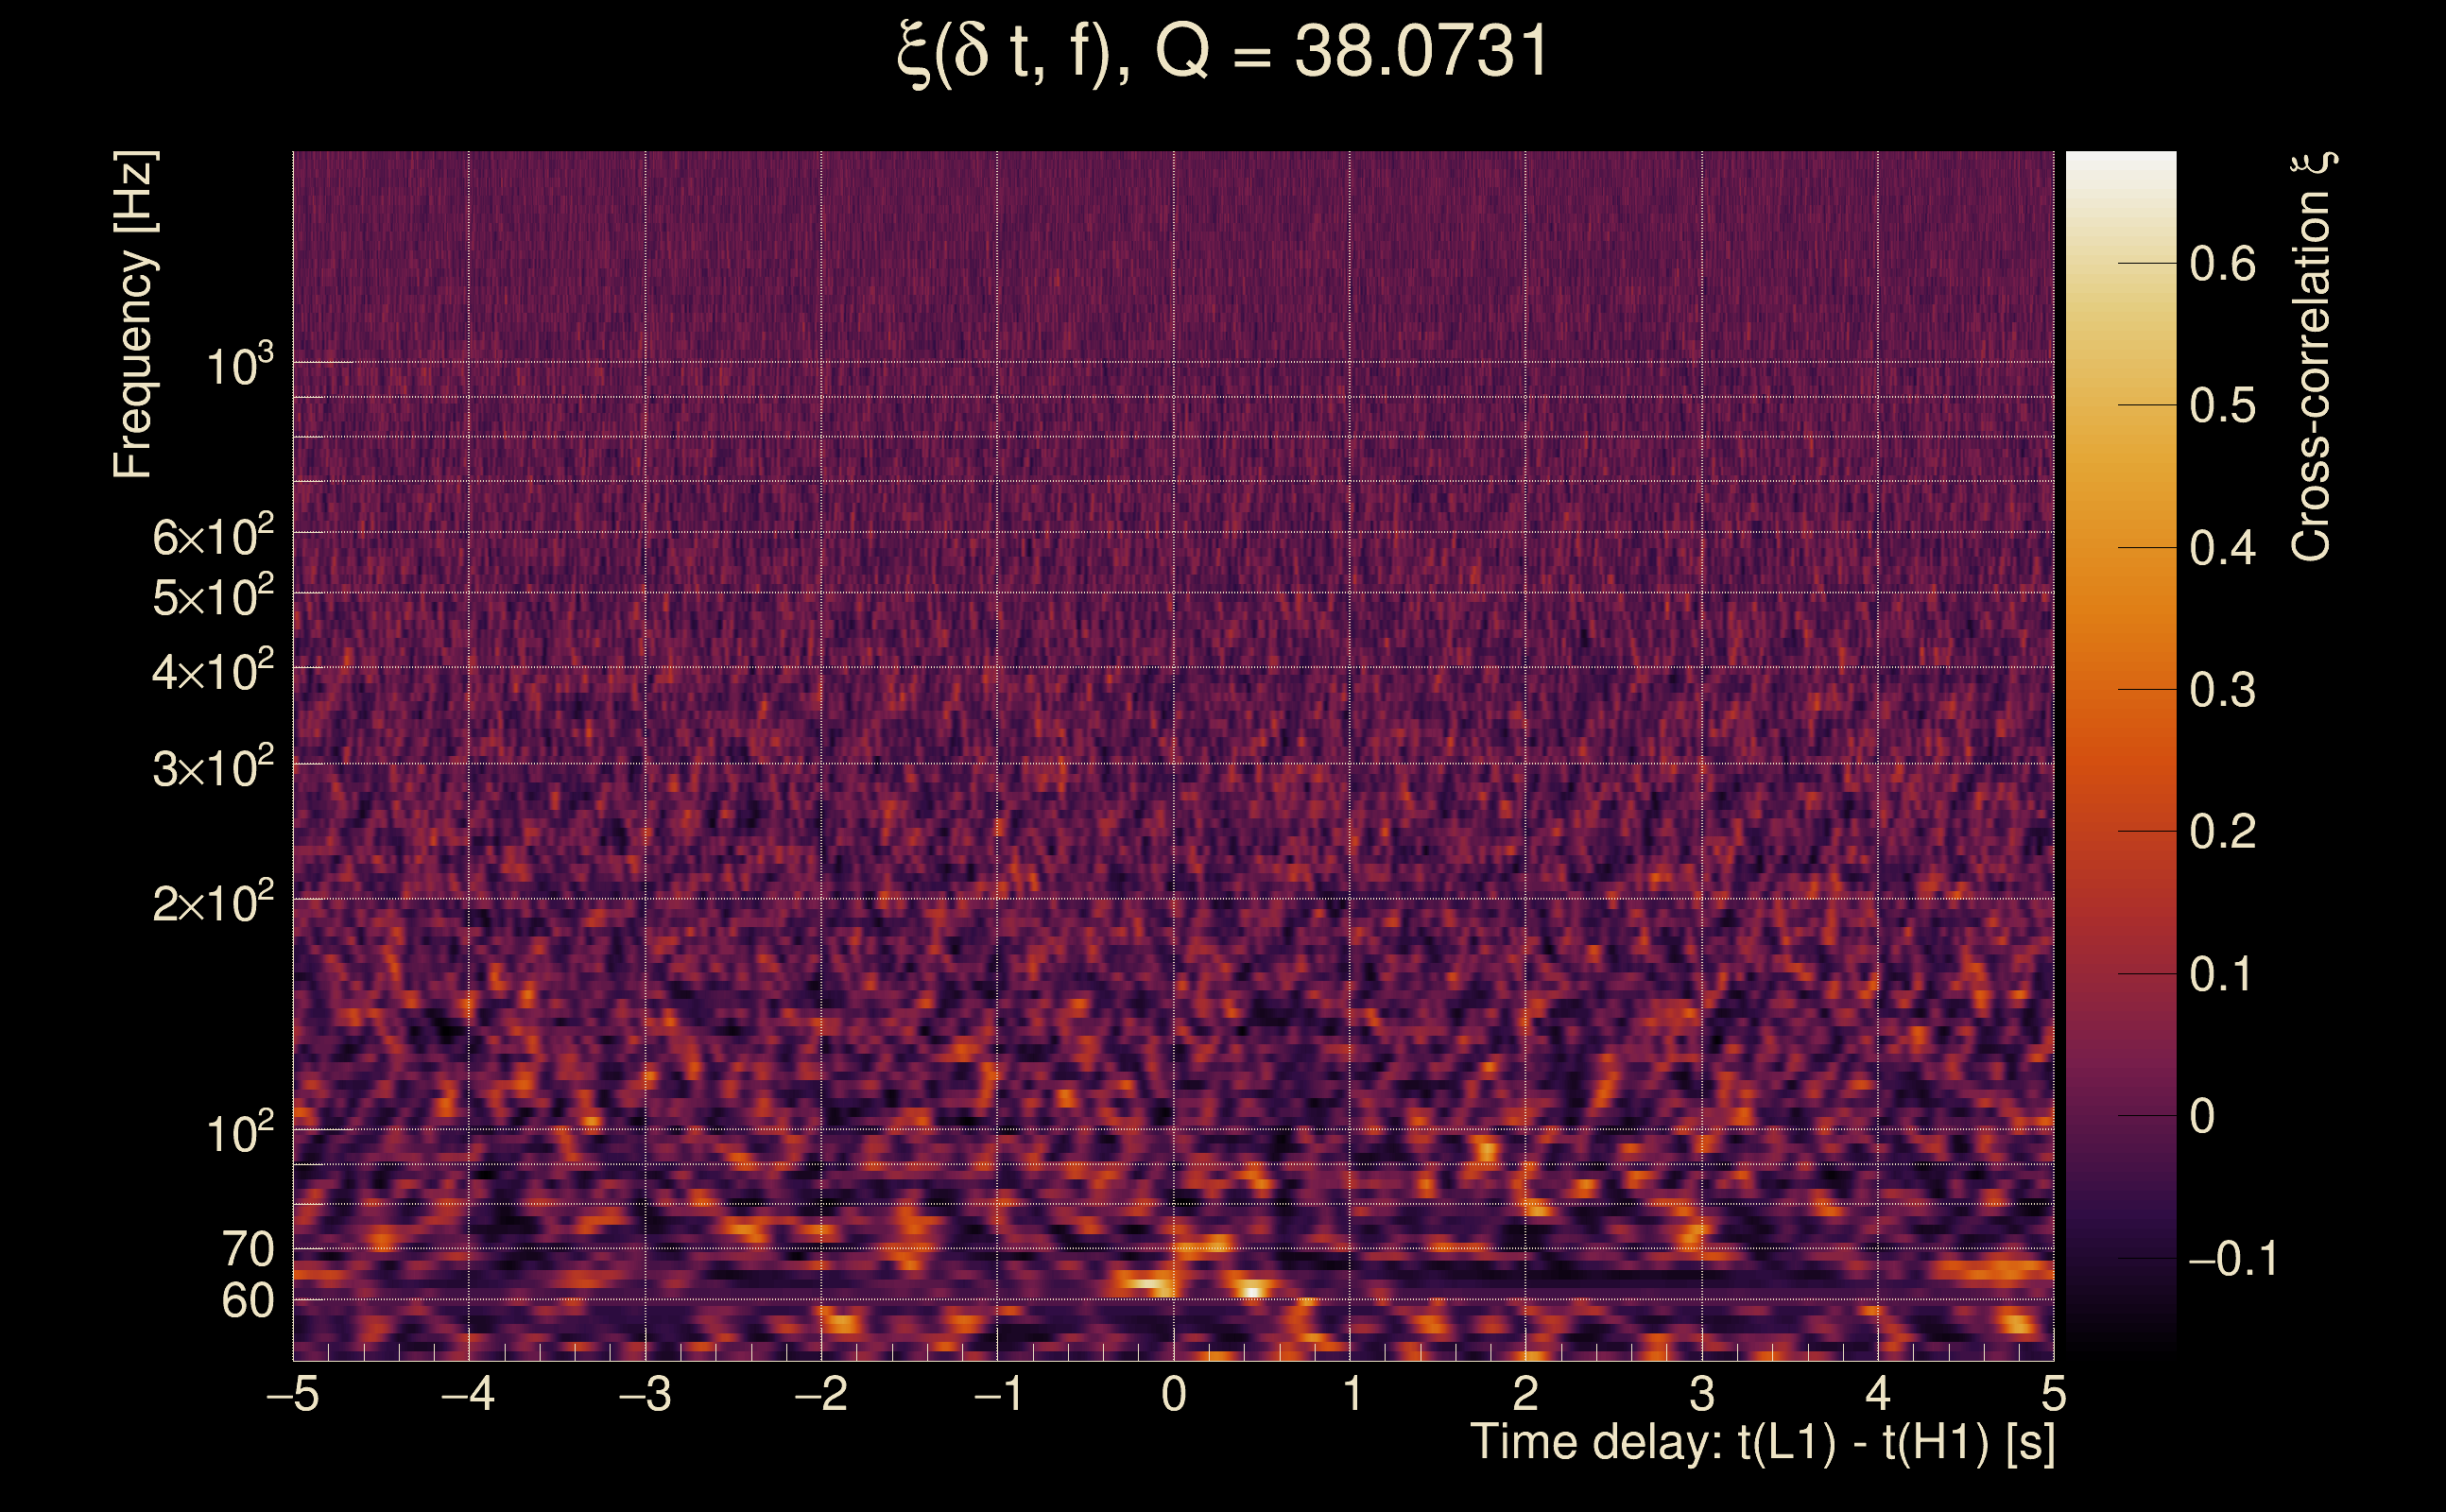
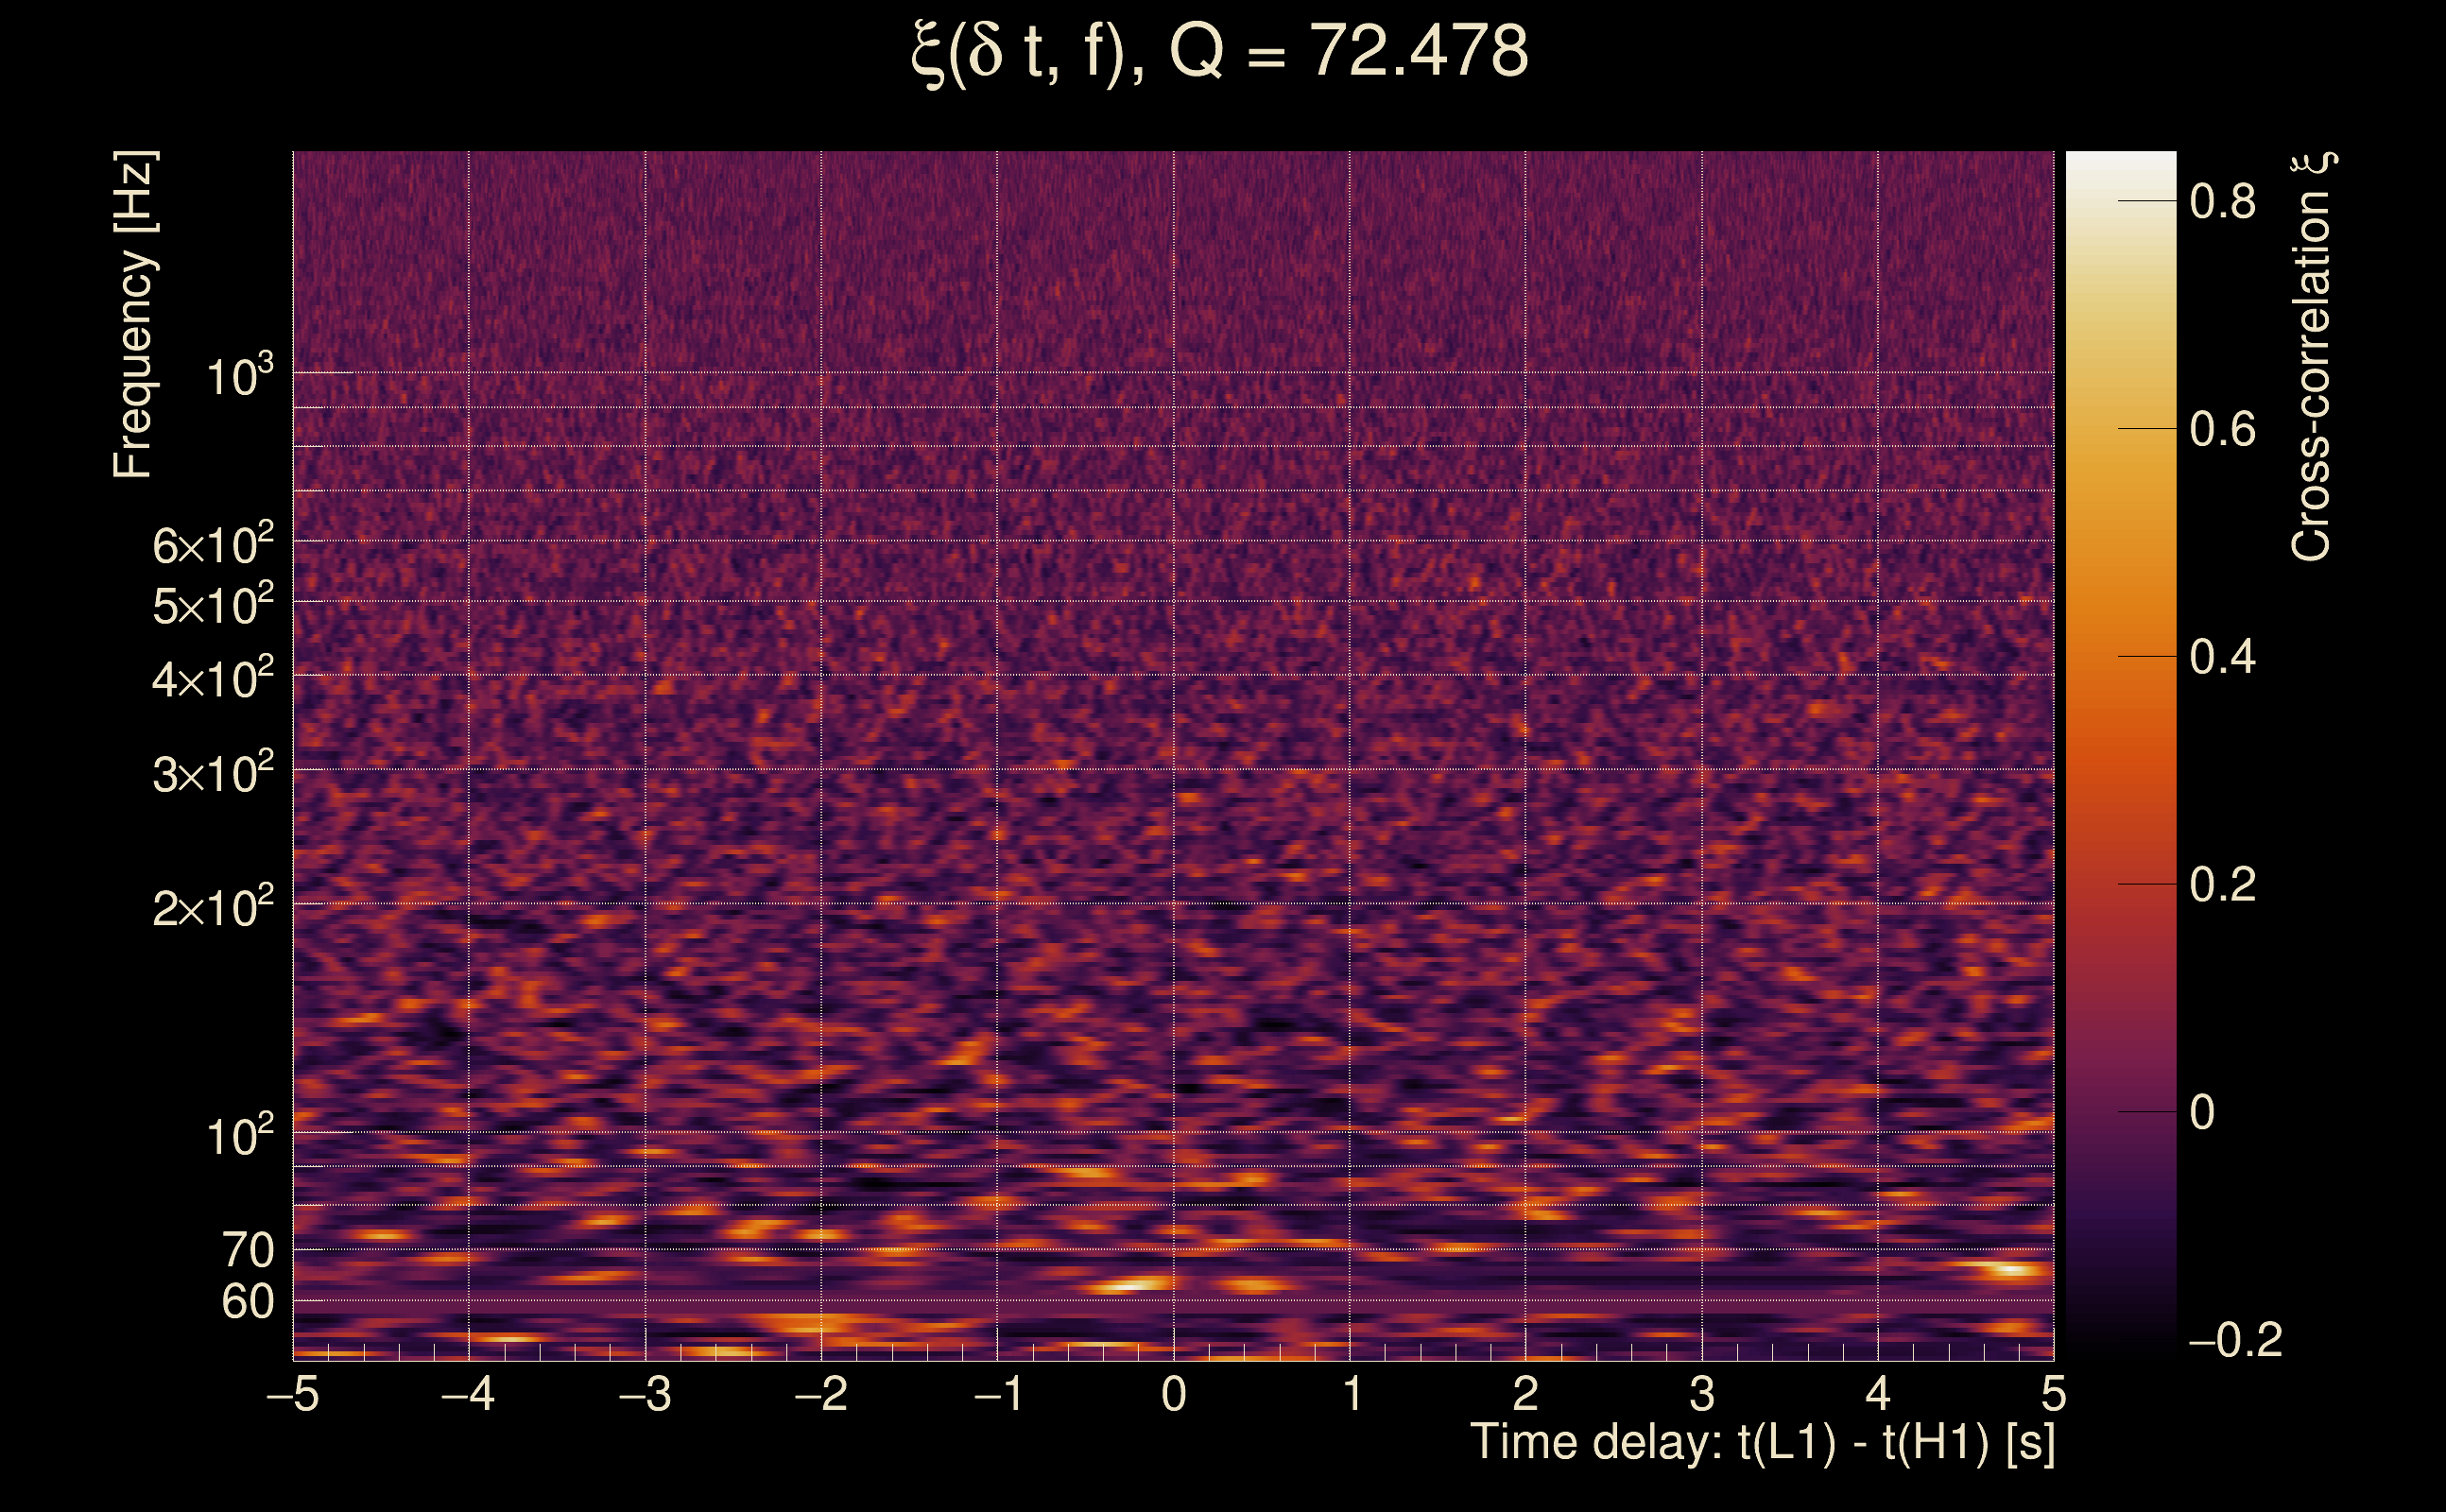
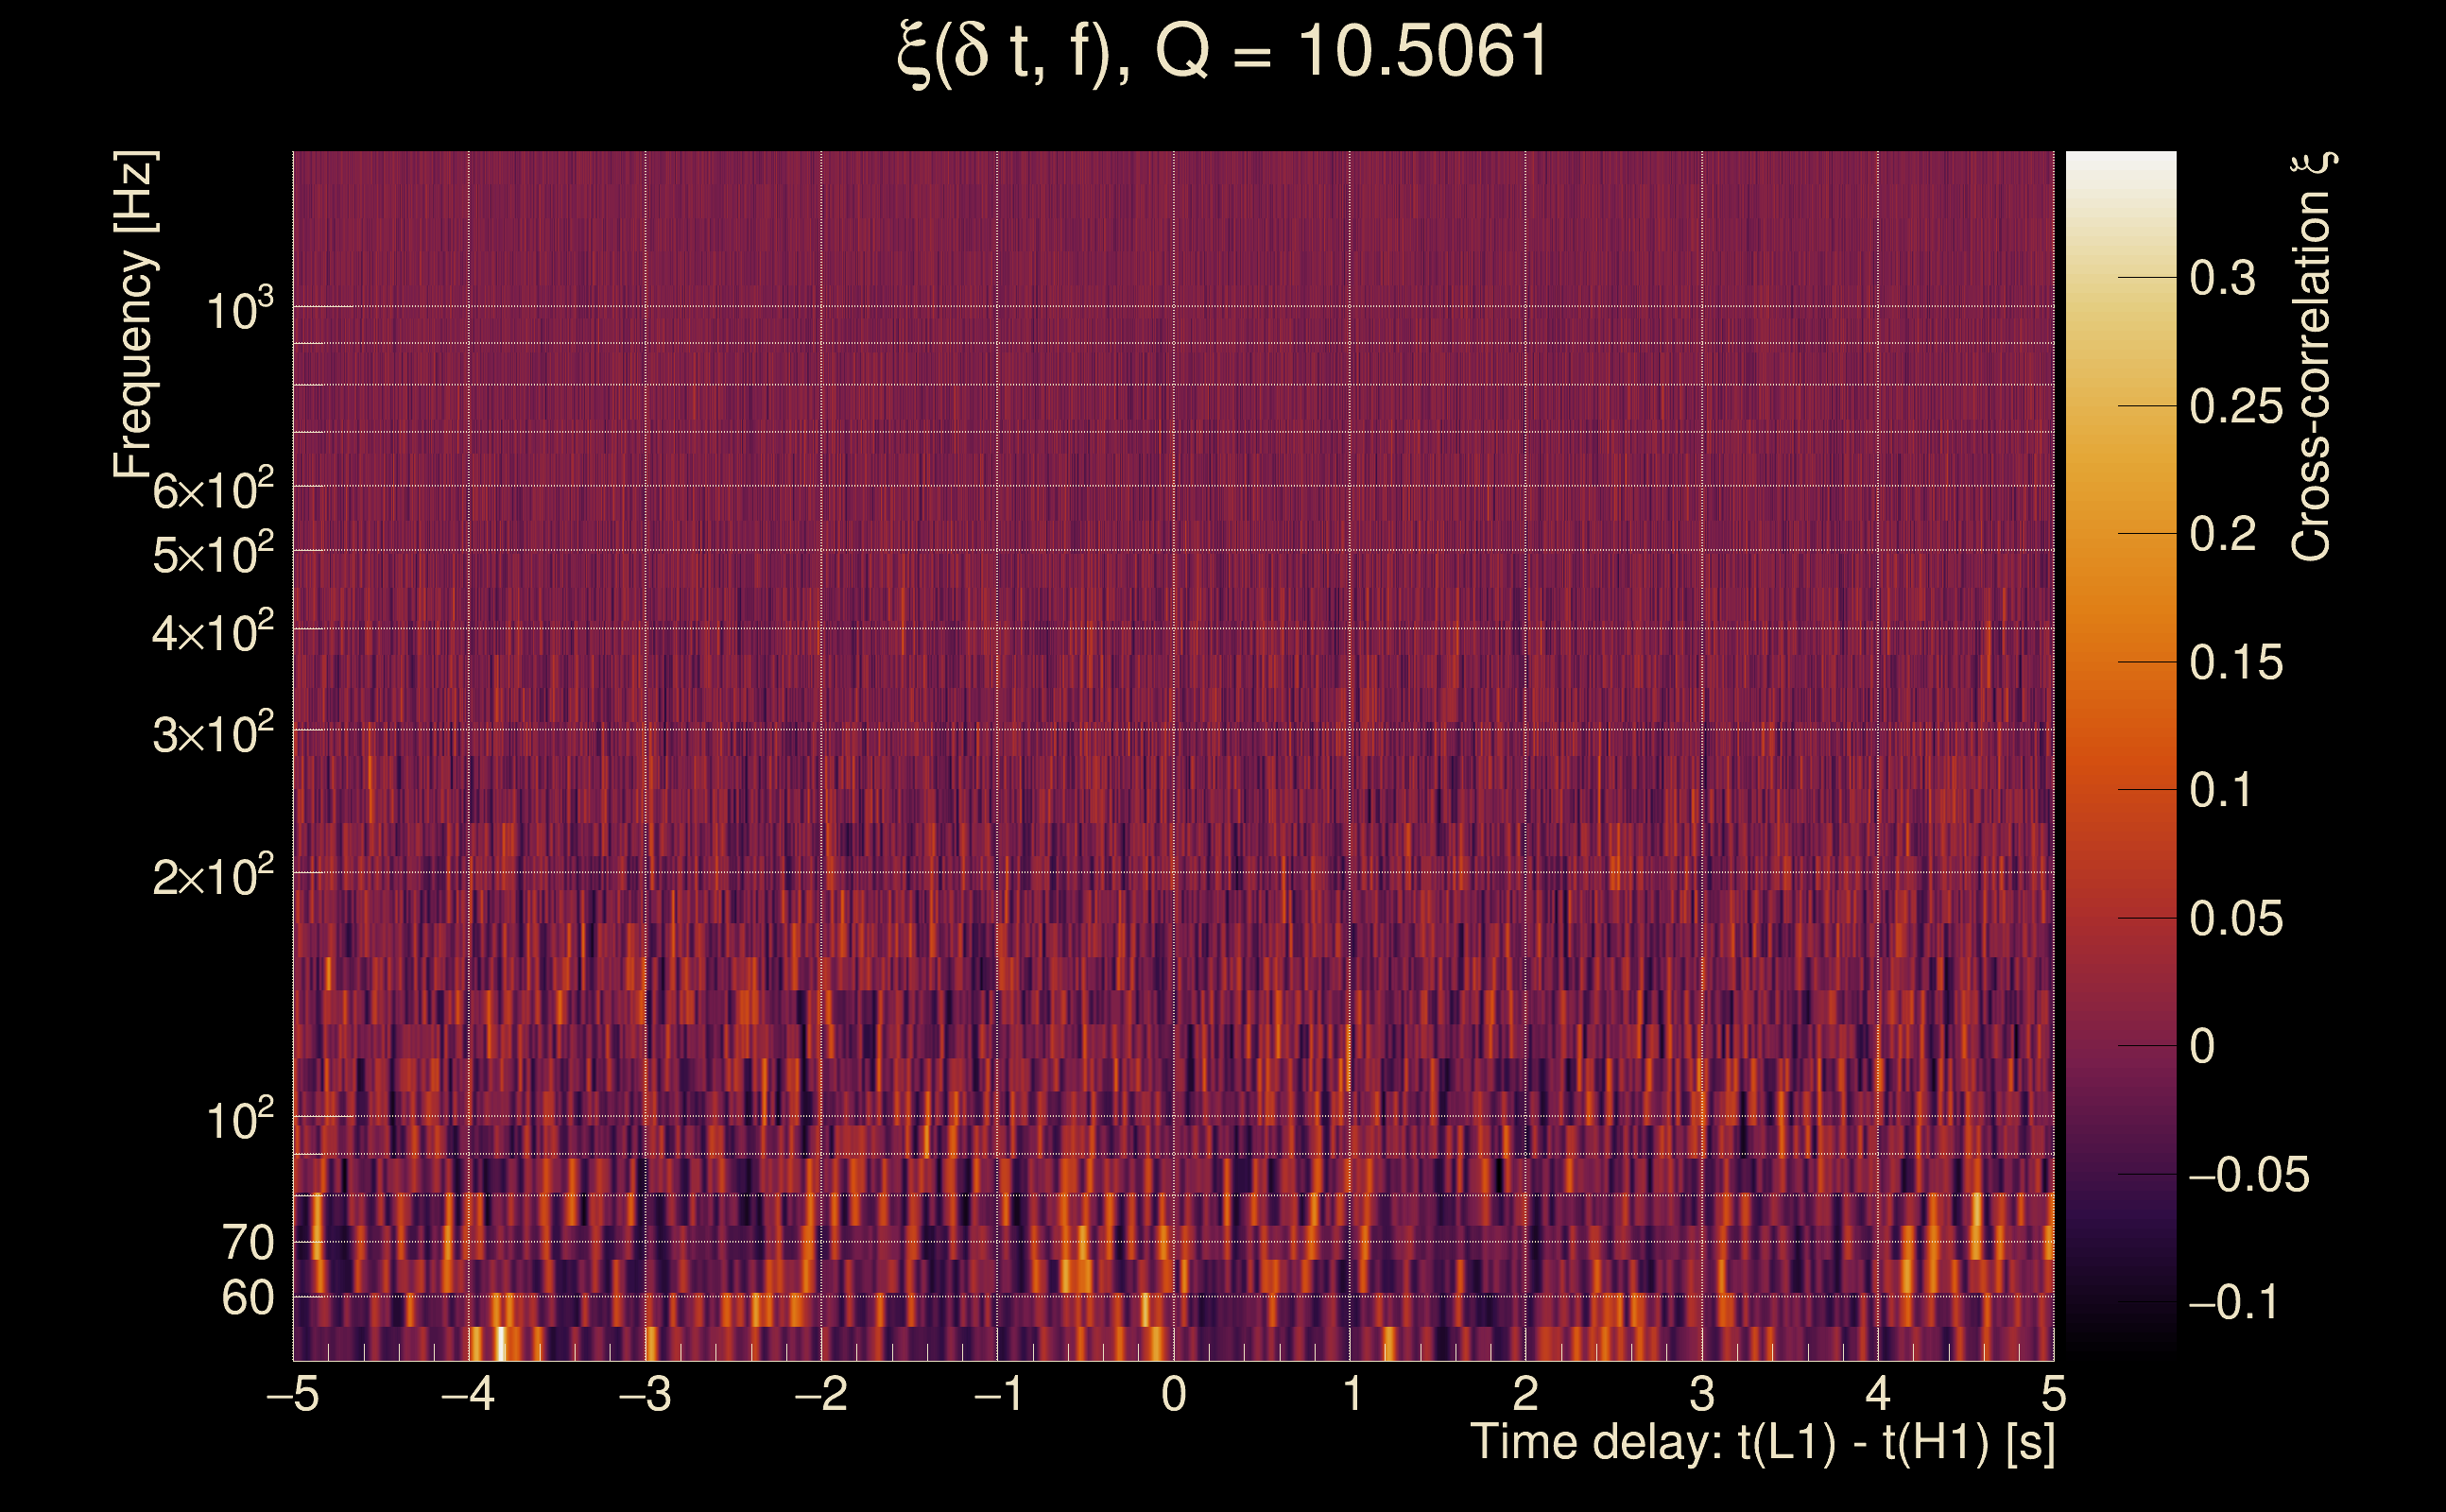
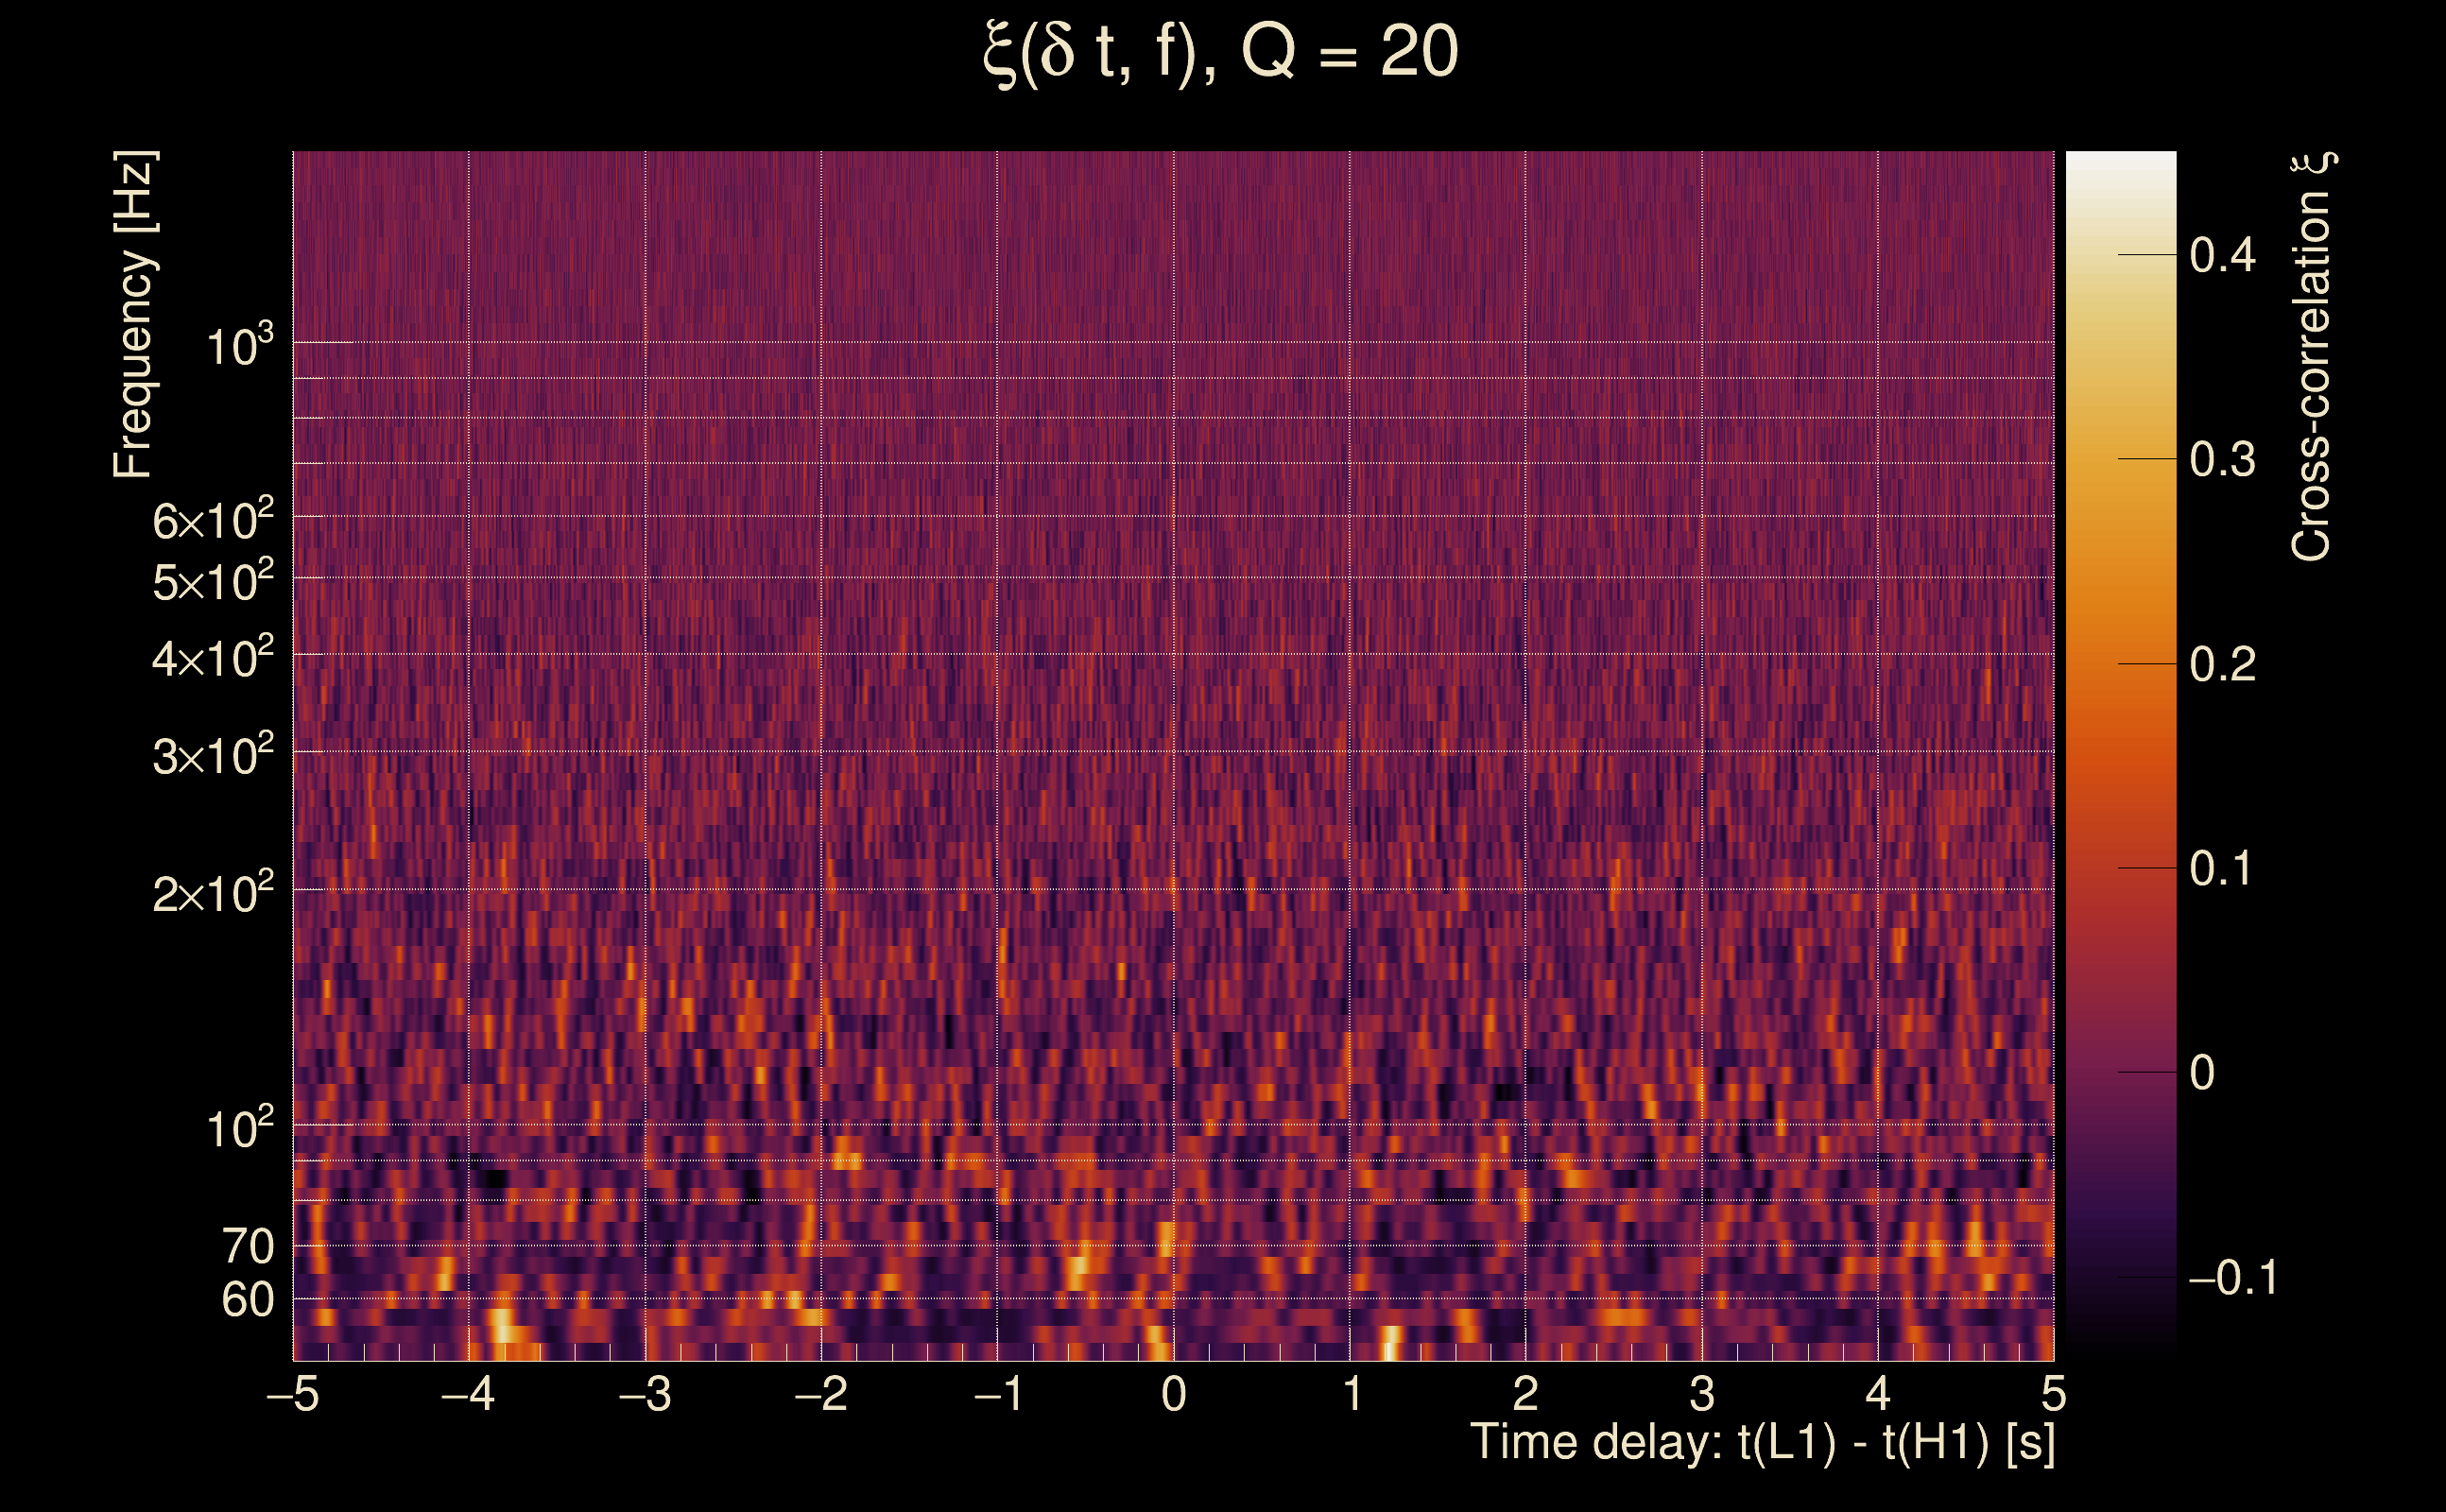
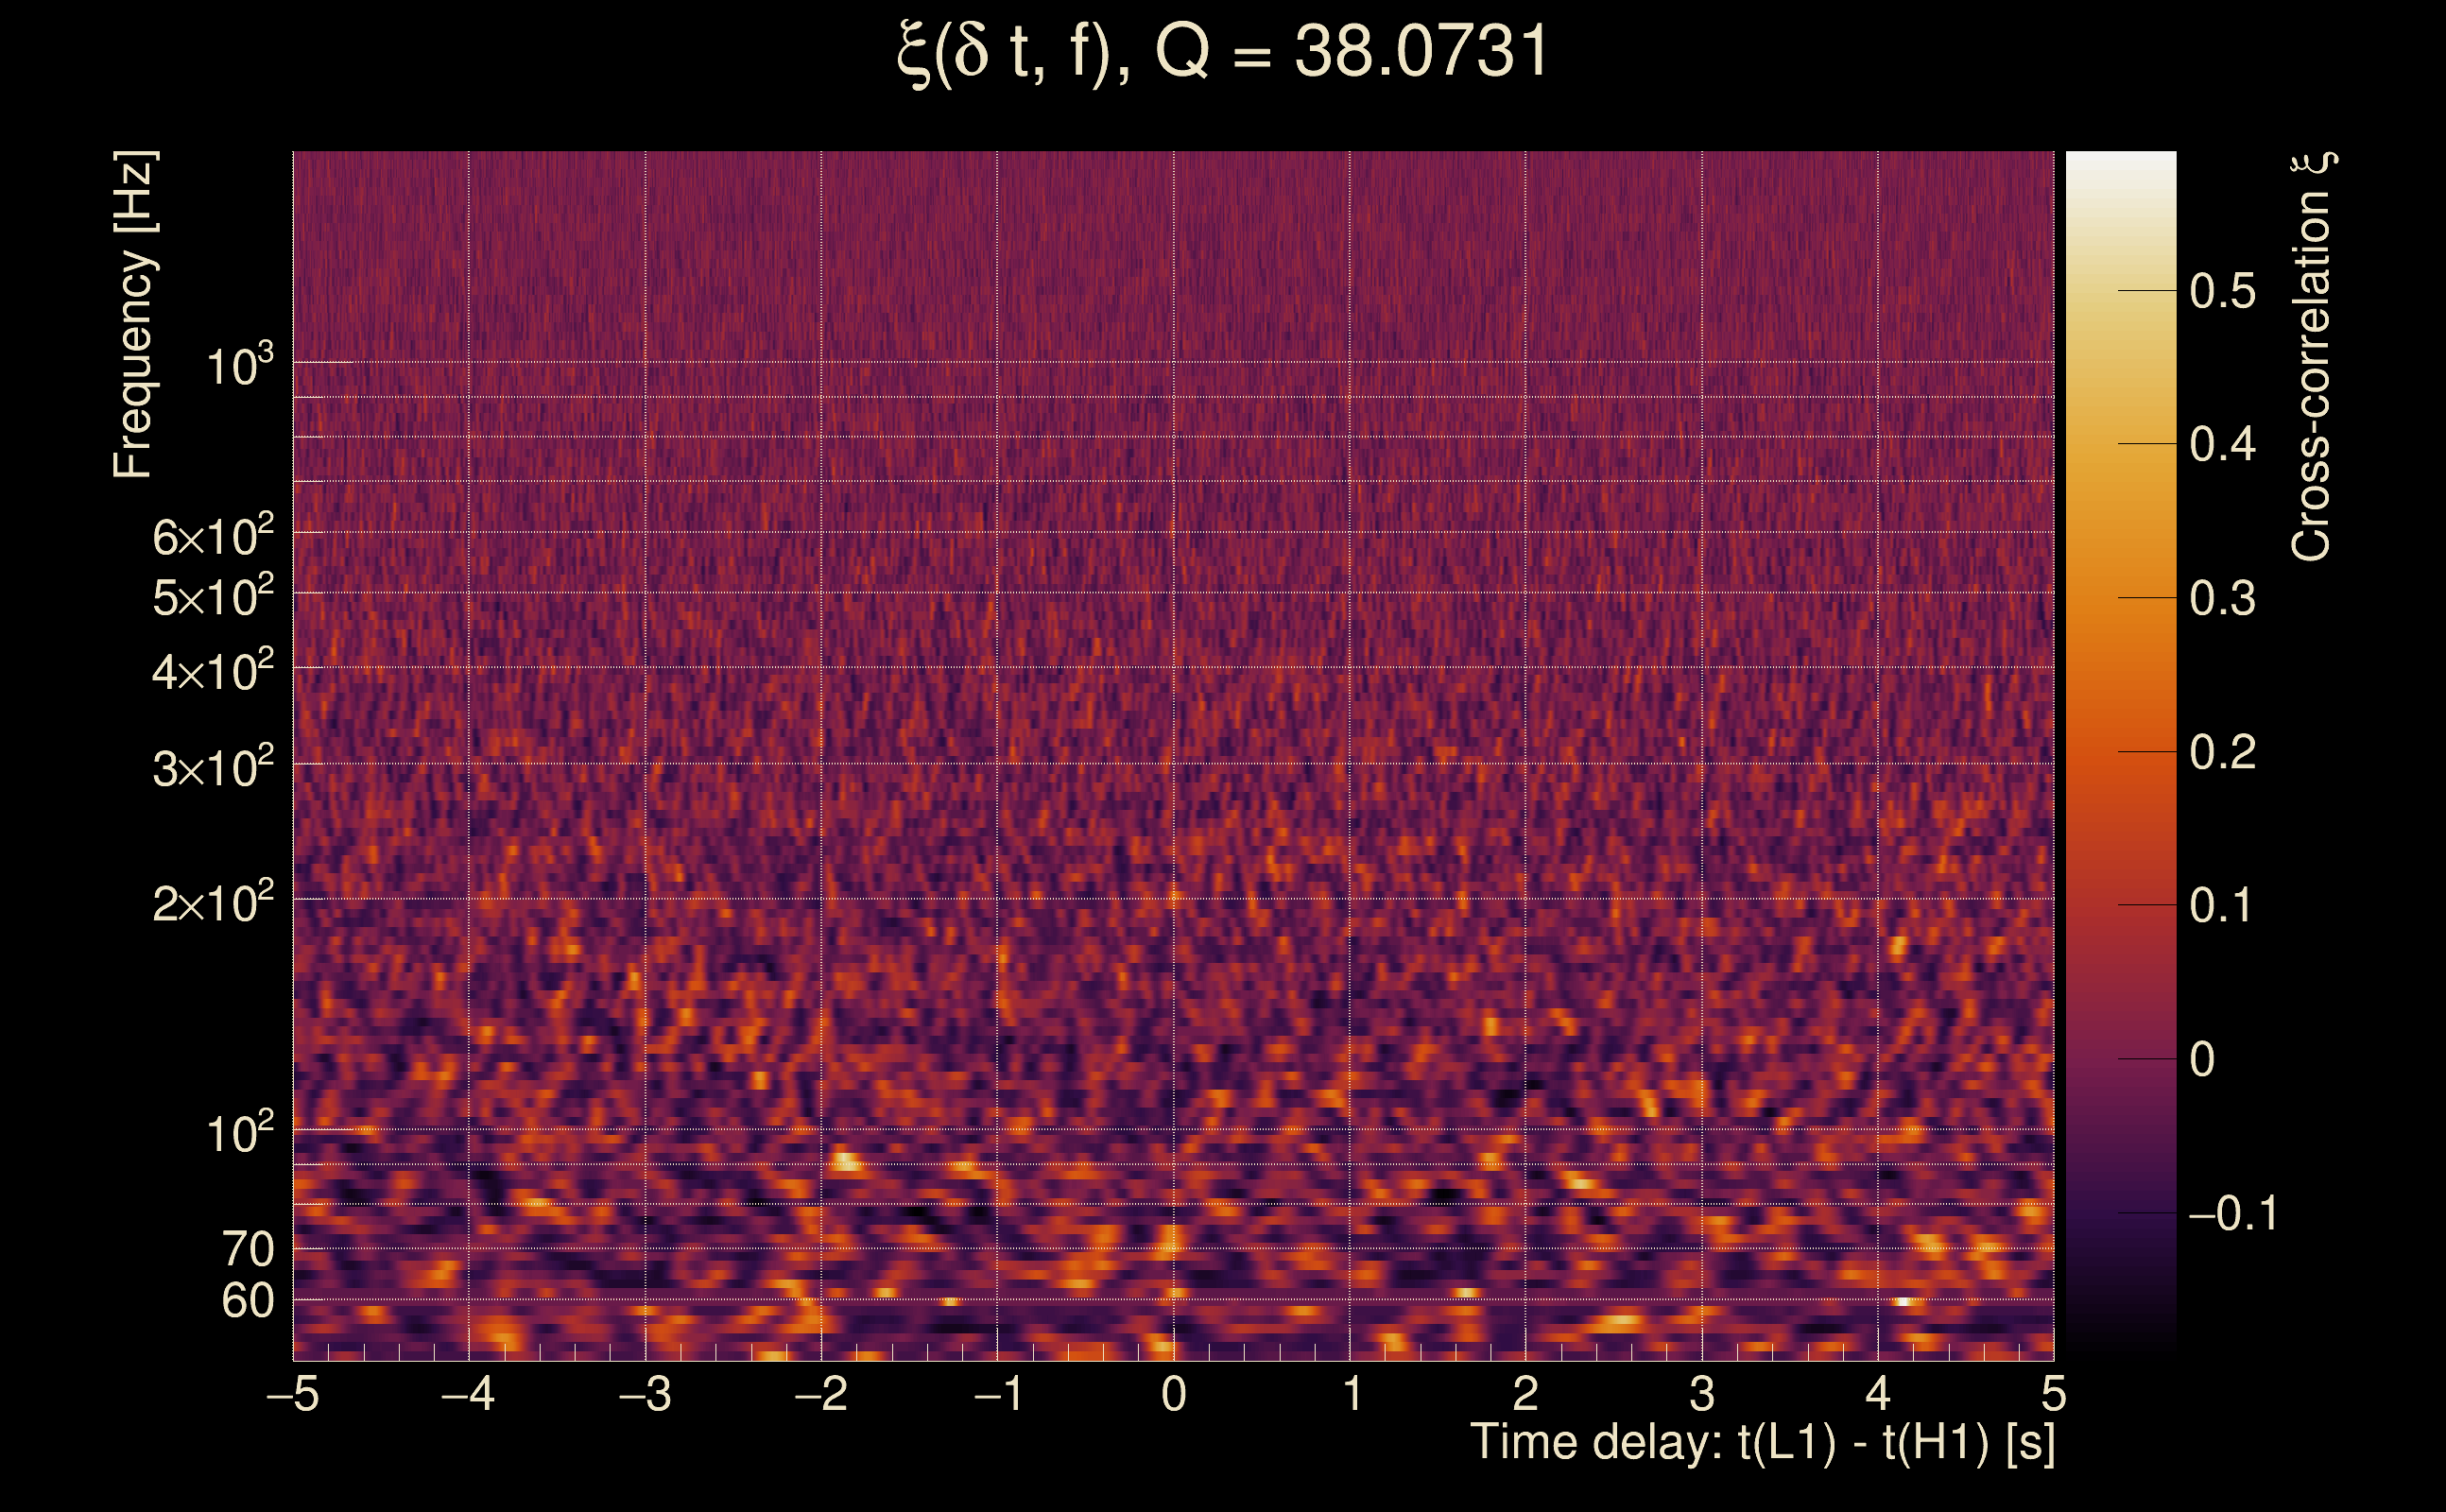
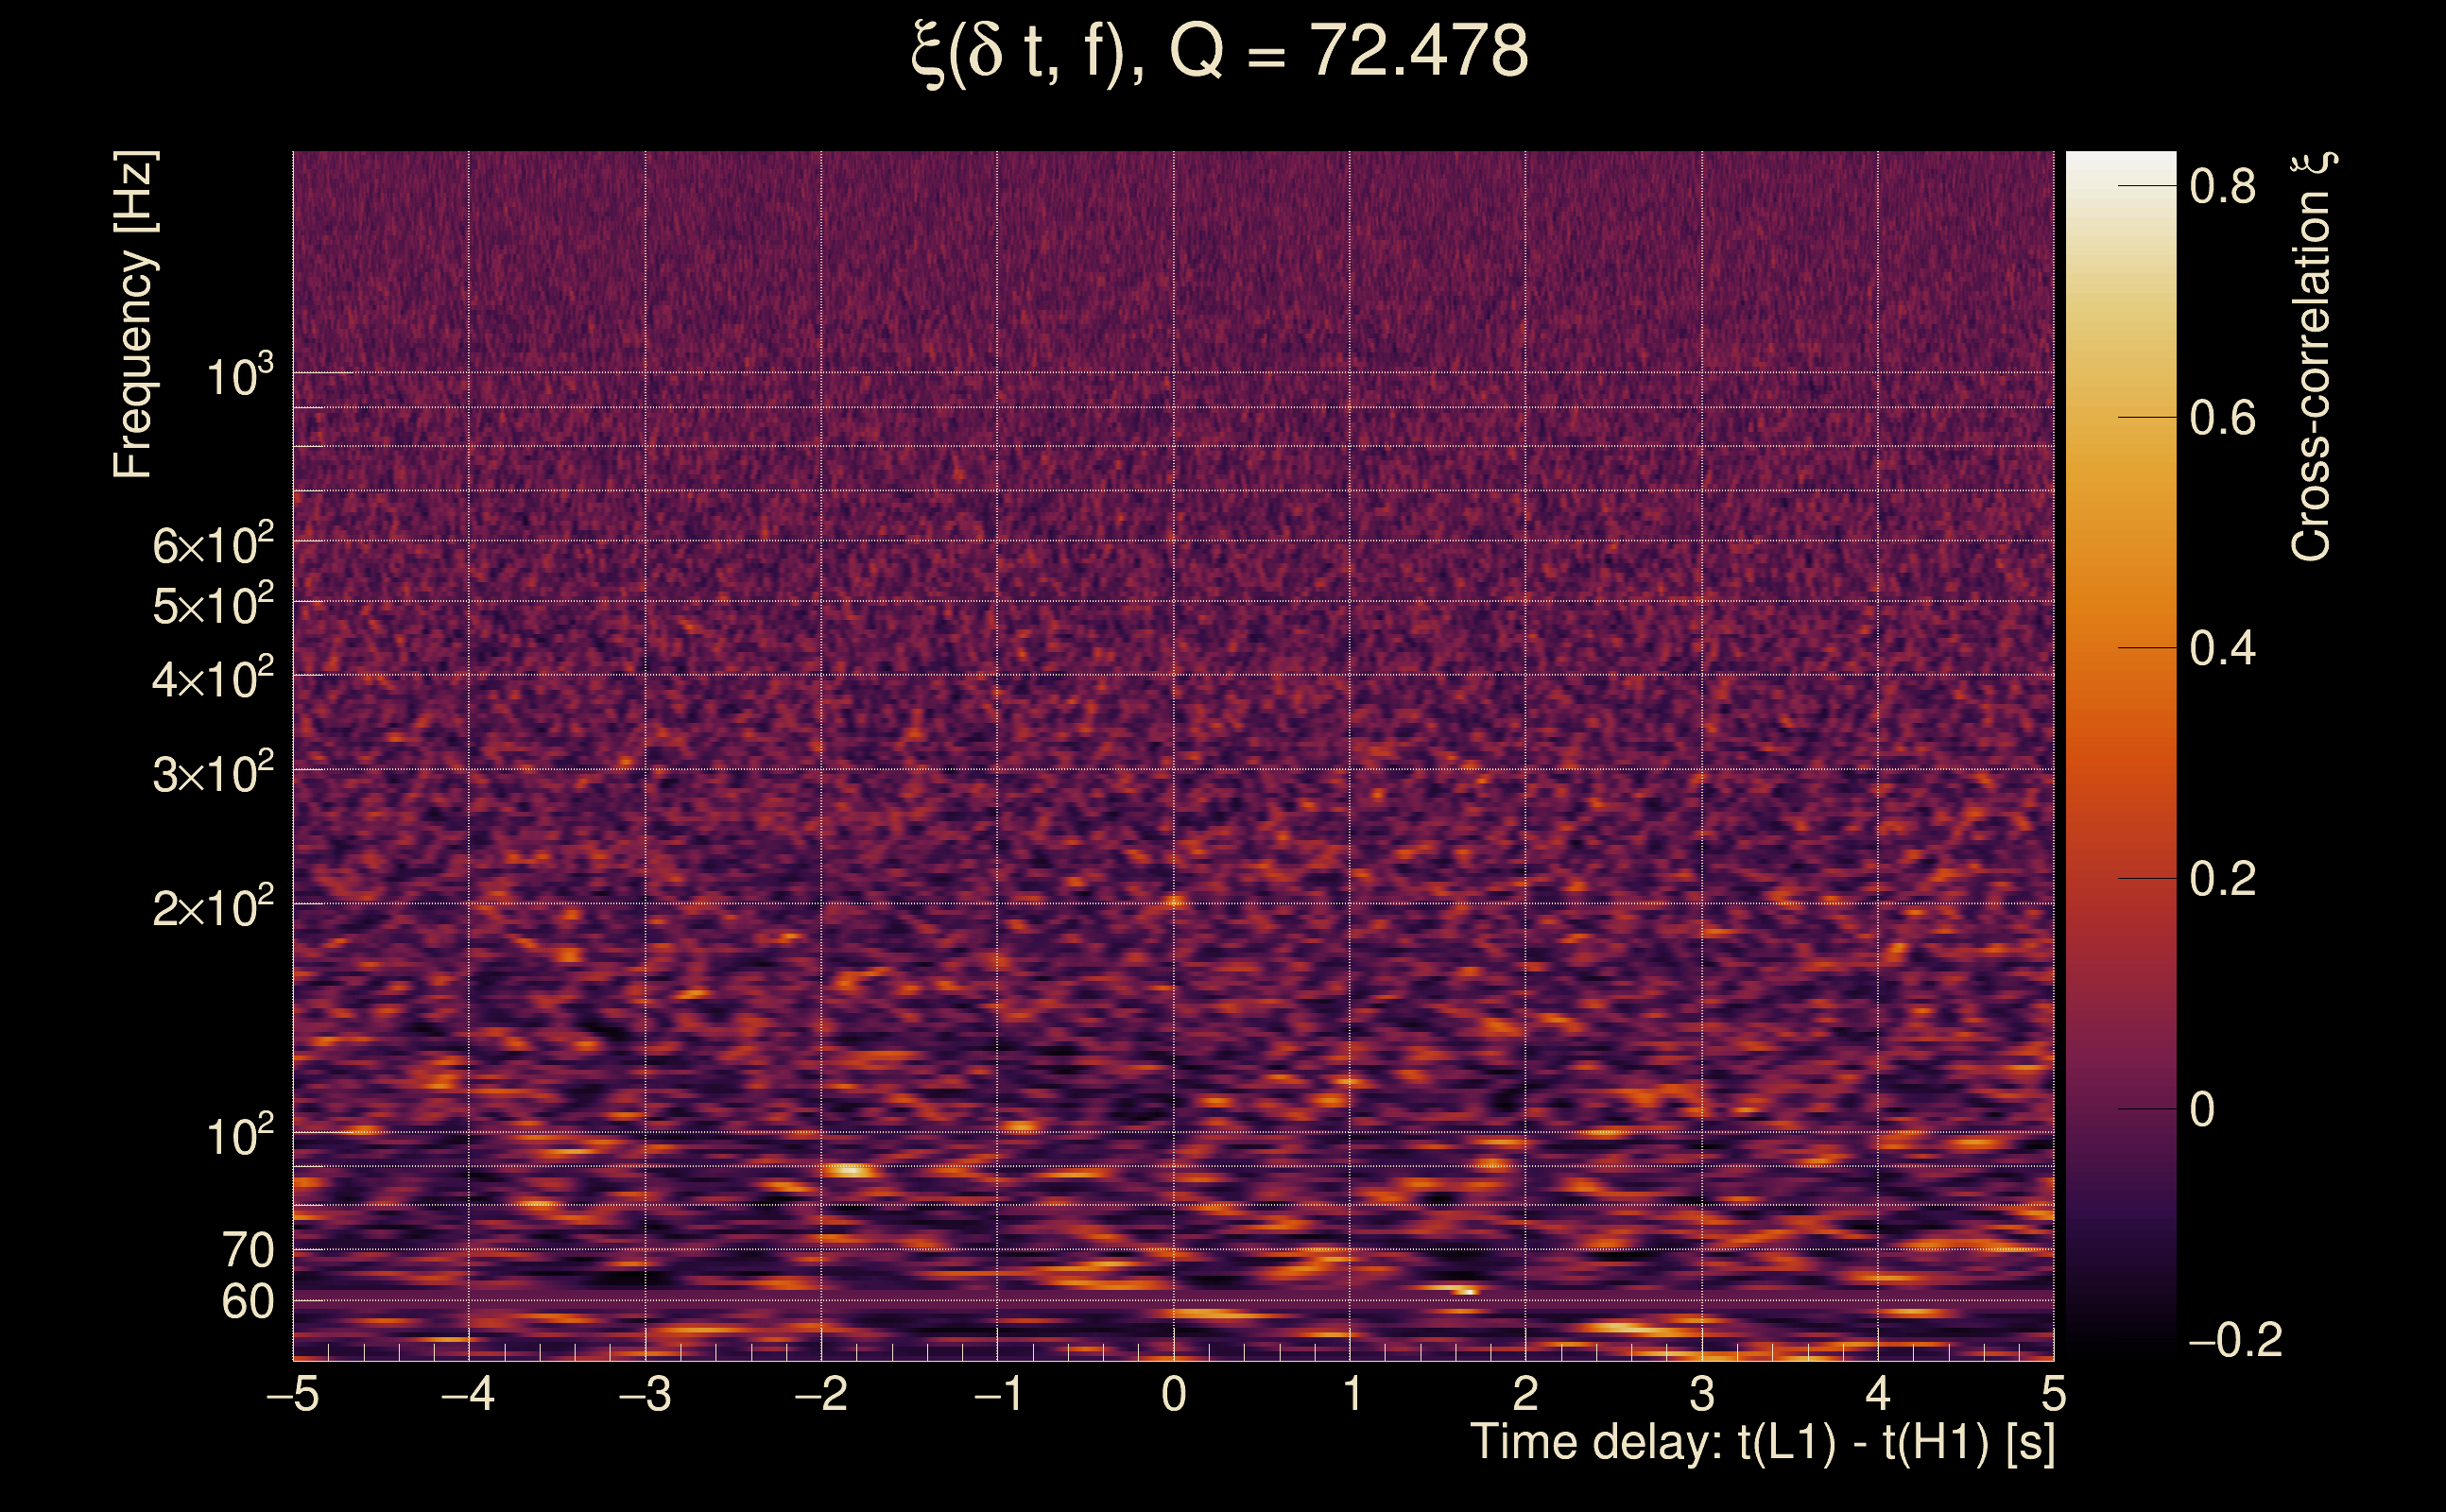
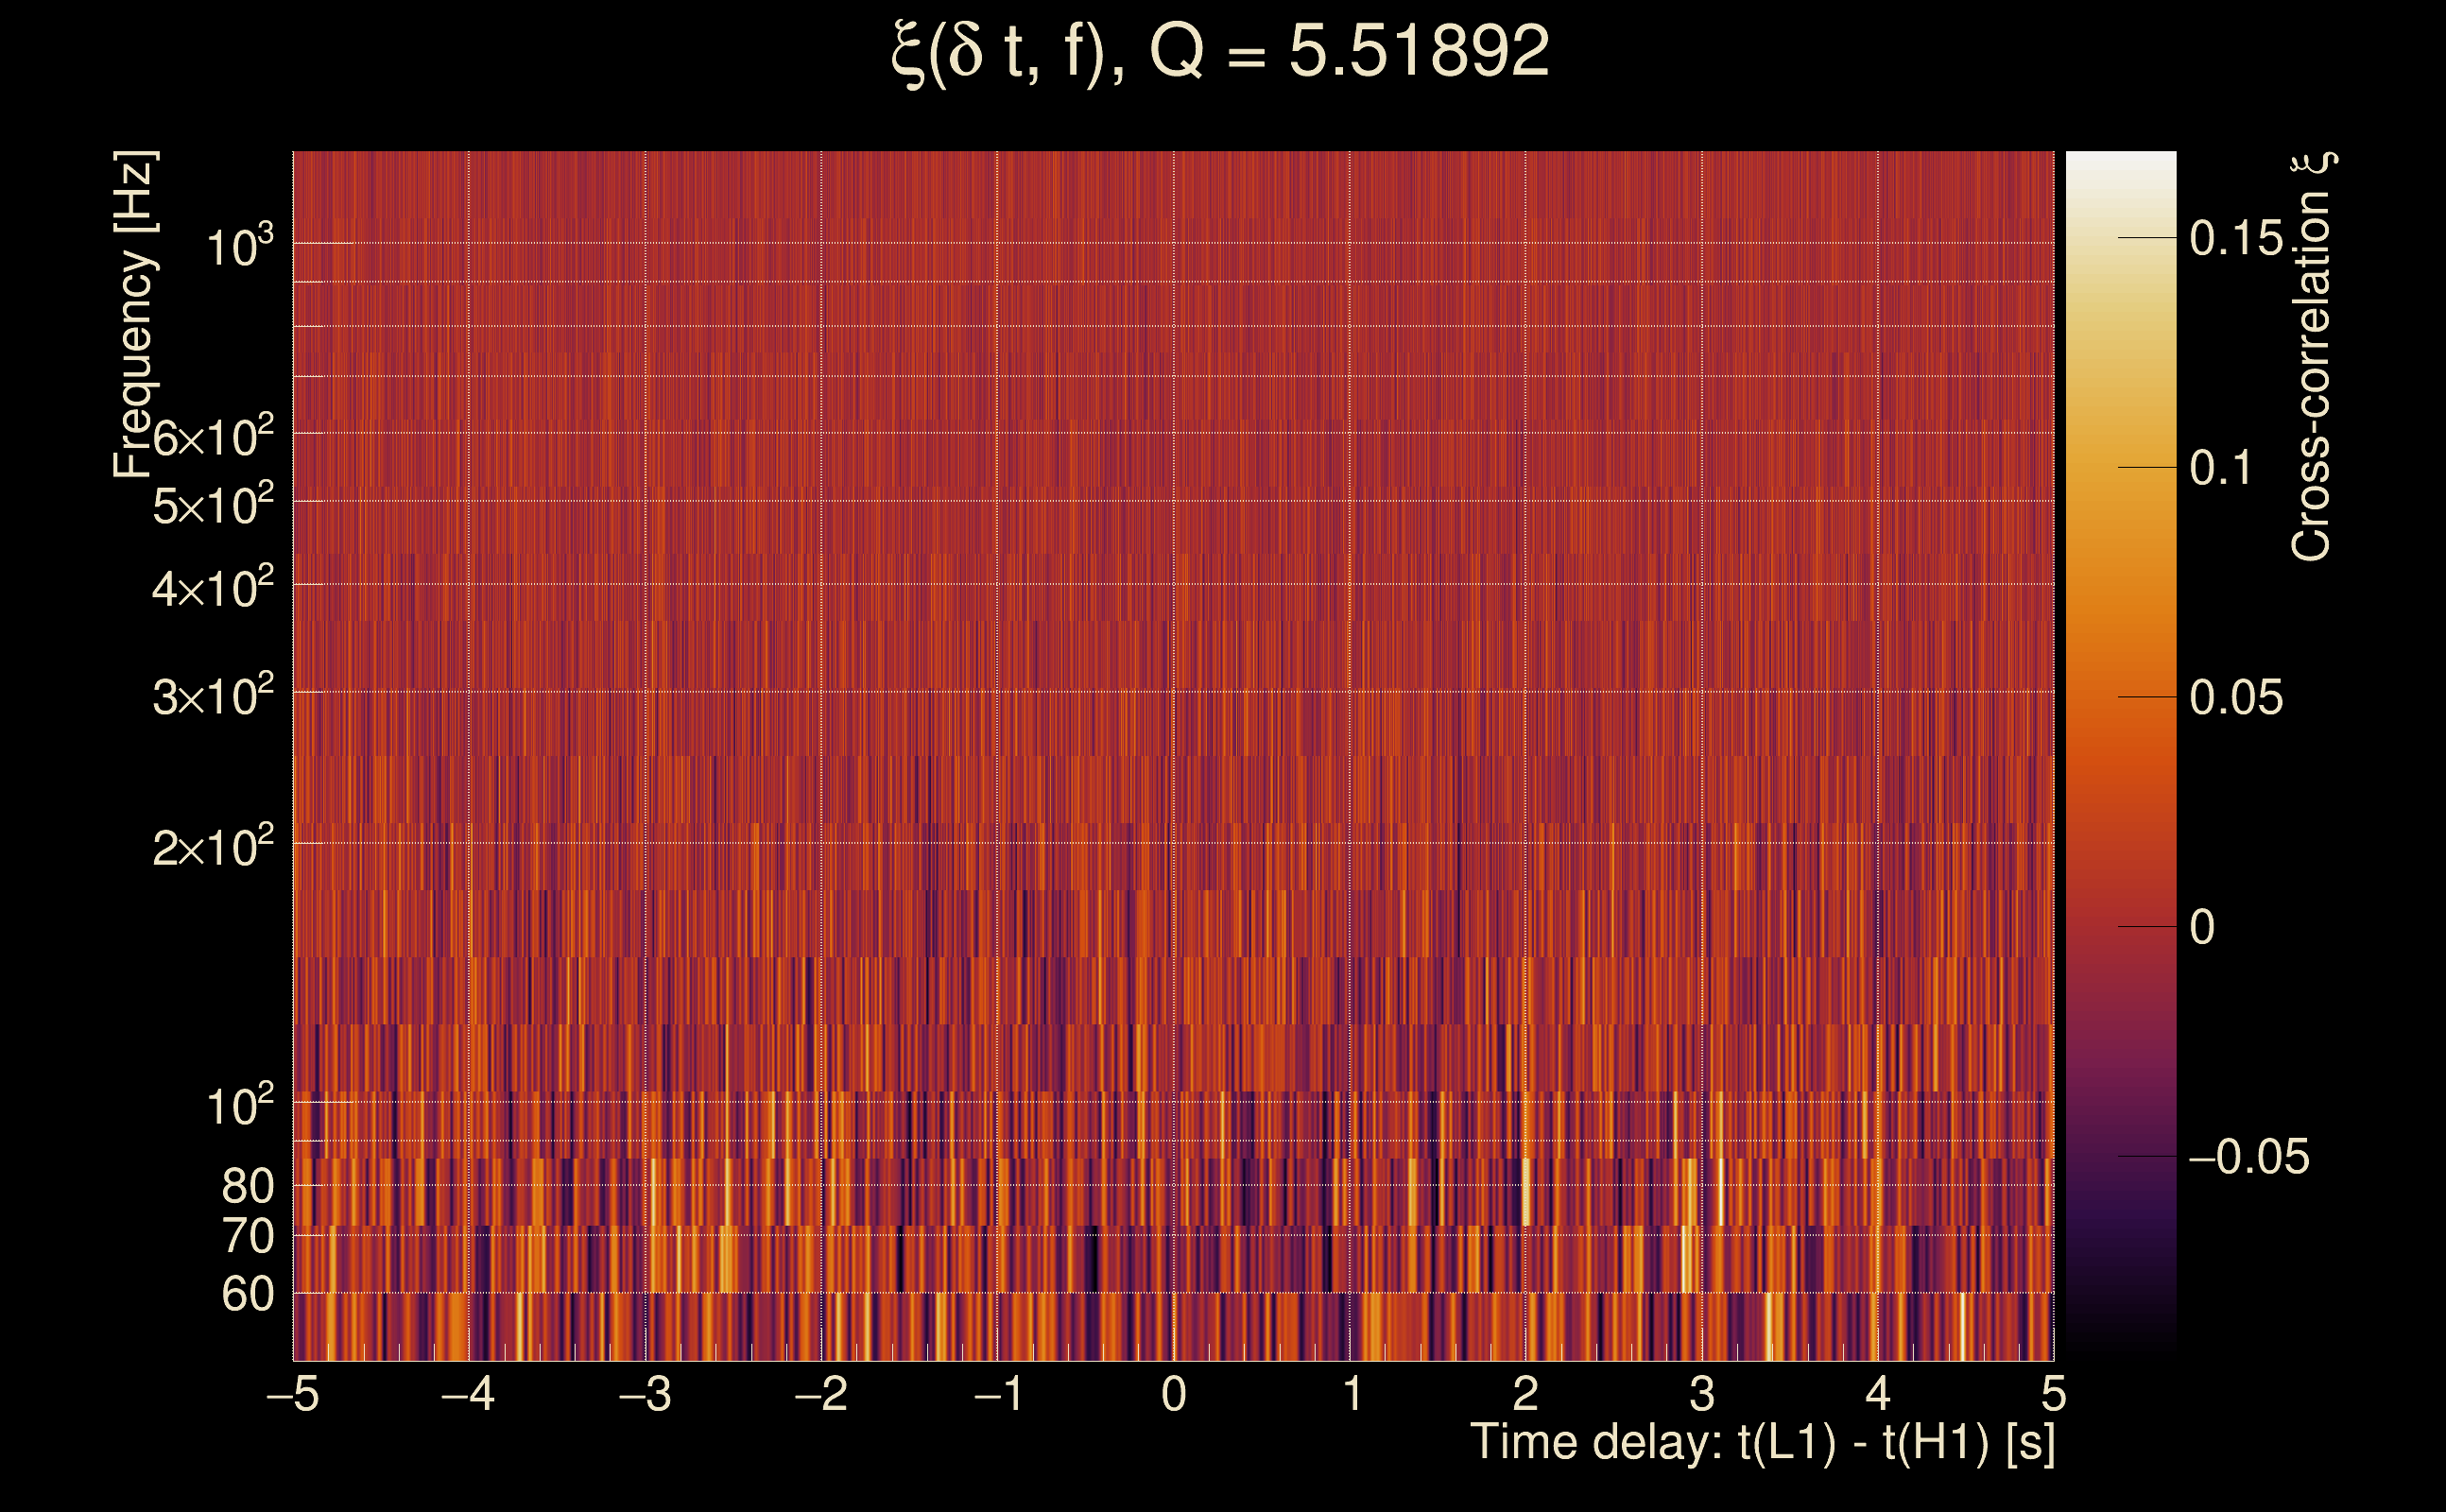
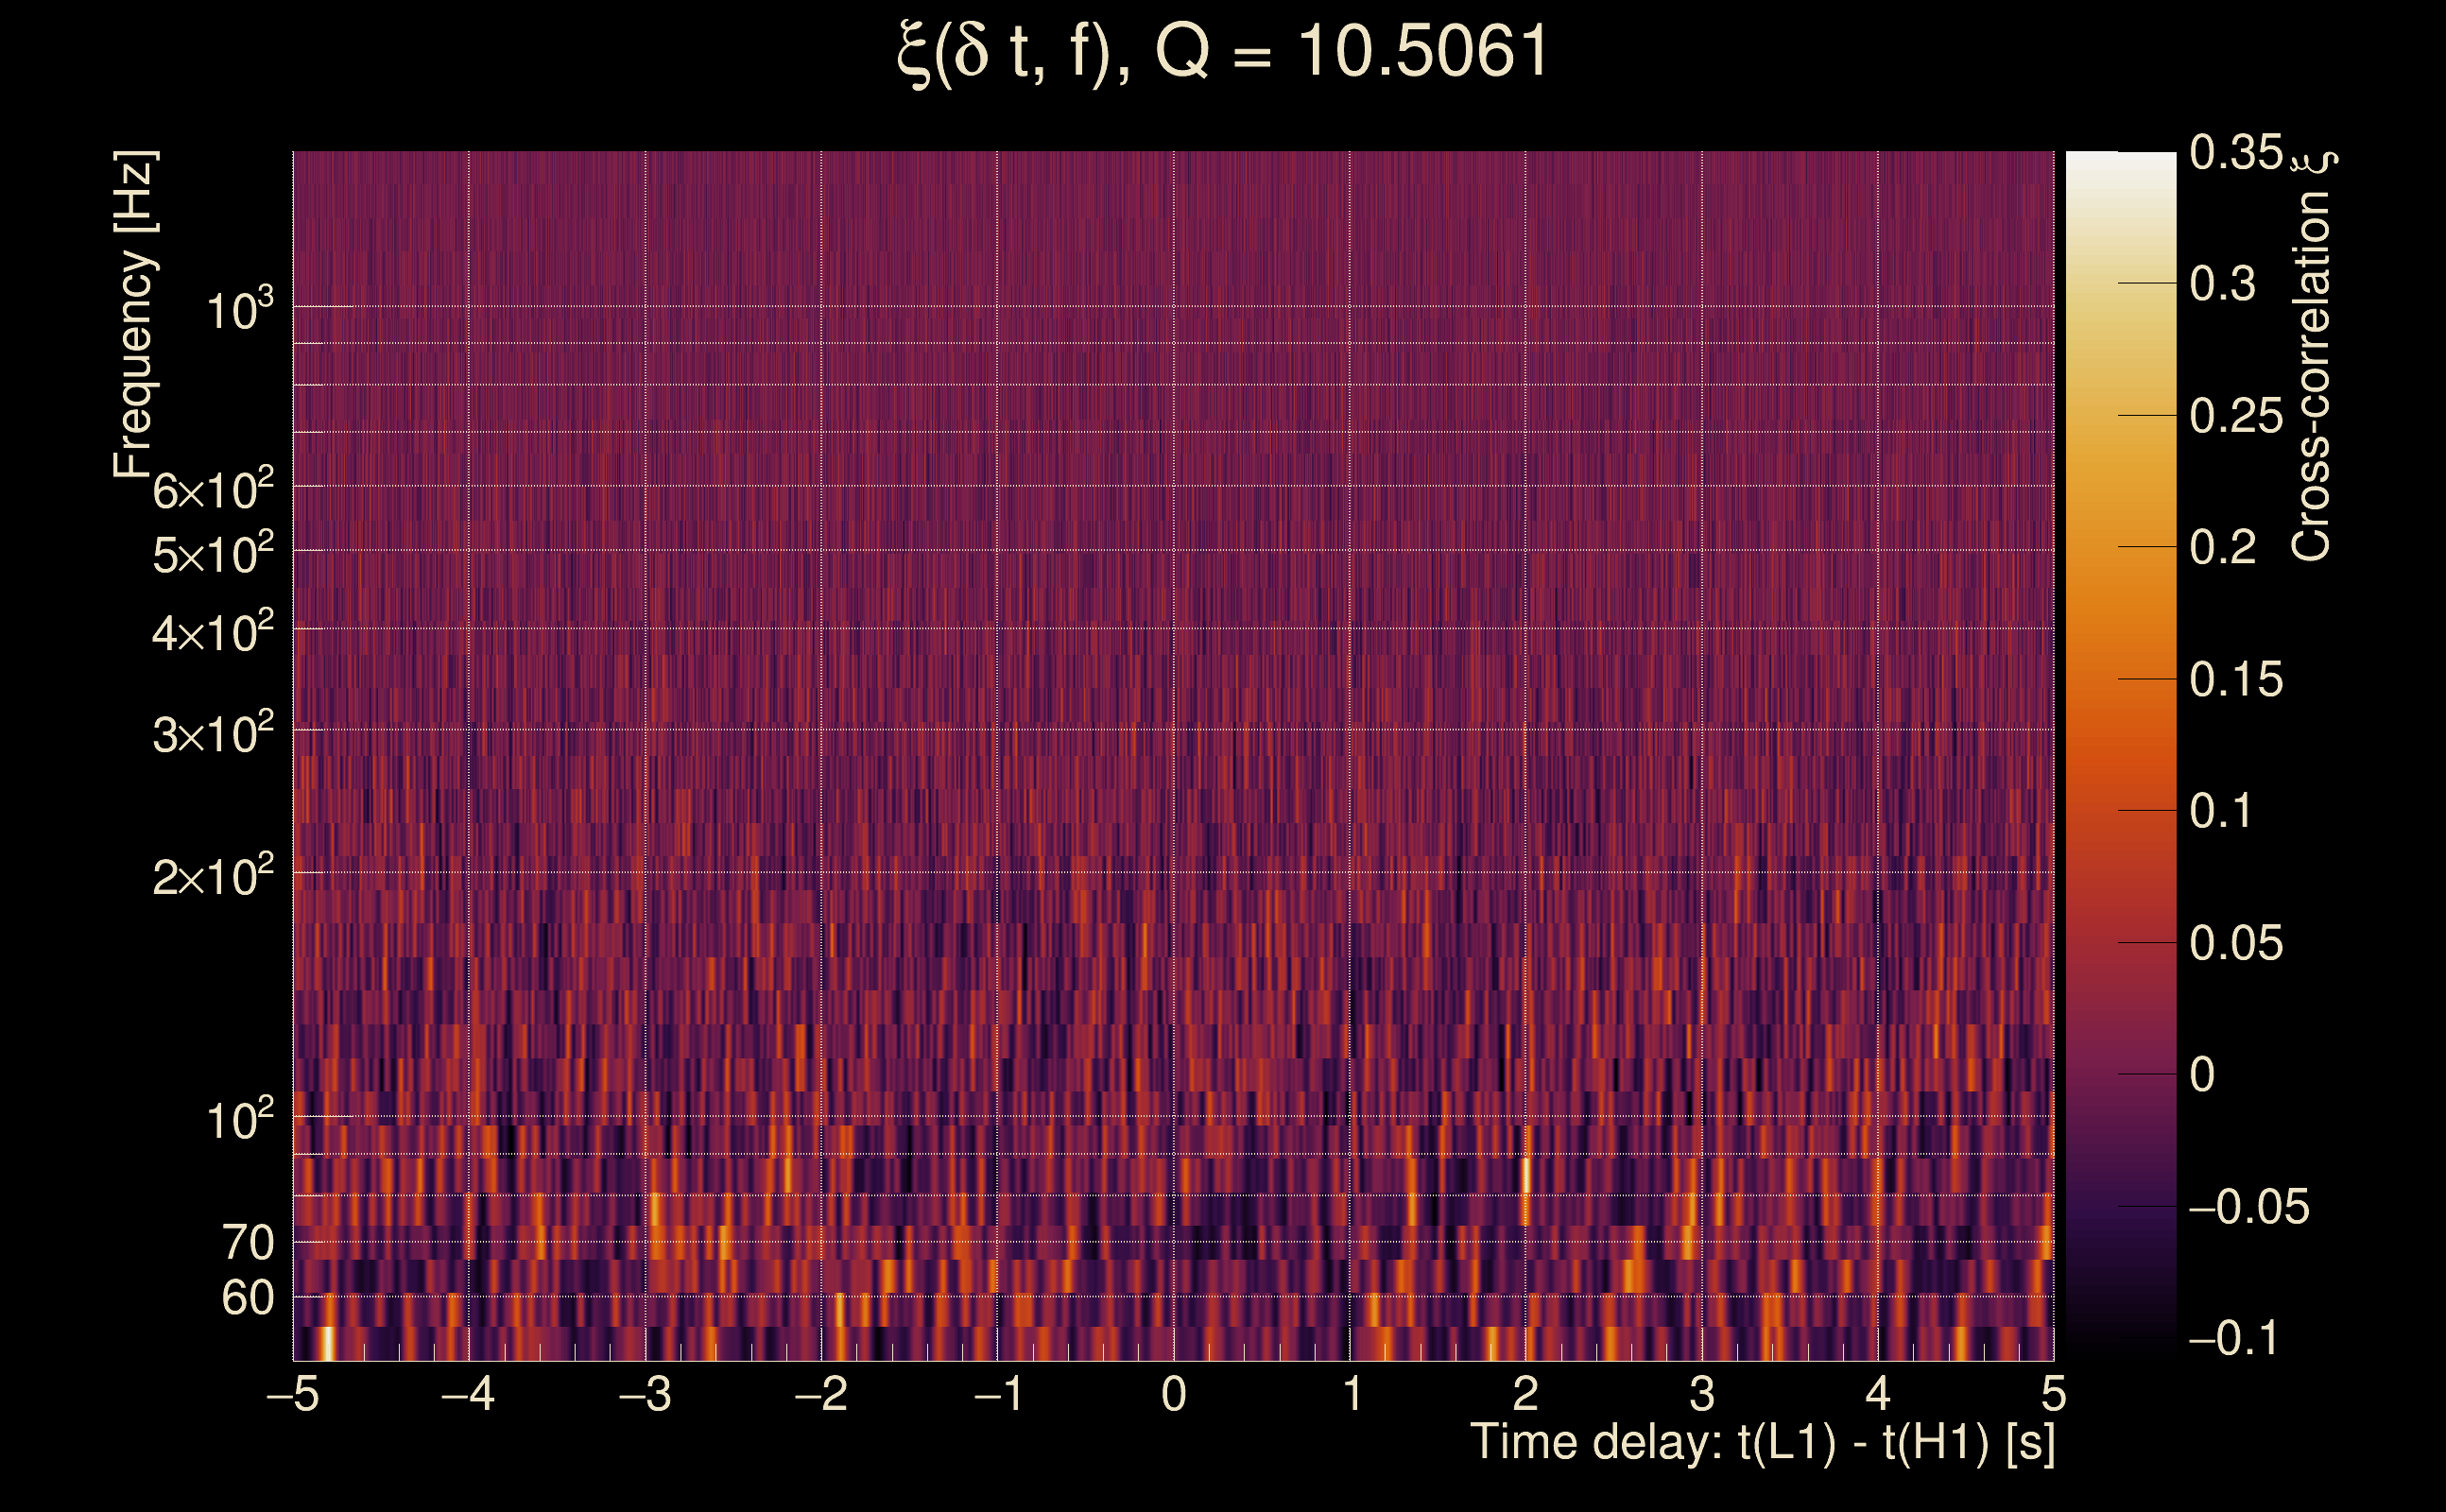
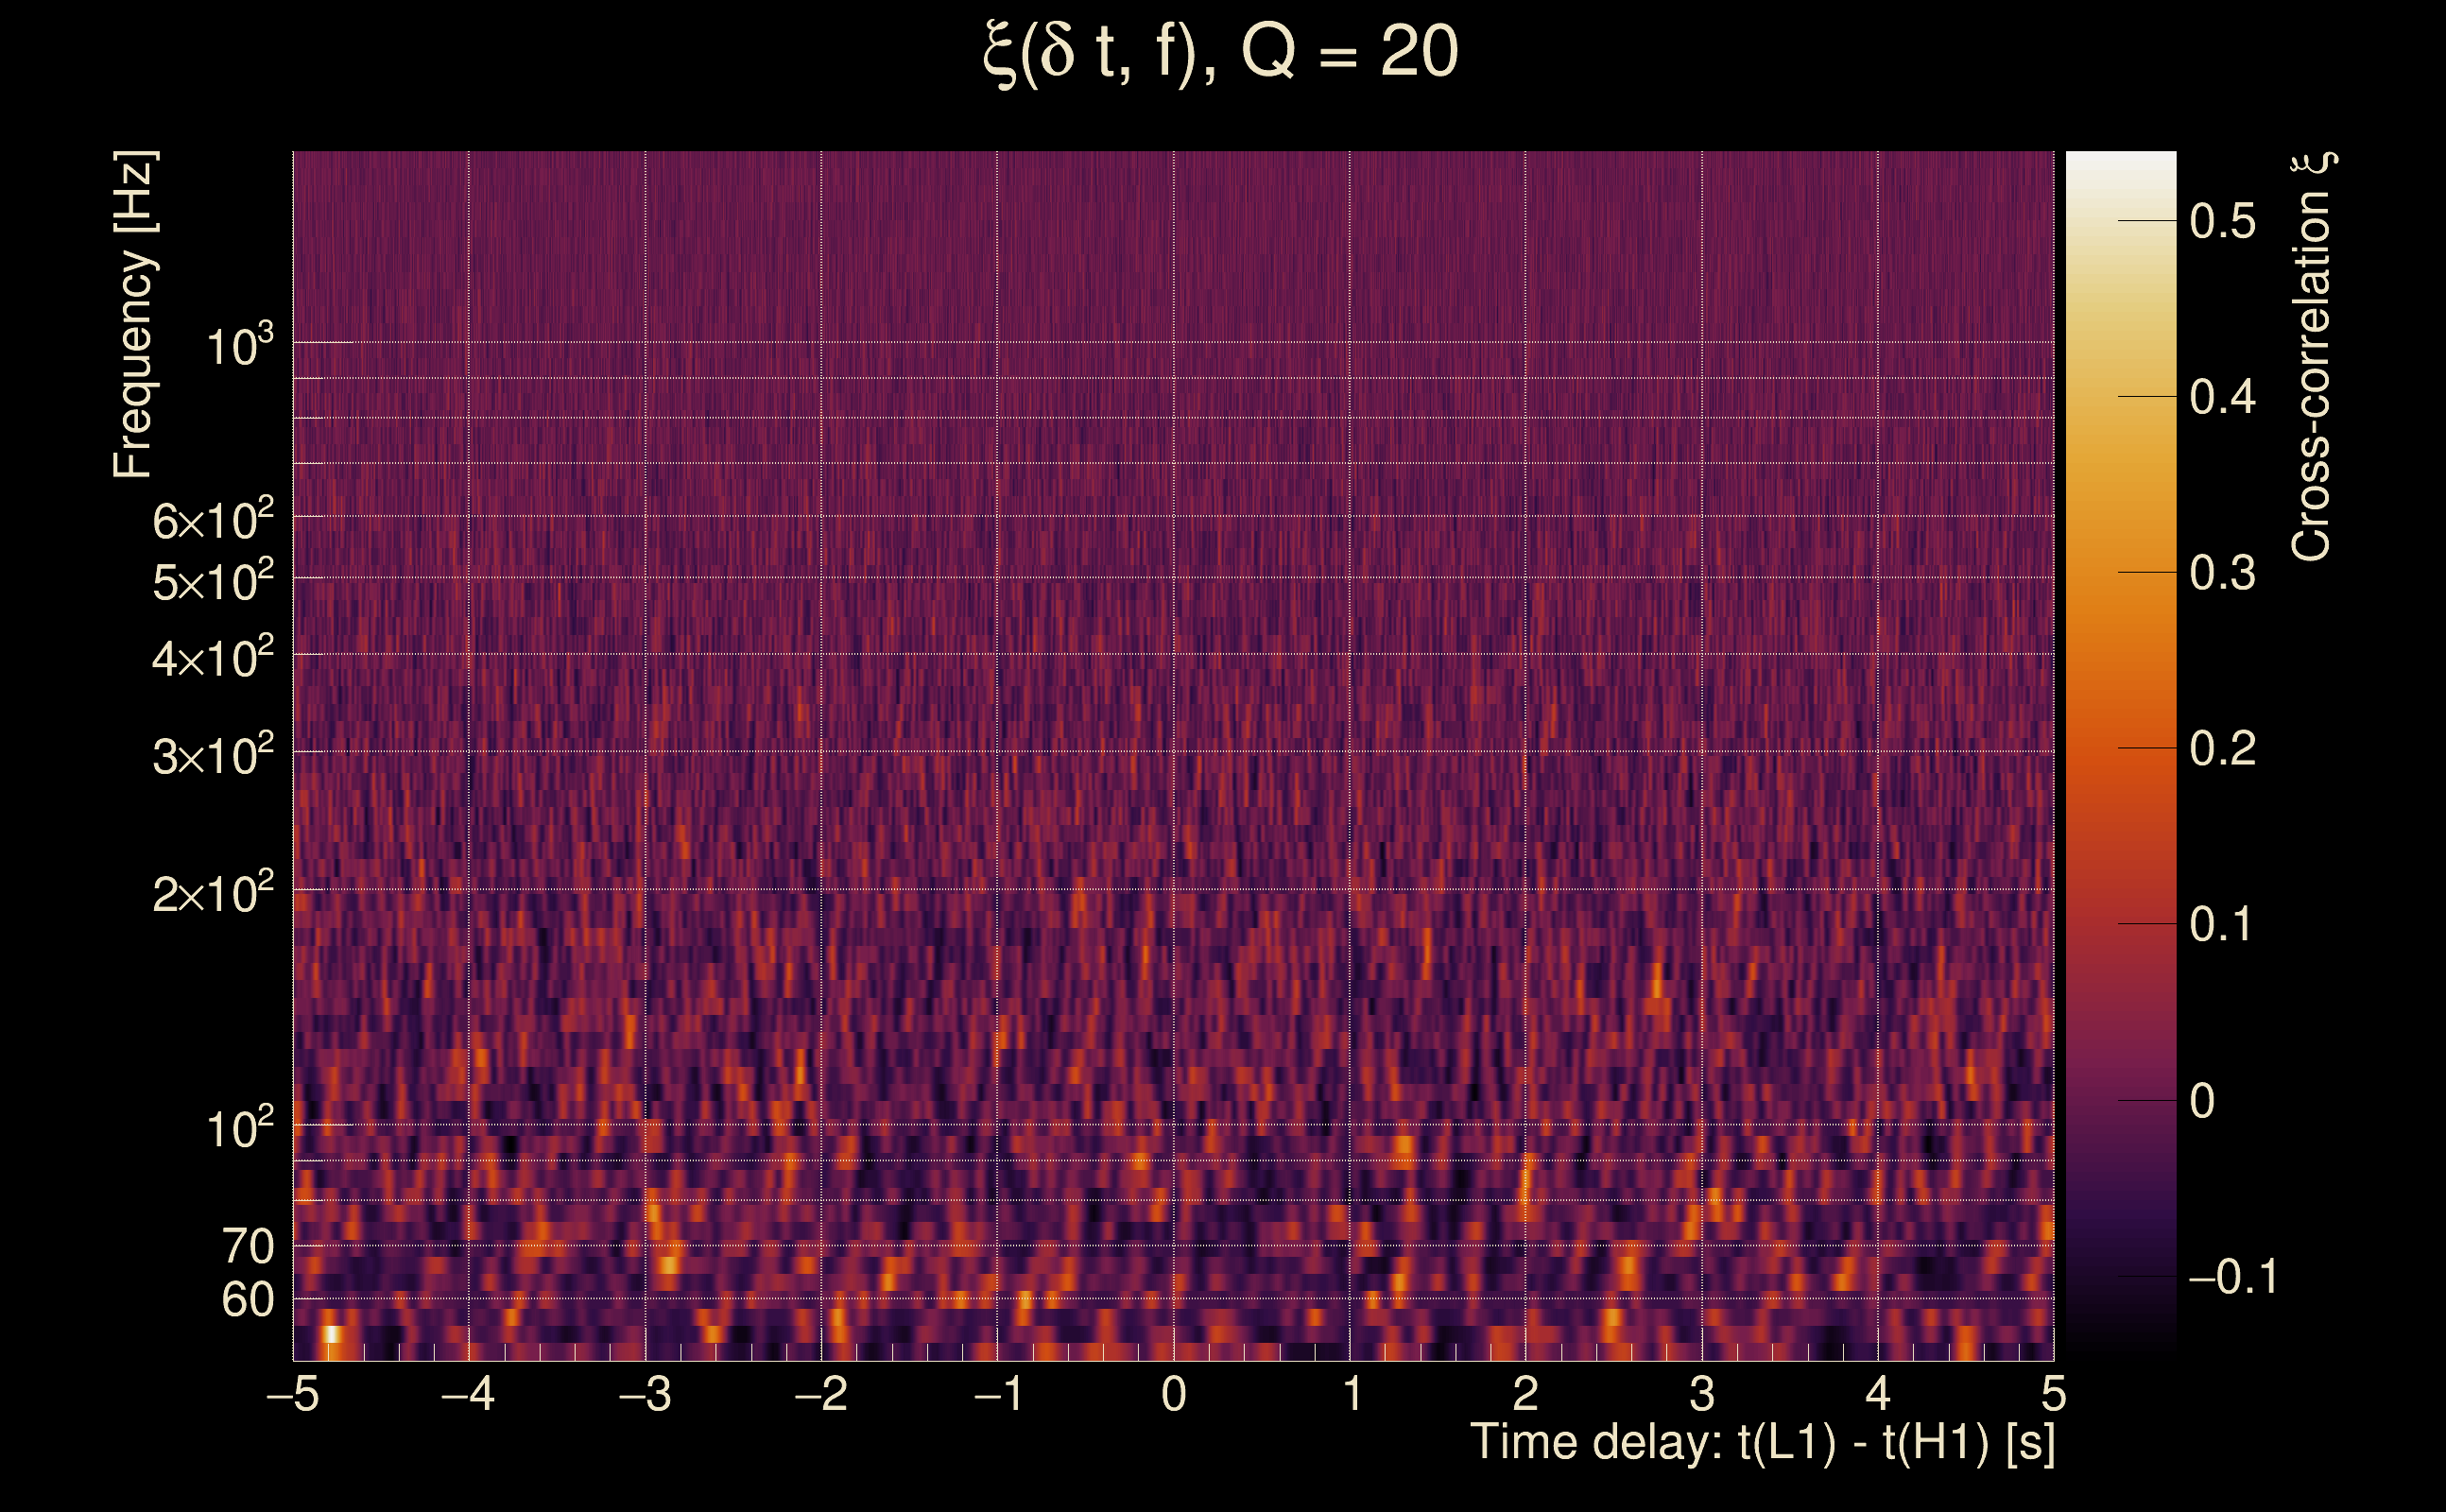
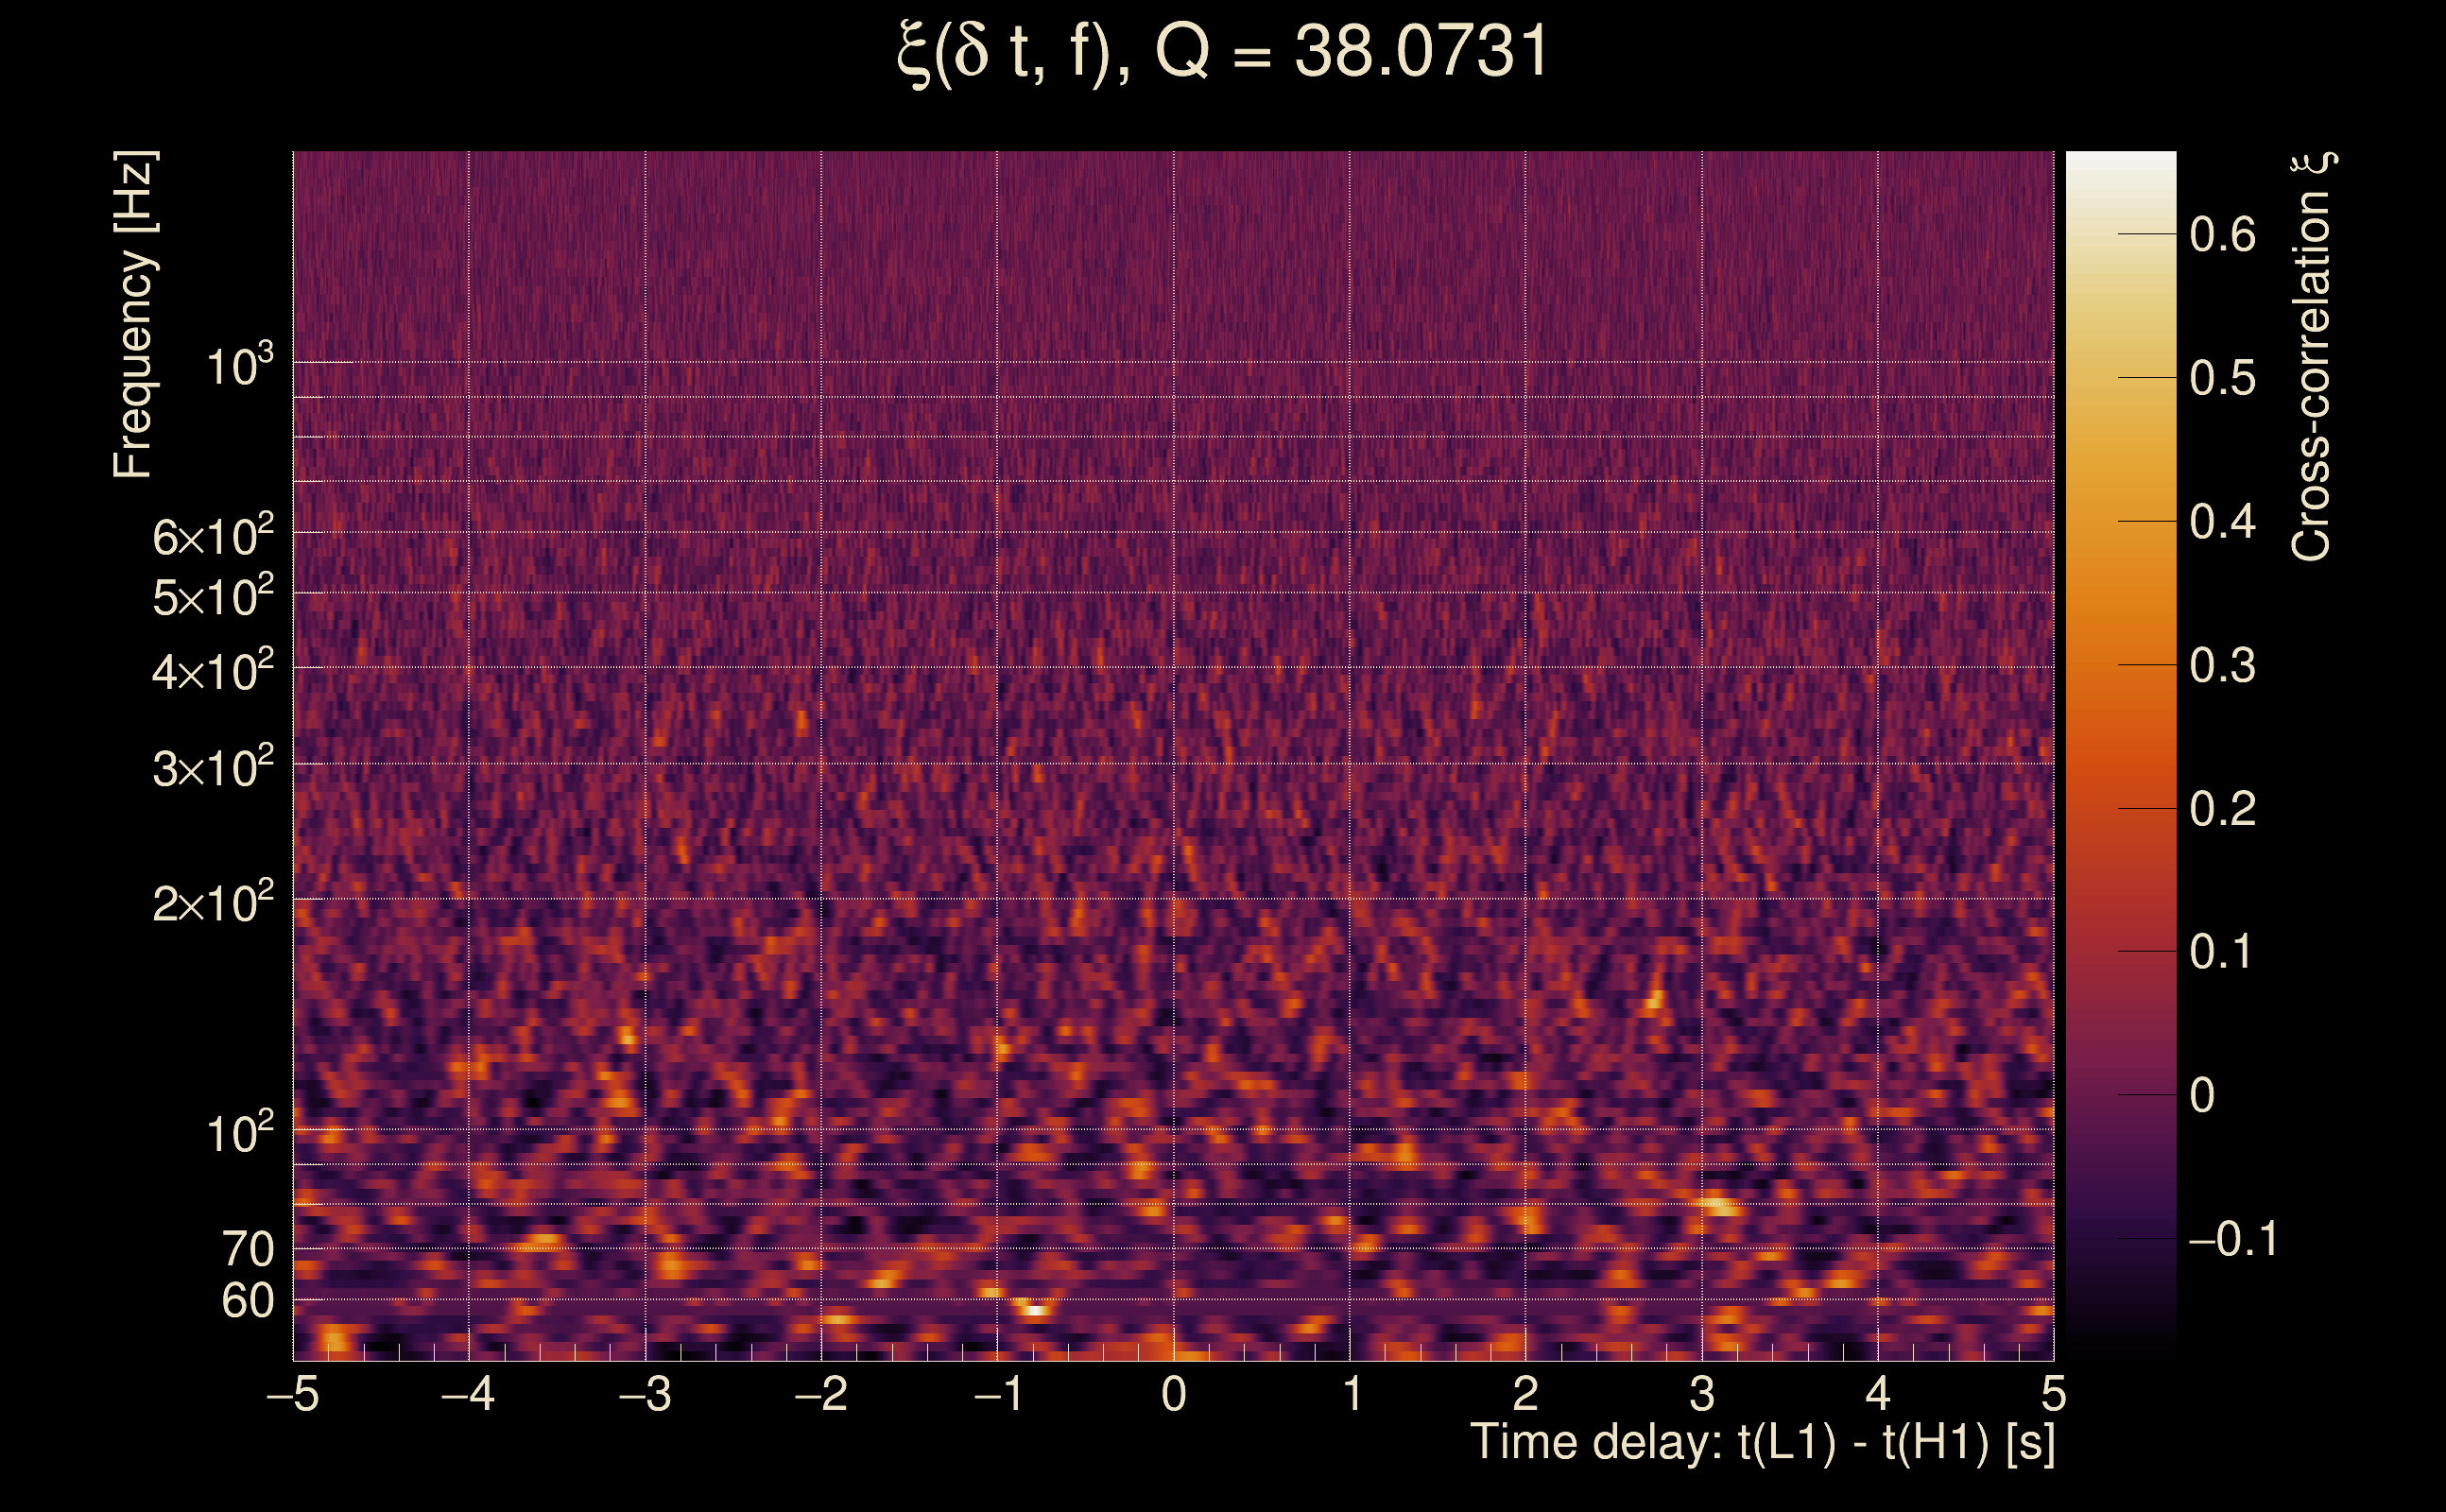
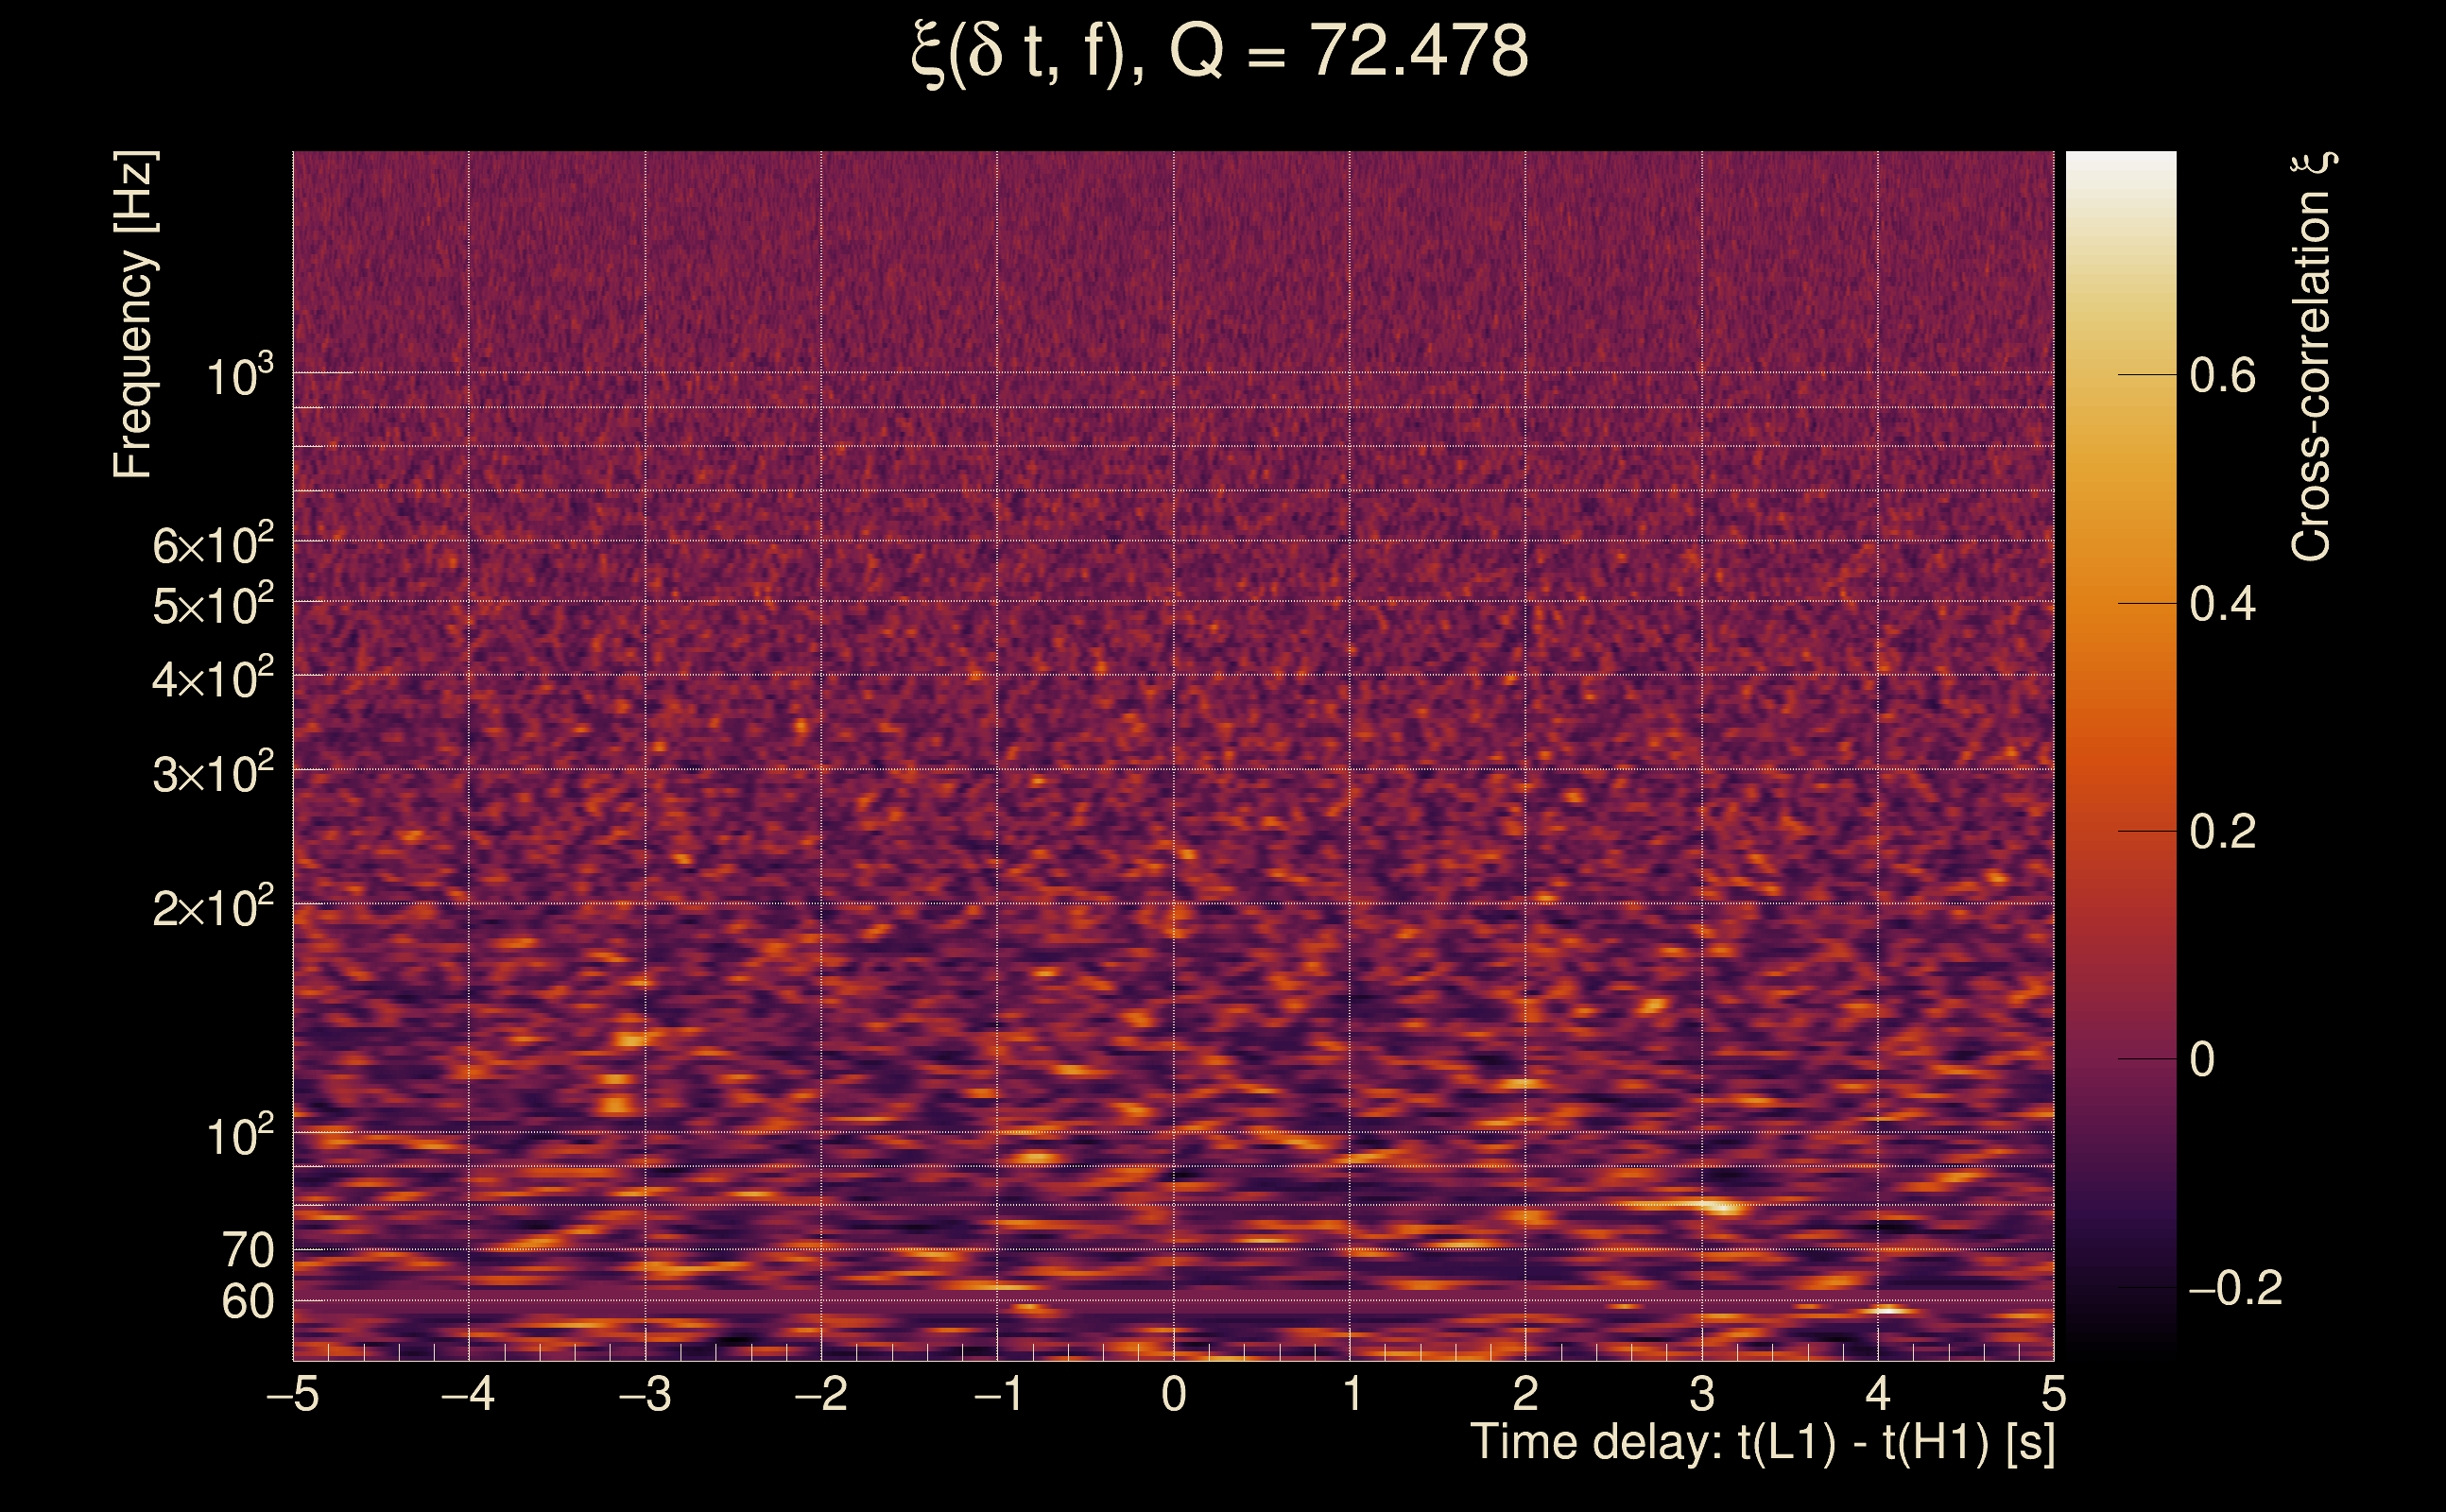
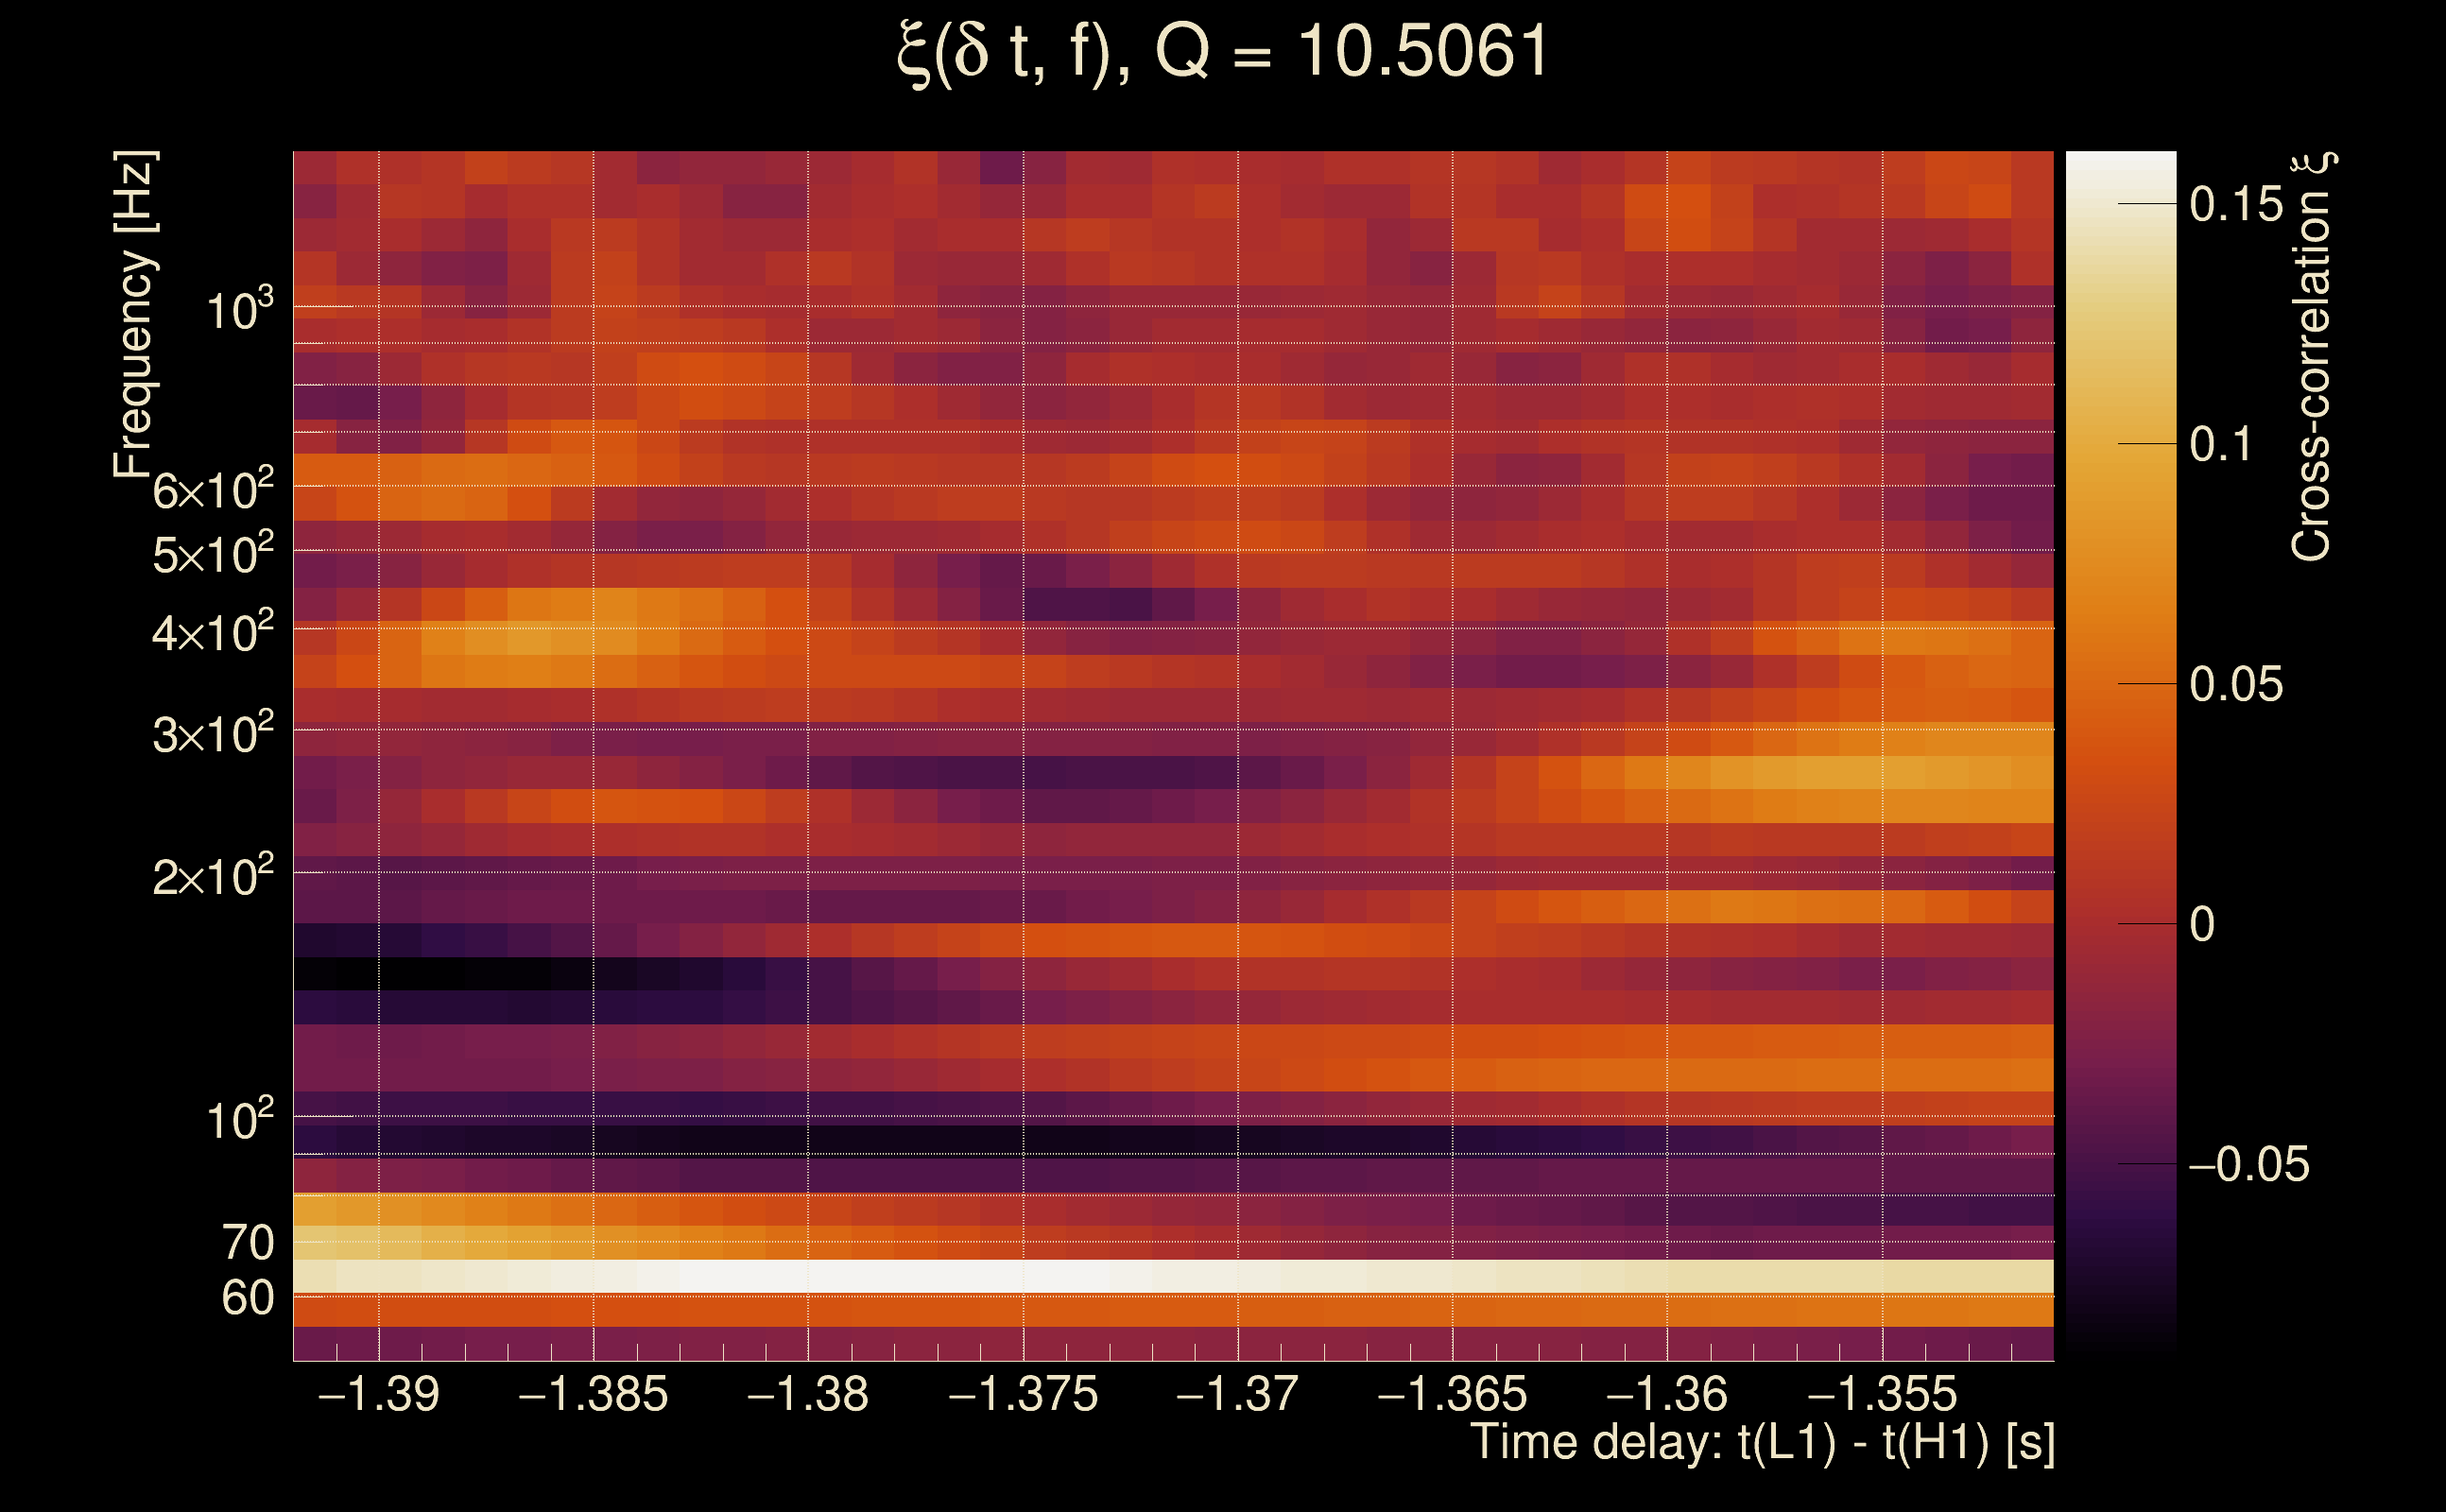
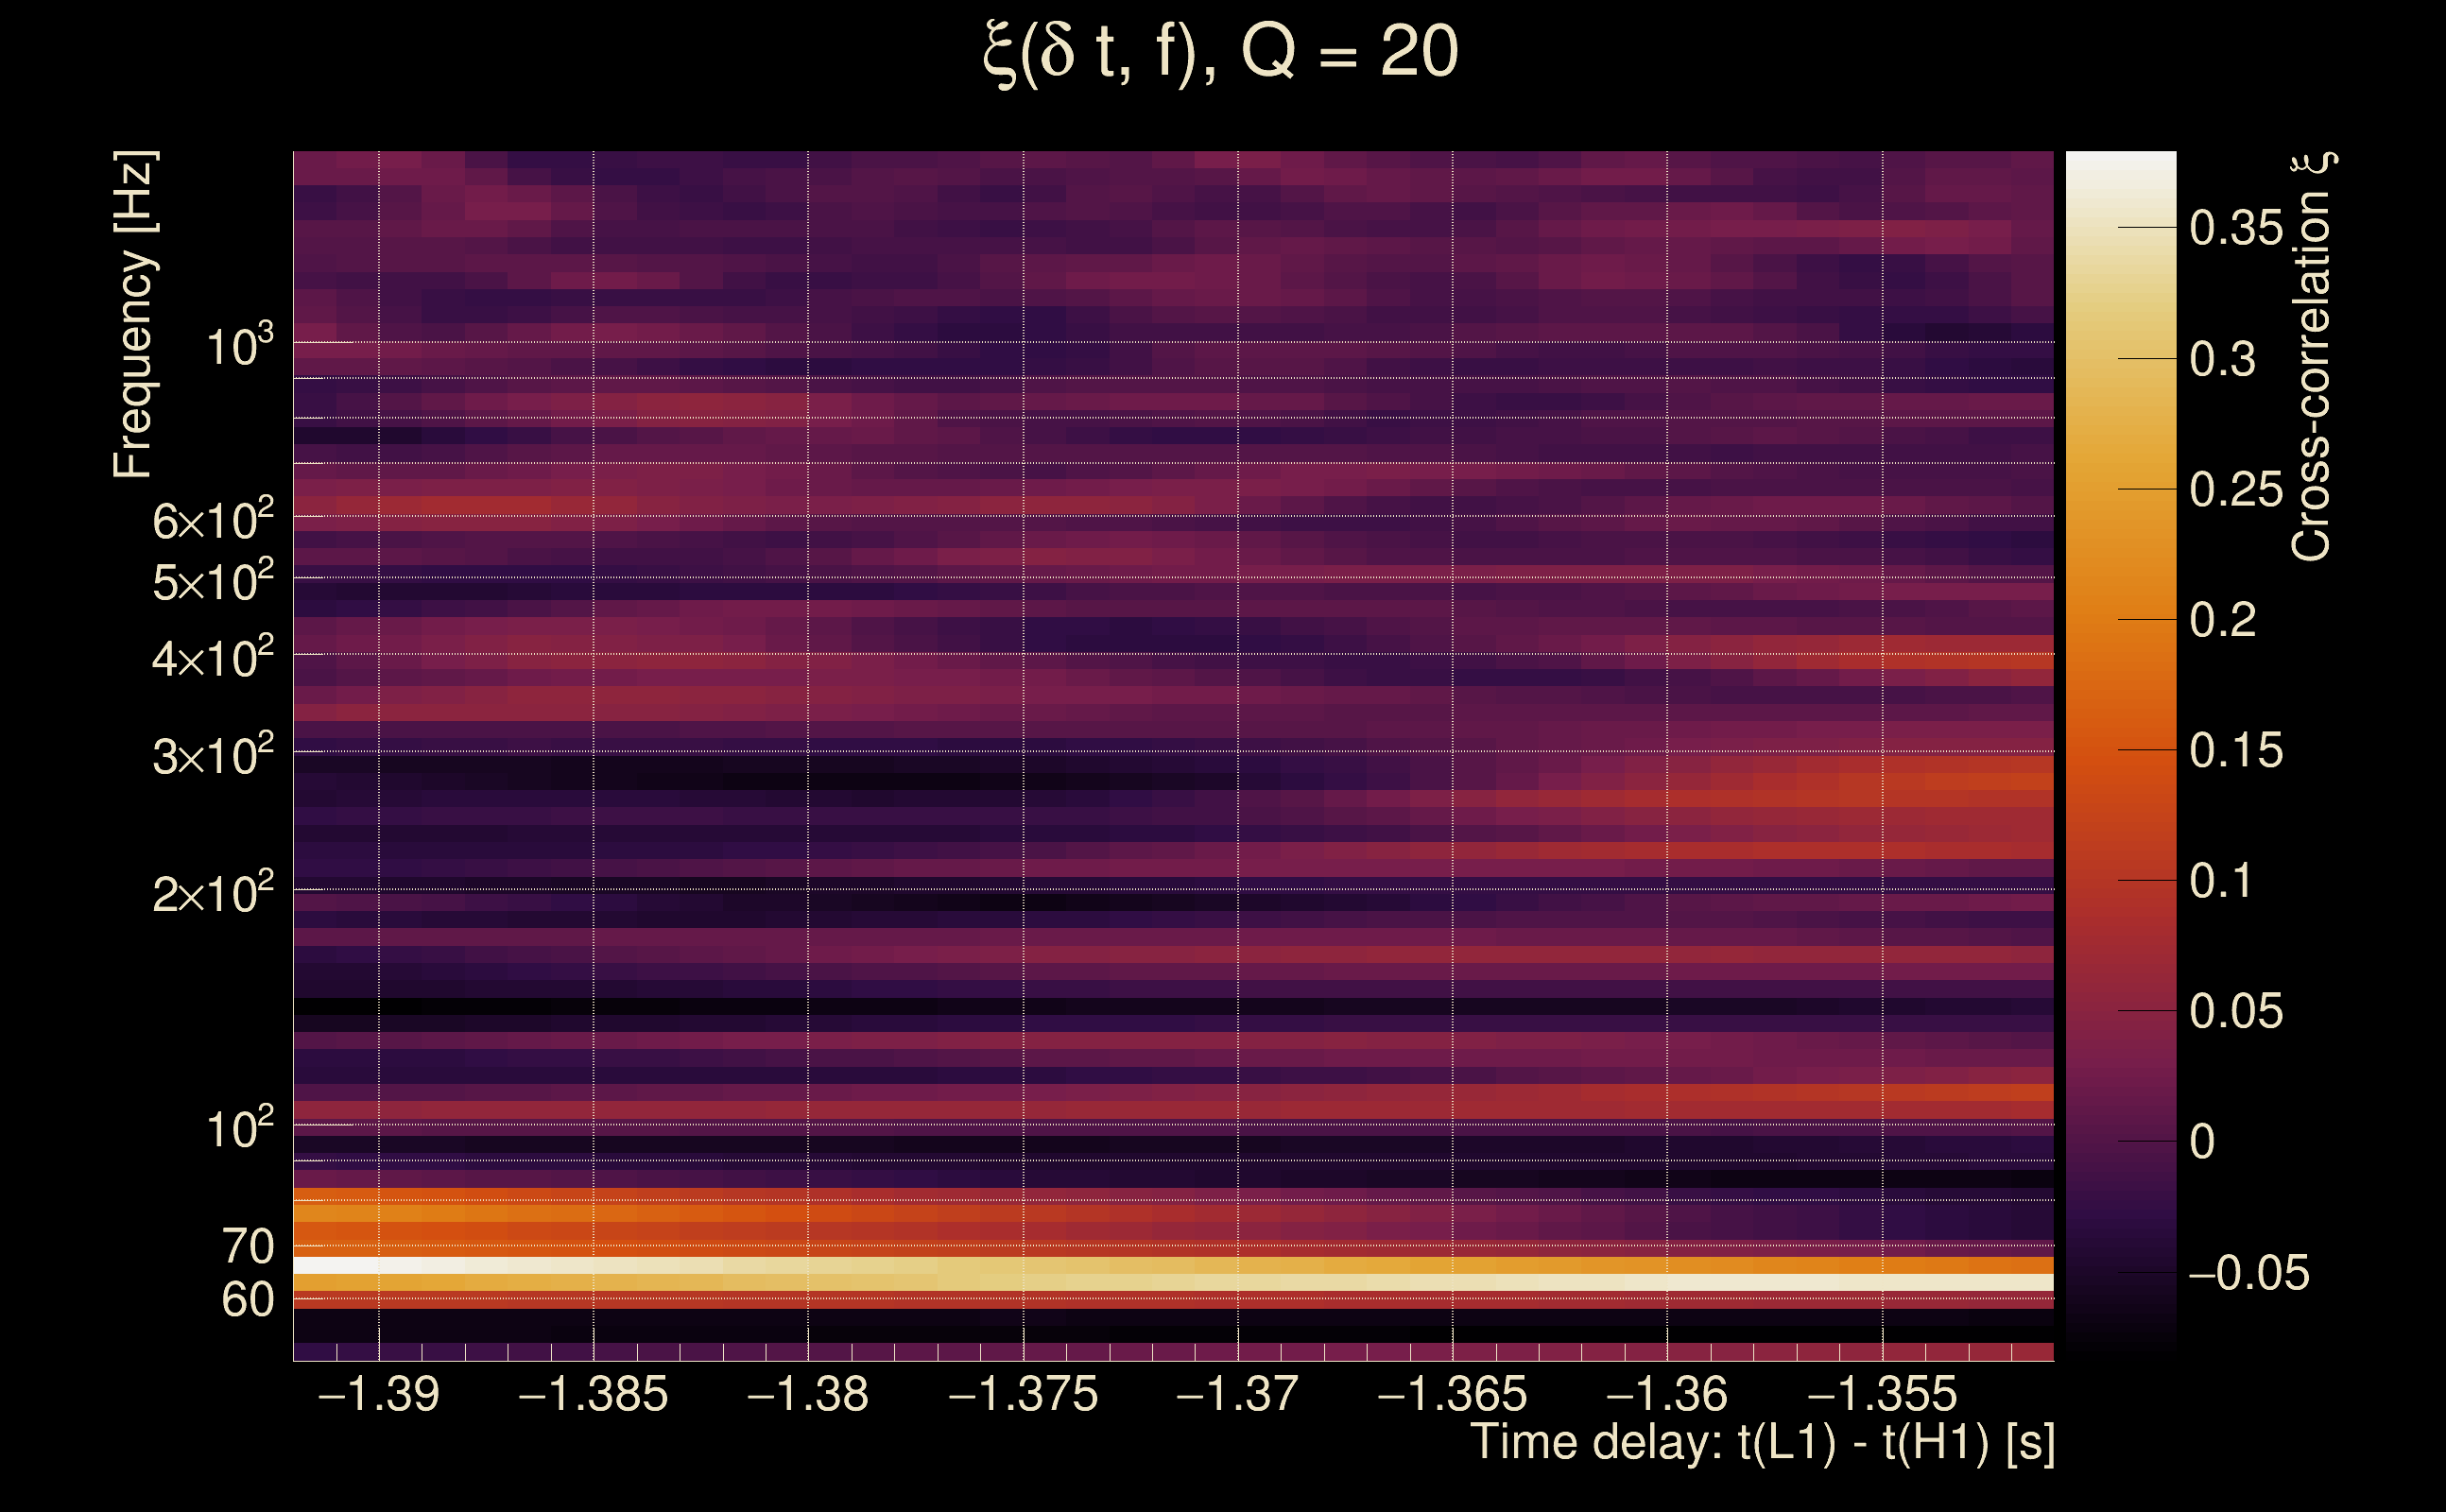
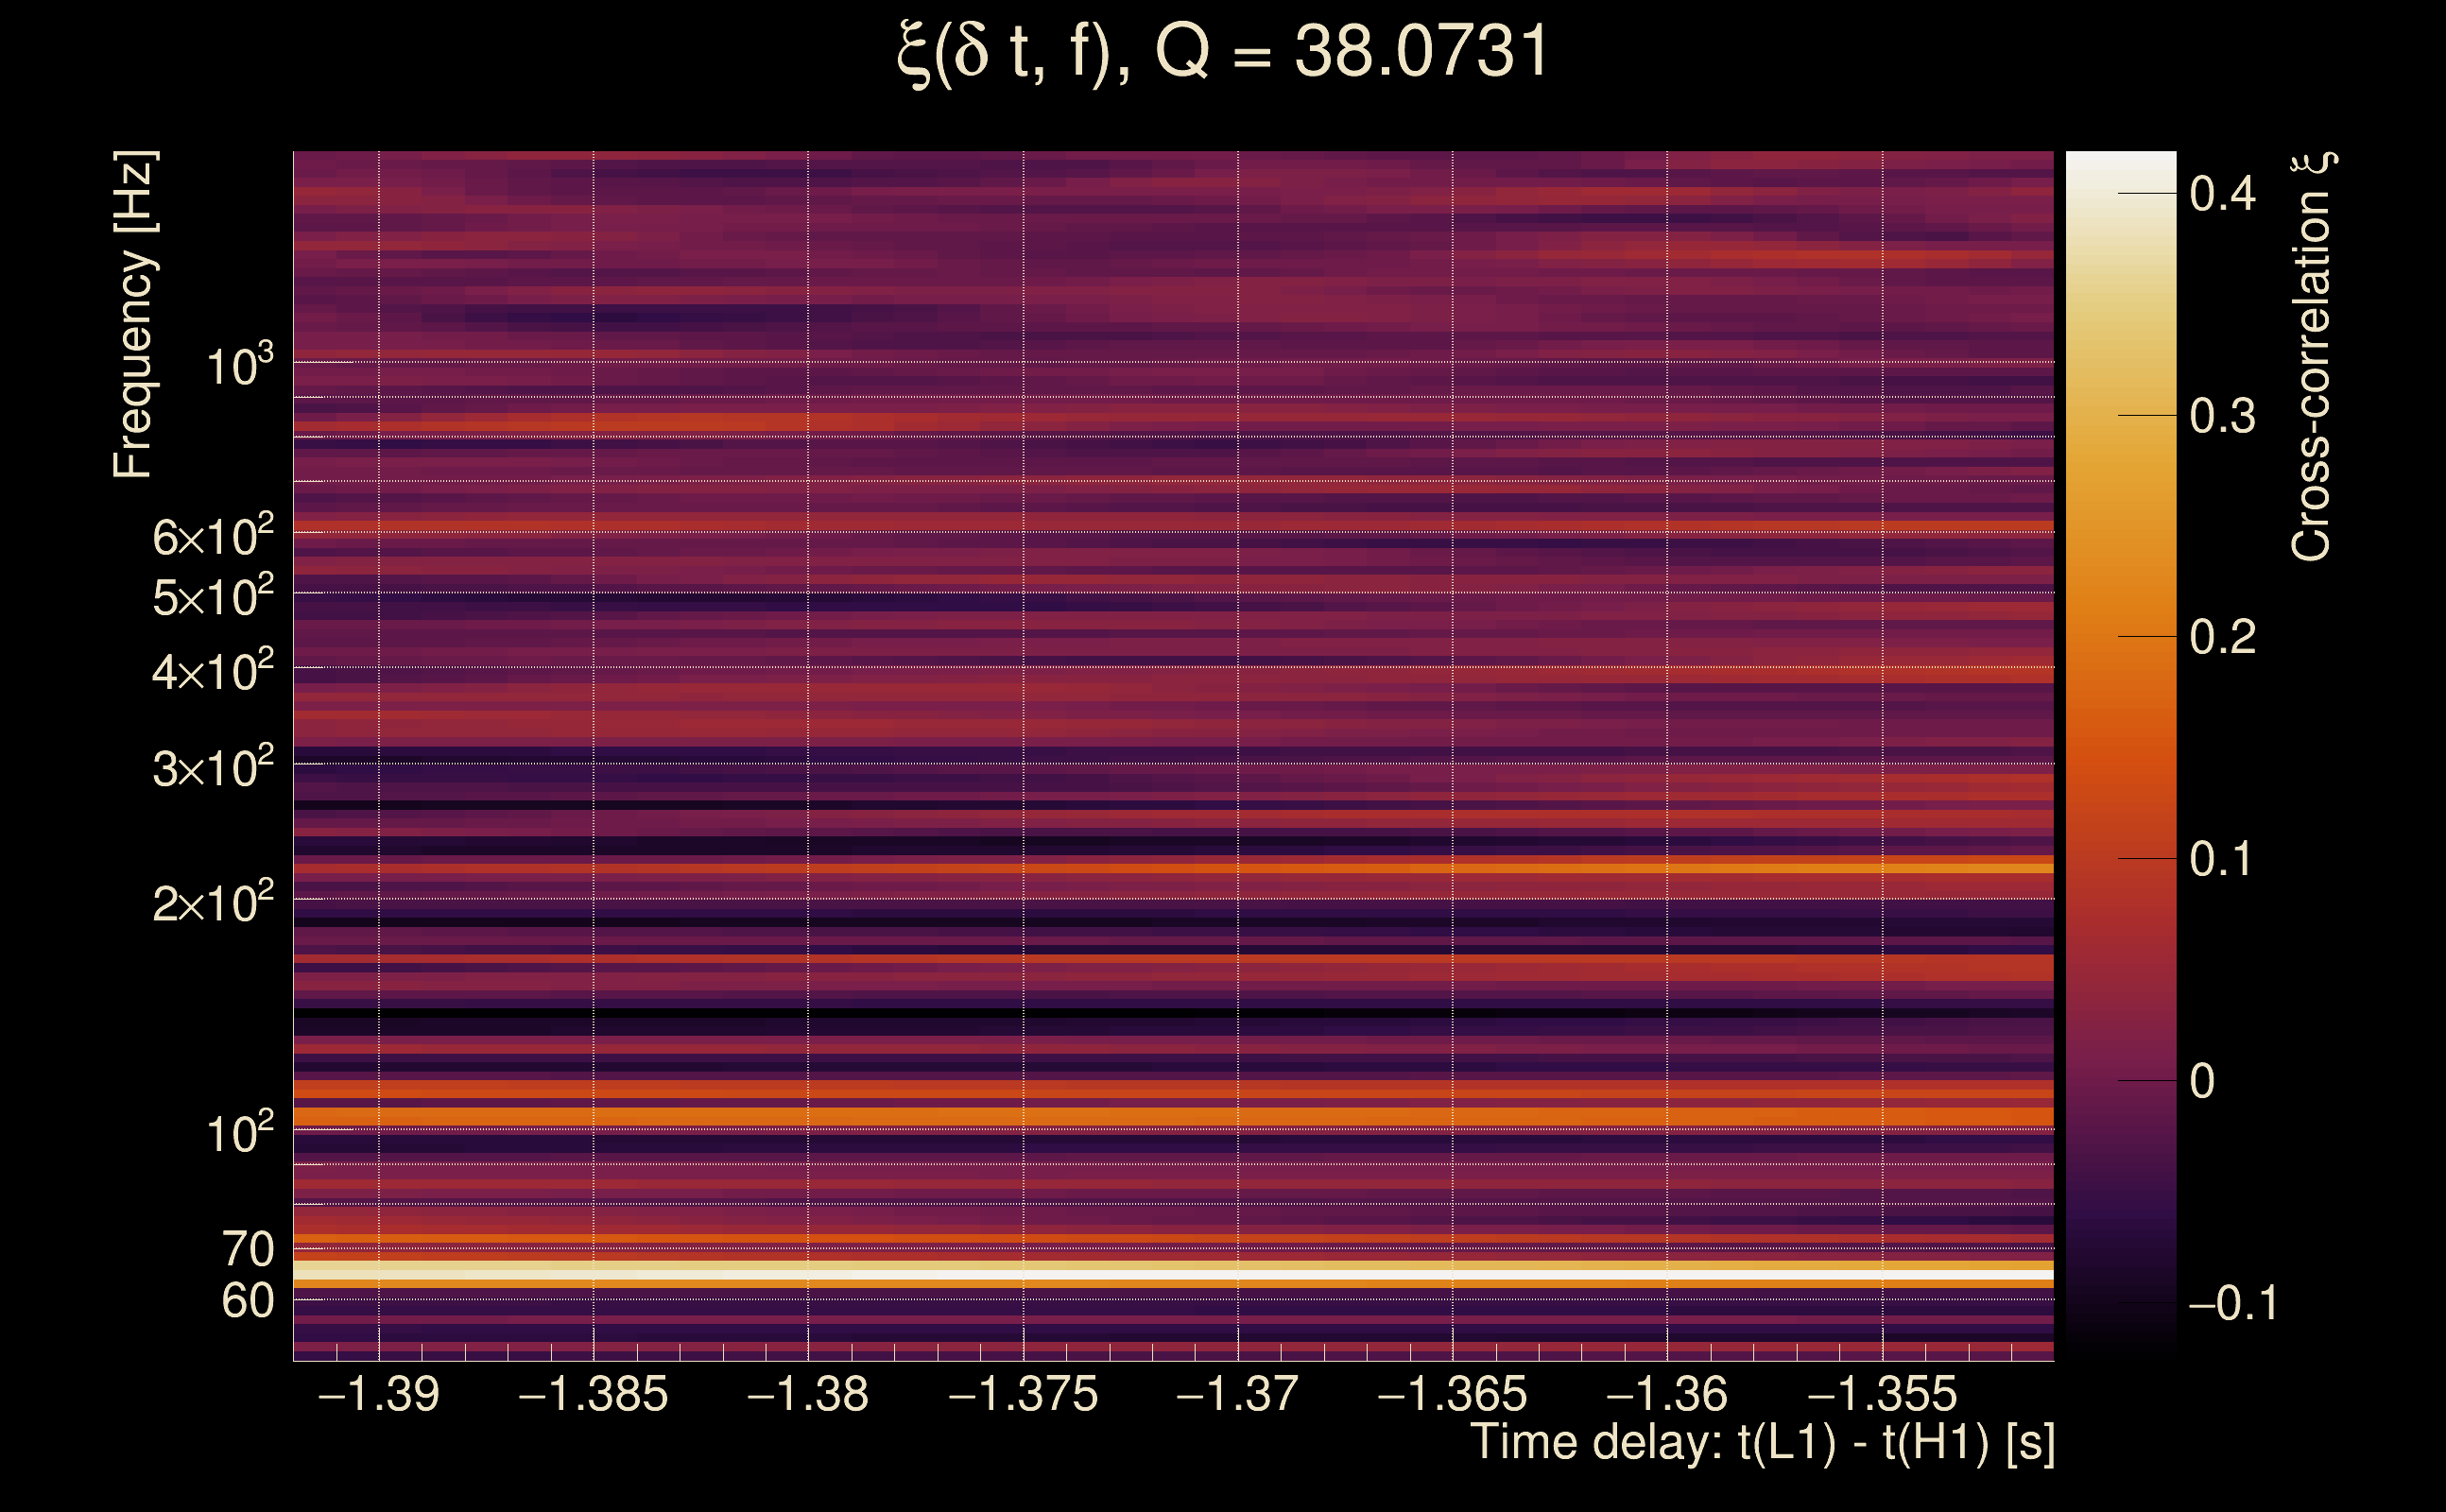
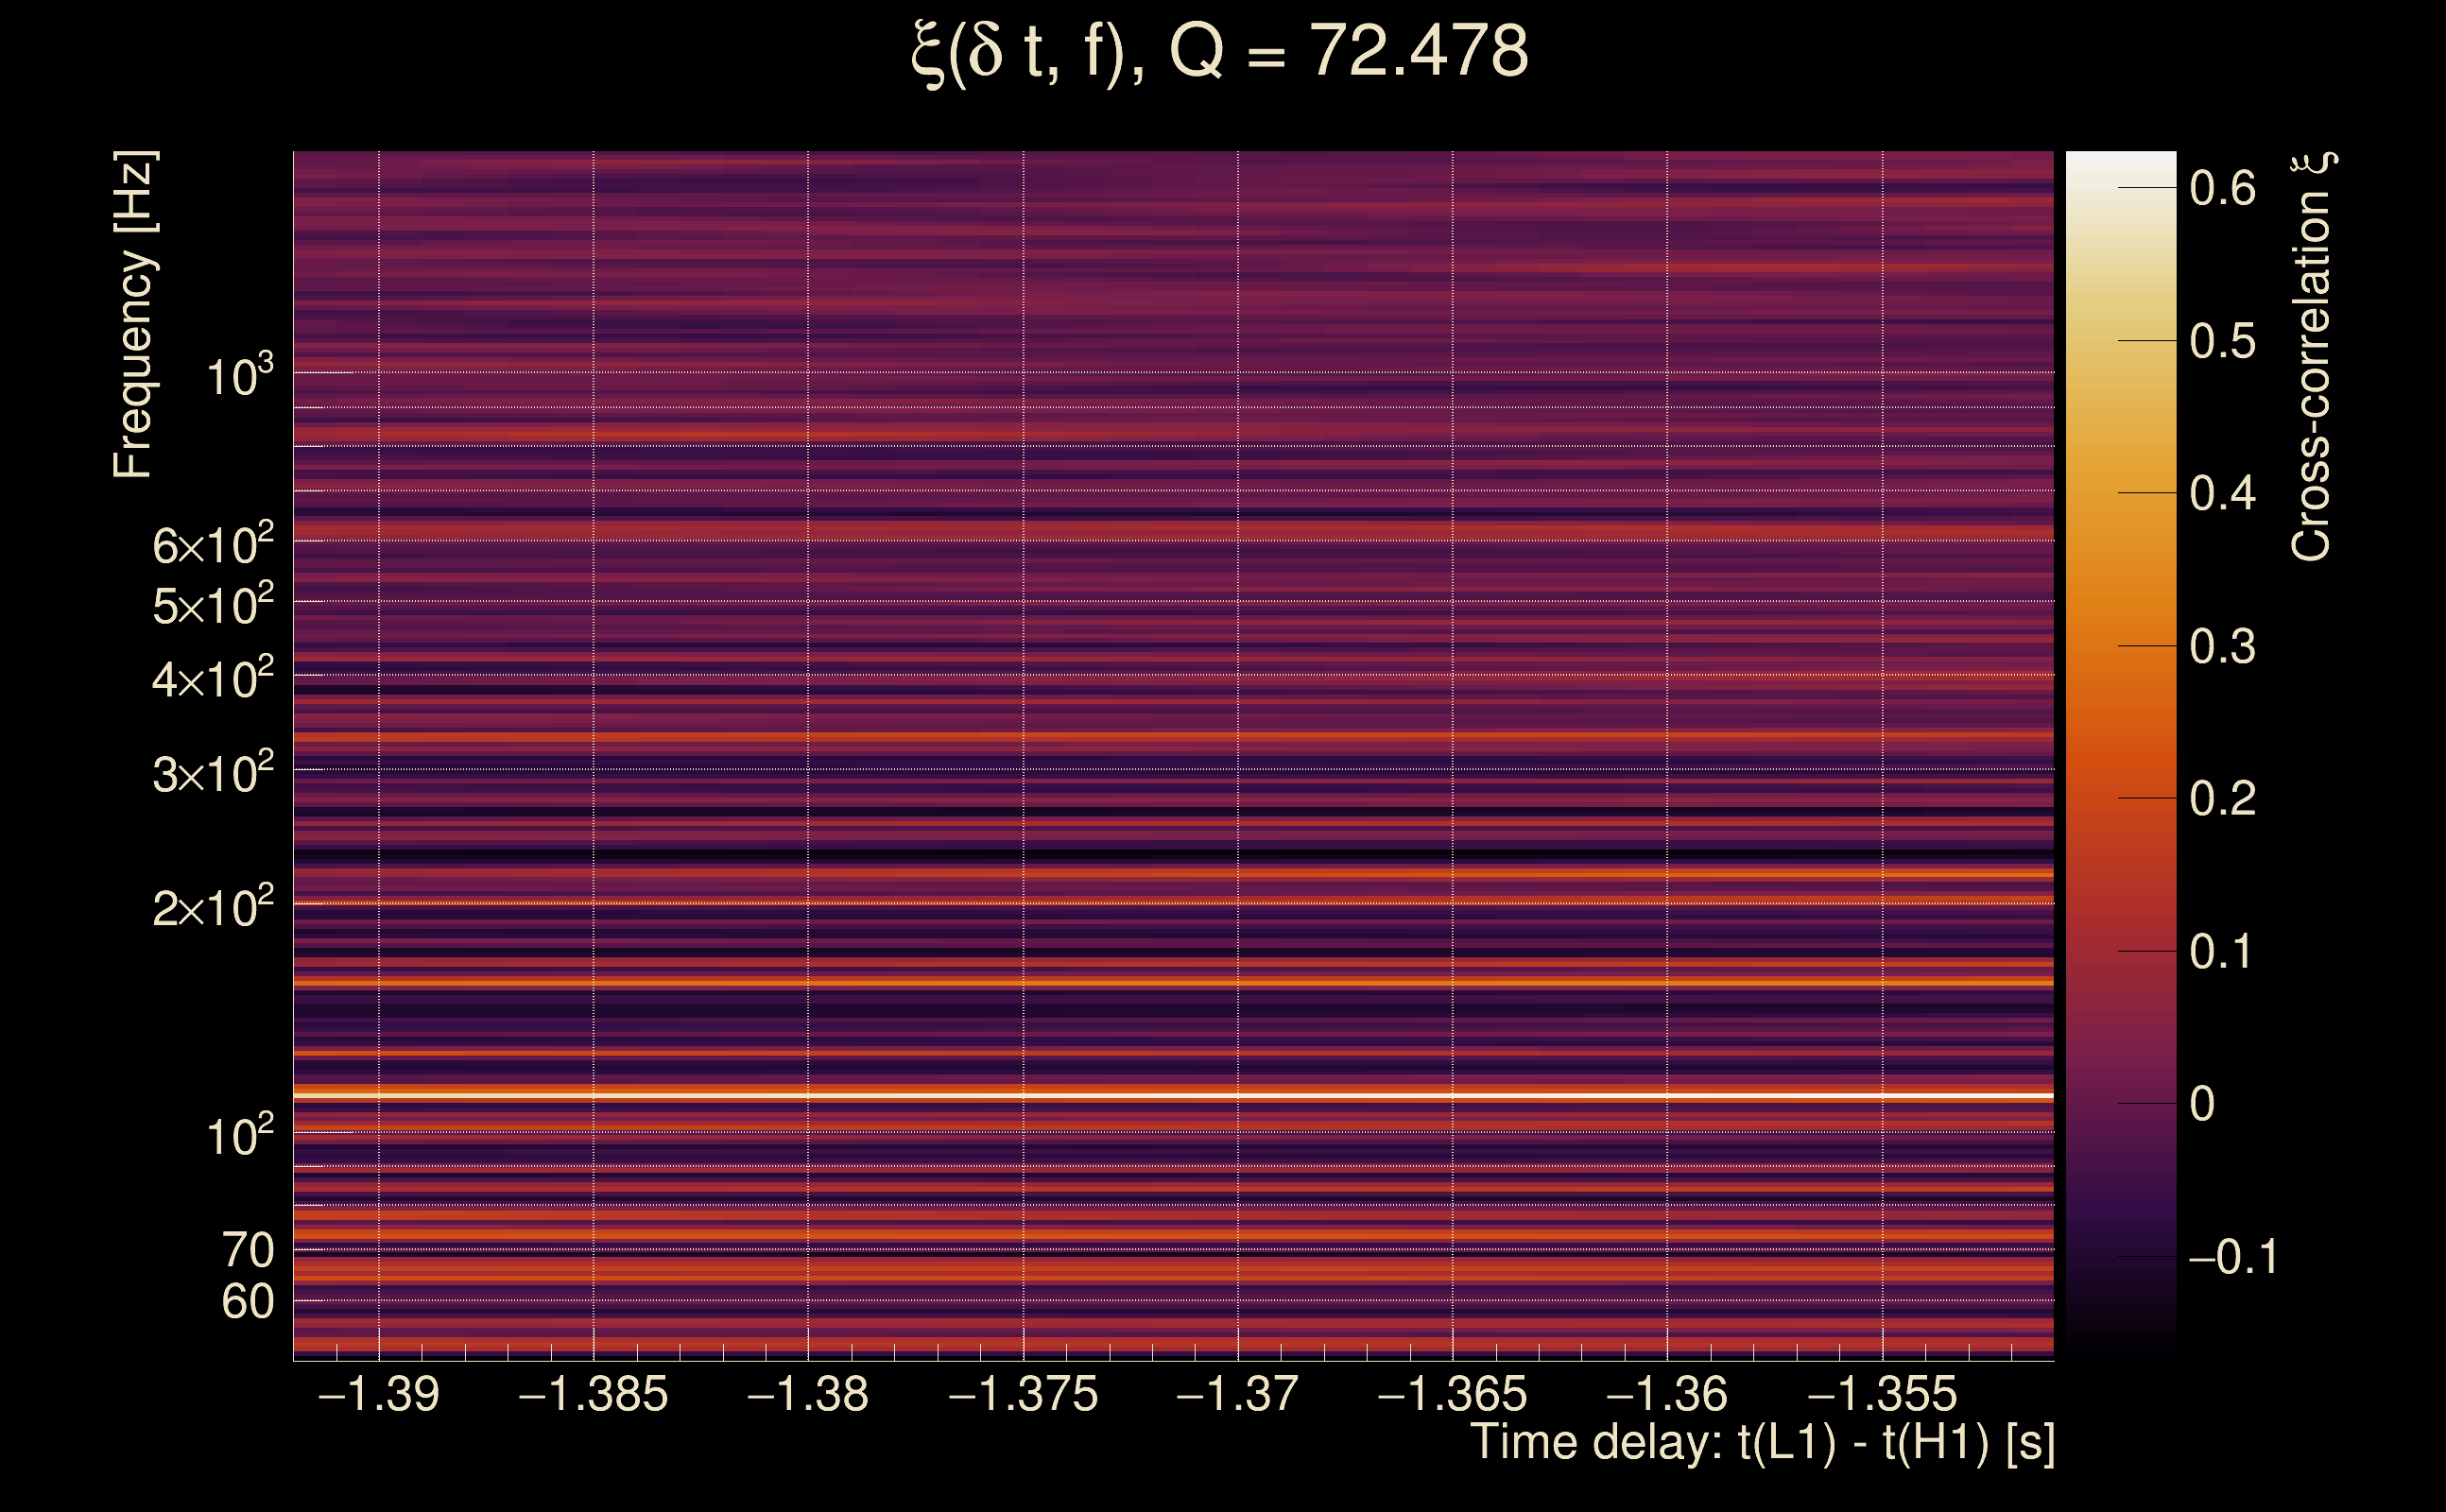
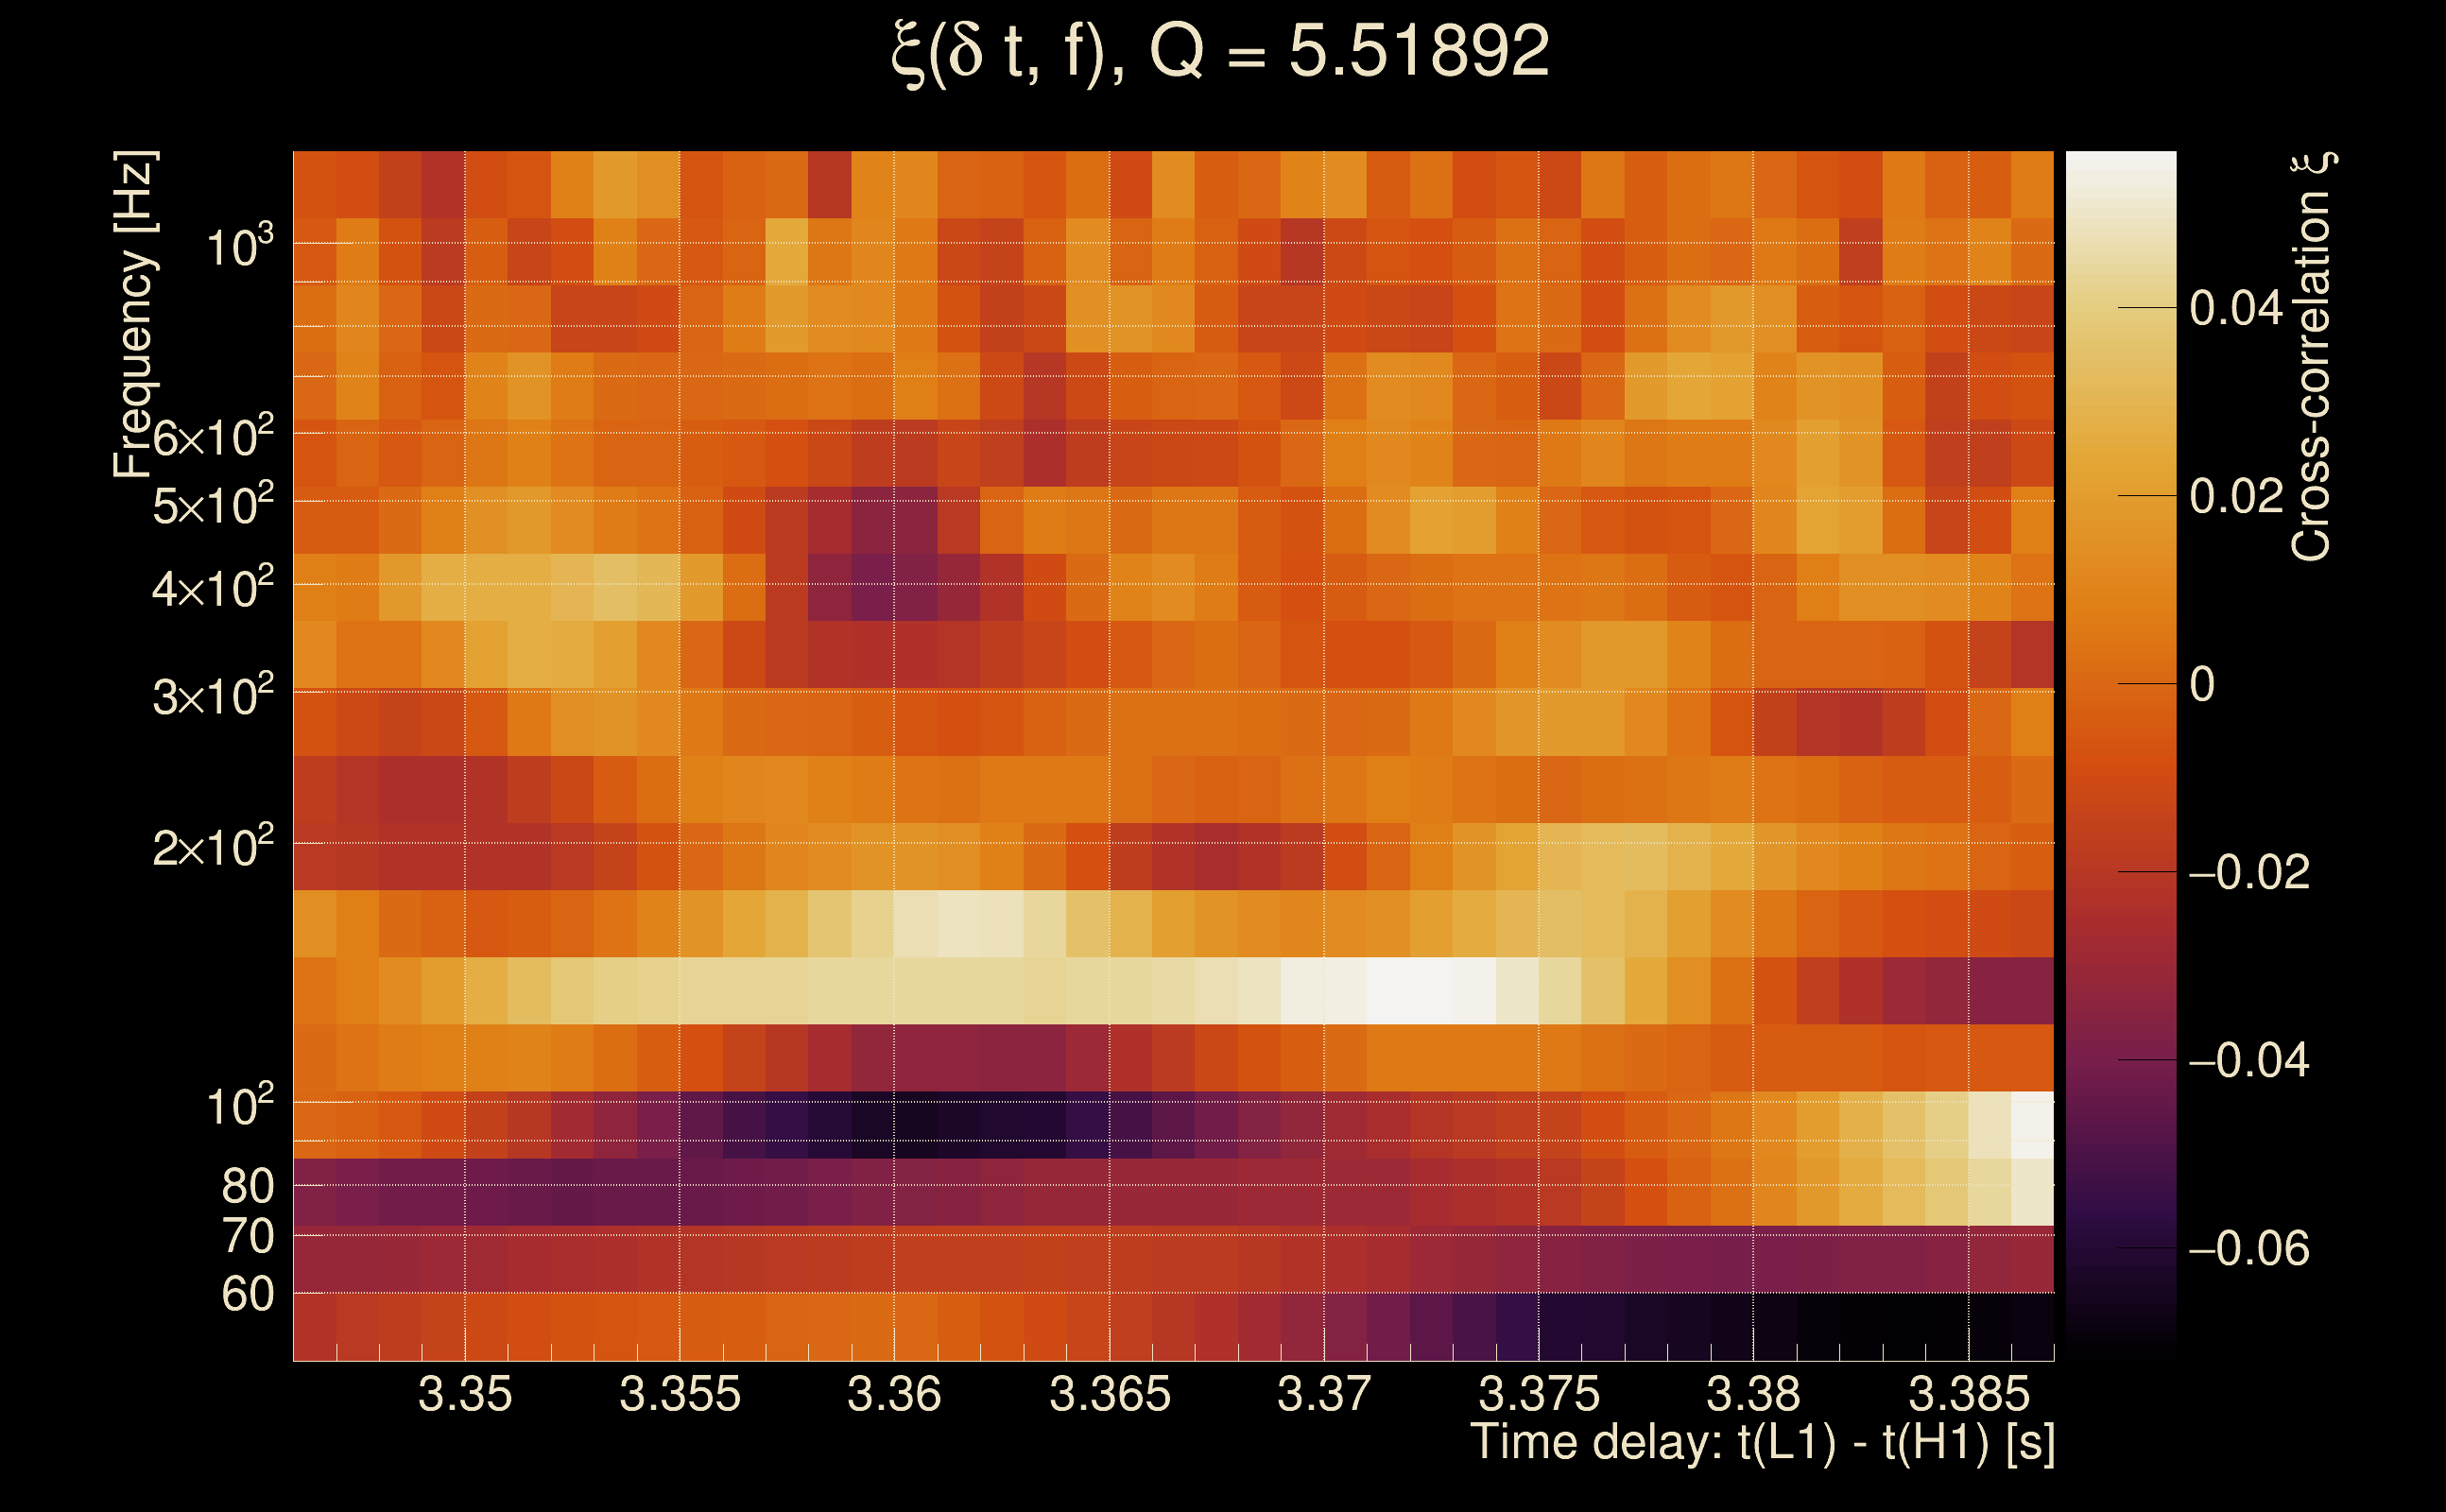
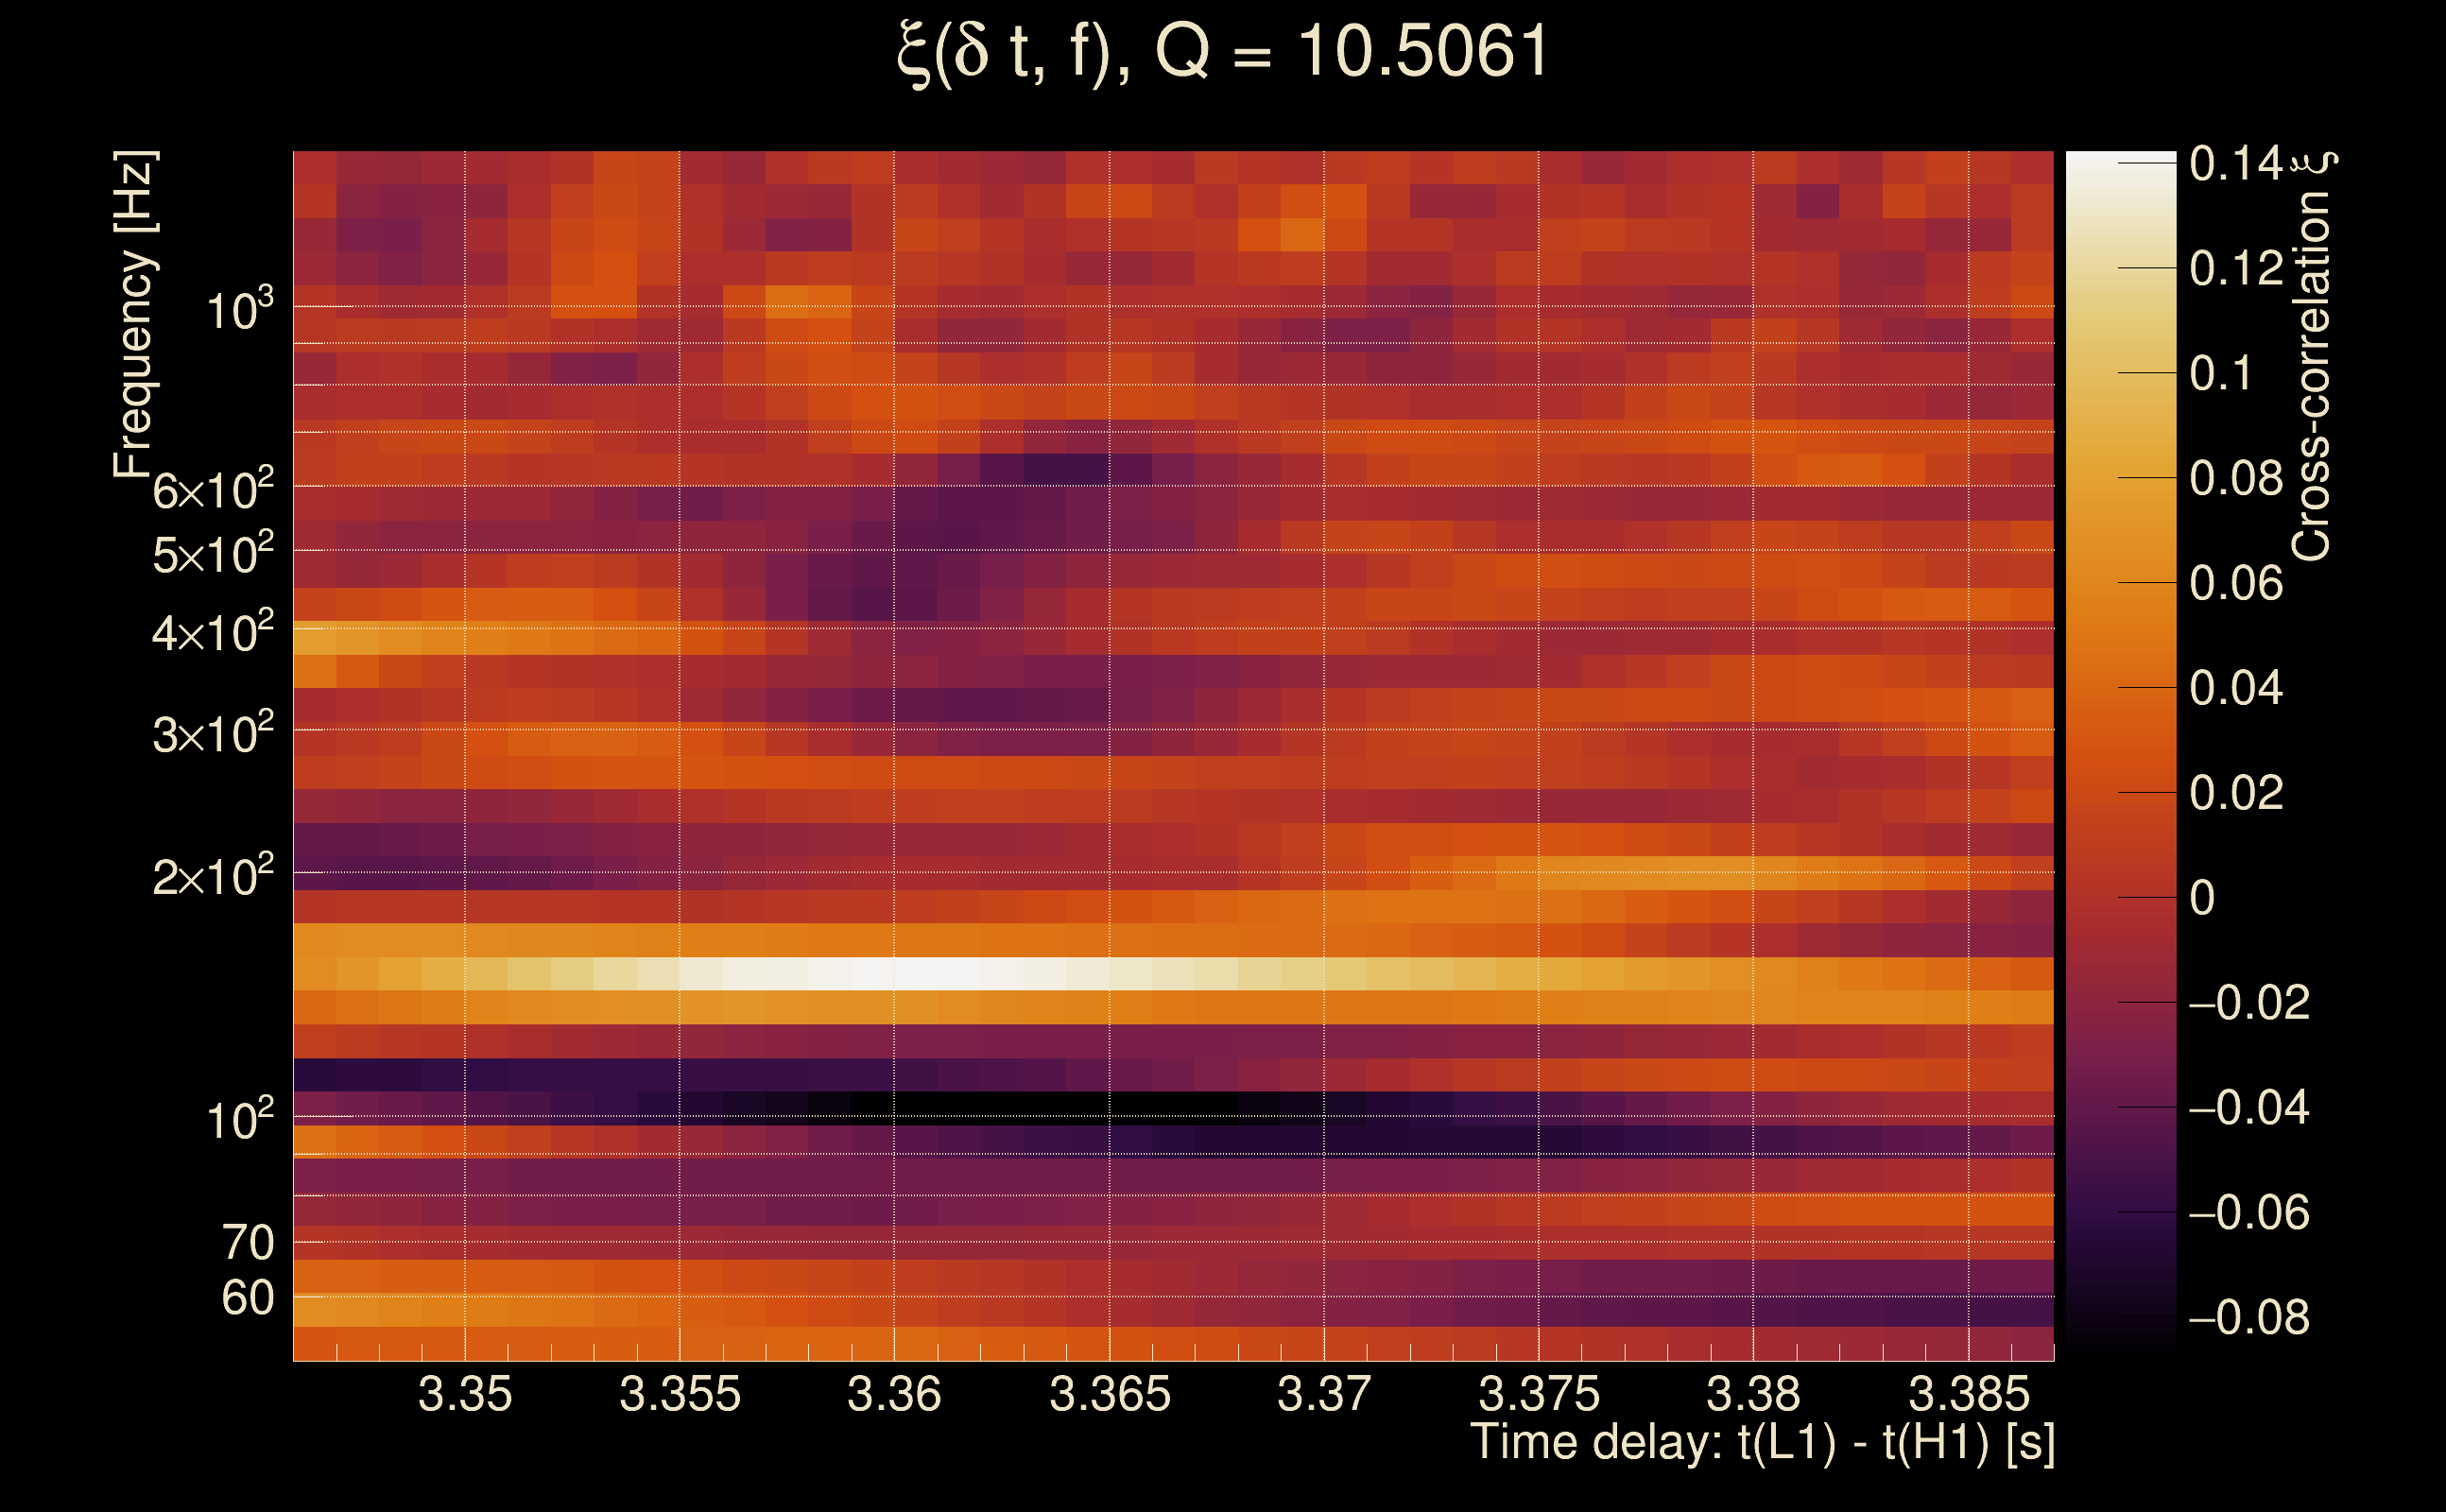
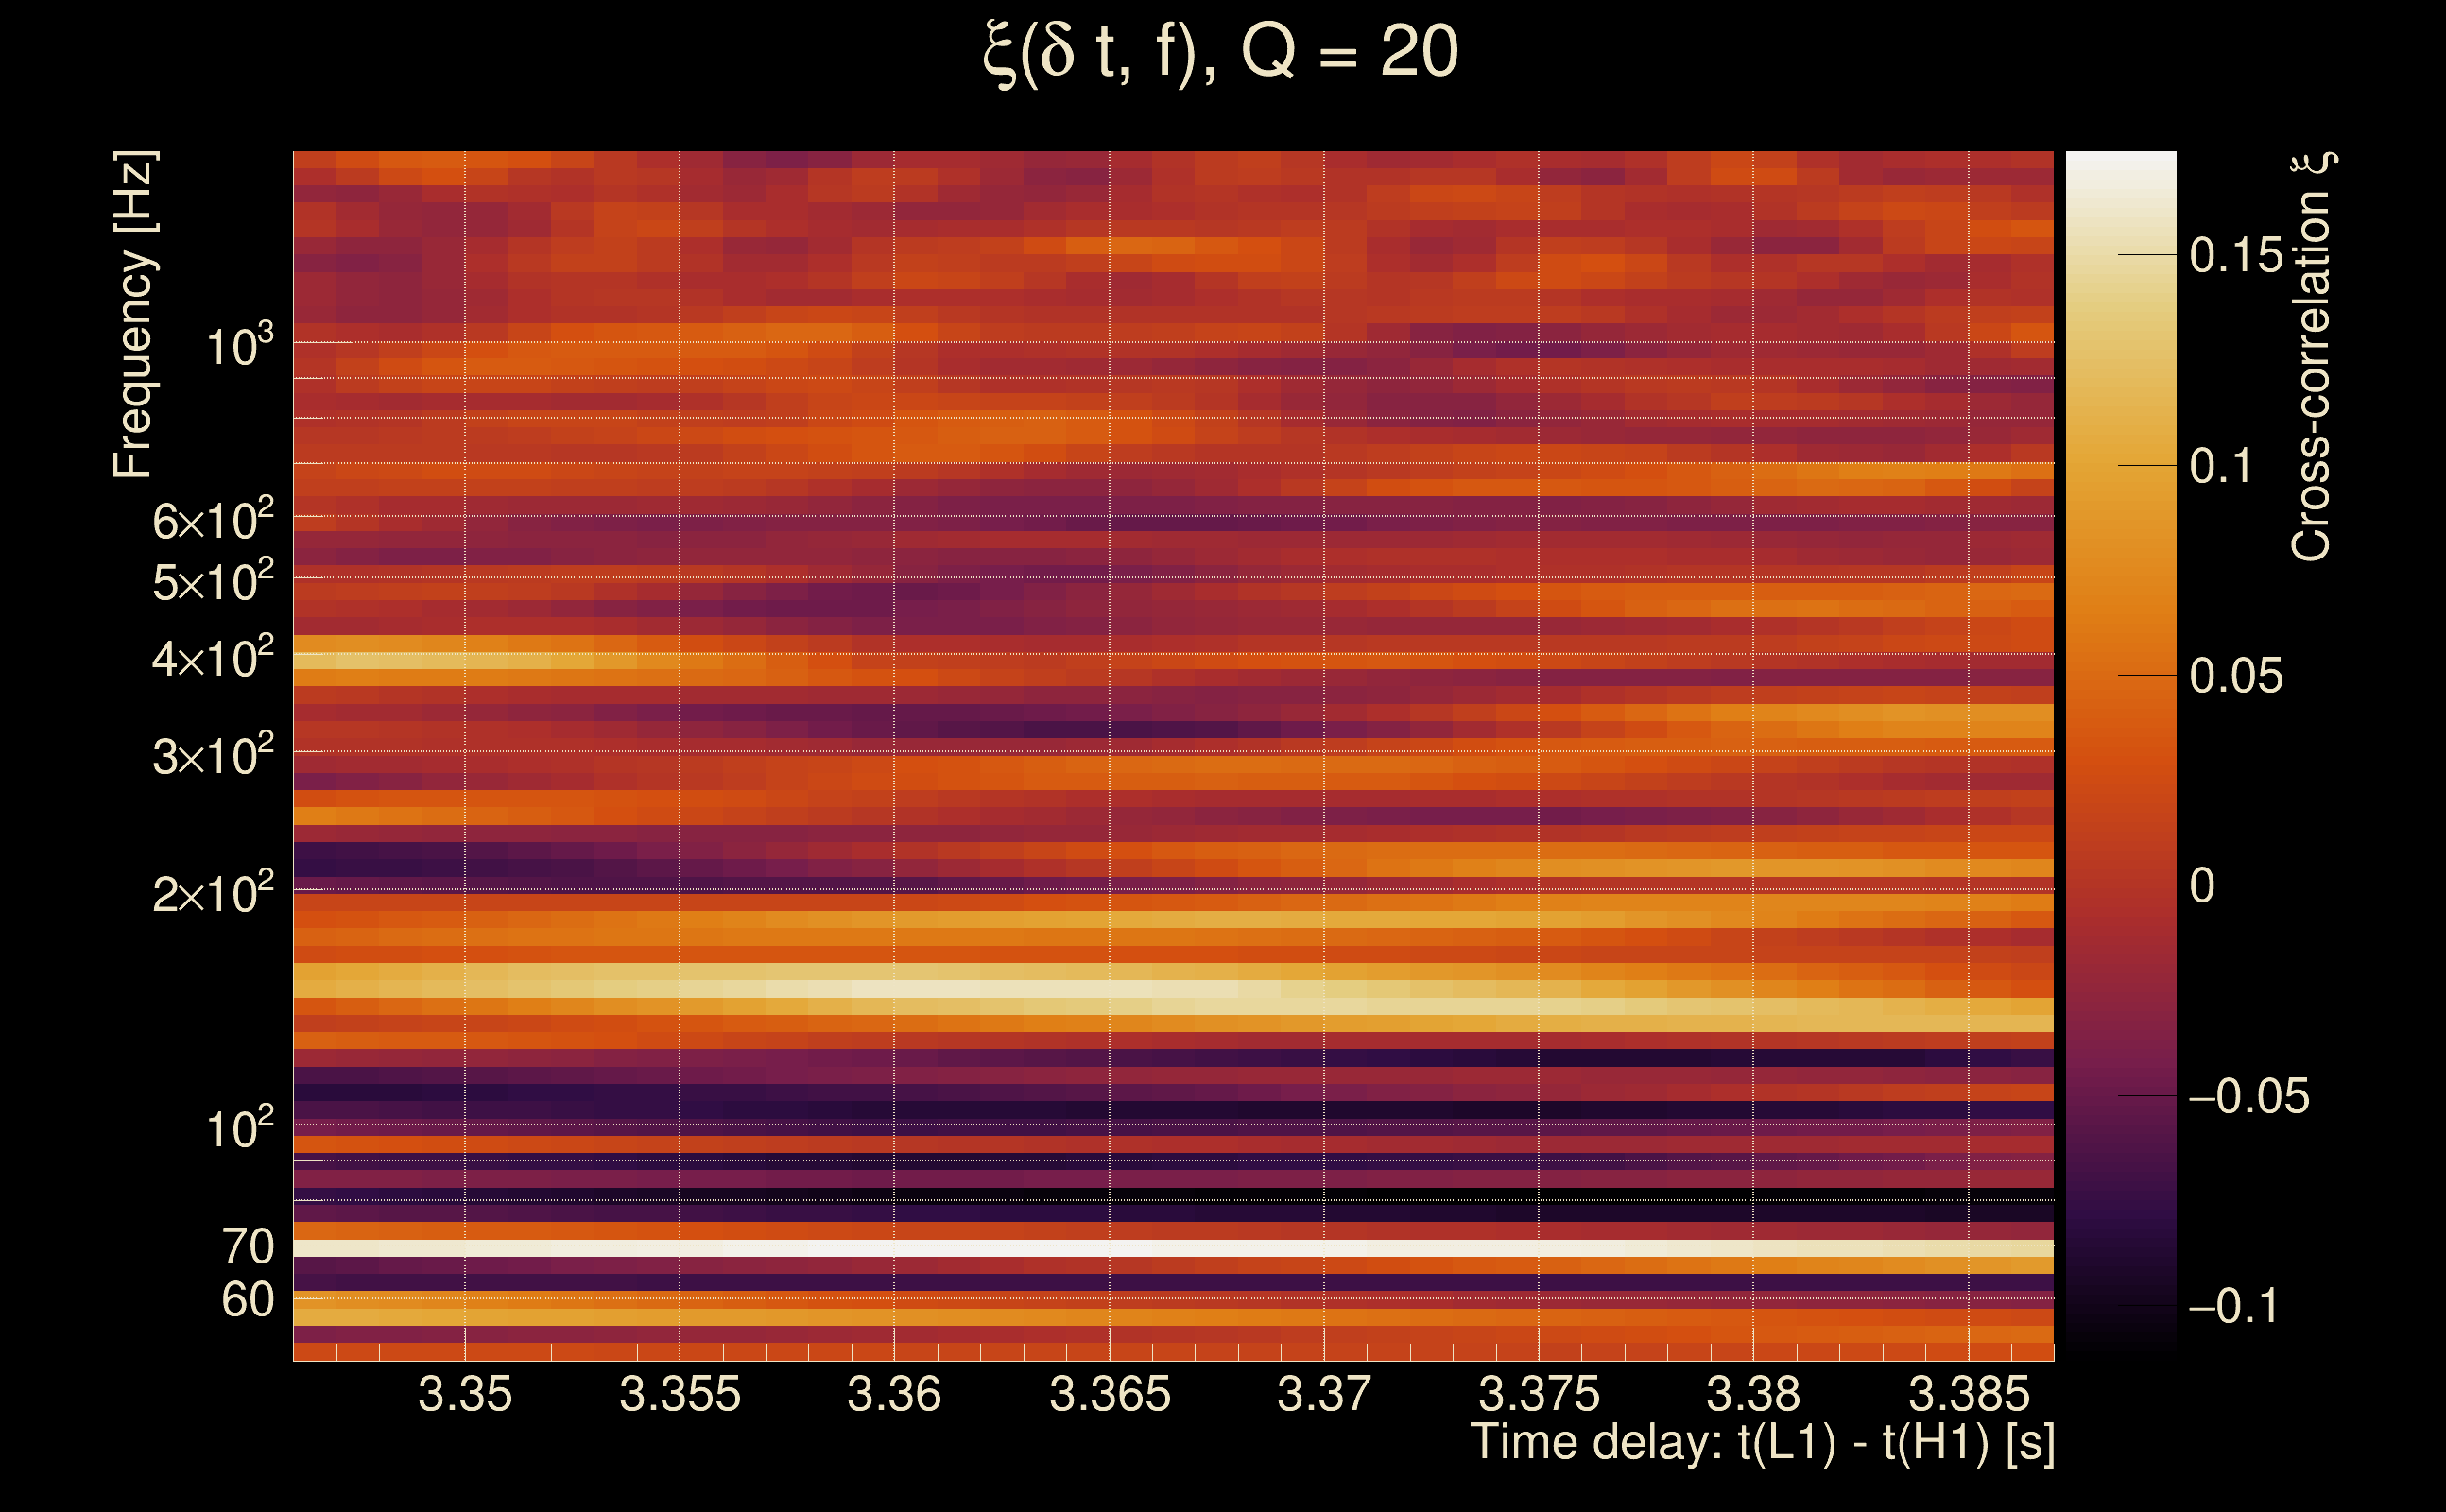
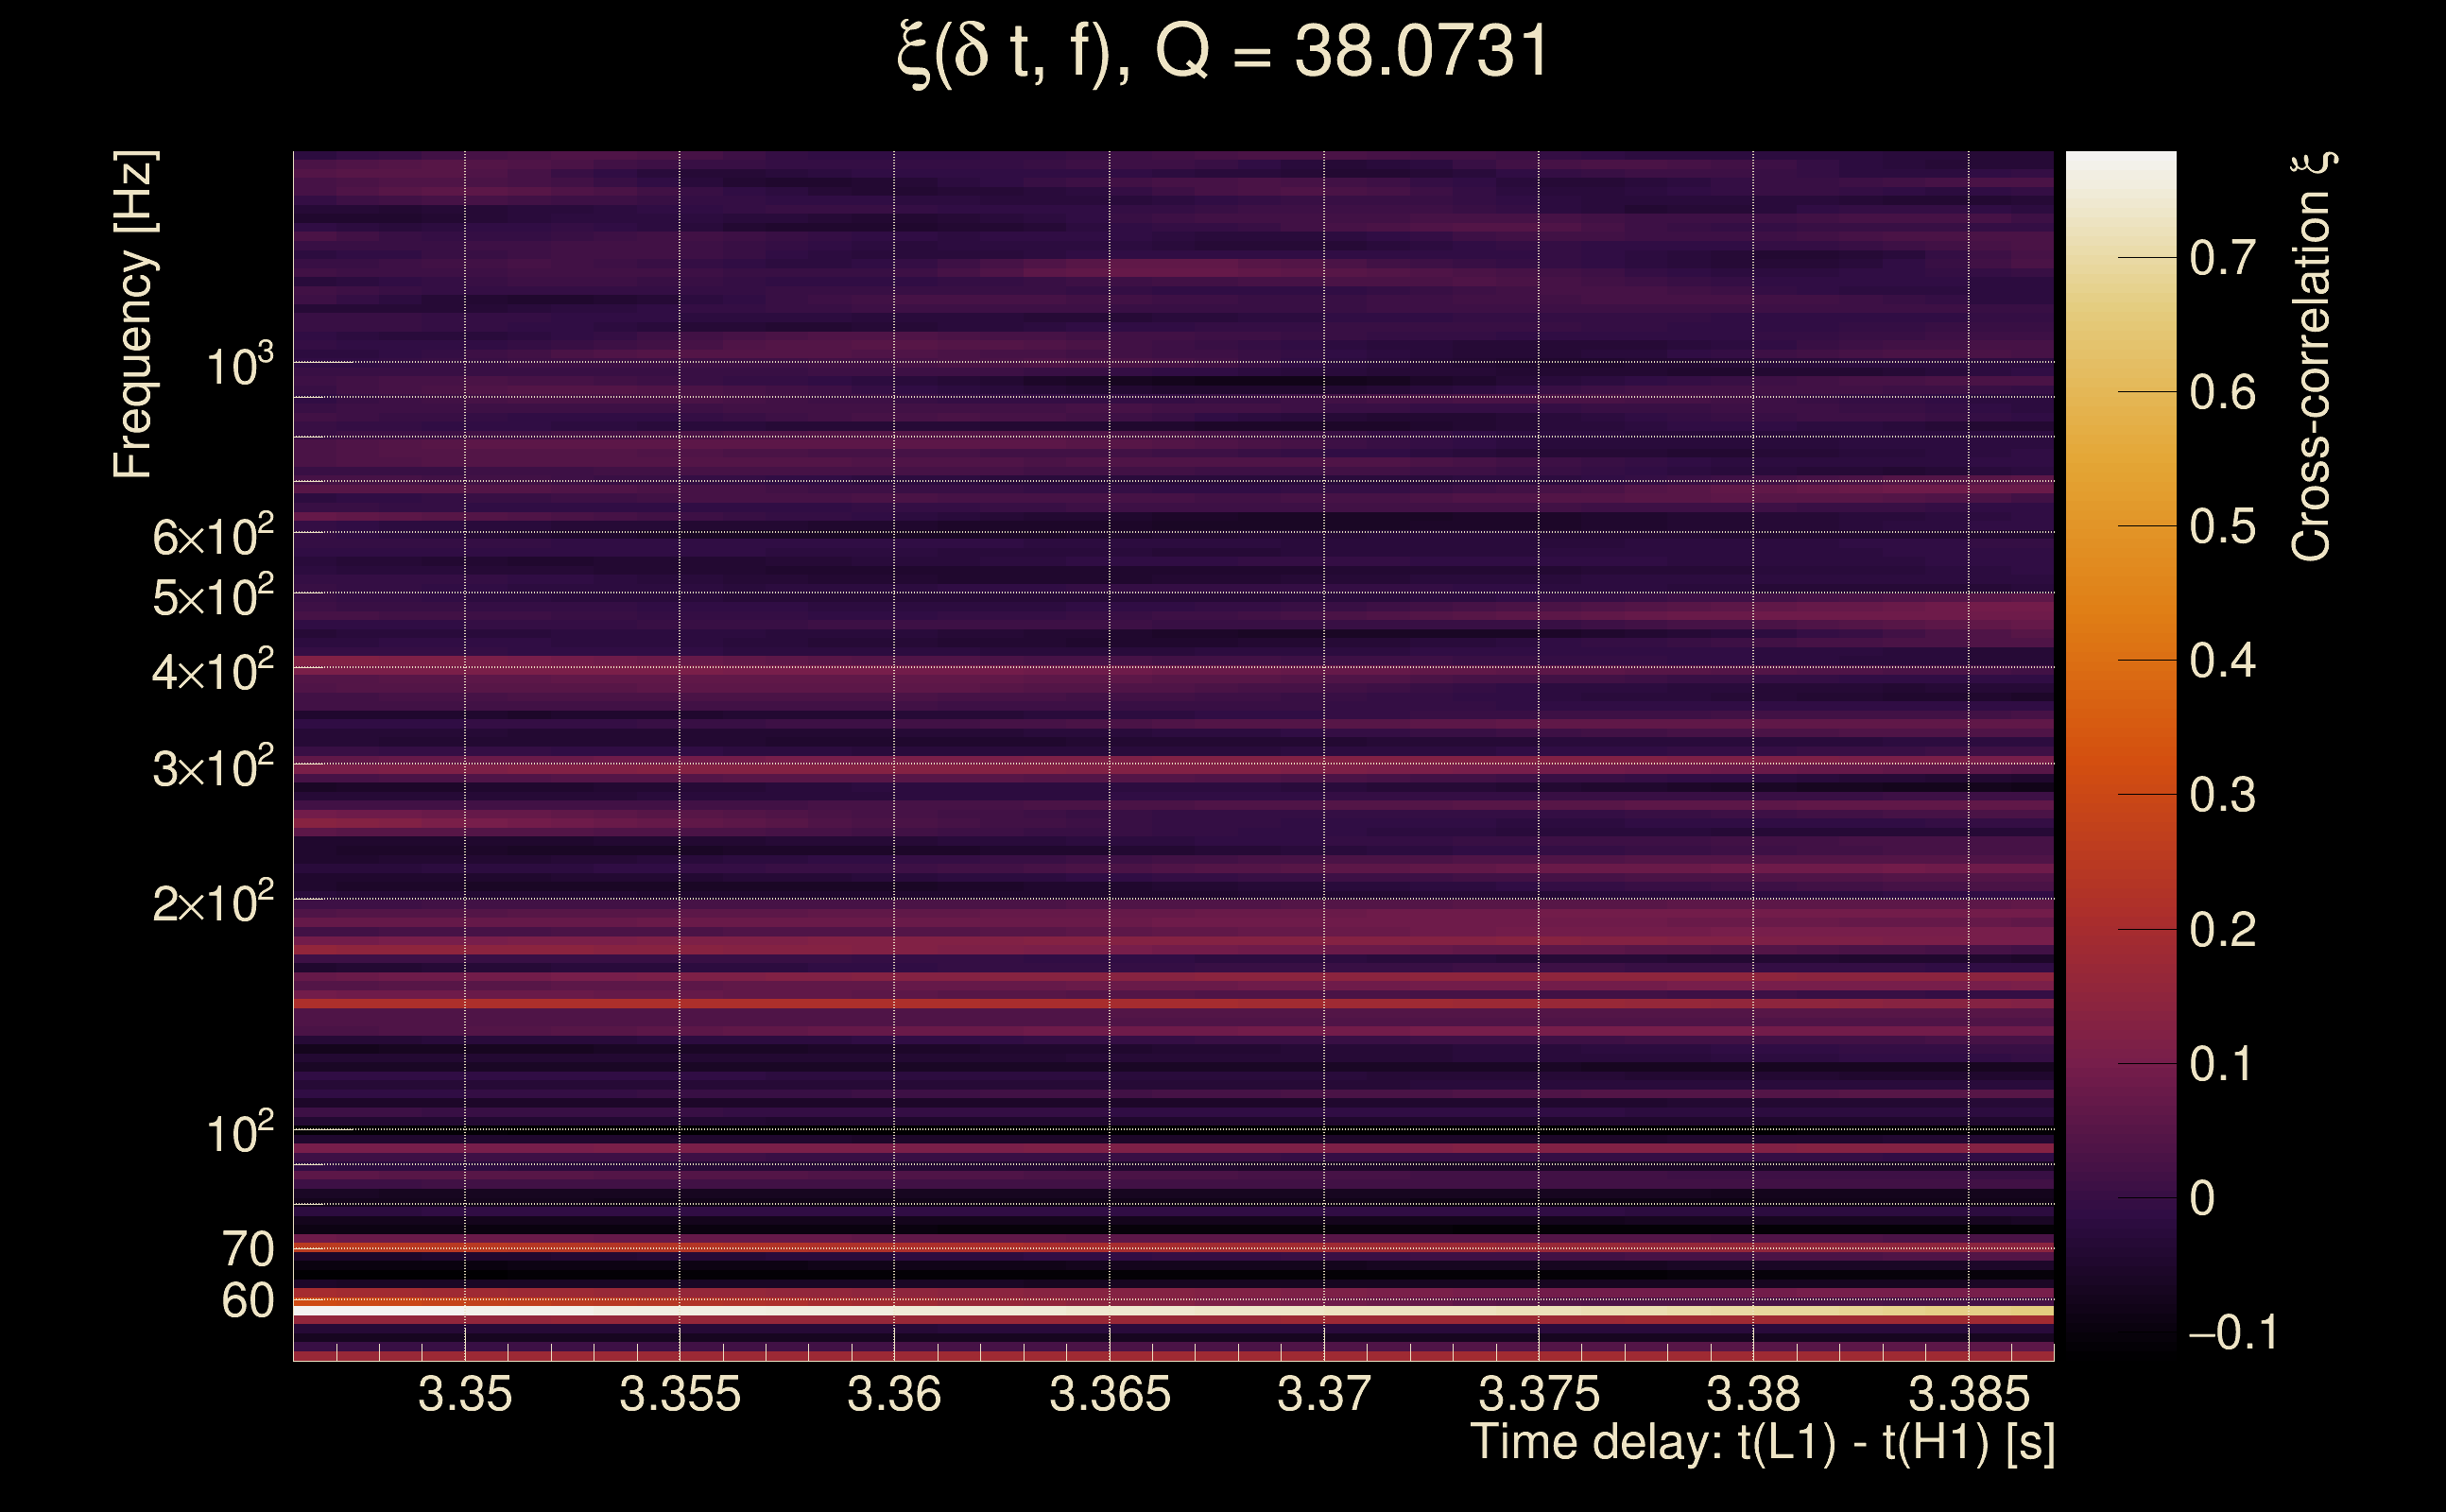
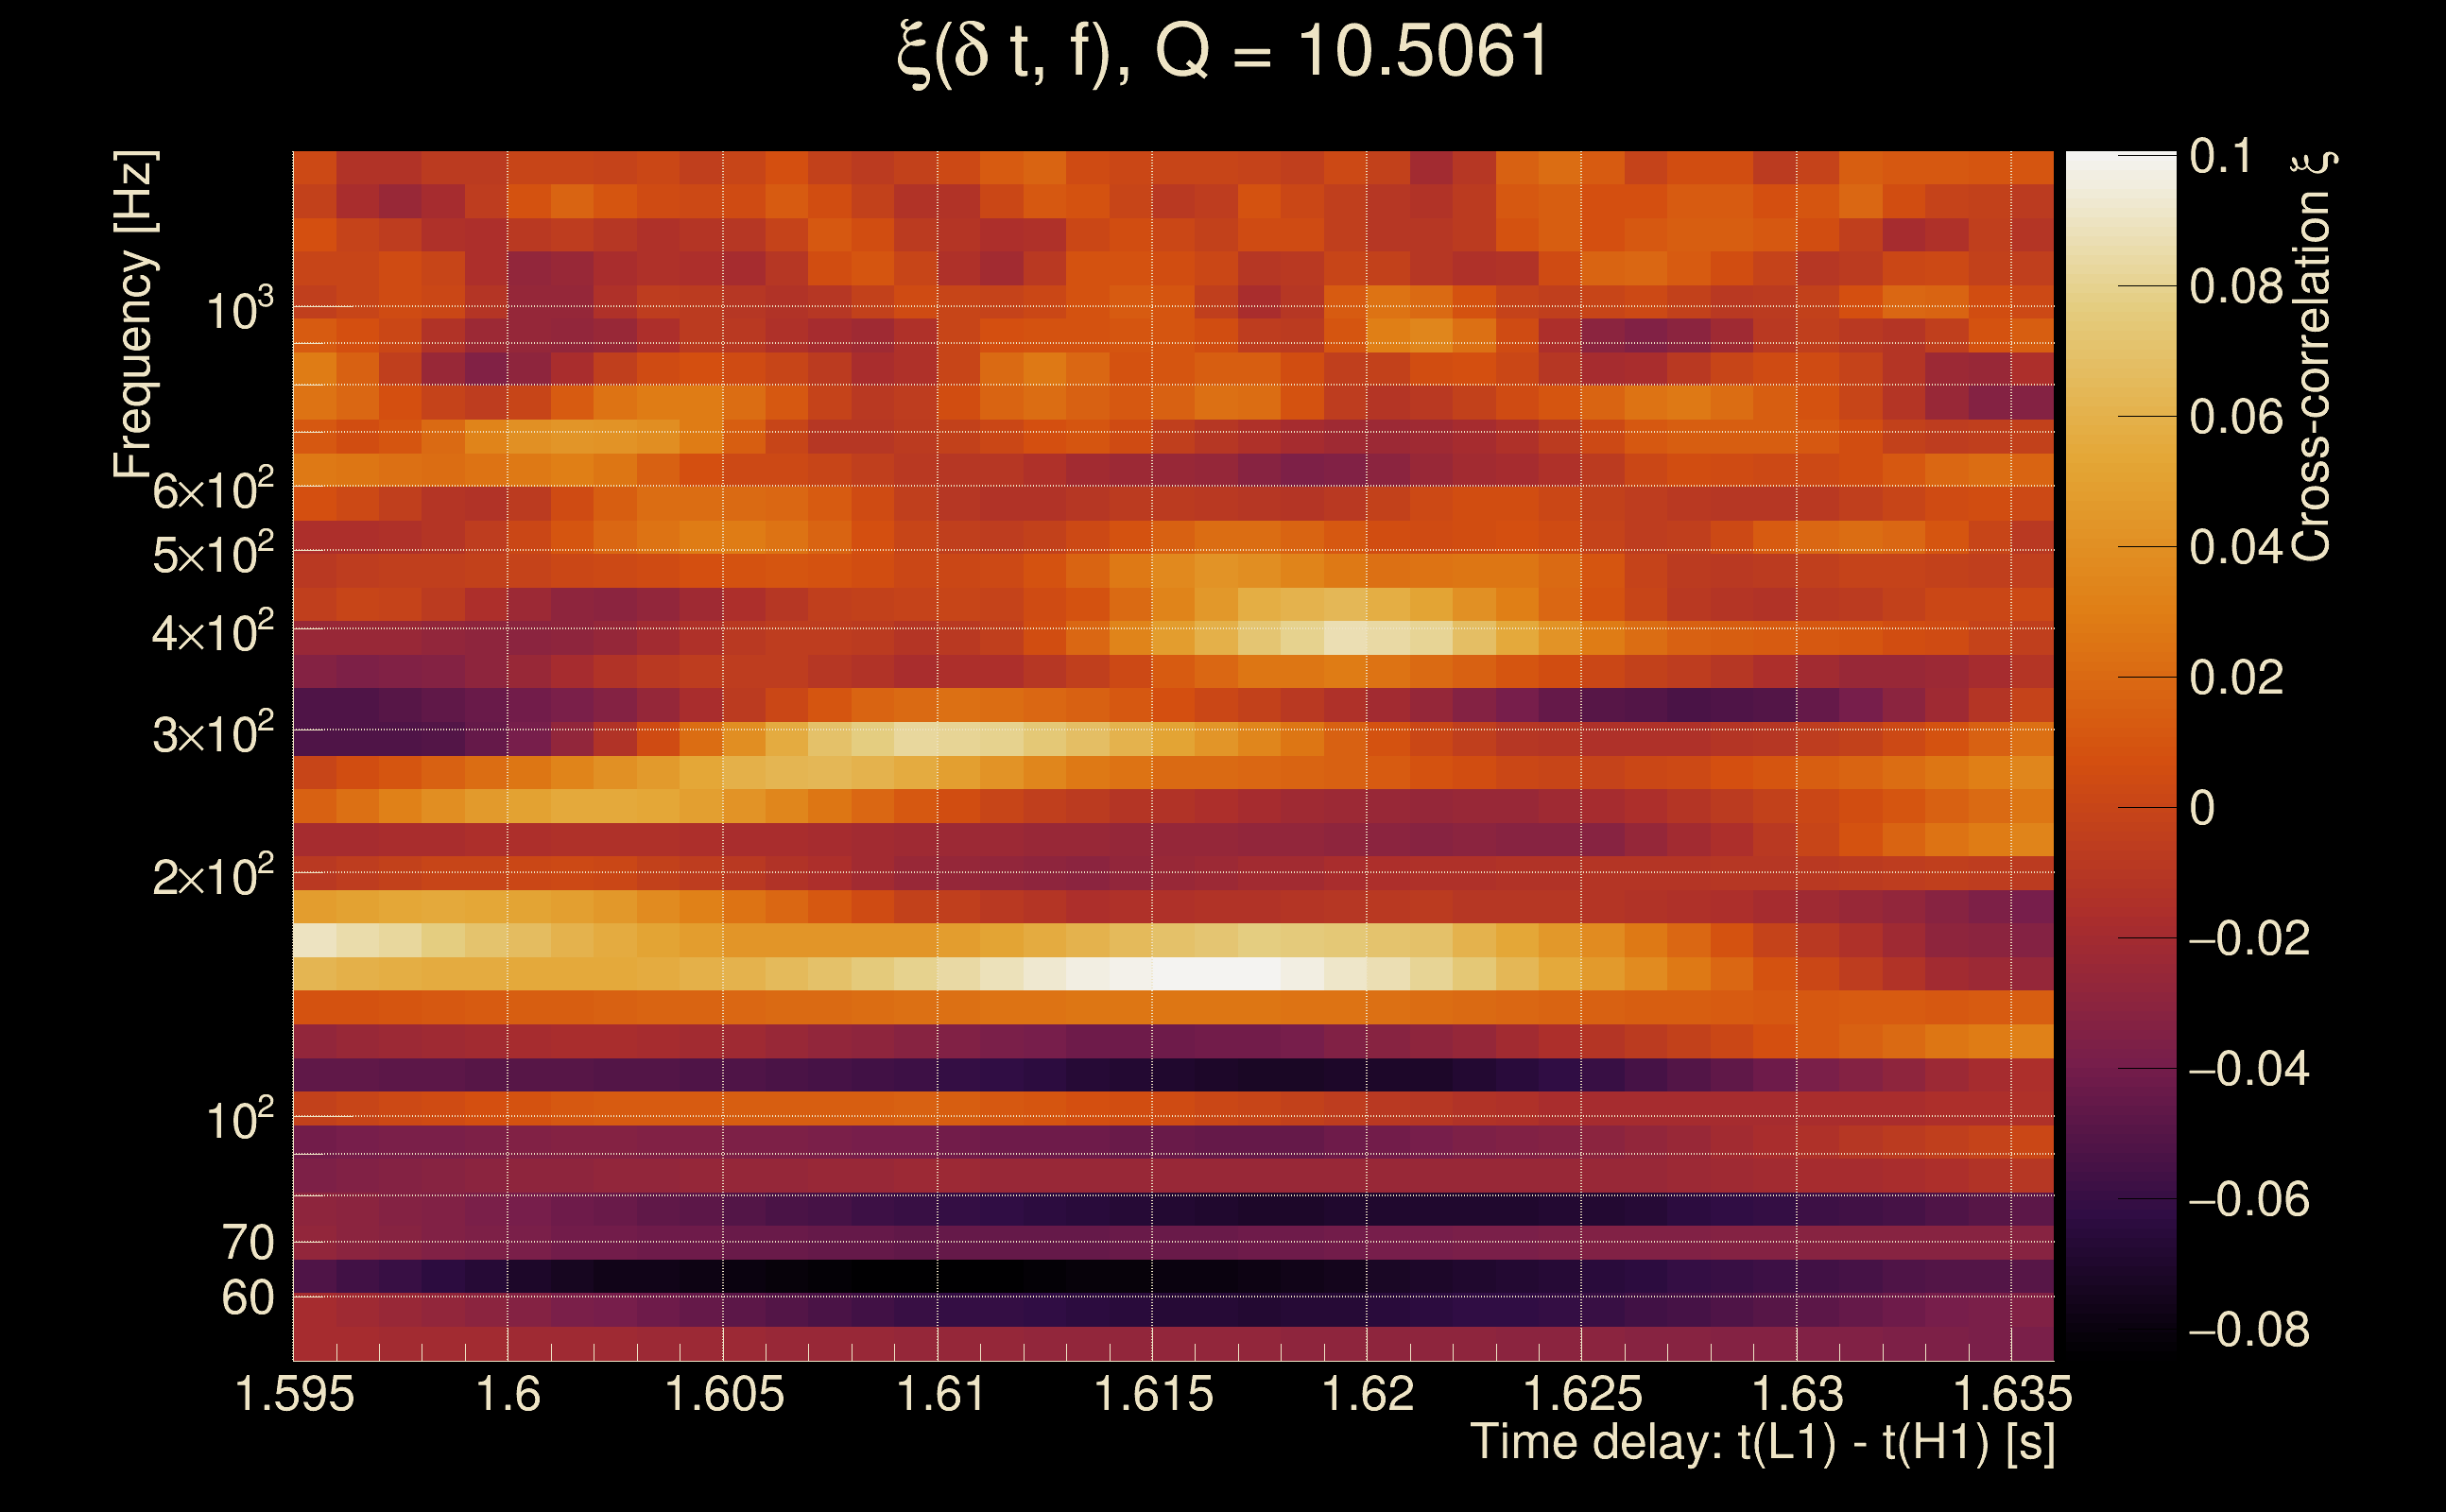
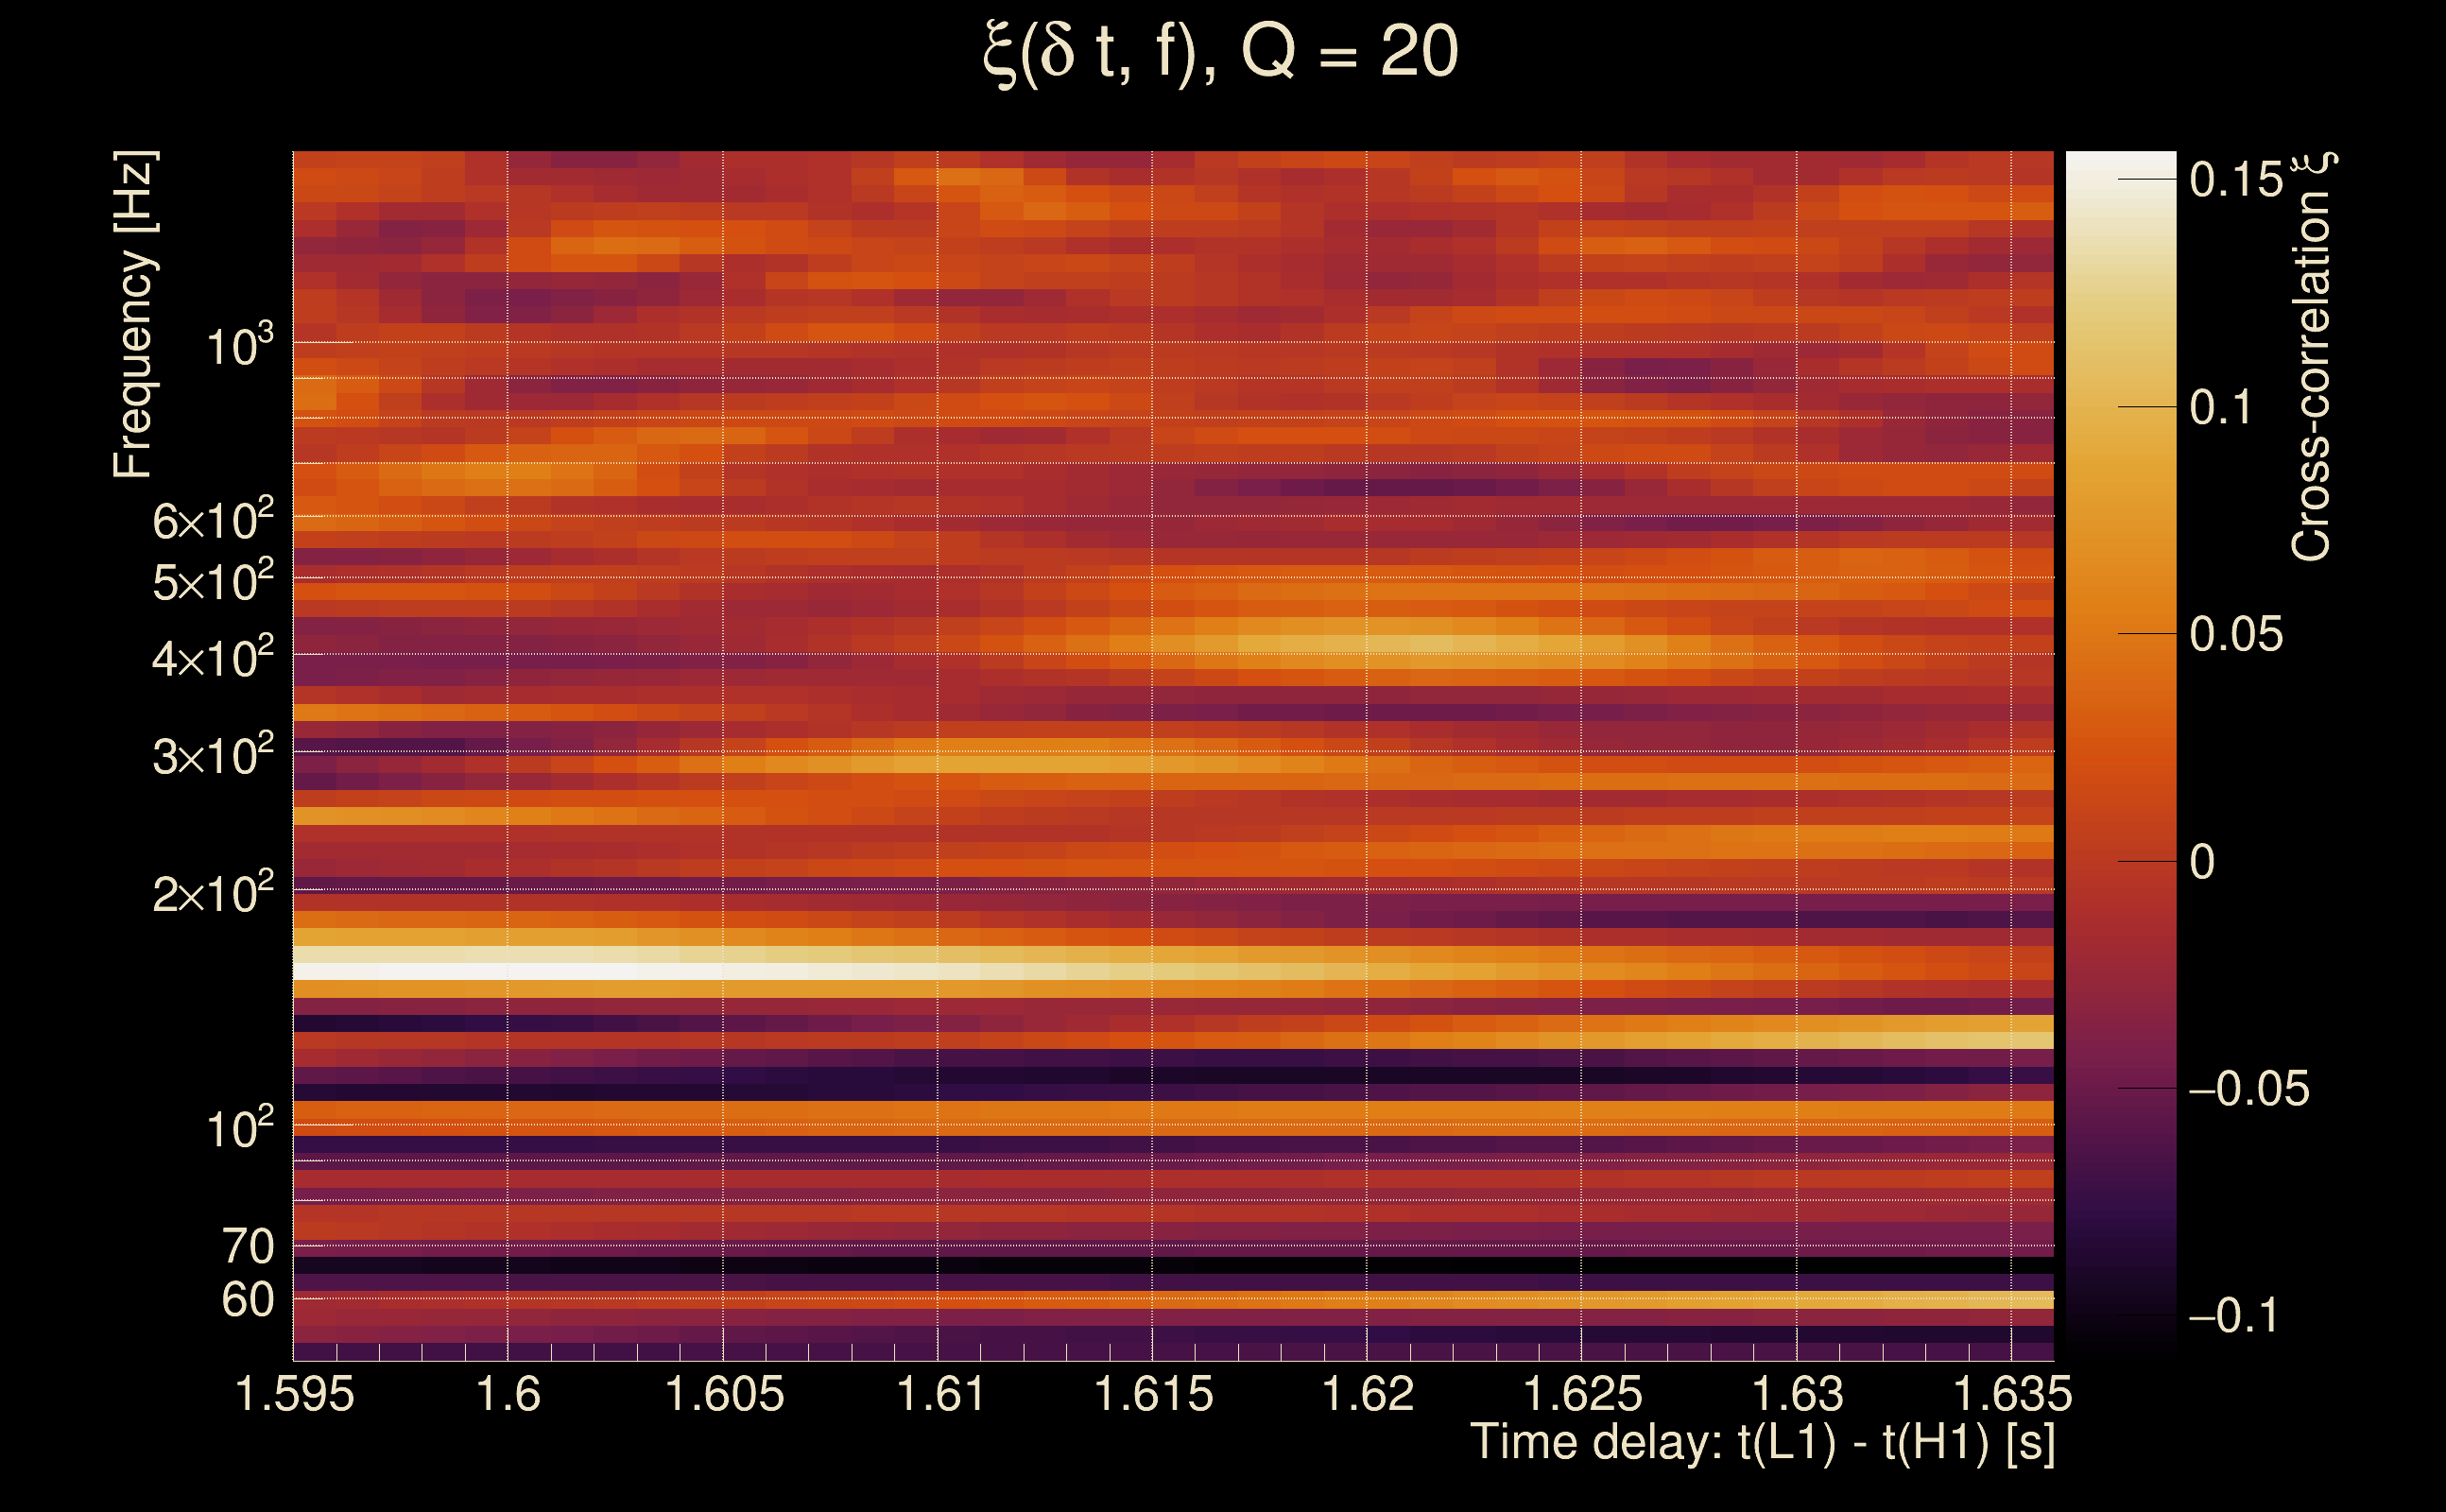
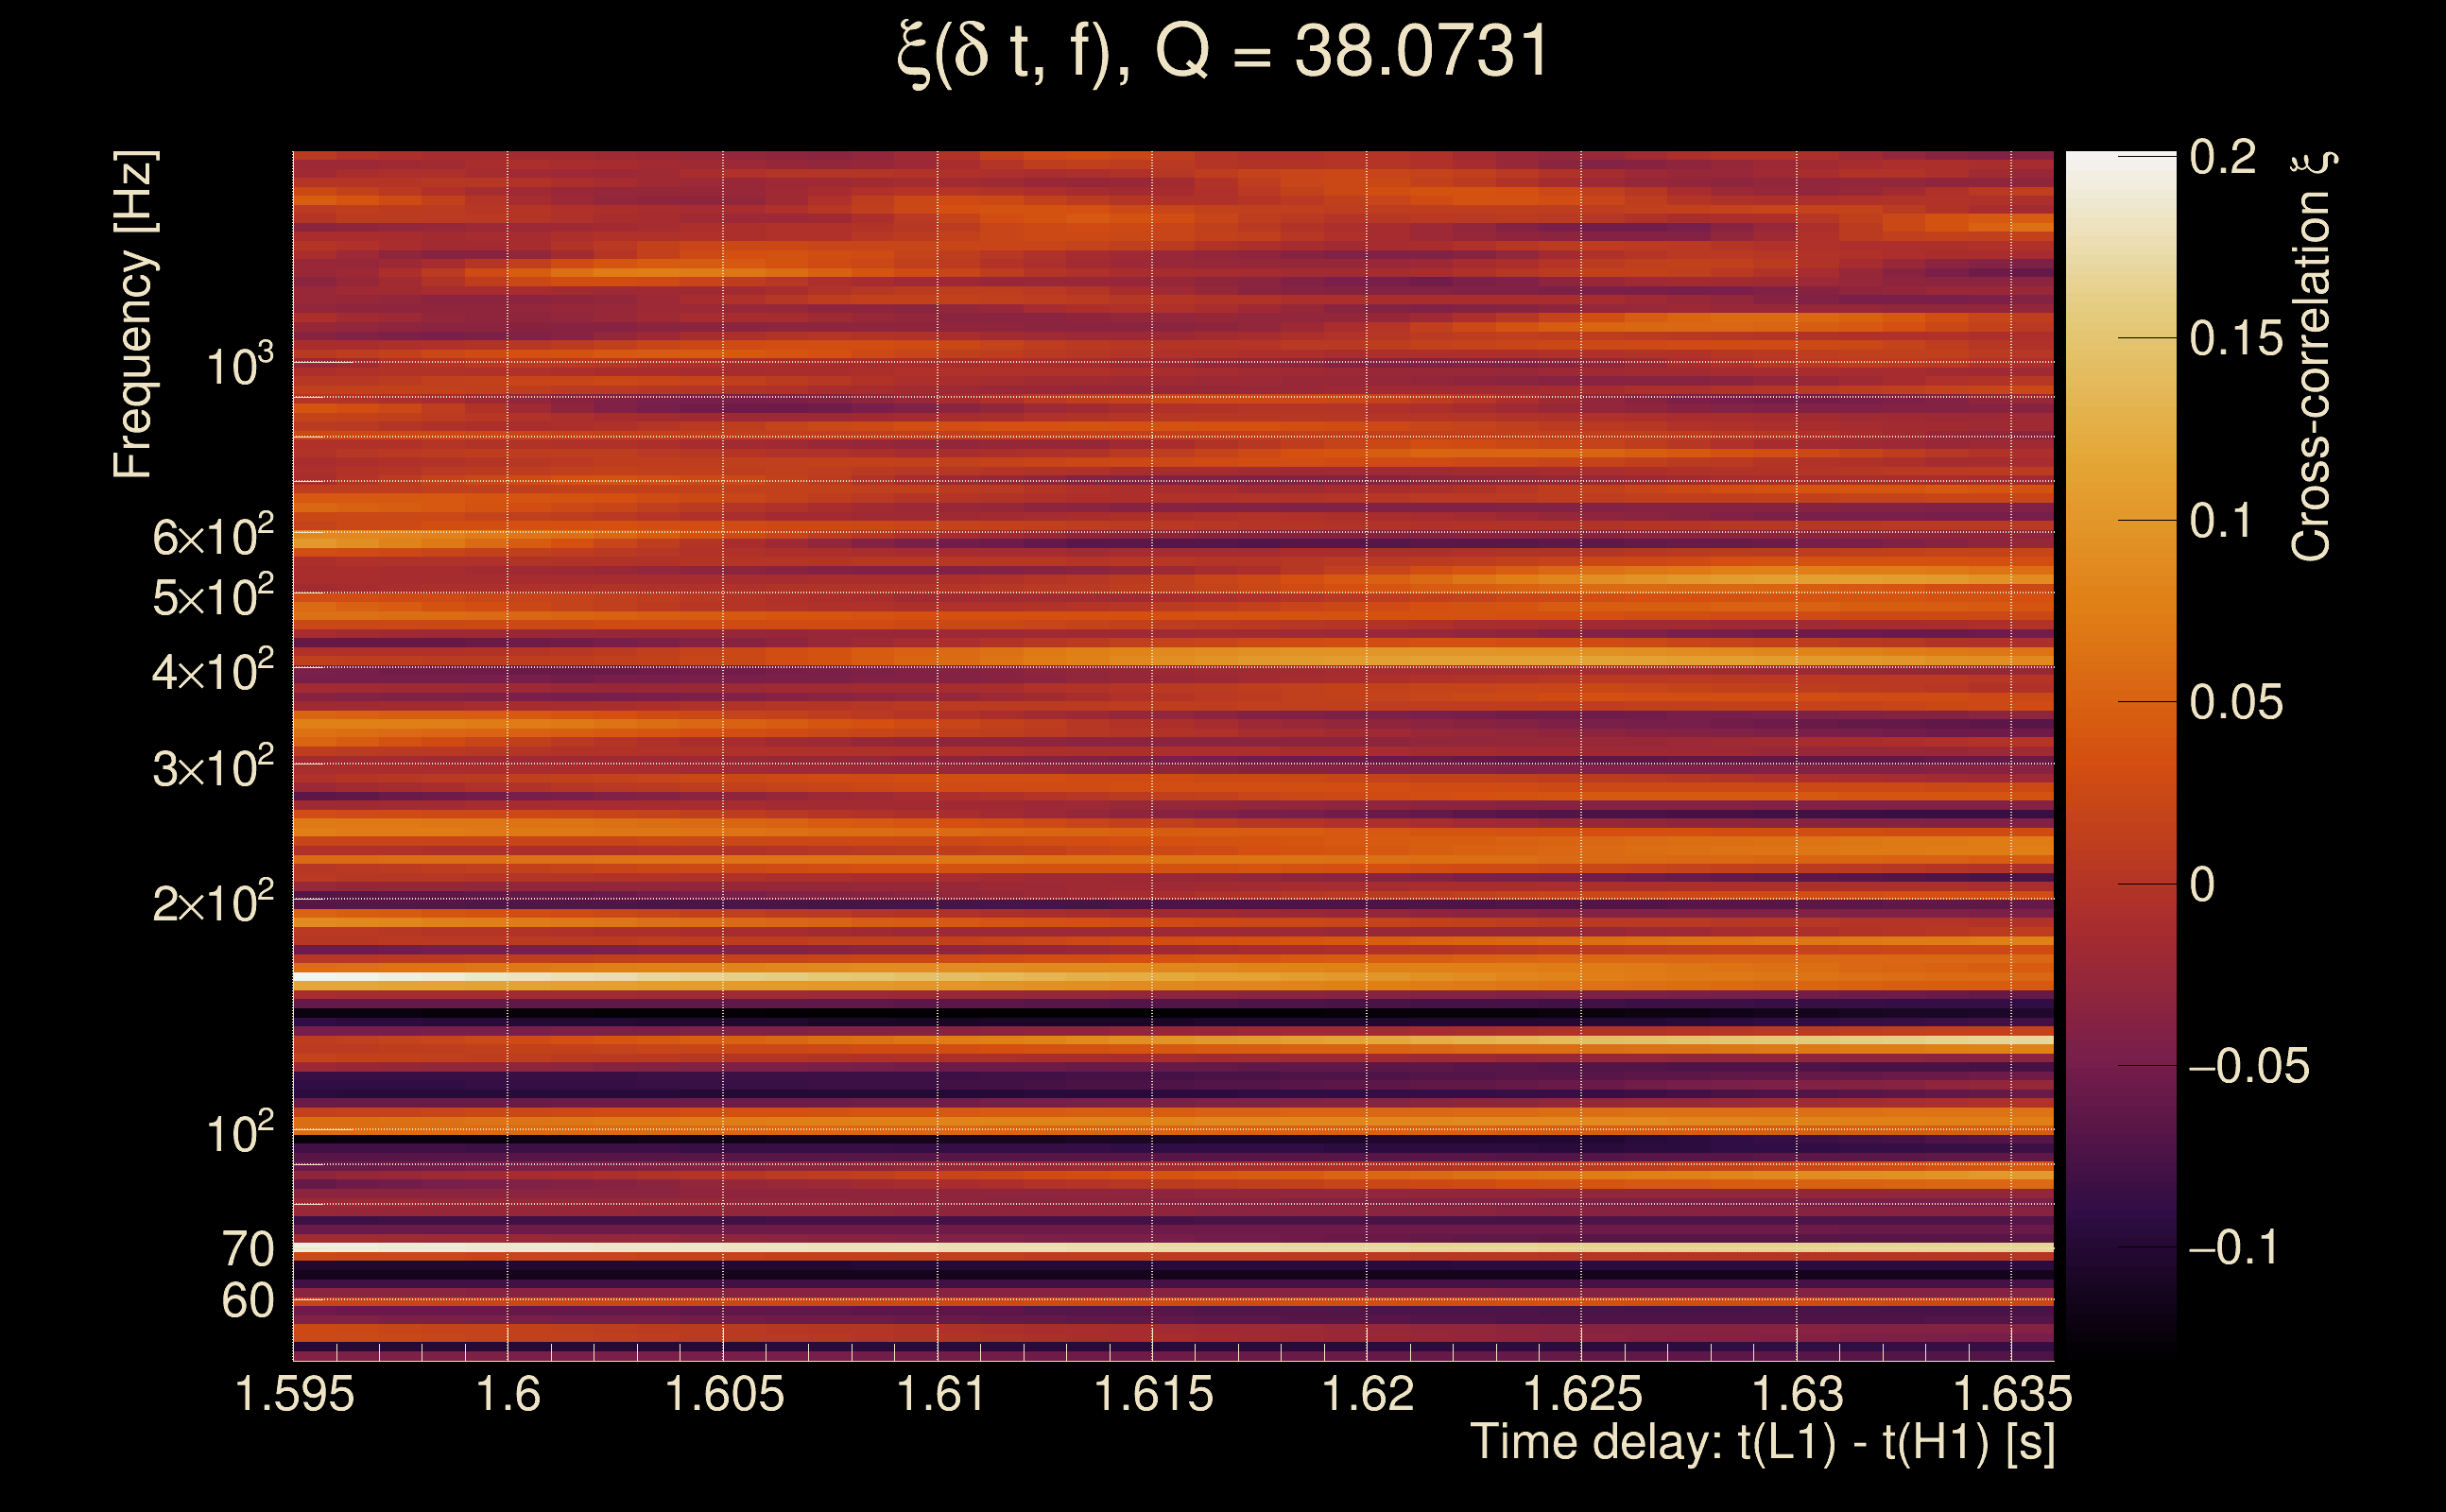
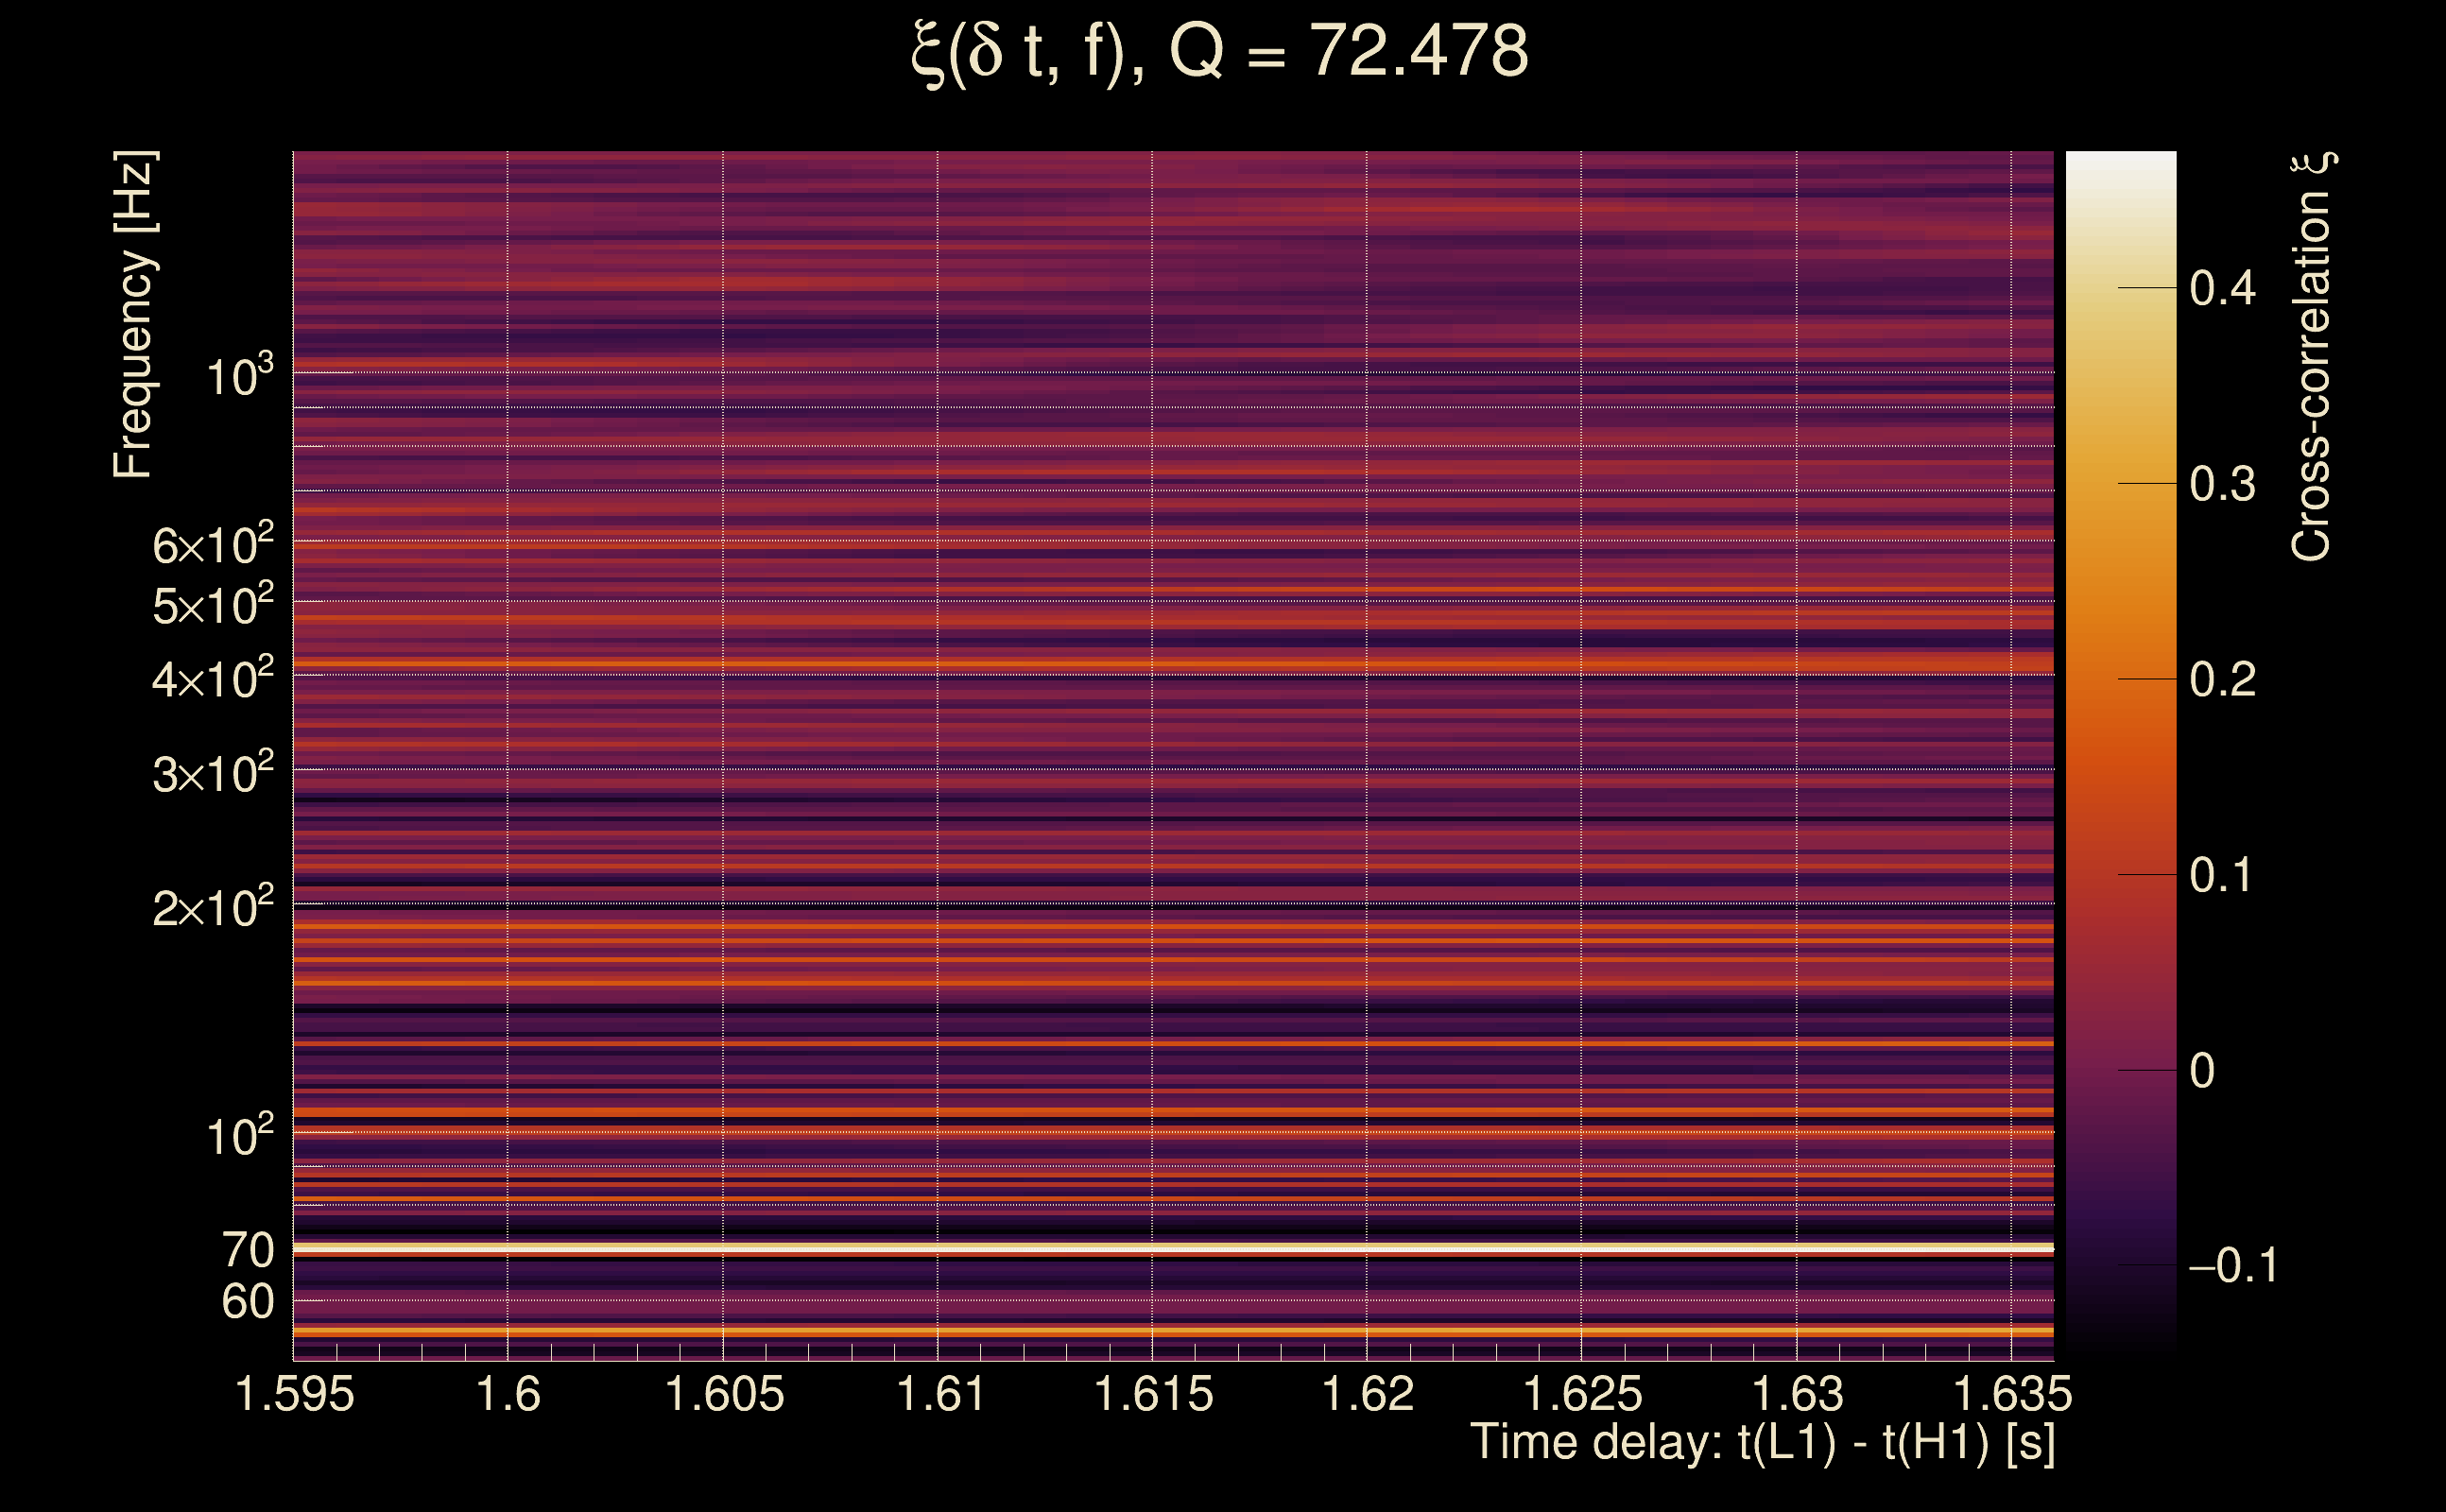
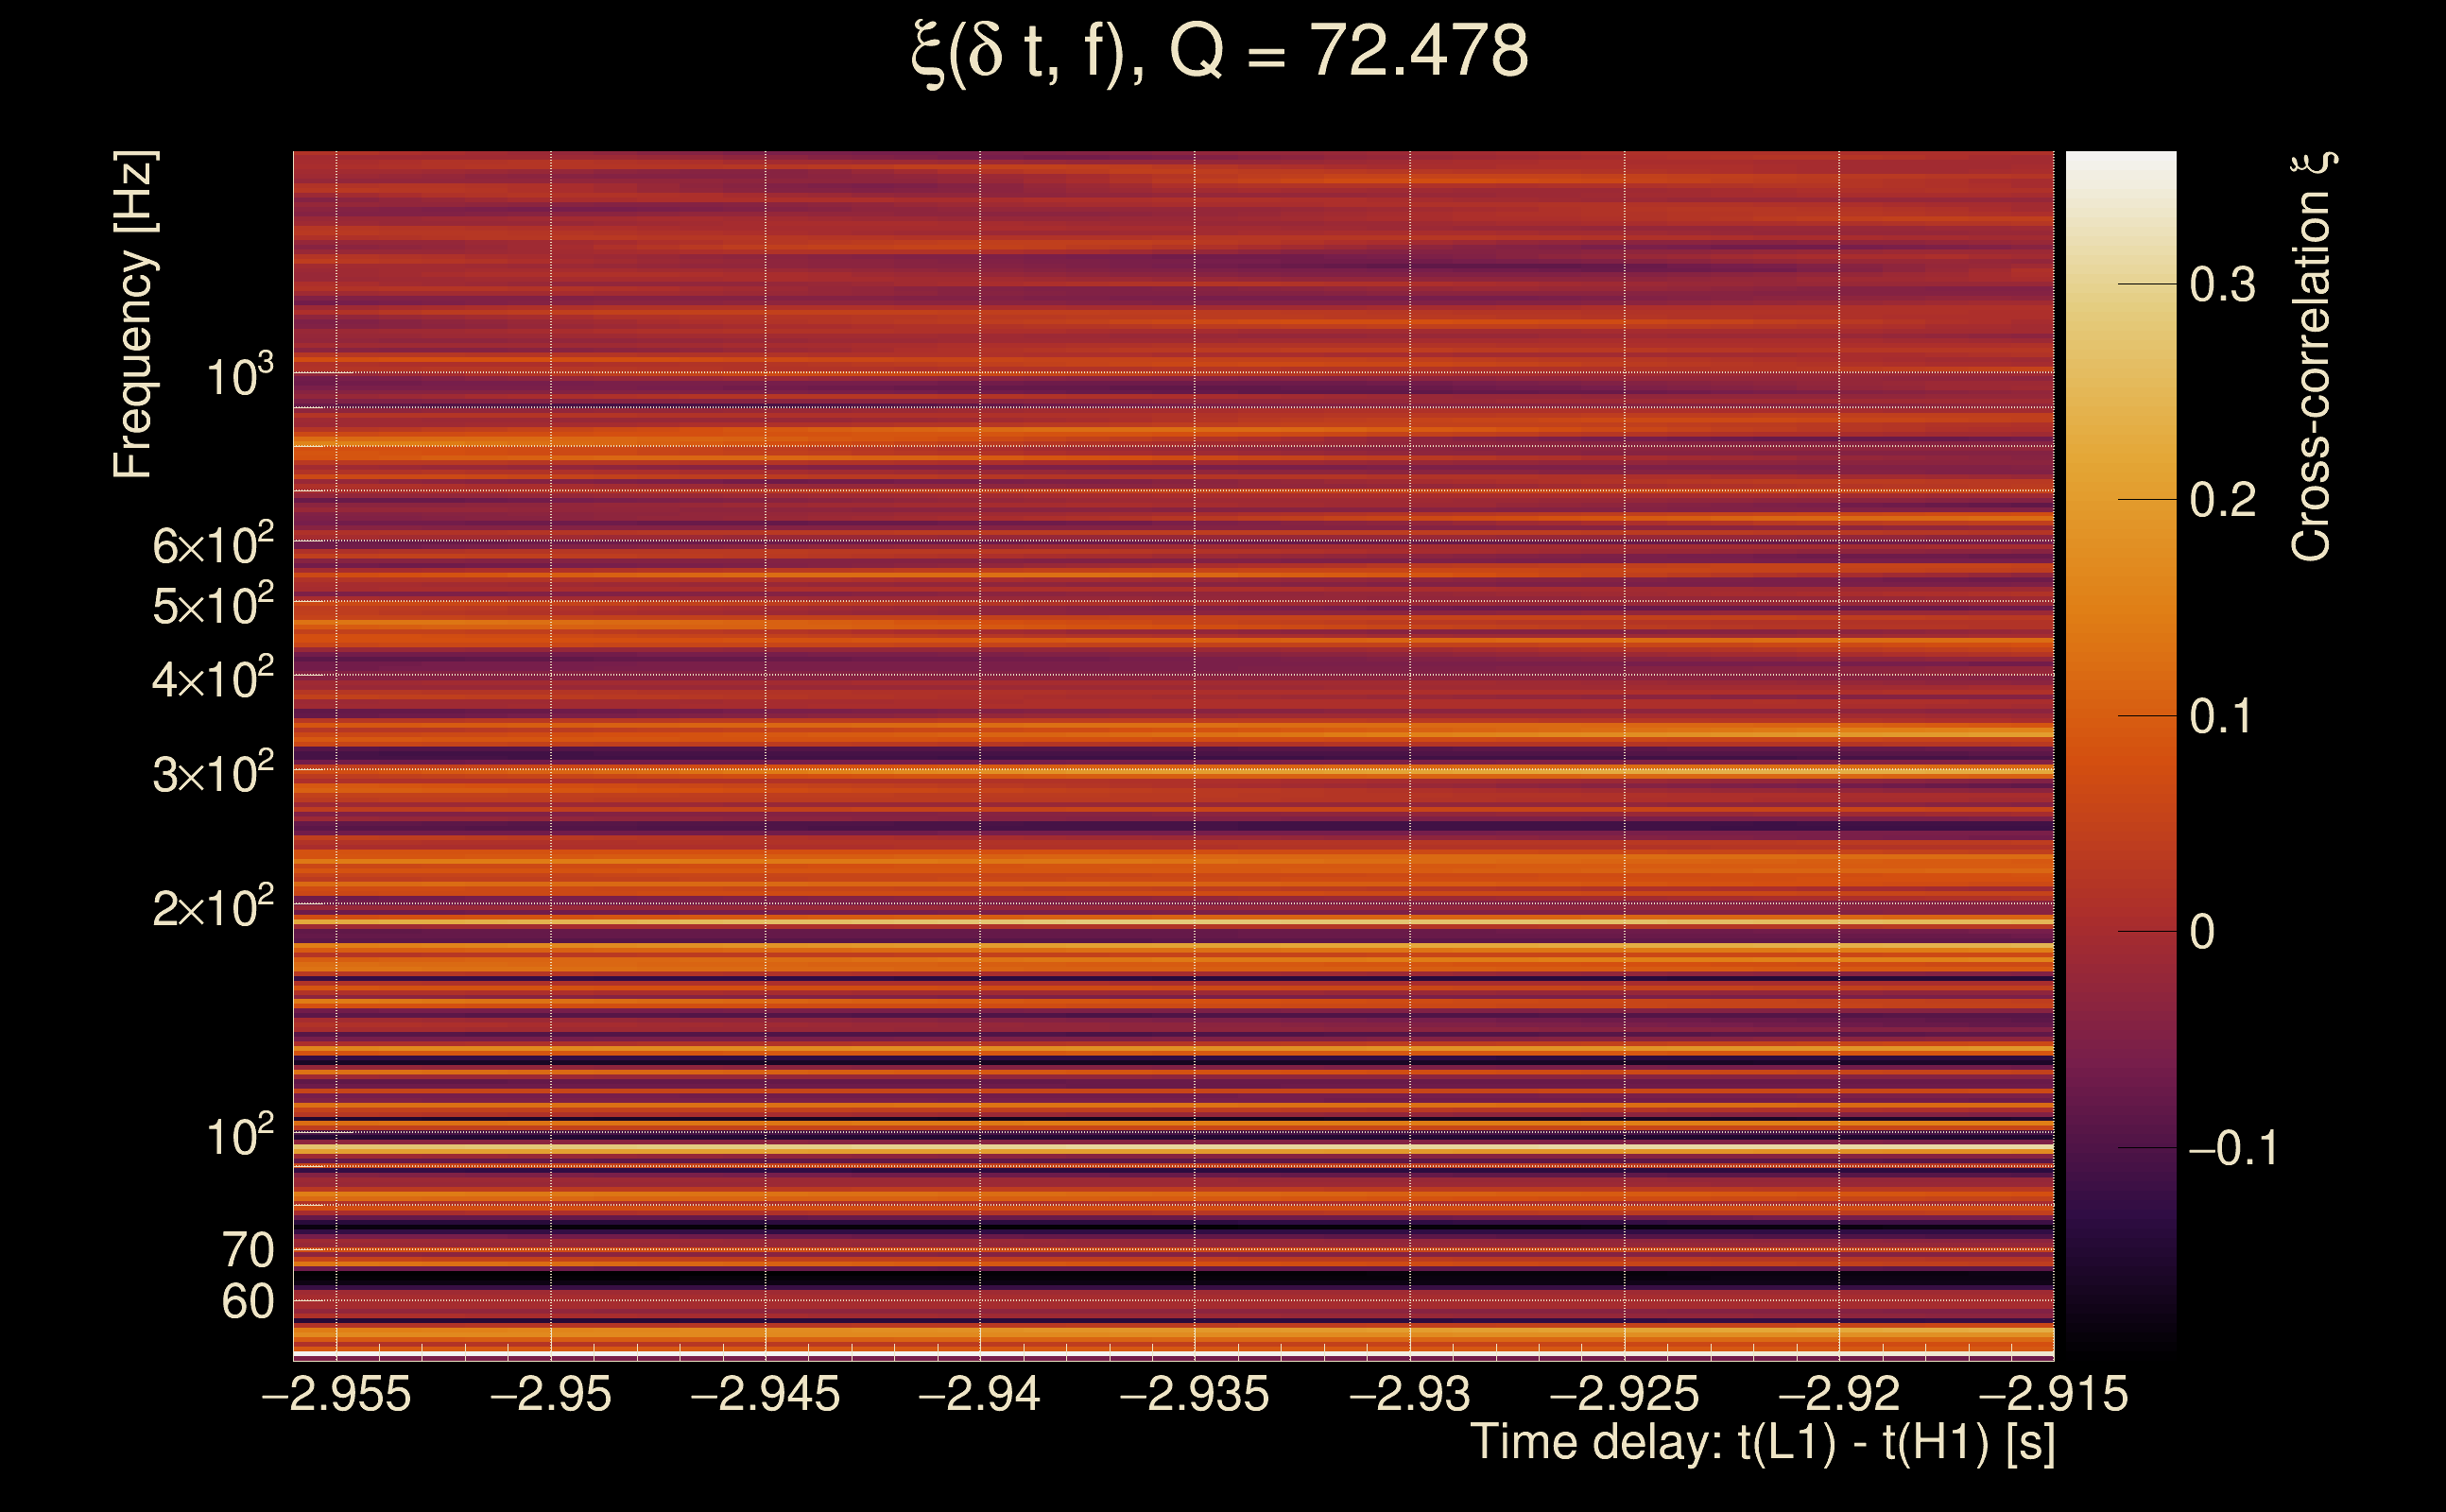
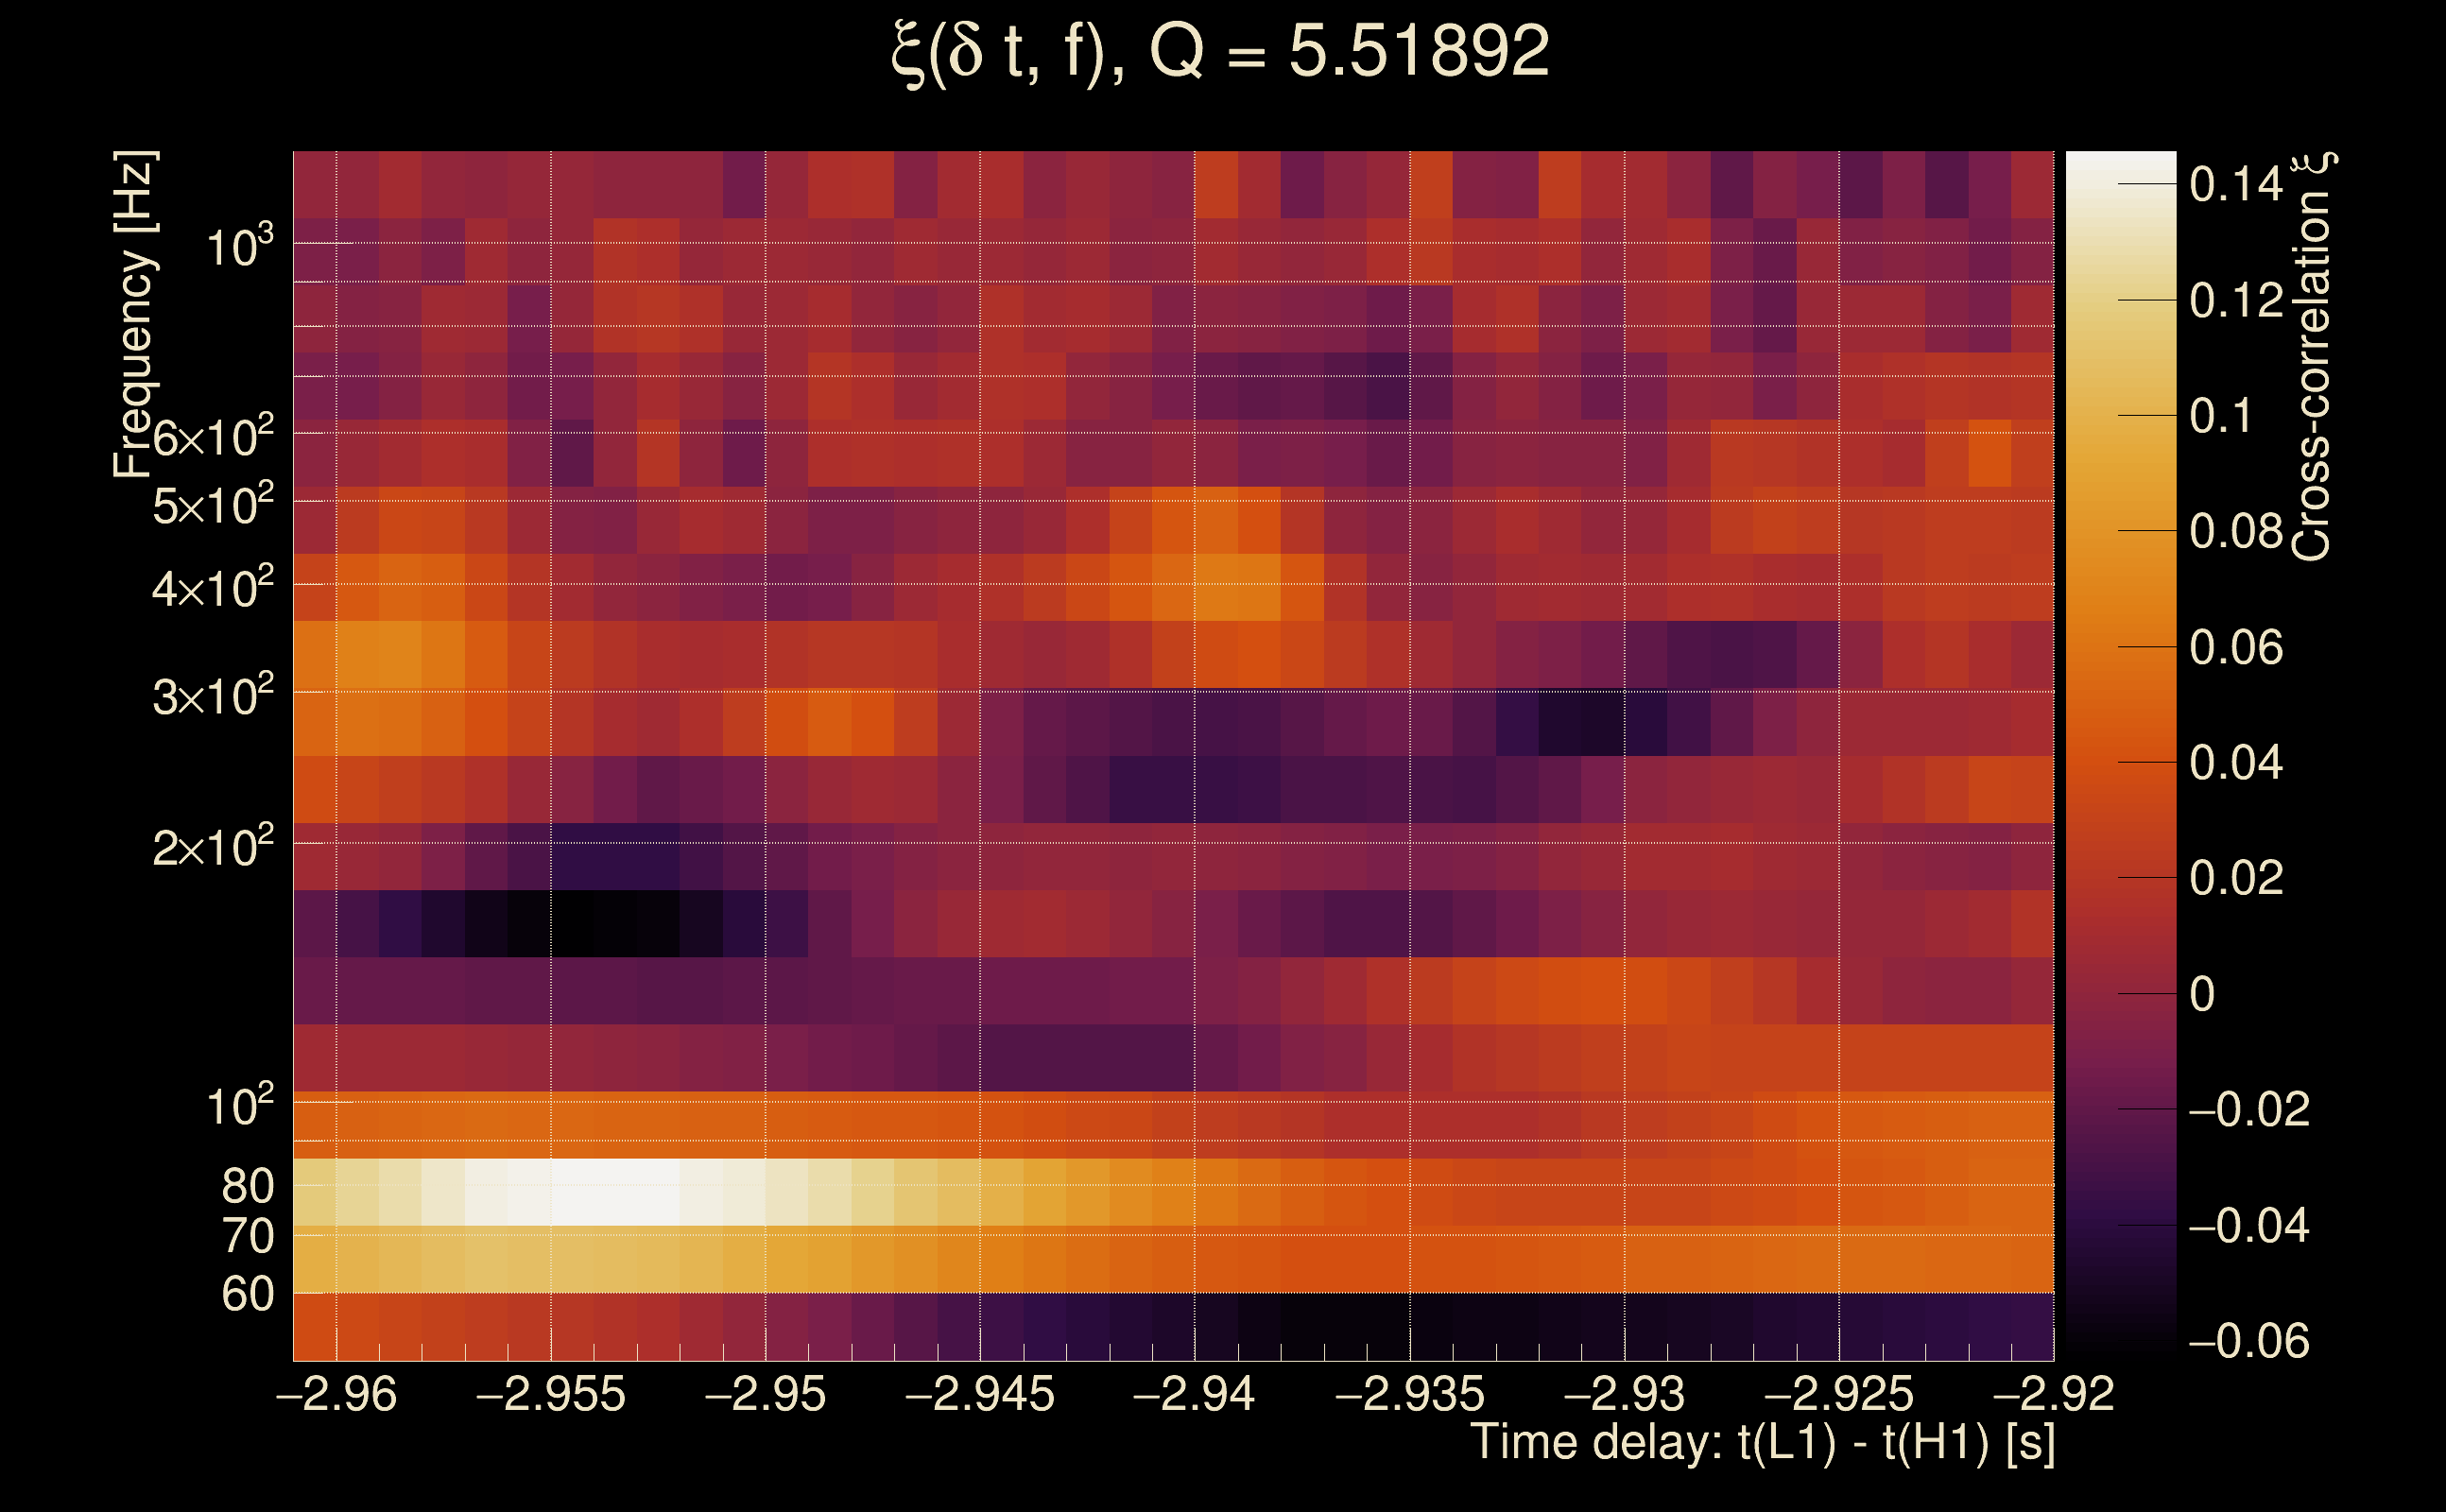
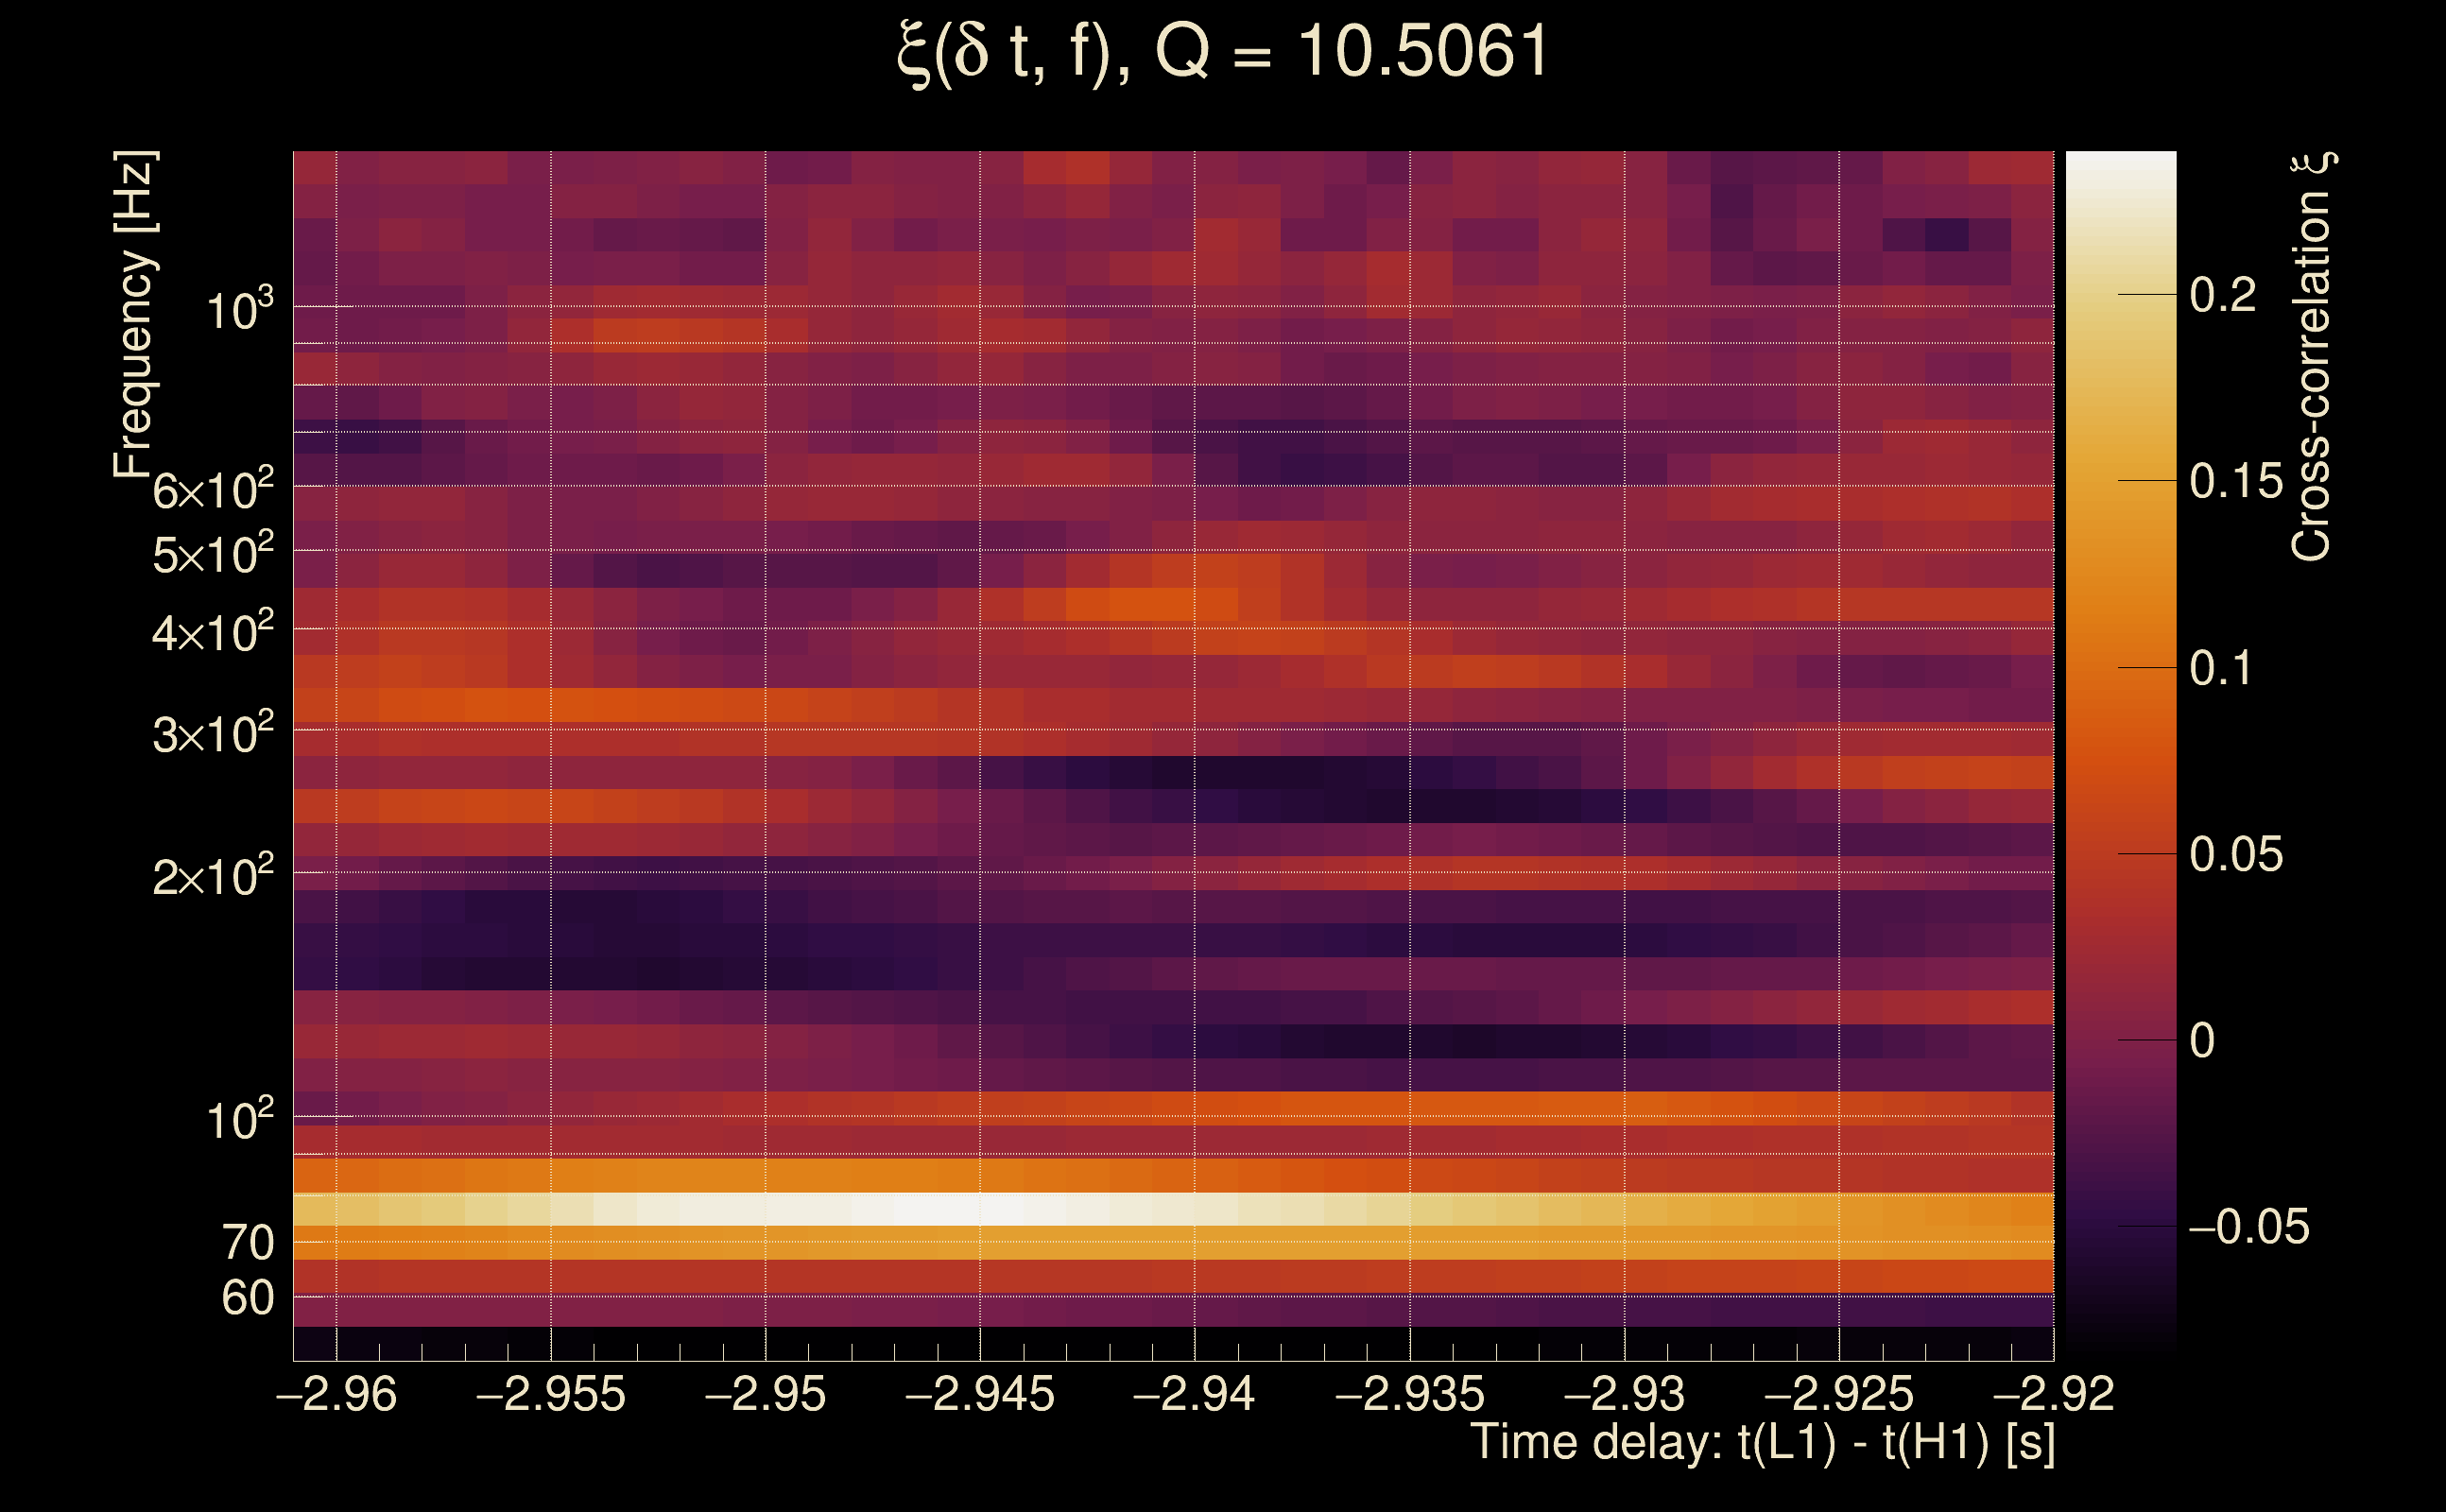
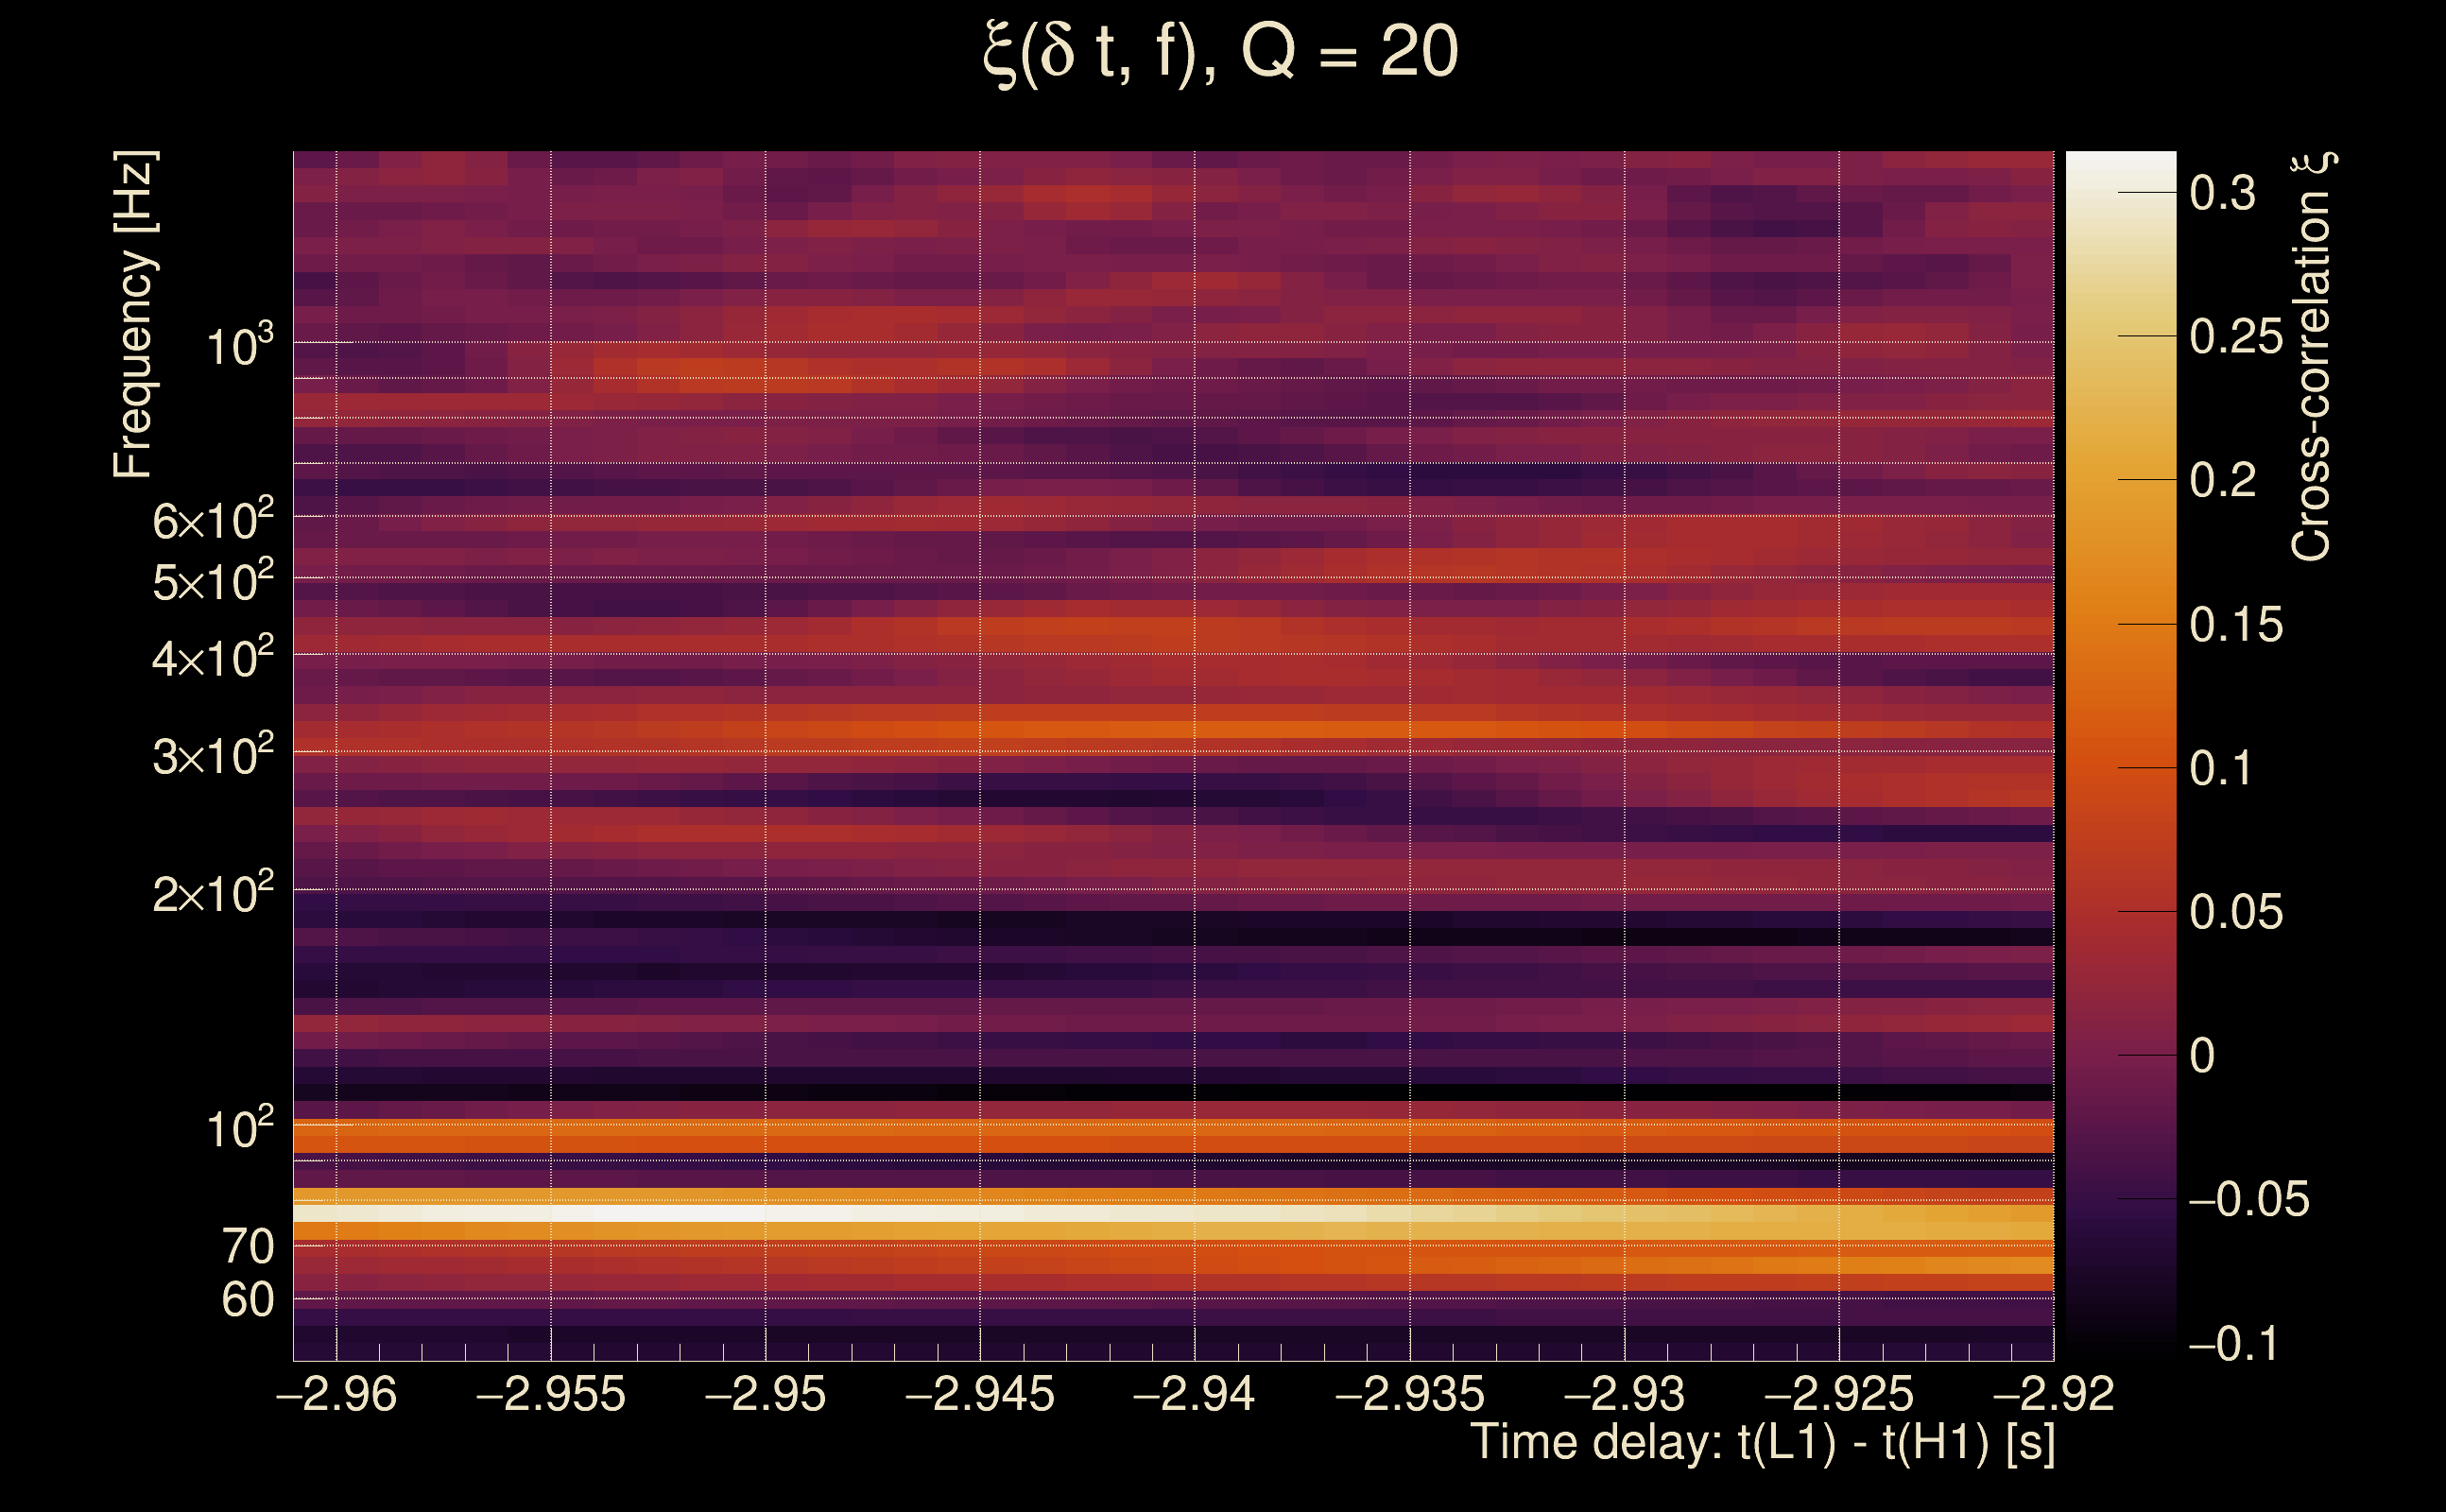
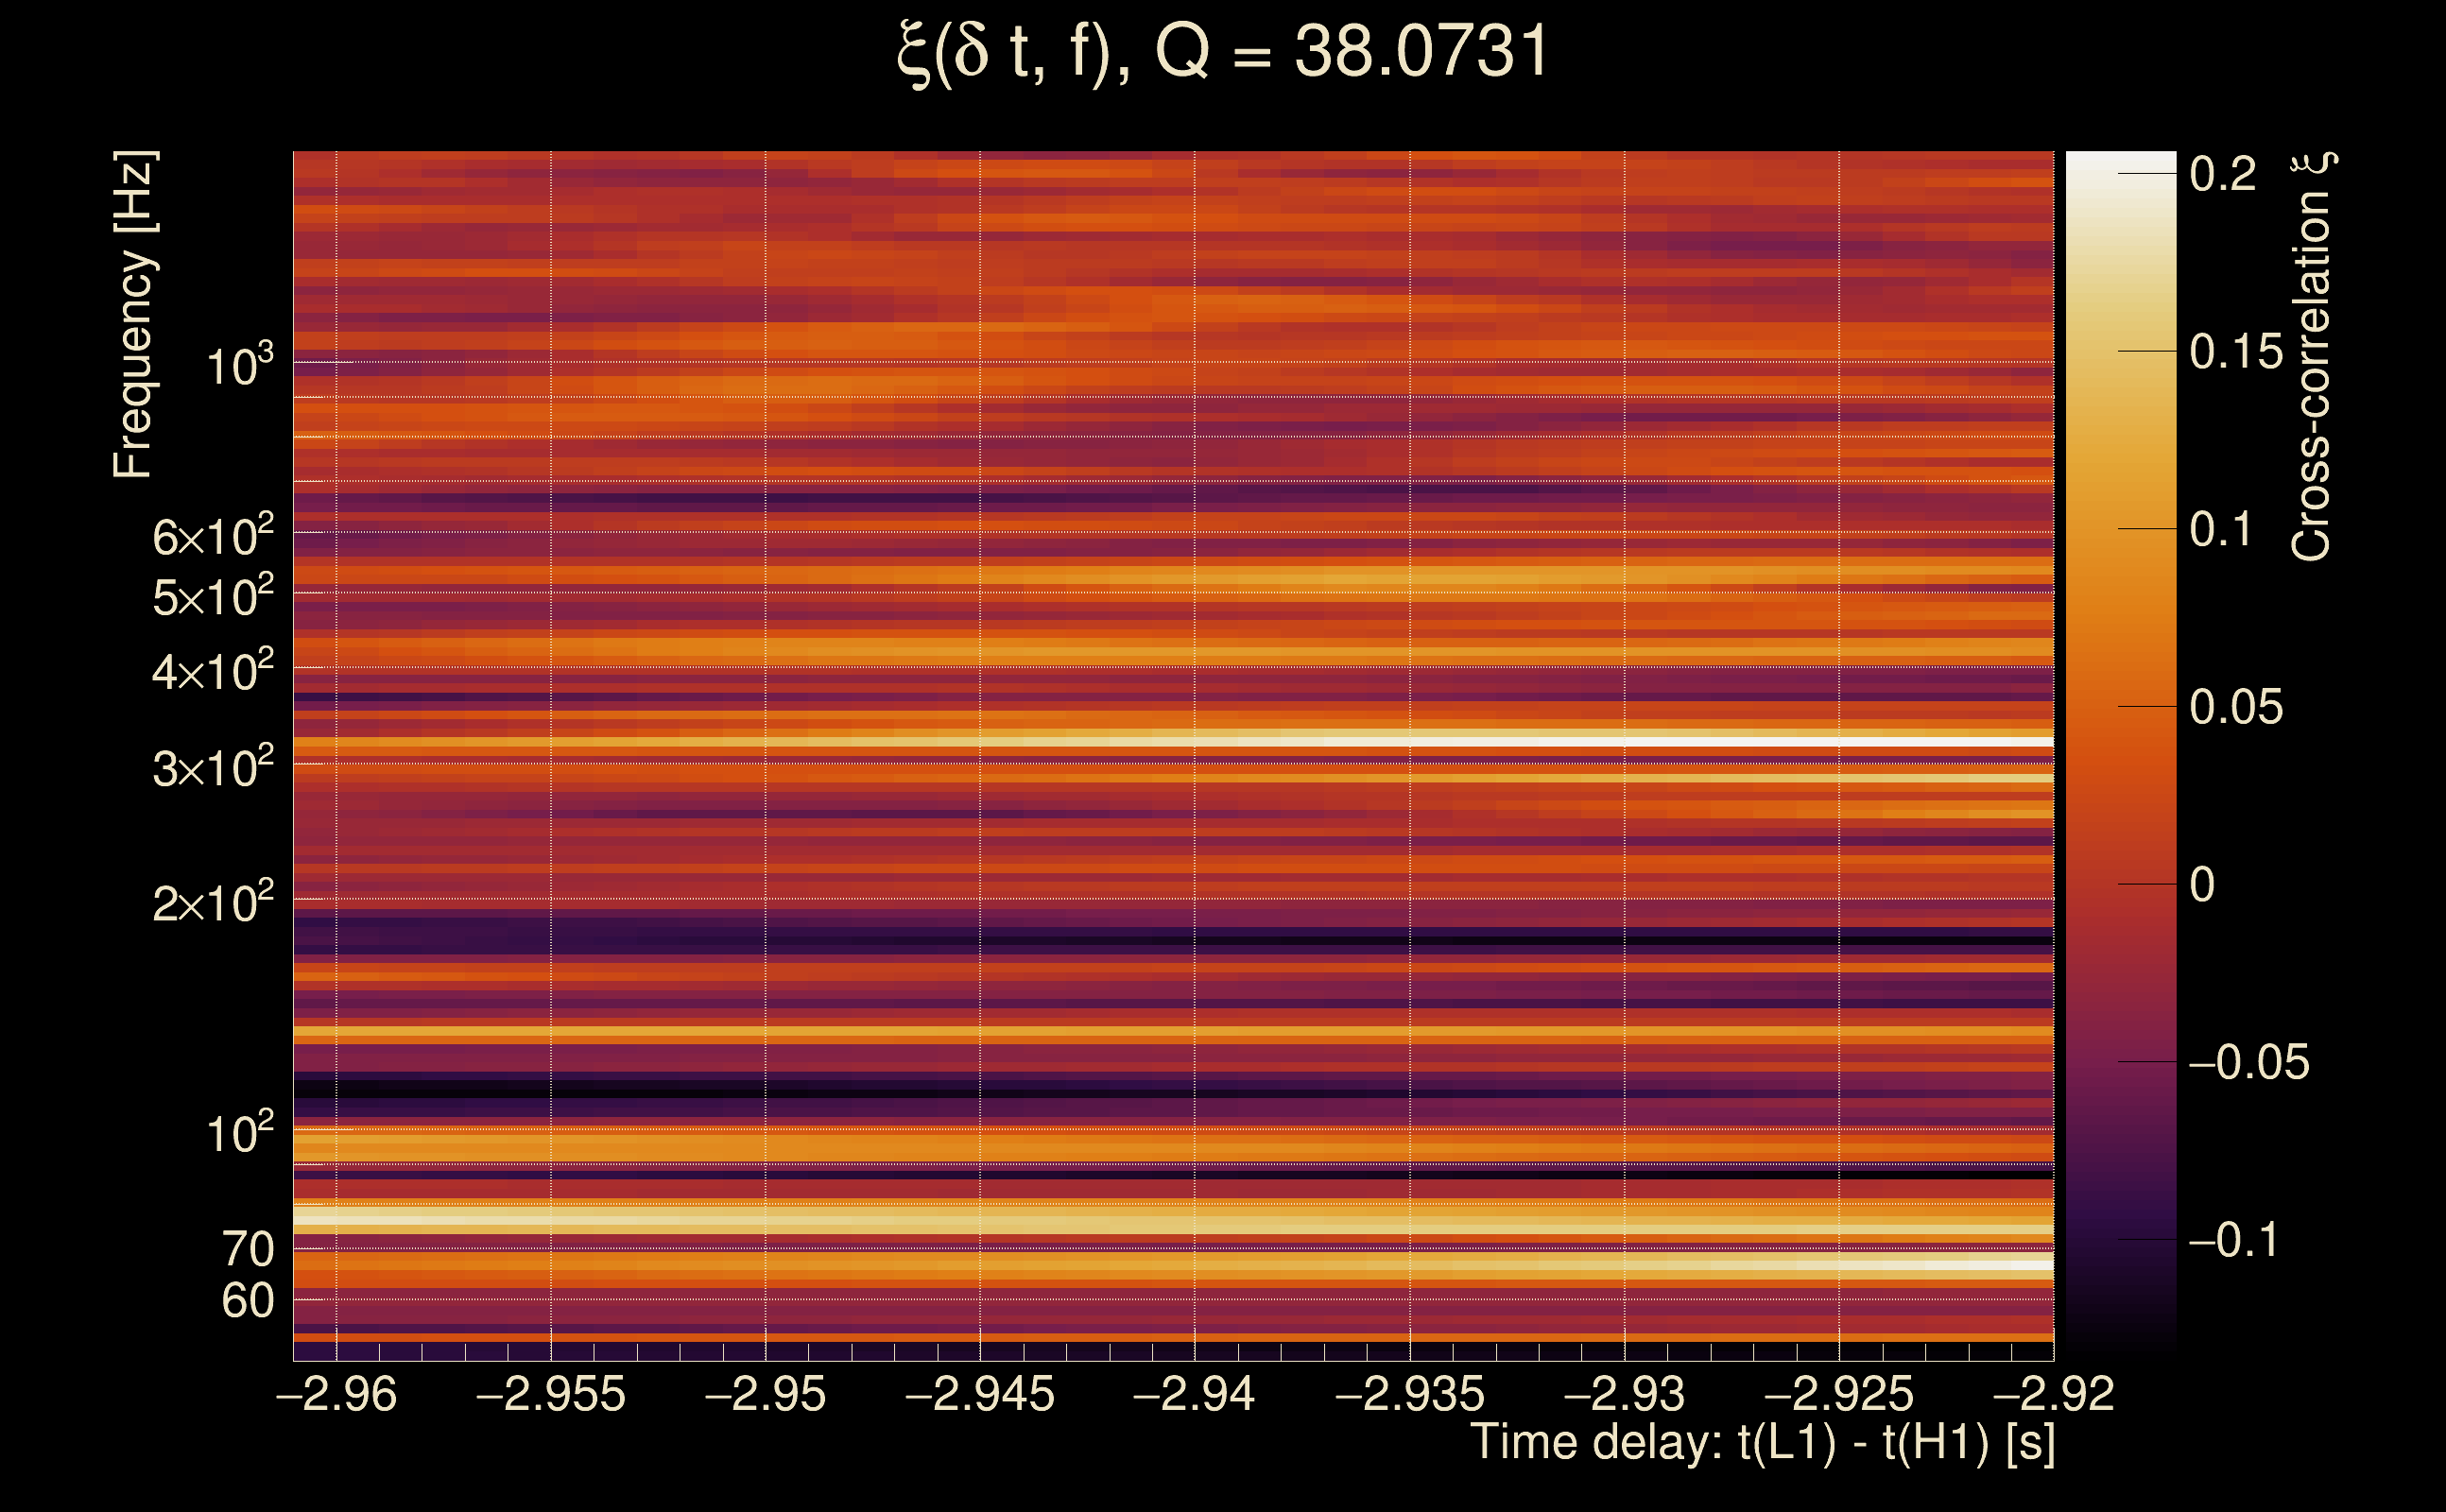
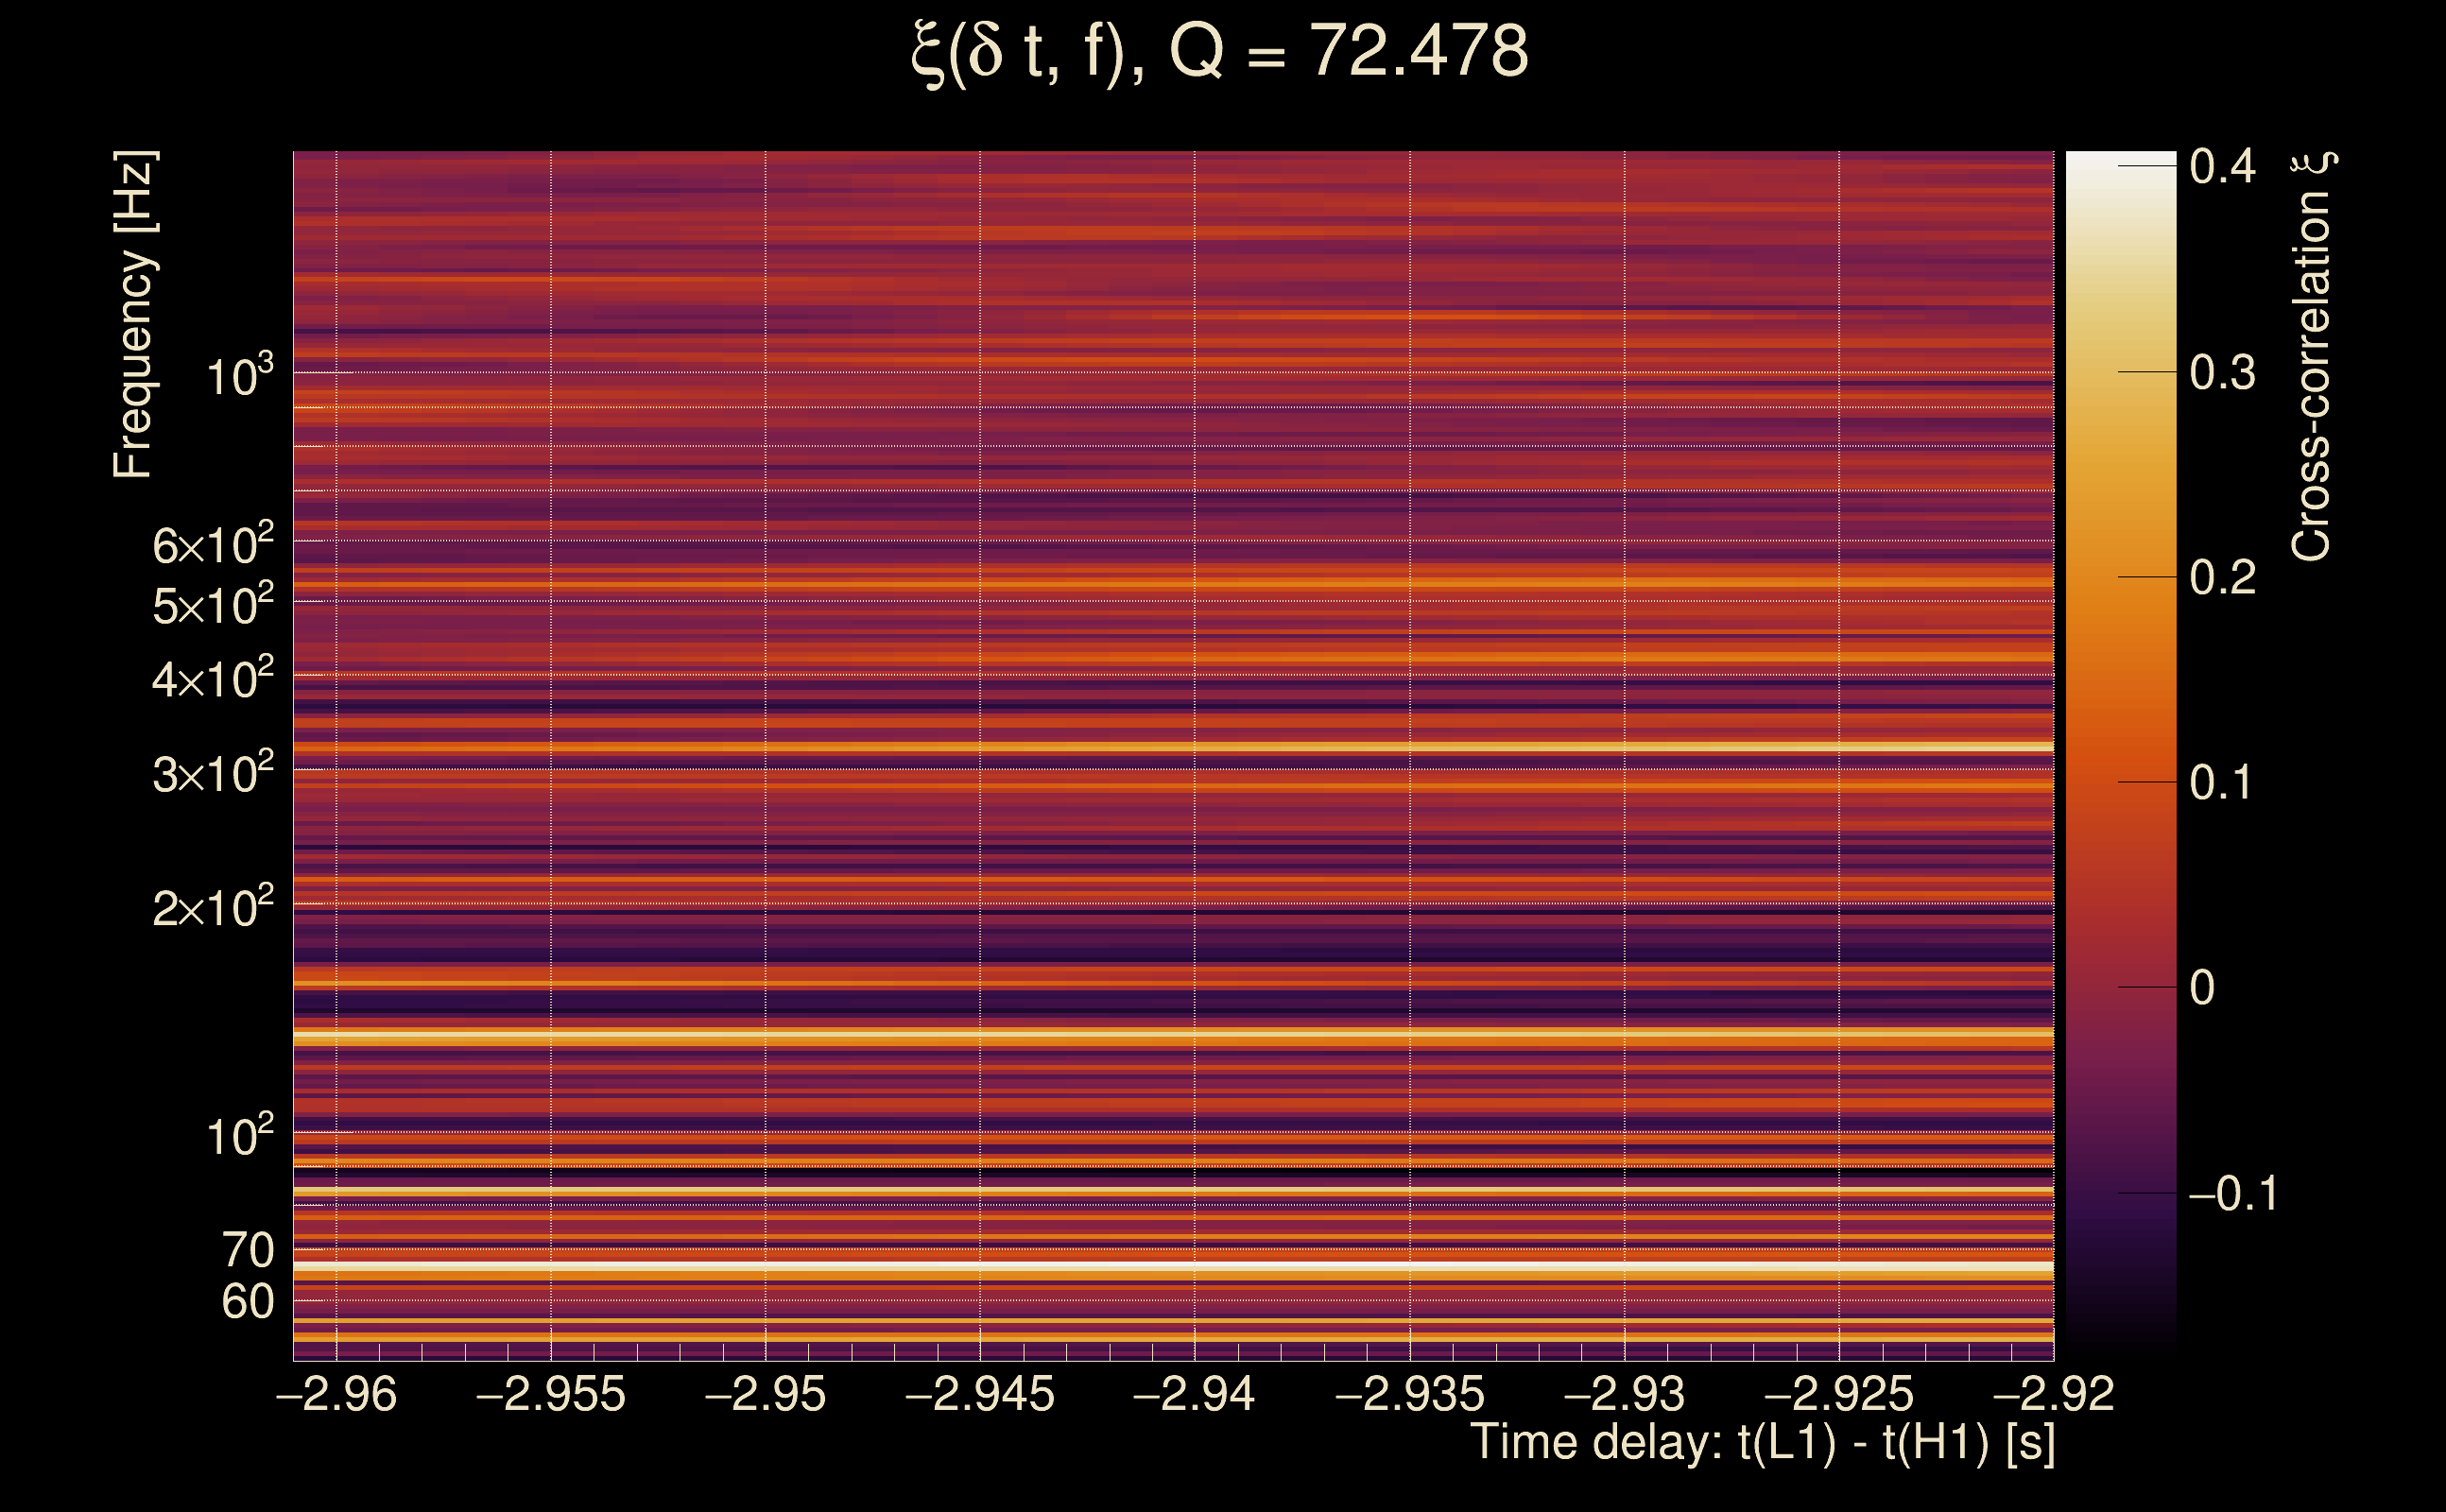
| Number of Q planes: | 5 (Q = 5.51892 → Q = 72.478) |
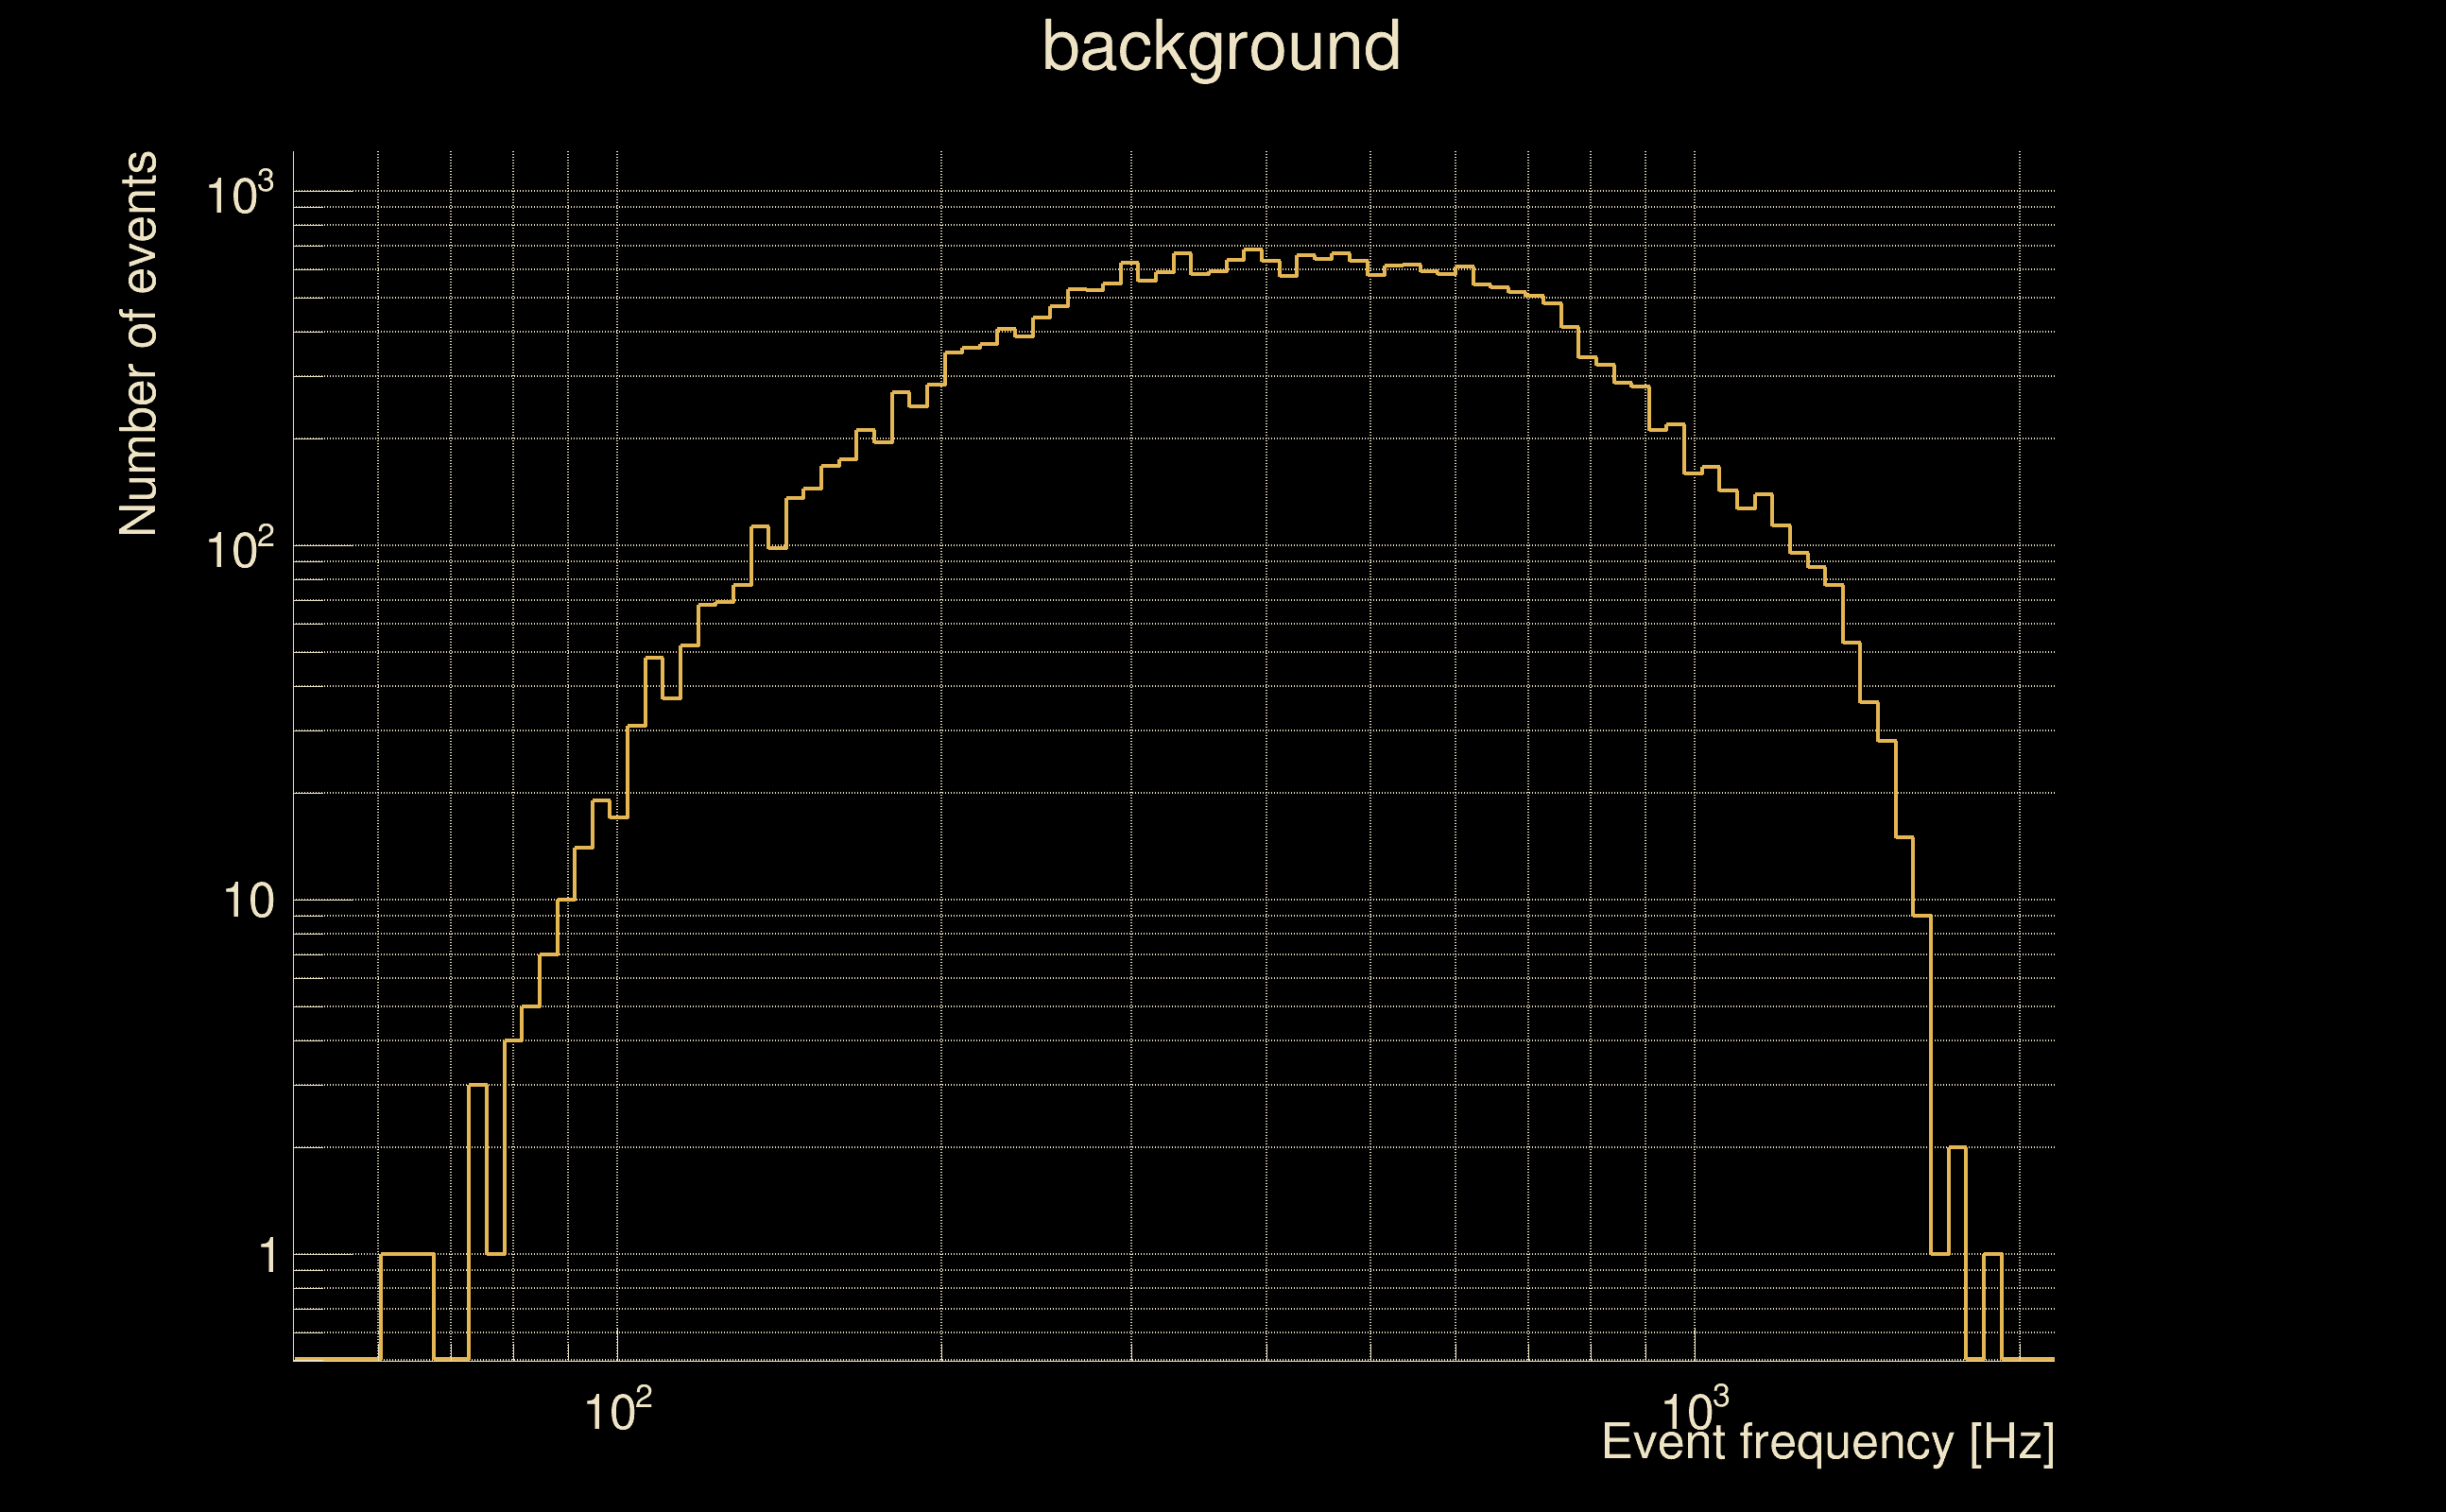
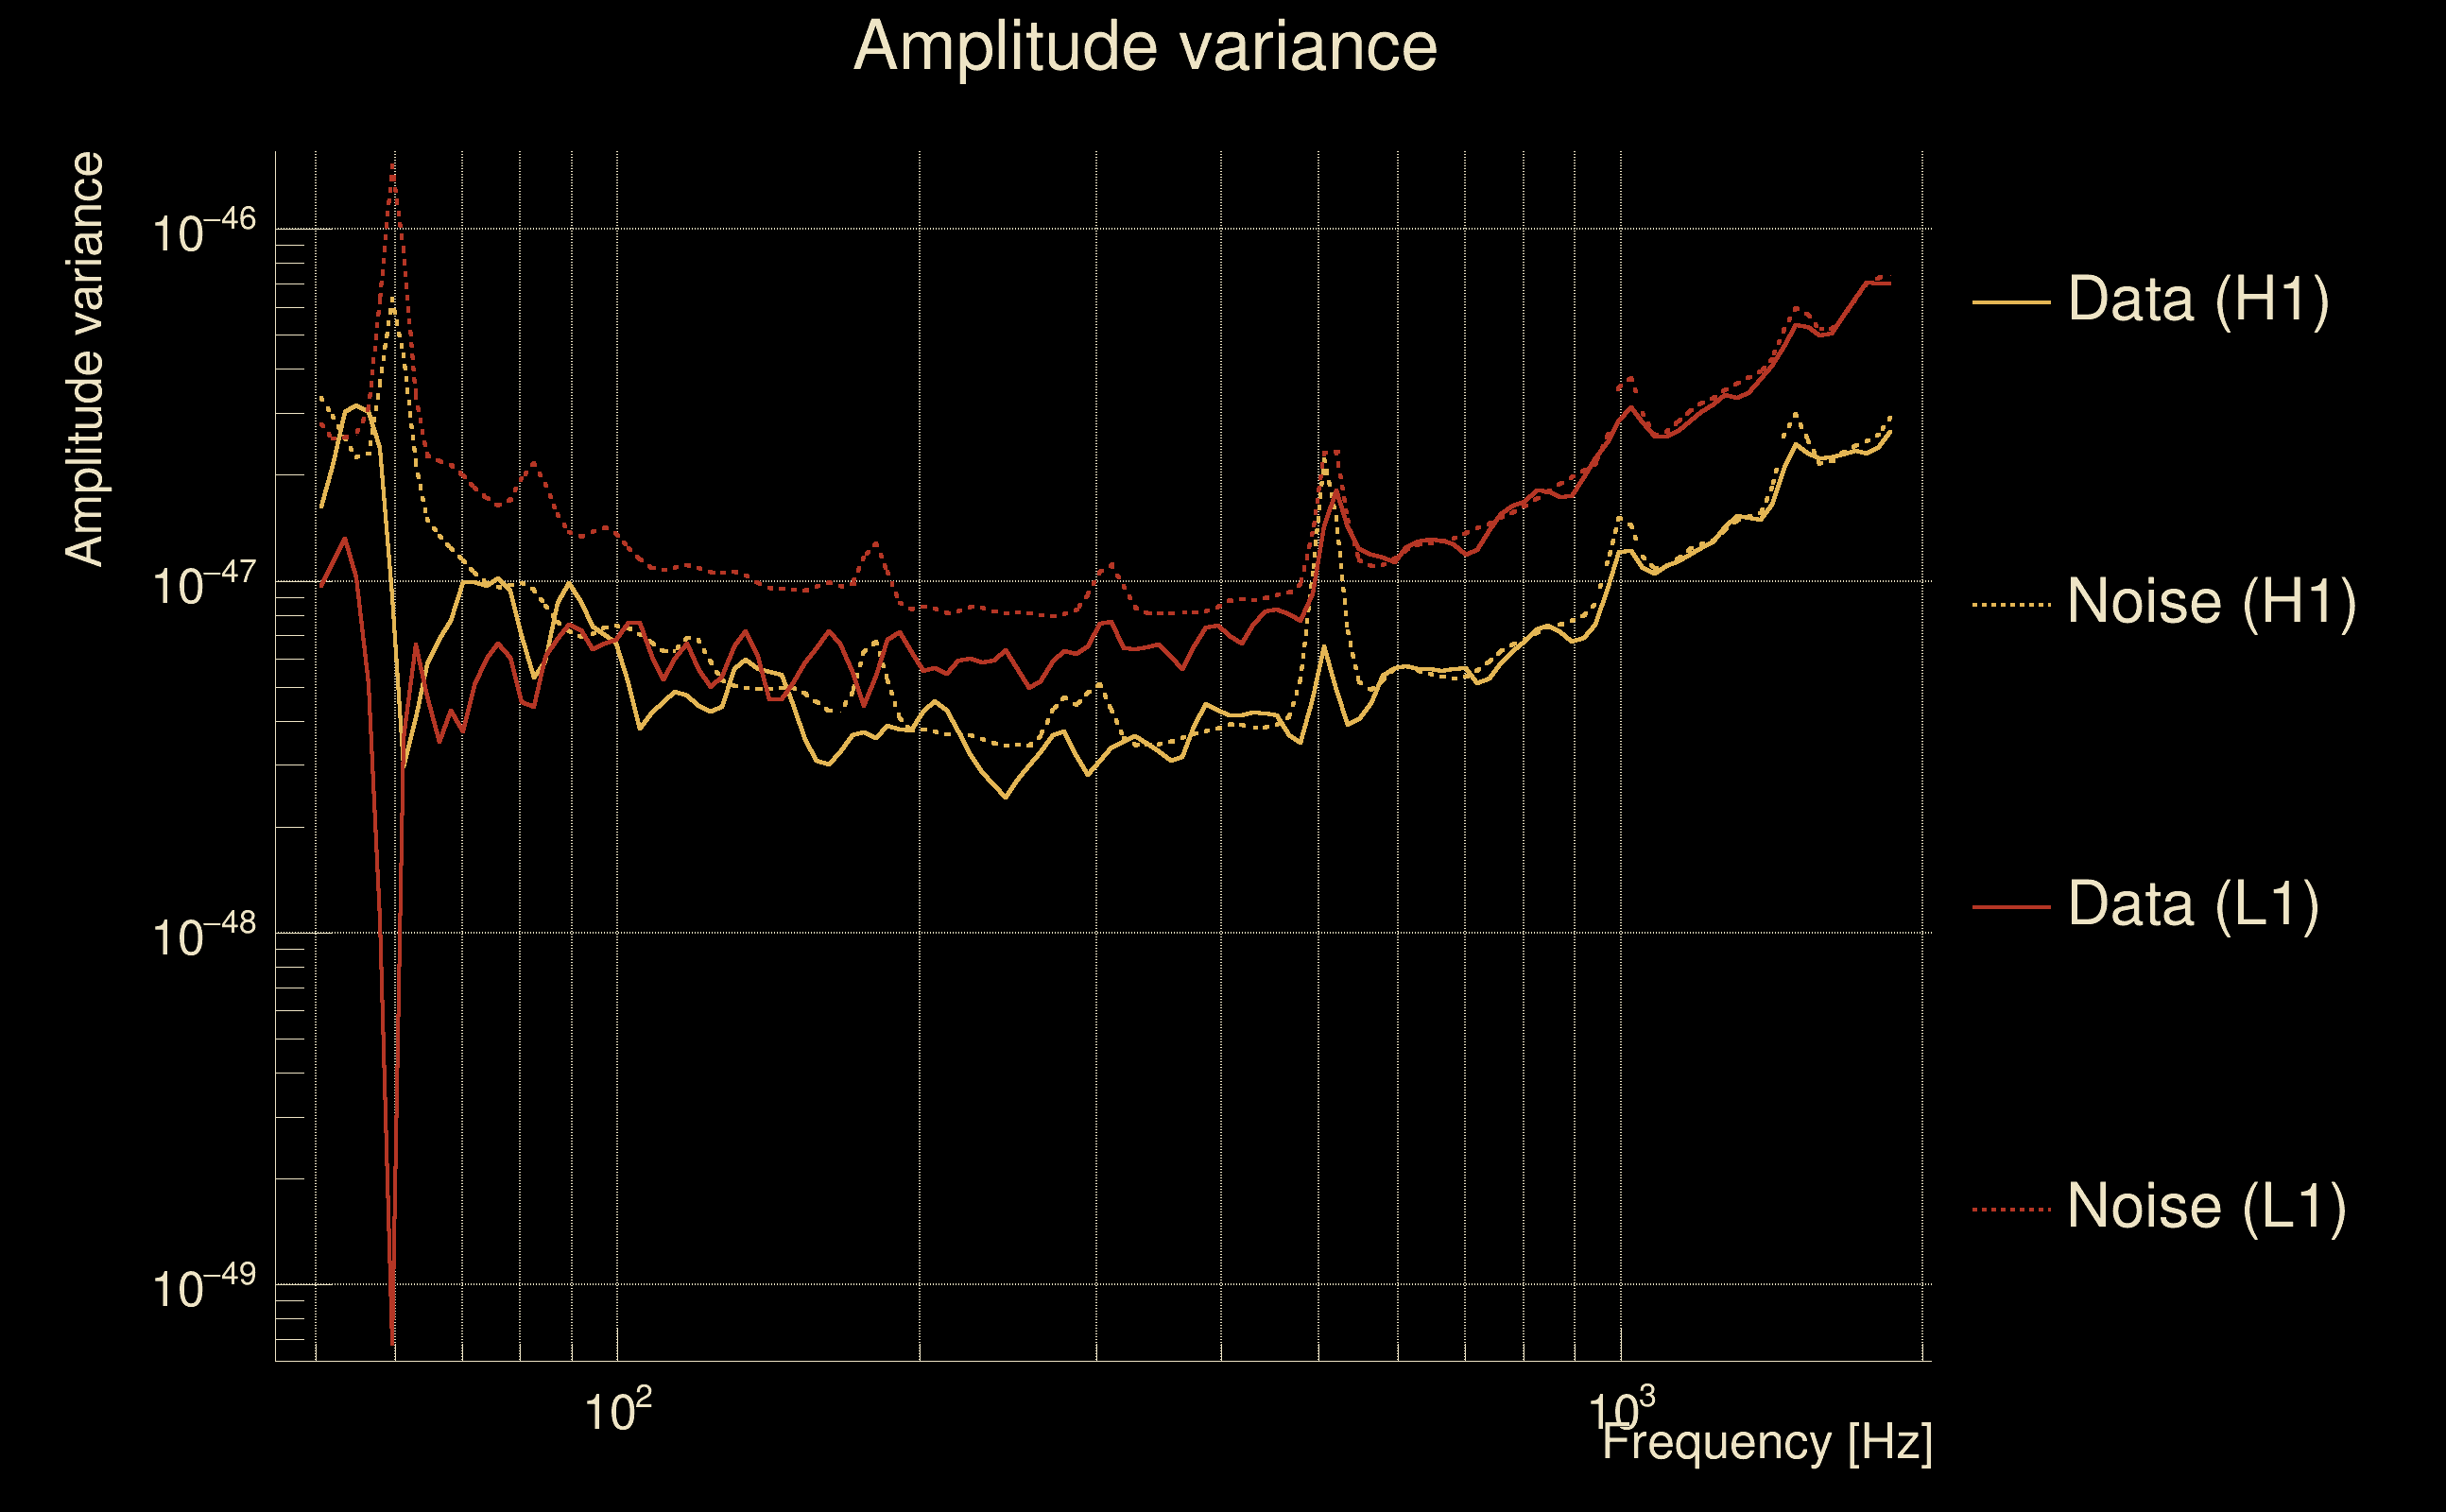
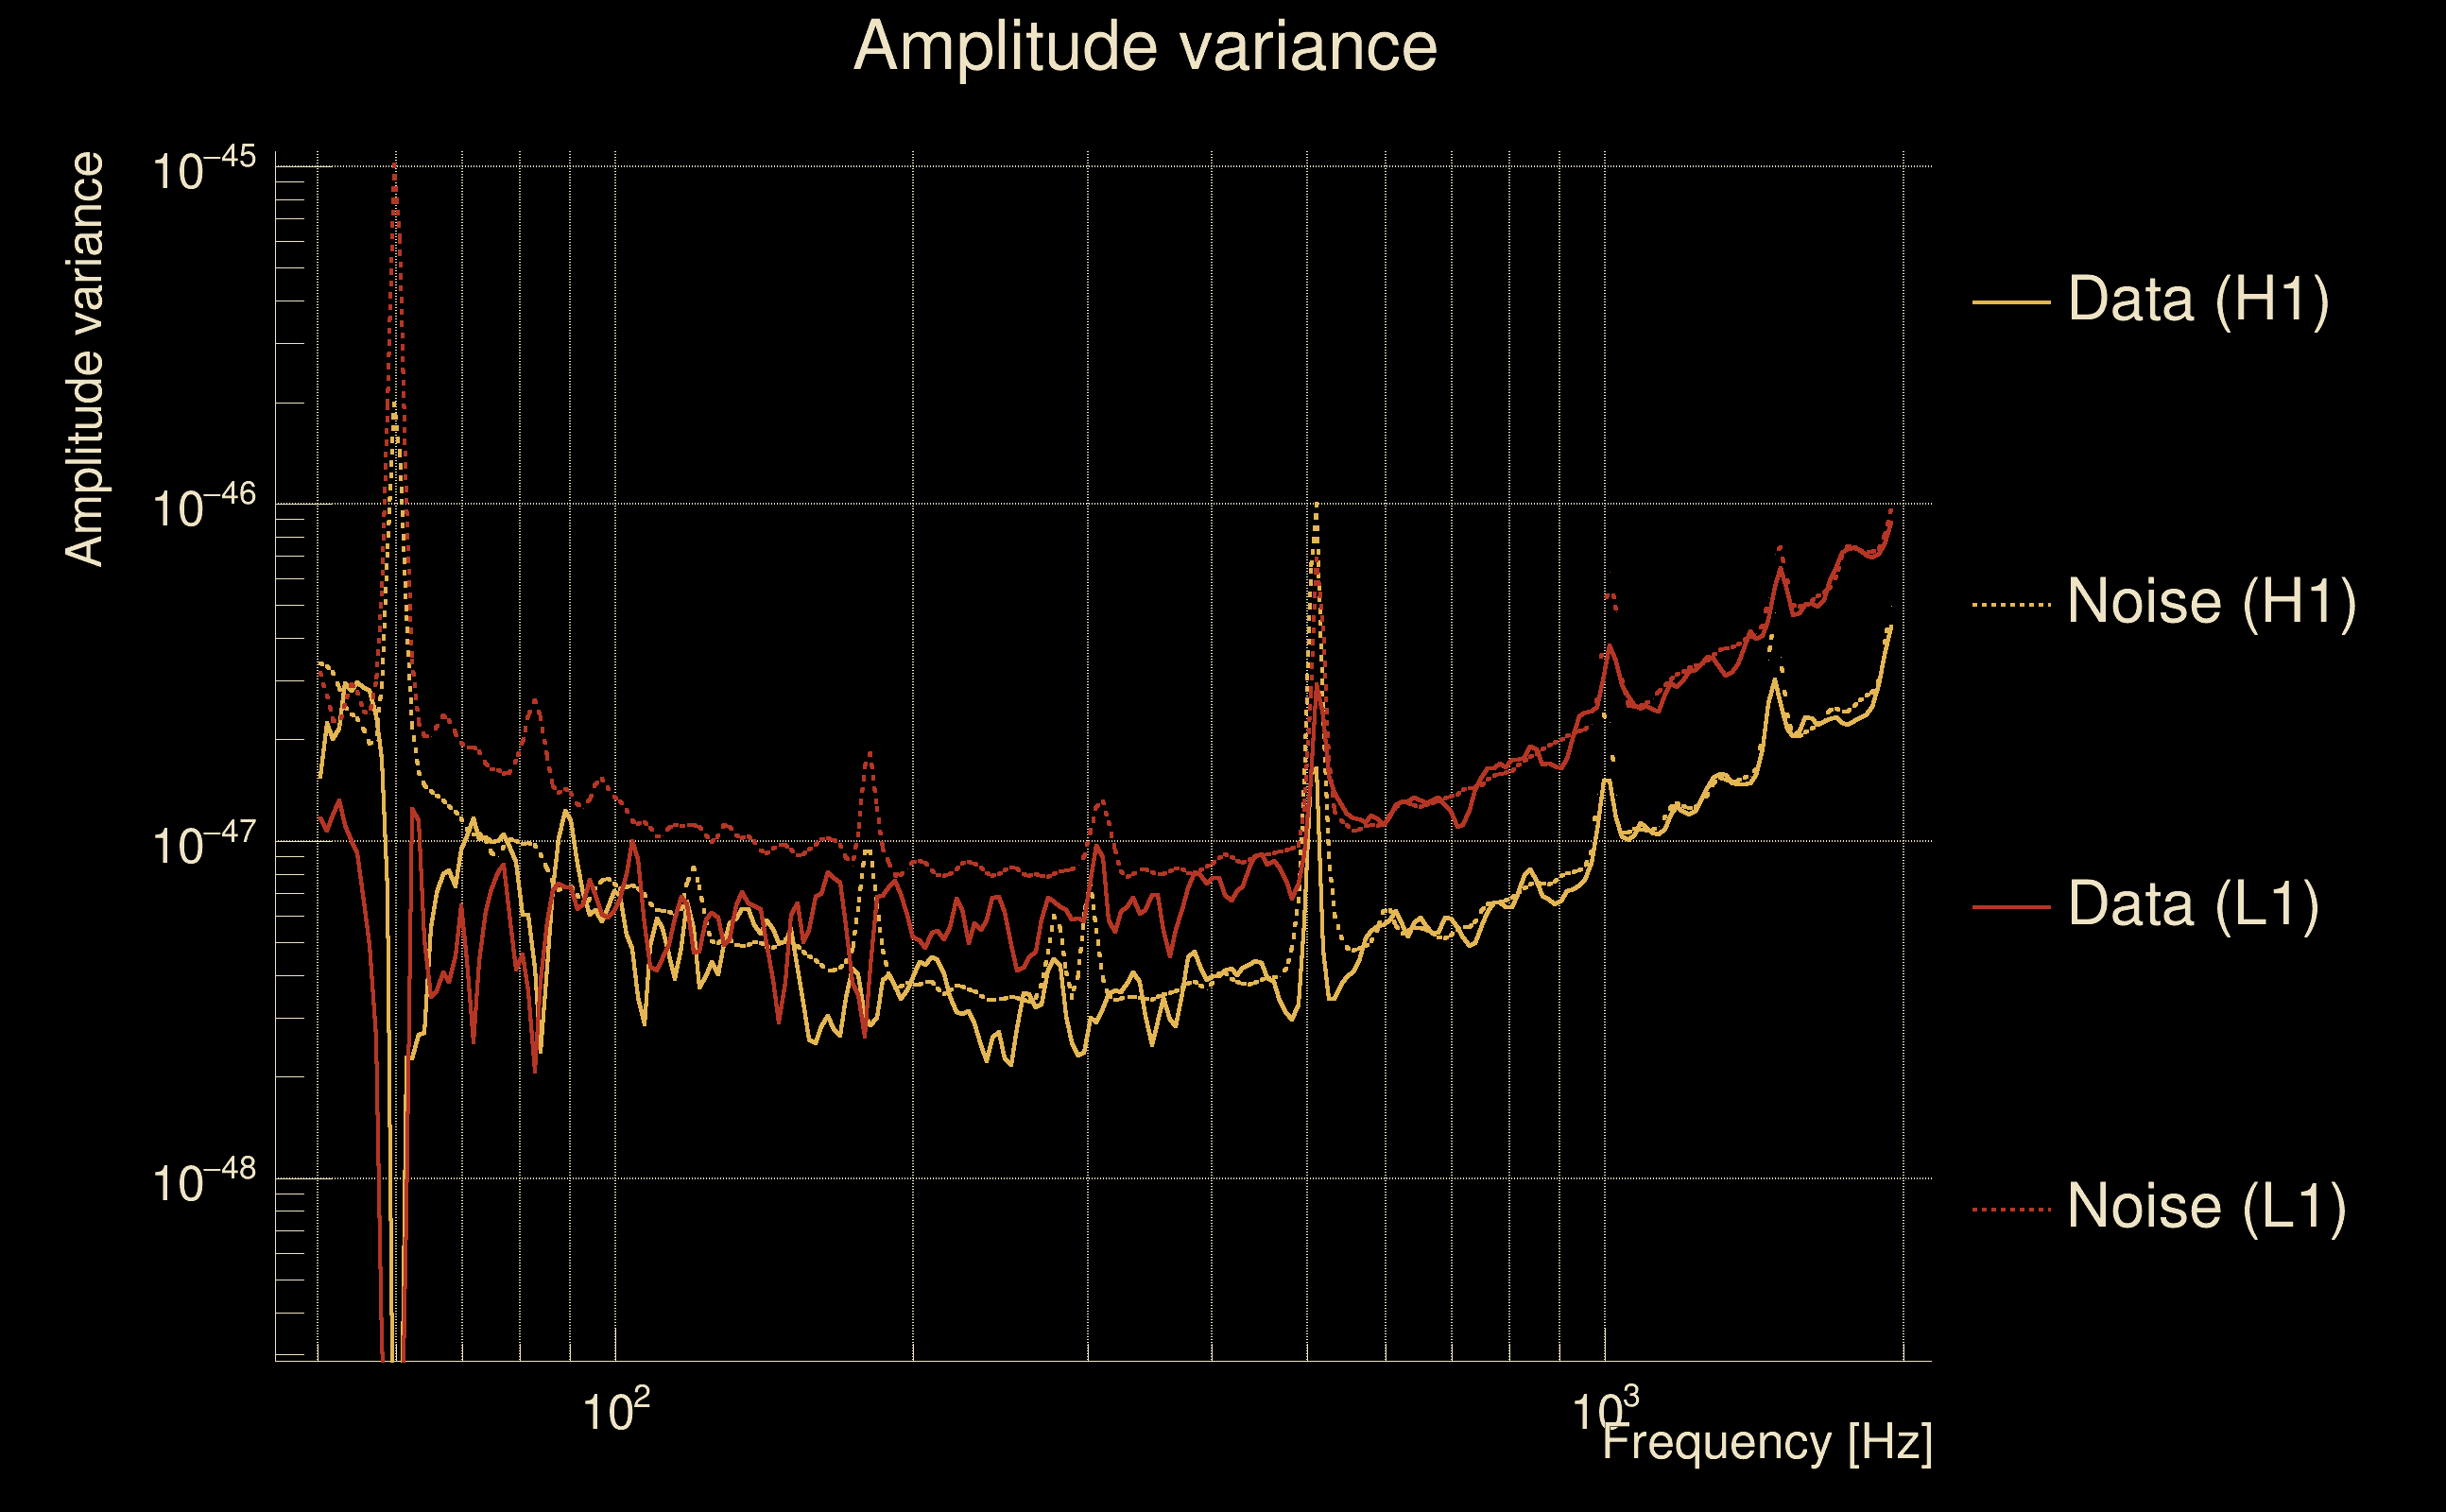
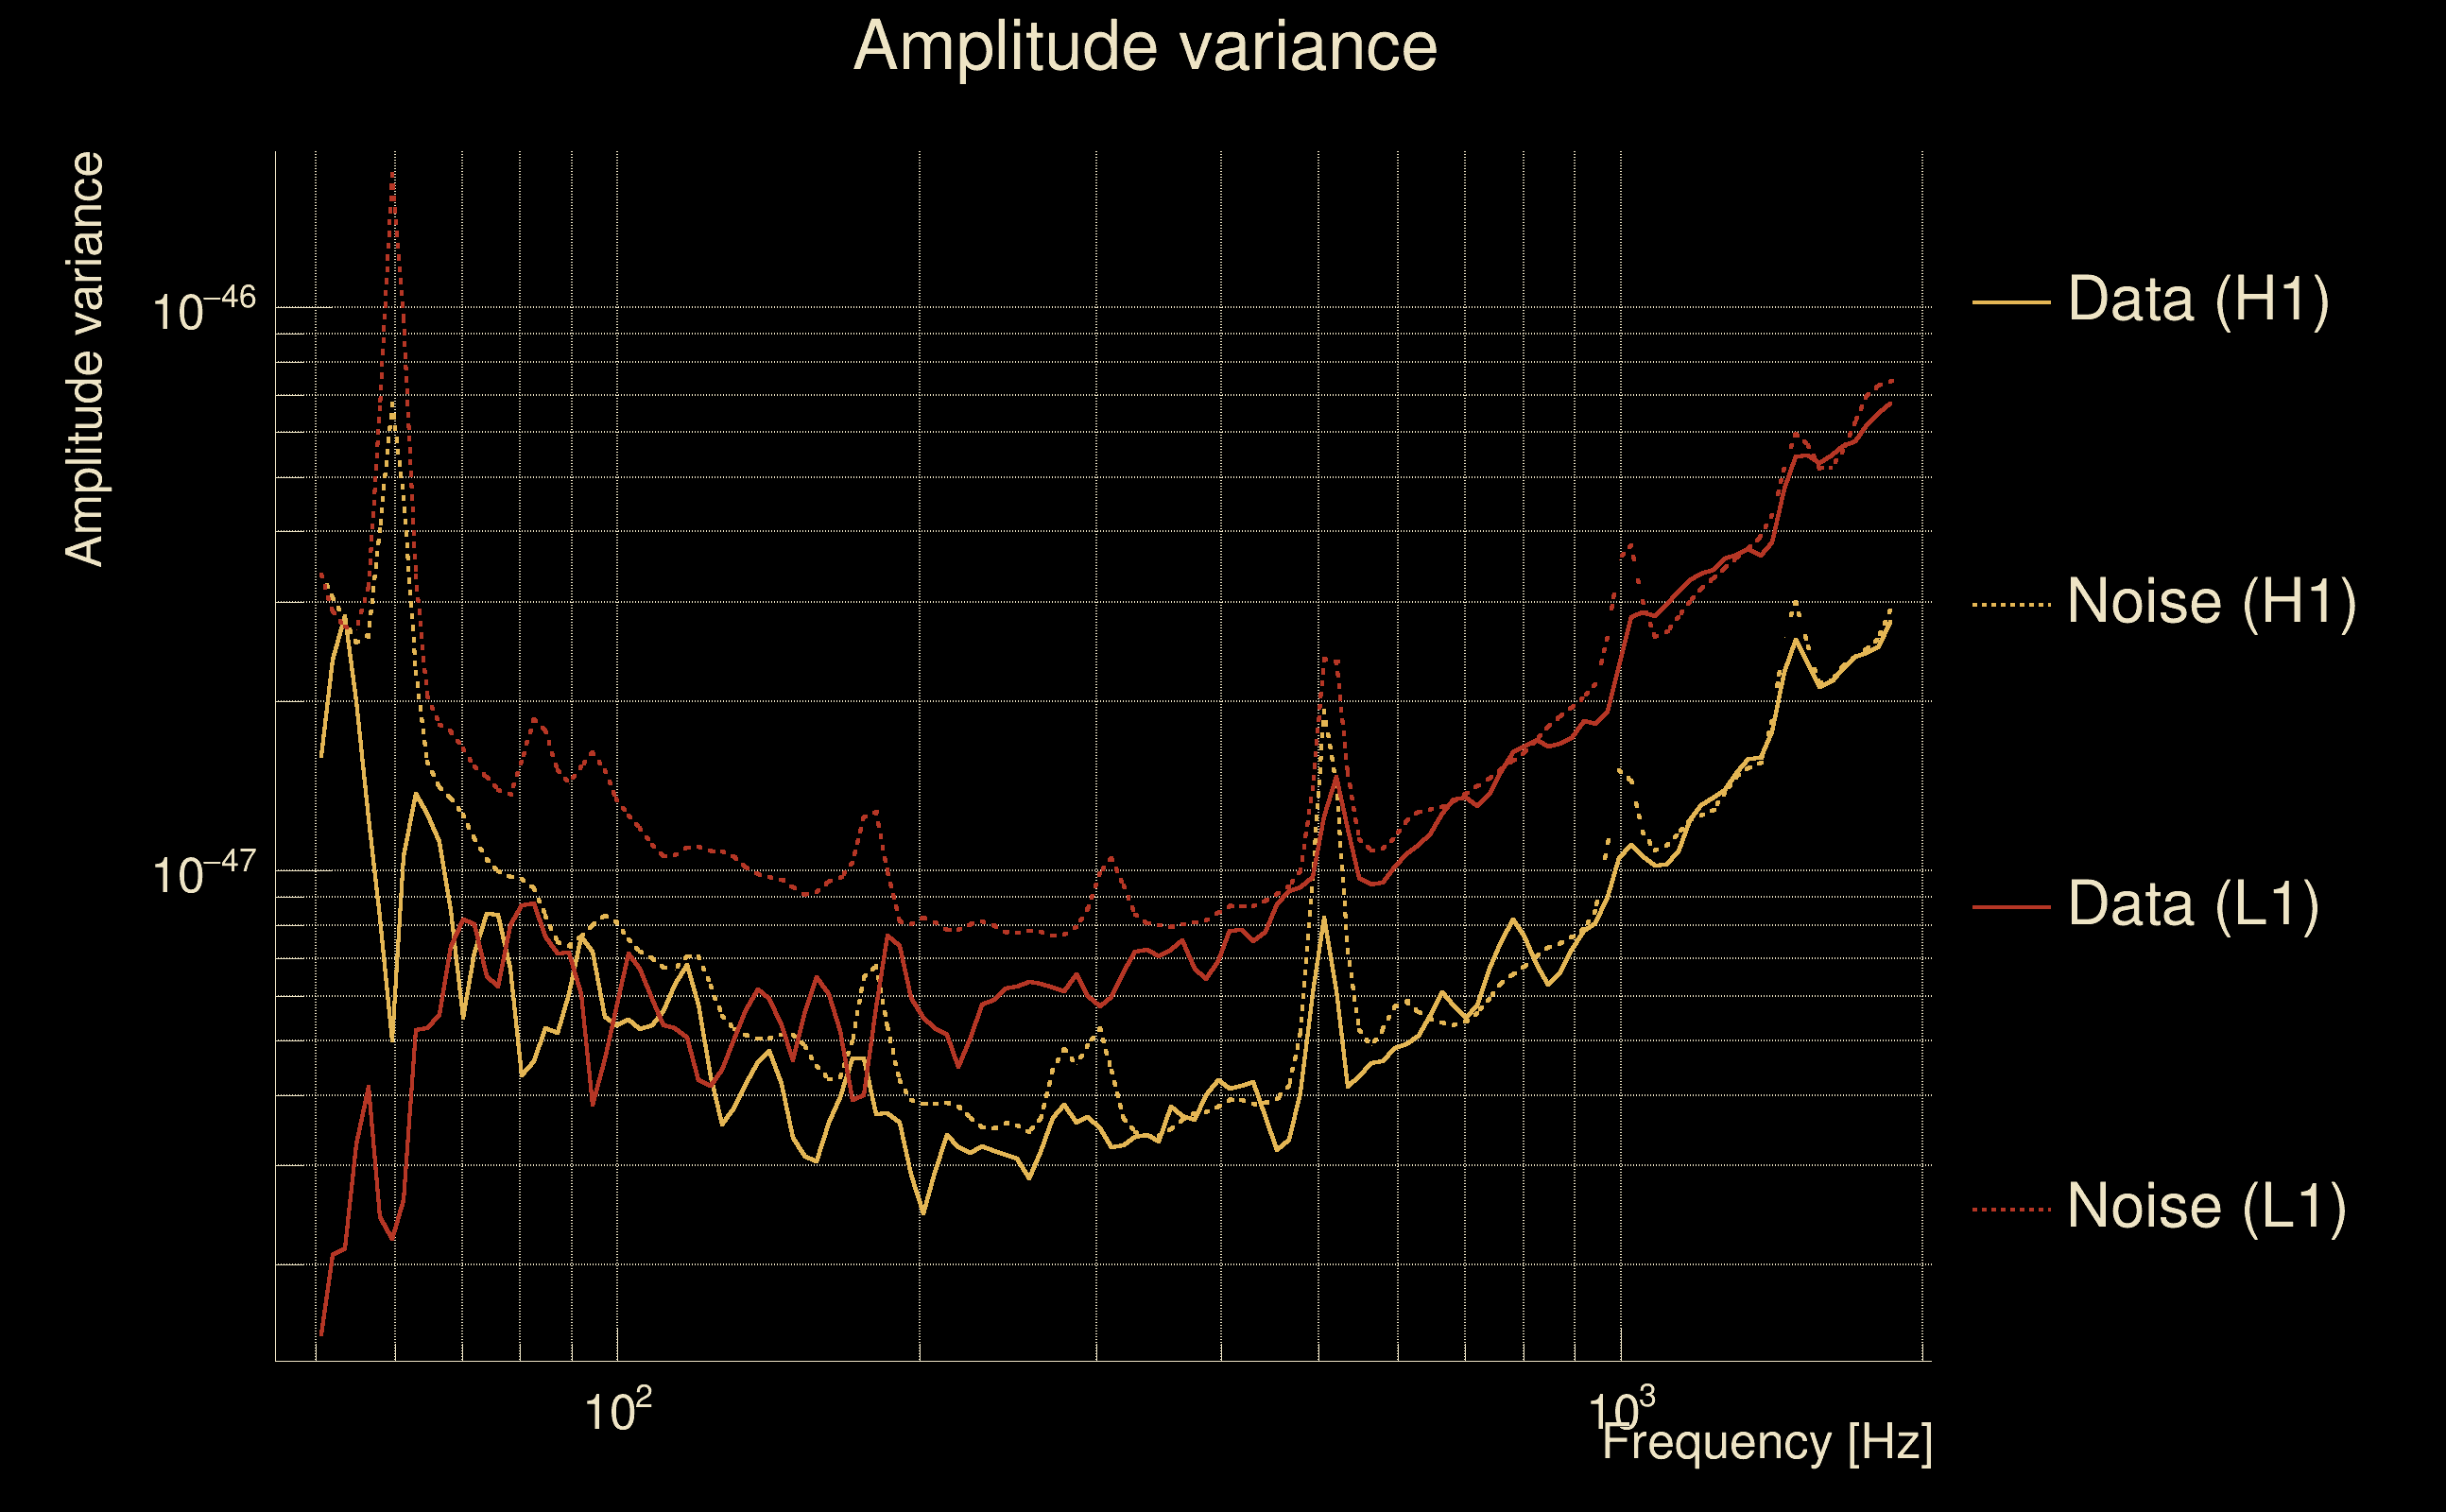
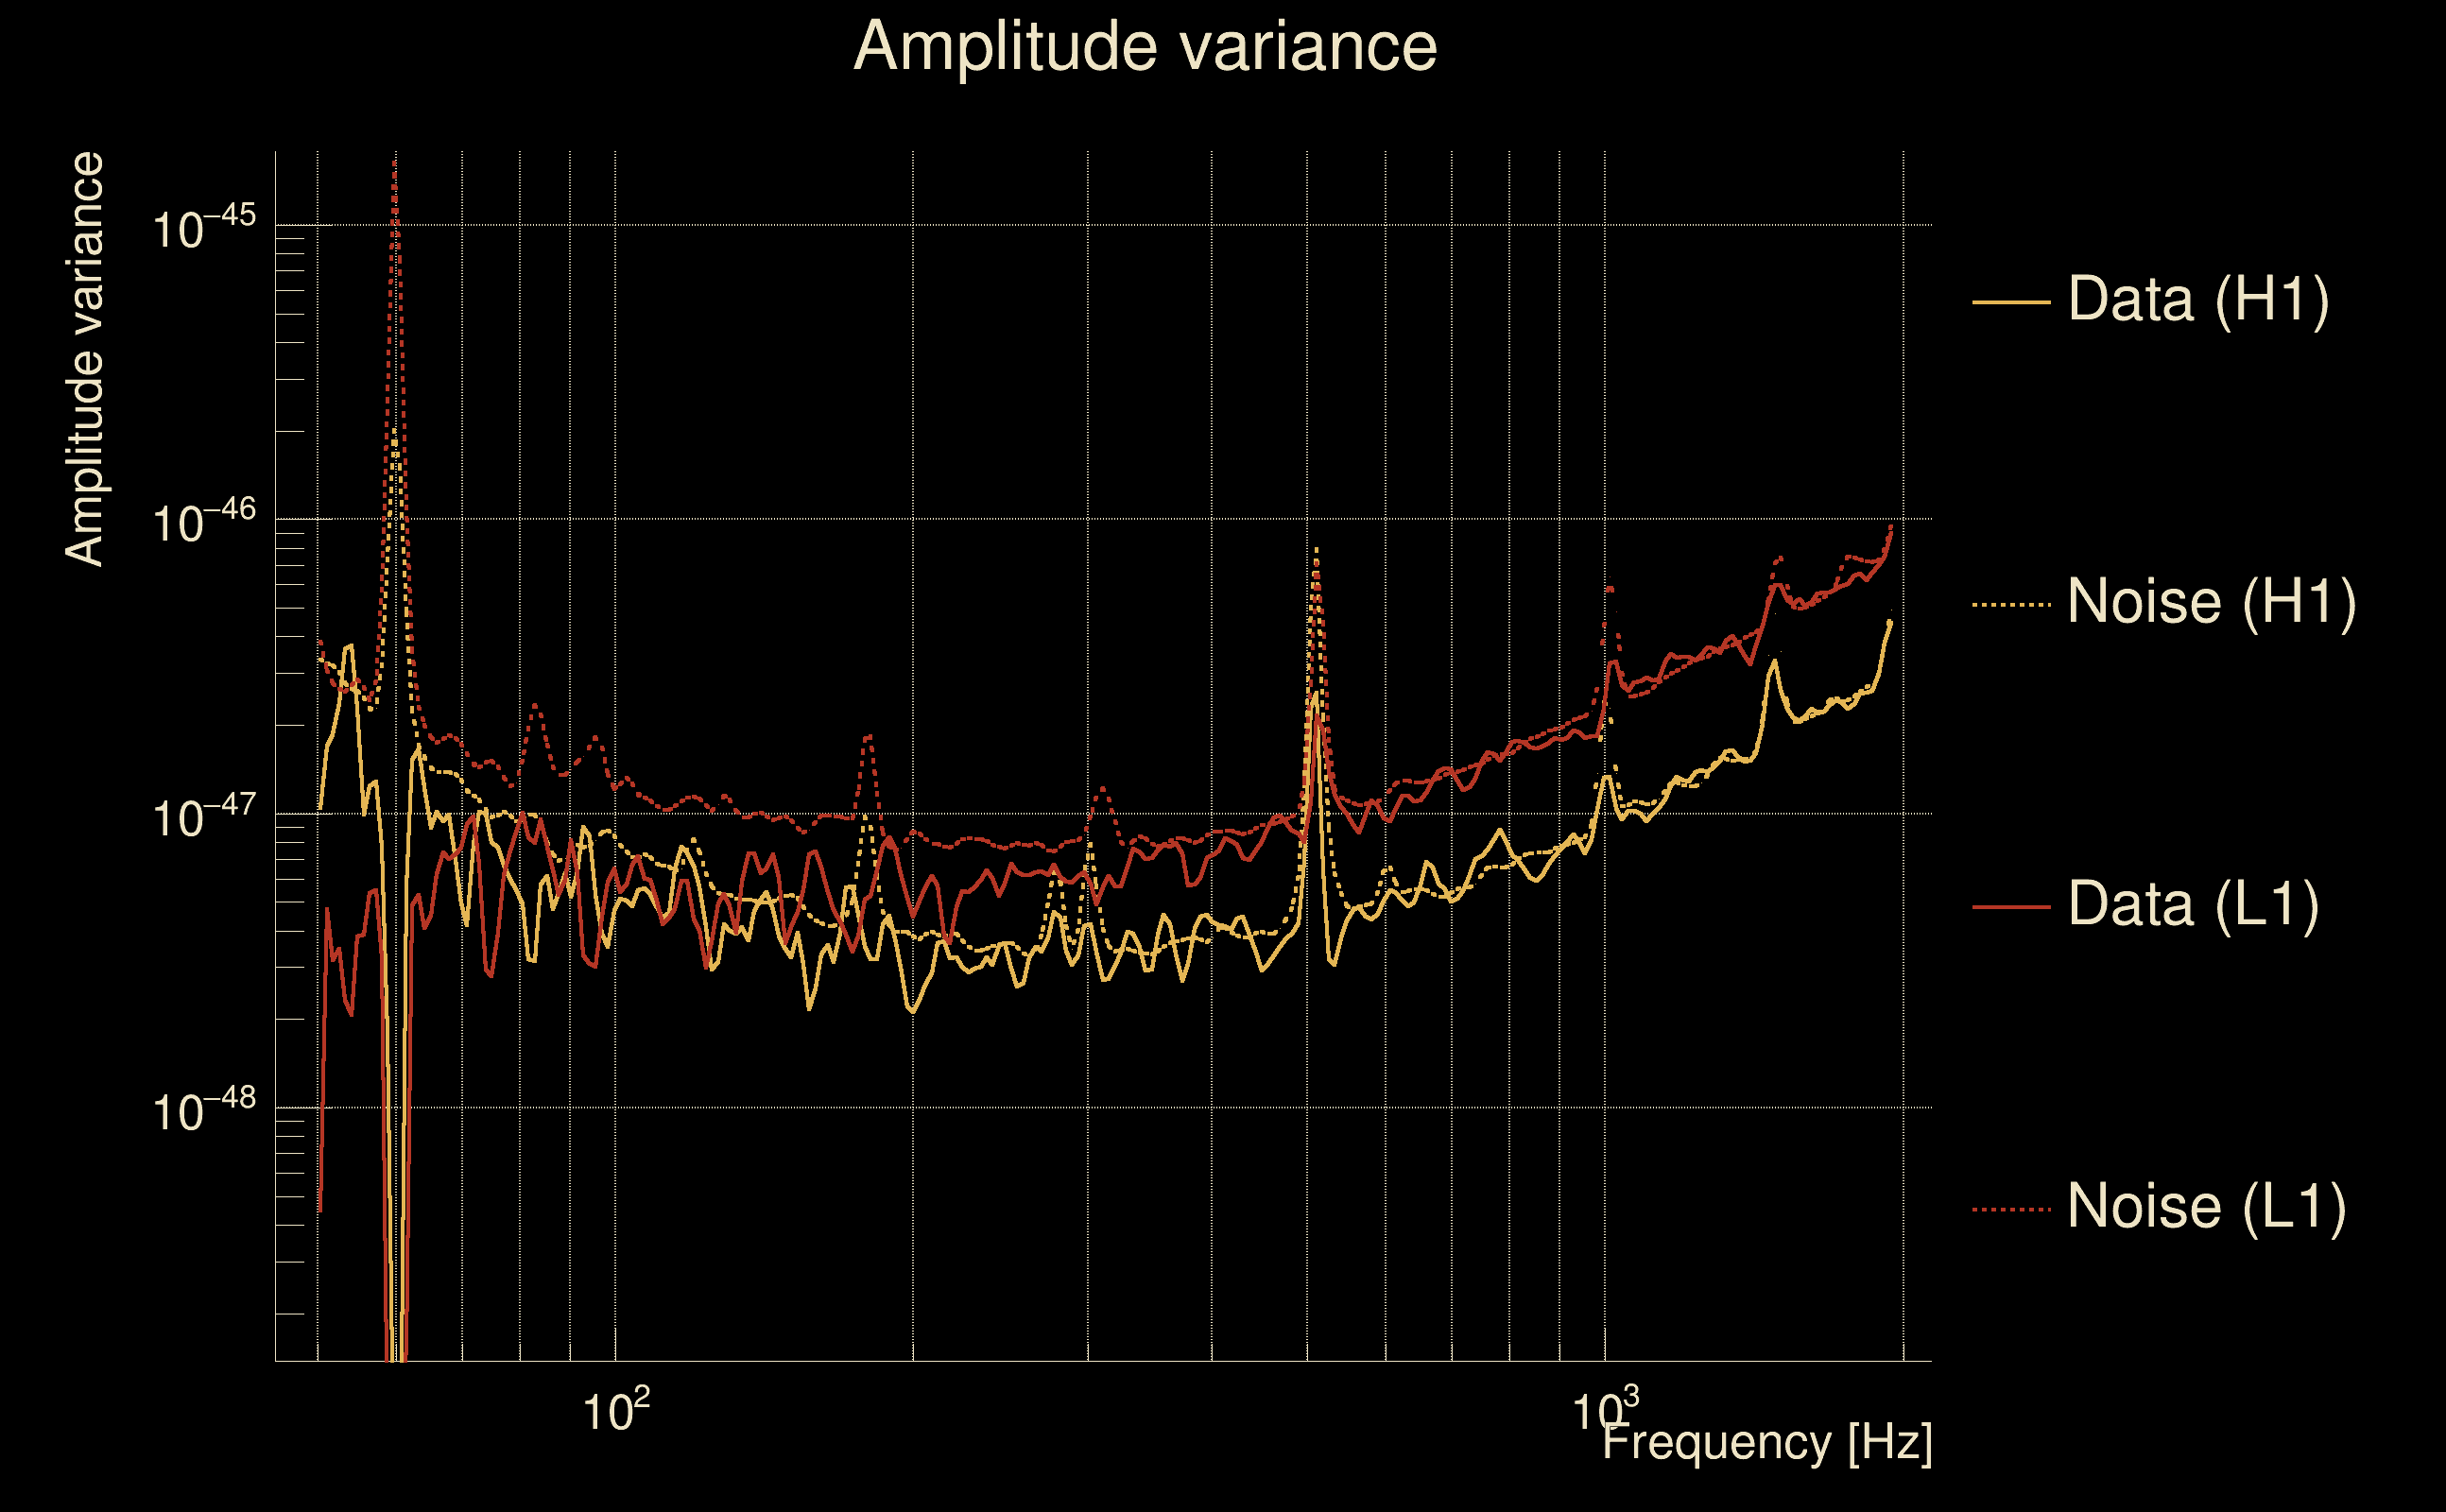
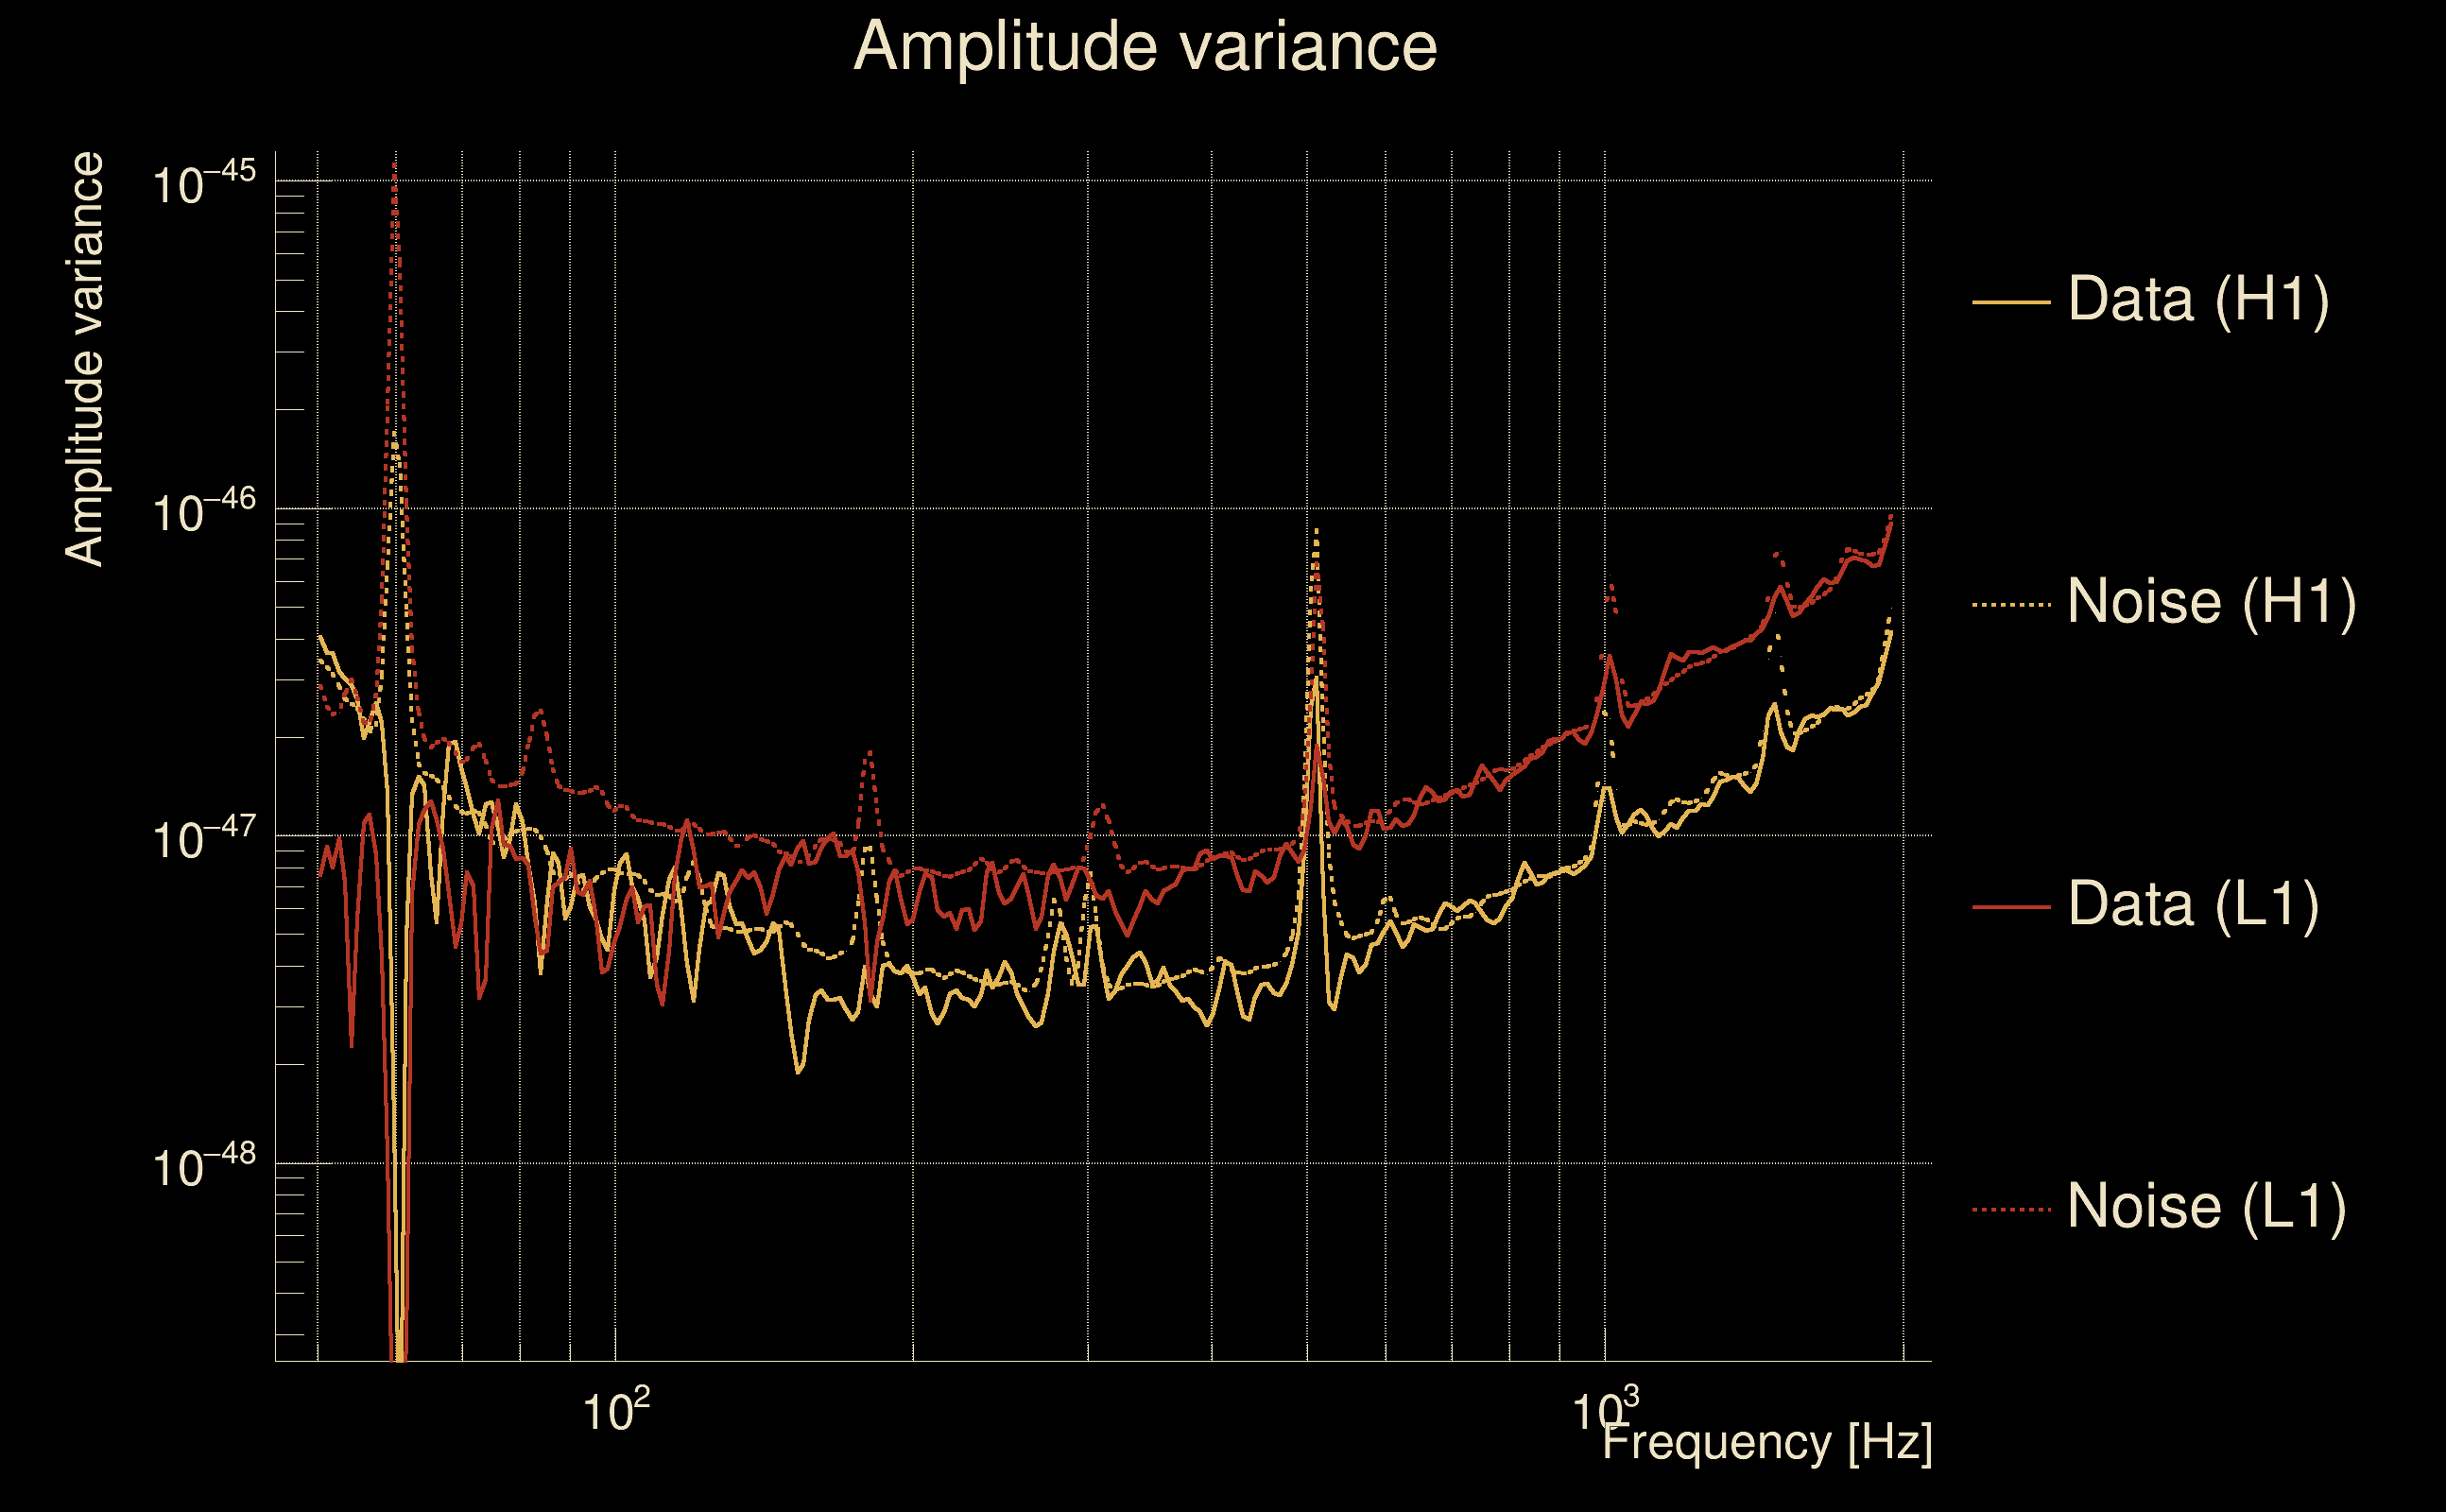
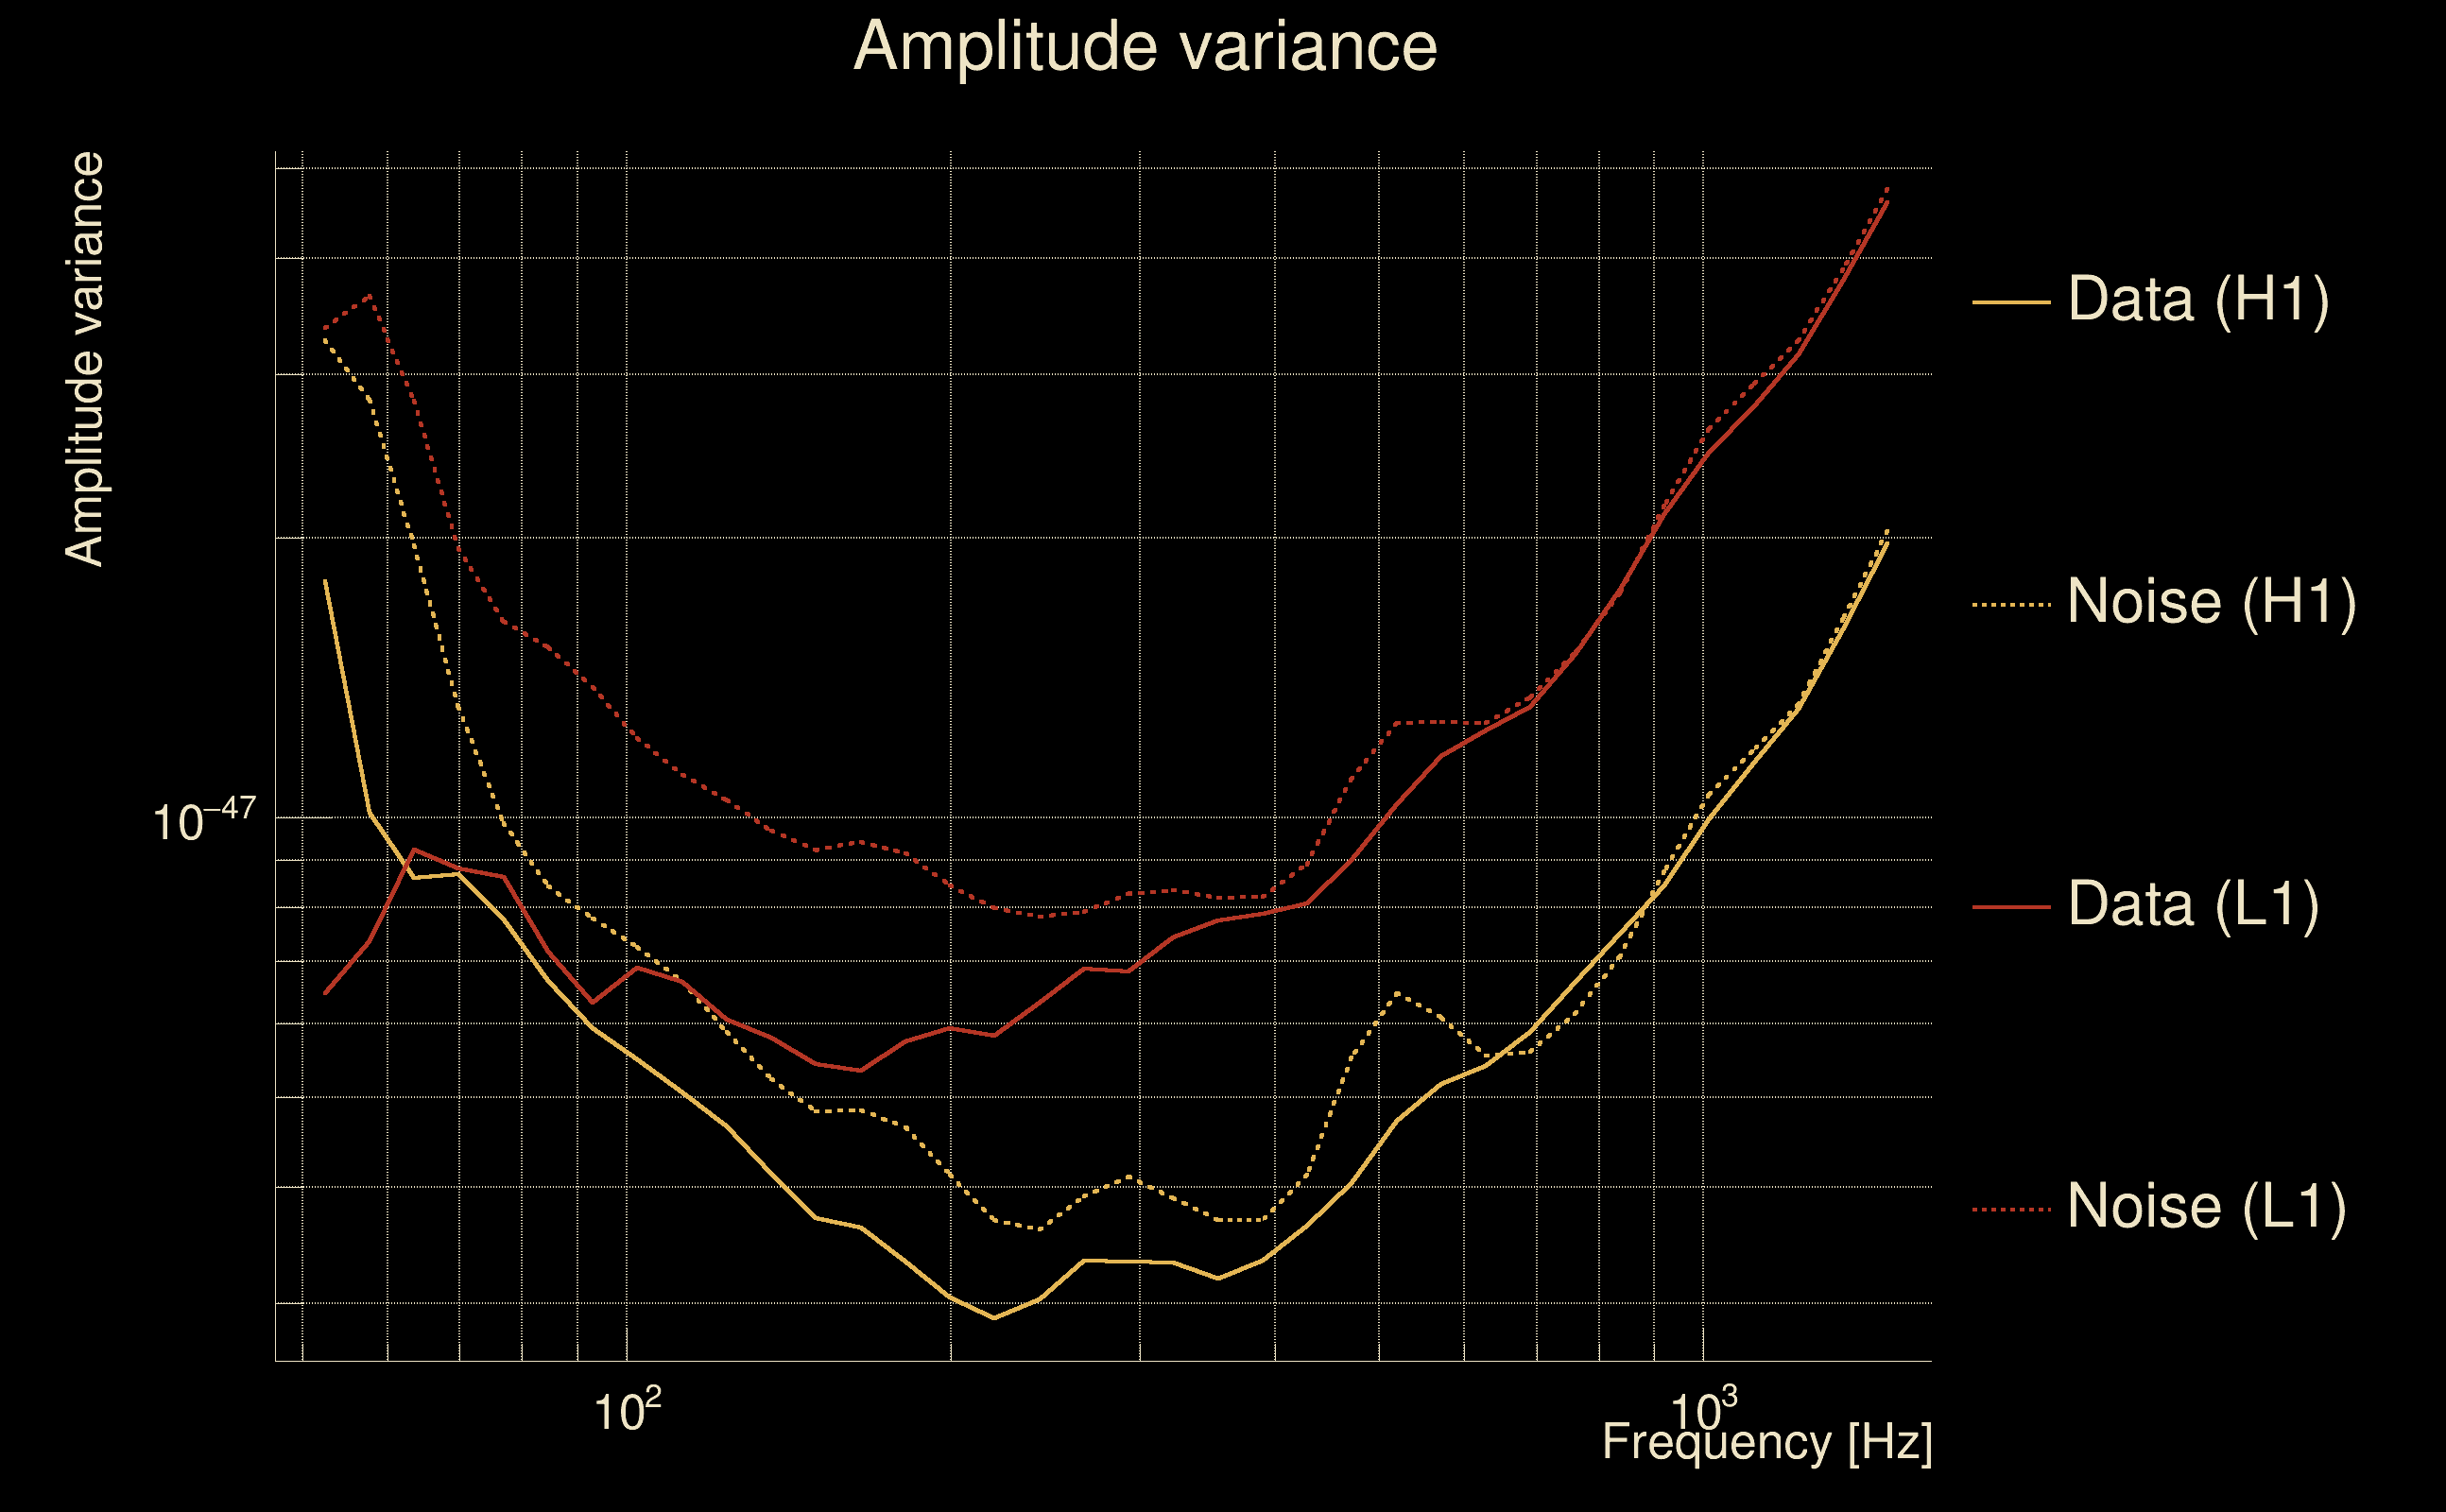
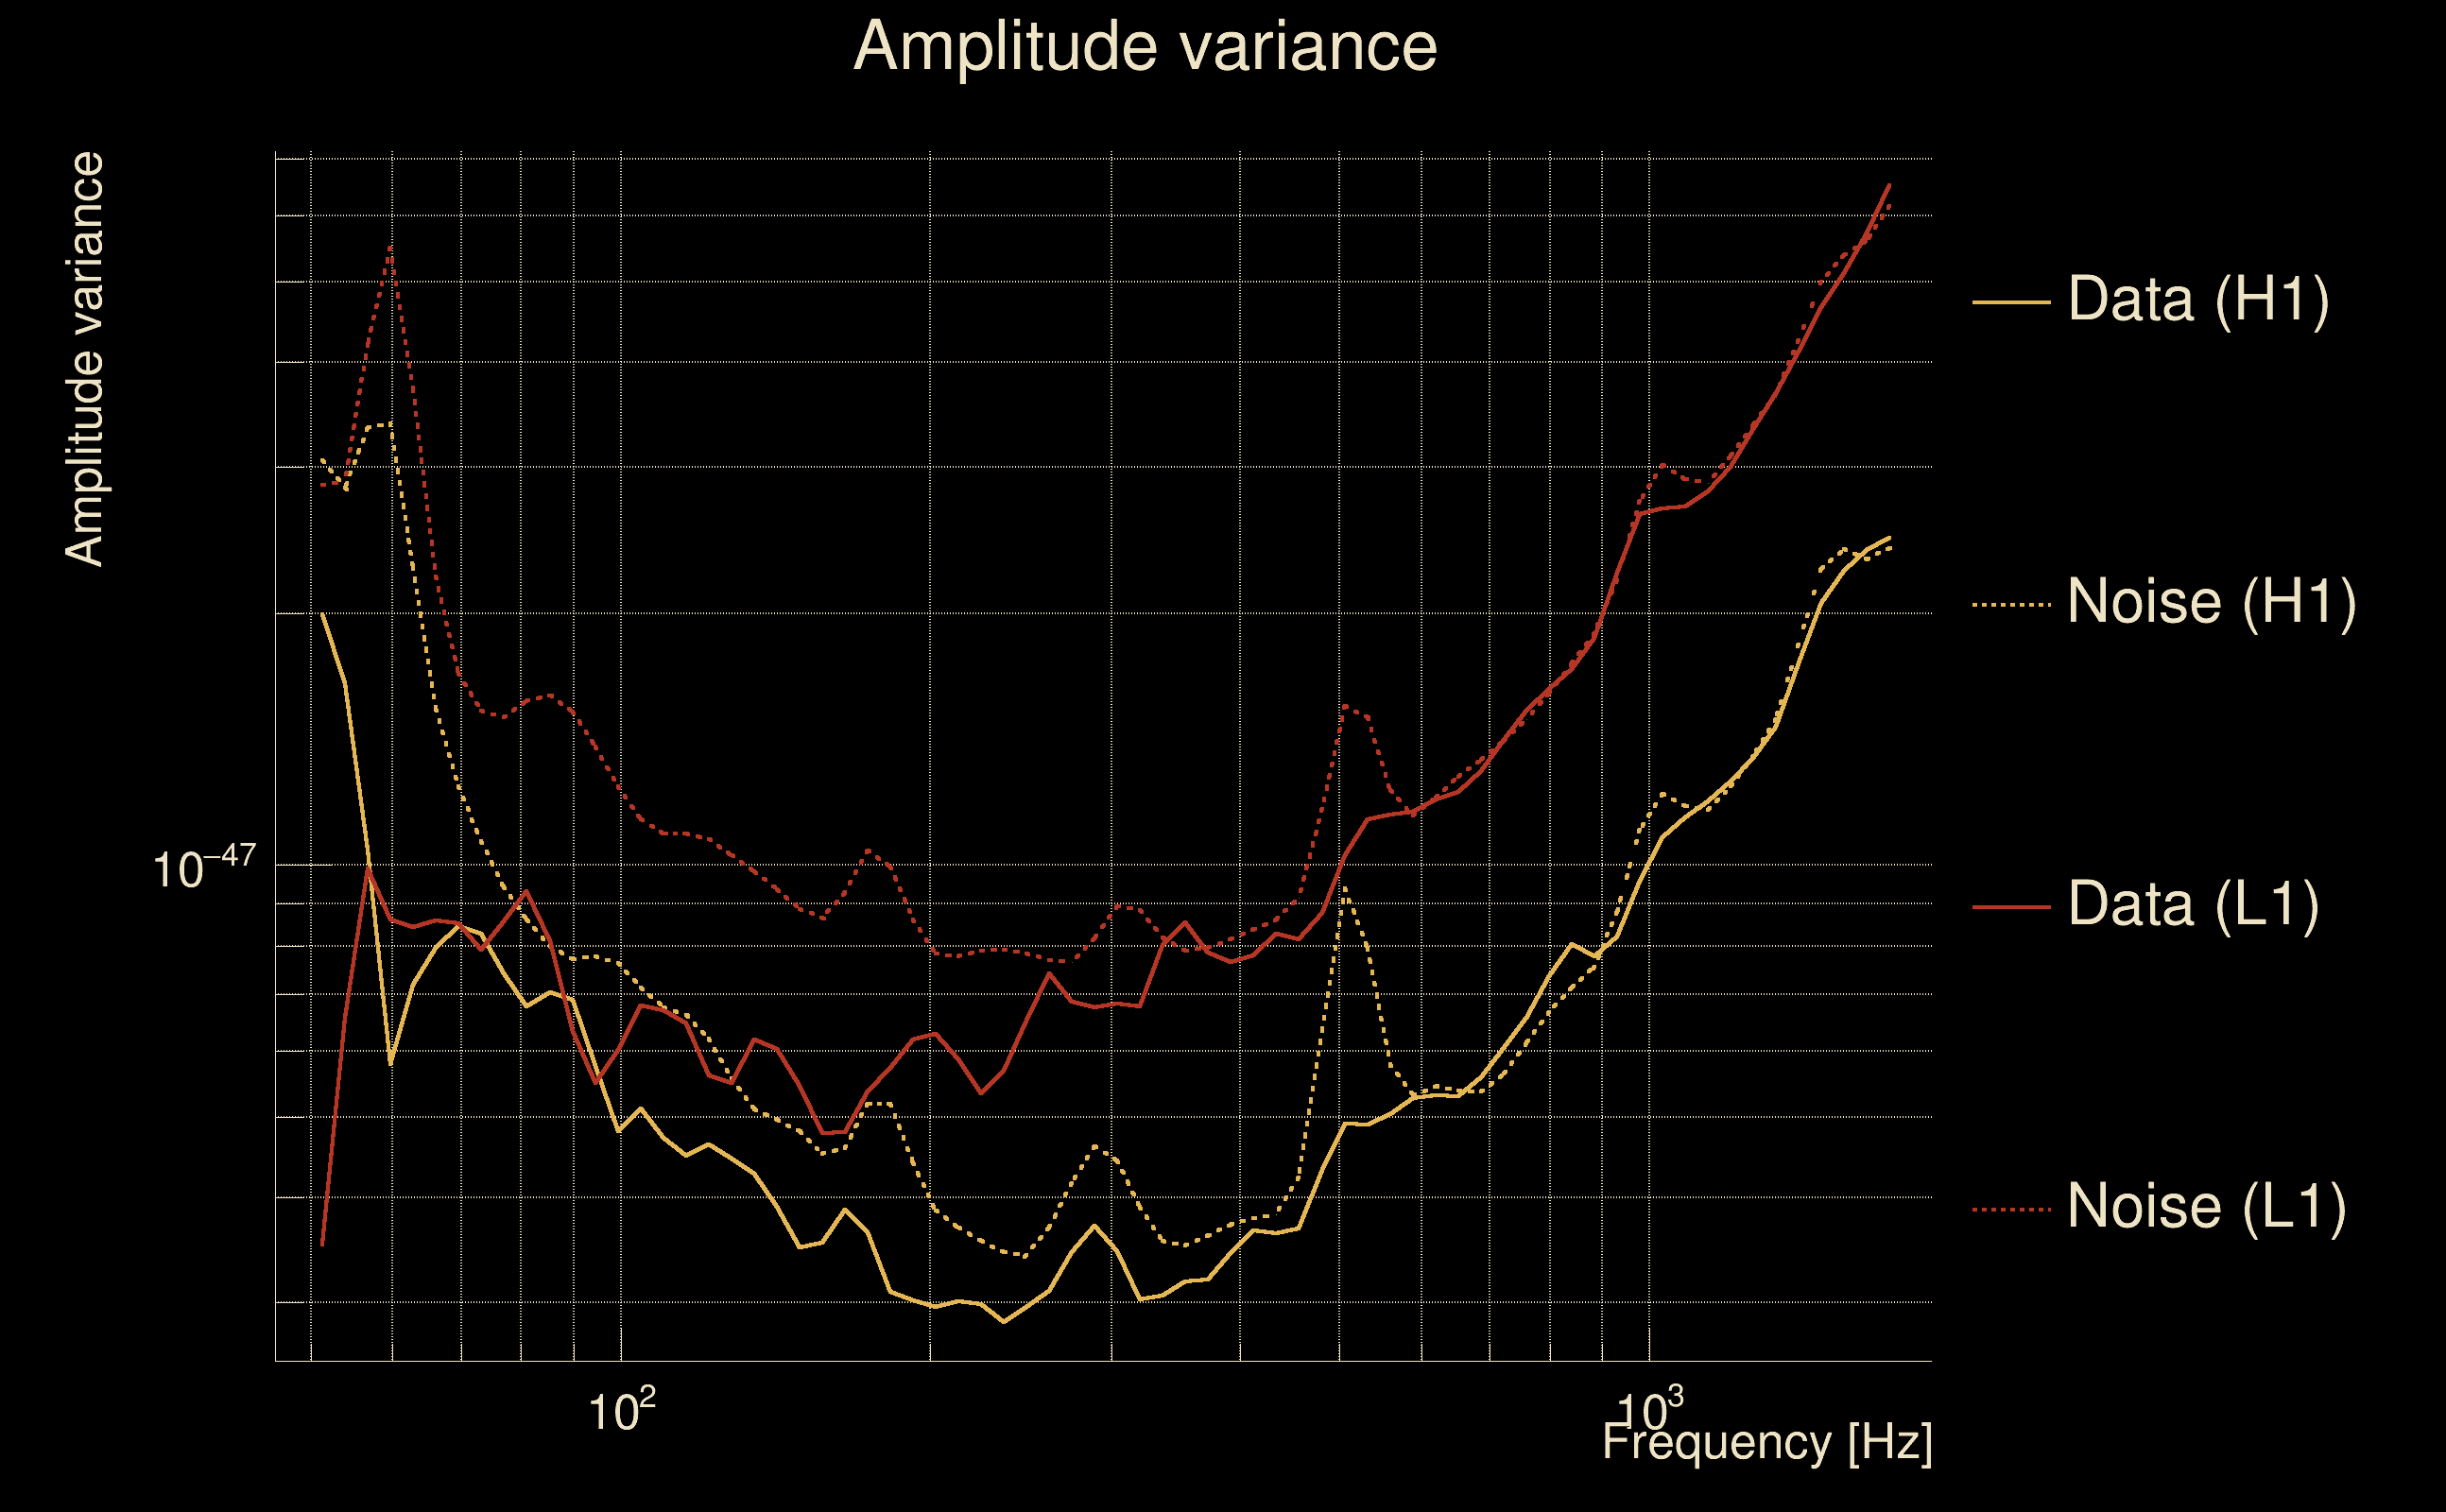
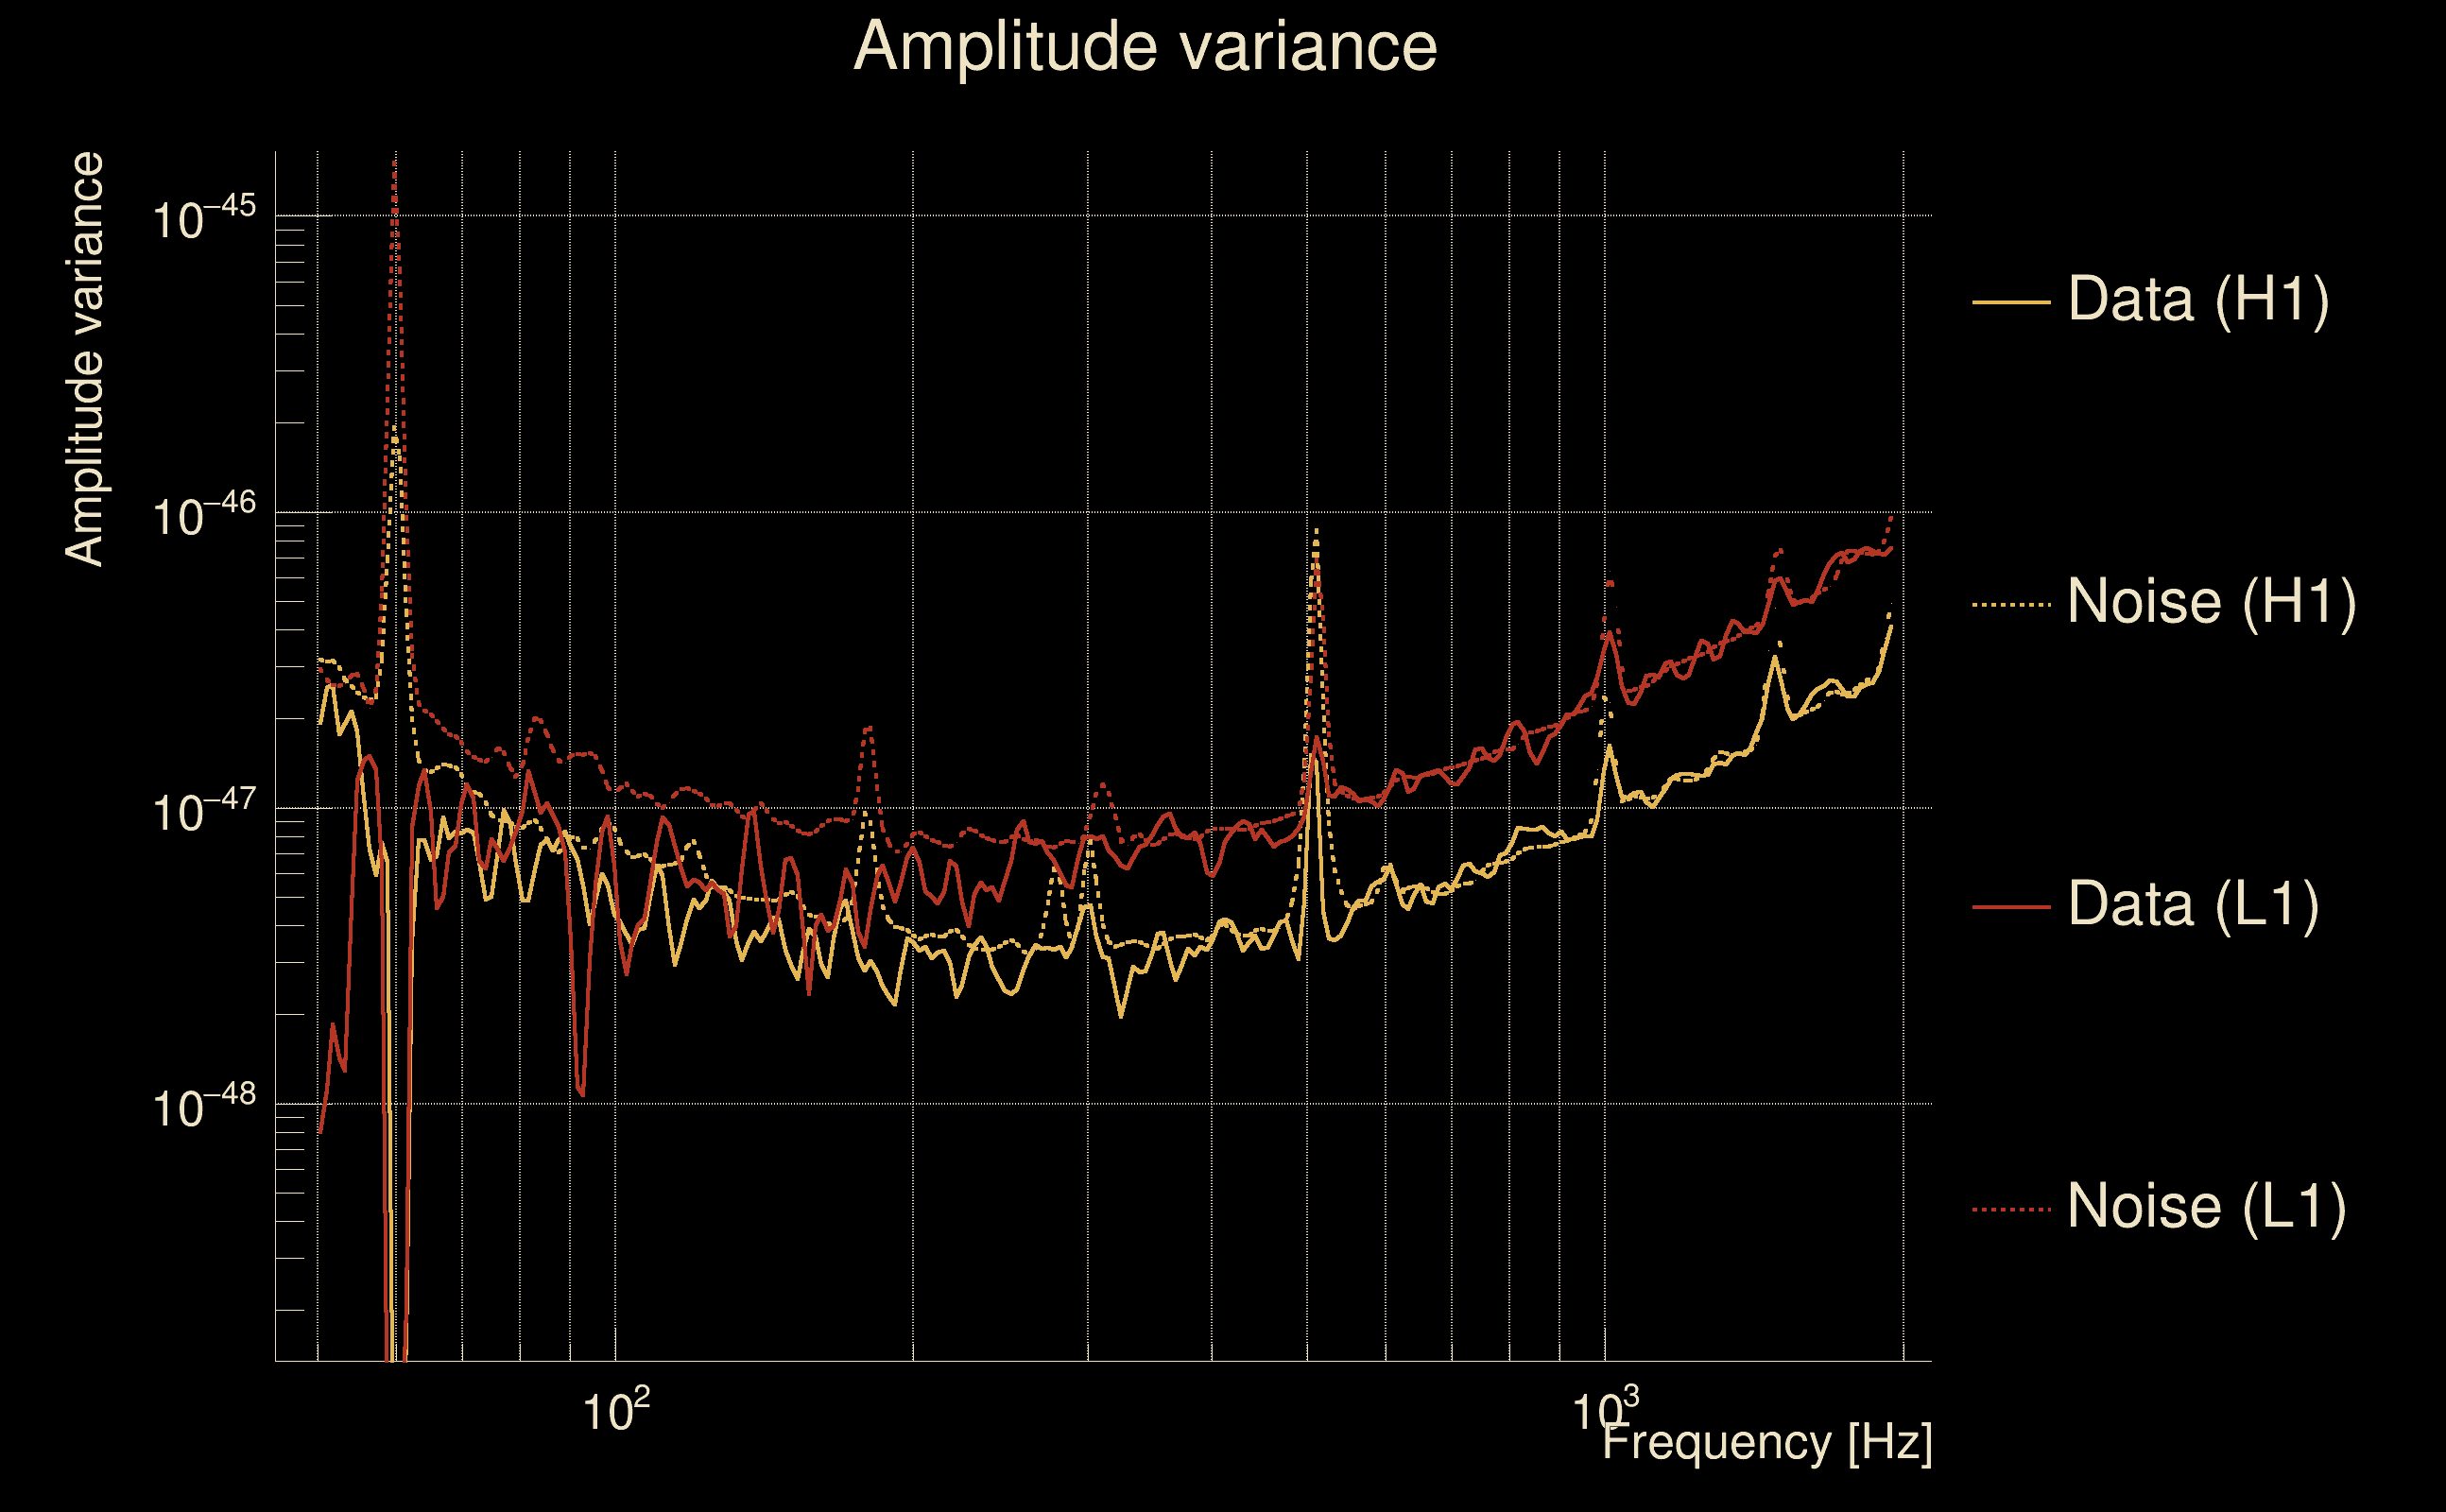
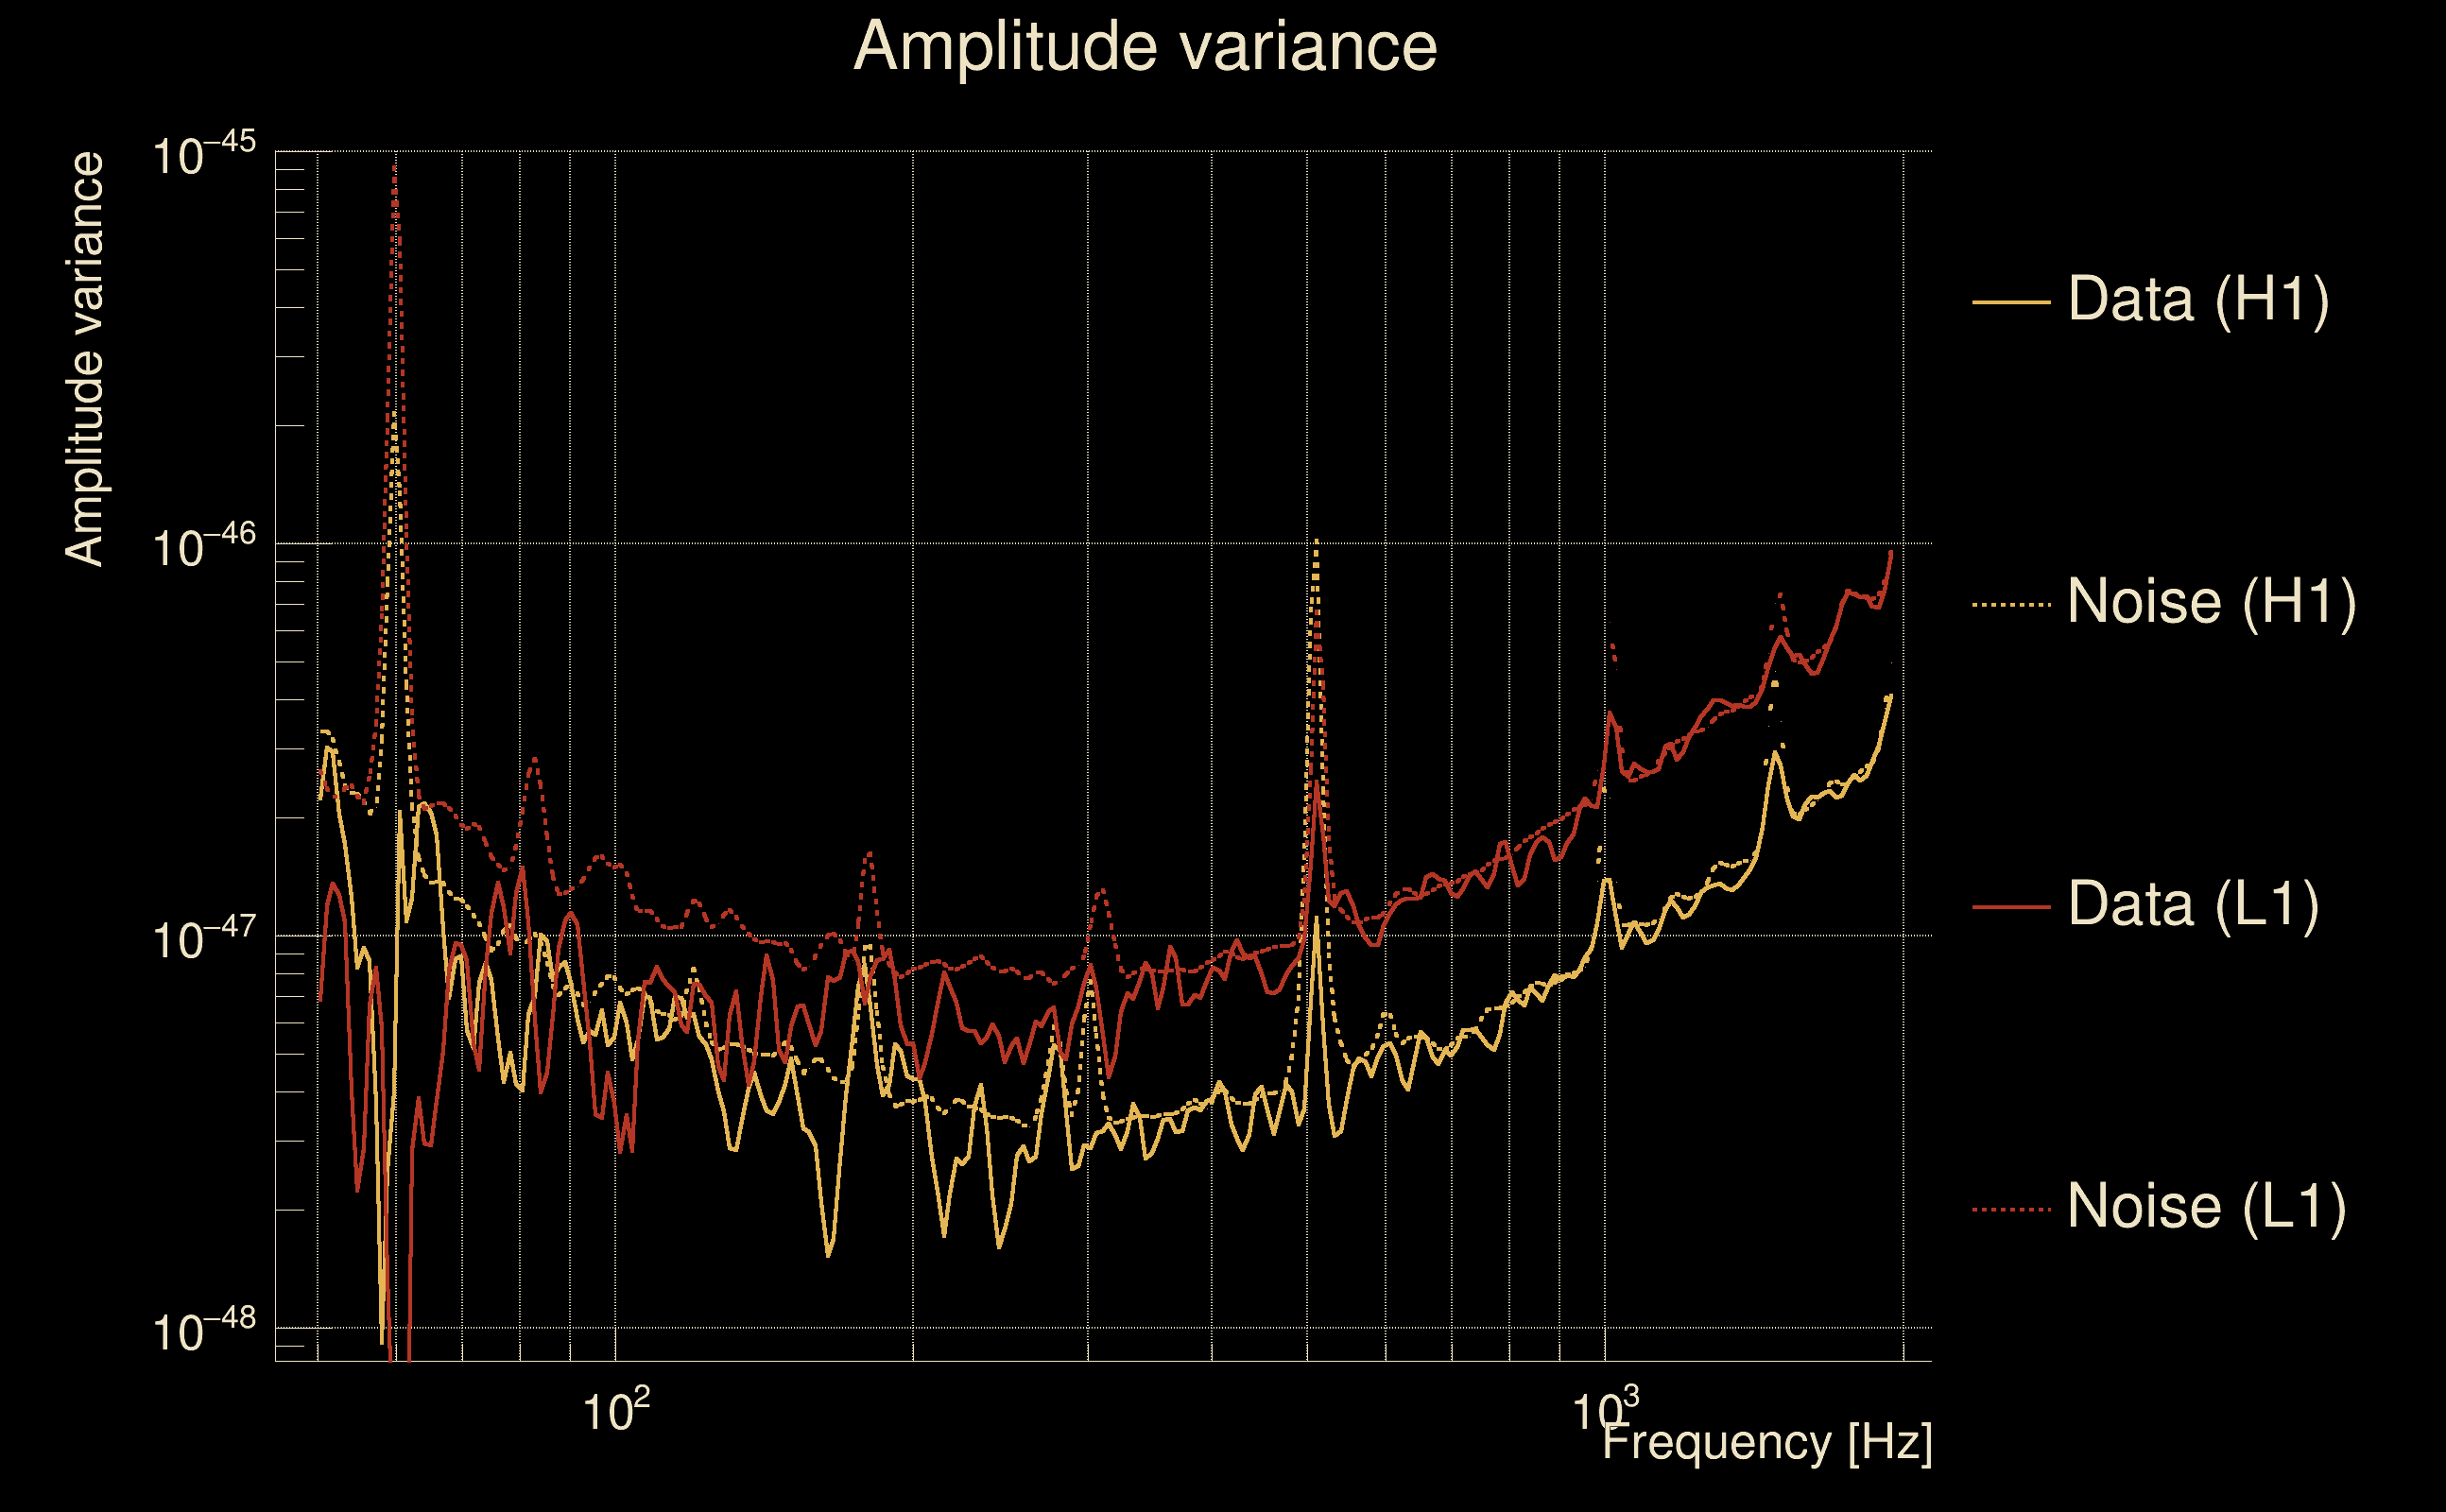
| Omicron frequency range: | 50 Hz → 1958.38 Hz |
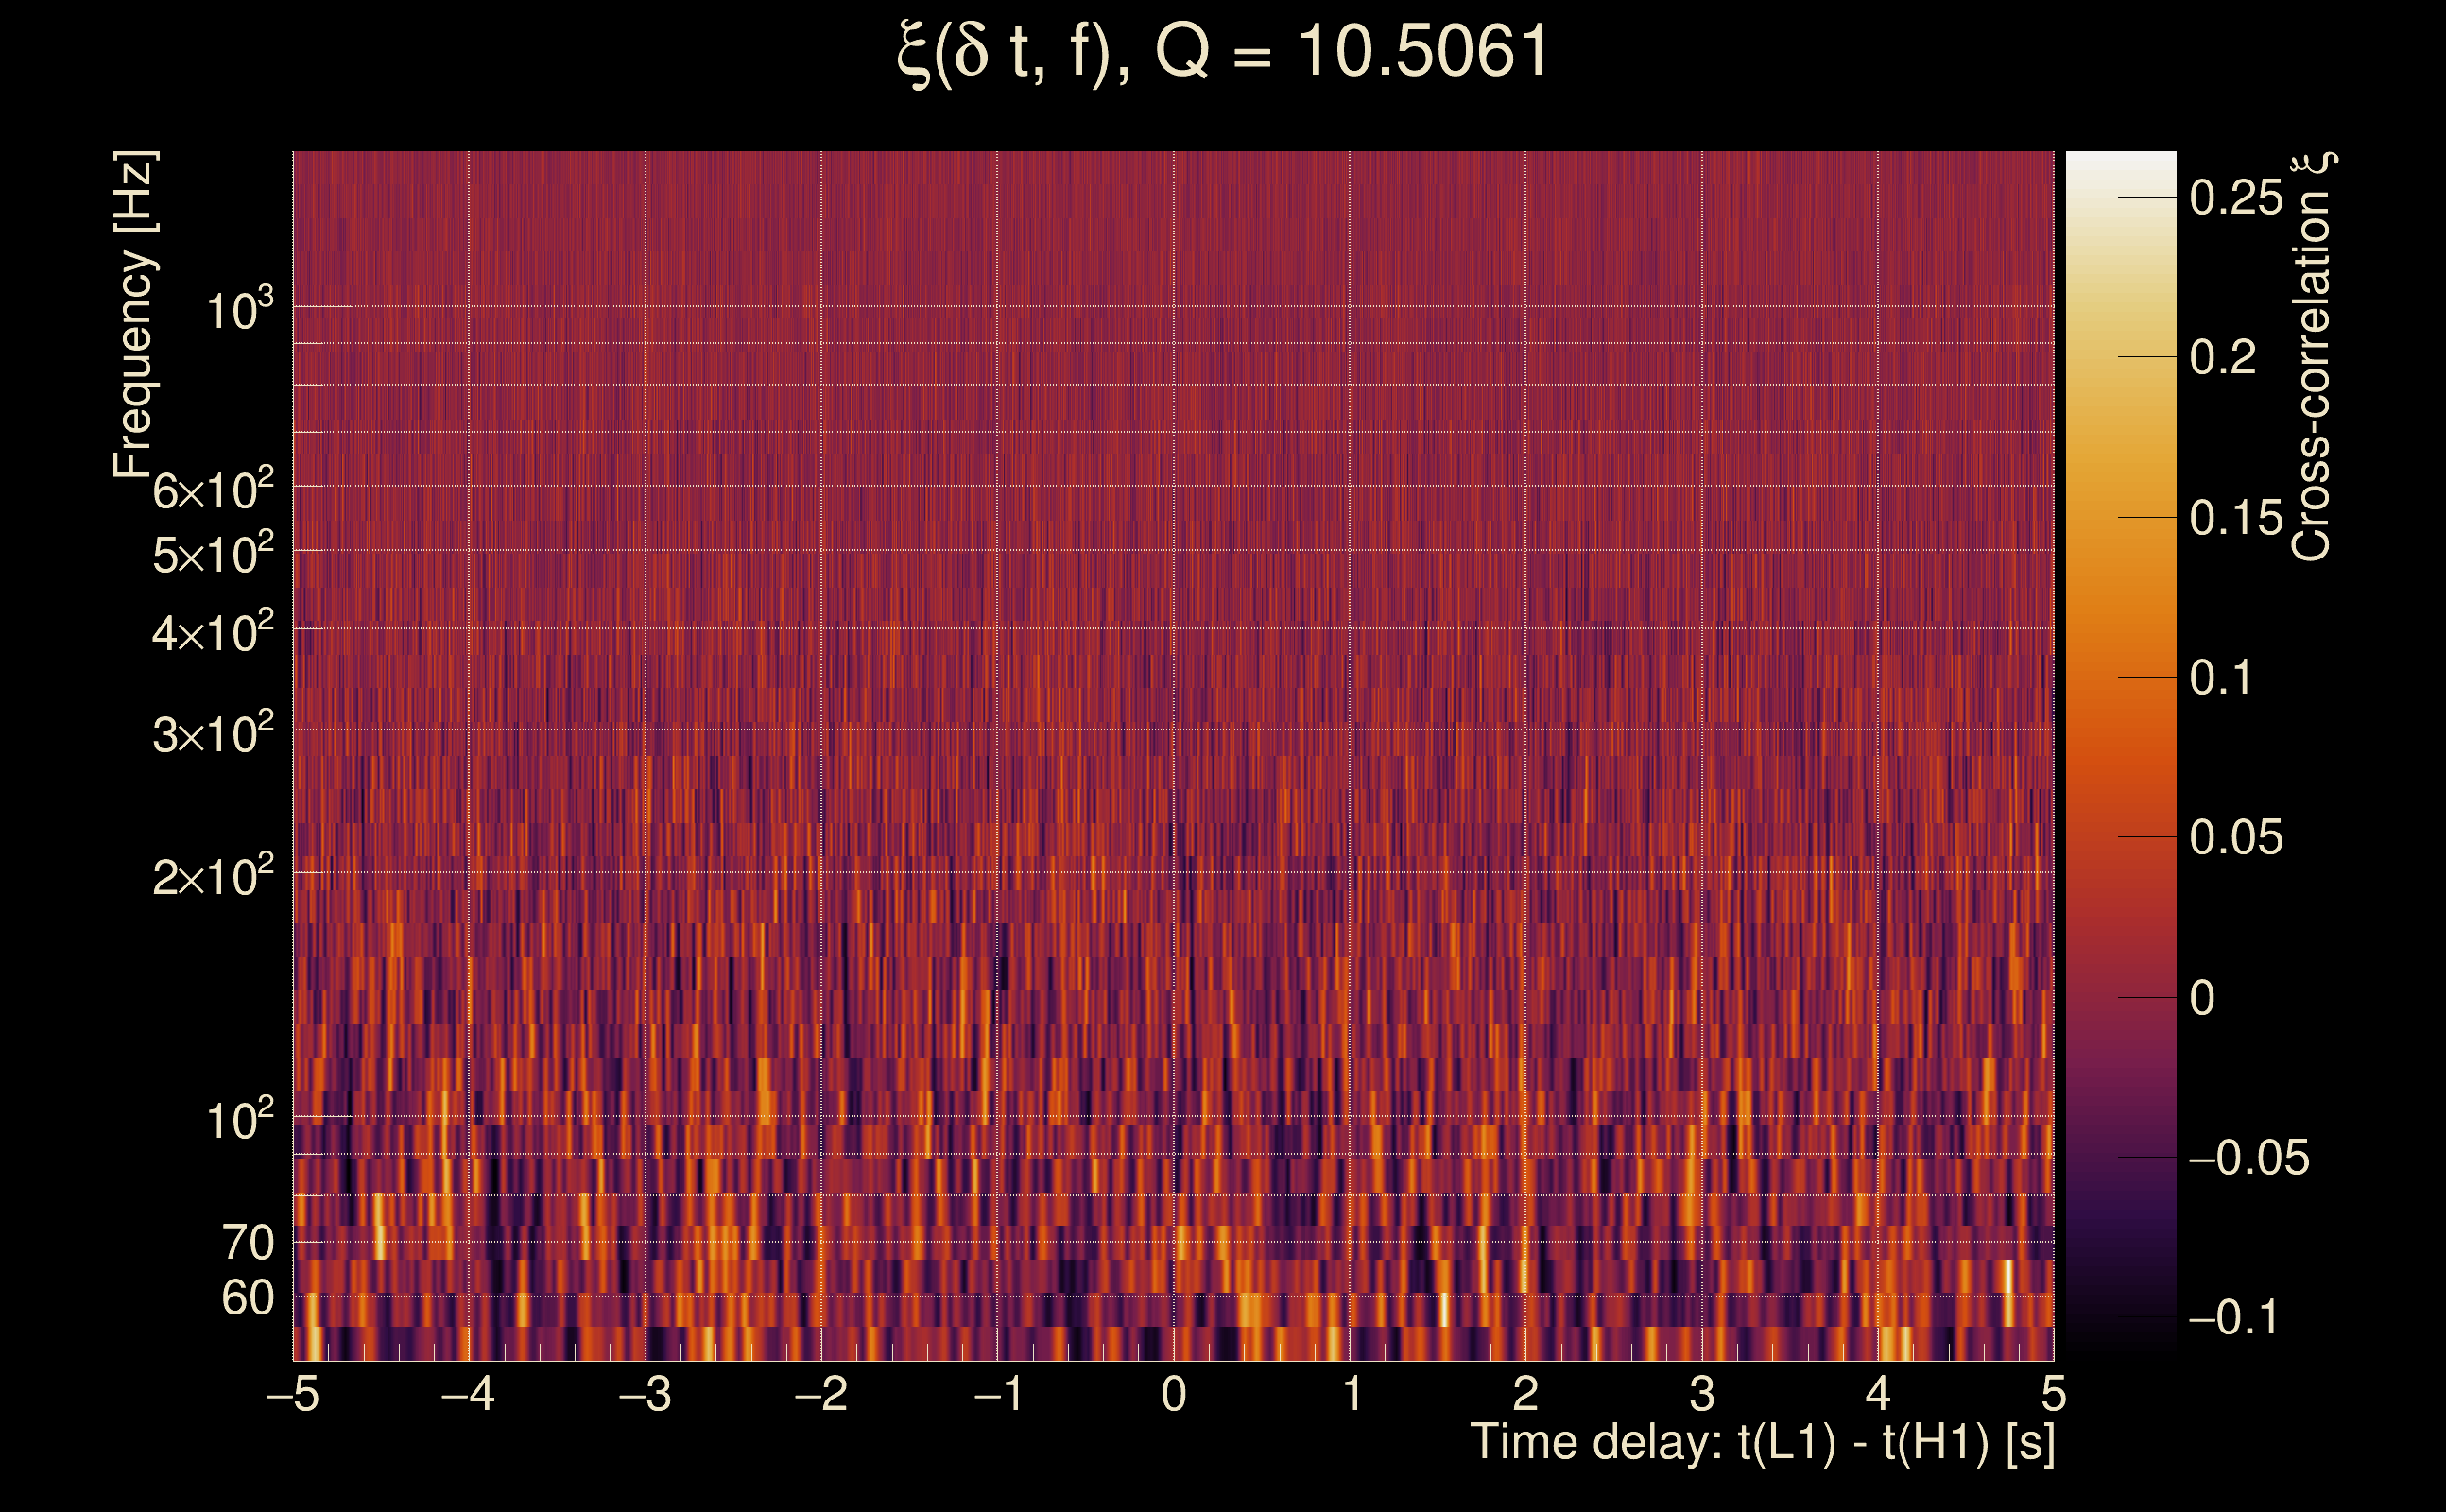
| Light travel time between detectors: | 0.0100128 s |
| Slice extra-time (calibration uncertainty + slice veto): | 0.0129872 s |
| Number of time-delay bins in a cross-correlation map: | 10000 |
| Number of slices in a cross-correlation map: | 217 |
| Number of time-delay bins in a slice: | 46 |
| SNR gating: | < 100 (detector 0), < 100 (detector 1) |
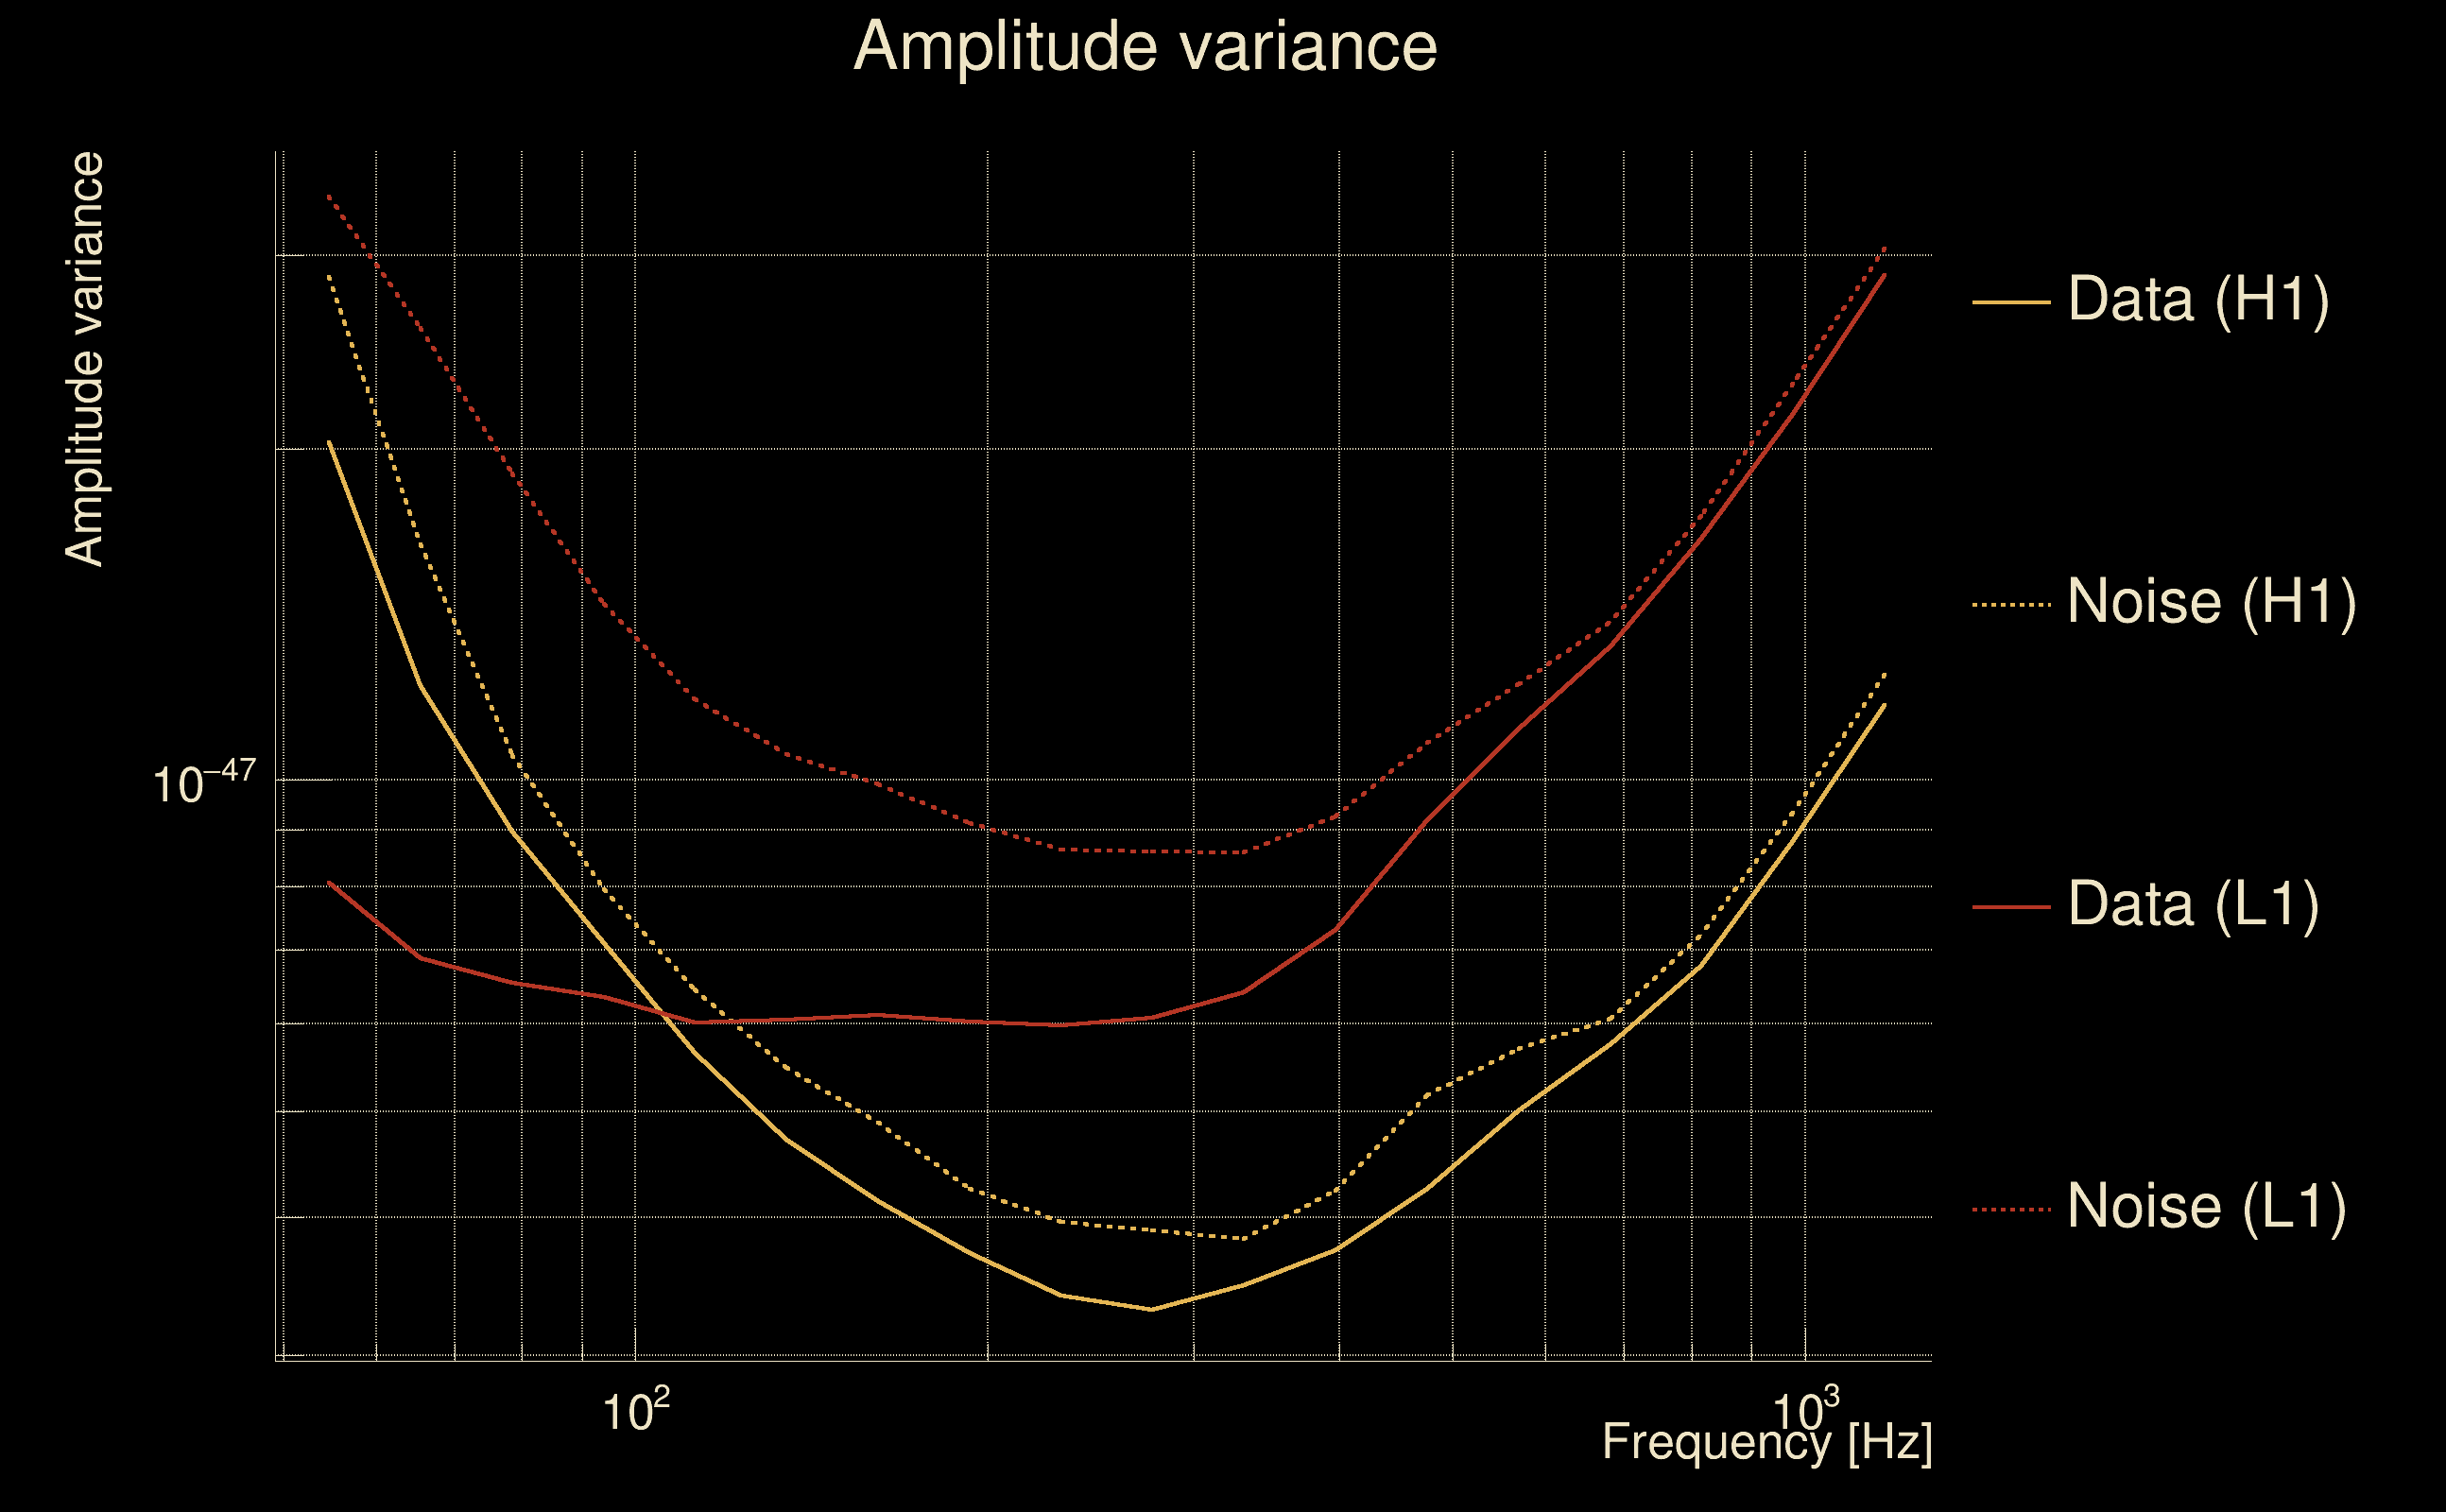
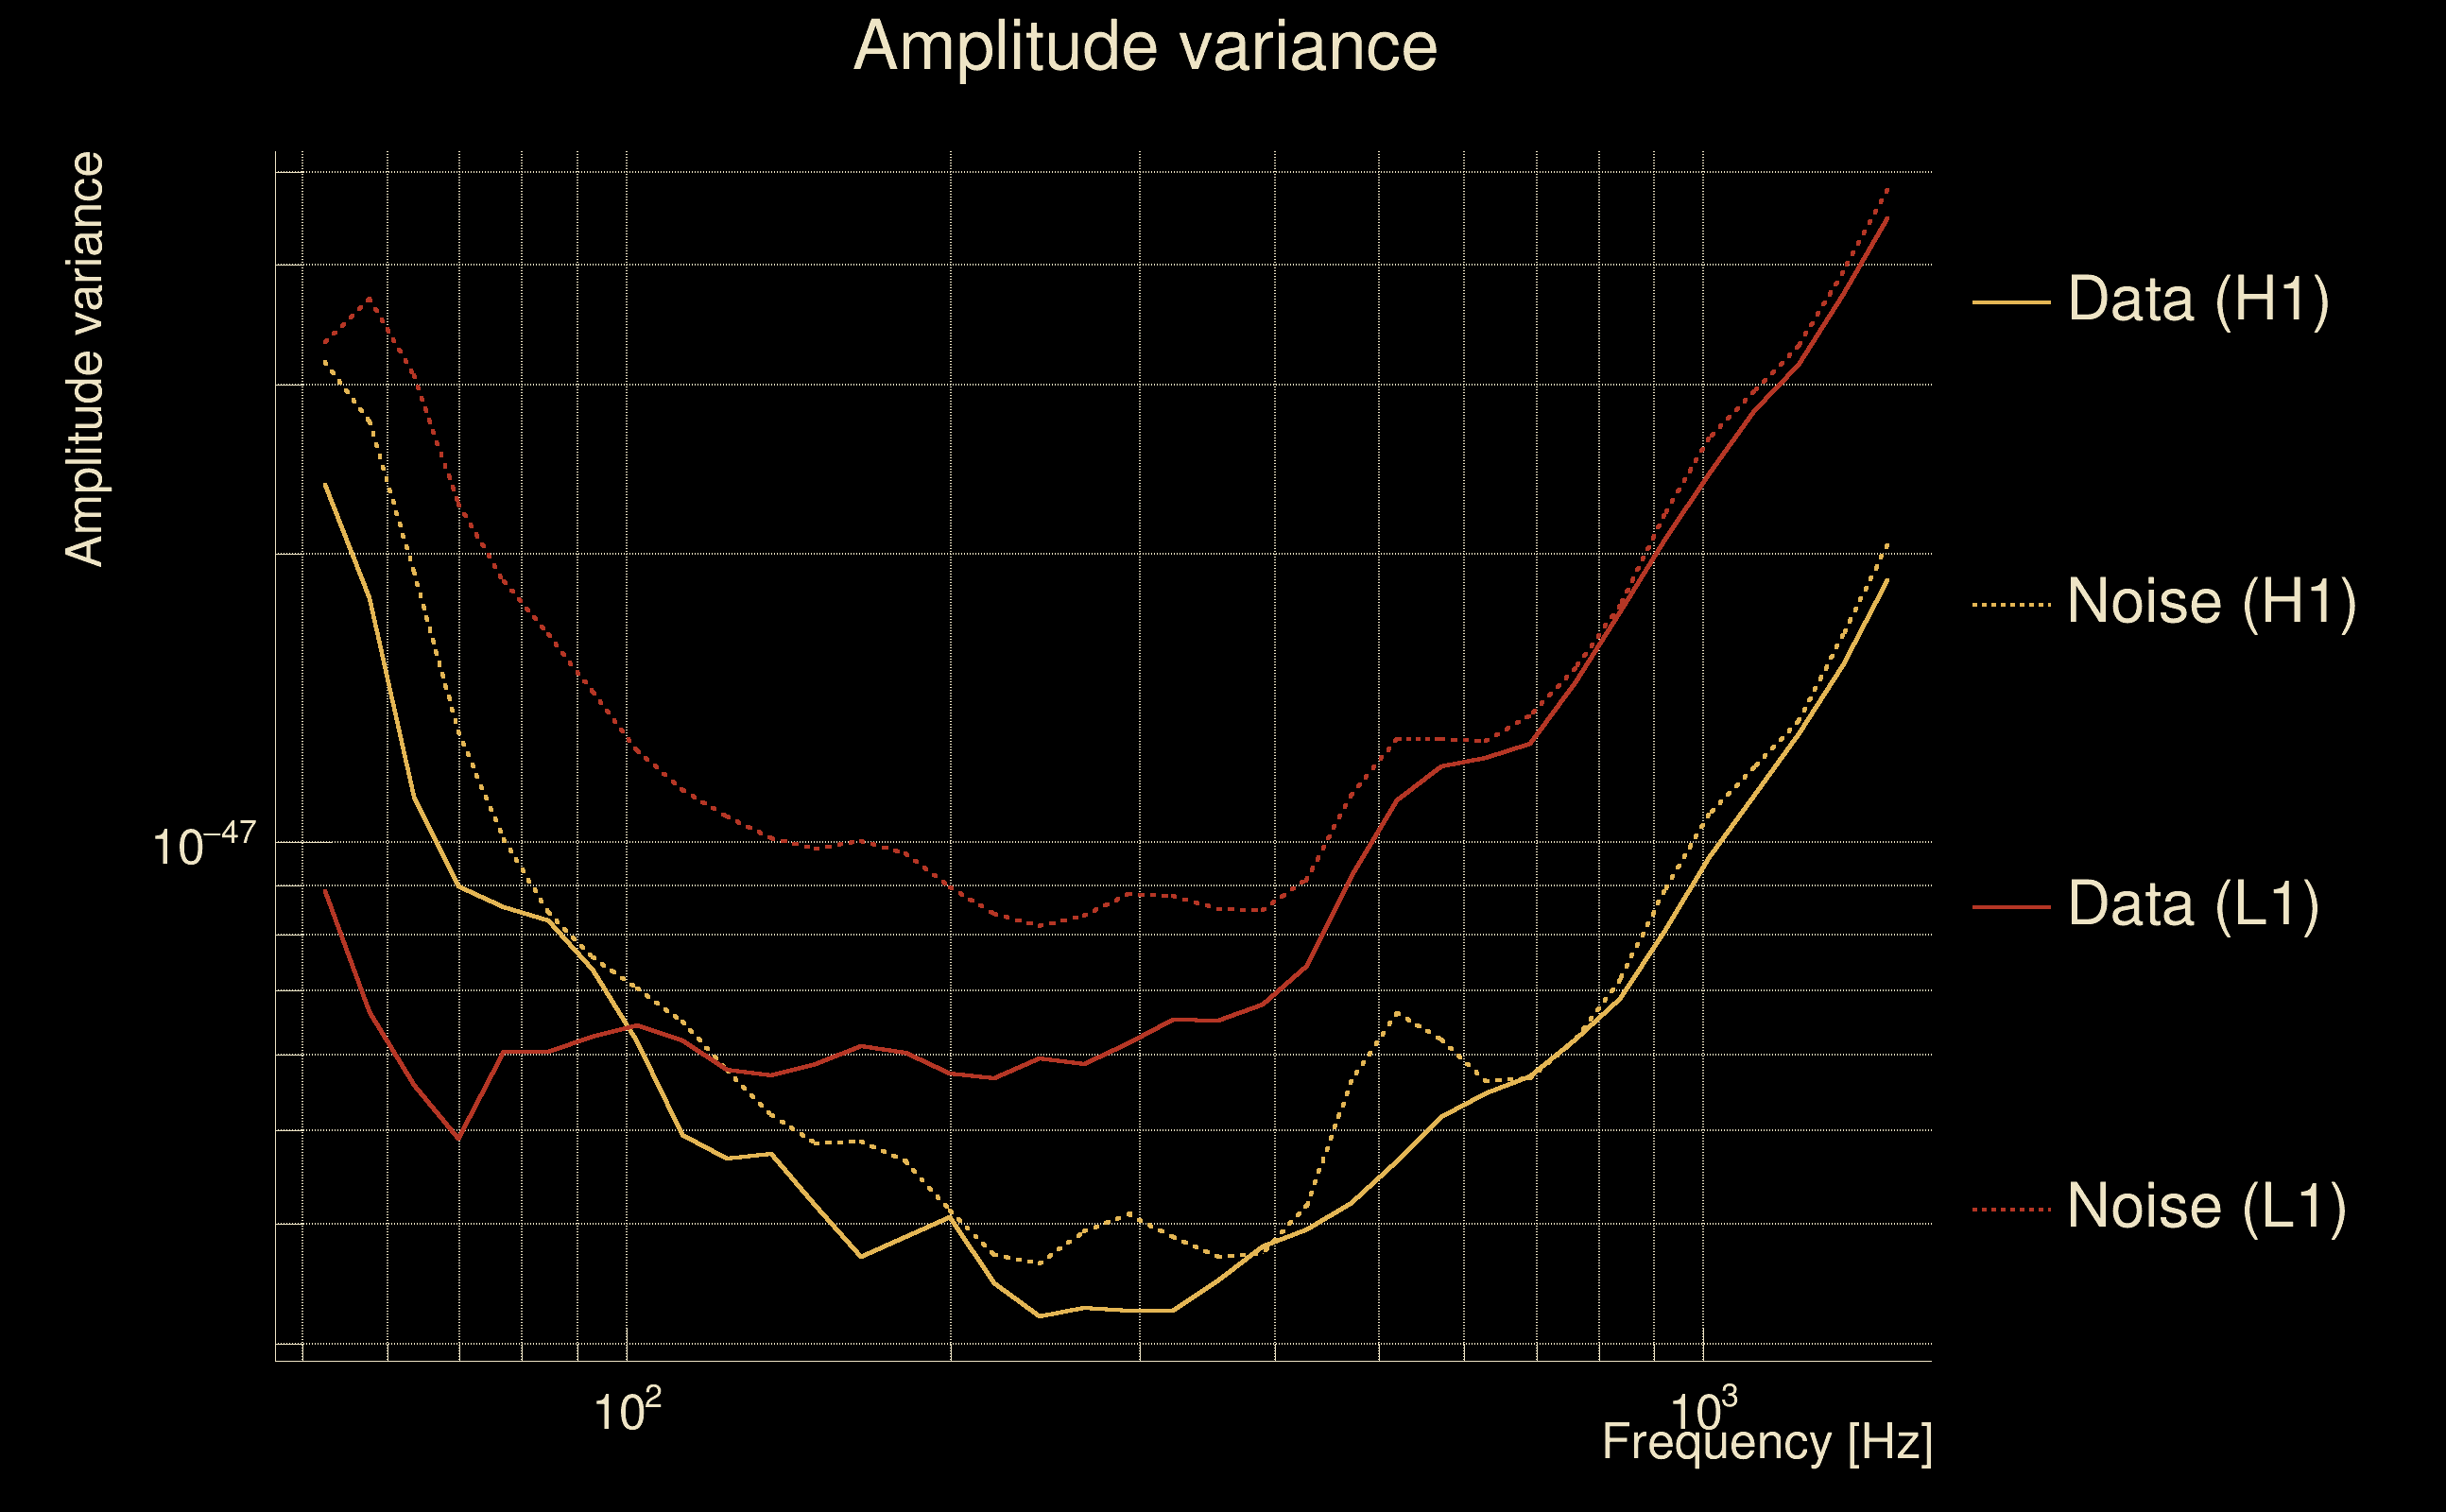
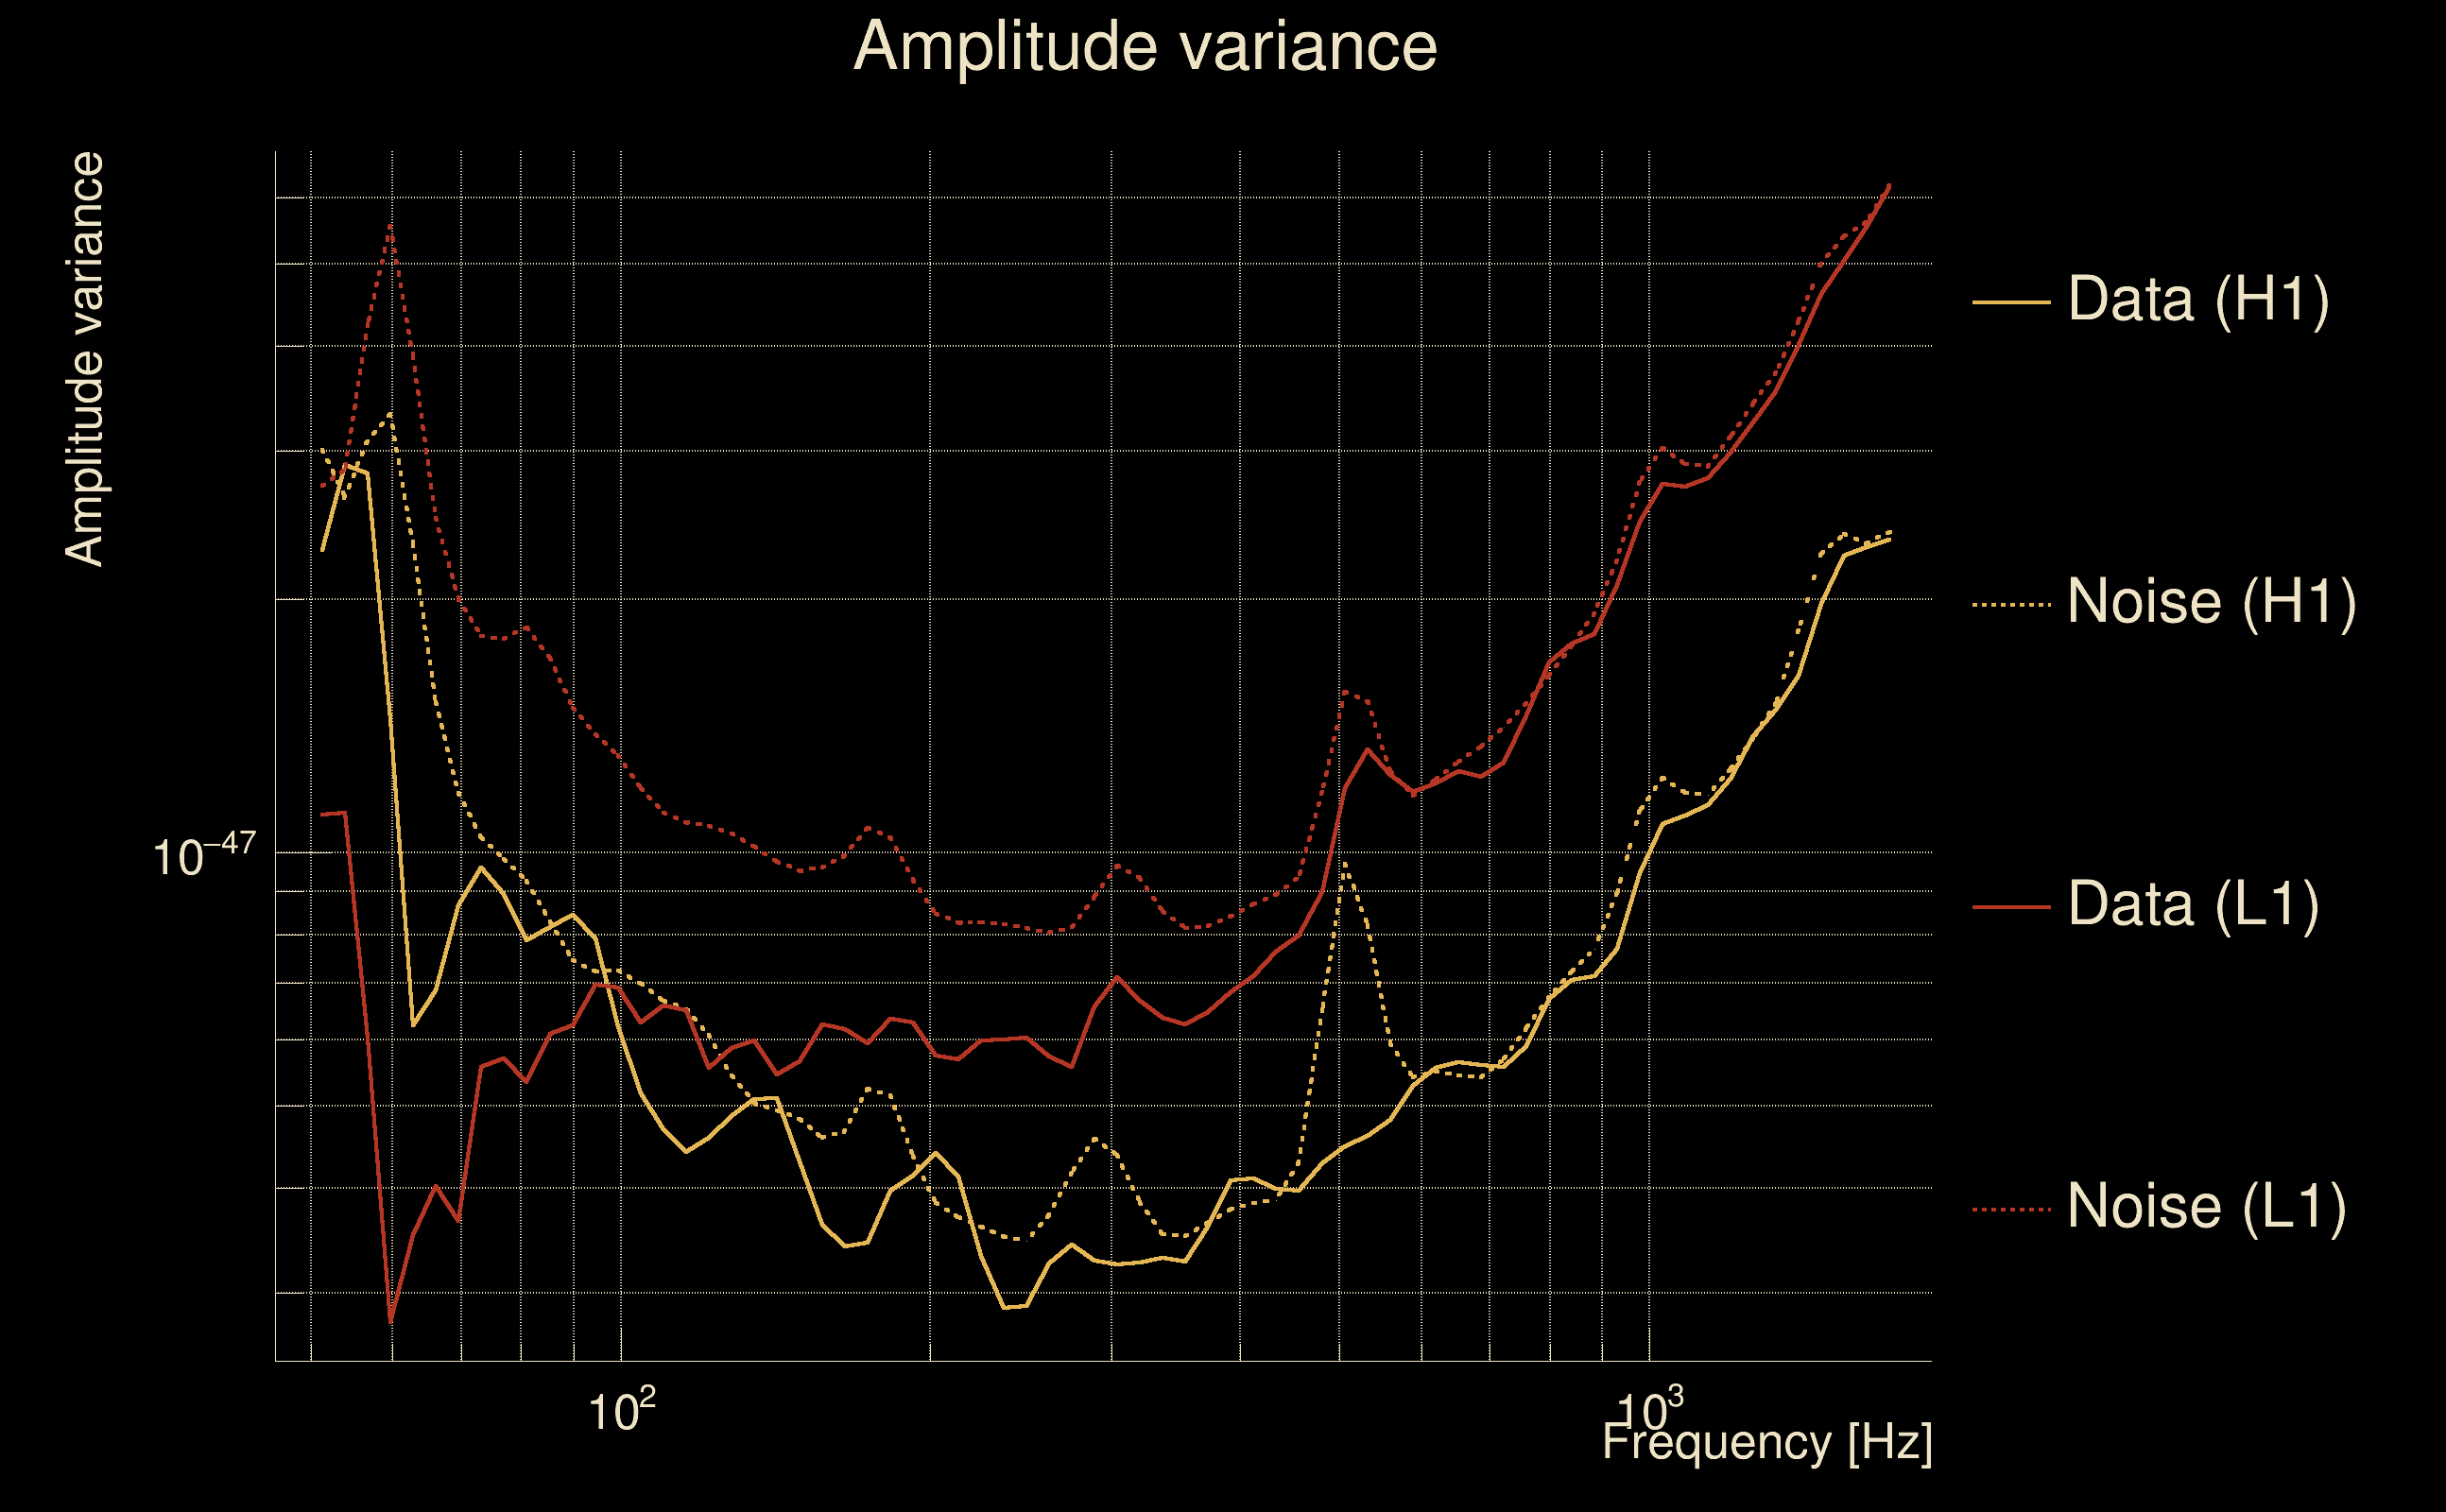
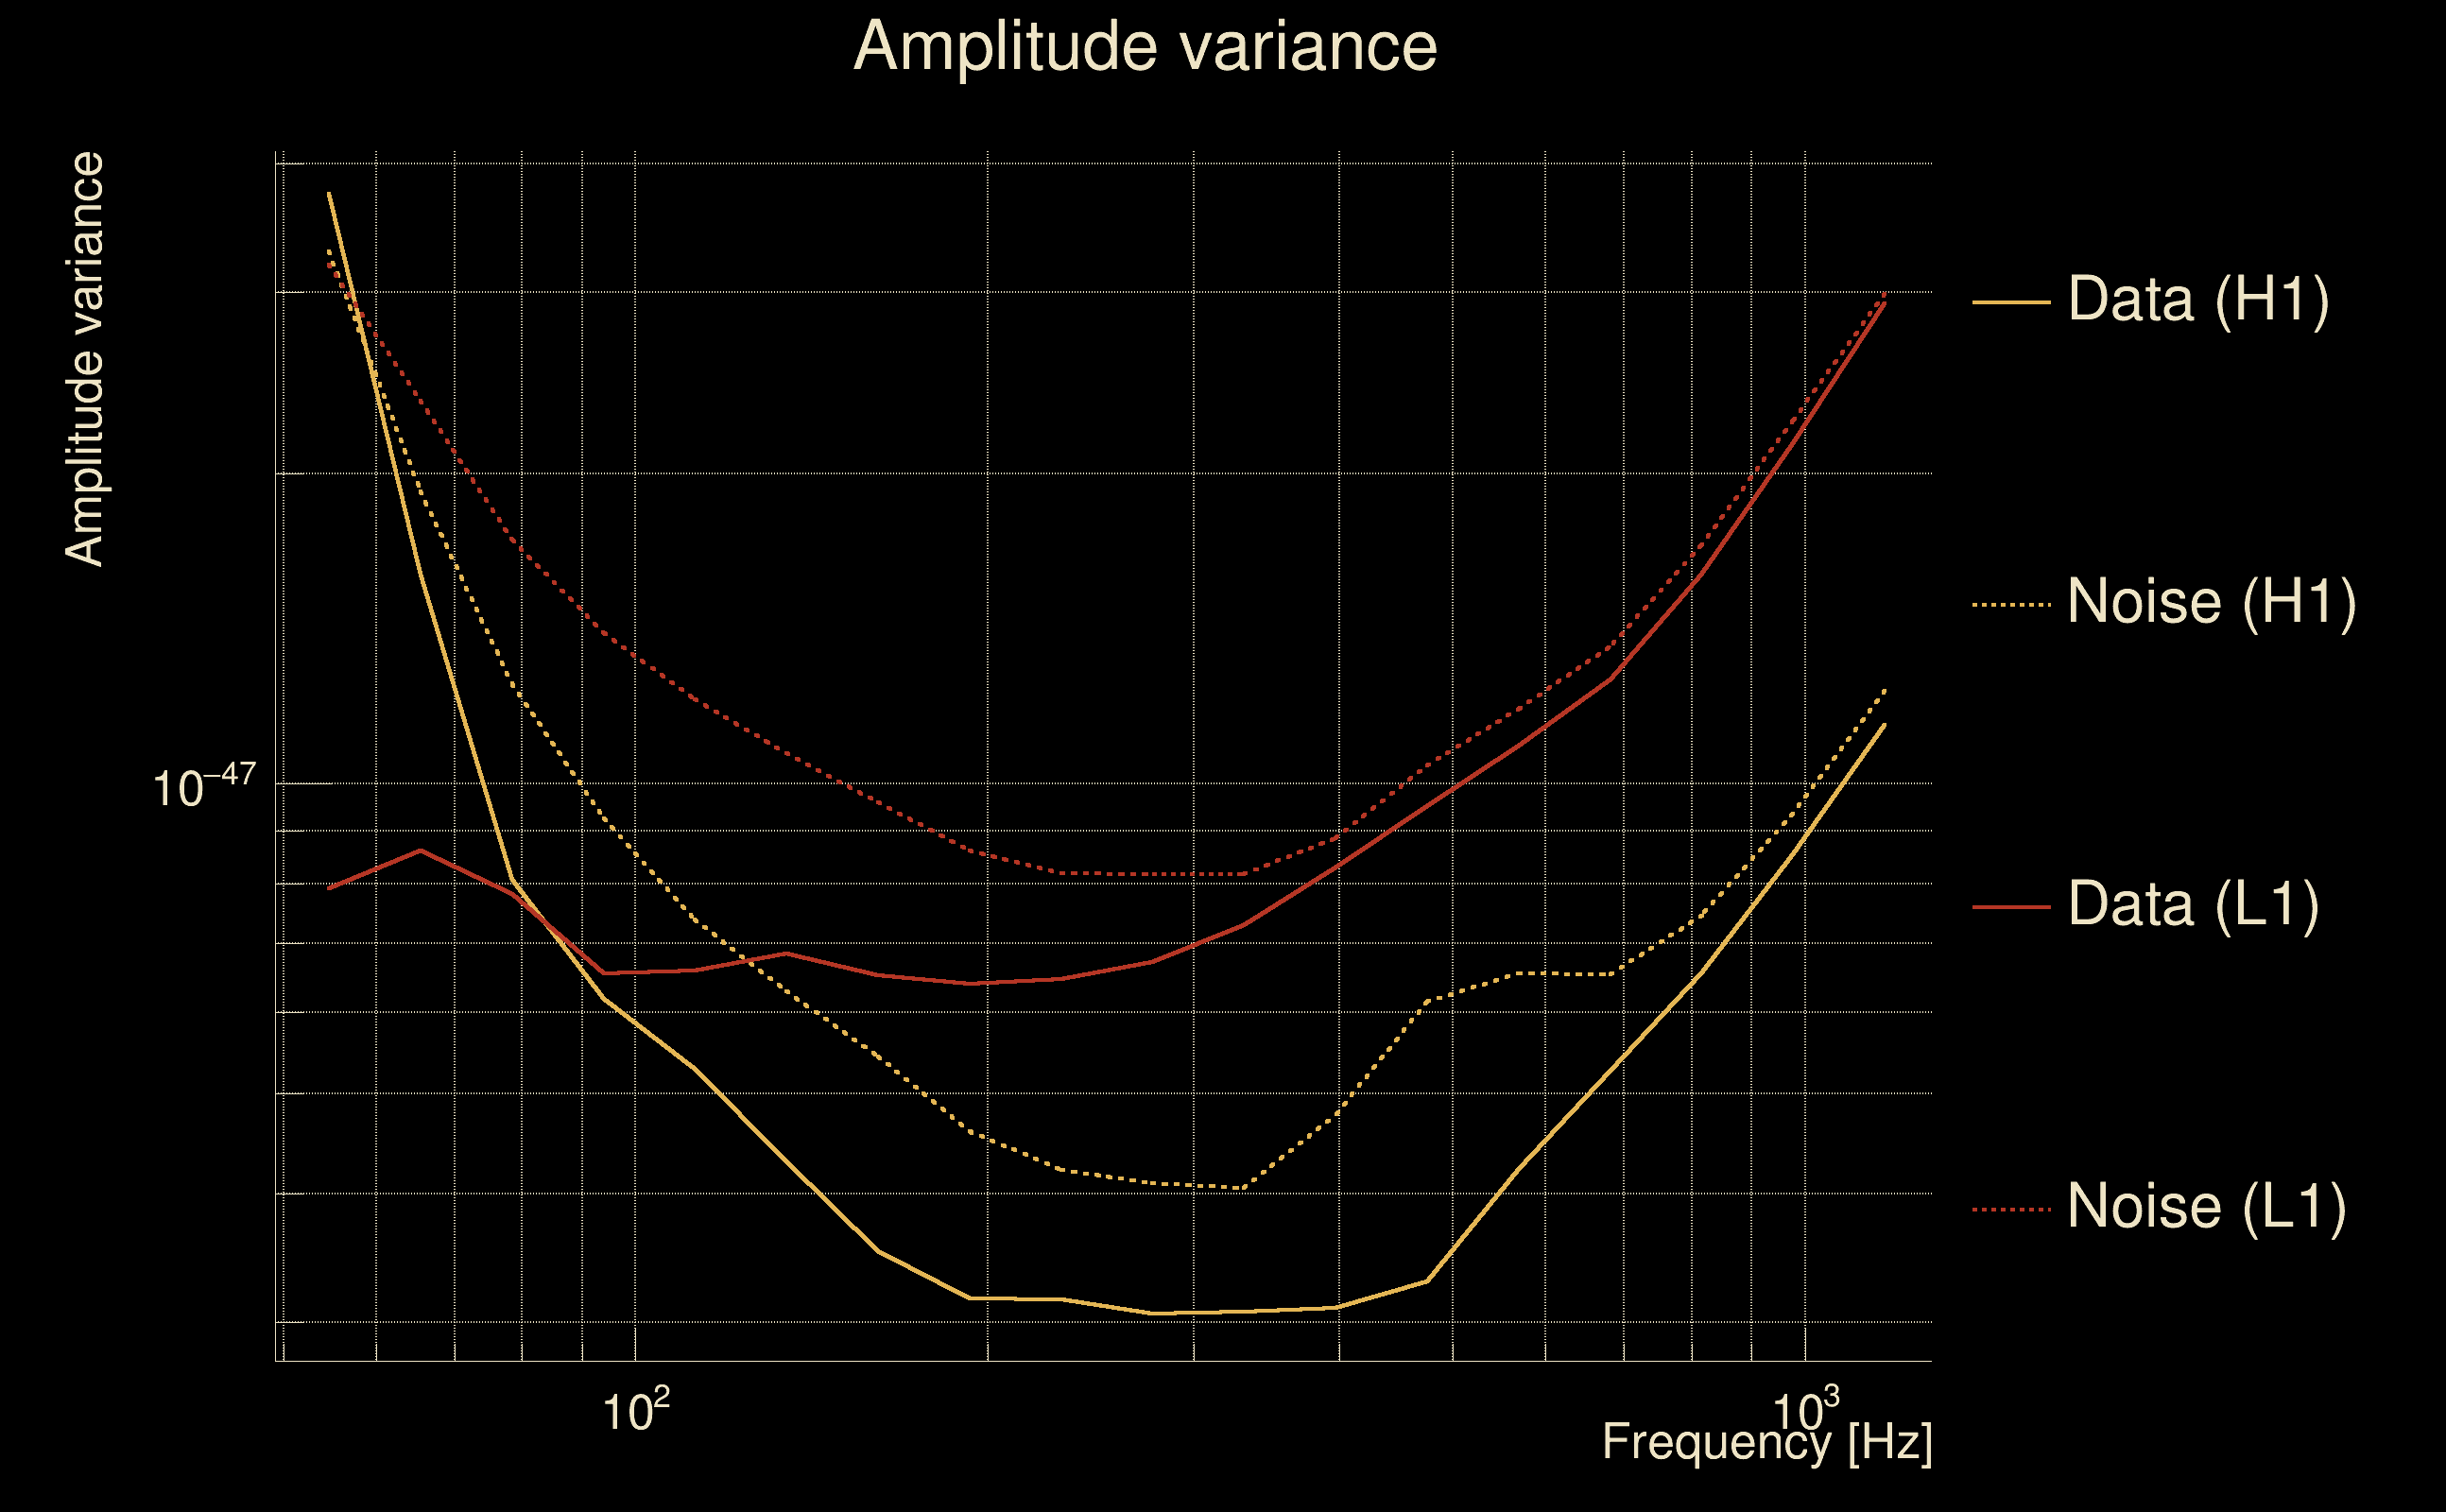
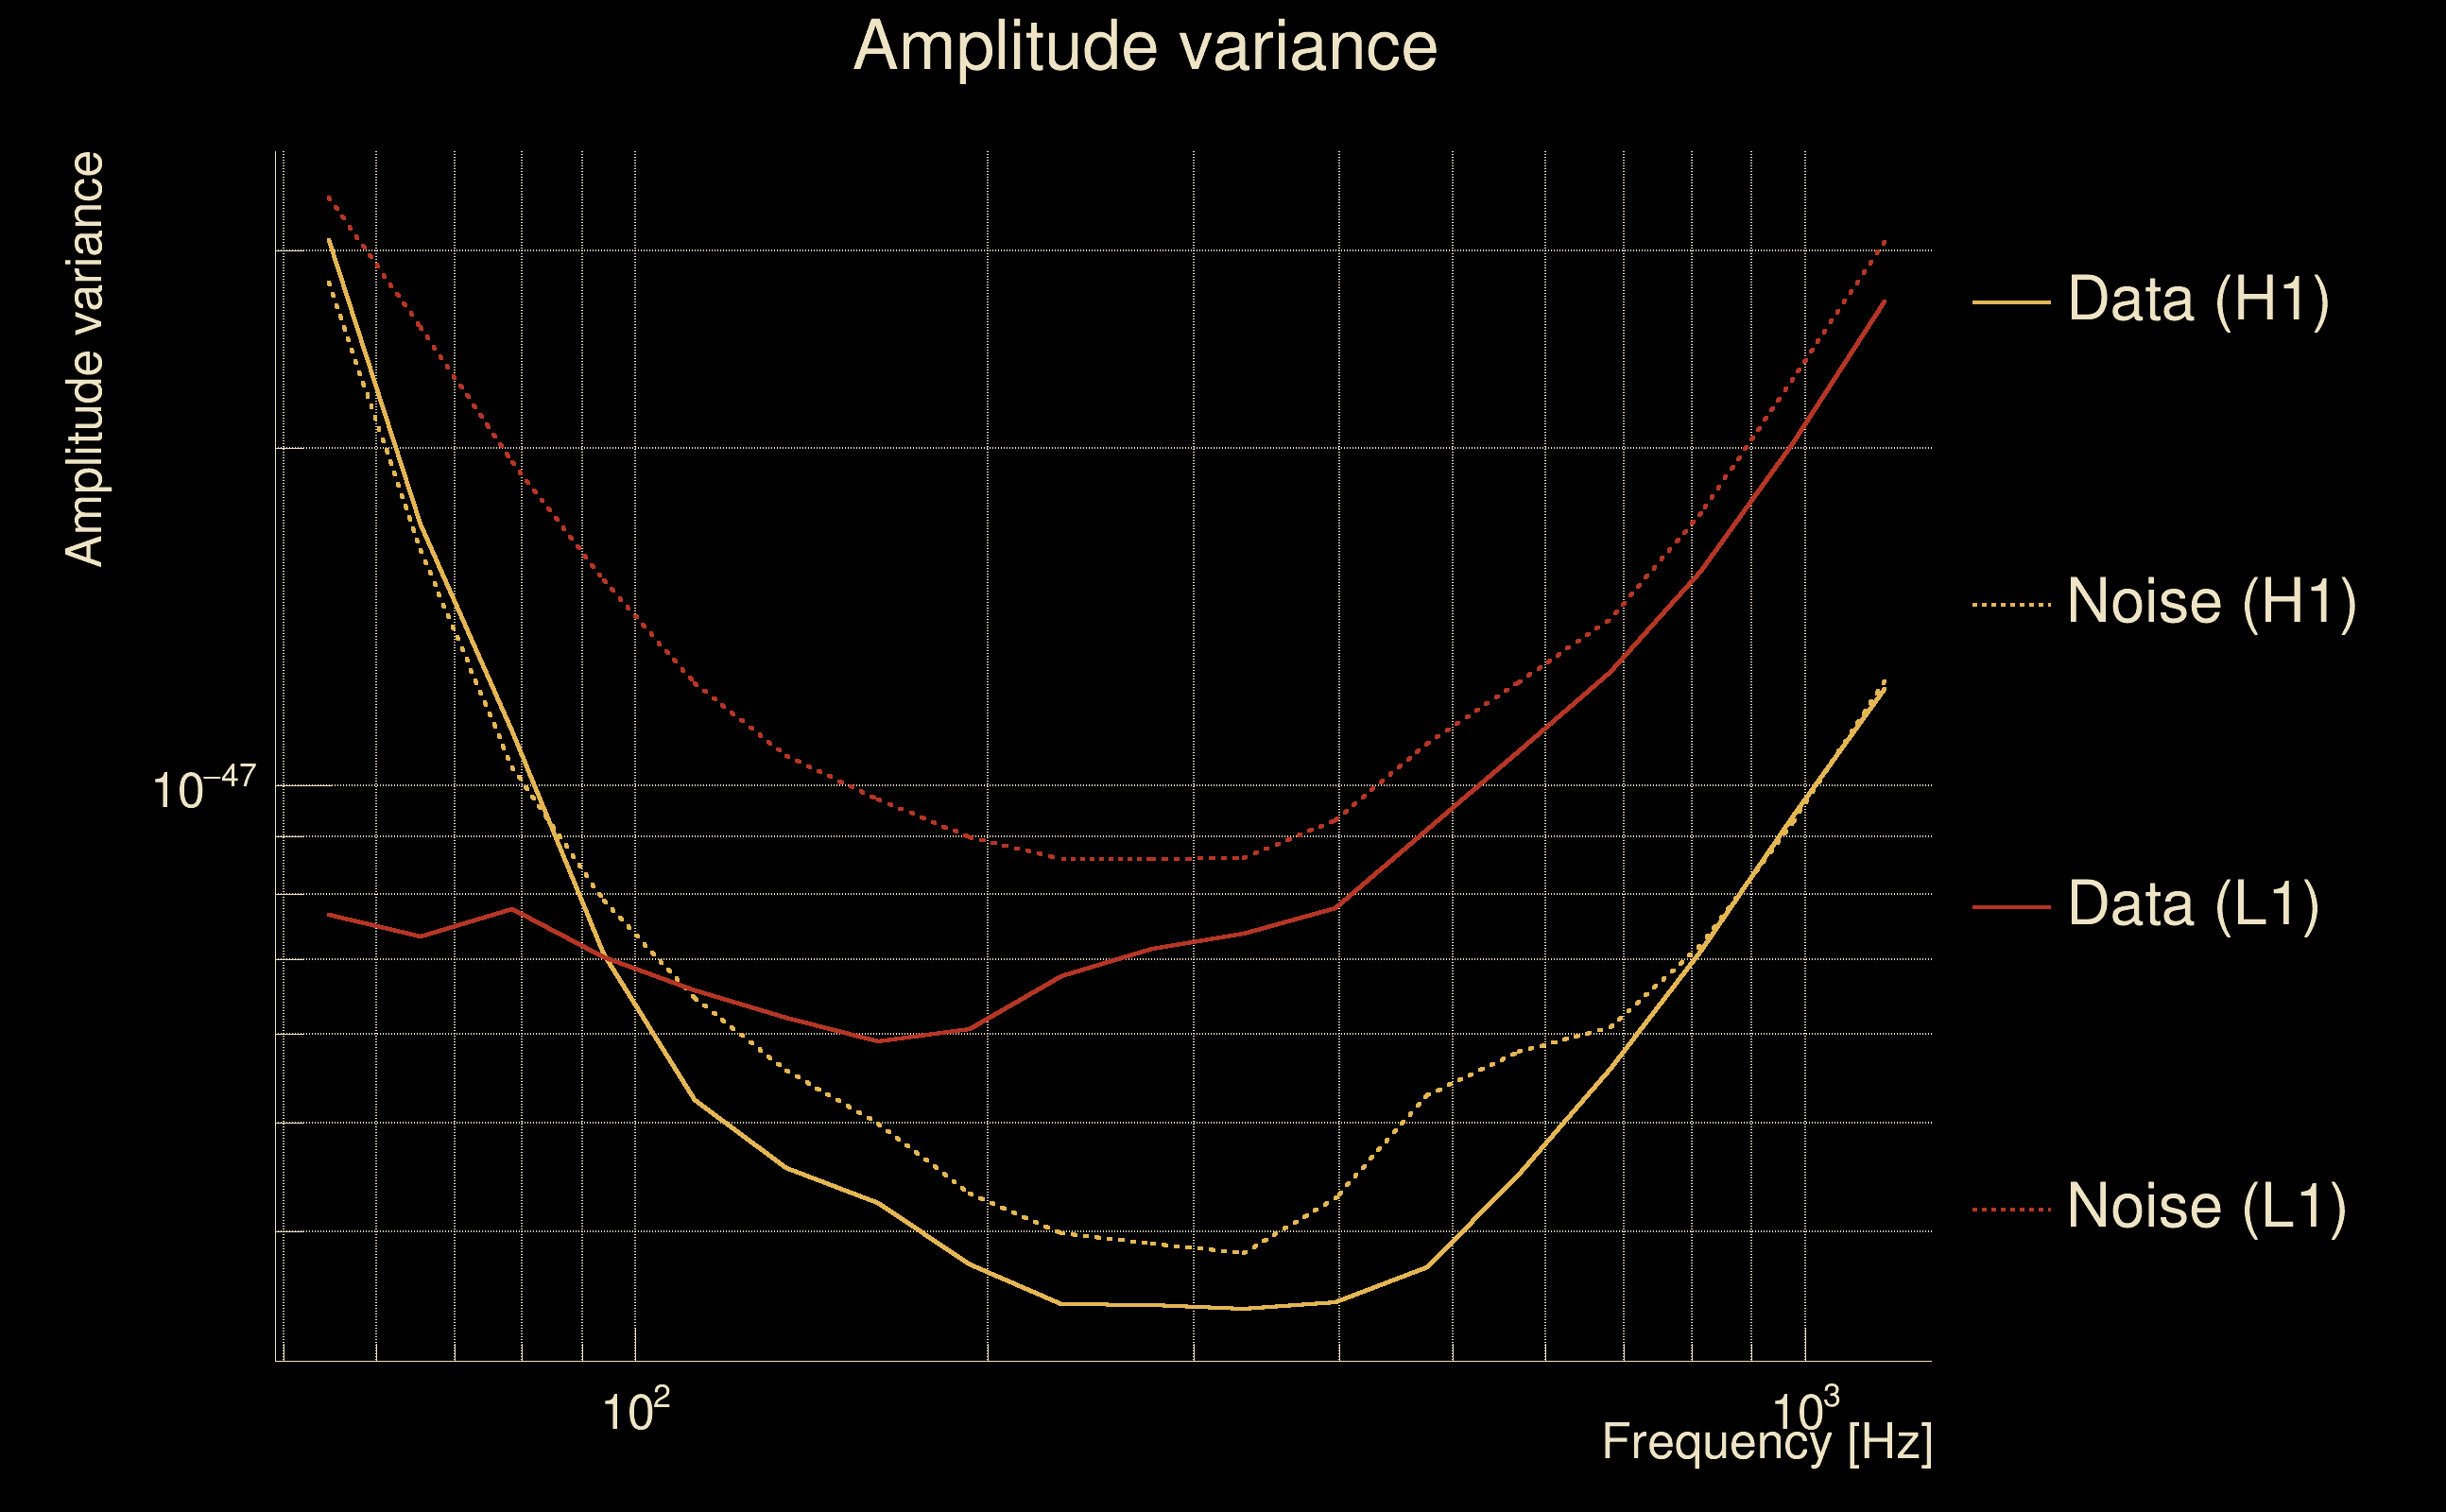
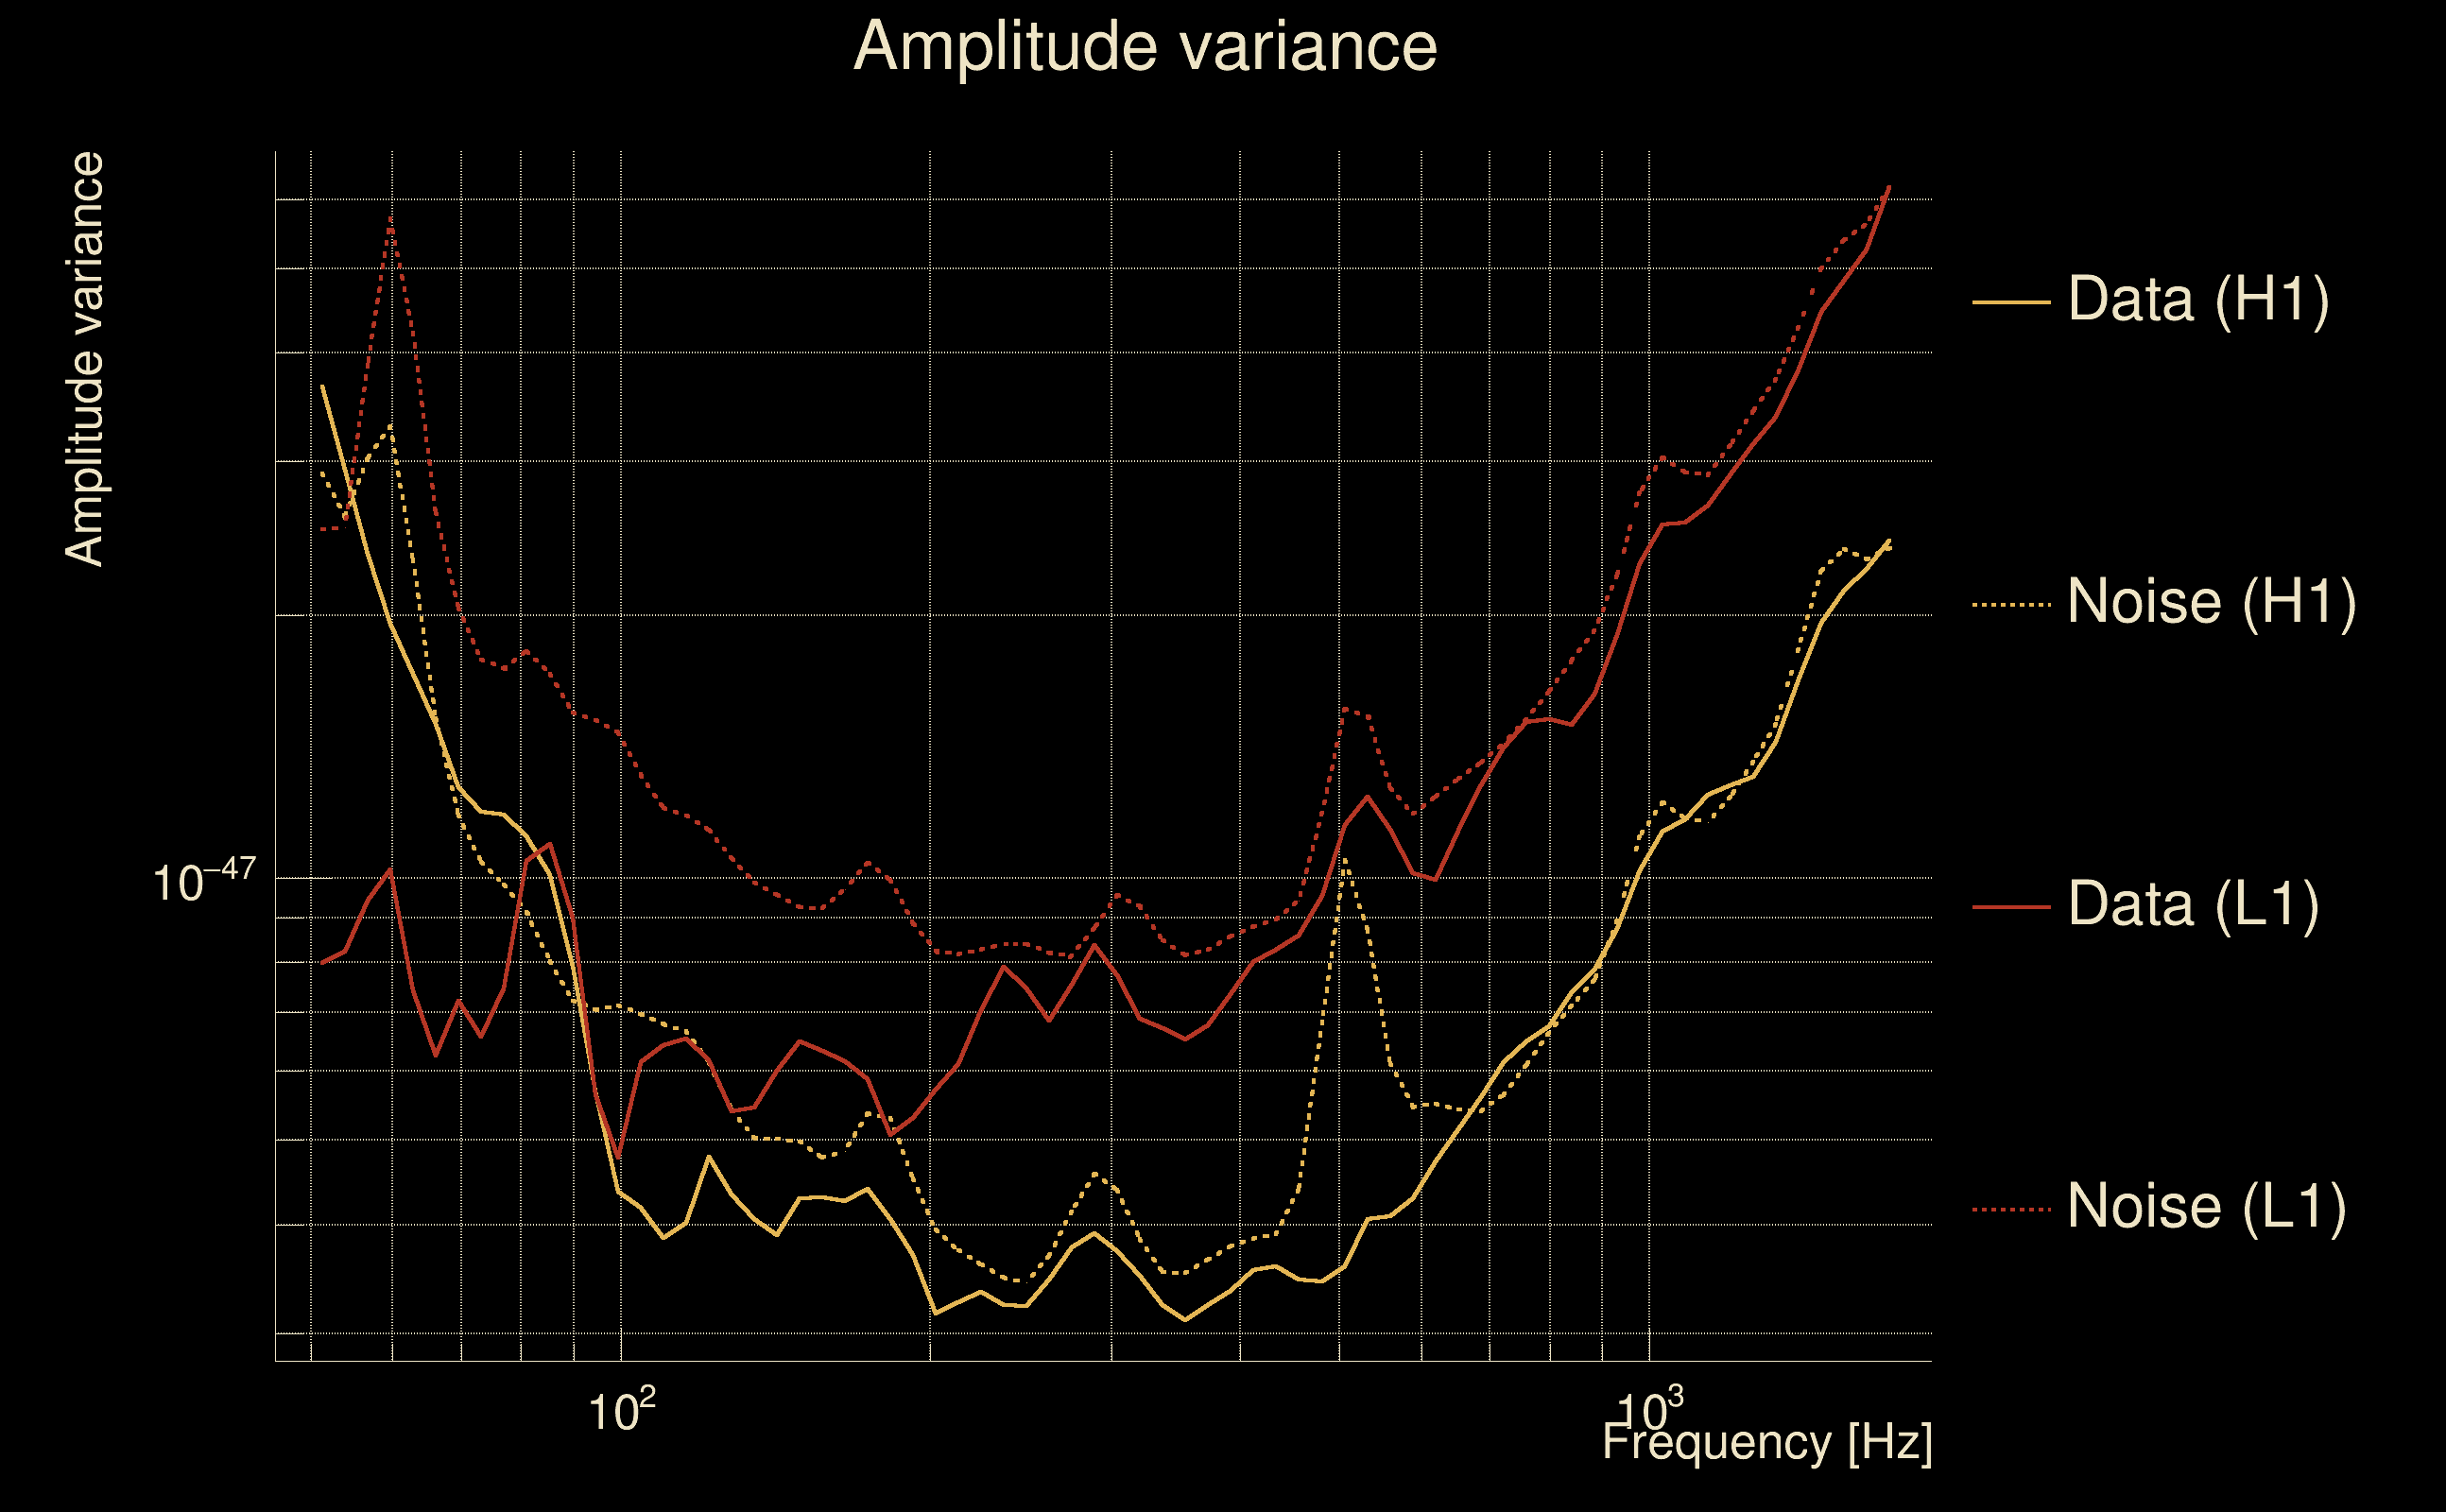
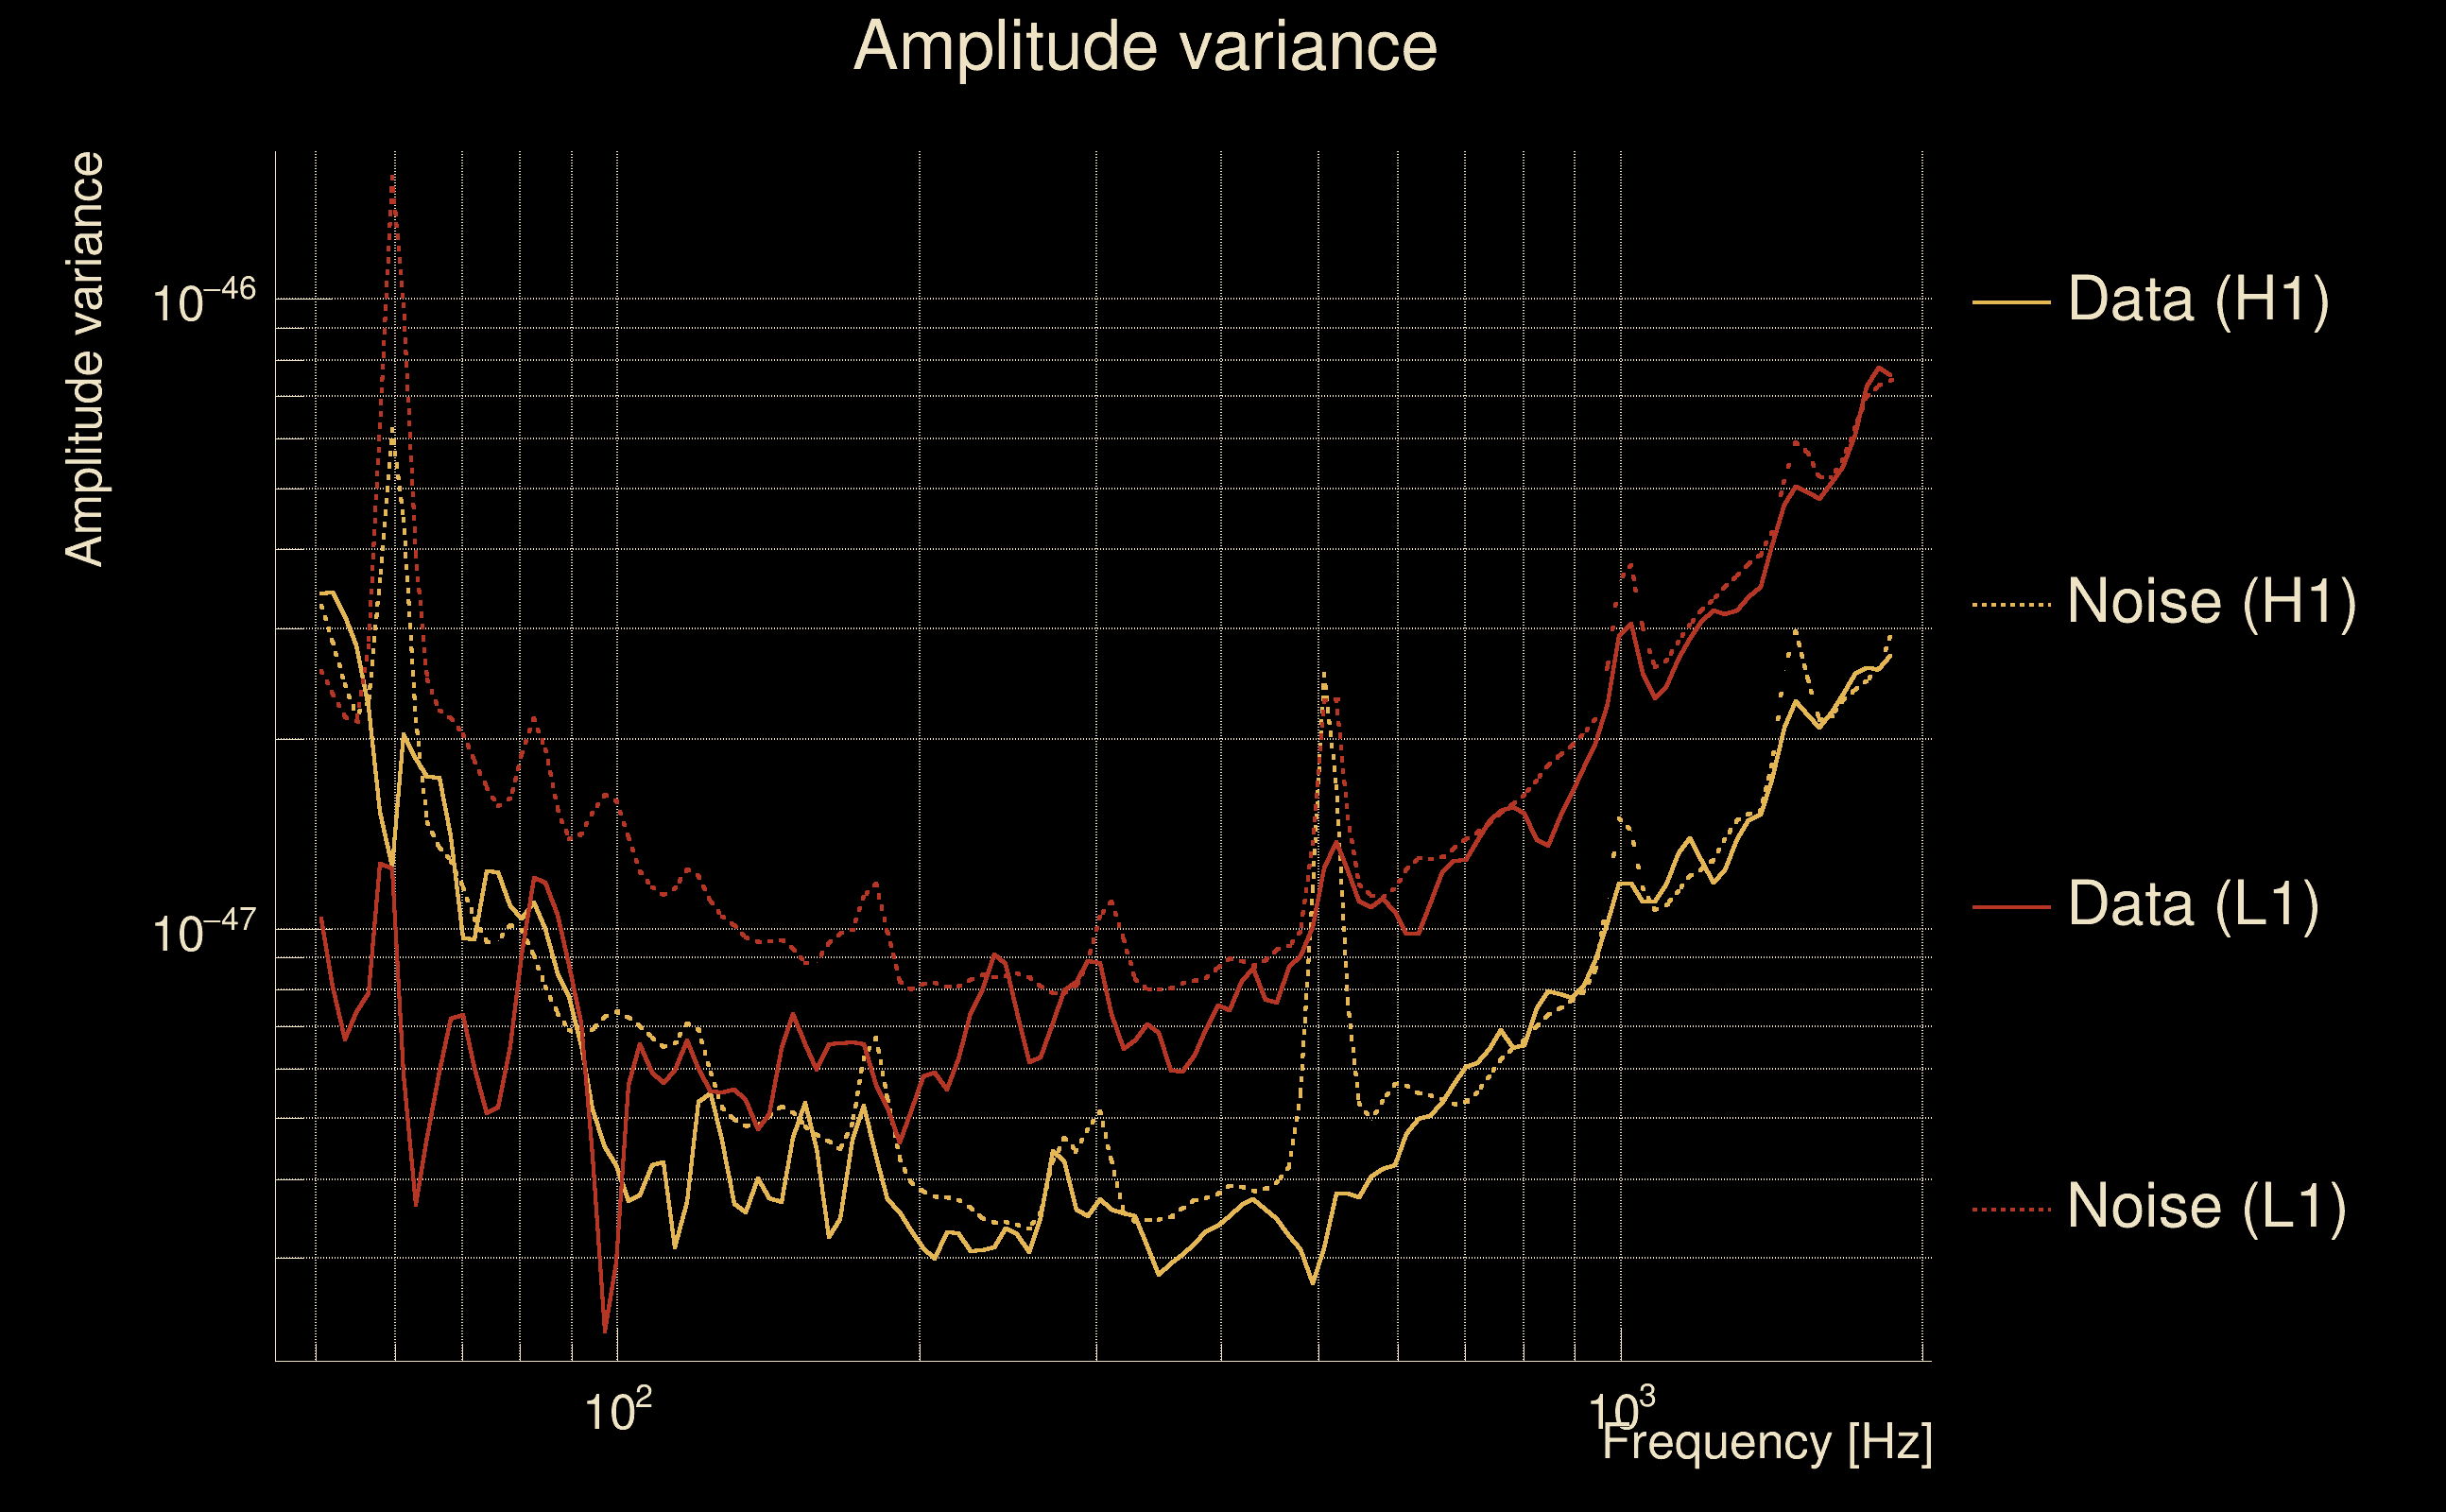
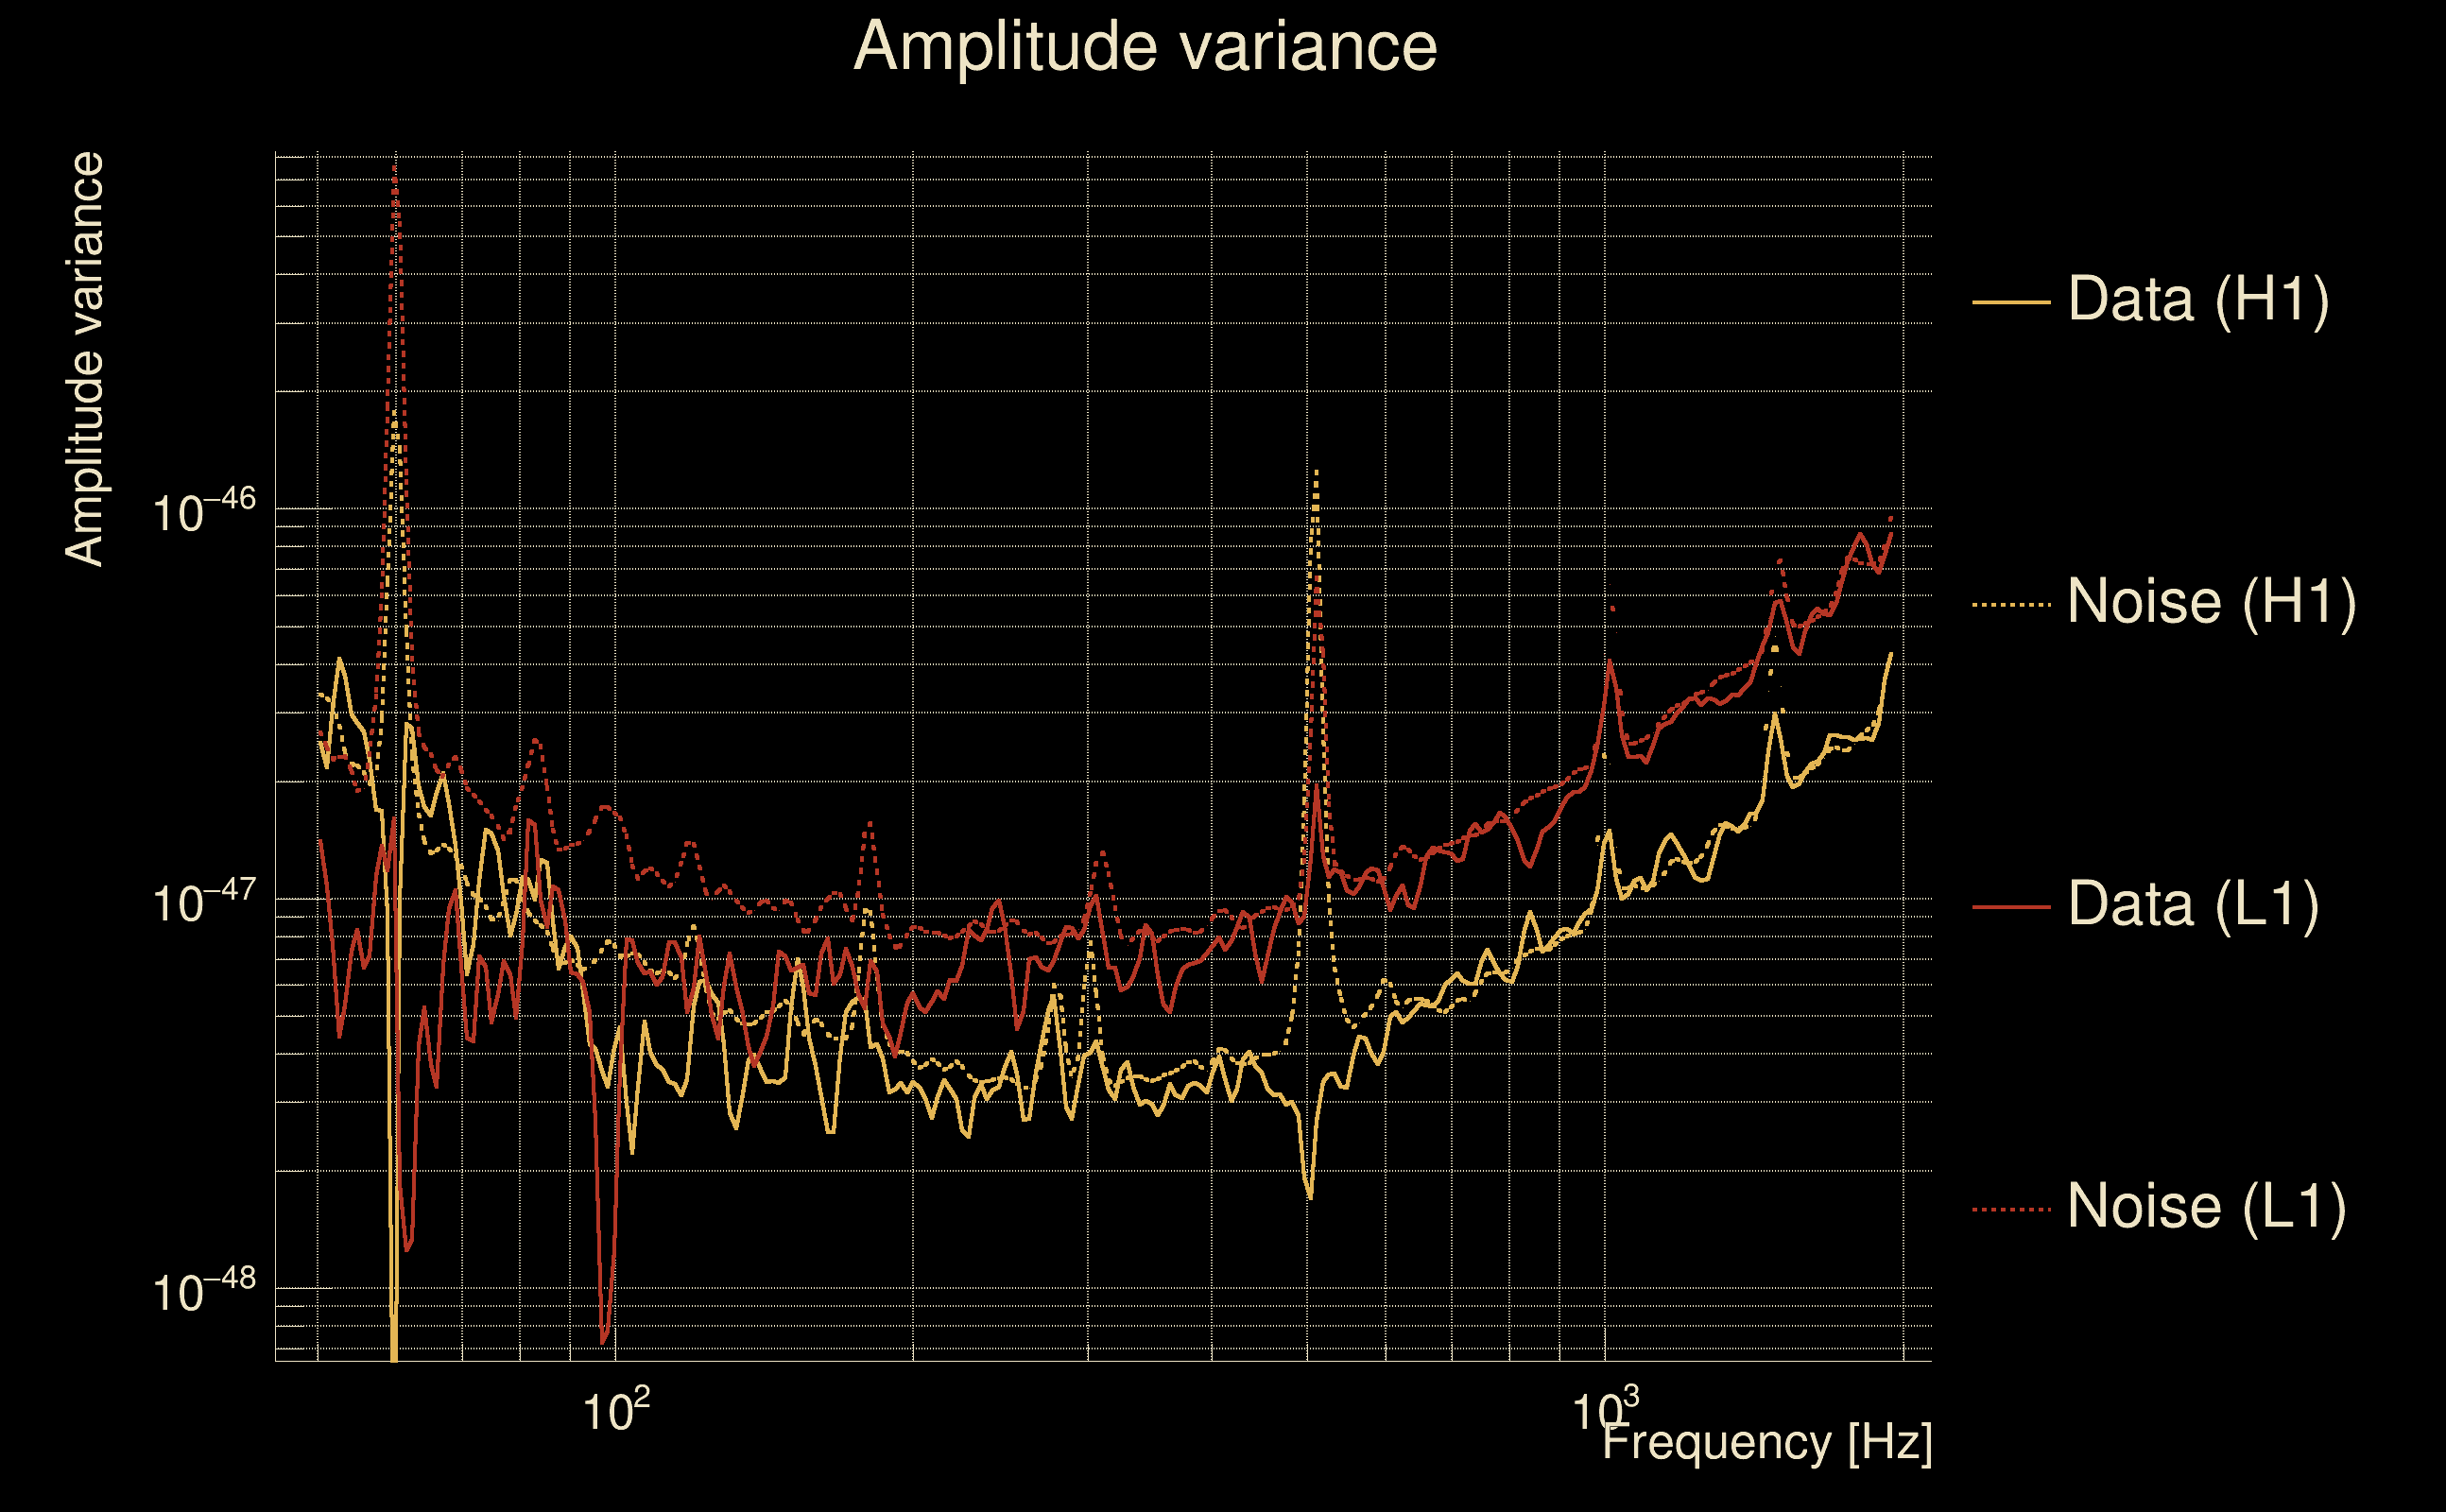
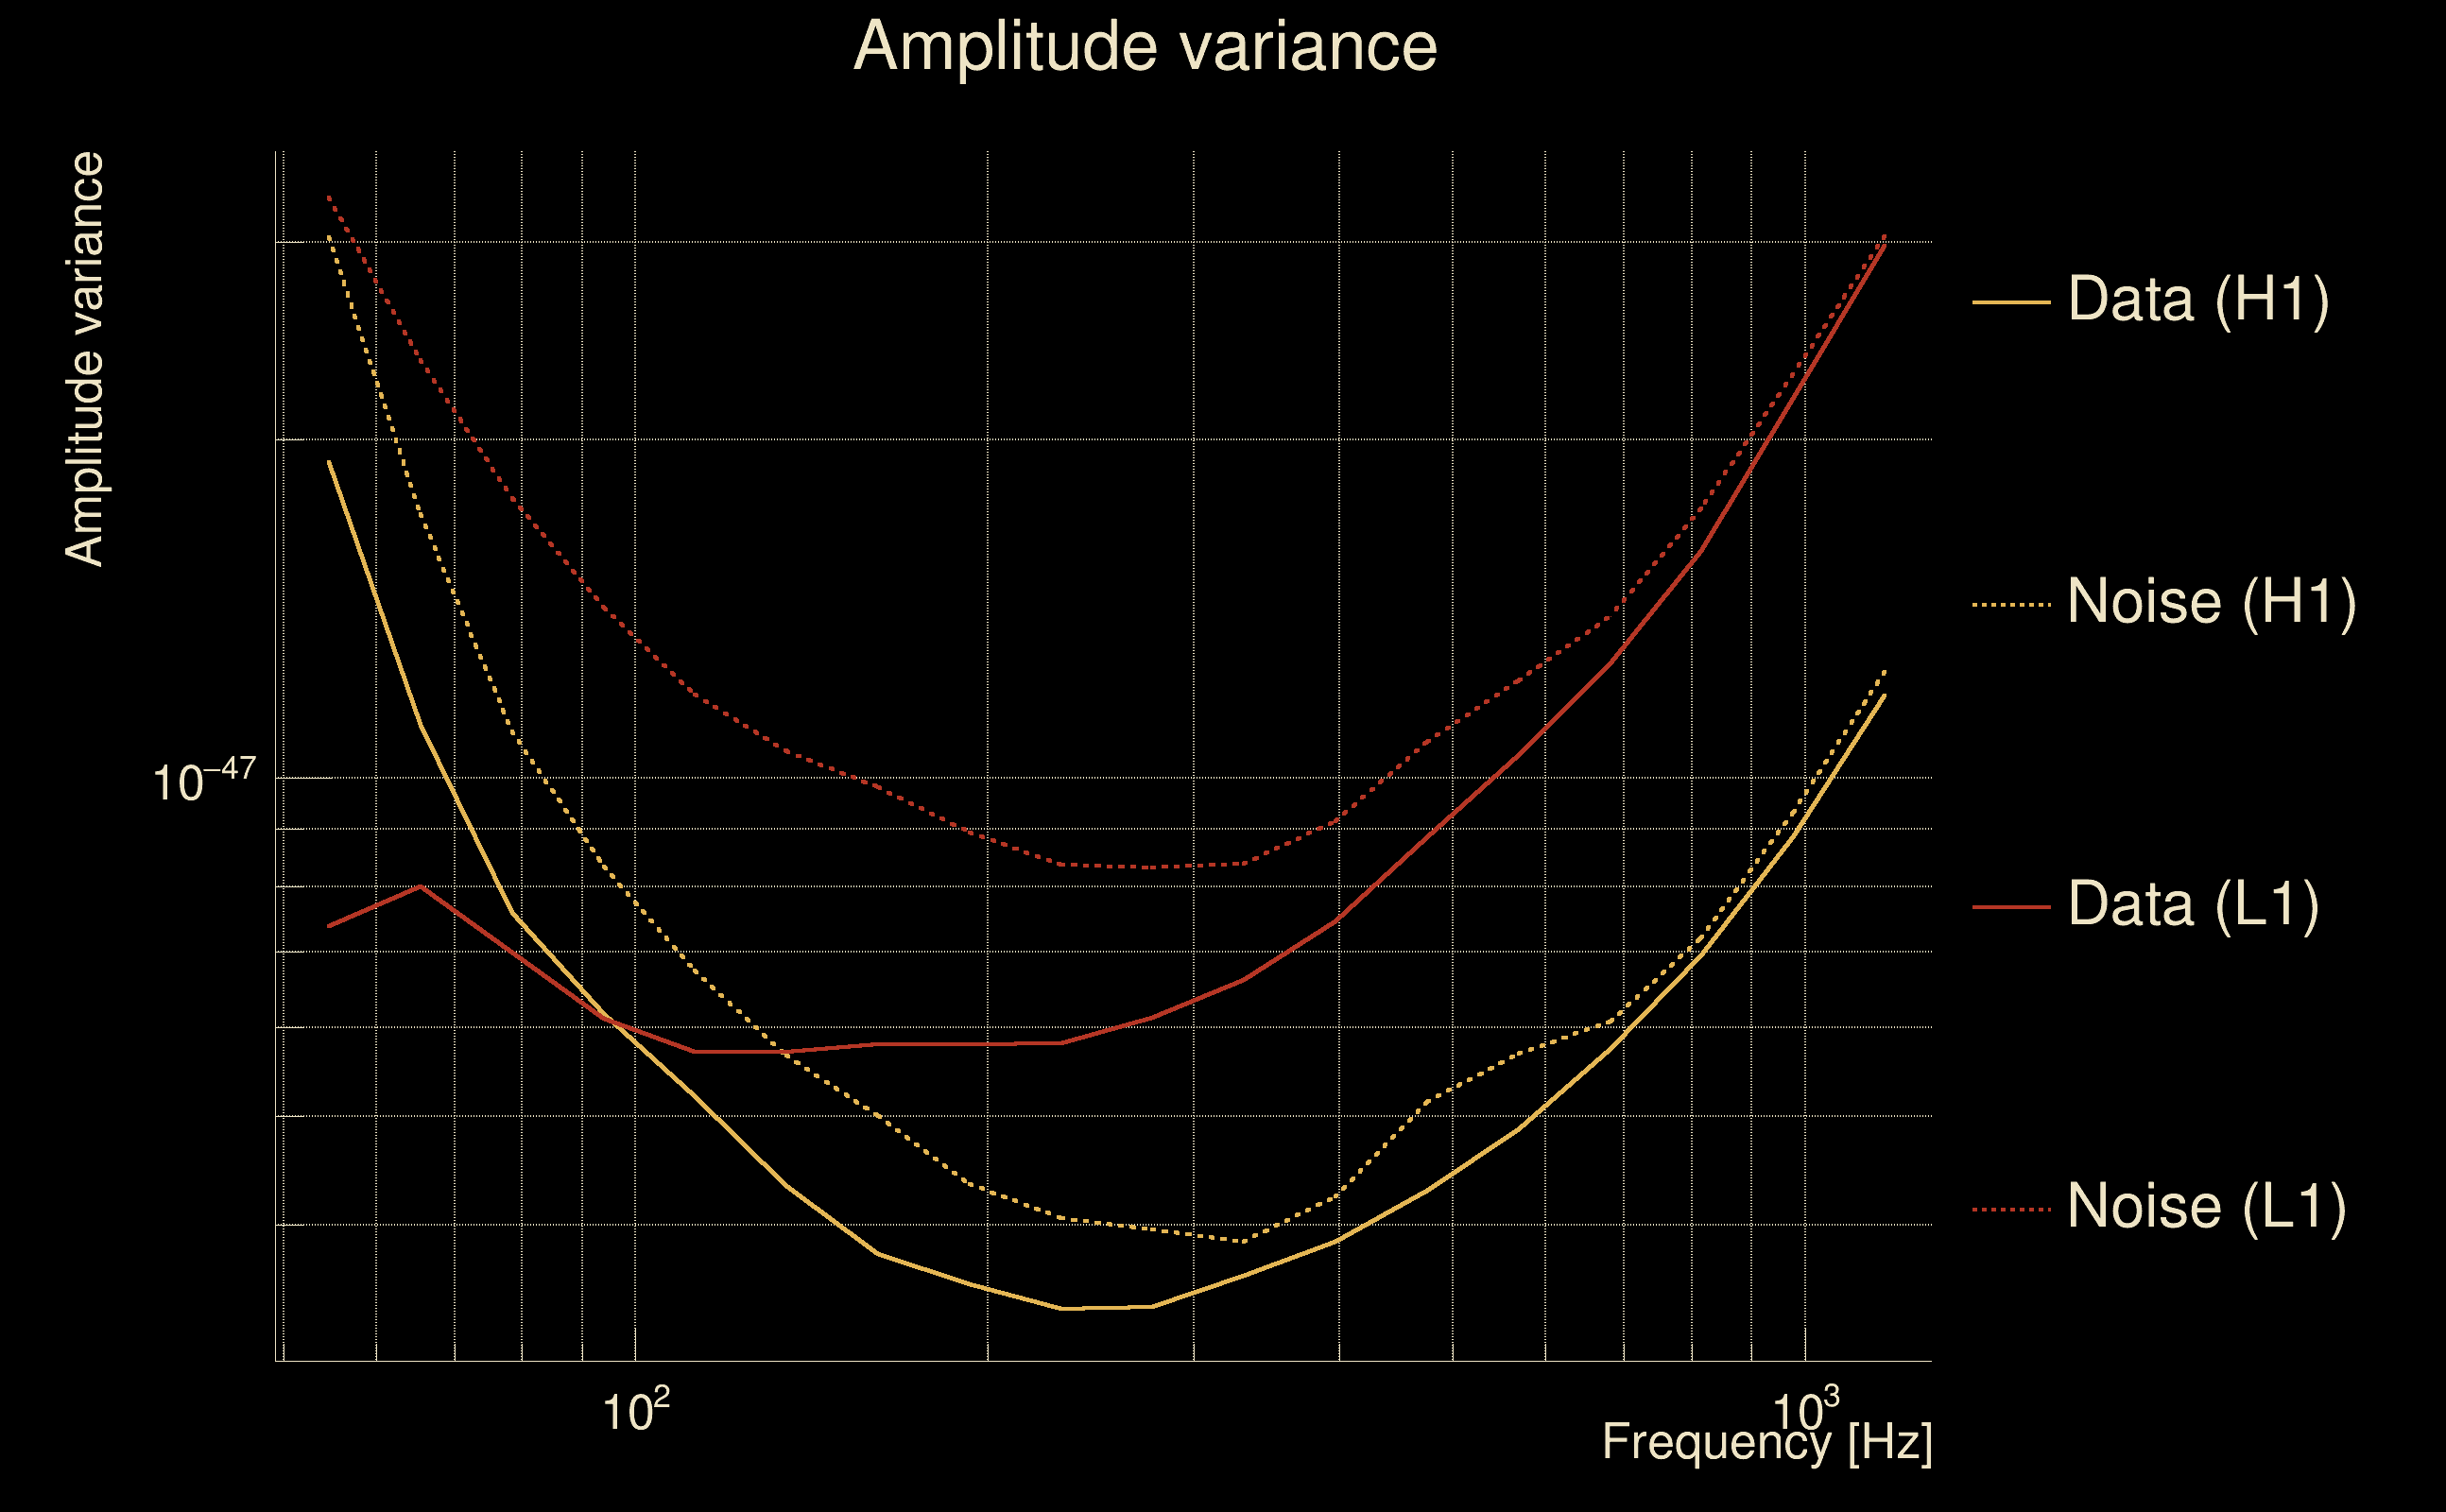
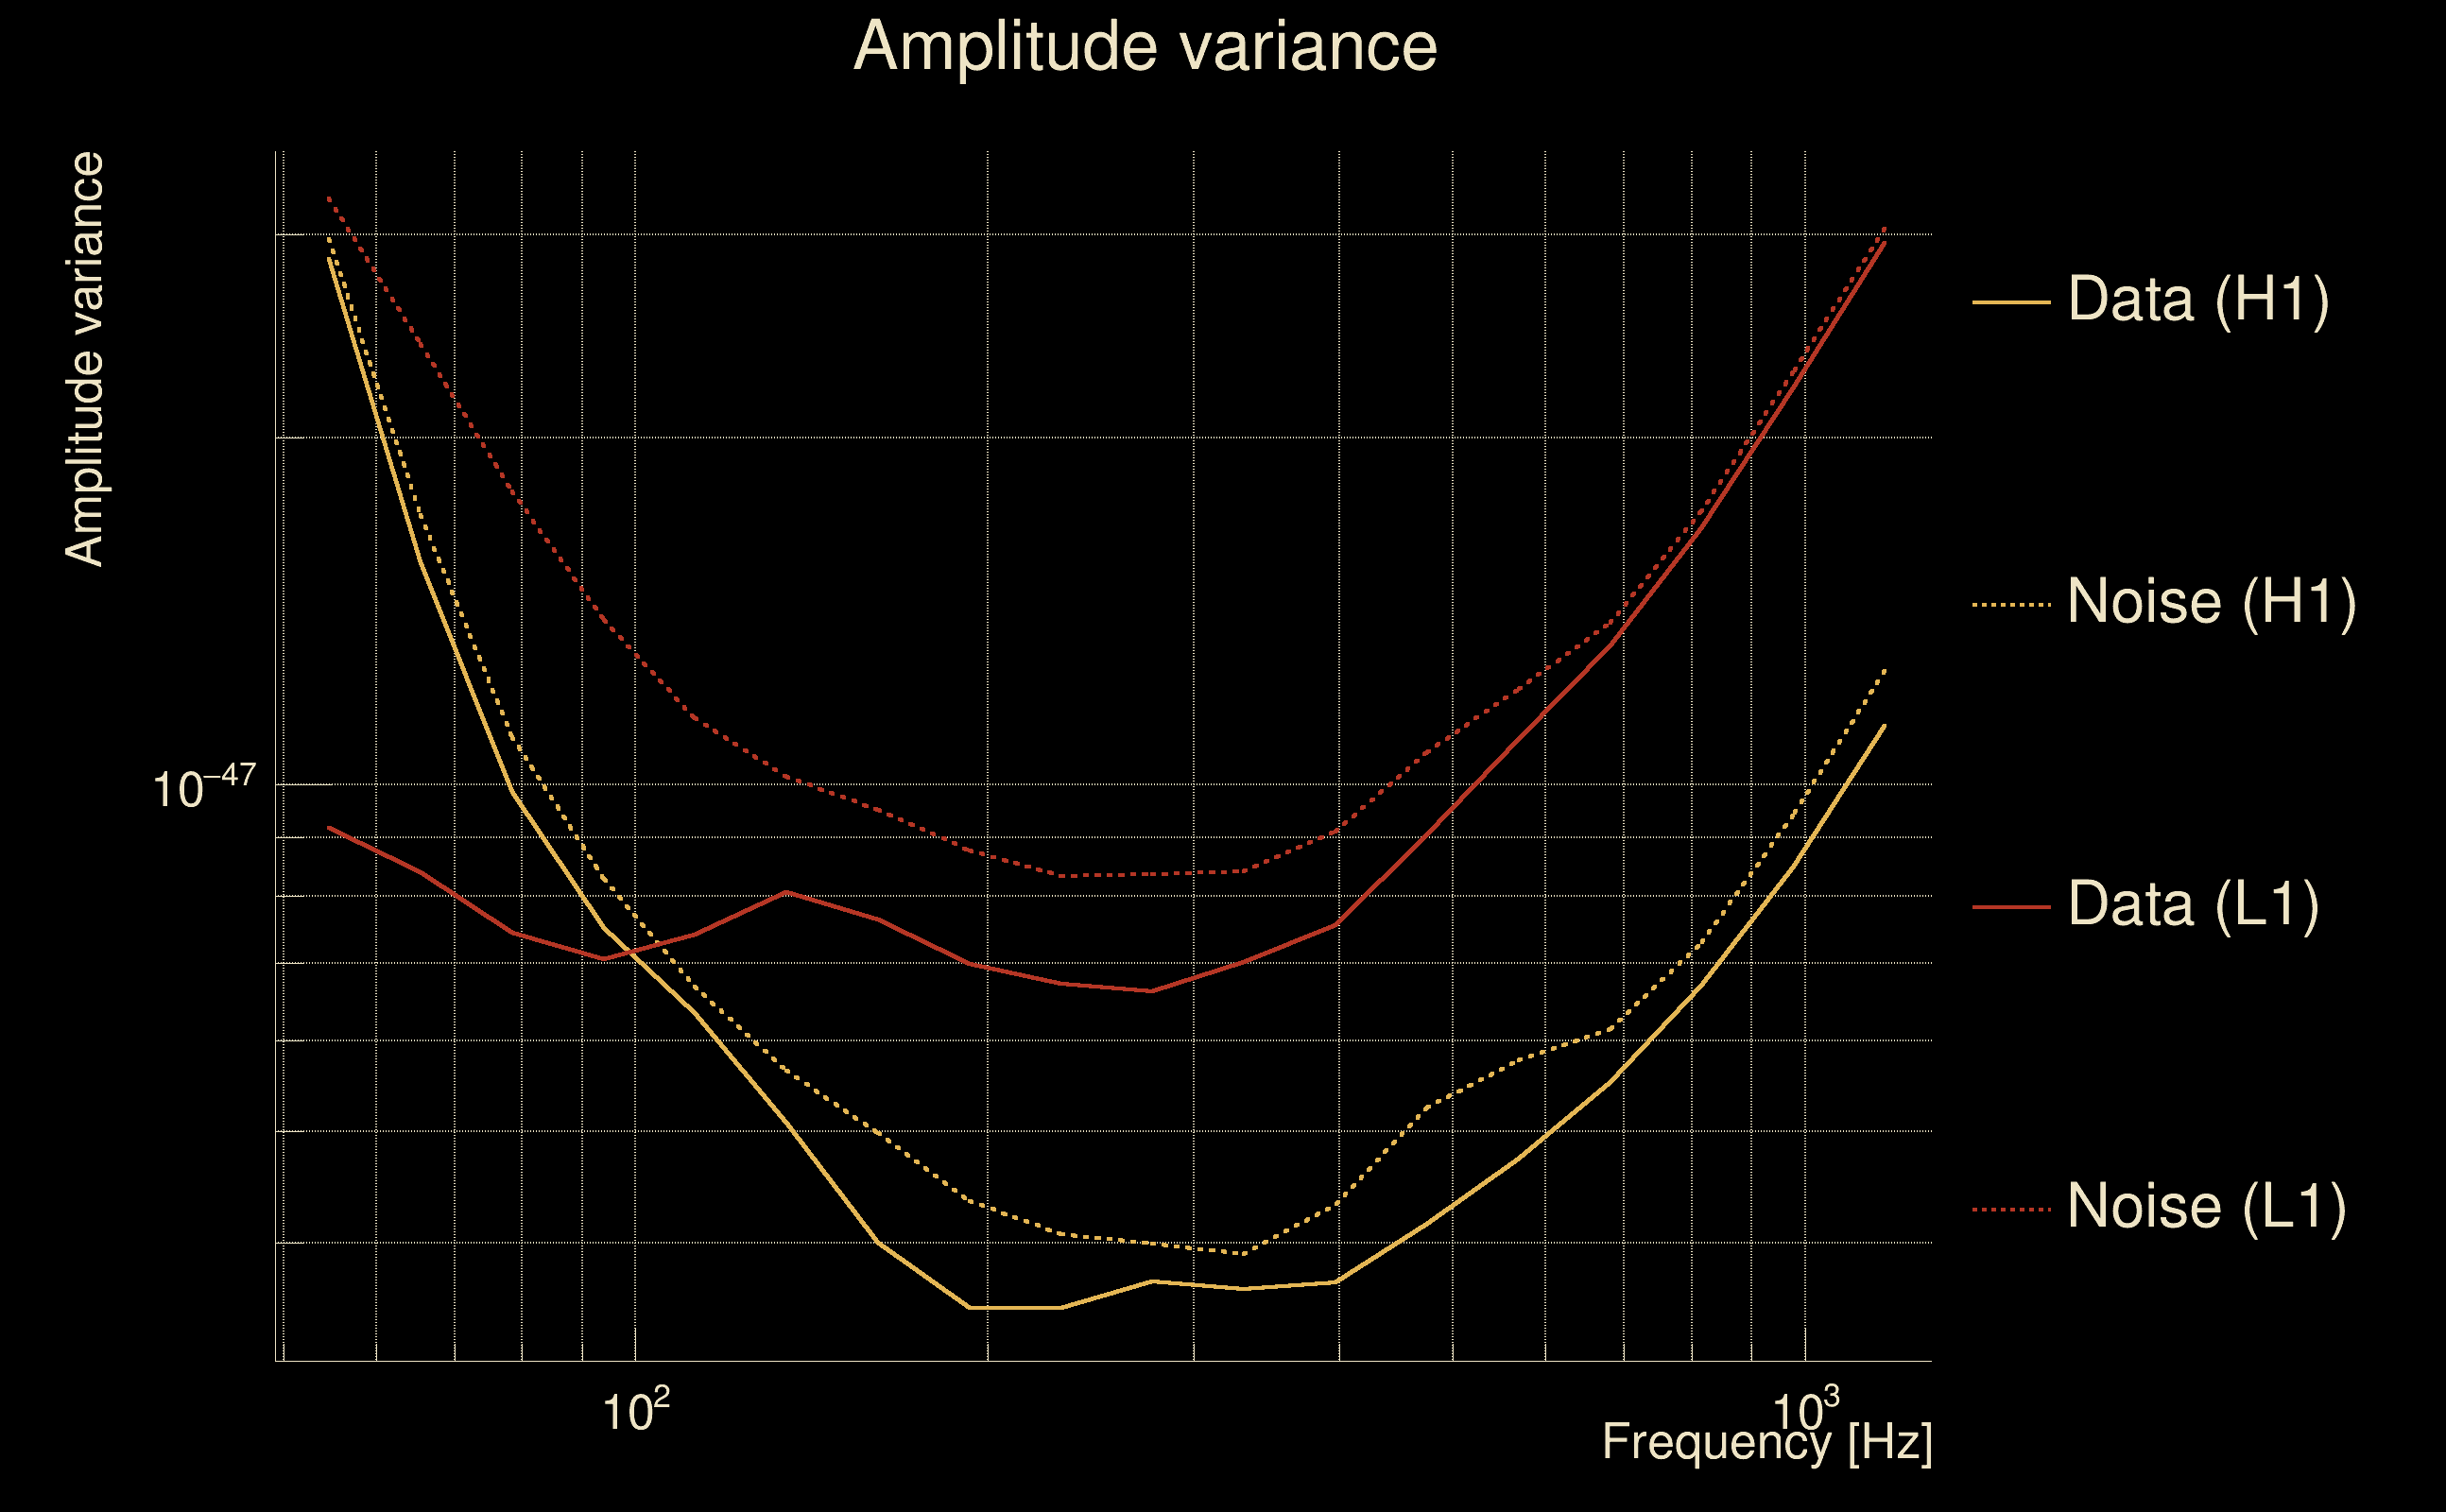
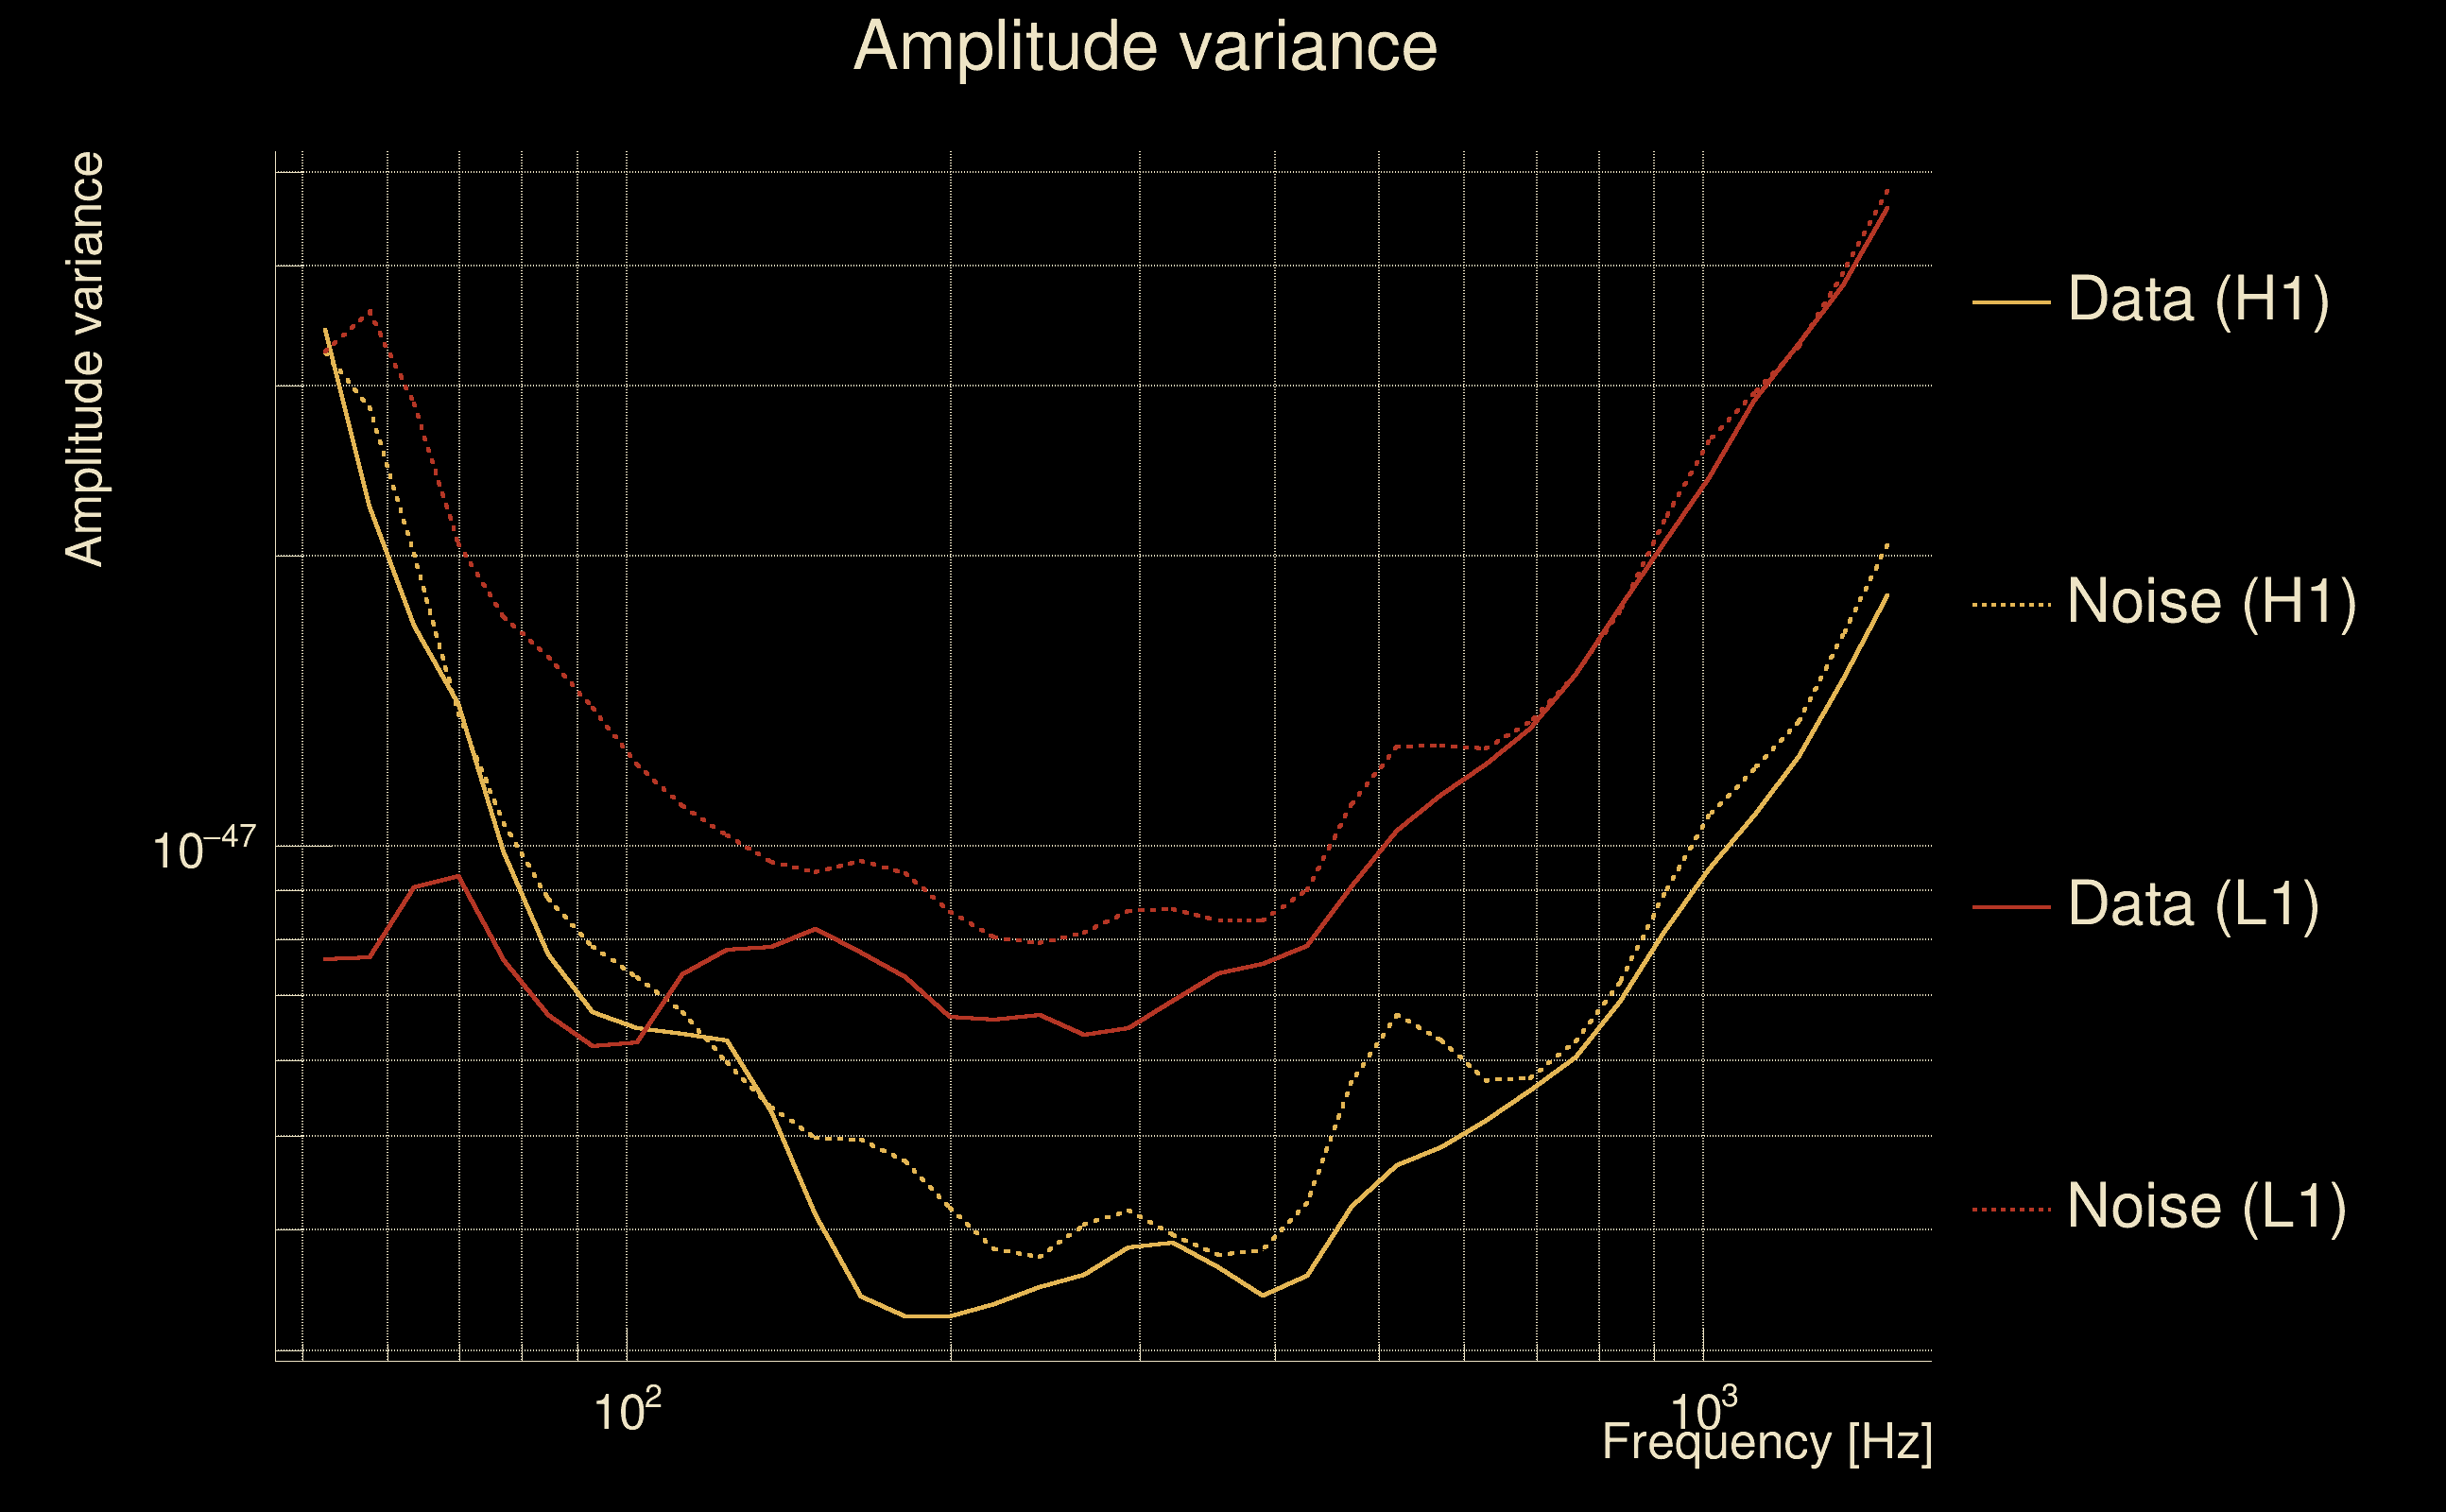
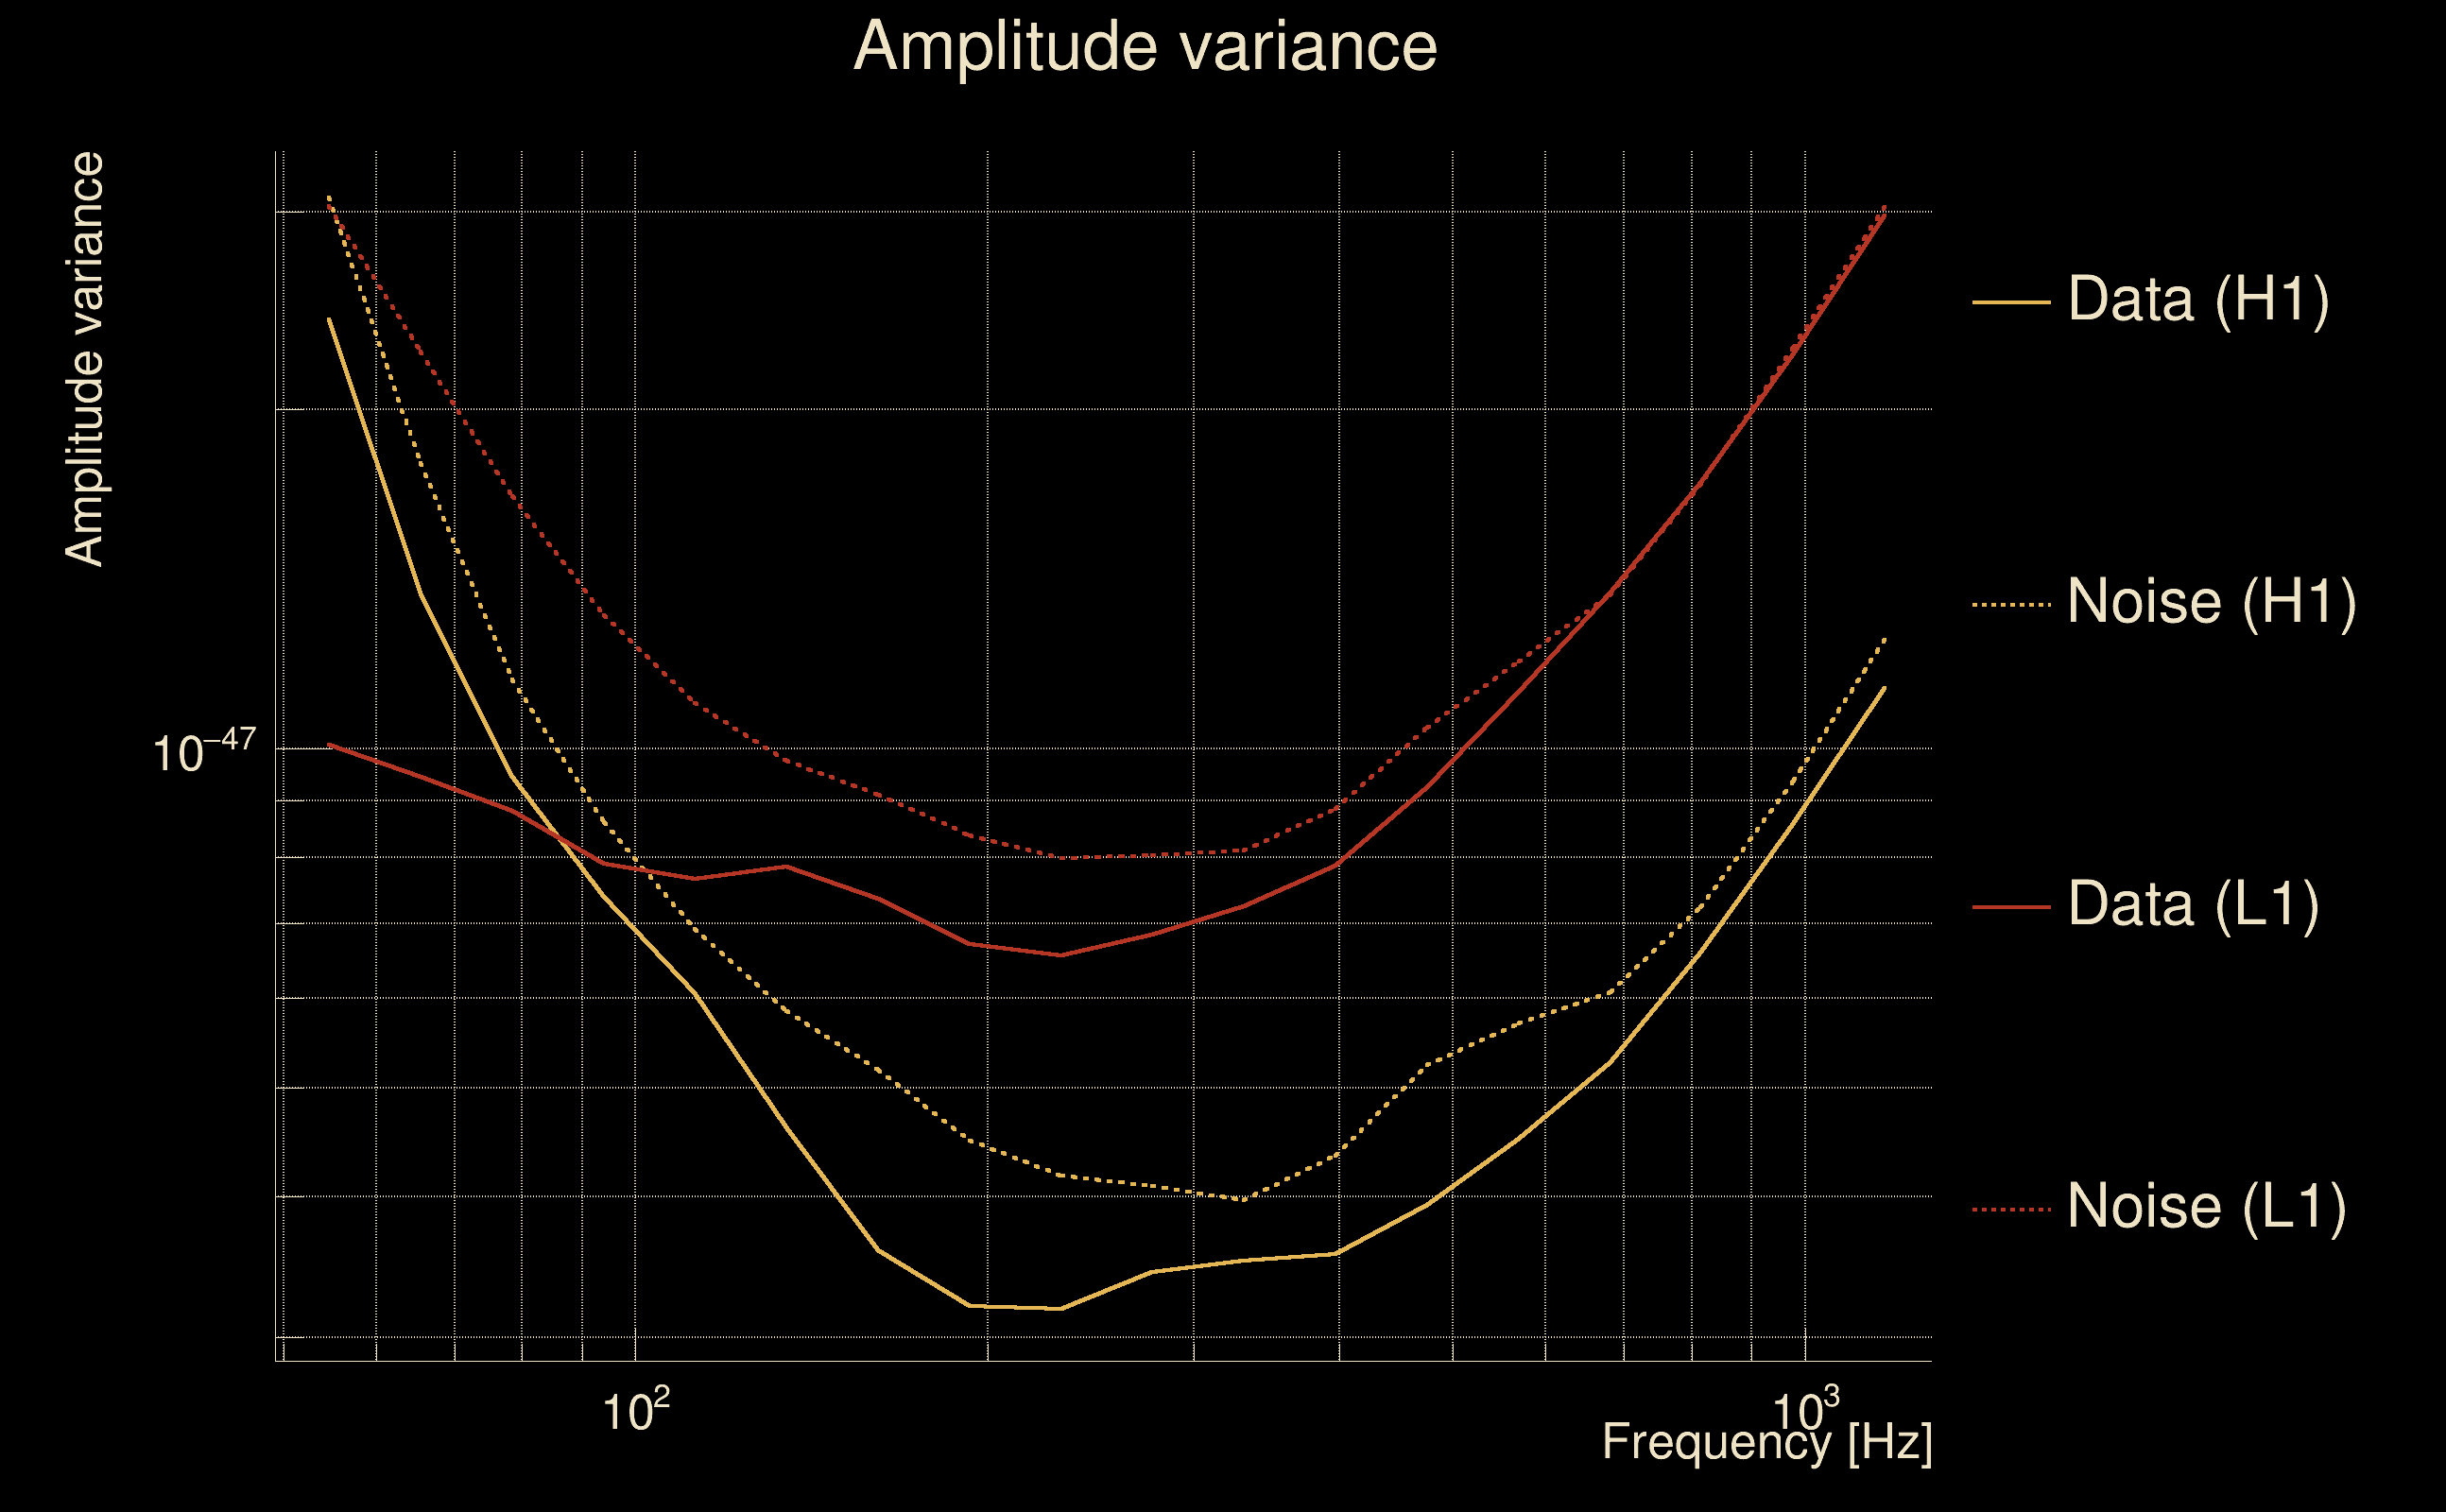
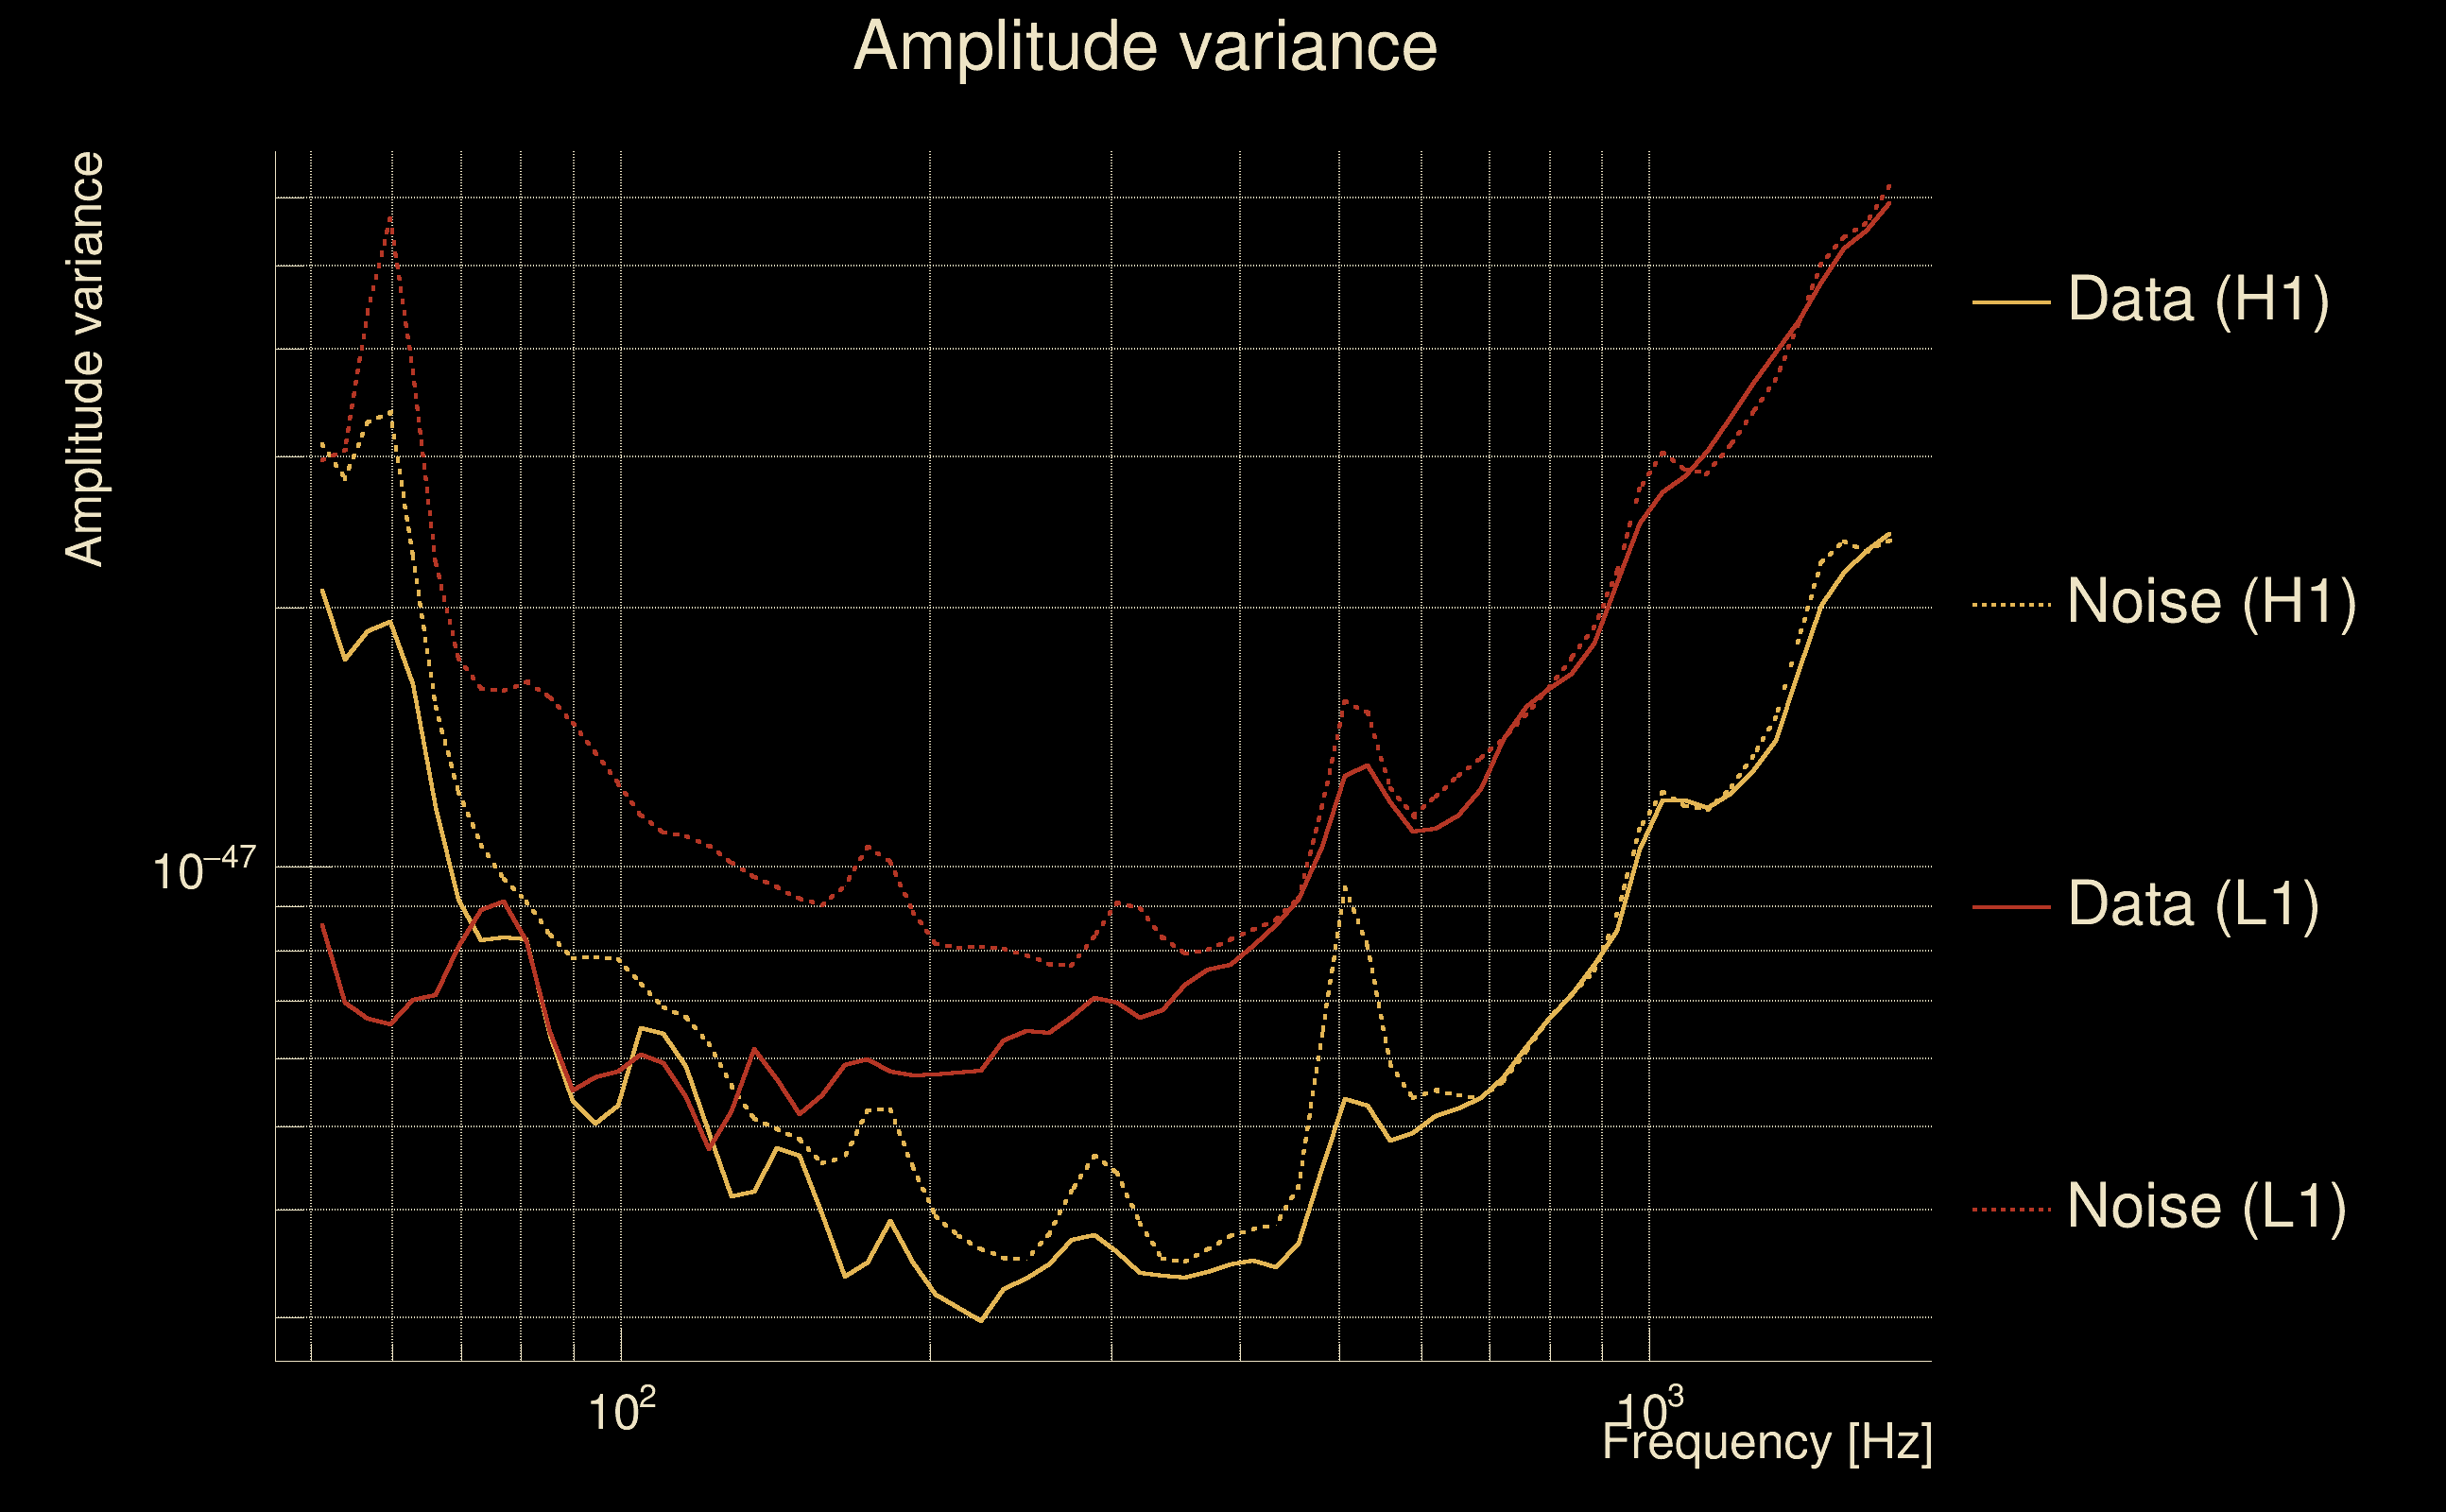
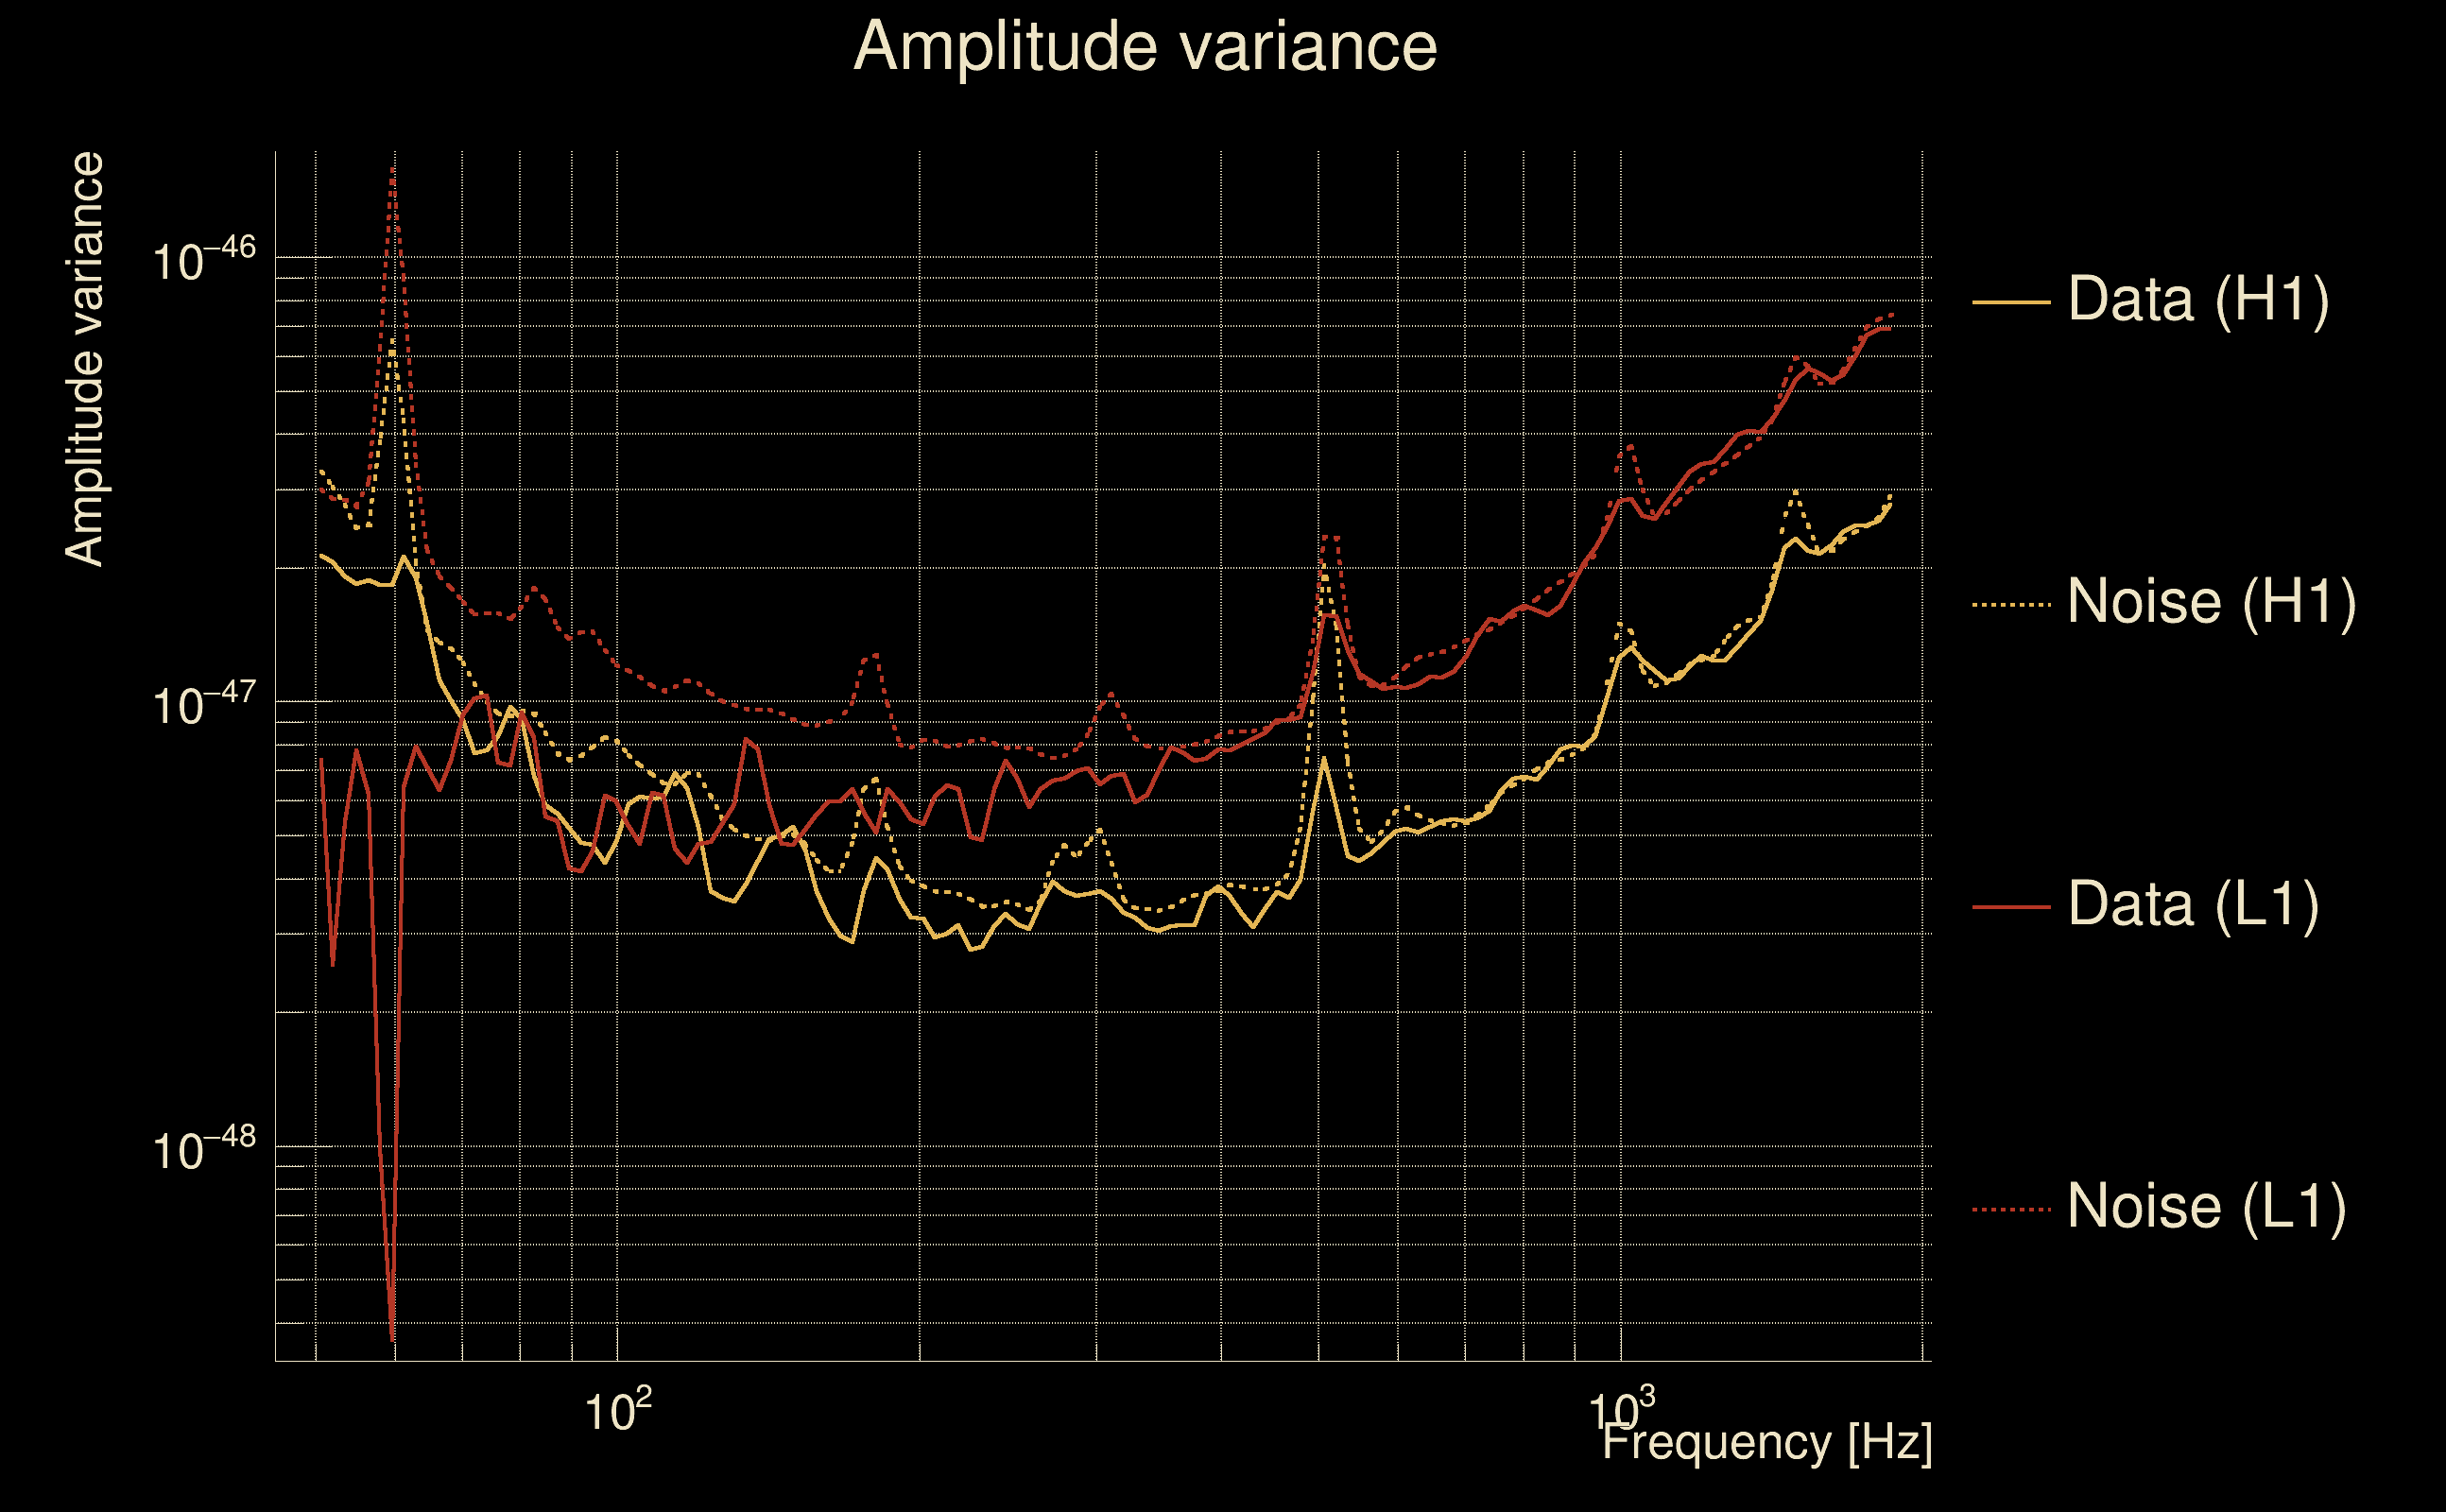
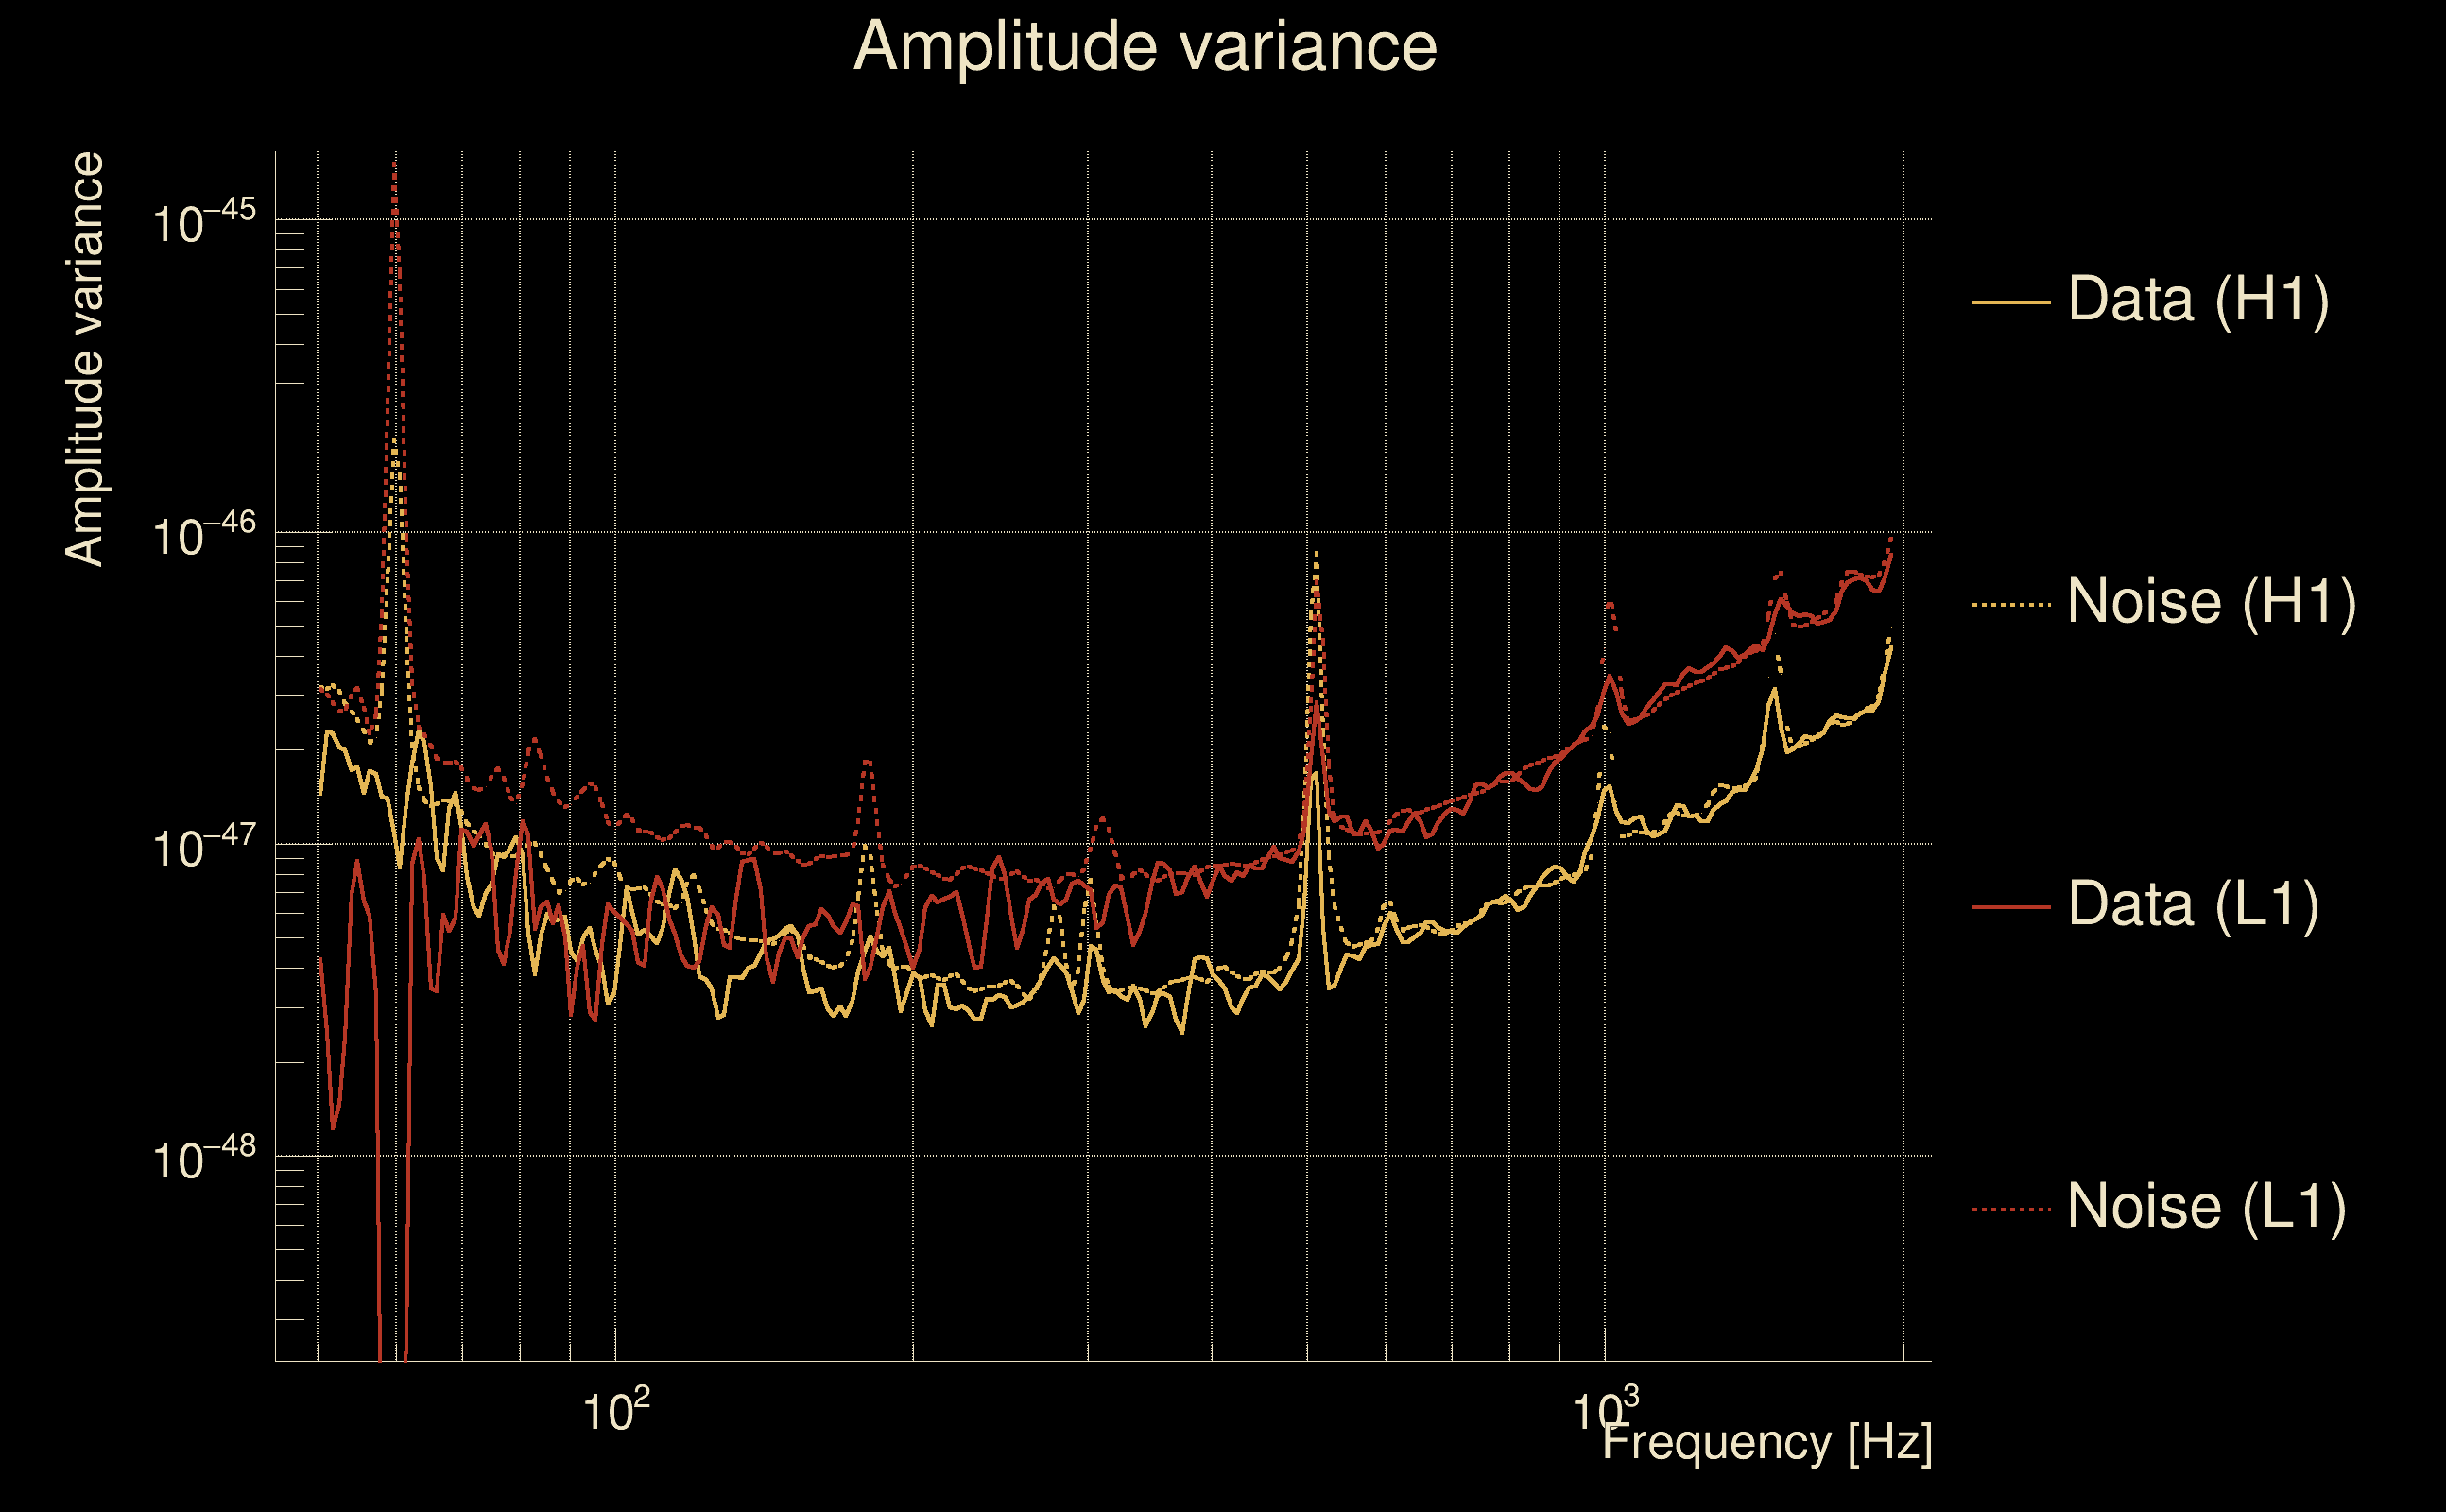
| Amplitude spectrograms: | normalization = 1e-22, power index = 2 |
| White noise SNR variance: | 0.523175 (after applying a correction factor = 1) |
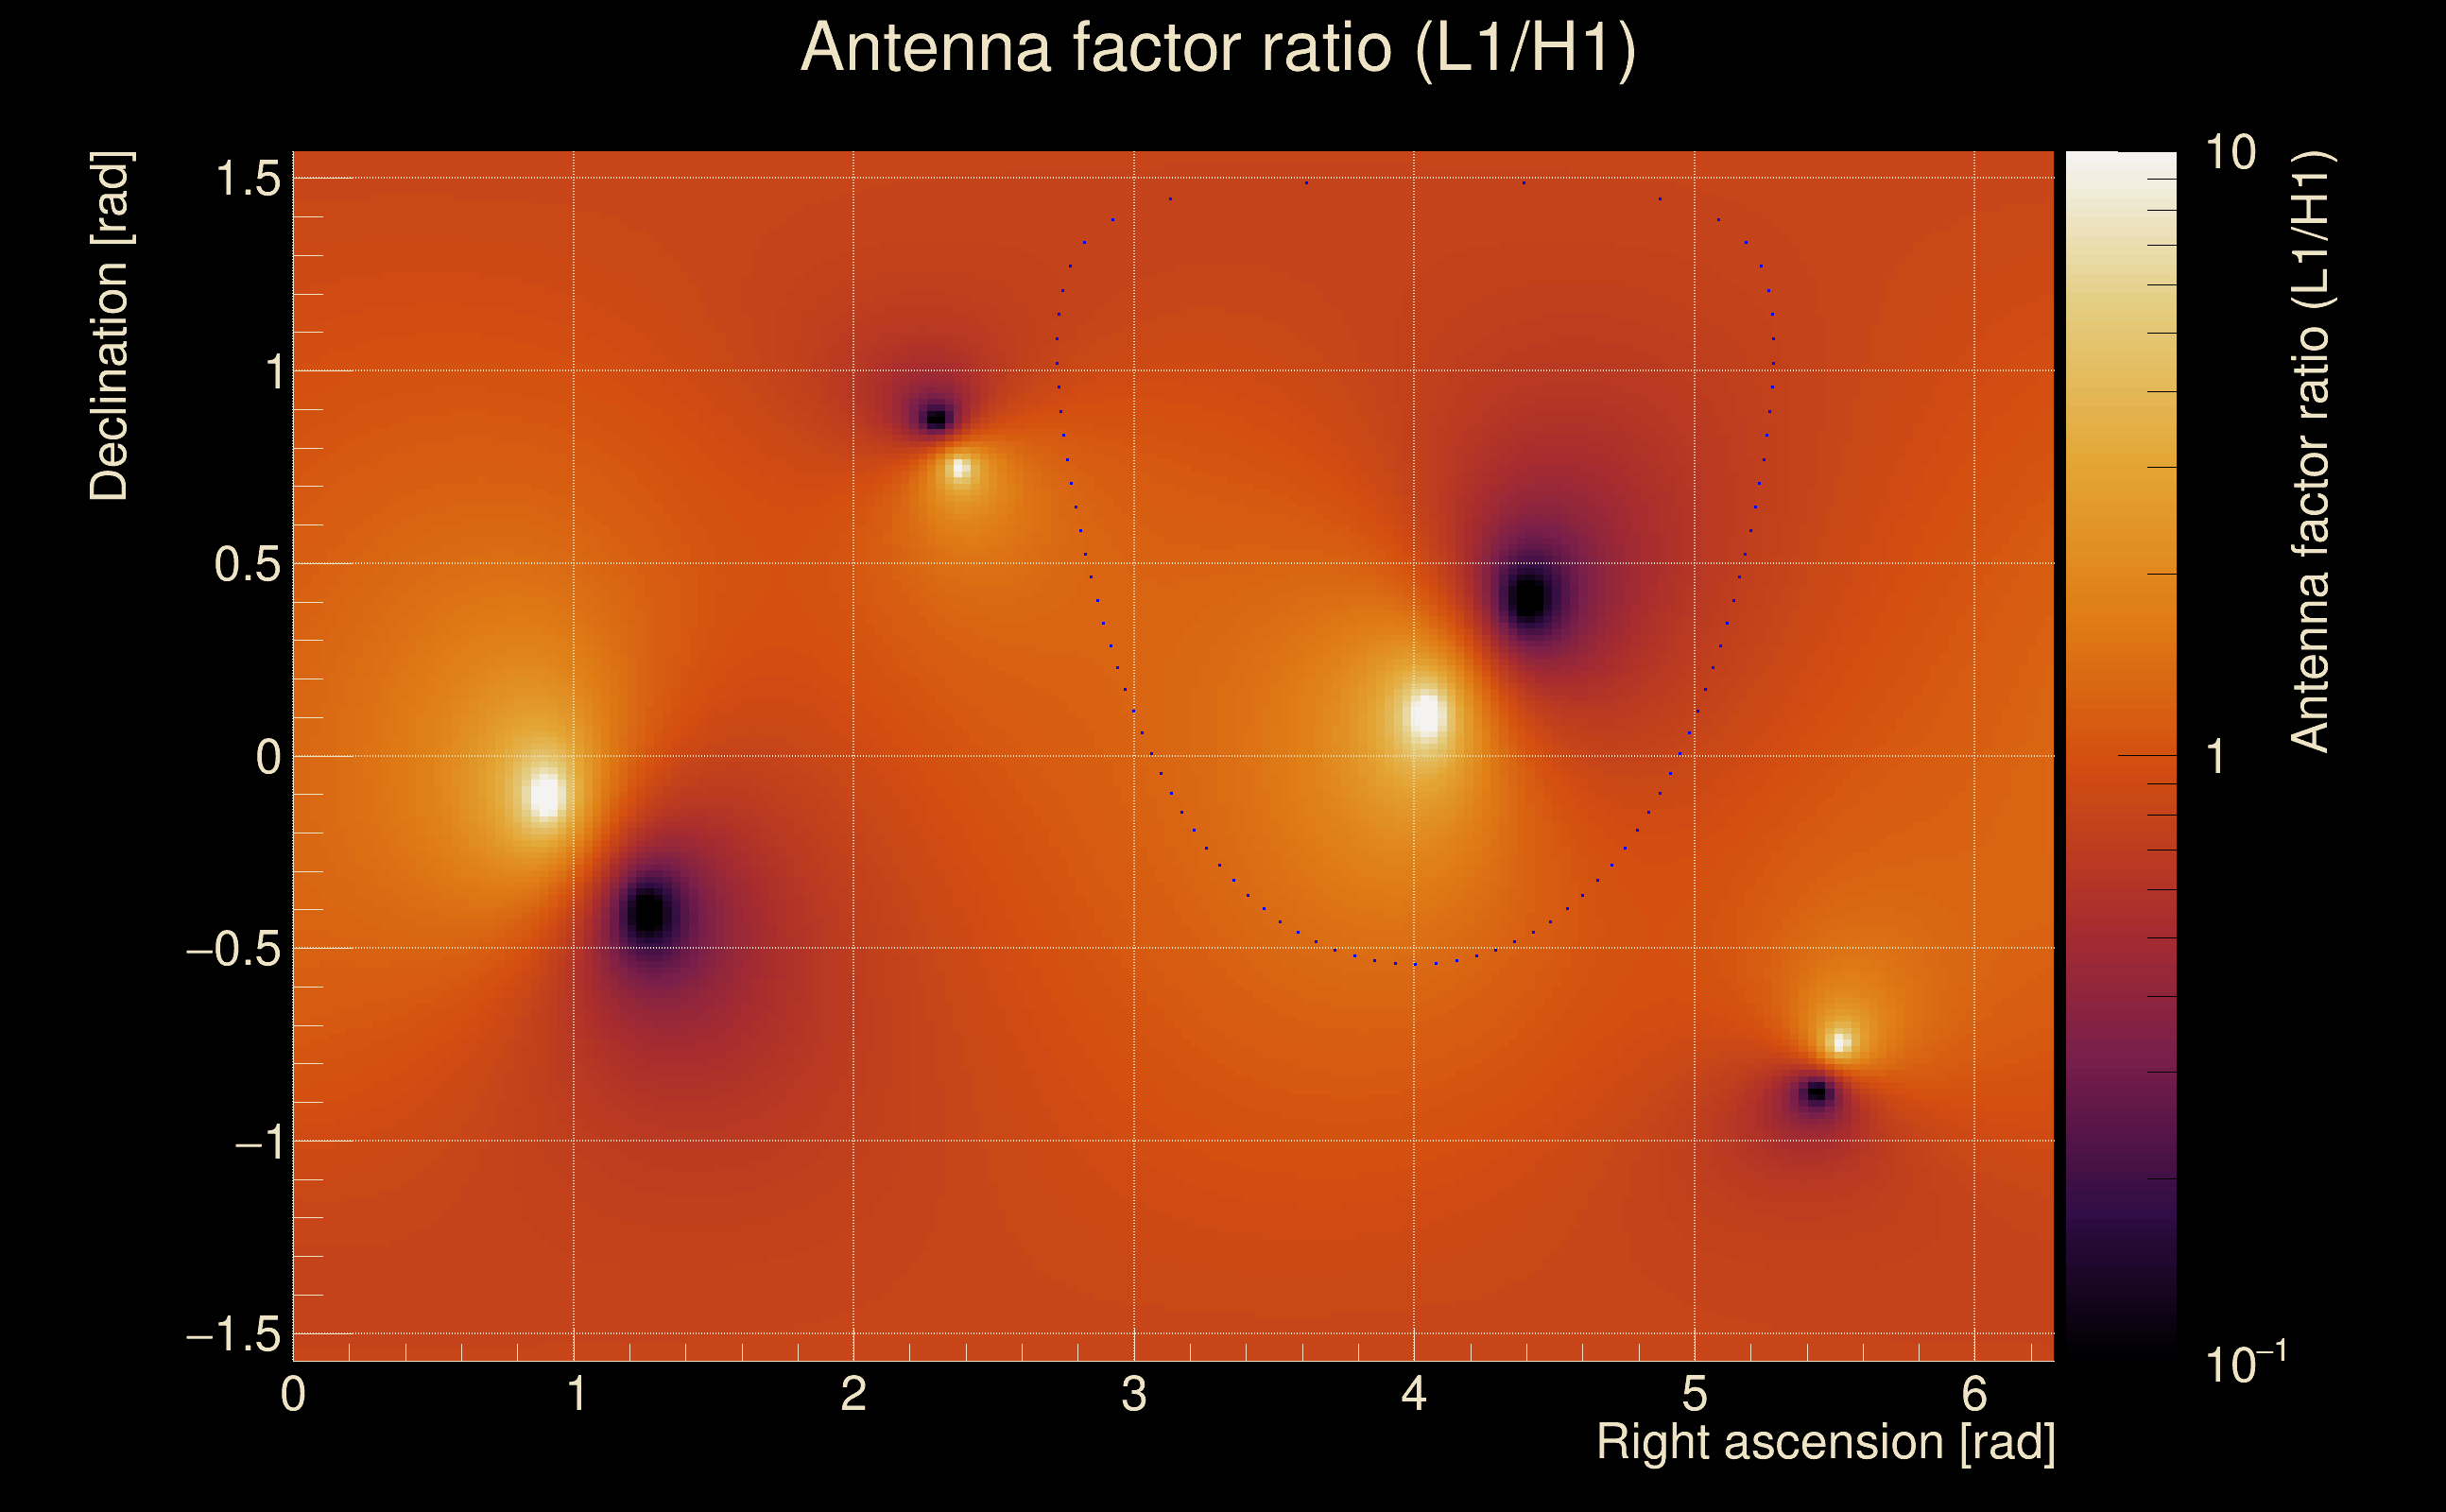
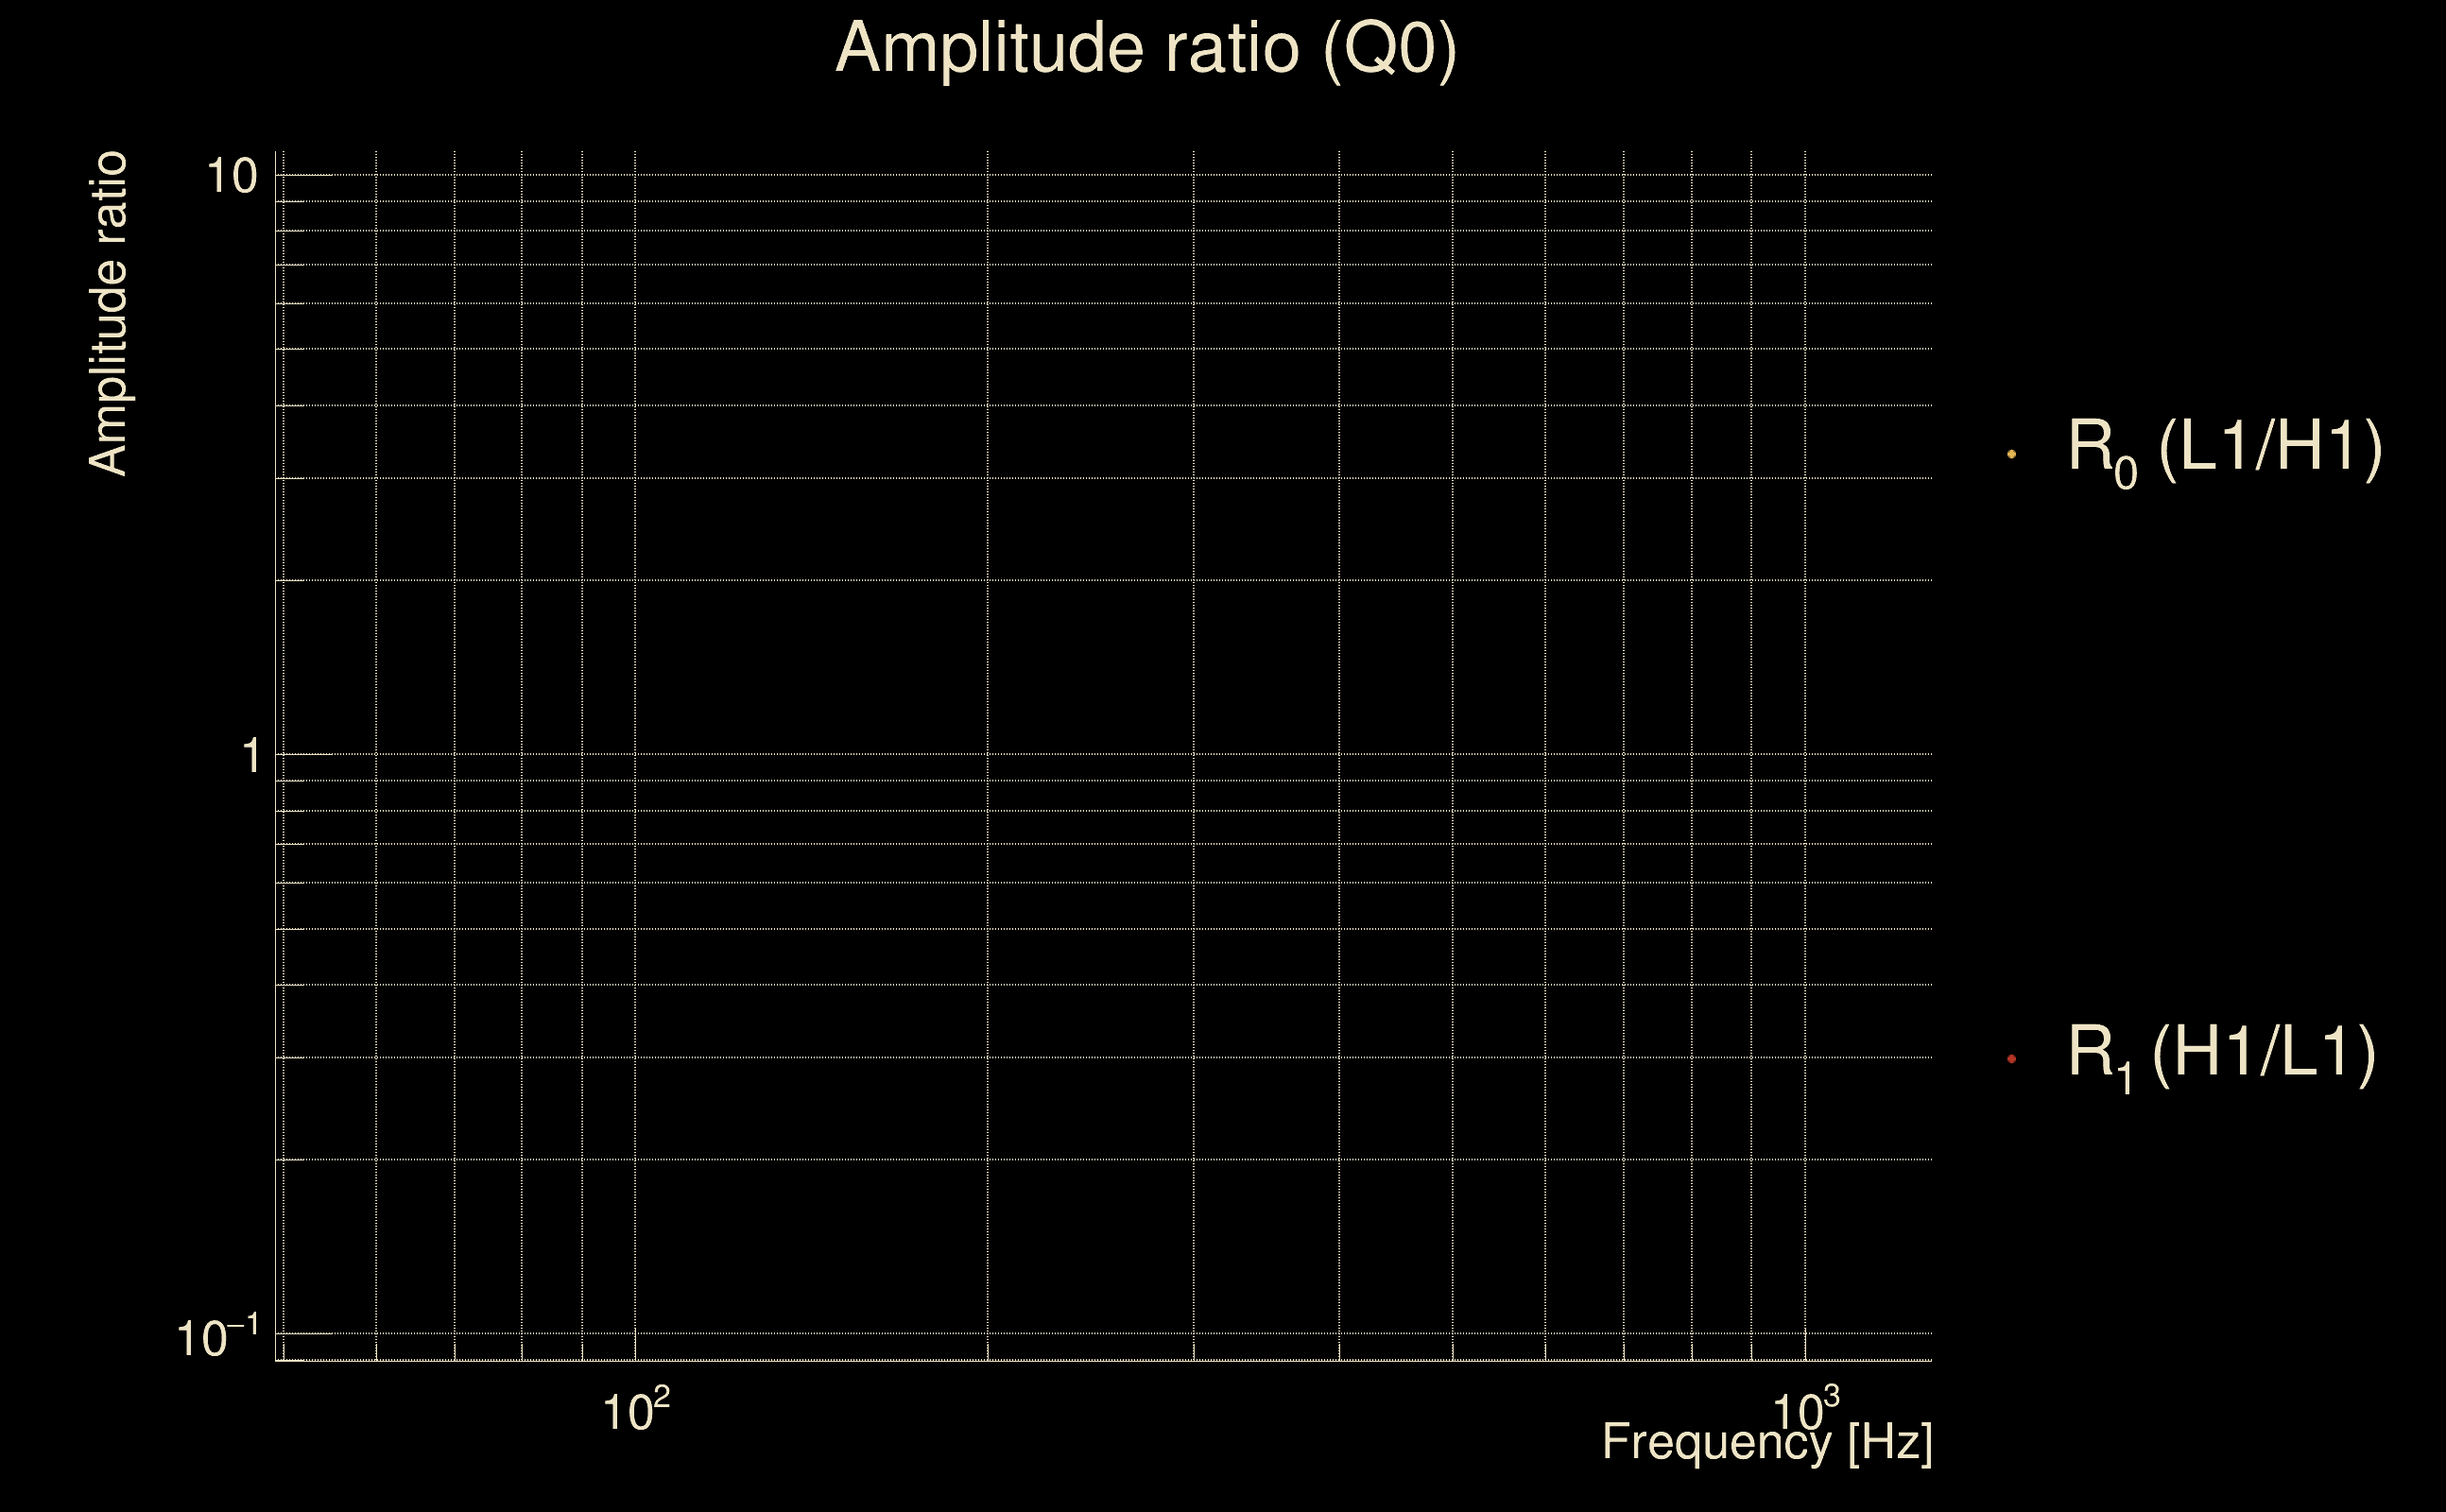
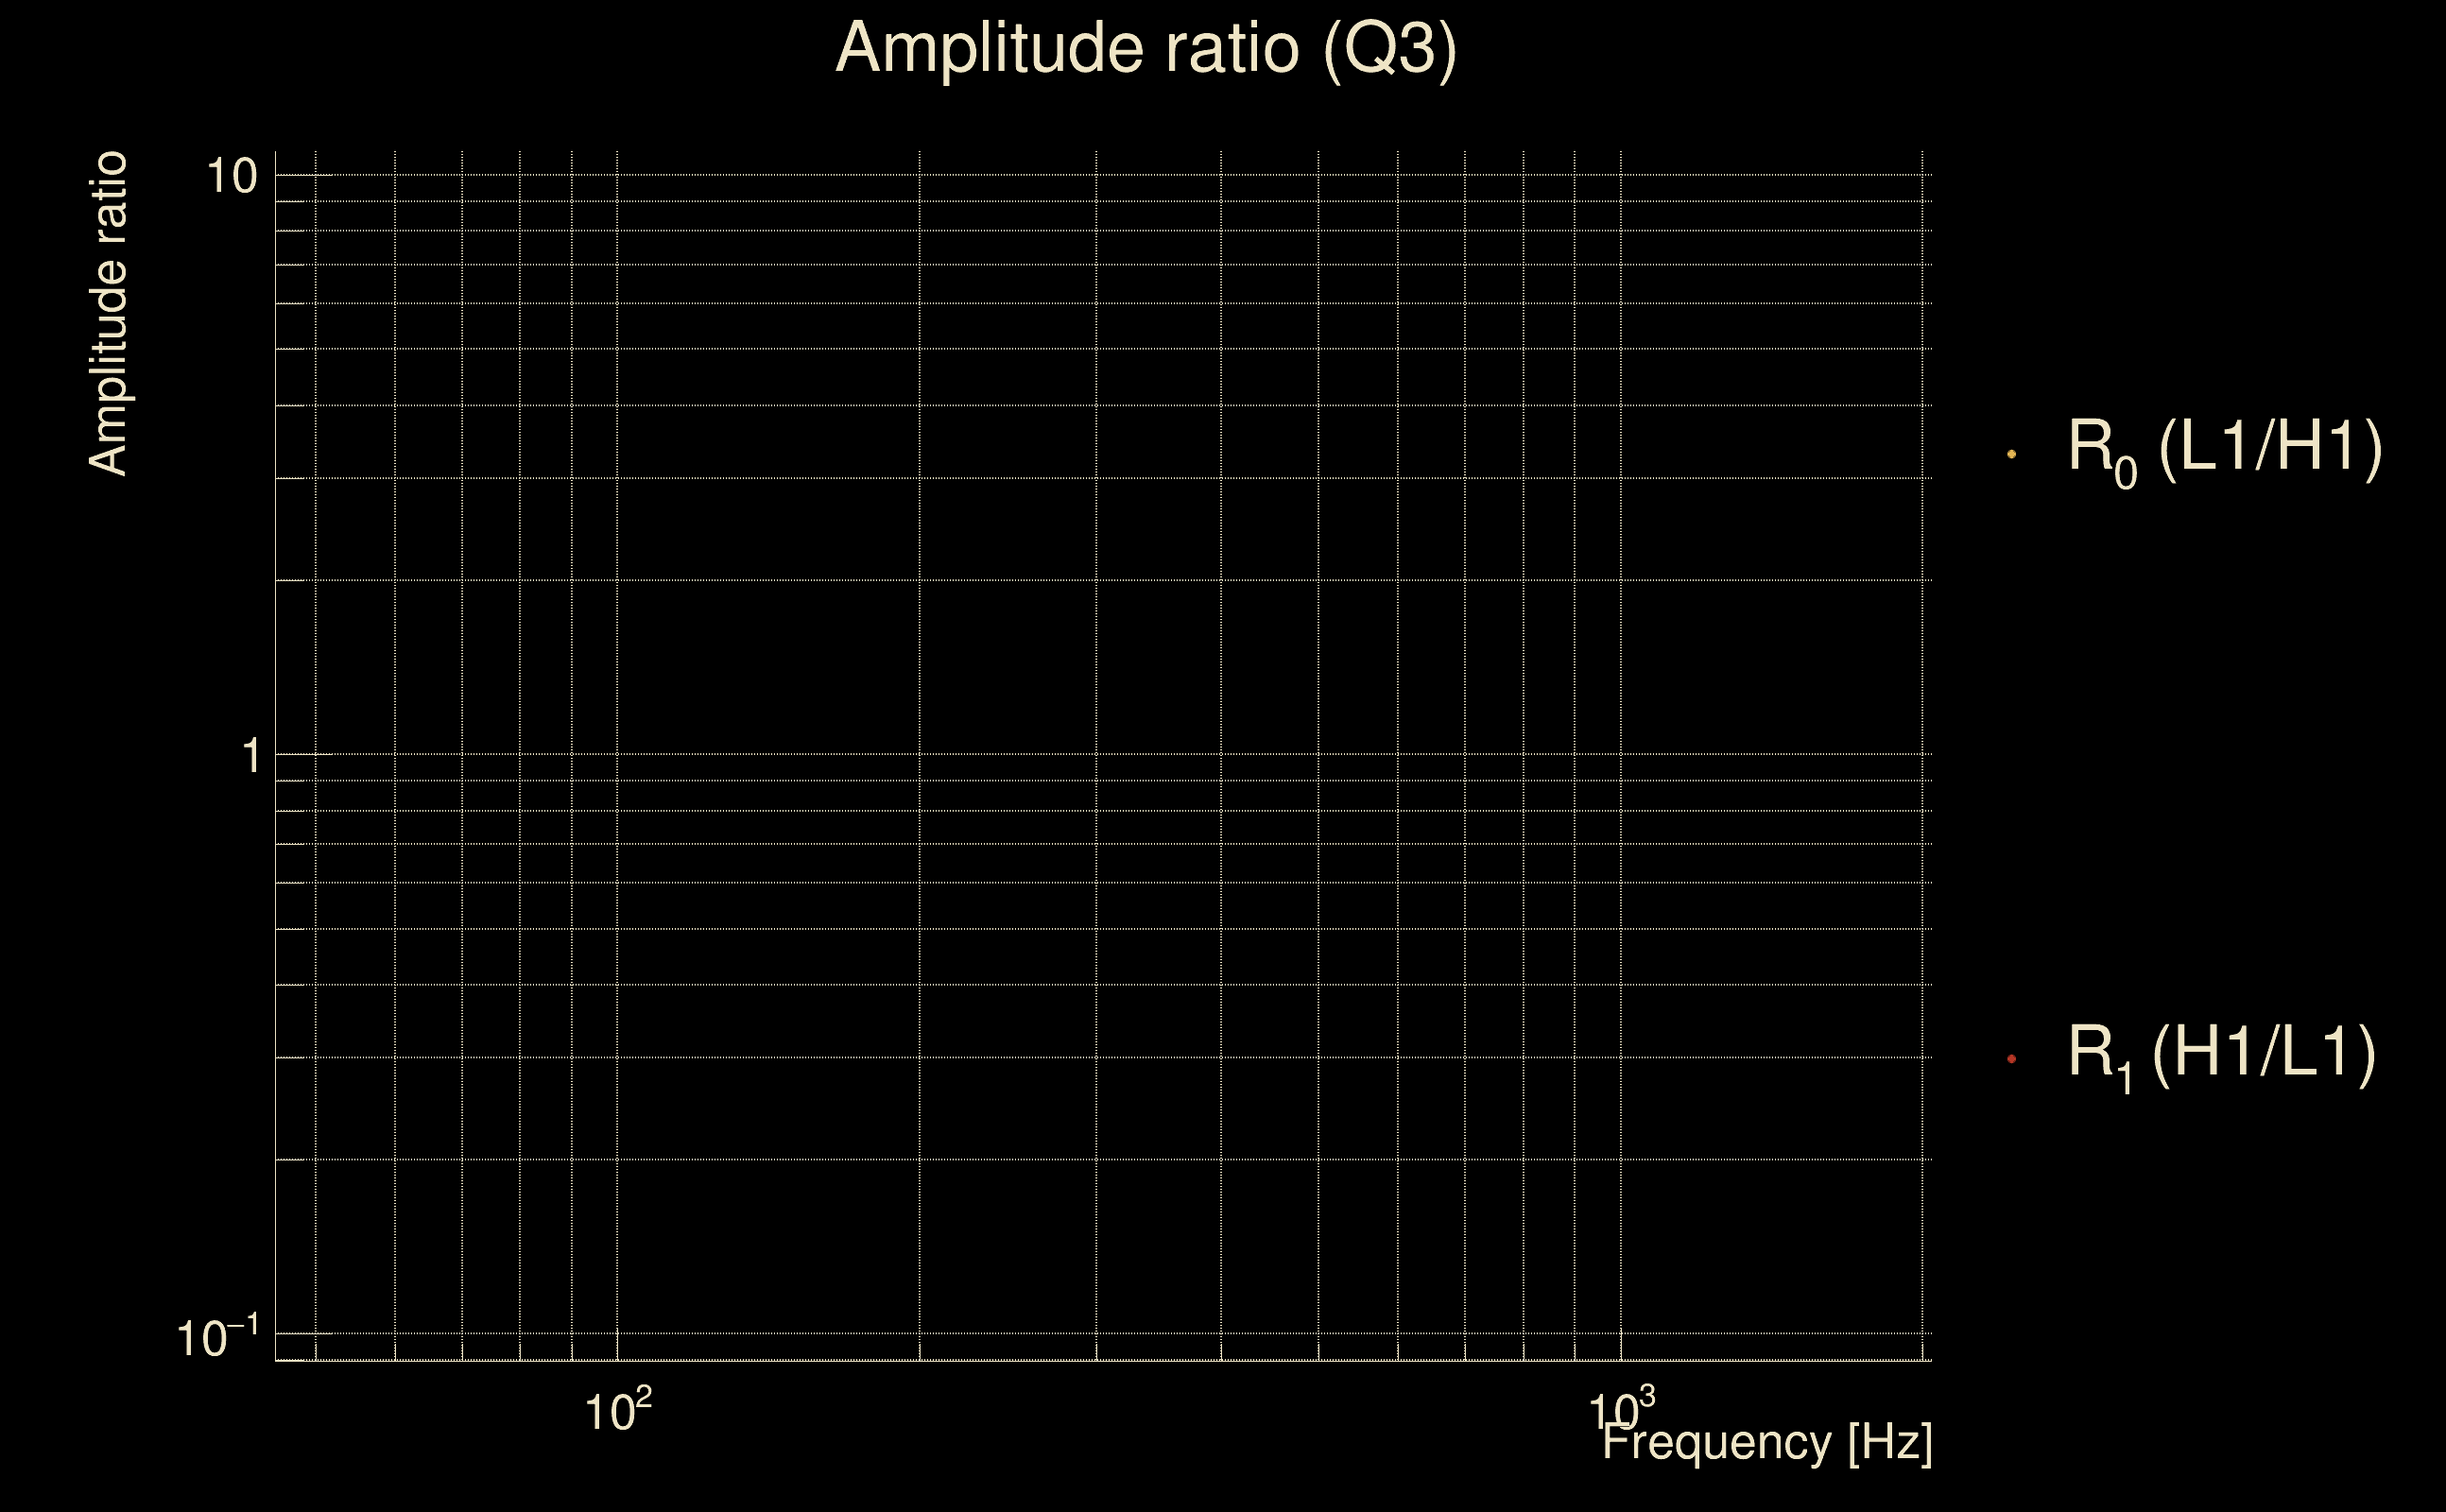
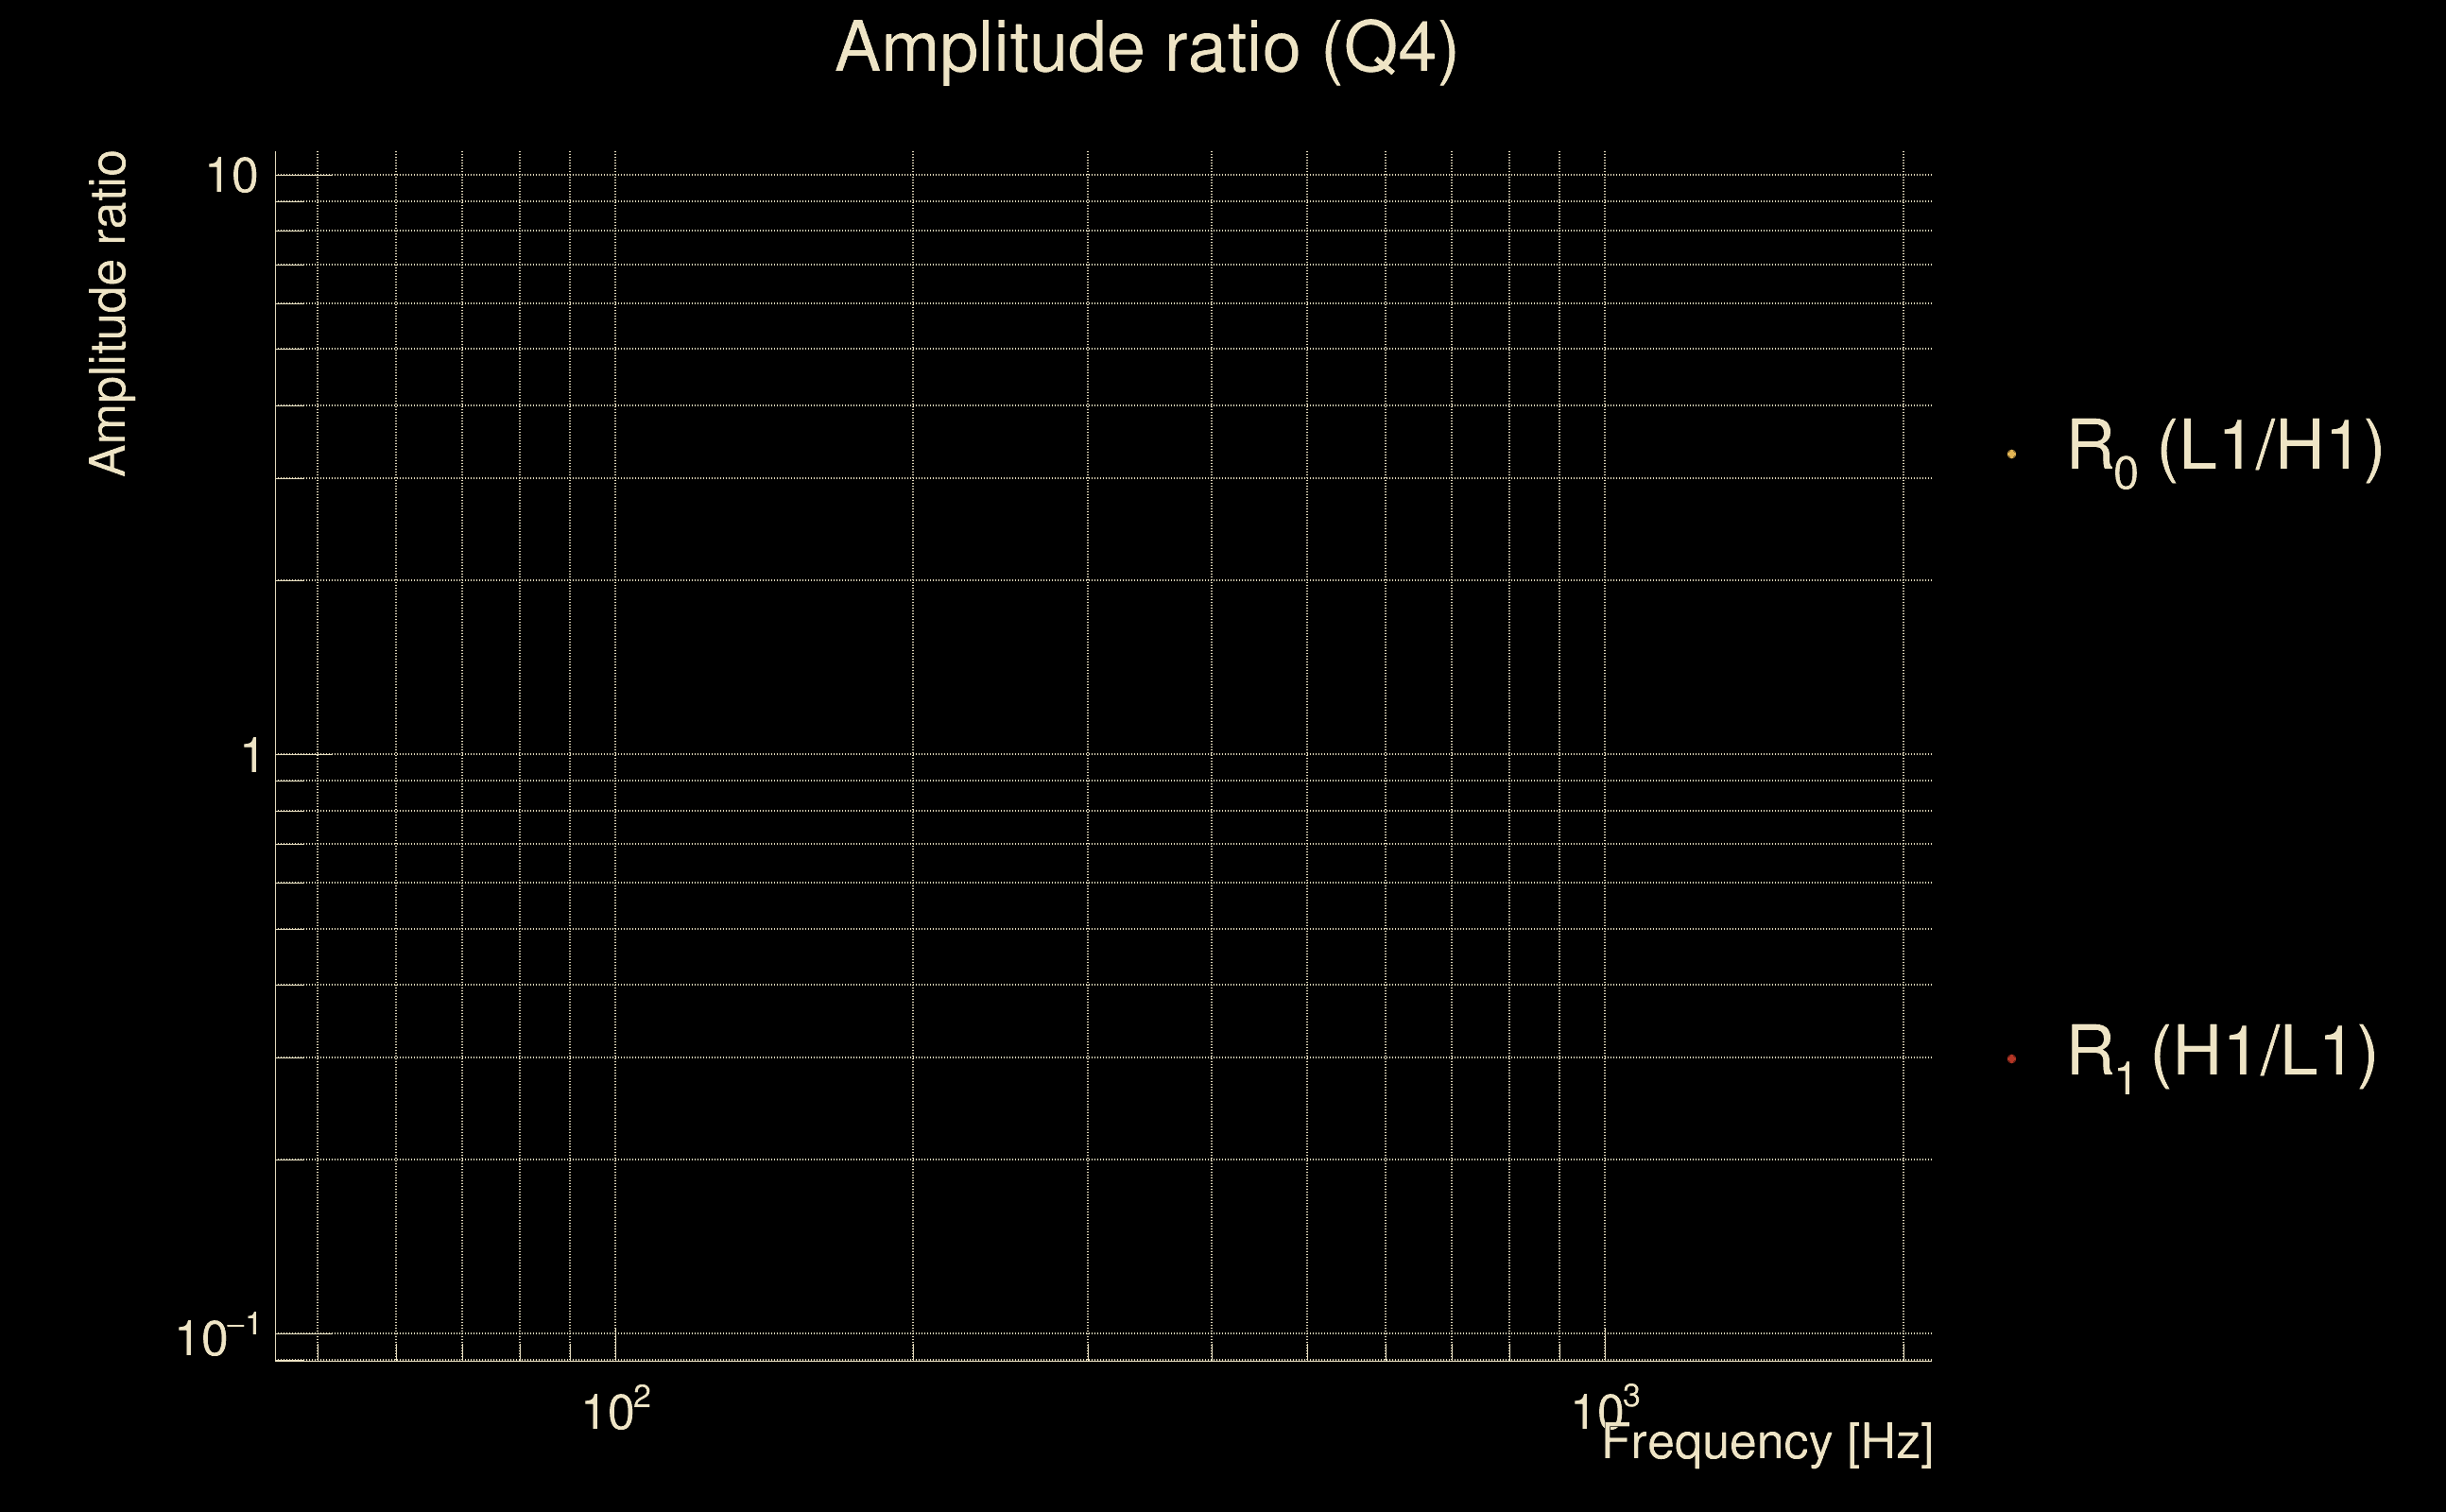
| Amplitude ratio confidence level: | 3 sigma |
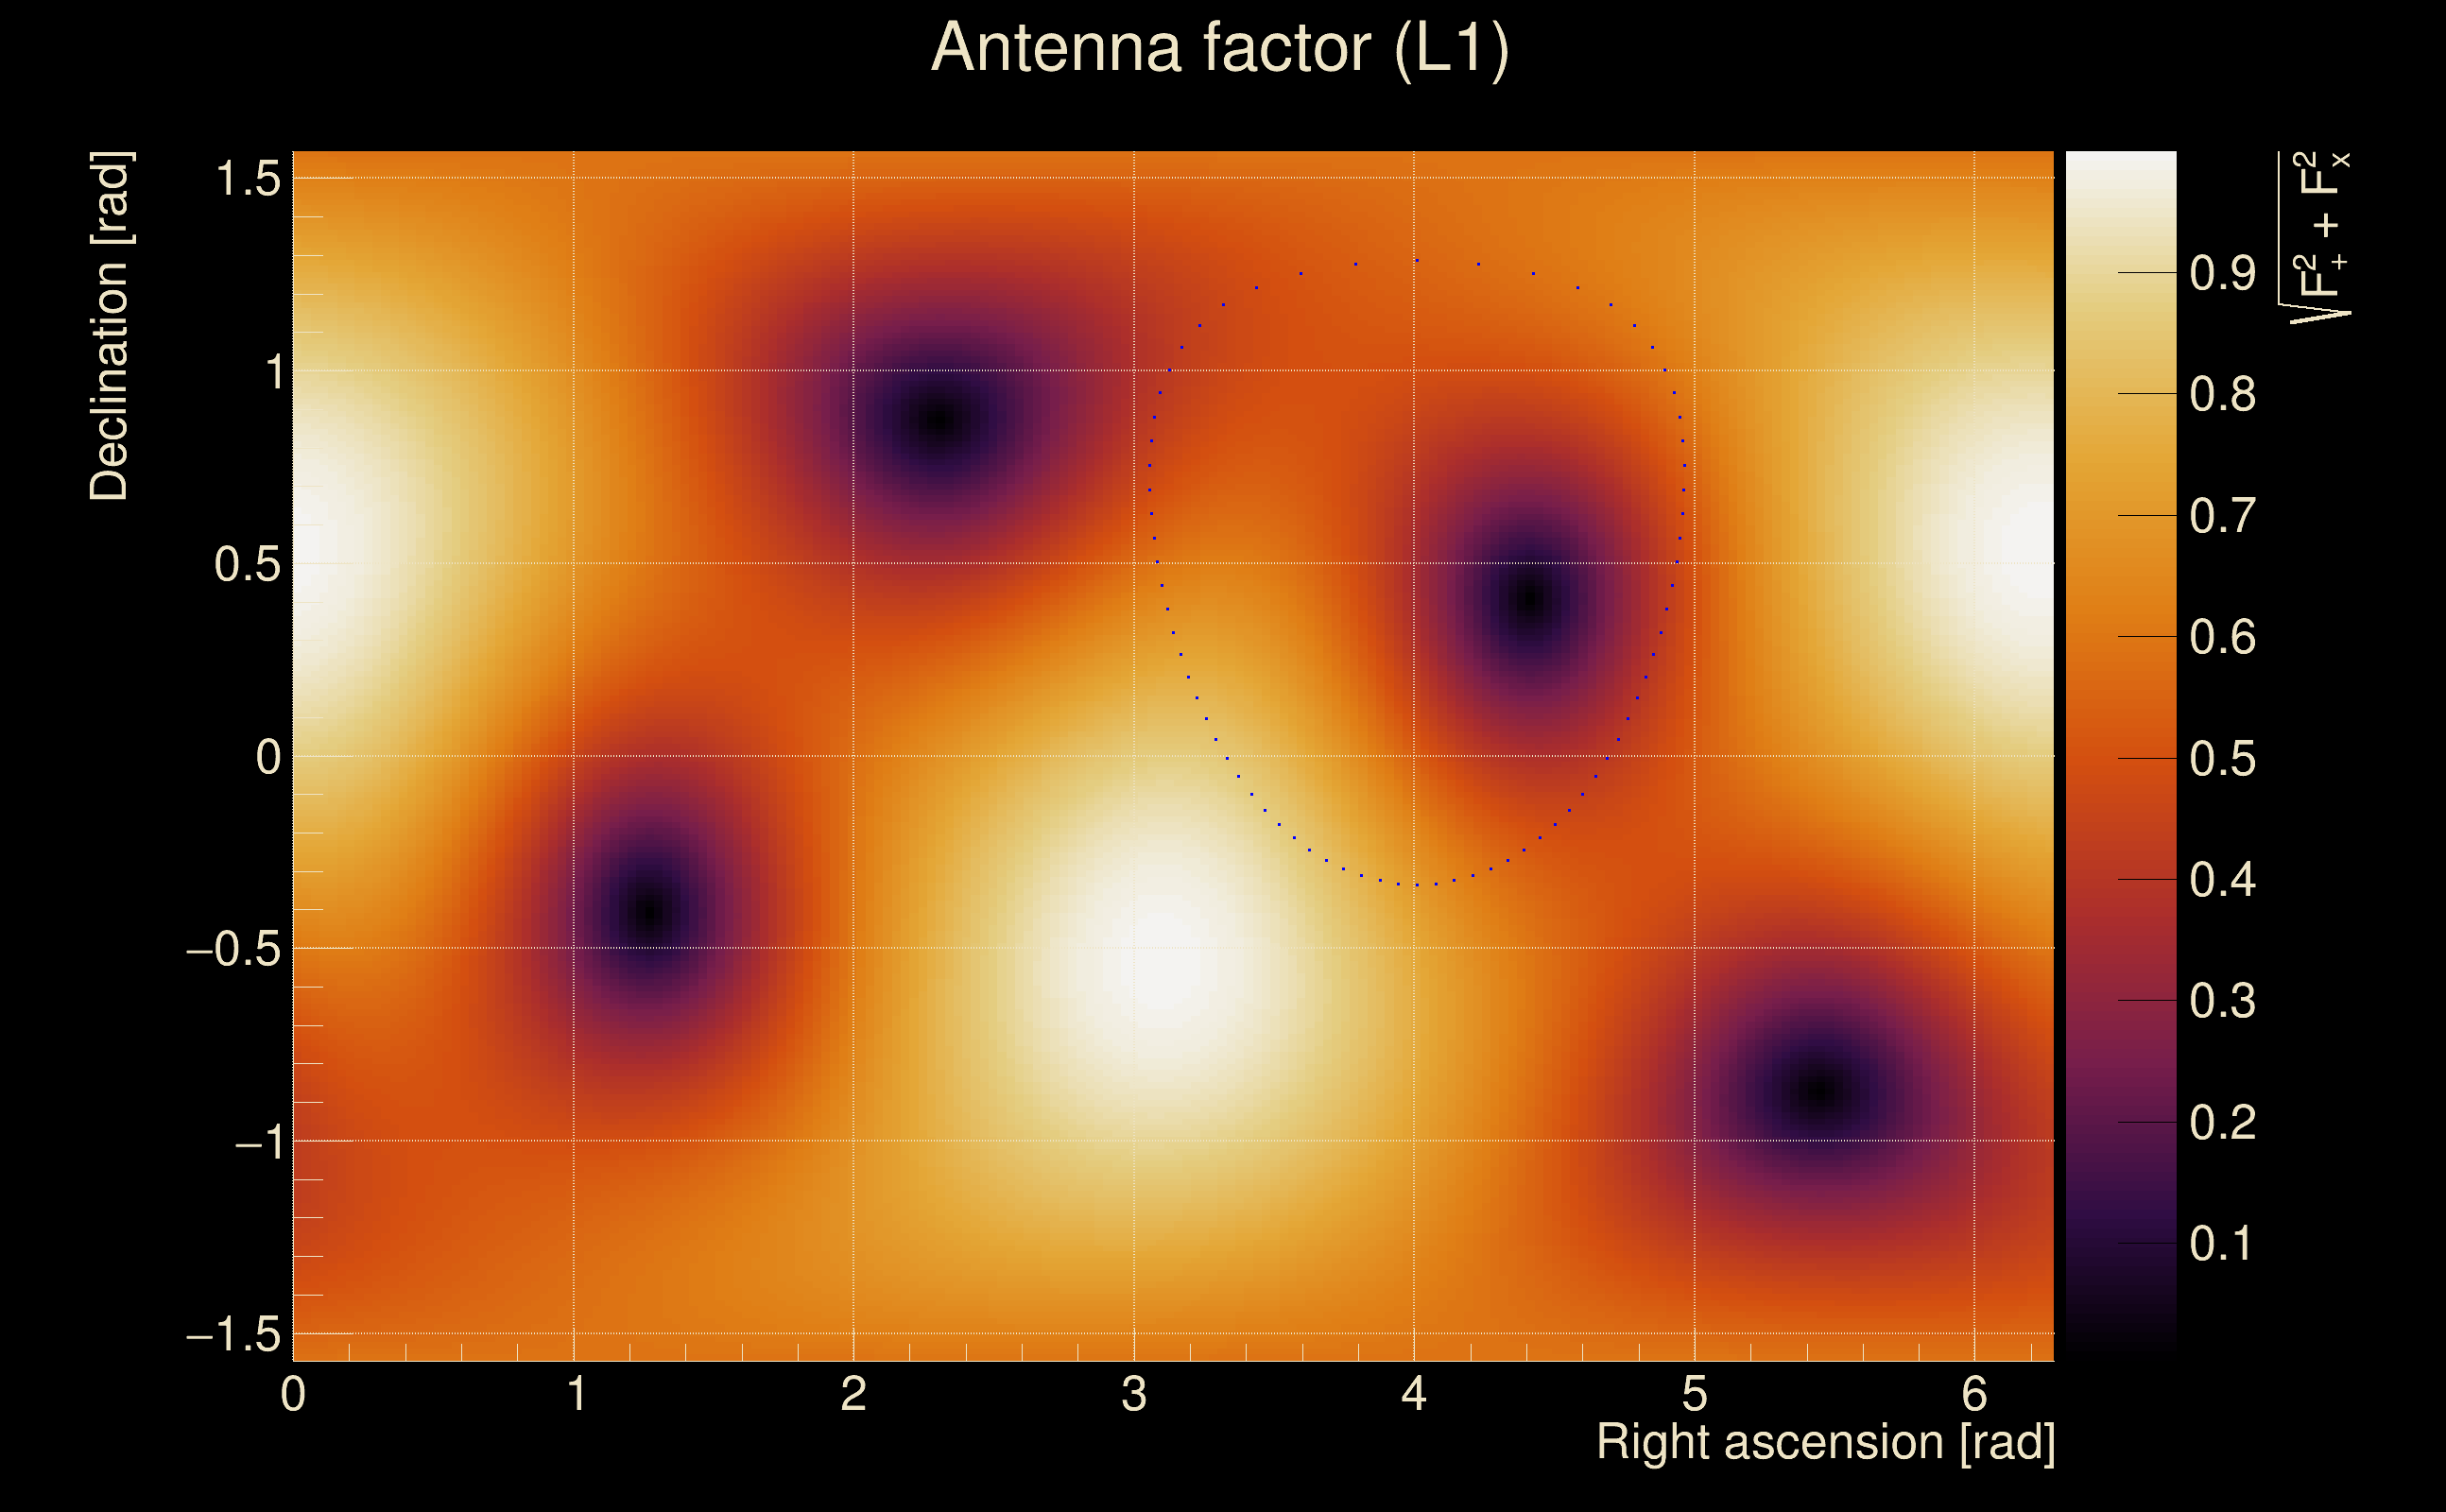
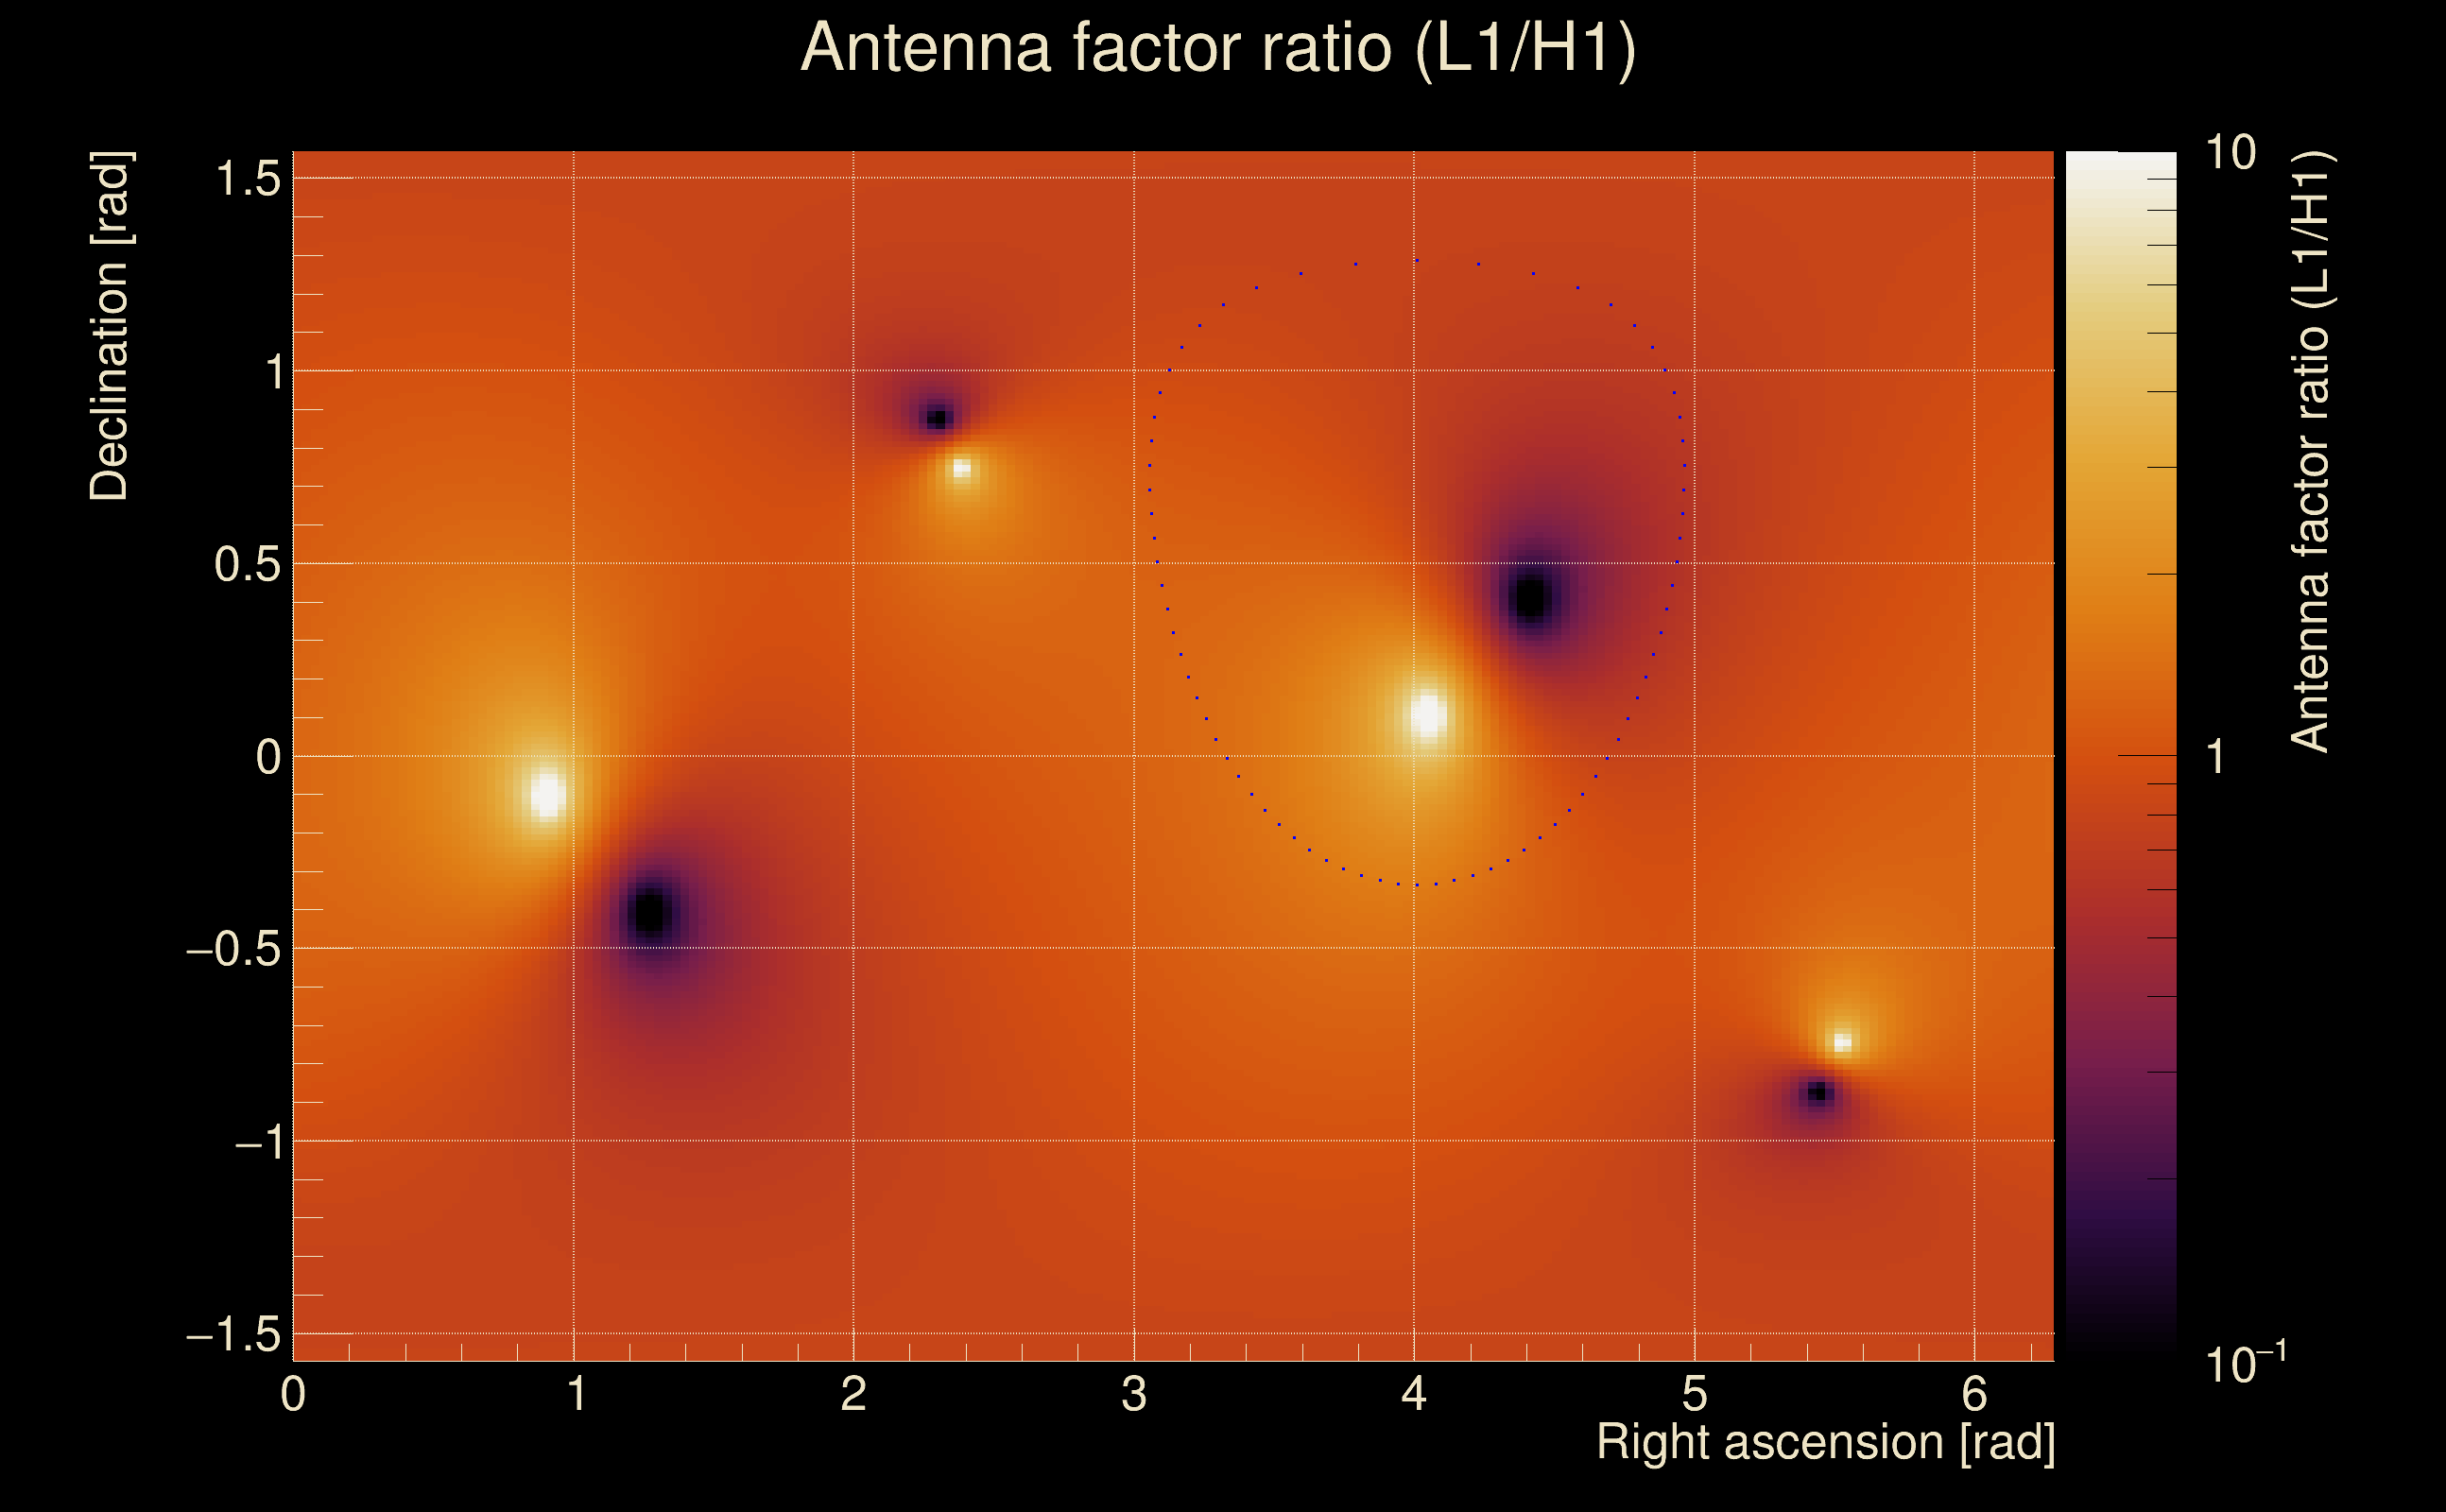
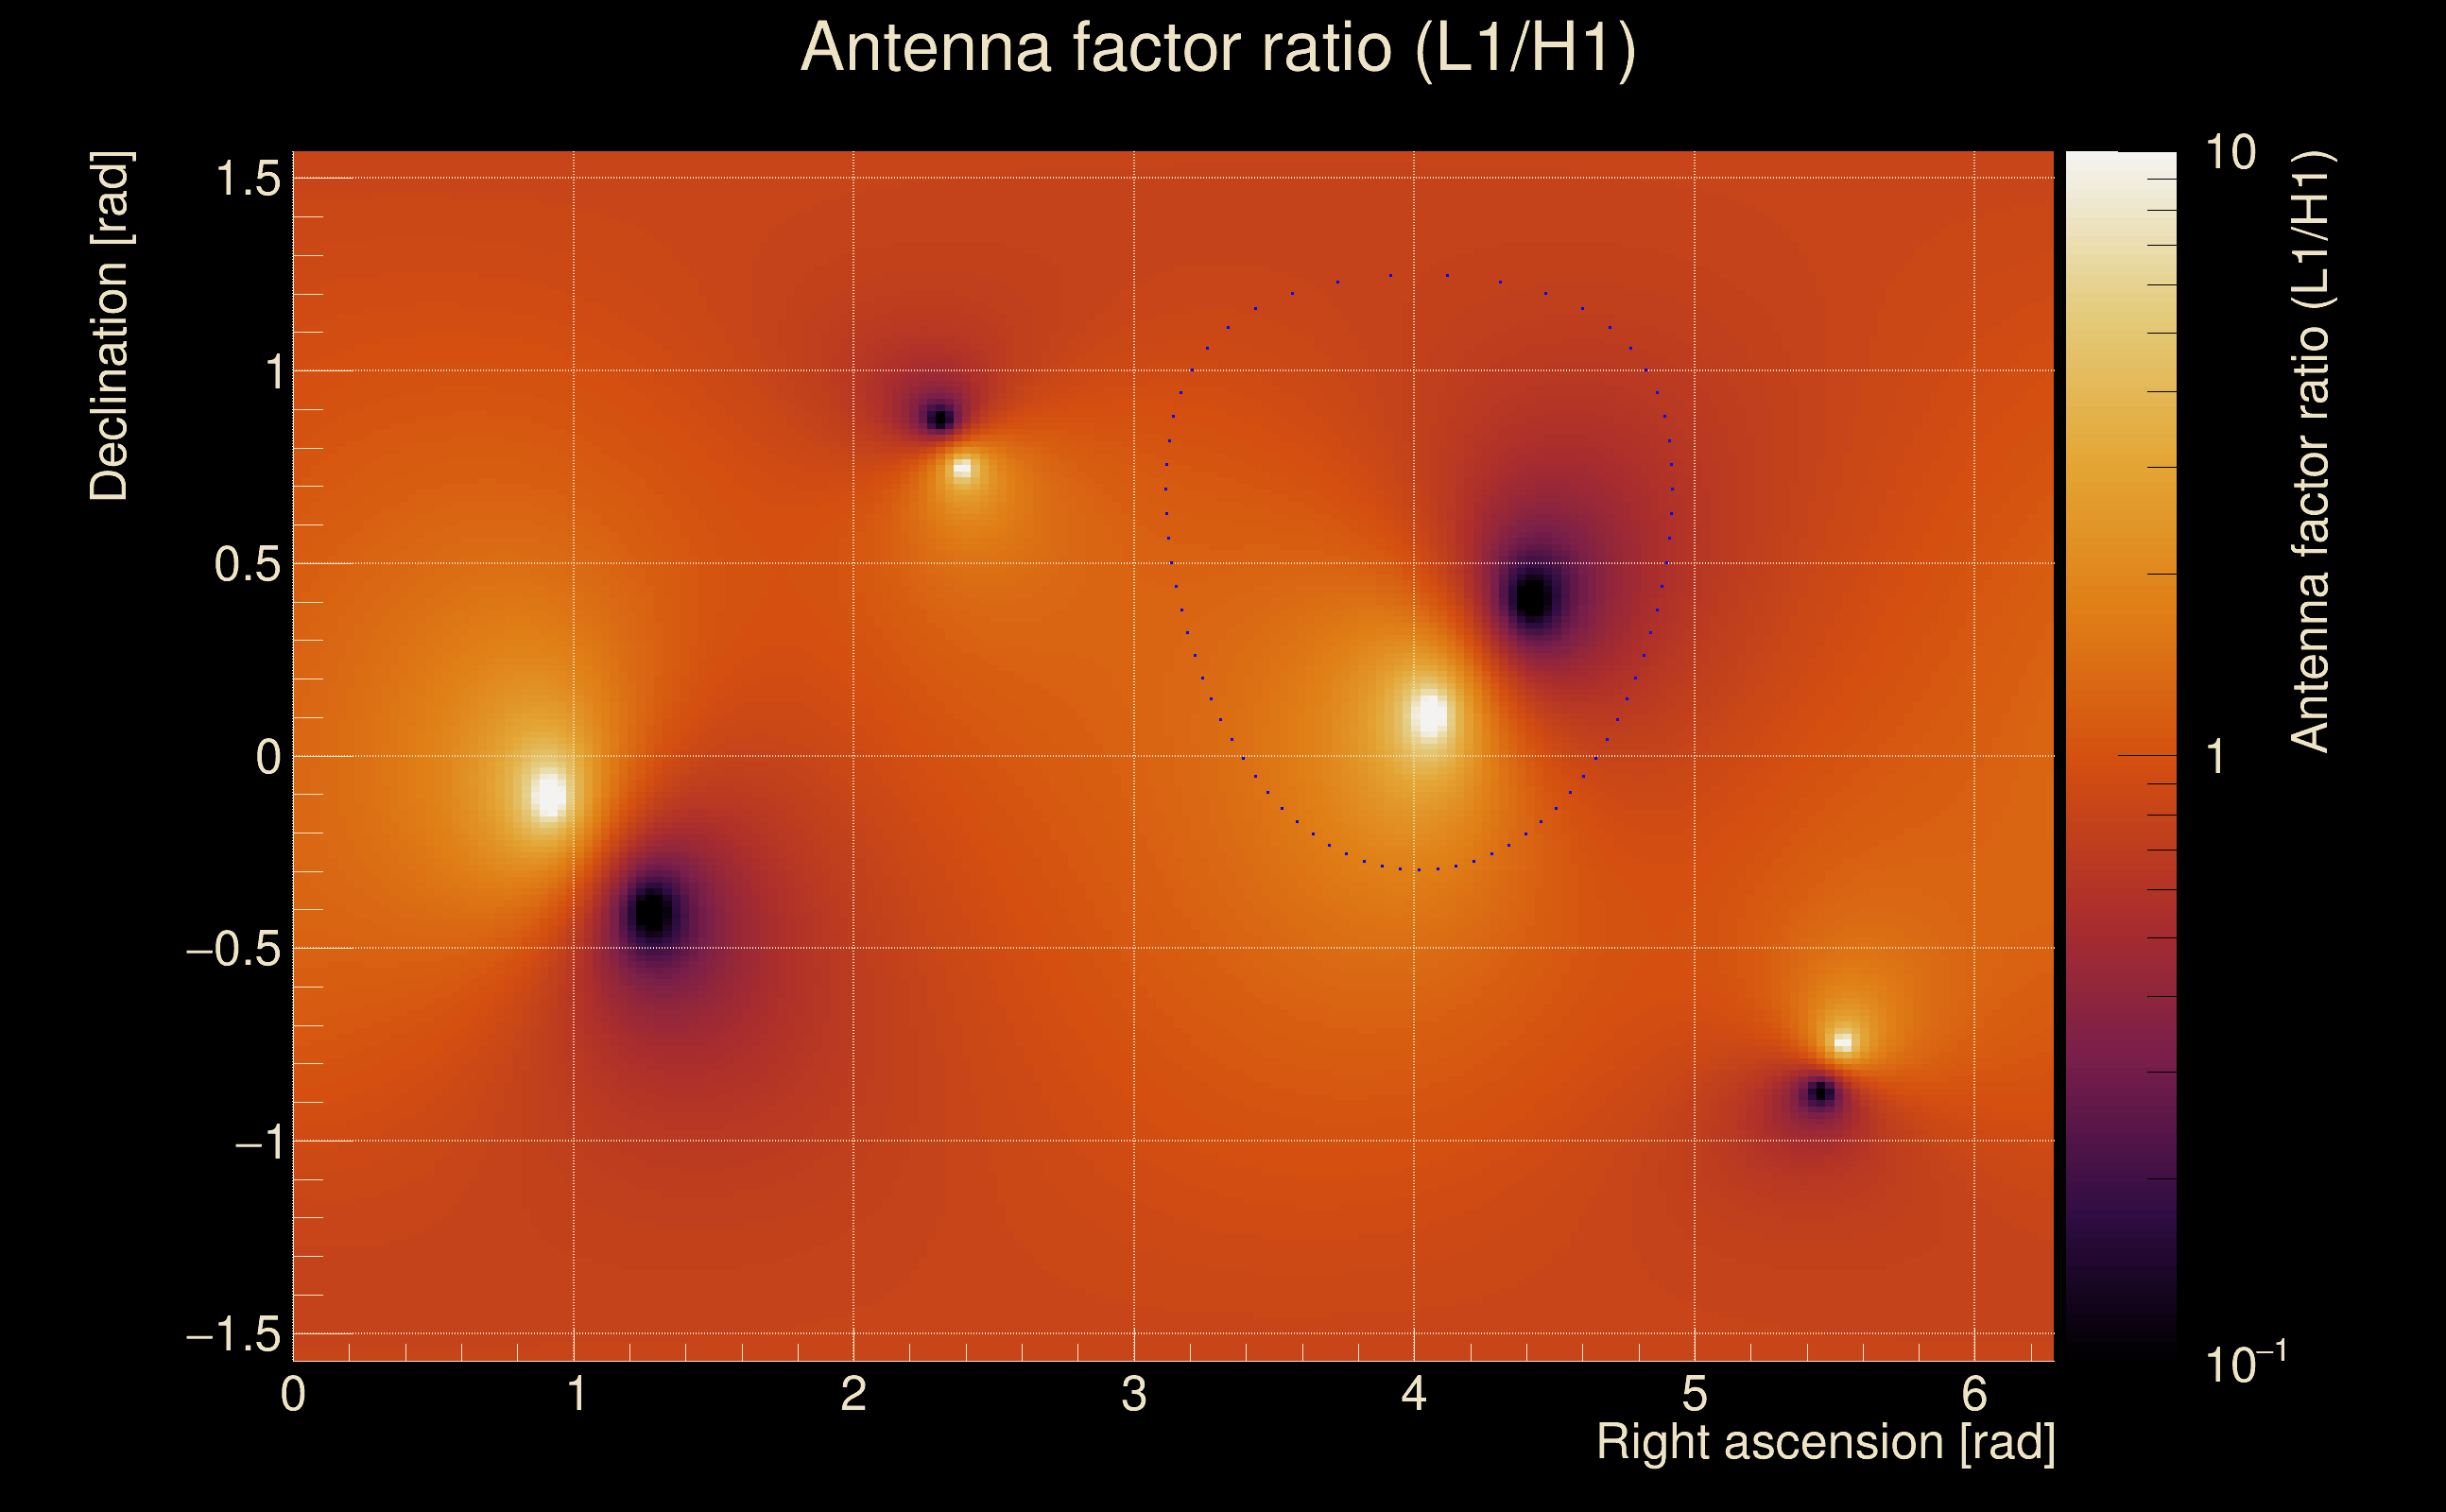
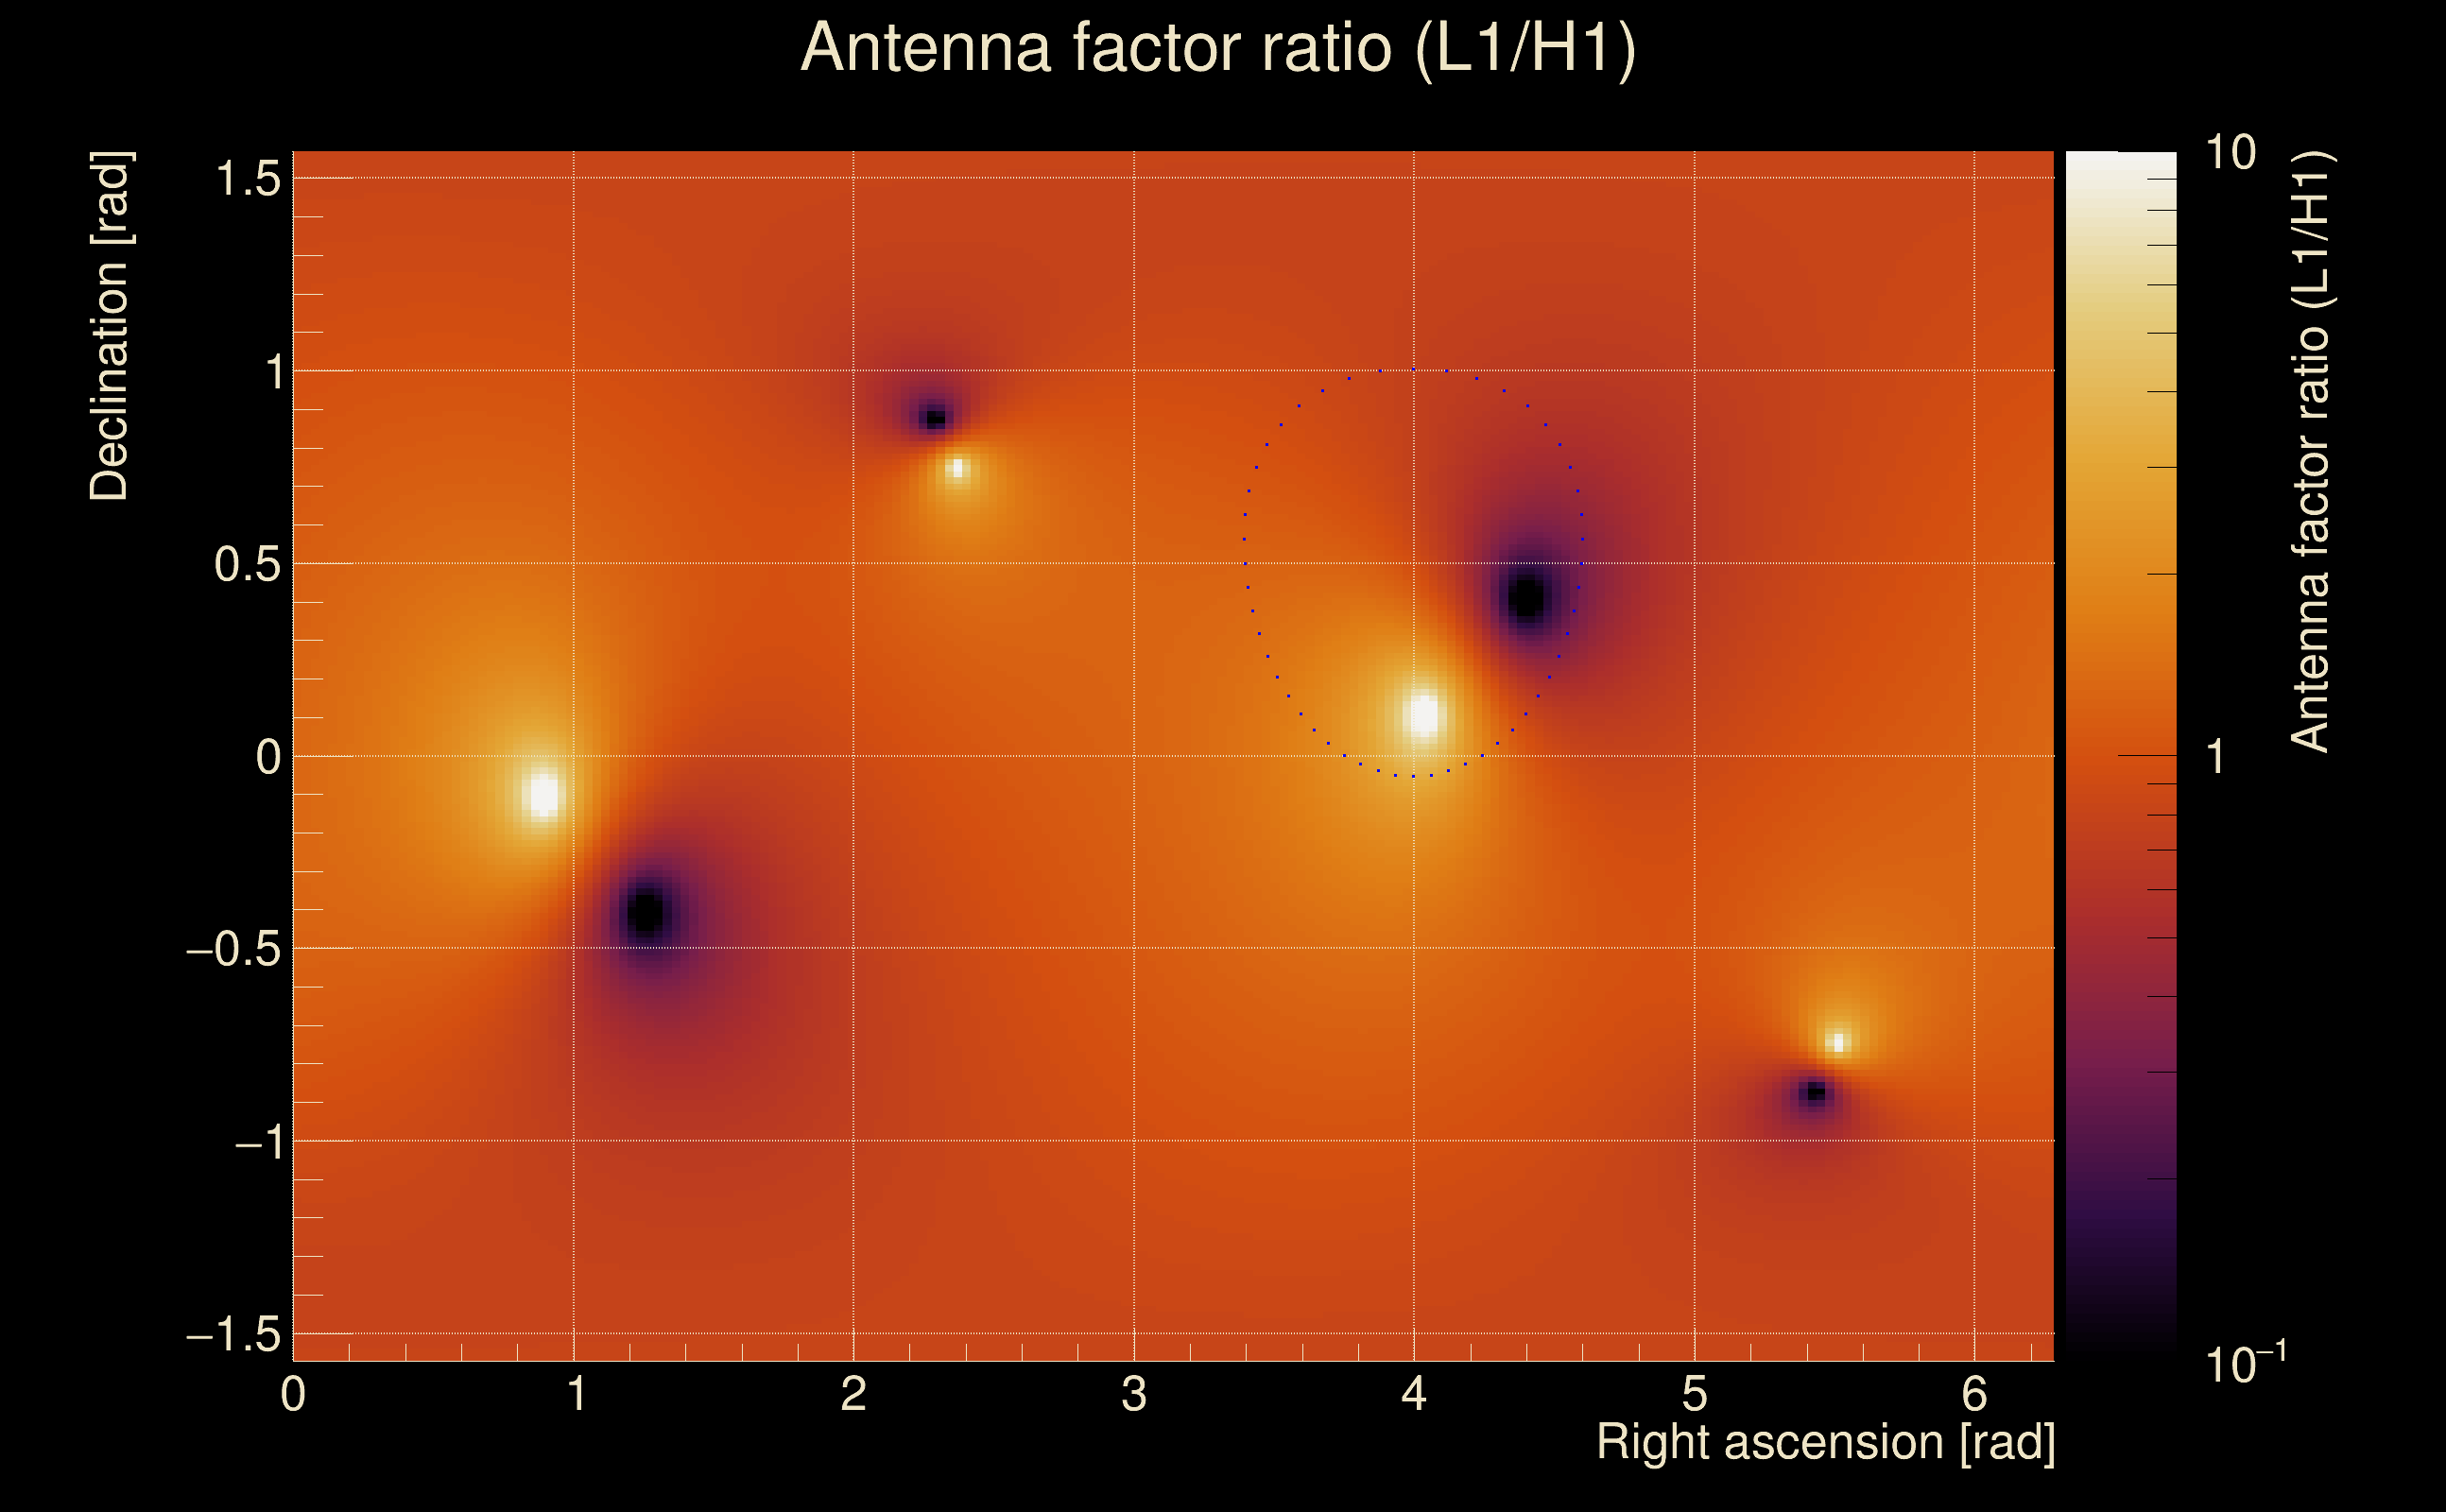
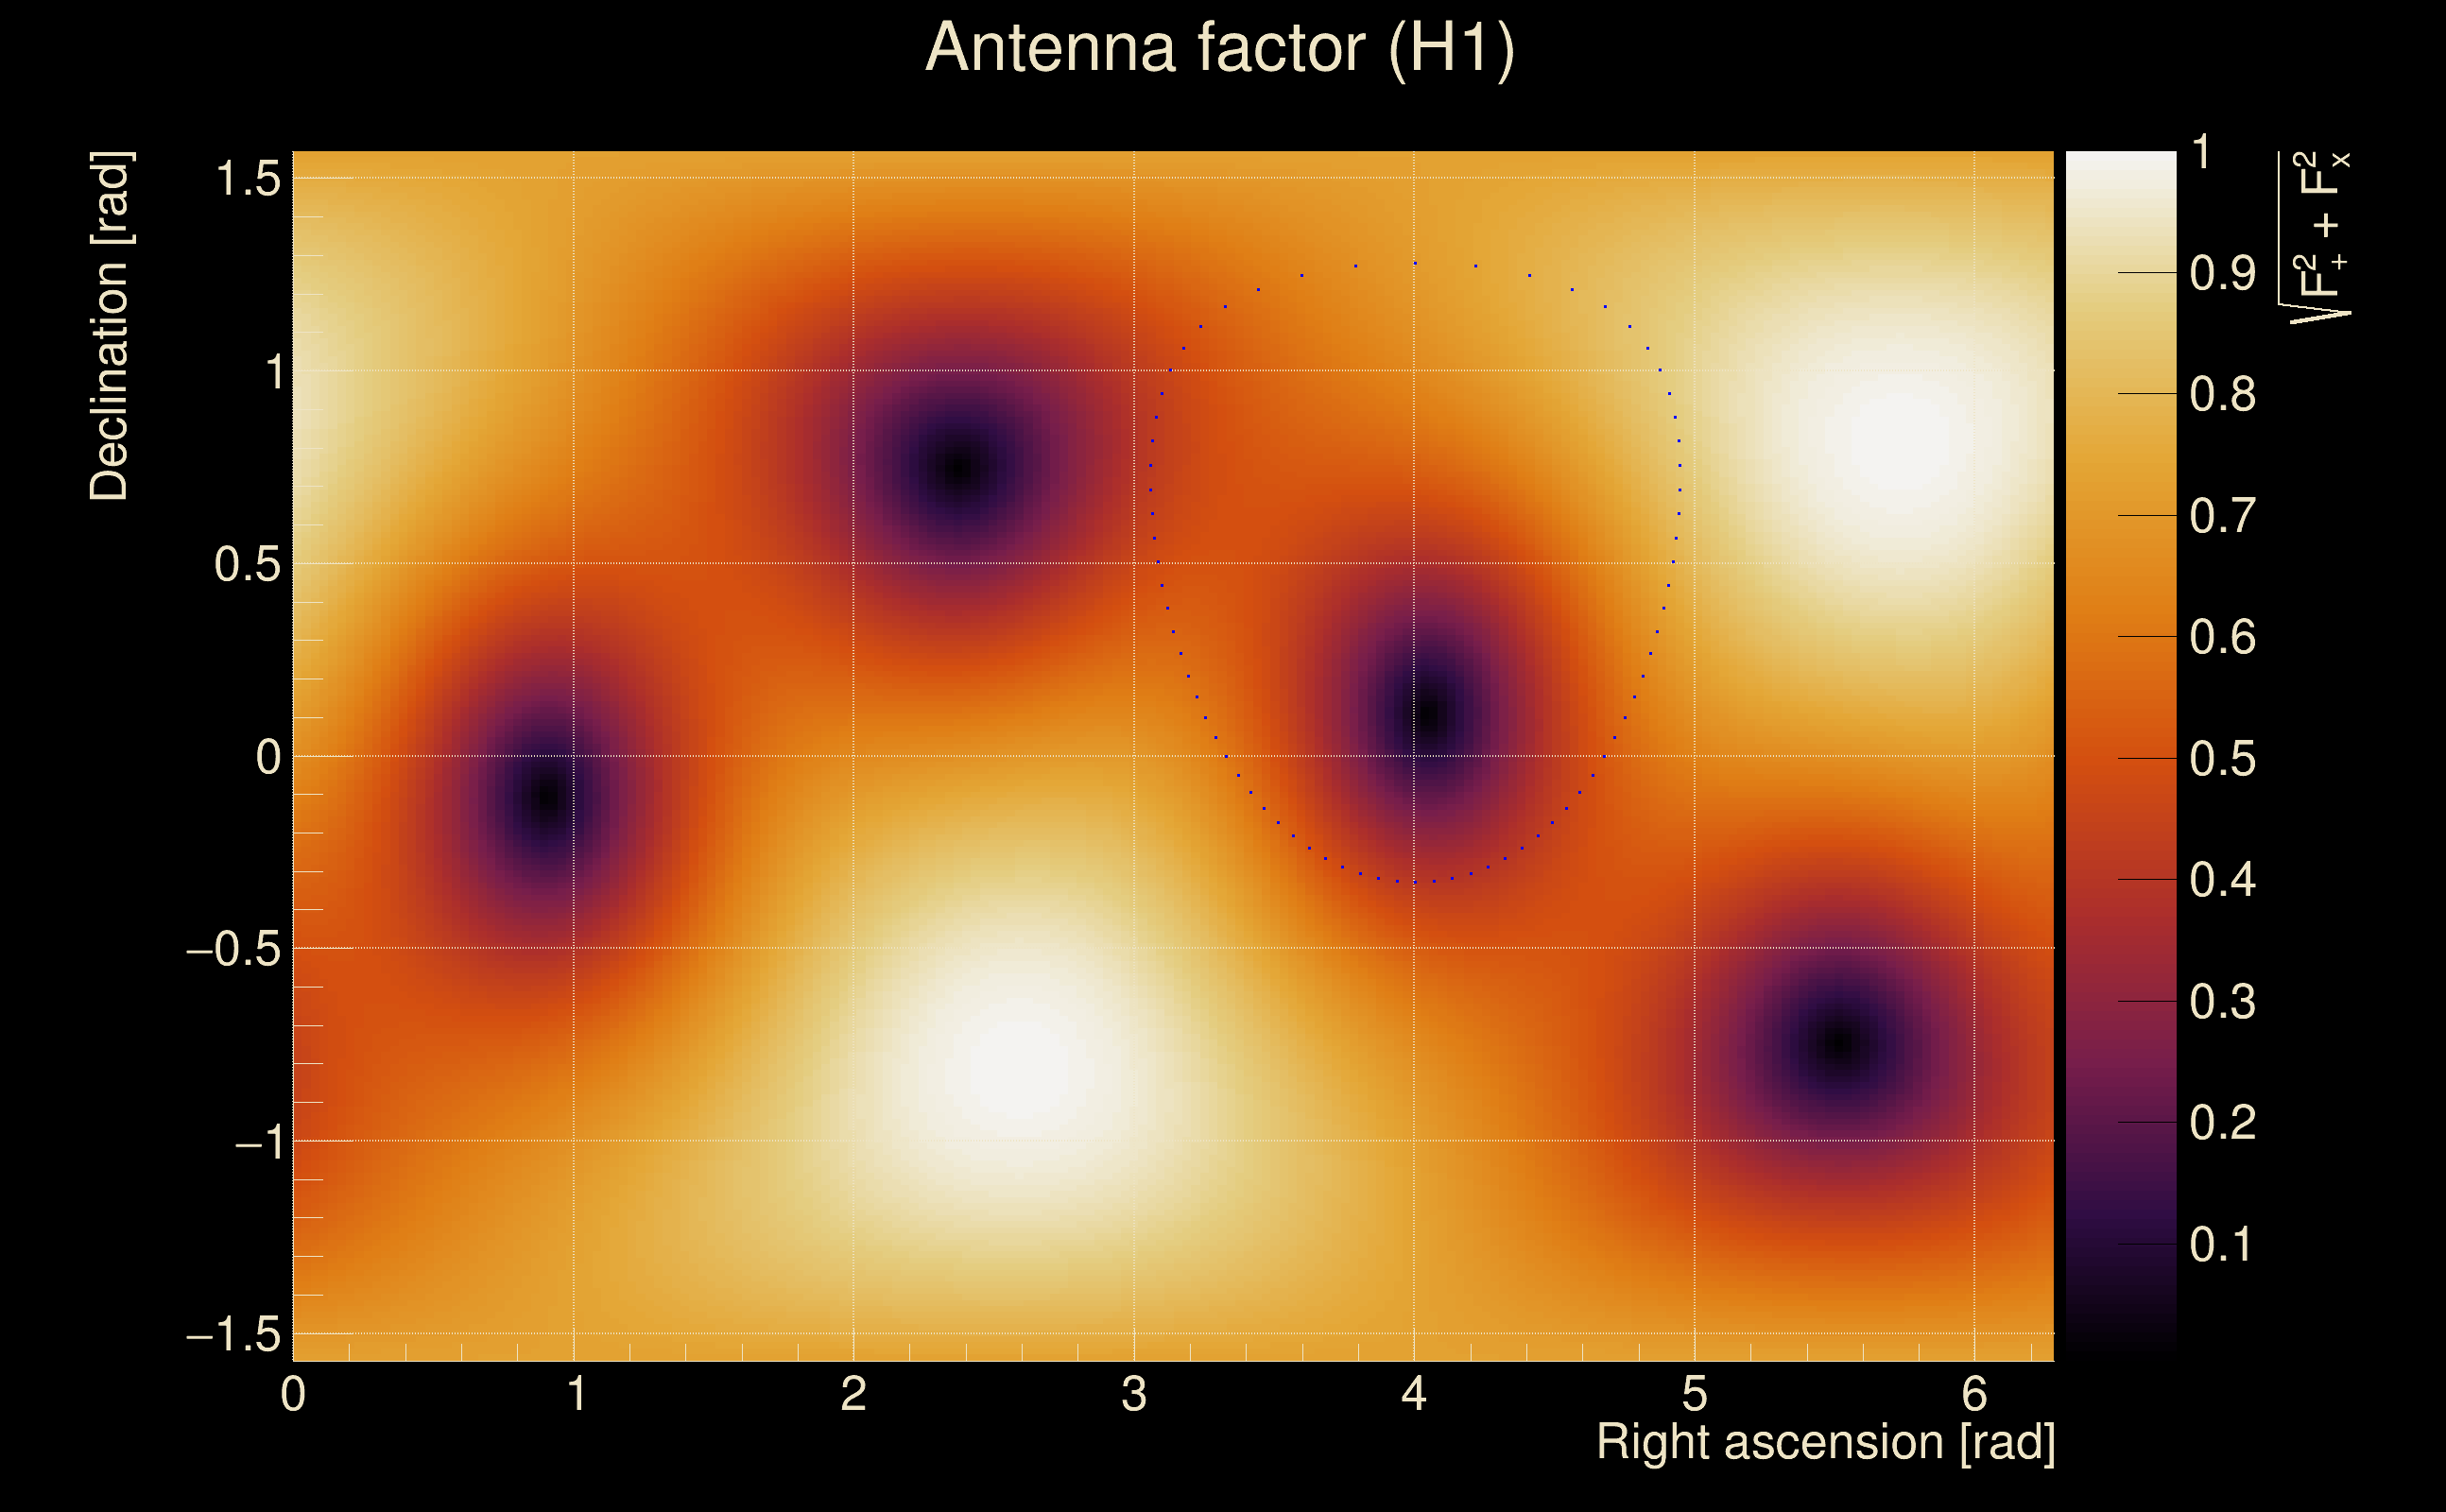
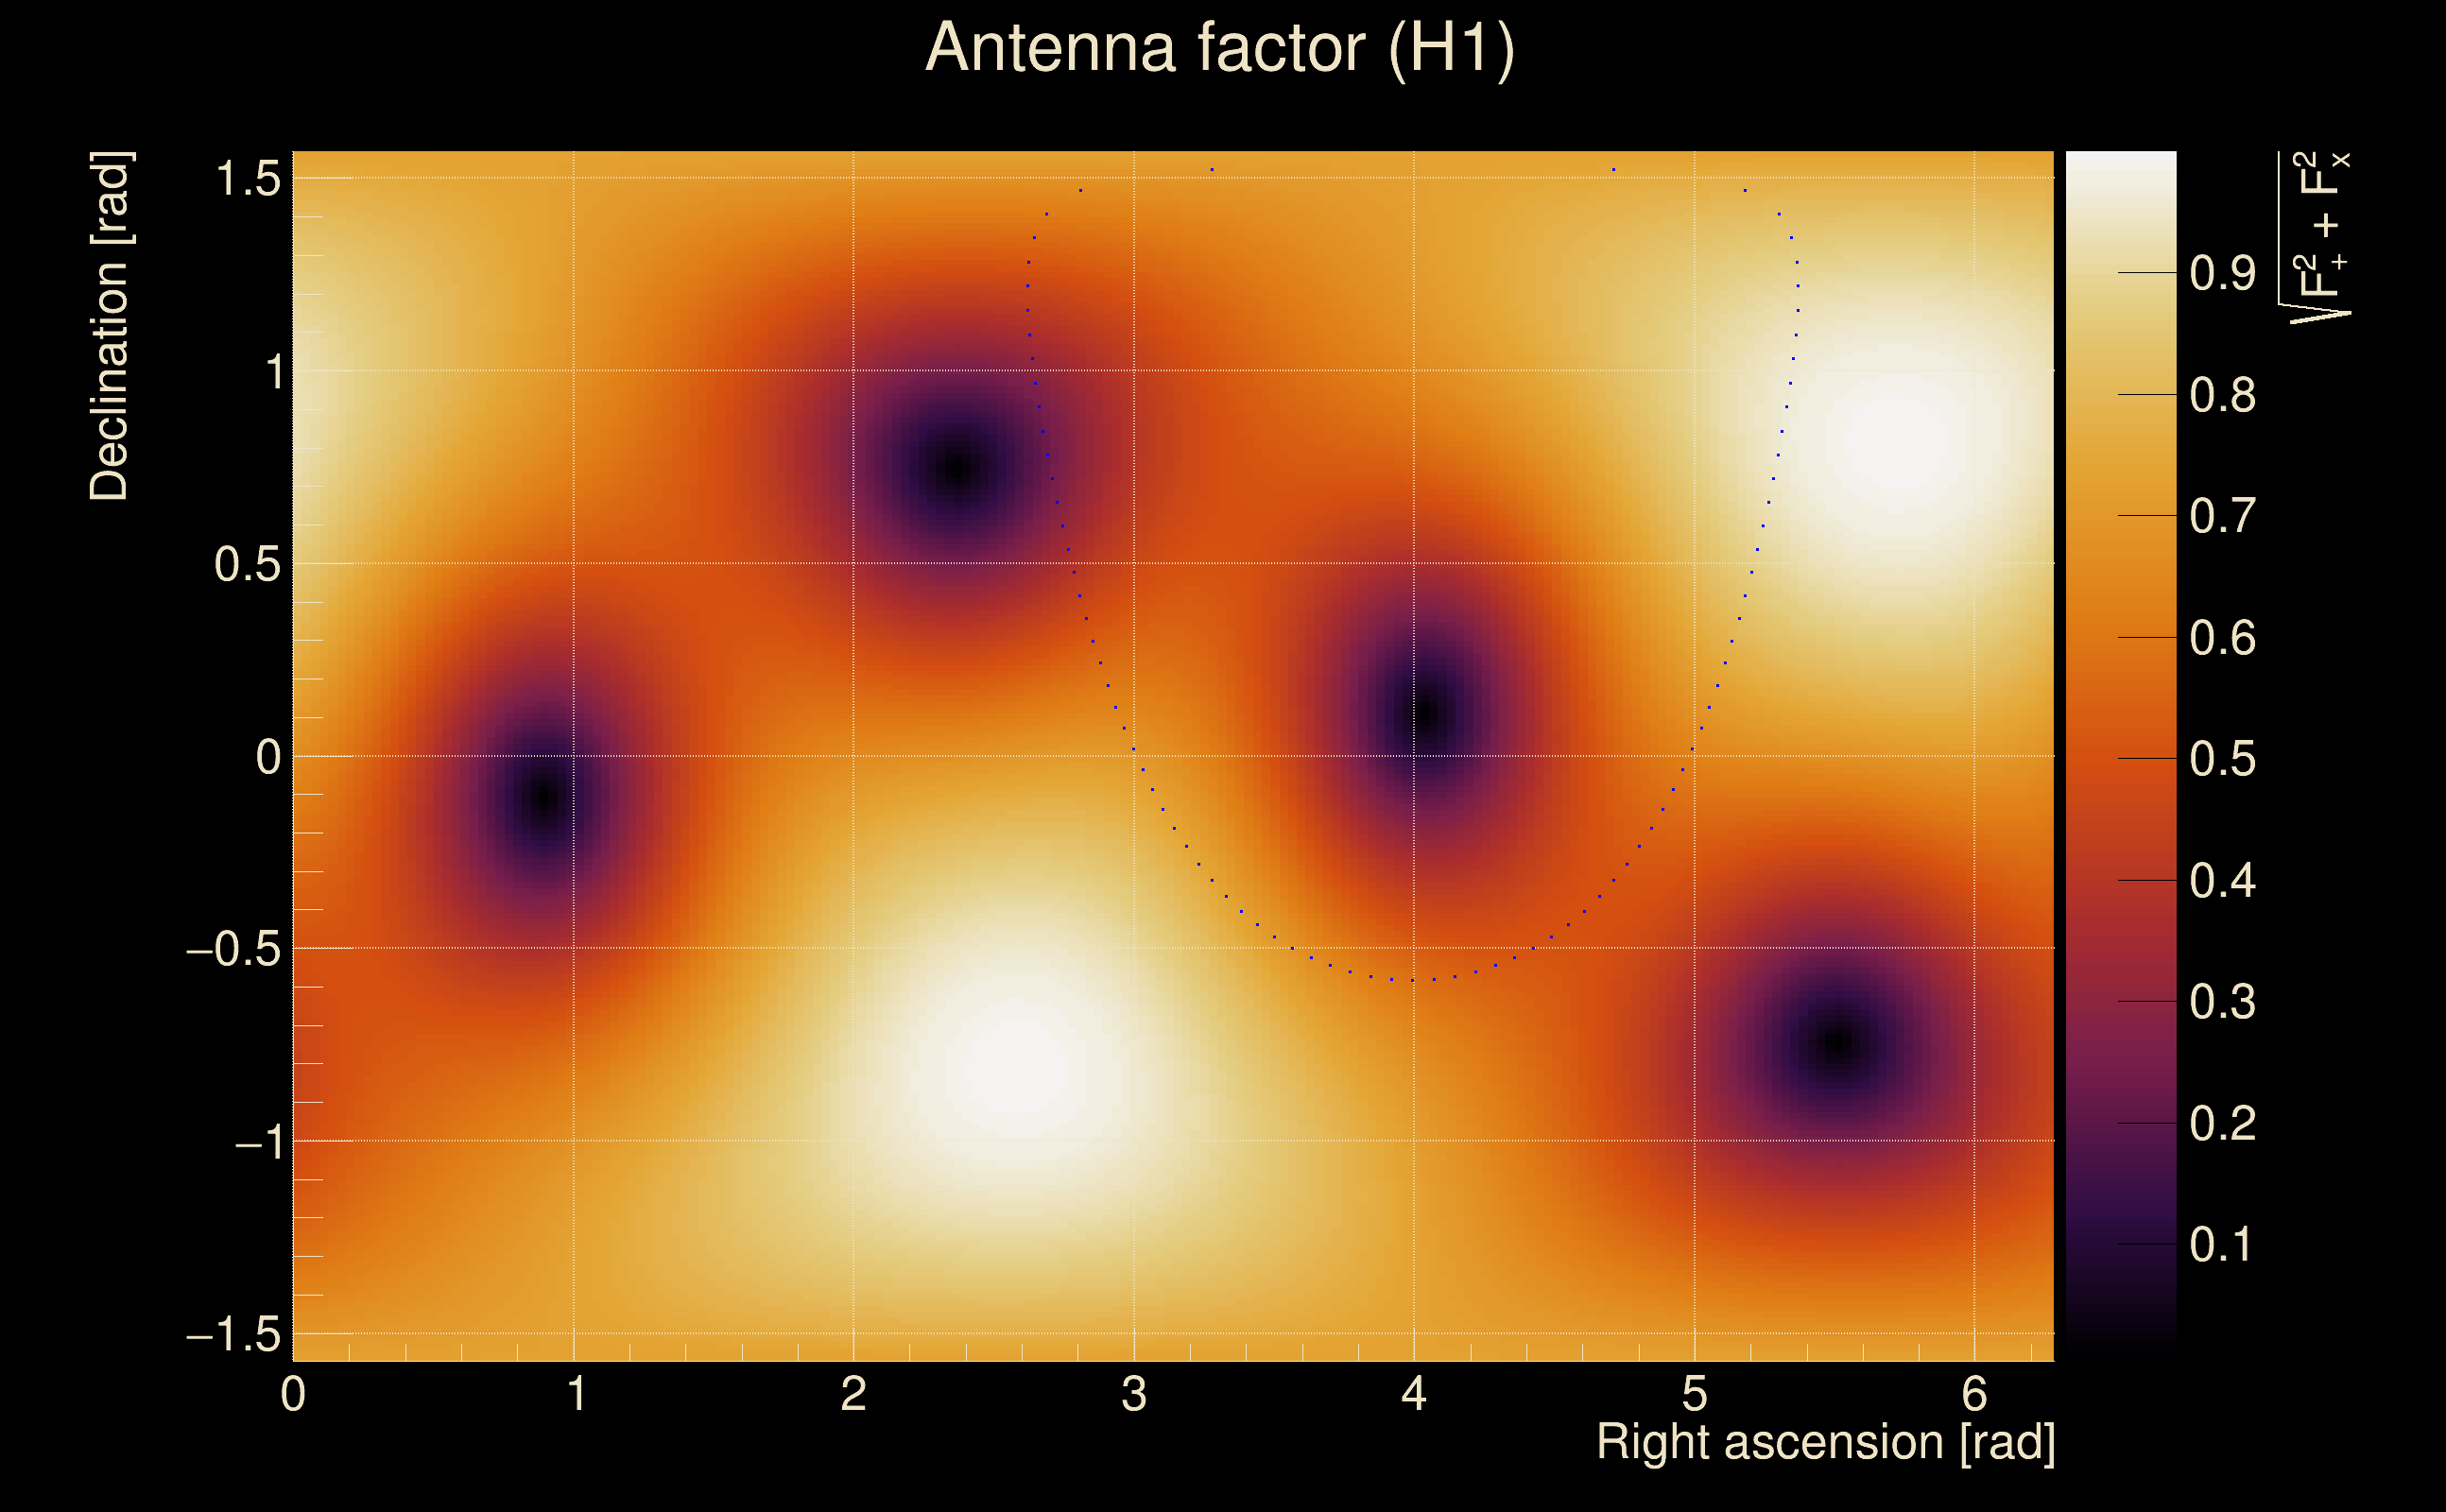
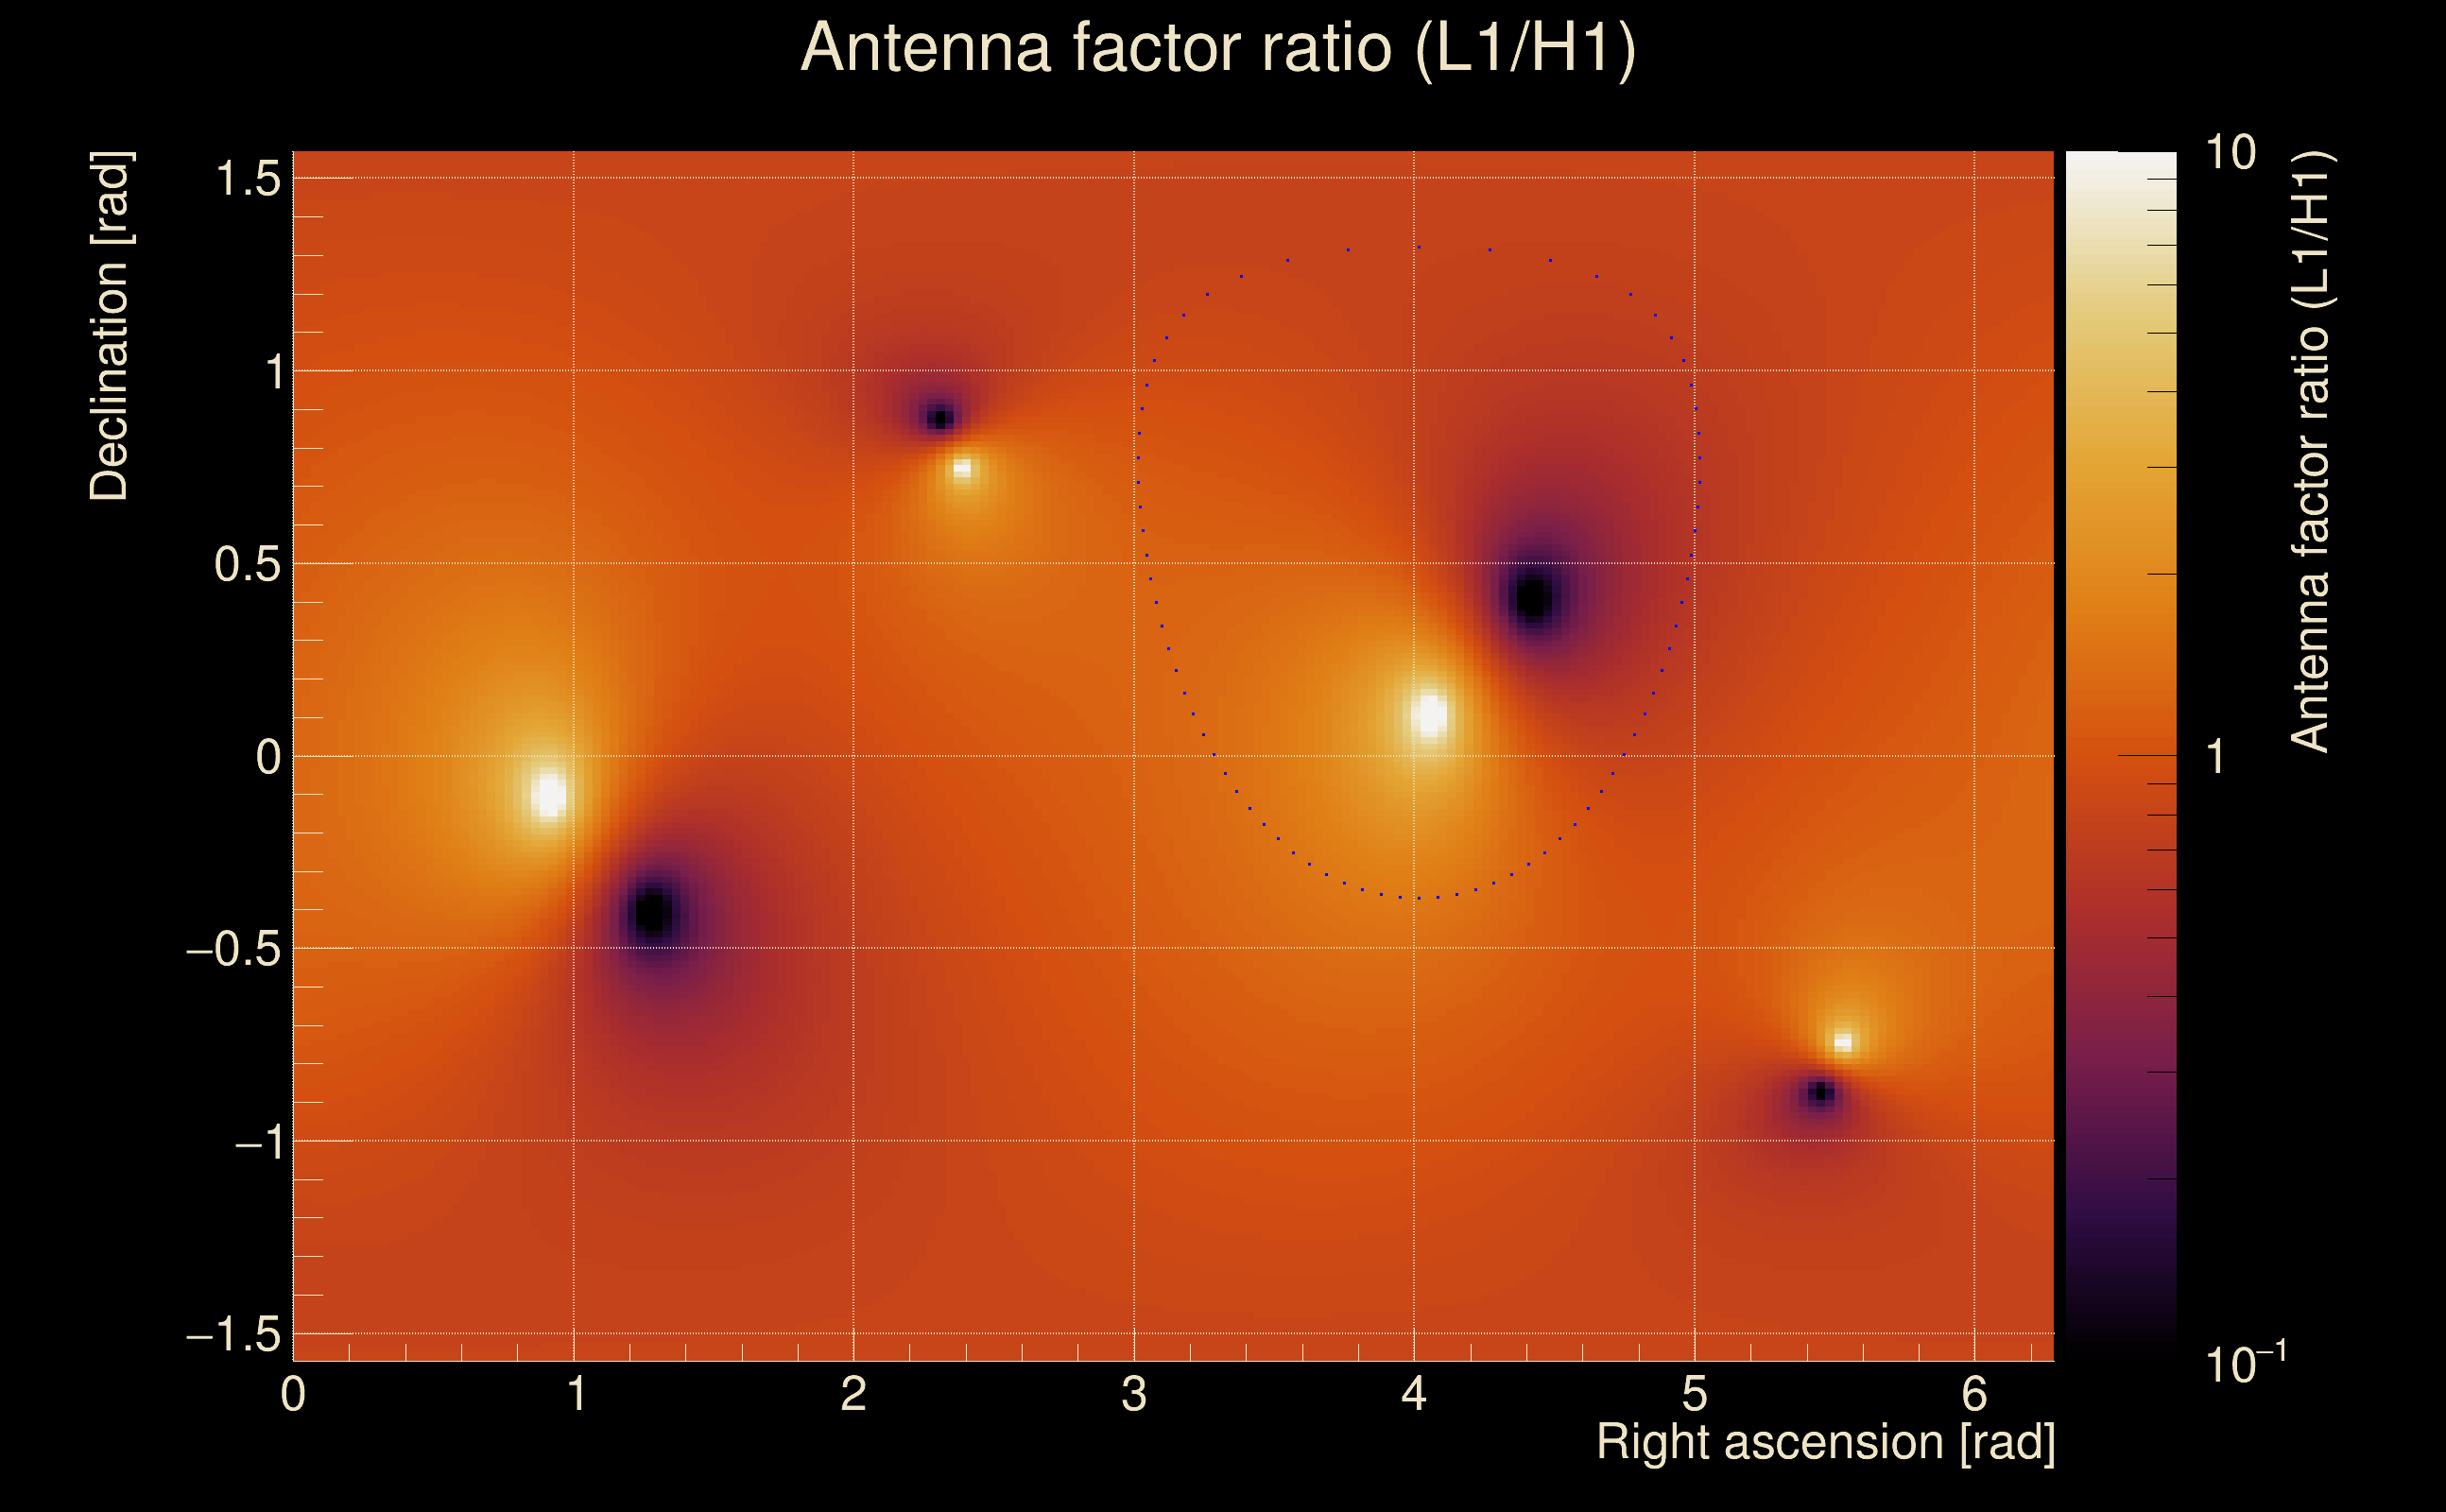
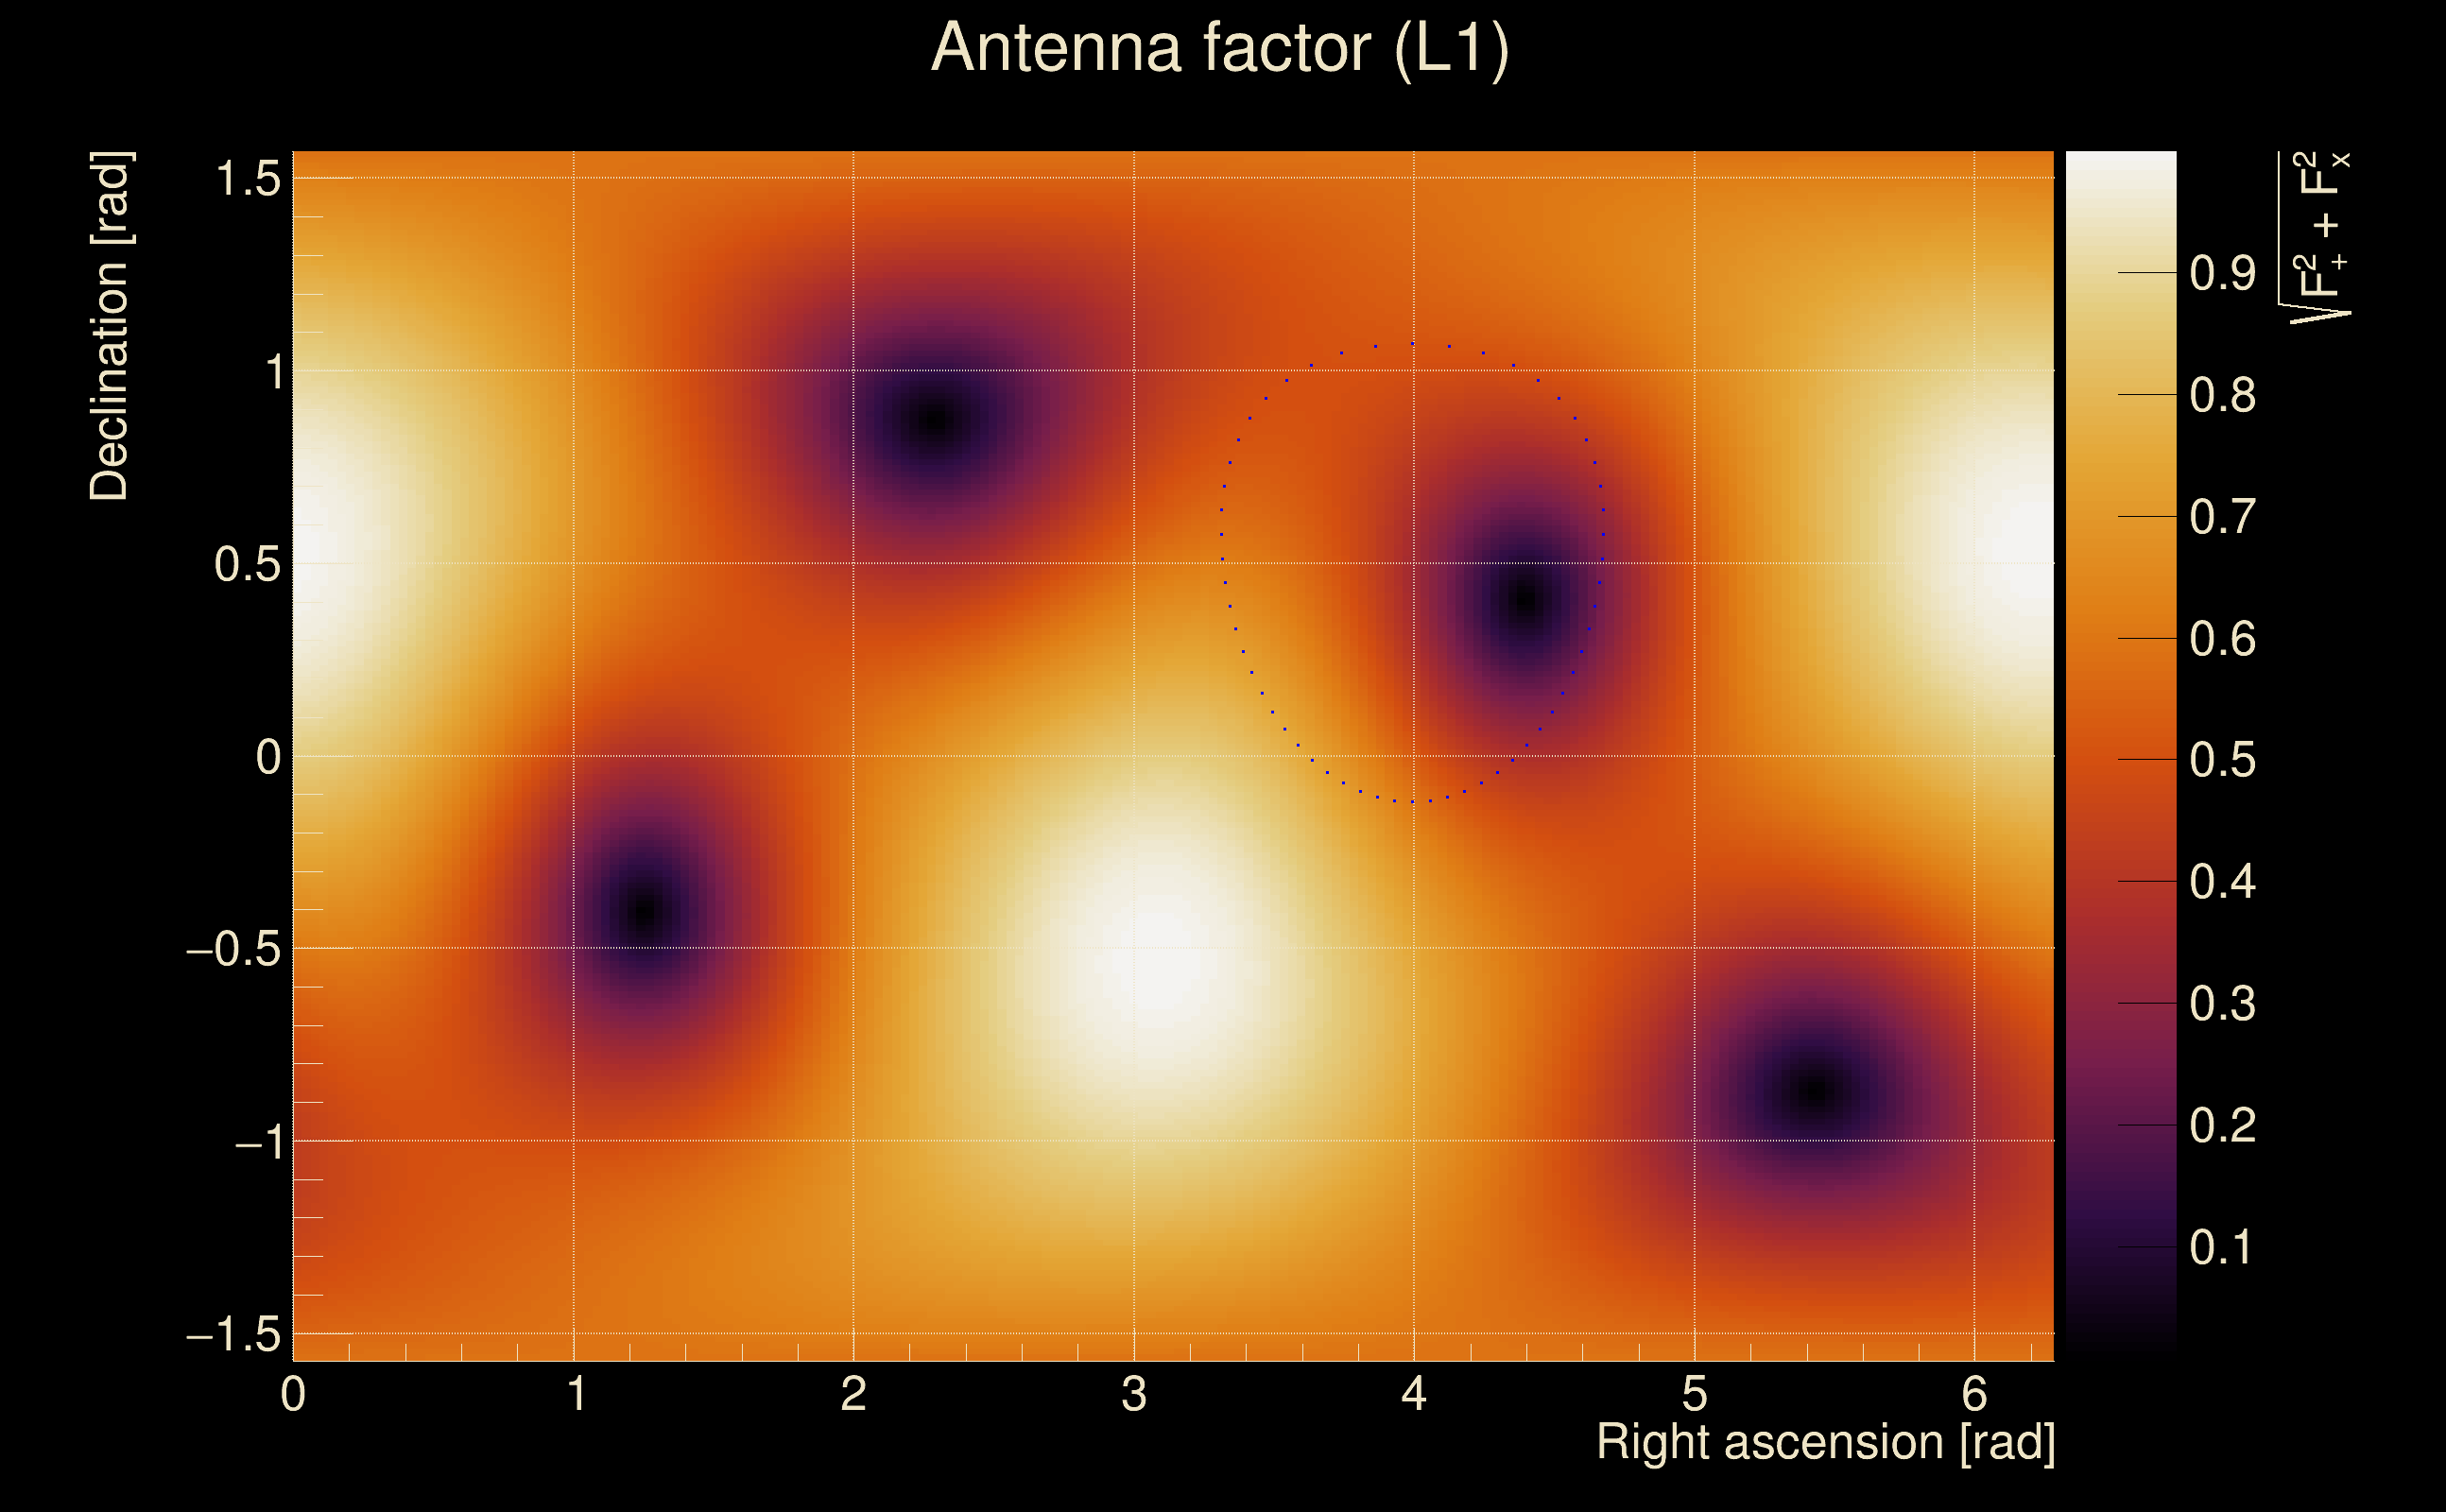
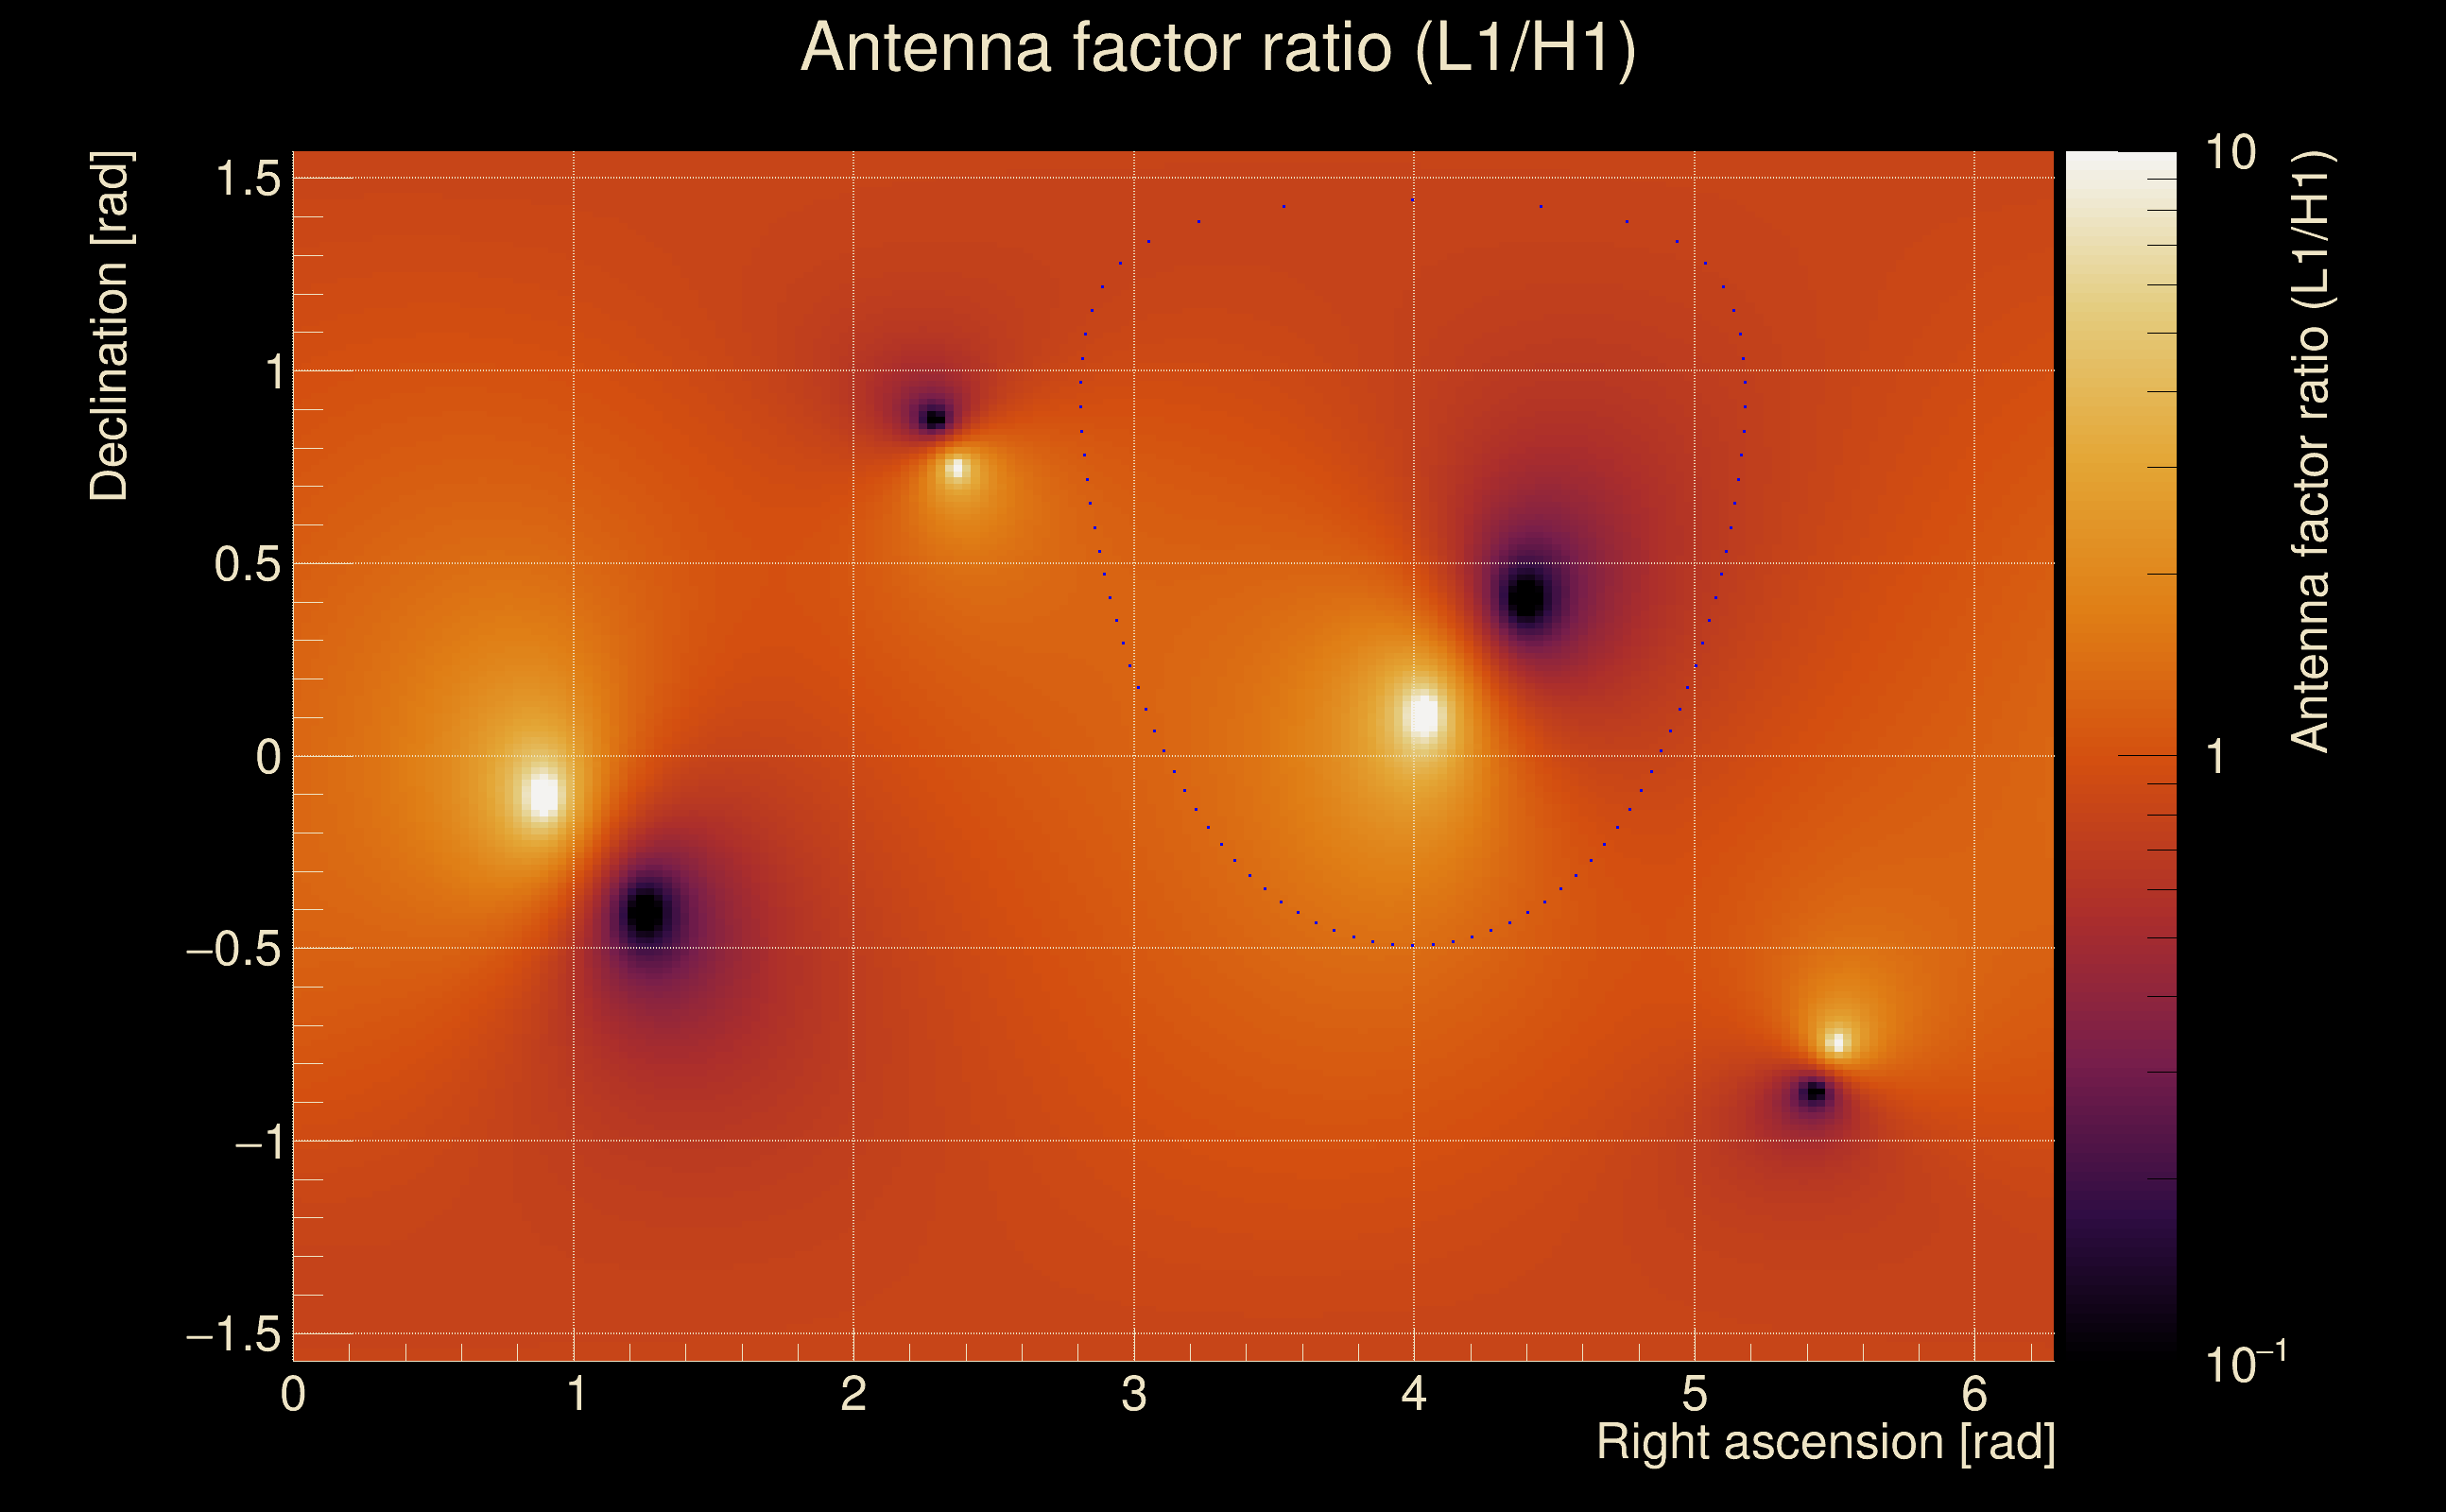
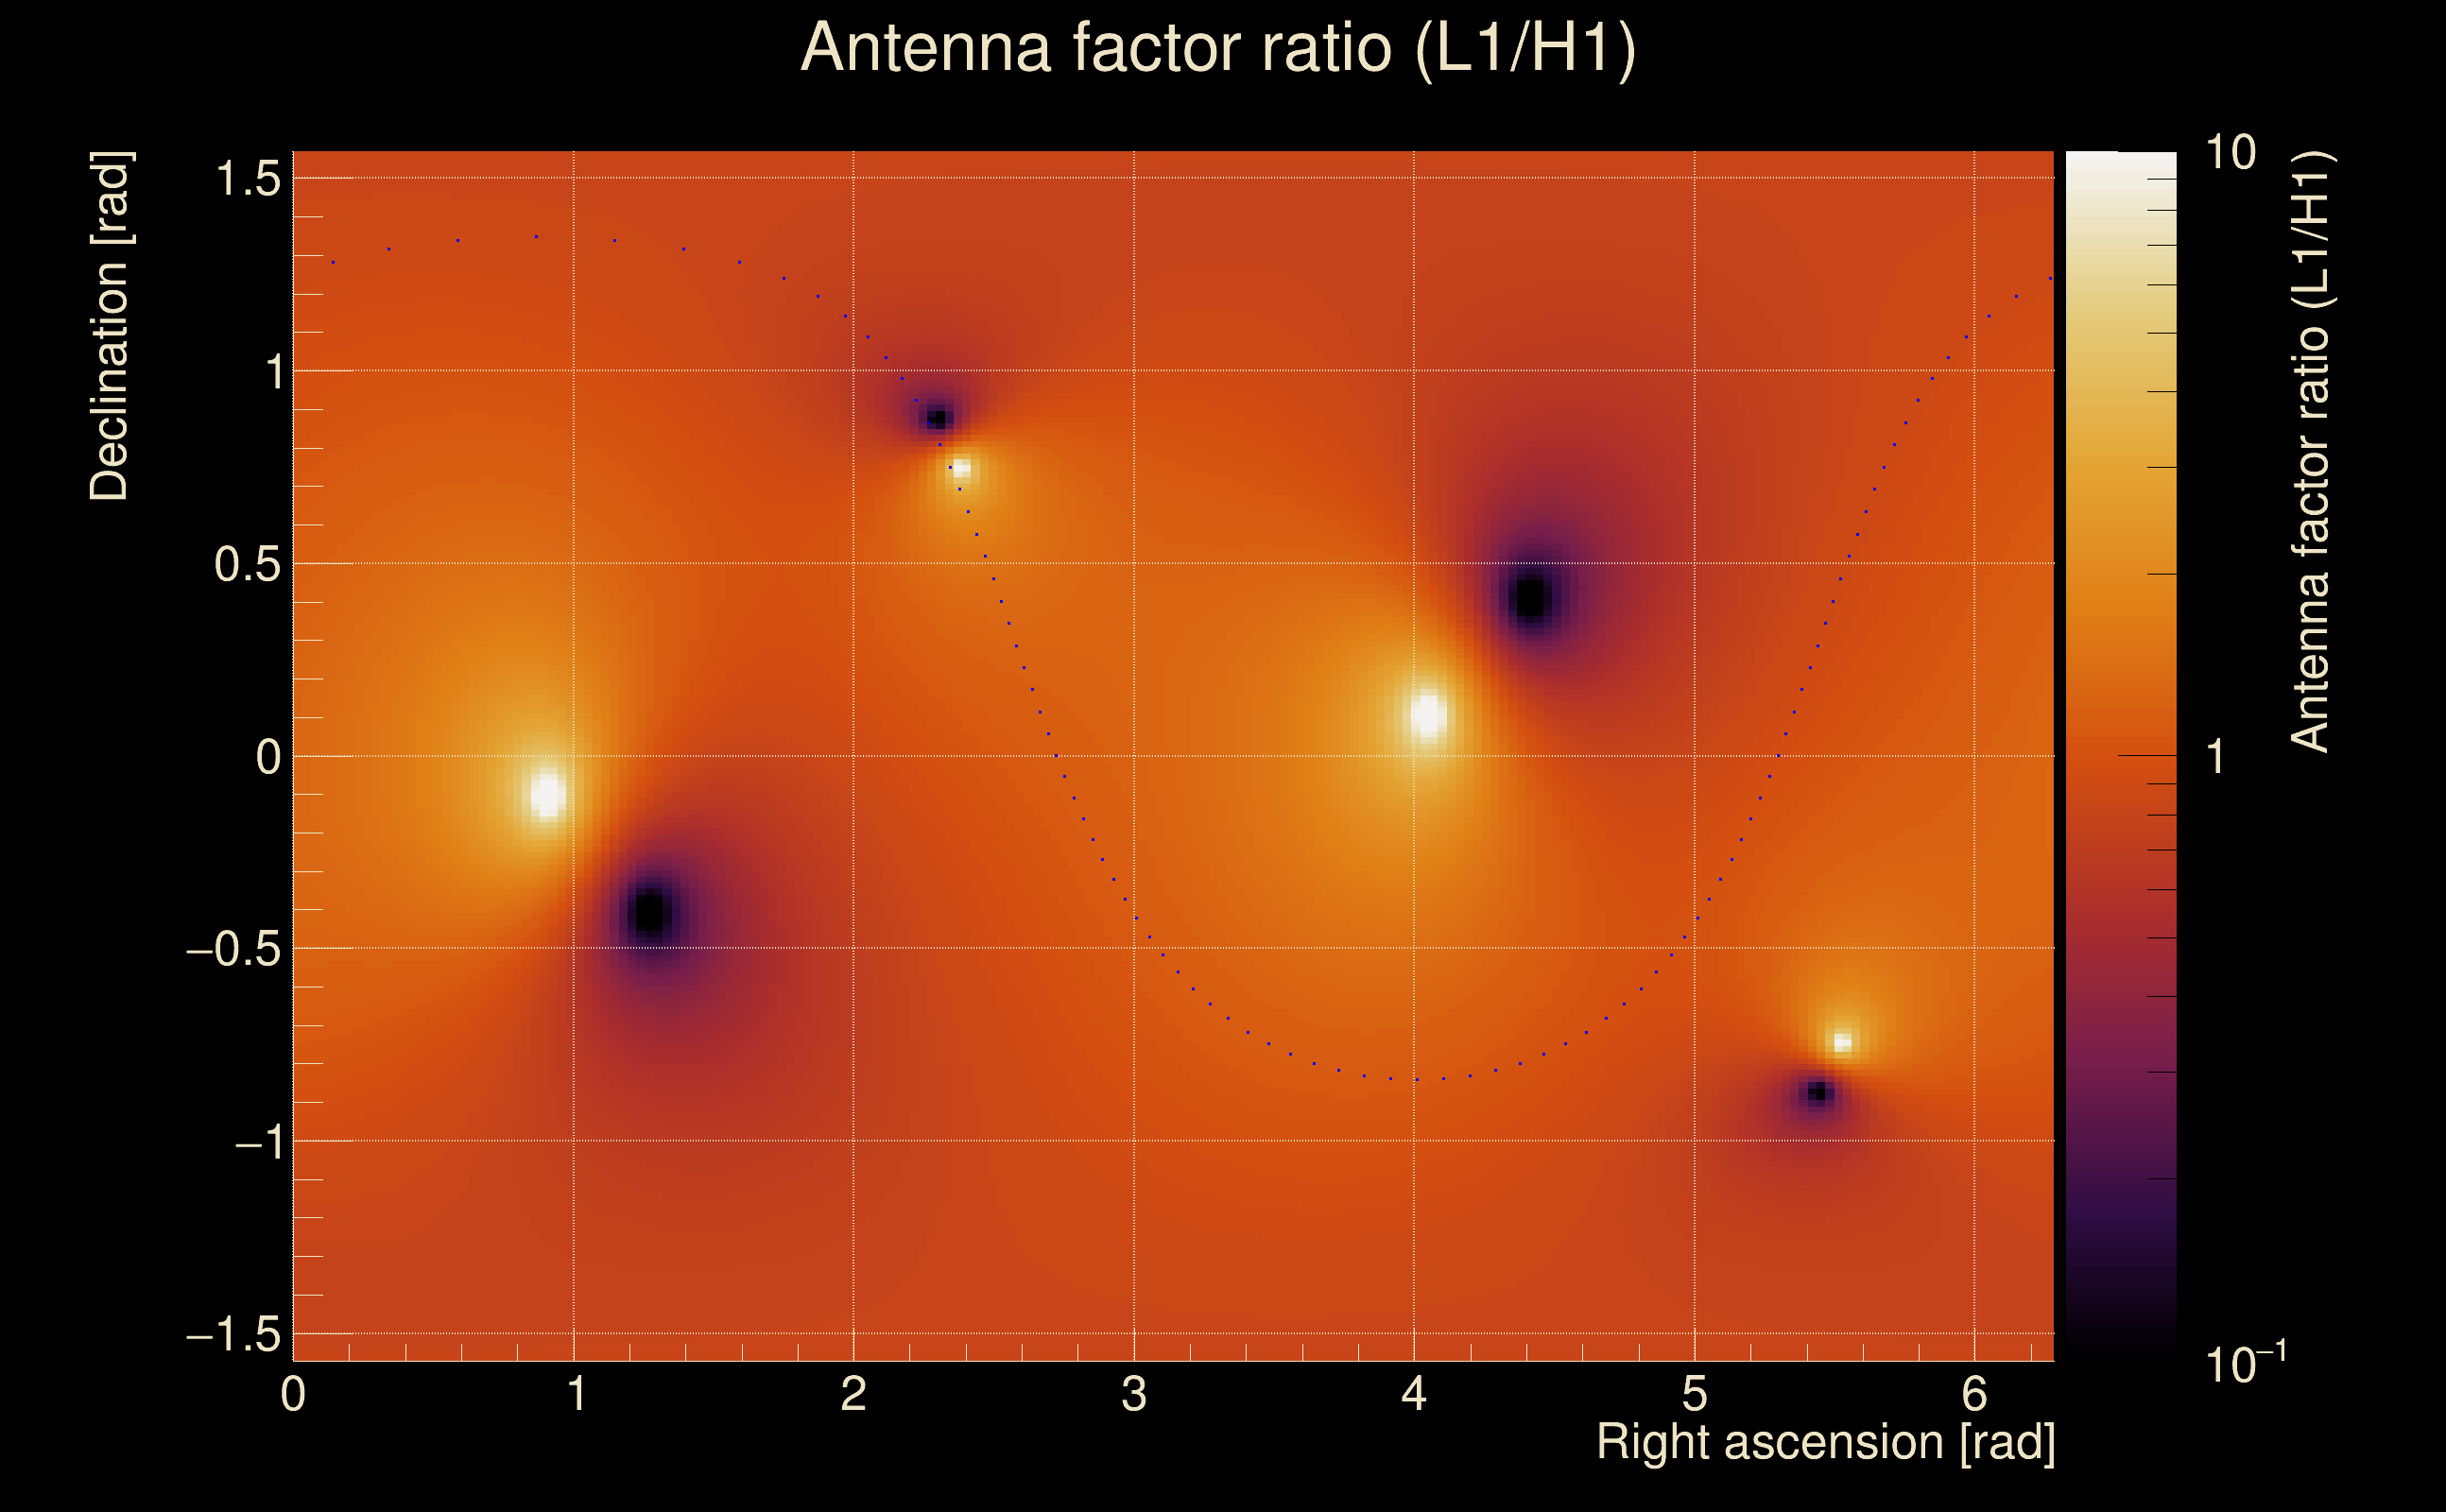
| Target sky positon: | Ra: 3.68109, Dec: 0.94792 [rad] |
| List of input Ox files: | TargIxf_injpt1_10min_2TEST_file_list.txt (1 files) |
| Analysis result file: | TargIxf_injpt1_10min_2TEST_results-0.root |
| Slice selected for the the fakeground: | slice index=146 (-1.748 s), time lag = 0 s |
| Foreground | Fakeground | Background | ||
|---|---|---|---|---|
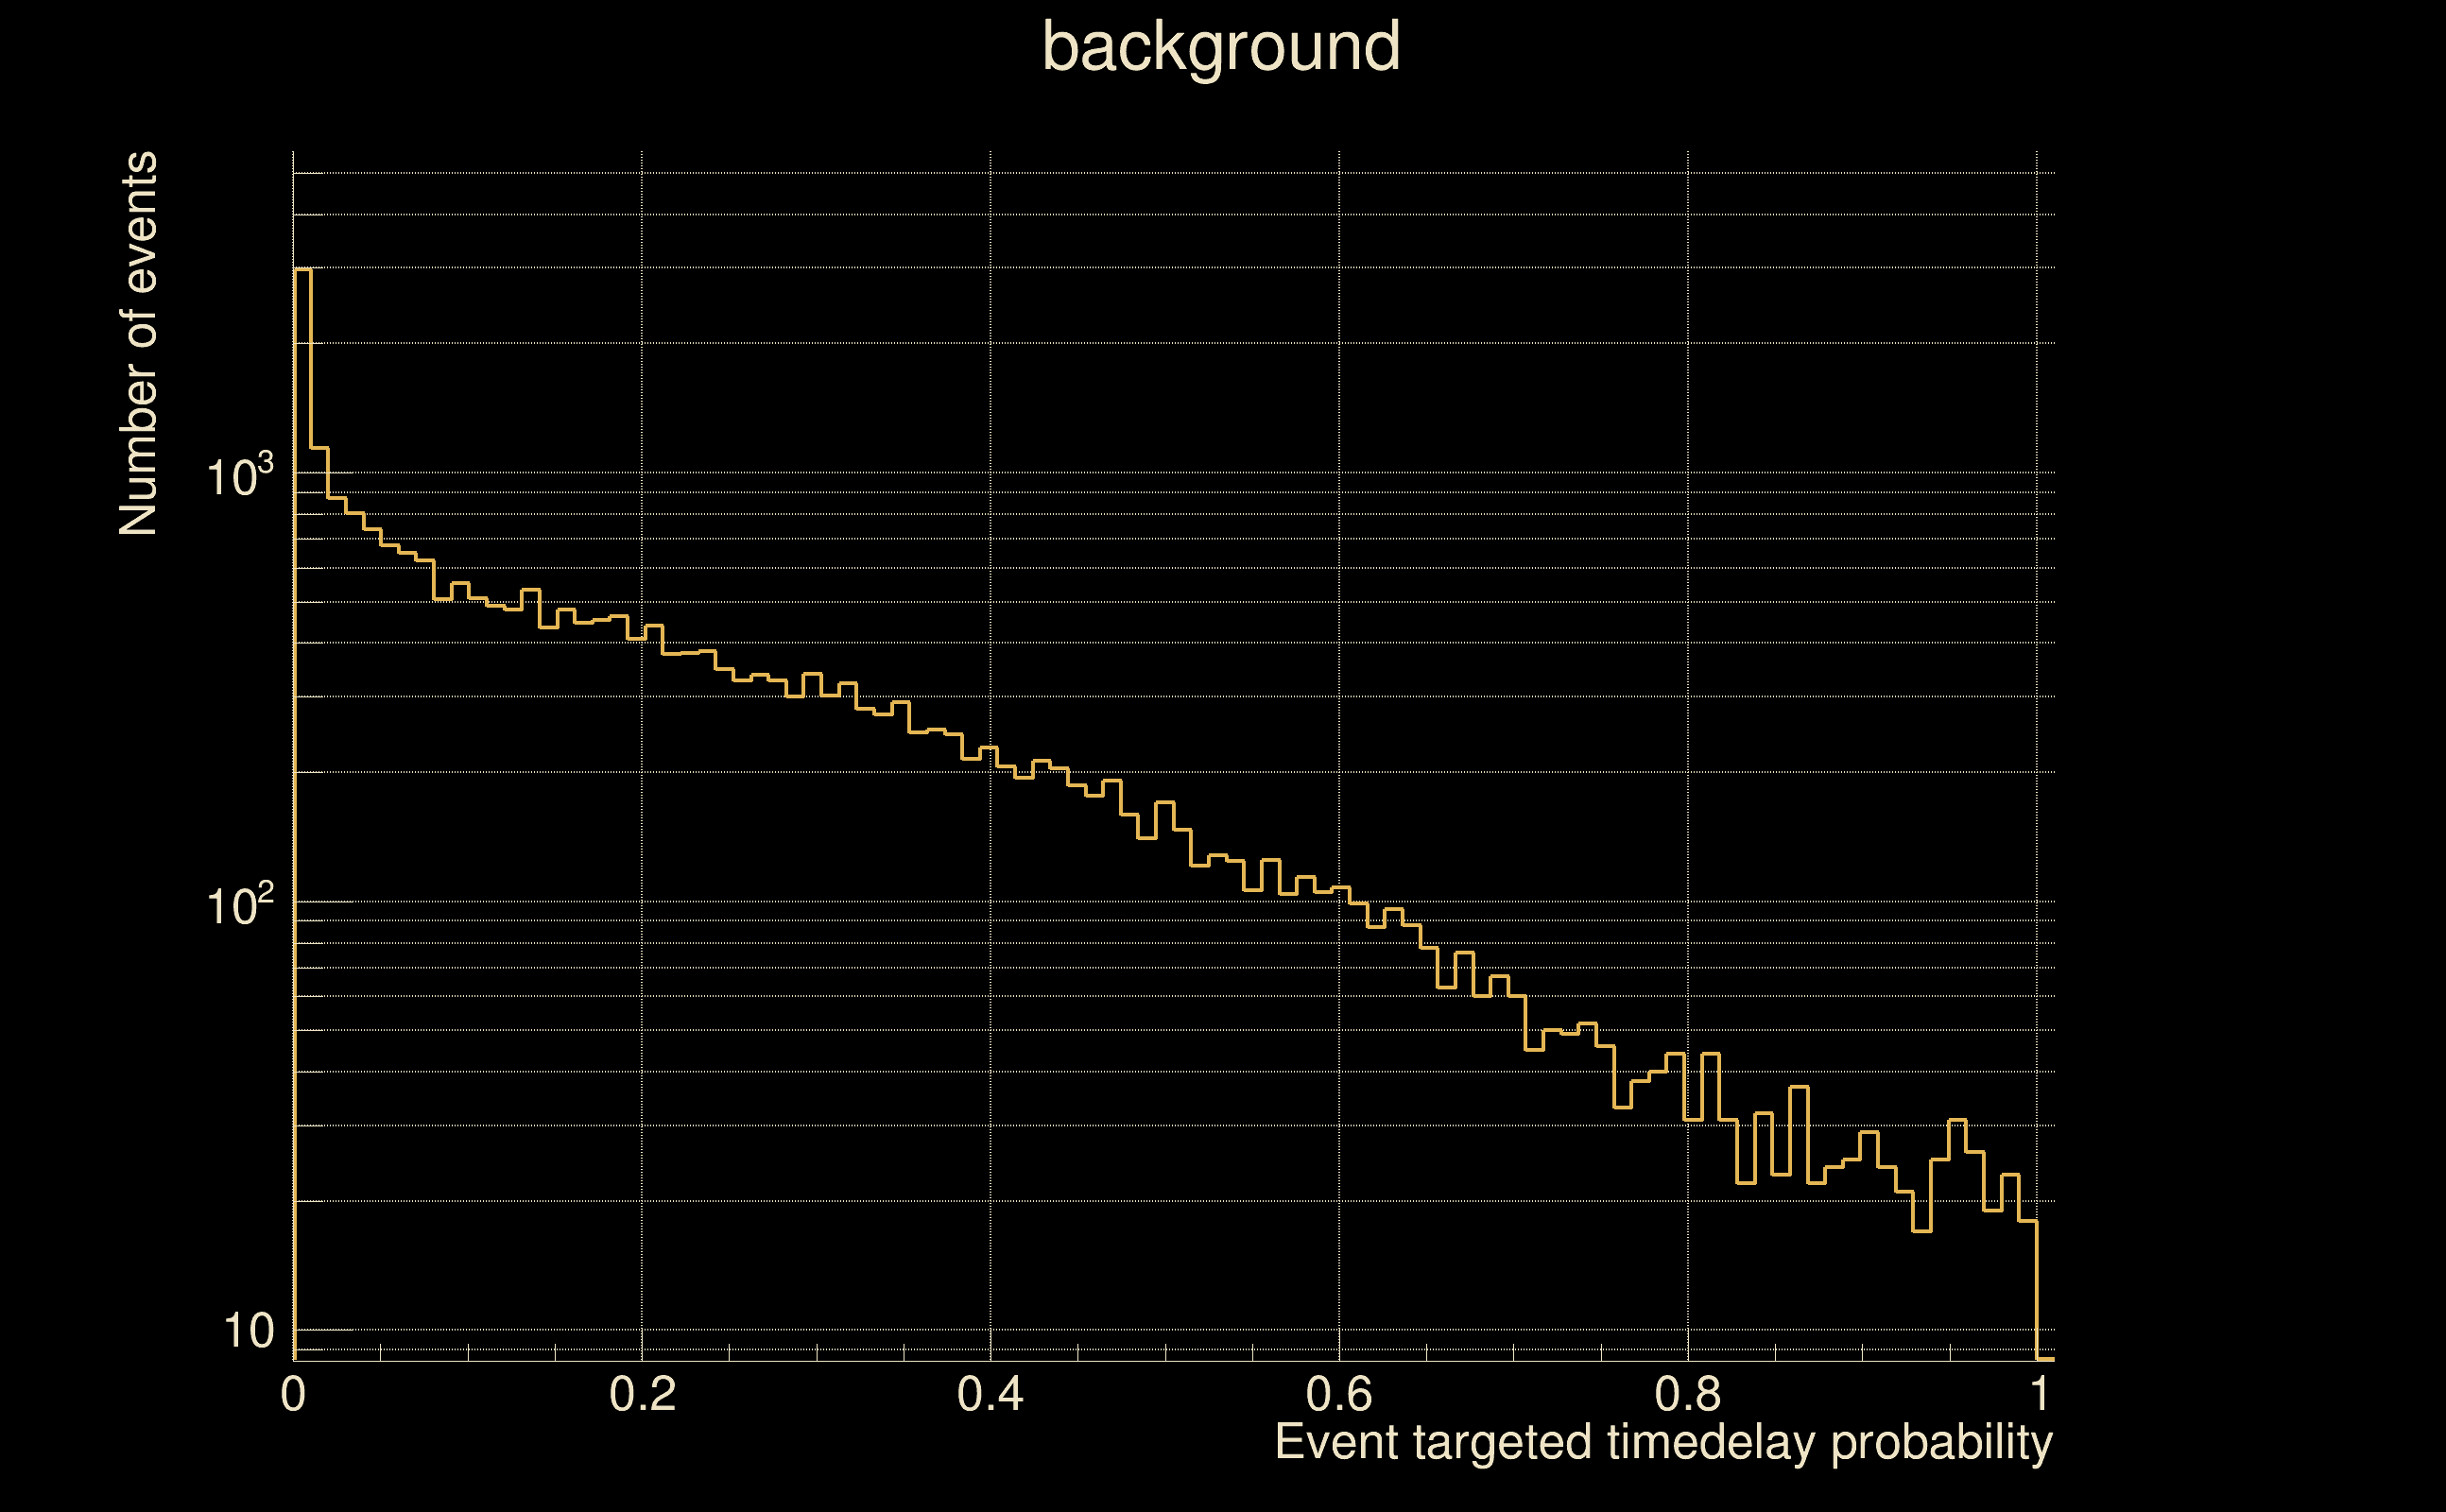
| Number of processed ox events | 117 | 117 | 25155 | |
| Start Date (detector 0) | Mon May 15 14:13:25 2023 UTC | Mon May 15 14:13:25 2023 UTC | Mon May 15 14:13:25 2023 UTC | |
| End Date (detector 0) | Mon May 15 14:23:15 2023 UTC | Mon May 15 14:23:15 2023 UTC | Mon May 15 14:23:15 2023 UTC | |
| Start GPS (detector 0) | 1368195223 | 1368195223 | 1368195223 | |
| End GPS (detector 0) | 1368195813 | 1368195813 | 1368195813 | |
| Used livetime (detector 0) | 590 s | 590 s | 590 s | |
| Start Date (detector 1) | Mon May 15 14:13:25 2023 UTC | Mon May 15 14:13:25 2023 UTC | Mon May 15 14:13:25 2023 UTC | |
| End Date (detector 1) | Mon May 15 14:23:15 2023 UTC | Mon May 15 14:23:15 2023 UTC | Mon May 15 14:23:15 2023 UTC | |
| Start GPS (detector 1) | 1368195223 | 1368195223 | 1368195223 | |
| End GPS (detector 1) | 1368195813 | 1368195813 | 1368195813 | |
| Used livetime (detector 1) | 590 s | 590 s | 590 s | |
| Cumulative livetime | 1170 s | 1170 s | 251550 s | |
| 0 years, 0 days, 0 hours, 19 min, 30 s | 0 years, 0 days, 0 hours, 19 min, 30 s | 0 years, 2 days, 21 hours, 52 min, 30 s |
|
|
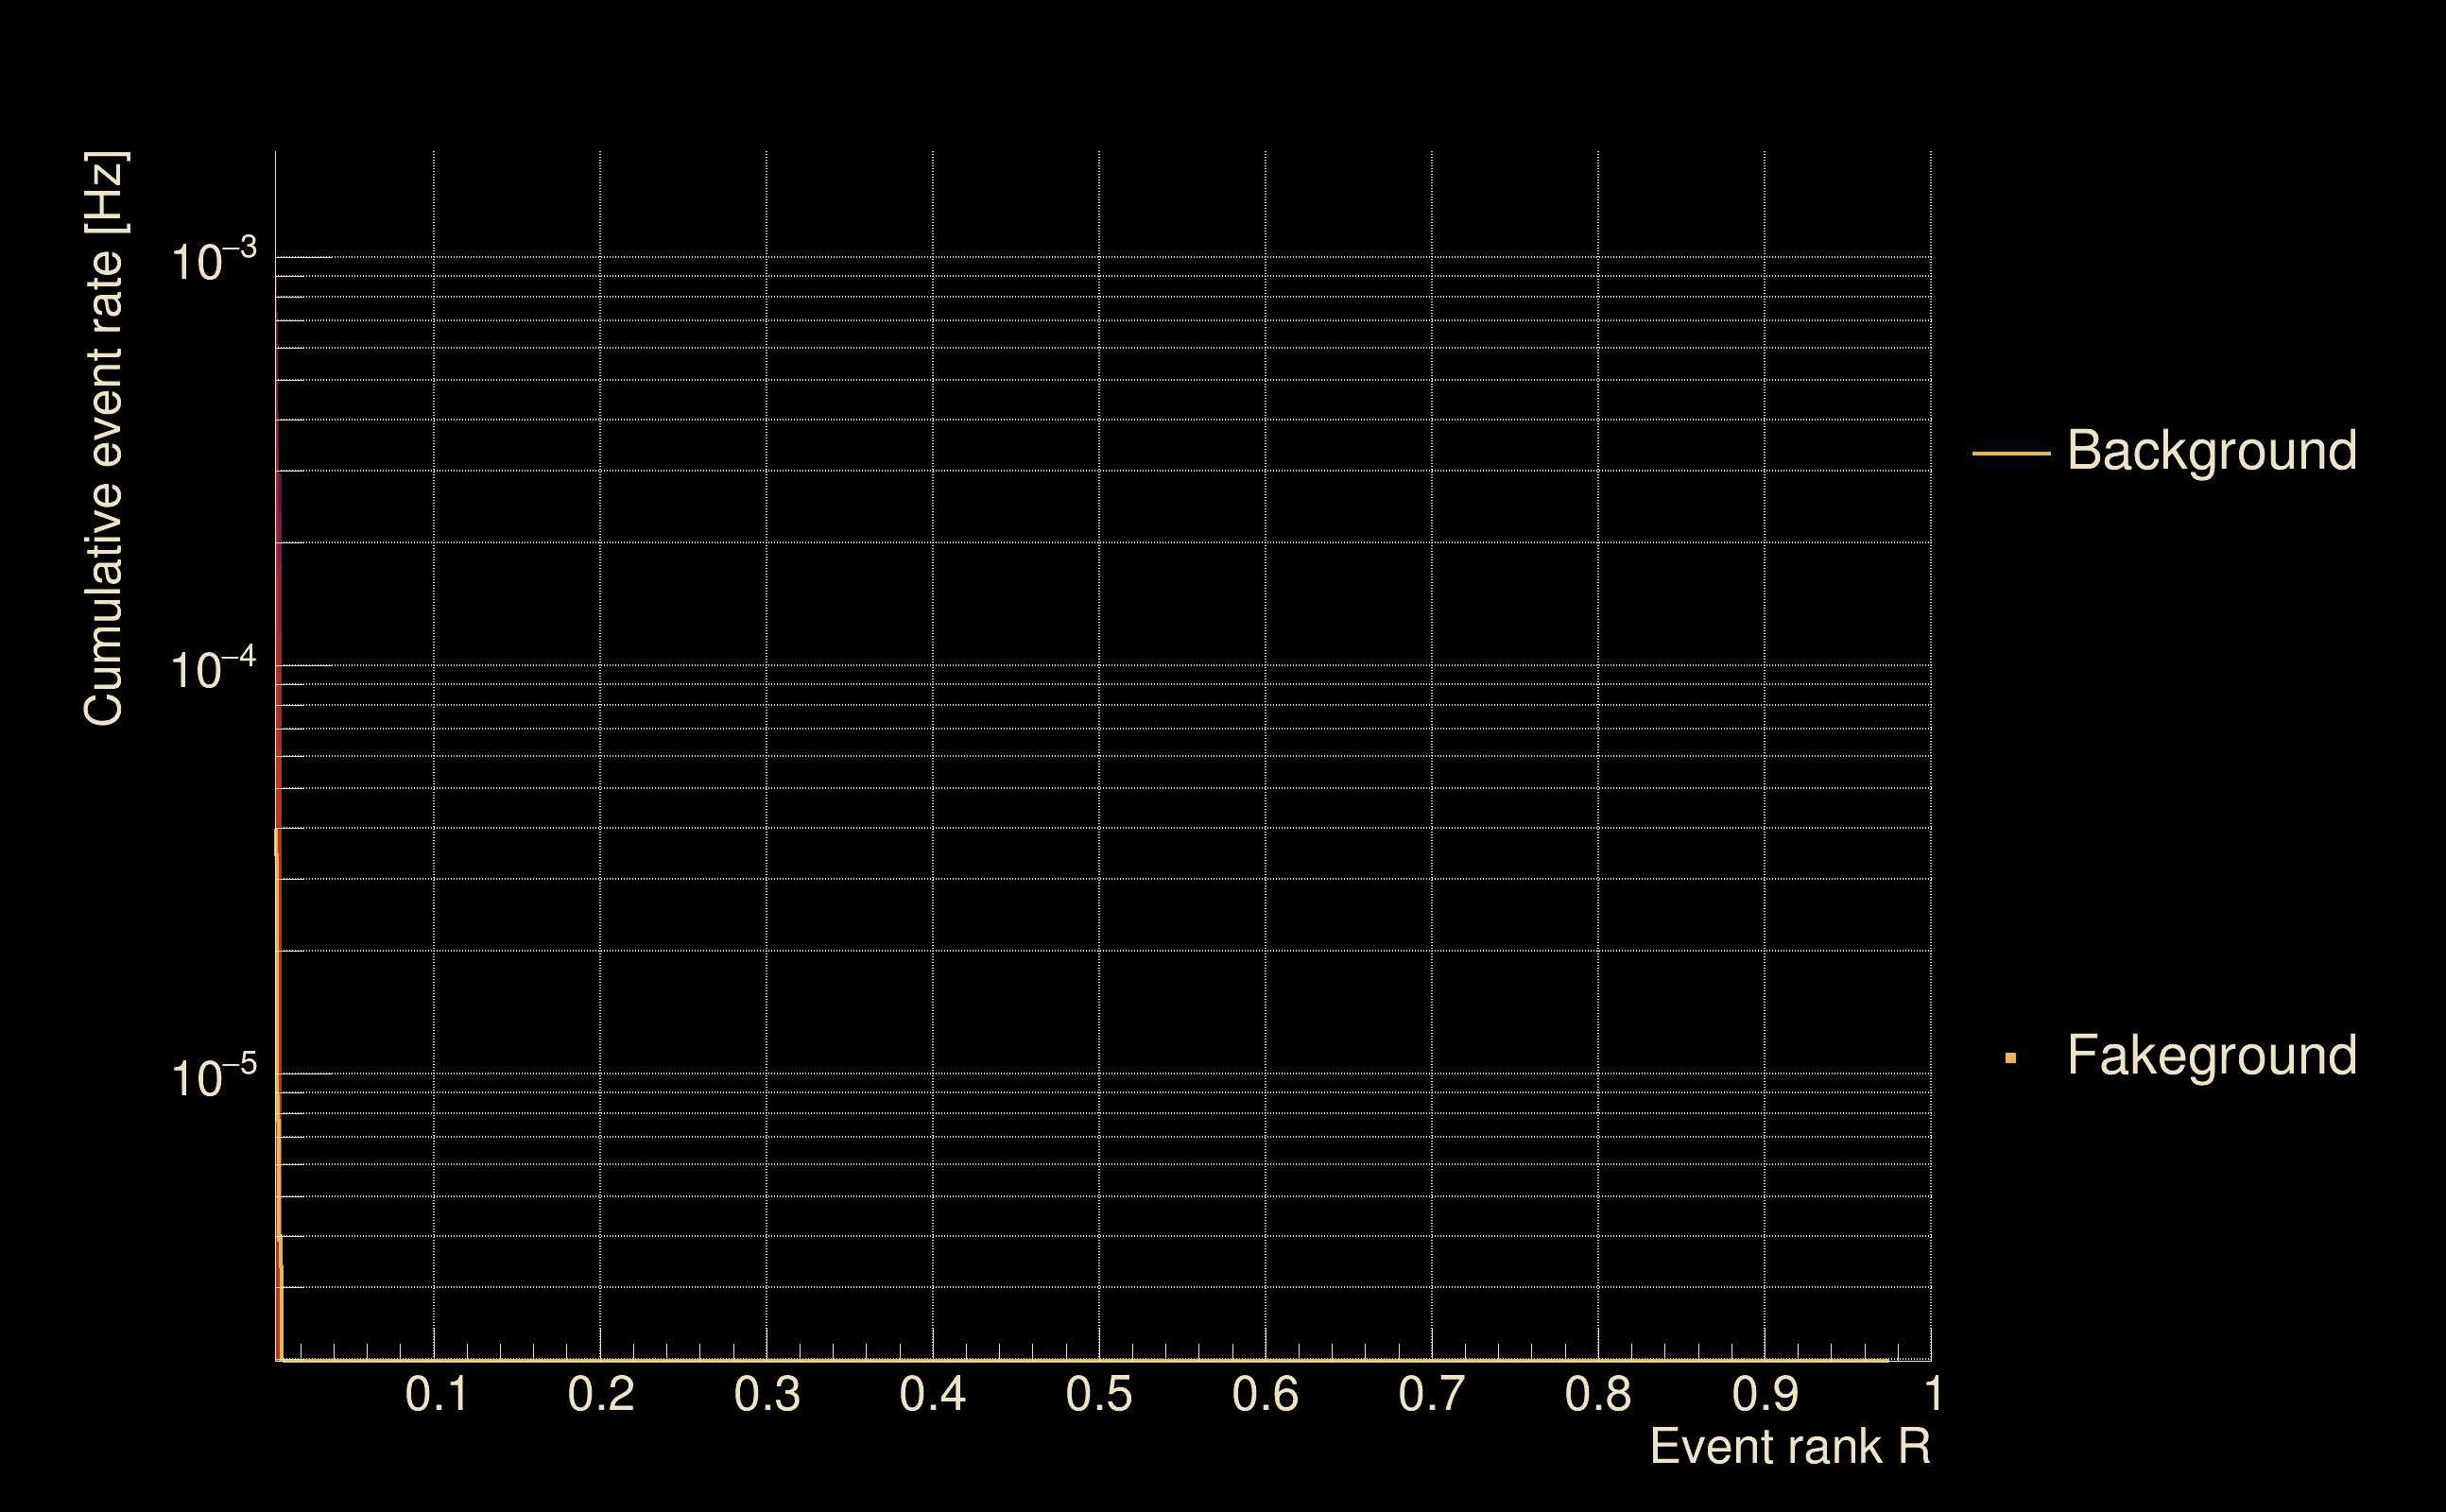
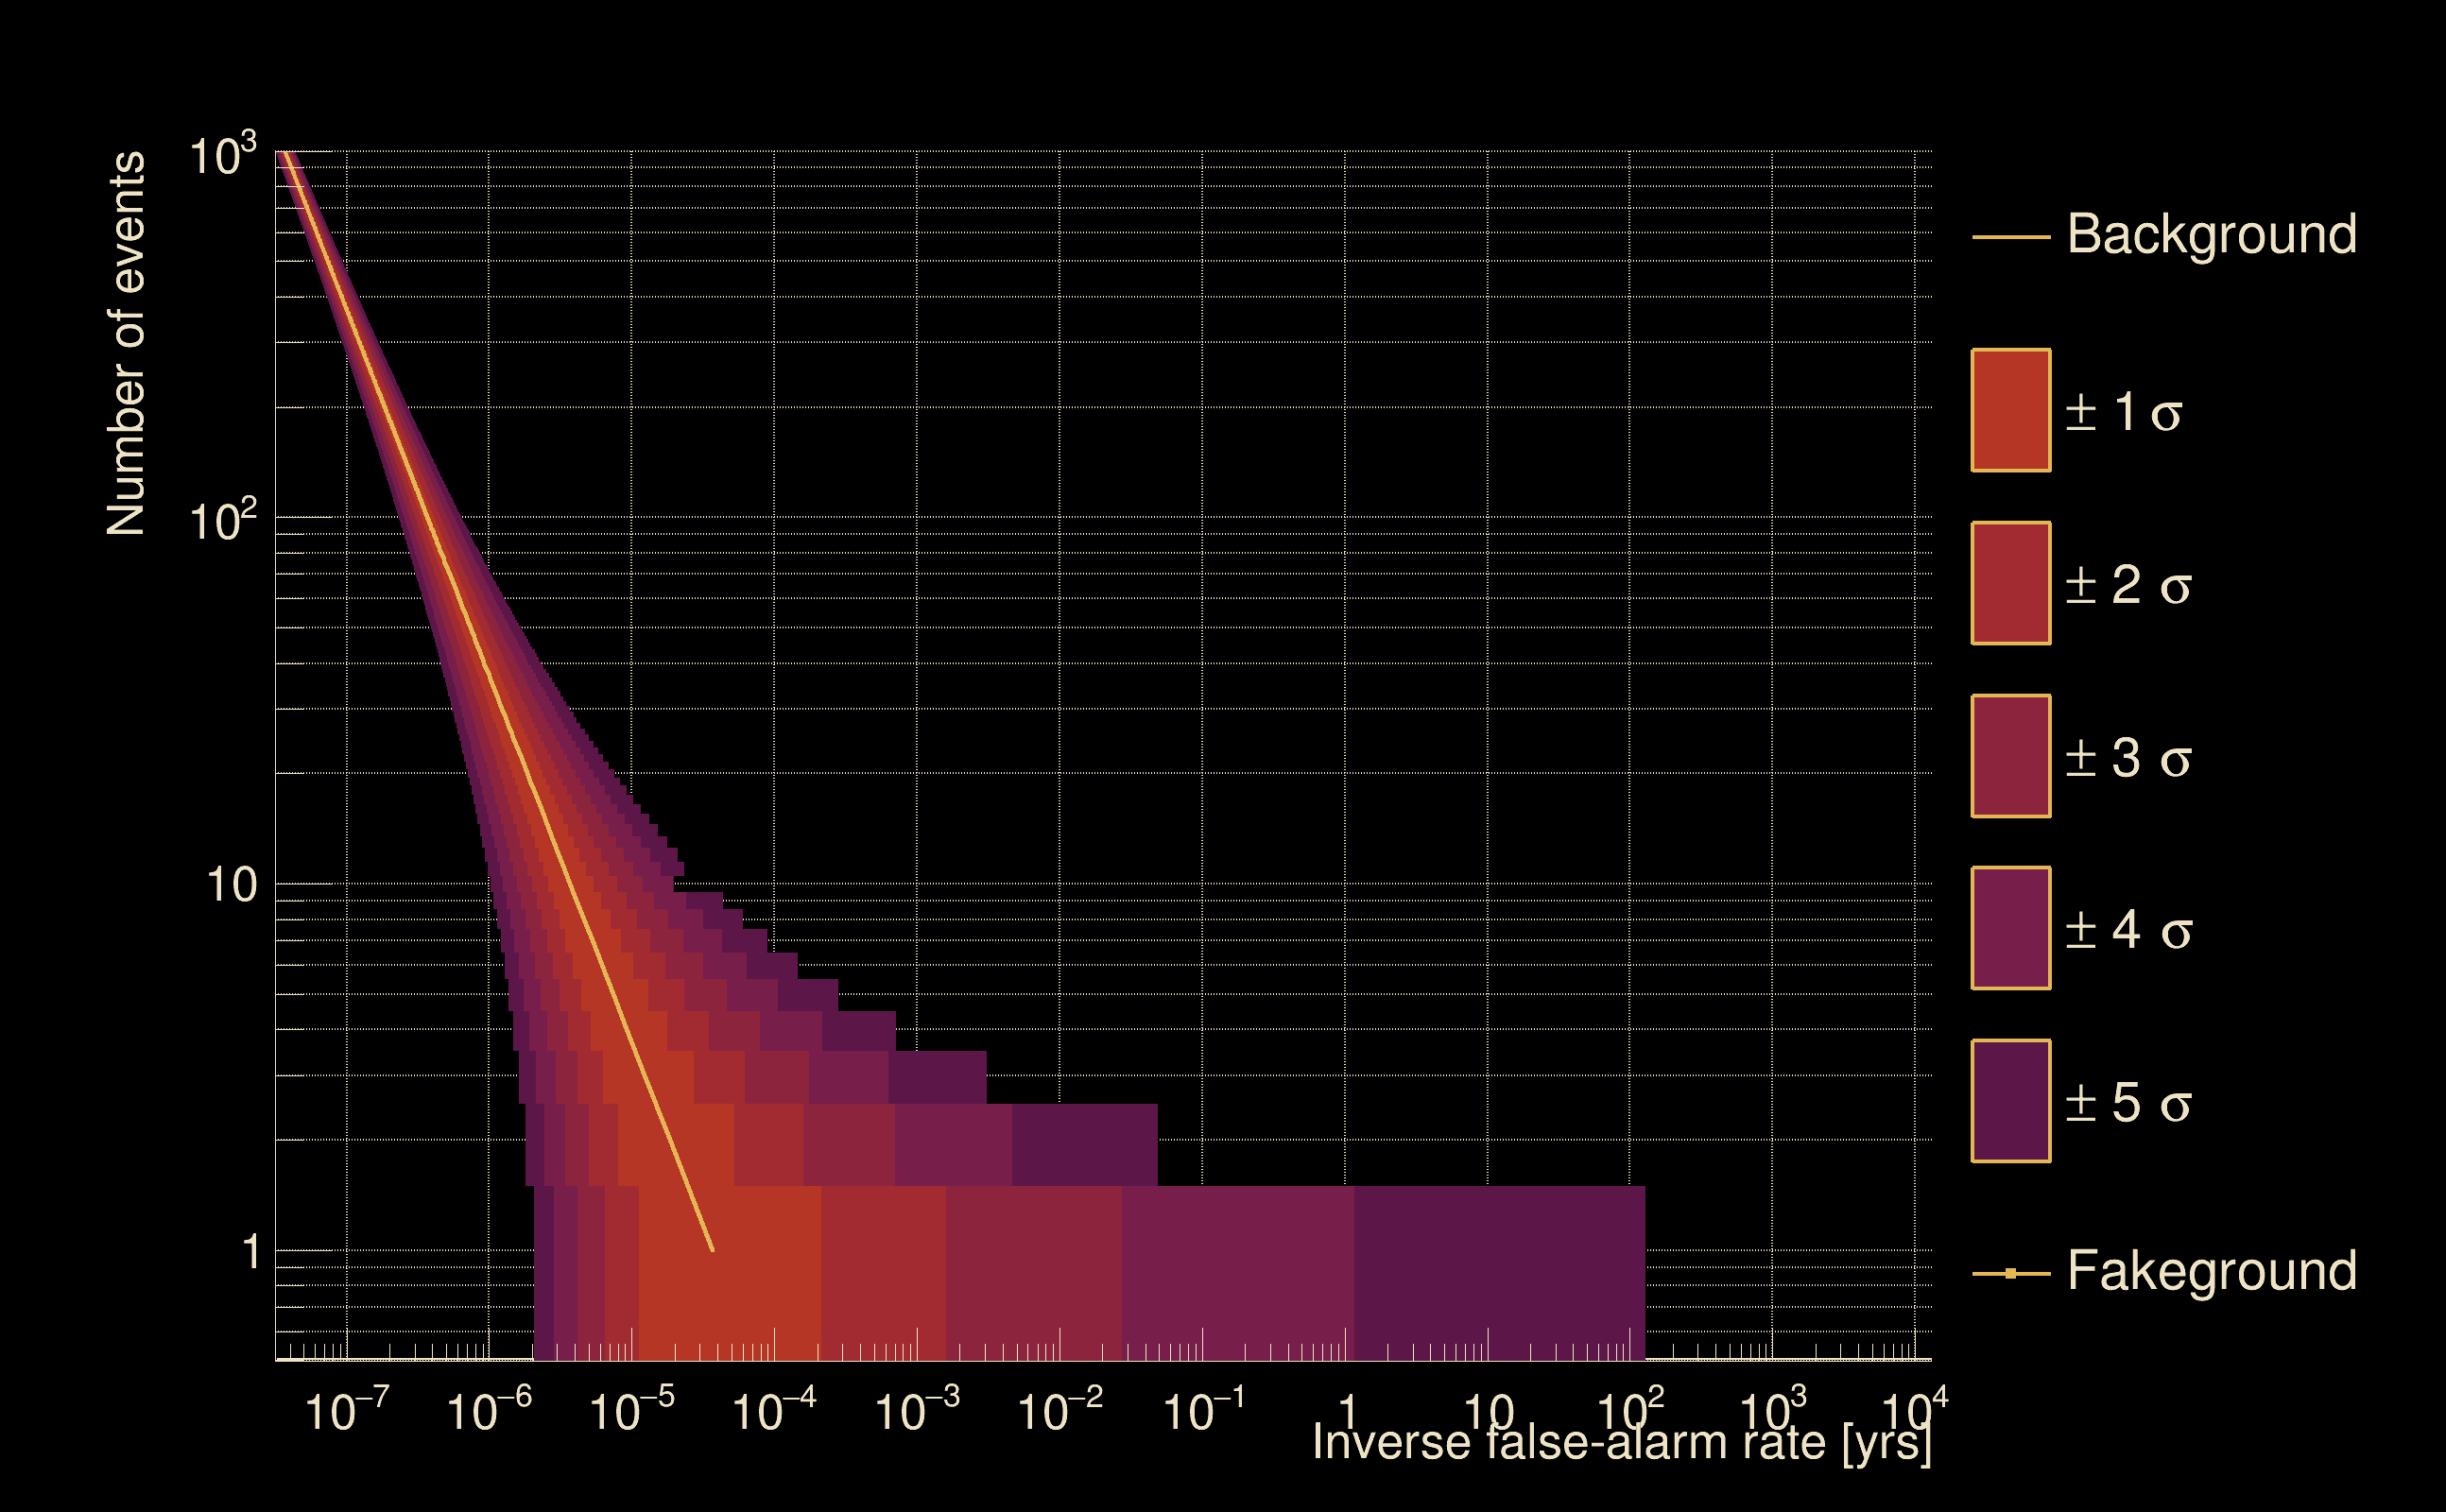
| Detection threshold: | R > 0.00827409 |
| False-alarm rate above that detection threshold: | 1.98768e-06 |
| Alternative threshold at 1/1000 yrs: | R > 0.00827409 |
| Alternative threshold at 1/100 yrs: | R > 0.00827409 |
| Alternative threshold at 1/10 yrs: | R > 0.00827409 |
| Alternative threshold at 1/1 yr: | R > 0.00827409 |
| Alternative threshold at 1/1 d: | R > 0.00619174 |
 |
|
 |
 |
 |
 |
 |
 |
 |
 |
 |
 |
| Event time t(H1): | GPS = 1368195578 (Mon May 15 14:19:20 2023 ) → GPS = 1368195588 (Mon May 15 14:19:30 2023 ) |
| Event time t(L1): | GPS = 1368195578 (Mon May 15 14:19:30 2023 ) → GPS = 1368195588 (Mon May 15 14:19:30 2023 ) |
| Omicron analysis time window (H1): | GPS = 1368195575 → GPS = 1368195591 |
| Omicron analysis time window (L1): | GPS = 1368195575 → GPS = 1368195591 |
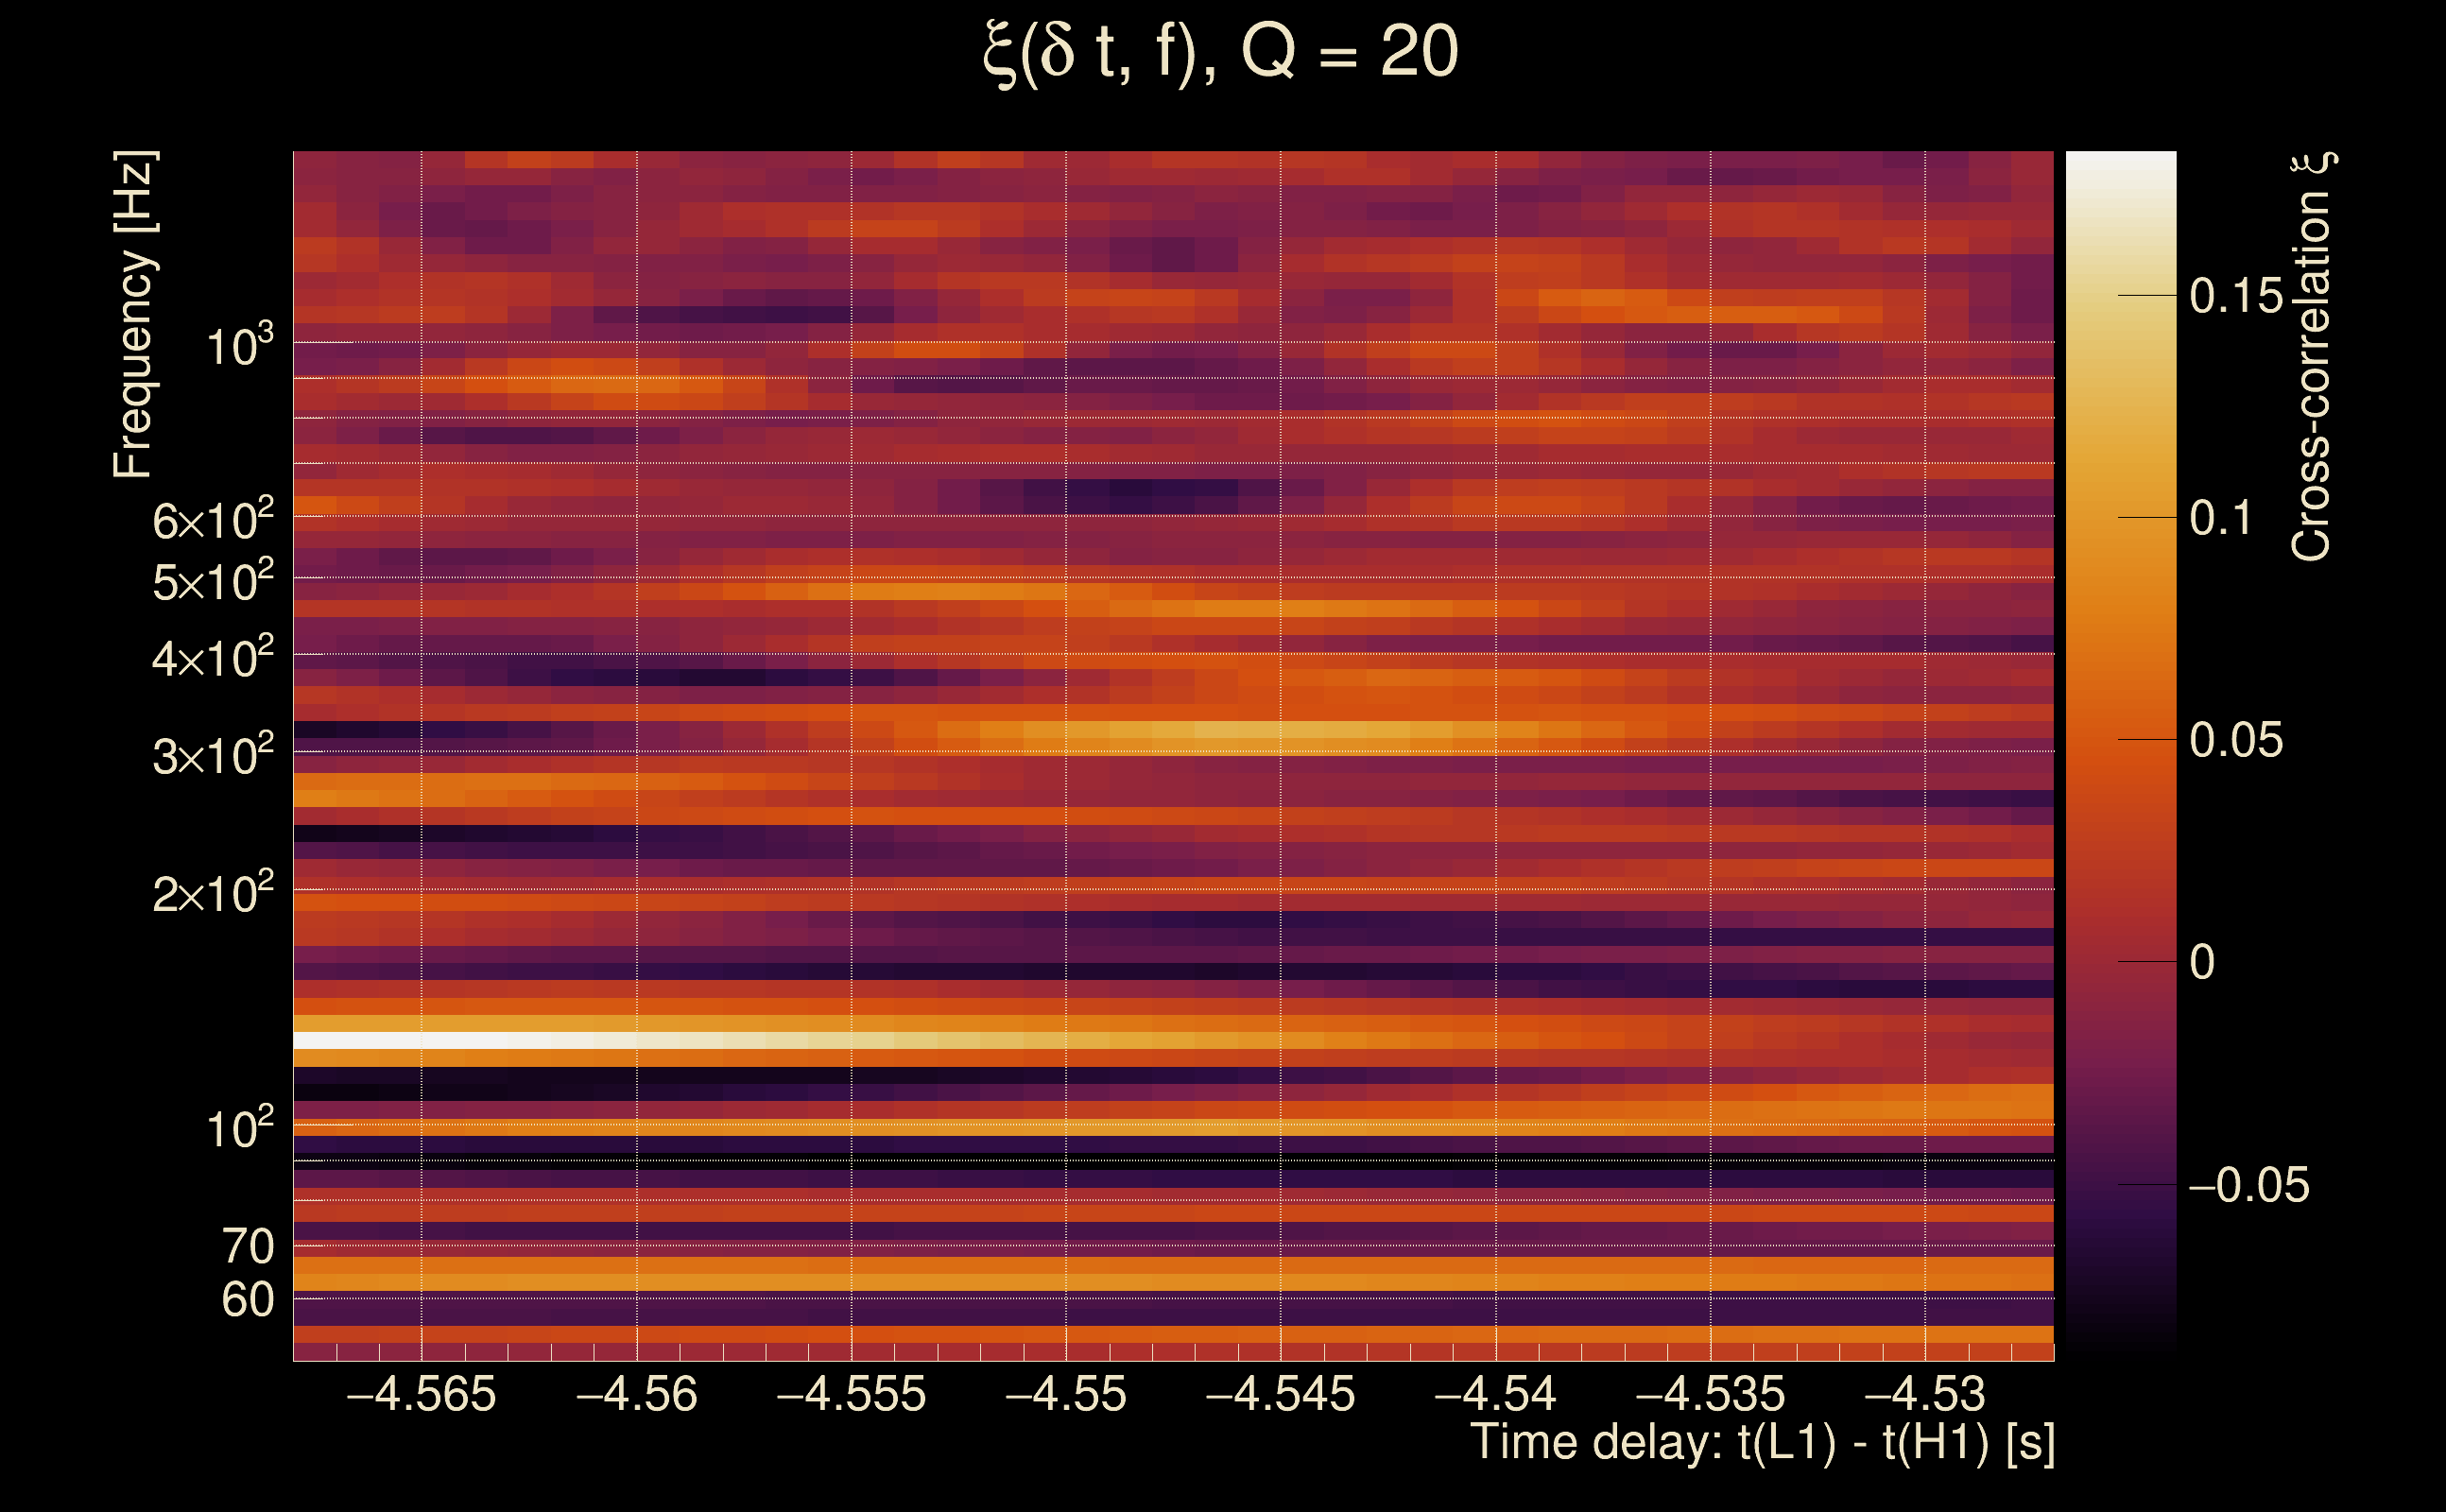
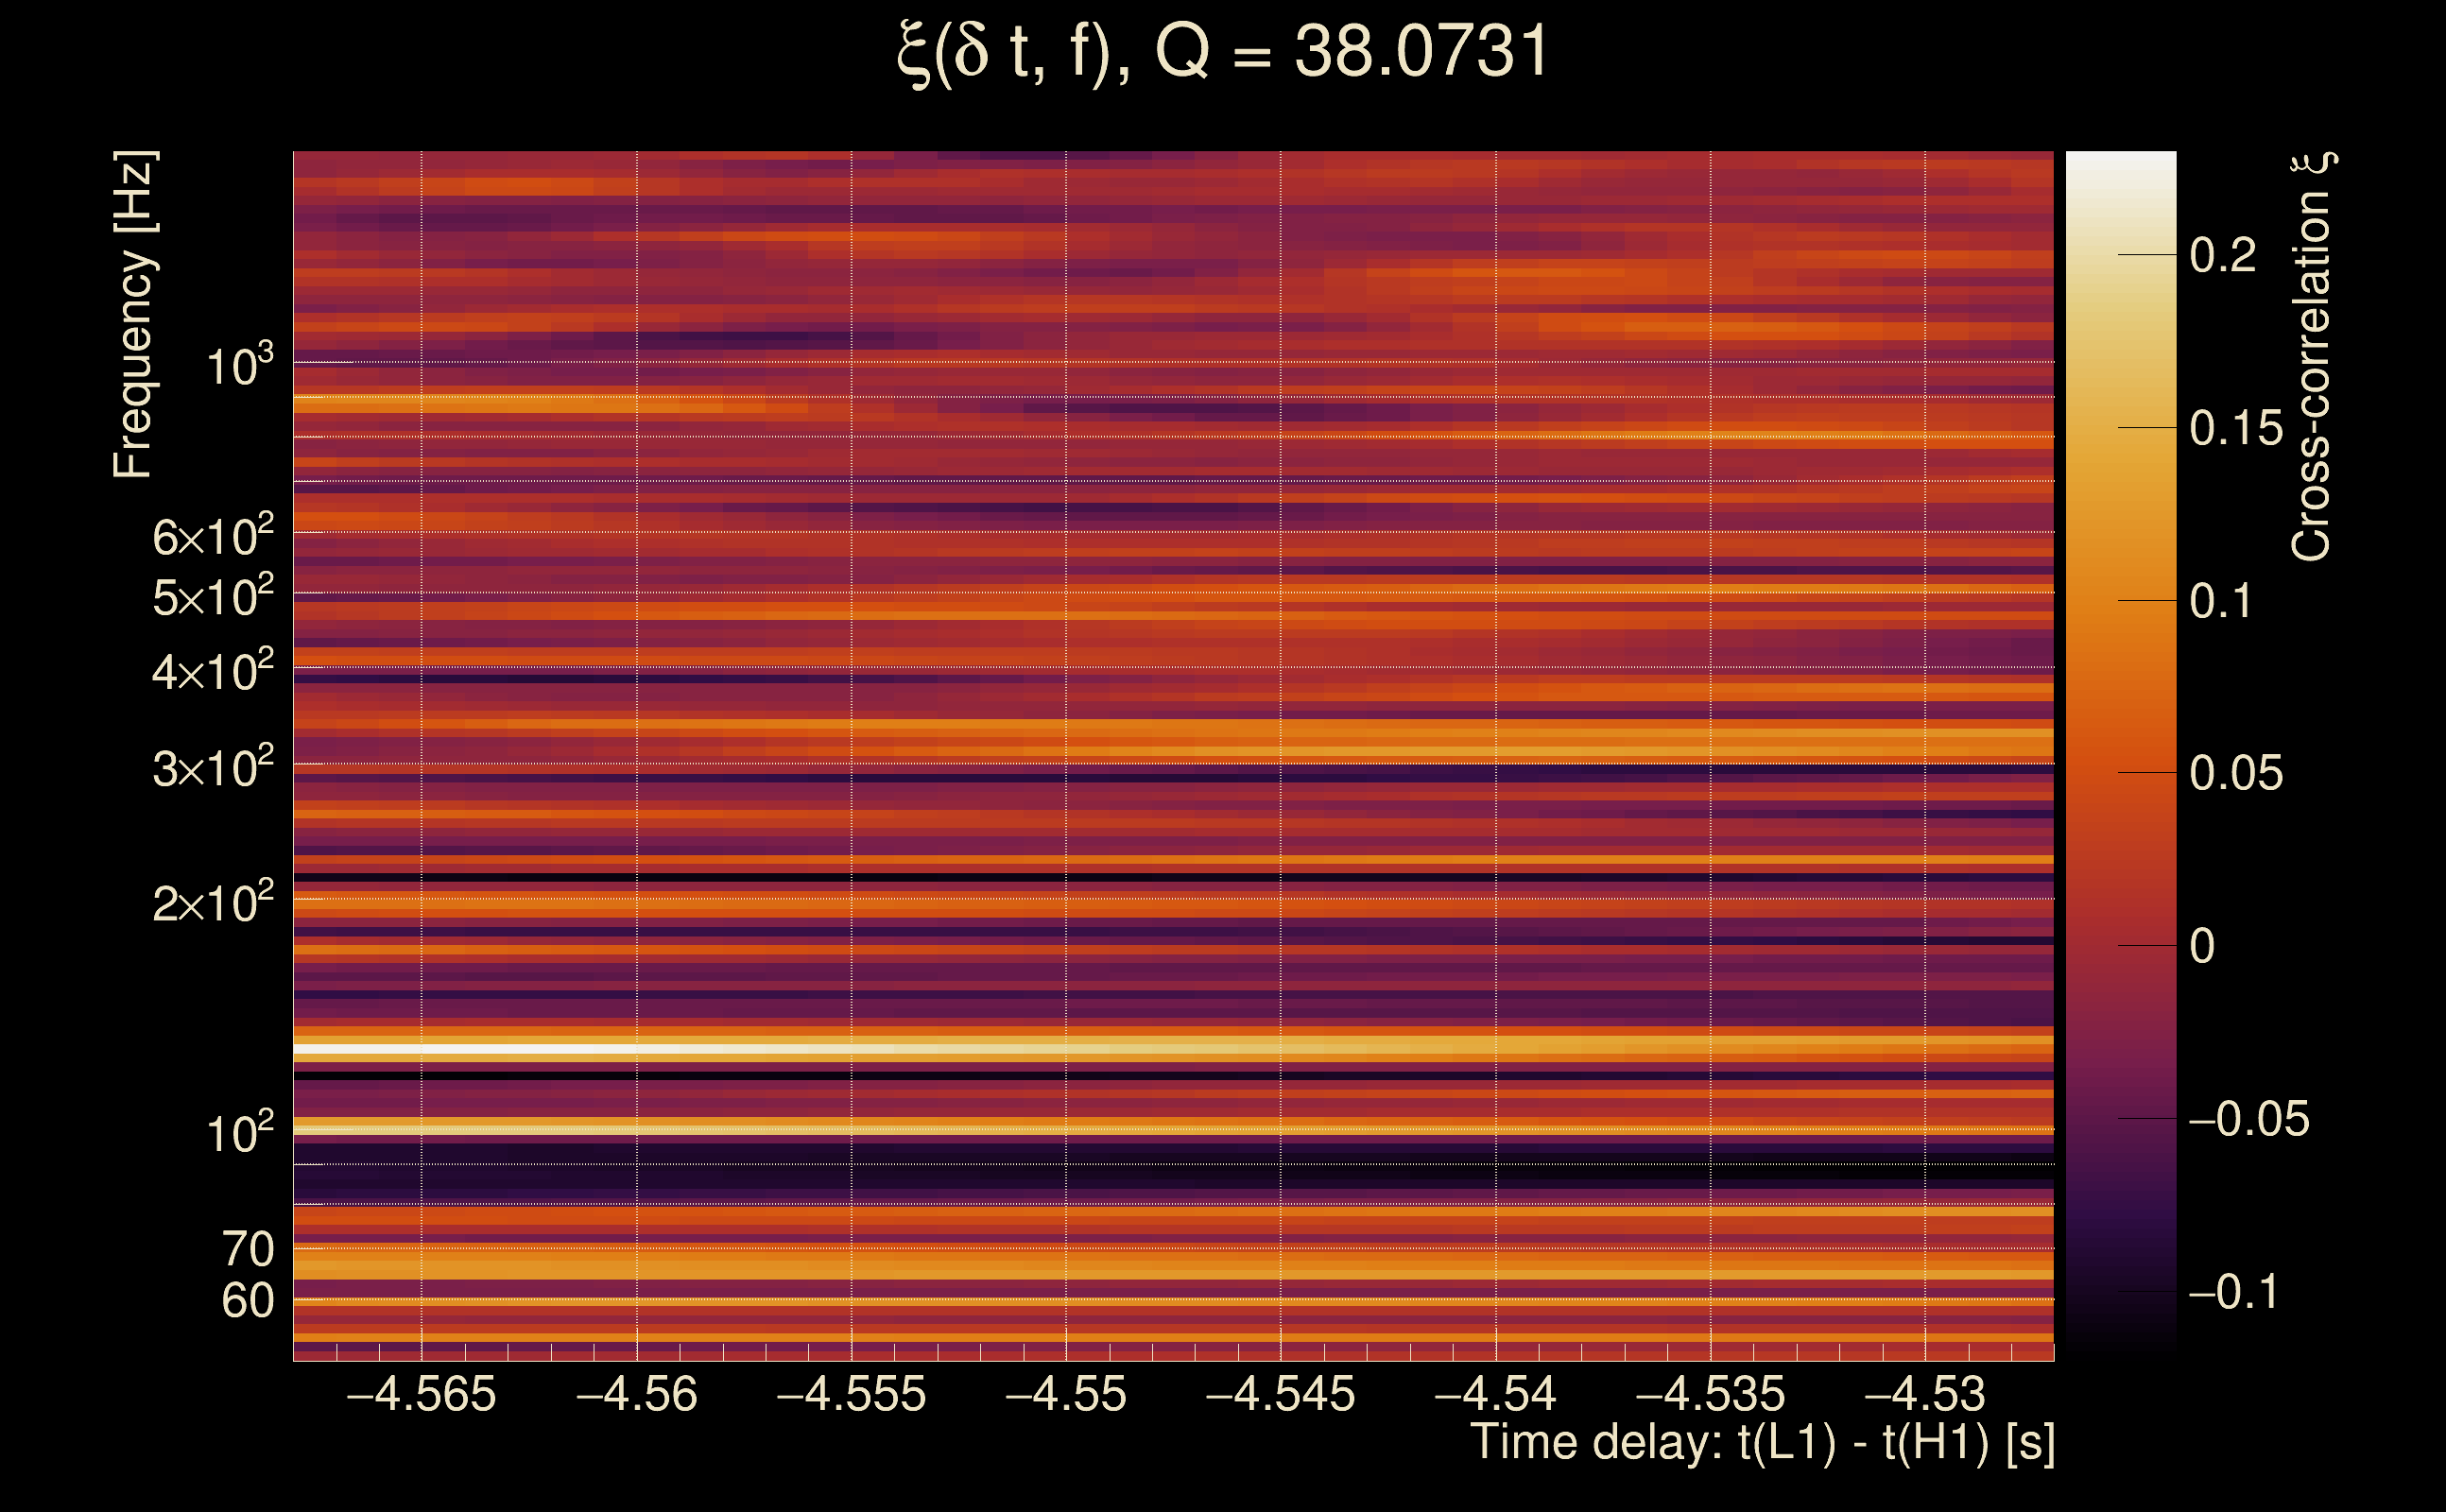
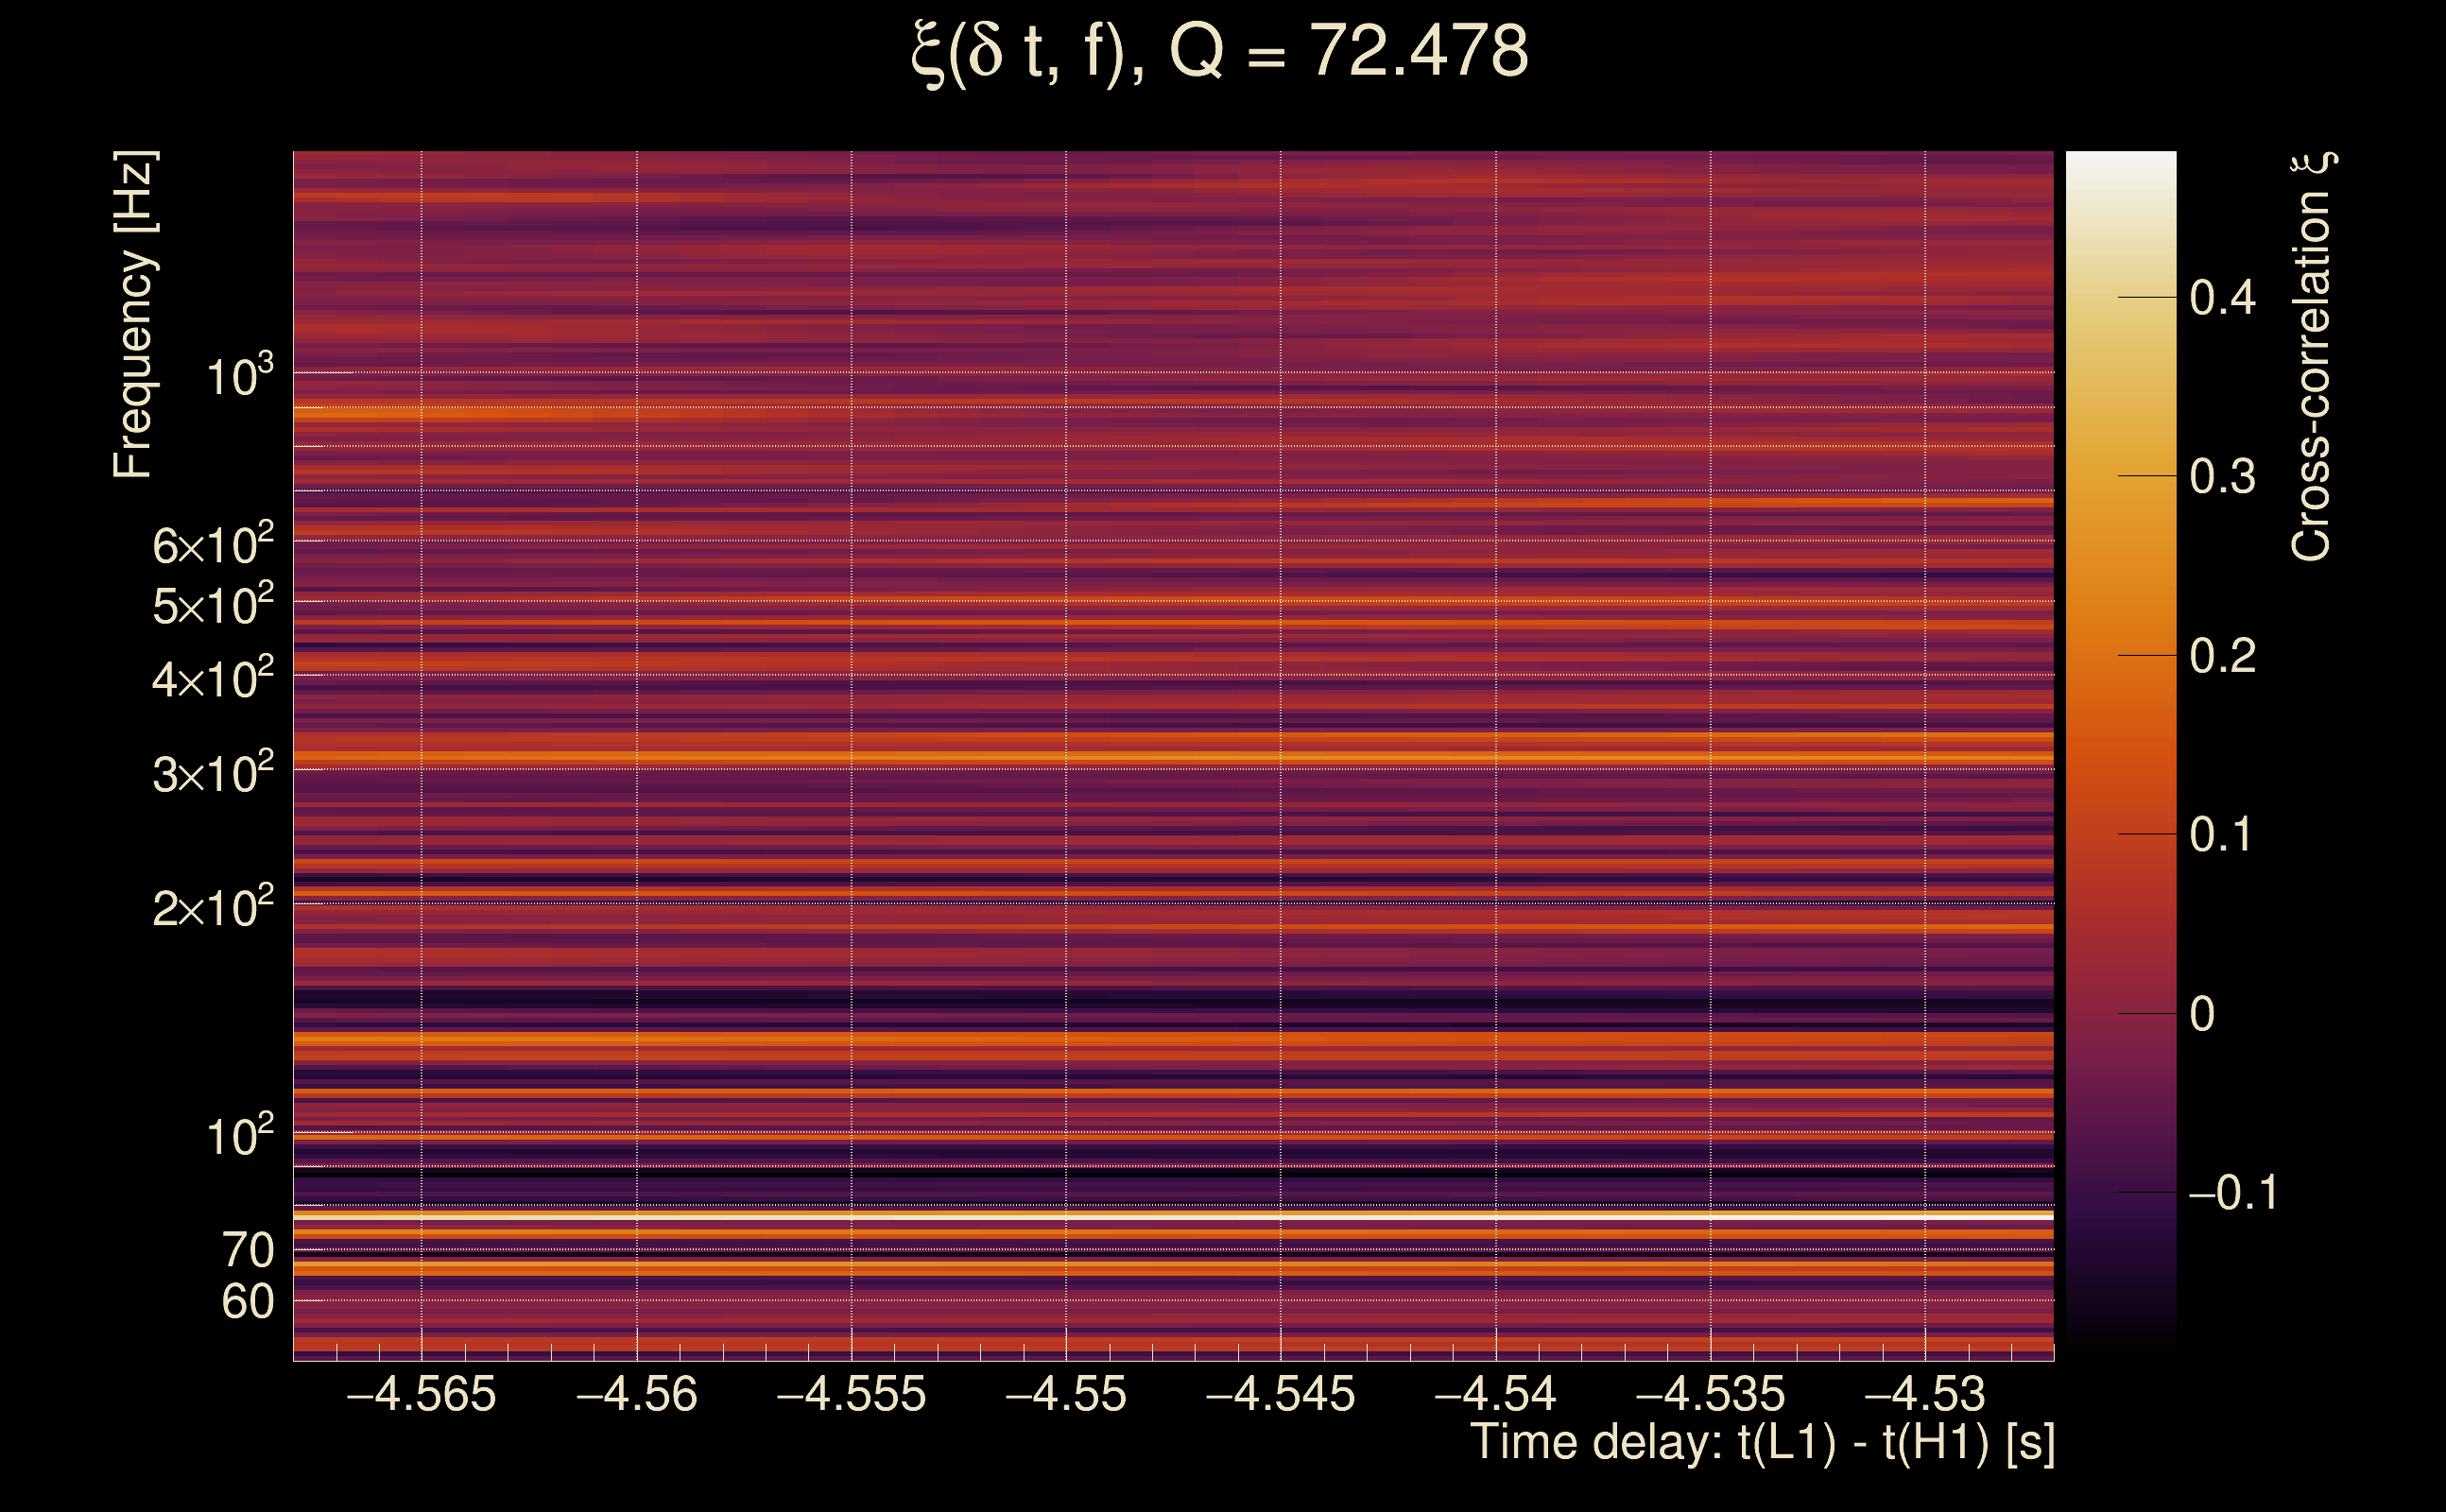
| Time delay between detectors t(L1) - t(H1): | -4.31874 s (slice index = 202 / 217), δt_gw = 0.0052582 s |
| Time delay uncertainty: | 0.00499963 s |
| [targeted mode] Time delay probability: | 0.497171 (0.678948 sigmas), δt_target = 1.72247e+45 s |
| Frequency: | 111.061 Hz |
| Ξ: | 0.0251046 ± 0.0429263 (variance = 0.00184267): Q0: 0.158332, Q1: 0.14643, Q2: 0.152479, Q3: 0.0519854, Q4: 0.0828921 |
| Rank: | R_A = 0.00817966 |
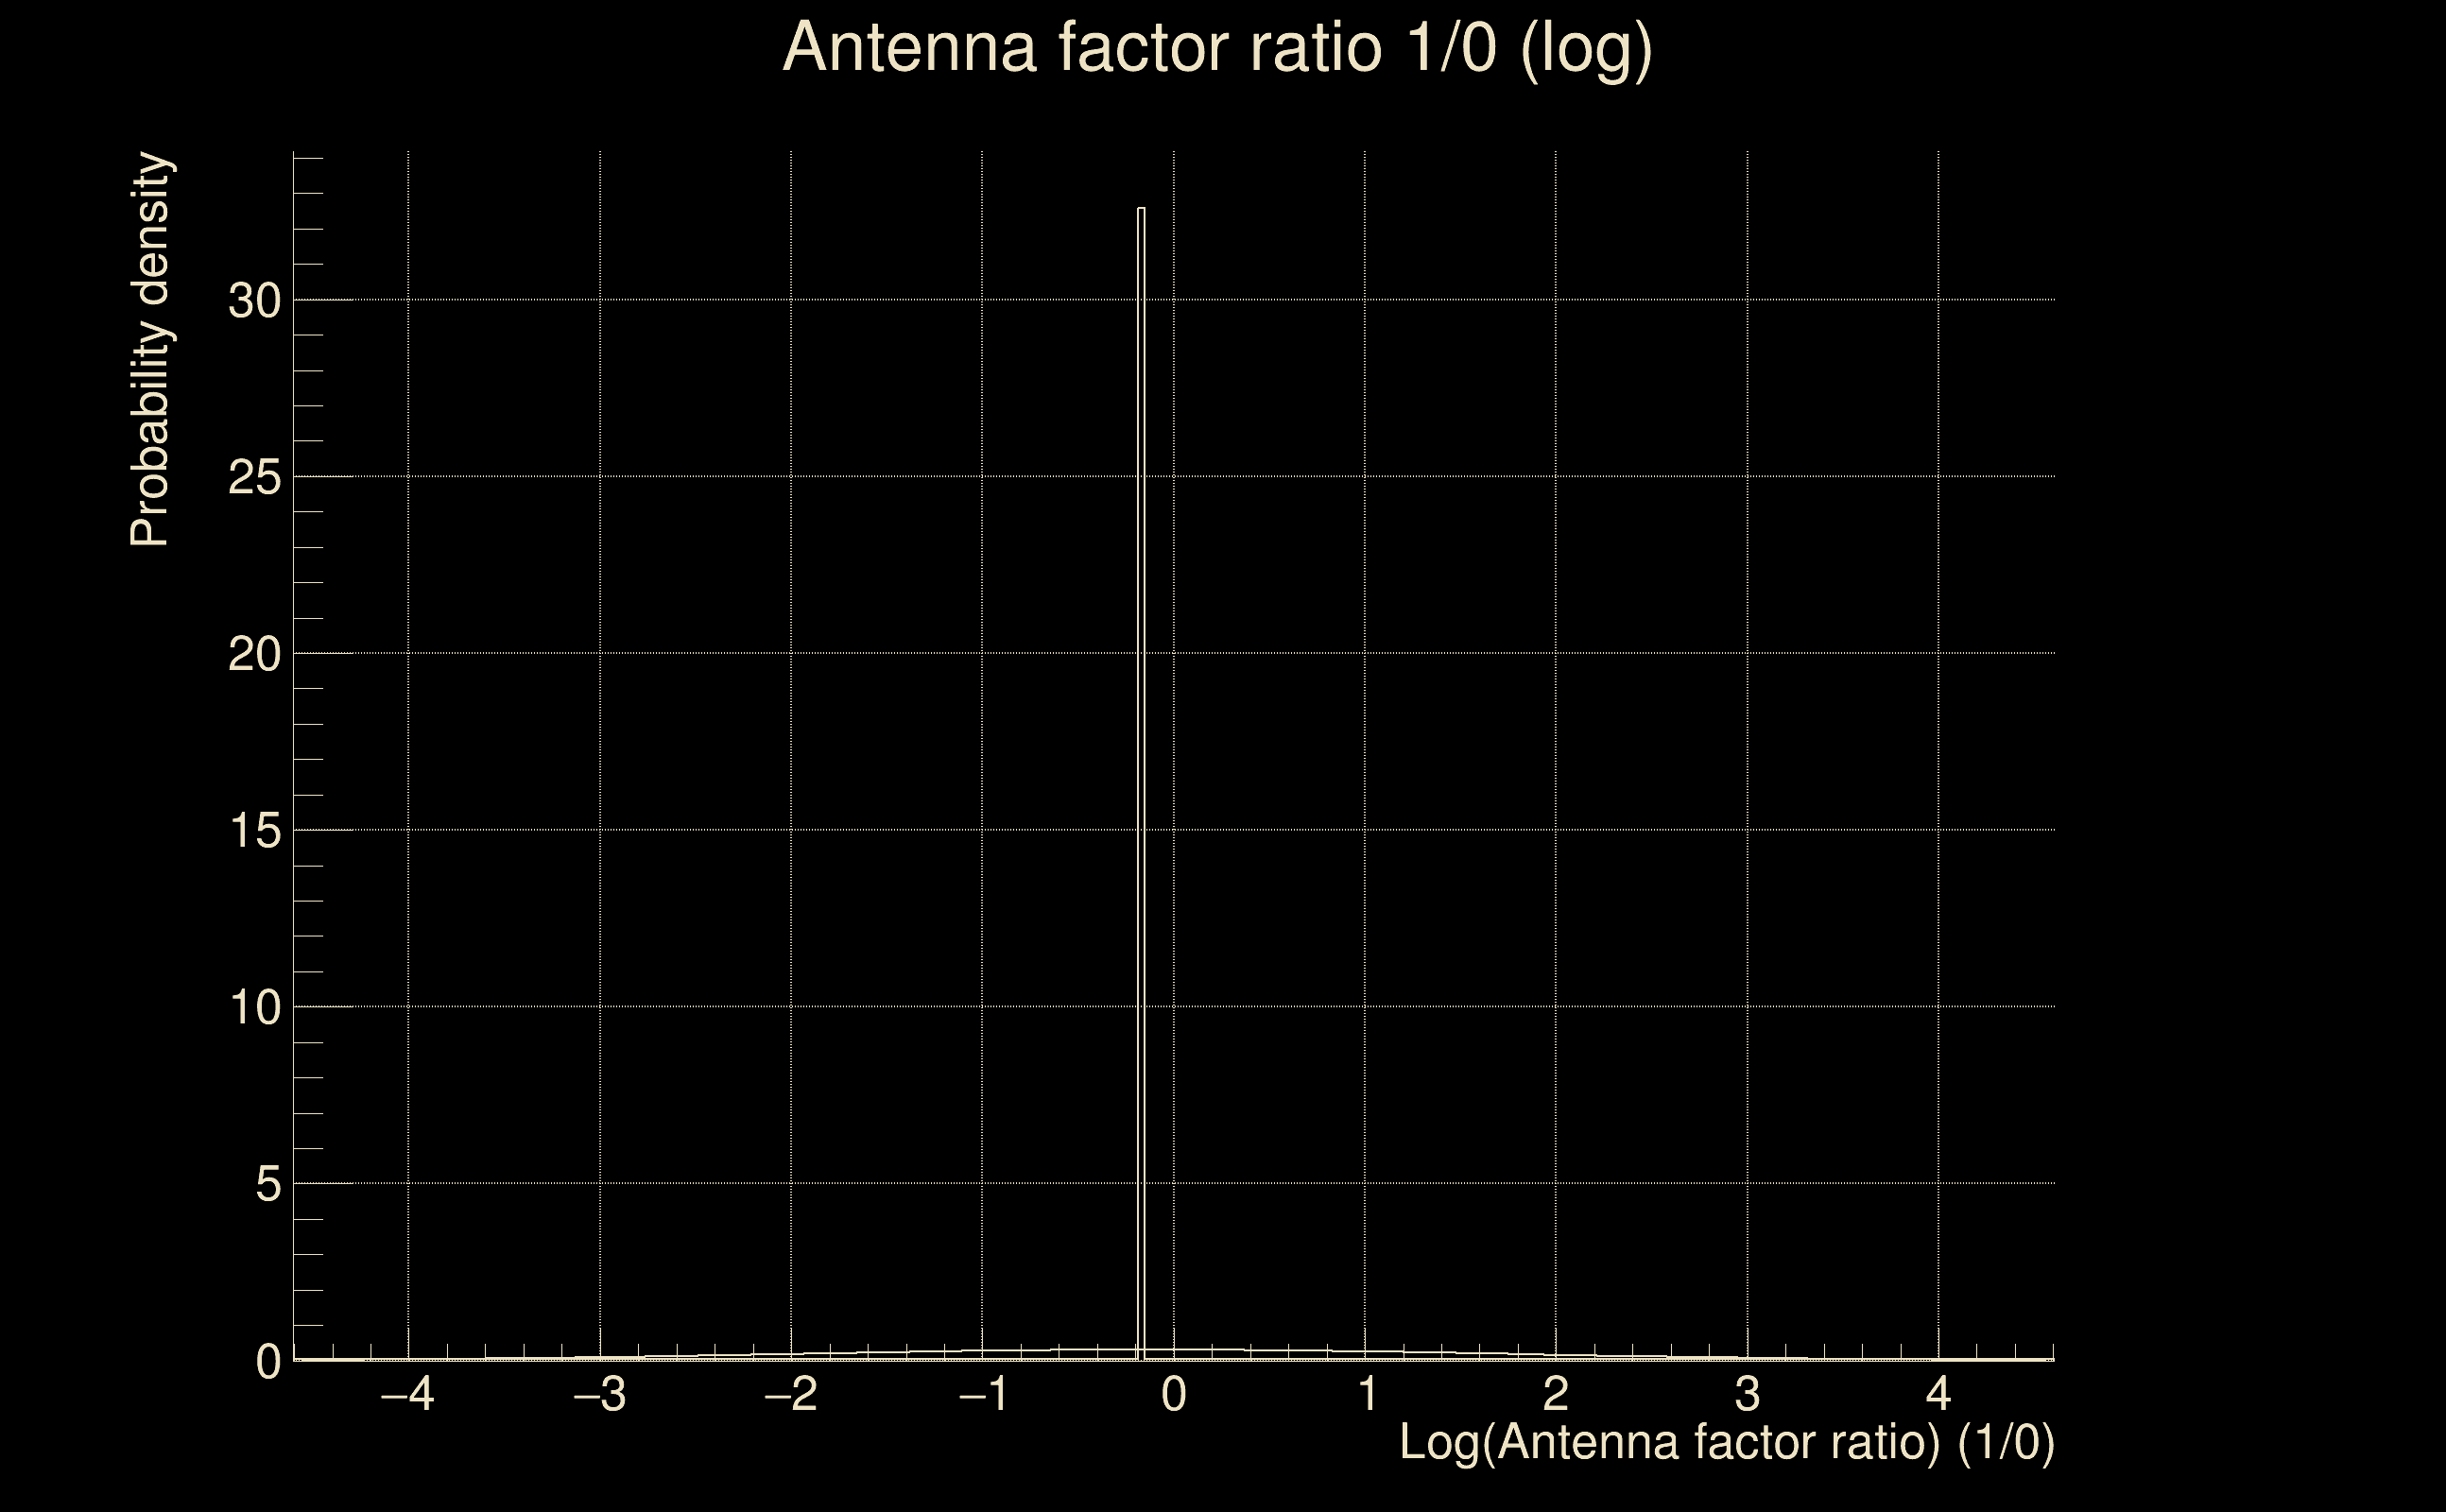
| Log of amplitude ratio (L1/H1): | -0.198694, variance = 0.822432 (L1/H1: -0.551829, variance = 1.42251, H1/L1: -0.19024, variance = 1.90614) |
| Amplitude ratio (L1/H1): | 0.819801 ⋇ 2.47658 (L1/H1: 0.575896 ⋇ 3.29593, H1/L1: 0.826761 ⋇ 3.97741) |
| Amplitude ratio H1|L1 compatibility (probability): | 0.684203 |
| Antenna factor probability: | 0.957835 |
| Number of rejected frequency rows: | Q0: 14 / 18, Q1: 31 / 36, Q2: 64 / 70, Q3: 127 / 134, Q4: 251 / 258 |
| Maximum signal-to-noise ratio: | H1: 4.99095, L1: 4.7557 |
| SNR variance: | H1: 0.524408, L1: 0.53681 |
| Click here for a zoomed plot | Click here for a zoomed plot | Click here for a zoomed plot | Click here for a zoomed plot | Click here for a zoomed plot |
 |
 |
 |
 |
 |
 |
 |
 |
 |
 |
 |
 |
 |
 |
 |
 |
 |
 |
 |
 |
 |
 |
 |
 |
 |
 |
 |
 |
 |
| Event time t(H1): | GPS = 1368195658 (Mon May 15 14:20:40 2023 ) → GPS = 1368195668 (Mon May 15 14:20:50 2023 ) |
| Event time t(L1): | GPS = 1368195658 (Mon May 15 14:20:50 2023 ) → GPS = 1368195668 (Mon May 15 14:20:50 2023 ) |
| Omicron analysis time window (H1): | GPS = 1368195655 → GPS = 1368195671 |
| Omicron analysis time window (L1): | GPS = 1368195655 → GPS = 1368195671 |
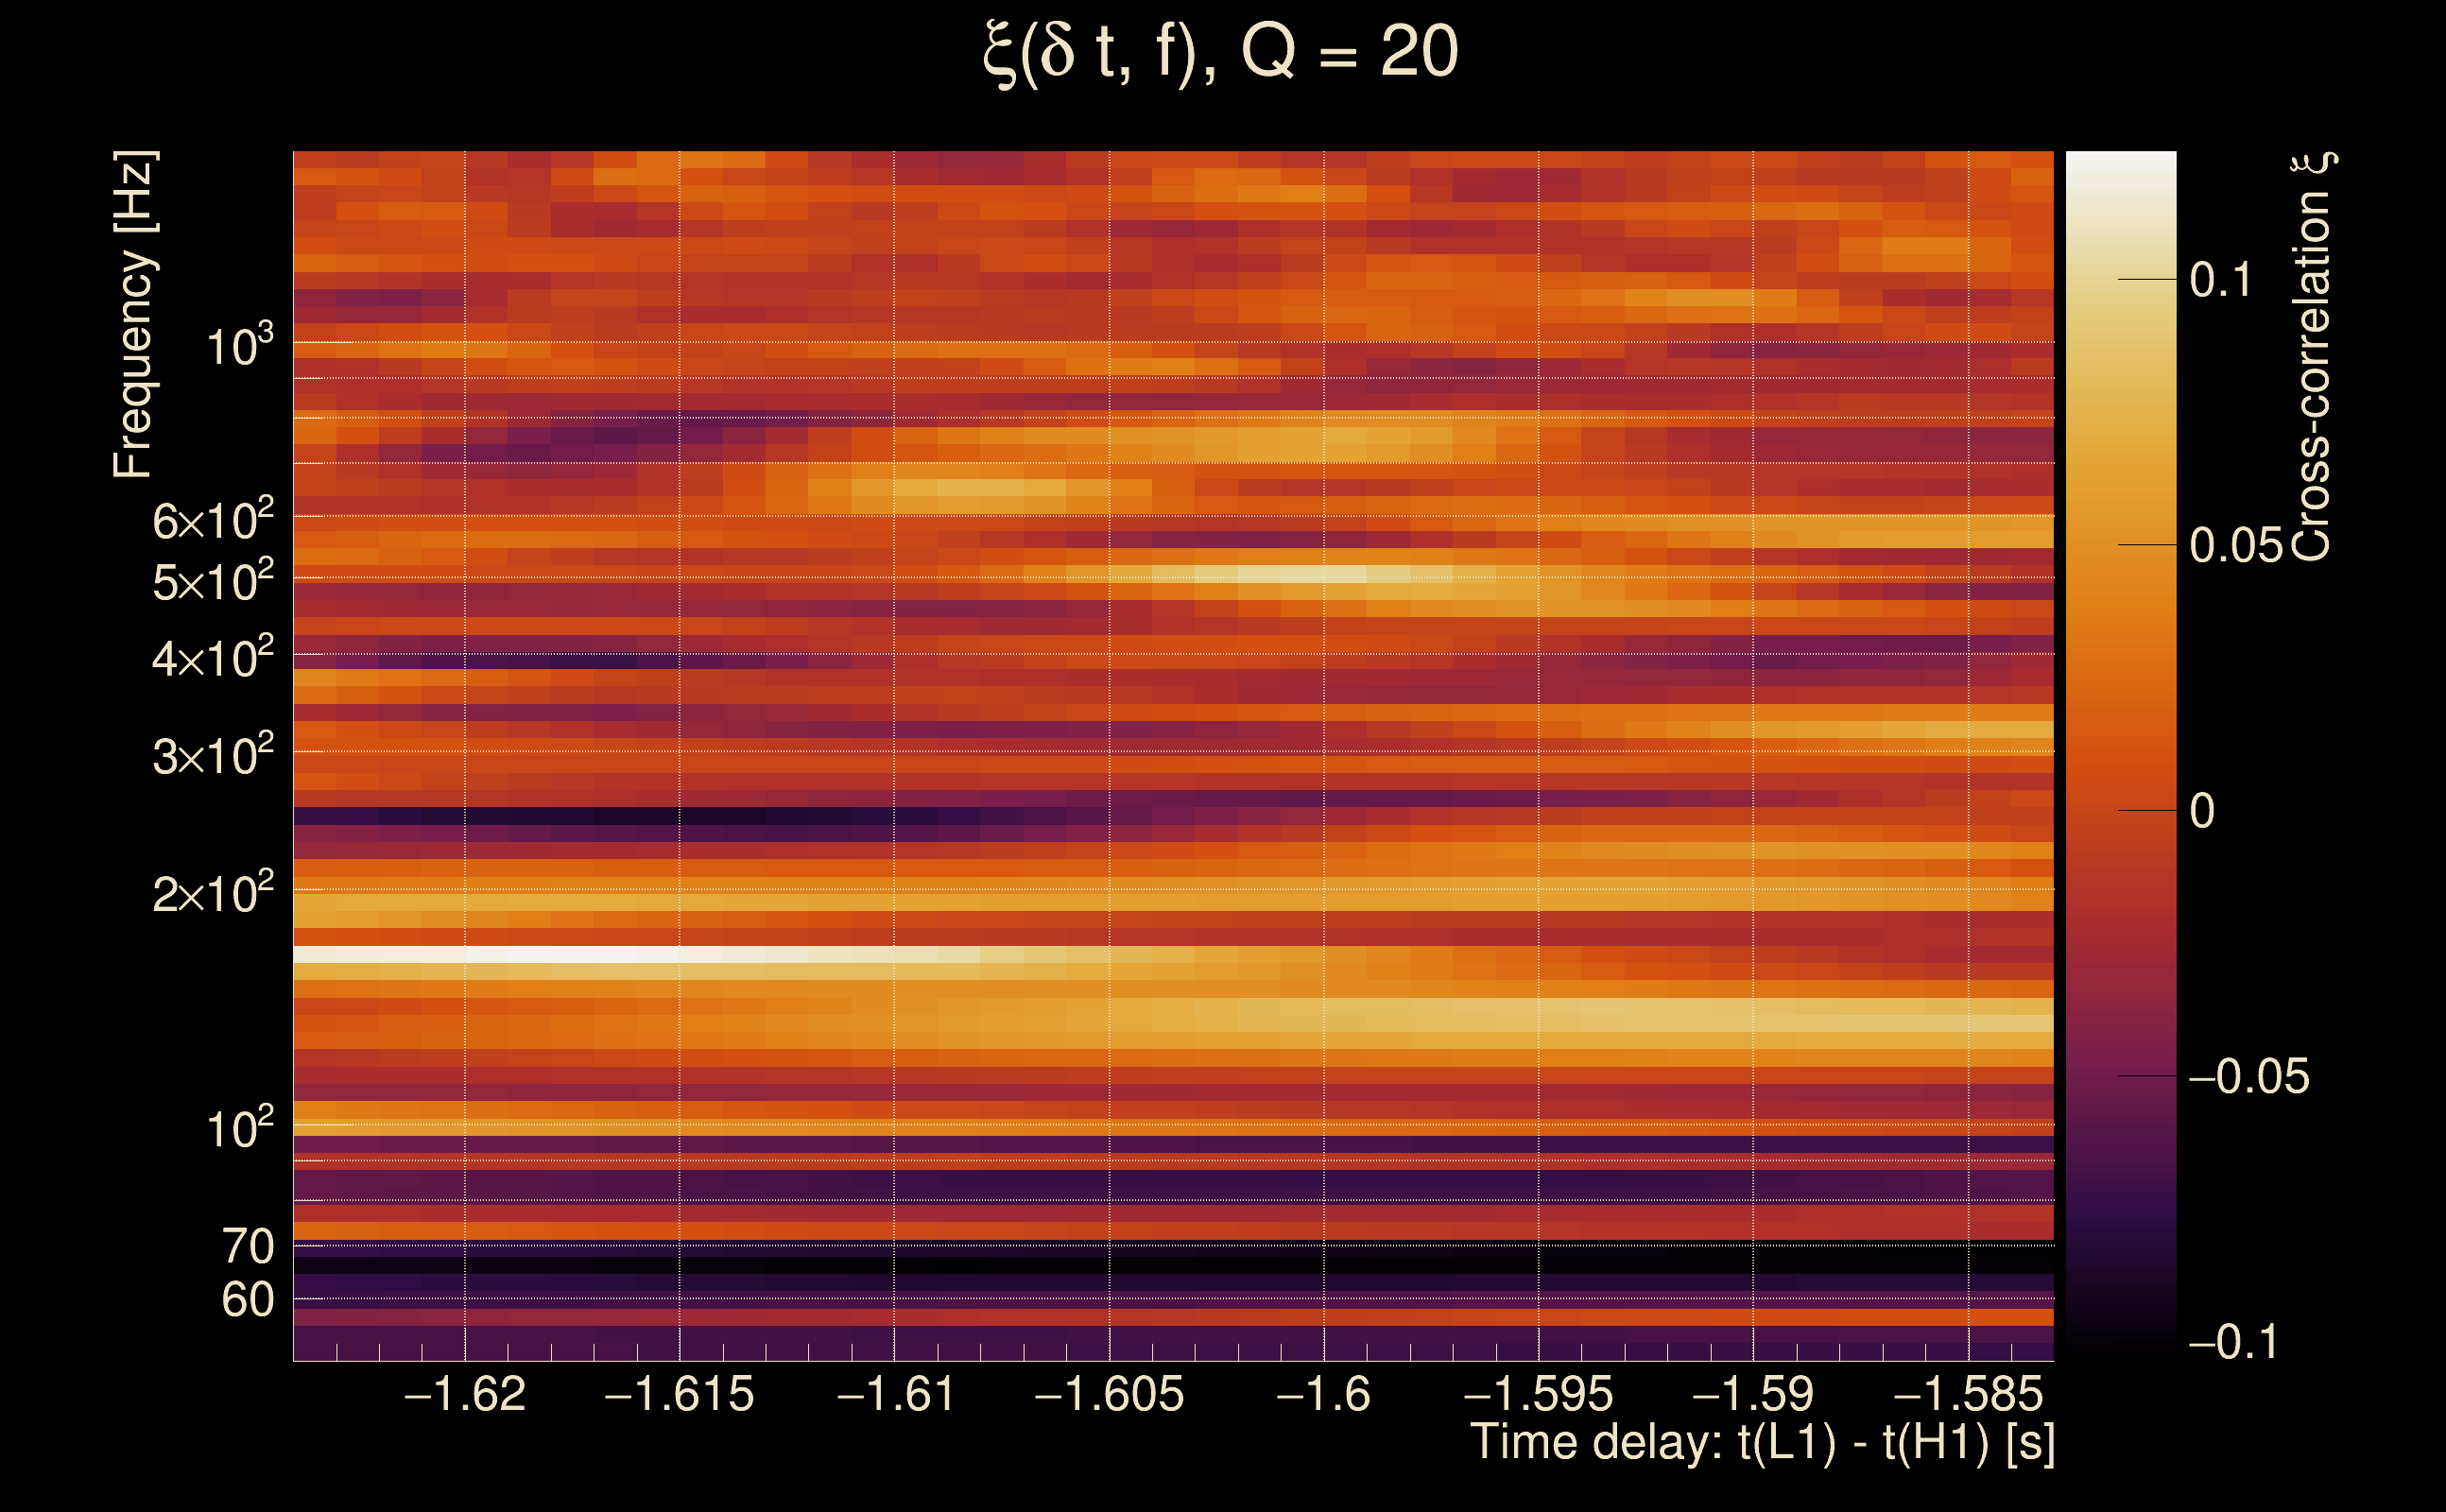
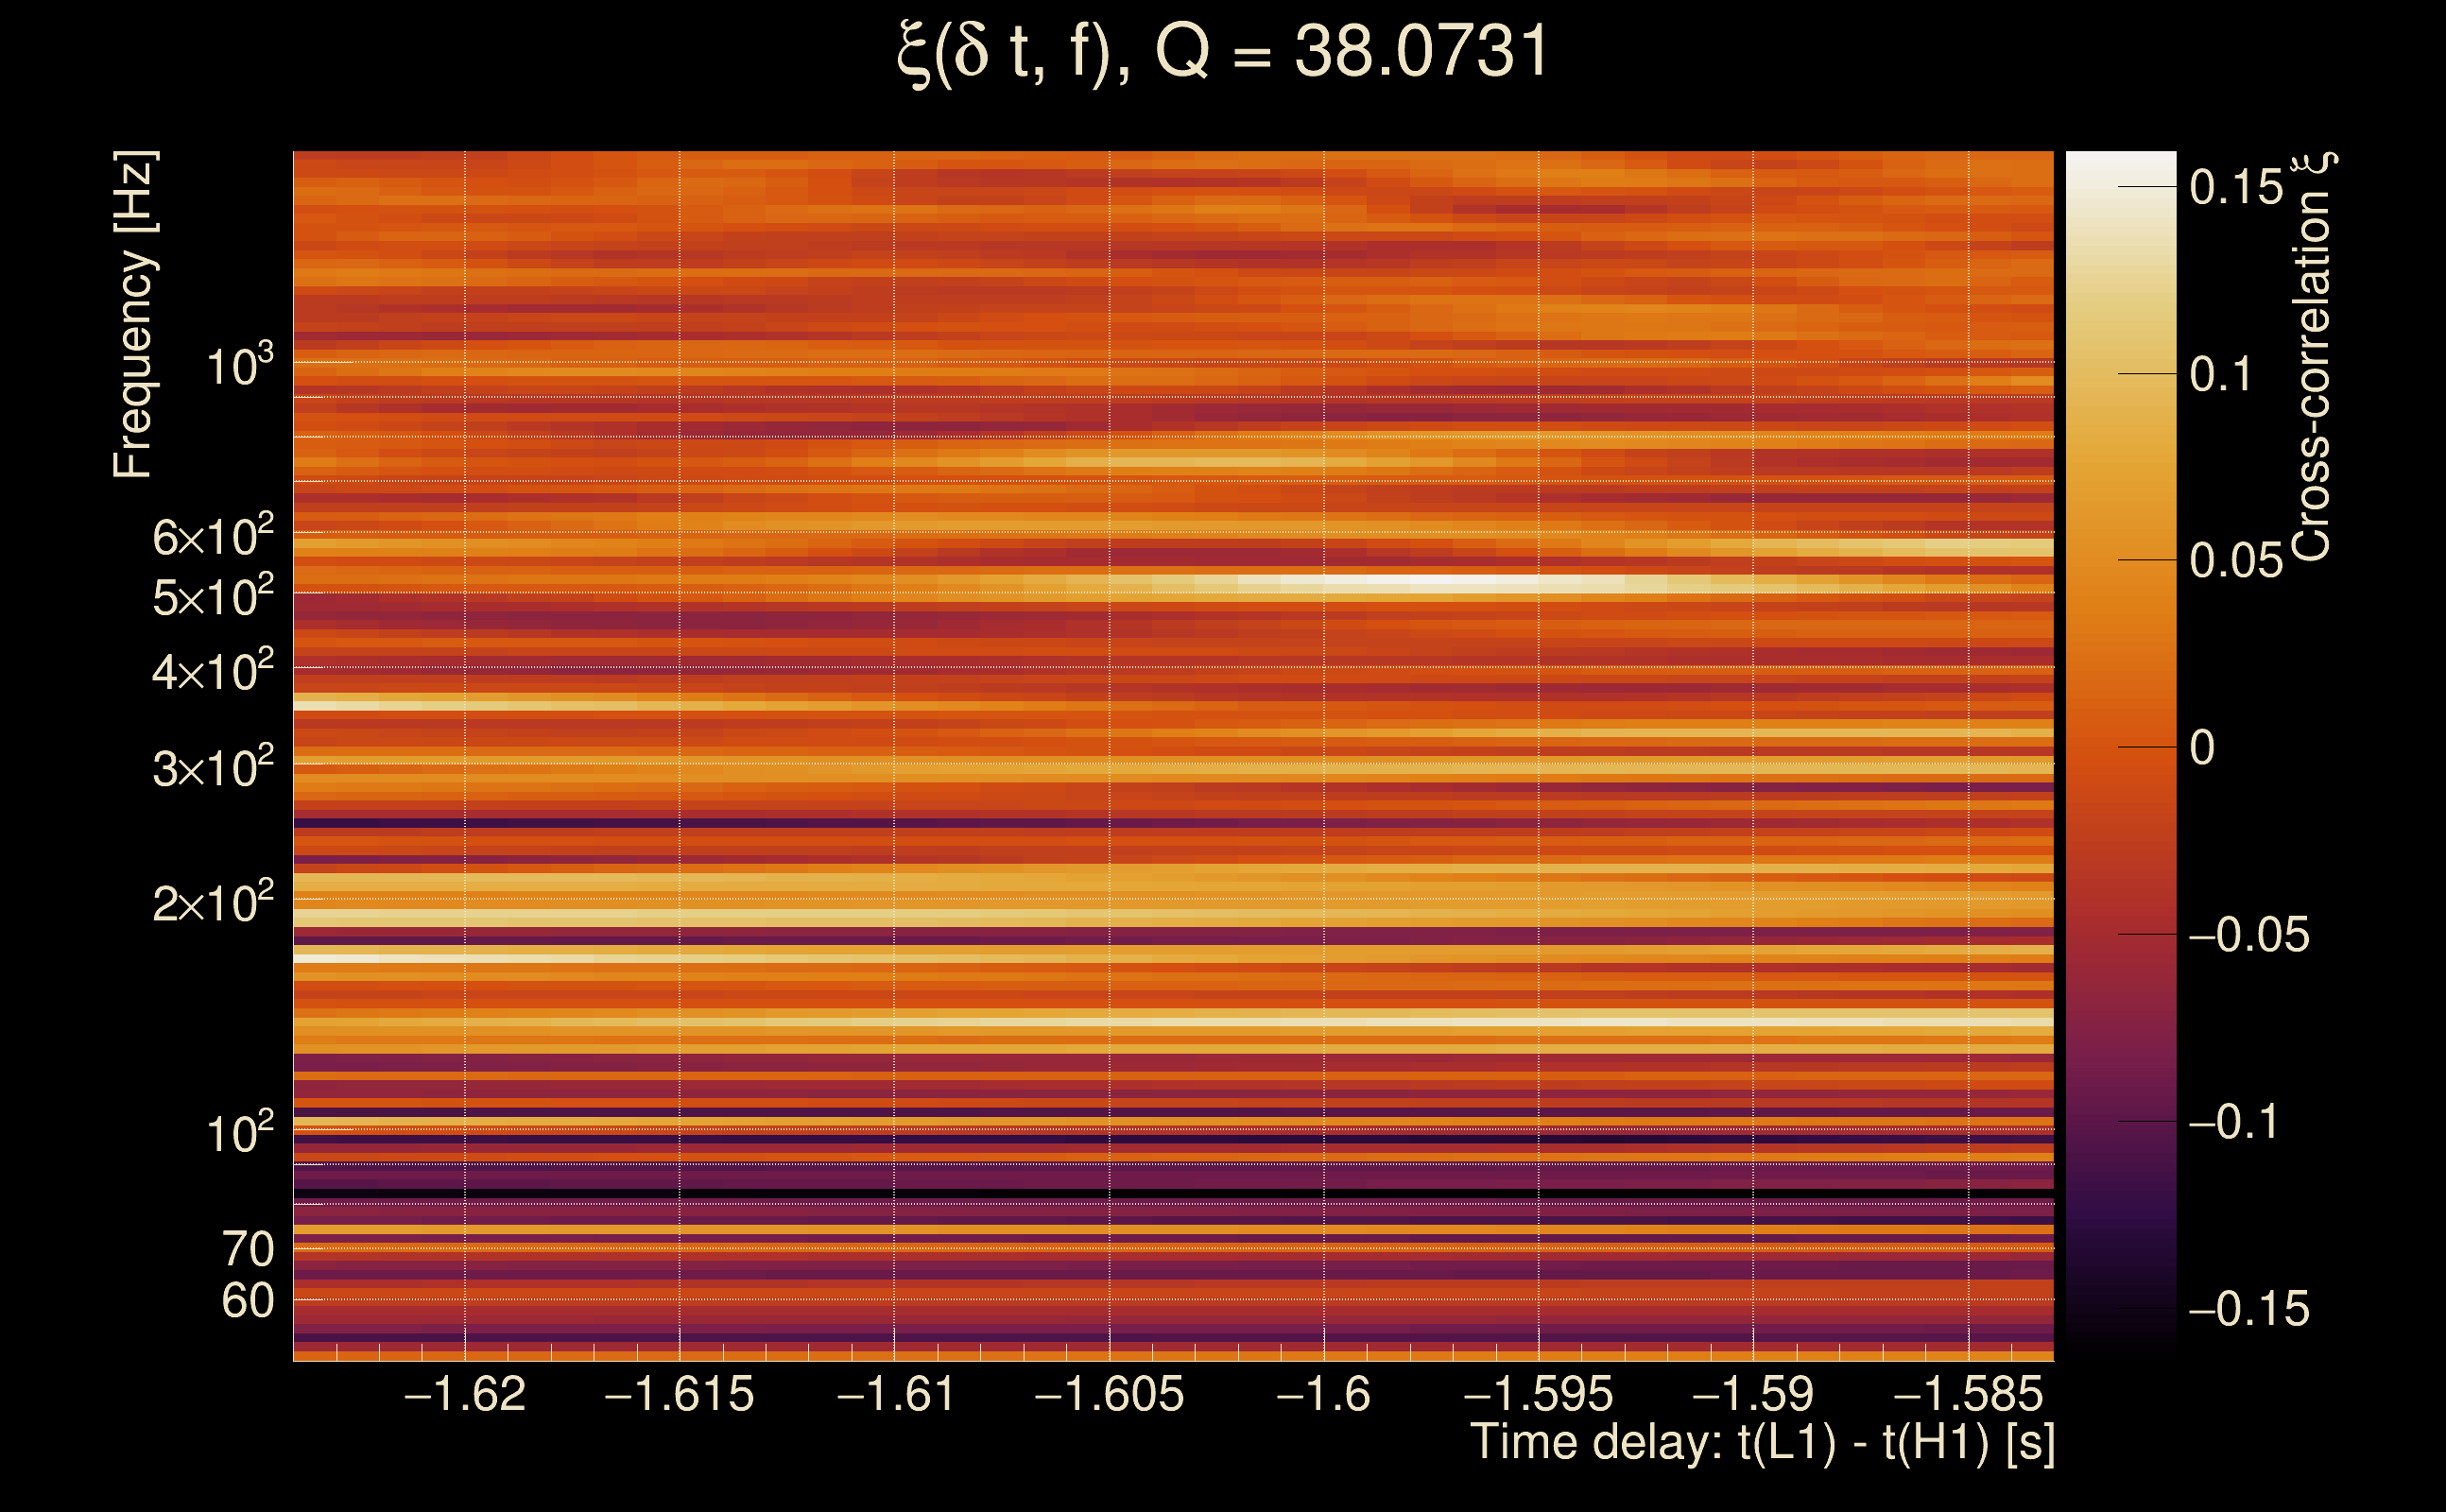
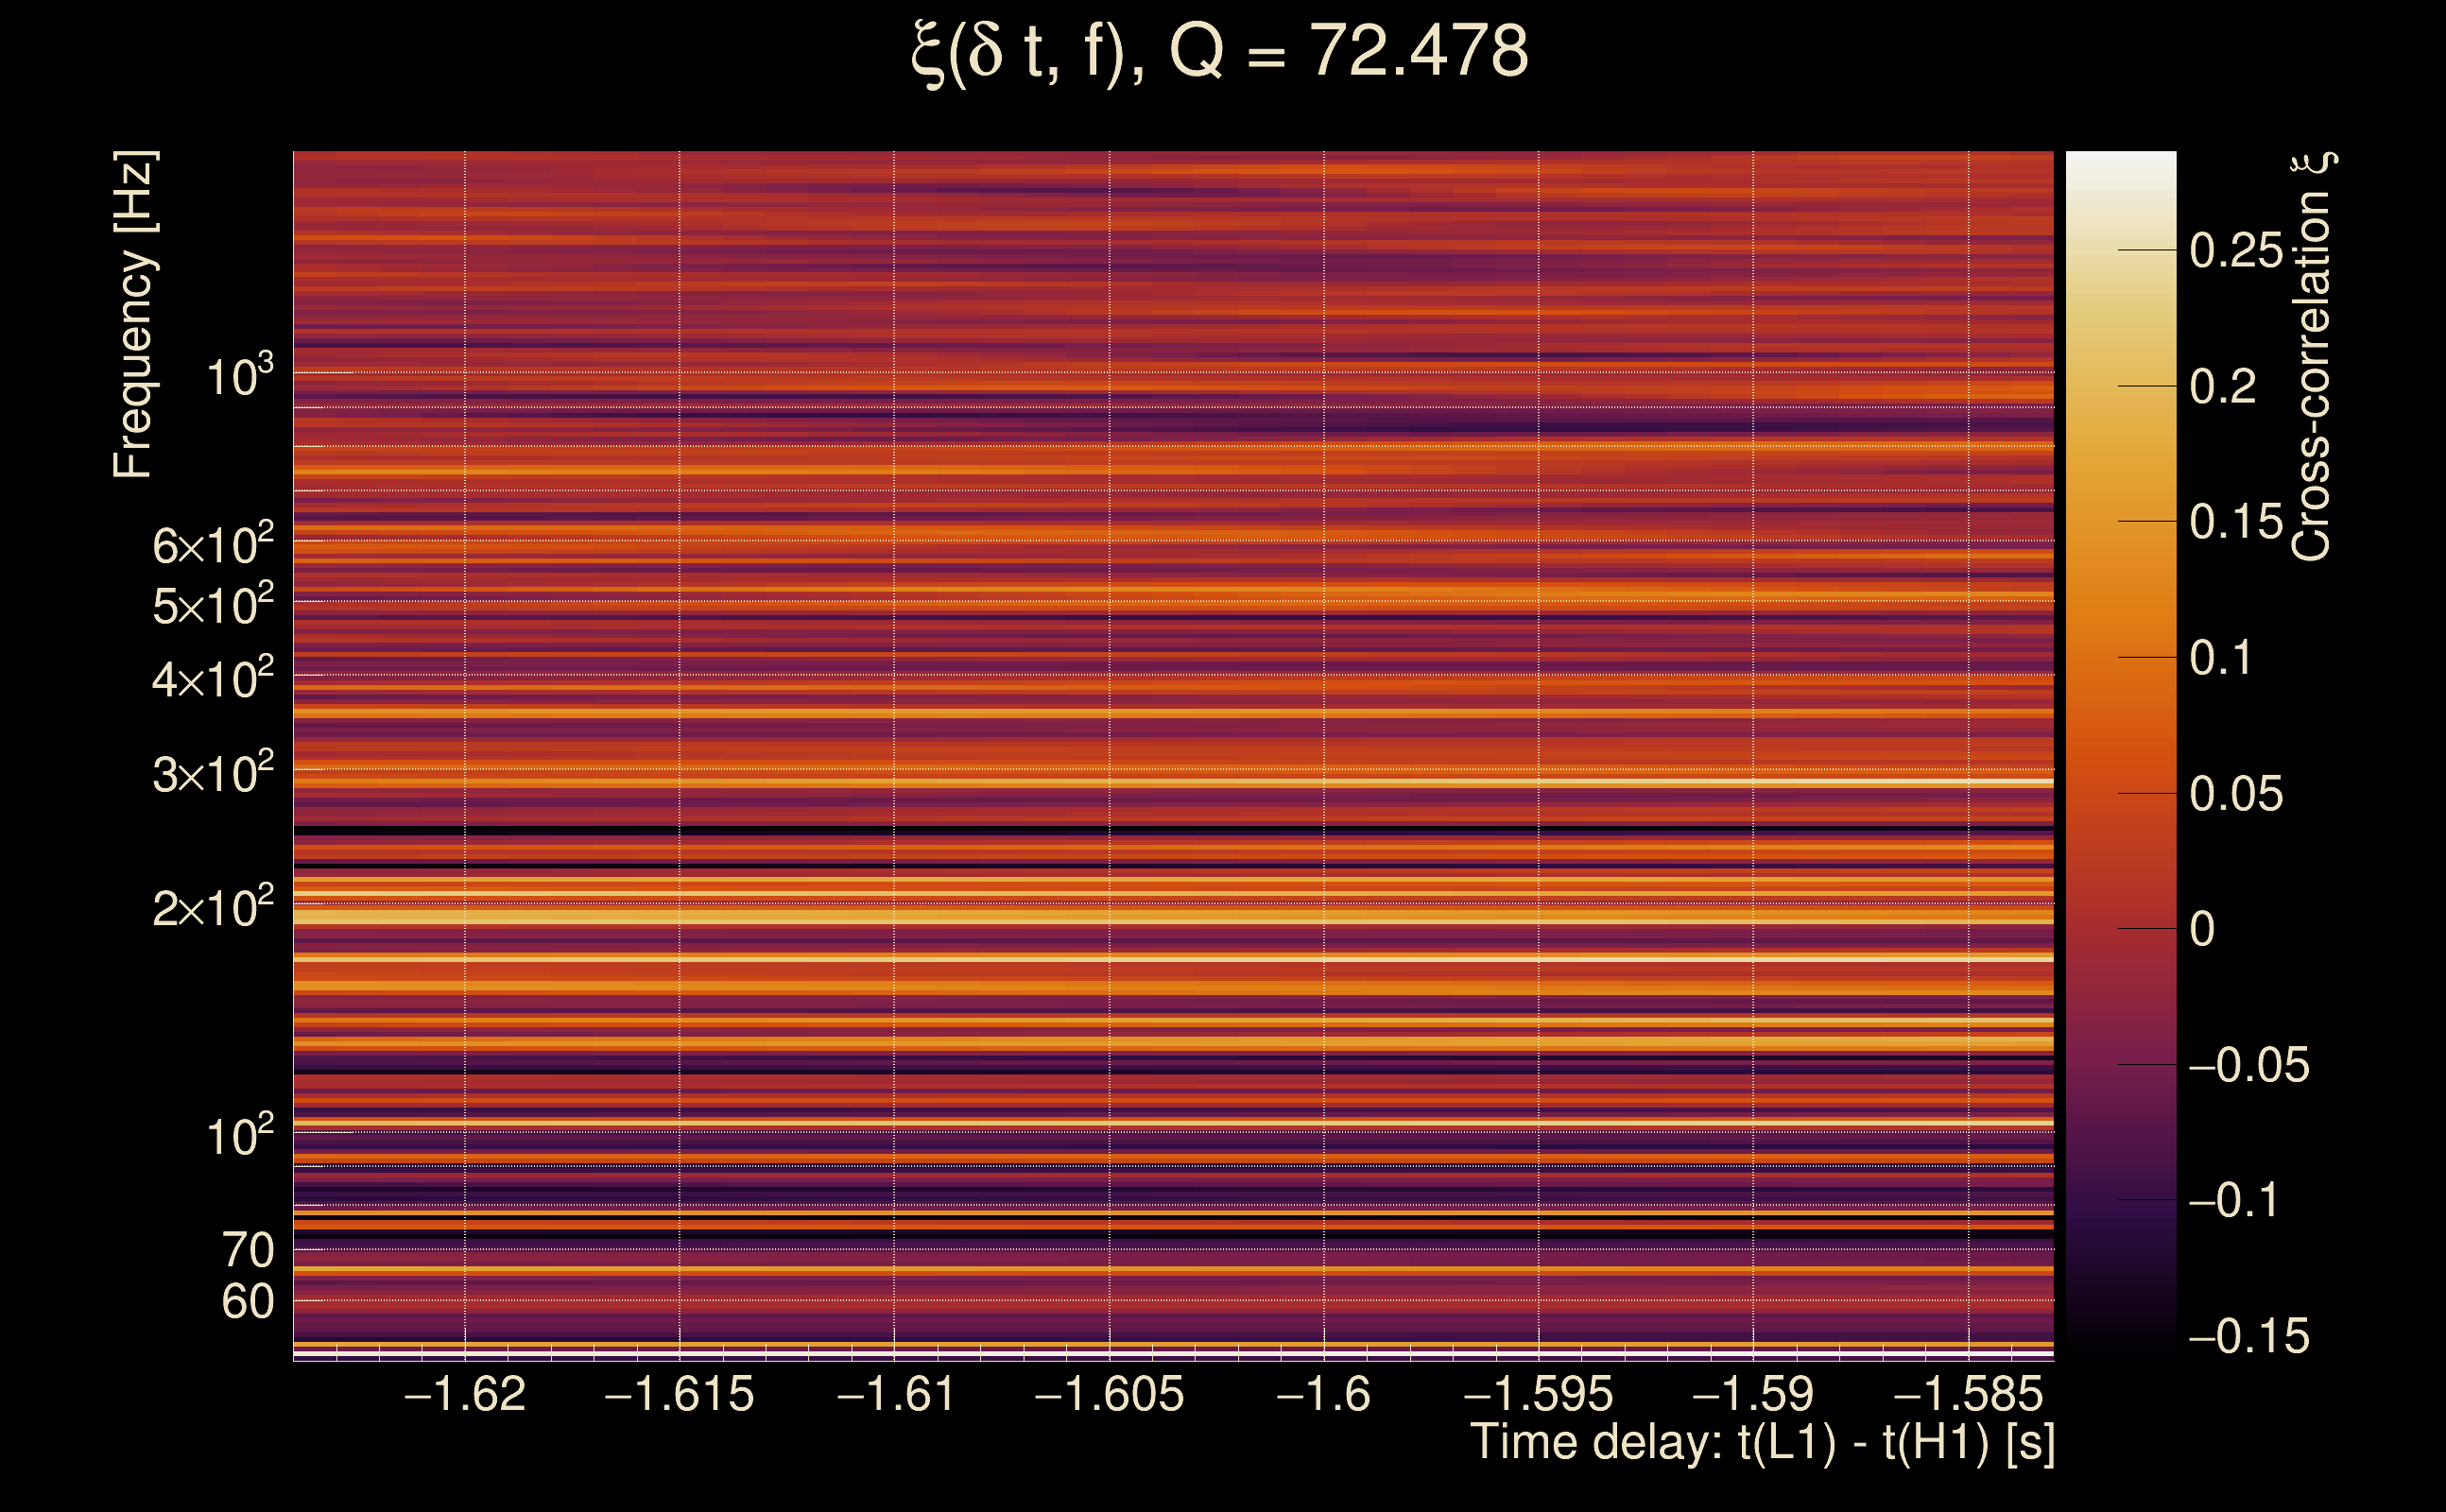
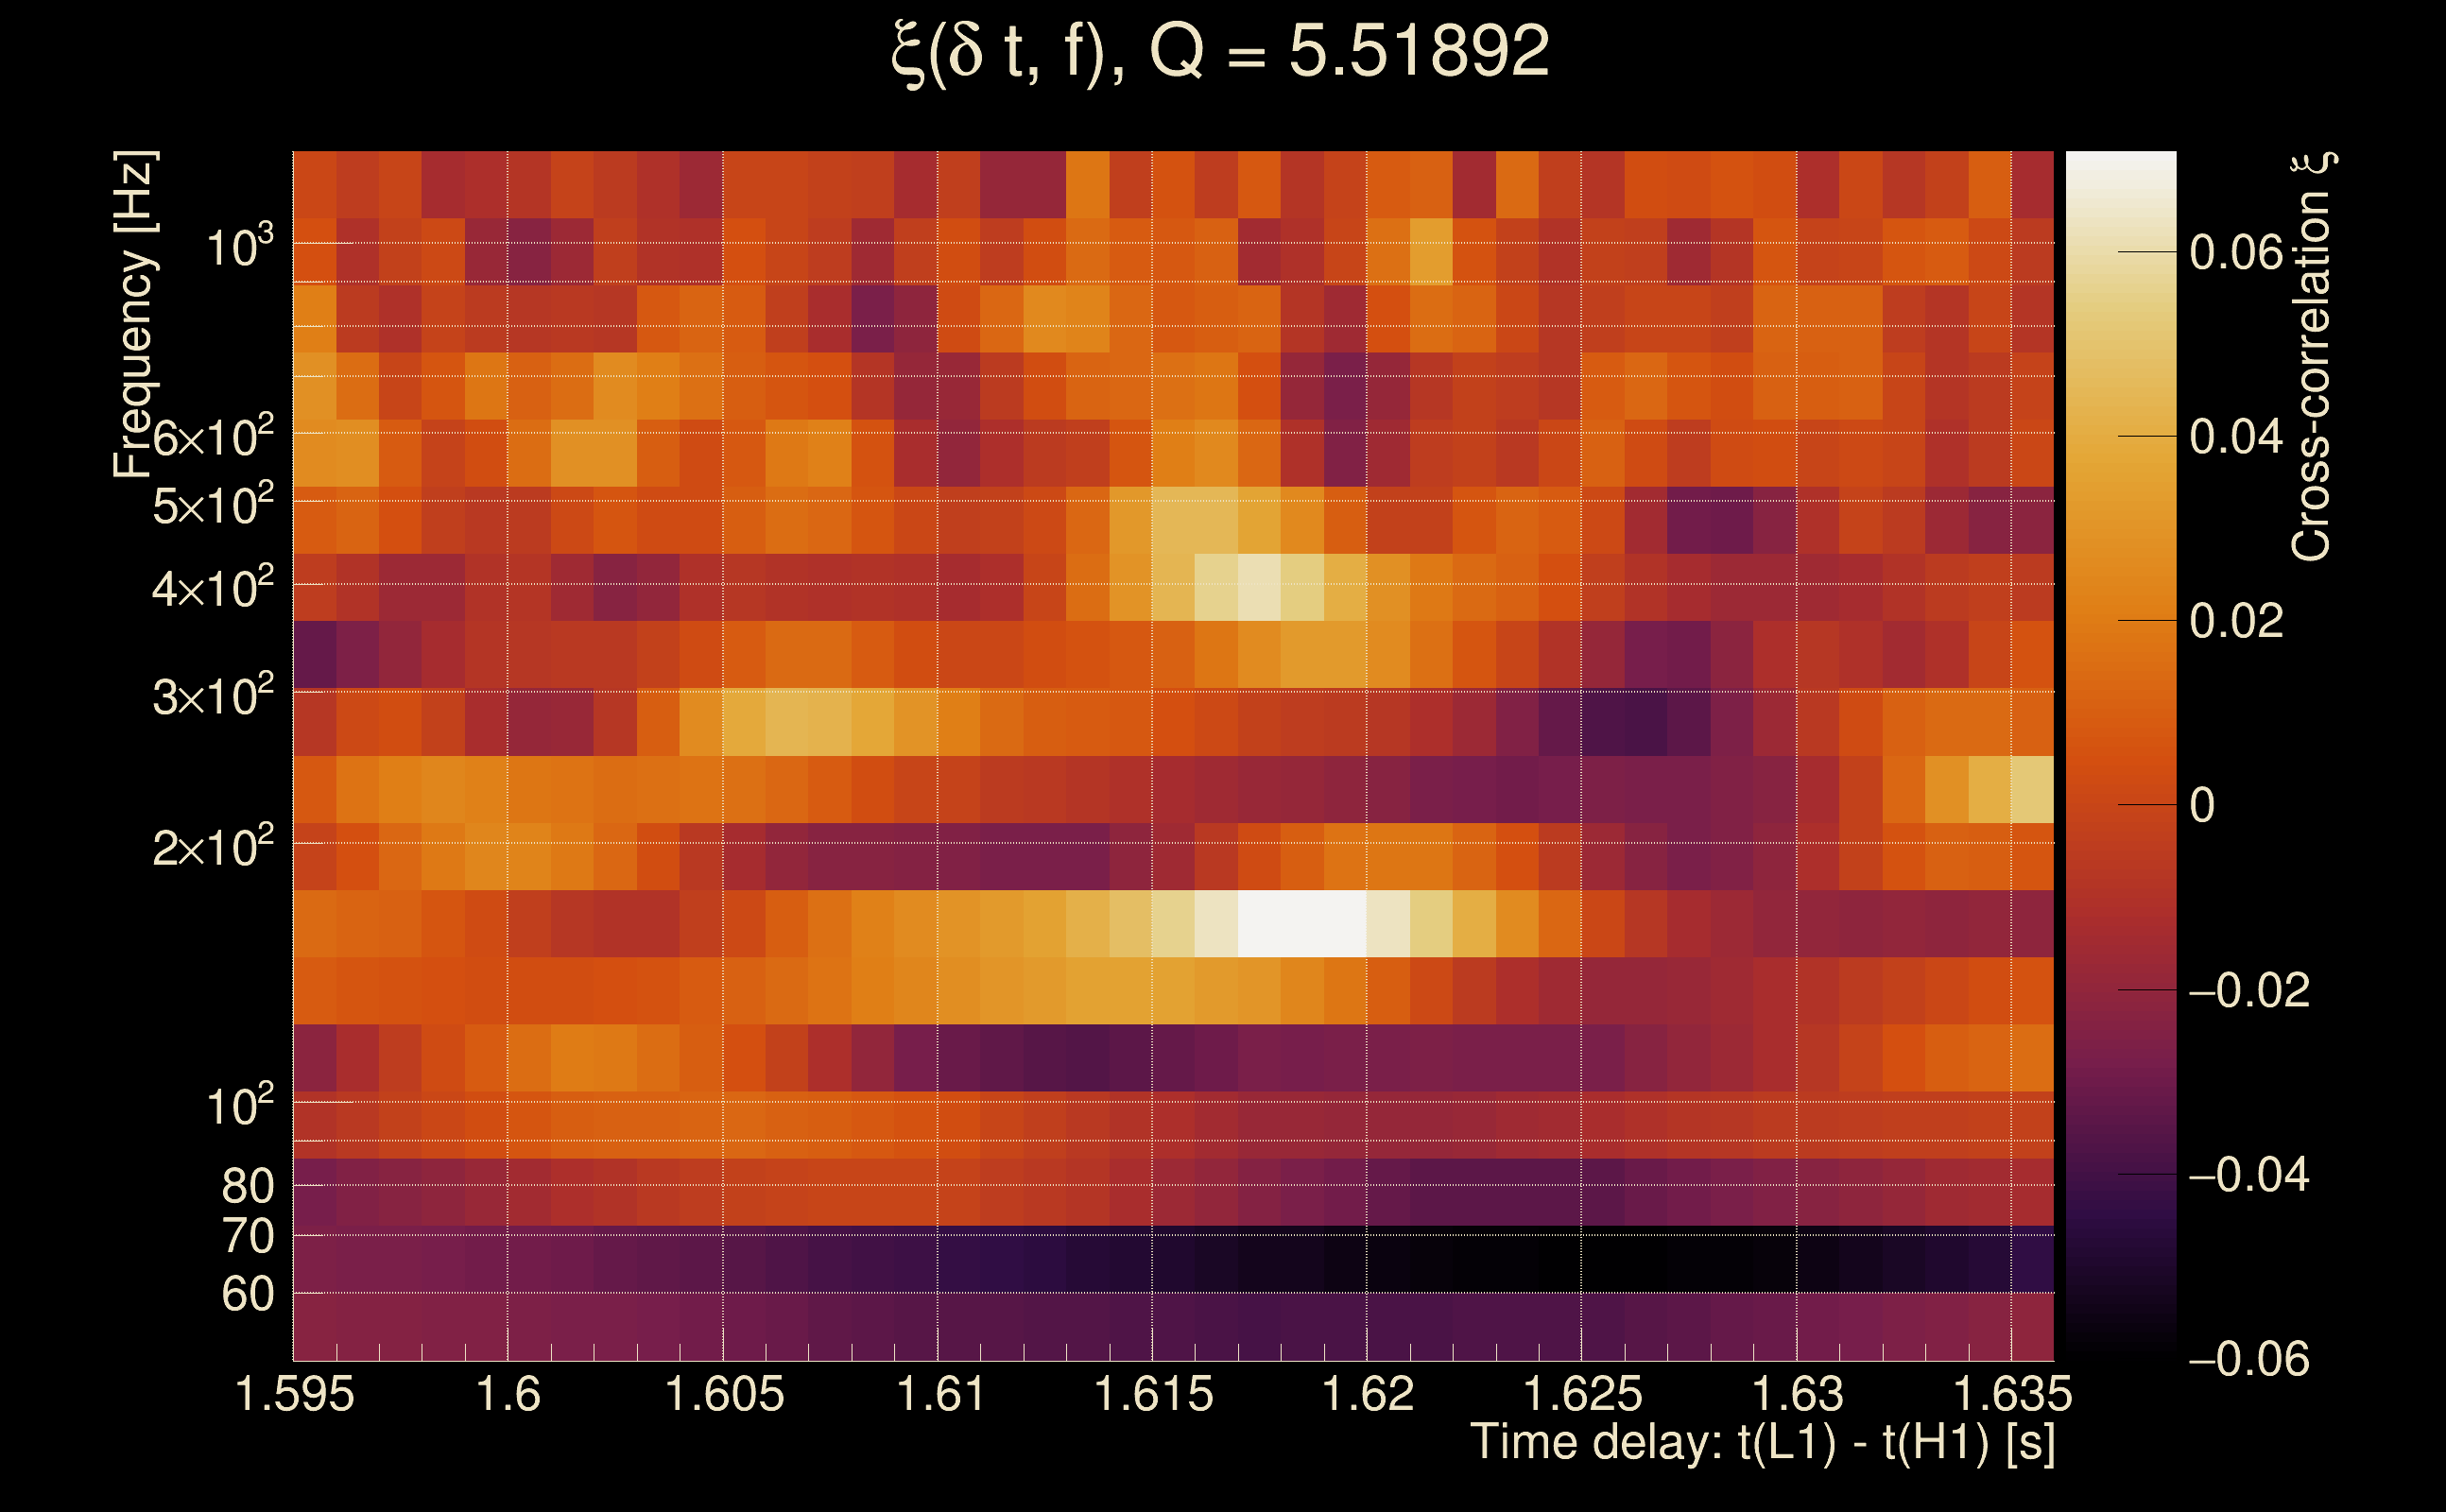
| Time delay between detectors t(L1) - t(H1): | 1.6169 s (slice index = 73 / 217), δt_gw = 0.00689533 s |
| Time delay uncertainty: | 0.00515309 s |
| [targeted mode] Time delay probability: | 0.734474 (0.33918 sigmas), δt_target = 0.00865269 s |
| Frequency: | 131.701 Hz |
| Ξ: | 0.0138038 ± 0.0290692 (variance = 0.000845017): Q0: 0.123881, Q1: 0.0843583, Q2: 0.071538, Q3: 0.0375832, Q4: 0.0566601 |
| Rank: | R_A = 0.00659055 |
| Log of amplitude ratio (L1/H1): | 0.0103061, variance = 0.329241 (L1/H1: -0.105449, variance = 0.52436, H1/L1: -0.141133, variance = 0.824222) |
| Amplitude ratio (L1/H1): | 1.01036 ⋇ 1.77499 (L1/H1: 0.89992 ⋇ 2.06293, H1/L1: 0.868374 ⋇ 2.47903) |
| Amplitude ratio H1|L1 compatibility (probability): | 0.831845 |
| Antenna factor probability: | 0.781453 |
| Number of rejected frequency rows: | Q0: 15 / 18, Q1: 32 / 36, Q2: 65 / 70, Q3: 128 / 134, Q4: 245 / 258 |
| Maximum signal-to-noise ratio: | H1: 5.22251, L1: 4.91249 |
| SNR variance: | H1: 0.54372, L1: 0.516257 |
| Click here for a zoomed plot | Click here for a zoomed plot | Click here for a zoomed plot | Click here for a zoomed plot | Click here for a zoomed plot |
 |
 |
 |
 |
 |
 |
 |
 |
 |
 |
 |
 |
 |
 |
 |
 |
 |
 |
 |
 |
 |
 |
 |
 |
 |
 |
 |
 |
 |
| Event time t(H1): | GPS = 1368195753 (Mon May 15 14:22:15 2023 ) → GPS = 1368195763 (Mon May 15 14:22:25 2023 ) |
| Event time t(L1): | GPS = 1368195753 (Mon May 15 14:22:25 2023 ) → GPS = 1368195763 (Mon May 15 14:22:25 2023 ) |
| Omicron analysis time window (H1): | GPS = 1368195750 → GPS = 1368195766 |
| Omicron analysis time window (L1): | GPS = 1368195750 → GPS = 1368195766 |
| Time delay between detectors t(L1) - t(H1): | 2.07717 s (slice index = 63 / 217), δt_gw = 0.00717118 s |
| Time delay uncertainty: | 0.00665214 s |
| [targeted mode] Time delay probability: | 0.826244 (0.219521 sigmas), δt_target = 0.00864315 s |
| Frequency: | 174.143 Hz |
| Ξ: | 0.0212963 ± 0.0252034 (variance = 0.000635211): Q0: 0.0768523, Q1: 0.0868057, Q2: 0.144318, Q3: 0.1164, Q4: 0.127936 |
| Rank: | R_A = 0.00610398 |
| Log of amplitude ratio (L1/H1): | -0.154784, variance = 0.684068 (L1/H1: -0.8483, variance = 0.872995, H1/L1: -0.790848, variance = 2.19831) |
| Amplitude ratio (L1/H1): | 0.8566 ⋇ 2.28664 (L1/H1: 0.428142 ⋇ 2.54554, H1/L1: 0.45346 ⋇ 4.40469) |
| Amplitude ratio H1|L1 compatibility (probability): | 0.349627 |
| Antenna factor probability: | 0.992191 |
| Number of rejected frequency rows: | Q0: 12 / 18, Q1: 28 / 36, Q2: 61 / 70, Q3: 123 / 134, Q4: 245 / 258 |
| Maximum signal-to-noise ratio: | H1: 6.17226, L1: 5.28581 |
| SNR variance: | H1: 0.553963, L1: 0.543081 |
| Click here for a zoomed plot | Click here for a zoomed plot | Click here for a zoomed plot | Click here for a zoomed plot | Click here for a zoomed plot |
 |
 |
 |
 |
 |
 |
 |
 |
 |
 |
 |
 |
 |
 |
 |
 |
 |
 |
 |
 |
 |
 |
 |
 |
 |
 |
 |
 |
 |
| Event time t(H1): | GPS = 1368195578 (Mon May 15 14:19:20 2023 ) → GPS = 1368195588 (Mon May 15 14:19:30 2023 ) |
| Event time t(L1): | GPS = 1368195578 (Mon May 15 14:19:30 2023 ) → GPS = 1368195588 (Mon May 15 14:19:30 2023 ) |
| Omicron analysis time window (H1): | GPS = 1368195575 → GPS = 1368195591 |
| Omicron analysis time window (L1): | GPS = 1368195575 → GPS = 1368195591 |
| Time delay between detectors t(L1) - t(H1): | -2.4322 s (slice index = 161 / 217), δt_gw = 0.00579502 s |
| Time delay uncertainty: | 0.00905247 s |
| [targeted mode] Time delay probability: | 0.752247 (0.315678 sigmas), δt_target = 0.00863147 s |
| Frequency: | 112.856 Hz |
| Ξ: | 0.01421 ± 0.0389613 (variance = 0.00151798): Q0: 0.0762026, Q1: 0.128404, Q2: 0.0743042, Q3: 0.0851835, Q4: 0.175131 |
| Rank: | R_A = 0.005994 |
| Log of amplitude ratio (L1/H1): | -0.111448, variance = 0.9506 (L1/H1: -0.635485, variance = 1.17826, H1/L1: -0.465715, variance = 2.76838) |
| Amplitude ratio (L1/H1): | 0.894538 ⋇ 2.65113 (L1/H1: 0.529679 ⋇ 2.96085, H1/L1: 0.627686 ⋇ 5.27957) |
| Amplitude ratio H1|L1 compatibility (probability): | 0.579367 |
| Antenna factor probability: | 0.967848 |
| Number of rejected frequency rows: | Q0: 13 / 18, Q1: 33 / 36, Q2: 68 / 70, Q3: 129 / 134, Q4: 250 / 258 |
| Maximum signal-to-noise ratio: | H1: 4.99095, L1: 4.7557 |
| SNR variance: | H1: 0.524408, L1: 0.53681 |
| Click here for a zoomed plot | Click here for a zoomed plot | Click here for a zoomed plot | Click here for a zoomed plot | Click here for a zoomed plot |
|
|
|
|
|
|
|
|
|
|
|
|
|
|
|
|
|
|
|
|
|
|
|
|
|
 |
 |
 |
 |
| Event time t(H1): | GPS = 1368195658 (Mon May 15 14:20:40 2023 ) → GPS = 1368195668 (Mon May 15 14:20:50 2023 ) |
| Event time t(L1): | GPS = 1368195658 (Mon May 15 14:20:50 2023 ) → GPS = 1368195668 (Mon May 15 14:20:50 2023 ) |
| Omicron analysis time window (H1): | GPS = 1368195655 → GPS = 1368195671 |
| Omicron analysis time window (L1): | GPS = 1368195655 → GPS = 1368195671 |
| Time delay between detectors t(L1) - t(H1): | -0.359796 s (slice index = 116 / 217), δt_gw = 0.00820407 s |
| Time delay uncertainty: | 0.00493562 s |
| [targeted mode] Time delay probability: | 0.929113 (0.0889605 sigmas), δt_target = 0.00865269 s |
| Frequency: | 157.821 Hz |
| Ξ: | 0.0149287 ± 0.0353308 (variance = 0.00124826): Q0: 0.0653252, Q1: 0.128467, Q2: 0.14992, Q3: 0.0584767, Q4: 0.104672 |
| Rank: | R_A = 0.00598704 |
| Log of amplitude ratio (L1/H1): | 0.0778431, variance = 0.553255 (L1/H1: -0.323608, variance = 0.982507, H1/L1: -0.531563, variance = 1.25553) |
| Amplitude ratio (L1/H1): | 1.08095 ⋇ 2.10394 (L1/H1: 0.723534 ⋇ 2.69451, H1/L1: 0.587686 ⋇ 3.0664) |
| Amplitude ratio H1|L1 compatibility (probability): | 0.567569 |
| Antenna factor probability: | 0.76051 |
| Number of rejected frequency rows: | Q0: 14 / 18, Q1: 30 / 36, Q2: 64 / 70, Q3: 126 / 134, Q4: 248 / 258 |
| Maximum signal-to-noise ratio: | H1: 5.22251, L1: 4.91249 |
| SNR variance: | H1: 0.54372, L1: 0.516257 |
| Click here for a zoomed plot | Click here for a zoomed plot | Click here for a zoomed plot | Click here for a zoomed plot | Click here for a zoomed plot |
|
|
|
|
|
|
|
|
|
|
|
|
|
|
|
|
|
|
|
|
|
|
|
|
|
 |
 |
 |
 |
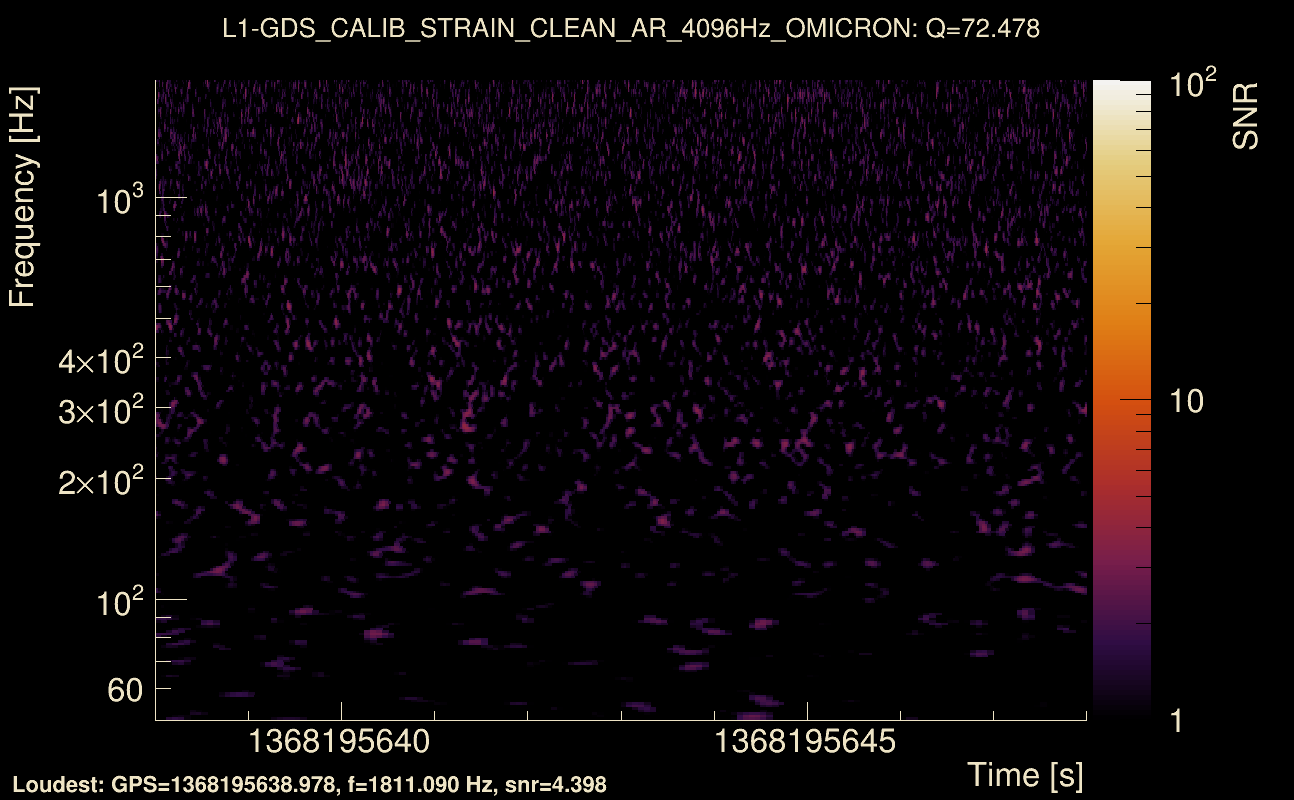
| Event time t(H1): | GPS = 1368195638 (Mon May 15 14:20:20 2023 ) → GPS = 1368195648 (Mon May 15 14:20:30 2023 ) |
| Event time t(L1): | GPS = 1368195638 (Mon May 15 14:20:30 2023 ) → GPS = 1368195648 (Mon May 15 14:20:30 2023 ) |
| Omicron analysis time window (H1): | GPS = 1368195635 → GPS = 1368195651 |
| Omicron analysis time window (L1): | GPS = 1368195635 → GPS = 1368195651 |
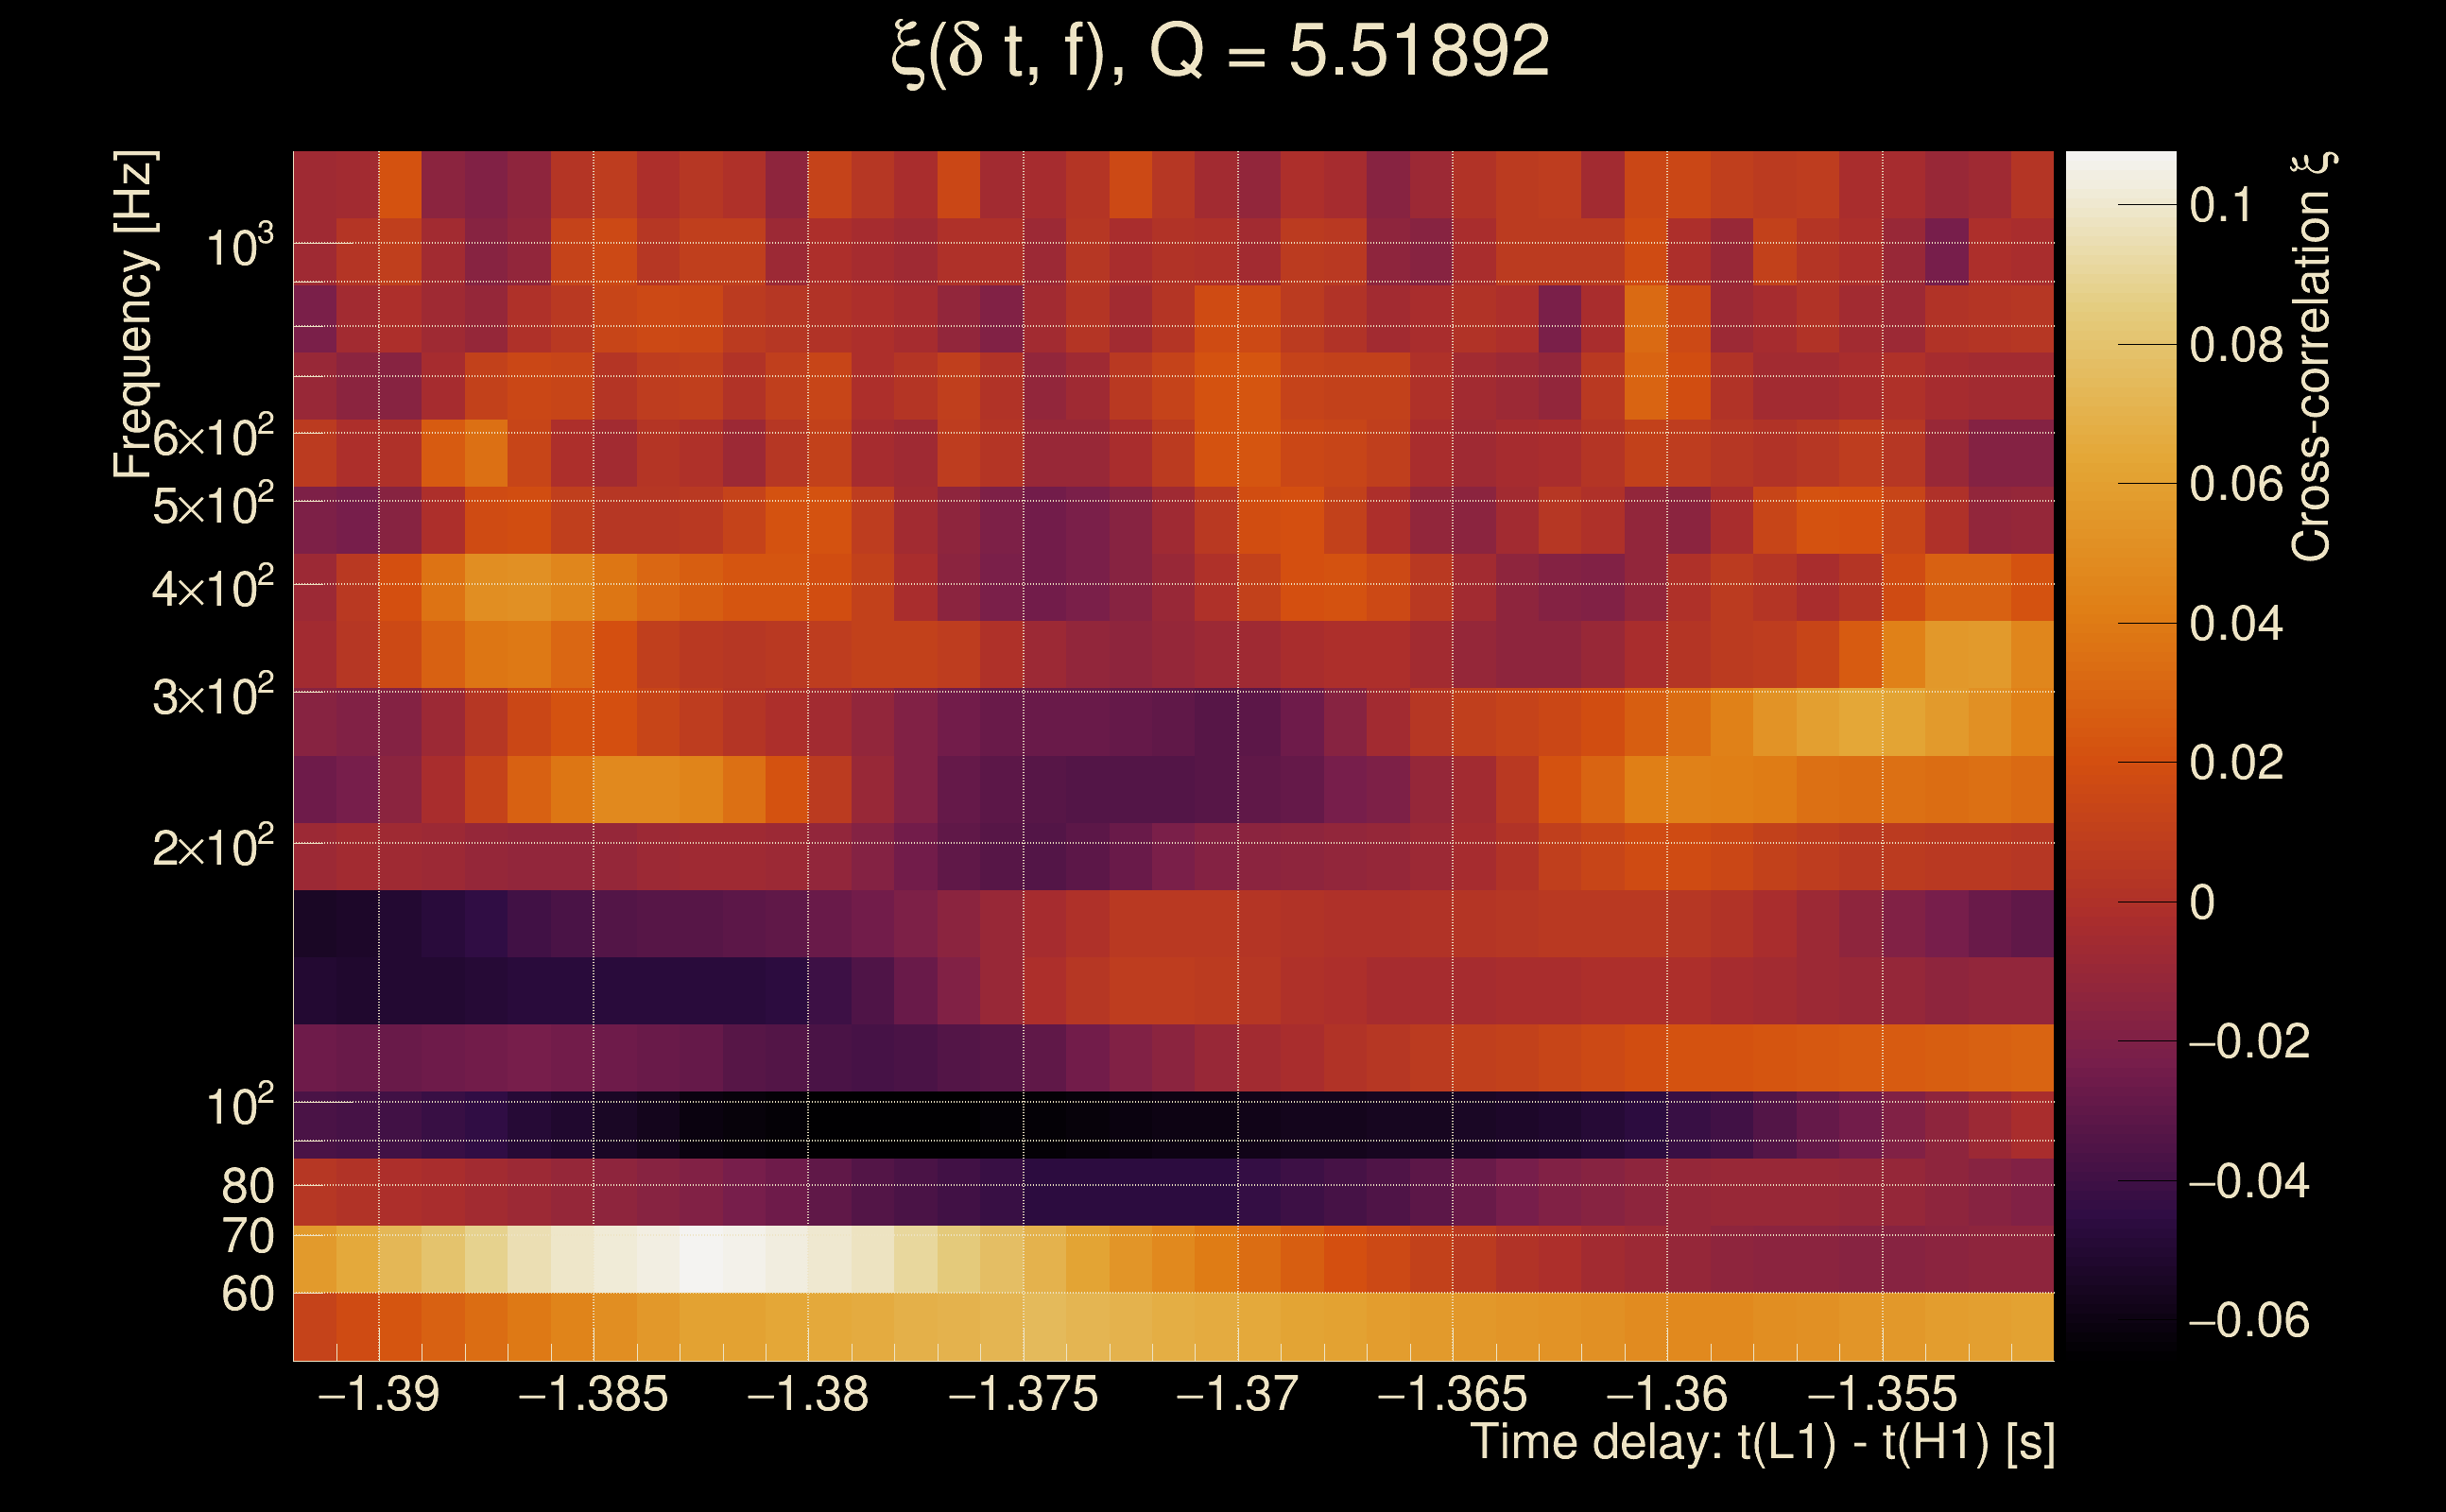
| Time delay between detectors t(L1) - t(H1): | -1.3719 s (slice index = 138 / 217), δt_gw = 0.00810321 s |
| Time delay uncertainty: | 0.00478647 s |
| [targeted mode] Time delay probability: | 0.909789 (0.113304 sigmas), δt_target = 0.00864315 s |
| Frequency: | 77.7796 Hz |
| Ξ: | 0.0110876 ± 0.0611292 (variance = 0.00373677): Q0: 0.133514, Q1: 0.139619, Q2: 0.03131, Q3: 0.0240082, Q4: 0.174157 |
| Rank: | R_A = 0.00596008 |
| Log of amplitude ratio (L1/H1): | -0.29706, variance = 0.635001 (L1/H1: -0.62178, variance = 0.54318, H1/L1: 0.017131, variance = 1.79806) |
| Amplitude ratio (L1/H1): | 0.742999 ⋇ 2.21858 (L1/H1: 0.536988 ⋇ 2.08967, H1/L1: 1.01728 ⋇ 3.82255) |
| Amplitude ratio H1|L1 compatibility (probability): | 0.69272 |
| Antenna factor probability: | 0.852938 |
| Number of rejected frequency rows: | Q0: 16 / 18, Q1: 33 / 36, Q2: 64 / 70, Q3: 129 / 134, Q4: 252 / 258 |
| Maximum signal-to-noise ratio: | H1: 5.04045, L1: 5.42875 |
| SNR variance: | H1: 0.541213, L1: 0.515733 |
| Click here for a zoomed plot | Click here for a zoomed plot | Click here for a zoomed plot | Click here for a zoomed plot | Click here for a zoomed plot |
 |
 |
 |
 |
 |
 |
 |
 |
 |
 |
 |
 |
 |
 |
 |
 |
 |
 |
 |
 |
 |
 |
 |
 |
 |
 |
 |
 |
 |
| Event time t(H1): | GPS = 1368195468 (Mon May 15 14:17:30 2023 ) → GPS = 1368195478 (Mon May 15 14:17:40 2023 ) |
| Event time t(L1): | GPS = 1368195468 (Mon May 15 14:17:40 2023 ) → GPS = 1368195478 (Mon May 15 14:17:40 2023 ) |
| Omicron analysis time window (H1): | GPS = 1368195465 → GPS = 1368195481 |
| Omicron analysis time window (L1): | GPS = 1368195465 → GPS = 1368195481 |
| Time delay between detectors t(L1) - t(H1): | 3.36664 s (slice index = 35 / 217), δt_gw = 0.00863908 s |
| Time delay uncertainty: | 0.00455381 s |
| [targeted mode] Time delay probability: | 0.995319 (0.00586706 sigmas), δt_target = 0.00864553 s |
| Frequency: | 251.021 Hz |
| Ξ: | 0.00978435 ± 0.0244708 (variance = 0.000598821): Q0: 0.0629632, Q1: 0.0951737, Q2: 0.112979, Q3: 0.0600581, Q4: 0.0470949 |
| Rank: | R_A = 0.00570772 |
| Log of amplitude ratio (L1/H1): | -0.142004, variance = 0.609908 (L1/H1: -0.510449, variance = 1.31553, H1/L1: -0.310574, variance = 1.04359) |
| Amplitude ratio (L1/H1): | 0.867618 ⋇ 2.18358 (L1/H1: 0.600226 ⋇ 3.14863, H1/L1: 0.733026 ⋇ 2.77754) |
| Amplitude ratio H1|L1 compatibility (probability): | 0.592968 |
| Antenna factor probability: | 0.988409 |
| Number of rejected frequency rows: | Q0: 16 / 18, Q1: 29 / 36, Q2: 64 / 70, Q3: 128 / 134, Q4: 251 / 258 |
| Maximum signal-to-noise ratio: | H1: 5.46674, L1: 4.93252 |
| SNR variance: | H1: 0.537247, L1: 0.511559 |
| Click here for a zoomed plot | Click here for a zoomed plot | Click here for a zoomed plot | Click here for a zoomed plot | Click here for a zoomed plot |
 |
 |
 |
 |
 |
 |
 |
 |
 |
 |
 |
 |
 |
 |
 |
 |
 |
 |
 |
 |
 |
 |
 |
 |
 |
 |
 |
 |
 |
| Event time t(H1): | GPS = 1368195578 (Mon May 15 14:19:20 2023 ) → GPS = 1368195588 (Mon May 15 14:19:30 2023 ) |
| Event time t(L1): | GPS = 1368195578 (Mon May 15 14:19:30 2023 ) → GPS = 1368195588 (Mon May 15 14:19:30 2023 ) |
| Omicron analysis time window (H1): | GPS = 1368195575 → GPS = 1368195591 |
| Omicron analysis time window (L1): | GPS = 1368195575 → GPS = 1368195591 |
| Time delay between detectors t(L1) - t(H1): | -4.68506 s (slice index = 210 / 217), δt_gw = 0.00694192 s |
| Time delay uncertainty: | 0.00532956 s |
| [targeted mode] Time delay probability: | 0.748214 (0.320996 sigmas), δt_target = 0.0086658 s |
| Frequency: | 107.935 Hz |
| Ξ: | 0.0127614 ± 0.0684413 (variance = 0.00468422): Q0: 0.0767719, Q1: 0.0193724, Q2: 0.210636, Q3: 0.0769627, Q4: 0.163719 |
| Rank: | R_A = 0.00557783 |
| Log of amplitude ratio (L1/H1): | -0.261685, variance = 0.463323 (L1/H1: -0.539403, variance = 0.740723, H1/L1: -0.0441879, variance = 1.14741) |
| Amplitude ratio (L1/H1): | 0.769754 ⋇ 1.97522 (L1/H1: 0.583096 ⋇ 2.3647, H1/L1: 0.956774 ⋇ 2.9188) |
| Amplitude ratio H1|L1 compatibility (probability): | 0.671049 |
| Antenna factor probability: | 0.870533 |
| Number of rejected frequency rows: | Q0: 13 / 18, Q1: 33 / 36, Q2: 67 / 70, Q3: 130 / 134, Q4: 252 / 258 |
| Maximum signal-to-noise ratio: | H1: 4.99095, L1: 4.7557 |
| SNR variance: | H1: 0.524408, L1: 0.53681 |
| Click here for a zoomed plot | Click here for a zoomed plot | Click here for a zoomed plot | Click here for a zoomed plot | Click here for a zoomed plot |
|
|
|
|
|
|
|
|
|
|
|
|
|
|
|
|
|
|
|
|
|
|
|
|
|
 |
 |
 |
 |
| Event time t(H1): | GPS = 1368195753 (Mon May 15 14:22:15 2023 ) → GPS = 1368195763 (Mon May 15 14:22:25 2023 ) |
| Event time t(L1): | GPS = 1368195753 (Mon May 15 14:22:25 2023 ) → GPS = 1368195763 (Mon May 15 14:22:25 2023 ) |
| Omicron analysis time window (H1): | GPS = 1368195750 → GPS = 1368195766 |
| Omicron analysis time window (L1): | GPS = 1368195750 → GPS = 1368195766 |
| Time delay between detectors t(L1) - t(H1): | 3.31884 s (slice index = 36 / 217), δt_gw = 0.00683948 s |
| Time delay uncertainty: | 0.00592836 s |
| [targeted mode] Time delay probability: | 0.762443 (0.302274 sigmas), δt_target = 0.00865269 s |
| Frequency: | 219.46 Hz |
| Ξ: | 0.0141789 ± 0.0577603 (variance = 0.00333626): Q0: 0.0602923, Q1: 0.0479559, Q2: 0.0737148, Q3: 0.0627644, Q4: 0.204124 |
| Rank: | R_A = 0.00546762 |
| Log of amplitude ratio (L1/H1): | -0.182985, variance = 0.451996 (L1/H1: -0.548933, variance = 0.746842, H1/L1: -0.315997, variance = 1.13644) |
| Amplitude ratio (L1/H1): | 0.832781 ⋇ 1.95875 (L1/H1: 0.577566 ⋇ 2.37311, H1/L1: 0.729062 ⋇ 2.90385) |
| Amplitude ratio H1|L1 compatibility (probability): | 0.528521 |
| Antenna factor probability: | 0.956945 |
| Number of rejected frequency rows: | Q0: 12 / 18, Q1: 29 / 36, Q2: 62 / 70, Q3: 127 / 134, Q4: 250 / 258 |
| Maximum signal-to-noise ratio: | H1: 6.17226, L1: 5.28581 |
| SNR variance: | H1: 0.553963, L1: 0.543081 |
| Click here for a zoomed plot | Click here for a zoomed plot | Click here for a zoomed plot | Click here for a zoomed plot | Click here for a zoomed plot |
|
|
|
|
|
|
|
|
|
|
|
|
|
|
|
|
|
|
|
|
|
|
|
|
|
 |
 |
 |
 |
| Event time t(H1): | GPS = 1368195548 (Mon May 15 14:18:50 2023 ) → GPS = 1368195558 (Mon May 15 14:19:00 2023 ) |
| Event time t(L1): | GPS = 1368195548 (Mon May 15 14:19:00 2023 ) → GPS = 1368195558 (Mon May 15 14:19:00 2023 ) |
| Omicron analysis time window (H1): | GPS = 1368195545 → GPS = 1368195561 |
| Omicron analysis time window (L1): | GPS = 1368195545 → GPS = 1368195561 |
| Time delay between detectors t(L1) - t(H1): | 2.67347 s (slice index = 50 / 217), δt_gw = 0.00546821 s |
| Time delay uncertainty: | 0.00635403 s |
| [targeted mode] Time delay probability: | 0.615826 (0.501774 sigmas), δt_target = 0.00863147 s |
| Frequency: | 113.122 Hz |
| Ξ: | 0.0245402 ± 0.044482 (variance = 0.00197865): Q0: 0.0885815, Q1: 0.13552, Q2: 0.168723, Q3: 0.0656992, Q4: 0.048885 |
| Rank: | R_A = 0.00502189 |
| Log of amplitude ratio (L1/H1): | -0.205735, variance = 0.463383 (L1/H1: -0.812148, variance = 0.570416, H1/L1: -0.477058, variance = 1.37119) |
| Amplitude ratio (L1/H1): | 0.814049 ⋇ 1.9753 (L1/H1: 0.443903 ⋇ 2.12816, H1/L1: 0.620606 ⋇ 3.22514) |
| Amplitude ratio H1|L1 compatibility (probability): | 0.354854 |
| Antenna factor probability: | 0.936442 |
| Number of rejected frequency rows: | Q0: 13 / 18, Q1: 28 / 36, Q2: 58 / 70, Q3: 120 / 134, Q4: 250 / 258 |
| Maximum signal-to-noise ratio: | H1: 5.13488, L1: 4.83916 |
| SNR variance: | H1: 0.562136, L1: 0.544861 |
| Click here for a zoomed plot | Click here for a zoomed plot | Click here for a zoomed plot | Click here for a zoomed plot | Click here for a zoomed plot |
 |
 |
 |
 |
 |
 |
 |
 |
 |
 |
 |
 |
 |
 |
 |
 |
 |
 |
 |
 |
 |
 |
 |
 |
 |
 |
 |
 |
 |
| Event time t(H1): | GPS = 1368195553 (Mon May 15 14:18:55 2023 ) → GPS = 1368195563 (Mon May 15 14:19:05 2023 ) |
| Event time t(L1): | GPS = 1368195553 (Mon May 15 14:19:05 2023 ) → GPS = 1368195563 (Mon May 15 14:19:05 2023 ) |
| Omicron analysis time window (H1): | GPS = 1368195550 → GPS = 1368195566 |
| Omicron analysis time window (L1): | GPS = 1368195550 → GPS = 1368195566 |
| Time delay between detectors t(L1) - t(H1): | 2.3538 s (slice index = 57 / 217), δt_gw = 0.007804 s |
| Time delay uncertainty: | 0.00582747 s |
| [targeted mode] Time delay probability: | 0.883789 (0.146168 sigmas), δt_target = 0.0086565 s |
| Frequency: | 130.898 Hz |
| Ξ: | 0.0256973 ± 0.0269394 (variance = 0.00072573): Q0: 0.100449, Q1: 0.119619, Q2: 0.171334, Q3: 0.143475, Q4: 0.101843 |
| Rank: | R_A = 0.00482526 |
| Log of amplitude ratio (L1/H1): | 0.206188, variance = 0.563255 (L1/H1: -0.496317, variance = 0.92386, H1/L1: -0.958801, variance = 1.35623) |
| Amplitude ratio (L1/H1): | 1.22898 ⋇ 2.11807 (L1/H1: 0.608769 ⋇ 2.61477, H1/L1: 0.383352 ⋇ 3.20456) |
| Amplitude ratio H1|L1 compatibility (probability): | 0.335219 |
| Antenna factor probability: | 0.633806 |
| Number of rejected frequency rows: | Q0: 11 / 18, Q1: 33 / 36, Q2: 62 / 70, Q3: 126 / 134, Q4: 252 / 258 |
| Maximum signal-to-noise ratio: | H1: 5.07174, L1: 4.9 |
| SNR variance: | H1: 0.573753, L1: 0.546991 |
| Click here for a zoomed plot | Click here for a zoomed plot | Click here for a zoomed plot | Click here for a zoomed plot | Click here for a zoomed plot |
 |
 |
 |
 |
 |
 |
 |
 |
 |
 |
 |
 |
 |
 |
 |
 |
 |
 |
 |
 |
 |
 |
 |
 |
 |
 |
 |
 |
 |
| Event time t(H1): | GPS = 1368195483 (Mon May 15 14:17:45 2023 ) → GPS = 1368195493 (Mon May 15 14:17:55 2023 ) |
| Event time t(L1): | GPS = 1368195483 (Mon May 15 14:17:55 2023 ) → GPS = 1368195493 (Mon May 15 14:17:55 2023 ) |
| Omicron analysis time window (H1): | GPS = 1368195480 → GPS = 1368195496 |
| Omicron analysis time window (L1): | GPS = 1368195480 → GPS = 1368195496 |
| Time delay between detectors t(L1) - t(H1): | -4.54704 s (slice index = 207 / 217), δt_gw = 0.00696023 s |
| Time delay uncertainty: | 0.00783975 s |
| [targeted mode] Time delay probability: | 0.827966 (0.217311 sigmas), δt_target = 0.00865579 s |
| Frequency: | 180.371 Hz |
| Ξ: | 0.0142483 ± 0.0238947 (variance = 0.000570956): Q0: 0.0718378, Q1: 0.133011, Q2: 0.0987499, Q3: 0.065641, Q4: 0.0980544 |
| Rank: | R_A = 0.0047957 |
| Log of amplitude ratio (L1/H1): | 0.0946409, variance = 0.624445 (L1/H1: -0.290776, variance = 1.20458, H1/L1: -0.662512, variance = 1.20514) |
| Amplitude ratio (L1/H1): | 1.09926 ⋇ 2.20388 (L1/H1: 0.747683 ⋇ 2.99676, H1/L1: 0.515554 ⋇ 2.99754) |
| Amplitude ratio H1|L1 compatibility (probability): | 0.539148 |
| Antenna factor probability: | 0.753997 |
| Number of rejected frequency rows: | Q0: 13 / 18, Q1: 33 / 36, Q2: 65 / 70, Q3: 128 / 134, Q4: 249 / 258 |
| Maximum signal-to-noise ratio: | H1: 6.18534, L1: 5.09569 |
| SNR variance: | H1: 0.536575, L1: 0.540197 |
| Click here for a zoomed plot | Click here for a zoomed plot | Click here for a zoomed plot | Click here for a zoomed plot | Click here for a zoomed plot |
 |
 |
 |
 |
 |
 |
 |
 |
 |
 |
 |
 |
 |
 |
 |
 |
 |
 |
 |
 |
 |
 |
 |
 |
 |
 |
 |
 |
 |
| Event time t(H1): | GPS = 1368195448 (Mon May 15 14:17:10 2023 ) → GPS = 1368195458 (Mon May 15 14:17:20 2023 ) |
| Event time t(L1): | GPS = 1368195448 (Mon May 15 14:17:20 2023 ) → GPS = 1368195458 (Mon May 15 14:17:20 2023 ) |
| Omicron analysis time window (H1): | GPS = 1368195445 → GPS = 1368195461 |
| Omicron analysis time window (L1): | GPS = 1368195445 → GPS = 1368195461 |
| Time delay between detectors t(L1) - t(H1): | -4.45709 s (slice index = 205 / 217), δt_gw = 0.00491075 s |
| Time delay uncertainty: | 0.00669523 s |
| [targeted mode] Time delay probability: | 0.574654 (0.56121 sigmas), δt_target = 0.00866389 s |
| Frequency: | 369.506 Hz |
| Ξ: | 0.015001 ± 0.0161916 (variance = 0.000262167): Q0: 0.0642777, Q1: 0.0626294, Q2: 0.0549241, Q3: 0.0986007, Q4: 0.0850466 |
| Rank: | R_A = 0.00454456 |
| Log of amplitude ratio (L1/H1): | -0.0947526, variance = 1.64184 (L1/H1: -0.846616, variance = 5.17075, H1/L1: -0.681014, variance = 1.27306) |
| Amplitude ratio (L1/H1): | 0.909598 ⋇ 3.60148 (L1/H1: 0.428864 ⋇ 9.71751, H1/L1: 0.506103 ⋇ 3.0904) |
| Amplitude ratio H1|L1 compatibility (probability): | 0.547312 |
| Antenna factor probability: | 0.963228 |
| Number of rejected frequency rows: | Q0: 12 / 18, Q1: 30 / 36, Q2: 63 / 70, Q3: 123 / 134, Q4: 246 / 258 |
| Maximum signal-to-noise ratio: | H1: 5.11033, L1: 5.03098 |
| SNR variance: | H1: 0.546016, L1: 0.509304 |
| Click here for a zoomed plot | Click here for a zoomed plot | Click here for a zoomed plot | Click here for a zoomed plot | Click here for a zoomed plot |
 |
 |
 |
 |
 |
 |
 |
 |
 |
 |
 |
 |
 |
 |
 |
 |
 |
 |
 |
 |
 |
 |
 |
 |
 |
 |
 |
 |
 |
| Event time t(H1): | GPS = 1368195753 (Mon May 15 14:22:15 2023 ) → GPS = 1368195763 (Mon May 15 14:22:25 2023 ) |
| Event time t(L1): | GPS = 1368195753 (Mon May 15 14:22:25 2023 ) → GPS = 1368195763 (Mon May 15 14:22:25 2023 ) |
| Omicron analysis time window (H1): | GPS = 1368195750 → GPS = 1368195766 |
| Omicron analysis time window (L1): | GPS = 1368195750 → GPS = 1368195766 |
| Time delay between detectors t(L1) - t(H1): | -1.60337 s (slice index = 143 / 217), δt_gw = 0.00663064 s |
| Time delay uncertainty: | 0.00463084 s |
| [targeted mode] Time delay probability: | 0.665693 (0.432066 sigmas), δt_target = 0.00866818 s |
| Frequency: | 216.631 Hz |
| Ξ: | 0.0160526 ± 0.0168884 (variance = 0.000285217): Q0: 0.0698646, Q1: 0.083674, Q2: 0.0782019, Q3: 0.0359494, Q4: 0.0748484 |
| Rank: | R_A = 0.00445056 |
| Log of amplitude ratio (L1/H1): | 0.178413, variance = 0.340456 (L1/H1: 0.00114644, variance = 0.608078, H1/L1: -0.420121, variance = 0.771332) |
| Amplitude ratio (L1/H1): | 1.19532 ⋇ 1.79228 (L1/H1: 1.00115 ⋇ 2.18102, H1/L1: 0.656967 ⋇ 2.4067) |
| Amplitude ratio H1|L1 compatibility (probability): | 0.721293 |
| Antenna factor probability: | 0.57741 |
| Number of rejected frequency rows: | Q0: 13 / 18, Q1: 28 / 36, Q2: 61 / 70, Q3: 132 / 134, Q4: 252 / 258 |
| Maximum signal-to-noise ratio: | H1: 6.17226, L1: 5.28581 |
| SNR variance: | H1: 0.553963, L1: 0.543081 |
| Click here for a zoomed plot | Click here for a zoomed plot | Click here for a zoomed plot | Click here for a zoomed plot | Click here for a zoomed plot |
|
|
|
|
|
|
|
|
|
|
|
|
|
|
|
|
|
|
|
|
|
|
|
|
|
 |
 |
 |
 |
| Event time t(H1): | GPS = 1368195448 (Mon May 15 14:17:10 2023 ) → GPS = 1368195458 (Mon May 15 14:17:20 2023 ) |
| Event time t(L1): | GPS = 1368195448 (Mon May 15 14:17:20 2023 ) → GPS = 1368195458 (Mon May 15 14:17:20 2023 ) |
| Omicron analysis time window (H1): | GPS = 1368195445 → GPS = 1368195461 |
| Omicron analysis time window (L1): | GPS = 1368195445 → GPS = 1368195461 |
| Time delay between detectors t(L1) - t(H1): | -0.268846 s (slice index = 114 / 217), δt_gw = 0.00715365 s |
| Time delay uncertainty: | 0.00558202 s |
| [targeted mode] Time delay probability: | 0.786142 (0.271324 sigmas), δt_target = 0.00863147 s |
| Frequency: | 311.501 Hz |
| Ξ: | 0.0145376 ± 0.0342869 (variance = 0.00117559): Q0: 0.0422891, Q1: 0.0849695, Q2: 0.127416, Q3: 0.0405722, Q4: 0.0425571 |
| Rank: | R_A = 0.0043947 |
| Log of amplitude ratio (L1/H1): | 0.0286782, variance = 0.521754 (L1/H1: -0.473632, variance = 0.969013, H1/L1: -0.546958, variance = 1.12229) |
| Amplitude ratio (L1/H1): | 1.02909 ⋇ 2.05922 (L1/H1: 0.622737 ⋇ 2.67616, H1/L1: 0.578708 ⋇ 2.88459) |
| Amplitude ratio H1|L1 compatibility (probability): | 0.480352 |
| Antenna factor probability: | 0.800528 |
| Number of rejected frequency rows: | Q0: 10 / 18, Q1: 30 / 36, Q2: 65 / 70, Q3: 129 / 134, Q4: 250 / 258 |
| Maximum signal-to-noise ratio: | H1: 5.11033, L1: 5.03098 |
| SNR variance: | H1: 0.546016, L1: 0.509304 |
| Click here for a zoomed plot | Click here for a zoomed plot | Click here for a zoomed plot | Click here for a zoomed plot | Click here for a zoomed plot |
|
|
|
|
|
|
|
|
|
|
|
|
|
|
|
|
|
|
|
|
|
|
|
|
|
 |
 |
 |
 |
| Event time t(H1): | GPS = 1368195428 (Mon May 15 14:16:50 2023 ) → GPS = 1368195438 (Mon May 15 14:17:00 2023 ) |
| Event time t(L1): | GPS = 1368195428 (Mon May 15 14:17:00 2023 ) → GPS = 1368195438 (Mon May 15 14:17:00 2023 ) |
| Omicron analysis time window (H1): | GPS = 1368195425 → GPS = 1368195441 |
| Omicron analysis time window (L1): | GPS = 1368195425 → GPS = 1368195441 |
| Time delay between detectors t(L1) - t(H1): | -2.93571 s (slice index = 172 / 217), δt_gw = 0.0082861 s |
| Time delay uncertainty: | 0.00459058 s |
| [targeted mode] Time delay probability: | 0.933254 (0.083751 sigmas), δt_target = 0.00866818 s |
| Frequency: | 200.684 Hz |
| Ξ: | 0.0074721 ± 0.0144484 (variance = 0.000208756): Q0: 0.0936757, Q1: 0.0674977, Q2: 0.0523187, Q3: 0.0666912, Q4: 0.0838938 |
| Rank: | R_A = 0.00438826 |
| Log of amplitude ratio (L1/H1): | 0.113296, variance = 0.588618 (L1/H1: -0.013725, variance = 1.26023, H1/L1: -0.246058, variance = 1.08536) |
| Amplitude ratio (L1/H1): | 1.11996 ⋇ 2.15376 (L1/H1: 0.986369 ⋇ 3.07284, H1/L1: 0.781877 ⋇ 2.83433) |
| Amplitude ratio H1|L1 compatibility (probability): | 0.865307 |
| Antenna factor probability: | 0.727242 |
| Number of rejected frequency rows: | Q0: 16 / 18, Q1: 33 / 36, Q2: 65 / 70, Q3: 131 / 134, Q4: 246 / 258 |
| Maximum signal-to-noise ratio: | H1: 5.06843, L1: 4.95762 |
| SNR variance: | H1: 0.526662, L1: 0.52019 |
| Click here for a zoomed plot | Click here for a zoomed plot | Click here for a zoomed plot | Click here for a zoomed plot | Click here for a zoomed plot |
 |
 |
 |
 |
 |
 |
 |
 |
 |
 |
 |
 |
 |
 |
 |
 |
 |
 |
 |
 |
 |
 |
 |
 |
 |
 |
 |
 |
 |
| Event time t(H1): | GPS = 1368195598 (Mon May 15 14:19:40 2023 ) → GPS = 1368195608 (Mon May 15 14:19:50 2023 ) |
| Event time t(L1): | GPS = 1368195598 (Mon May 15 14:19:50 2023 ) → GPS = 1368195608 (Mon May 15 14:19:50 2023 ) |
| Omicron analysis time window (H1): | GPS = 1368195595 → GPS = 1368195611 |
| Omicron analysis time window (L1): | GPS = 1368195595 → GPS = 1368195611 |
| Time delay between detectors t(L1) - t(H1): | -2.94095 s (slice index = 172 / 217), δt_gw = 0.00304772 s |
| Time delay uncertainty: | 0.00629909 s |
| [targeted mode] Time delay probability: | 0.373754 (0.889464 sigmas), δt_target = 0.00867057 s |
| Frequency: | 109.307 Hz |
| Ξ: | 0.0225622 ± 0.039984 (variance = 0.00159872): Q0: 0.106679, Q1: 0.175342, Q2: 0.158398, Q3: 0.0648764, Q4: 0.103952 |
| Rank: | R_A = 0.00435559 |
| Log of amplitude ratio (L1/H1): | 0.227582, variance = 0.614855 (L1/H1: 0.0418452, variance = 1.55711, H1/L1: -0.401431, variance = 0.940362) |
| Amplitude ratio (L1/H1): | 1.25556 ⋇ 2.19049 (L1/H1: 1.04273 ⋇ 3.48282, H1/L1: 0.669361 ⋇ 2.63721) |
| Amplitude ratio H1|L1 compatibility (probability): | 0.820006 |
| Antenna factor probability: | 0.629886 |
| Number of rejected frequency rows: | Q0: 14 / 18, Q1: 29 / 36, Q2: 65 / 70, Q3: 128 / 134, Q4: 251 / 258 |
| Maximum signal-to-noise ratio: | H1: 5.06034, L1: 5.2305 |
| SNR variance: | H1: 0.528405, L1: 0.526139 |
| Click here for a zoomed plot | Click here for a zoomed plot | Click here for a zoomed plot | Click here for a zoomed plot | Click here for a zoomed plot |
 |
 |
 |
 |
 |
 |
 |
 |
 |
 |
 |
 |
 |
 |
 |
 |
 |
 |
 |
 |
 |
 |
 |
 |
 |
 |
 |
 |
 |
| Event time t(H1): | GPS = 1368195448 (Mon May 15 14:17:10 2023 ) → GPS = 1368195458 (Mon May 15 14:17:20 2023 ) |
| Event time t(L1): | GPS = 1368195448 (Mon May 15 14:17:20 2023 ) → GPS = 1368195458 (Mon May 15 14:17:20 2023 ) |
| Omicron analysis time window (H1): | GPS = 1368195445 → GPS = 1368195461 |
| Omicron analysis time window (L1): | GPS = 1368195445 → GPS = 1368195461 |
| Time delay between detectors t(L1) - t(H1): | 4.78728 s (slice index = 4 / 217), δt_gw = 0.00327614 s |
| Time delay uncertainty: | 0.00538088 s |
| [targeted mode] Time delay probability: | 0.316308 (1.00207 sigmas), δt_target = 0.00865054 s |
| Frequency: | 274.784 Hz |
| Ξ: | 0.0269431 ± 0.0588167 (variance = 0.00345941): Q0: 0.0563986, Q1: 0.080144, Q2: 0.0794707, Q3: 0.219425, Q4: 0.0807538 |
| Rank: | R_A = 0.0042969 |
| Log of amplitude ratio (L1/H1): | 0.124637, variance = 0.591021 (L1/H1: -0.164763, variance = 0.947955, H1/L1: -0.423237, variance = 1.43065) |
| Amplitude ratio (L1/H1): | 1.13274 ⋇ 2.15713 (L1/H1: 0.848095 ⋇ 2.64754, H1/L1: 0.654923 ⋇ 3.30719) |
| Amplitude ratio H1|L1 compatibility (probability): | 0.703014 |
| Antenna factor probability: | 0.717191 |
| Number of rejected frequency rows: | Q0: 8 / 18, Q1: 23 / 36, Q2: 55 / 70, Q3: 123 / 134, Q4: 247 / 258 |
| Maximum signal-to-noise ratio: | H1: 5.11033, L1: 5.03098 |
| SNR variance: | H1: 0.546016, L1: 0.509304 |
| Click here for a zoomed plot | Click here for a zoomed plot | Click here for a zoomed plot | Click here for a zoomed plot | Click here for a zoomed plot |
|
|
|
|
|
|
|
|
|
|
|
|
|
|
|
|
|
|
|
|
|
|
|
|
|
 |
 |
 |
 |
| Event time t(H1): | GPS = 1368195448 (Mon May 15 14:17:10 2023 ) → GPS = 1368195458 (Mon May 15 14:17:20 2023 ) |
| Event time t(L1): | GPS = 1368195448 (Mon May 15 14:17:20 2023 ) → GPS = 1368195458 (Mon May 15 14:17:20 2023 ) |
| Omicron analysis time window (H1): | GPS = 1368195445 → GPS = 1368195461 |
| Omicron analysis time window (L1): | GPS = 1368195445 → GPS = 1368195461 |
| Time delay between detectors t(L1) - t(H1): | 1.61568 s (slice index = 73 / 217), δt_gw = 0.00567643 s |
| Time delay uncertainty: | 0.00560221 s |
| [targeted mode] Time delay probability: | 0.59332 (0.534031 sigmas), δt_target = 0.00866818 s |
| Frequency: | 332.826 Hz |
| Ξ: | 0.0184229 ± 0.0160932 (variance = 0.000258992): Q0: 0.040915, Q1: 0.0683951, Q2: 0.0710698, Q3: 0.0307388, Q4: 0.0421717 |
| Rank: | R_A = 0.00421028 |
| Log of amplitude ratio (L1/H1): | 0.0133943, variance = 1.207 (L1/H1: -0.823818, variance = 2.60514, H1/L1: -0.877224, variance = 2.20931) |
| Amplitude ratio (L1/H1): | 1.01348 ⋇ 3.00007 (L1/H1: 0.438753 ⋇ 5.02308, H1/L1: 0.415936 ⋇ 4.42103) |
| Amplitude ratio H1|L1 compatibility (probability): | 0.438192 |
| Antenna factor probability: | 0.879023 |
| Number of rejected frequency rows: | Q0: 8 / 18, Q1: 25 / 36, Q2: 60 / 70, Q3: 127 / 134, Q4: 247 / 258 |
| Maximum signal-to-noise ratio: | H1: 5.11033, L1: 5.03098 |
| SNR variance: | H1: 0.546016, L1: 0.509304 |
| Click here for a zoomed plot | Click here for a zoomed plot | Click here for a zoomed plot | Click here for a zoomed plot | Click here for a zoomed plot |
|
|
|
|
|
|
|
|
|
|
|
|
|
|
|
|
|
|
|
|
|
|
|
|
|
 |
 |
 |
 |
| Event time t(H1): | GPS = 1368195658 (Mon May 15 14:20:40 2023 ) → GPS = 1368195668 (Mon May 15 14:20:50 2023 ) |
| Event time t(L1): | GPS = 1368195658 (Mon May 15 14:20:50 2023 ) → GPS = 1368195668 (Mon May 15 14:20:50 2023 ) |
| Omicron analysis time window (H1): | GPS = 1368195655 → GPS = 1368195671 |
| Omicron analysis time window (L1): | GPS = 1368195655 → GPS = 1368195671 |
| Time delay between detectors t(L1) - t(H1): | -1.4695 s (slice index = 140 / 217), δt_gw = 0.00250186 s |
| Time delay uncertainty: | 0.0064145 s |
| [targeted mode] Time delay probability: | 0.338362 (0.957407 sigmas), δt_target = 0.00866818 s |
| Frequency: | 130.812 Hz |
| Ξ: | 0.0208911 ± 0.0284743 (variance = 0.000810787): Q0: 0.146422, Q1: 0.133075, Q2: 0.130201, Q3: 0.152713, Q4: 0.0725168 |
| Rank: | R_A = 0.0042005 |
| Log of amplitude ratio (L1/H1): | 0.191232, variance = 0.494969 (L1/H1: 0.144881, variance = 0.701177, H1/L1: -0.243618, variance = 1.3504) |
| Amplitude ratio (L1/H1): | 1.21074 ⋇ 2.0209 (L1/H1: 1.1559 ⋇ 2.31027, H1/L1: 0.783787 ⋇ 3.19653) |
| Amplitude ratio H1|L1 compatibility (probability): | 0.945042 |
| Antenna factor probability: | 0.628792 |
| Number of rejected frequency rows: | Q0: 15 / 18, Q1: 30 / 36, Q2: 63 / 70, Q3: 122 / 134, Q4: 243 / 258 |
| Maximum signal-to-noise ratio: | H1: 5.22251, L1: 4.91249 |
| SNR variance: | H1: 0.54372, L1: 0.516257 |
| Click here for a zoomed plot | Click here for a zoomed plot | Click here for a zoomed plot | Click here for a zoomed plot | Click here for a zoomed plot |
|
|
|
|
|
|
|
|
|
|
|
|
|
|
|
|
|
|
|
|
|
|
|
|
|
 |
 |
 |
 |
| florent.robinet@ijclab.in2p3.fr |