| Omicron version: | 4.2.0: documentation gitlab repository |
| Omicron run by: | unknown |
| Report produced on: | Thu Dec 11 15:08:58 2025 UTC |
| Ox option file: | TargIxf_injpt1_10min_2TEST_options.txt |
| Omicron option files: | detector 0, detector 1 |
| Detector channel names: | H1:GDS-CALIB_STRAIN_CLEAN_AR_4096Hz, L1:GDS-CALIB_STRAIN_CLEAN_AR_4096Hz |
| Omicron analysis time window and overlap: | 16 s, 6 s |
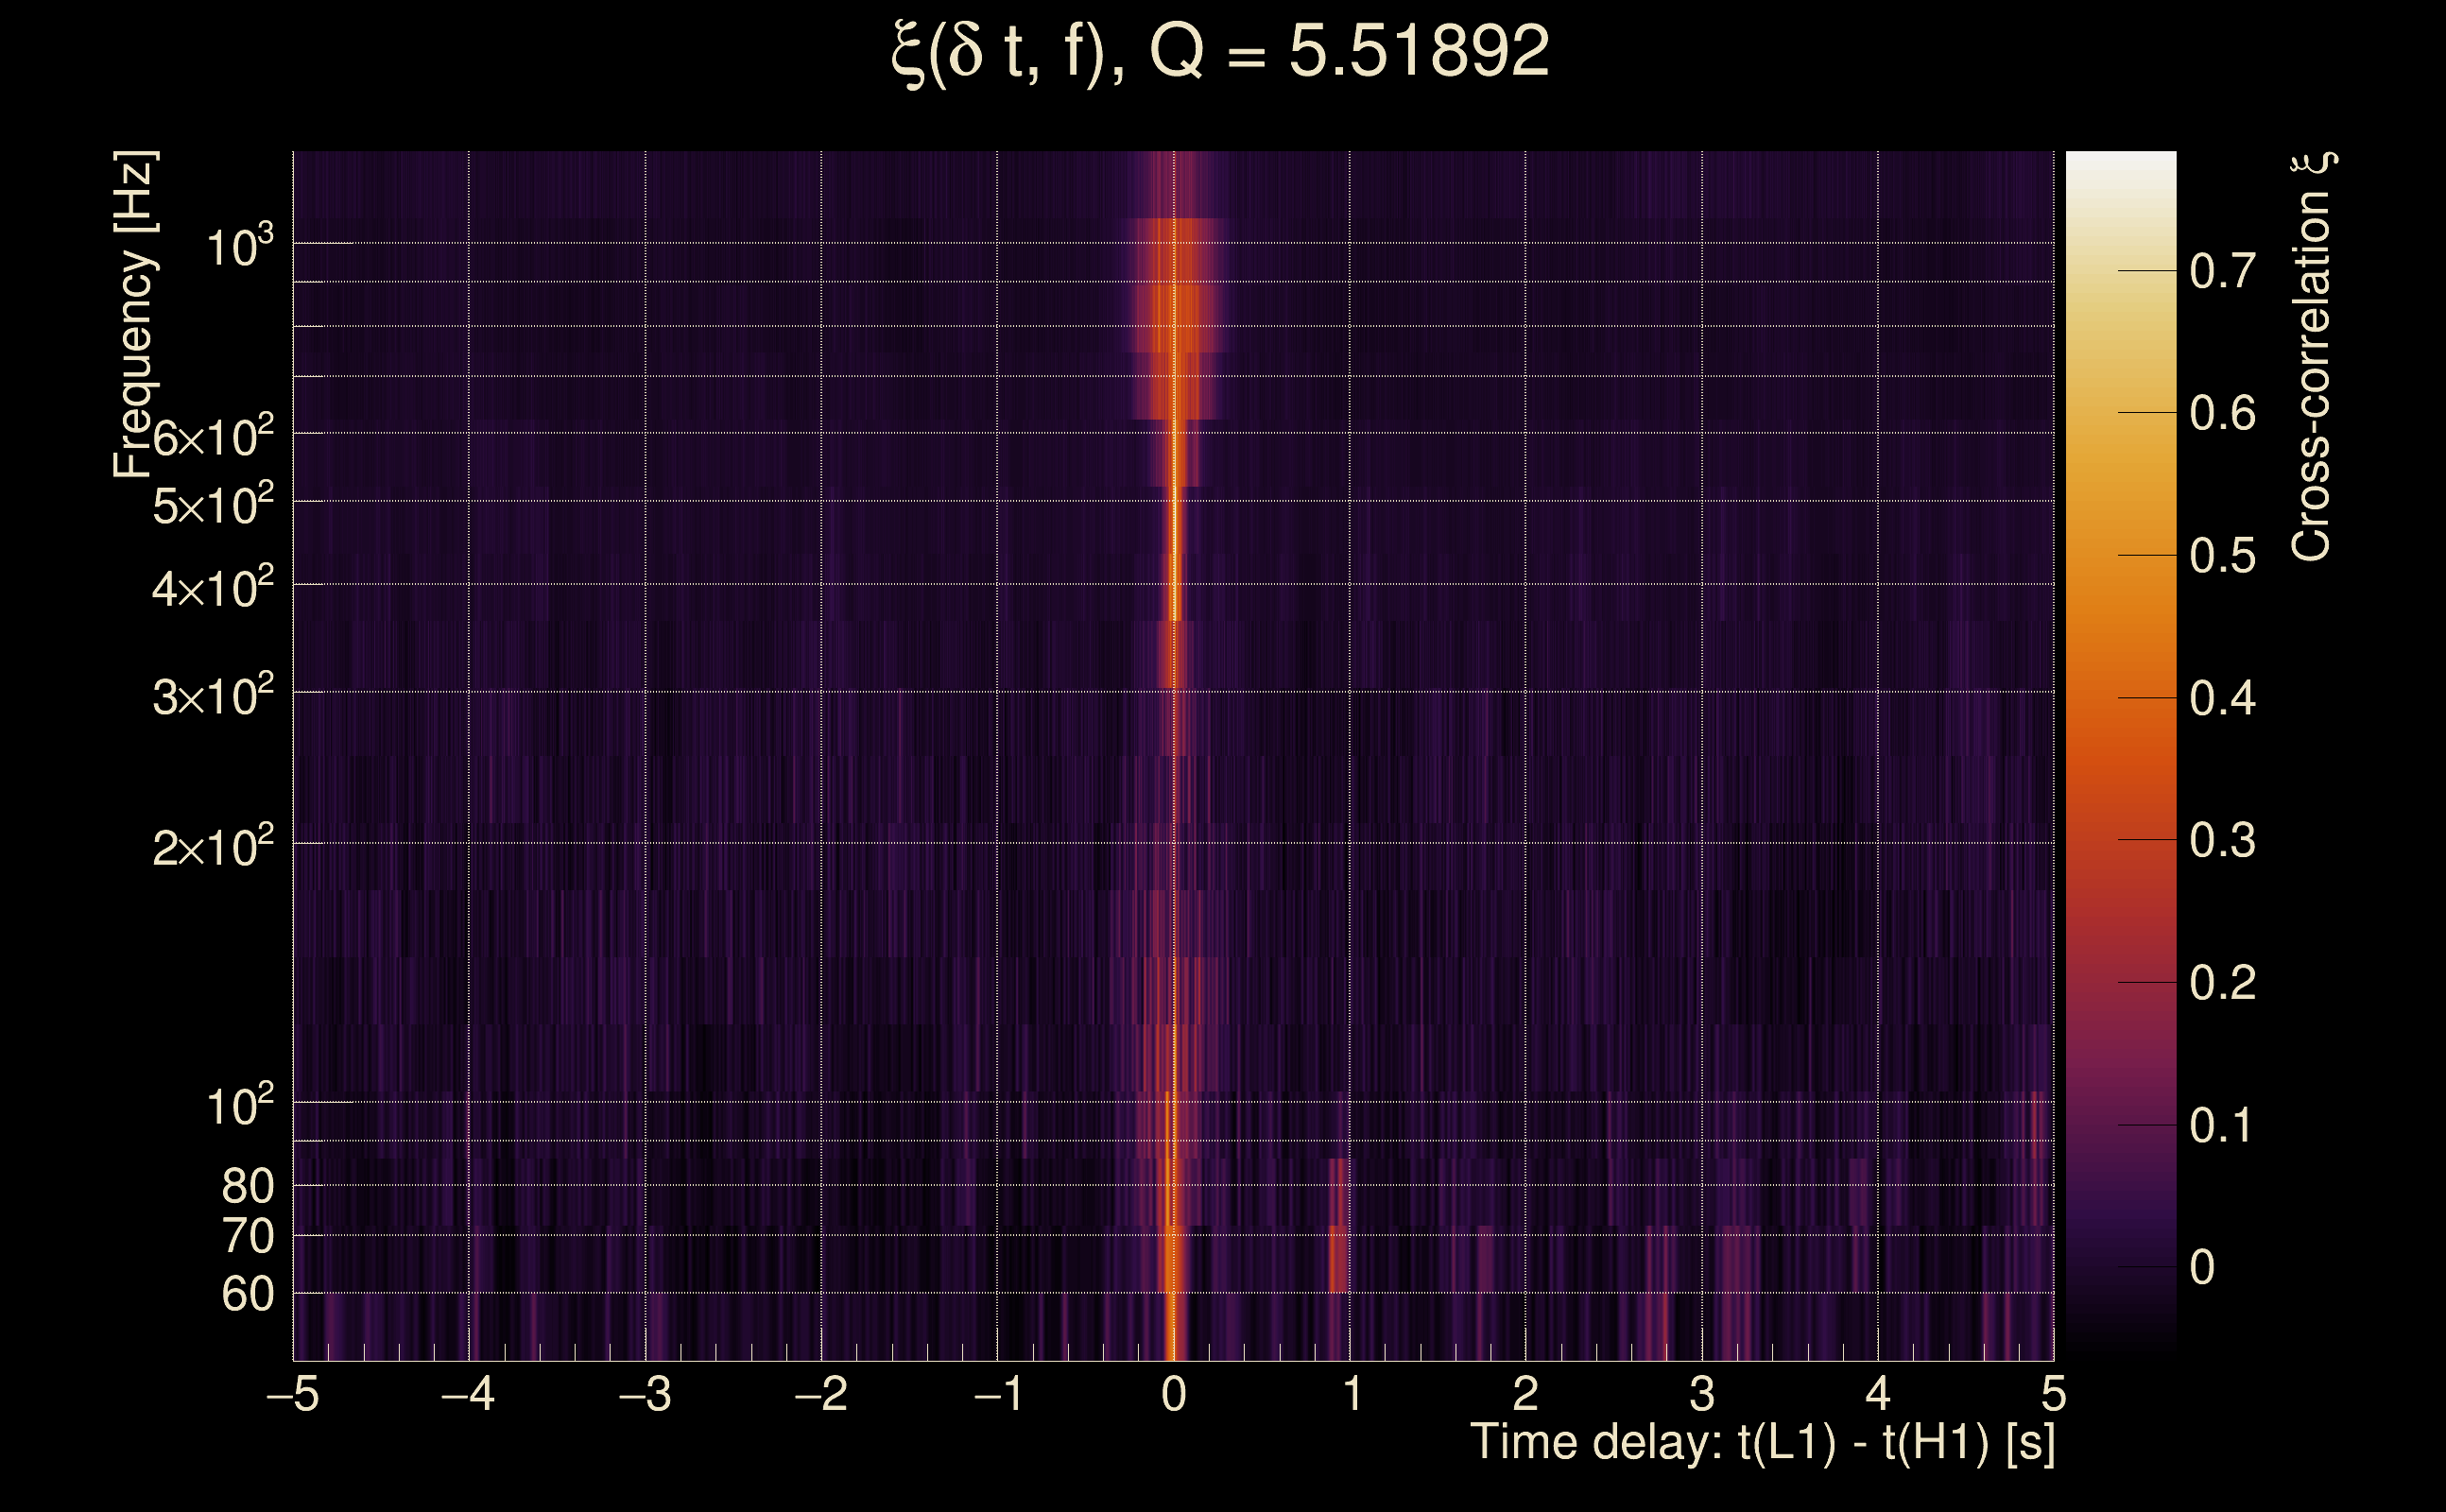
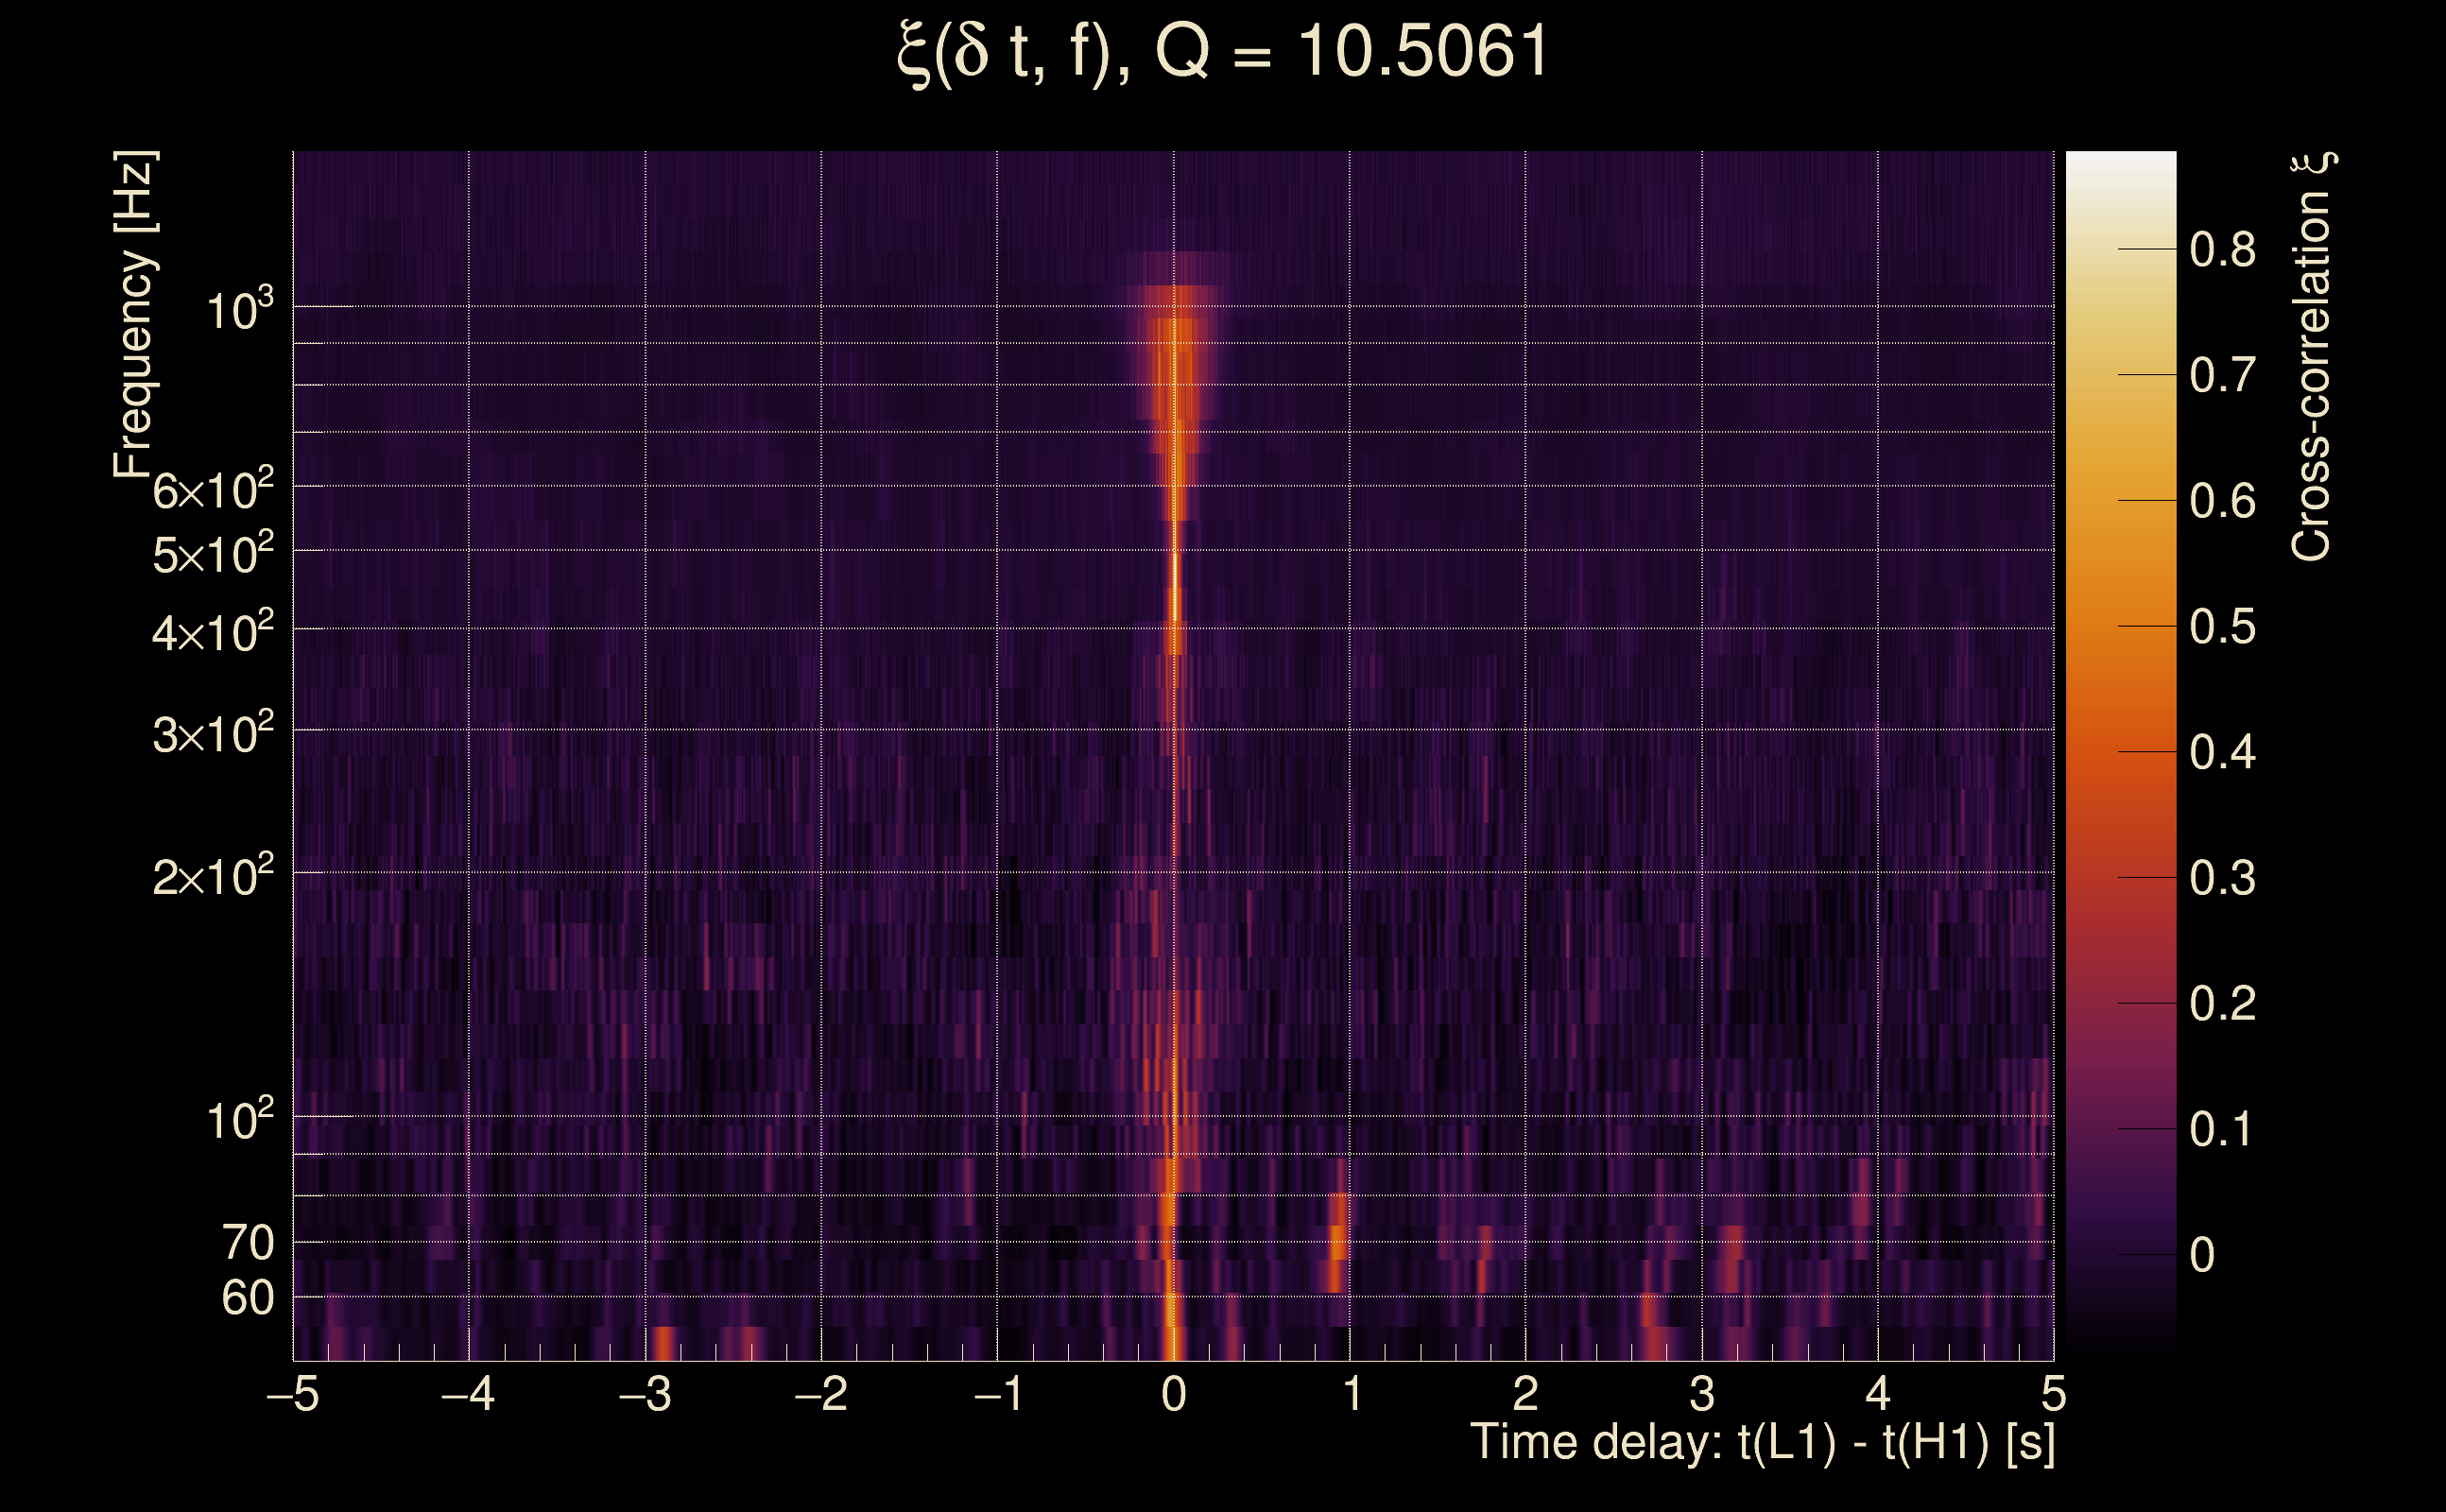
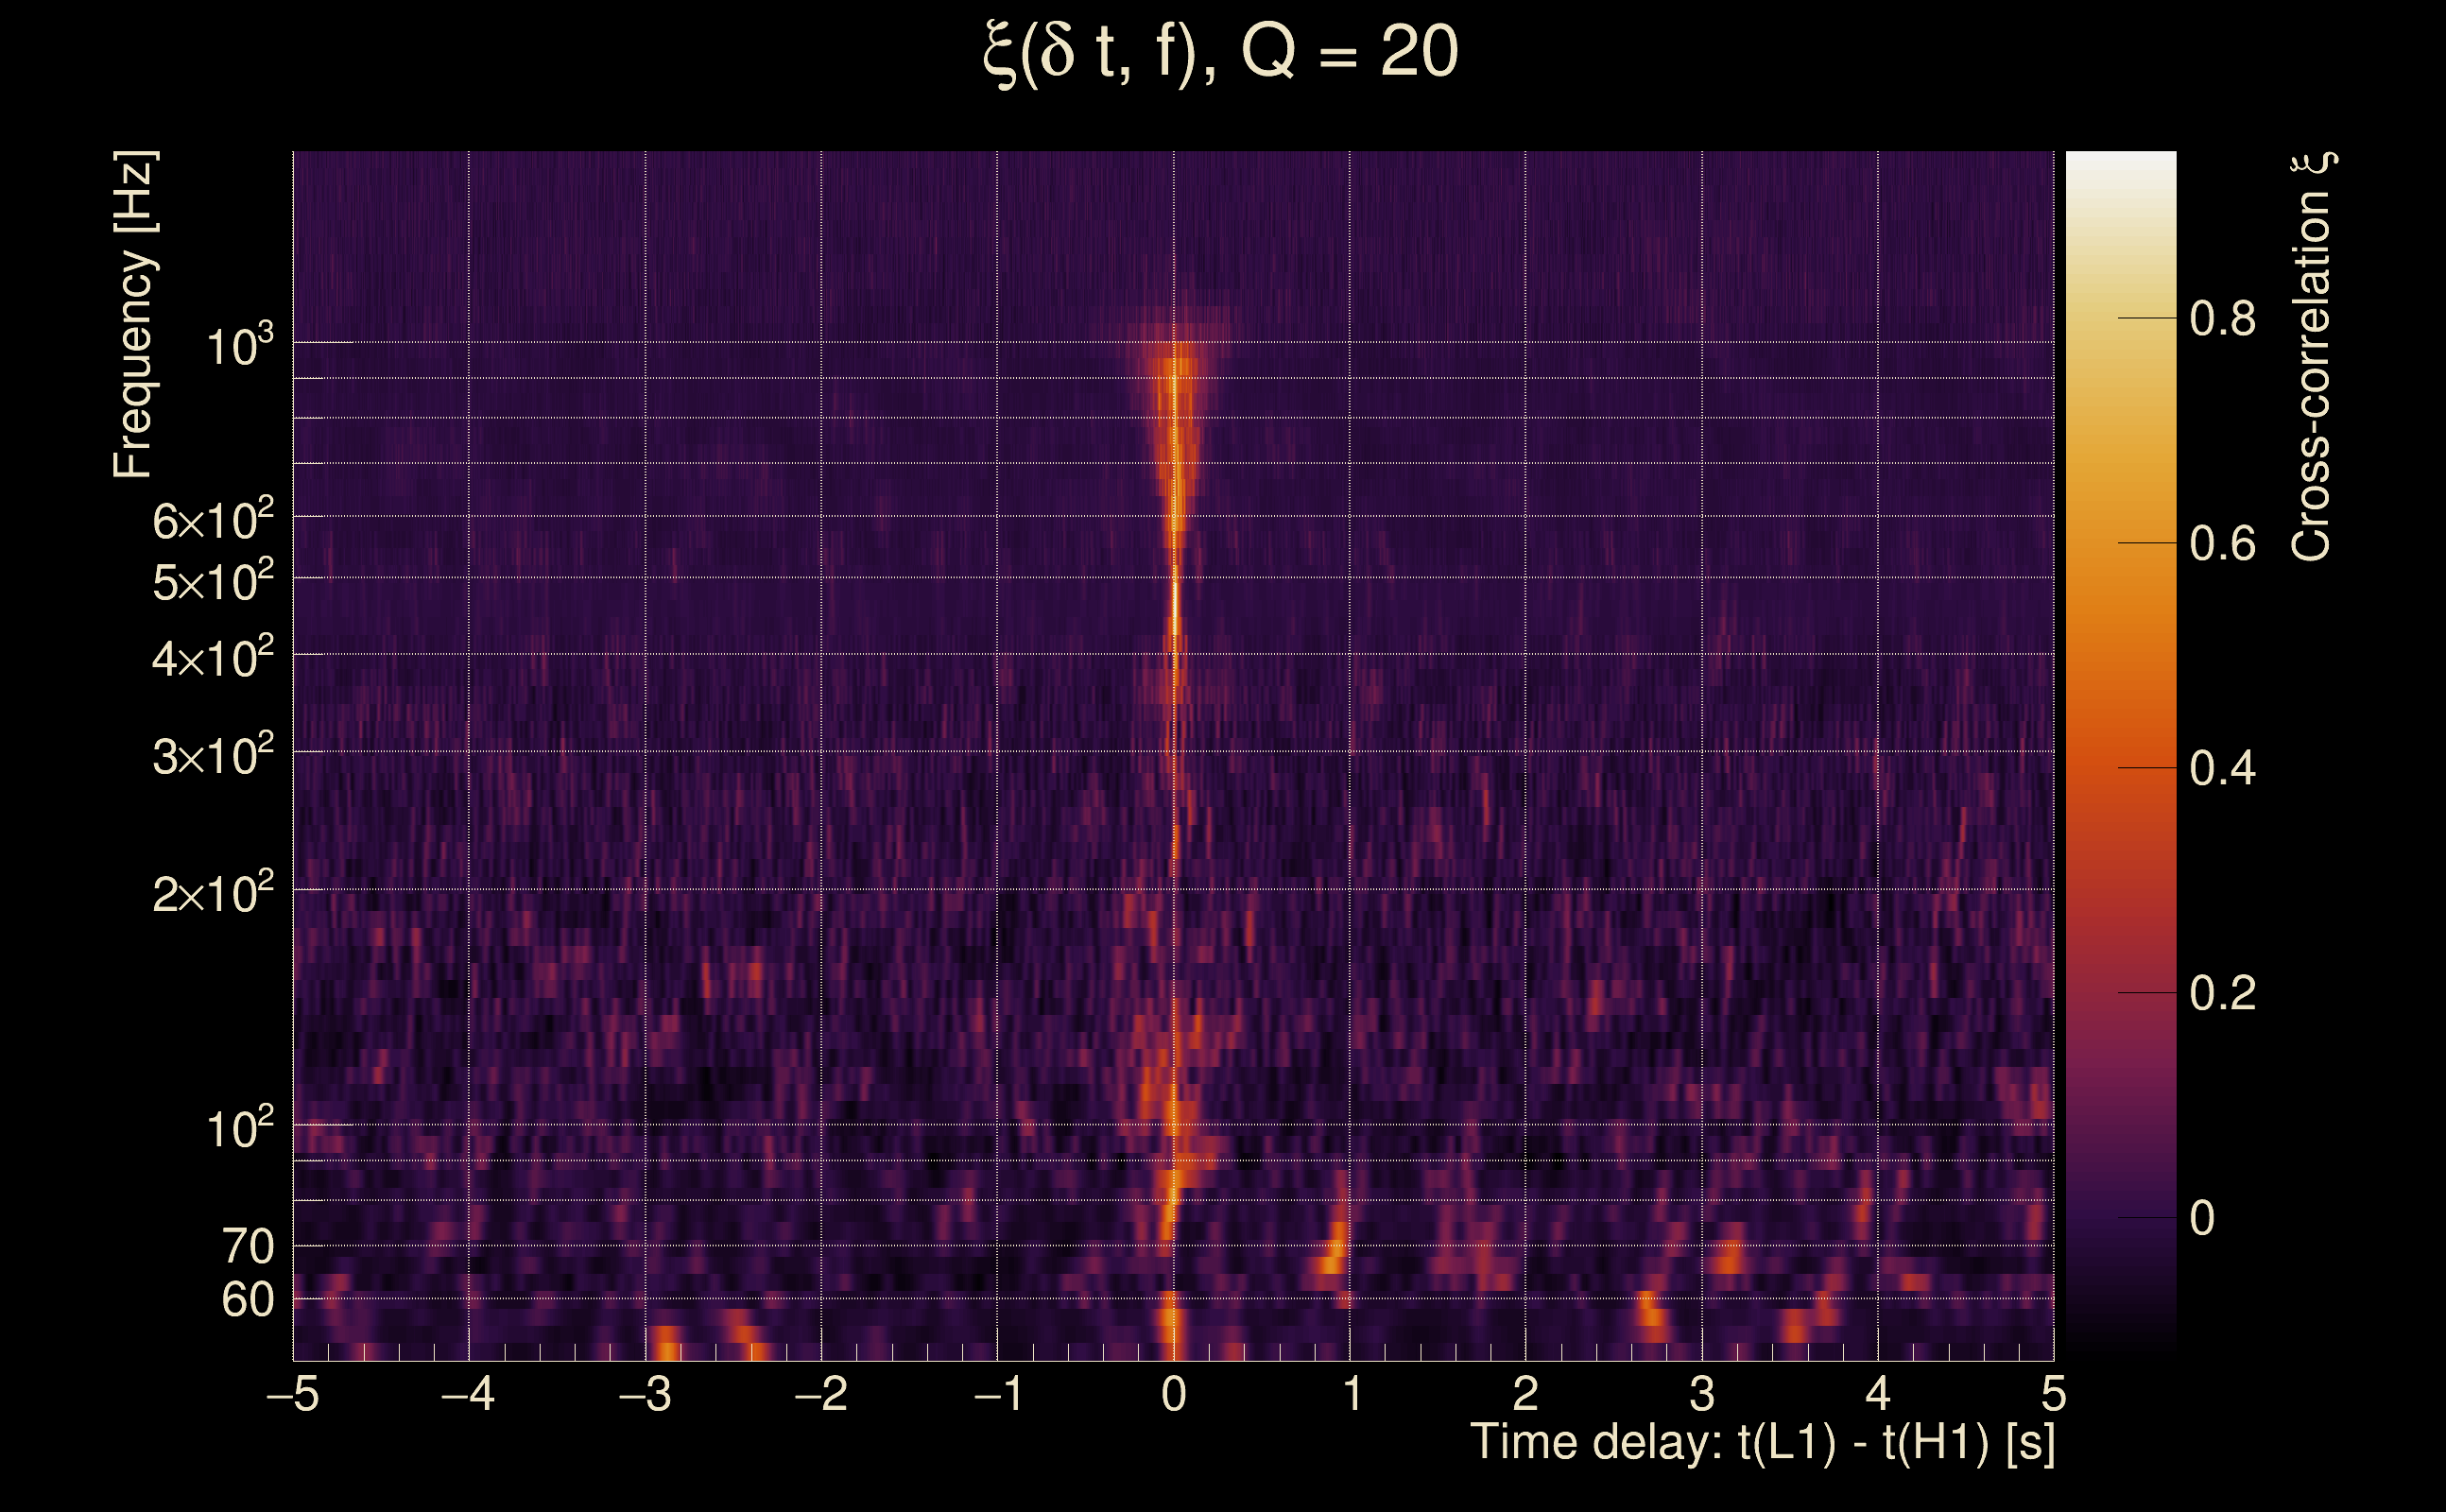
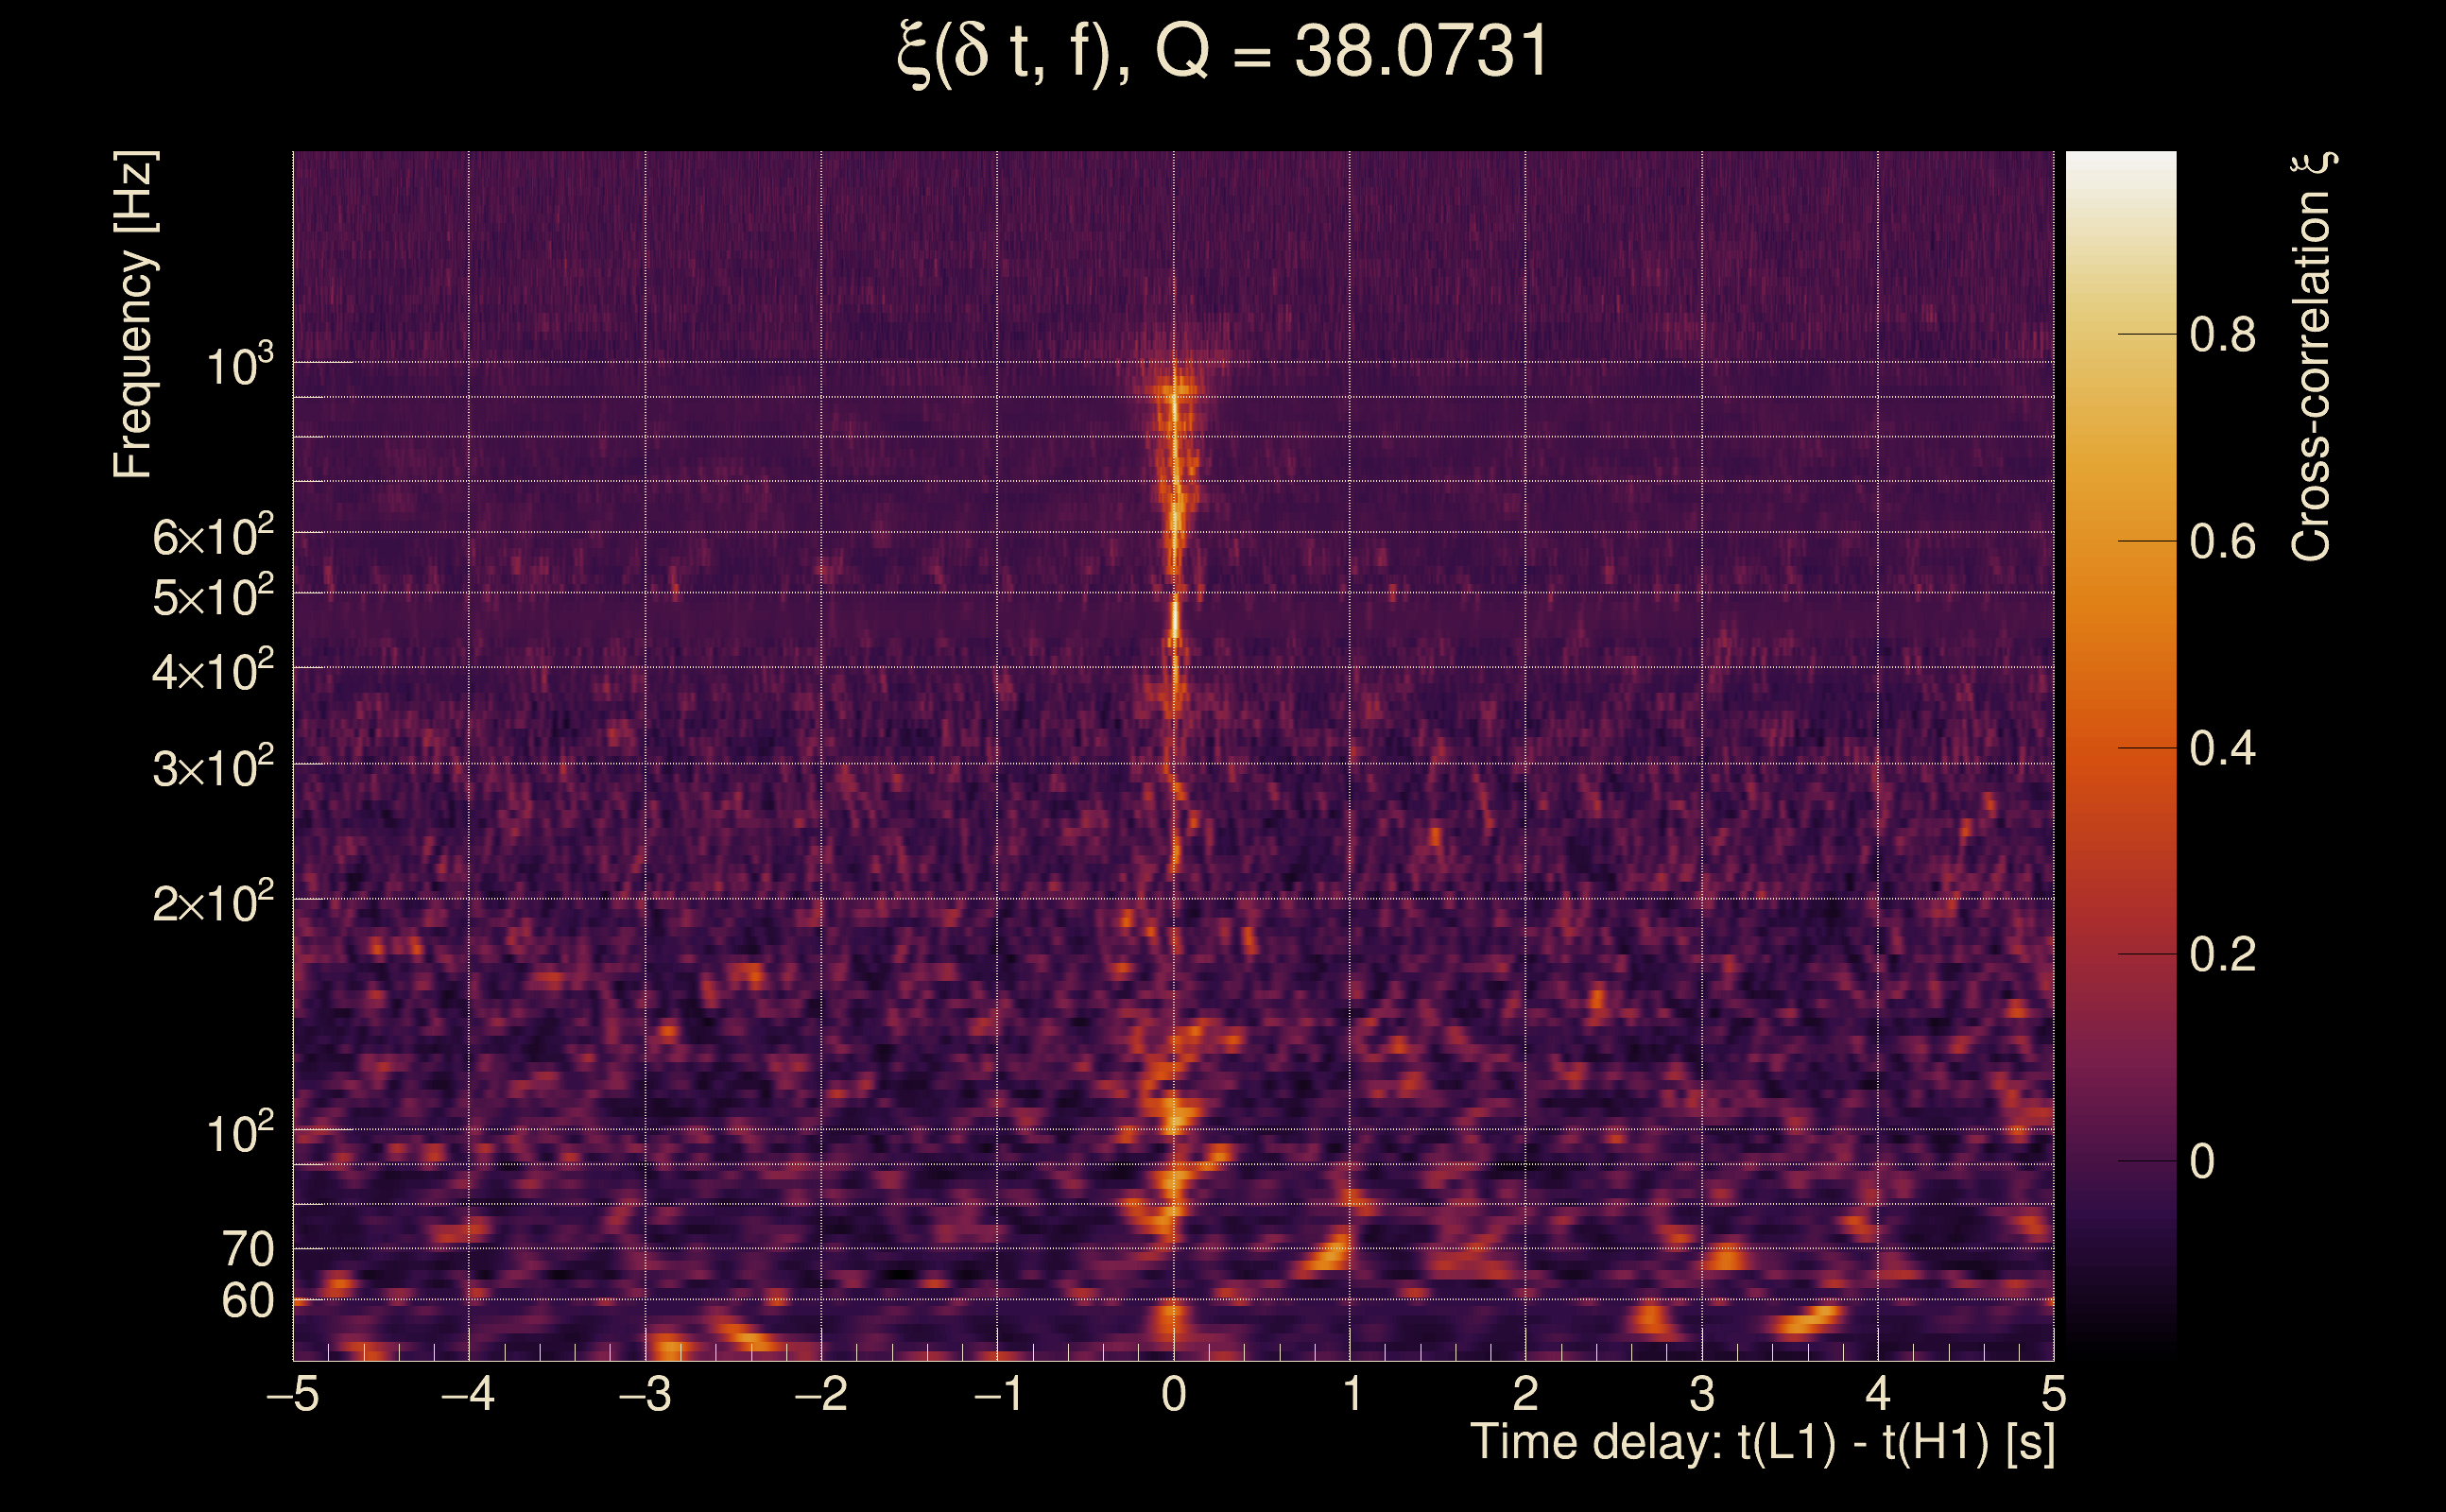
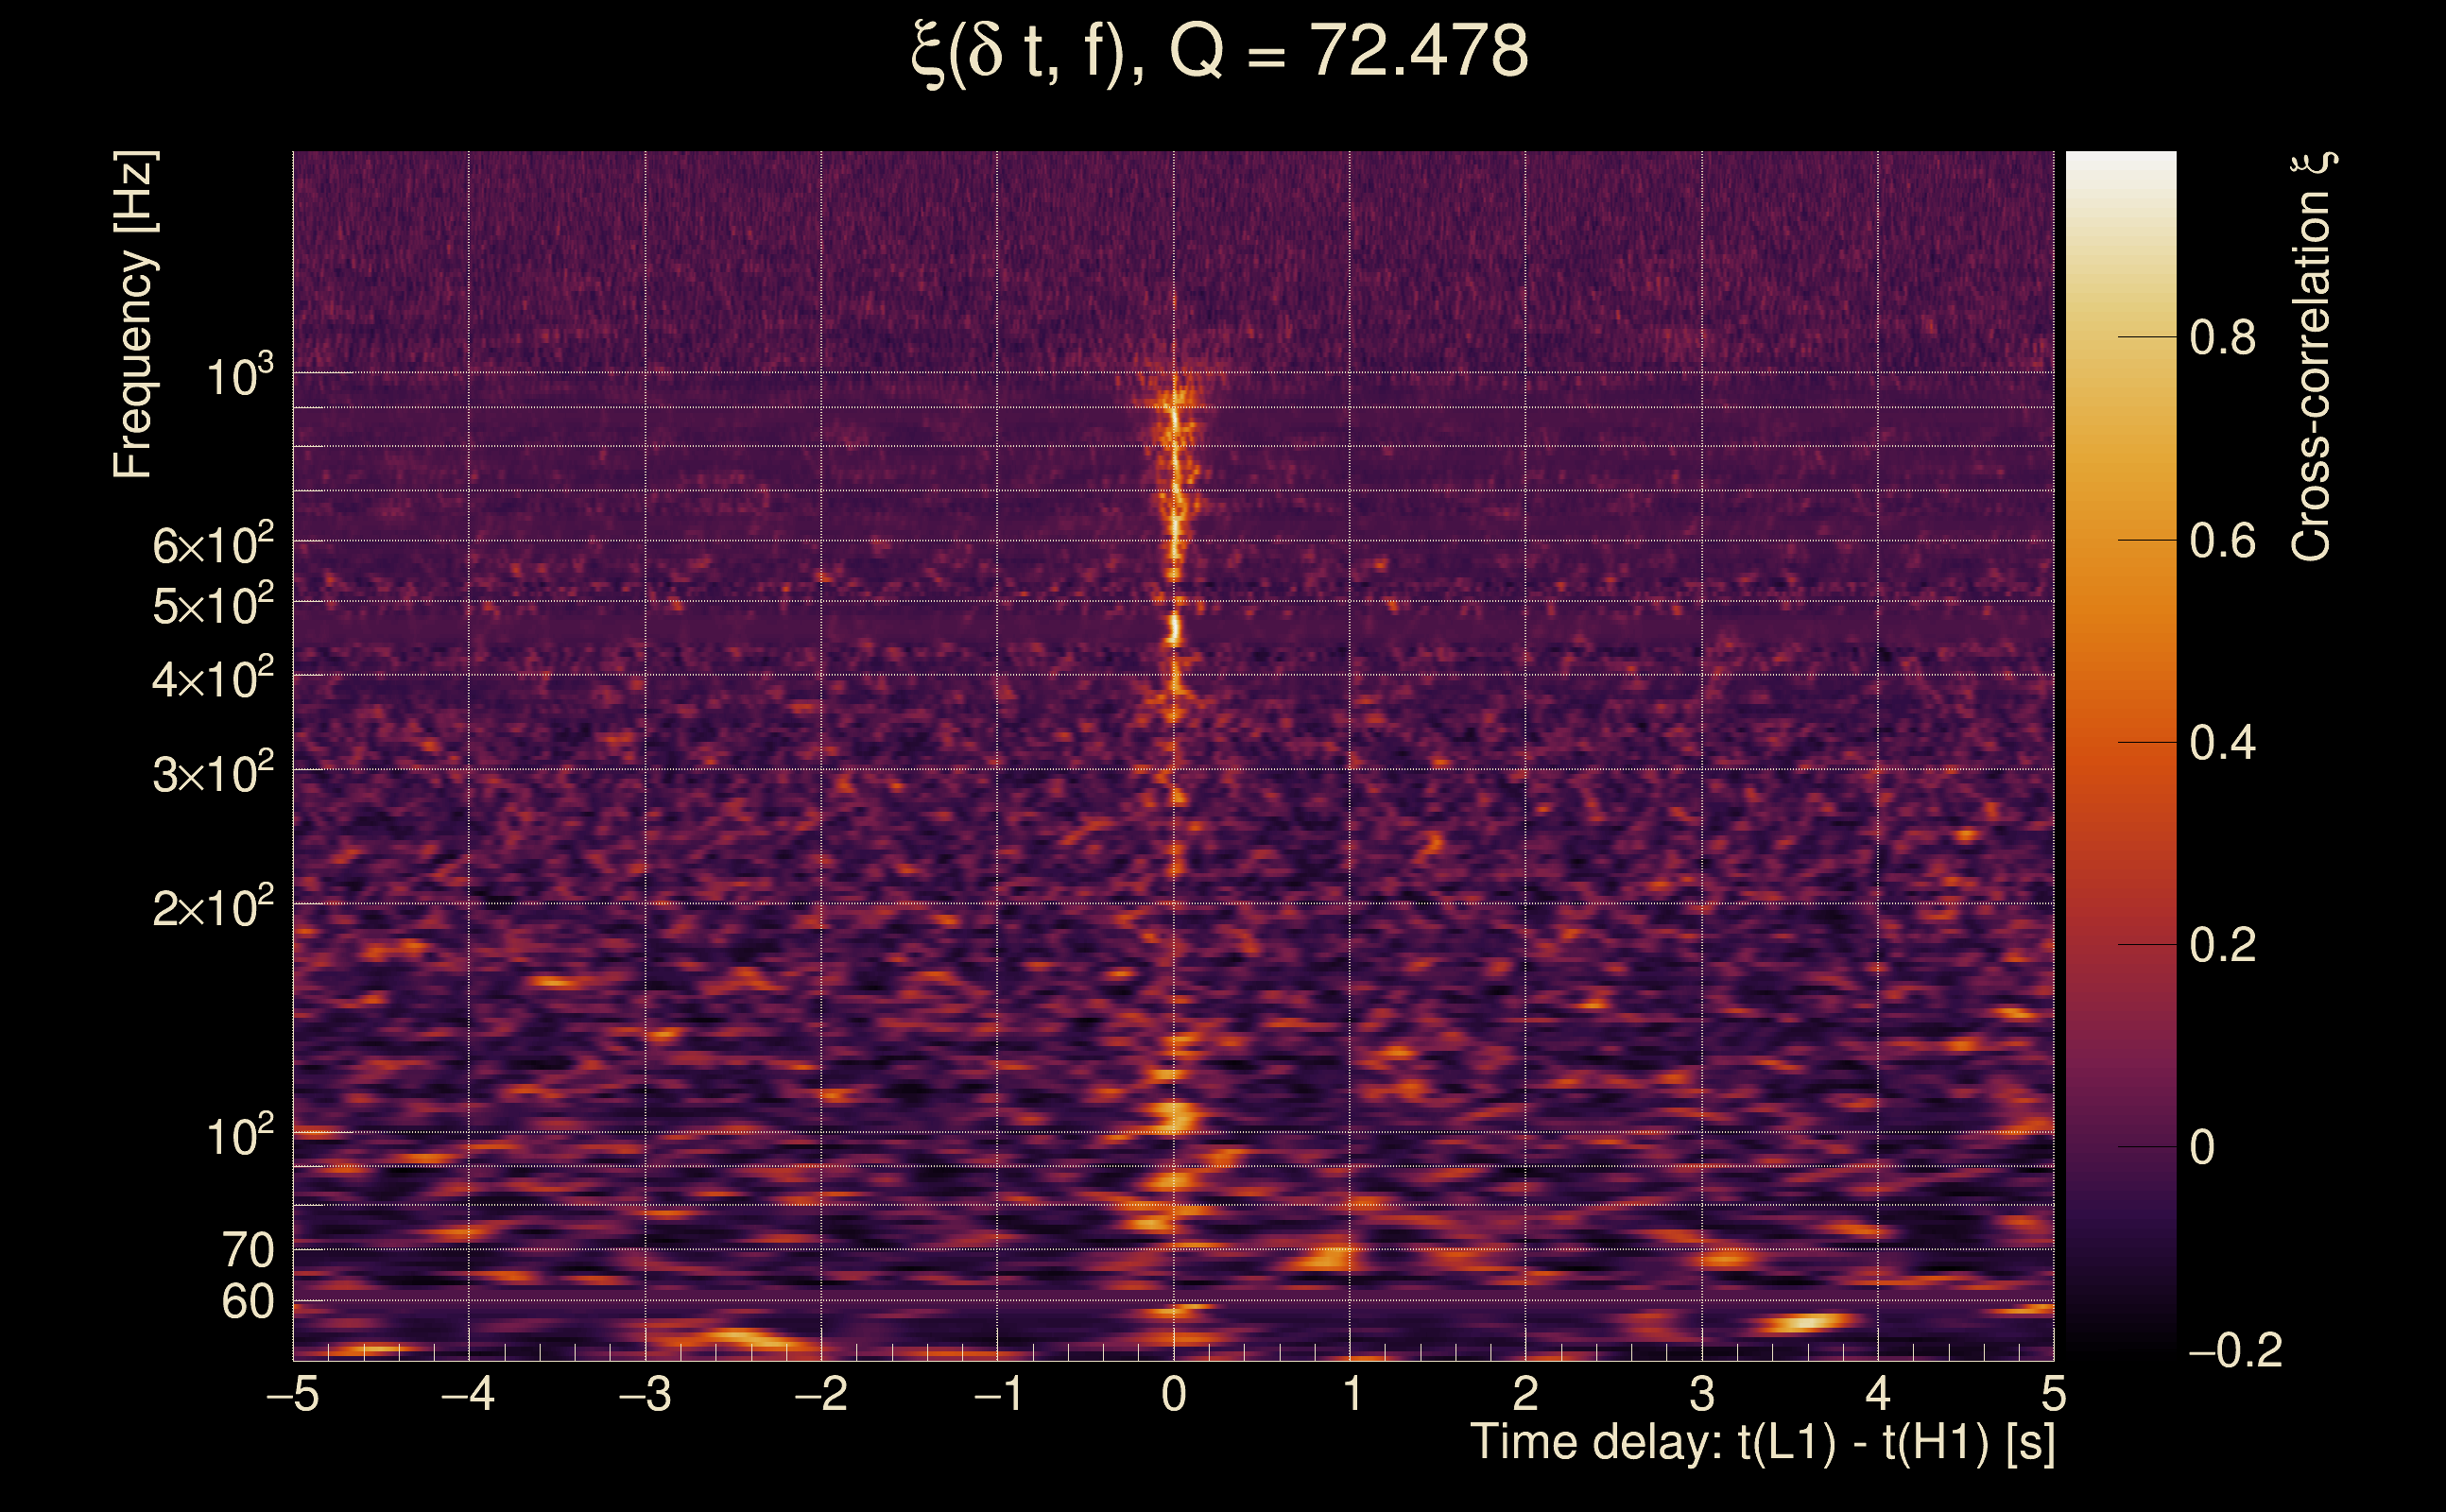
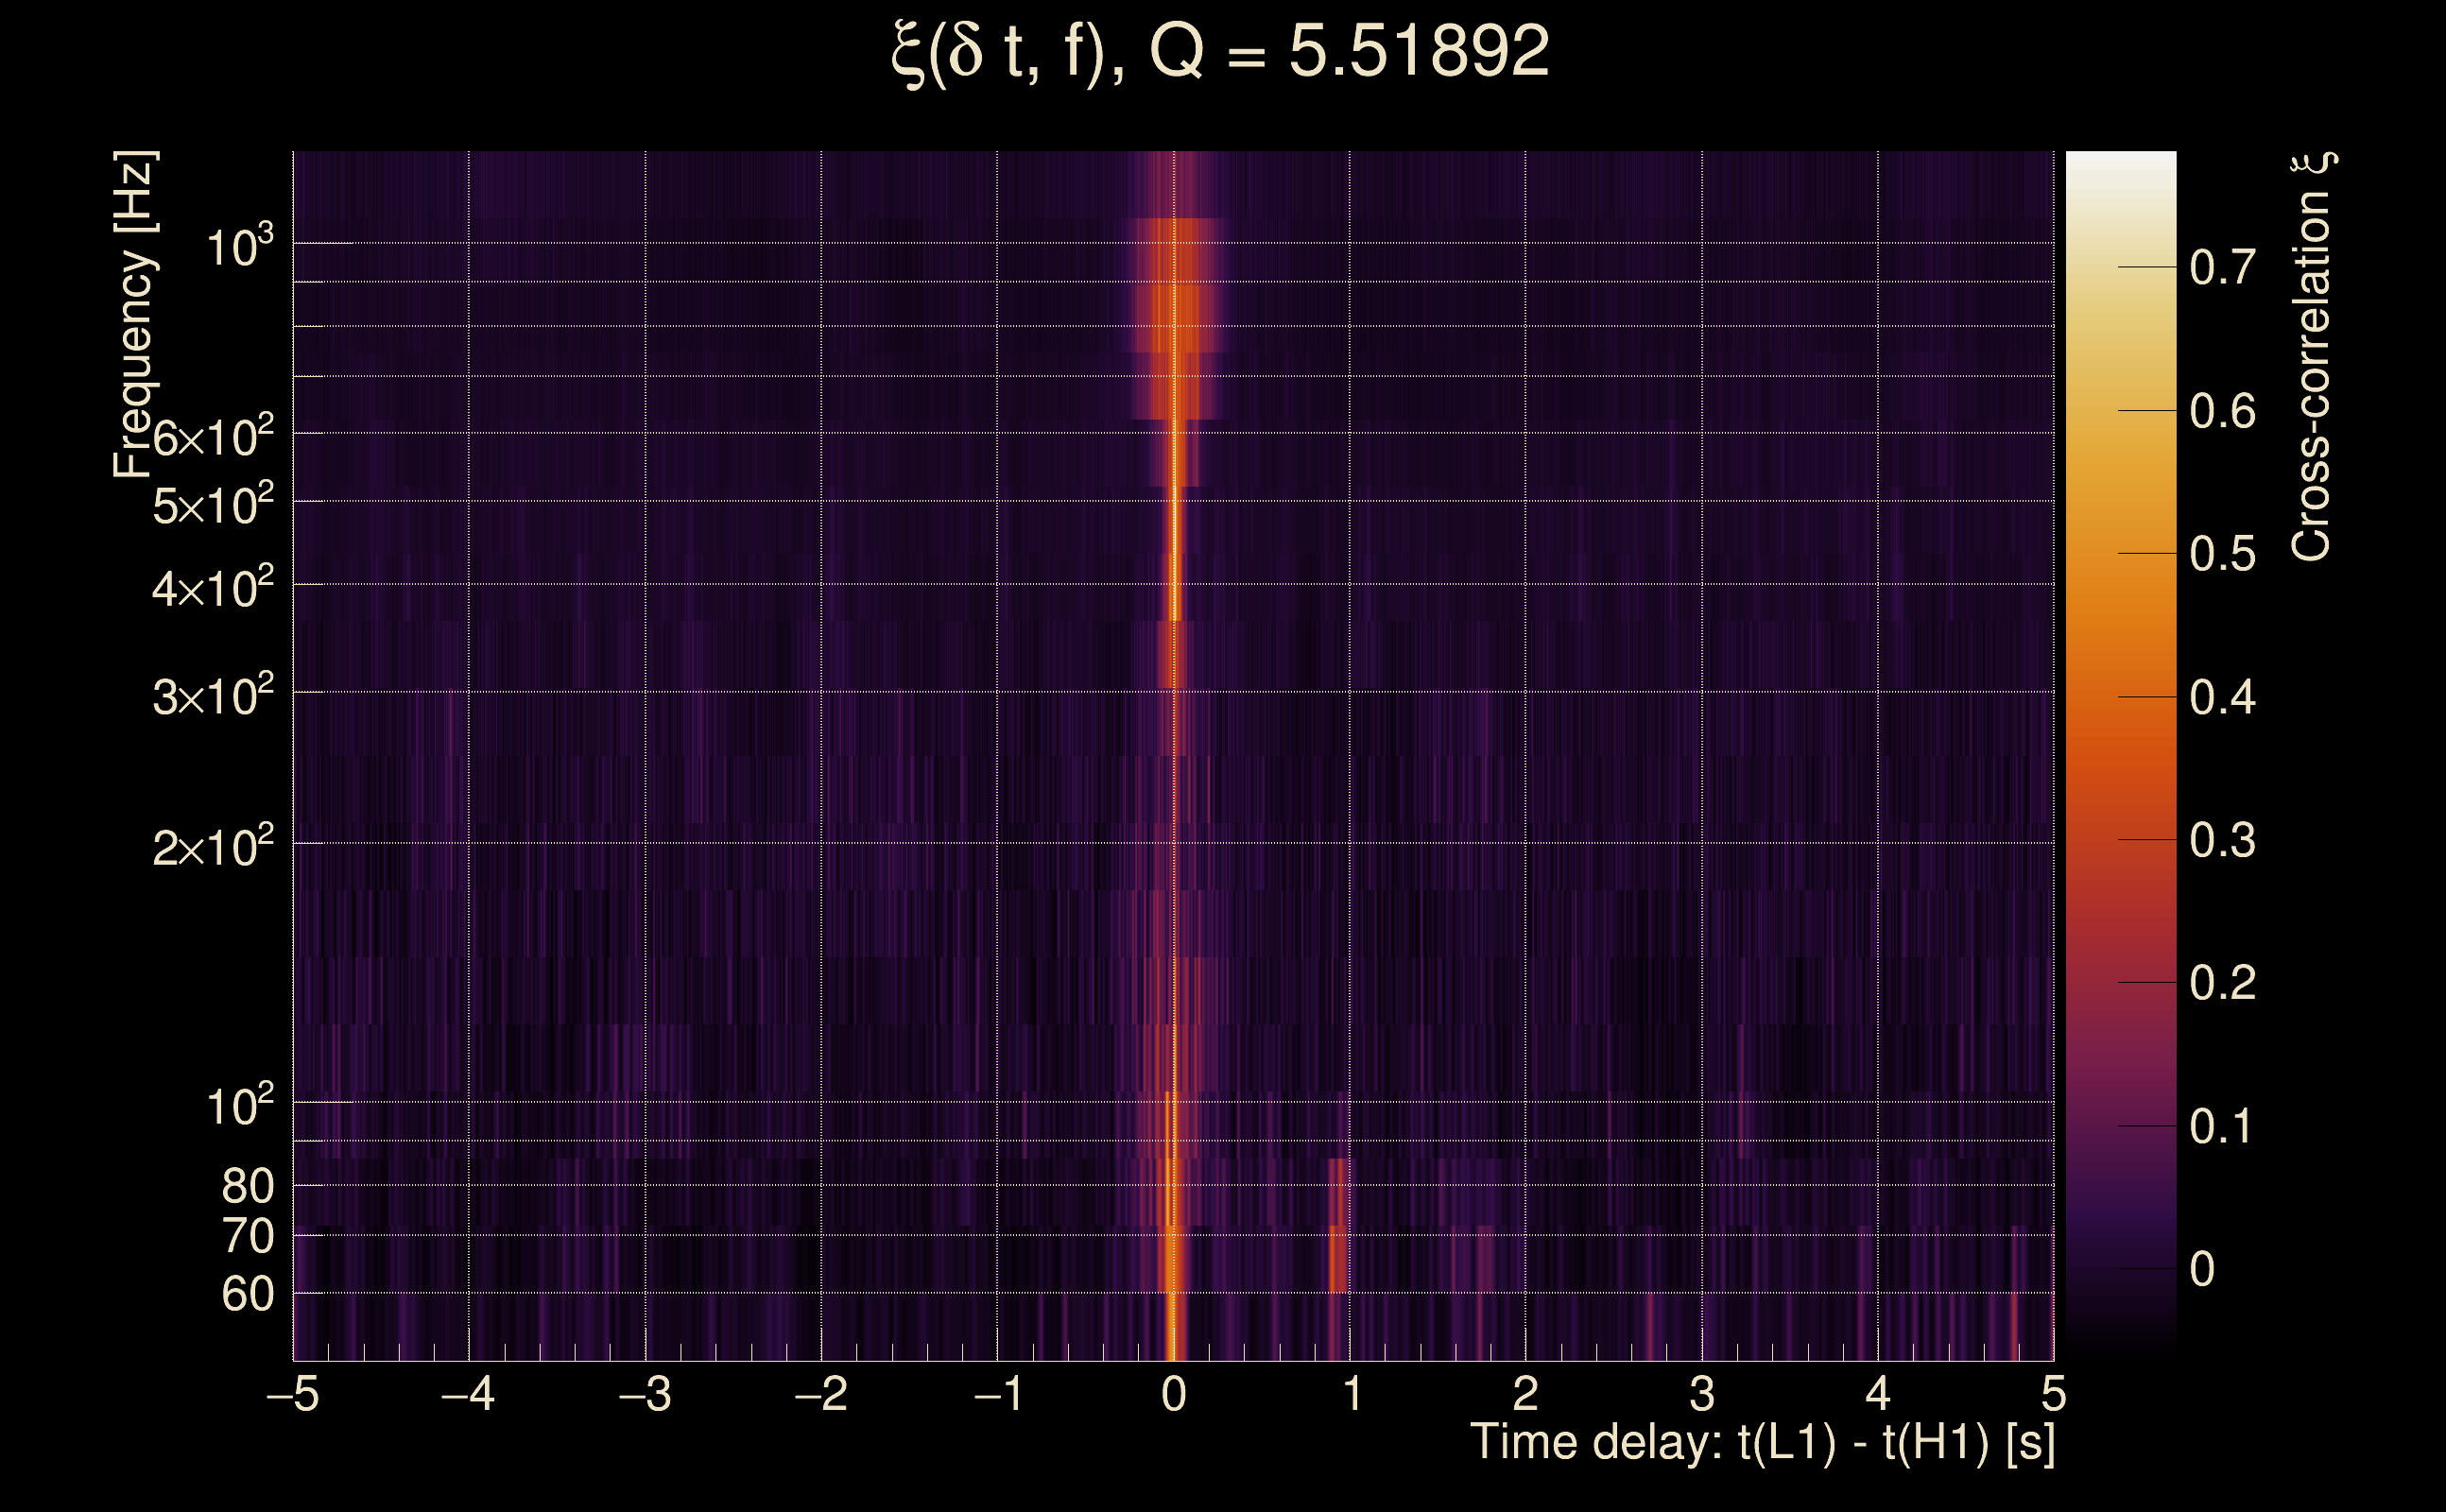
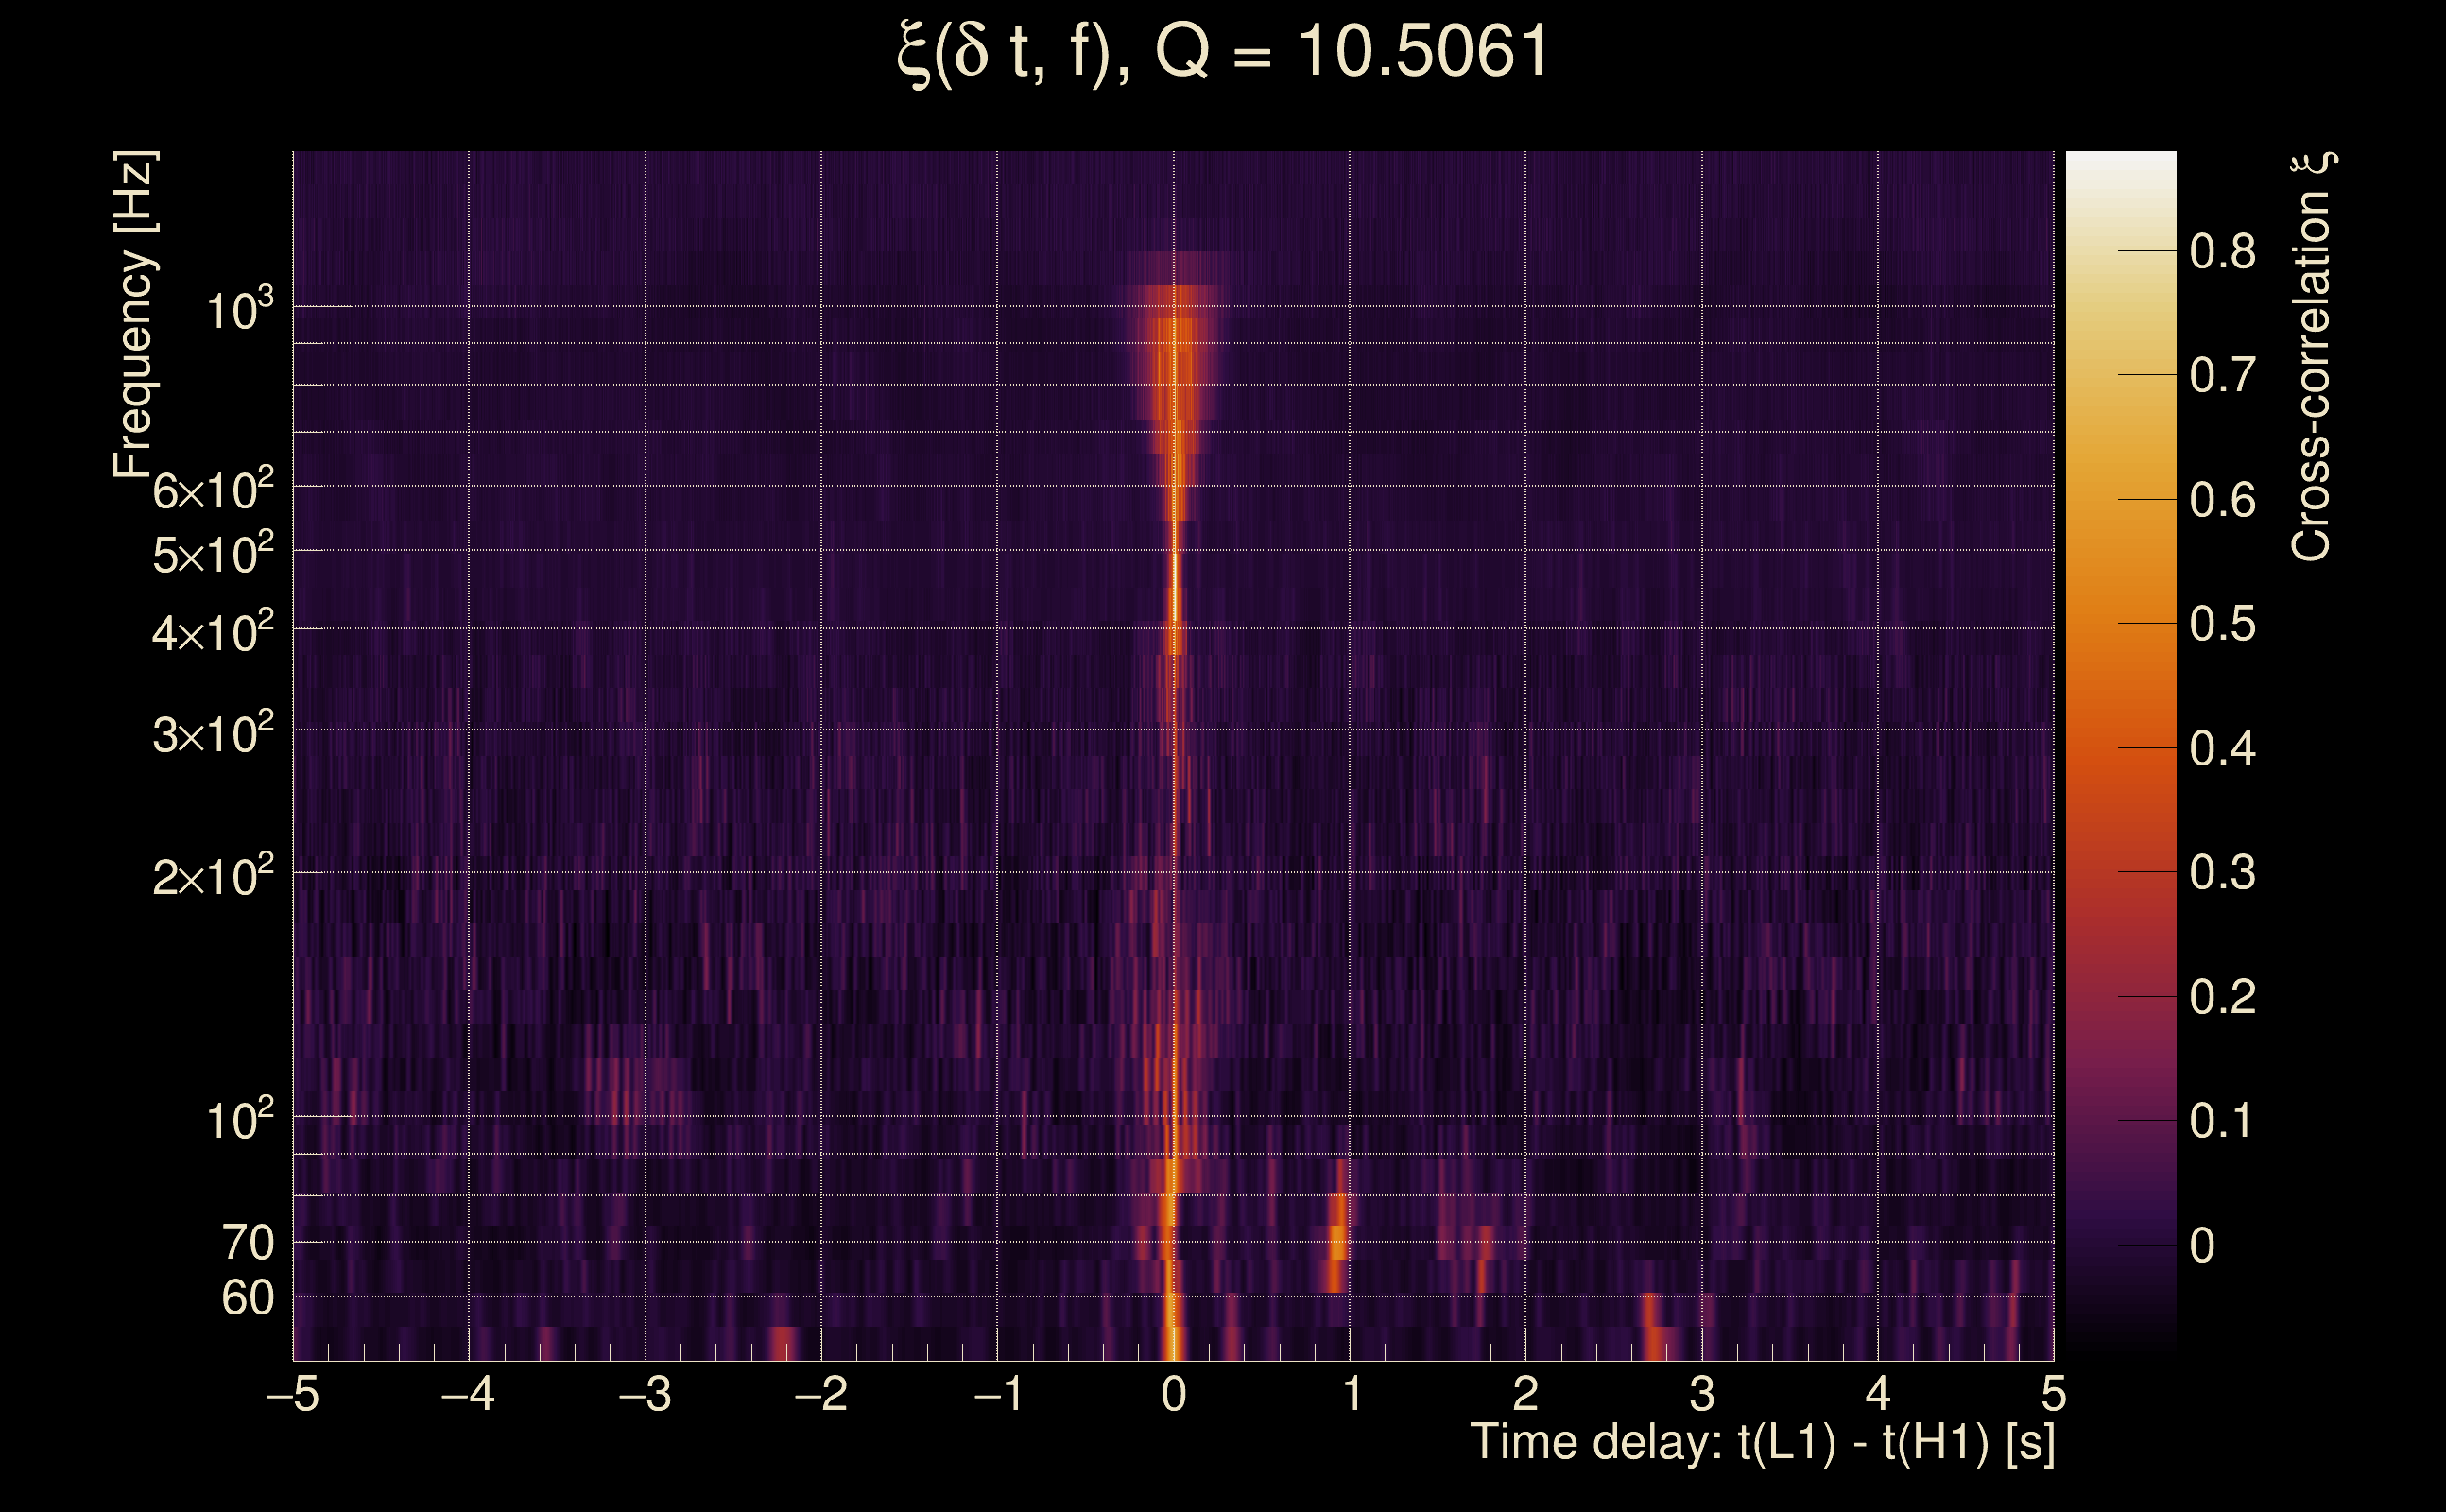
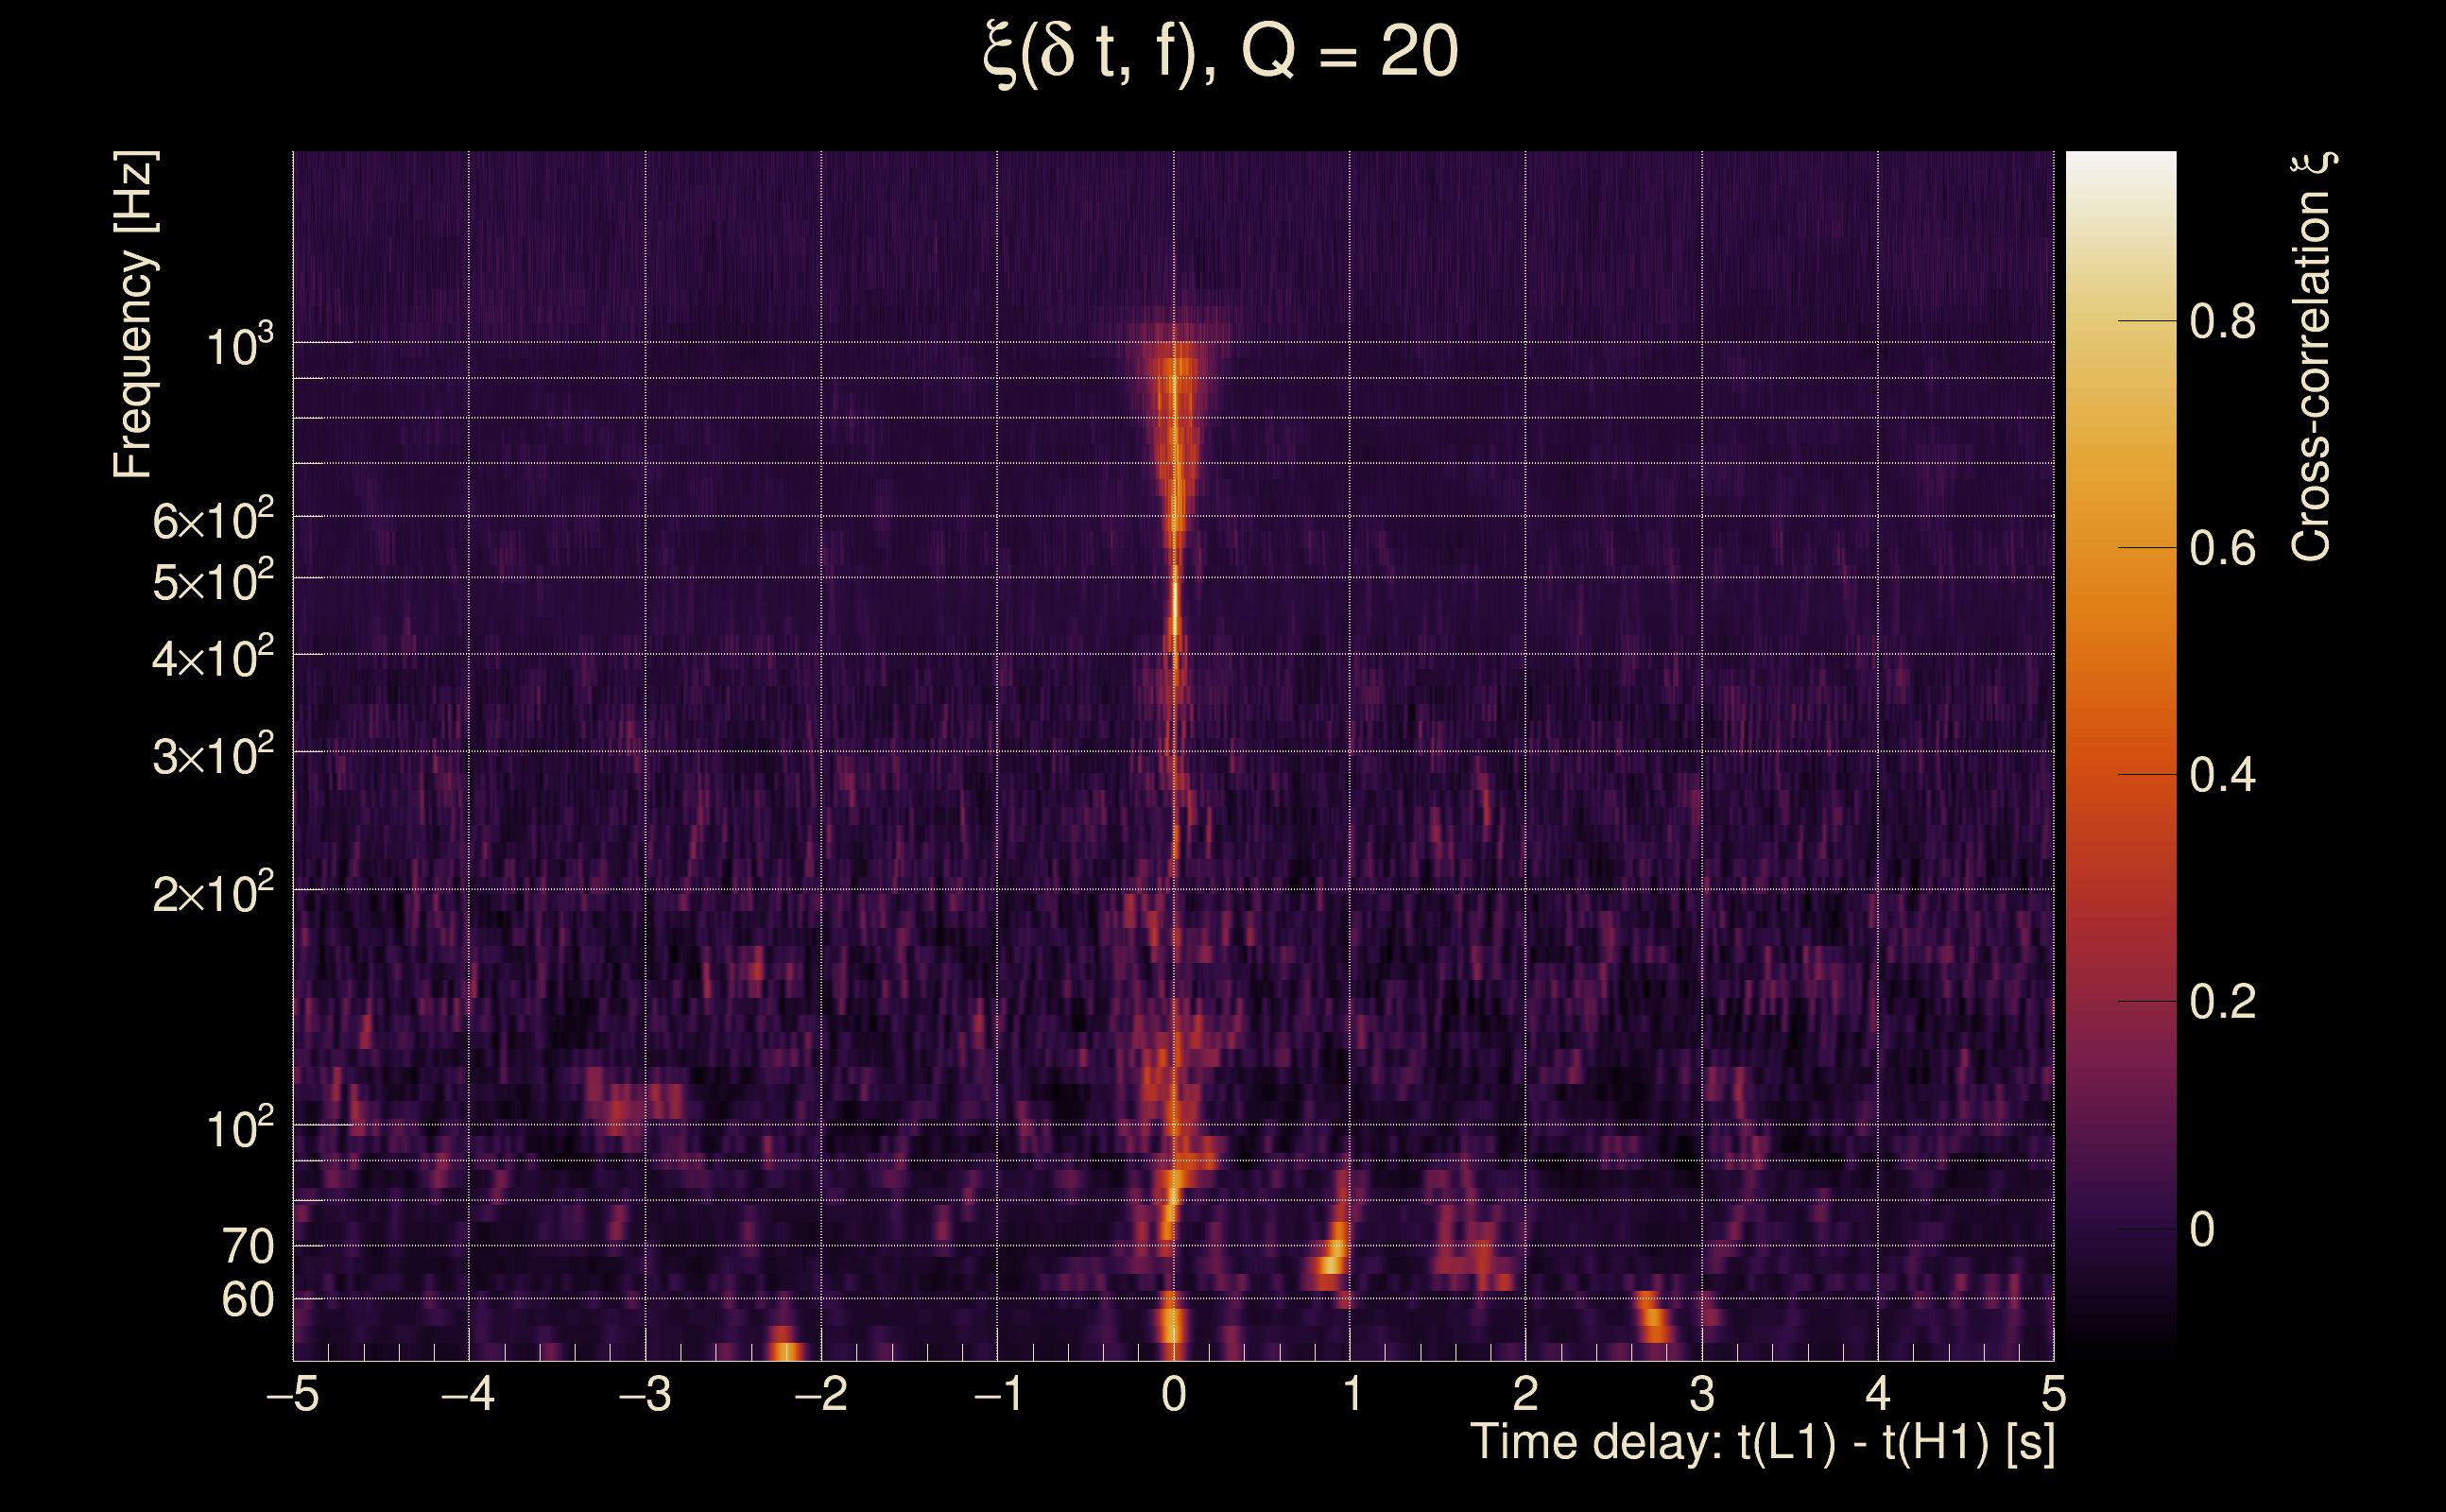
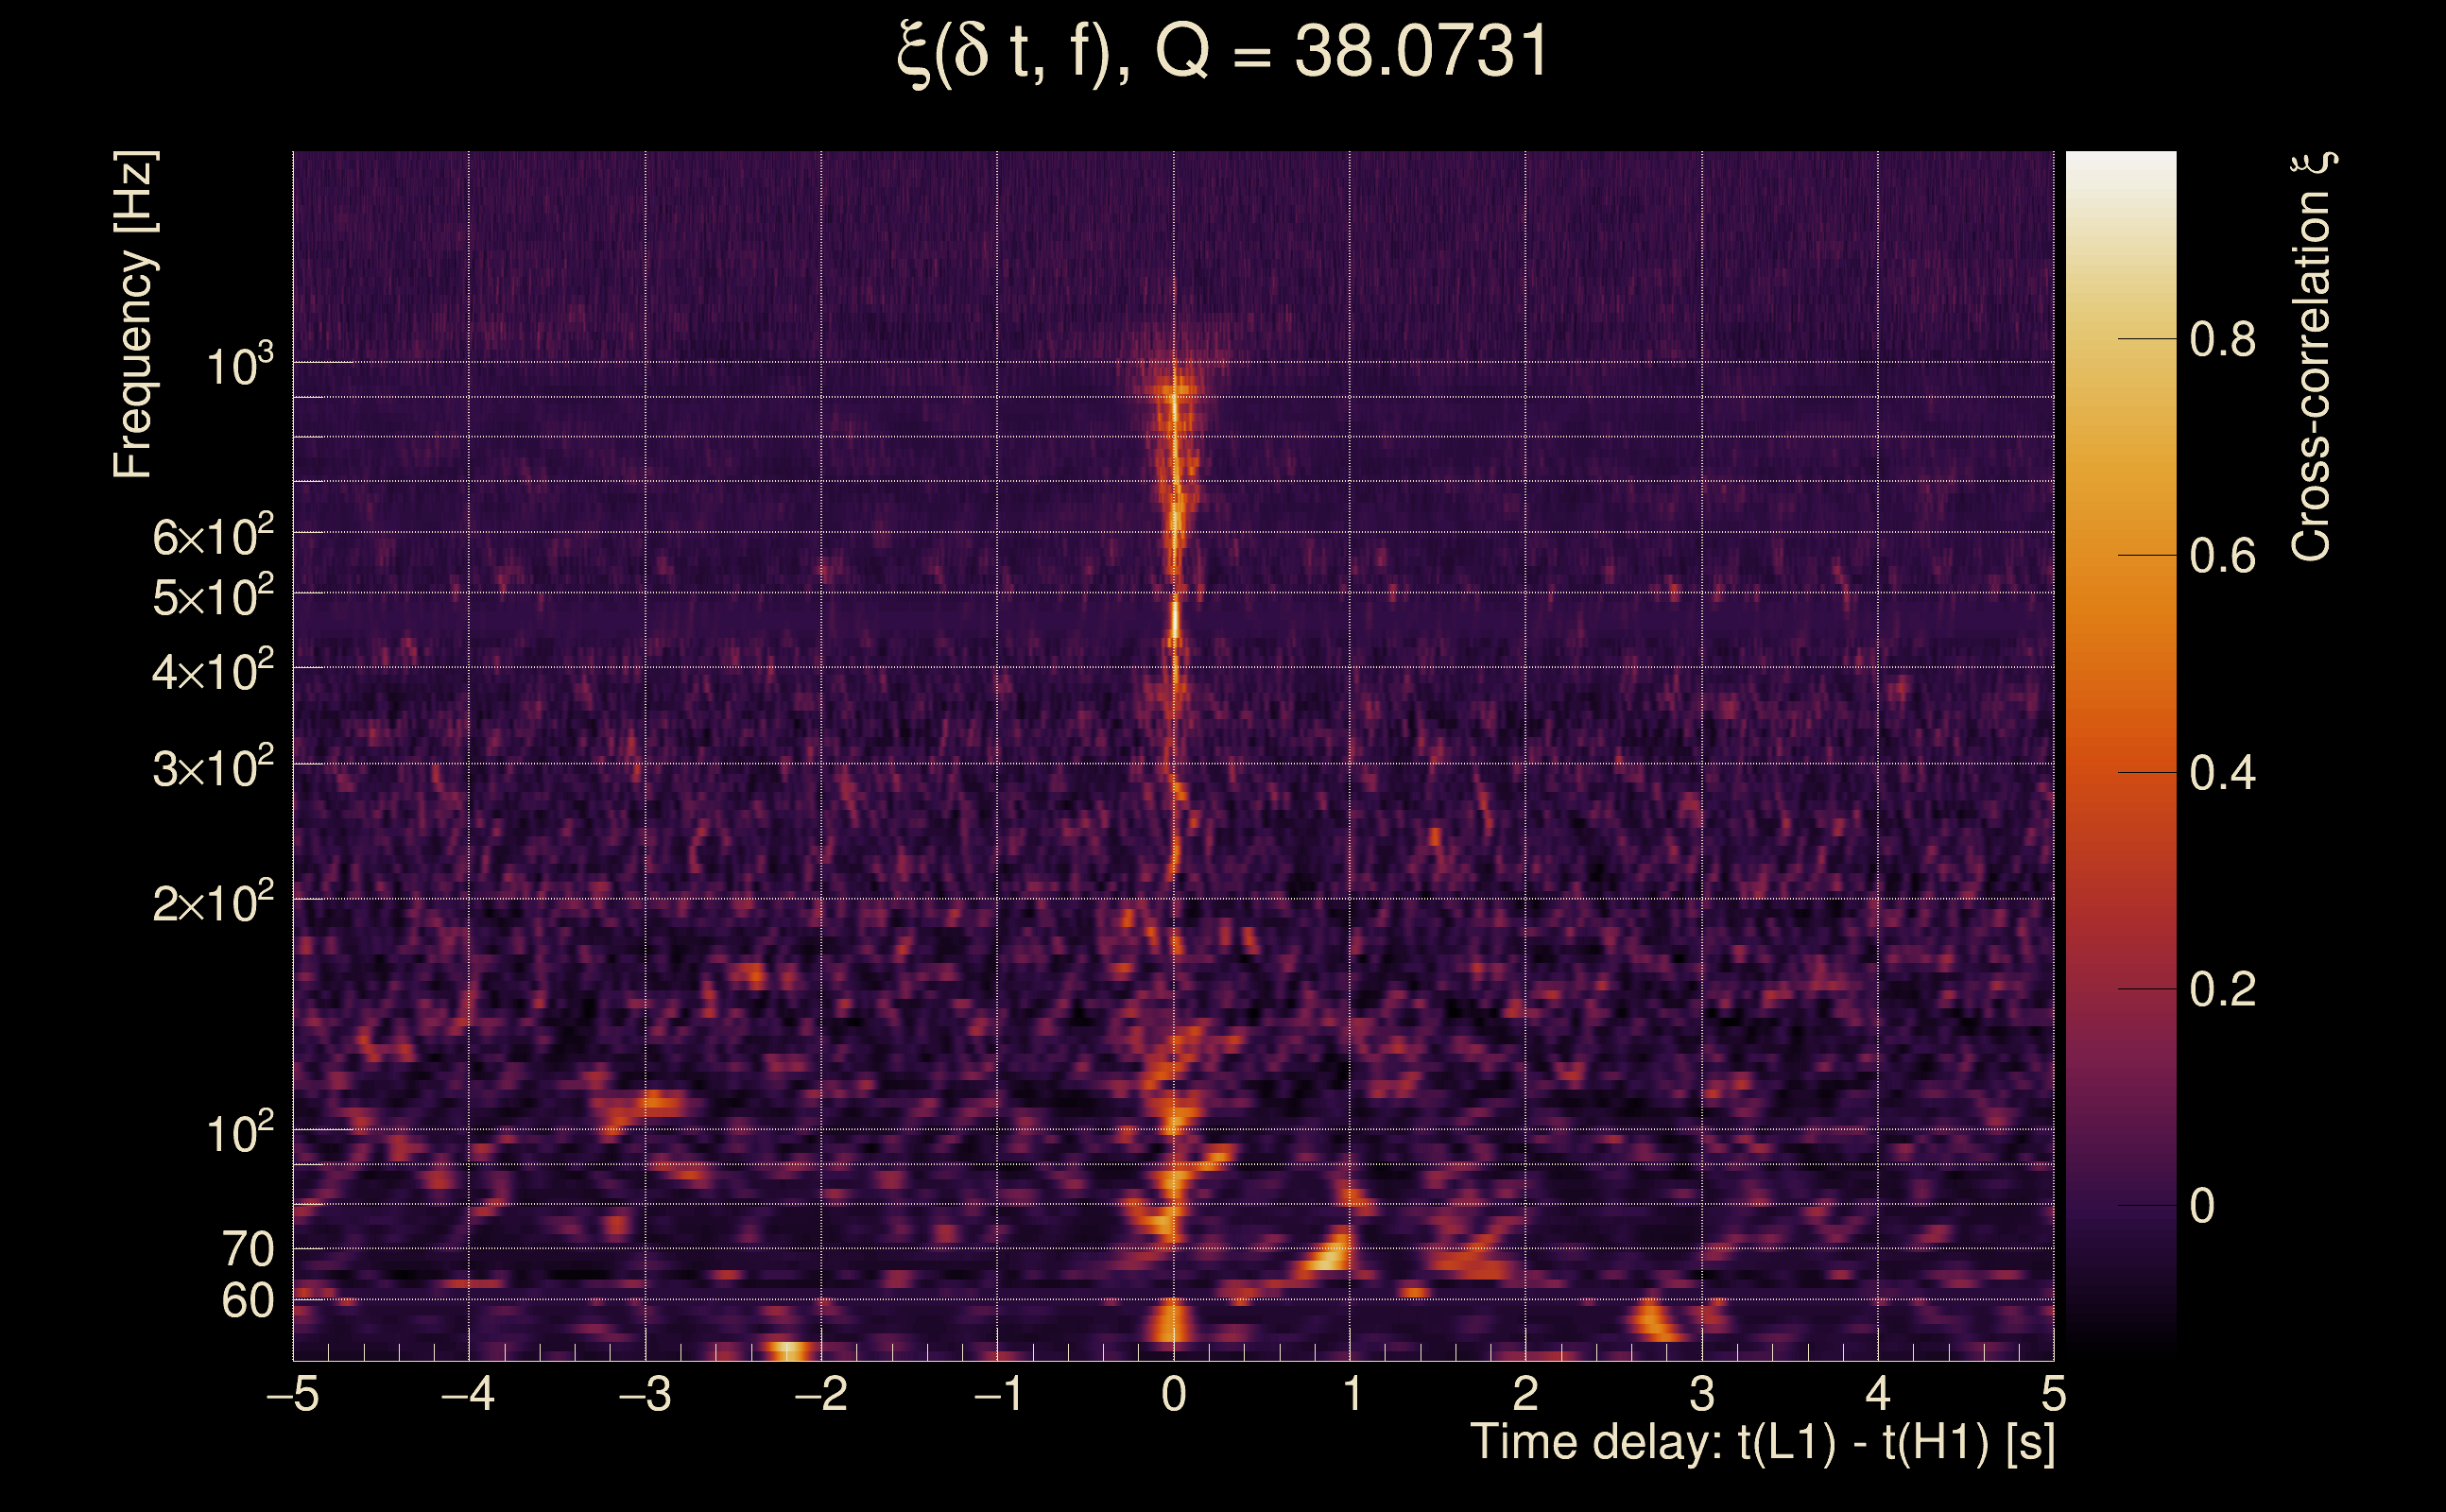
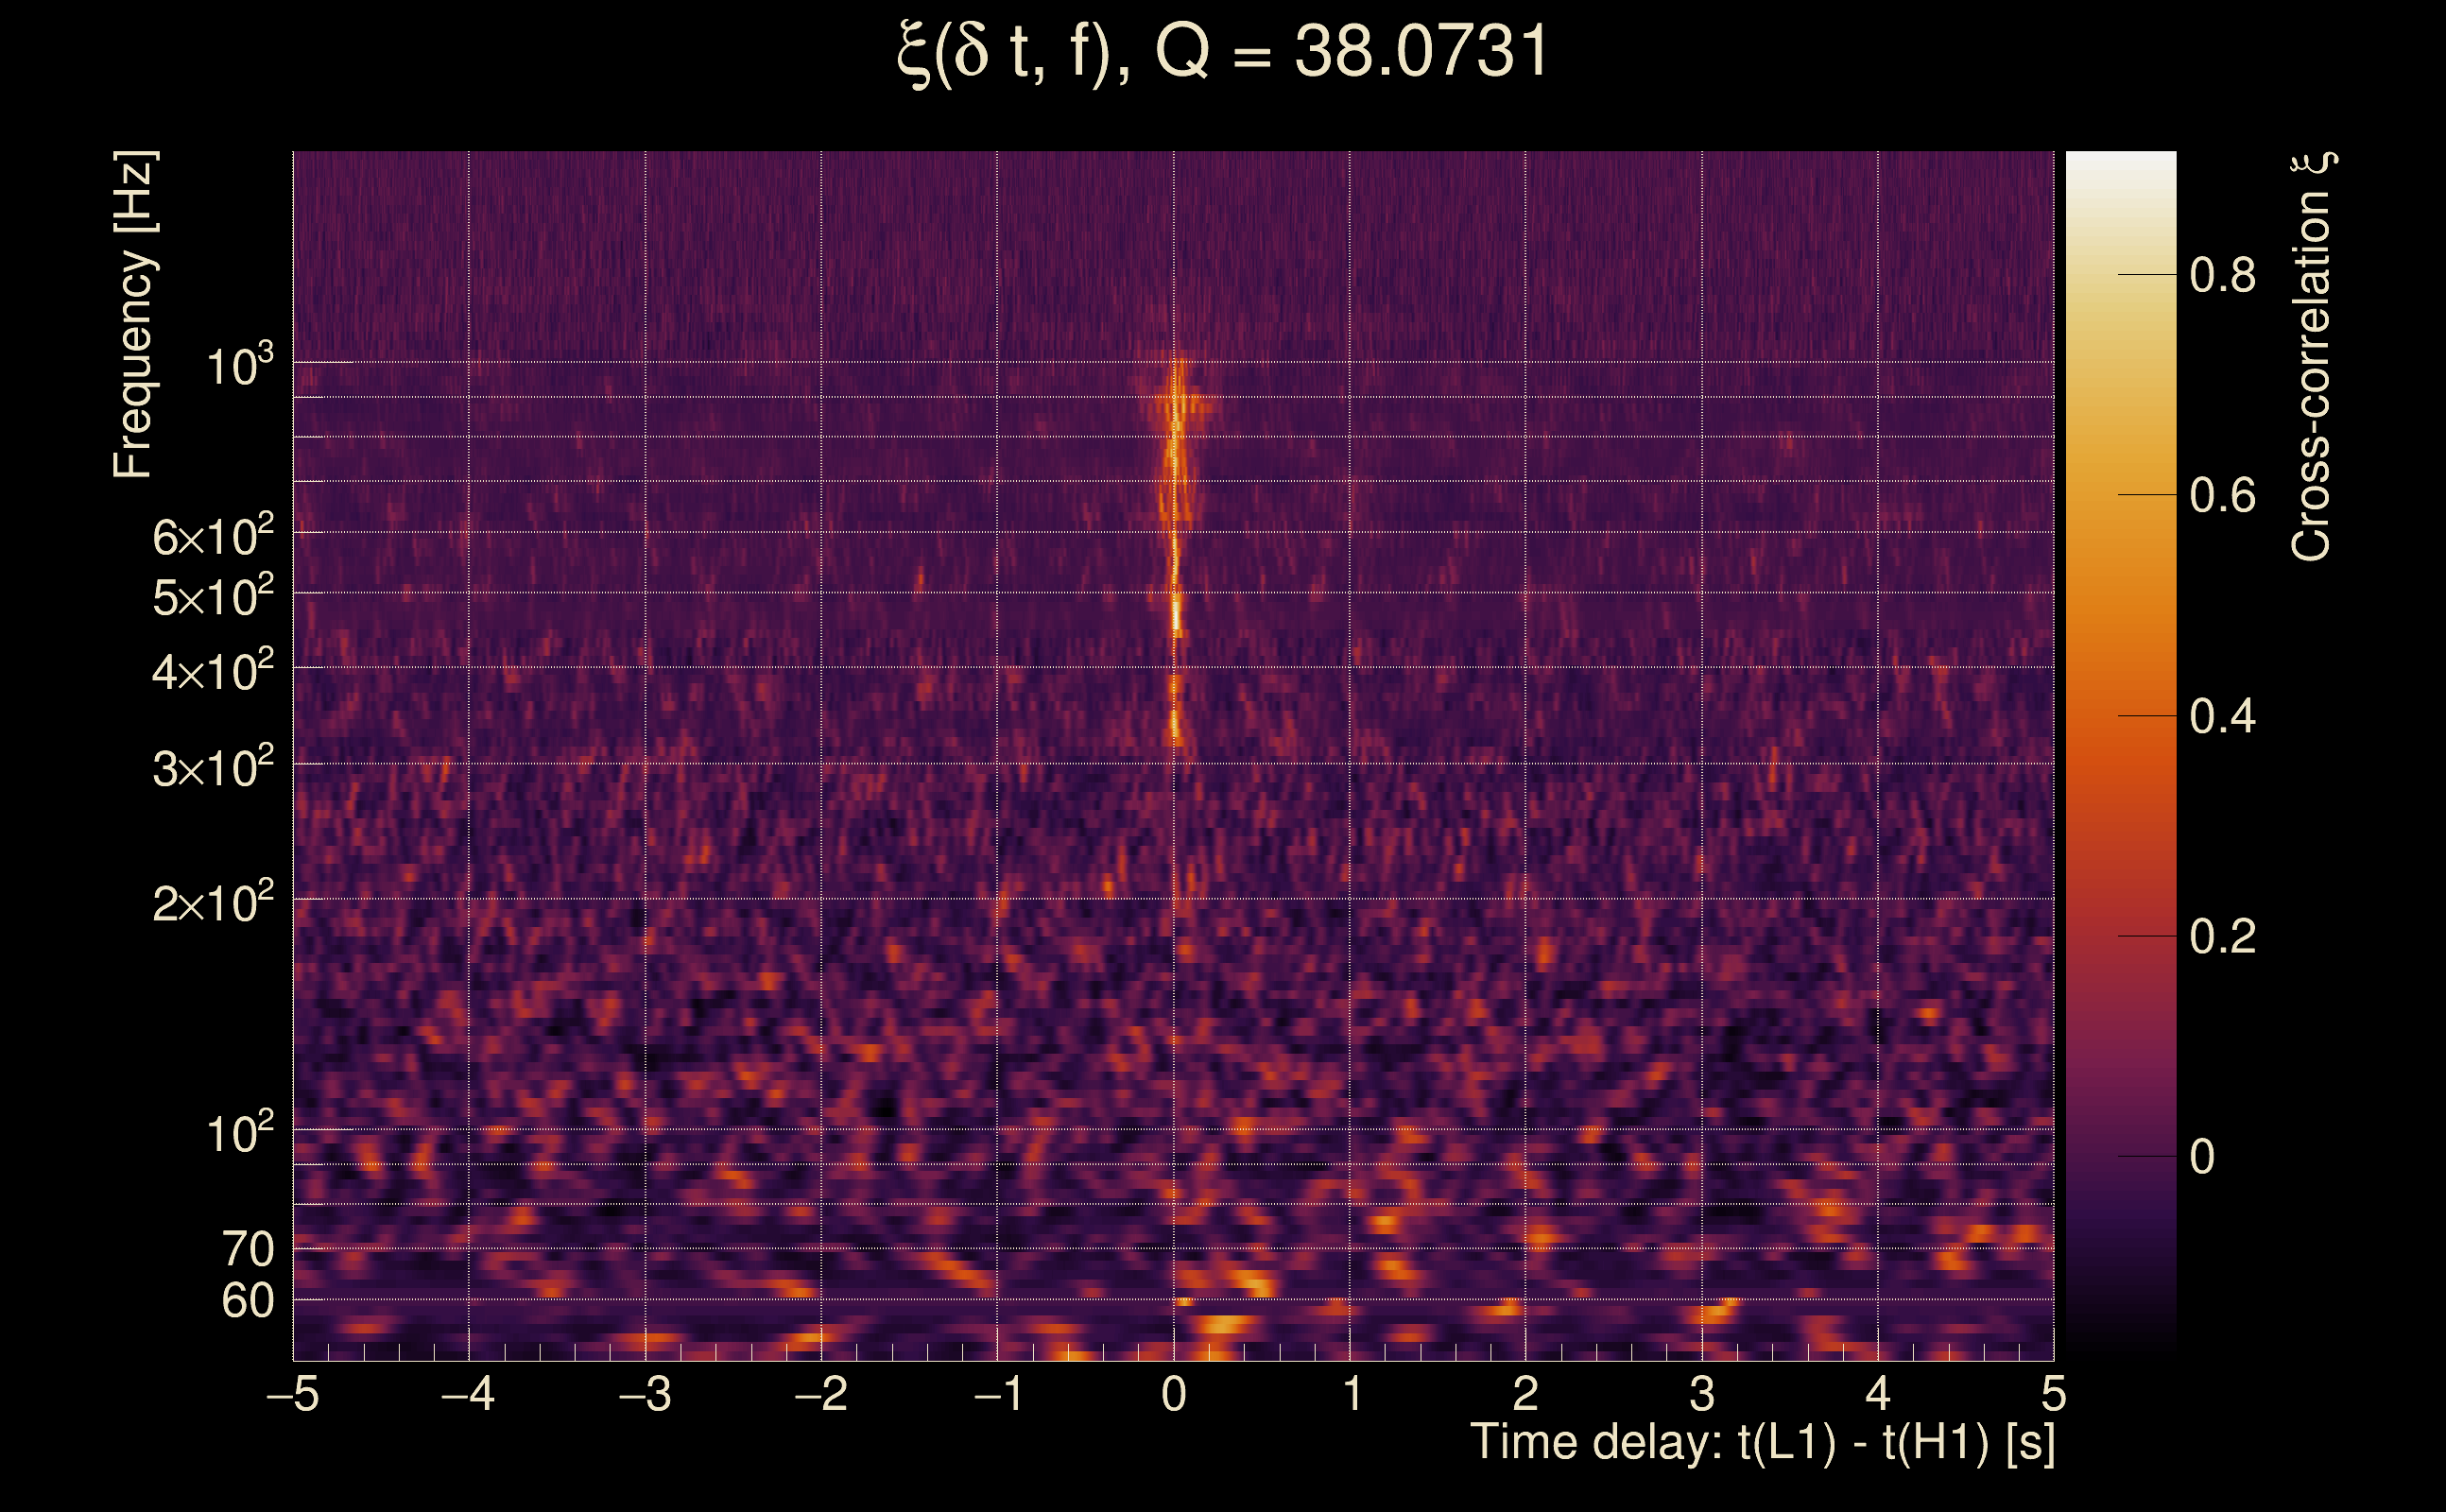
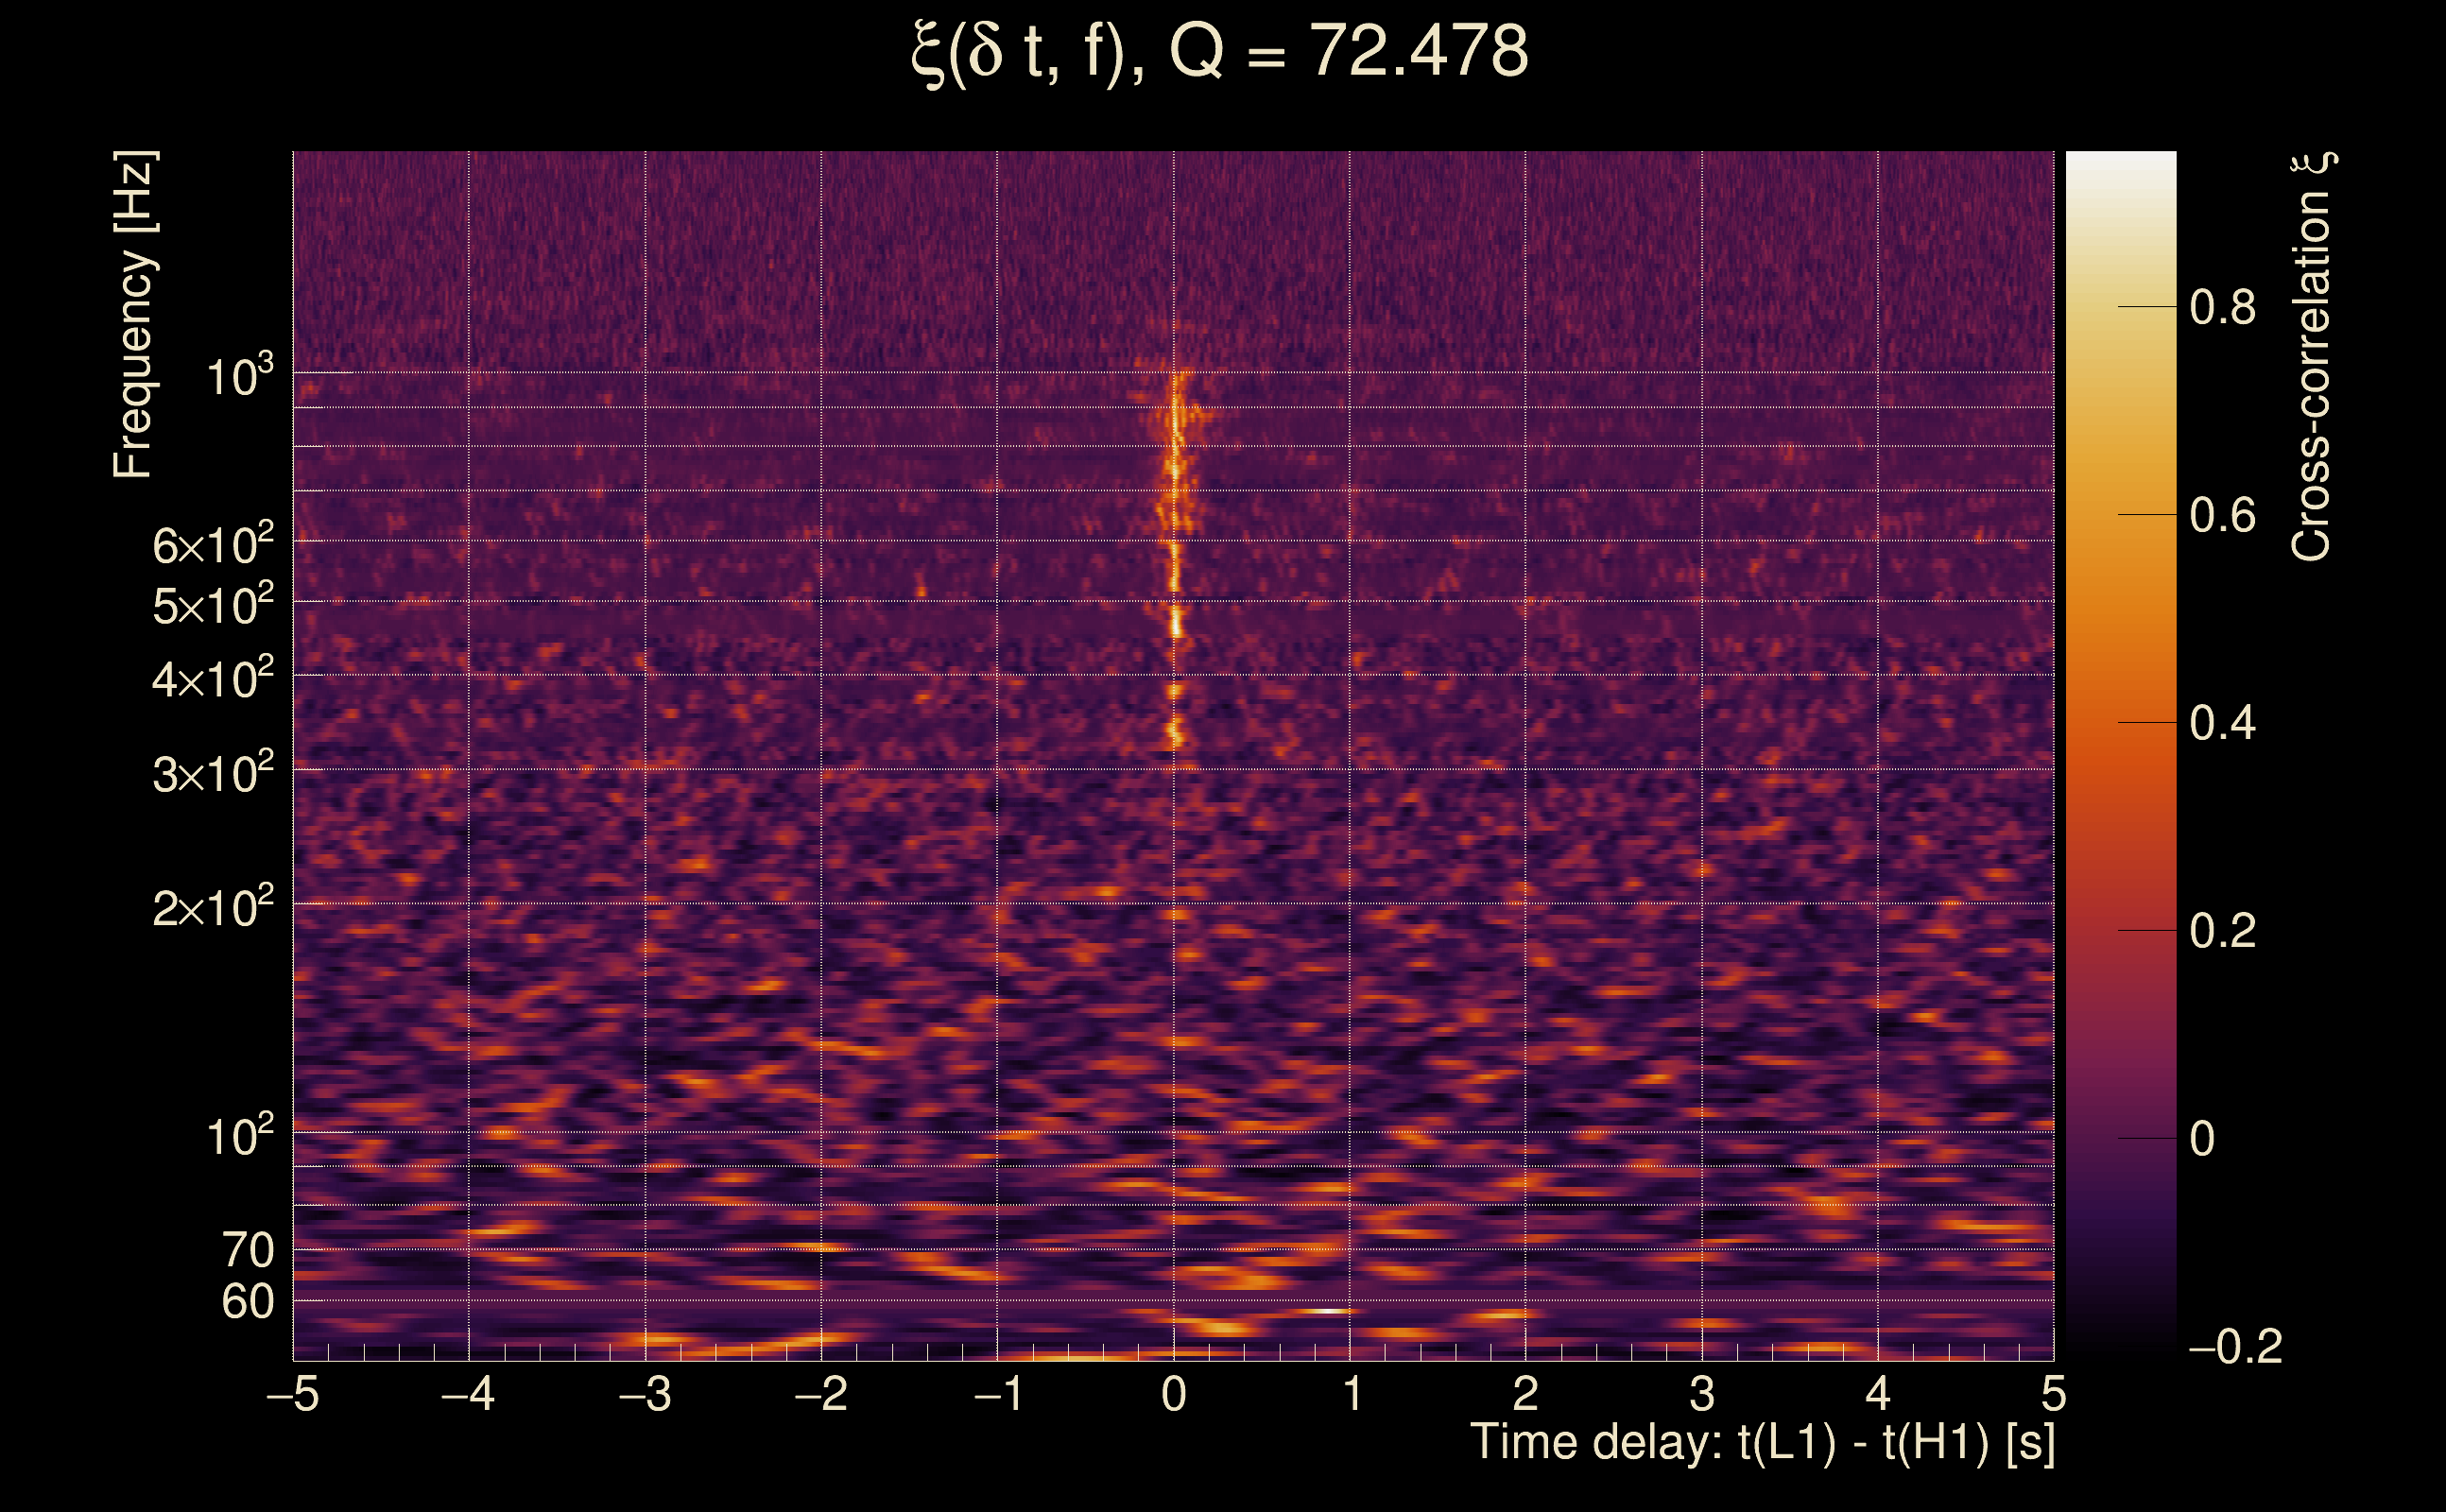
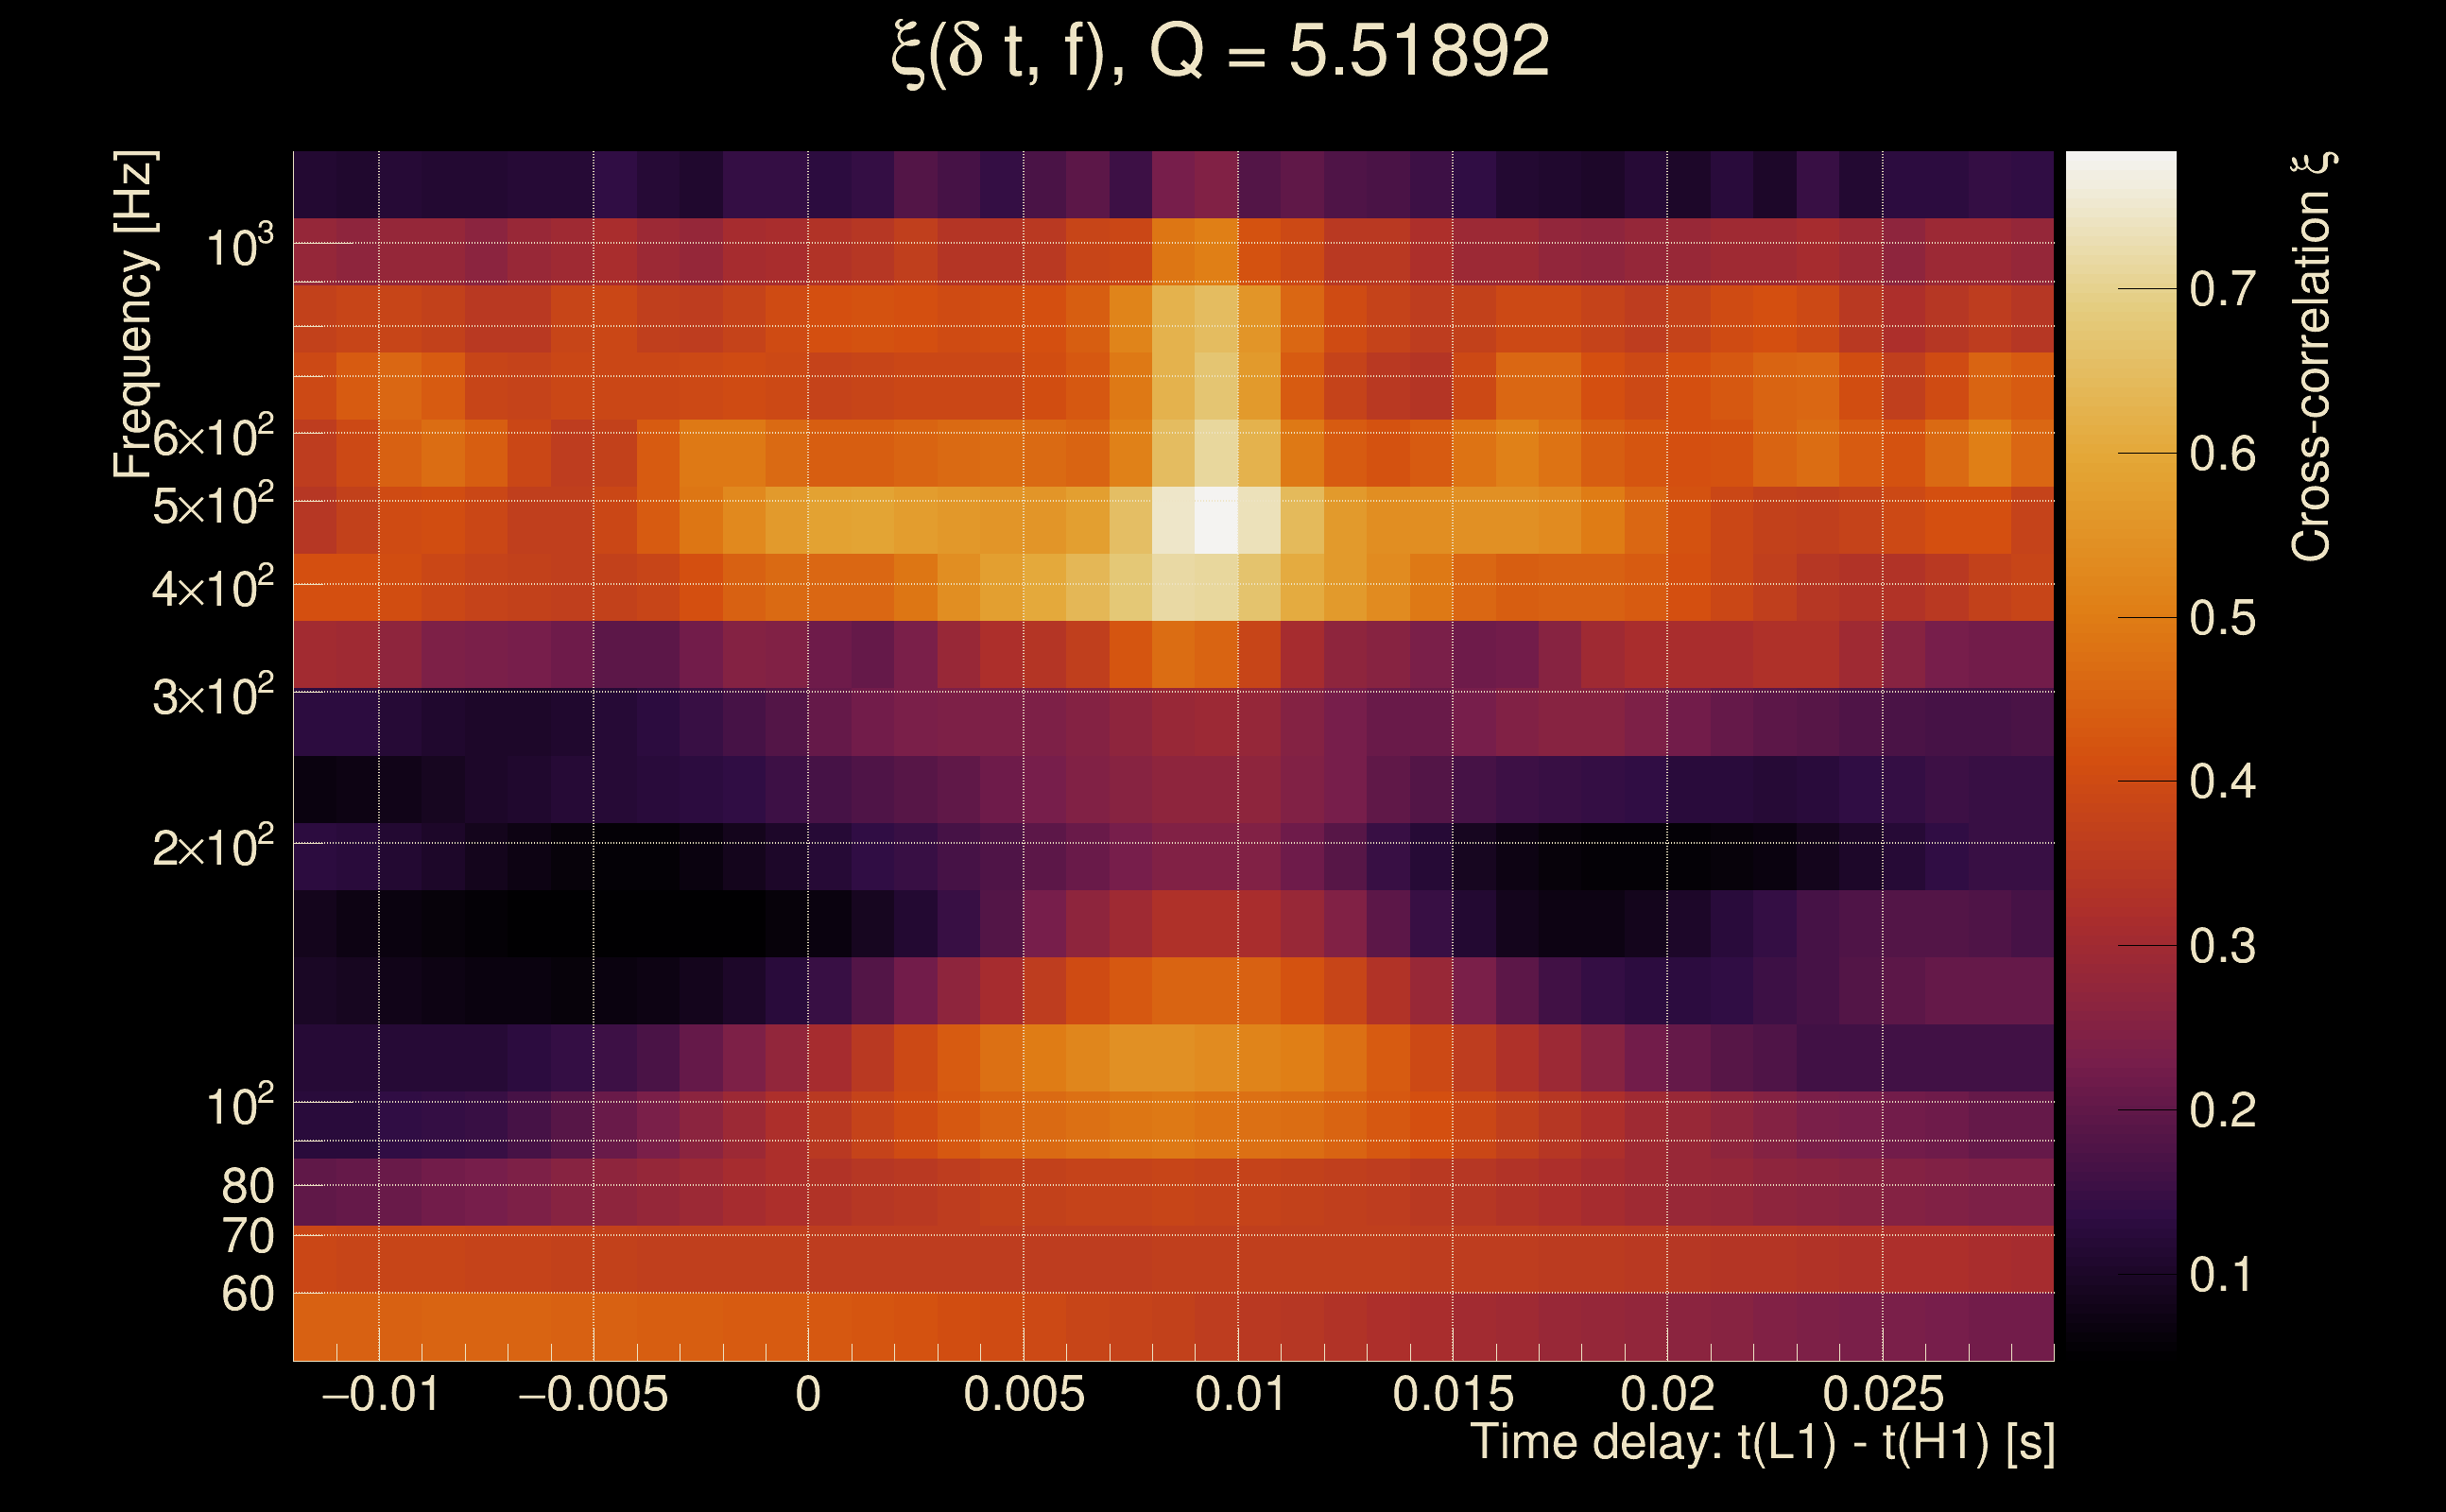
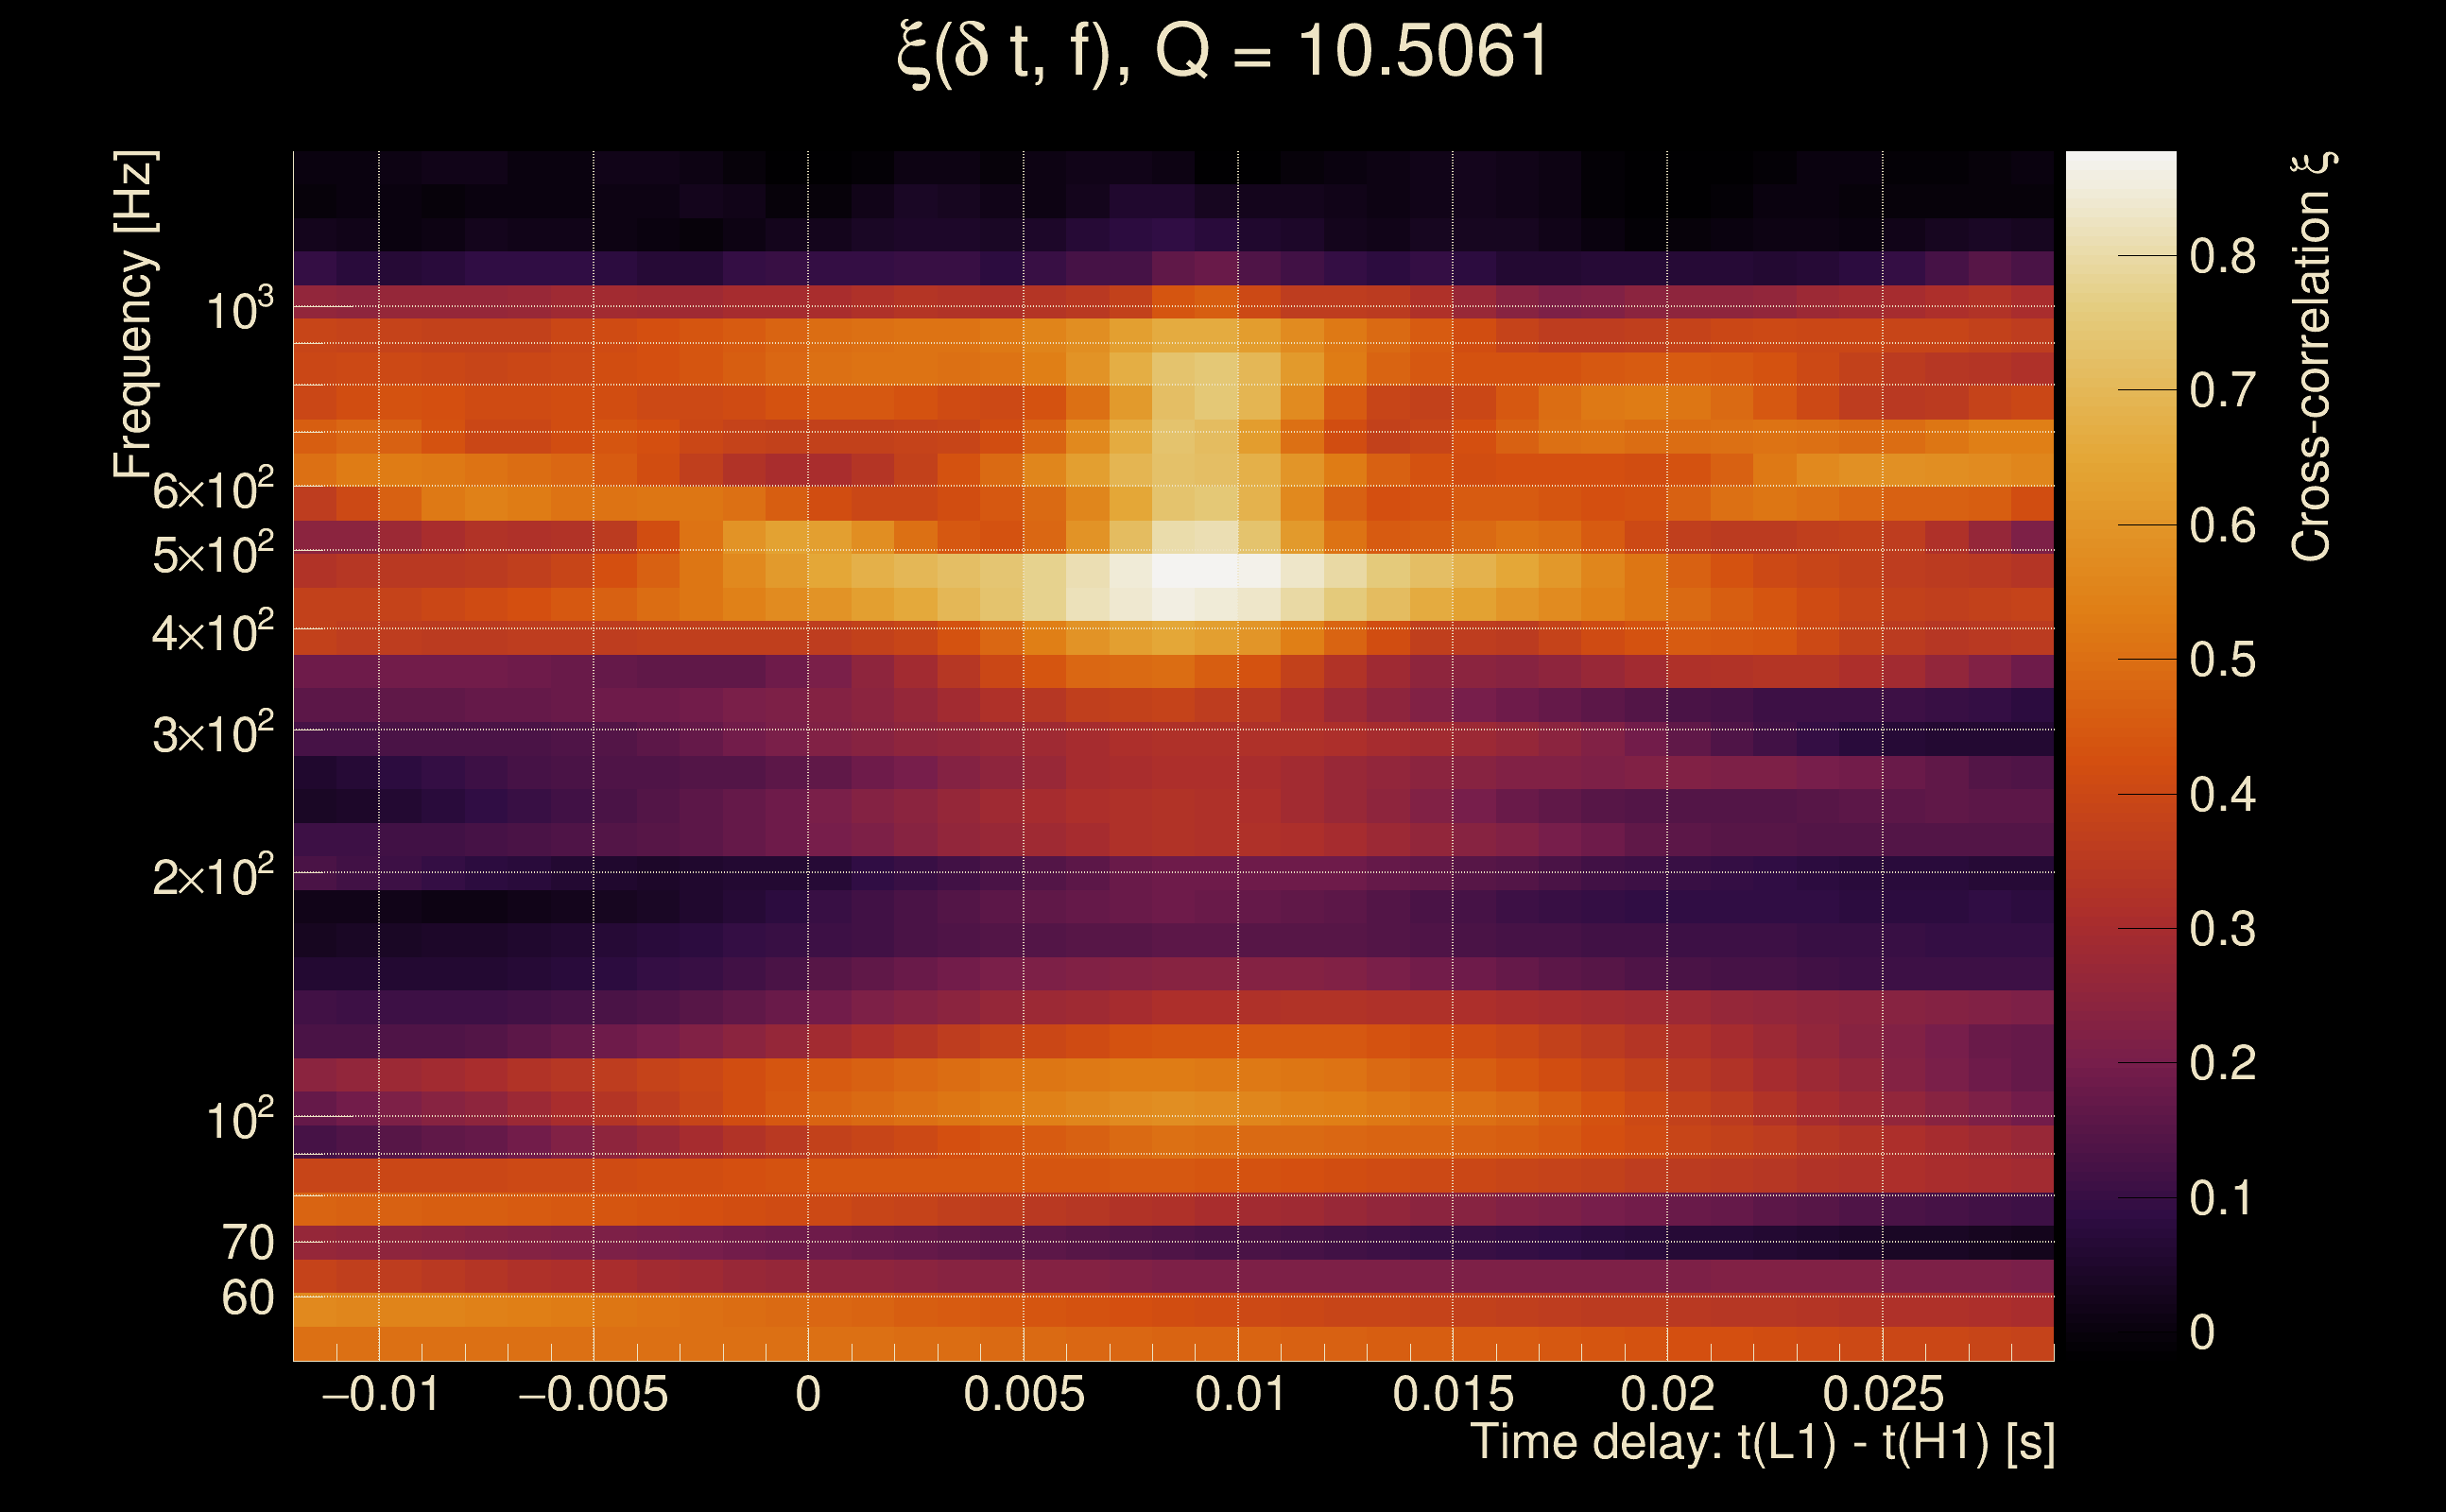
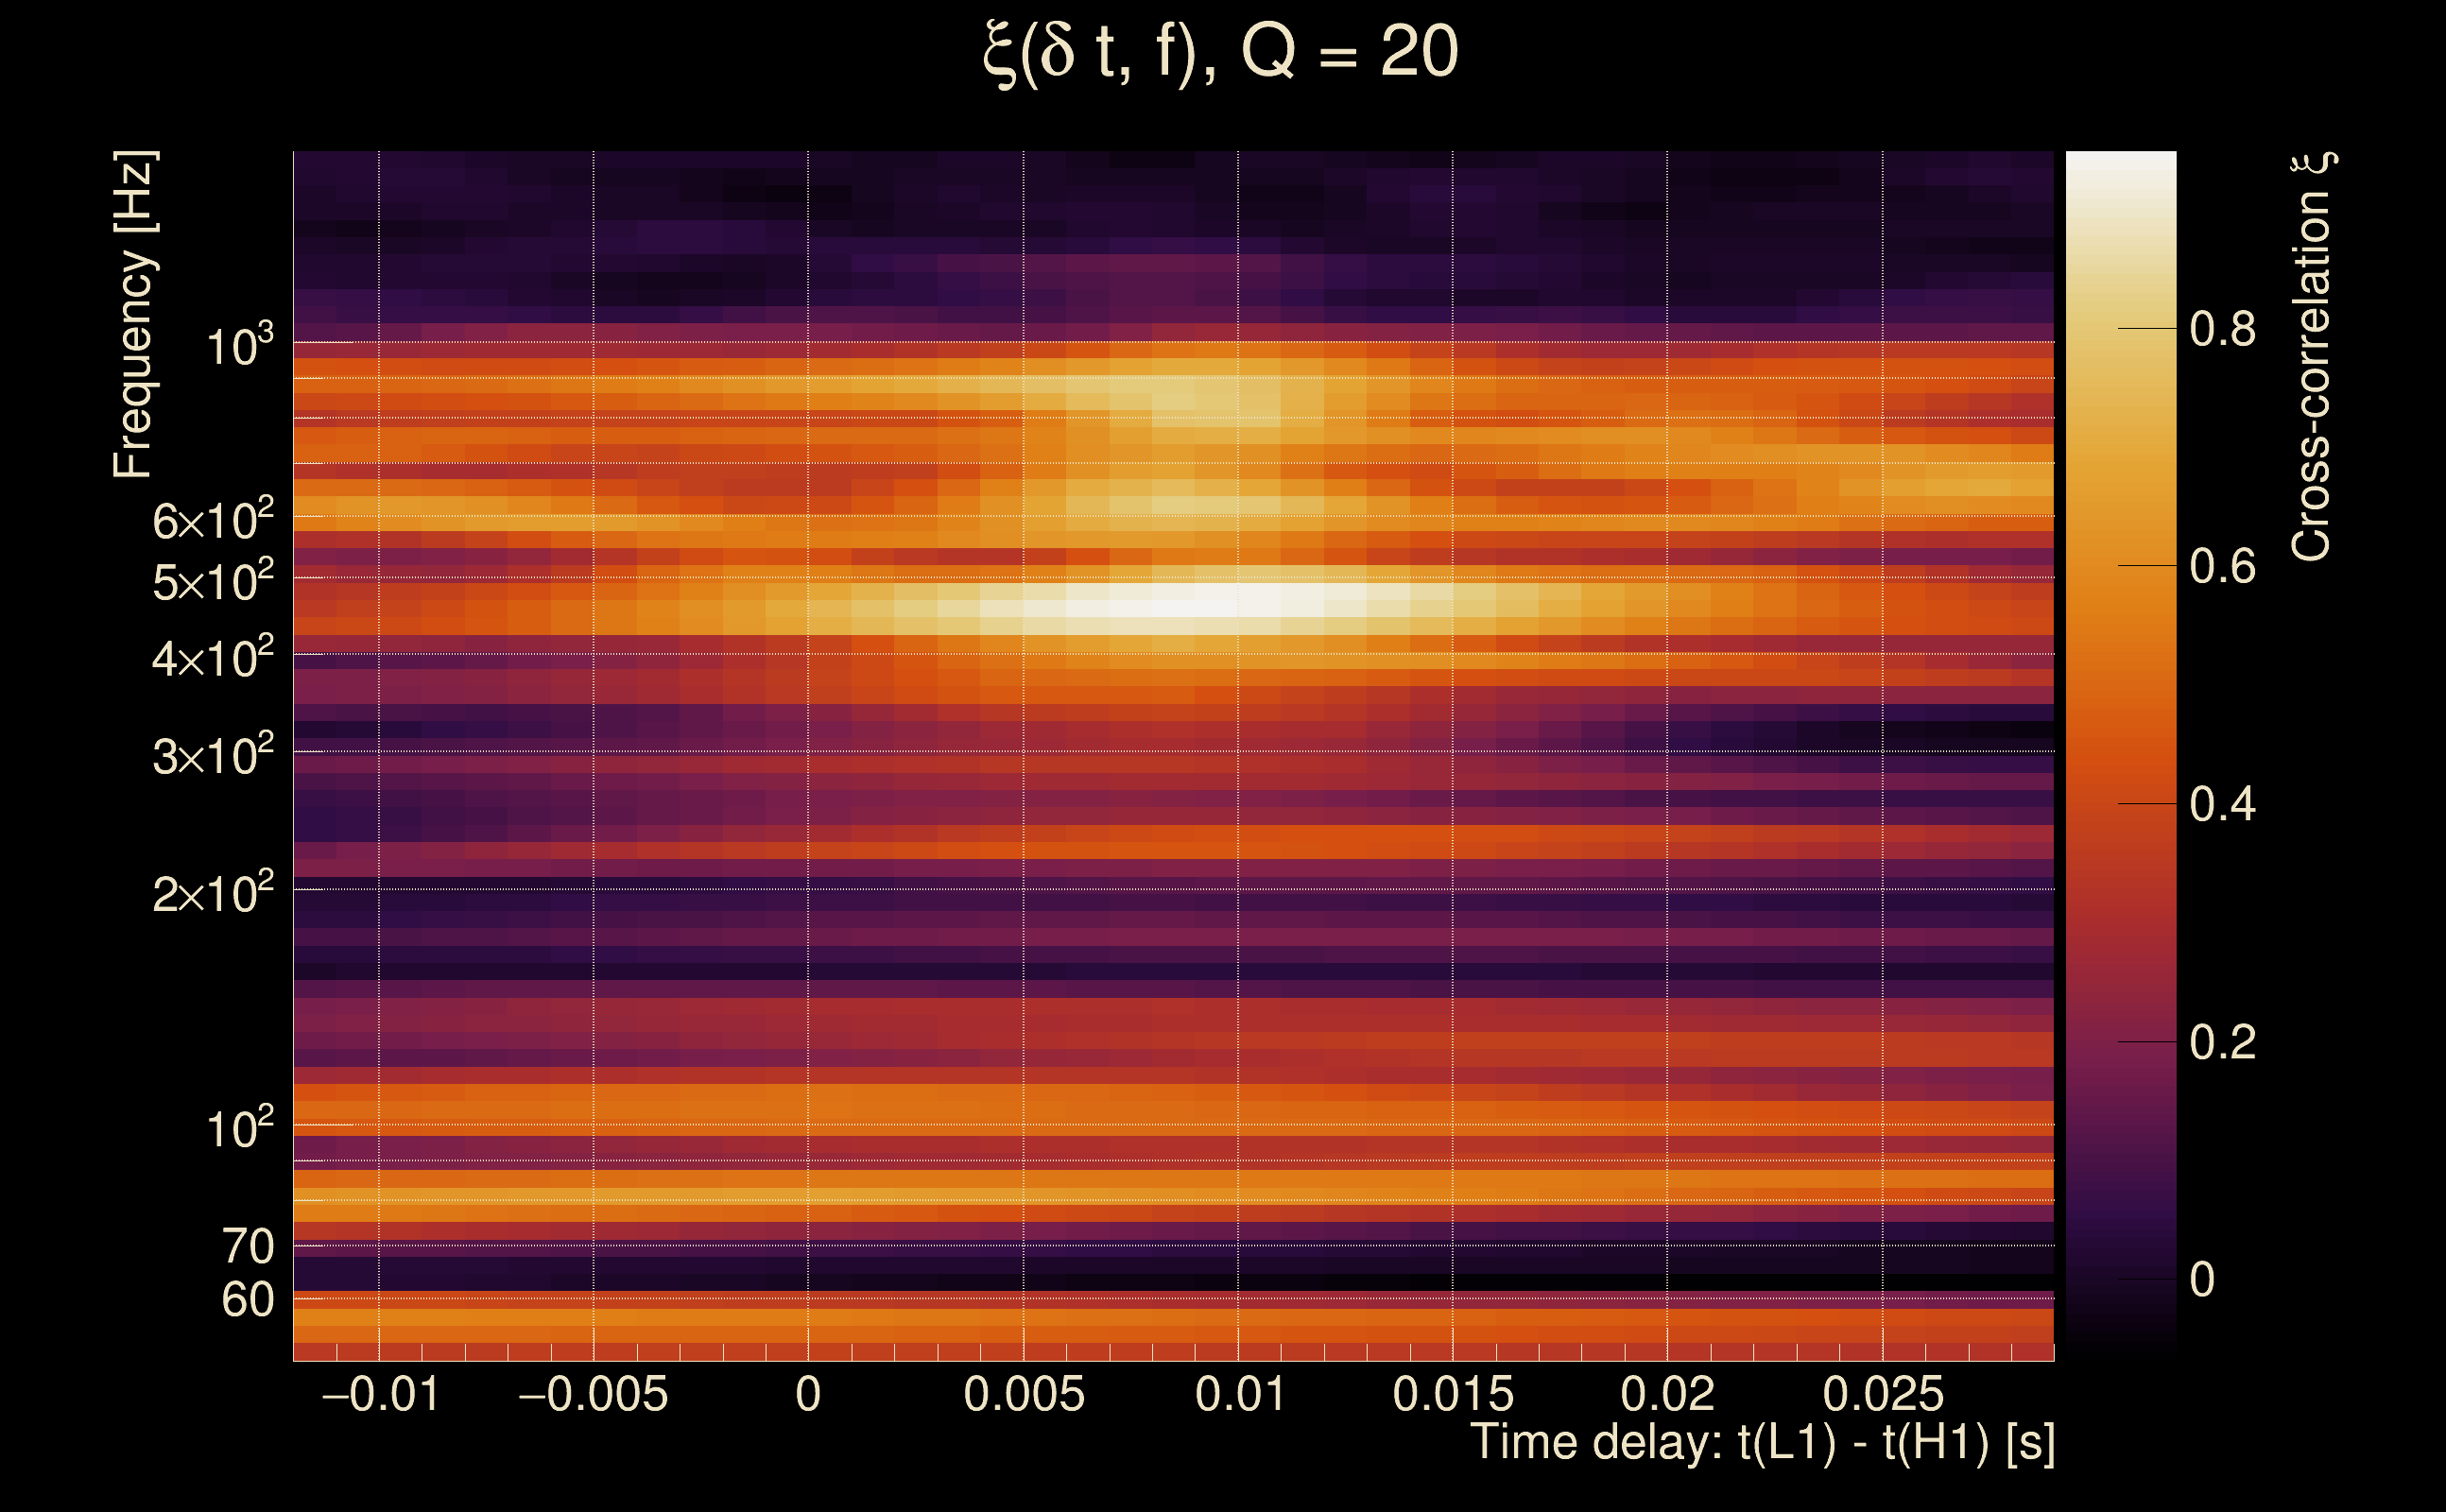
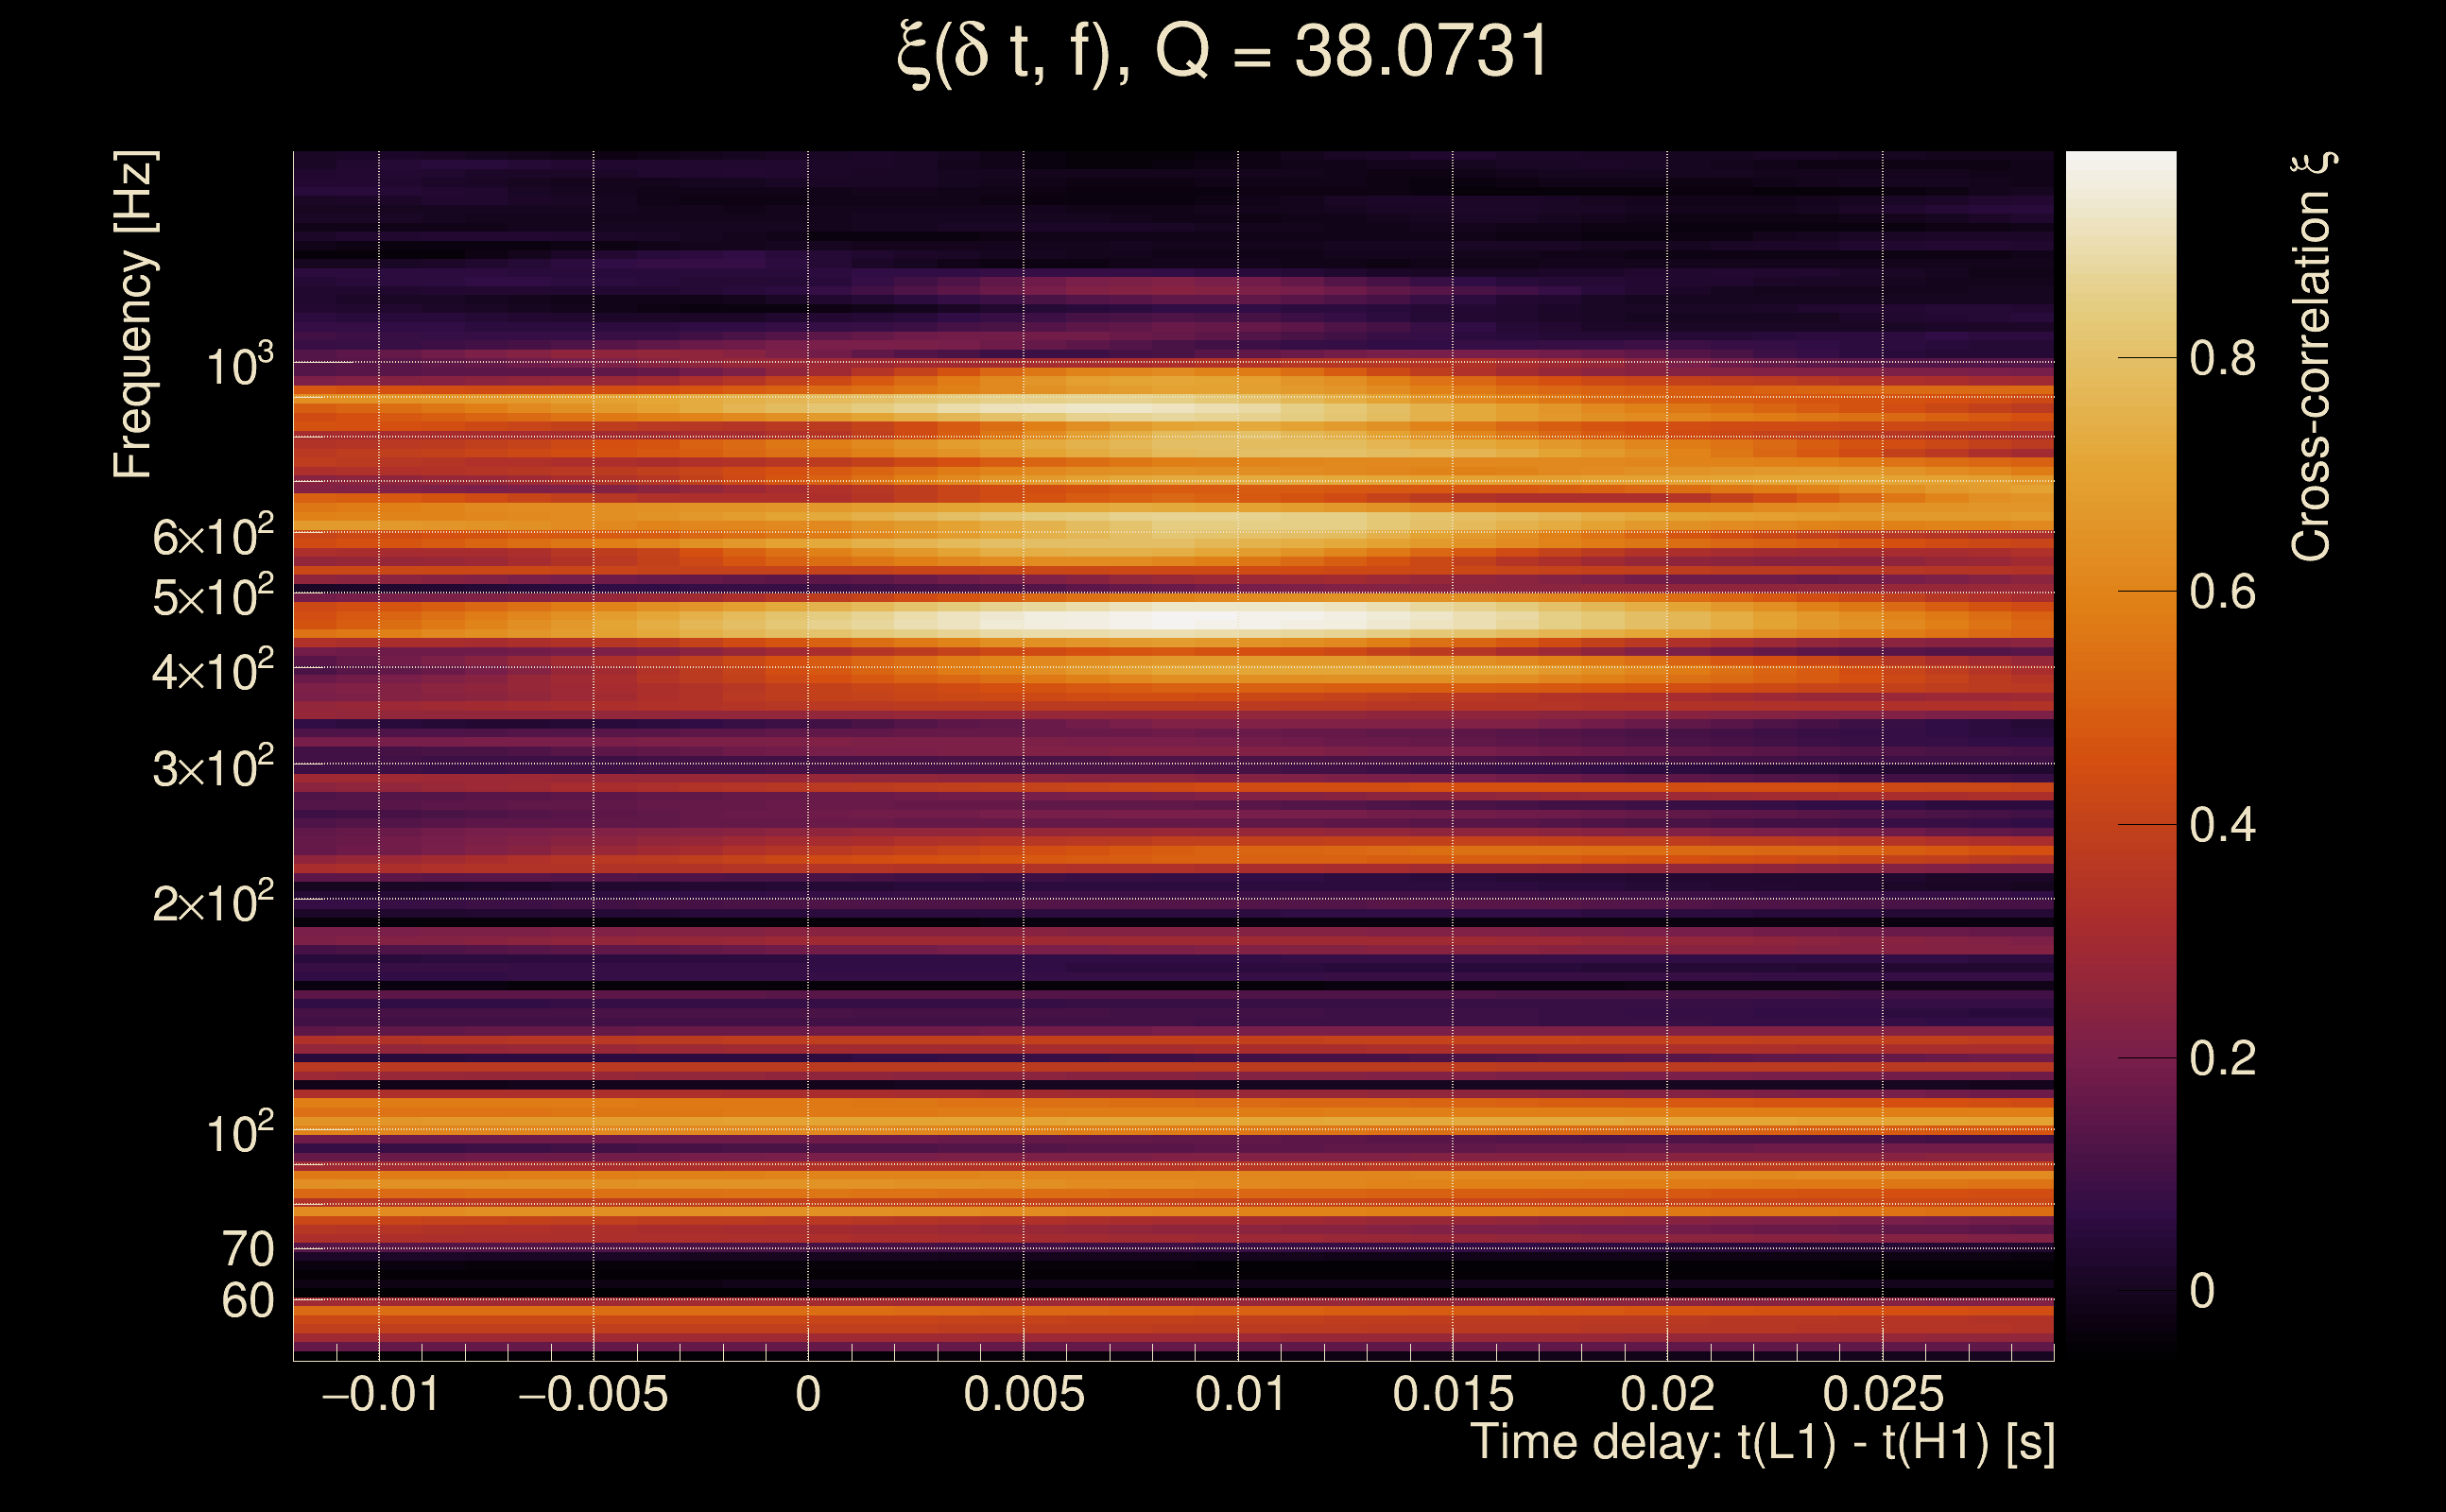
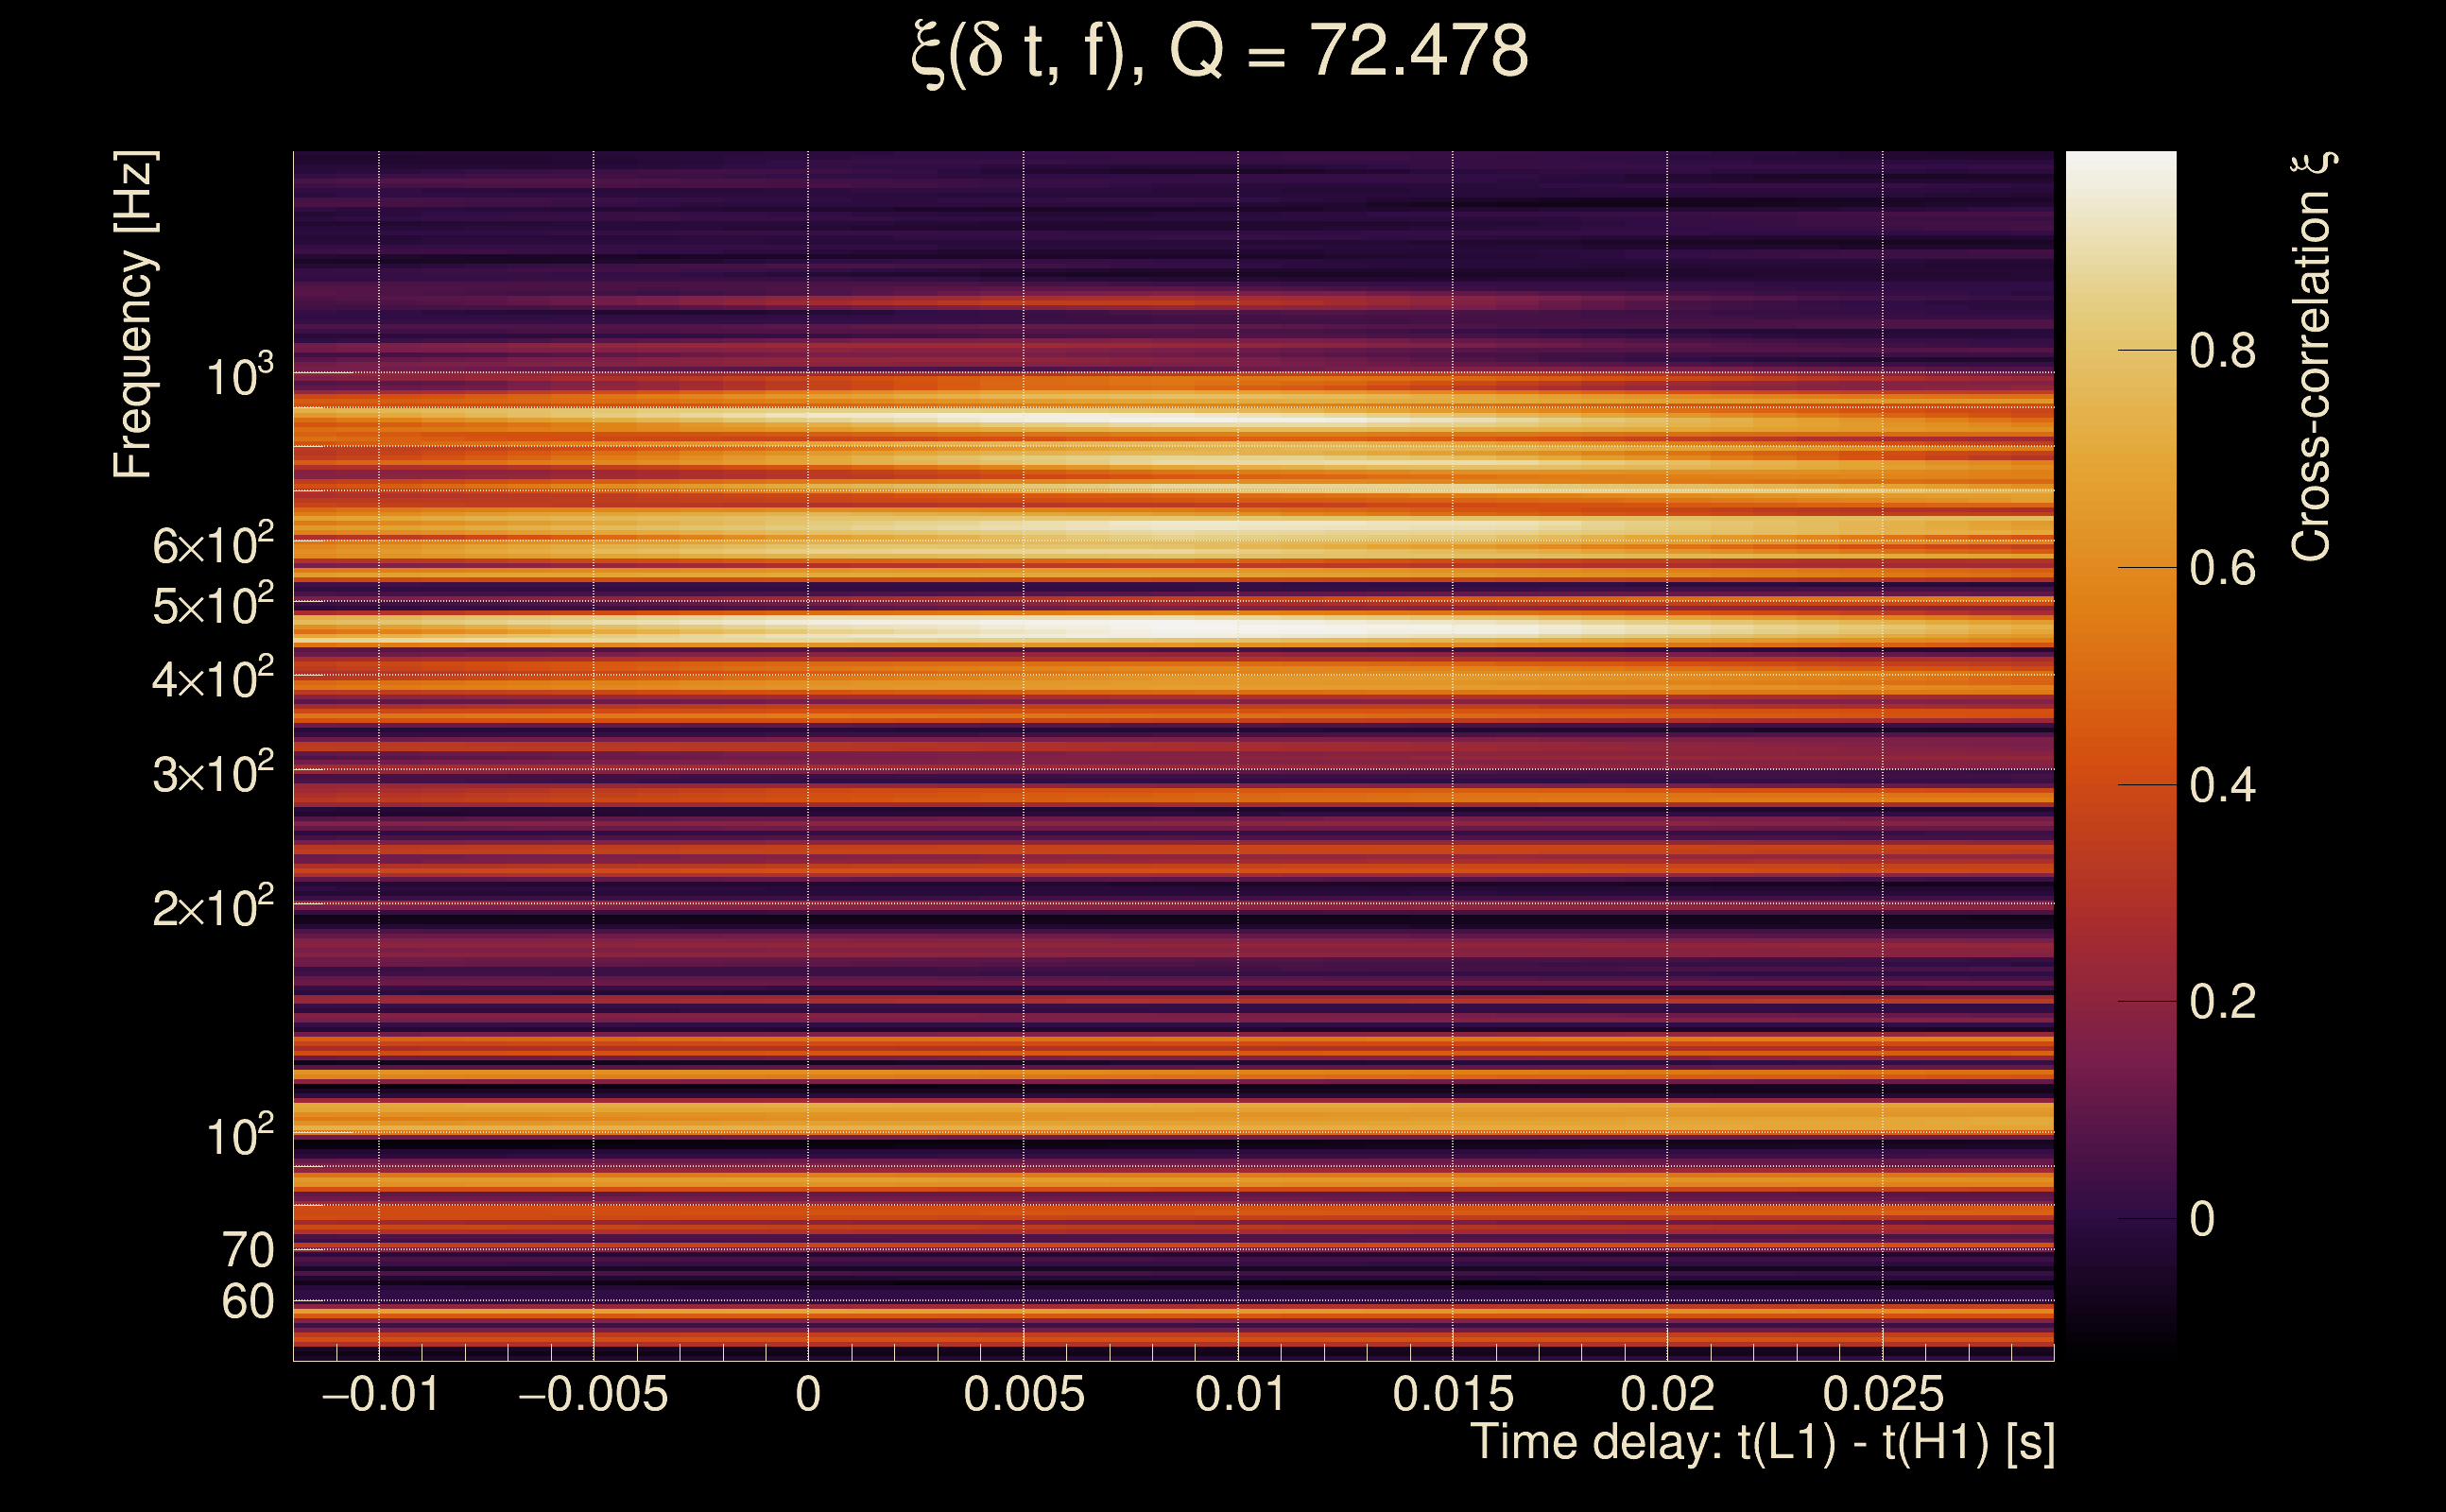
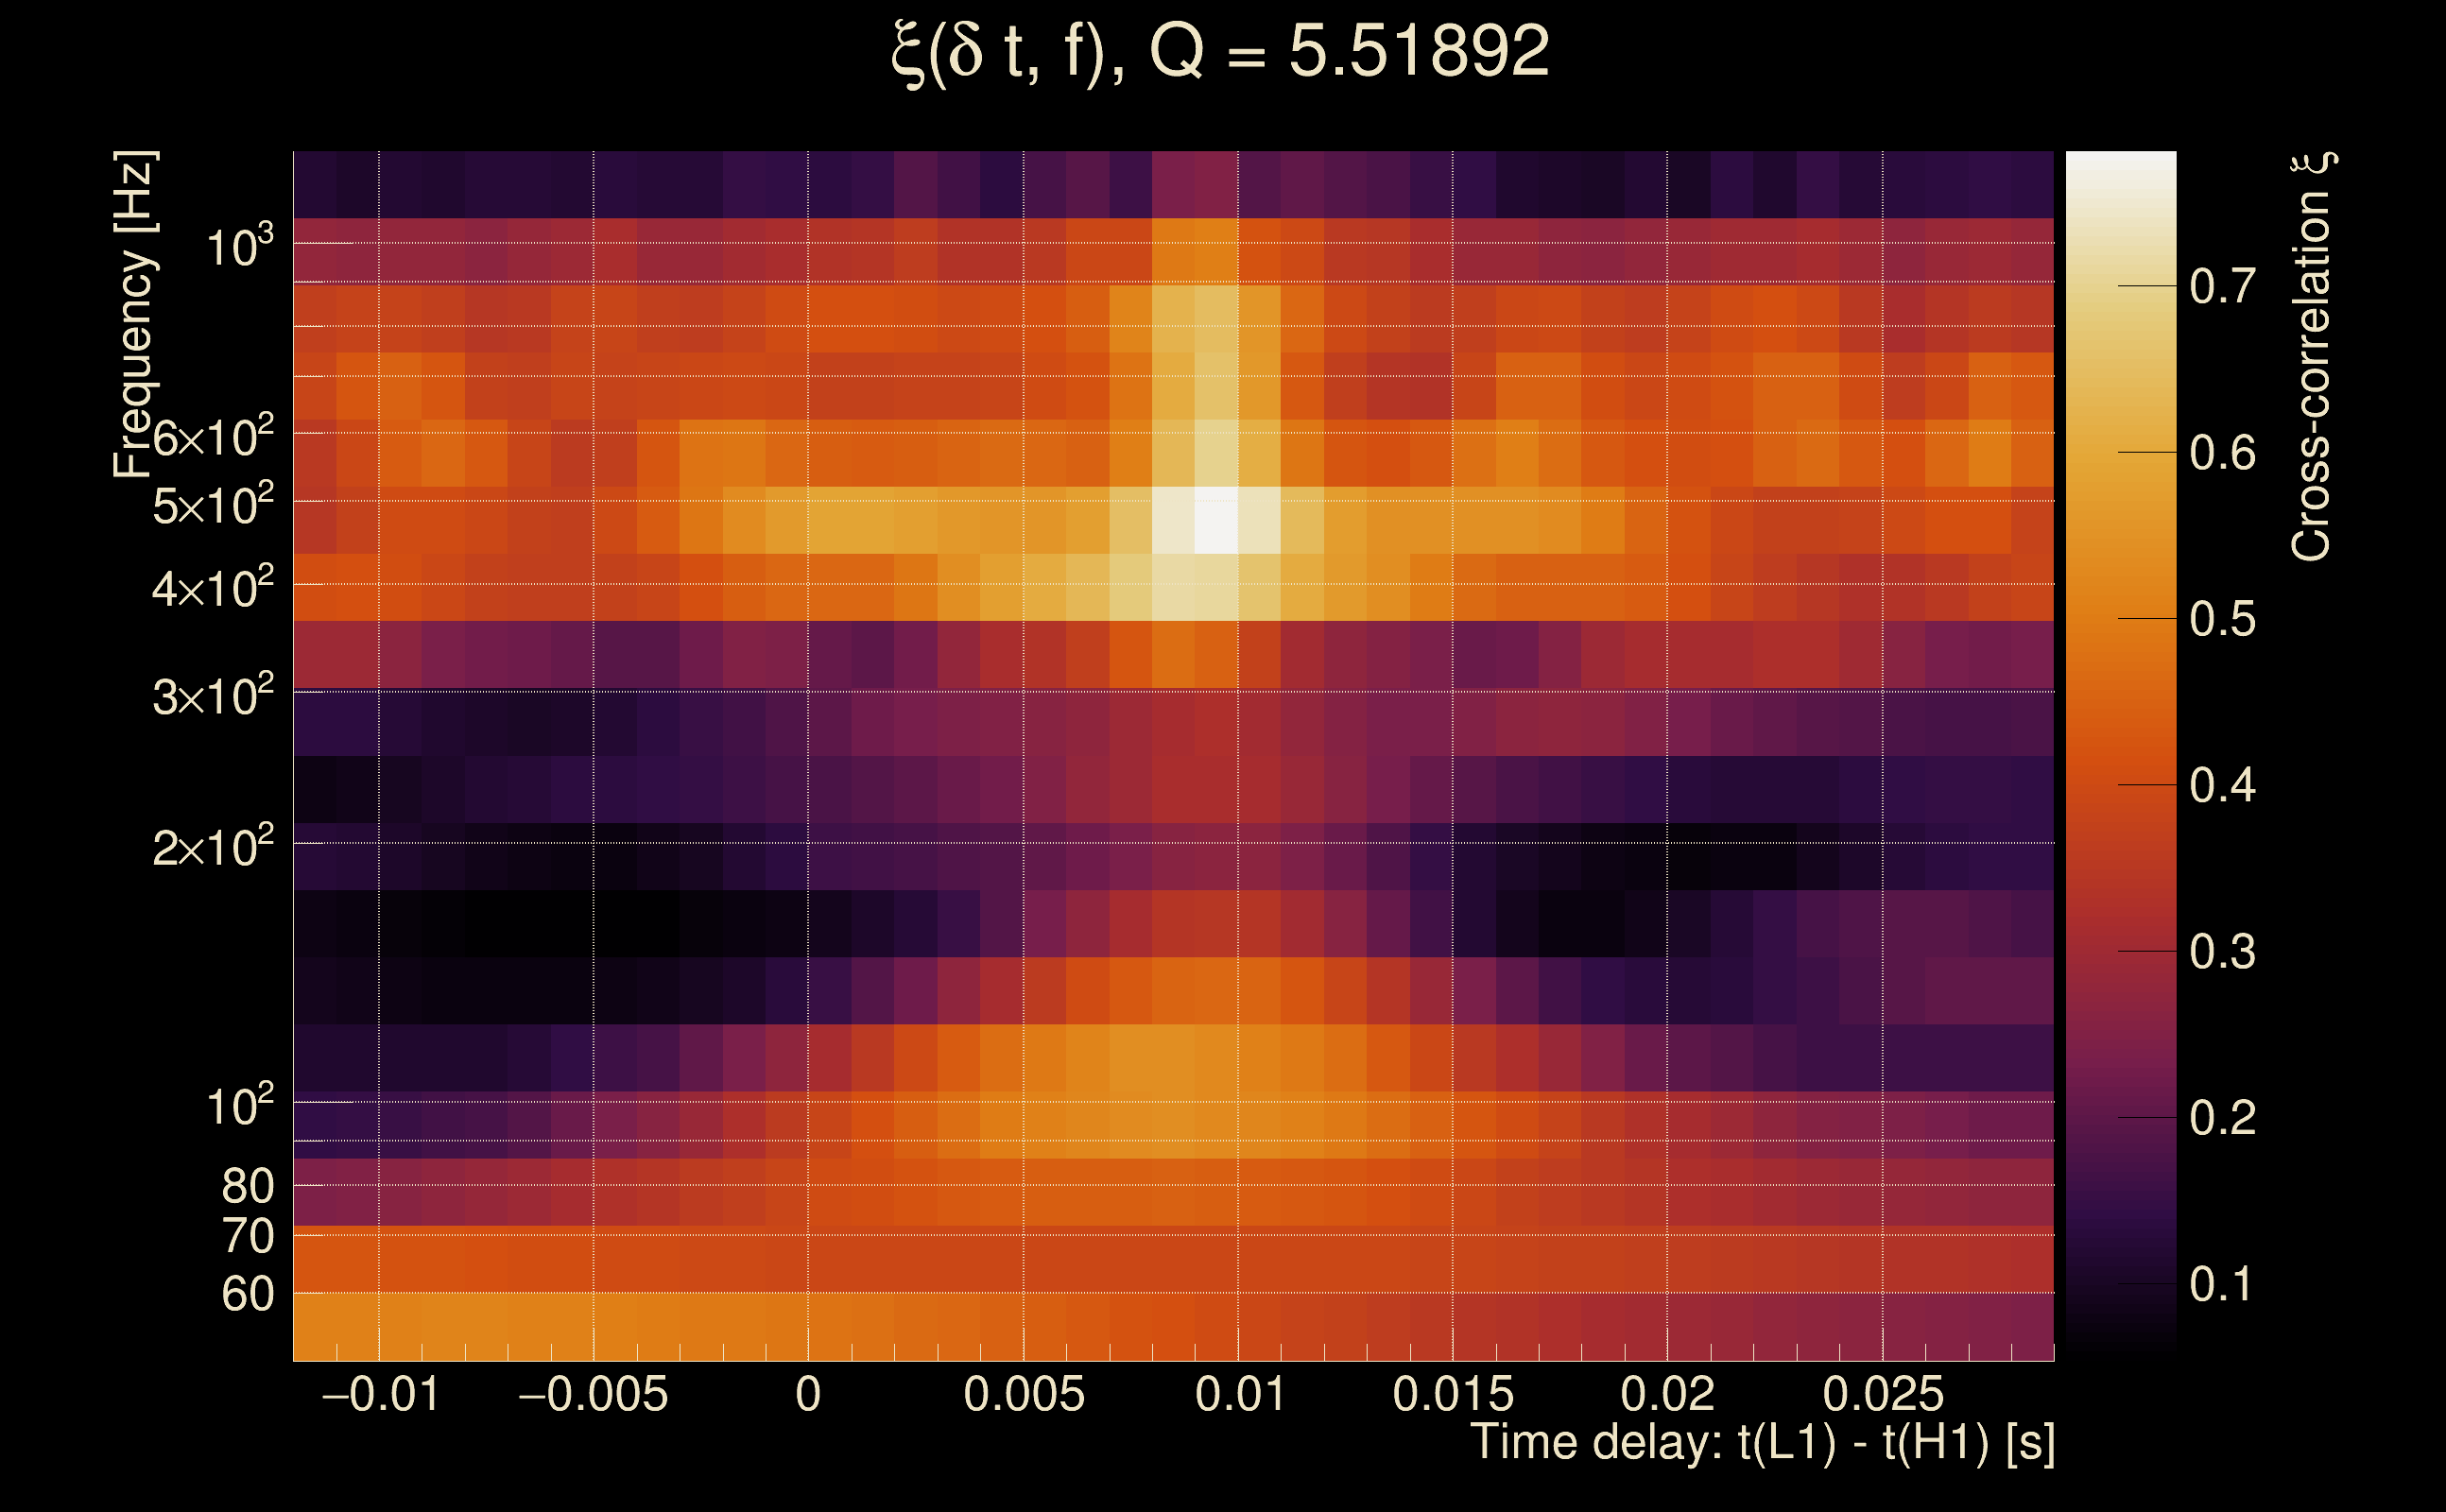
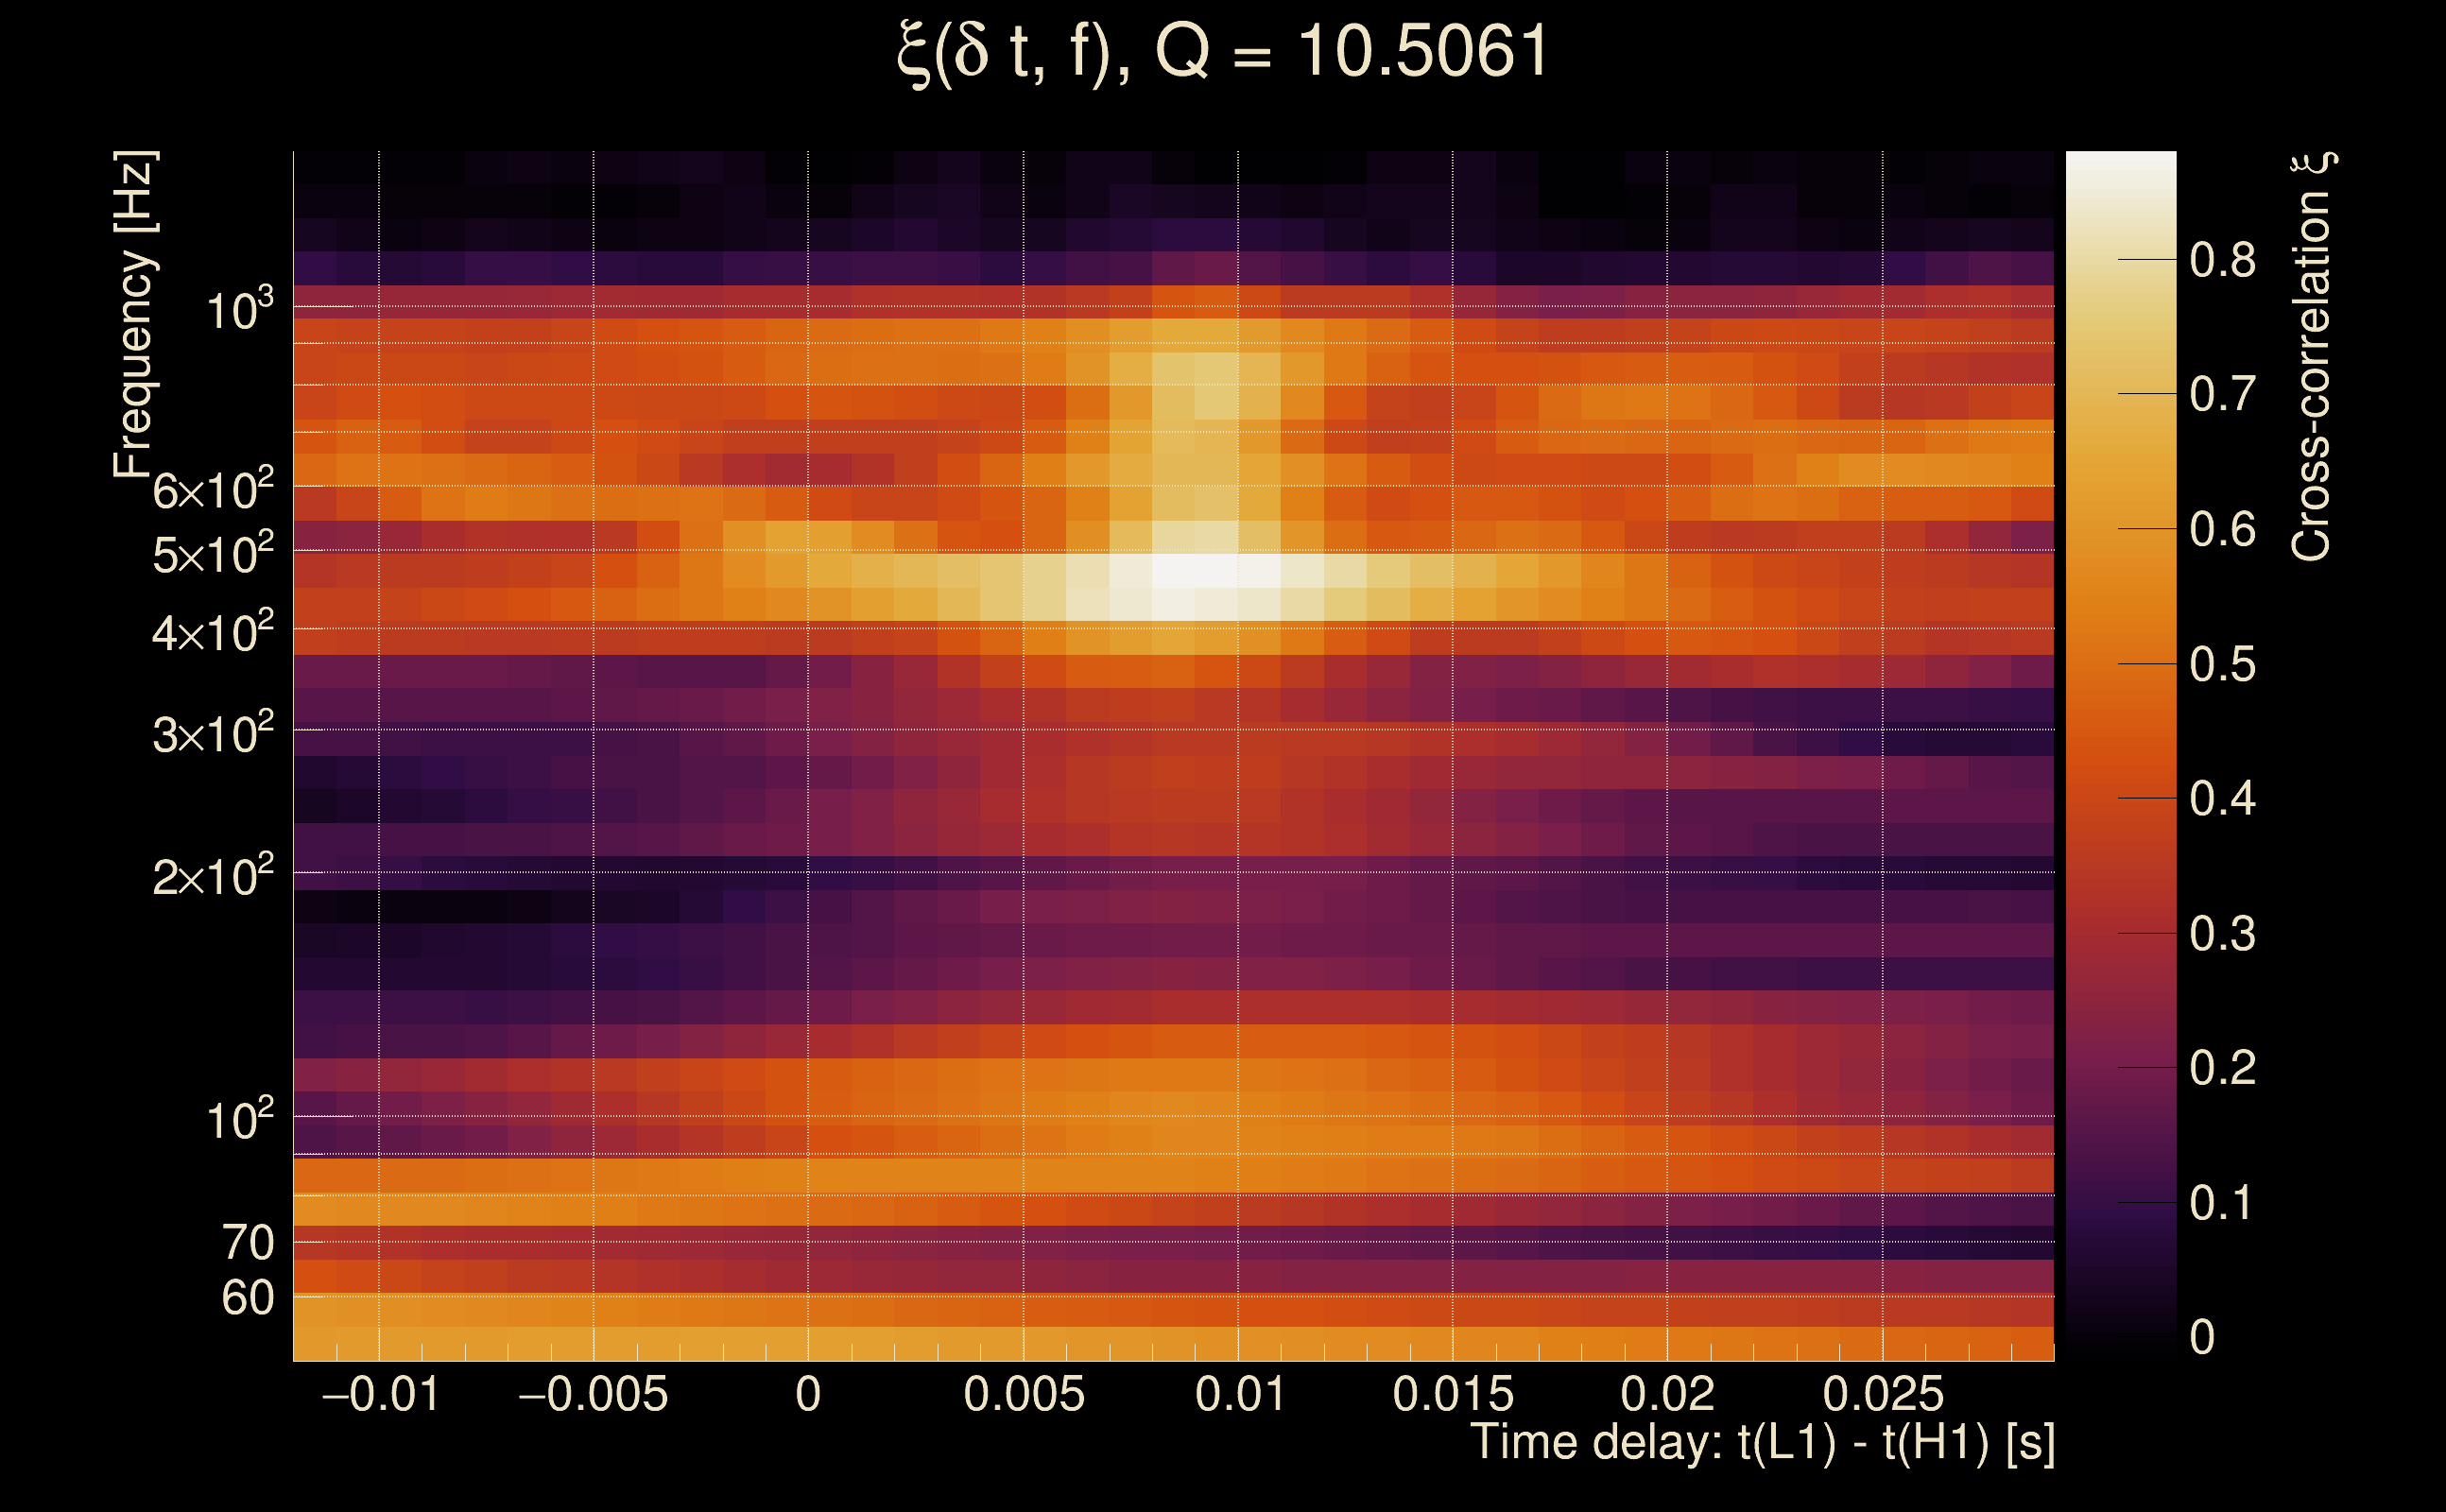
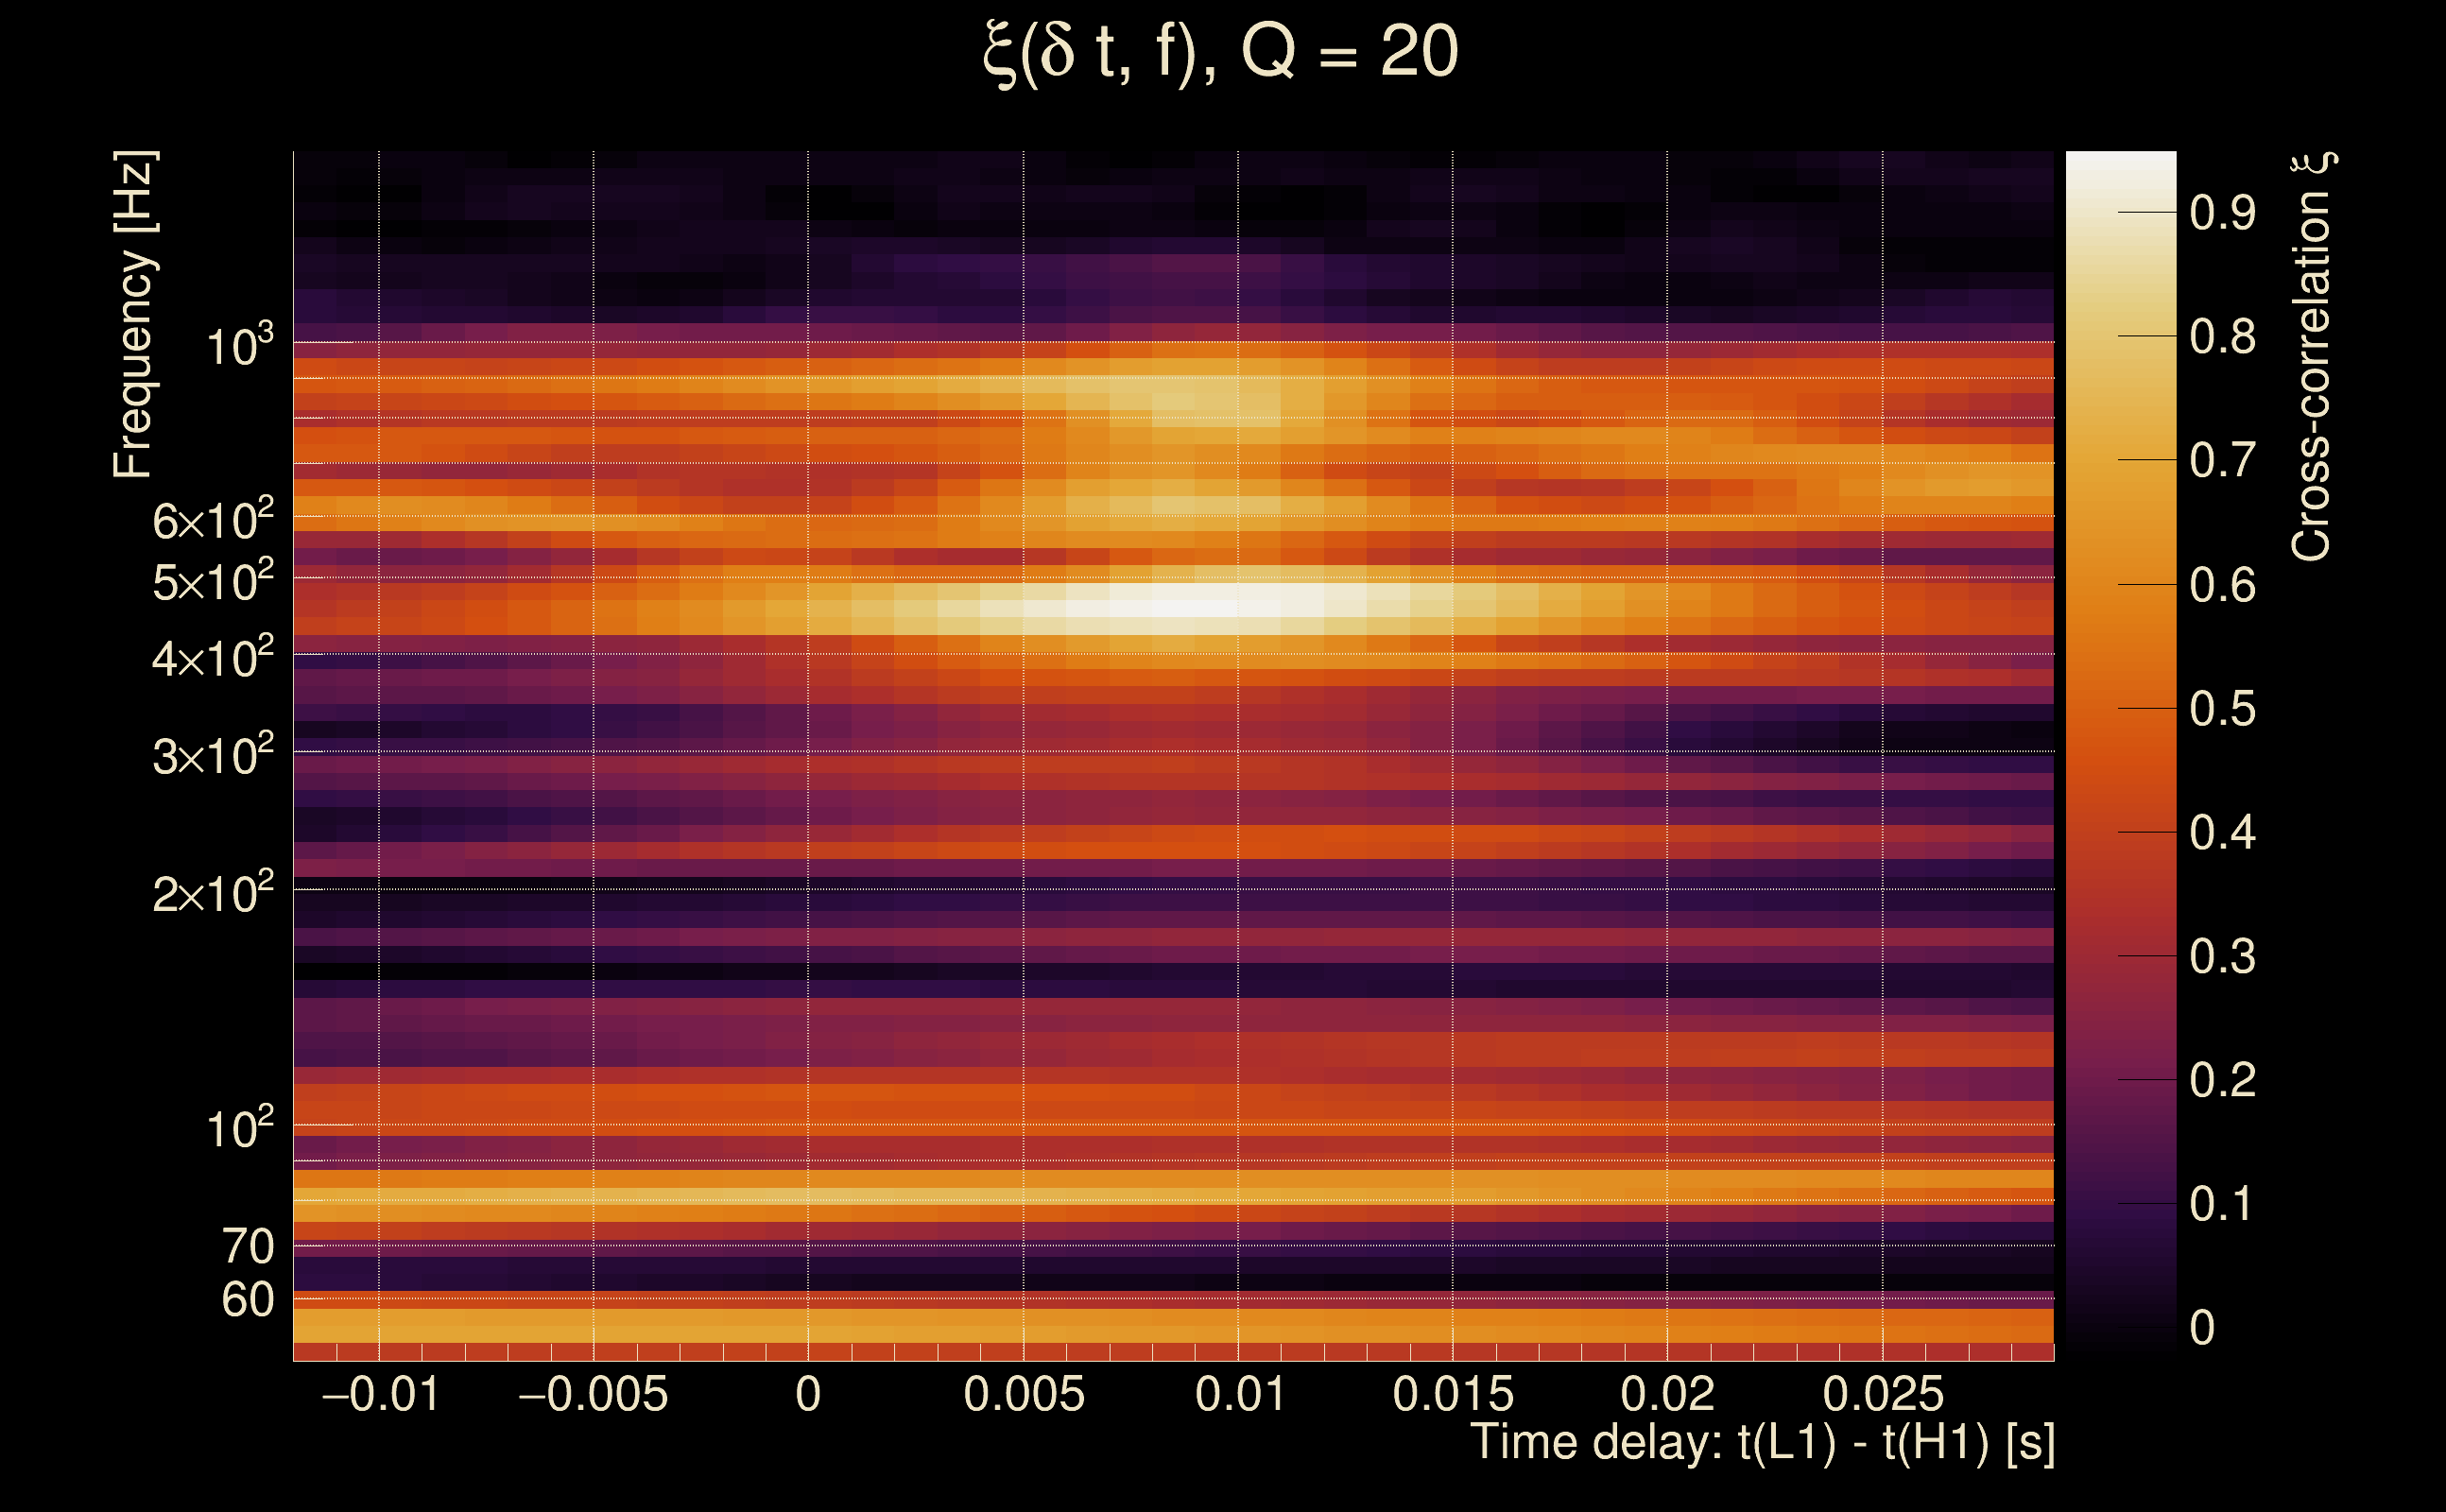
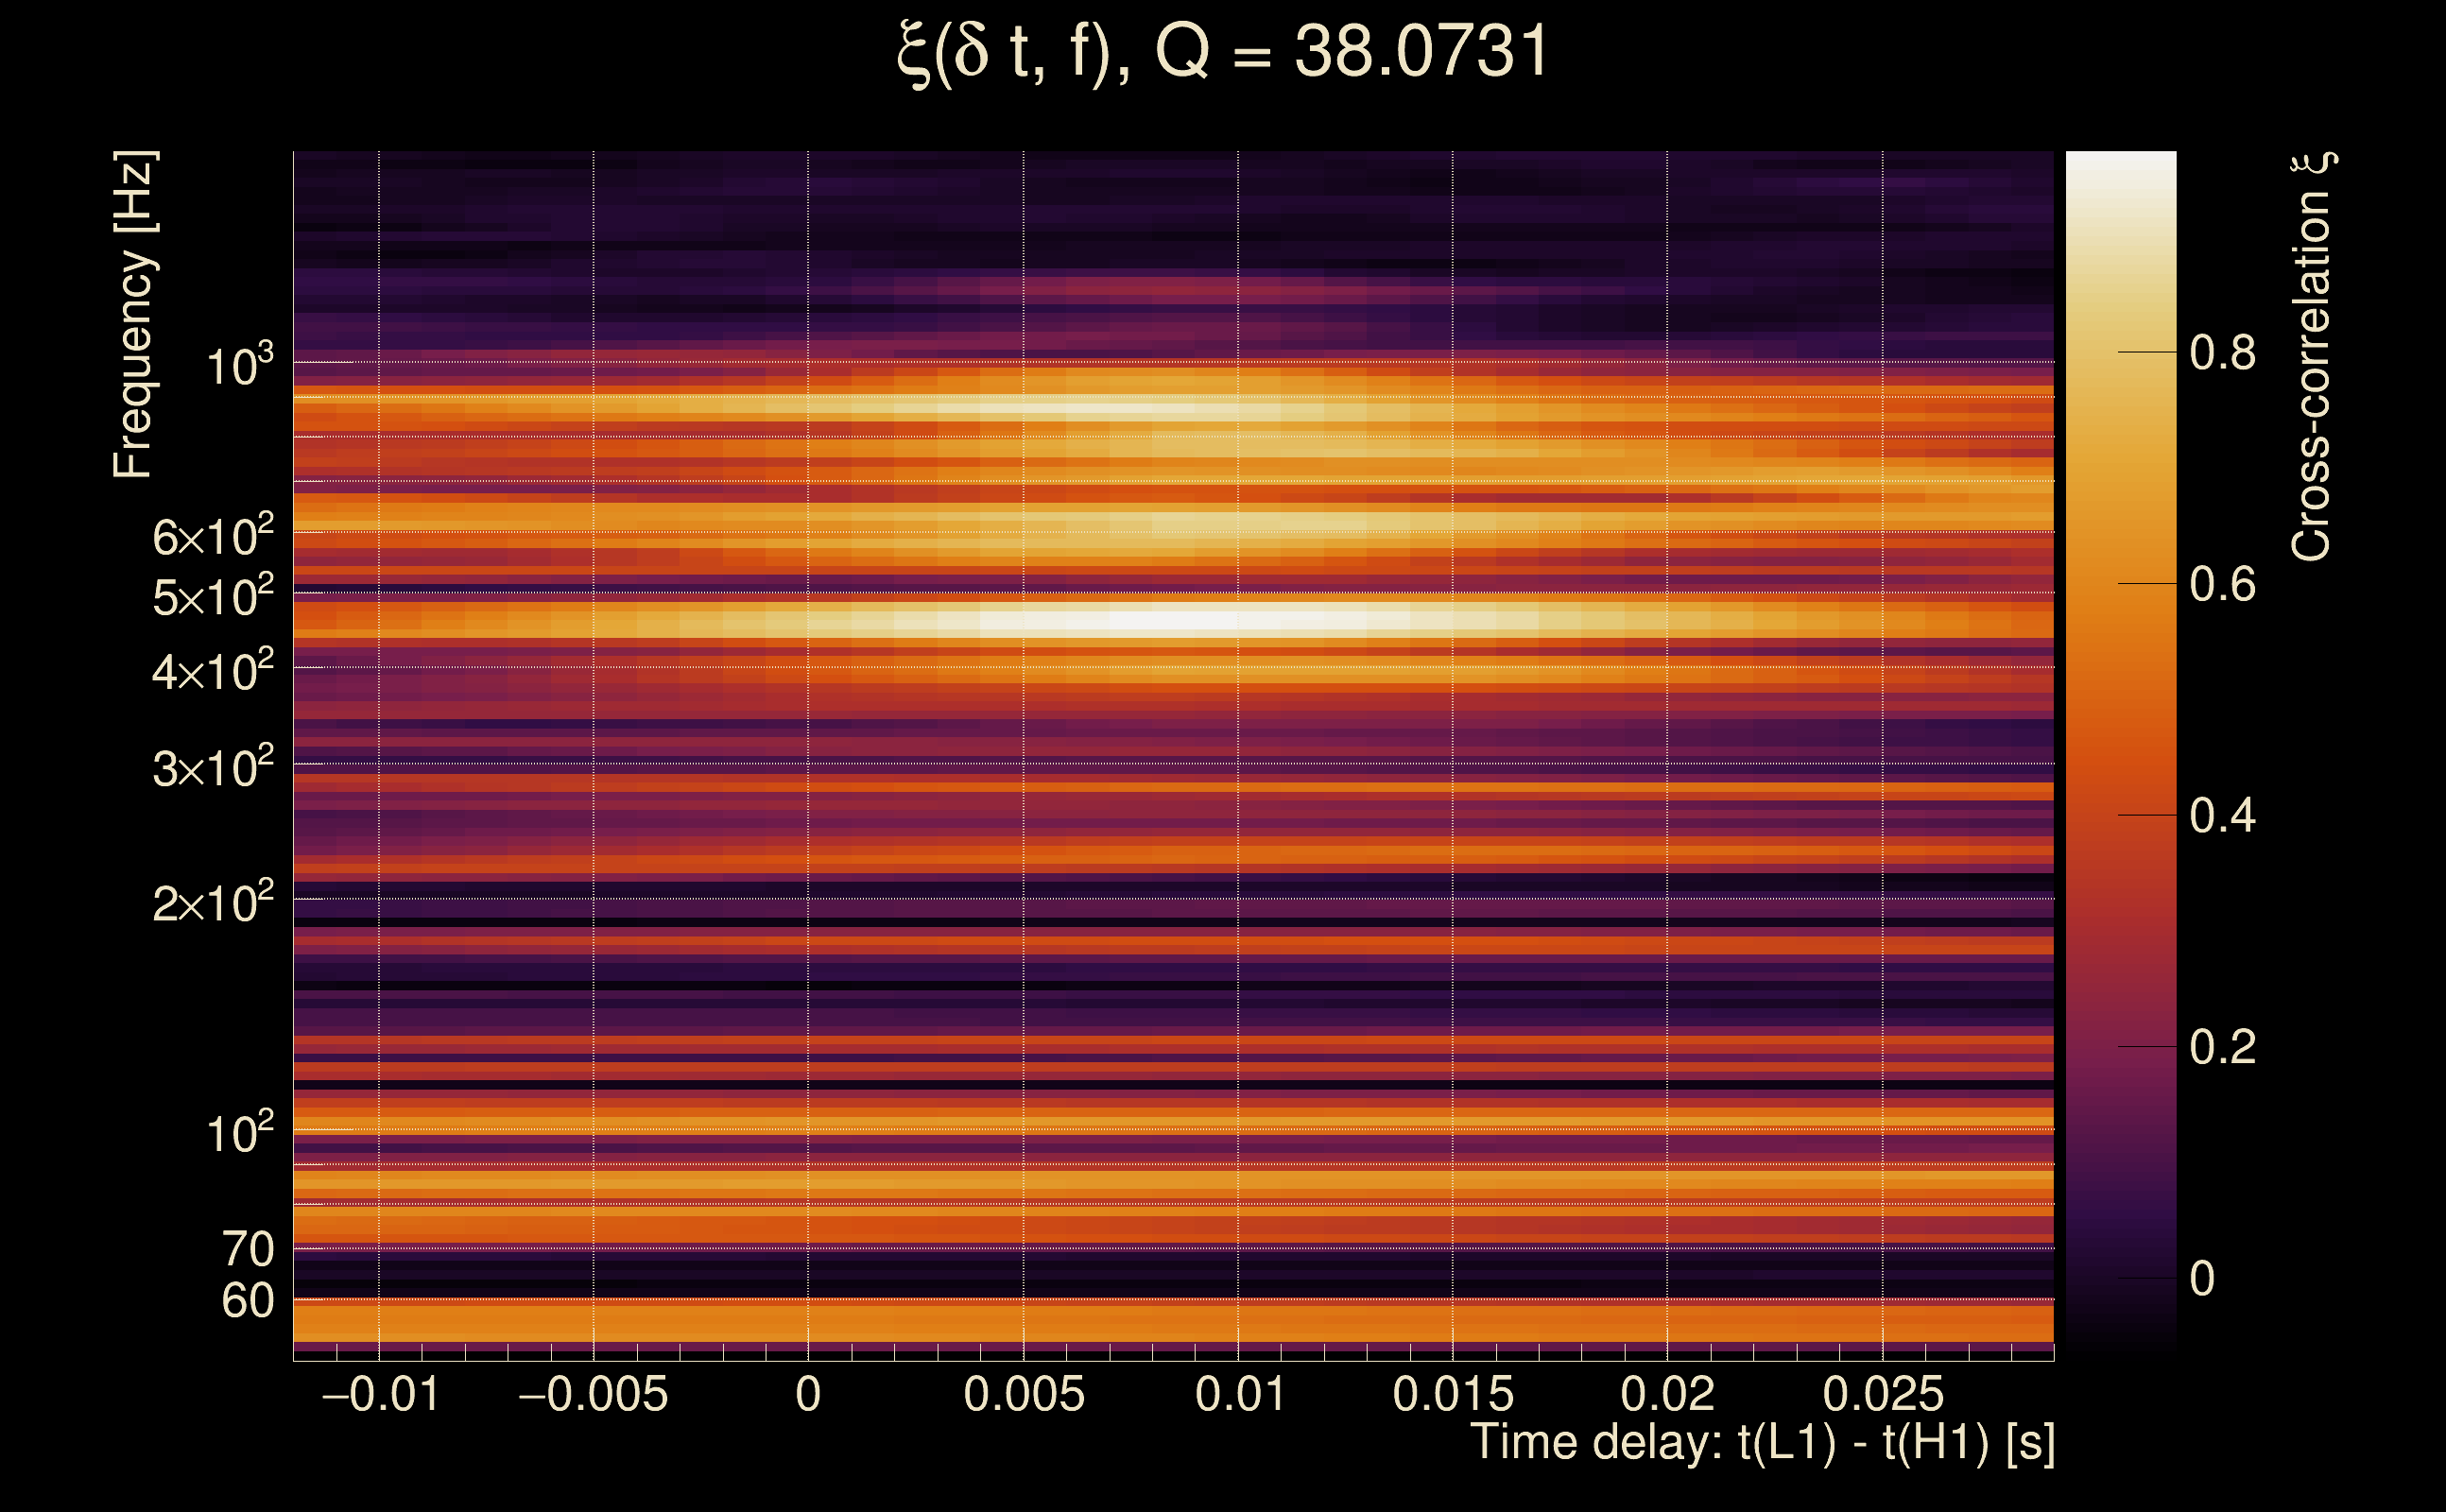
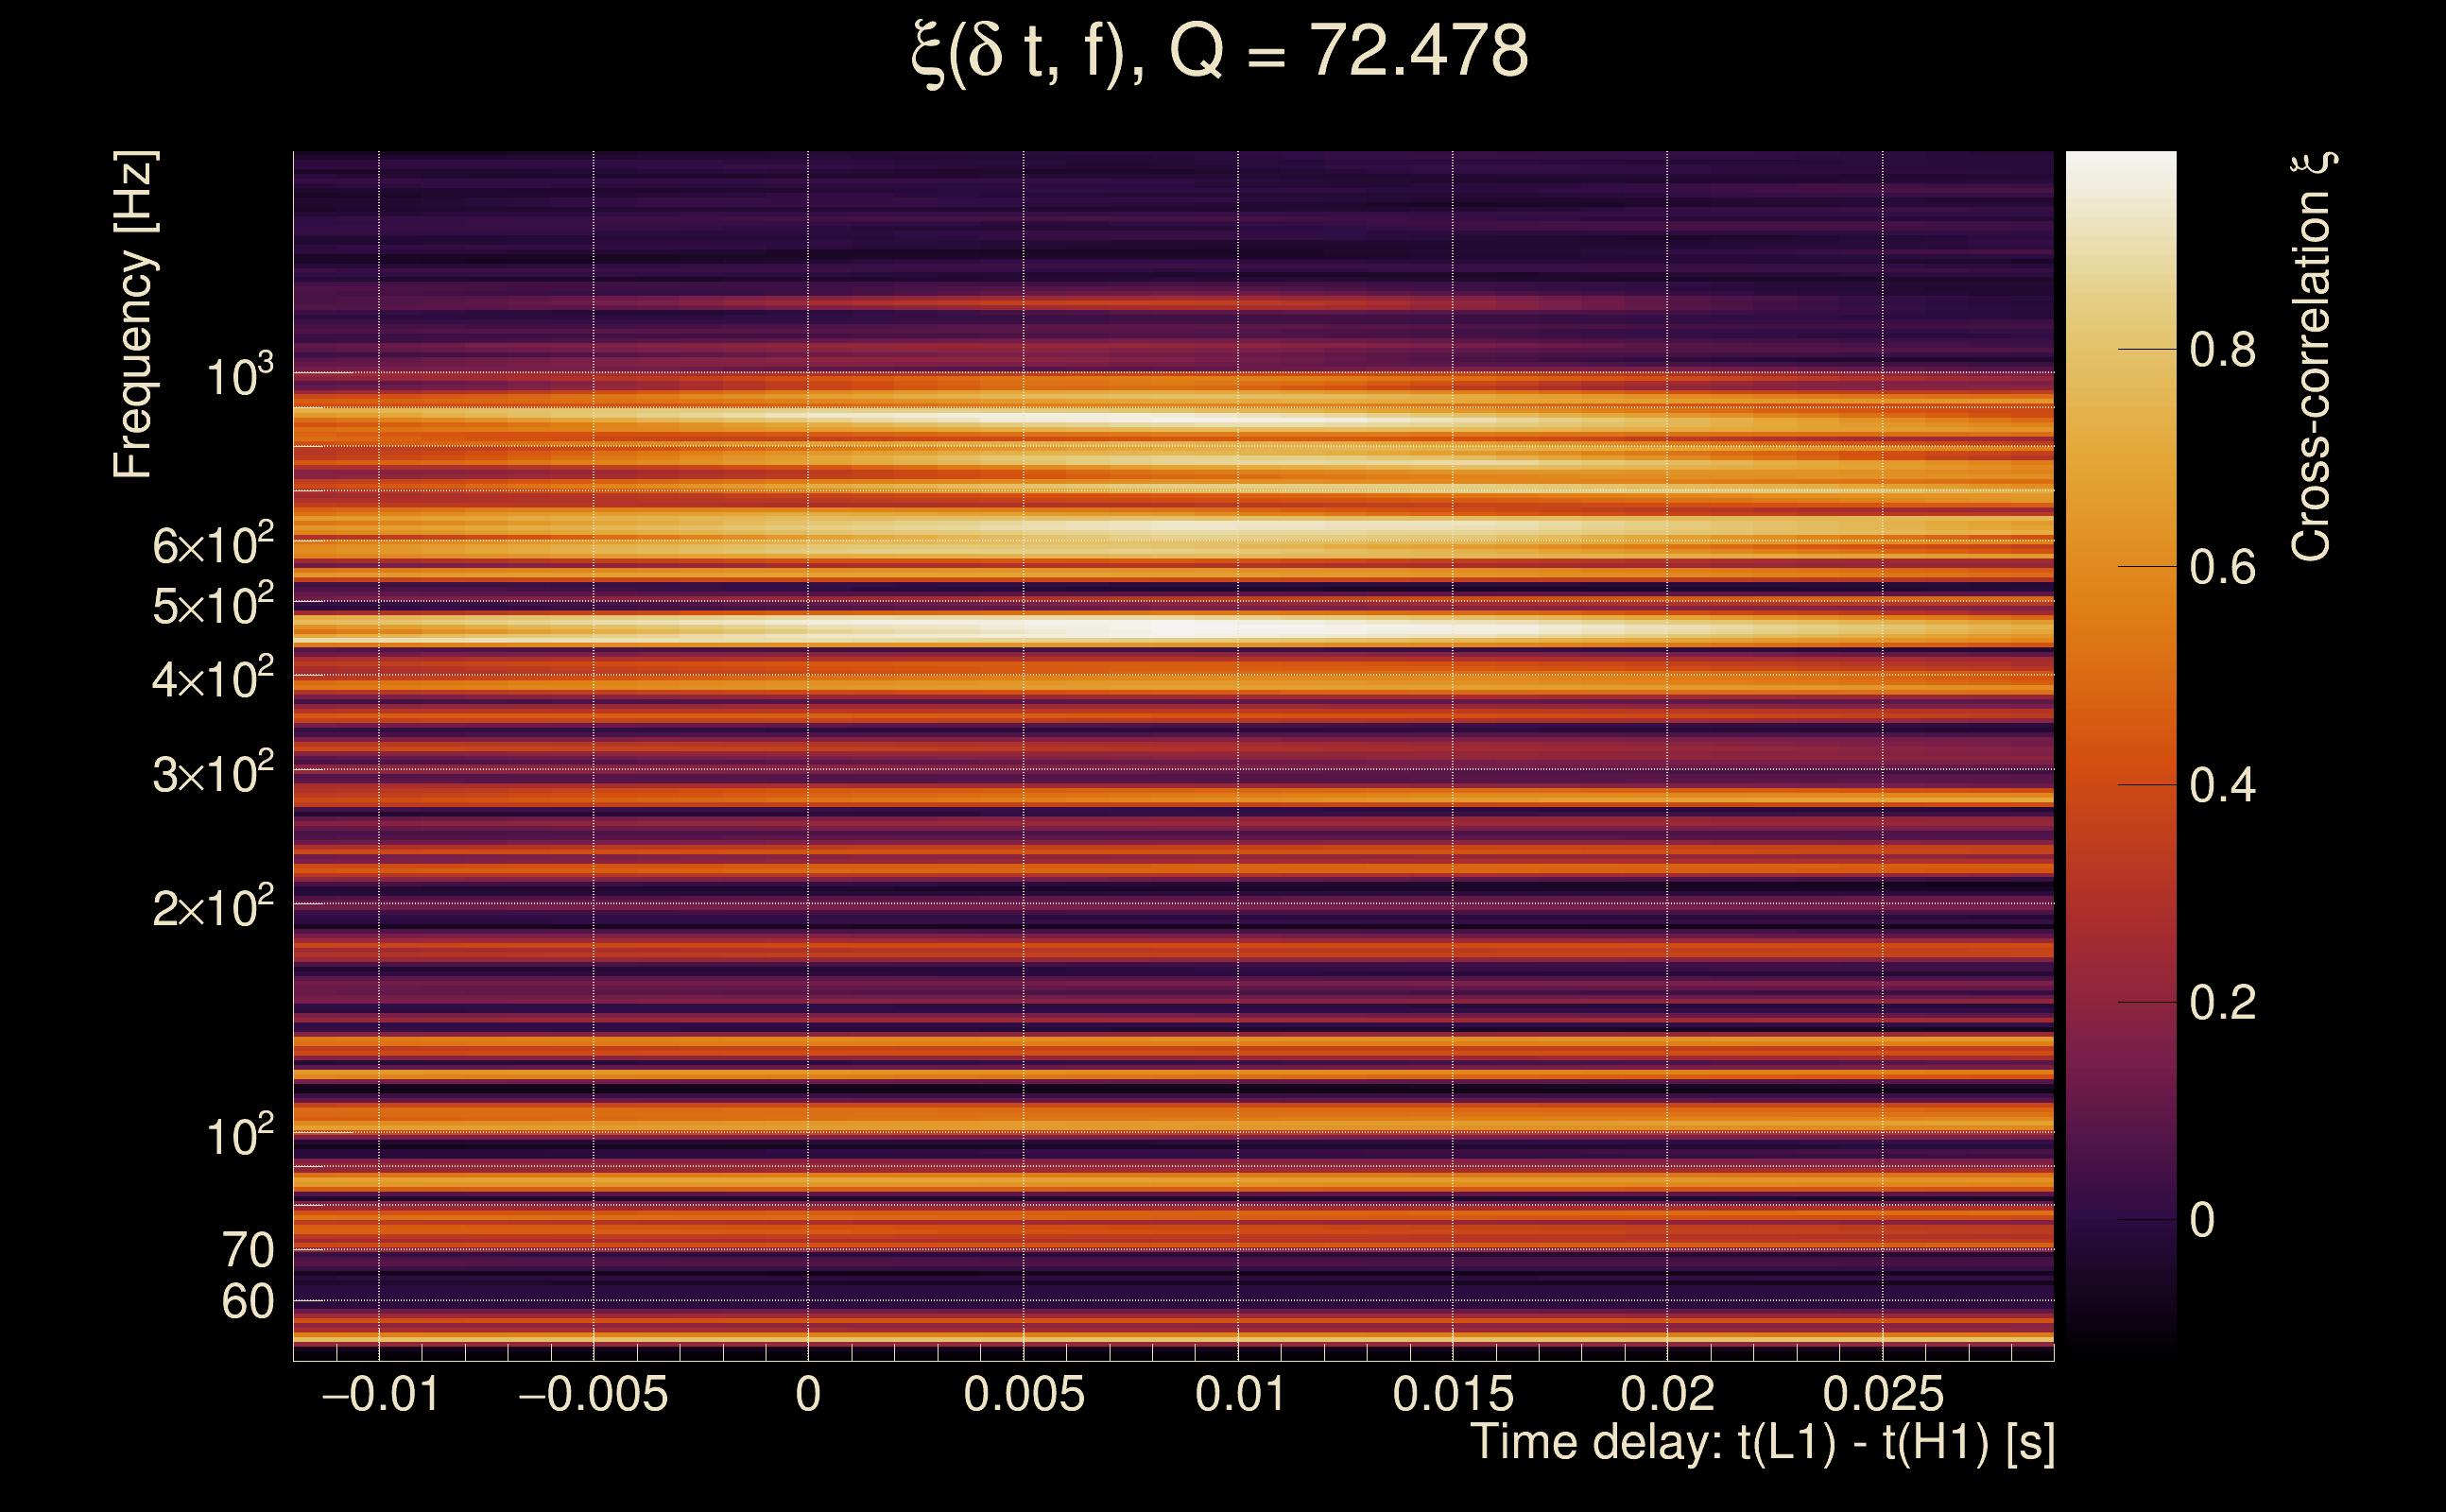
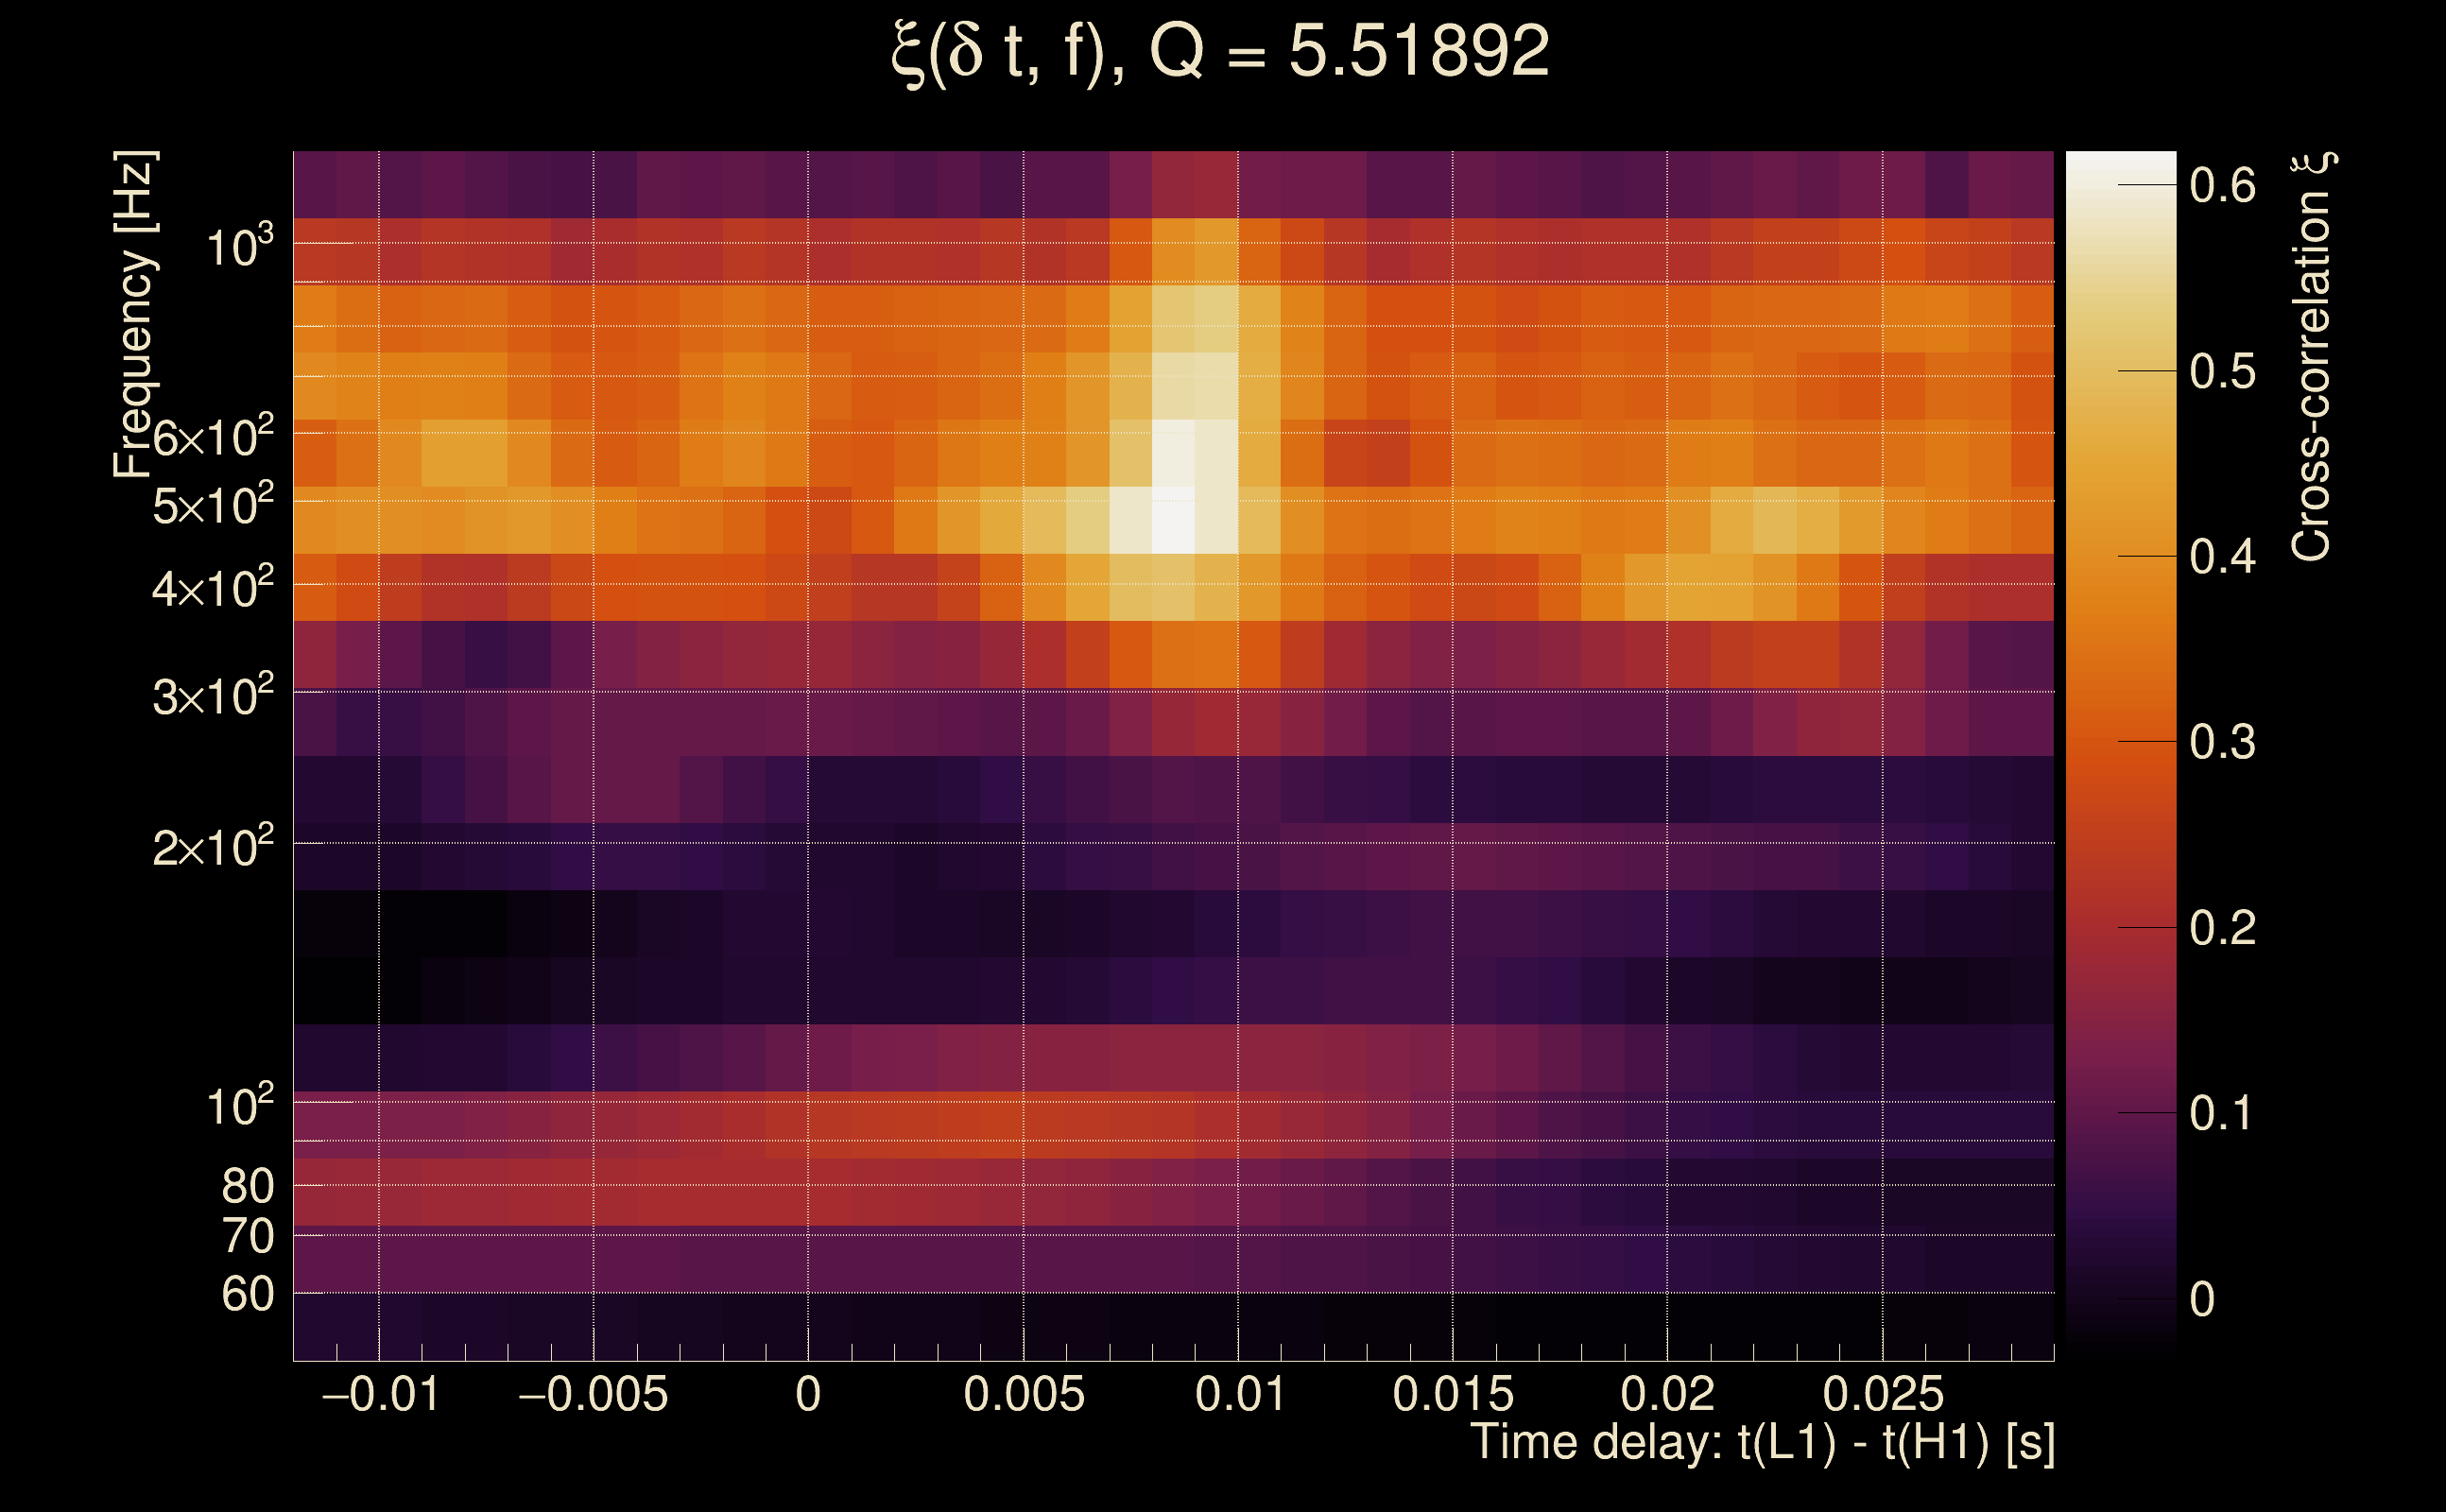
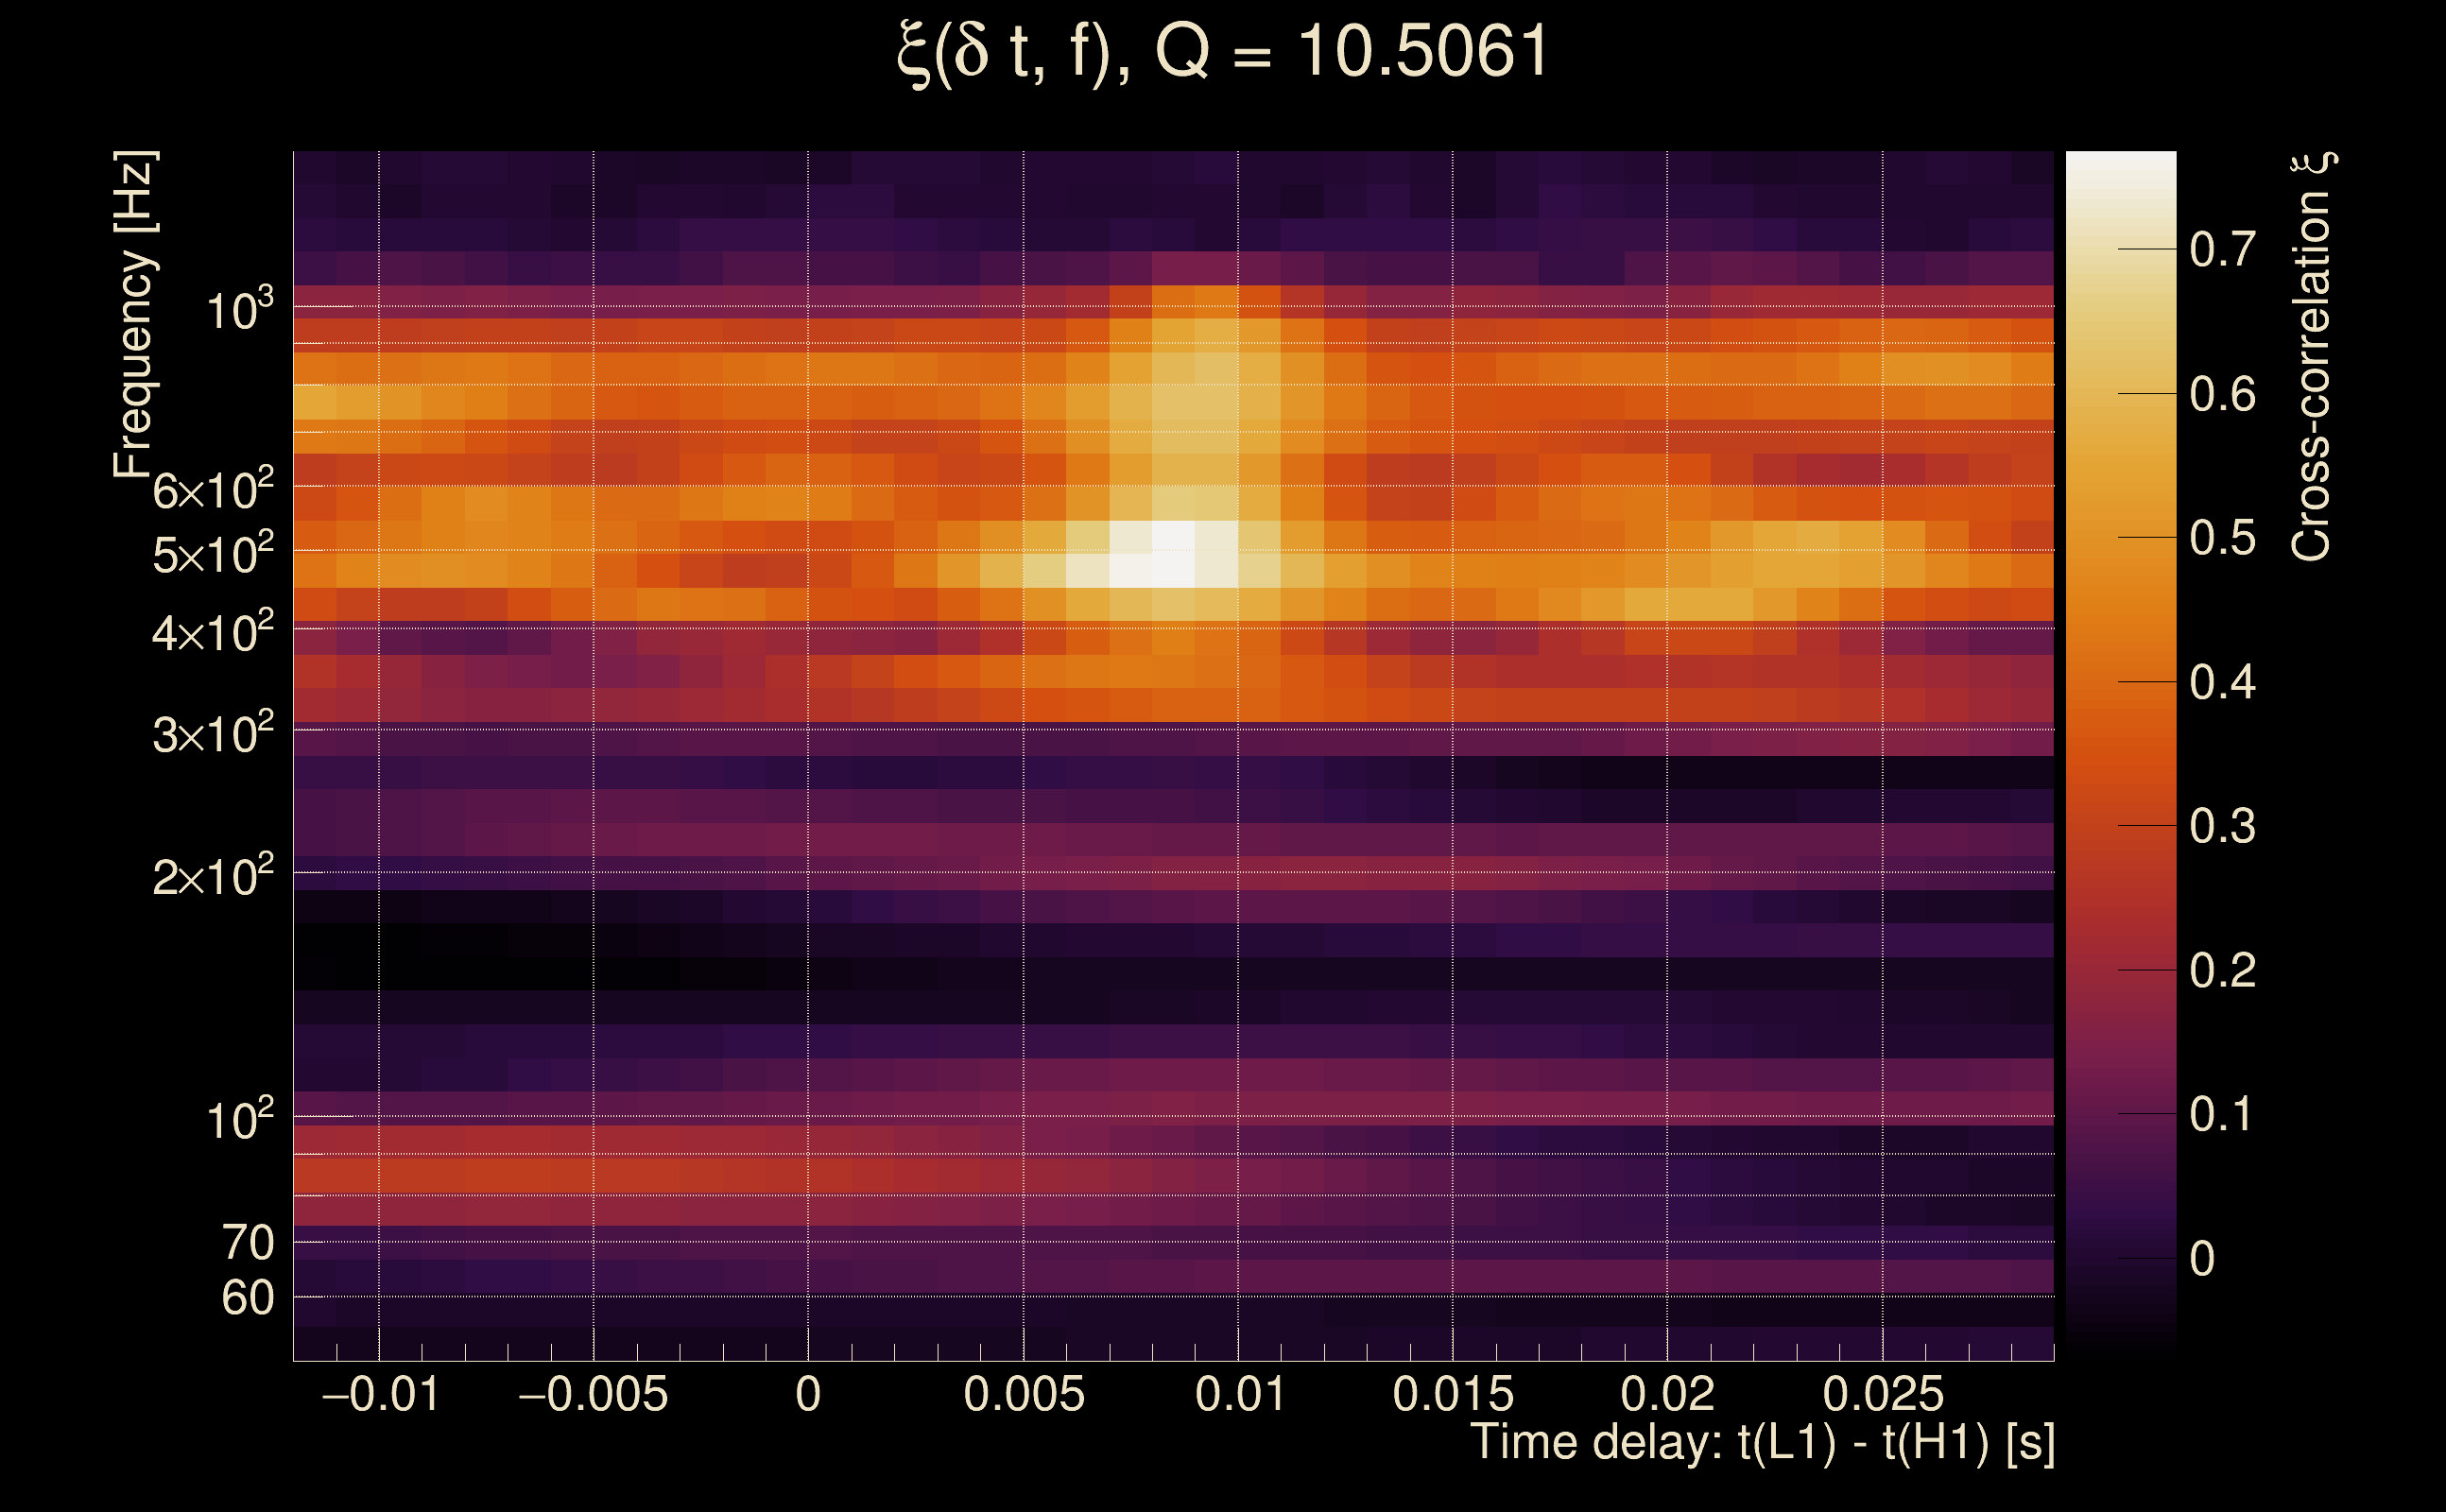
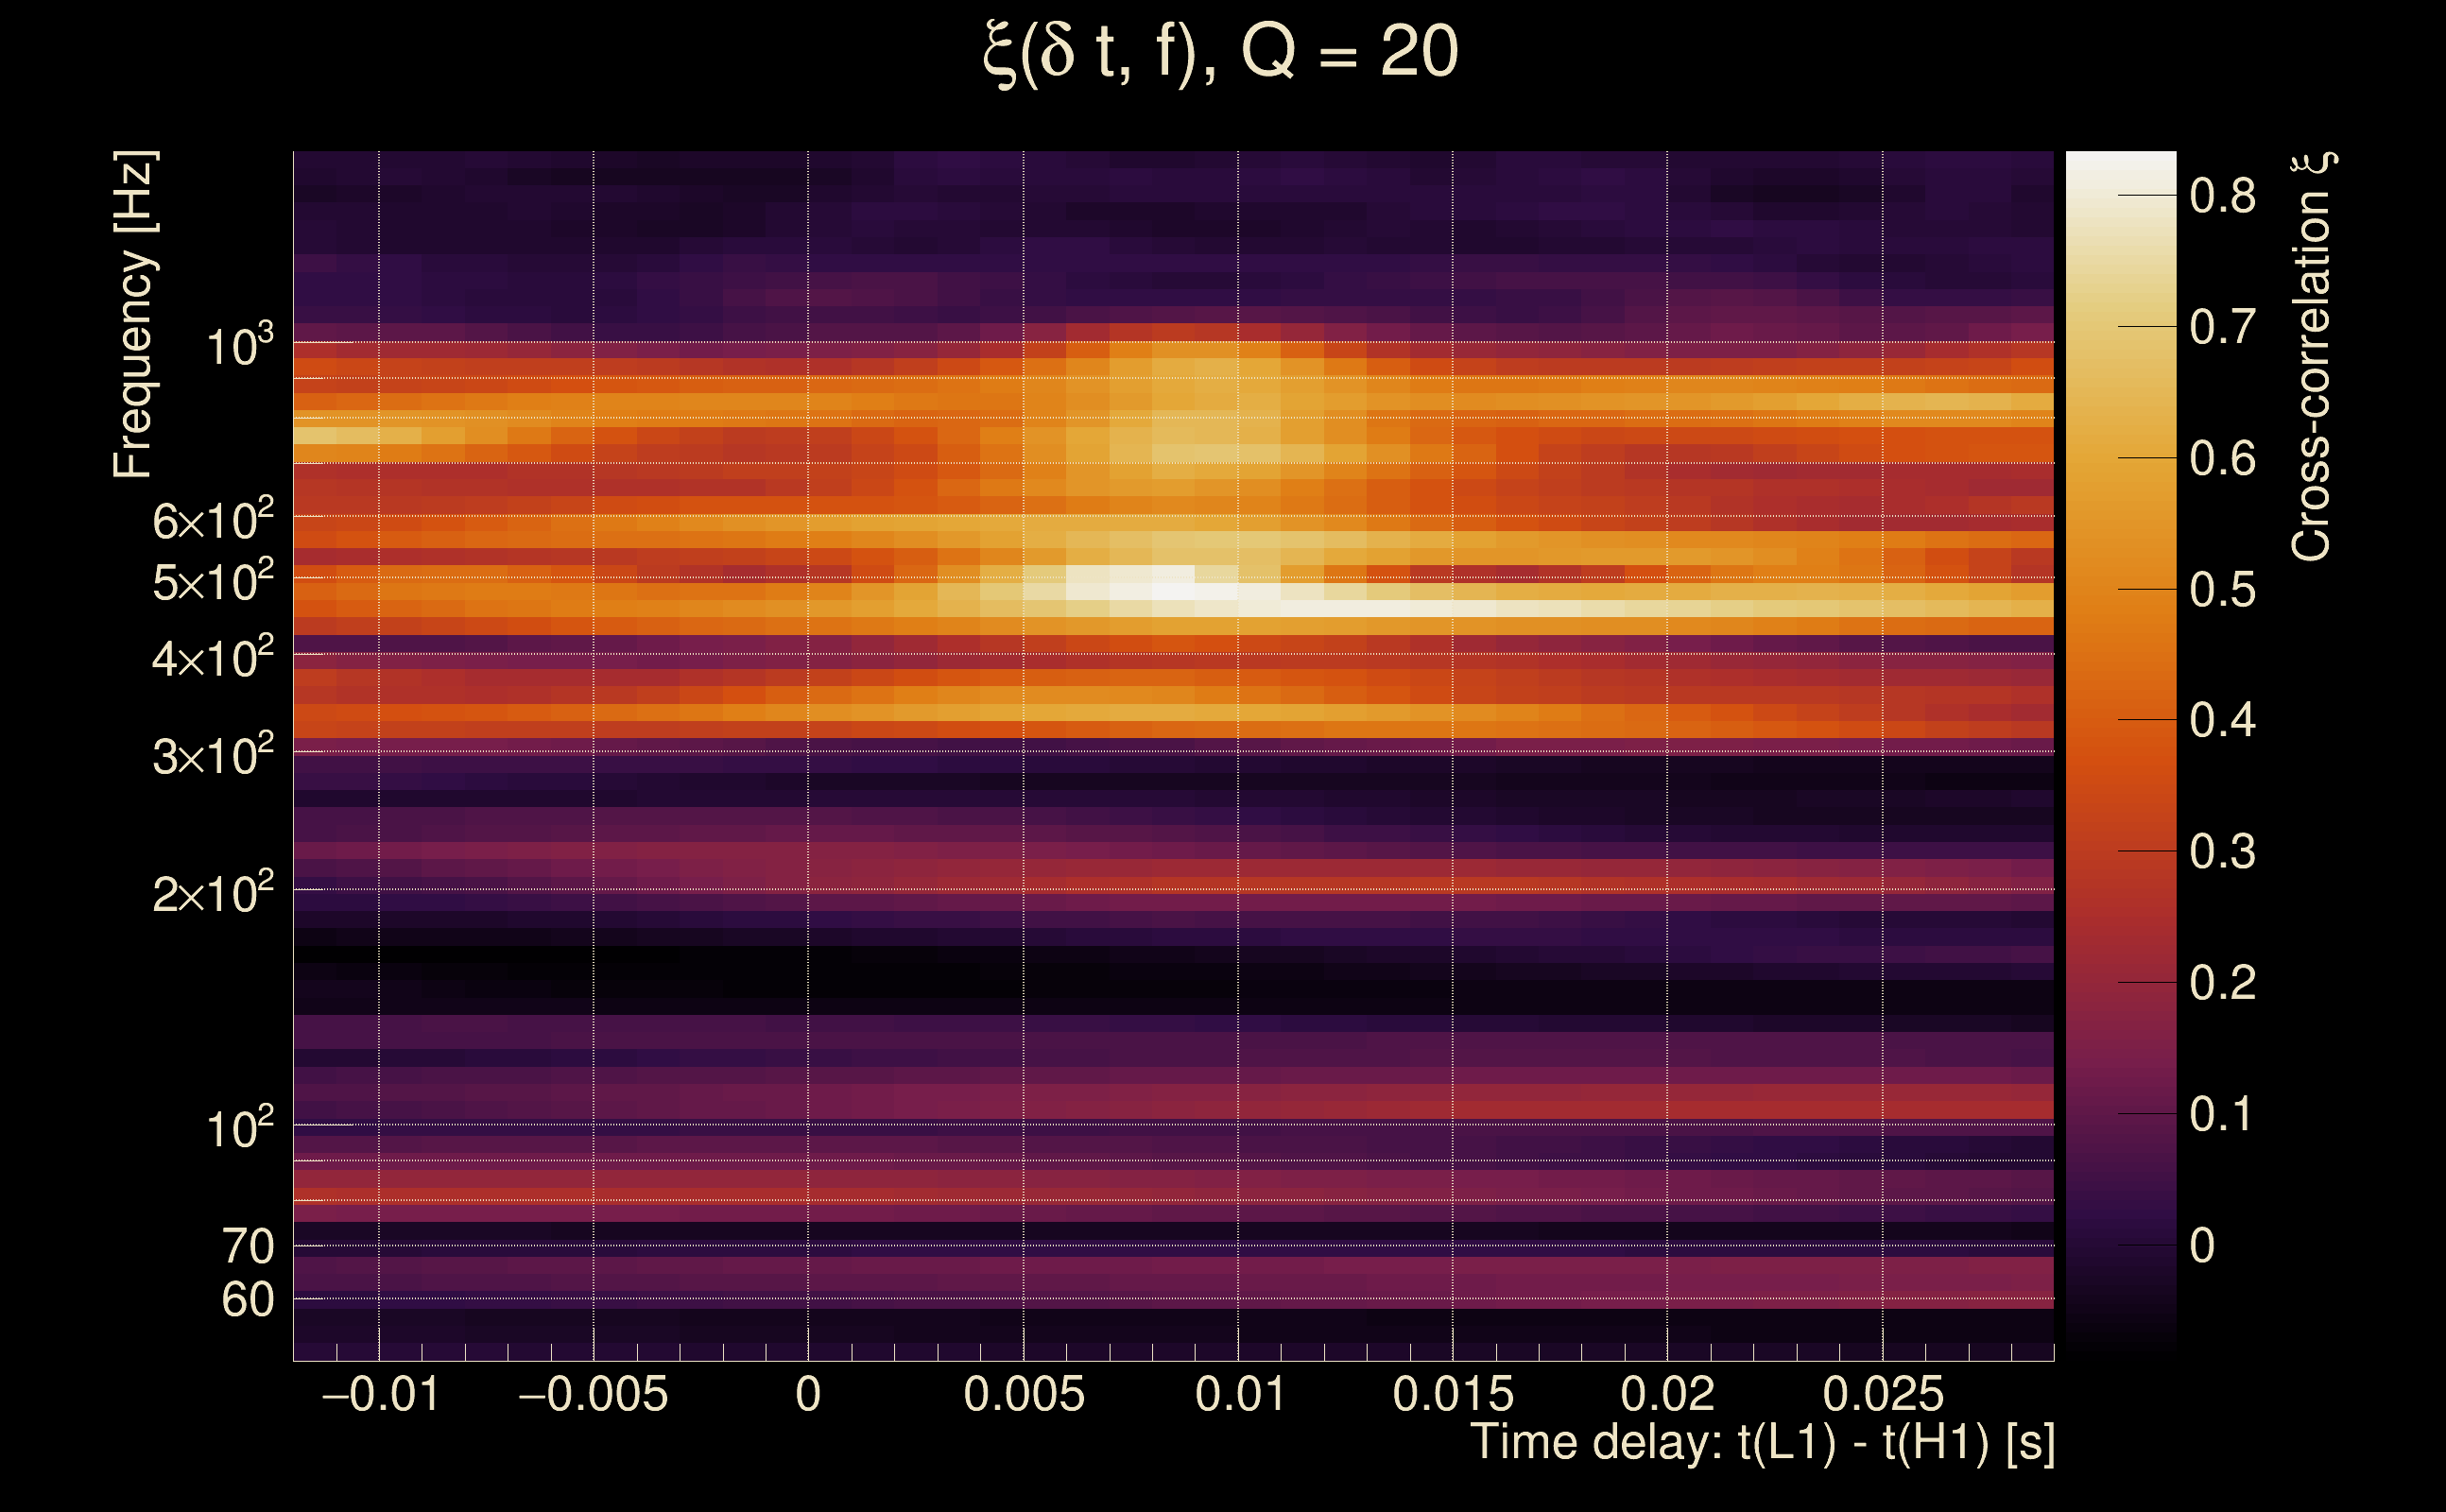
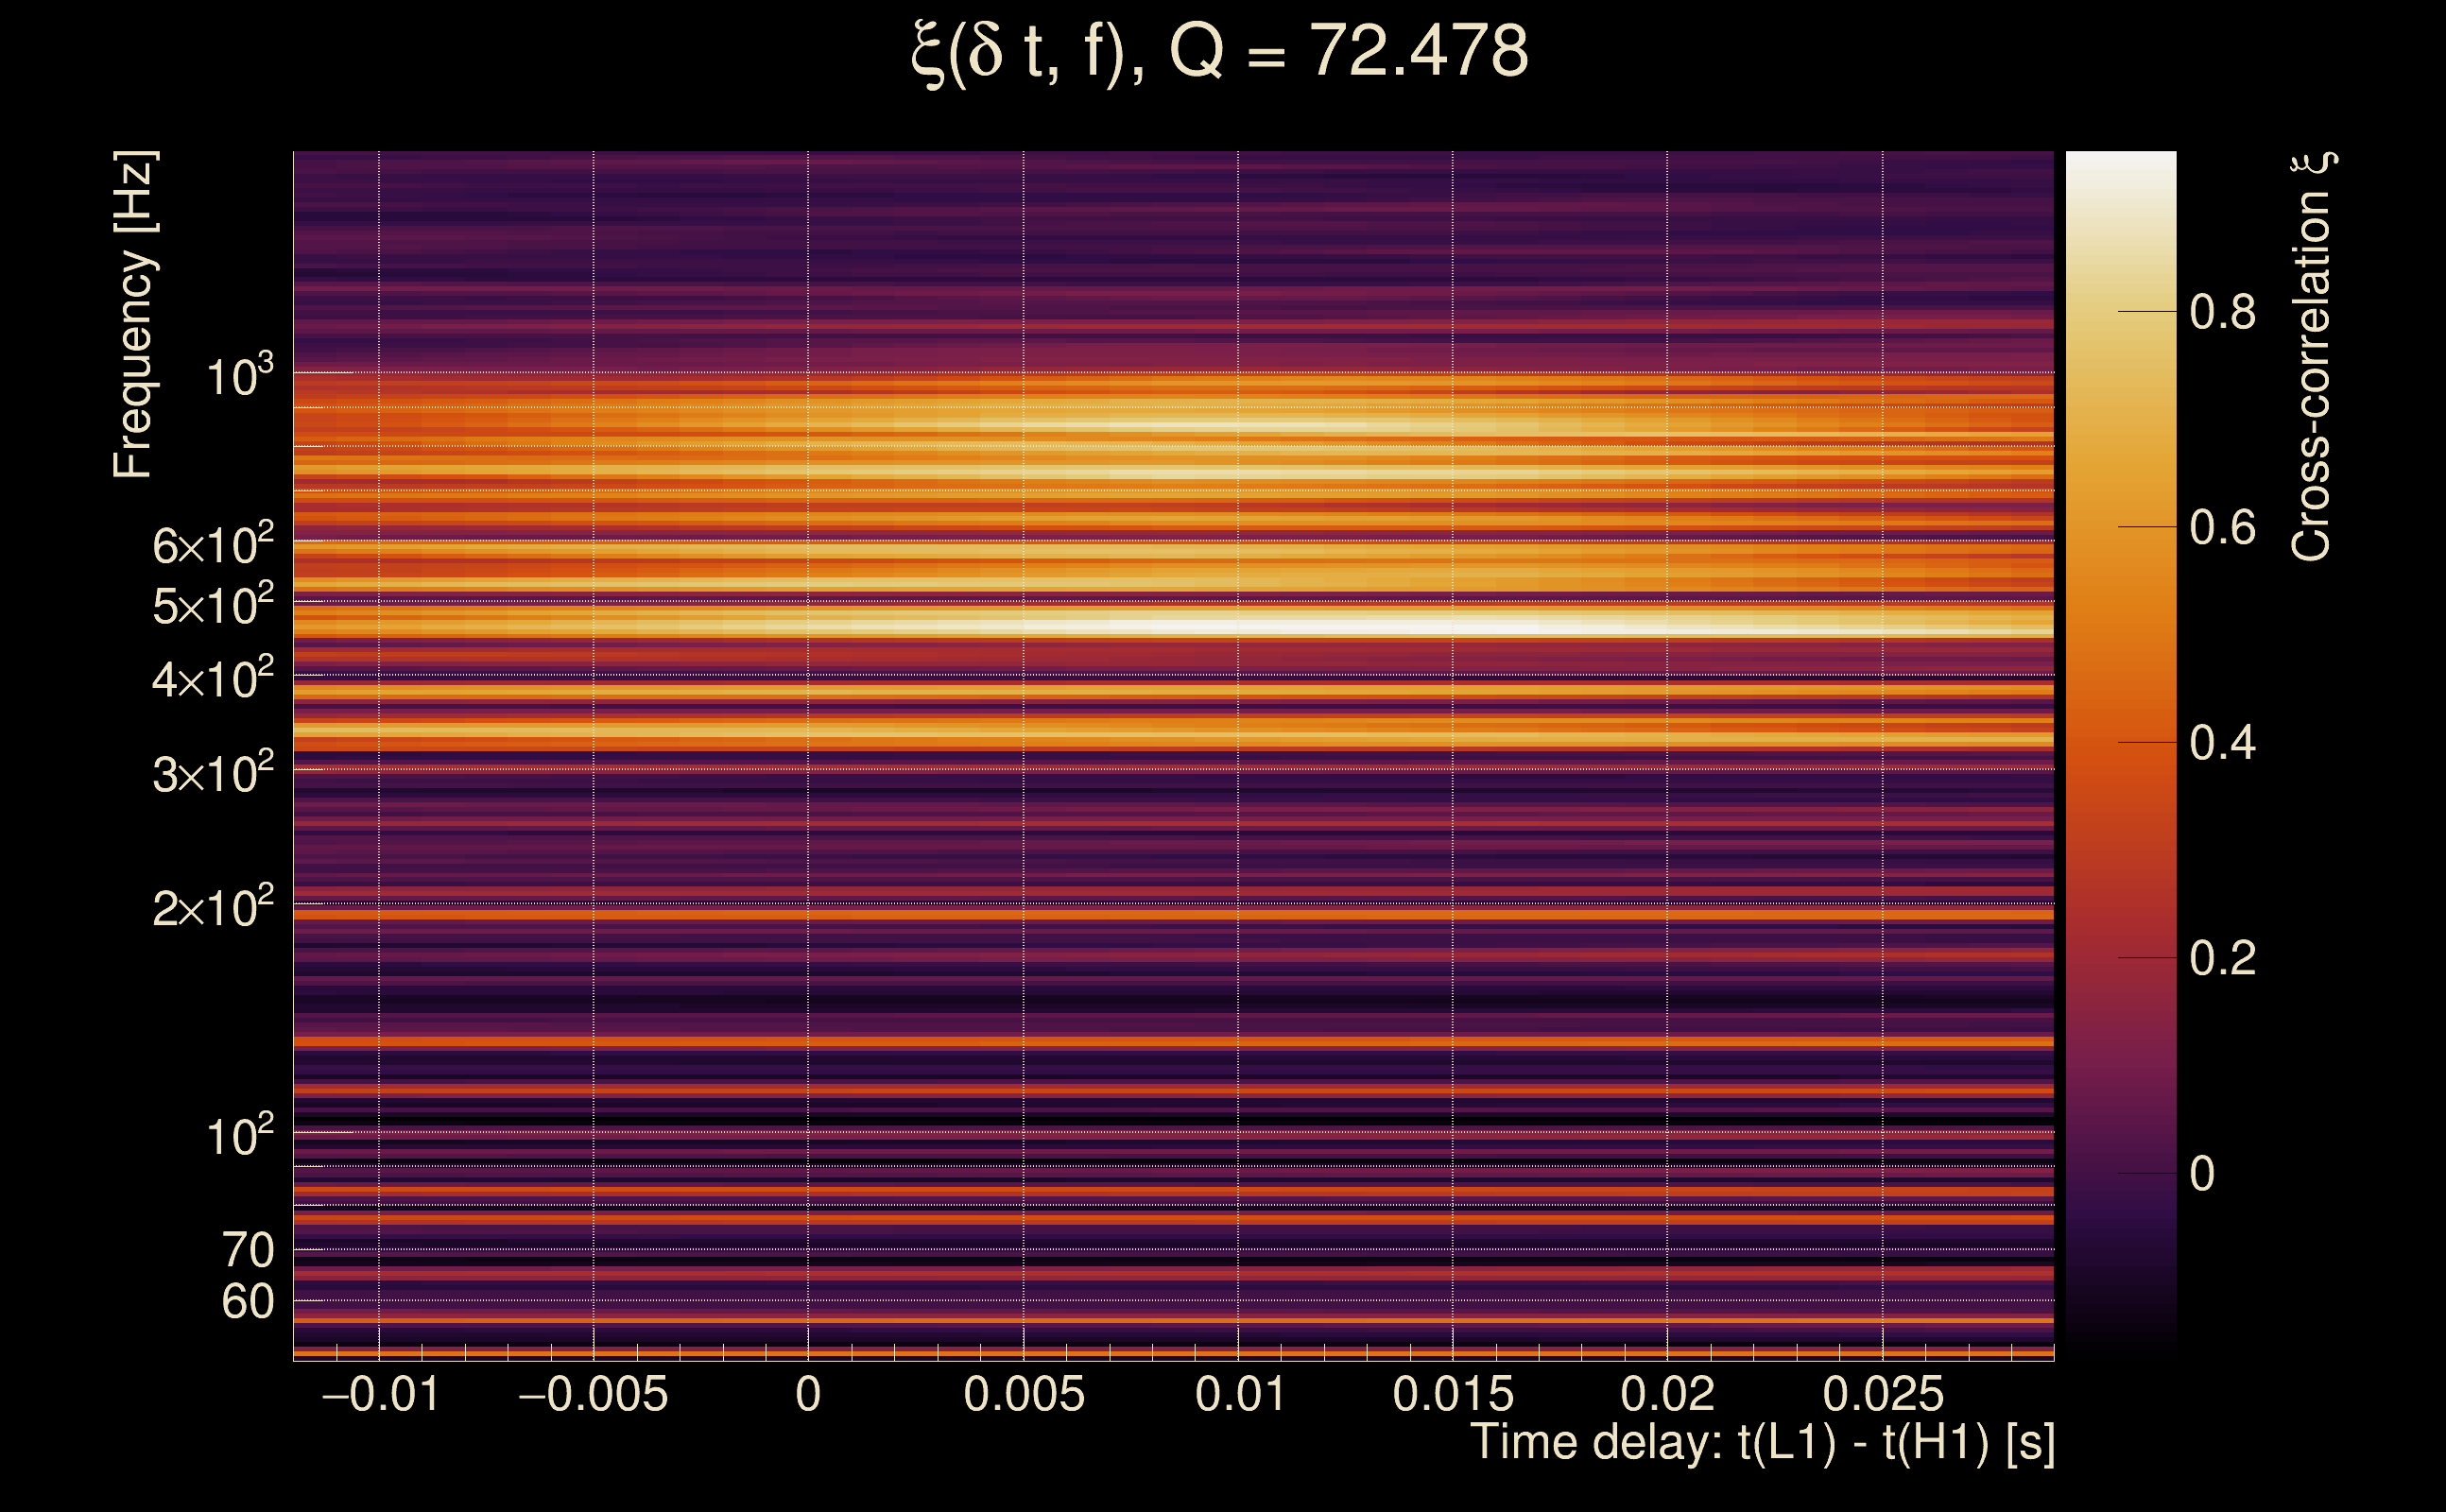
| Number of Q planes: | 5 (Q = 5.51892 → Q = 72.478) |
| Omicron frequency range: | 50 Hz → 1958.38 Hz |
| Light travel time between detectors: | 0.0100128 s |
| Slice extra-time (calibration uncertainty + slice veto): | 0.0129872 s |
| Number of time-delay bins in a cross-correlation map: | 10000 |
| Number of slices in a cross-correlation map: | 217 |
| Number of time-delay bins in a slice: | 46 |
| SNR gating: | < 100 (detector 0), < 100 (detector 1) |
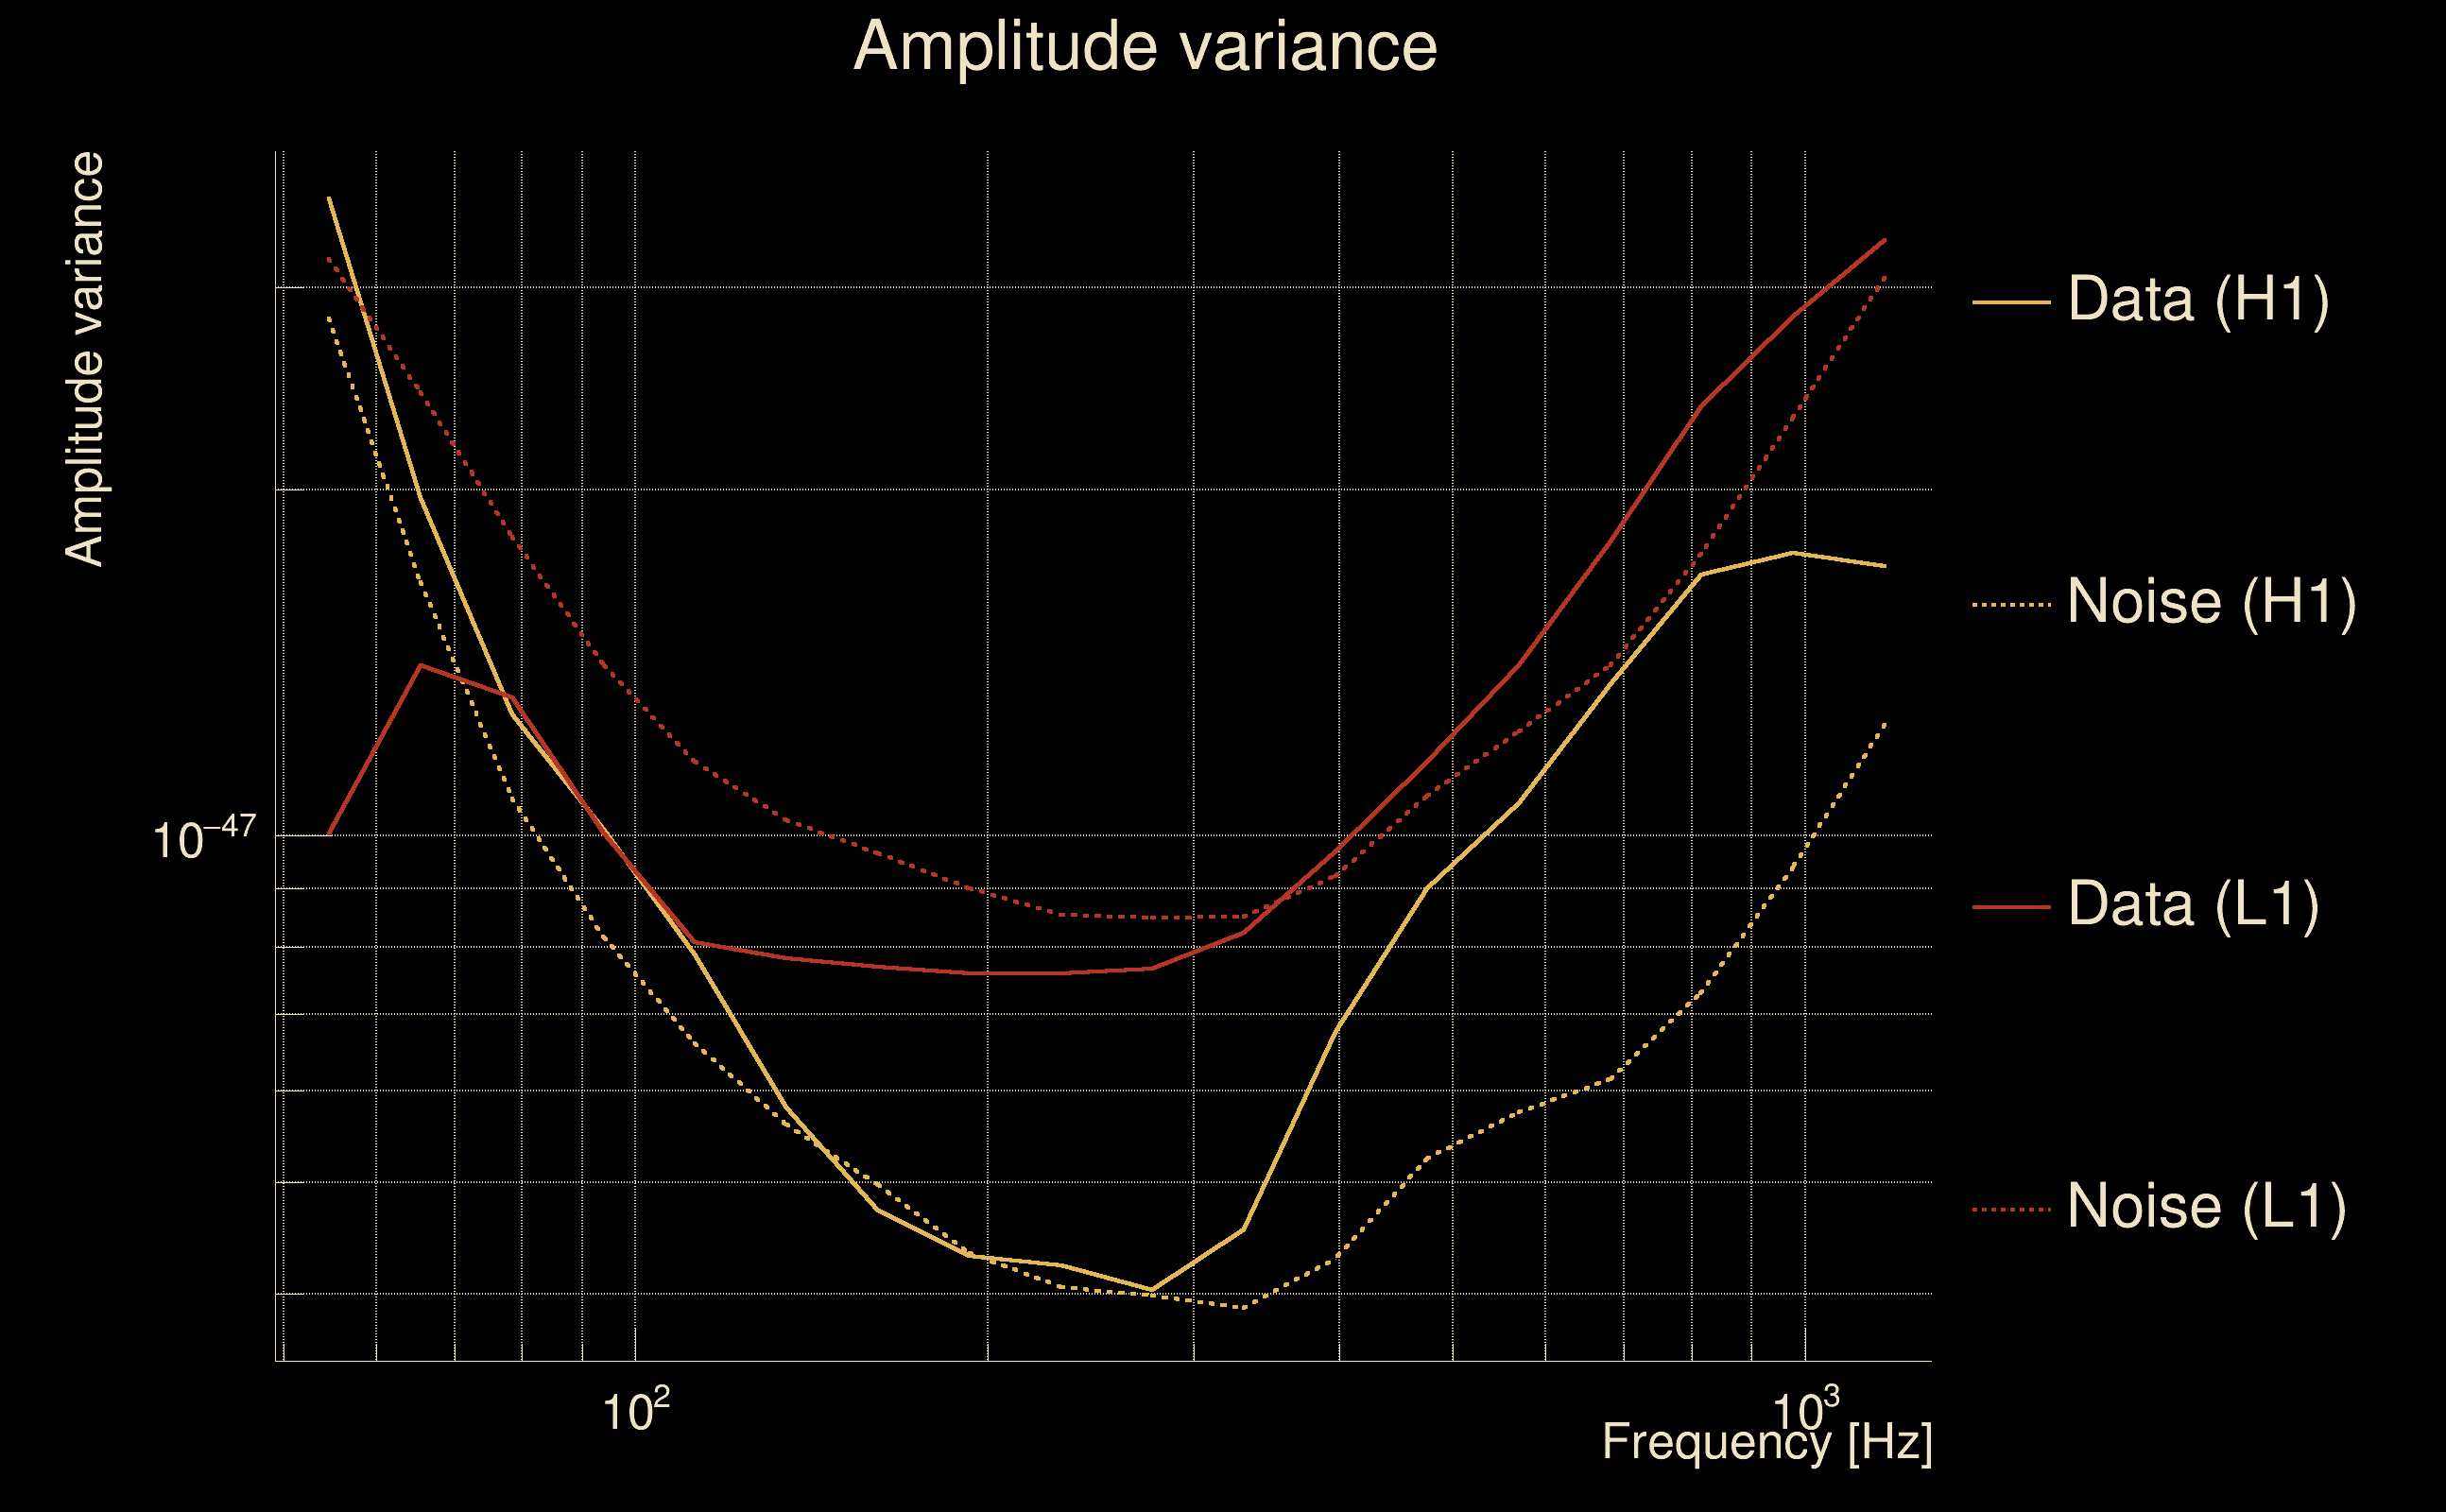
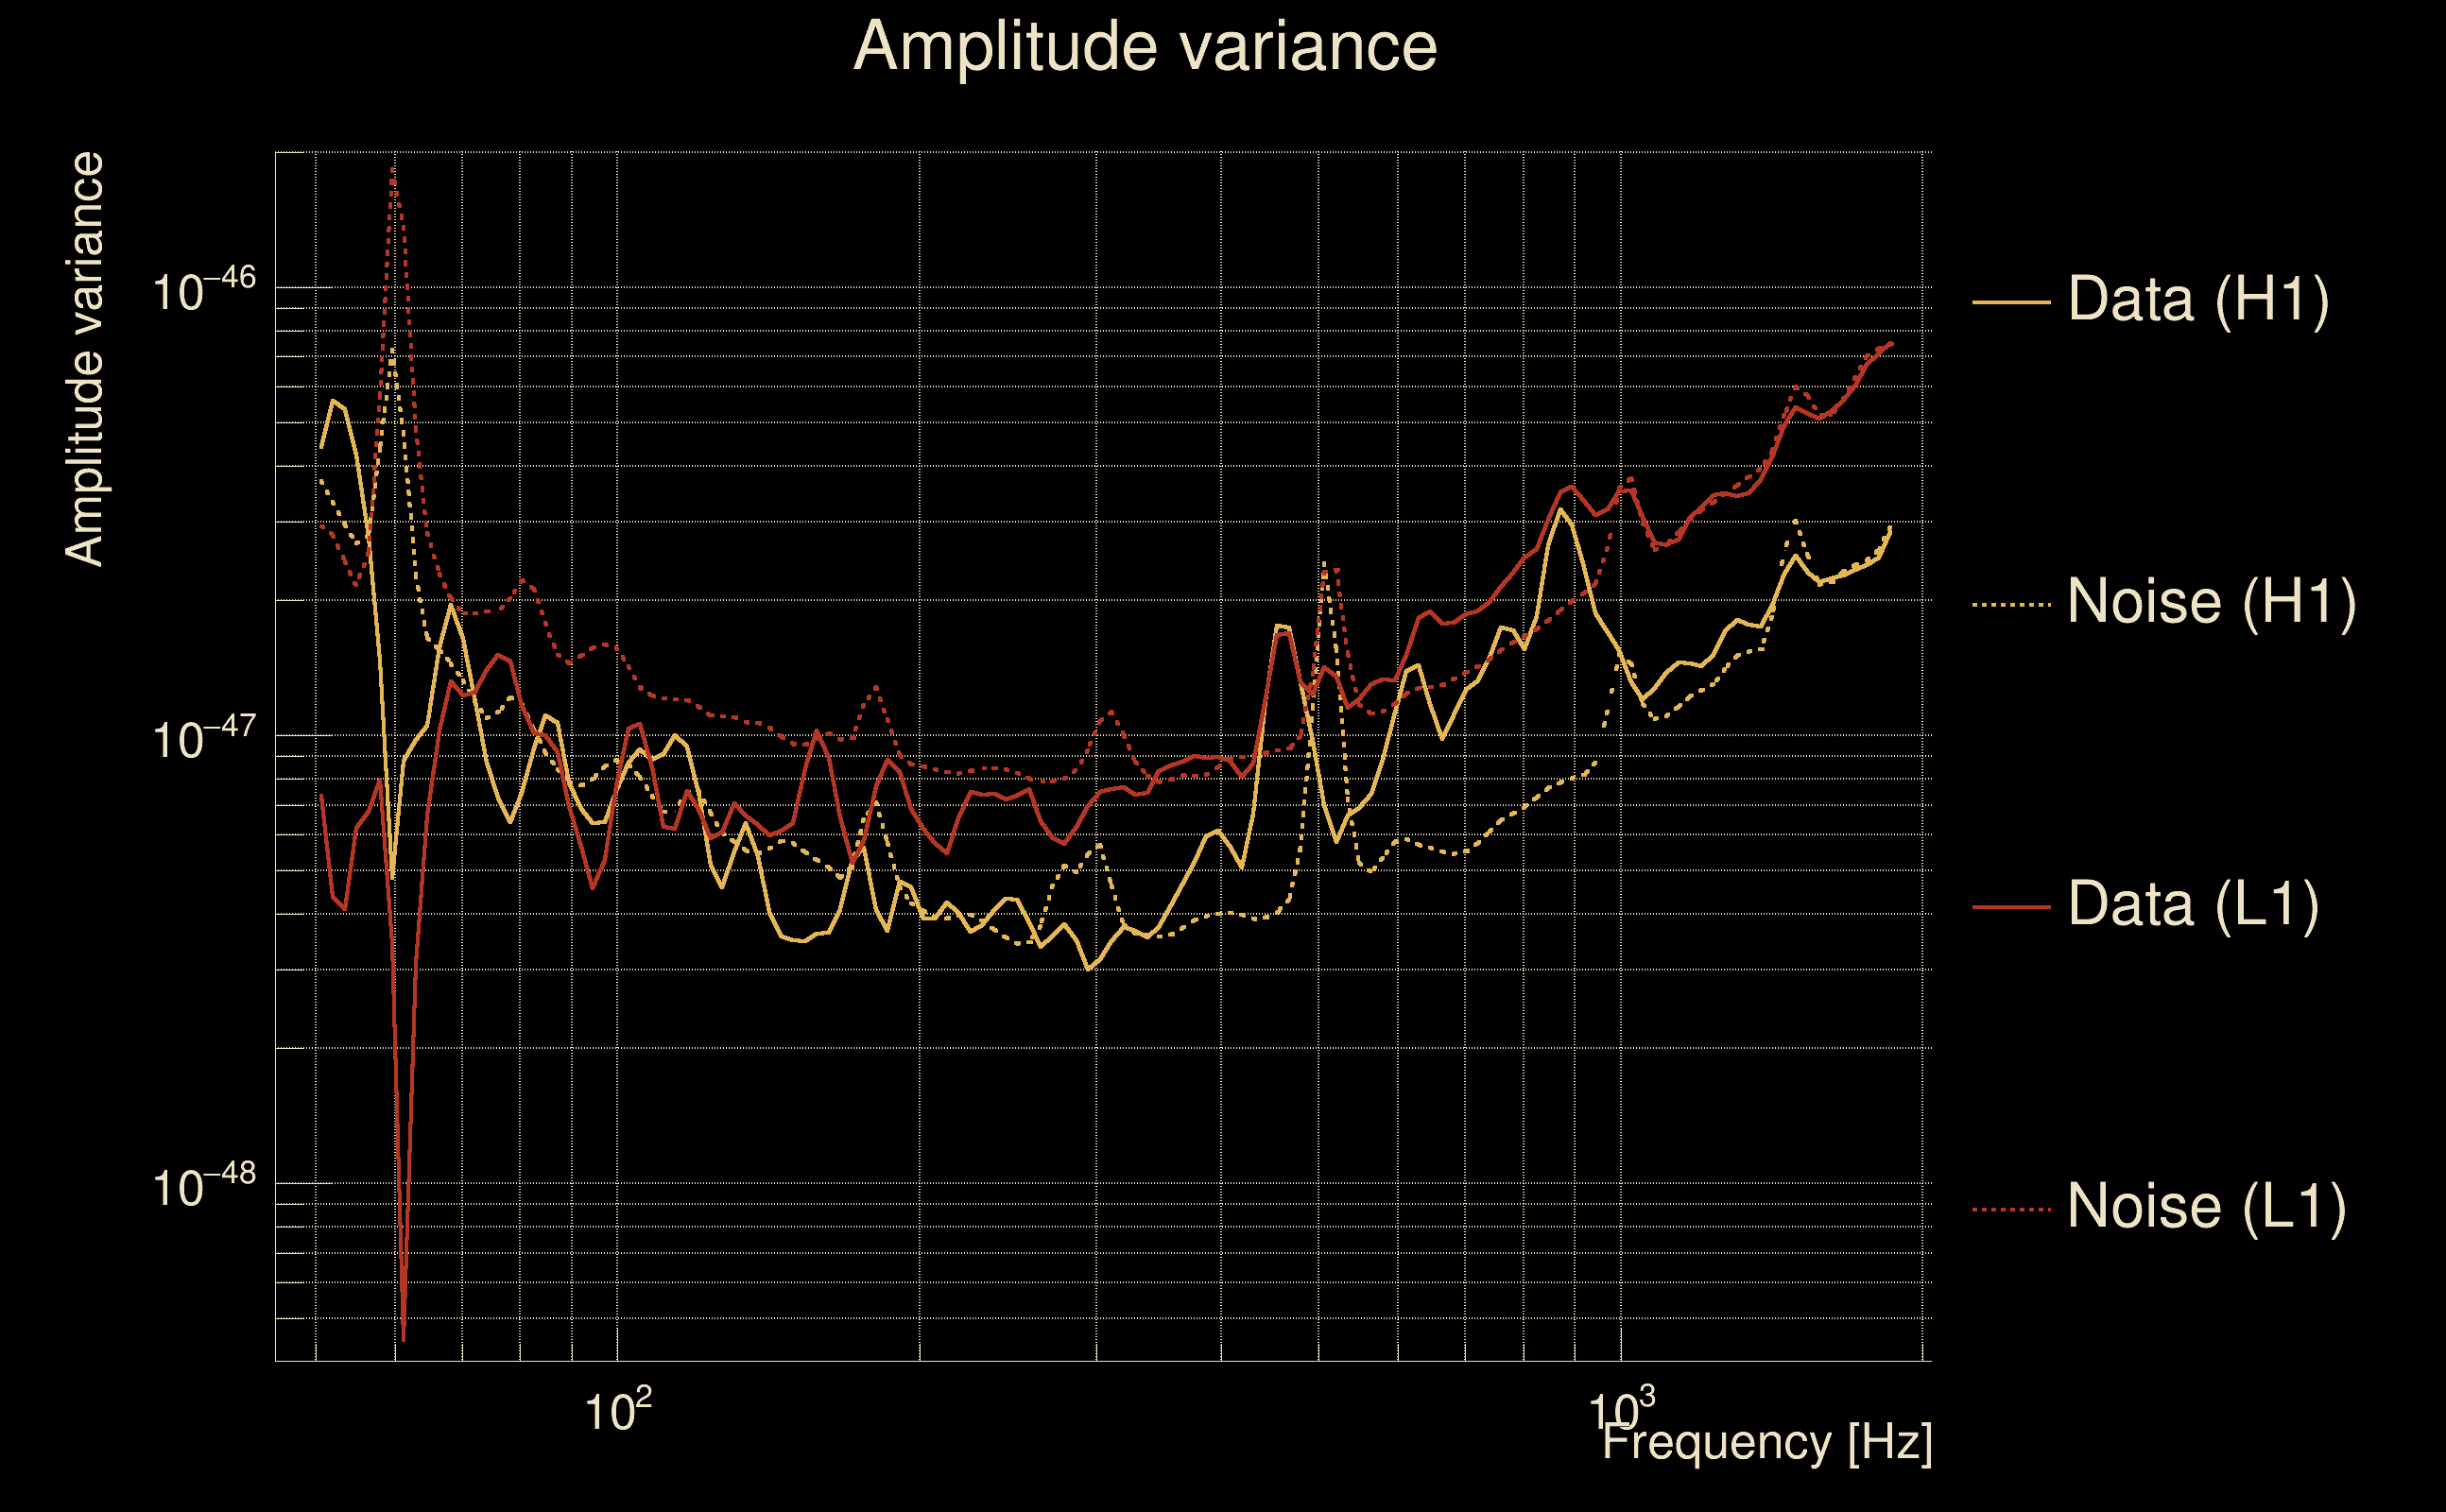
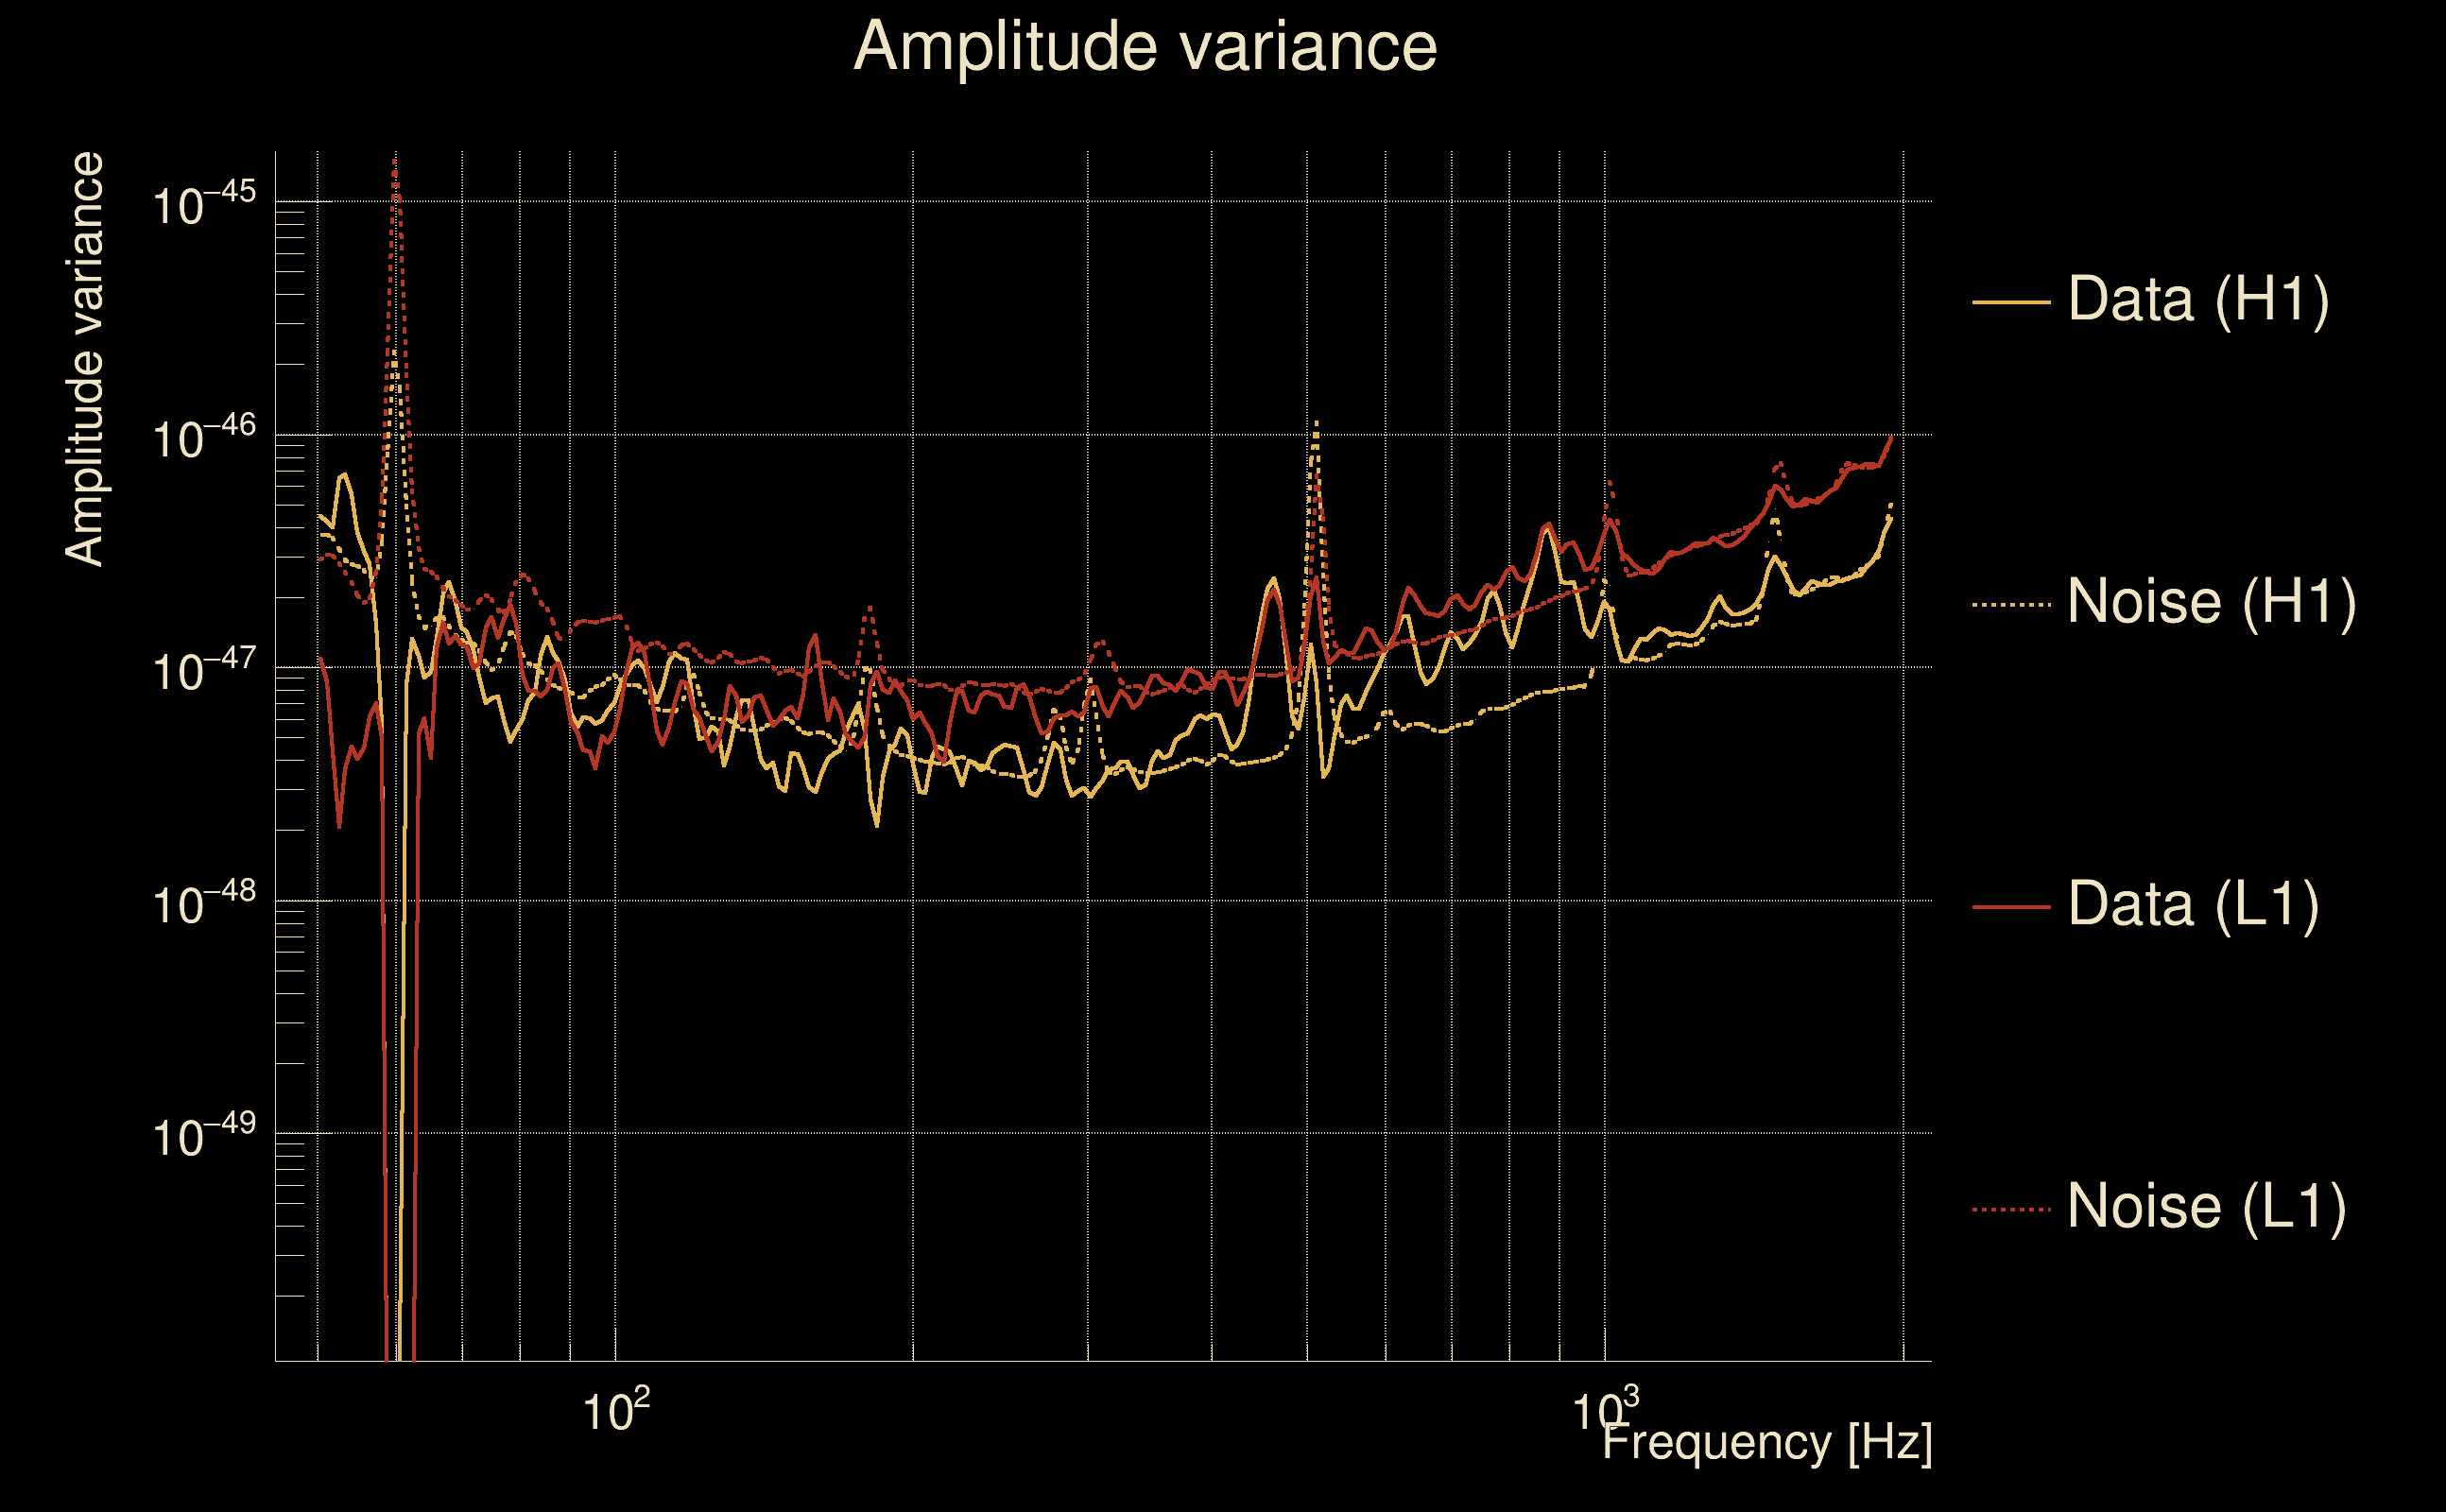
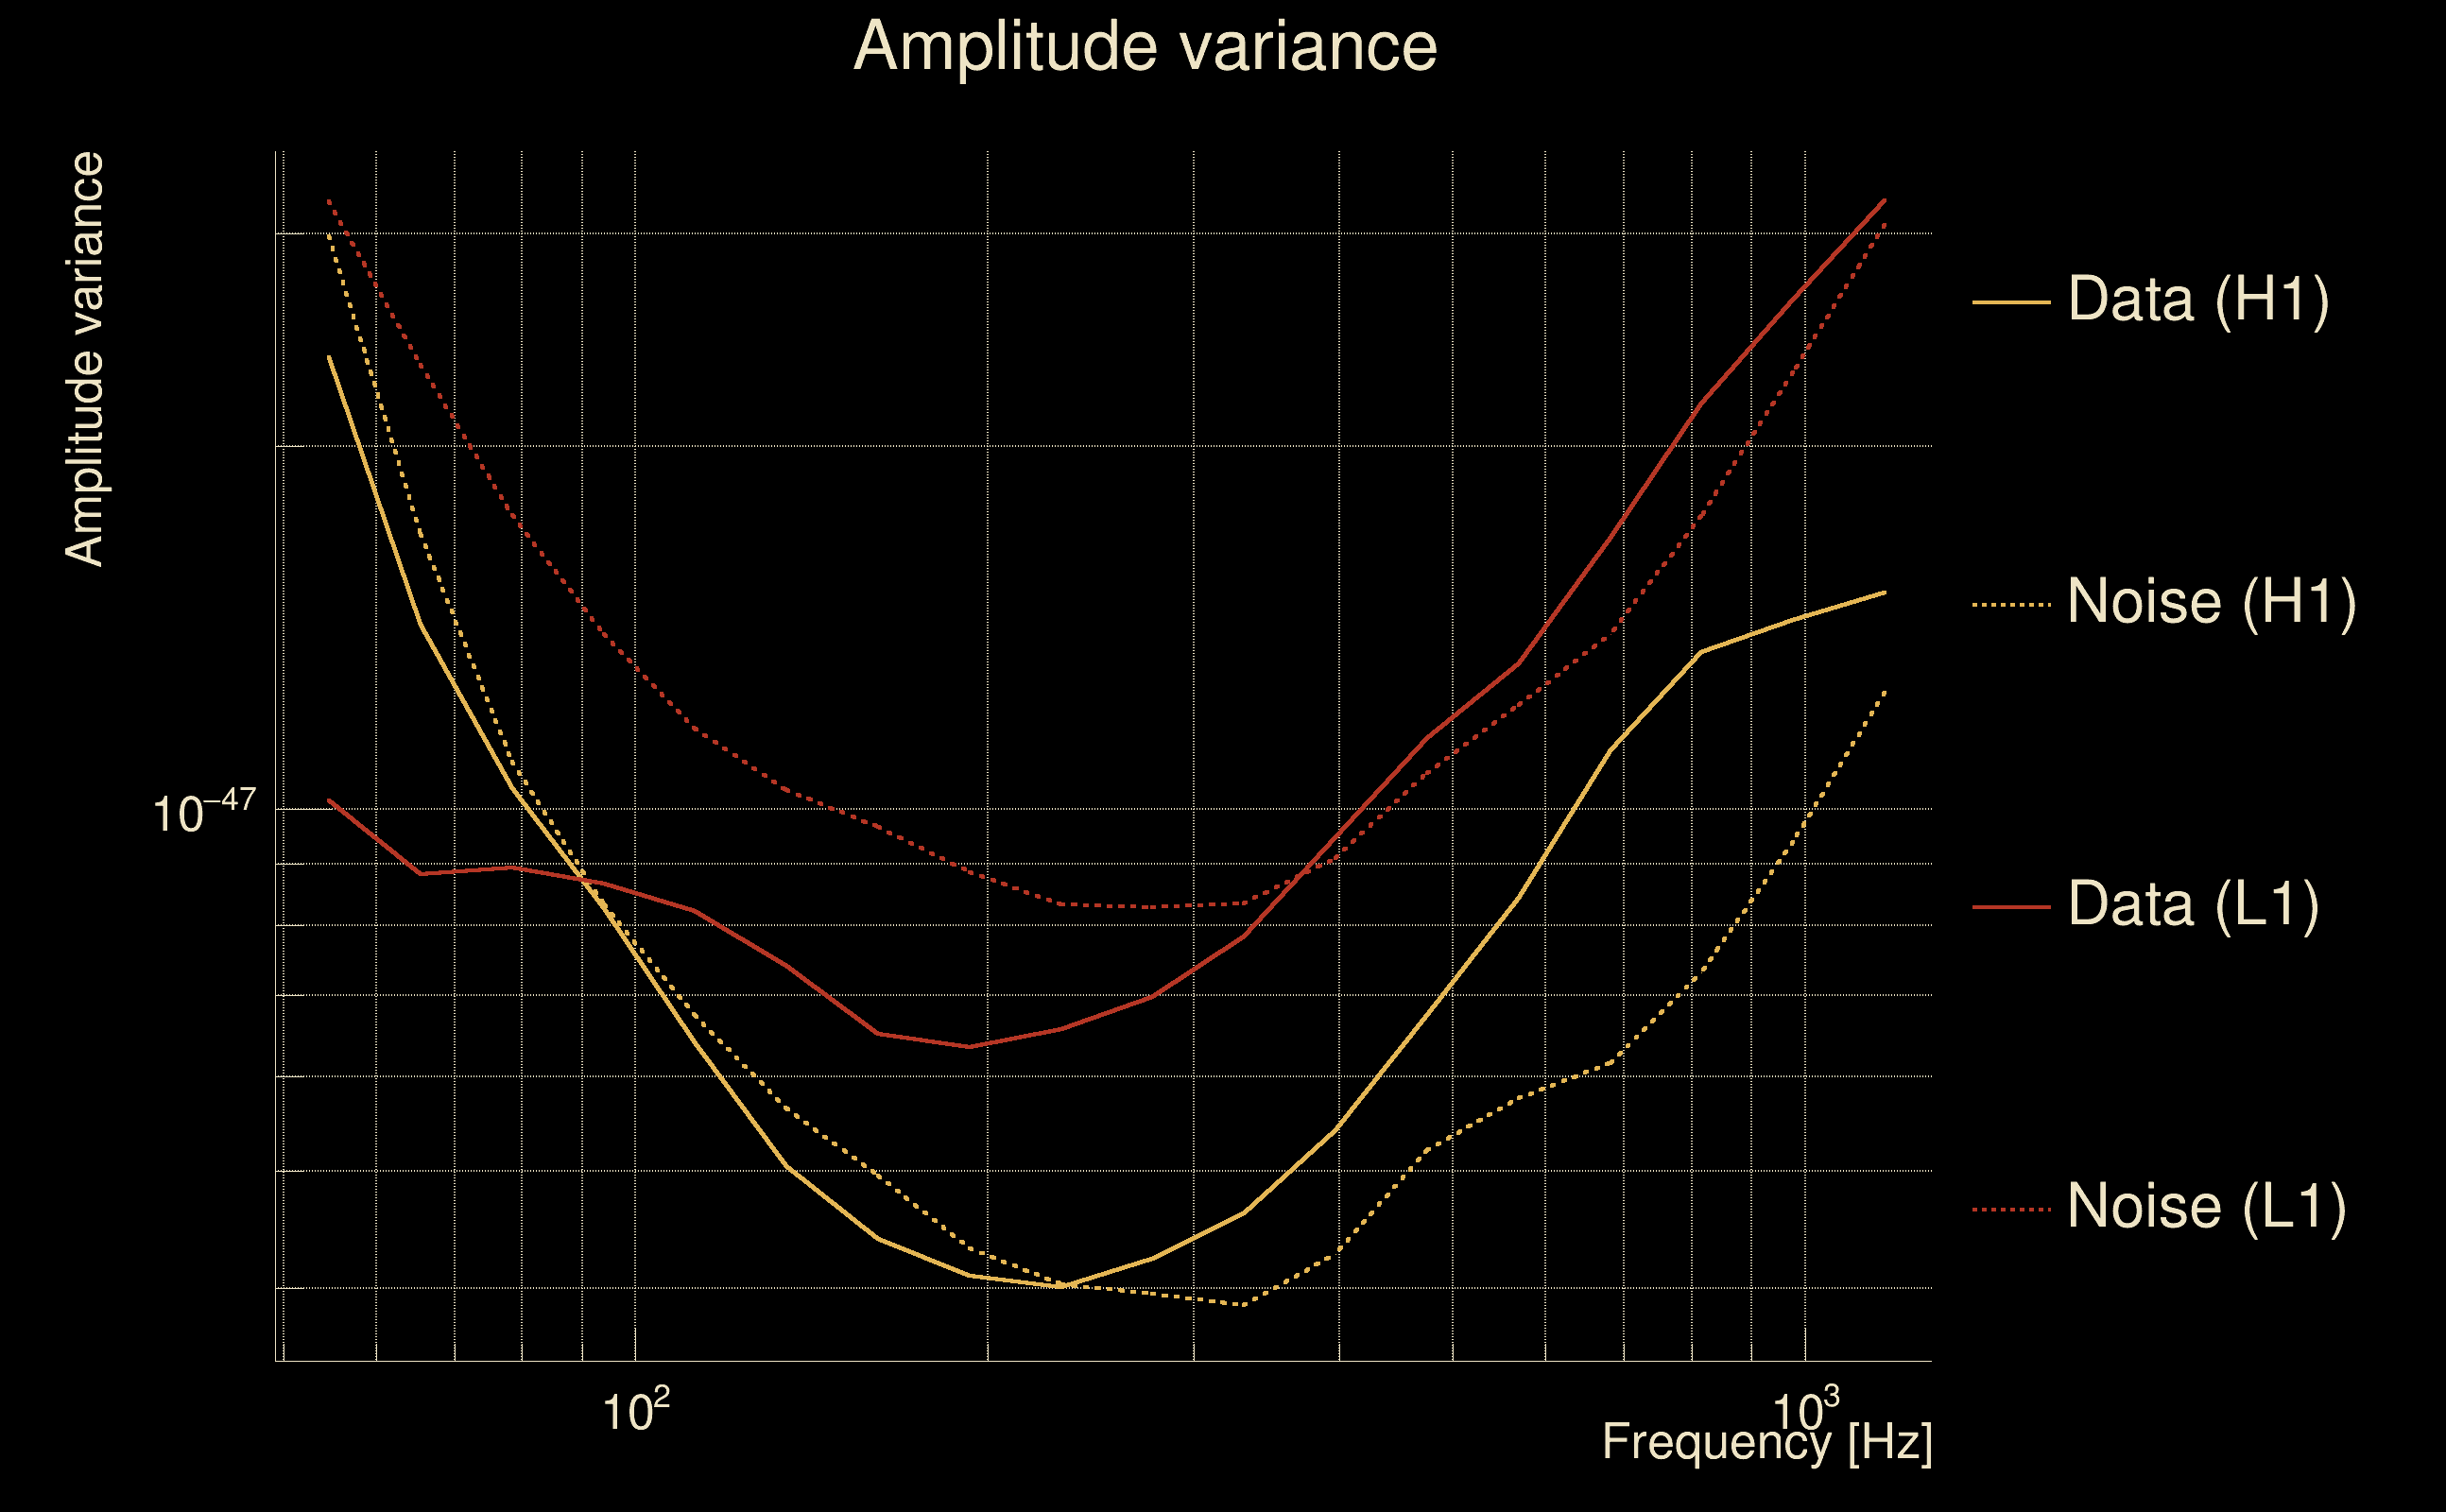
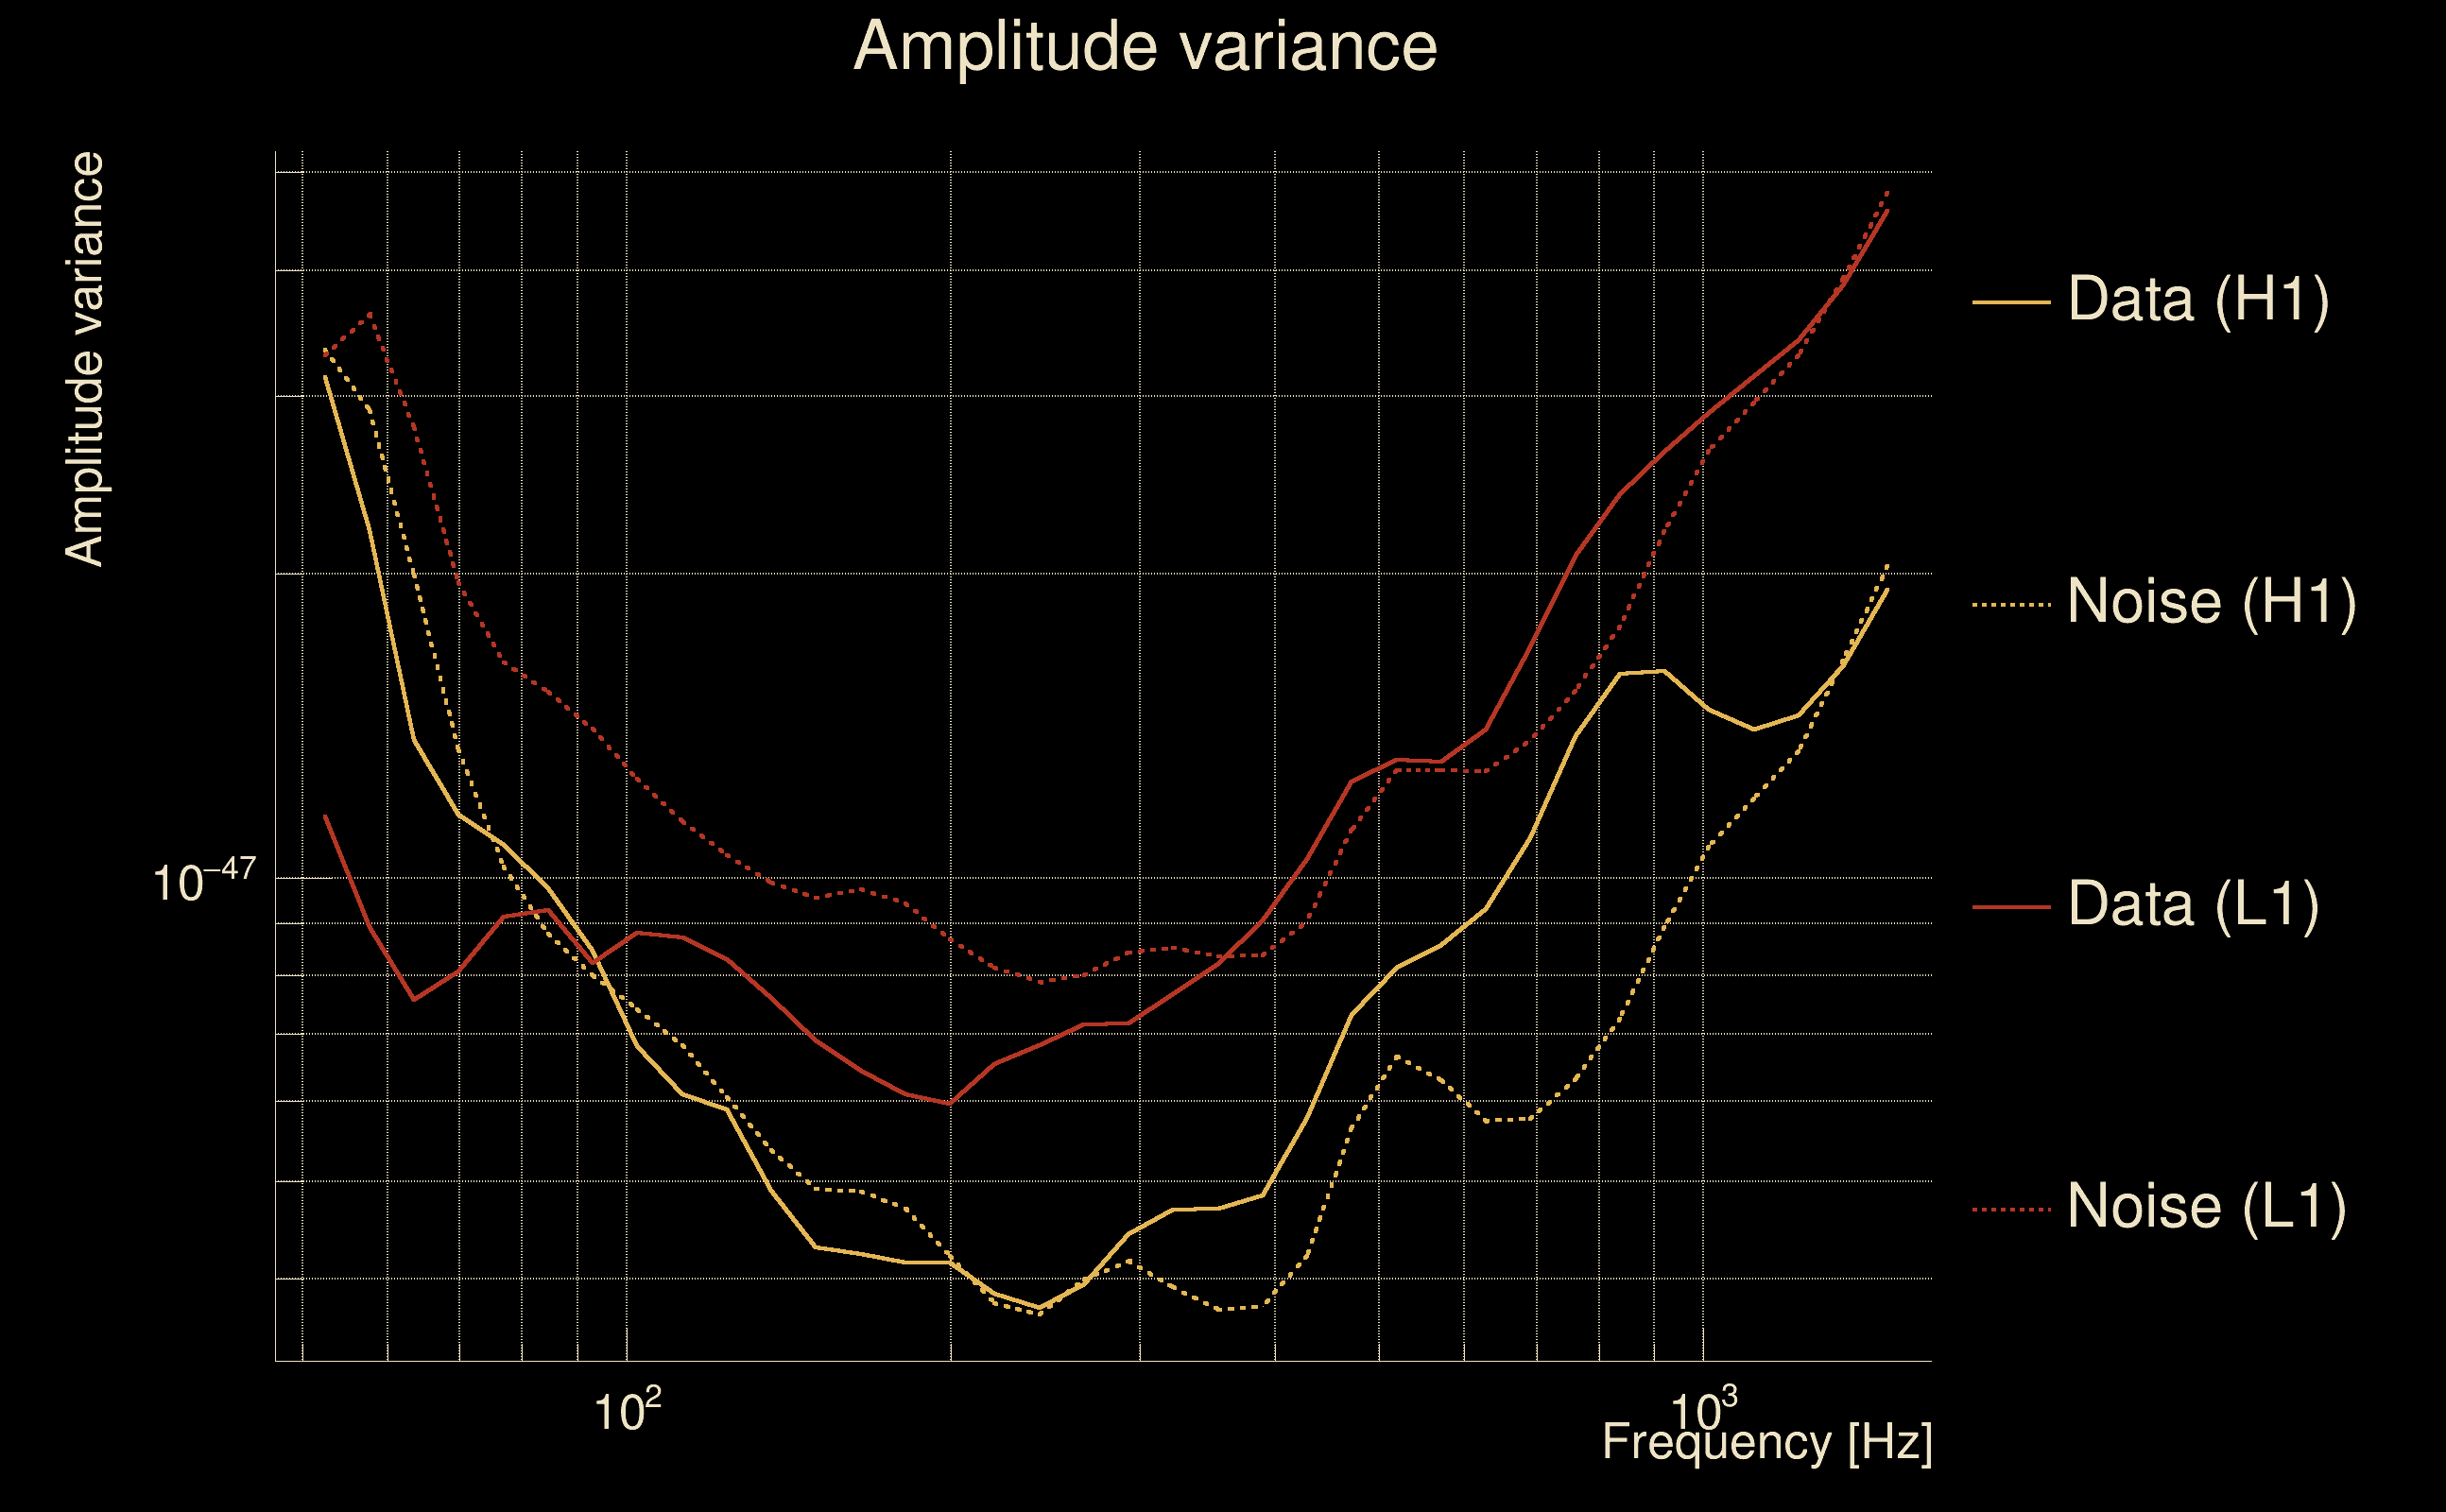
| Amplitude spectrograms: | normalization = 1e-22, power index = 2 |
| White noise SNR variance: | 0.523175 (after applying a correction factor = 1) |
| Amplitude ratio confidence level: | 3 sigma |
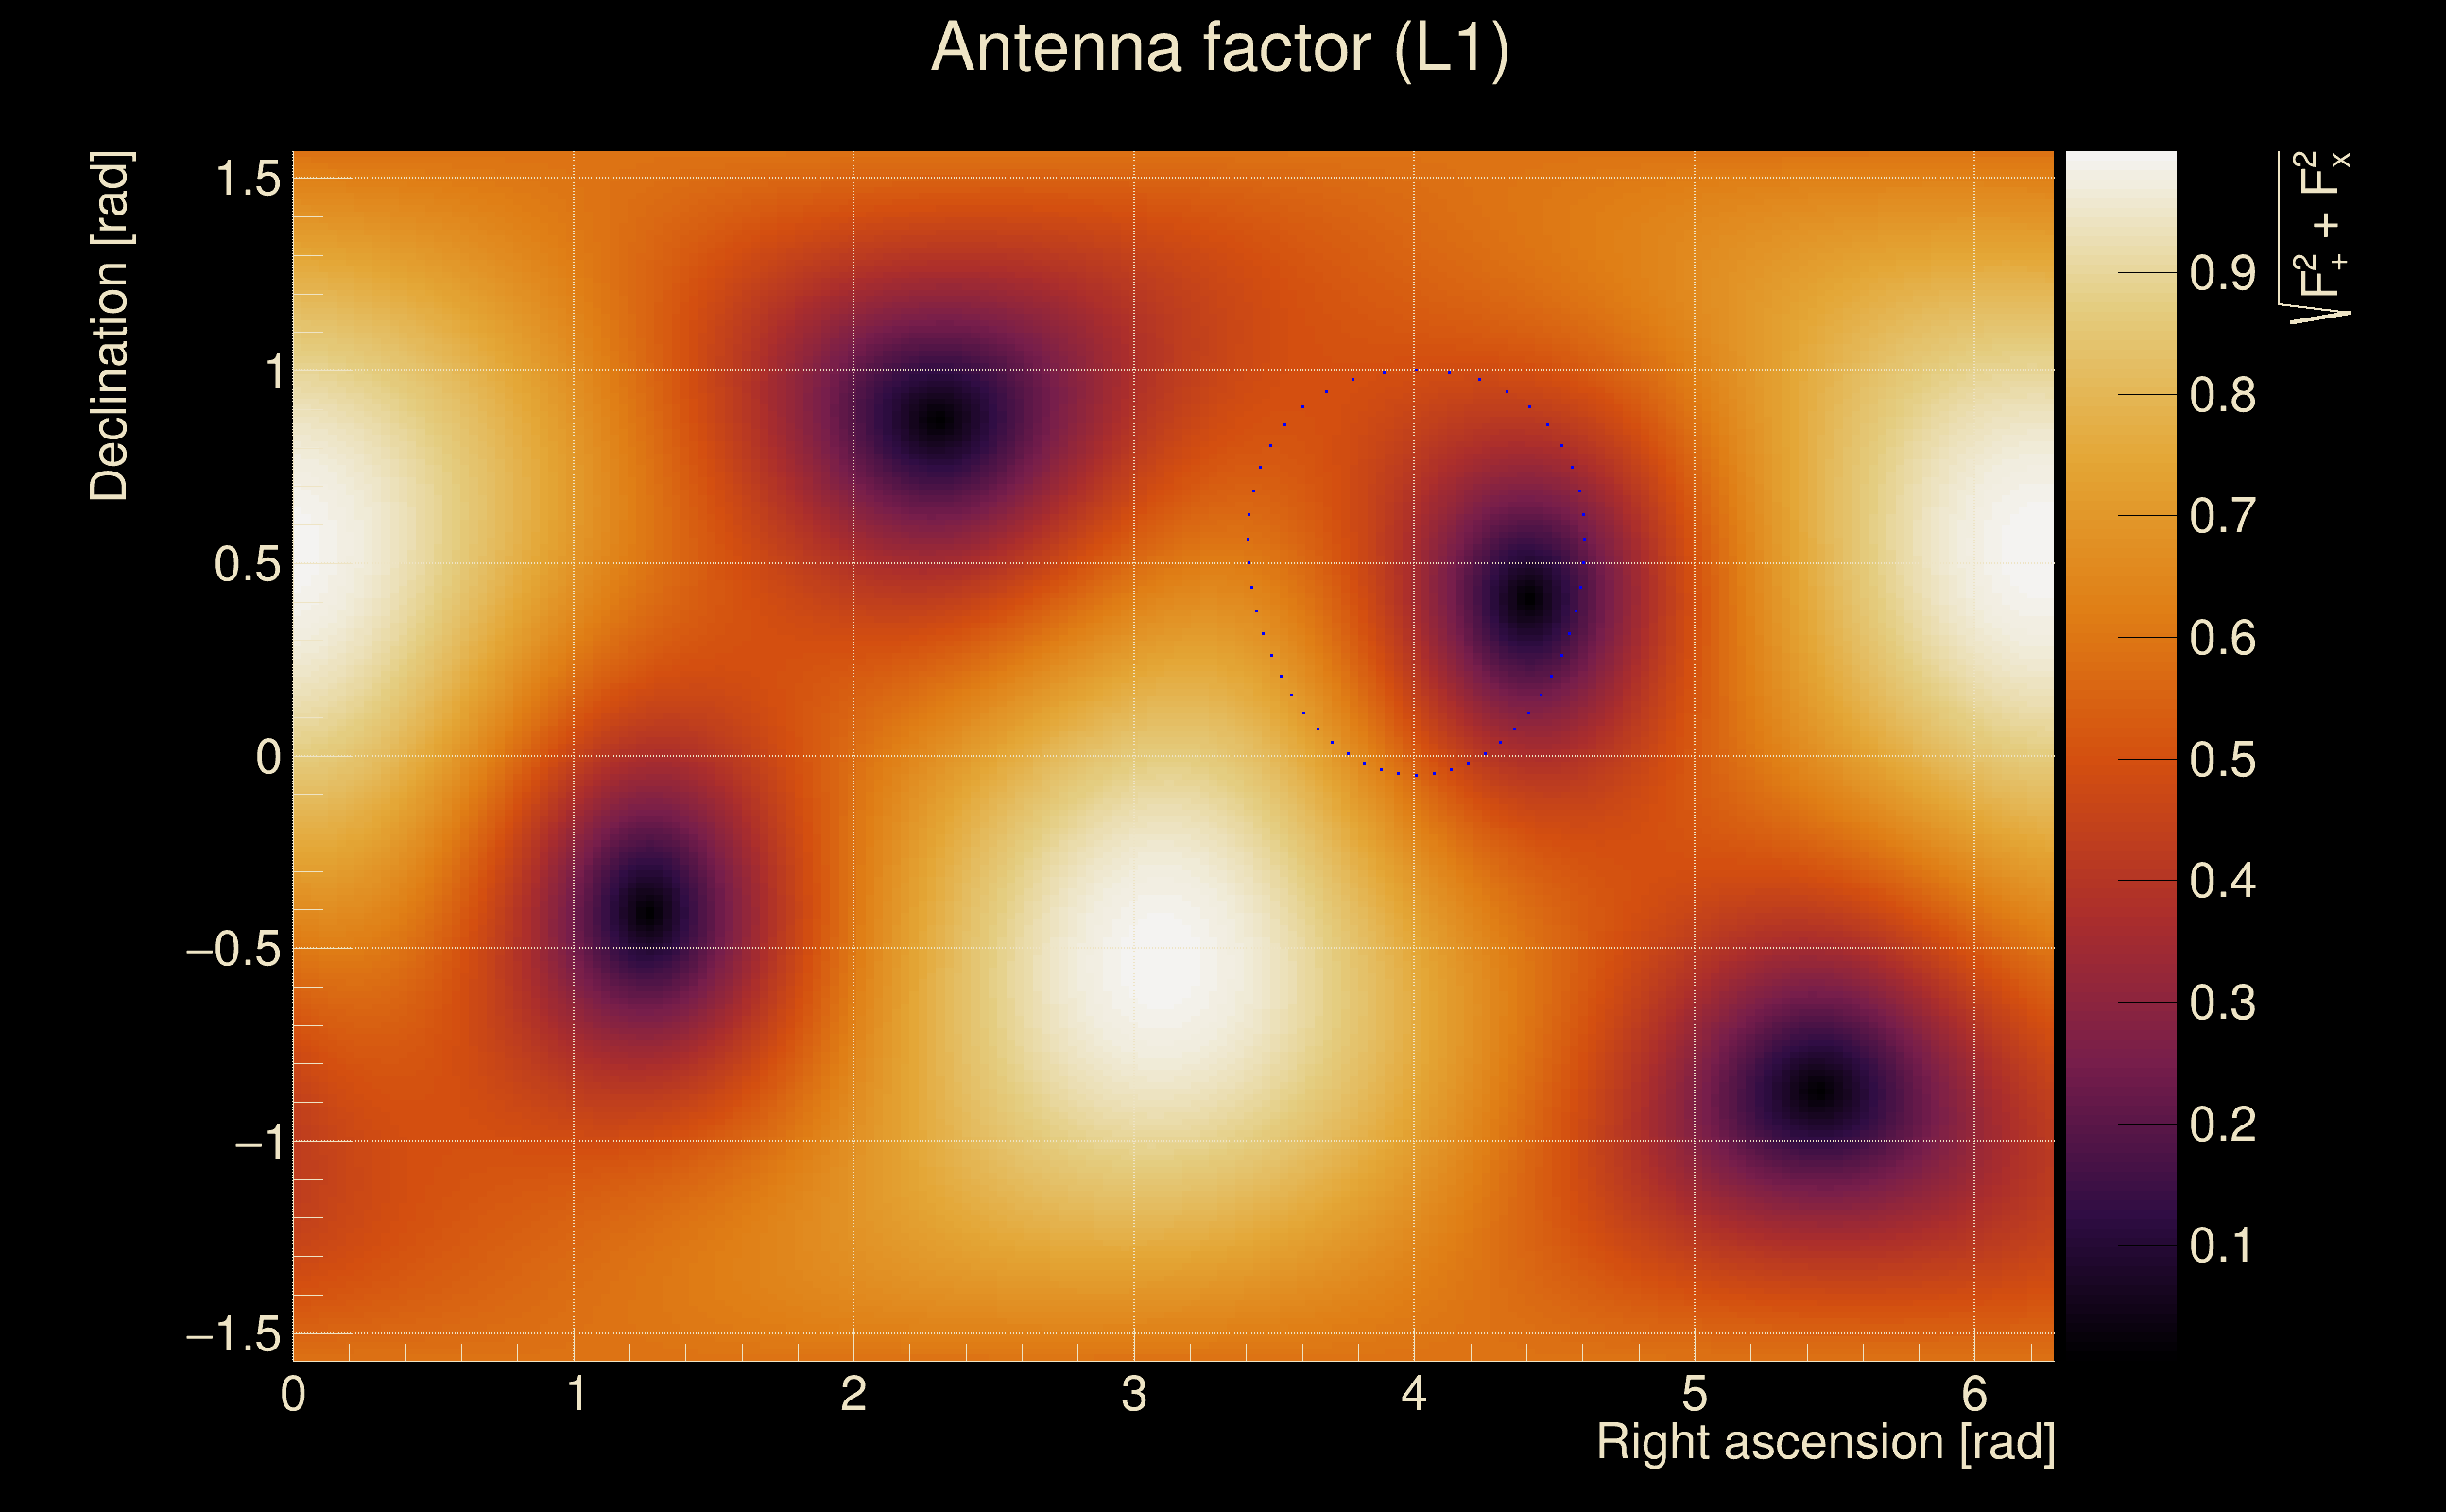
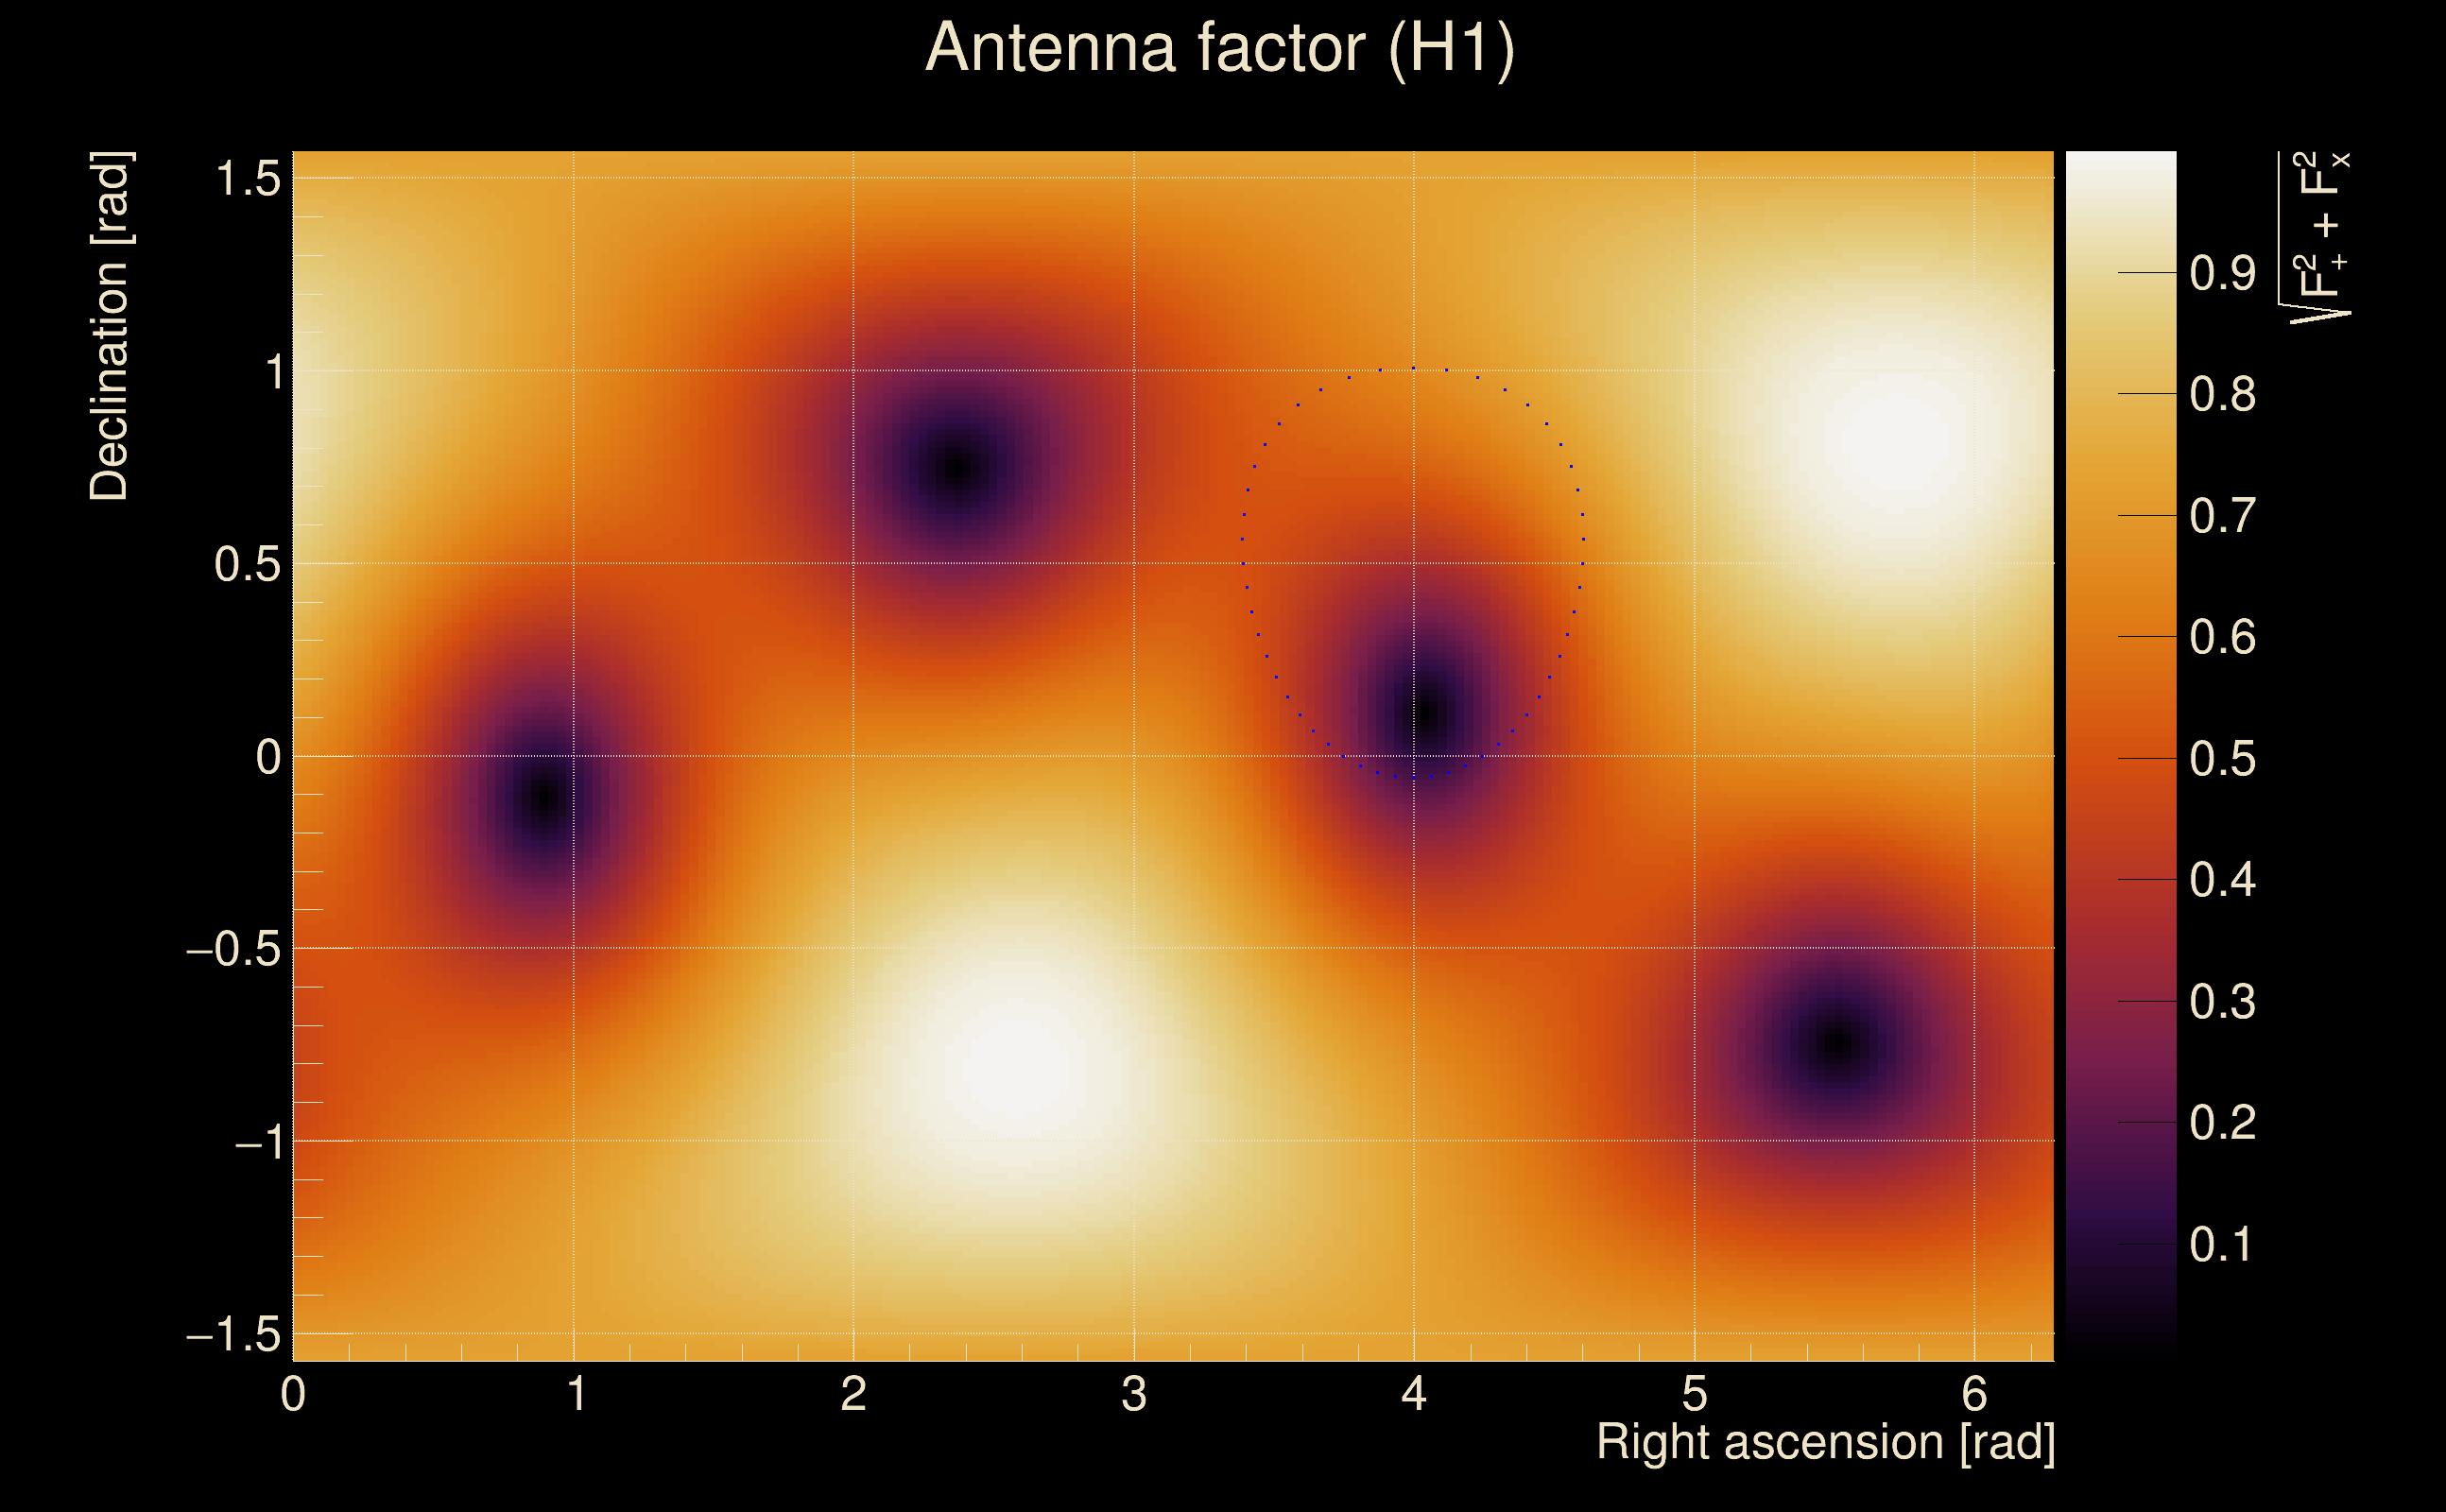
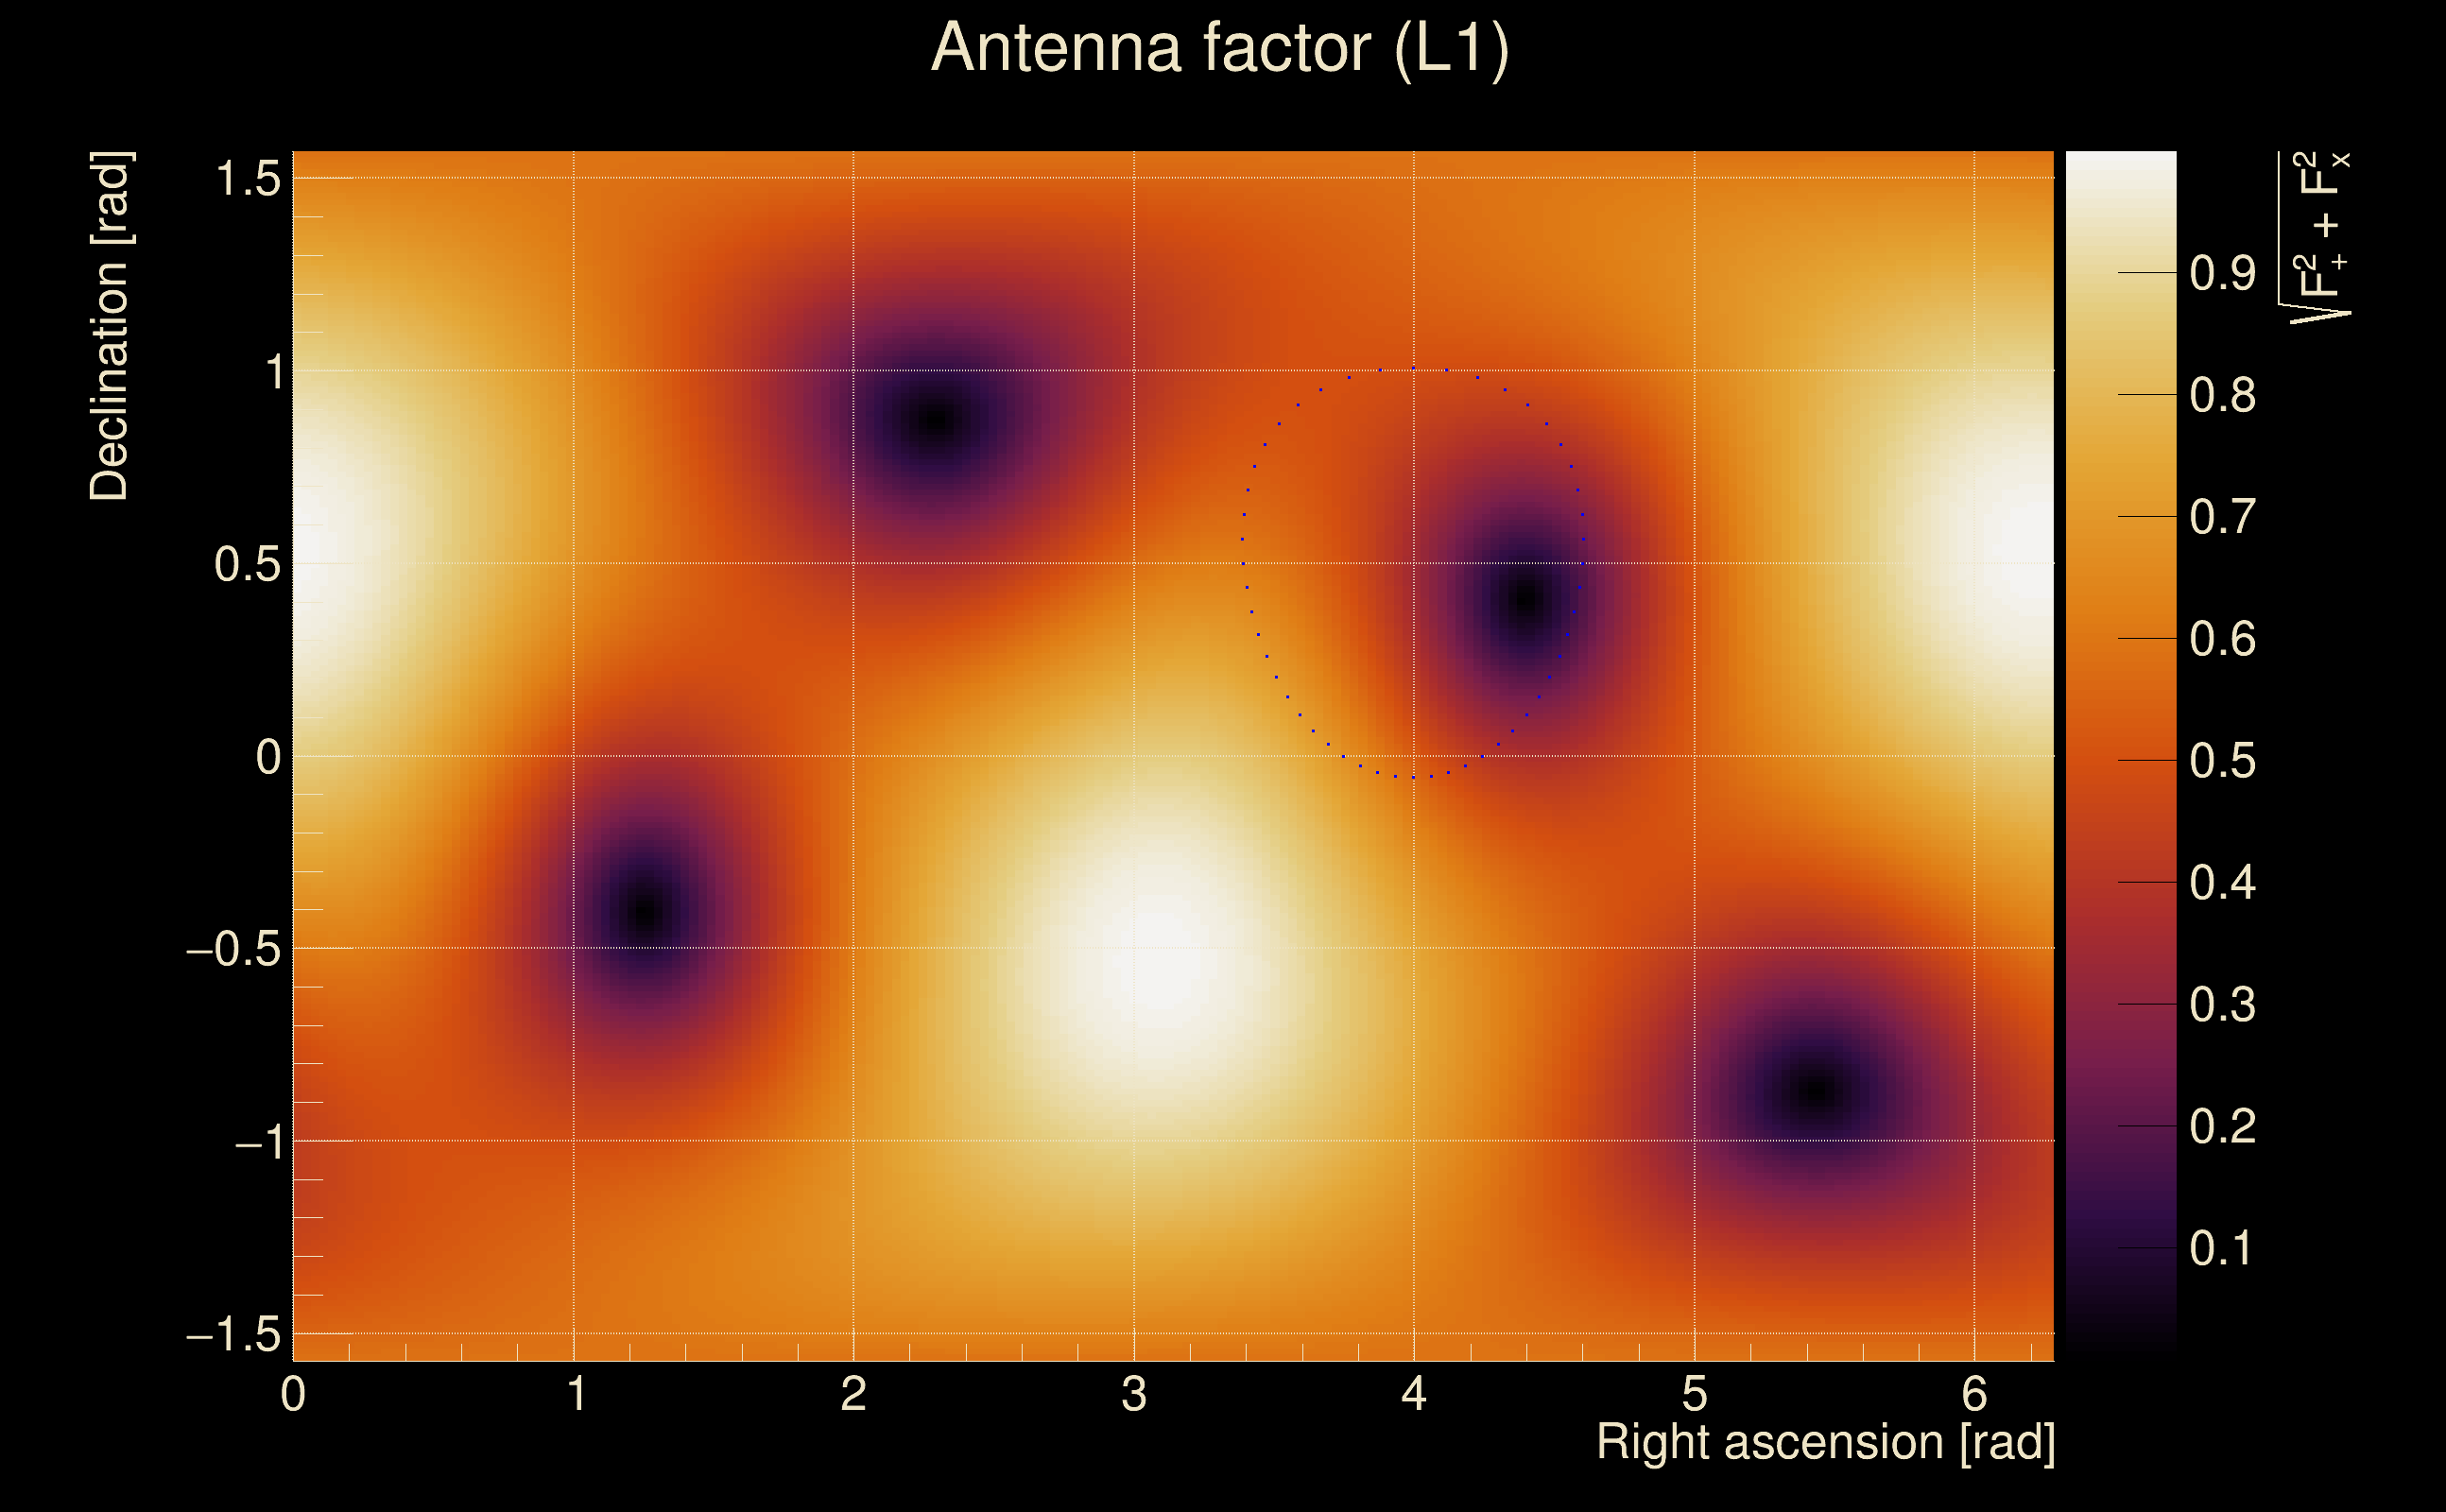
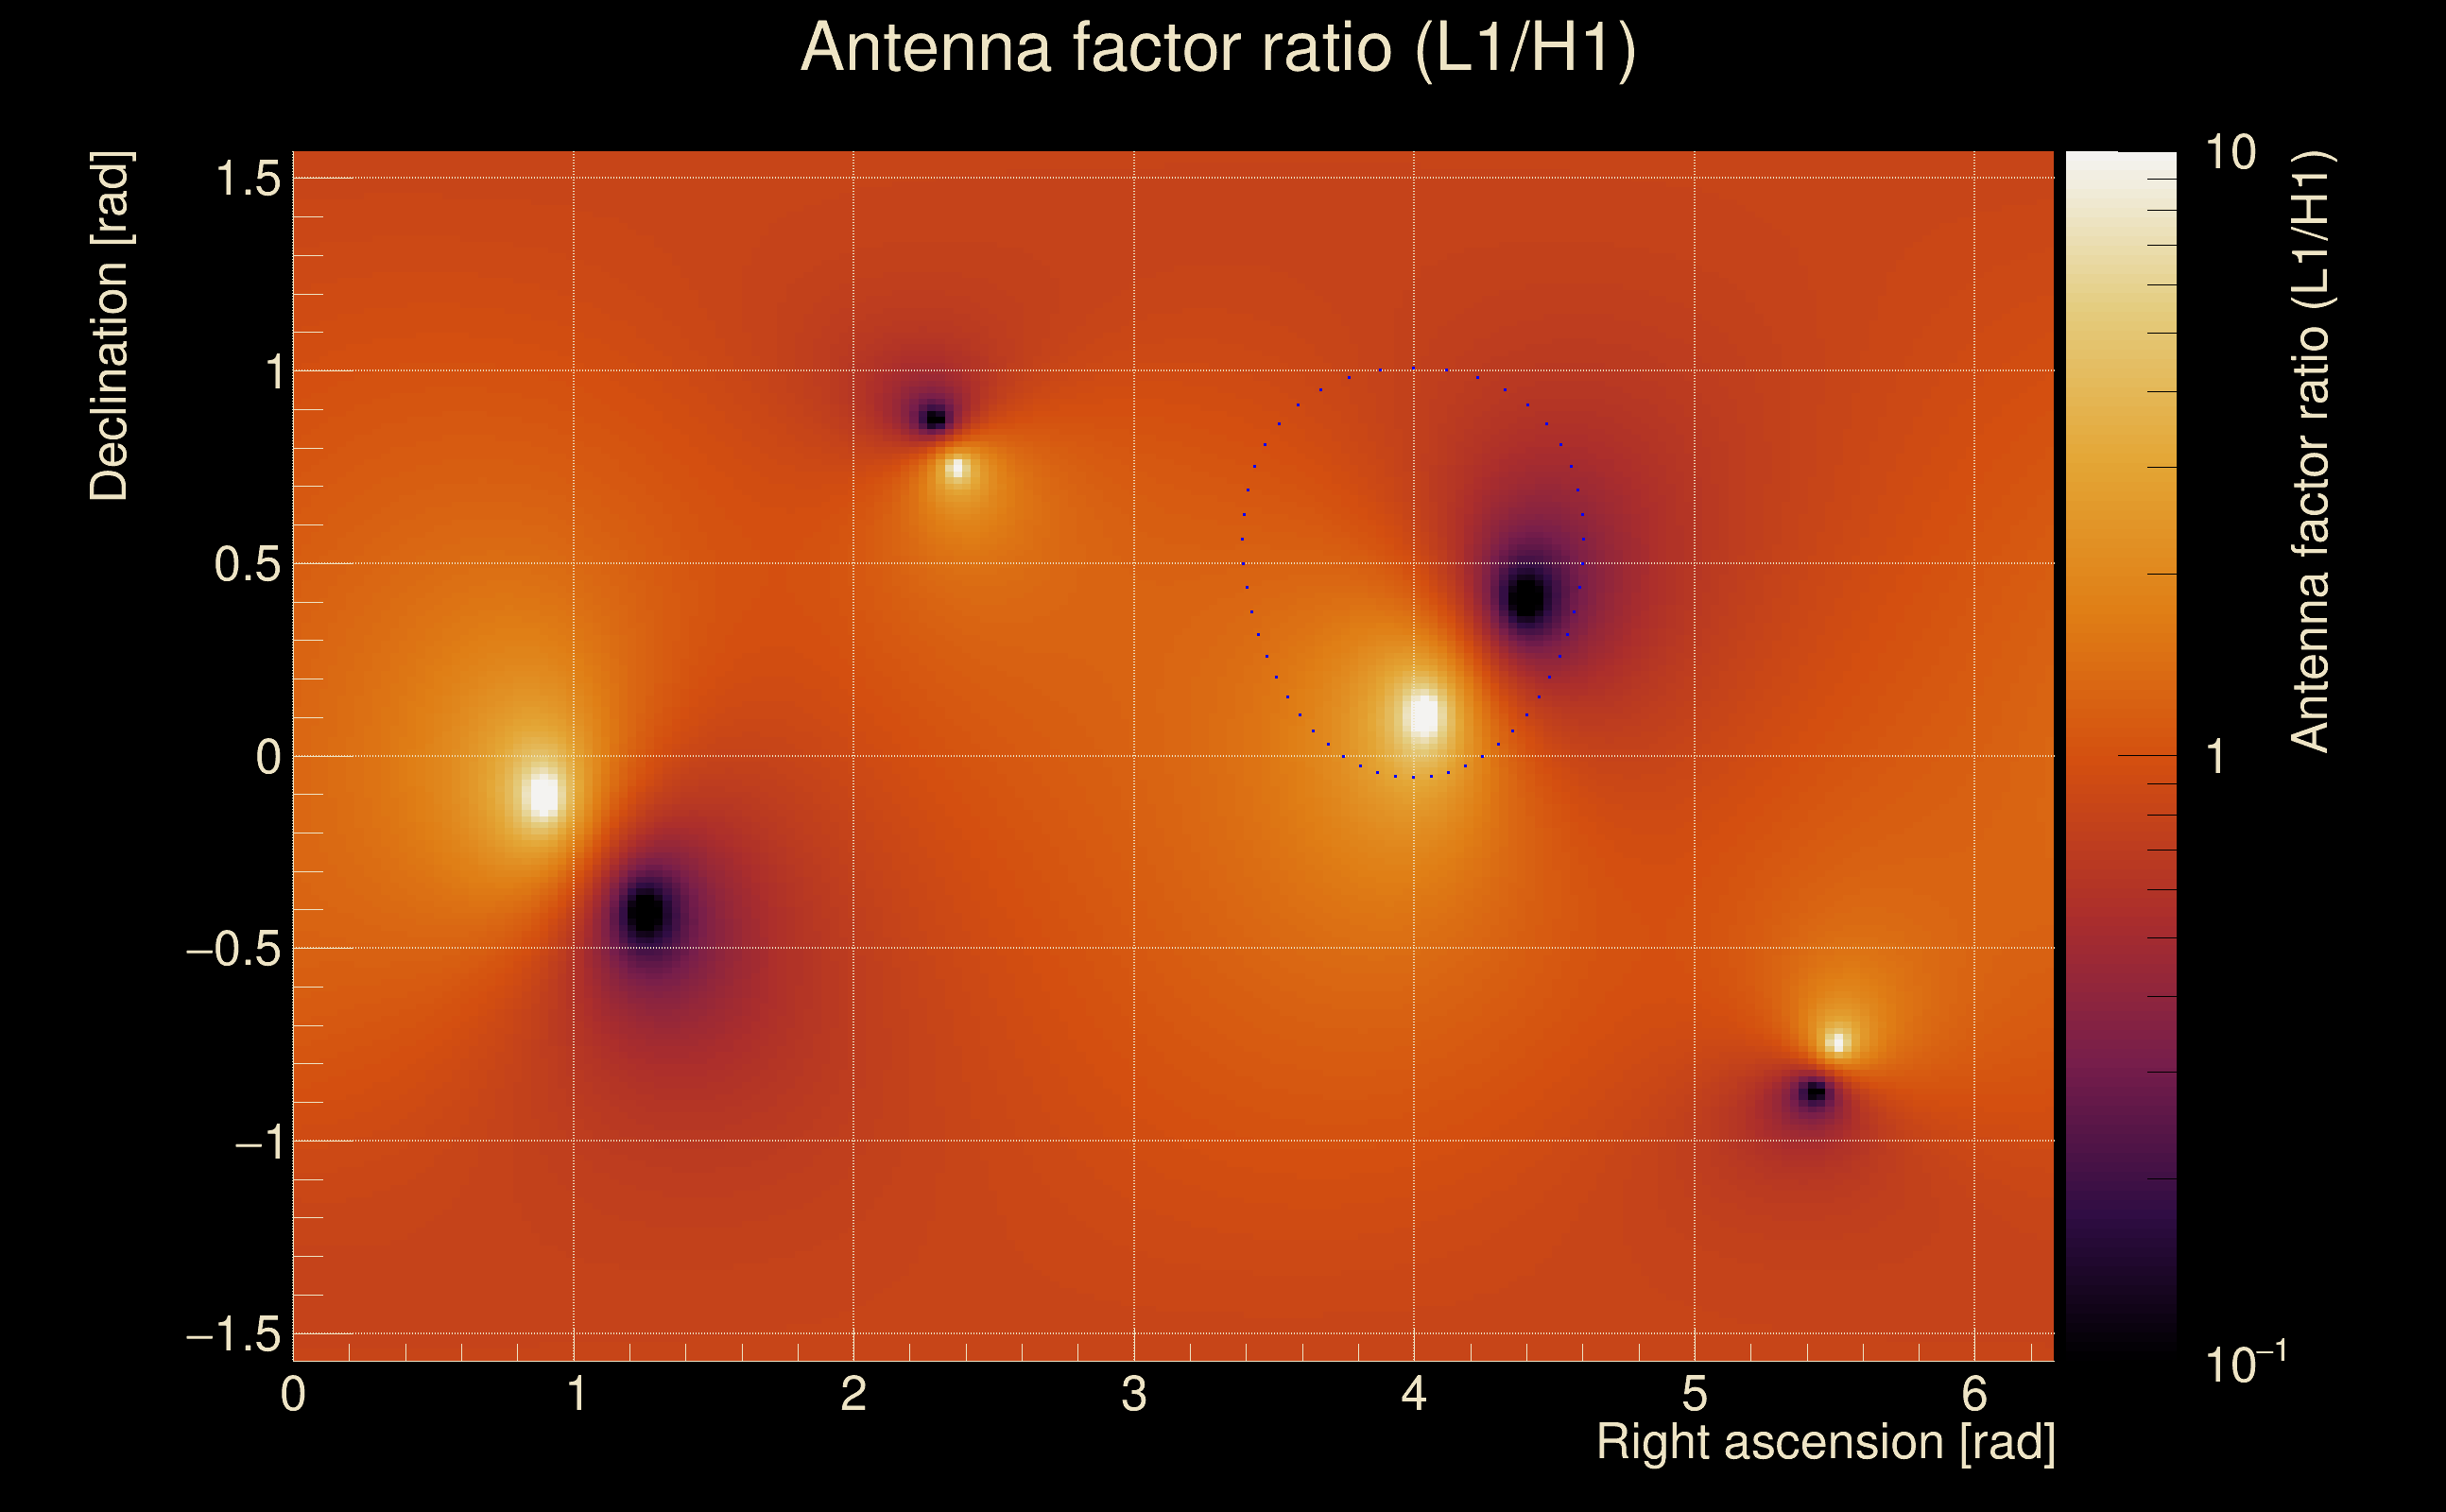
| Target sky positon: | Ra: 3.68109, Dec: 0.94792 [rad] |
| List of input Ox files: | TargIxf_injpt1_10min_2TEST_file_list.txt (1 files) |
| Analysis result file: | TargIxf_injpt1_10min_2TEST_results-0.root |
| Slice selected for the the fakeground: | slice index=25 (3.818 s), time lag = 0 s |
| Foreground | Fakeground | Background | ||
|---|---|---|---|---|
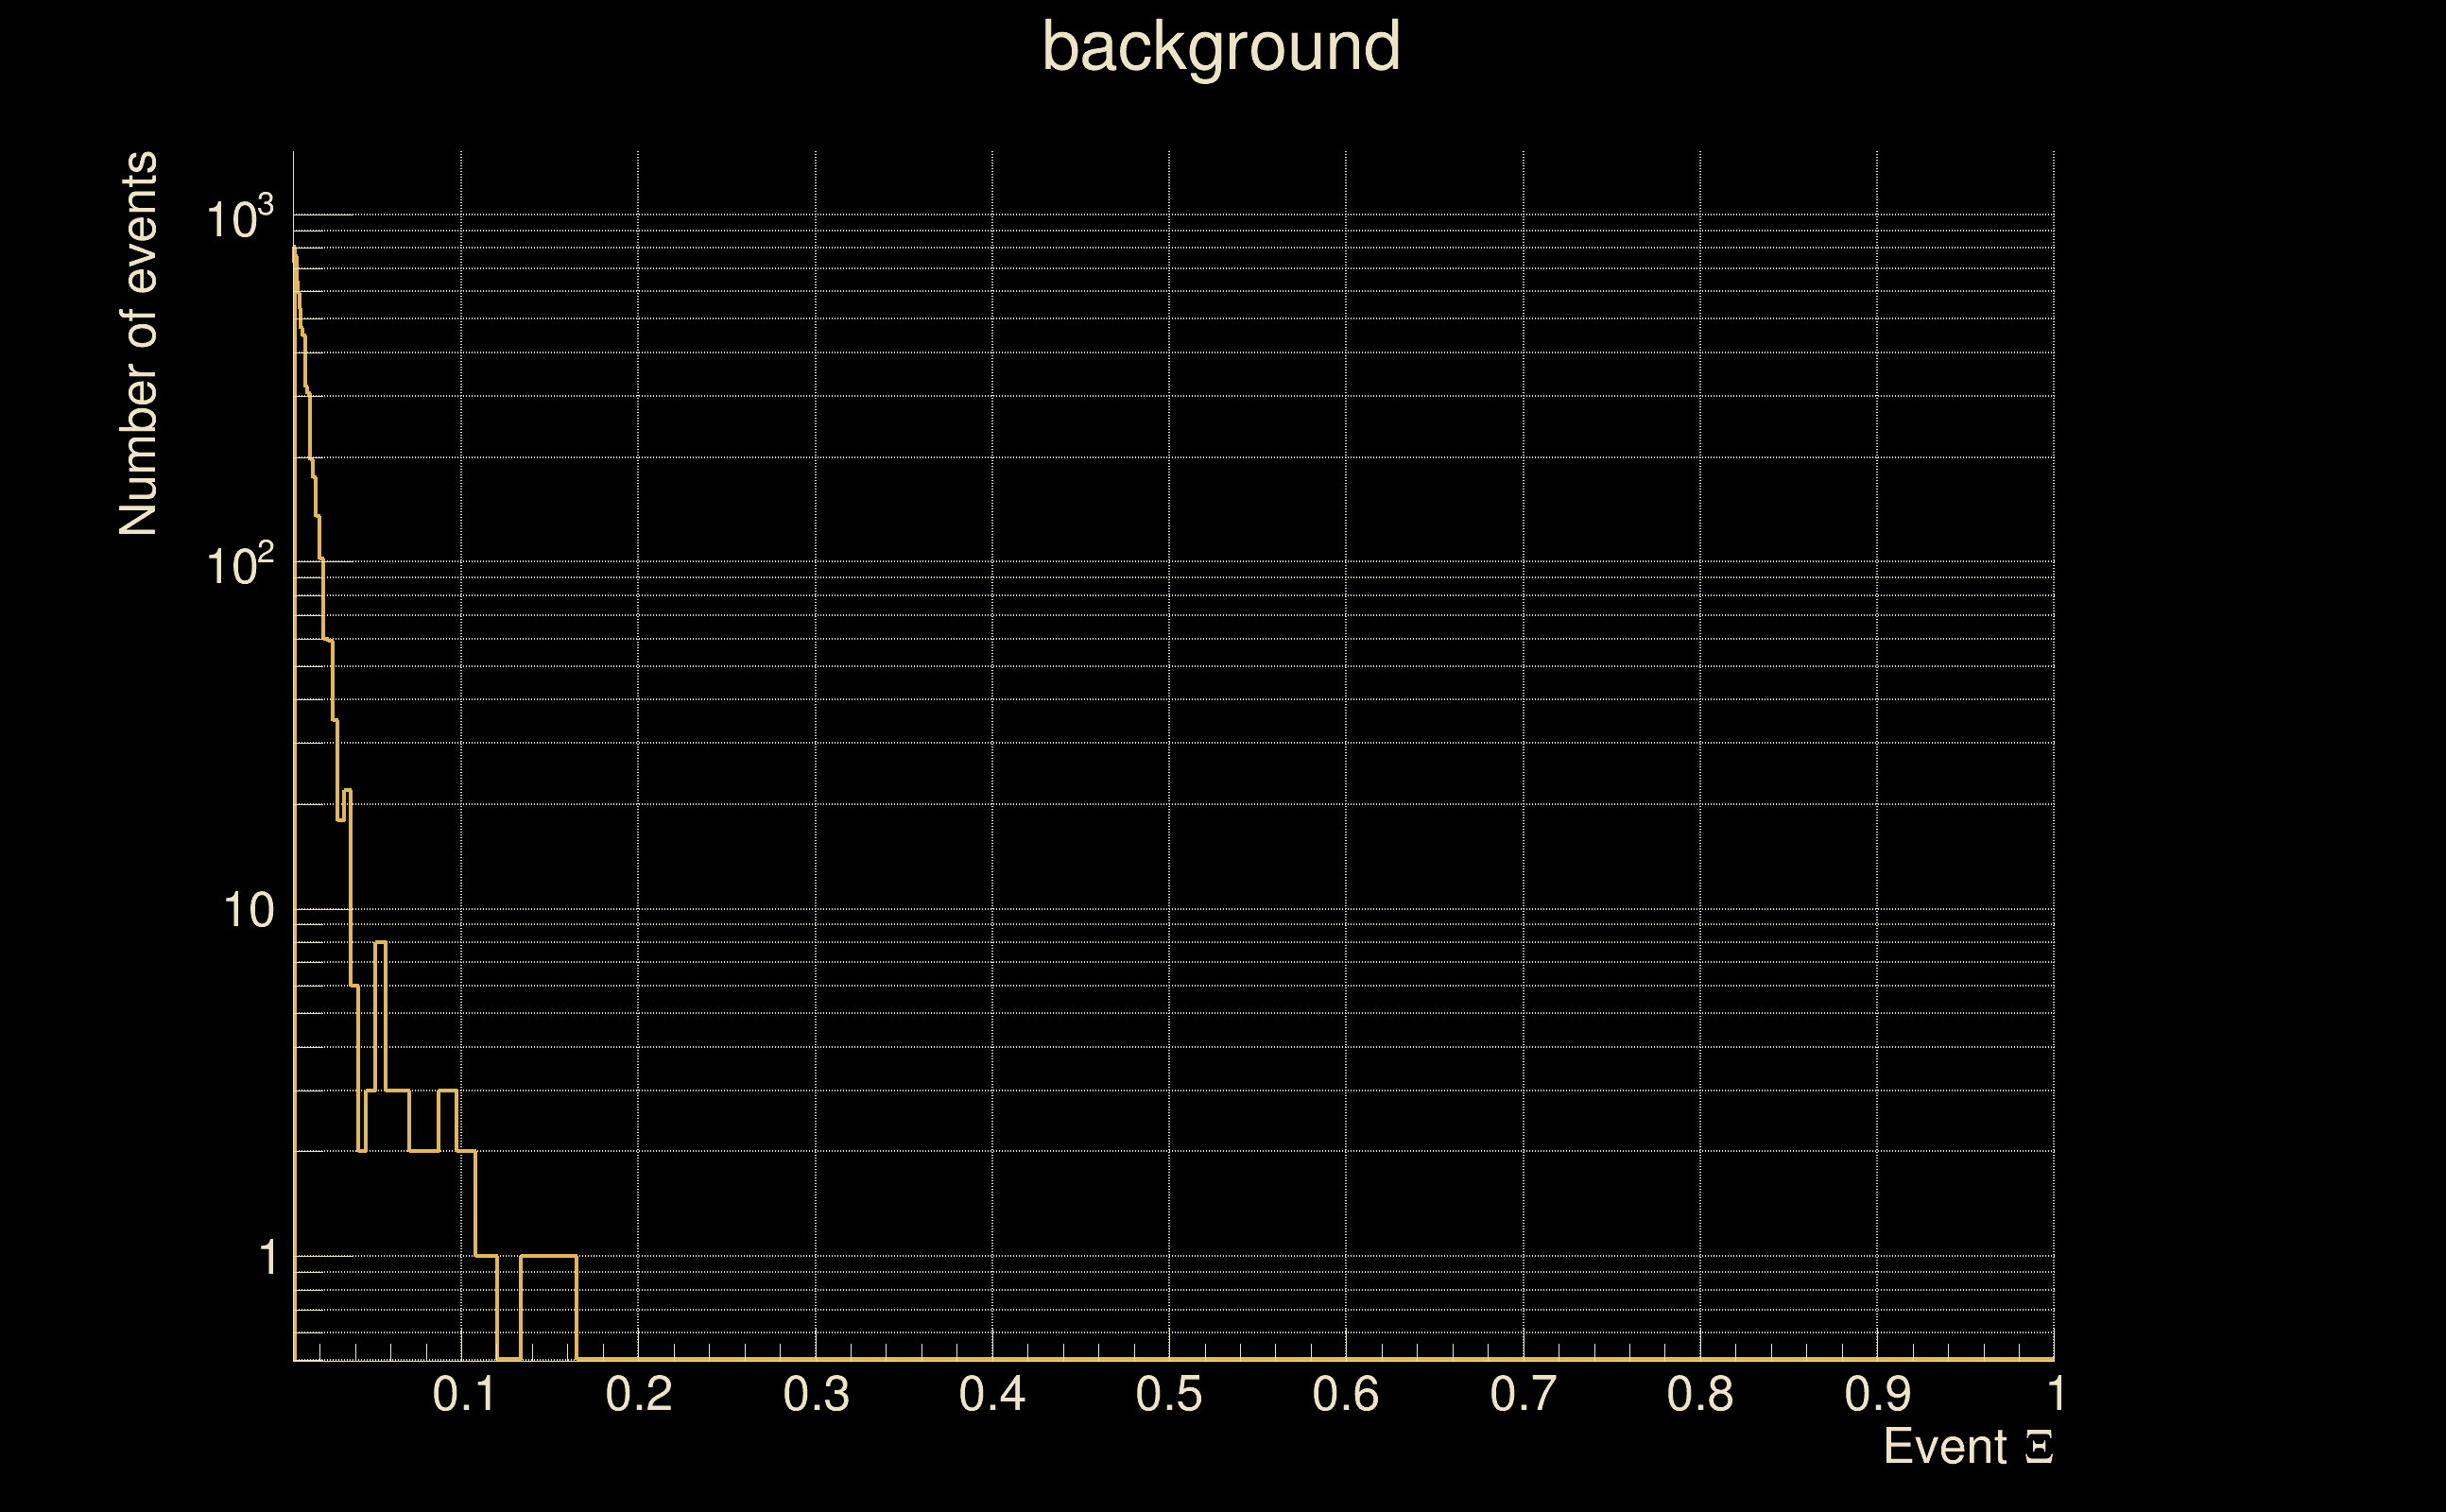
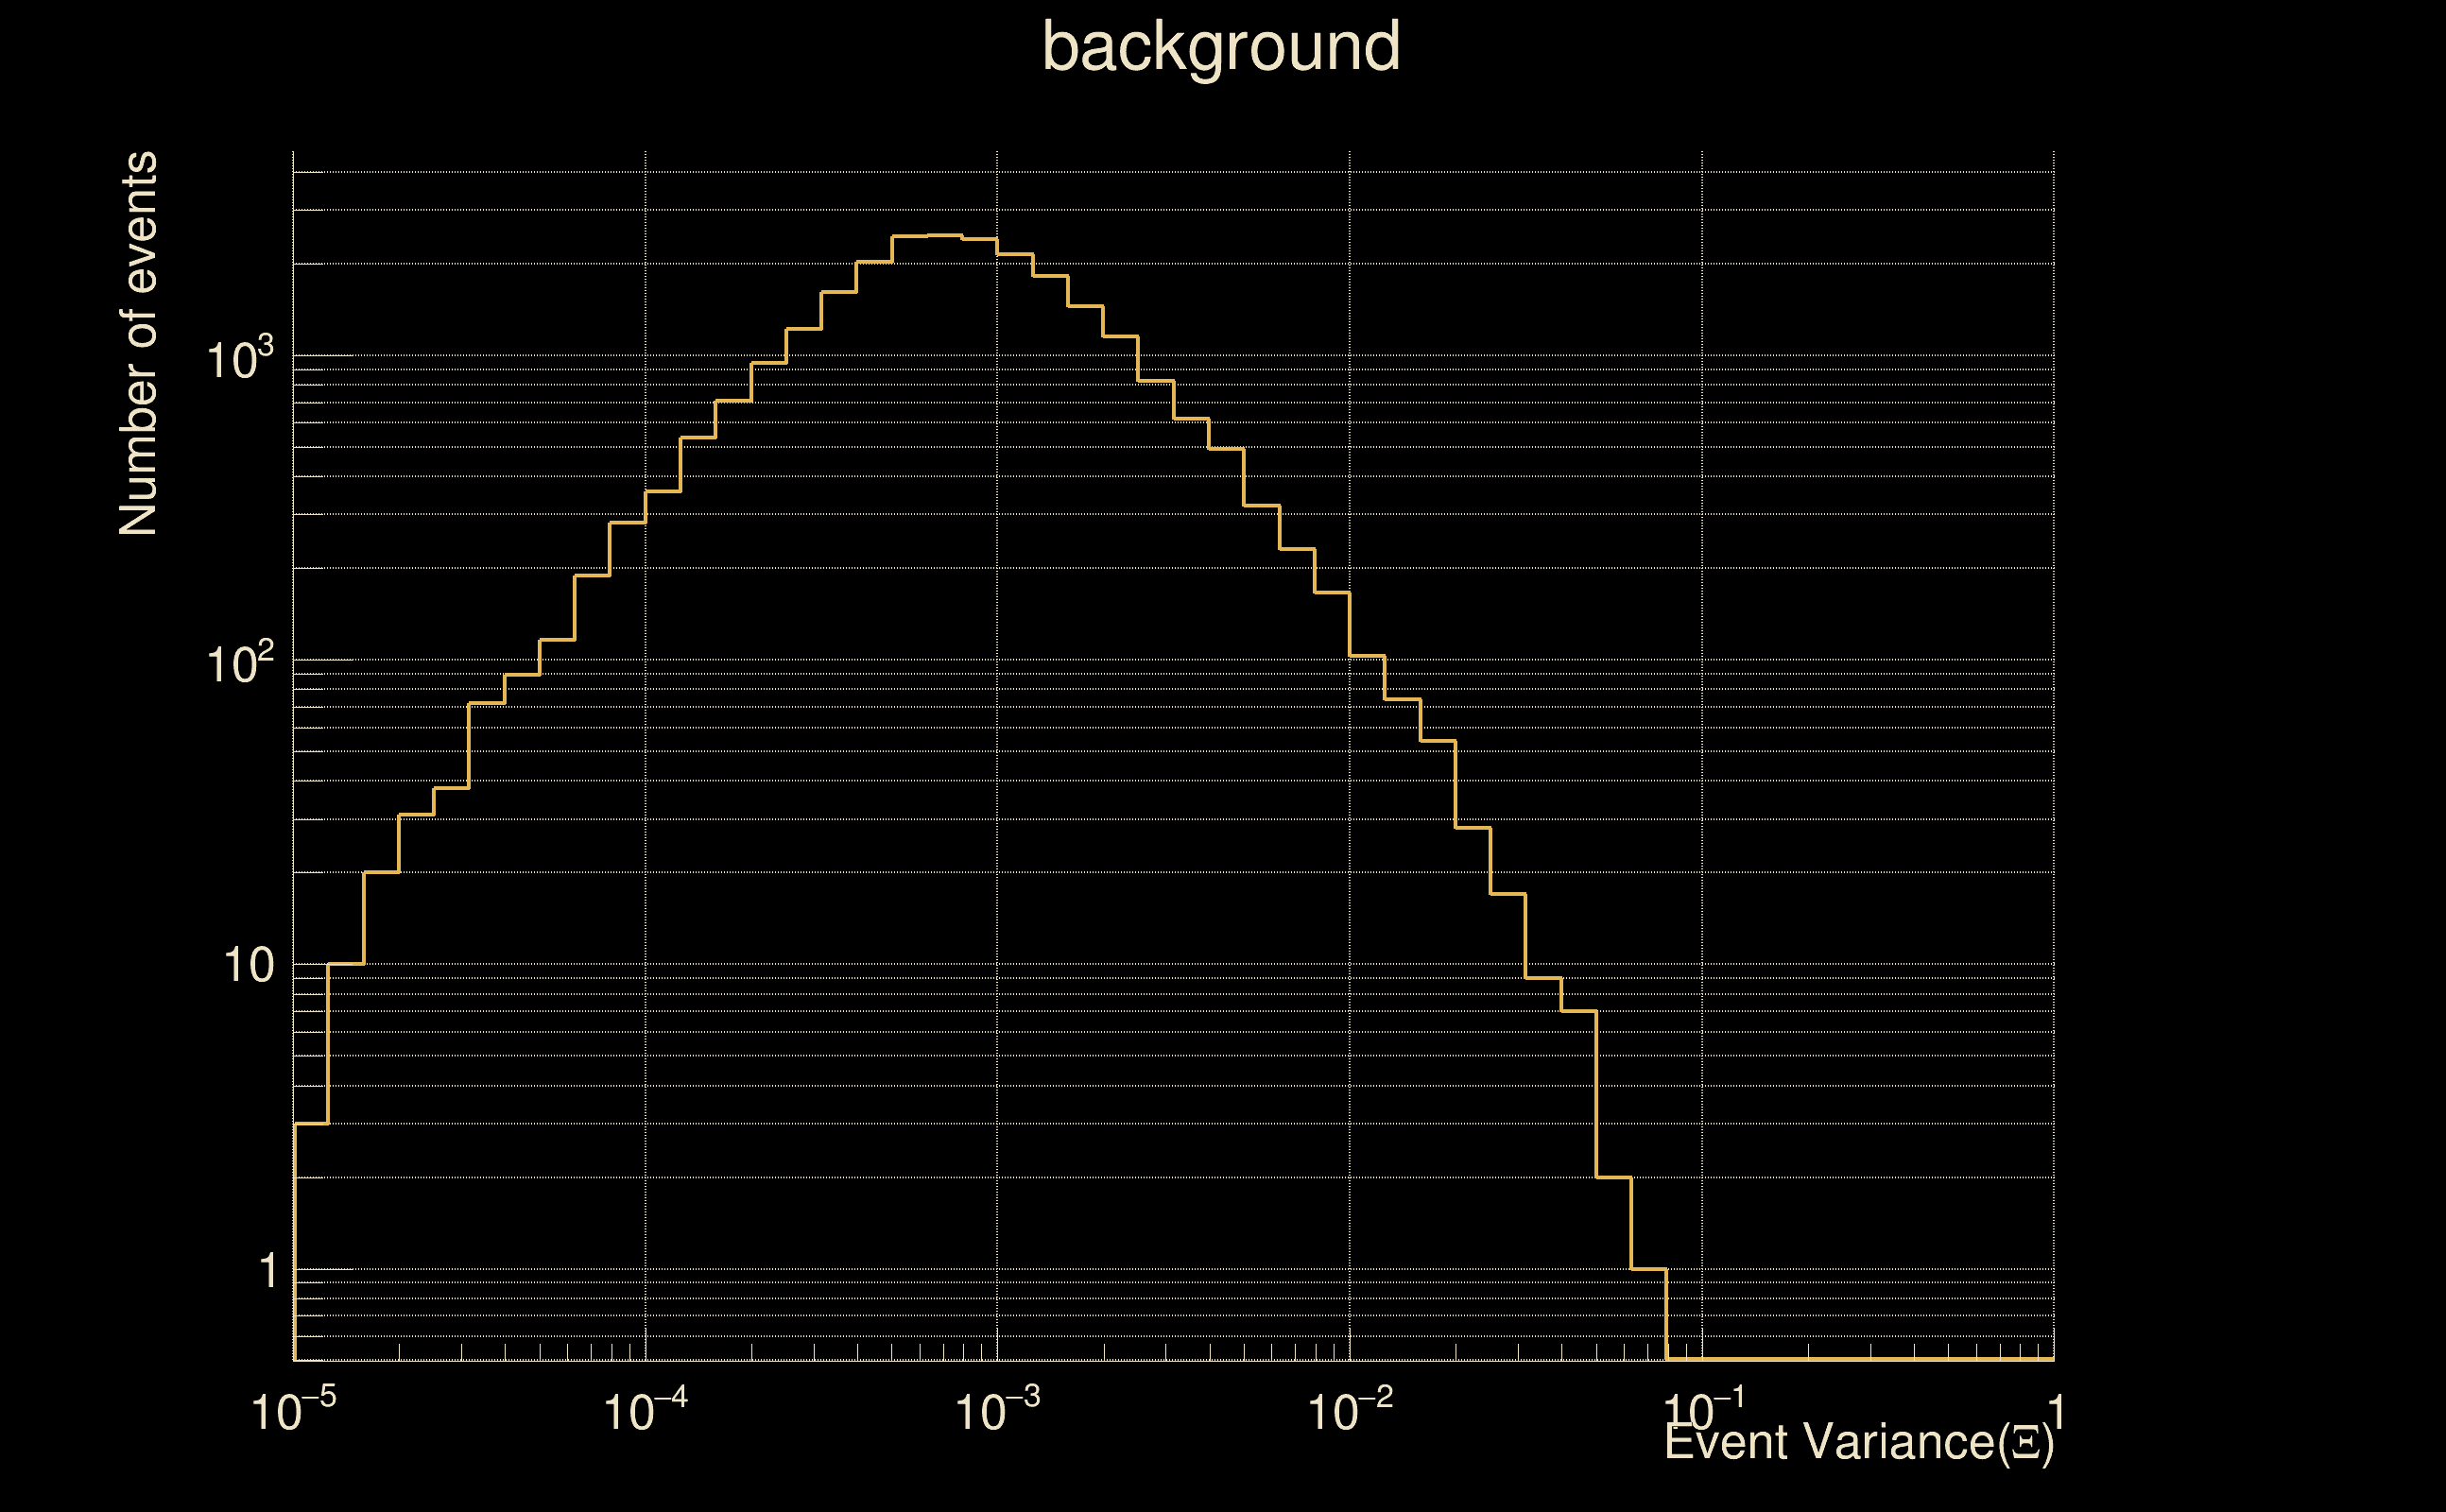
| Number of processed ox events | 117 | 117 | 25155 | |
| Start Date (detector 0) | Mon May 15 14:13:25 2023 UTC | Mon May 15 14:13:25 2023 UTC | Mon May 15 14:13:25 2023 UTC | |
| End Date (detector 0) | Mon May 15 14:23:15 2023 UTC | Mon May 15 14:23:15 2023 UTC | Mon May 15 14:23:15 2023 UTC | |
| Start GPS (detector 0) | 1368195223 | 1368195223 | 1368195223 | |
| End GPS (detector 0) | 1368195813 | 1368195813 | 1368195813 | |
| Used livetime (detector 0) | 590 s | 590 s | 590 s | |
| Start Date (detector 1) | Mon May 15 14:13:25 2023 UTC | Mon May 15 14:13:25 2023 UTC | Mon May 15 14:13:25 2023 UTC | |
| End Date (detector 1) | Mon May 15 14:23:15 2023 UTC | Mon May 15 14:23:15 2023 UTC | Mon May 15 14:23:15 2023 UTC | |
| Start GPS (detector 1) | 1368195223 | 1368195223 | 1368195223 | |
| End GPS (detector 1) | 1368195813 | 1368195813 | 1368195813 | |
| Used livetime (detector 1) | 590 s | 590 s | 590 s | |
| Cumulative livetime | 1170 s | 1170 s | 251550 s | |
| 0 years, 0 days, 0 hours, 19 min, 30 s | 0 years, 0 days, 0 hours, 19 min, 30 s | 0 years, 2 days, 21 hours, 52 min, 30 s |
|
|
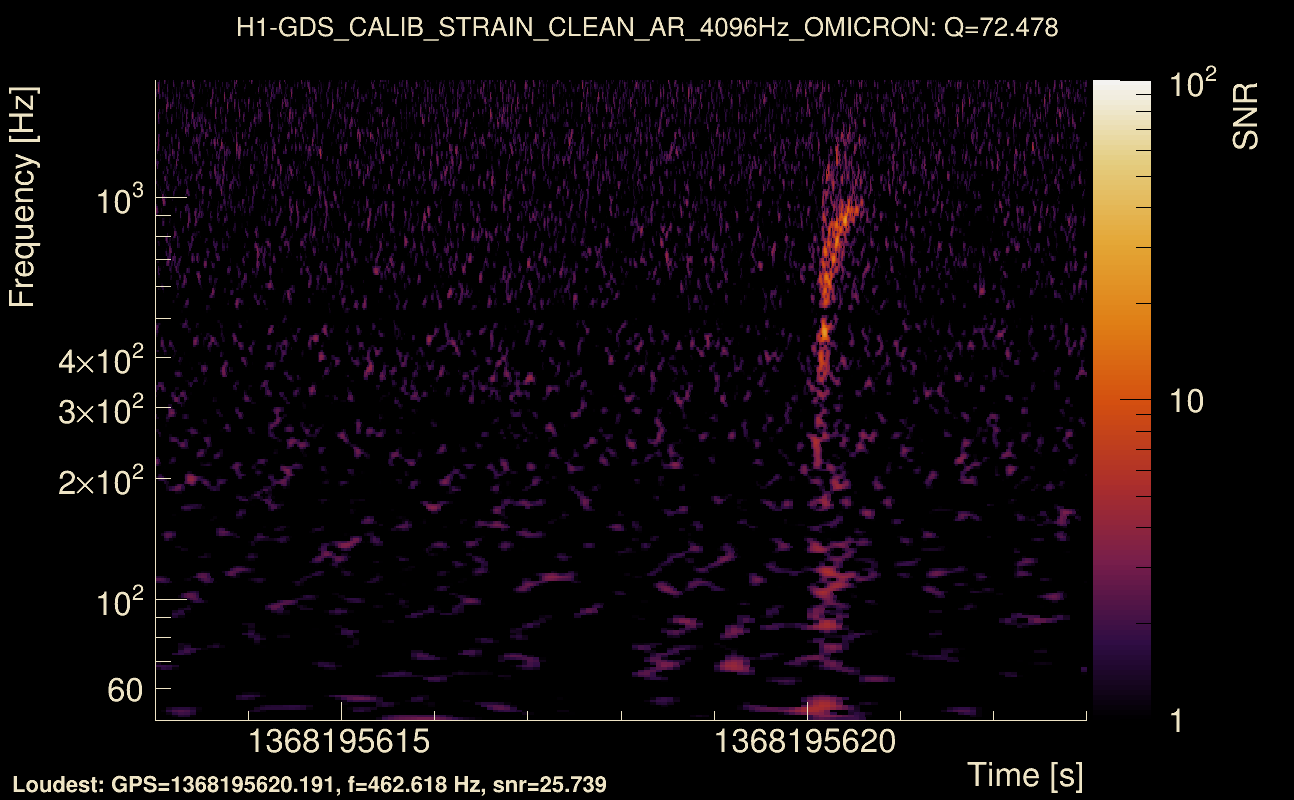
| Event time t(H1): | GPS = 1368195618 (Mon May 15 14:20:00 2023 ) → GPS = 1368195628 (Mon May 15 14:20:10 2023 ) |
| Event time t(L1): | GPS = 1368195618 (Mon May 15 14:20:10 2023 ) → GPS = 1368195628 (Mon May 15 14:20:10 2023 ) |
| Omicron analysis time window (H1): | GPS = 1368195615 → GPS = 1368195631 |
| Omicron analysis time window (L1): | GPS = 1368195615 → GPS = 1368195631 |
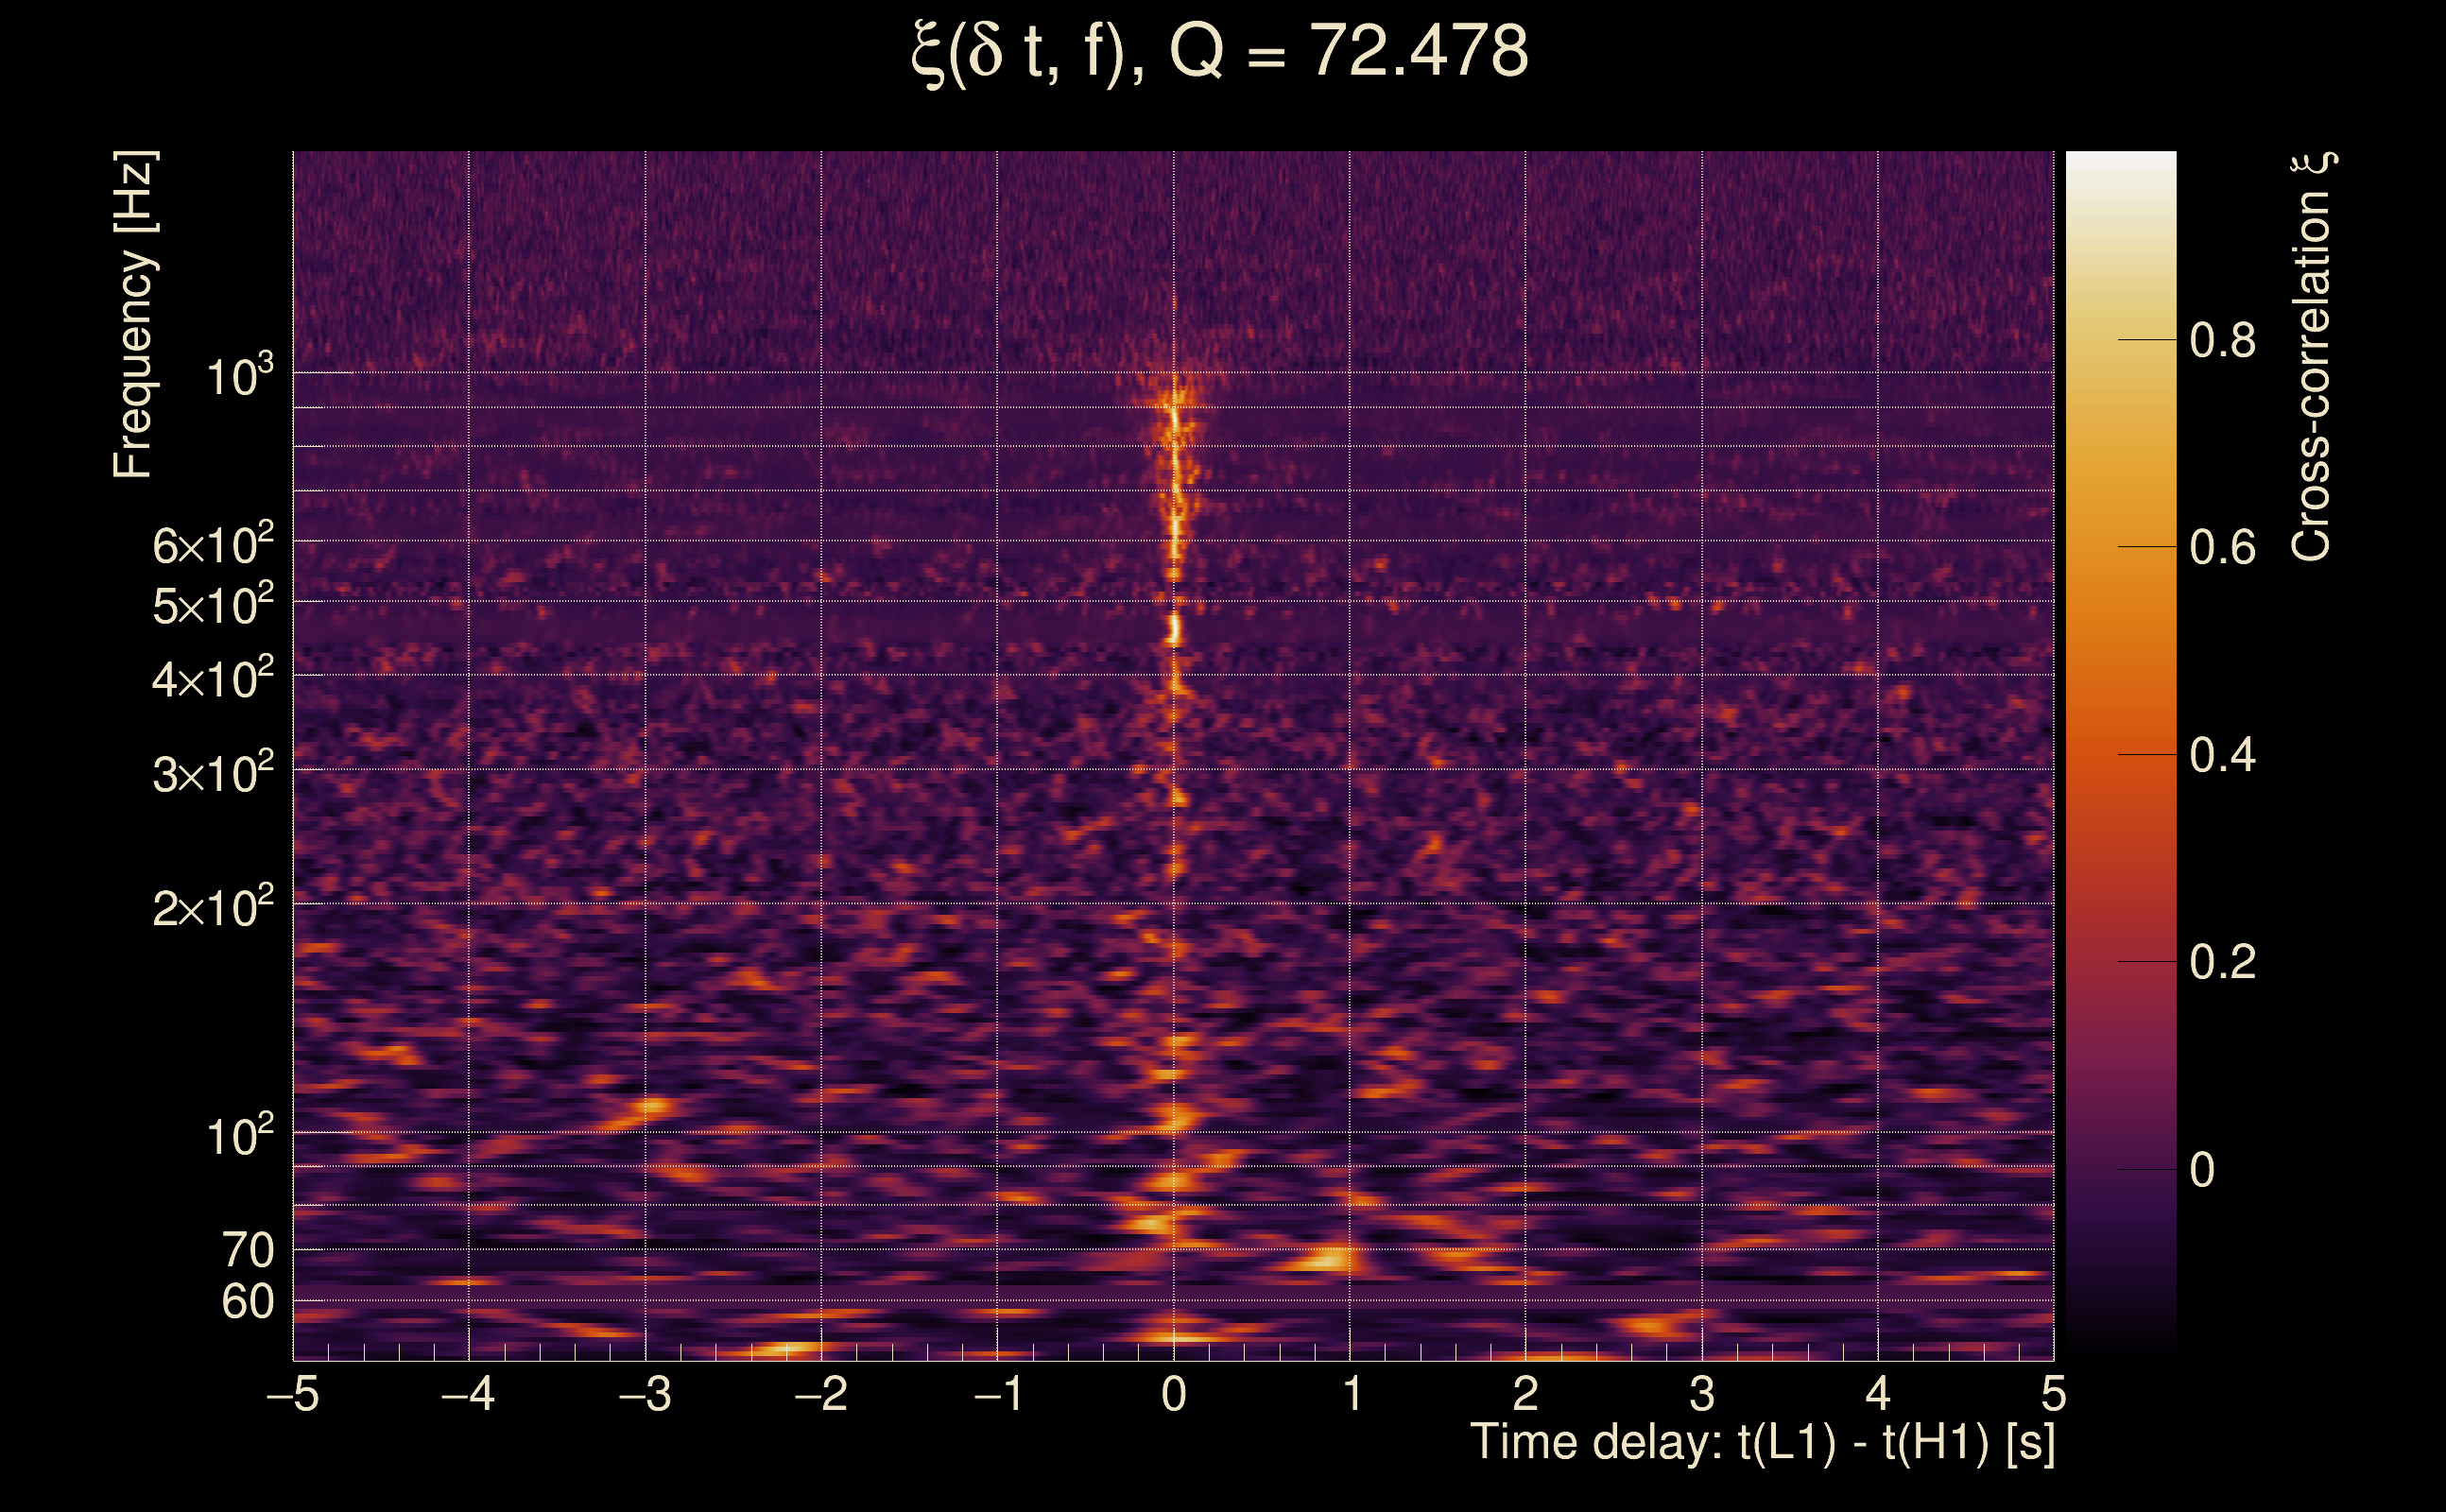
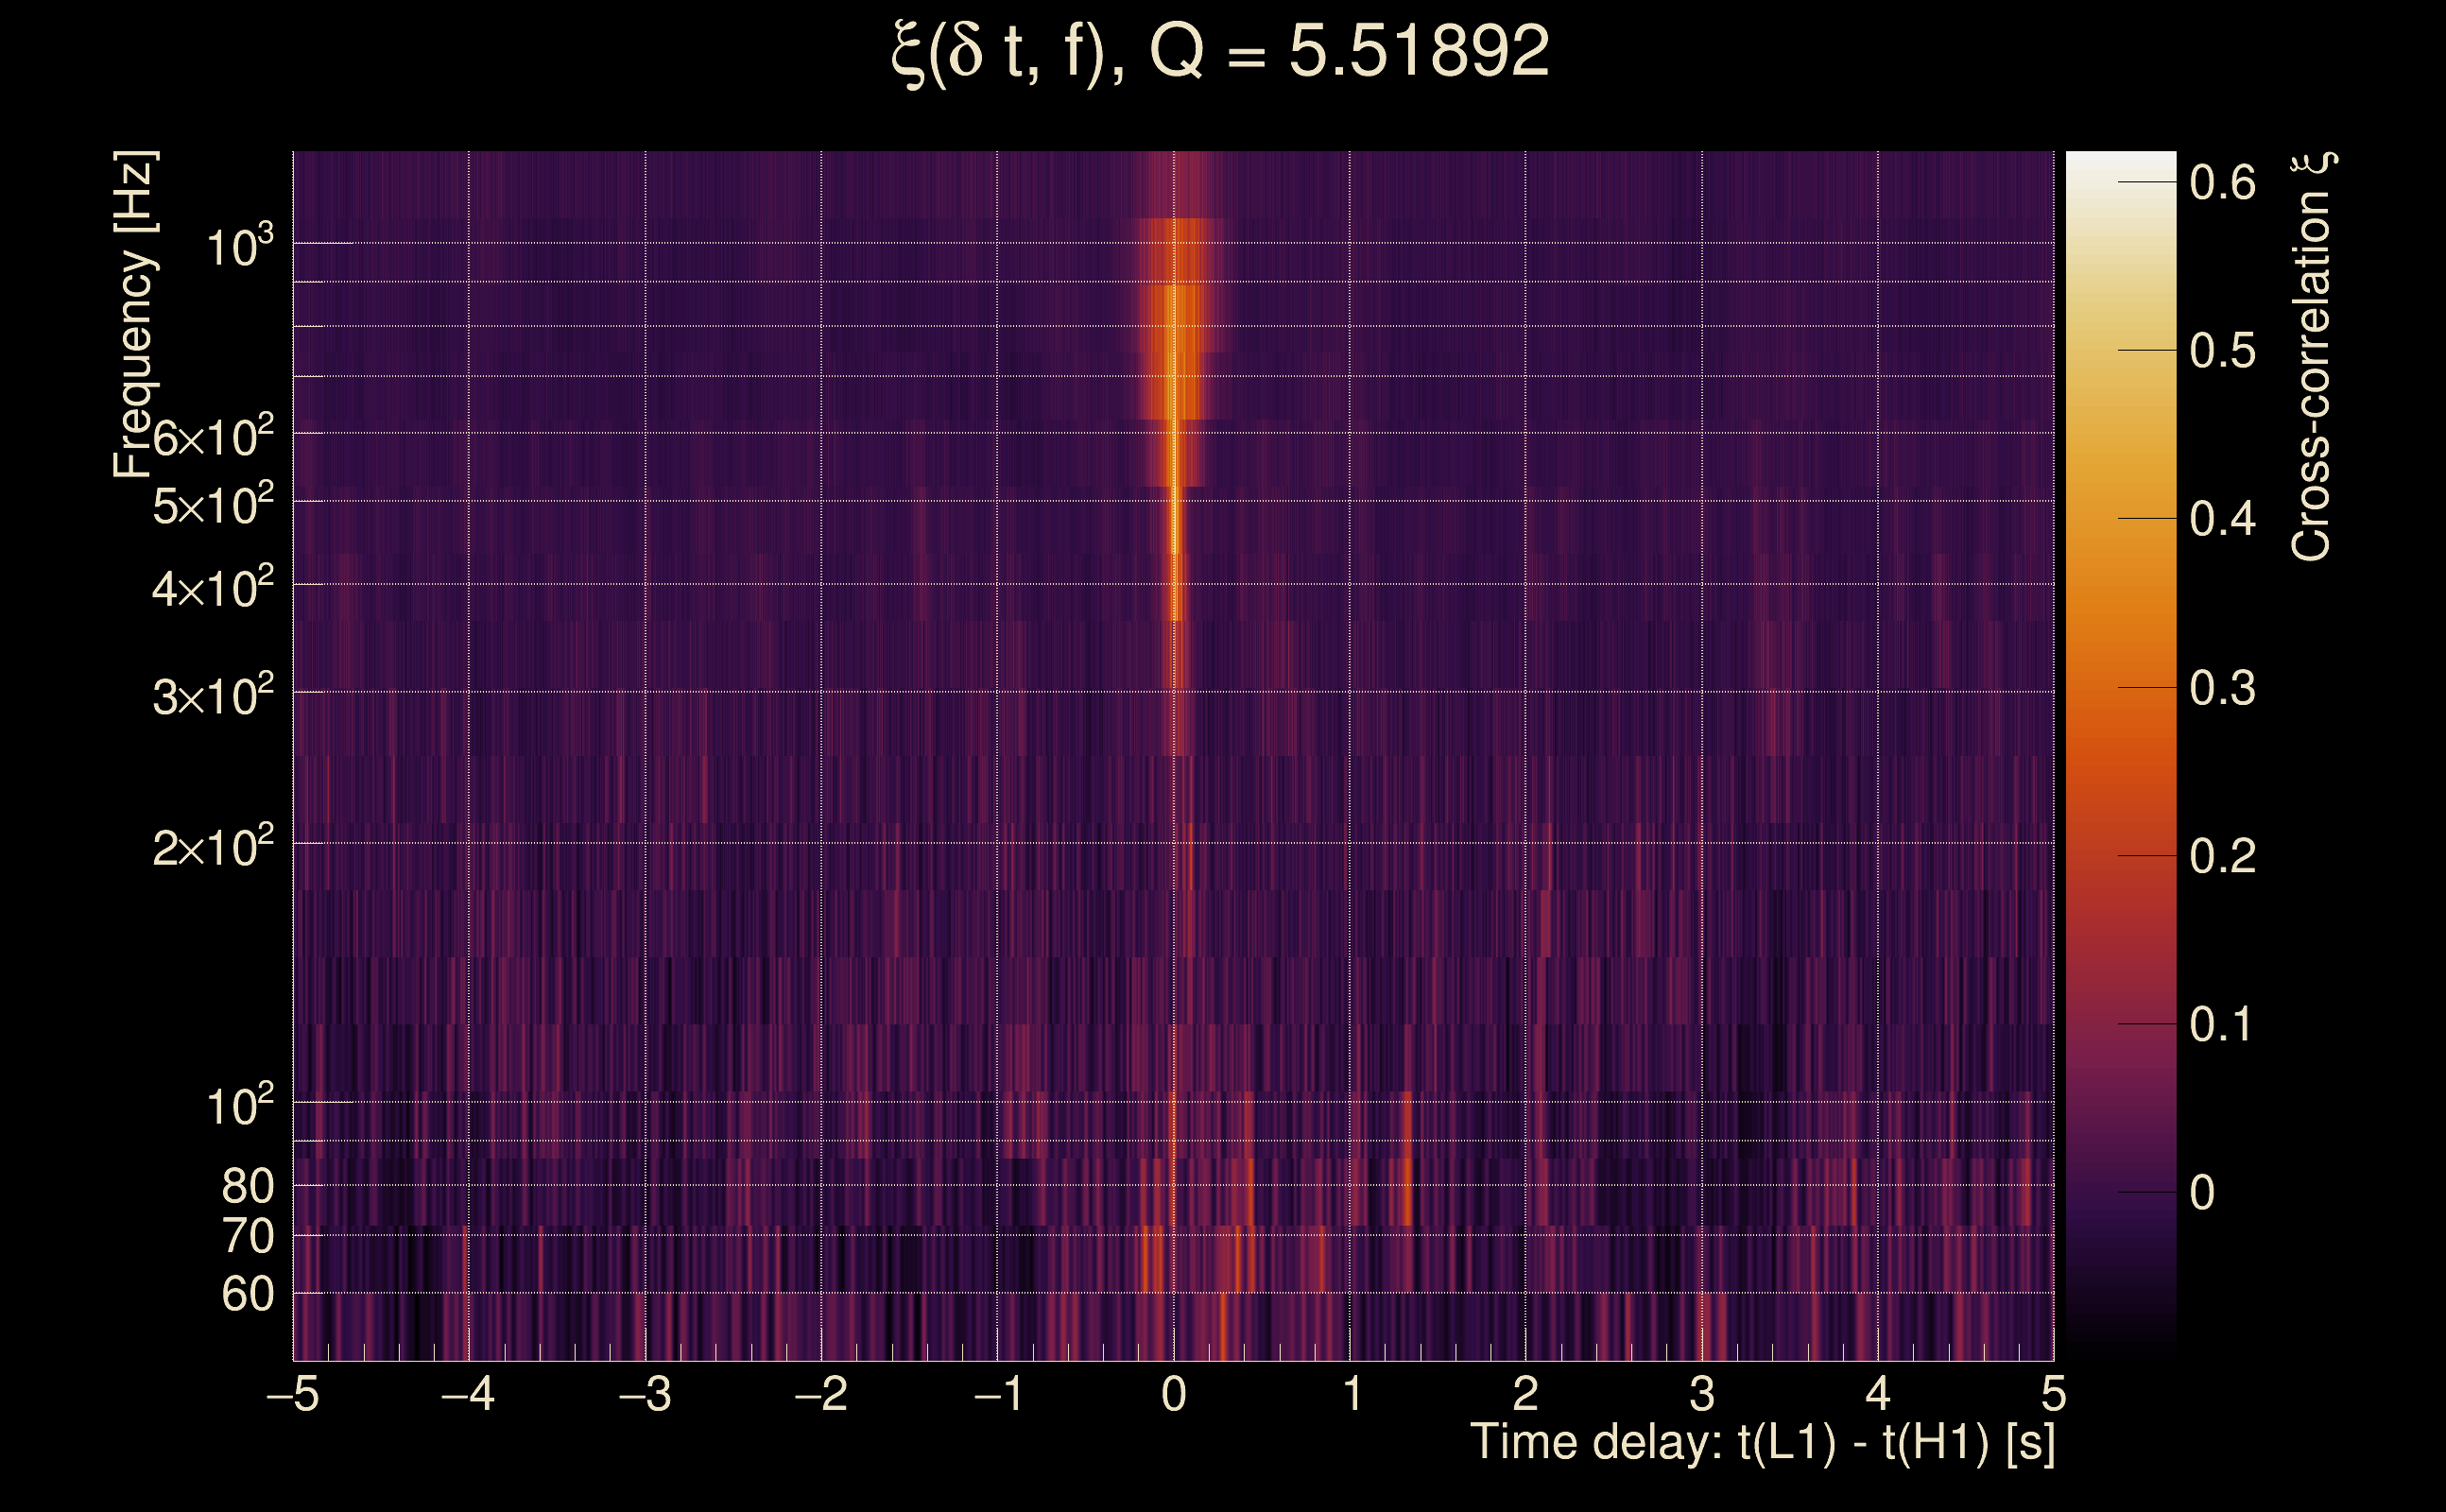
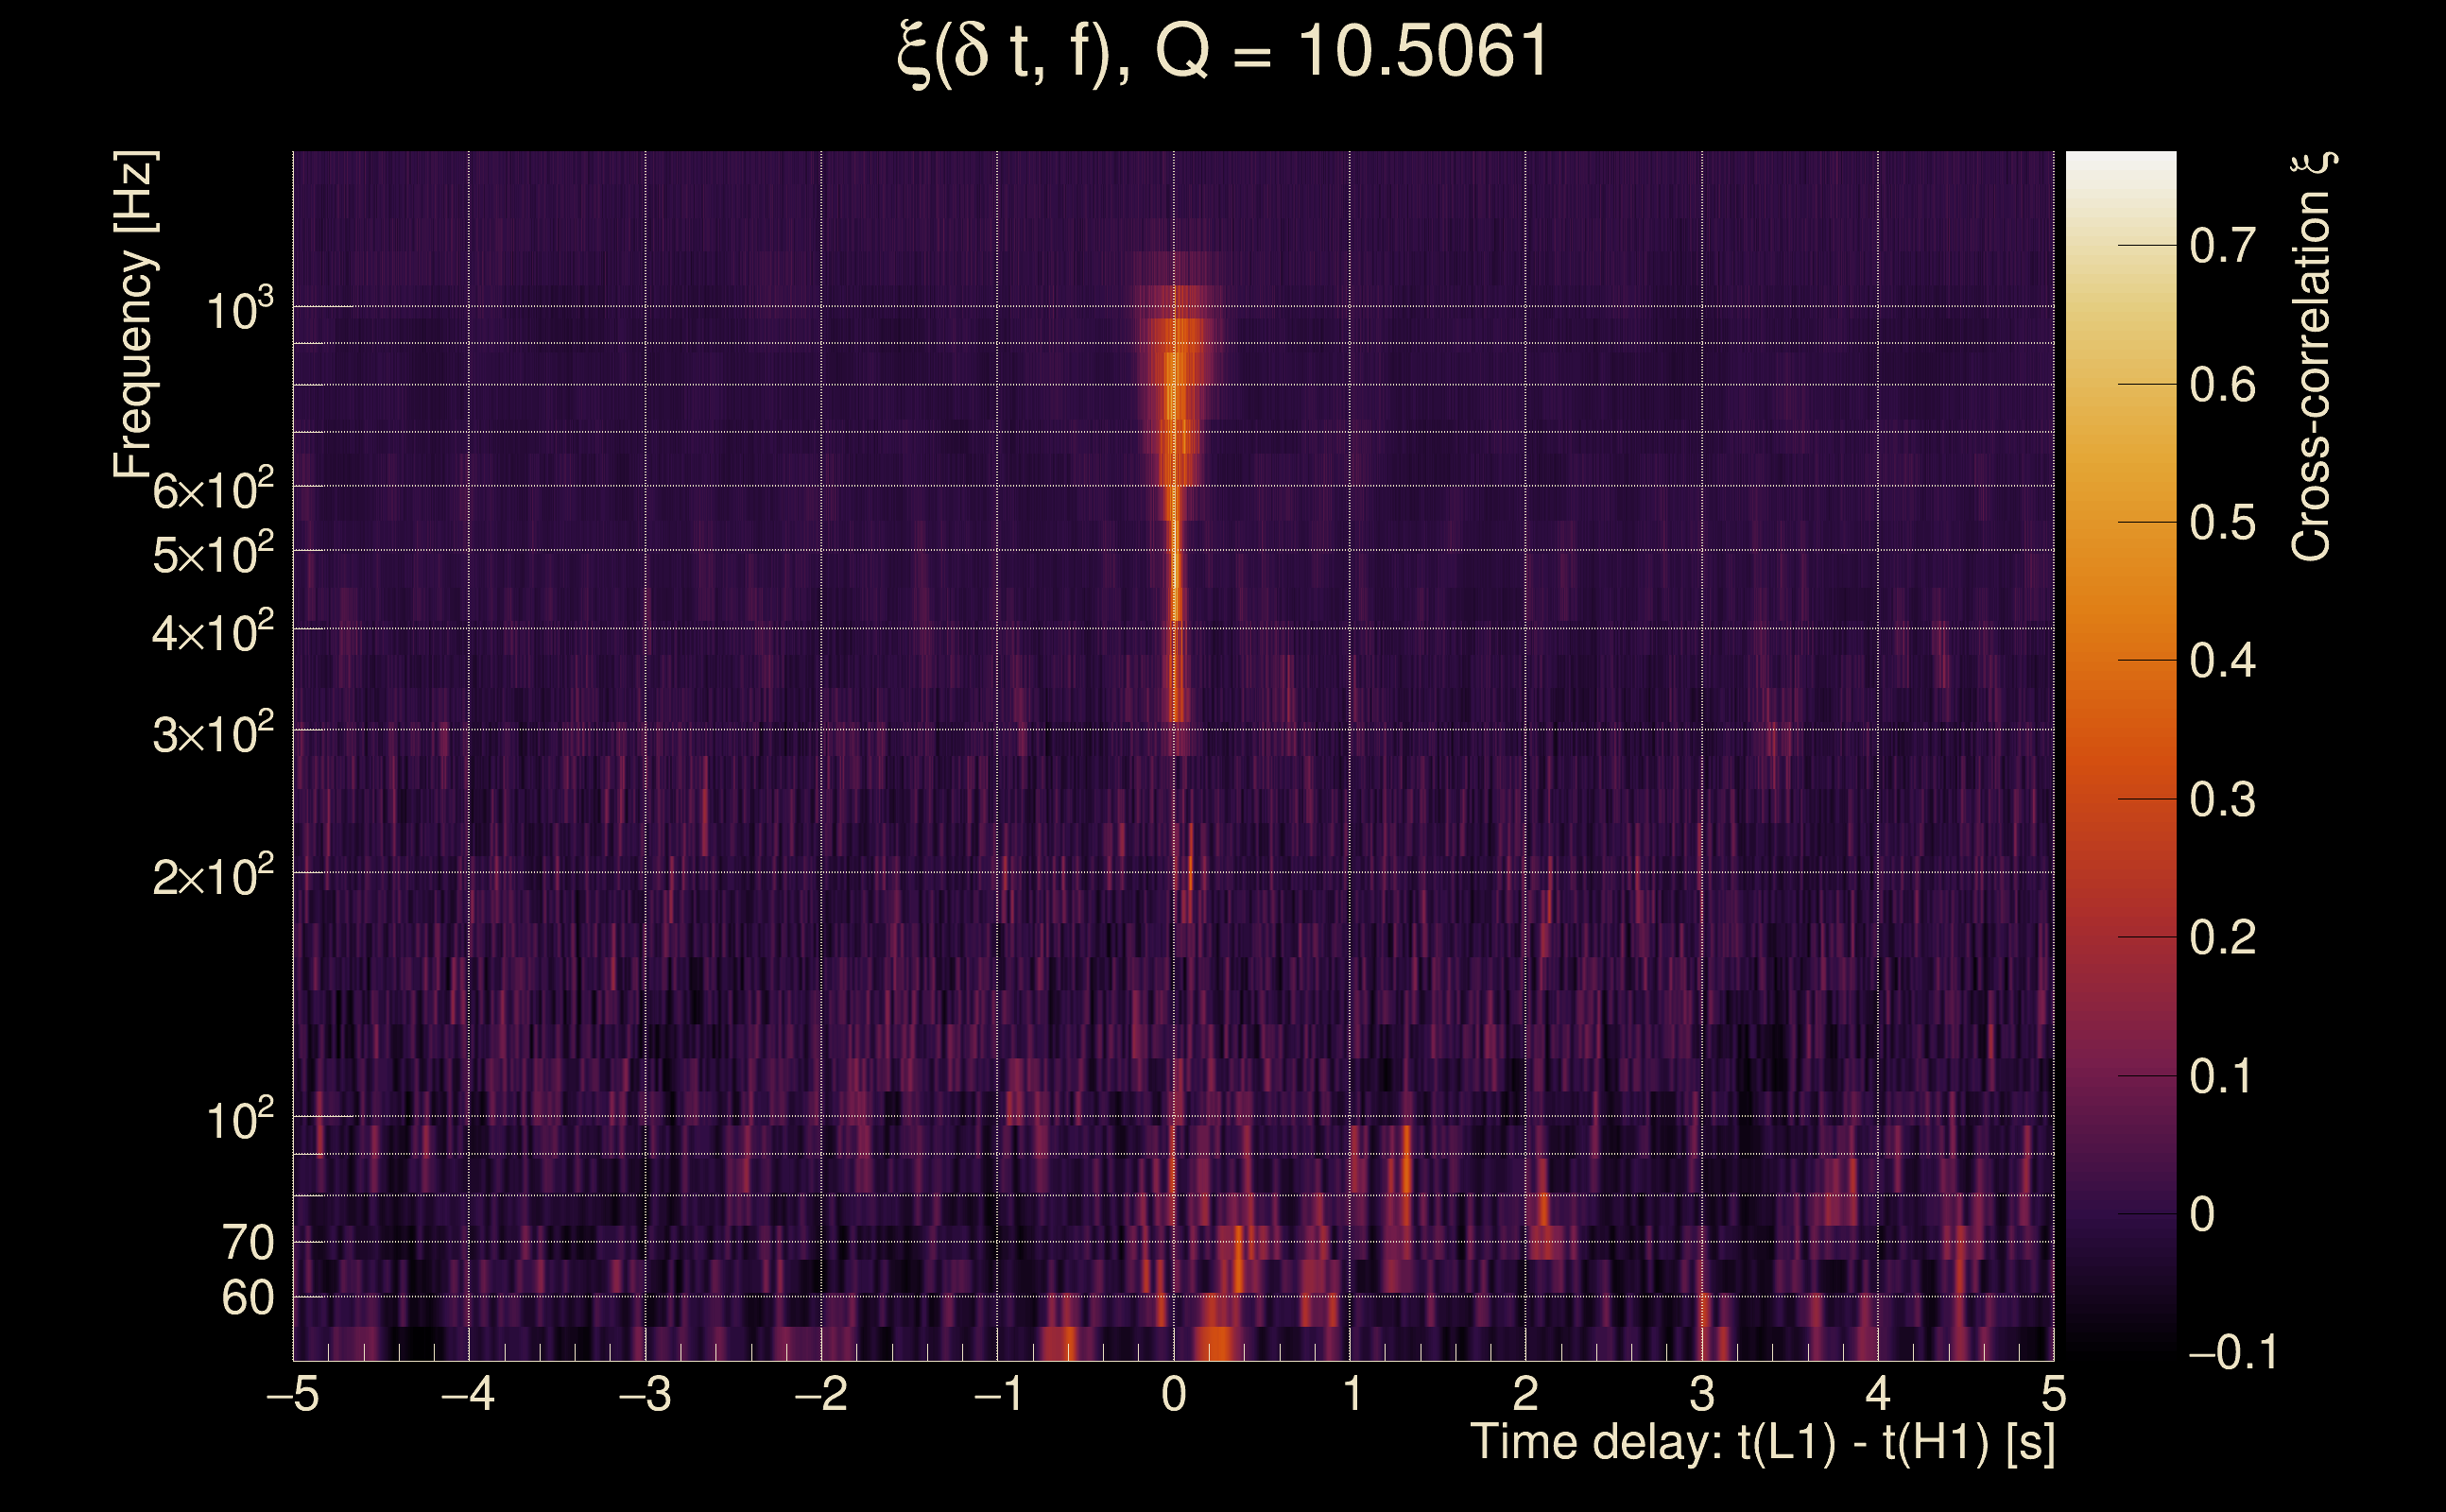
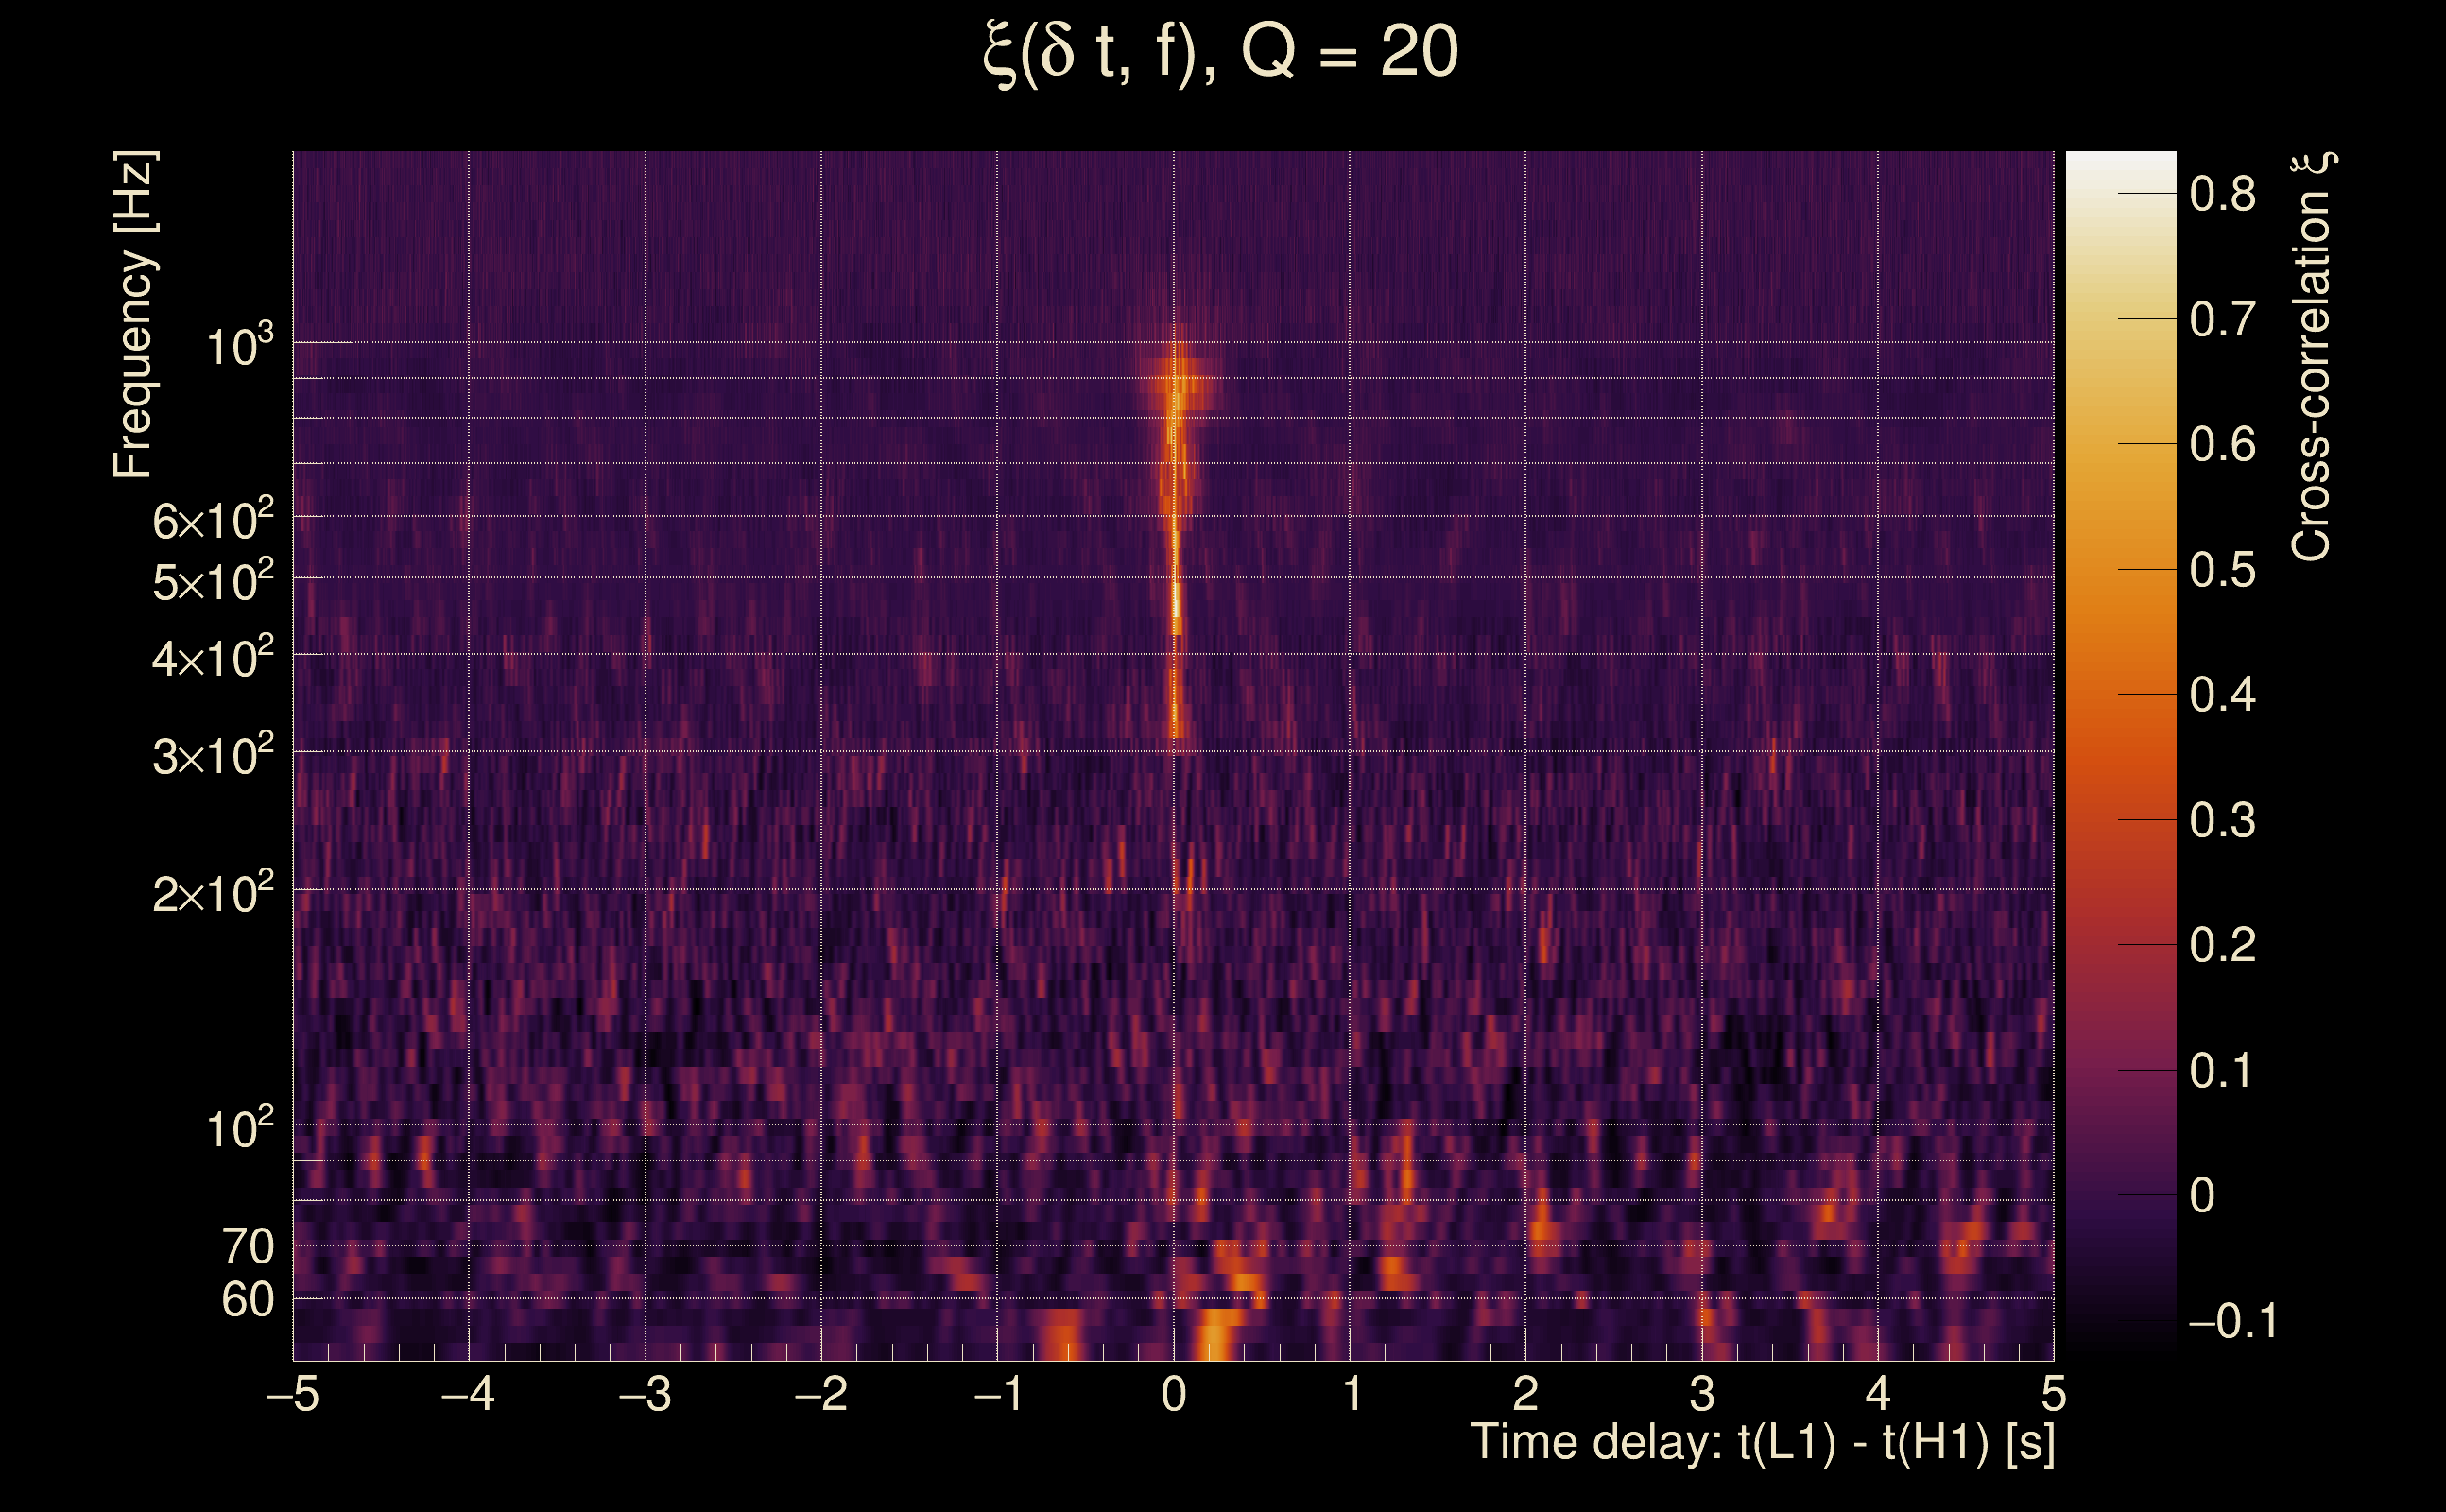
| Time delay between detectors t(L1) - t(H1): | 0.00865718 s (slice index = 108 / 217), δt_gw = 0.00865718 s |
| Time delay uncertainty: | 0.00156463 s |
| [targeted mode] Time delay probability: | 0.995277 (0.00591983 sigmas), δt_target = 1.72247e+45 s |
| Frequency: | 382.868 Hz |
| Ξ: | 0.470915 ± 0.0649543 (variance = 0.00421906): Q0: 0.521973, Q1: 0.586963, Q2: 0.598466, Q3: 0.663415, Q4: 0.710105 |
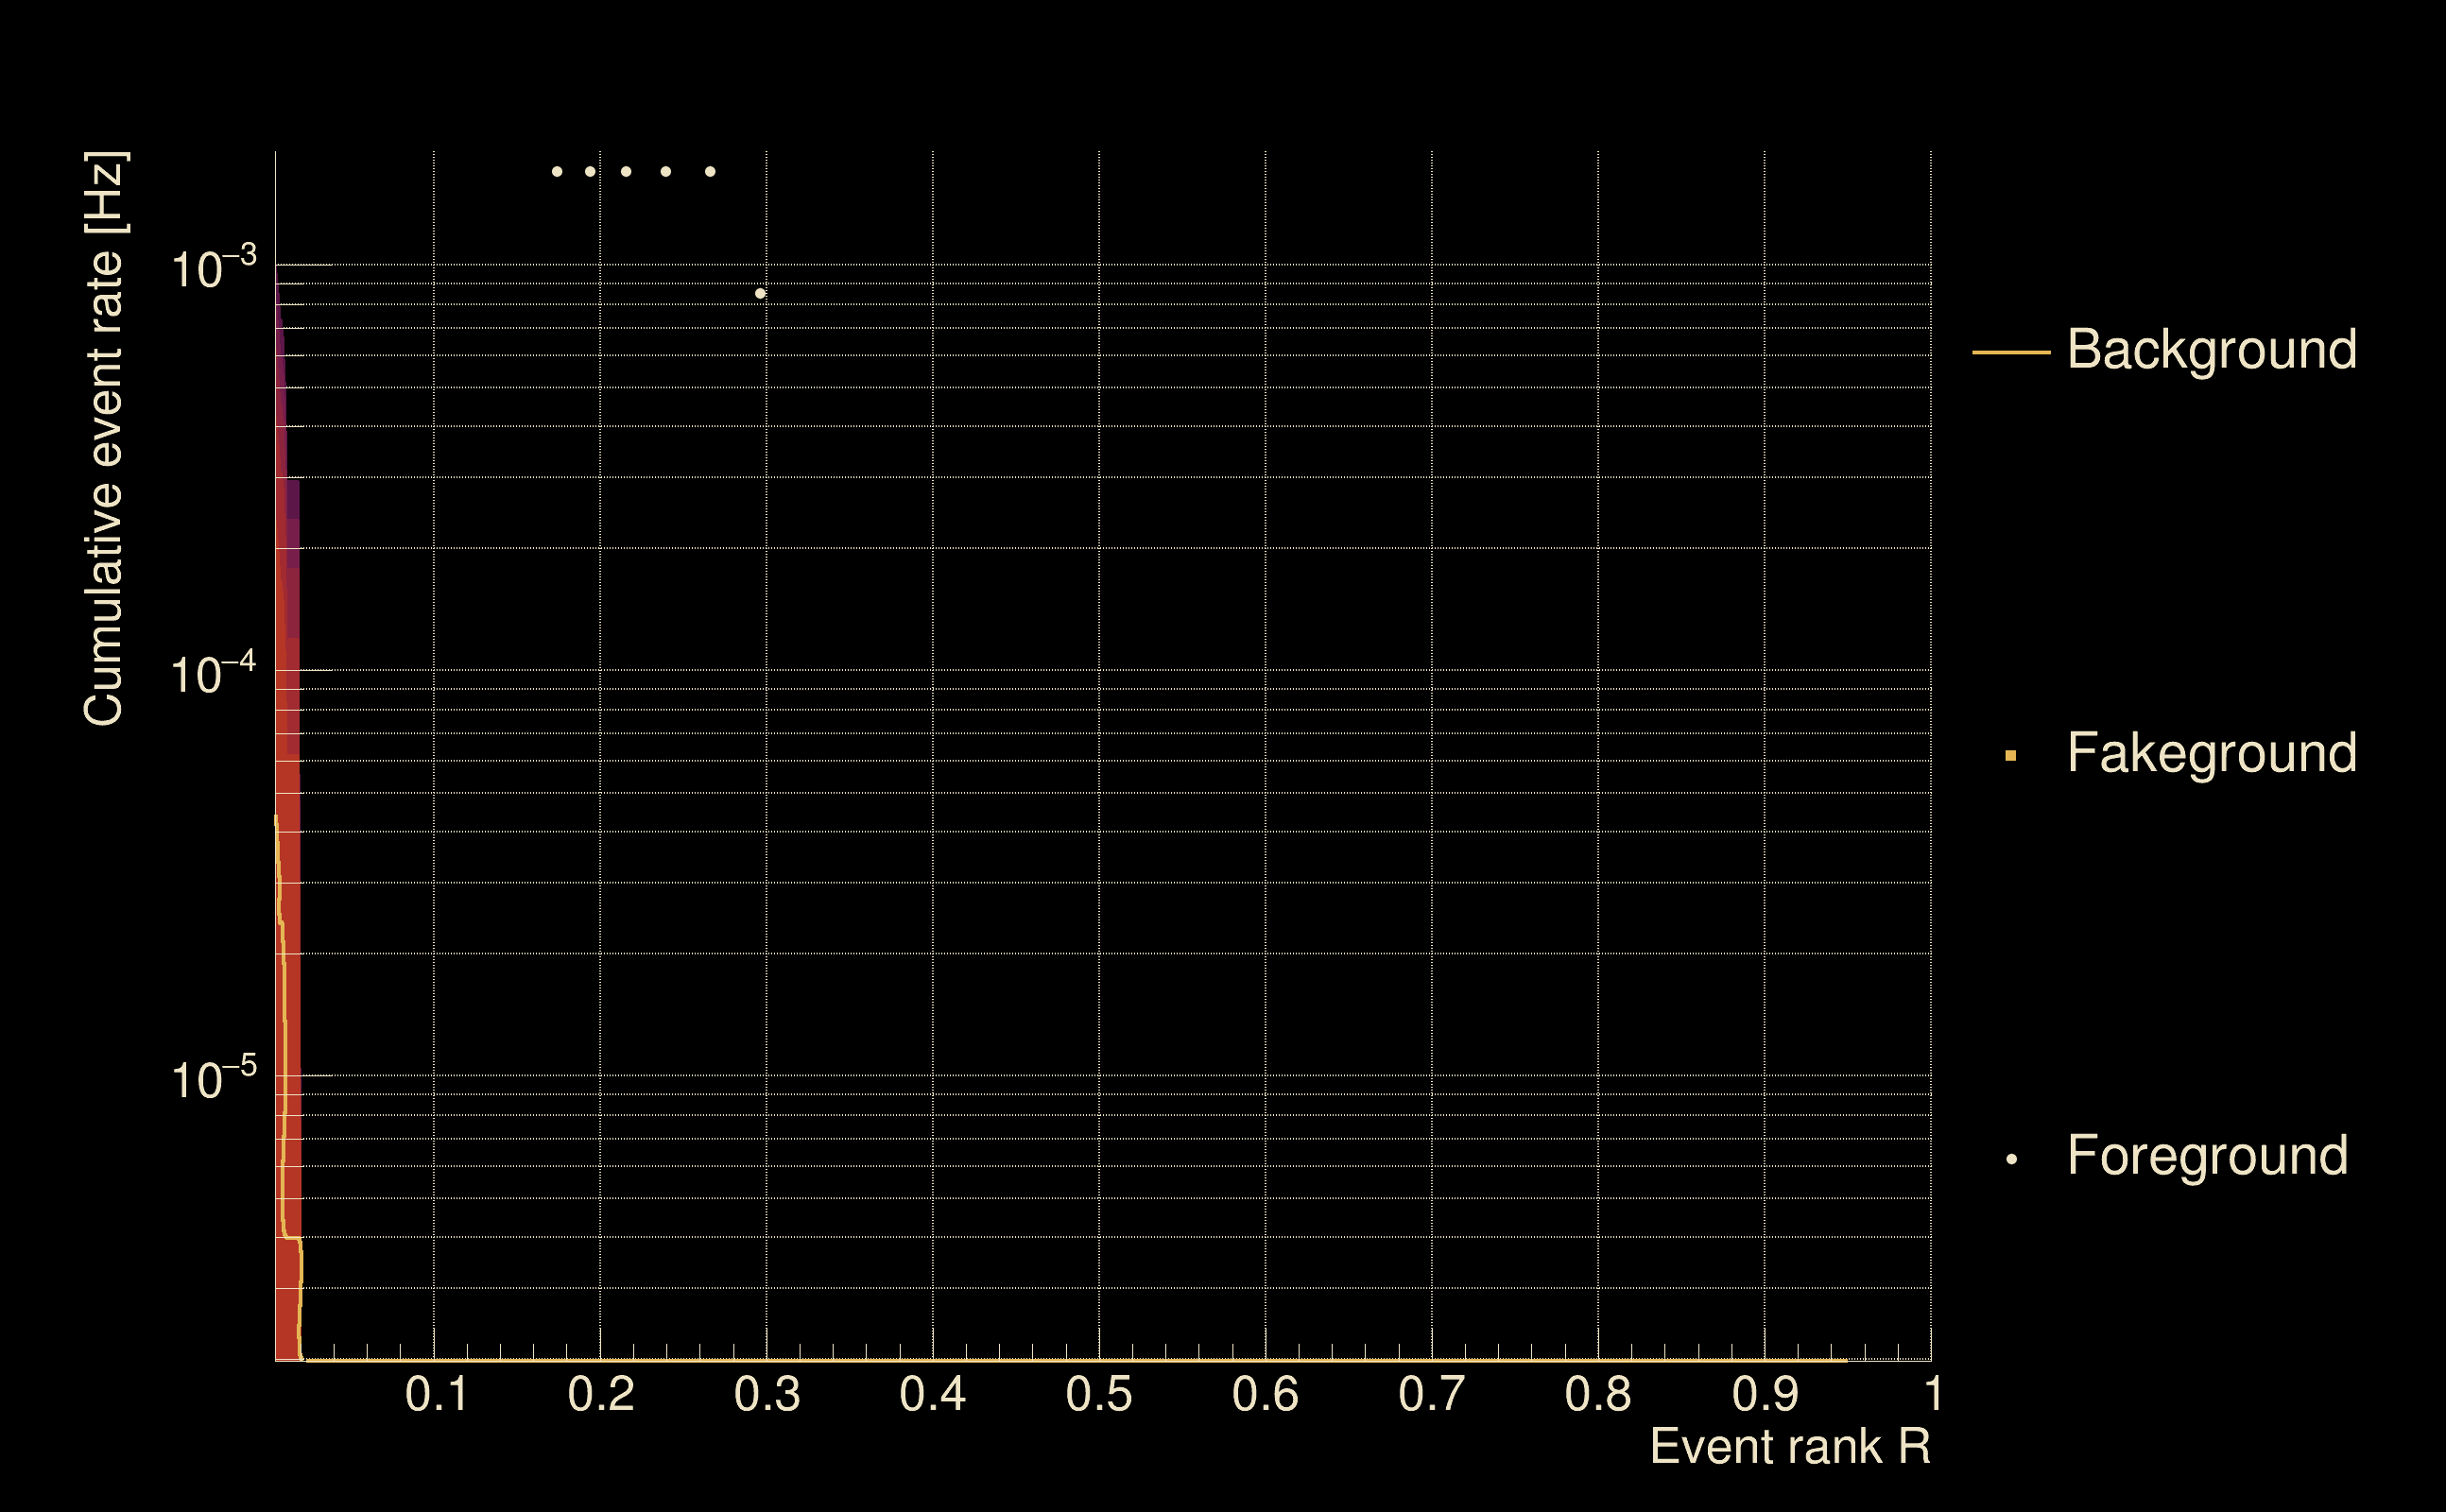
| Rank: | R_A = 0.289626 |
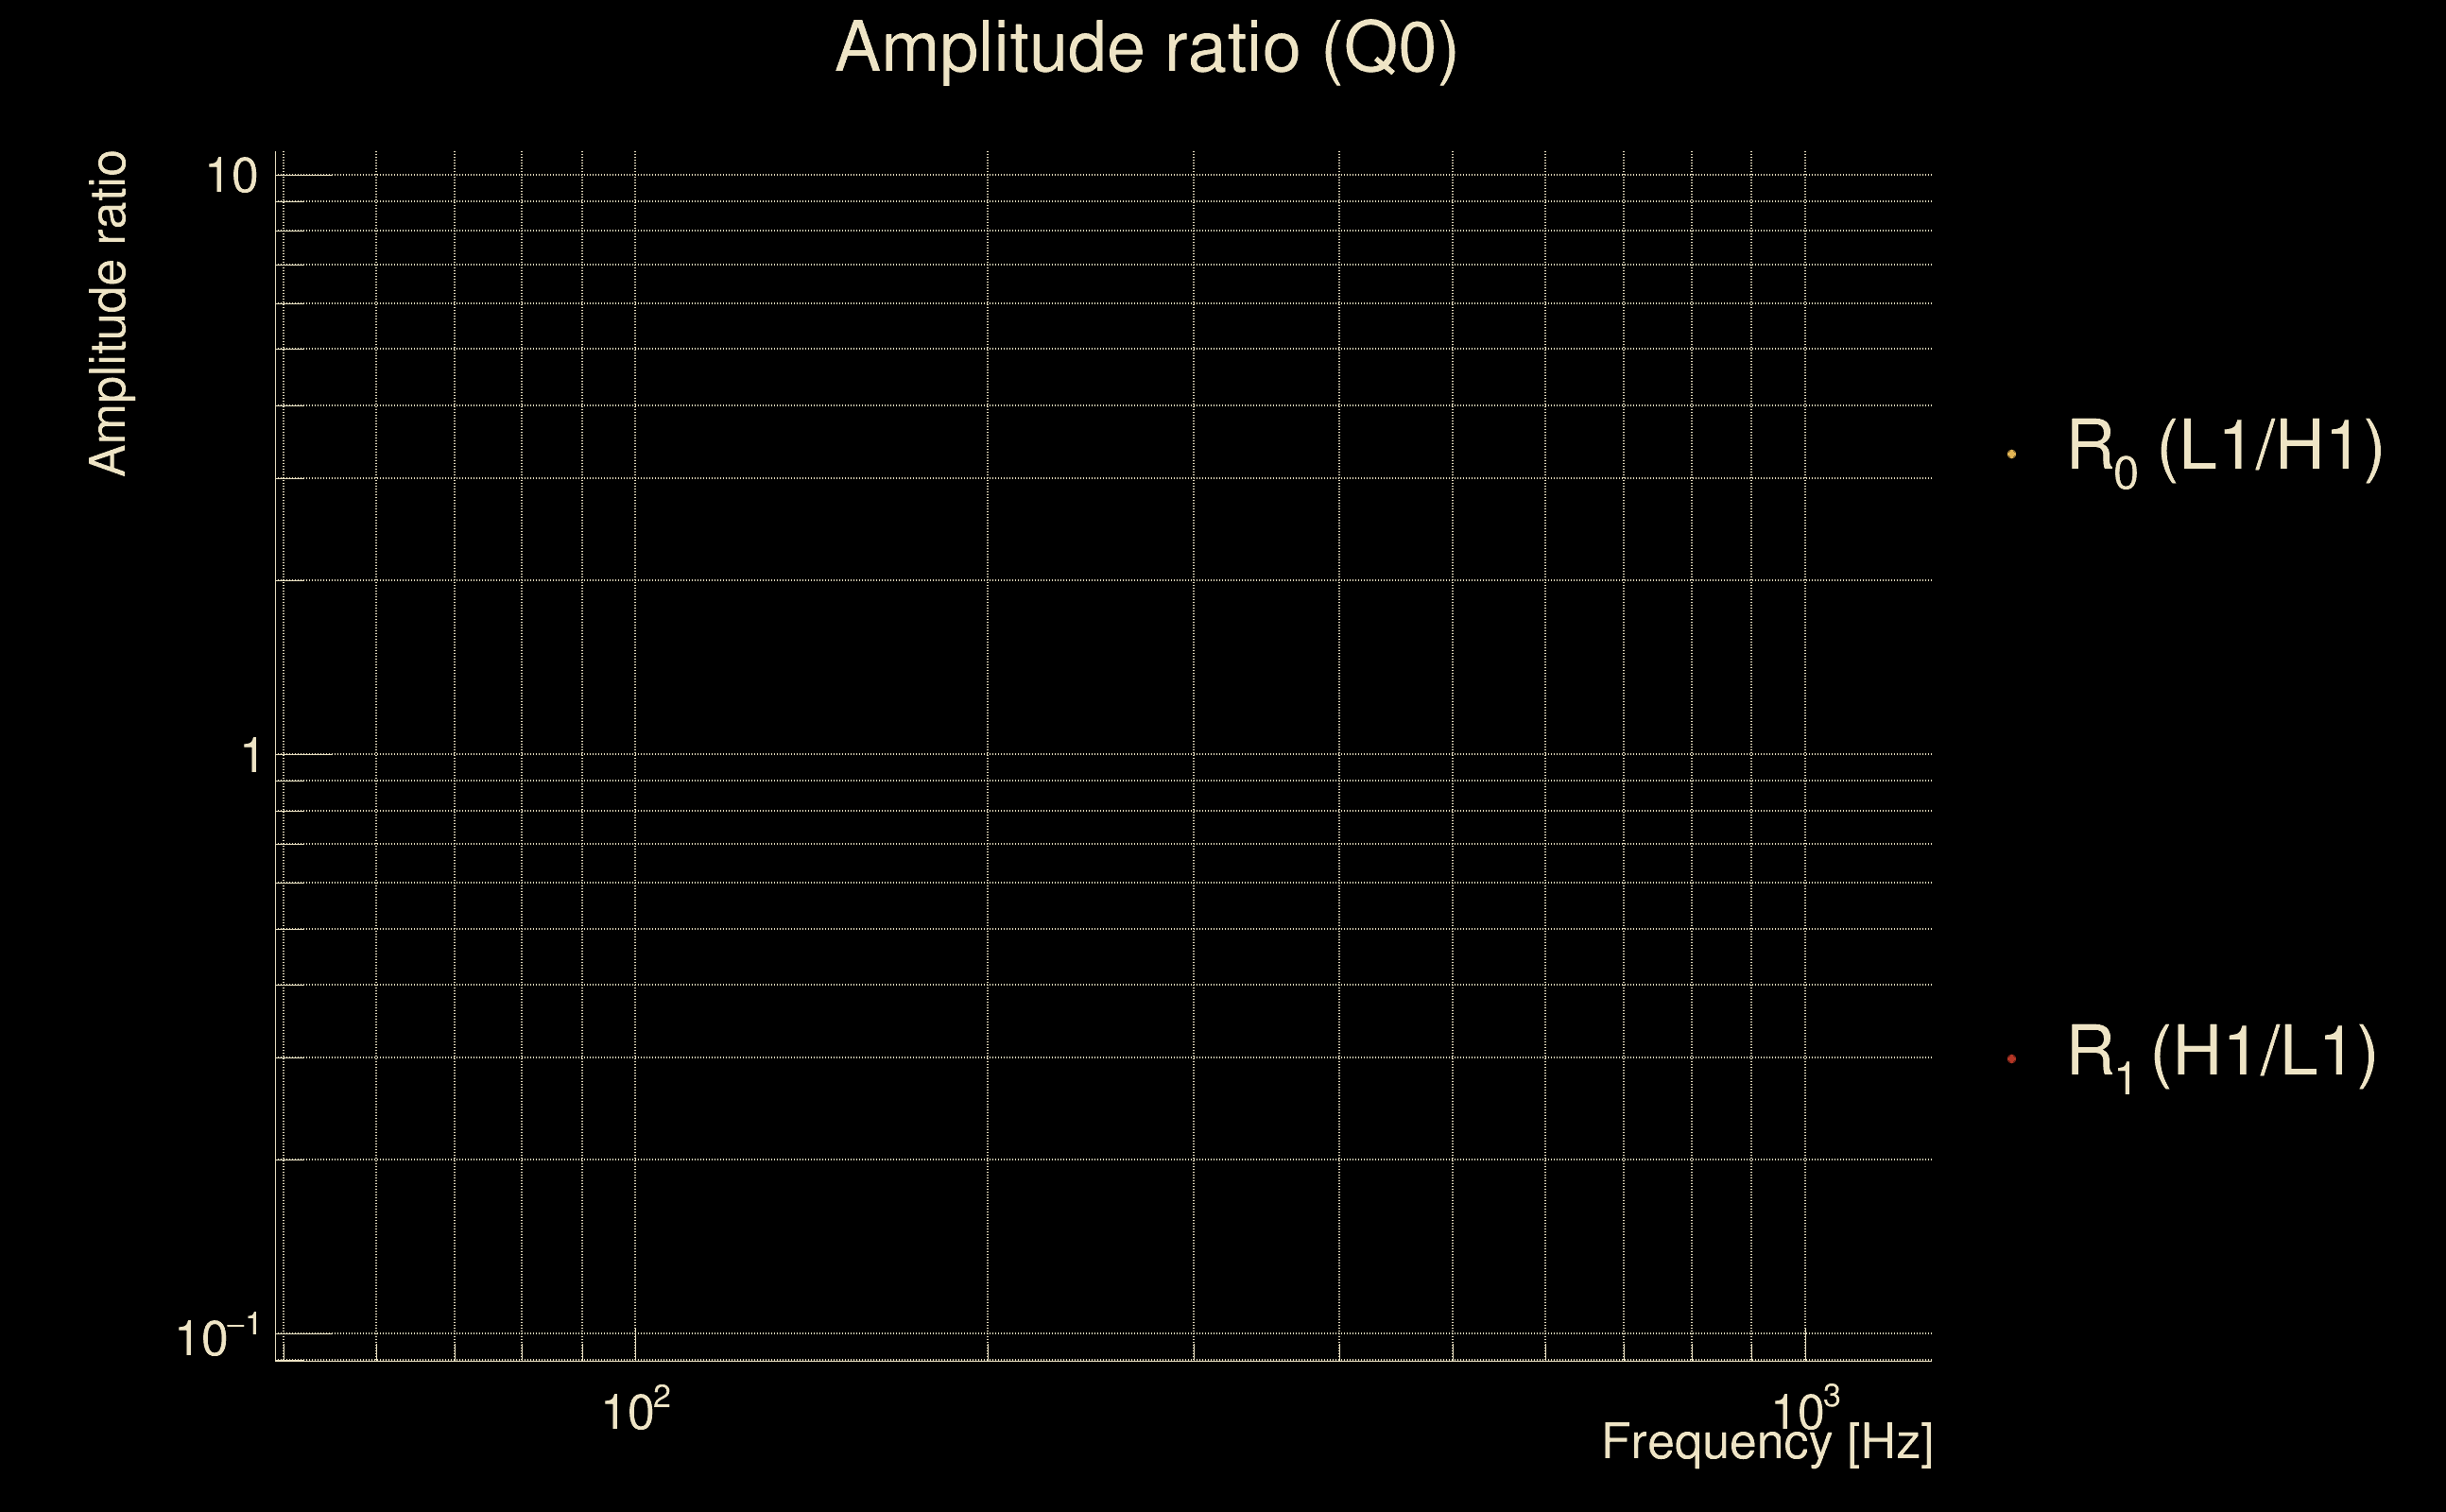
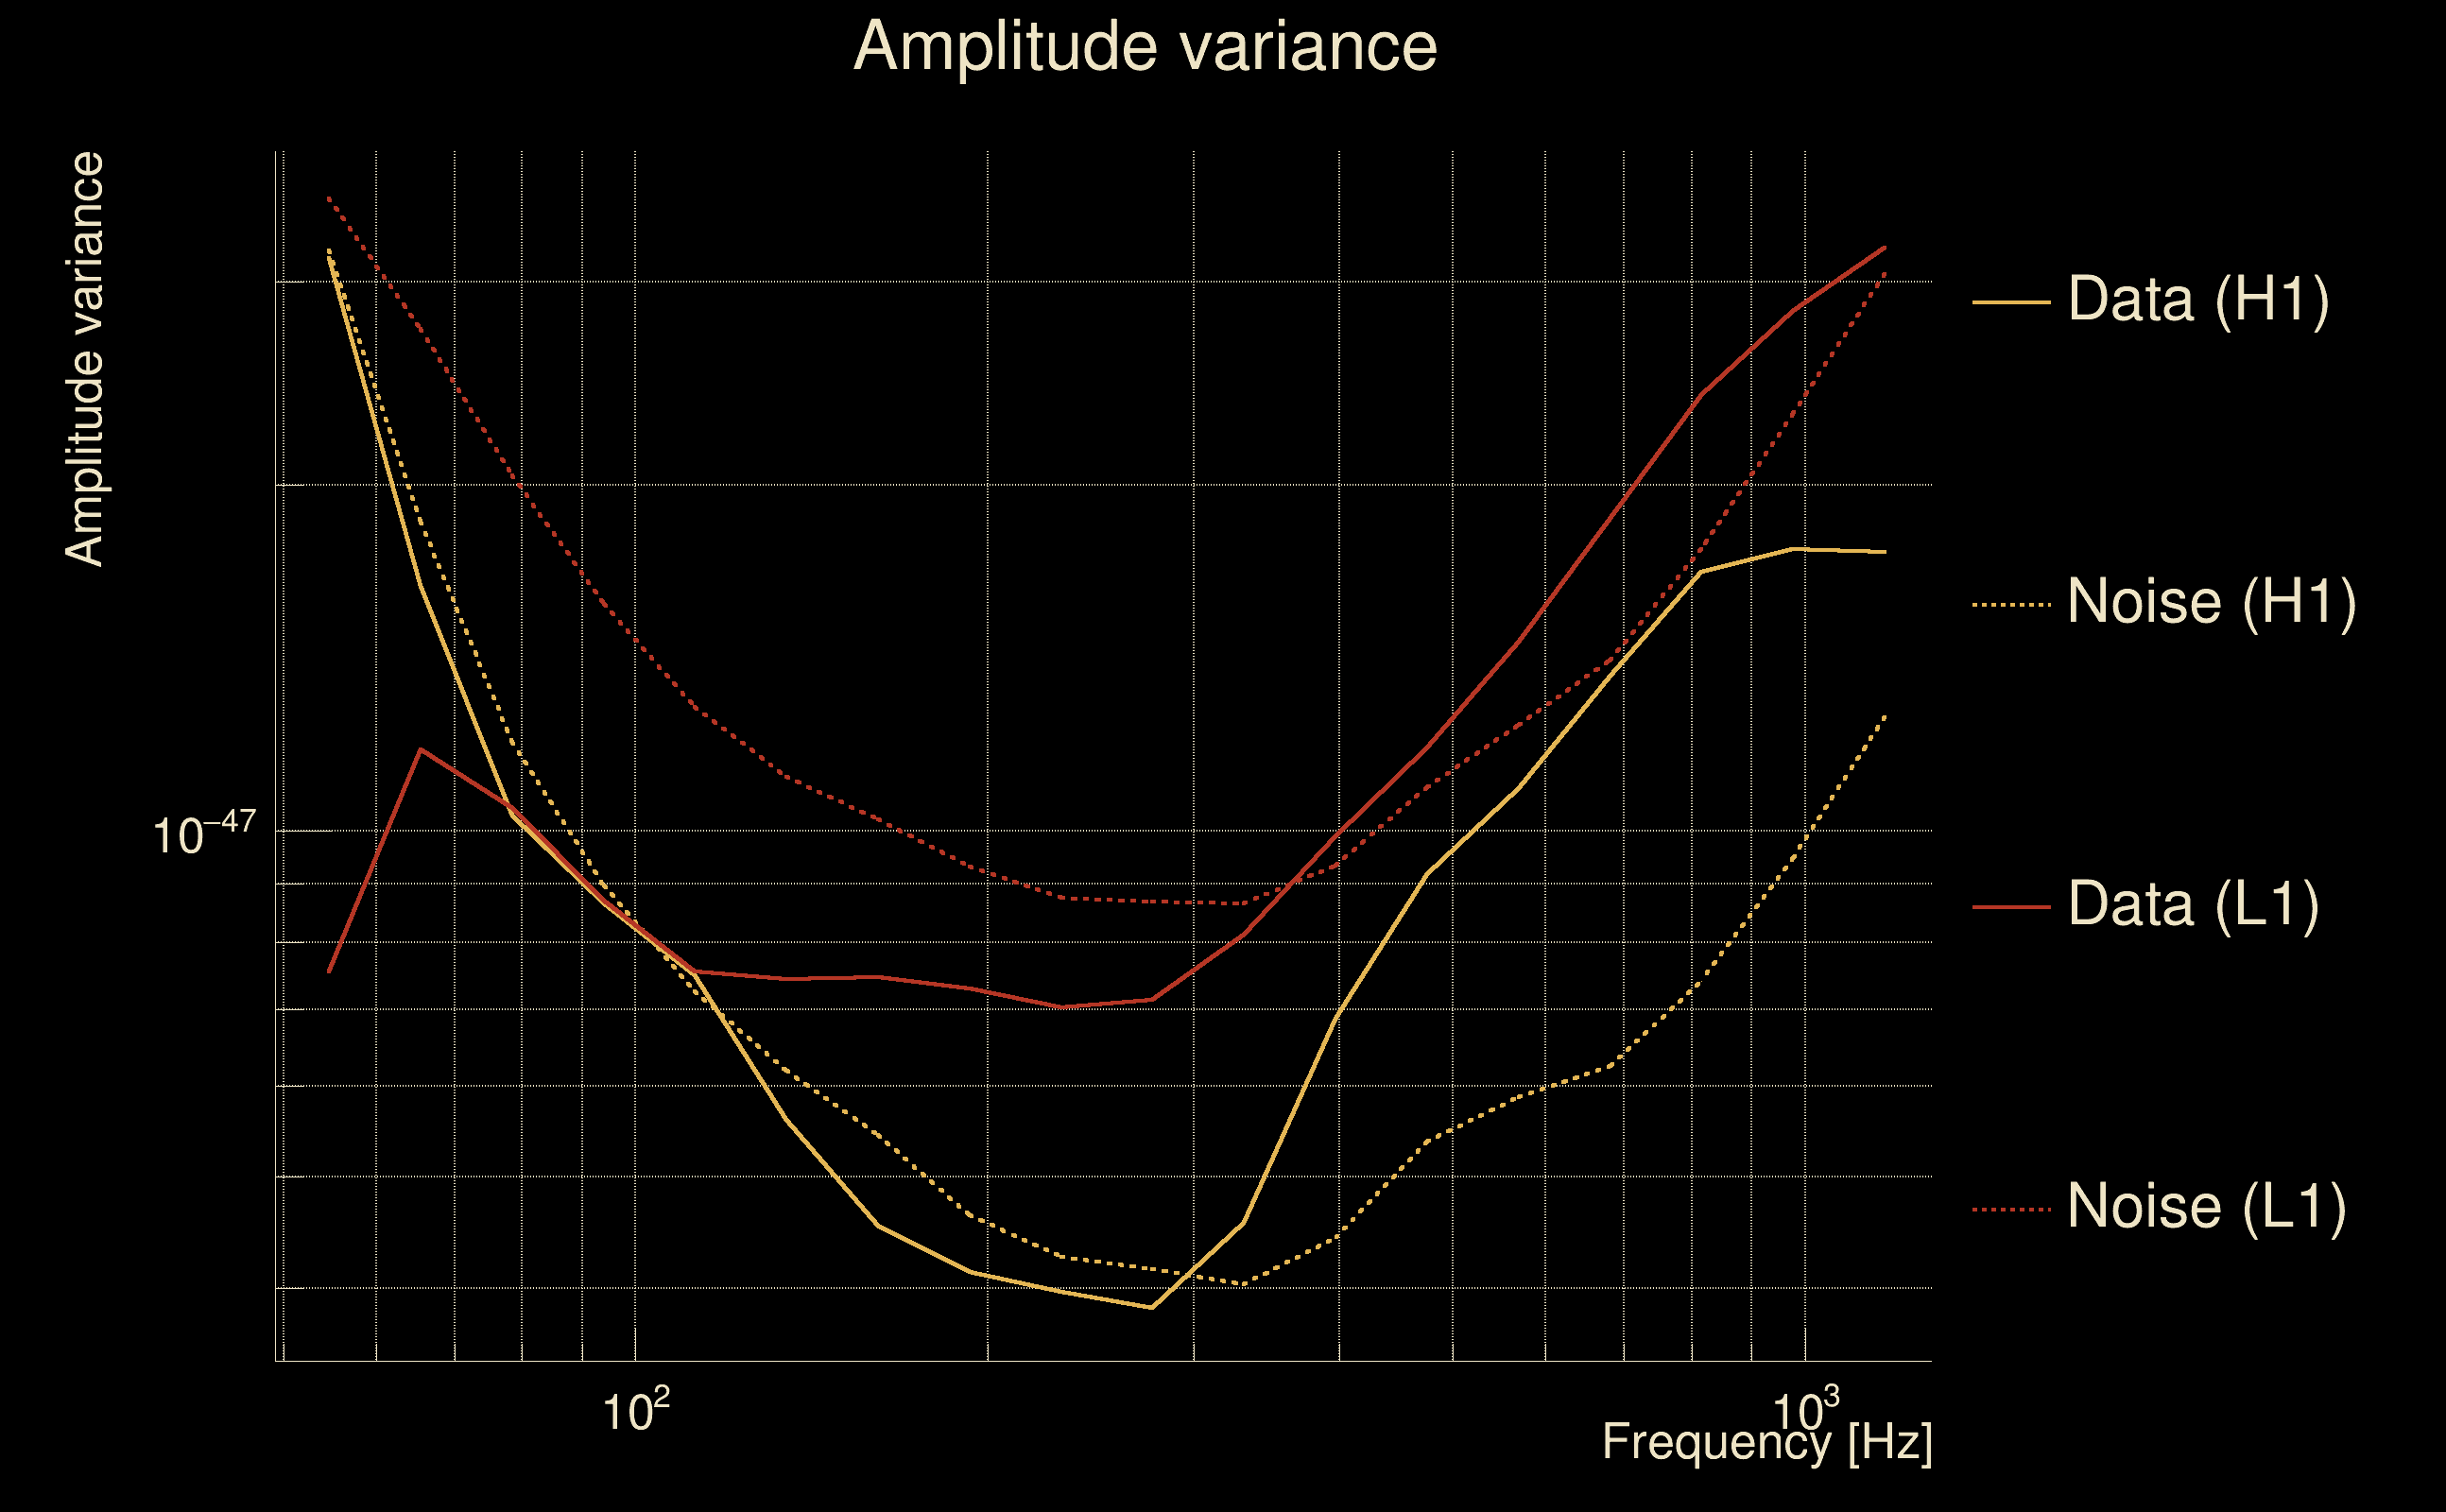
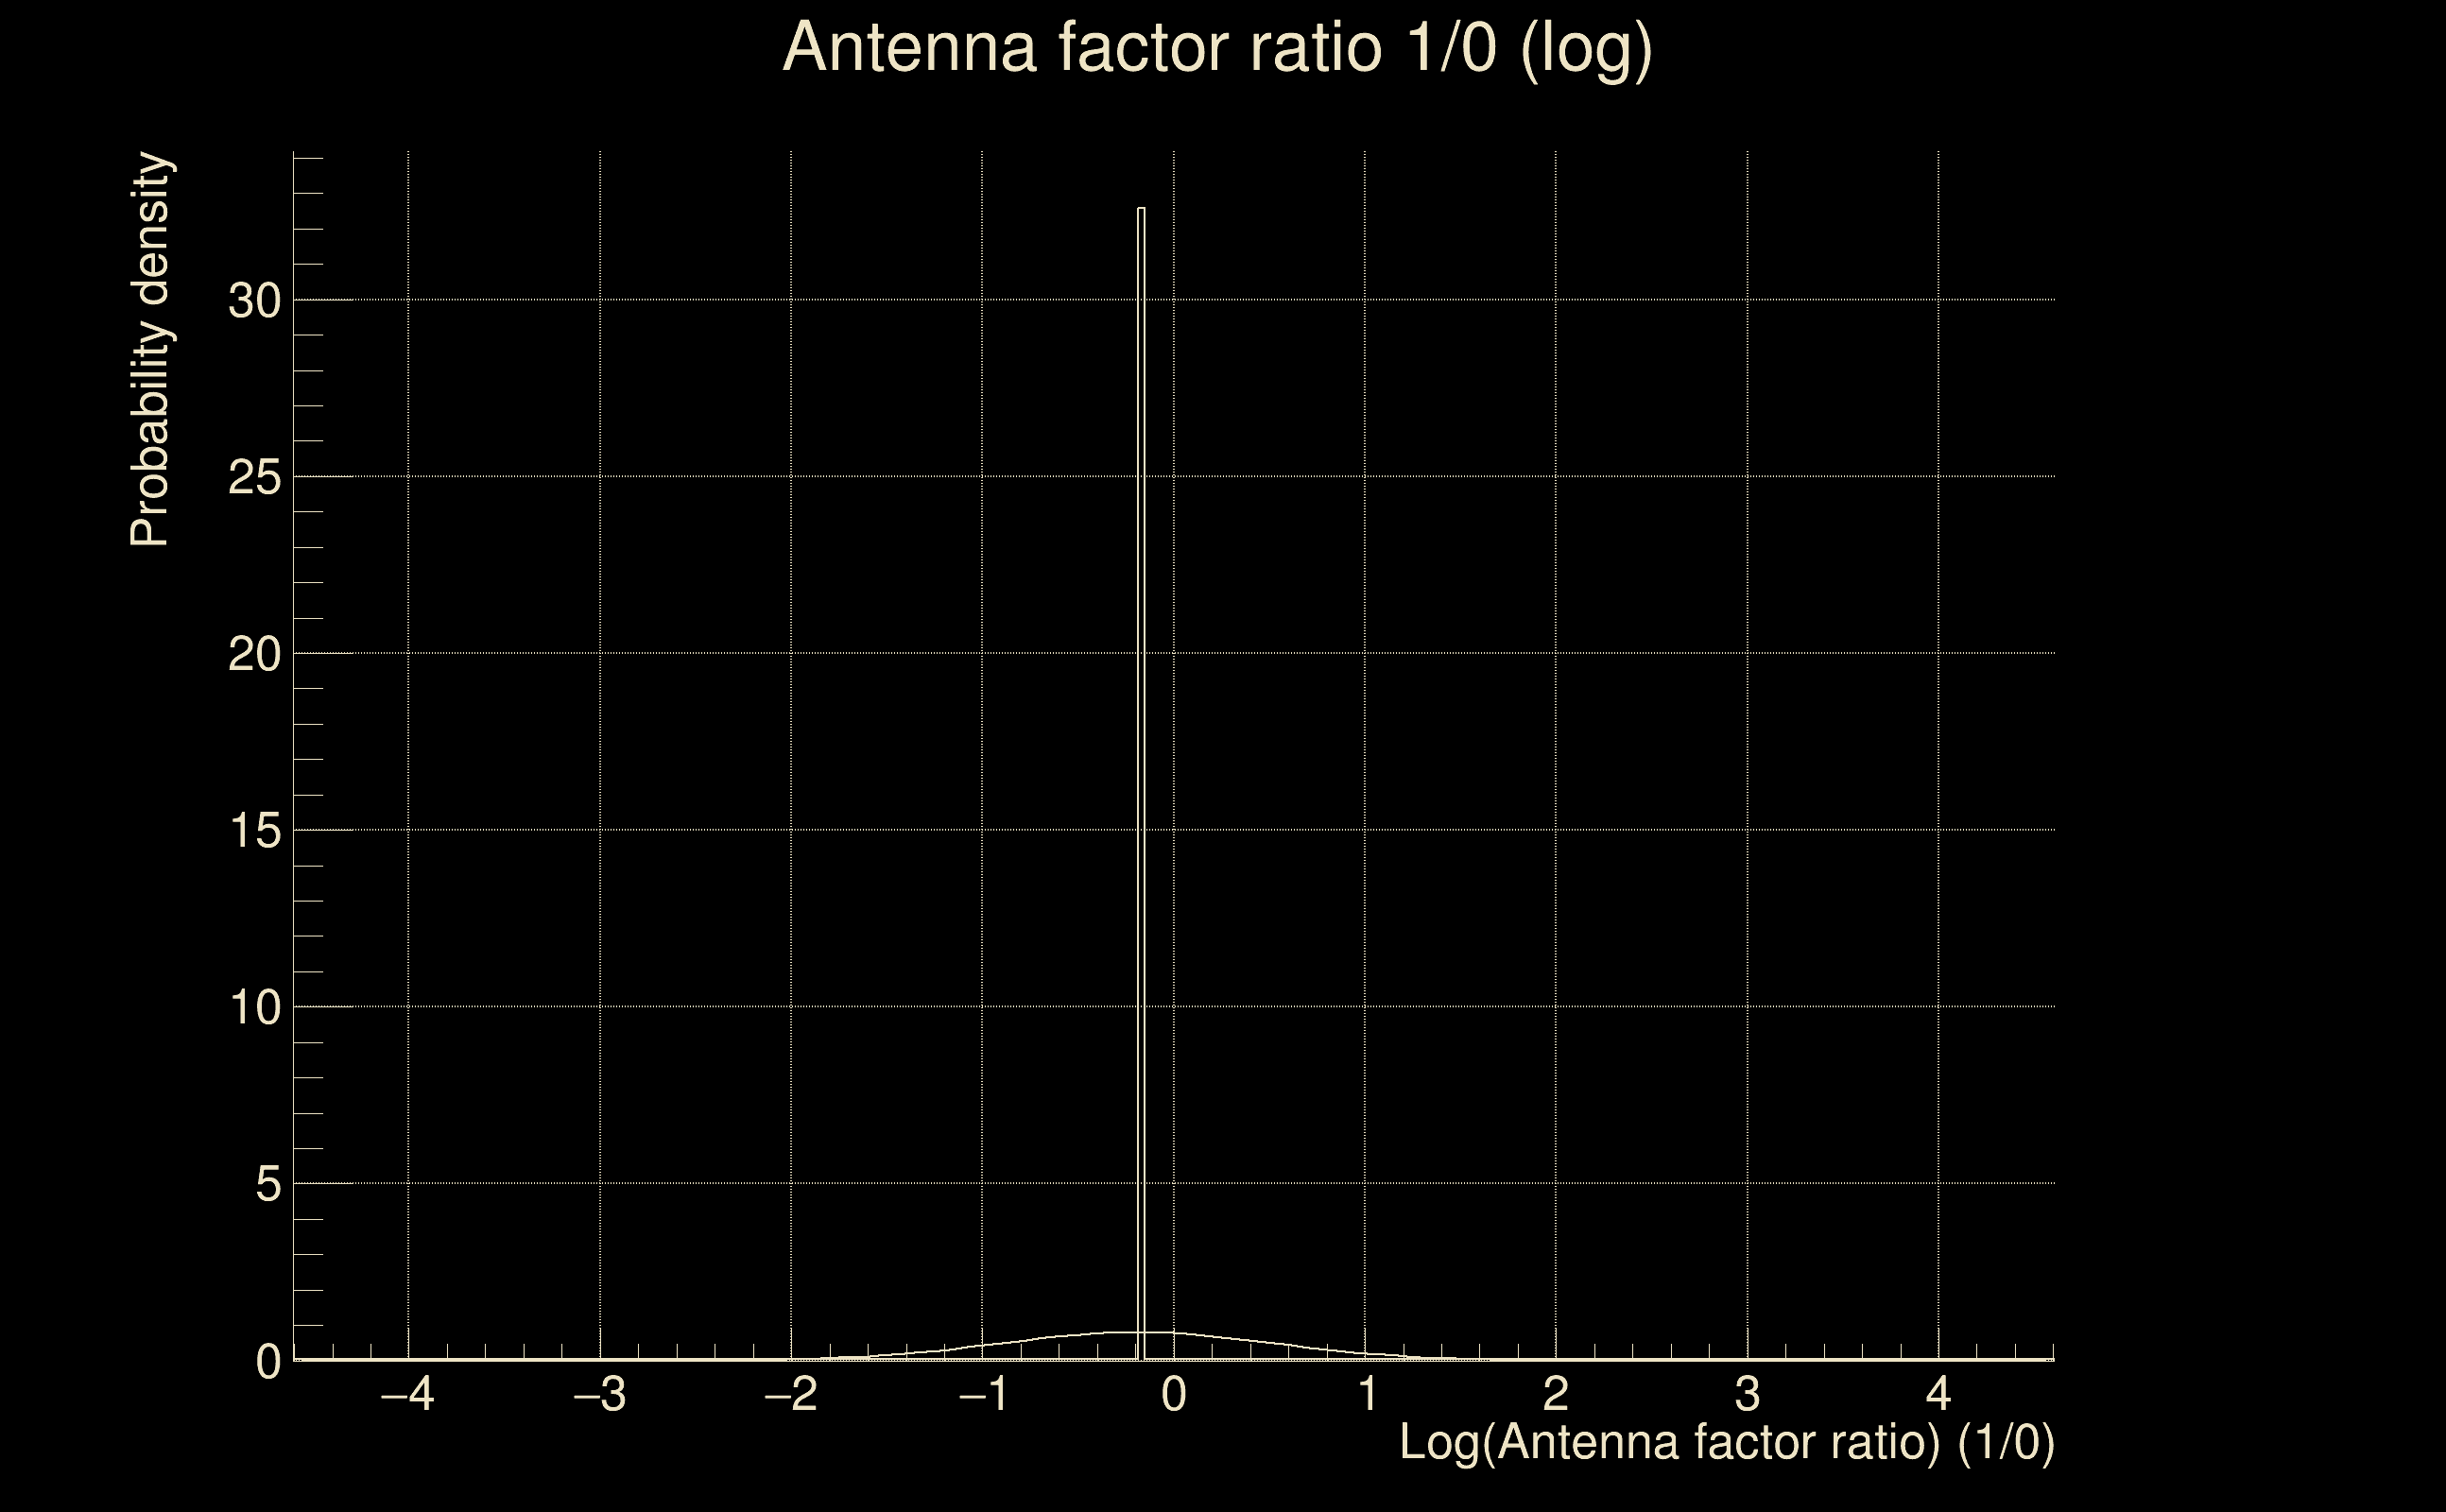
| Log of amplitude ratio (L1/H1): | -0.207957, variance = 0.274635 (L1/H1: -0.297742, variance = 0.40319, H1/L1: -0.115349, variance = 0.585612) |
| Amplitude ratio (L1/H1): | 0.812242 ⋇ 1.68886 (L1/H1: 0.742493 ⋇ 1.88697, H1/L1: 0.891055 ⋇ 2.14954) |
| Amplitude ratio H1|L1 compatibility (probability): | 0.677832 |
| Antenna factor probability: | 0.911652 |
| Number of rejected frequency rows: | Q0: 0 / 18, Q1: 7 / 36, Q2: 20 / 70, Q3: 74 / 134, Q4: 178 / 258 |
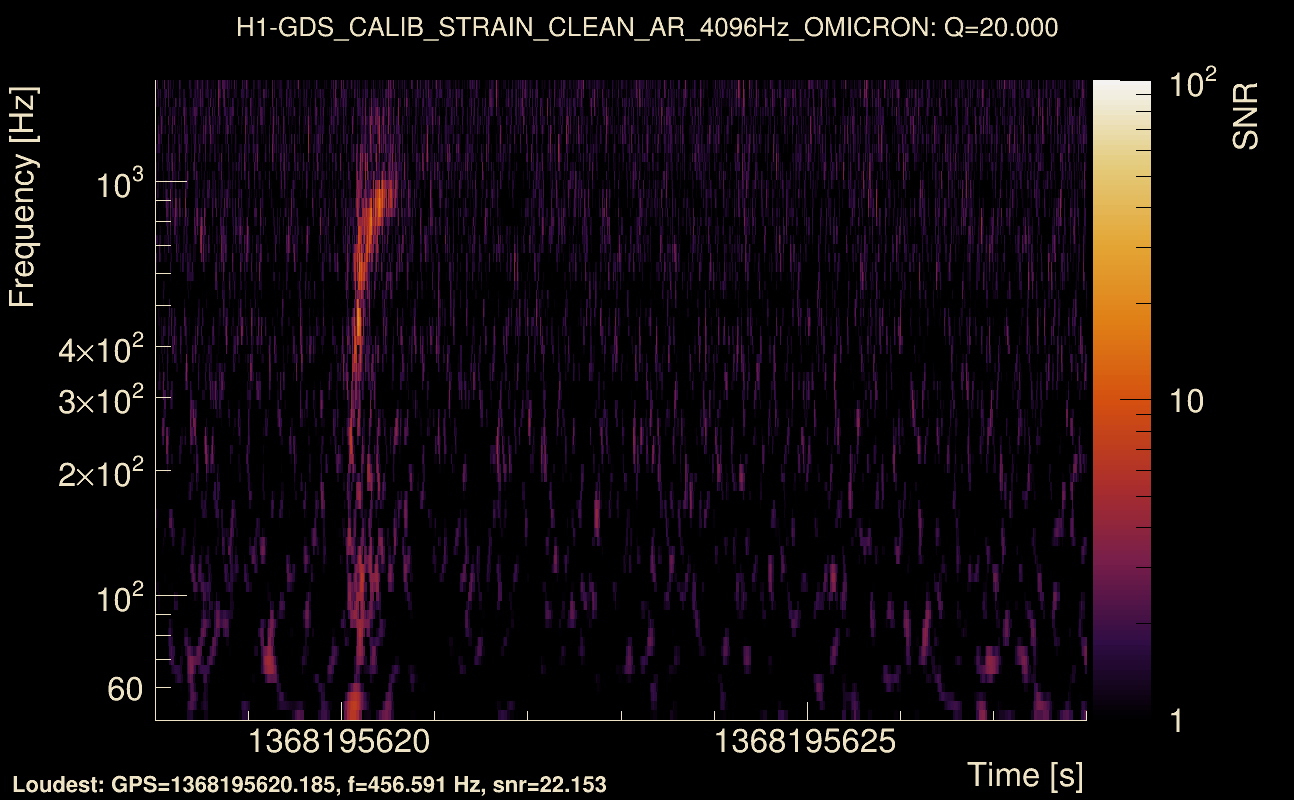
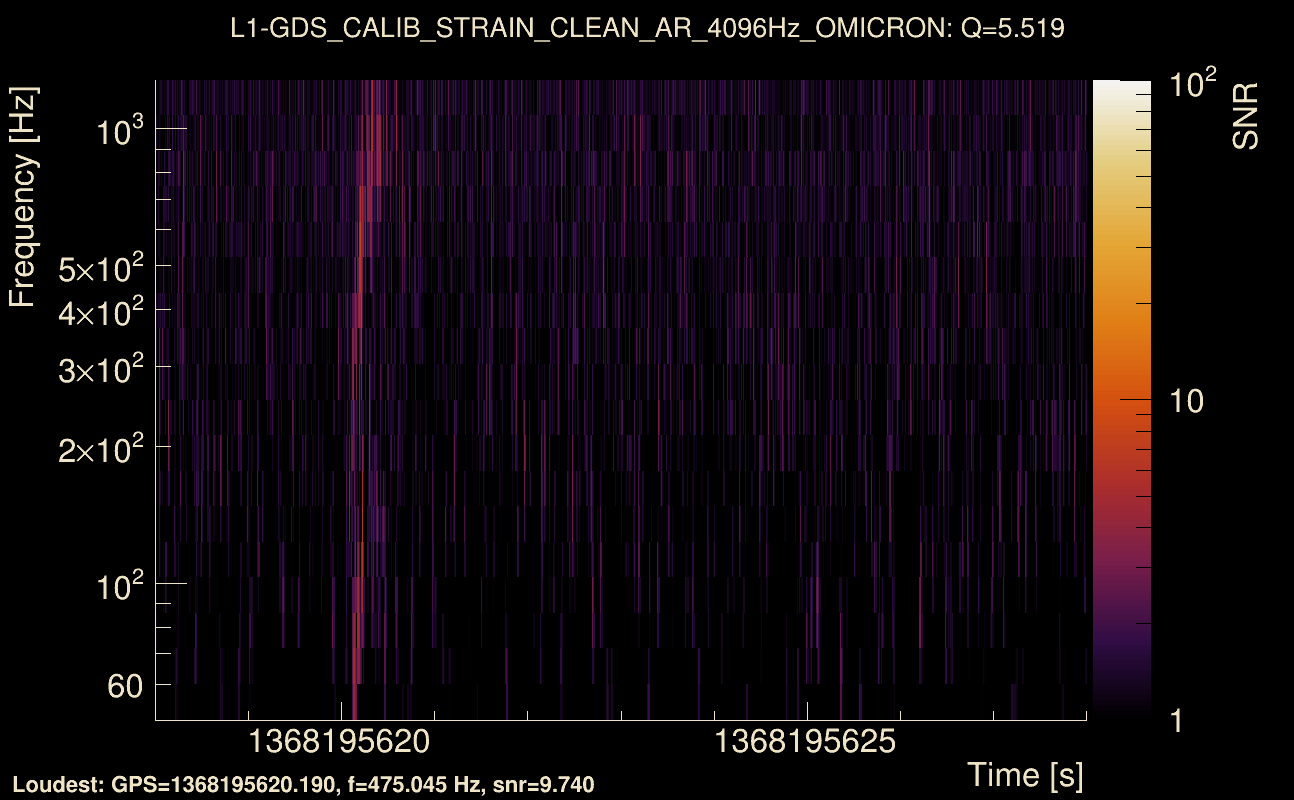
| Maximum signal-to-noise ratio: | H1: 26.4959, L1: 13.9629 |
| SNR variance: | H1: 0.805507, L1: 0.630858 |
| Click here for a zoomed plot | Click here for a zoomed plot | Click here for a zoomed plot | Click here for a zoomed plot | Click here for a zoomed plot |
 |
 |
 |
 |
 |
 |
 |
 |
 |
 |
 |
 |
 |
 |
 |
 |
 |
 |
 |
 |
 |
 |
 |
 |
 |
 |
 |
 |
 |
| Event time t(H1): | GPS = 1368195613 (Mon May 15 14:19:55 2023 ) → GPS = 1368195623 (Mon May 15 14:20:05 2023 ) |
| Event time t(L1): | GPS = 1368195613 (Mon May 15 14:20:05 2023 ) → GPS = 1368195623 (Mon May 15 14:20:05 2023 ) |
| Omicron analysis time window (H1): | GPS = 1368195610 → GPS = 1368195626 |
| Omicron analysis time window (L1): | GPS = 1368195610 → GPS = 1368195626 |
| Time delay between detectors t(L1) - t(H1): | 0.00877263 s (slice index = 108 / 217), δt_gw = 0.00877263 s |
| Time delay uncertainty: | 0.000897206 s |
| [targeted mode] Time delay probability: | 0.890081 (0.138201 sigmas), δt_target = 0.00864792 s |
| Frequency: | 372.44 Hz |
| Ξ: | 0.465288 ± 0.0604241 (variance = 0.00365107): Q0: 0.524502, Q1: 0.583485, Q2: 0.616659, Q3: 0.65693, Q4: 0.700567 |
| Rank: | R_A = 0.264085 |
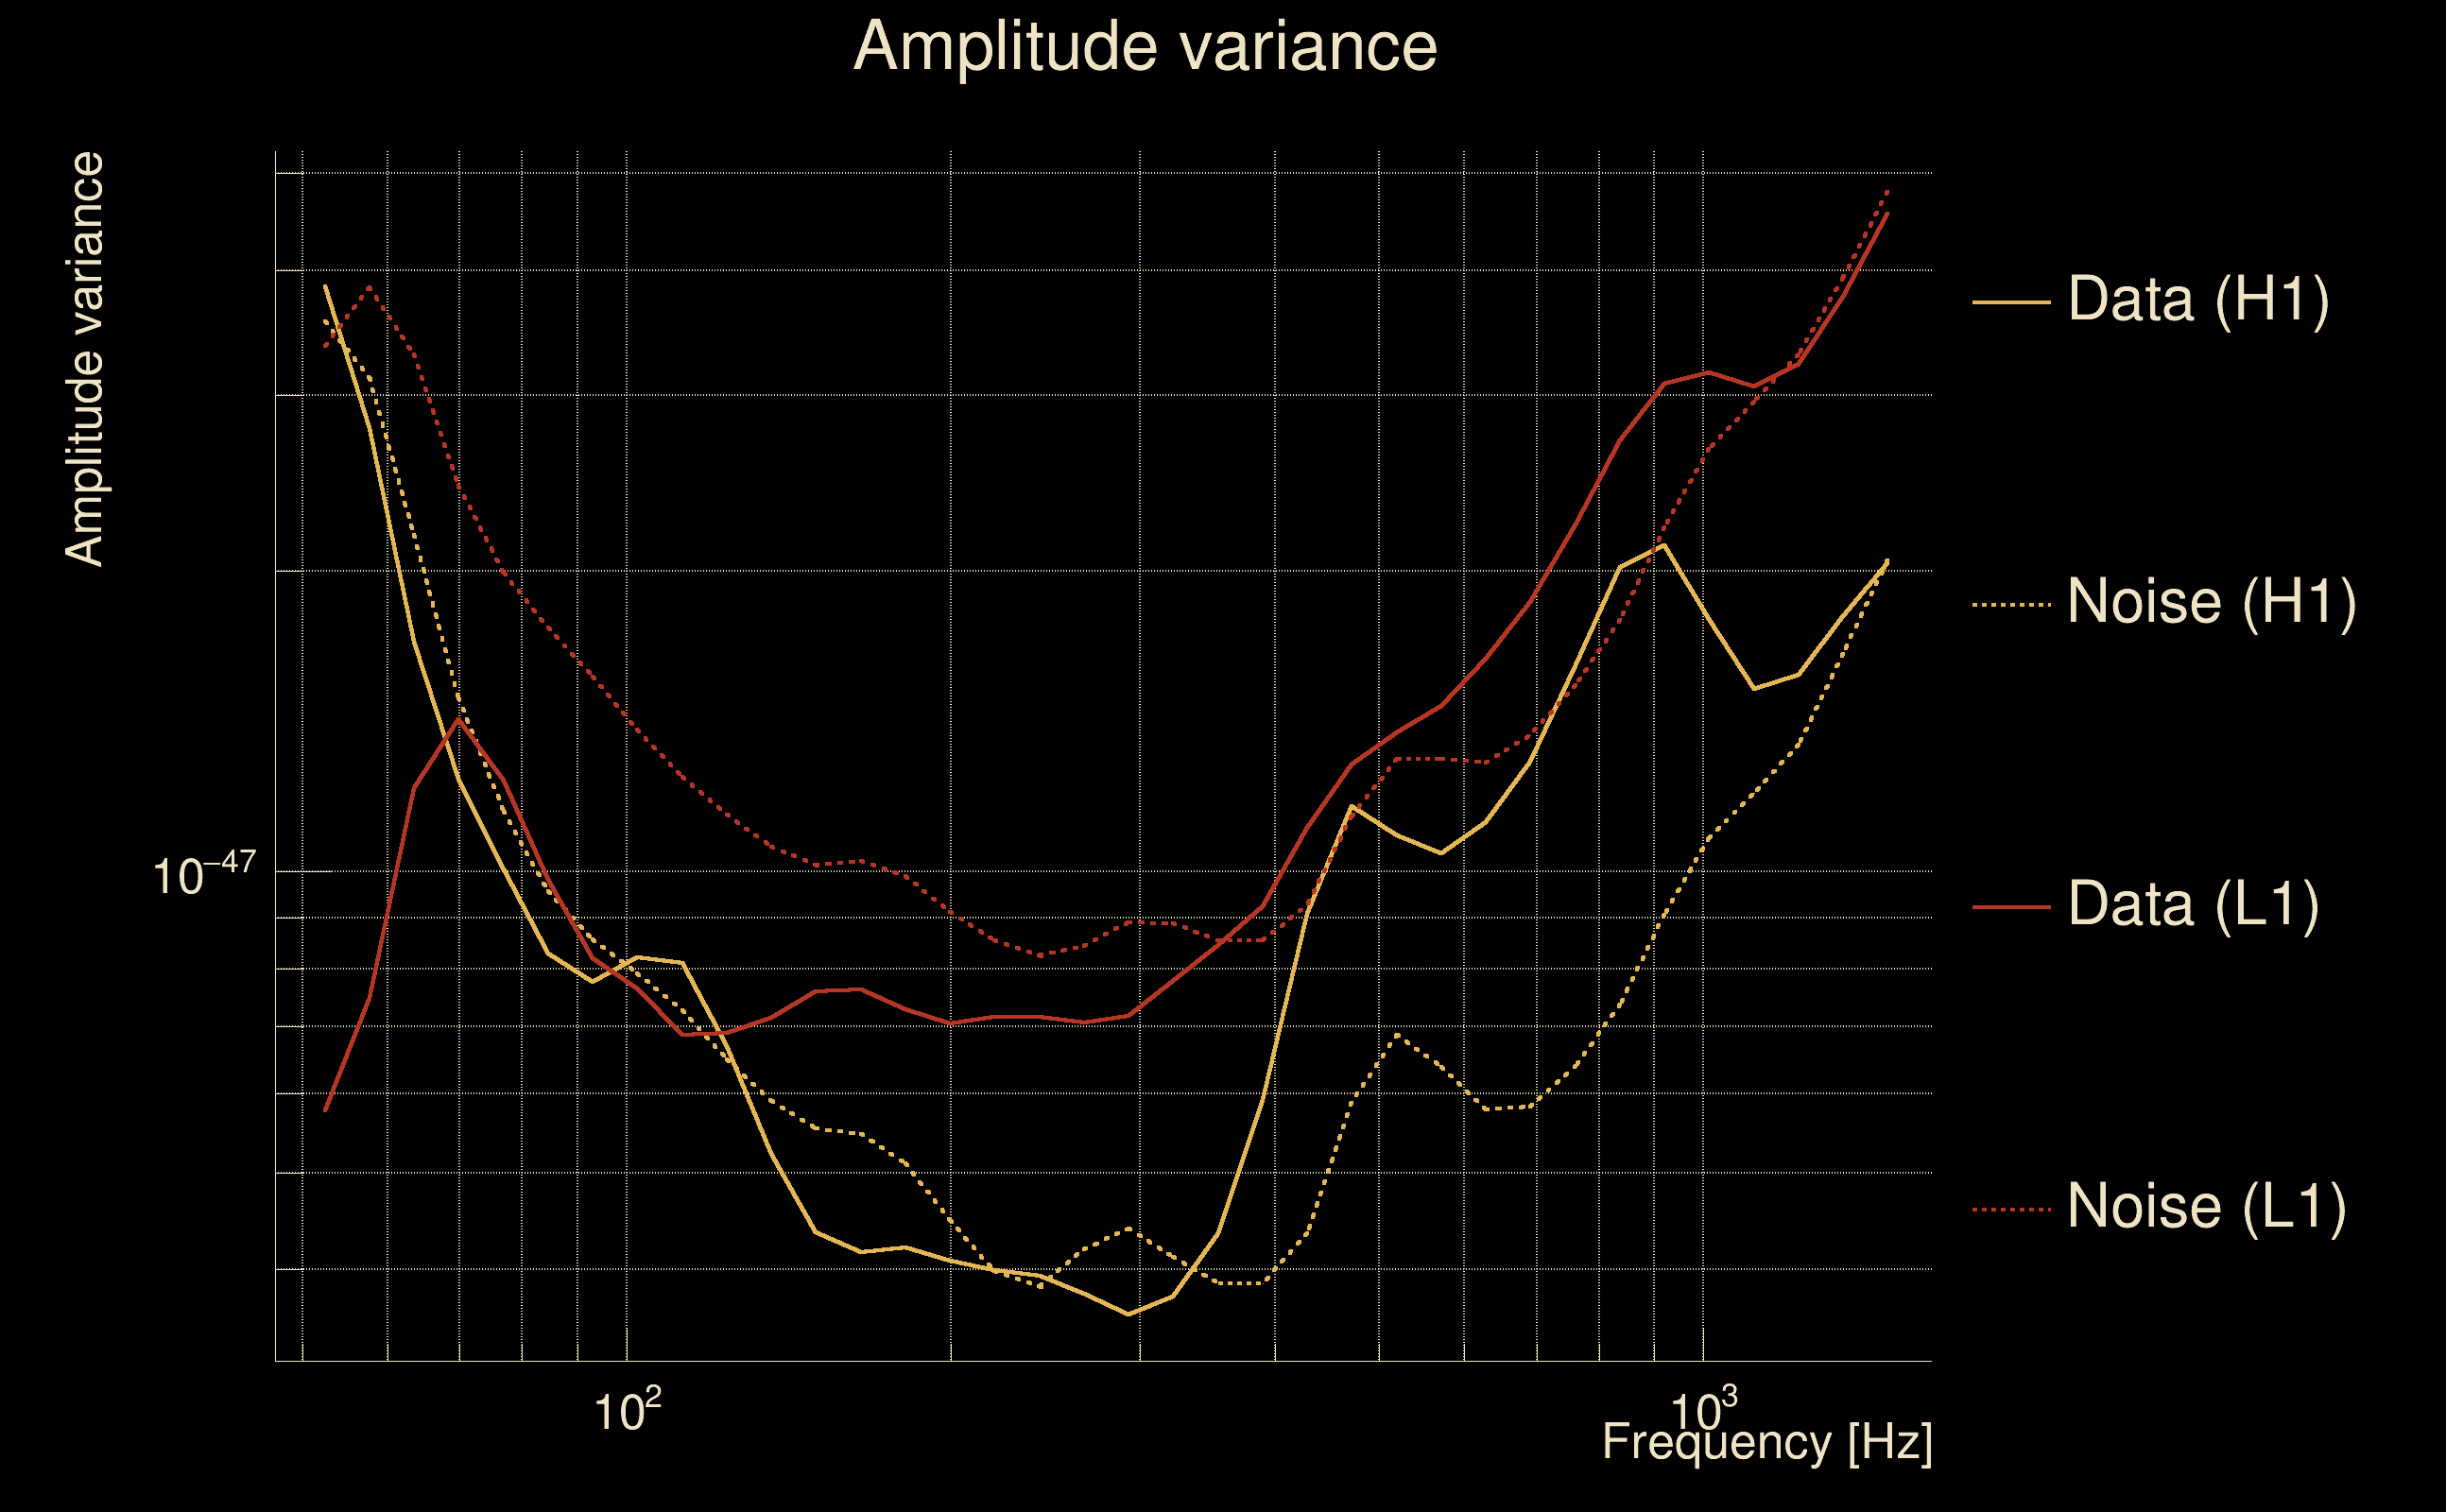
| Log of amplitude ratio (L1/H1): | -0.194883, variance = 0.243 (L1/H1: -0.274949, variance = 0.358842, H1/L1: -0.0945932, variance = 0.485886) |
| Amplitude ratio (L1/H1): | 0.822931 ⋇ 1.63714 (L1/H1: 0.759611 ⋇ 1.82036, H1/L1: 0.909743 ⋇ 2.00783) |
| Amplitude ratio H1|L1 compatibility (probability): | 0.68763 |
| Antenna factor probability: | 0.927336 |
| Number of rejected frequency rows: | Q0: 0 / 18, Q1: 7 / 36, Q2: 26 / 70, Q3: 76 / 134, Q4: 178 / 258 |
| Maximum signal-to-noise ratio: | H1: 26.7066, L1: 14.0455 |
| SNR variance: | H1: 0.511035, L1: 0.514277 |
| Click here for a zoomed plot | Click here for a zoomed plot | Click here for a zoomed plot | Click here for a zoomed plot | Click here for a zoomed plot |
 |
 |
 |
 |
 |
 |
 |
 |
 |
 |
 |
 |
 |
 |
 |
 |
 |
 |
 |
 |
 |
 |
 |
 |
 |
 |
 |
 |
 |
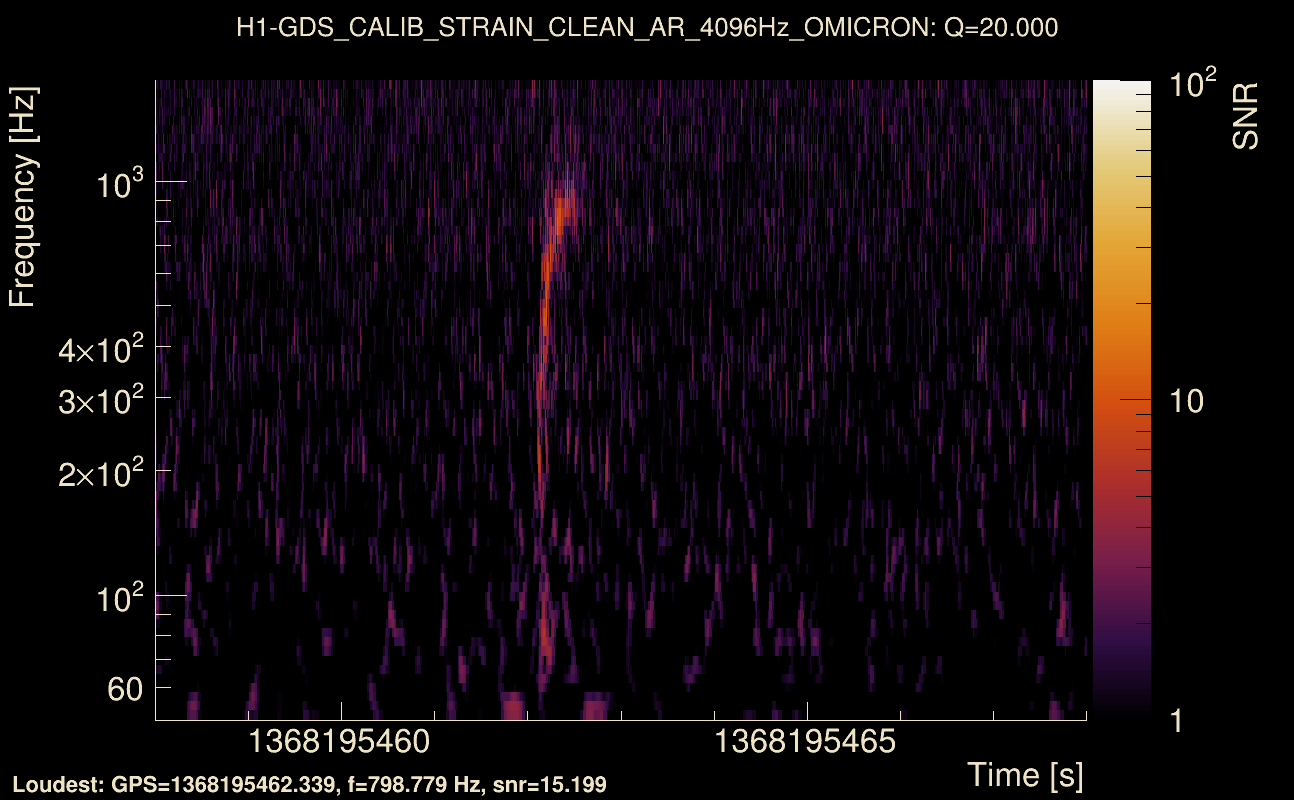
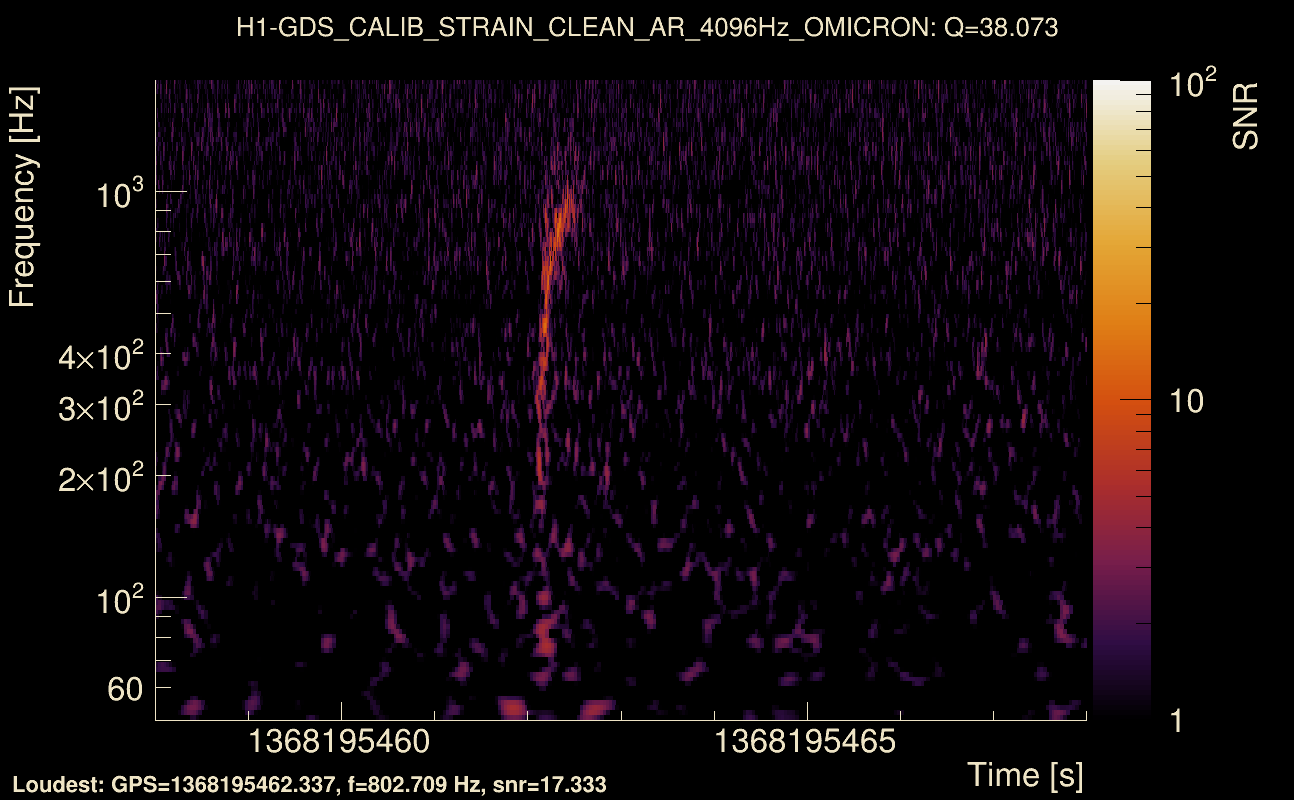
| Event time t(H1): | GPS = 1368195458 (Mon May 15 14:17:20 2023 ) → GPS = 1368195468 (Mon May 15 14:17:30 2023 ) |
| Event time t(L1): | GPS = 1368195458 (Mon May 15 14:17:30 2023 ) → GPS = 1368195468 (Mon May 15 14:17:30 2023 ) |
| Omicron analysis time window (H1): | GPS = 1368195455 → GPS = 1368195471 |
| Omicron analysis time window (L1): | GPS = 1368195455 → GPS = 1368195471 |
| Time delay between detectors t(L1) - t(H1): | 0.00862266 s (slice index = 108 / 217), δt_gw = 0.00862266 s |
| Time delay uncertainty: | 0.00134935 s |
| [targeted mode] Time delay probability: | 0.973788 (0.0328579 sigmas), δt_target = 0.00864863 s |
| Frequency: | 504.67 Hz |
| Ξ: | 0.309794 ± 0.0798256 (variance = 0.00637213): Q0: 0.437889, Q1: 0.527208, Q2: 0.596889, Q3: 0.637266, Q4: 0.655633 |
| Rank: | R_A = 0.149503 |
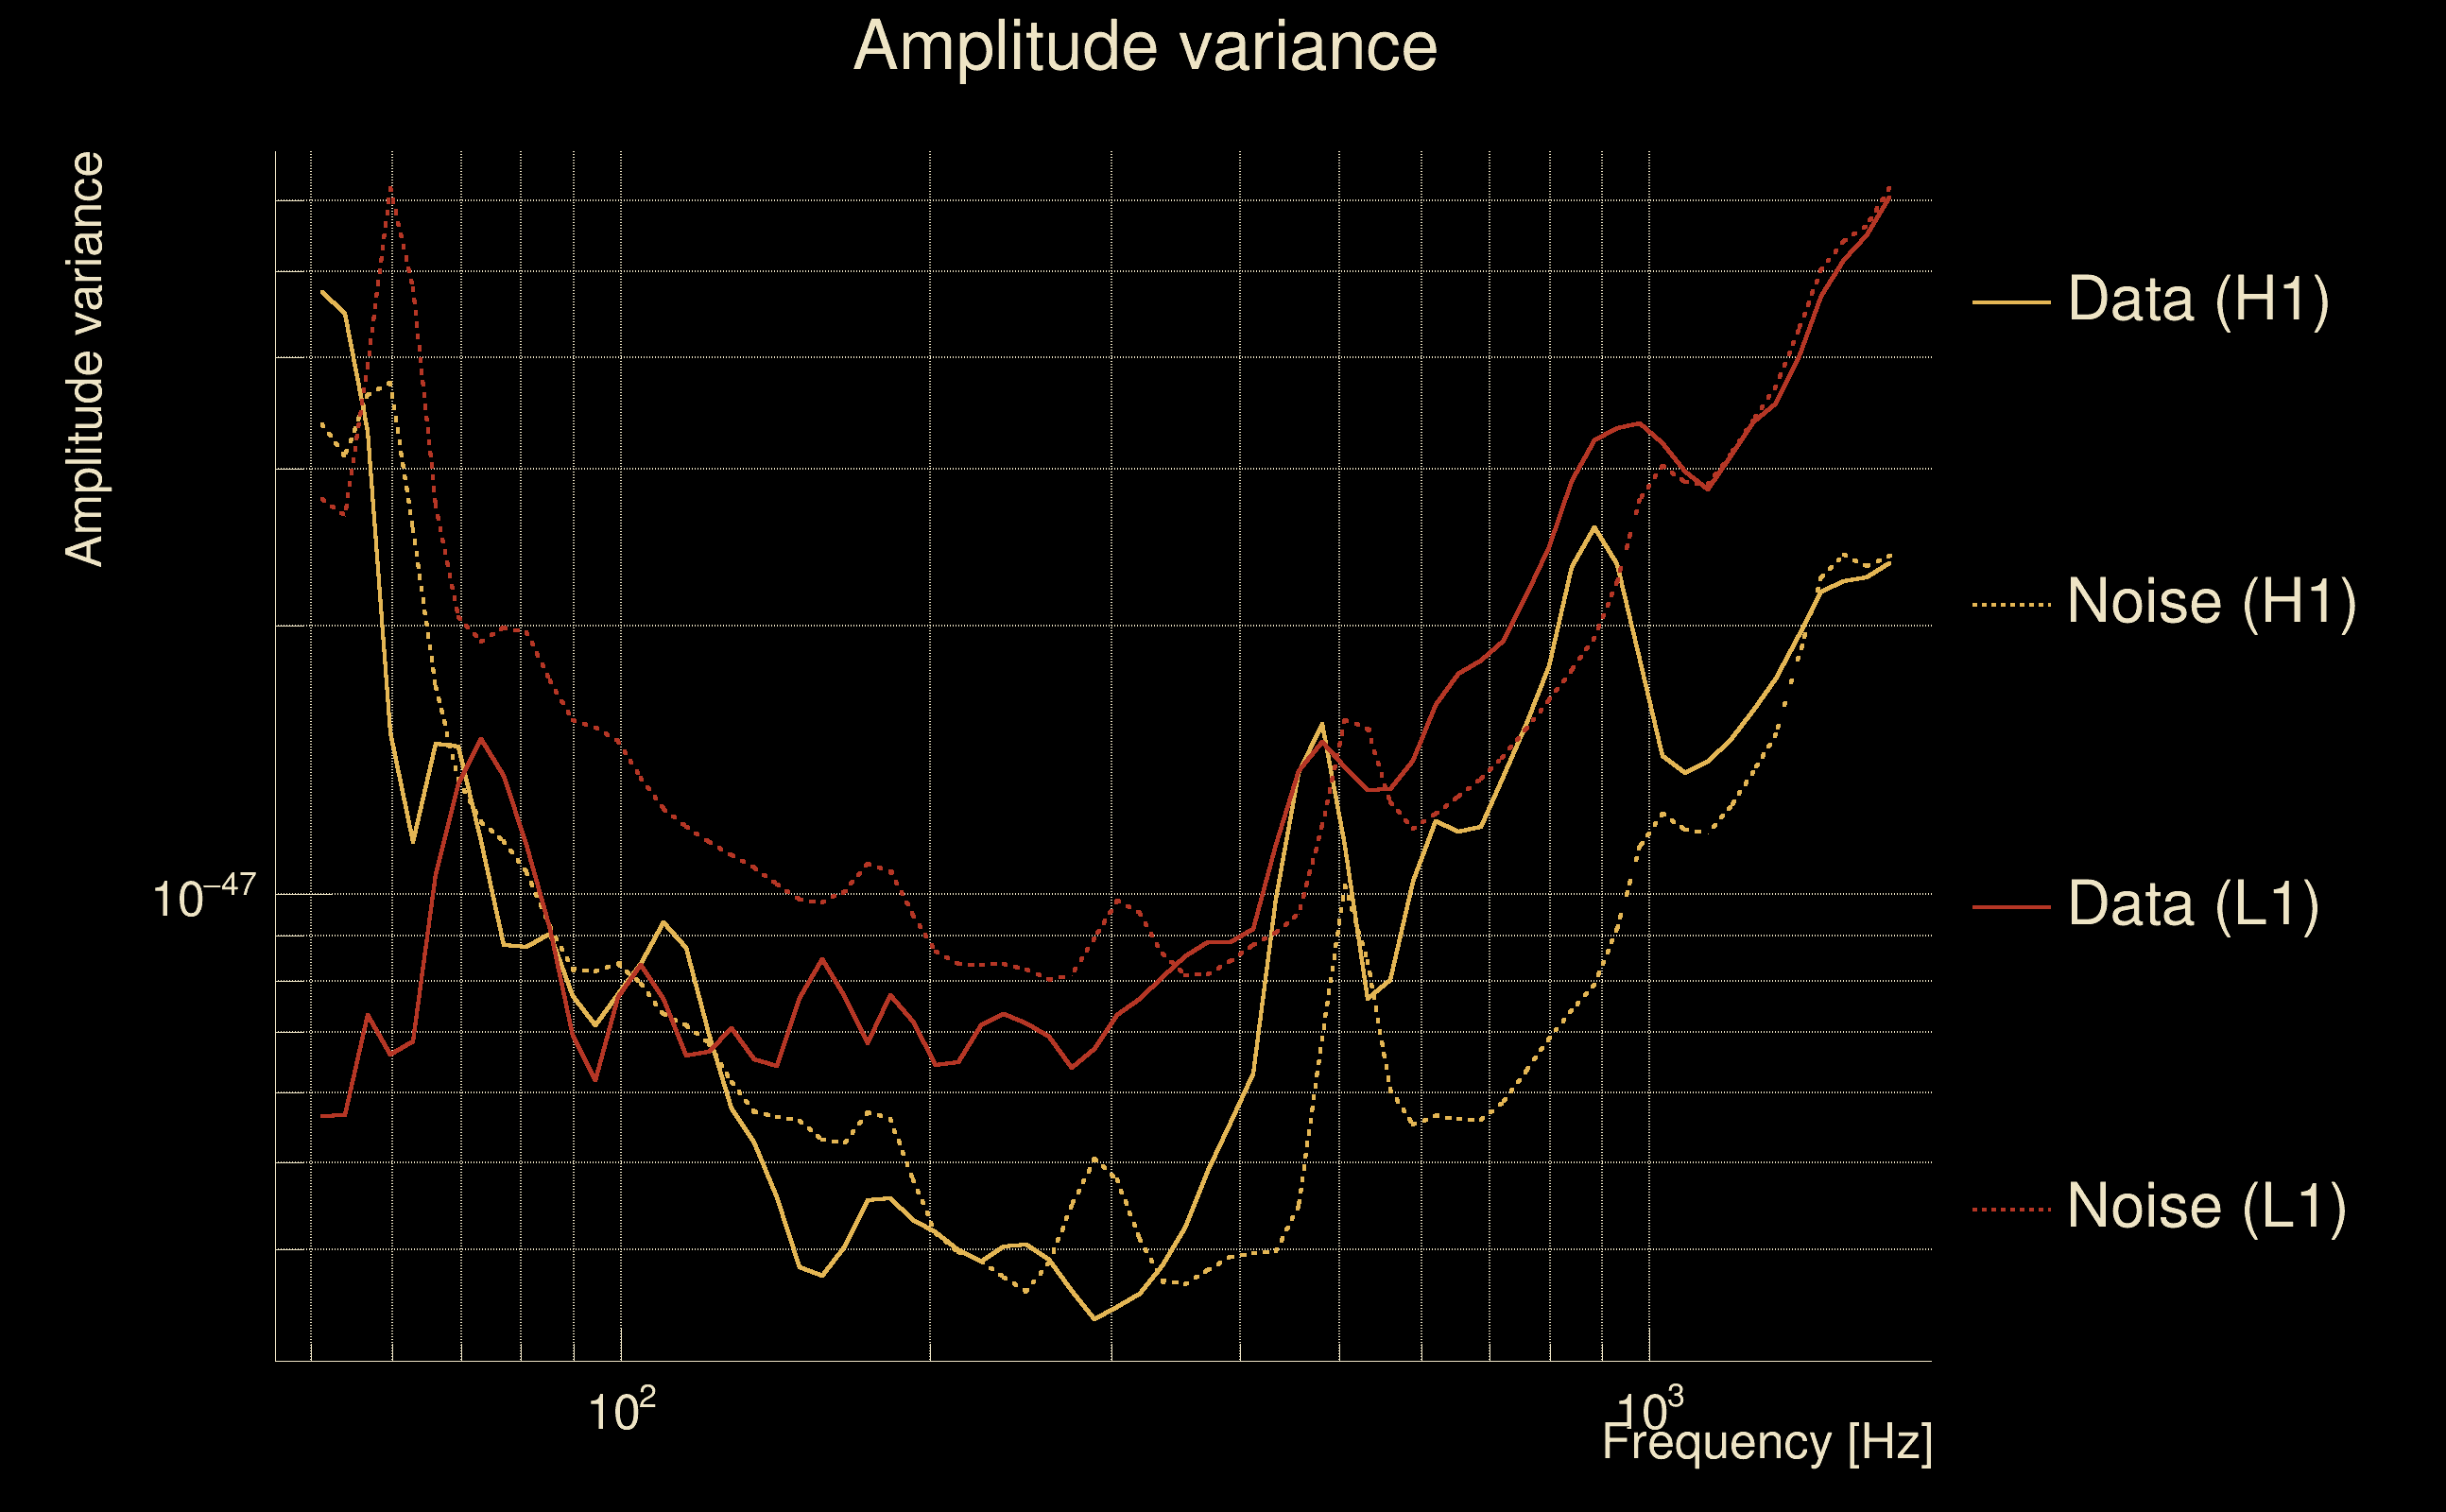
| Log of amplitude ratio (L1/H1): | -0.187255, variance = 0.252457 (L1/H1: -0.382227, variance = 0.3849, H1/L1: -0.282275, variance = 0.700294) |
| Amplitude ratio (L1/H1): | 0.829232 ⋇ 1.65277 (L1/H1: 0.68234 ⋇ 1.85968, H1/L1: 0.754067 ⋇ 2.30905) |
| Amplitude ratio H1|L1 compatibility (probability): | 0.523549 |
| Antenna factor probability: | 0.946577 |
| Number of rejected frequency rows: | Q0: 4 / 18, Q1: 13 / 36, Q2: 43 / 70, Q3: 89 / 134, Q4: 198 / 258 |
| Maximum signal-to-noise ratio: | H1: 18.5282, L1: 11.9395 |
| SNR variance: | H1: 0.743461, L1: 0.593319 |
| Click here for a zoomed plot | Click here for a zoomed plot | Click here for a zoomed plot | Click here for a zoomed plot | Click here for a zoomed plot |
 |
 |
 |
 |
 |
 |
 |
 |
 |
 |
 |
 |
 |
 |
 |
 |
 |
 |
 |
 |
 |
 |
 |
 |
 |
 |
 |
 |
 |
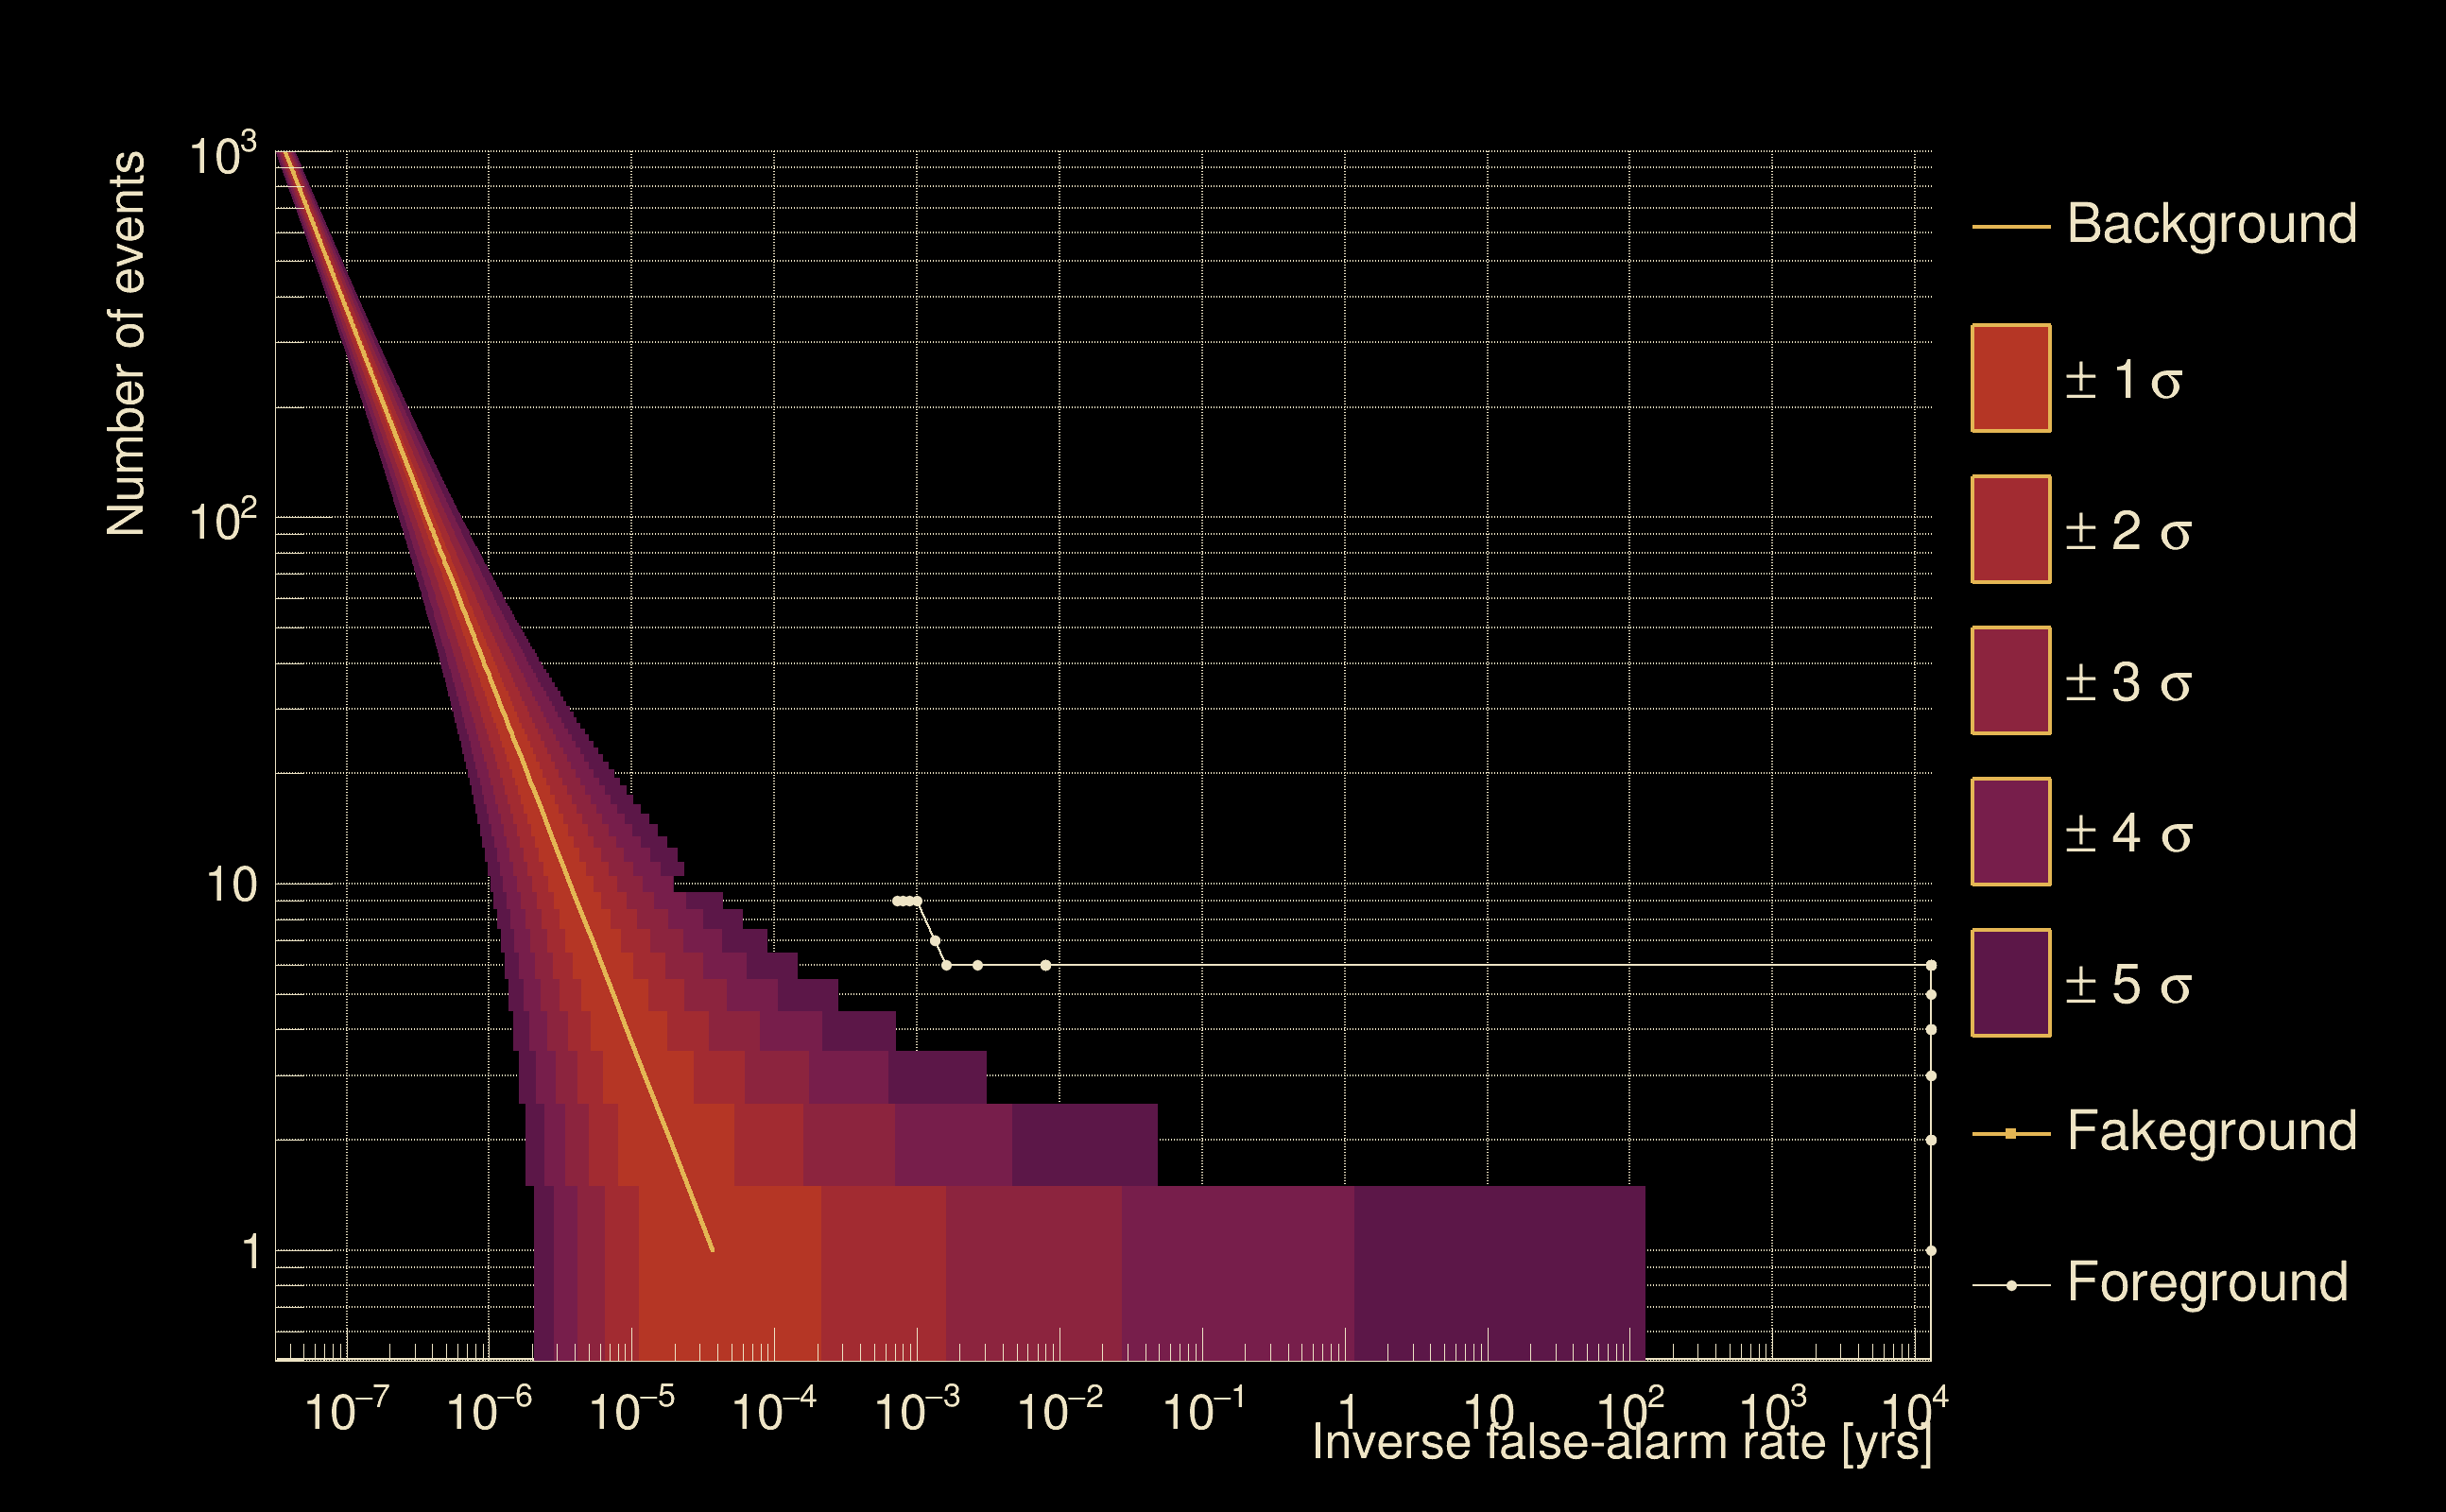
| Detection threshold: | R > 0.0188294 |
| False-alarm rate above that detection threshold: | 1.98768e-06 |
| Alternative threshold at 1/1000 yrs: | R > 0.0188294 |
| Alternative threshold at 1/100 yrs: | R > 0.0188294 |
| Alternative threshold at 1/10 yrs: | R > 0.0188294 |
| Alternative threshold at 1/1 yr: | R > 0.0188294 |
| Alternative threshold at 1/1 d: | R > 0.0111385 |
 |
|
 |
 |
 |
 |
 |
 |
 |
 |
 |
 |
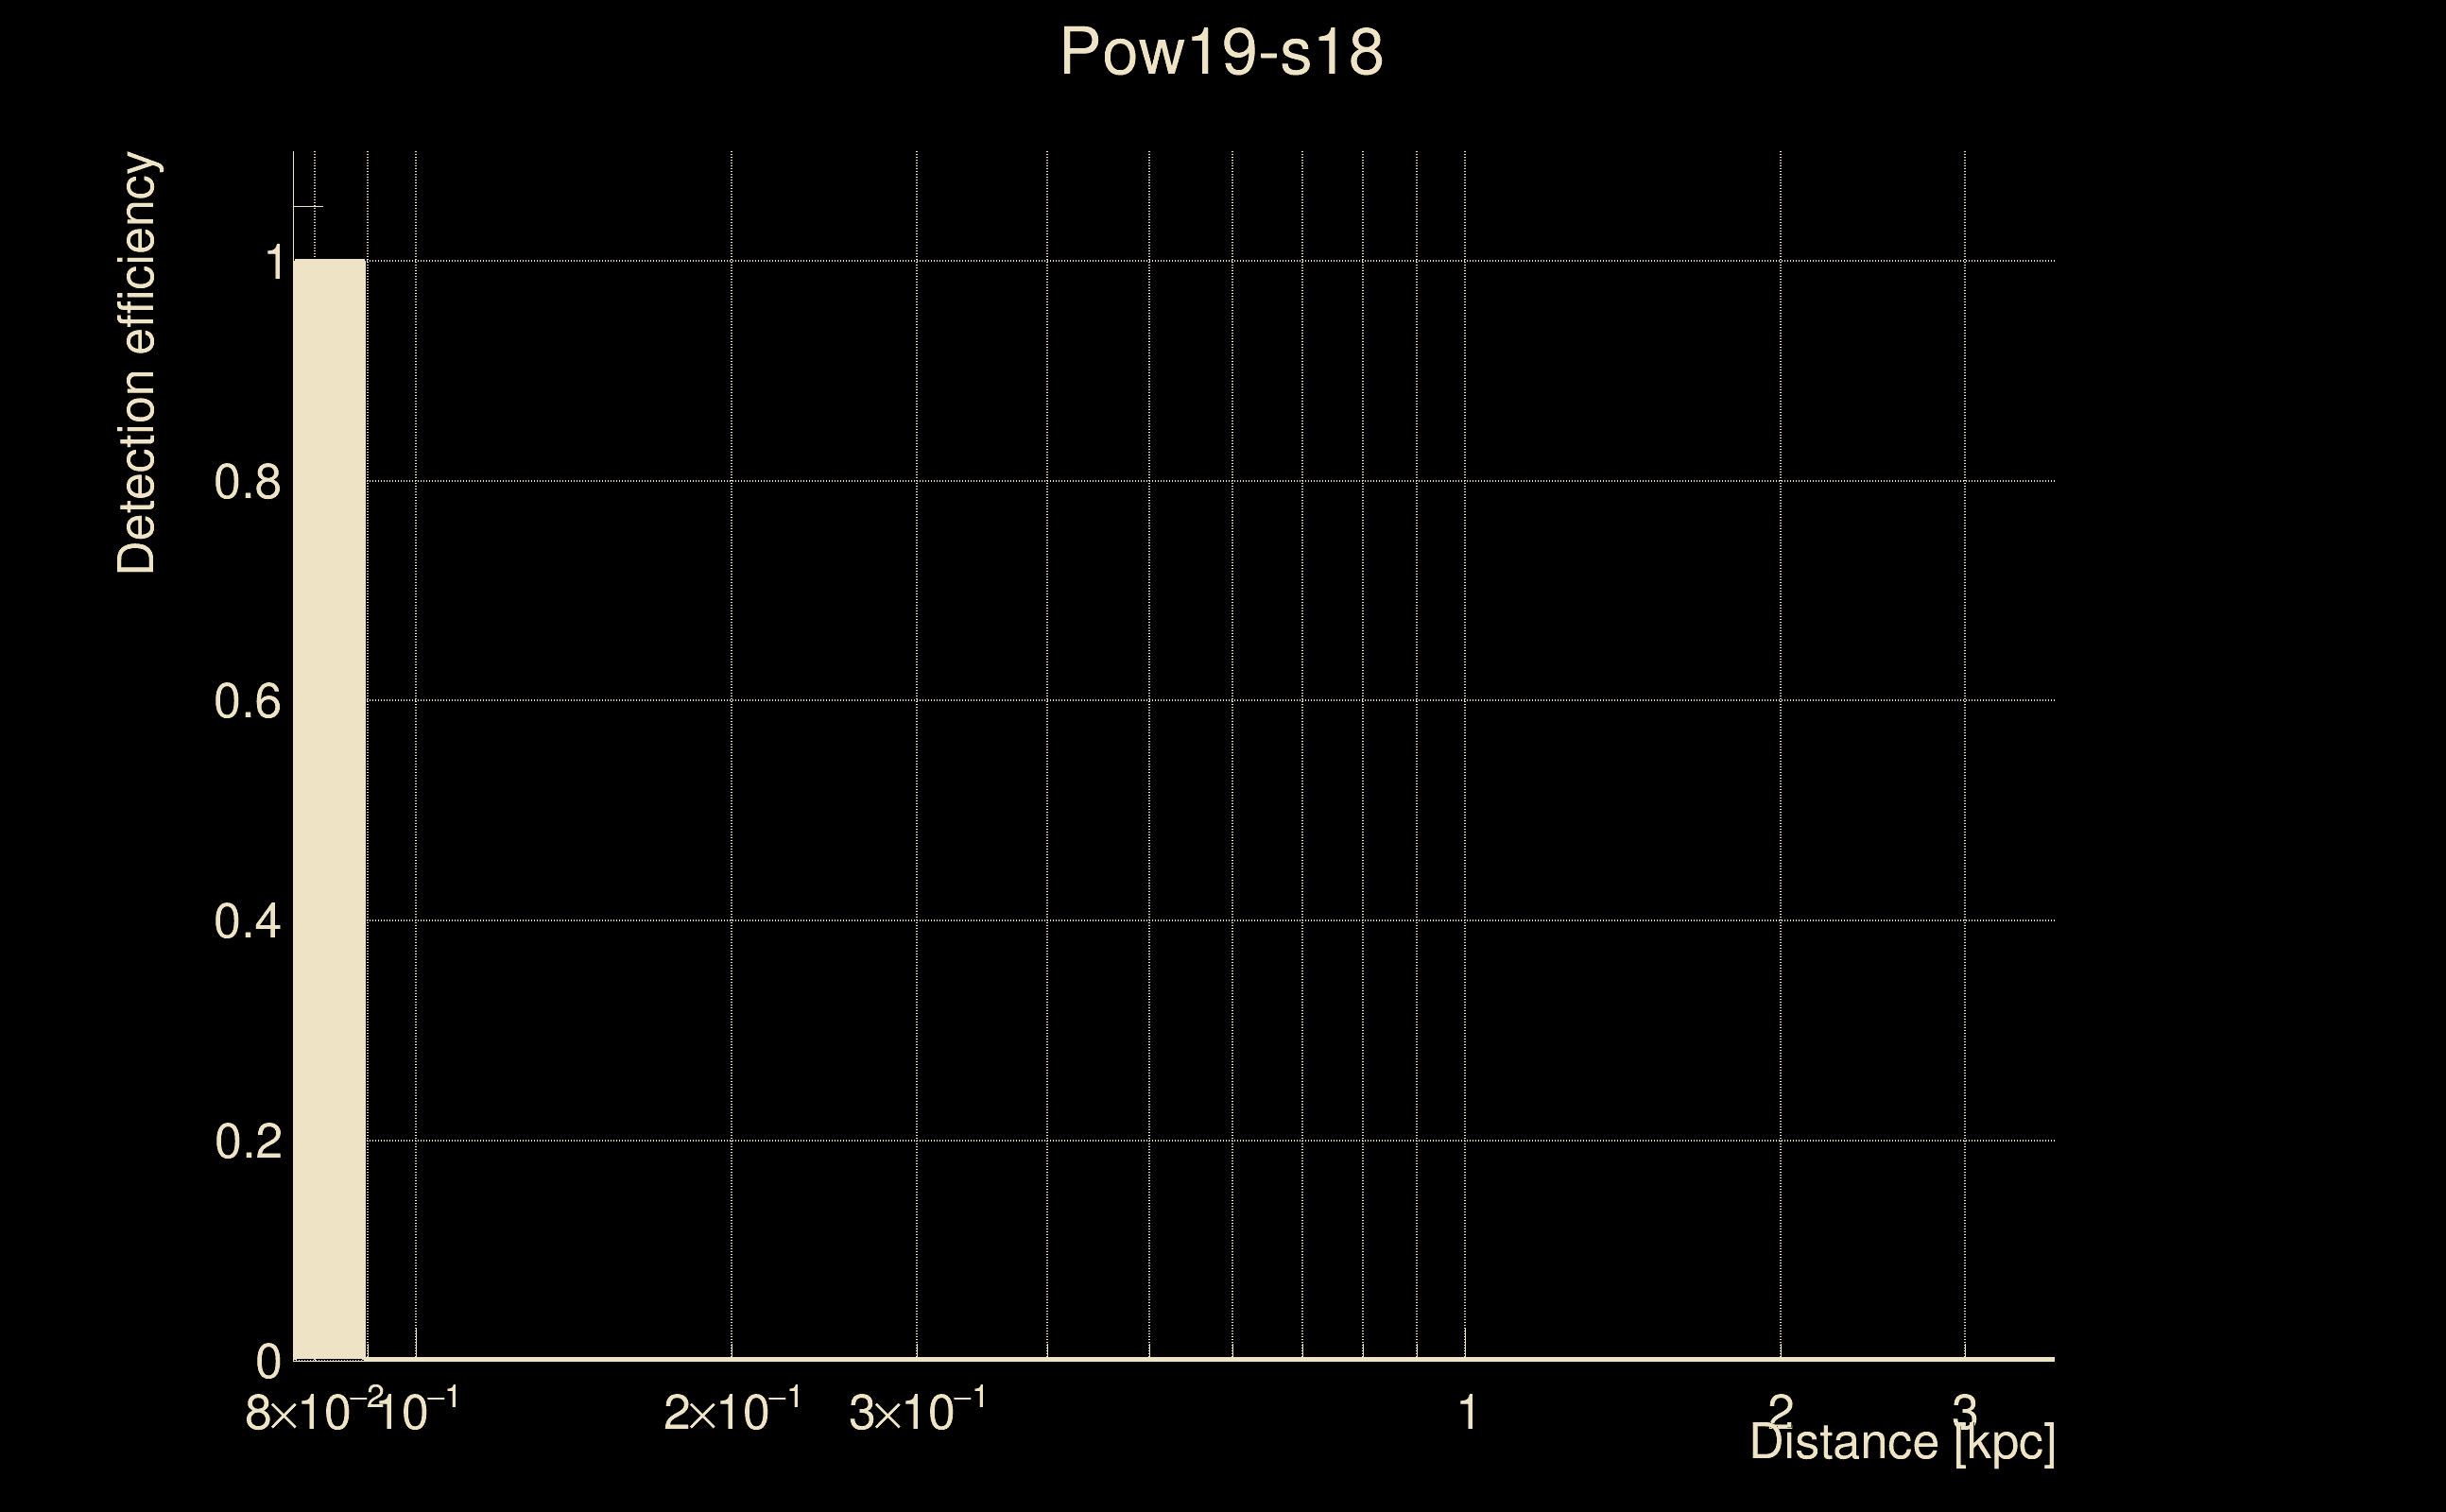
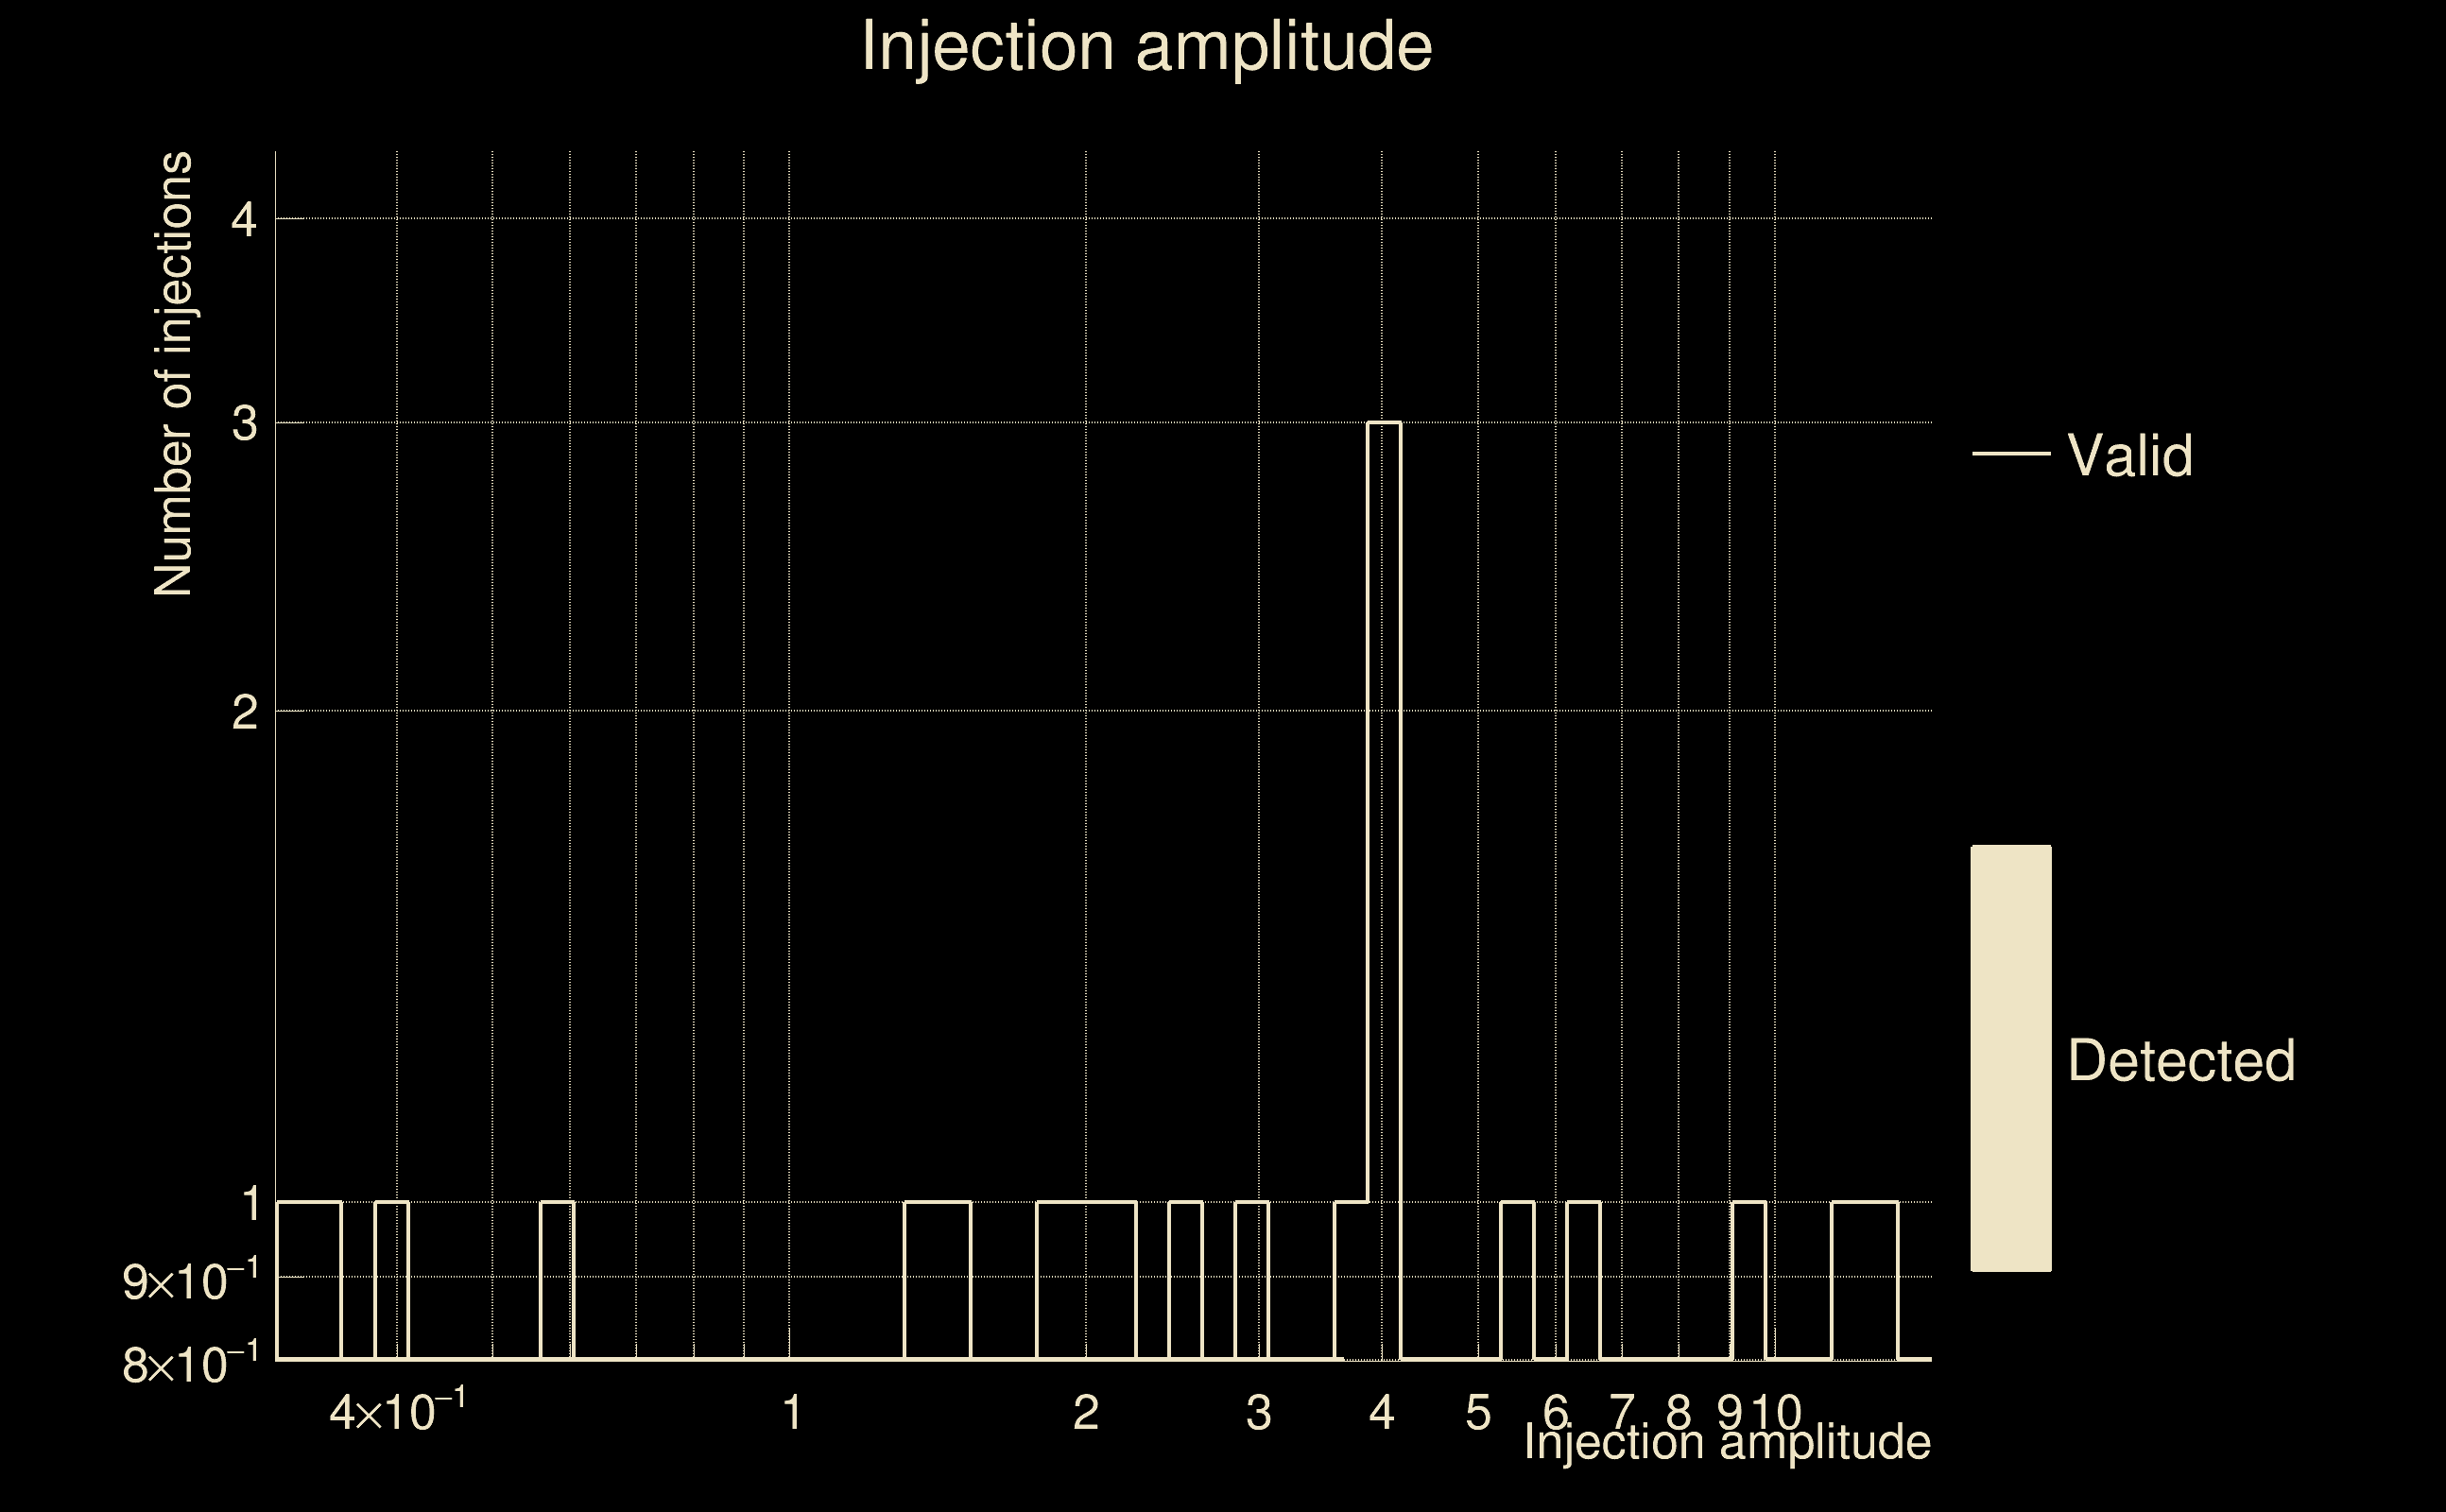
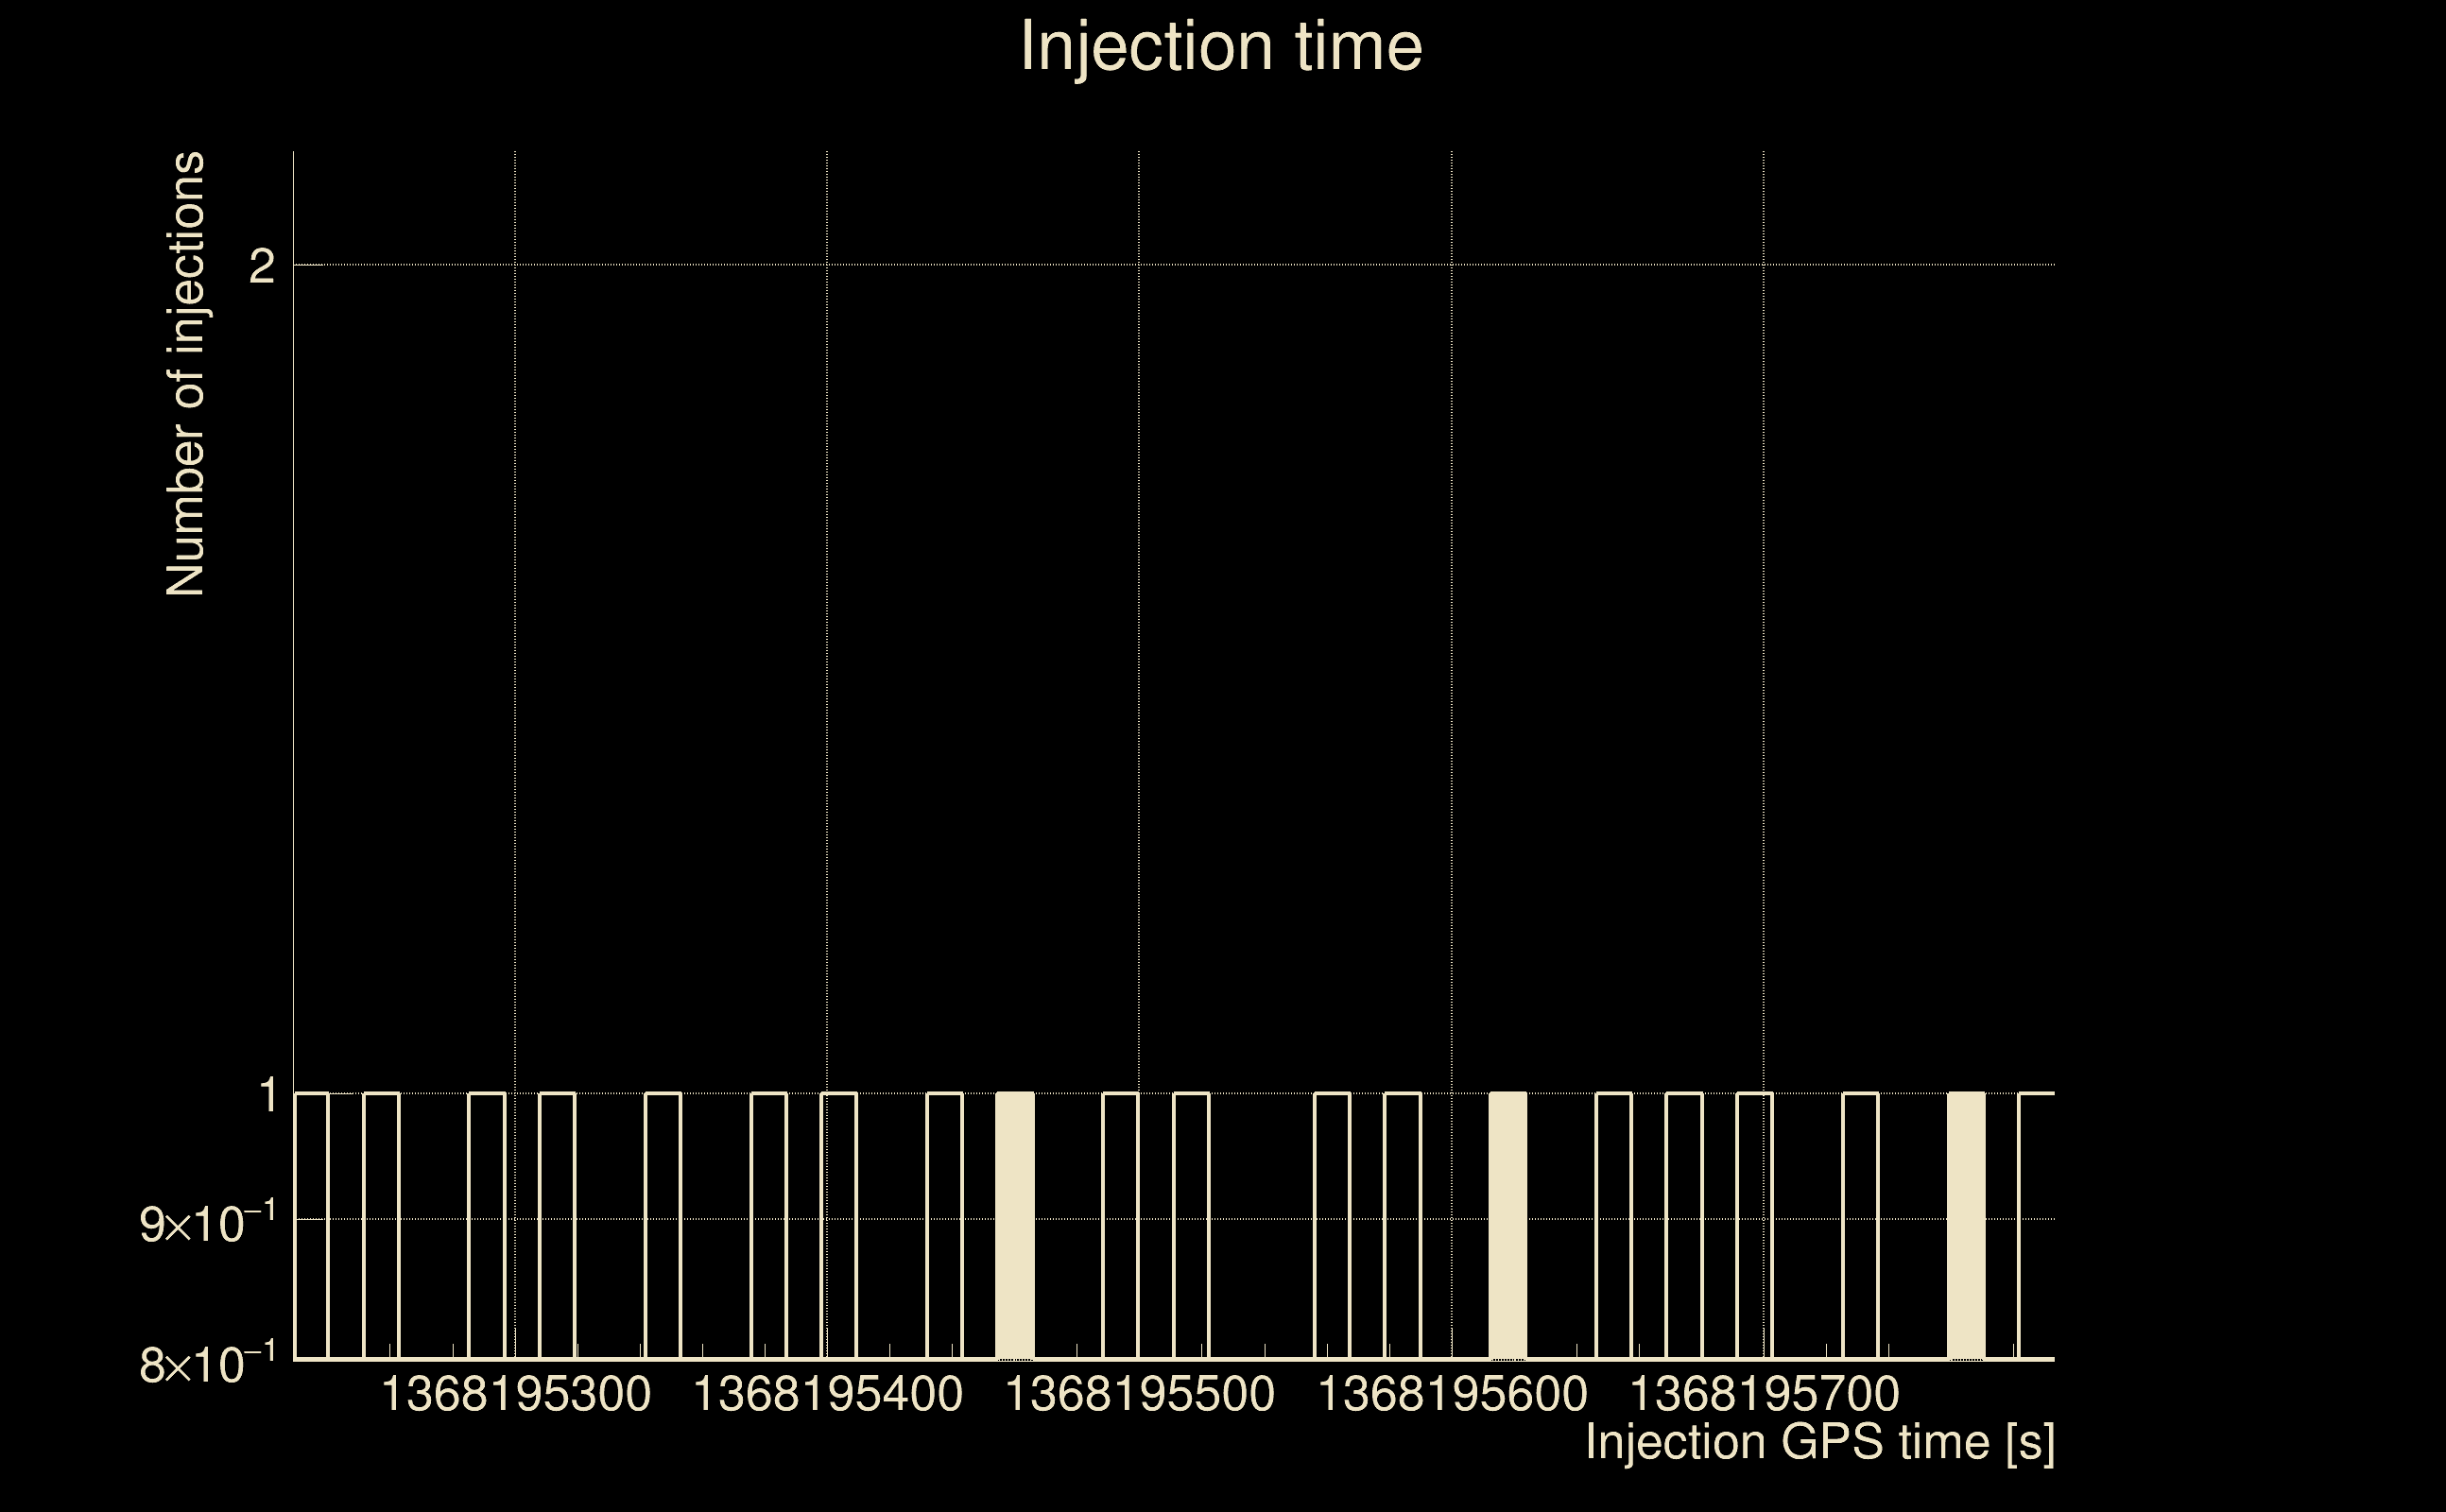
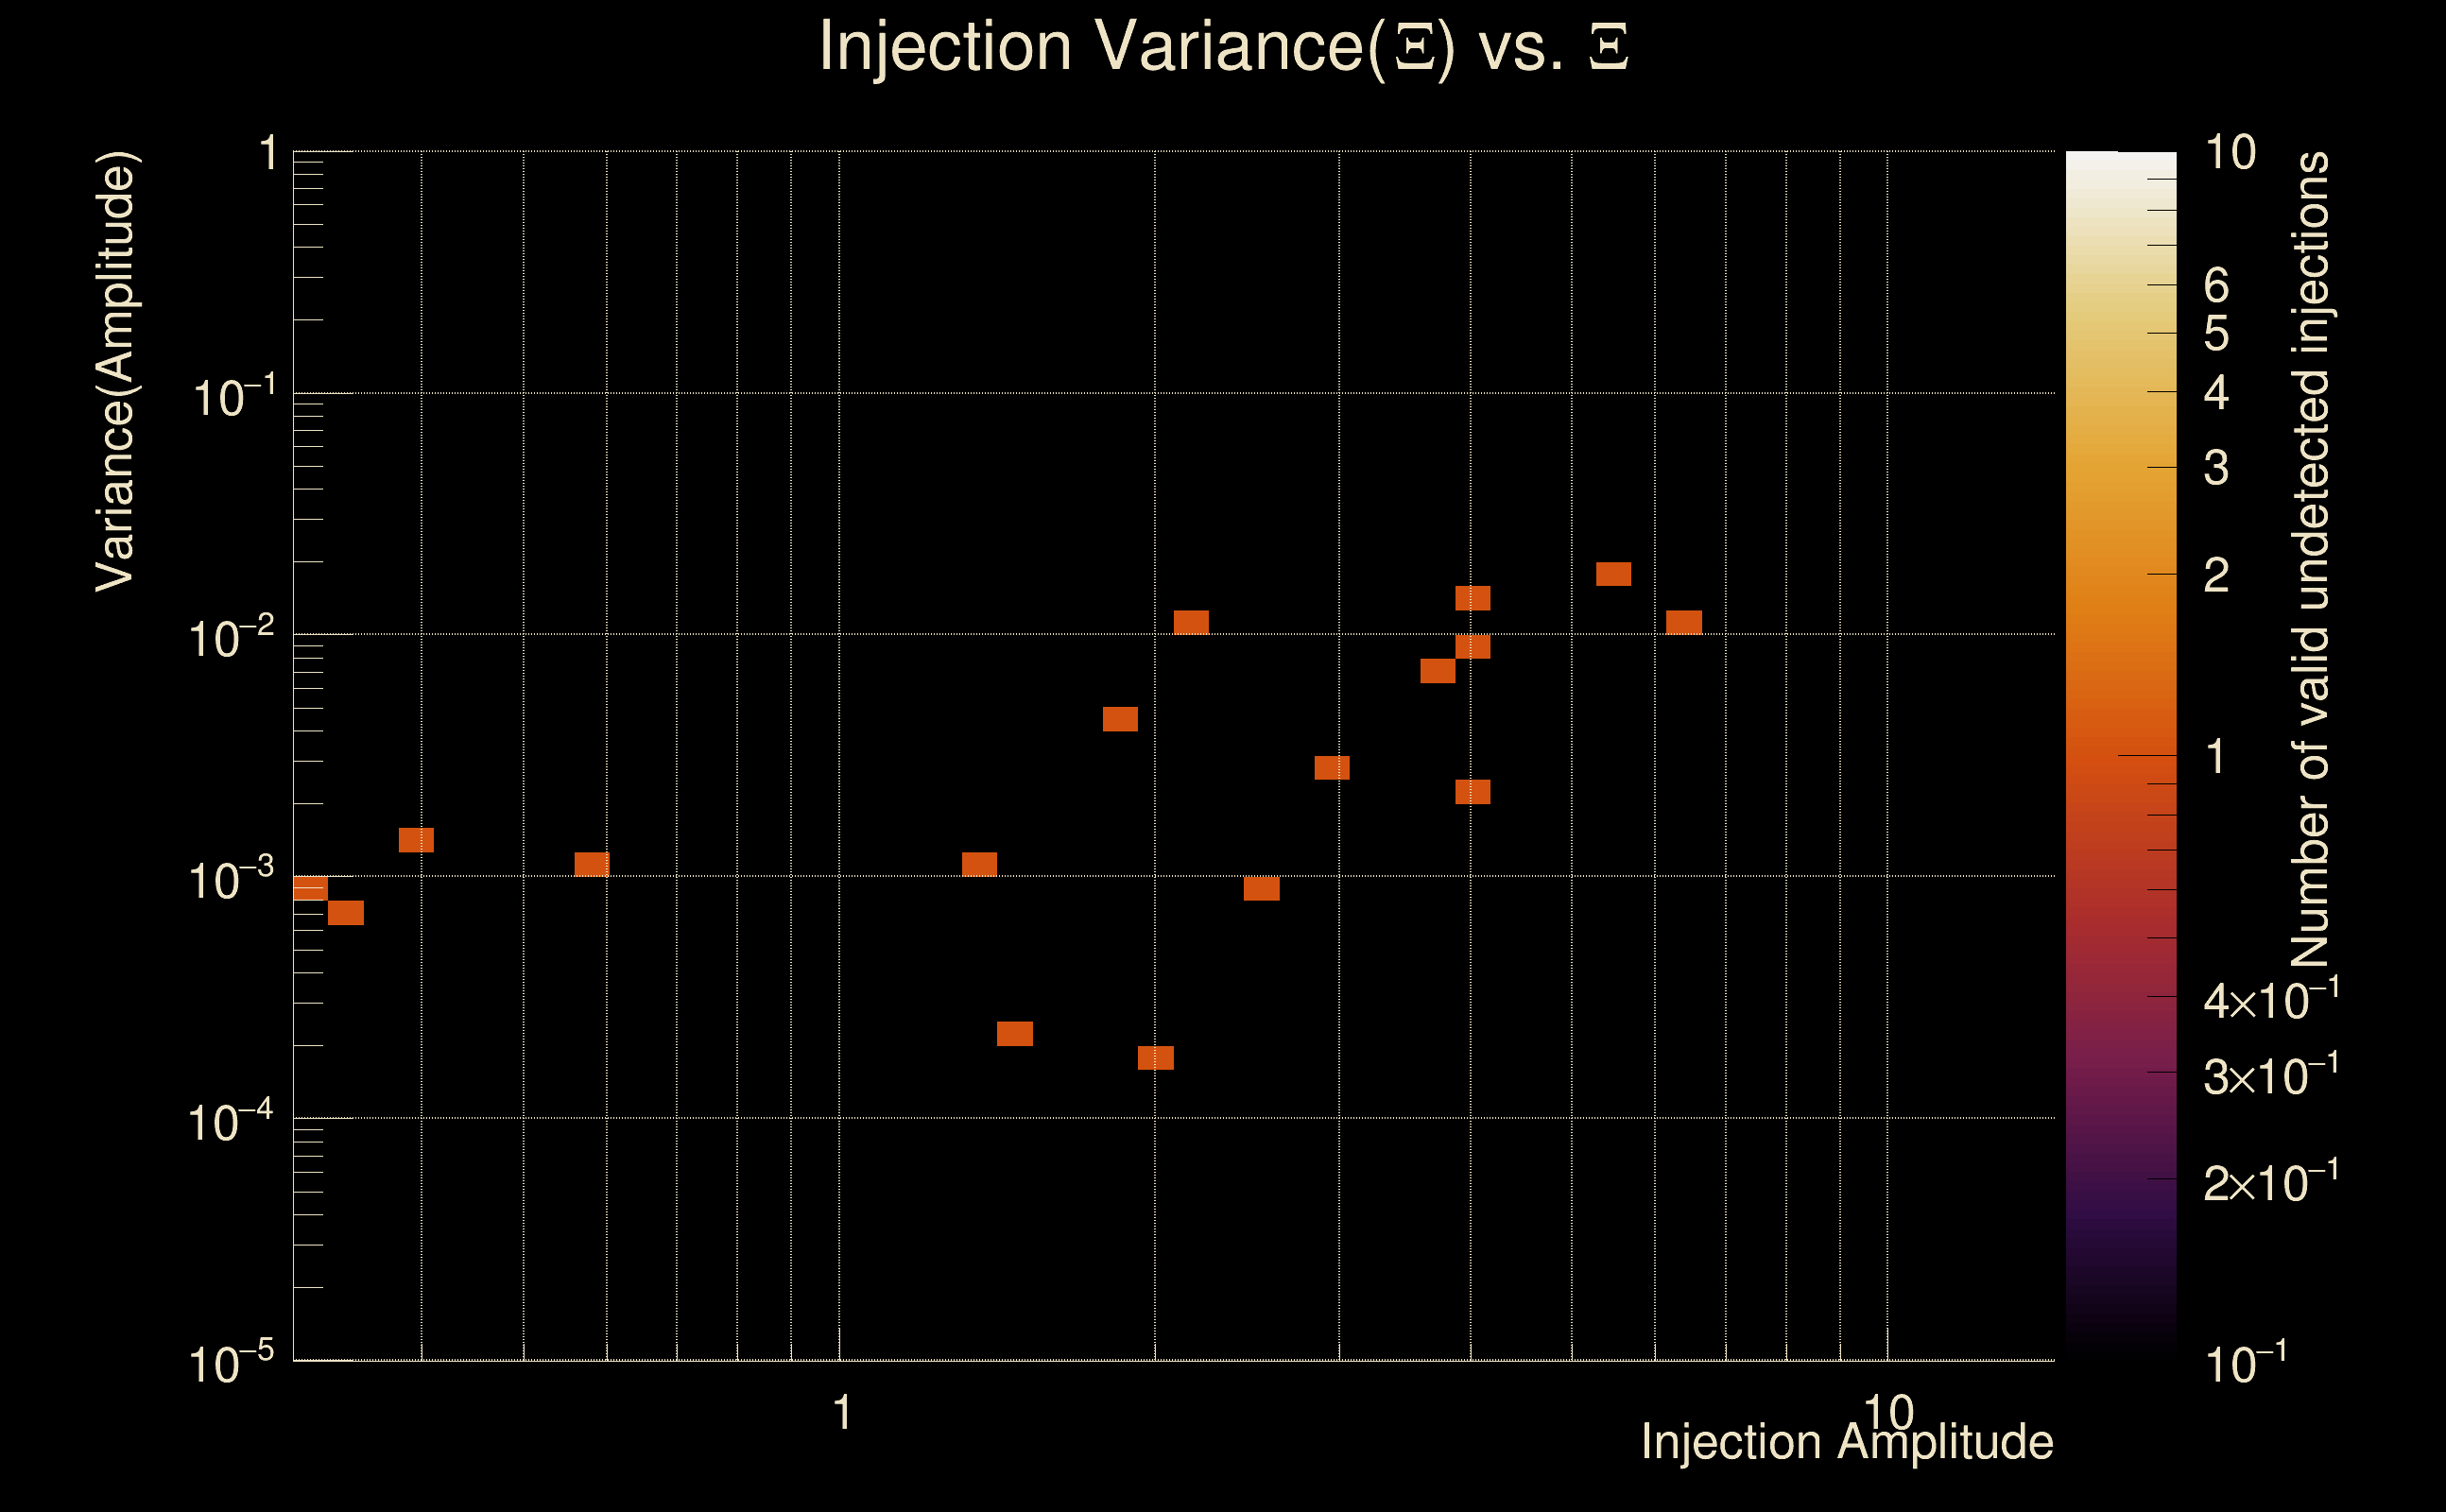
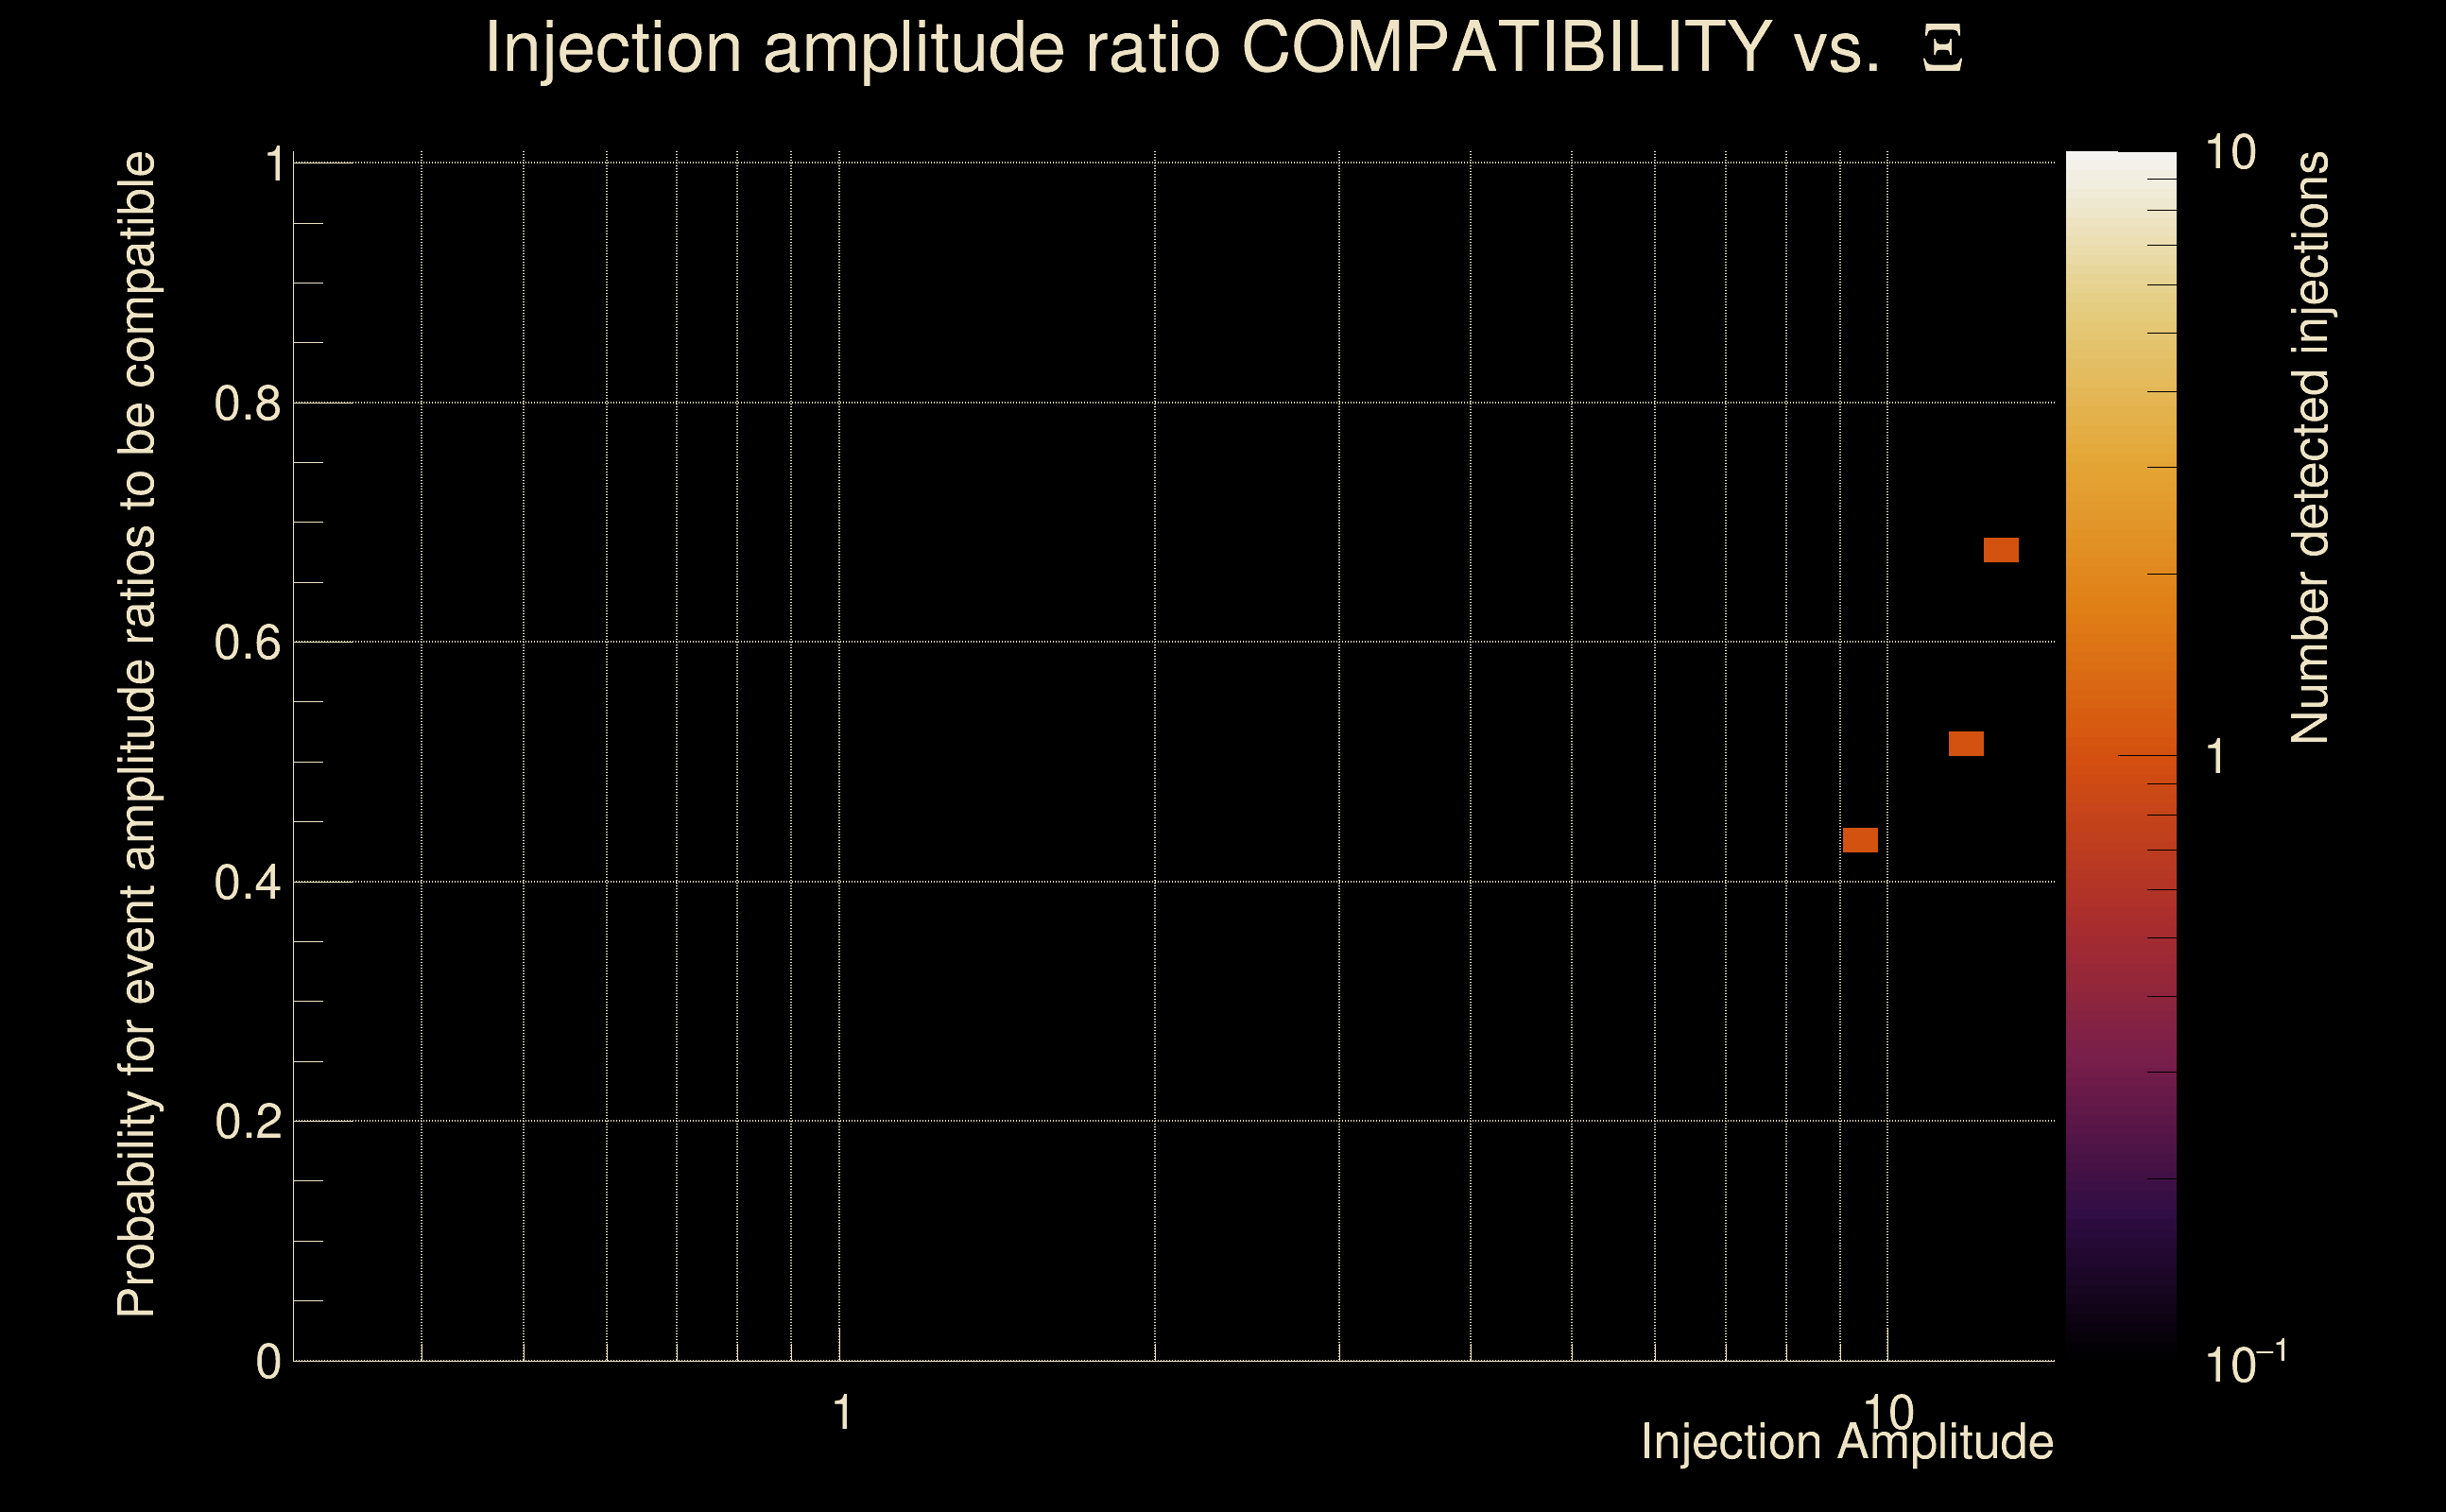
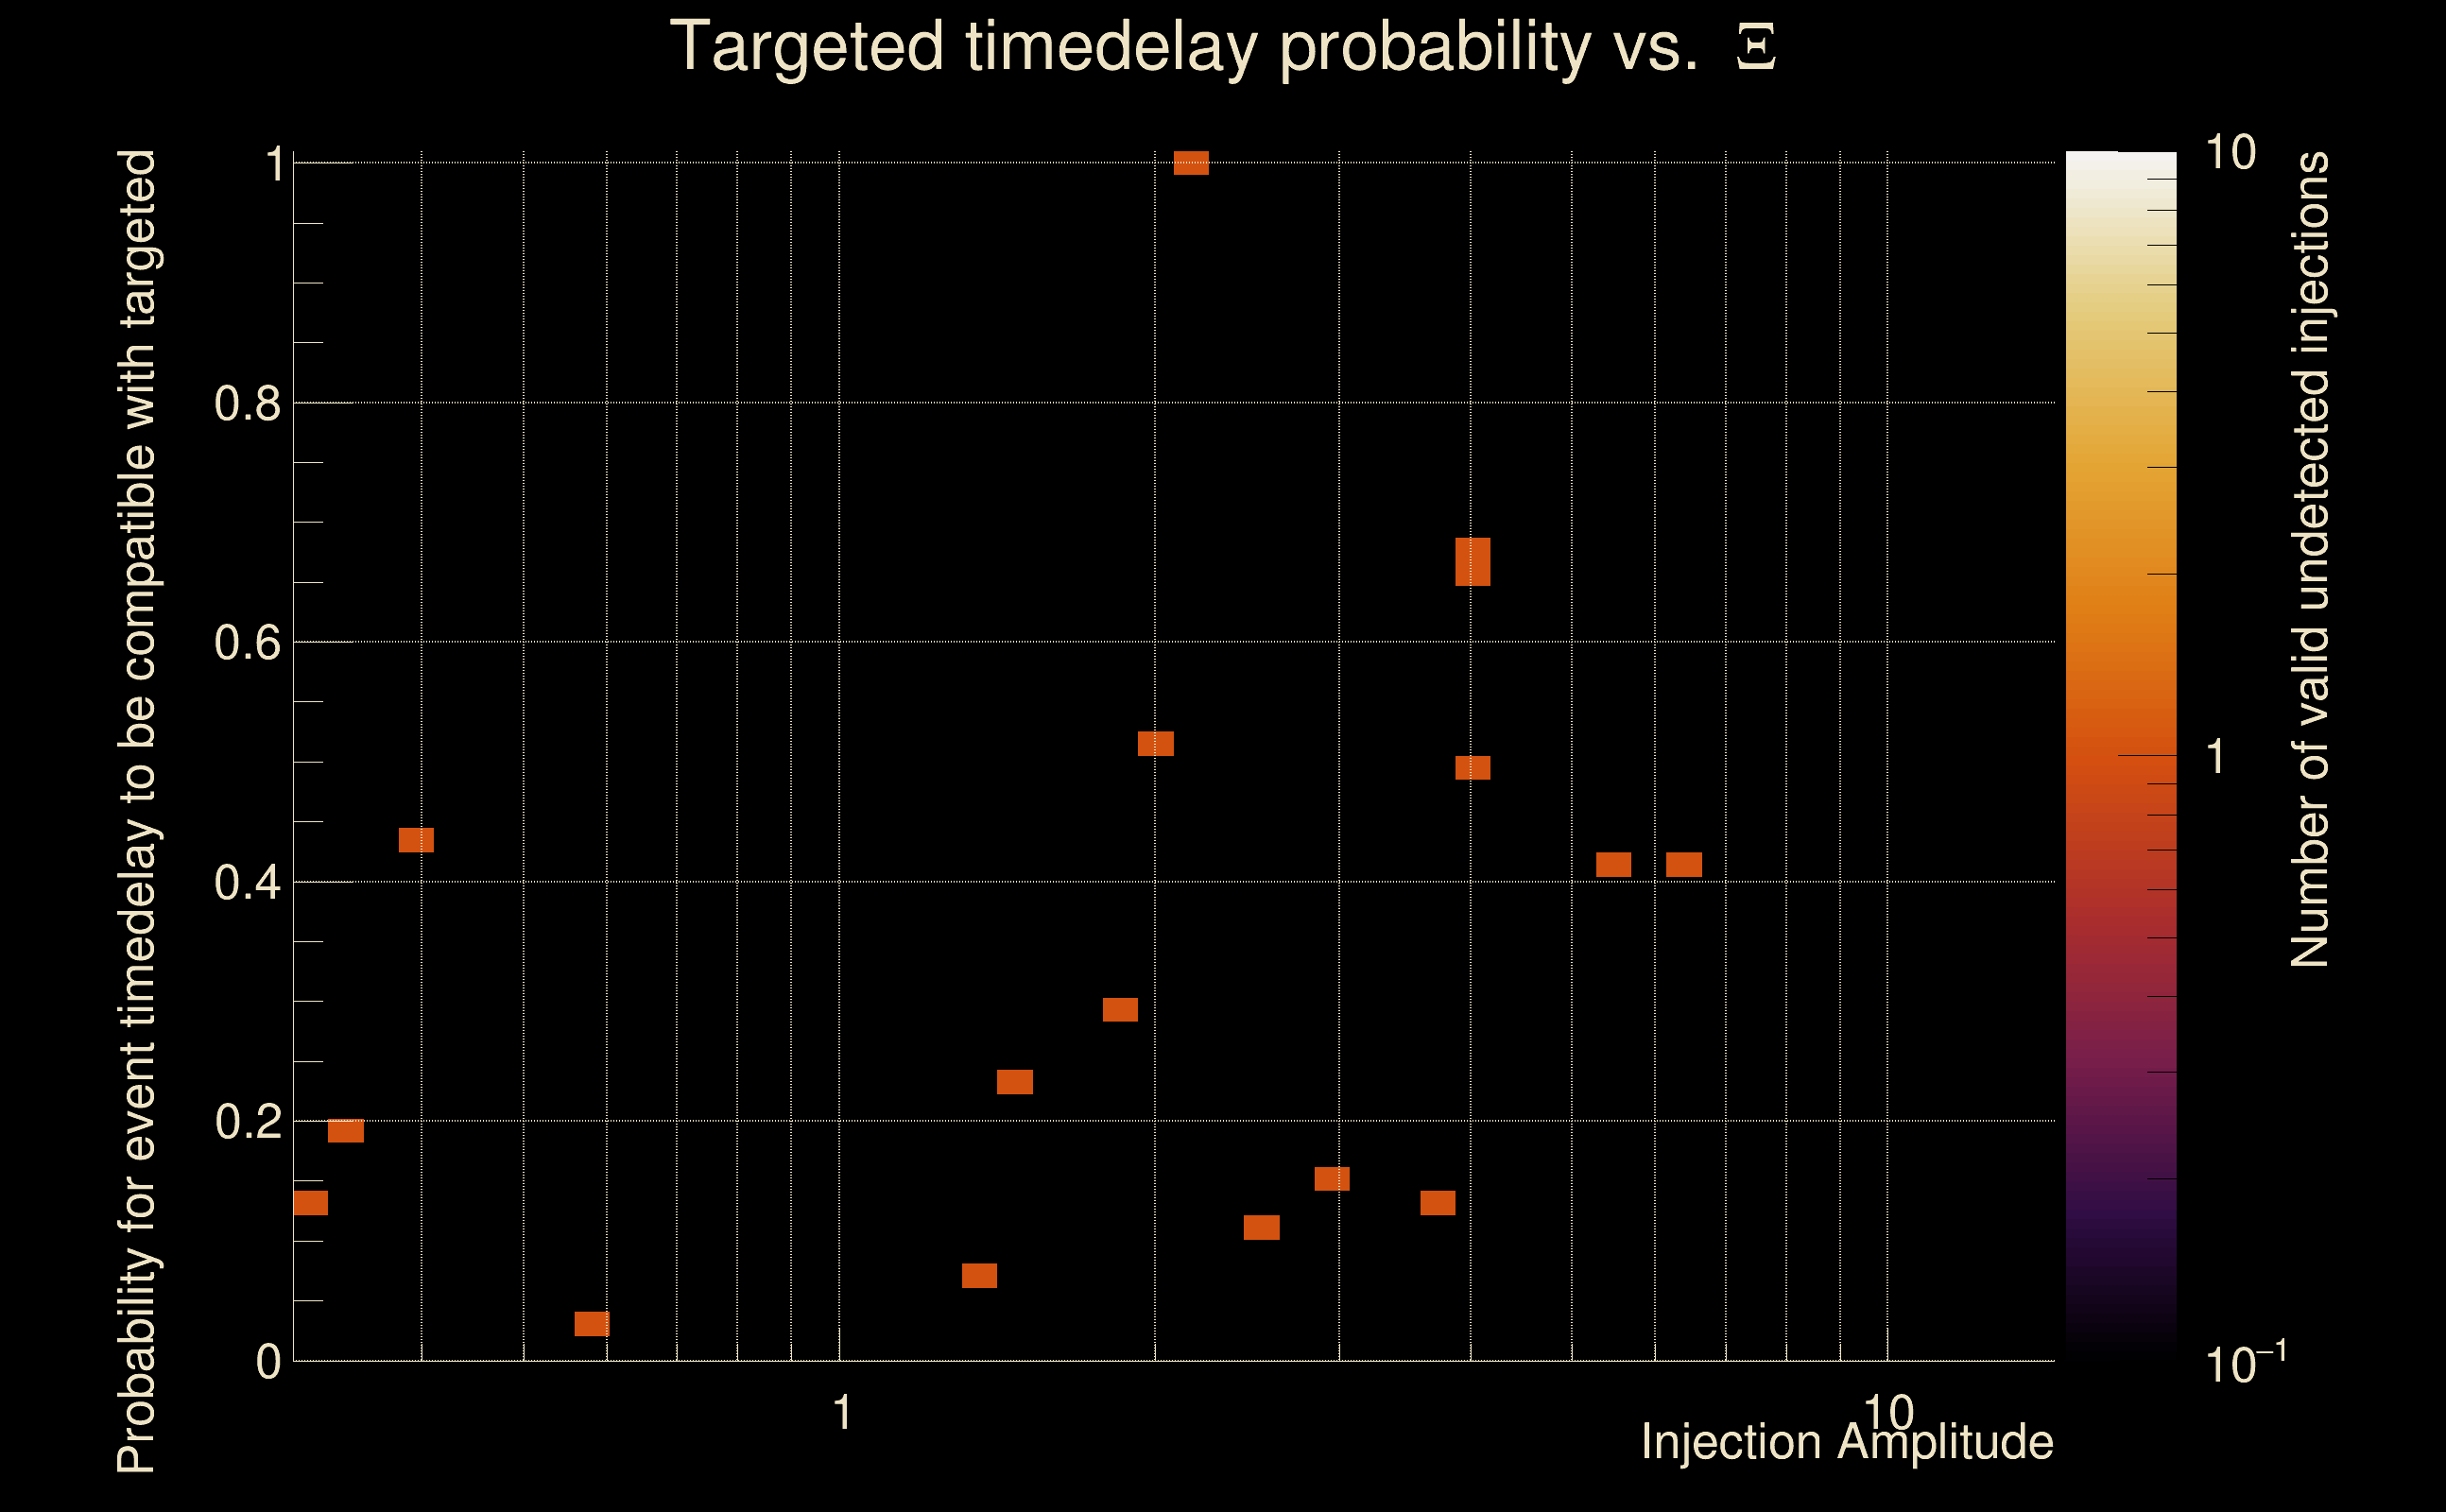
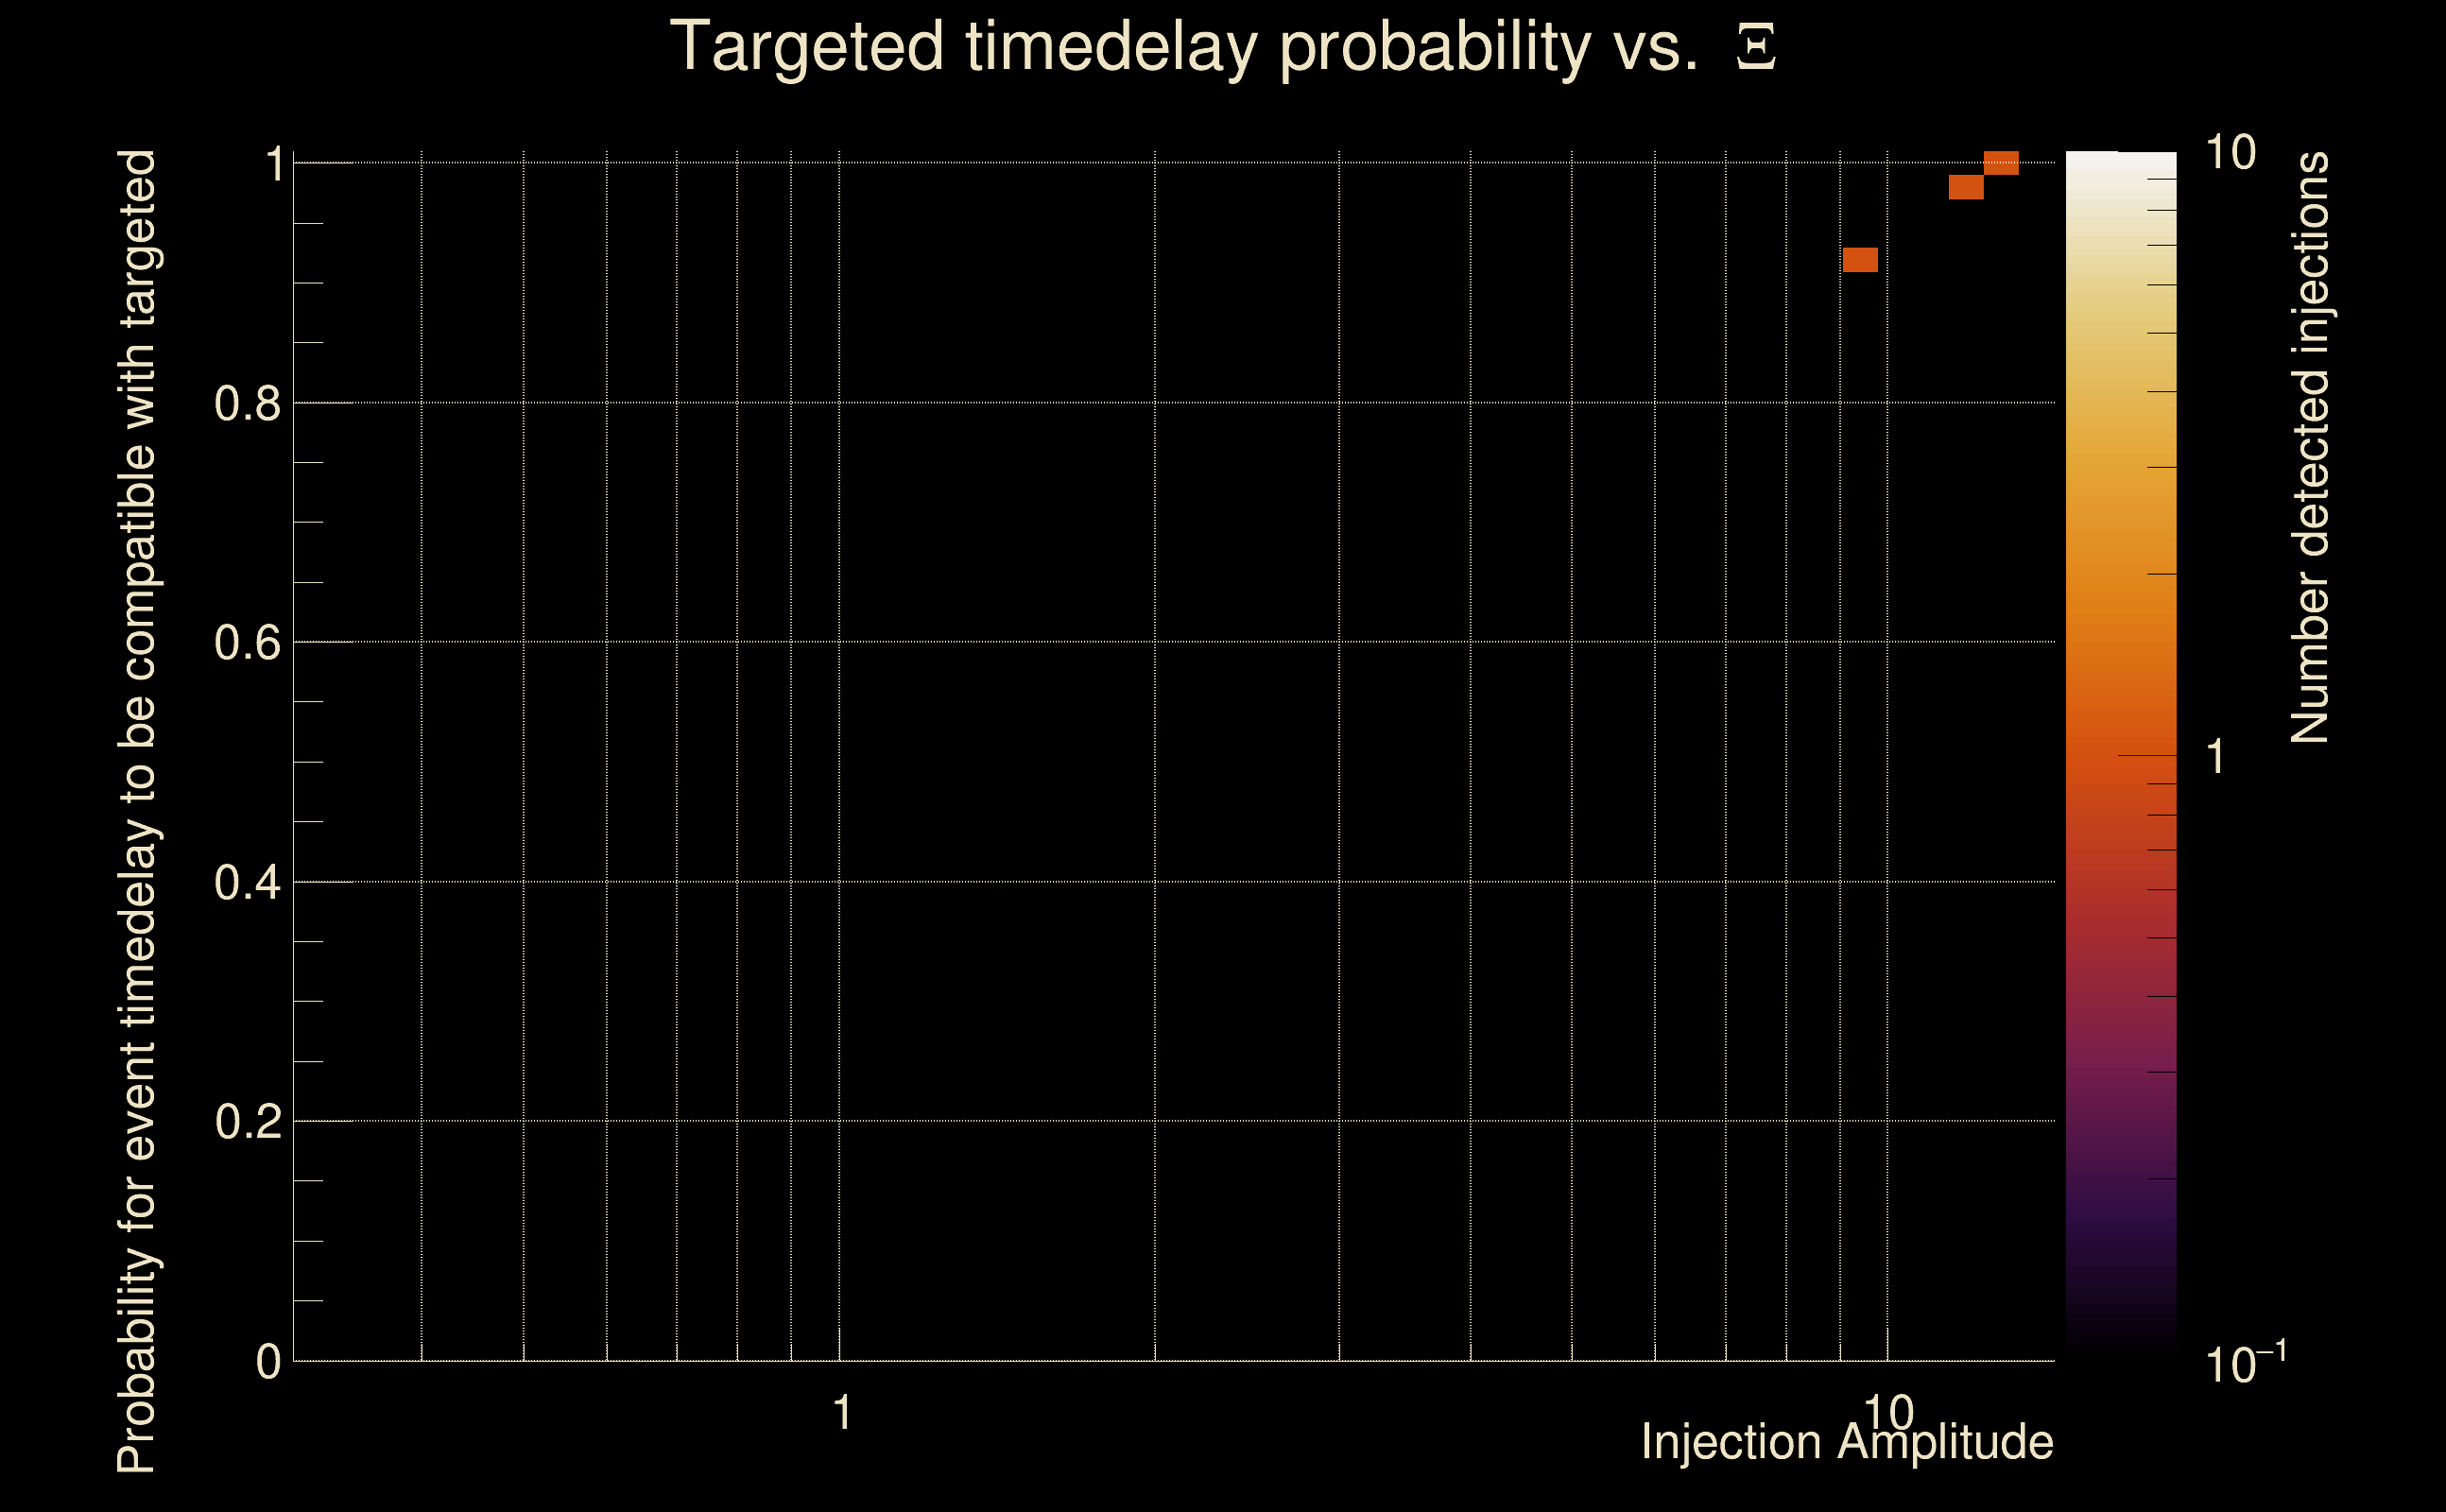
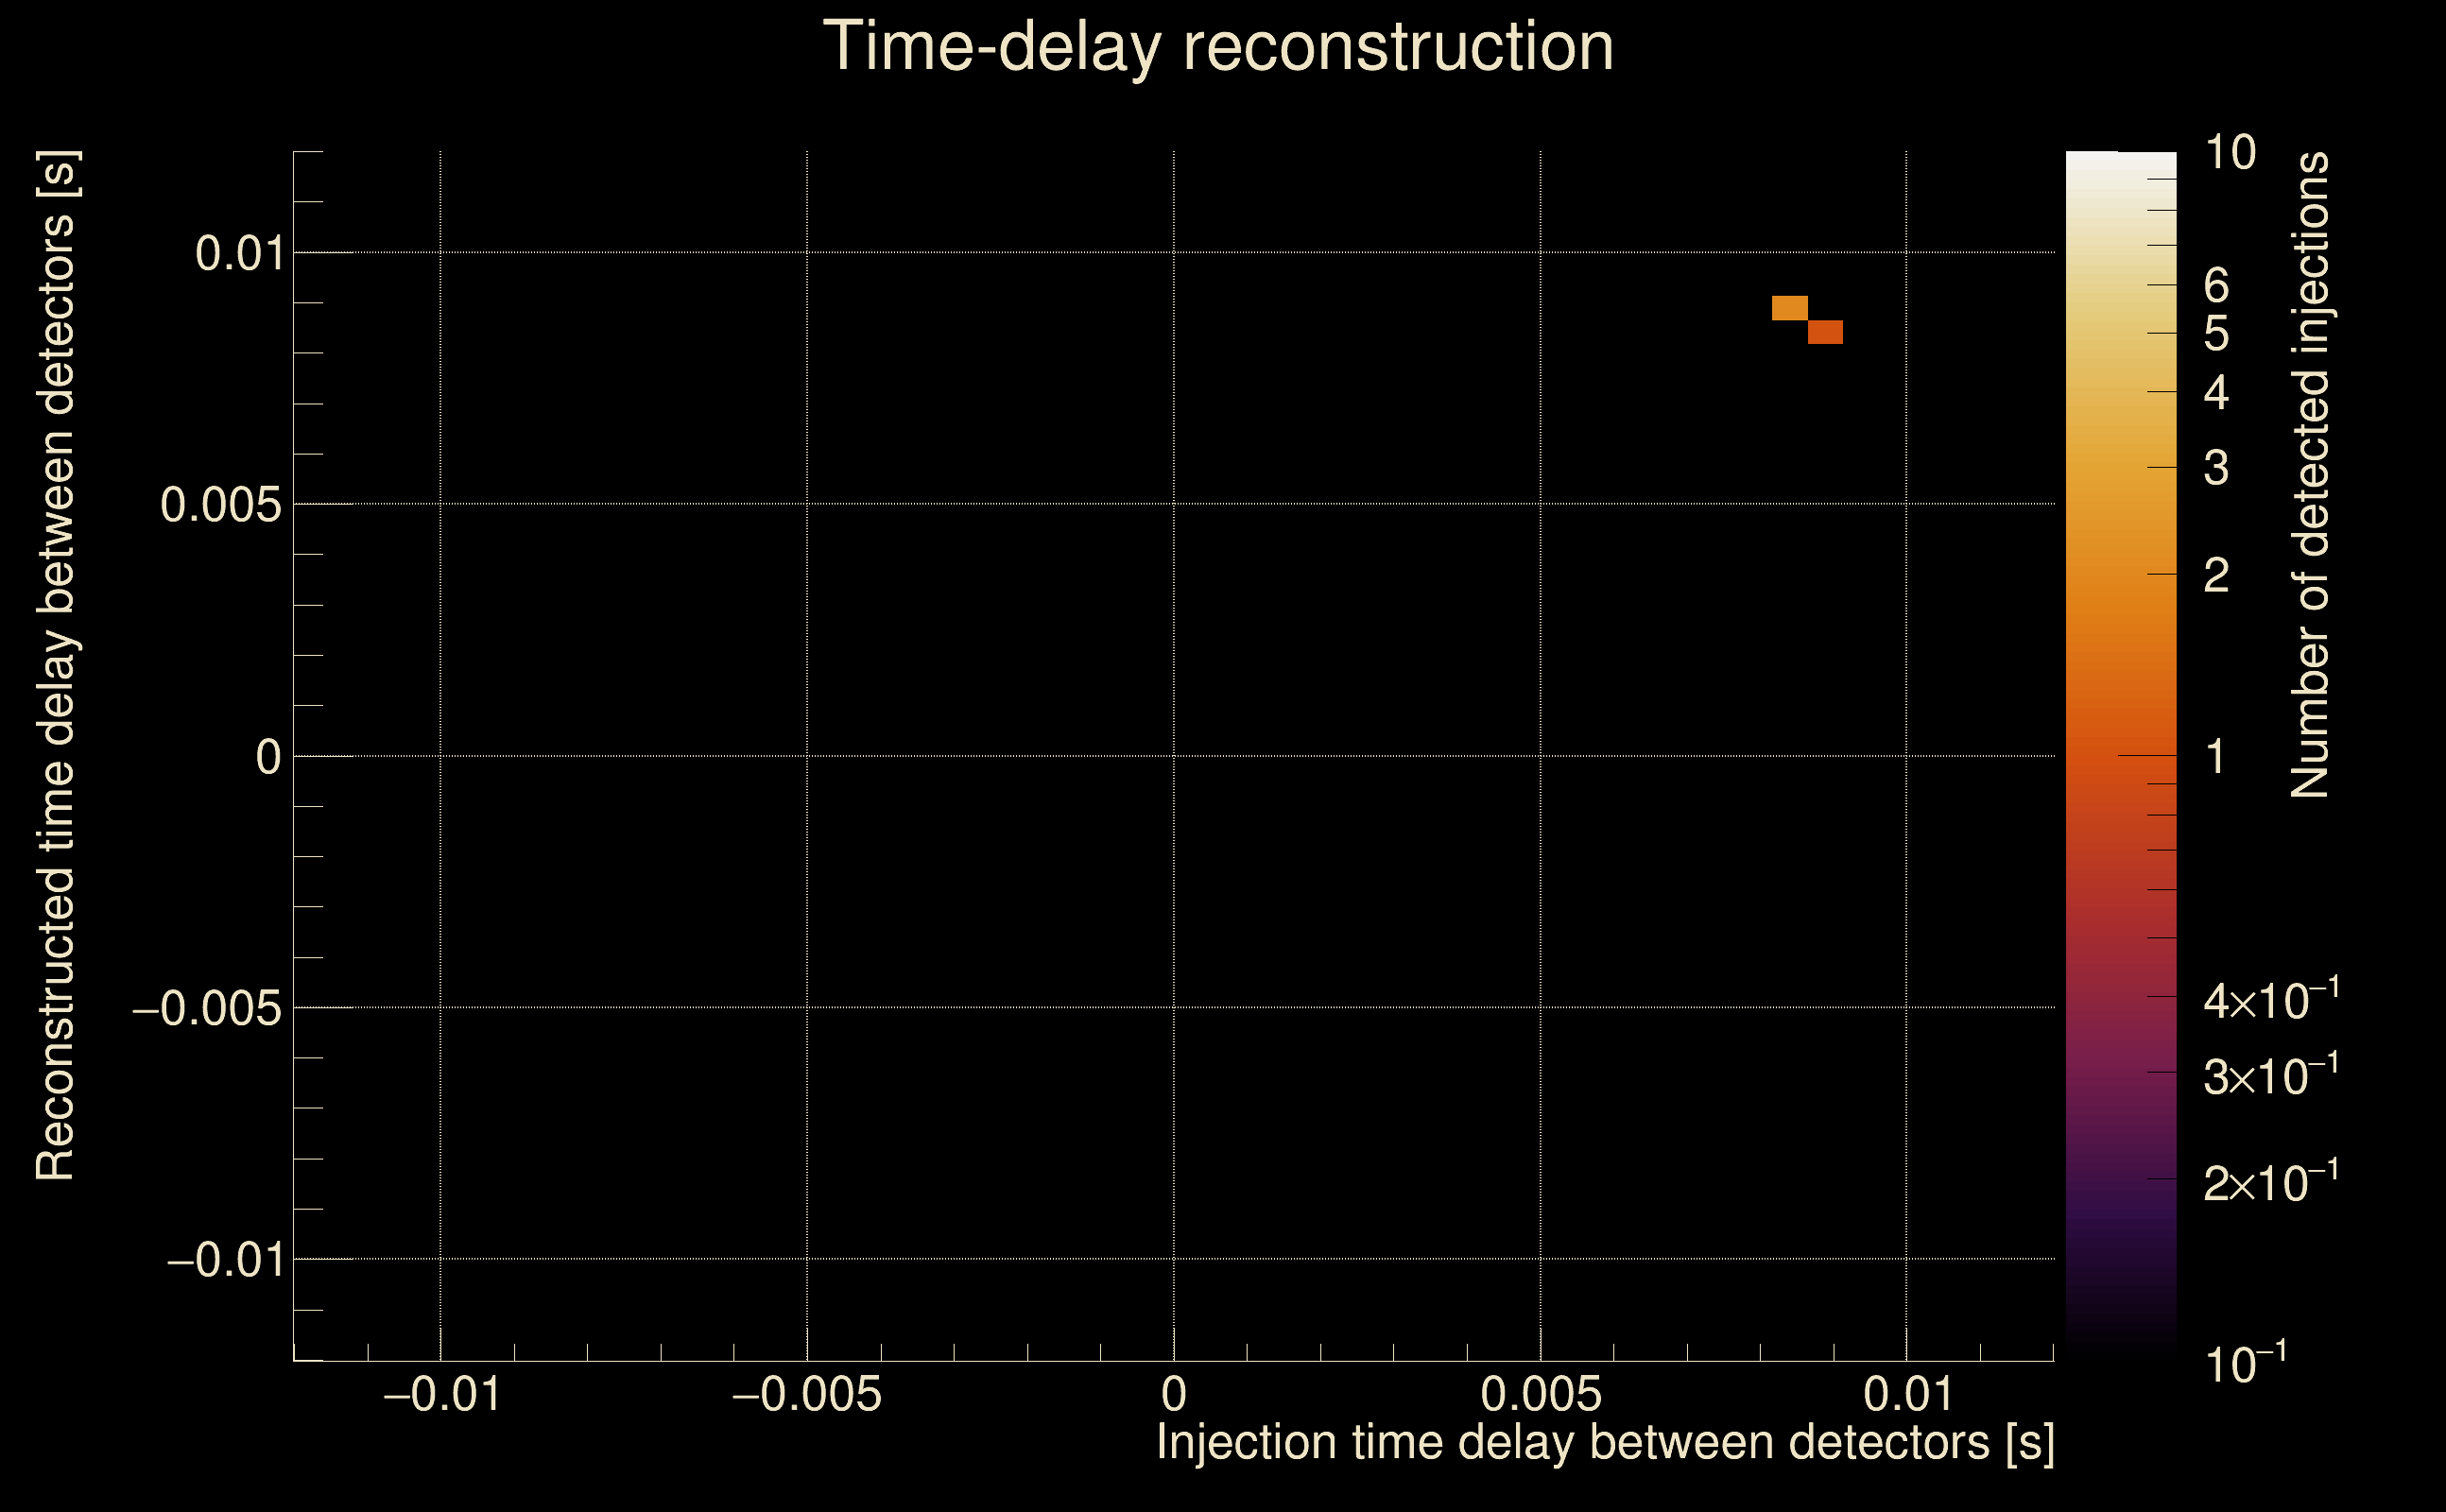
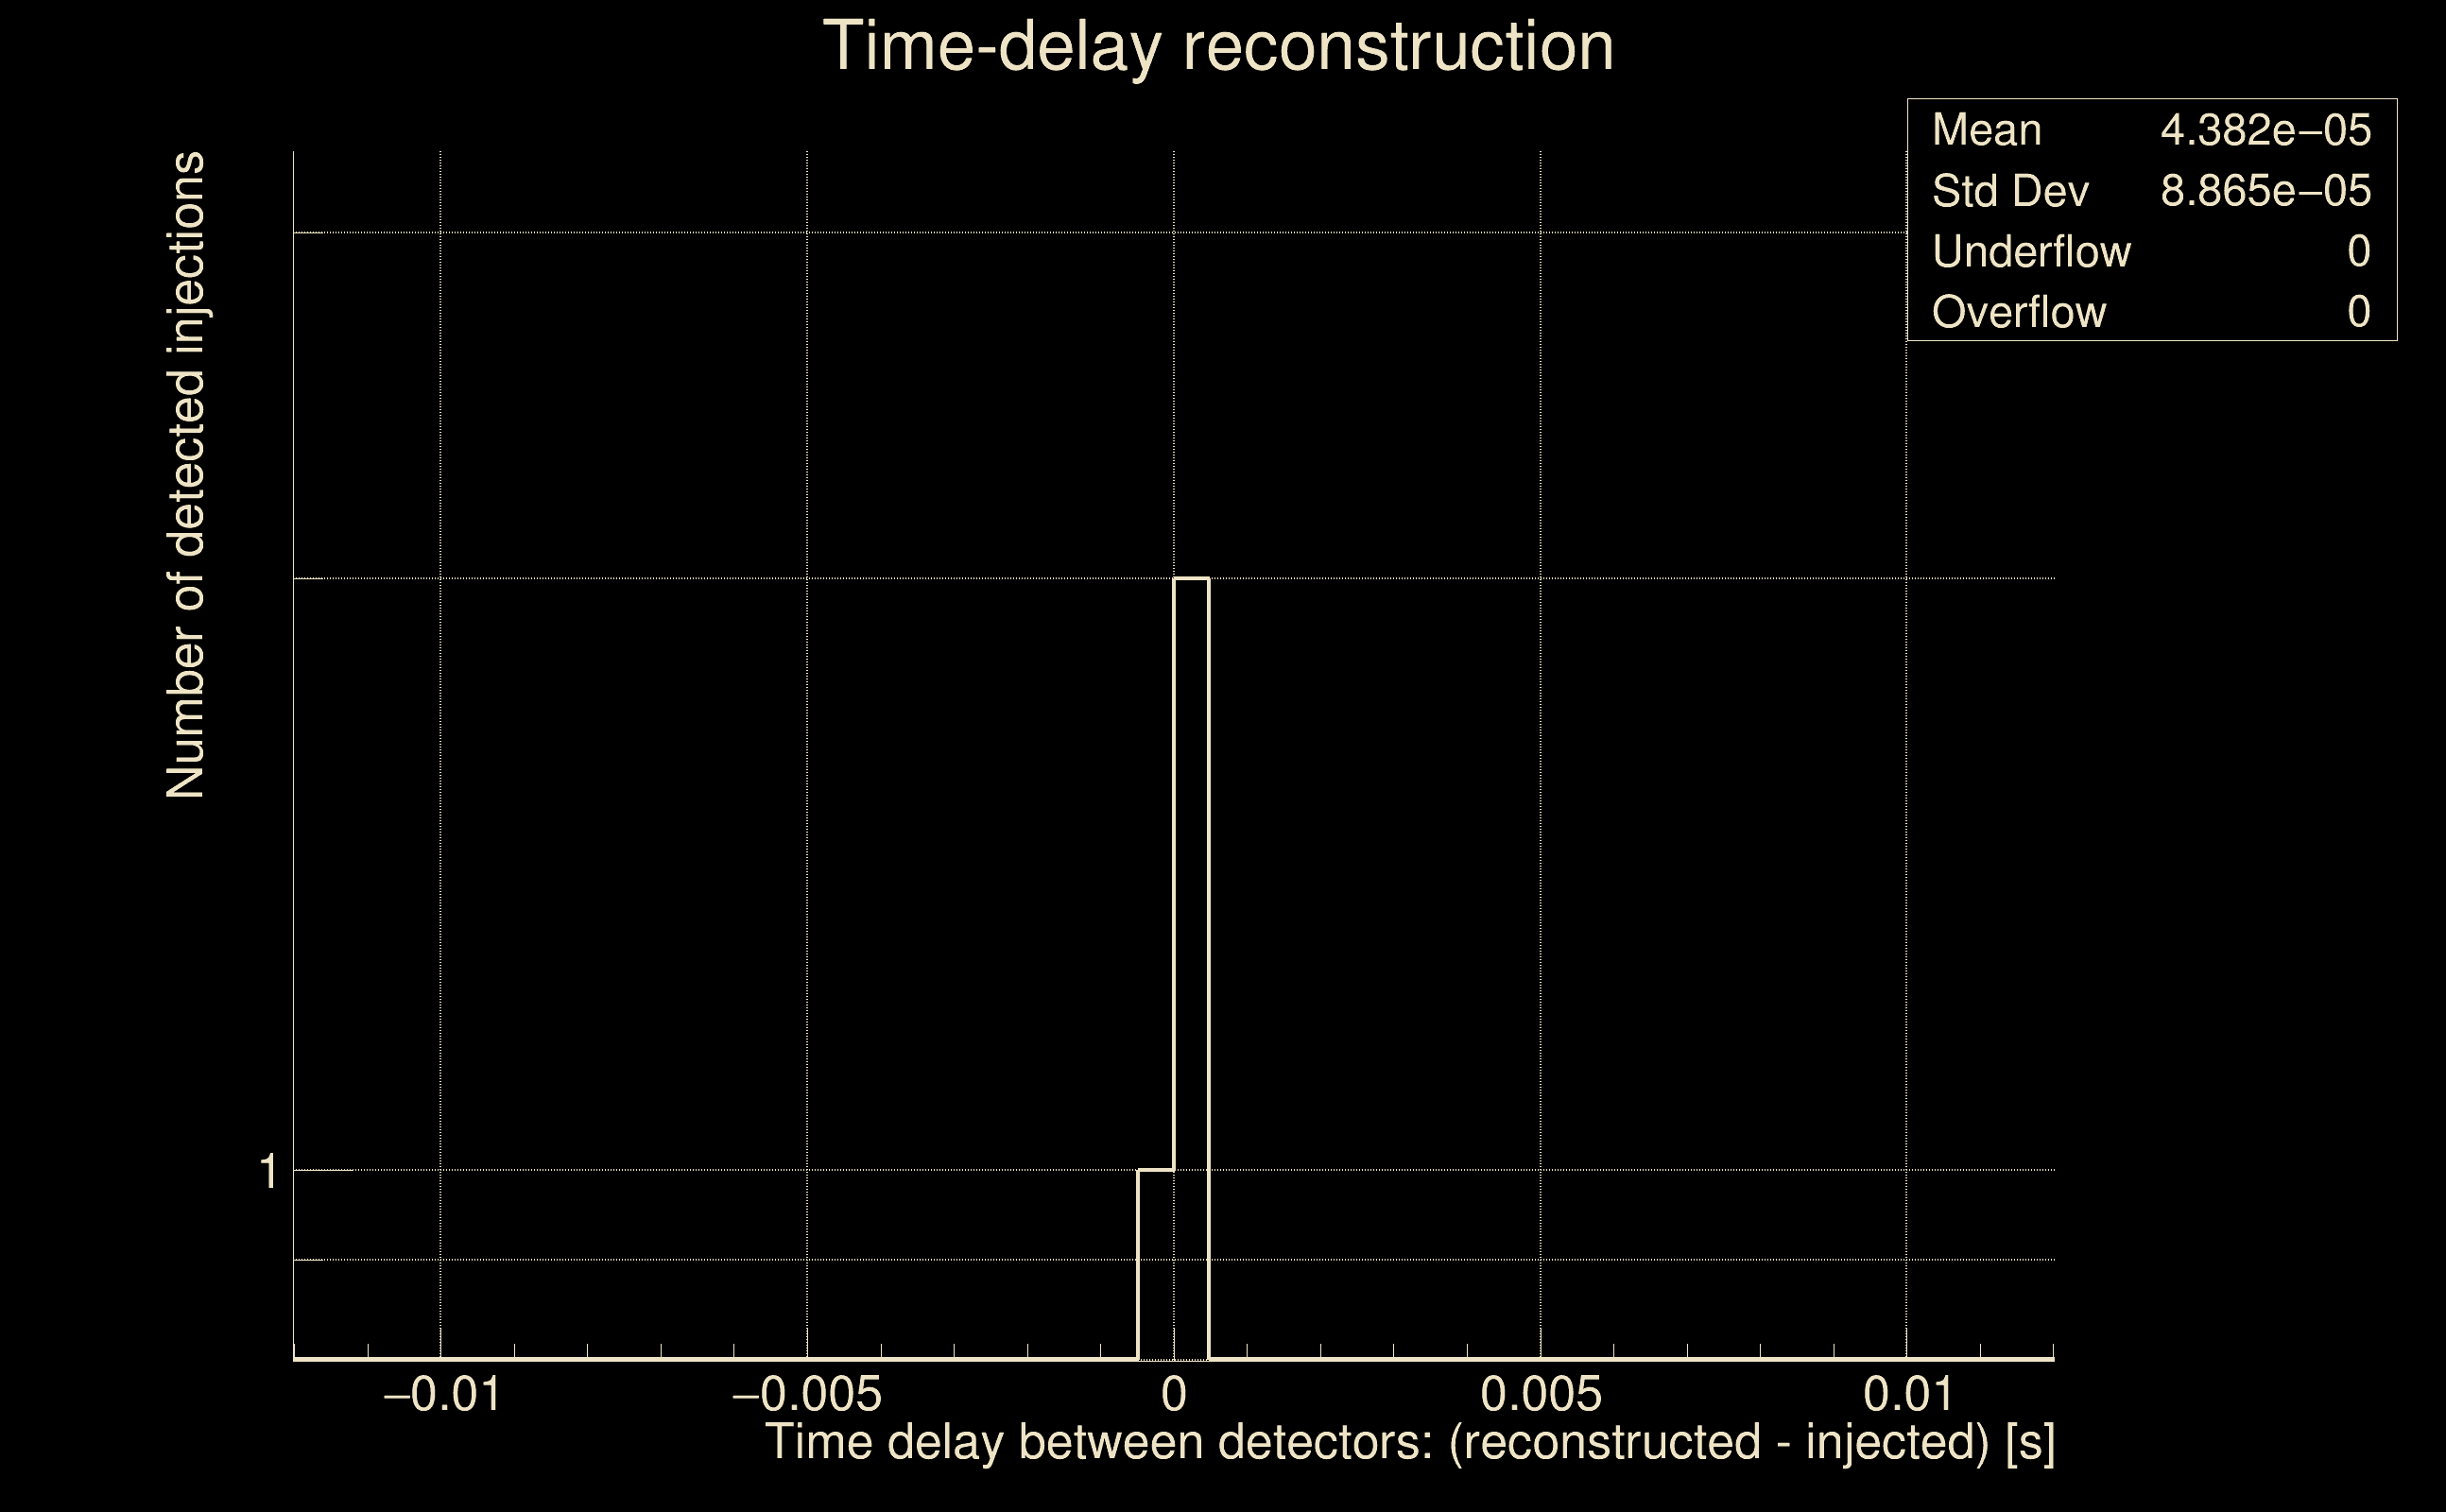
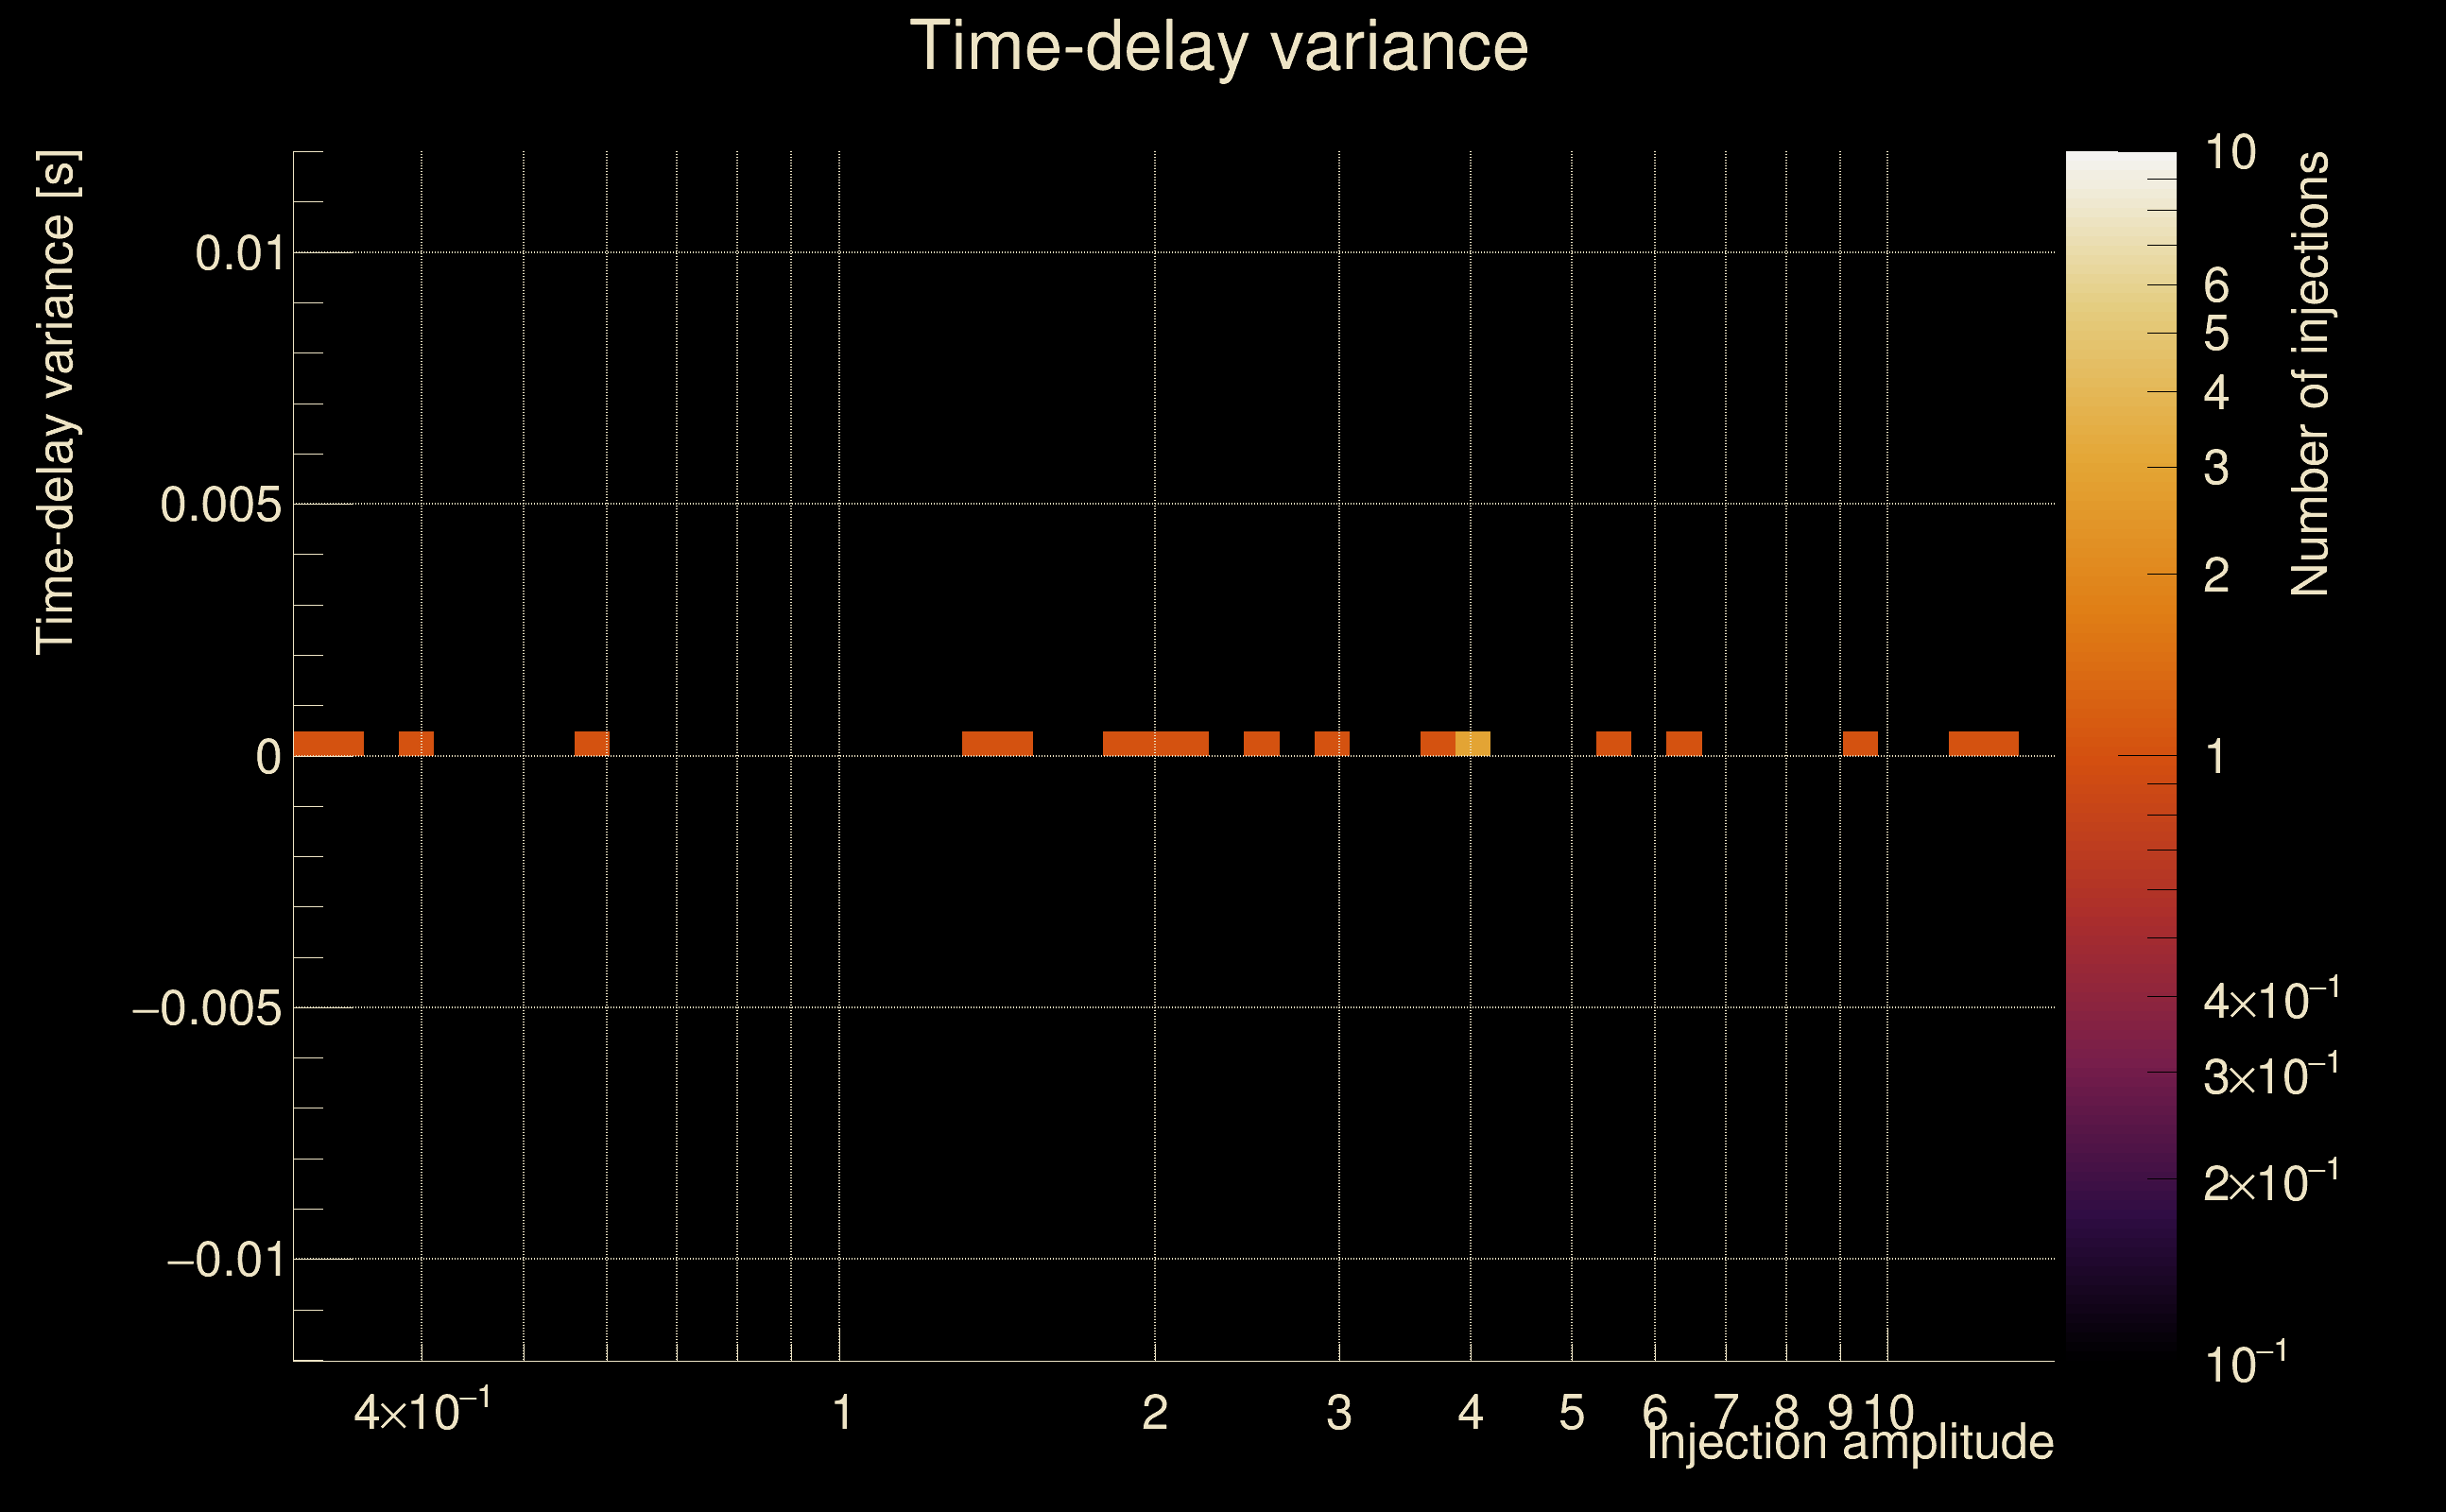
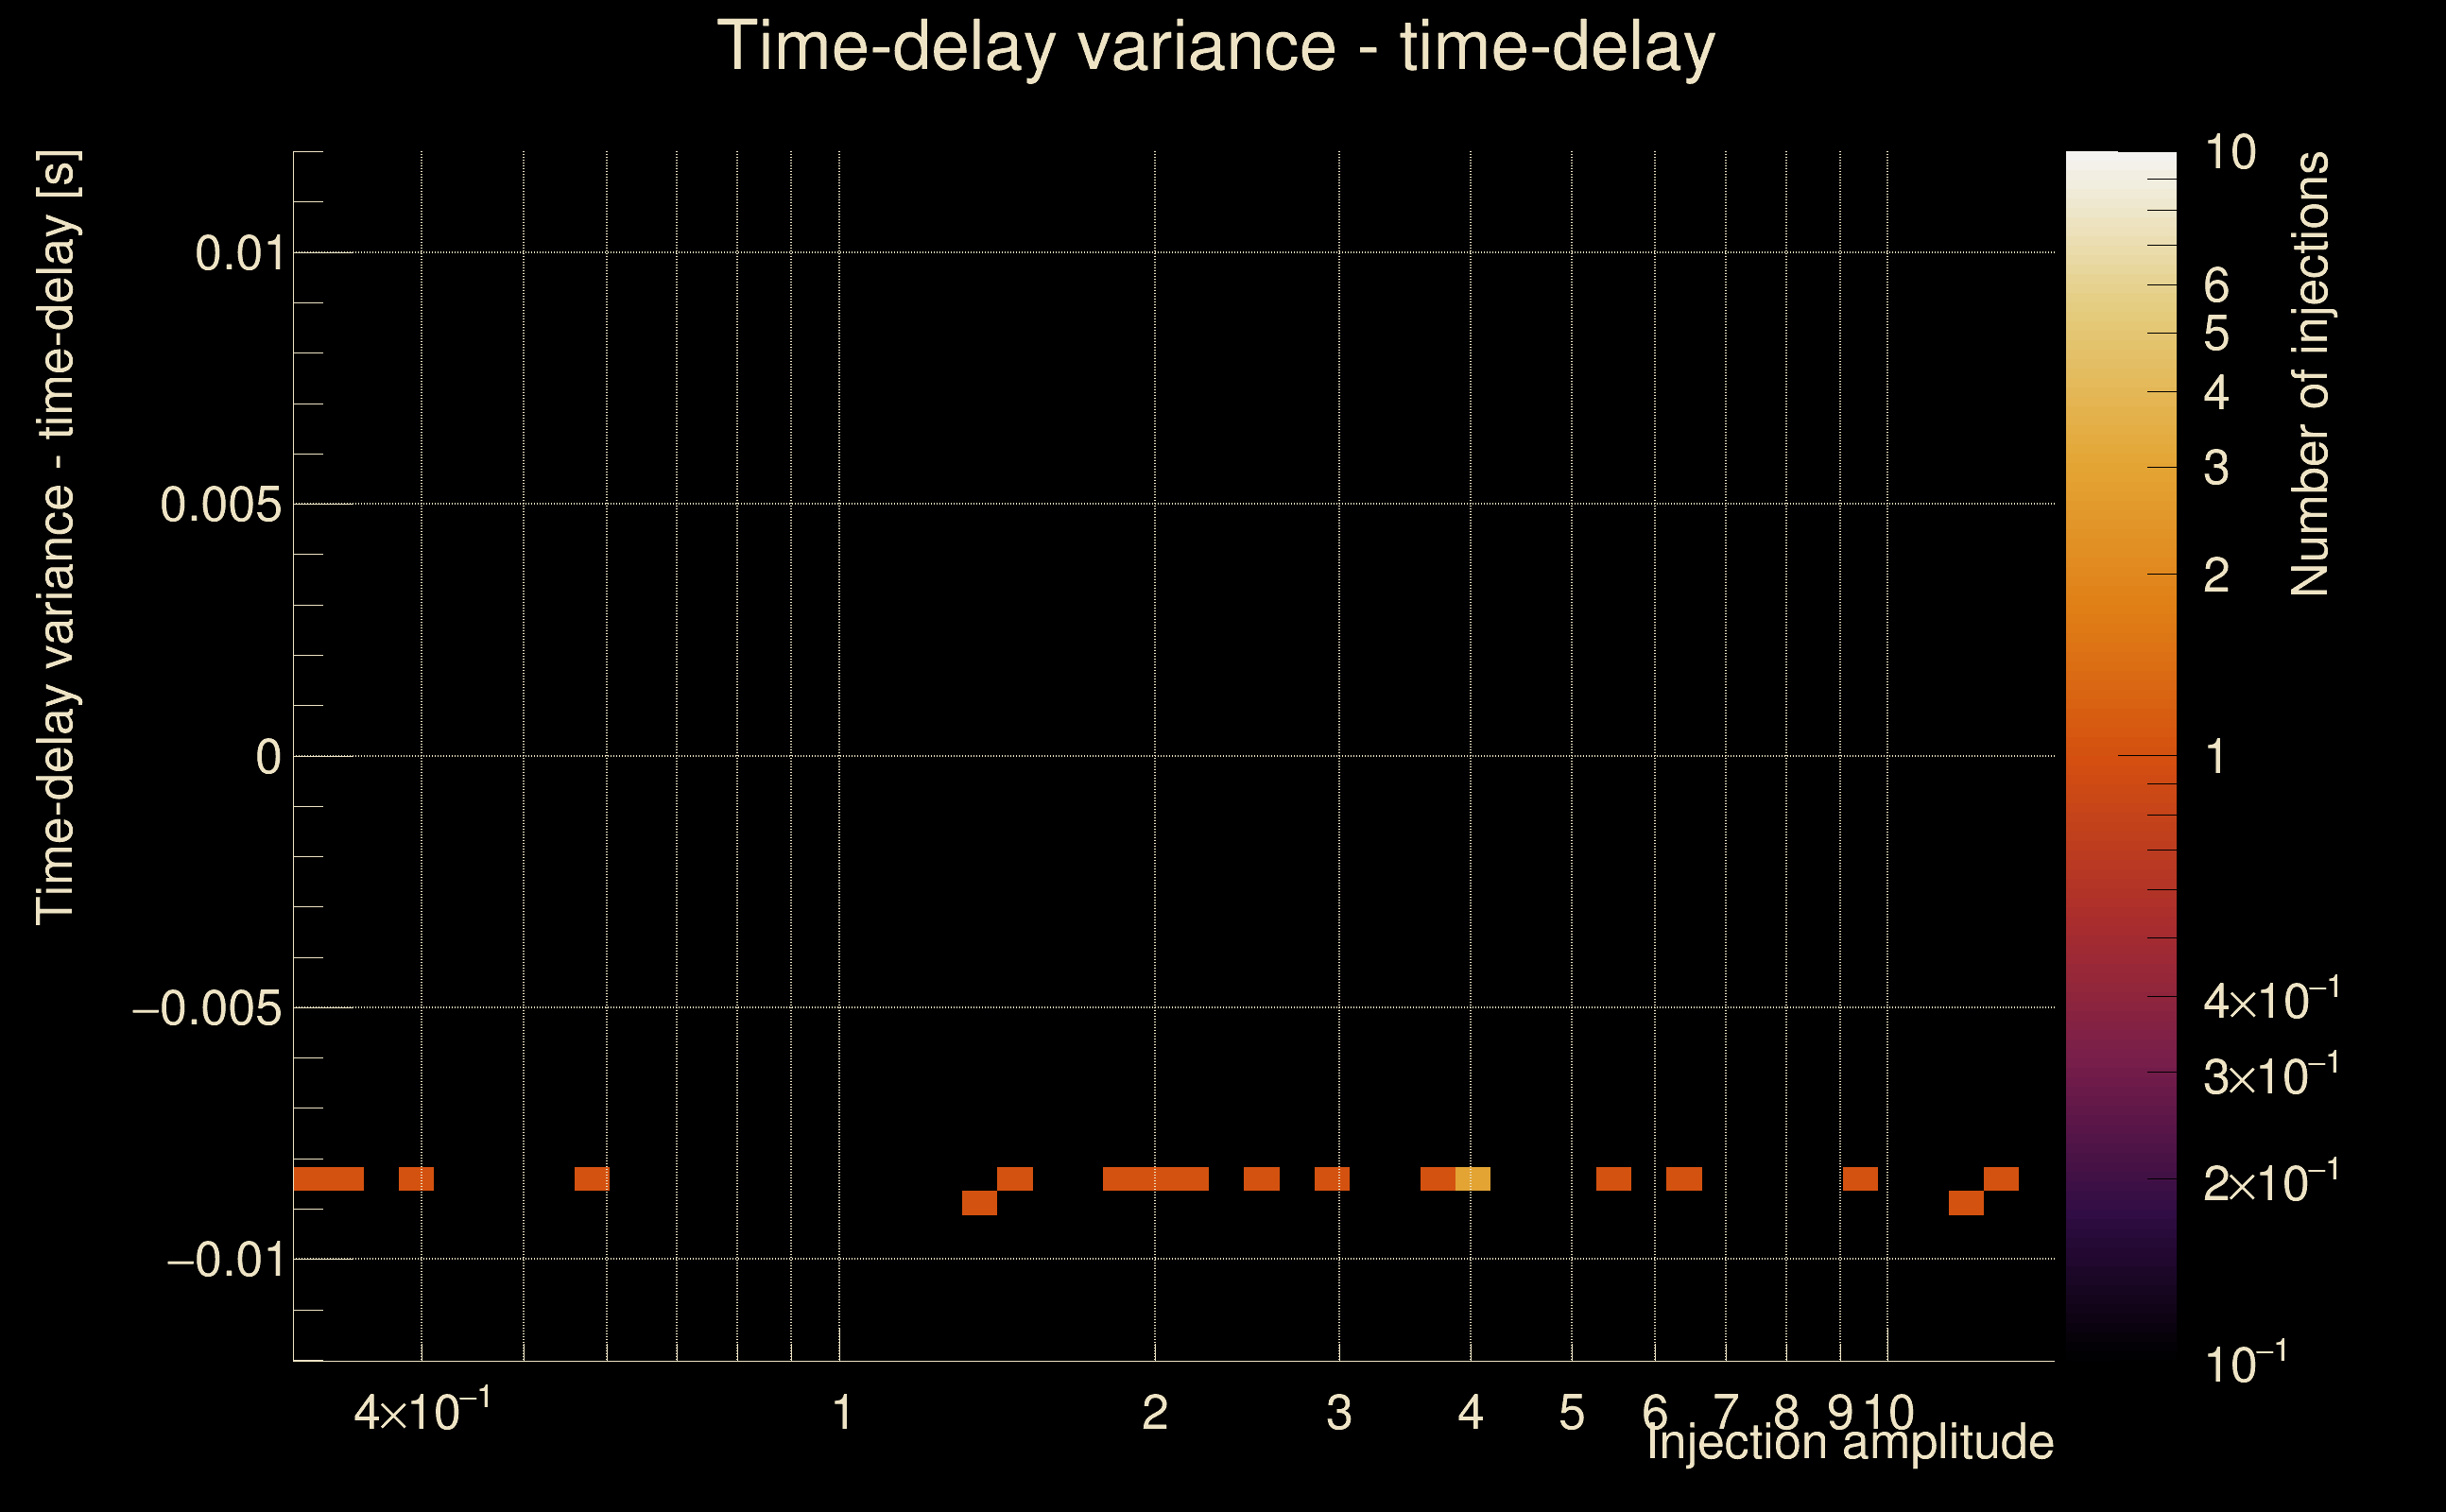
| Number of injections (total/valid/detected): | 20 / 20 / 3 |
| List of missed injections: | ./Pow19-s18_missed.txt |
| Injection amplitude at 90% detection efficiency: | -1 |
| Injection amplitude at 50% detection efficiency: | -1 |
| Injection amplitude at 10% detection efficiency: | -1 |
 |
 |
 |
 |
 |
 |
|
 |
 |
|
 |
 |
|
 |
 |
|
 |
 |
|
 |
 |
|
 |
 |
|
 |
 |
|
 |
 |
 |
 |
 |
 |
 |
 |
 |
| florent.robinet@ijclab.in2p3.fr |