| Omicron version: | 4.2.0: documentation gitlab repository |
| Omicron run by: | unknown |
| Report produced on: | Thu Dec 11 13:37:52 2025 UTC |
| Ox option file: | TargIxf_injpt1_10min_options.txt |
| Omicron option files: | detector 0, detector 1 |
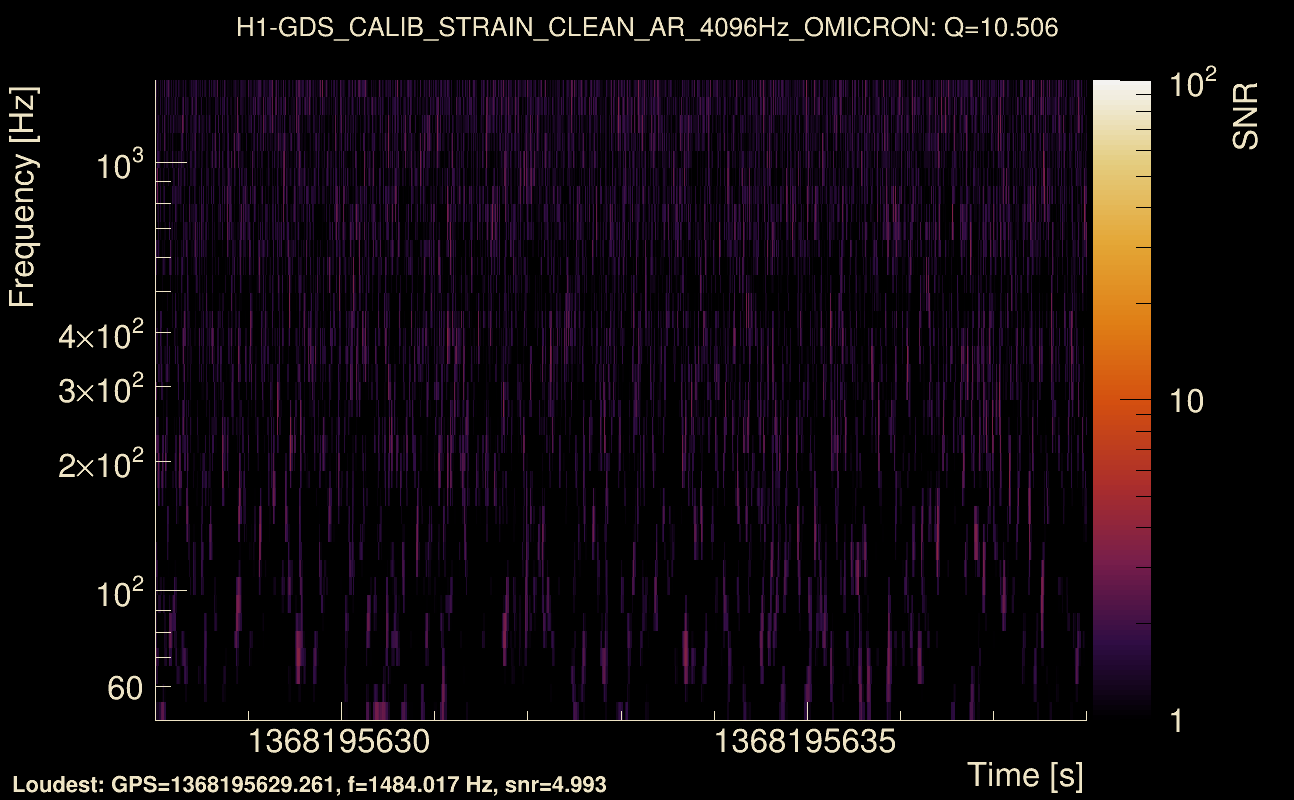
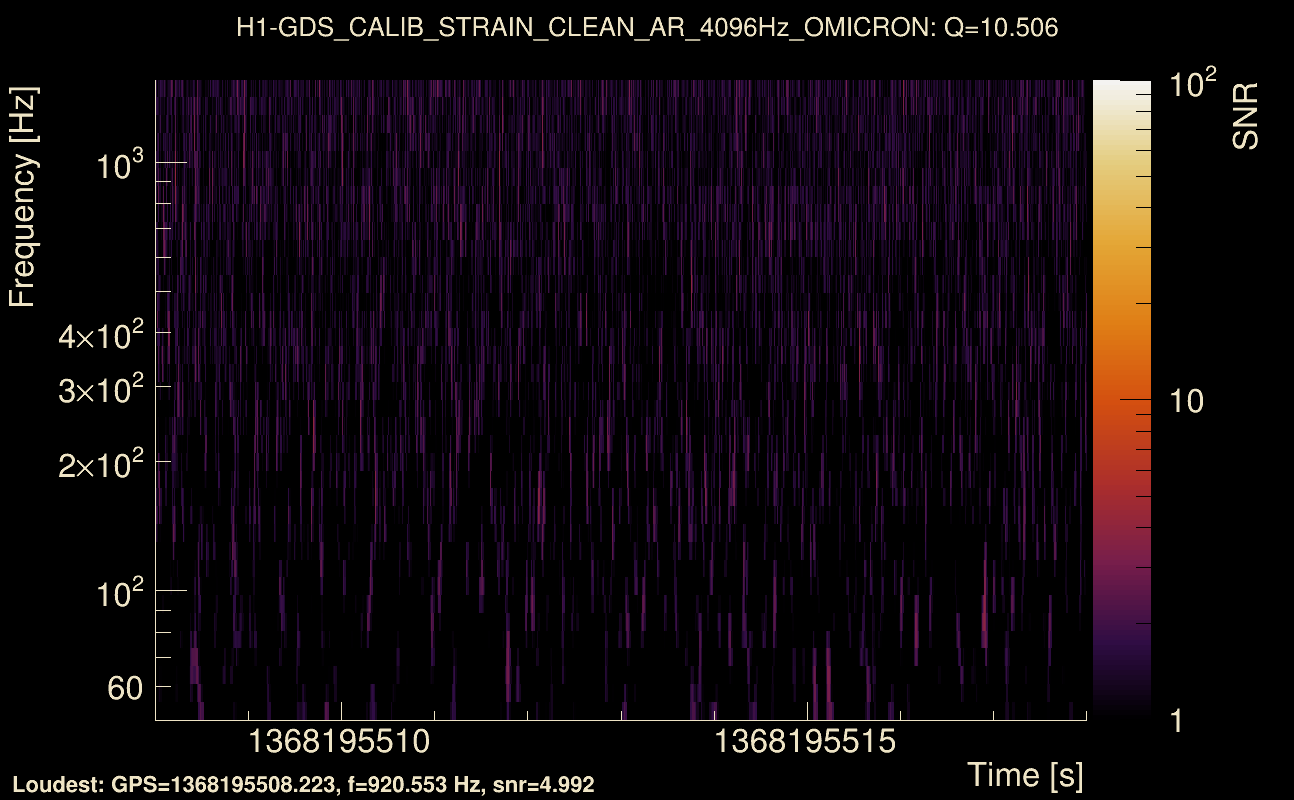
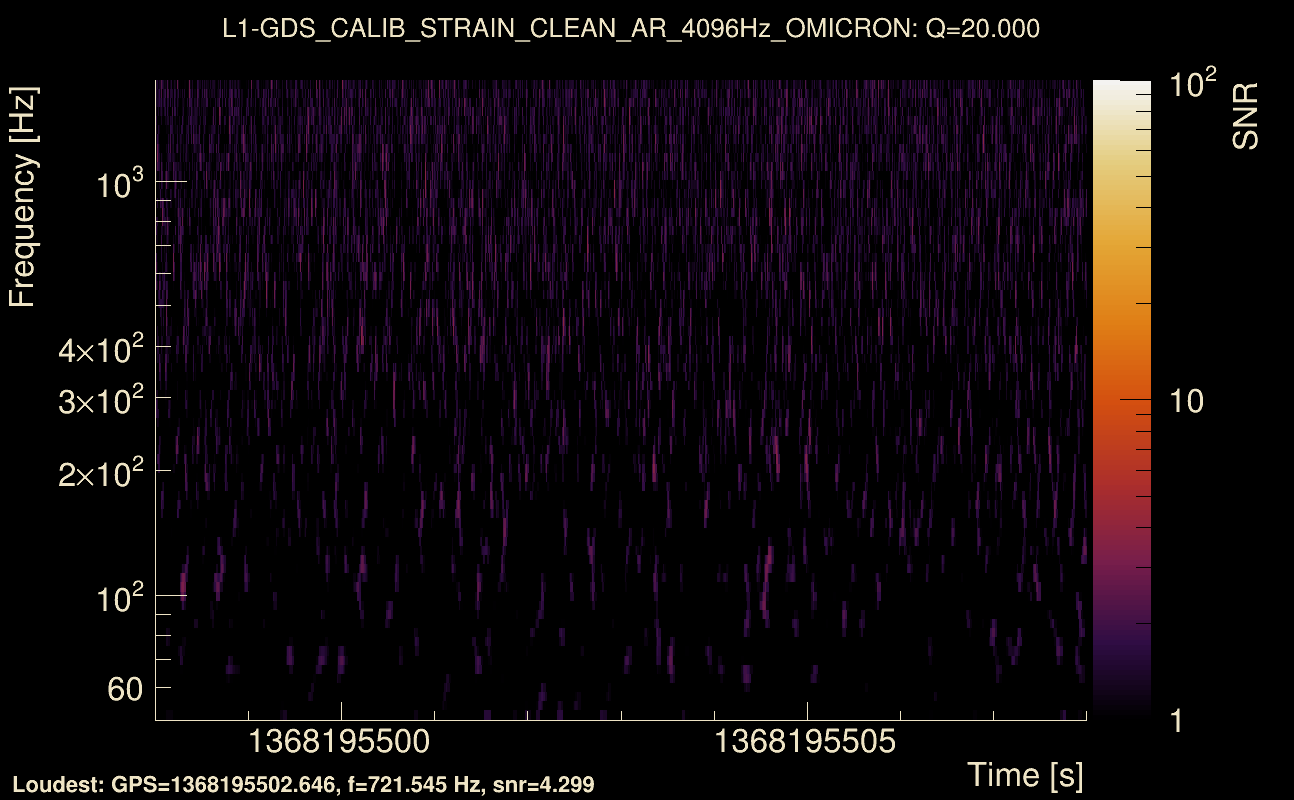
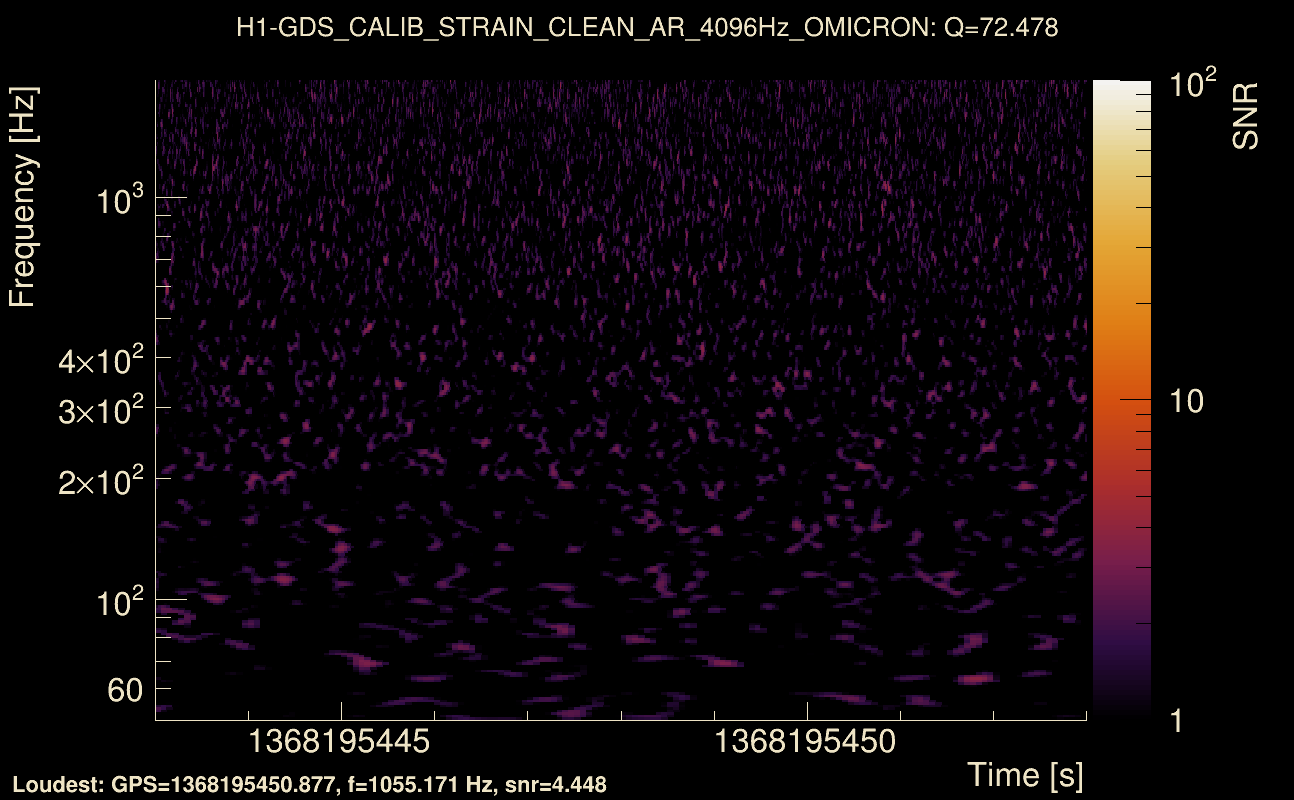
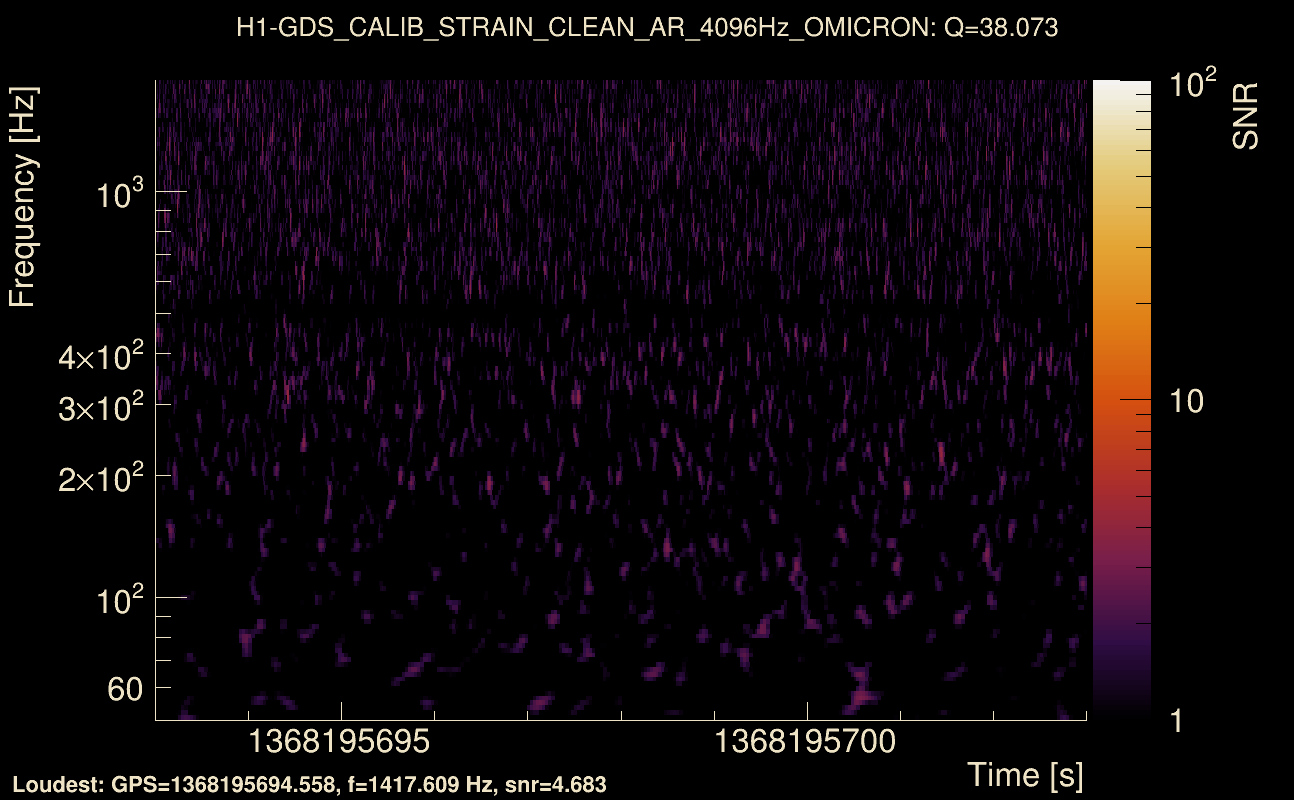
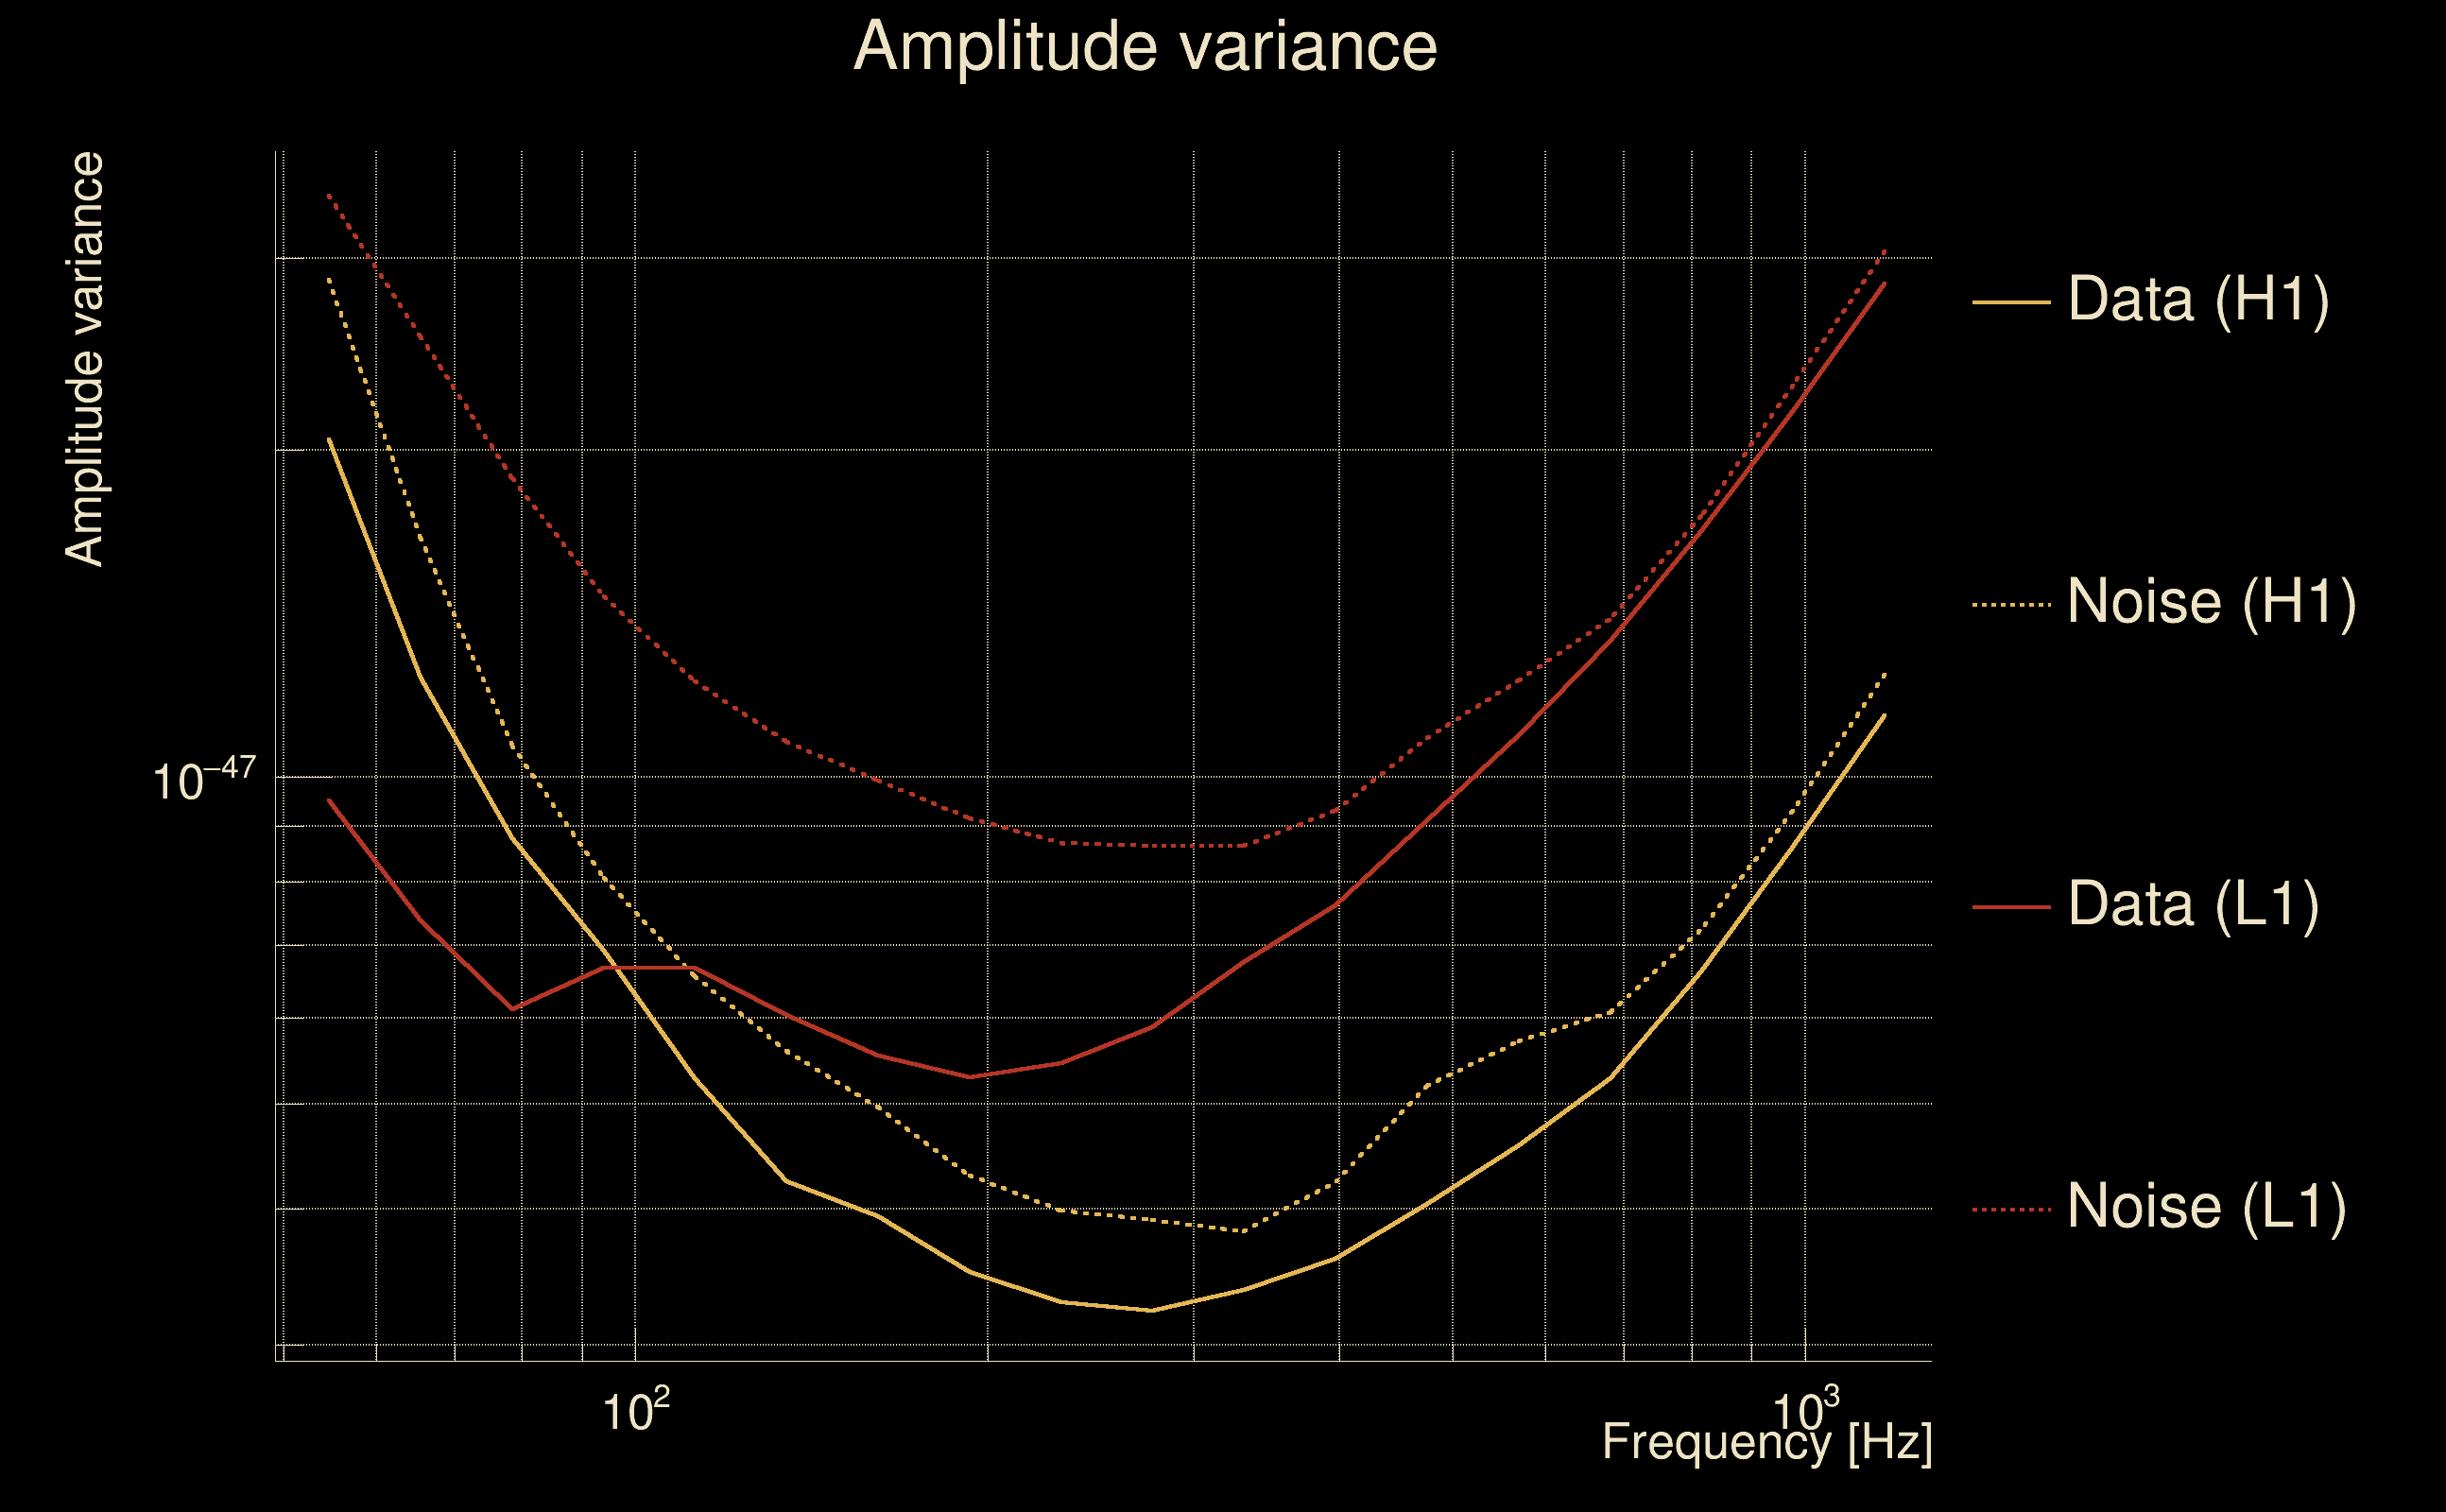
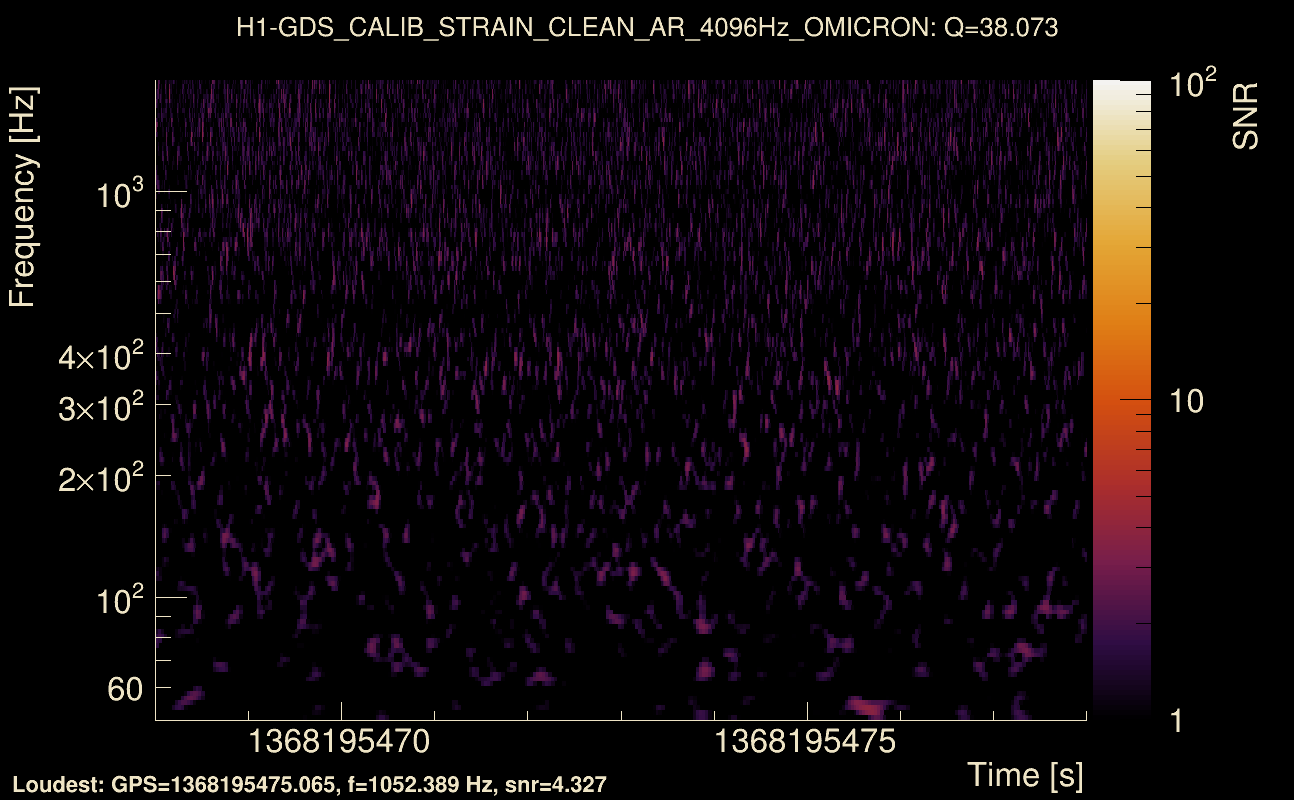
| Detector channel names: | H1:GDS-CALIB_STRAIN_CLEAN_AR_4096Hz, L1:GDS-CALIB_STRAIN_CLEAN_AR_4096Hz |
| Omicron analysis time window and overlap: | 16 s, 6 s |
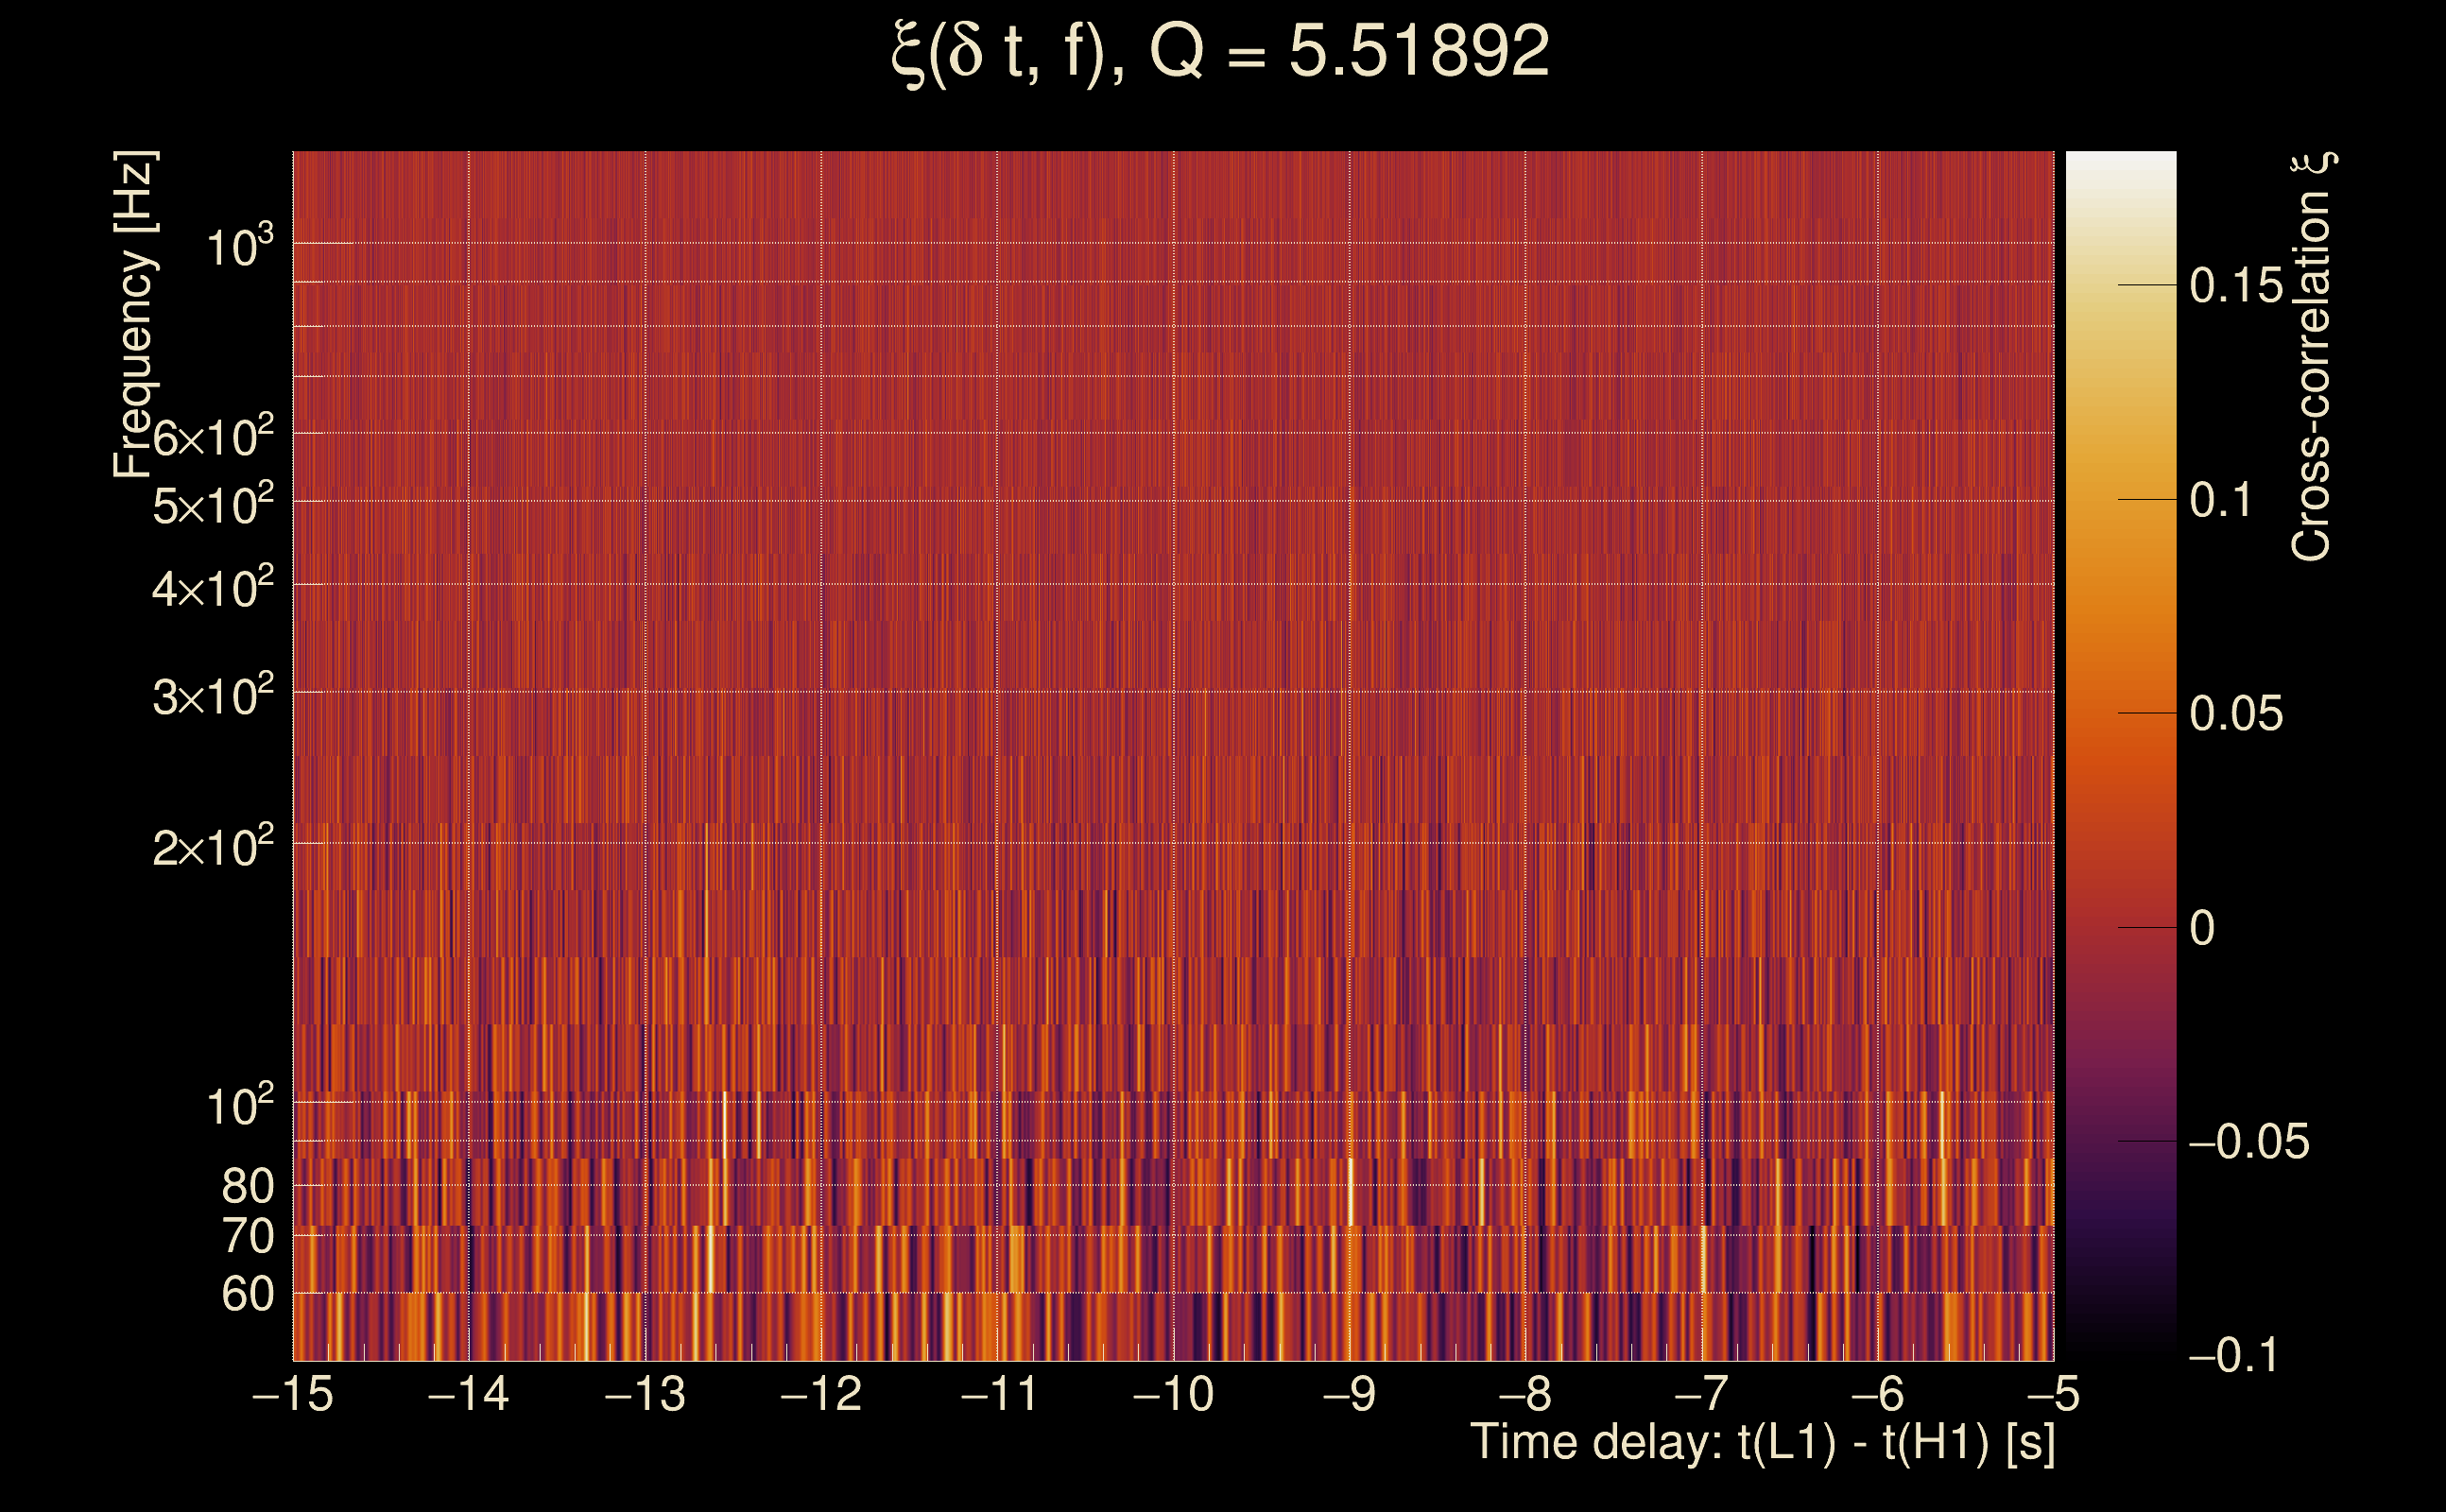
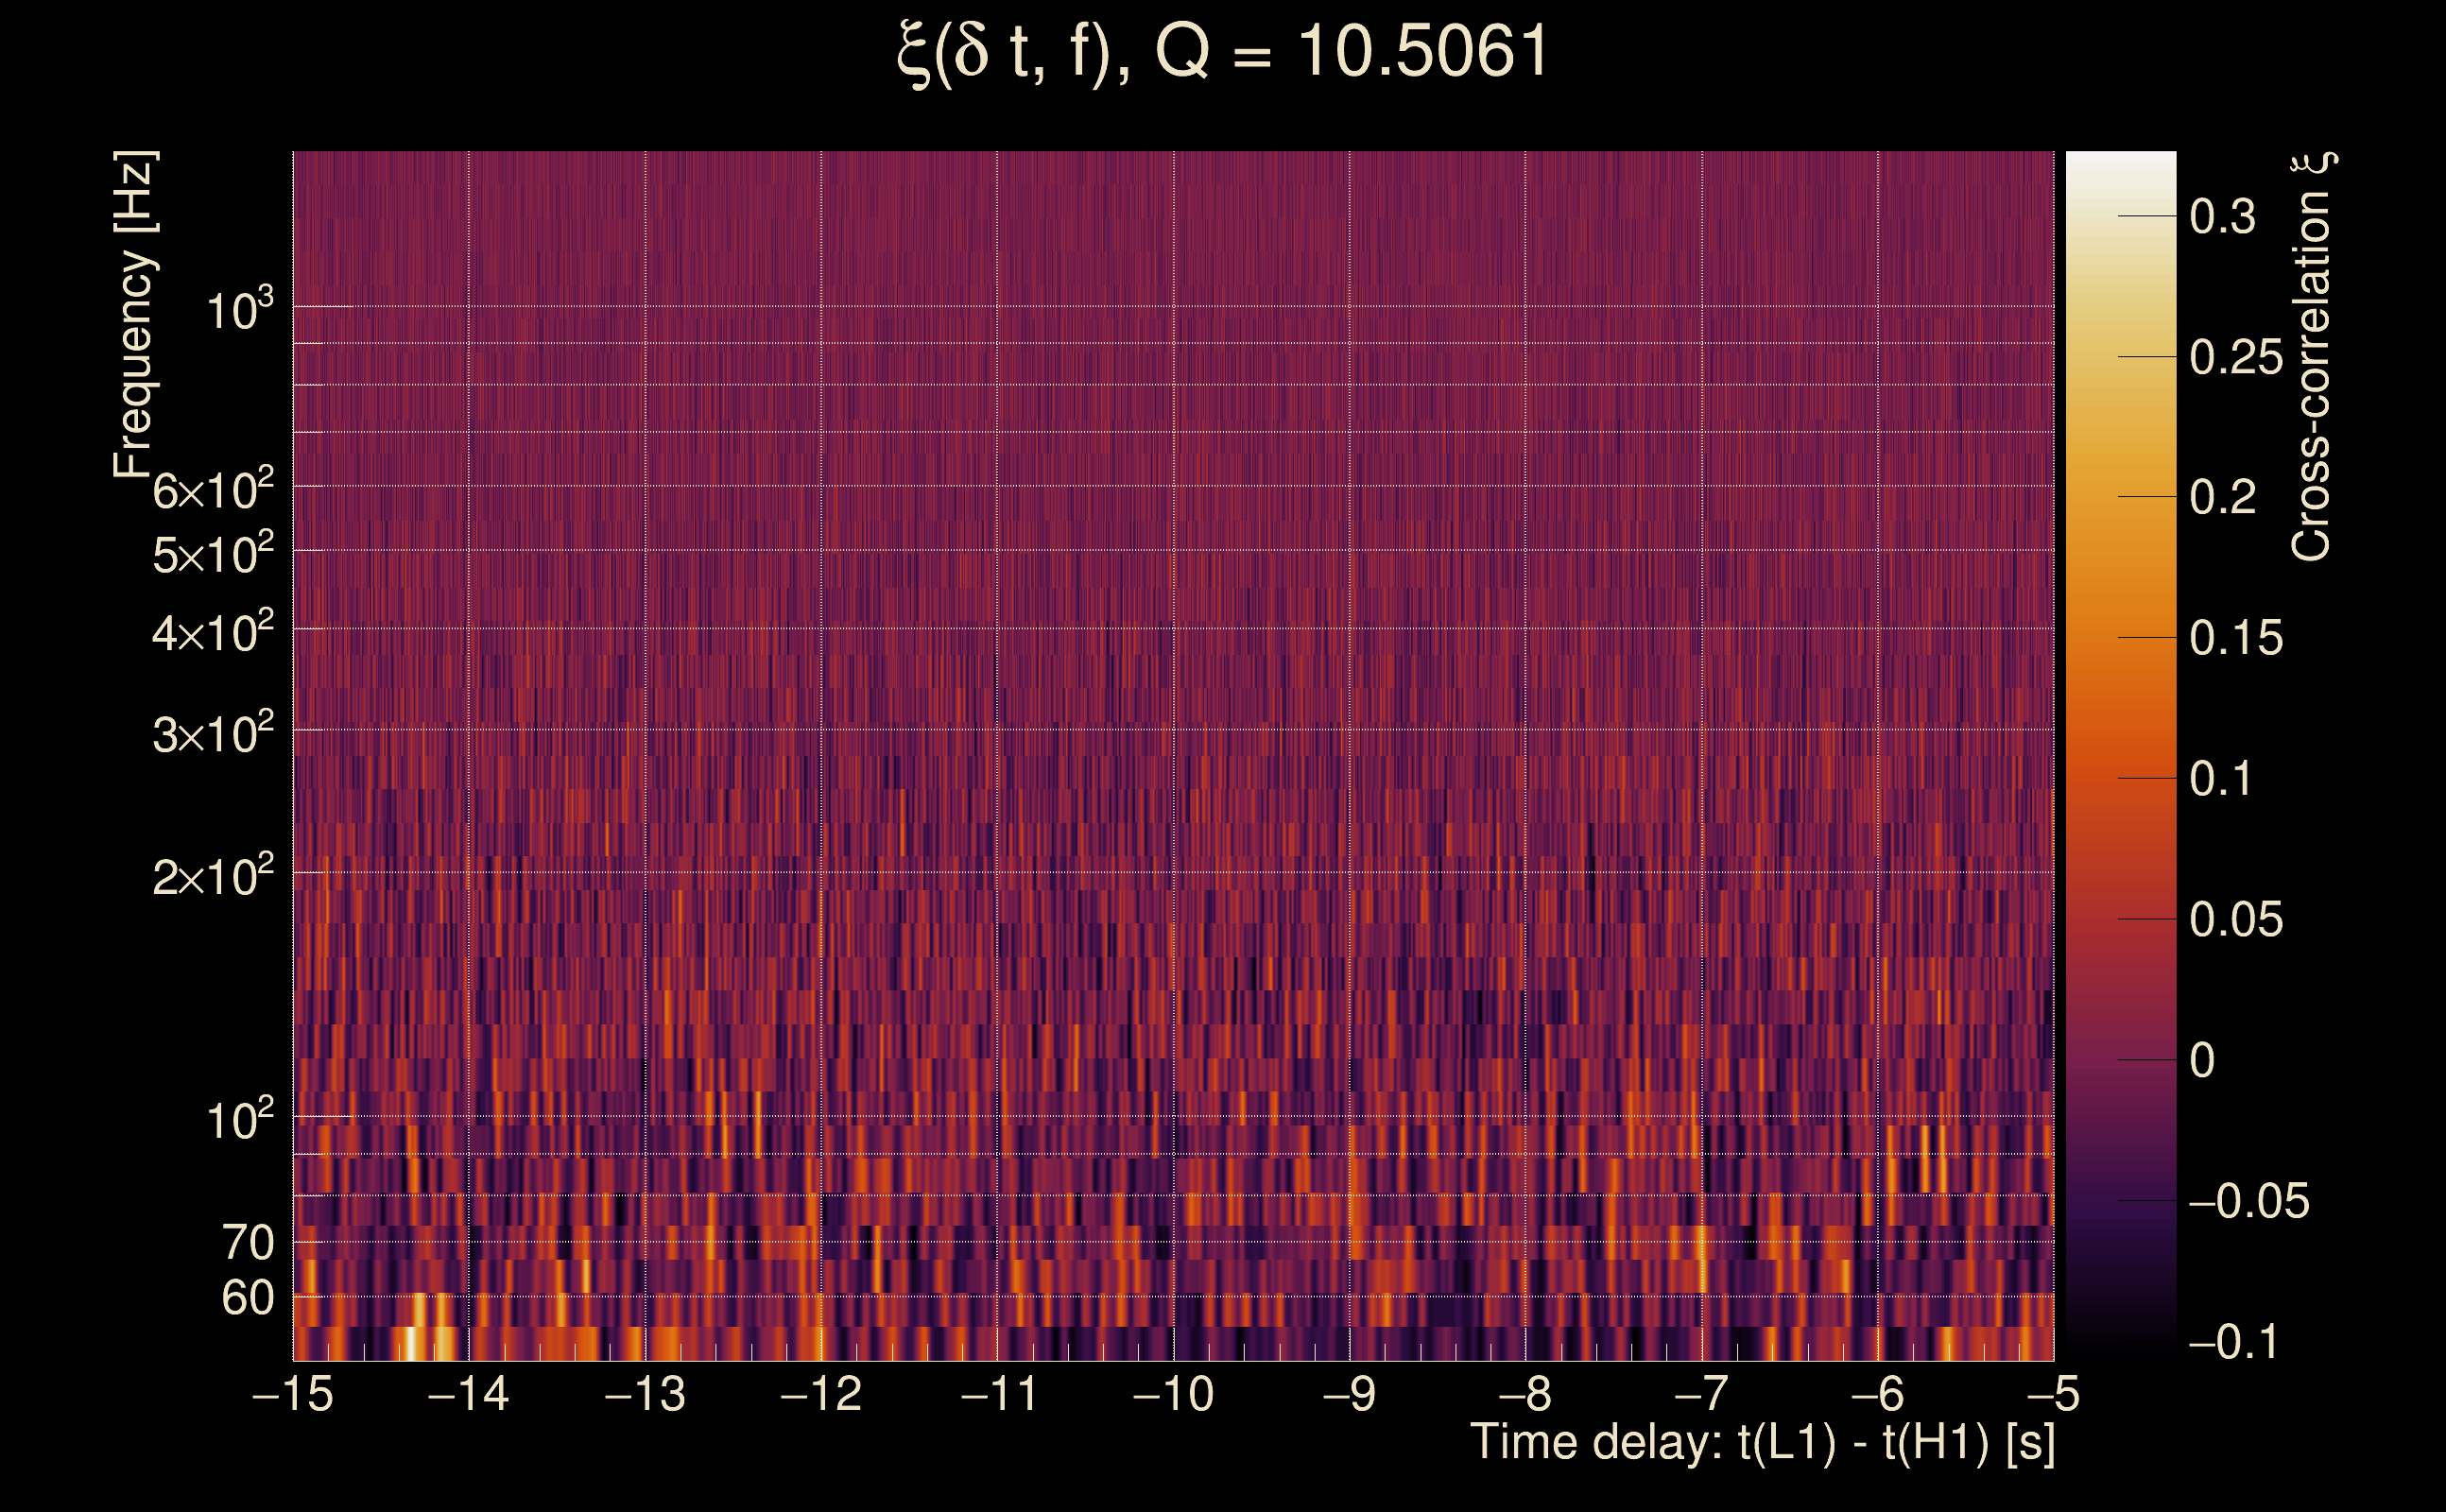
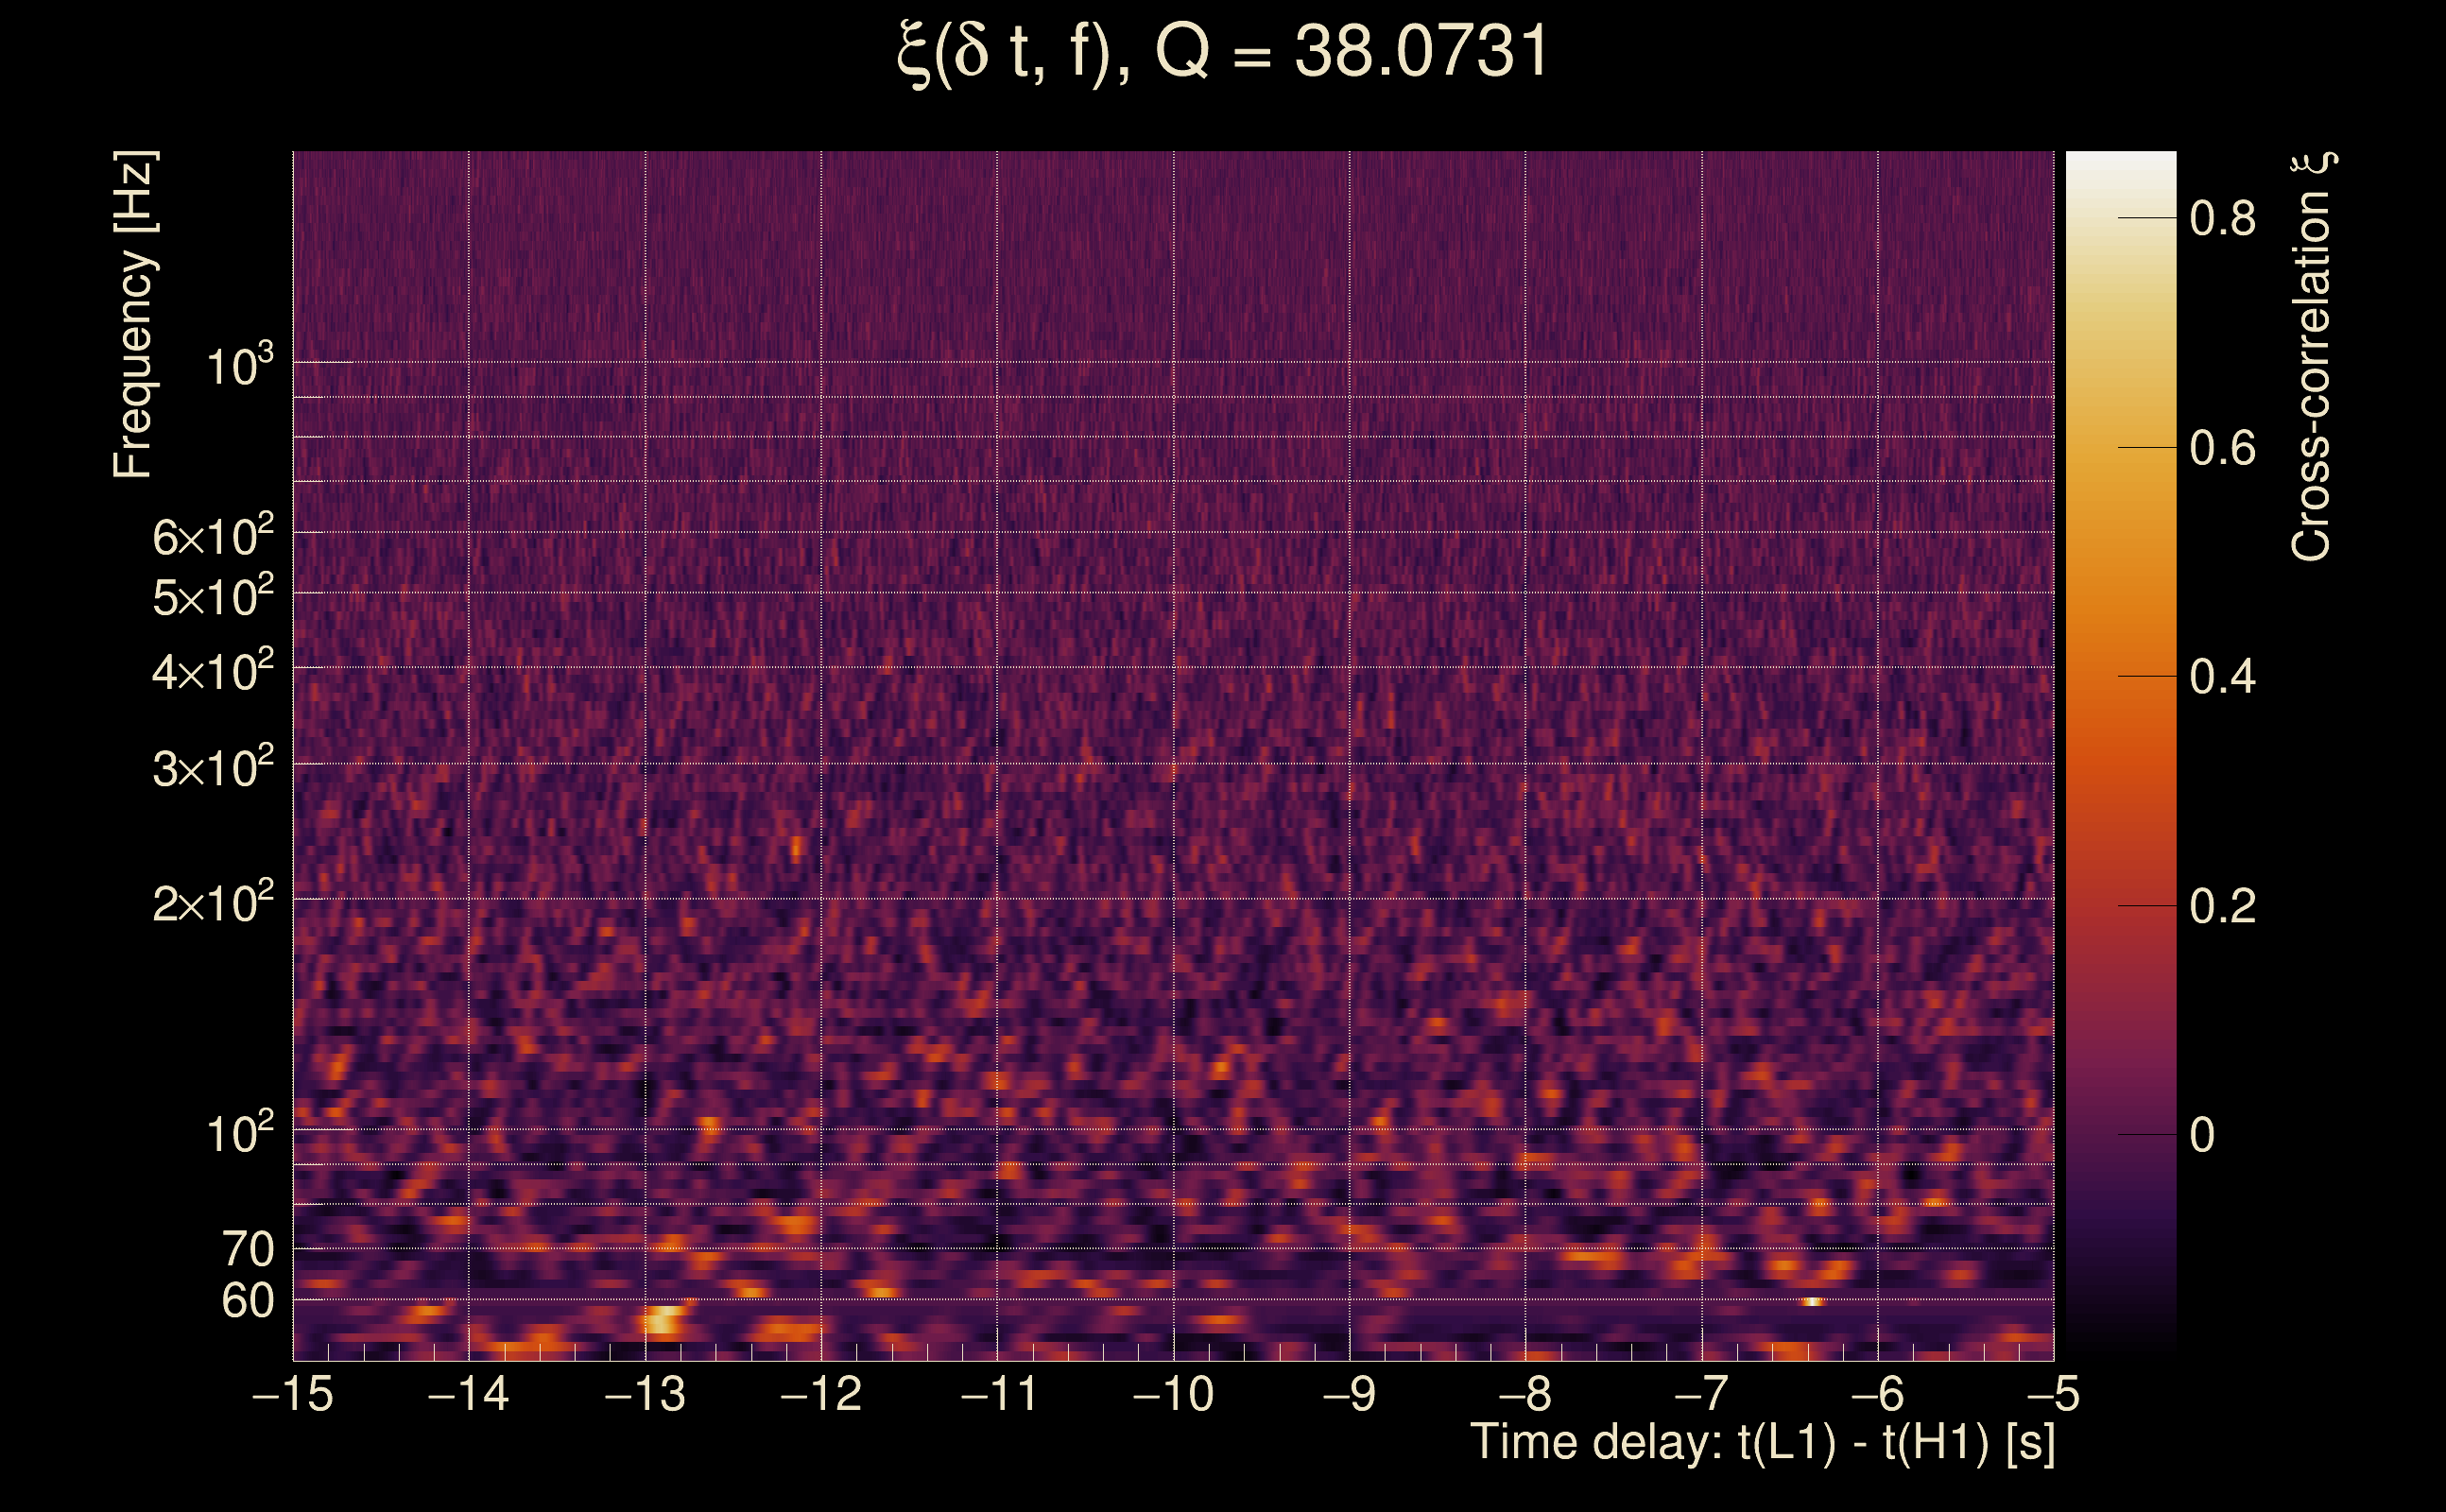
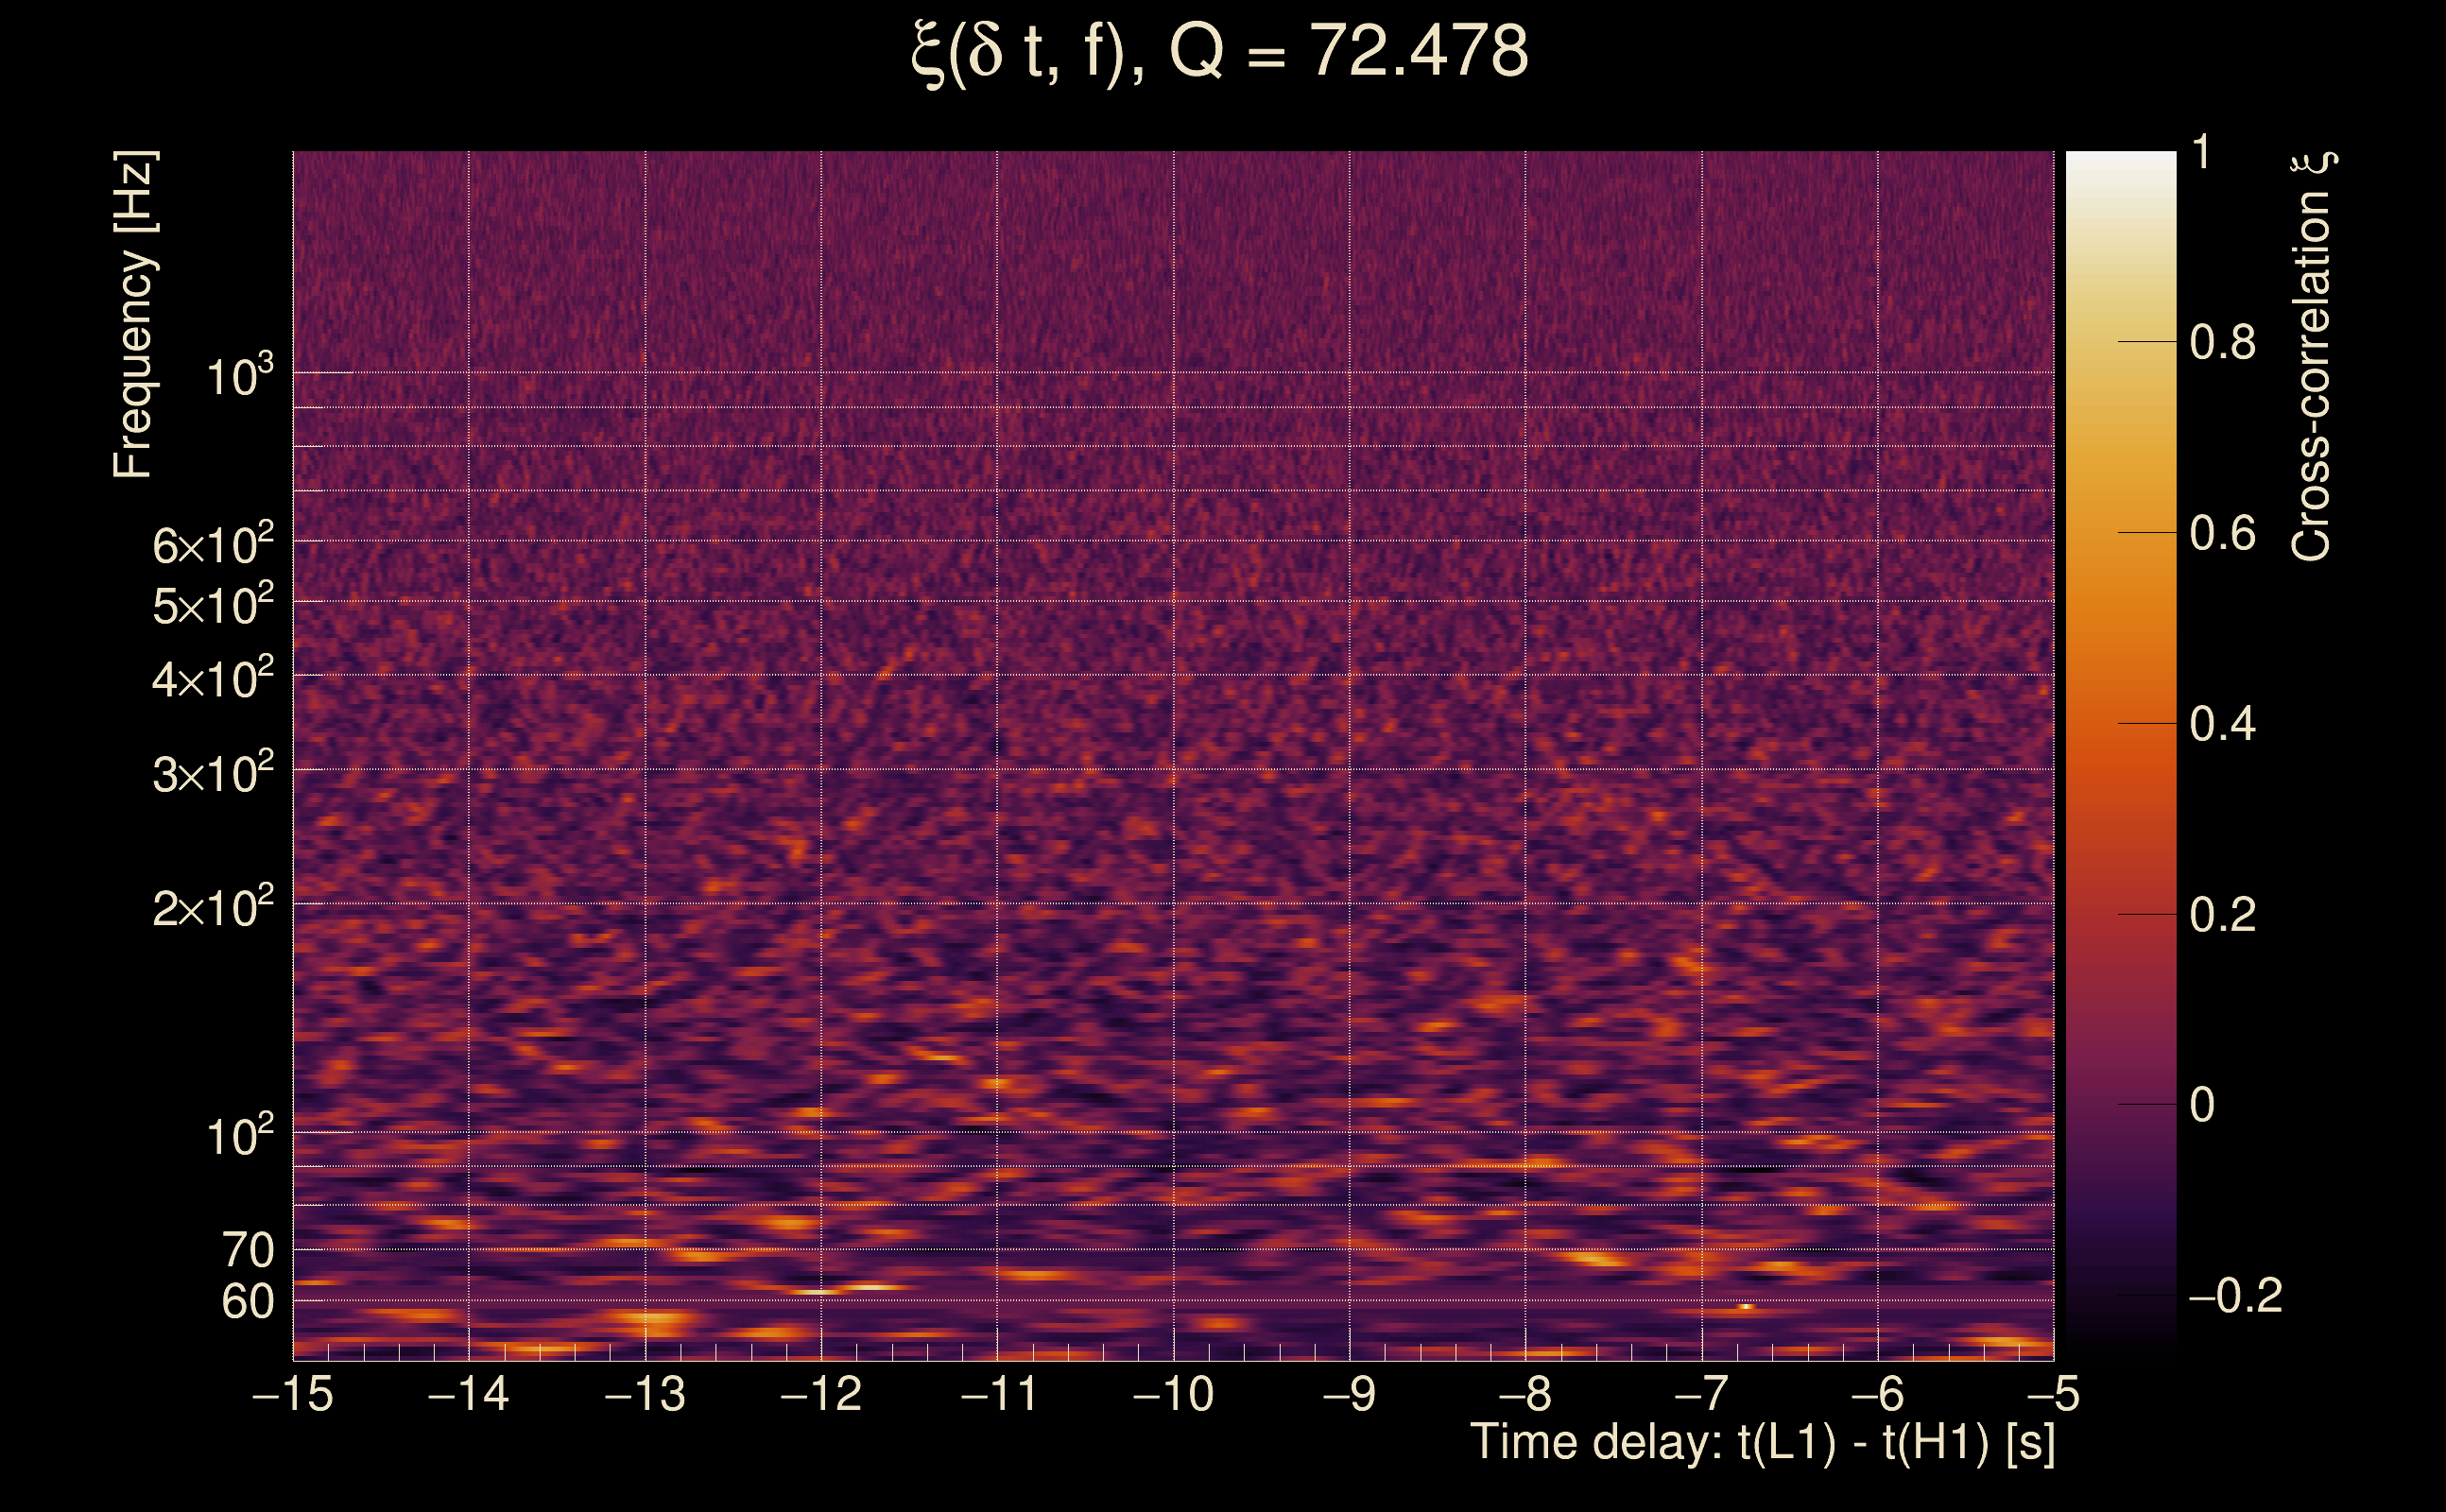
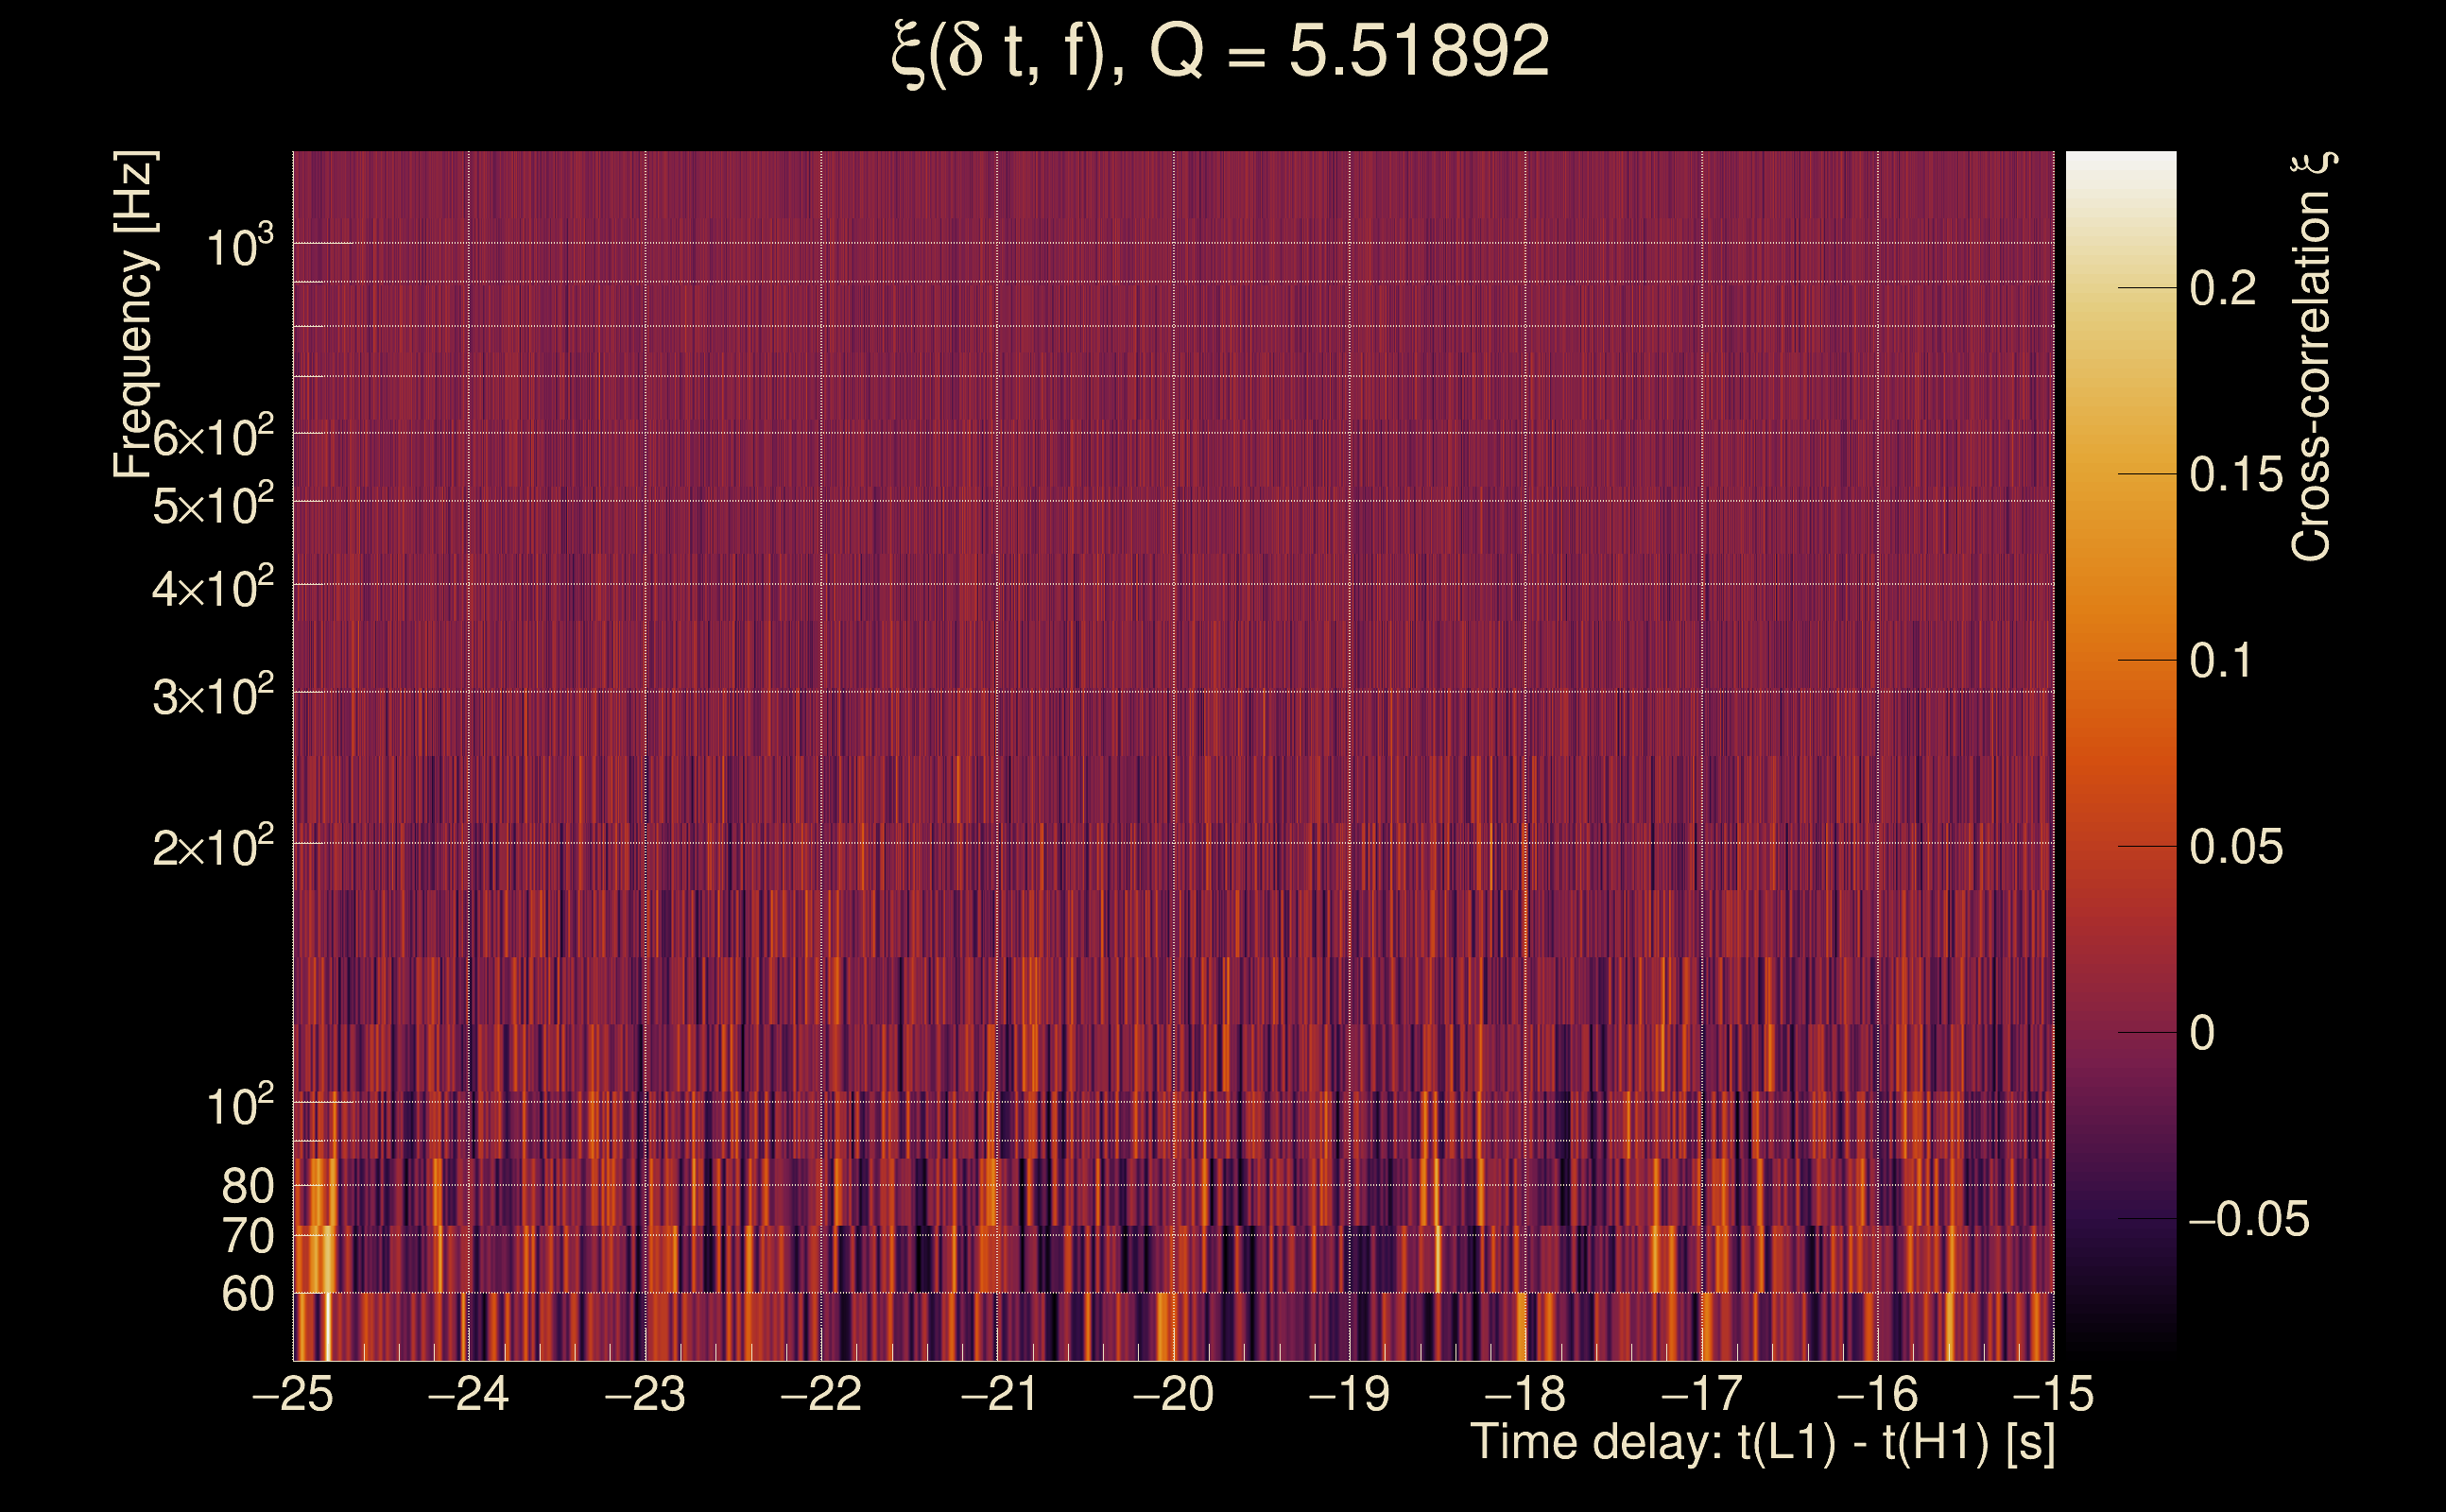
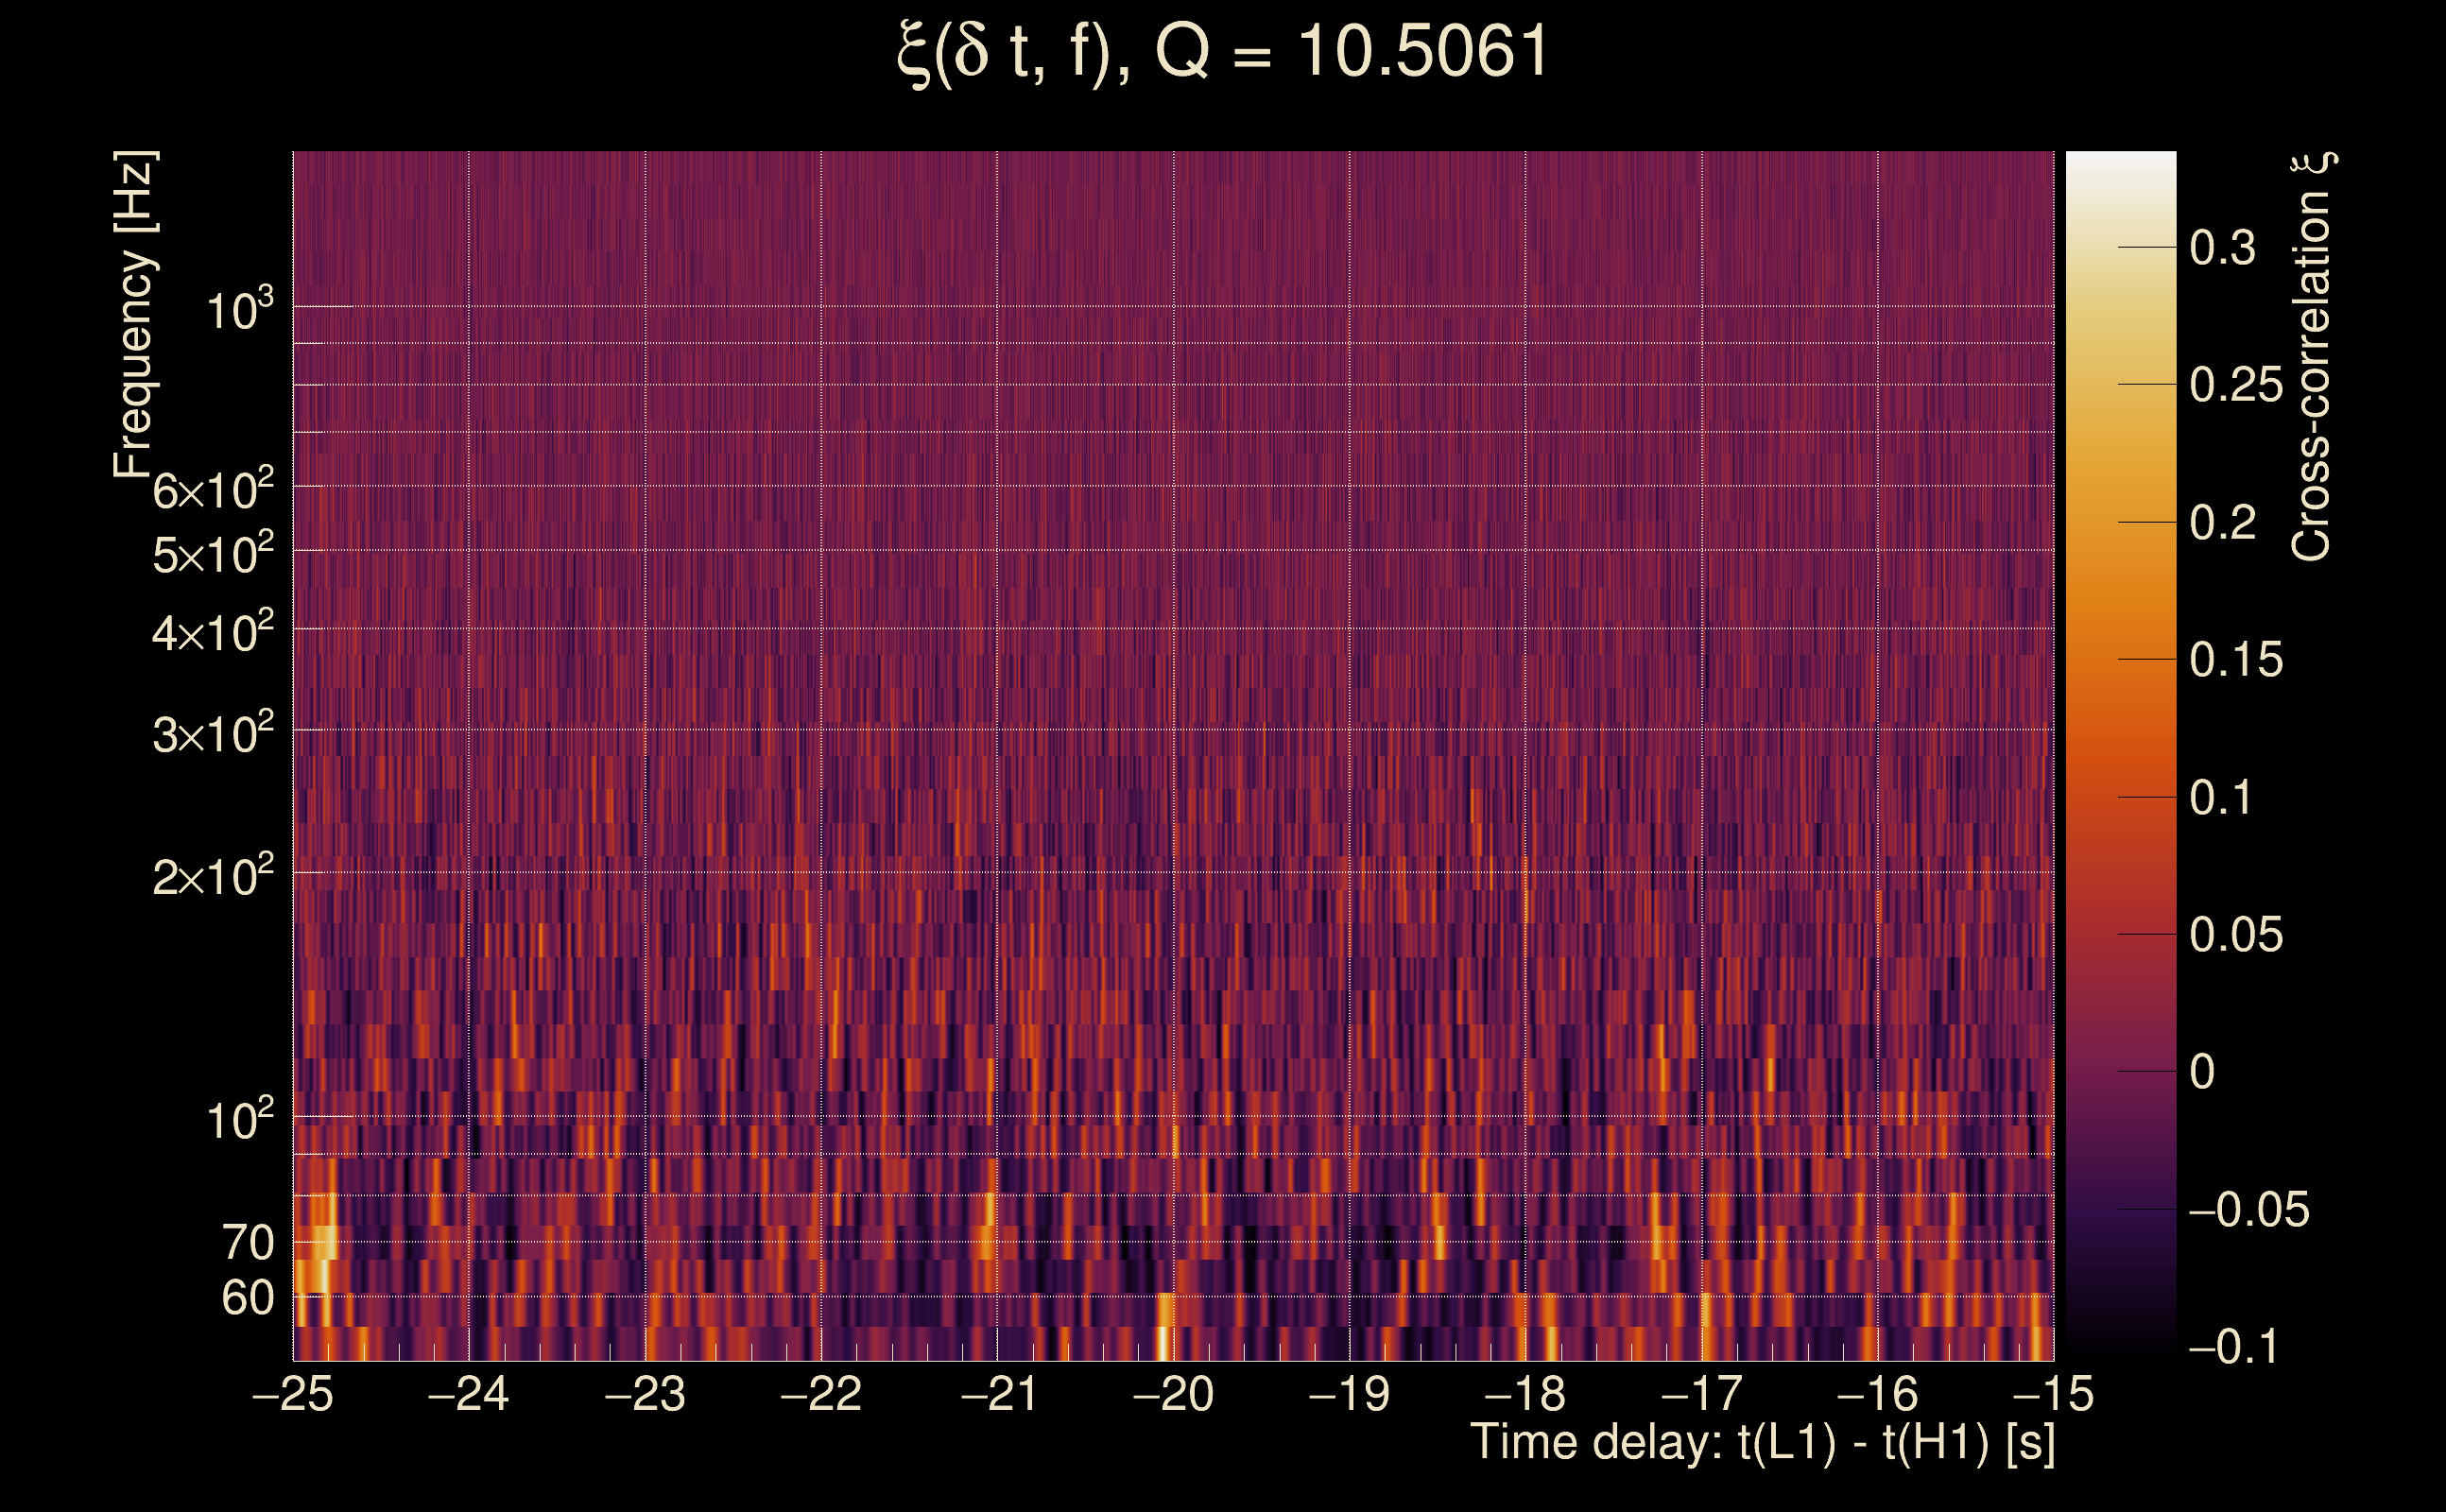
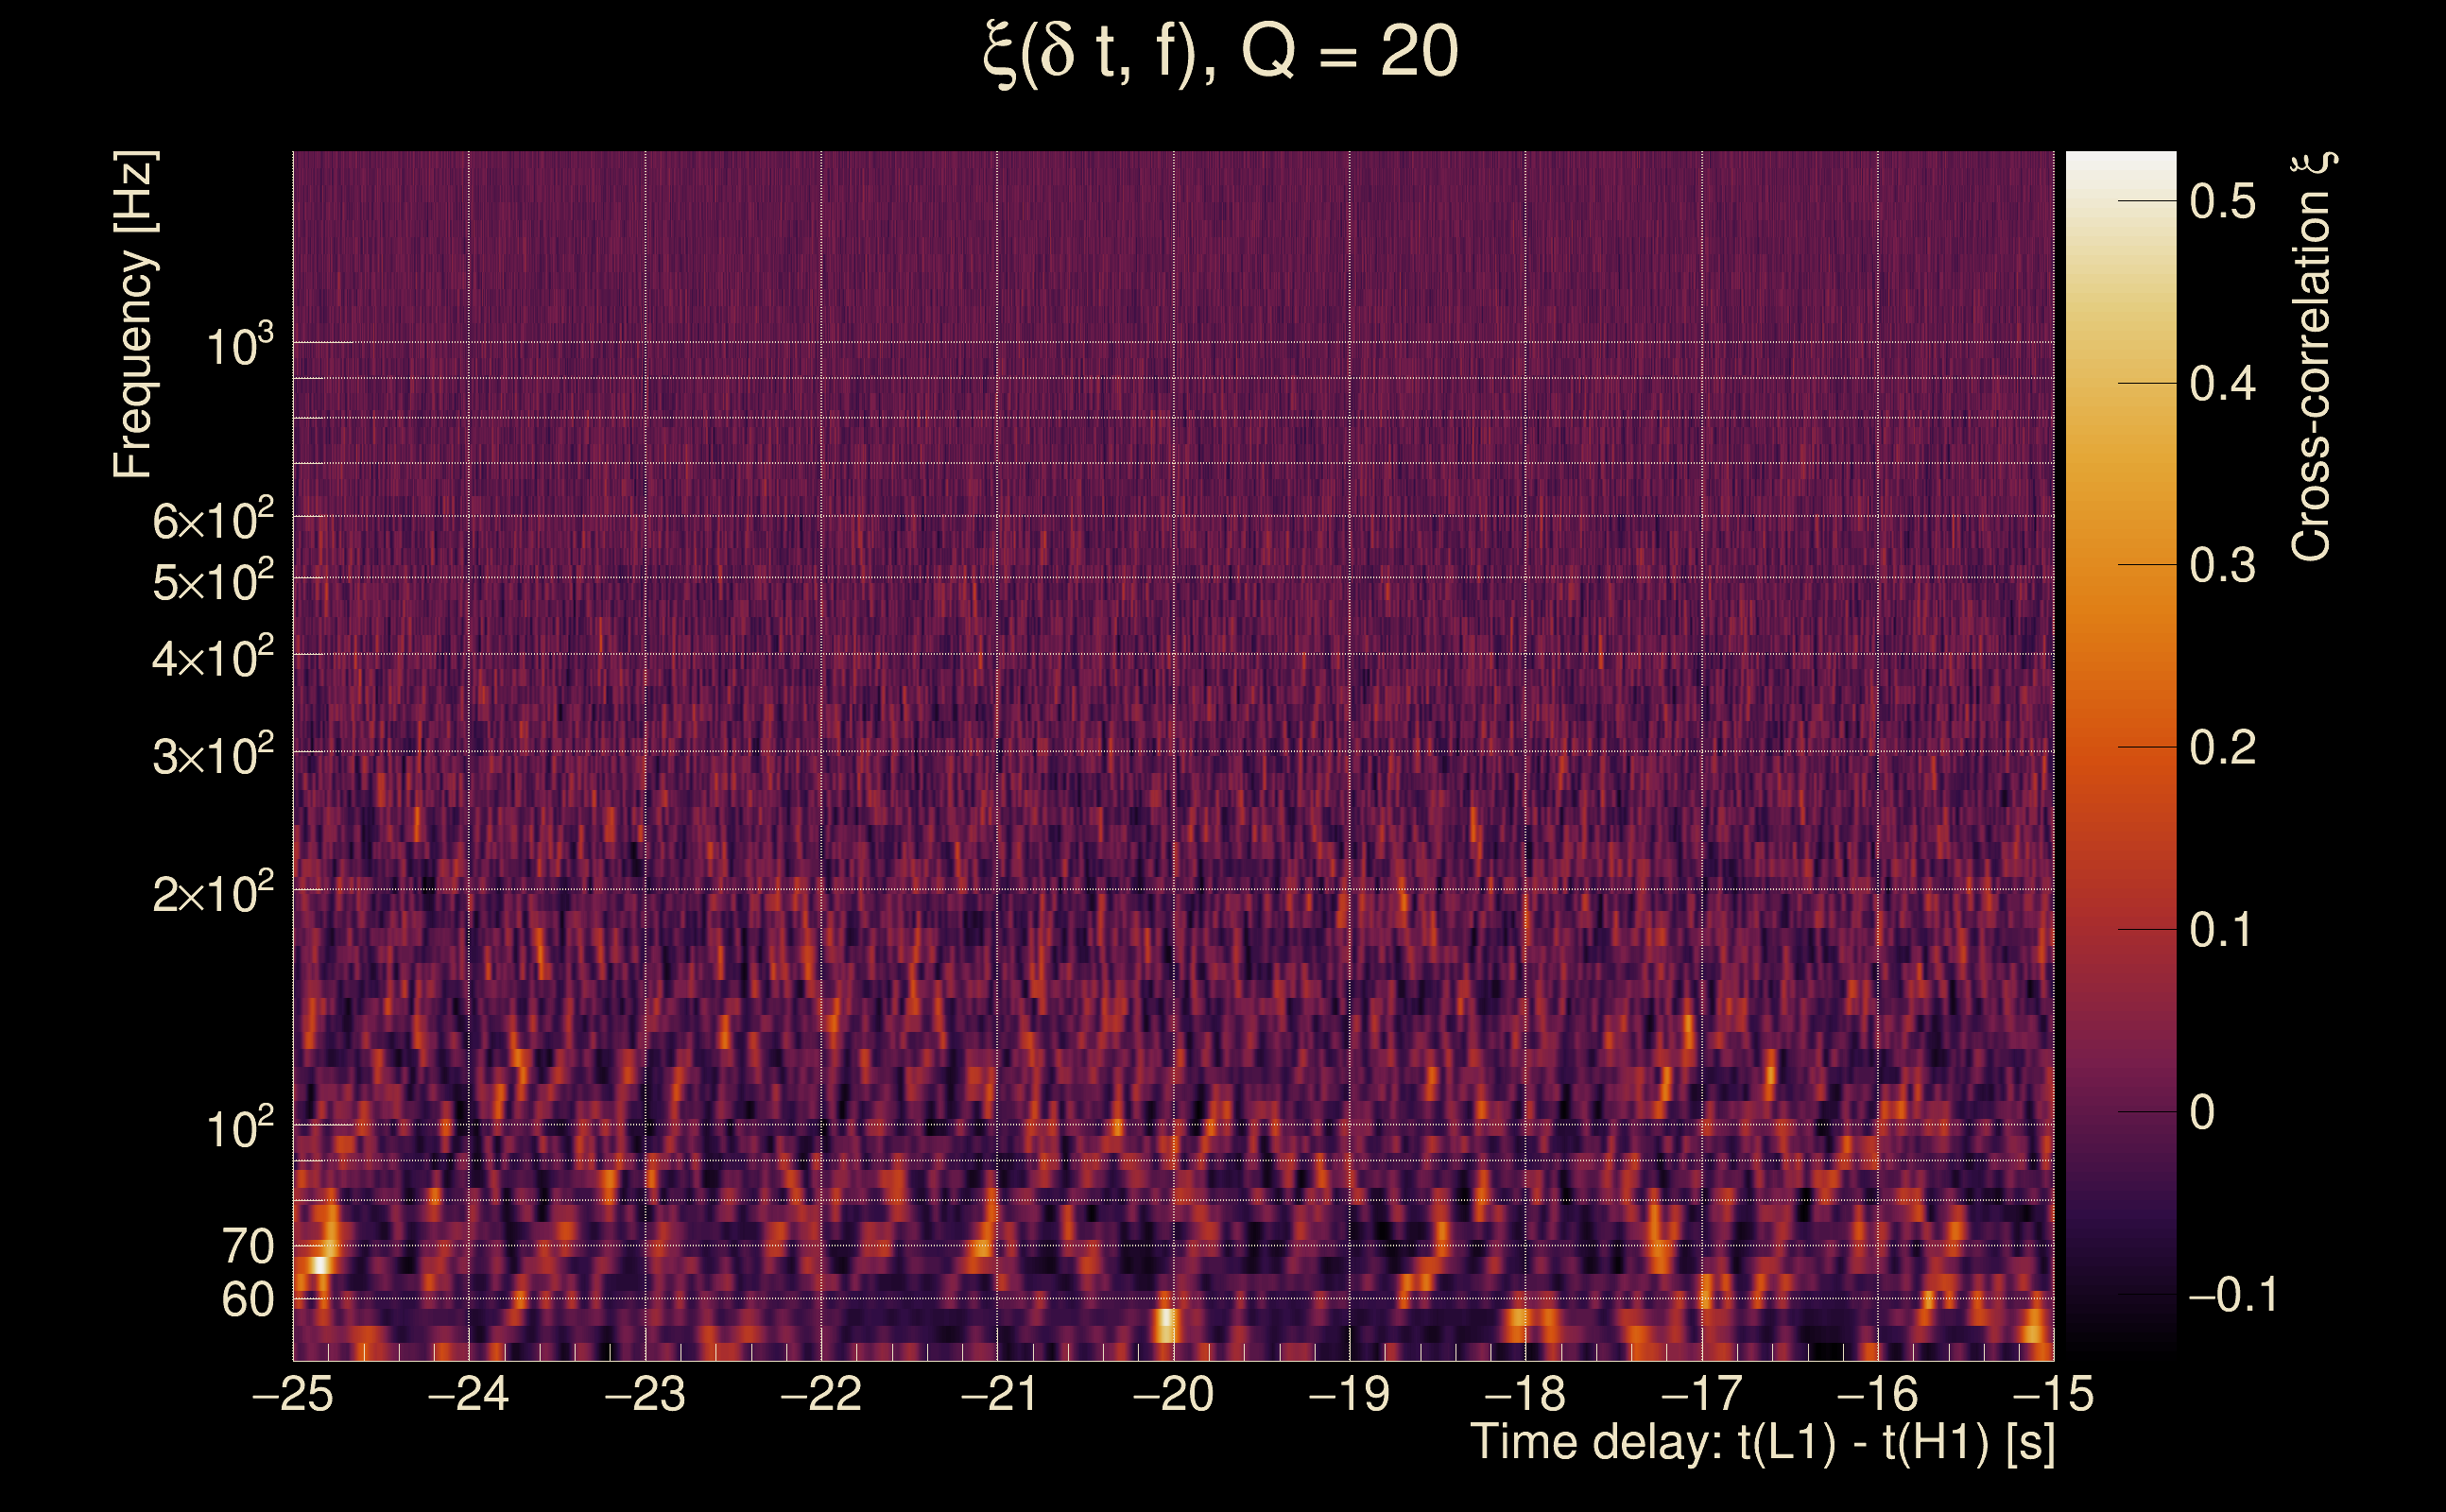
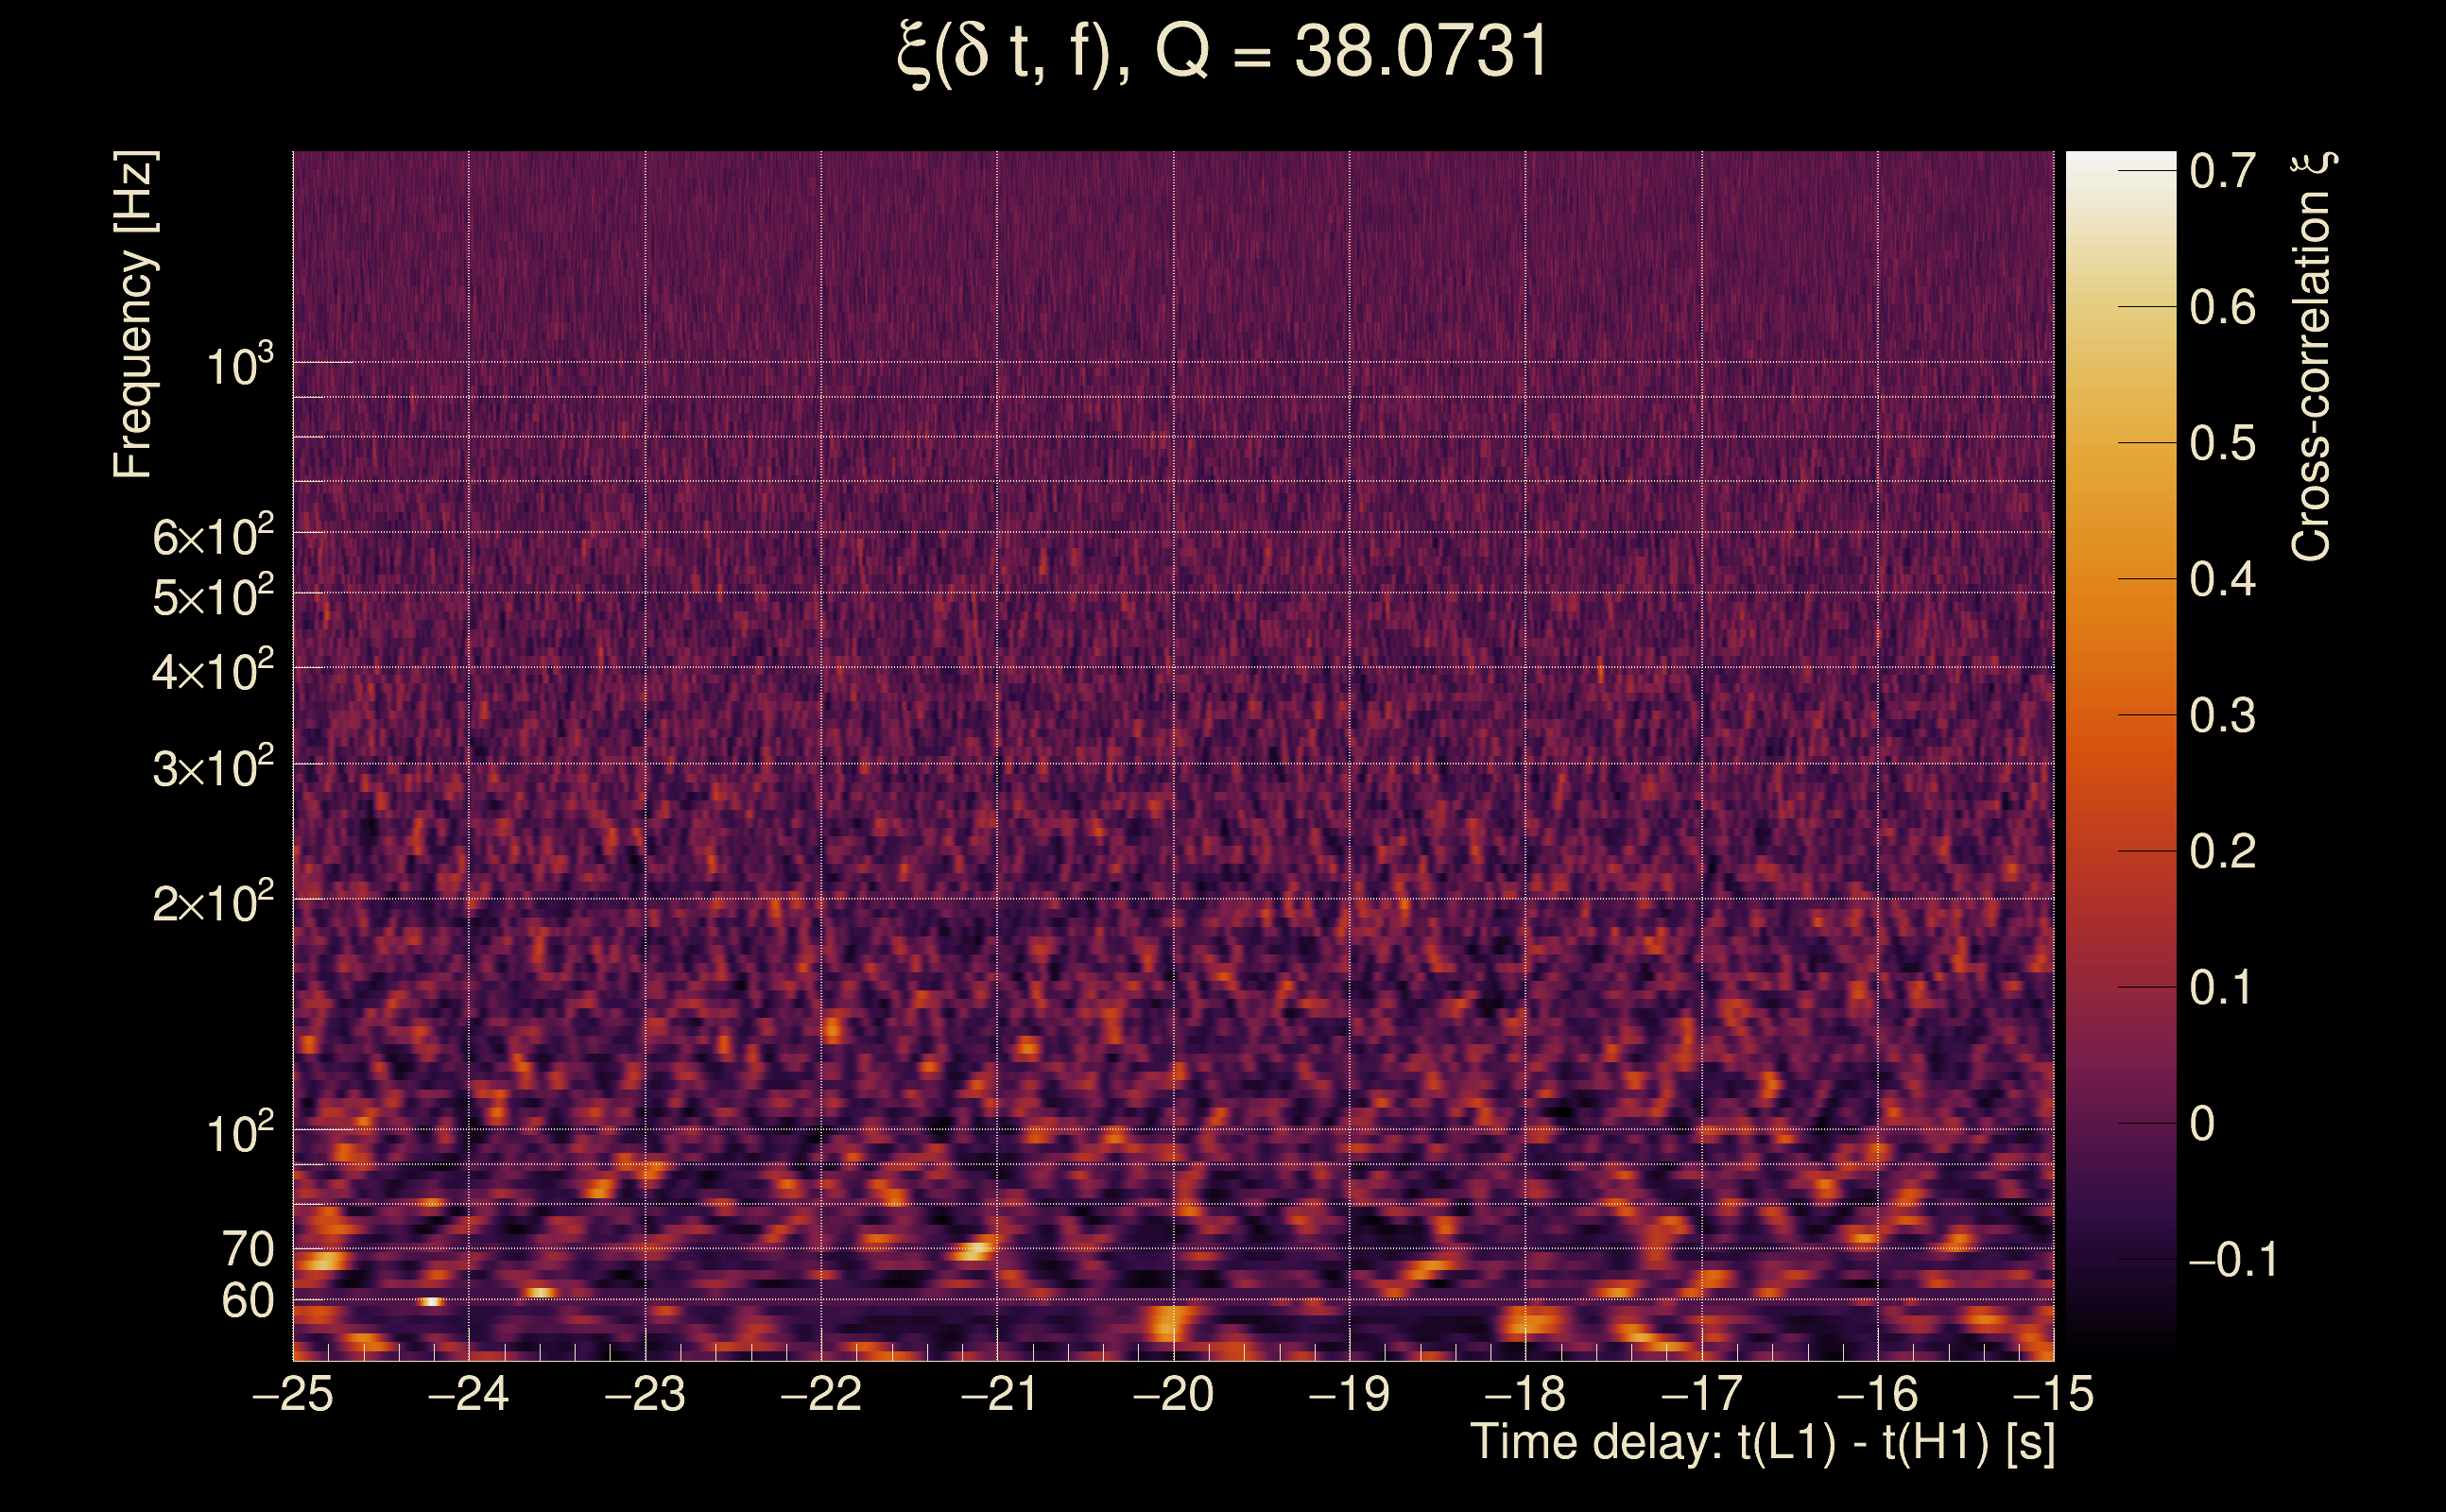
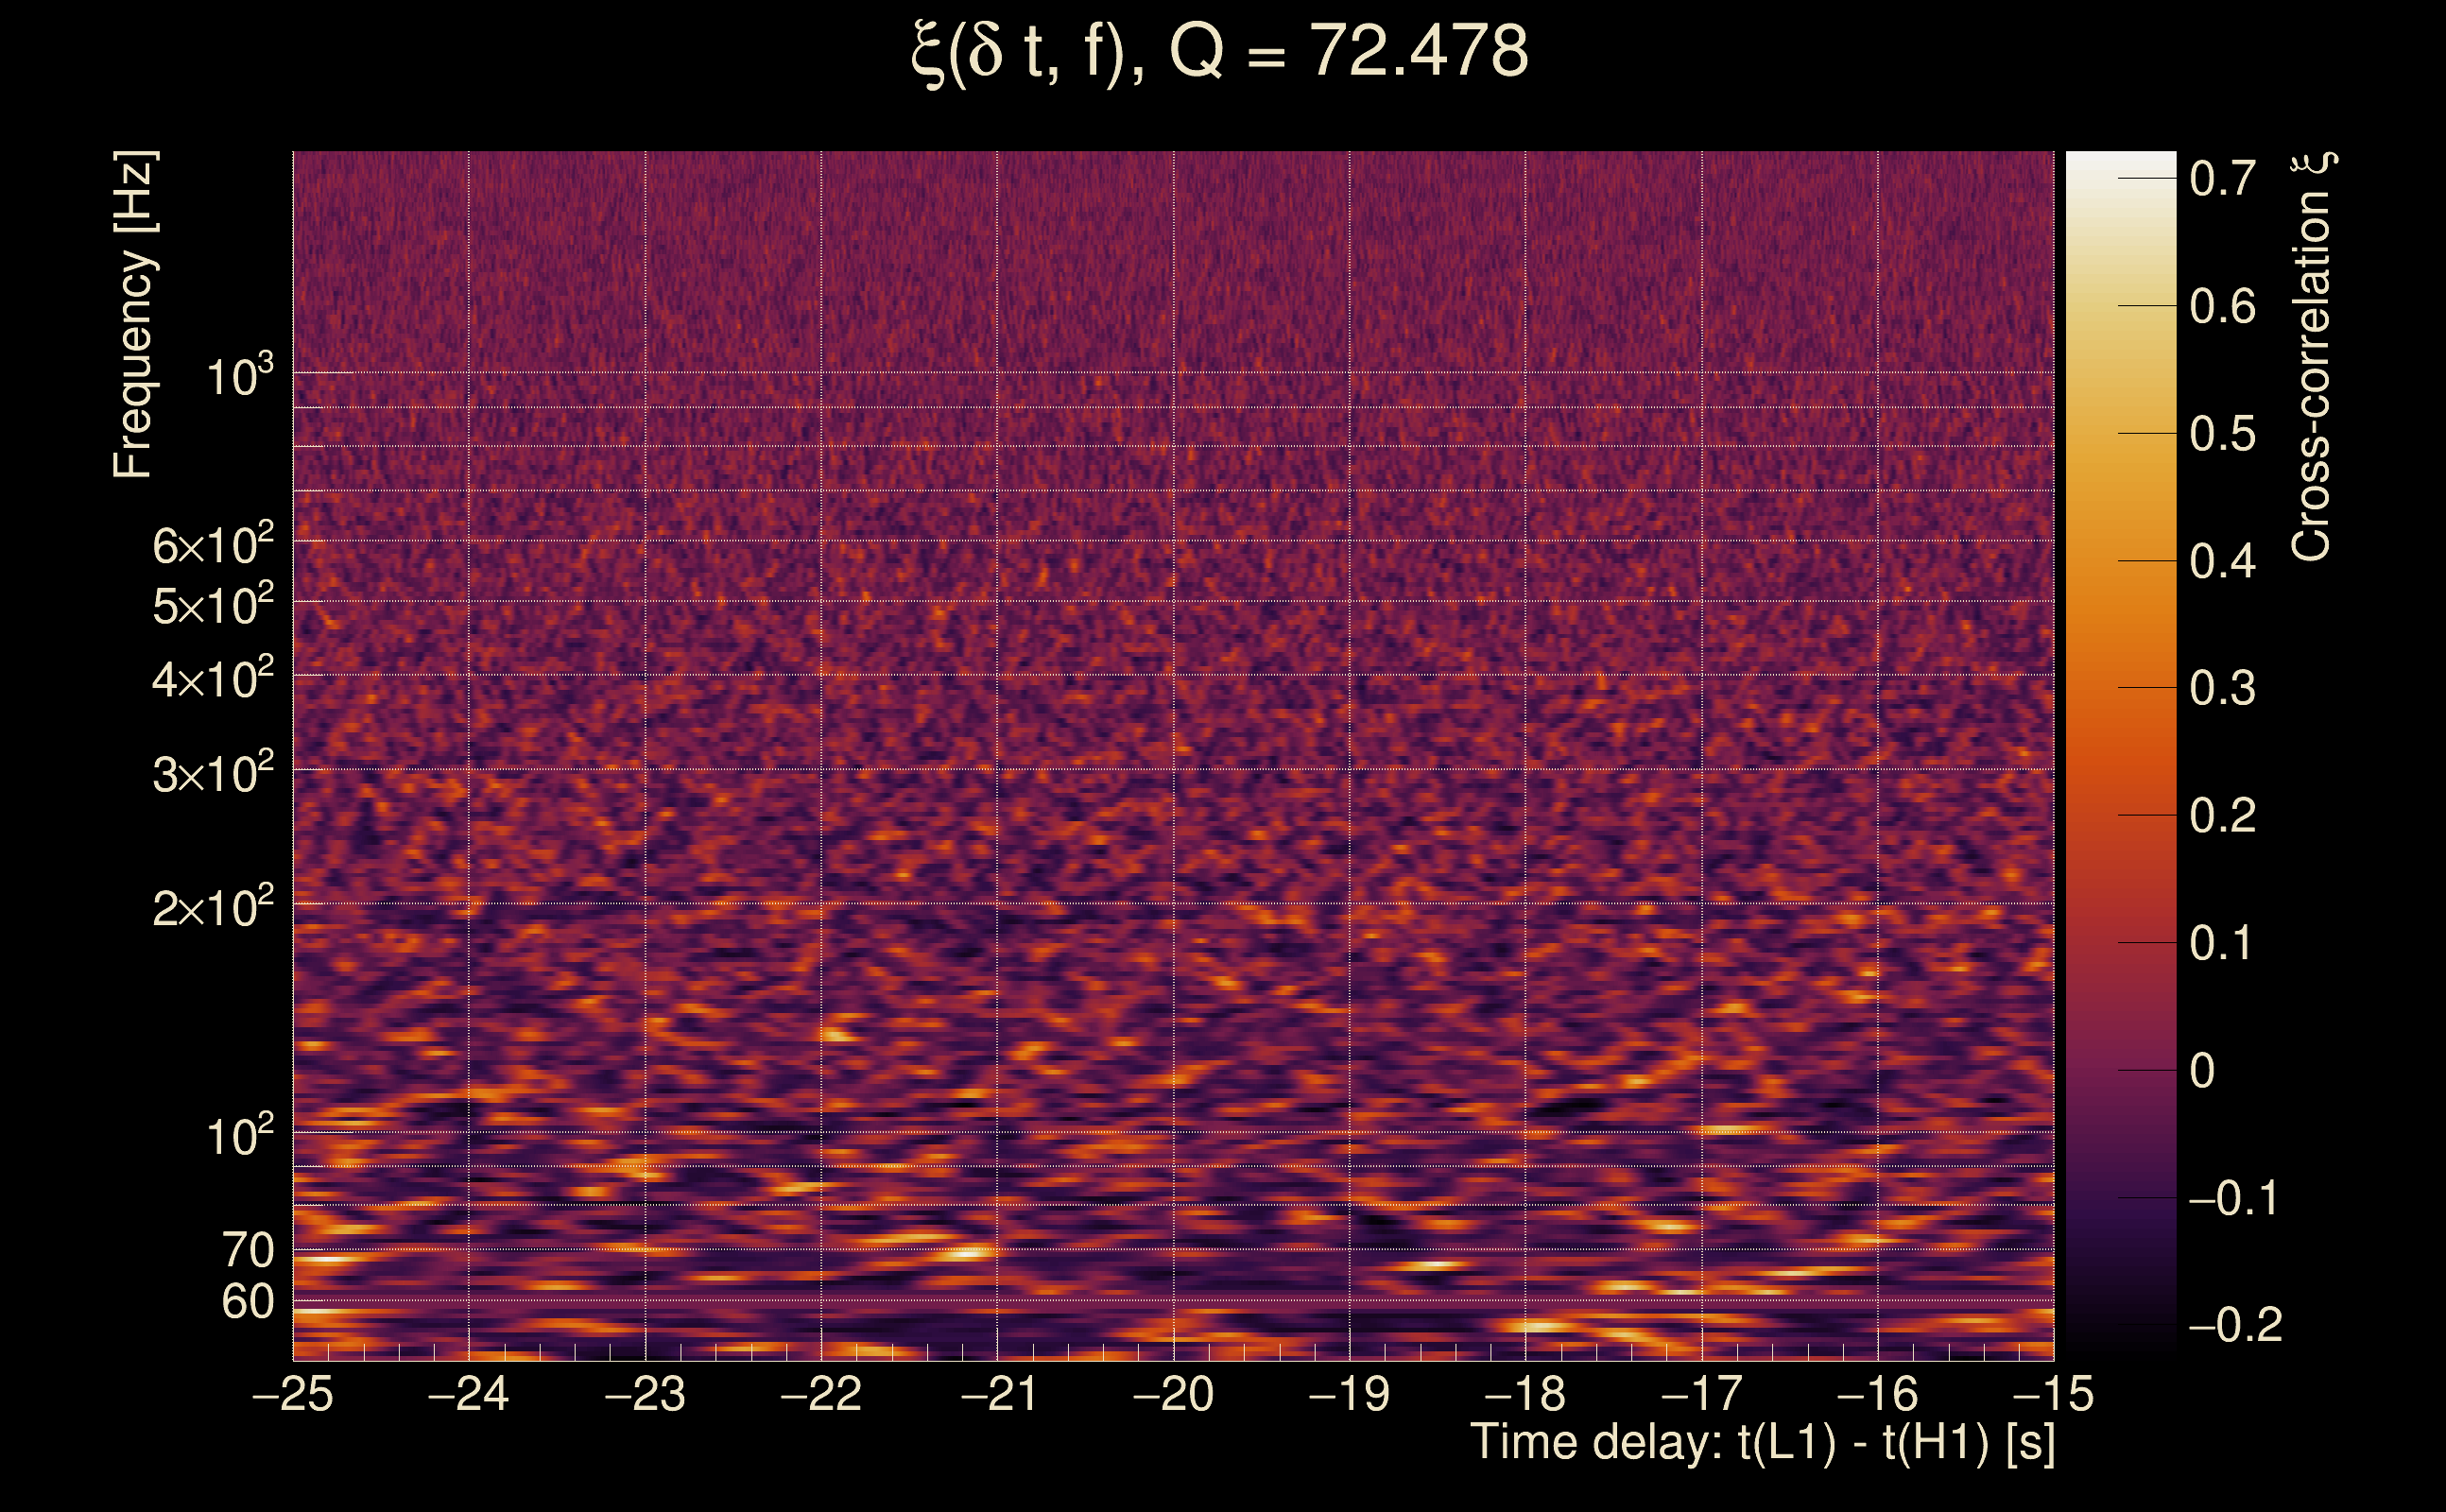
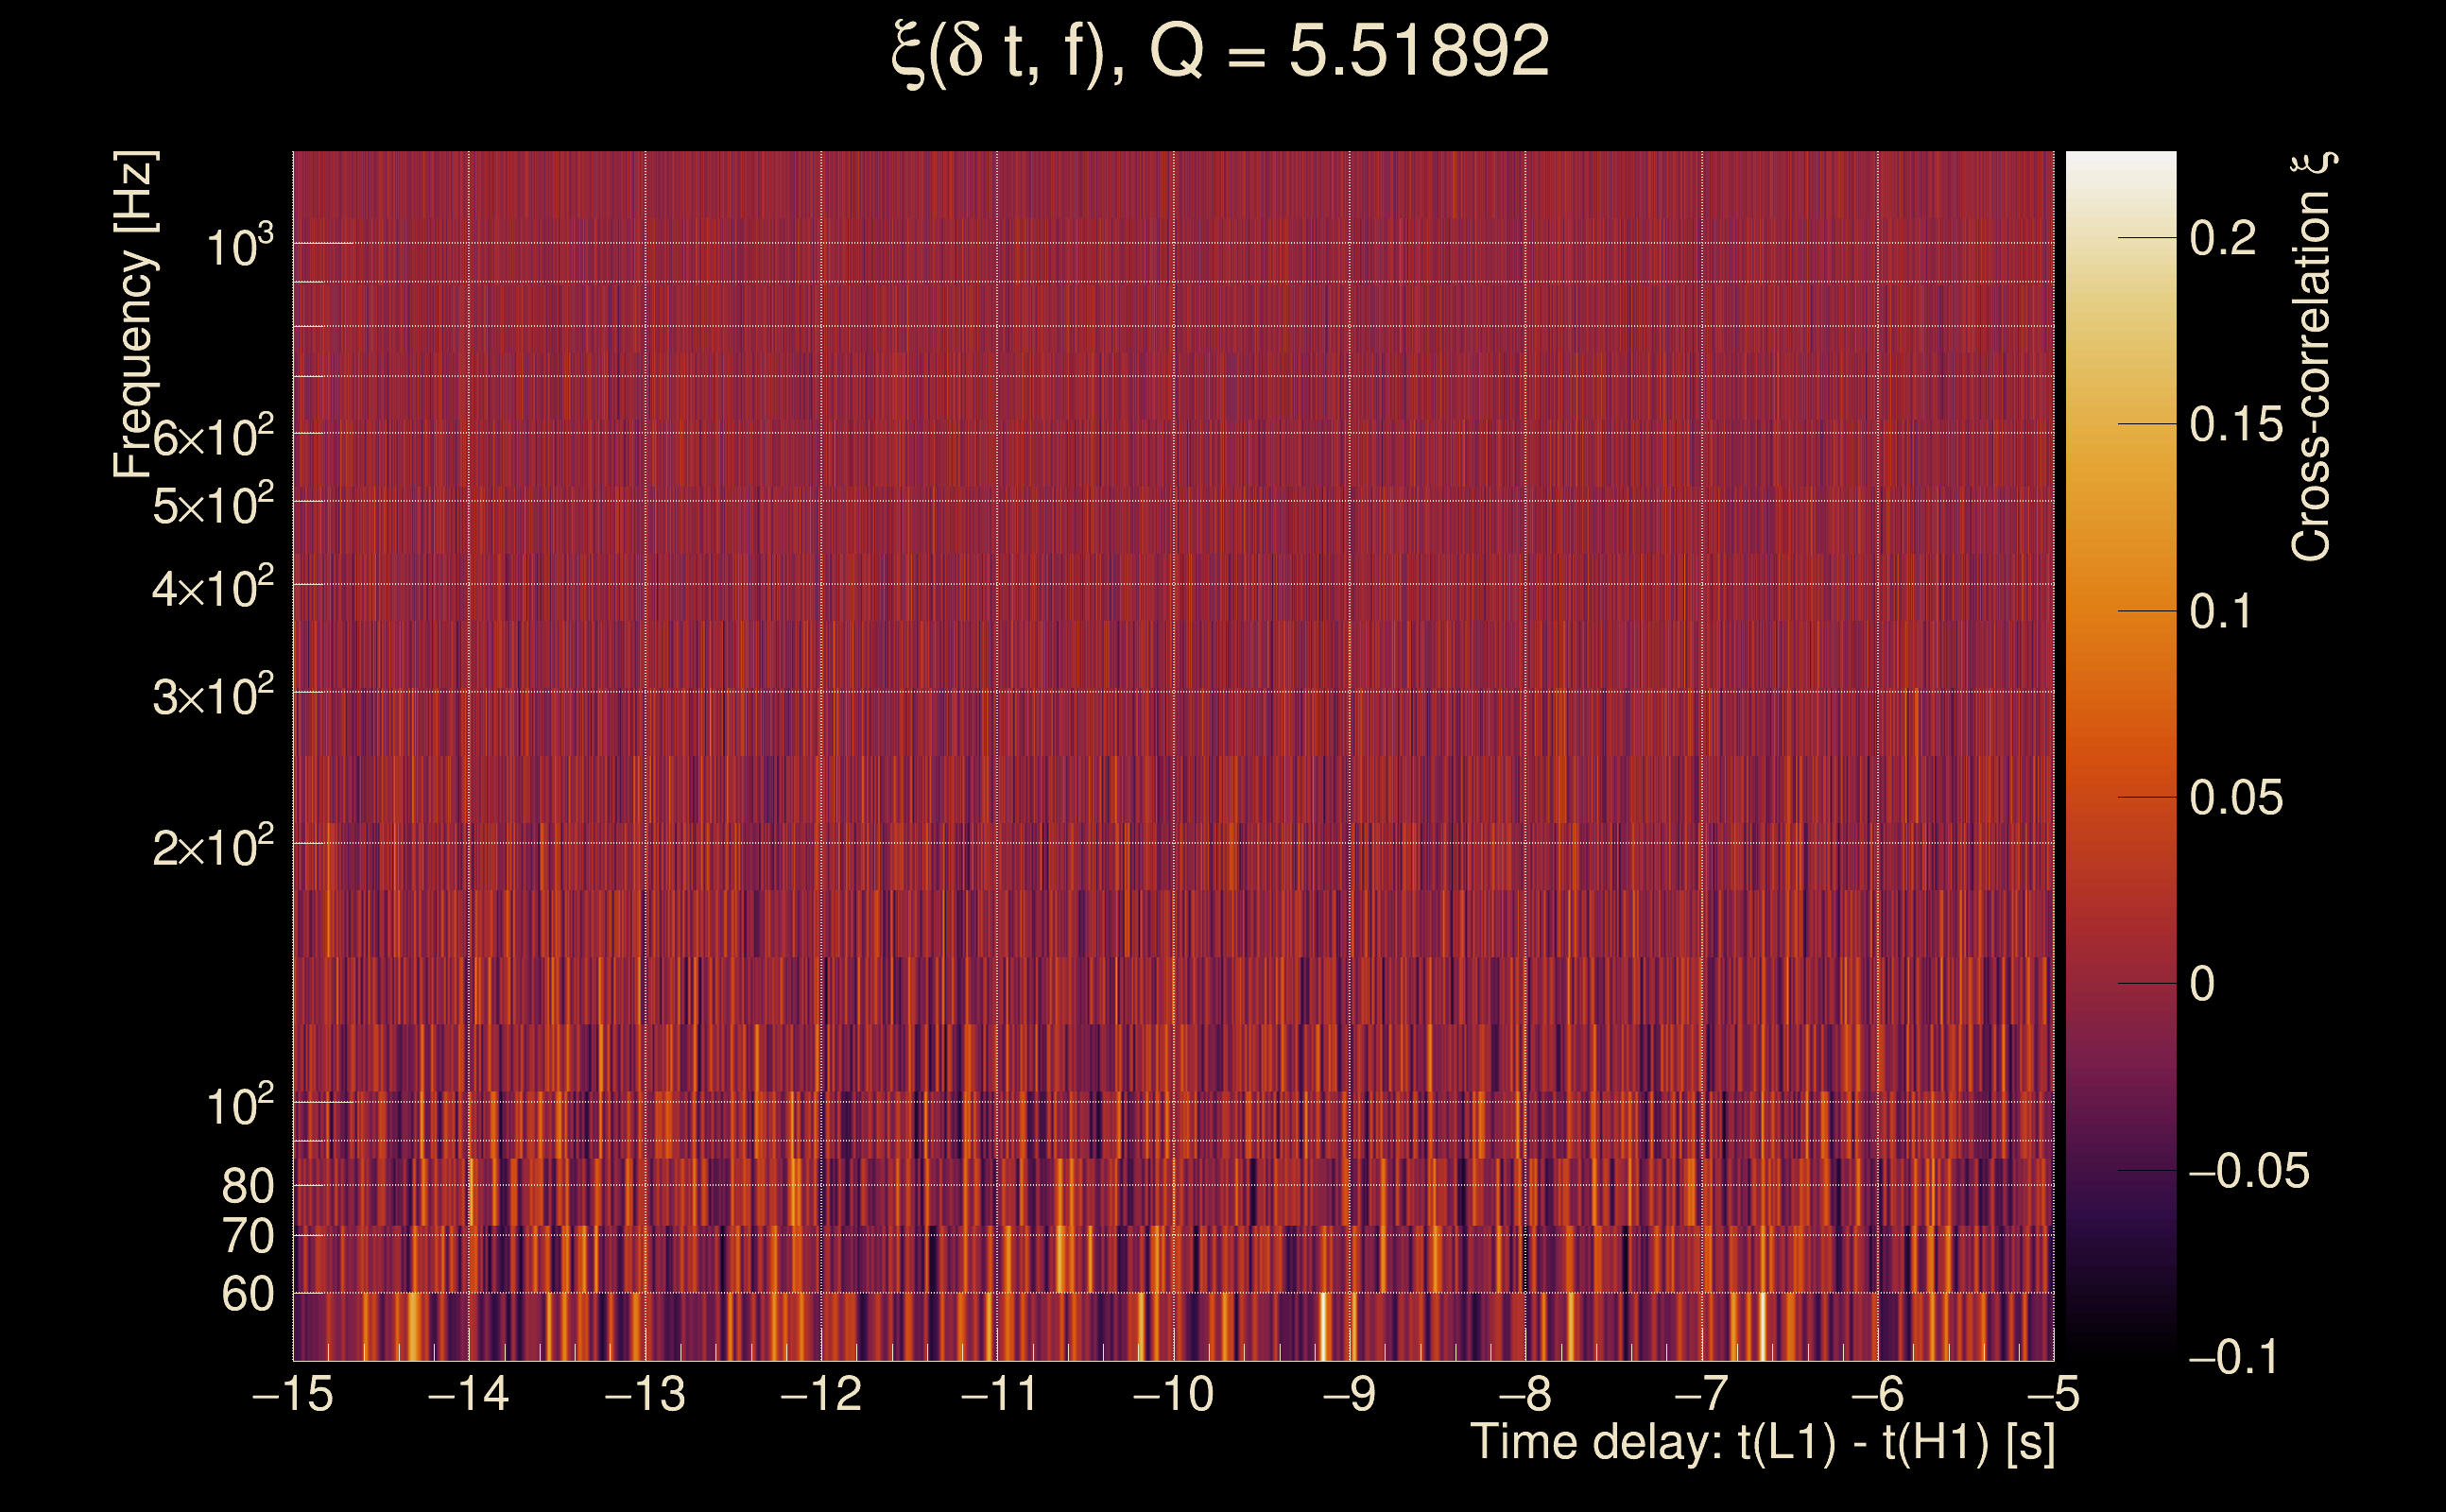
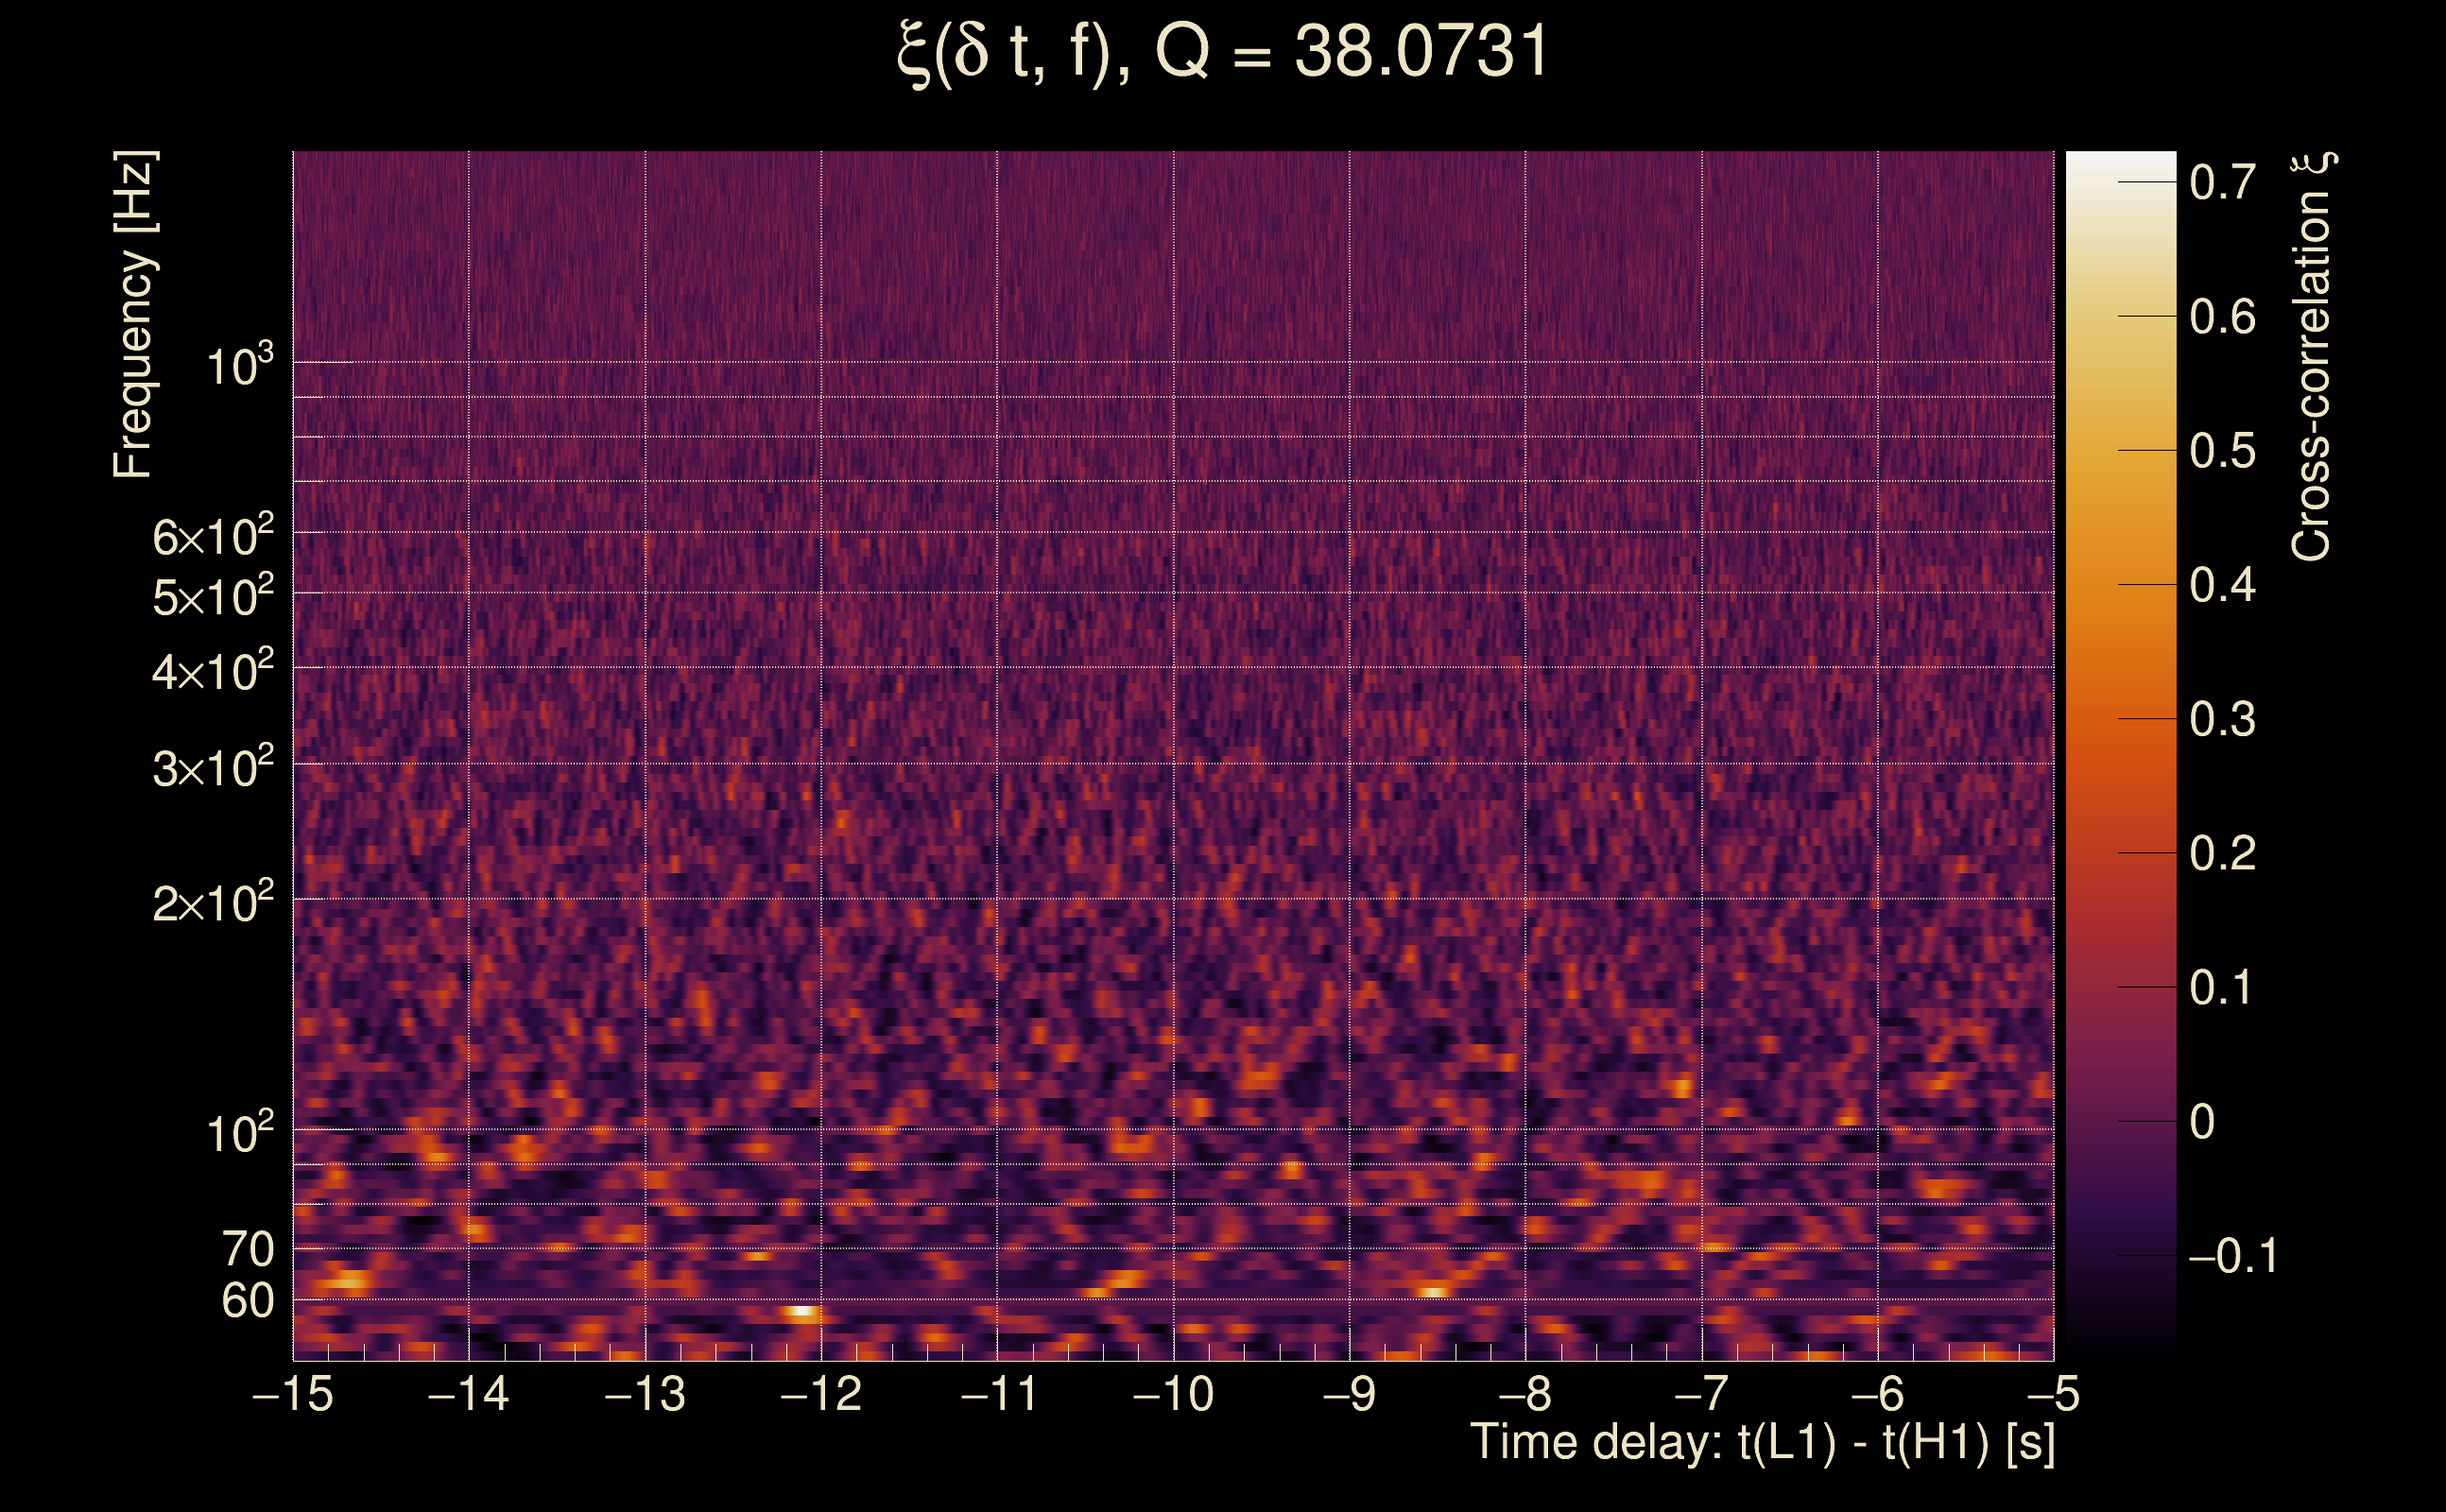
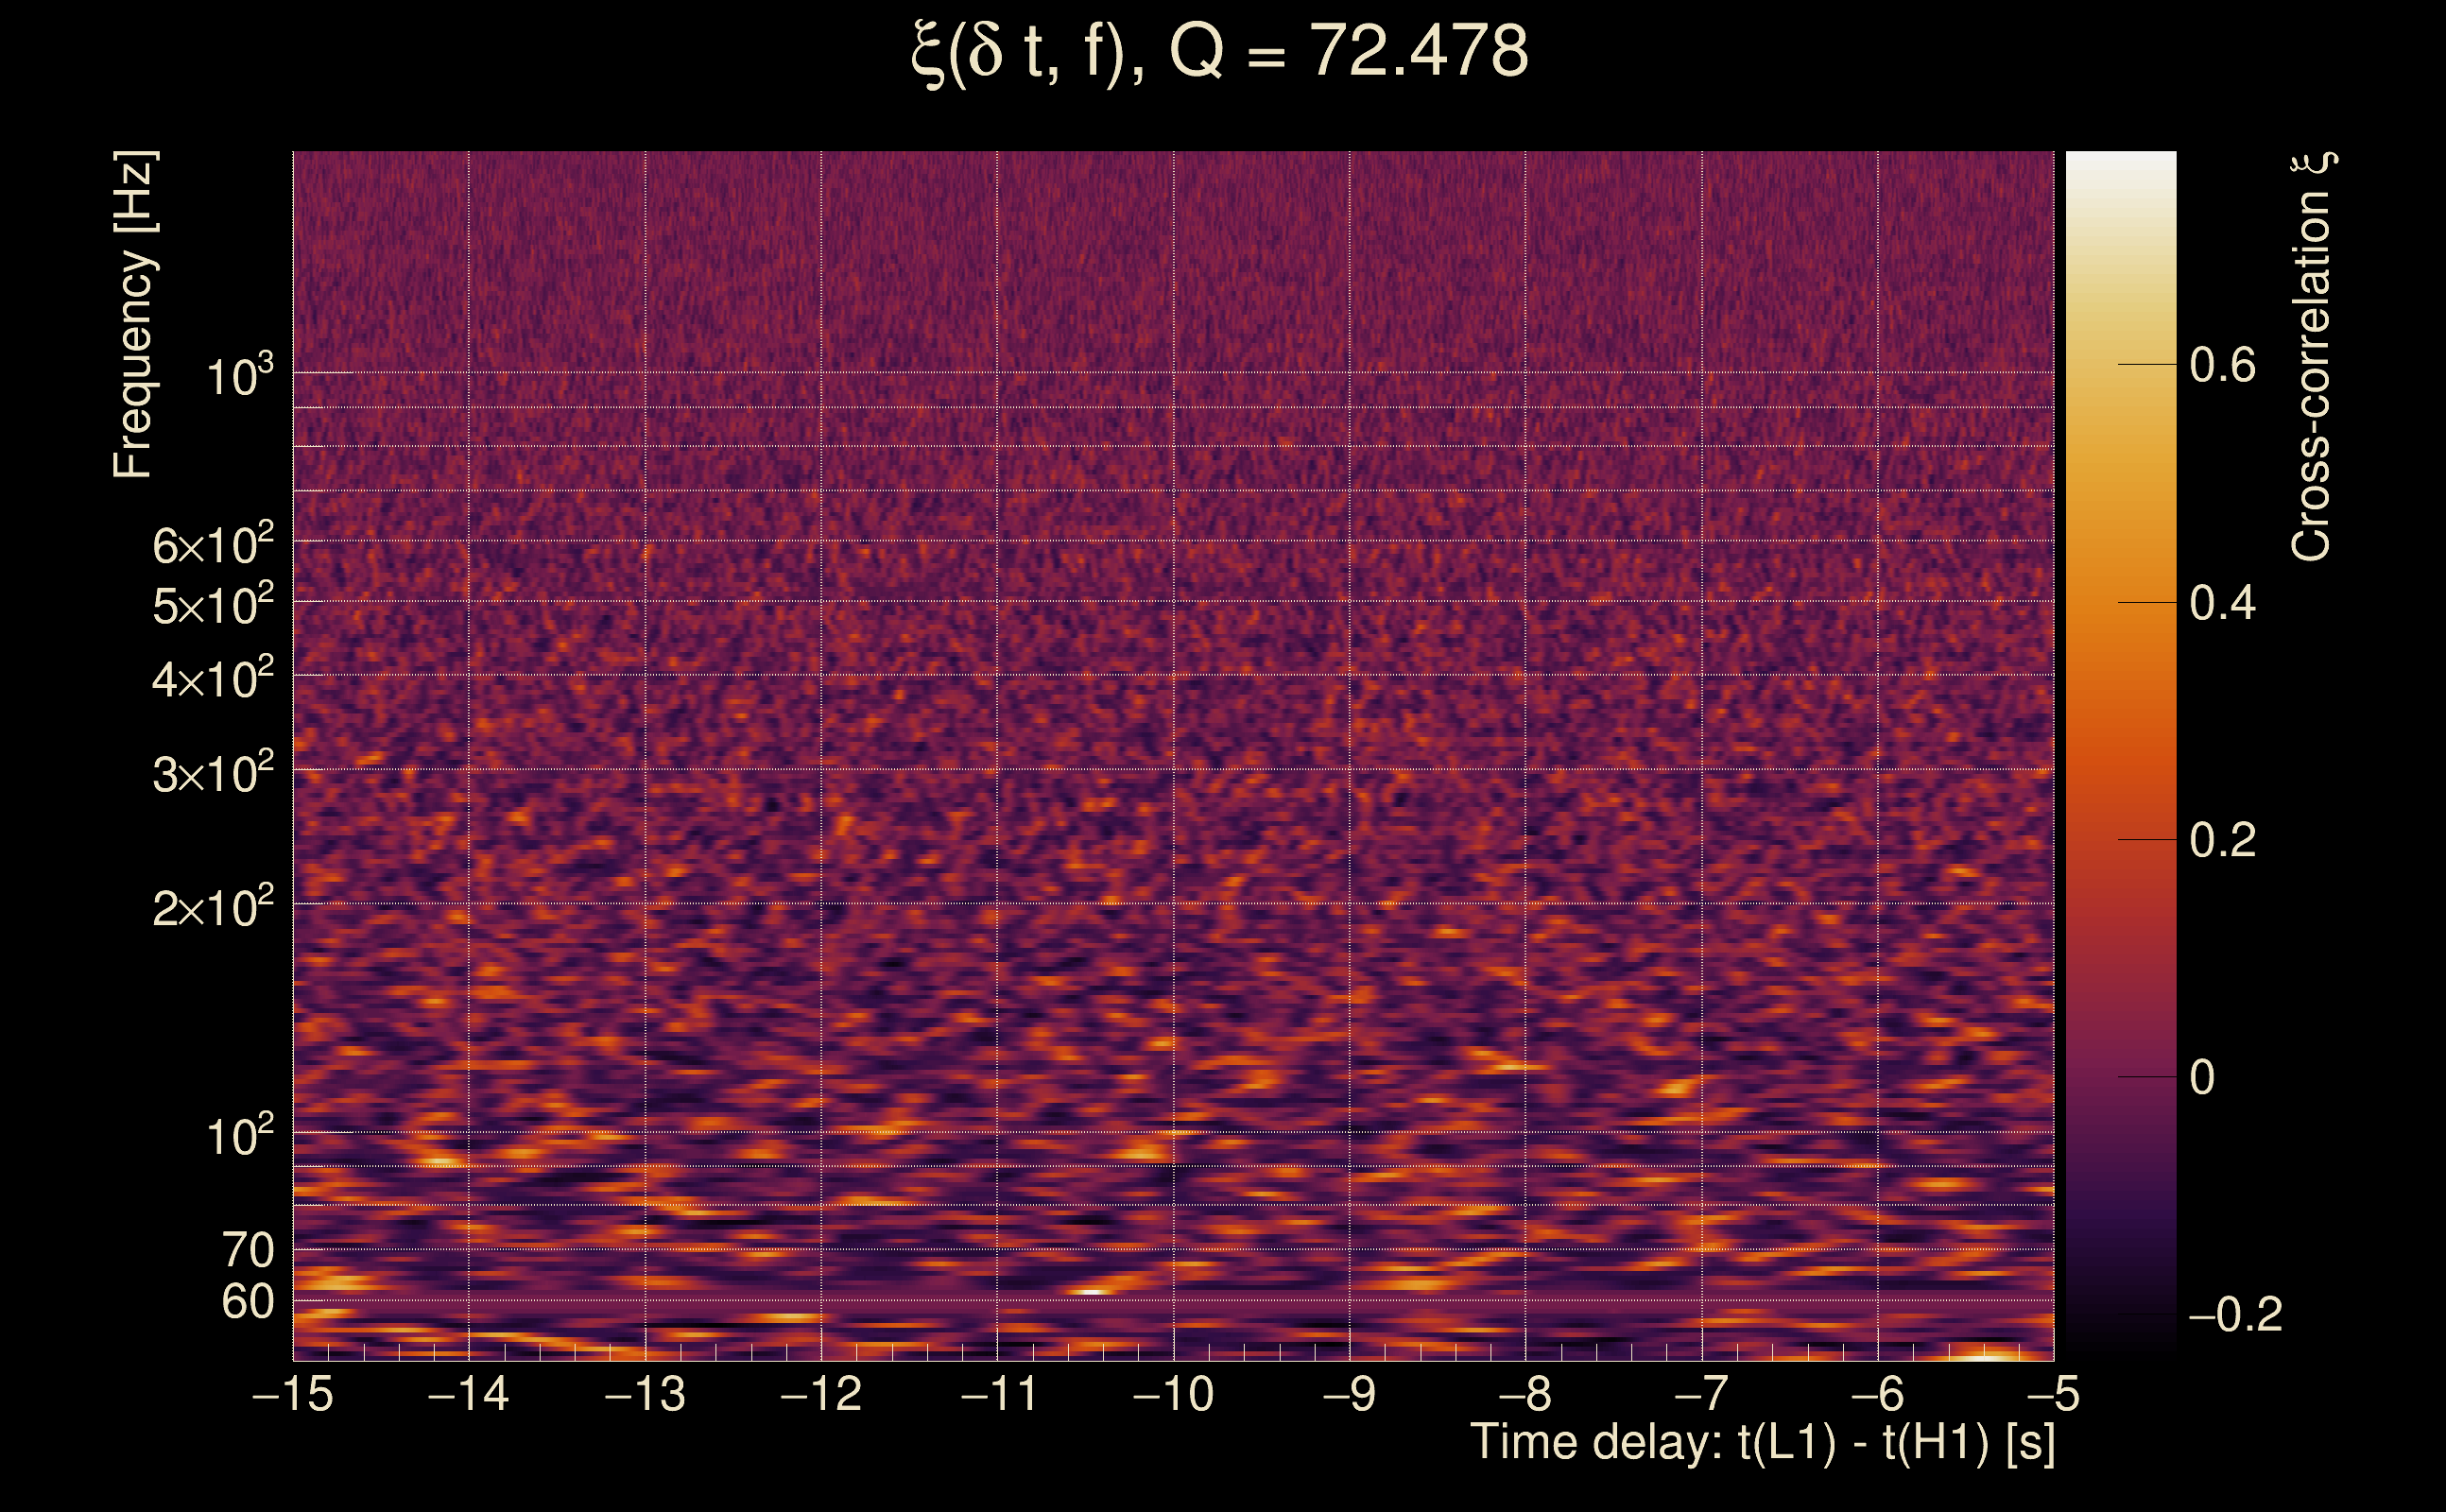
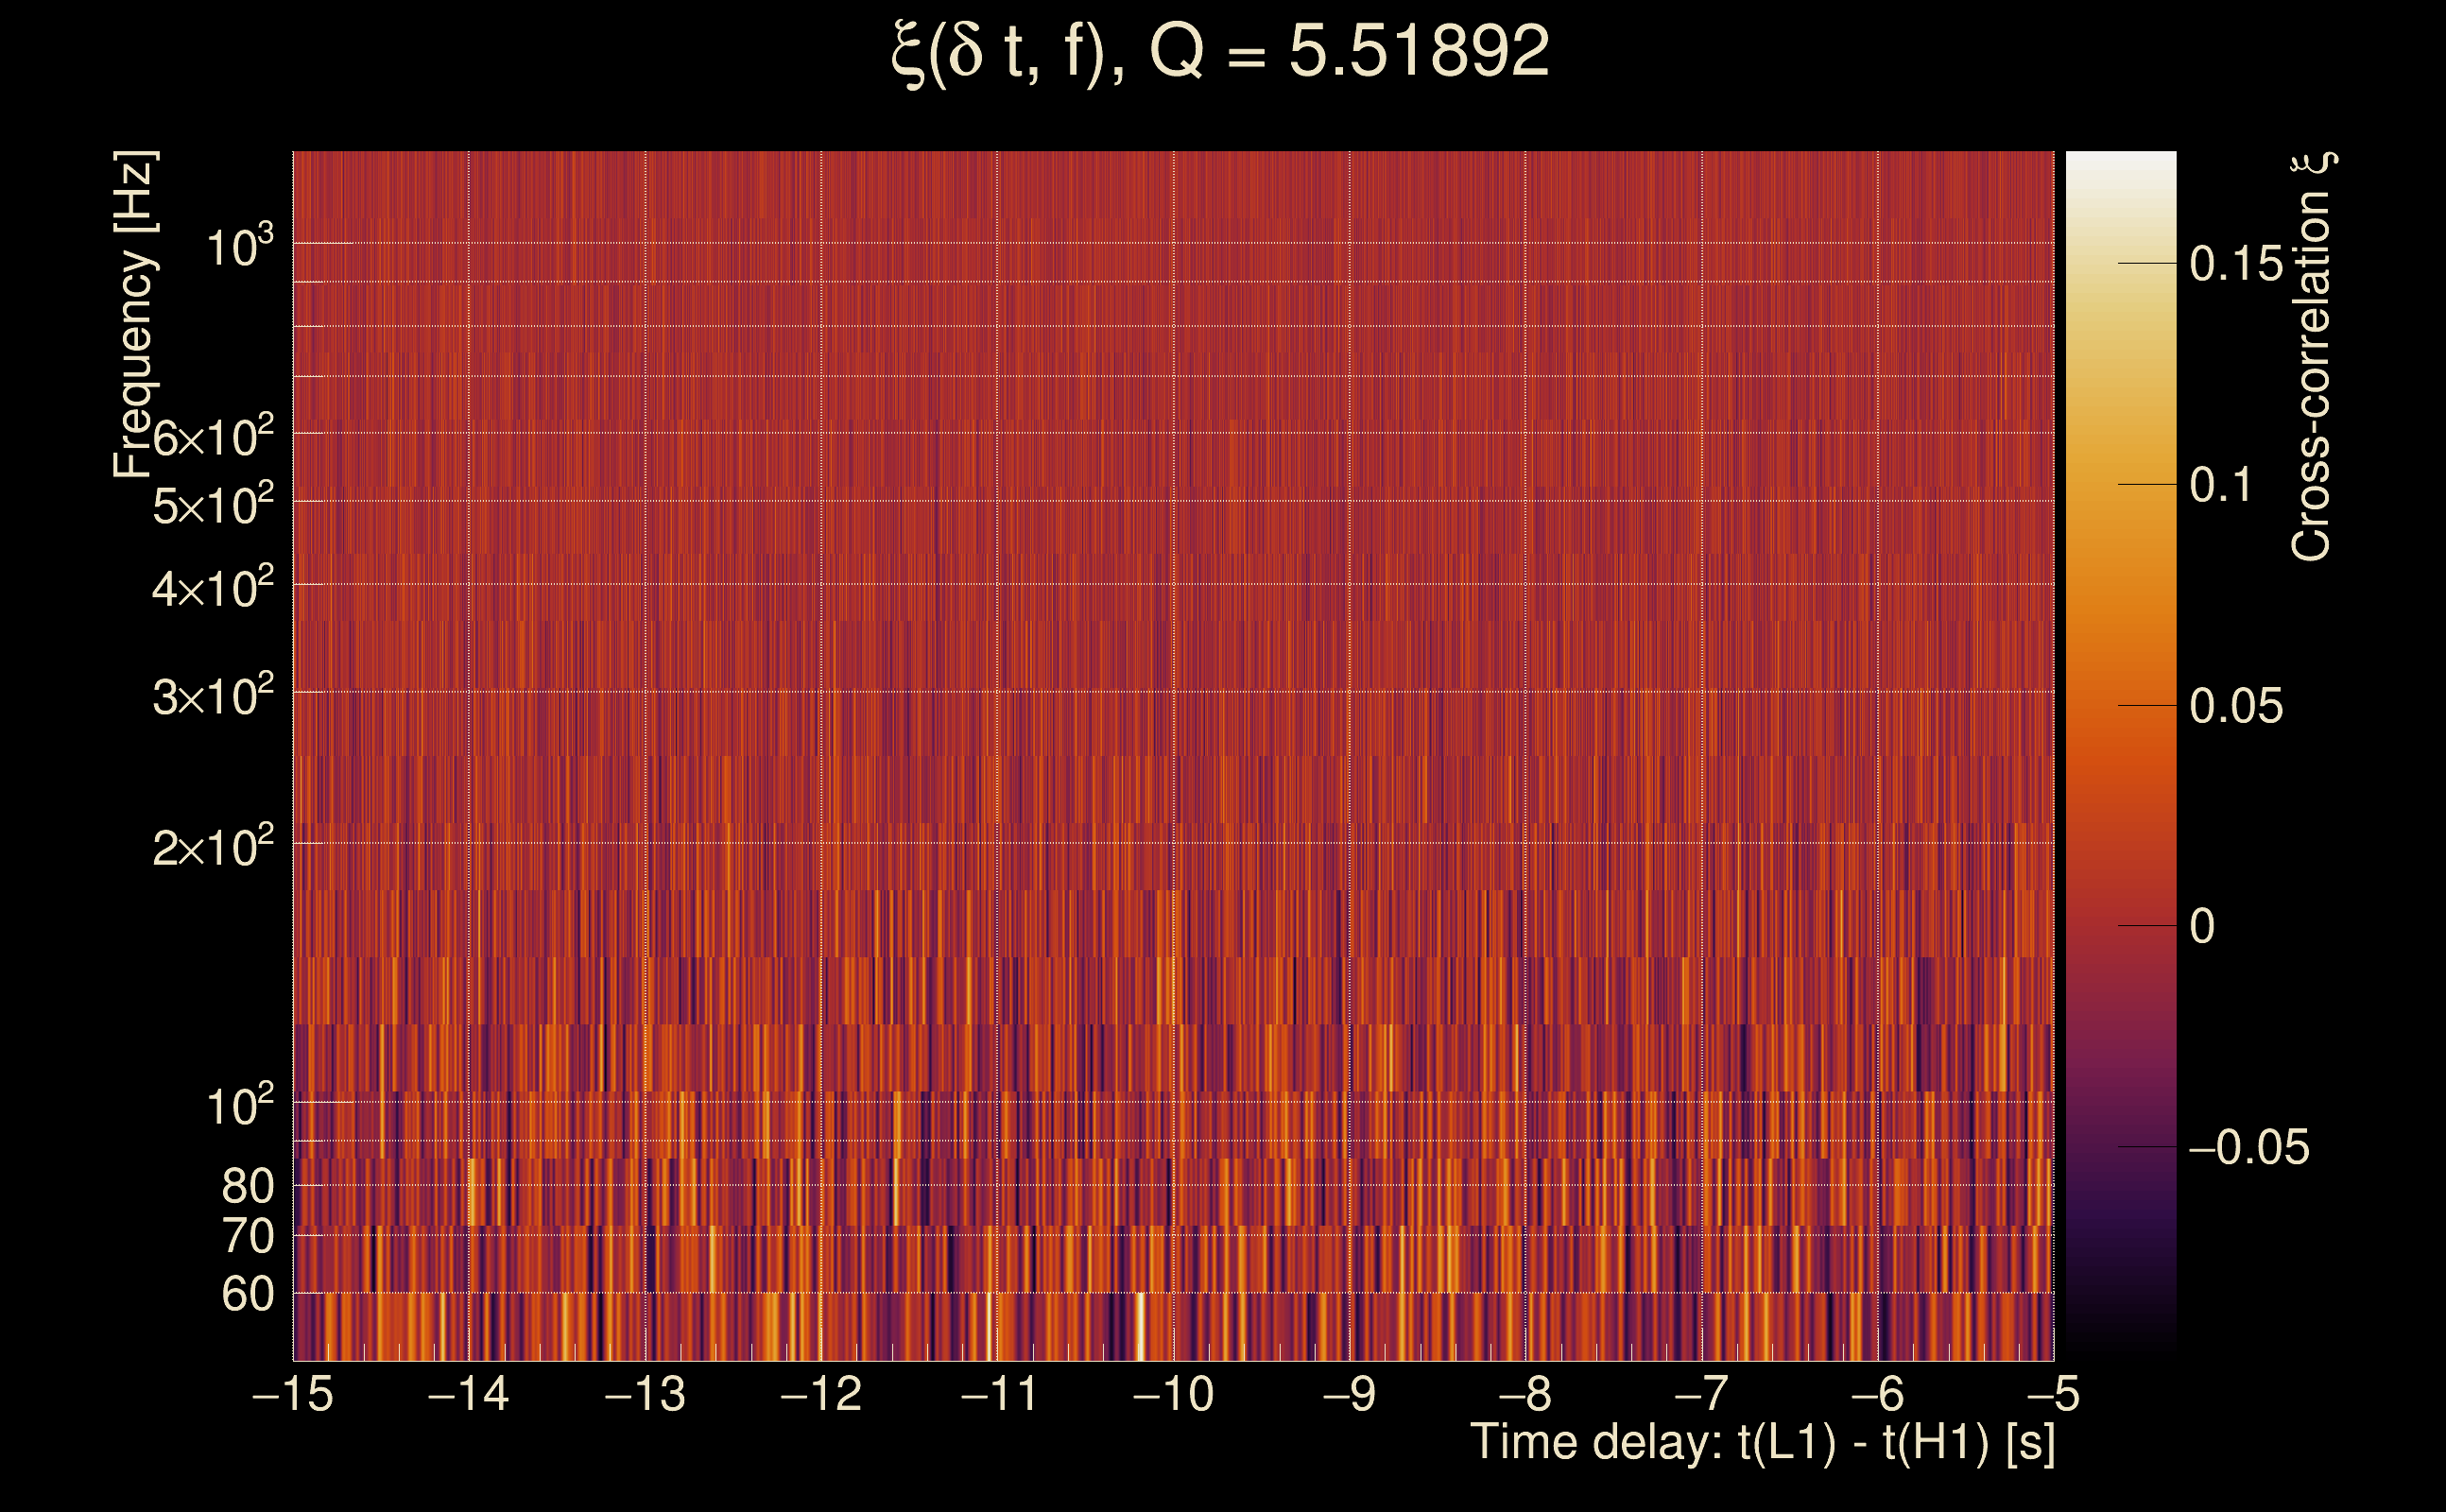
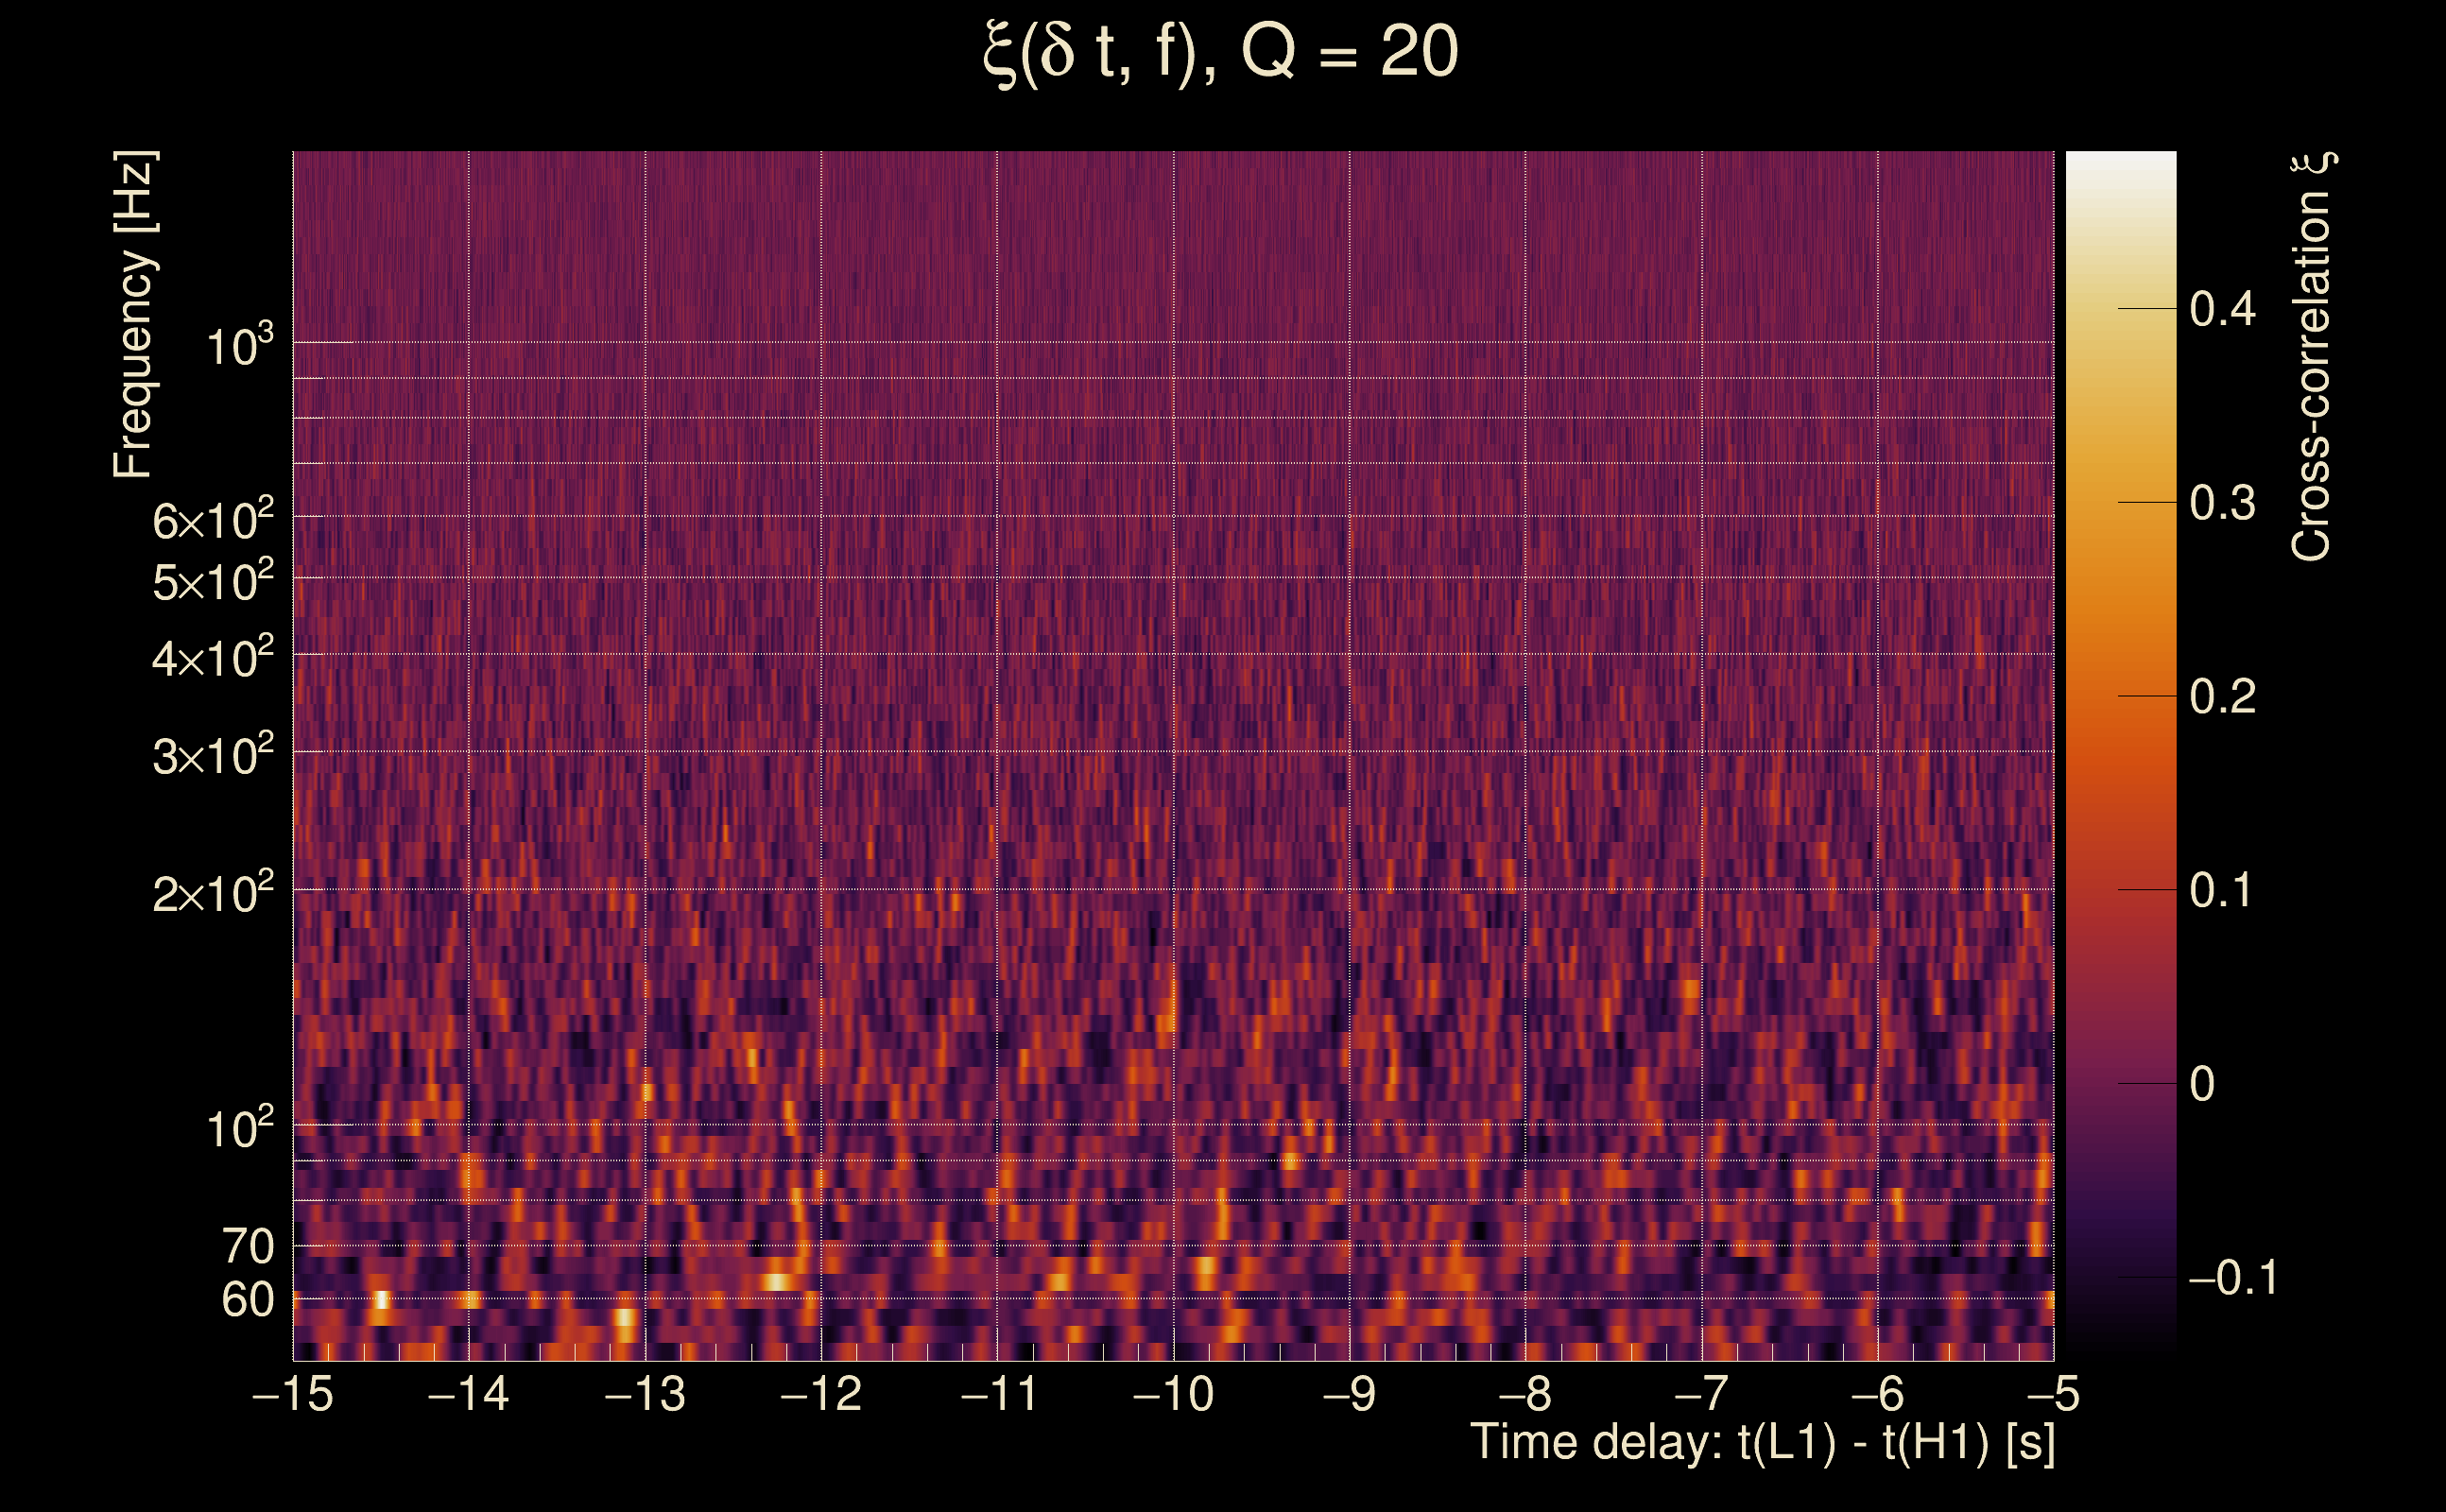
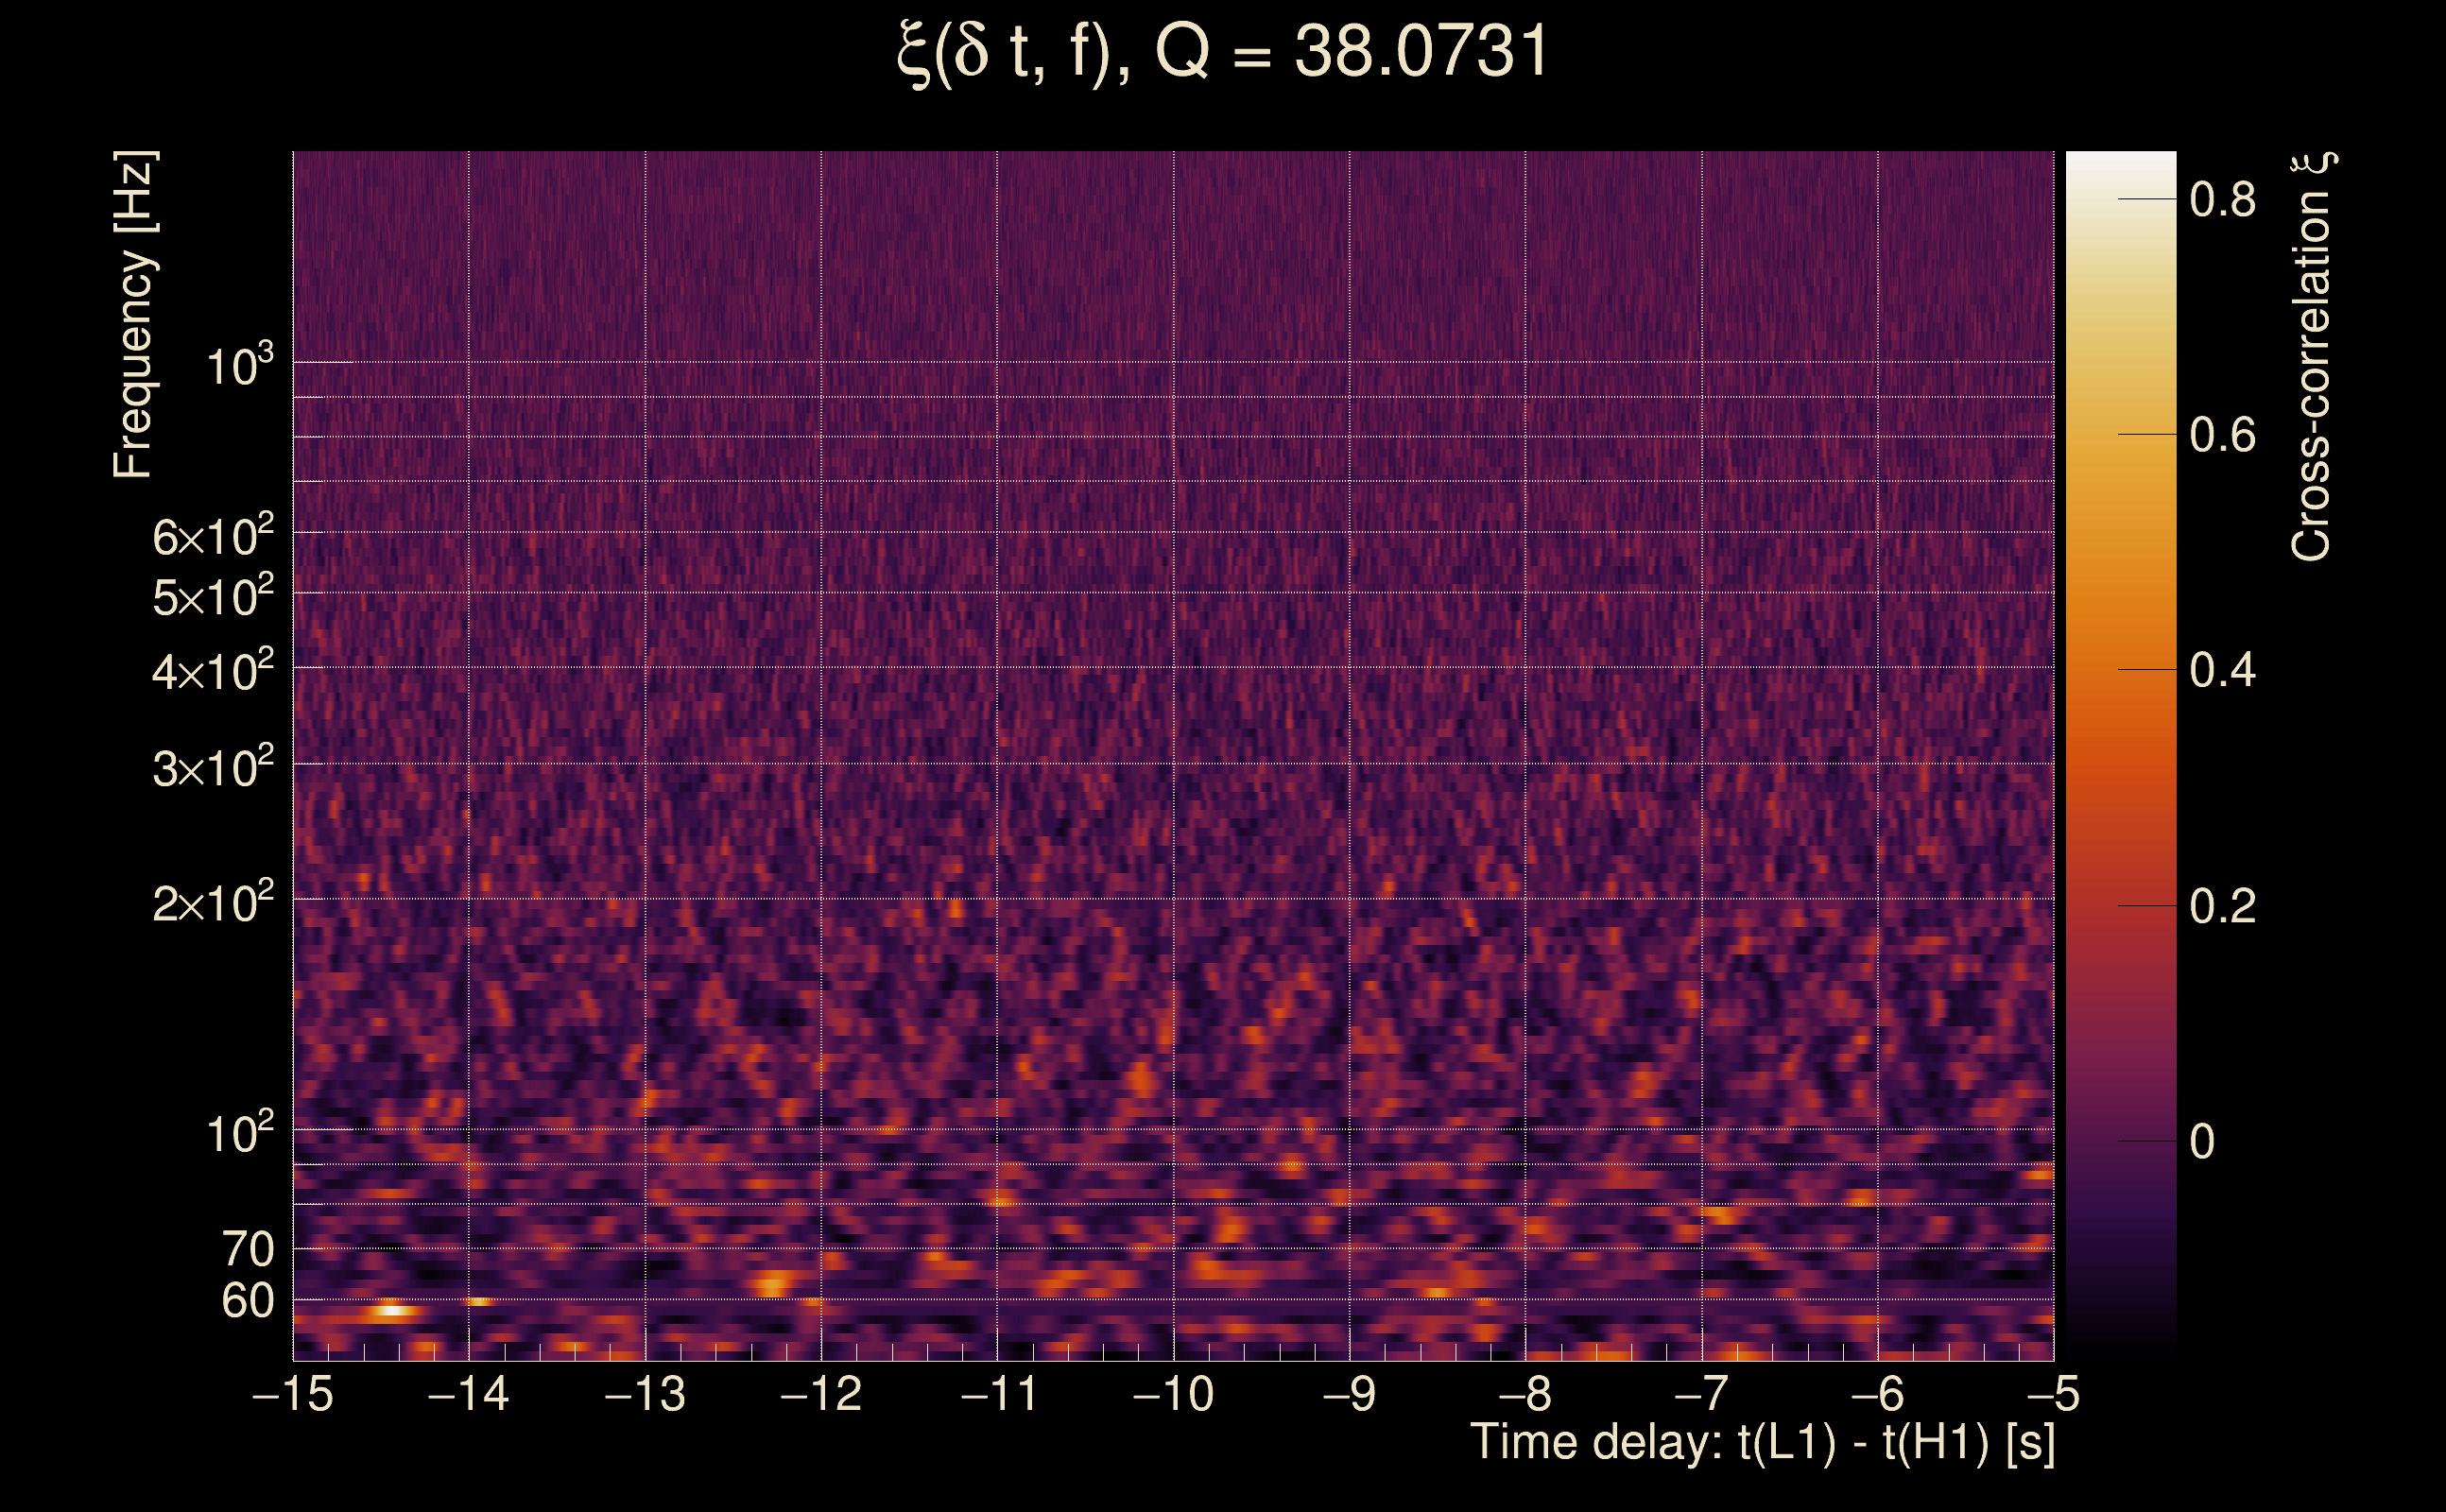
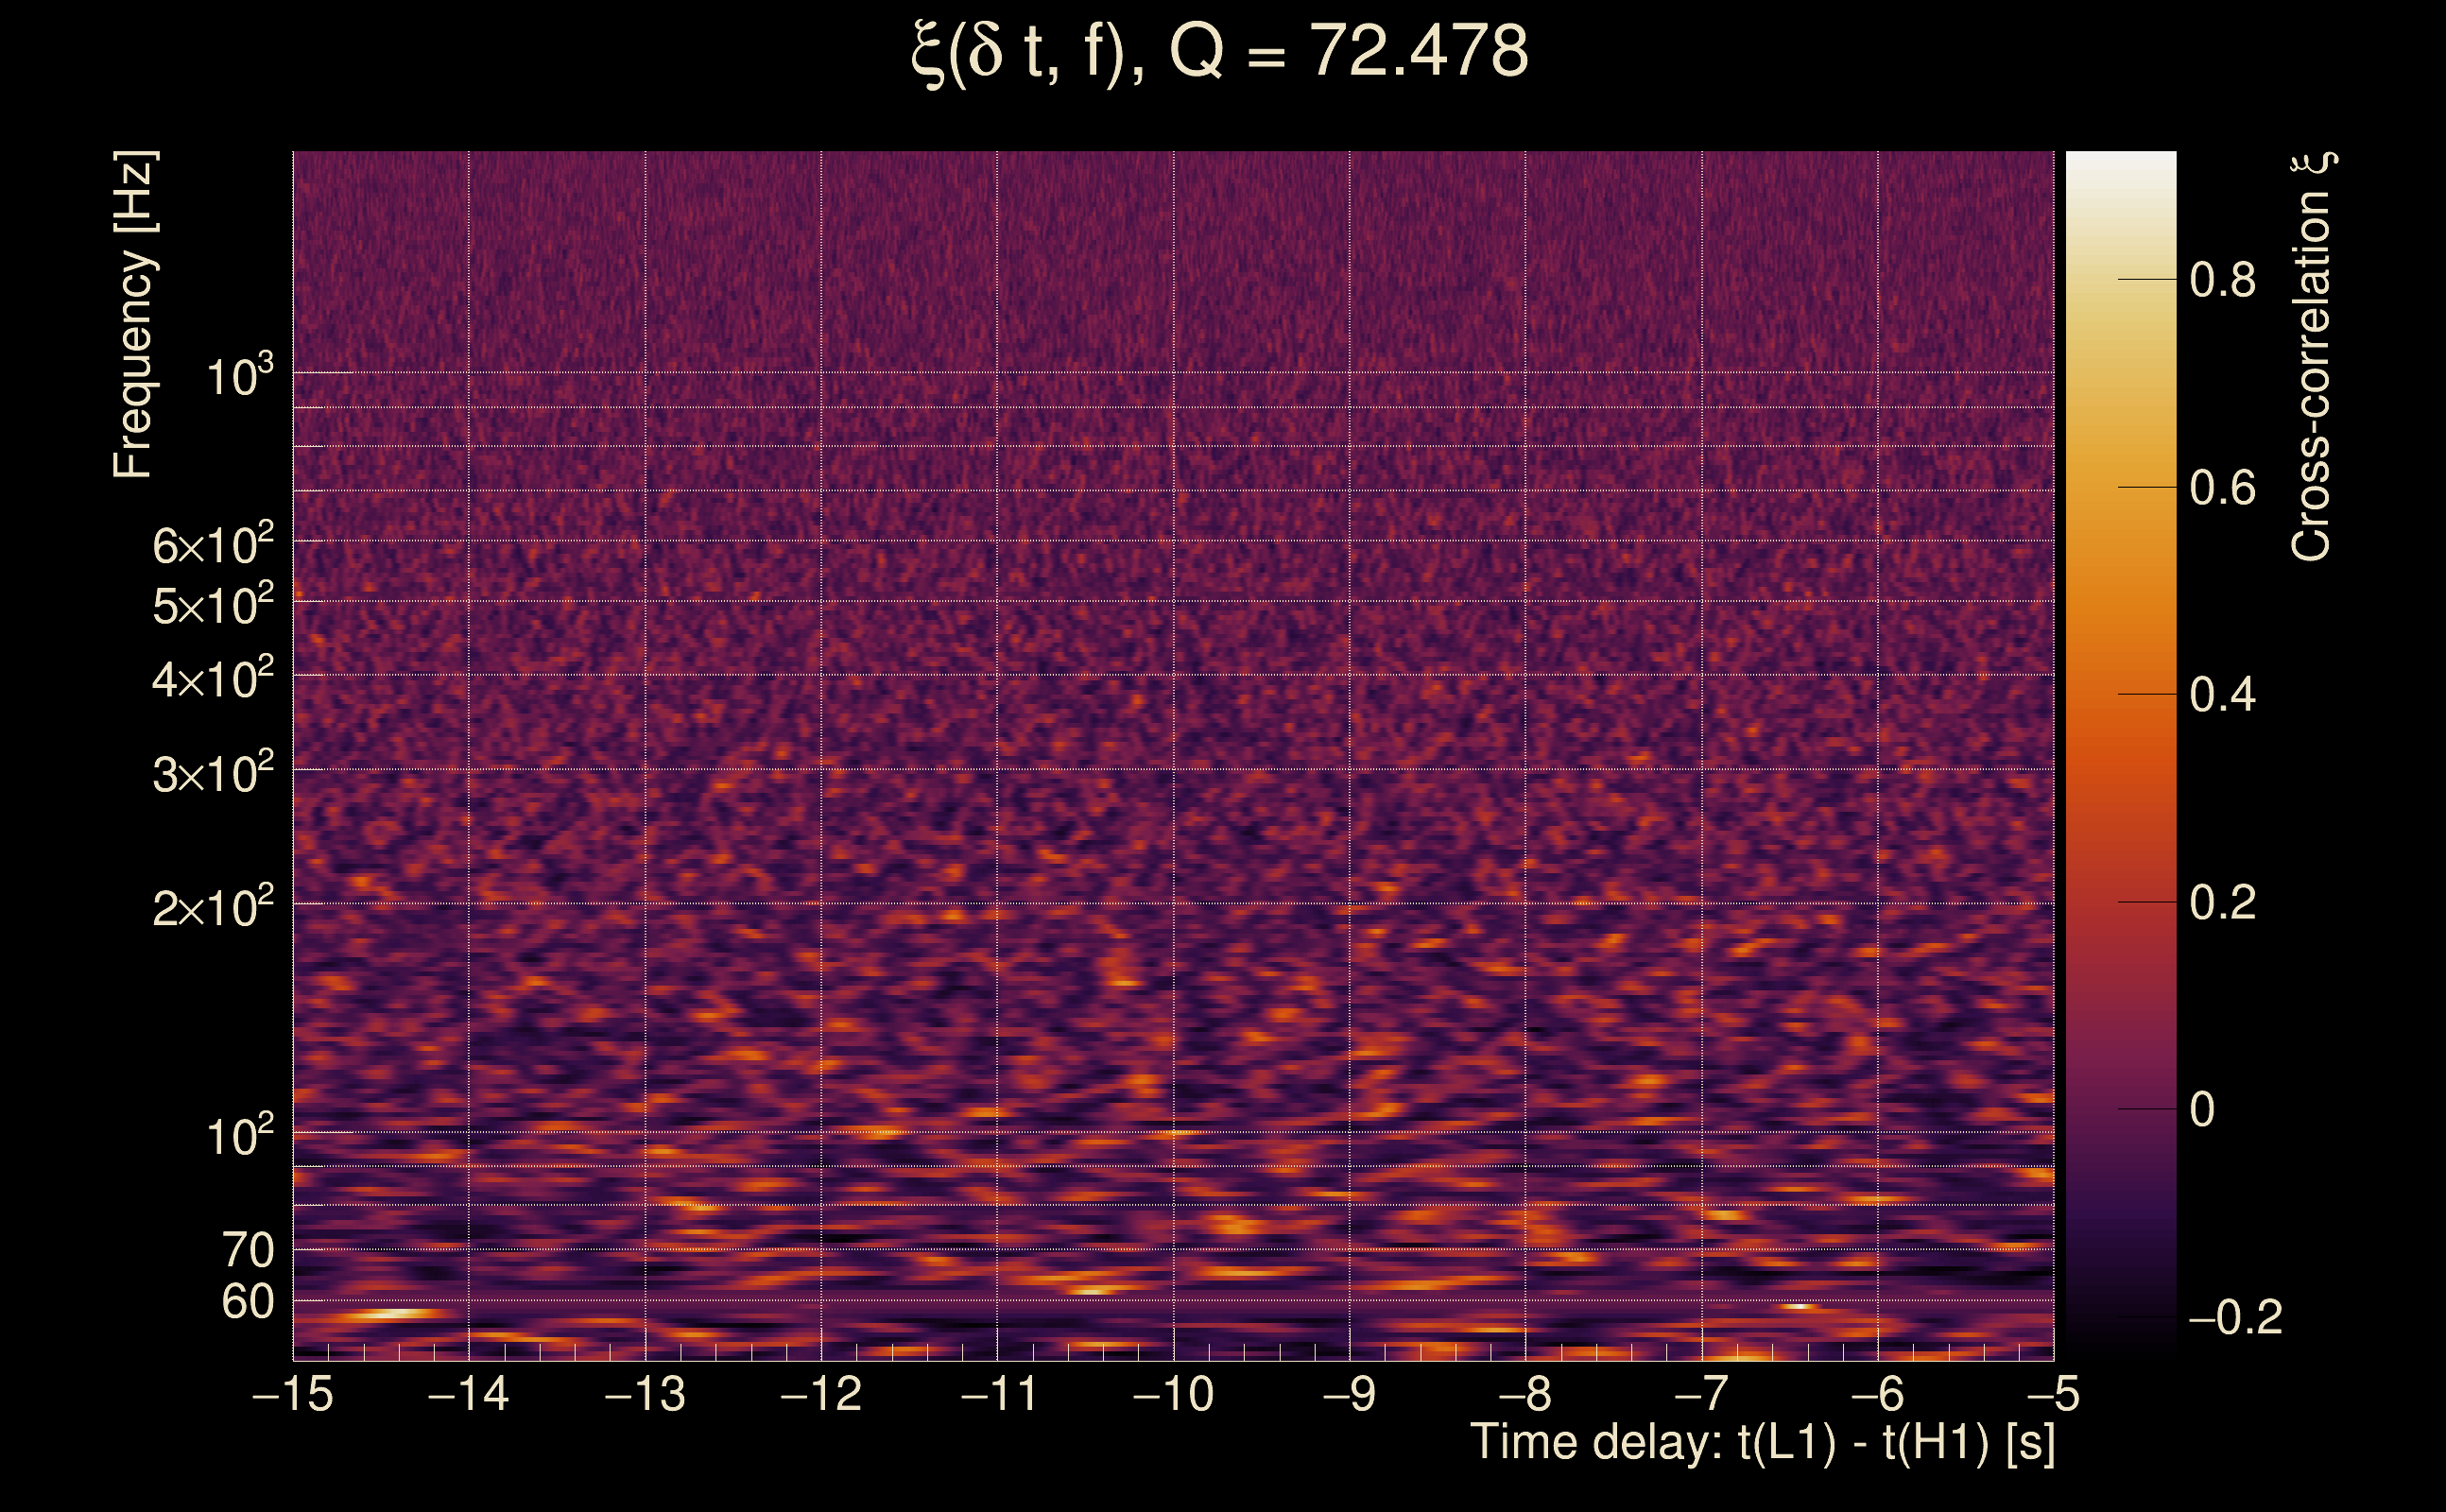
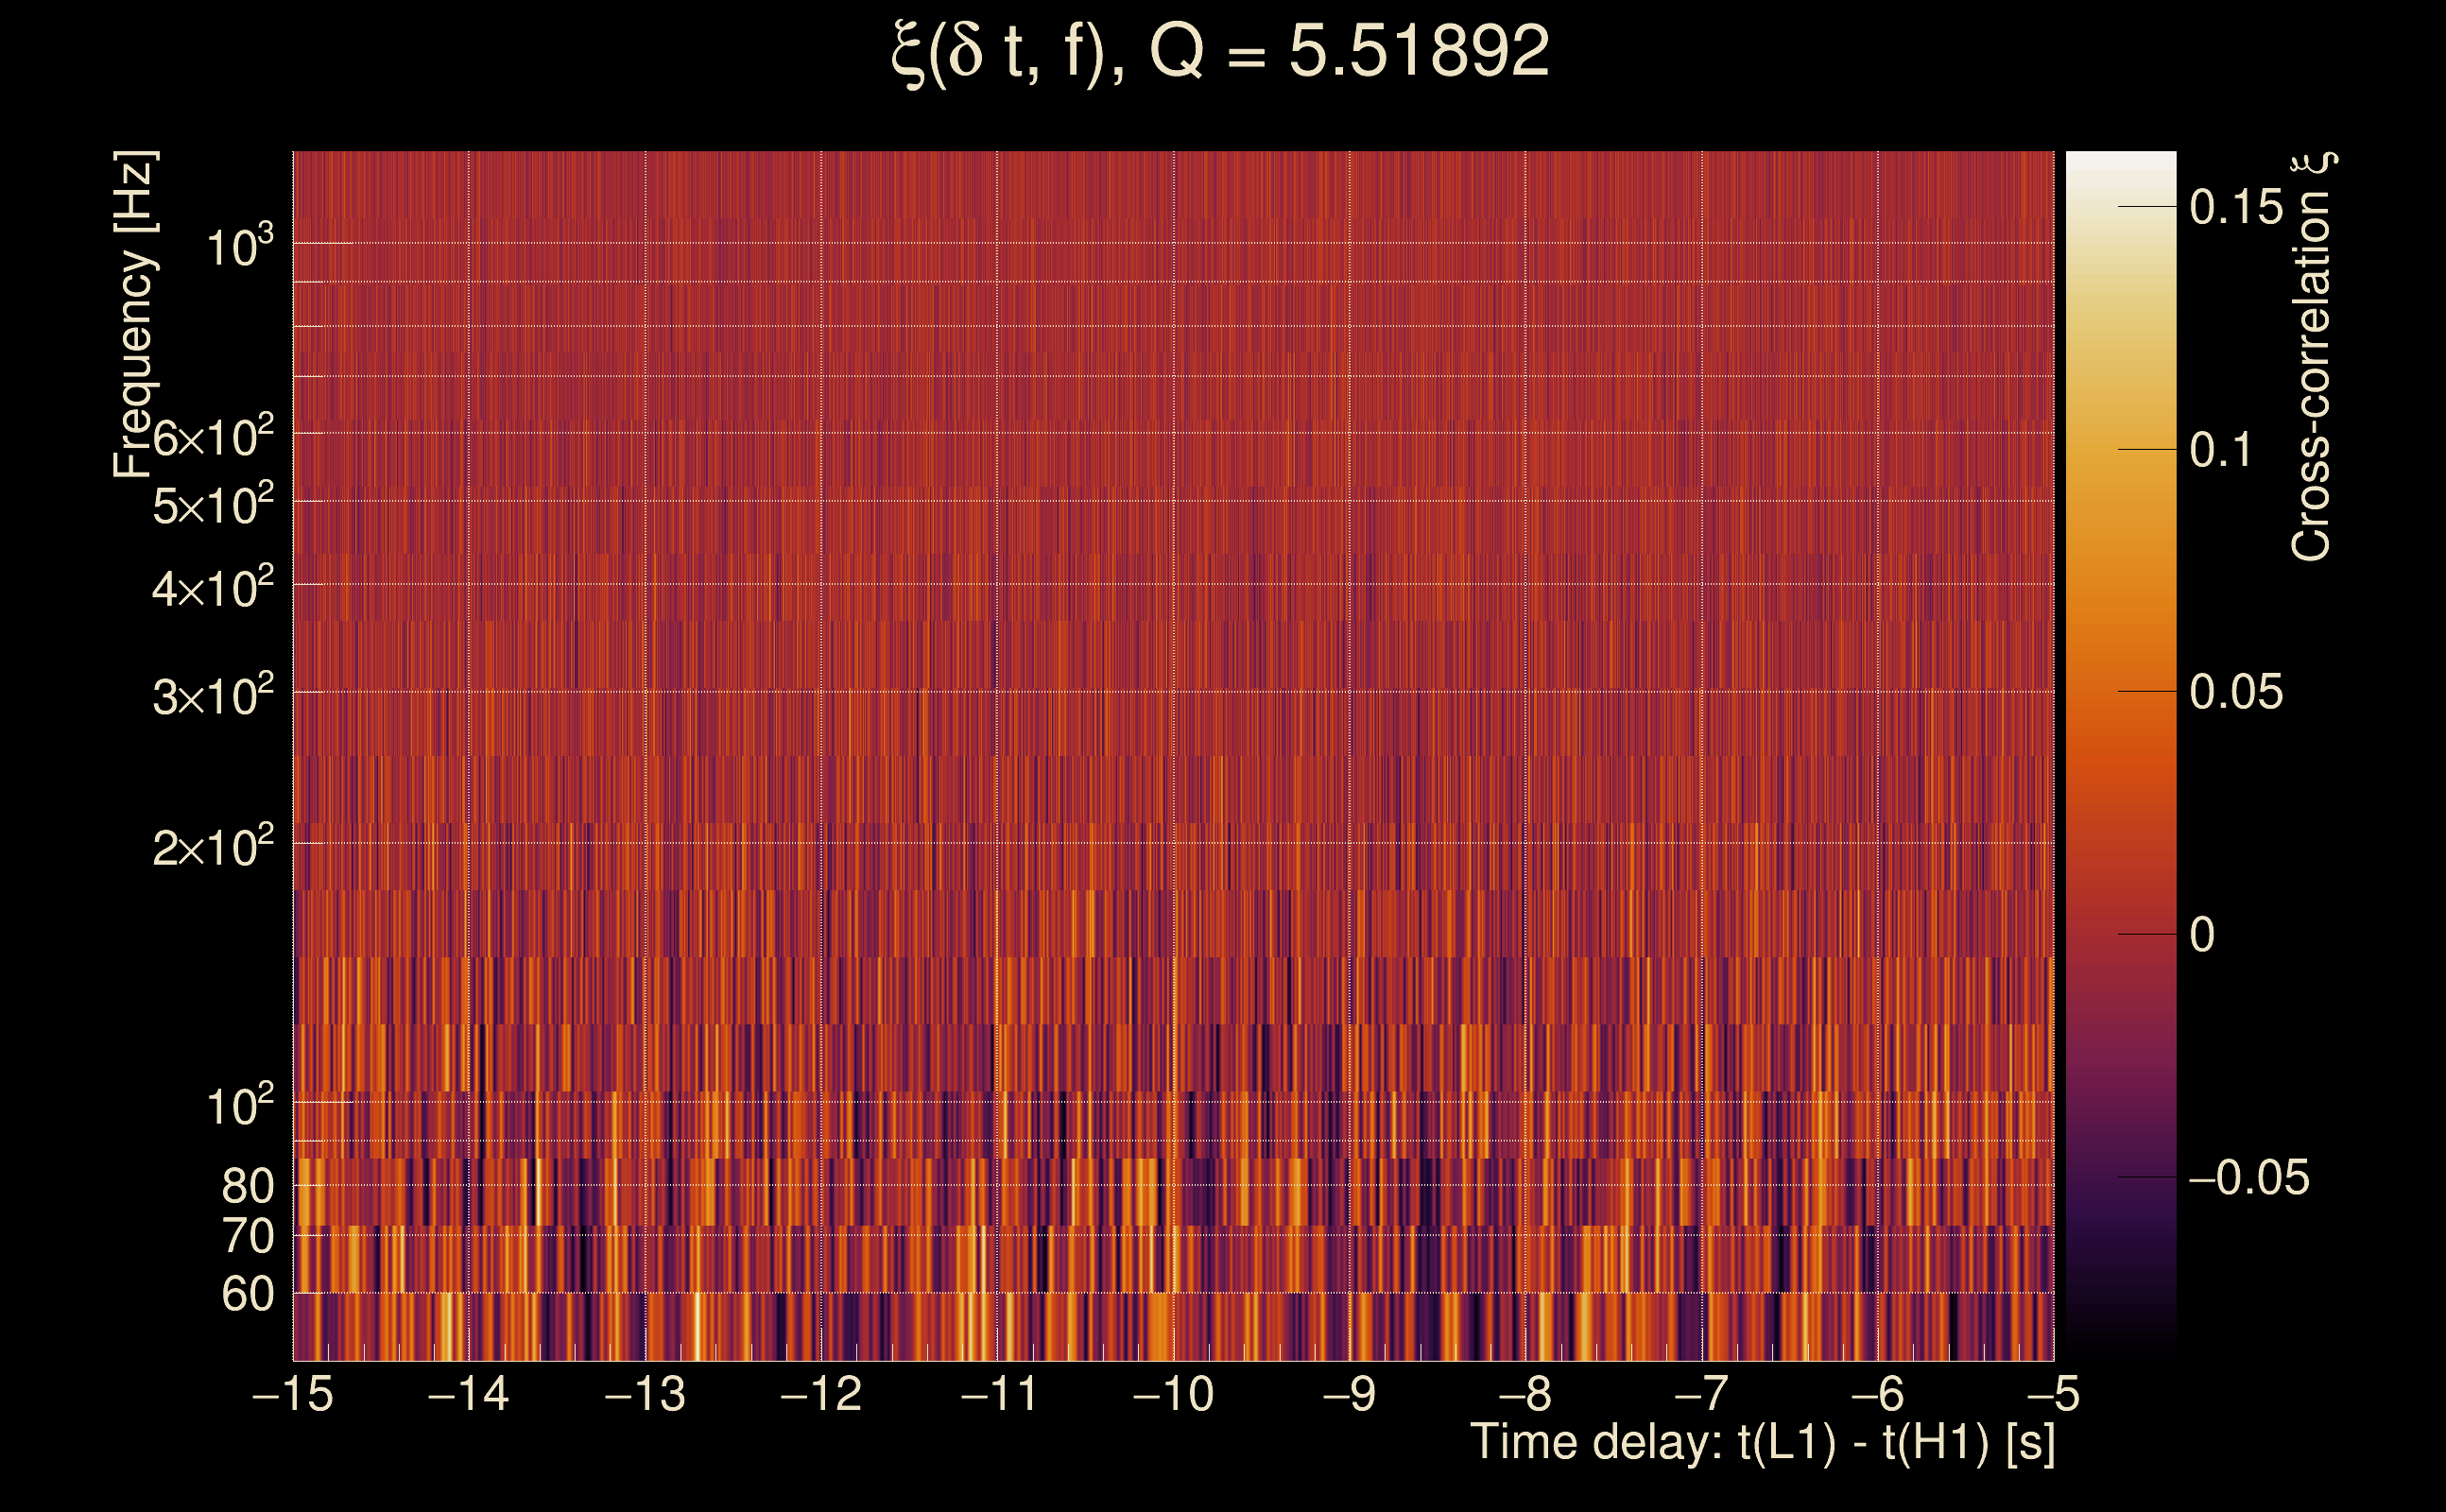
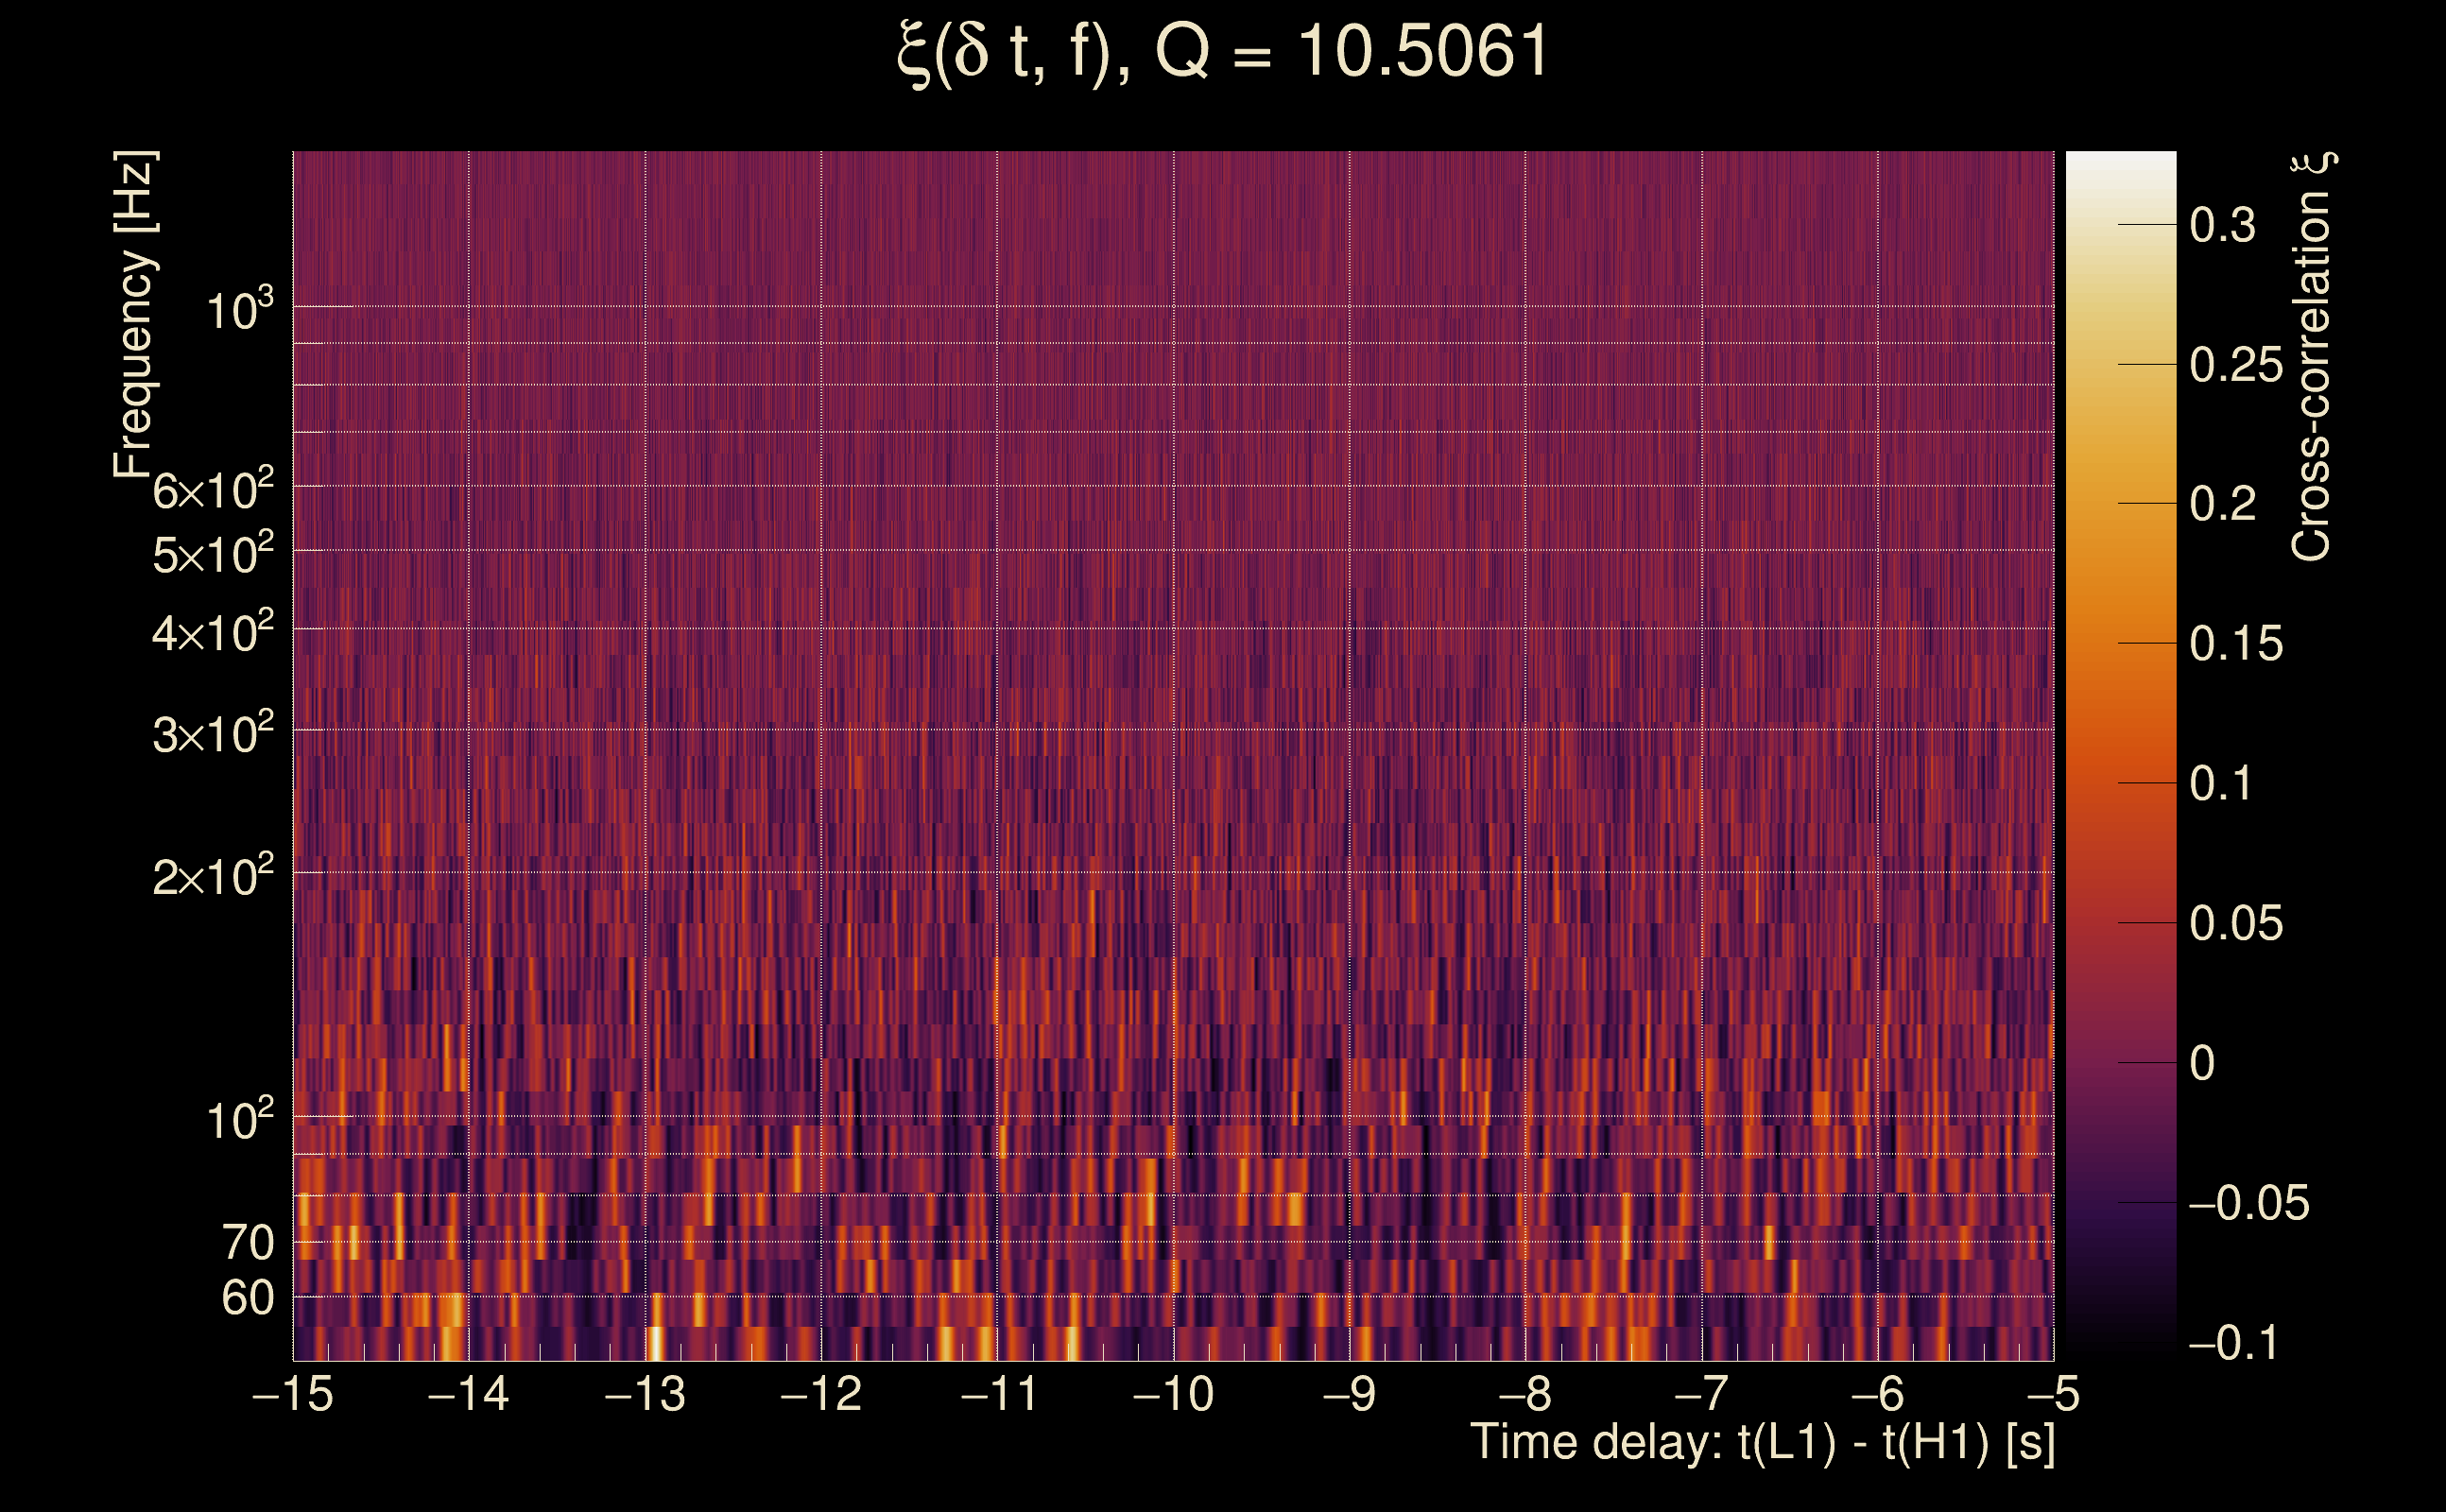
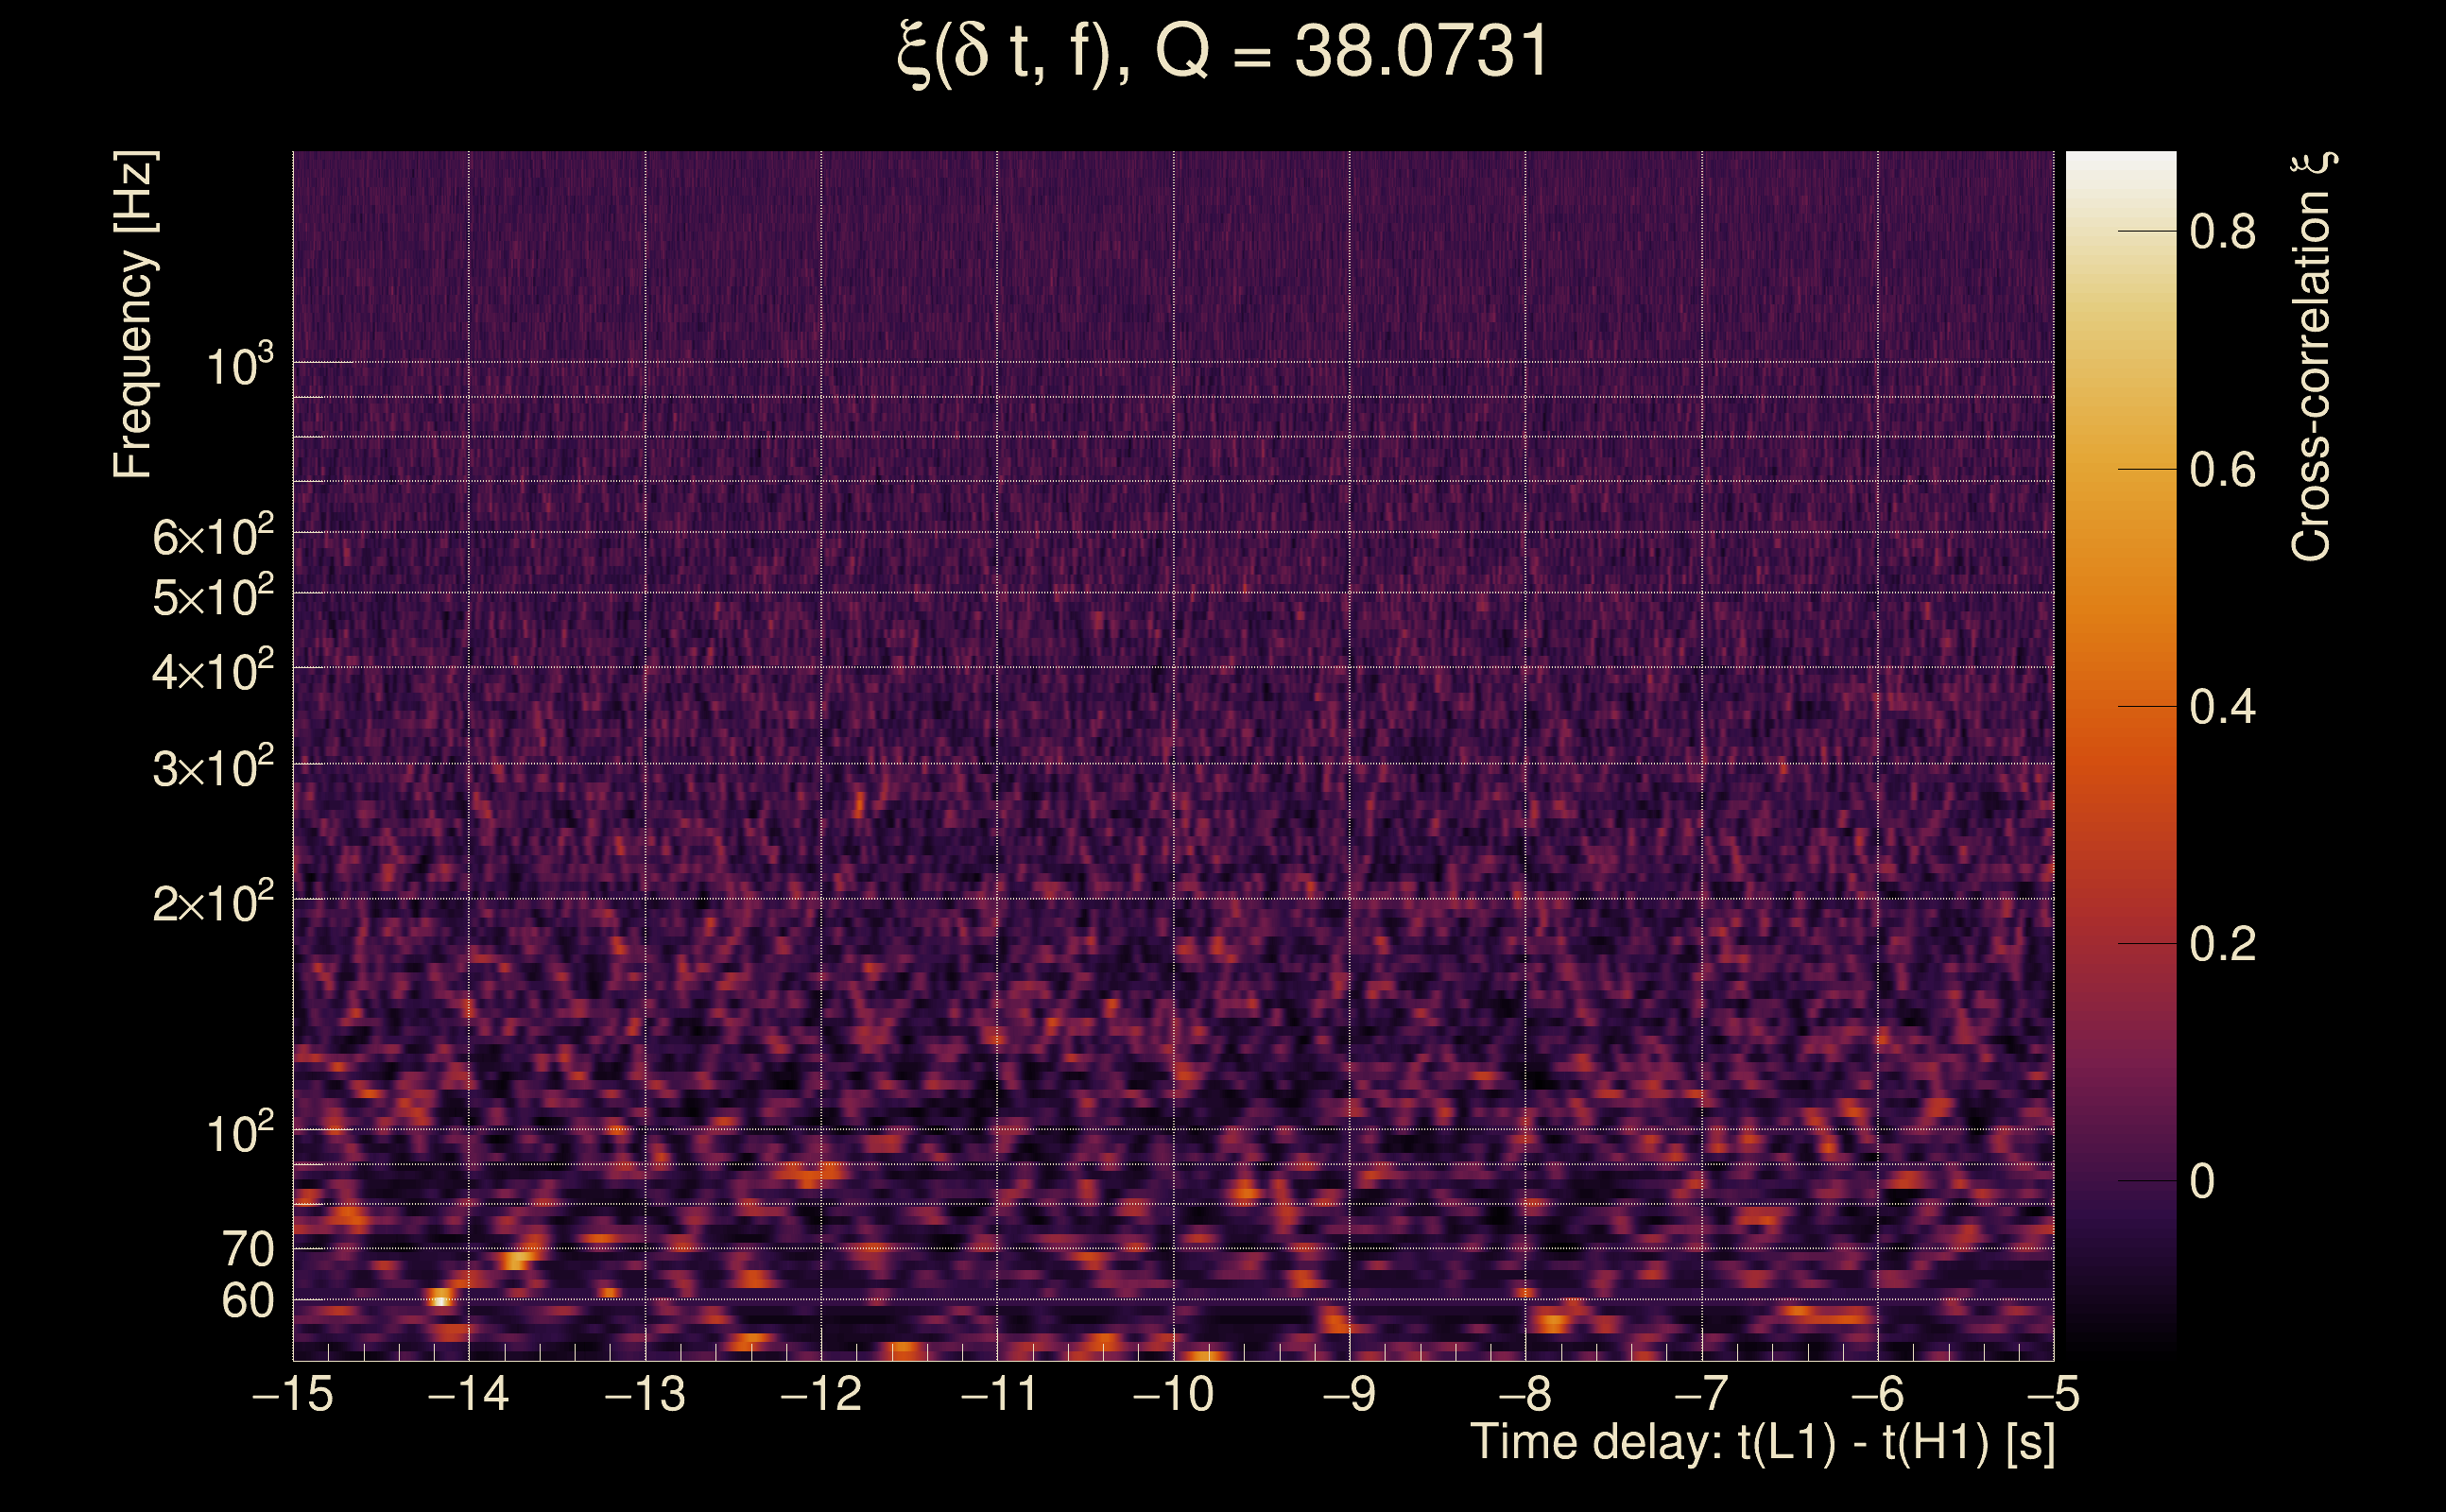
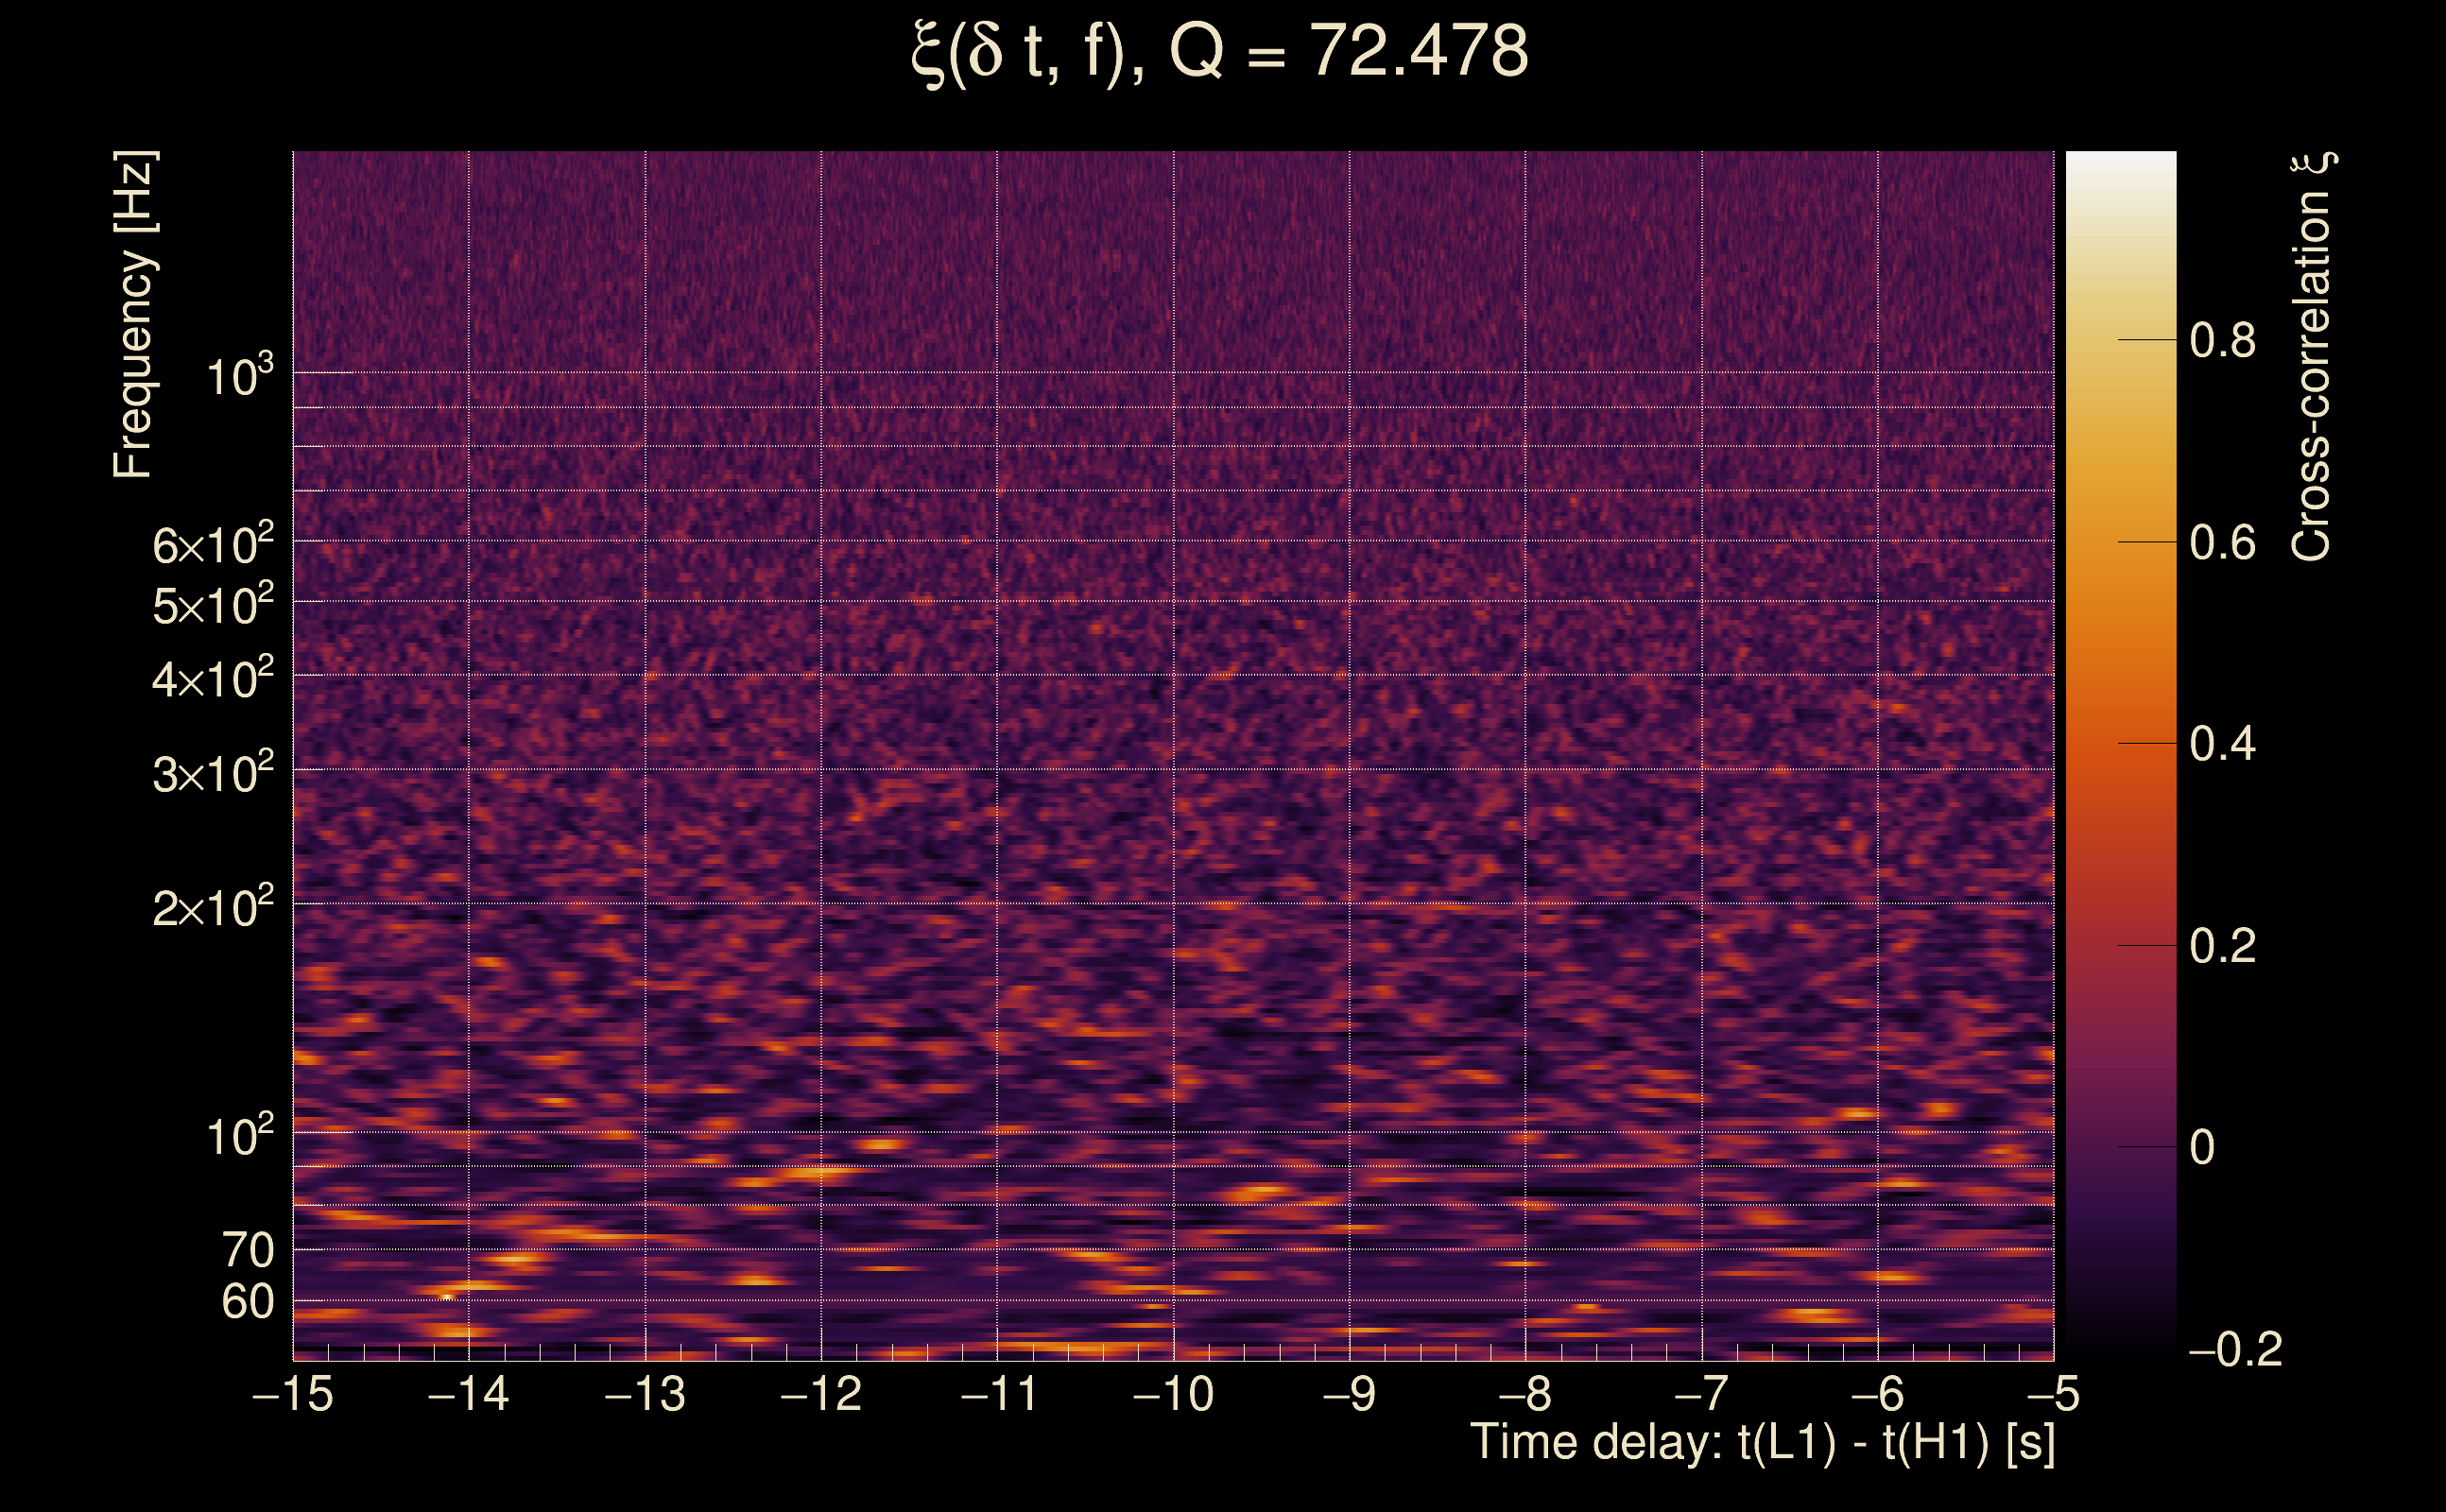
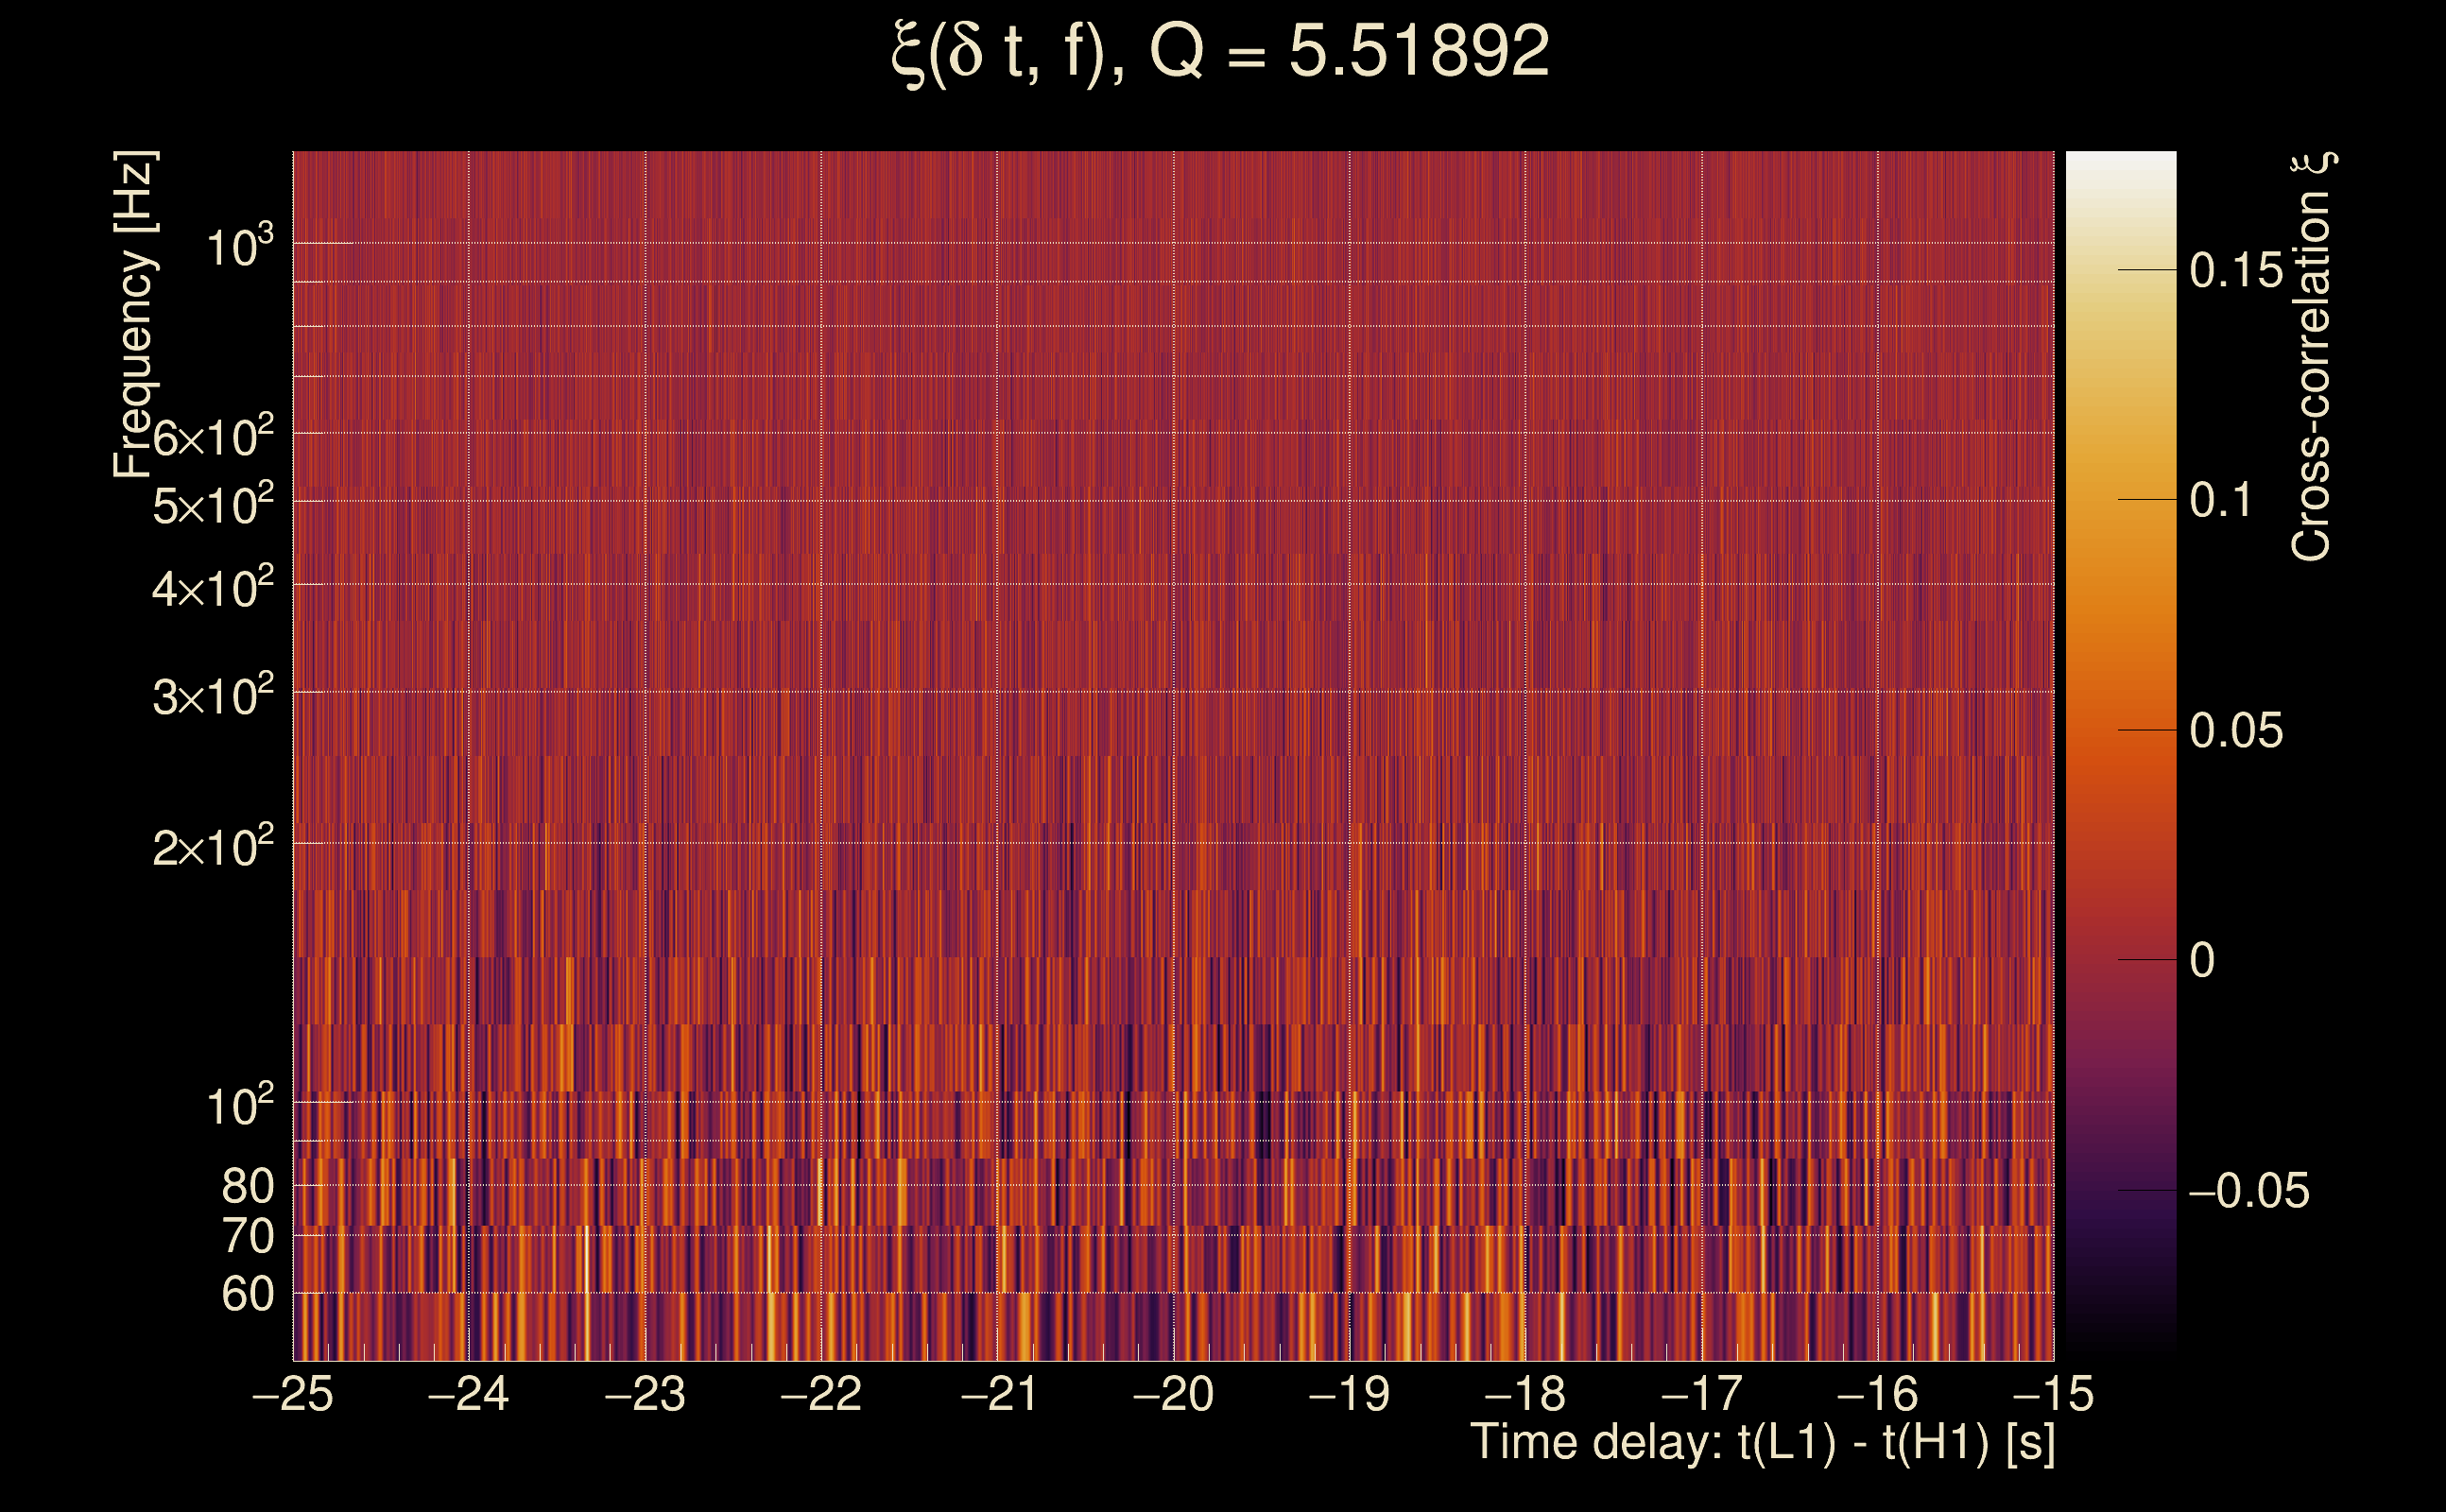
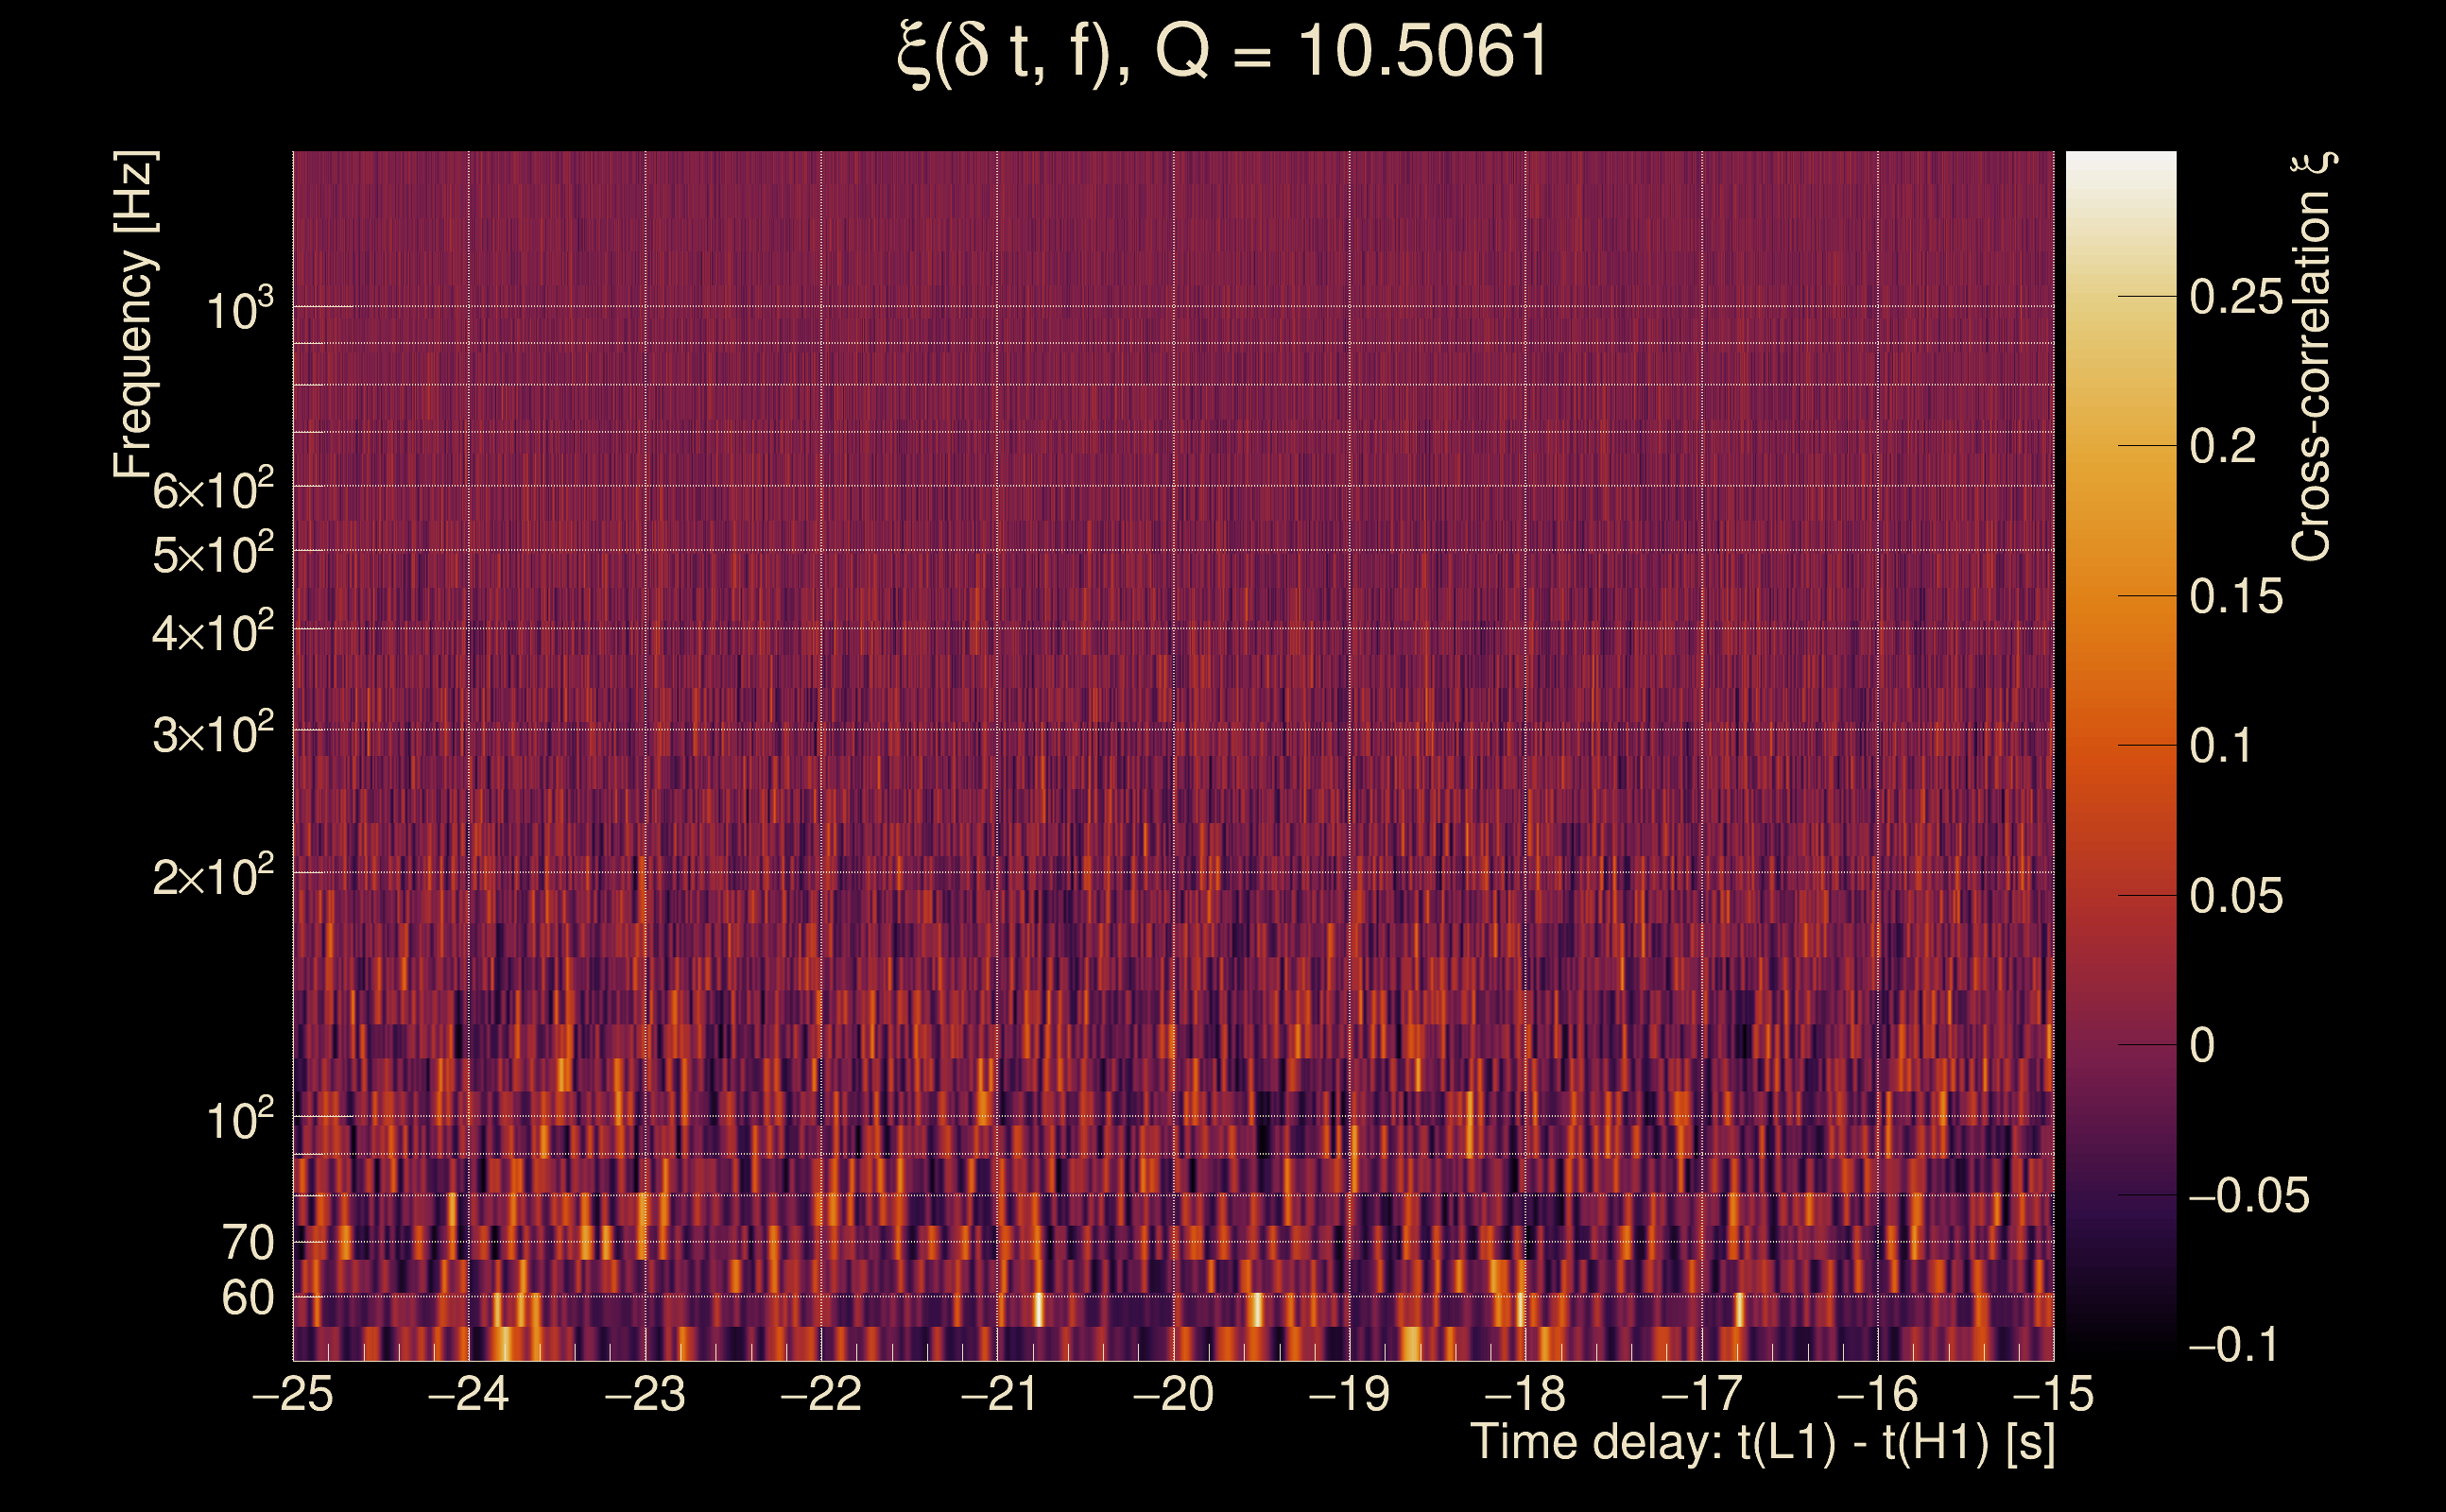
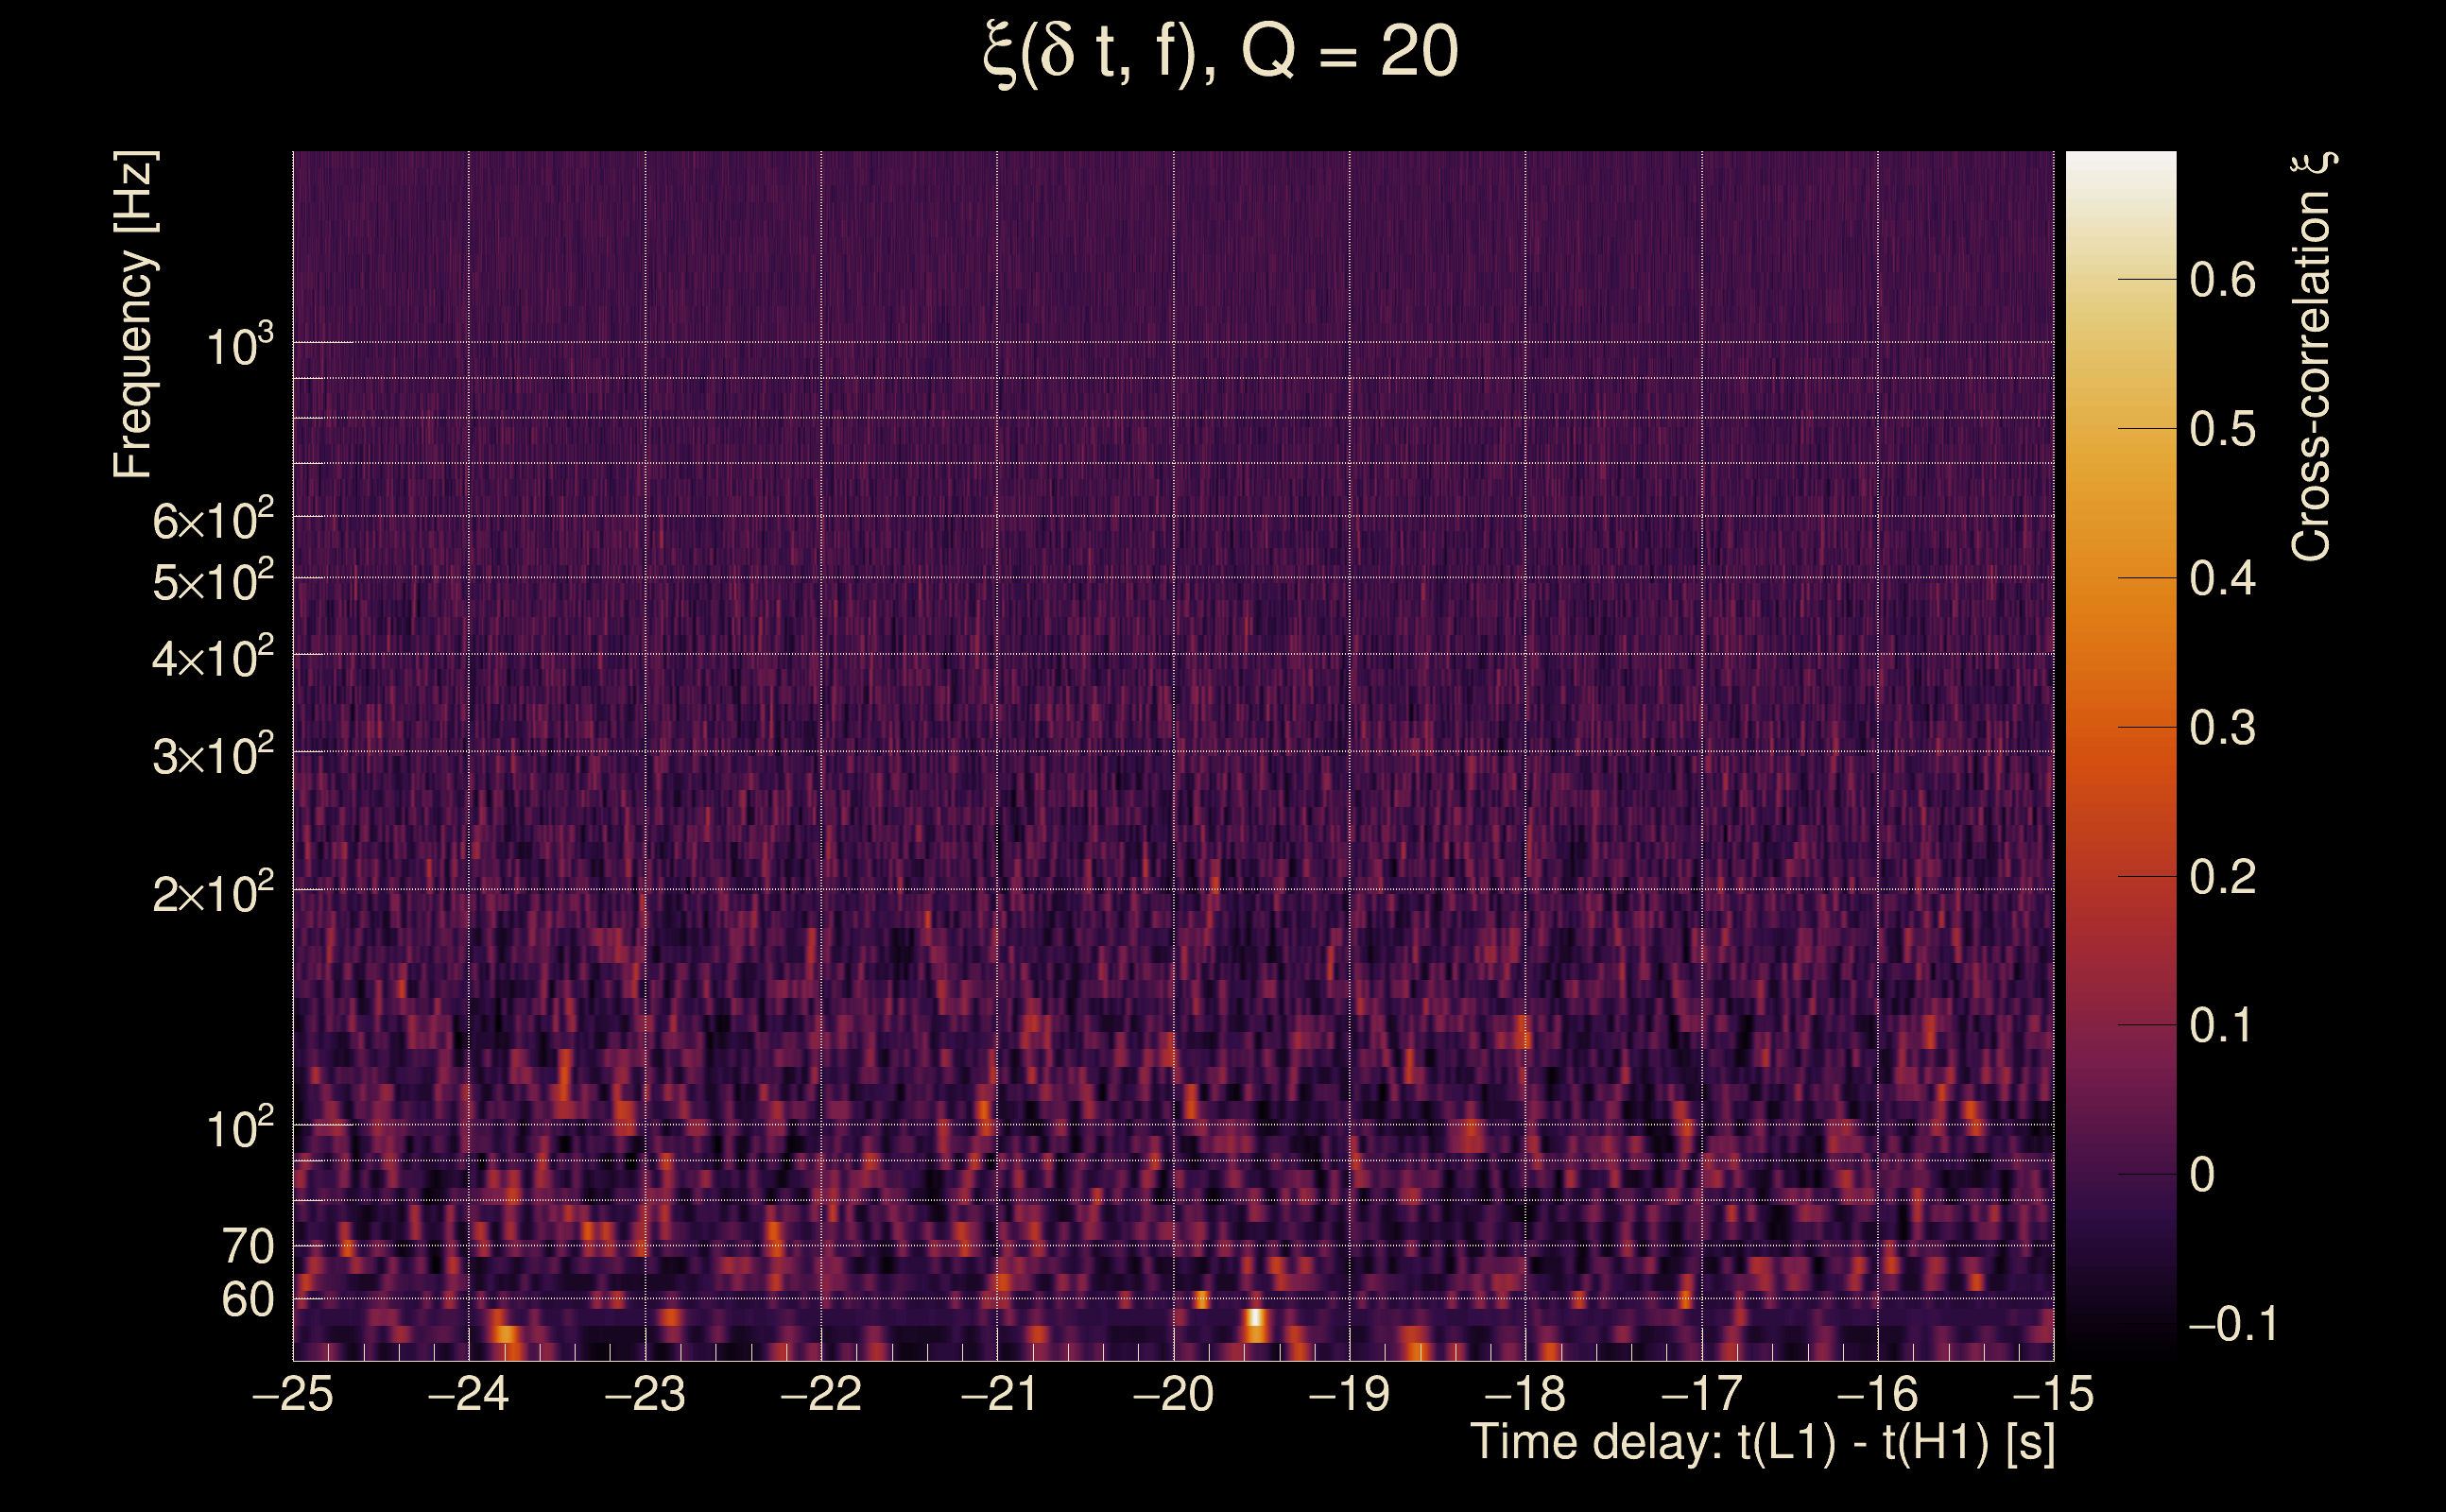
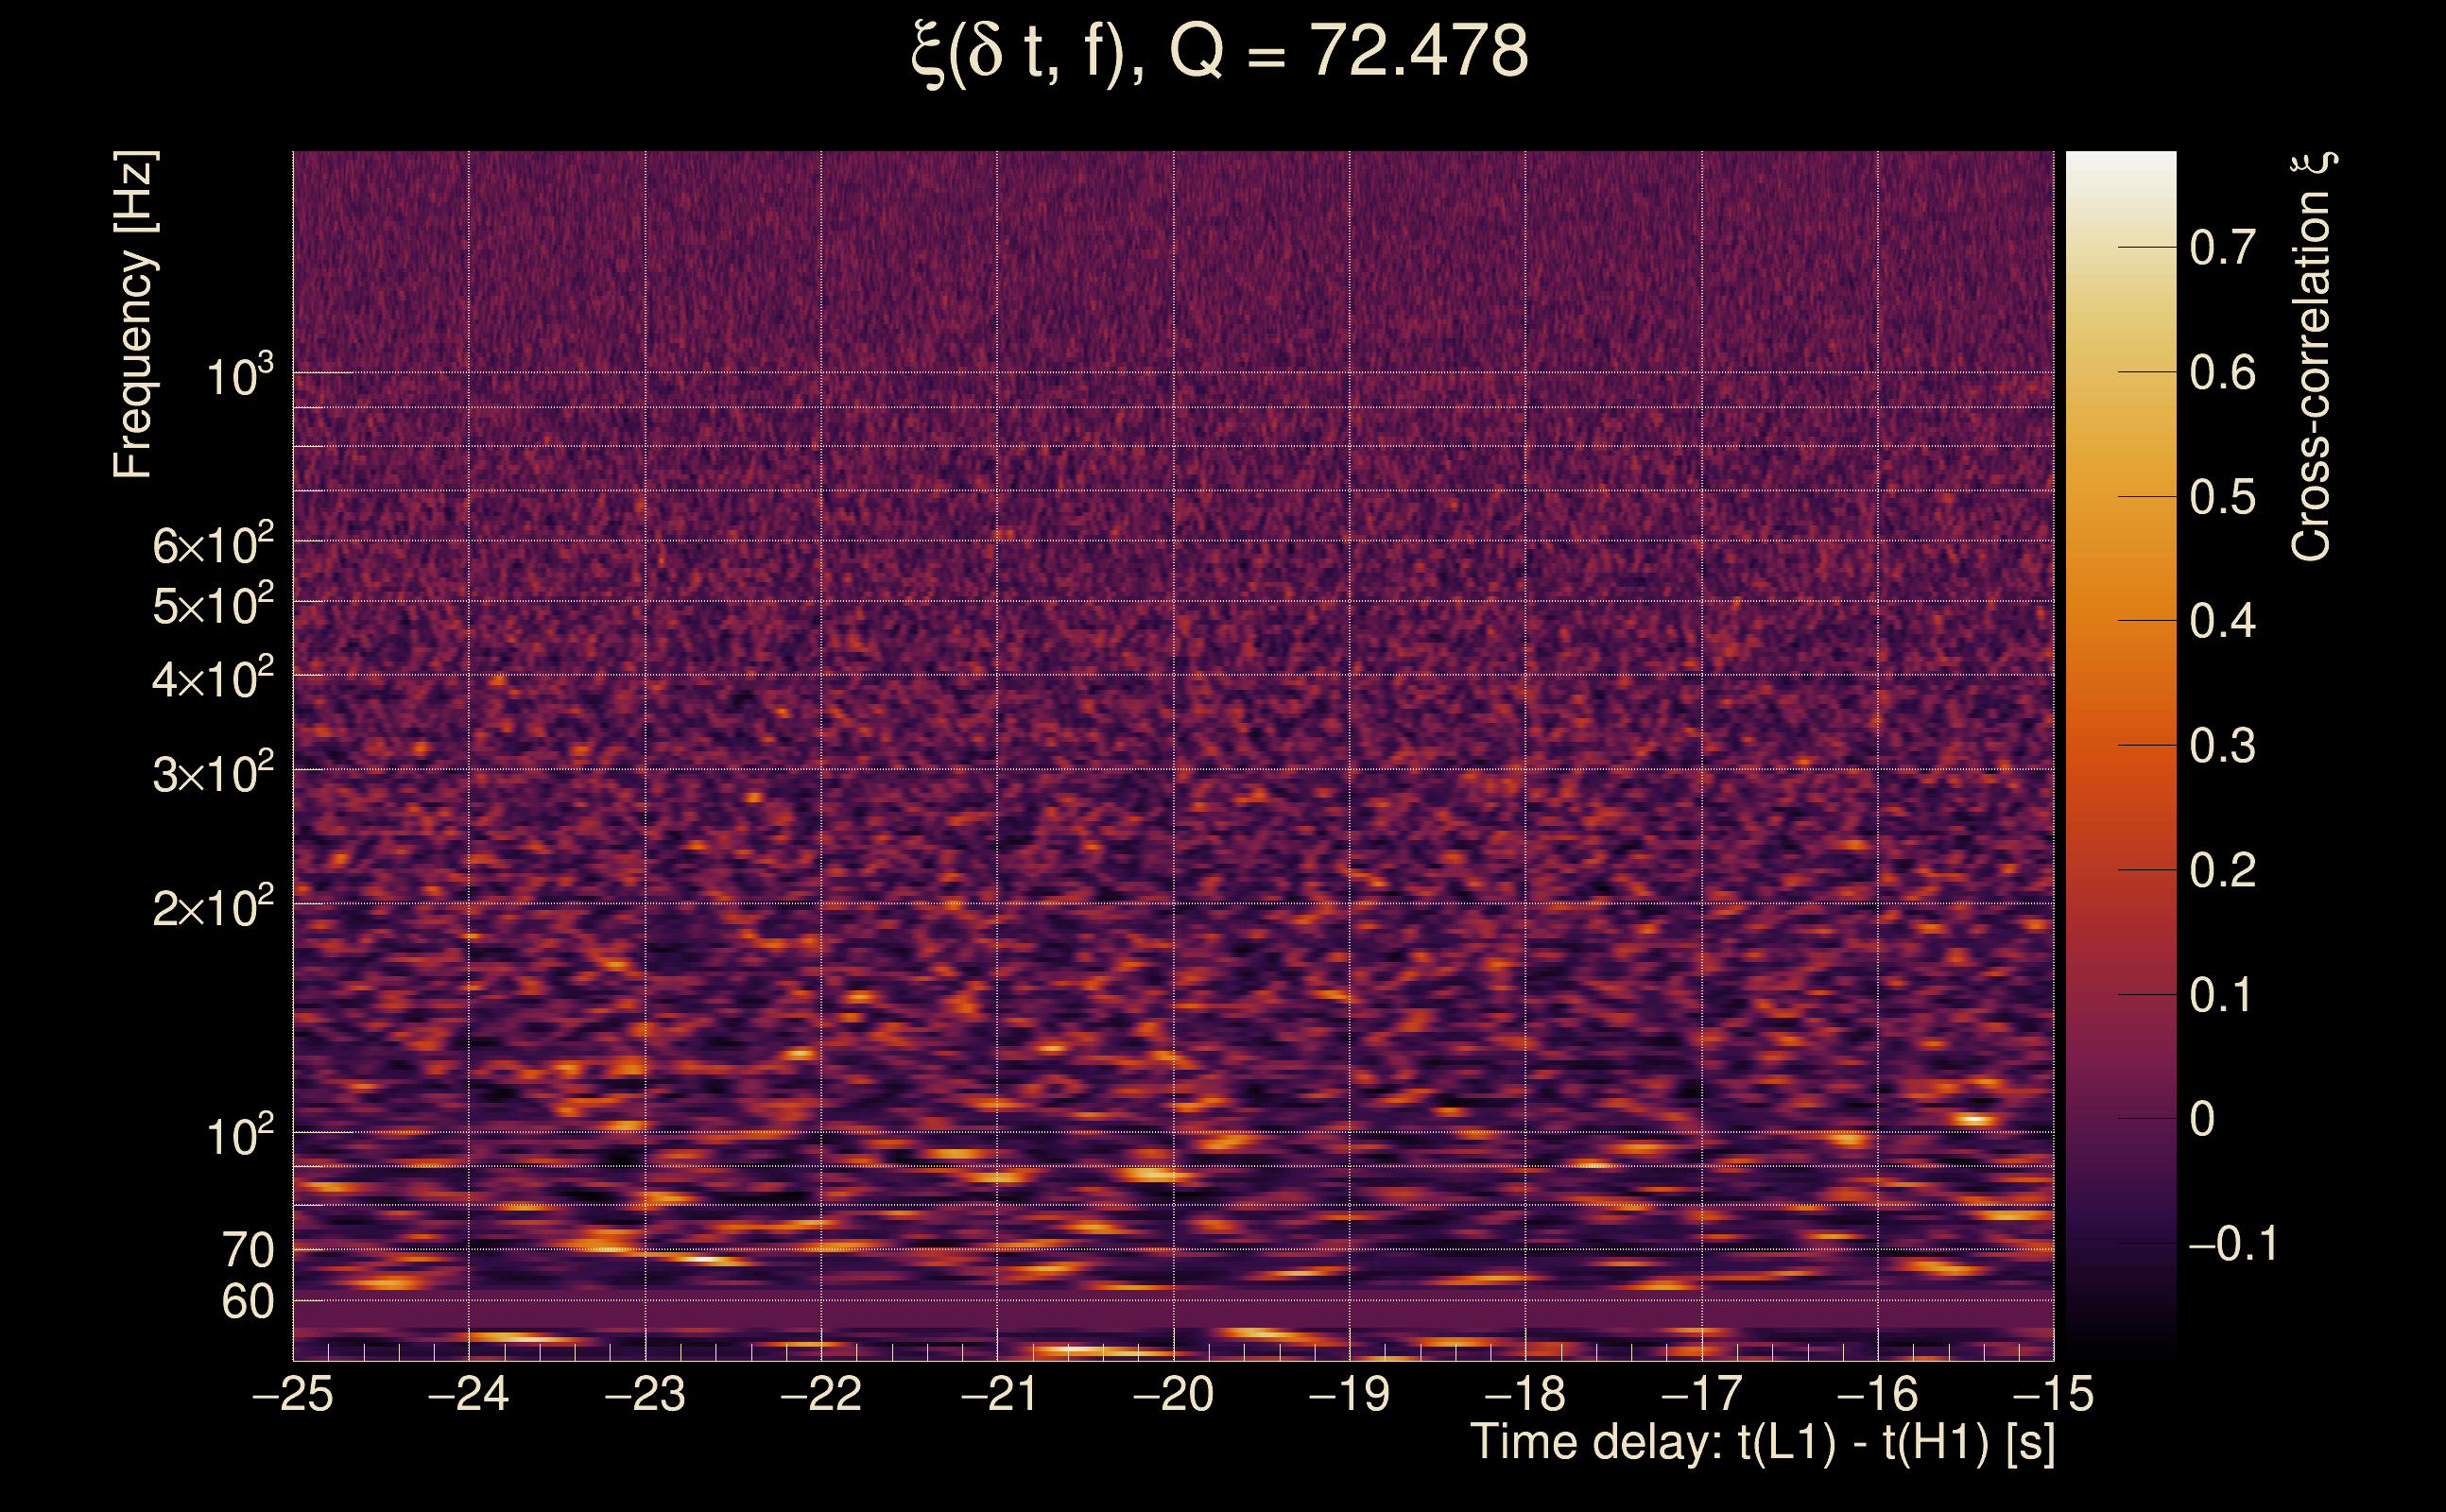
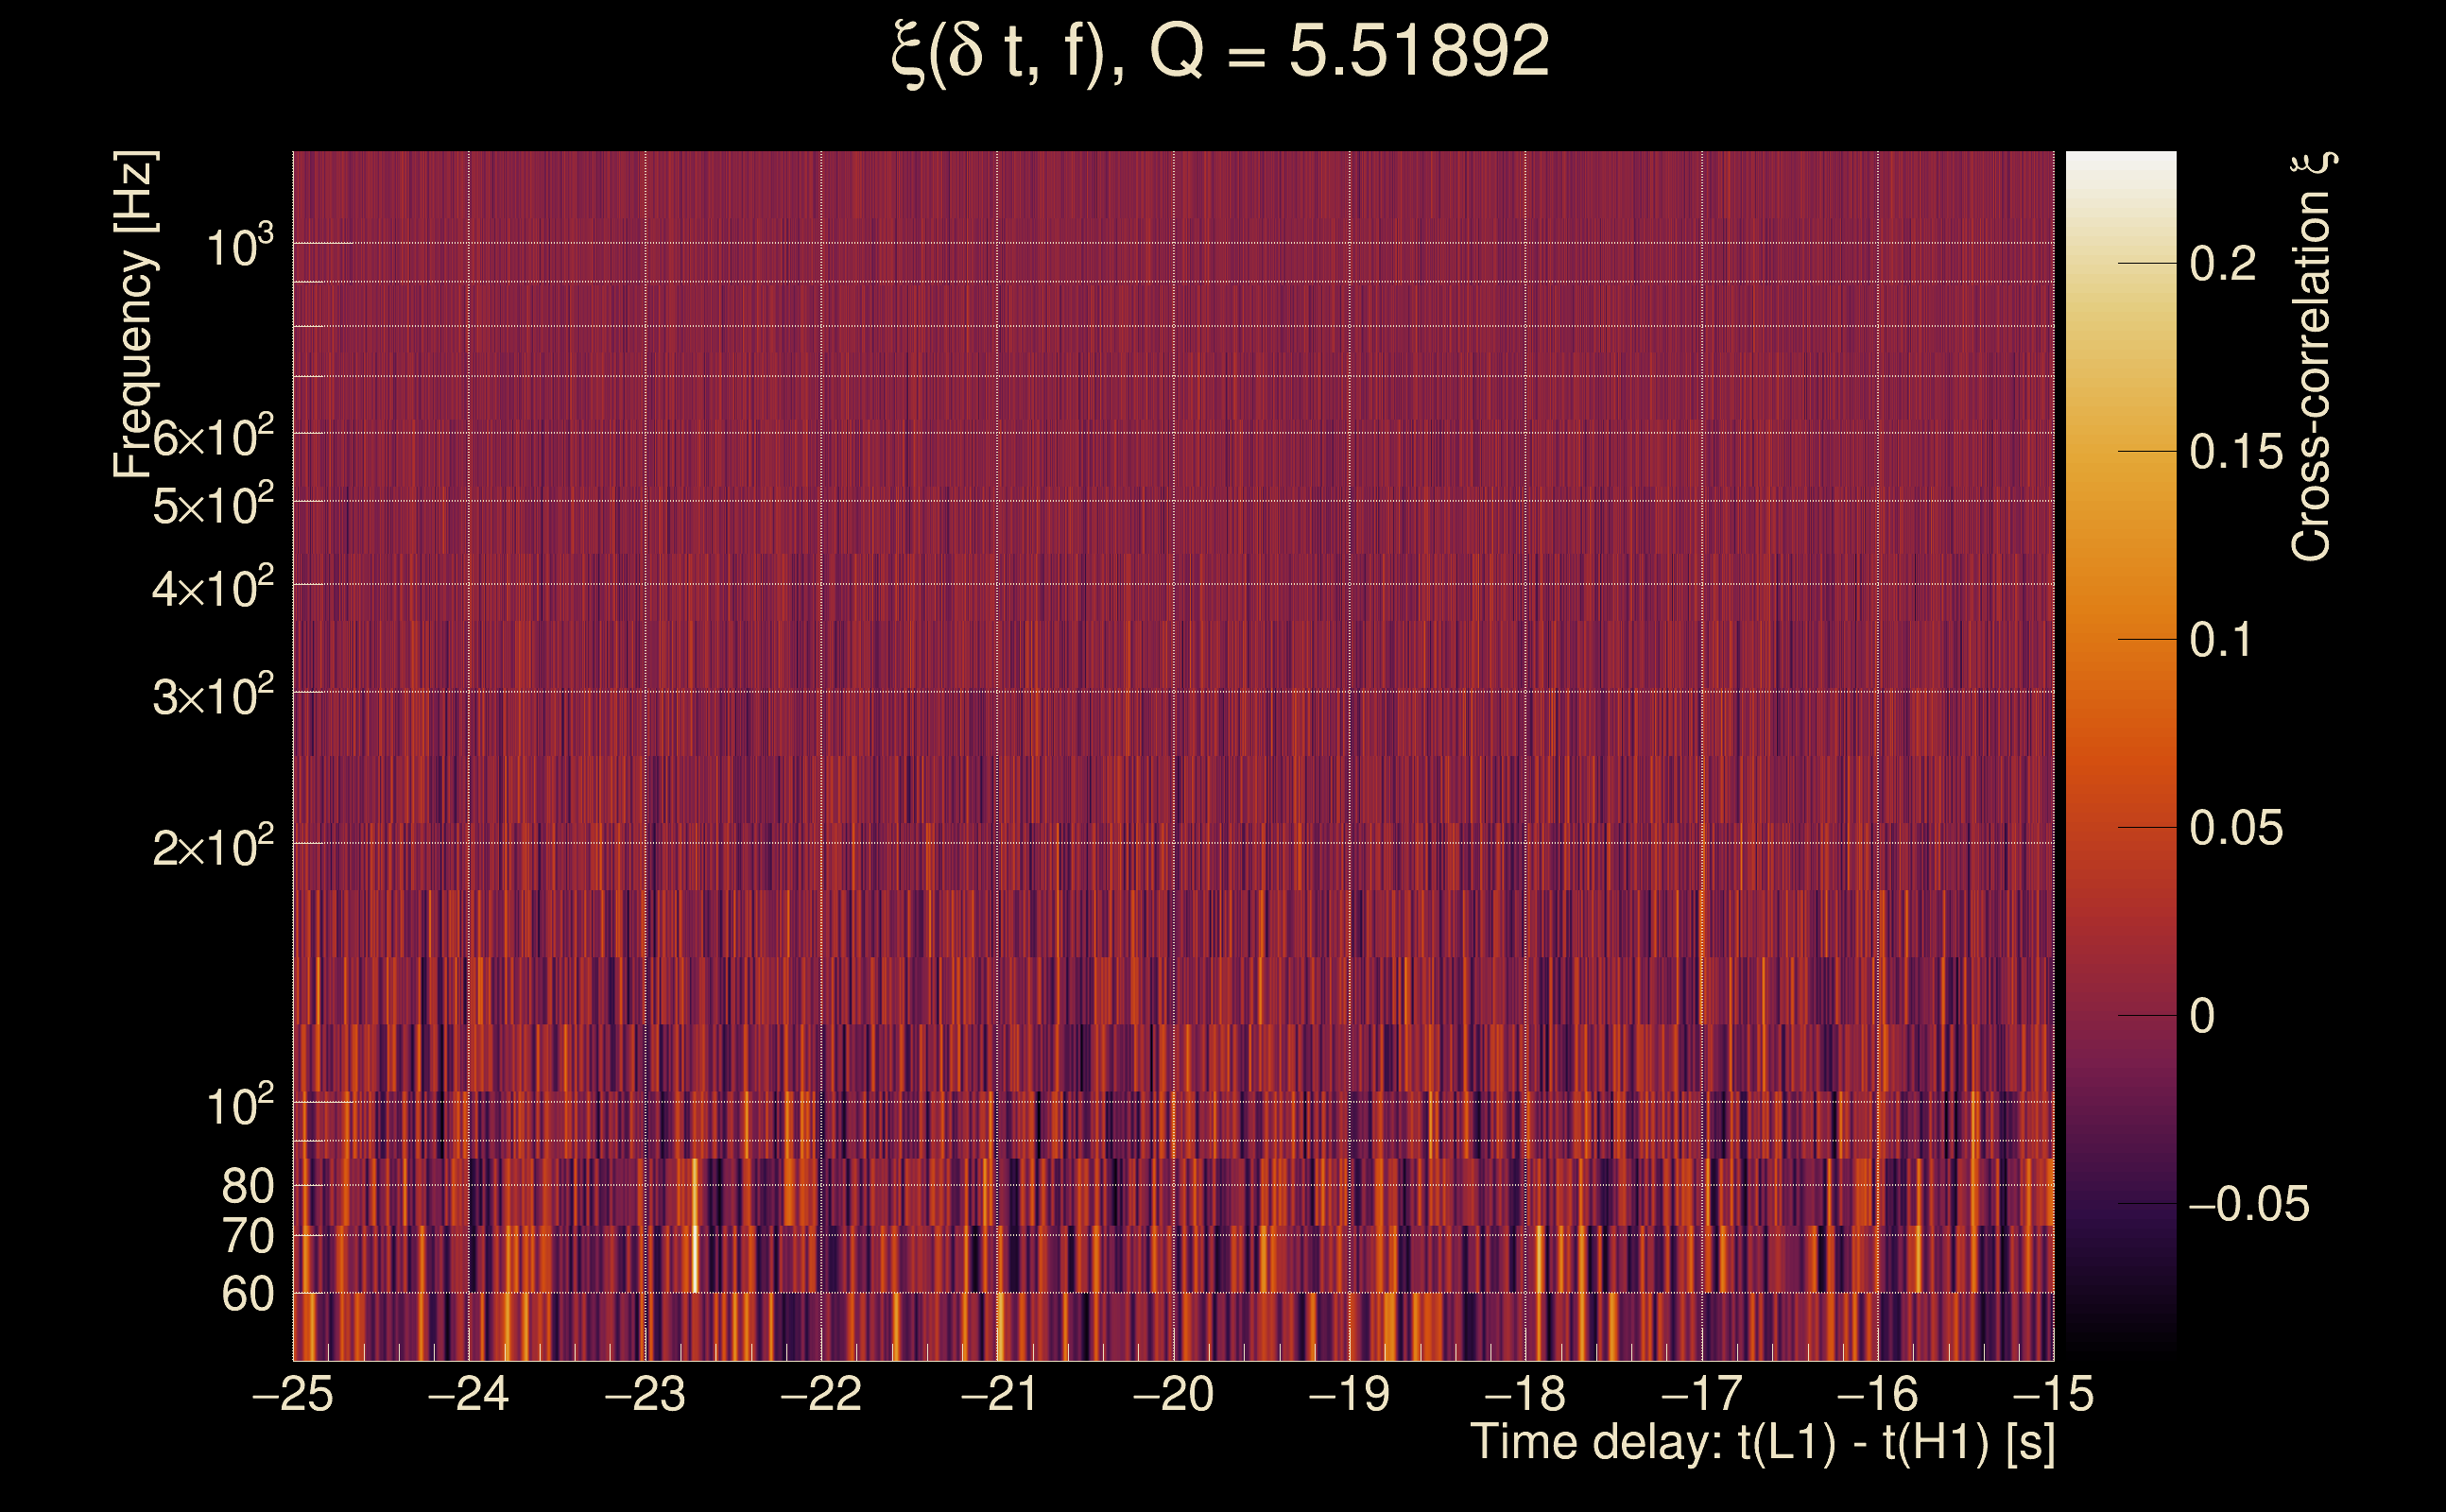
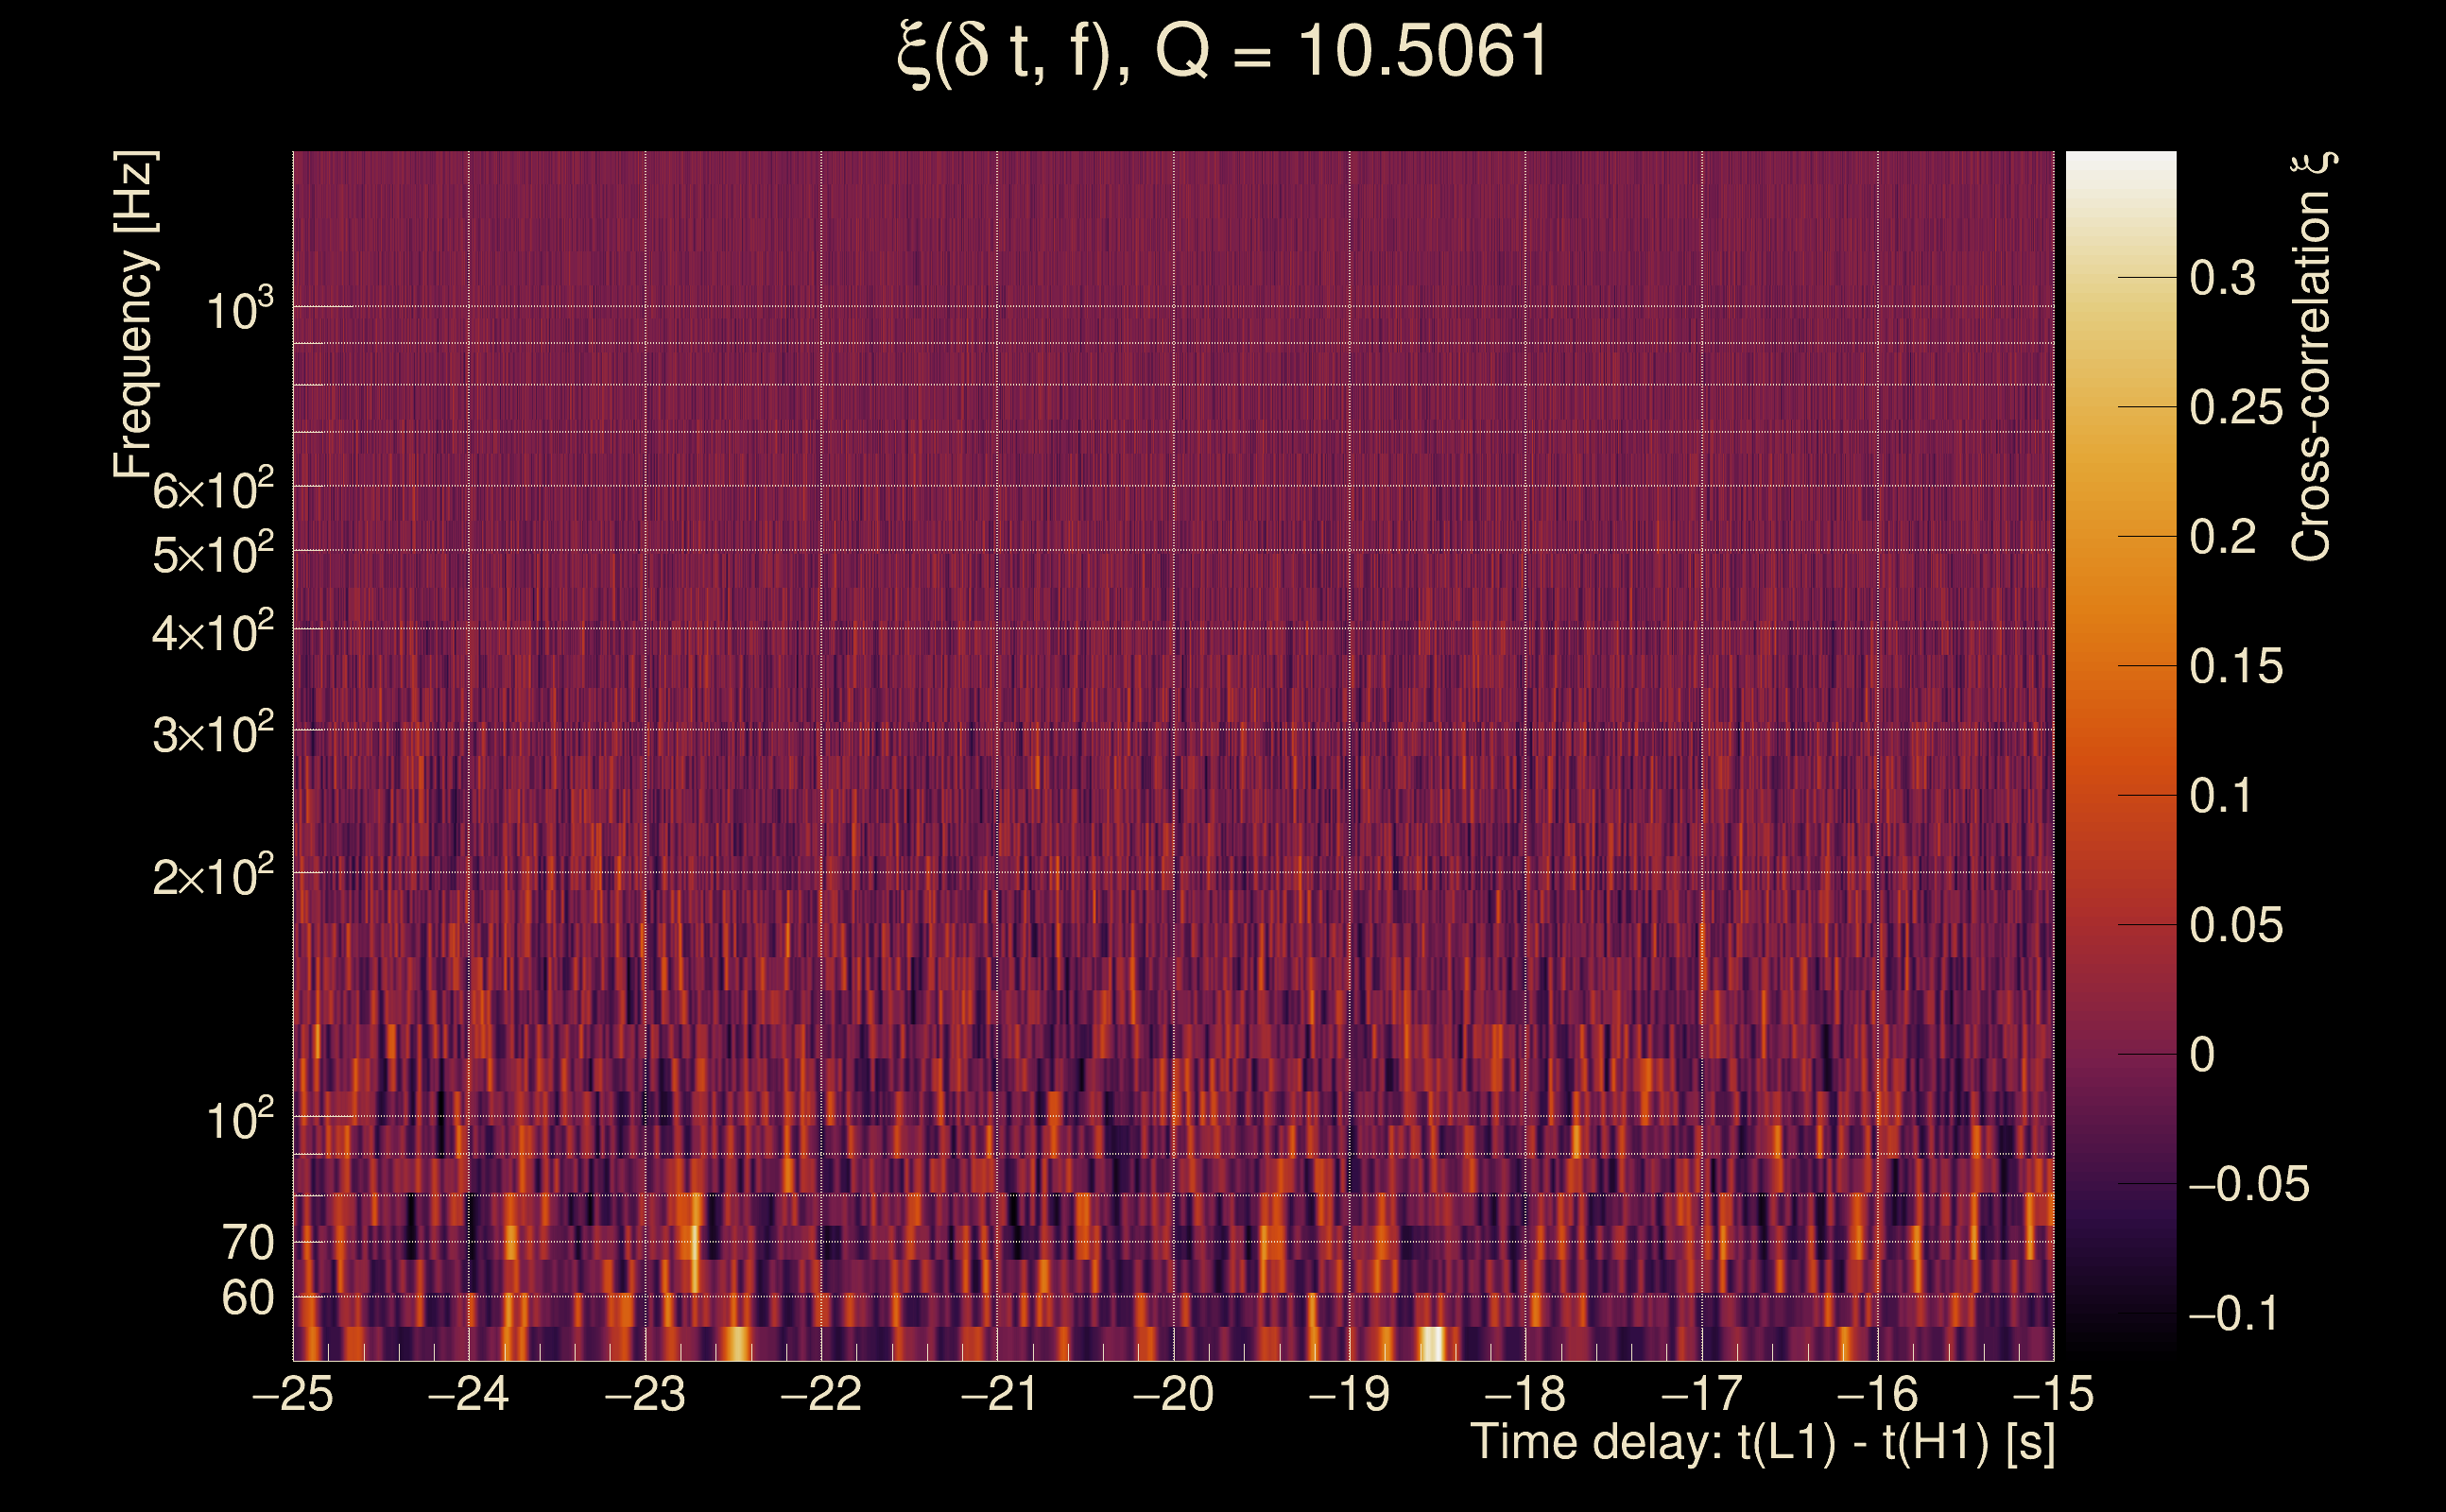
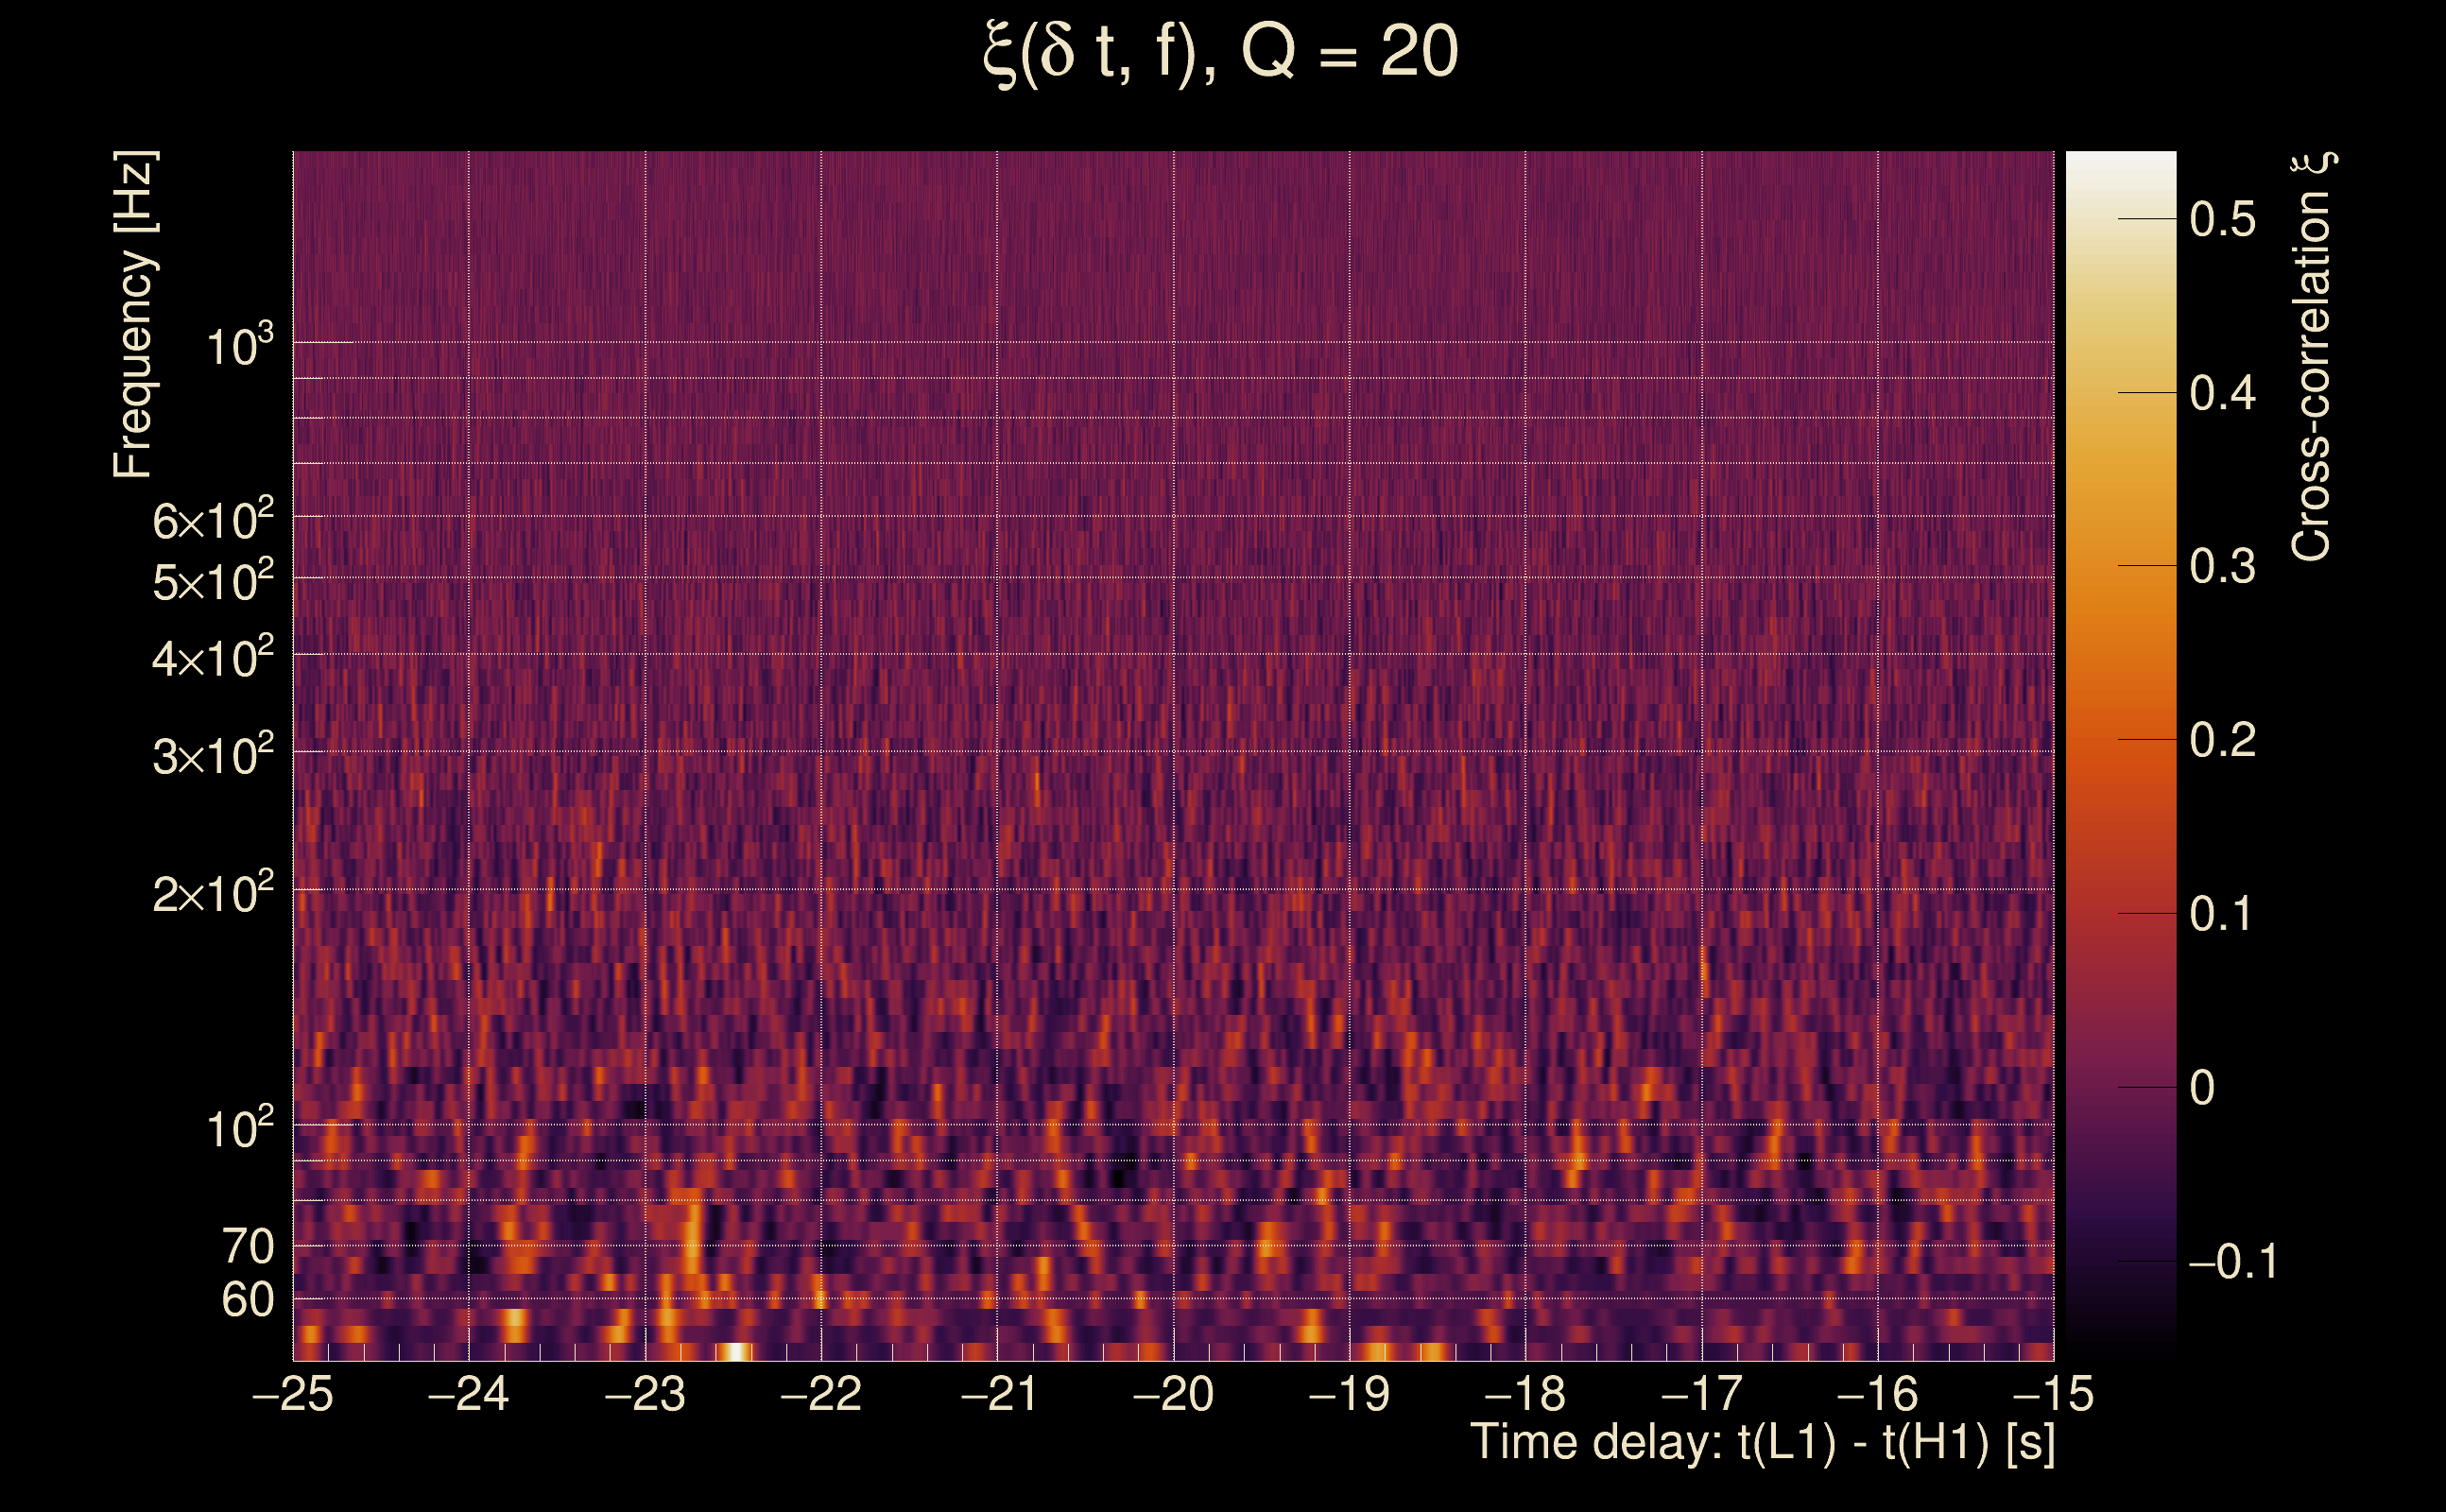
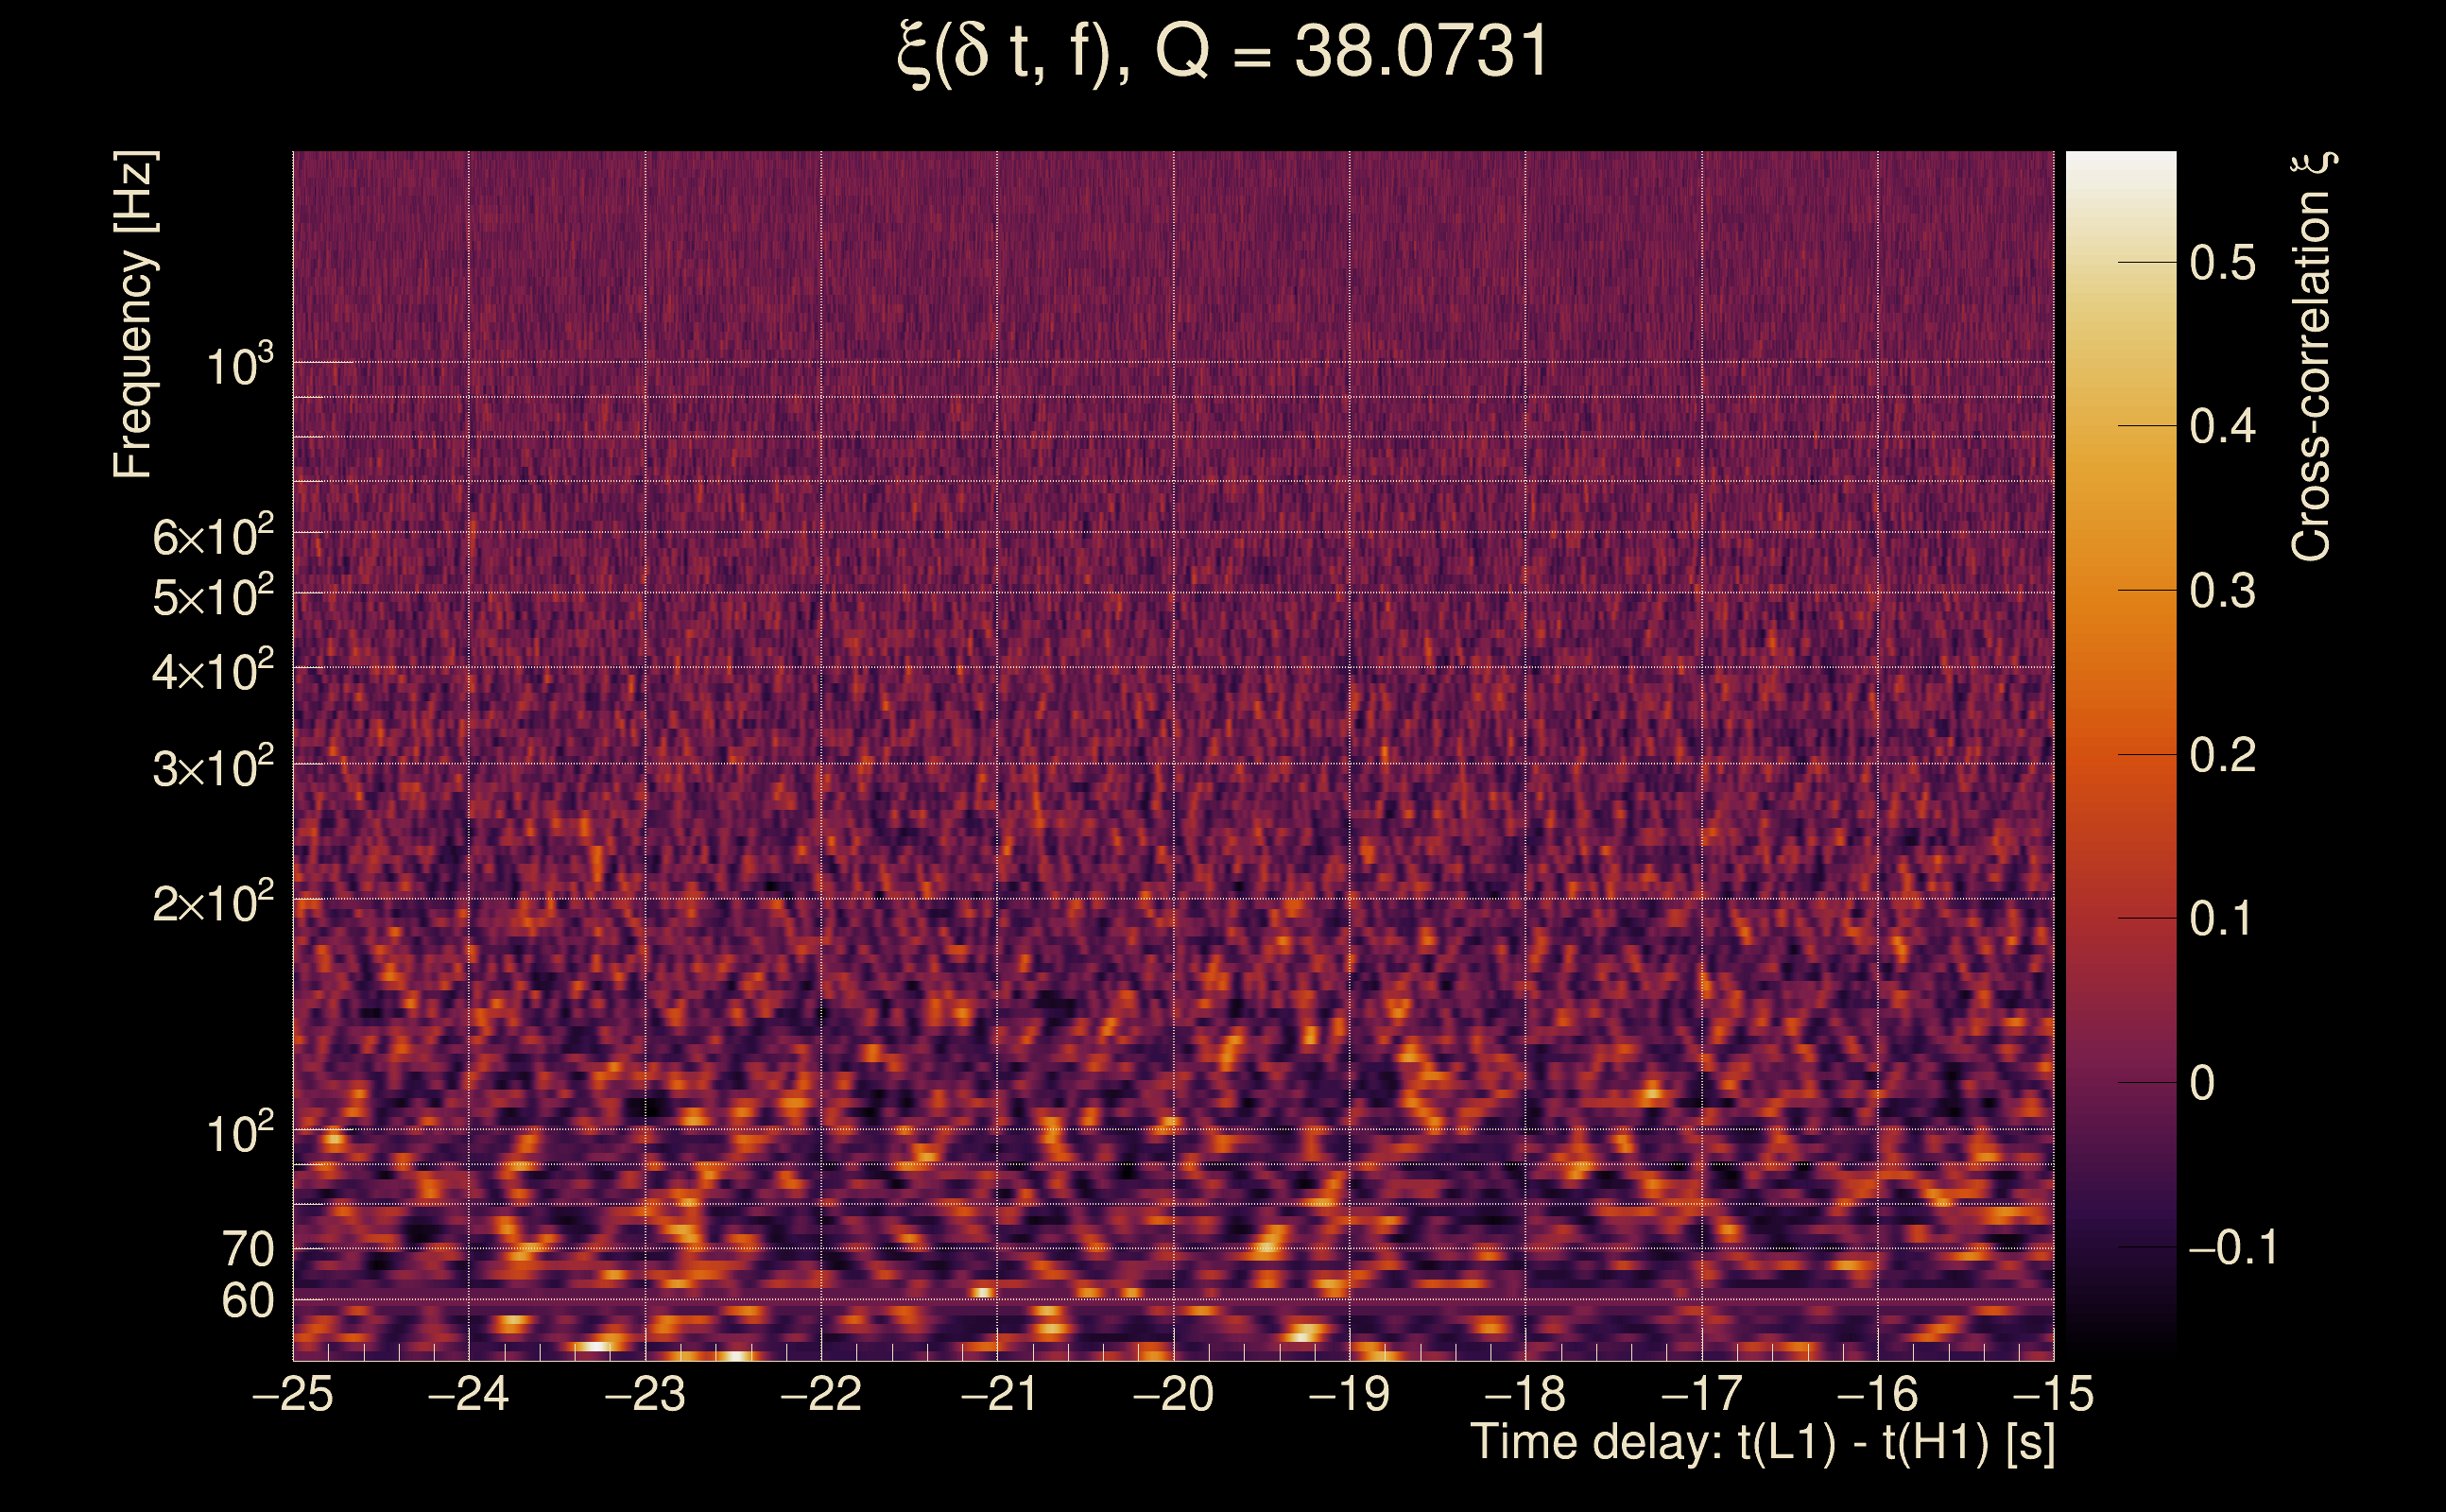
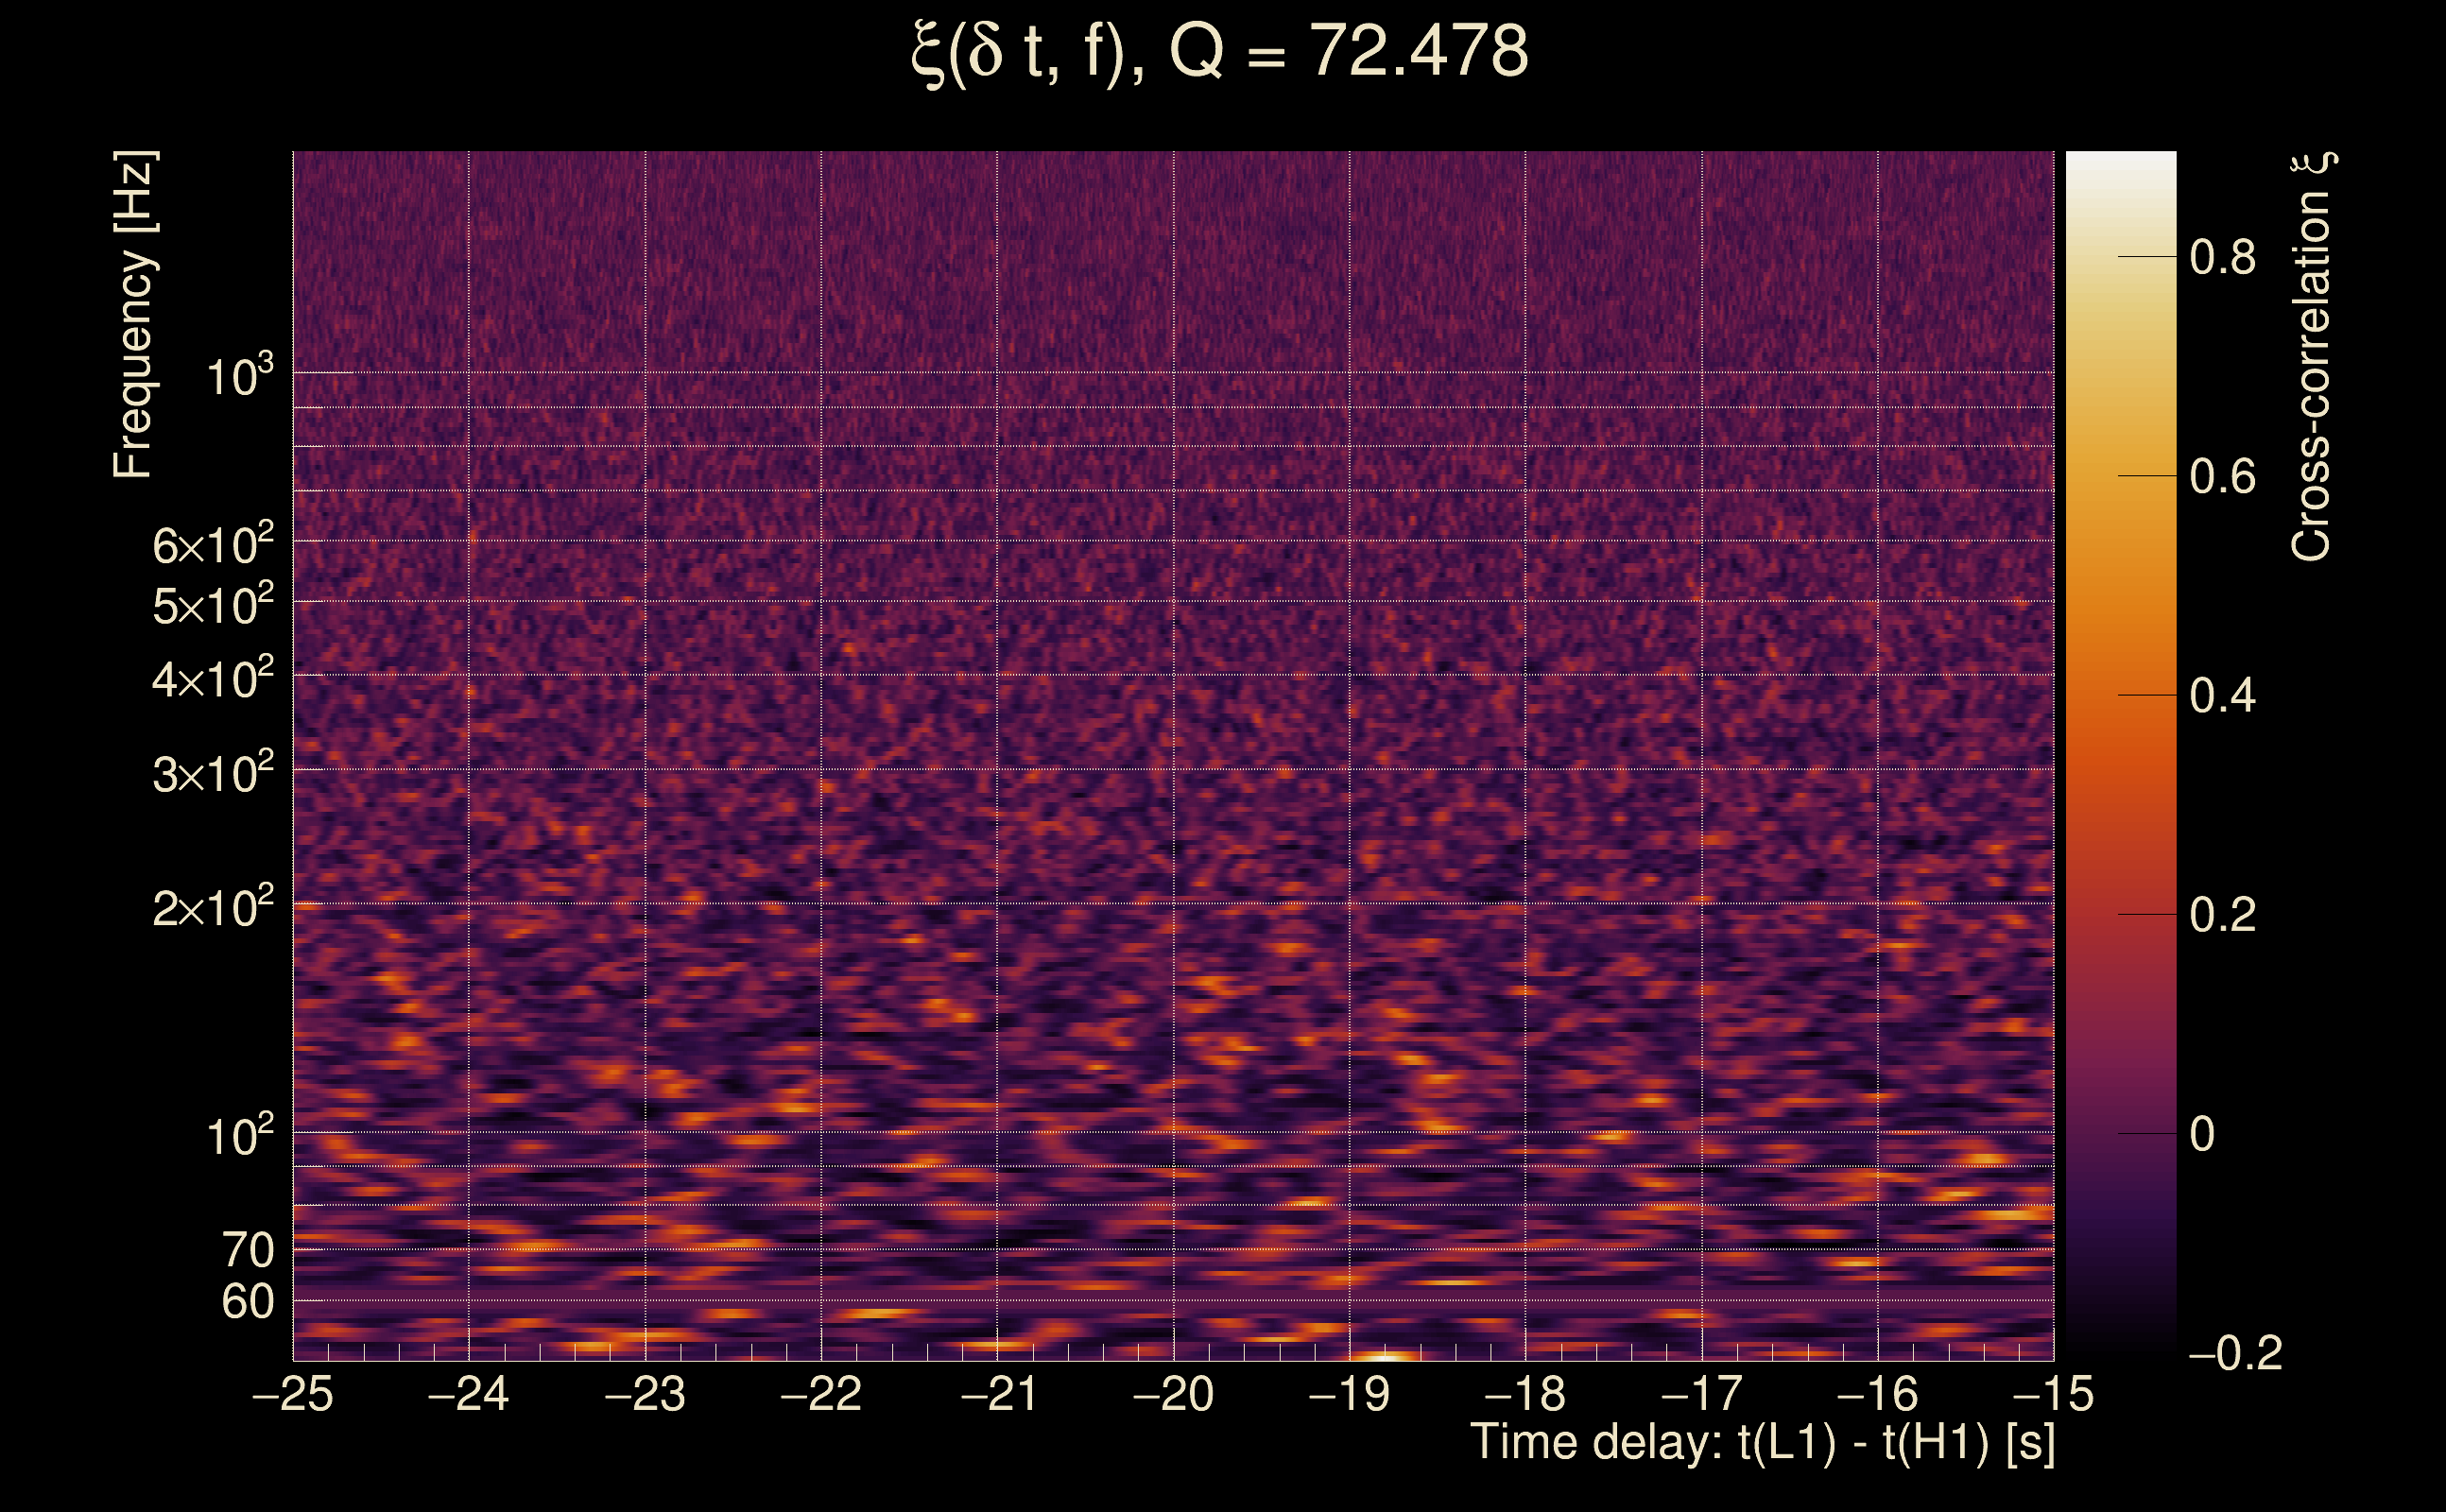
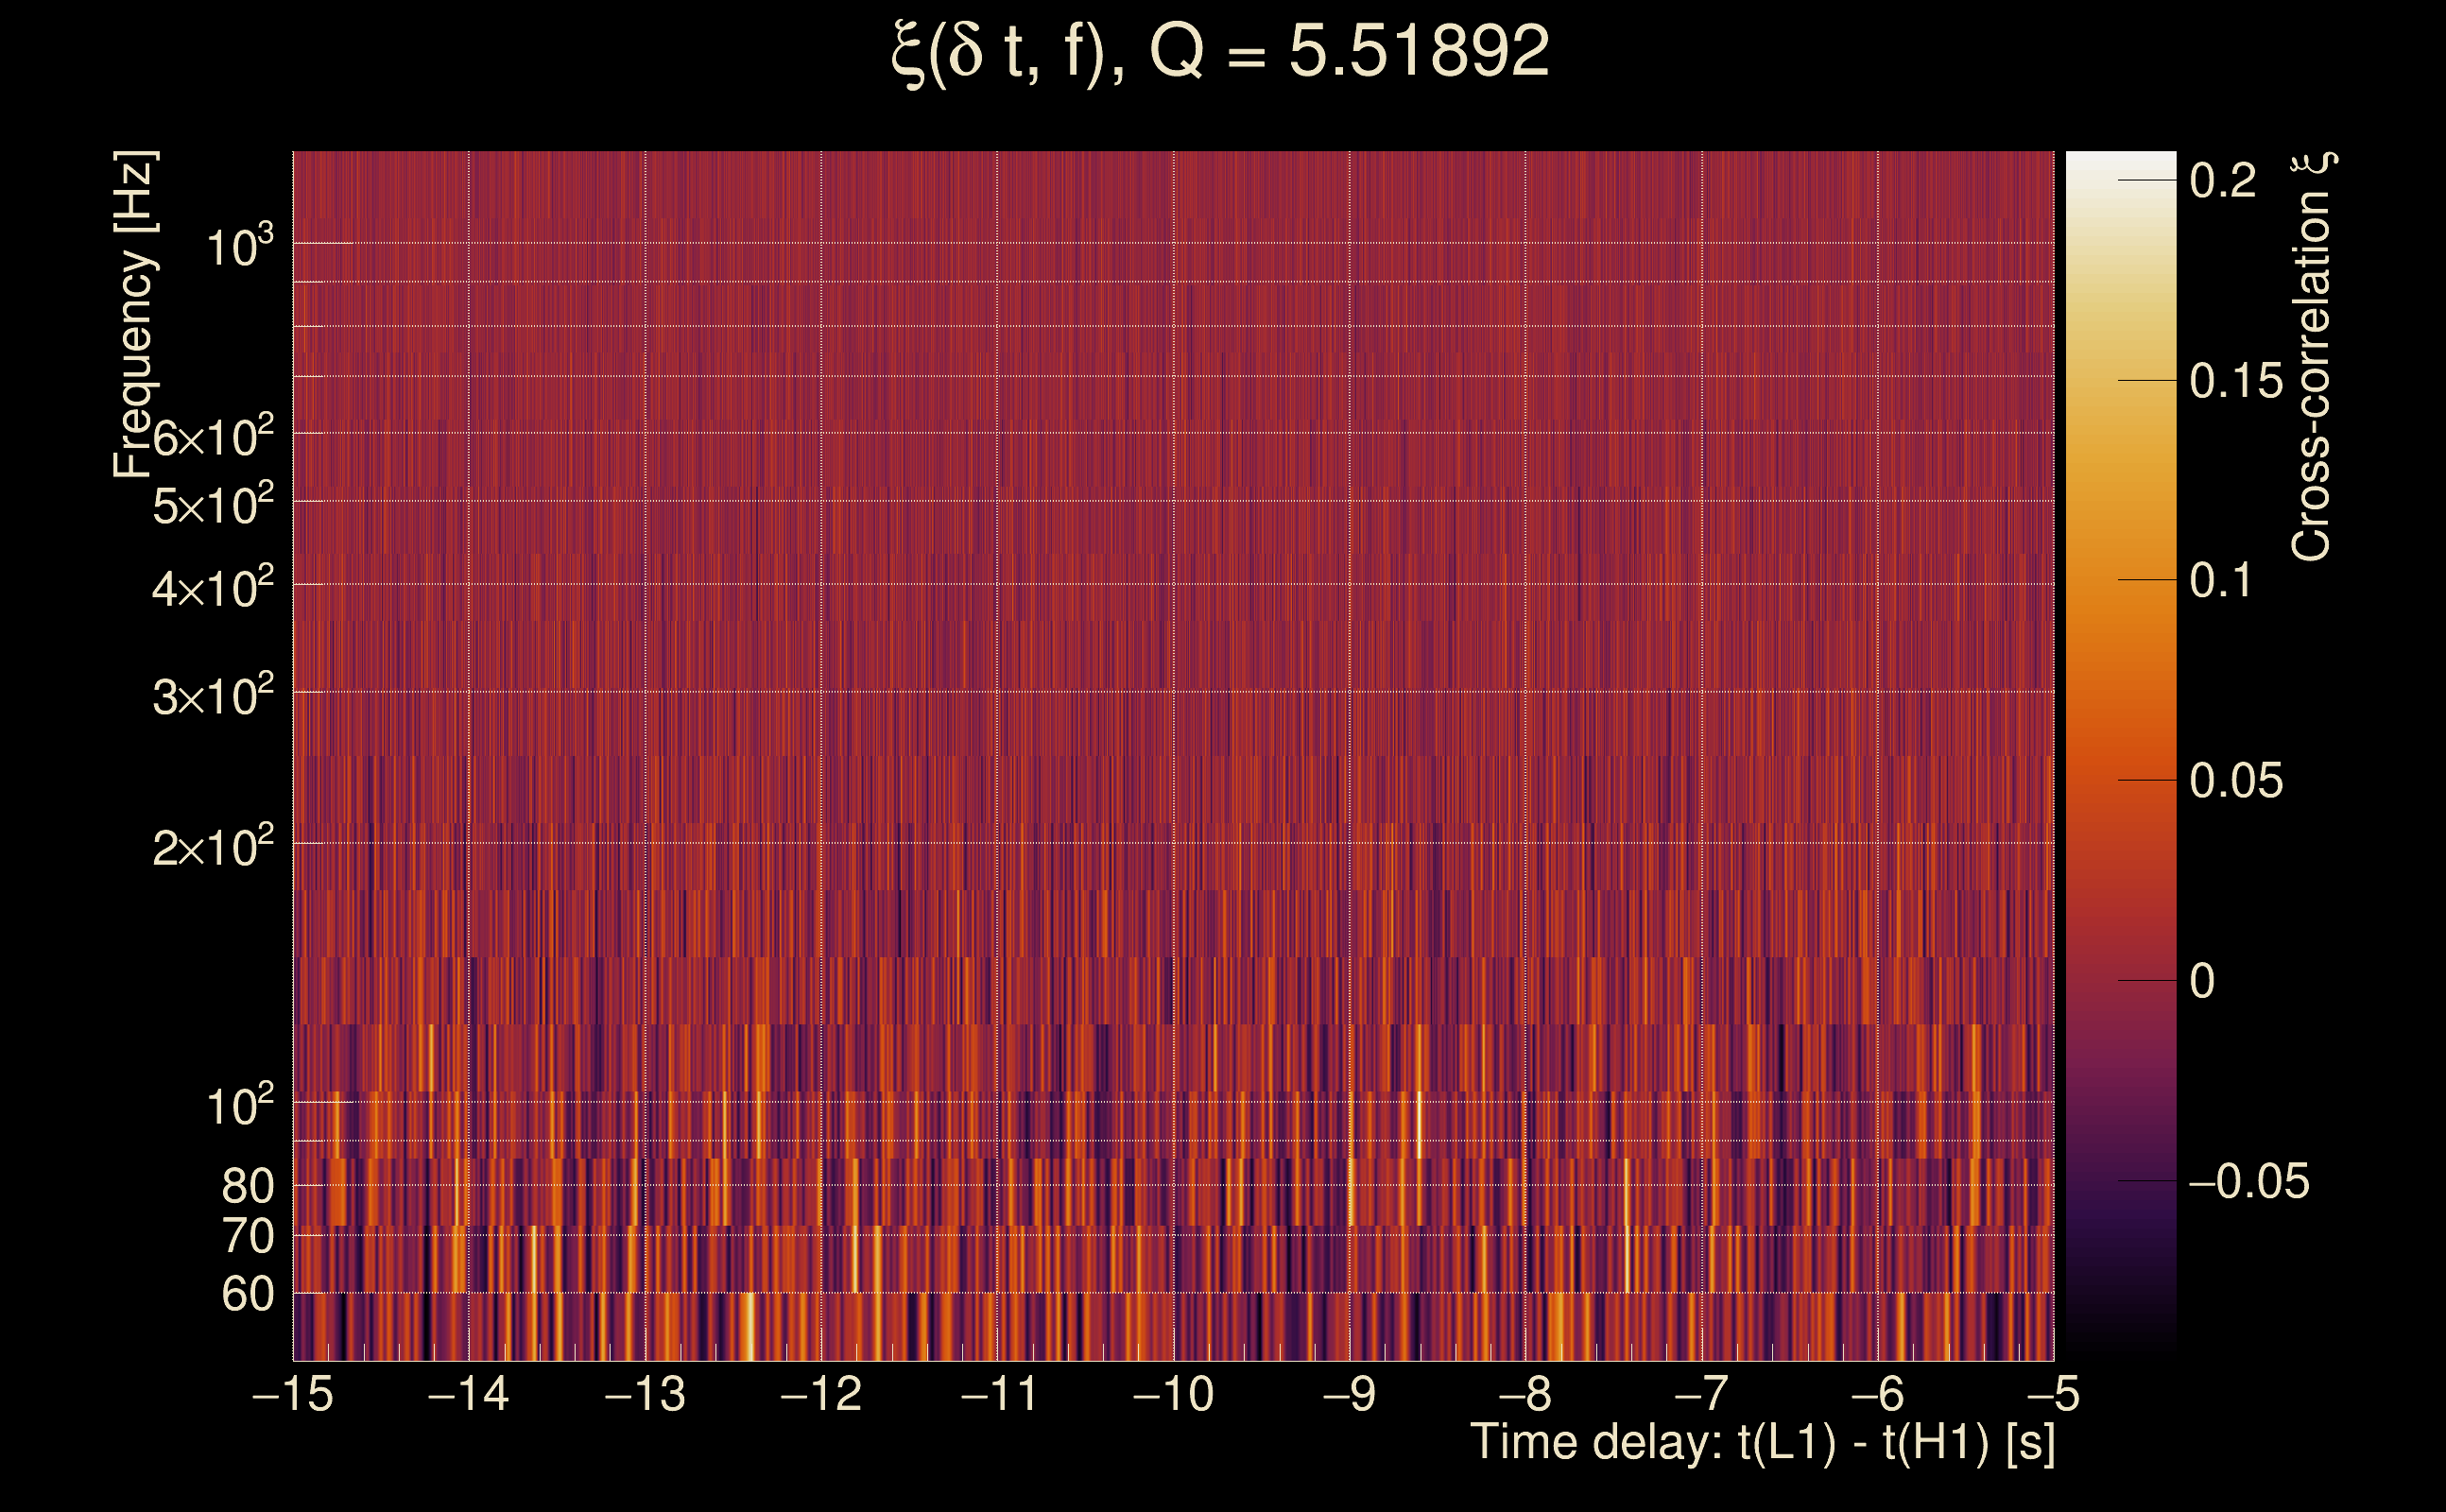
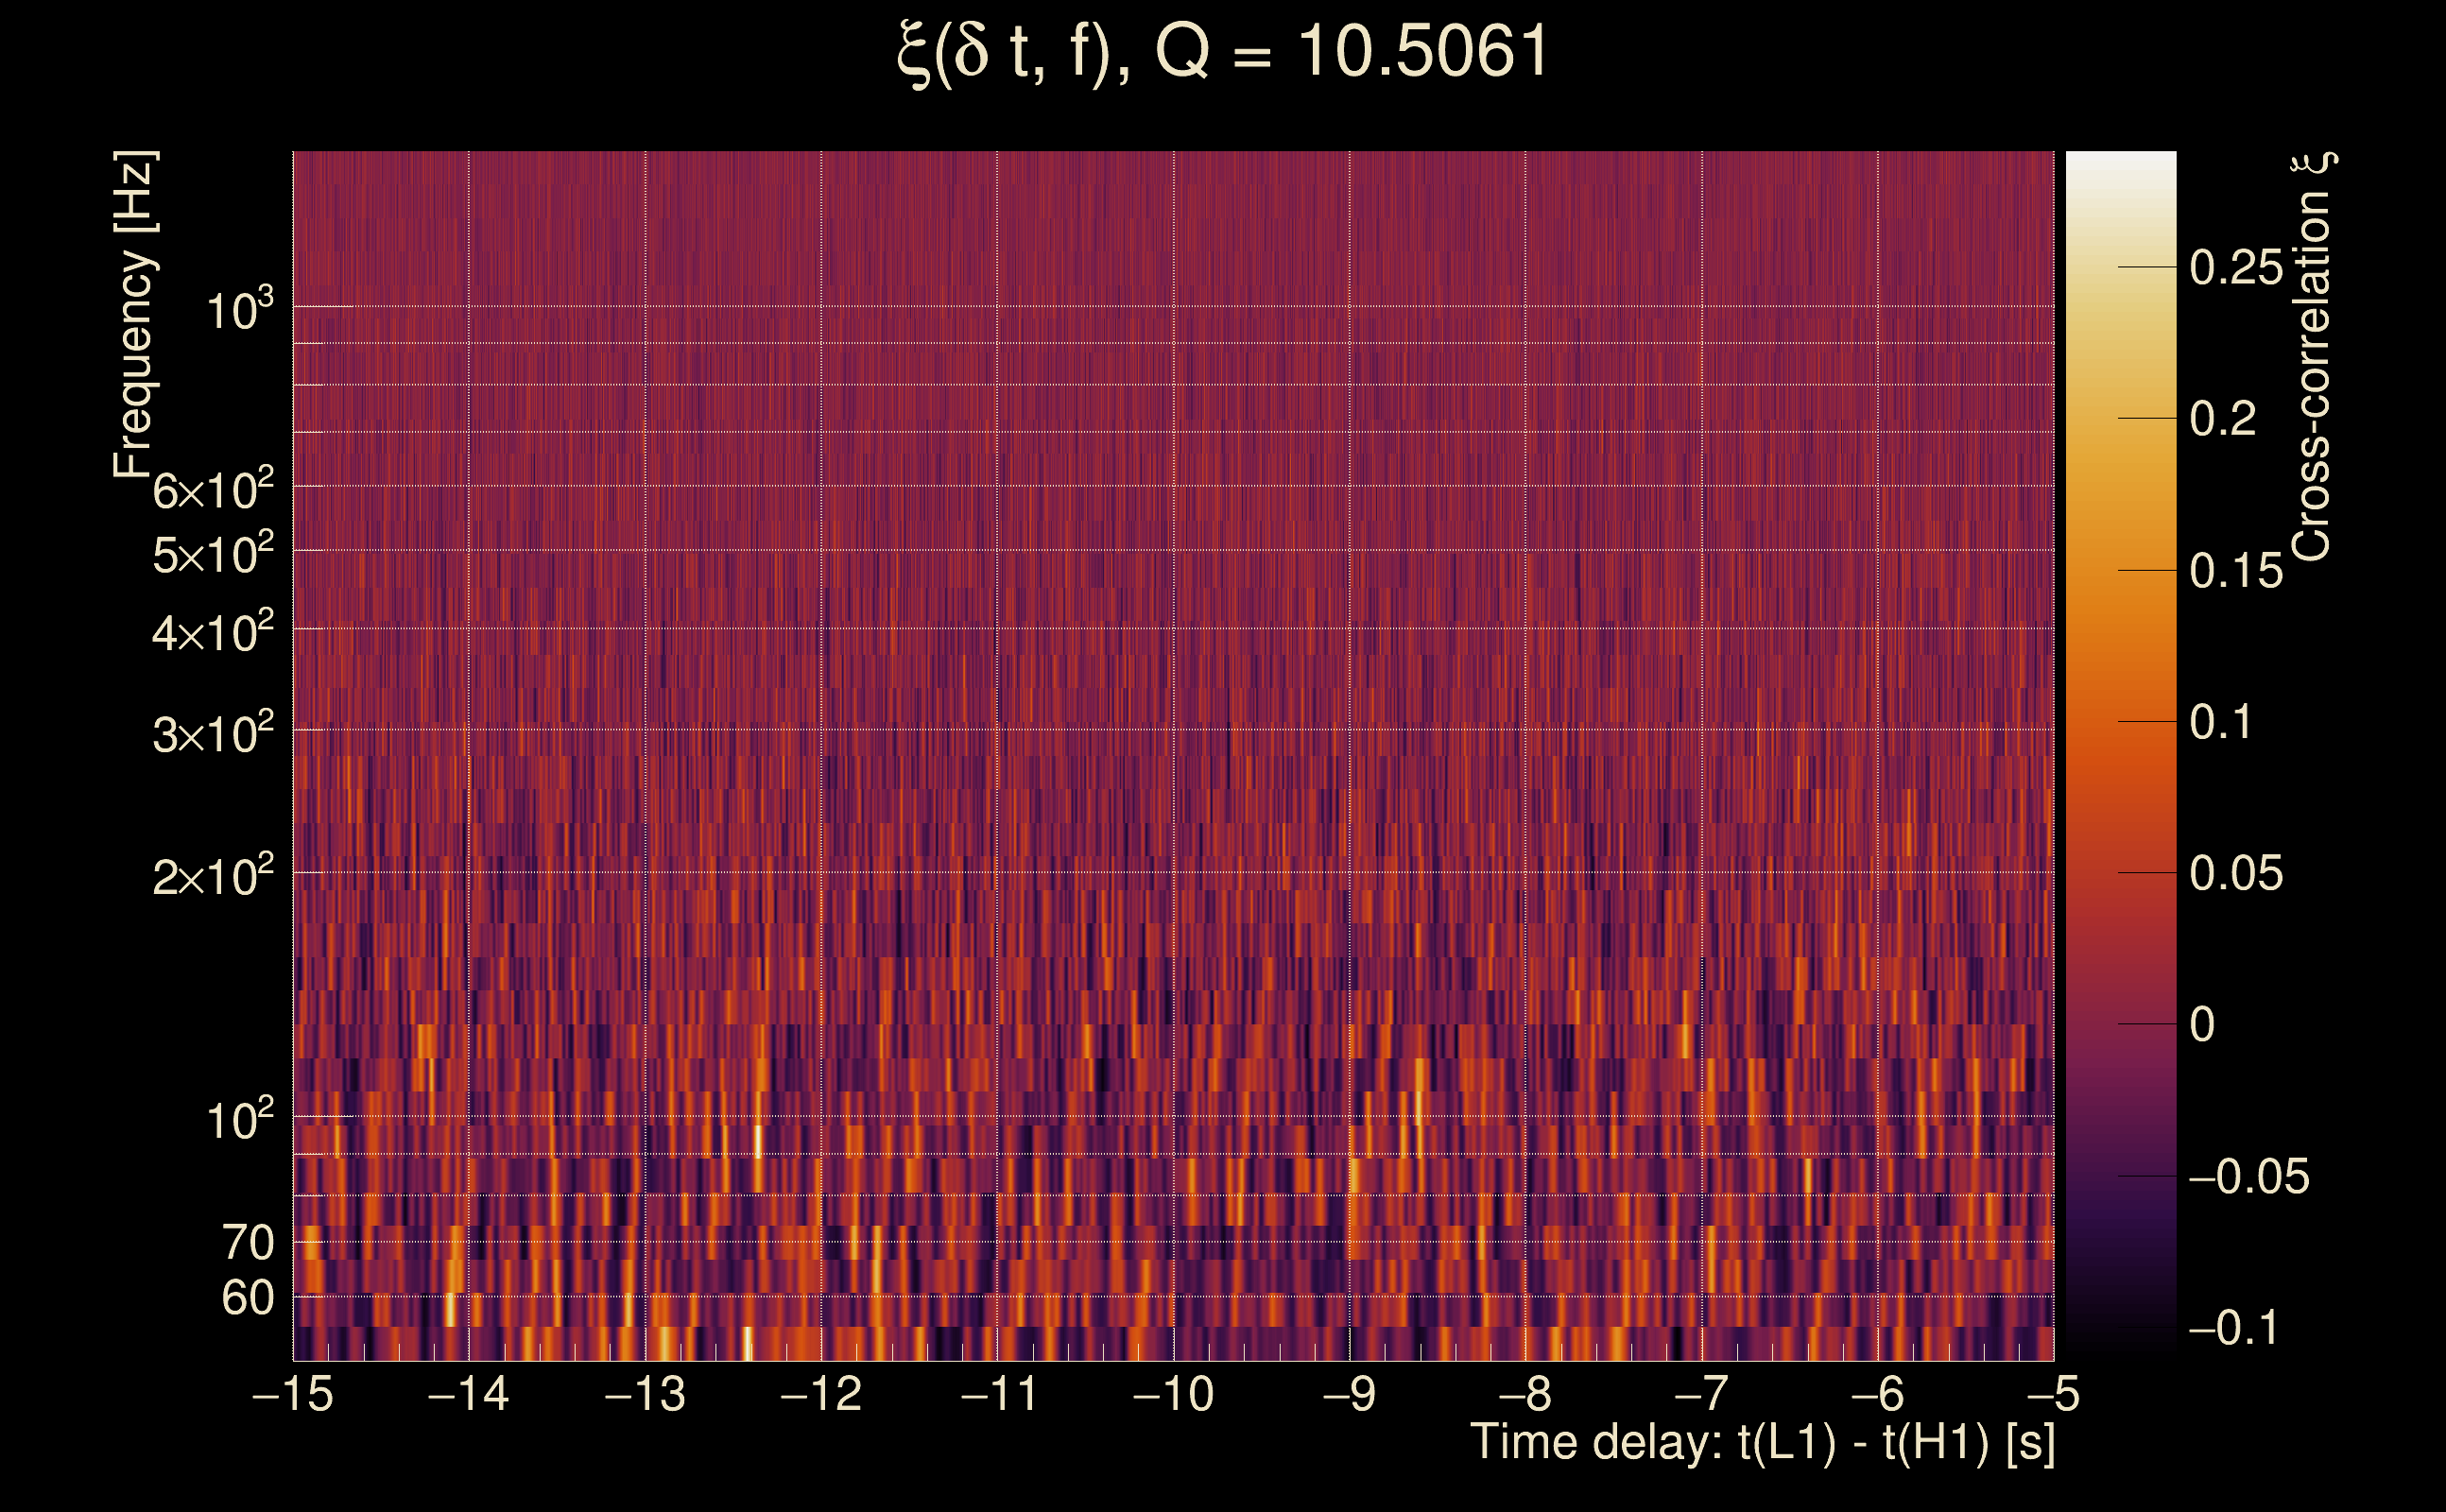
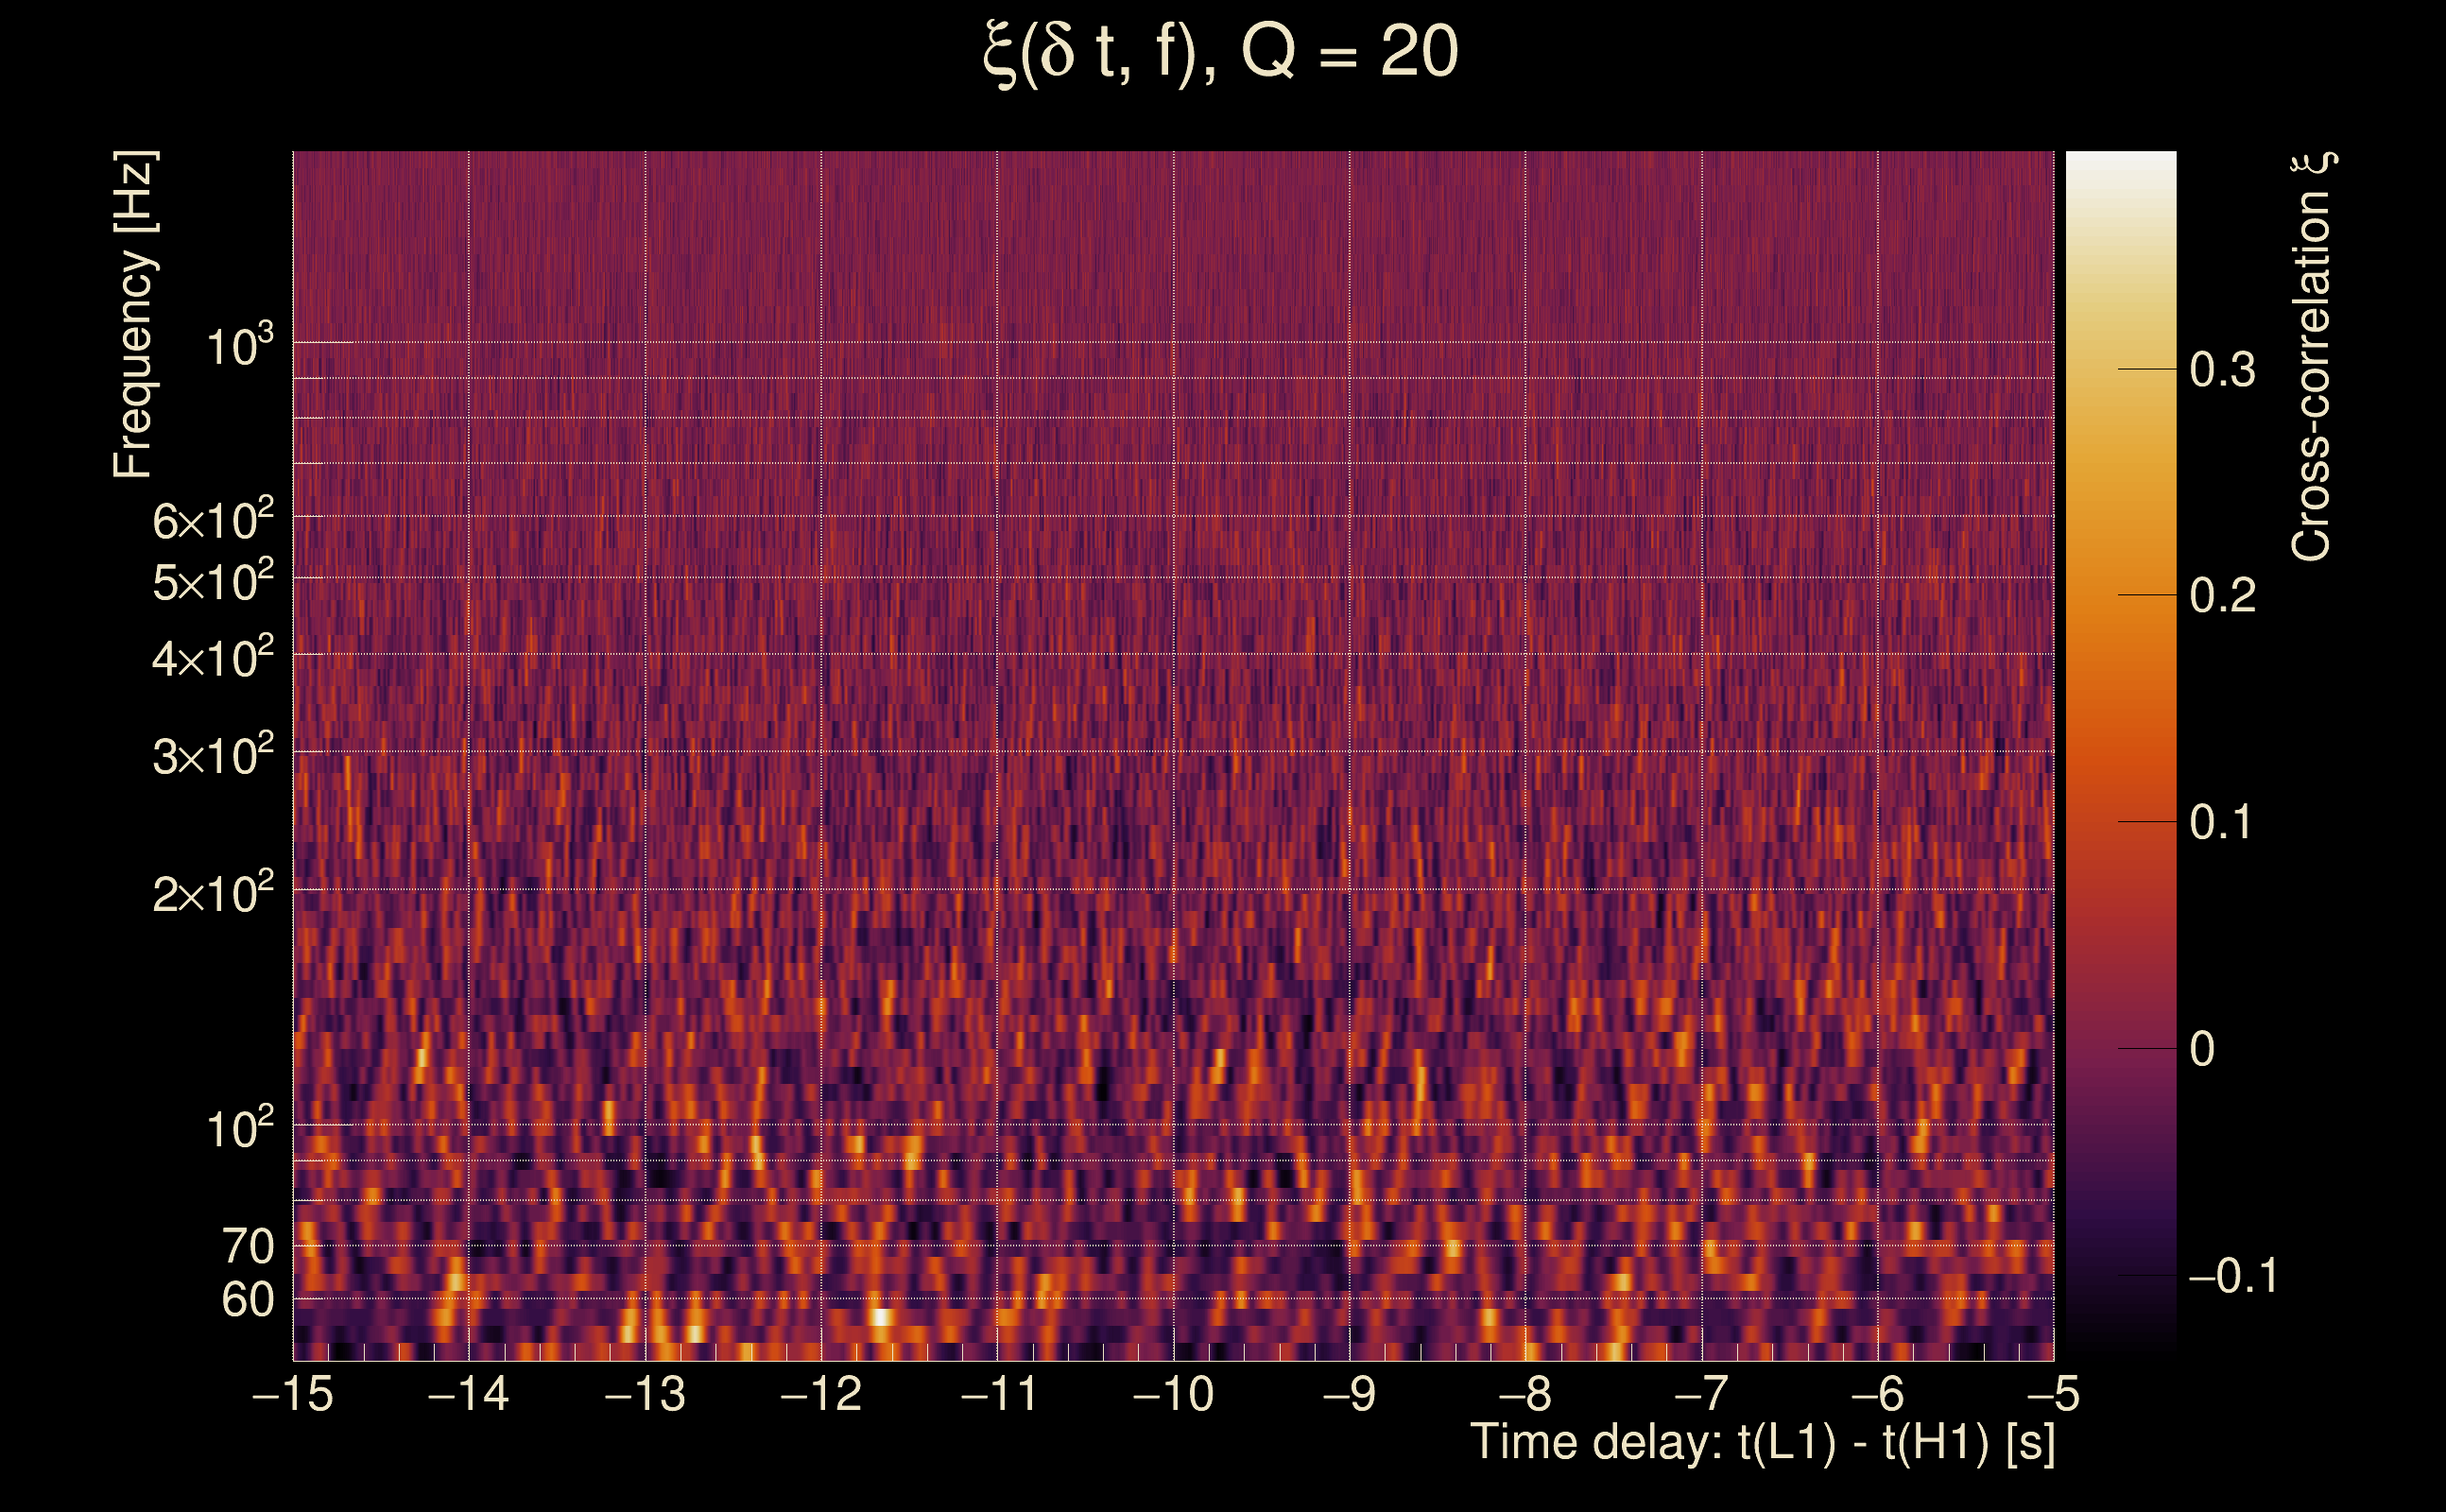
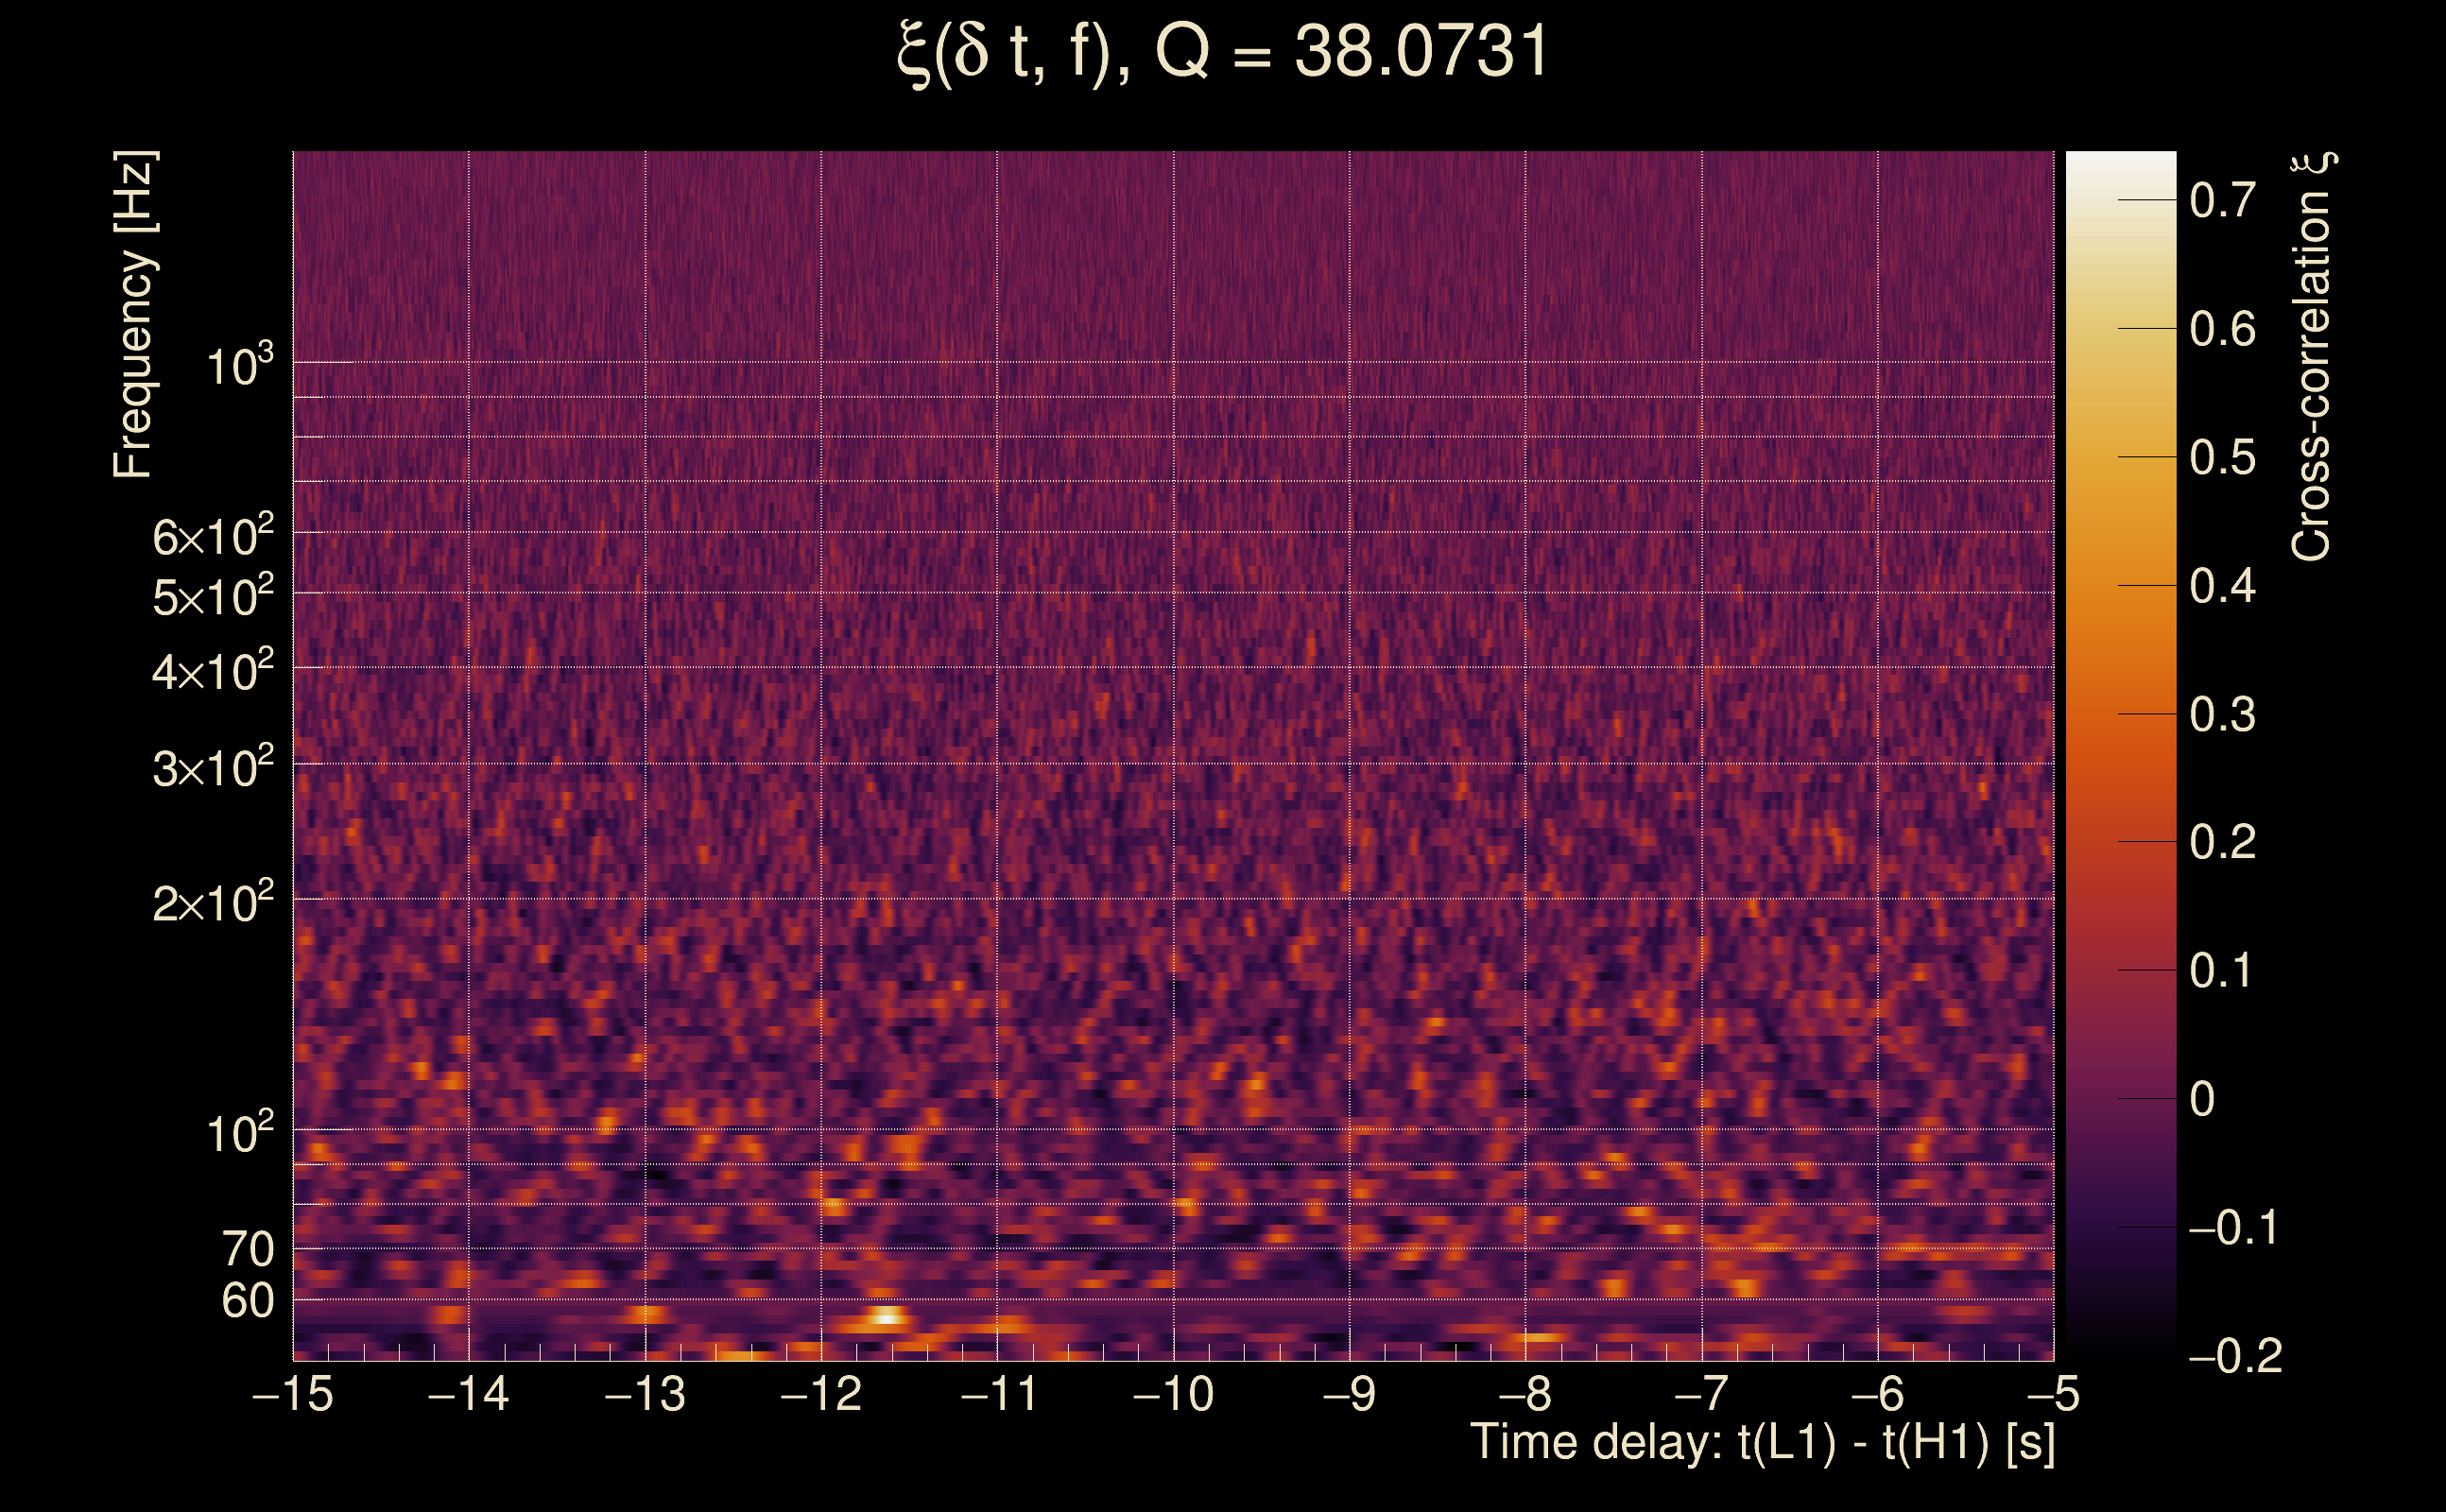
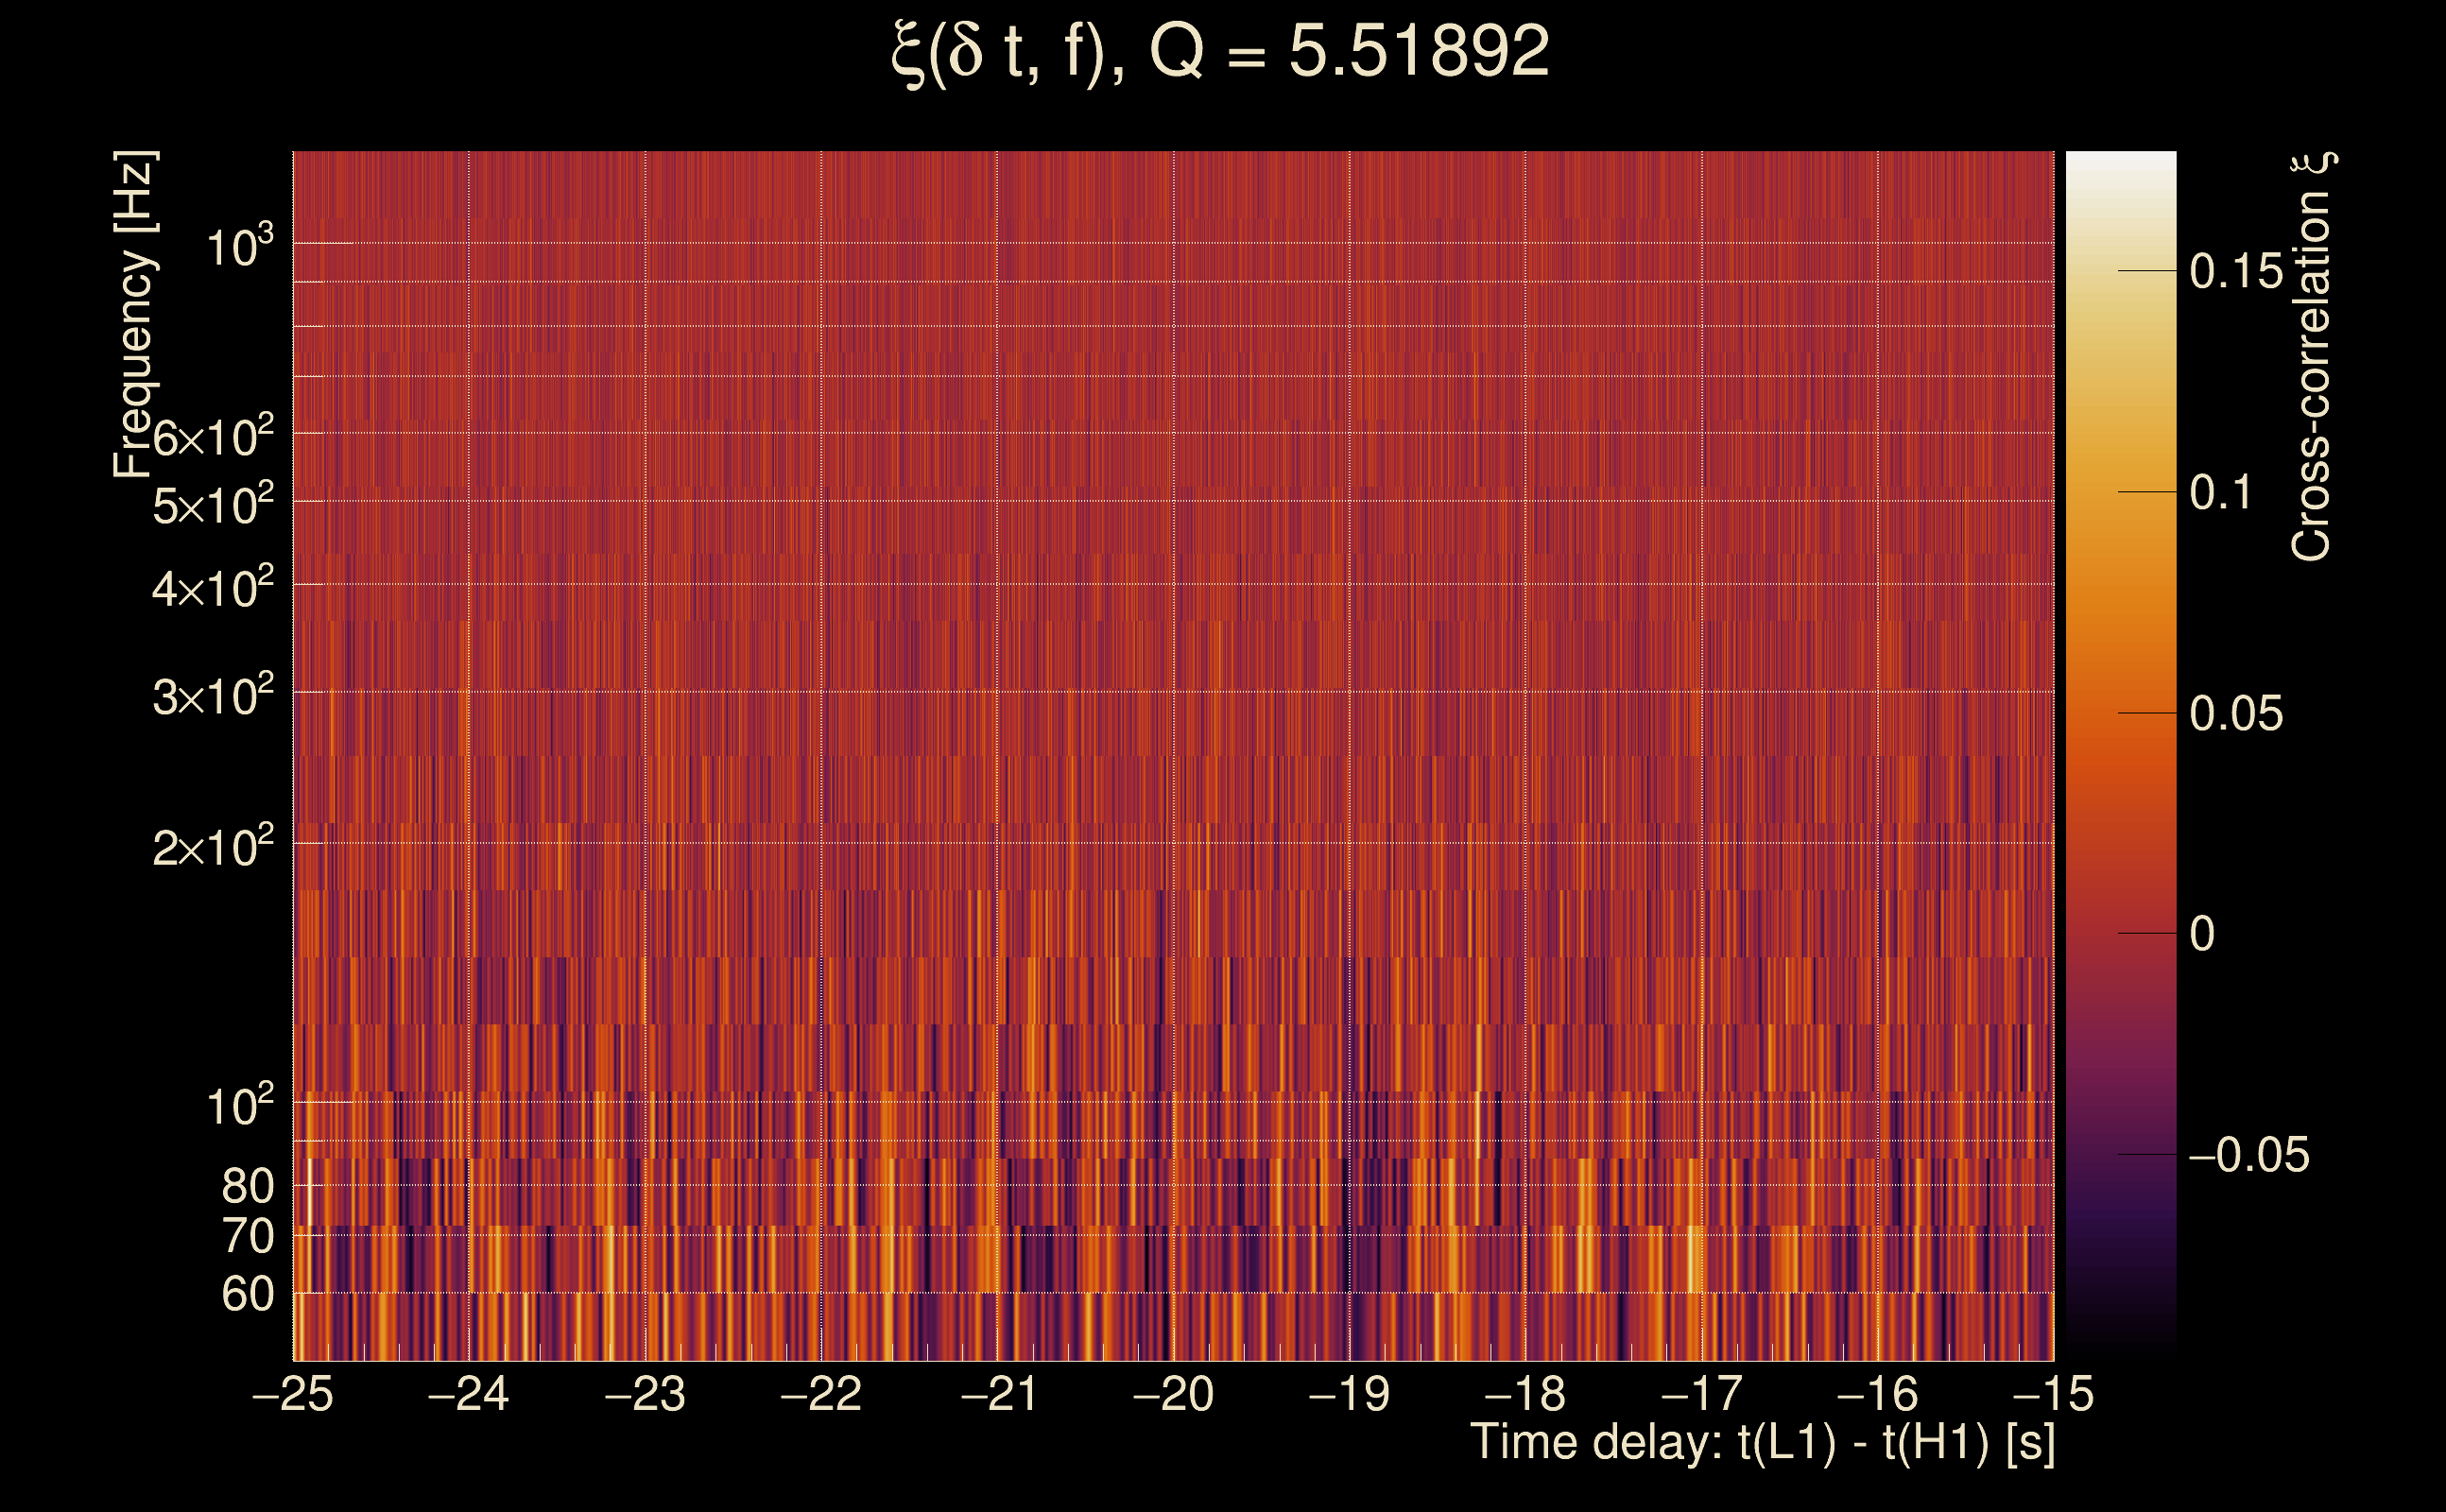
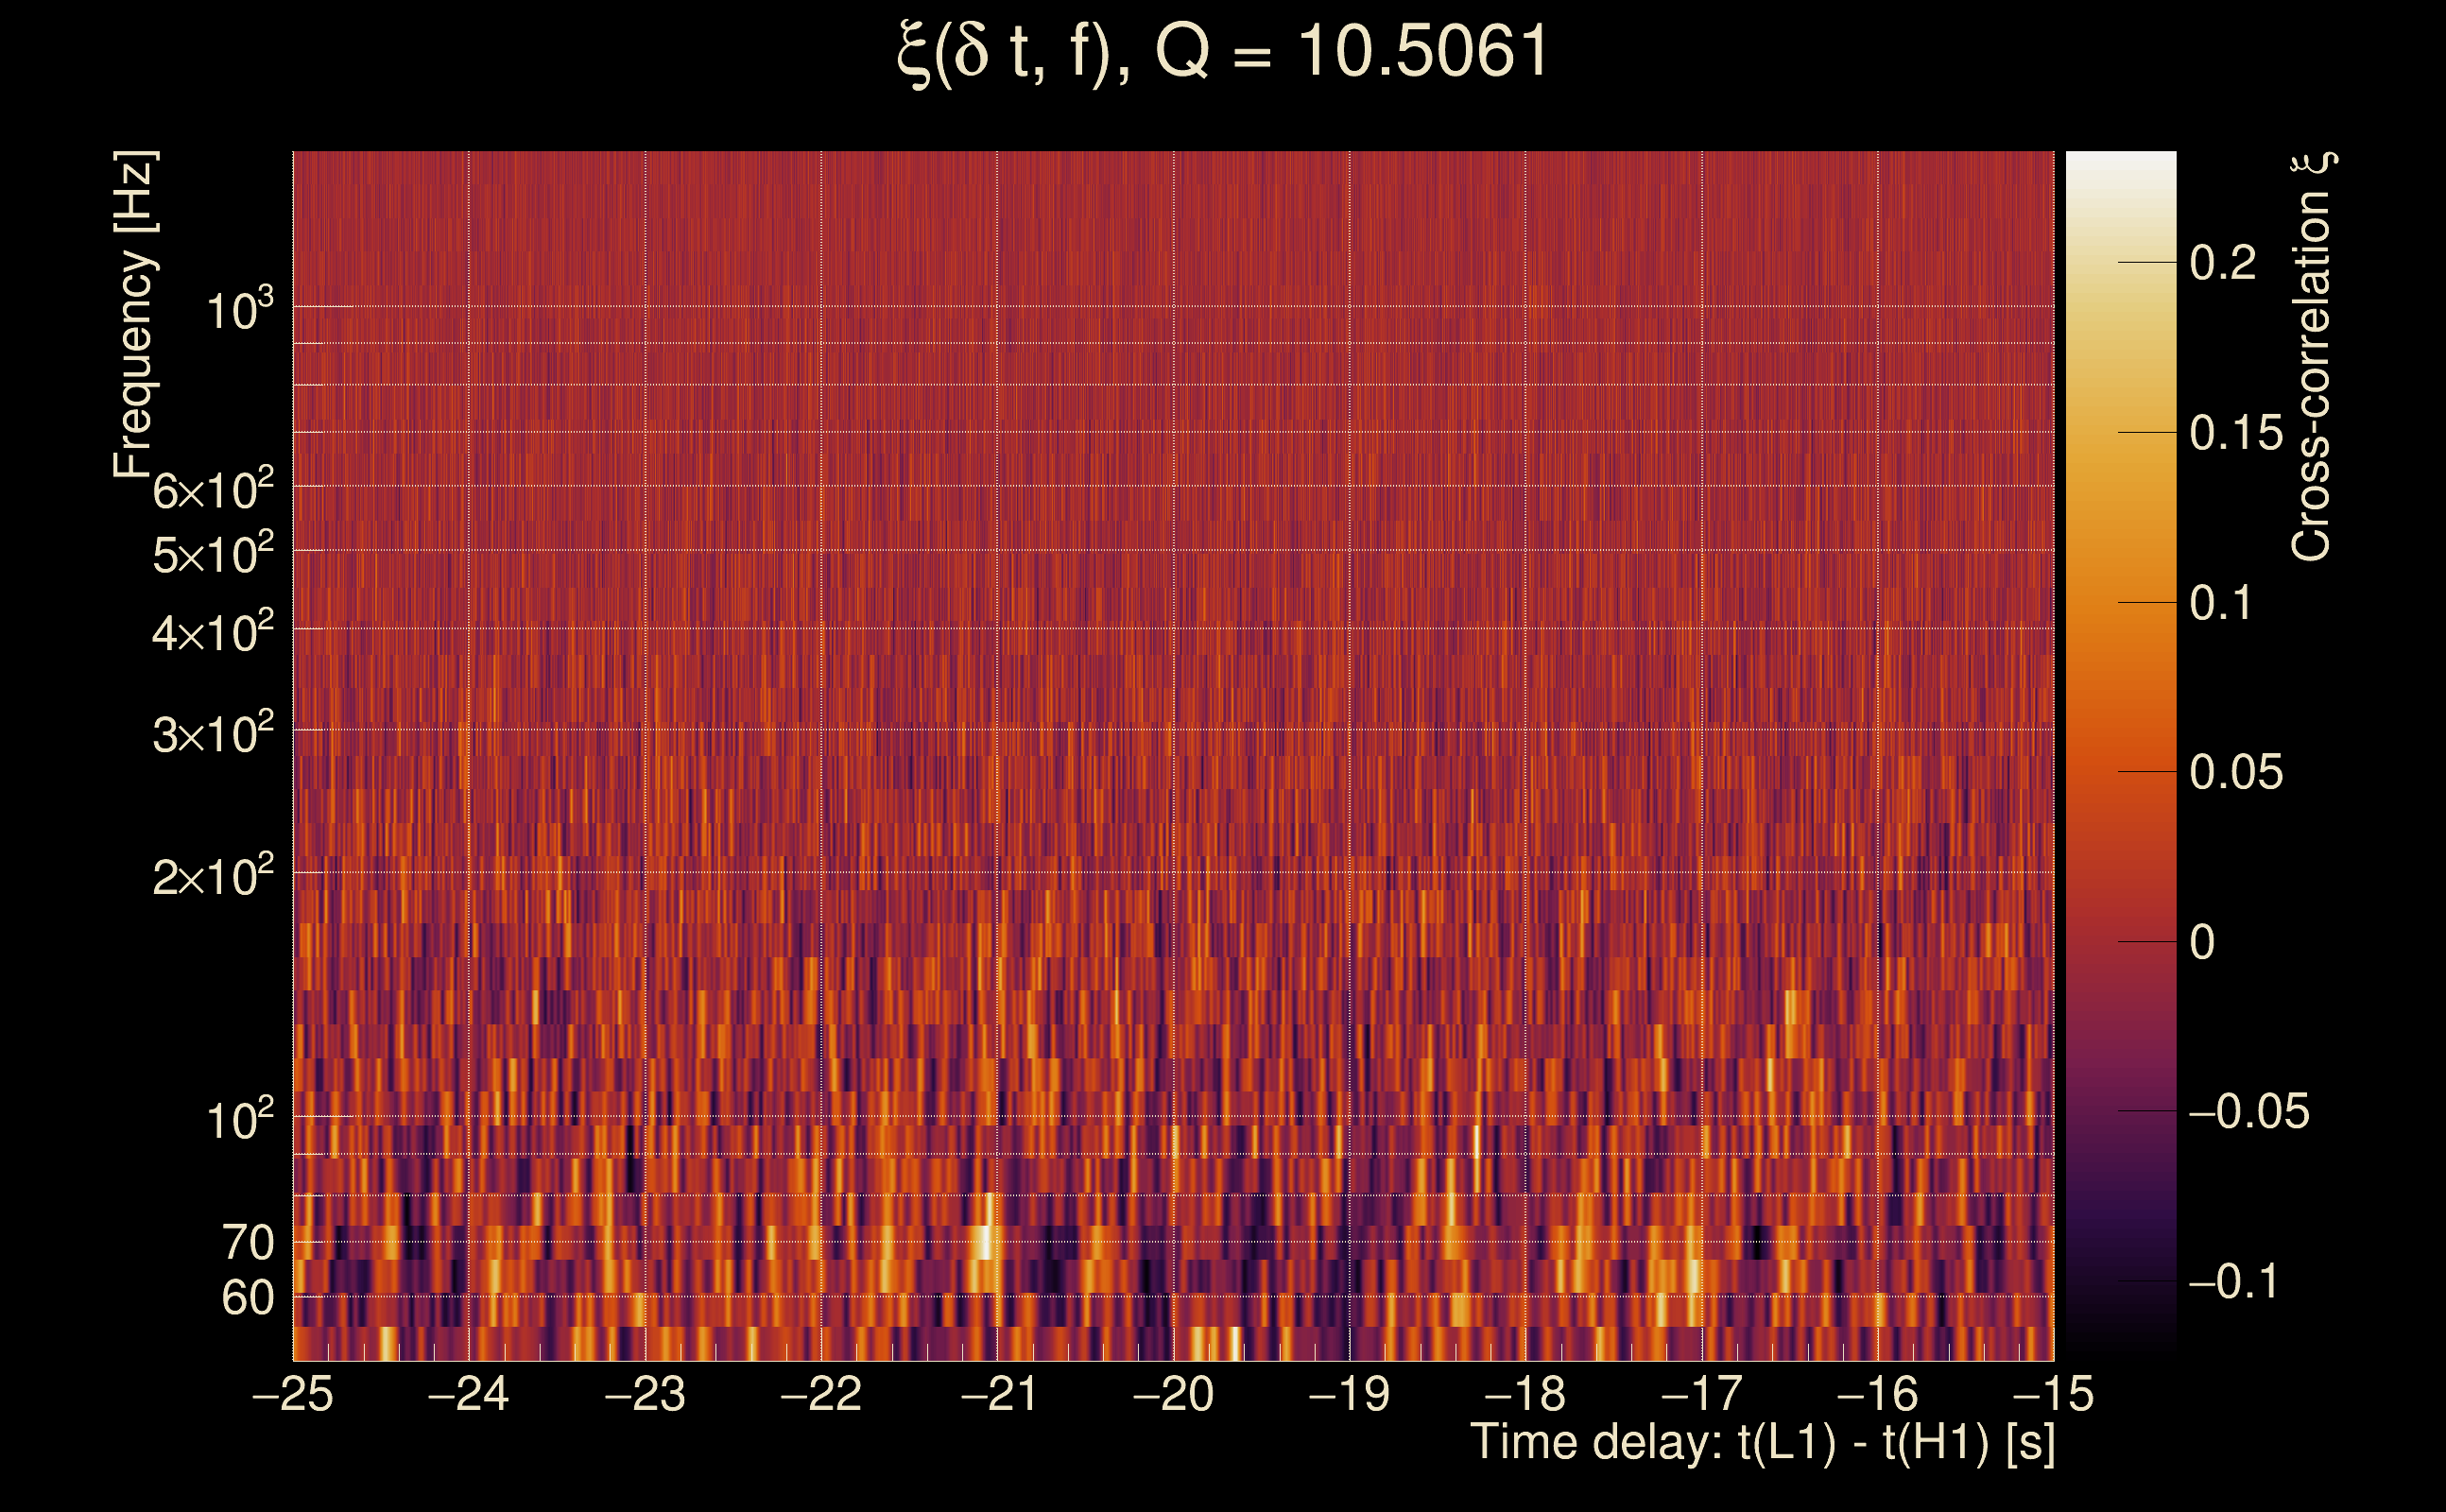
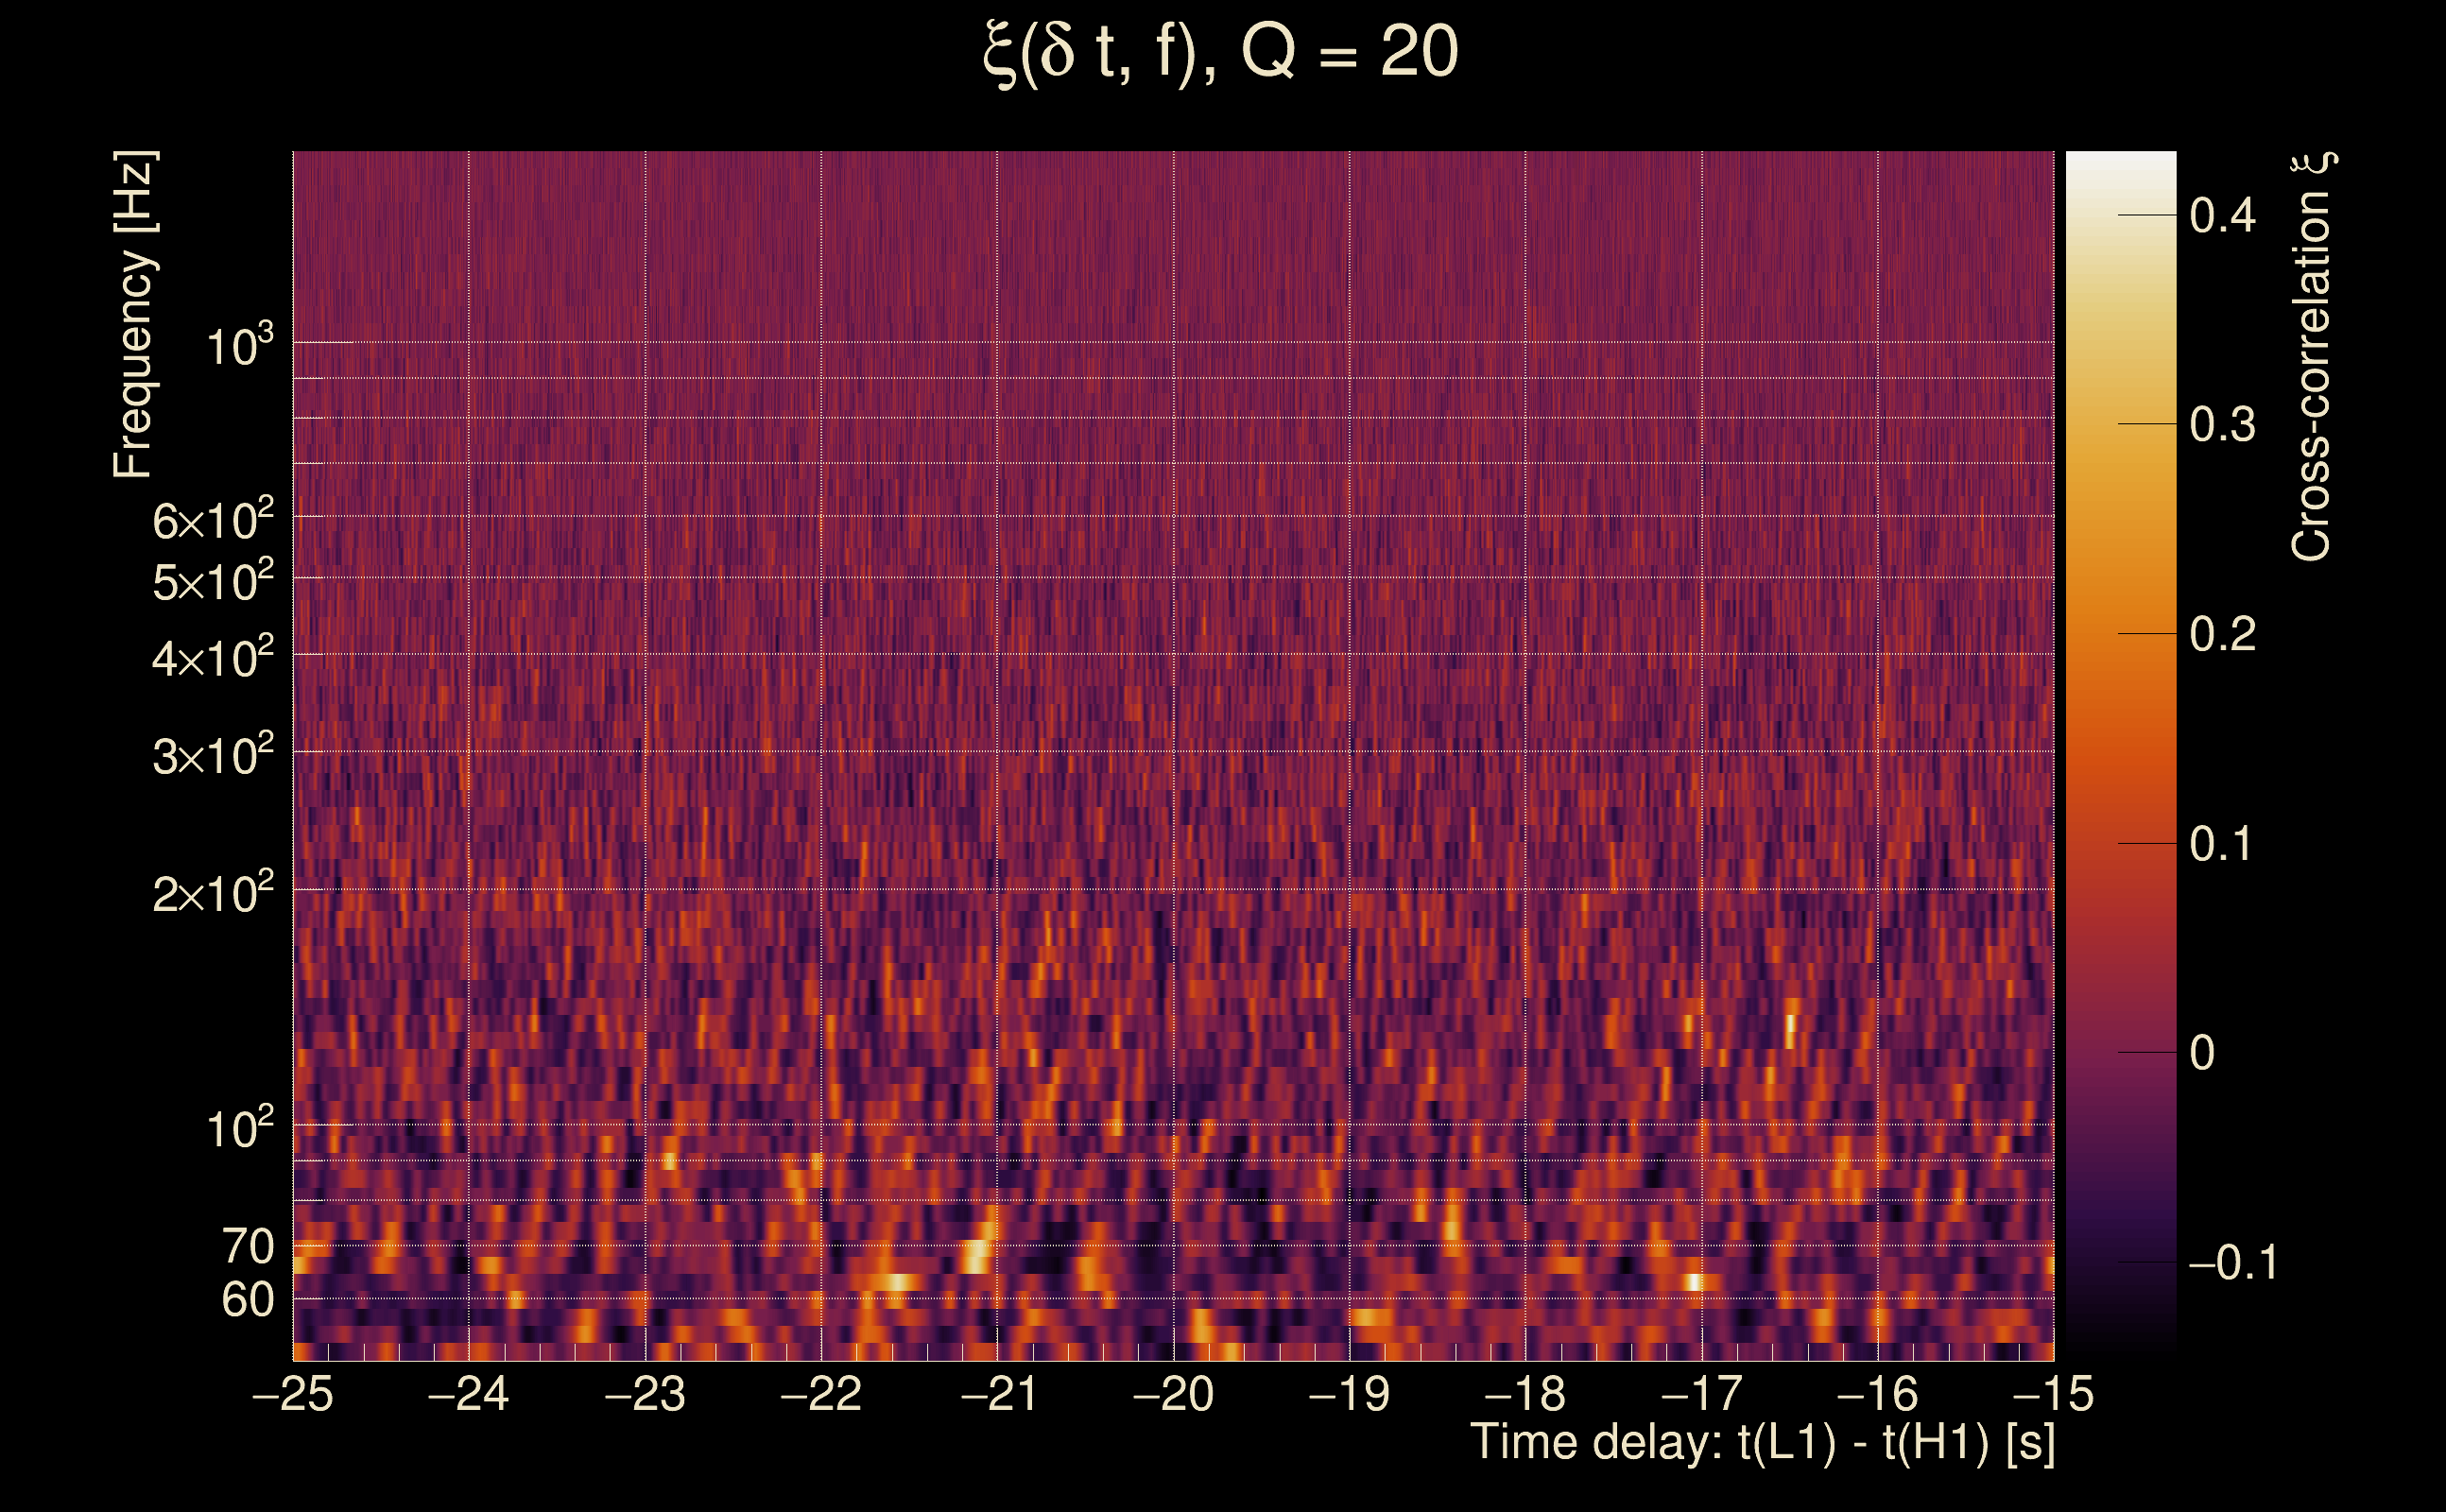
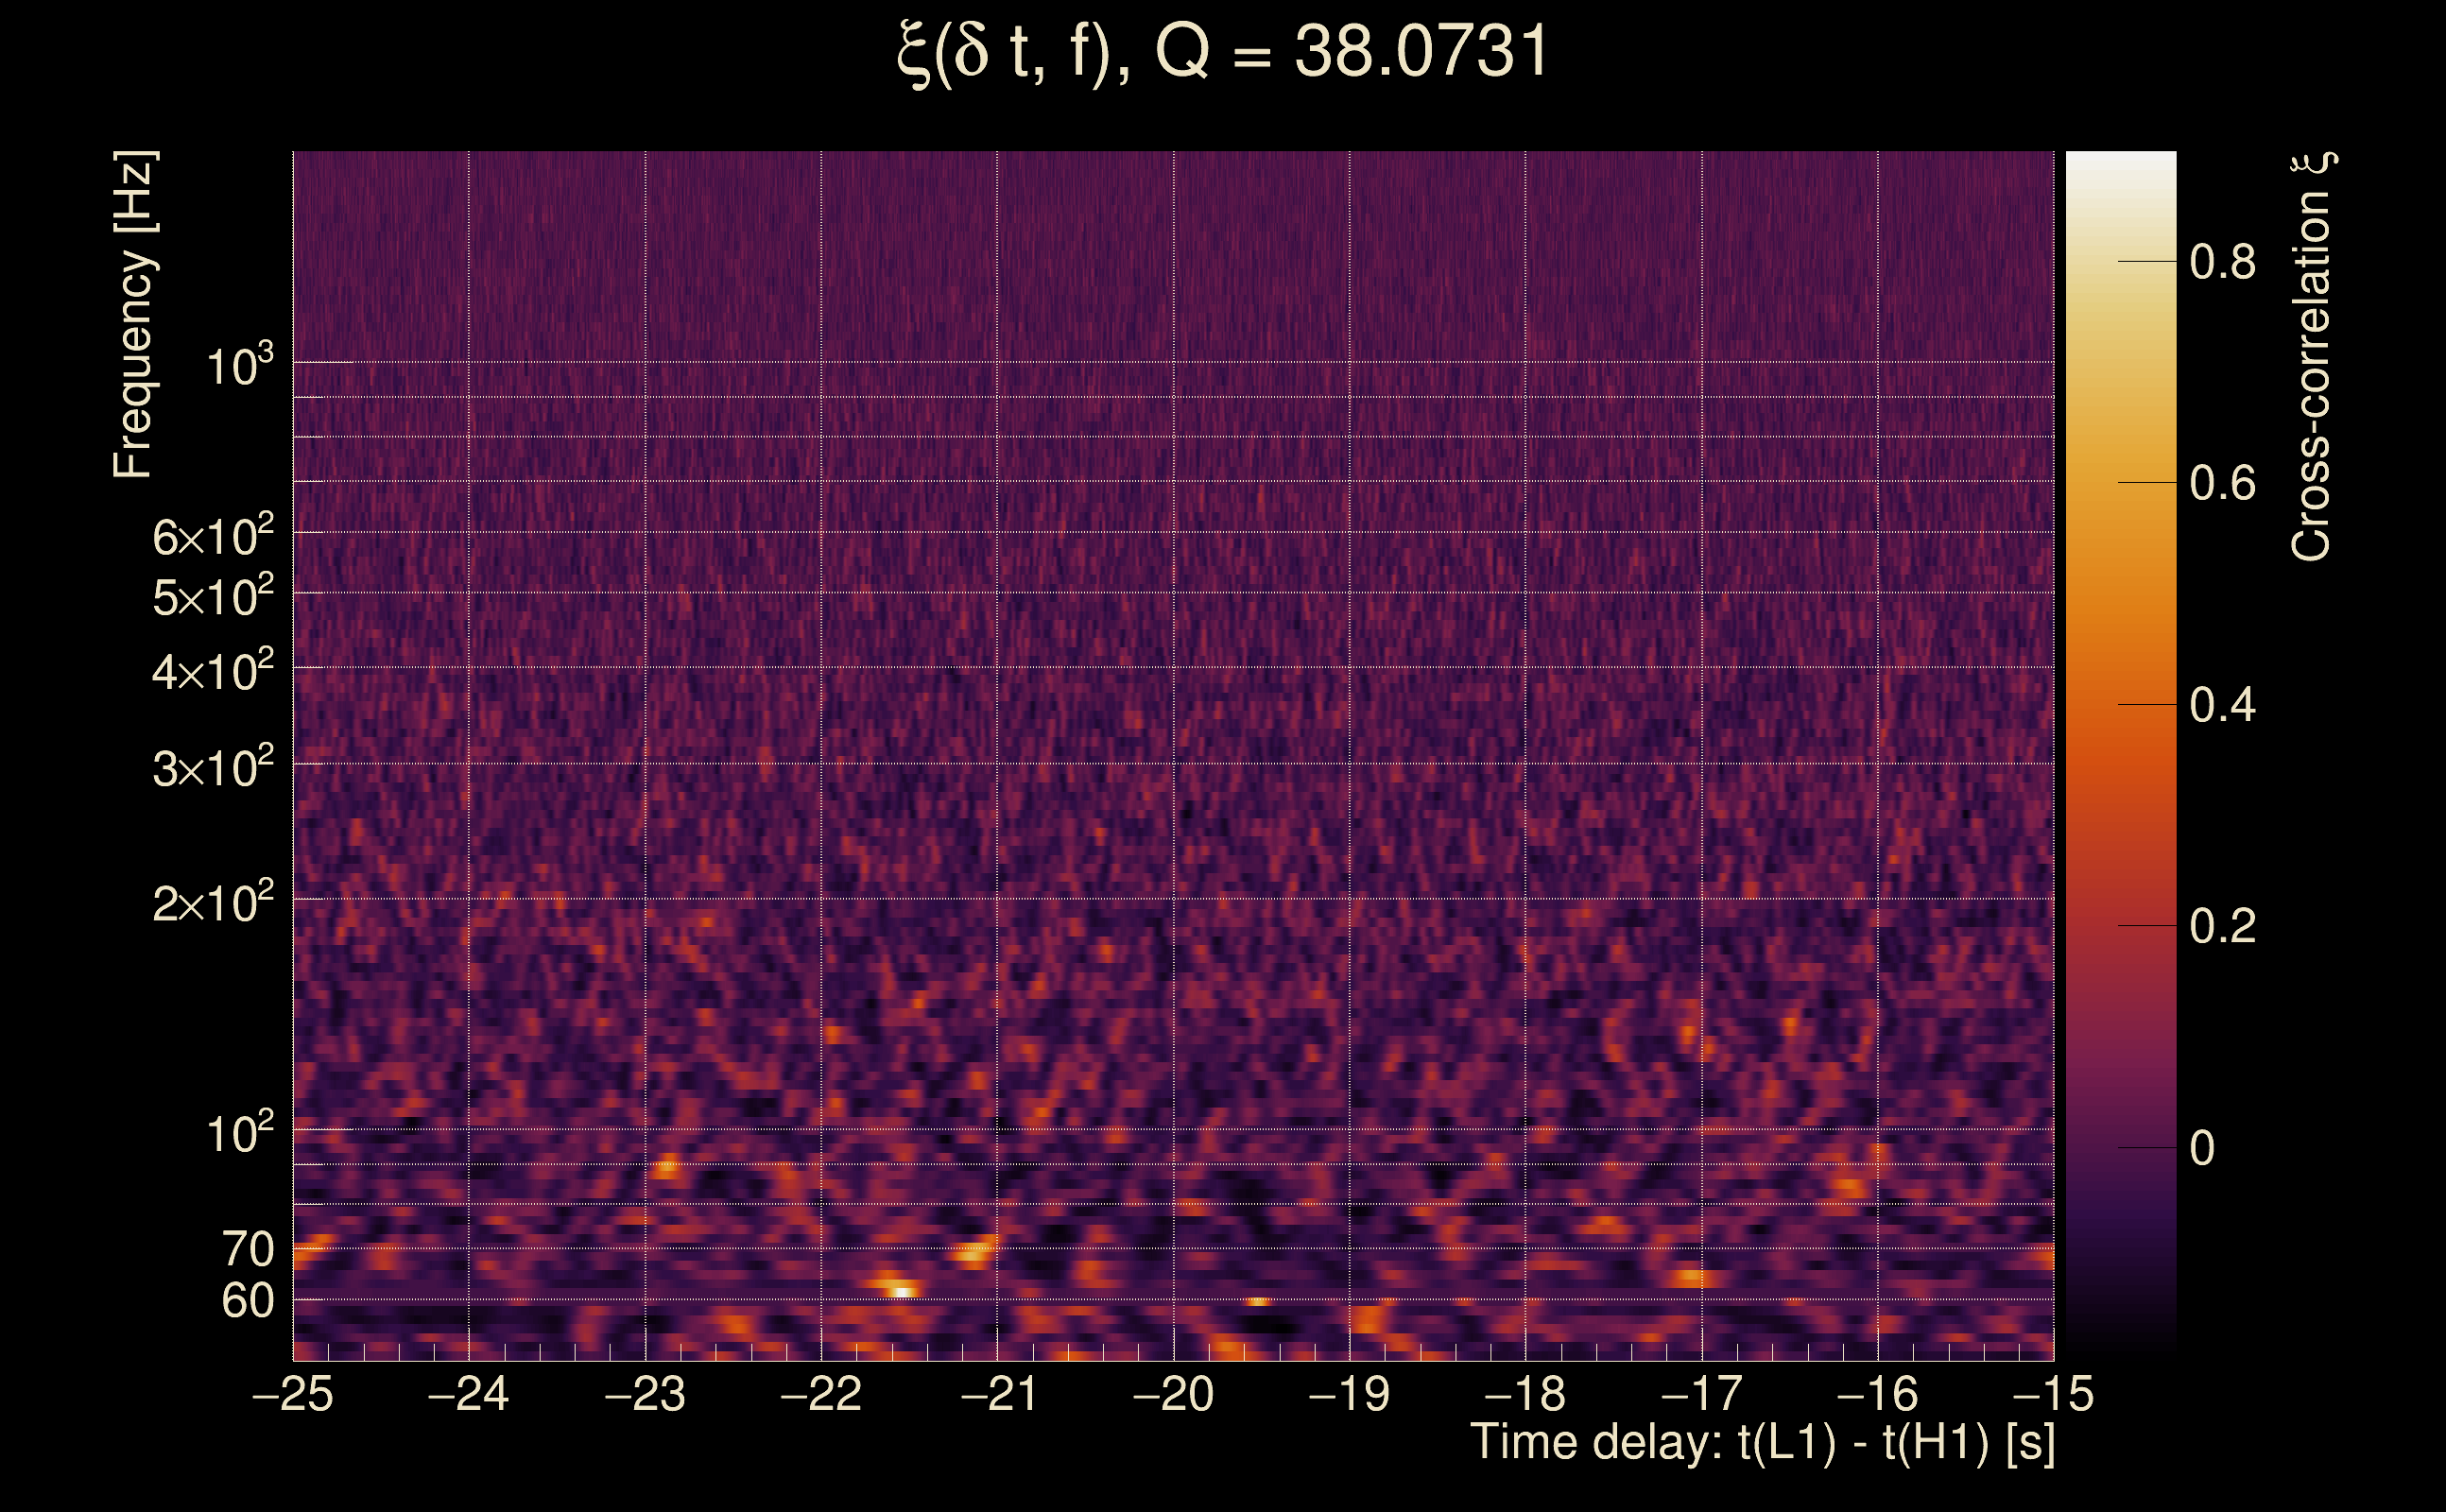
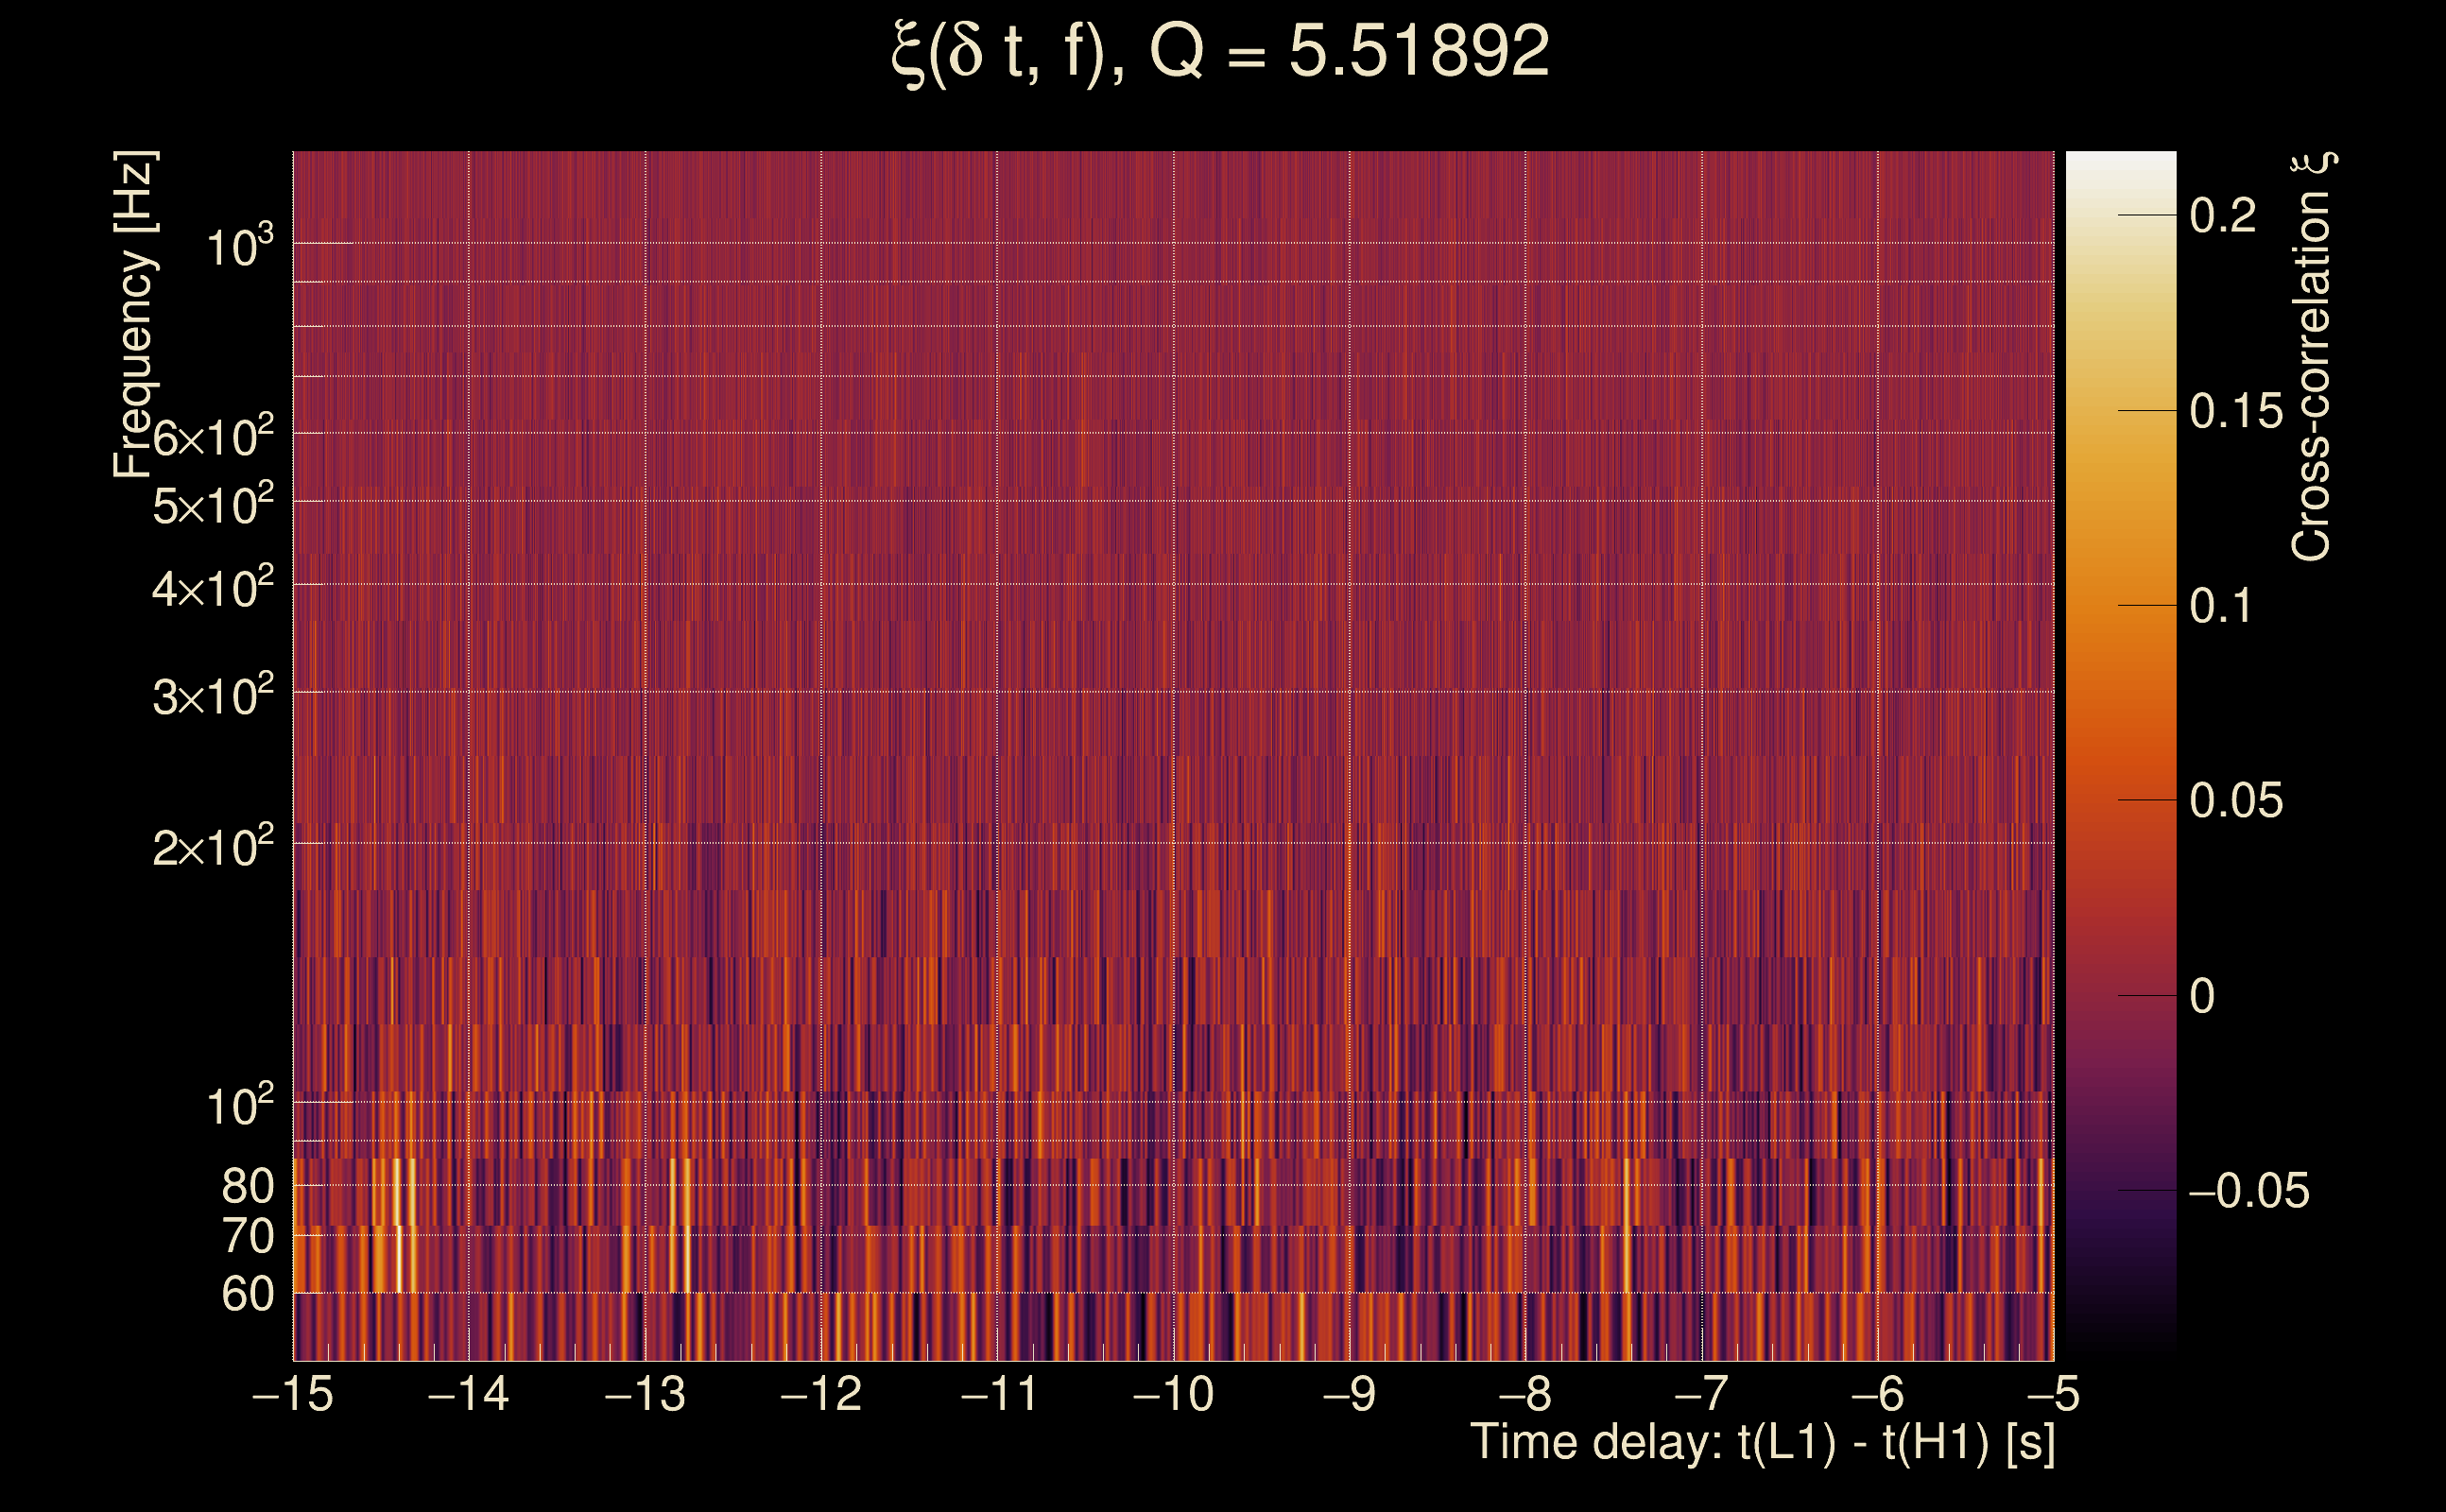
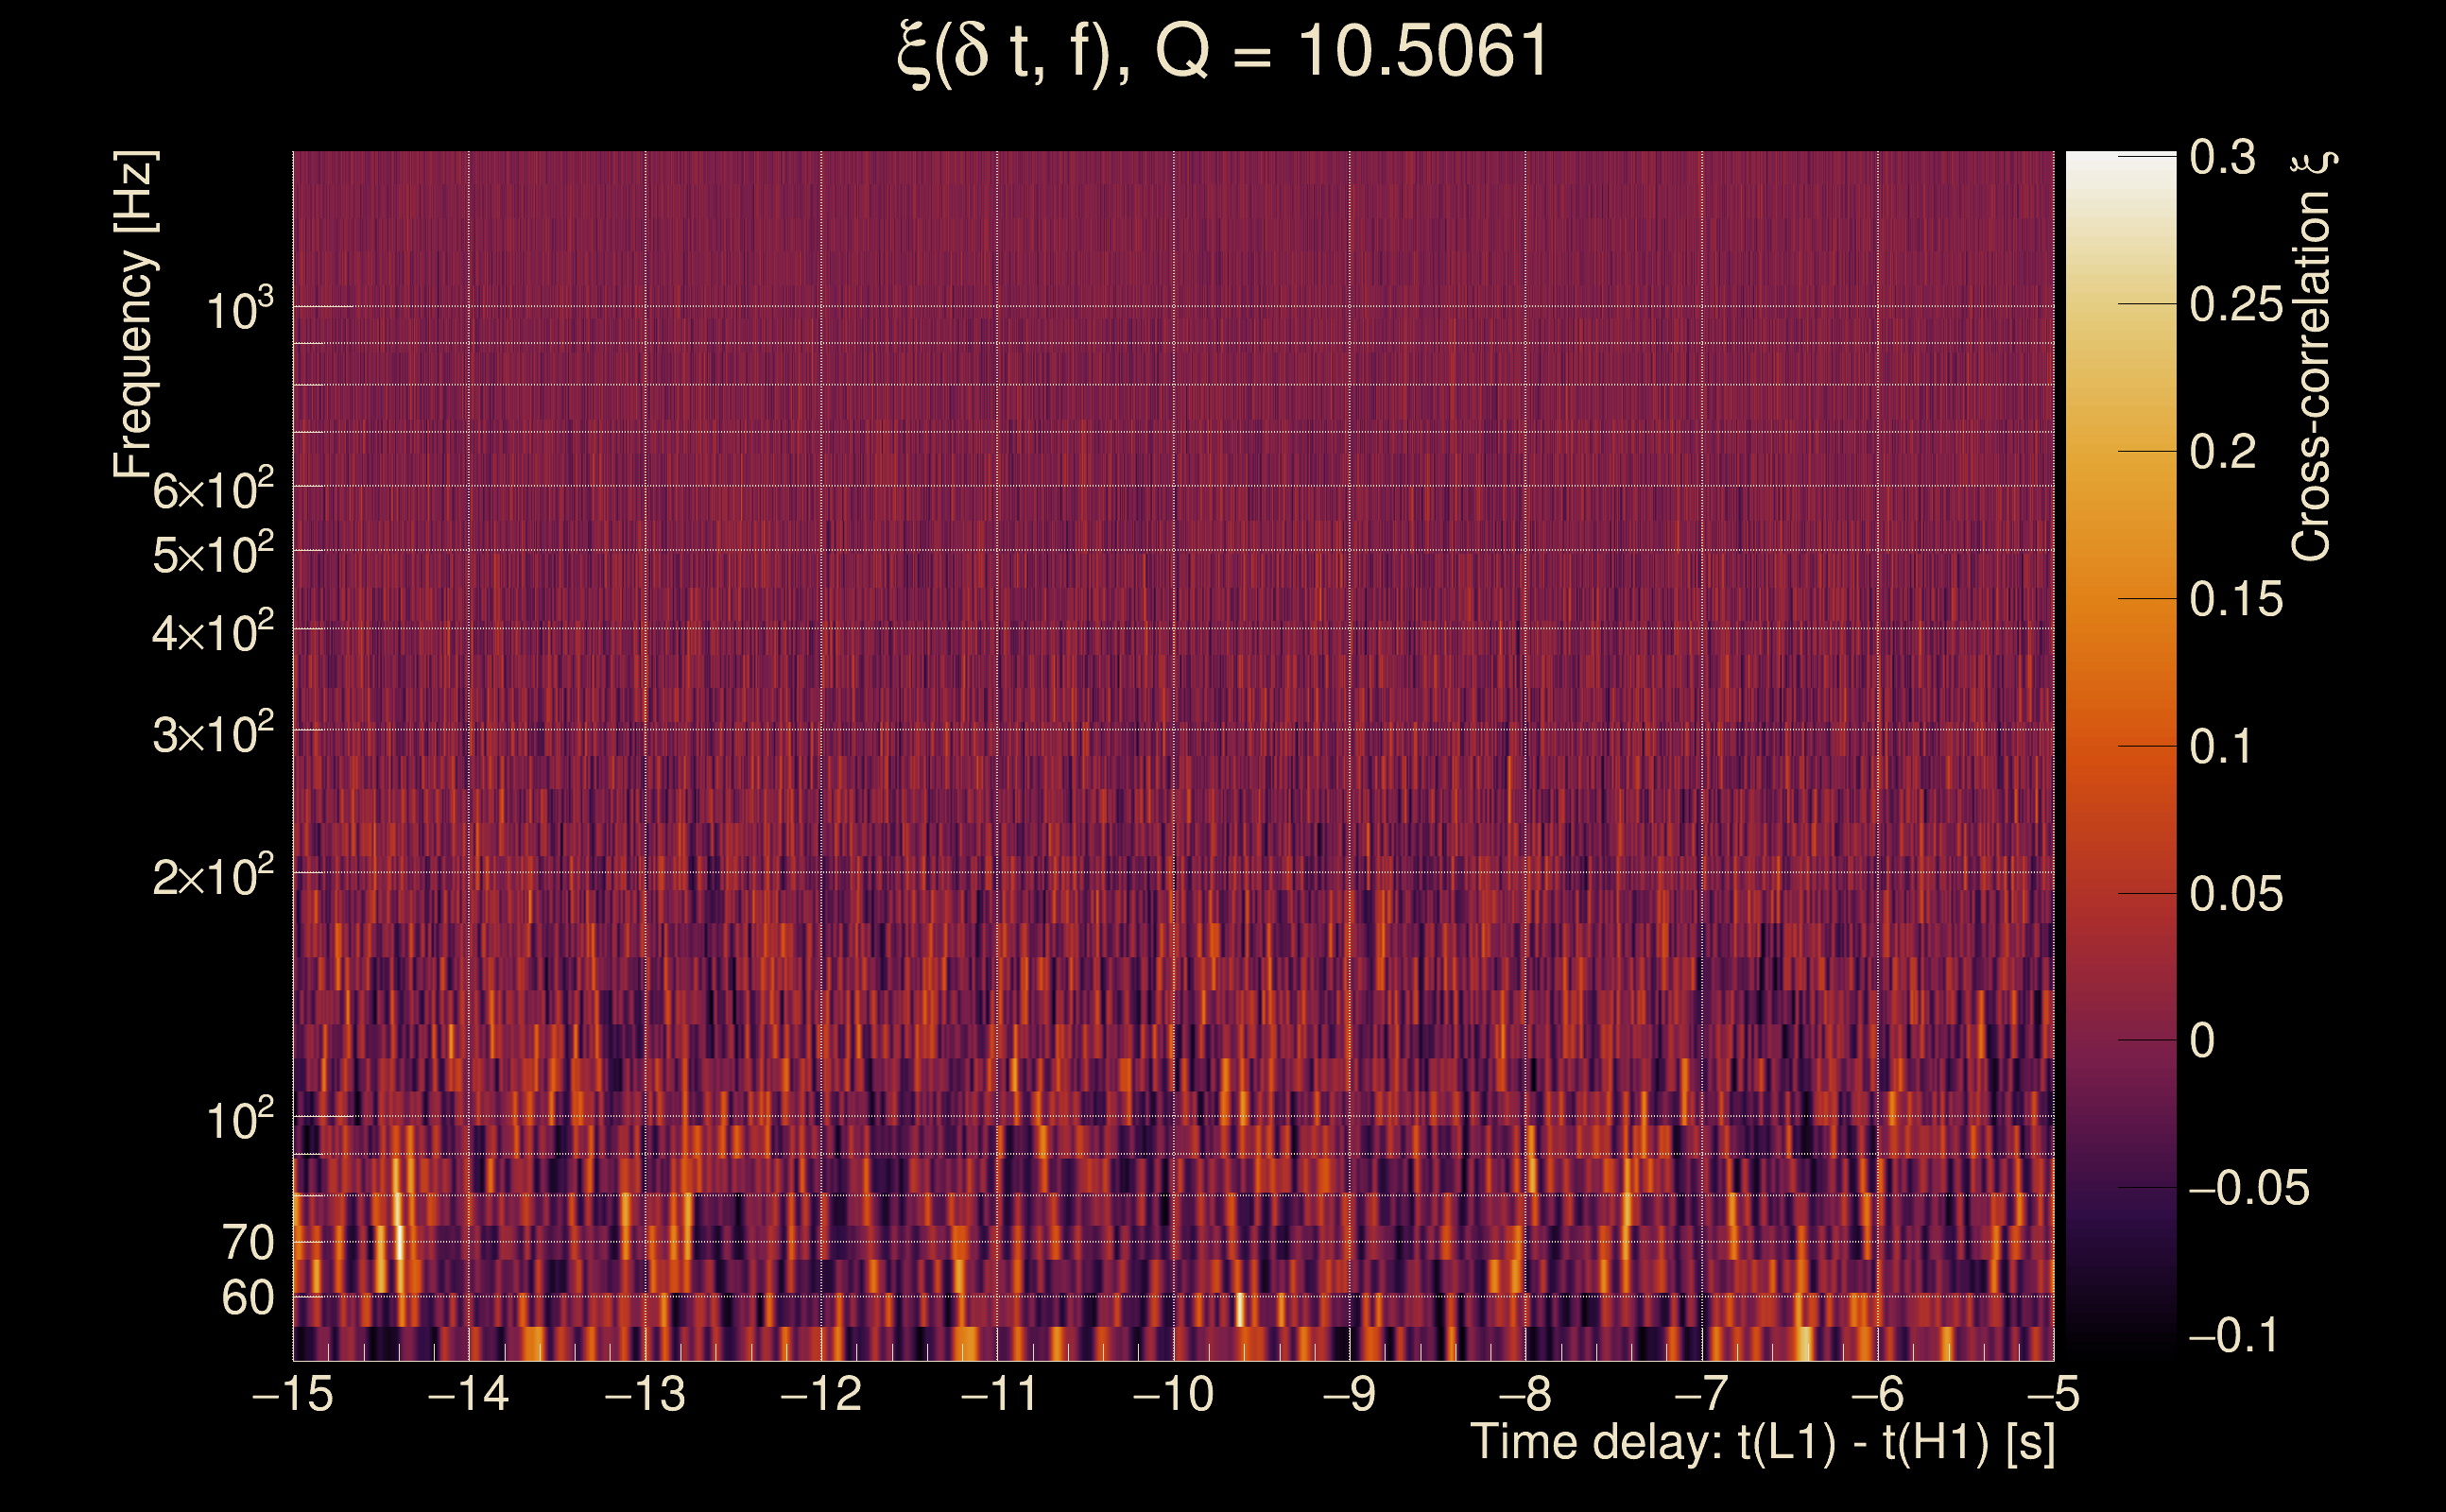
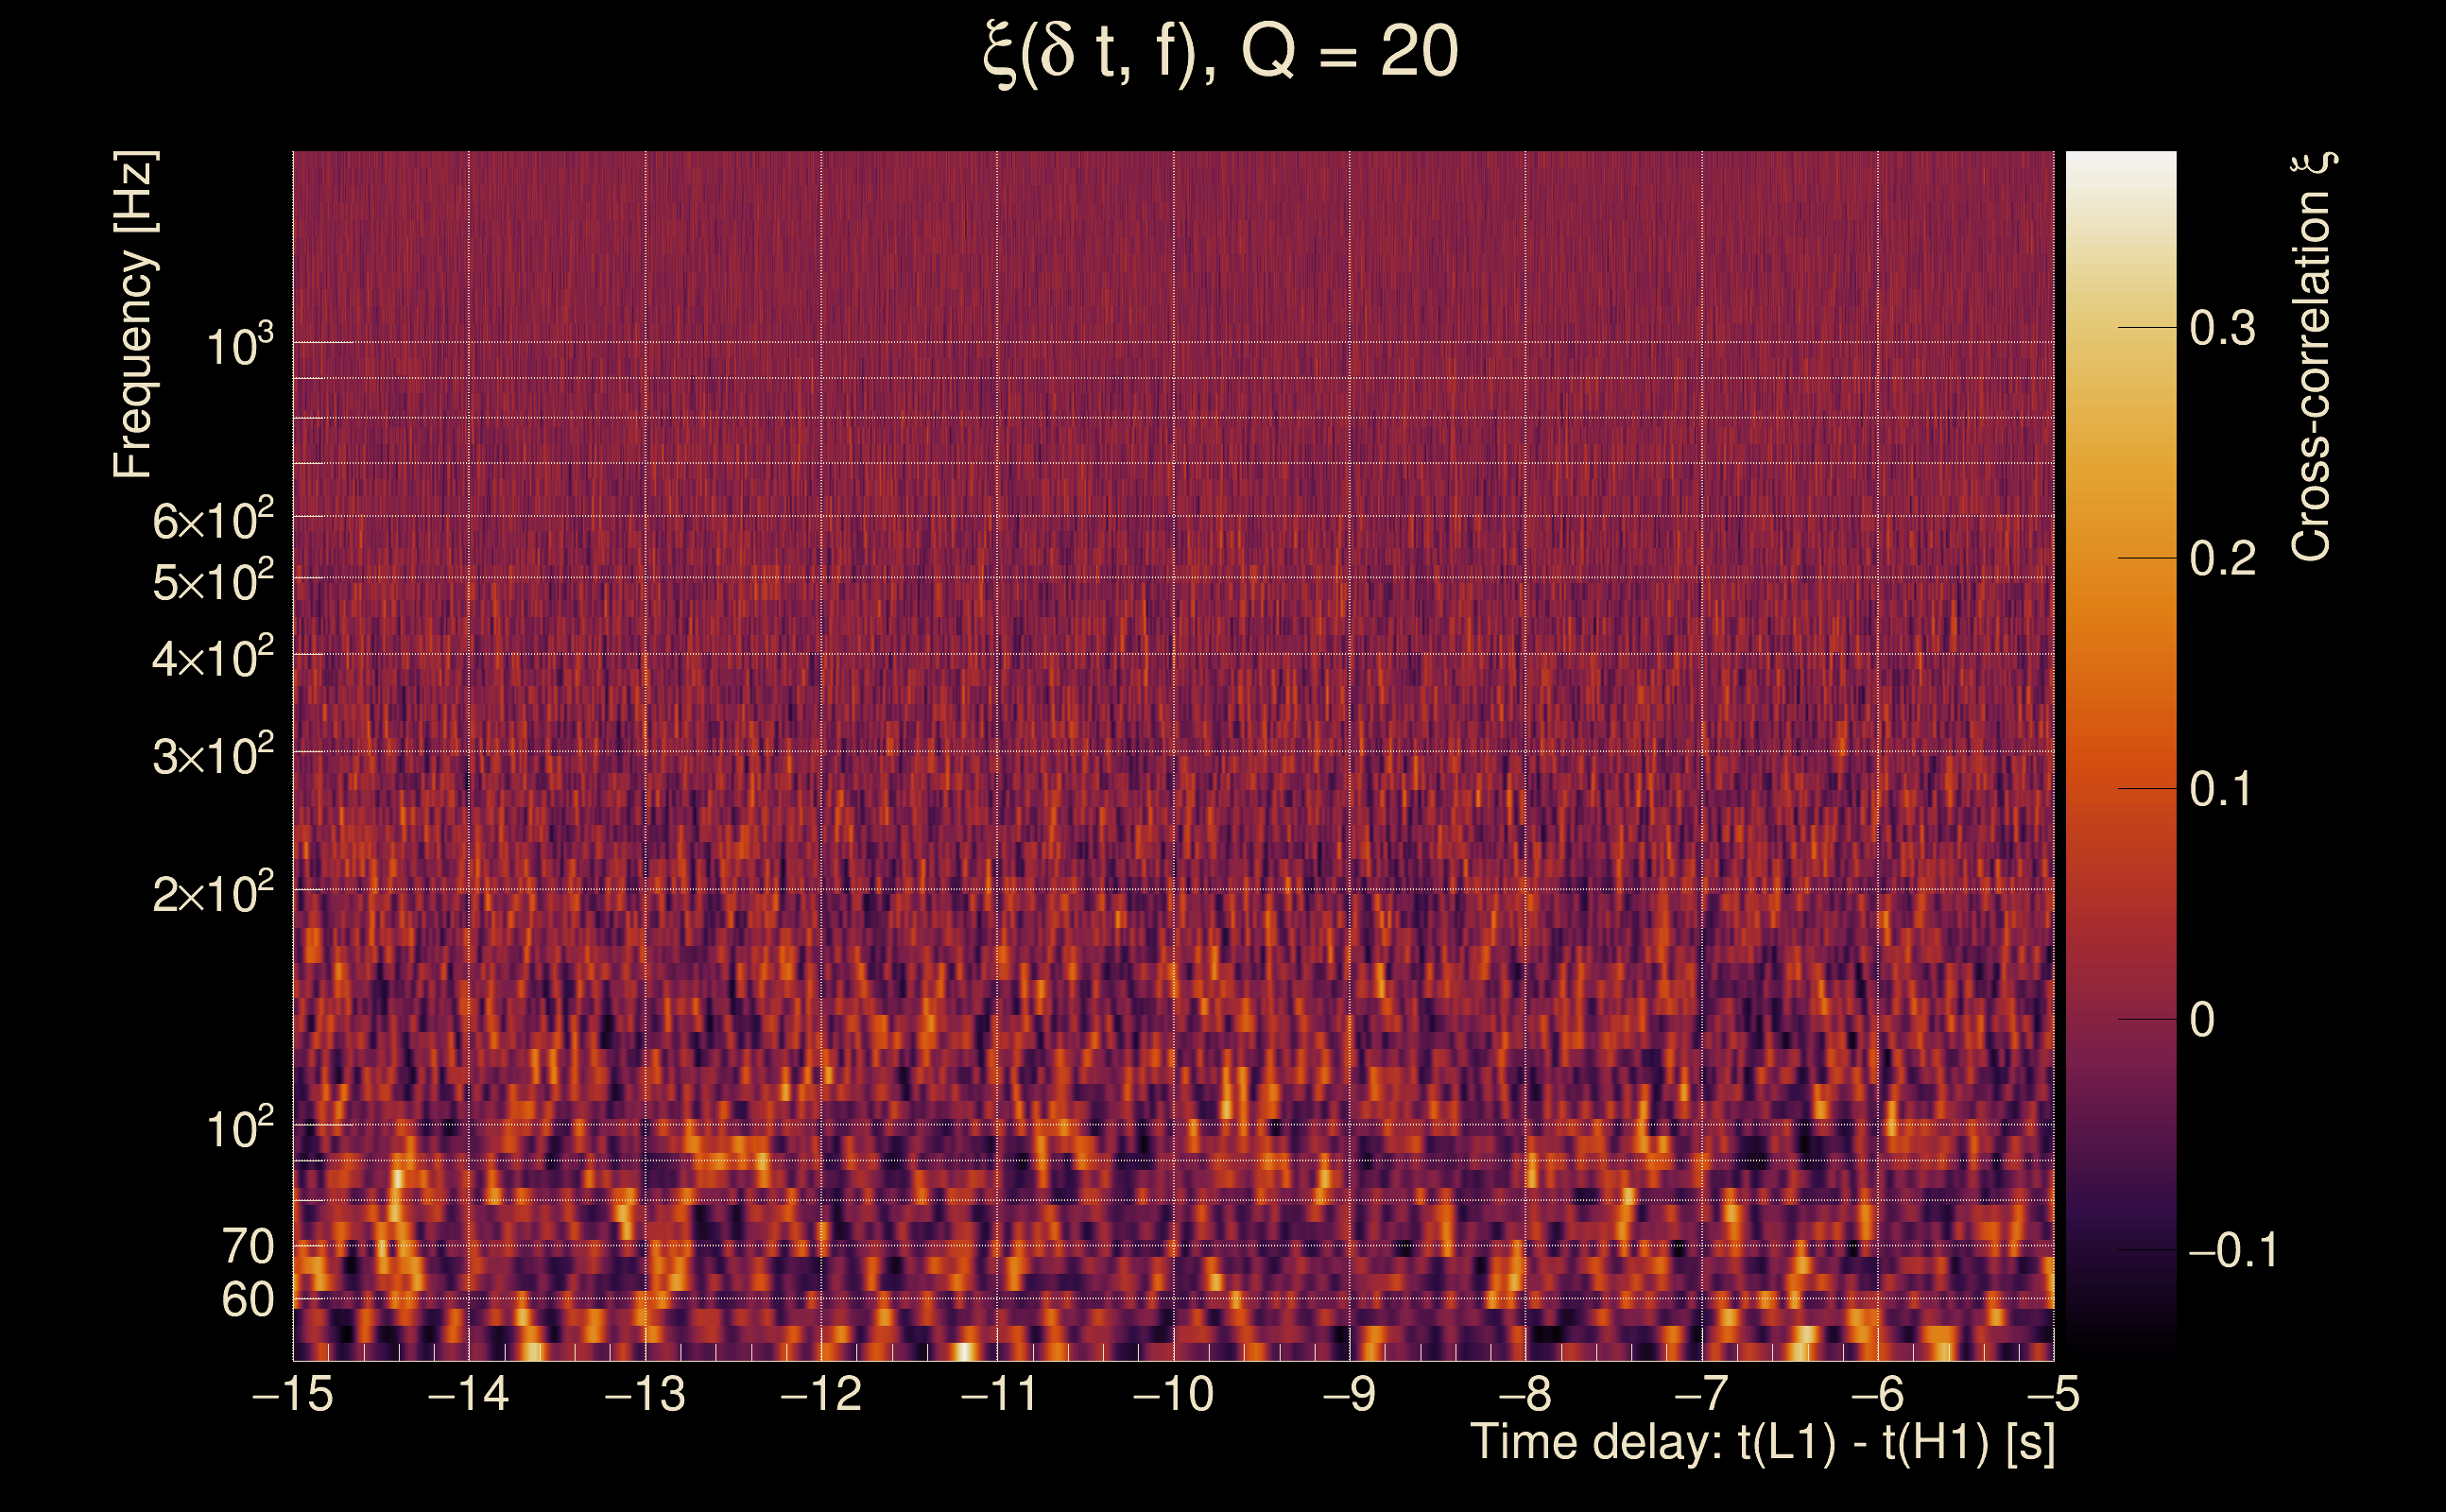
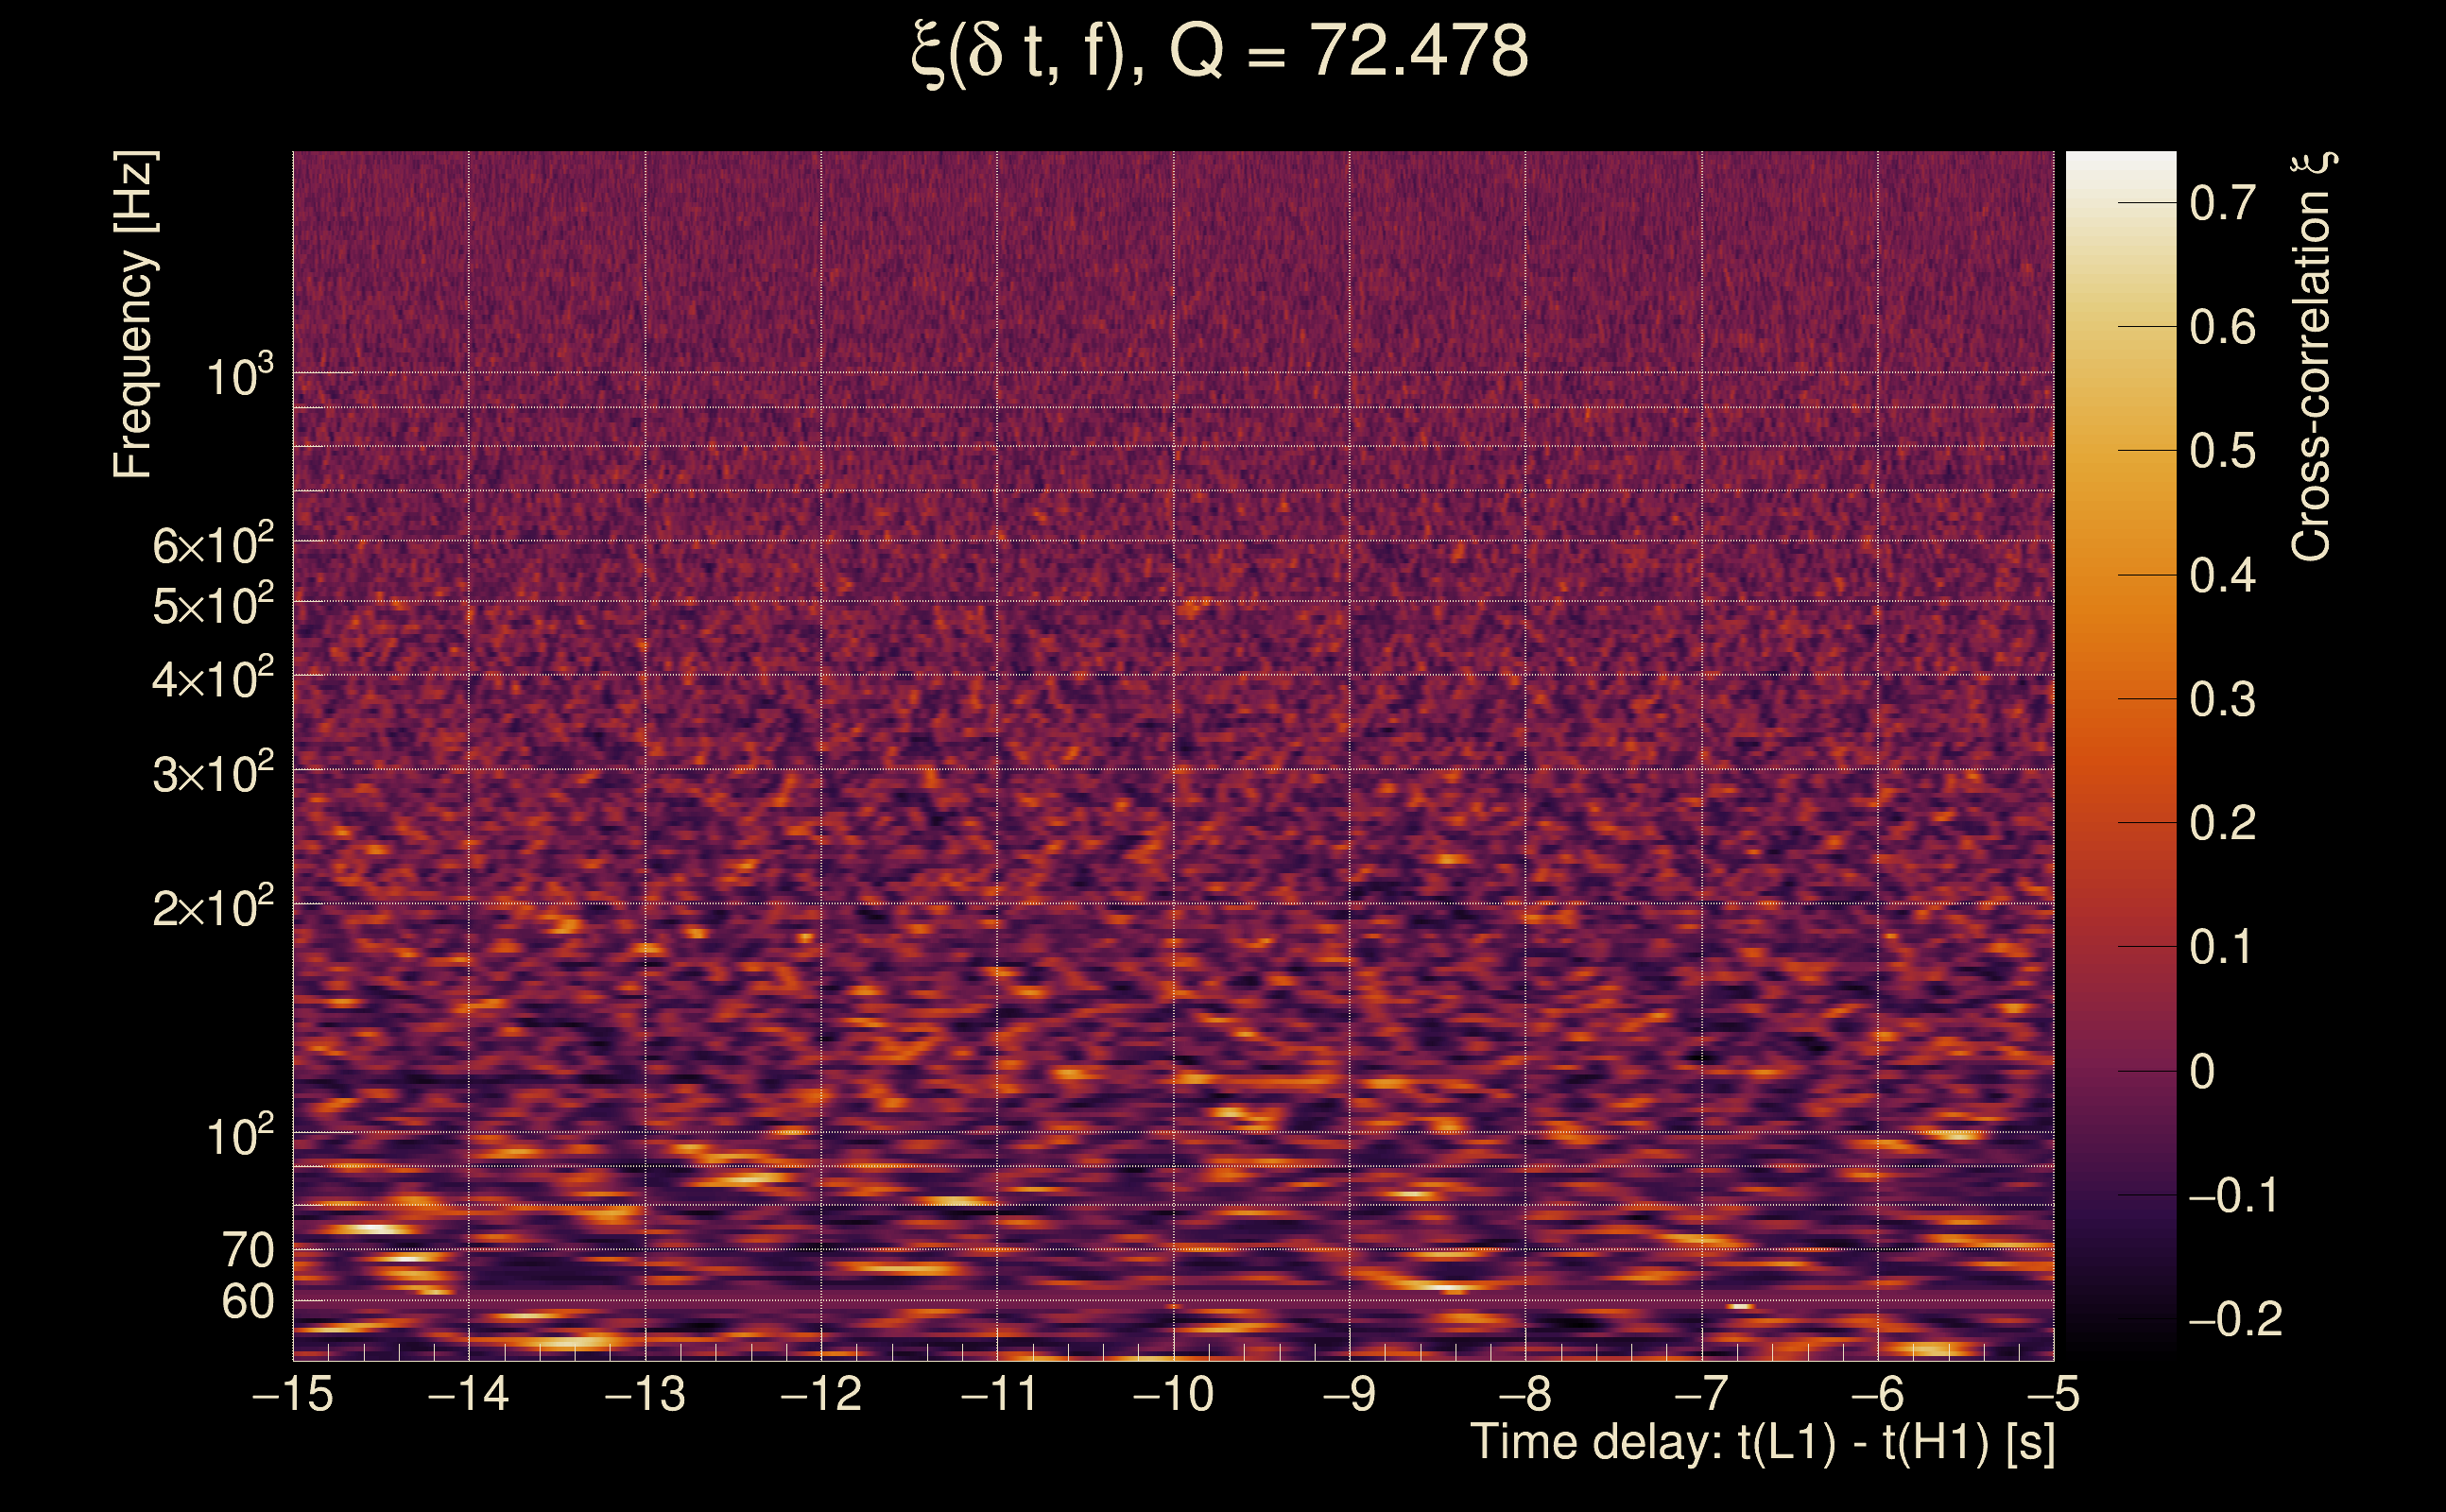
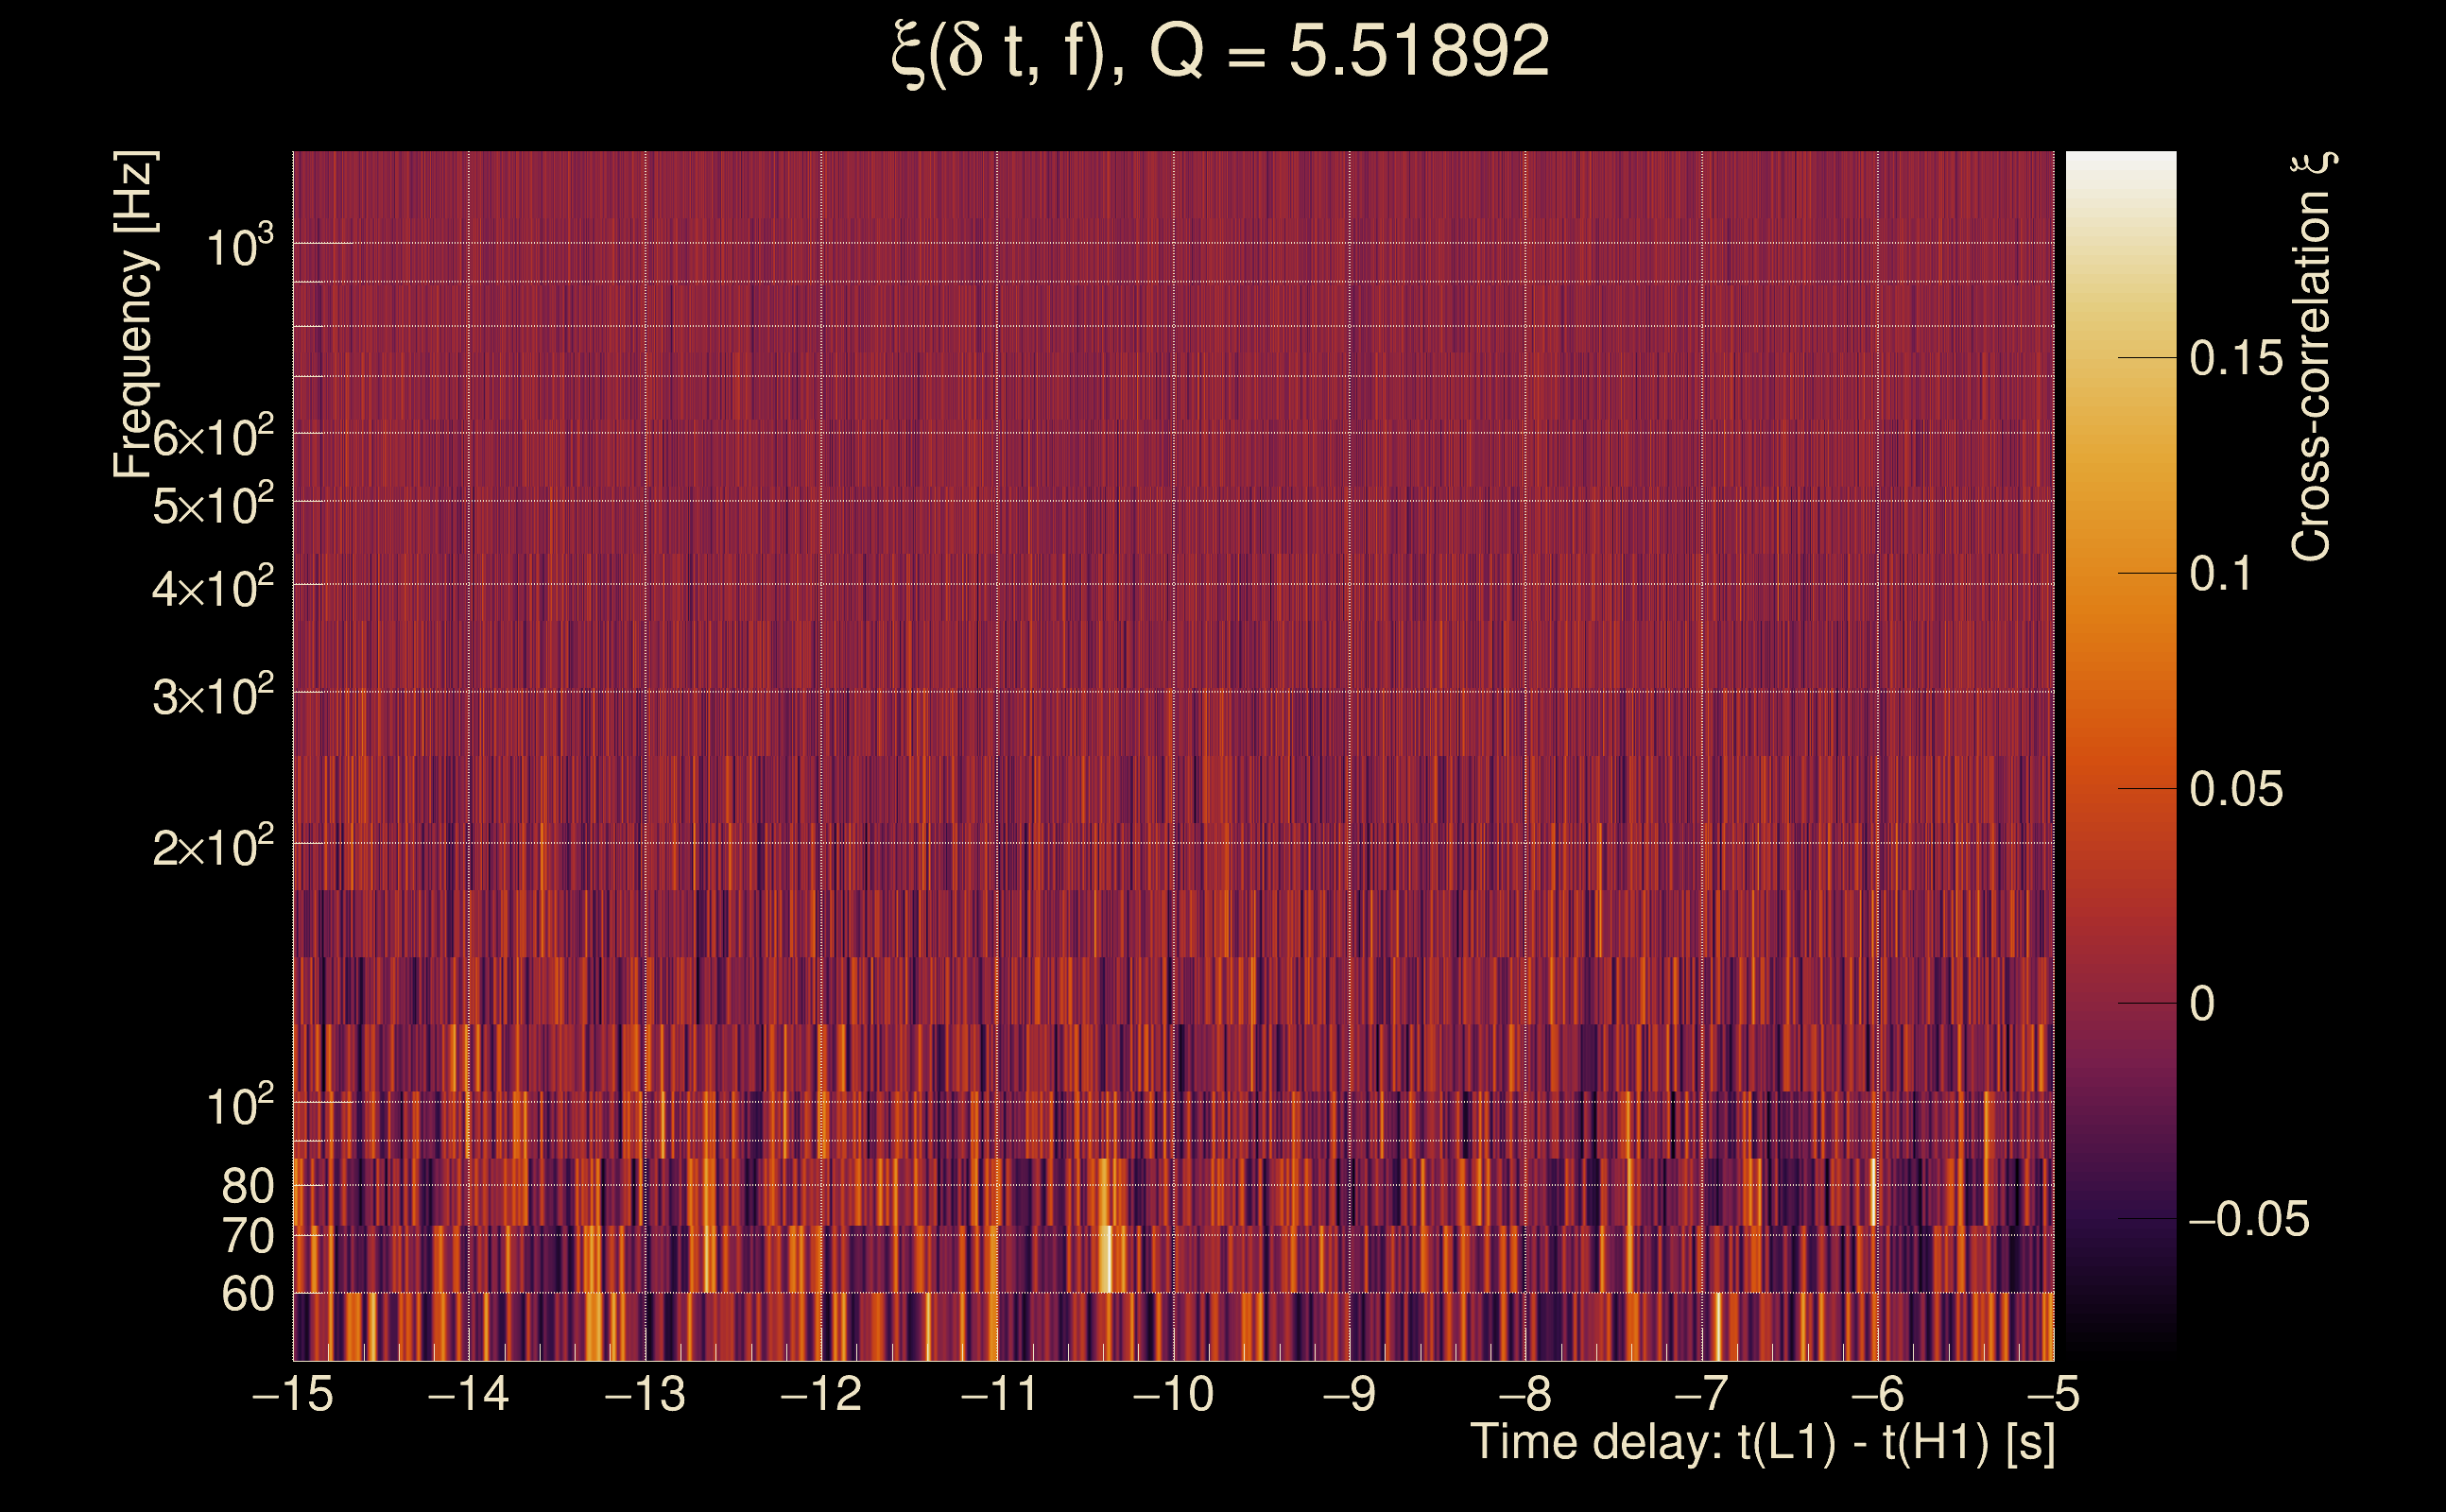
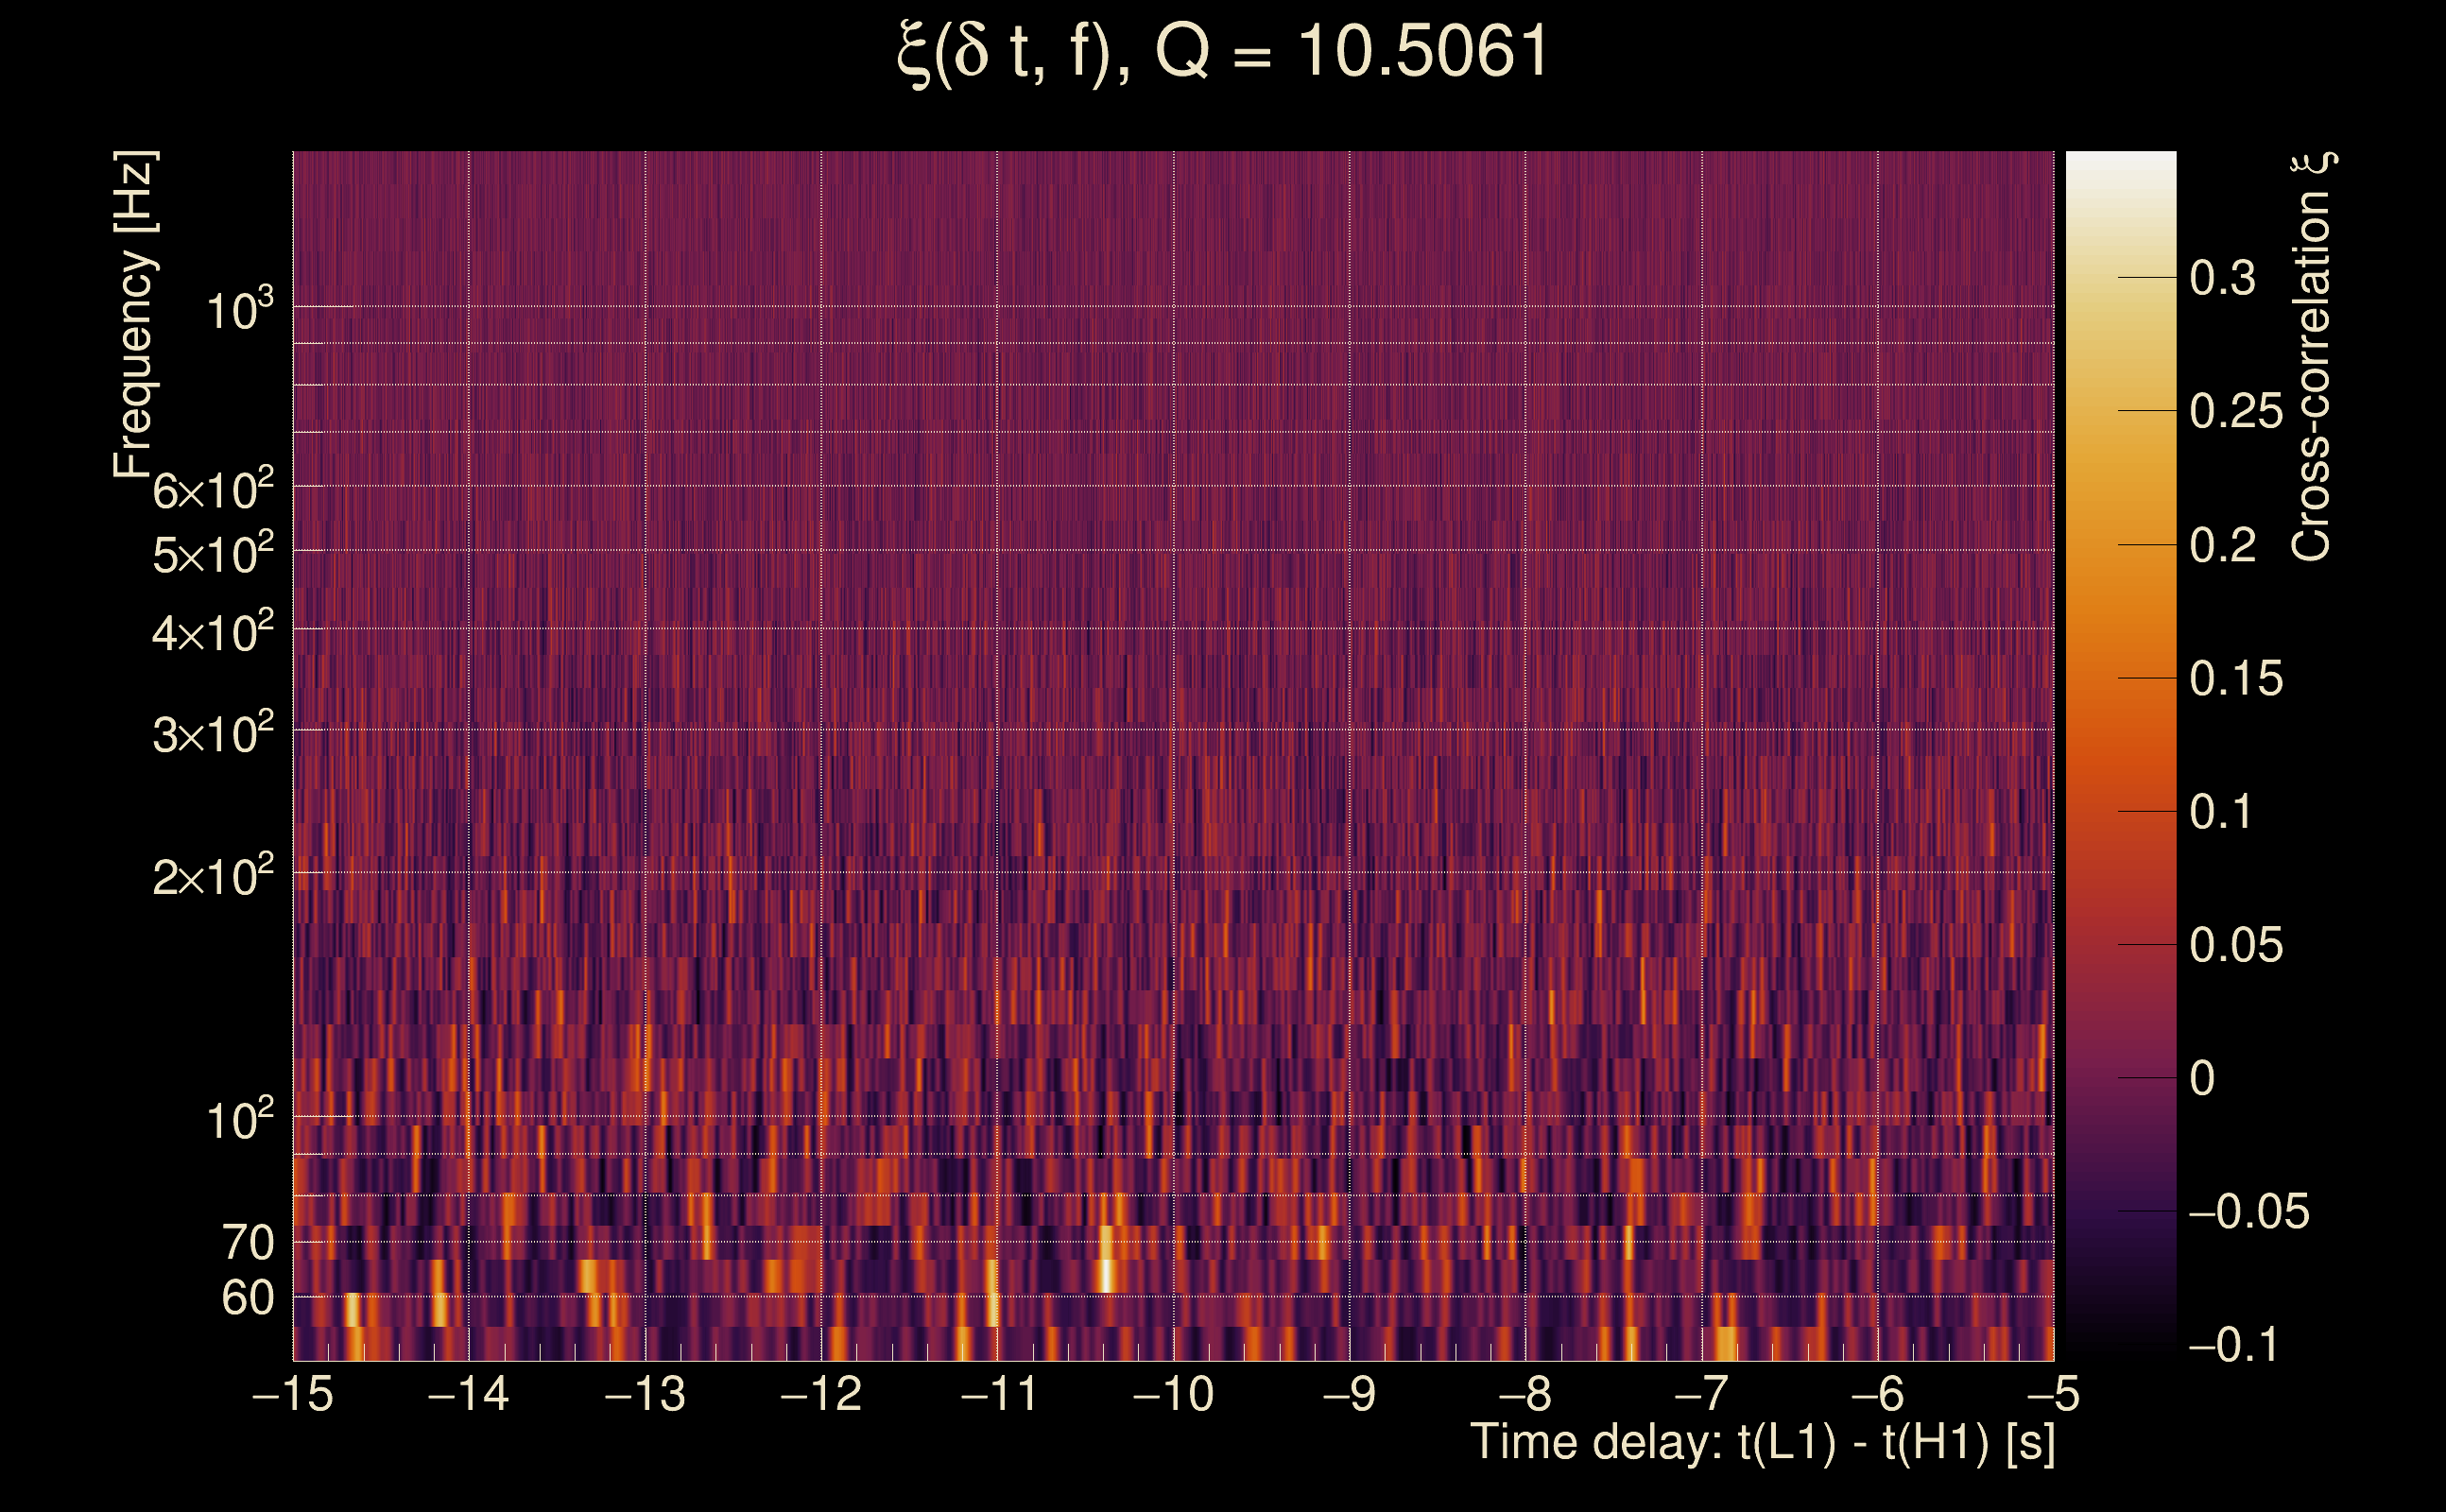
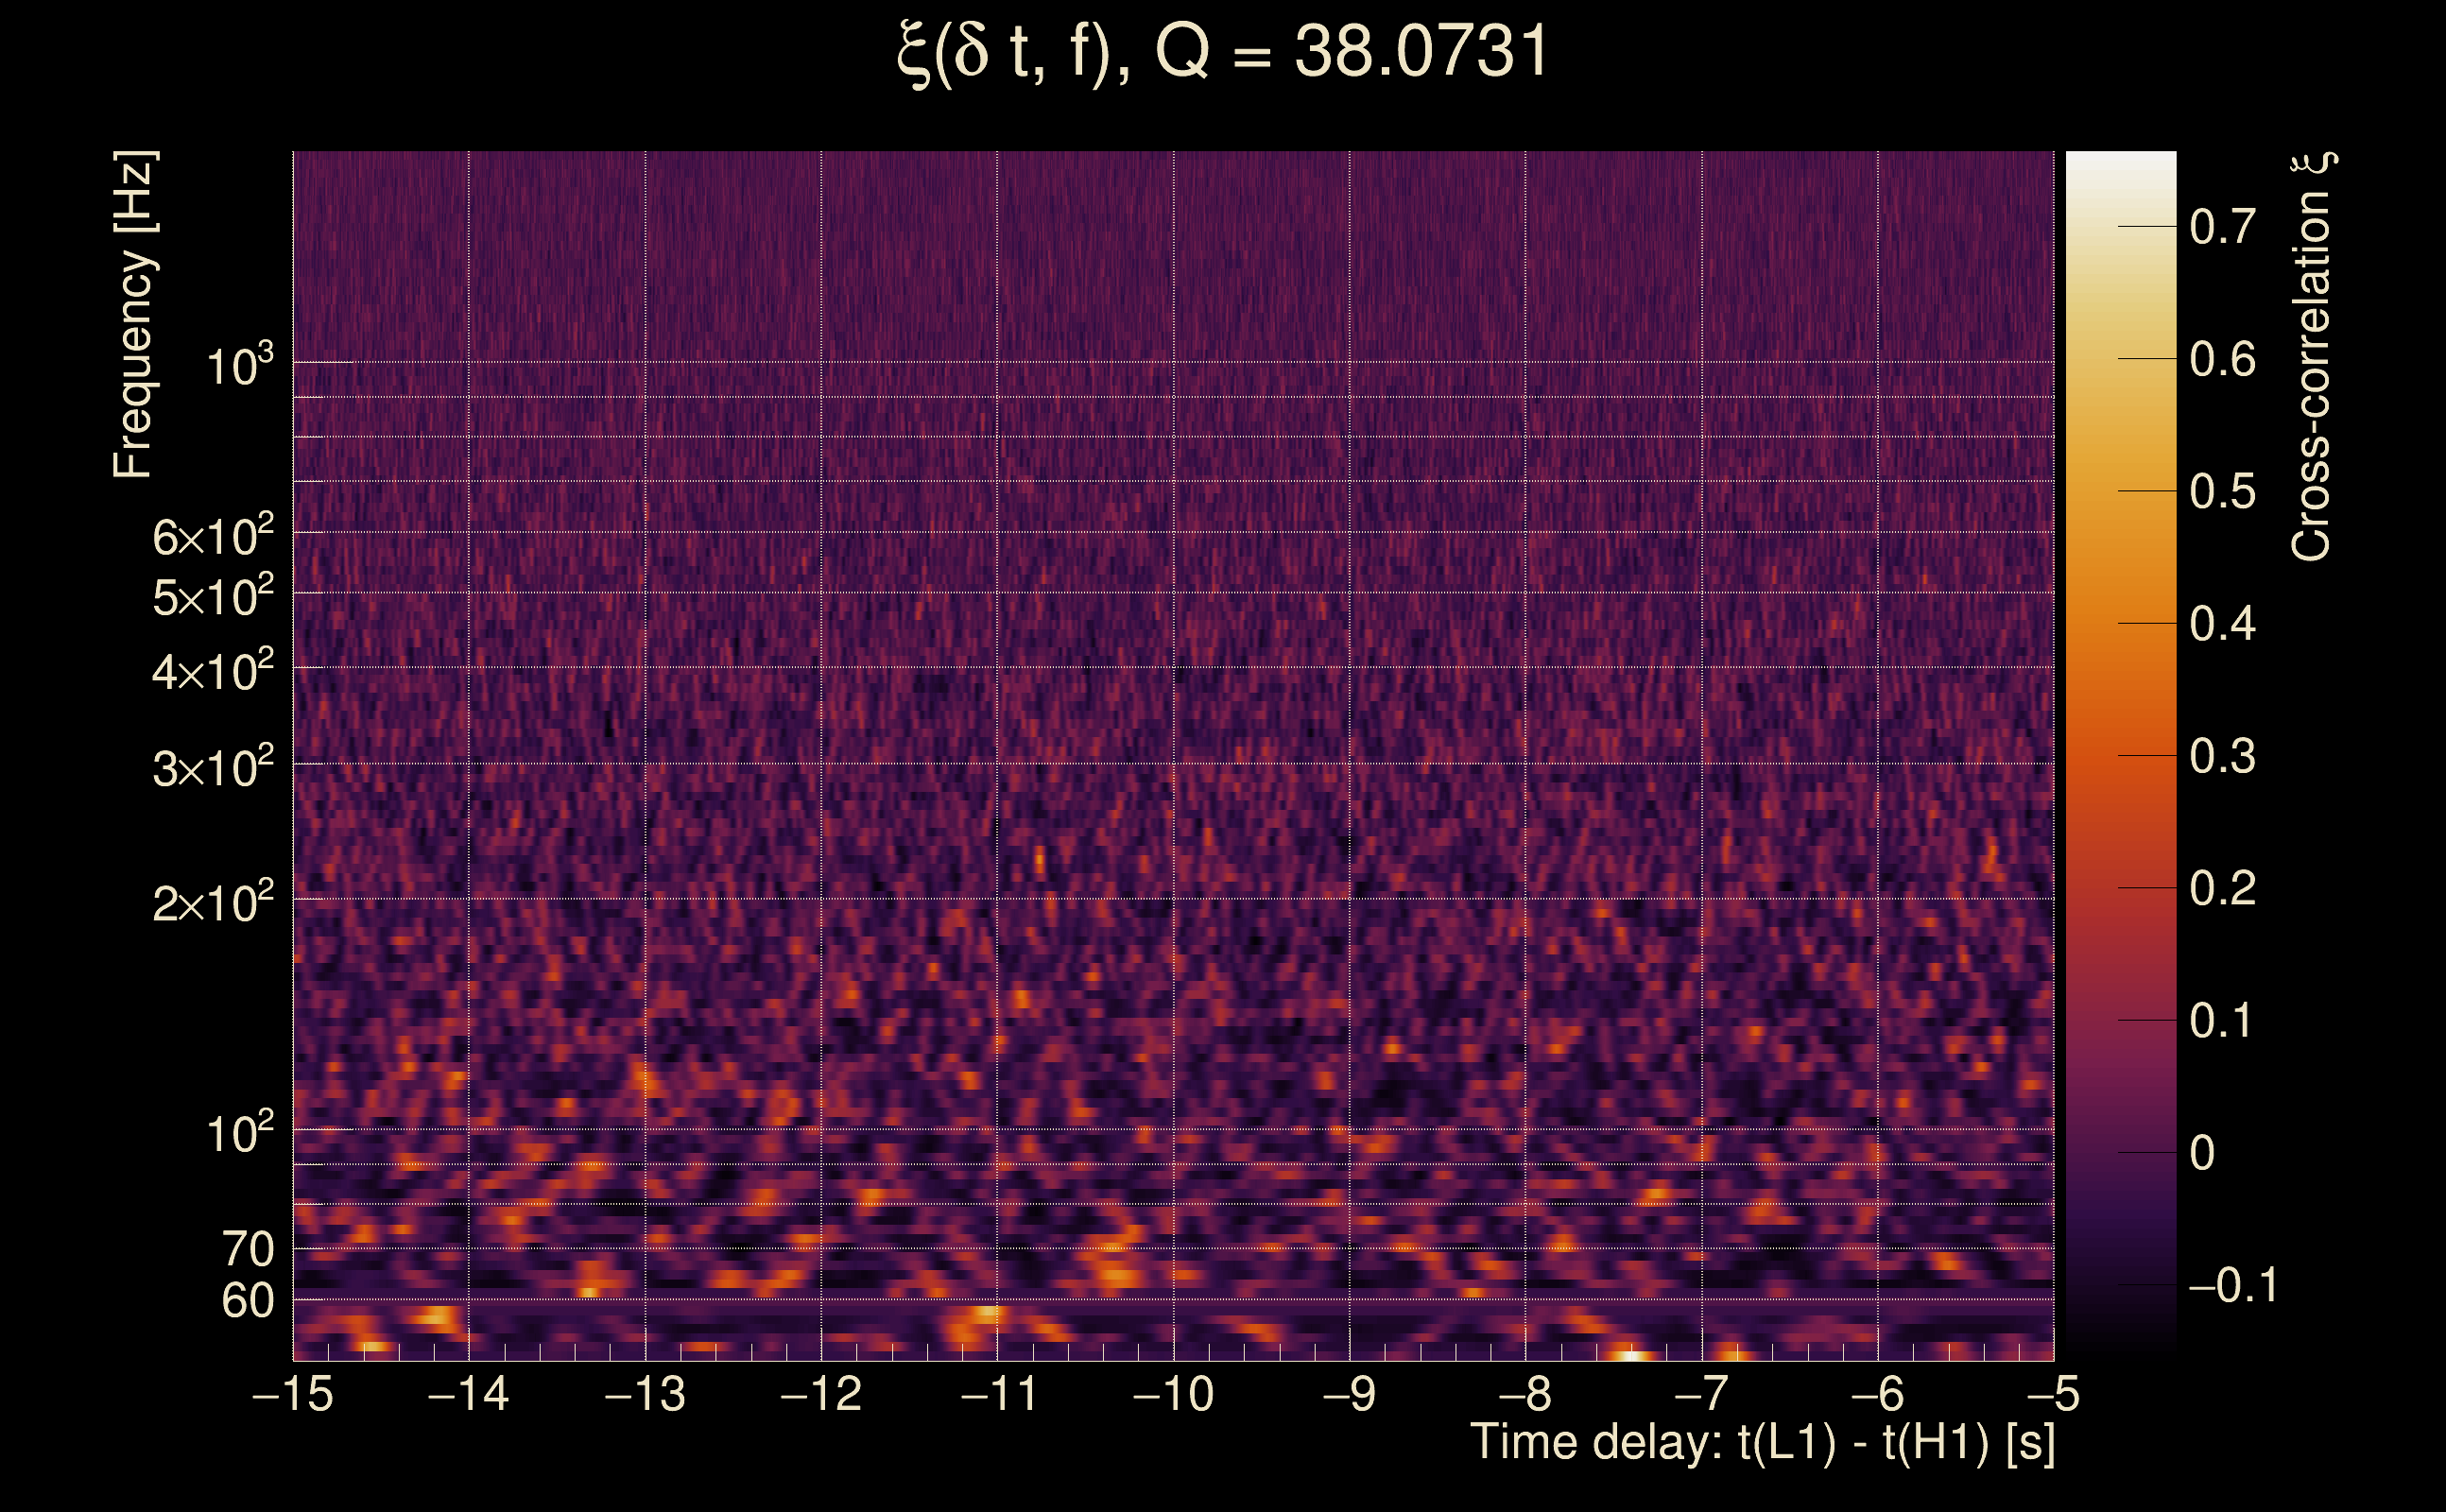
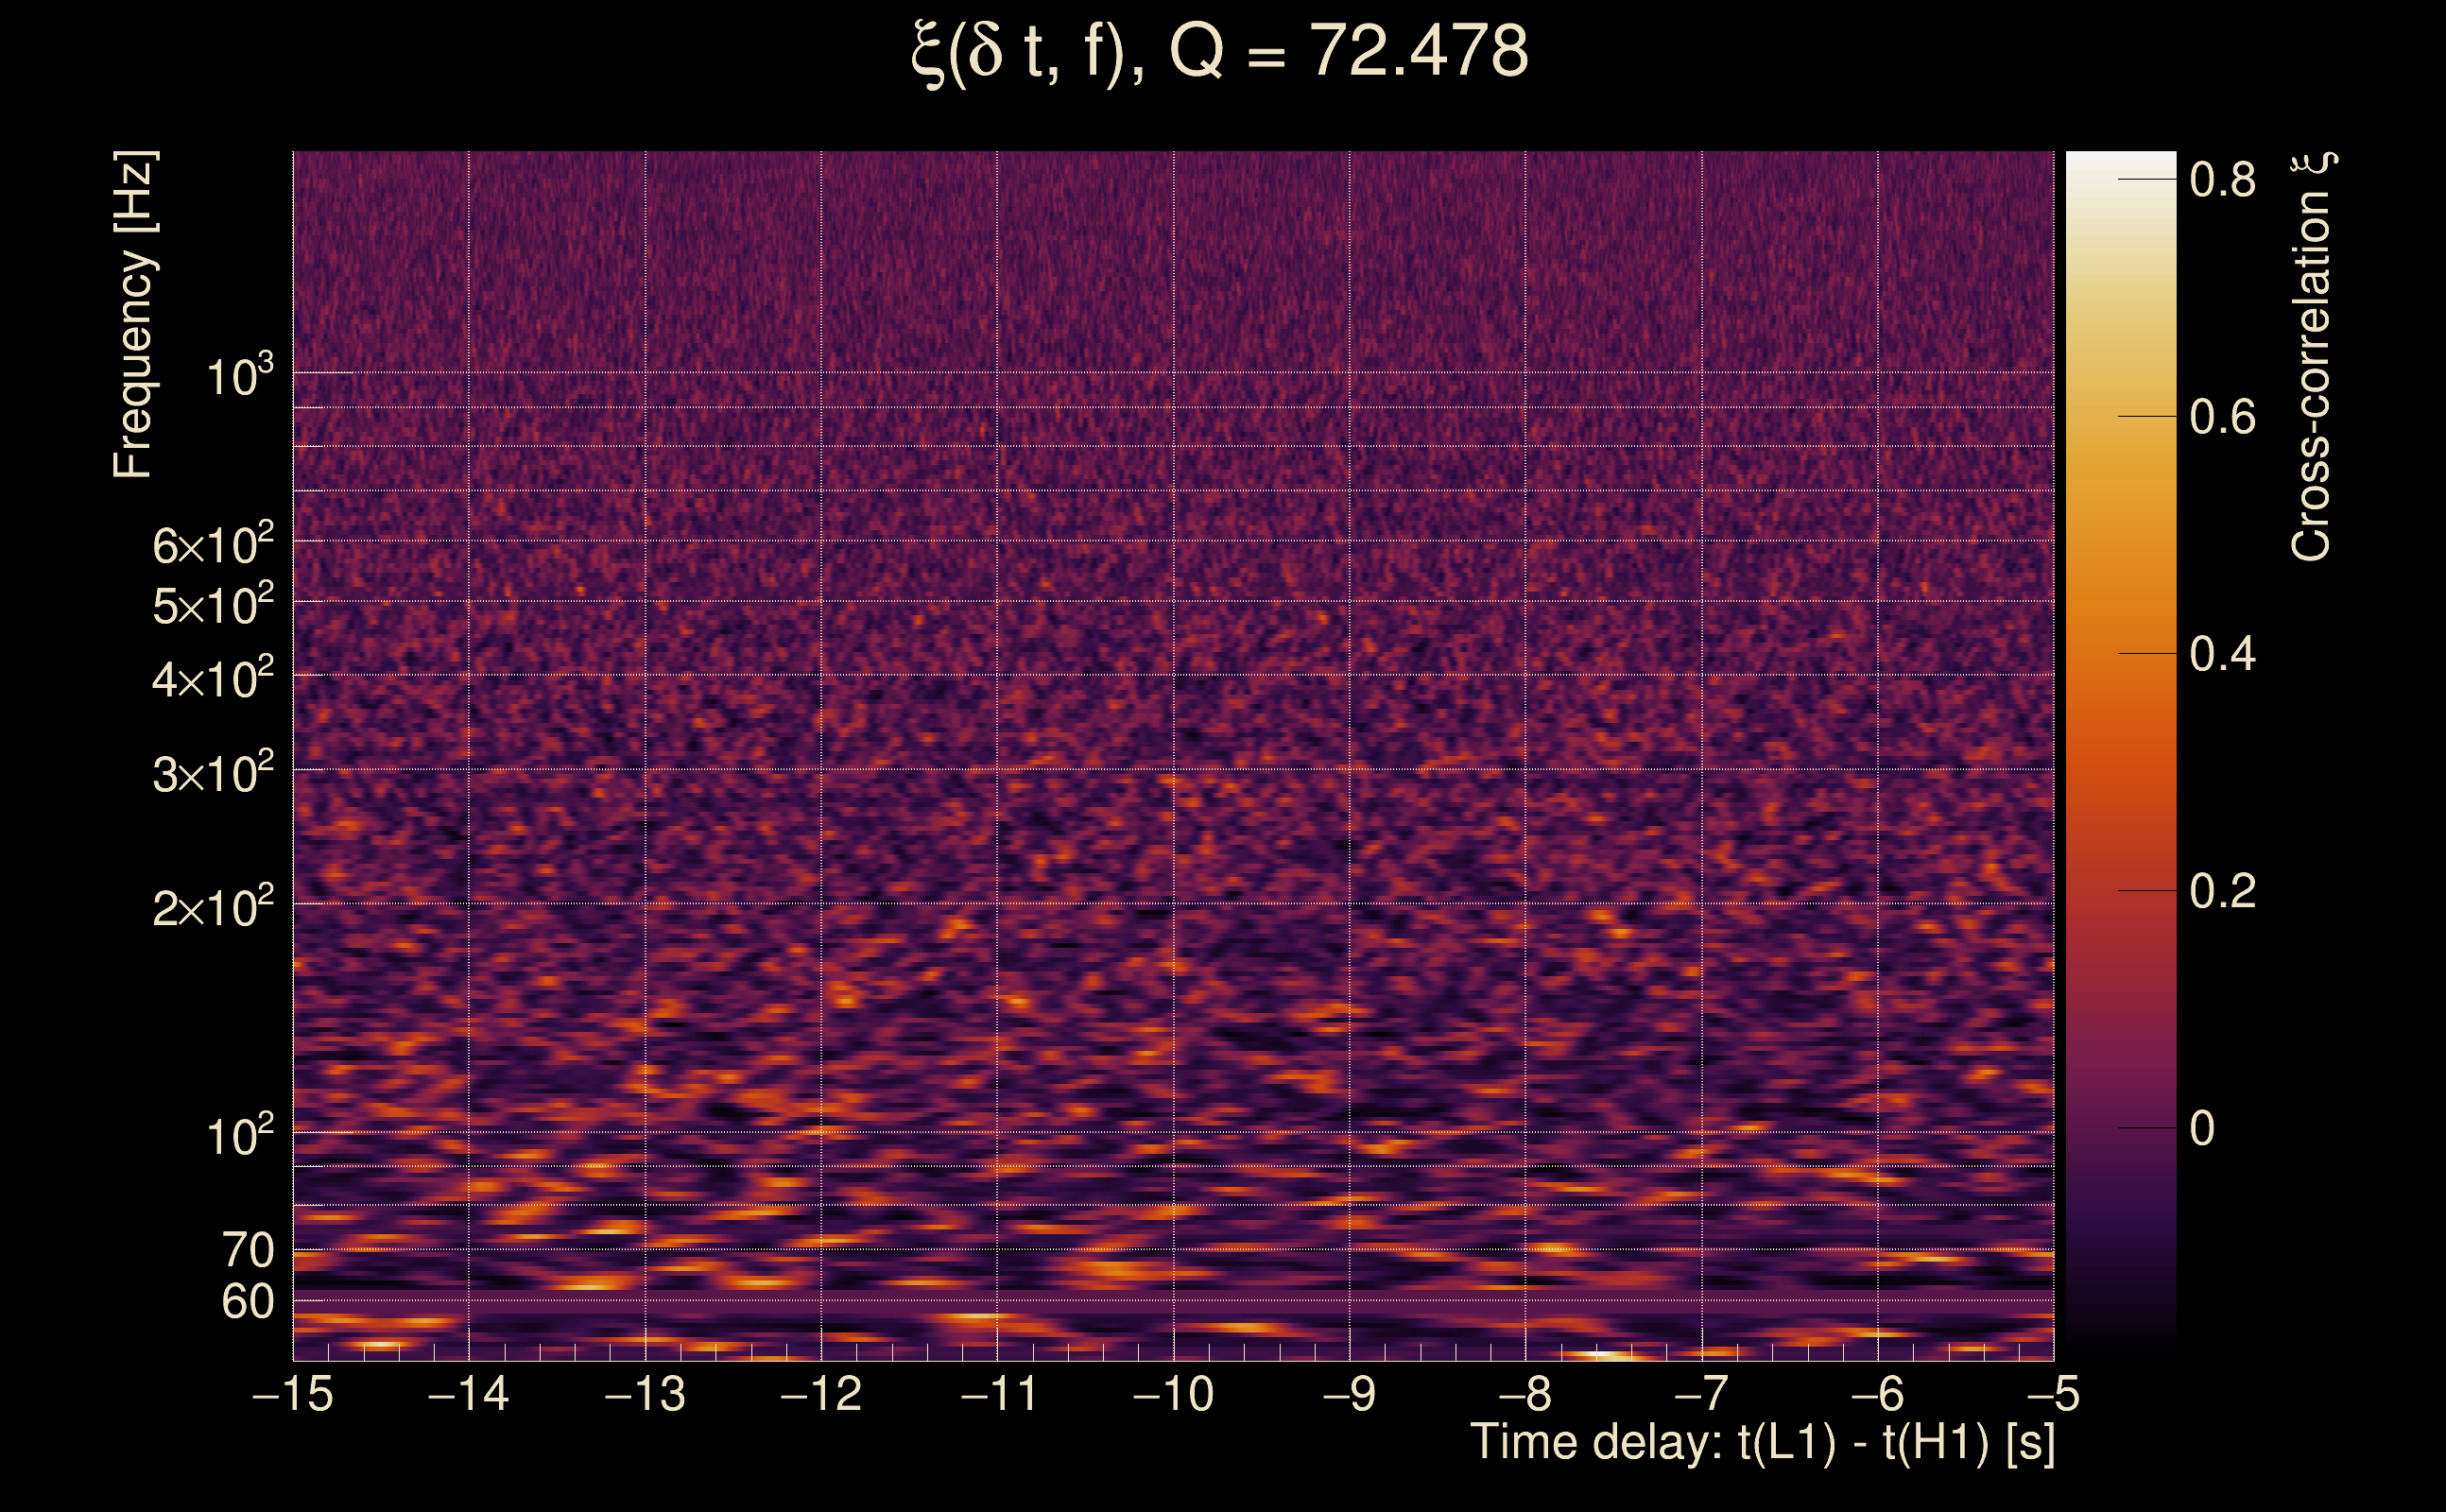
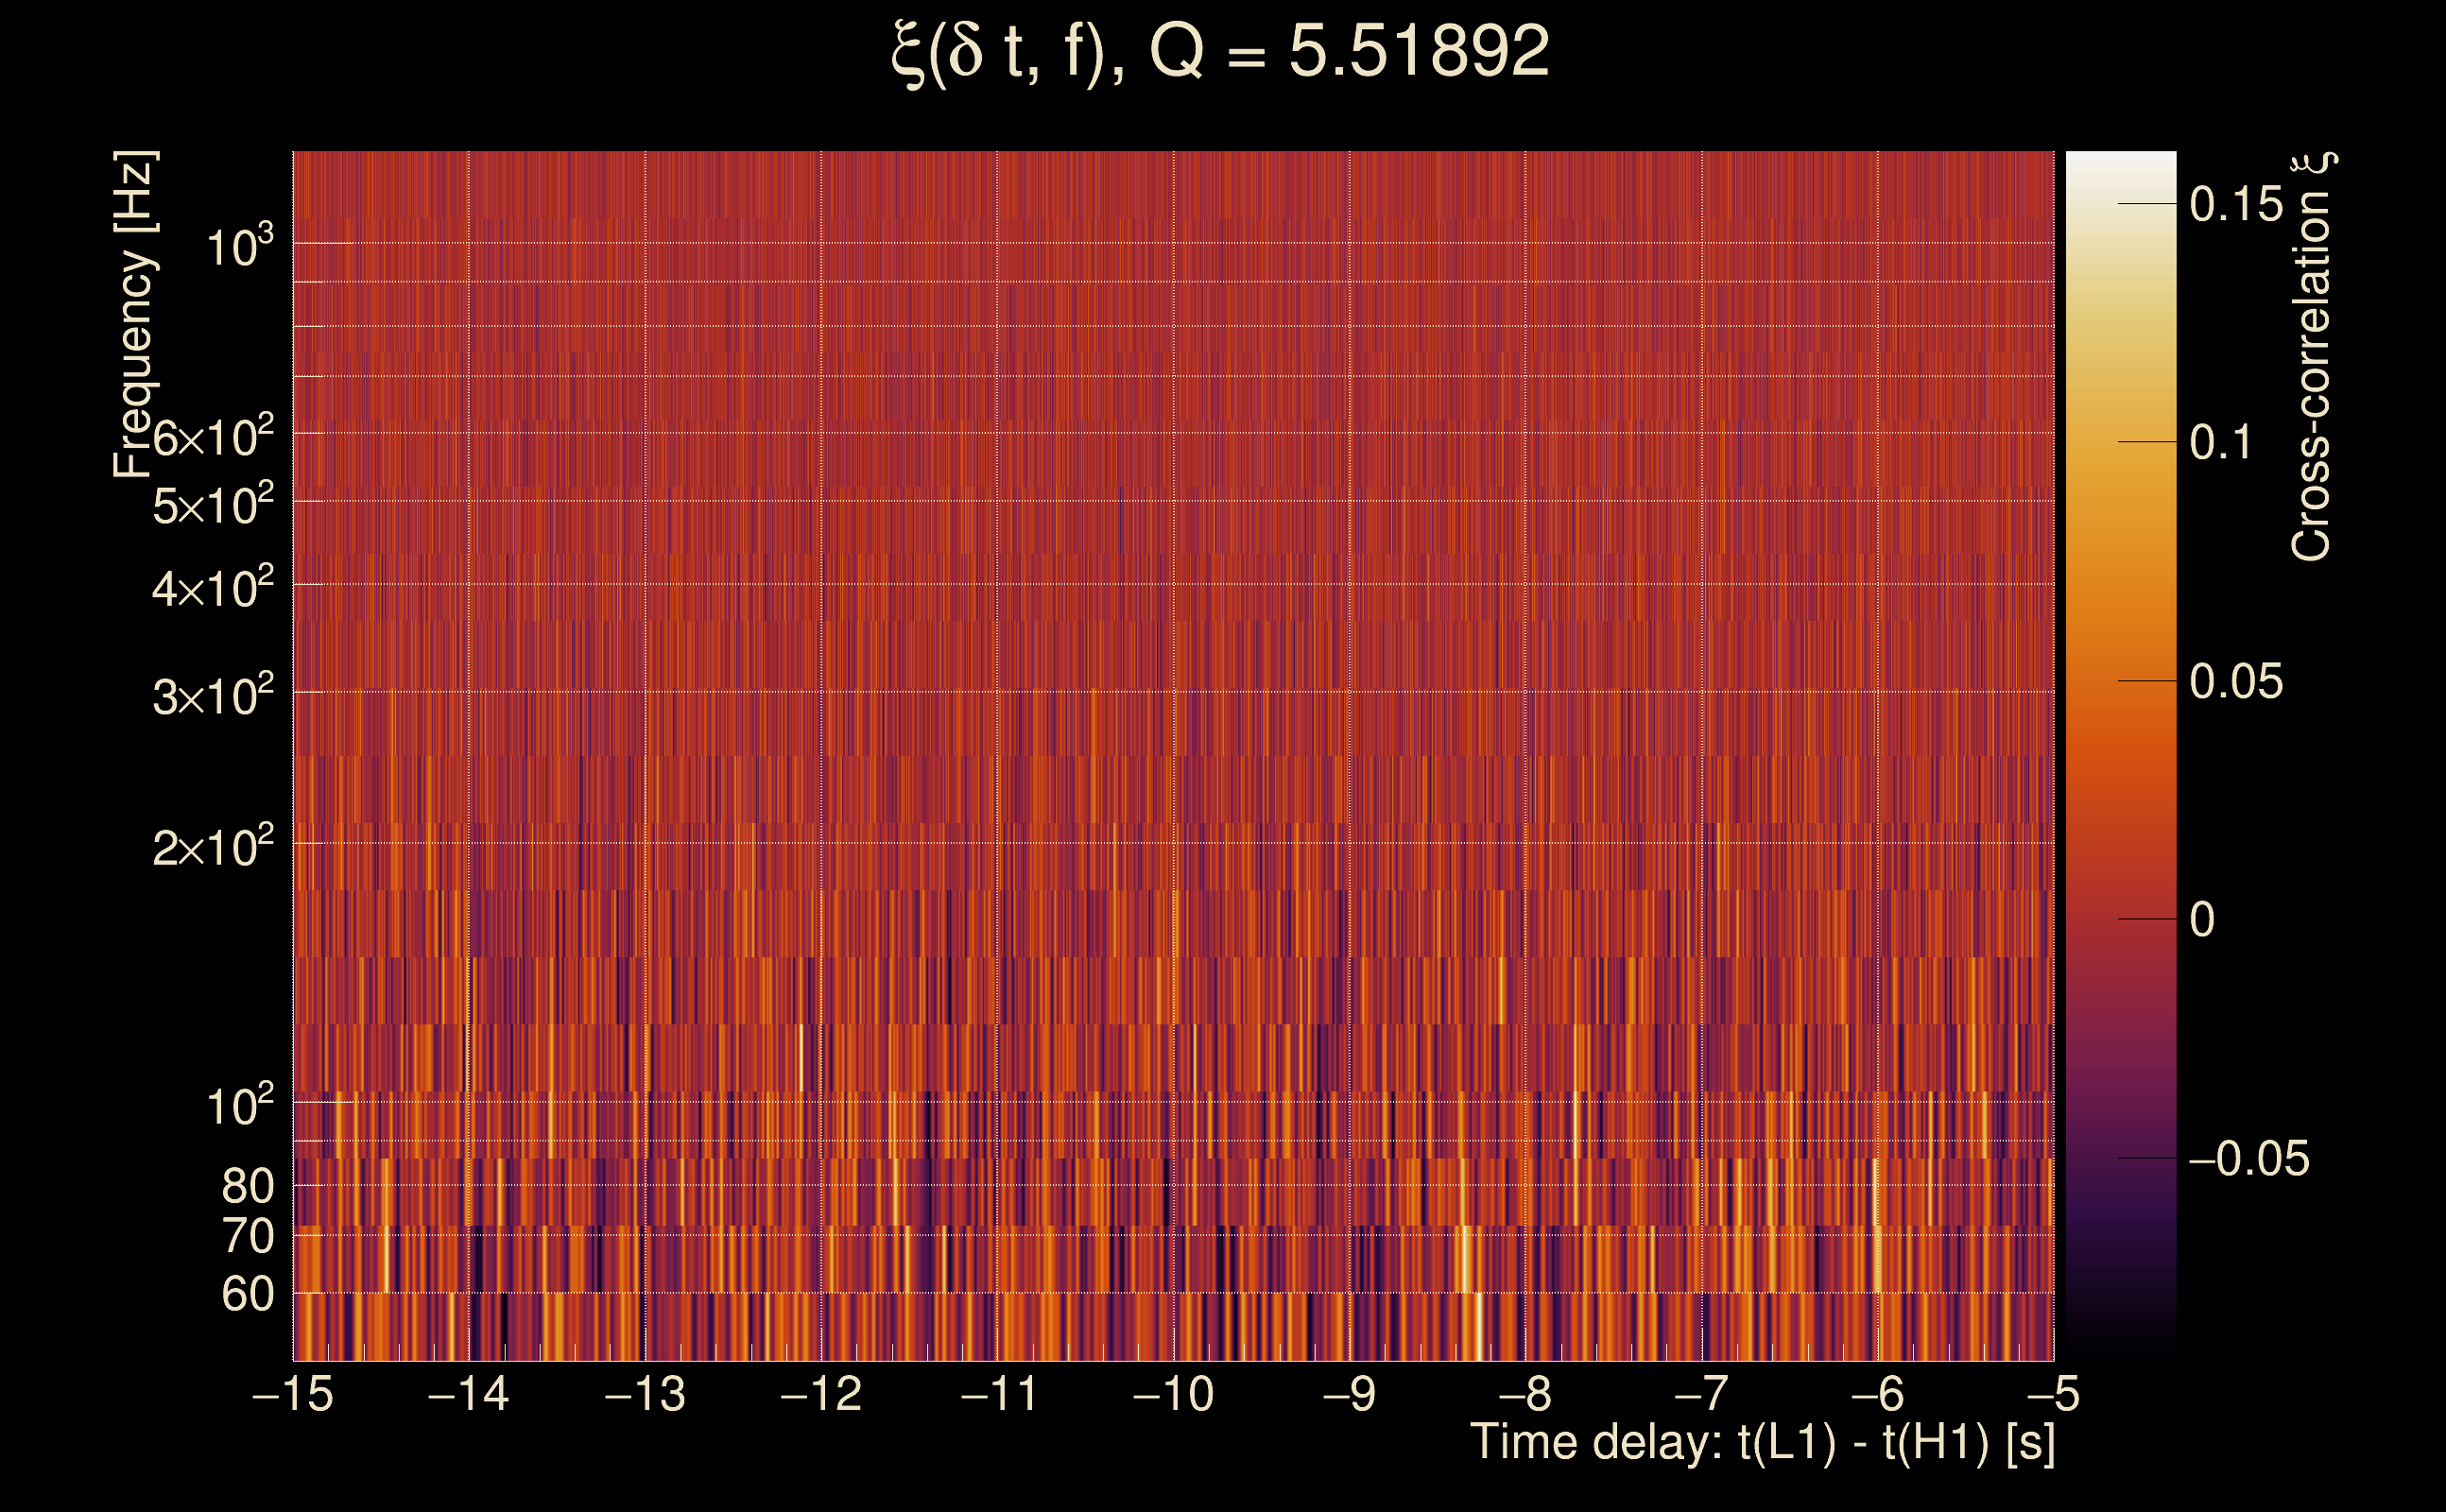
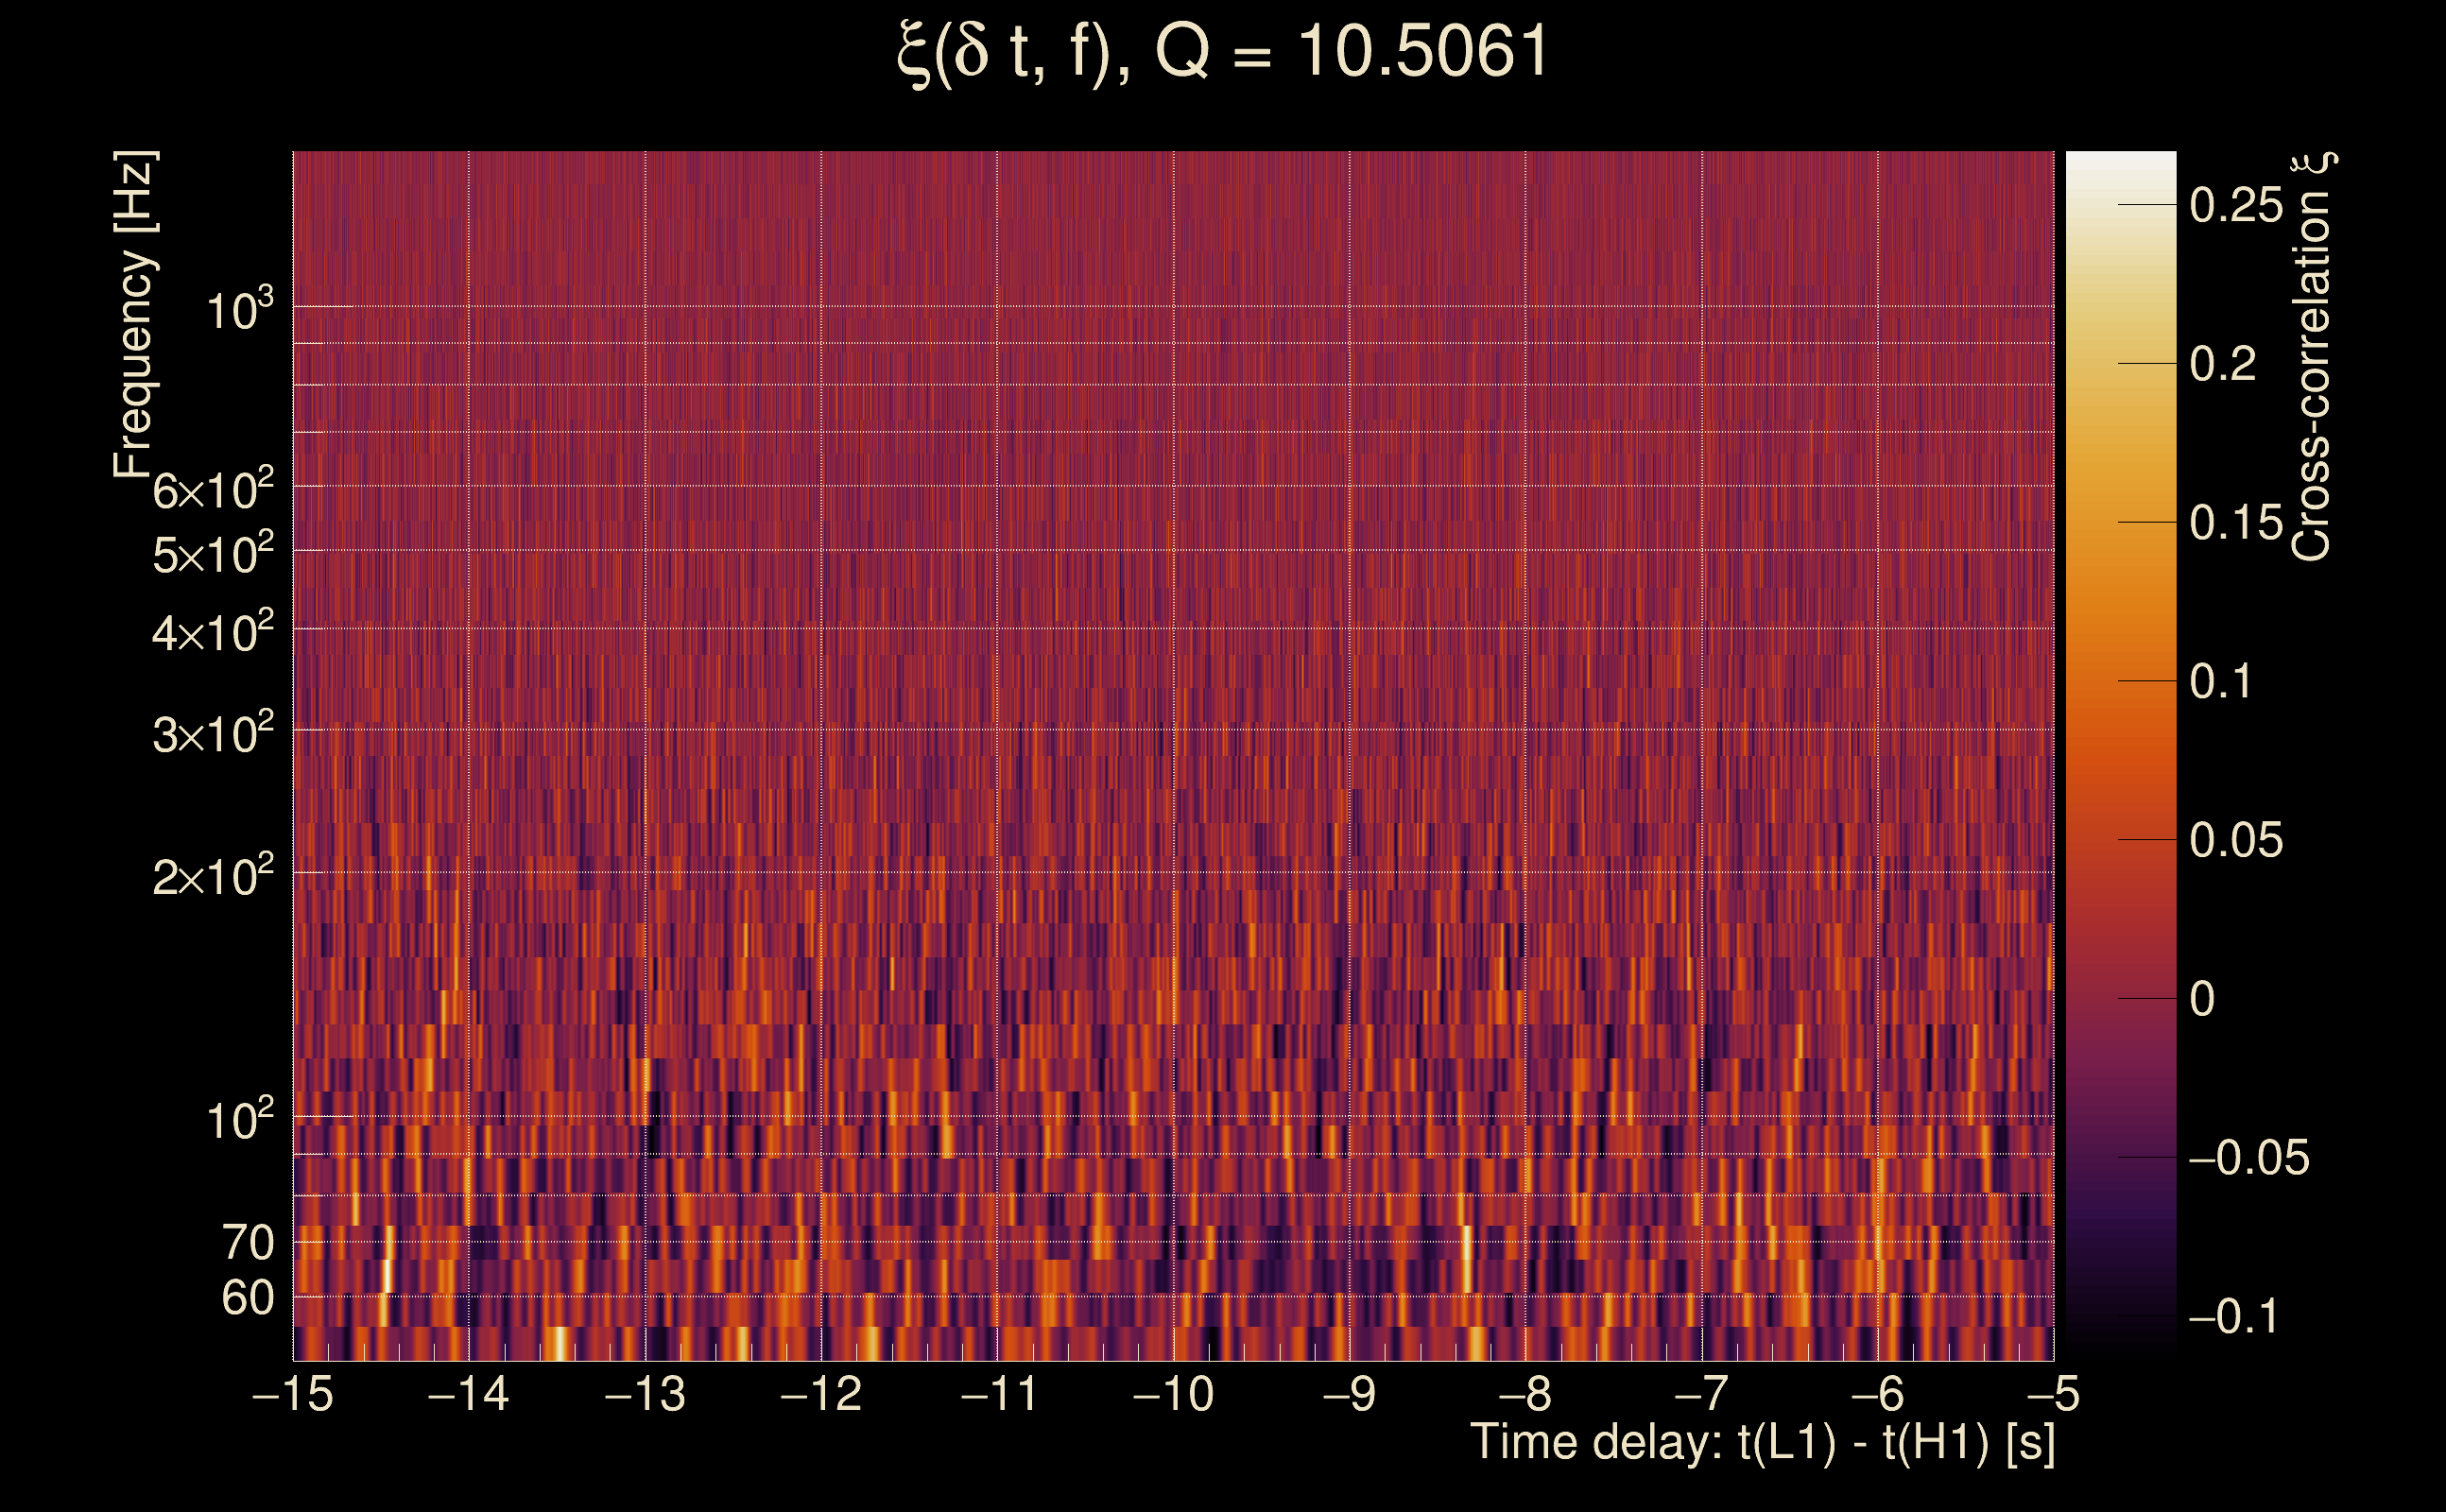
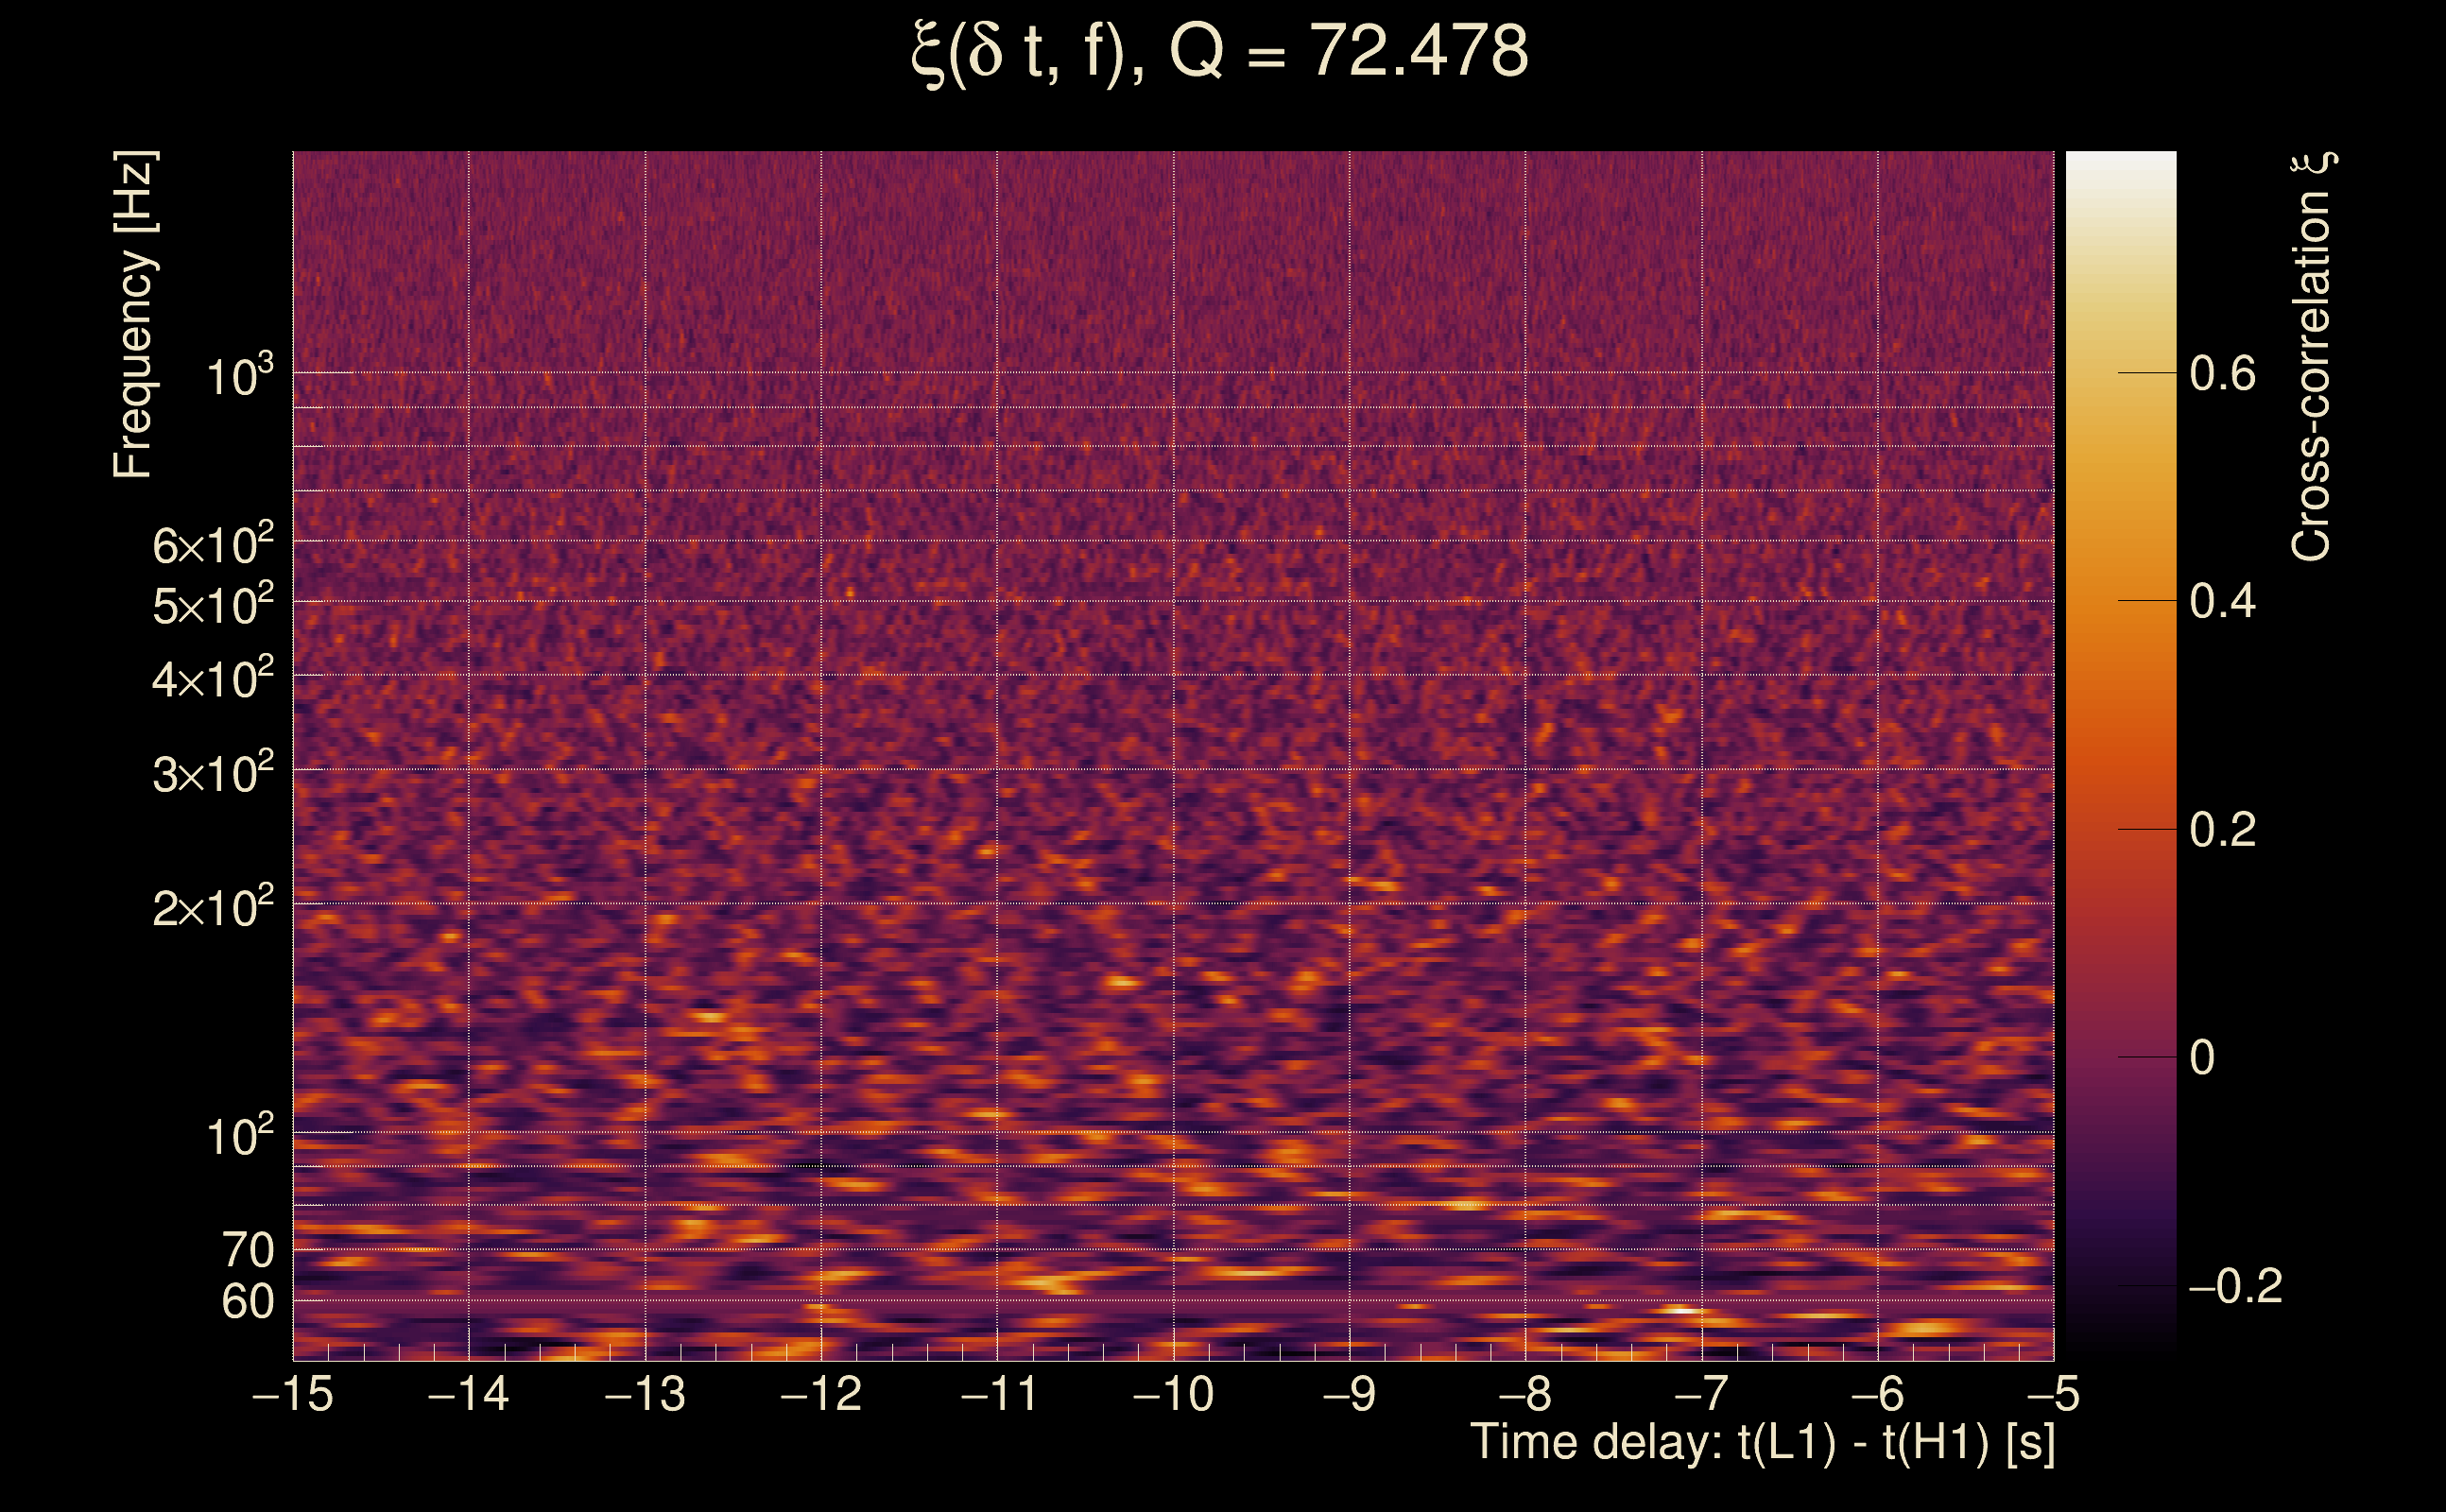
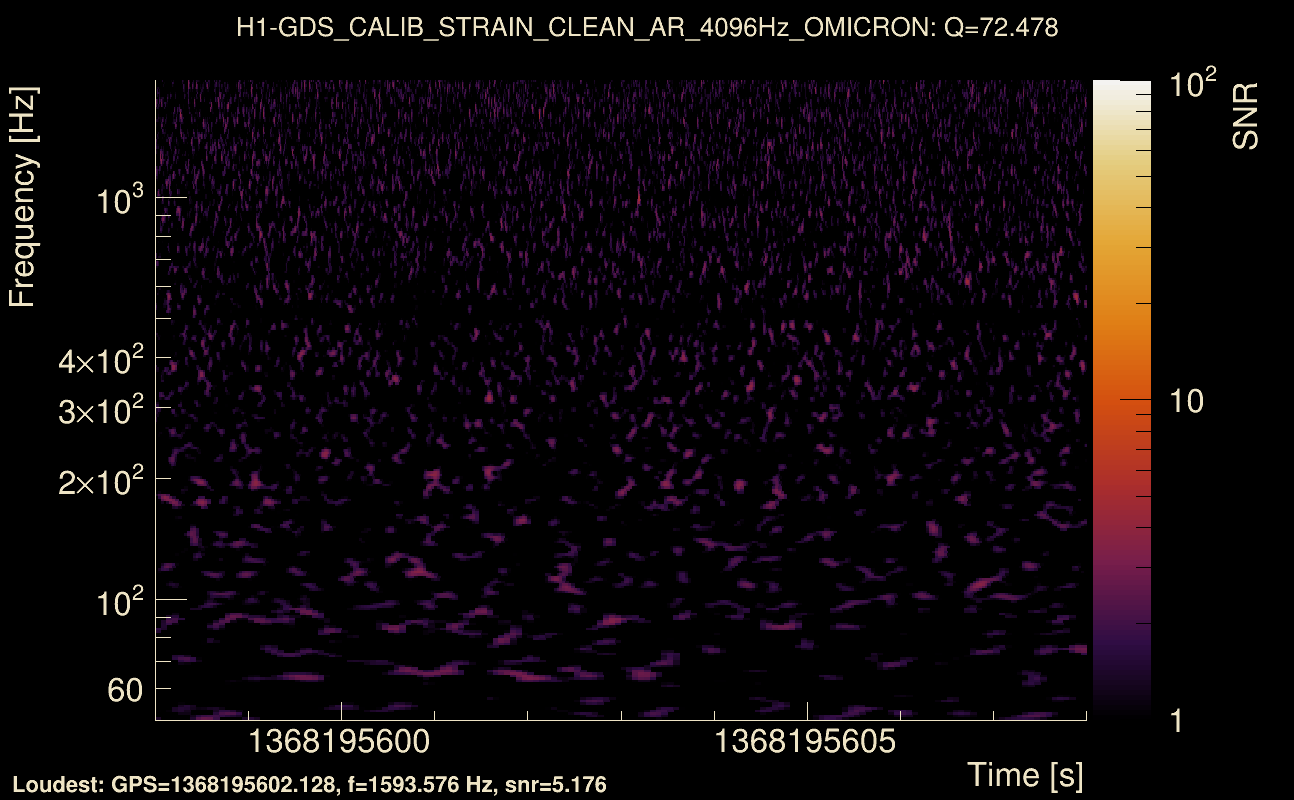
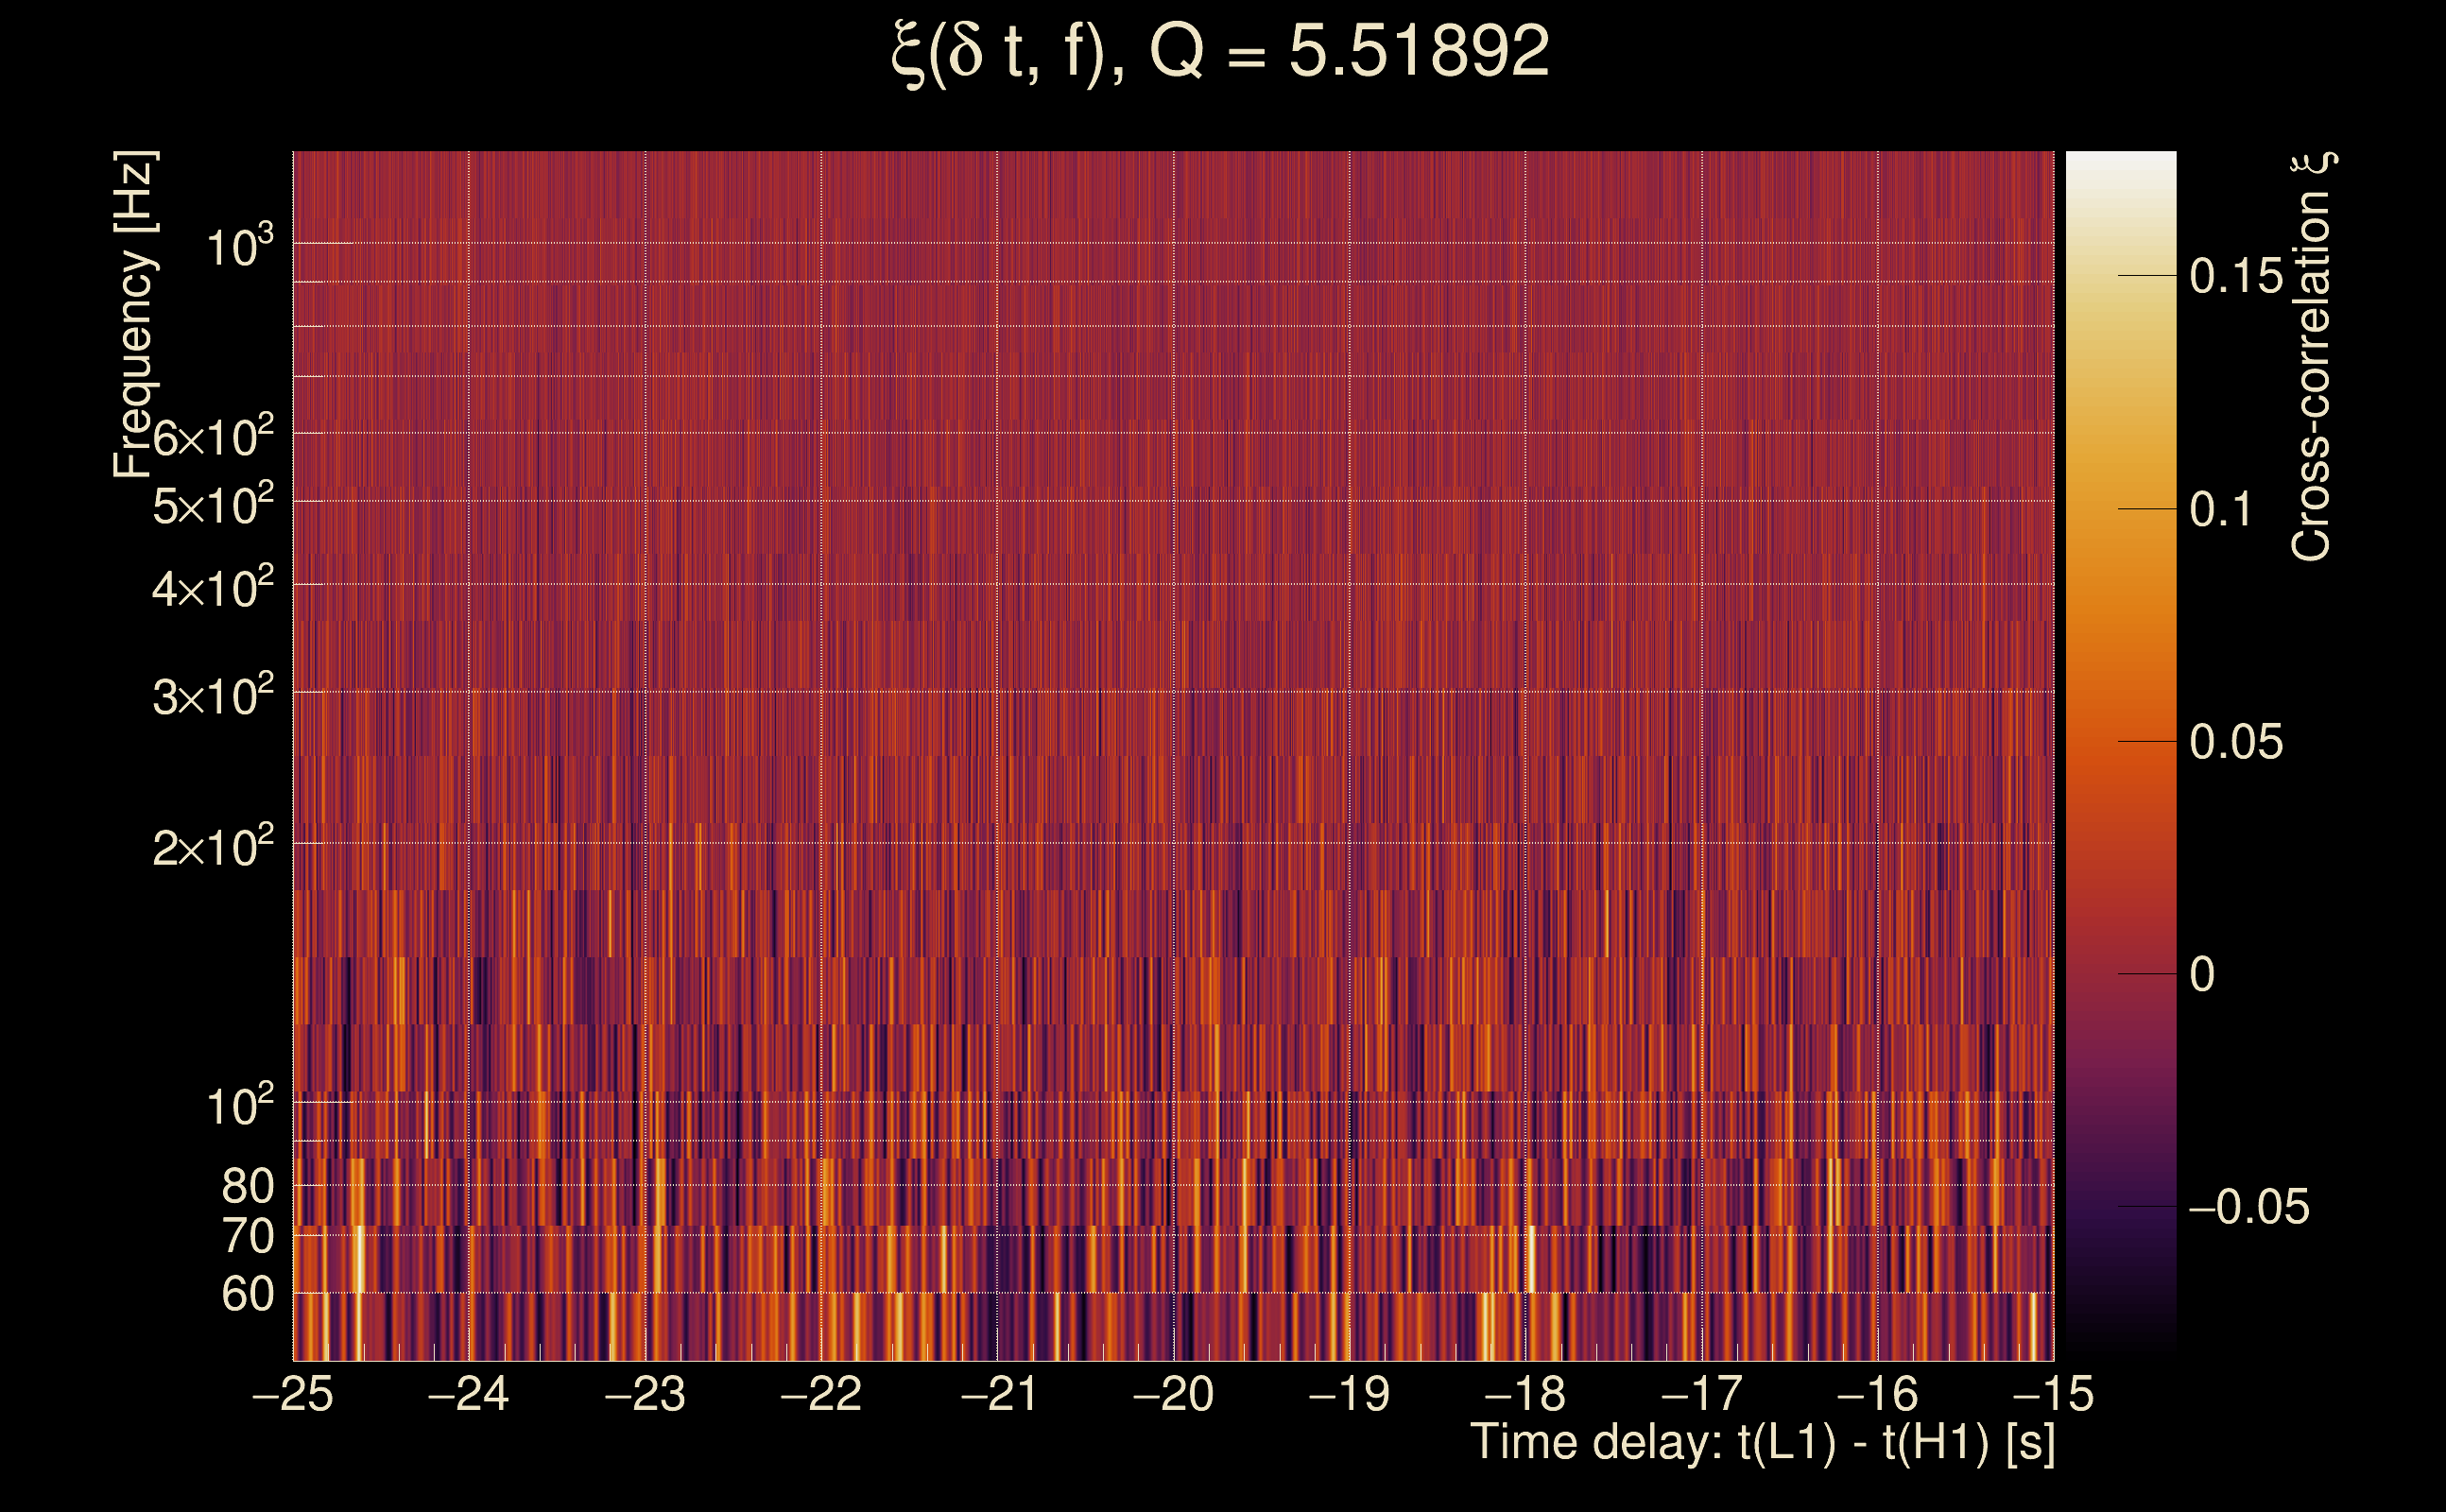
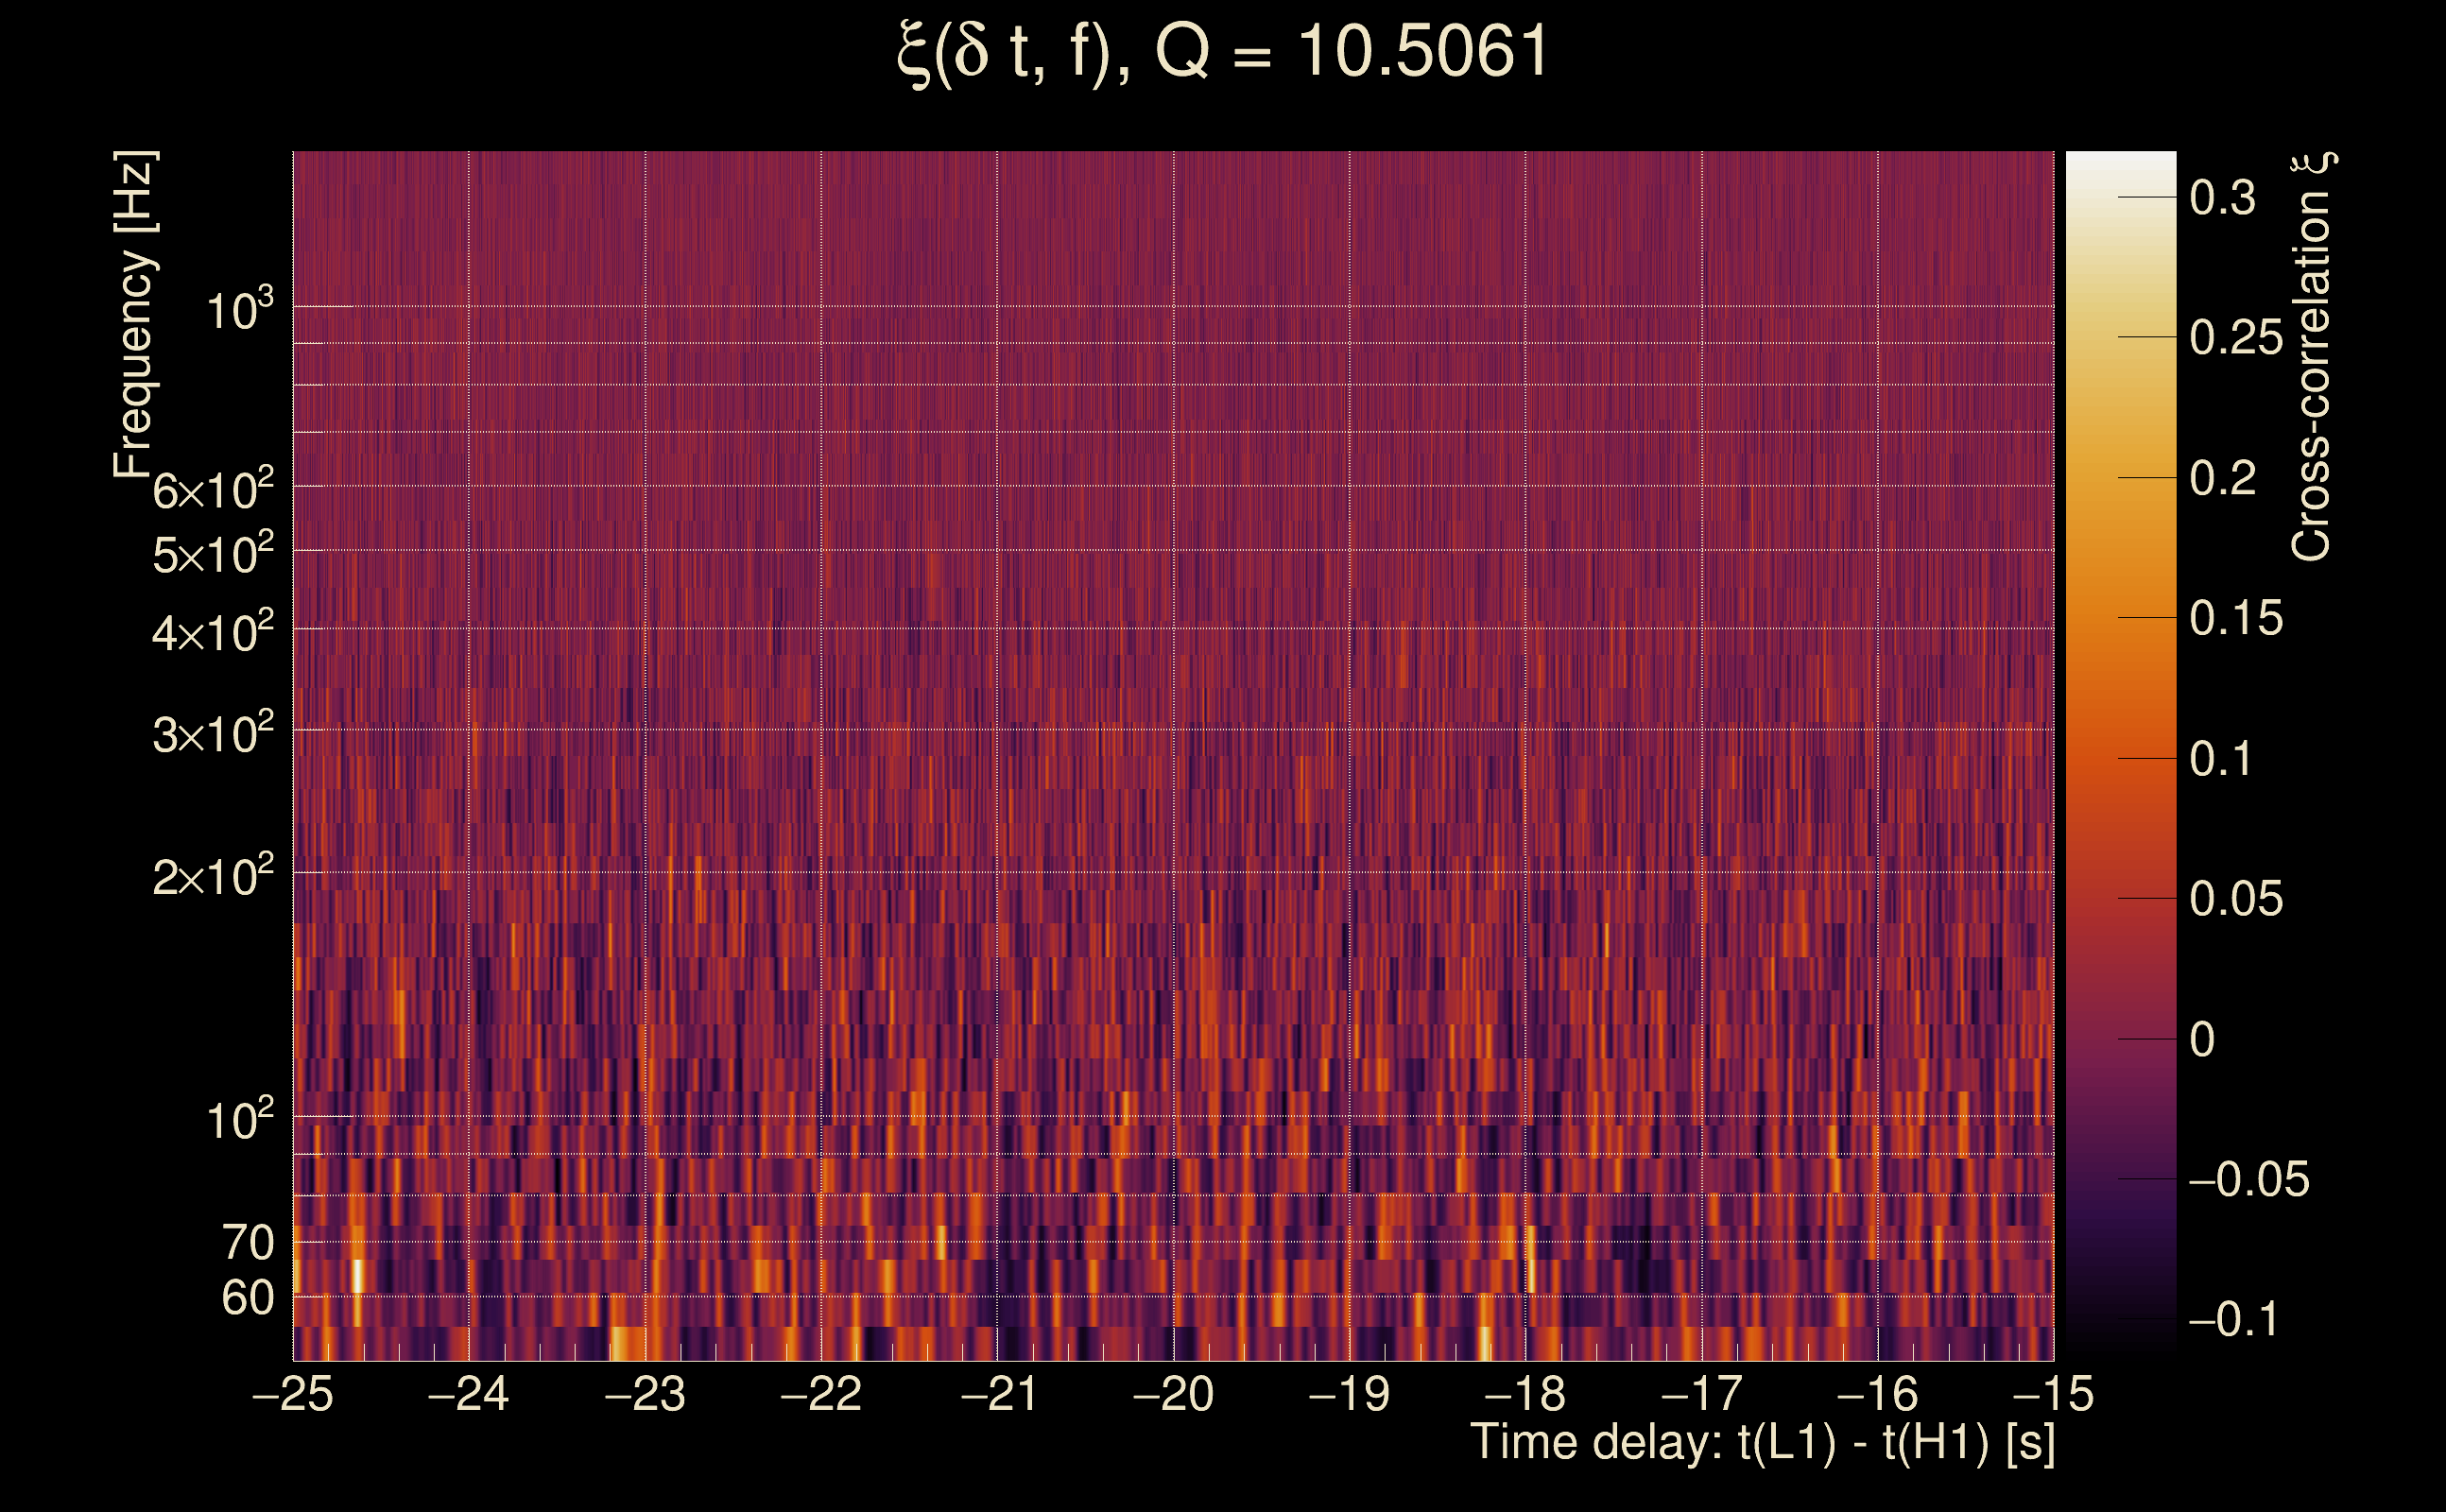
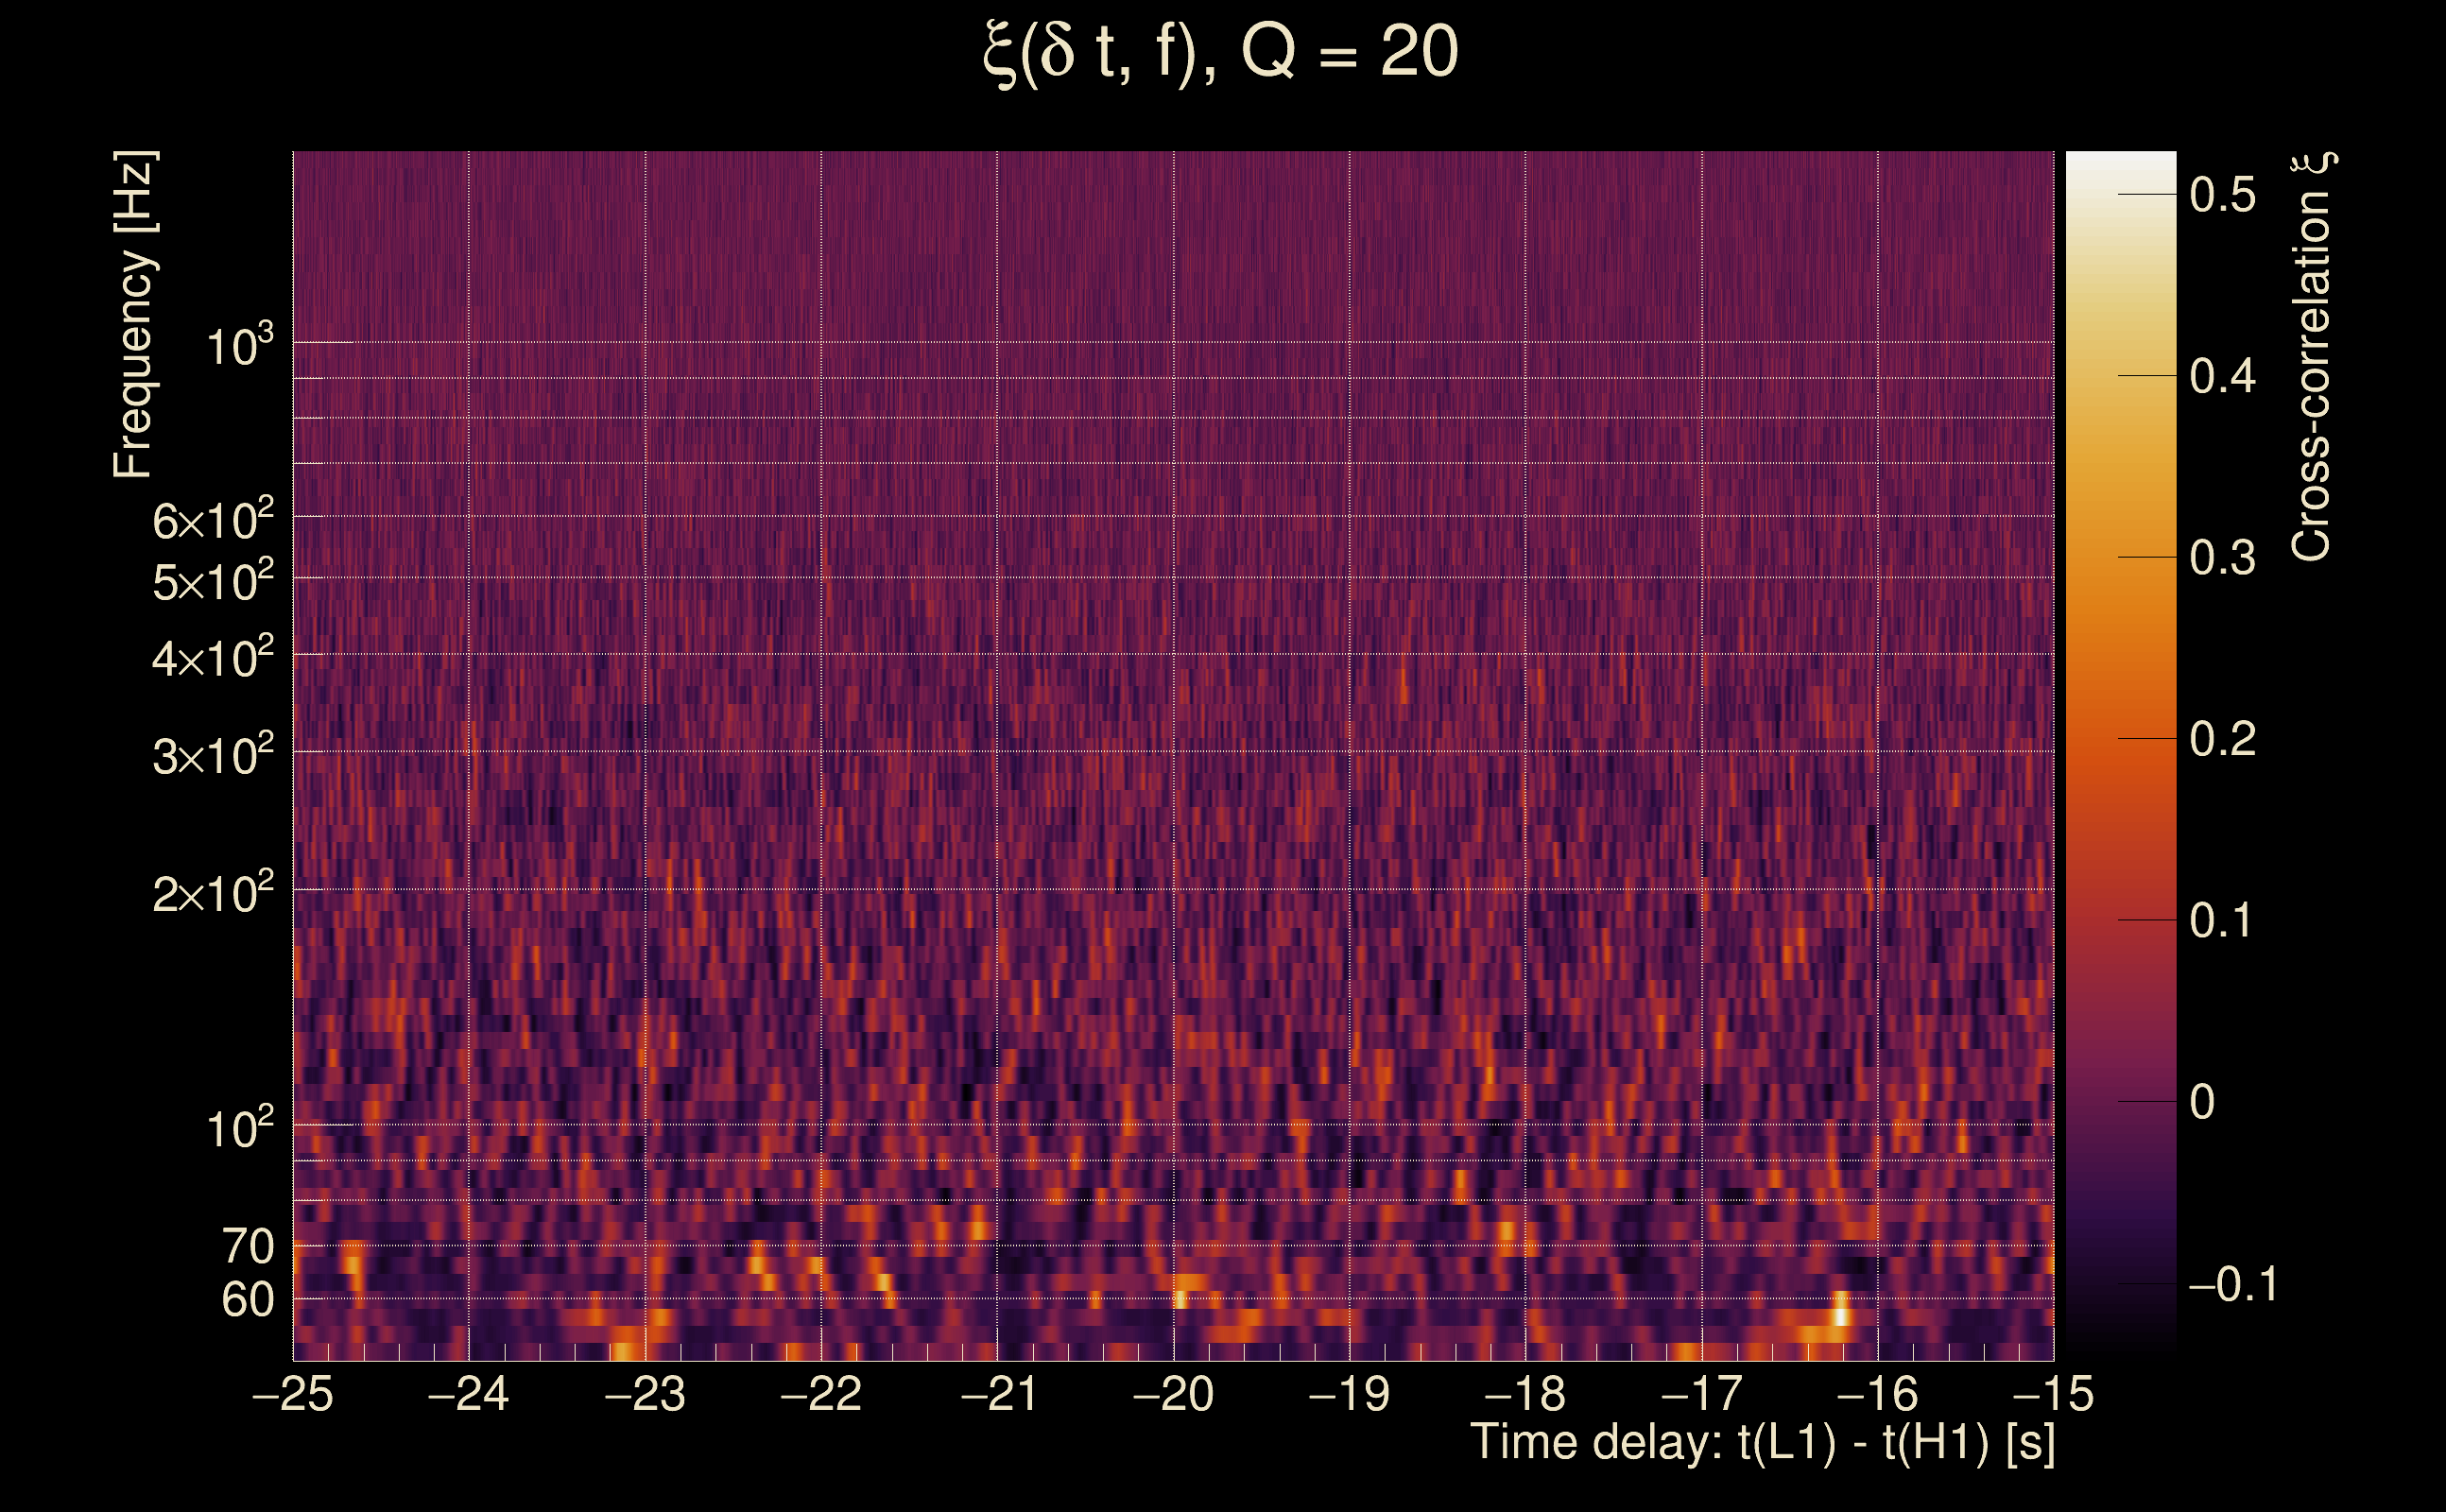
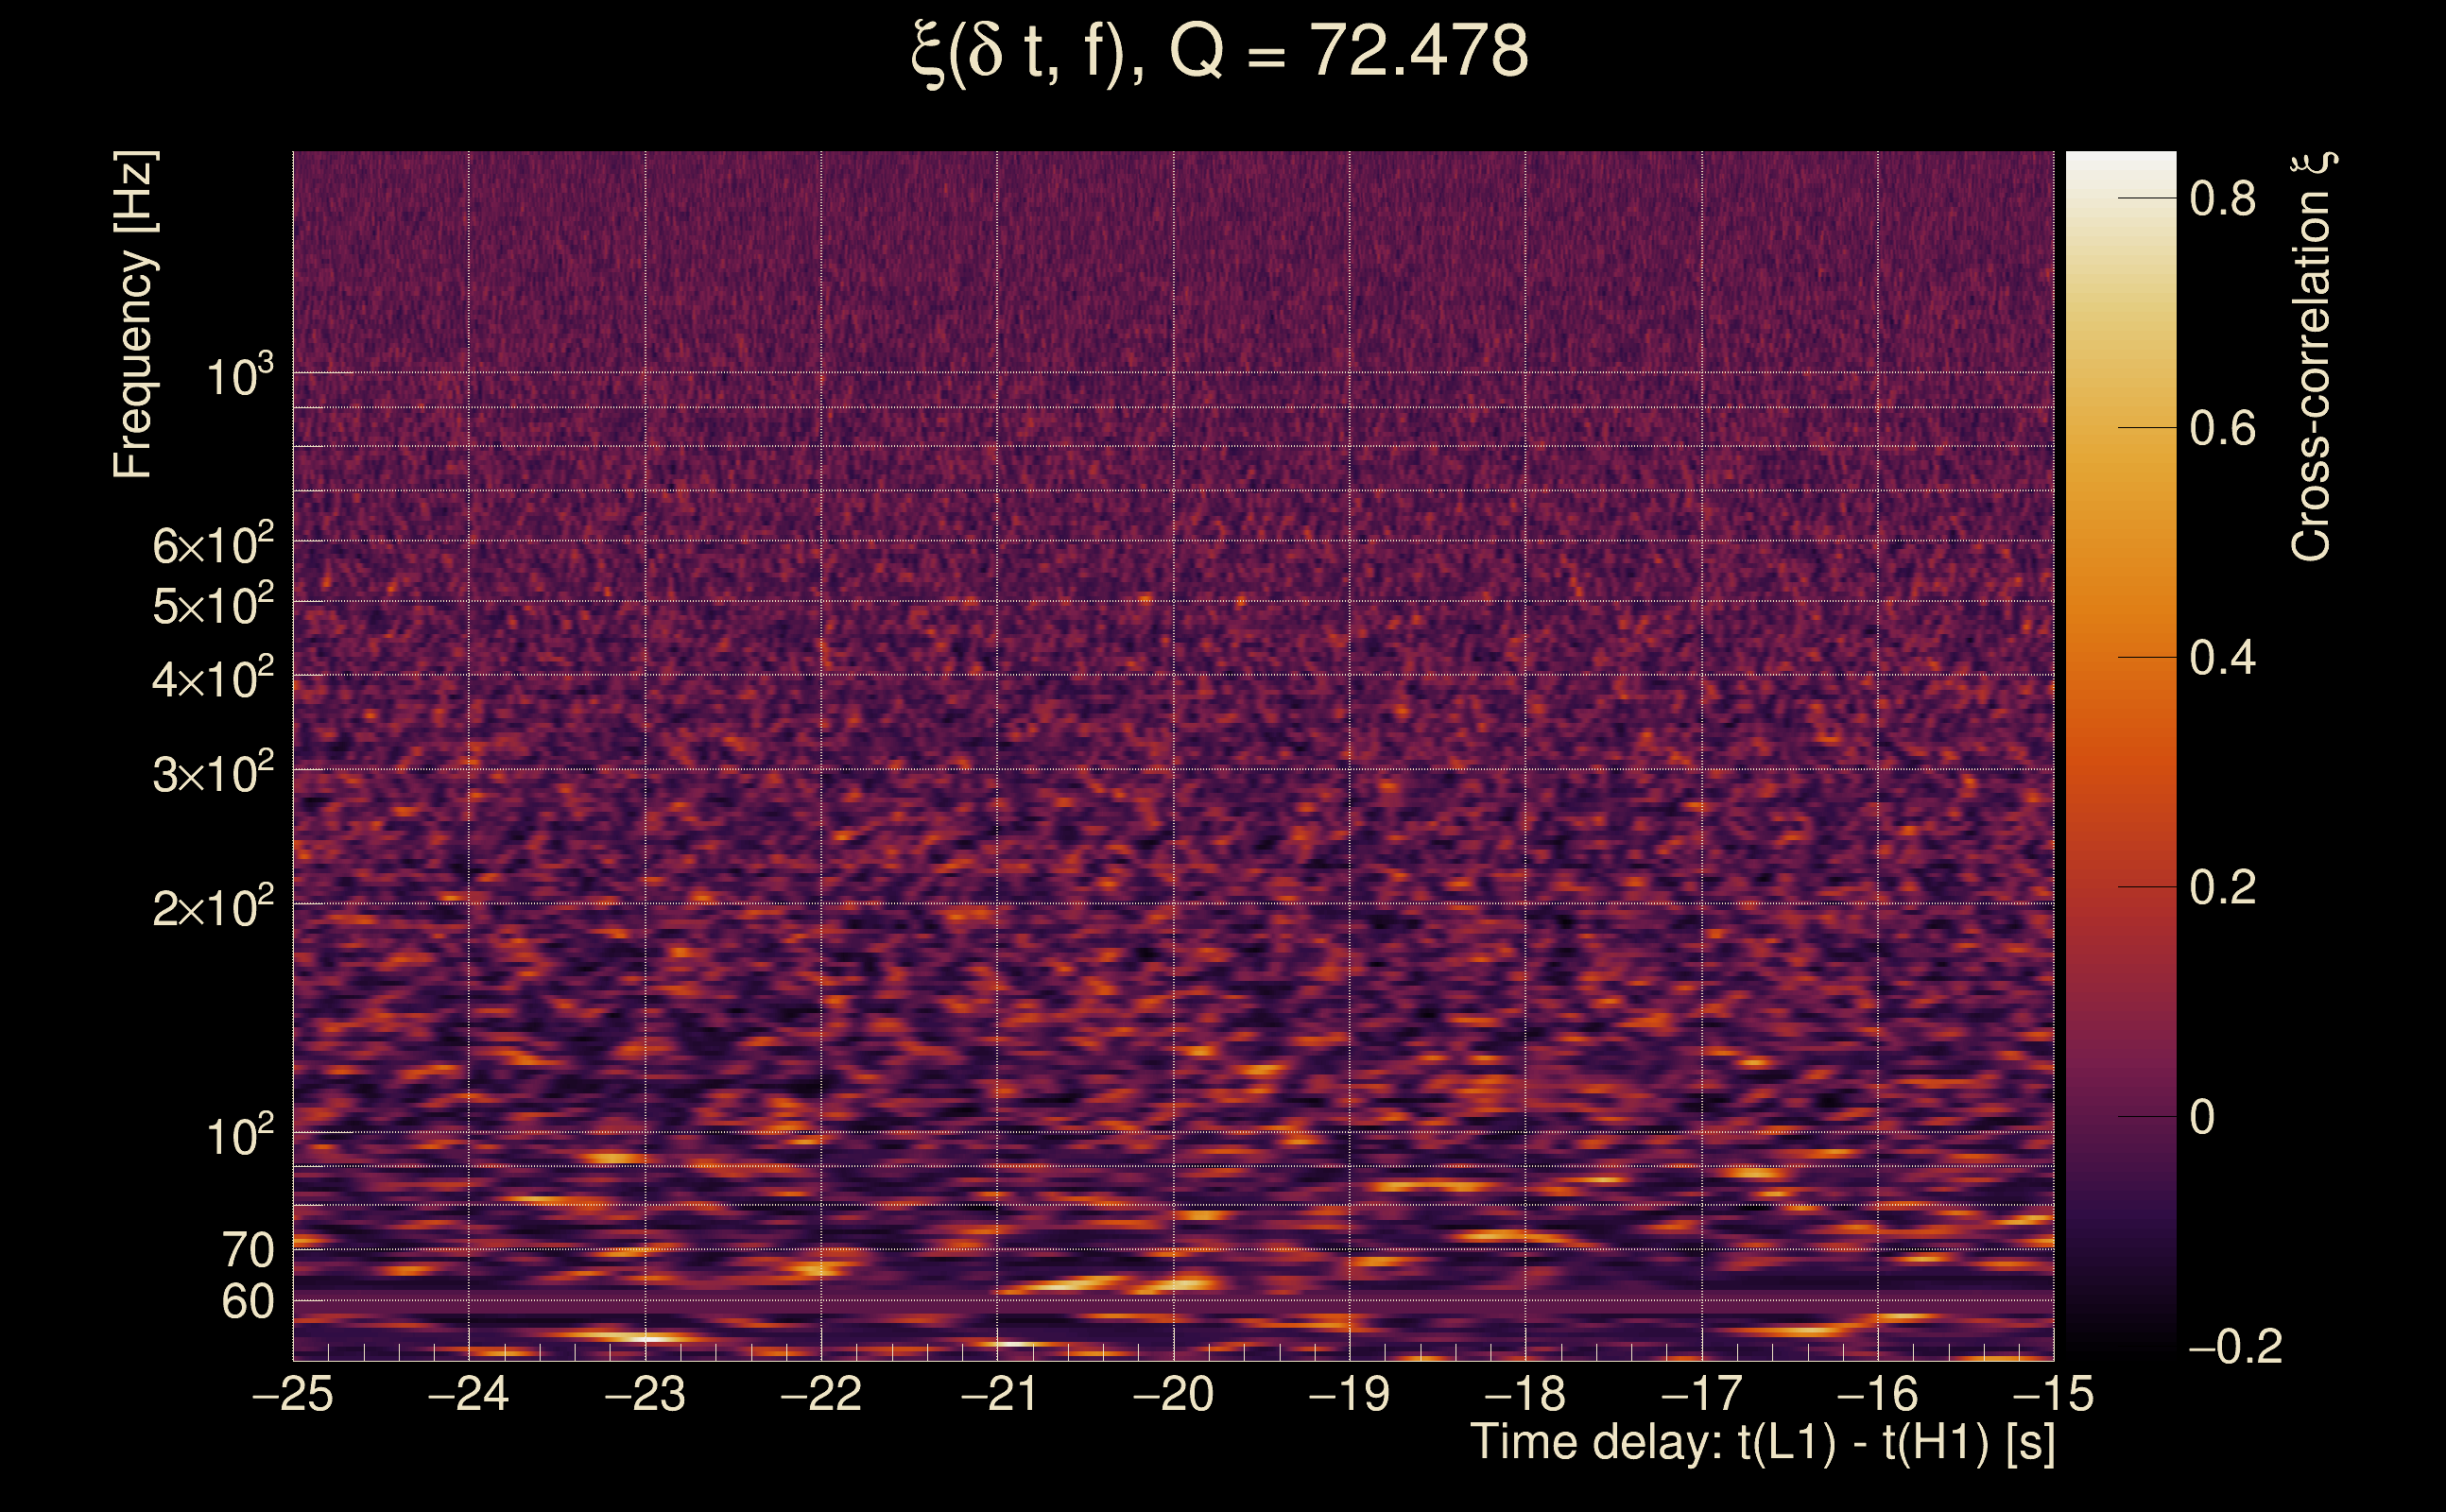
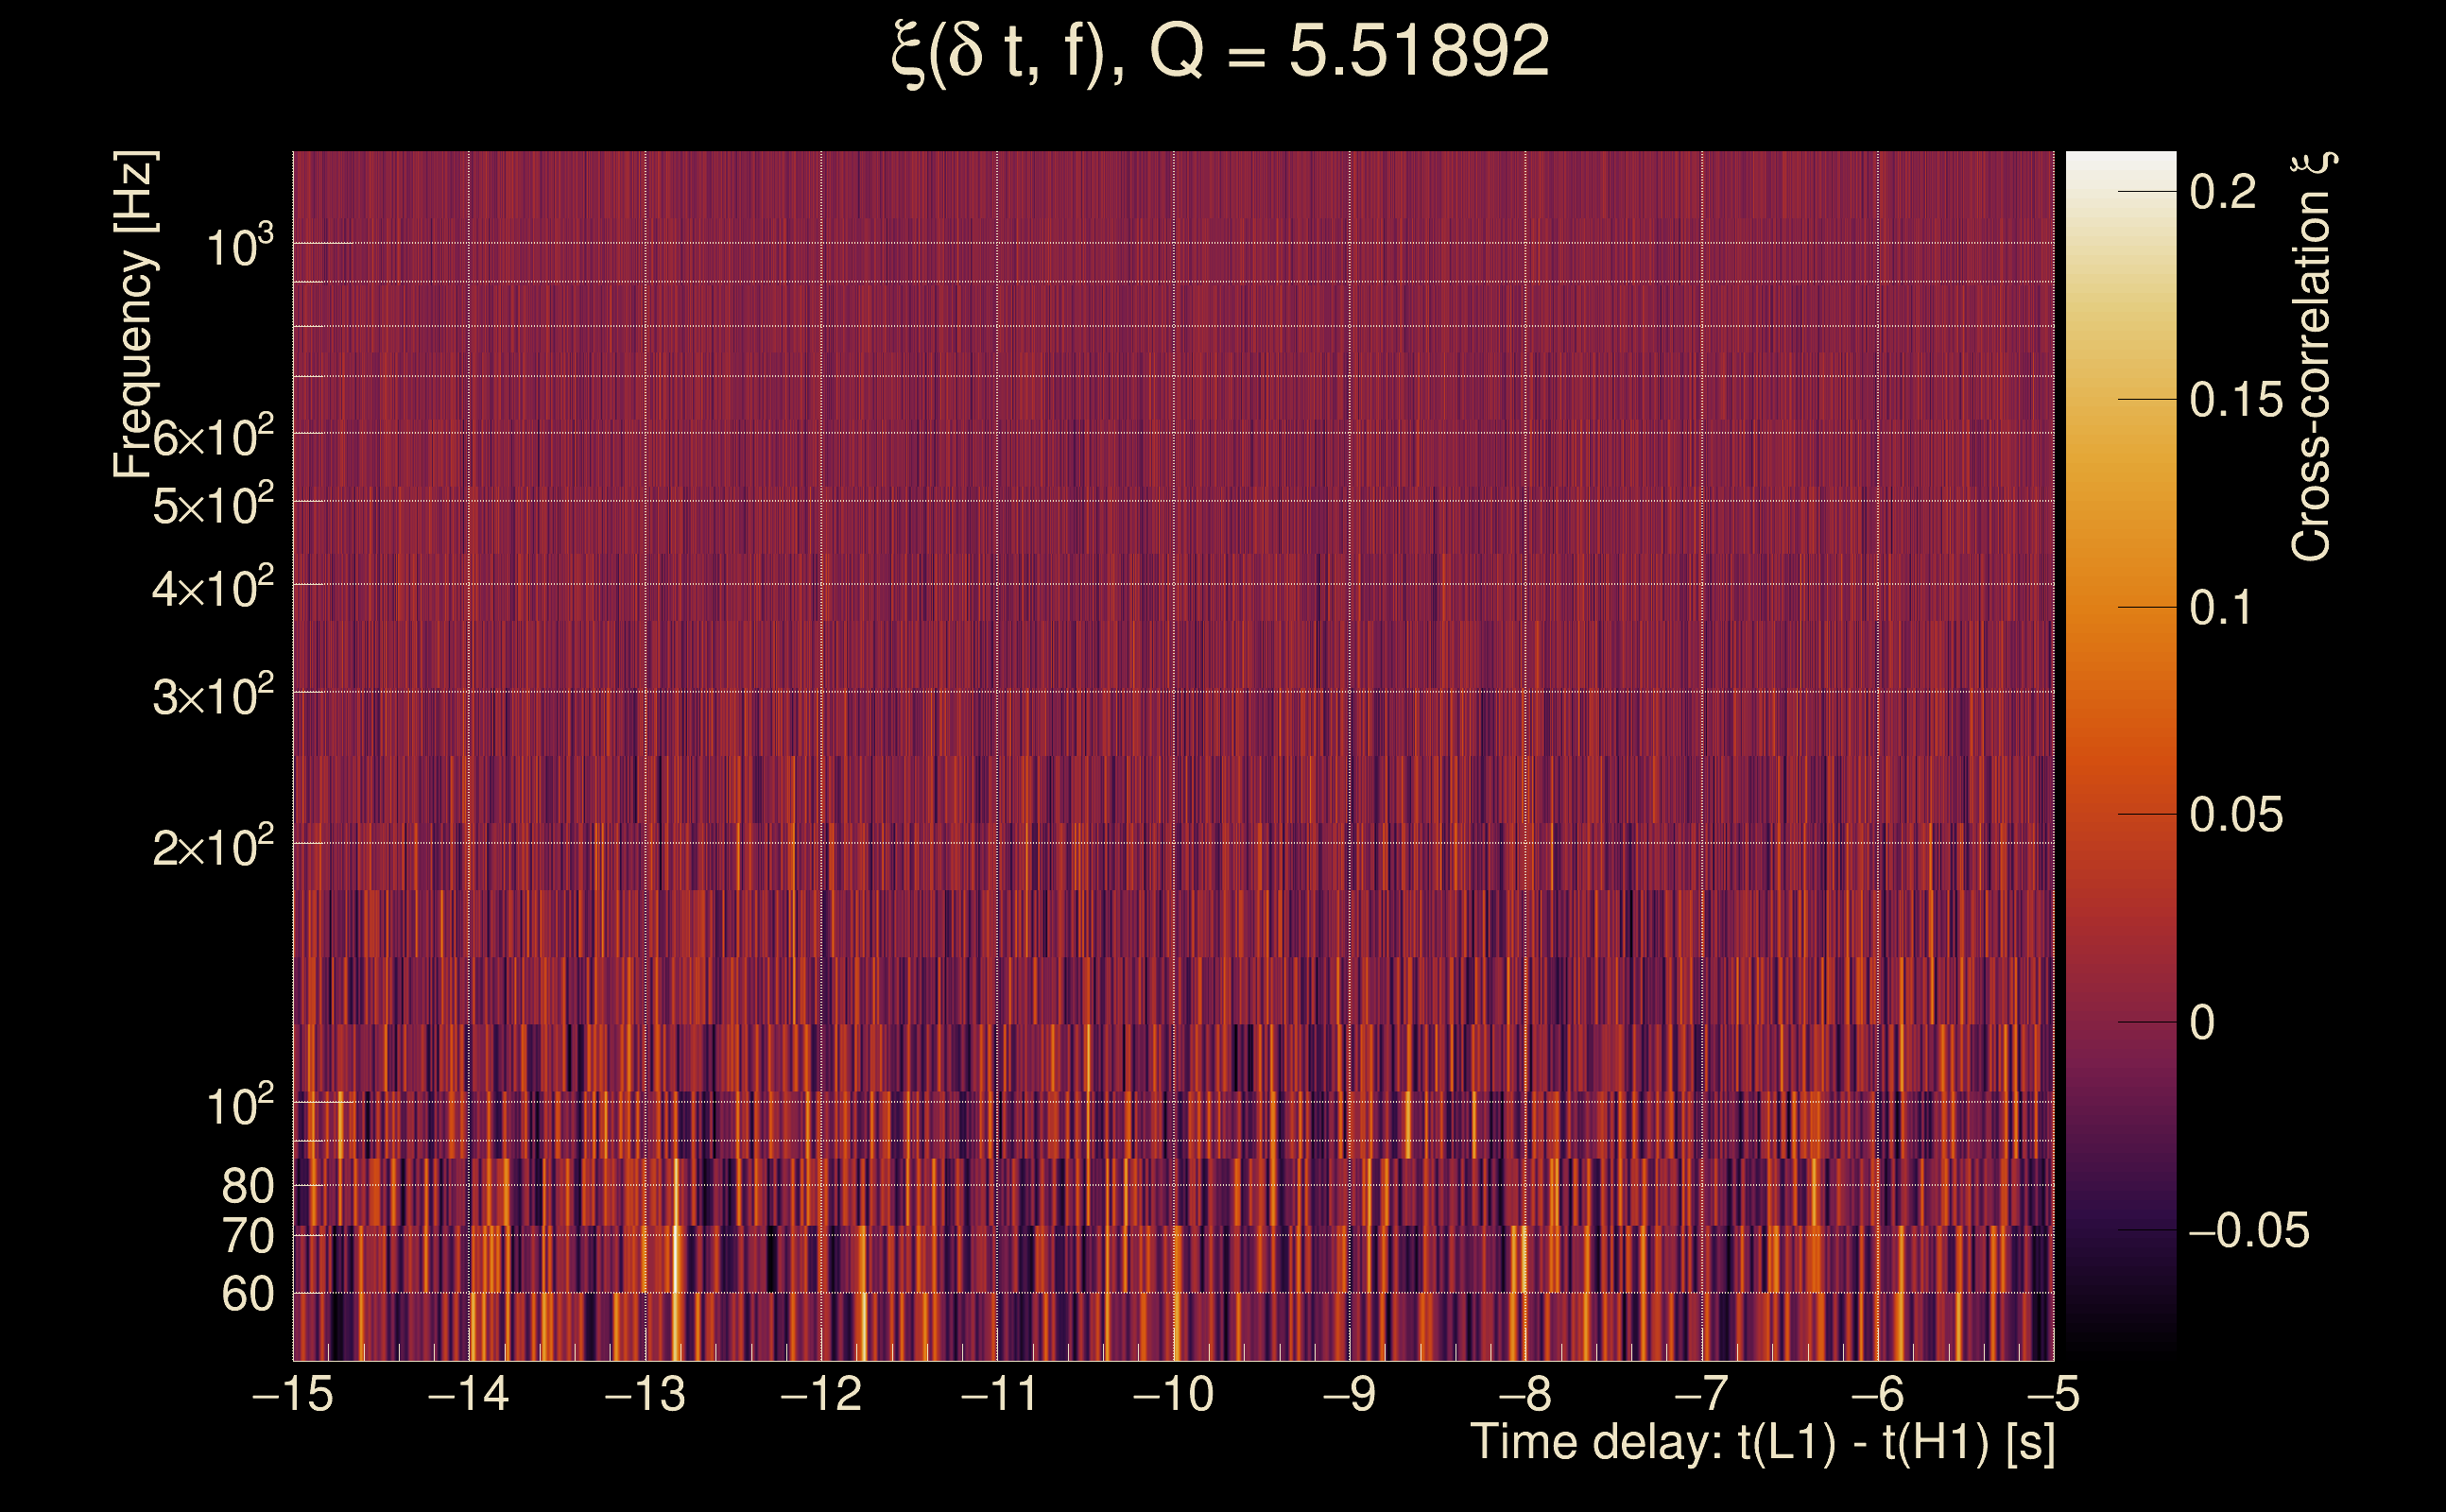
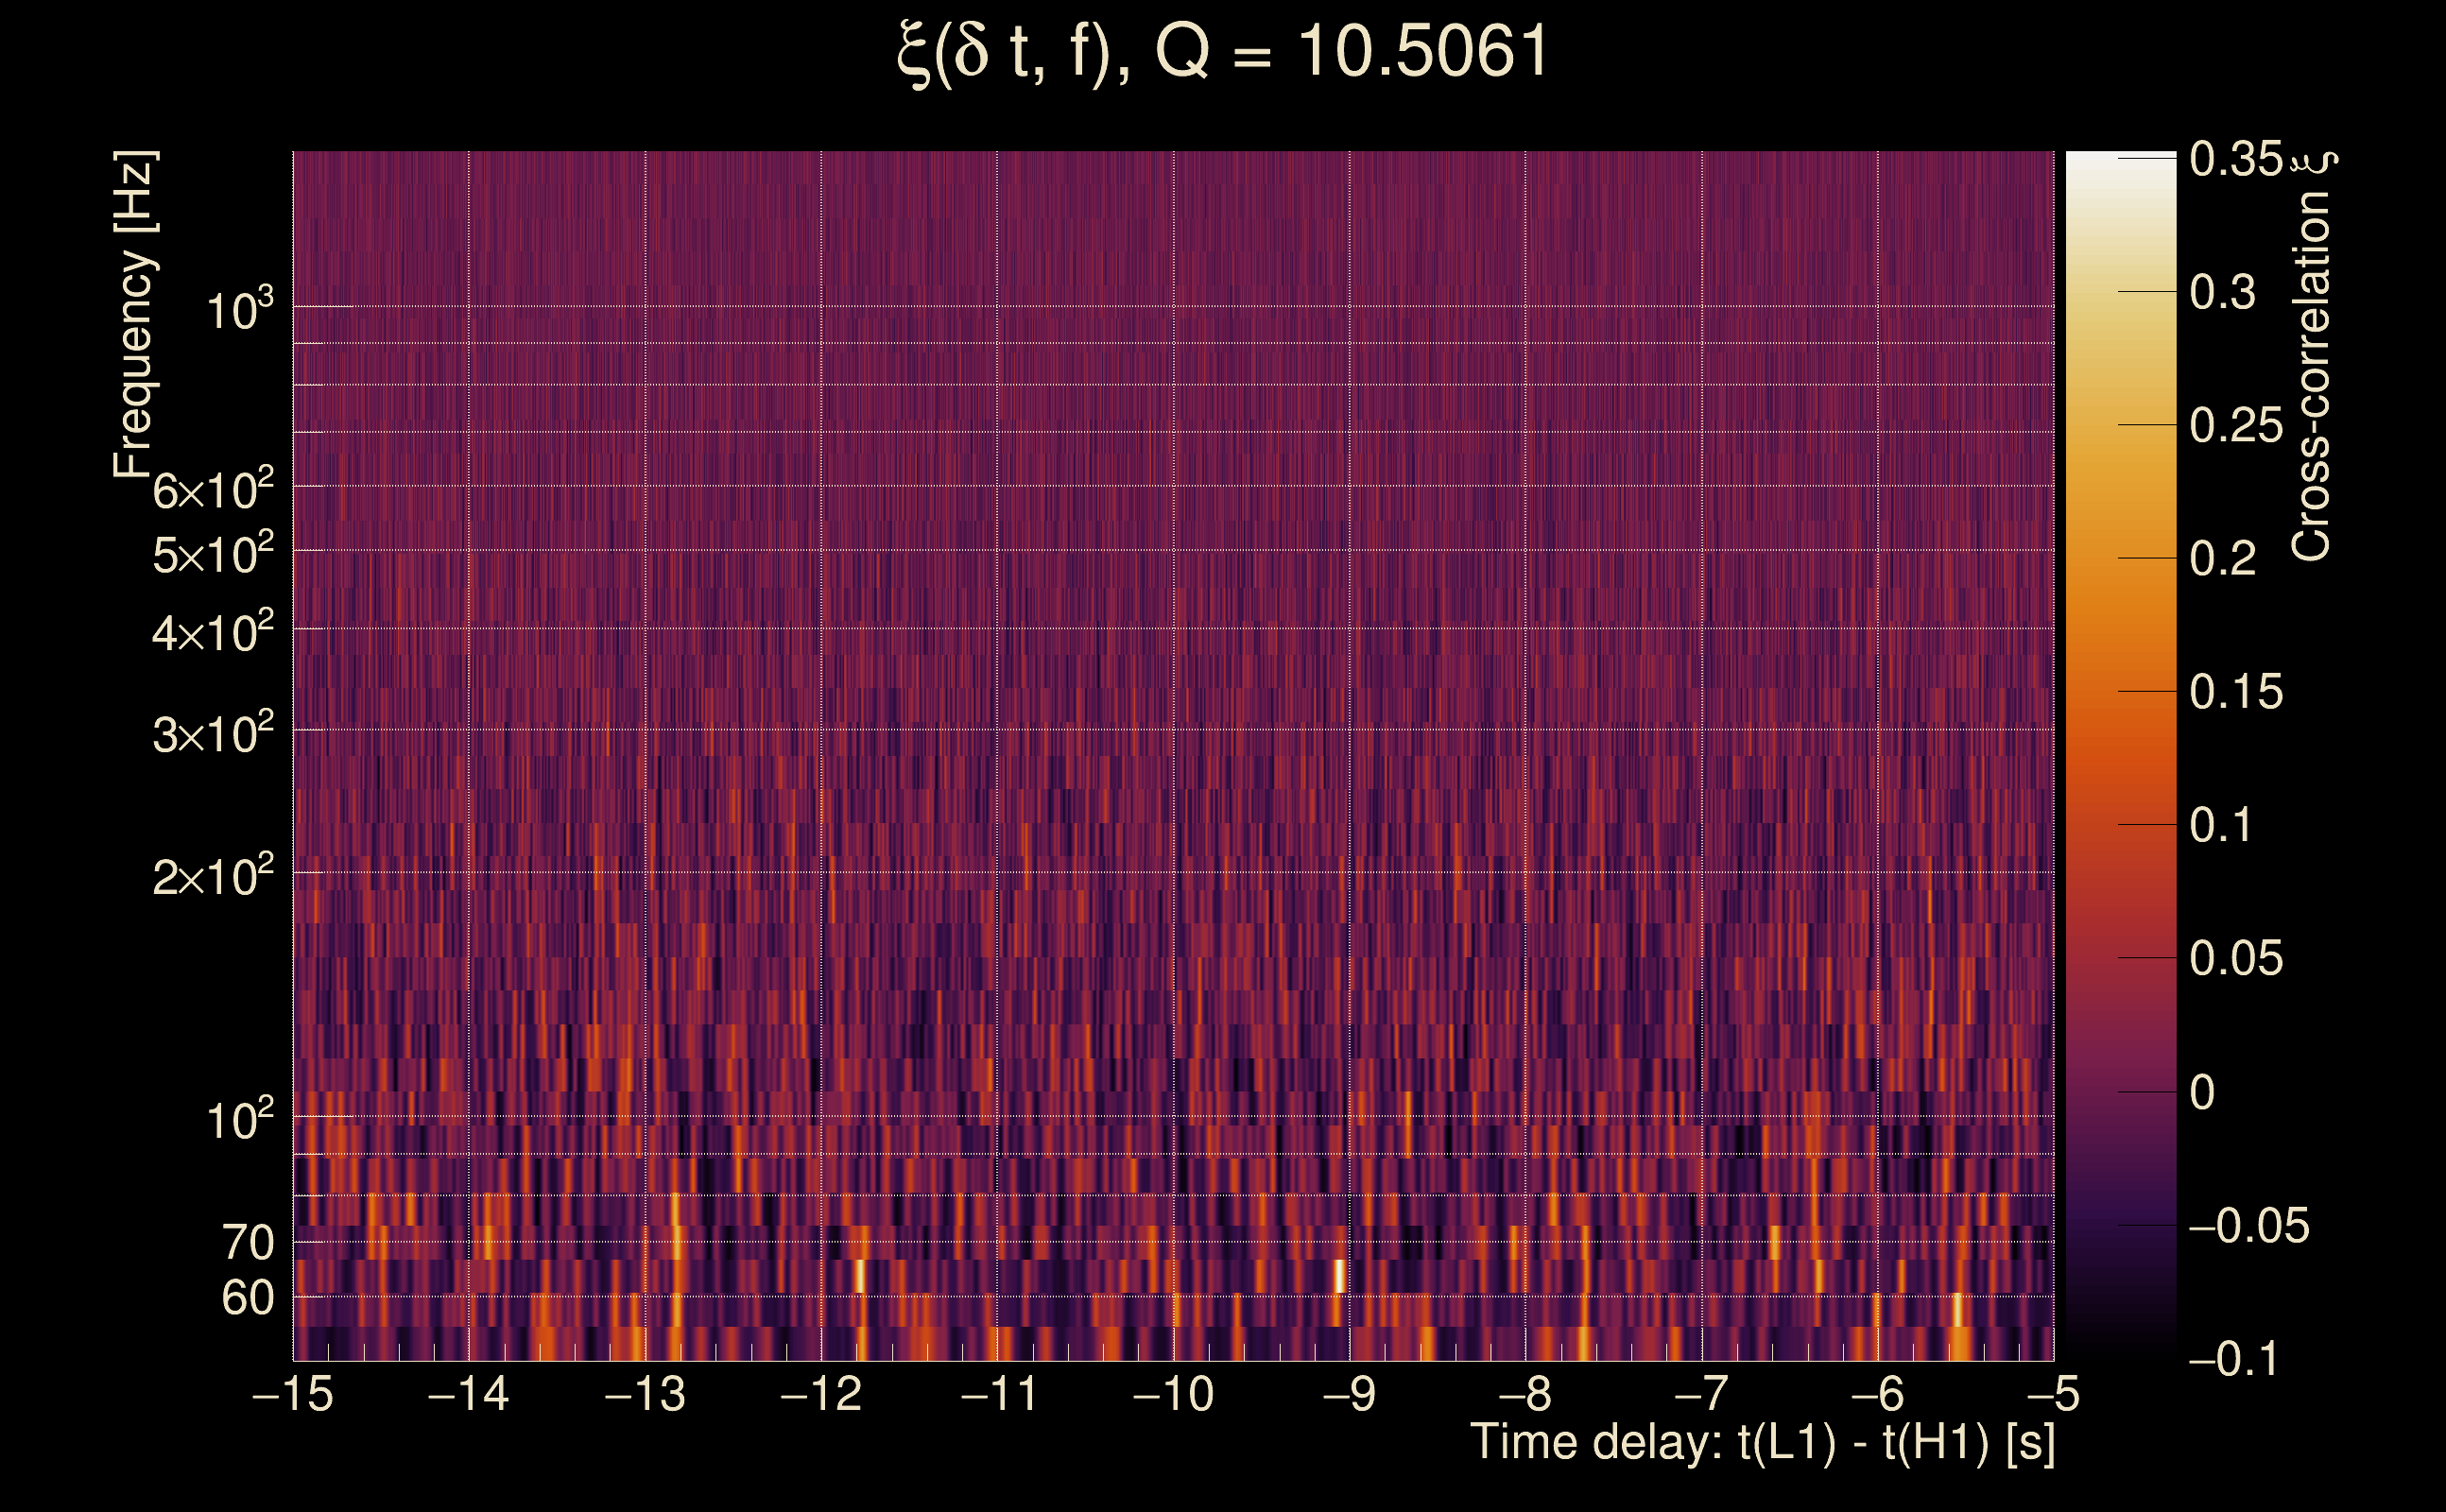
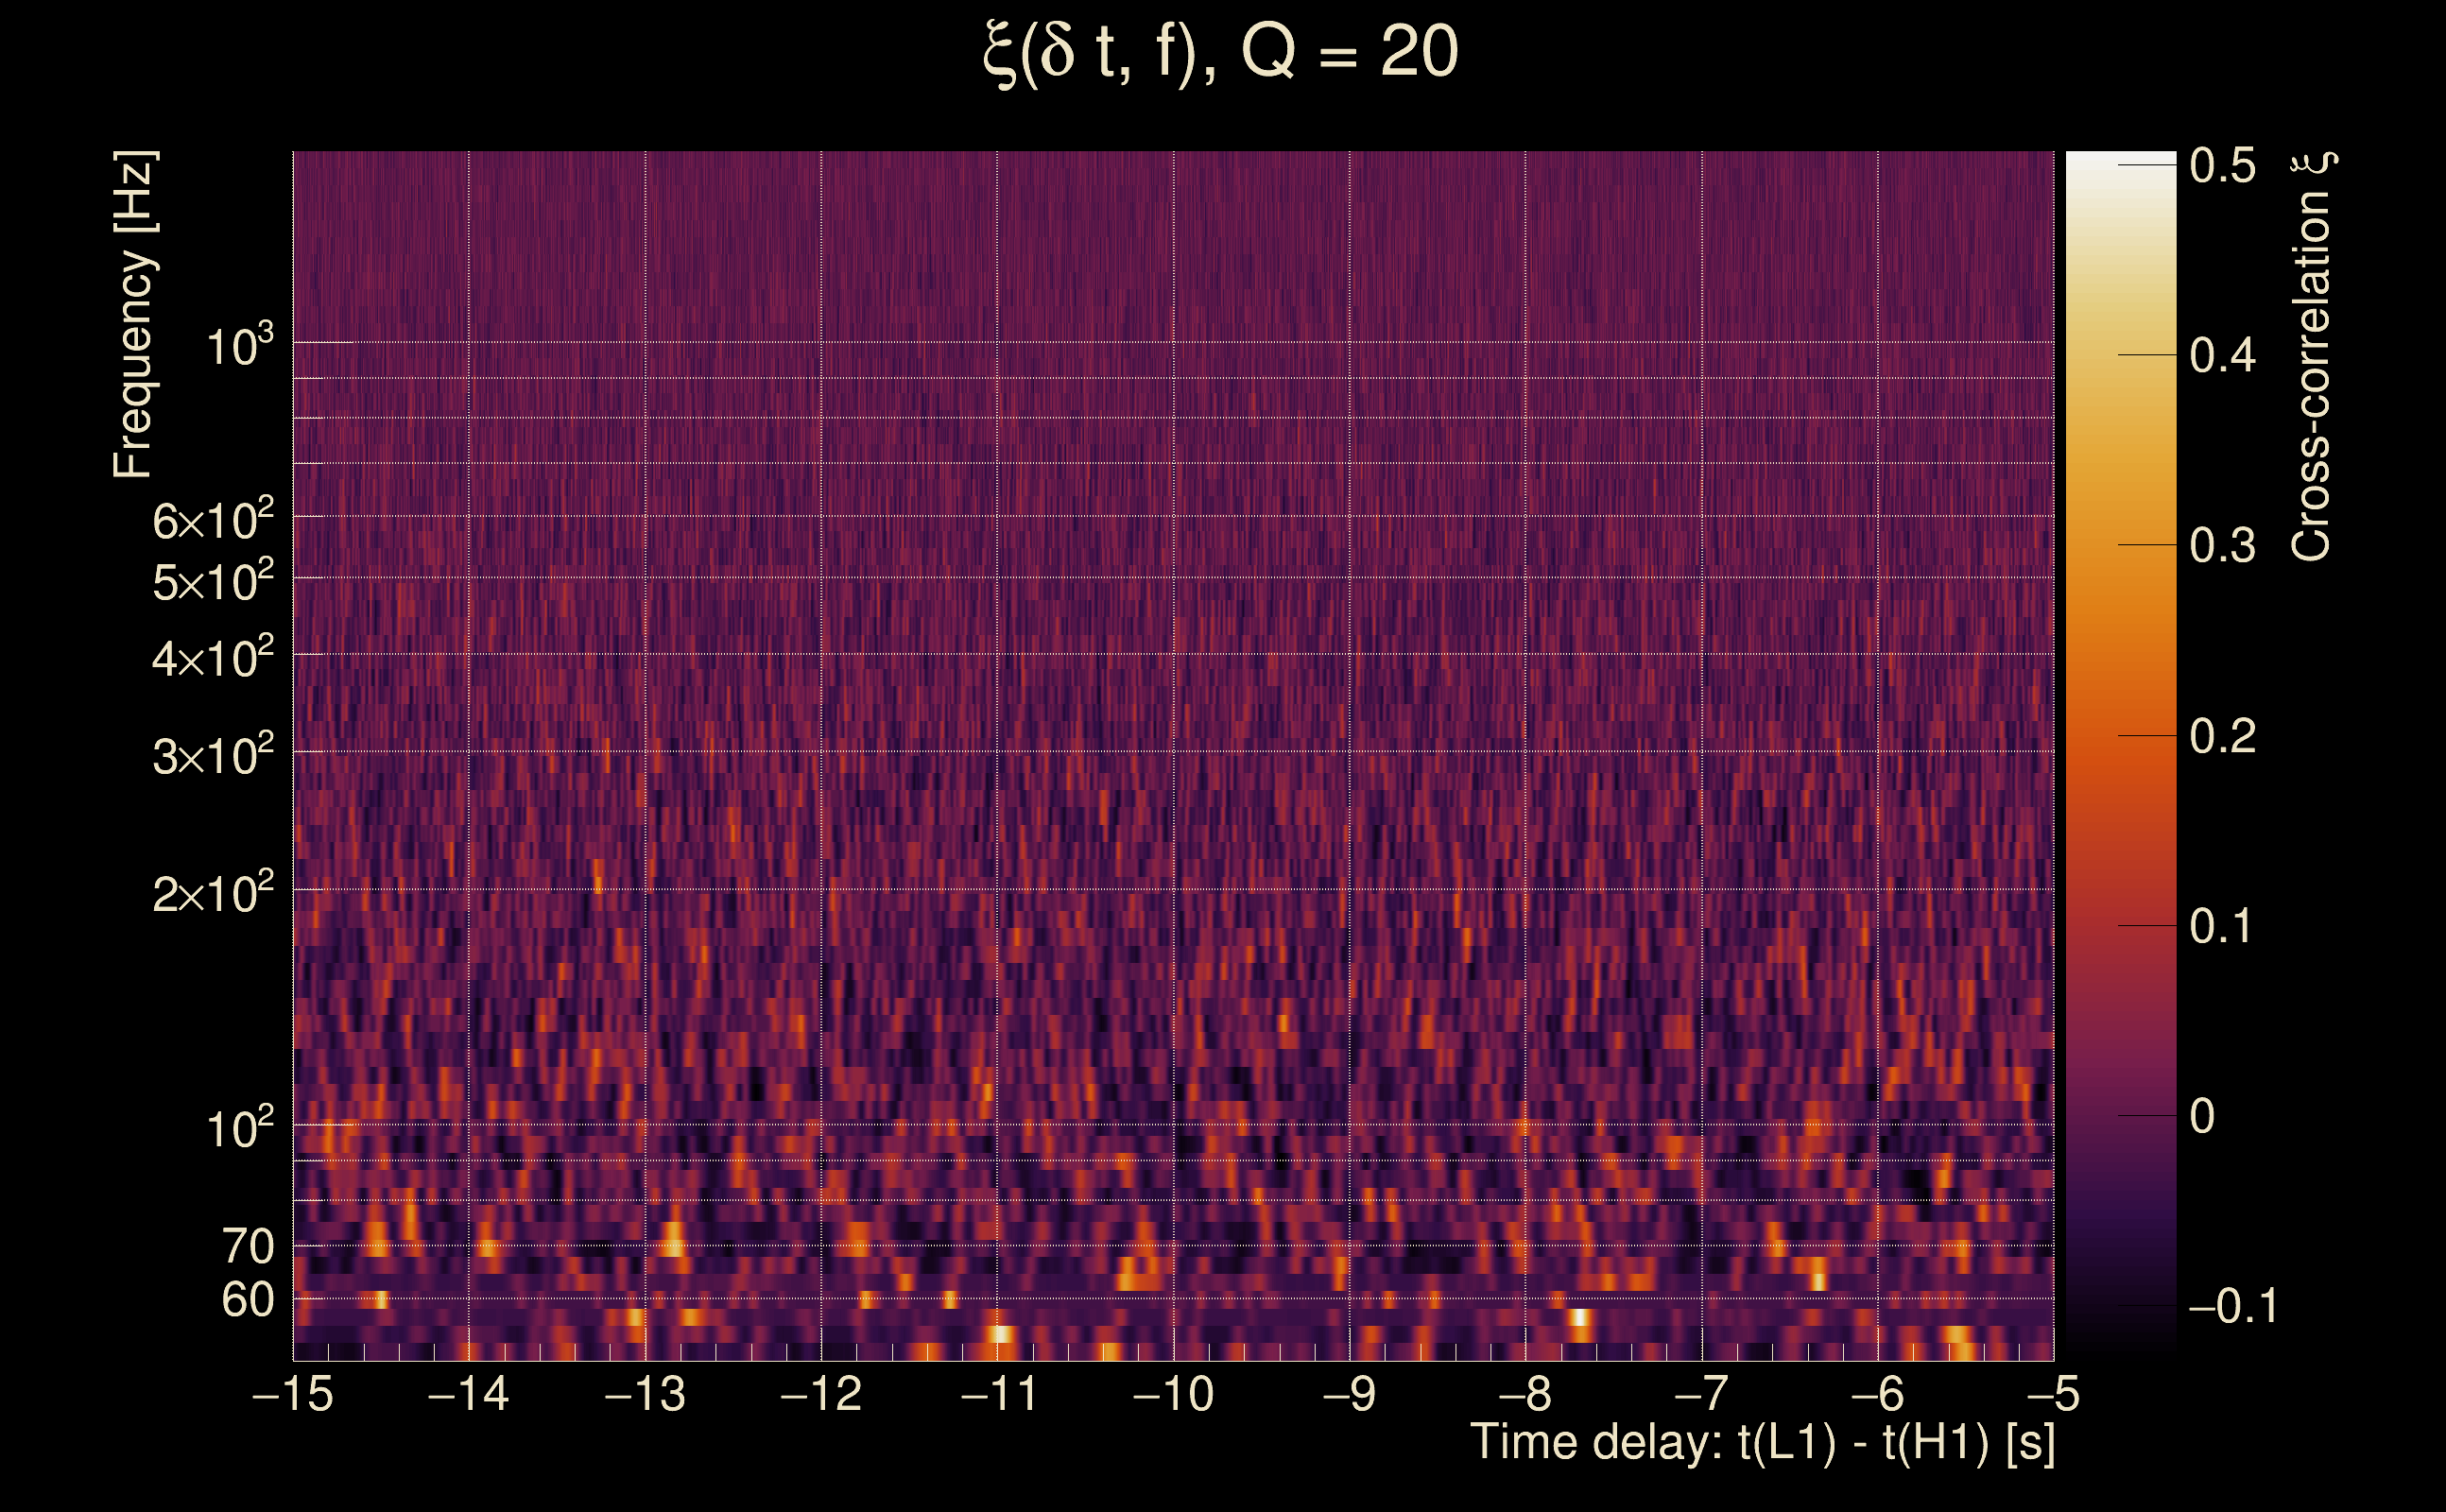
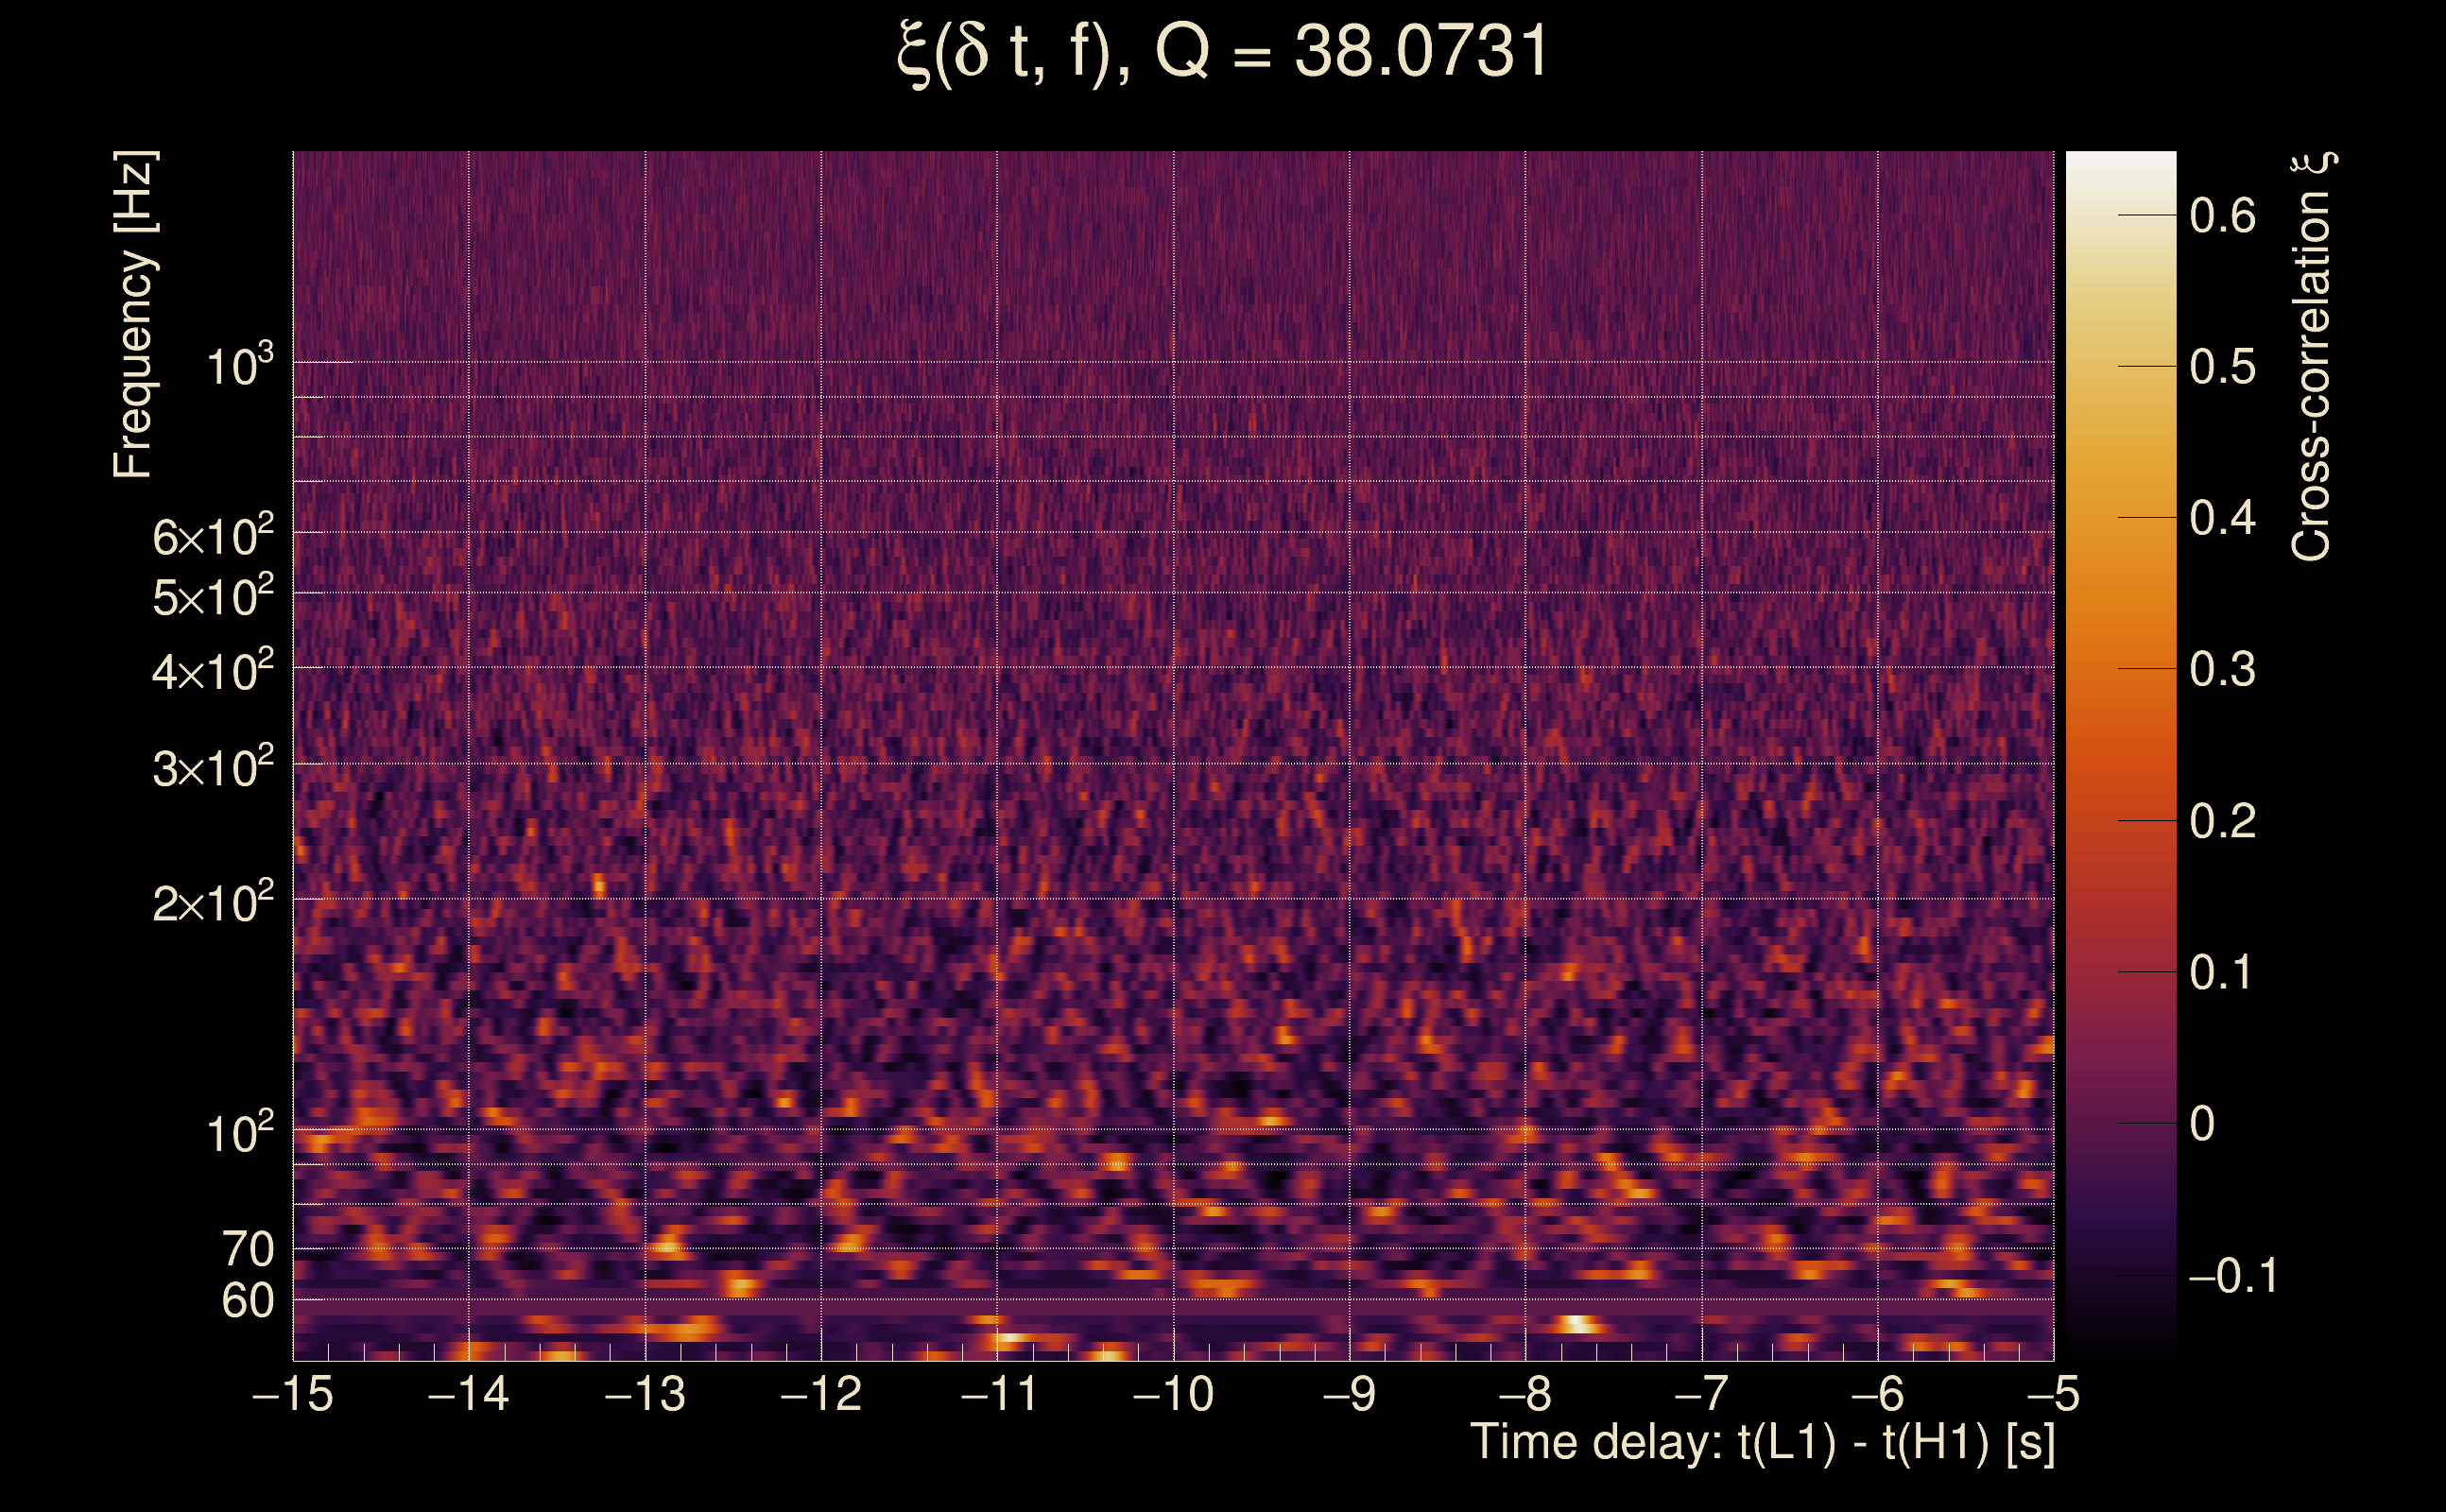
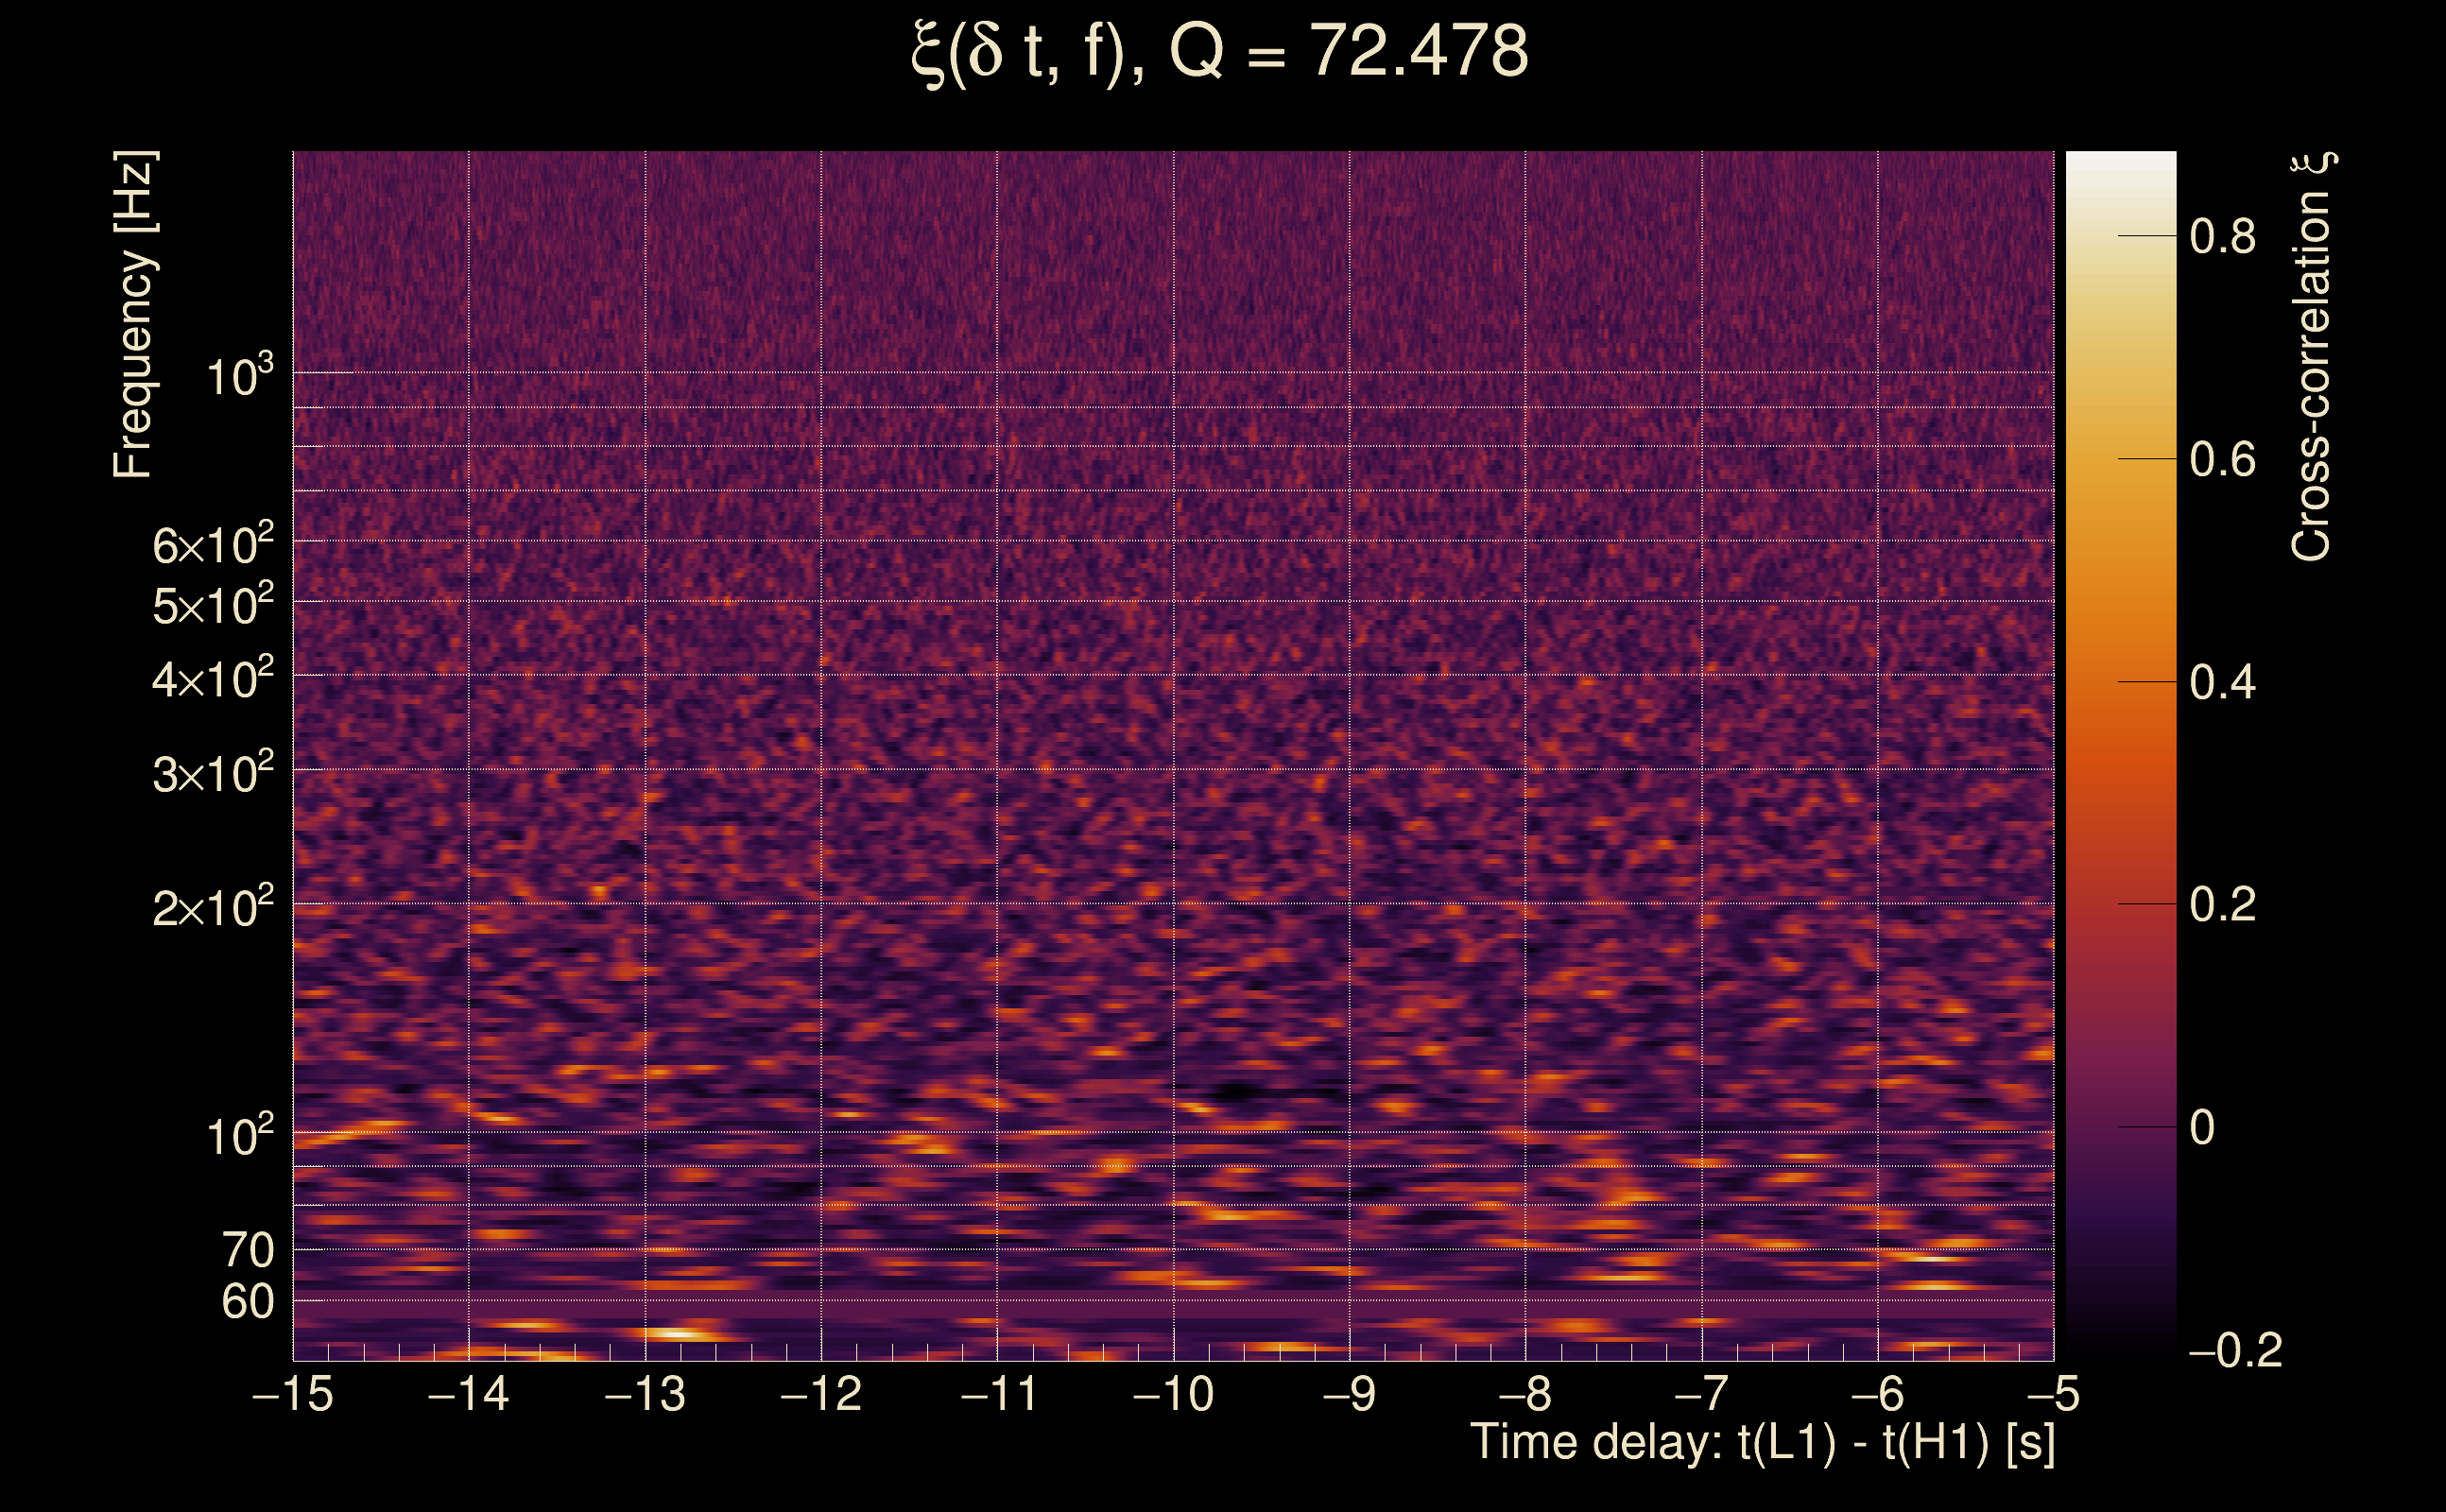
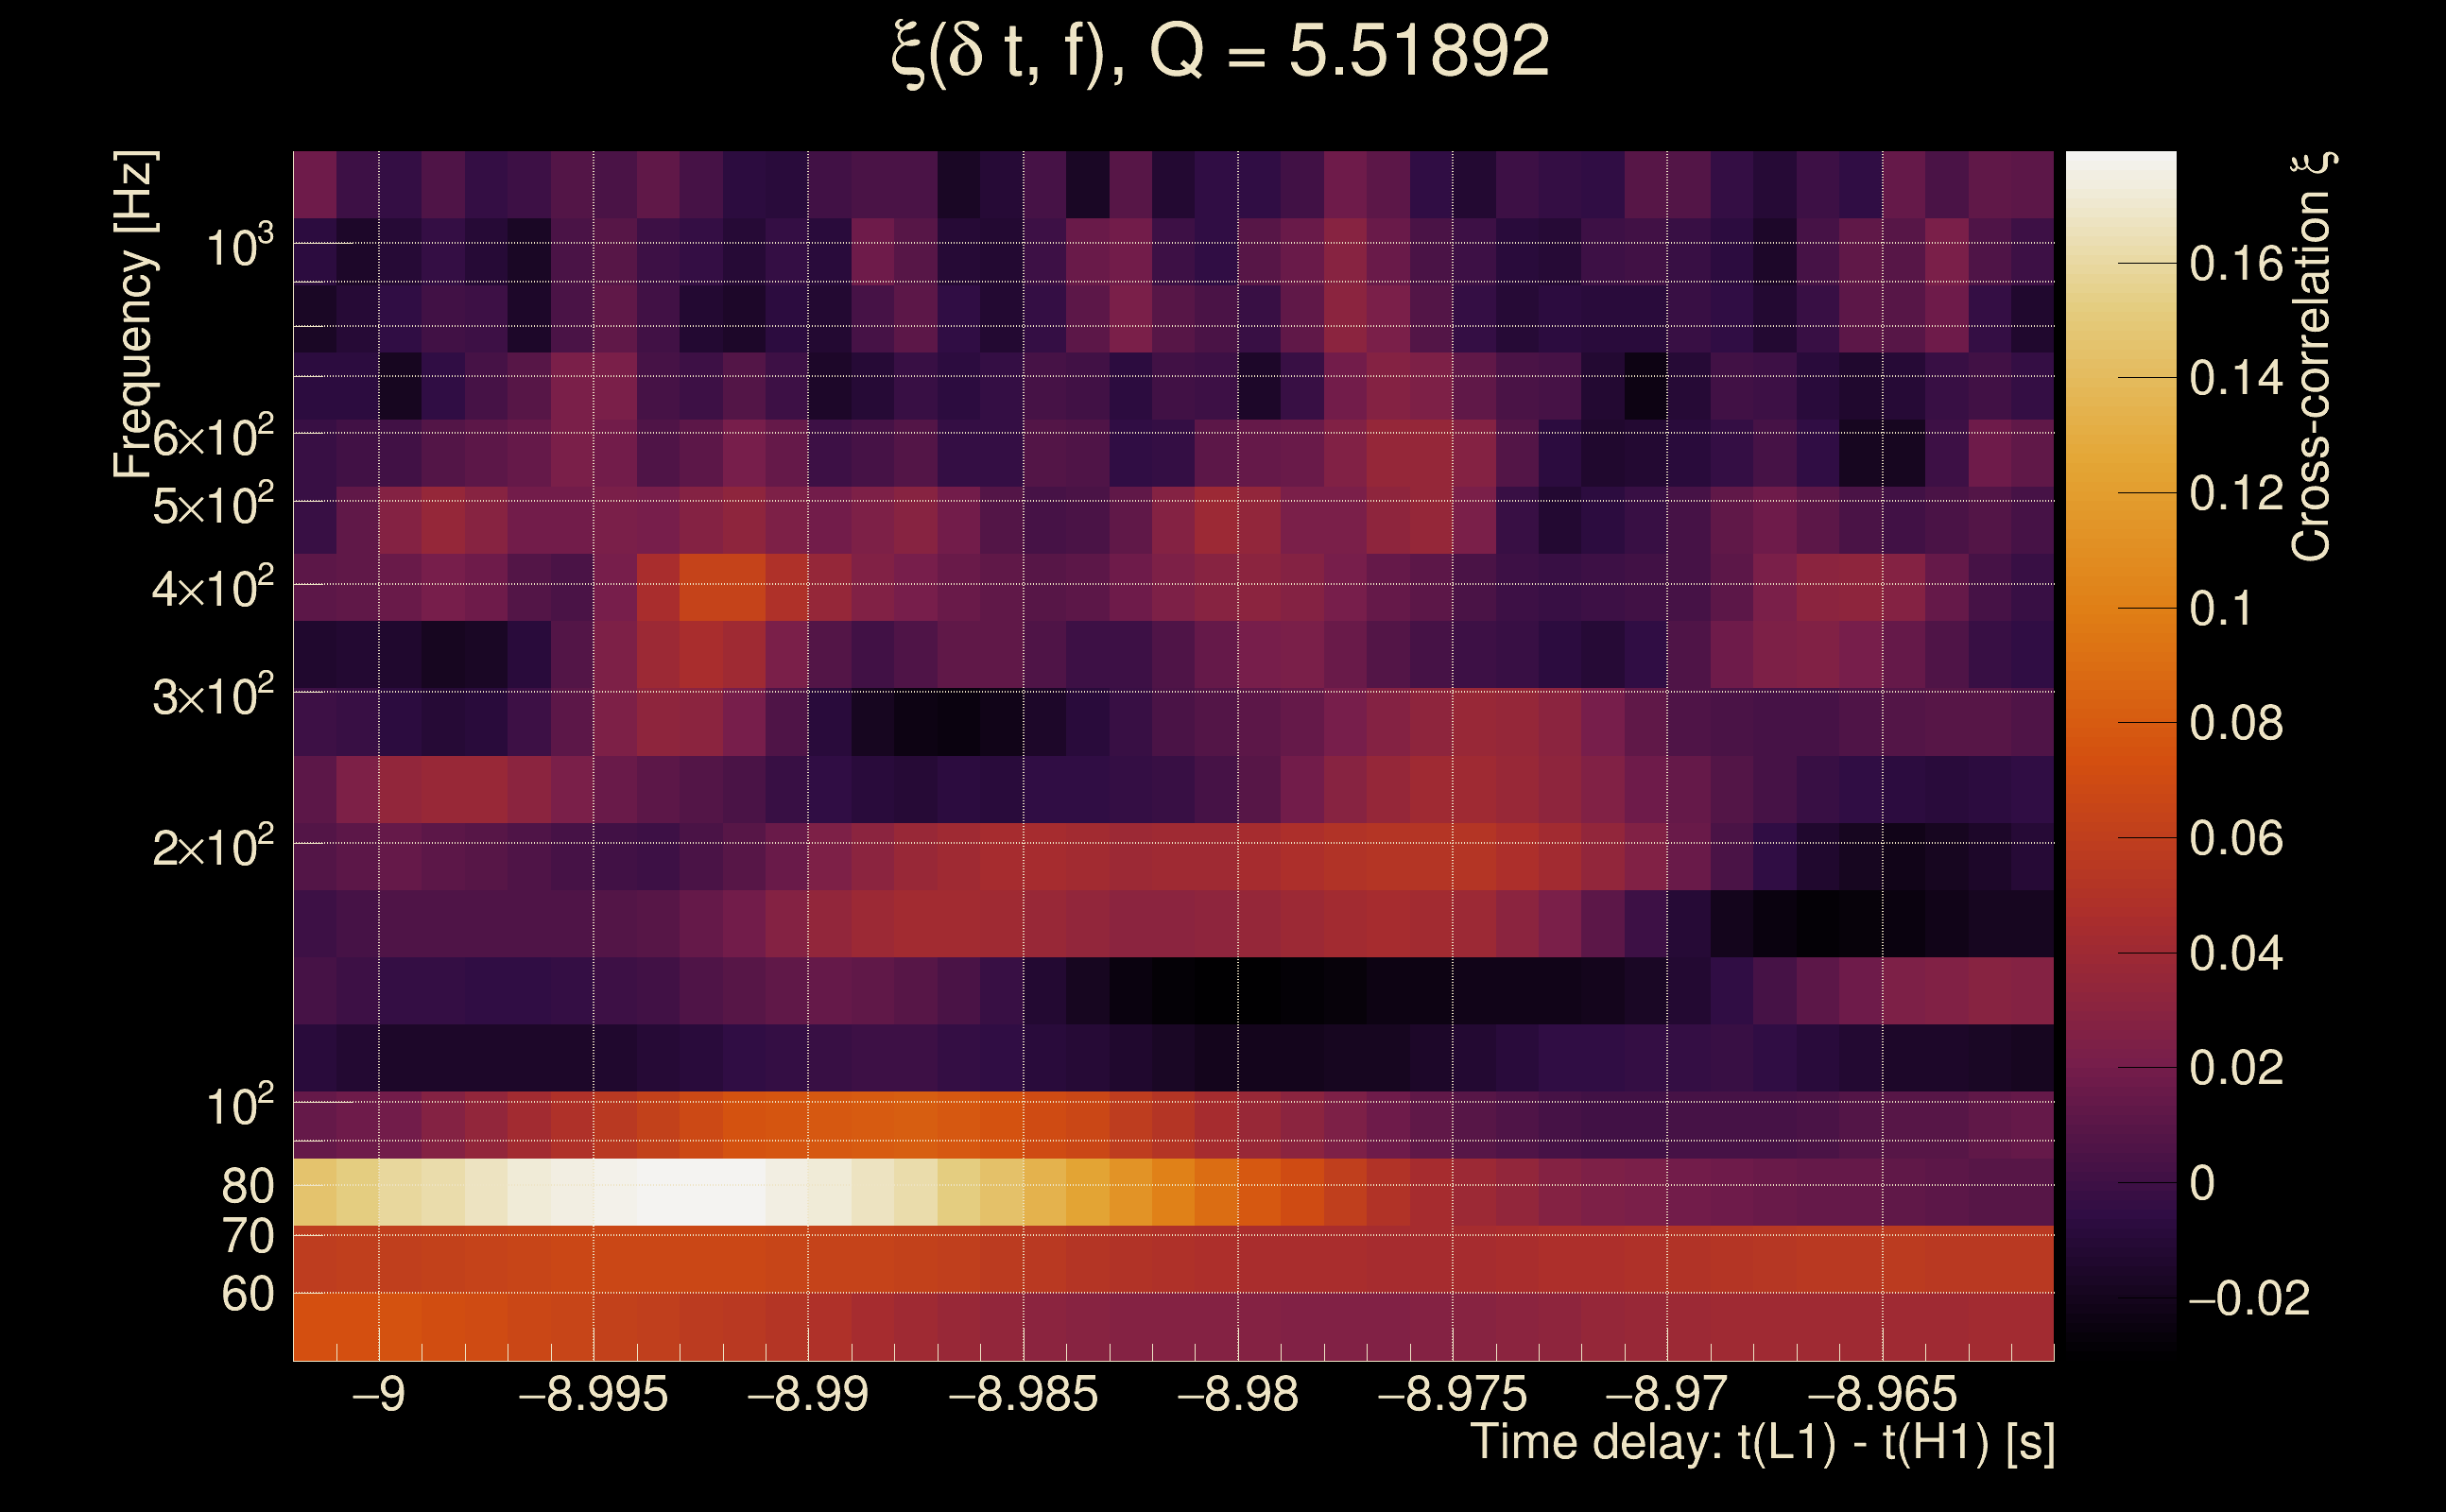
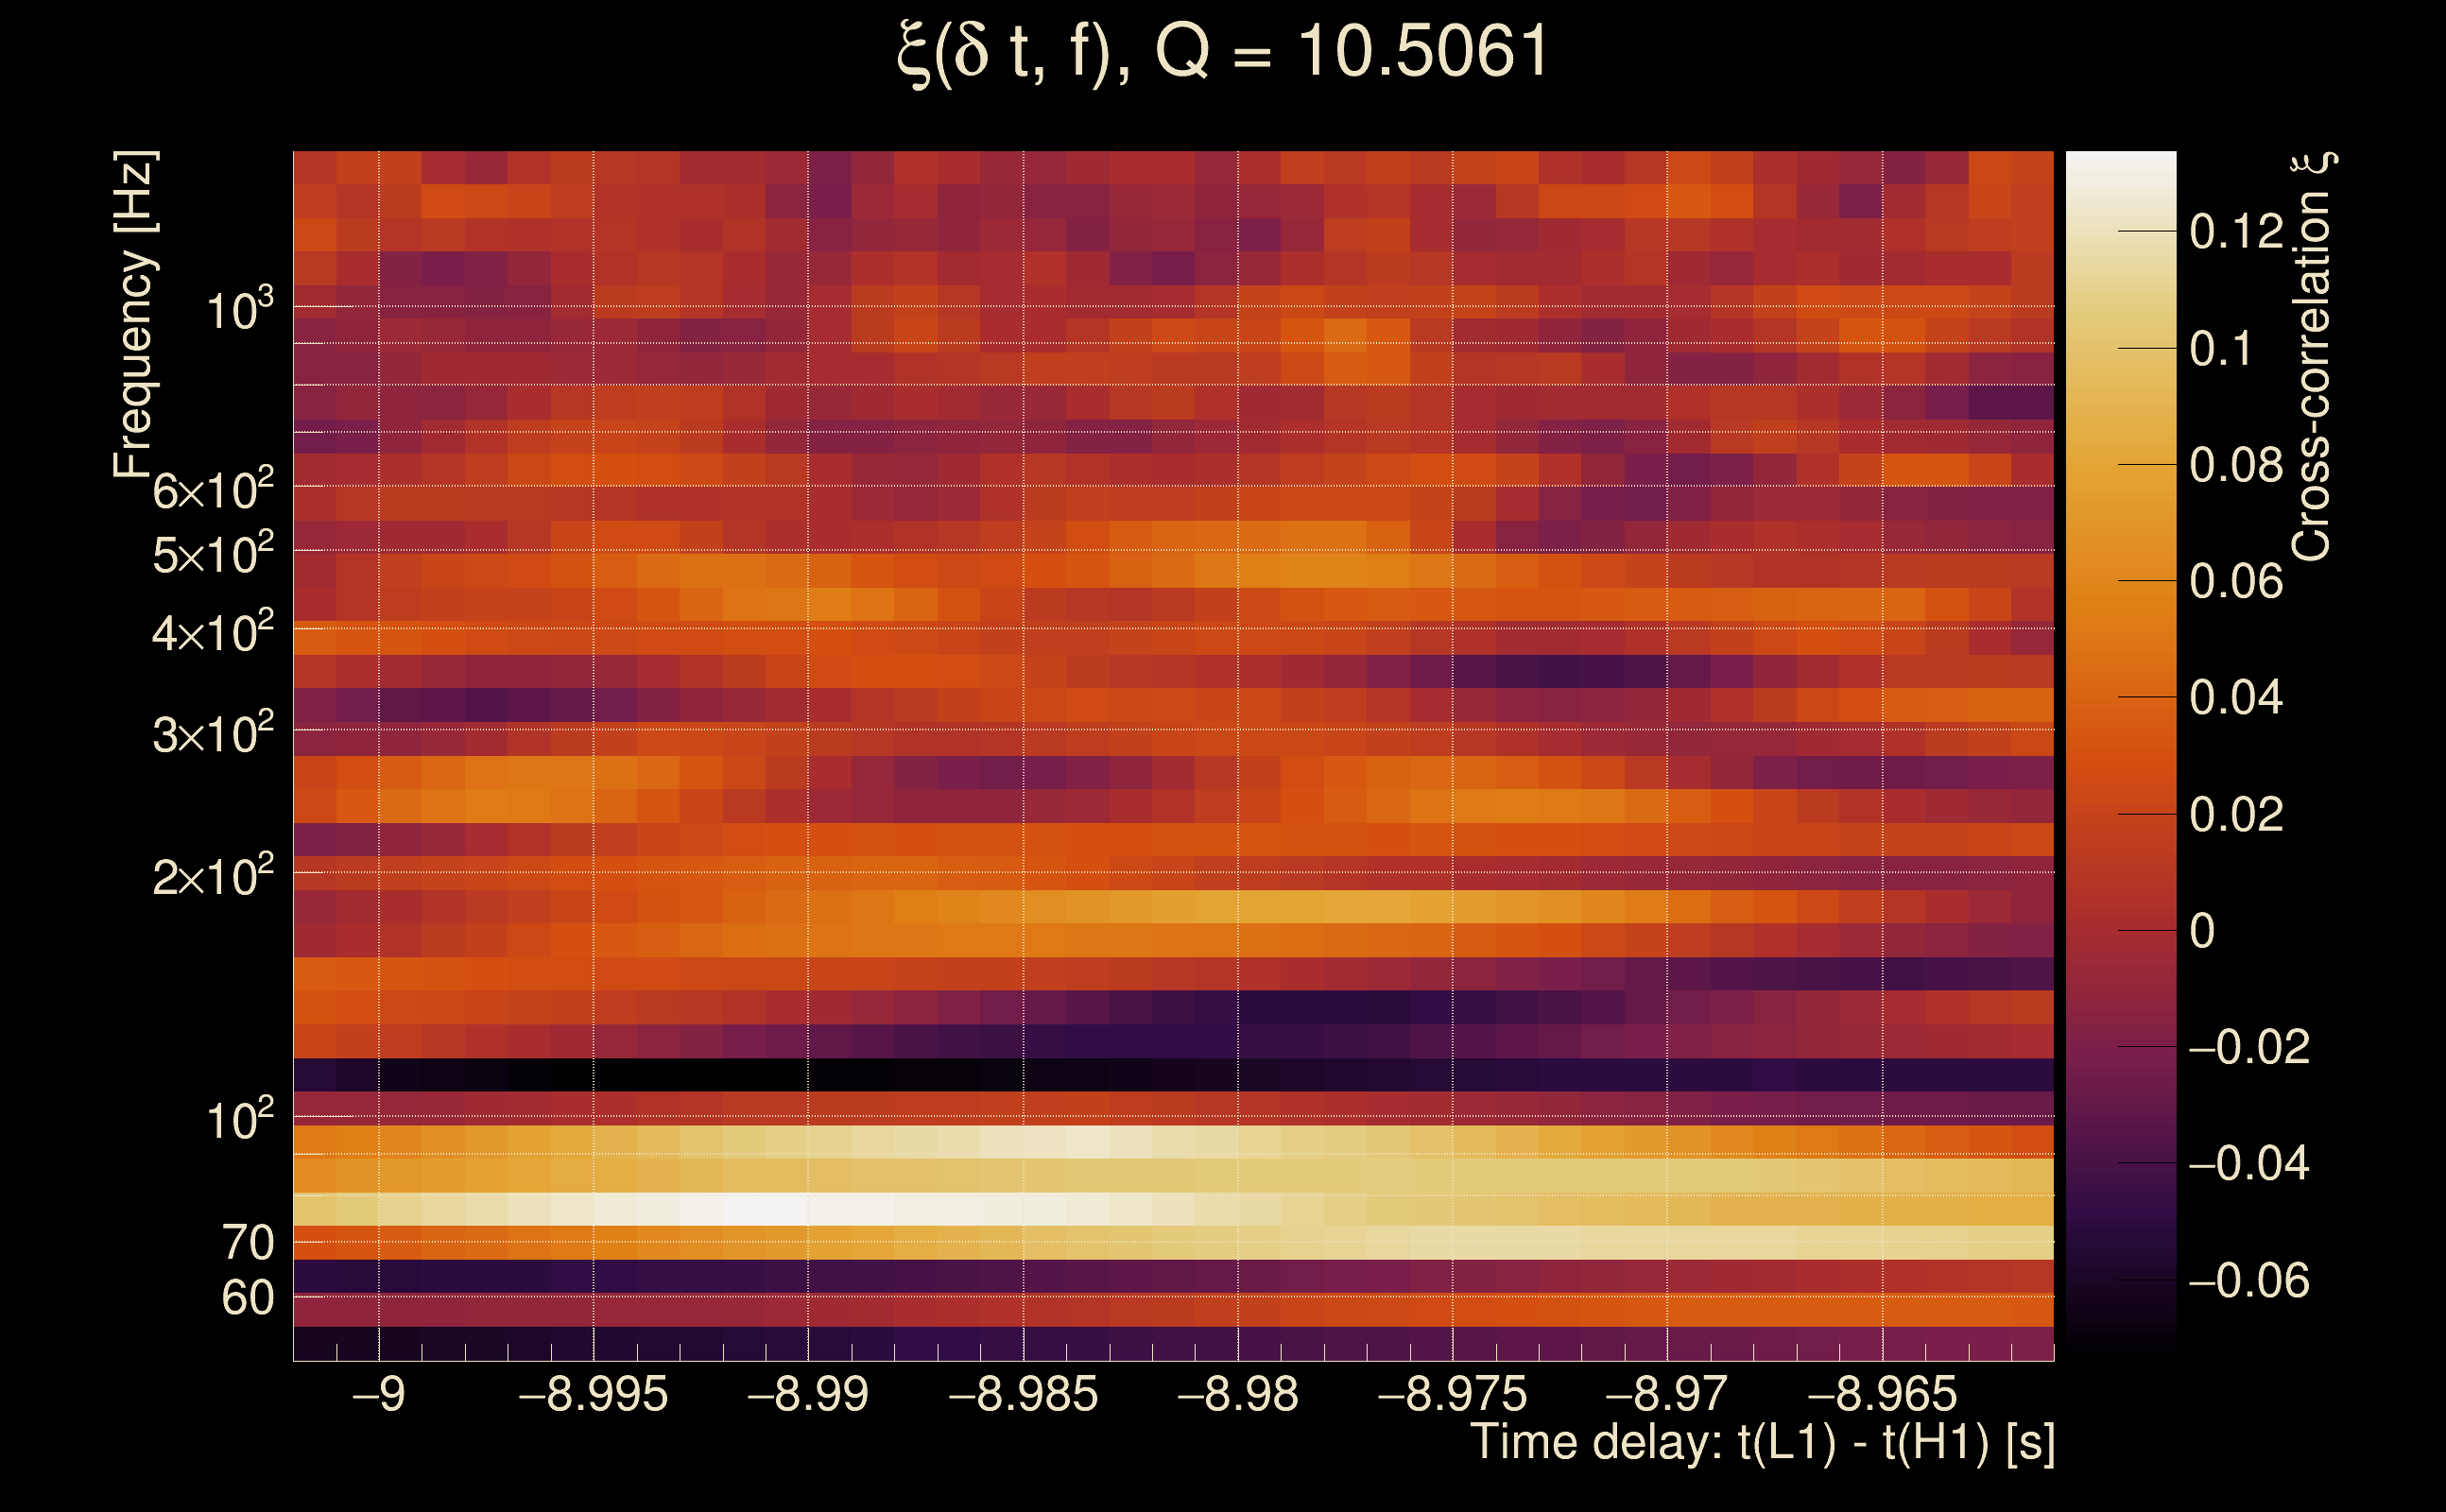
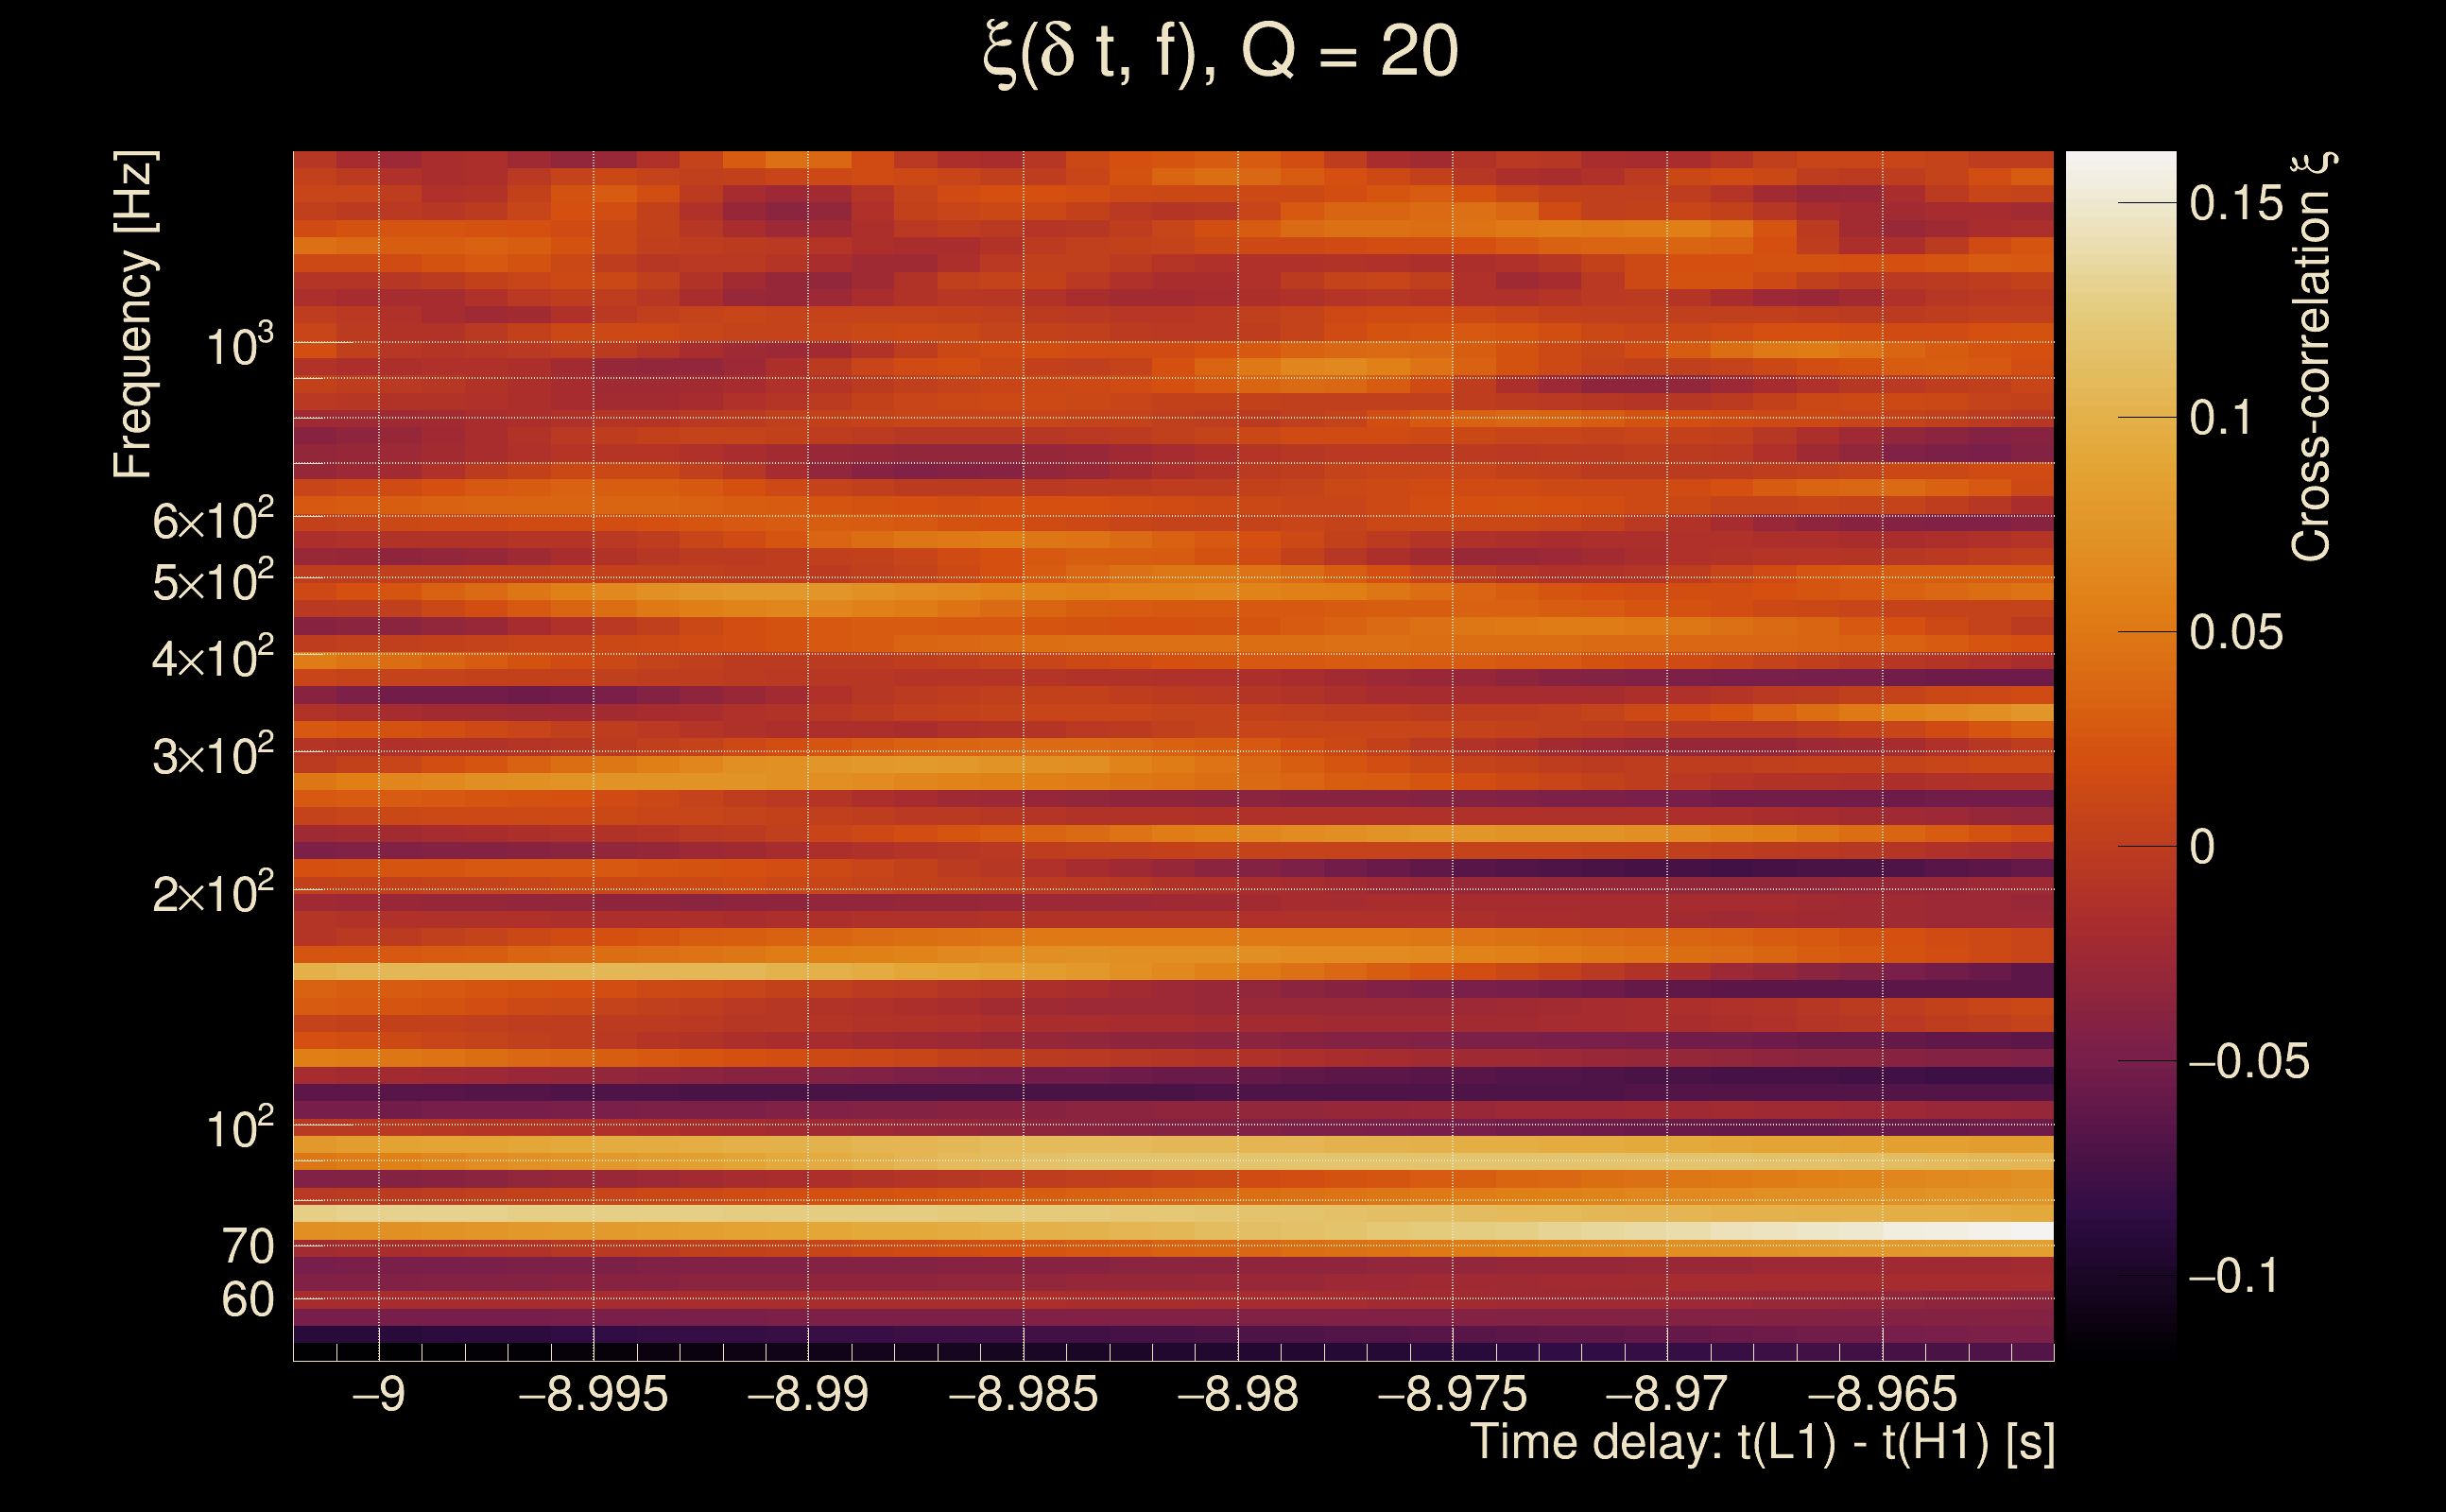
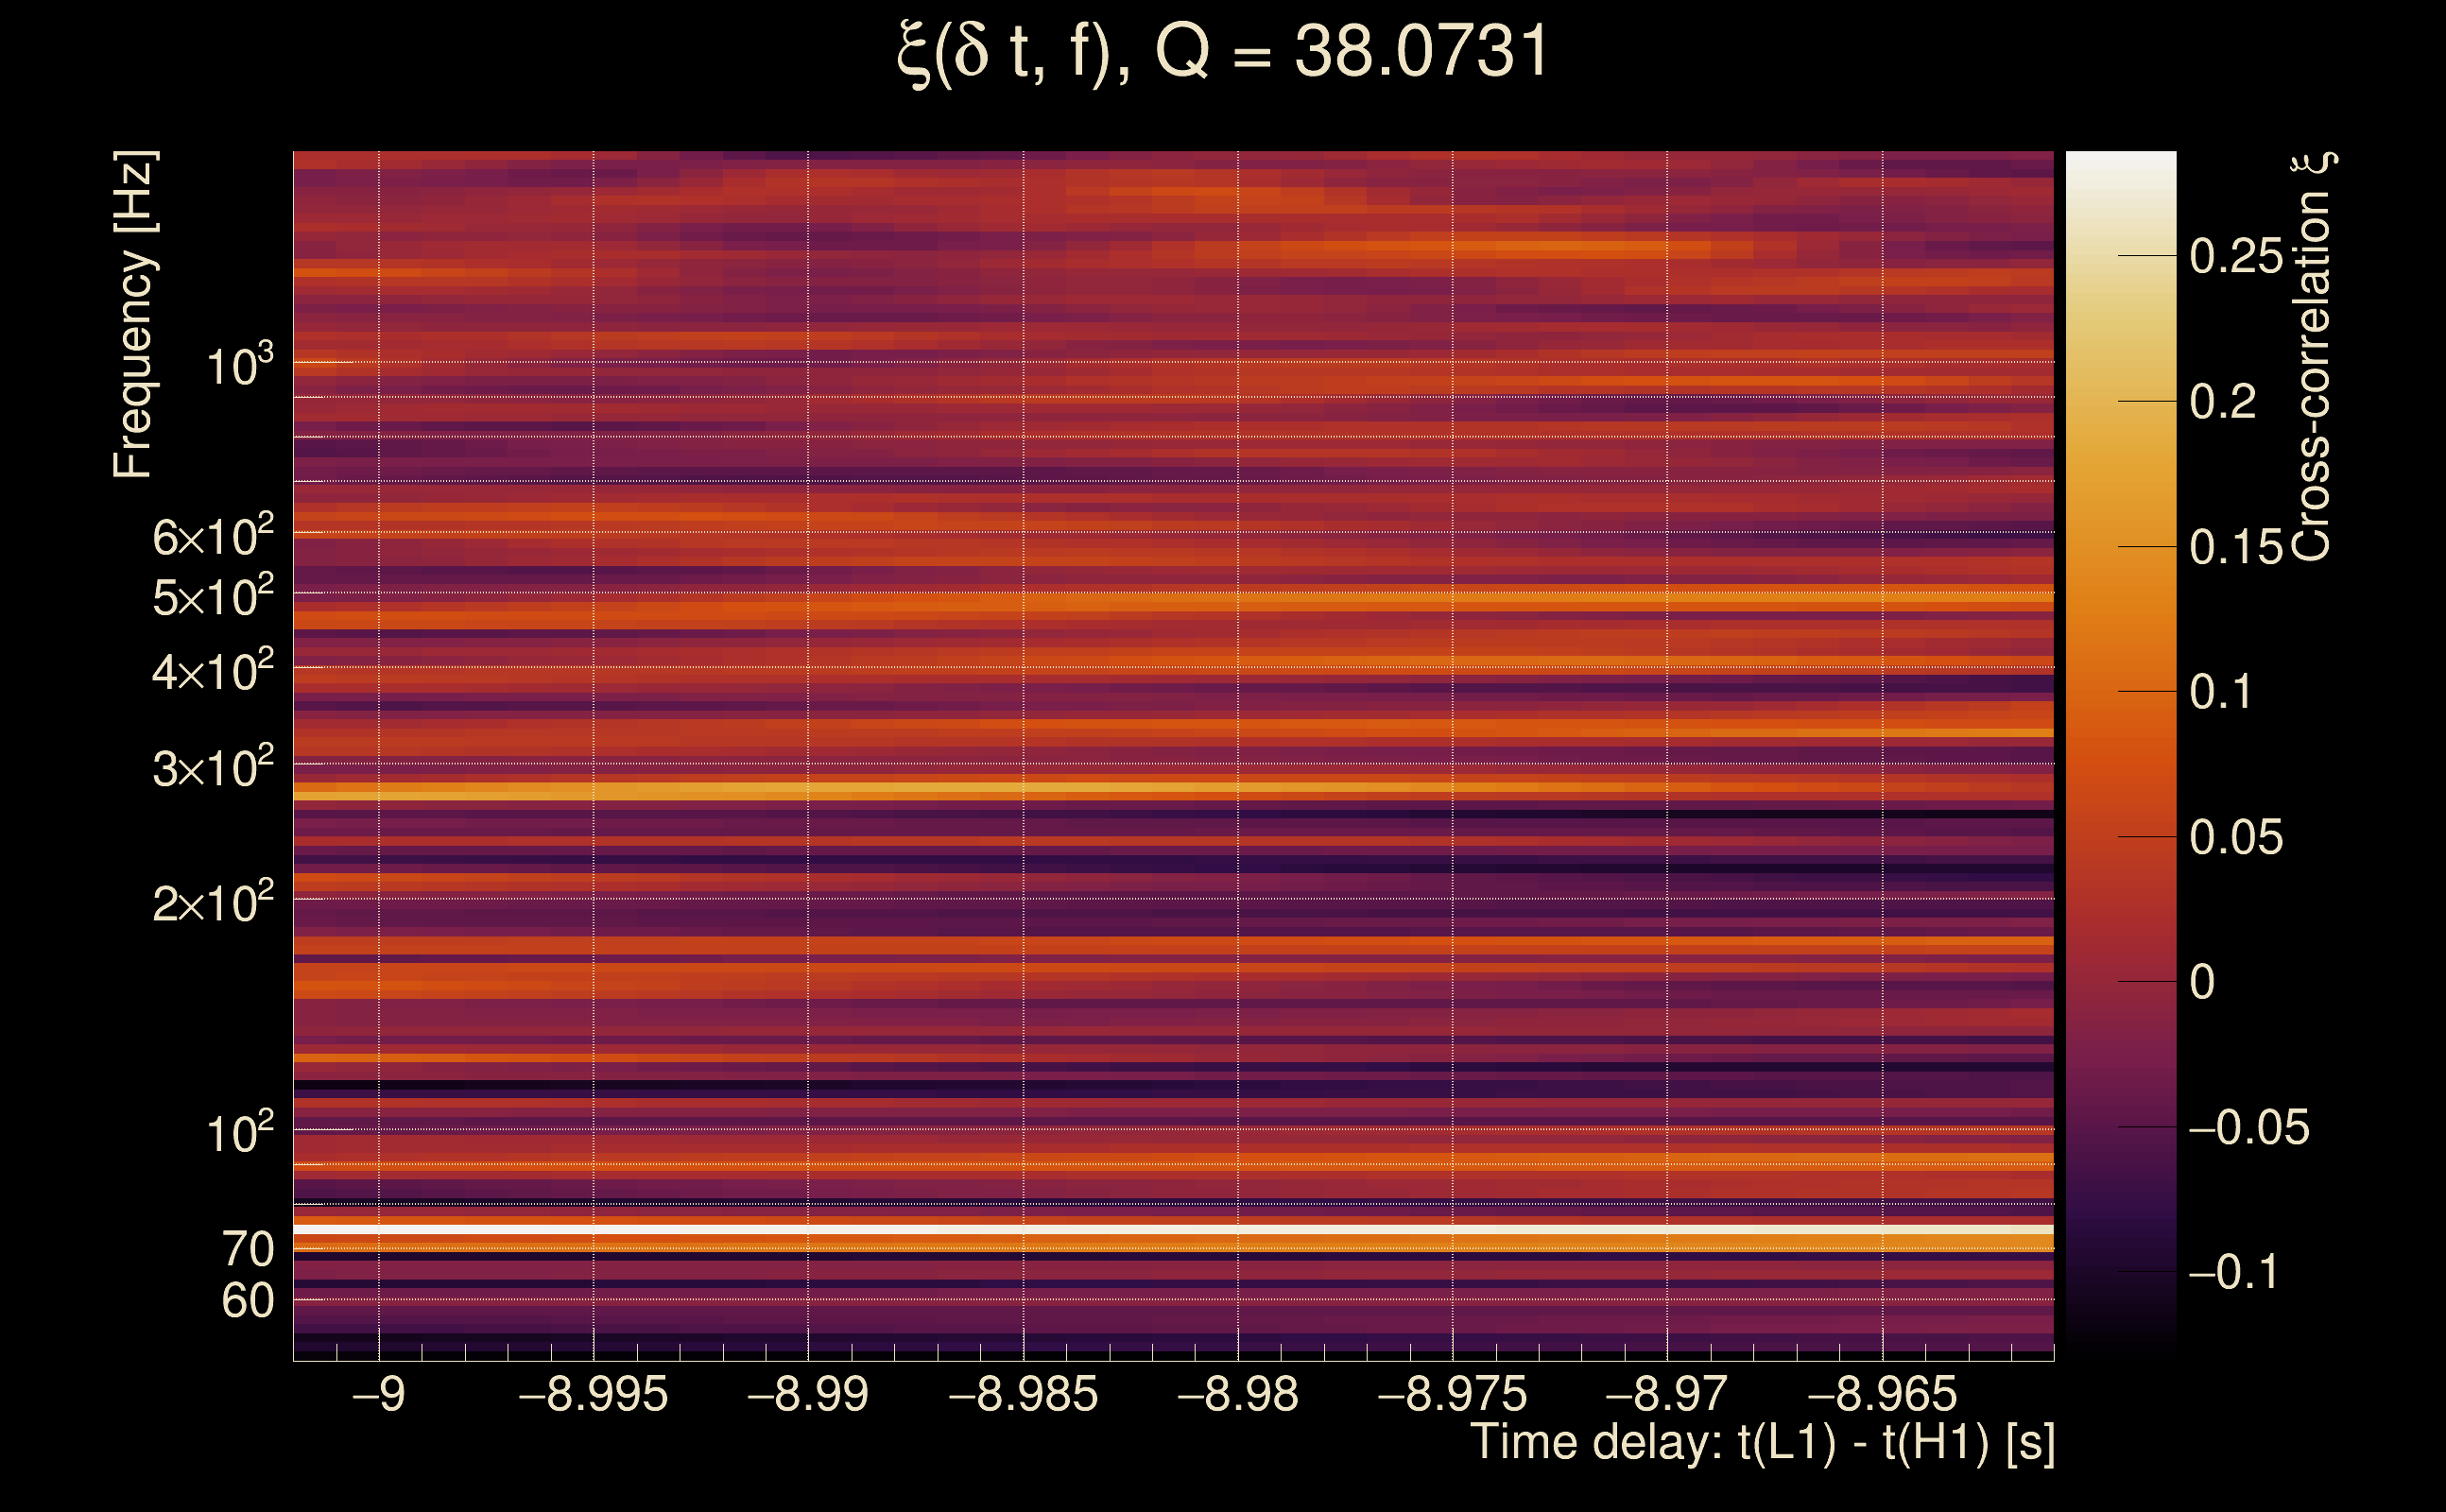
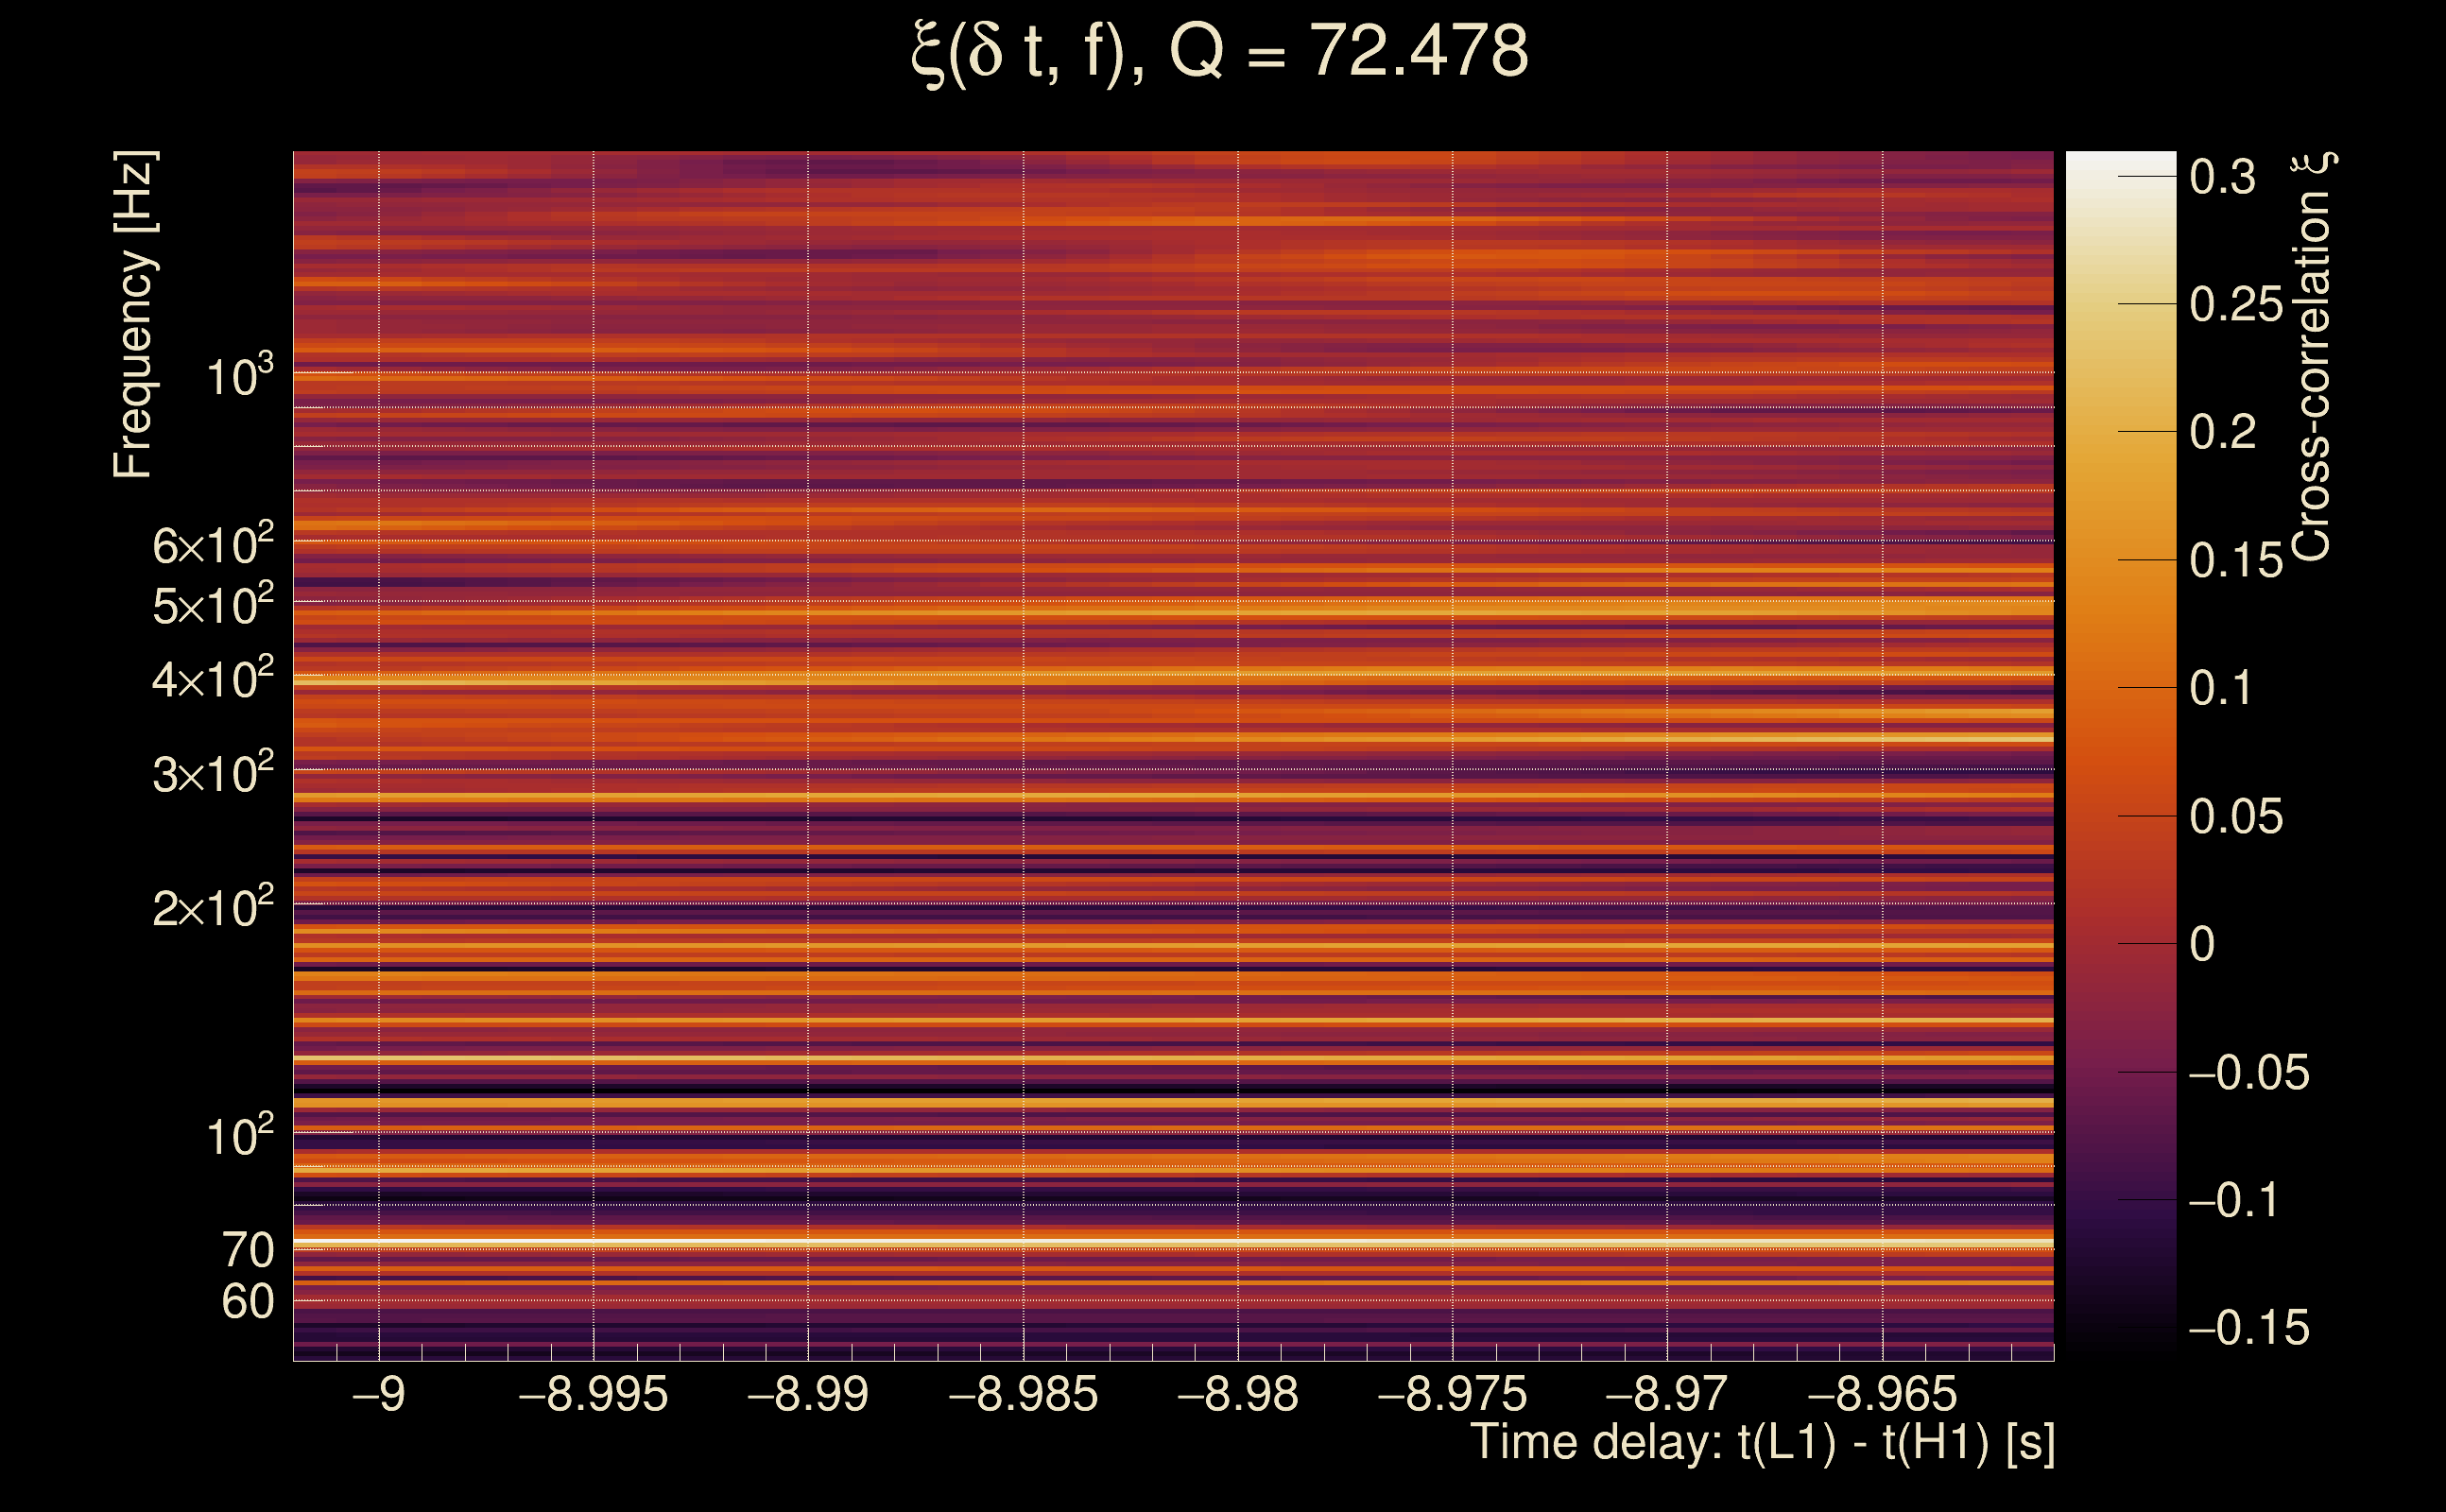
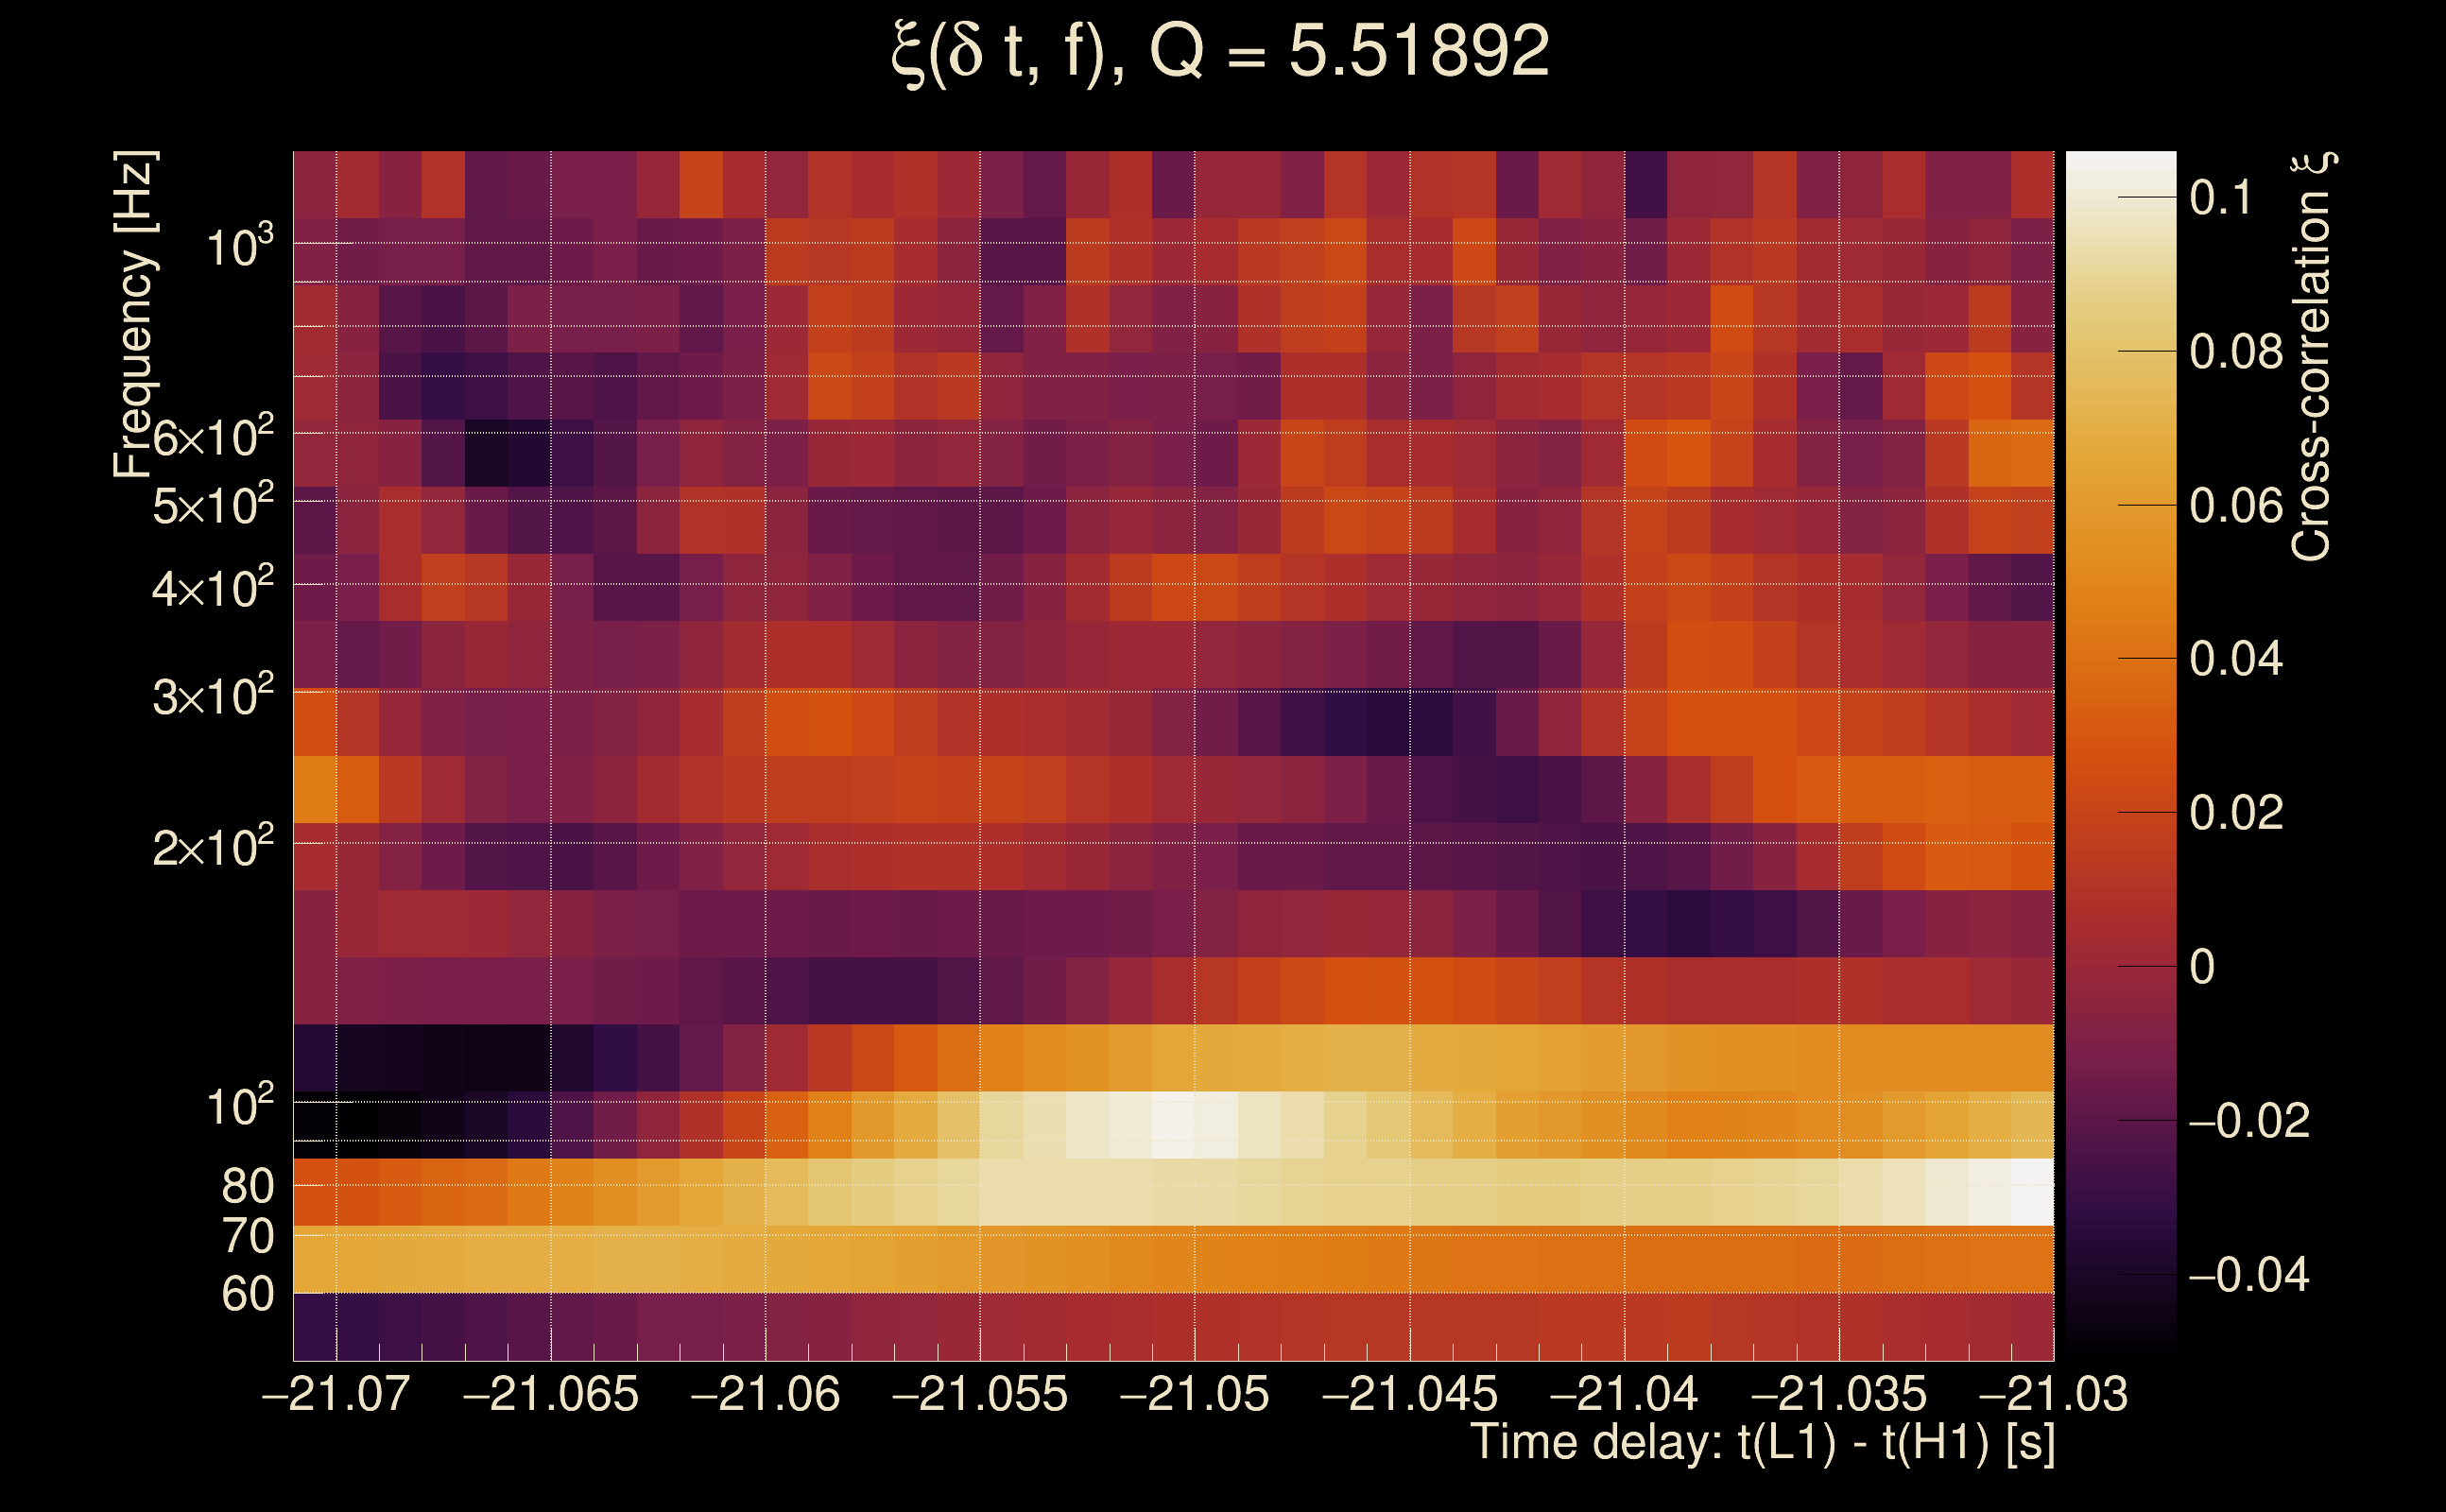
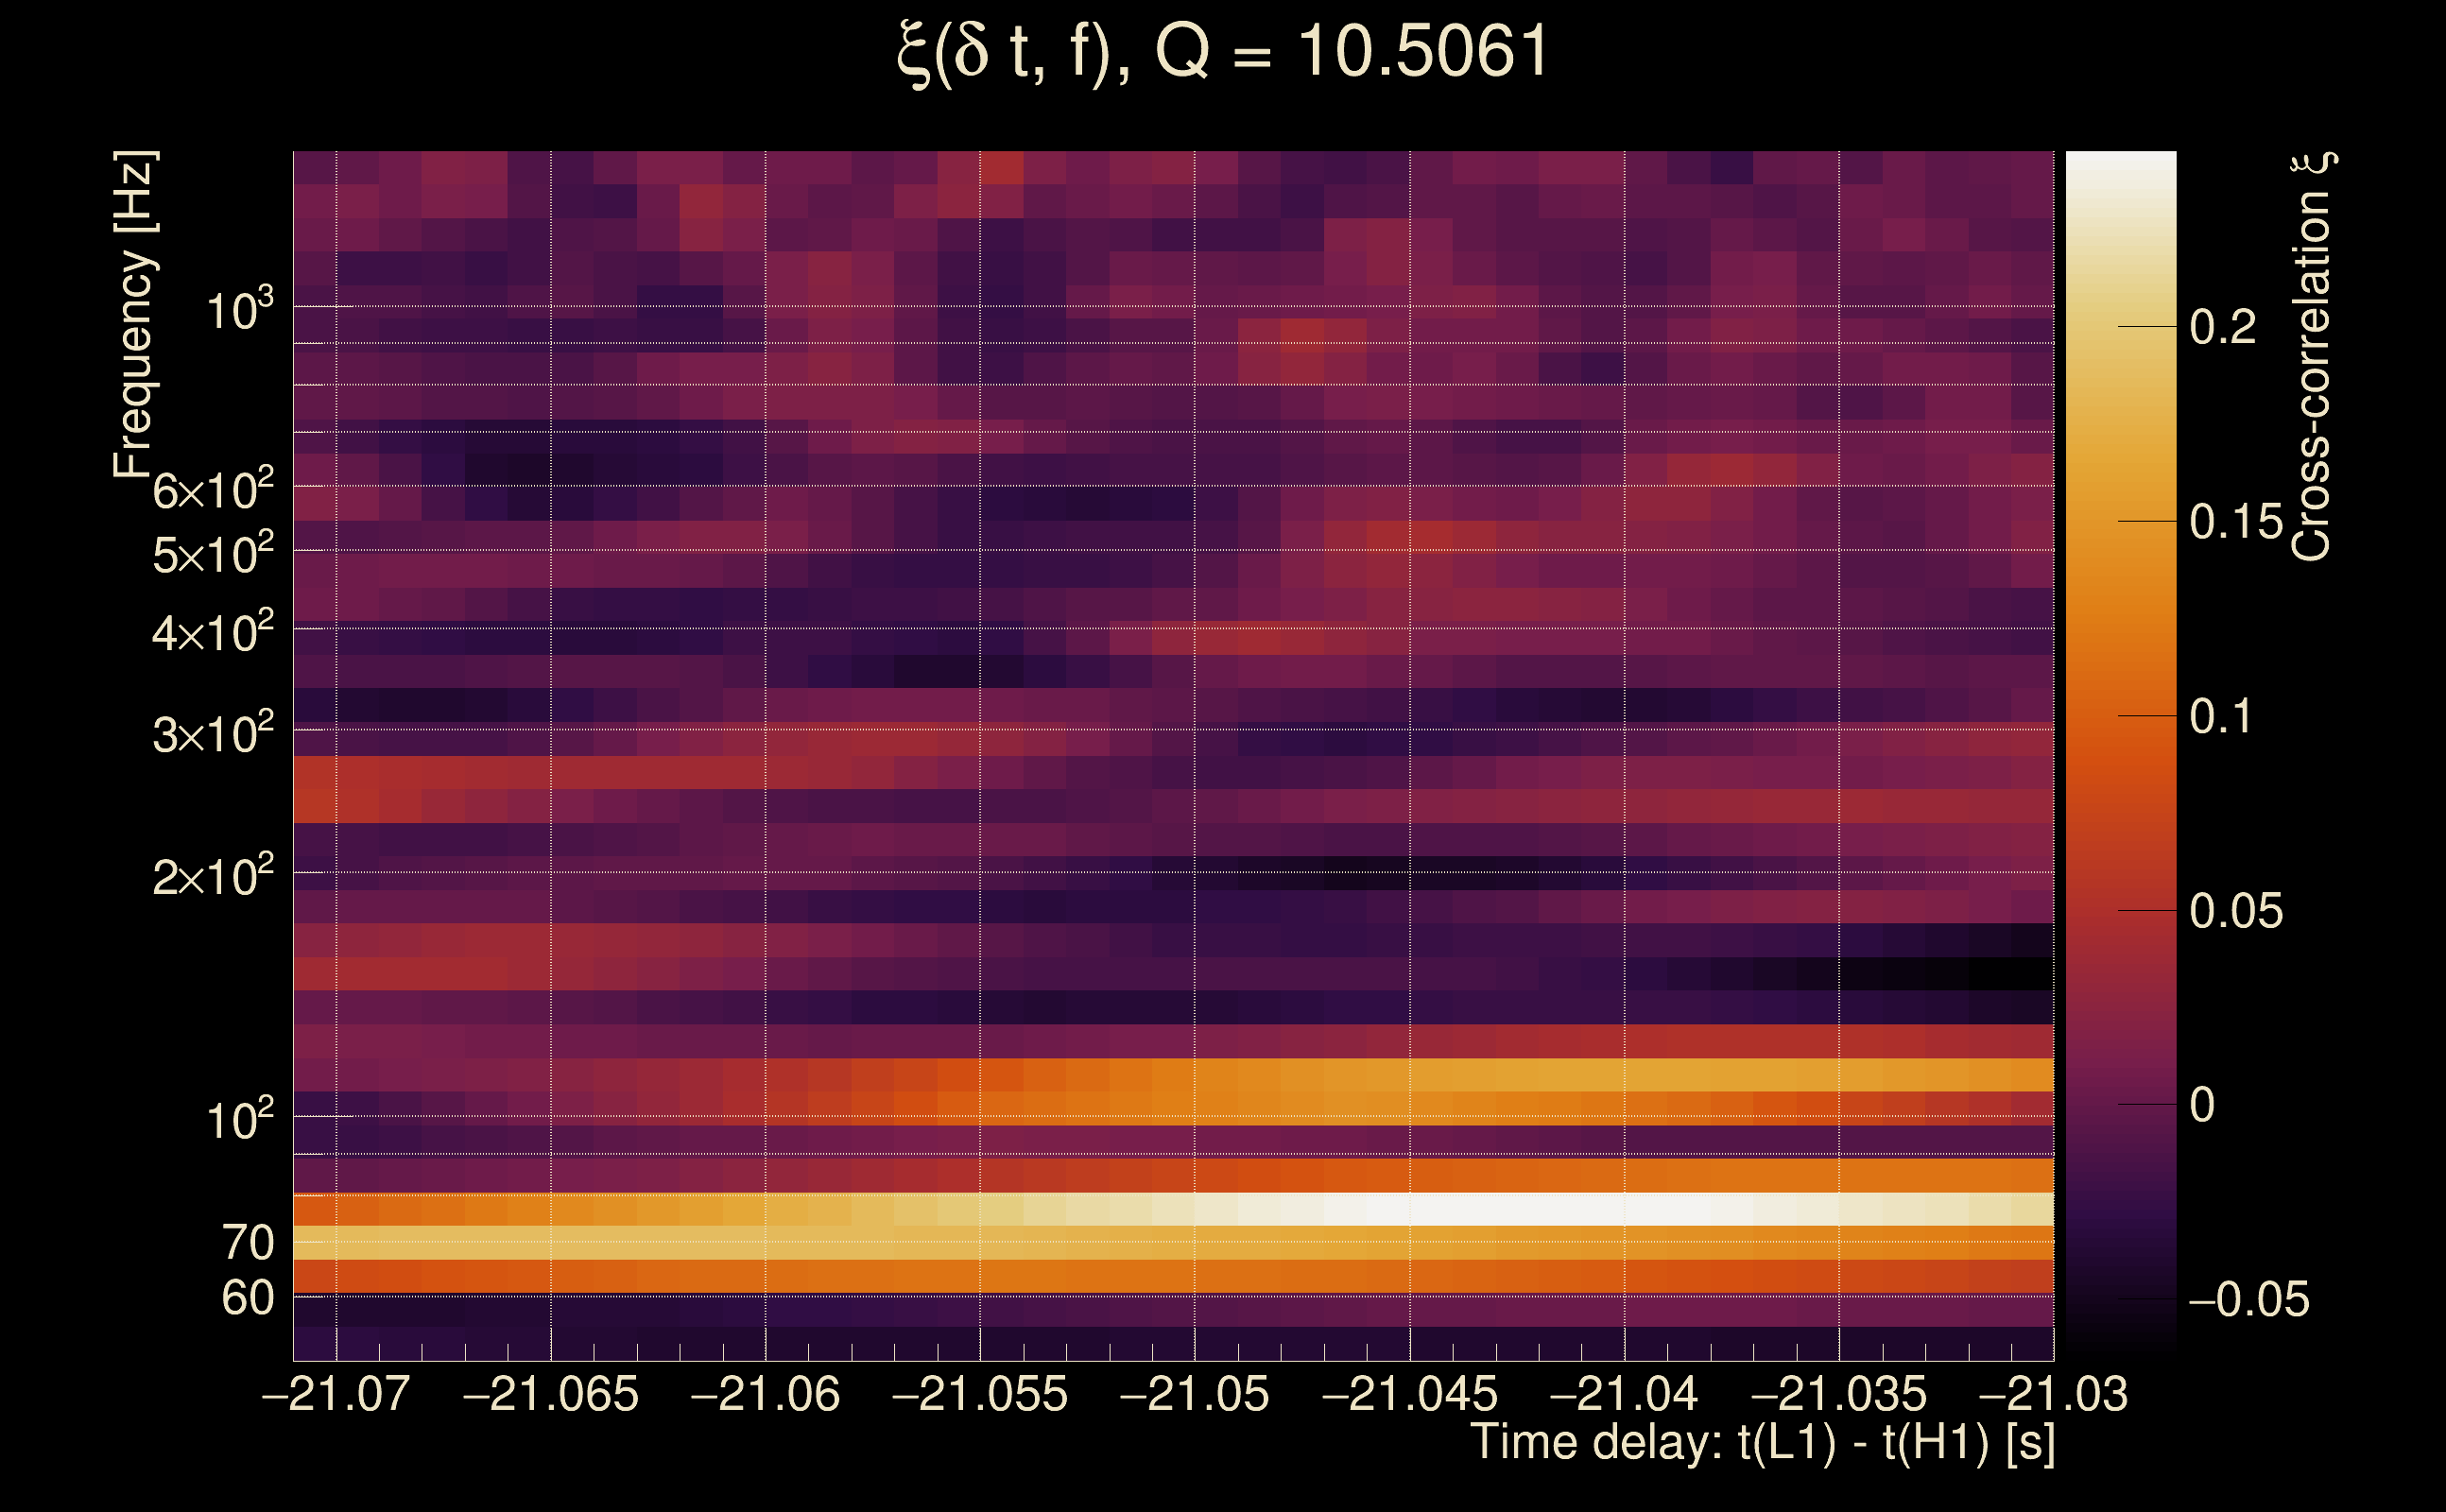
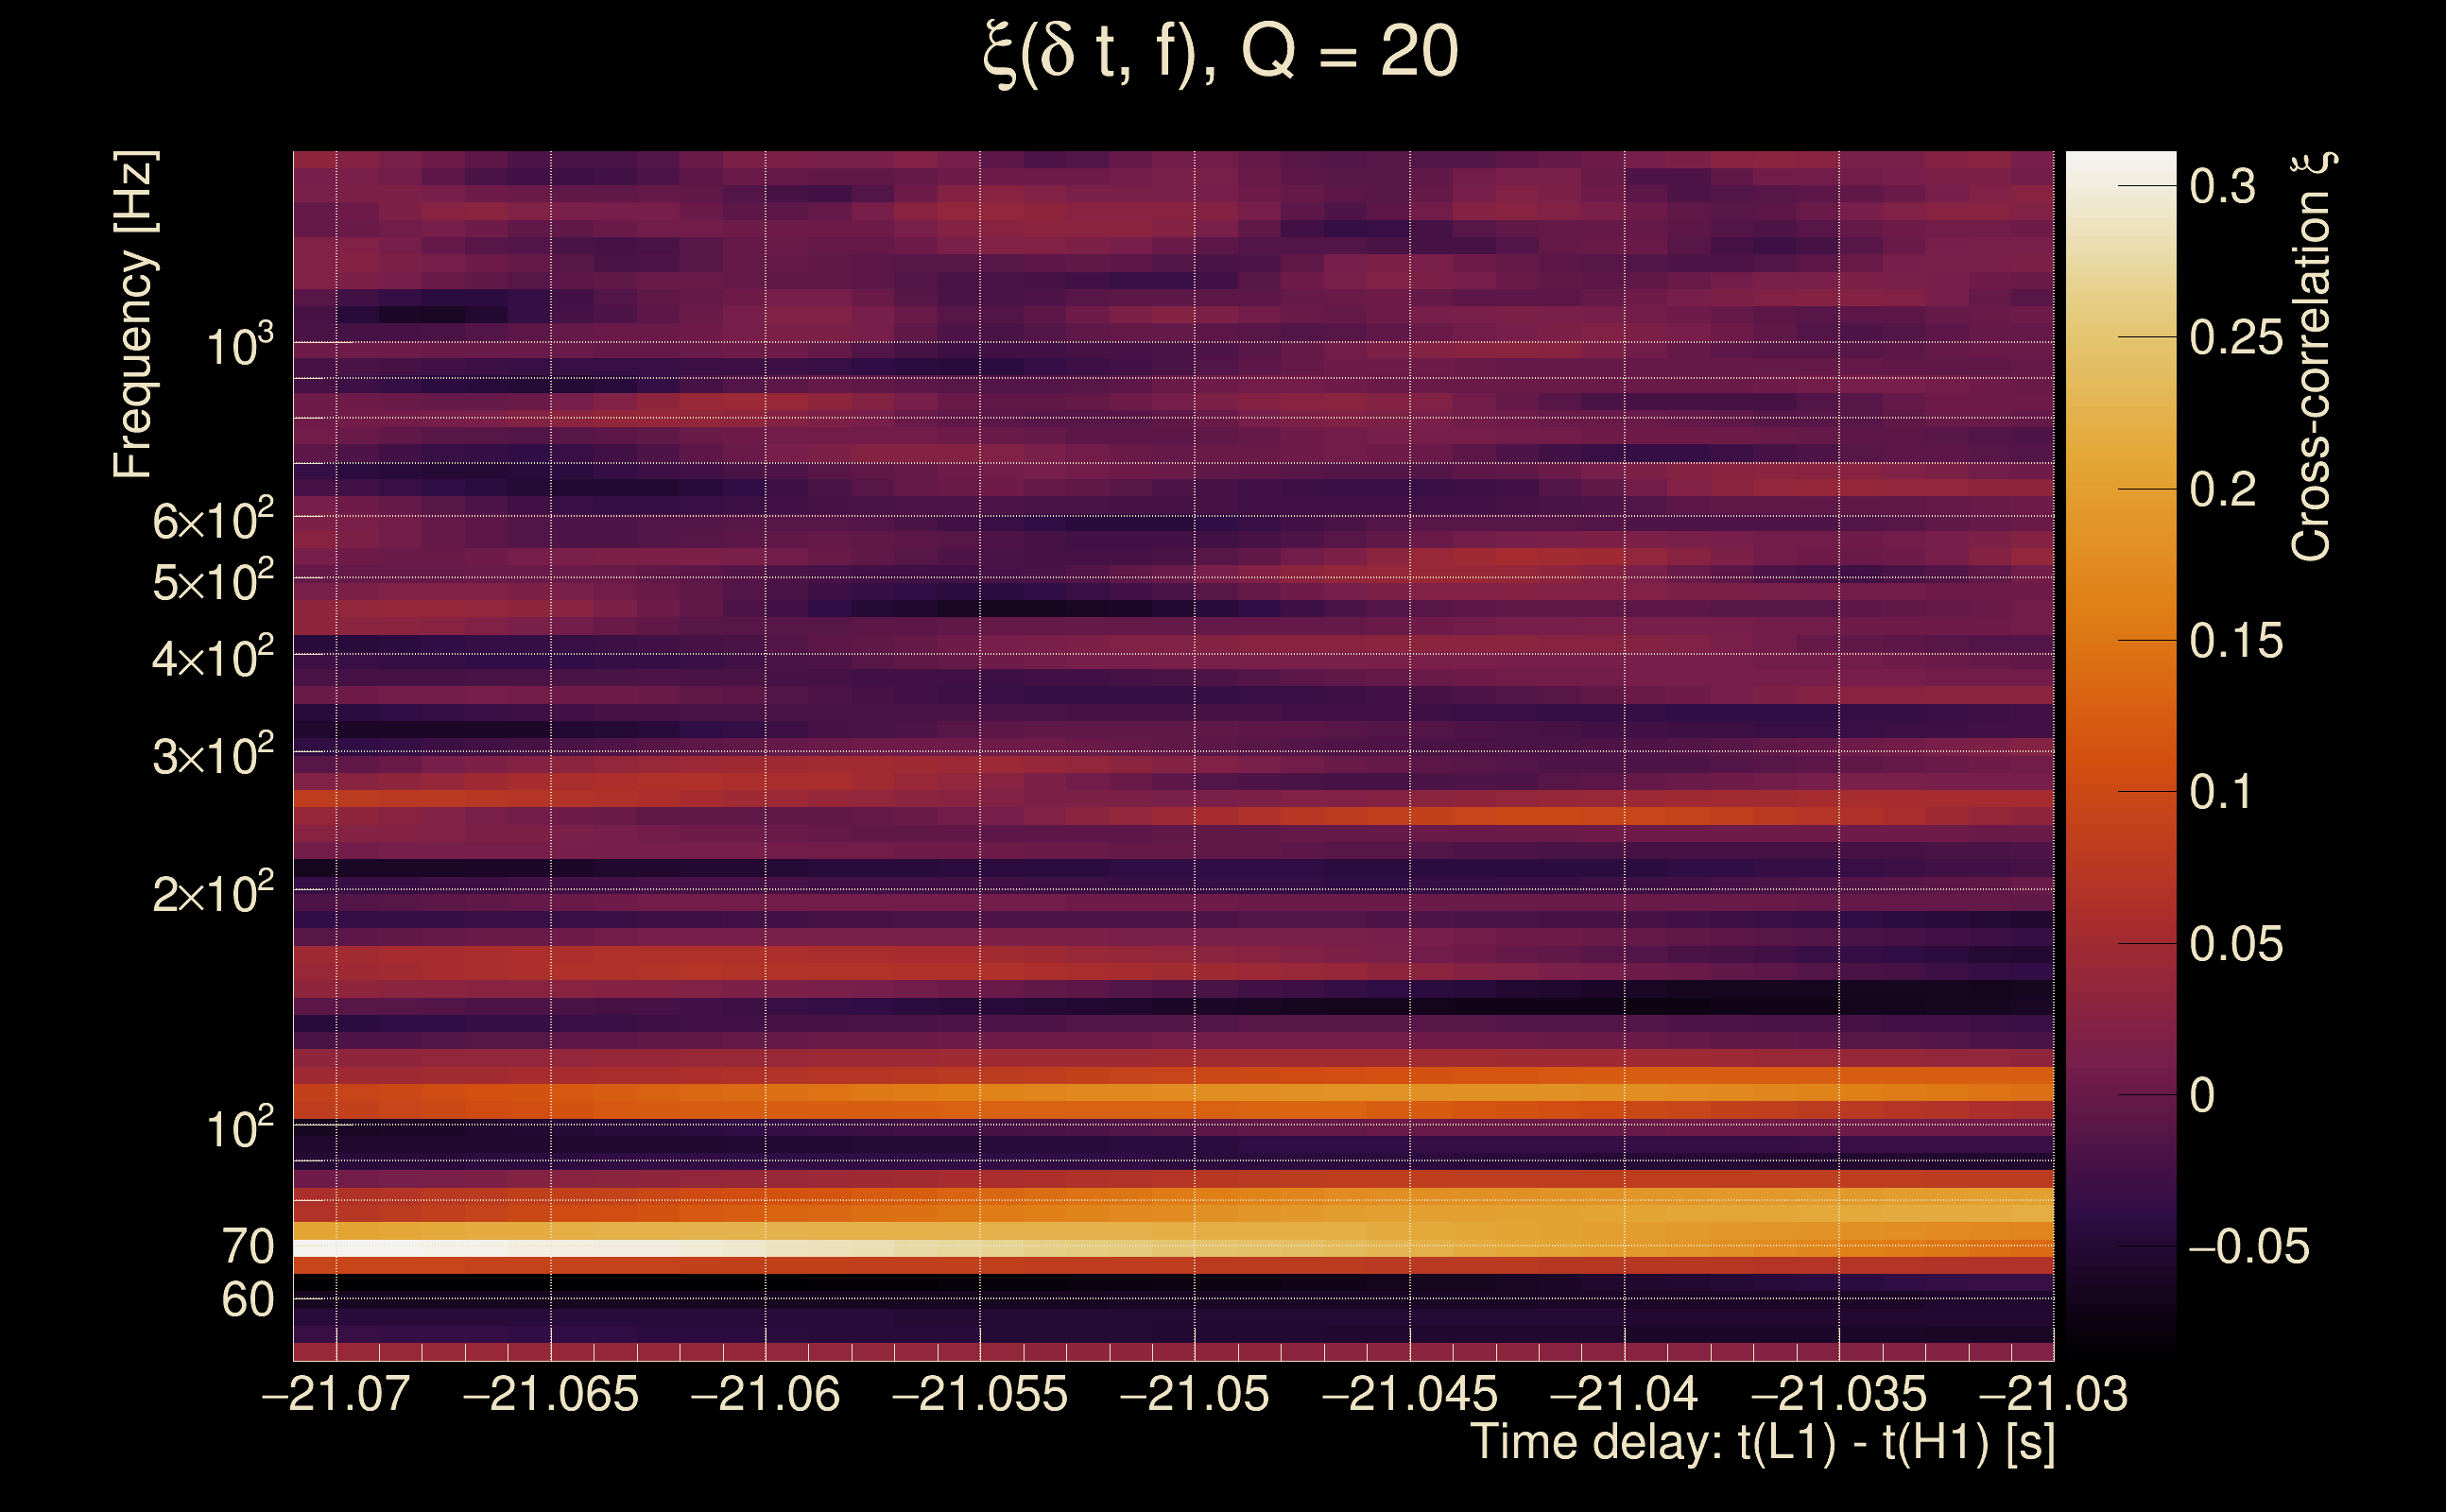
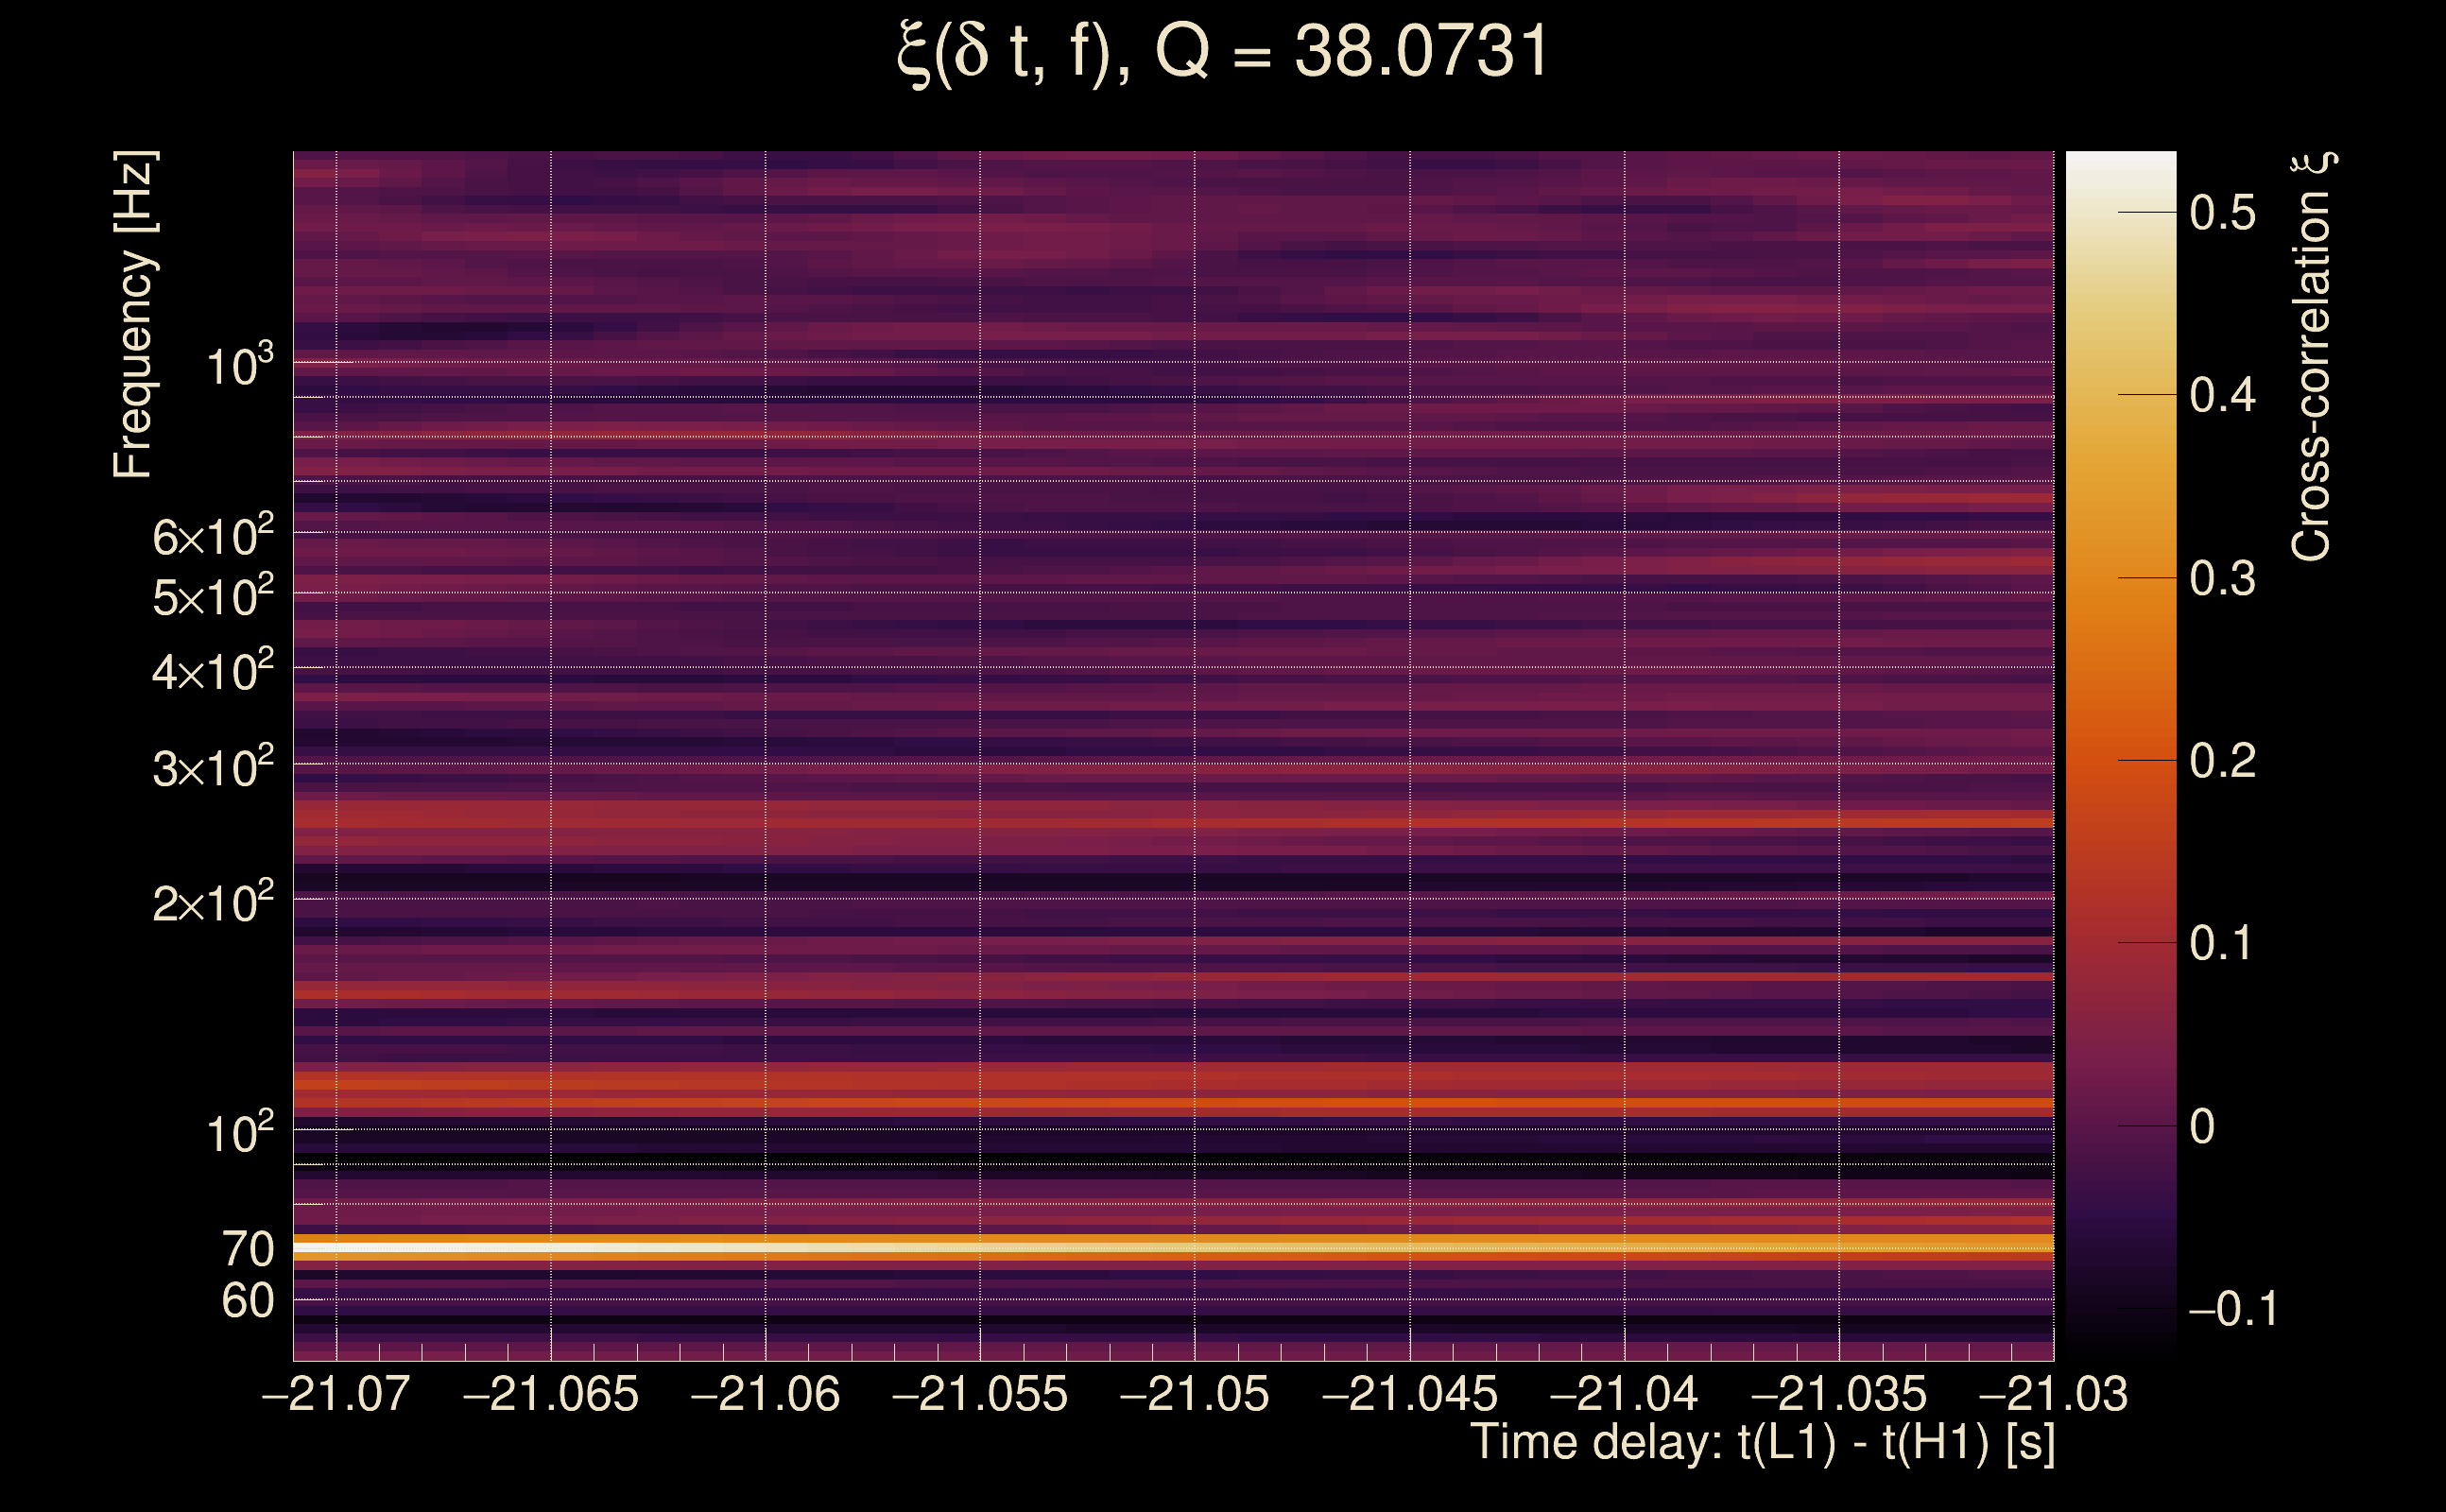
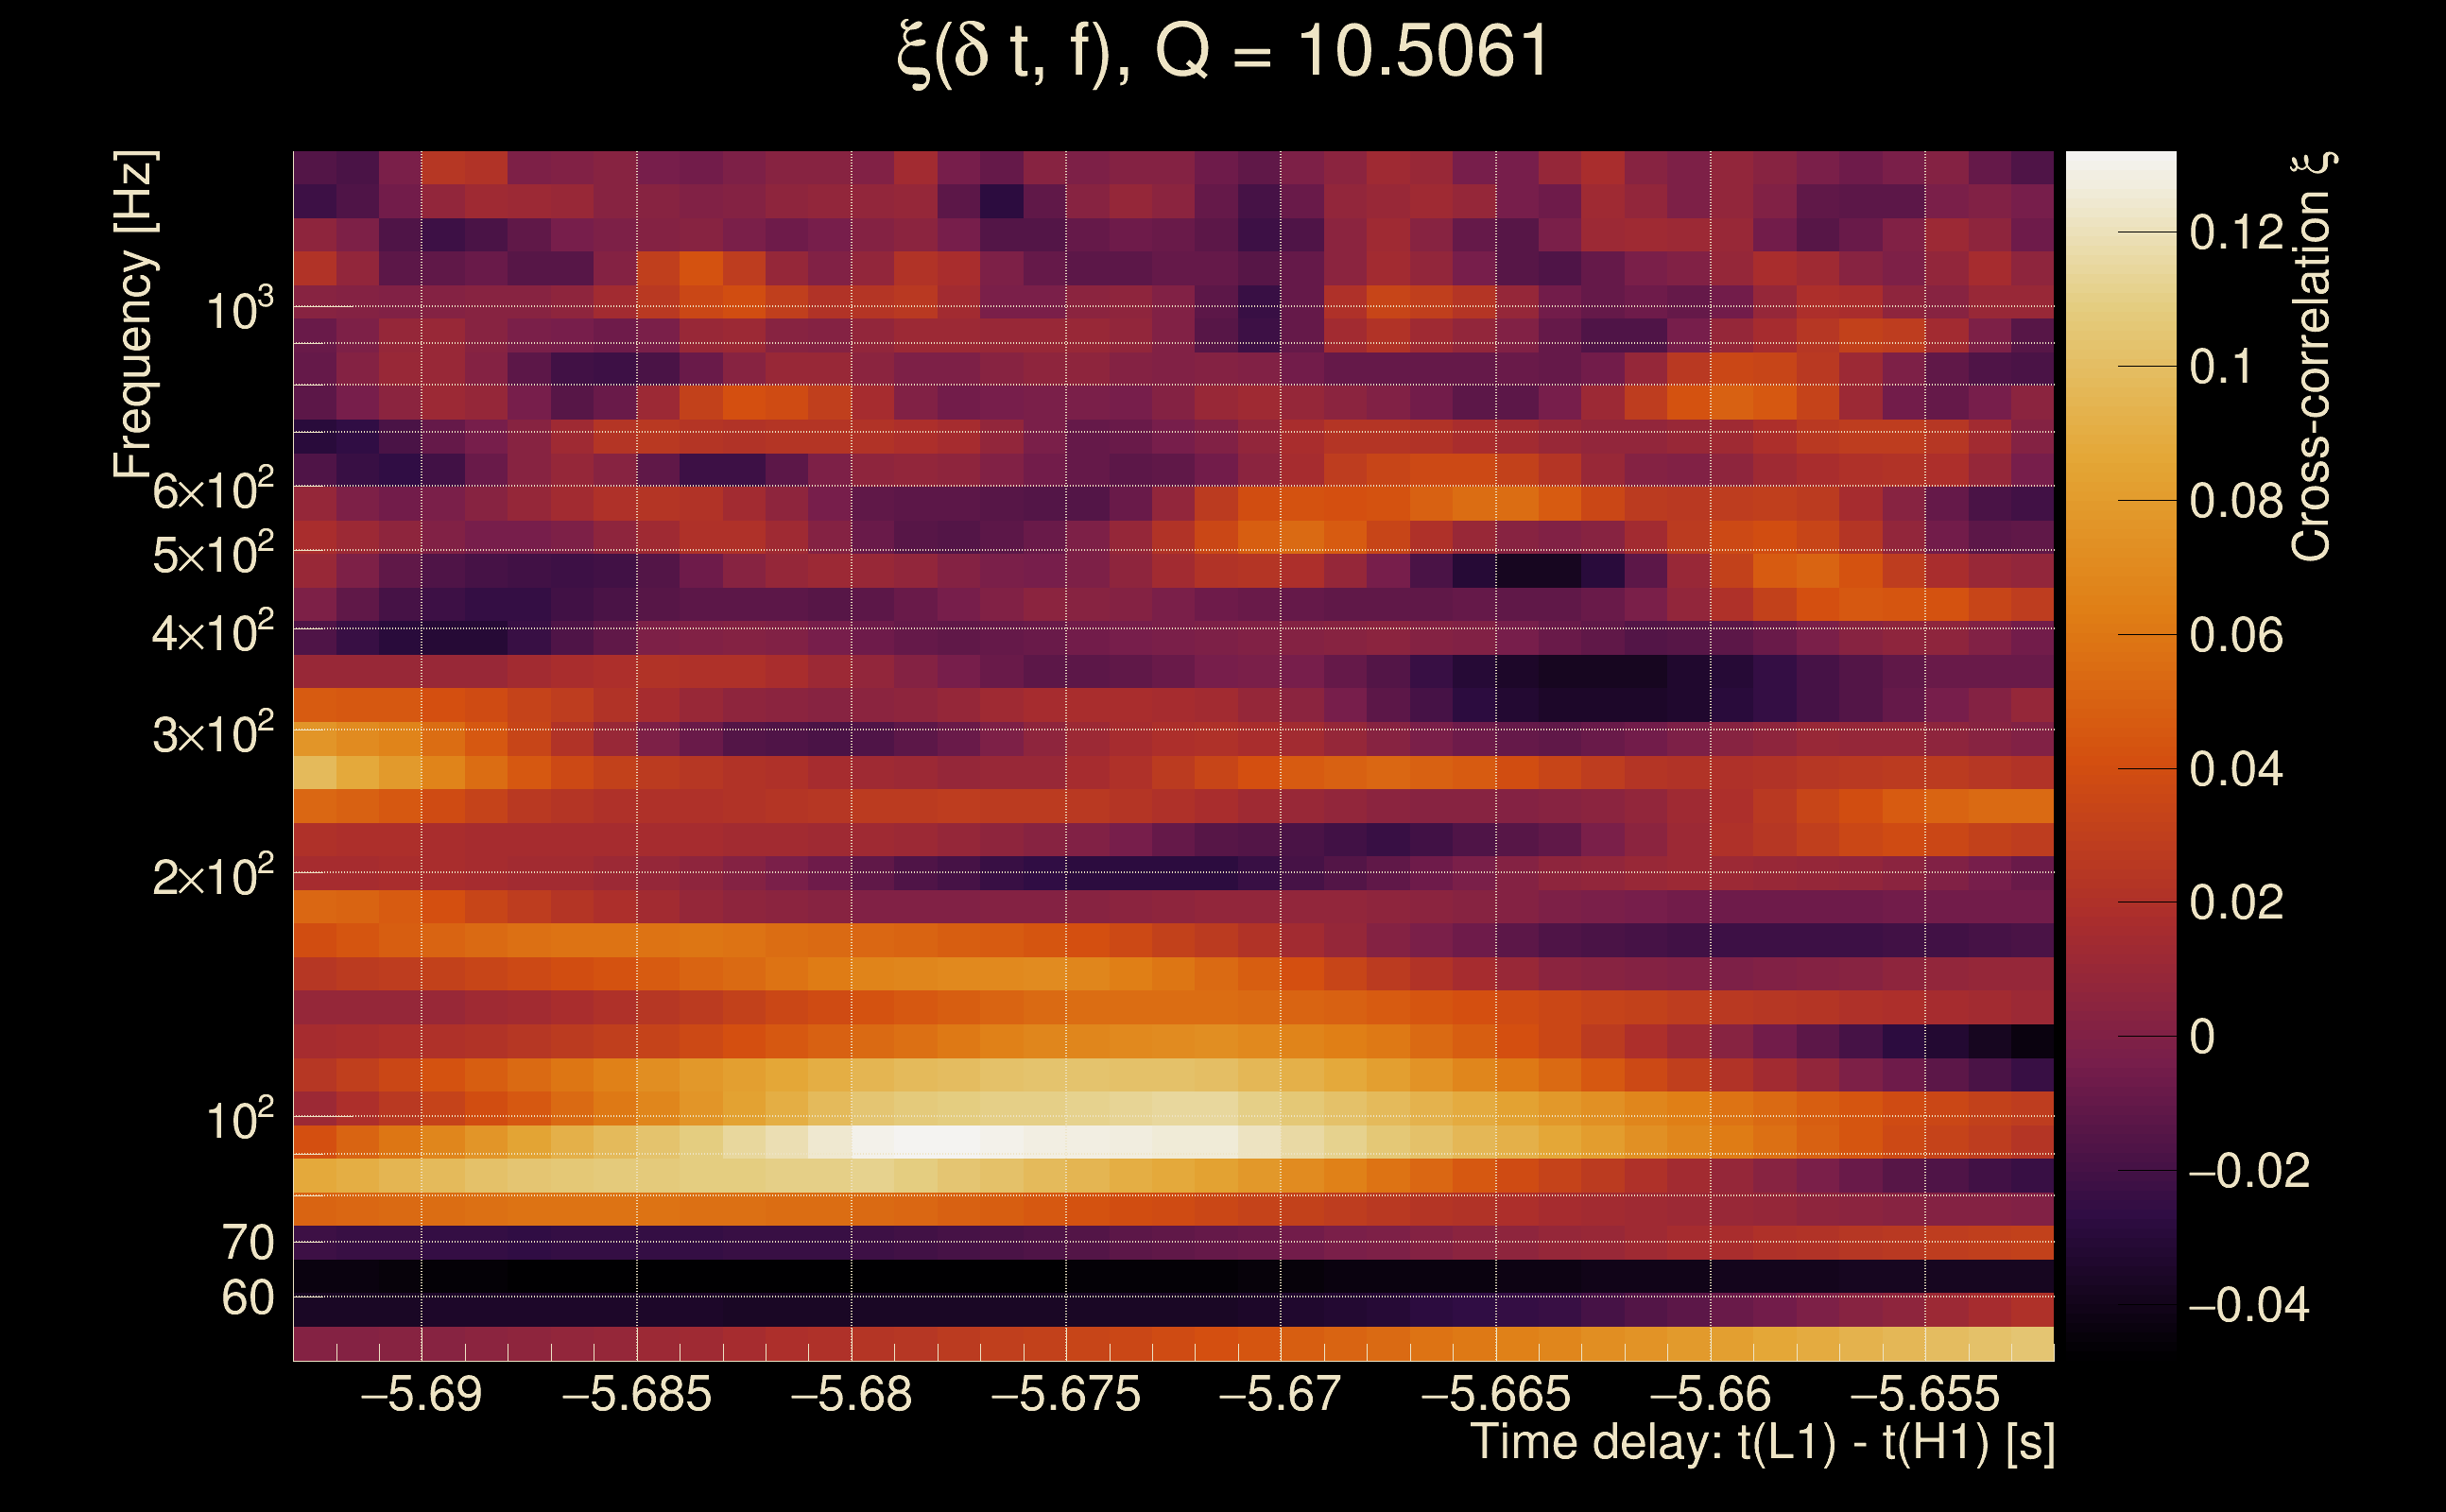
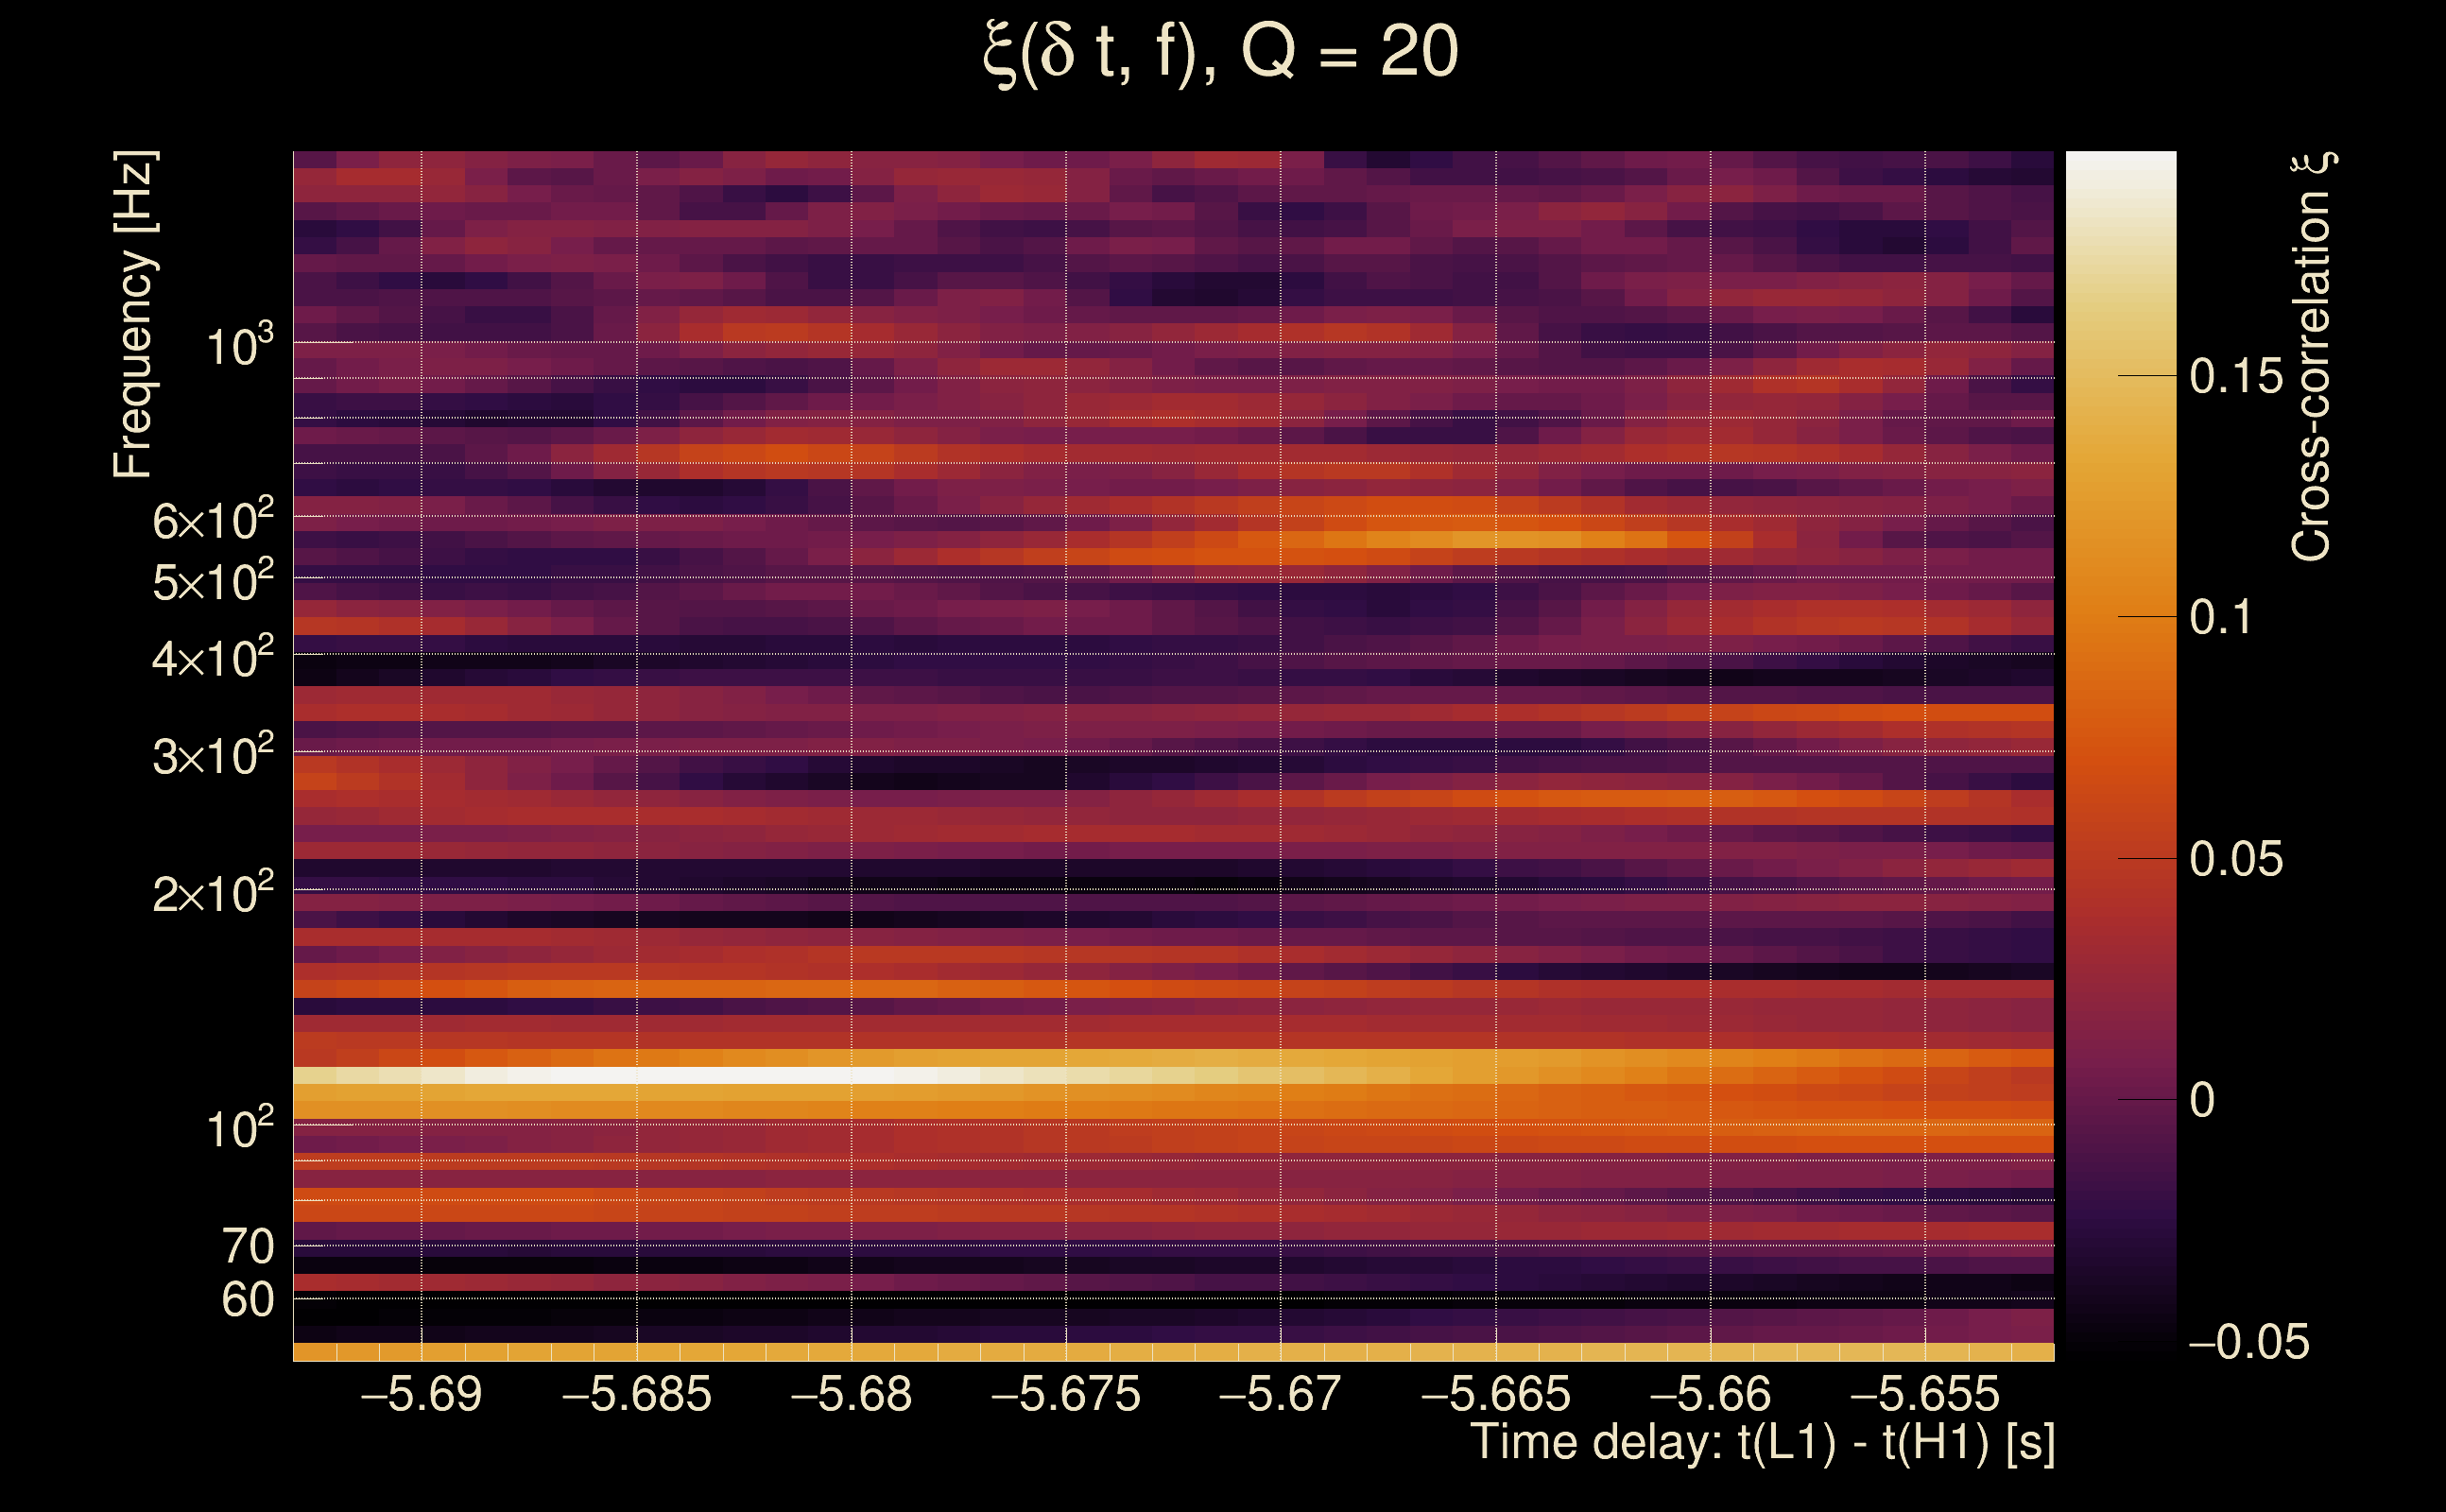
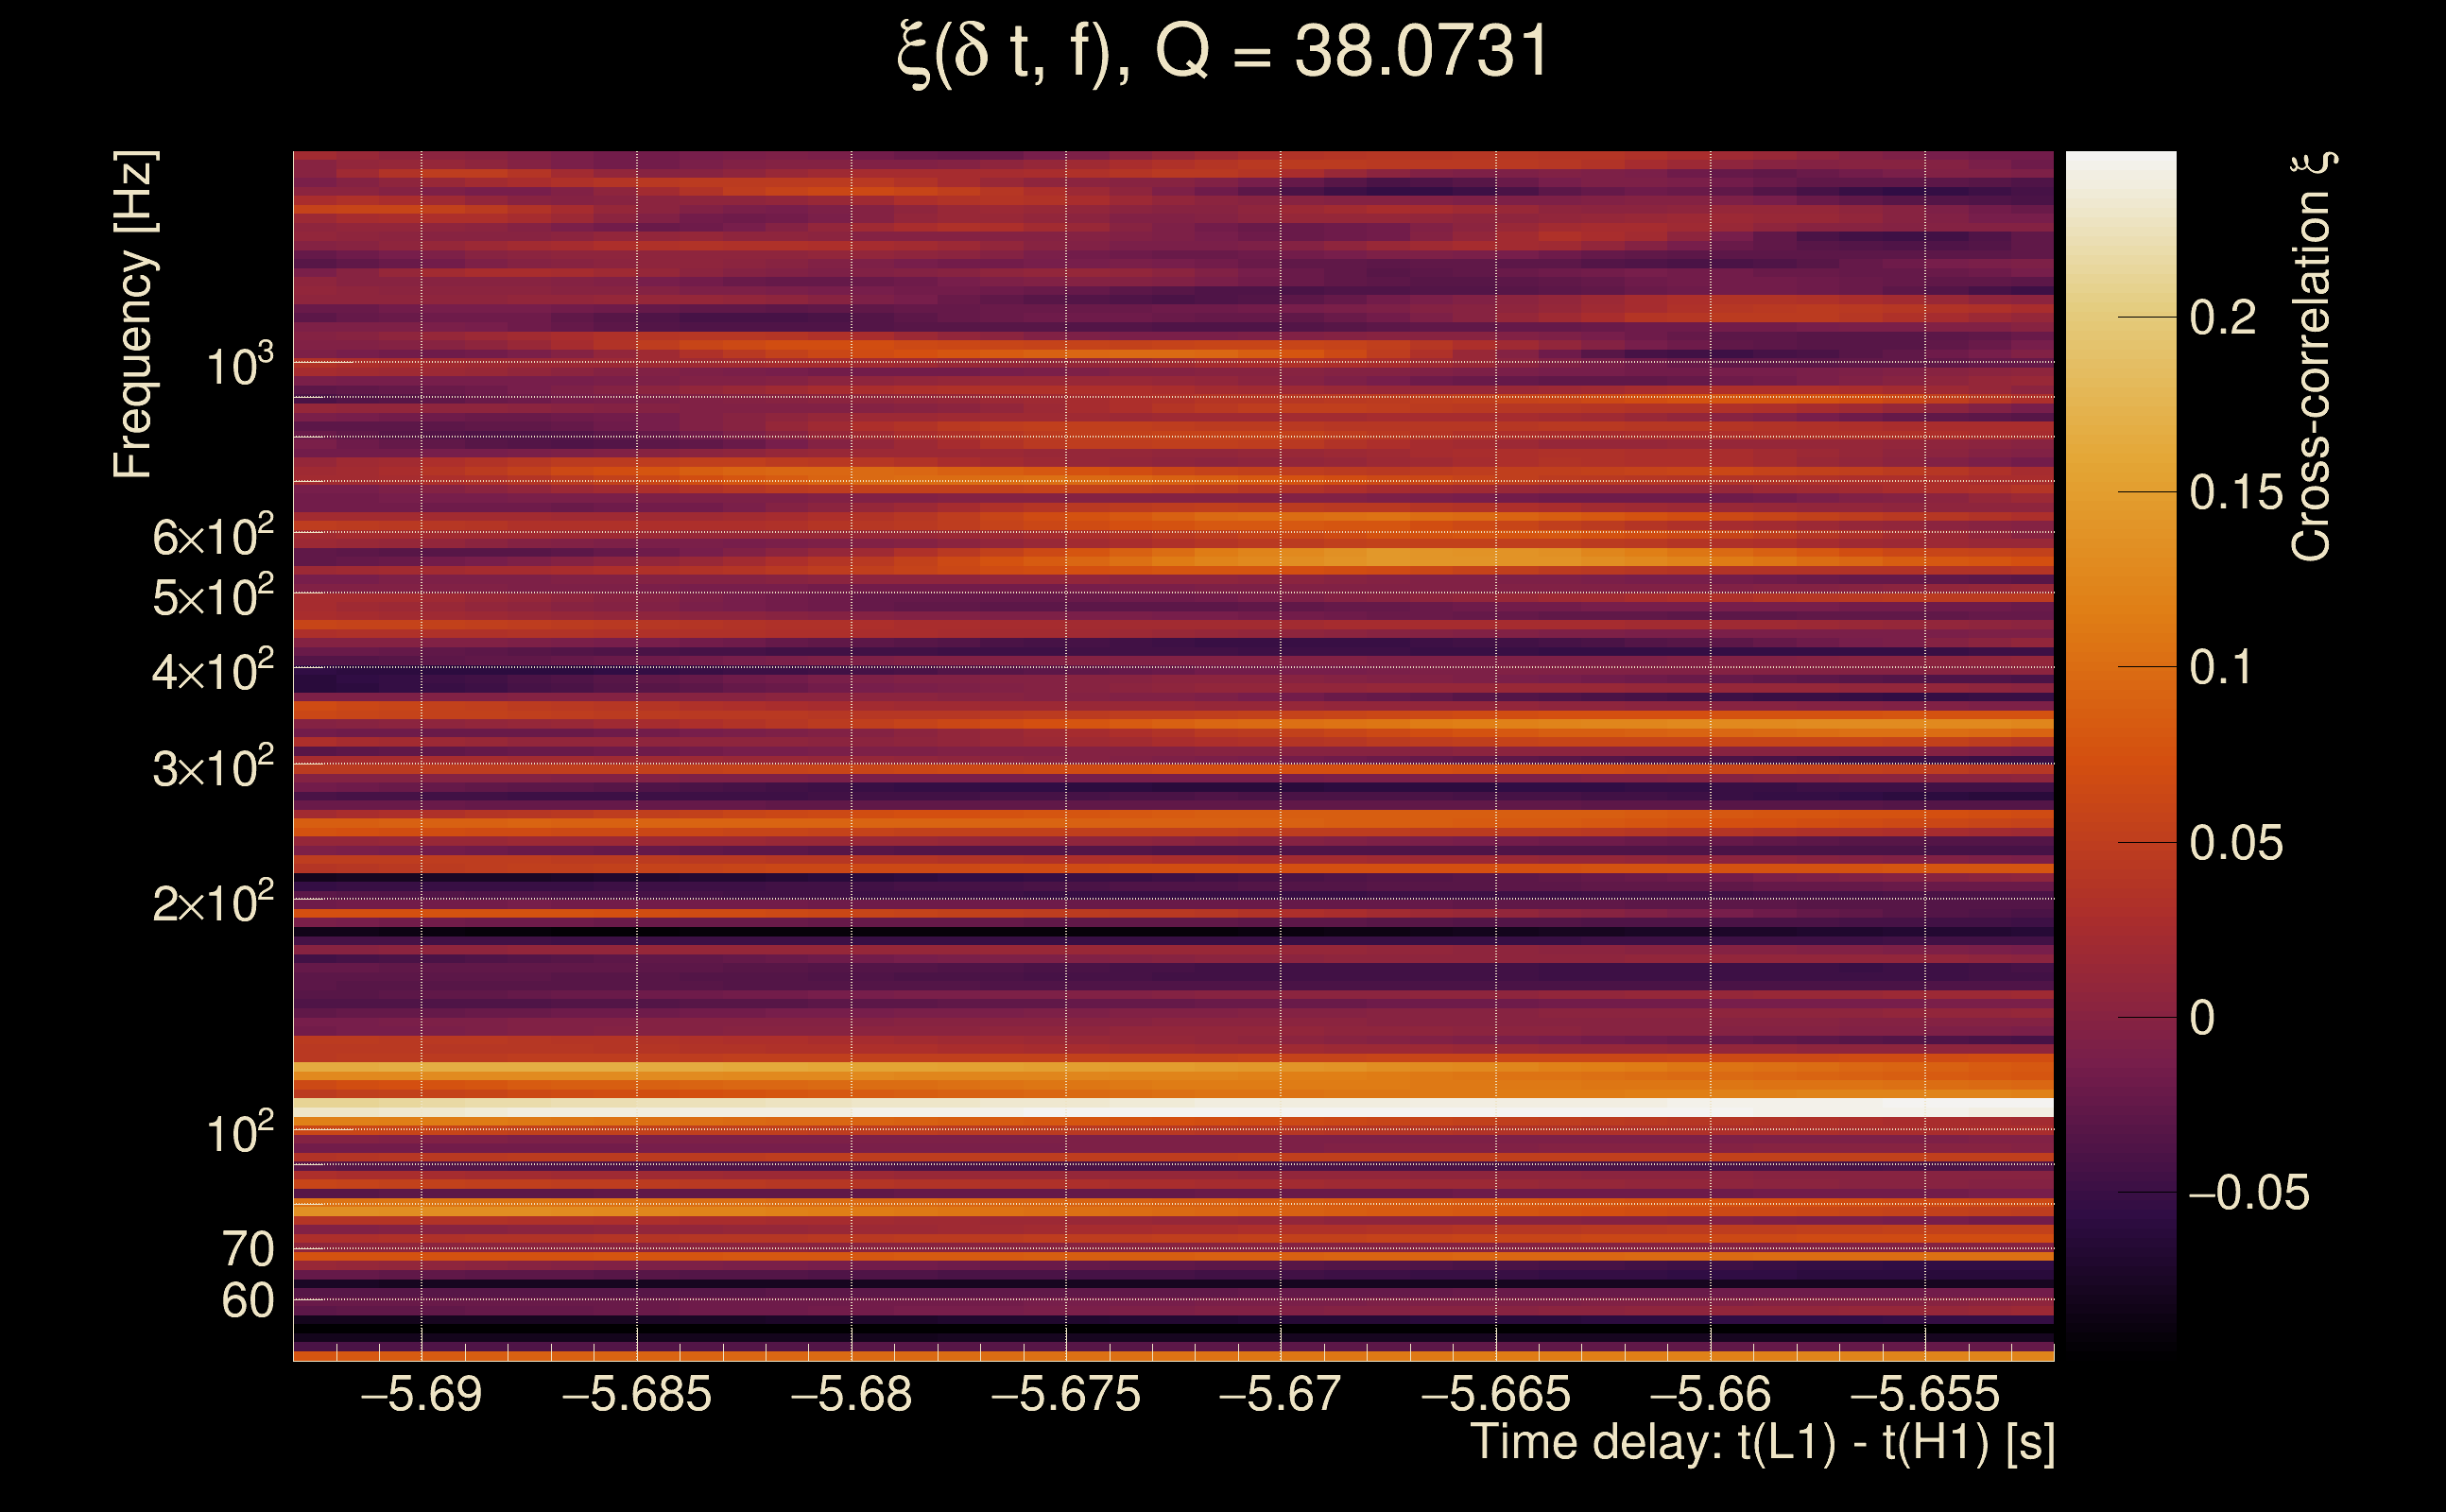
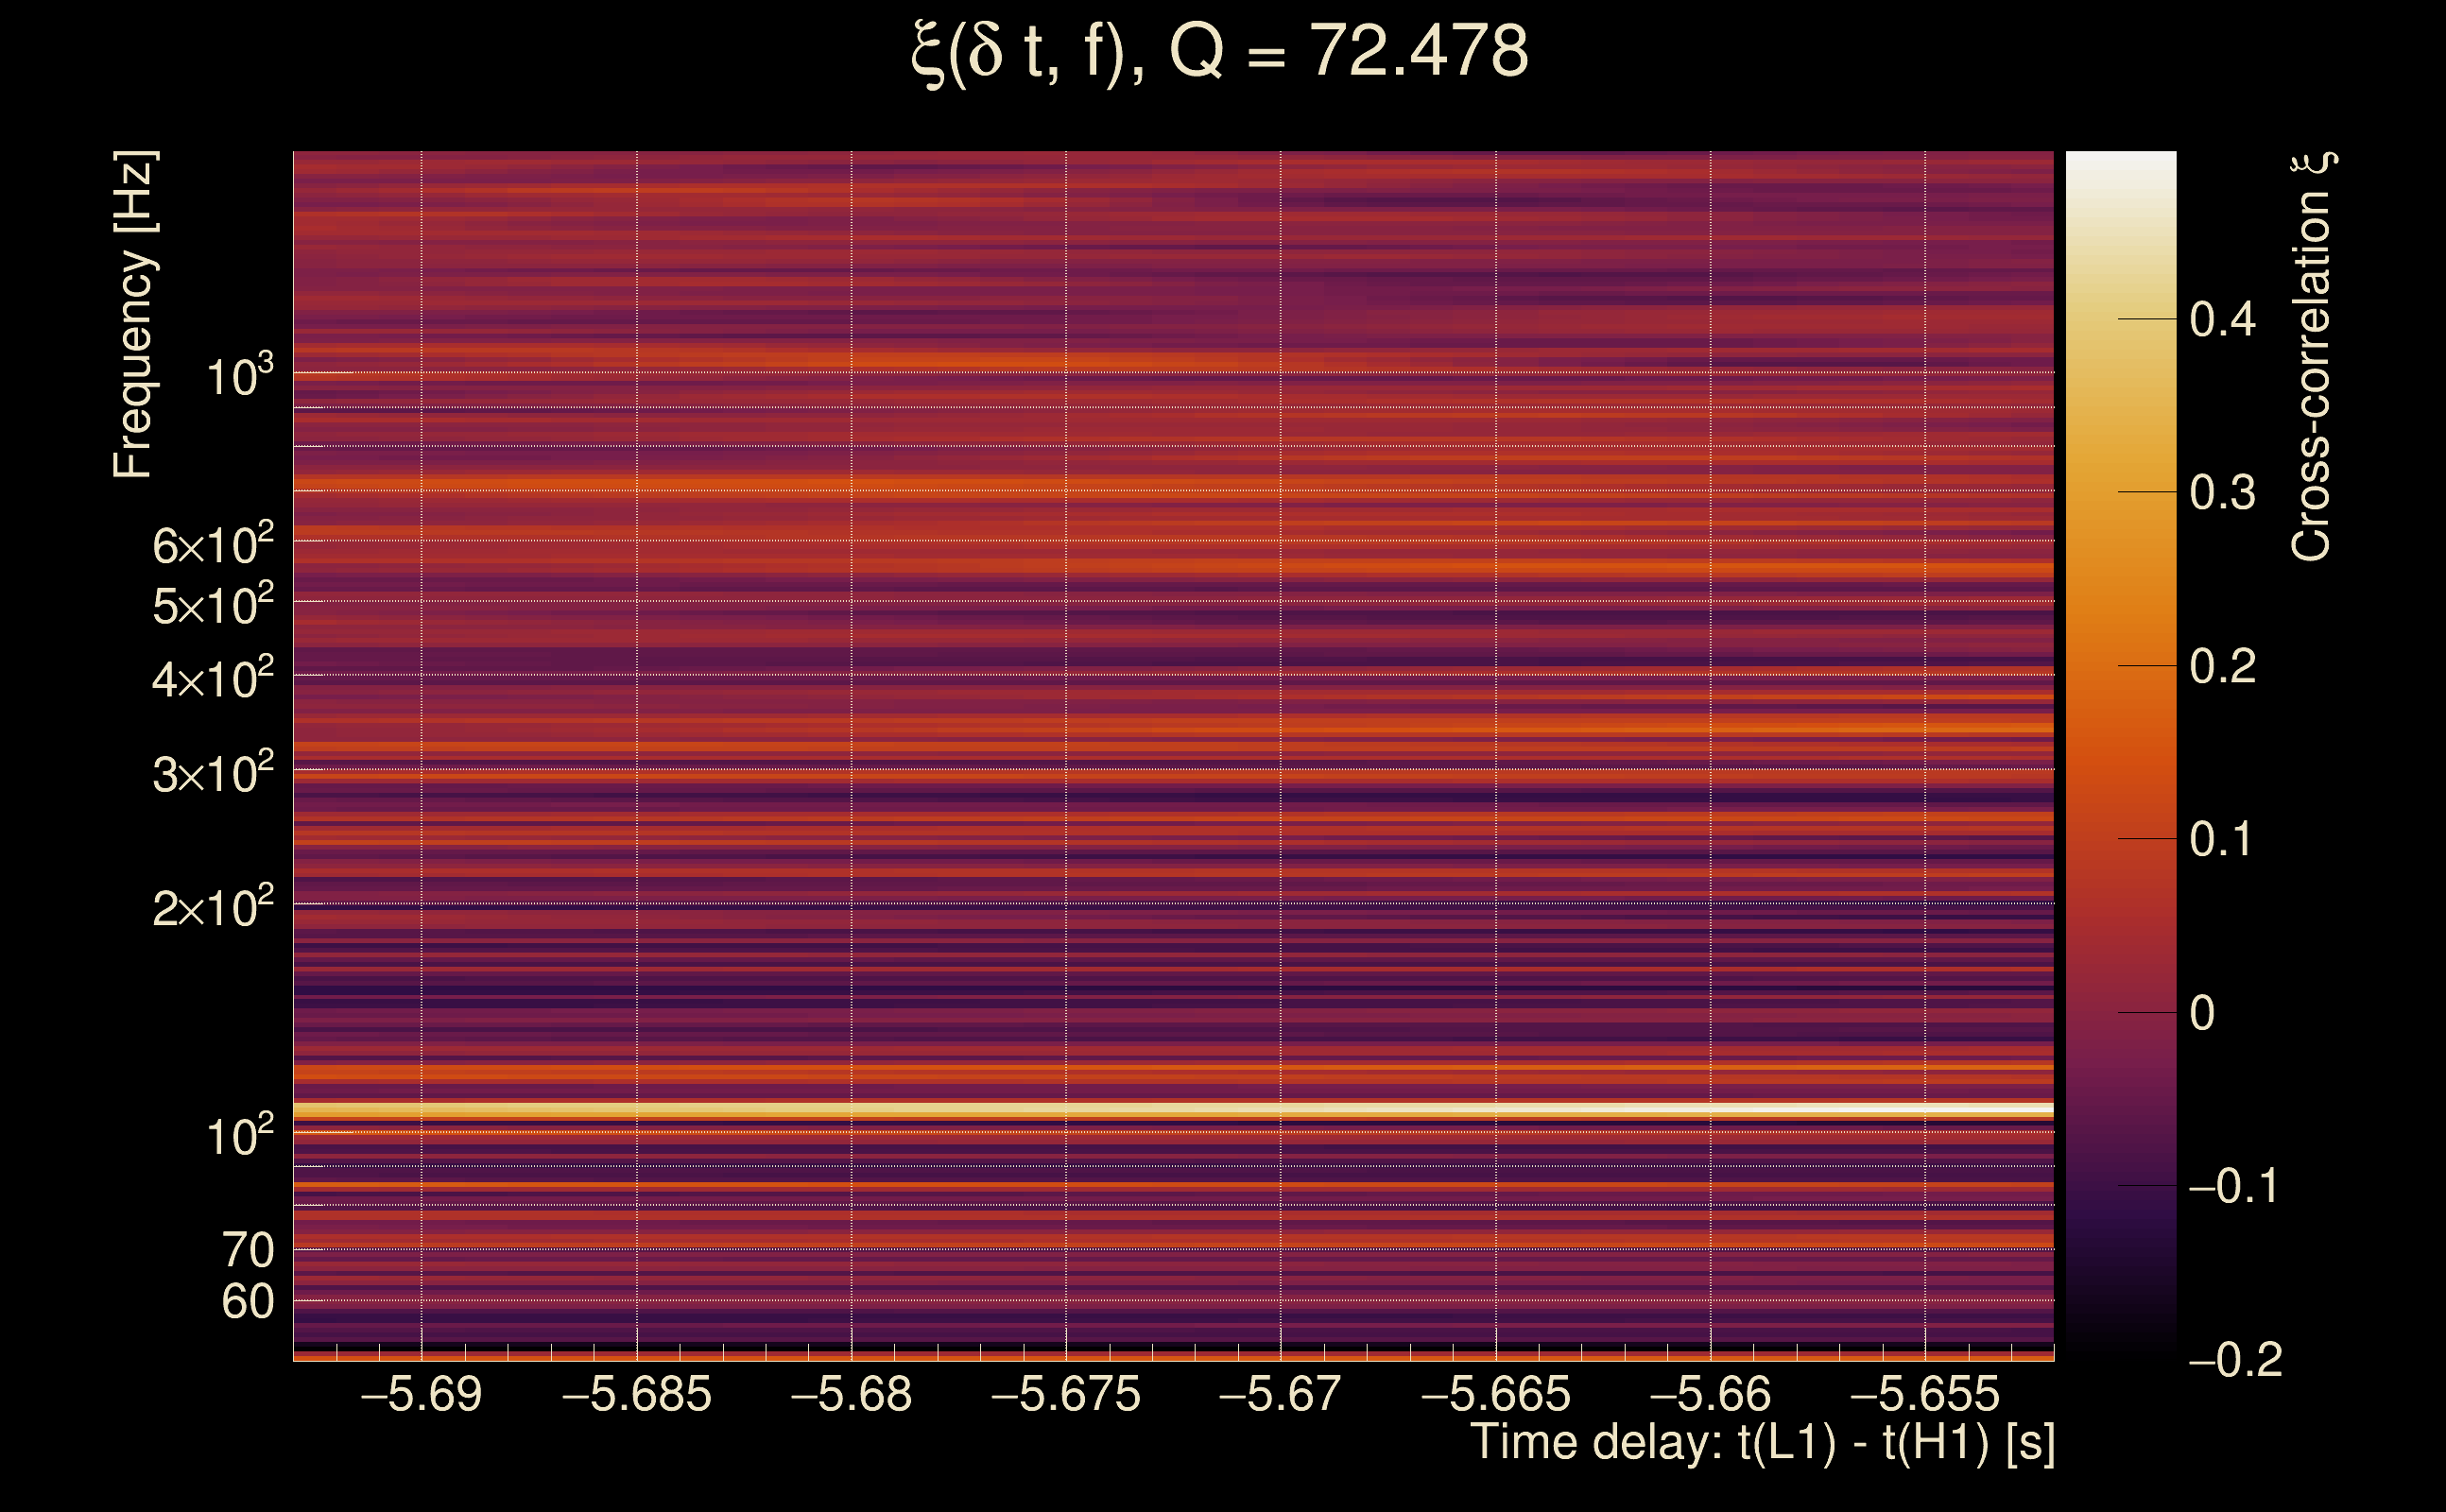
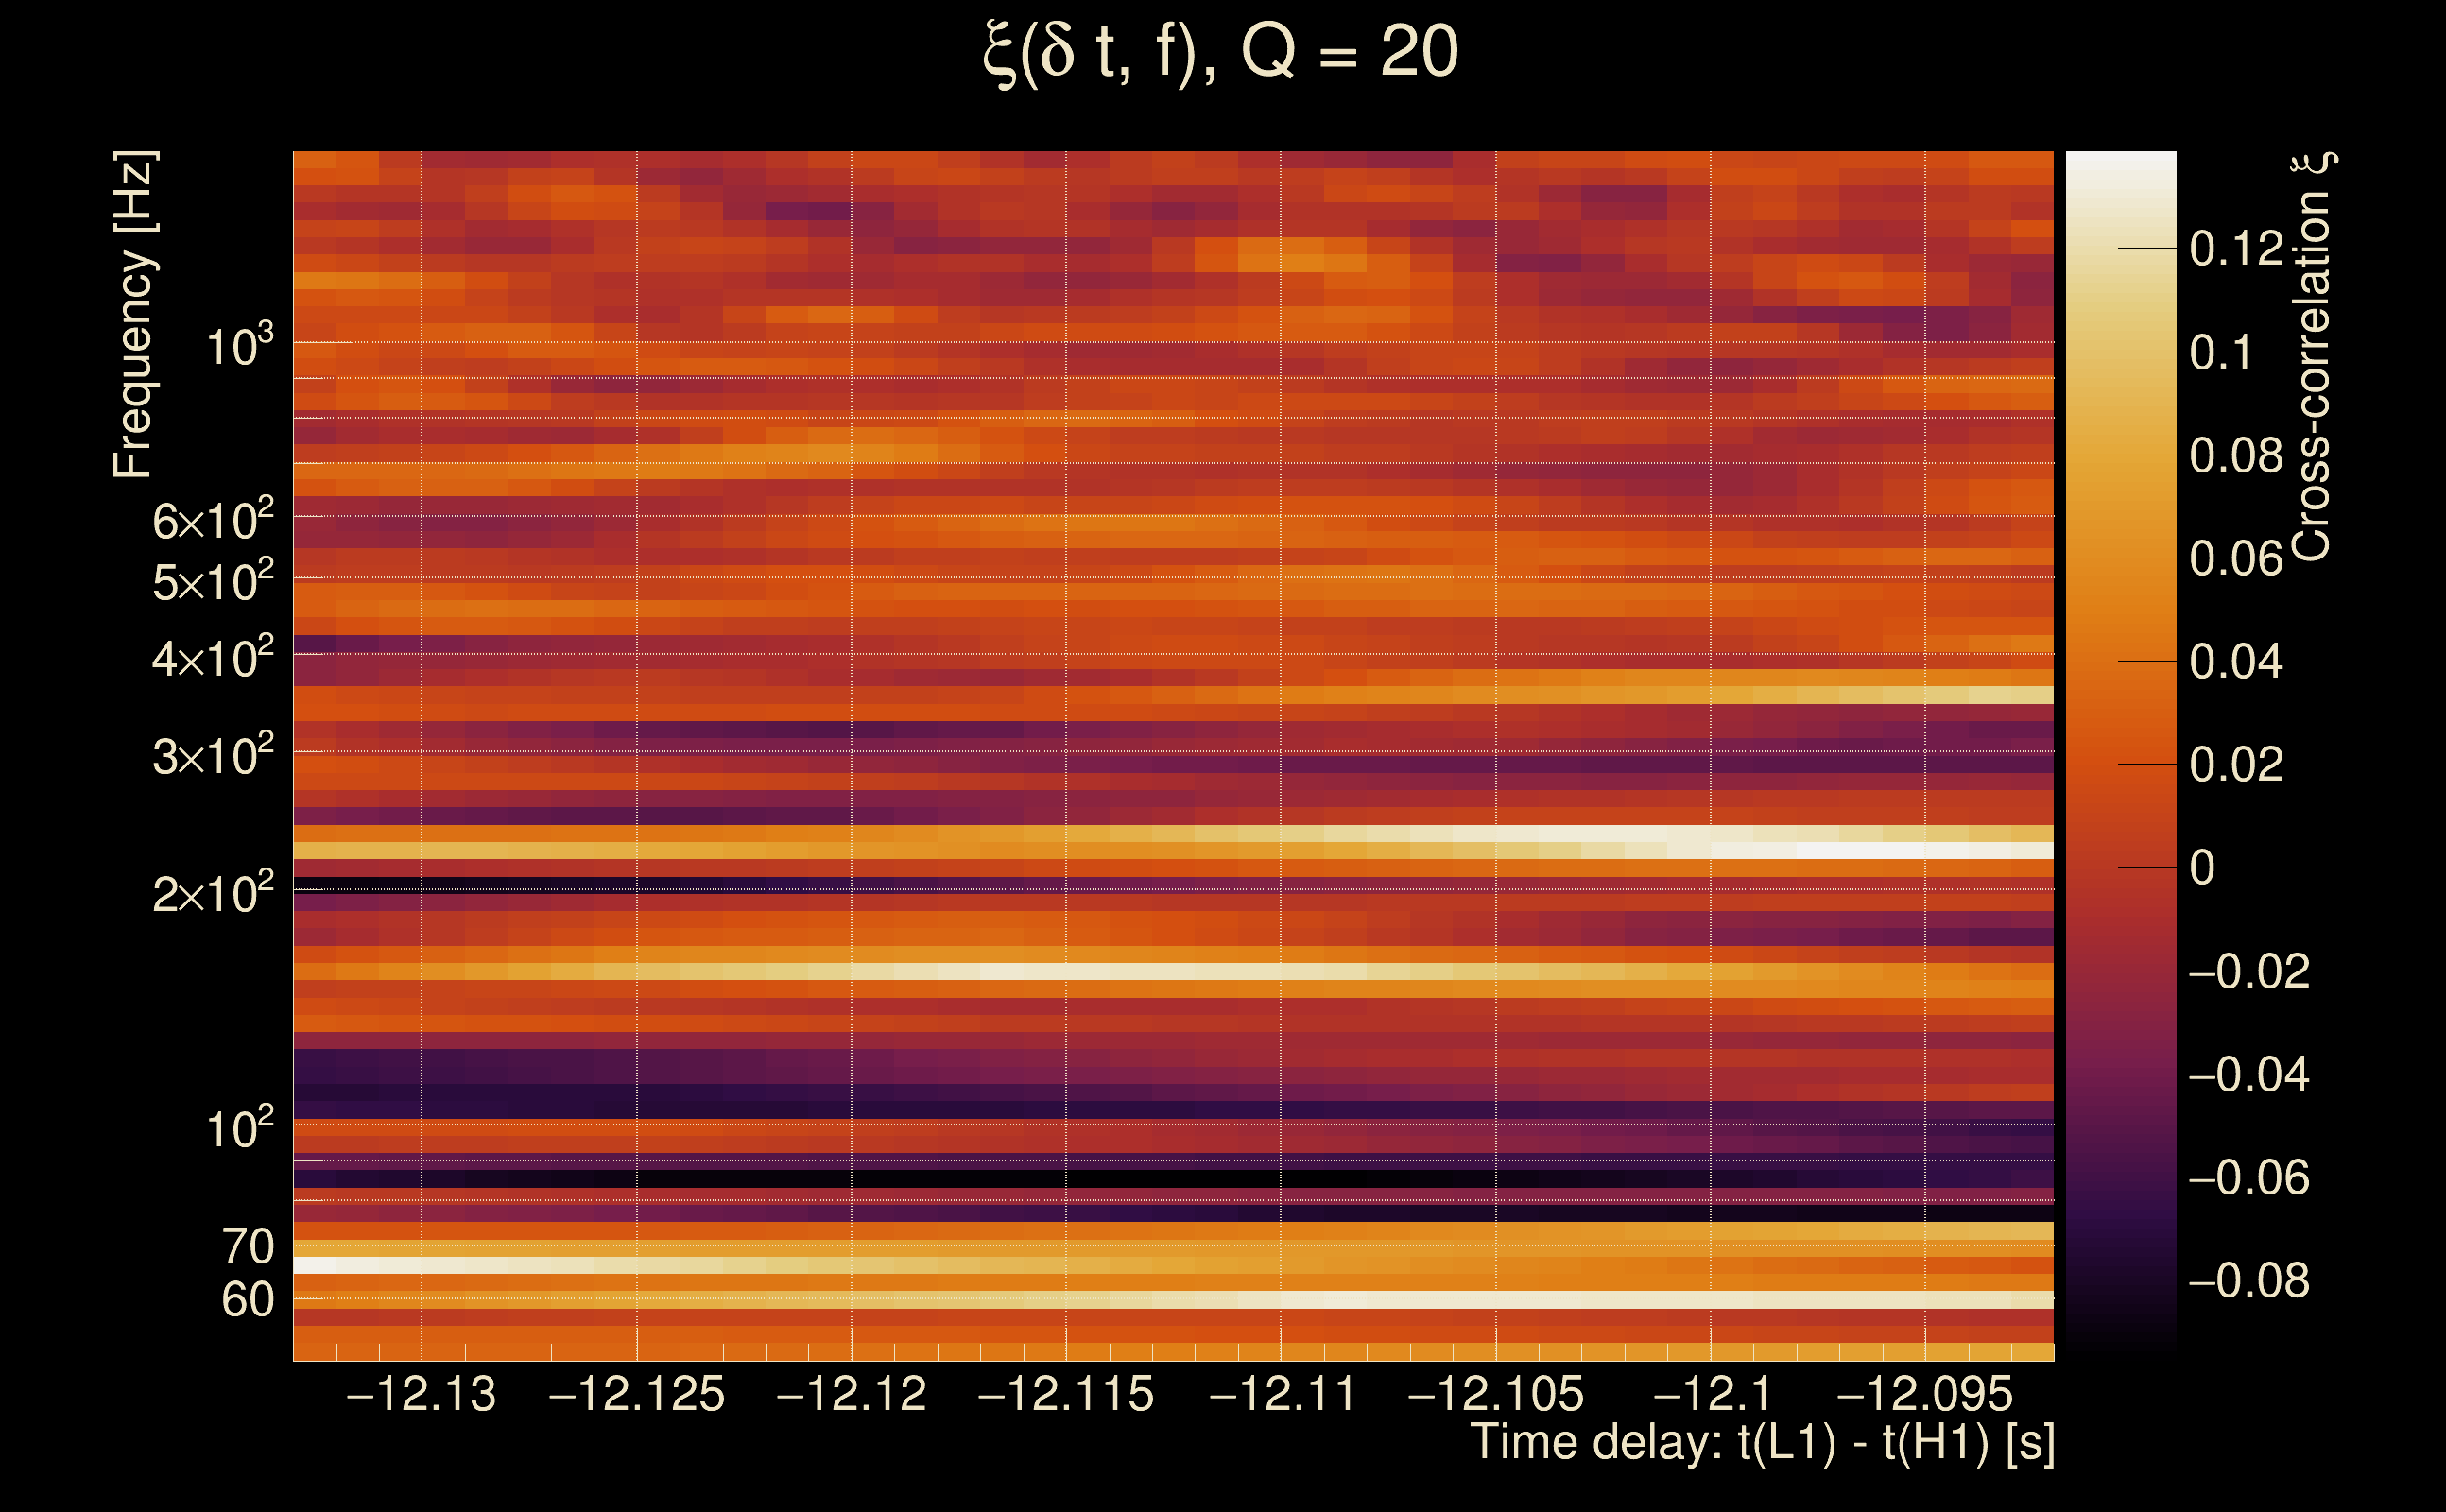
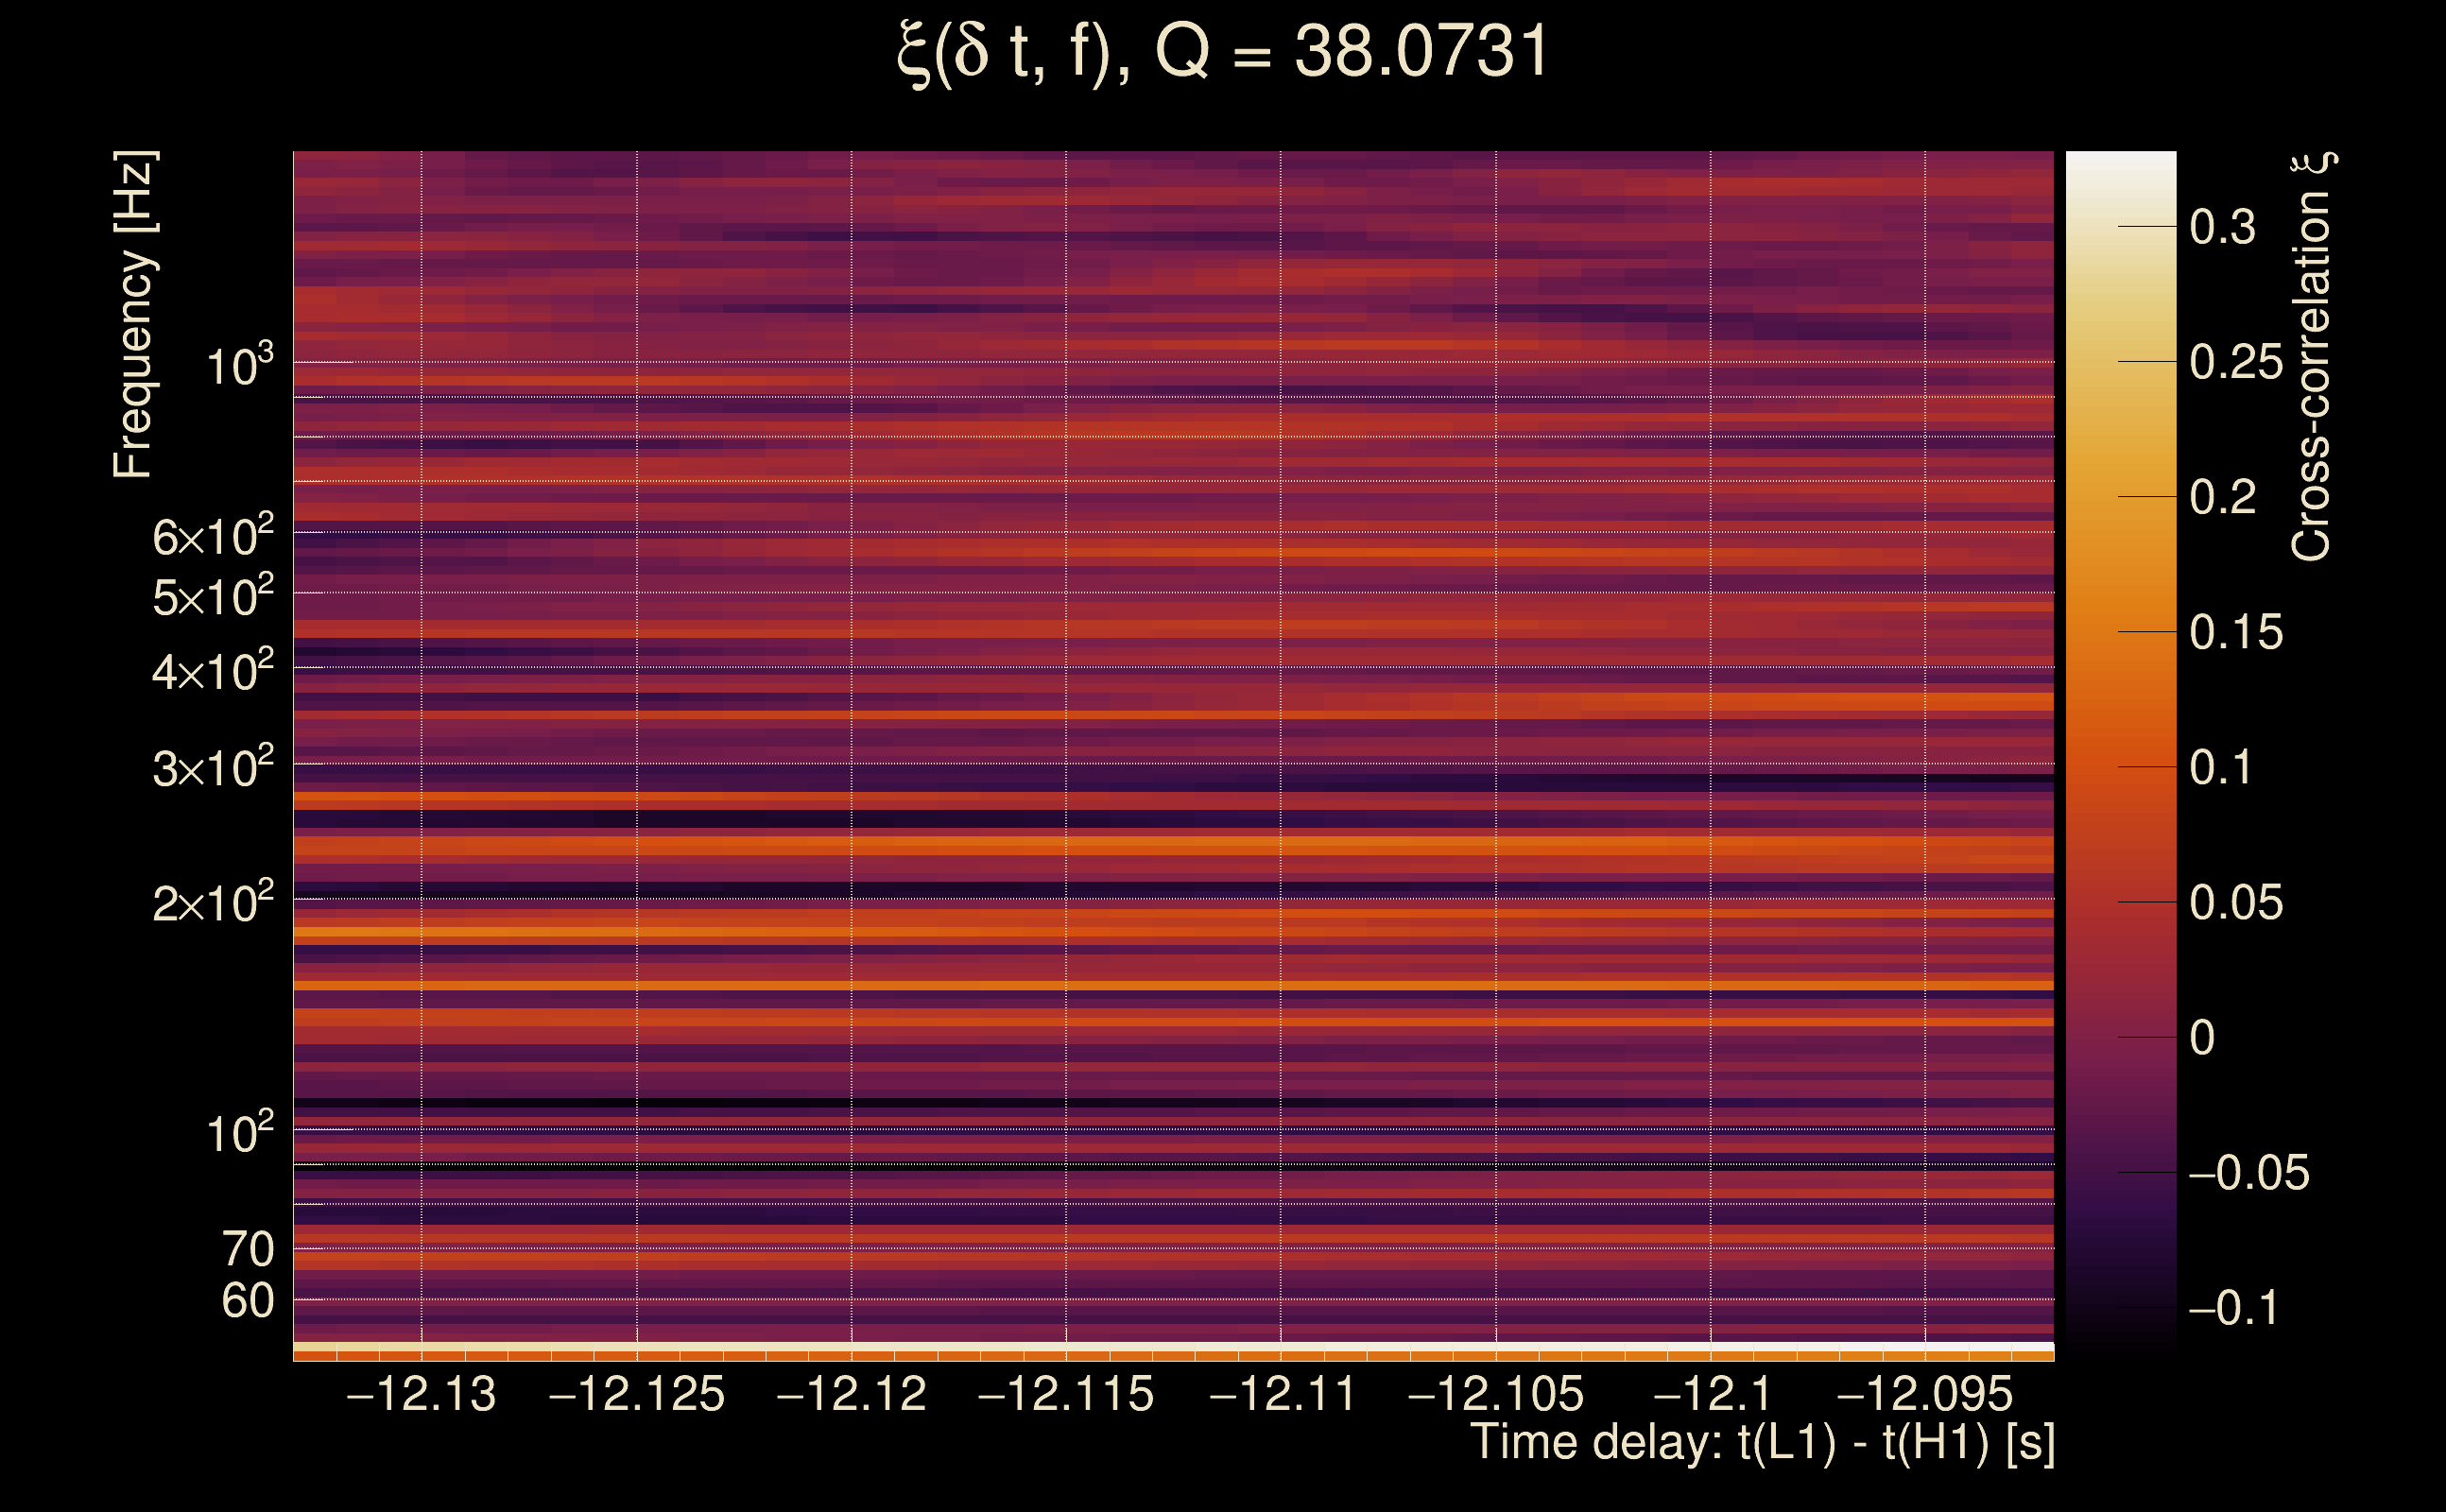
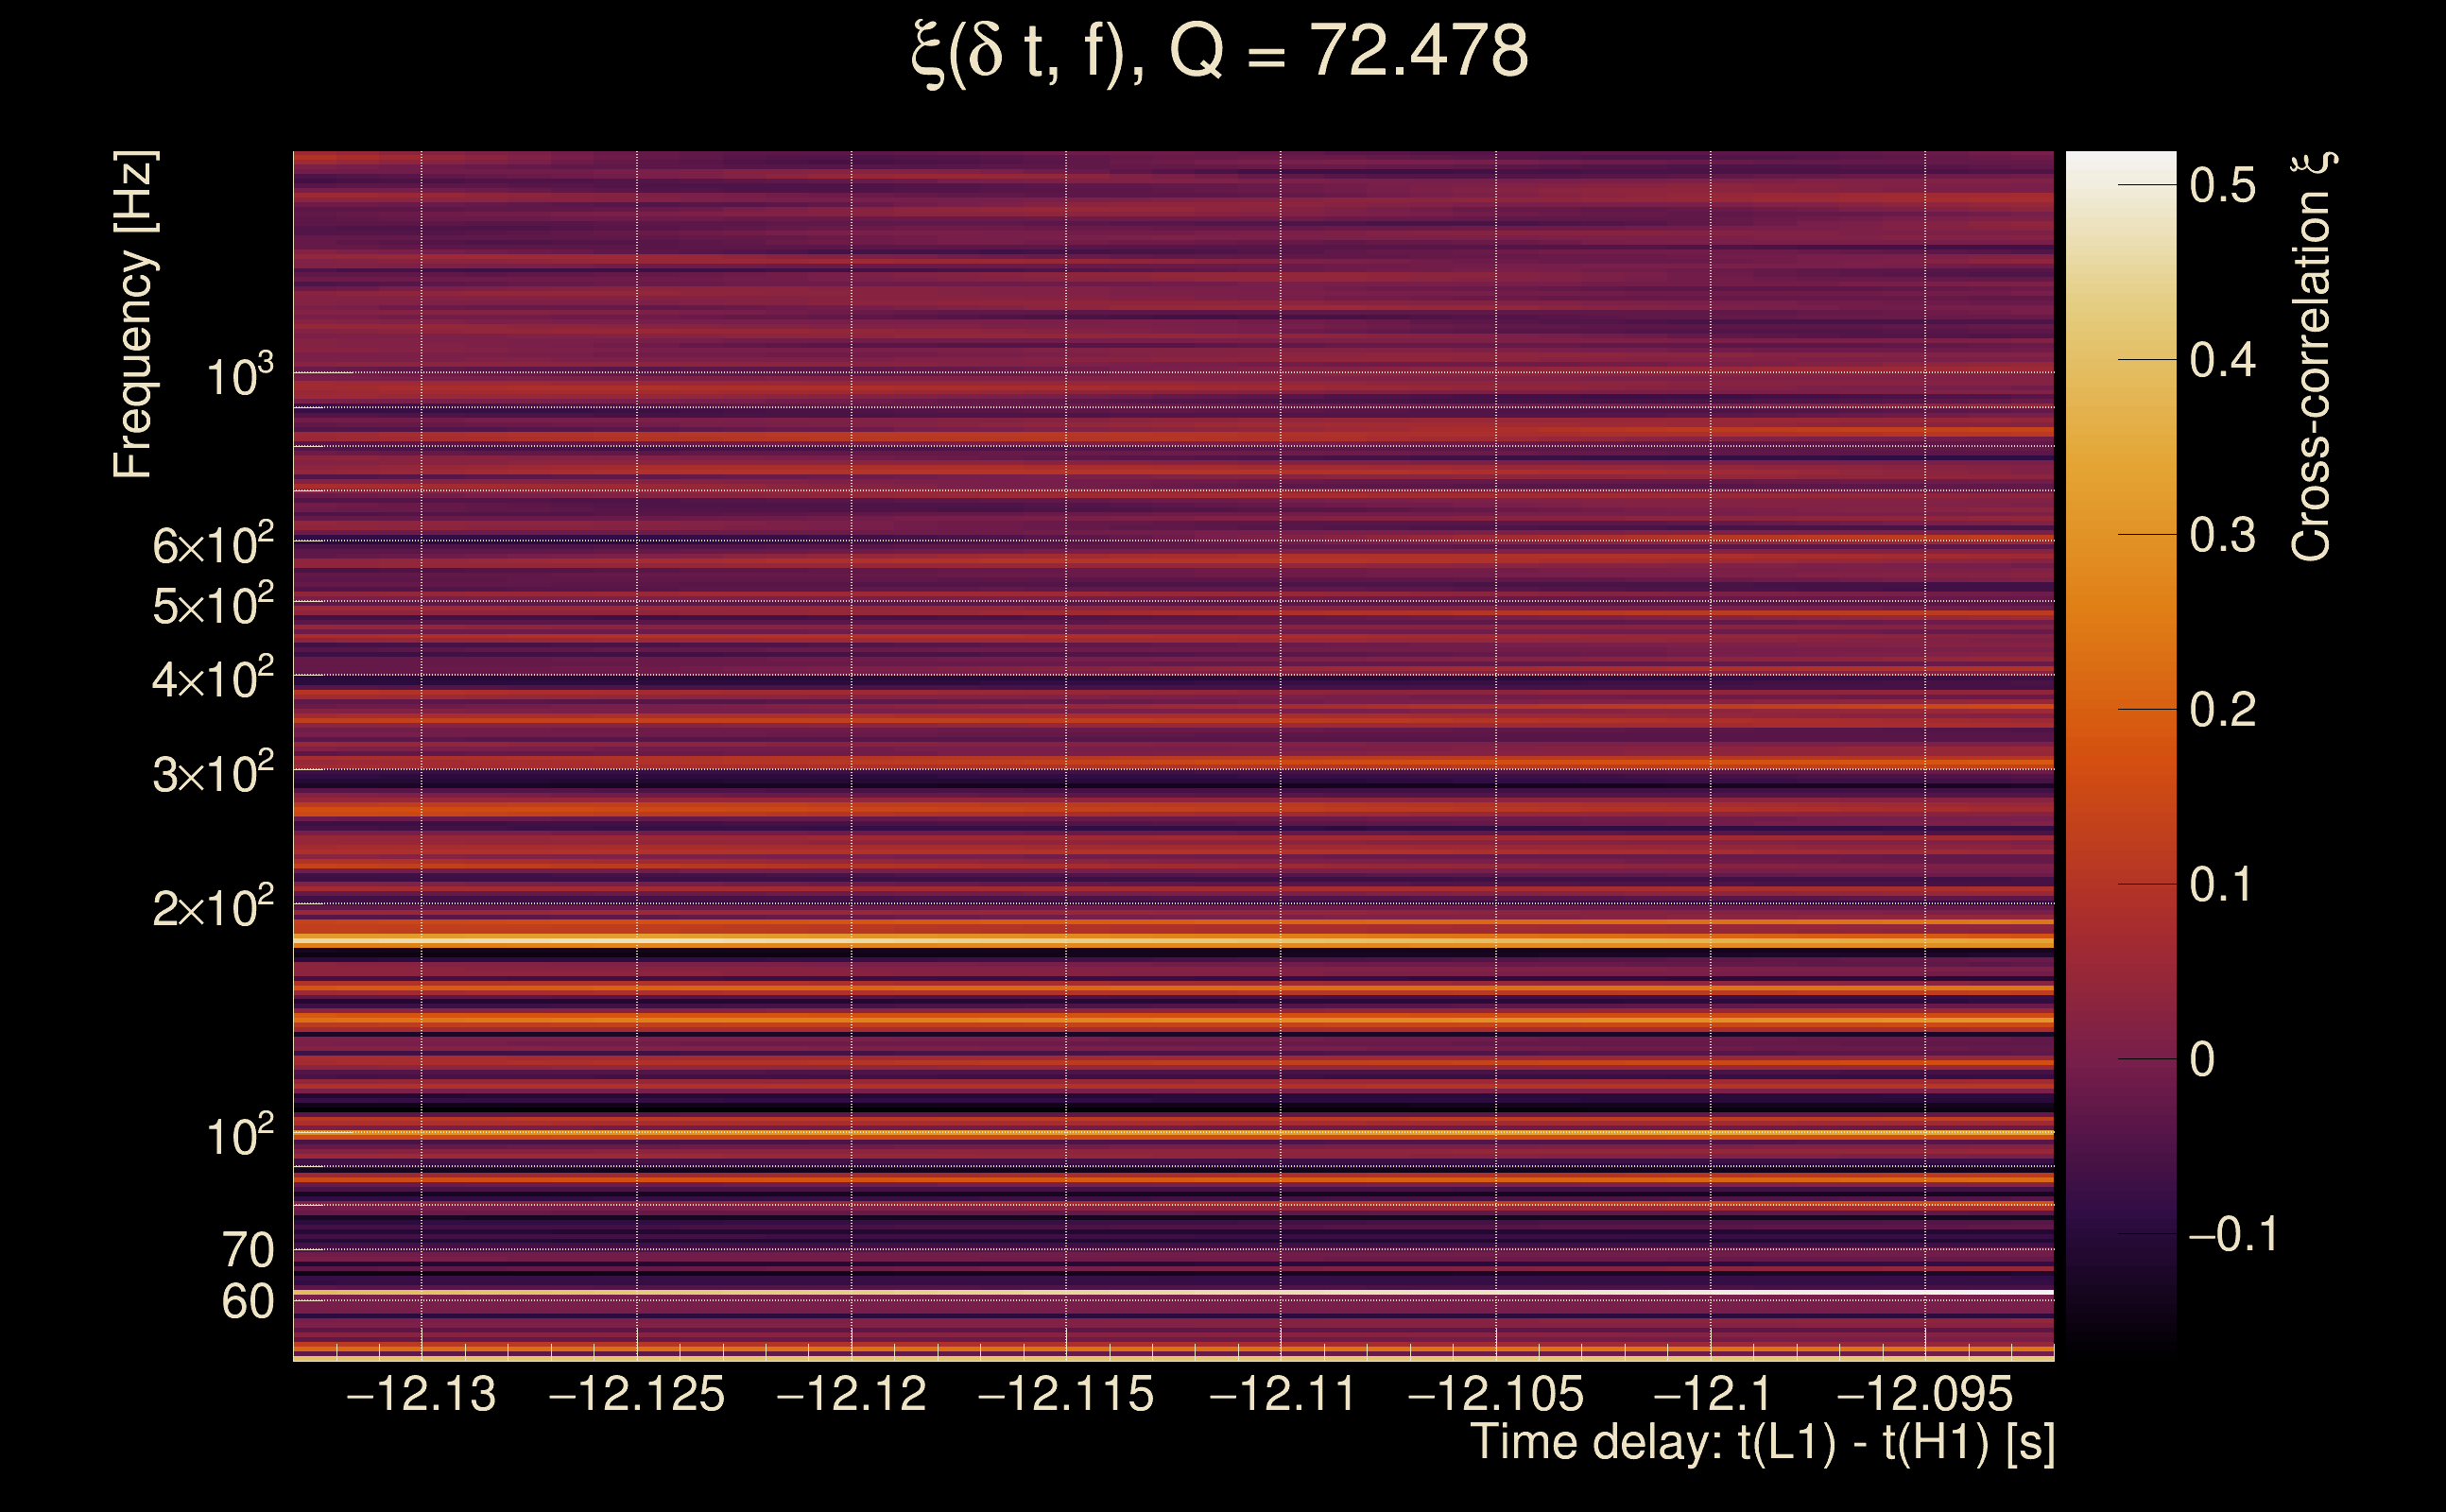
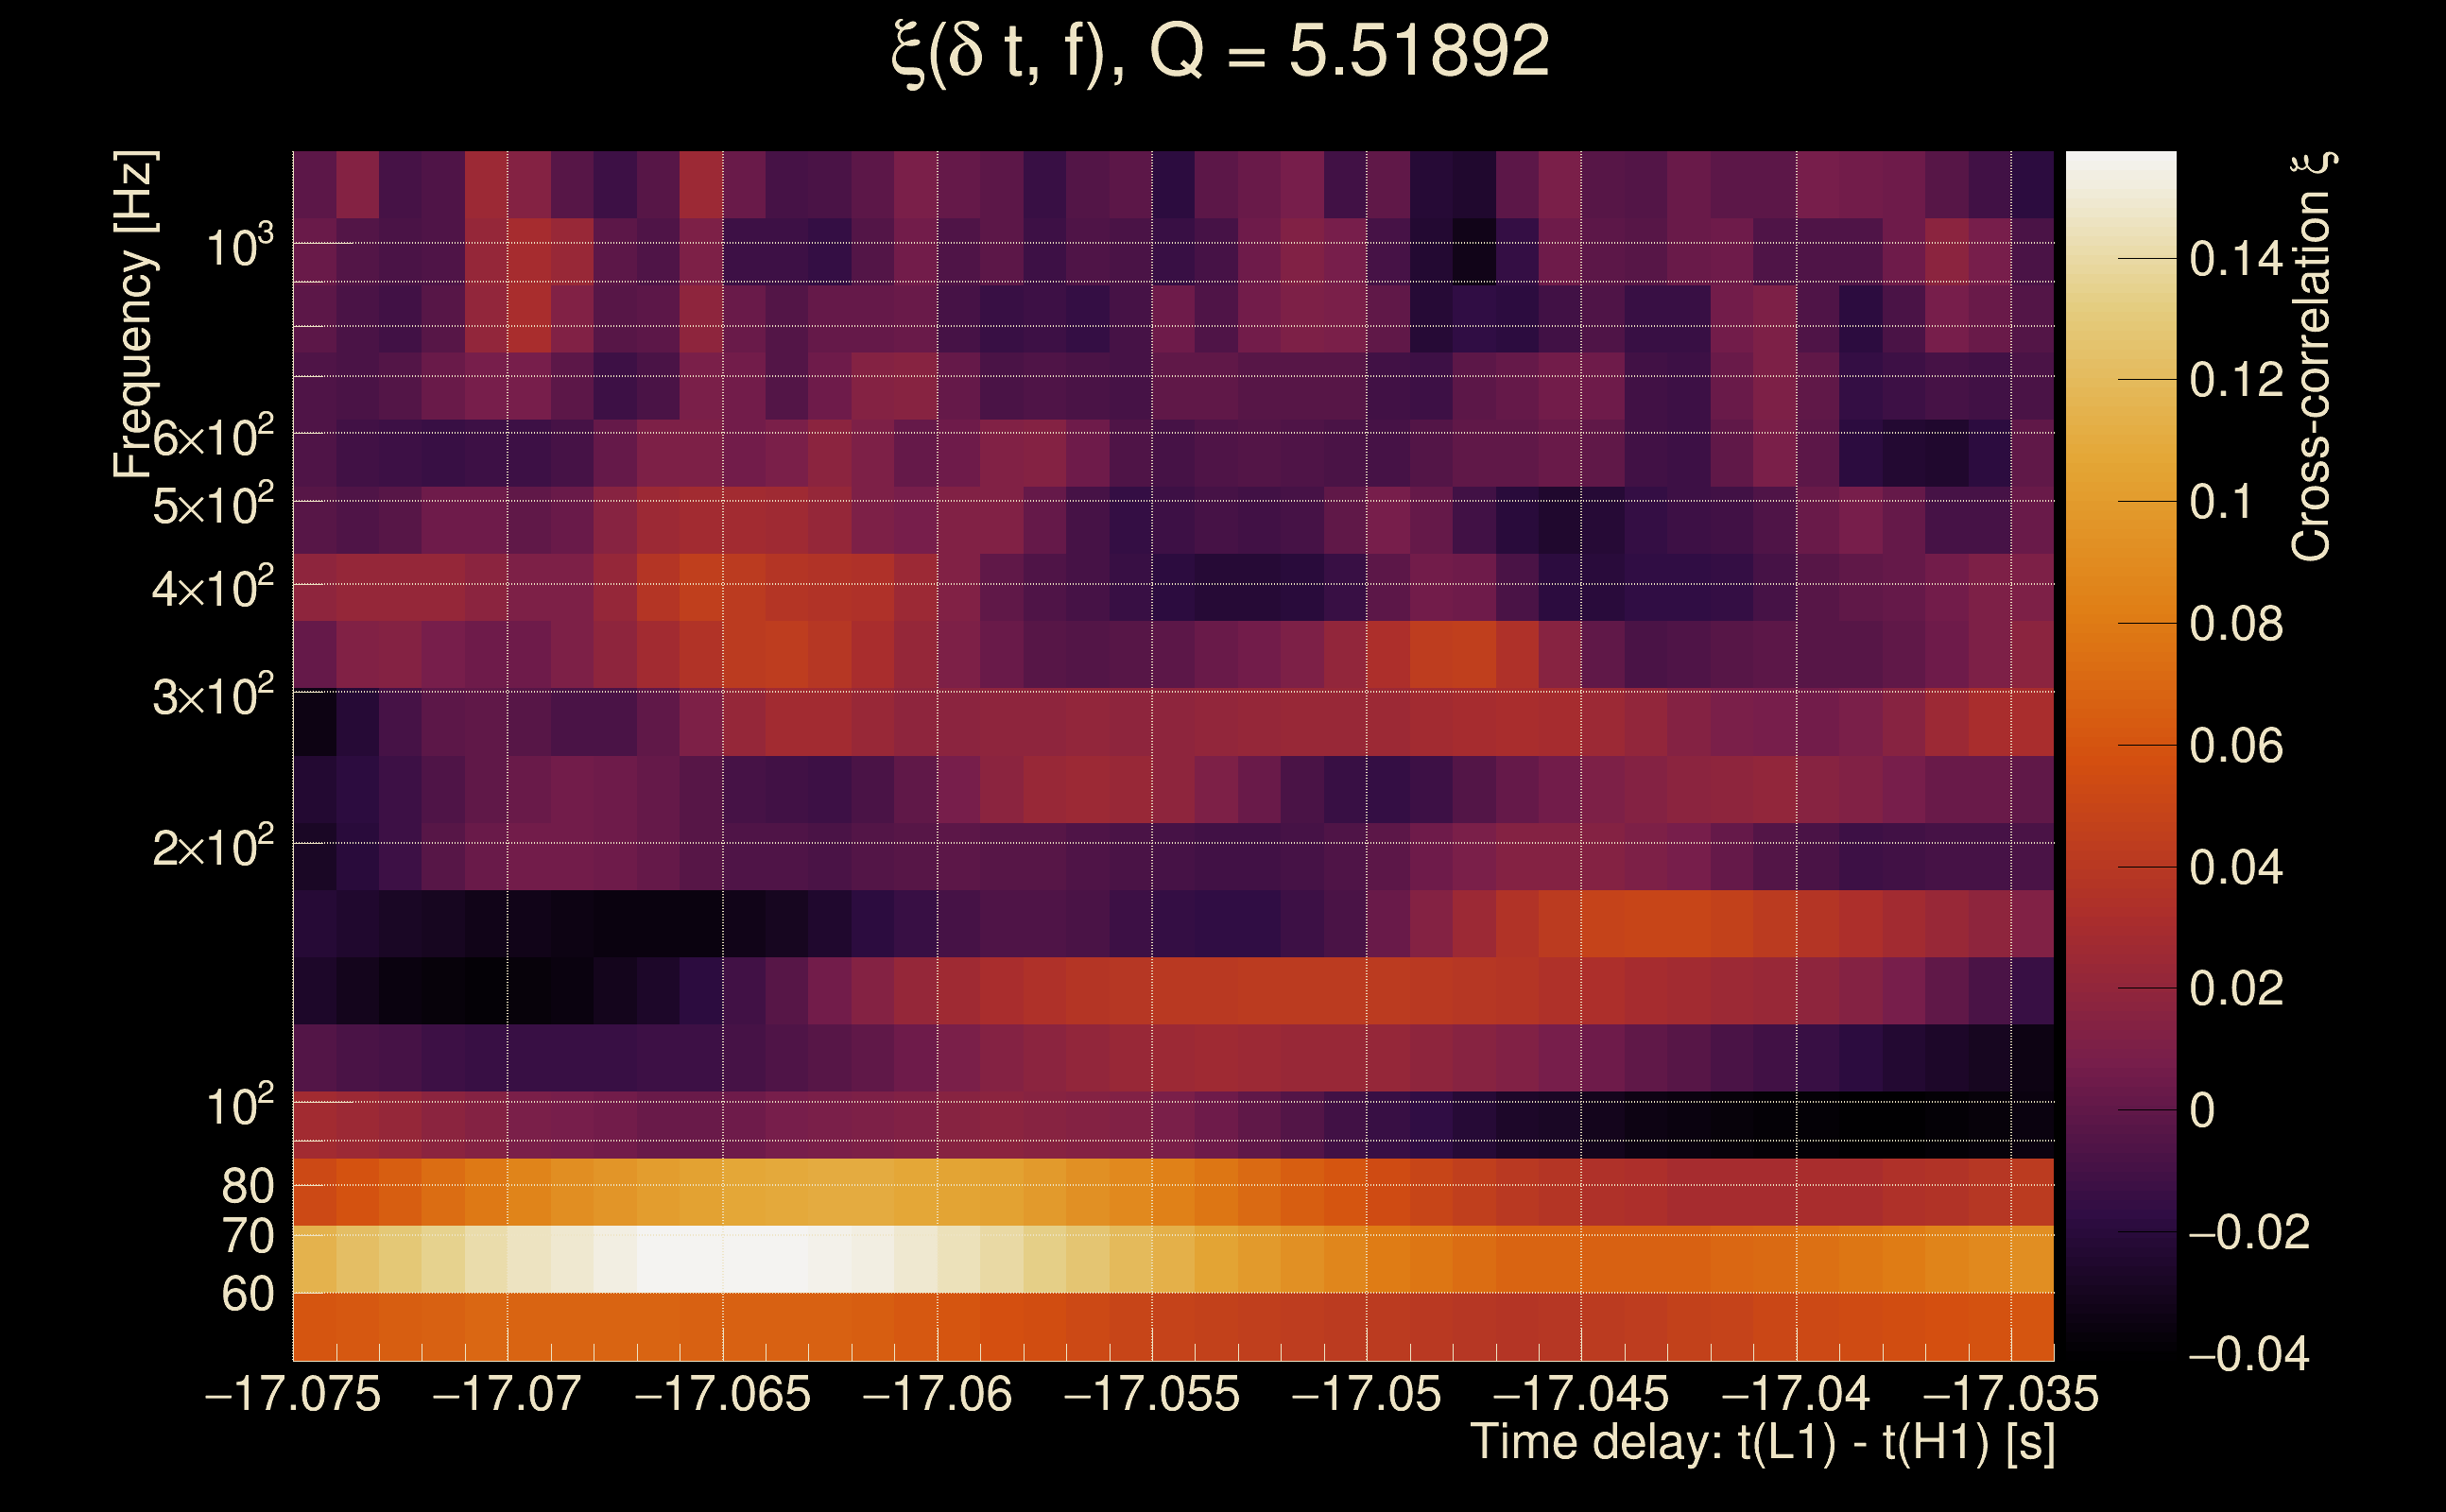
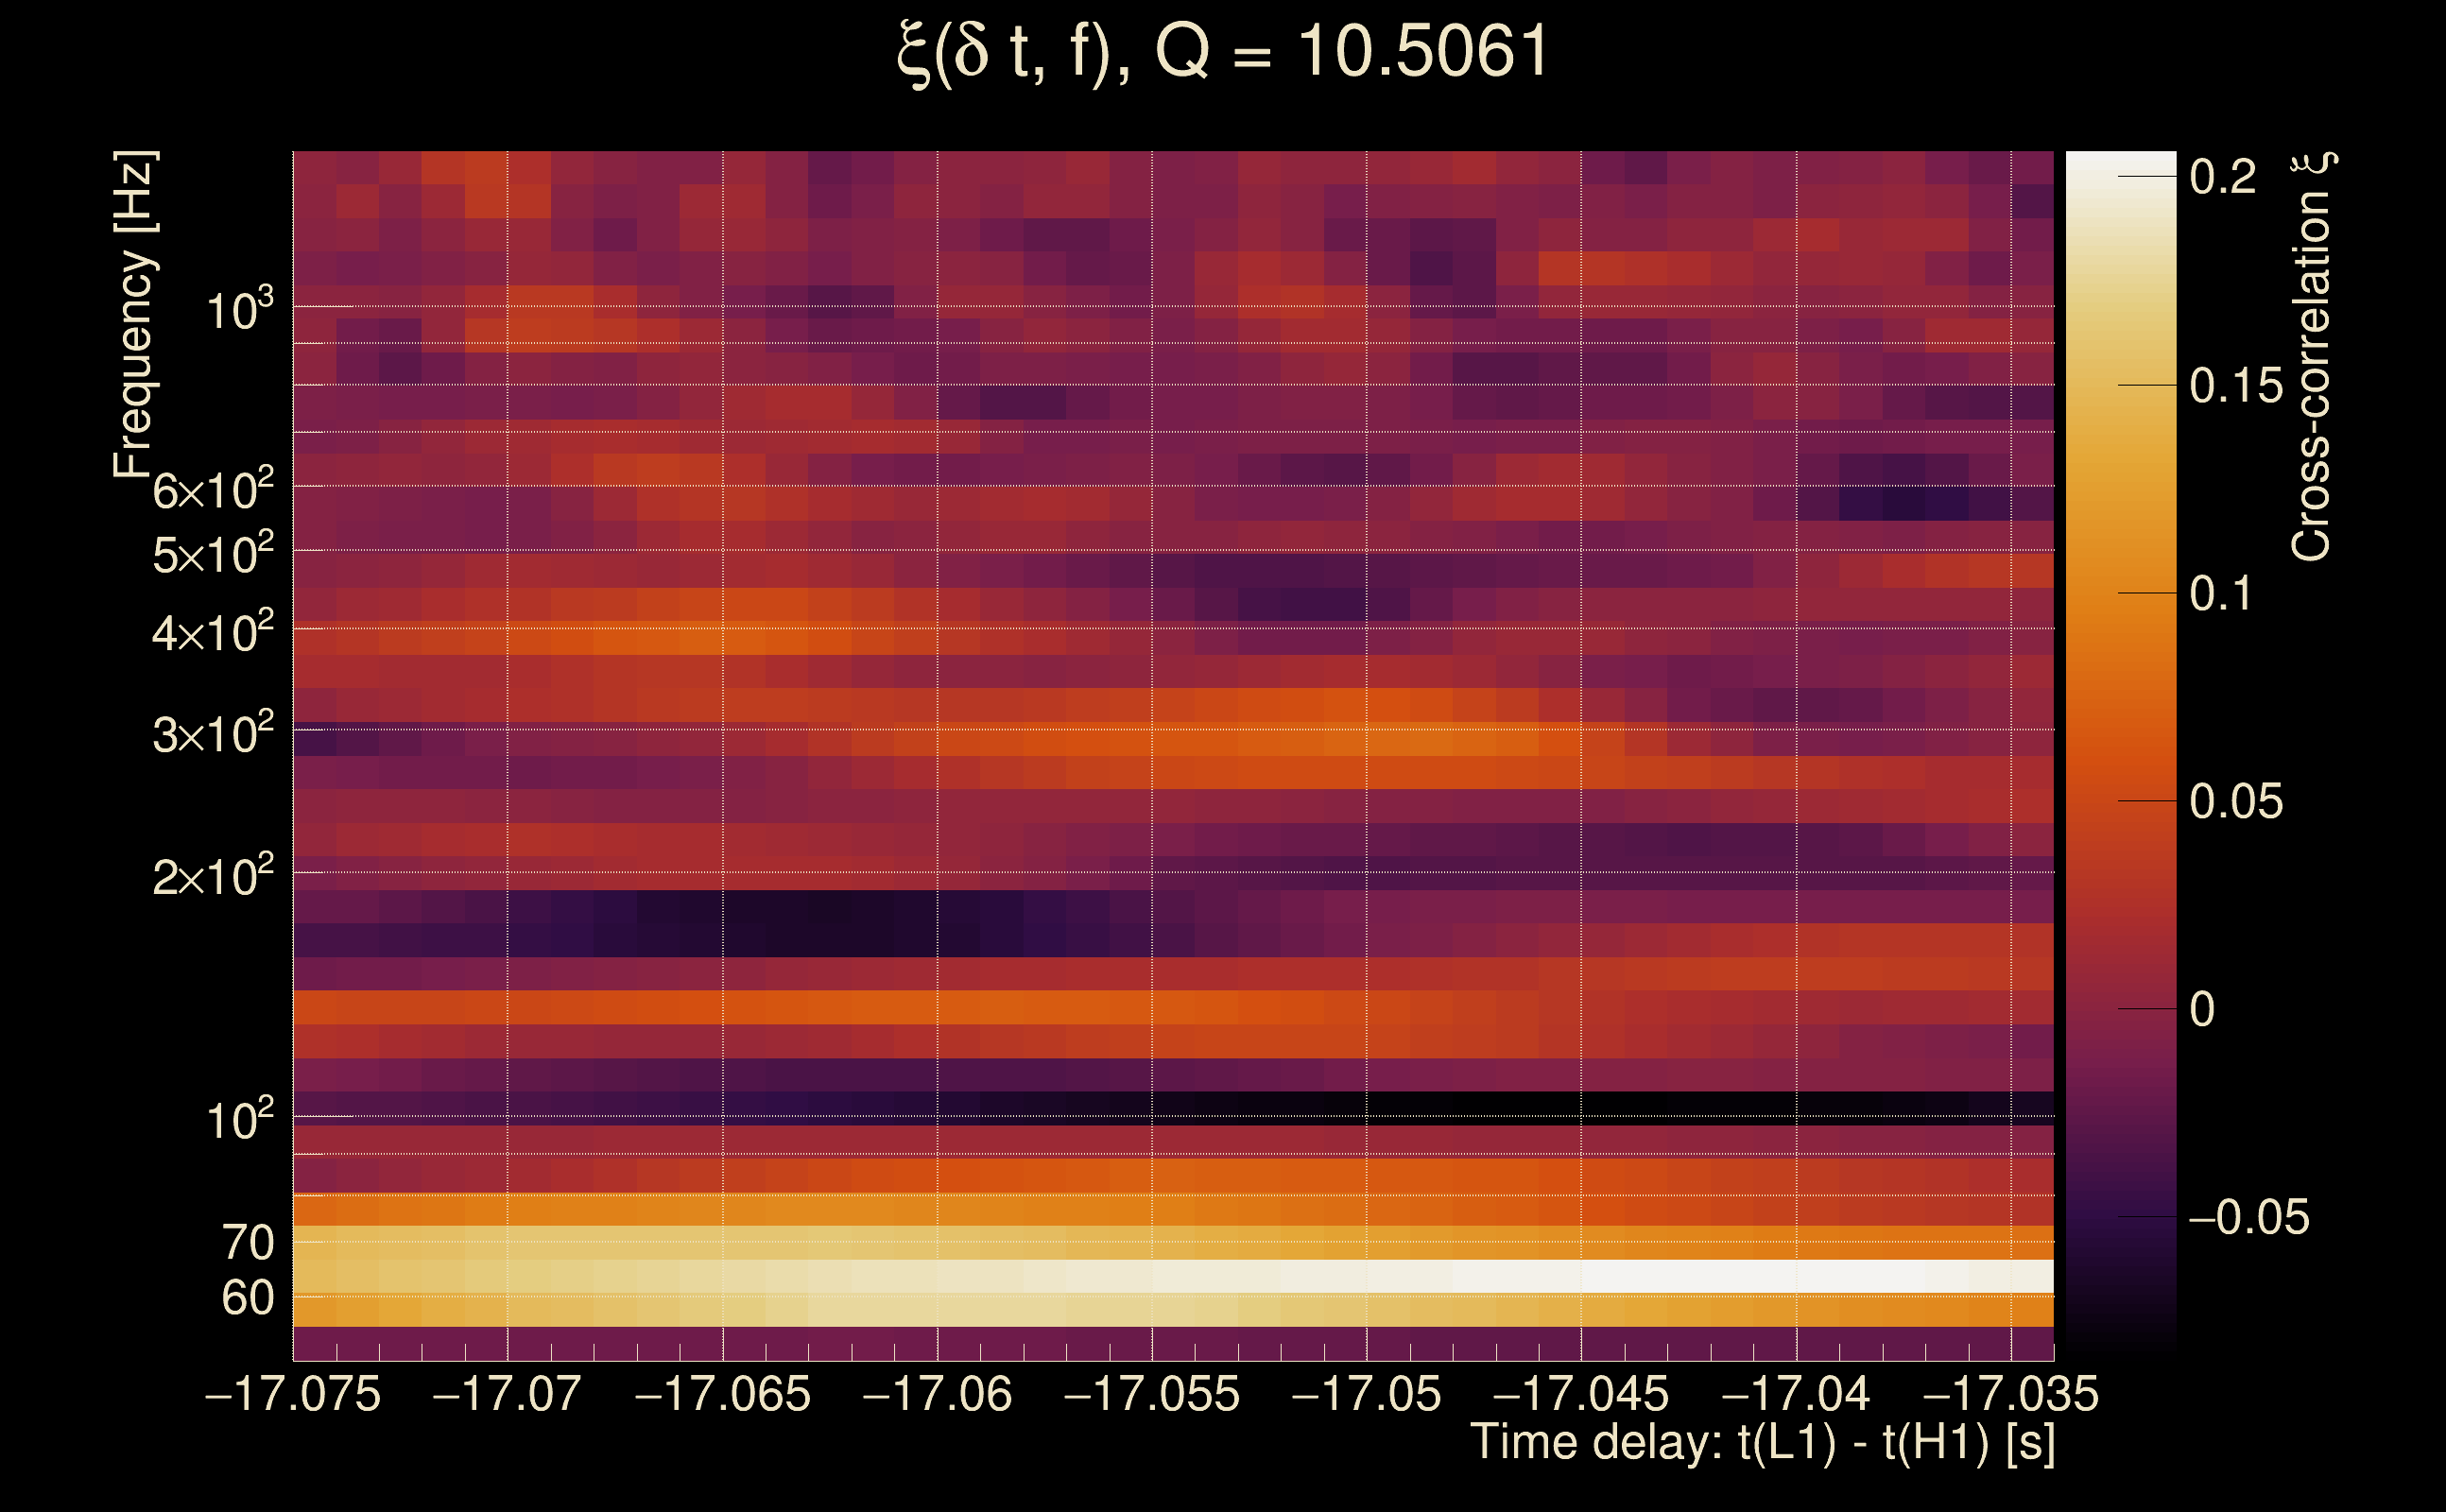
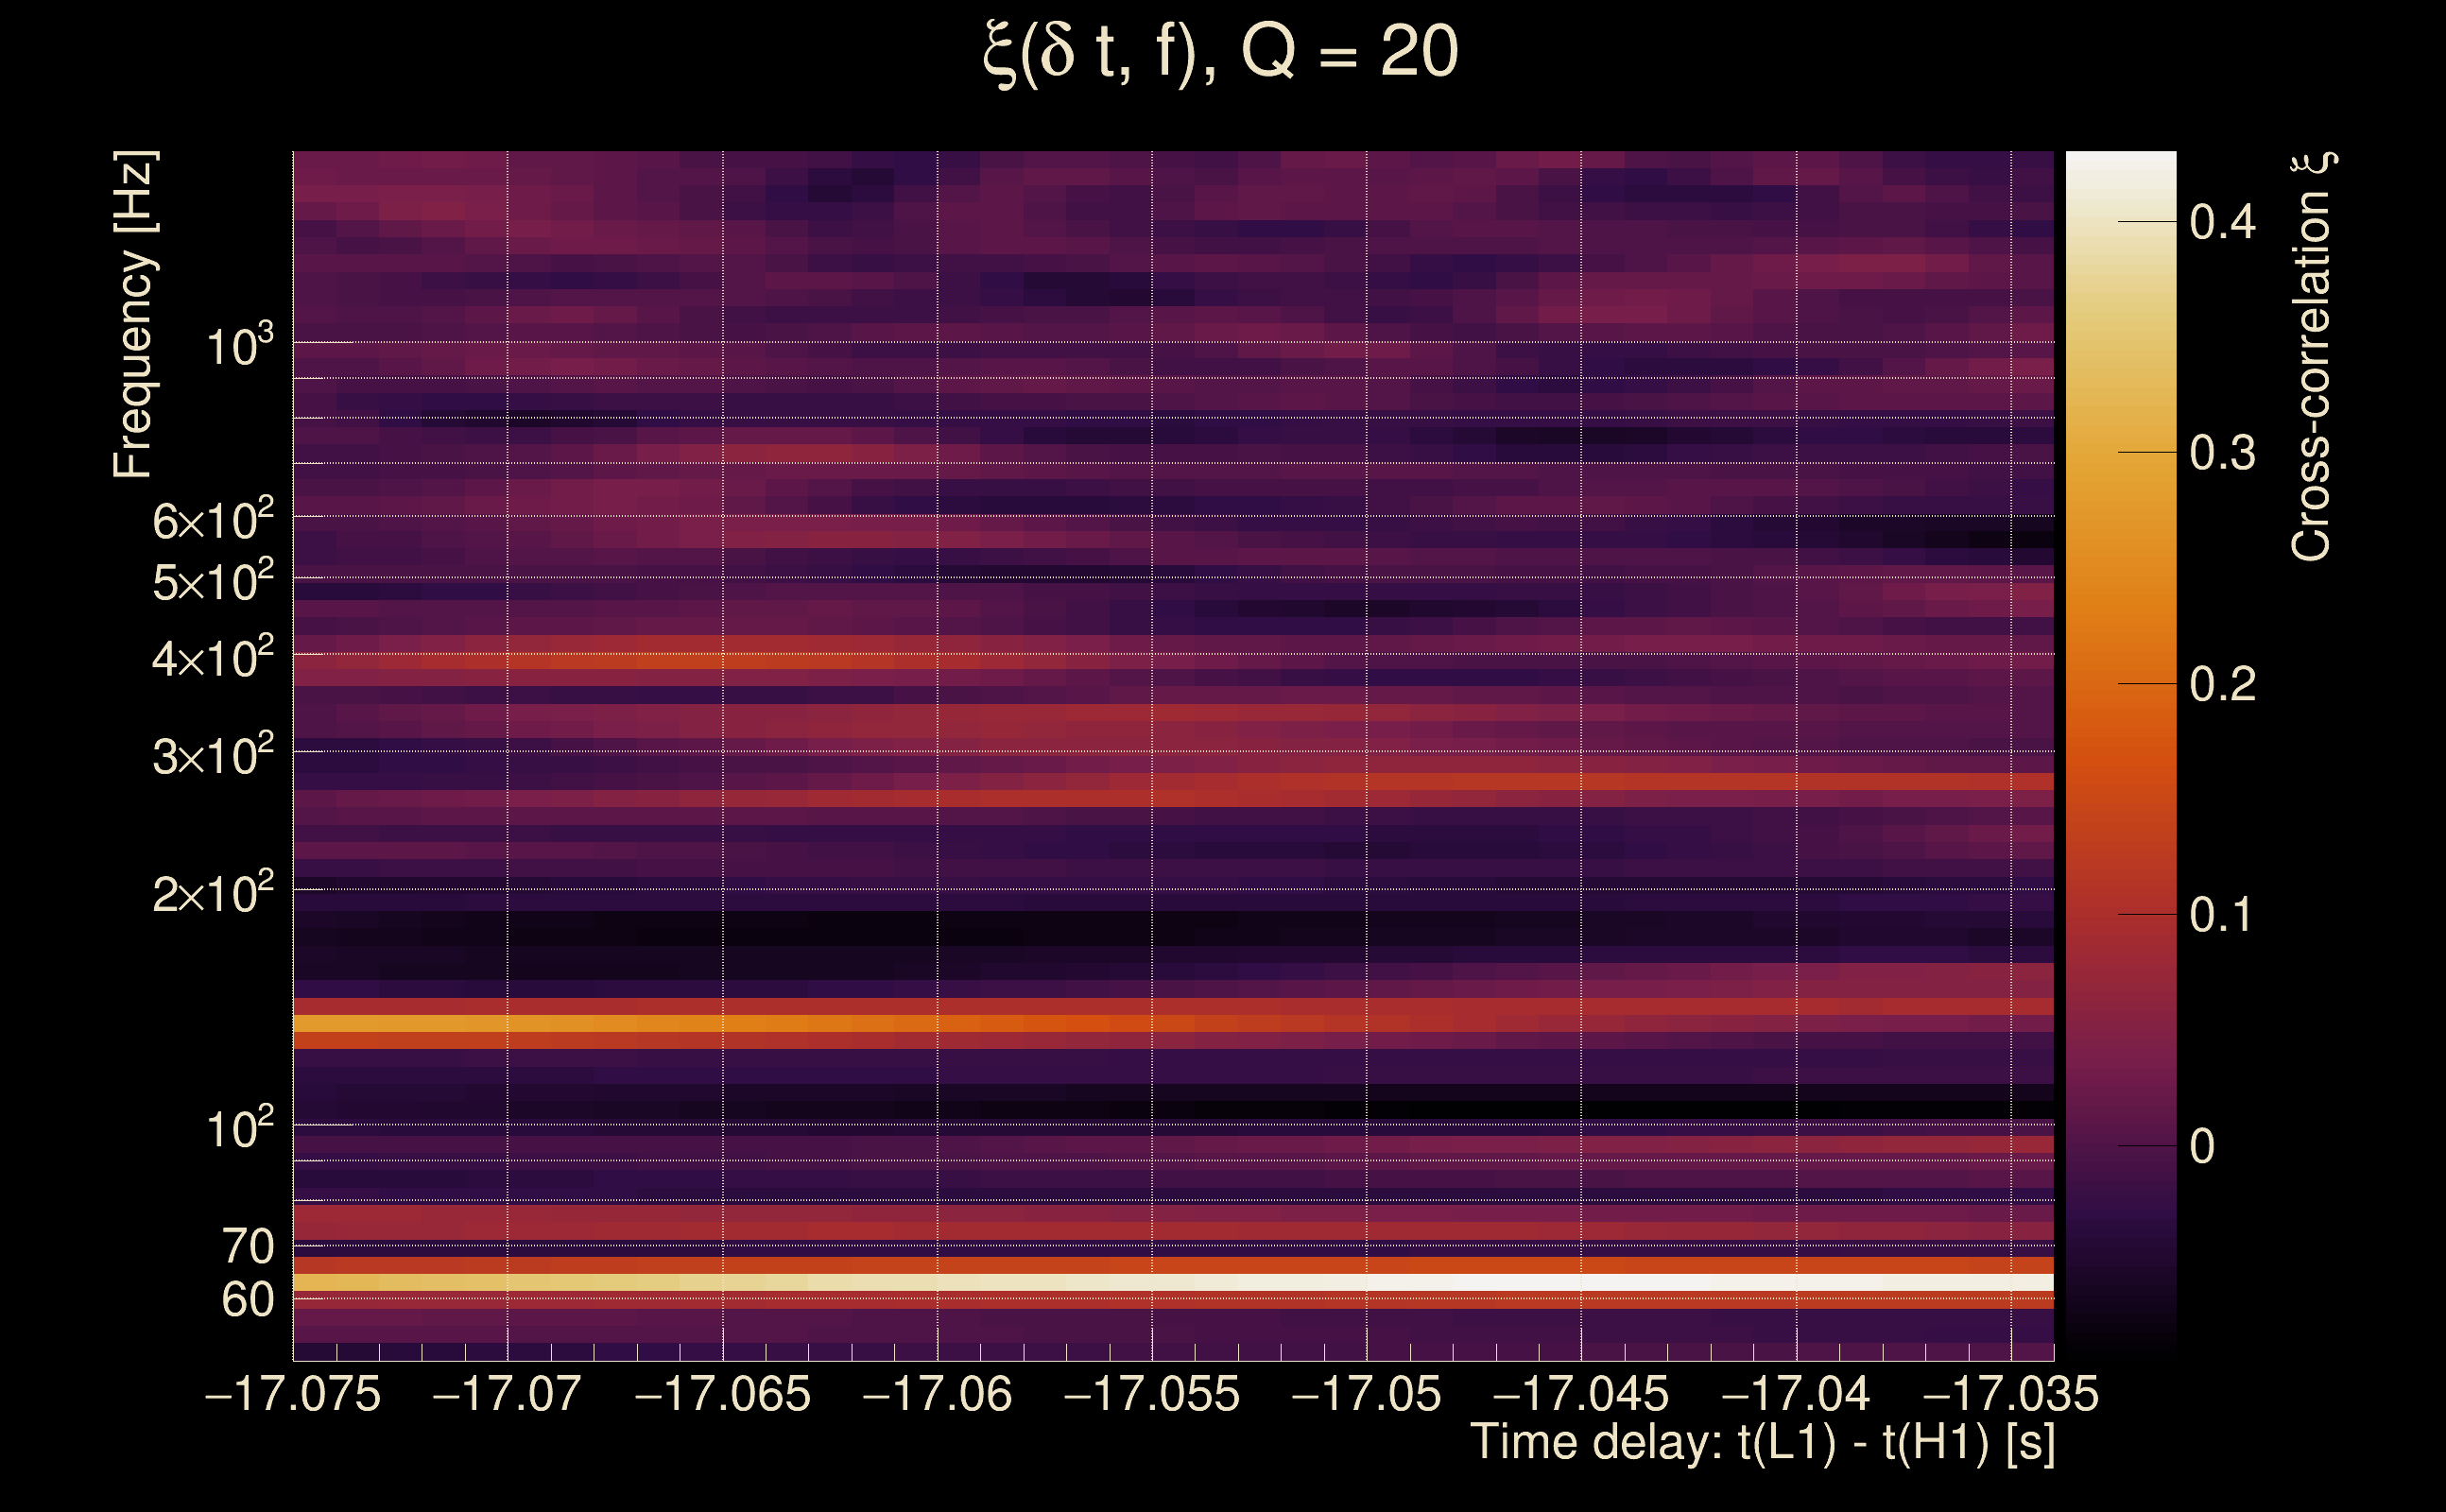
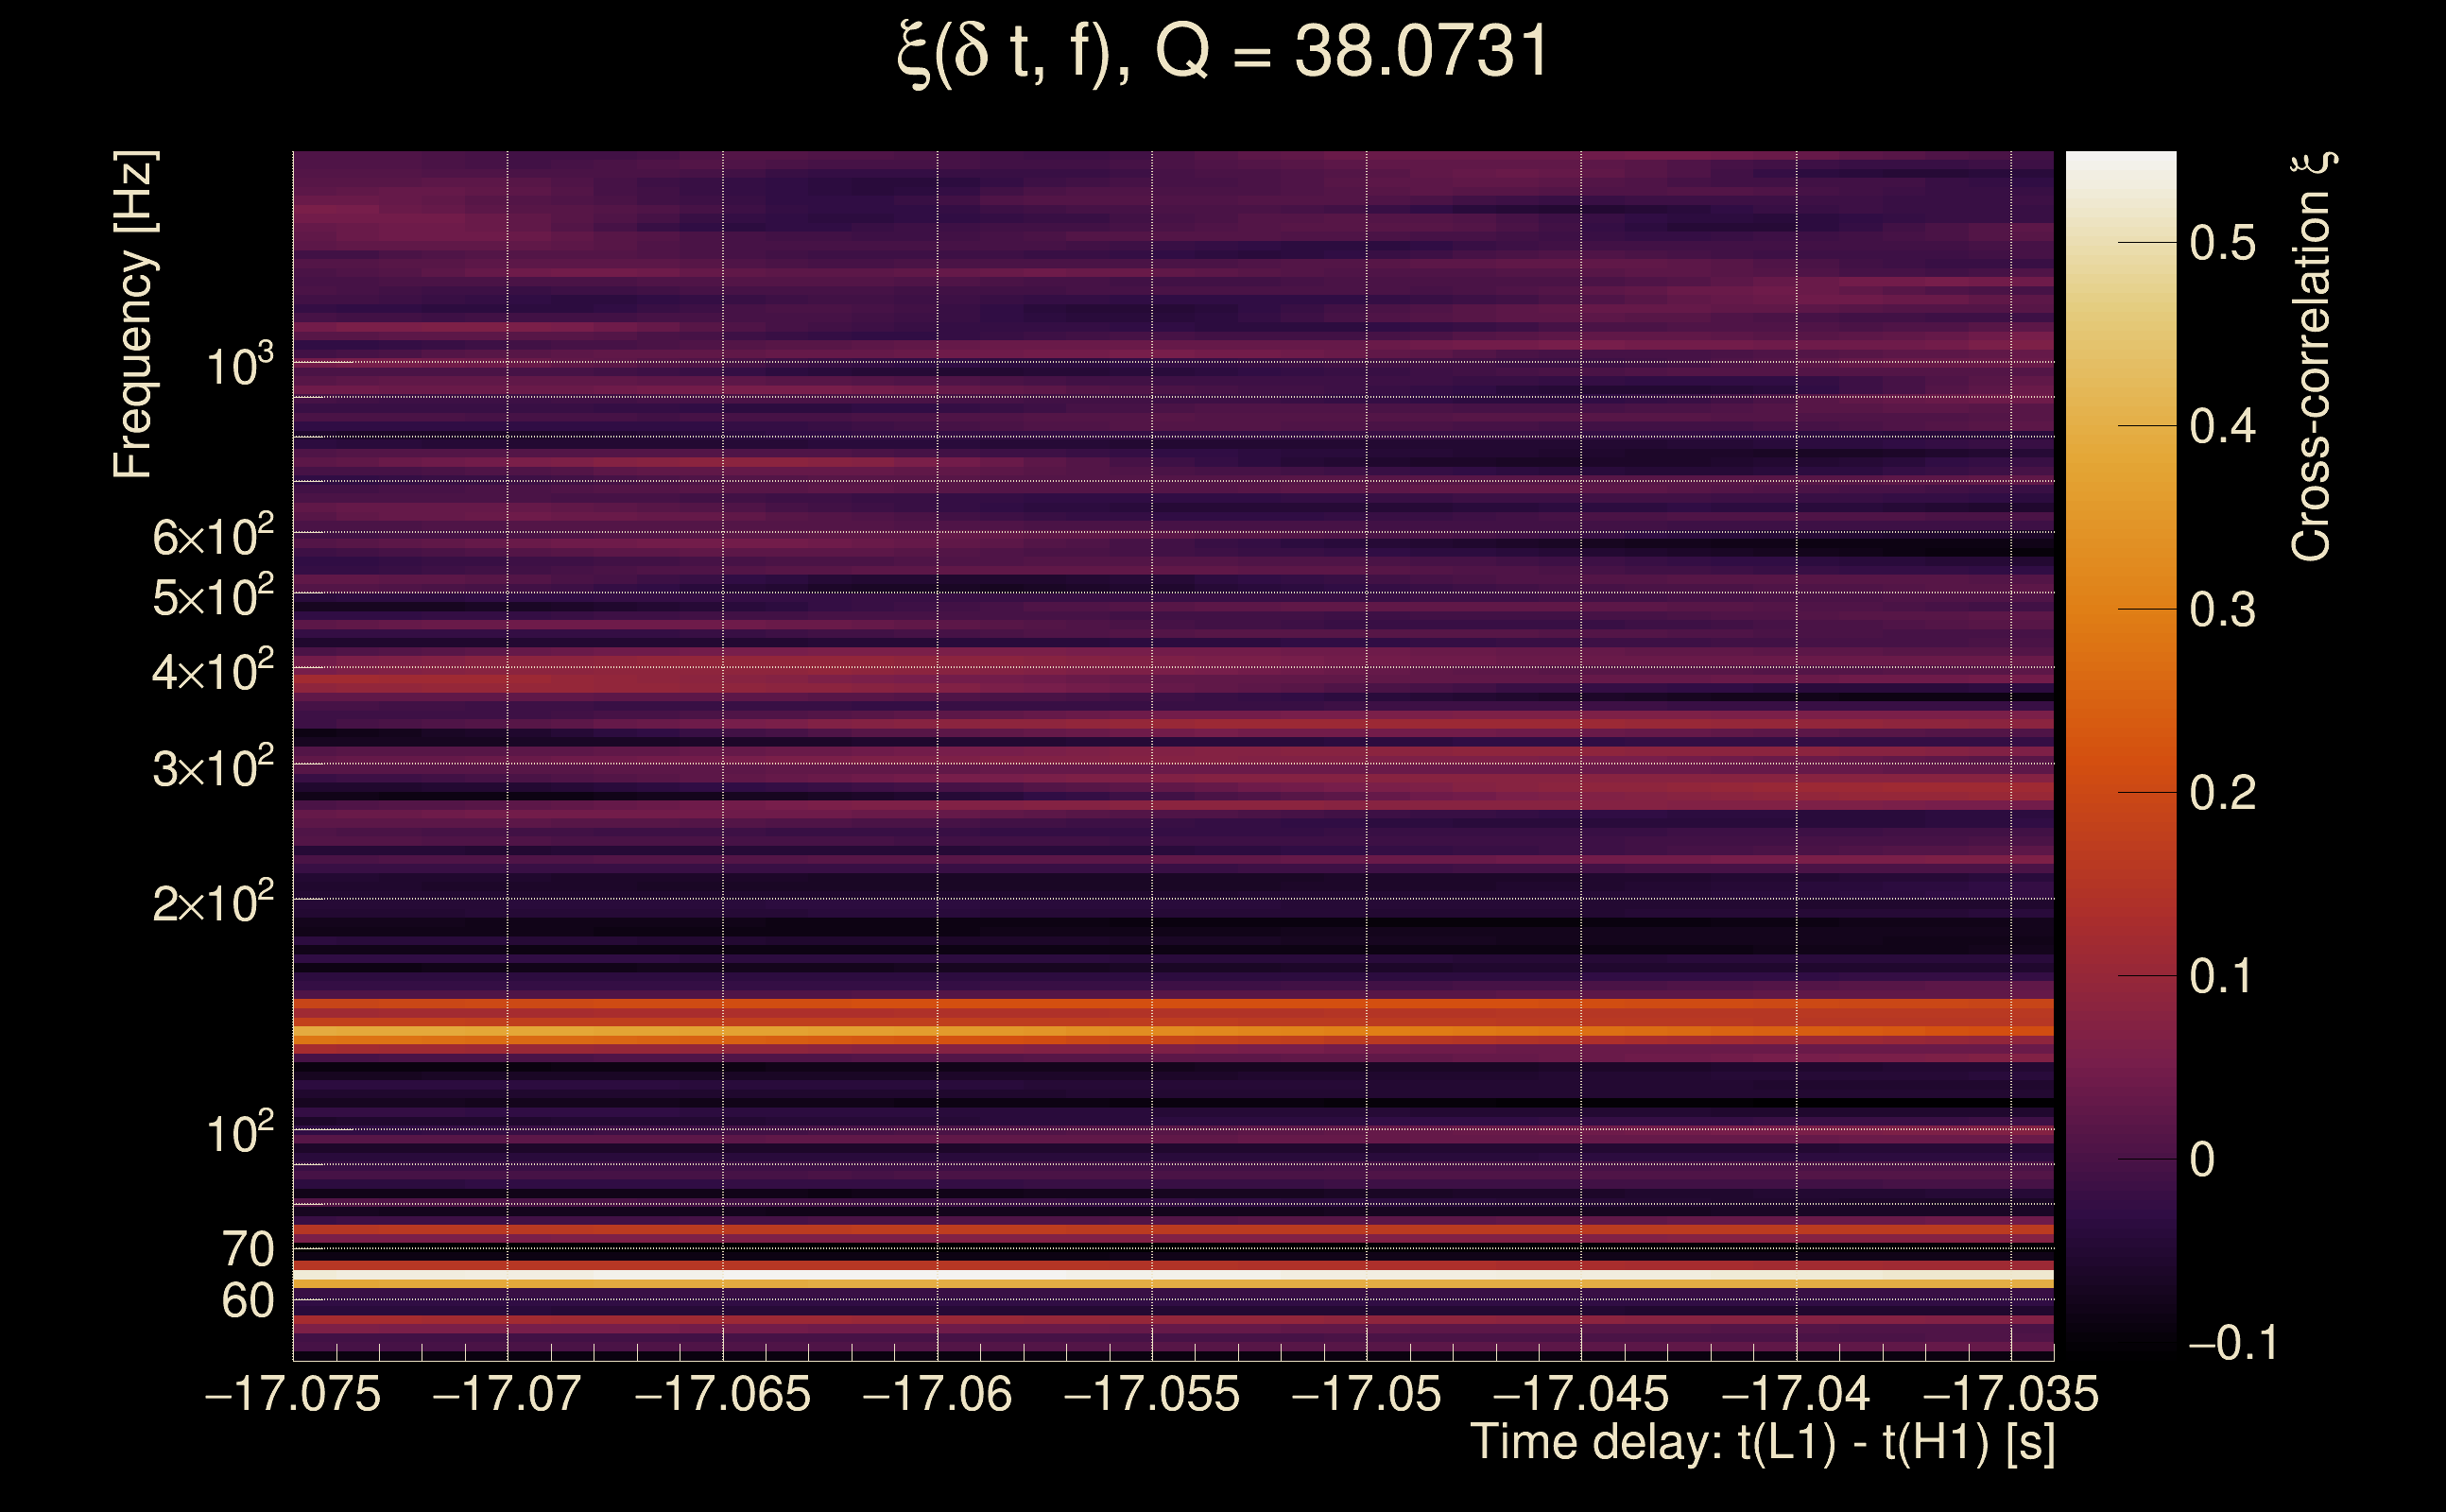
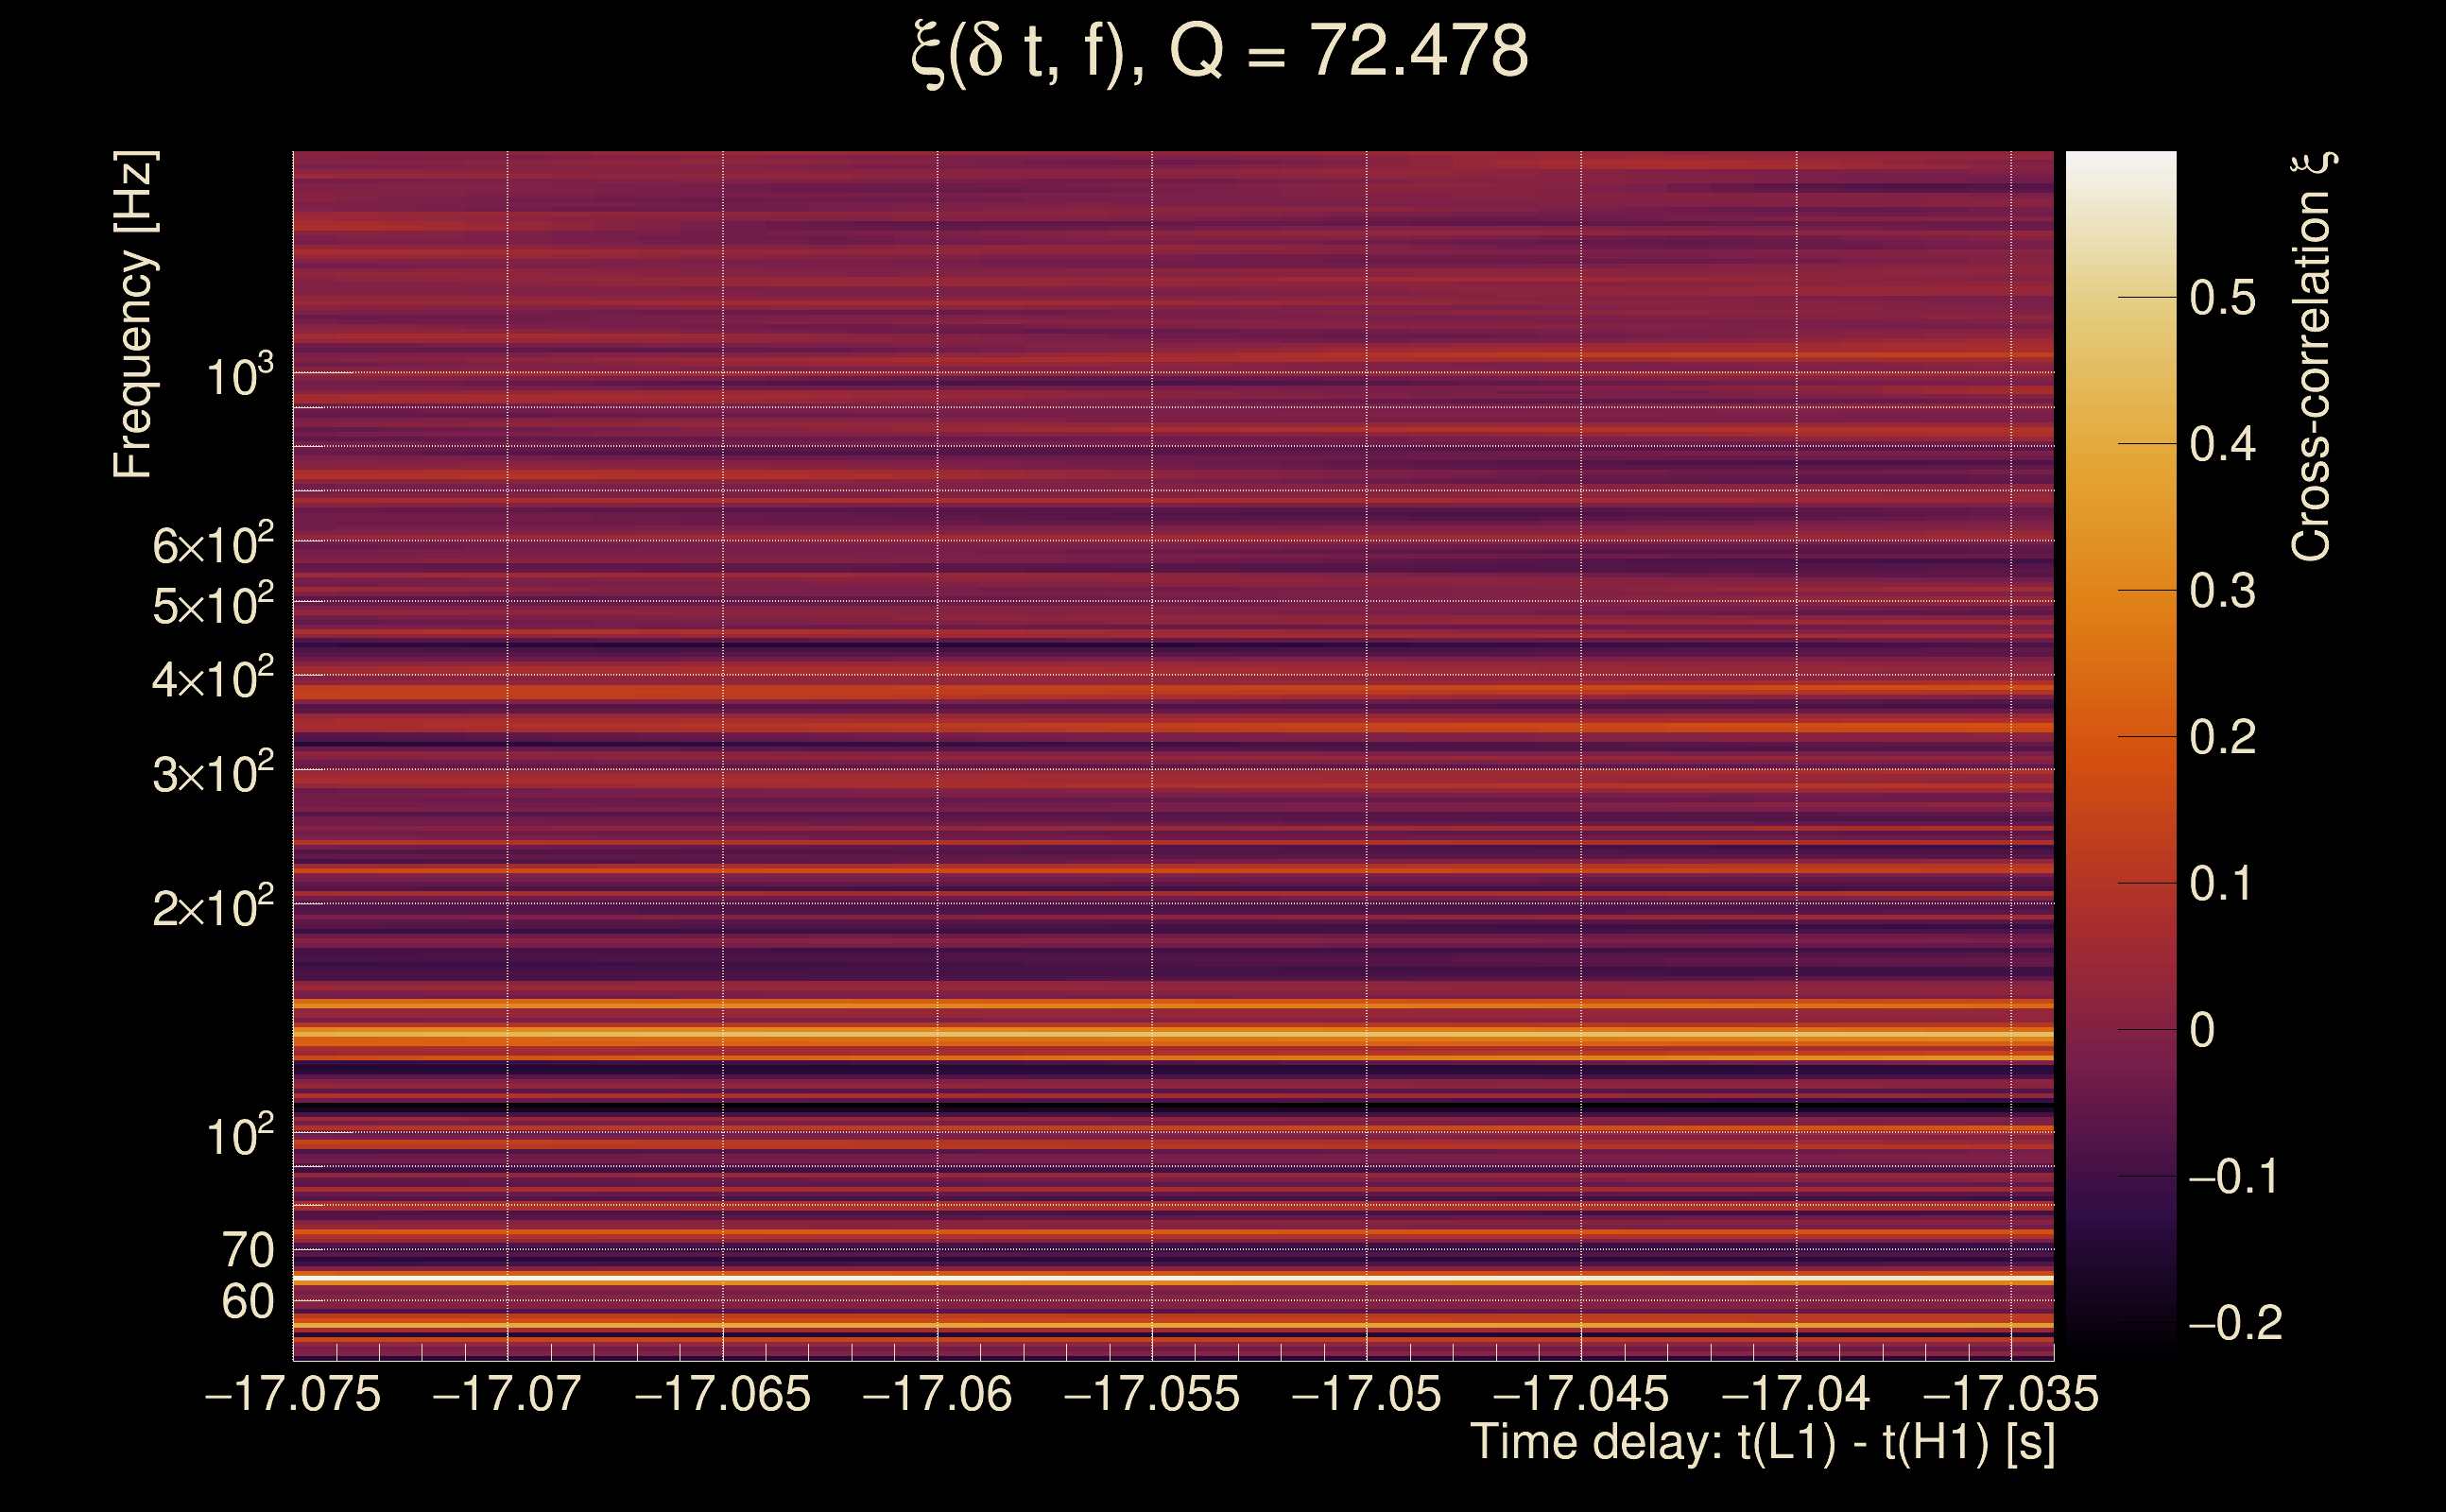
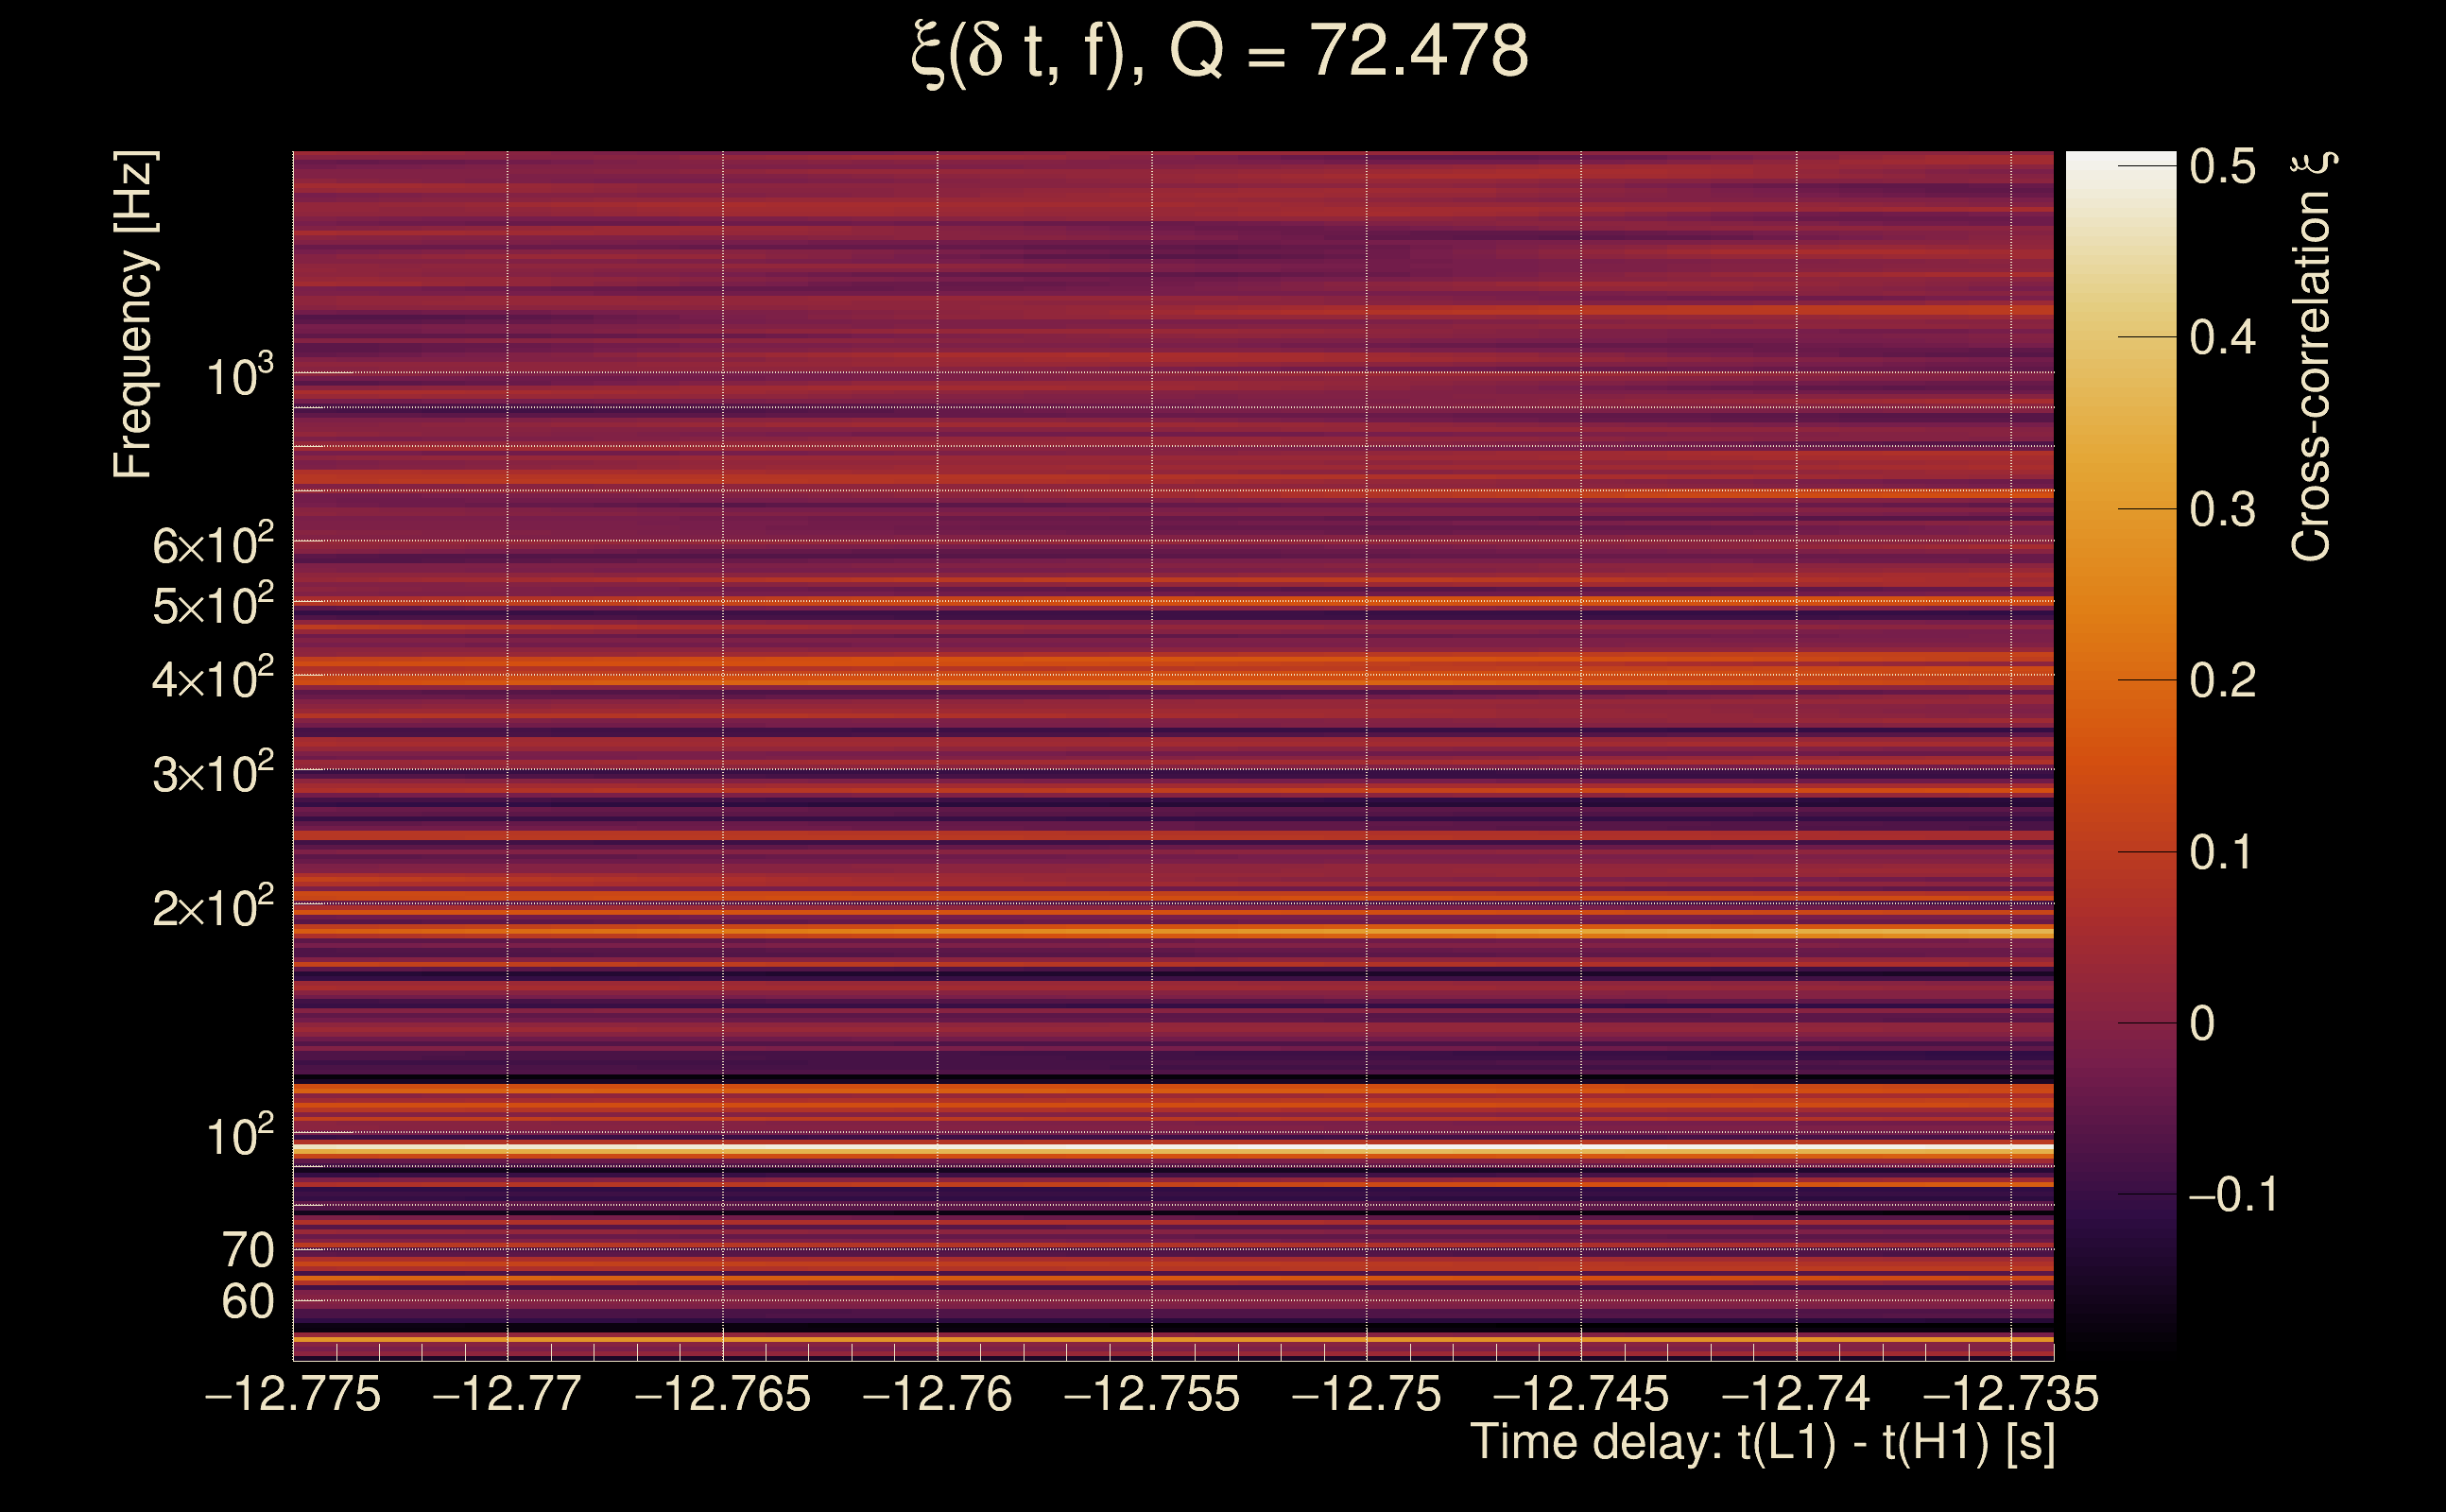
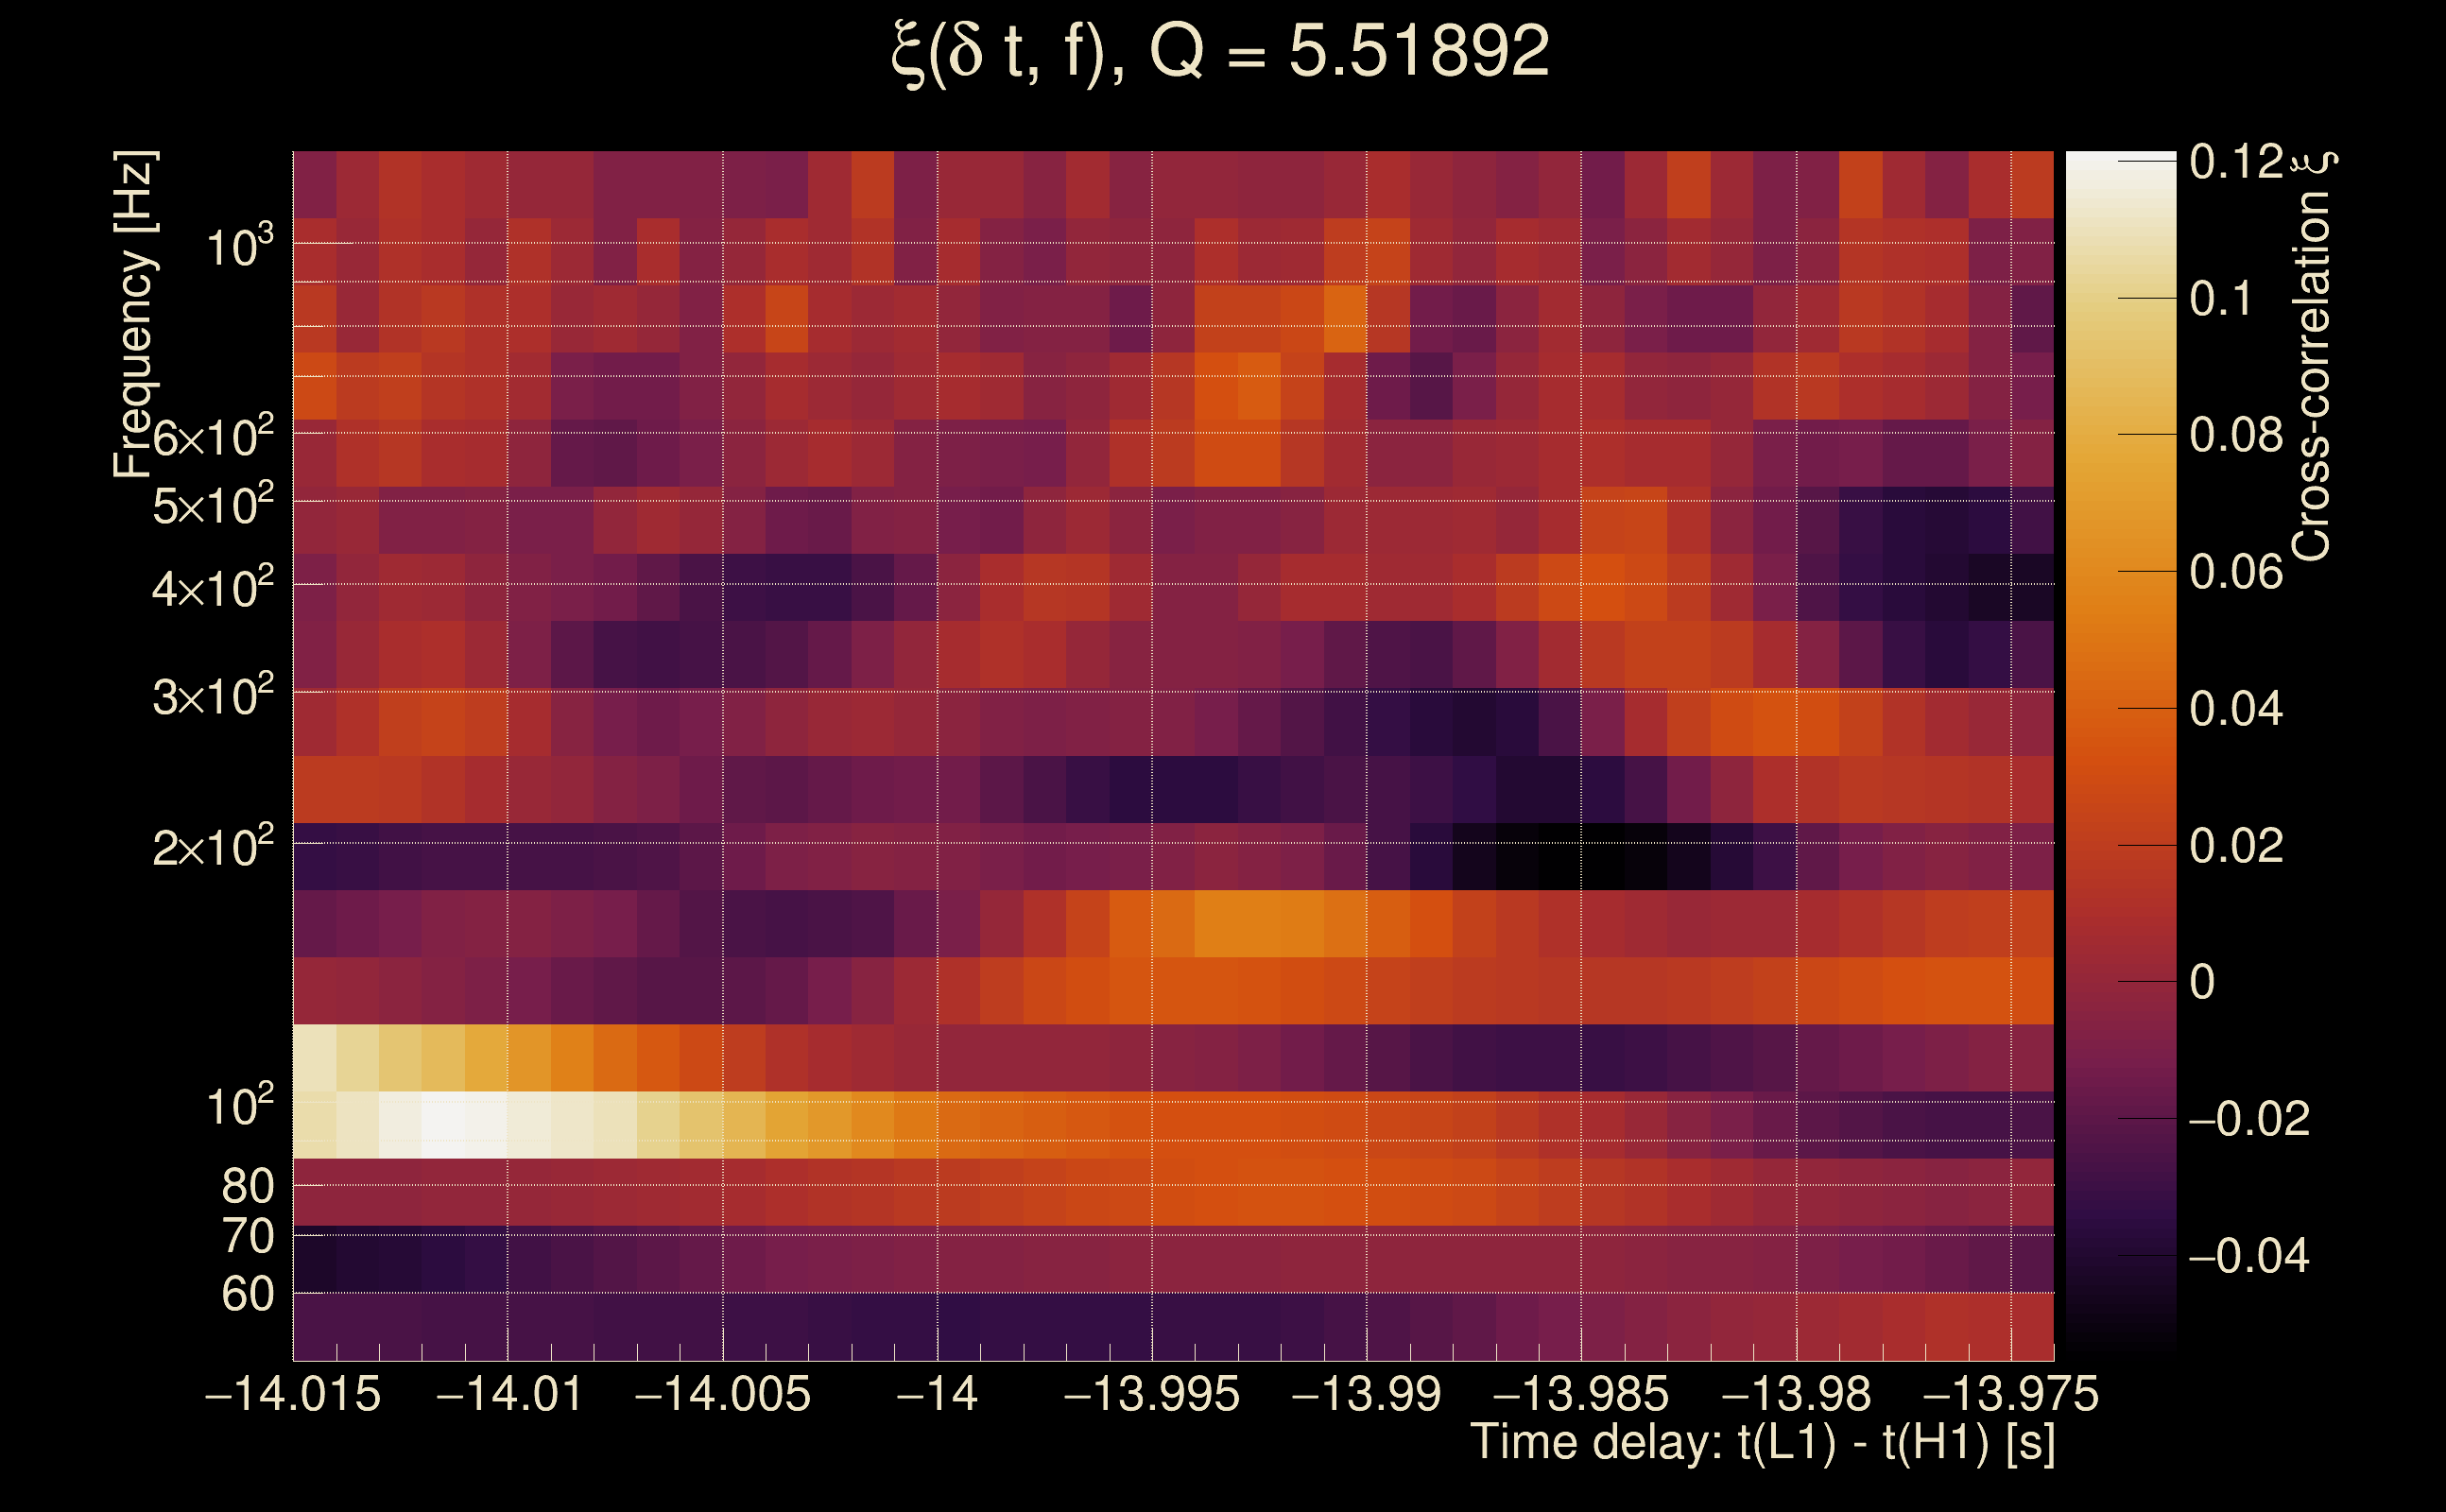
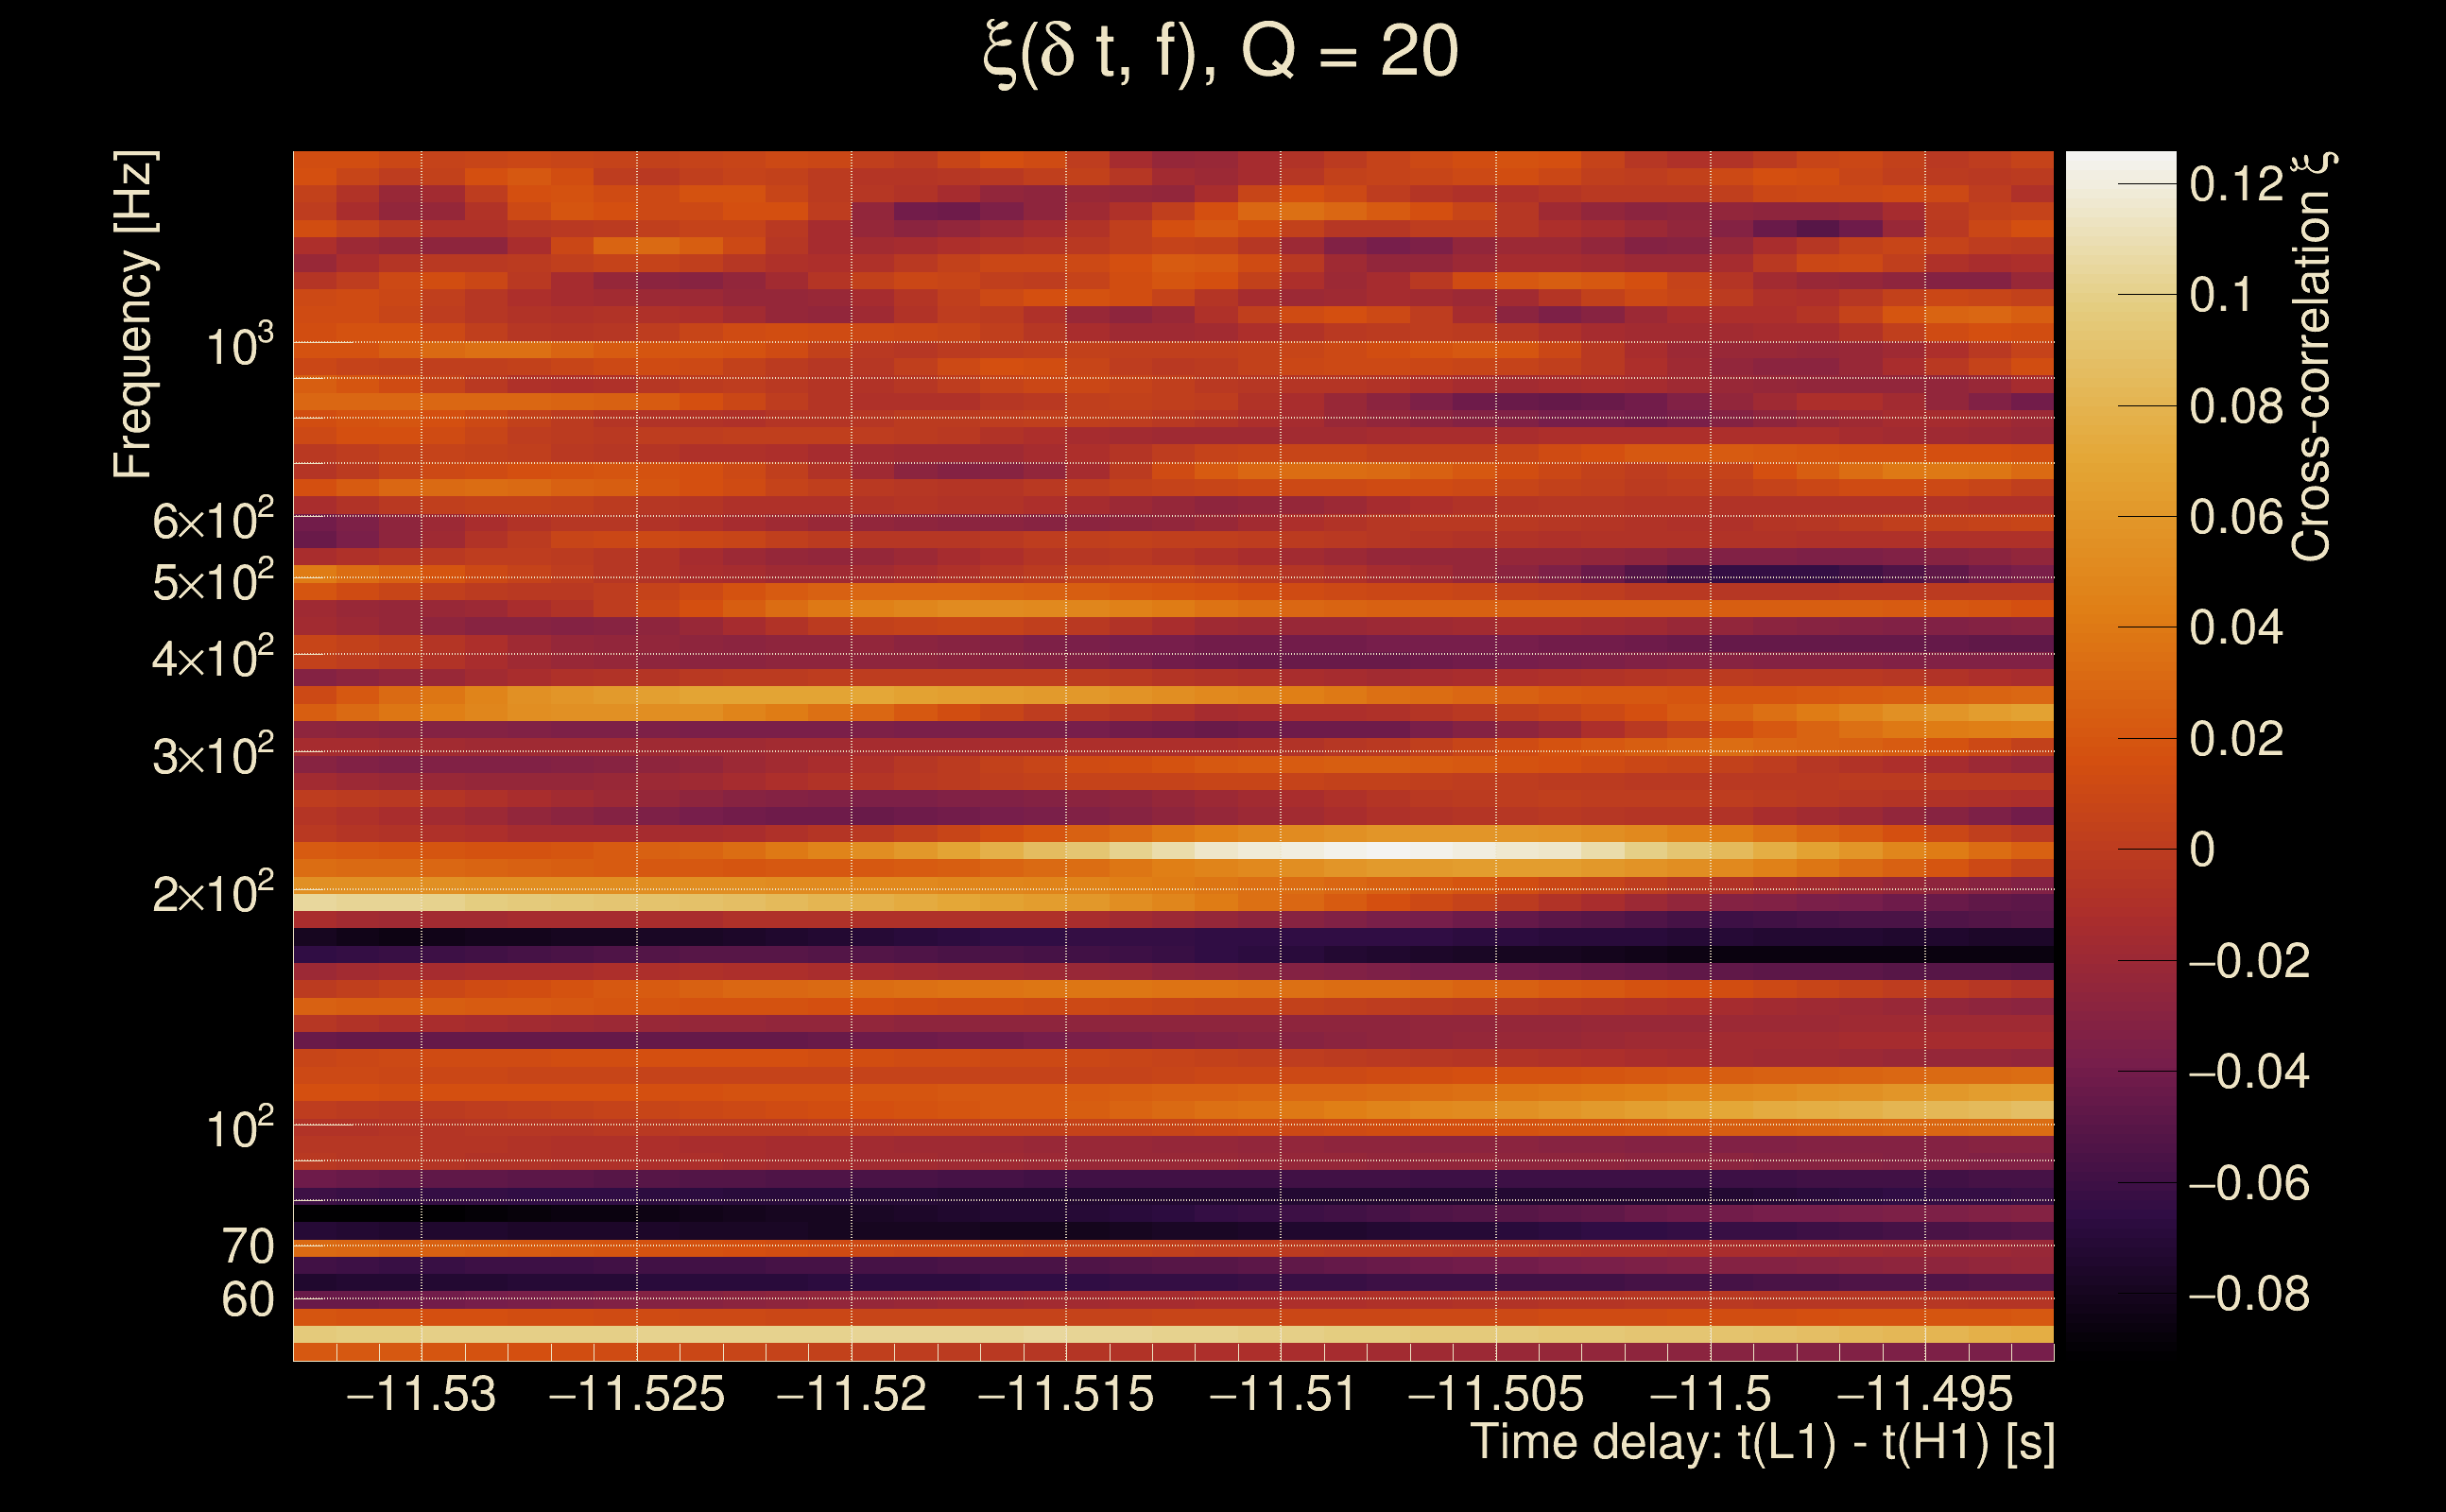
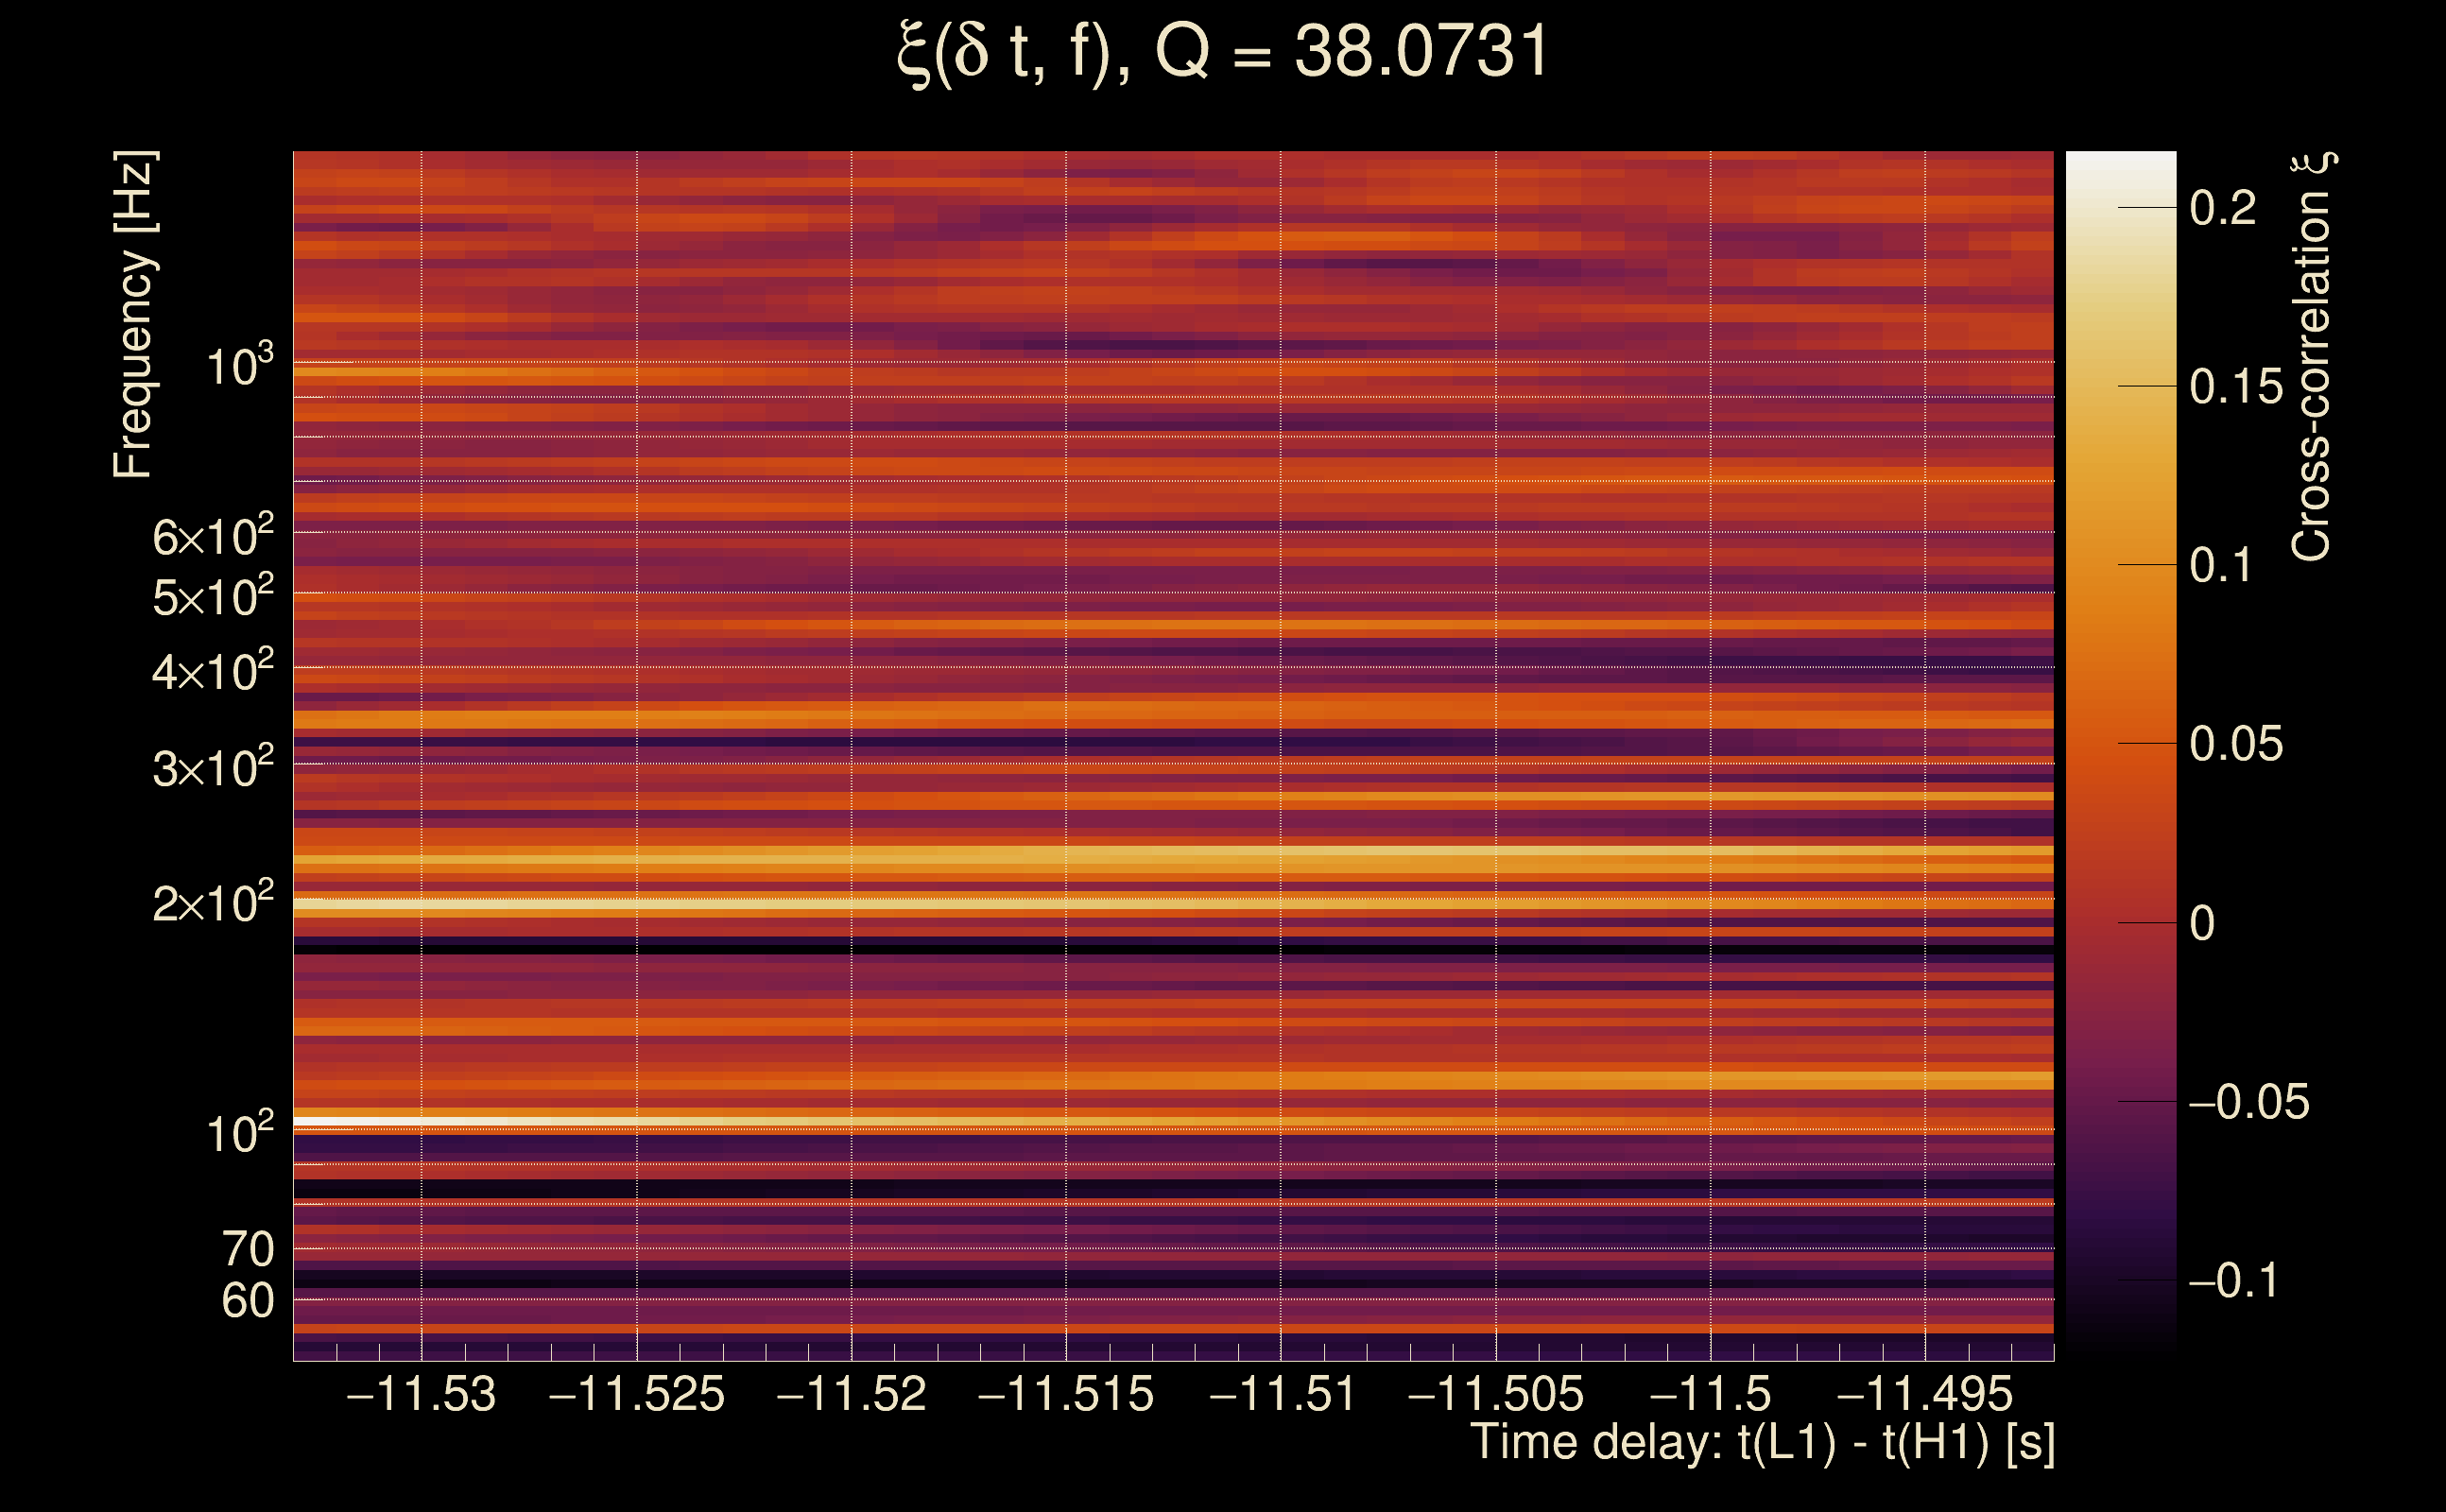
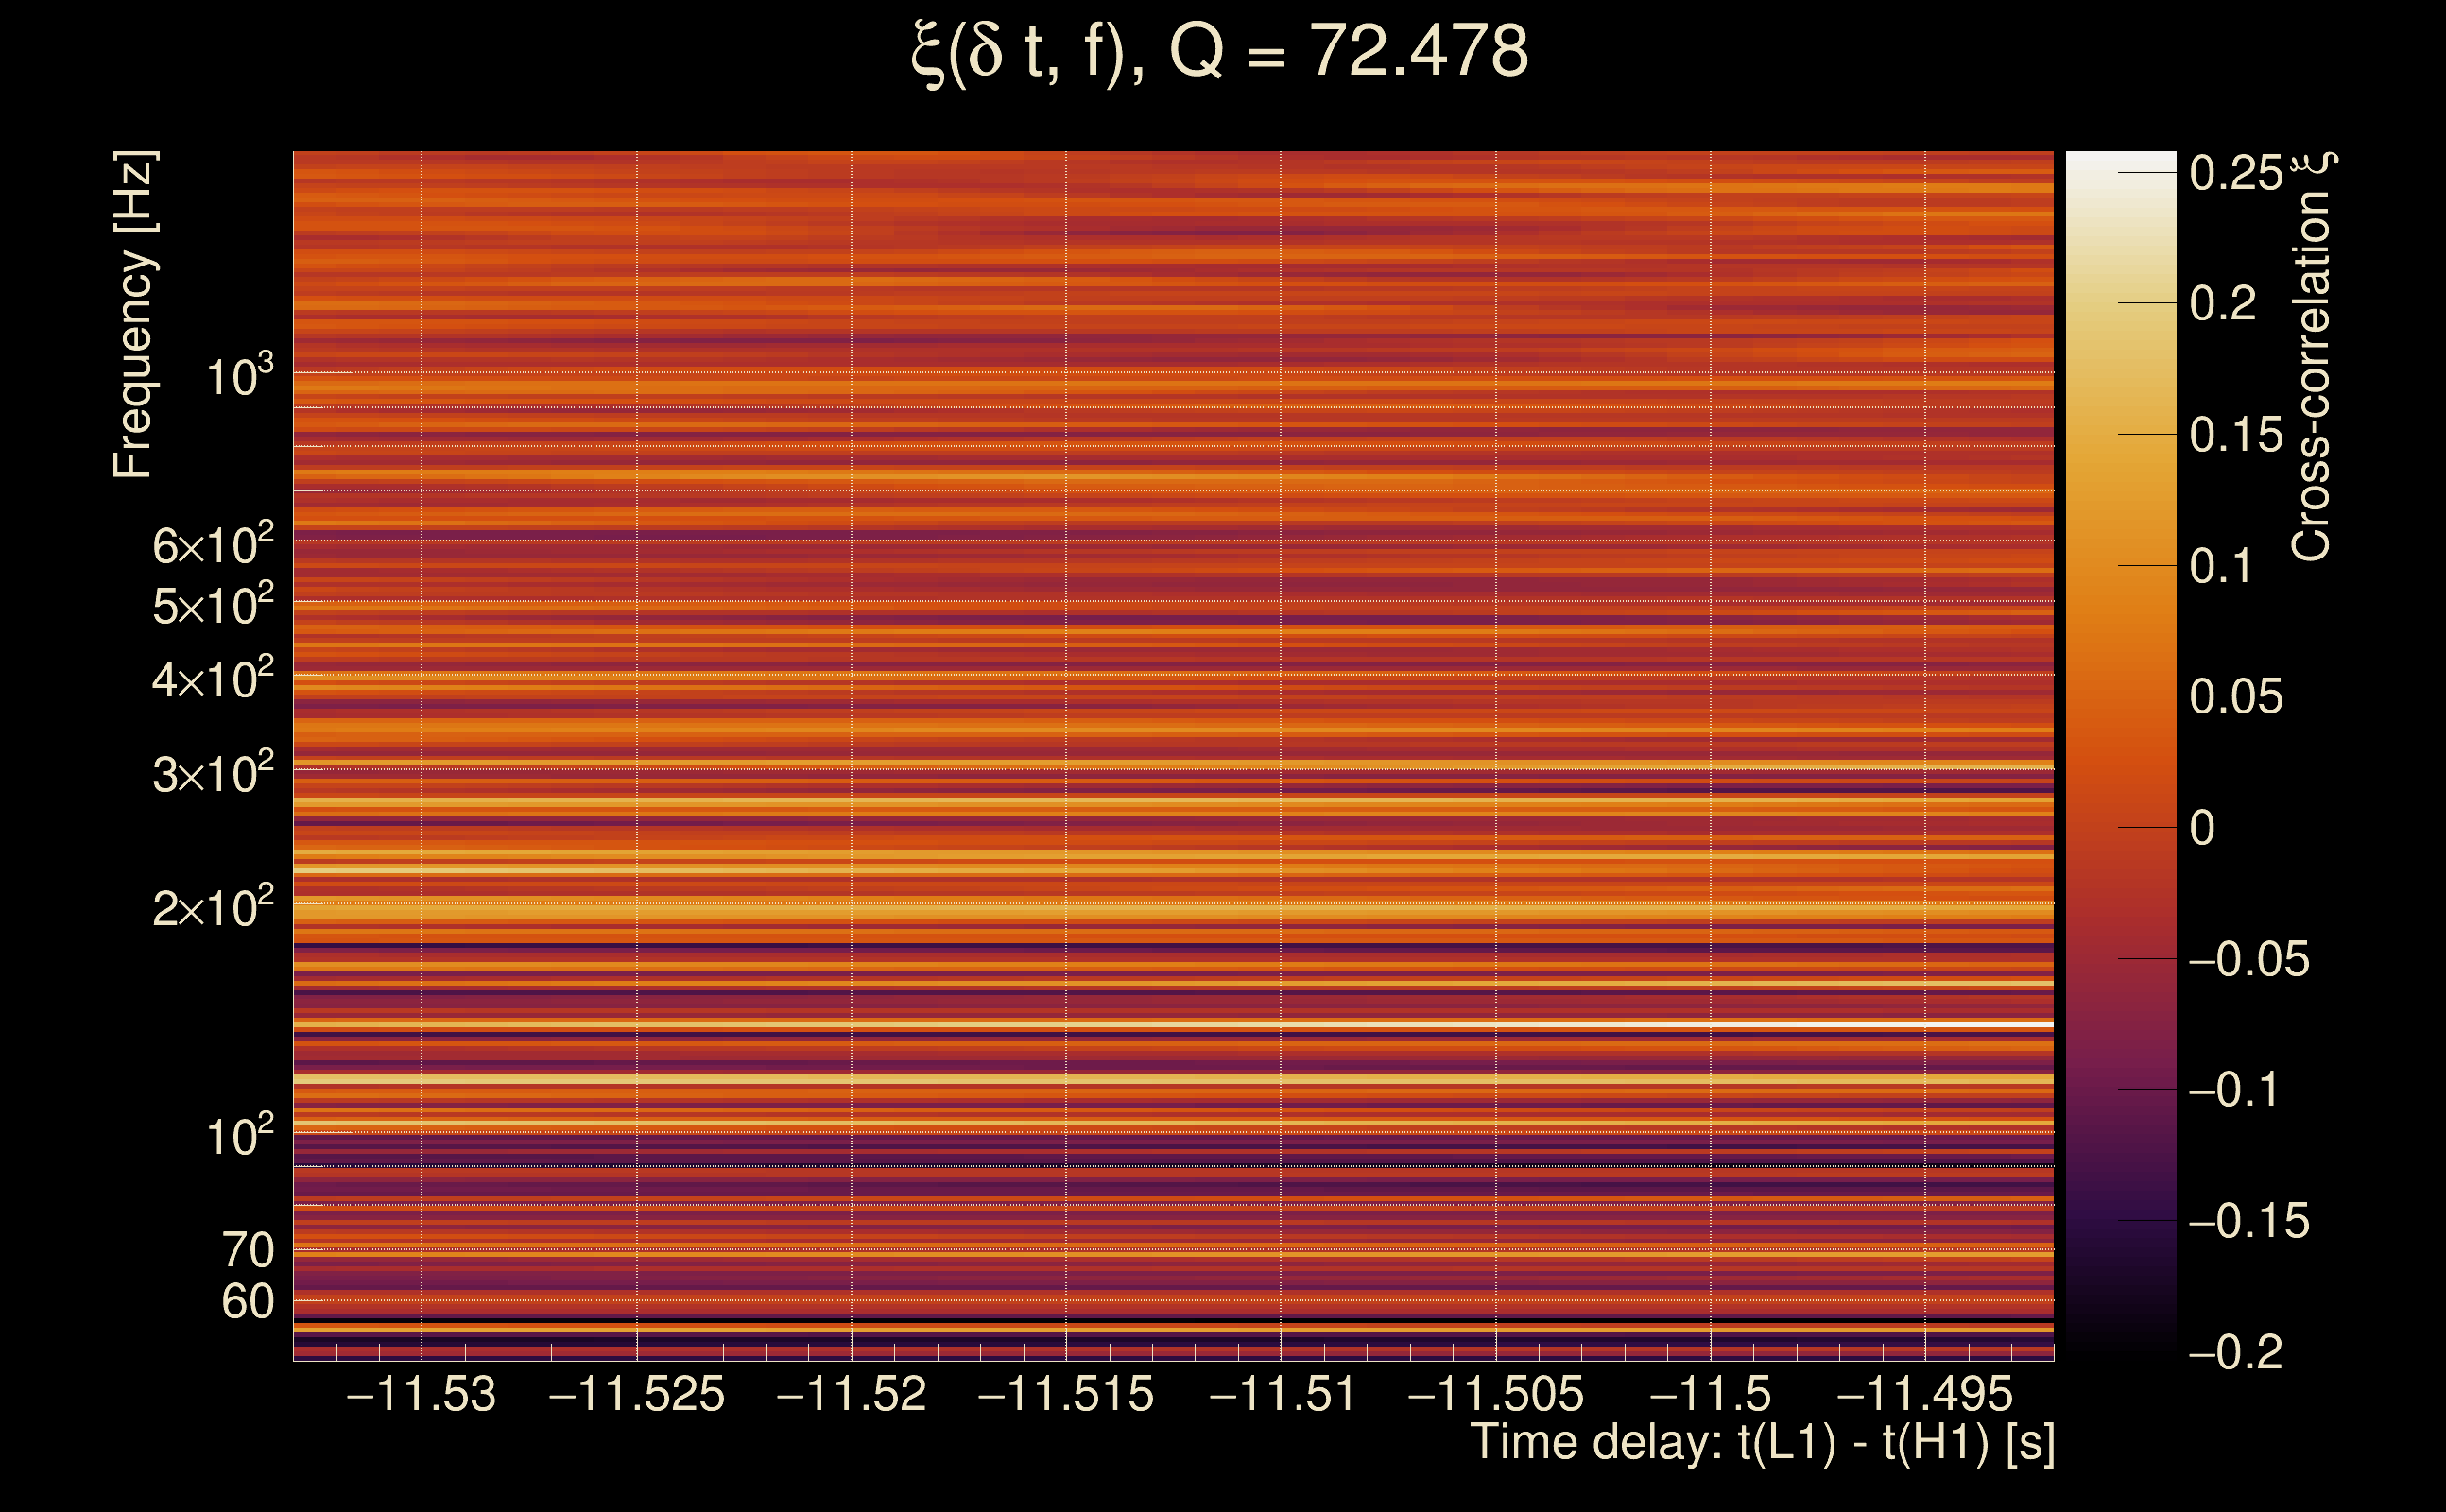
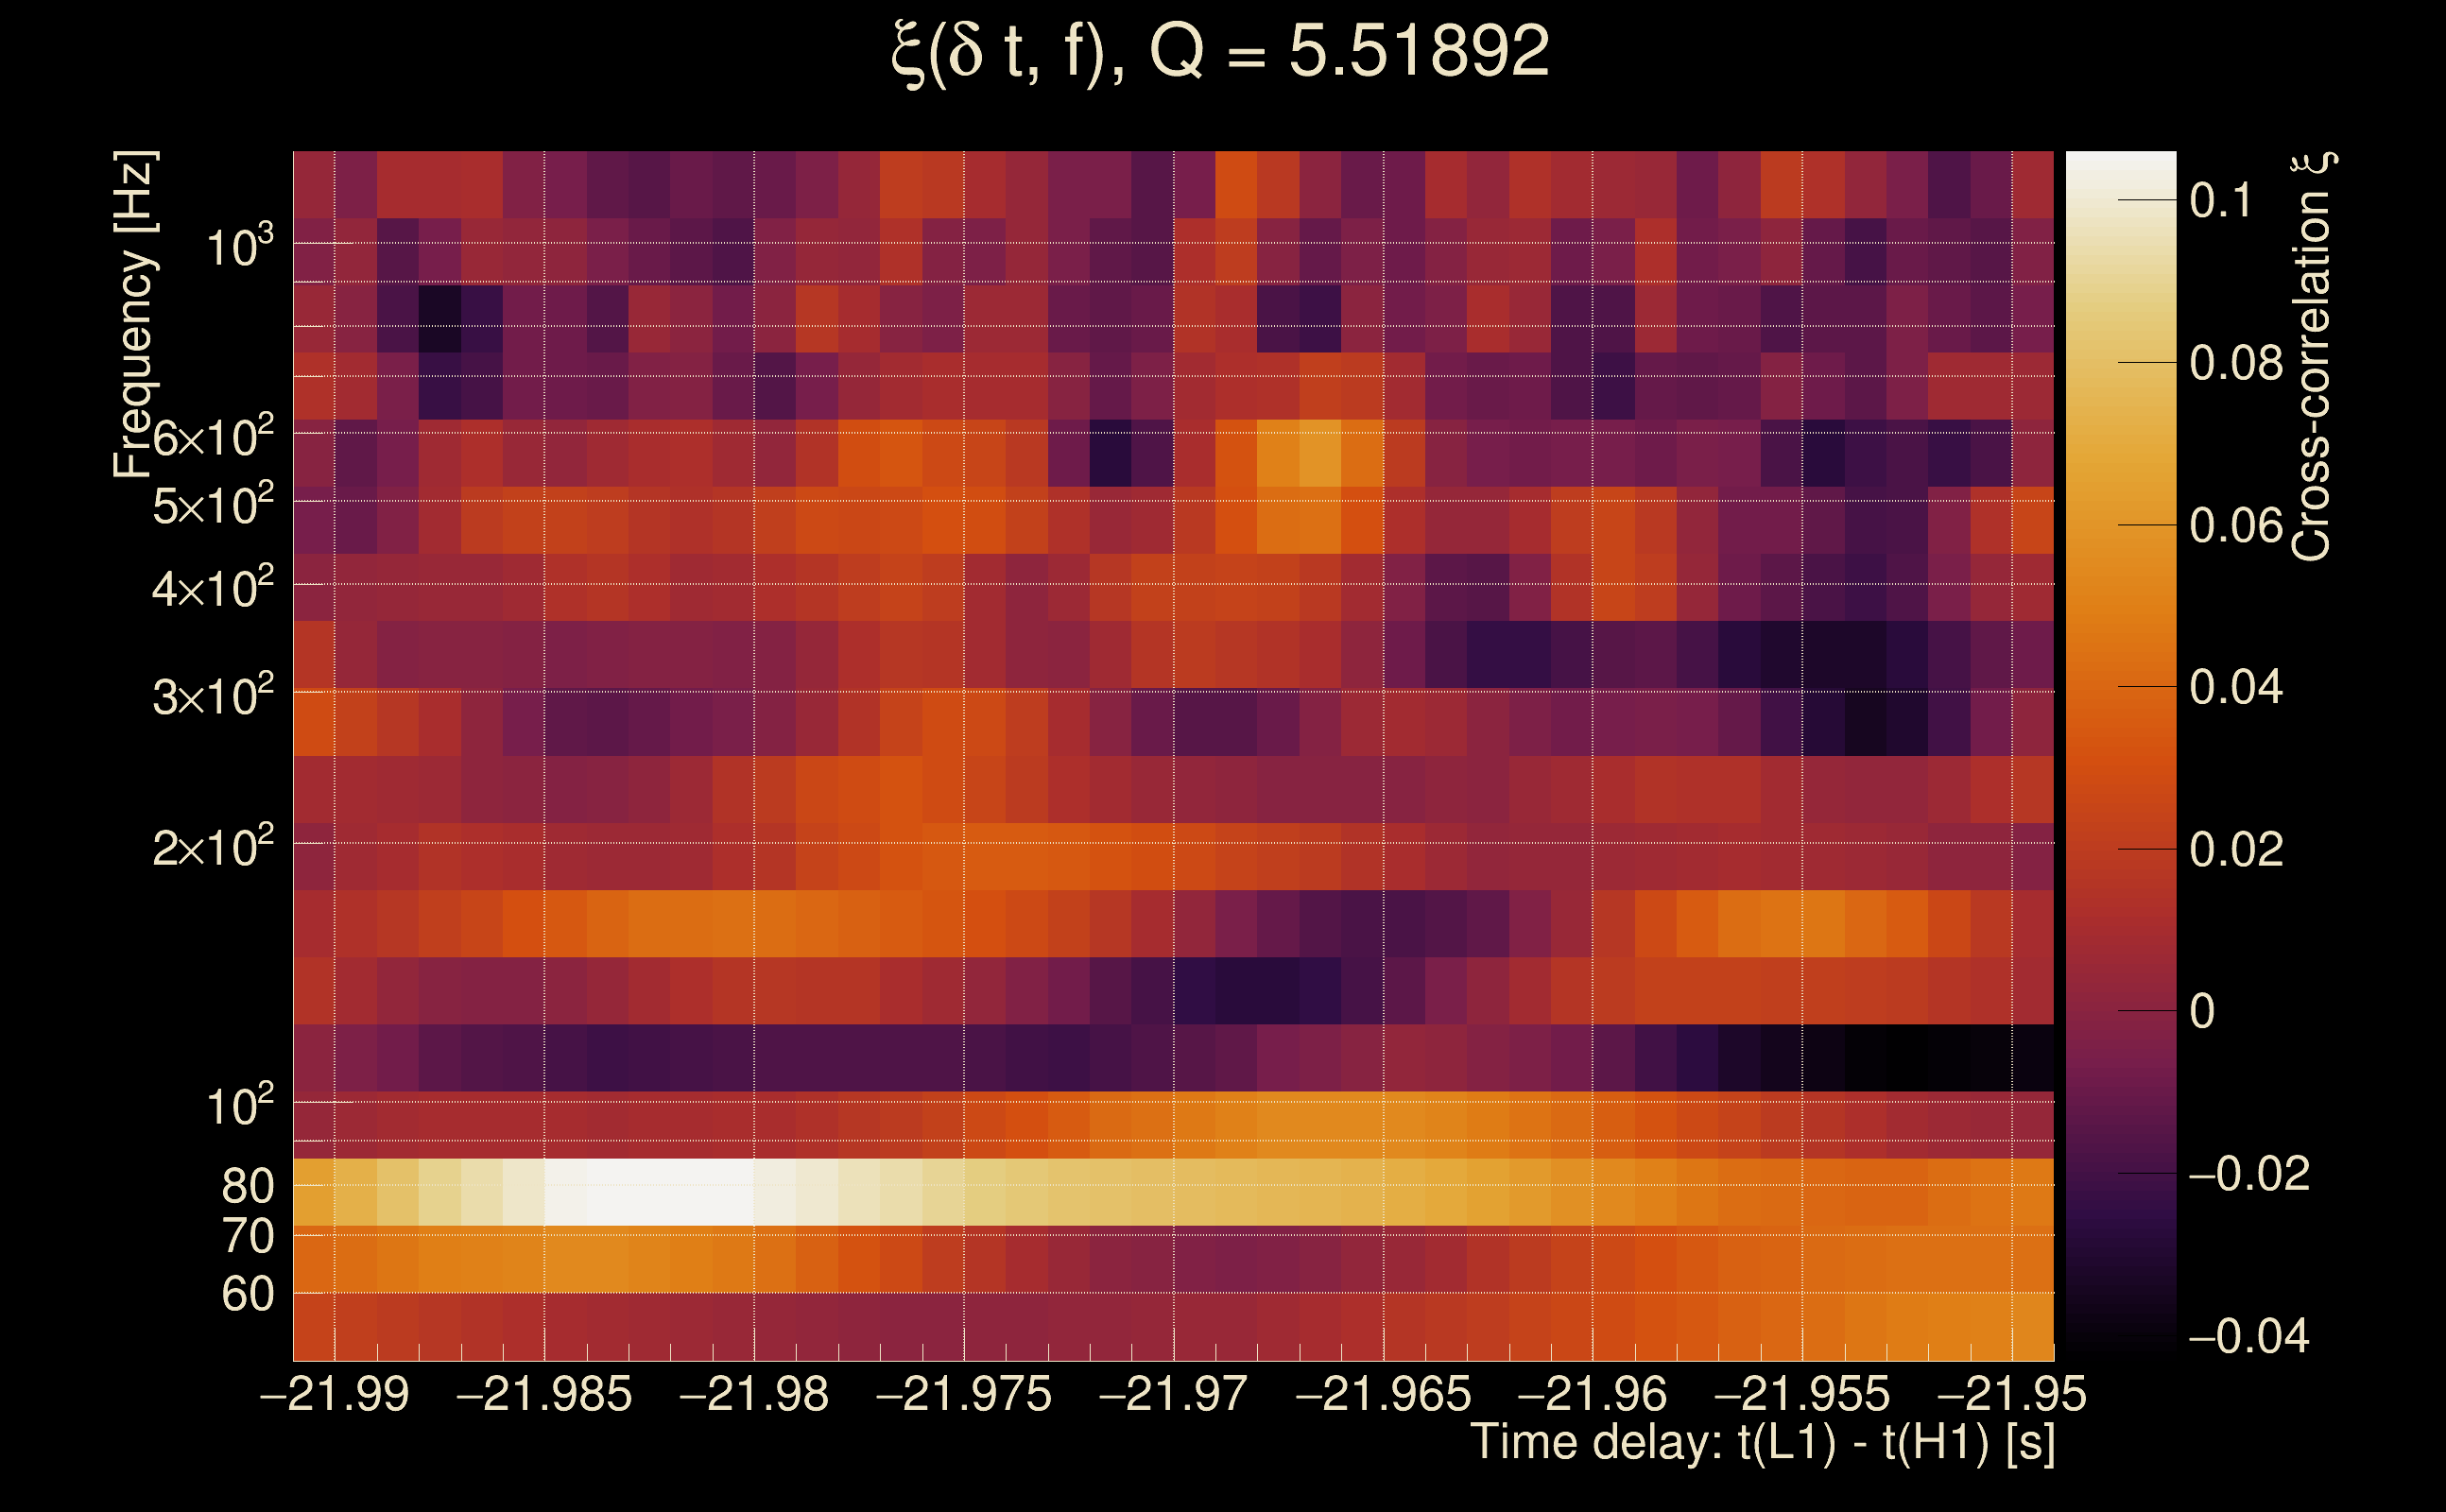
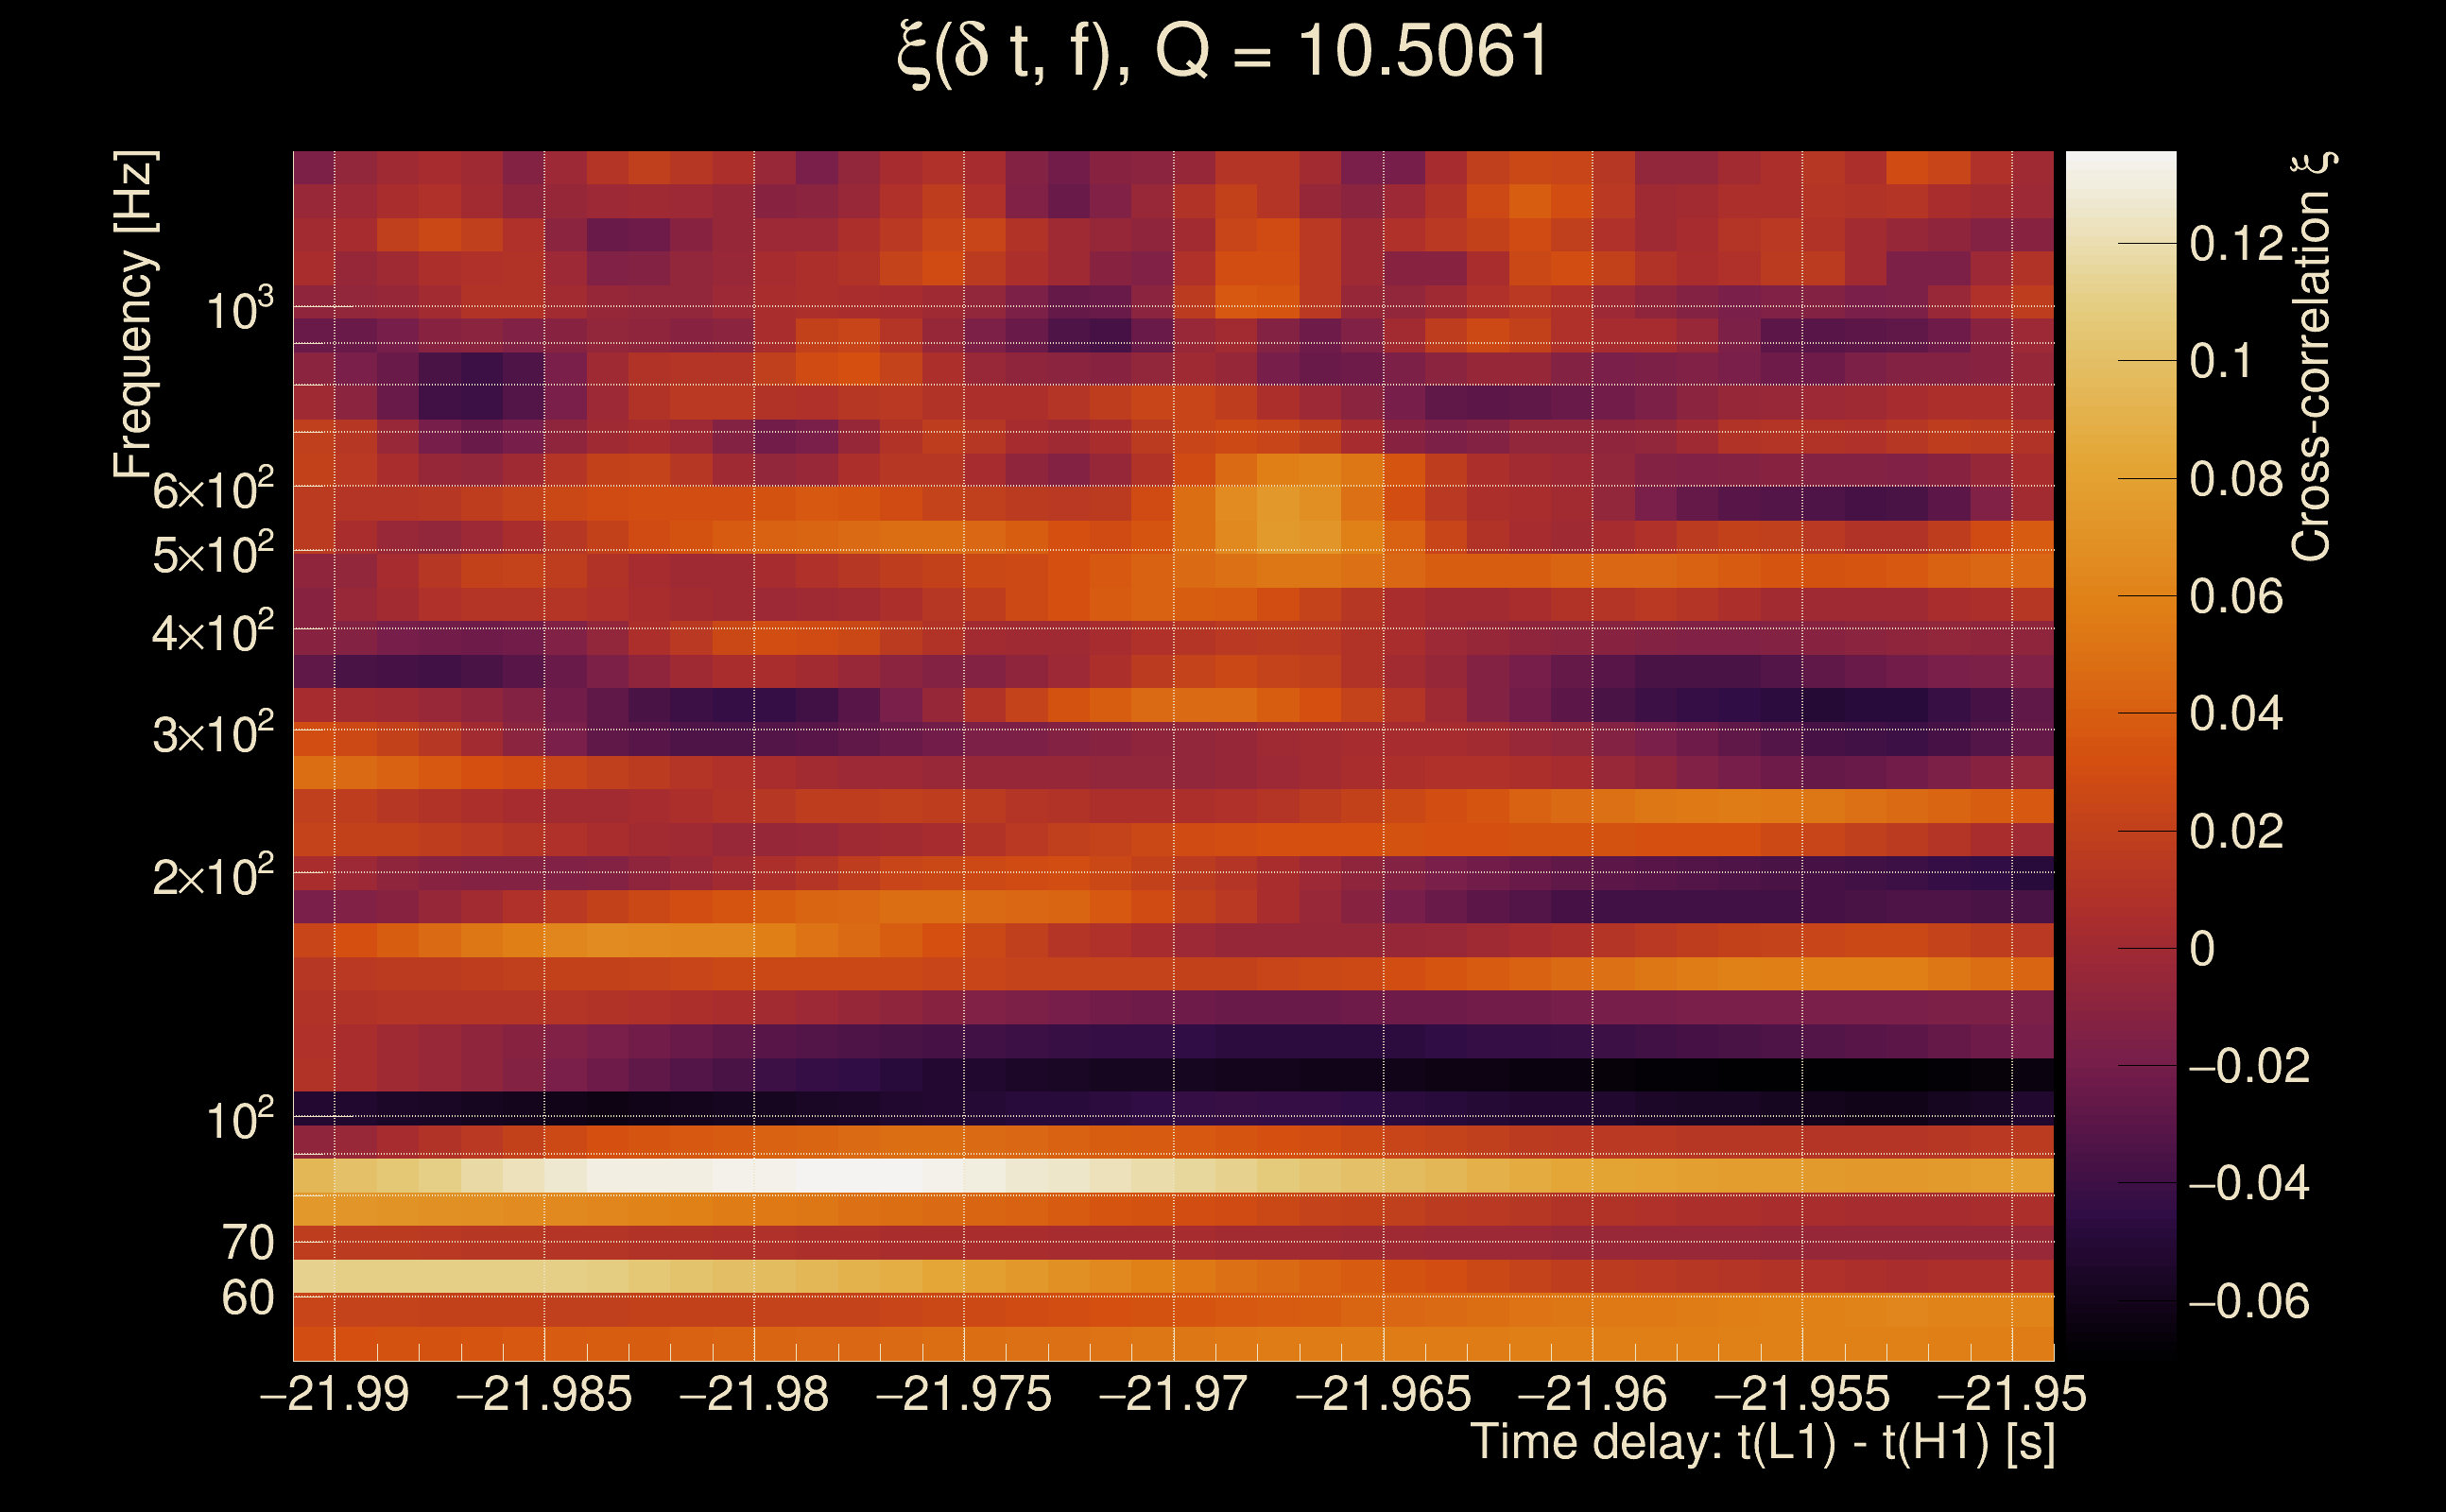
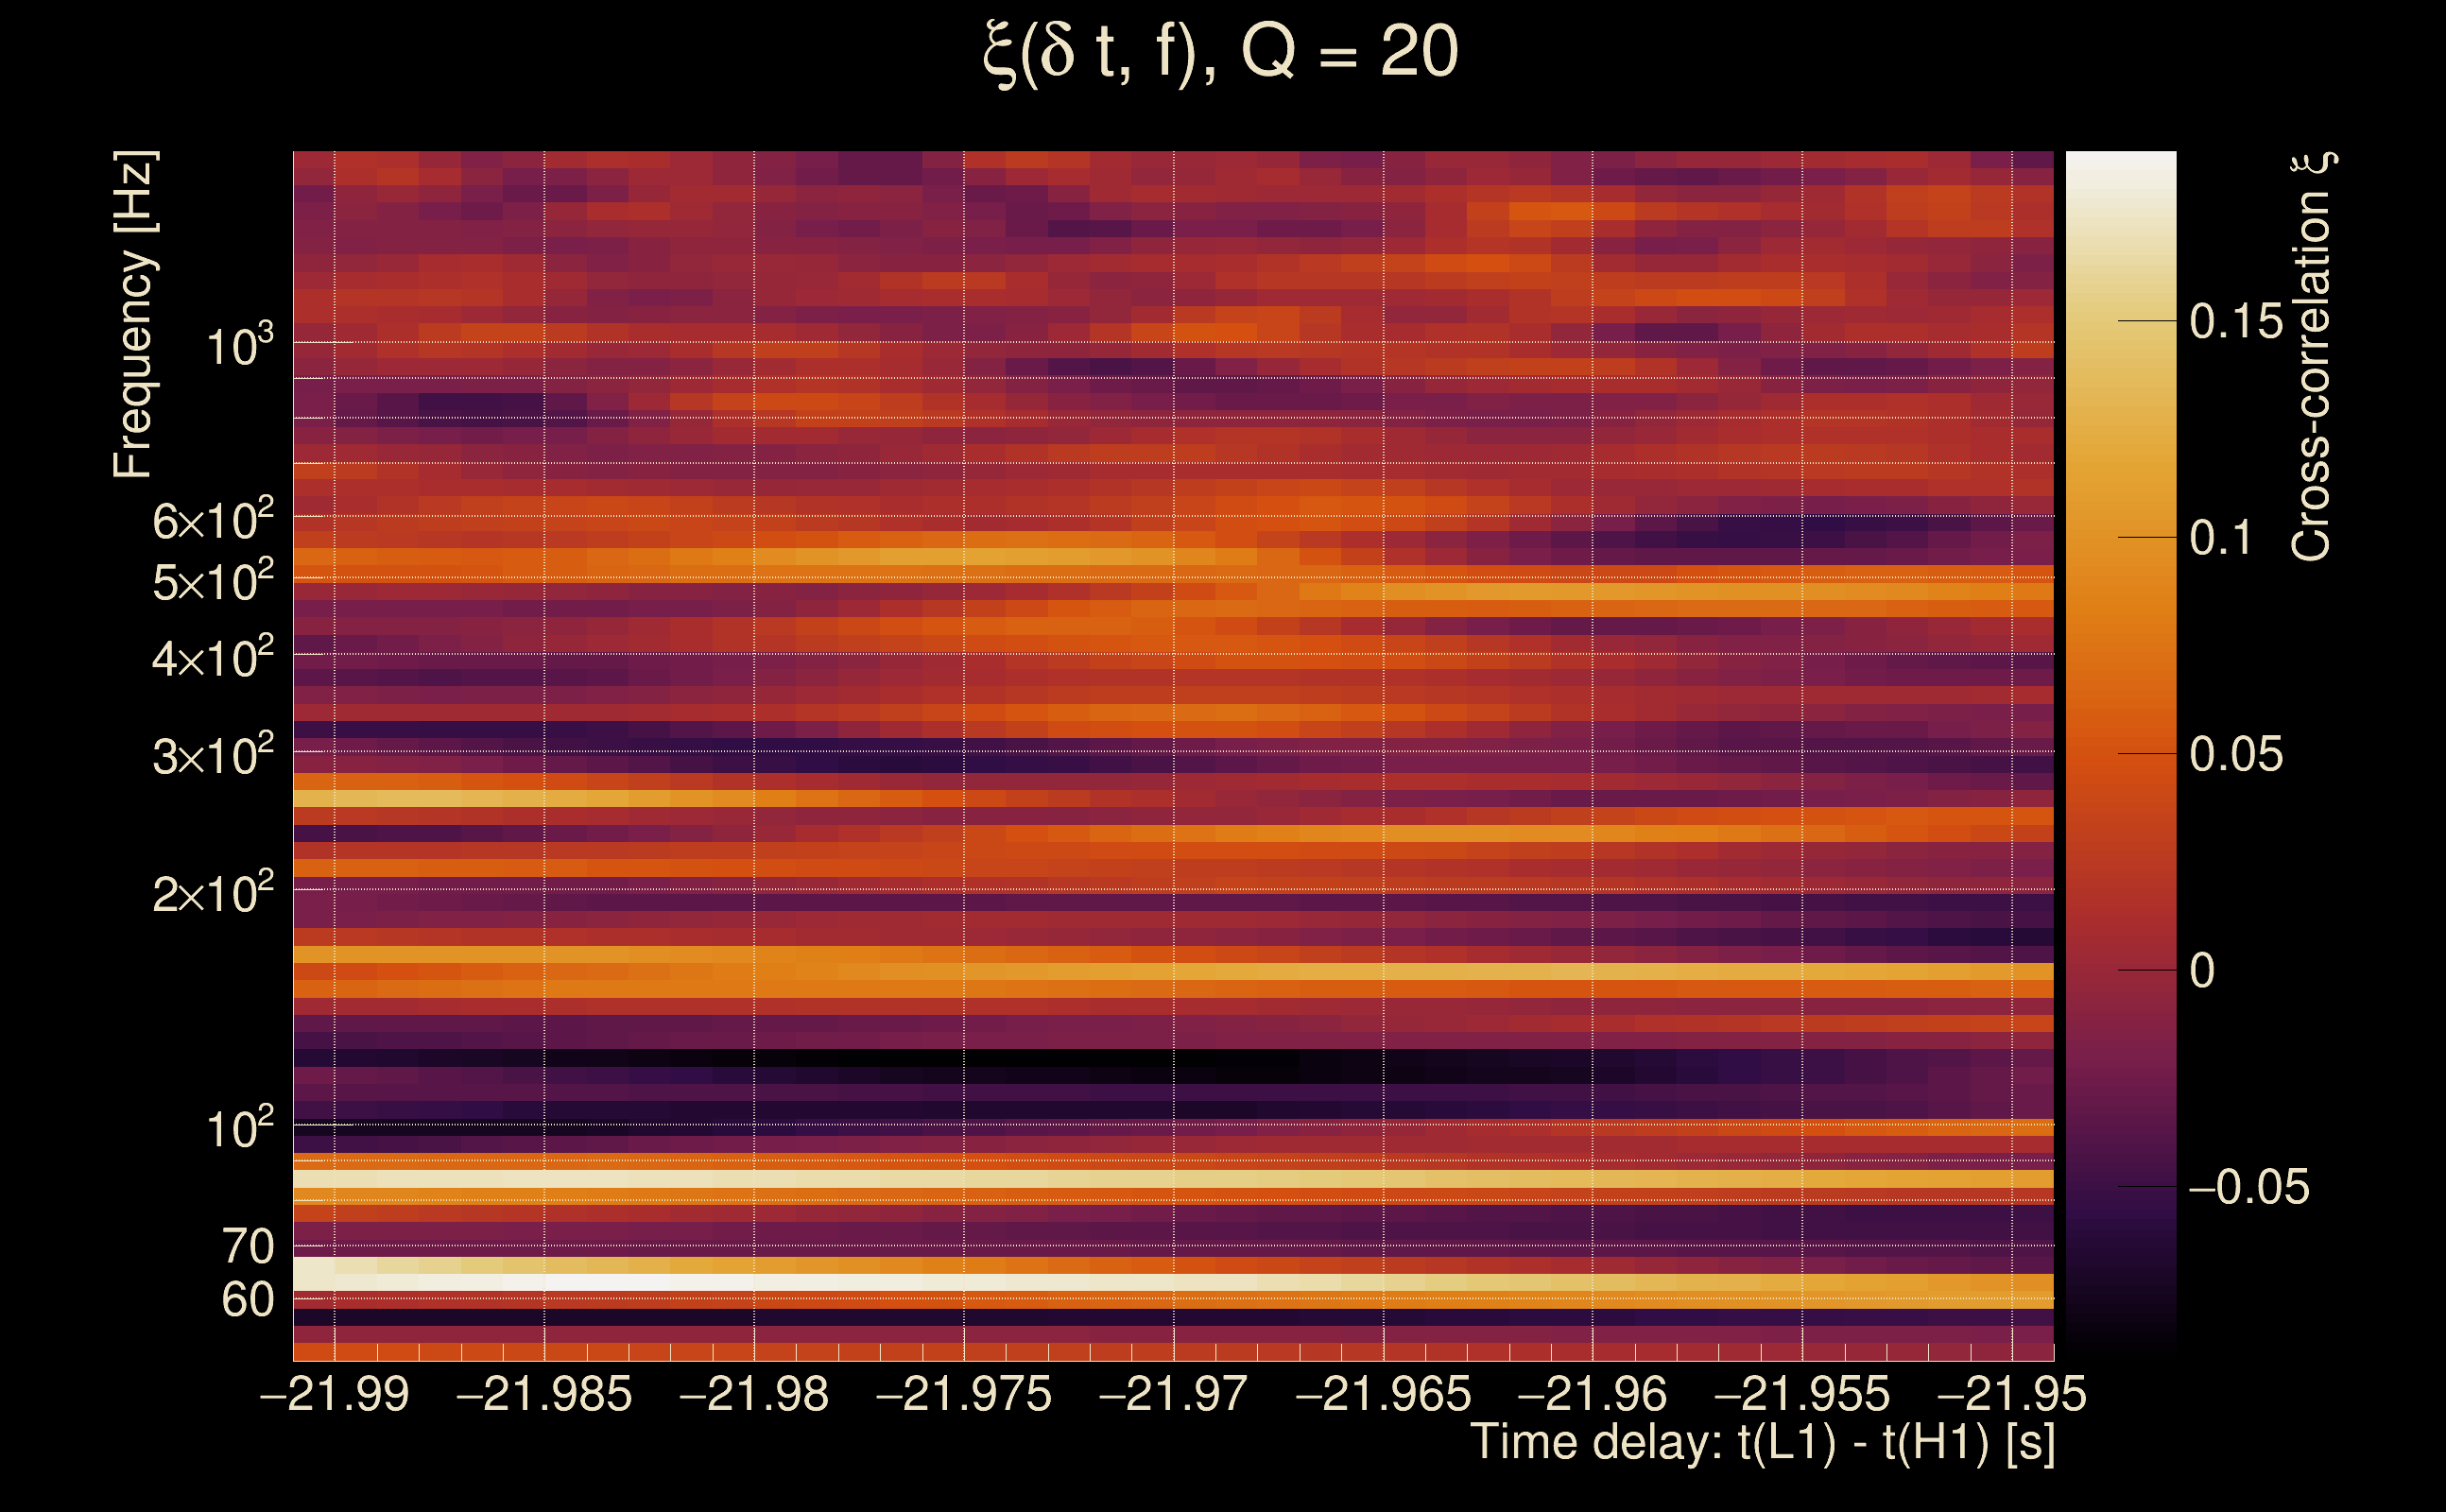
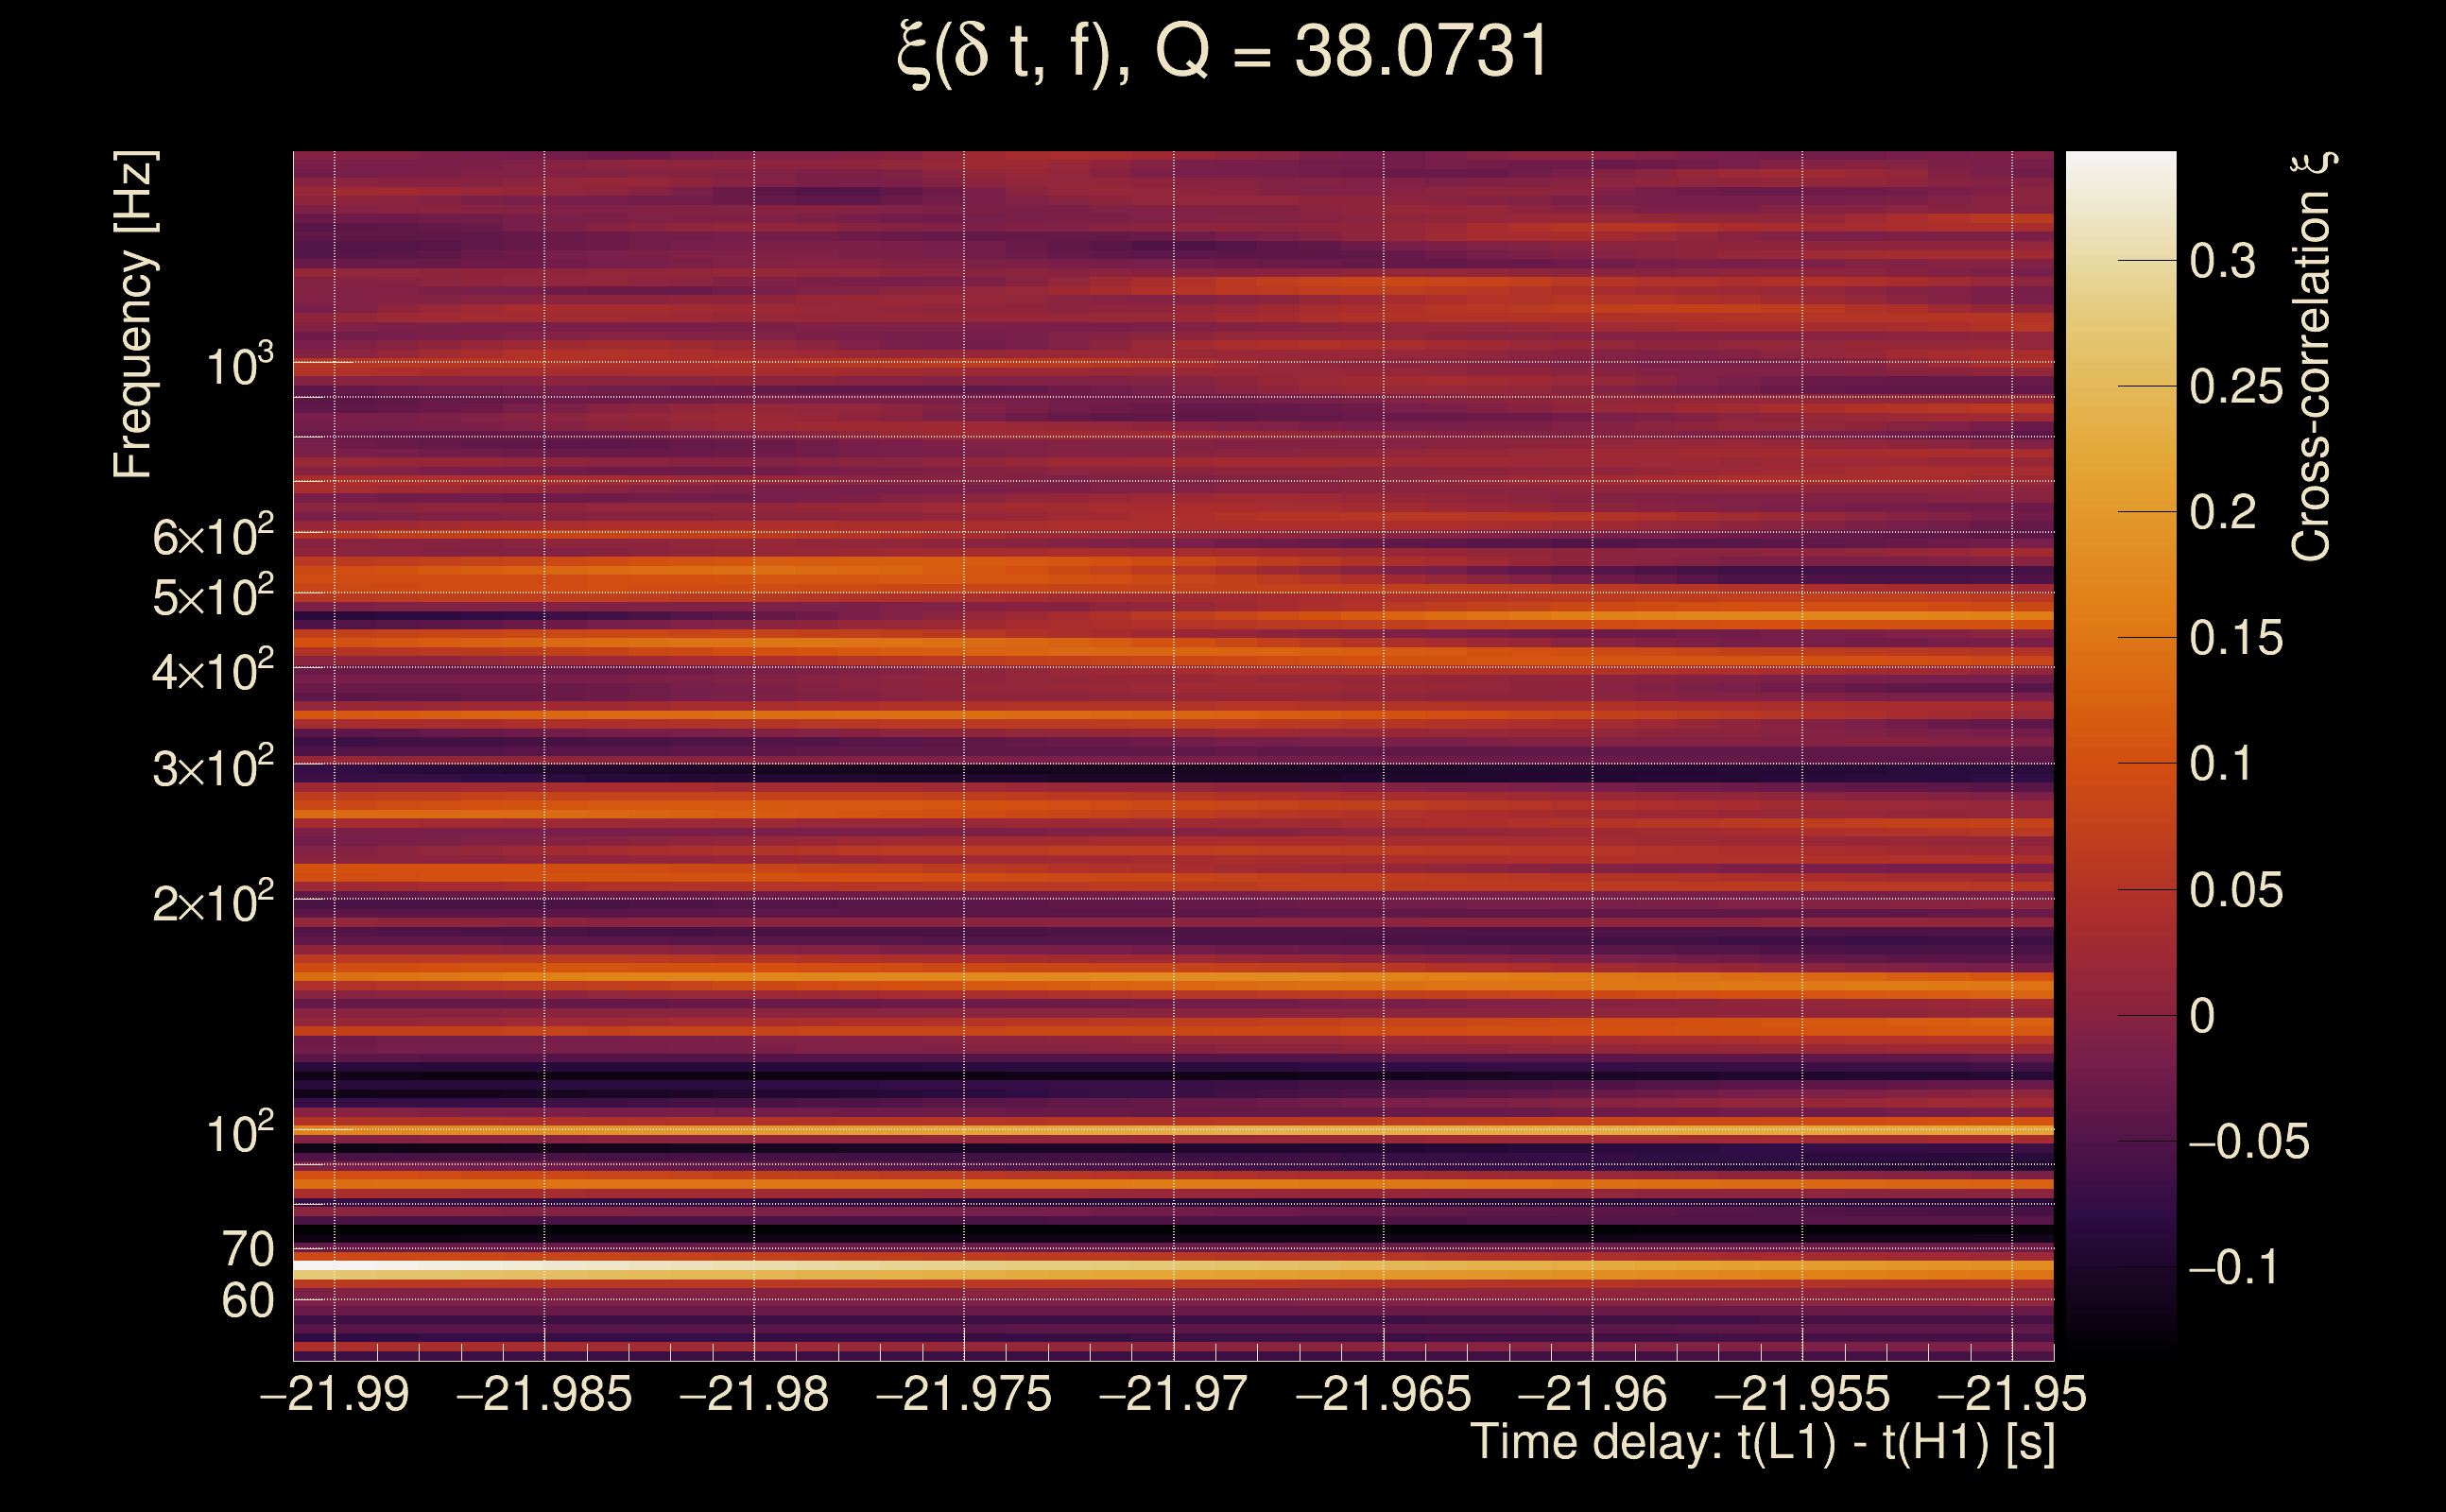
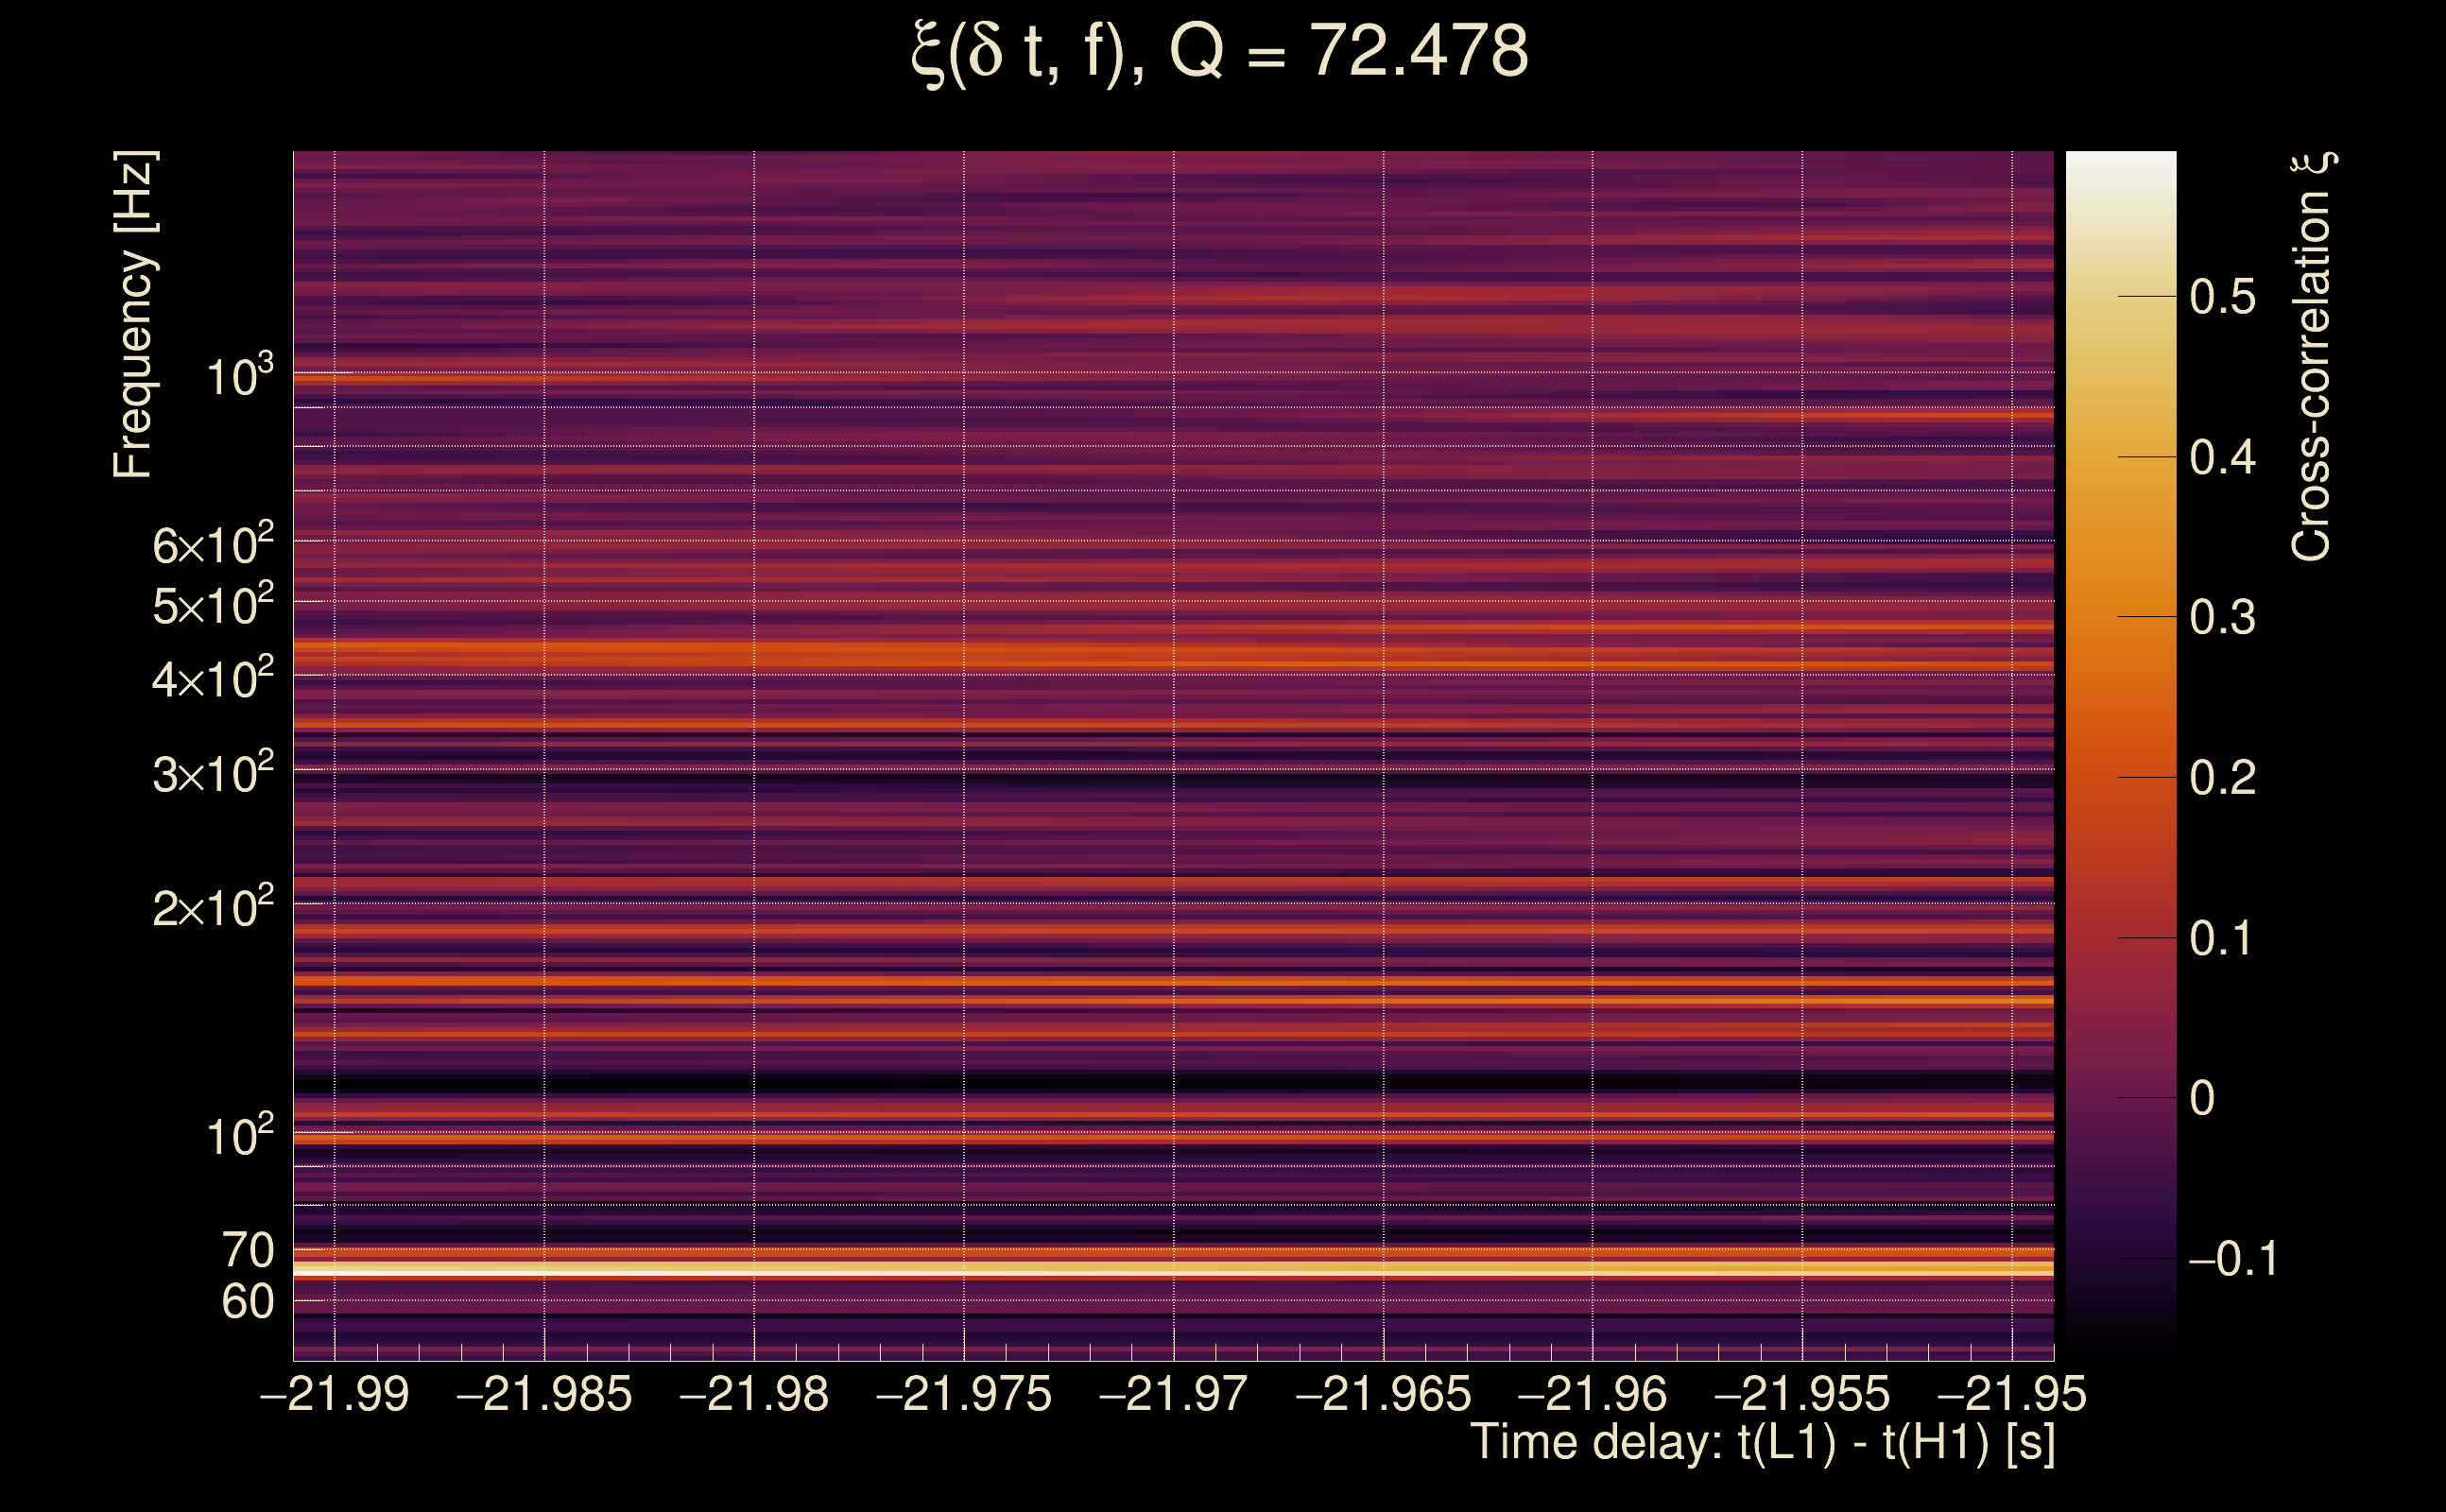
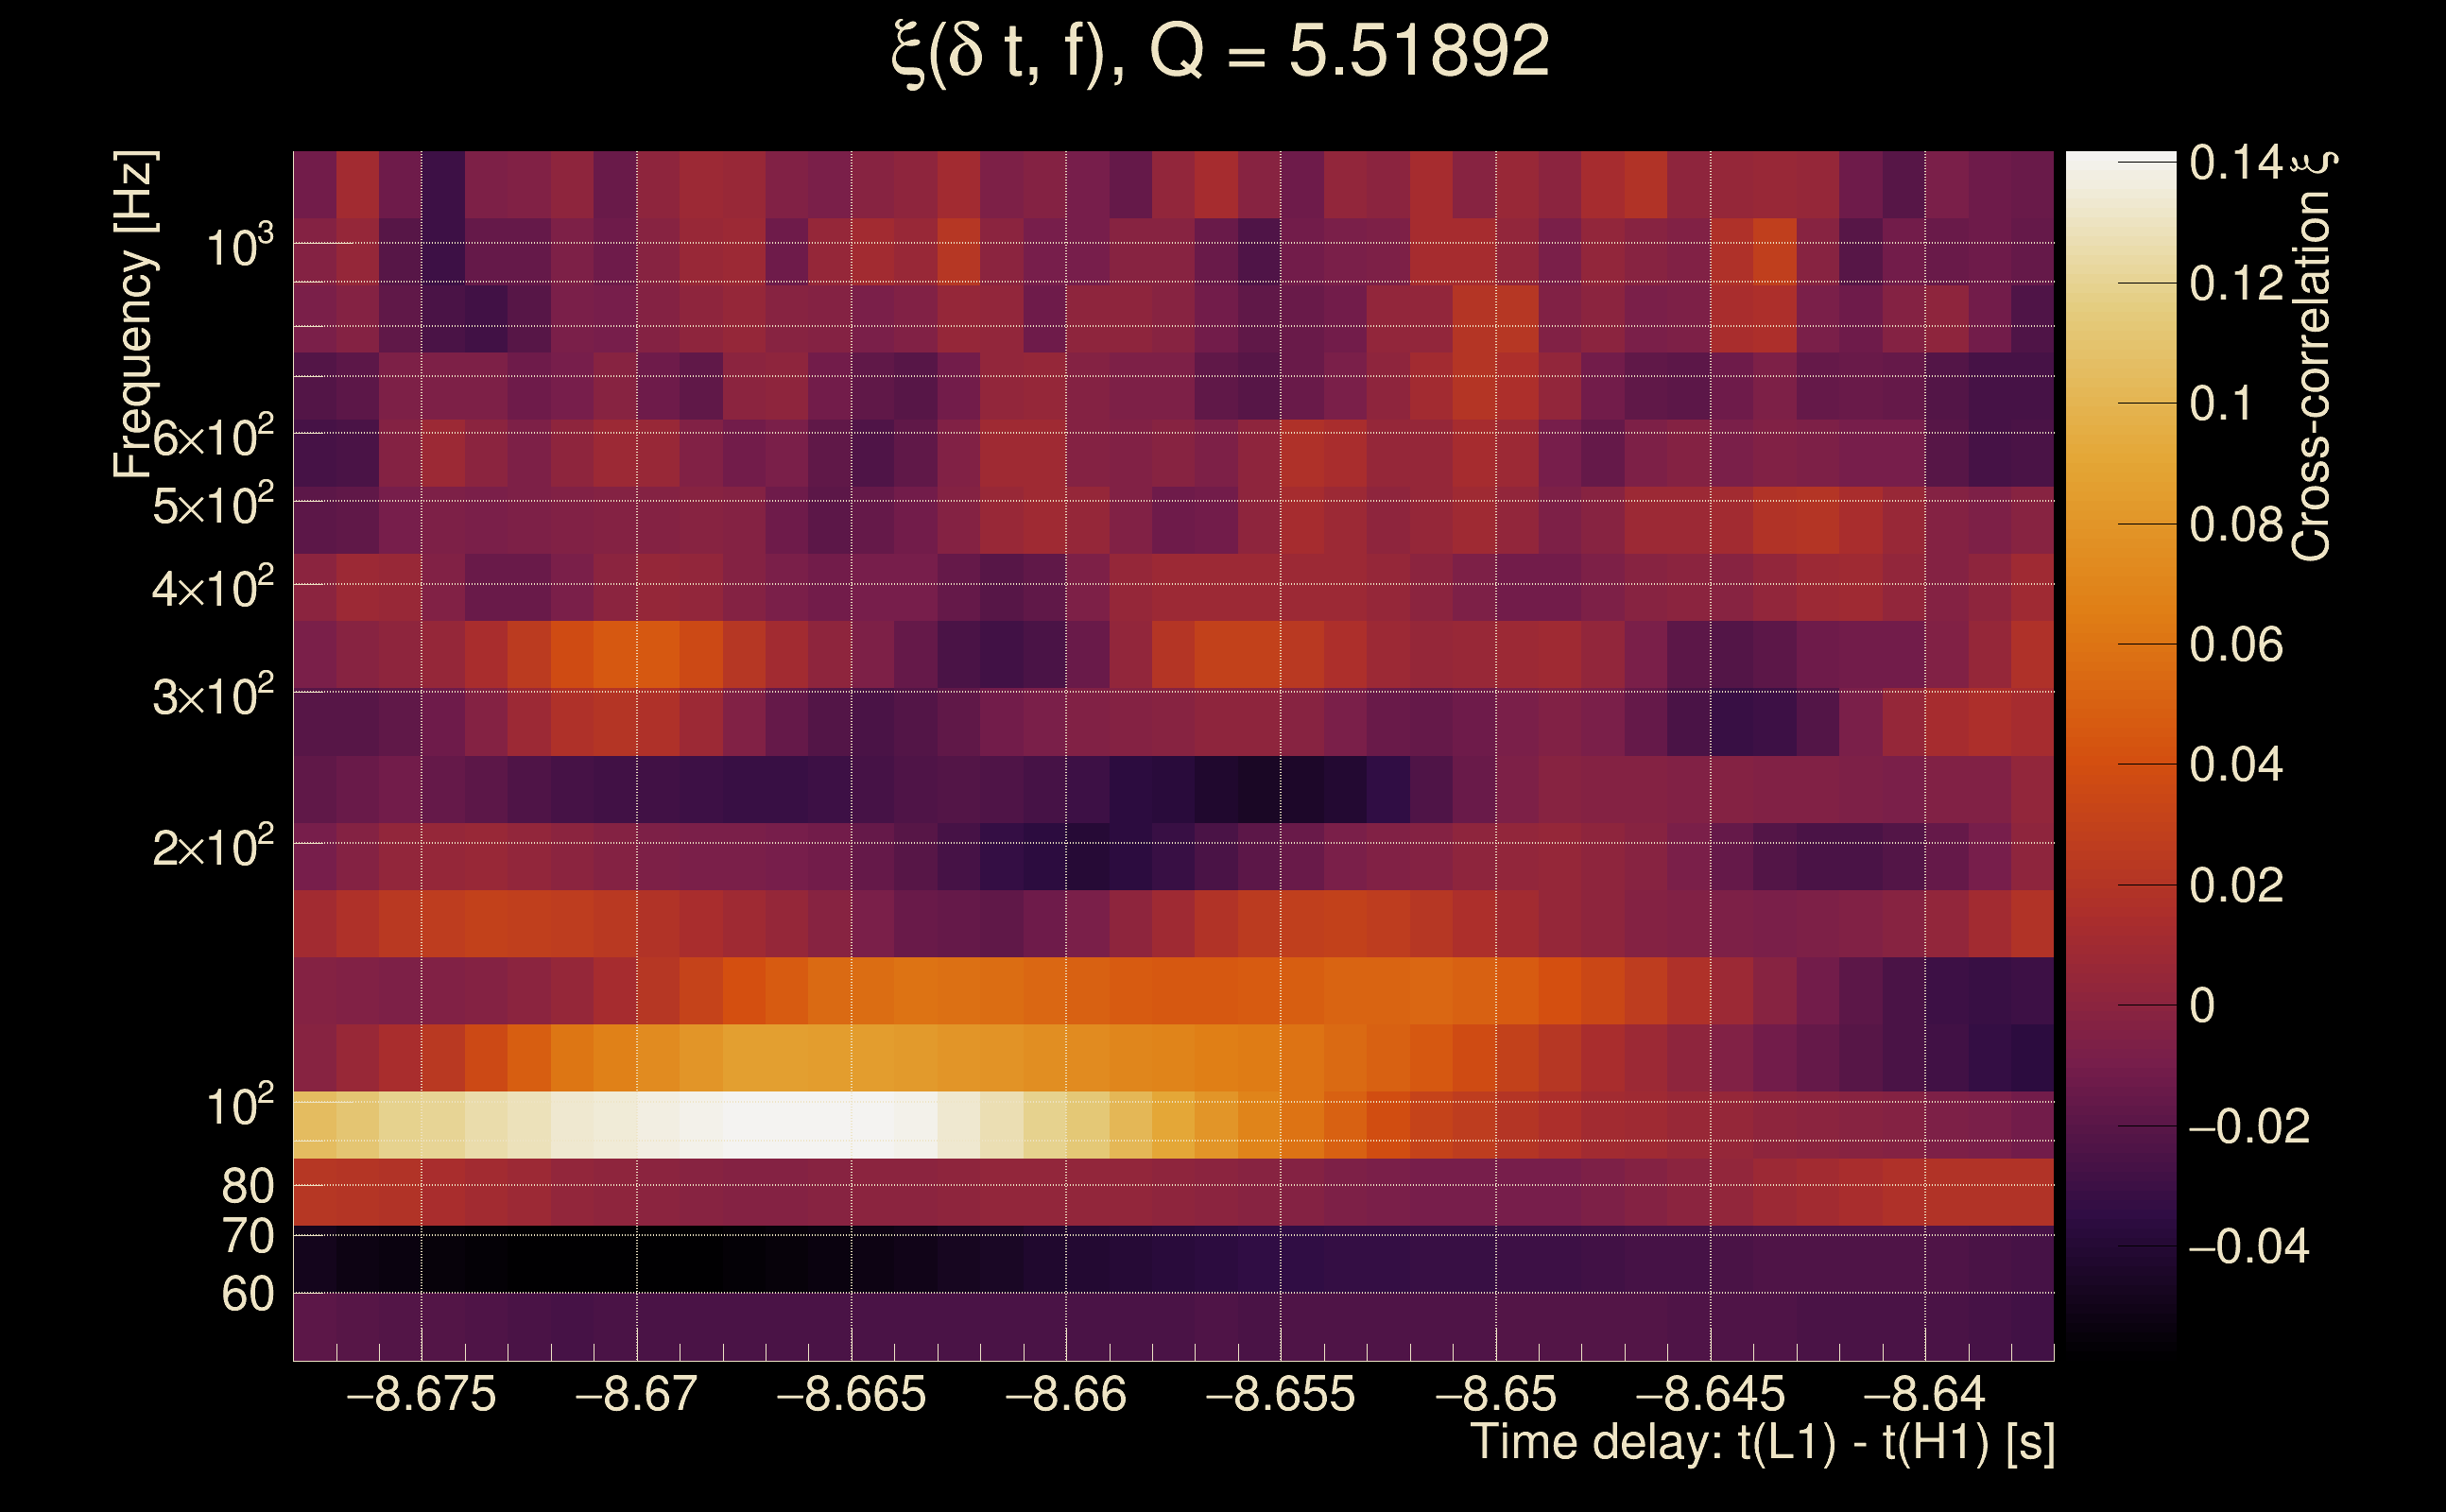
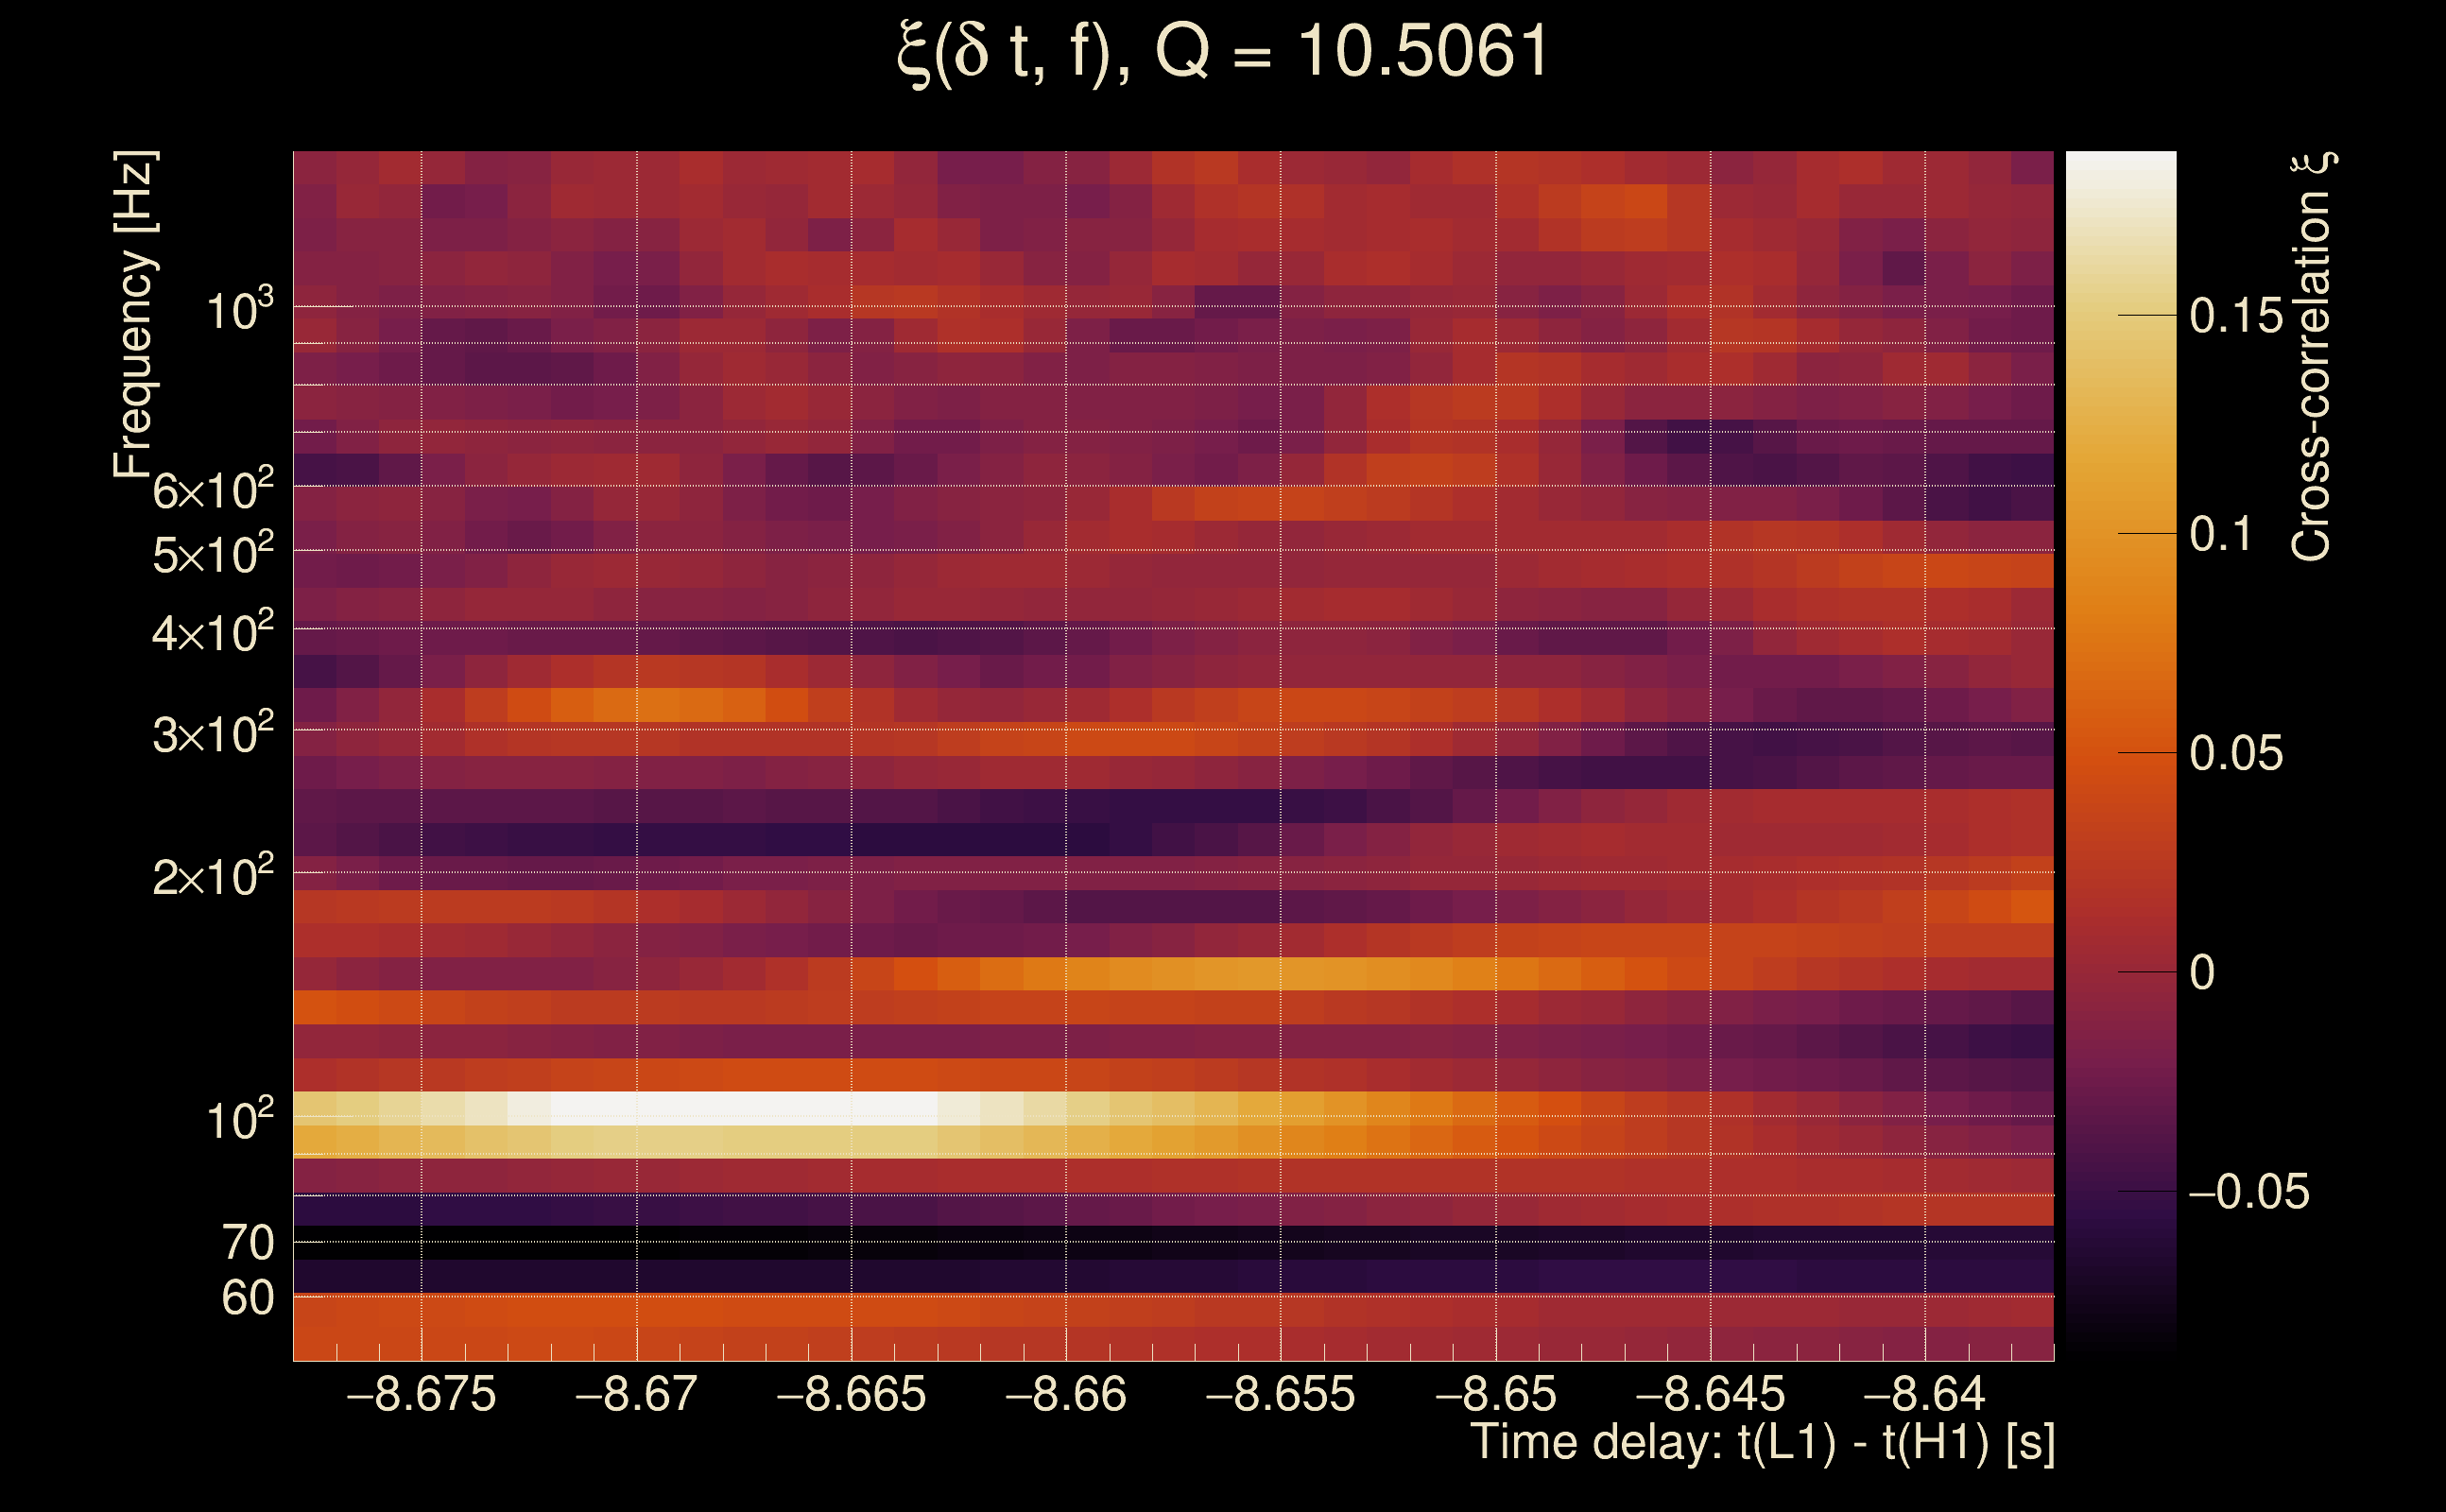
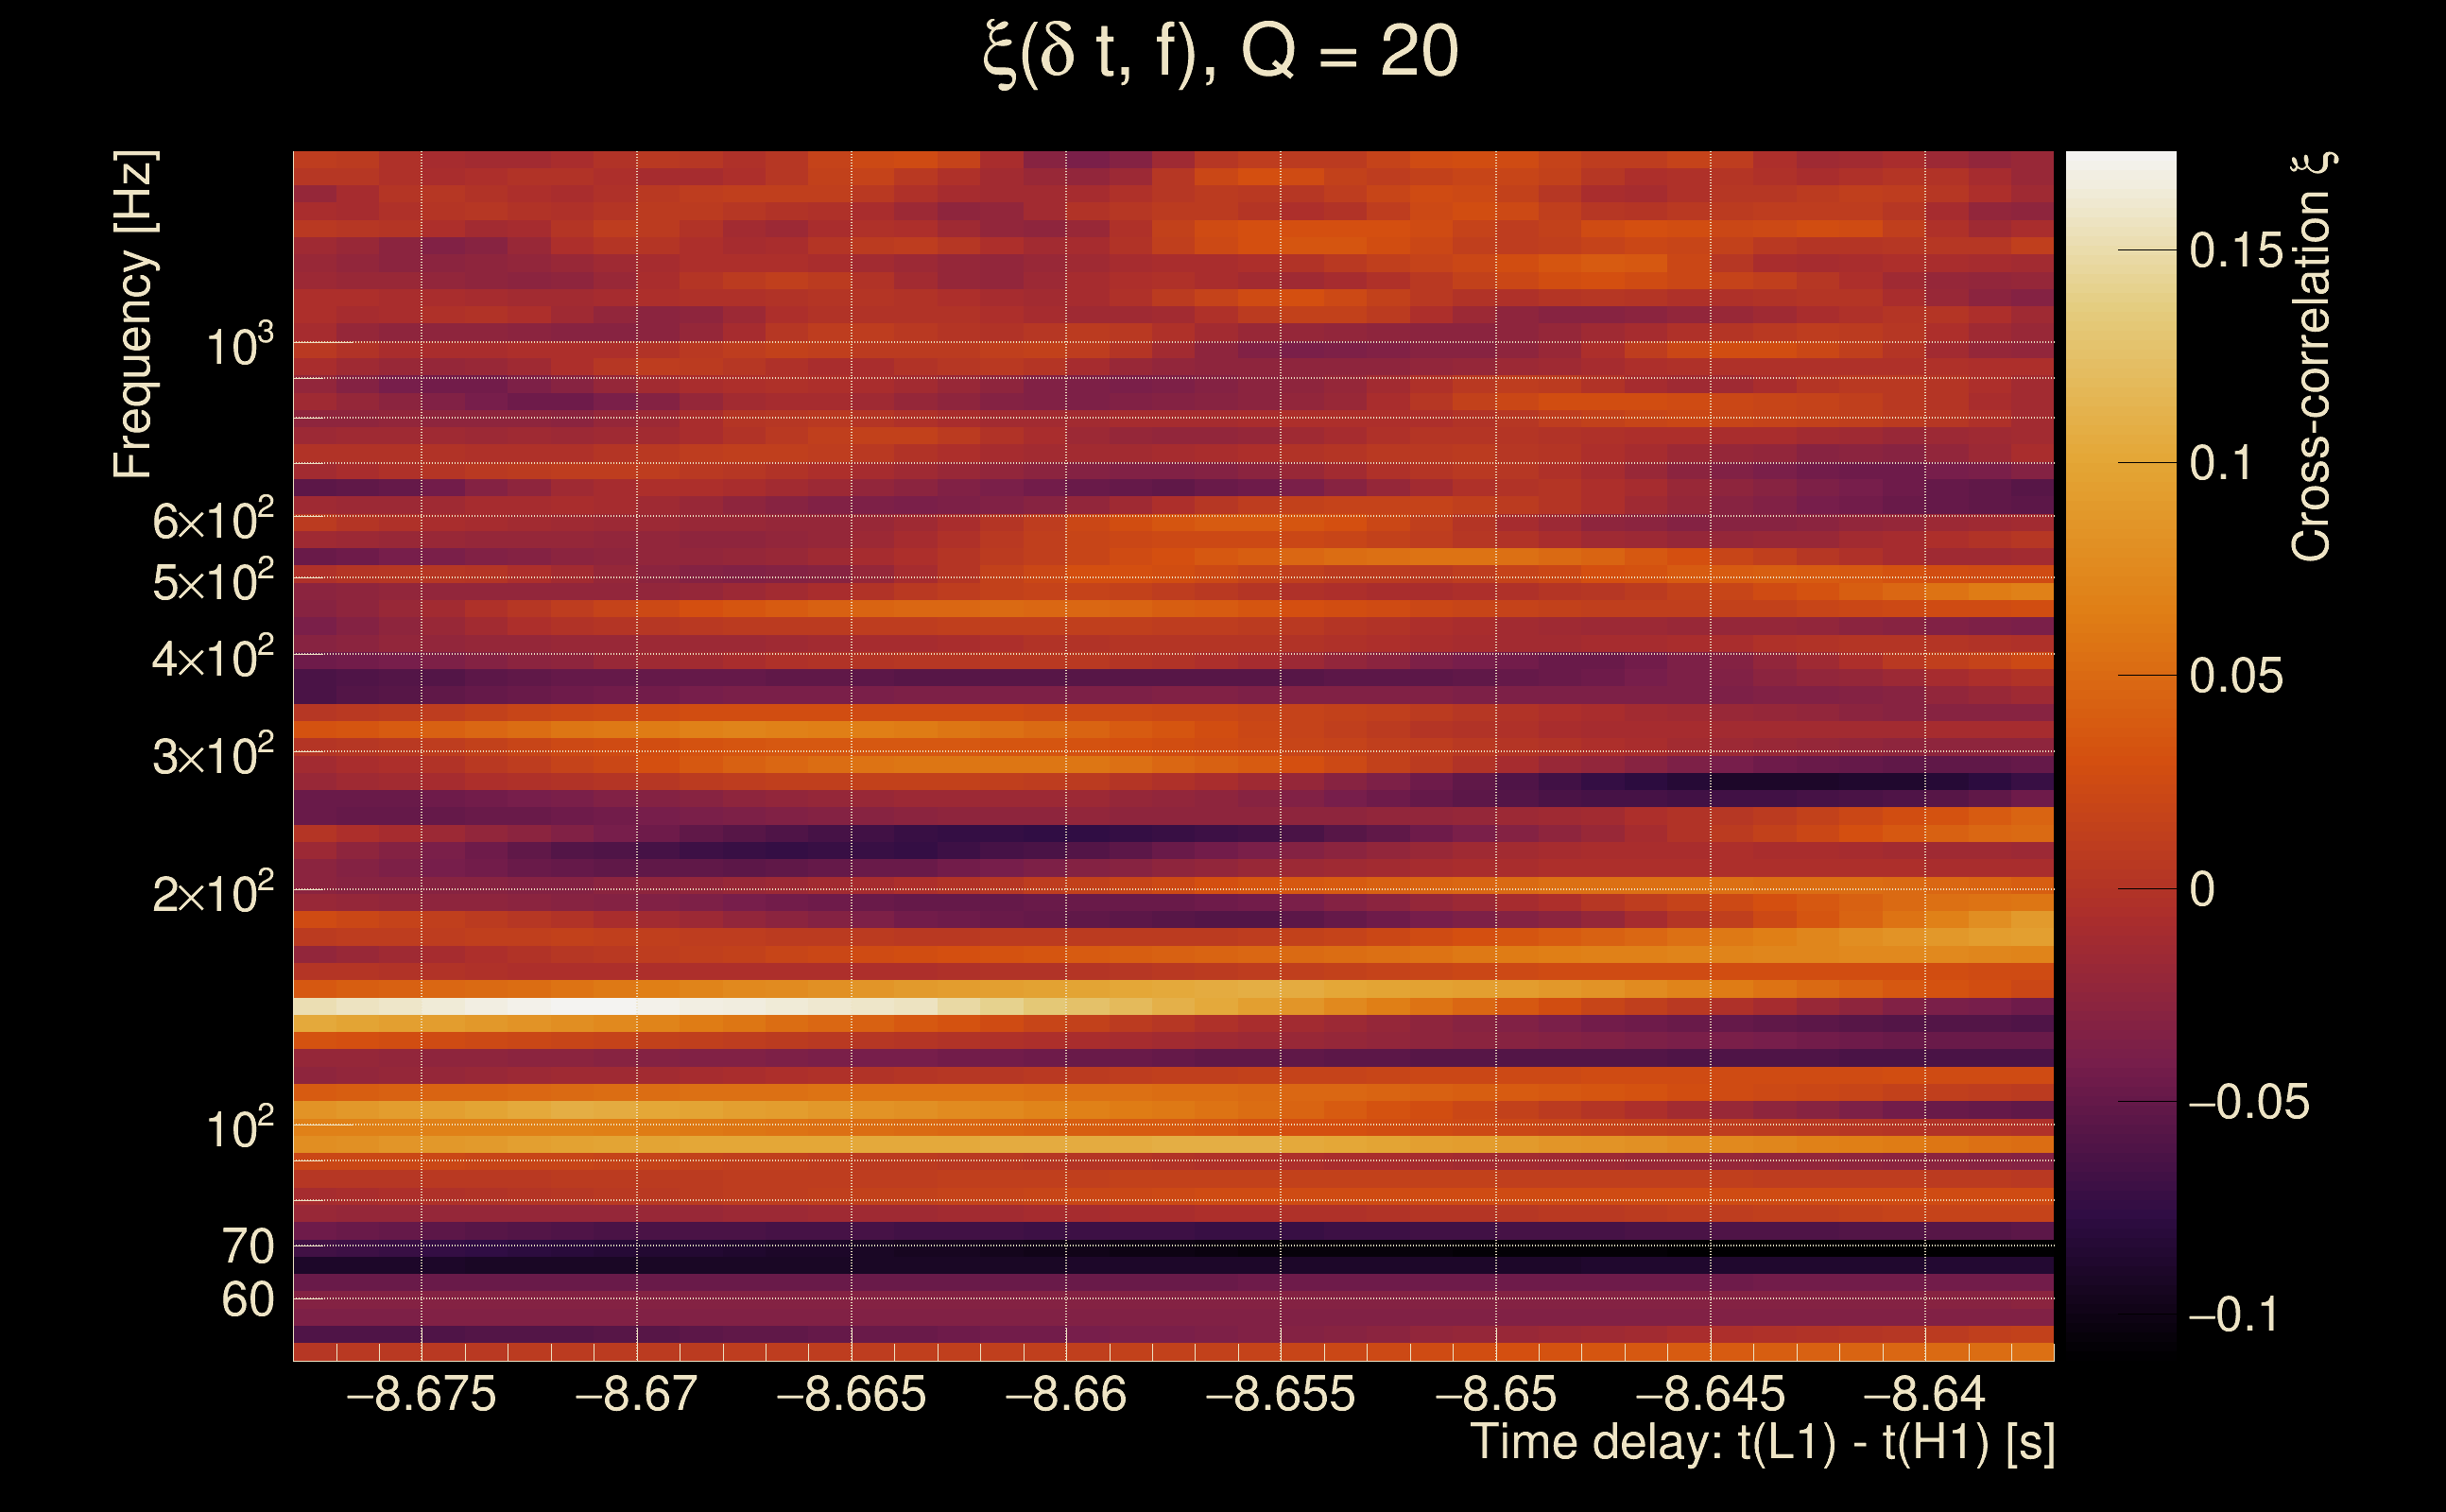
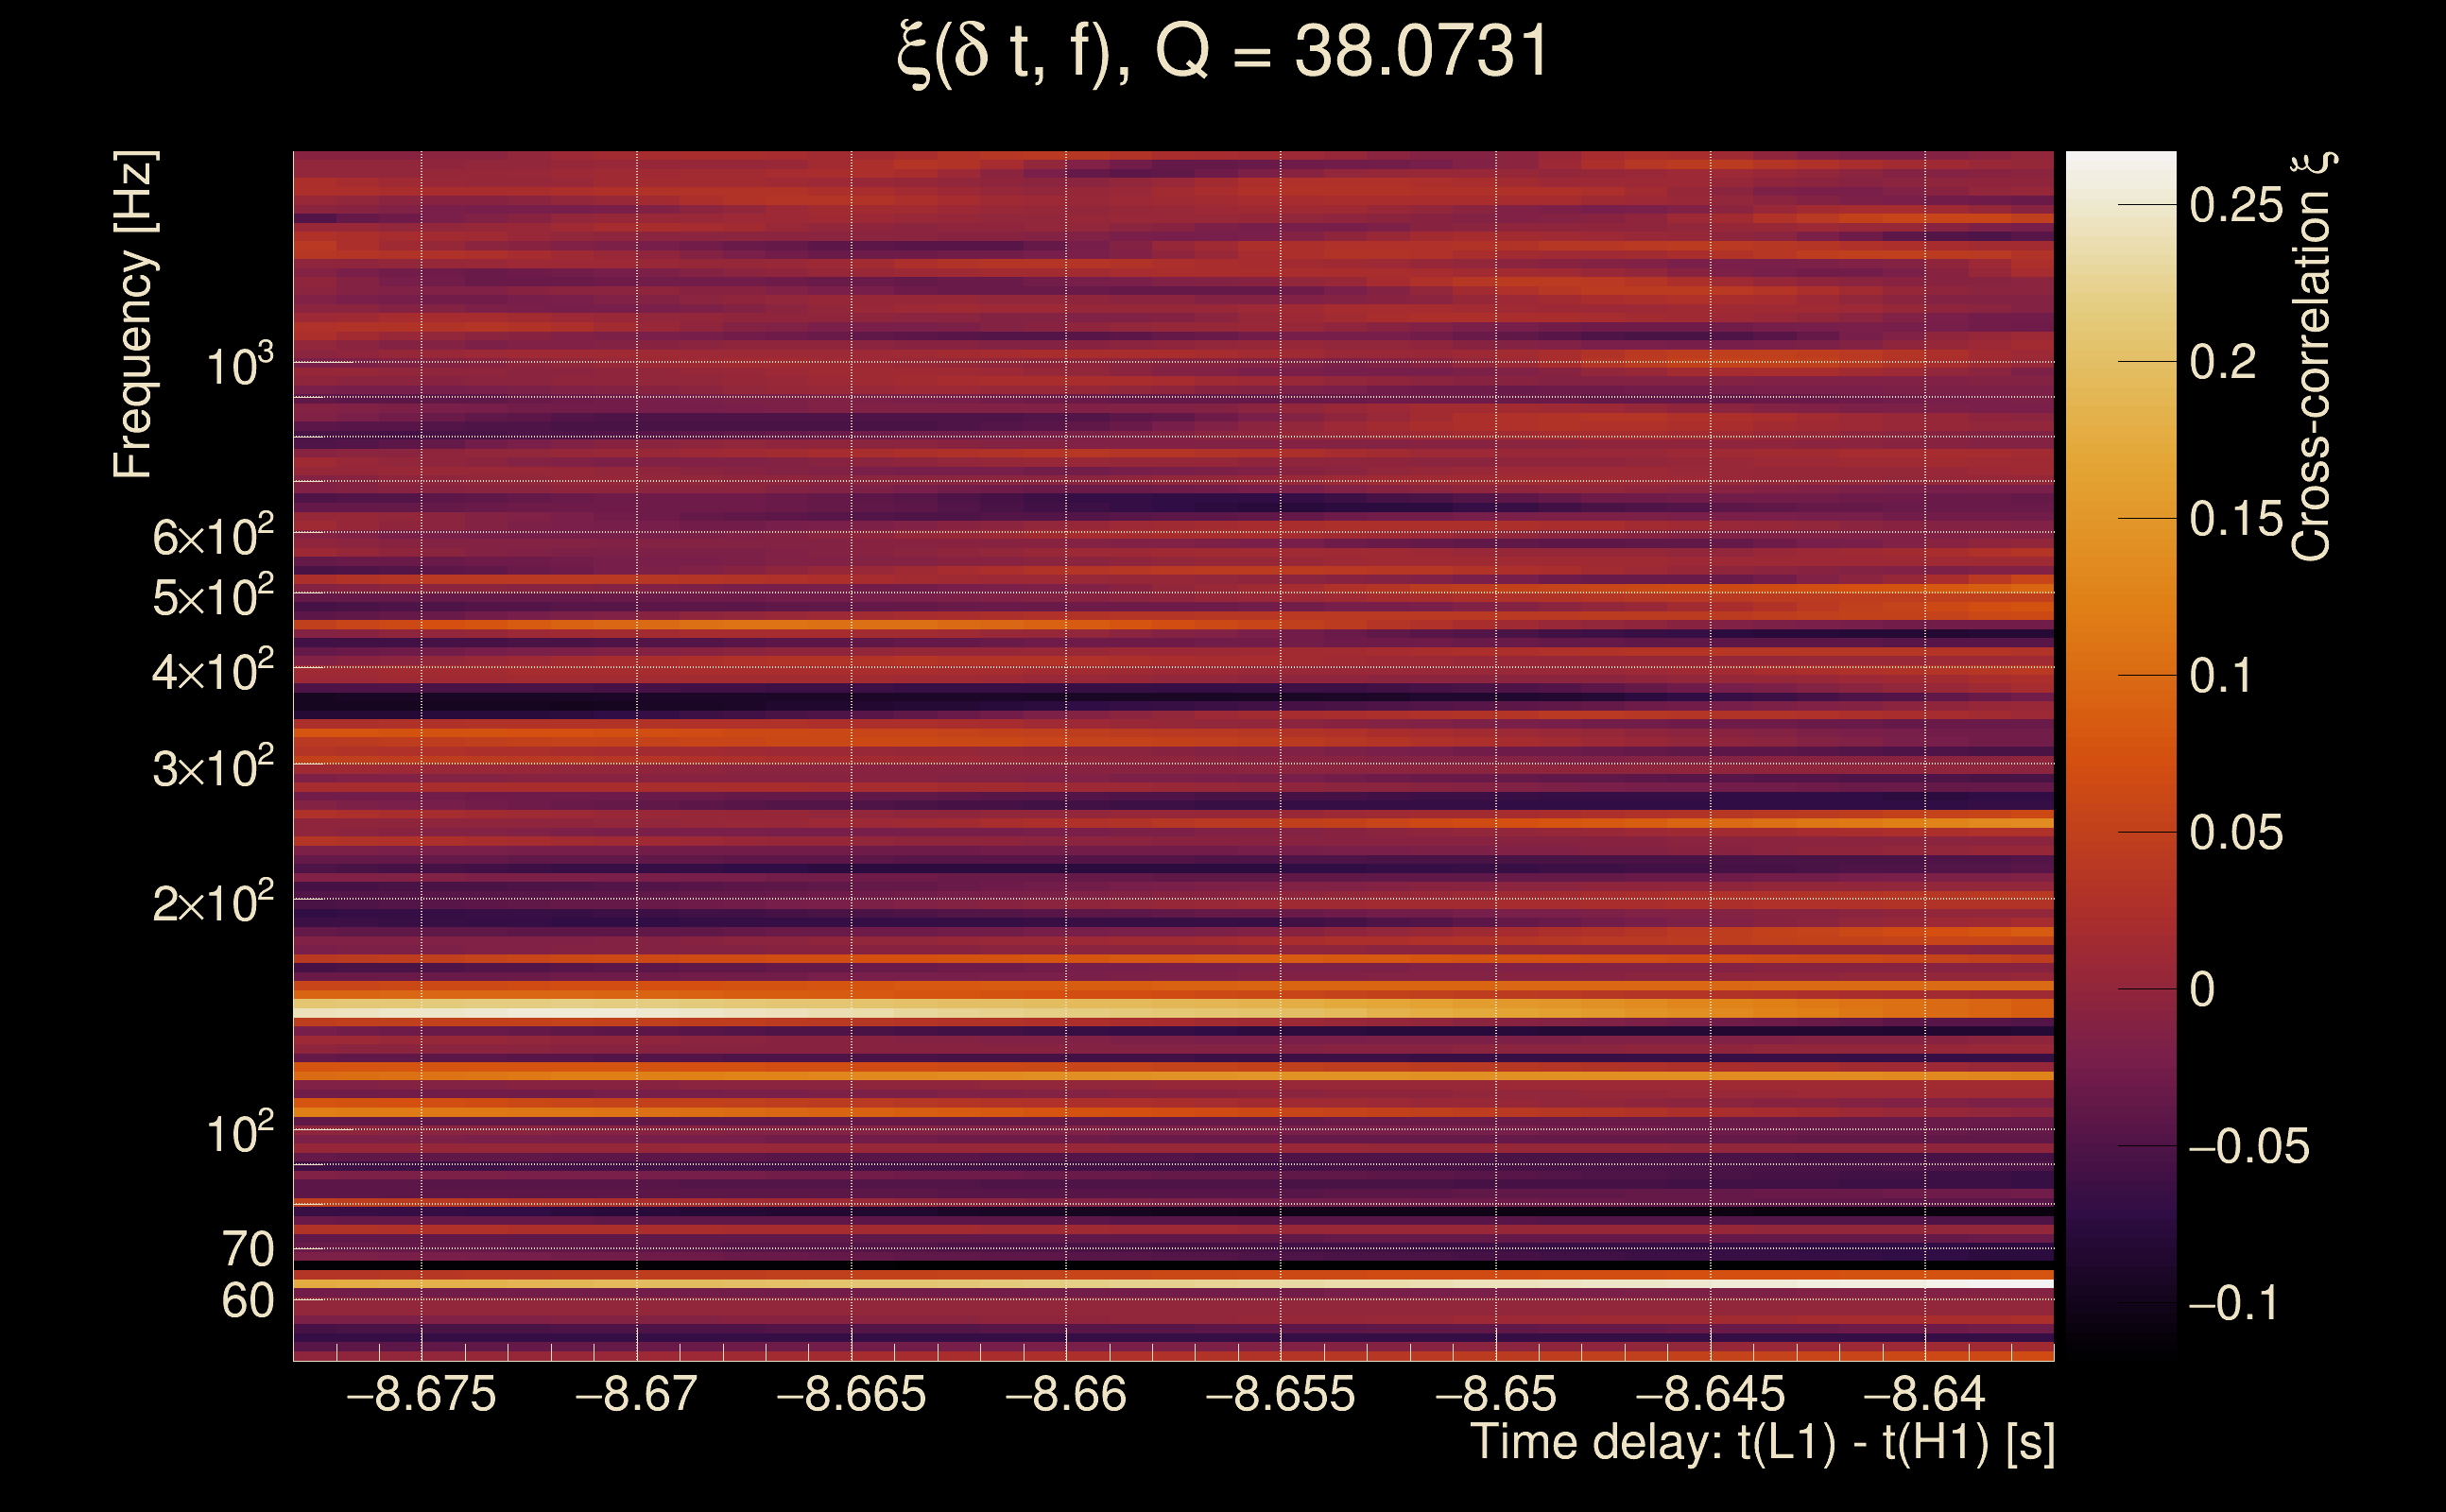
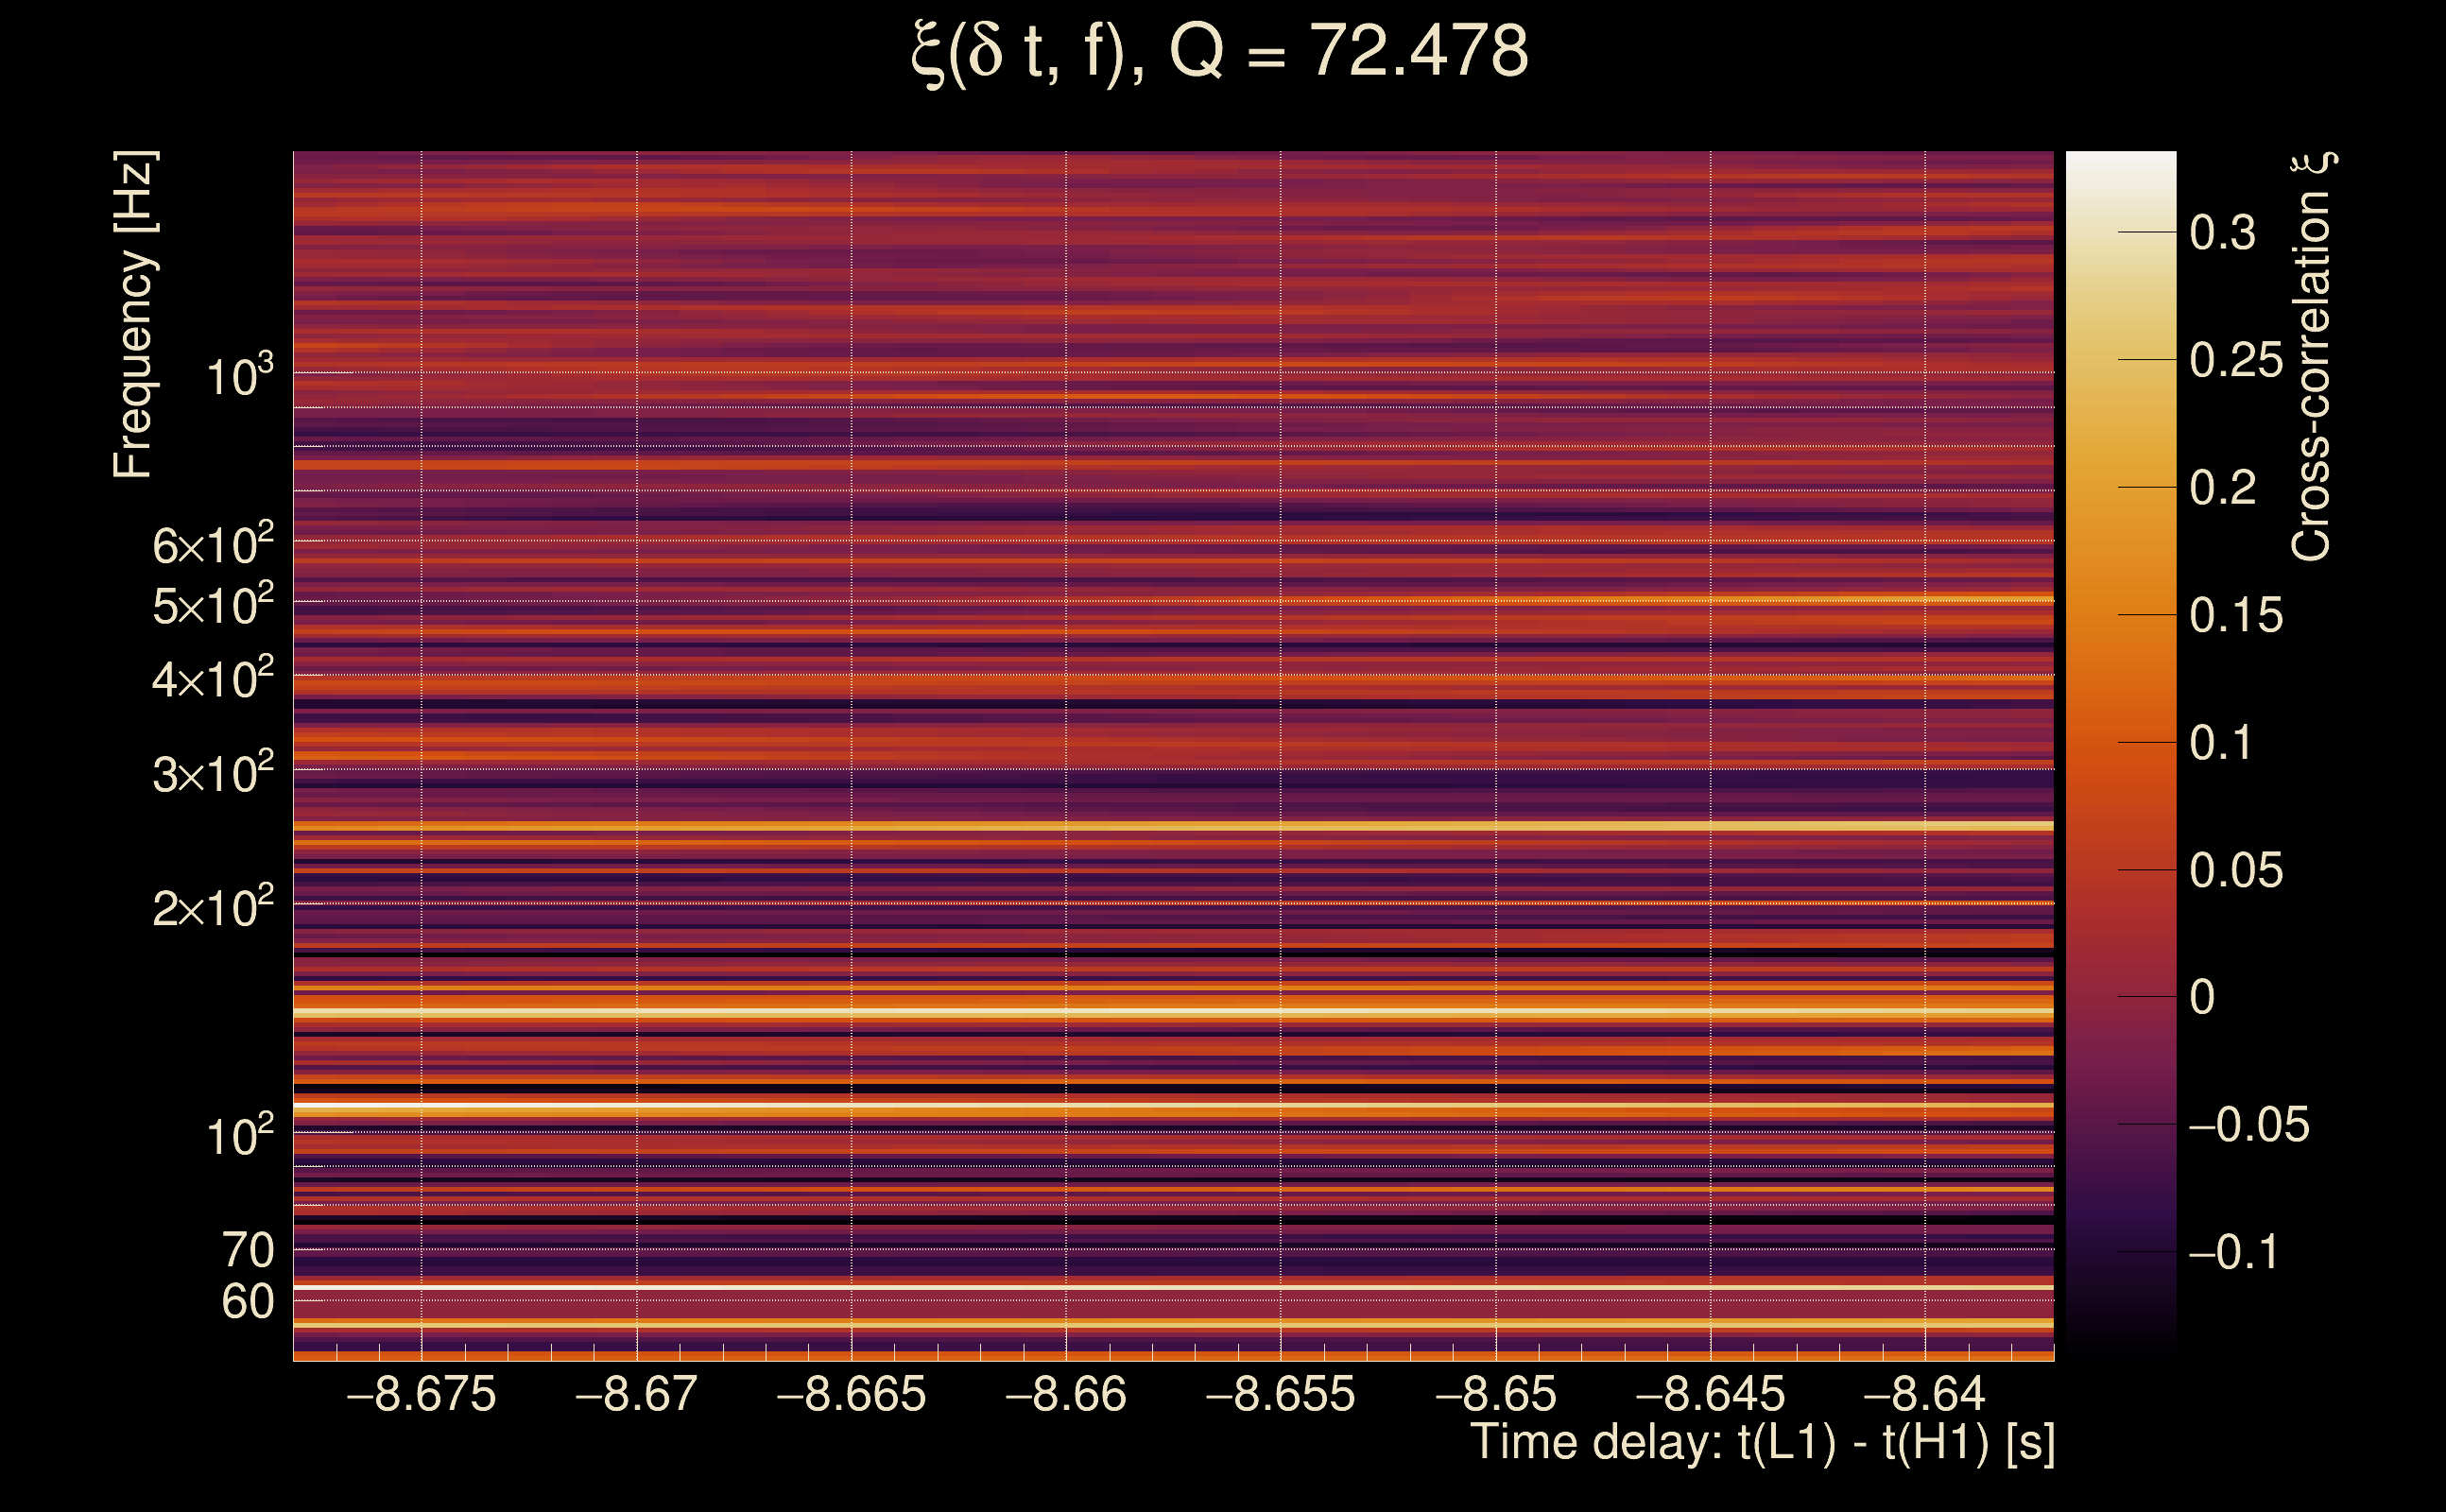
| Number of Q planes: | 5 (Q = 5.51892 → Q = 72.478) |
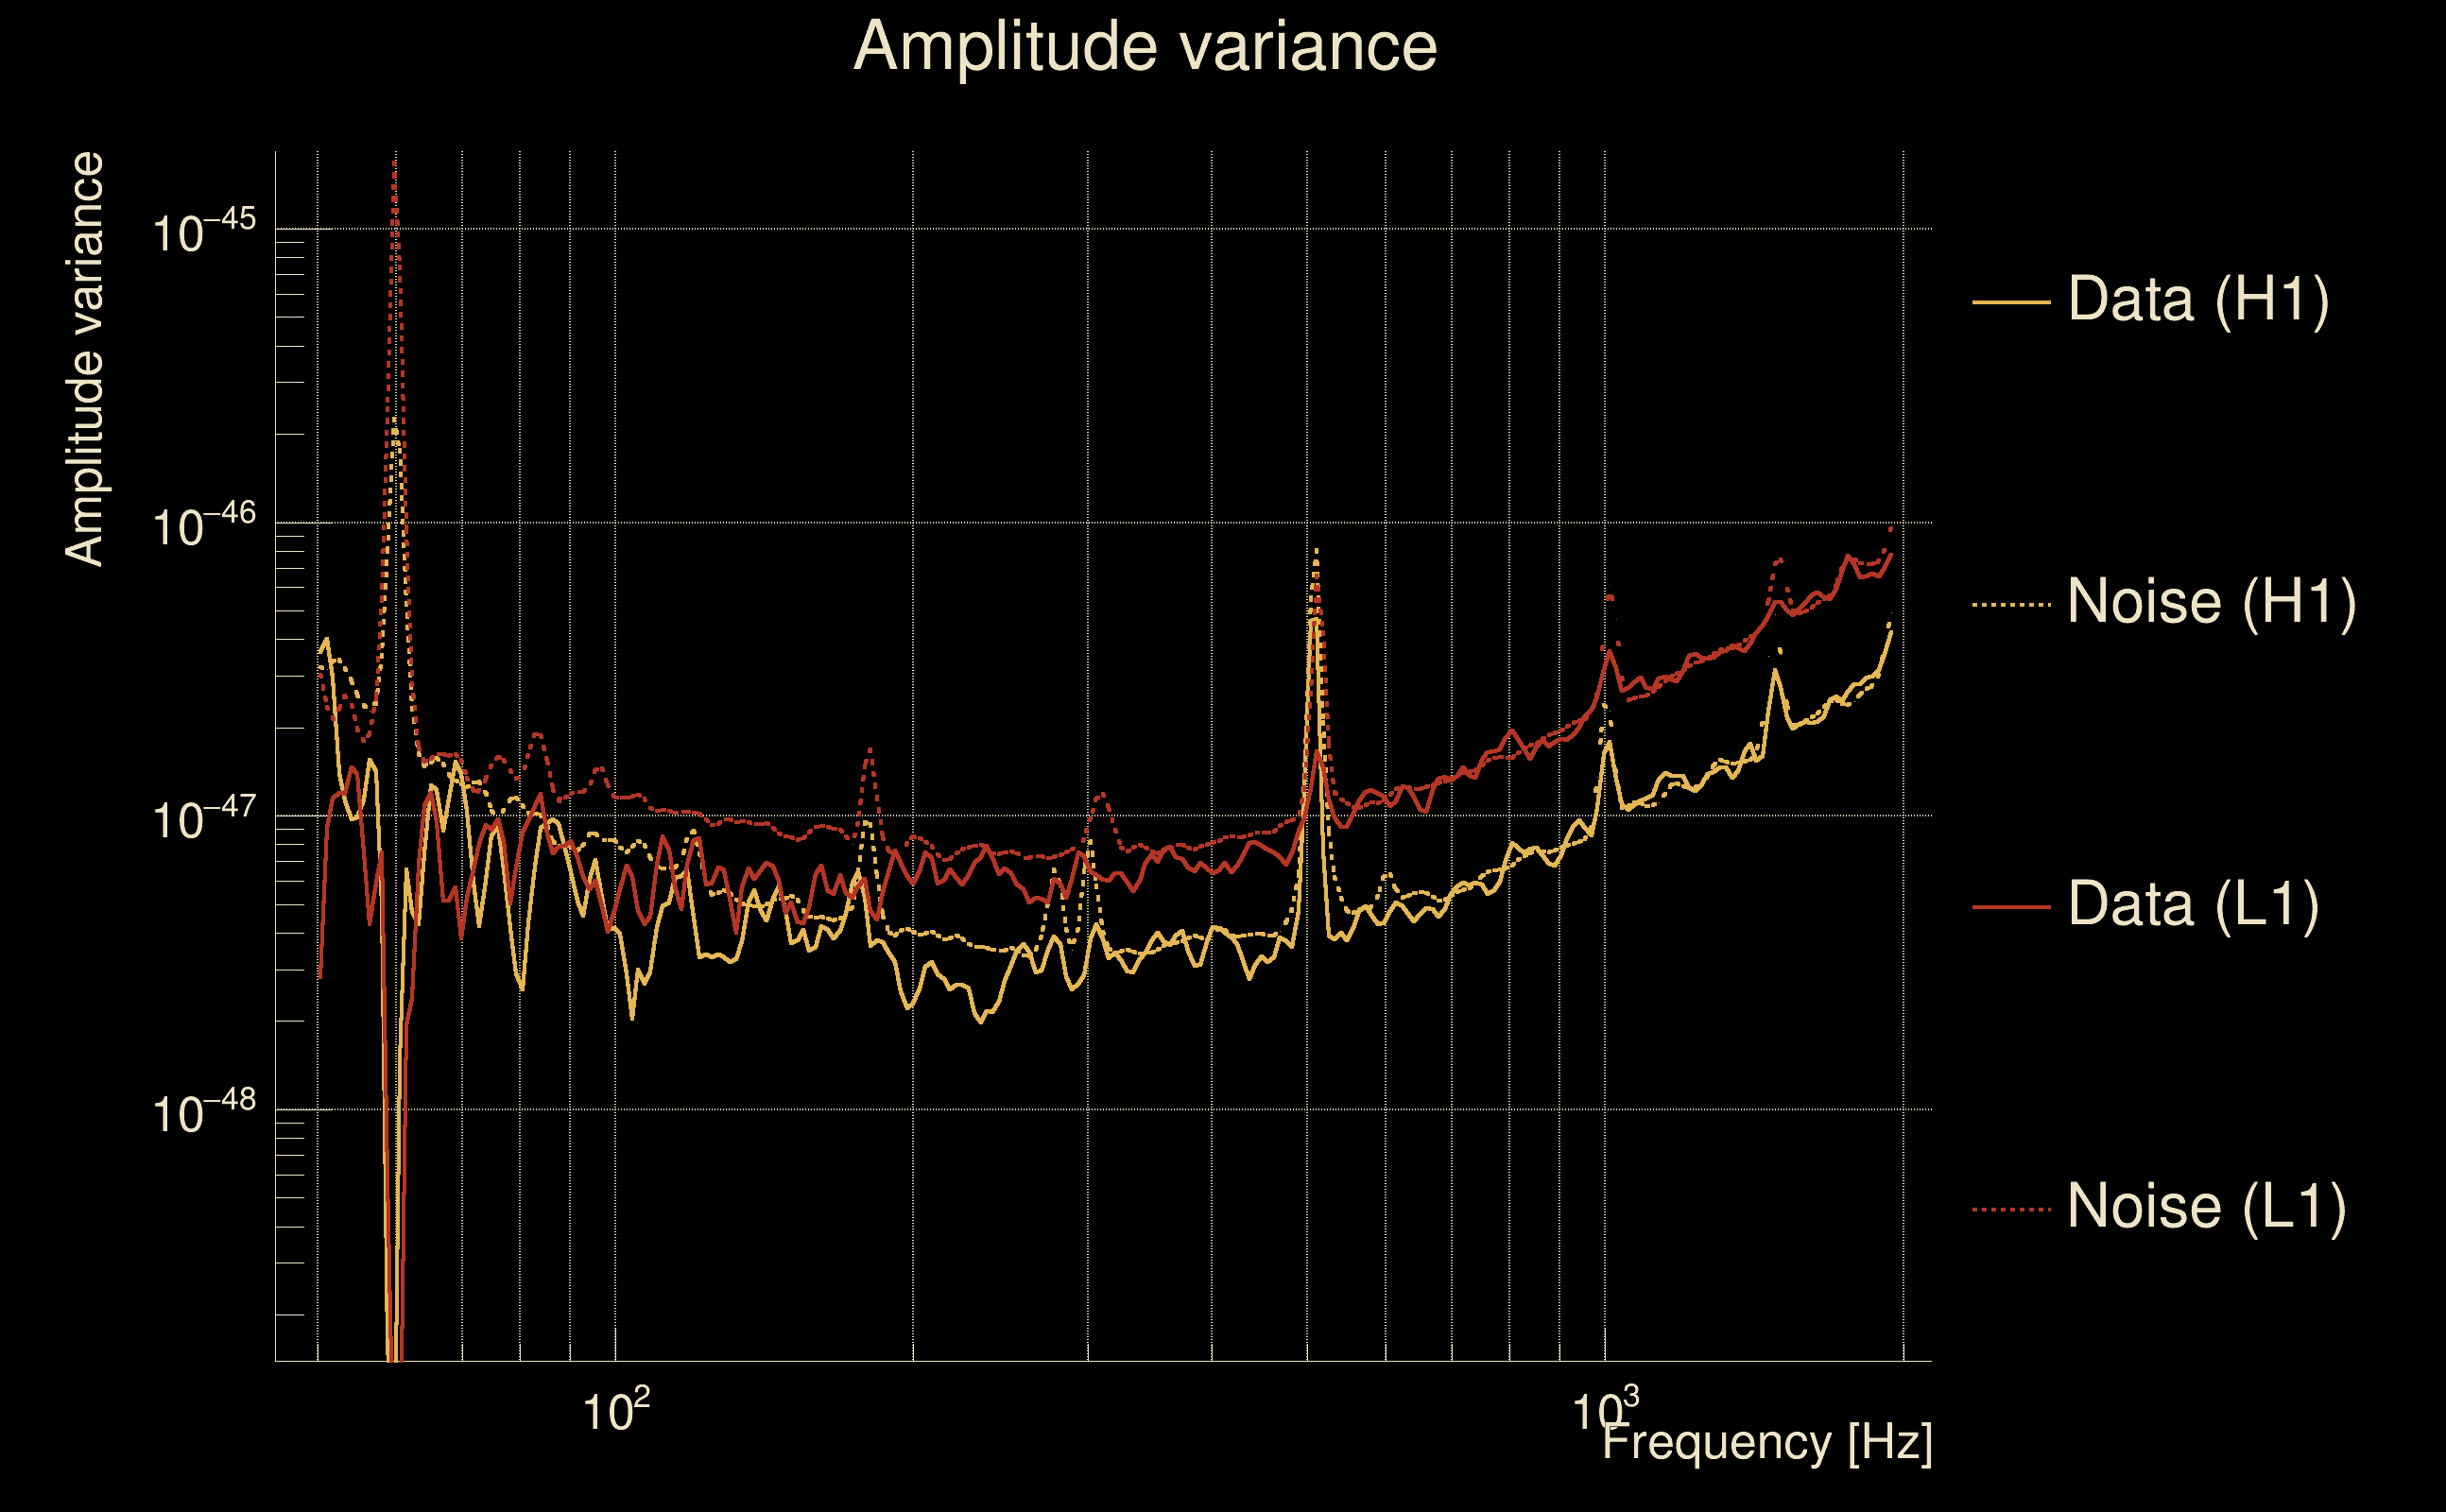
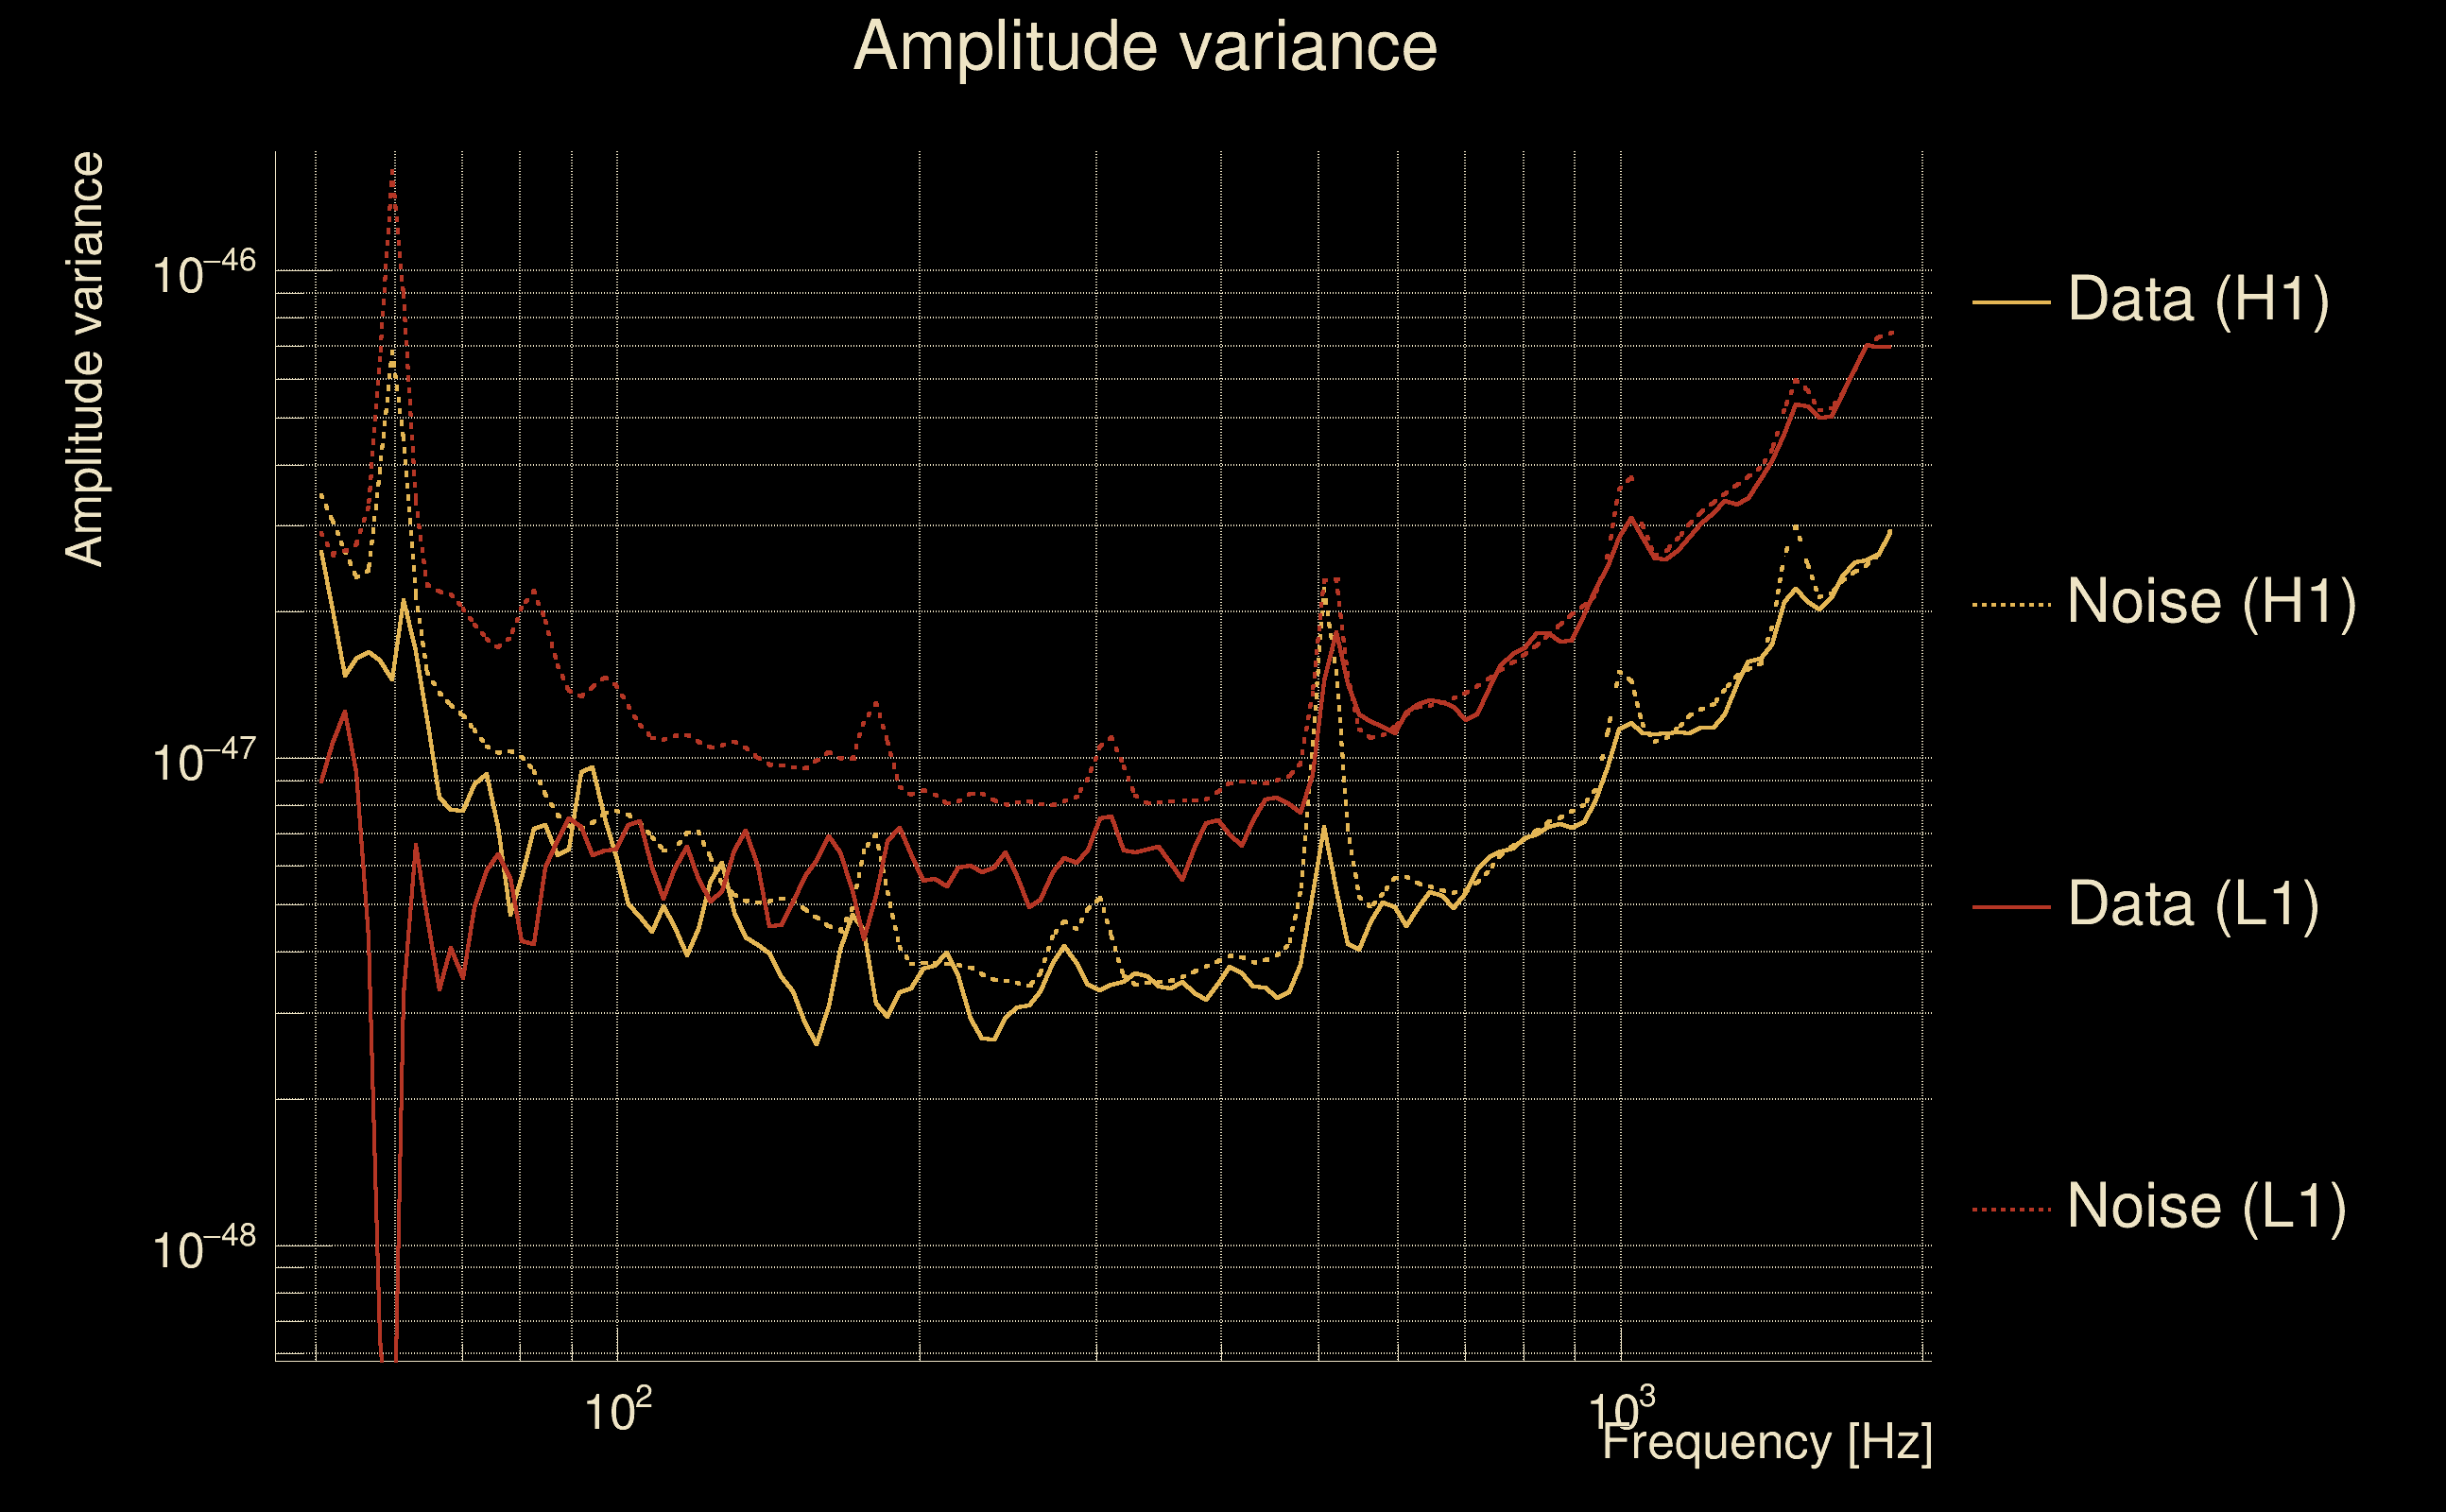
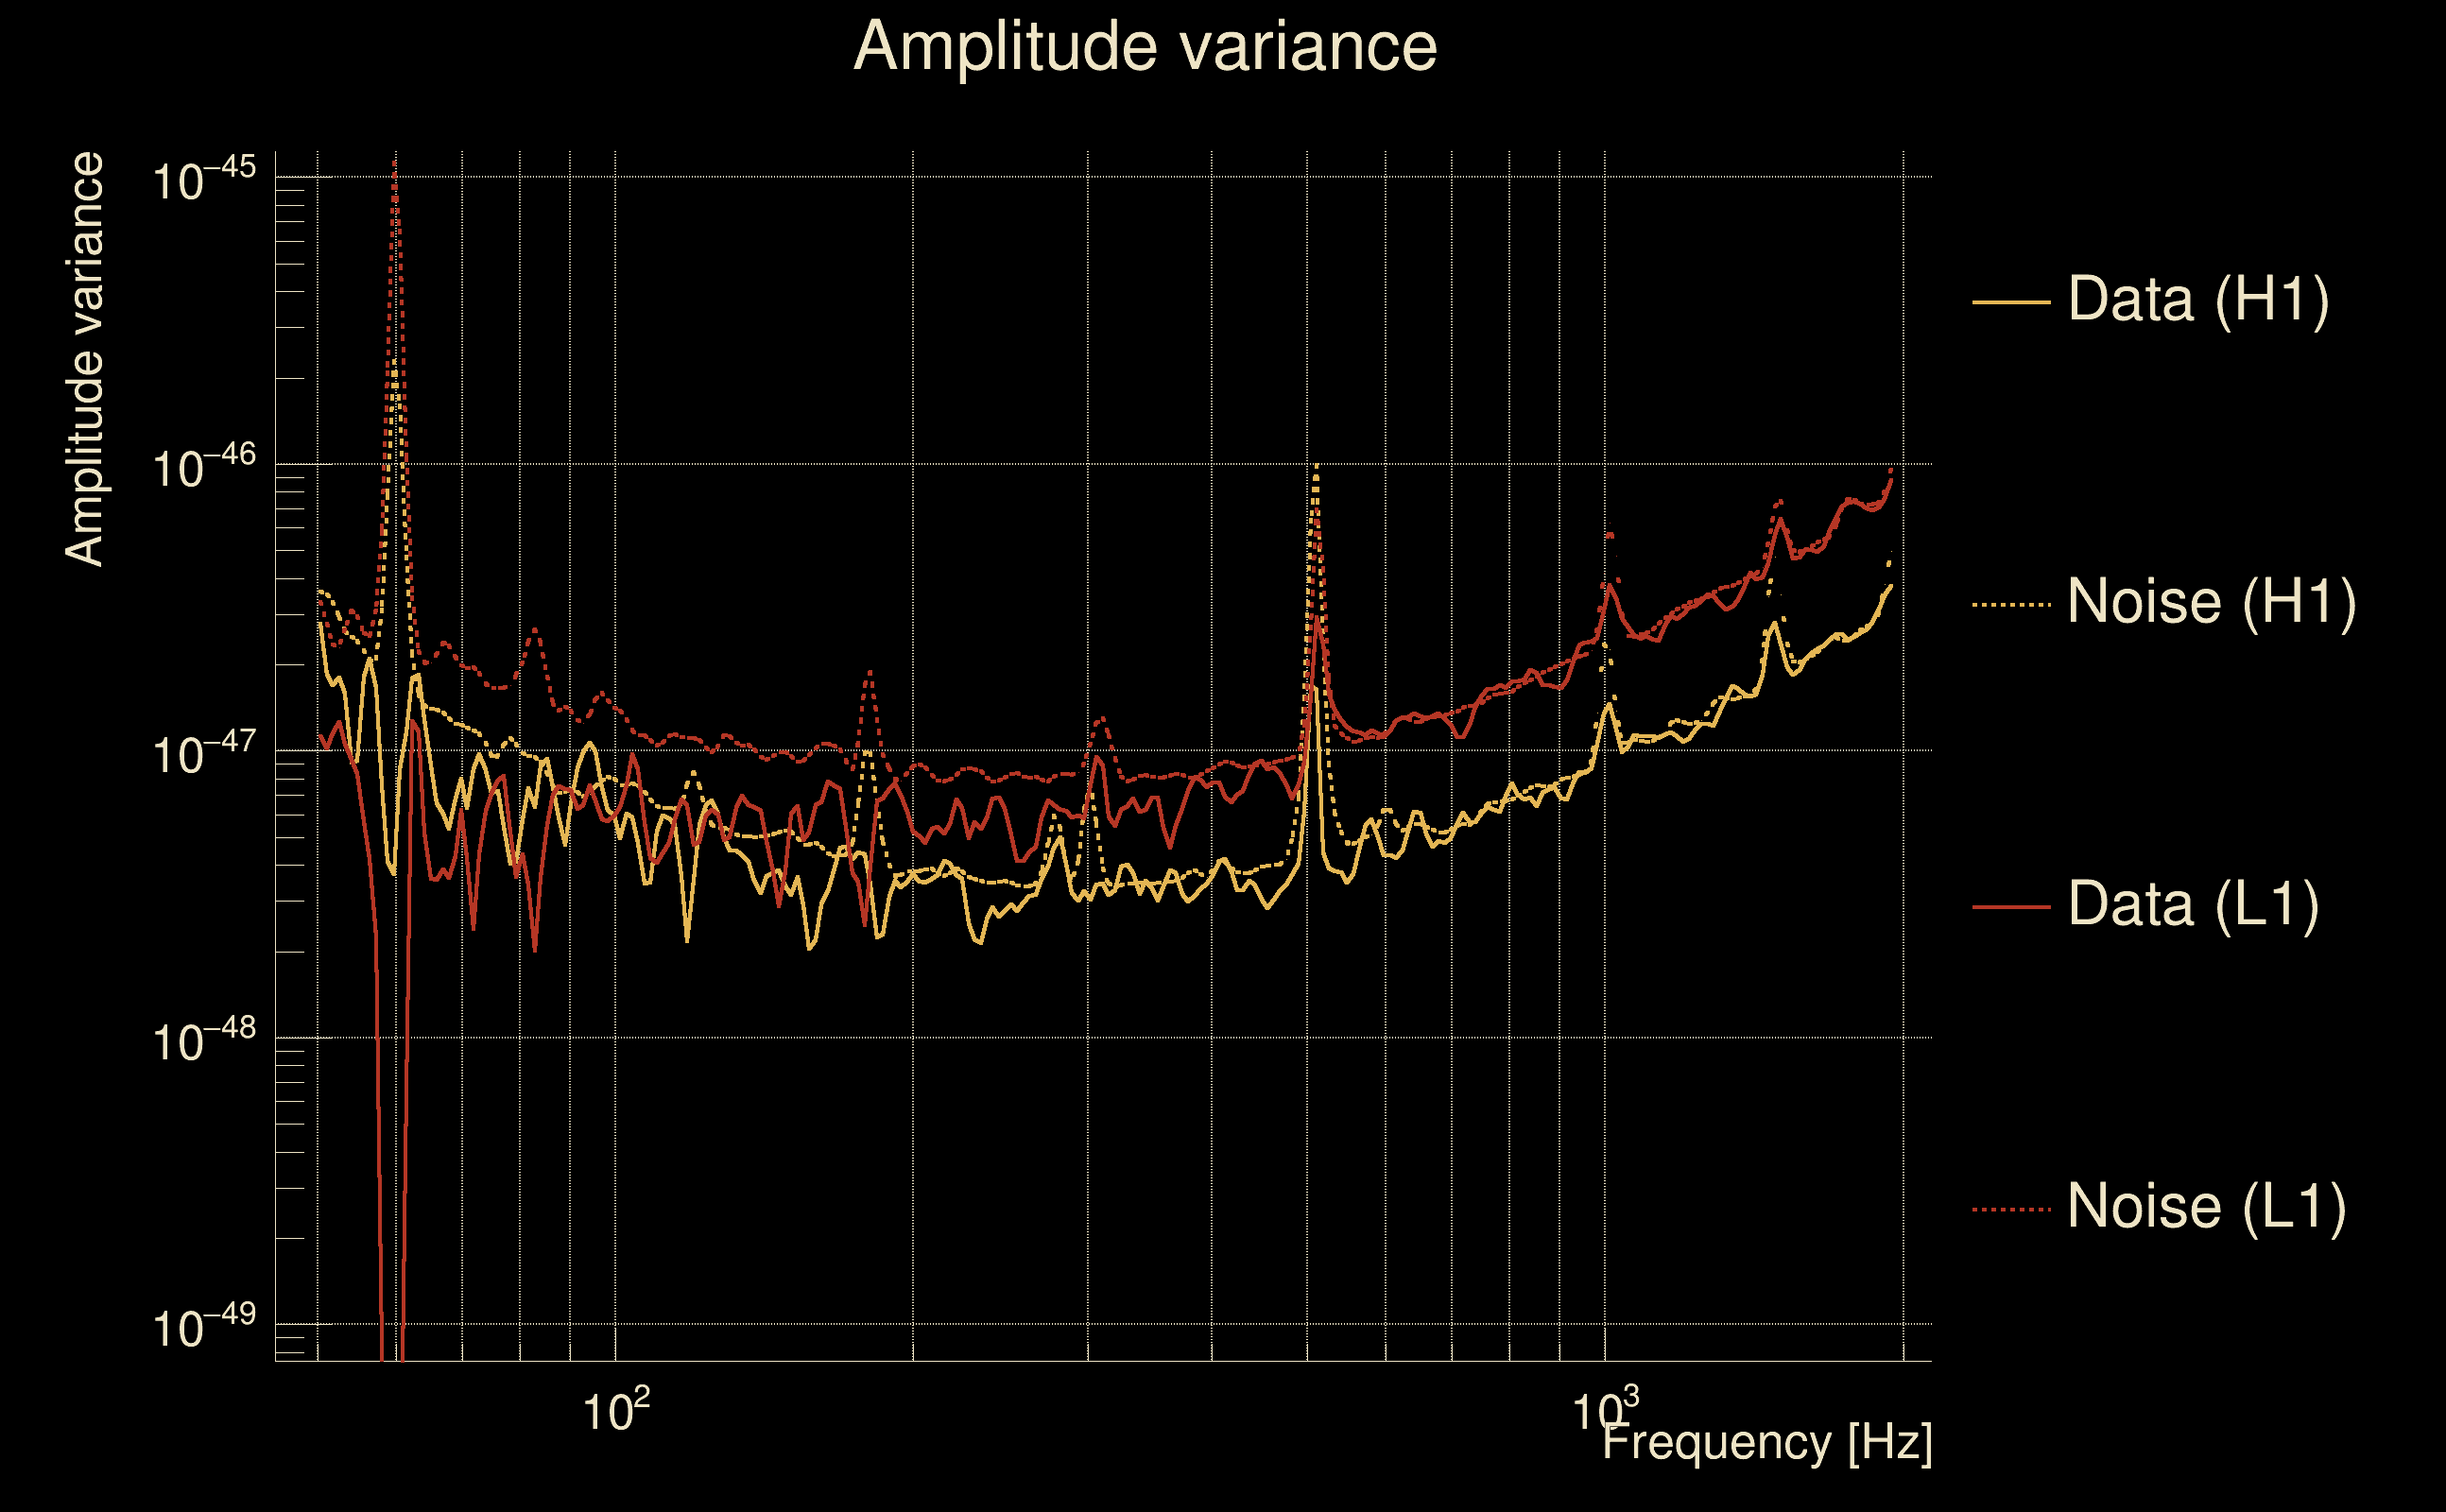
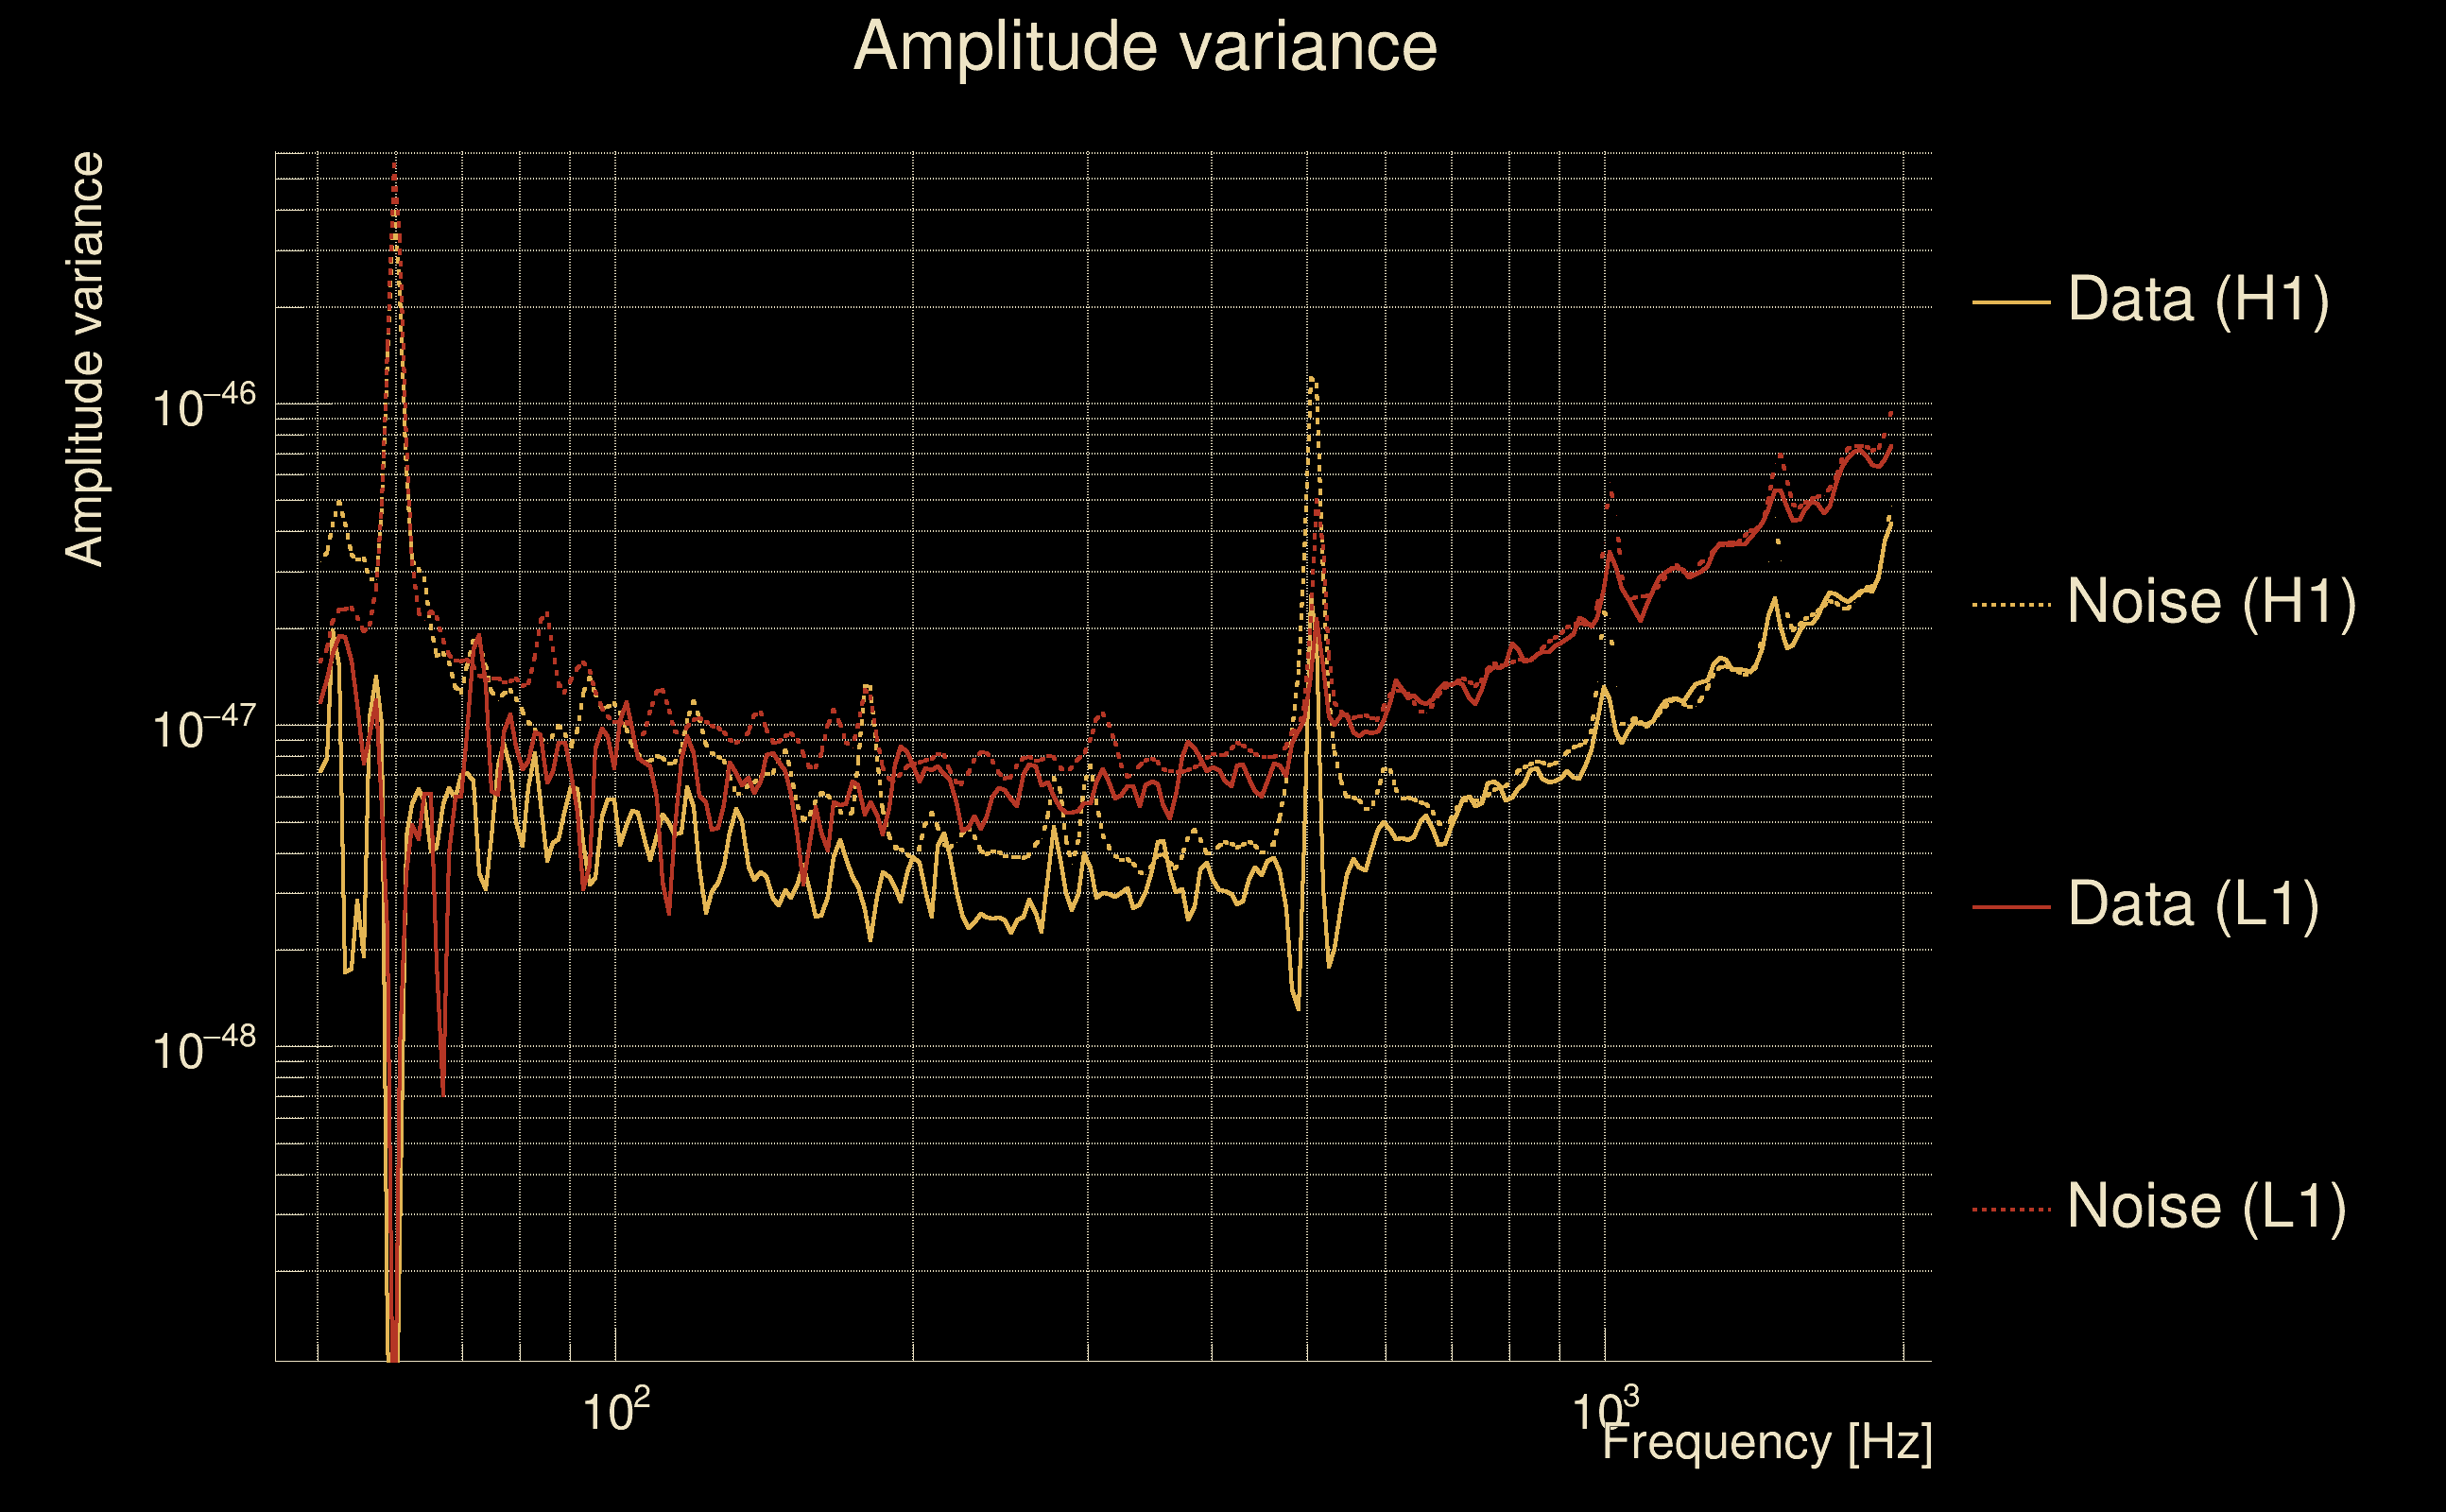
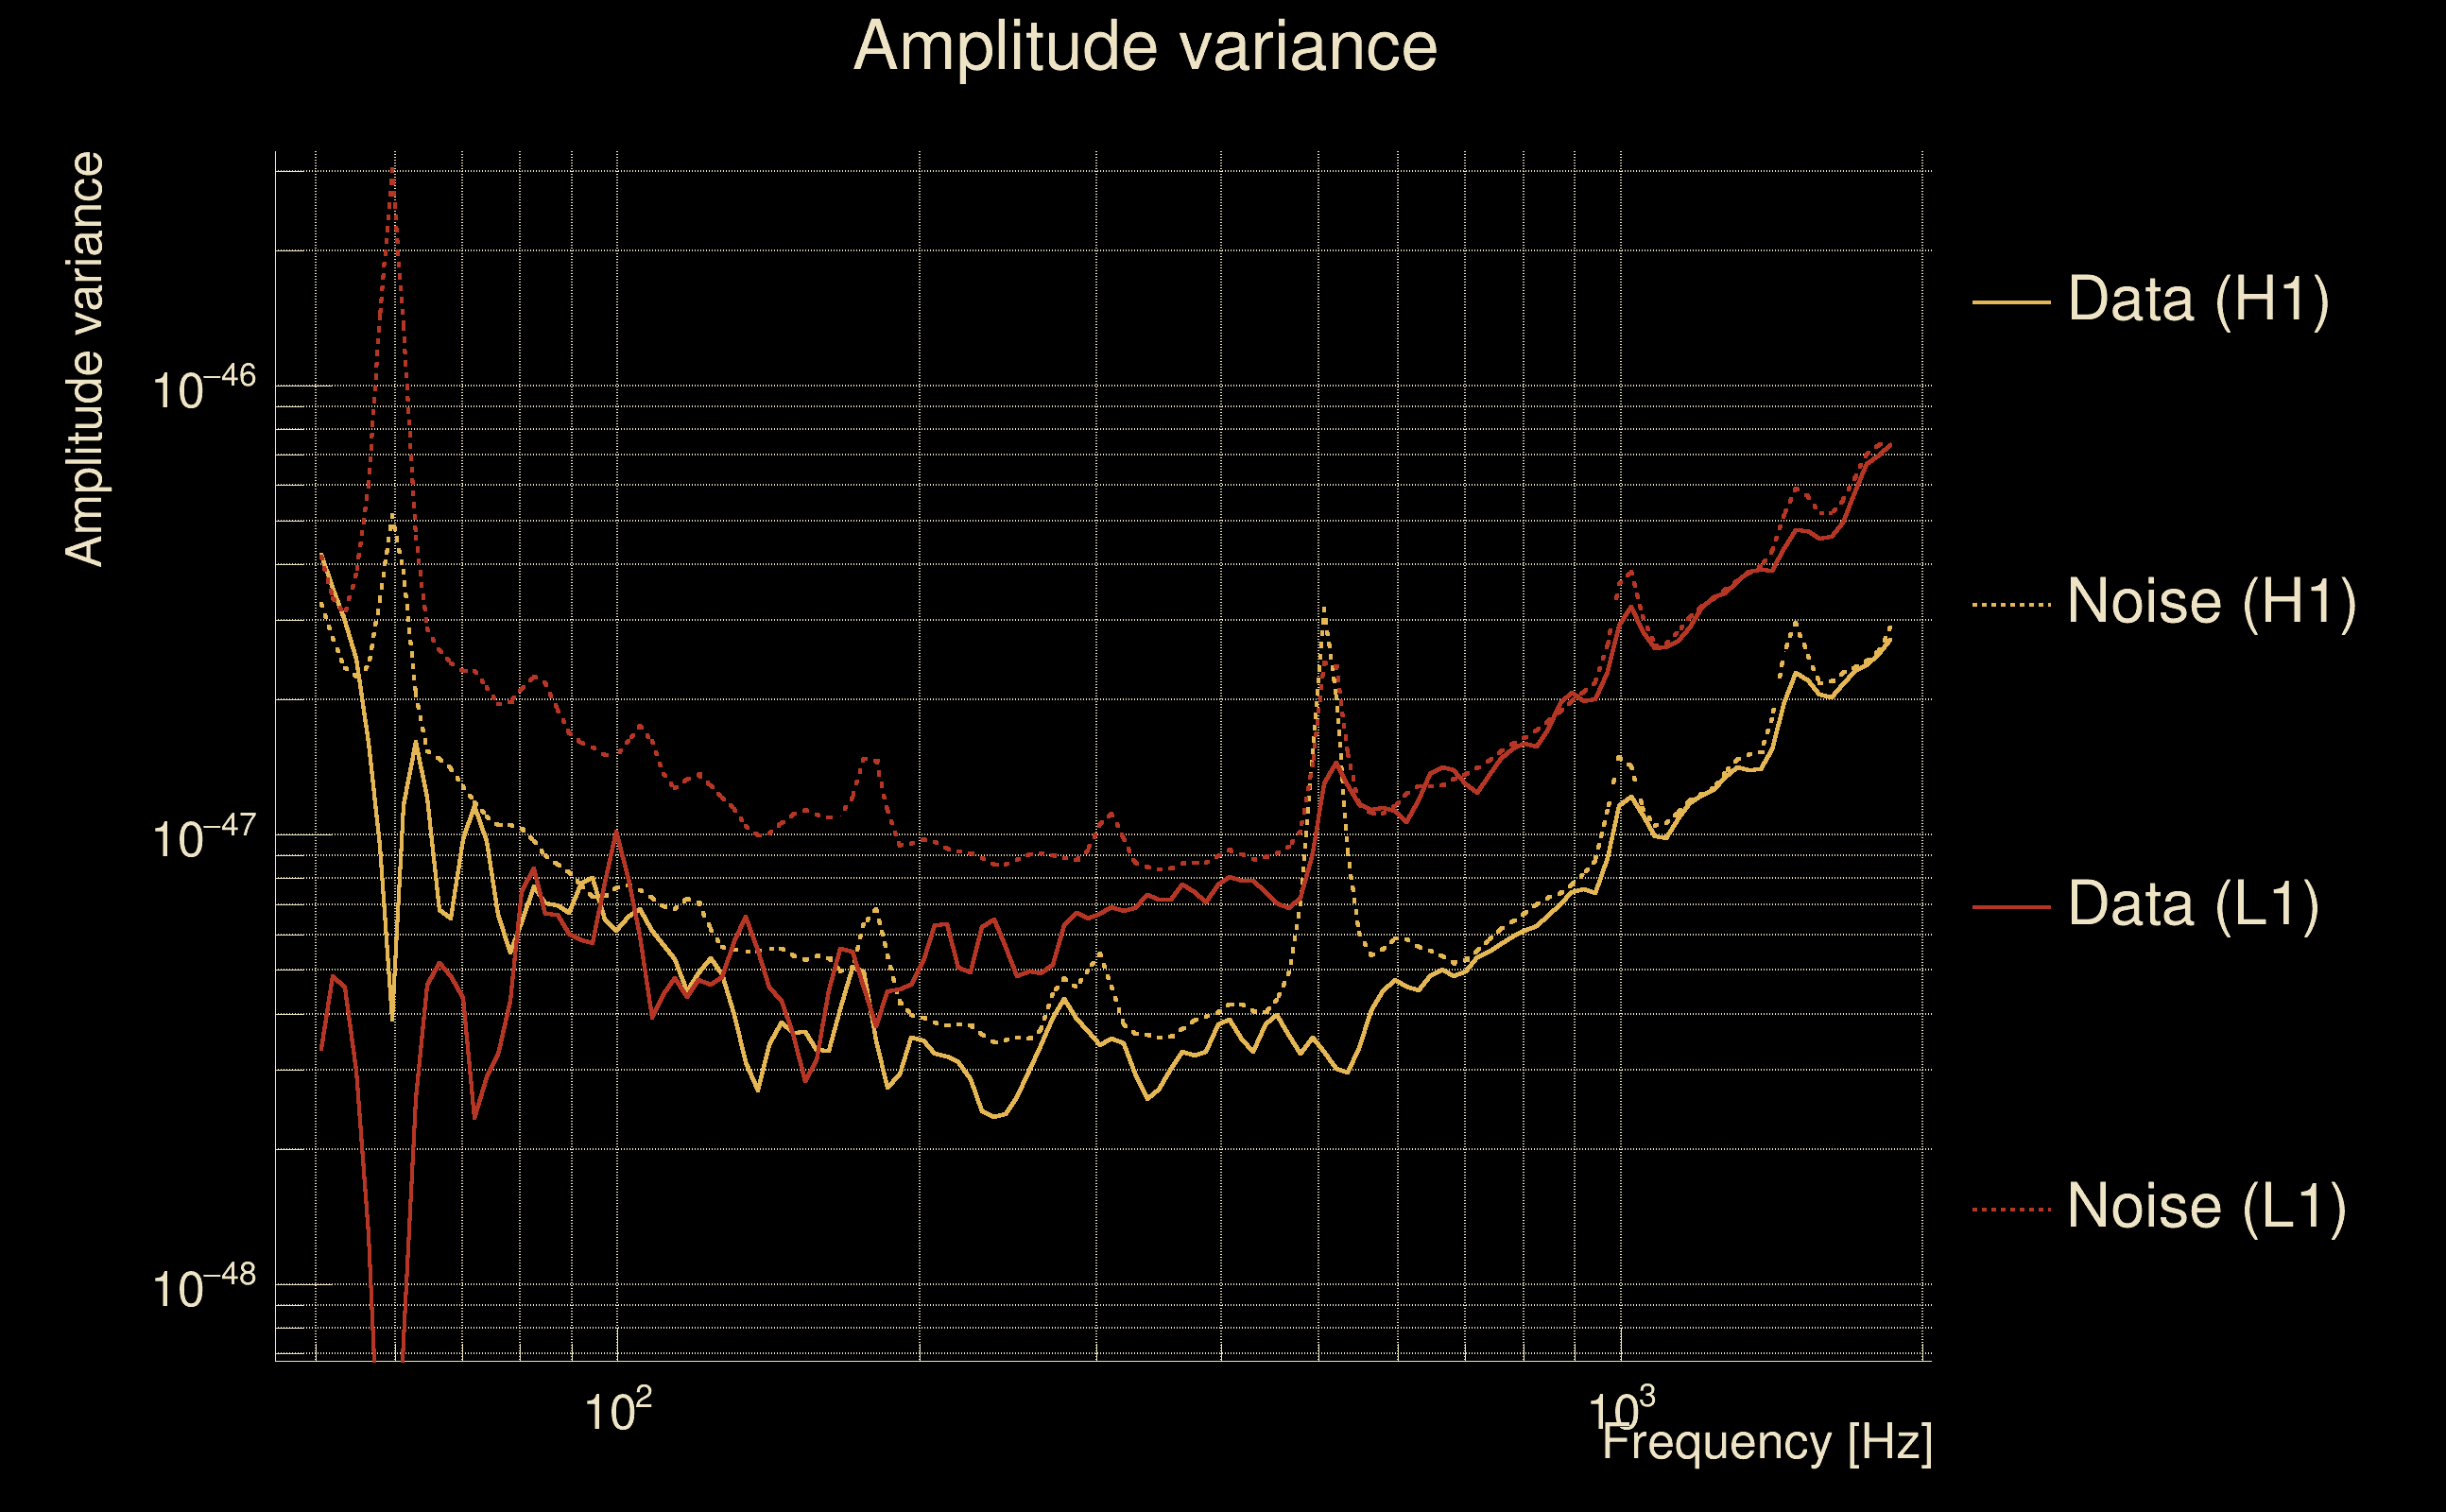
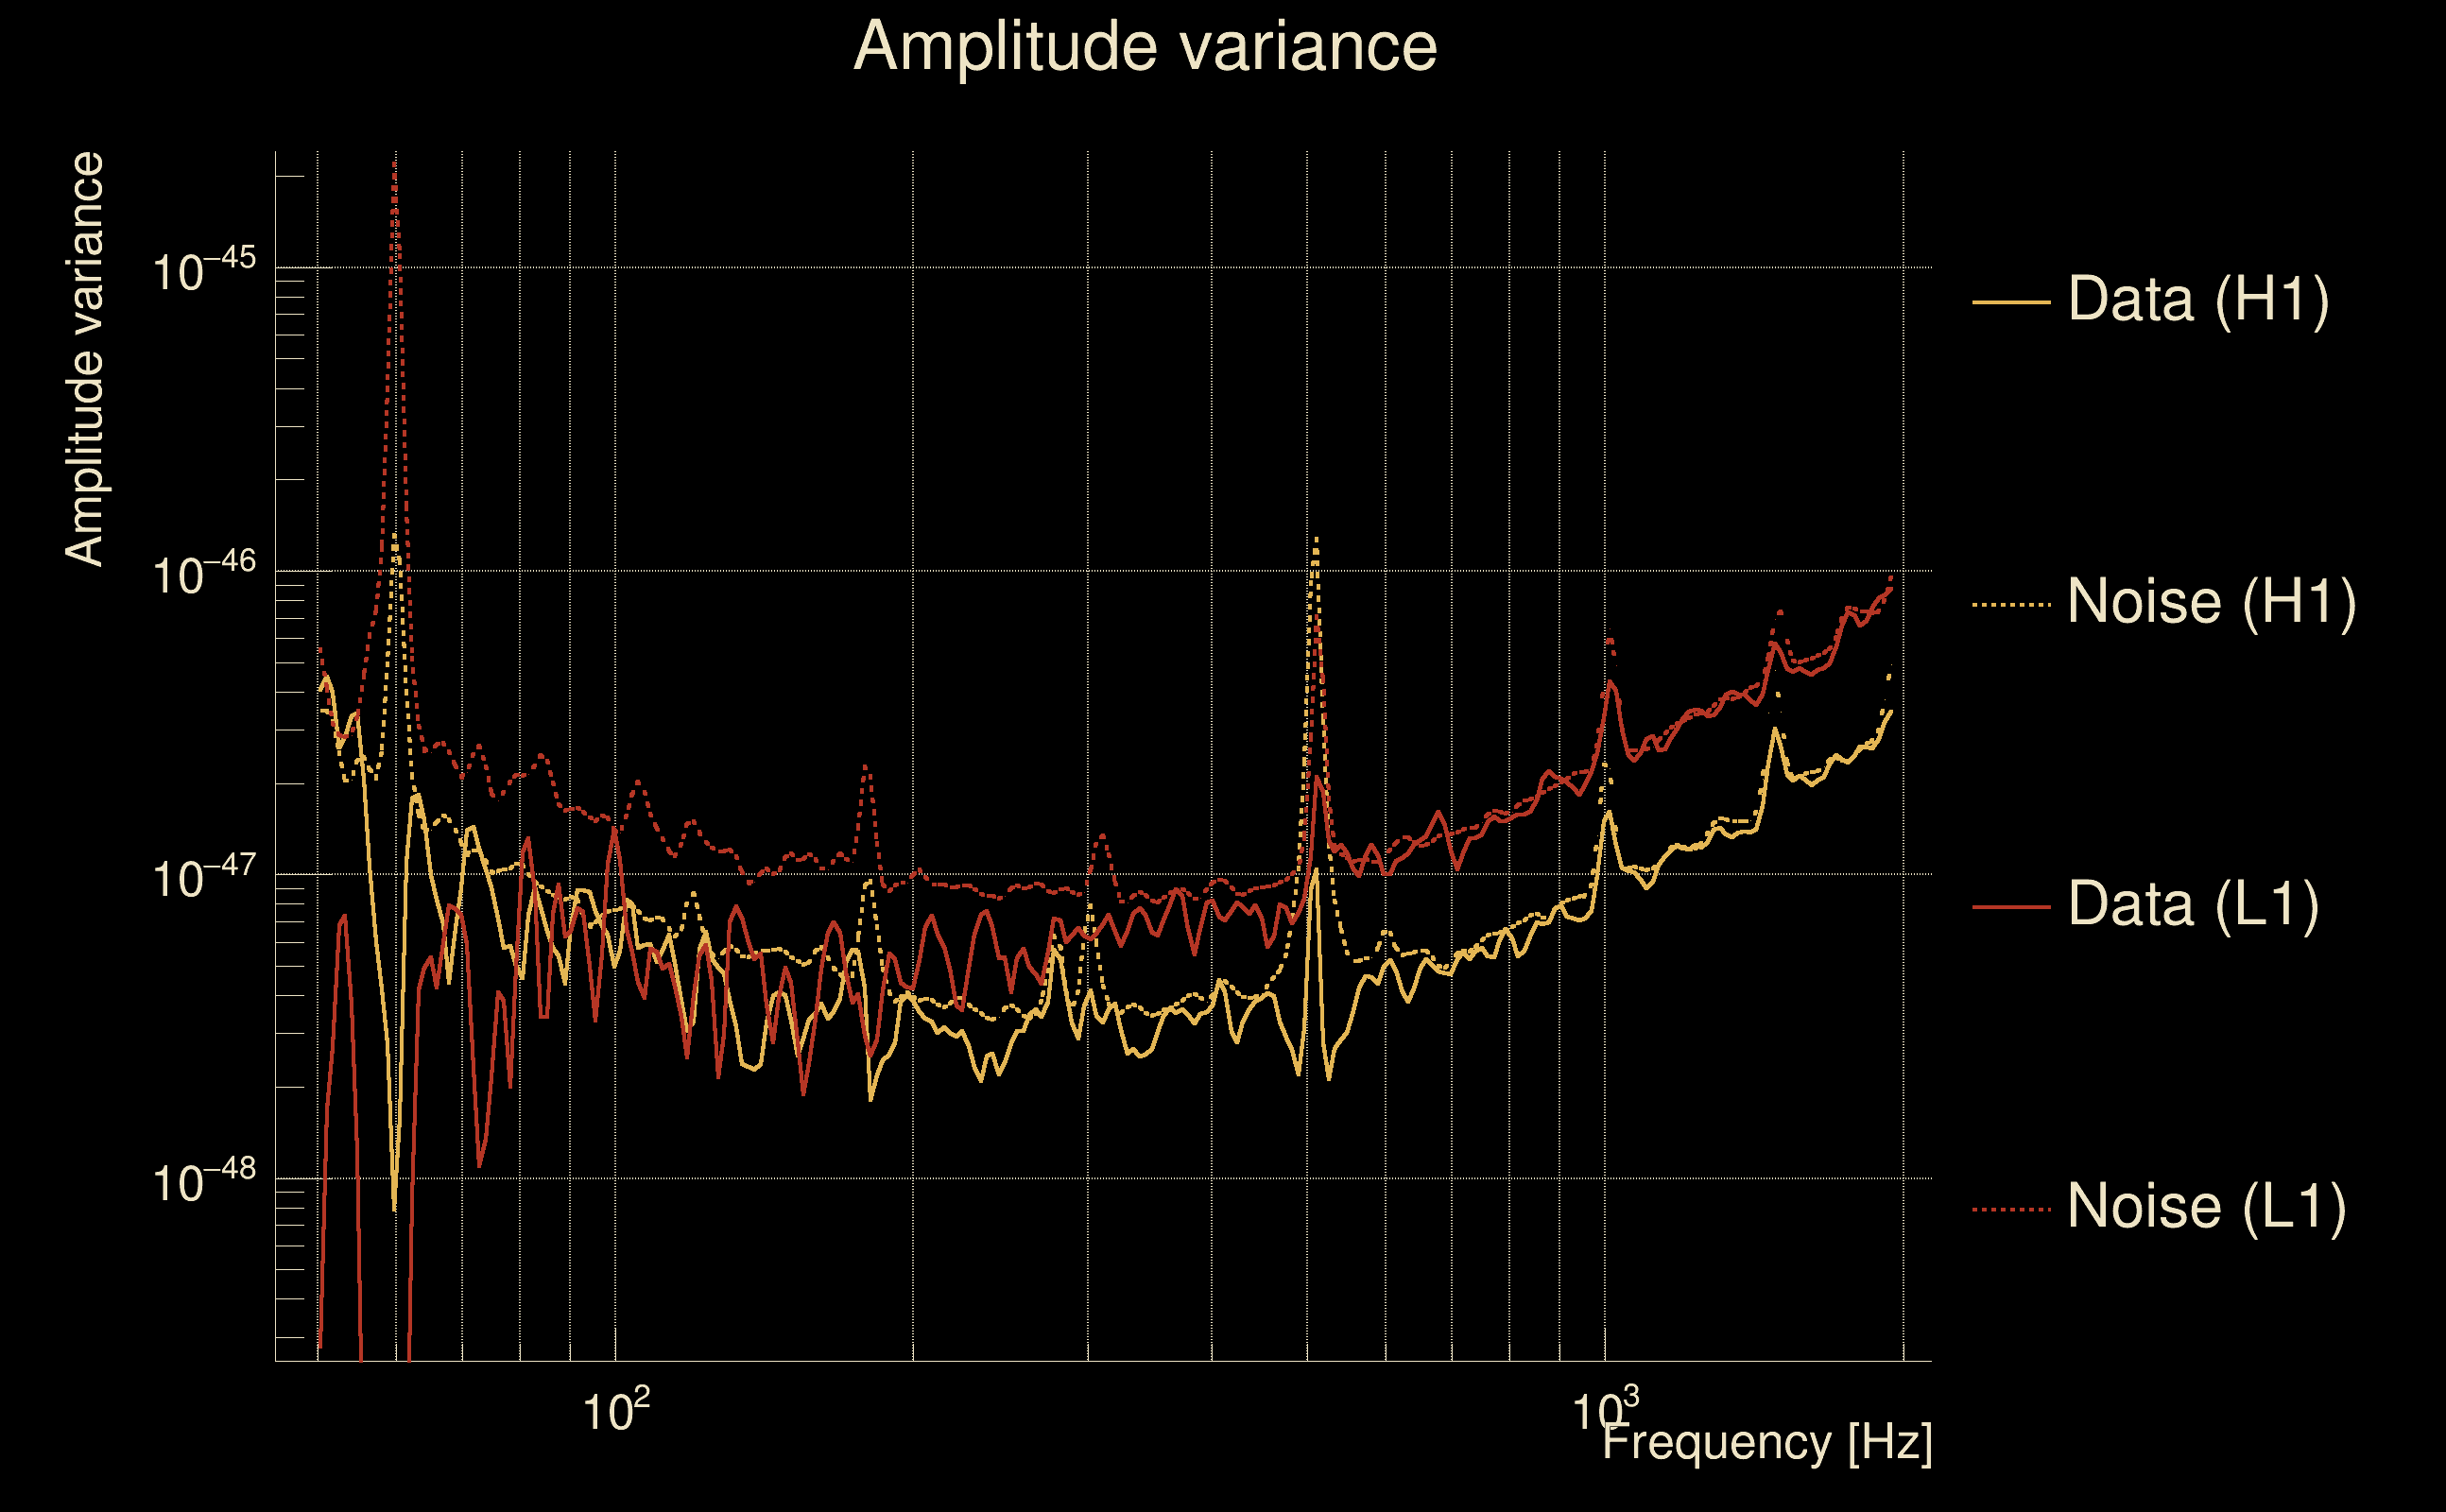
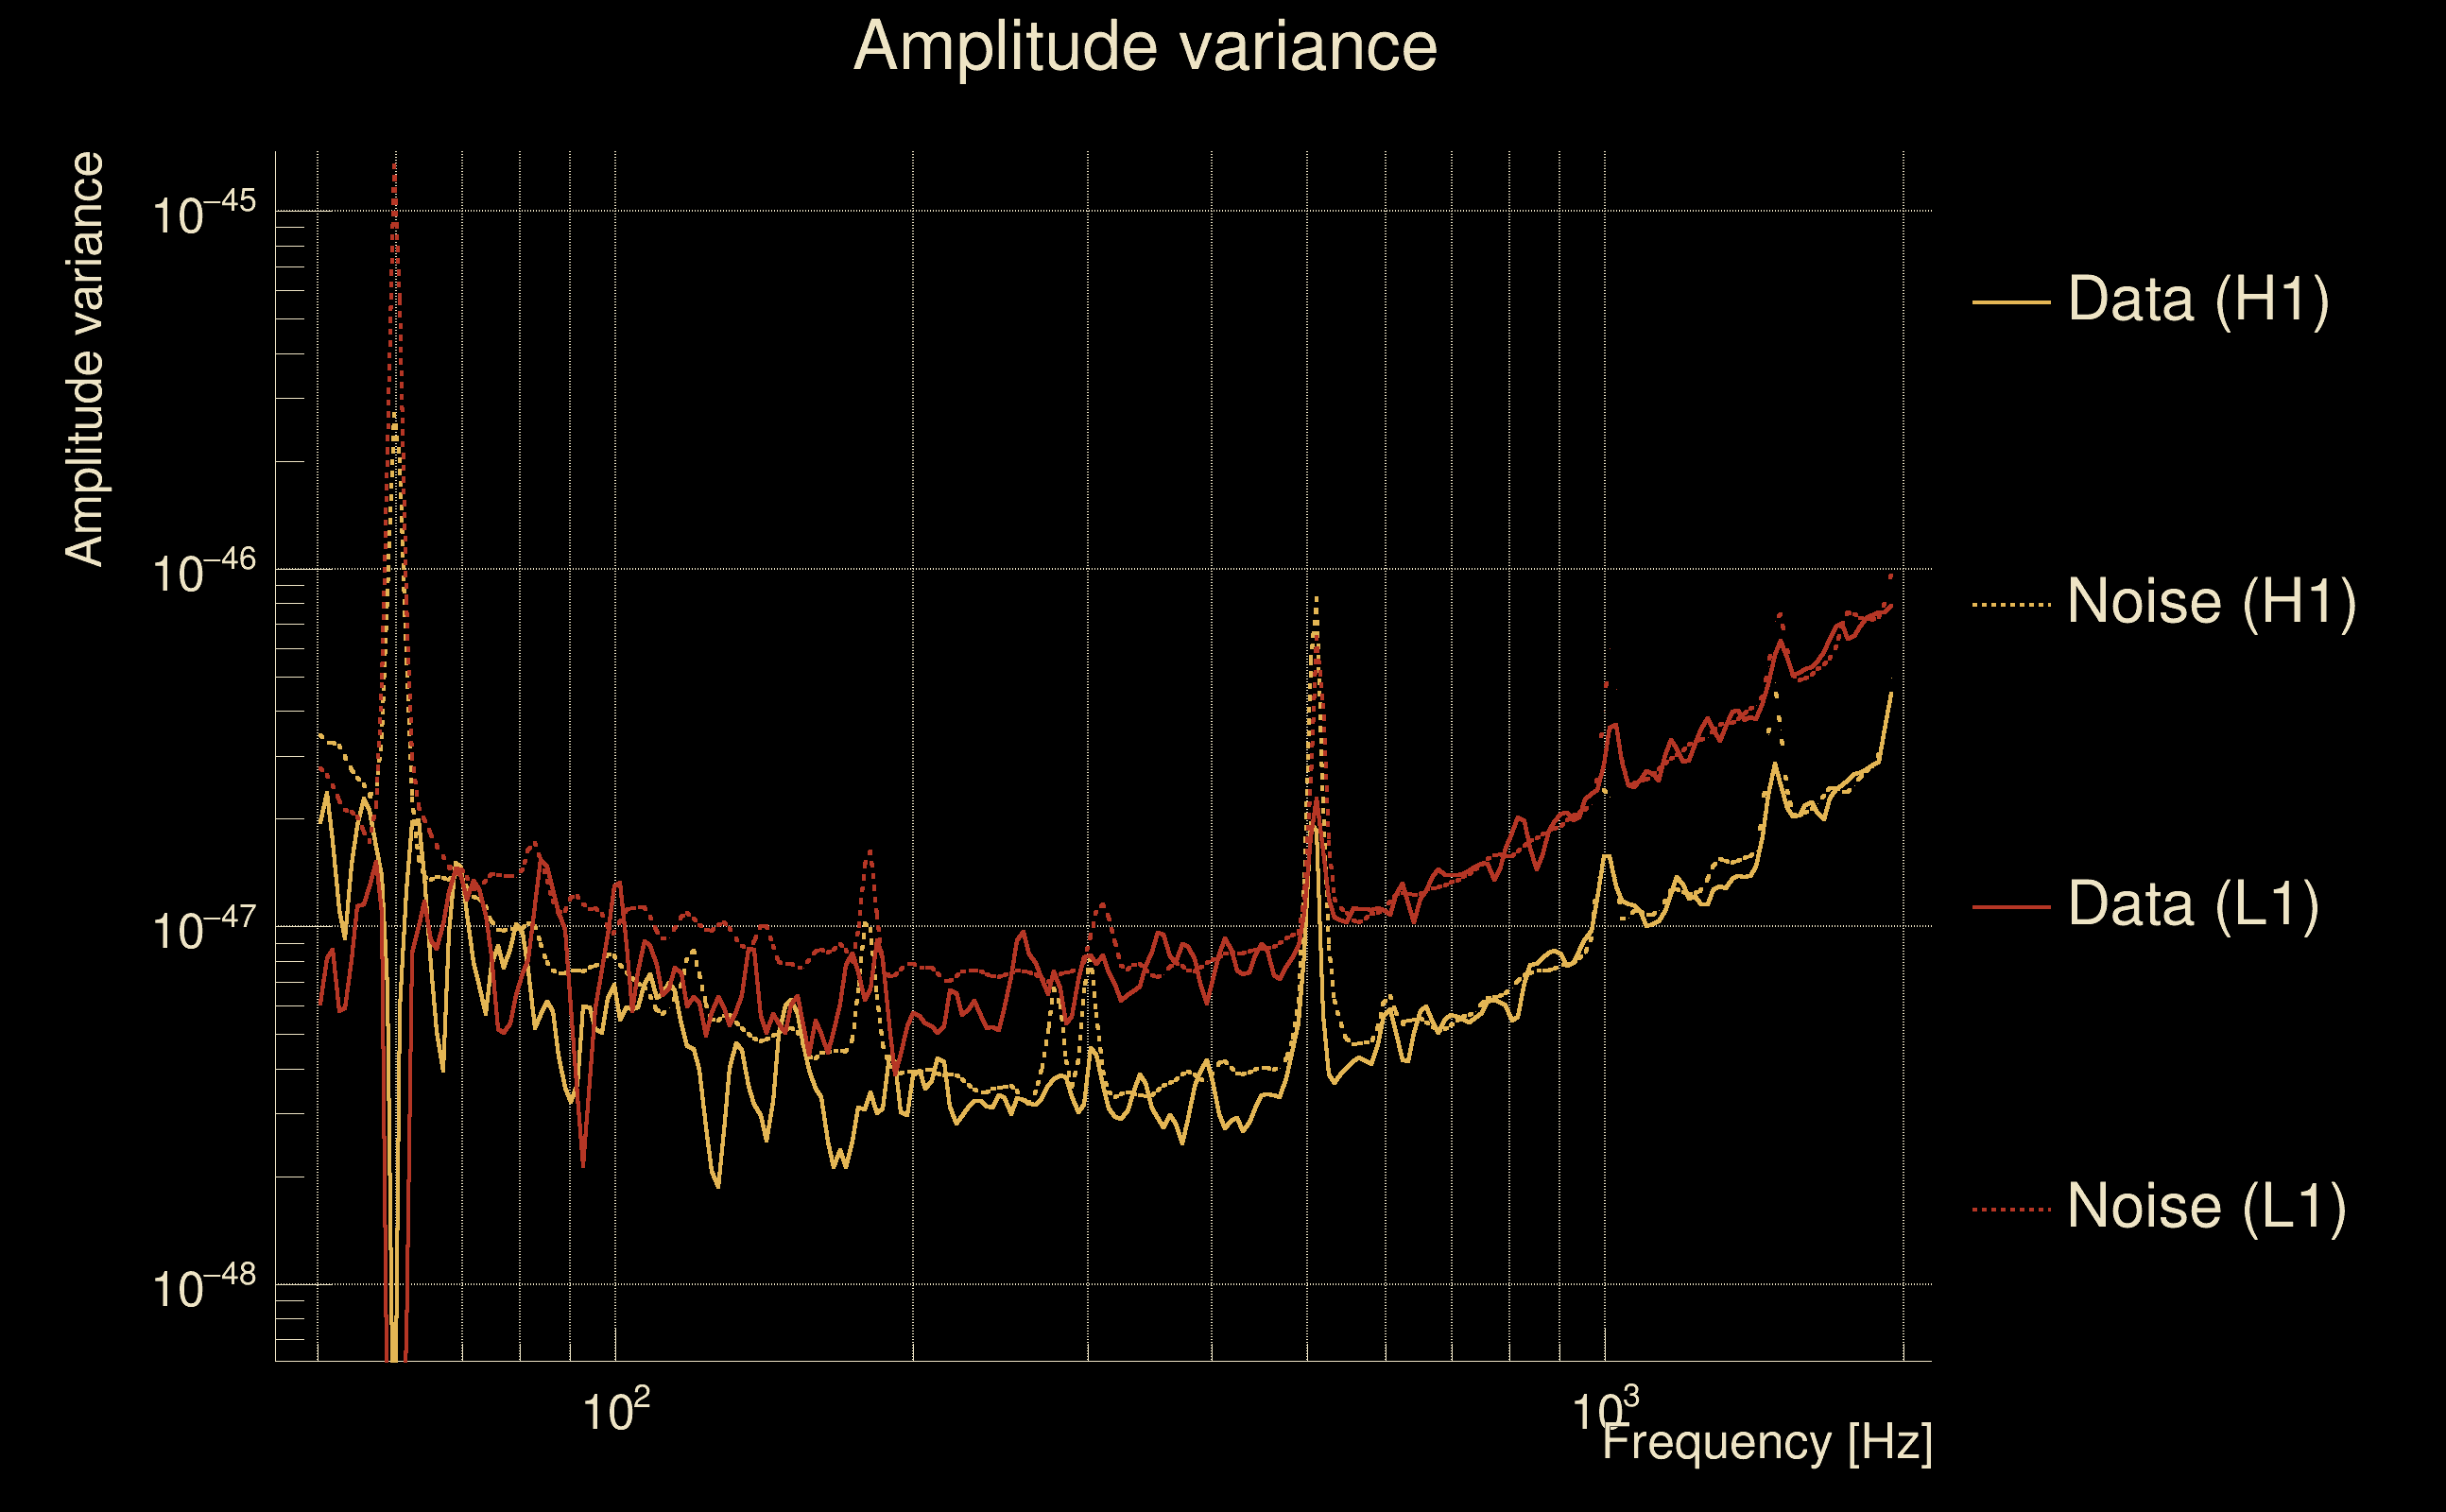
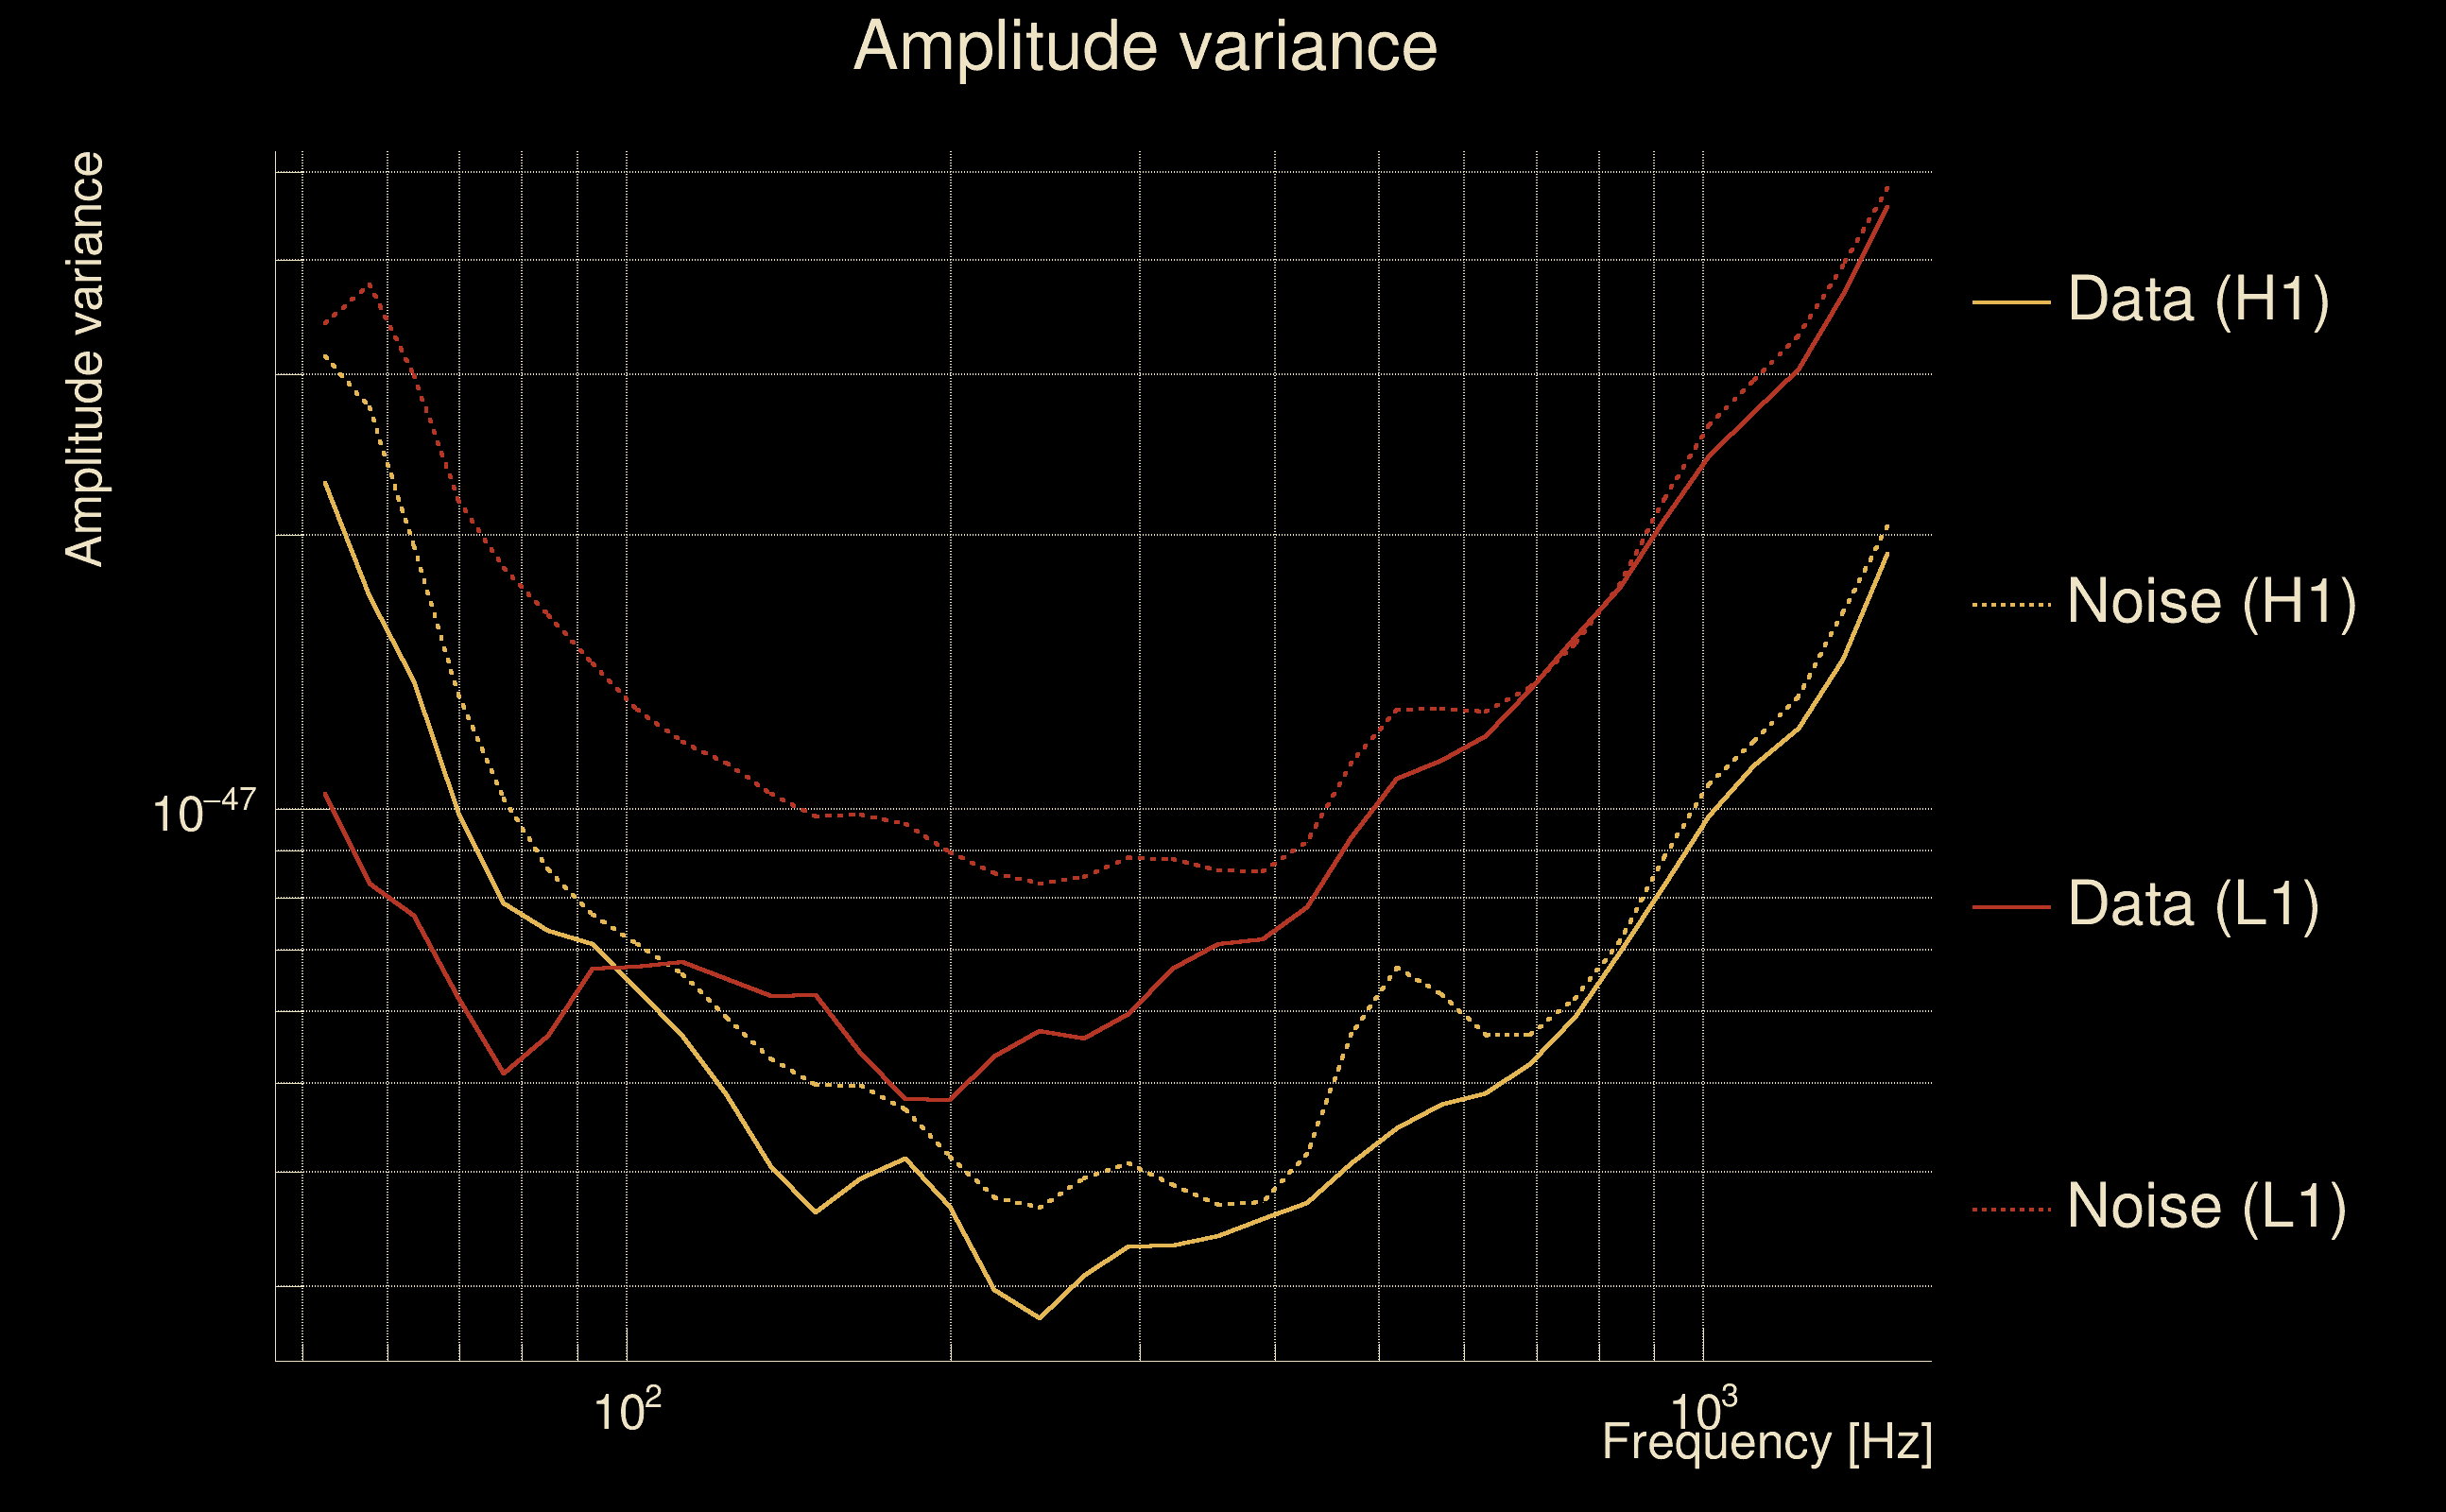
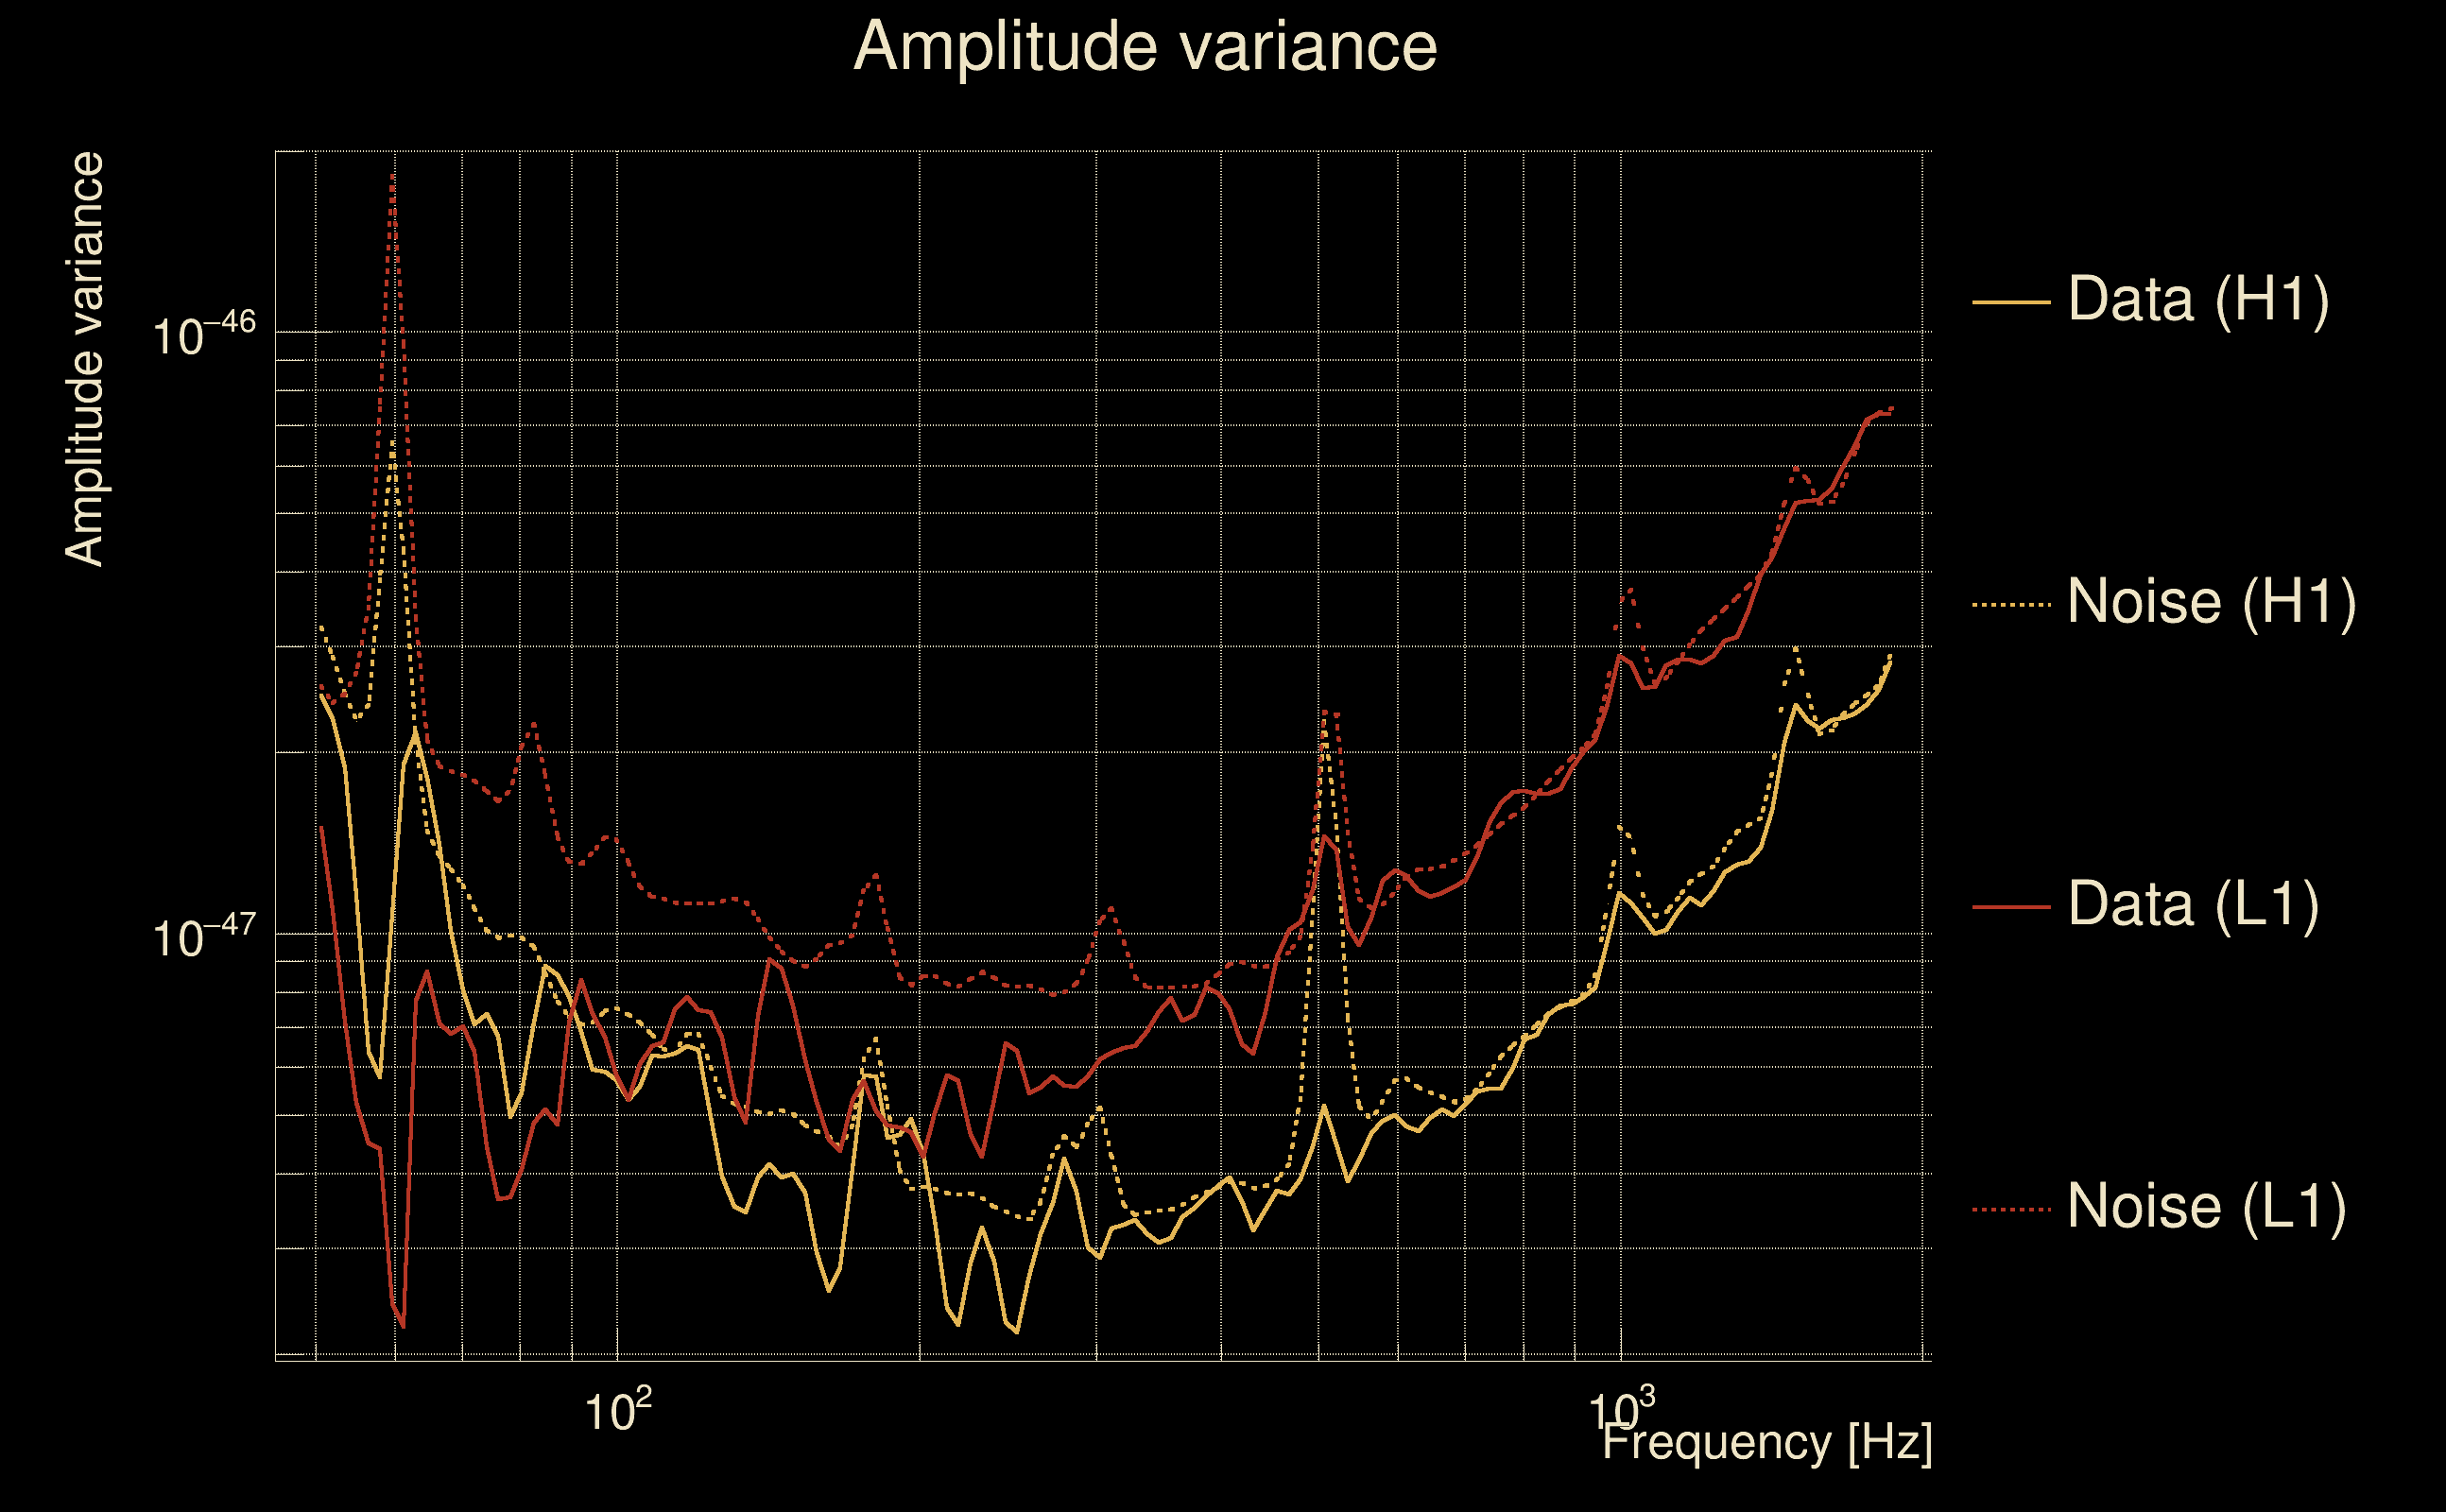
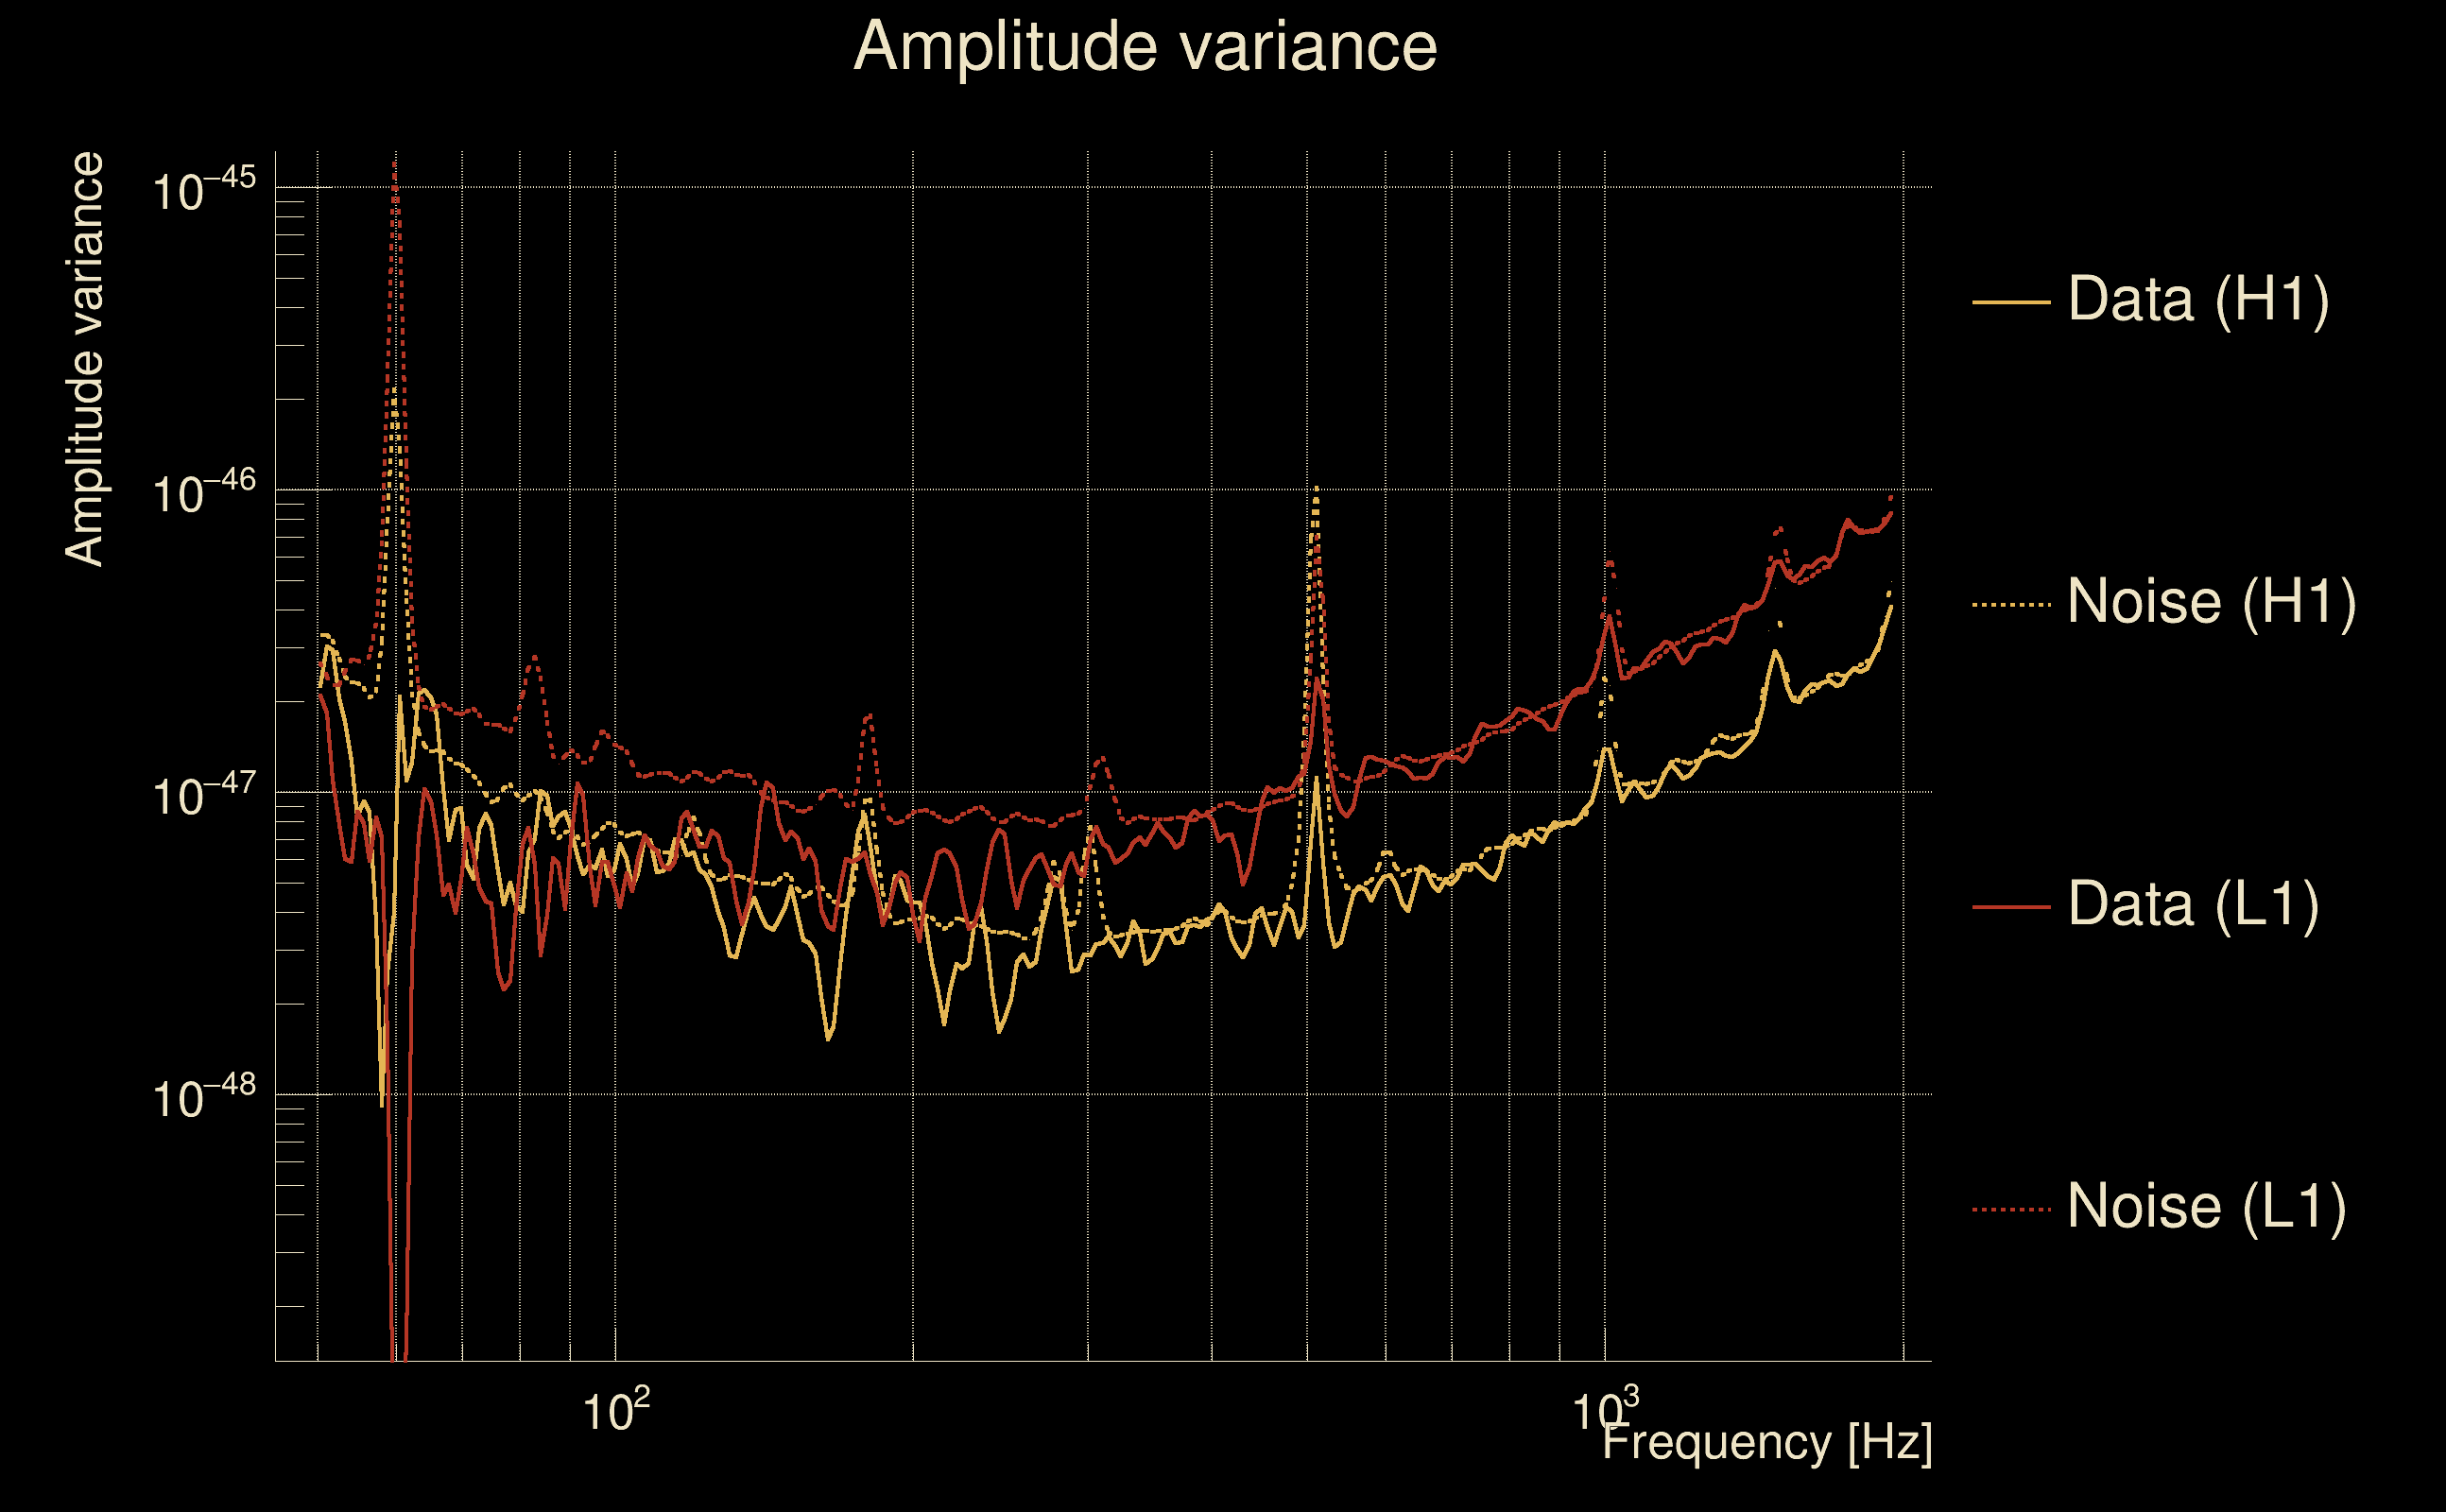
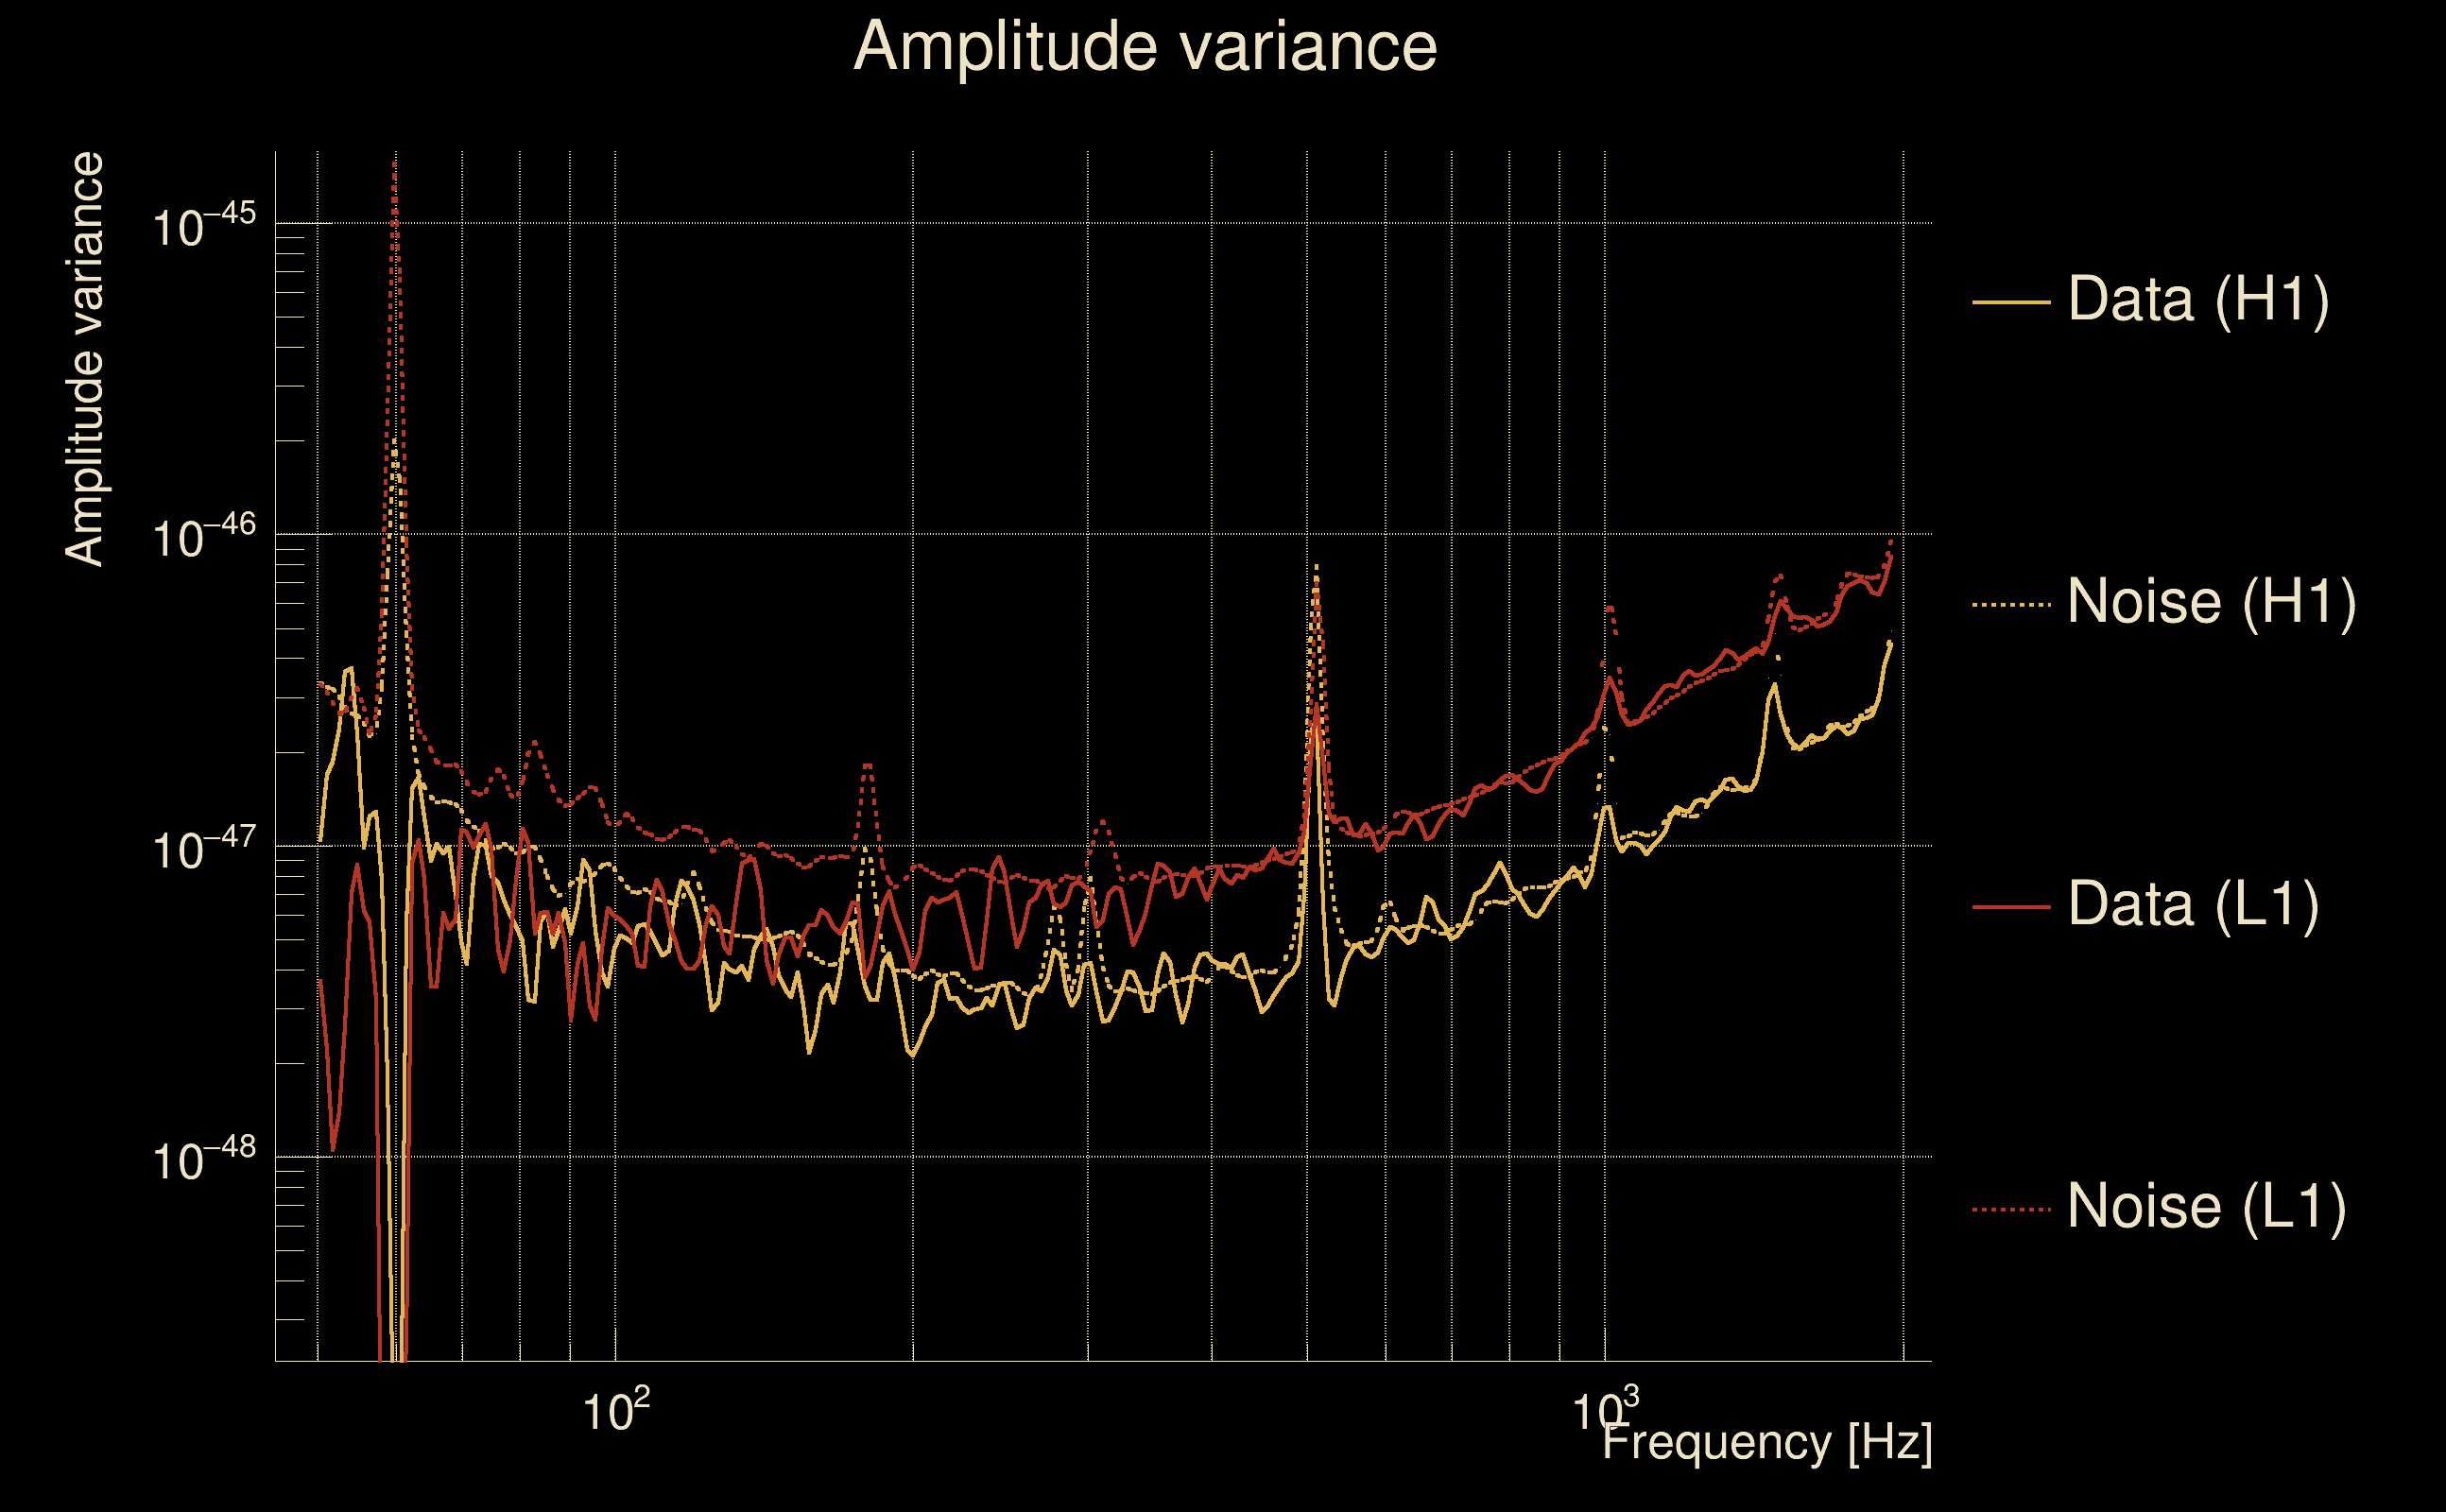
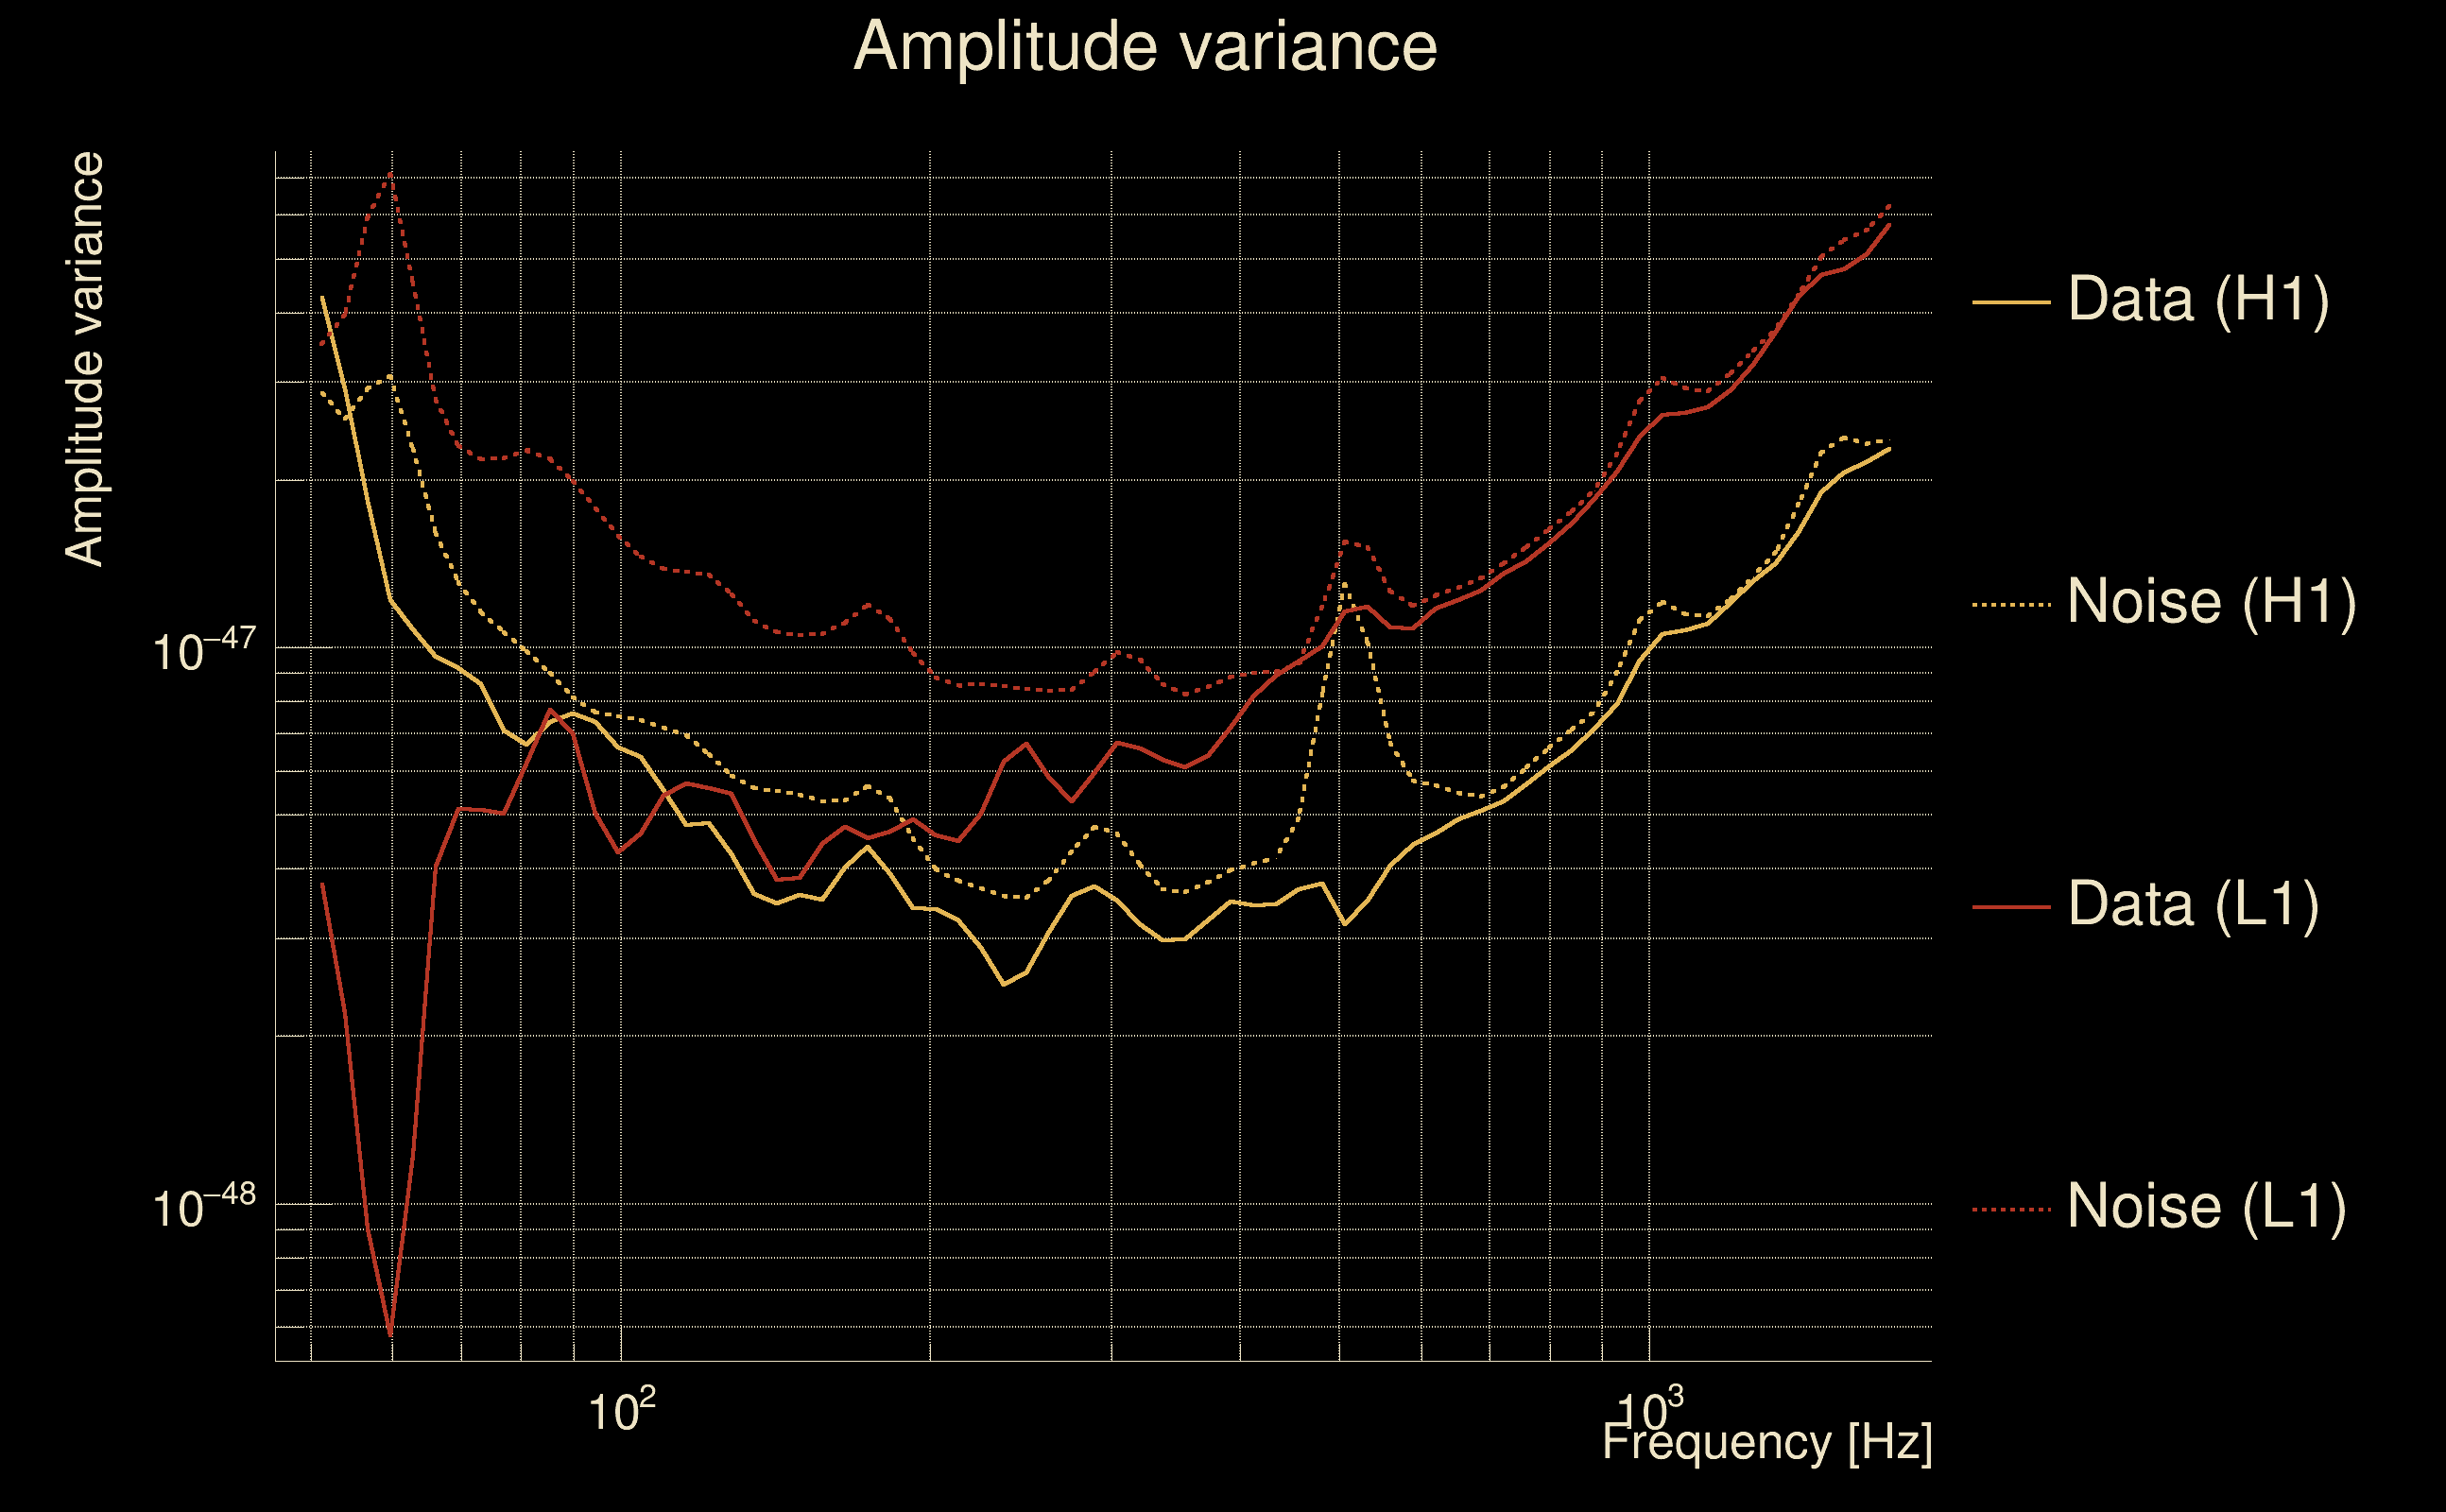
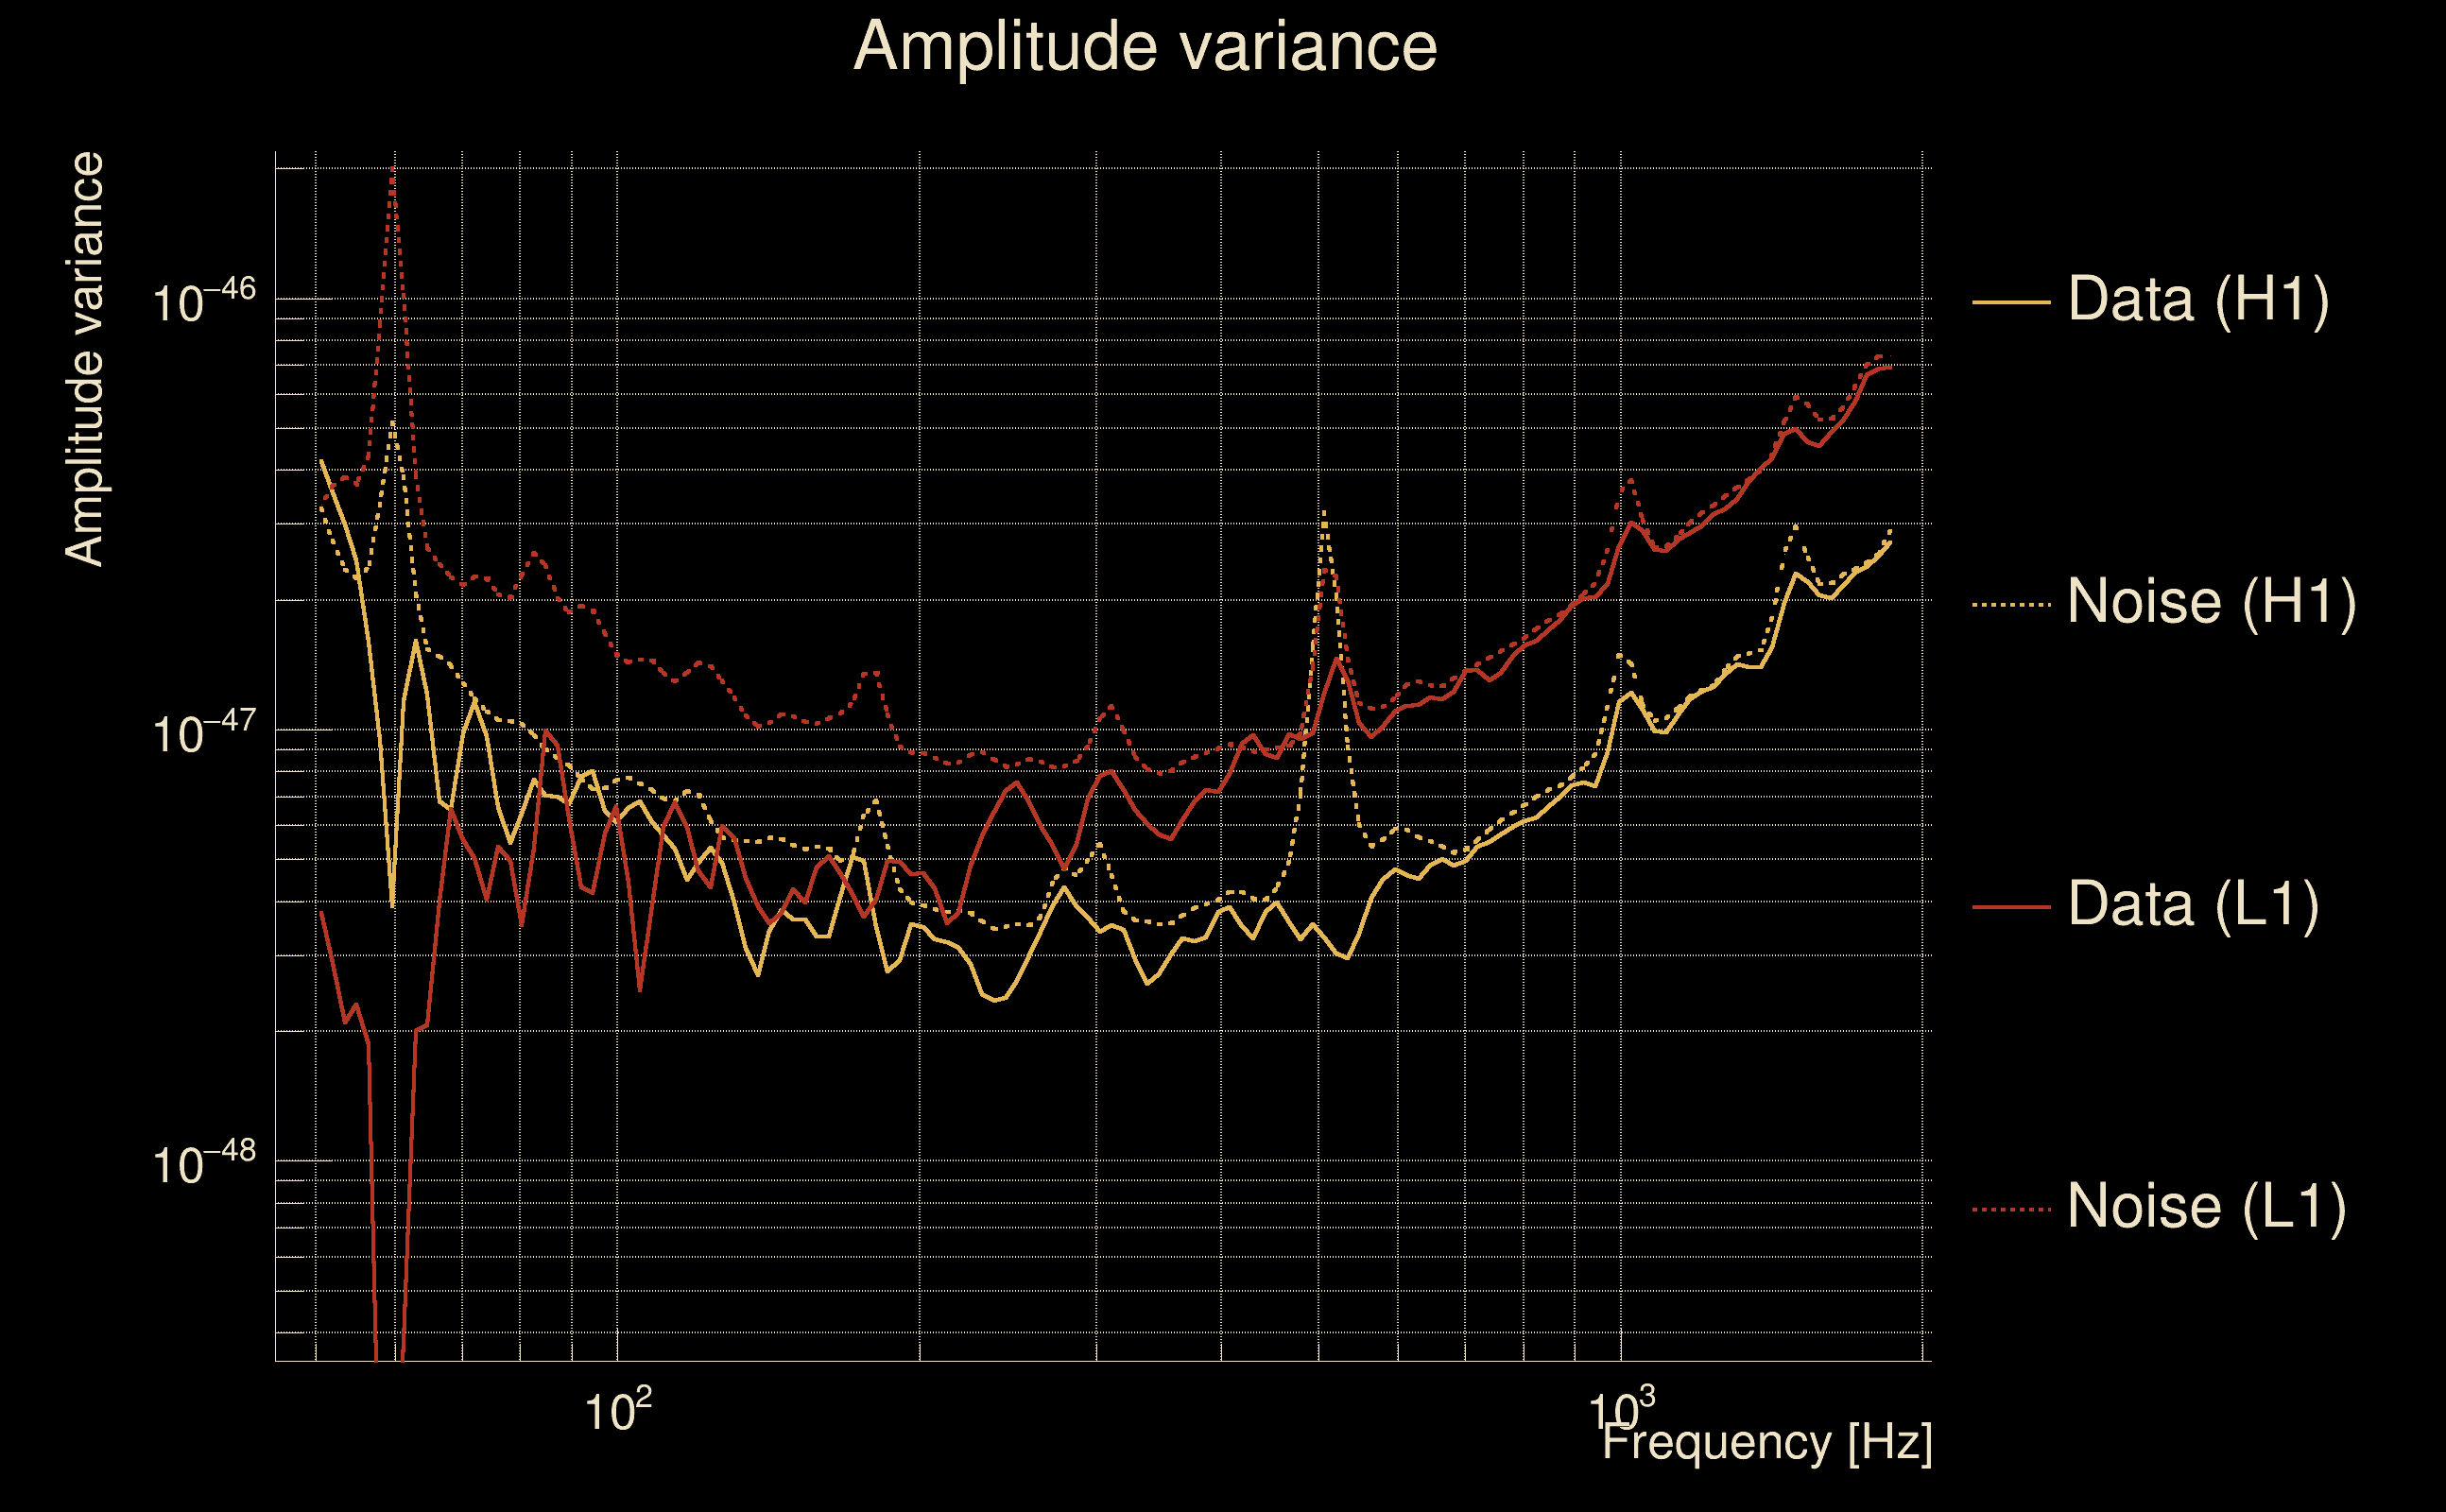
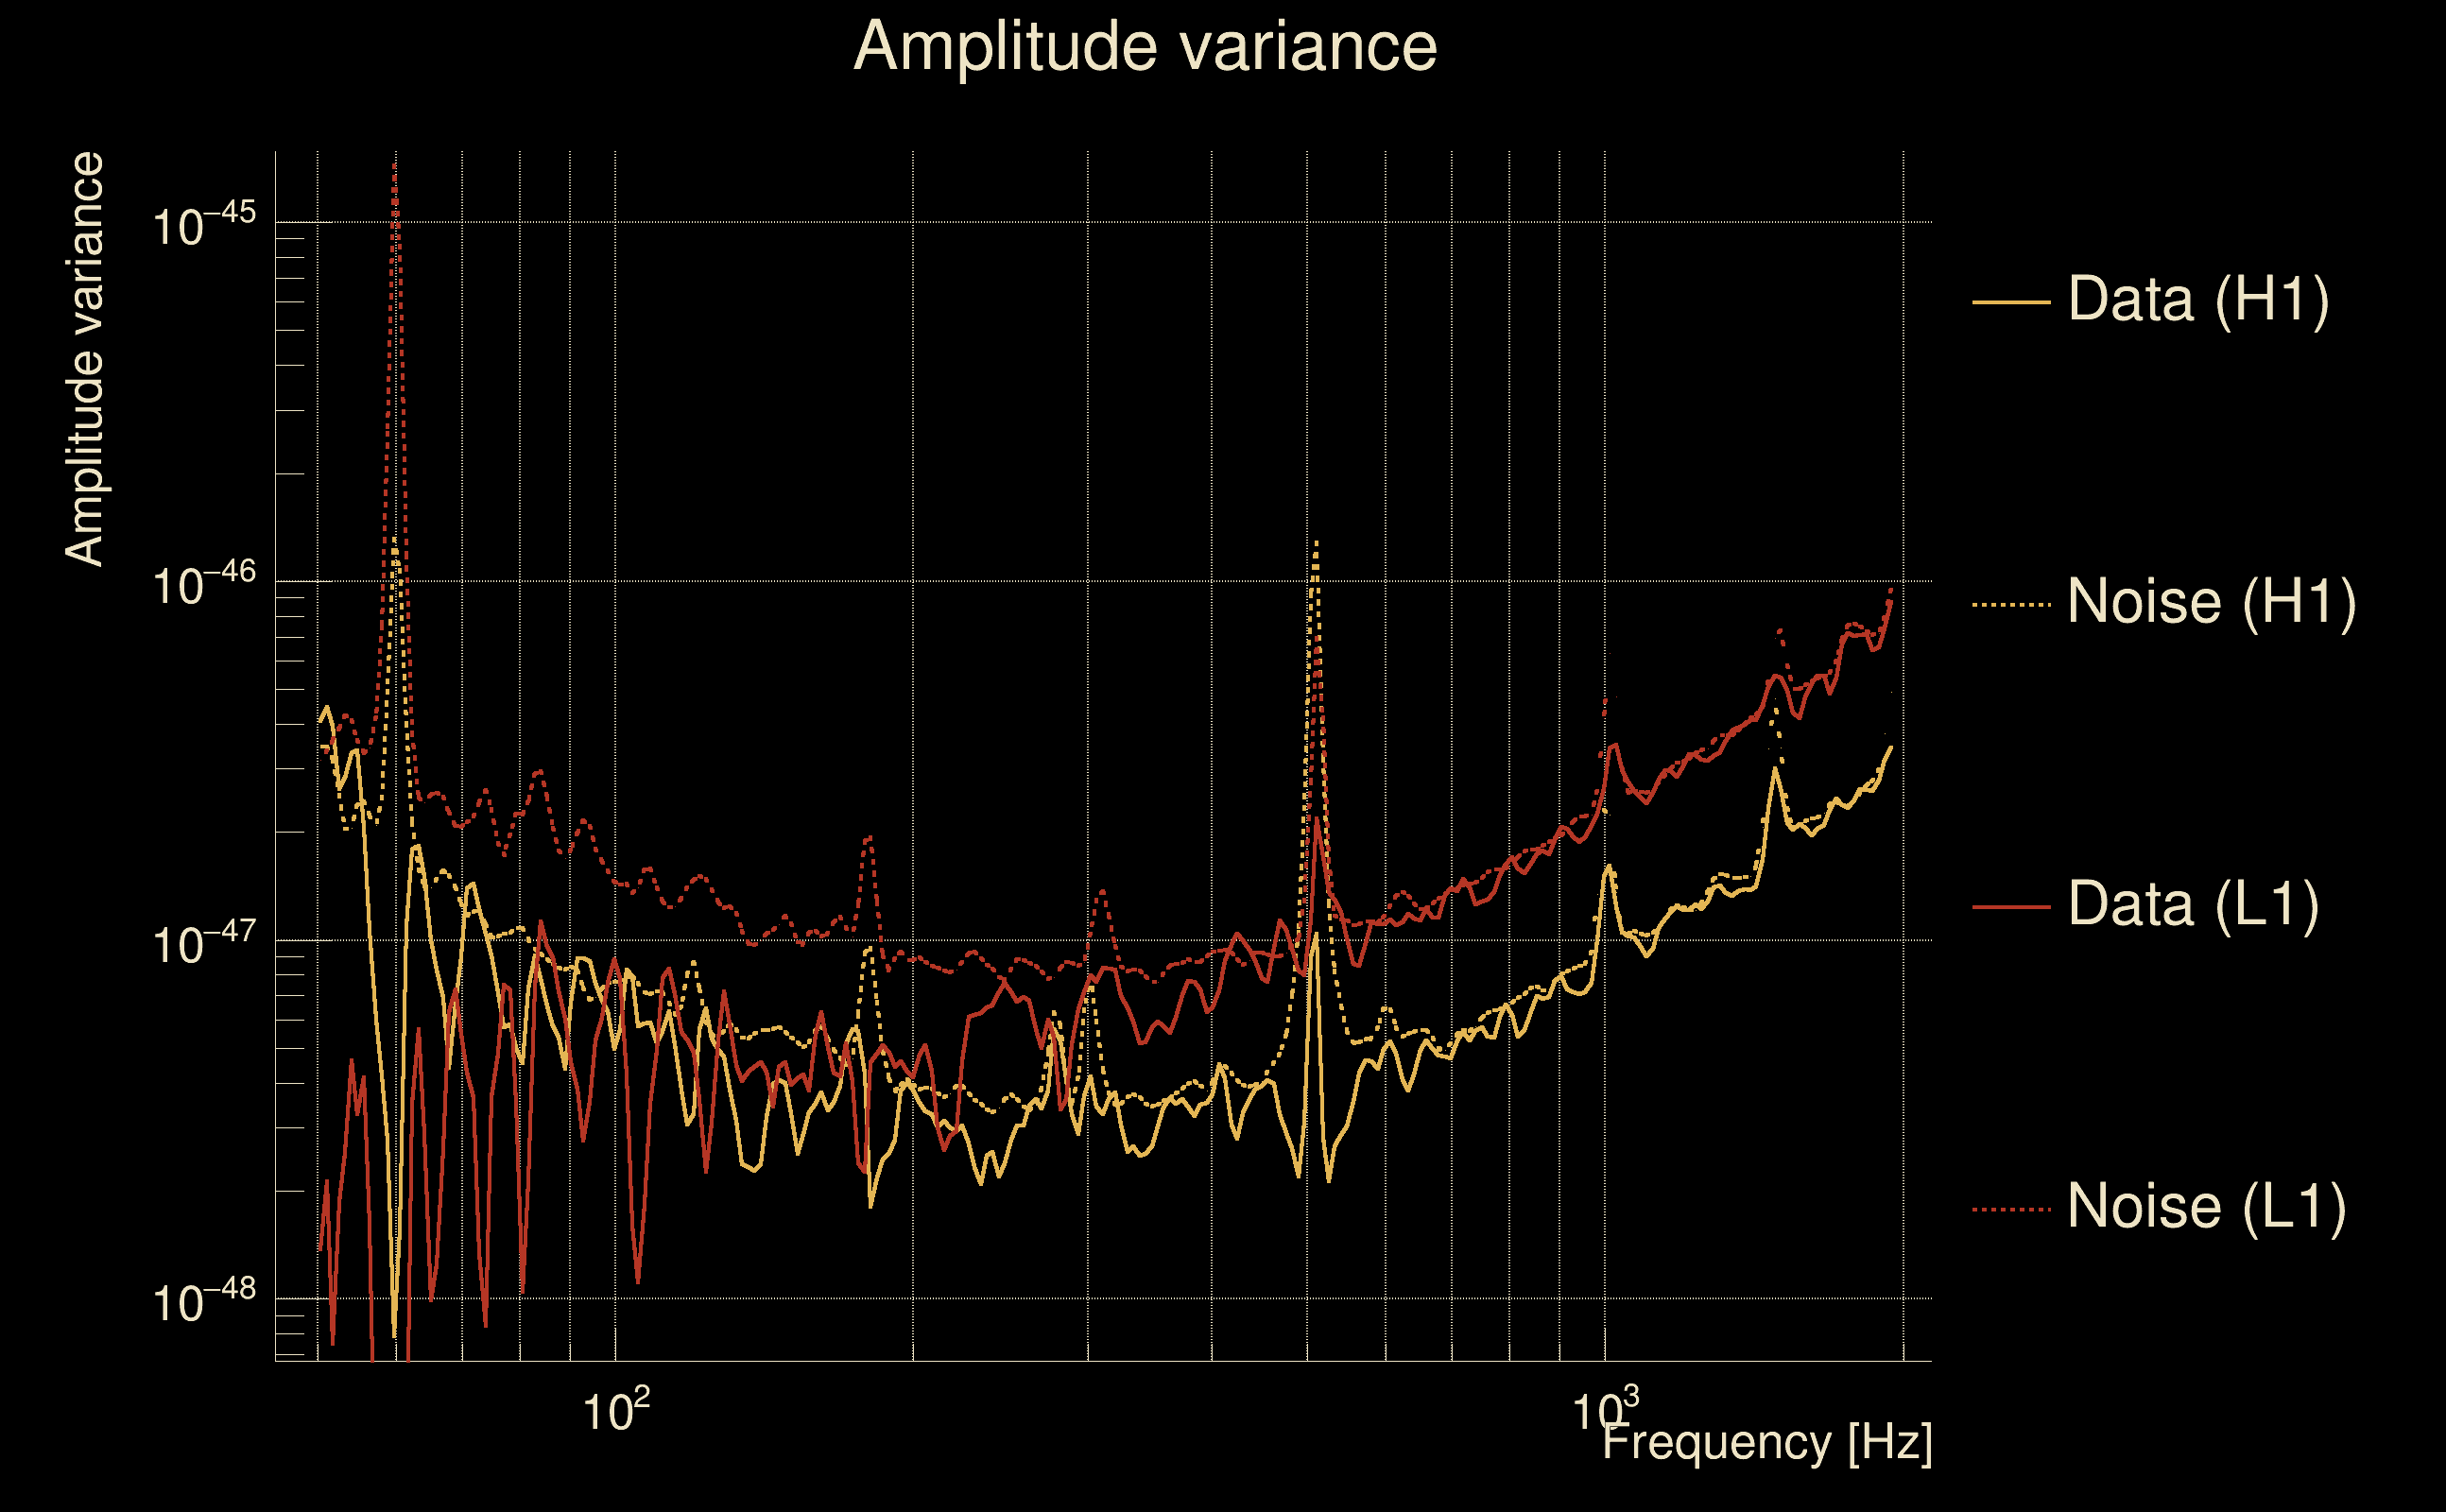
| Omicron frequency range: | 50 Hz → 1958.38 Hz |
| Light travel time between detectors: | 0.0100128 s |
| Slice extra-time (calibration uncertainty + slice veto): | 0.0129872 s |
| Number of time-delay bins in a cross-correlation map: | 10000 |
| Number of slices in a cross-correlation map: | 217 |
| Number of time-delay bins in a slice: | 46 |
| SNR gating: | < 100 (detector 0), < 100 (detector 1) |
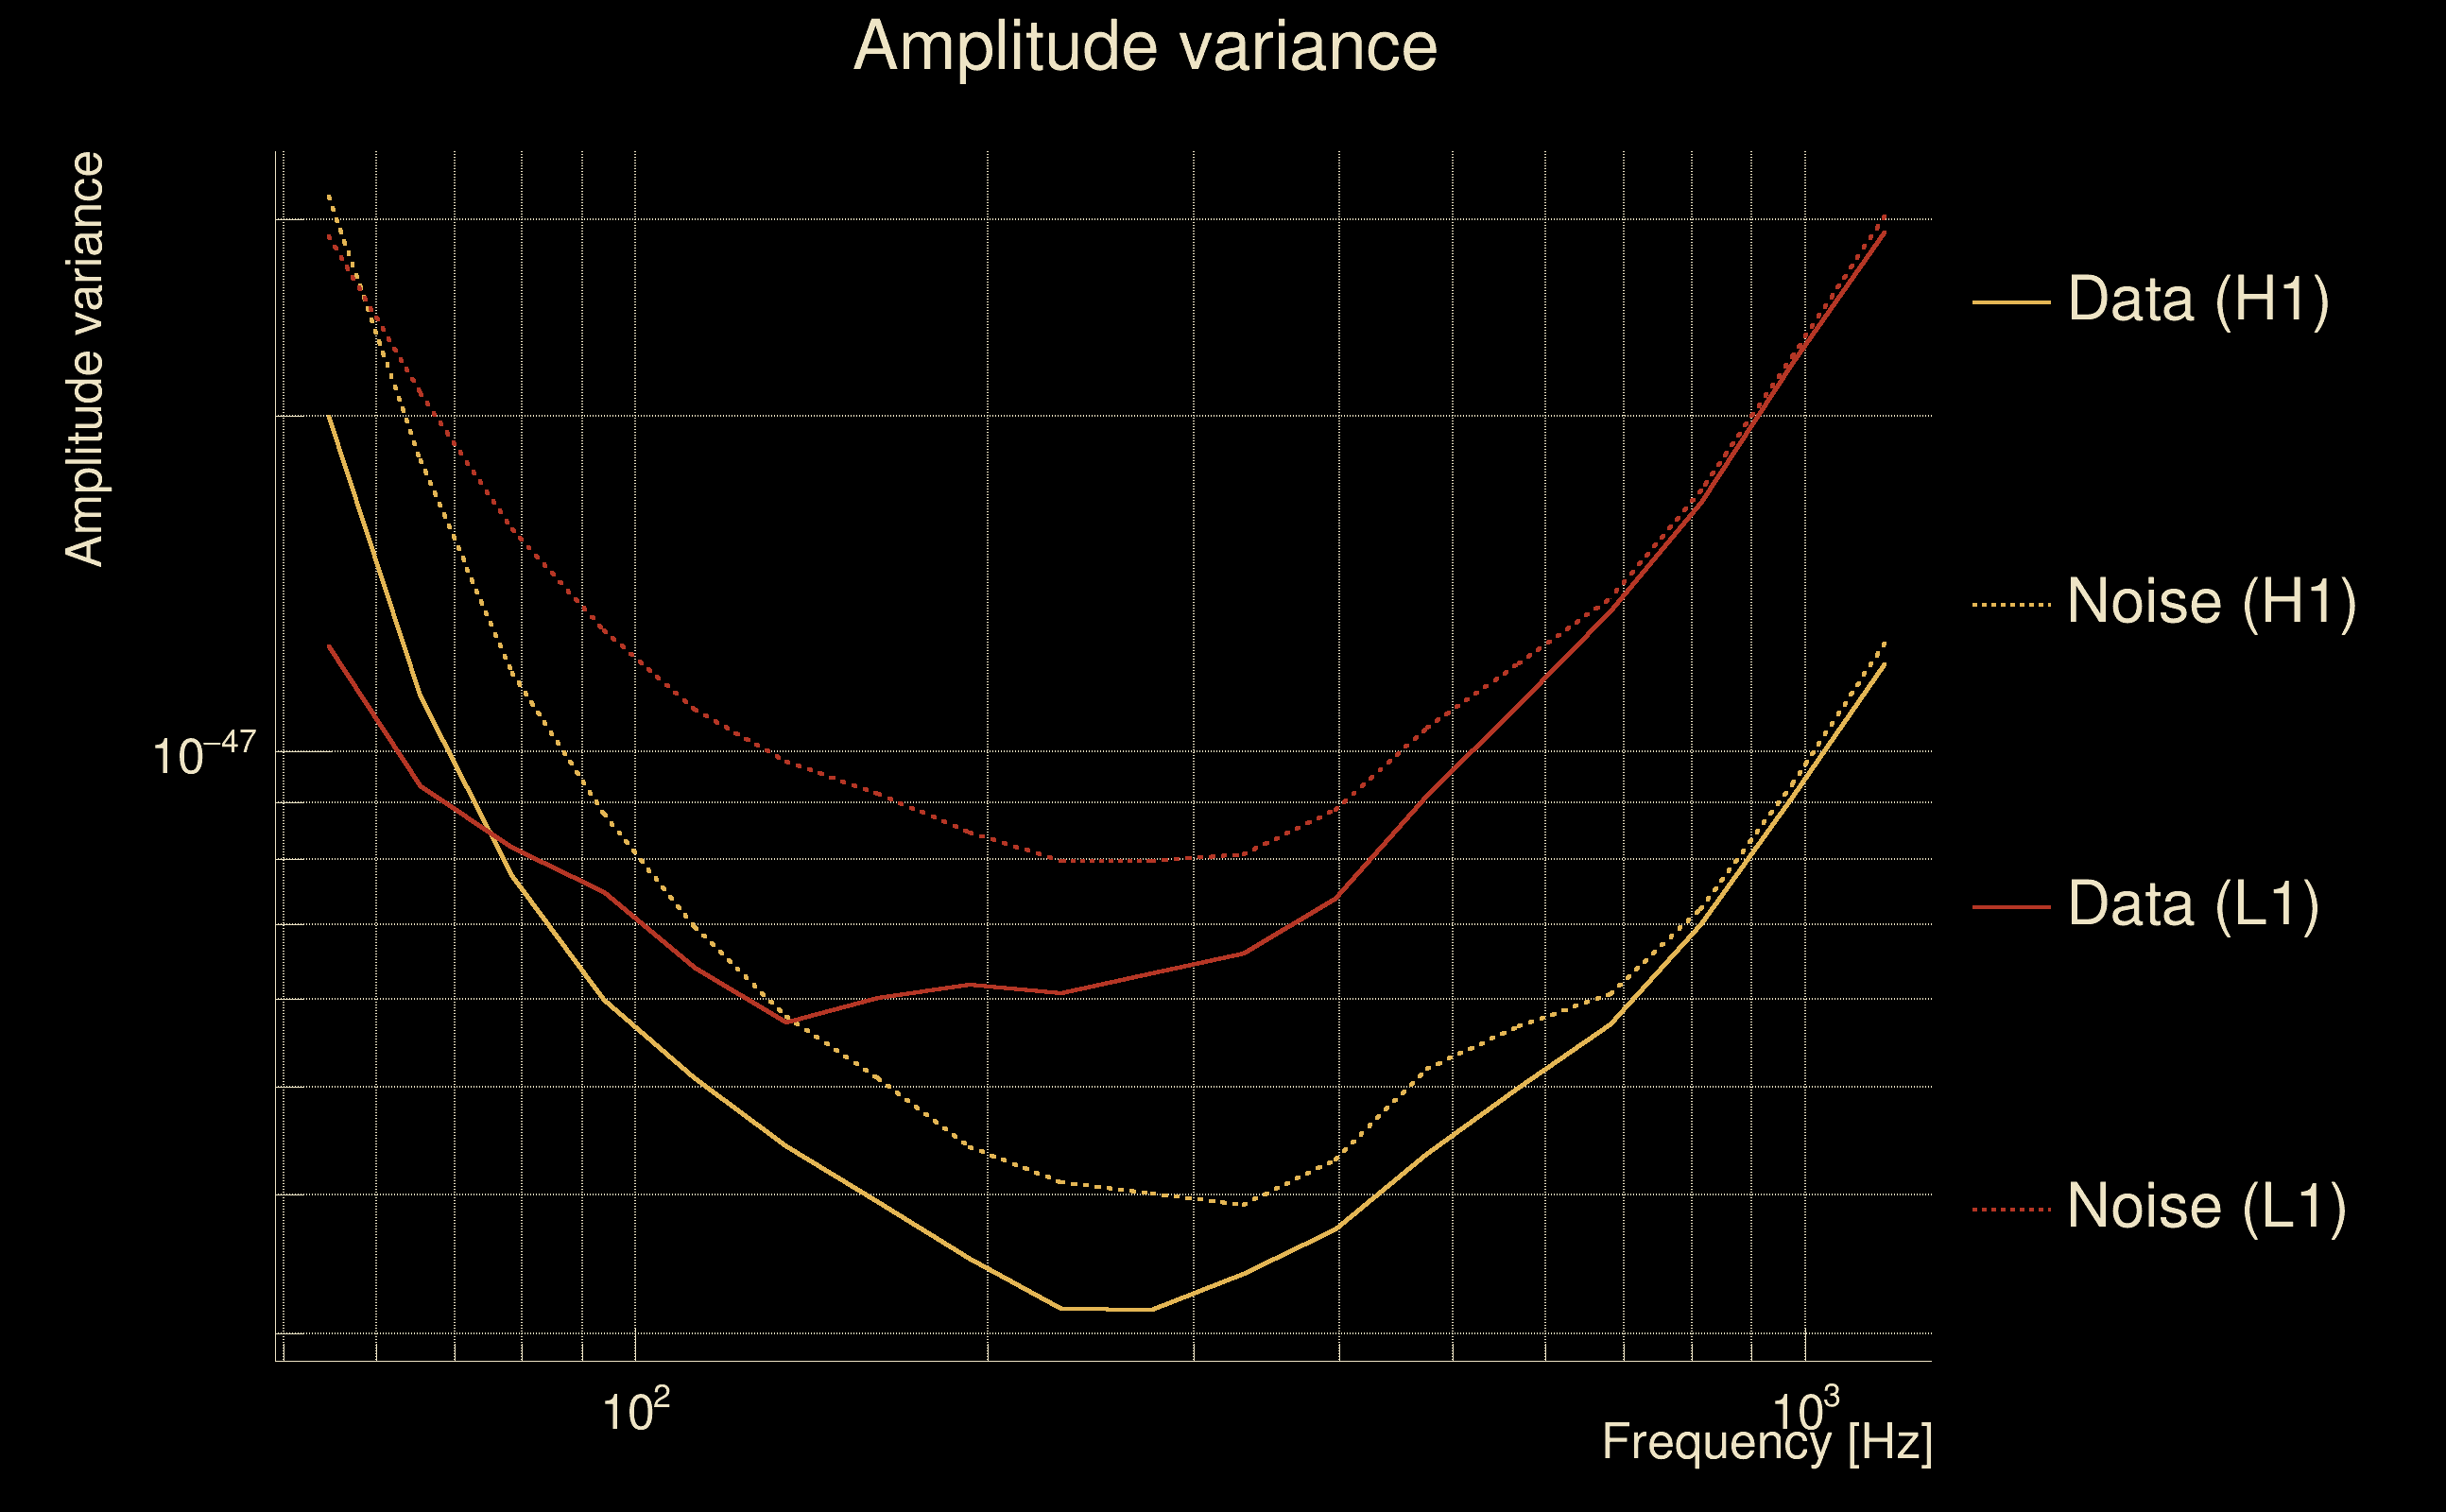
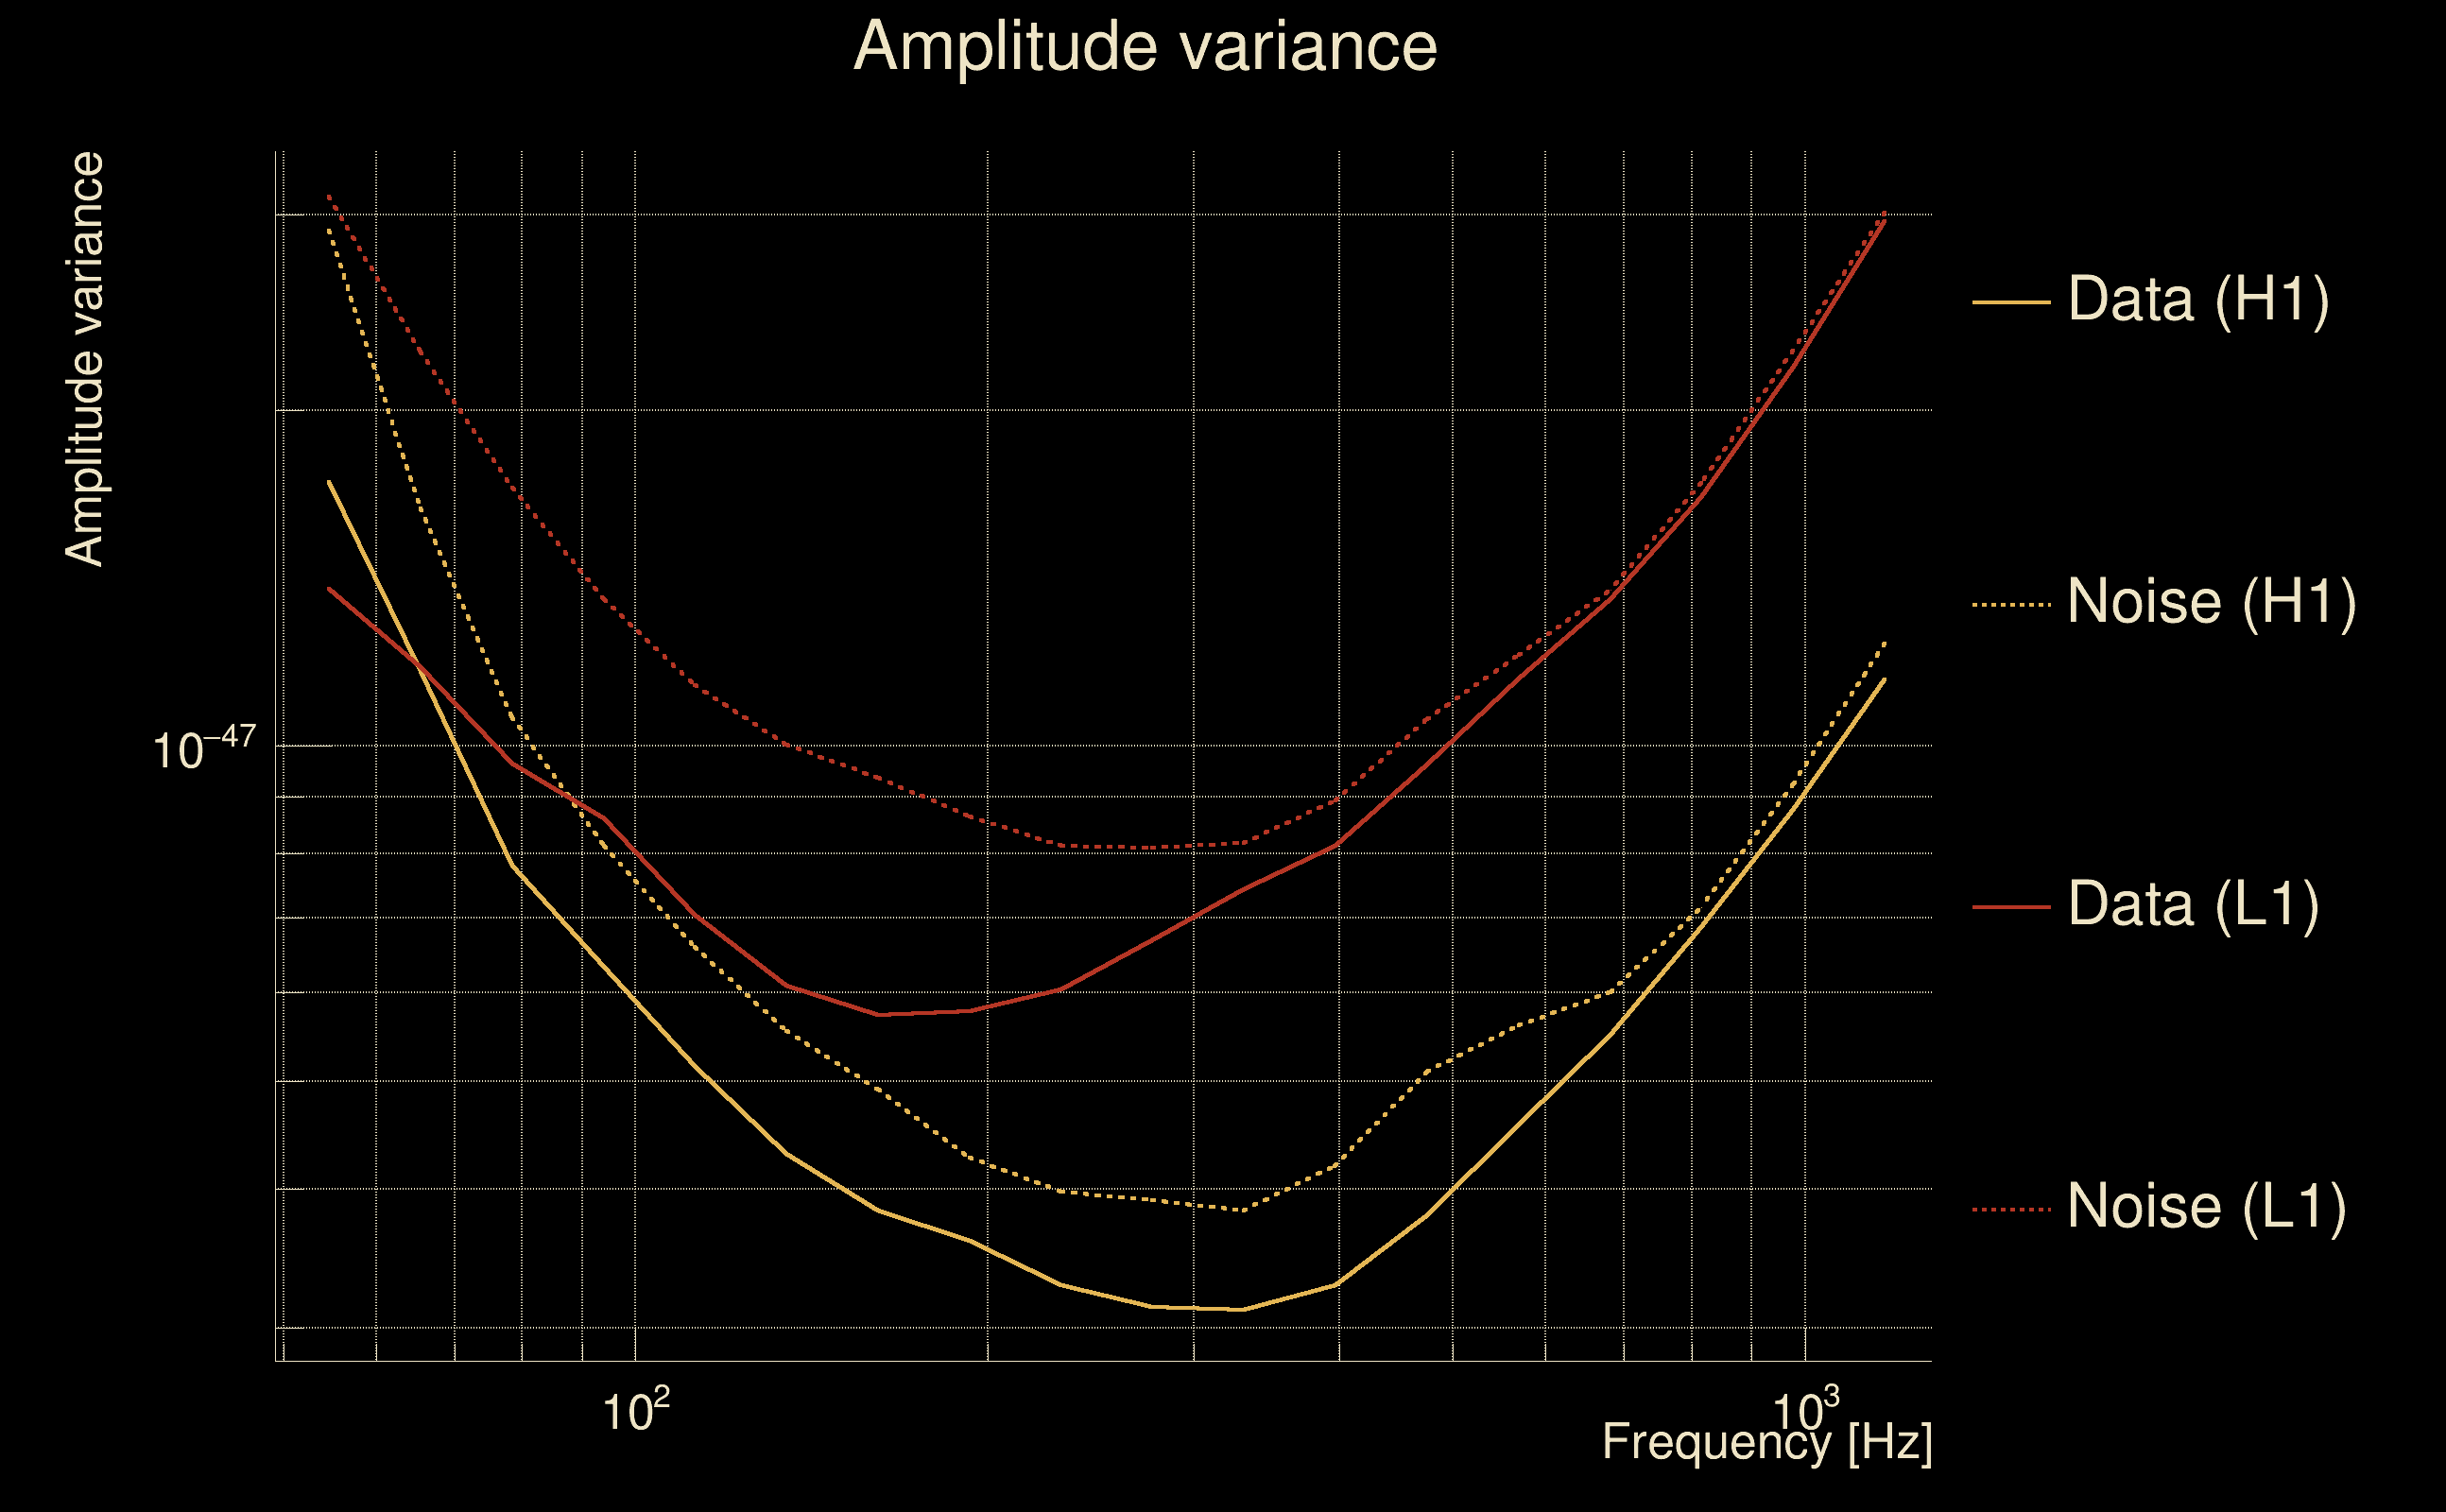
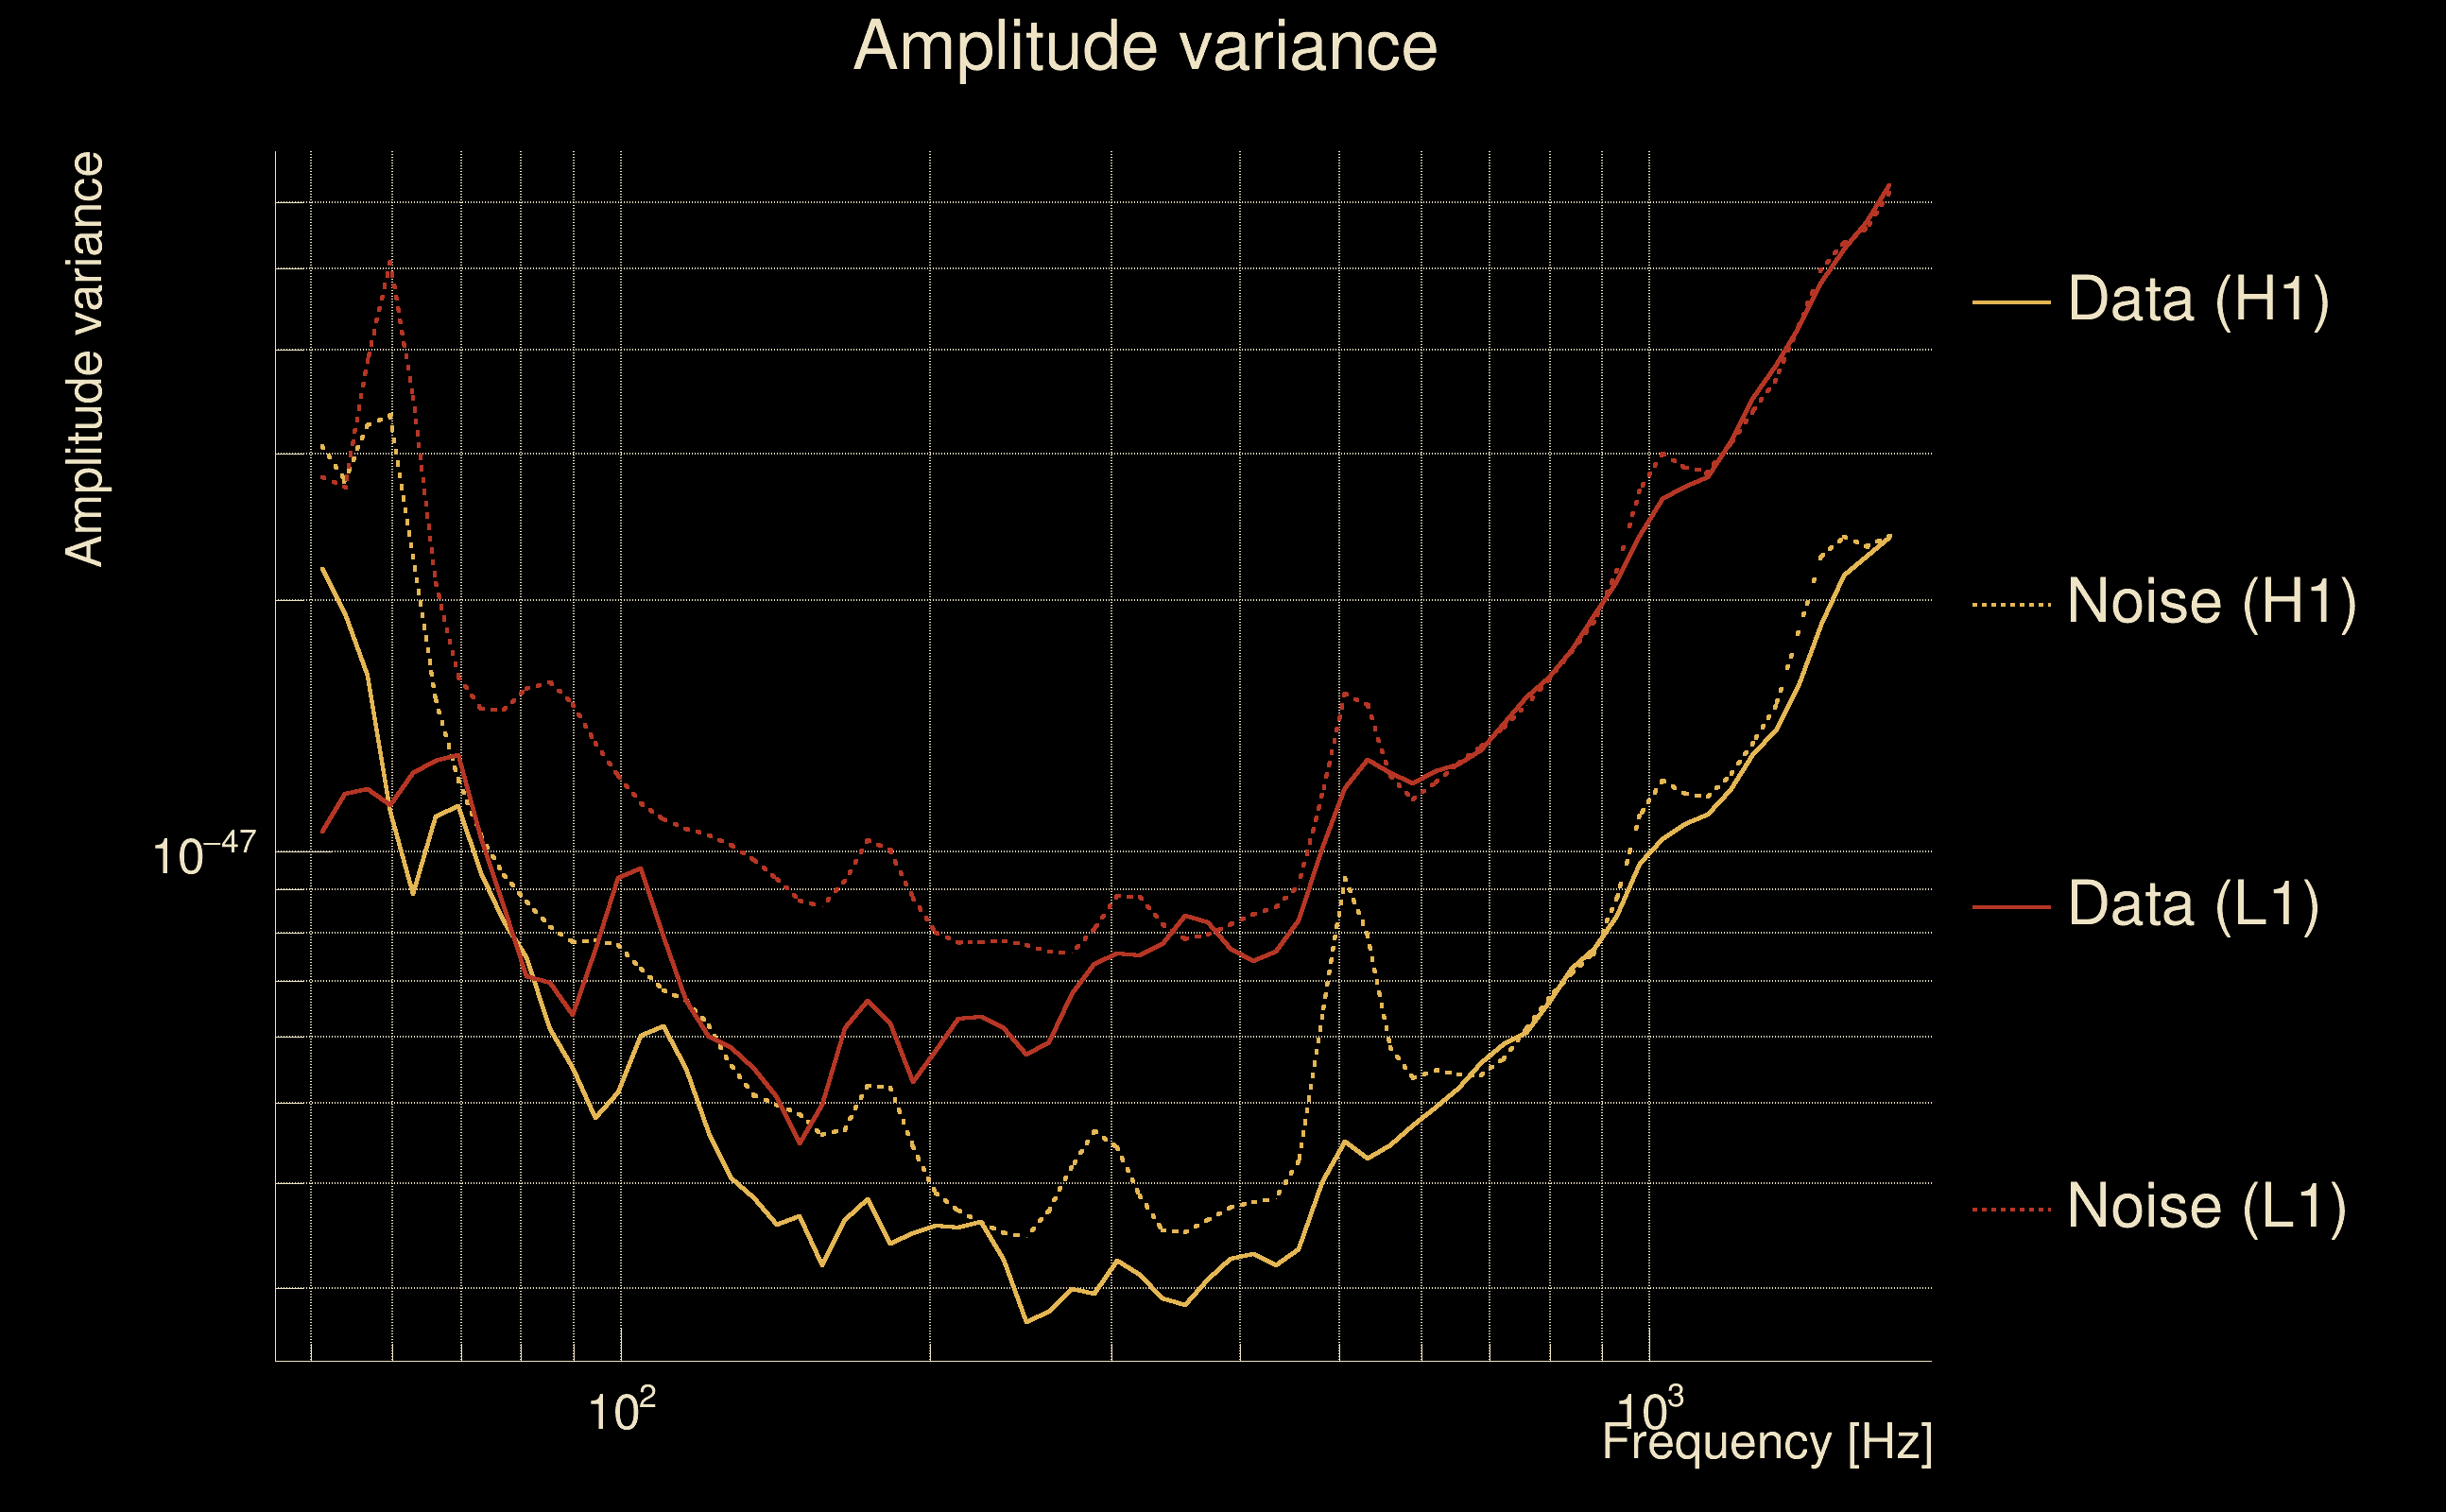
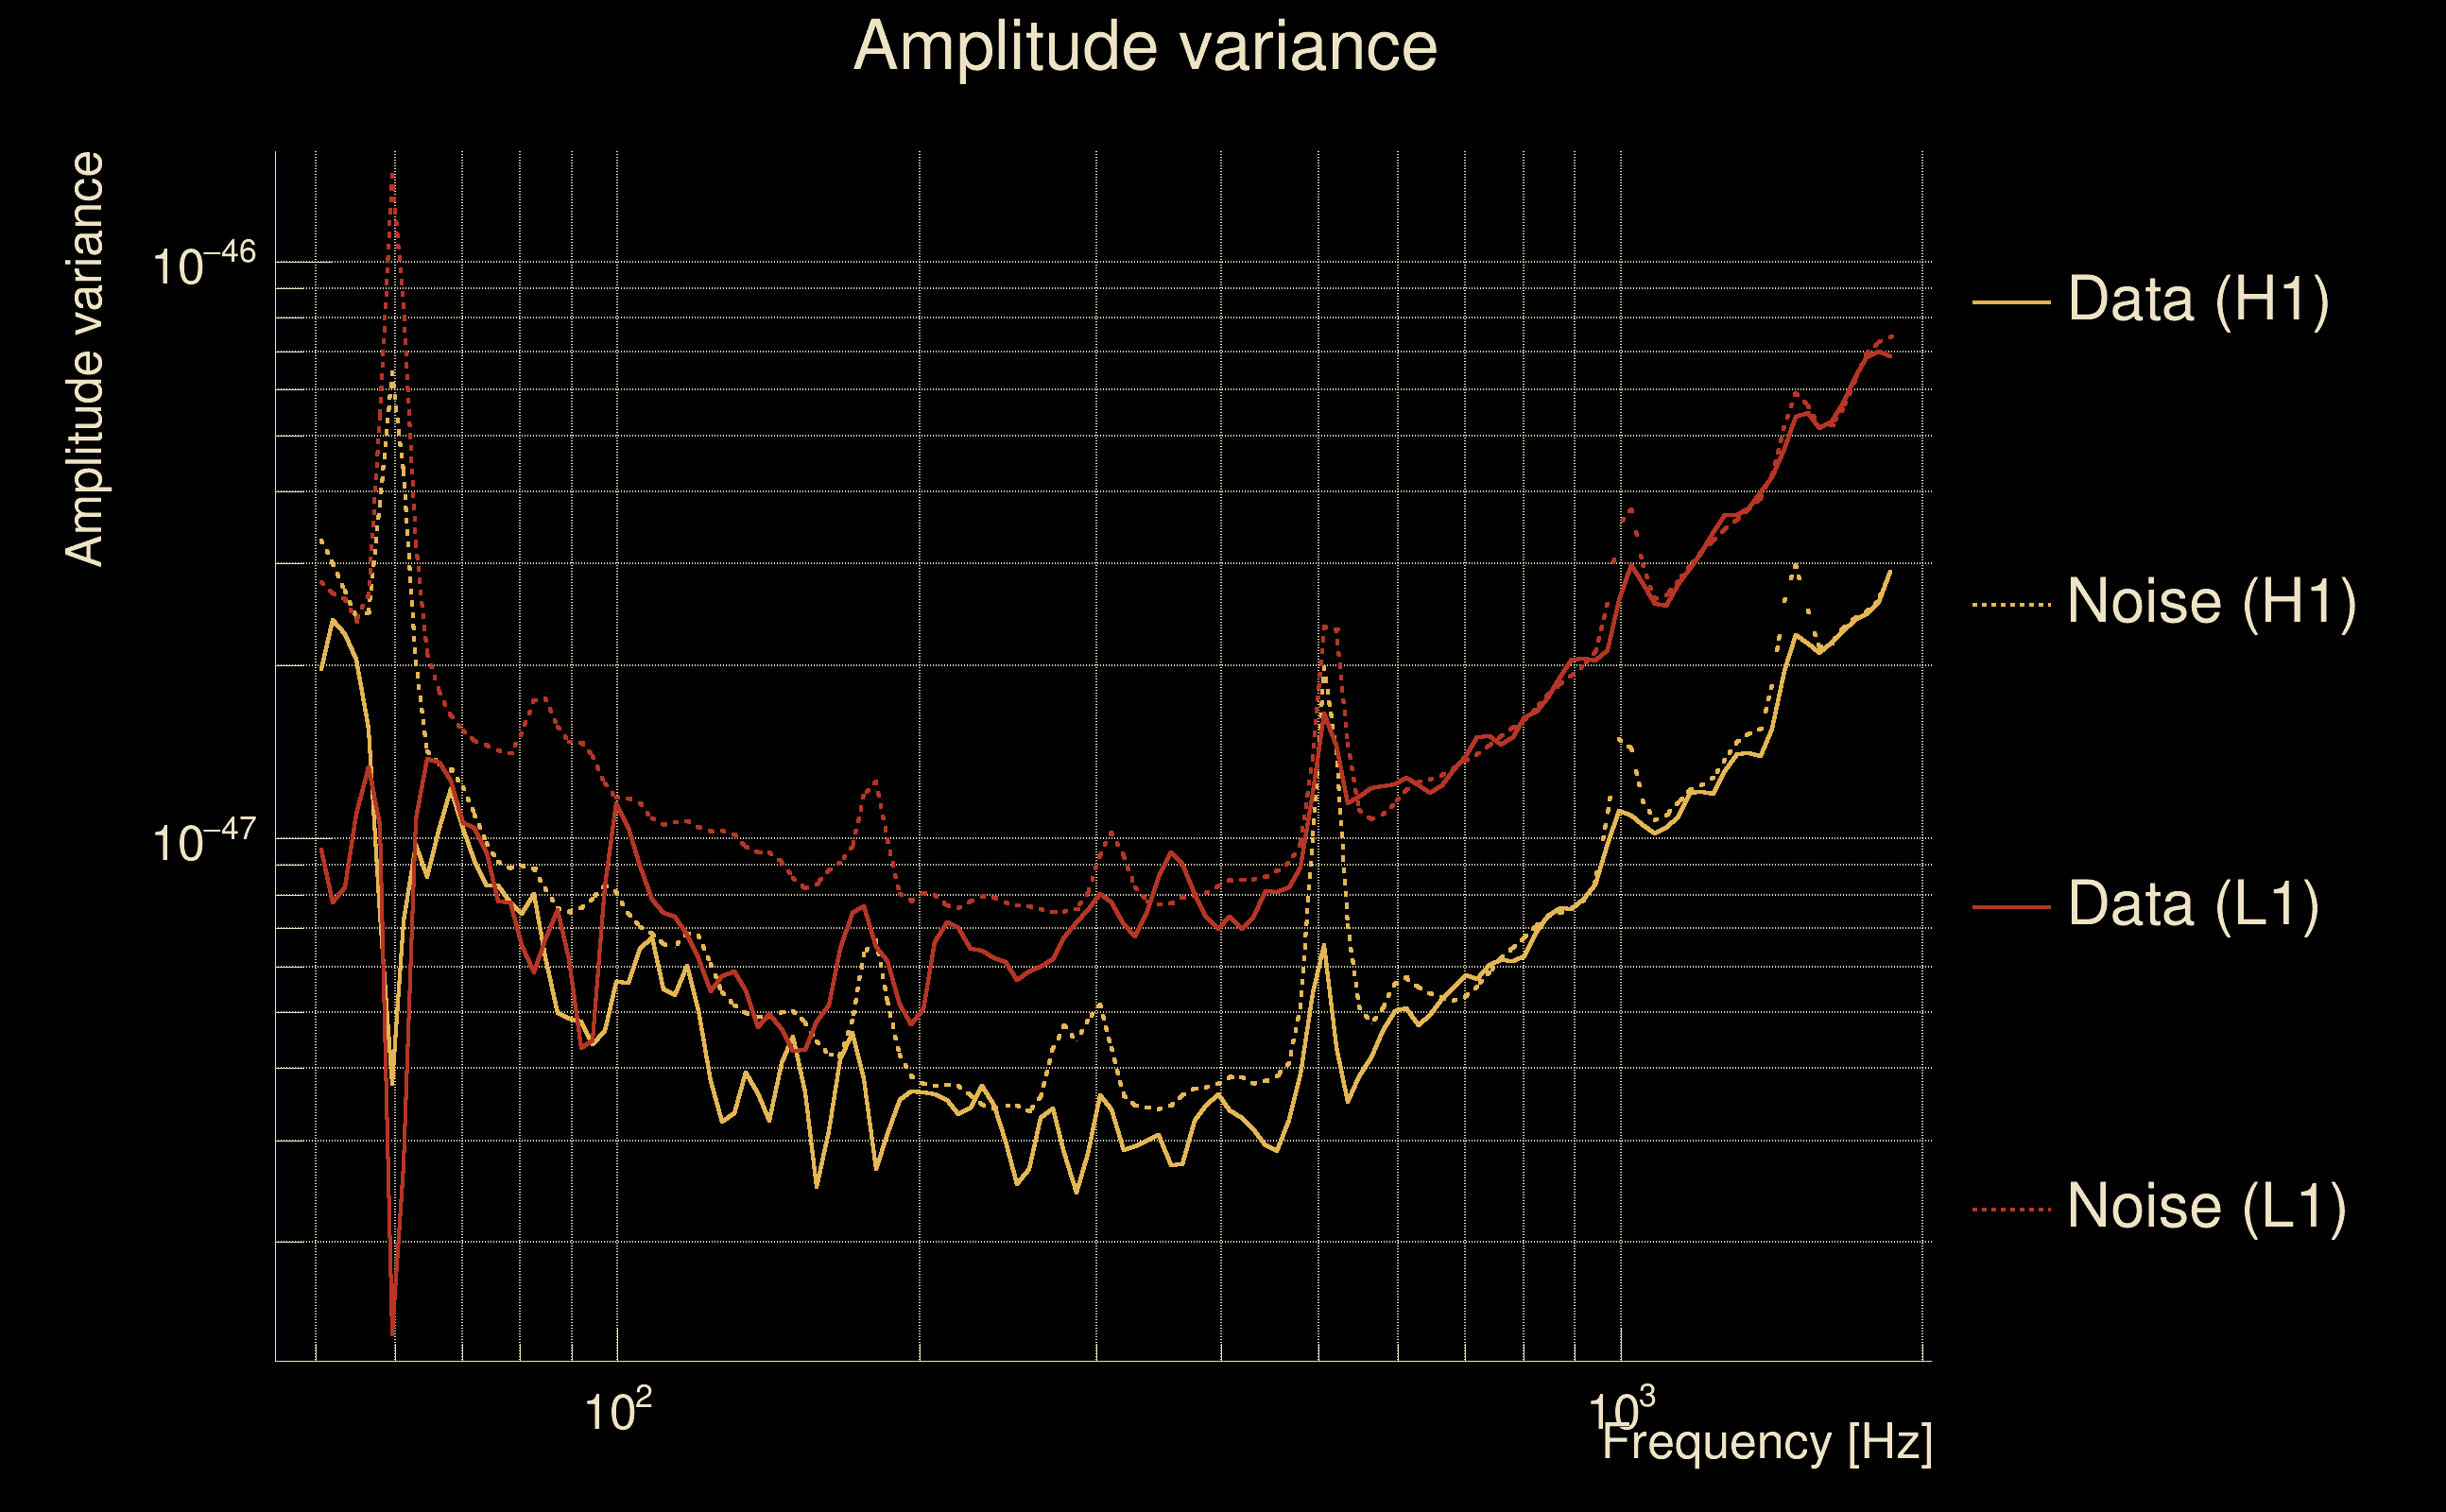
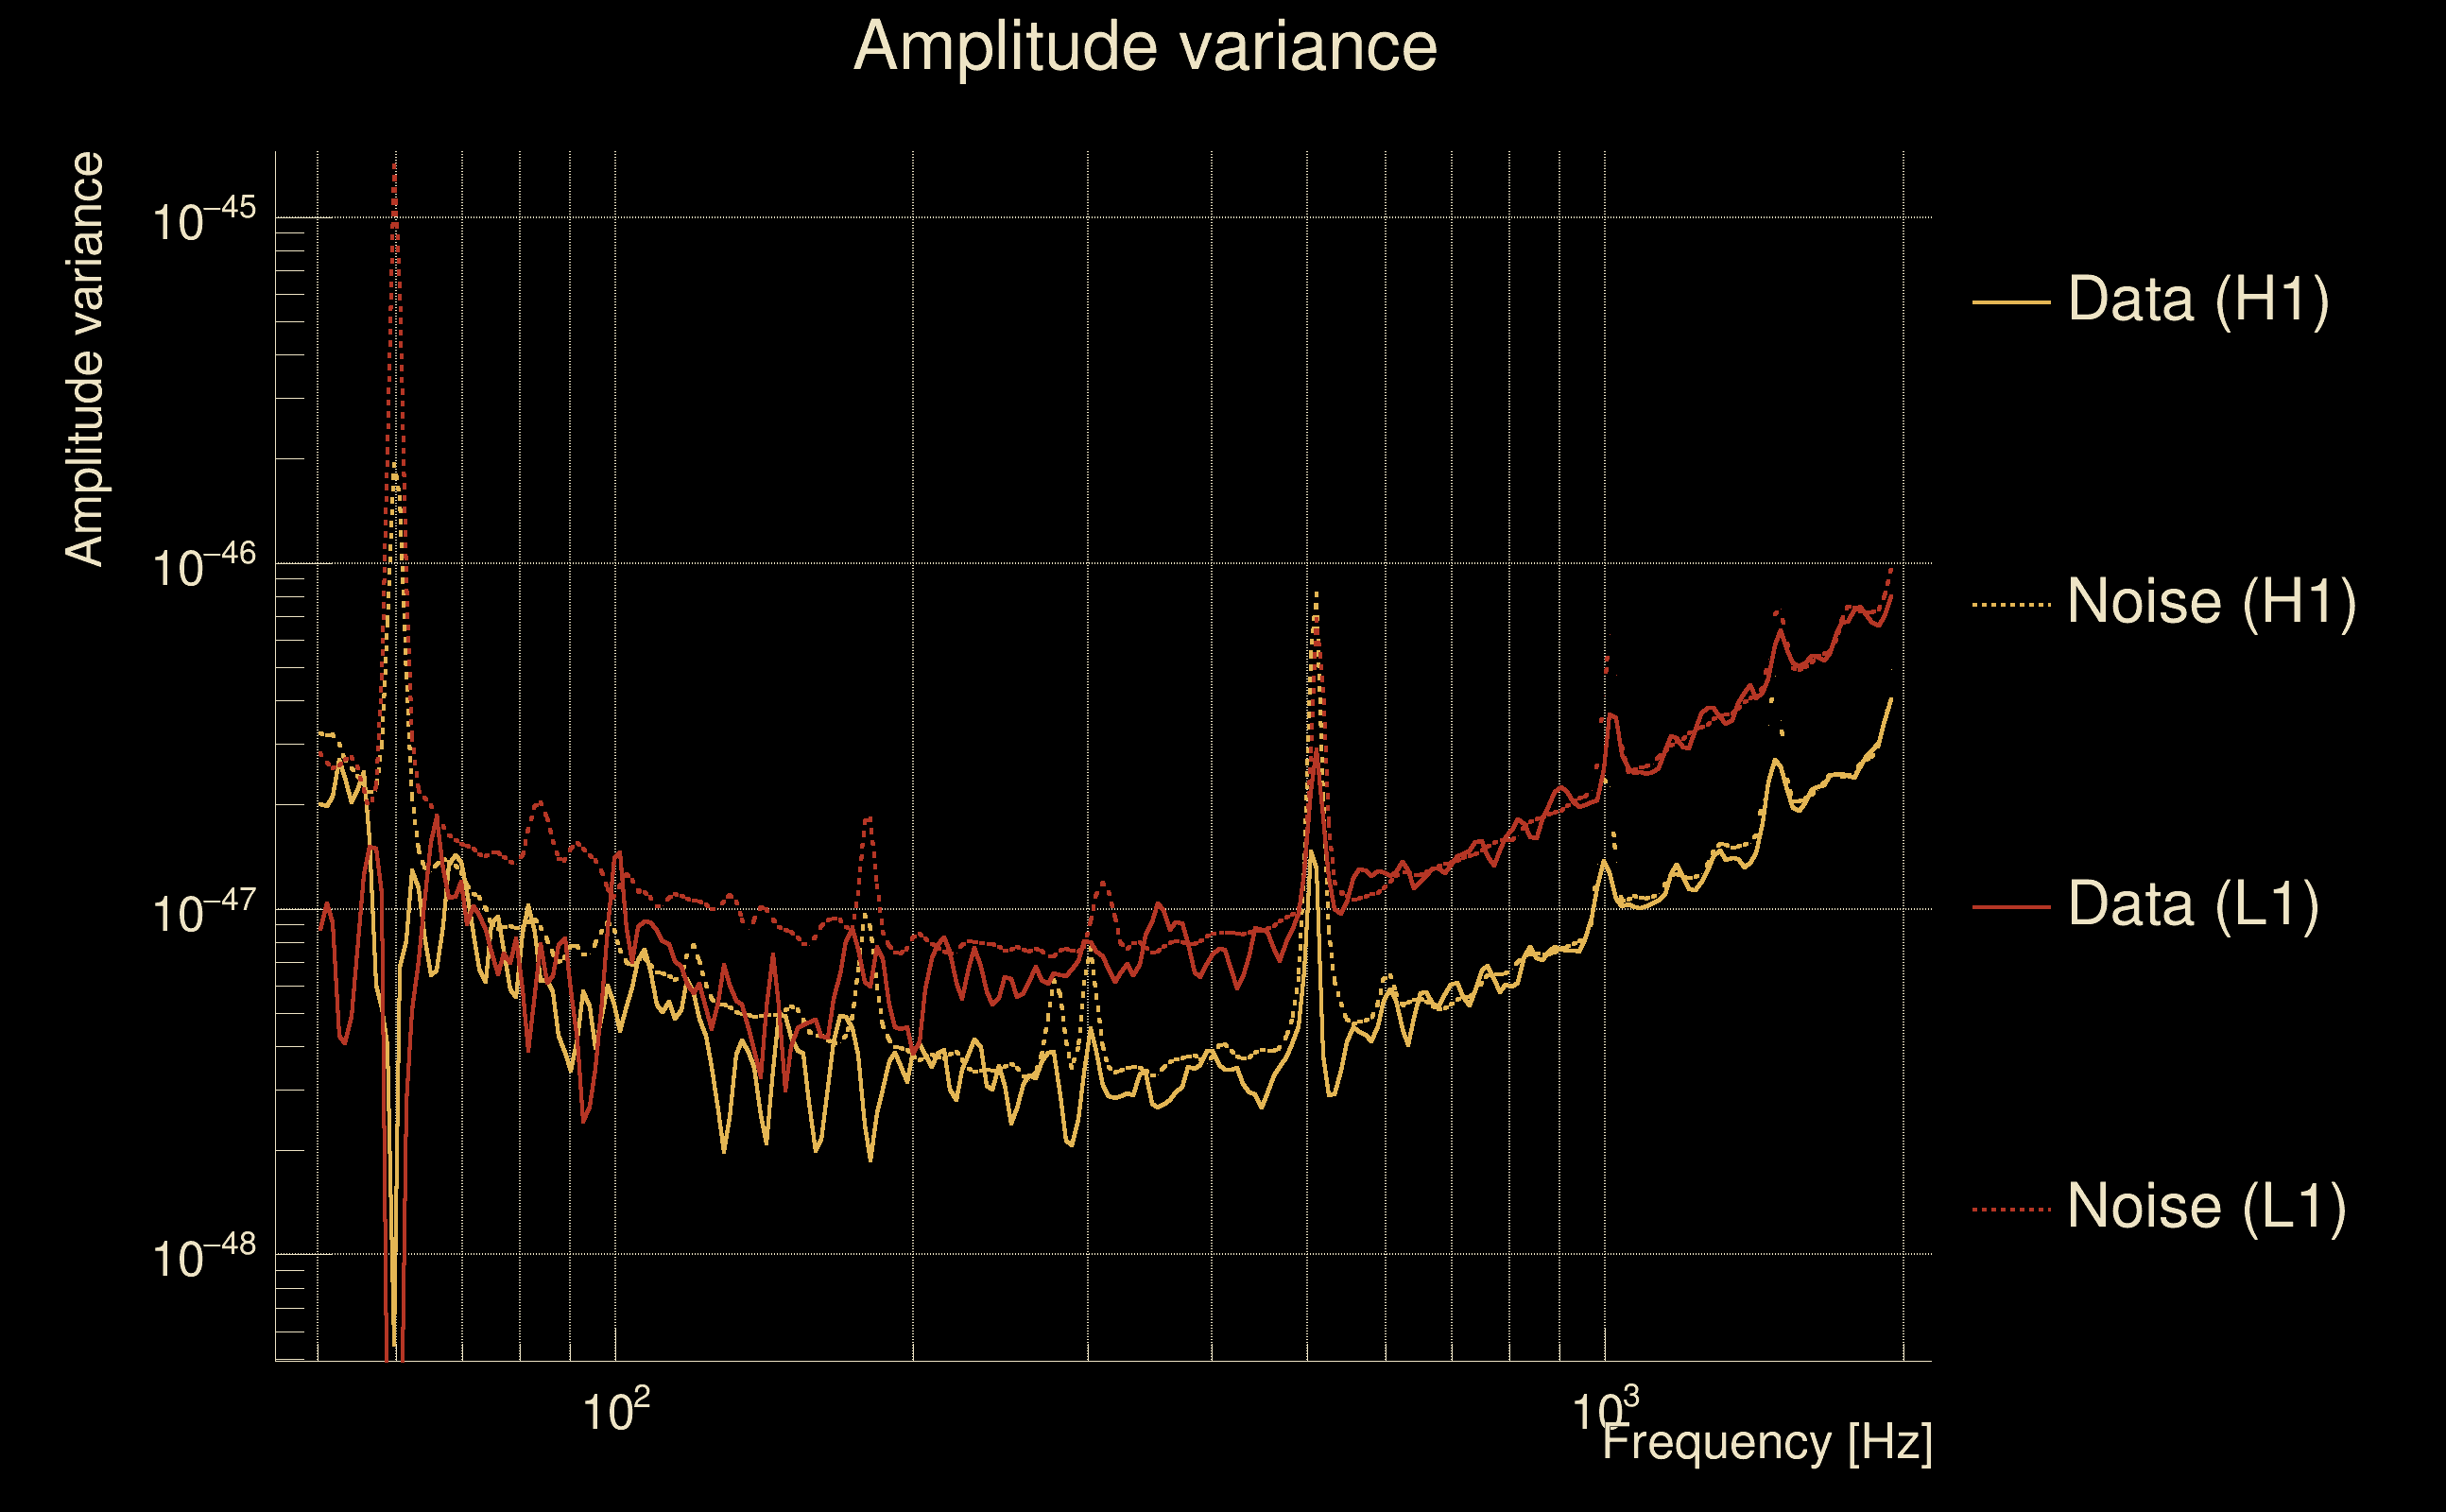
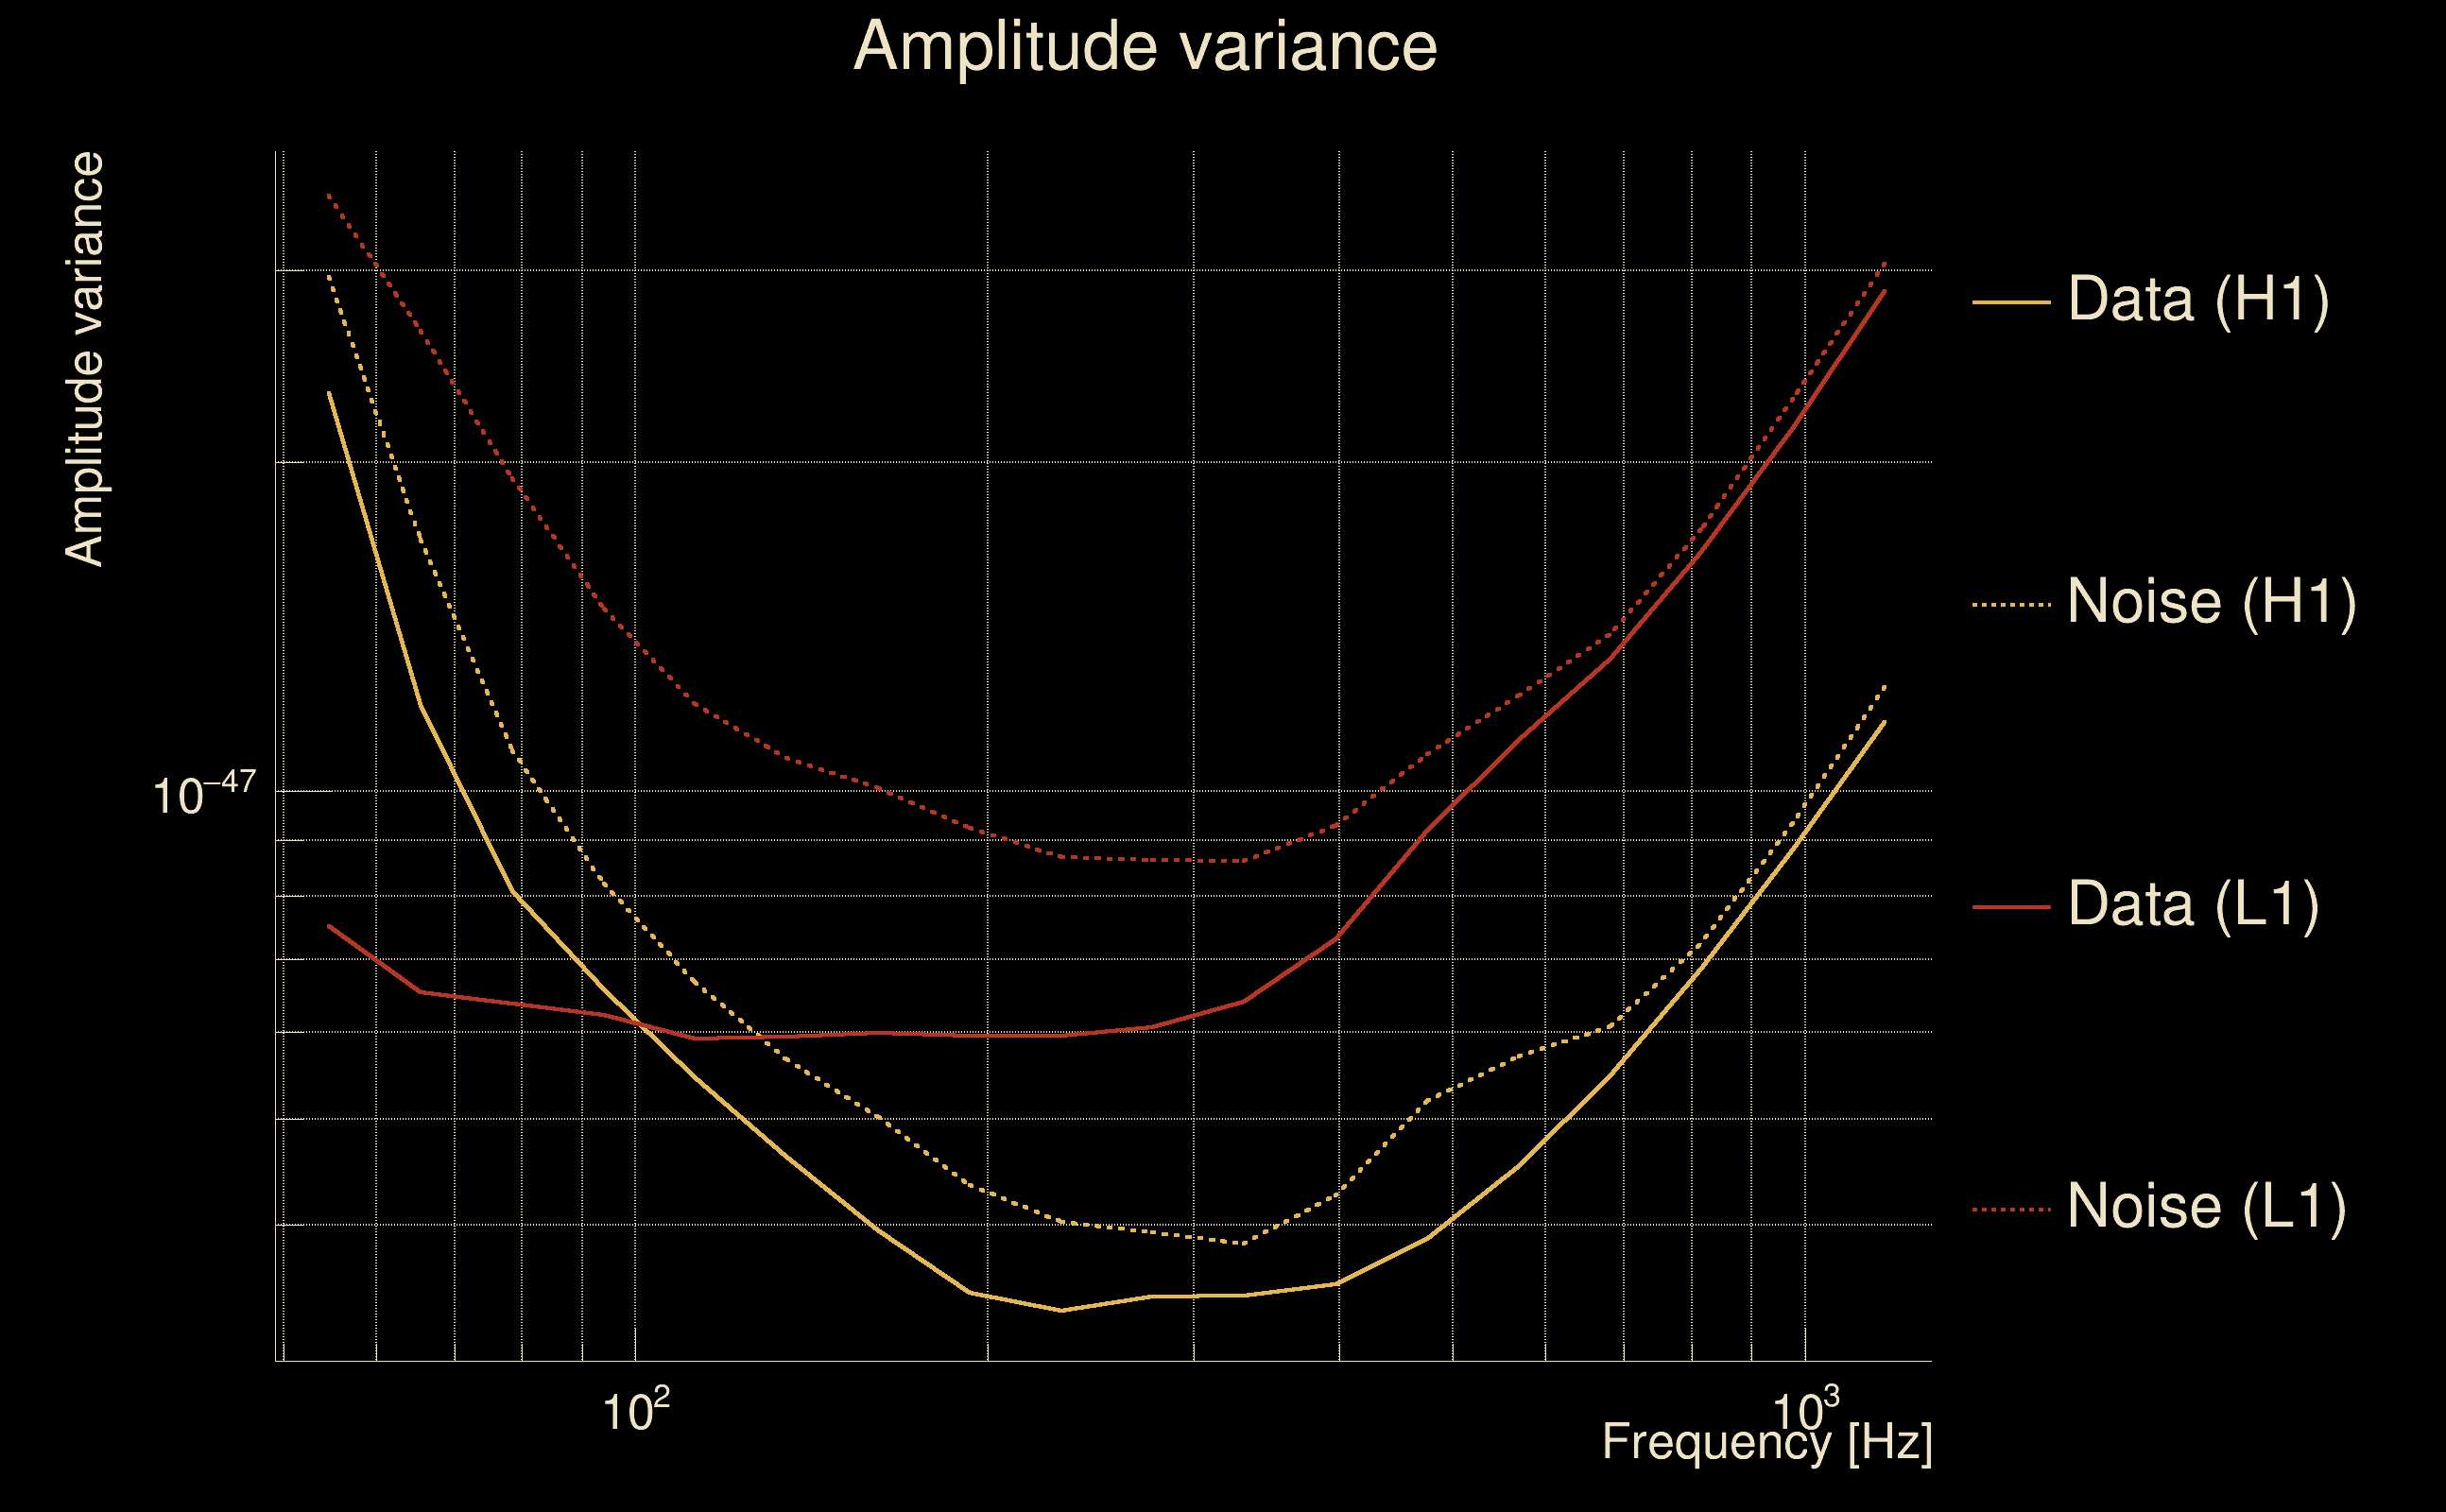
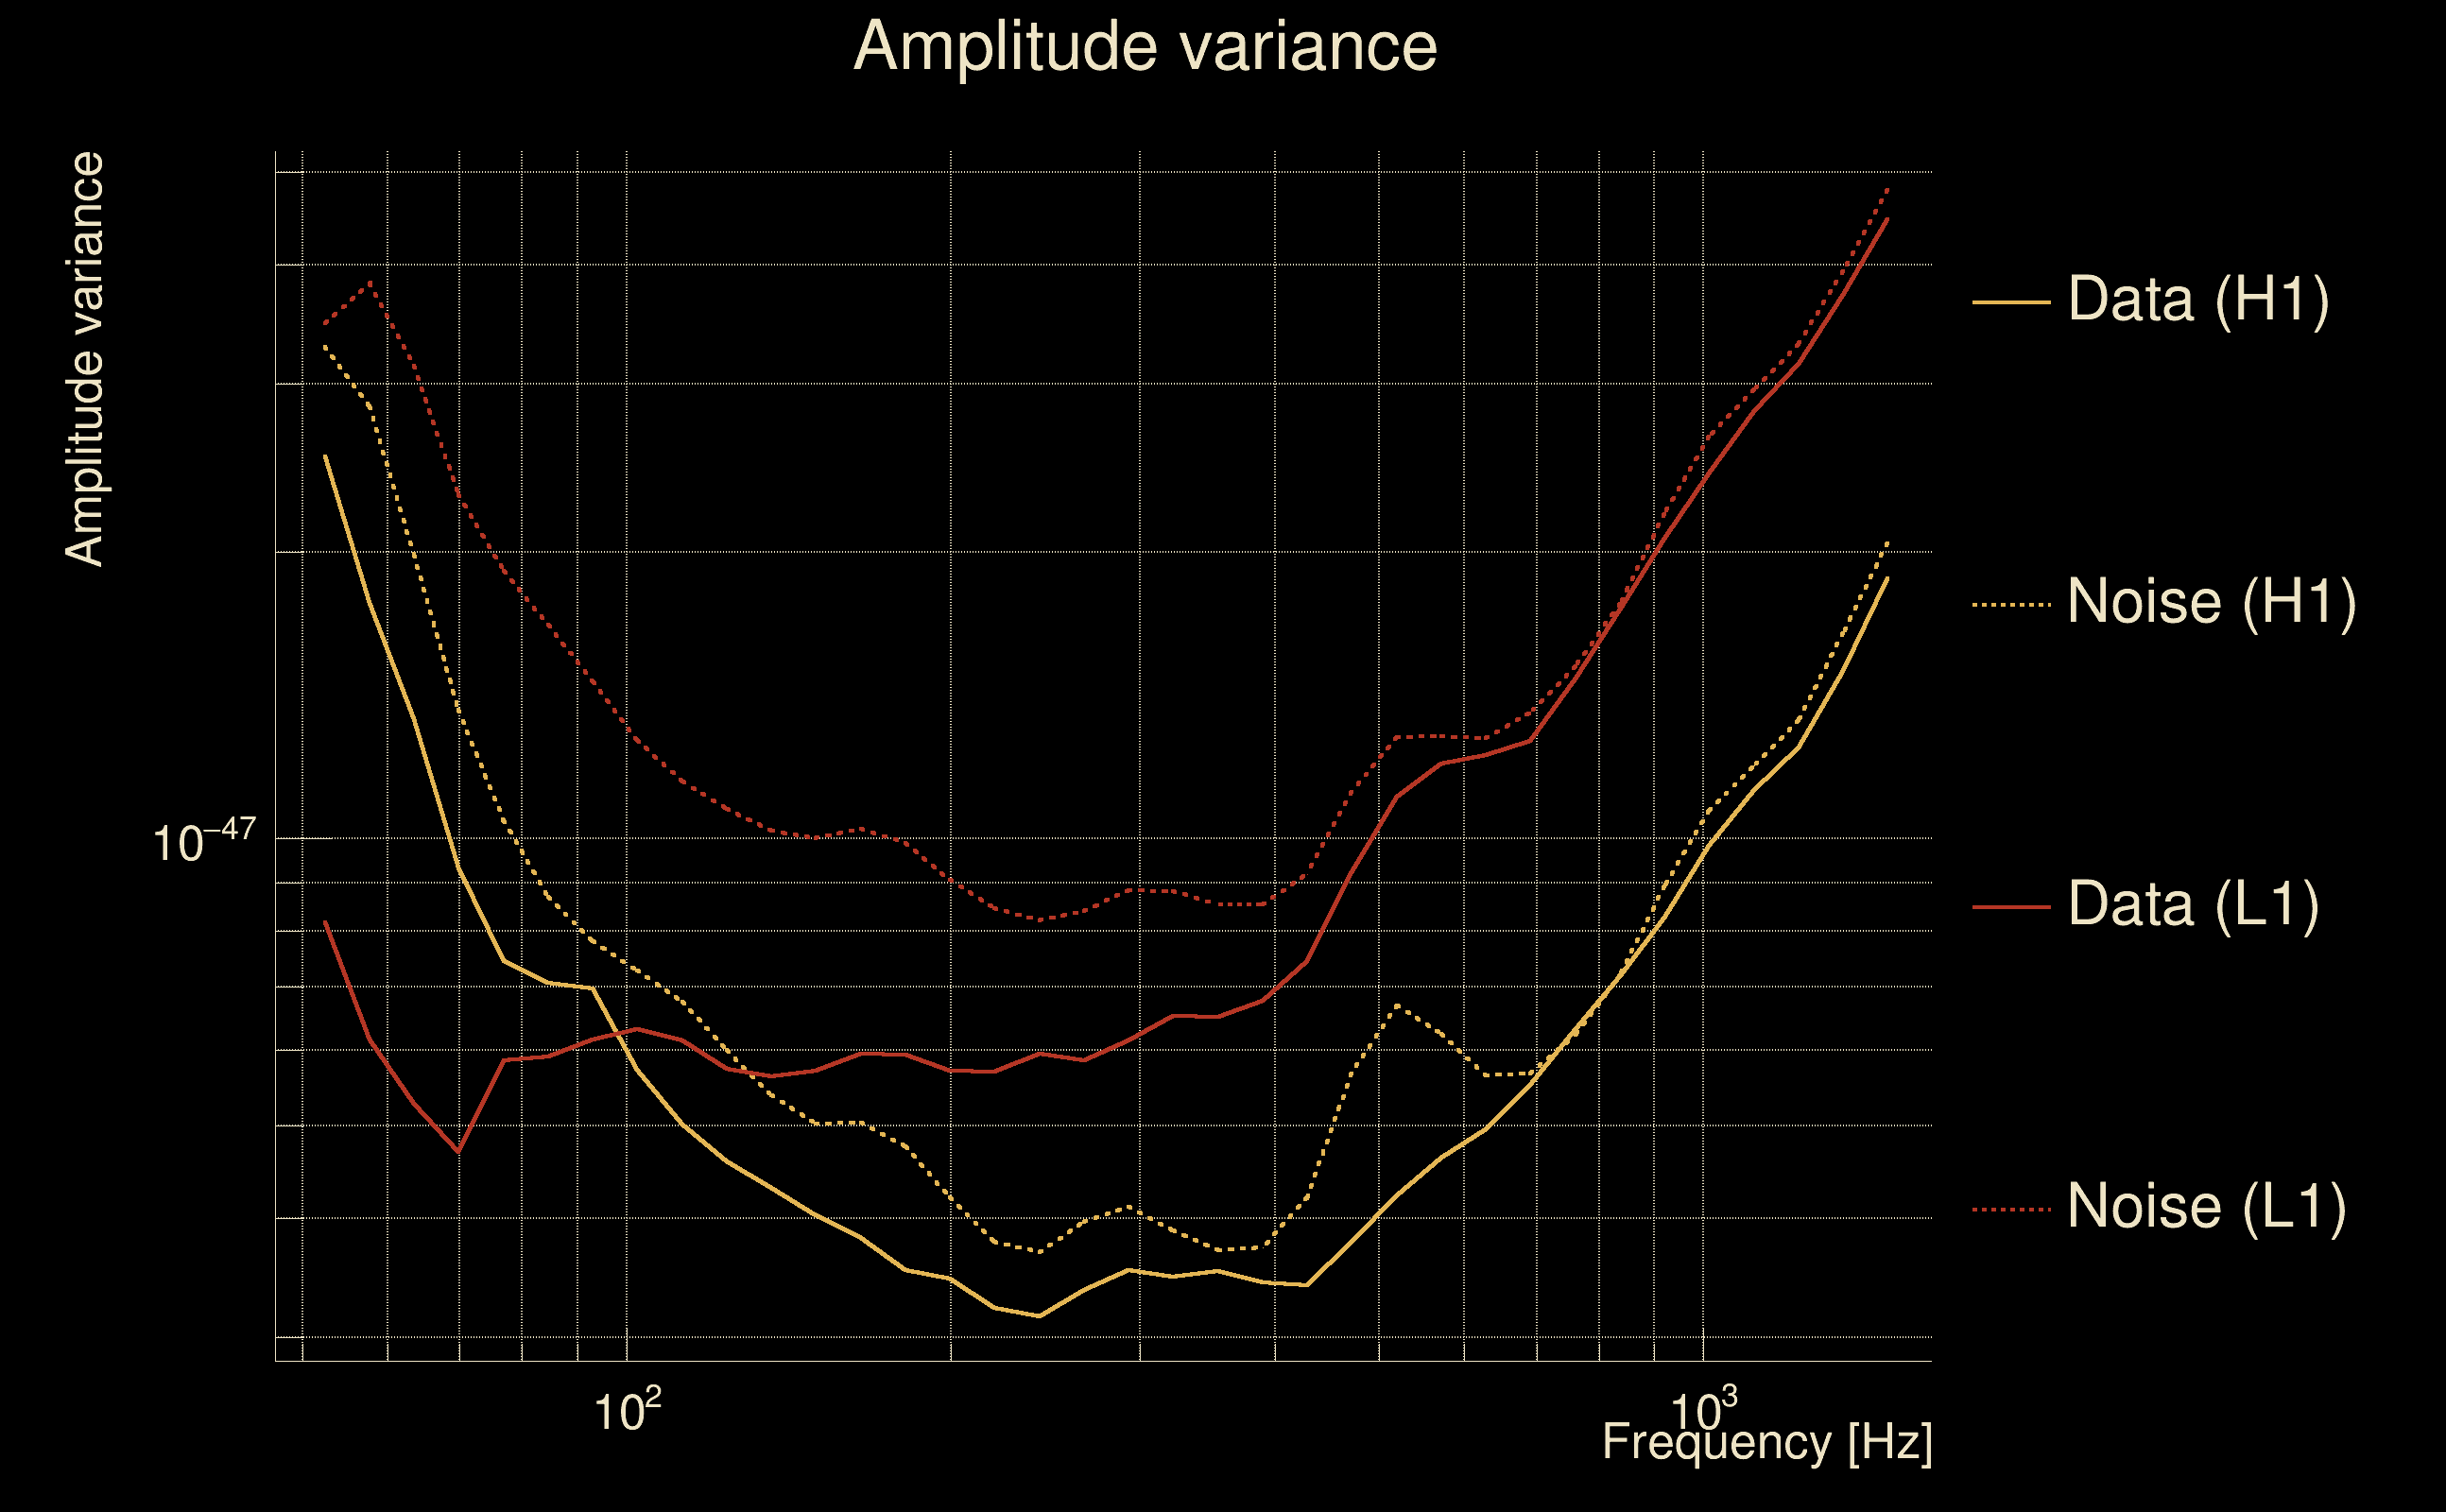
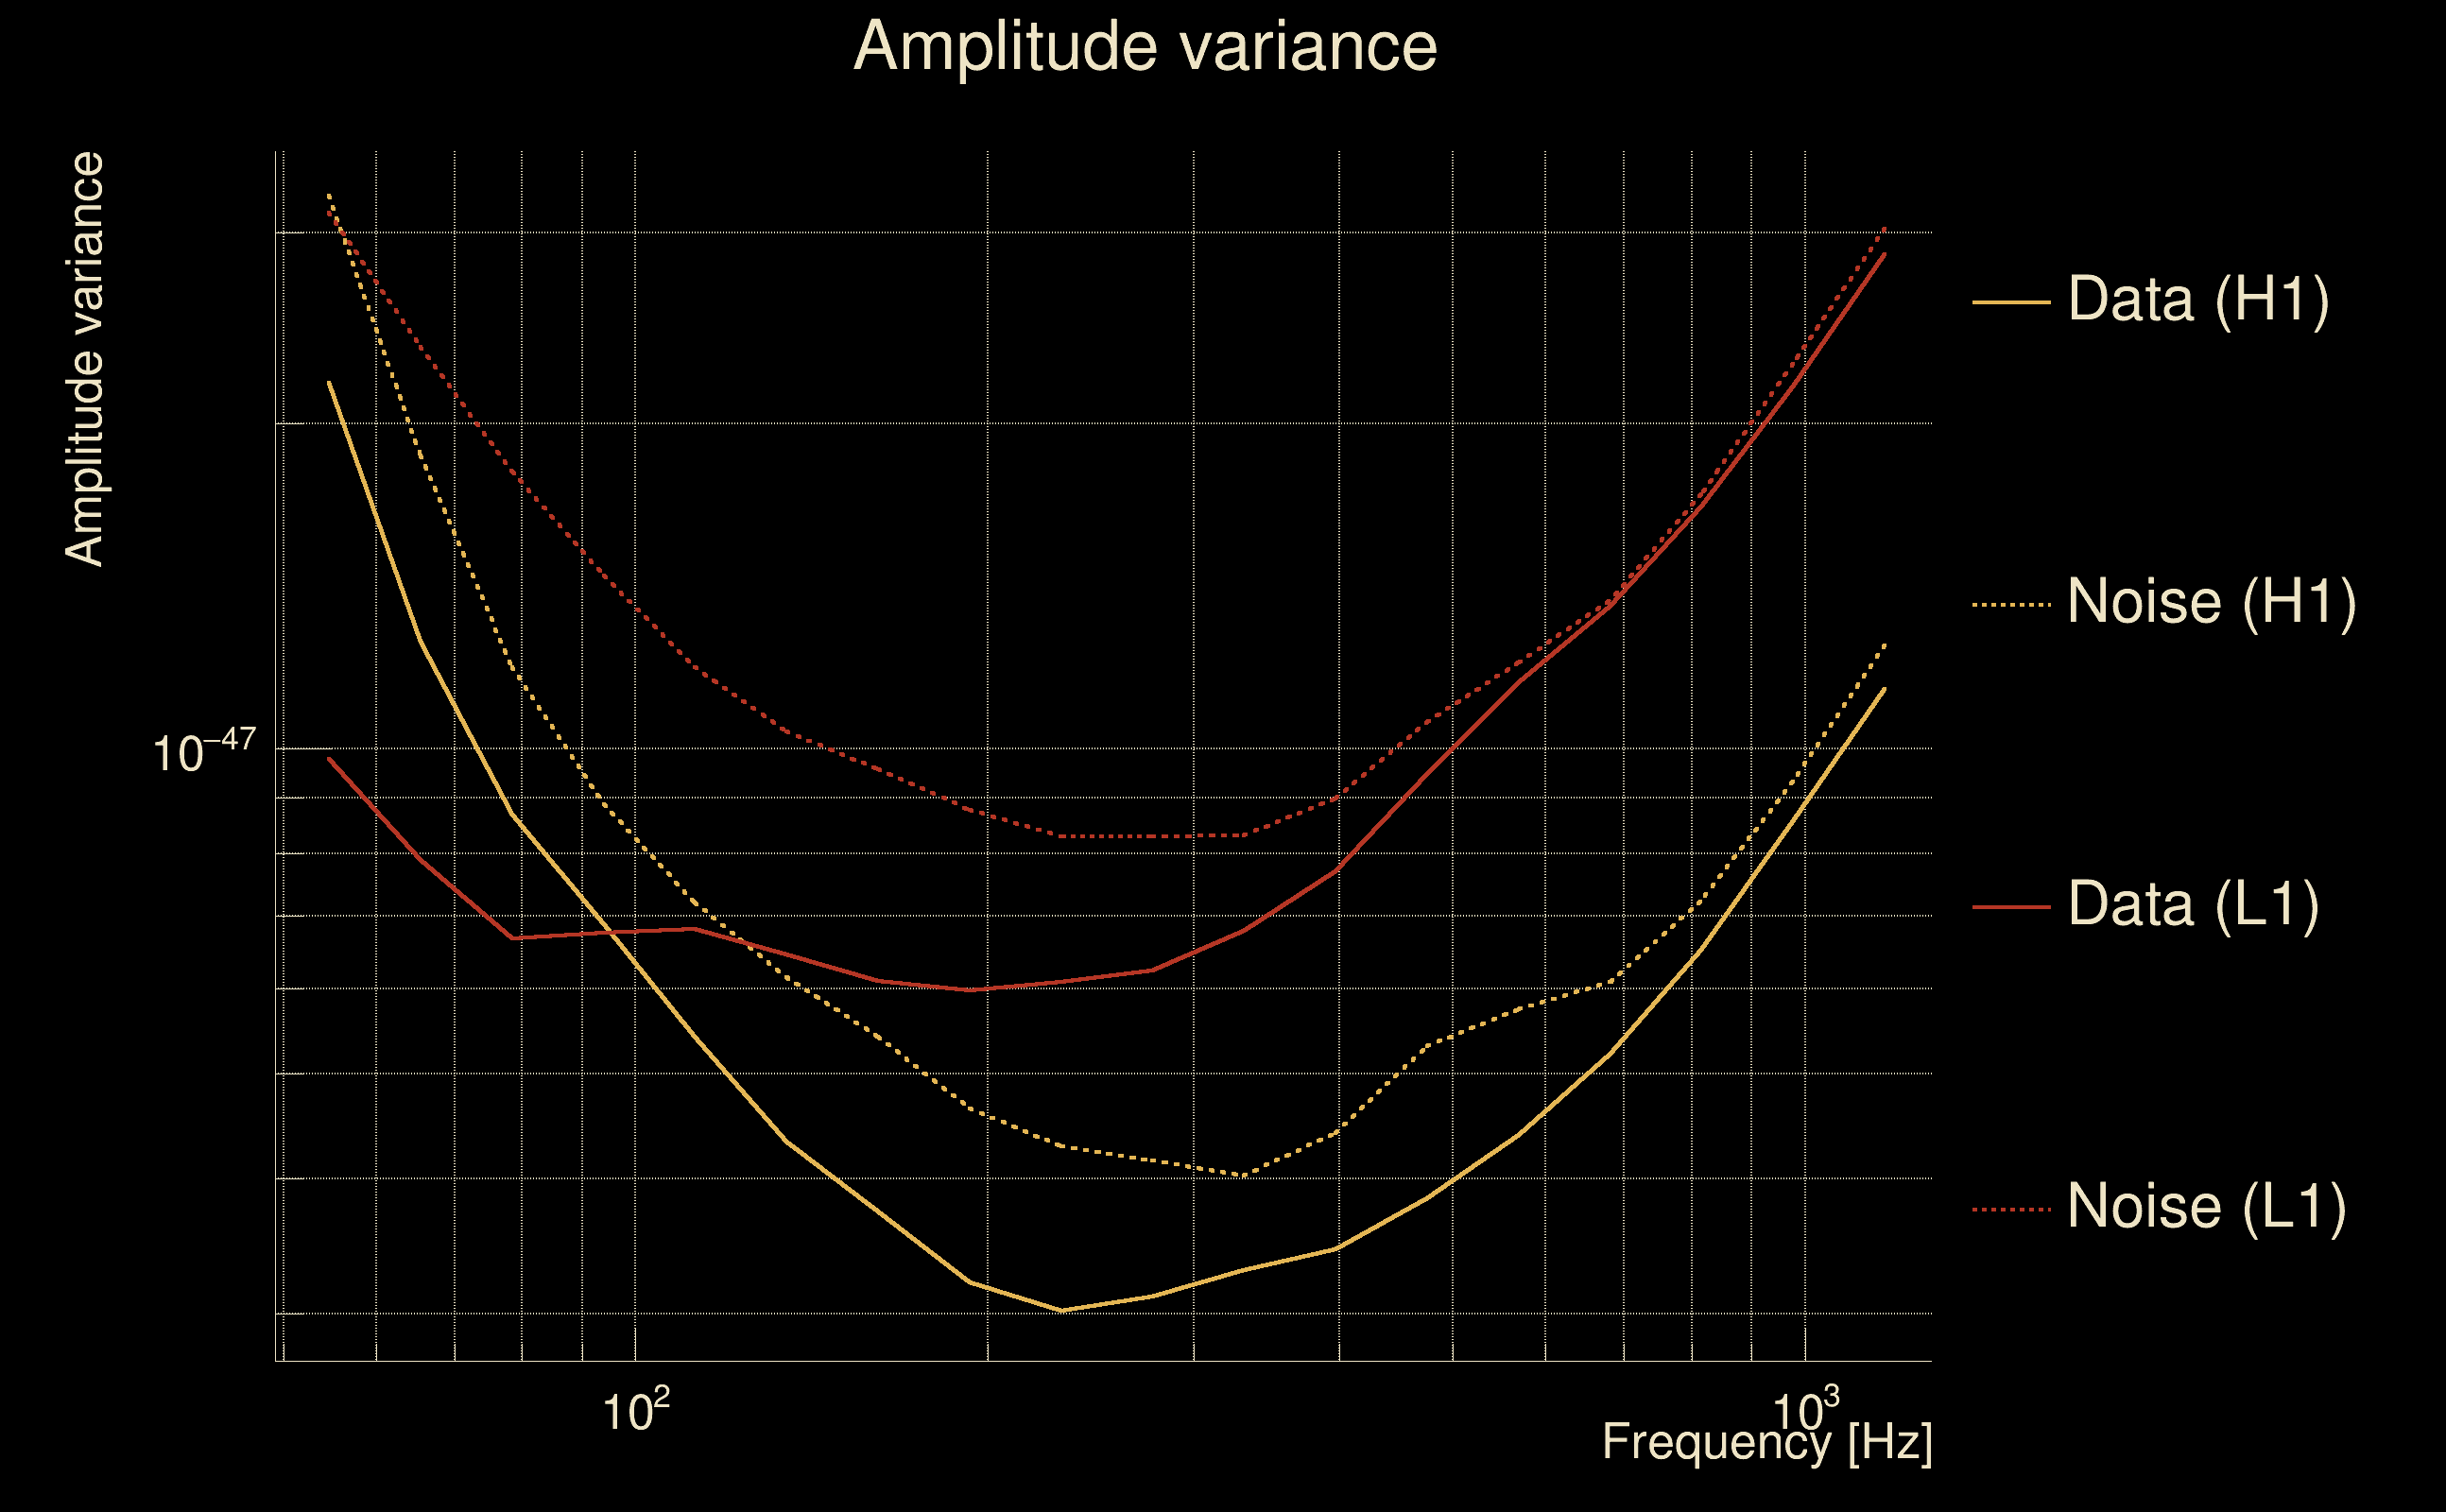
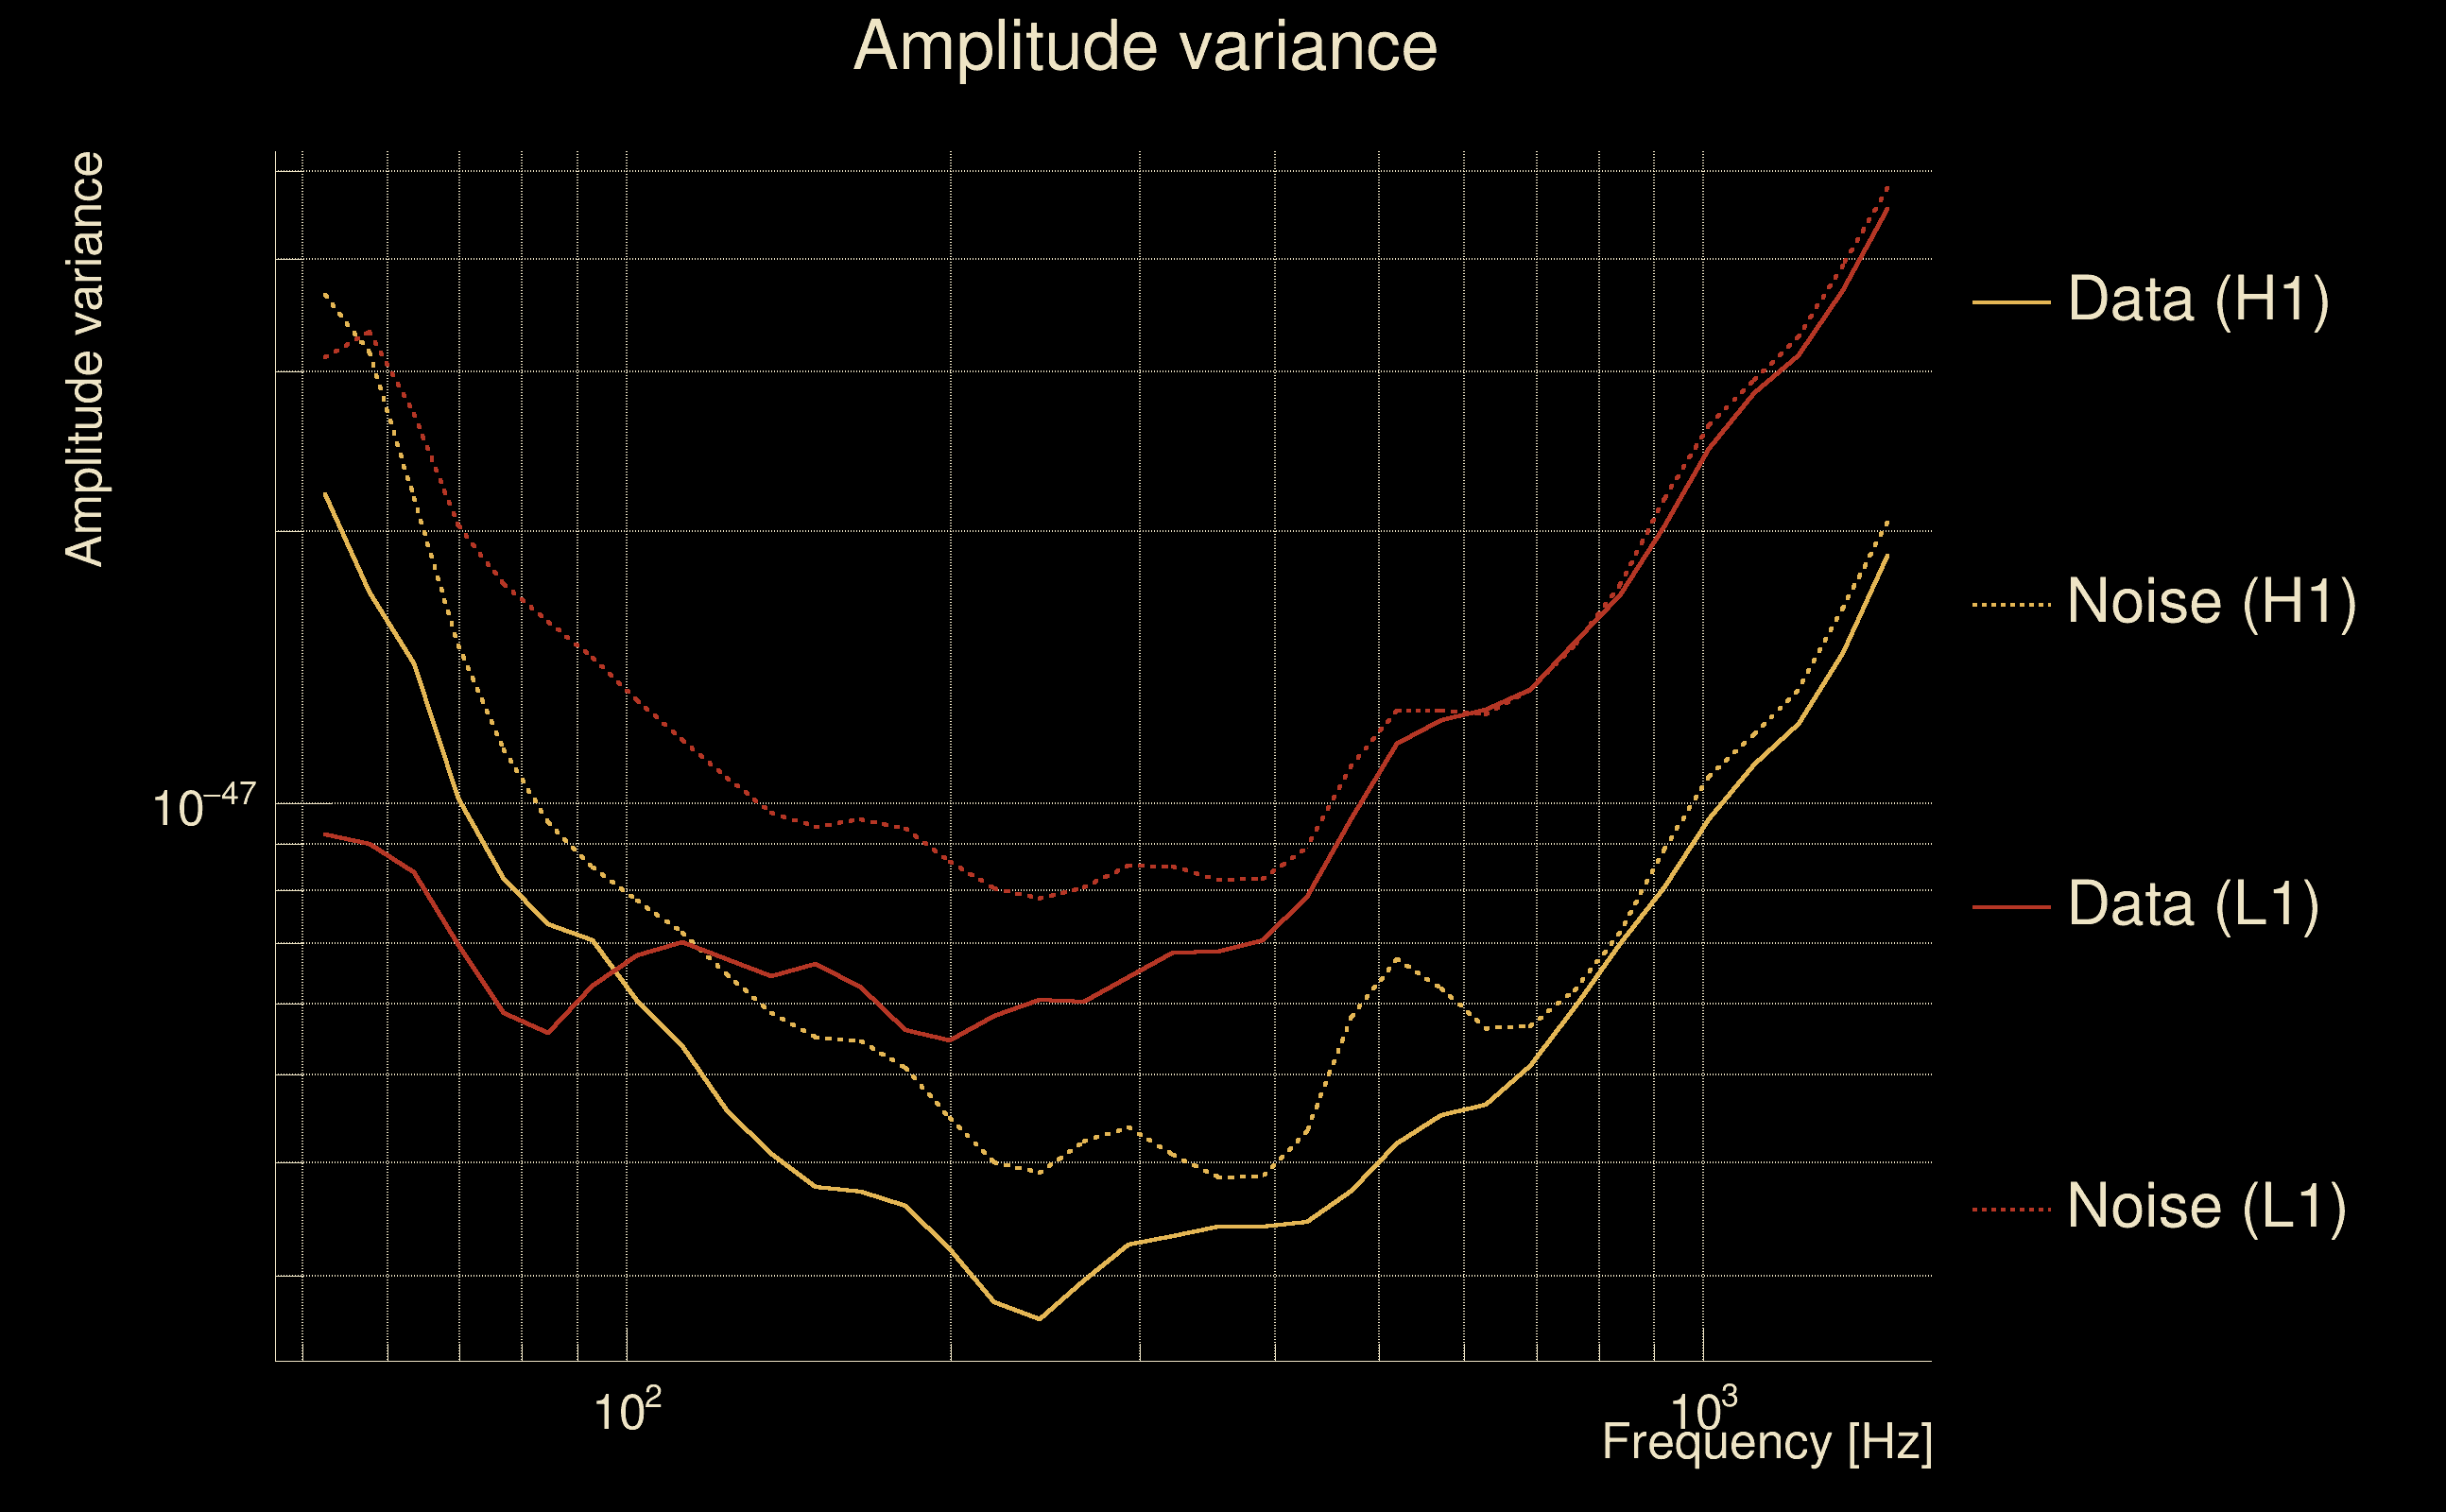
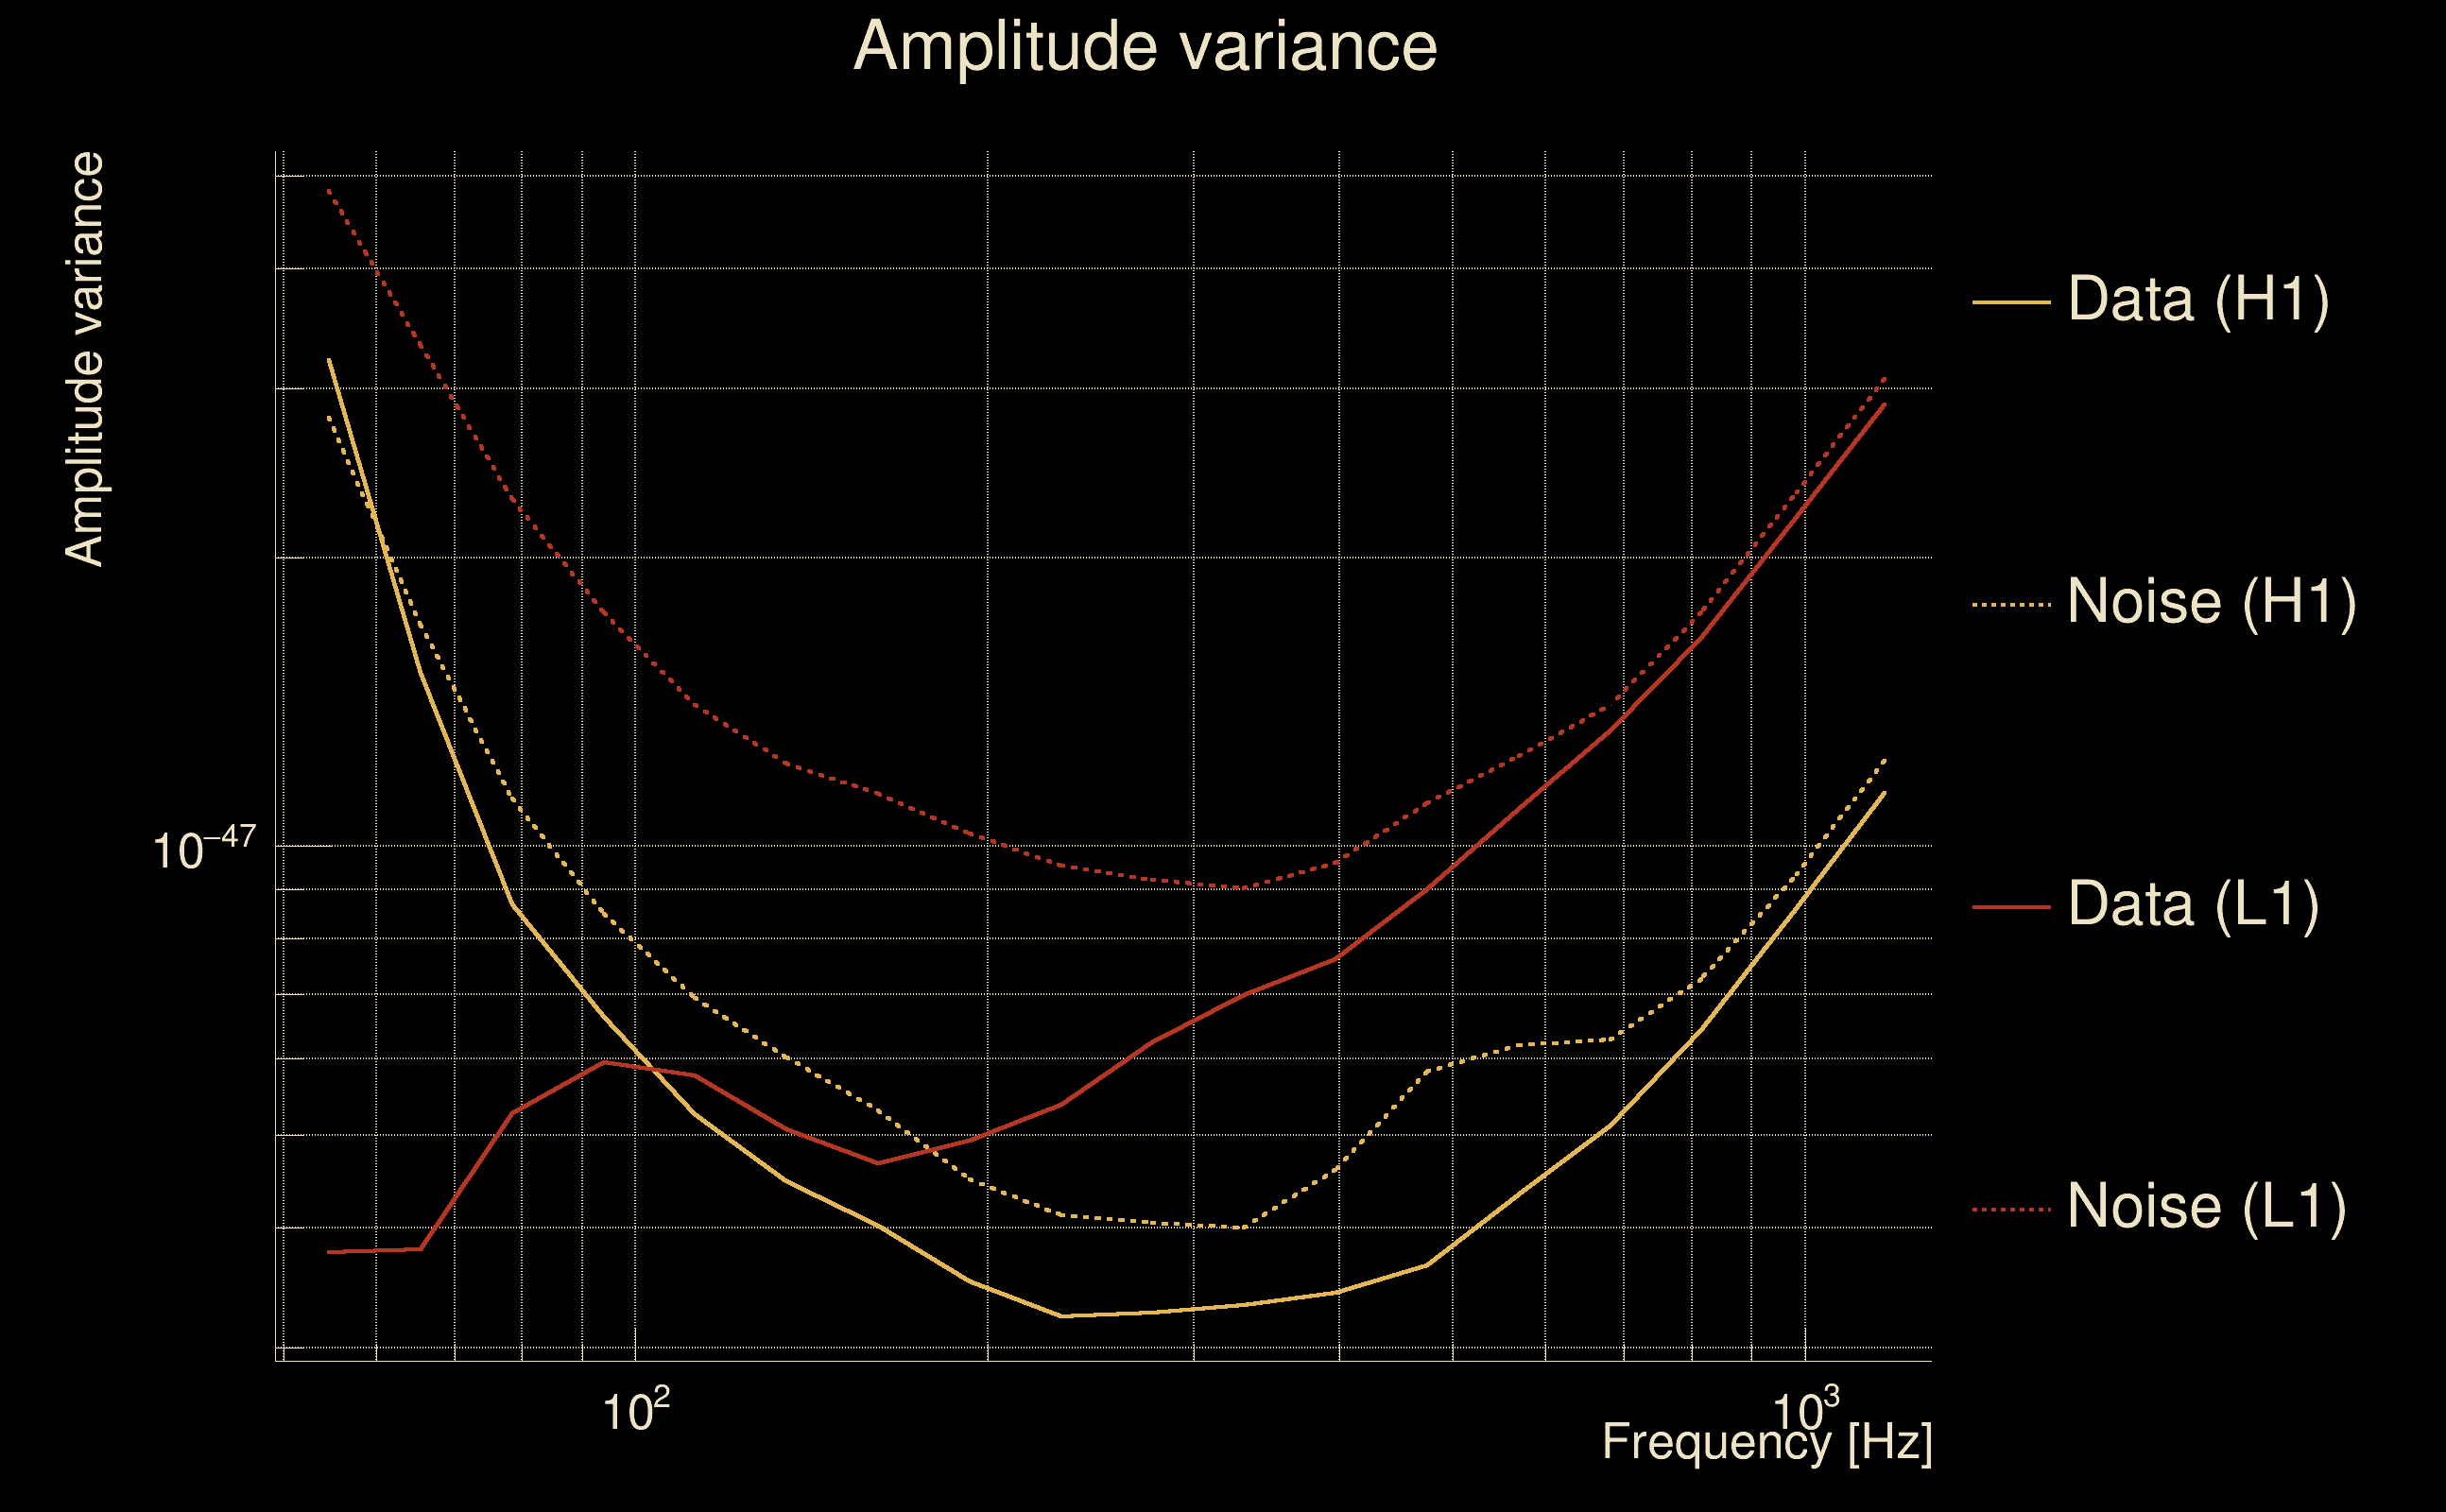
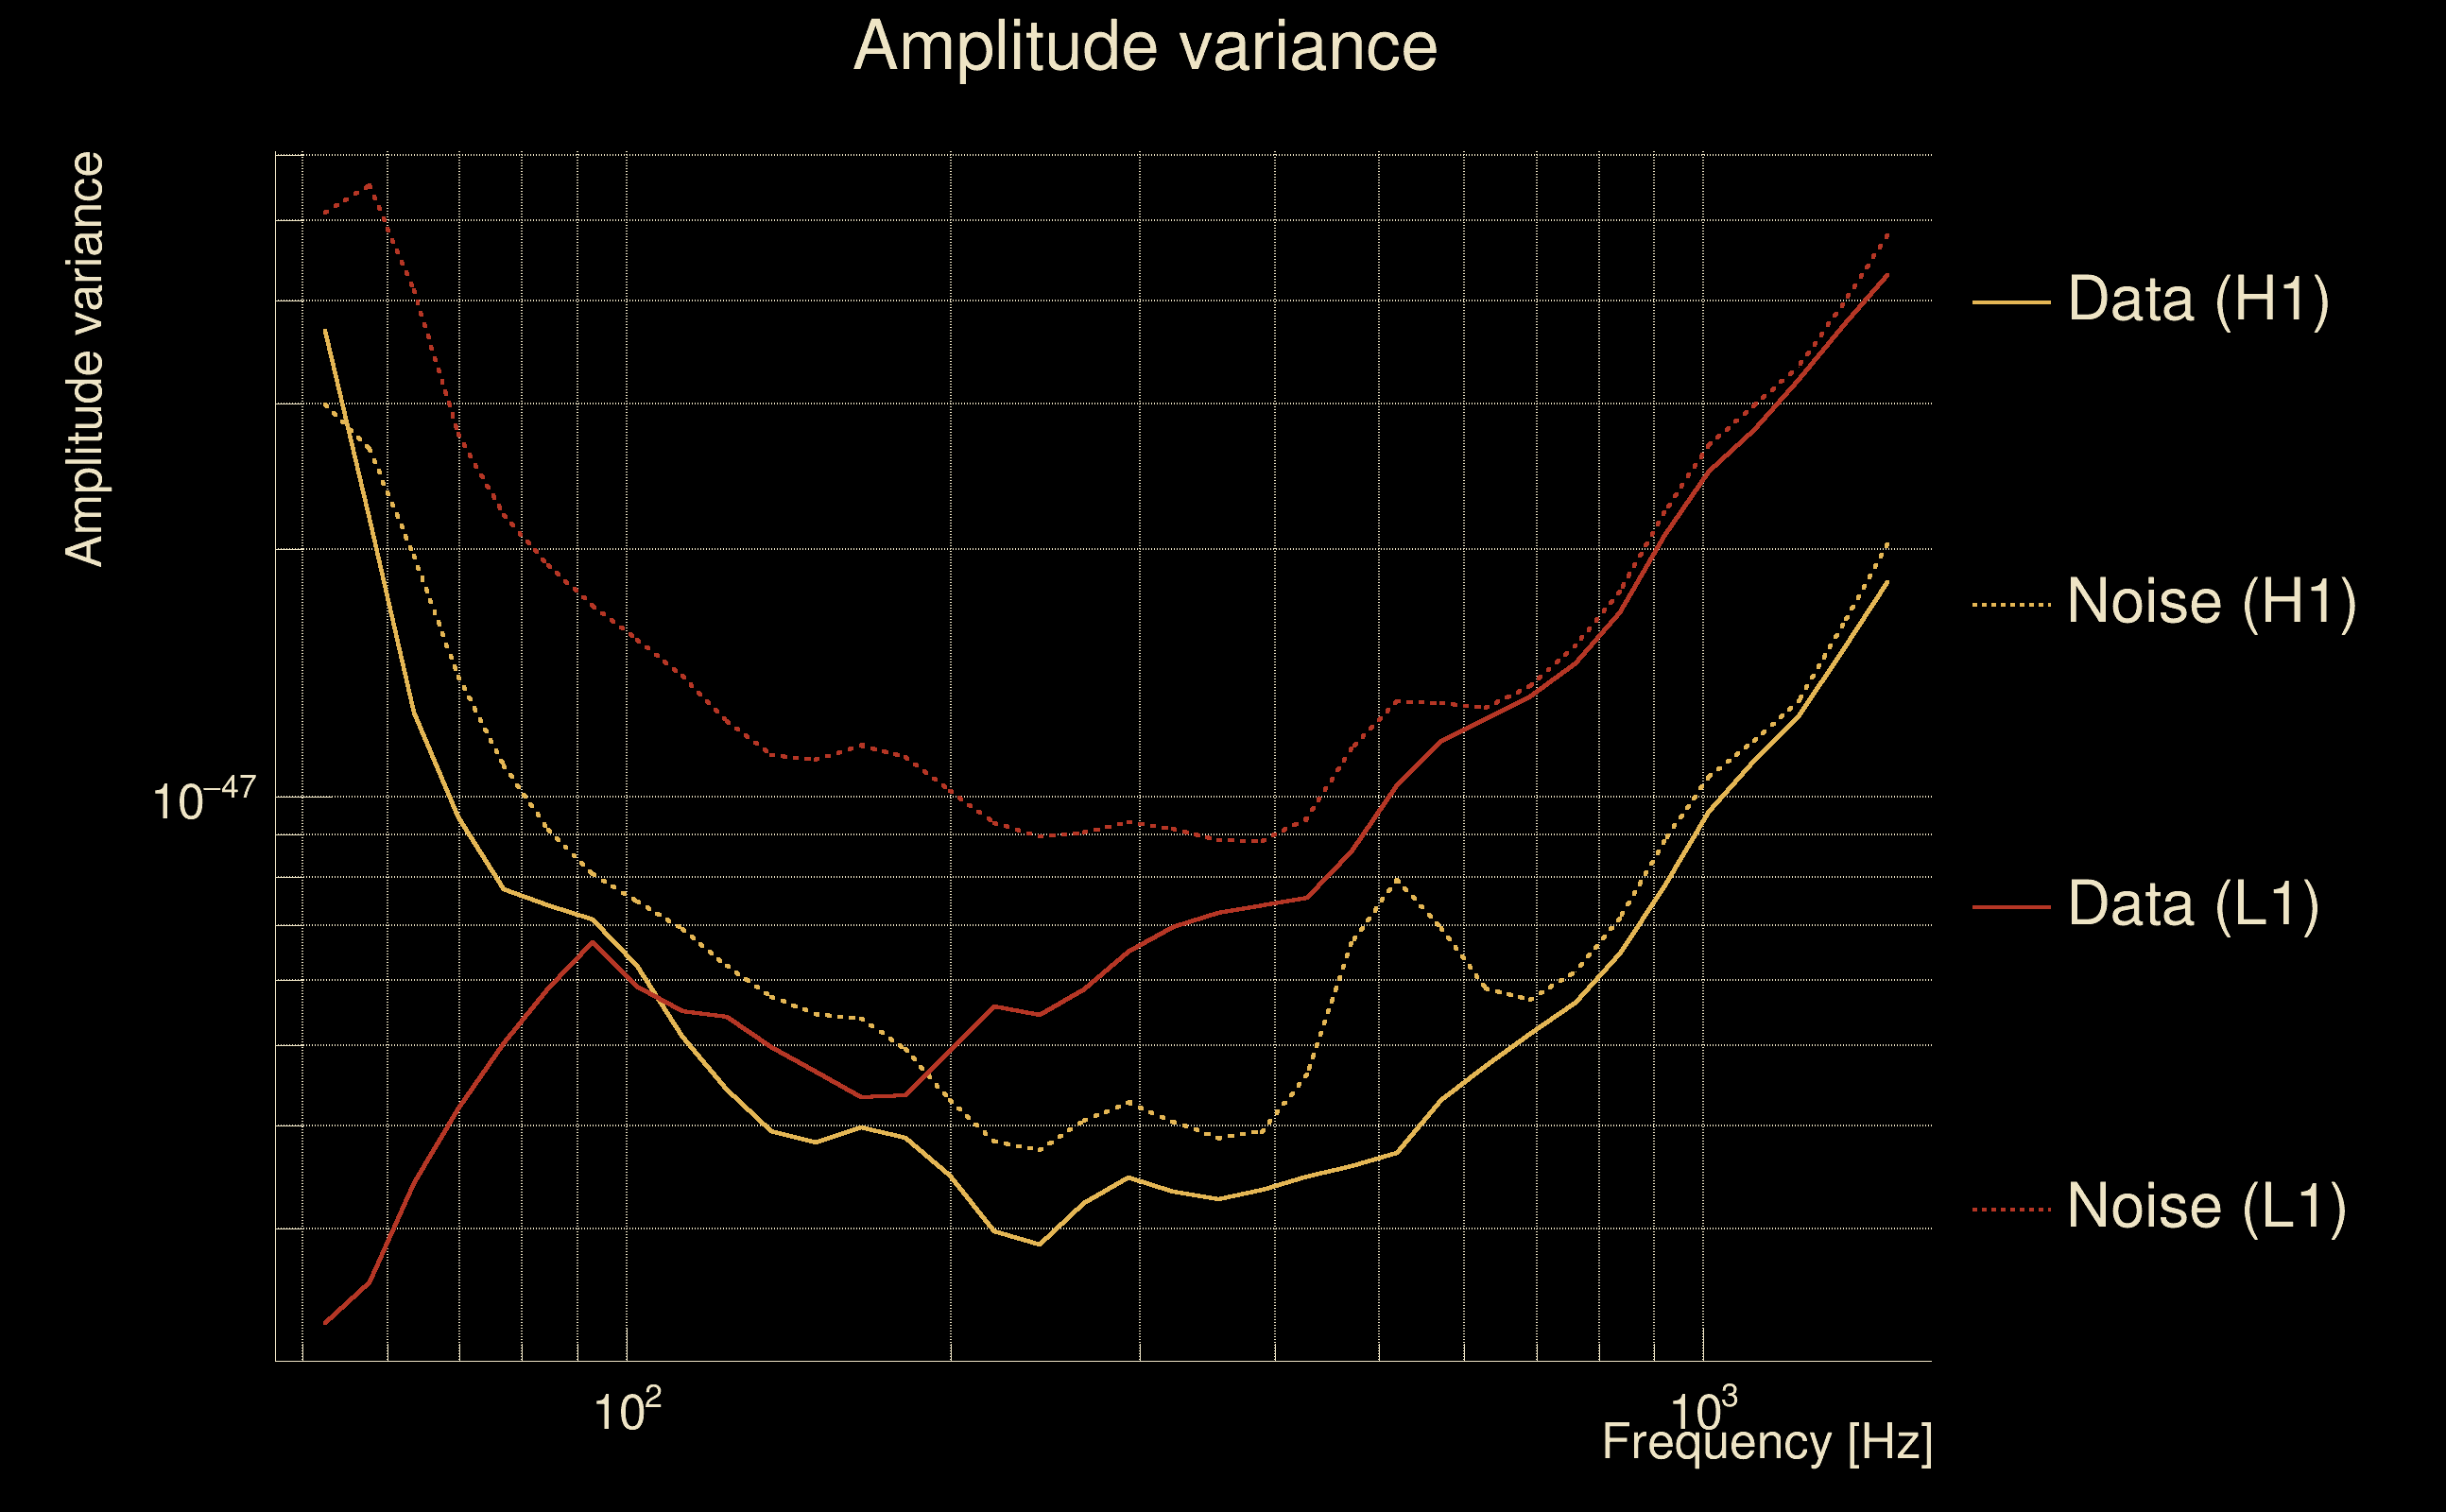
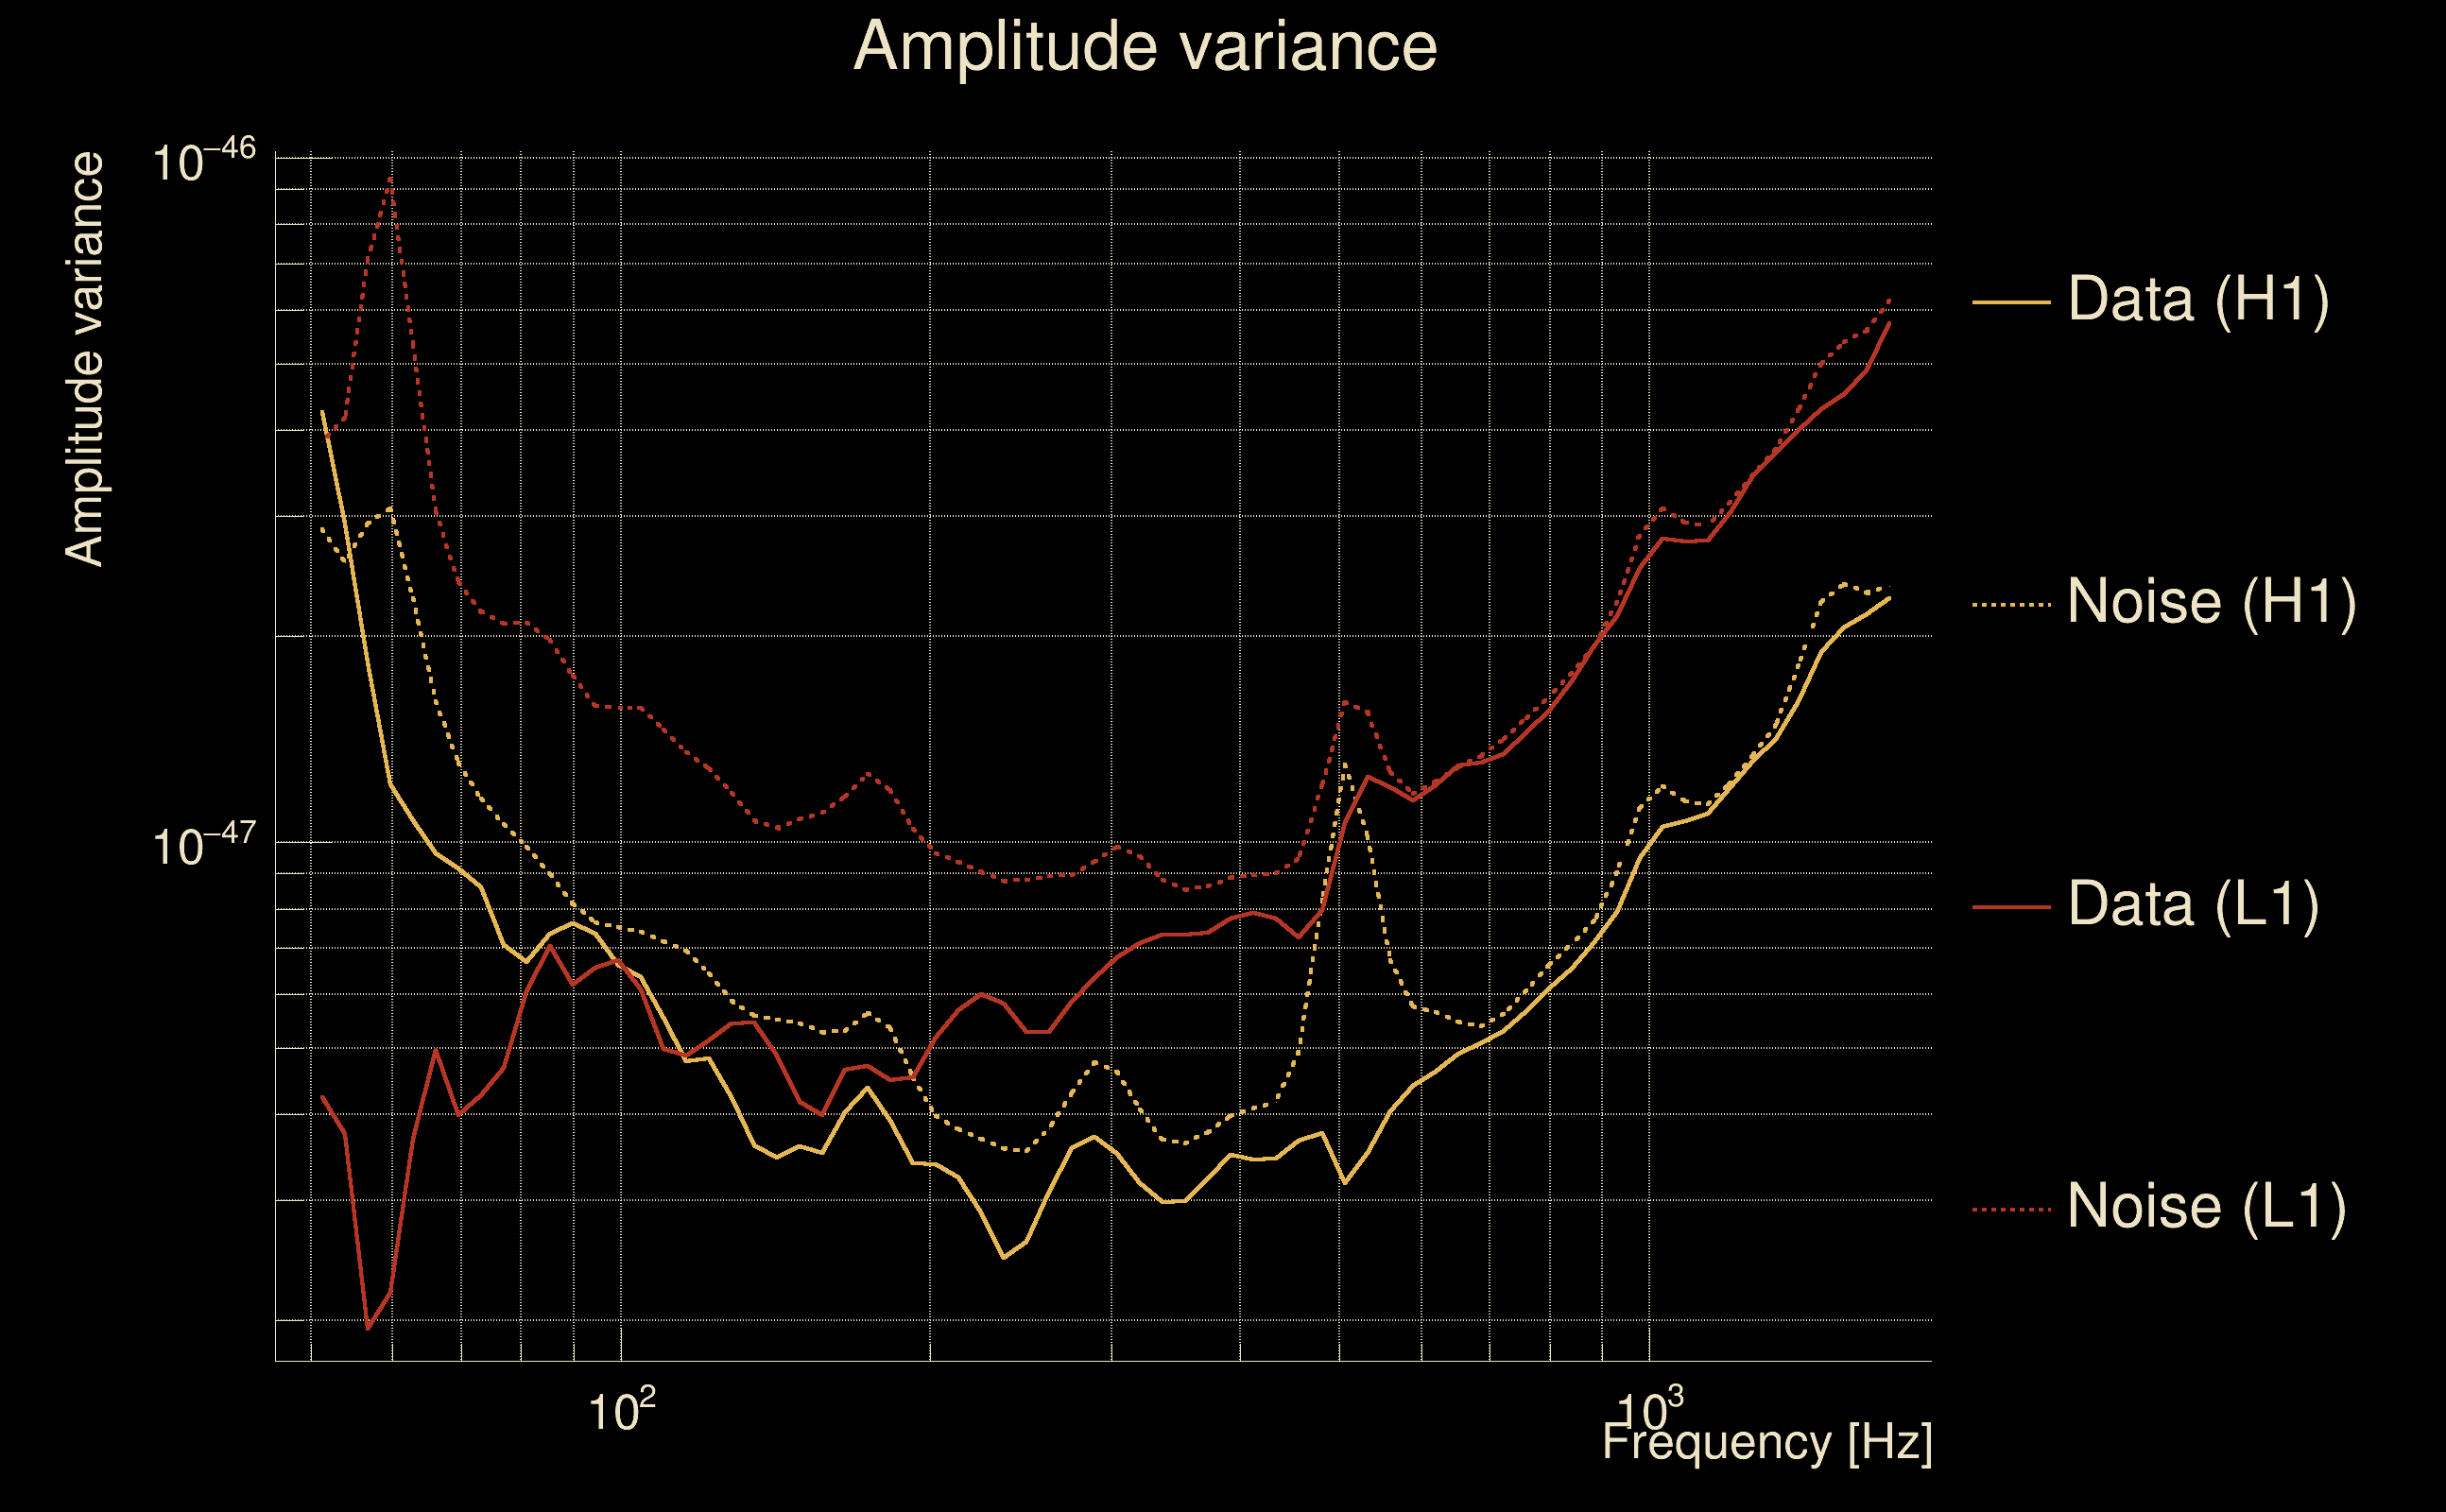
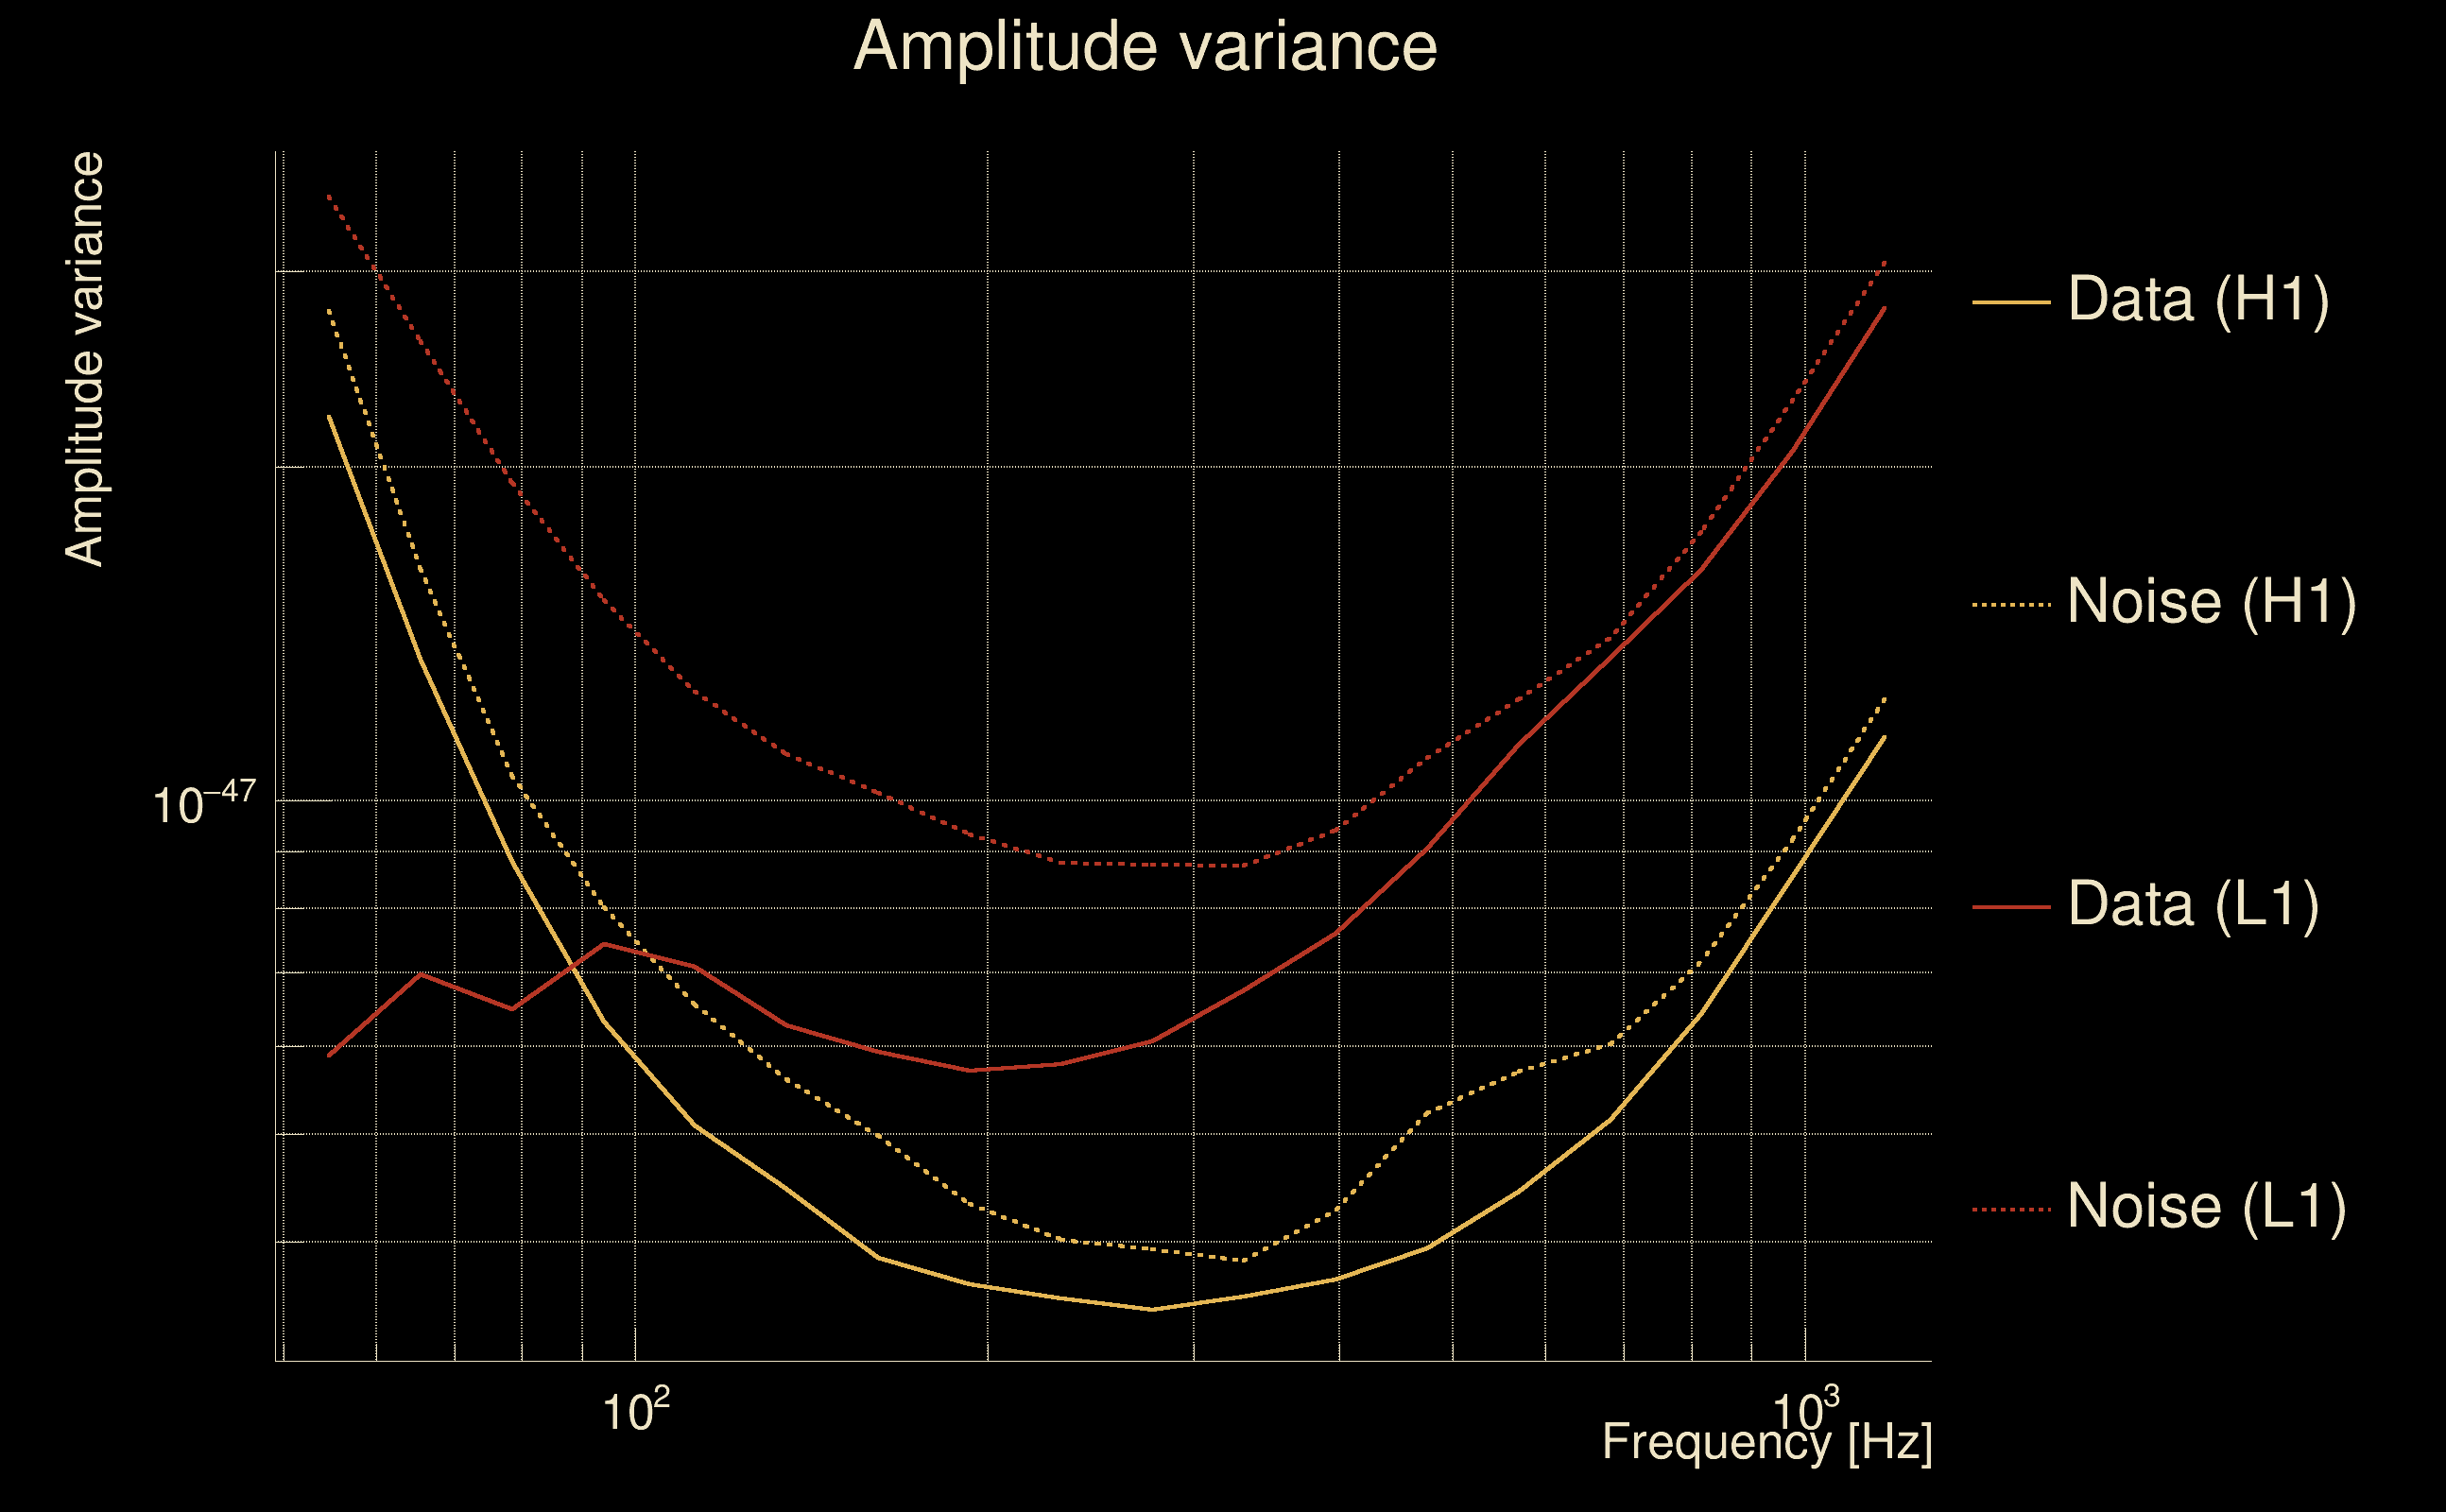
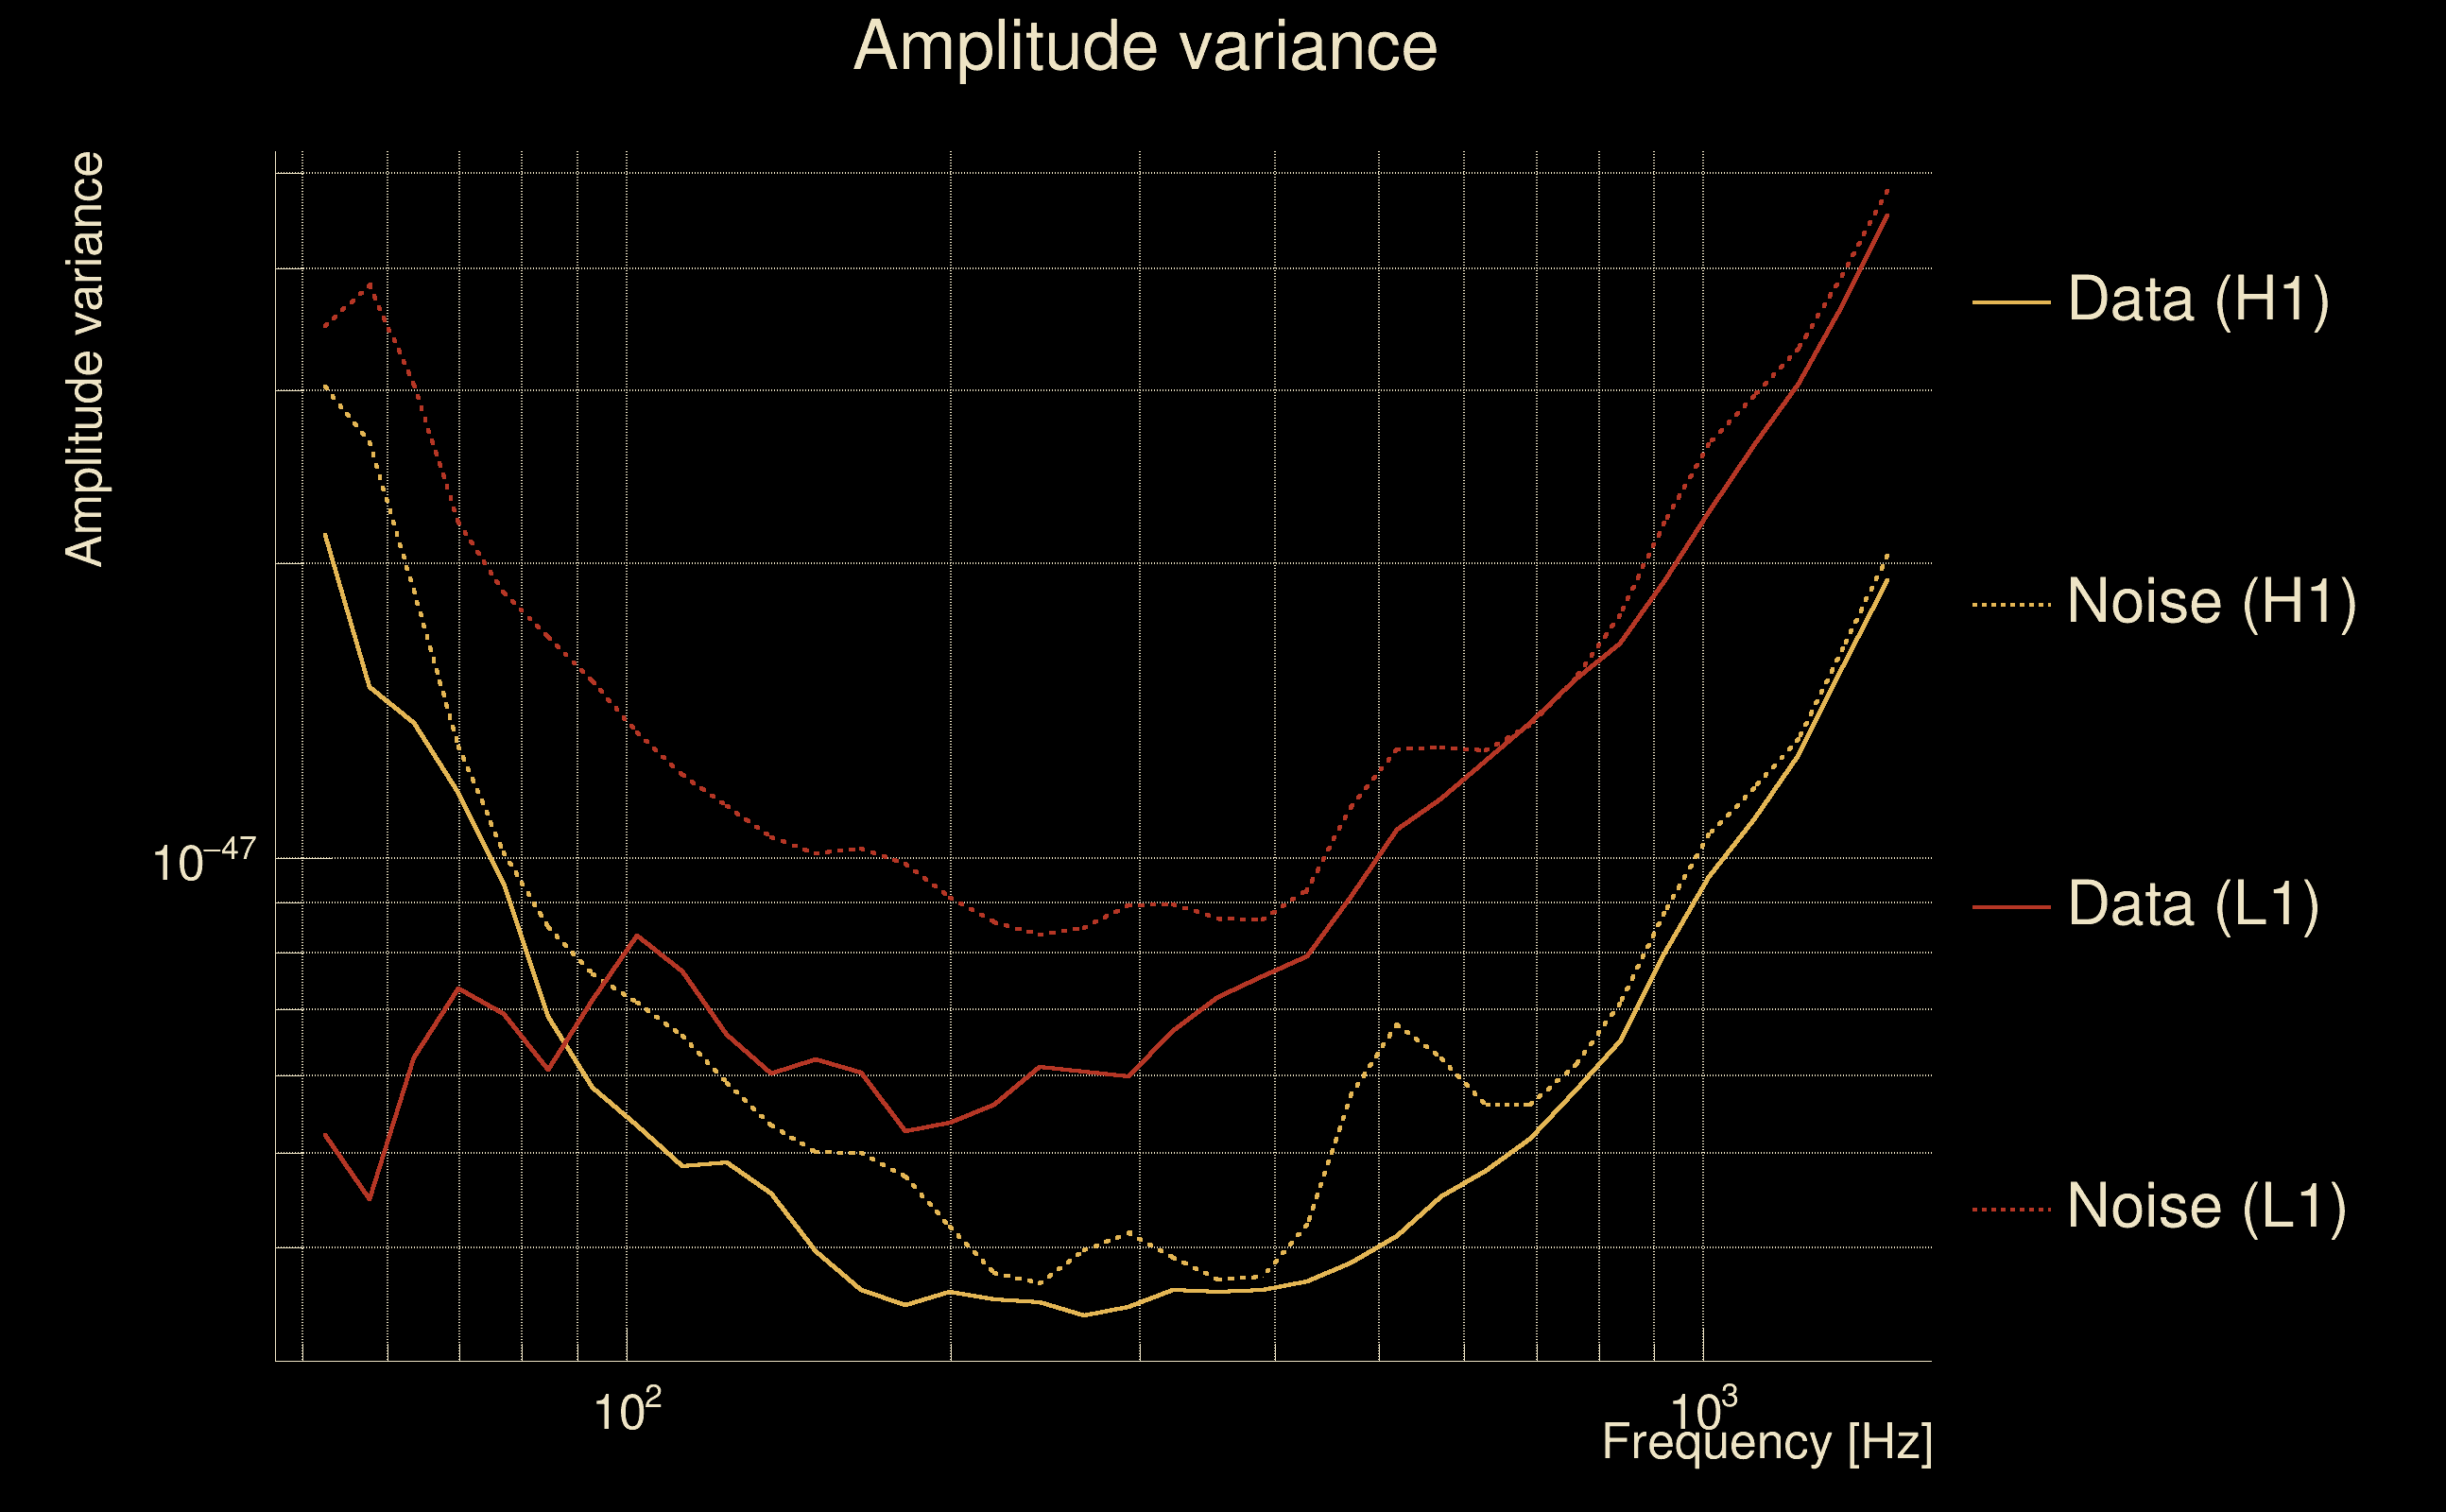
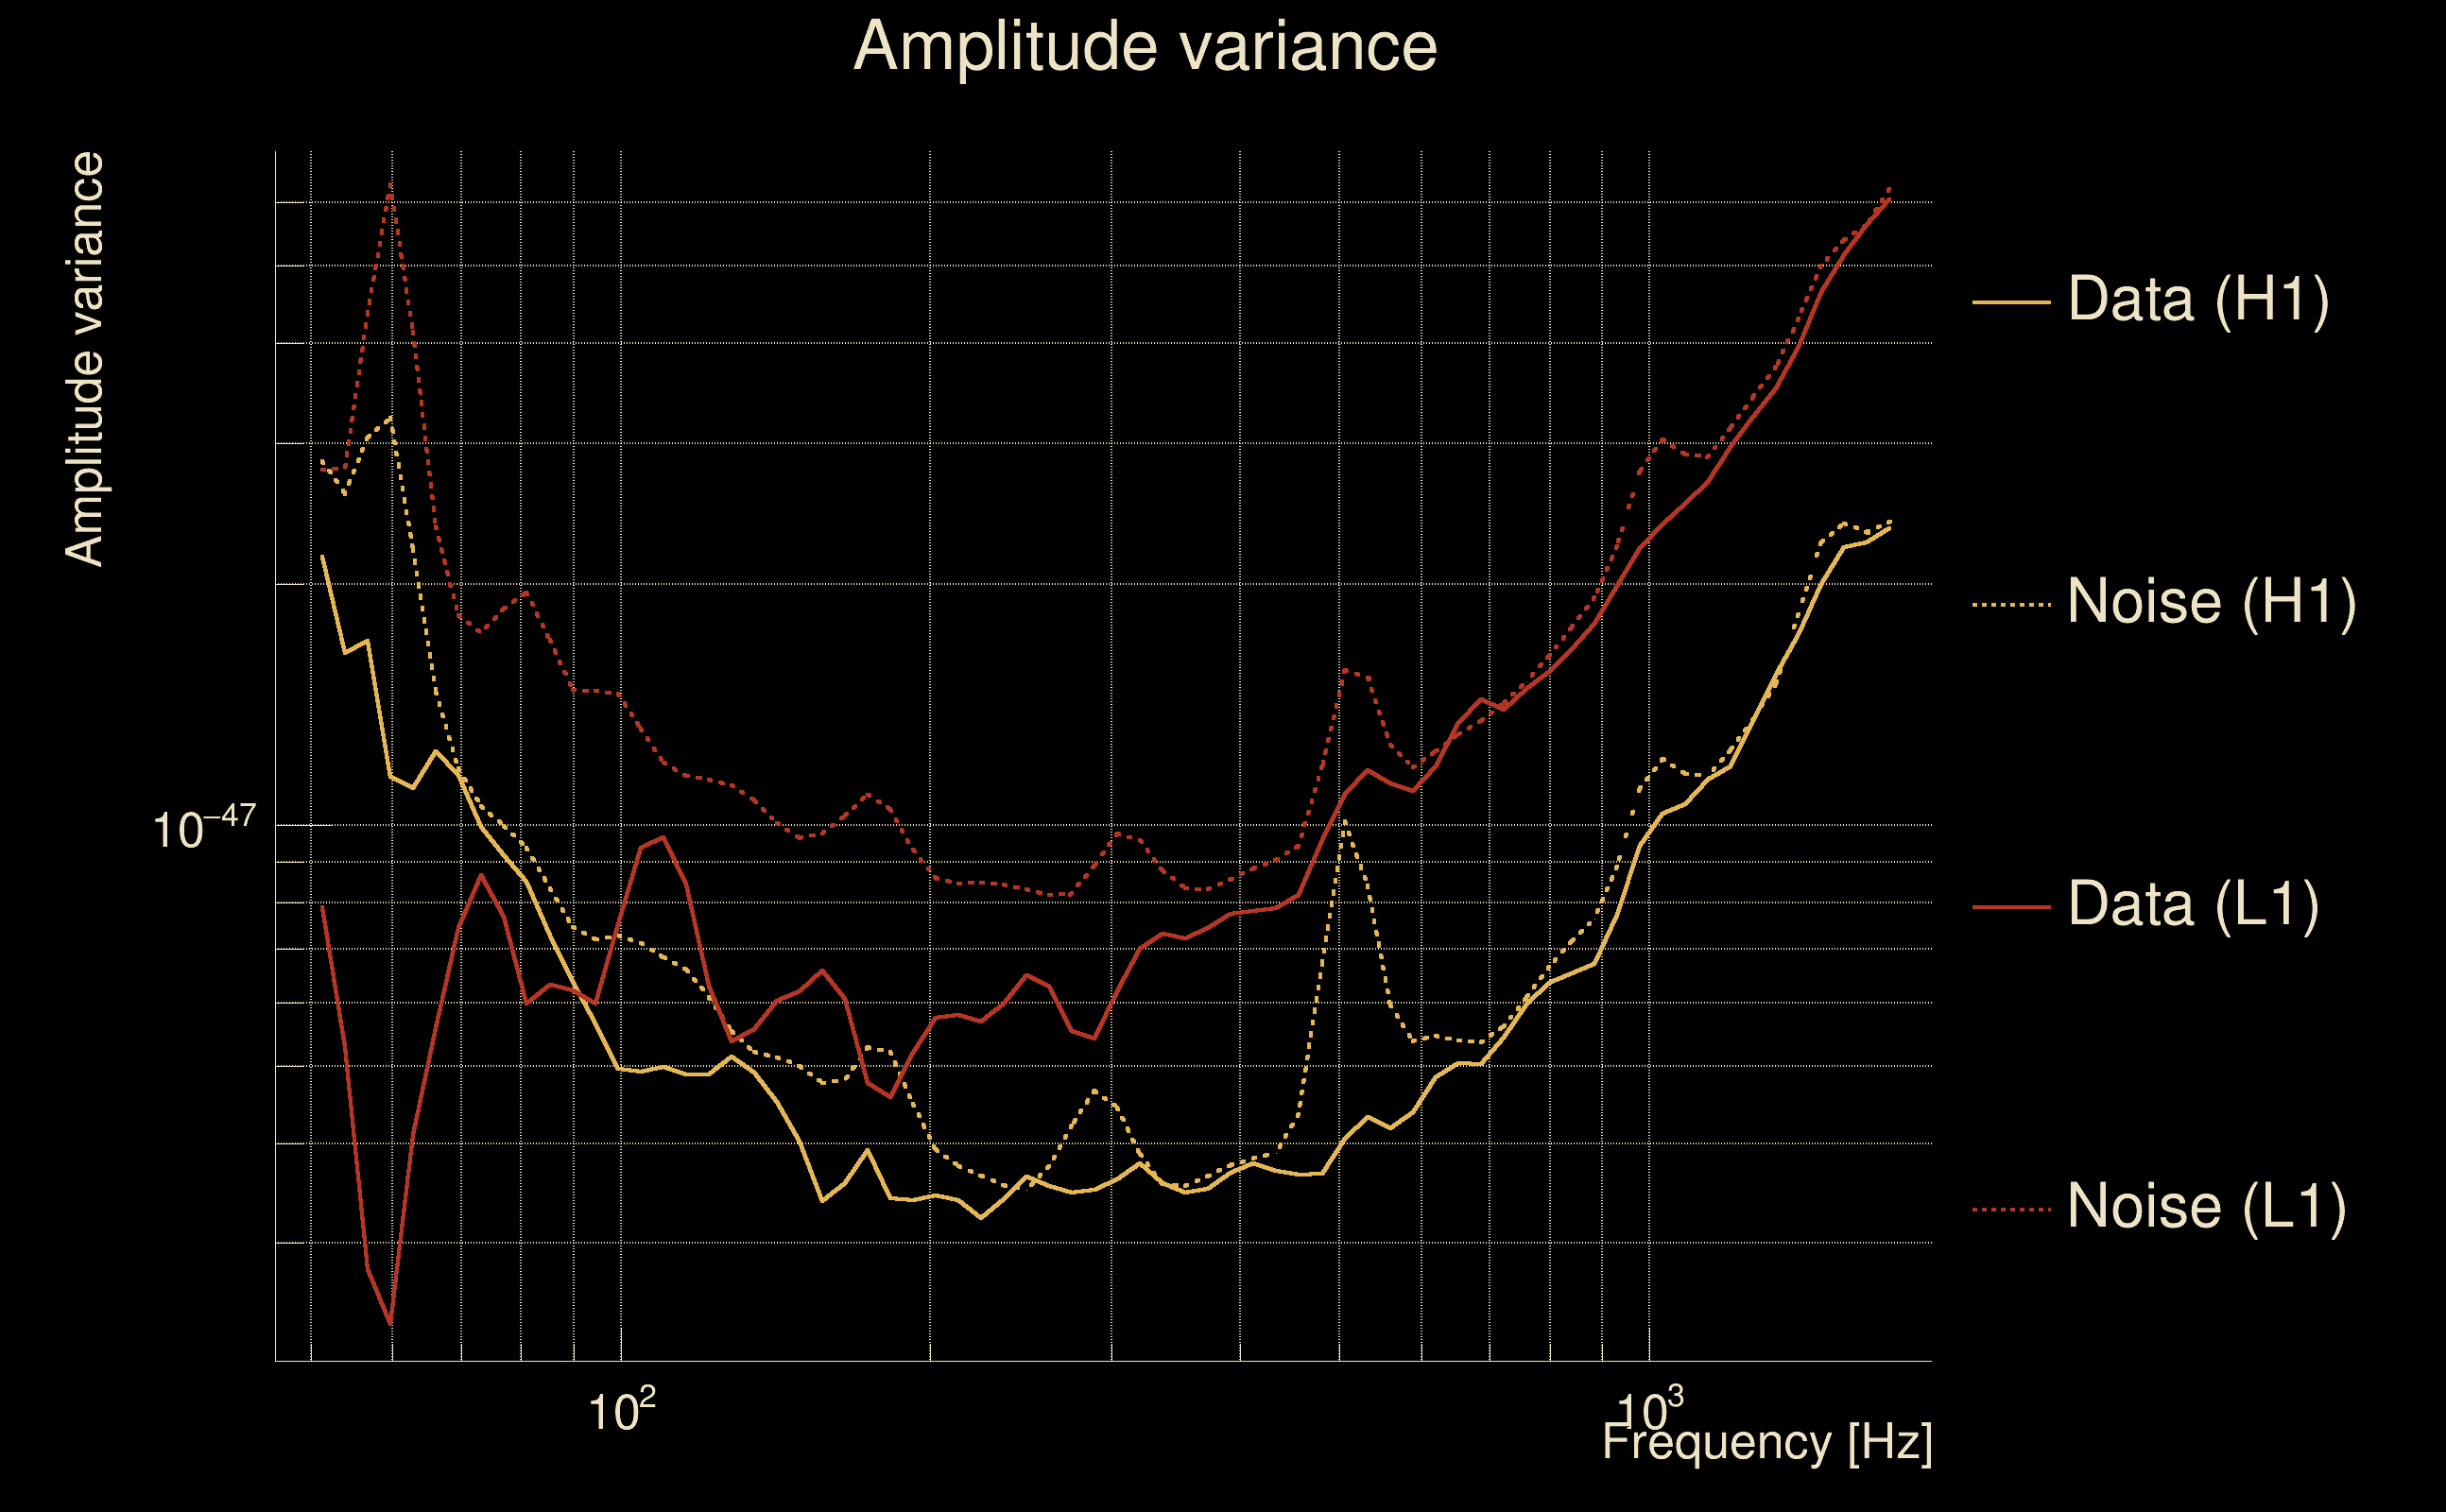
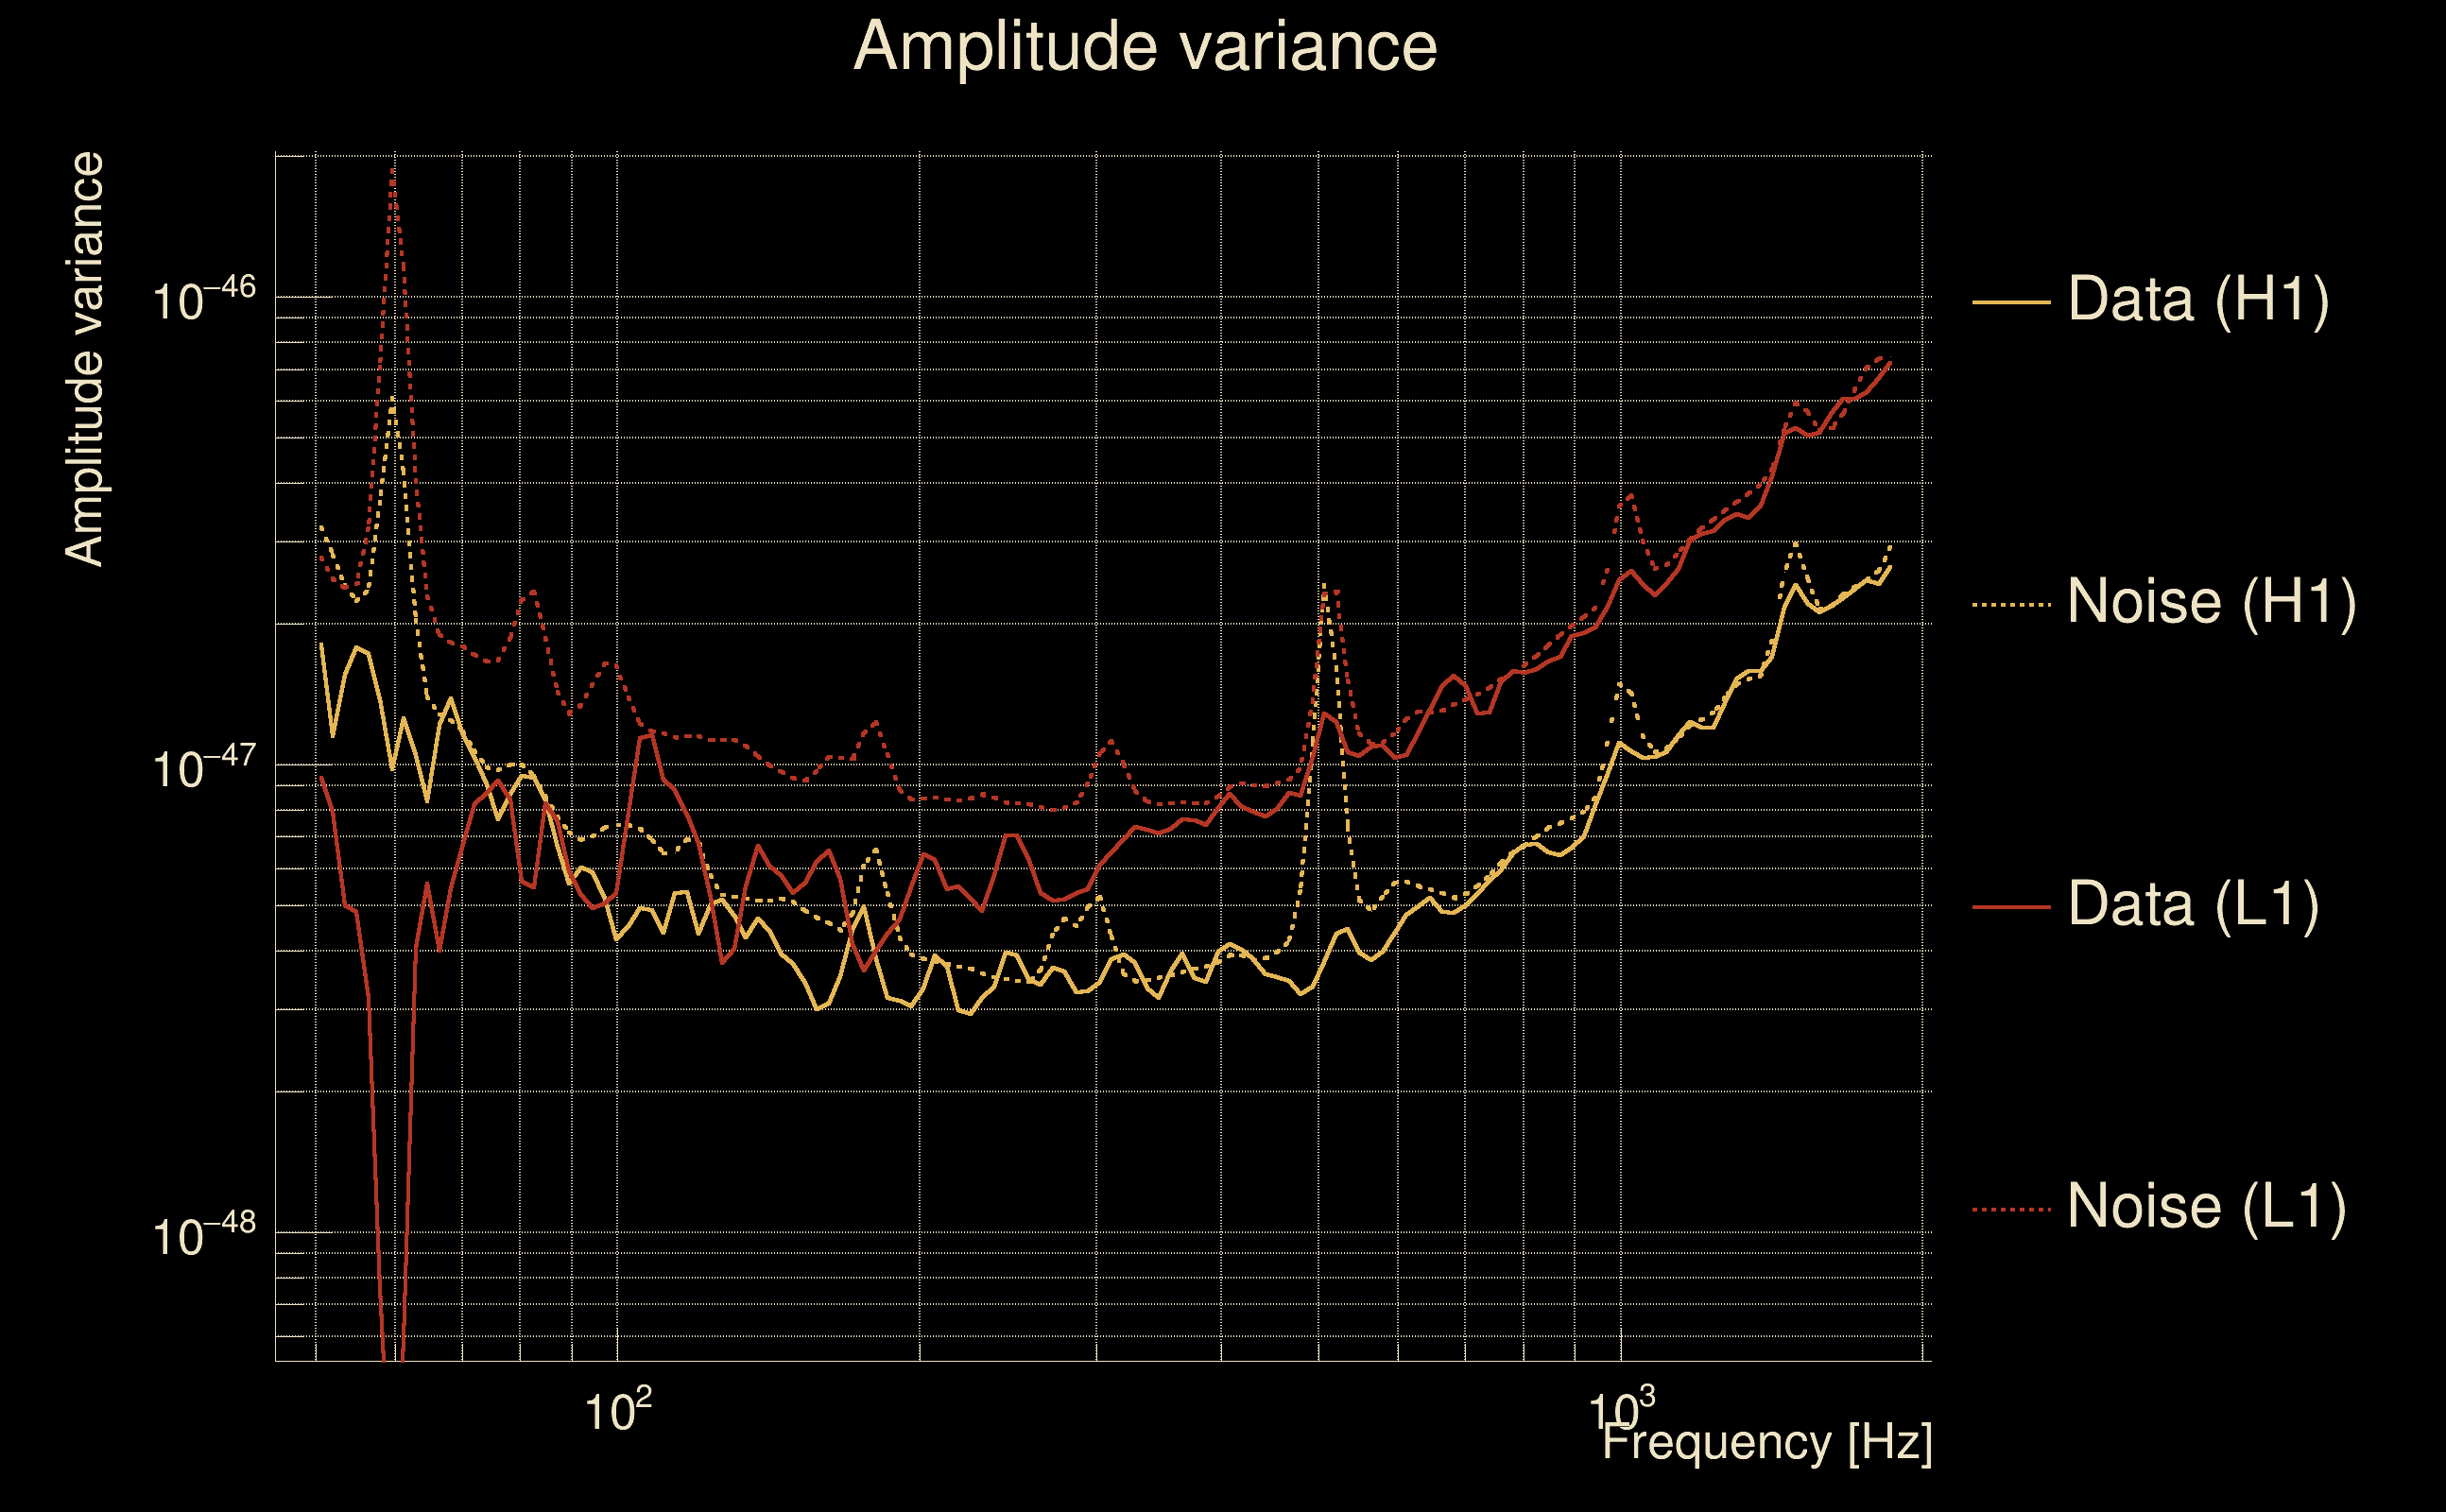
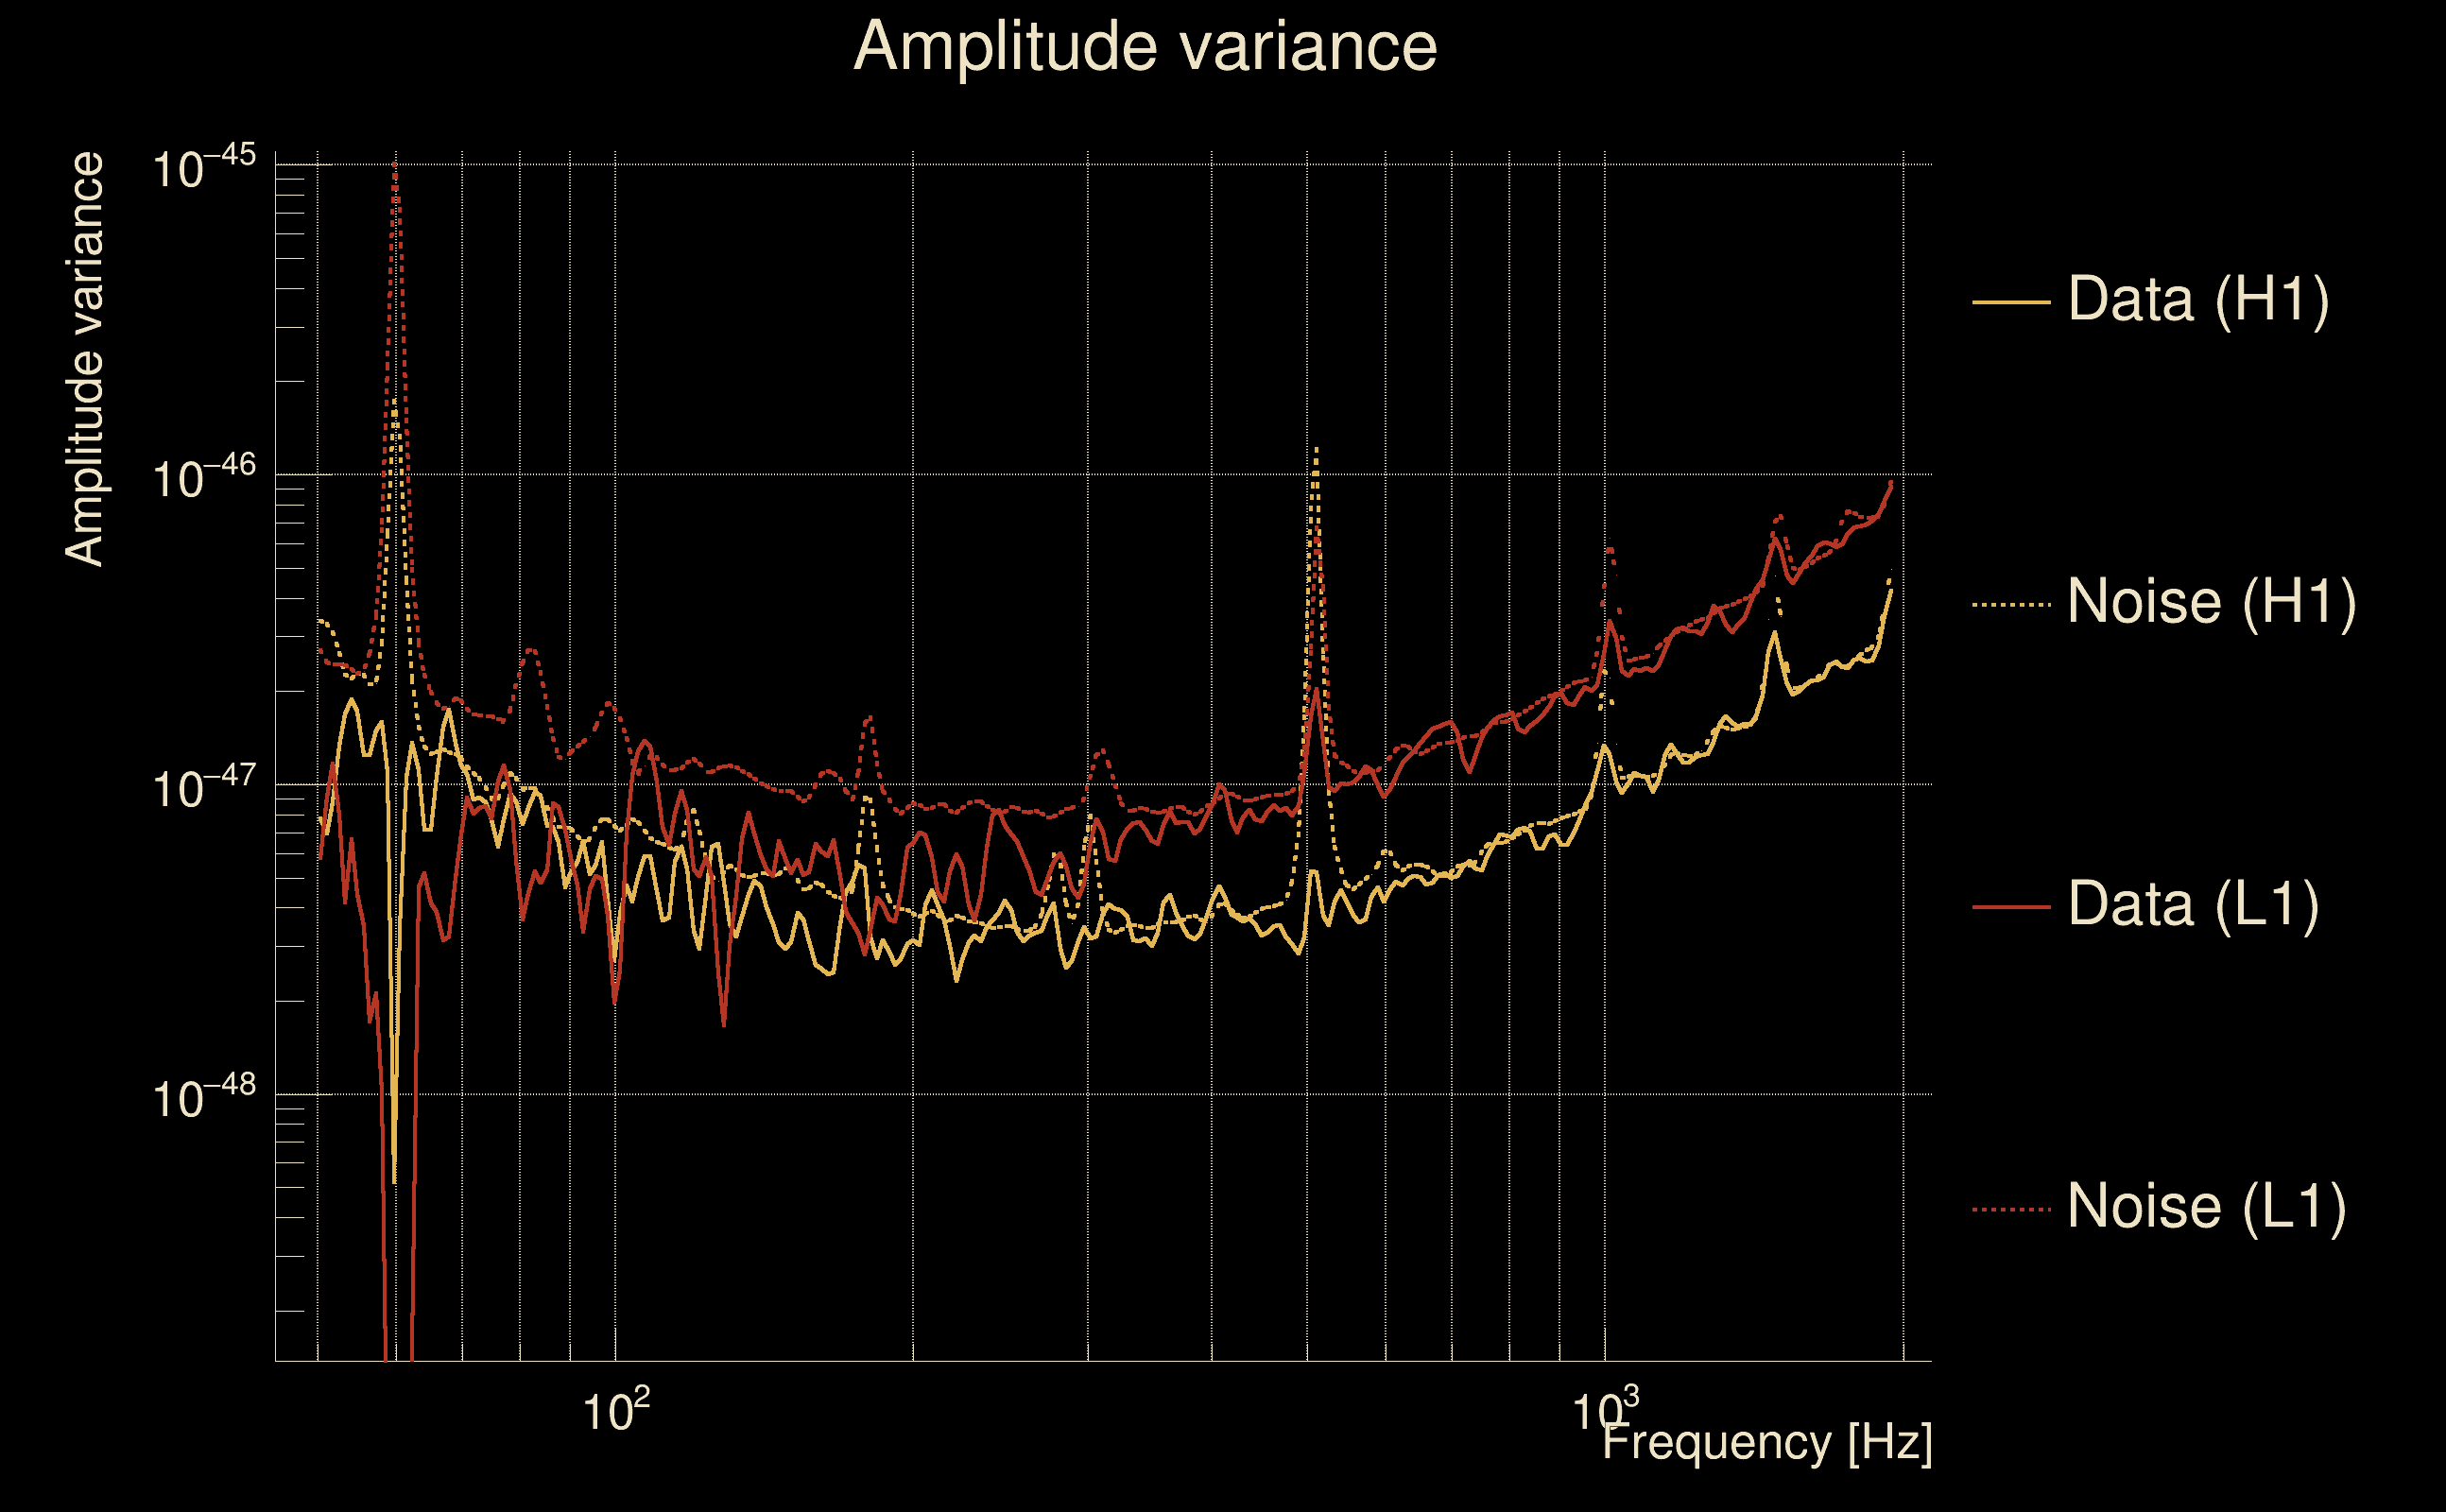
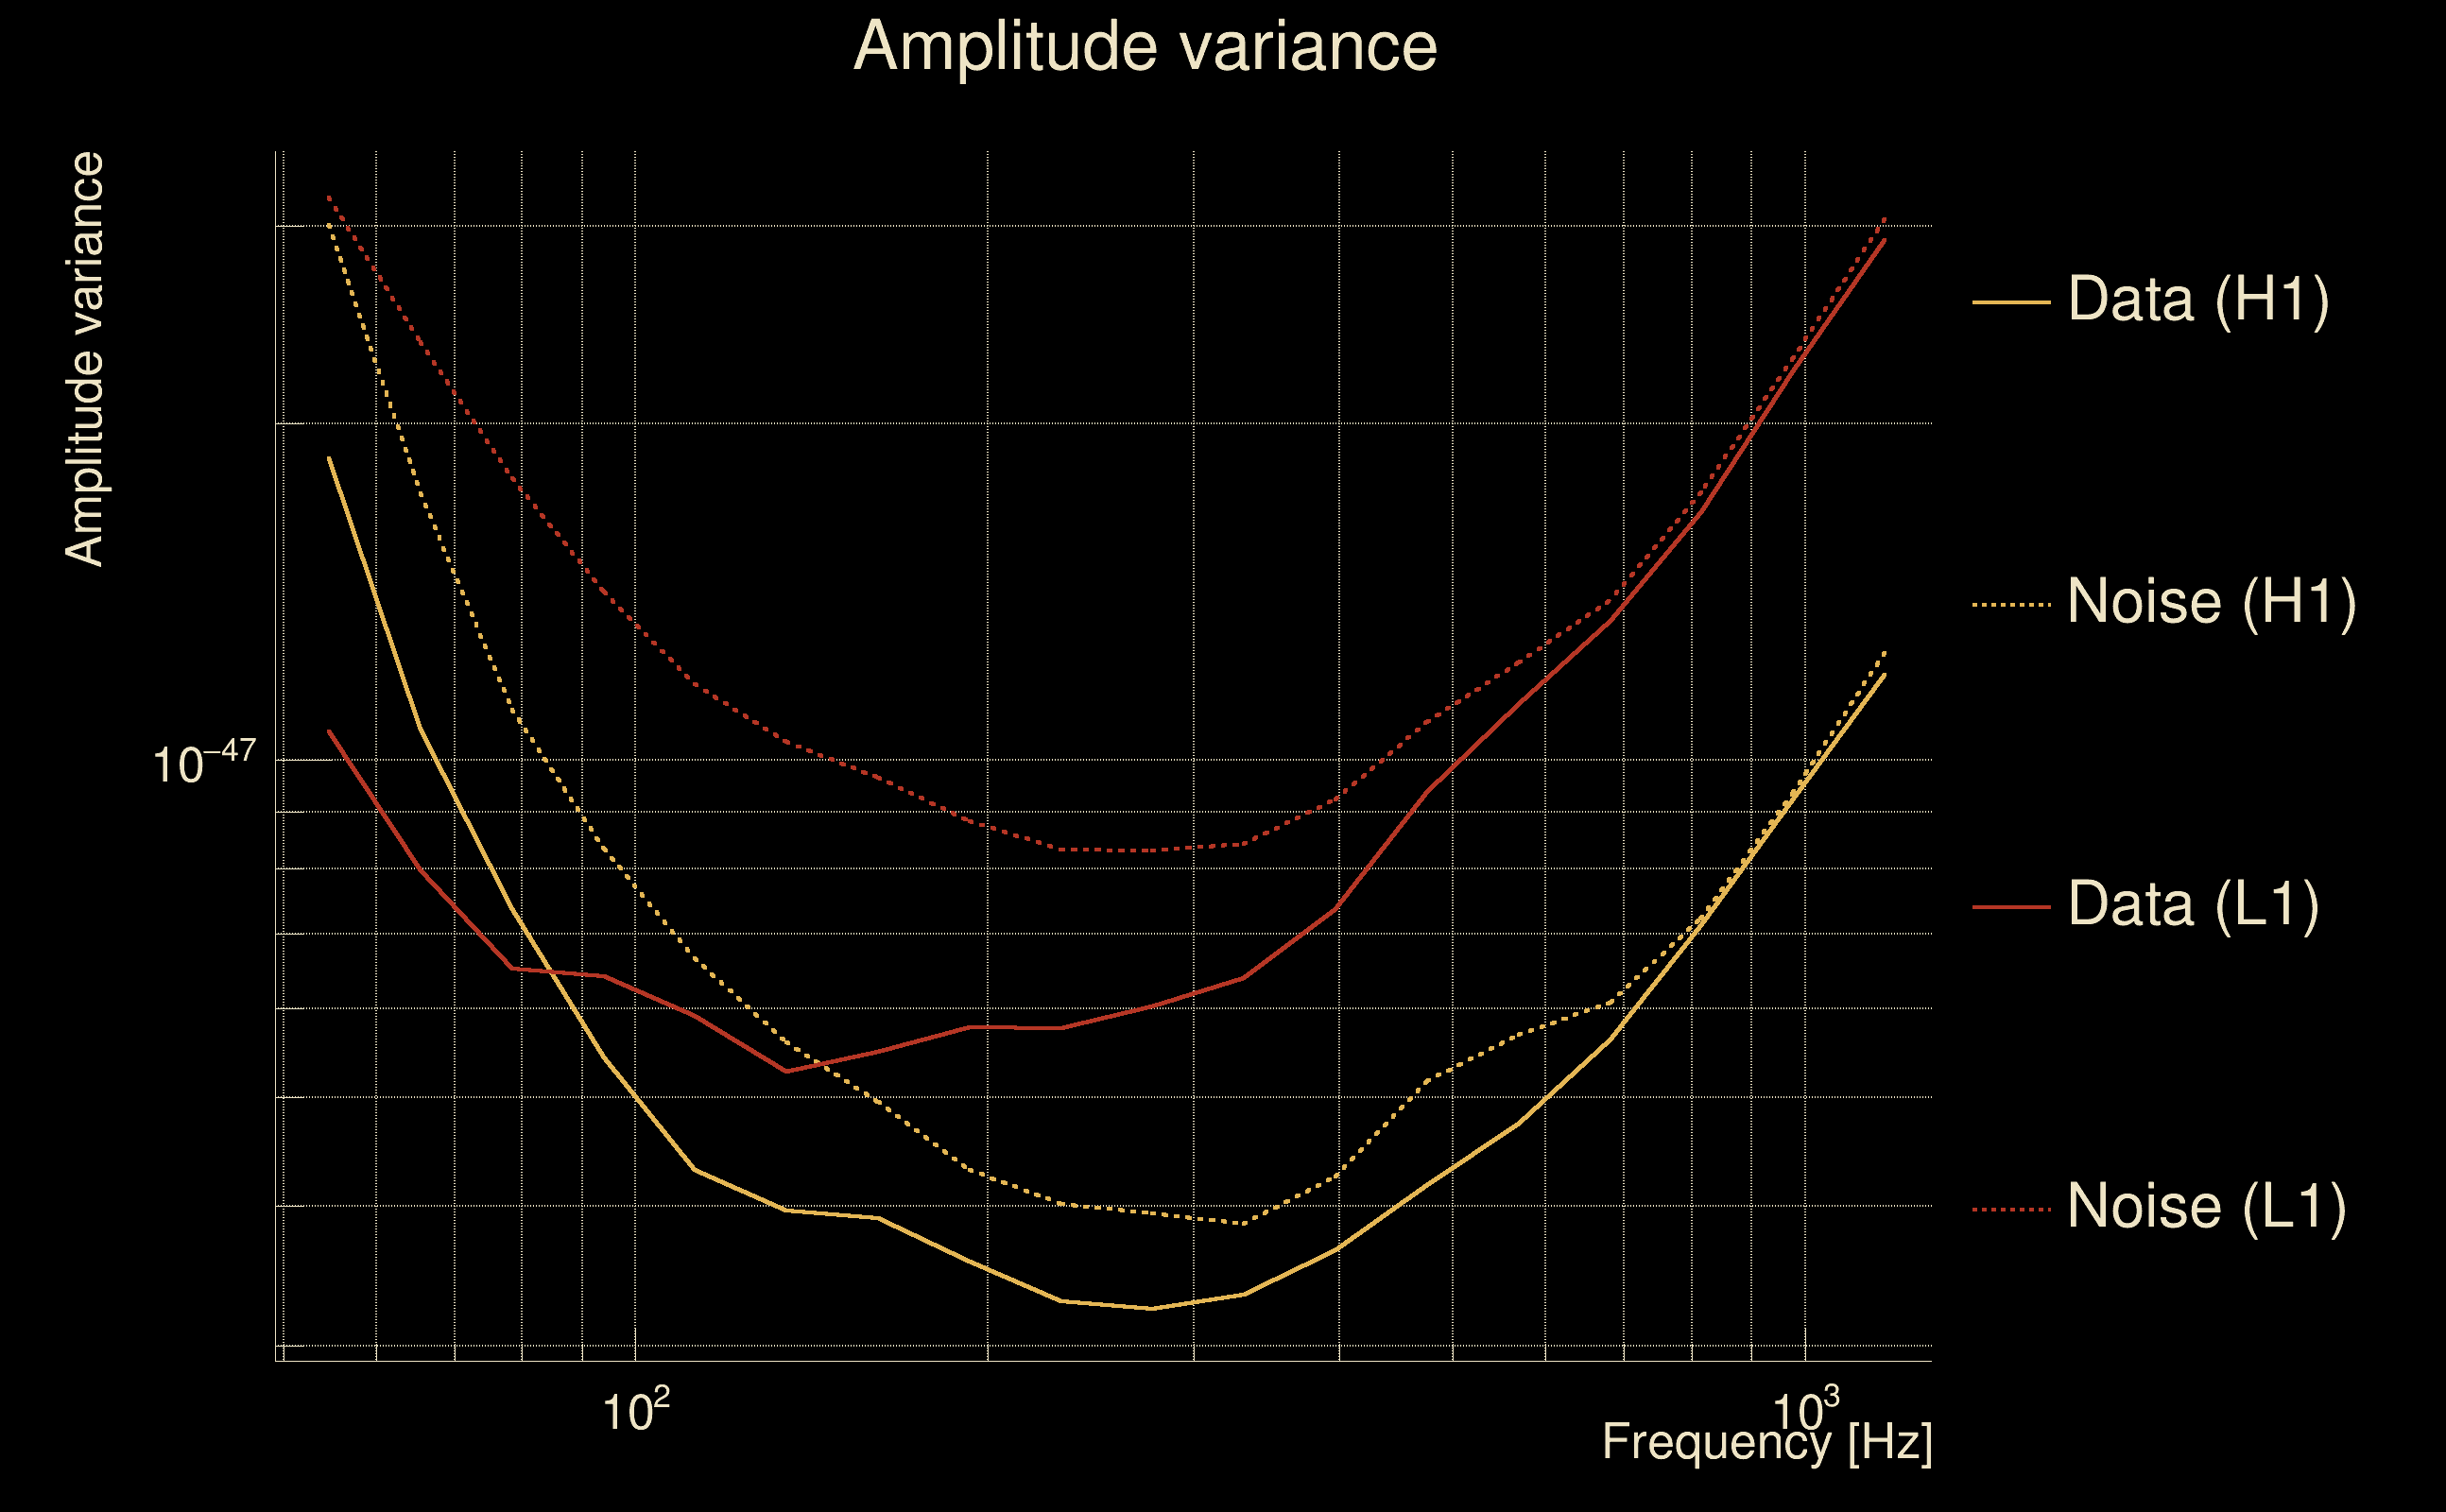
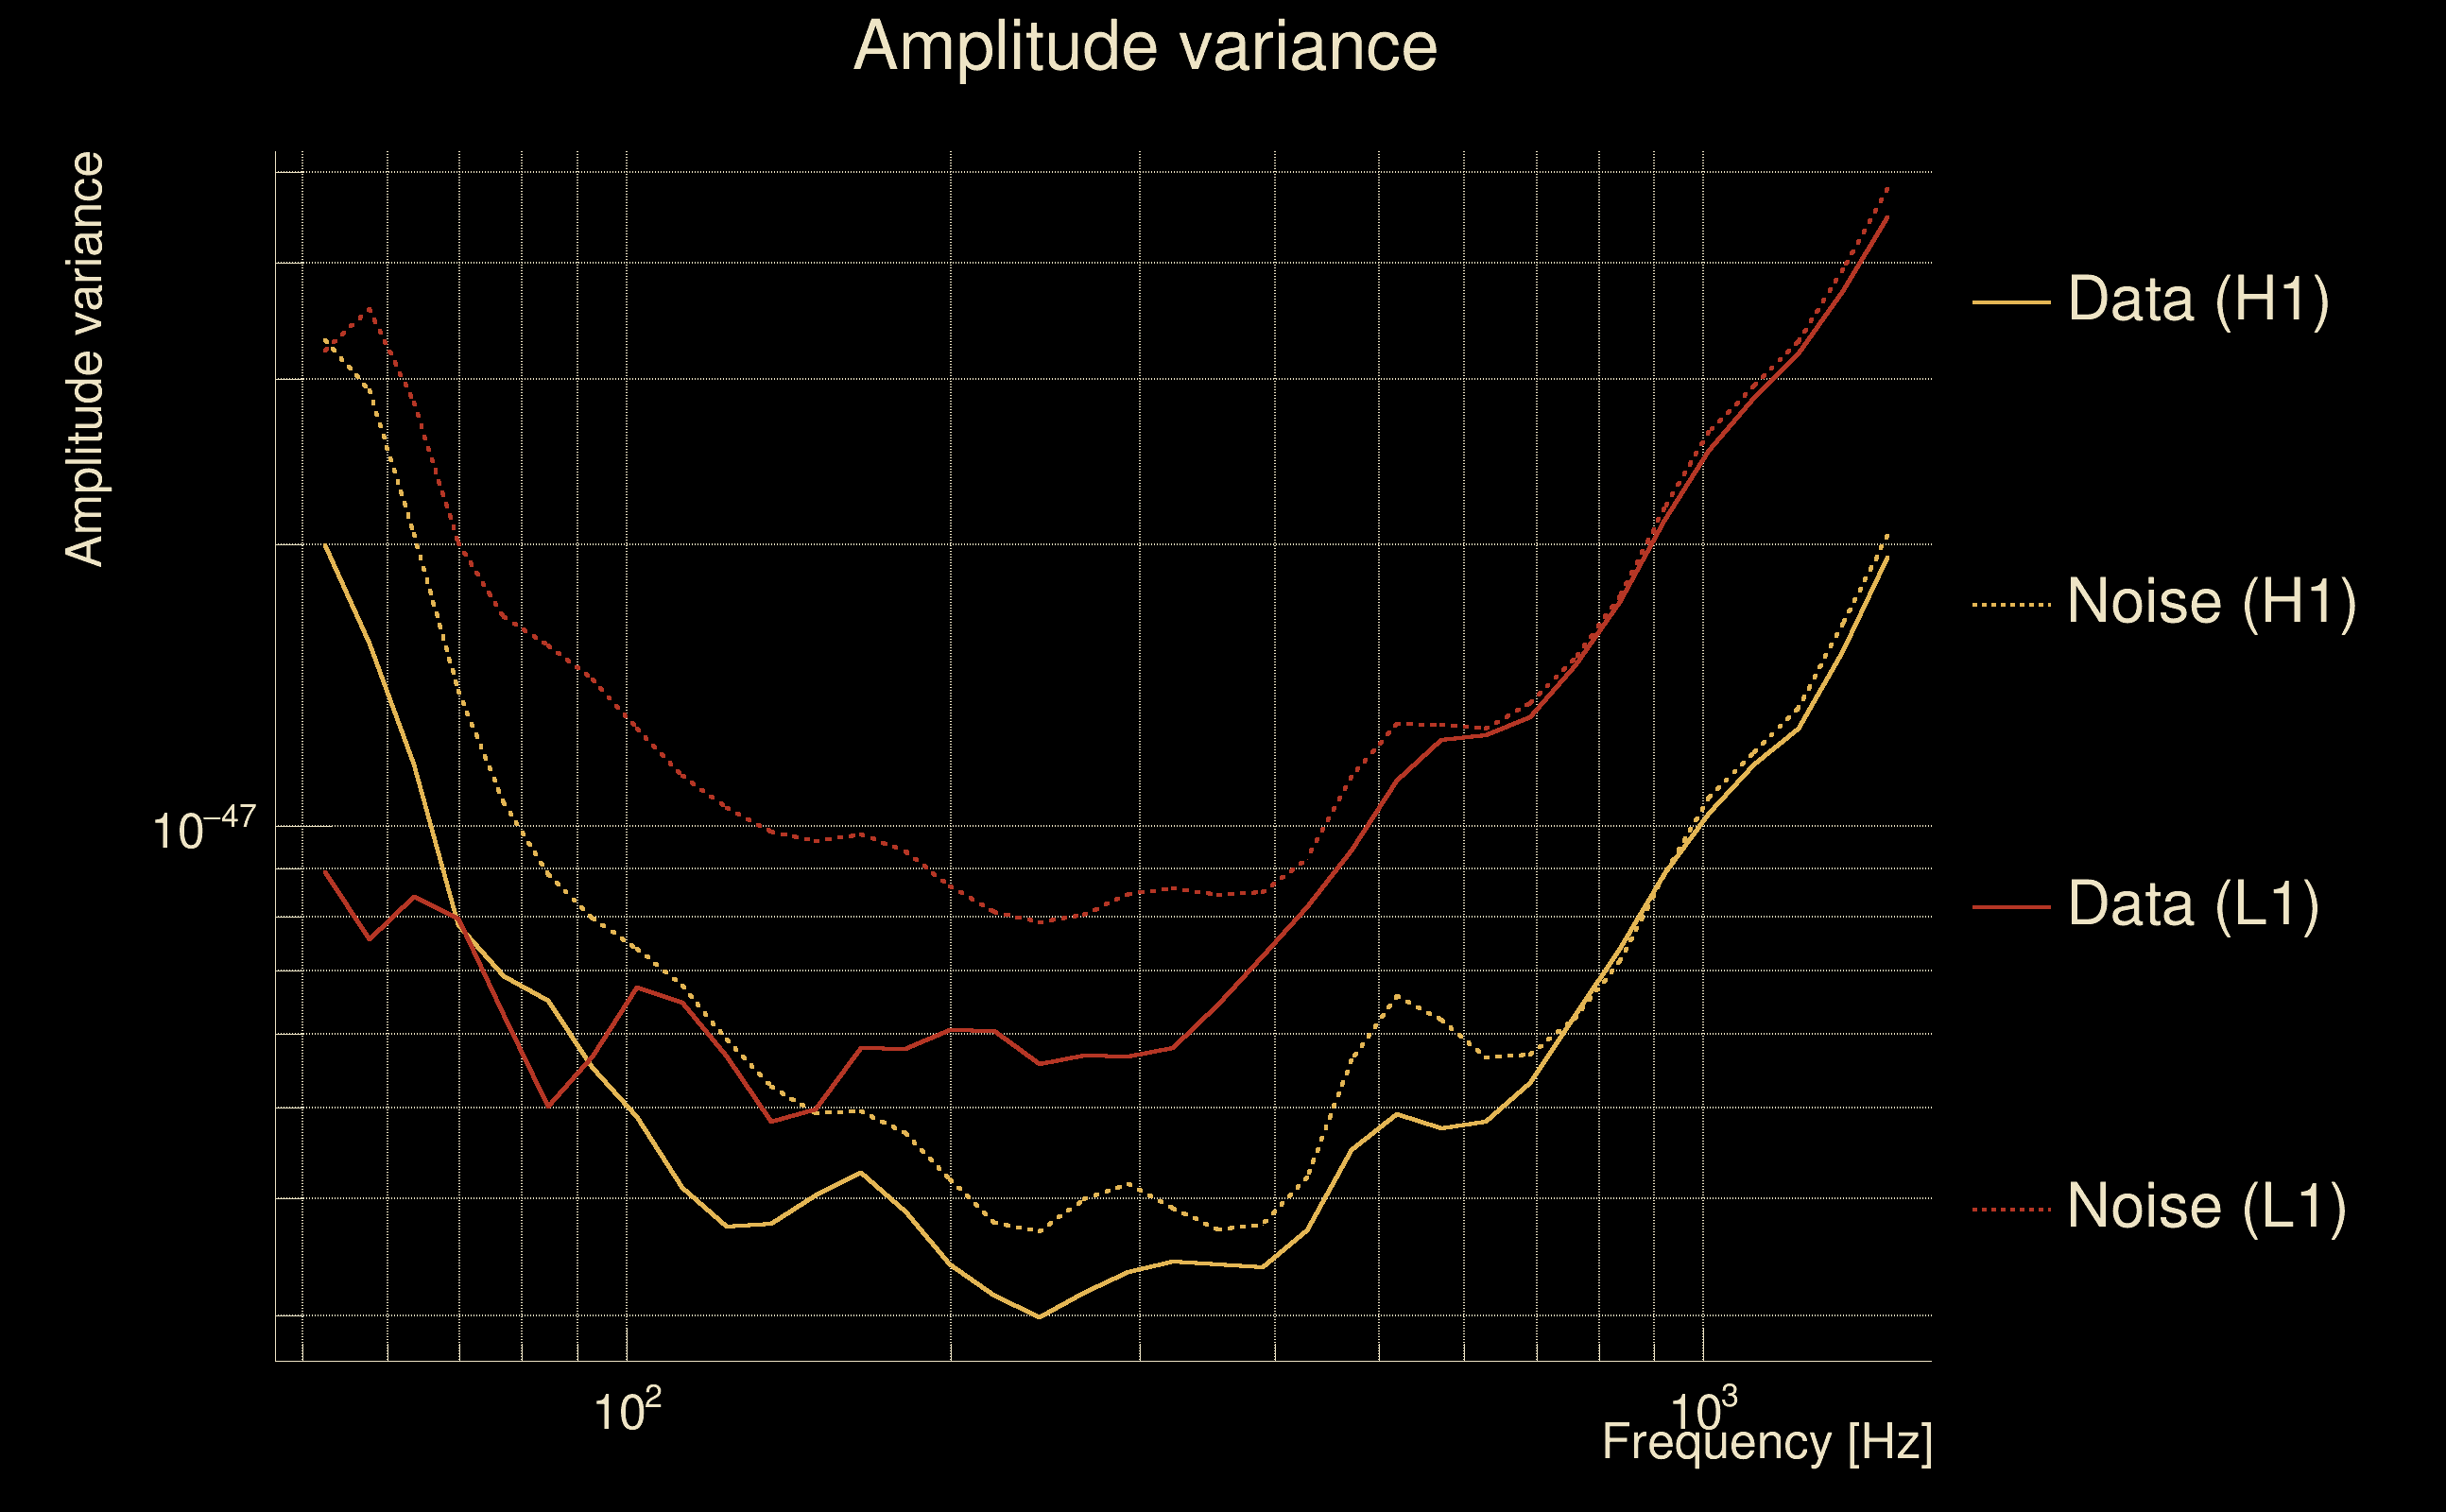
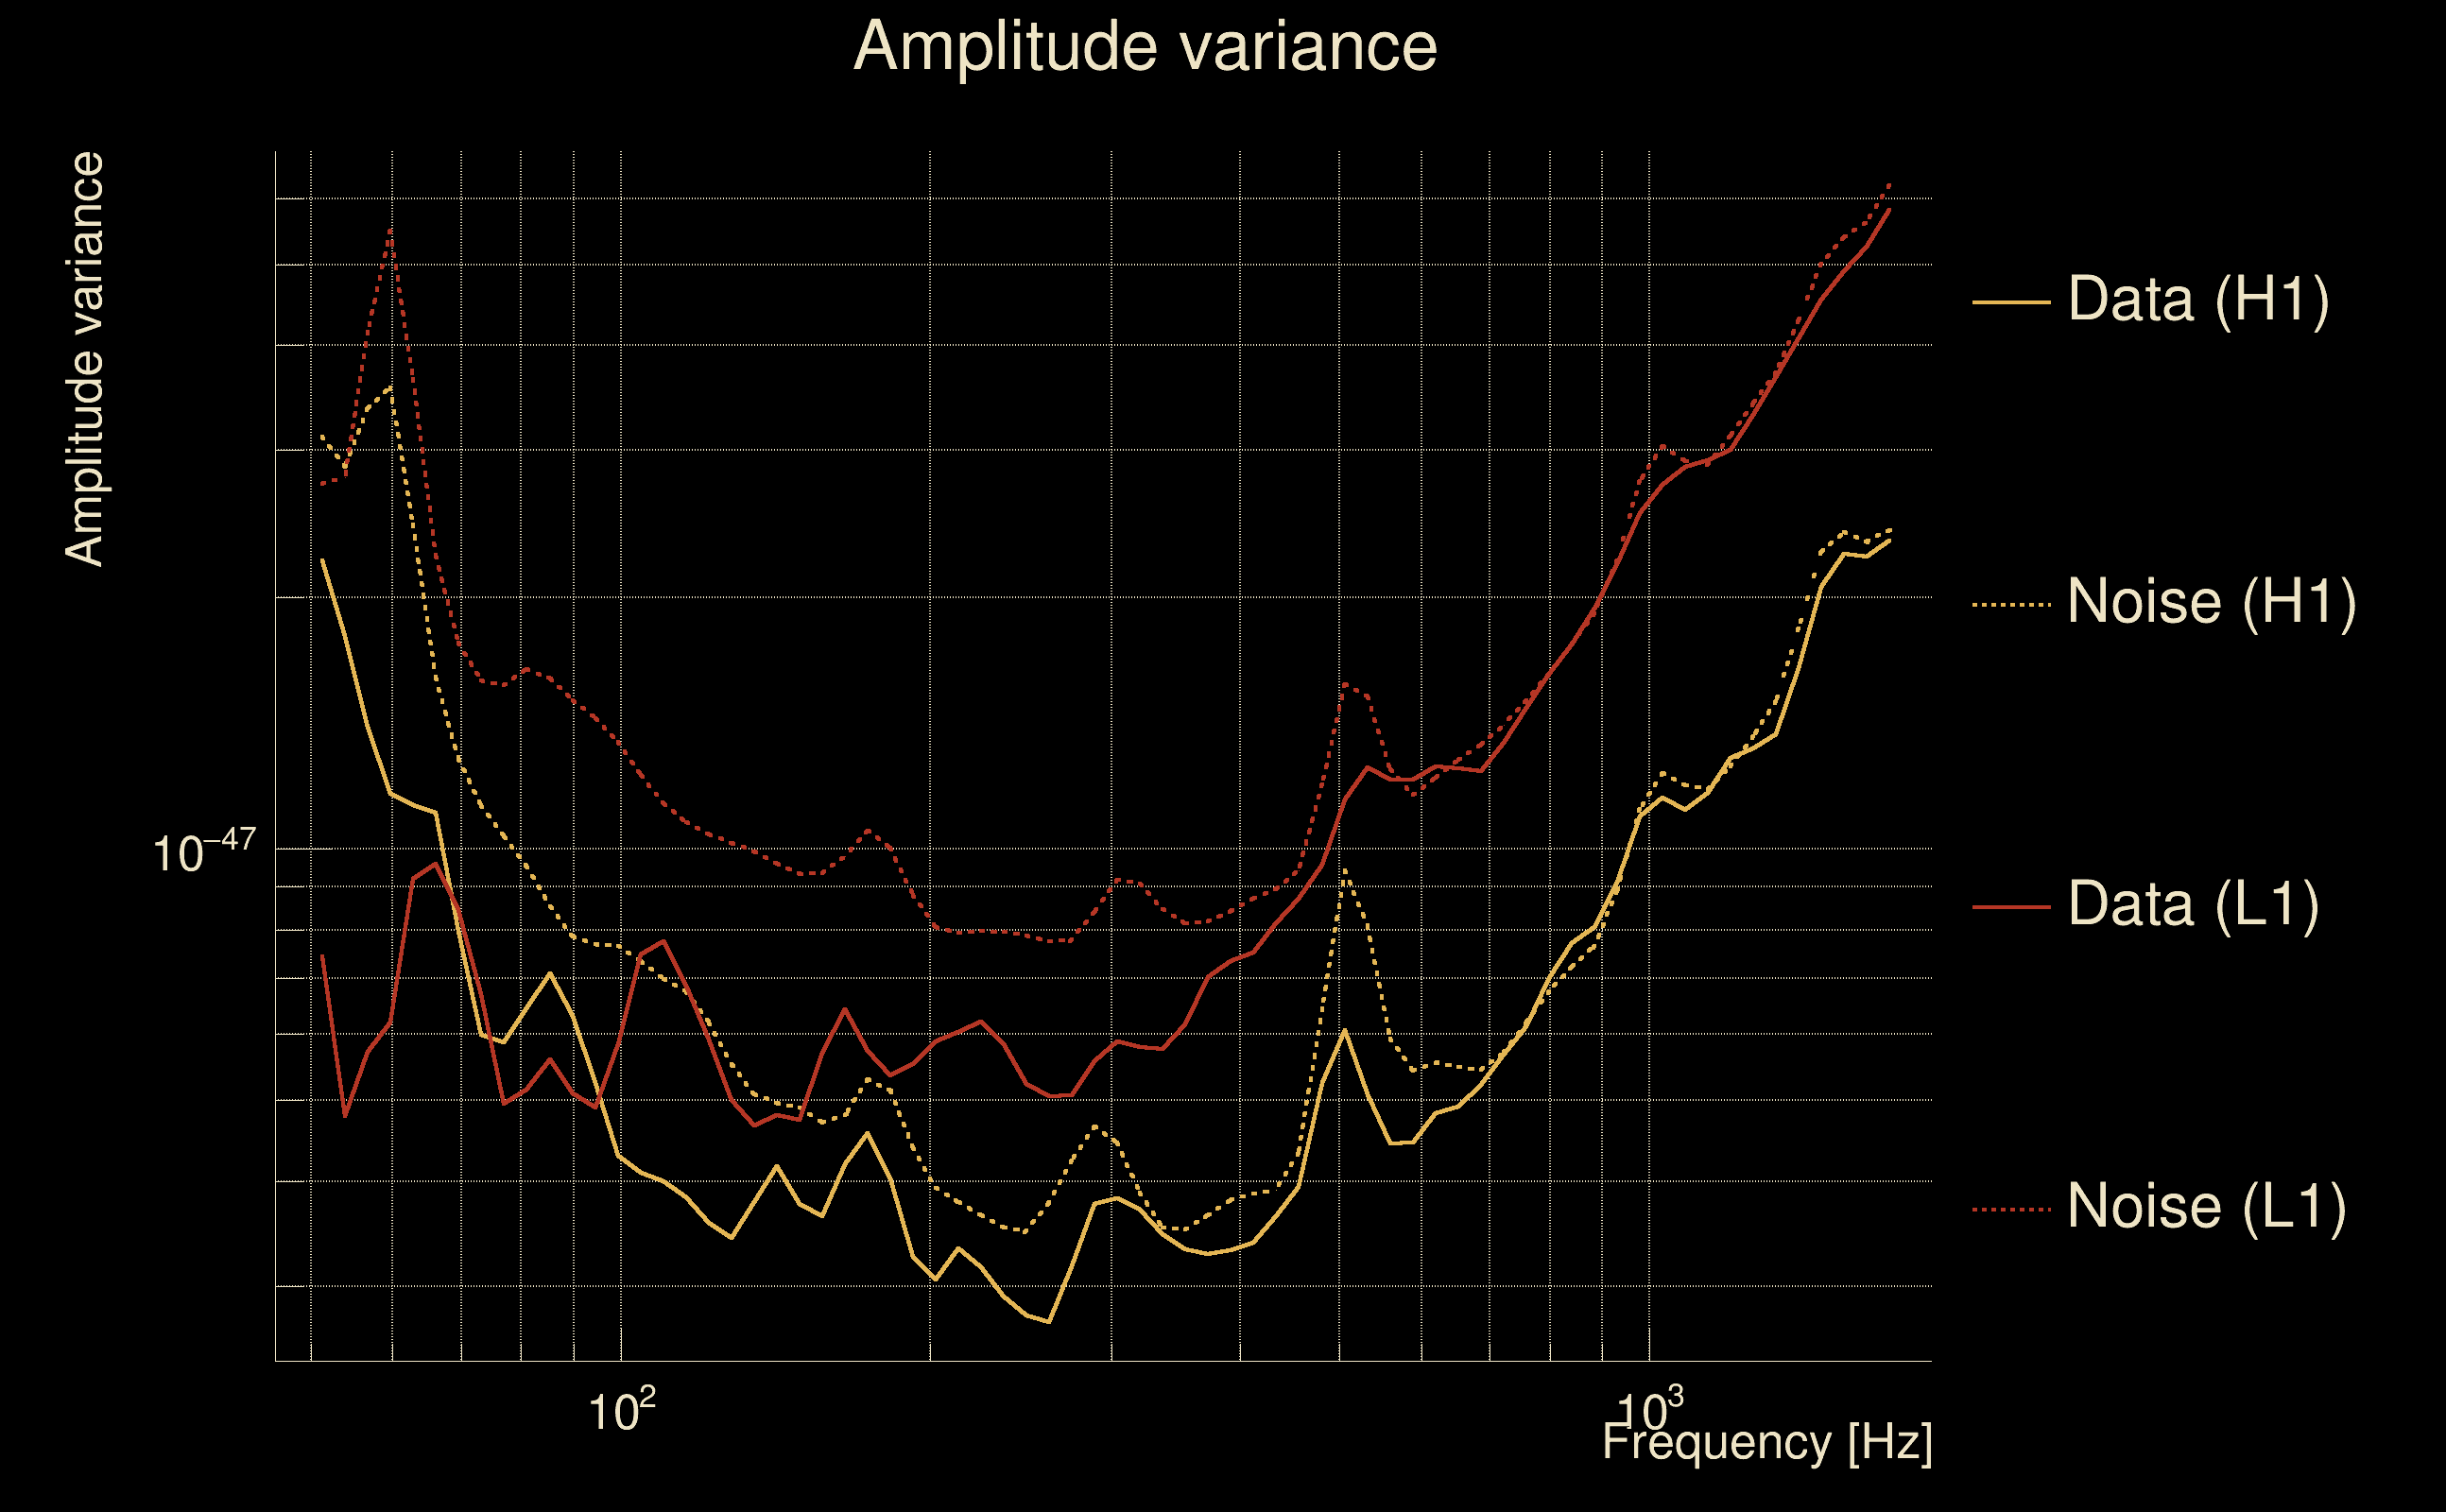
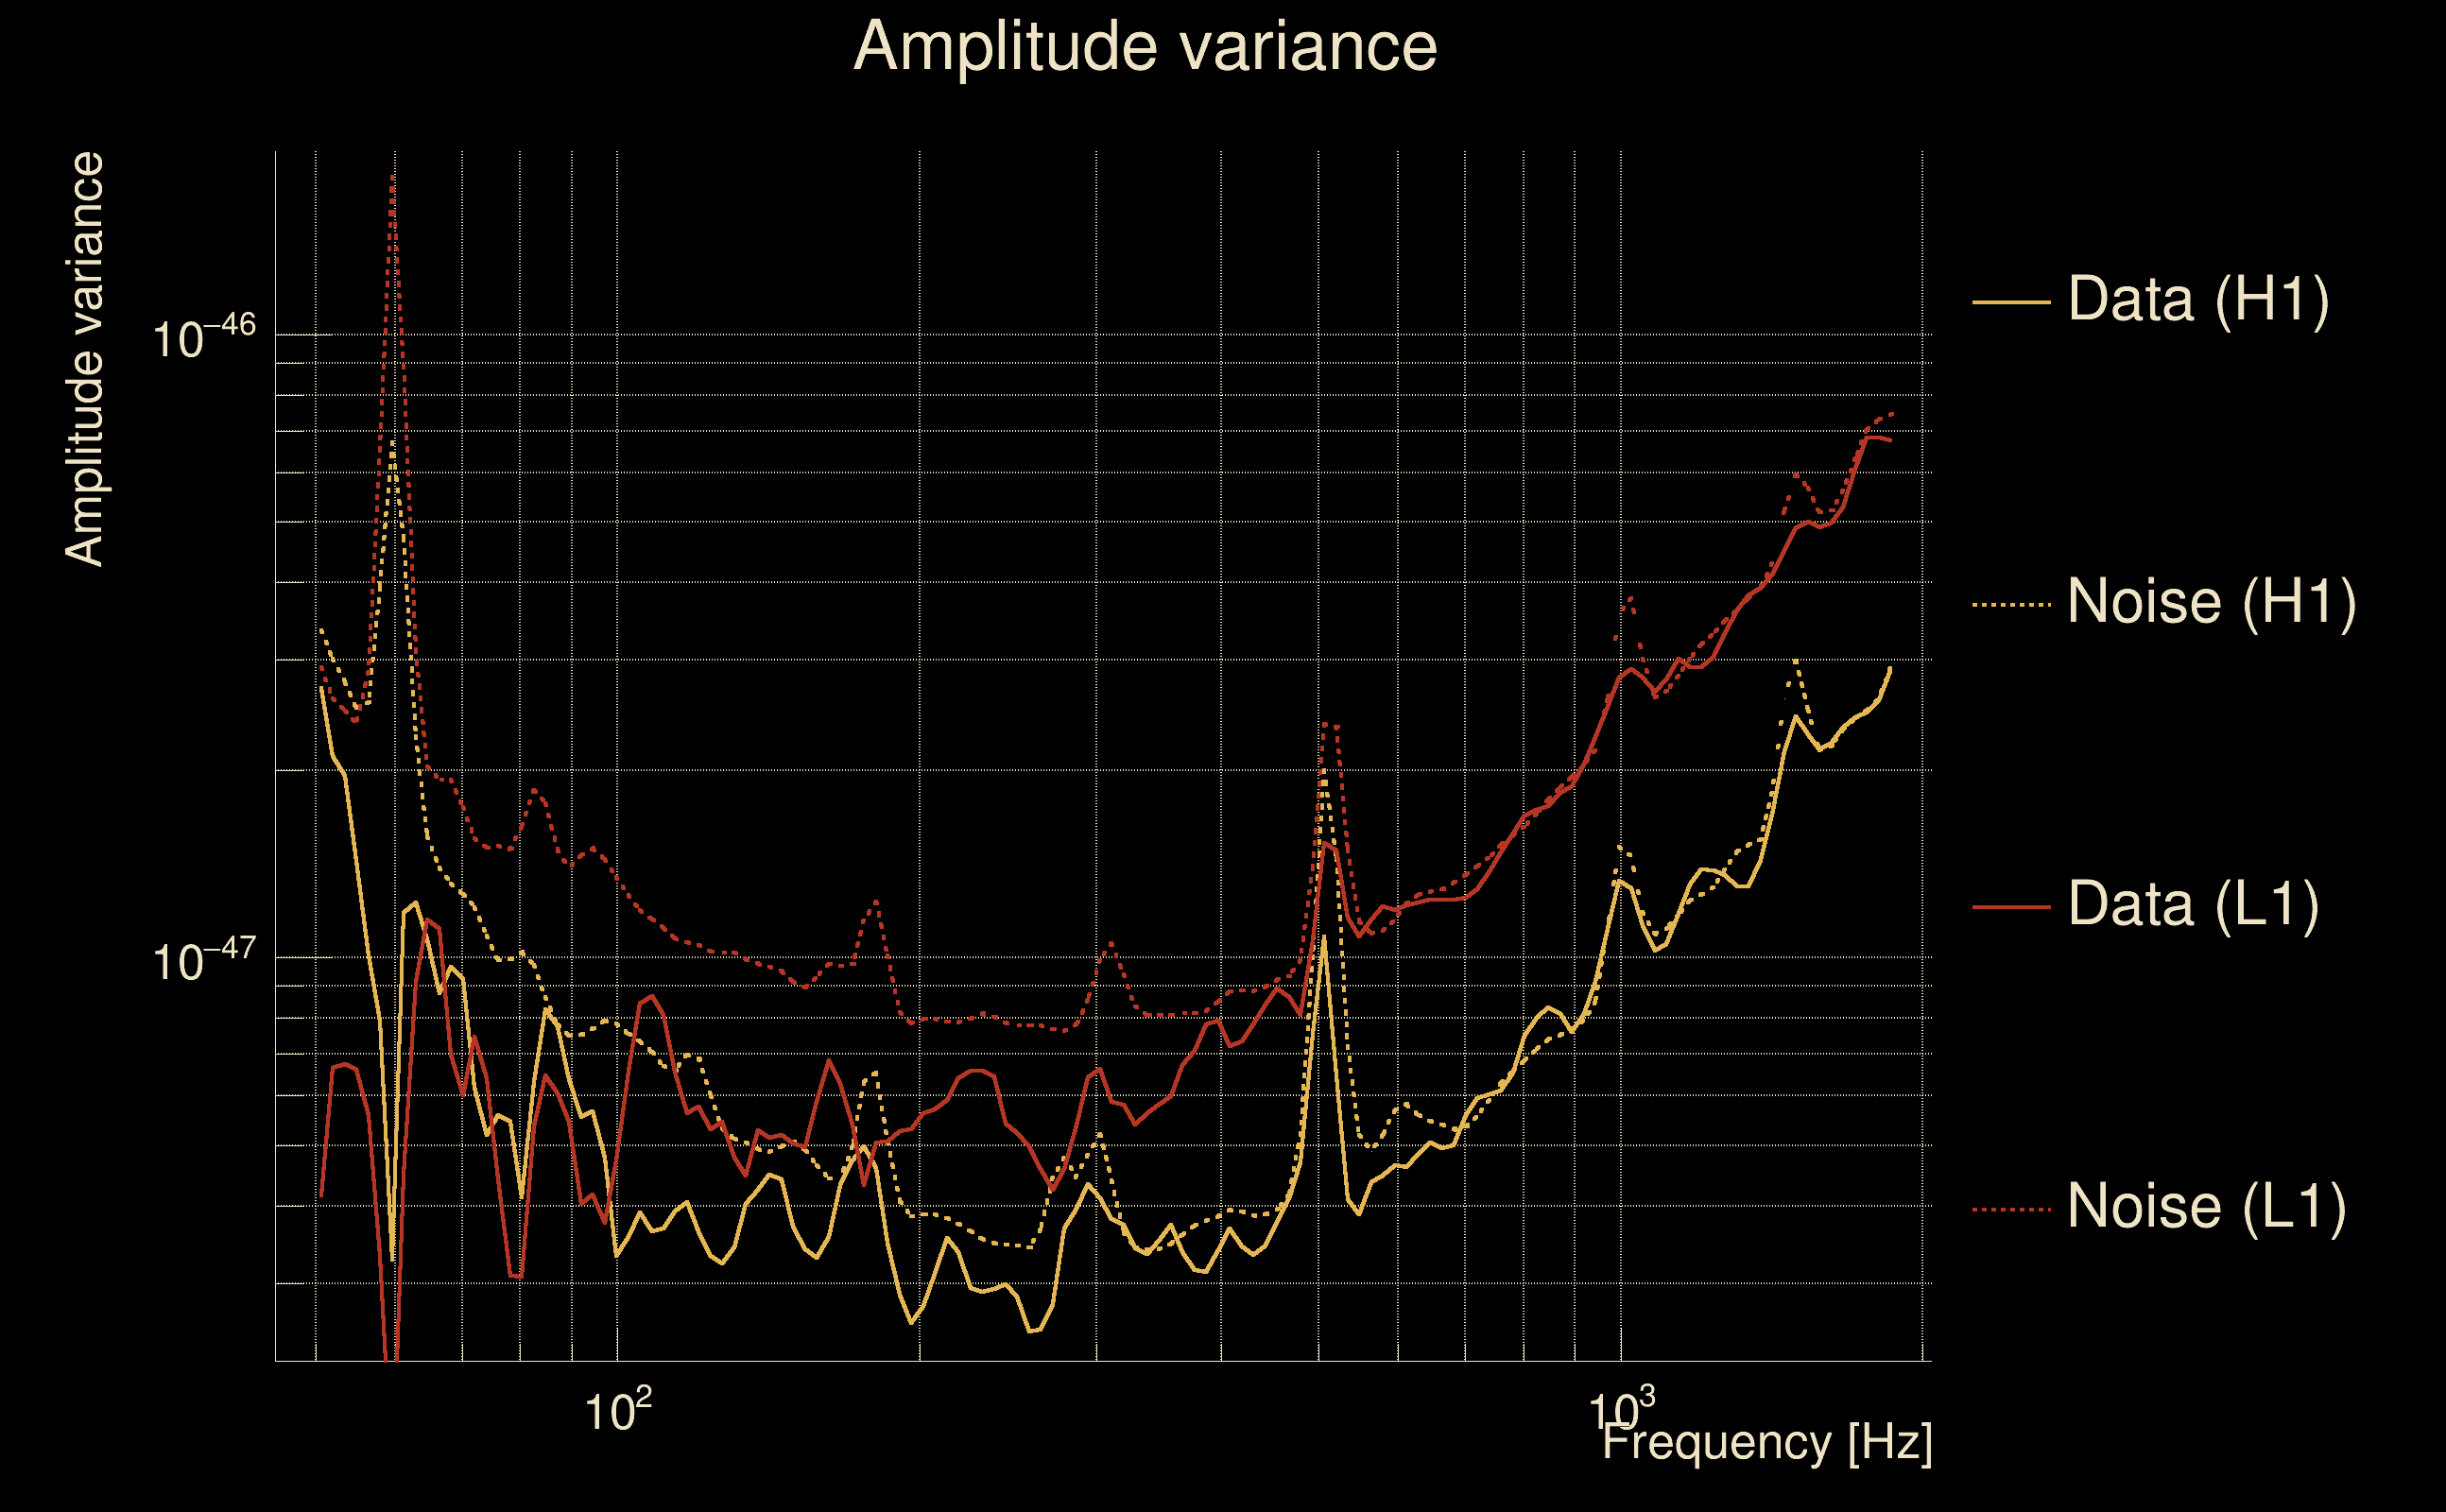
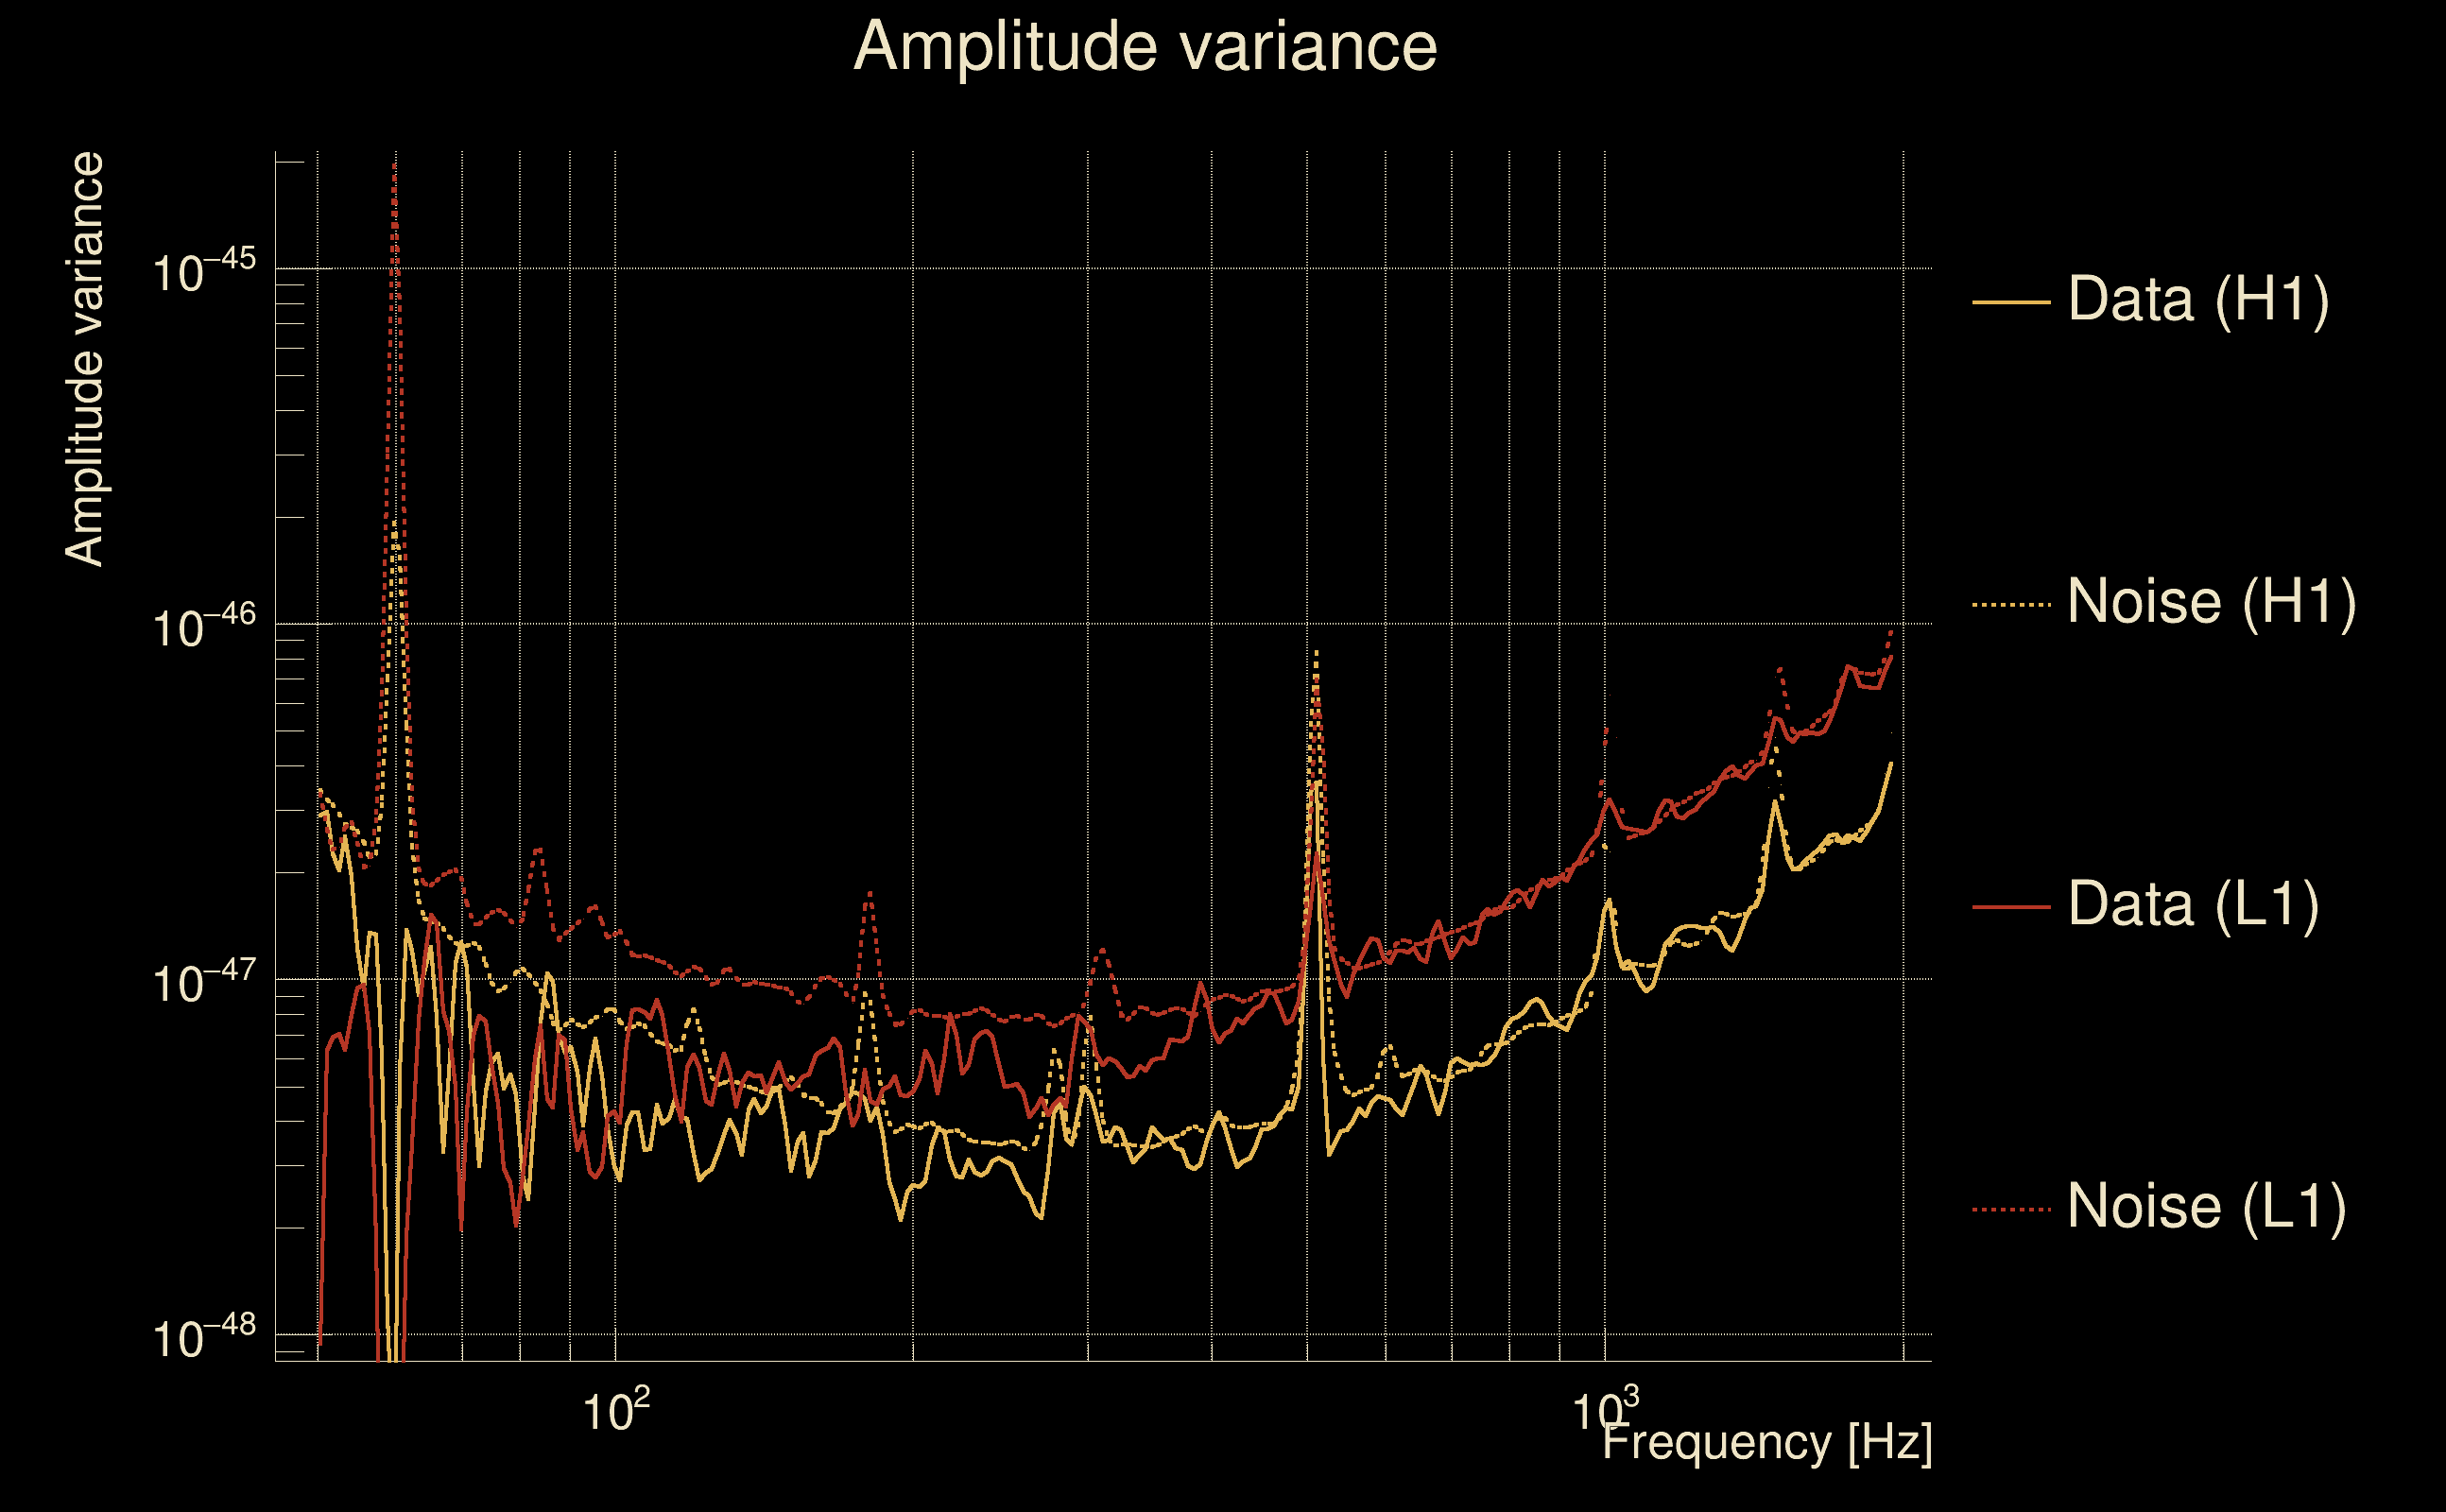
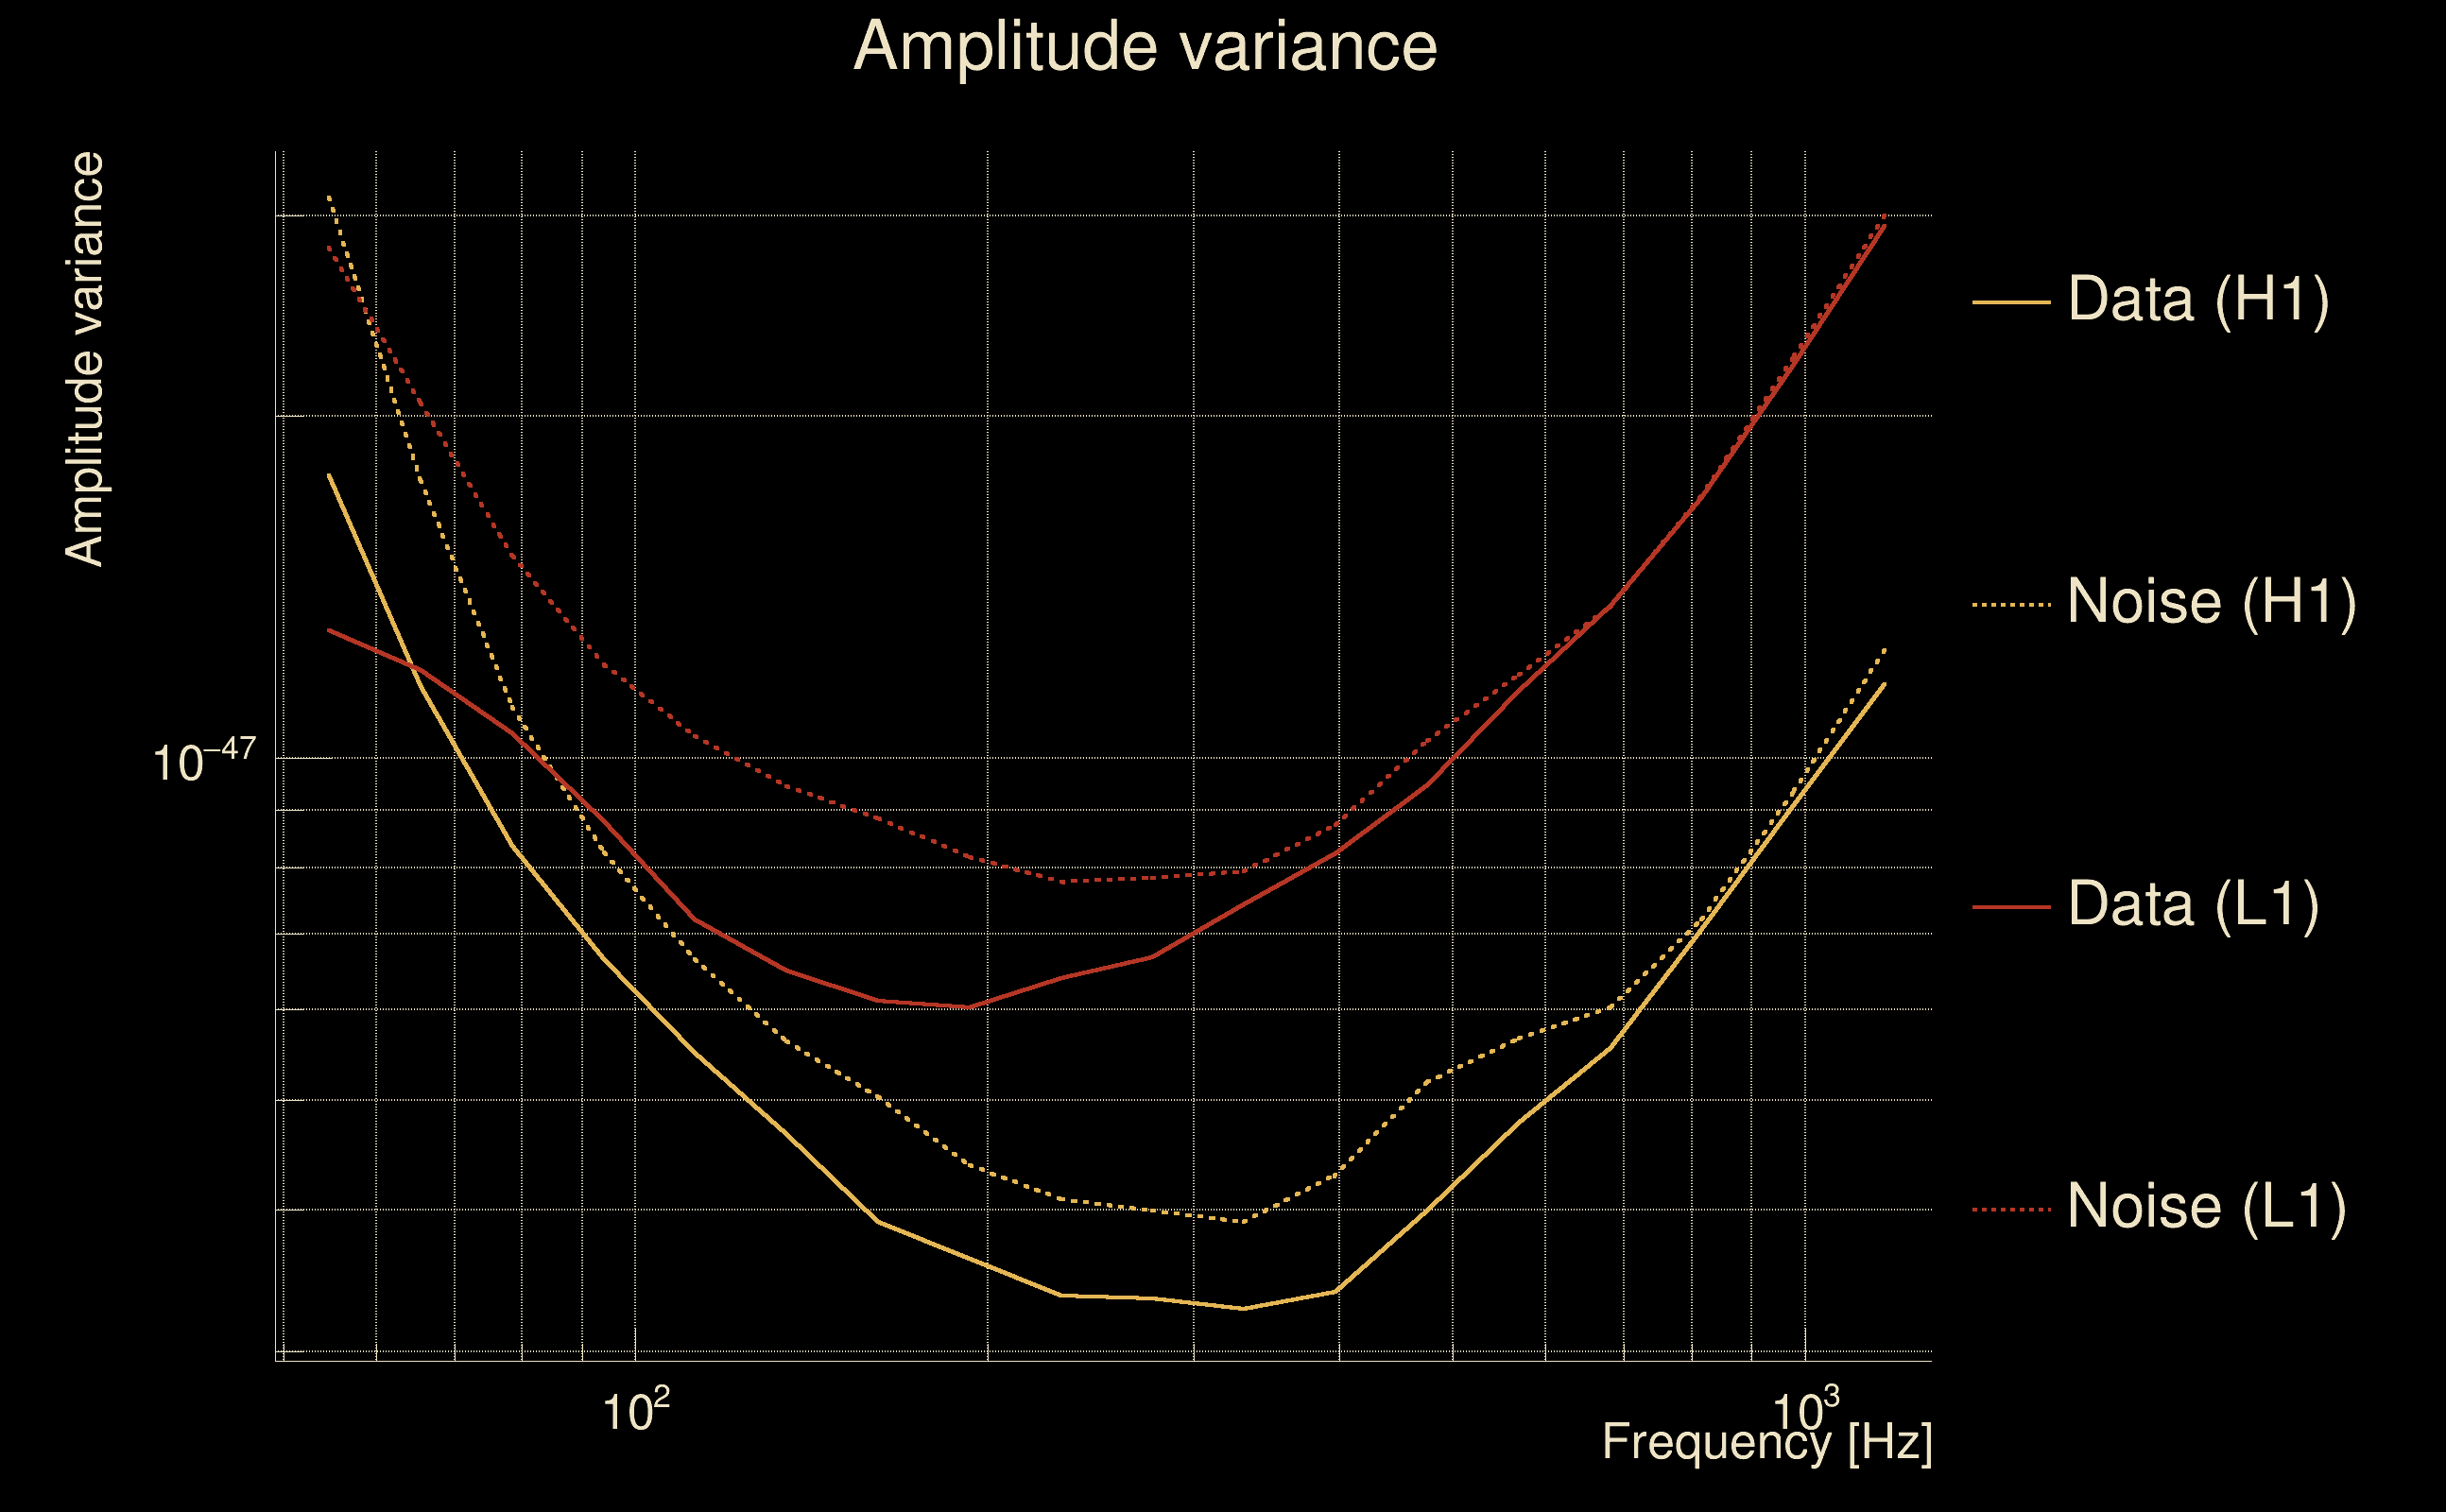
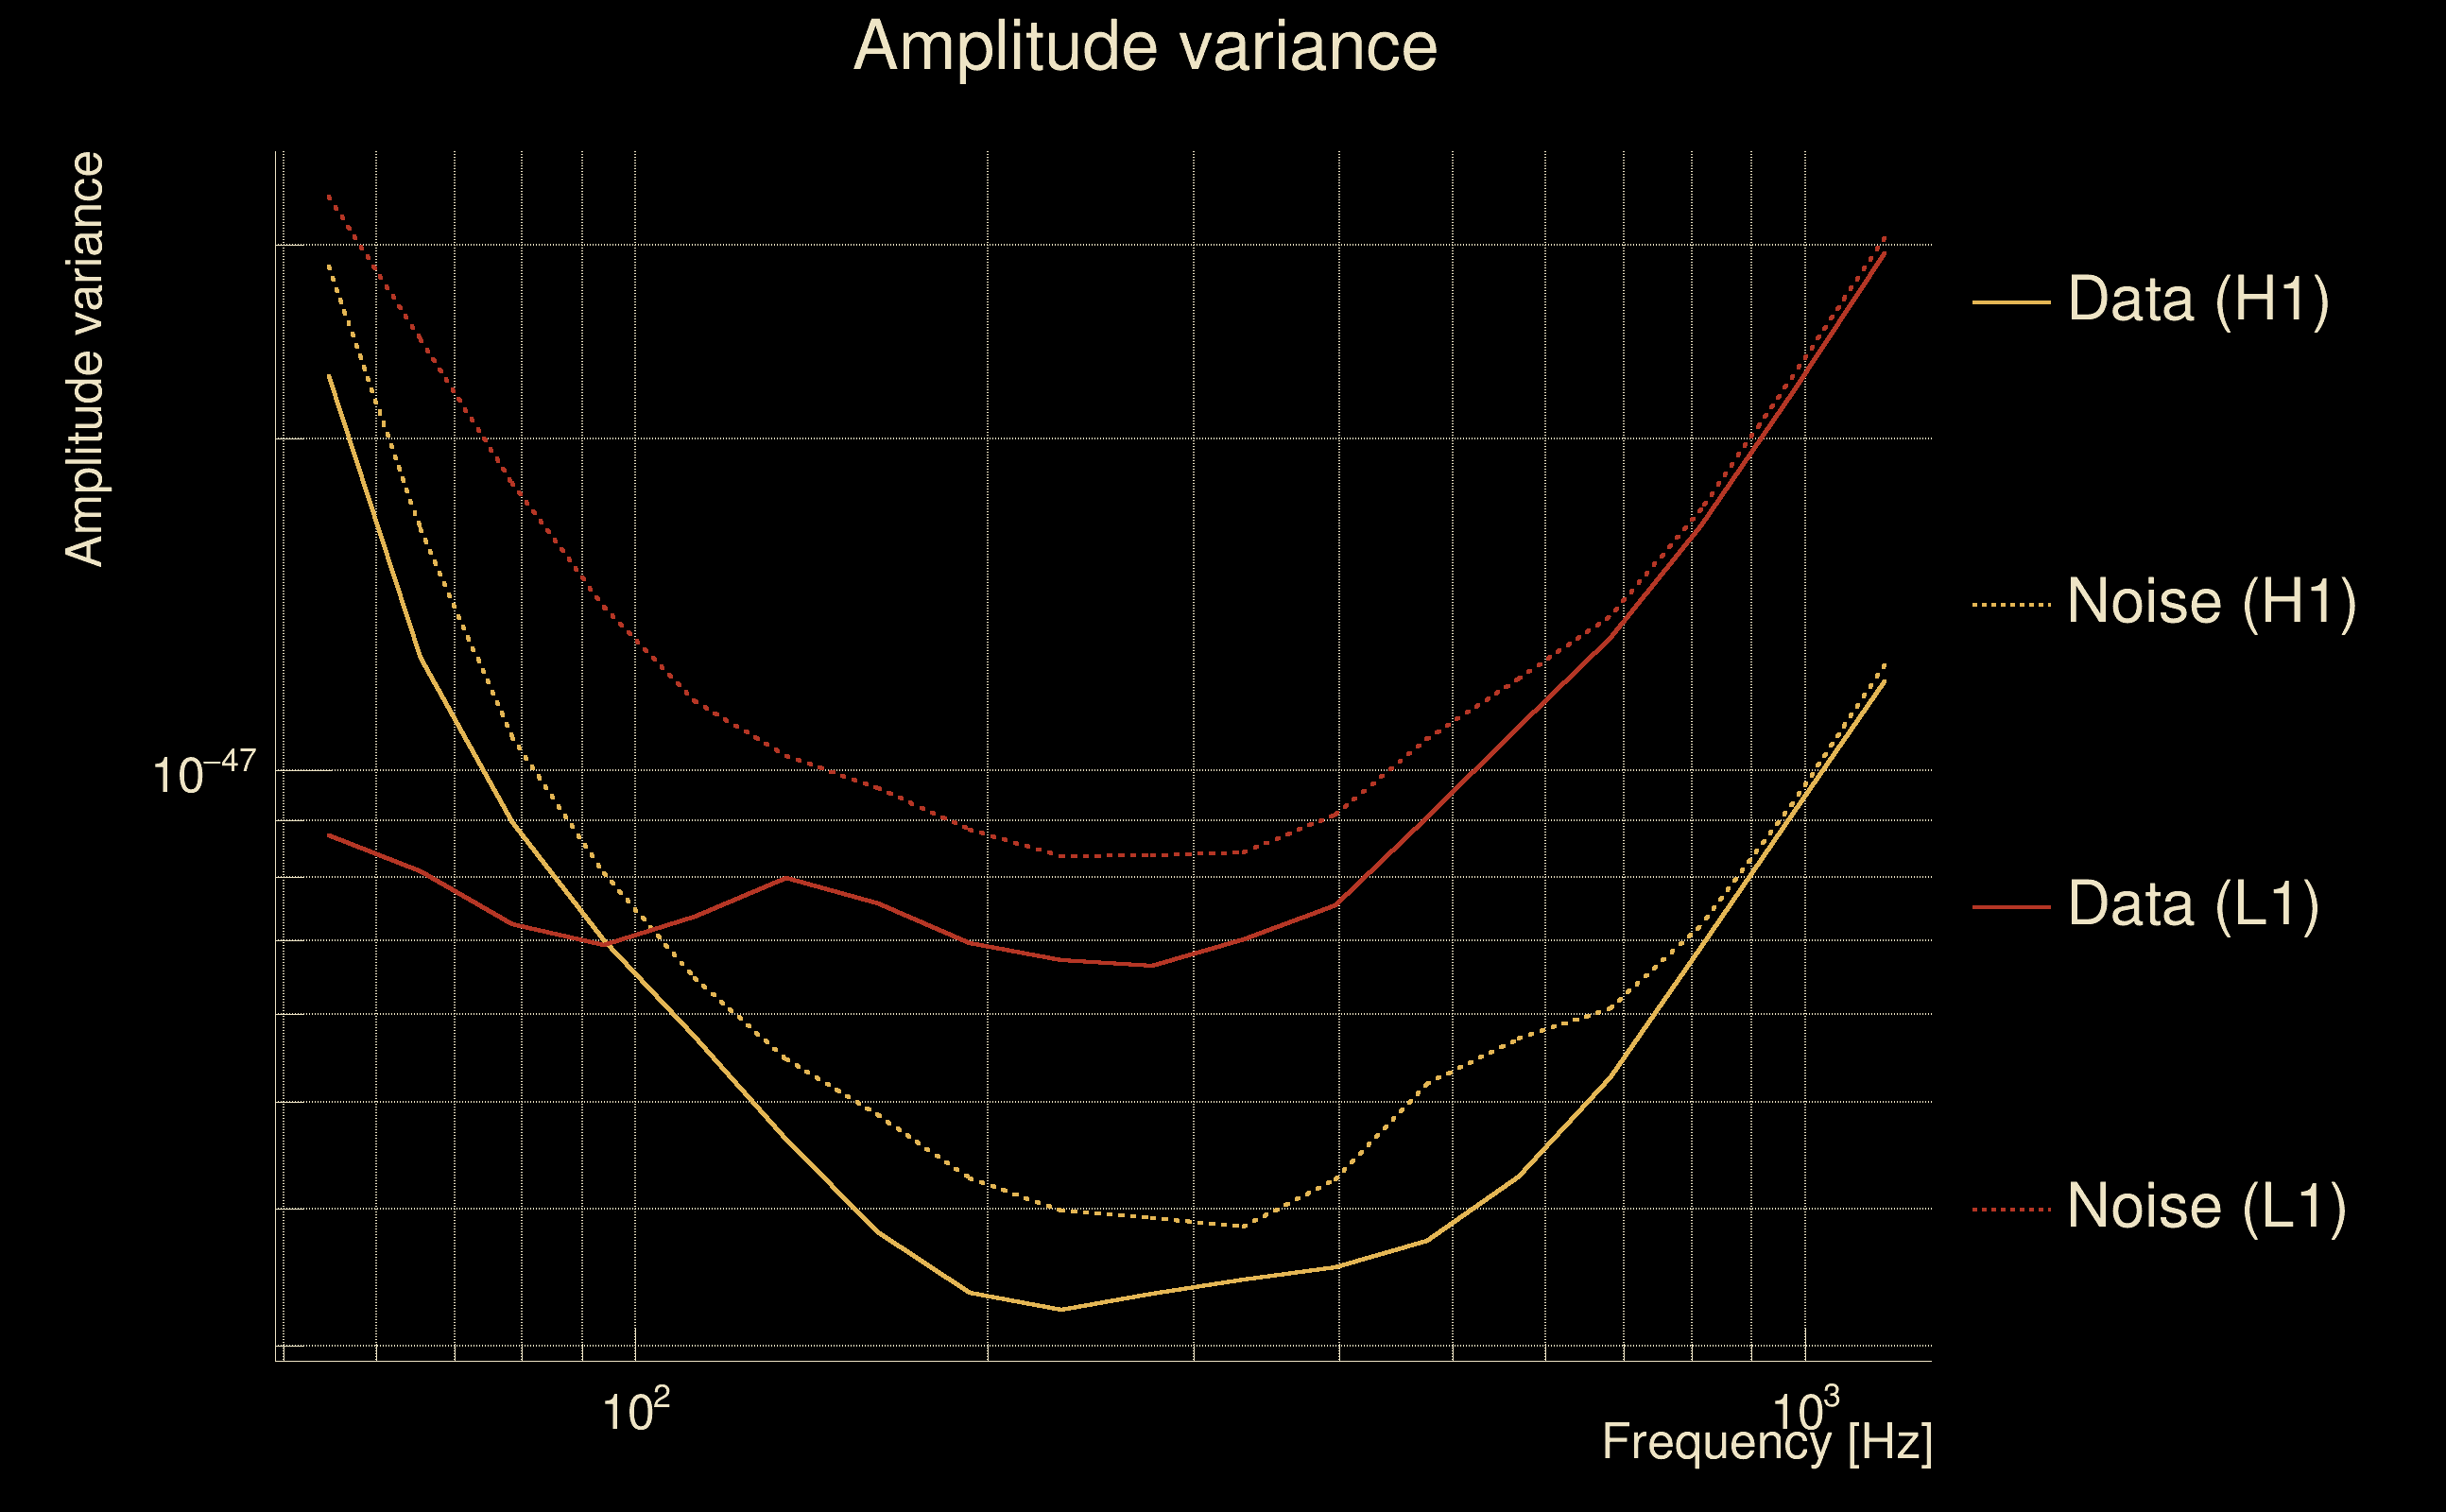
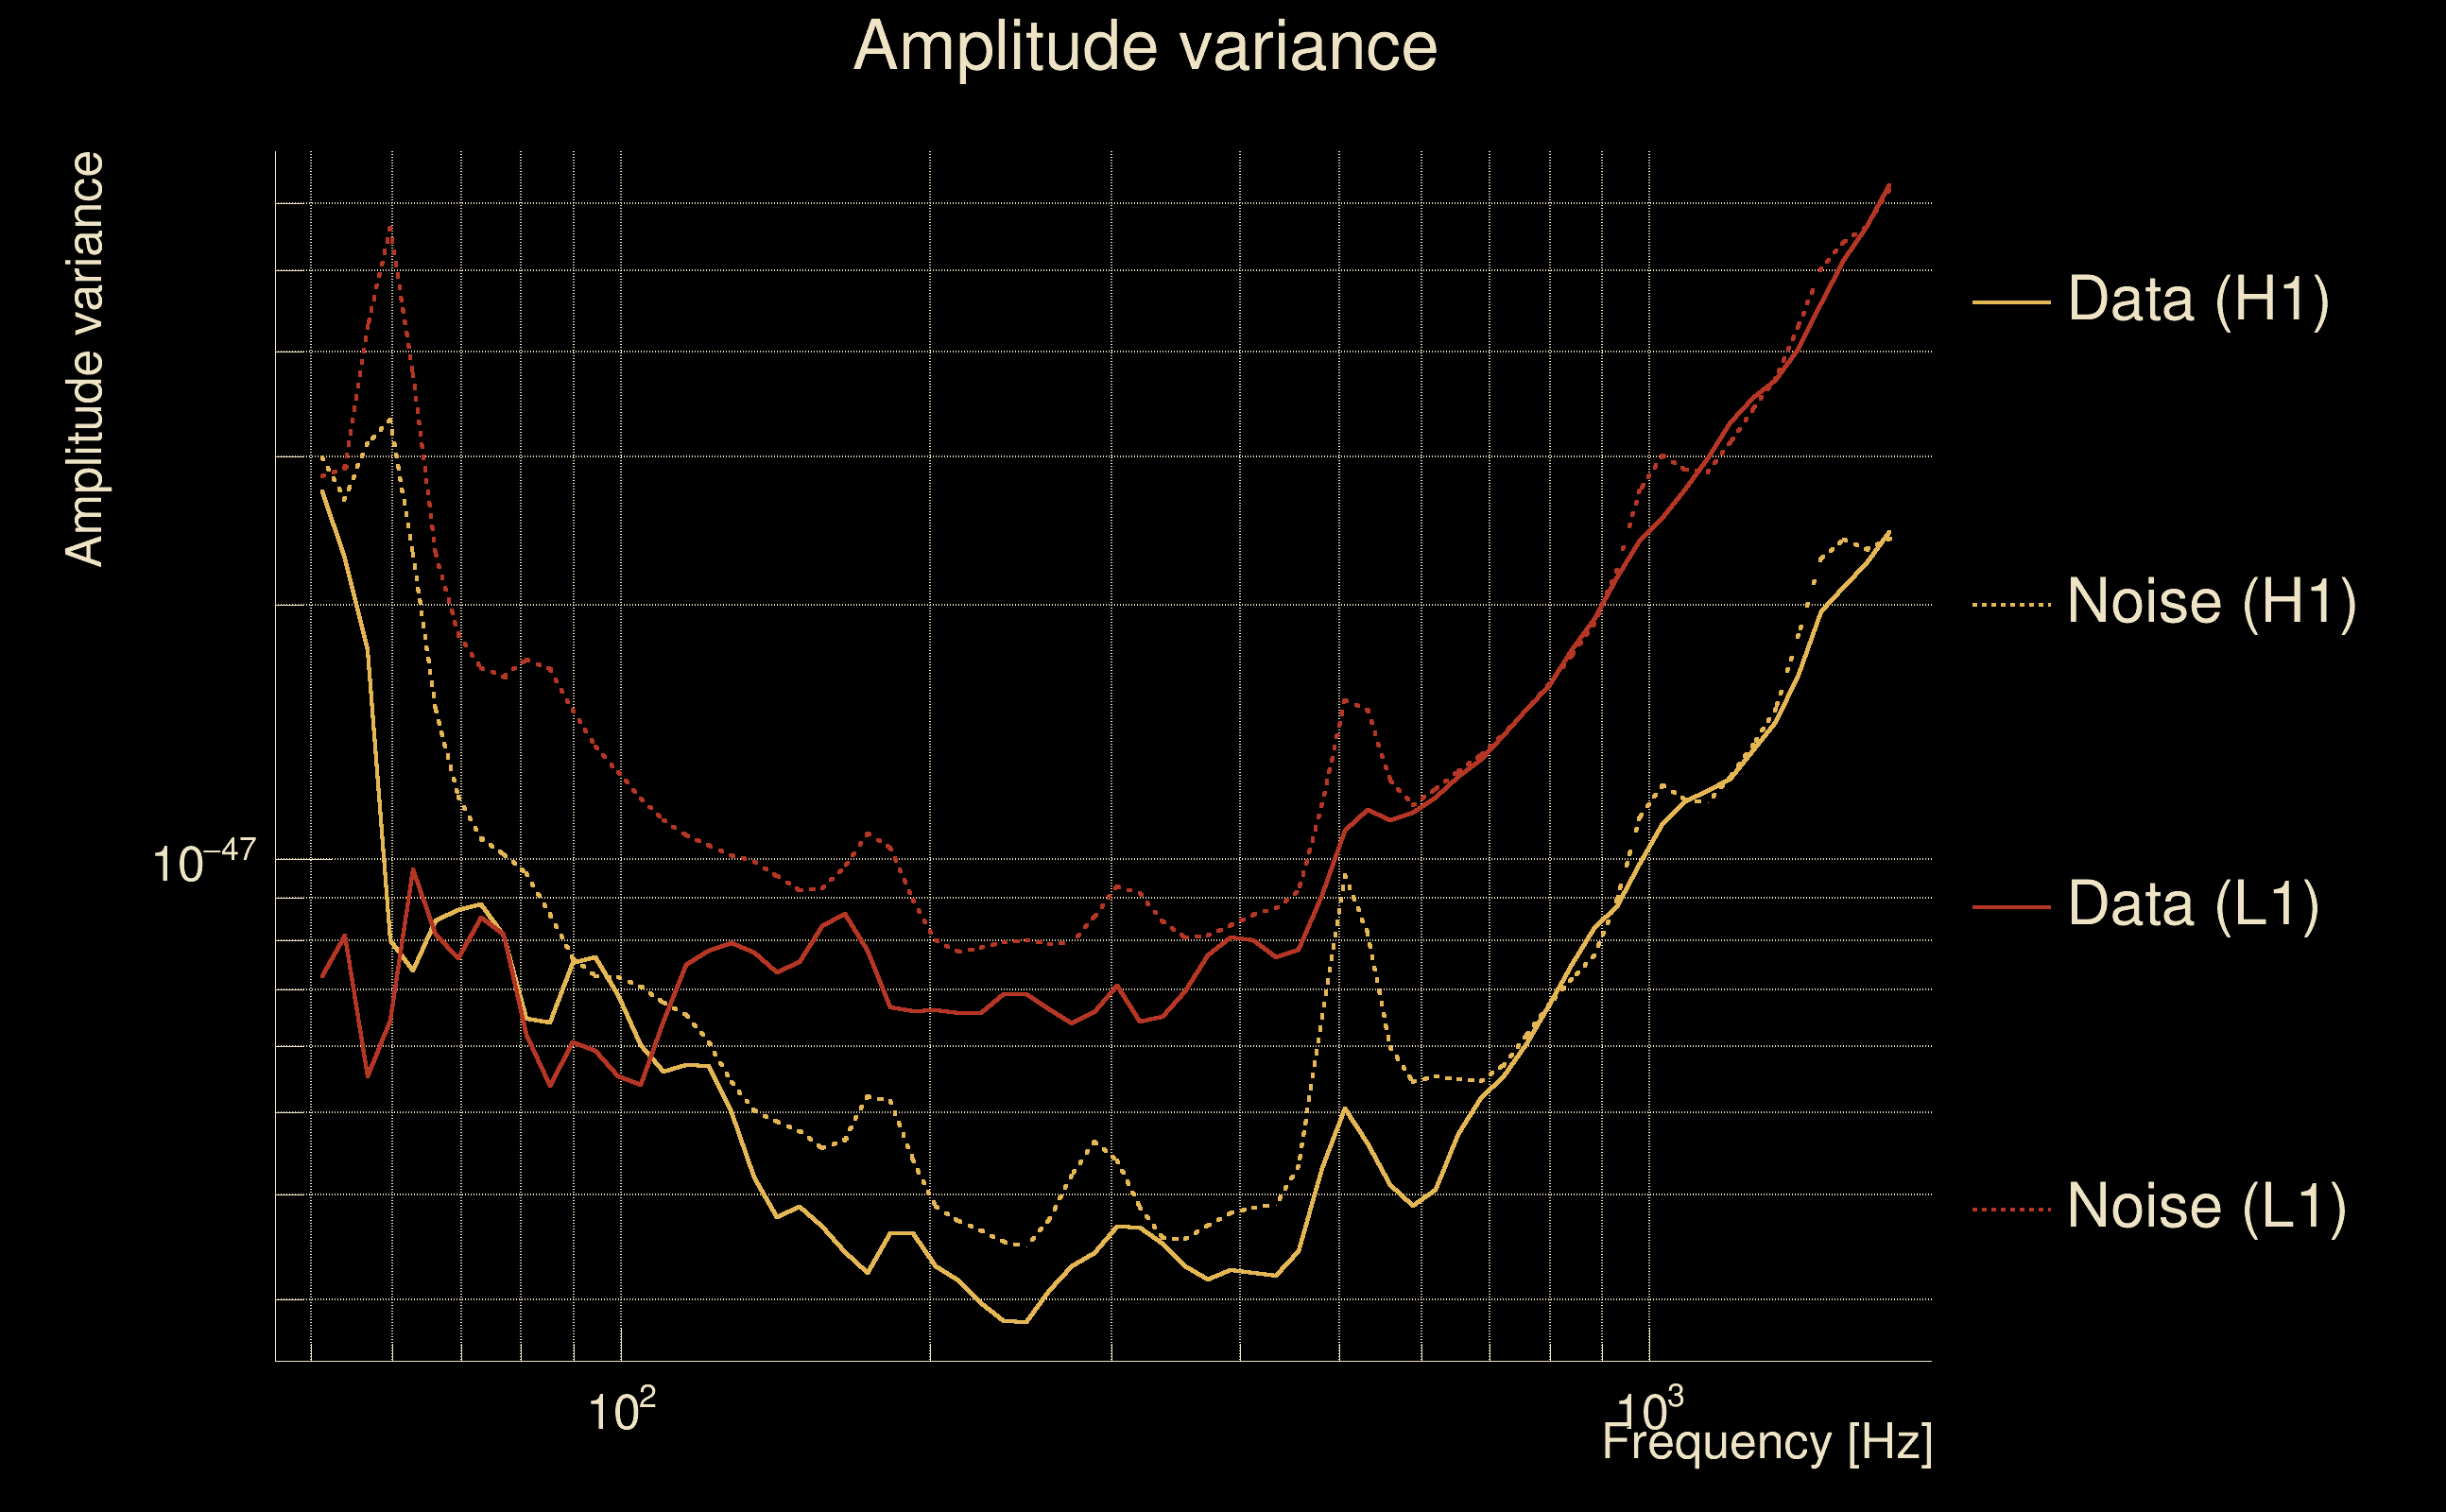
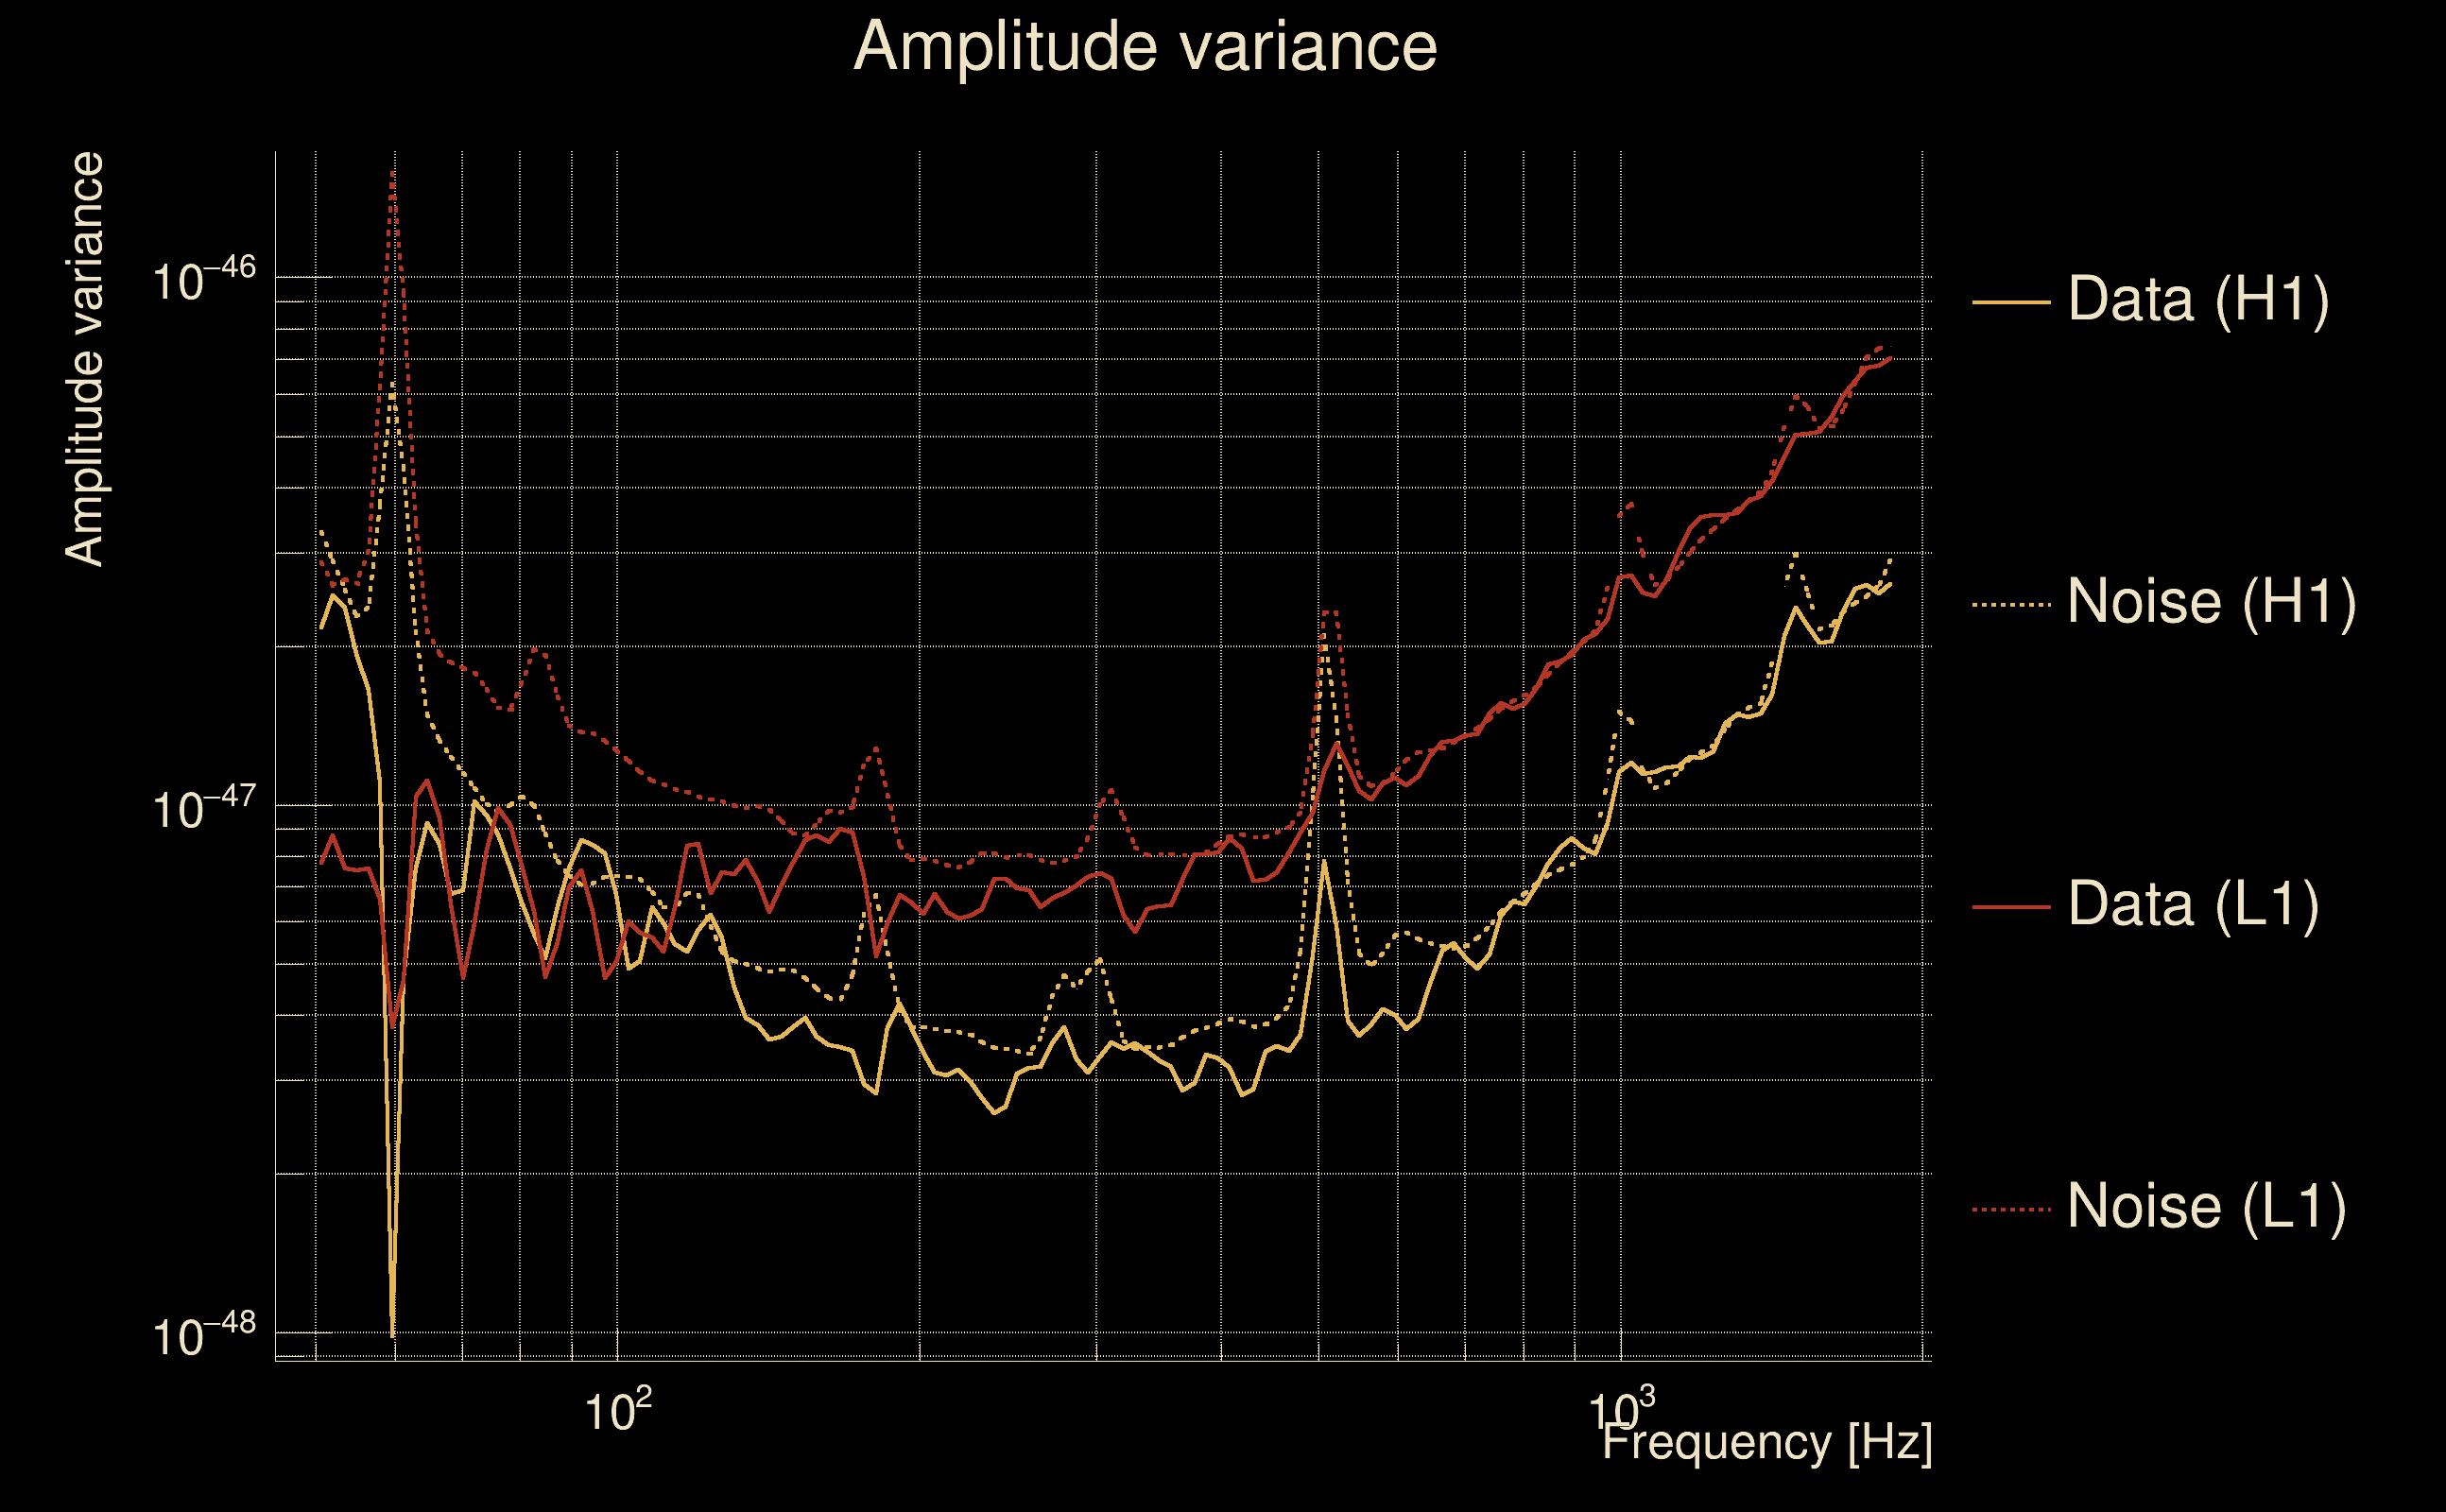
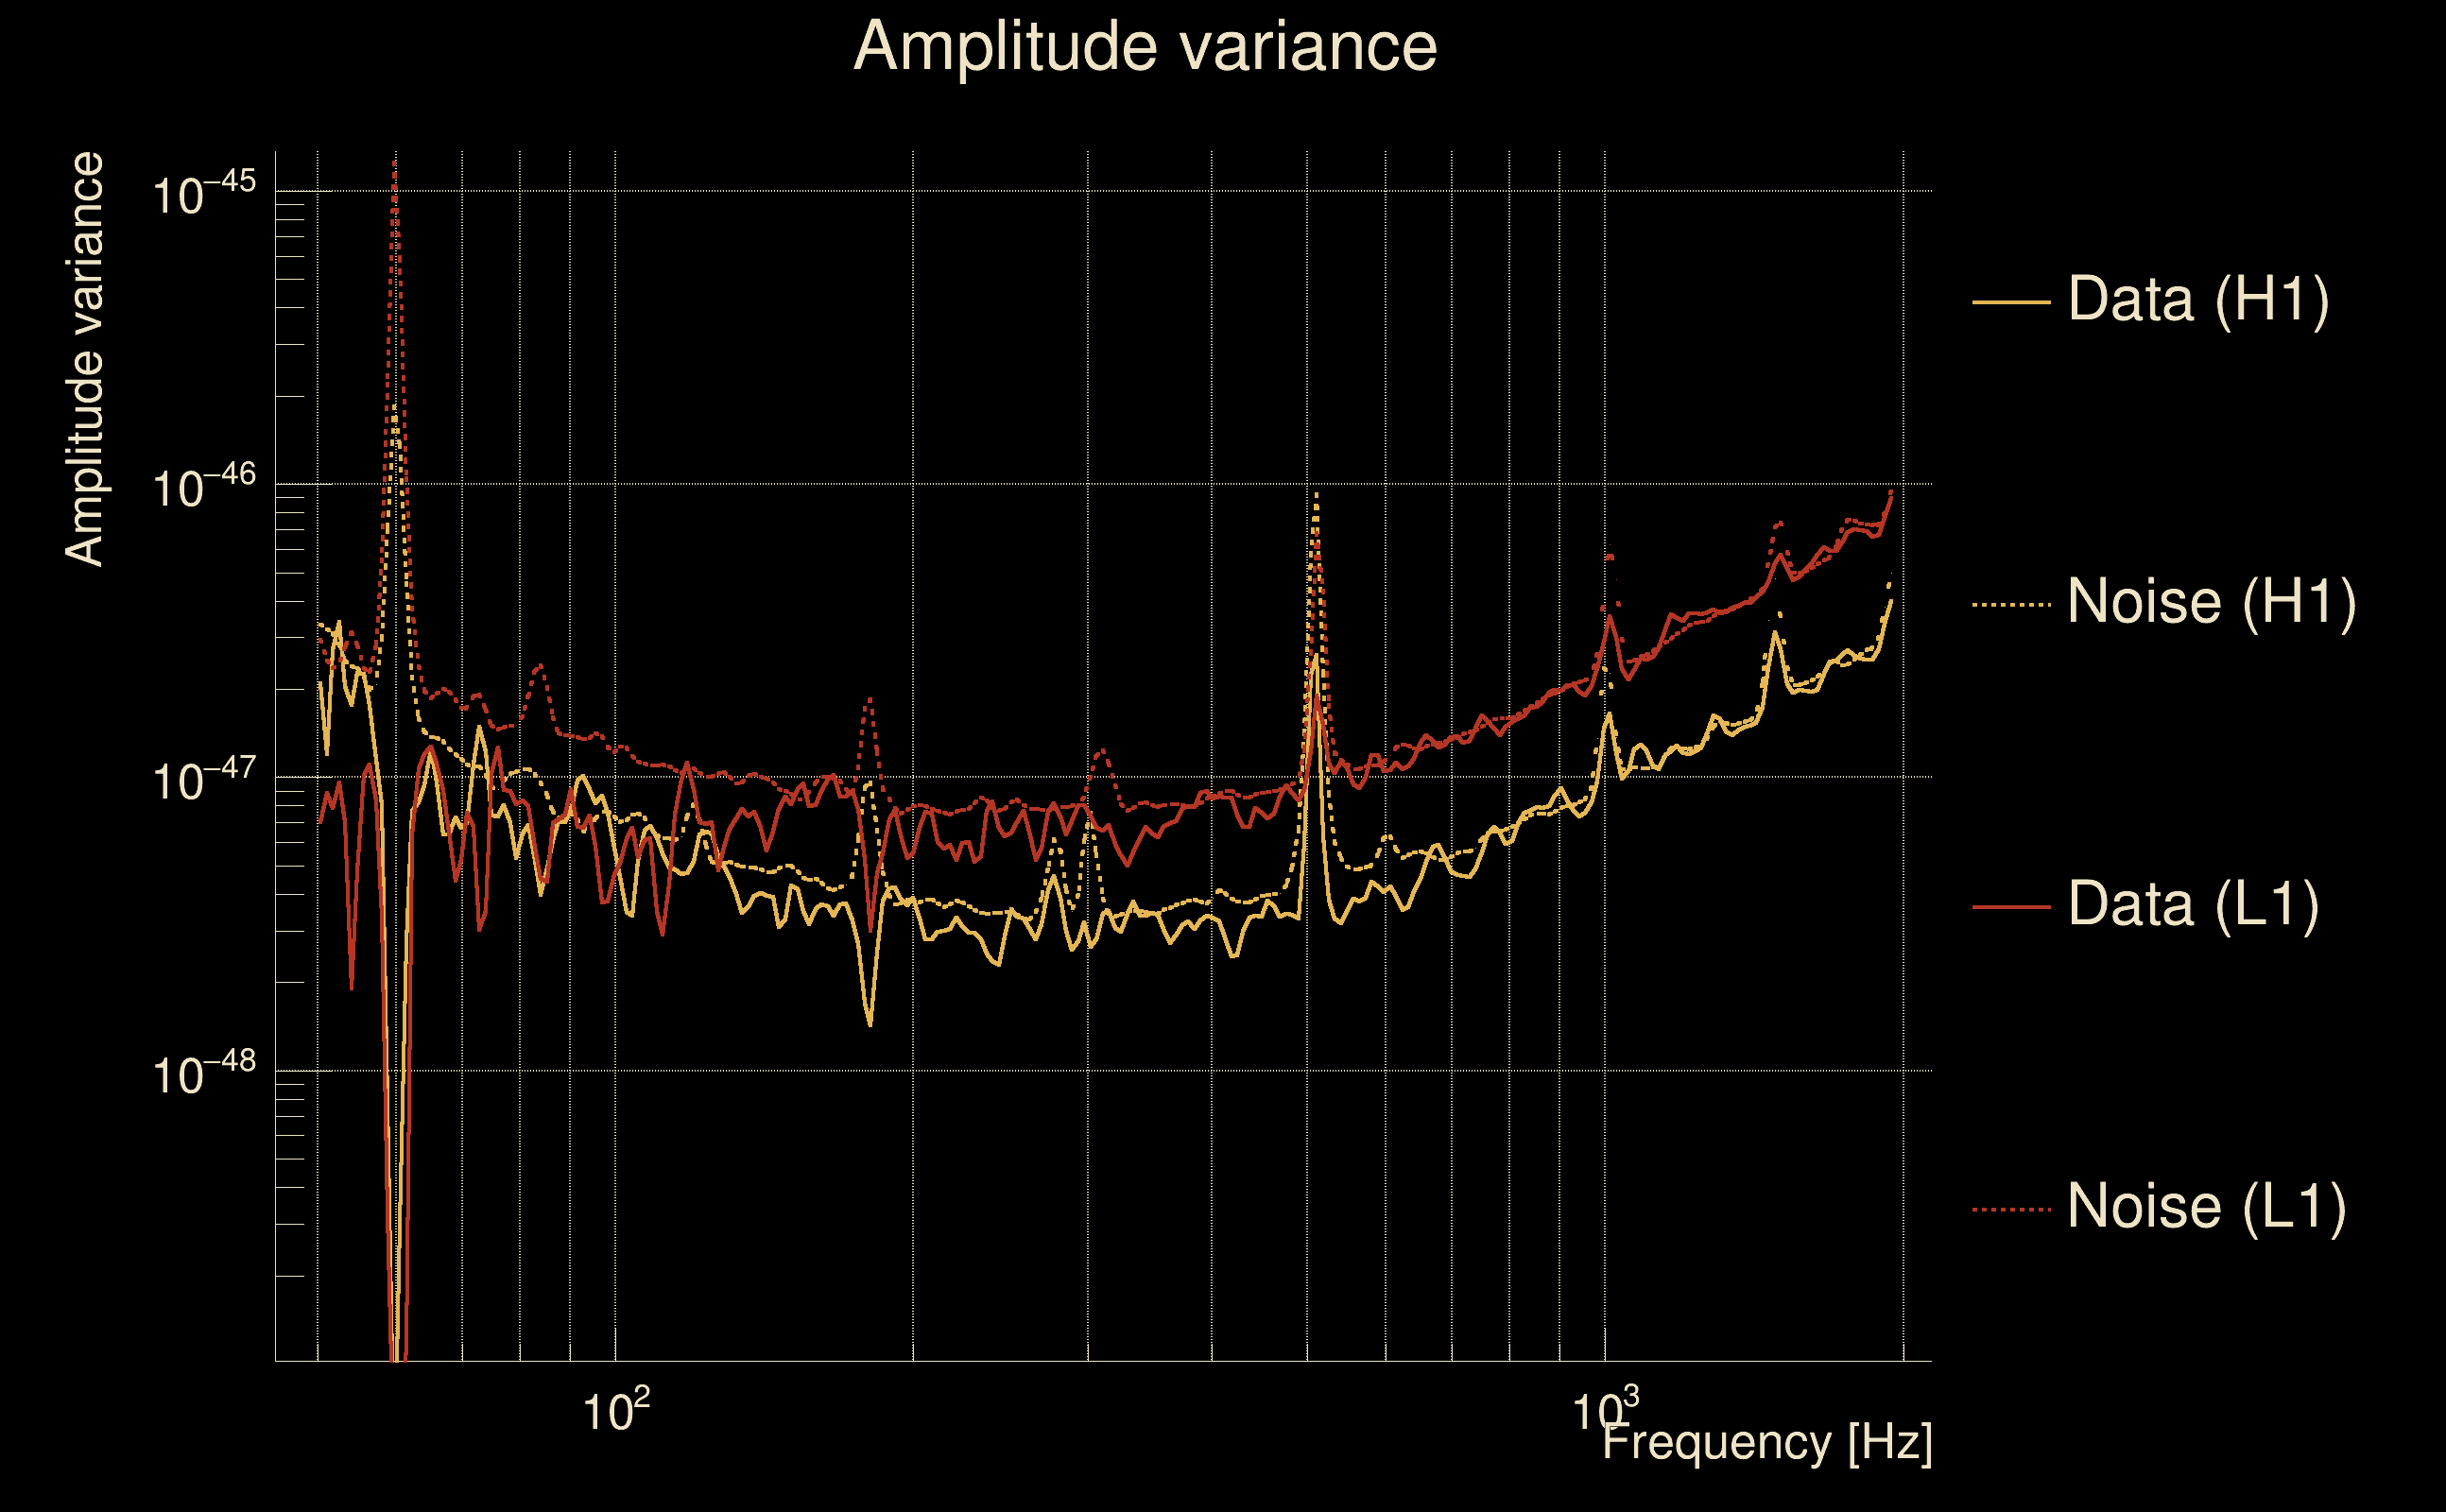
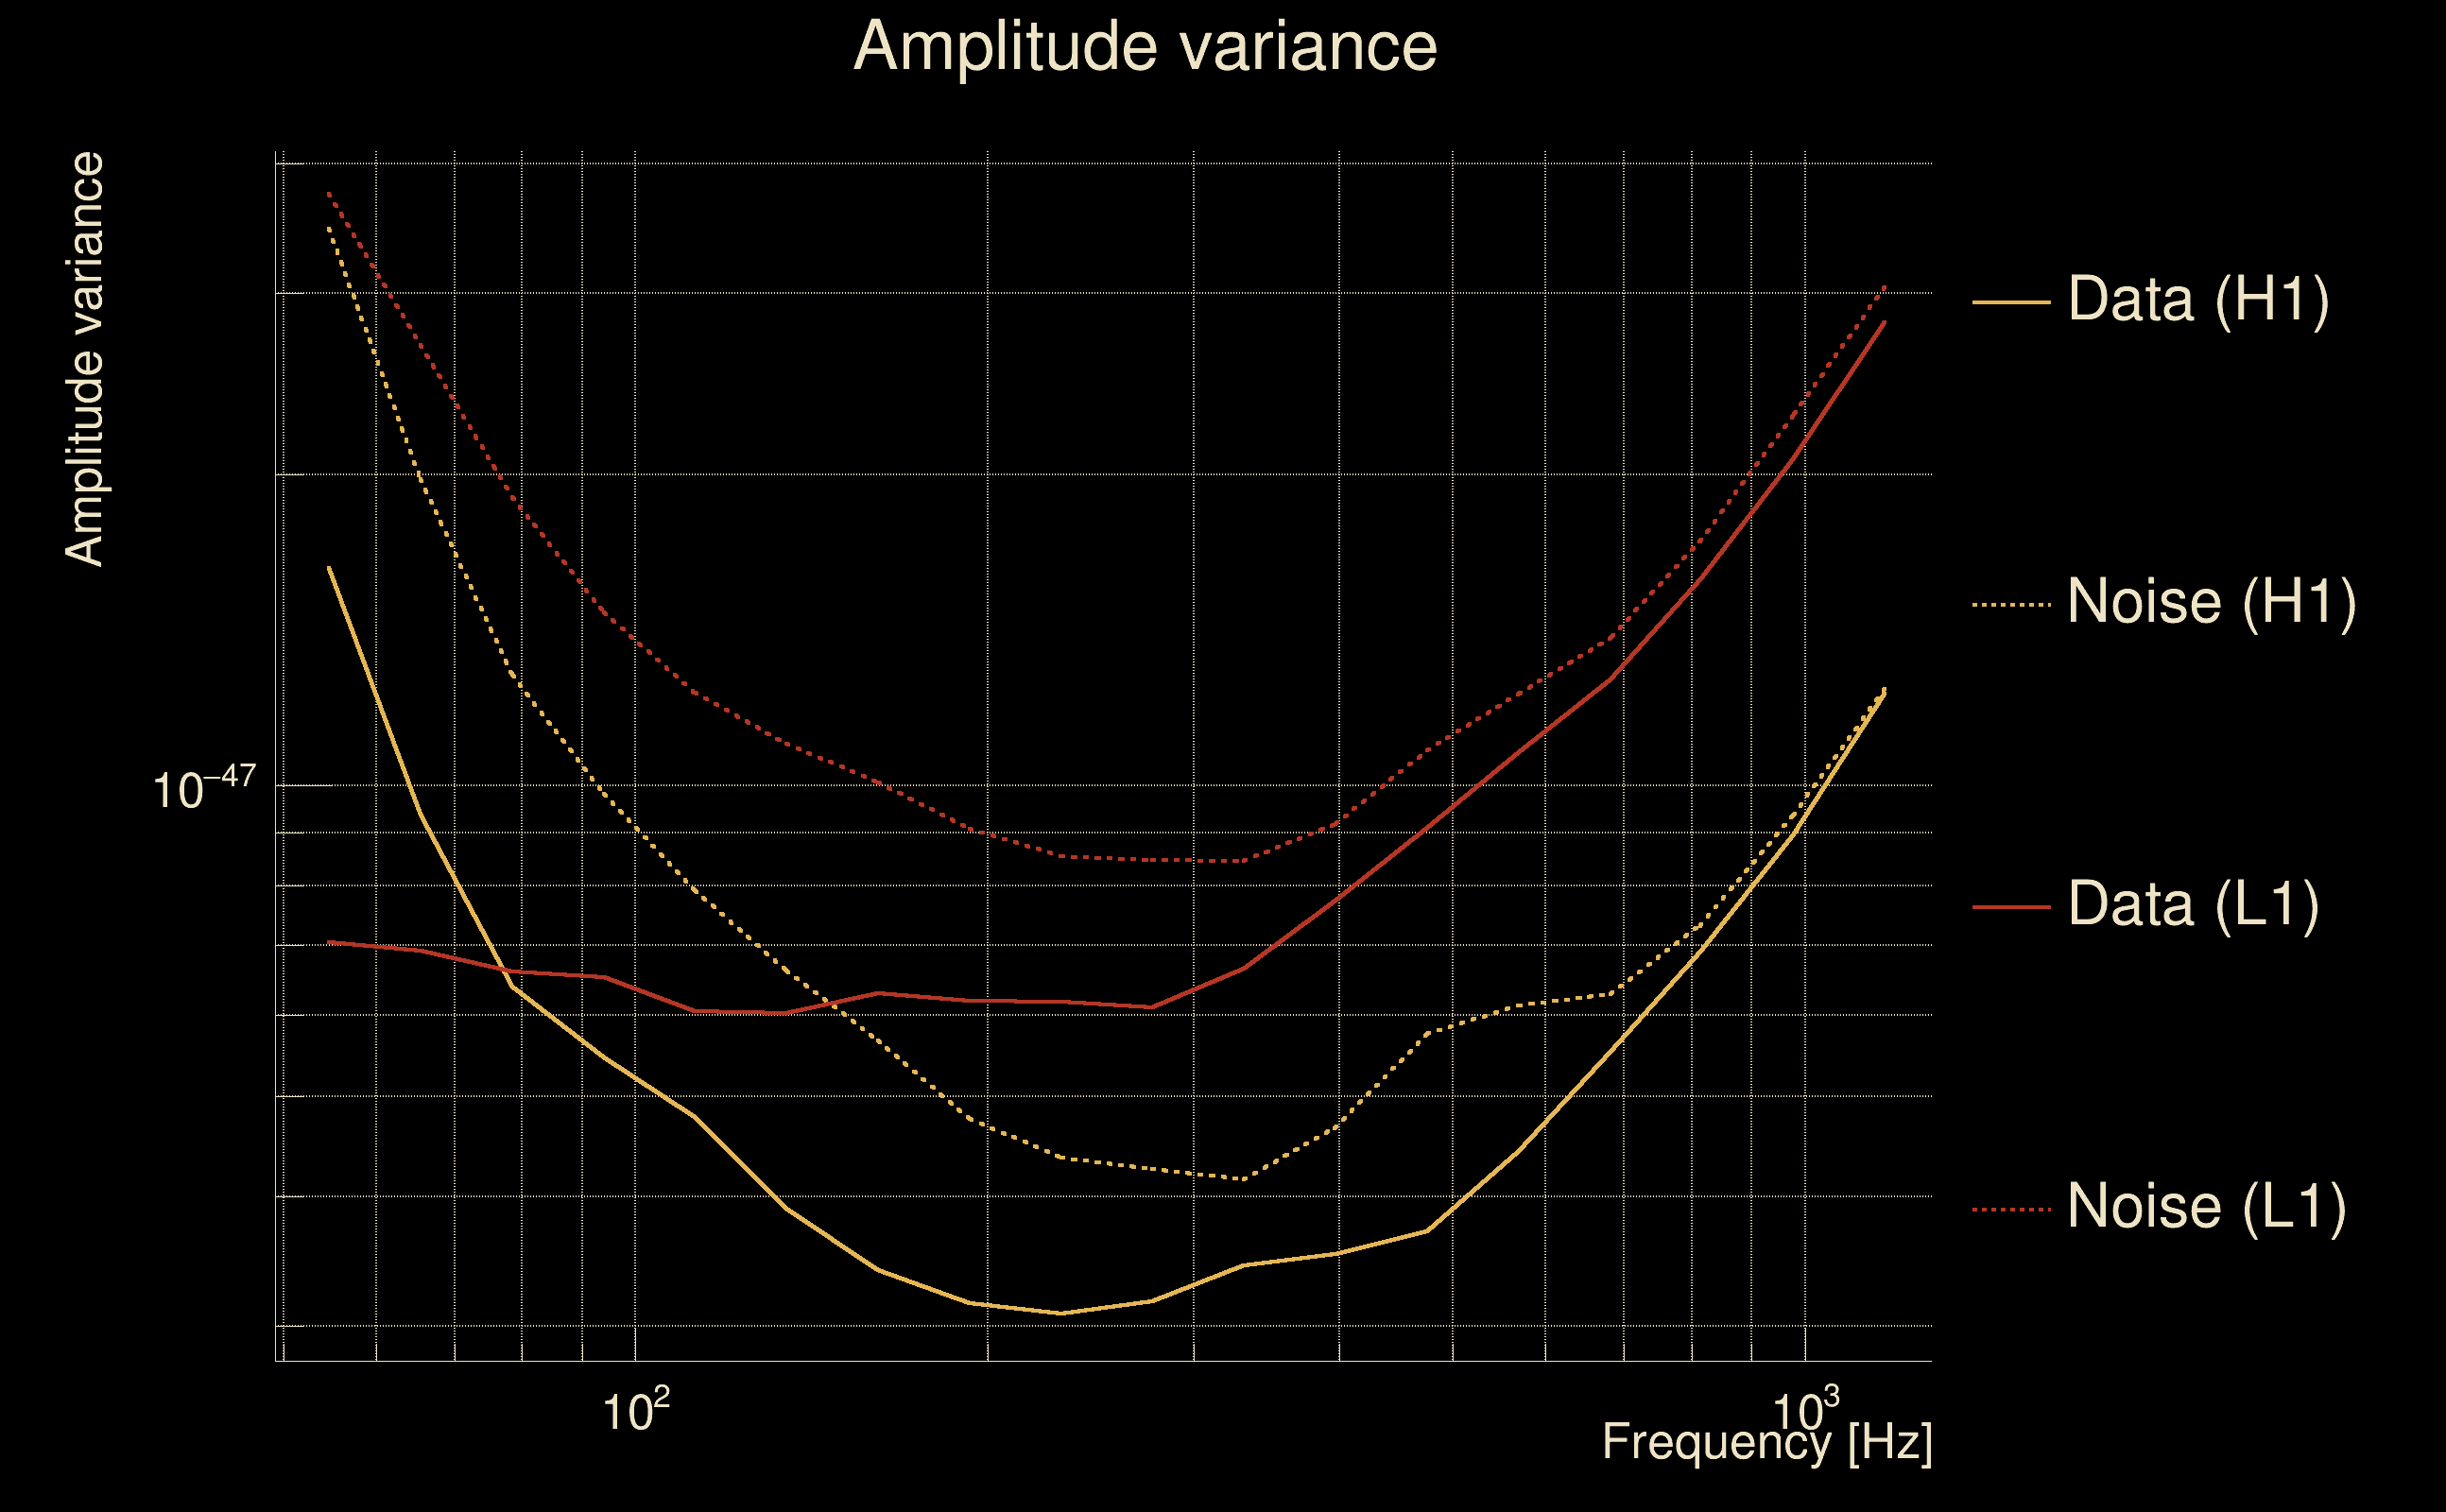
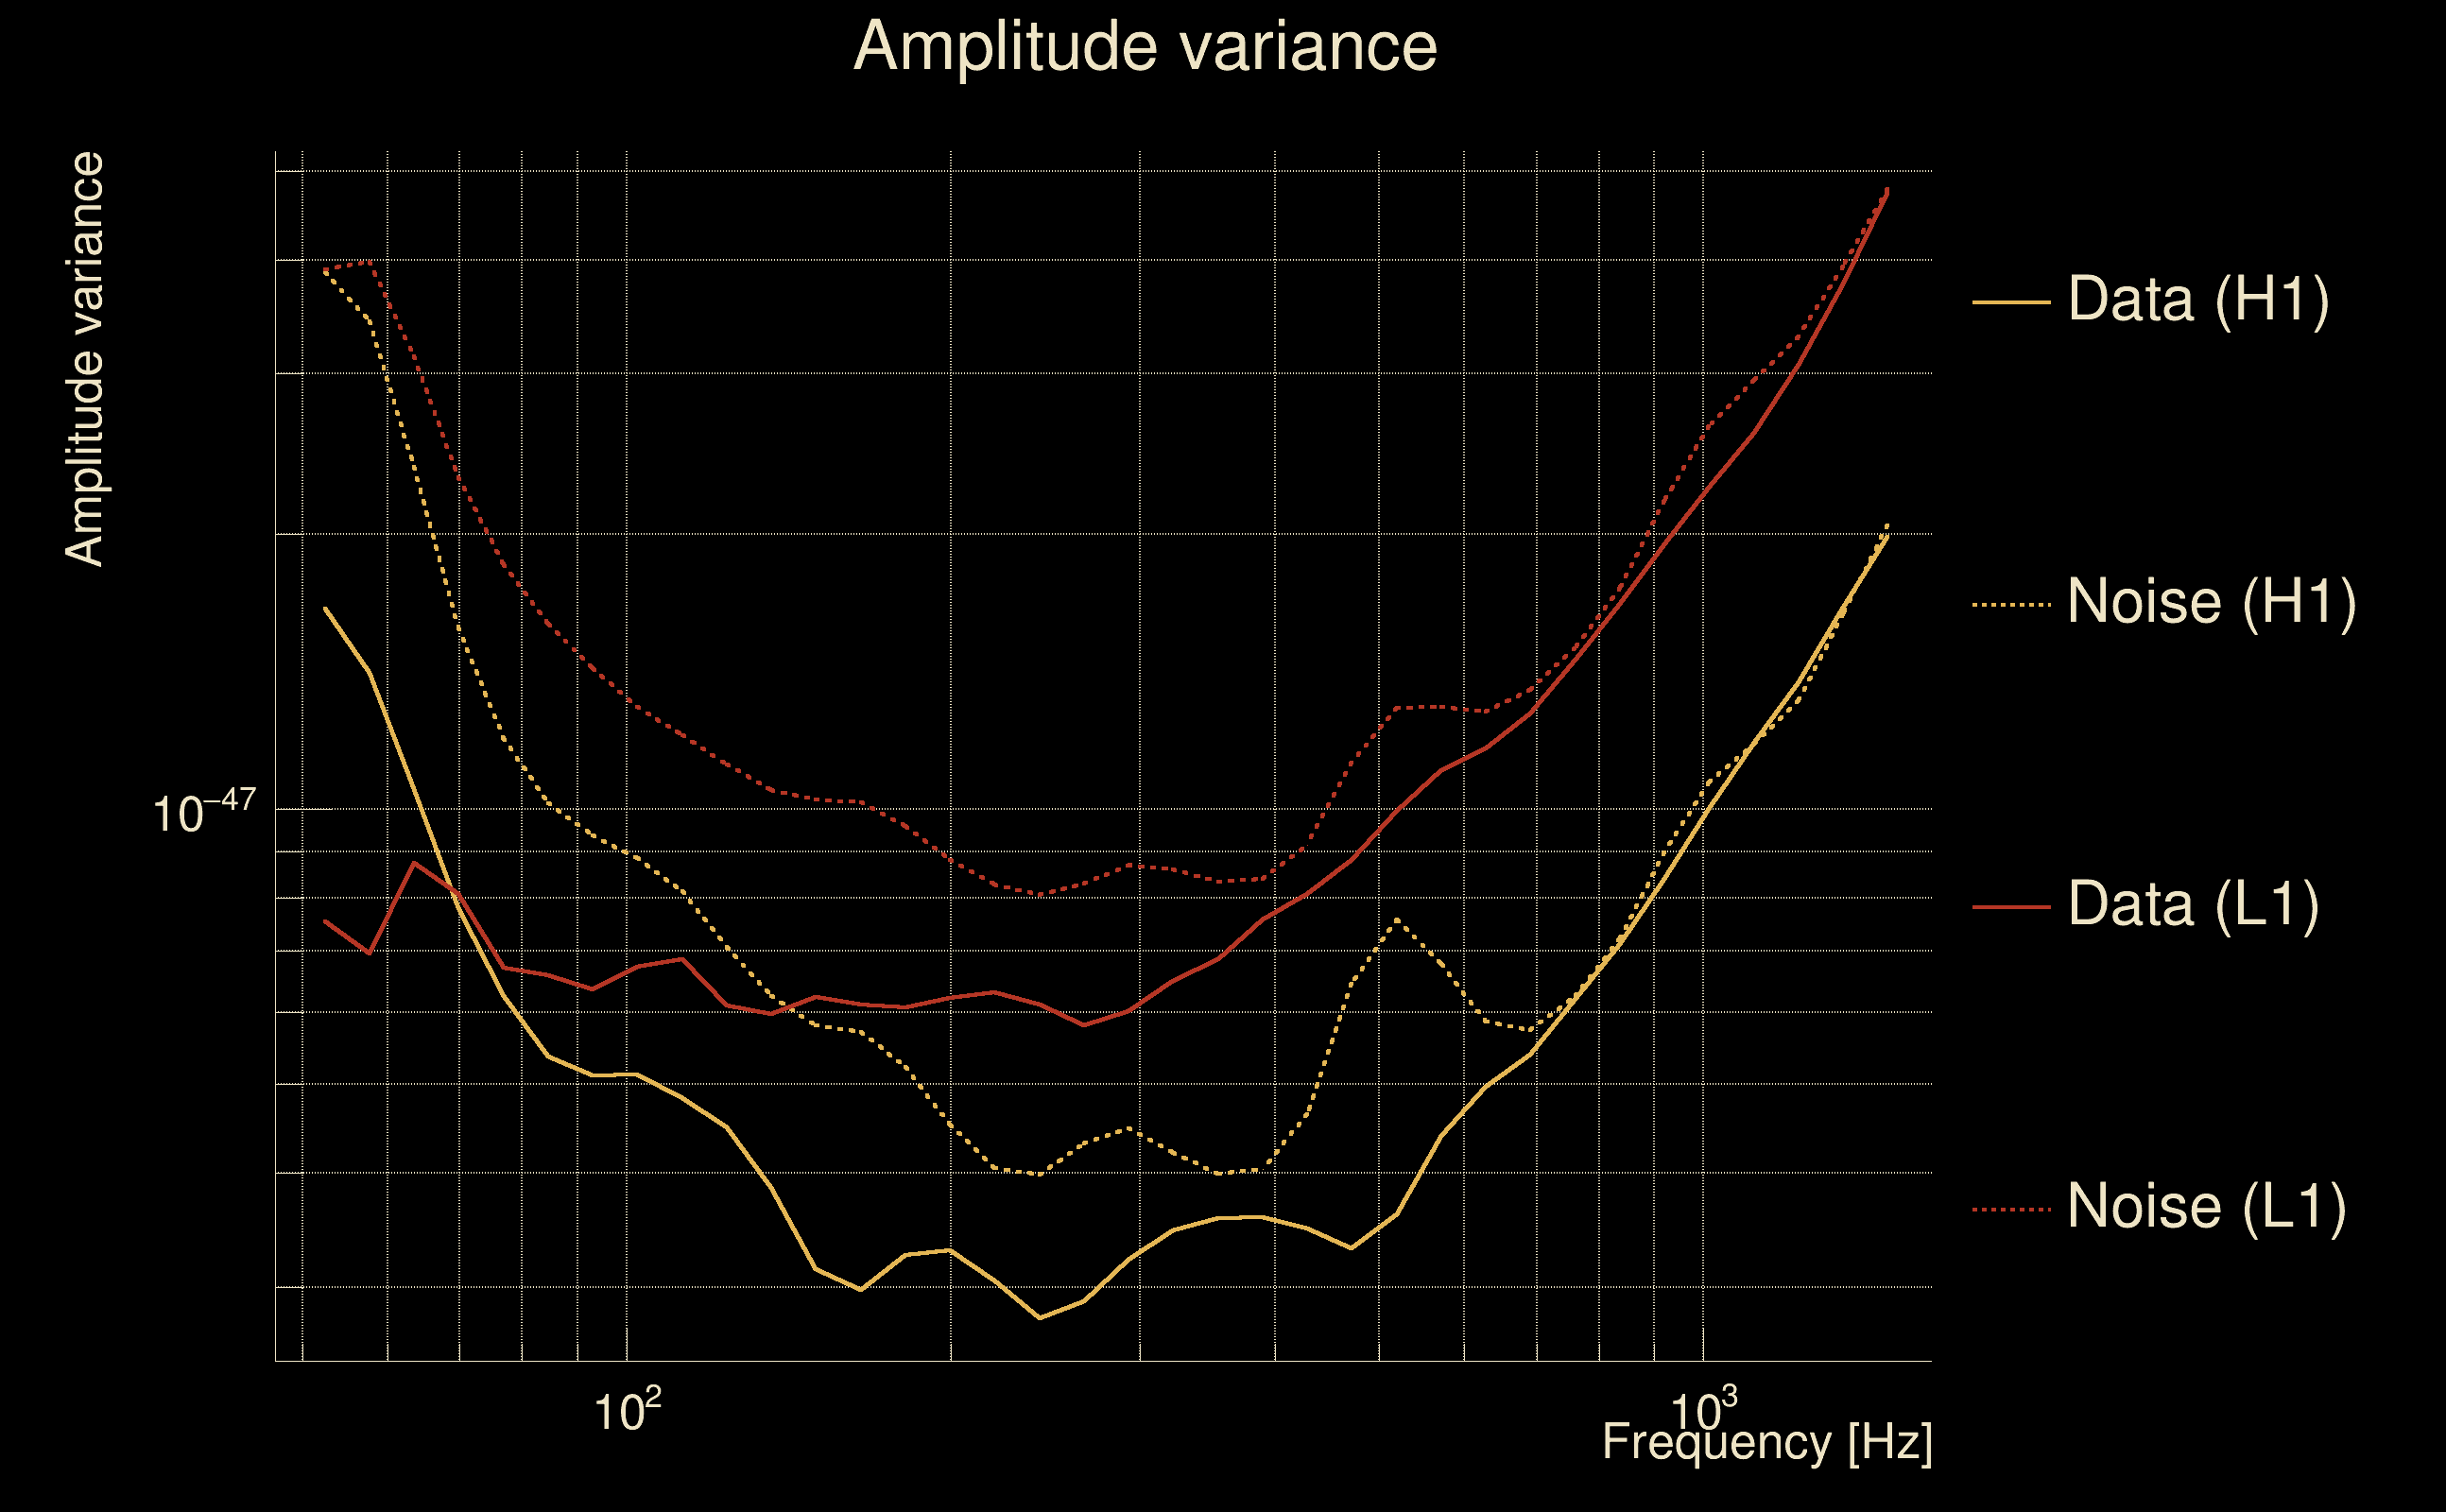
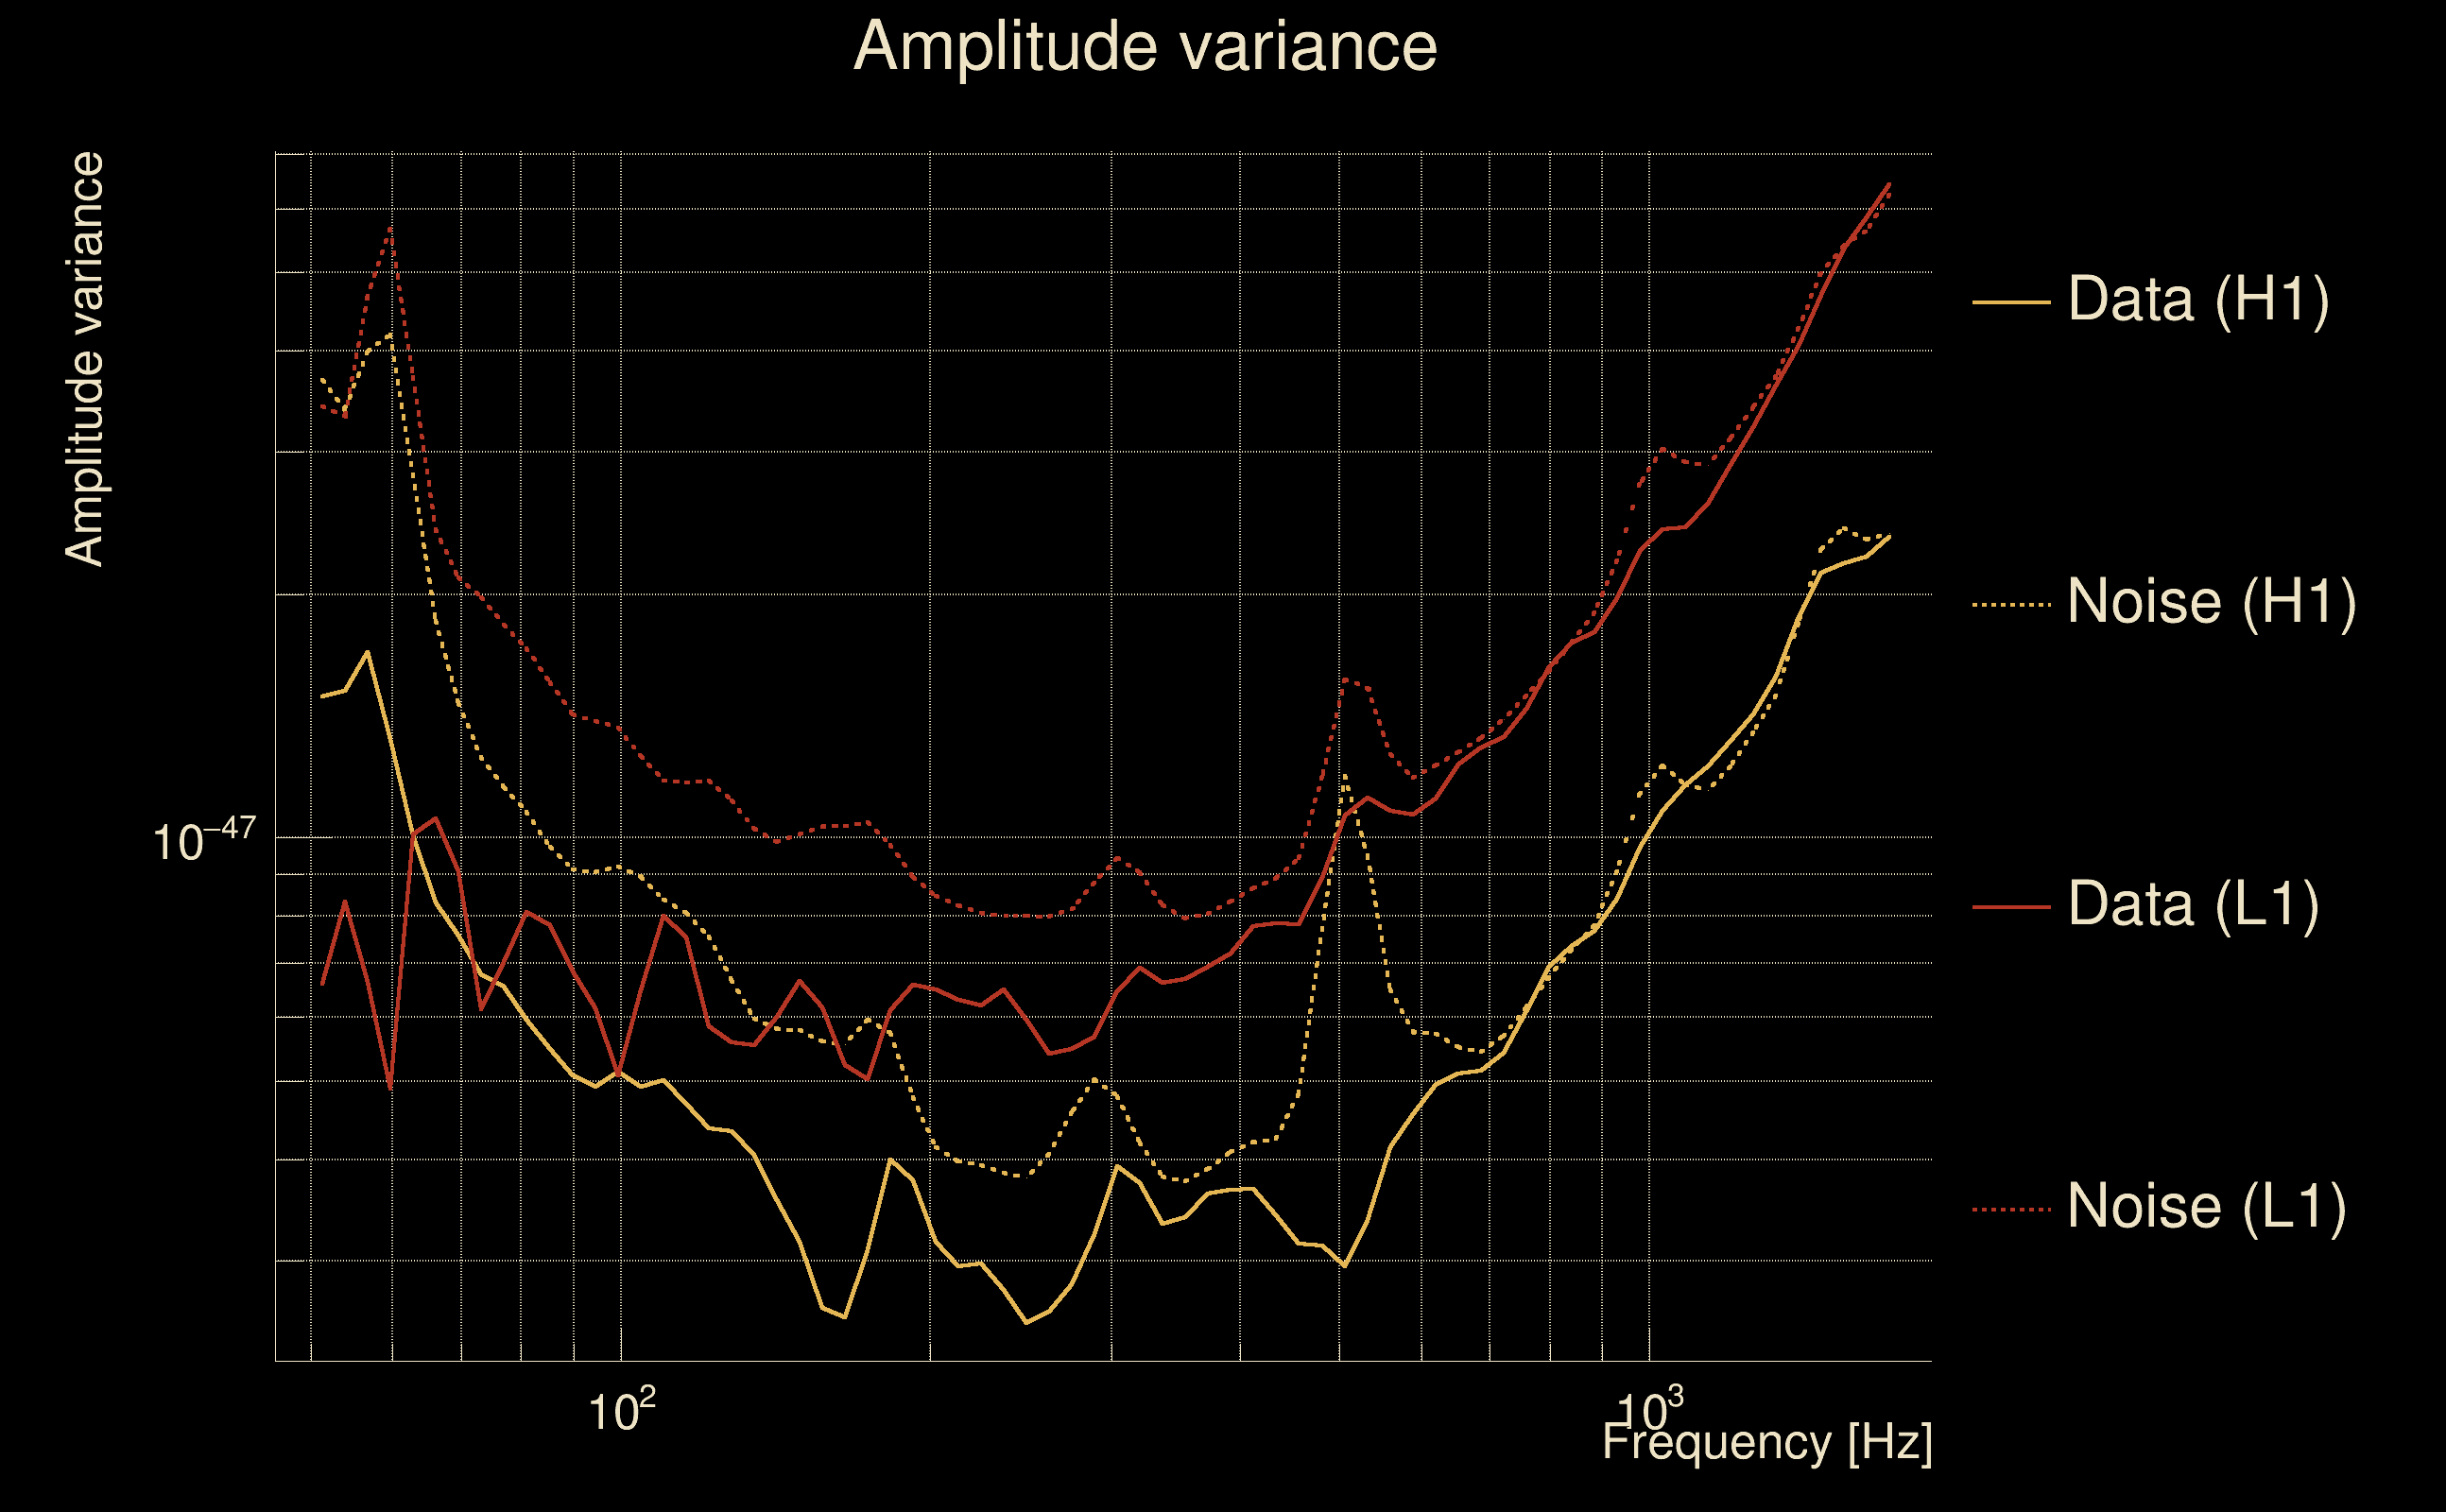
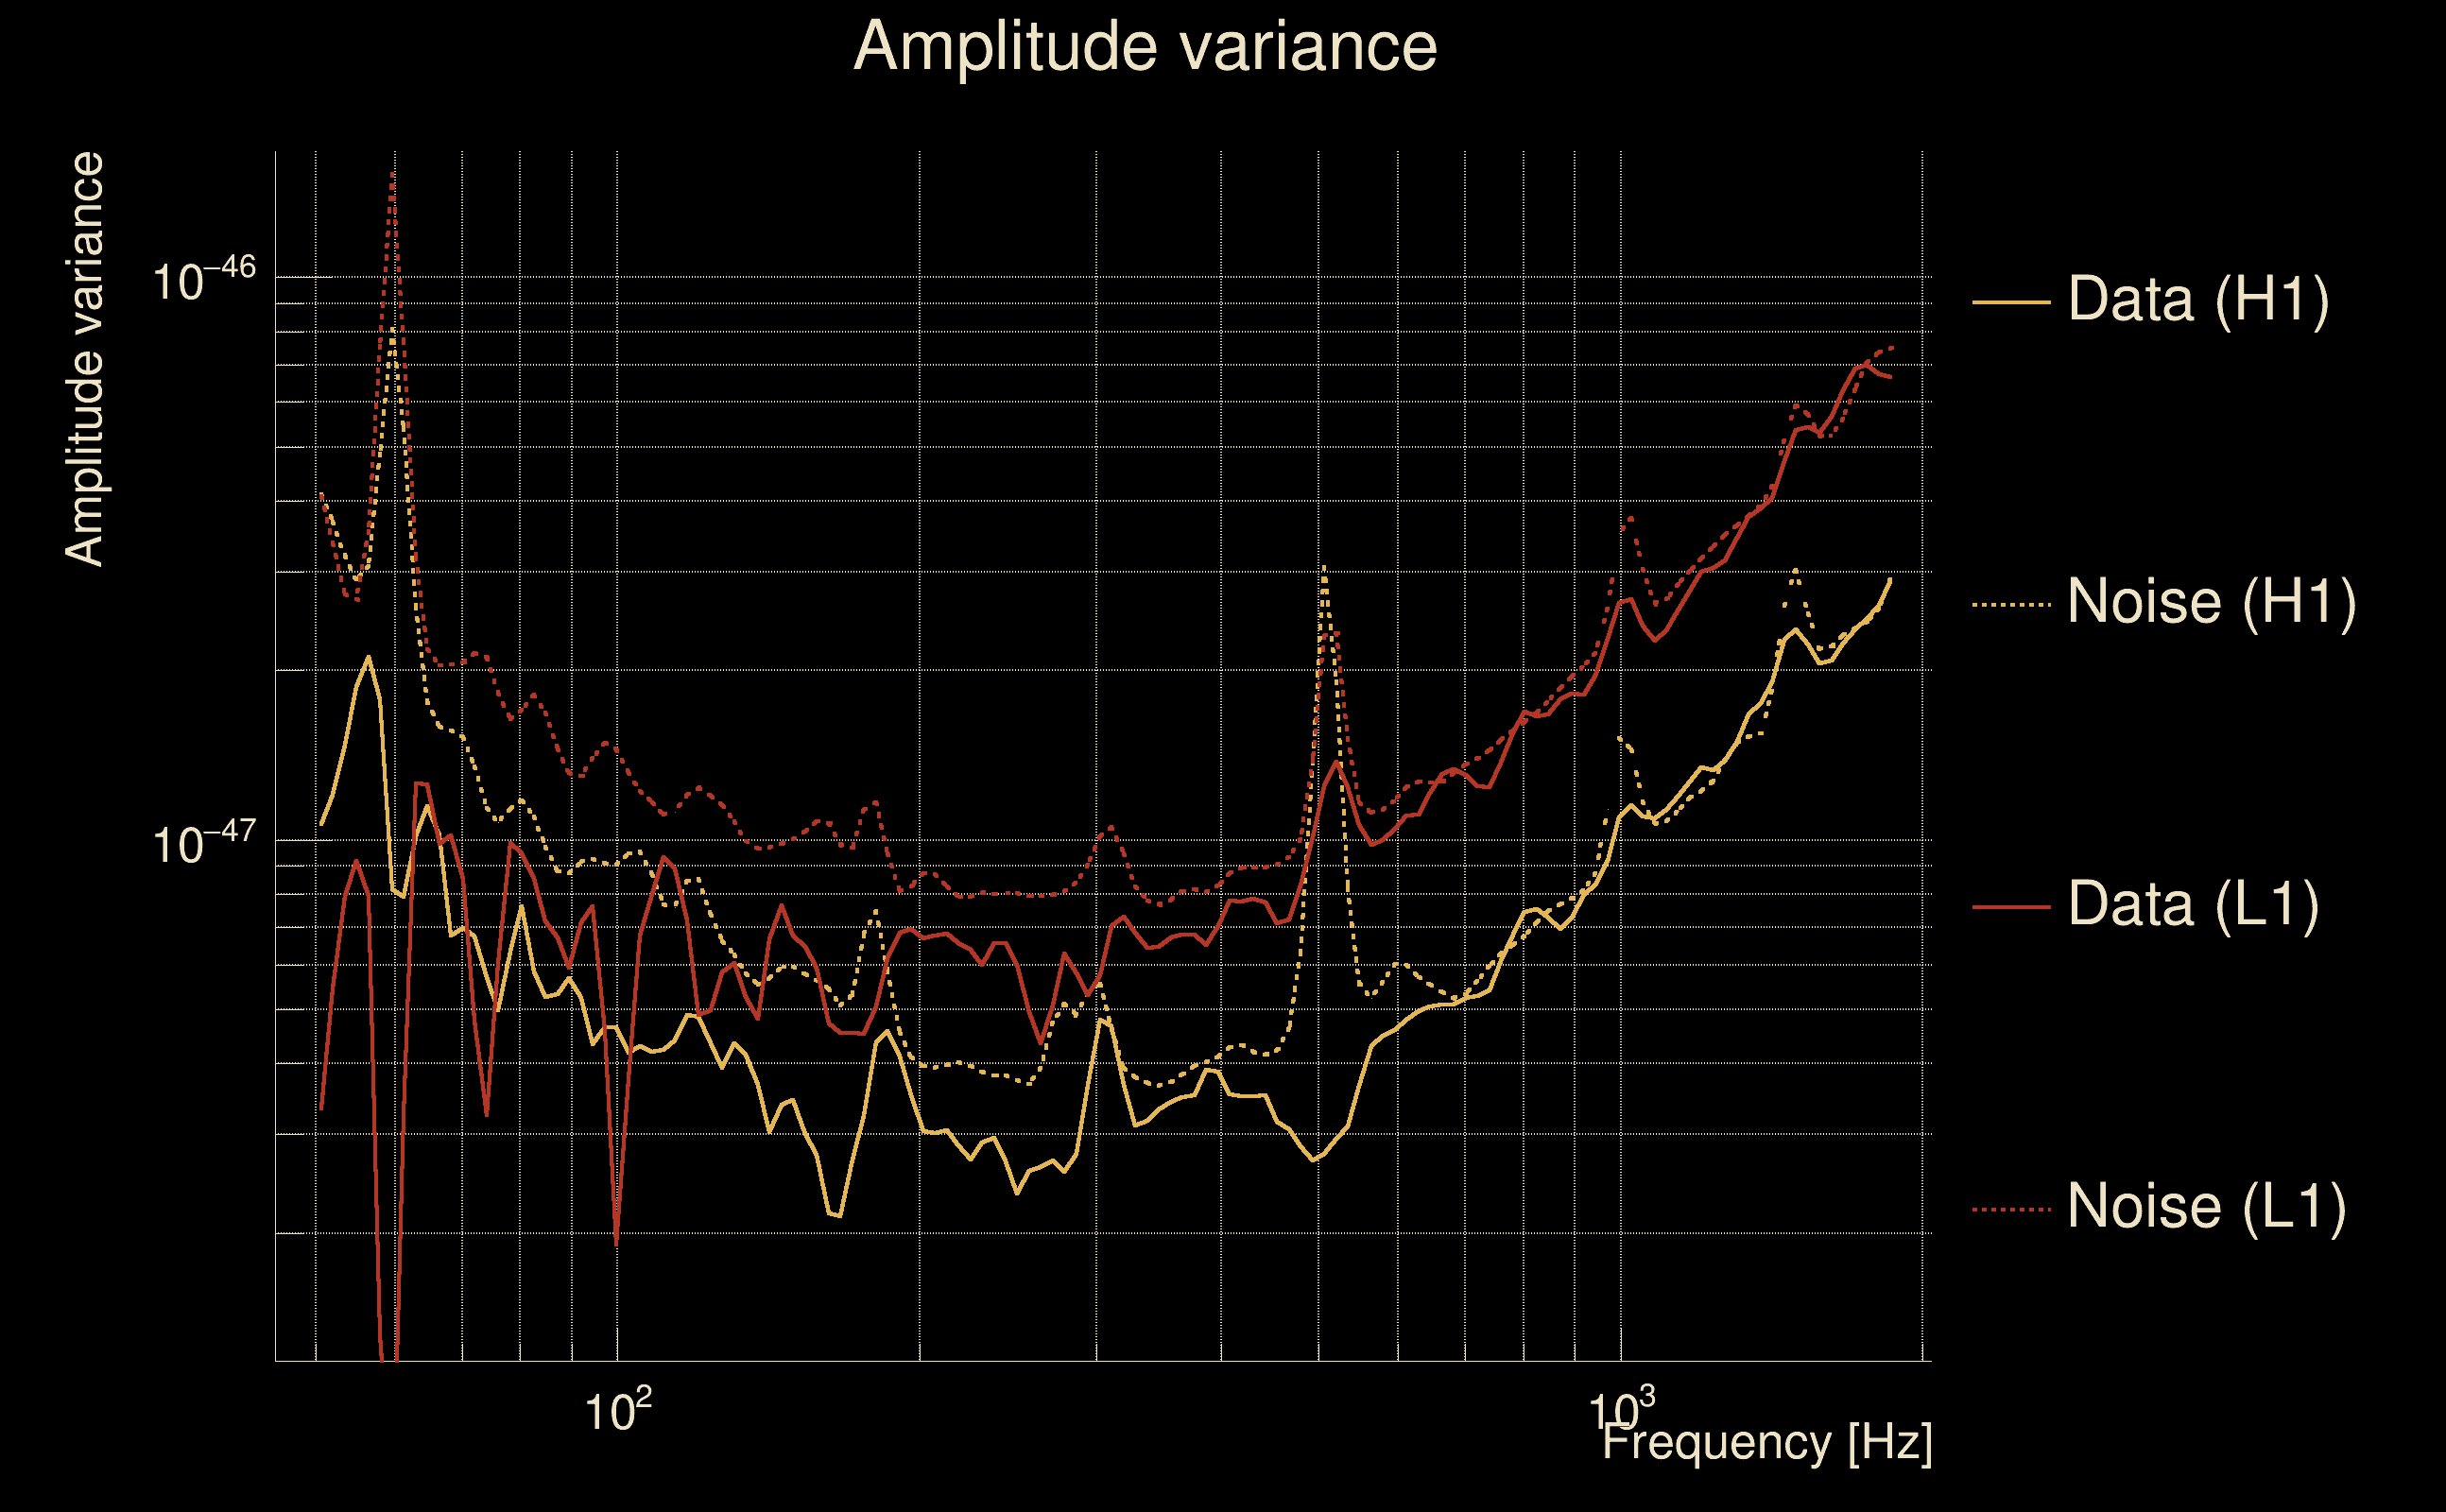
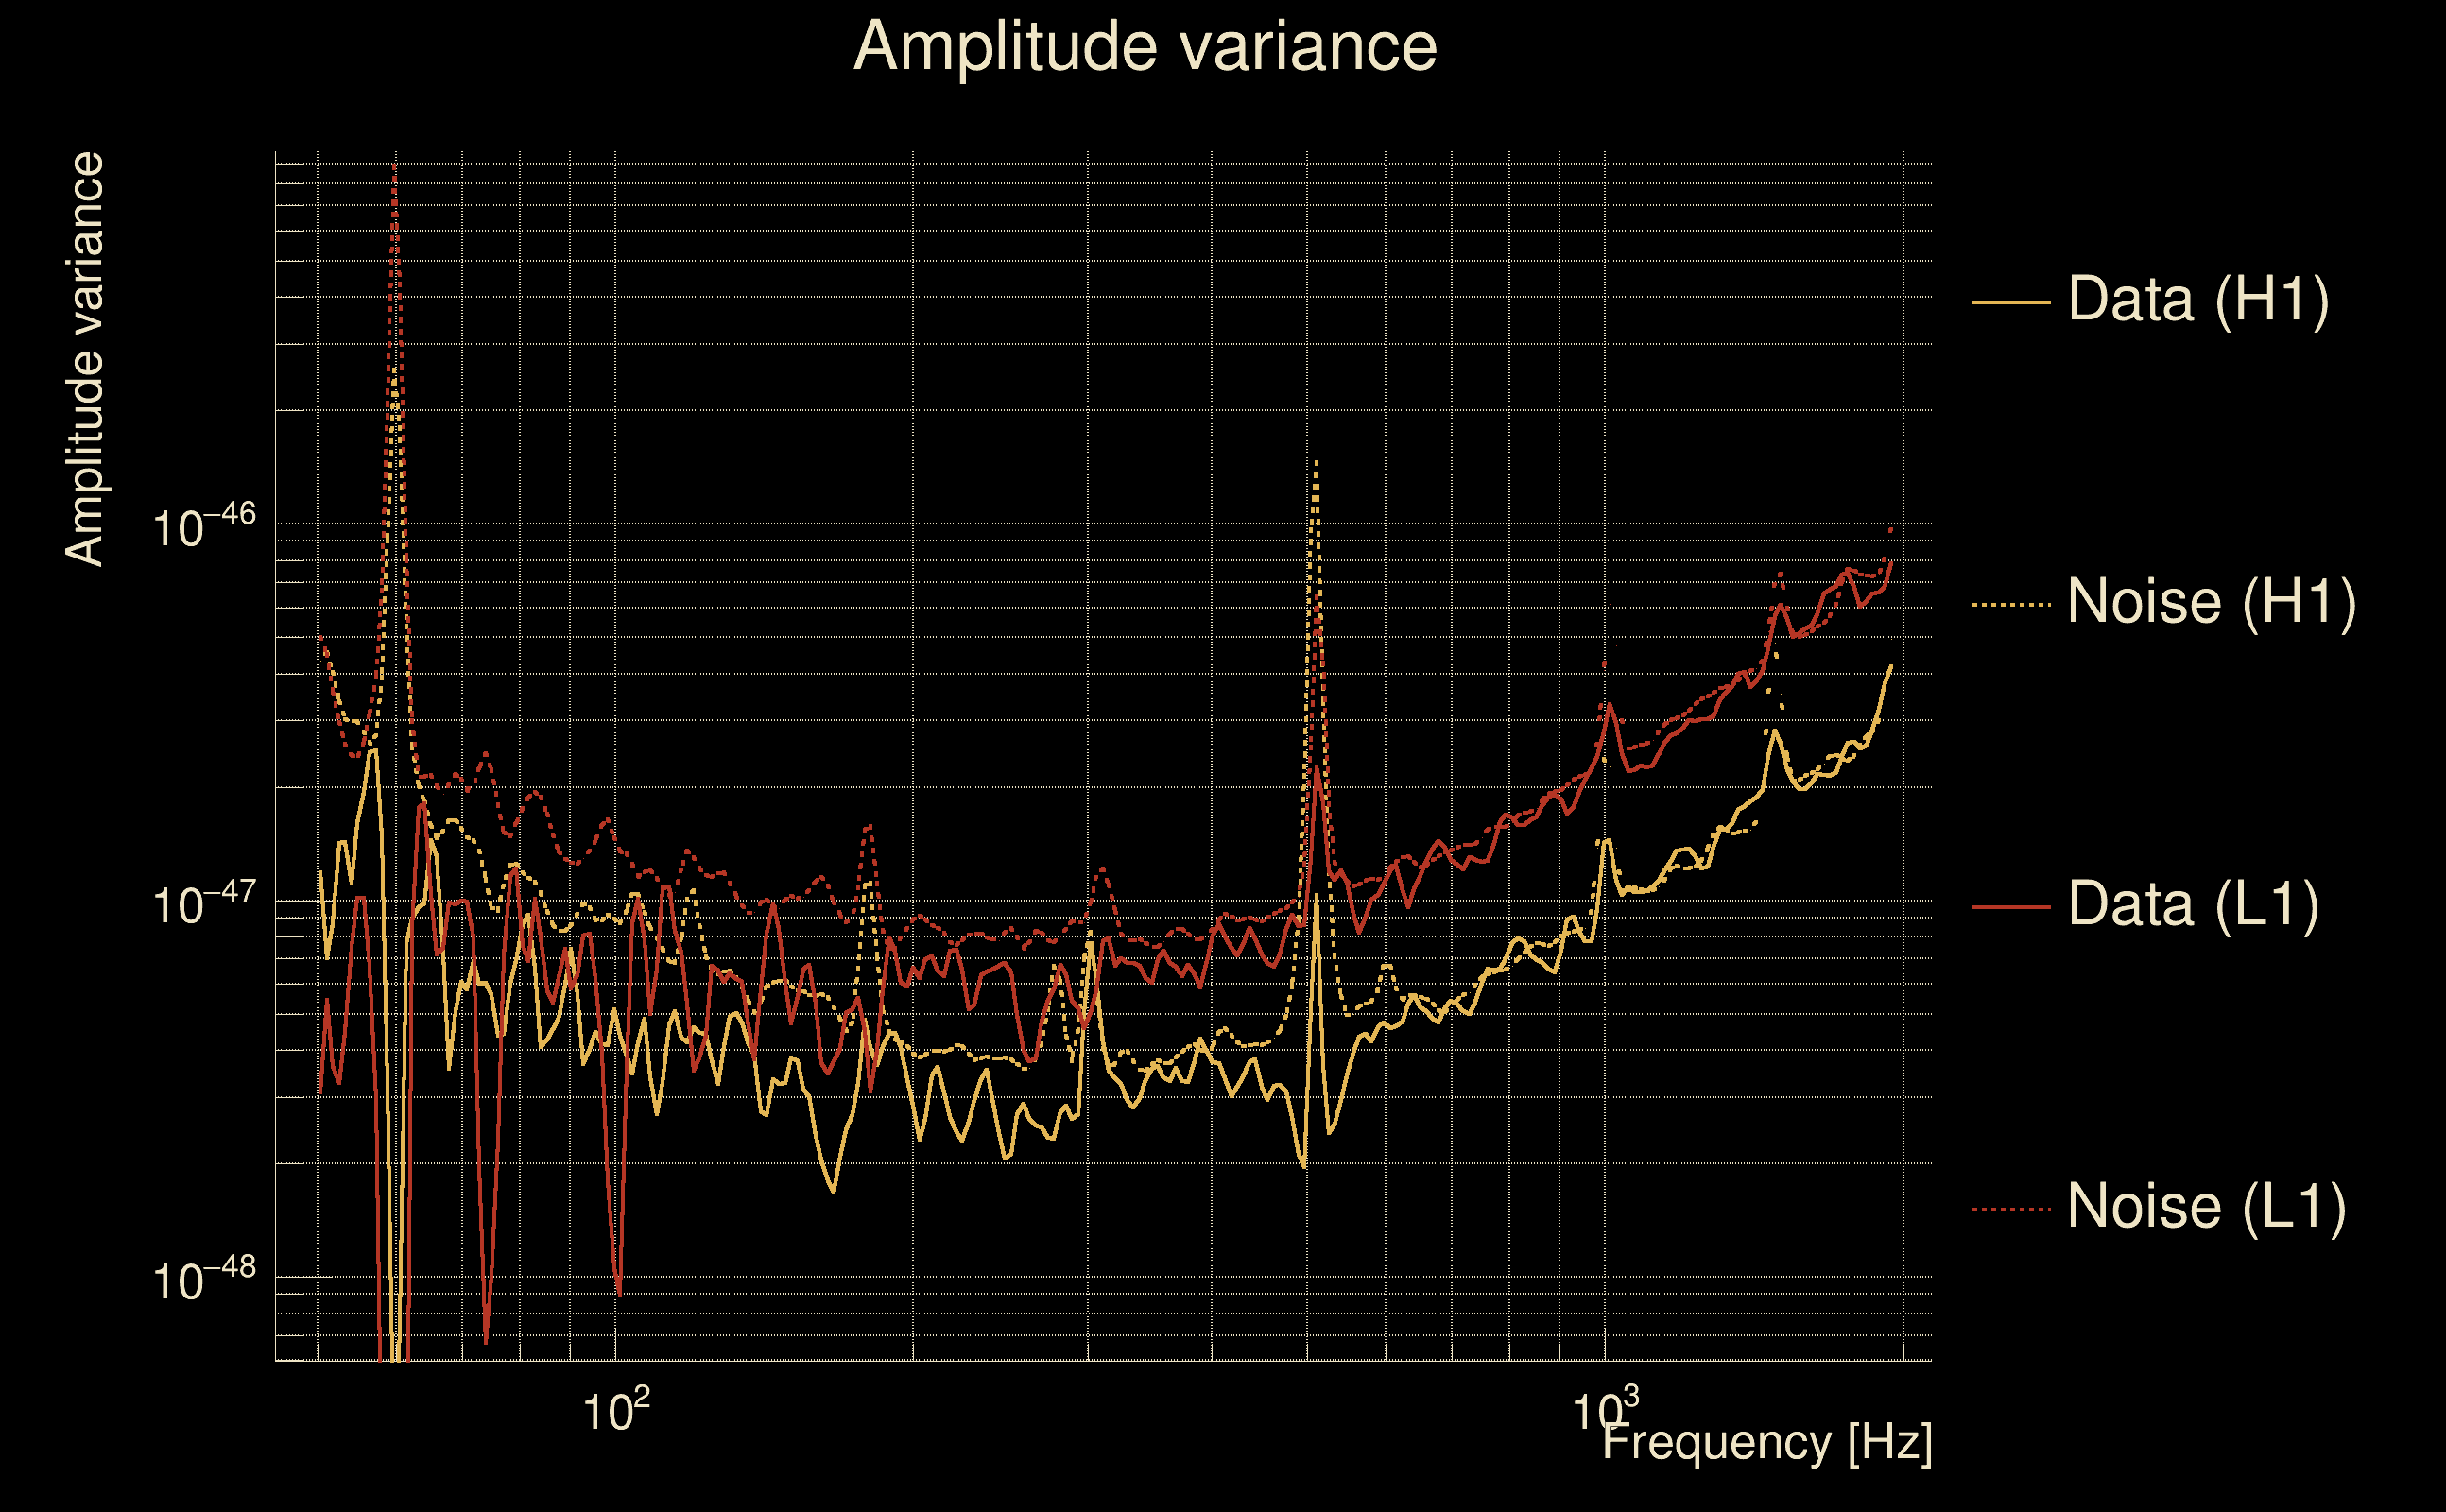
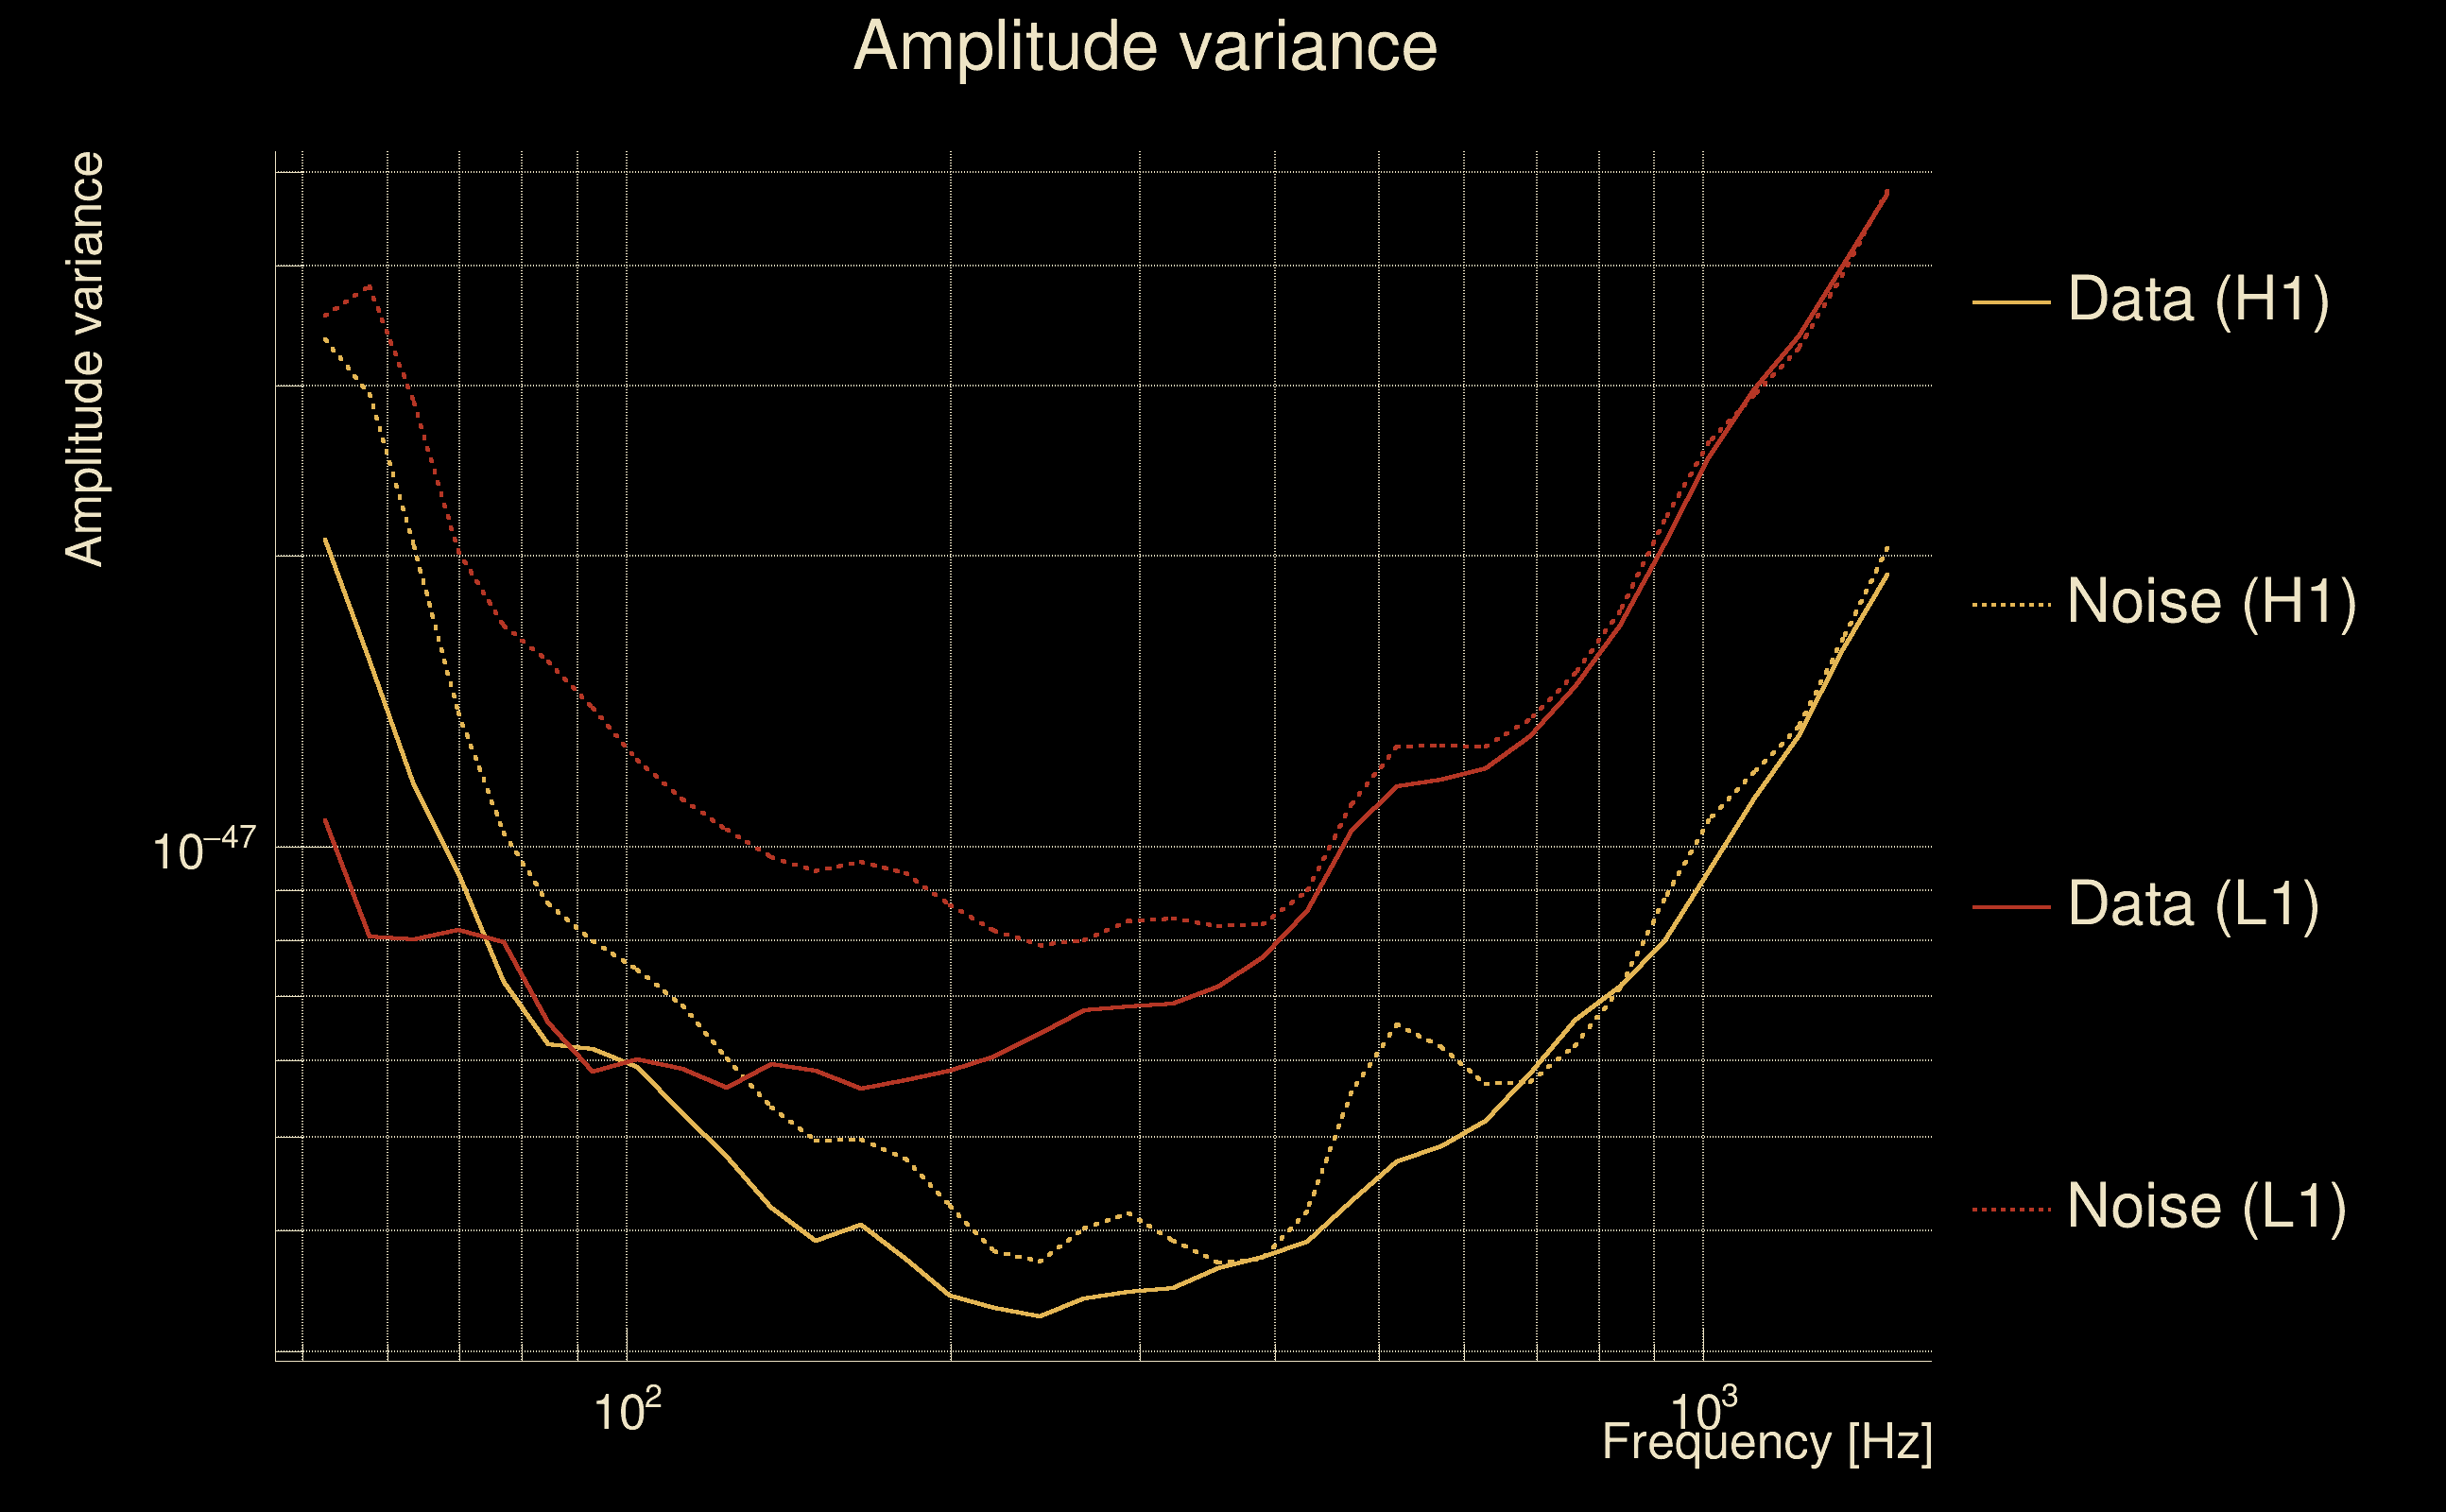
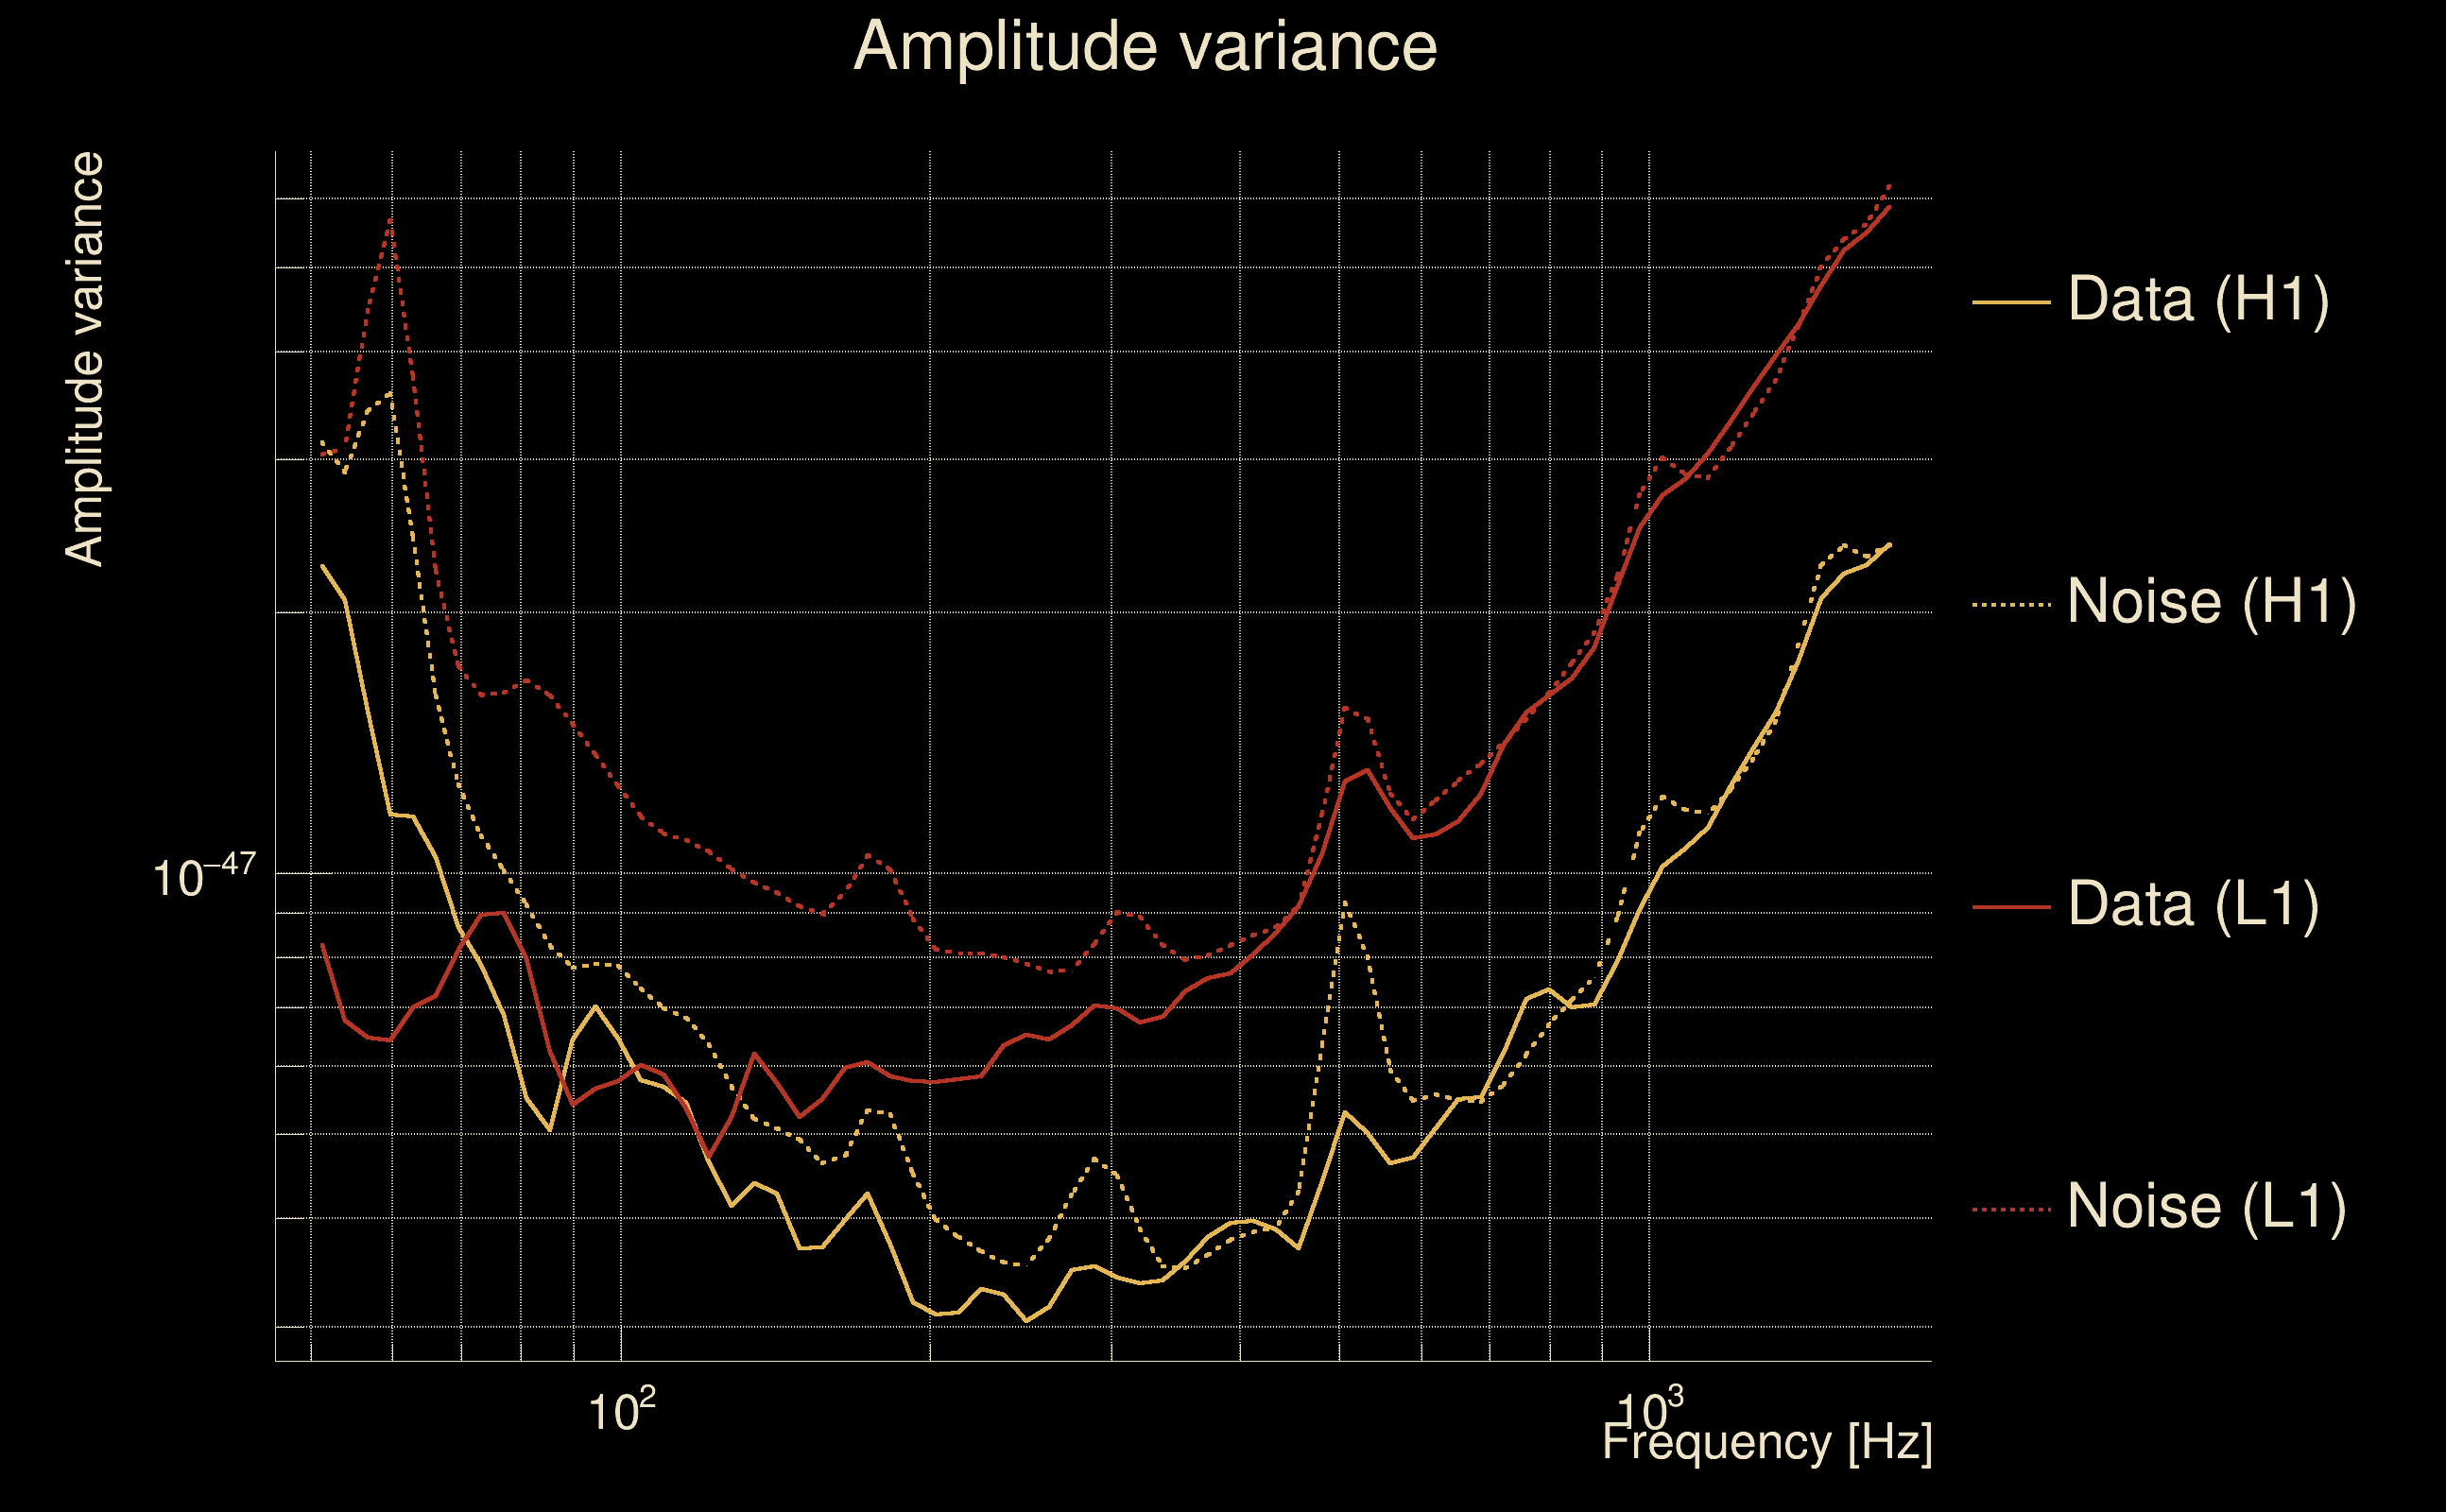
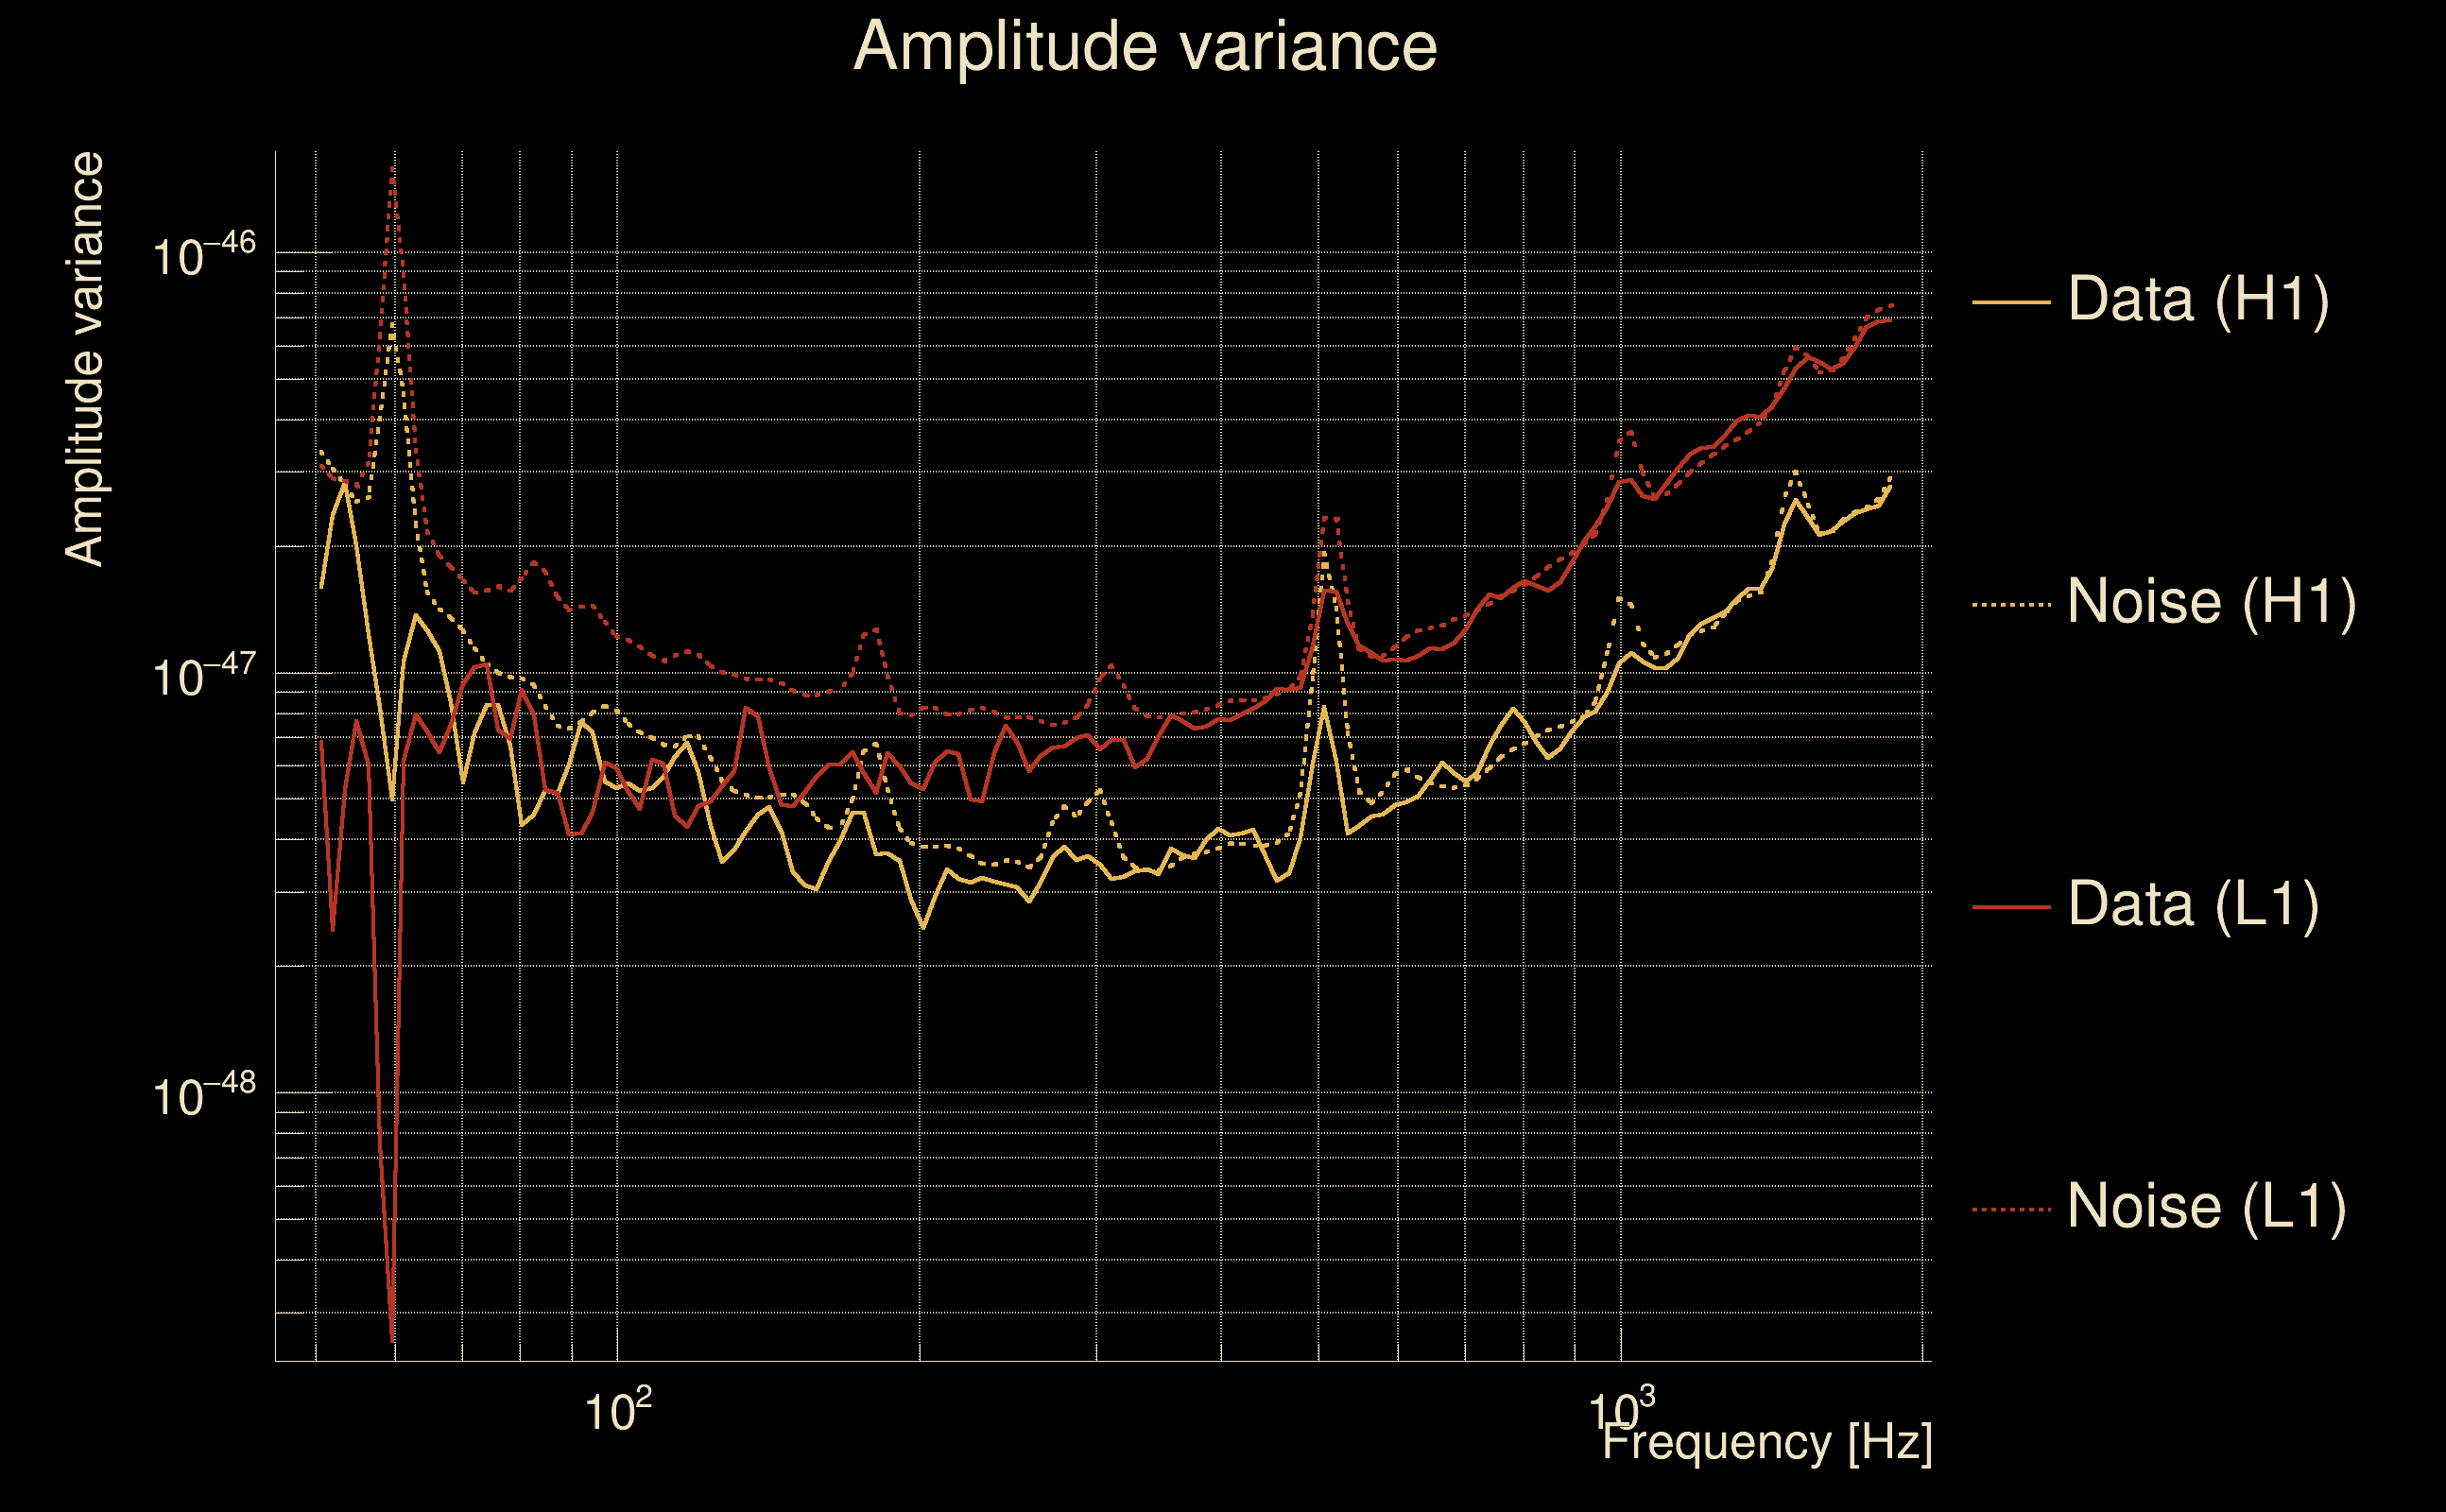
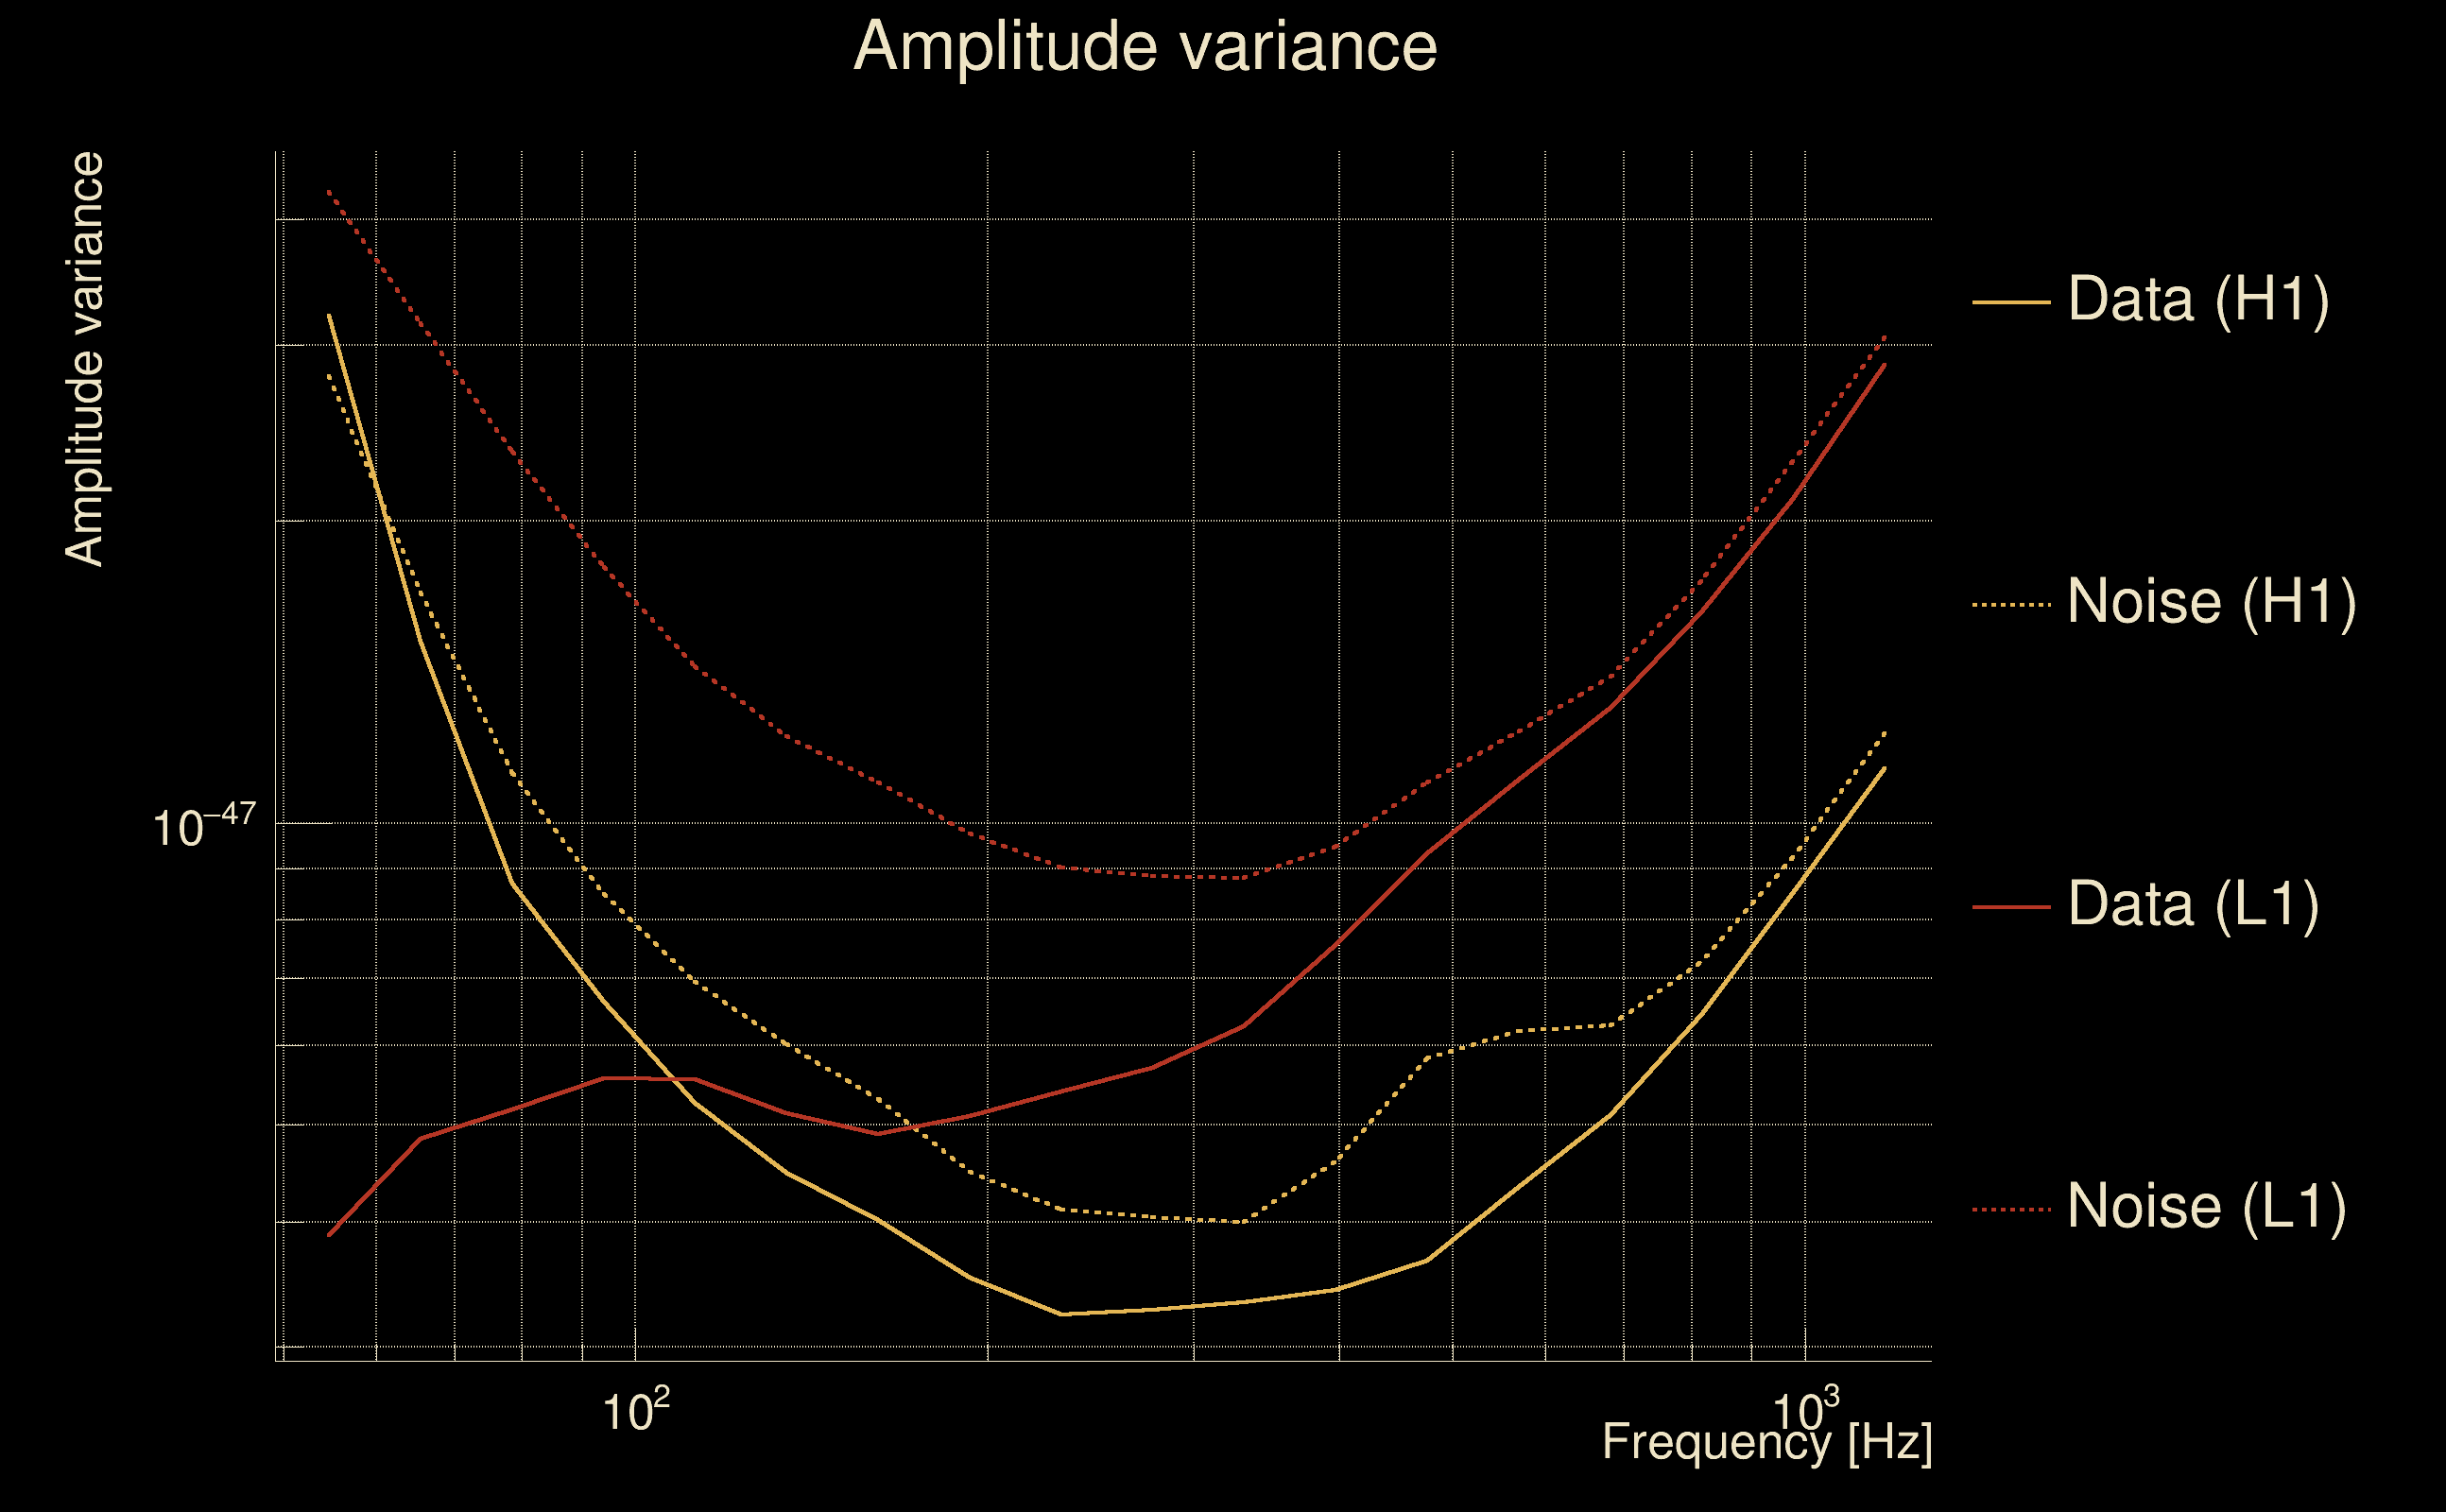
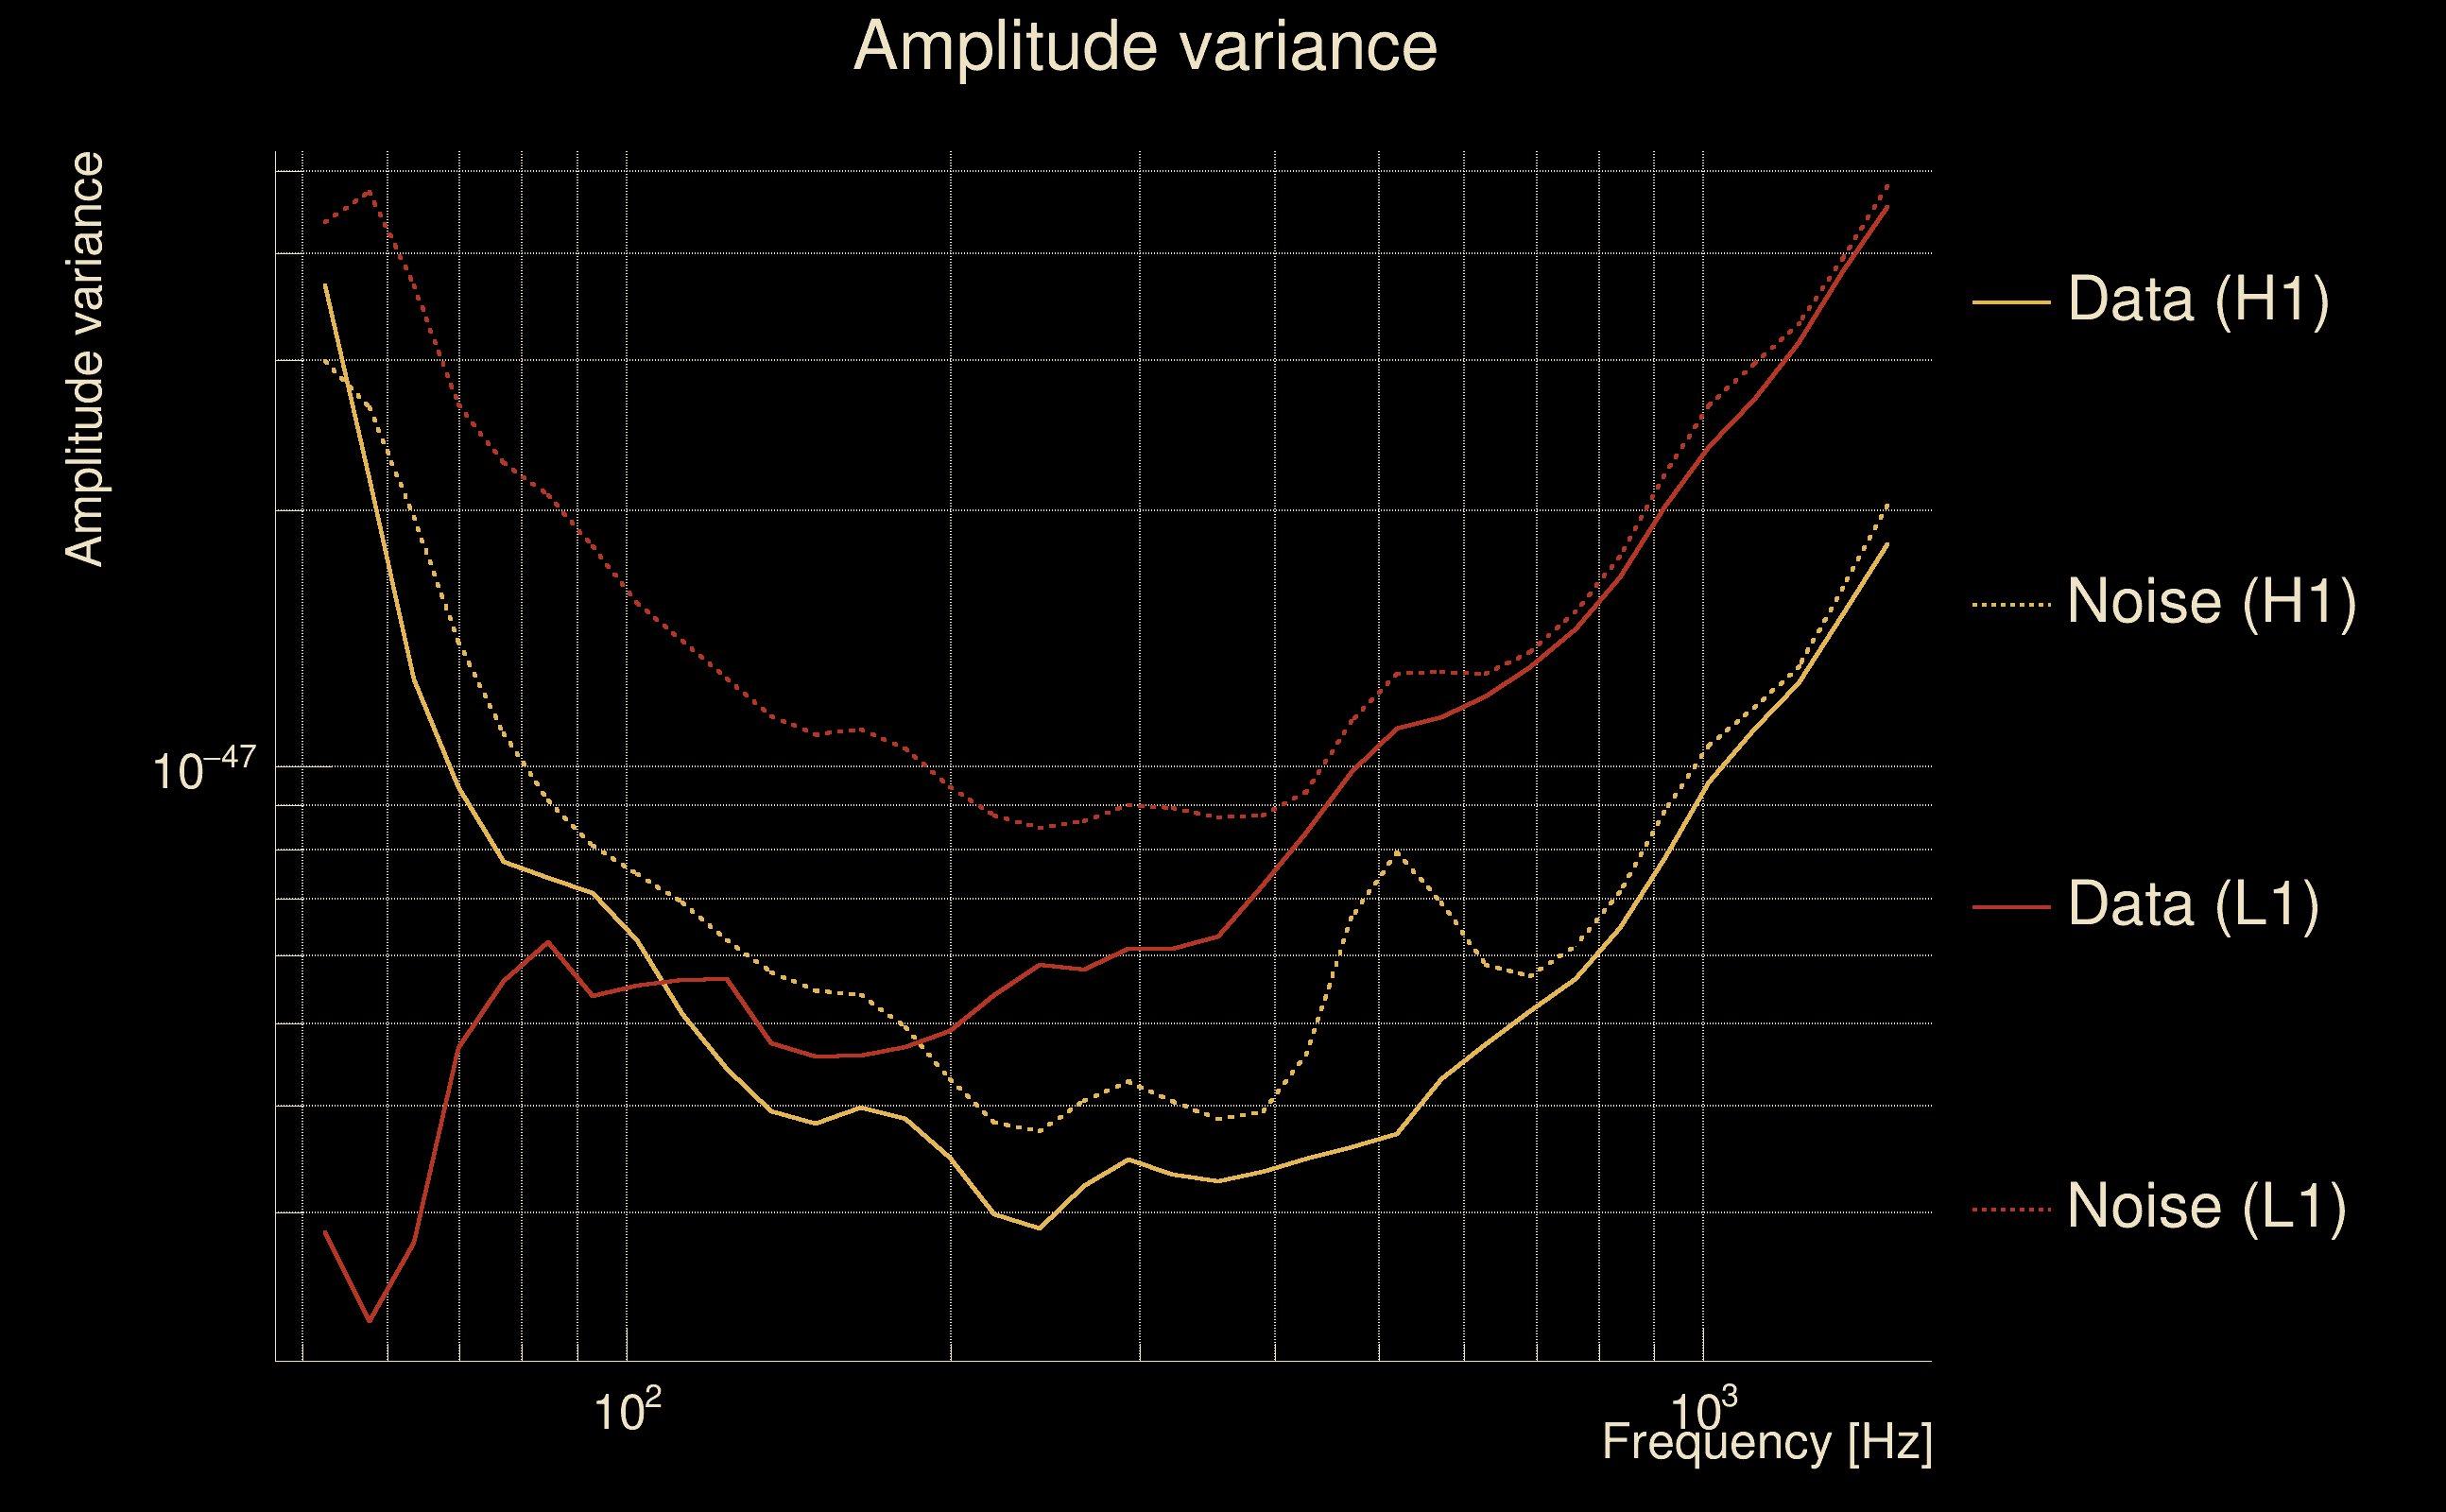
| Amplitude spectrograms: | normalization = 1e-22, power index = 2 |
| White noise SNR variance: | 0.523175 (after applying a correction factor = 1) |
| Amplitude ratio confidence level: | 3 sigma |
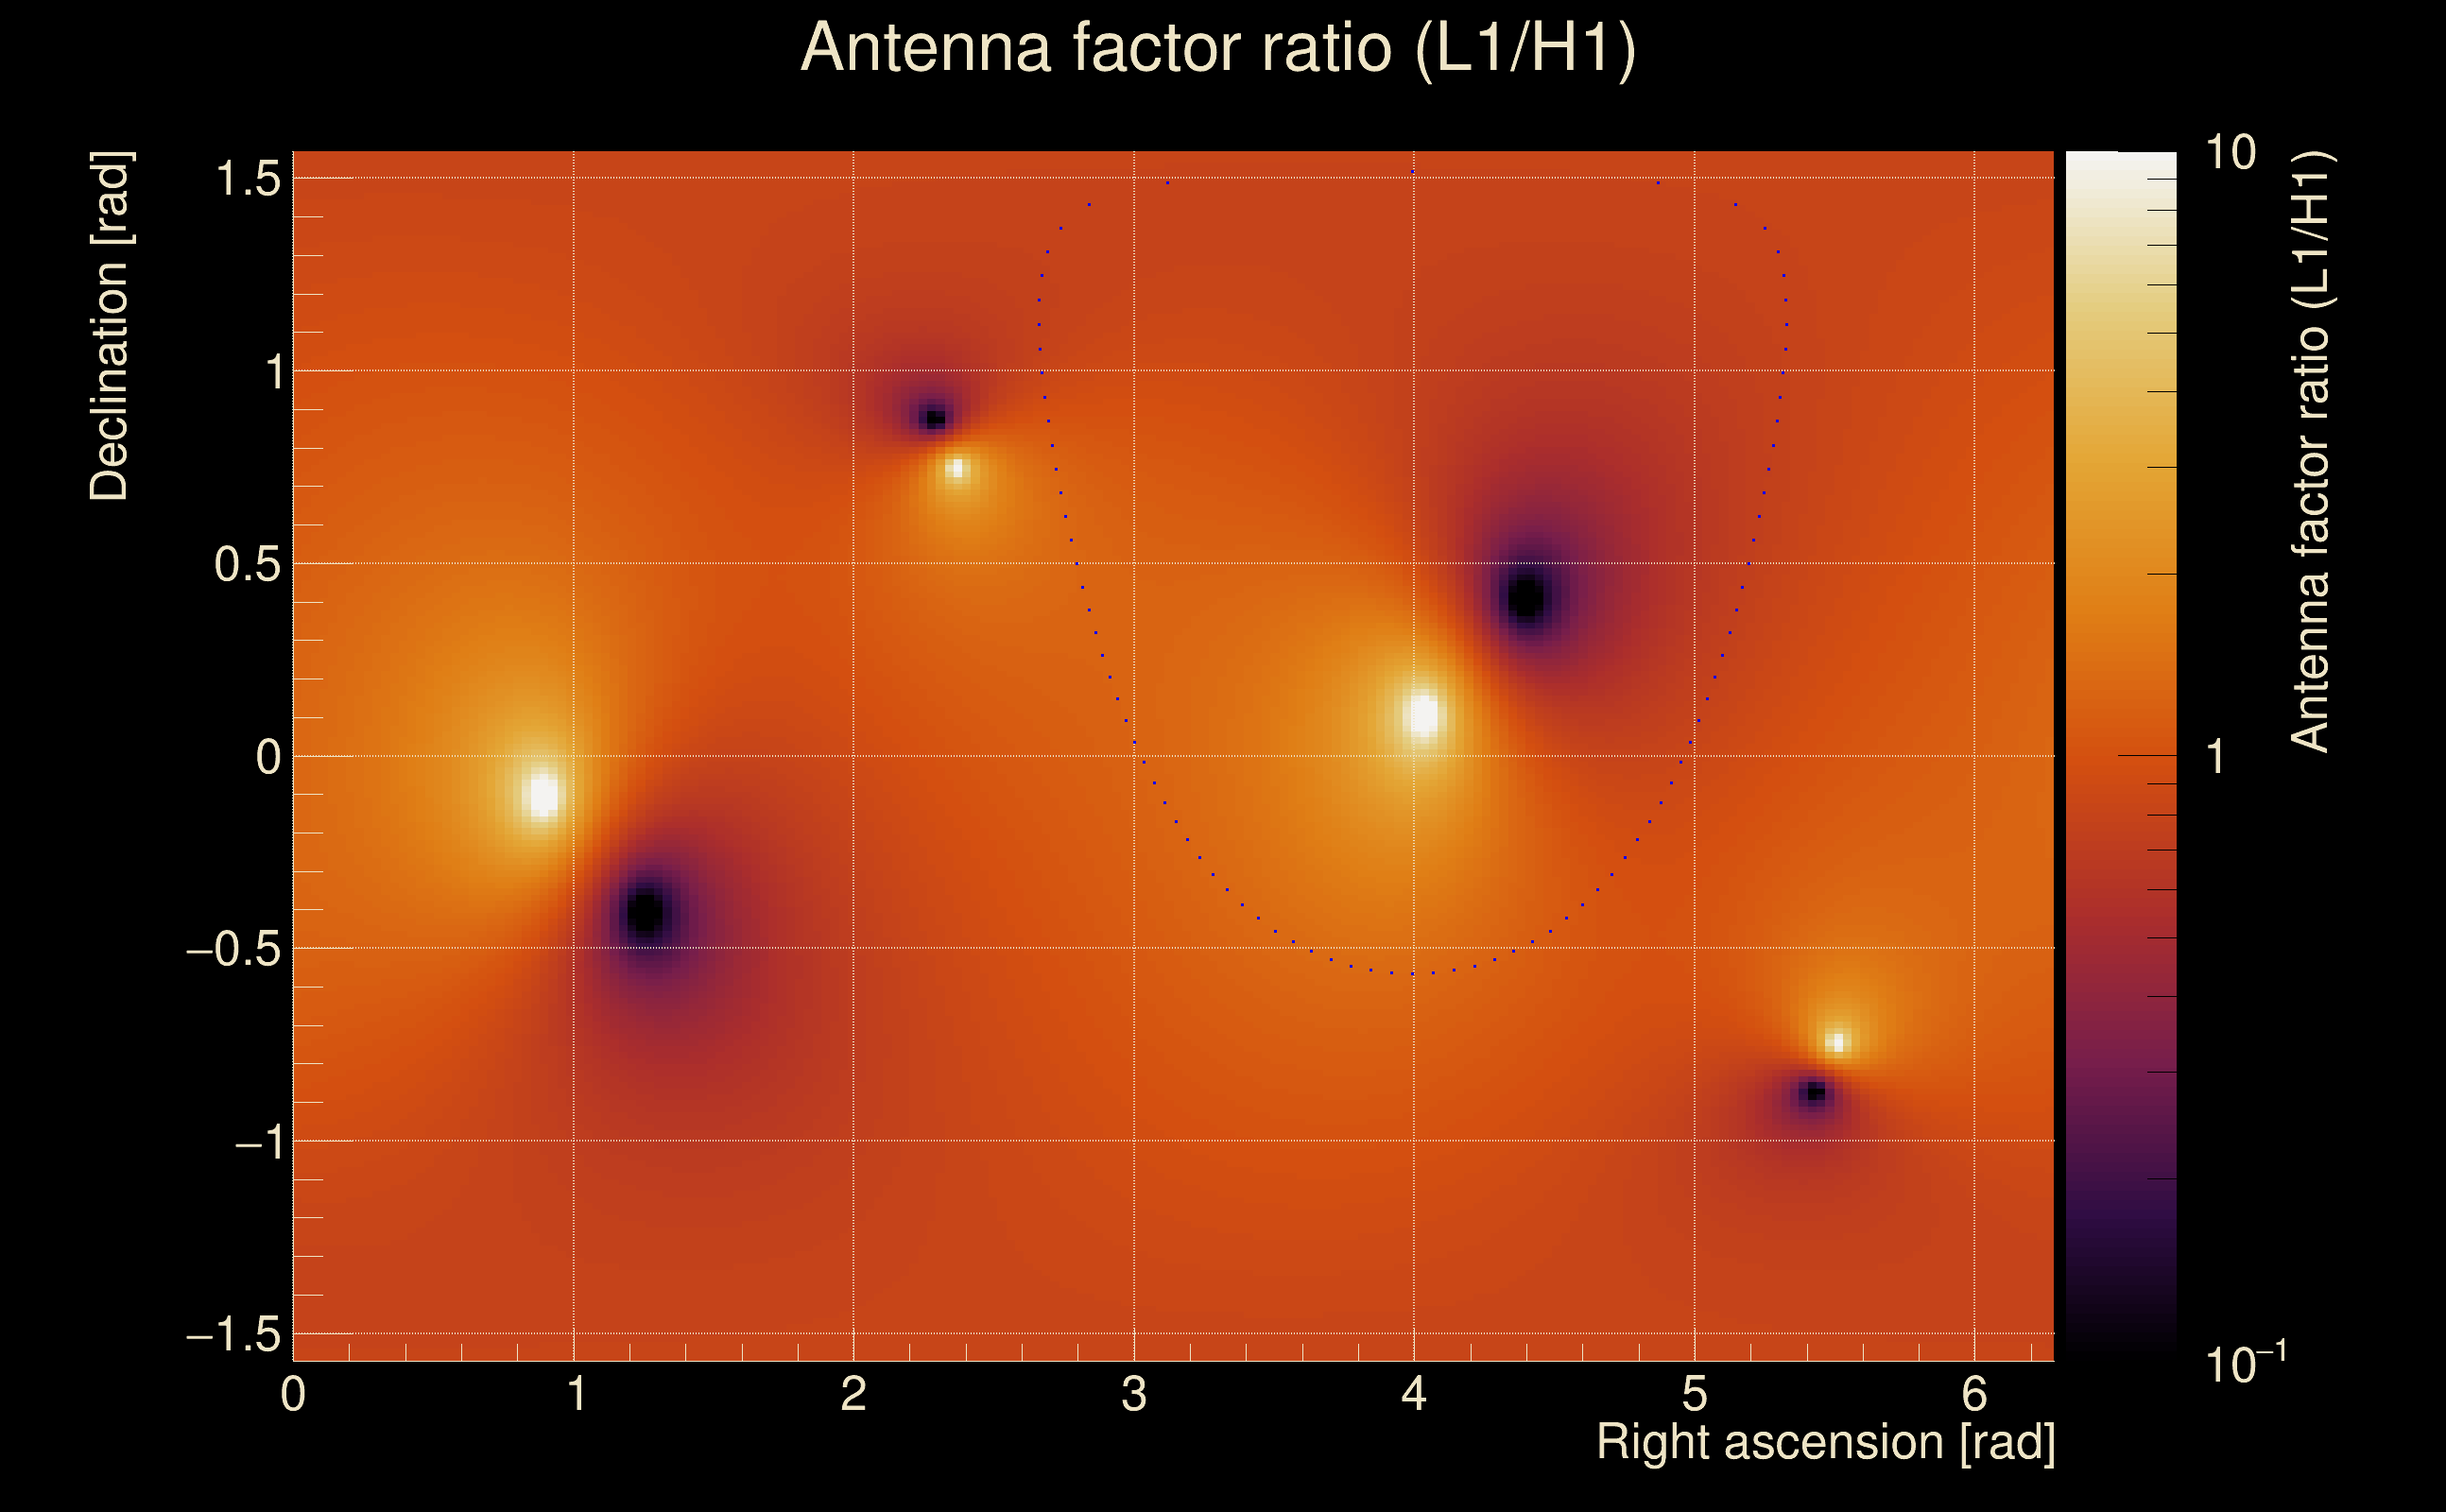
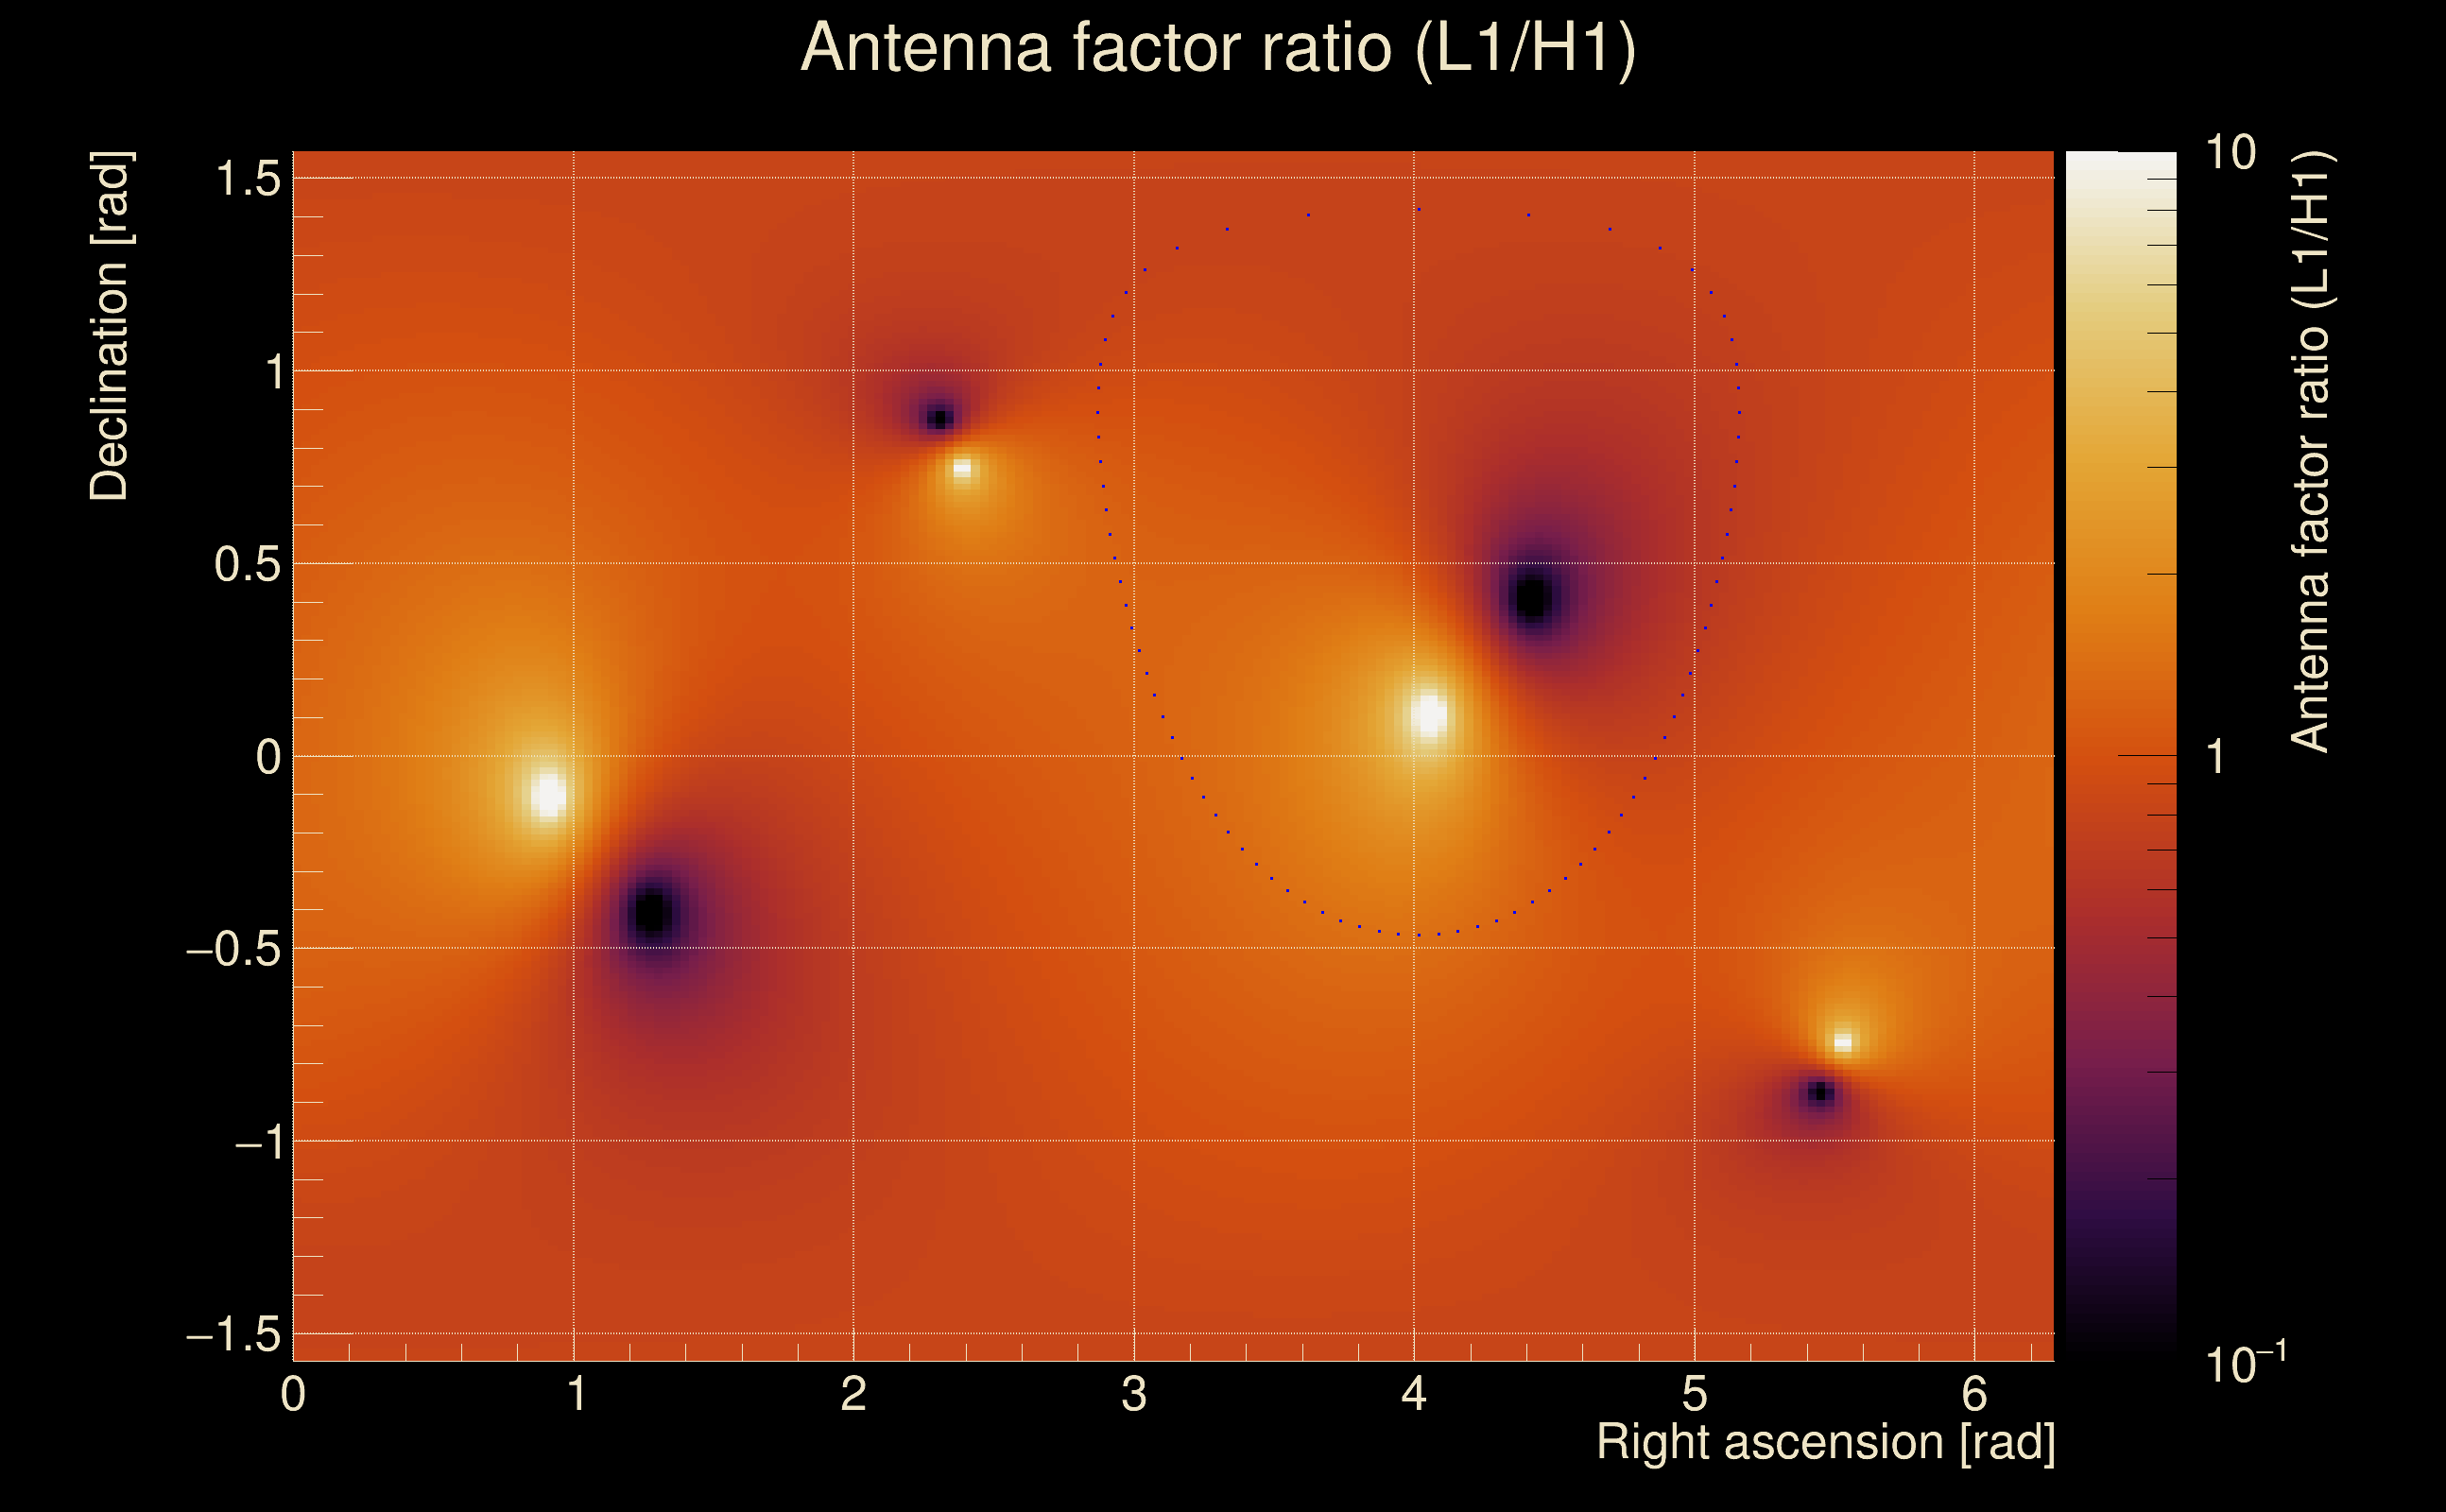
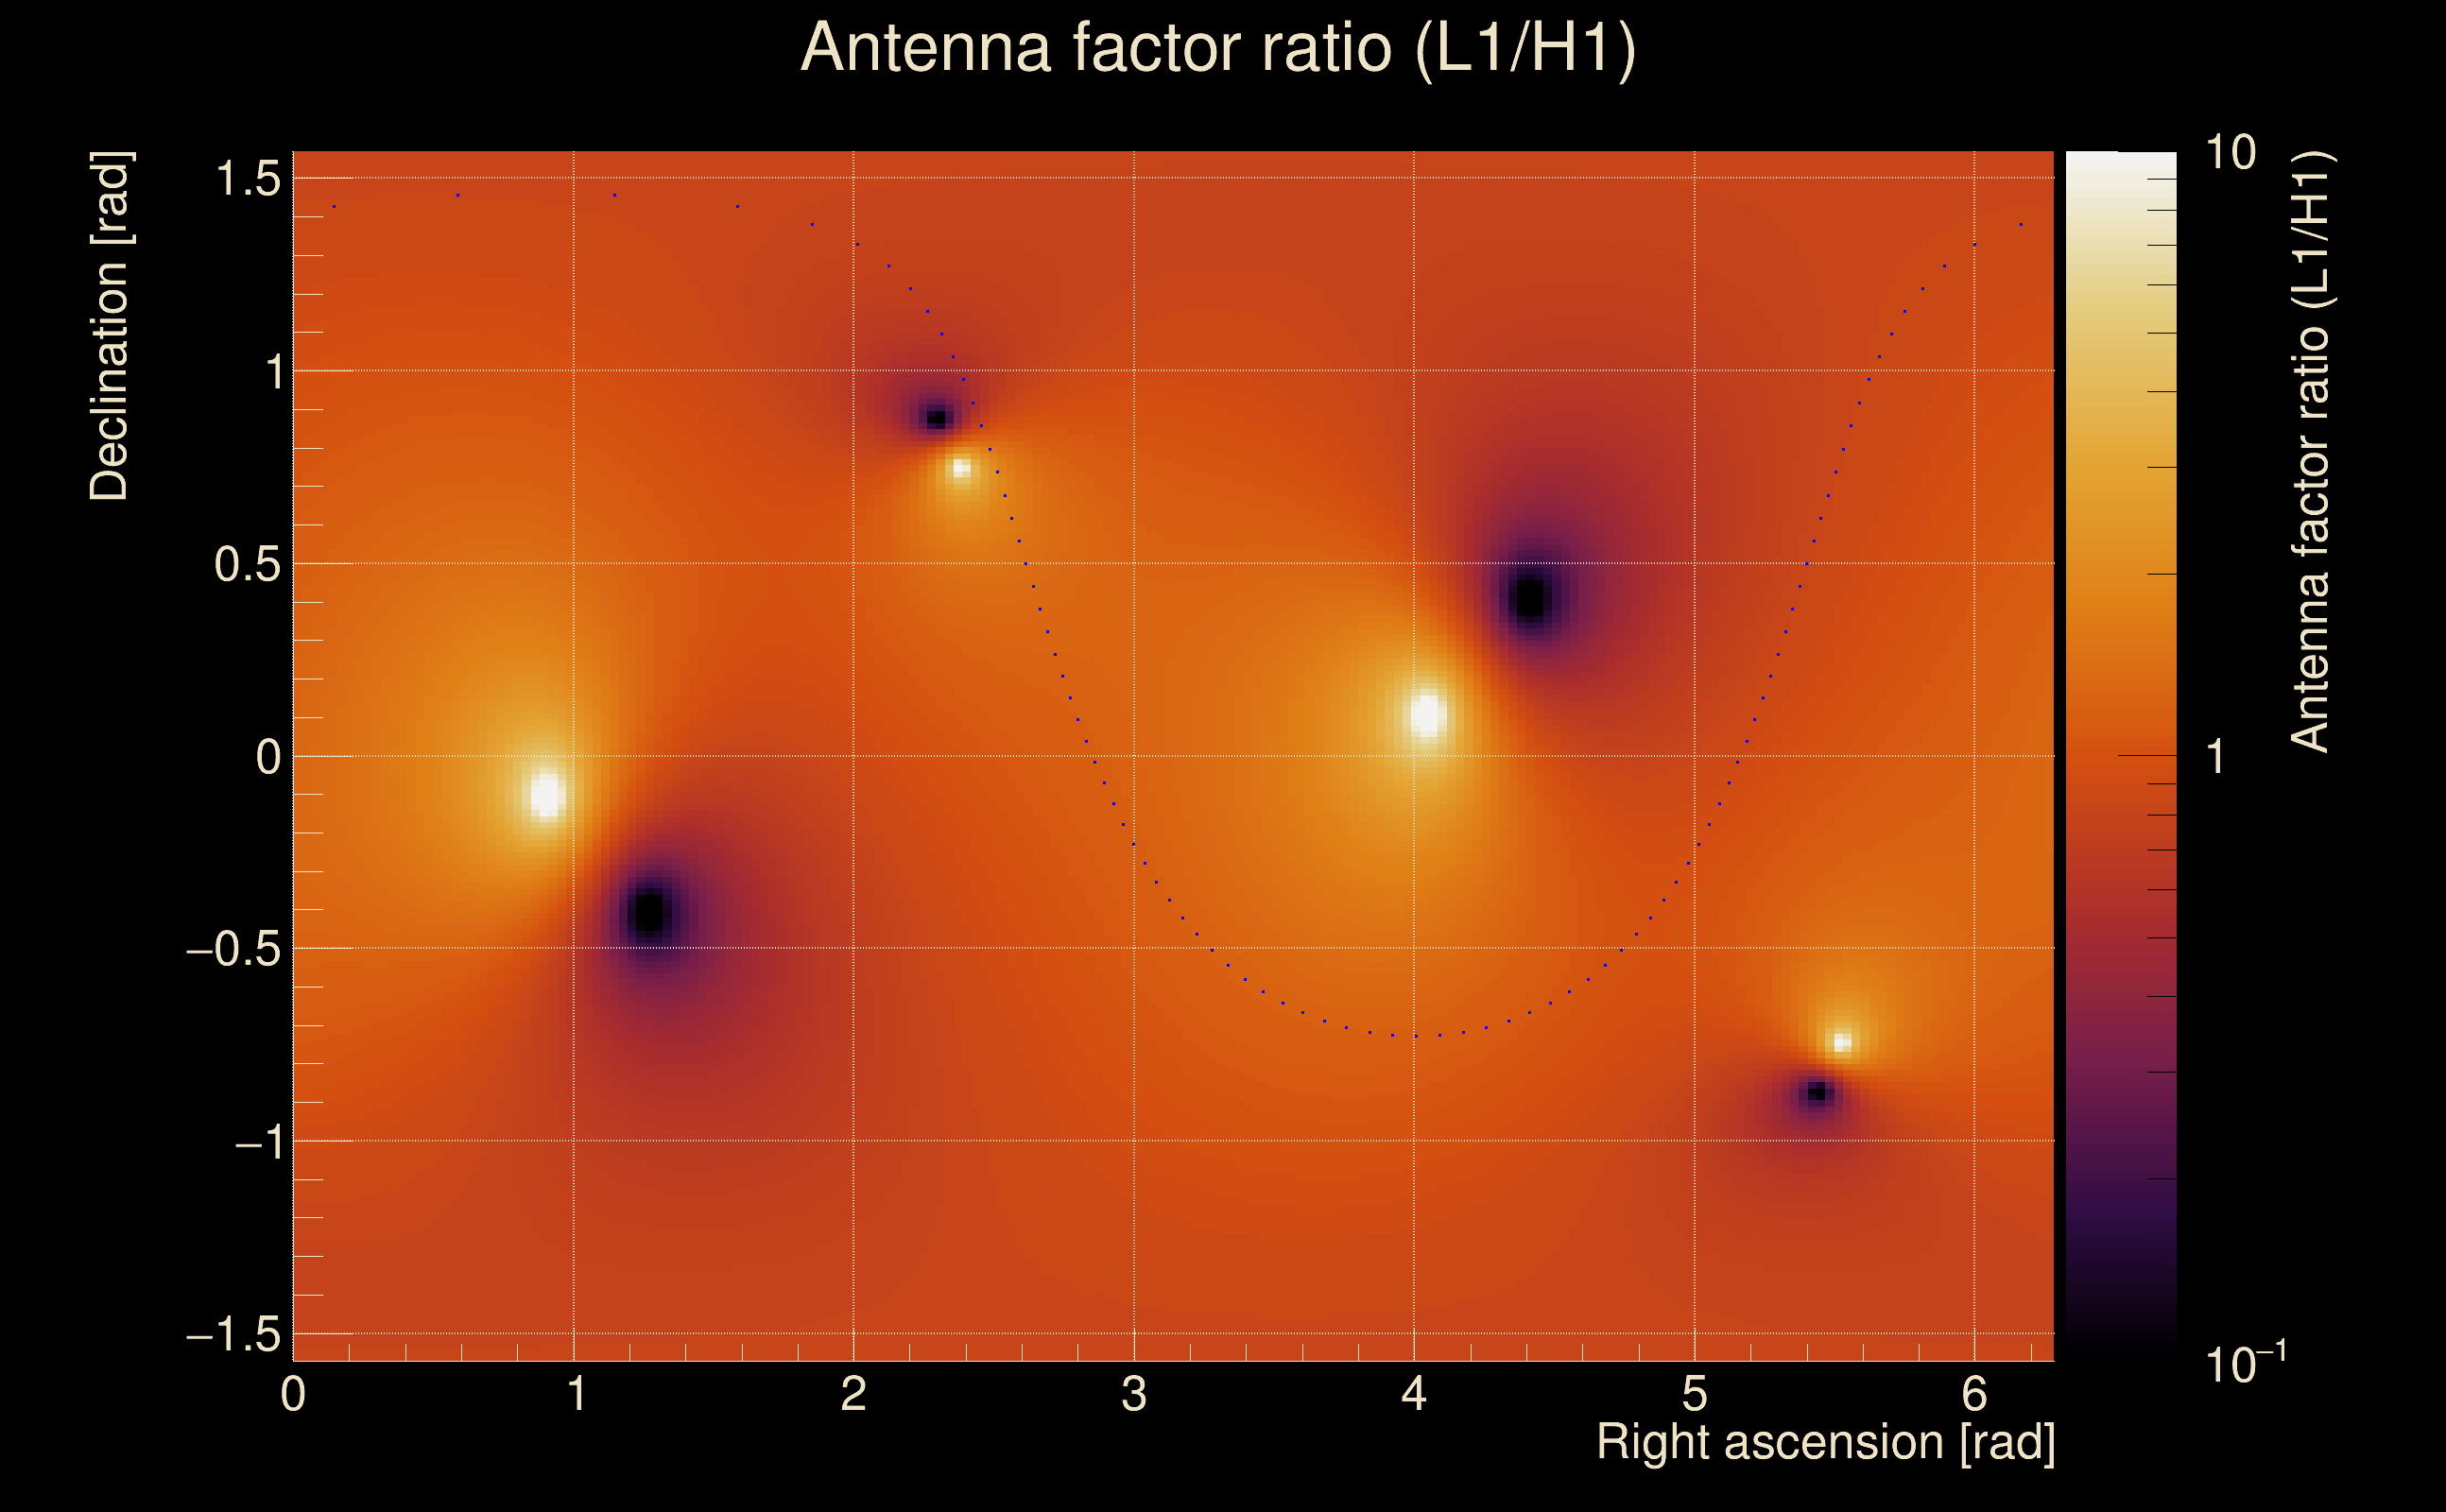
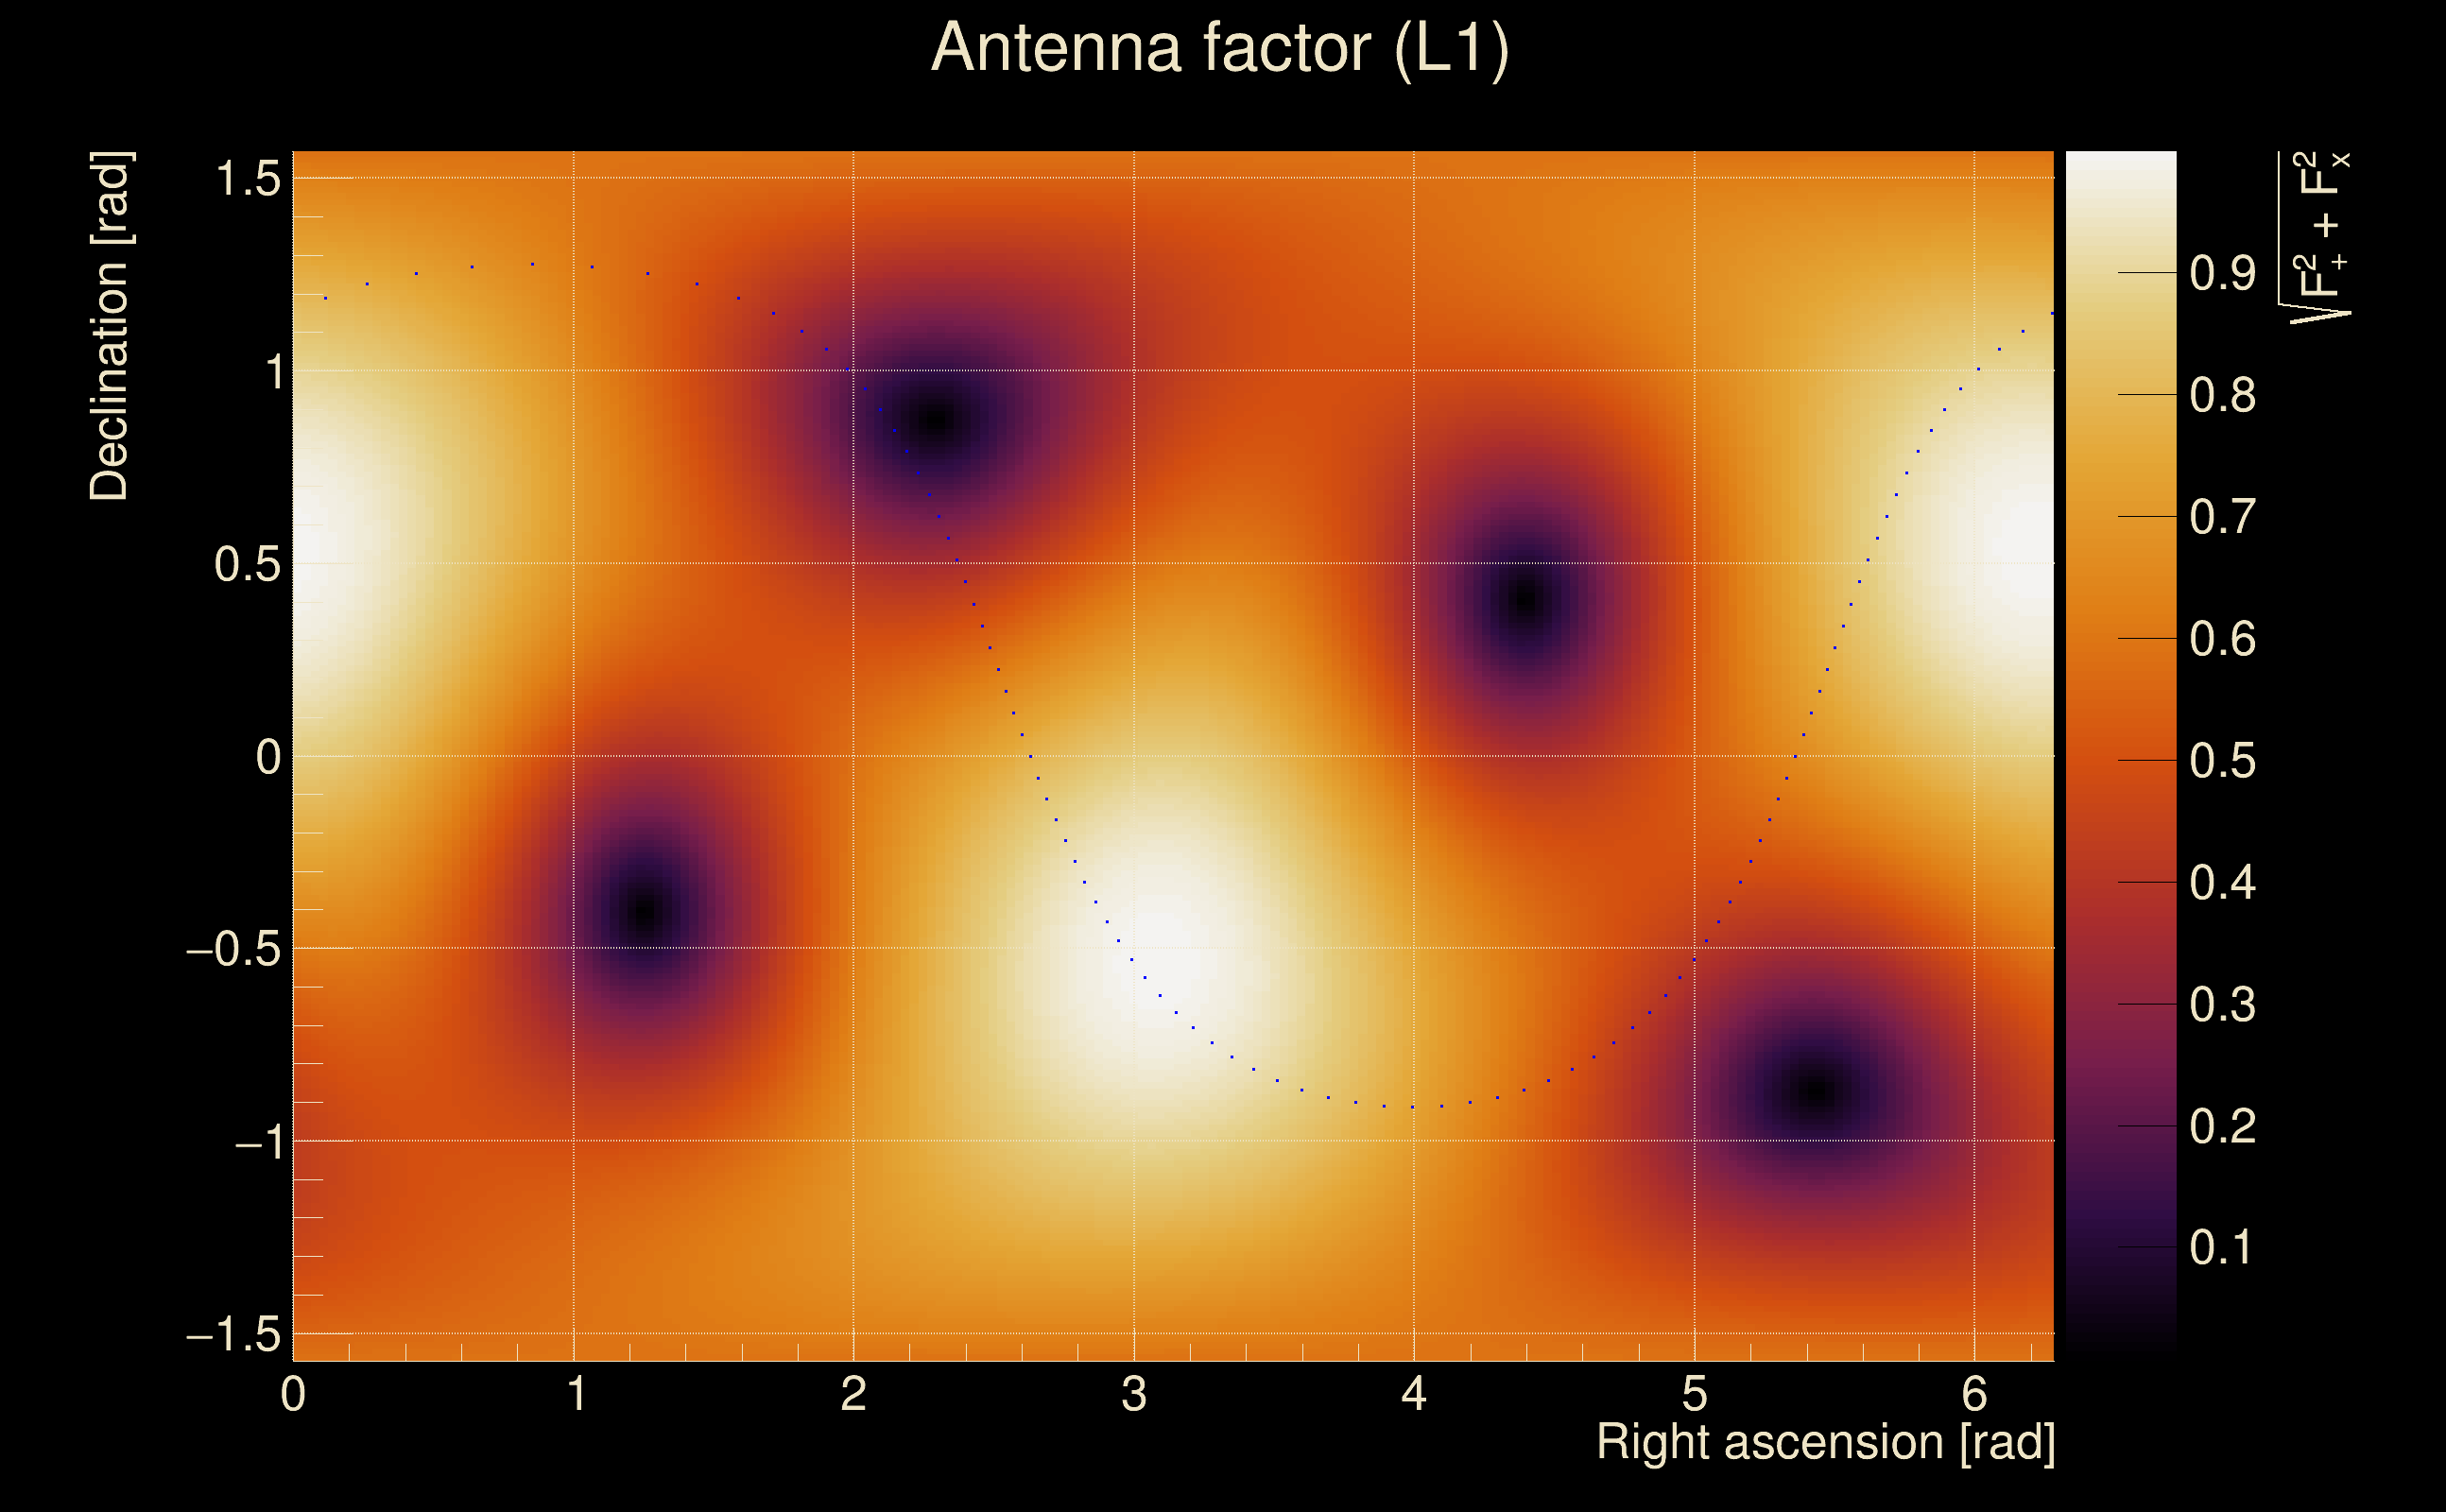
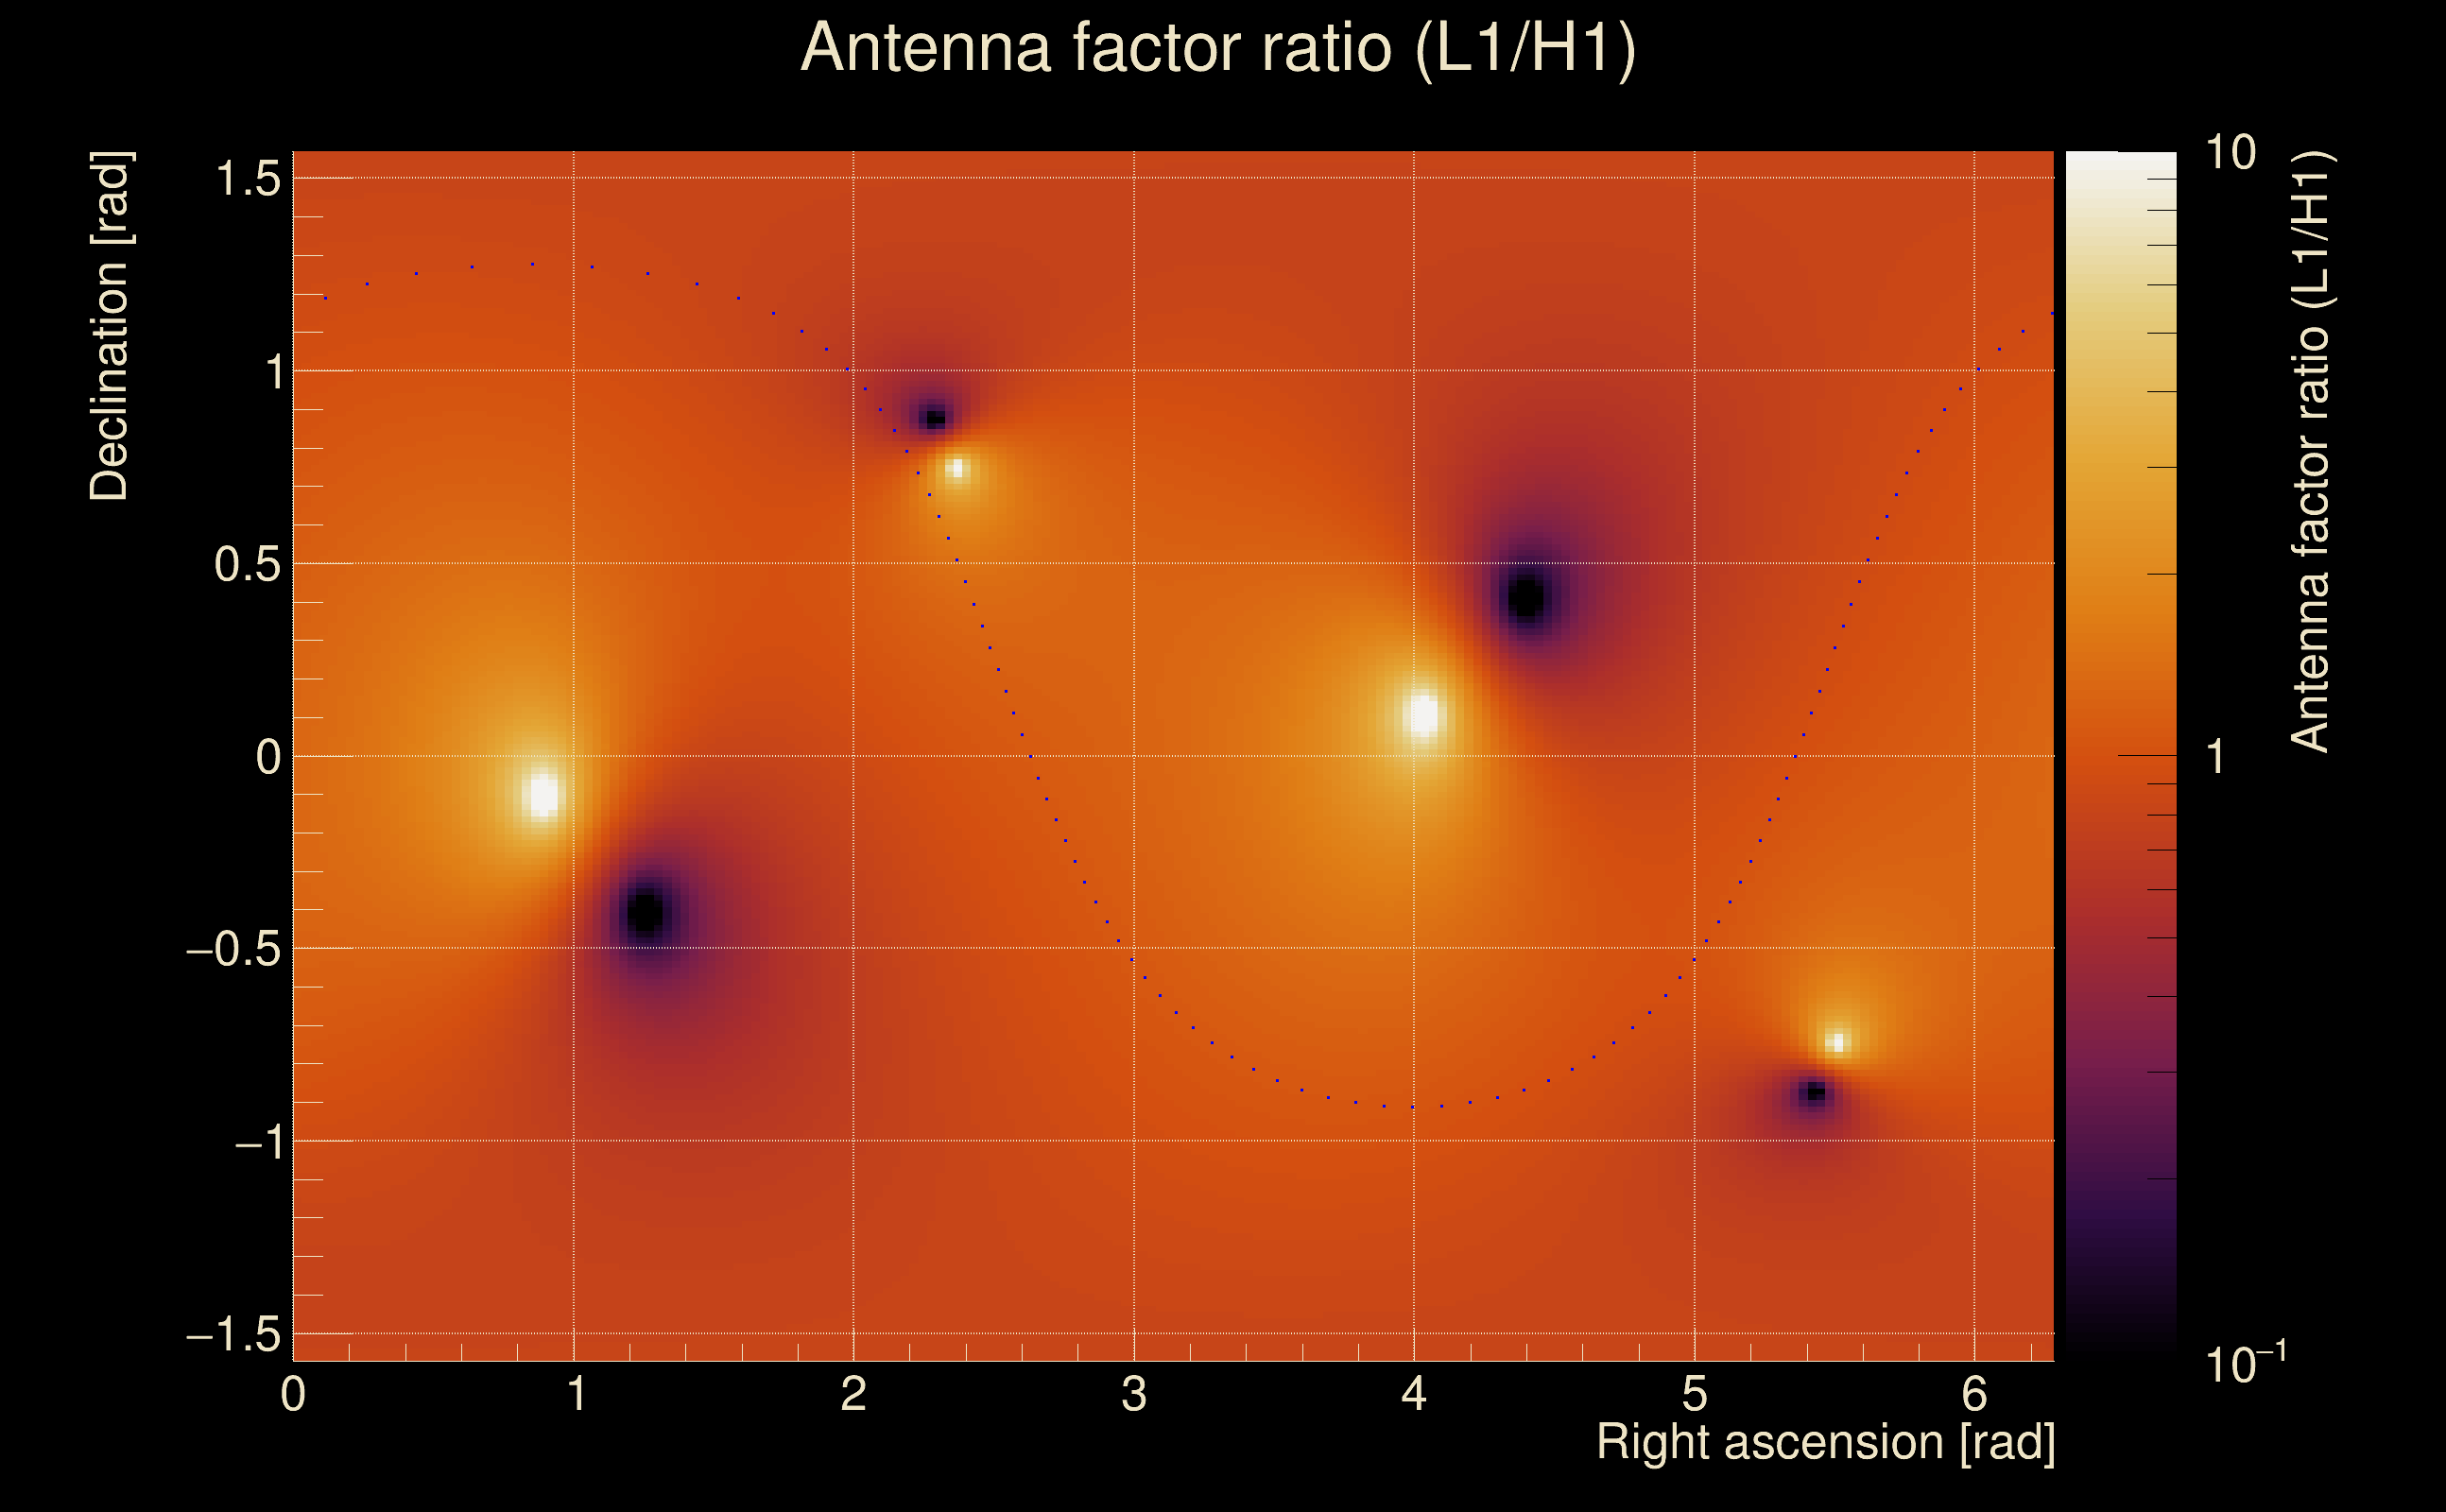
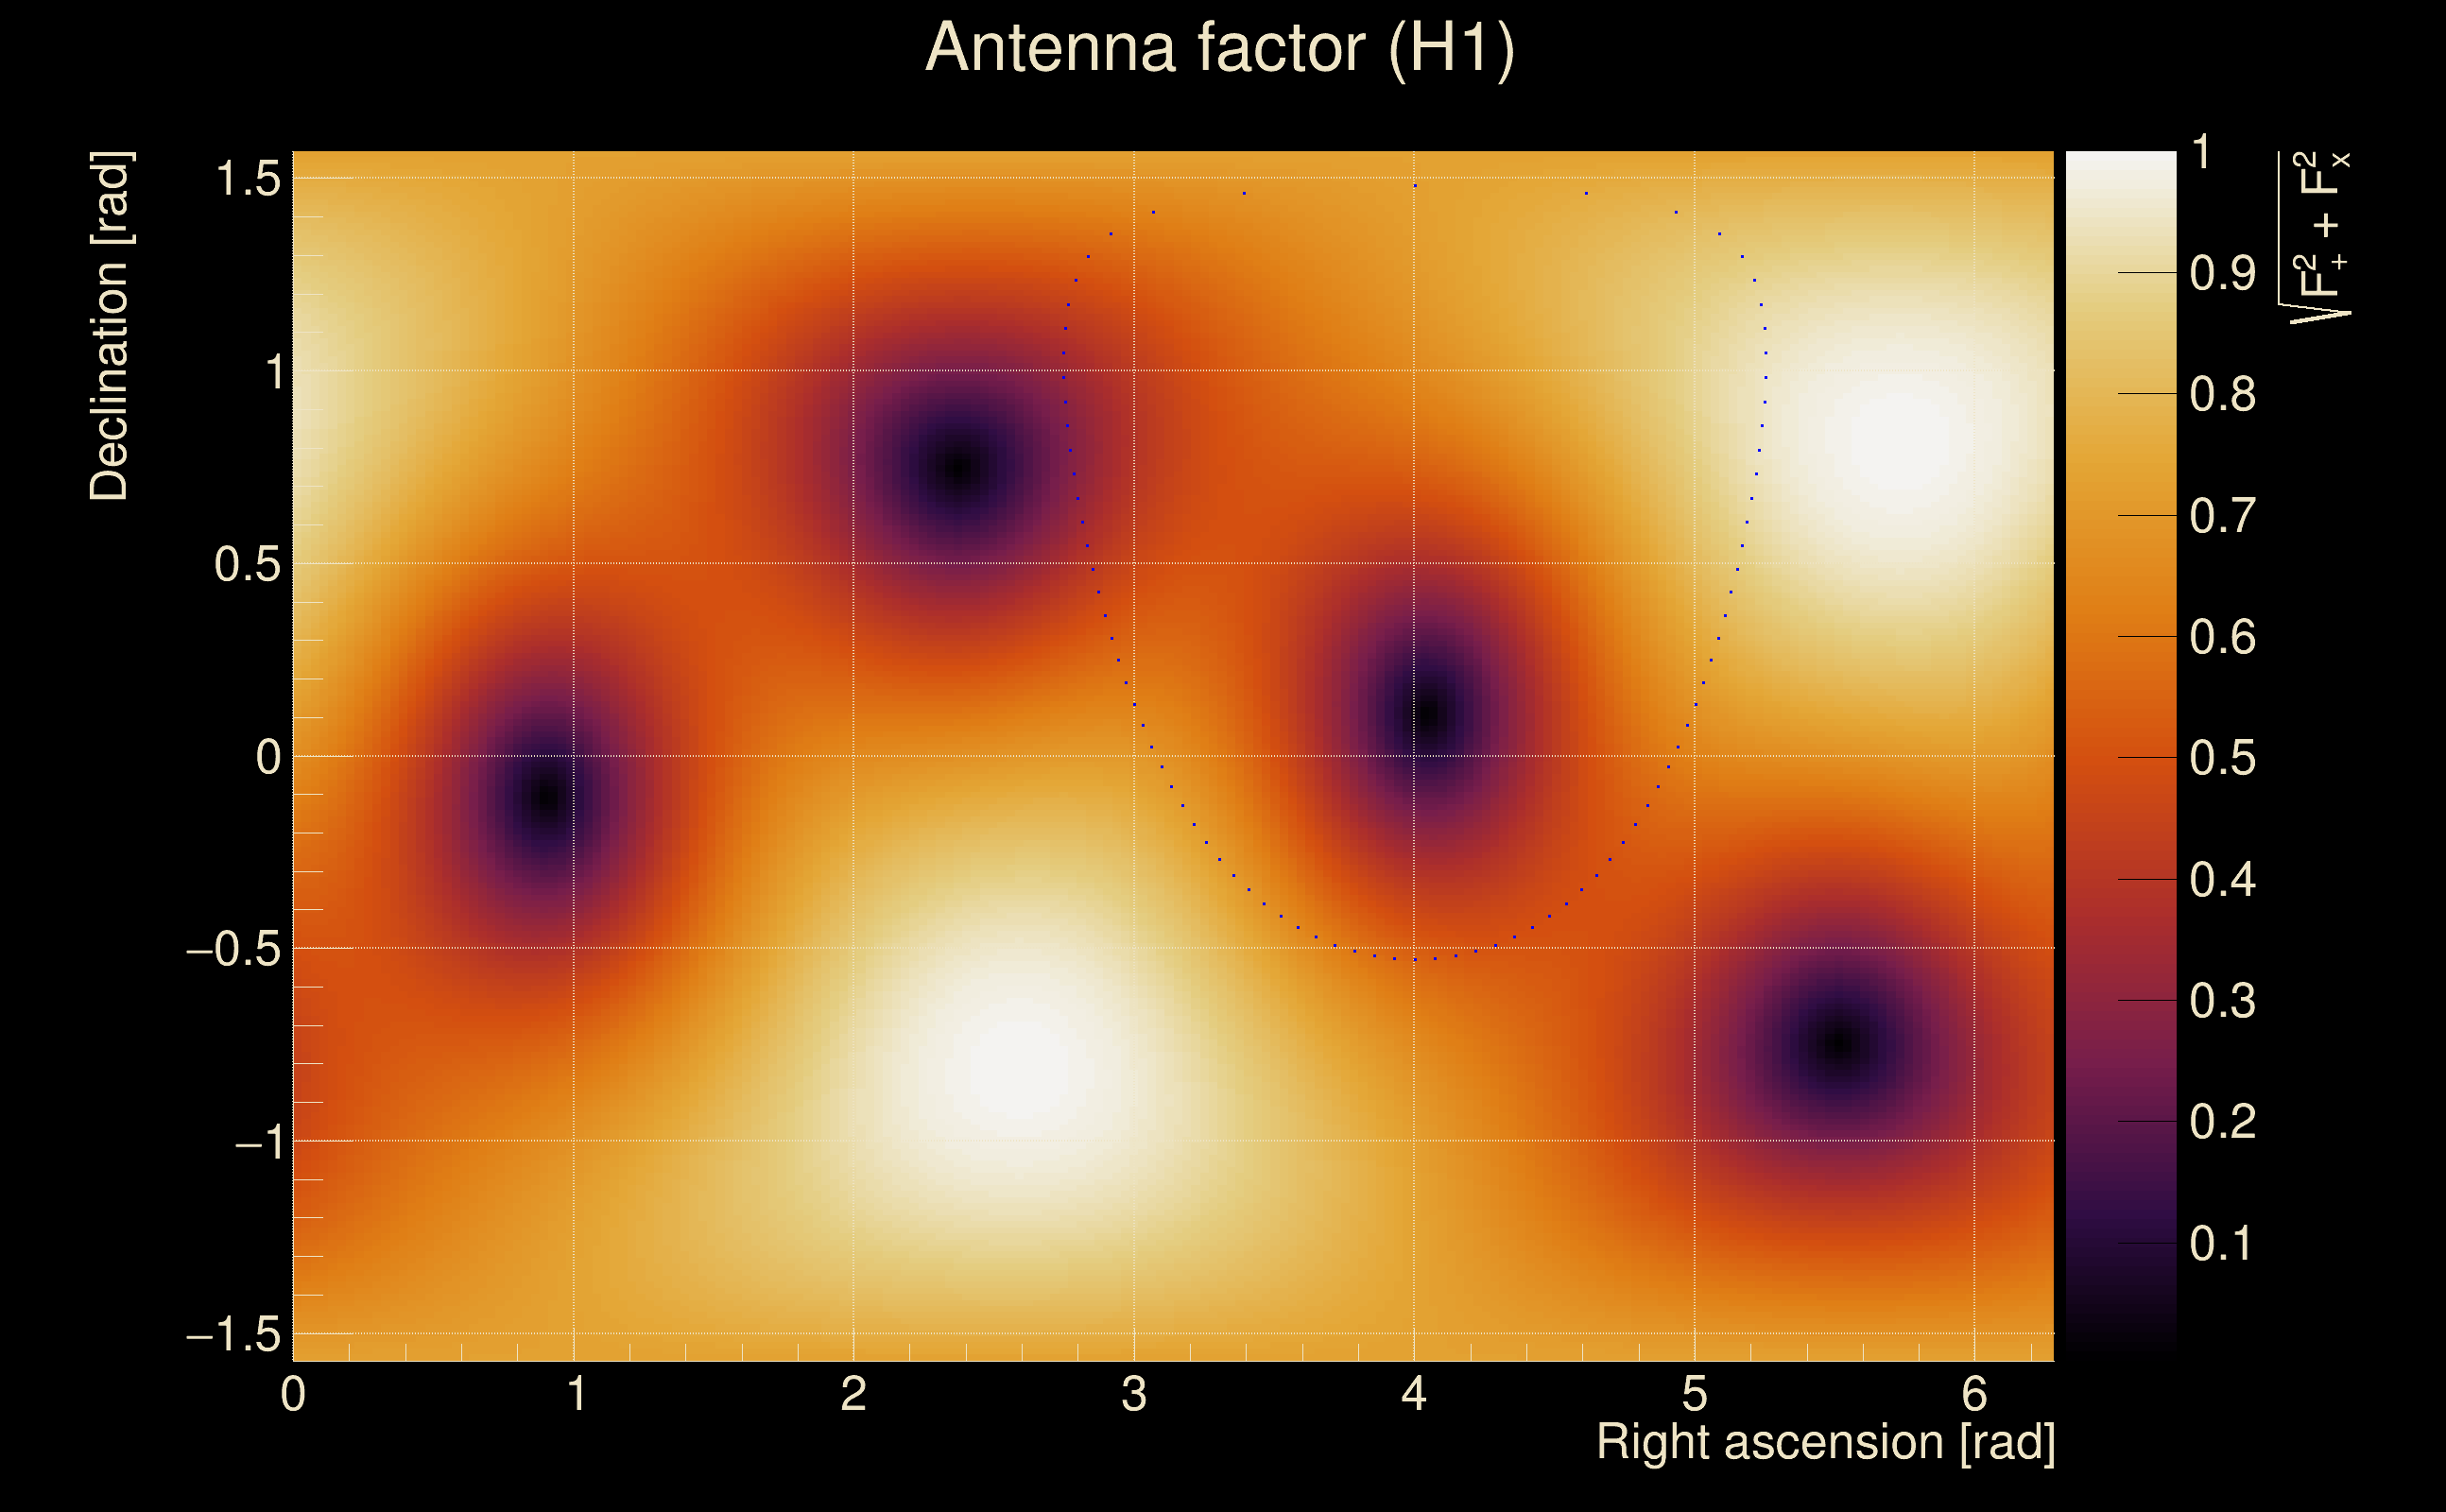
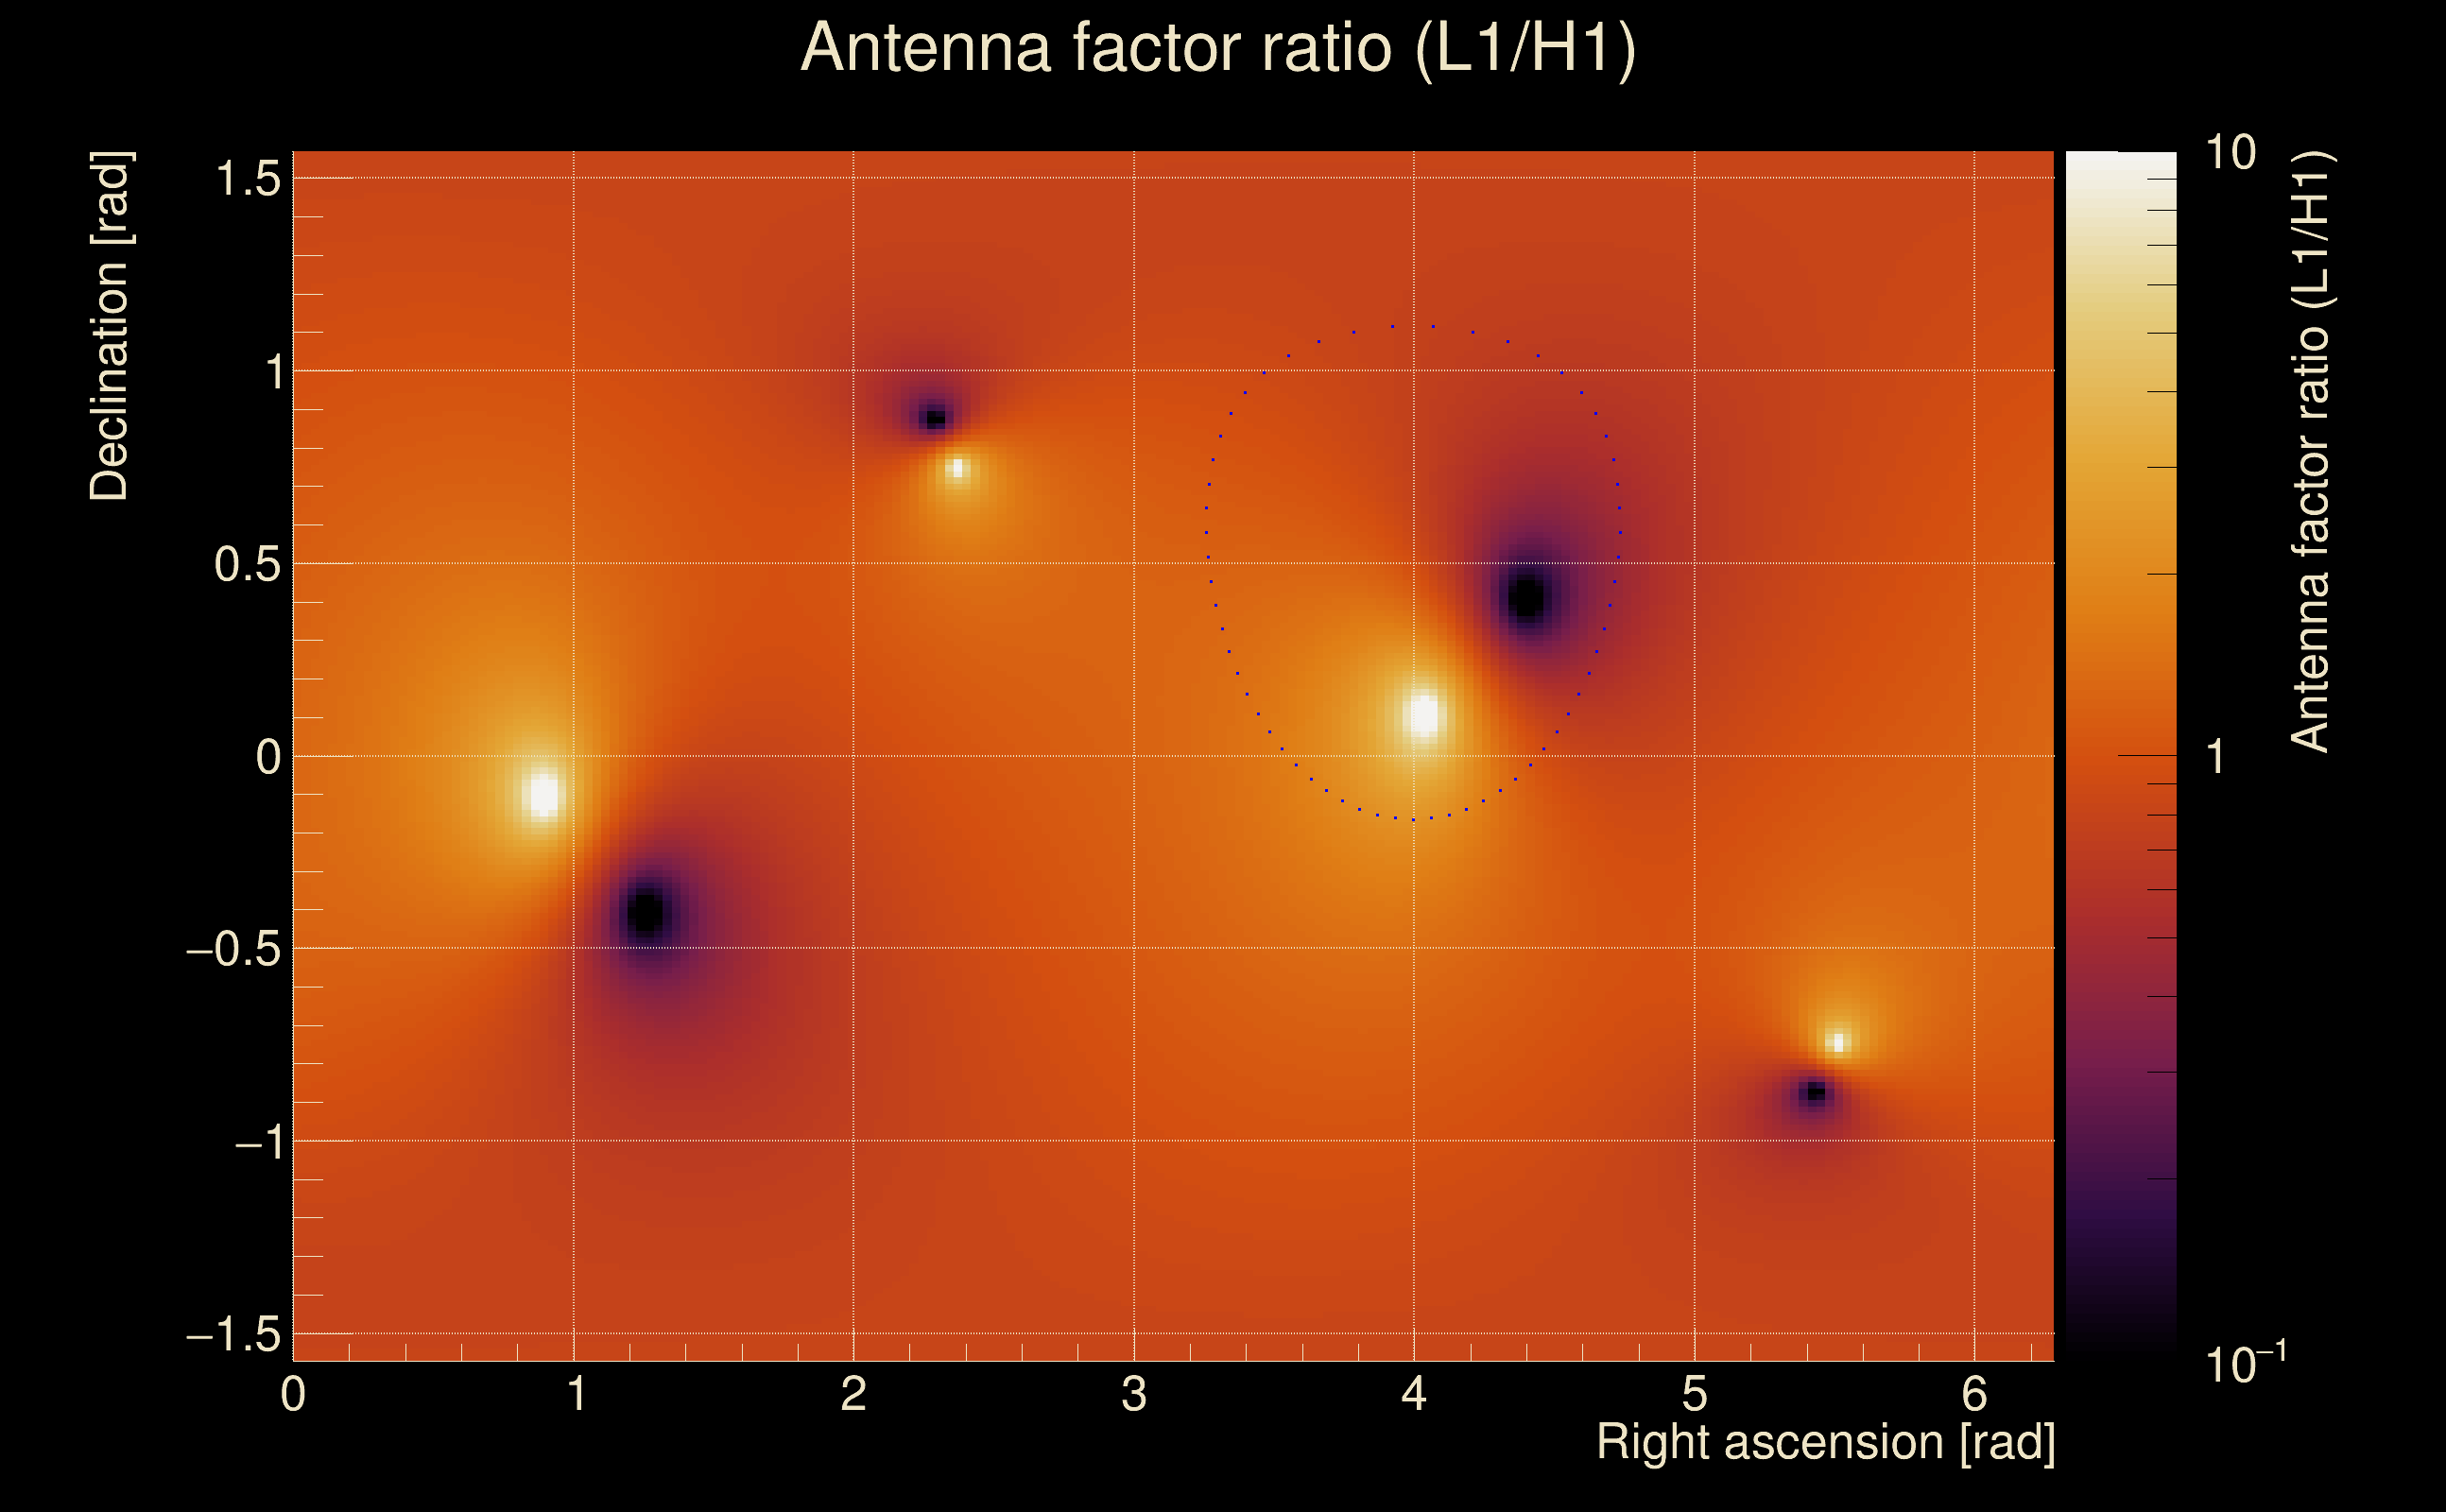
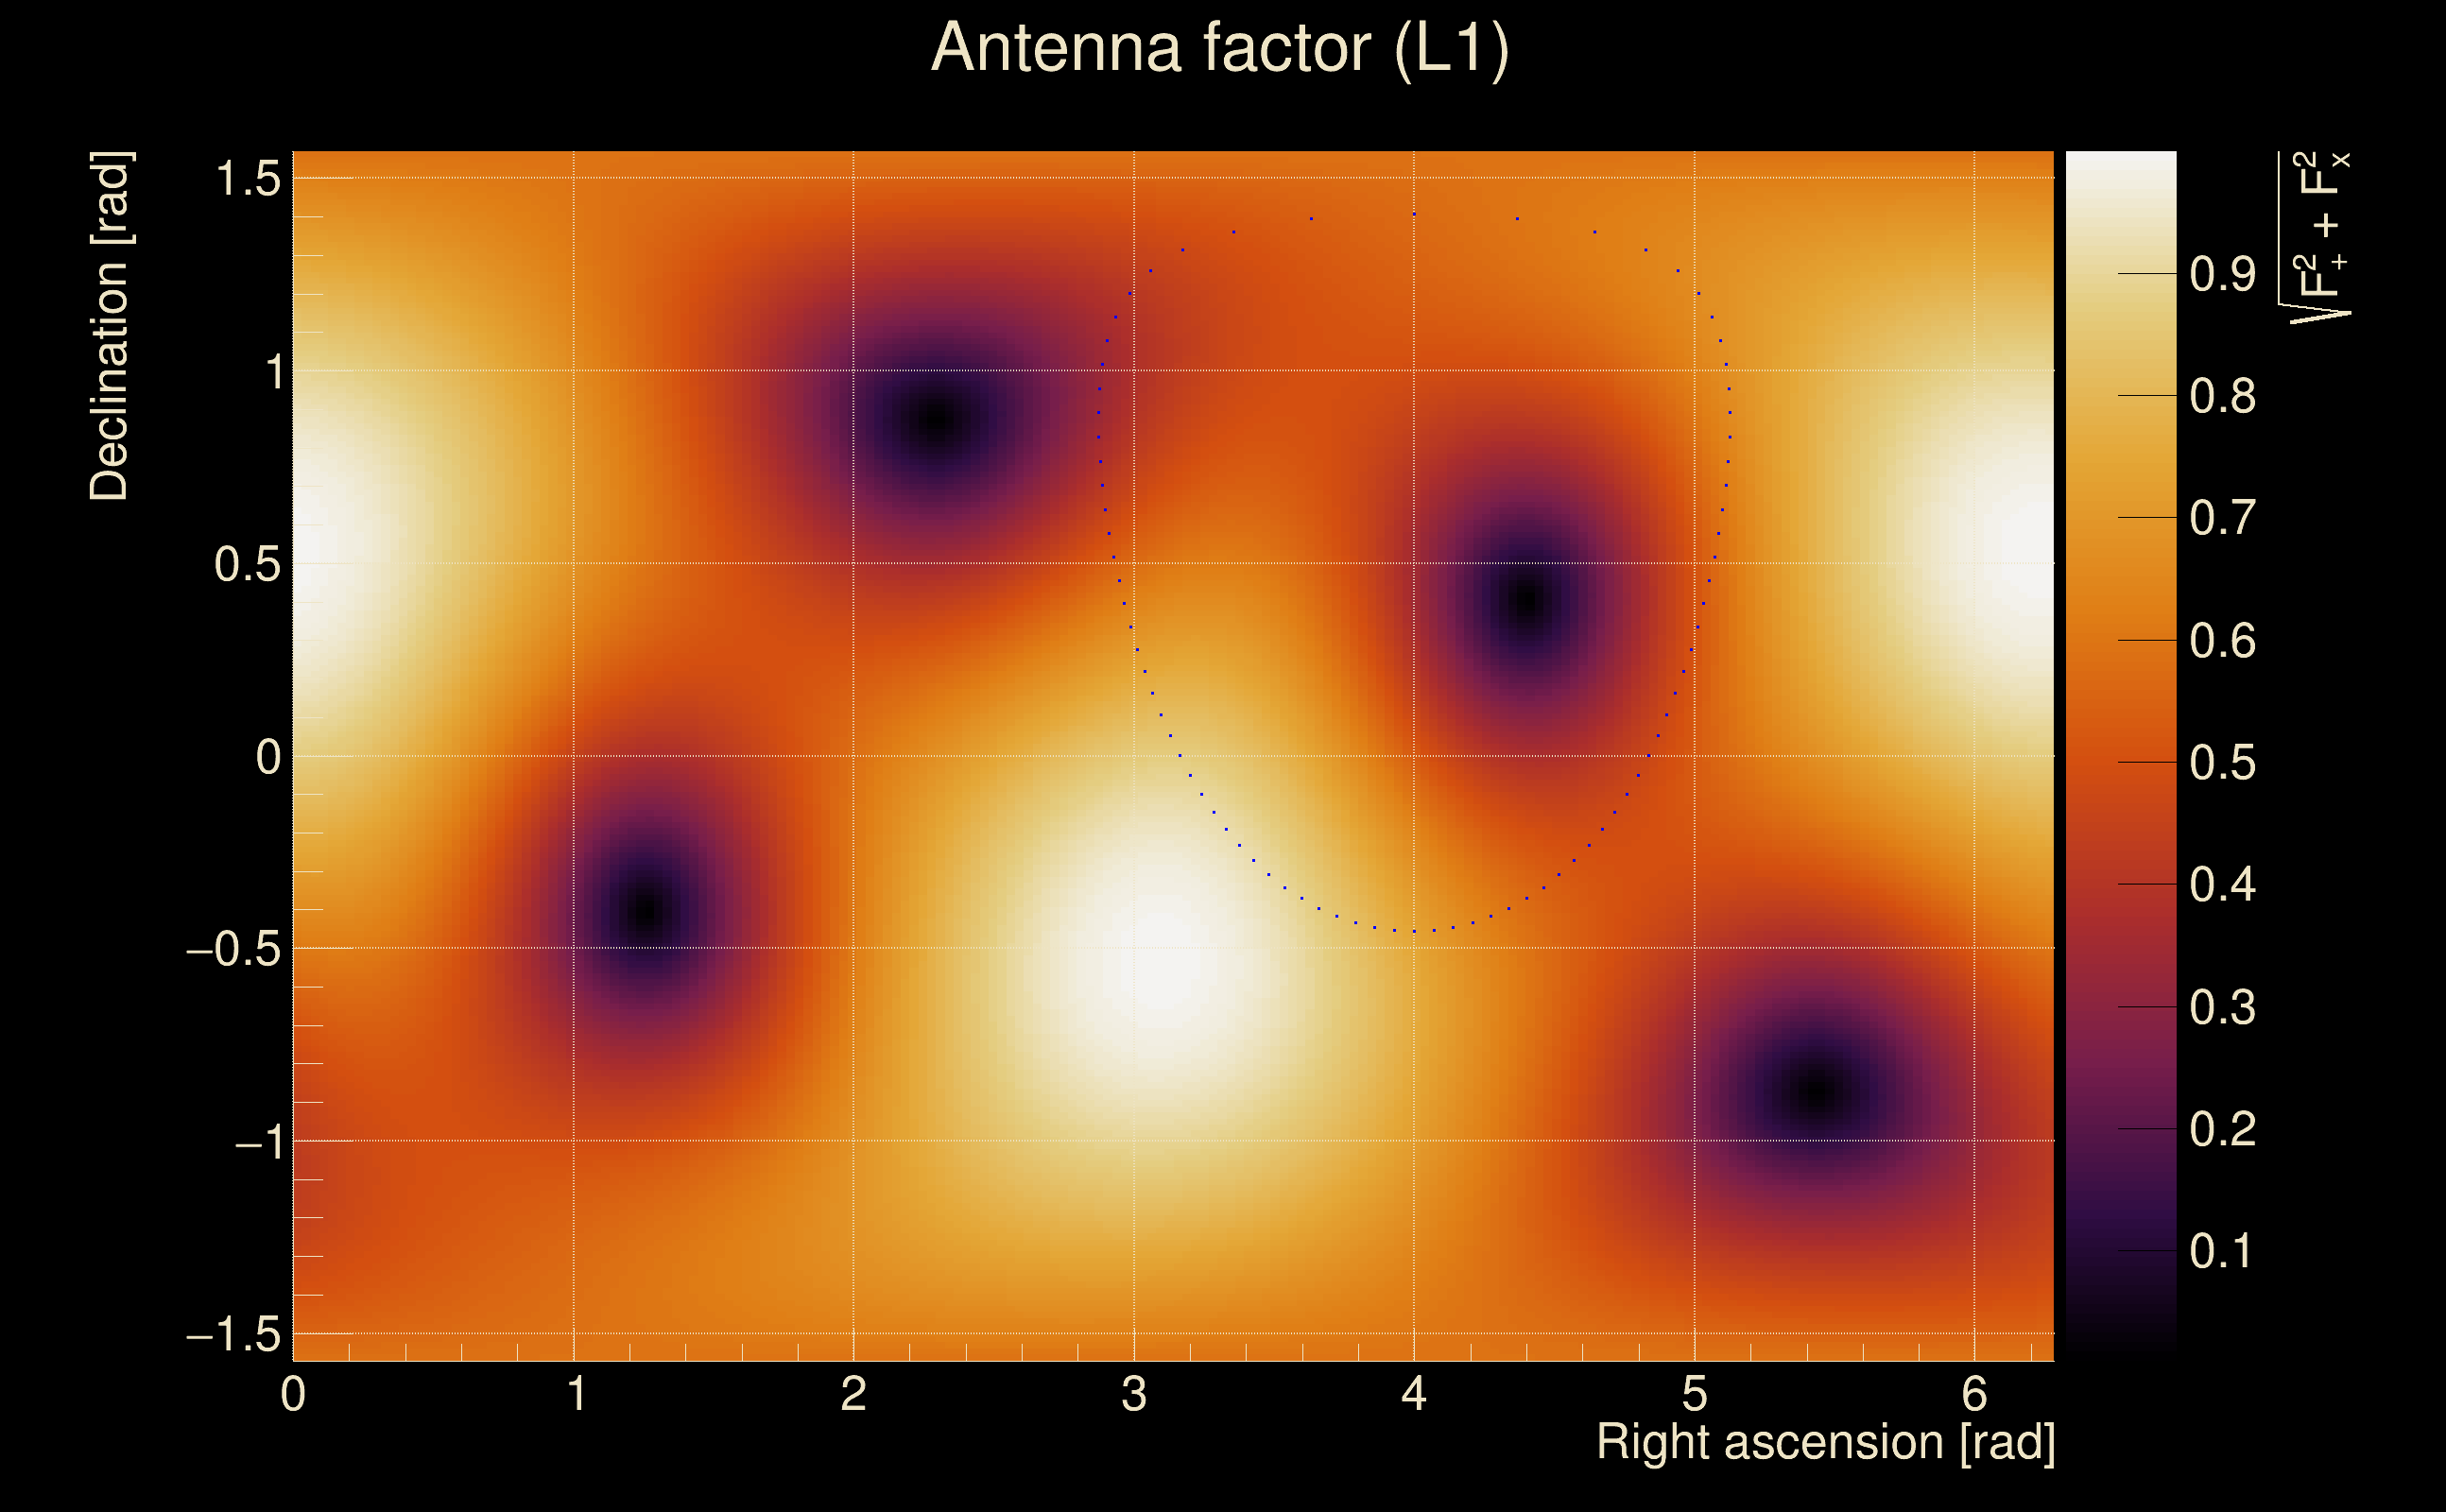
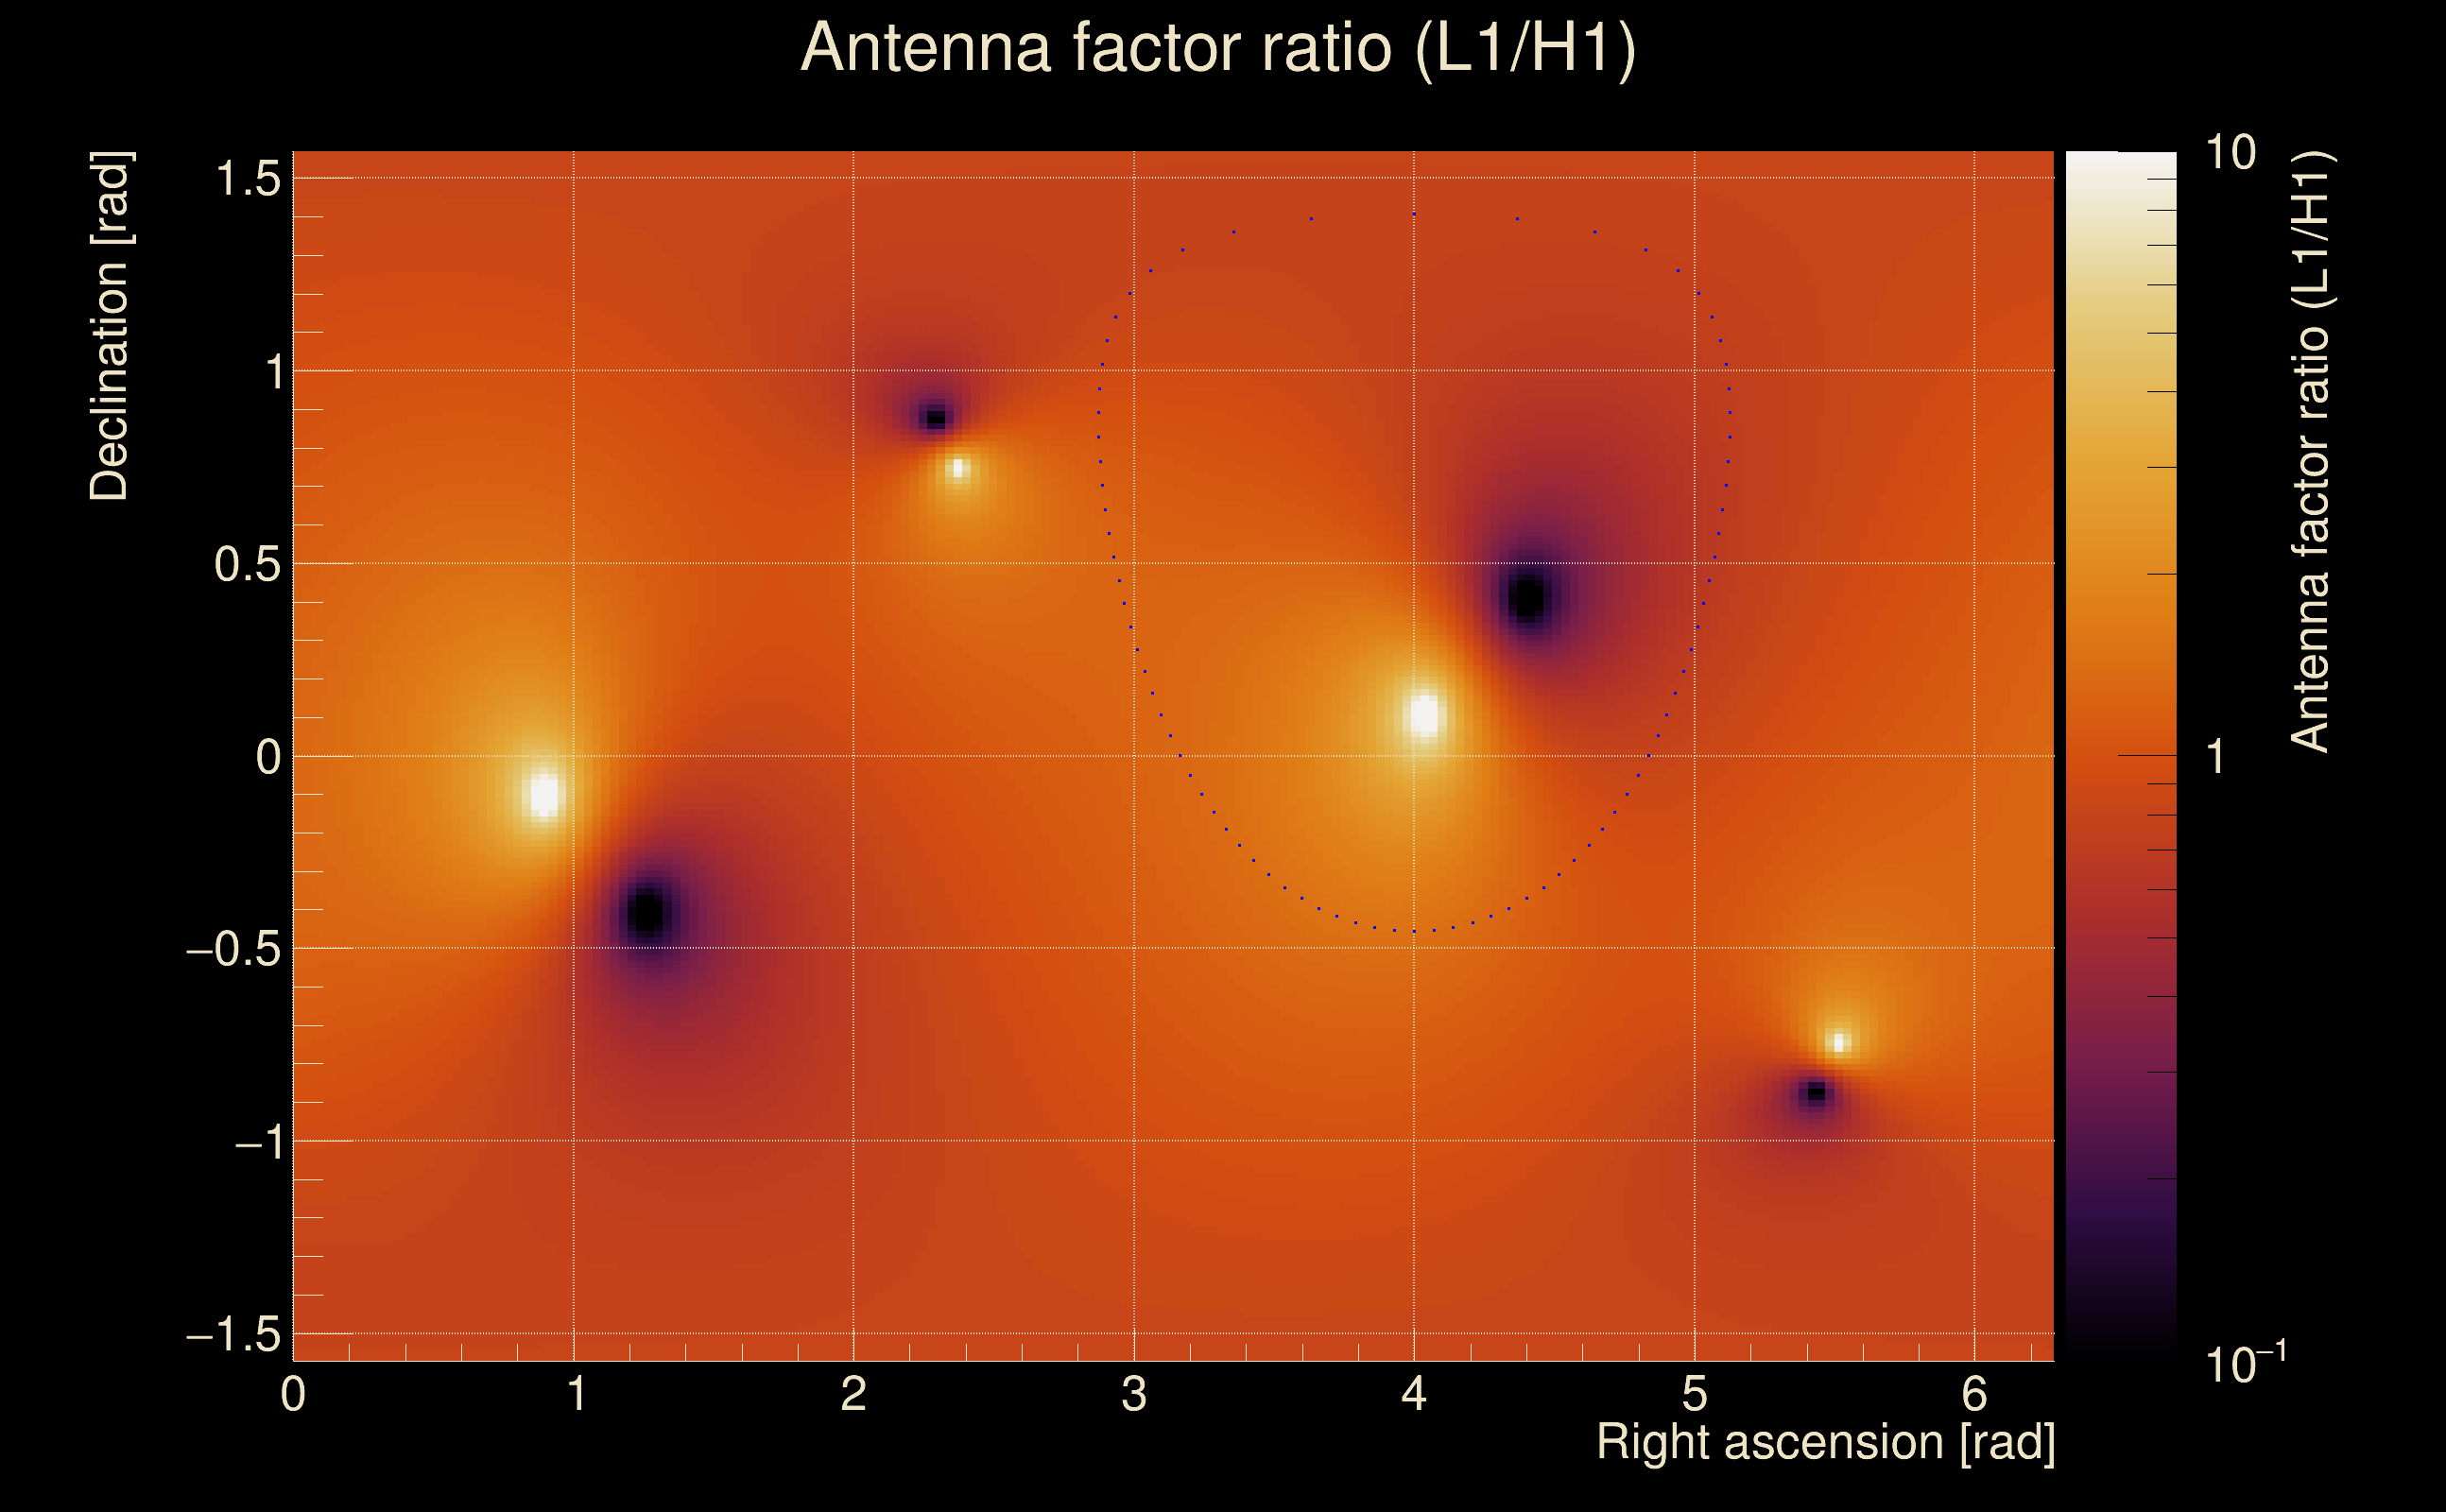
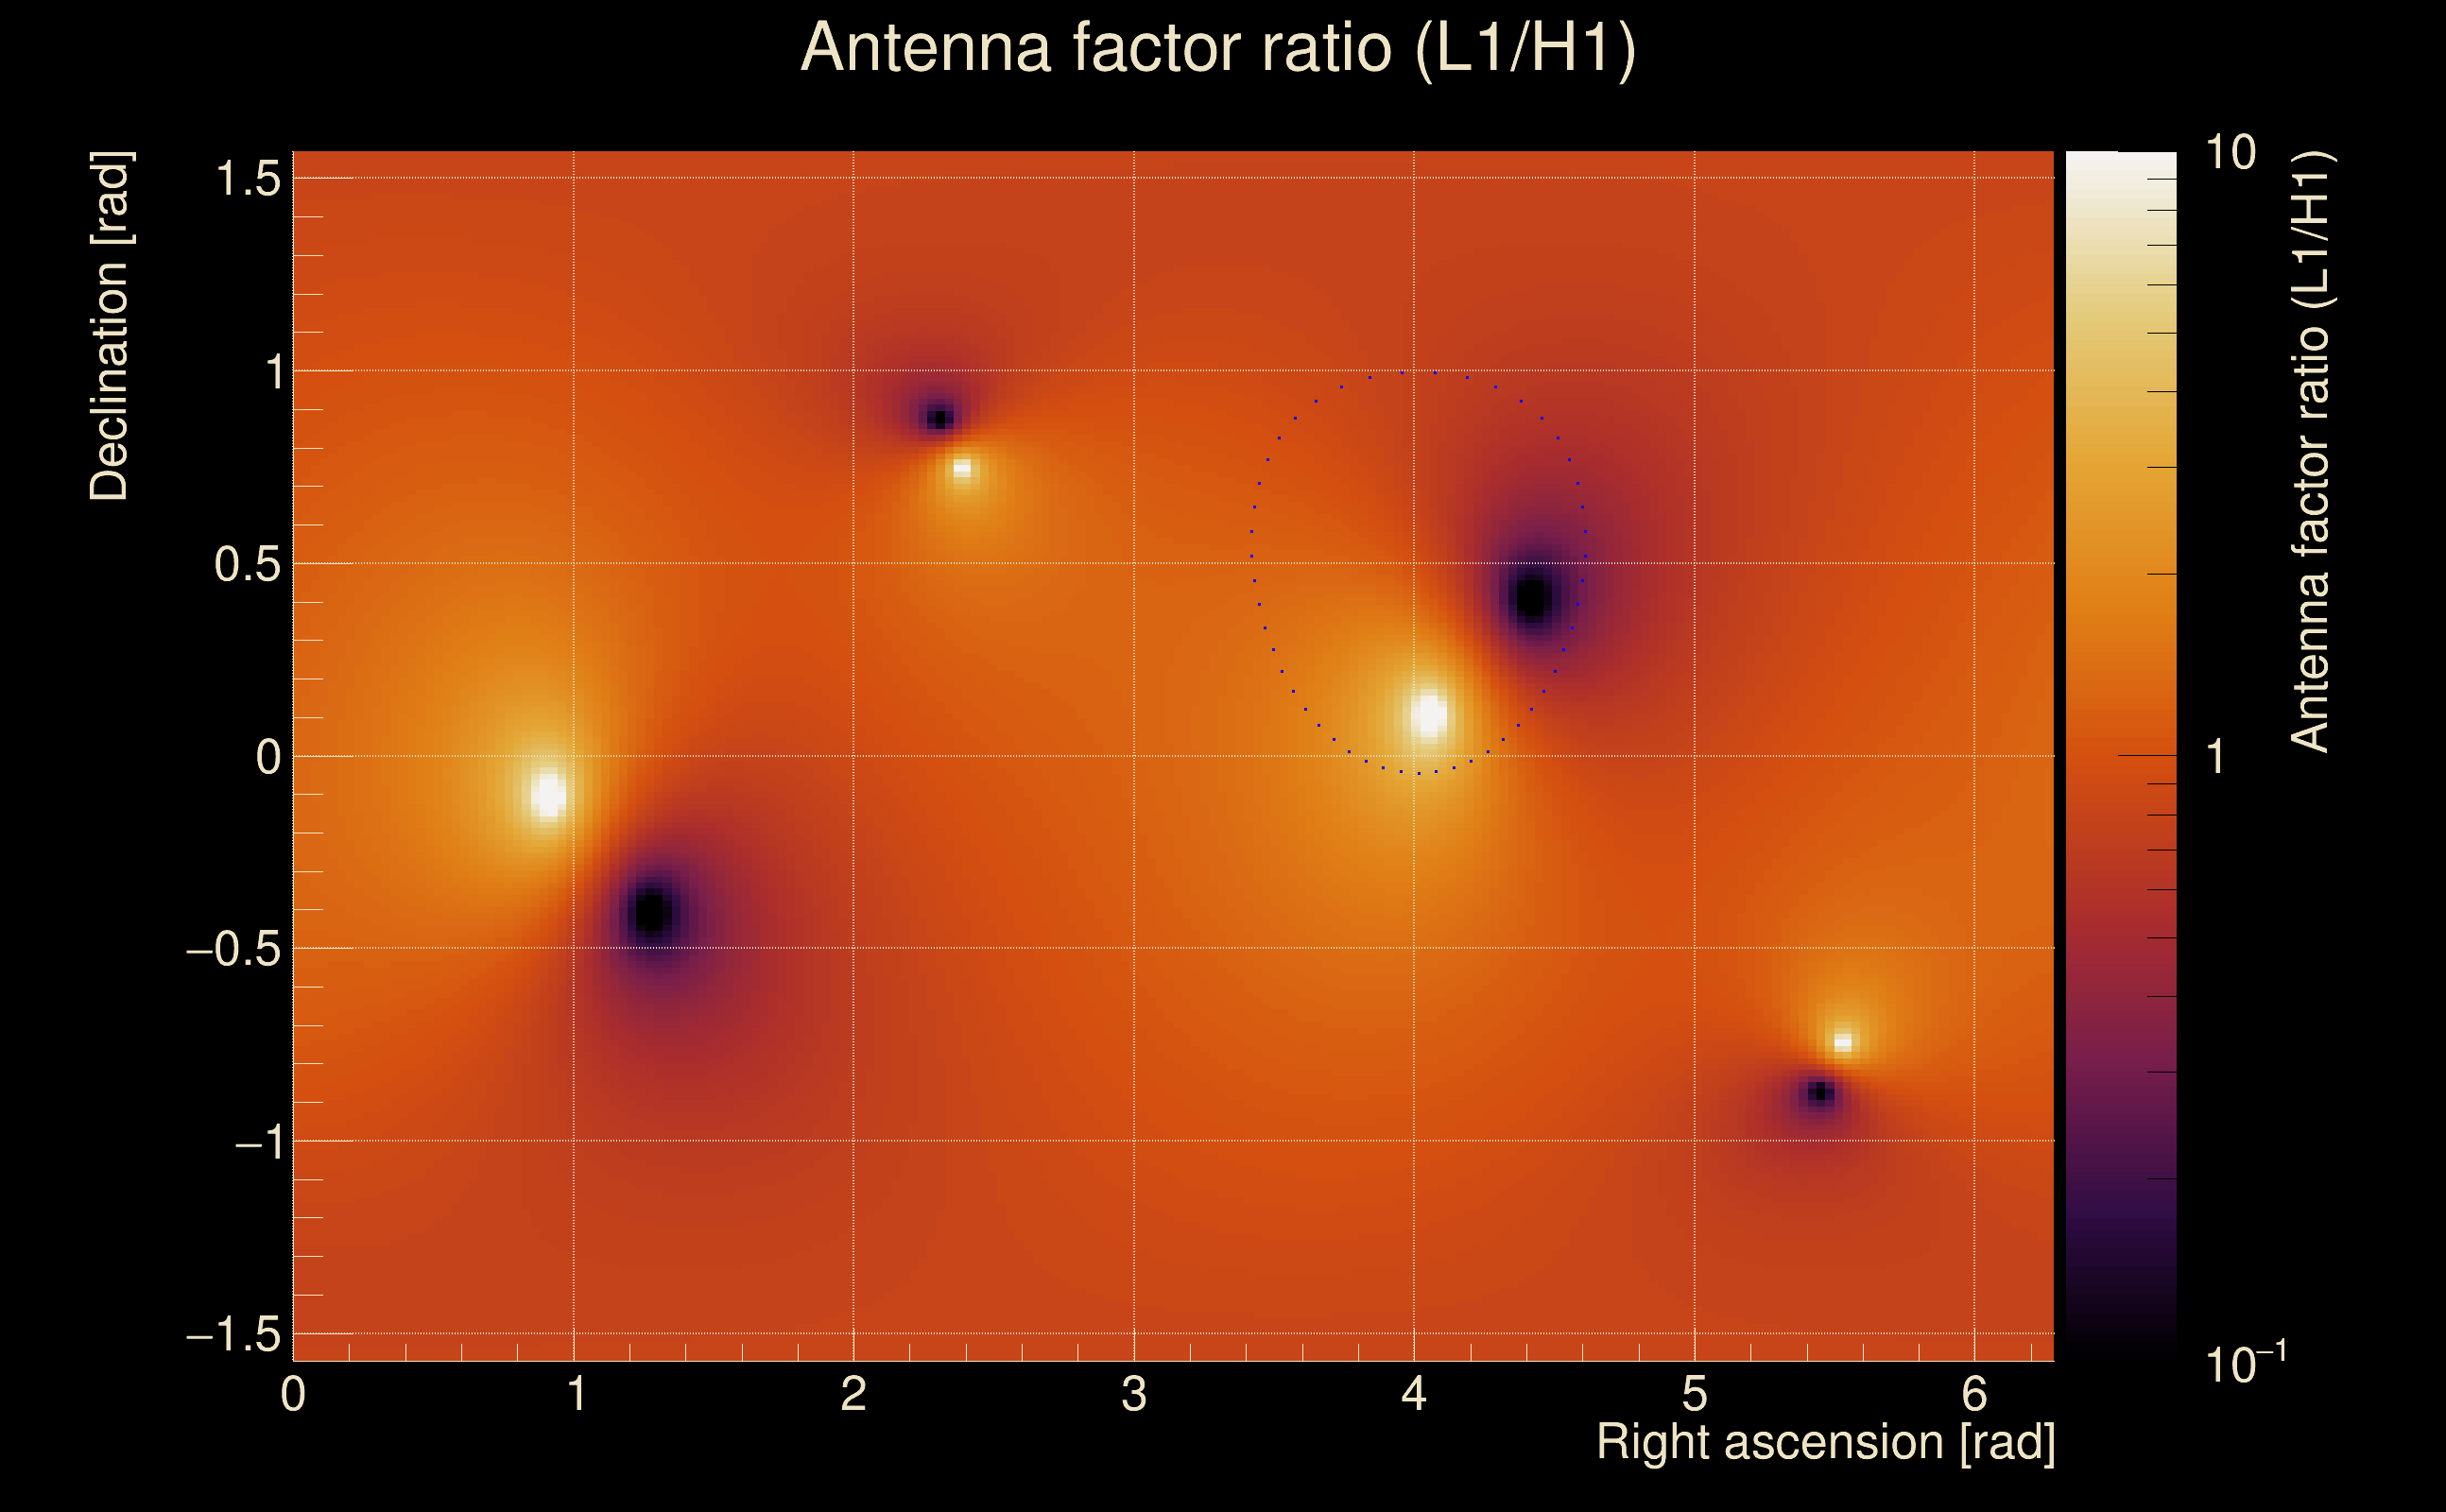
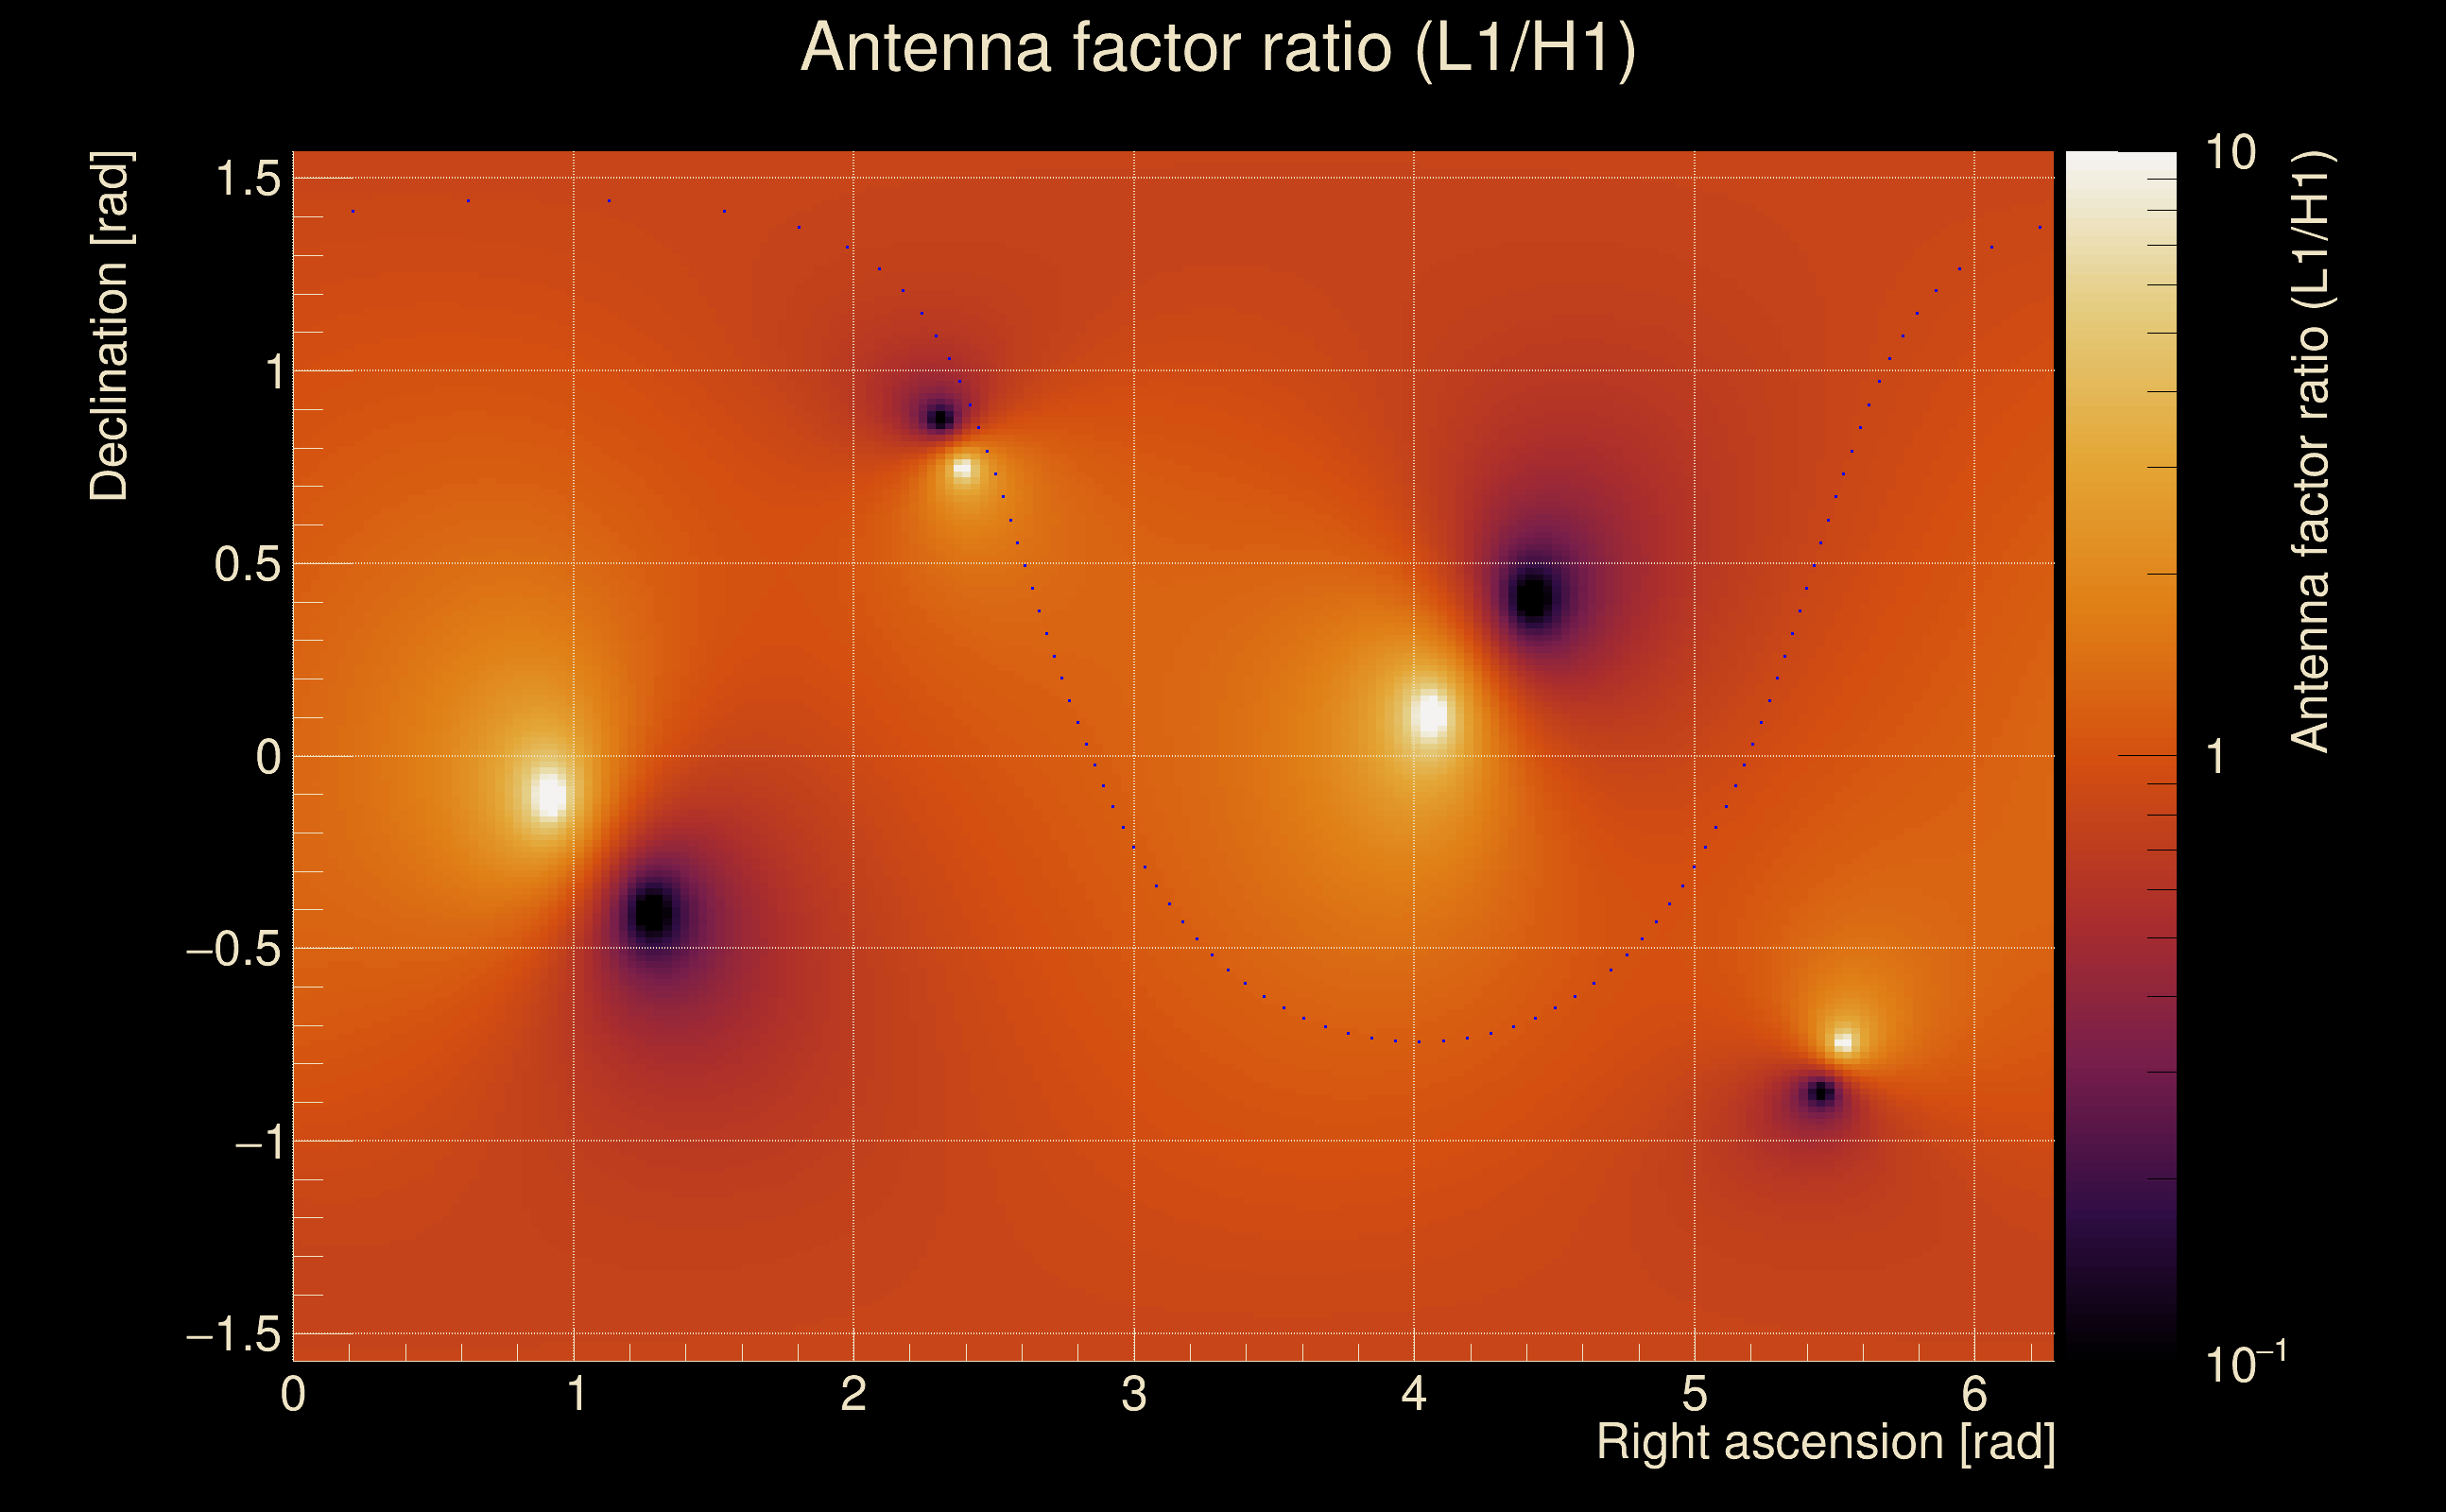
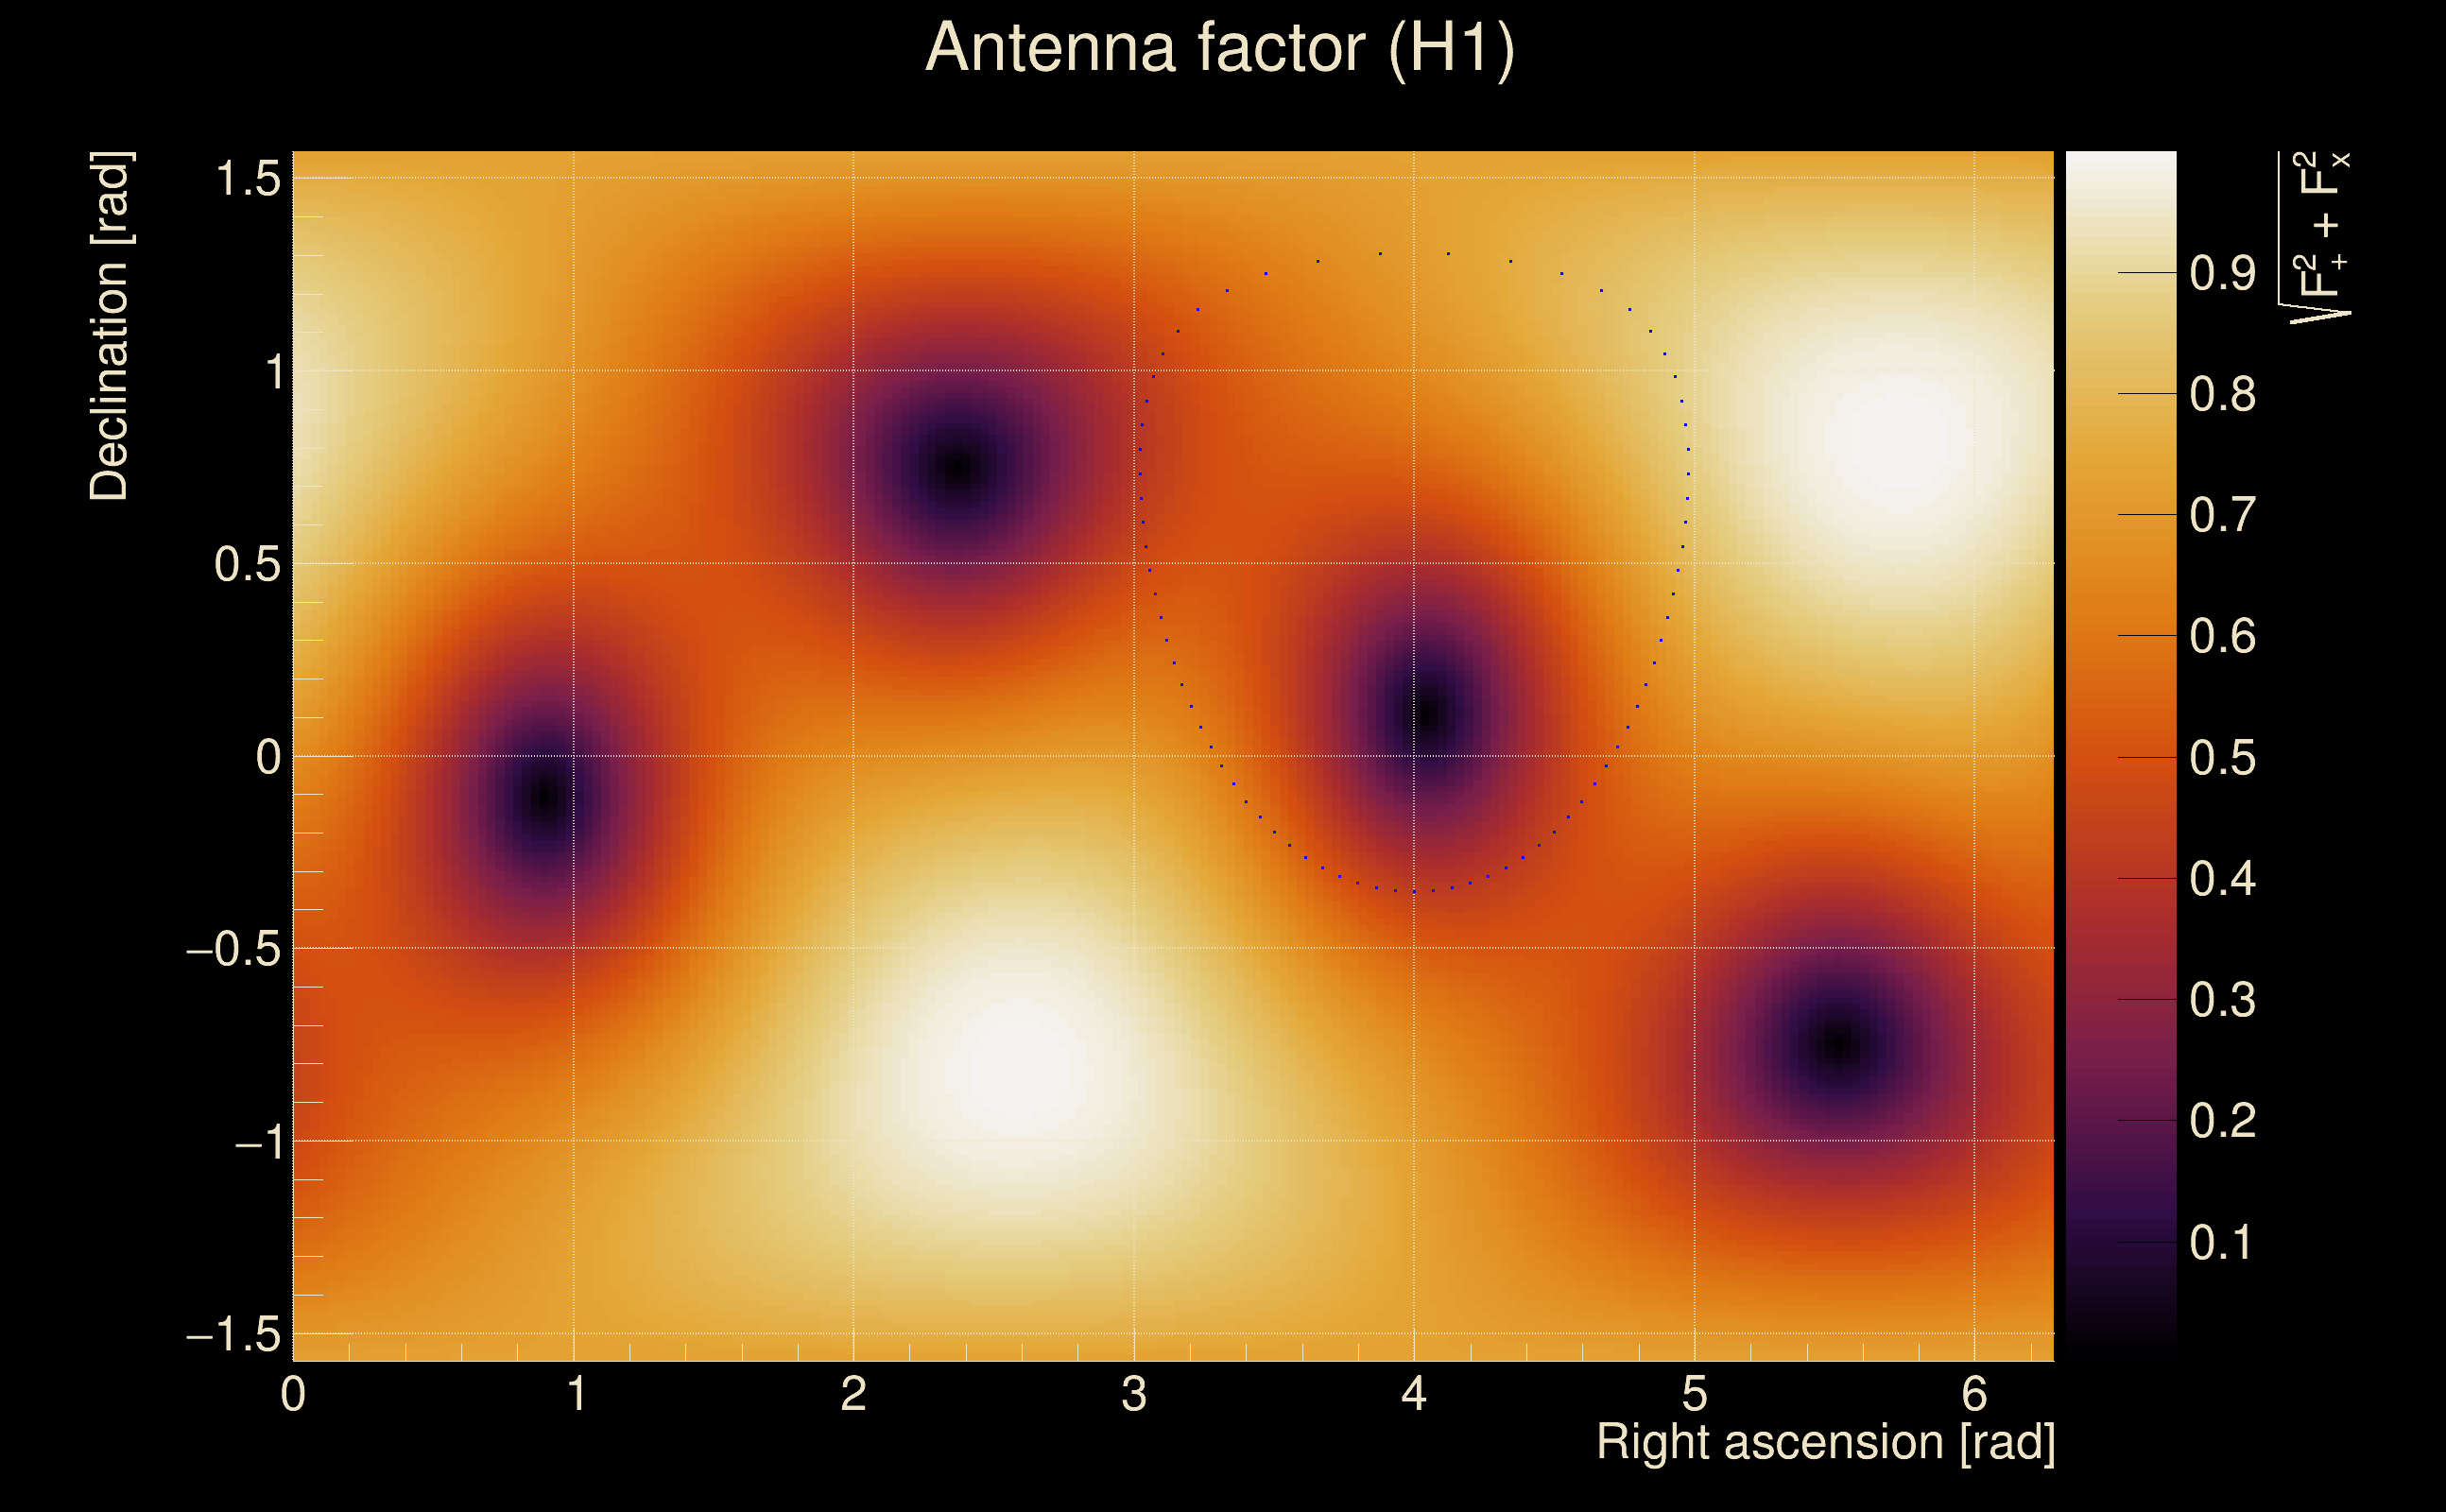
| Target sky positon: | Ra: 3.68109, Dec: 0.94792 [rad] |
| List of input Ox files: | TargIxf_injpt1_10min_file_list.txt (2 files) |
| Analysis result file: | TargIxf_injpt1_10min_results-0.root |
| Slice selected for the the fakeground: | slice index=10 (-5.492 s), time lag = -10 s |
| Foreground | Fakeground | Background | ||
|---|---|---|---|---|
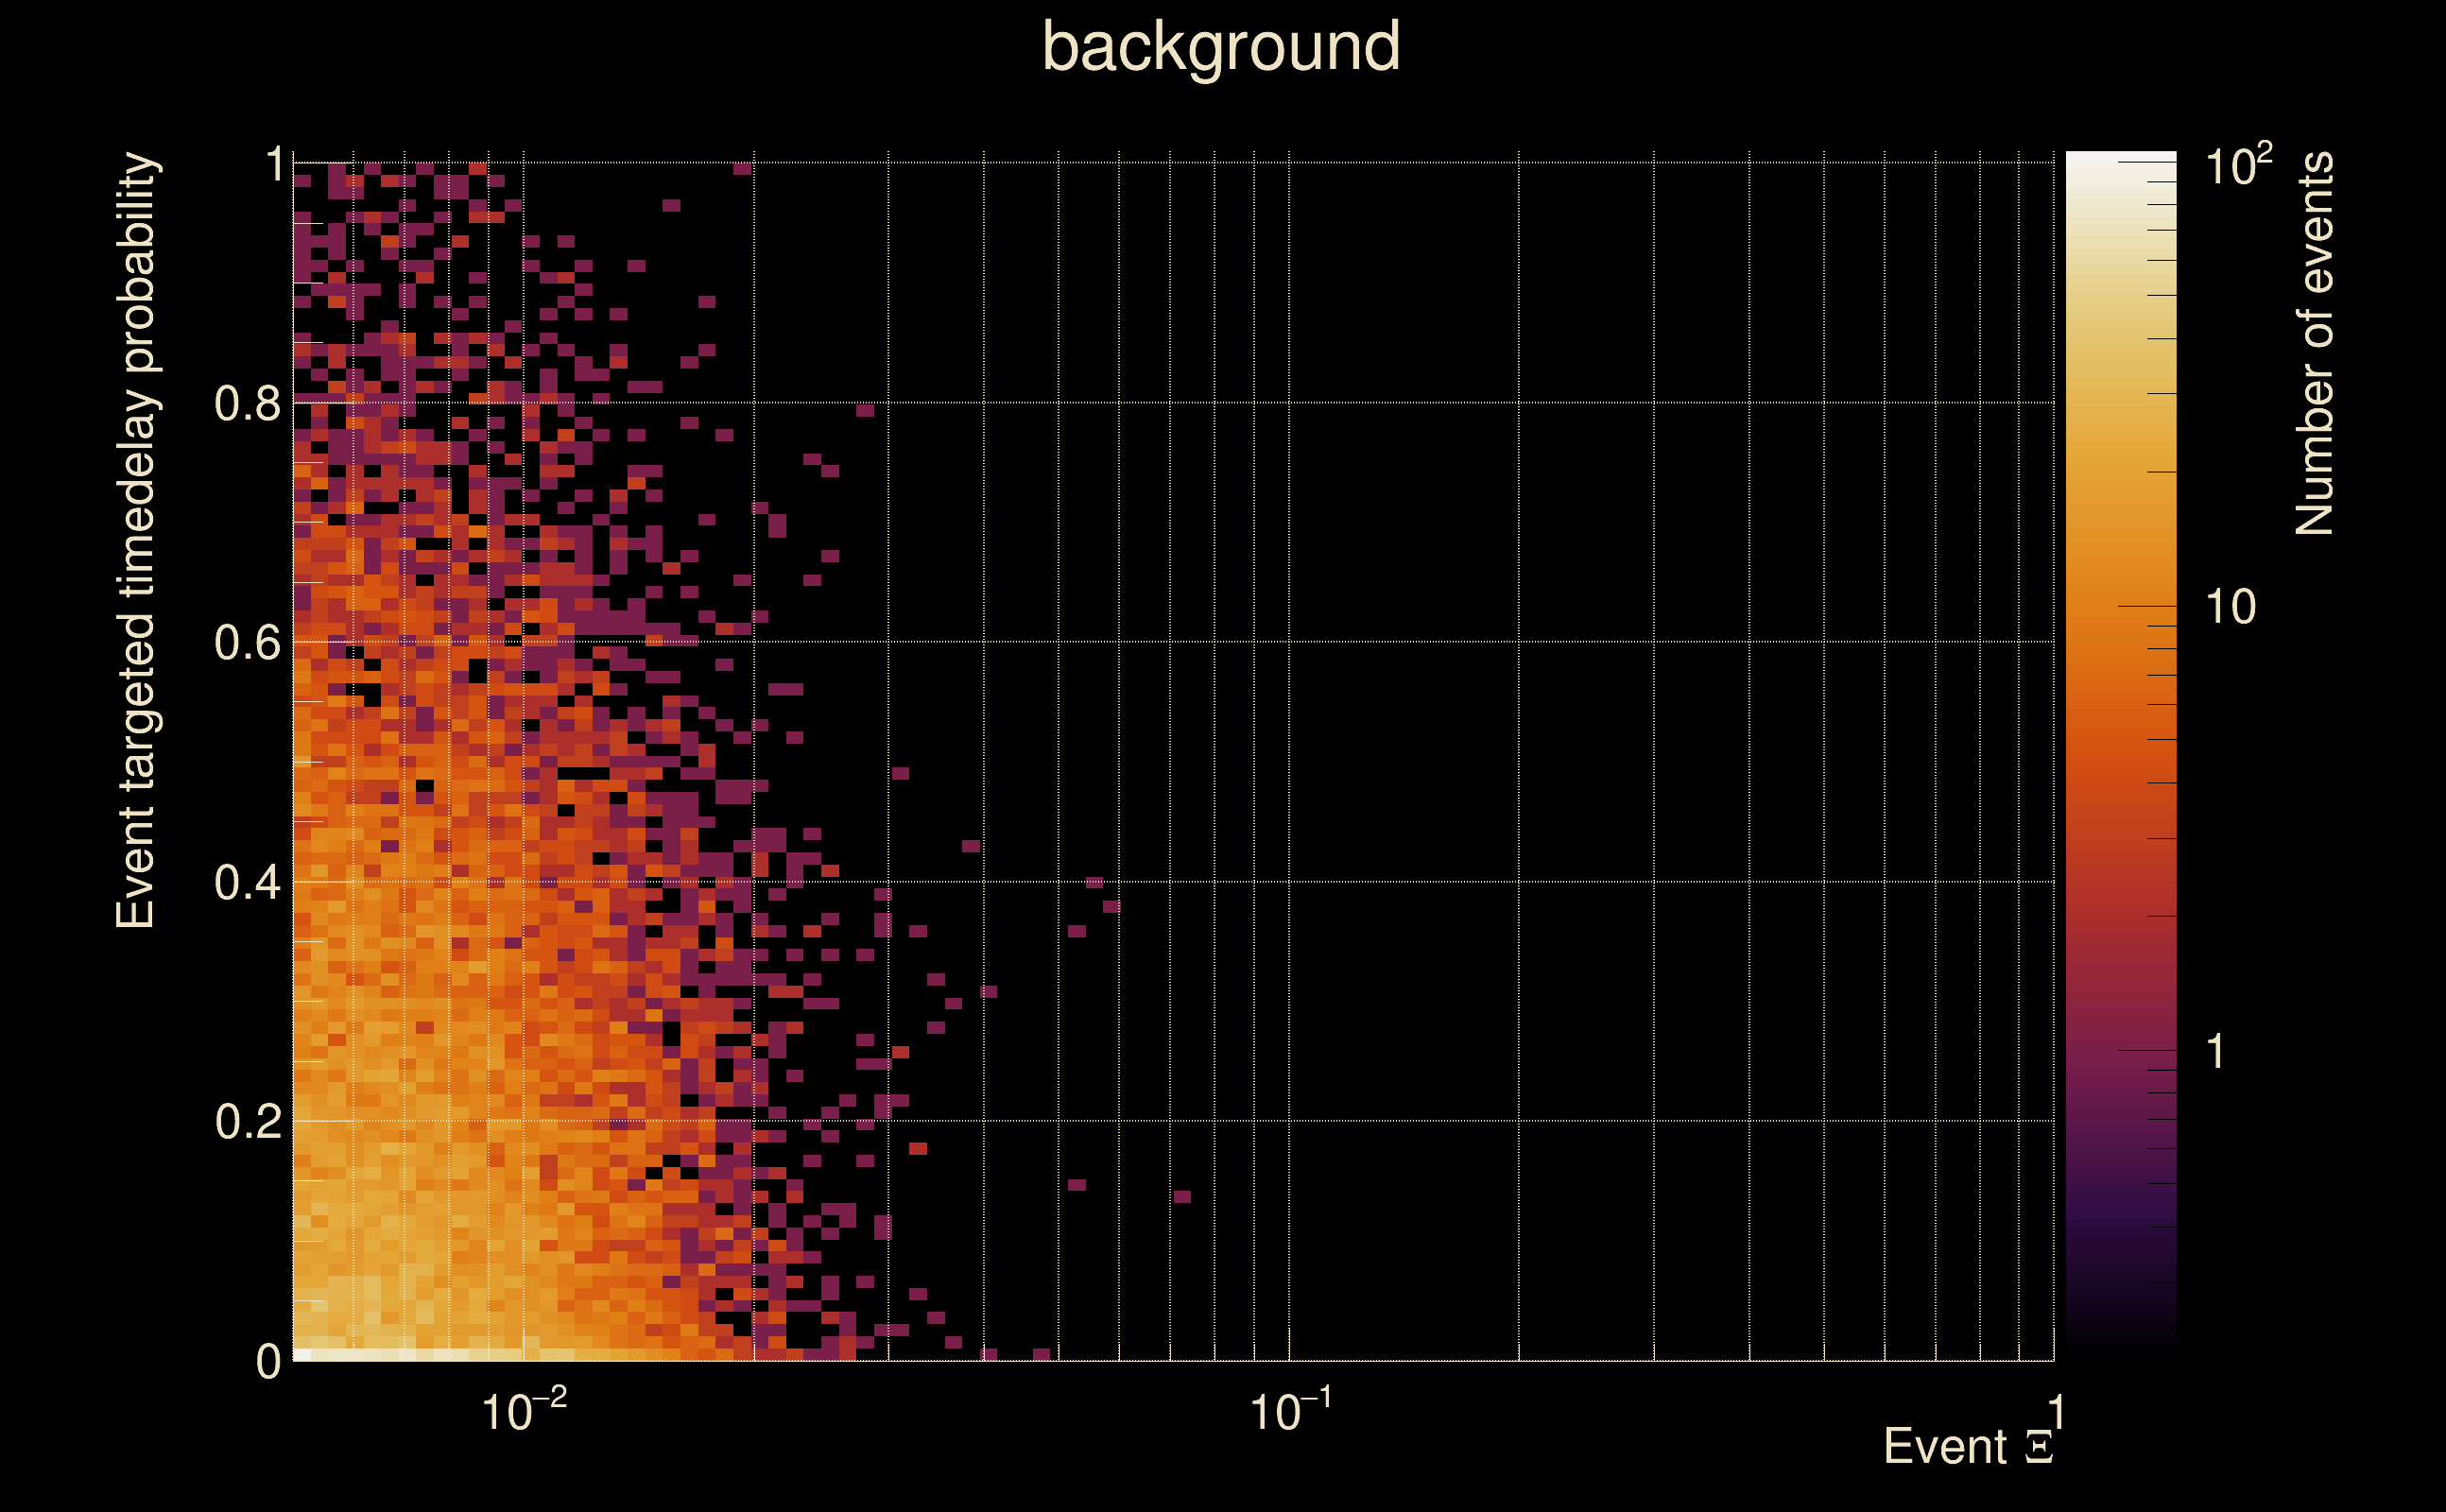
| Number of processed ox events | 0 | 115 | 49361 | |
| Start Date (detector 0) | - | Mon May 15 14:13:35 2023 UTC | Mon May 15 14:13:35 2023 UTC | |
| End Date (detector 0) | - | Mon May 15 14:23:15 2023 UTC | Mon May 15 14:23:15 2023 UTC | |
| Start GPS (detector 0) | - | 1368195233 | 1368195233 | |
| End GPS (detector 0) | - | 1368195813 | 1368195813 | |
| Used livetime (detector 0) | 0 s | 580 s | 580 s | |
| Start Date (detector 1) | - | Mon May 15 14:13:25 2023 UTC | Mon May 15 14:13:25 2023 UTC | |
| End Date (detector 1) | - | Mon May 15 14:23:05 2023 UTC | Mon May 15 14:23:05 2023 UTC | |
| Start GPS (detector 1) | - | 1368195223 | 1368195223 | |
| End GPS (detector 1) | - | 1368195803 | 1368195803 | |
| Used livetime (detector 1) | 0 s | 580 s | 580 s | |
| Cumulative livetime | 0 s | 1150 s | 493610 s | |
| 0 years, 0 days, 0 hours, 0 min, 0 s | 0 years, 0 days, 0 hours, 19 min, 10 s | 0 years, 5 days, 17 hours, 6 min, 50 s |
|
|
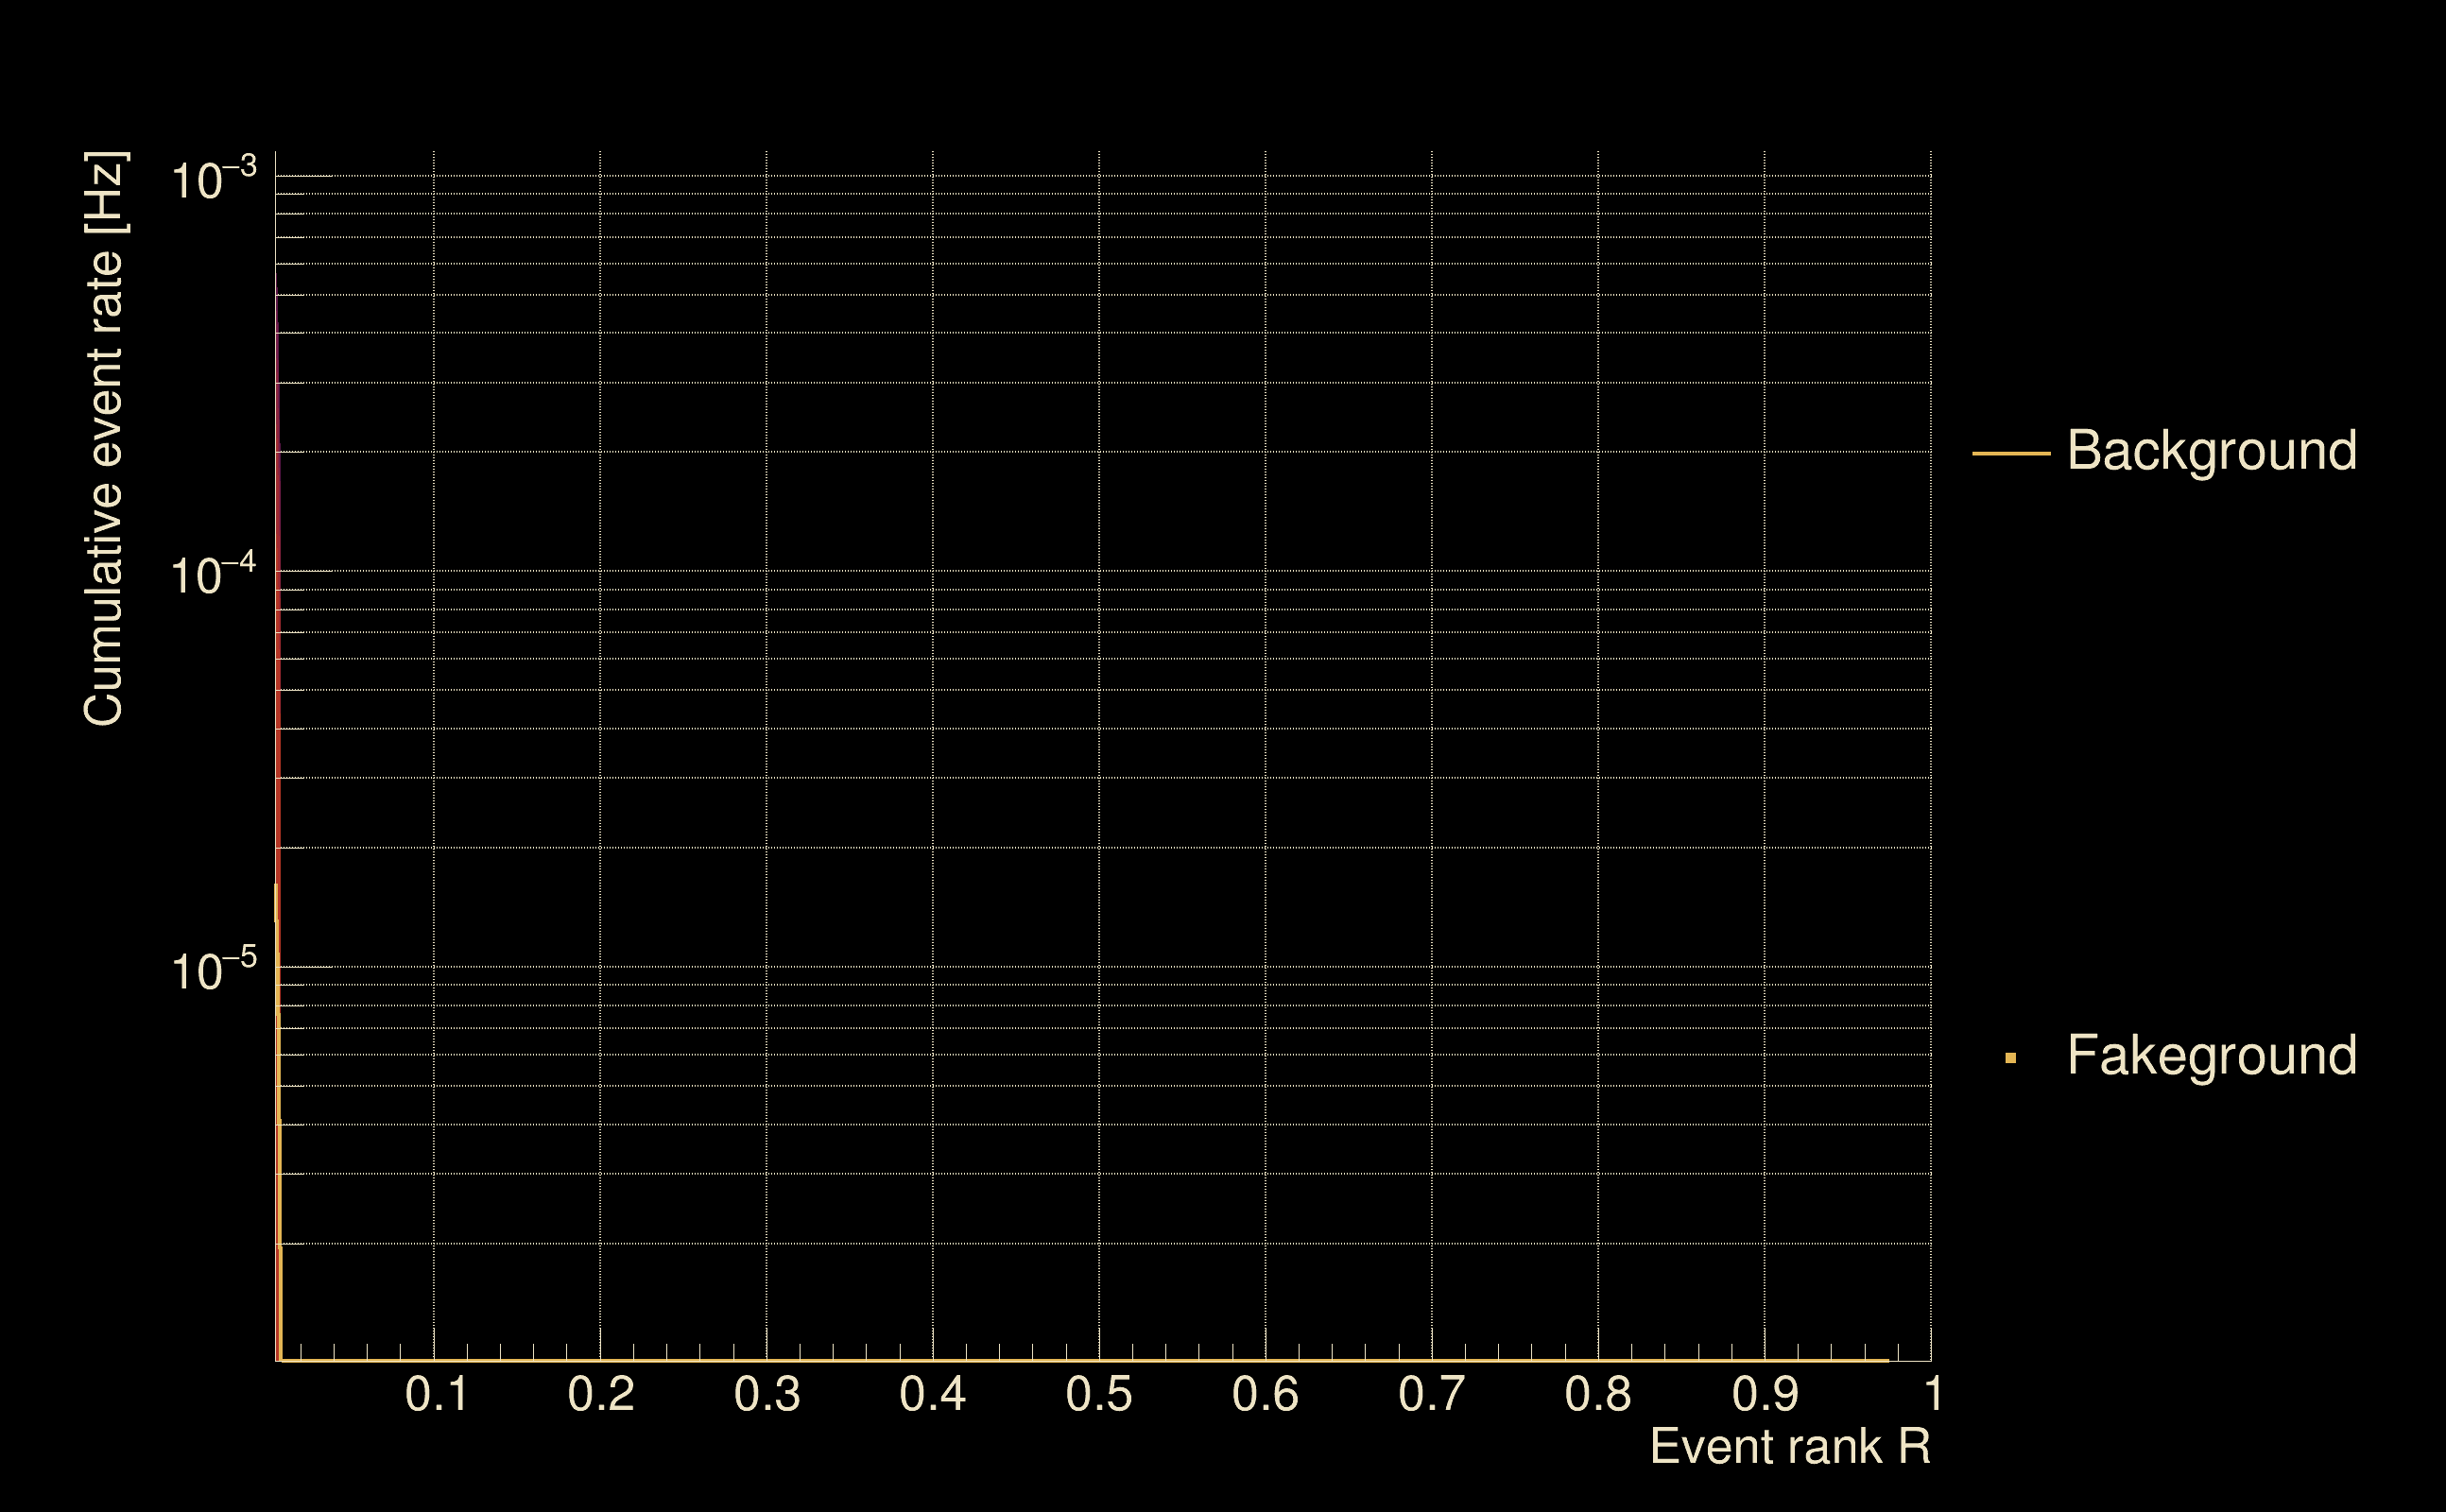
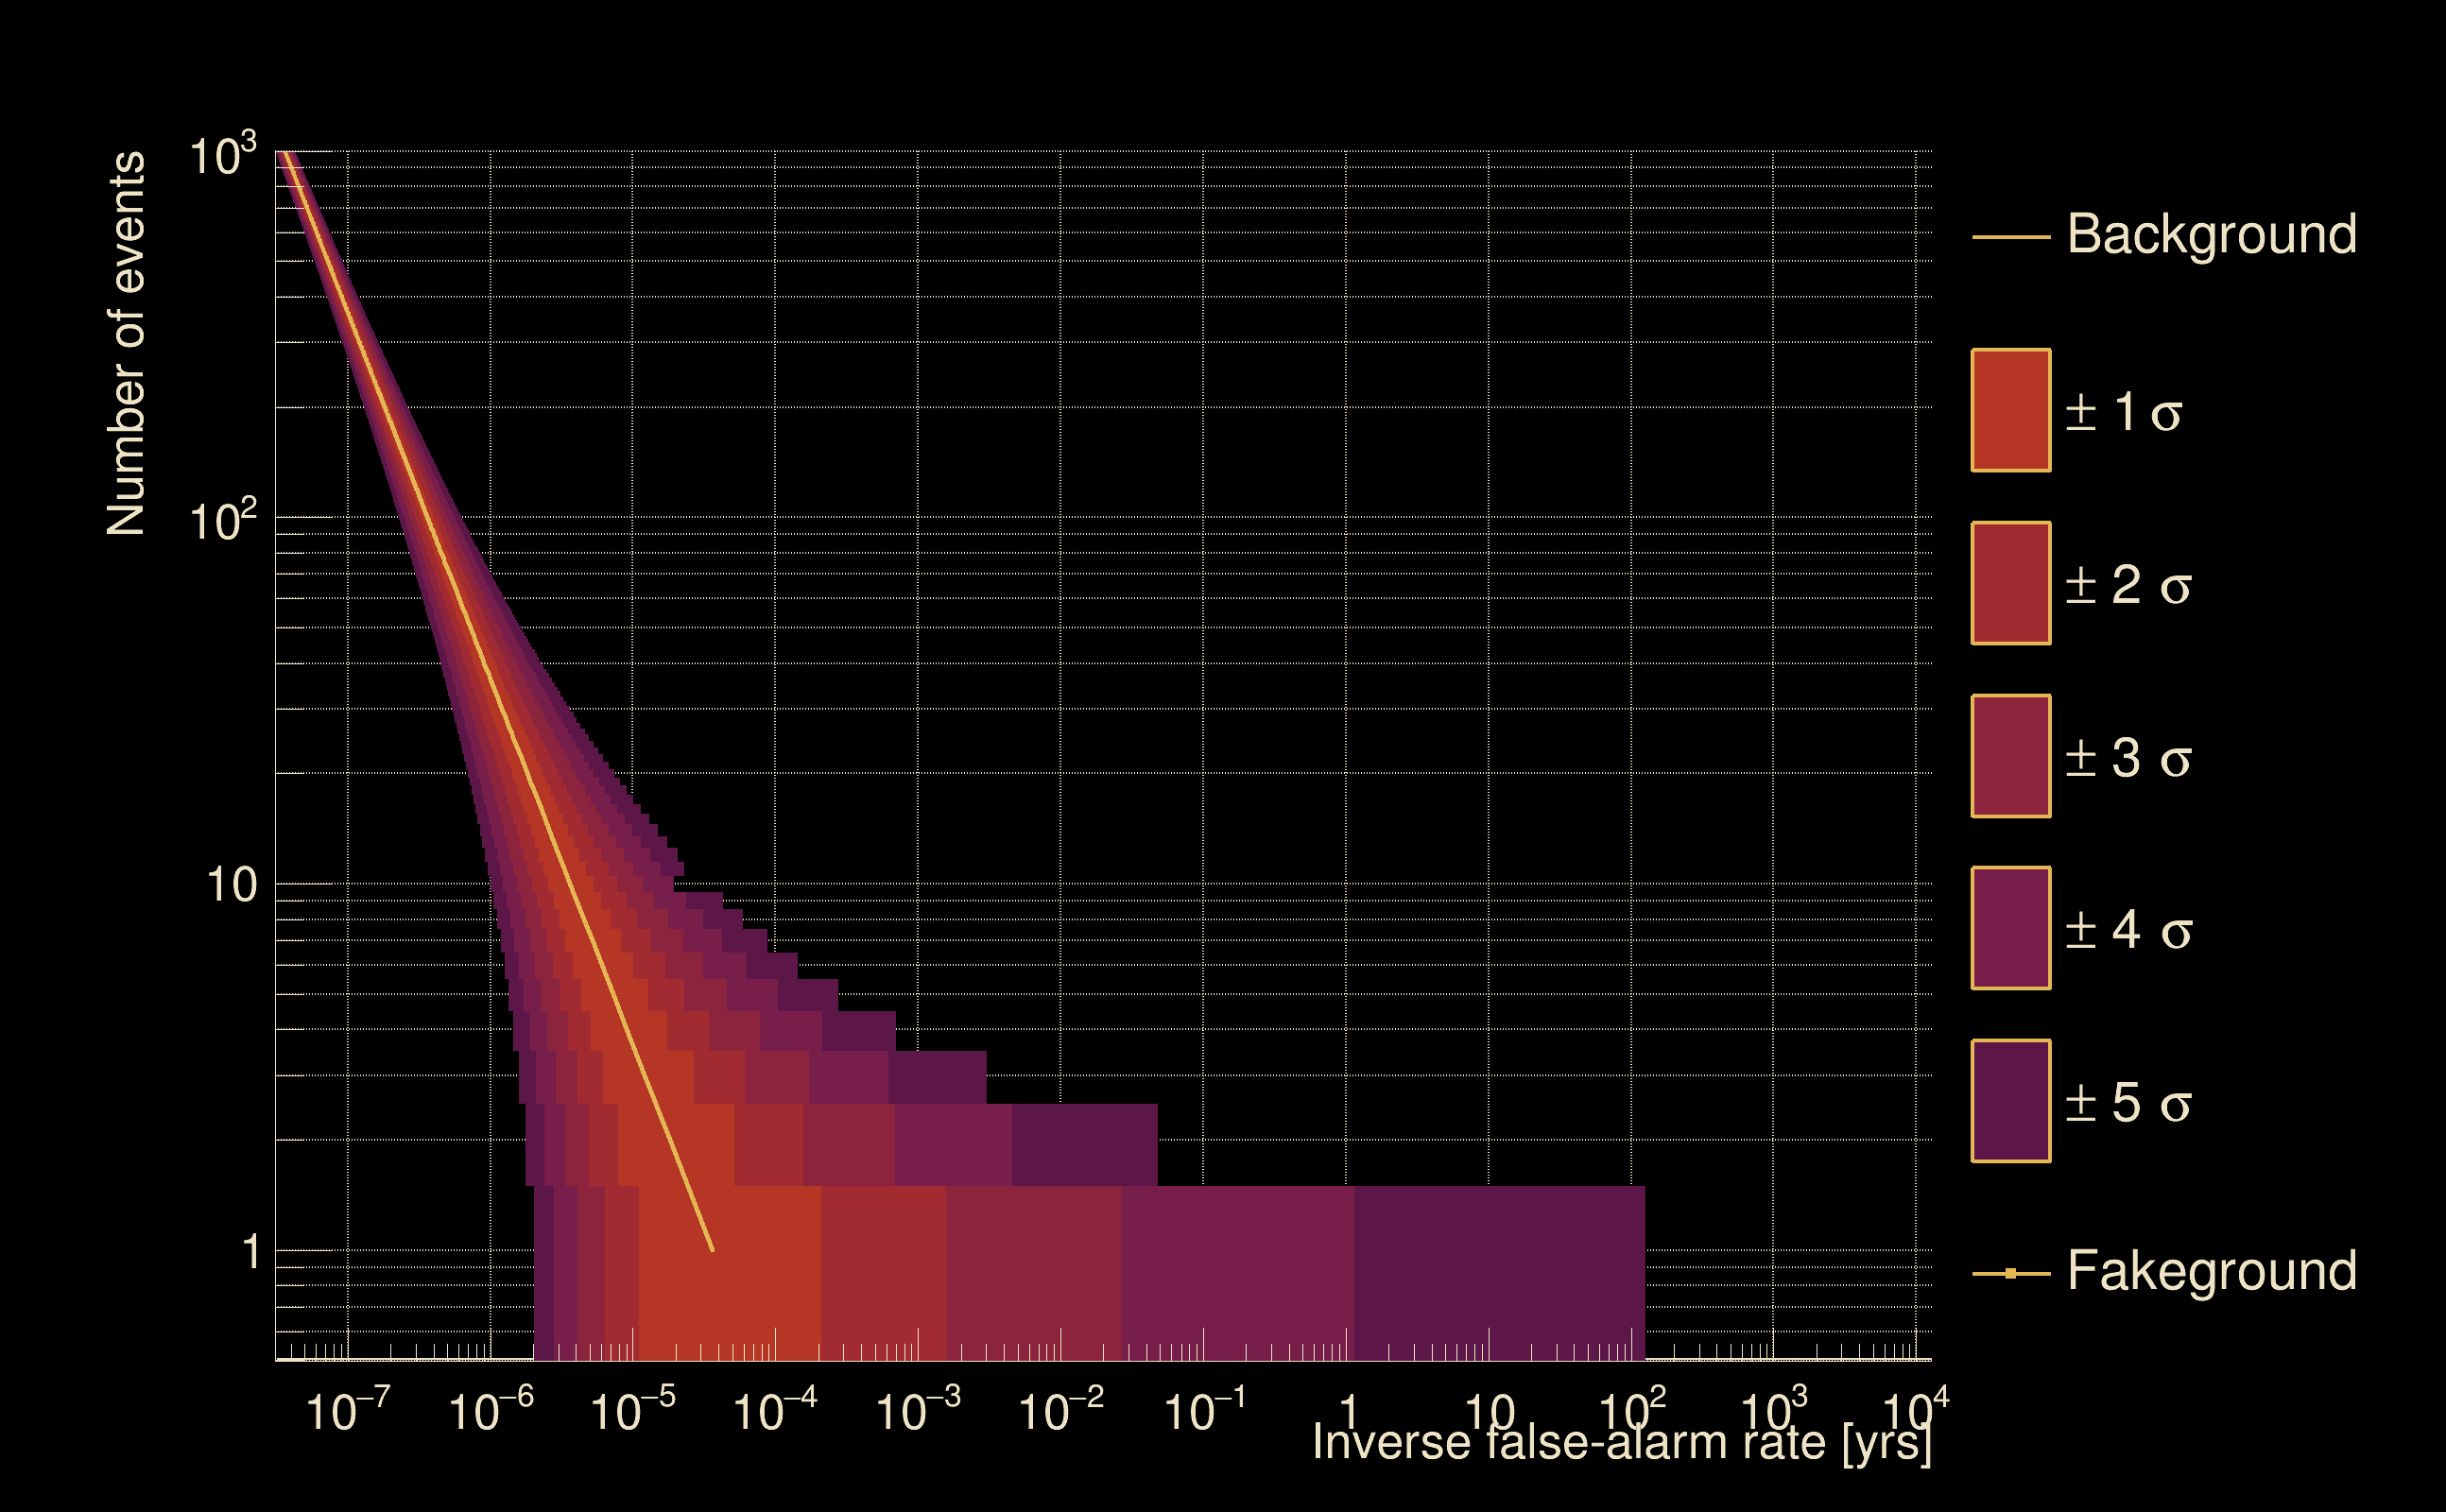
| Detection threshold: | R > 0.00784711 |
| False-alarm rate above that detection threshold: | 1.01295e-06 |
| Alternative threshold at 1/1000 yrs: | R > 0.00784711 |
| Alternative threshold at 1/100 yrs: | R > 0.00784711 |
| Alternative threshold at 1/10 yrs: | R > 0.00784711 |
| Alternative threshold at 1/1 yr: | R > 0.00784711 |
| Alternative threshold at 1/1 d: | R > inf |
 |
|
 |
 |
 |
 |
 |
 |
 |
 |
 |
 |
| Event time t(H1): | GPS = 1368195513 (Mon May 15 14:18:15 2023 ) → GPS = 1368195523 (Mon May 15 14:18:25 2023 ) |
| Event time t(L1): | GPS = 1368195503 (Mon May 15 14:18:25 2023 ) → GPS = 1368195513 (Mon May 15 14:18:15 2023 ) |
| Omicron analysis time window (H1): | GPS = 1368195510 → GPS = 1368195526 |
| Omicron analysis time window (L1): | GPS = 1368195500 → GPS = 1368195516 |
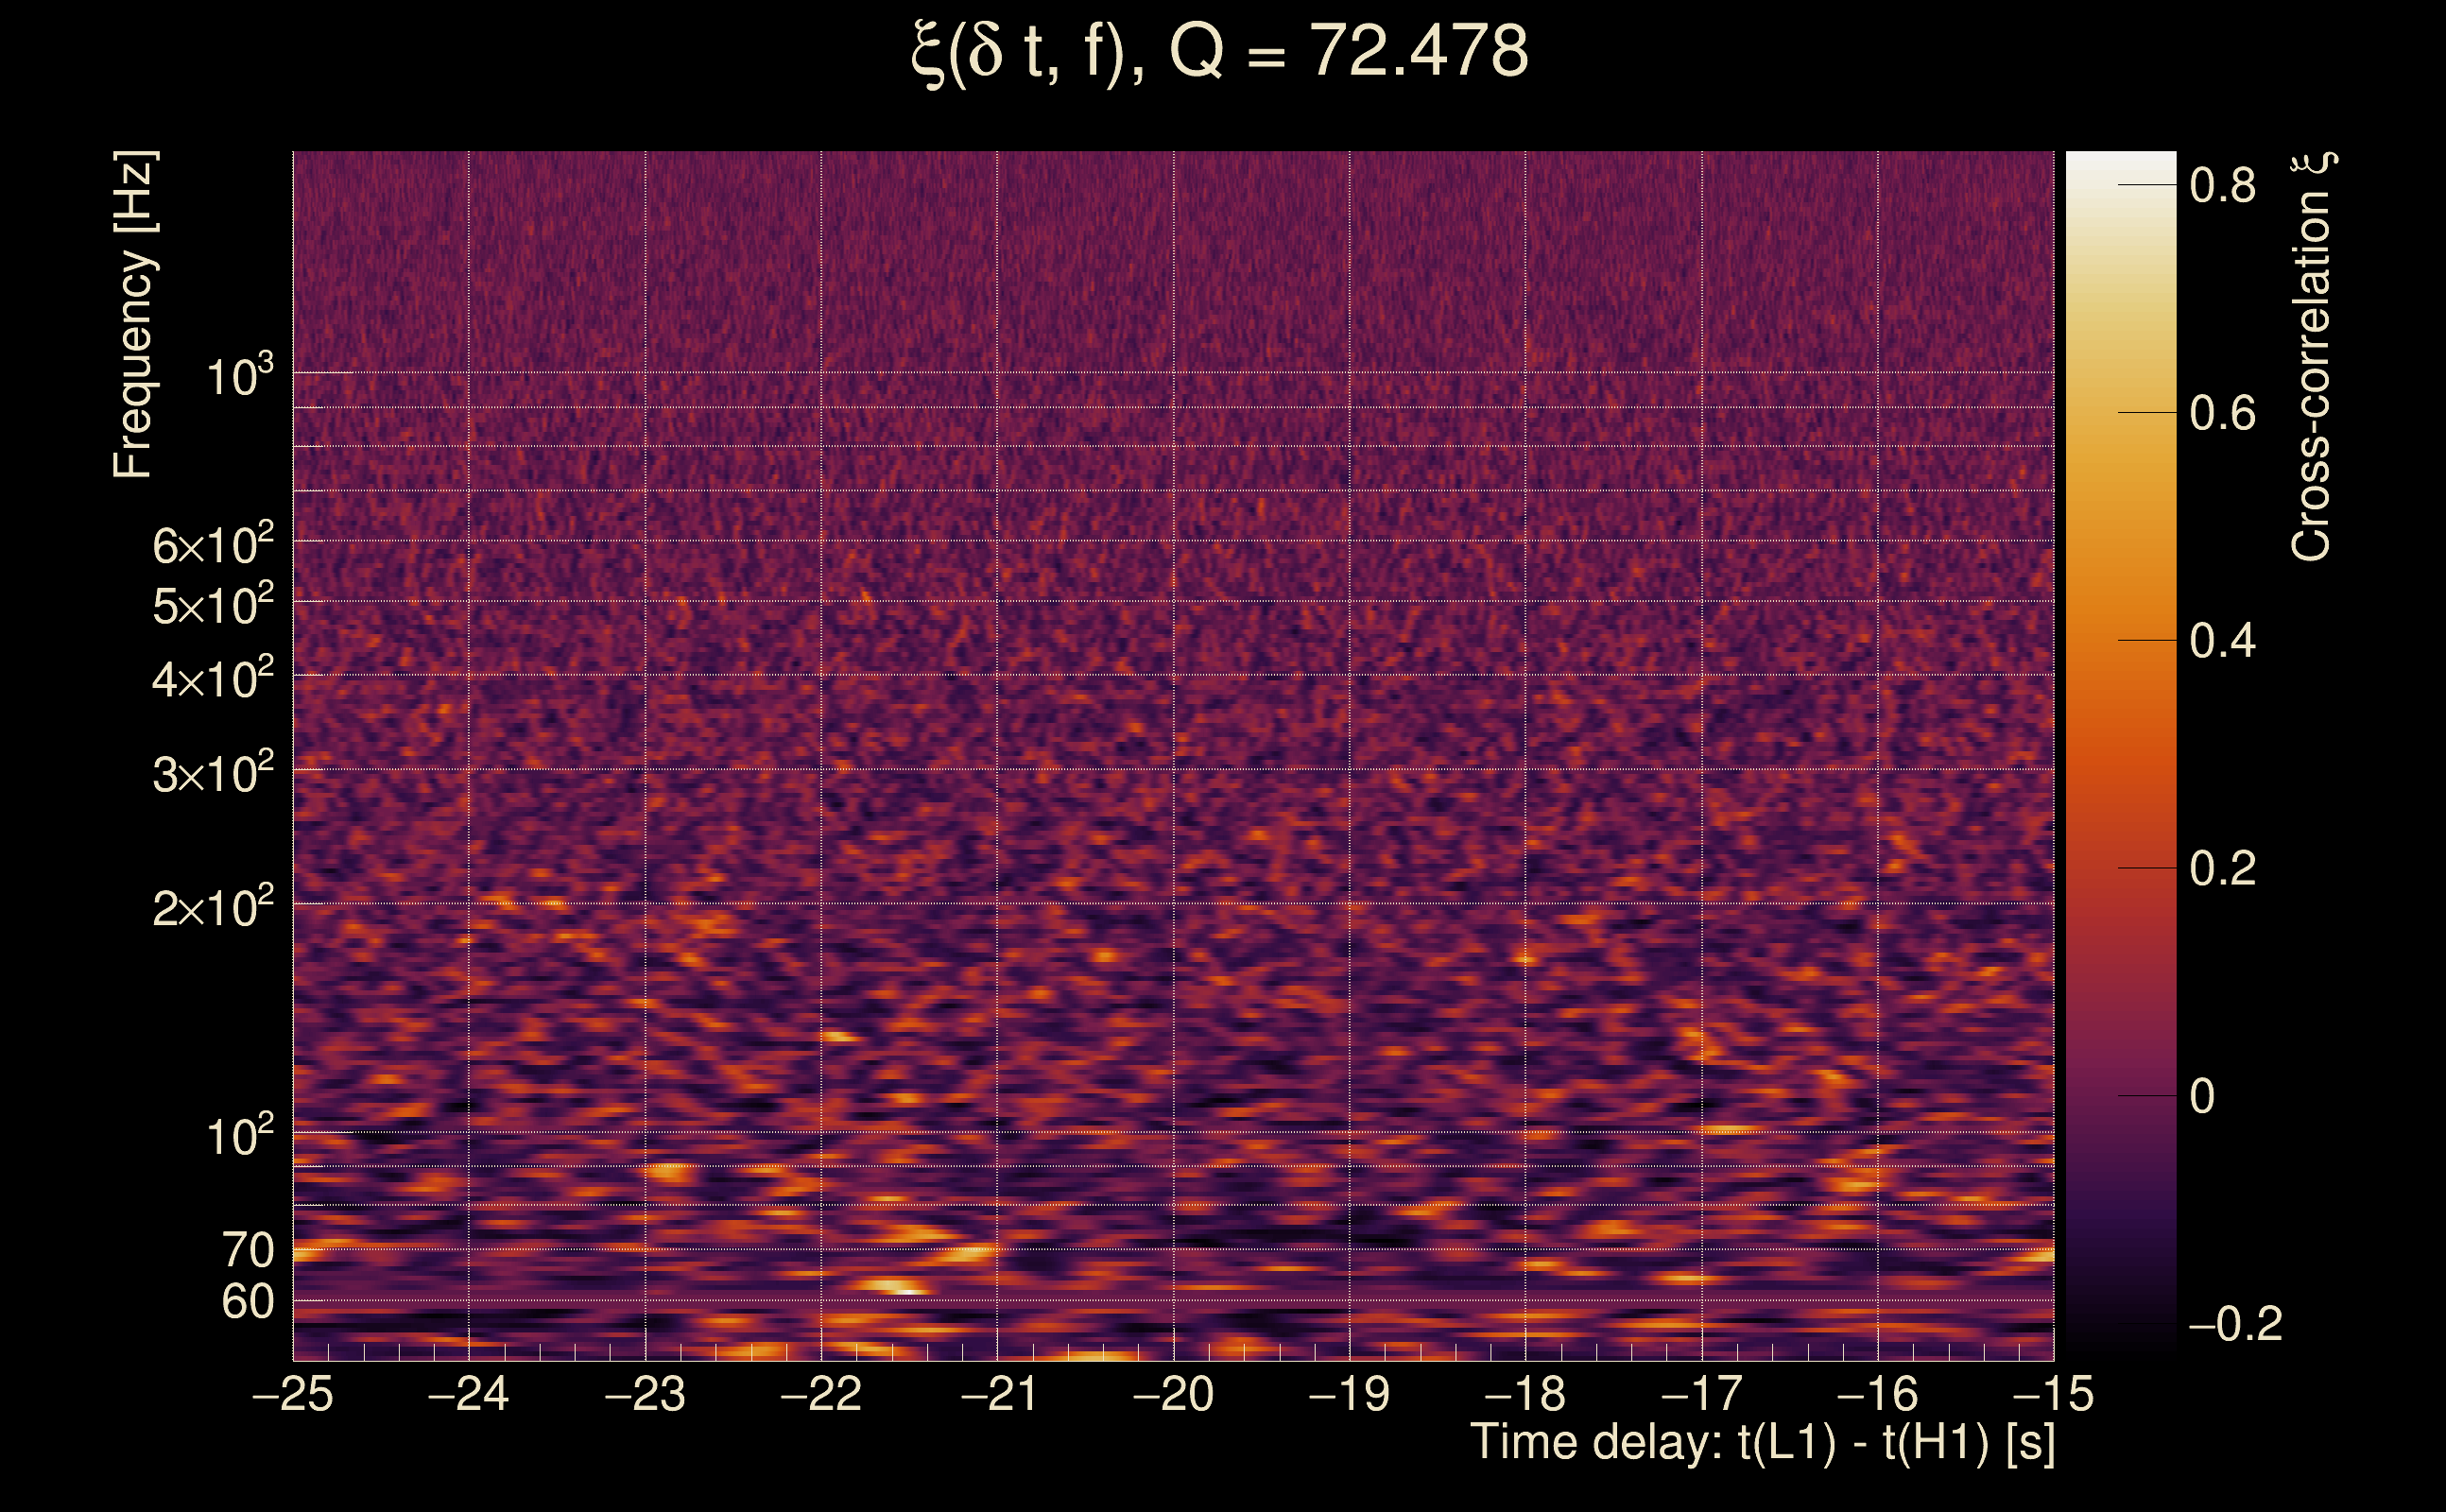
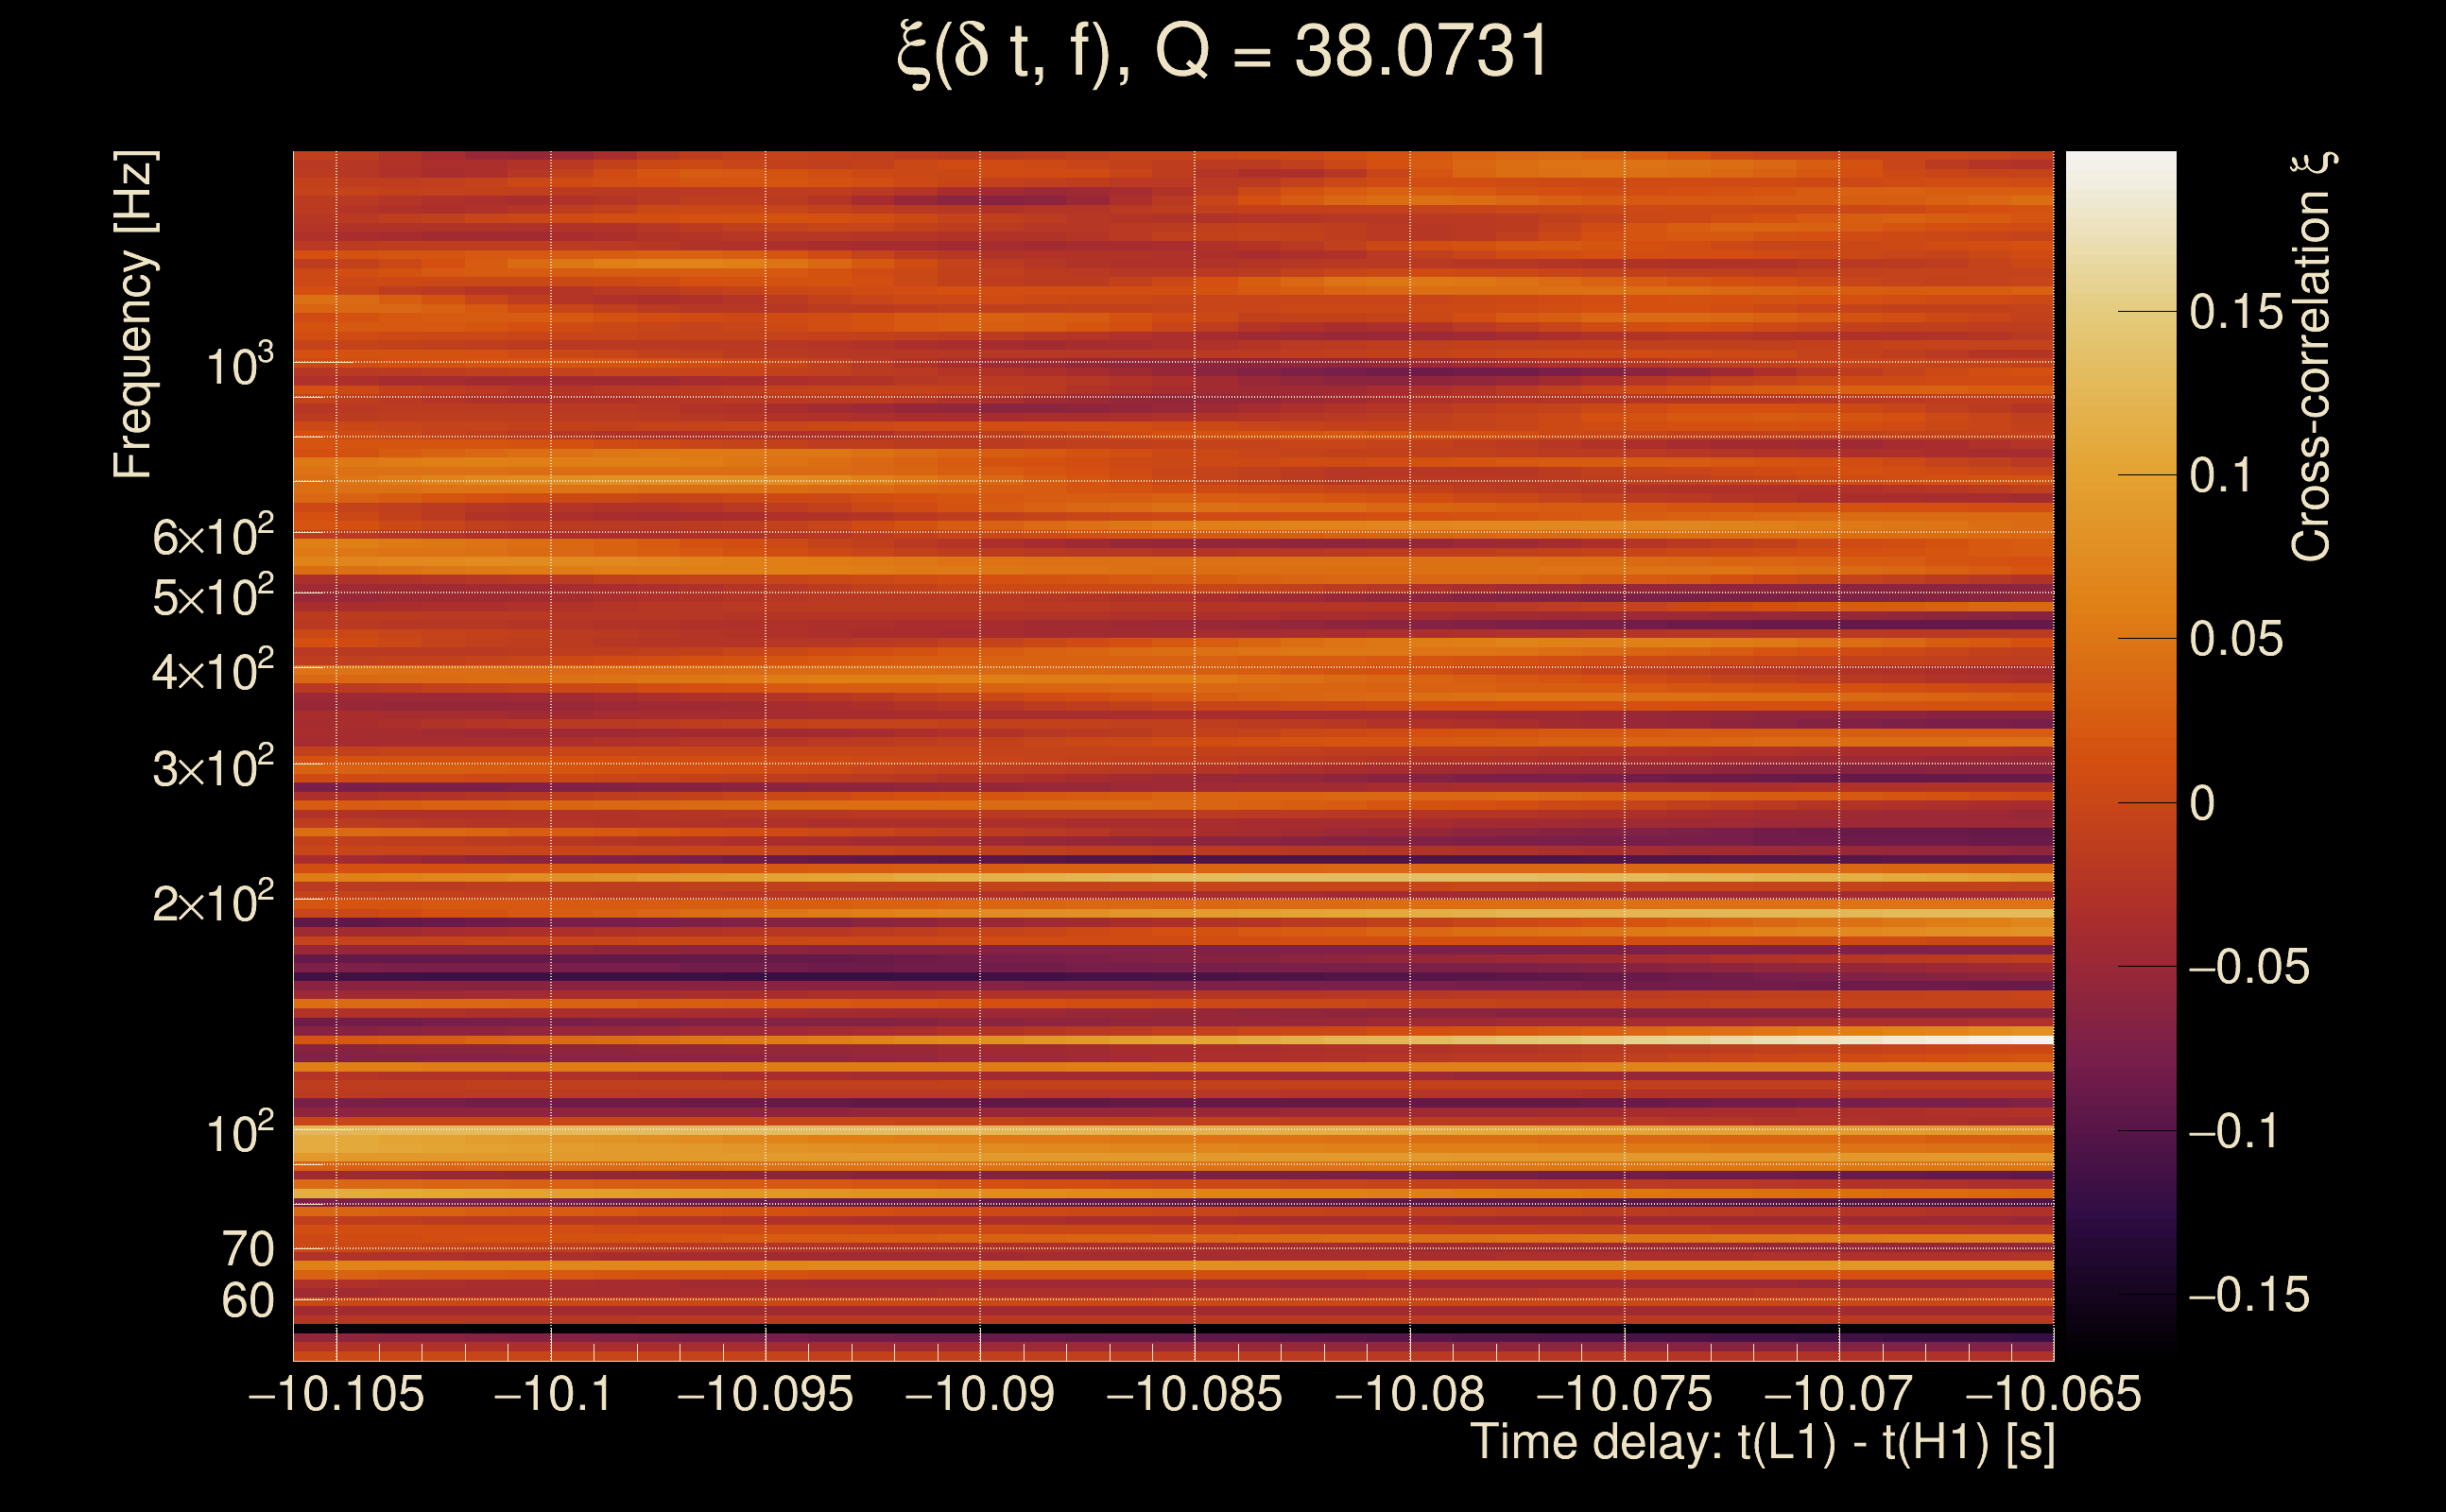
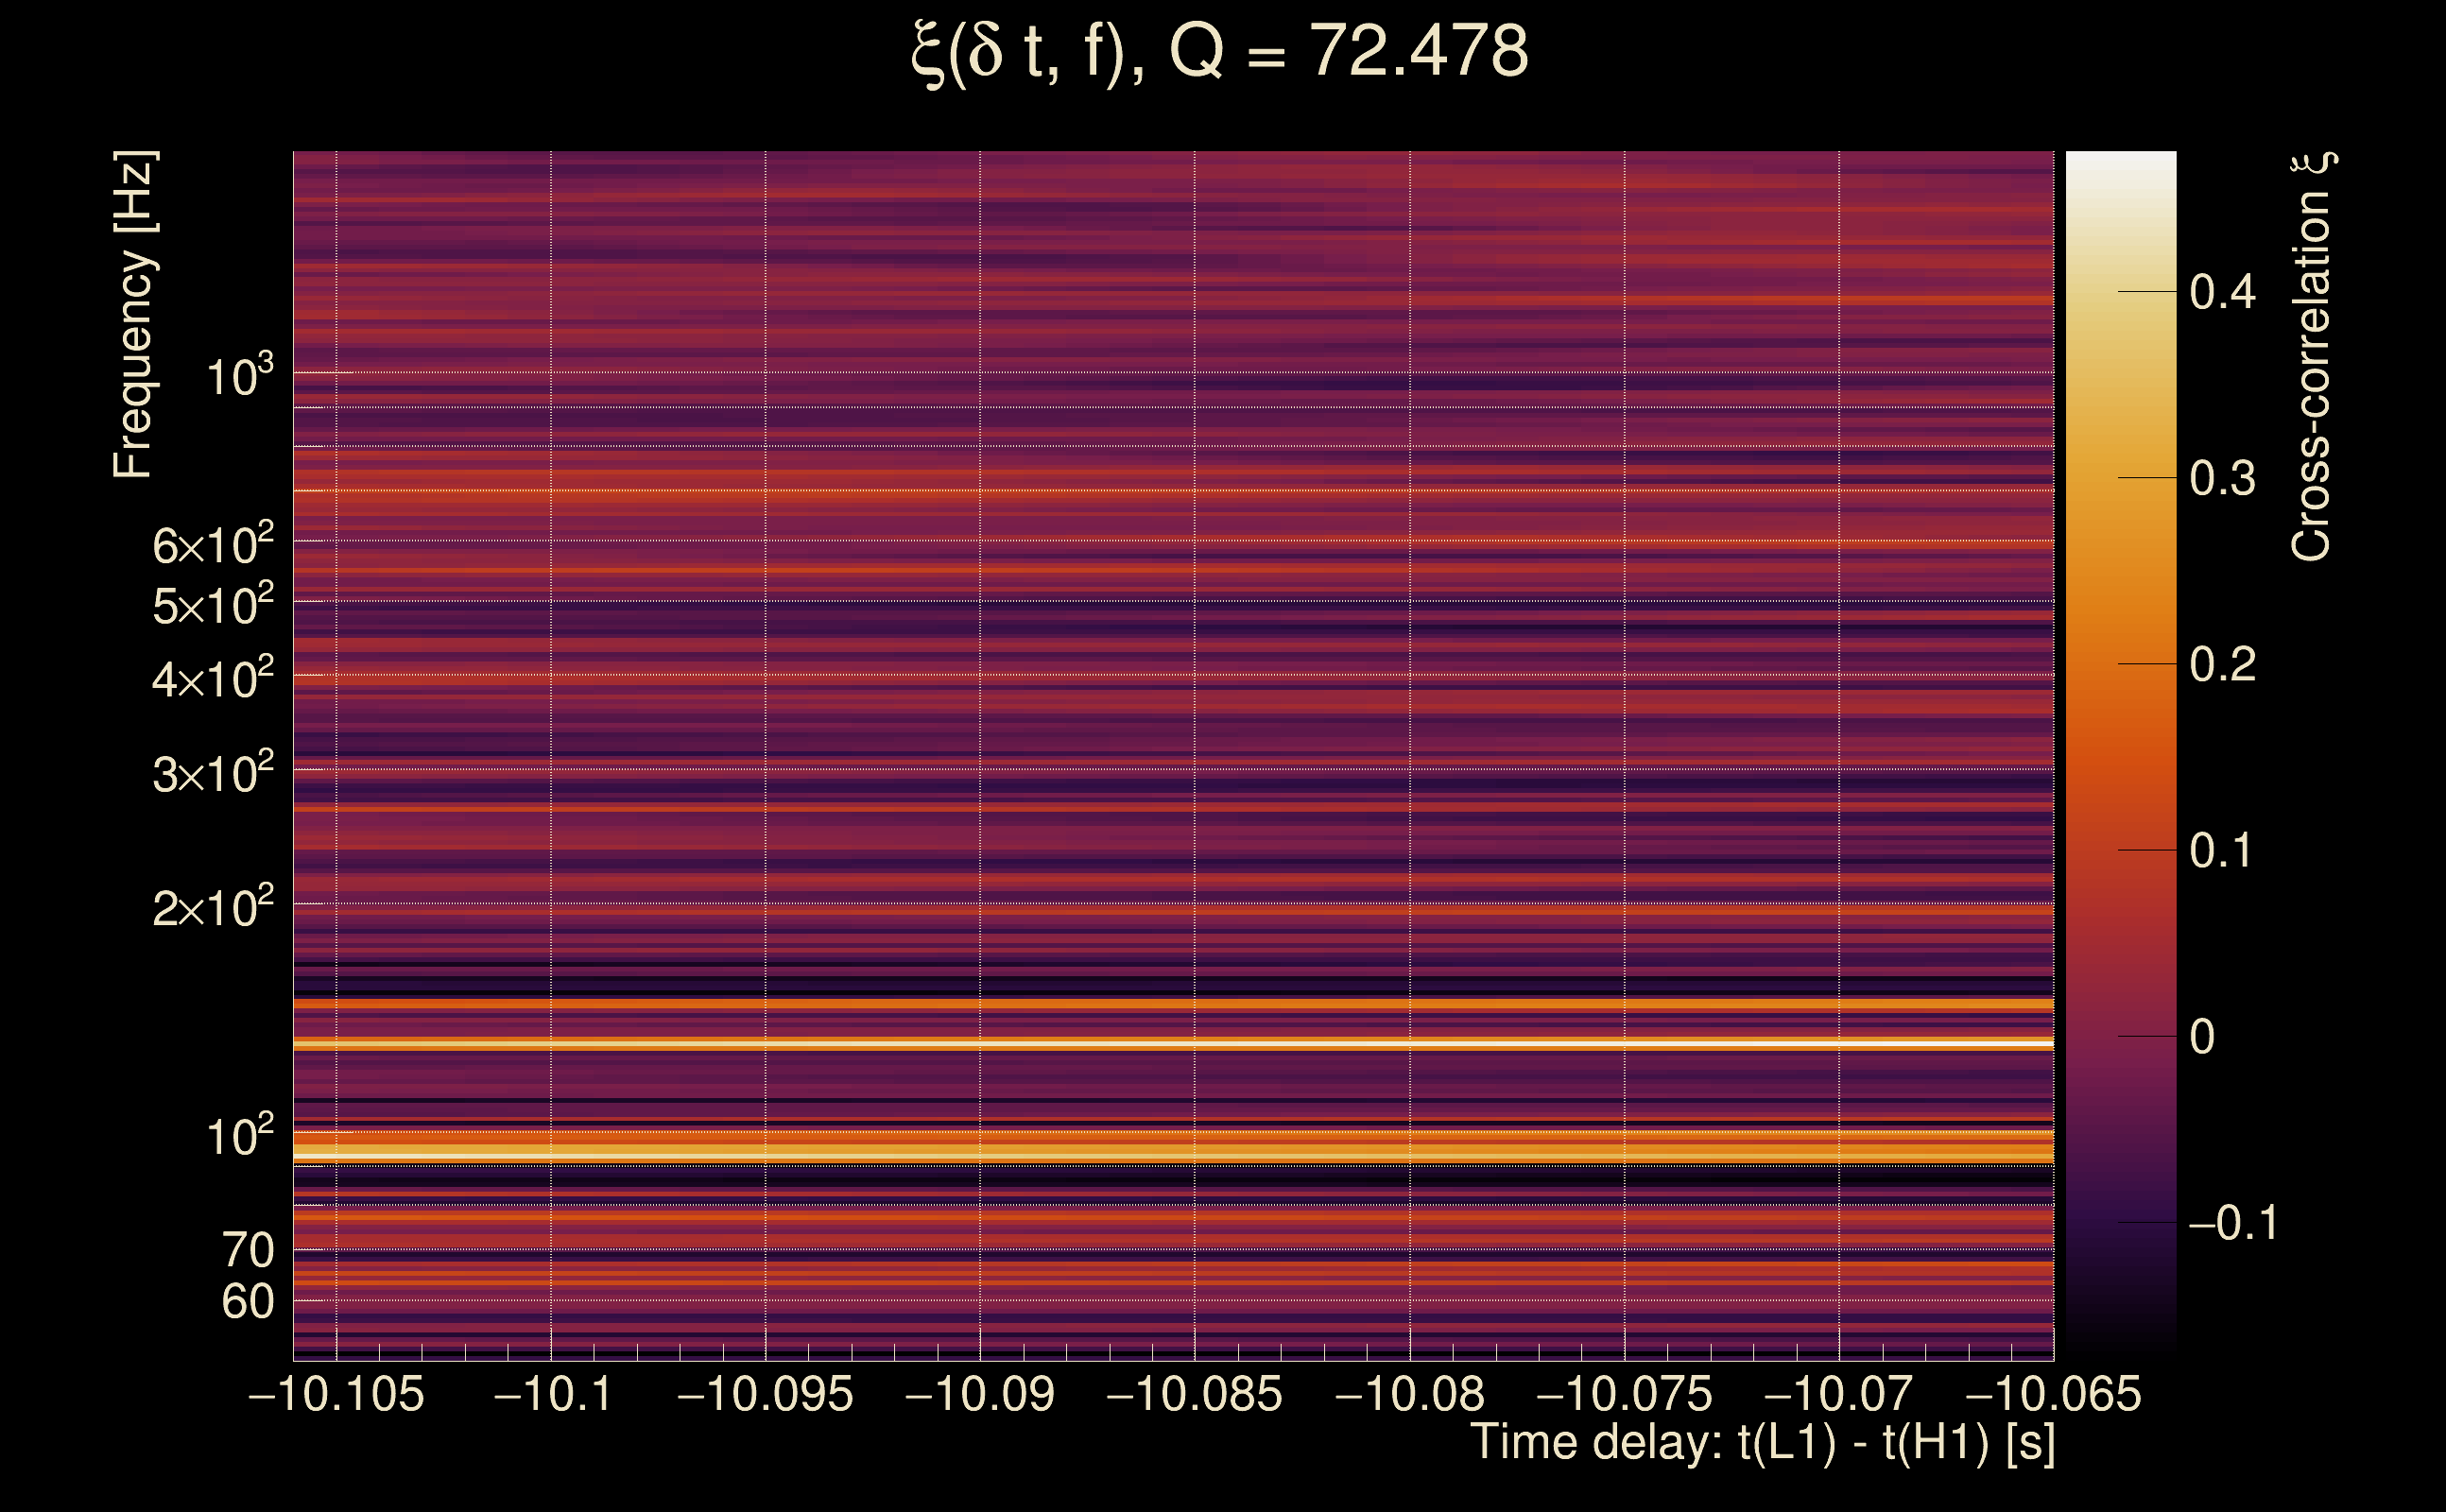
| Time delay between detectors t(L1) - t(H1): | -9.39406 s (slice index = 95 / 217), δt_gw = 0.00794284 s |
| Time delay uncertainty: | 0.00706286 s |
| [targeted mode] Time delay probability: | 0.91906 (0.101618 sigmas), δt_target = 1.72247e+45 s |
| Frequency: | 127.719 Hz |
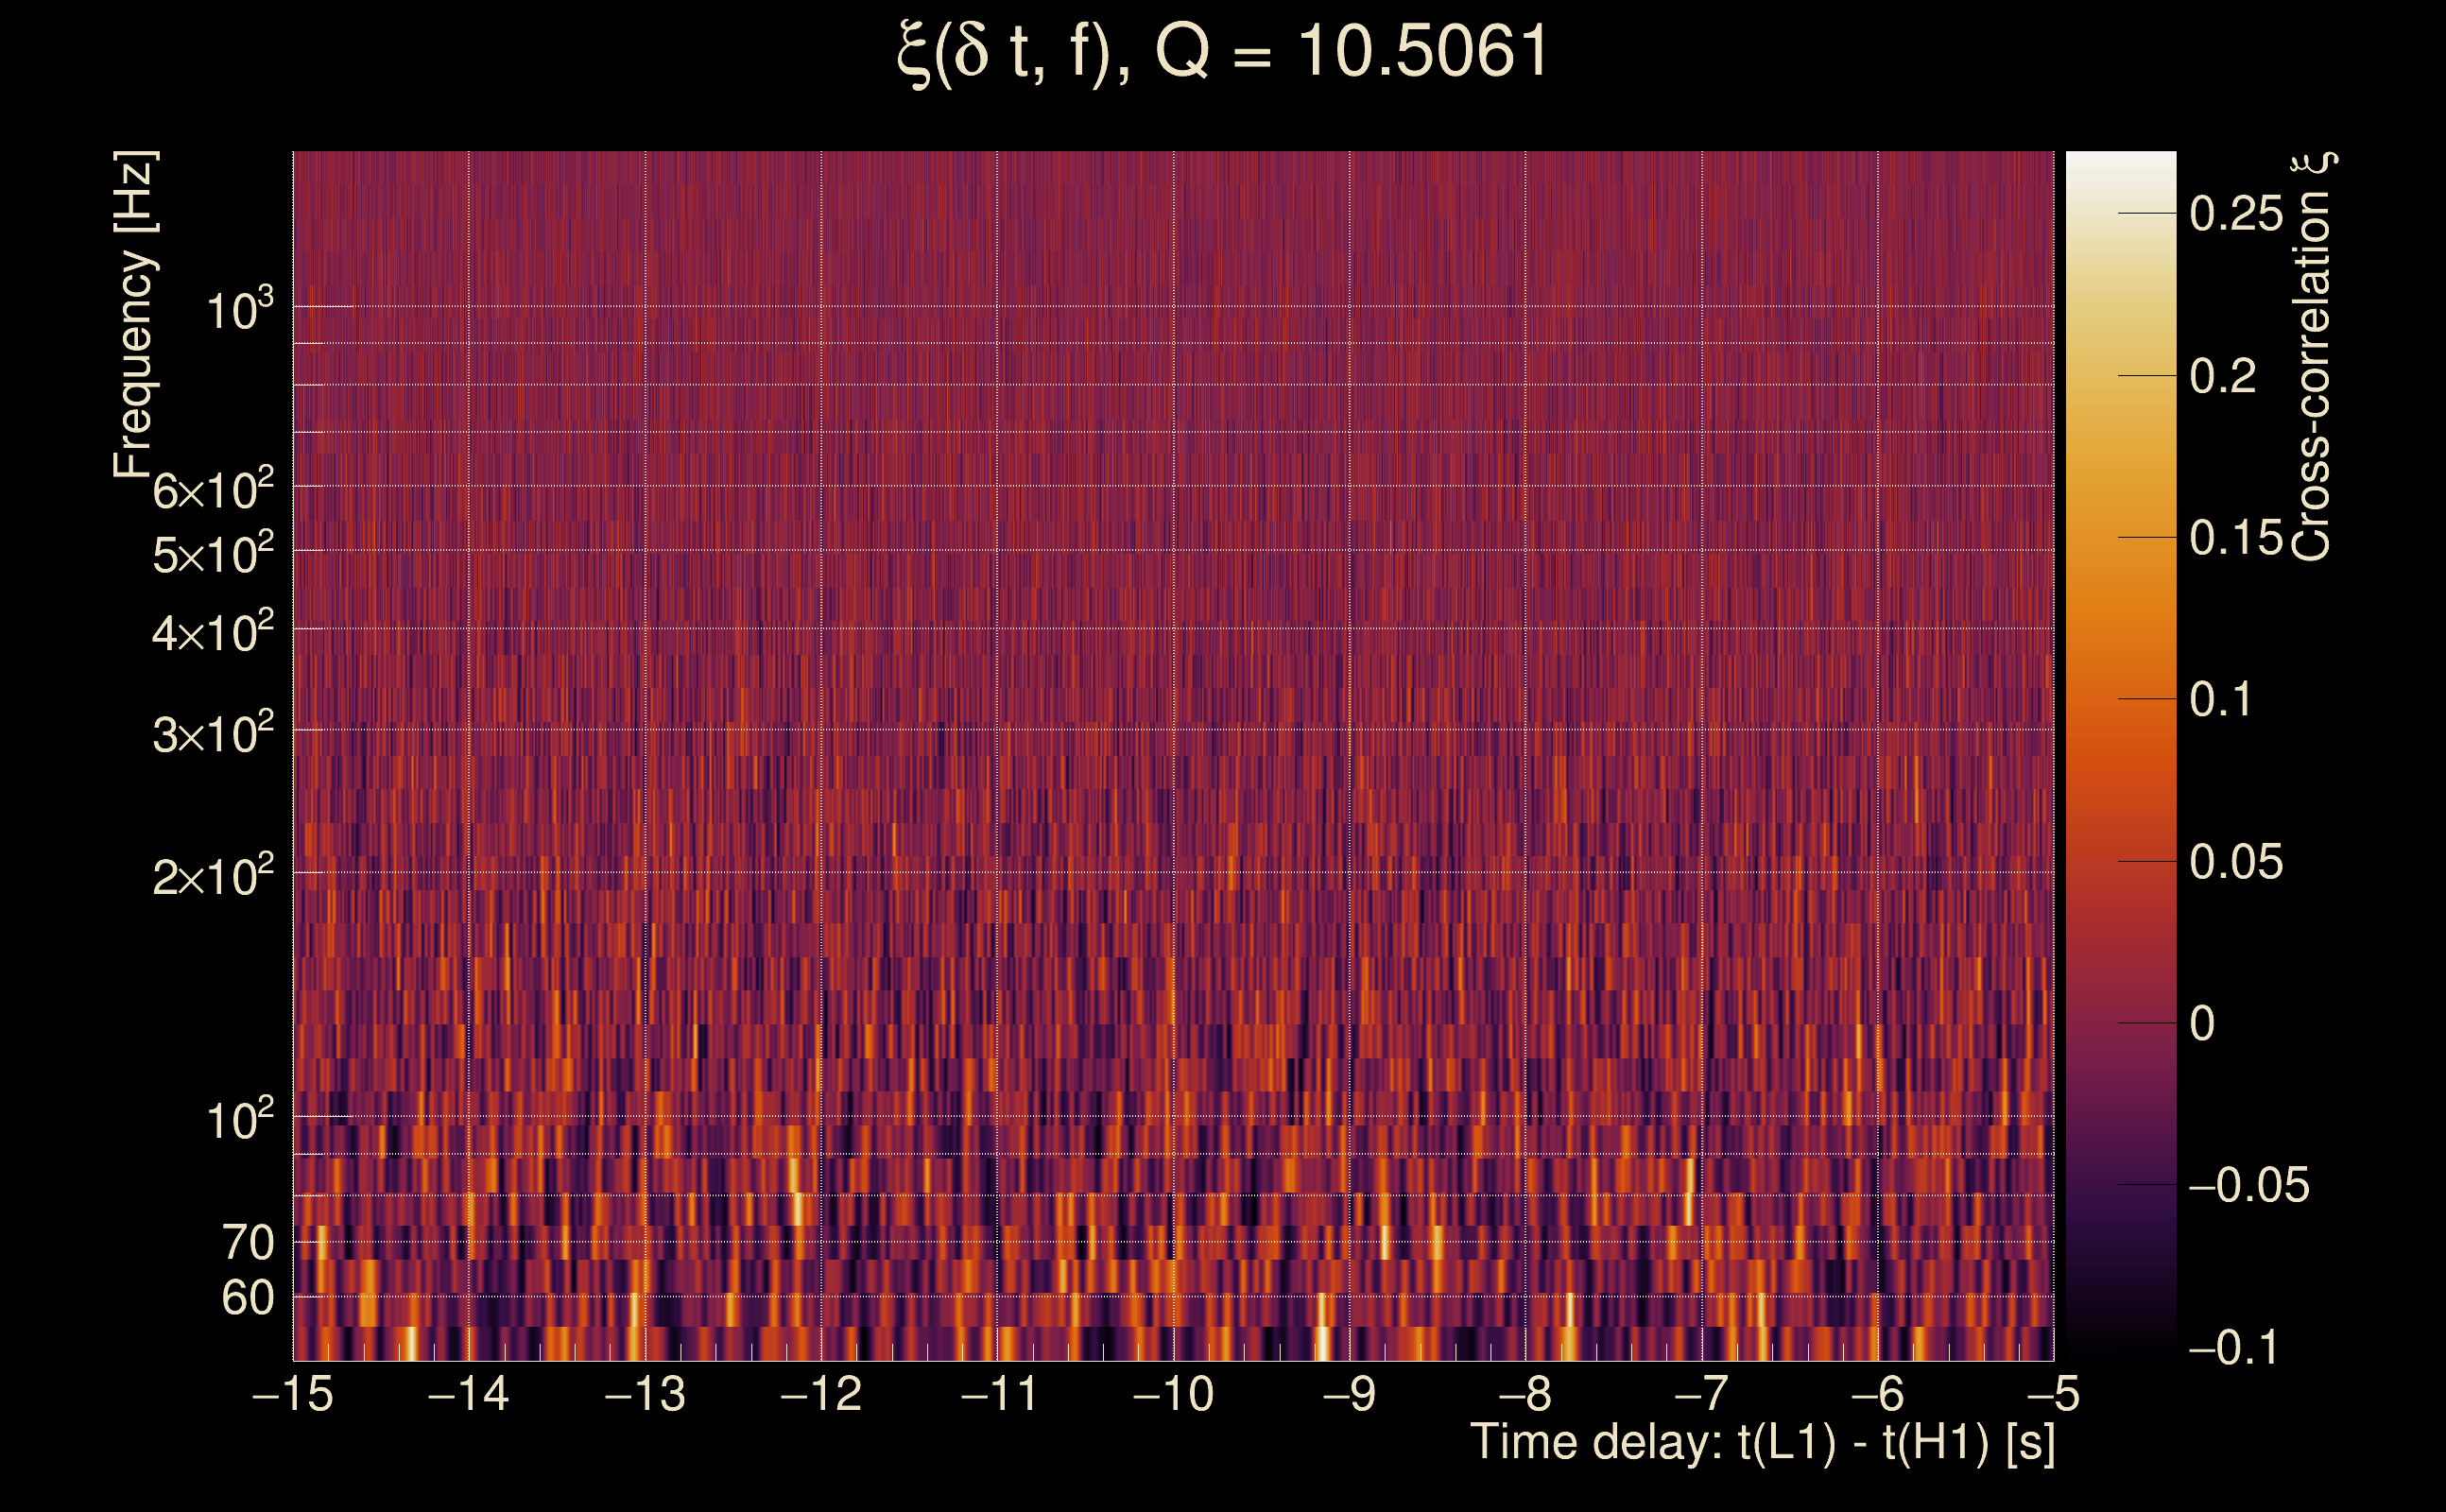
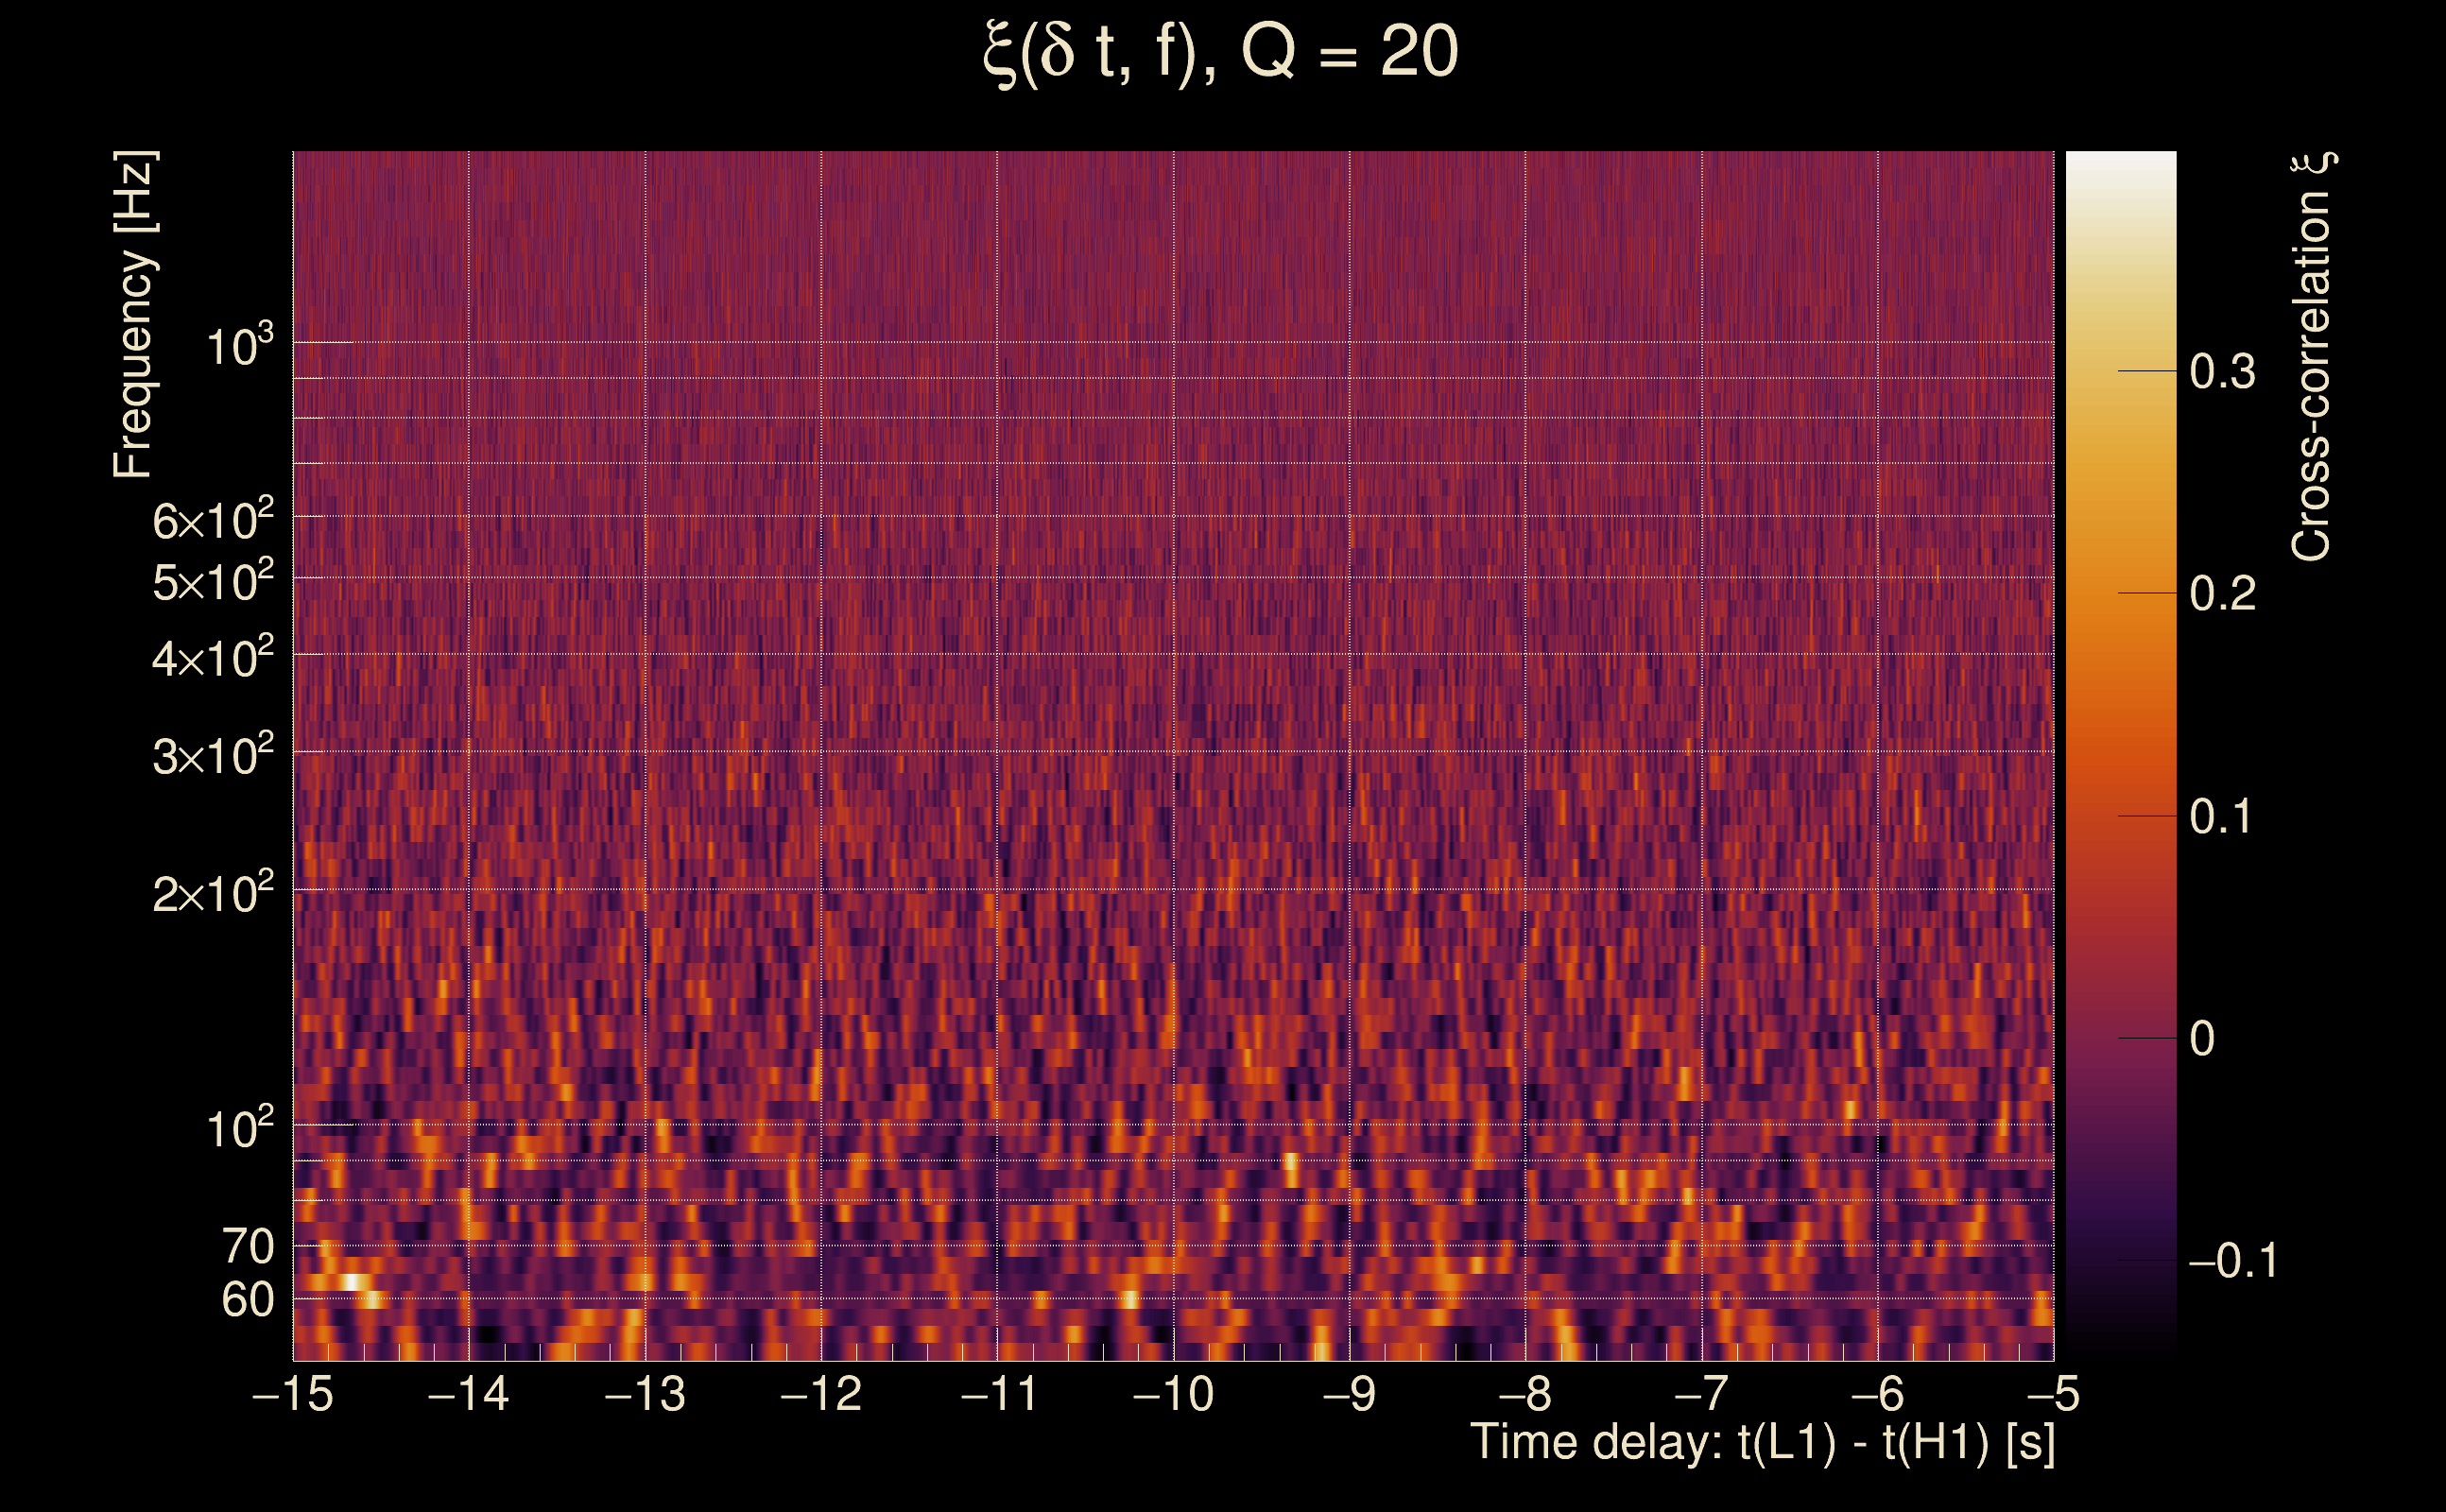
| Ξ: | 0.0137061 ± 0.0221123 (variance = 0.000488956): Q0: 0.117768, Q1: 0.0784931, Q2: 0.132331, Q3: 0.0820224, Q4: 0.122847 |
| Rank: | R_A = 0.00795424 |
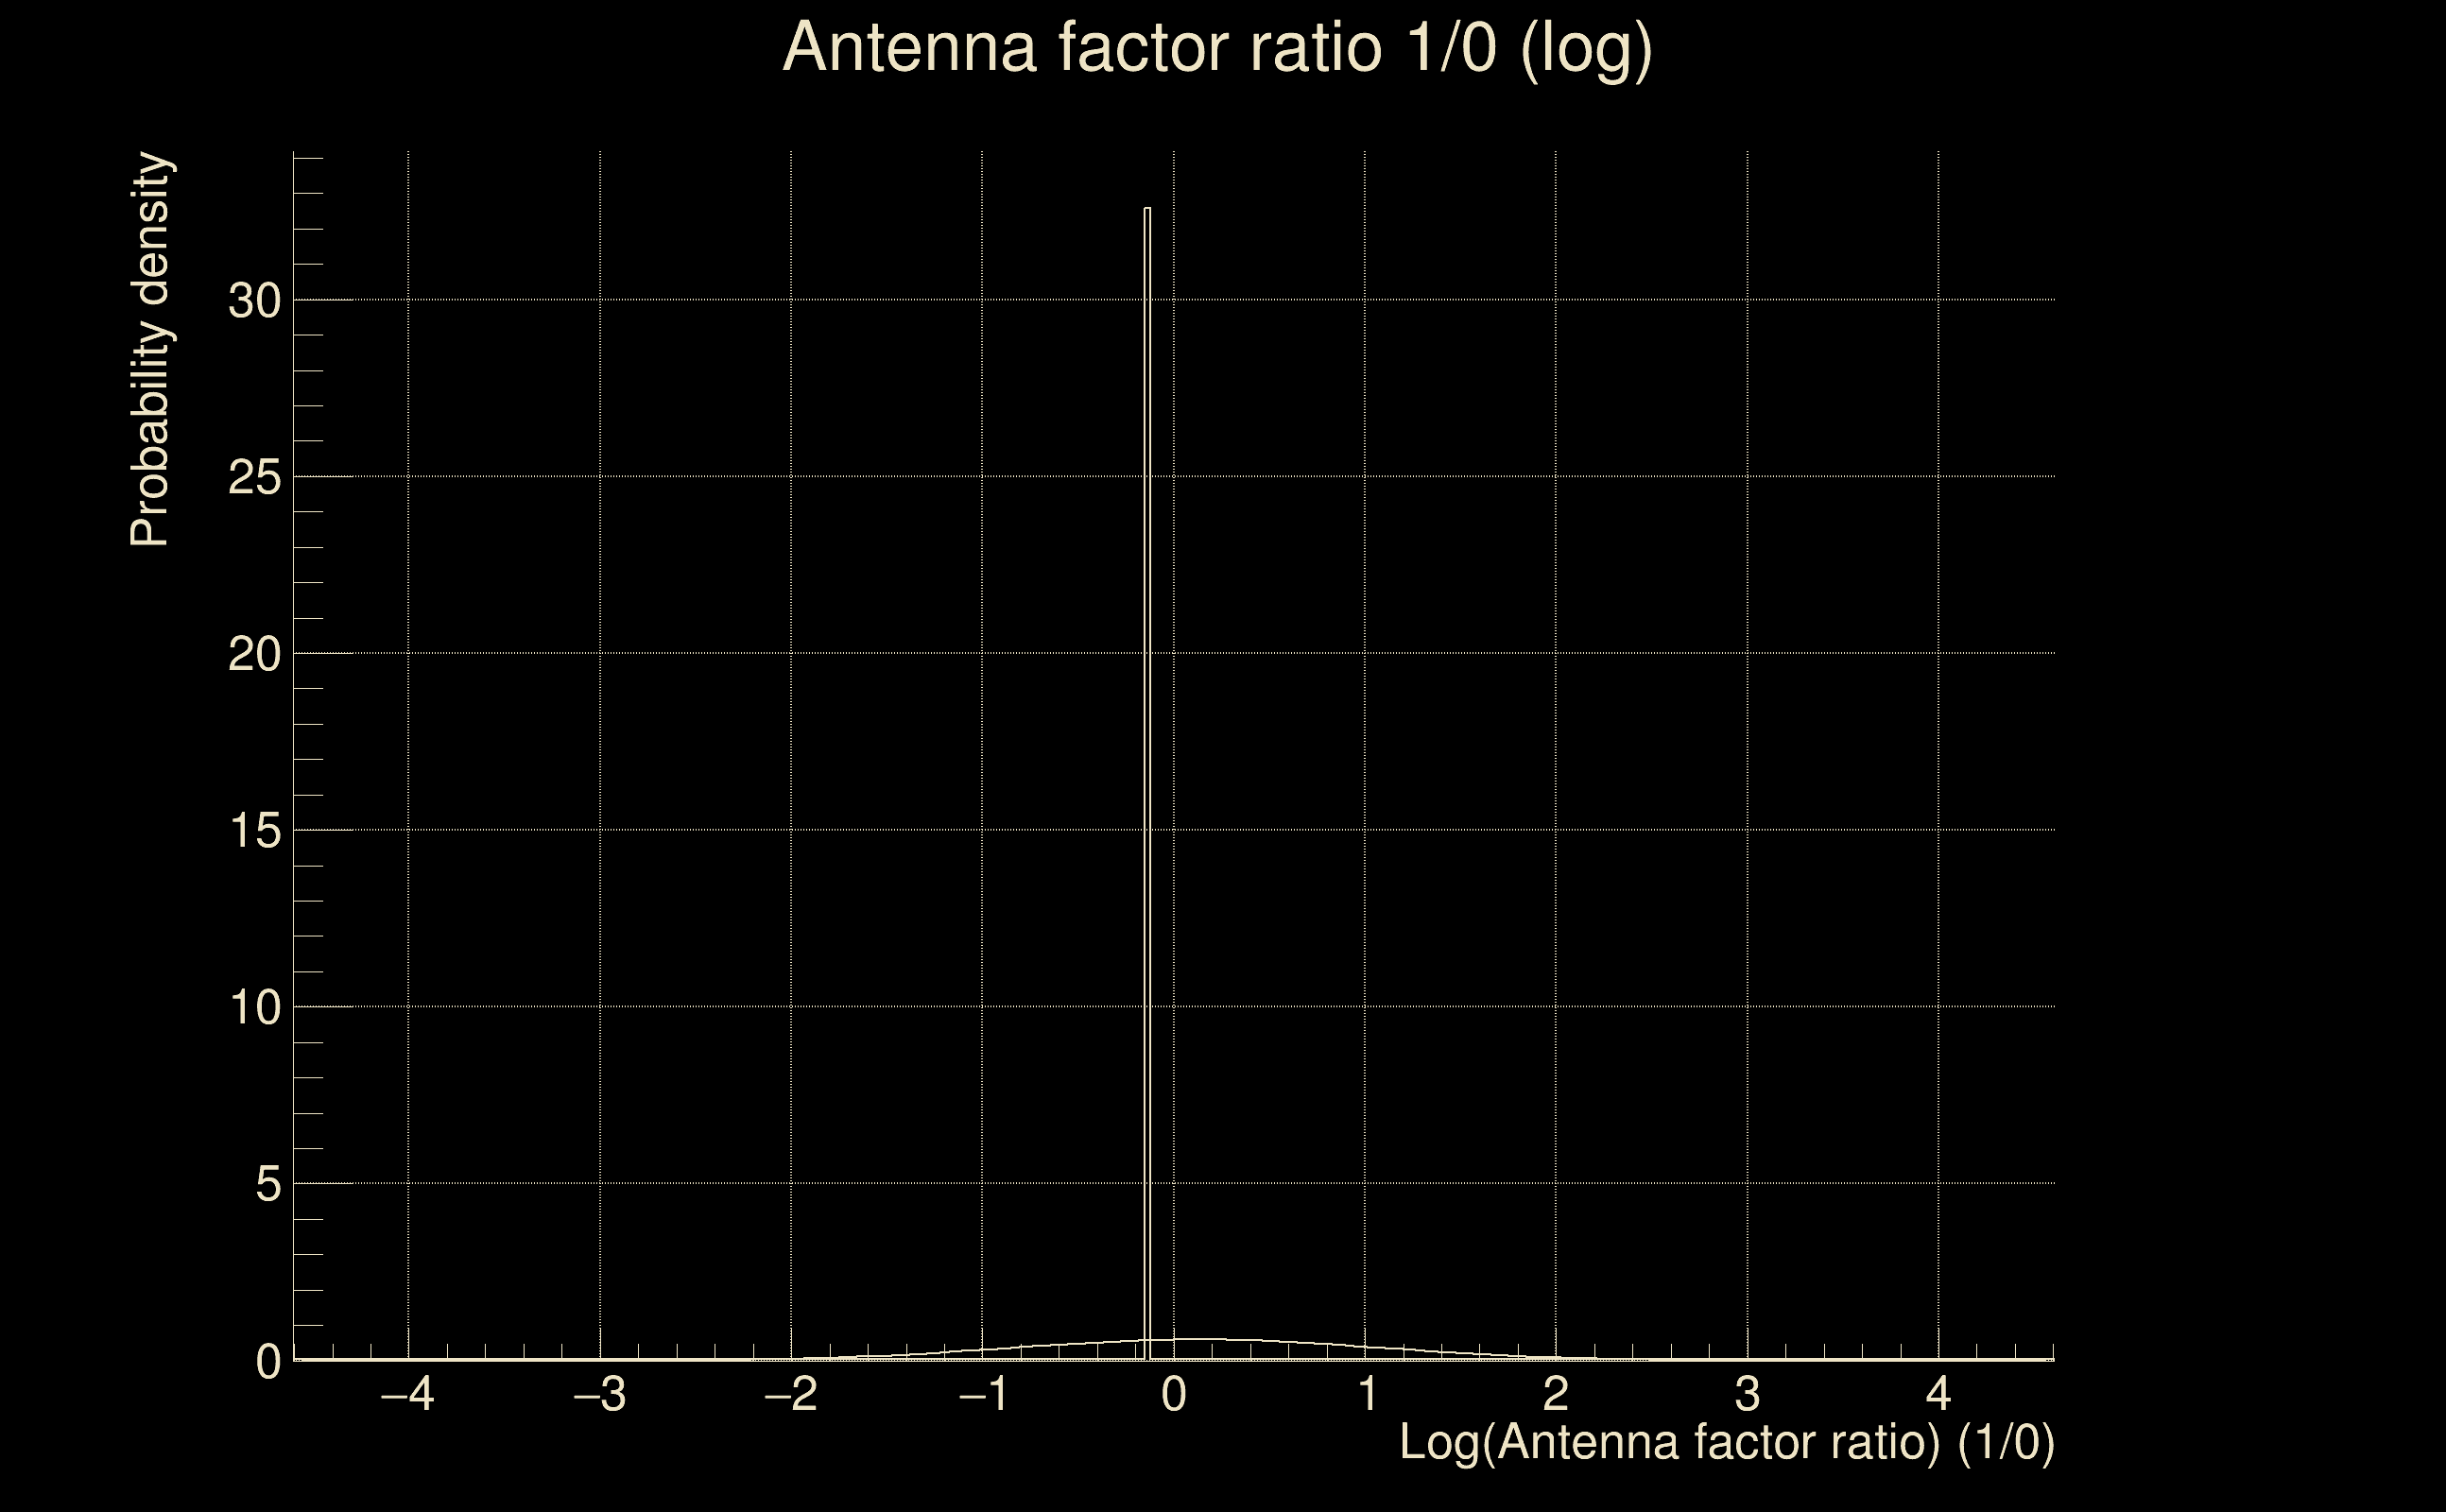
| Log of amplitude ratio (L1/H1): | -0.159735, variance = 0.559906 (L1/H1: -0.490885, variance = 0.701802, H1/L1: -0.243504, variance = 1.71309) |
| Amplitude ratio (L1/H1): | 0.85237 ⋇ 2.11334 (L1/H1: 0.612085 ⋇ 2.31113, H1/L1: 0.783876 ⋇ 3.70192) |
| Amplitude ratio H1|L1 compatibility (probability): | 0.636511 |
| Antenna factor probability: | 0.992051 |
| Number of rejected frequency rows: | Q0: 15 / 18, Q1: 32 / 36, Q2: 65 / 70, Q3: 130 / 134, Q4: 254 / 258 |
| Maximum signal-to-noise ratio: | H1: 5.16093, L1: 4.67692 |
| SNR variance: | H1: 0.529589, L1: 0.504736 |
| Click here for a zoomed plot | Click here for a zoomed plot | Click here for a zoomed plot | Click here for a zoomed plot | Click here for a zoomed plot |
 |
 |
 |
 |
 |
 |
 |
 |
 |
 |
 |
 |
 |
 |
 |
 |
 |
 |
 |
 |
 |
 |
 |
 |
 |
 |
 |
 |
 |
| Event time t(H1): | GPS = 1368195438 (Mon May 15 14:17:00 2023 ) → GPS = 1368195448 (Mon May 15 14:17:10 2023 ) |
| Event time t(L1): | GPS = 1368195418 (Mon May 15 14:17:10 2023 ) → GPS = 1368195428 (Mon May 15 14:16:50 2023 ) |
| Omicron analysis time window (H1): | GPS = 1368195435 → GPS = 1368195451 |
| Omicron analysis time window (L1): | GPS = 1368195415 → GPS = 1368195431 |
| Time delay between detectors t(L1) - t(H1): | -24.779 s (slice index = 212 / 217), δt_gw = 0.00504714 s |
| Time delay uncertainty: | 0.00653287 s |
| [targeted mode] Time delay probability: | 0.579262 (0.554463 sigmas), δt_target = 0.00866055 s |
| Frequency: | 145.414 Hz |
| Ξ: | 0.0185908 ± 0.0505554 (variance = 0.00255585): Q0: 0.105772, Q1: 0.200202, Q2: 0.238099, Q3: 0.141145, Q4: 0.117934 |
| Rank: | R_A = 0.00741859 |
| Log of amplitude ratio (L1/H1): | 0.0382331, variance = 0.776033 (L1/H1: -0.146245, variance = 1.43885, H1/L1: -0.225941, variance = 1.66905) |
| Amplitude ratio (L1/H1): | 1.03897 ⋇ 2.41314 (L1/H1: 0.863946 ⋇ 3.31852, H1/L1: 0.797765 ⋇ 3.63976) |
| Amplitude ratio H1|L1 compatibility (probability): | 0.832794 |
| Antenna factor probability: | 0.827202 |
| Number of rejected frequency rows: | Q0: 17 / 18, Q1: 30 / 36, Q2: 56 / 70, Q3: 125 / 134, Q4: 246 / 258 |
| Maximum signal-to-noise ratio: | H1: 5.2285, L1: 5.18333 |
| SNR variance: | H1: 0.506429, L1: 0.509076 |
| Click here for a zoomed plot | Click here for a zoomed plot | Click here for a zoomed plot | Click here for a zoomed plot | Click here for a zoomed plot |
 |
 |
 |
 |
 |
 |
 |
 |
 |
 |
 |
 |
 |
 |
 |
 |
 |
 |
 |
 |
 |
 |
 |
 |
 |
 |
 |
 |
 |
| Event time t(H1): | GPS = 1368195588 (Mon May 15 14:19:30 2023 ) → GPS = 1368195598 (Mon May 15 14:19:40 2023 ) |
| Event time t(L1): | GPS = 1368195578 (Mon May 15 14:19:40 2023 ) → GPS = 1368195588 (Mon May 15 14:19:30 2023 ) |
| Omicron analysis time window (H1): | GPS = 1368195585 → GPS = 1368195601 |
| Omicron analysis time window (L1): | GPS = 1368195575 → GPS = 1368195591 |
| Time delay between detectors t(L1) - t(H1): | -10.1783 s (slice index = 112 / 217), δt_gw = 0.00571711 s |
| Time delay uncertainty: | 0.00437908 s |
| [targeted mode] Time delay probability: | 0.502765 (0.670146 sigmas), δt_target = 0.00866938 s |
| Frequency: | 127.828 Hz |
| Ξ: | 0.0173283 ± 0.086621 (variance = 0.0075032): Q0: 0.113209, Q1: 0.0818782, Q2: 0.111402, Q3: 0.0393378, Q4: 0.292421 |
| Rank: | R_A = 0.00677126 |
| Log of amplitude ratio (L1/H1): | -0.113466, variance = 0.418579 (L1/H1: -0.250545, variance = 0.645613, H1/L1: -0.0610329, variance = 1.11636) |
| Amplitude ratio (L1/H1): | 0.892734 ⋇ 1.90976 (L1/H1: 0.778377 ⋇ 2.23334, H1/L1: 0.940792 ⋇ 2.87652) |
| Amplitude ratio H1|L1 compatibility (probability): | 0.814419 |
| Antenna factor probability: | 0.954338 |
| Number of rejected frequency rows: | Q0: 14 / 18, Q1: 30 / 36, Q2: 68 / 70, Q3: 130 / 134, Q4: 245 / 258 |
| Maximum signal-to-noise ratio: | H1: 5.3657, L1: 4.7557 |
| SNR variance: | H1: 0.522681, L1: 0.53681 |
| Click here for a zoomed plot | Click here for a zoomed plot | Click here for a zoomed plot | Click here for a zoomed plot | Click here for a zoomed plot |
 |
 |
 |
 |
 |
 |
 |
 |
 |
 |
 |
 |
 |
 |
 |
 |
 |
 |
 |
 |
 |
 |
 |
 |
 |
 |
 |
 |
 |
| Event time t(H1): | GPS = 1368195588 (Mon May 15 14:19:30 2023 ) → GPS = 1368195598 (Mon May 15 14:19:40 2023 ) |
| Event time t(L1): | GPS = 1368195578 (Mon May 15 14:19:40 2023 ) → GPS = 1368195588 (Mon May 15 14:19:30 2023 ) |
| Omicron analysis time window (H1): | GPS = 1368195585 → GPS = 1368195601 |
| Omicron analysis time window (L1): | GPS = 1368195575 → GPS = 1368195591 |
| Time delay between detectors t(L1) - t(H1): | -10.0851 s (slice index = 110 / 217), δt_gw = 0.00693719 s |
| Time delay uncertainty: | 0.00795425 s |
| [targeted mode] Time delay probability: | 0.829338 (0.215551 sigmas), δt_target = 0.00865173 s |
| Frequency: | 107.157 Hz |
| Ξ: | 0.01353 ± 0.0354009 (variance = 0.00125323): Q0: 0.0928875, Q1: 0, Q2: 0.0555825, Q3: 0.0924301, Q4: 0.0348892 |
| Rank: | R_A = 0.00662605 |
| Log of amplitude ratio (L1/H1): | -0.288082, variance = 0.441433 (L1/H1: -0.505468, variance = 0.903045, H1/L1: 0.0113529, variance = 0.817268) |
| Amplitude ratio (L1/H1): | 0.7497 ⋇ 1.94333 (L1/H1: 0.603223 ⋇ 2.58645, H1/L1: 1.01142 ⋇ 2.46953) |
| Amplitude ratio H1|L1 compatibility (probability): | 0.706378 |
| Antenna factor probability: | 0.835965 |
| Number of rejected frequency rows: | Q0: 13 / 18, Q1: 36 / 36, Q2: 69 / 70, Q3: 129 / 134, Q4: 251 / 258 |
| Maximum signal-to-noise ratio: | H1: 5.3657, L1: 4.7557 |
| SNR variance: | H1: 0.522681, L1: 0.53681 |
| Click here for a zoomed plot | Click here for a zoomed plot | Click here for a zoomed plot | Click here for a zoomed plot | Click here for a zoomed plot |
|
|
|
|
|
|
|
|
|
|
|
|
|
|
|
|
|
|
|
|
|
|
|
|
|
 |
 |
 |
 |
| Event time t(H1): | GPS = 1368195593 (Mon May 15 14:19:35 2023 ) → GPS = 1368195603 (Mon May 15 14:19:45 2023 ) |
| Event time t(L1): | GPS = 1368195583 (Mon May 15 14:19:45 2023 ) → GPS = 1368195593 (Mon May 15 14:19:35 2023 ) |
| Omicron analysis time window (H1): | GPS = 1368195590 → GPS = 1368195606 |
| Omicron analysis time window (L1): | GPS = 1368195580 → GPS = 1368195596 |
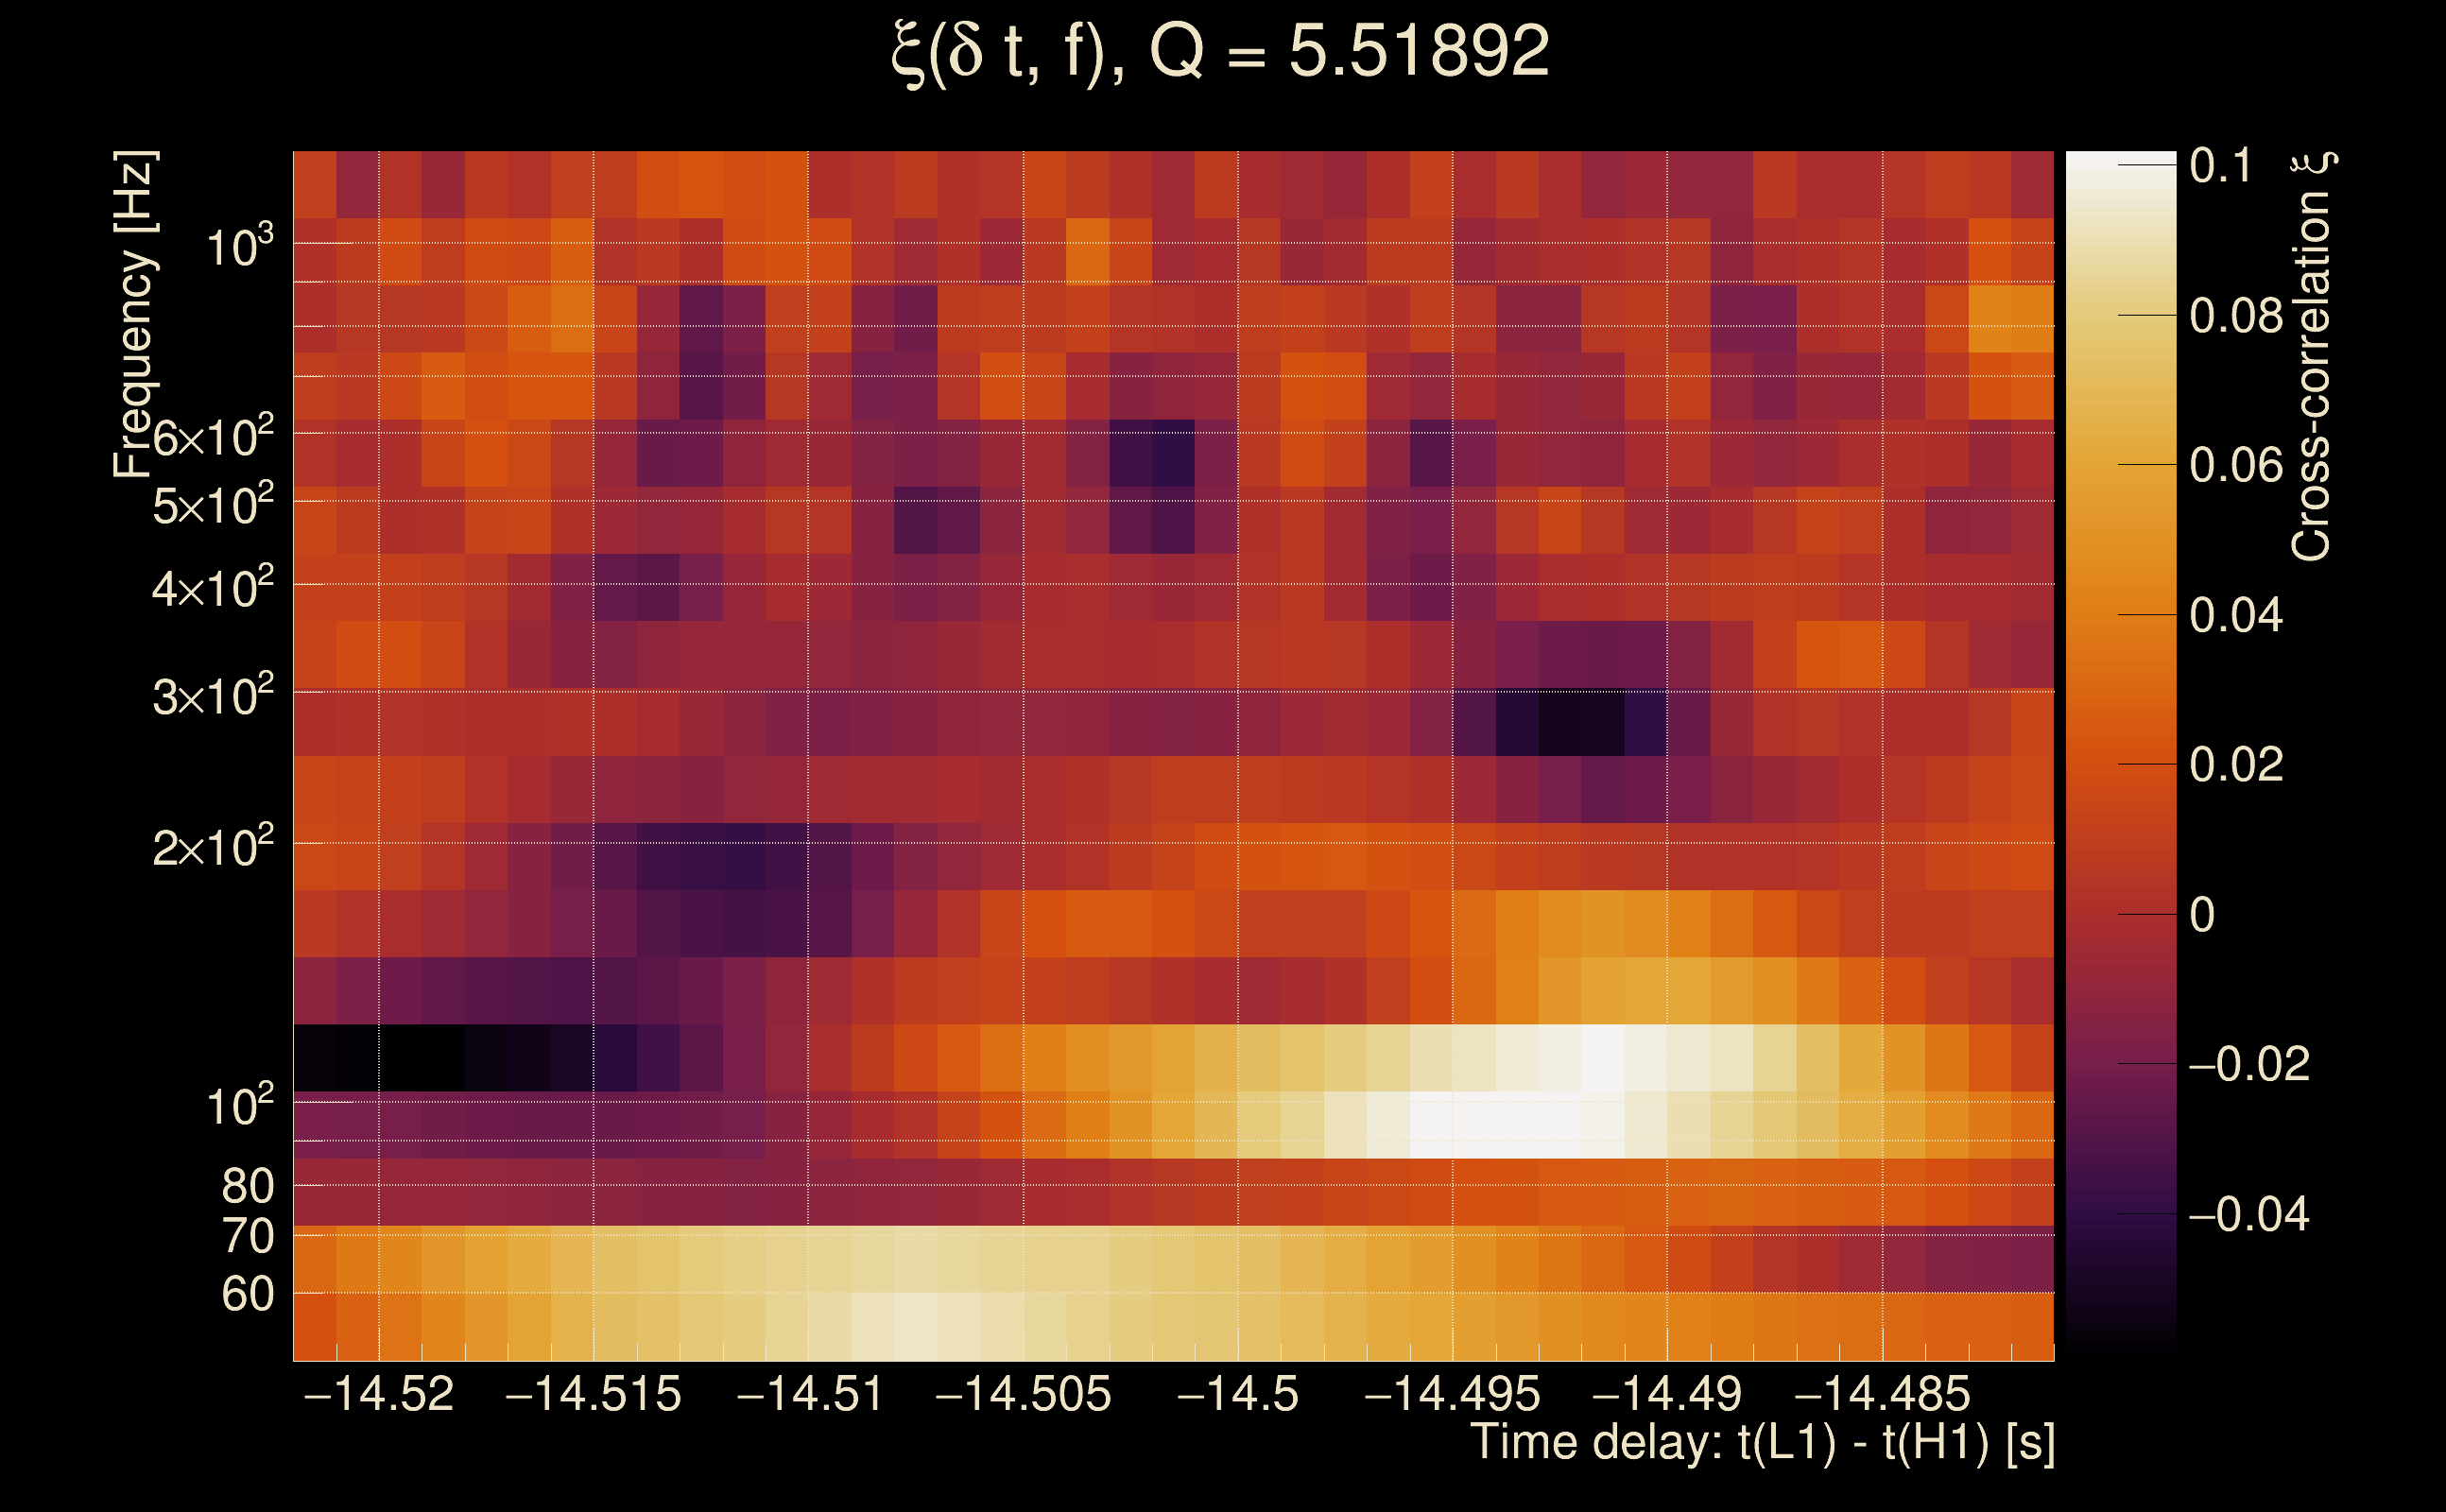
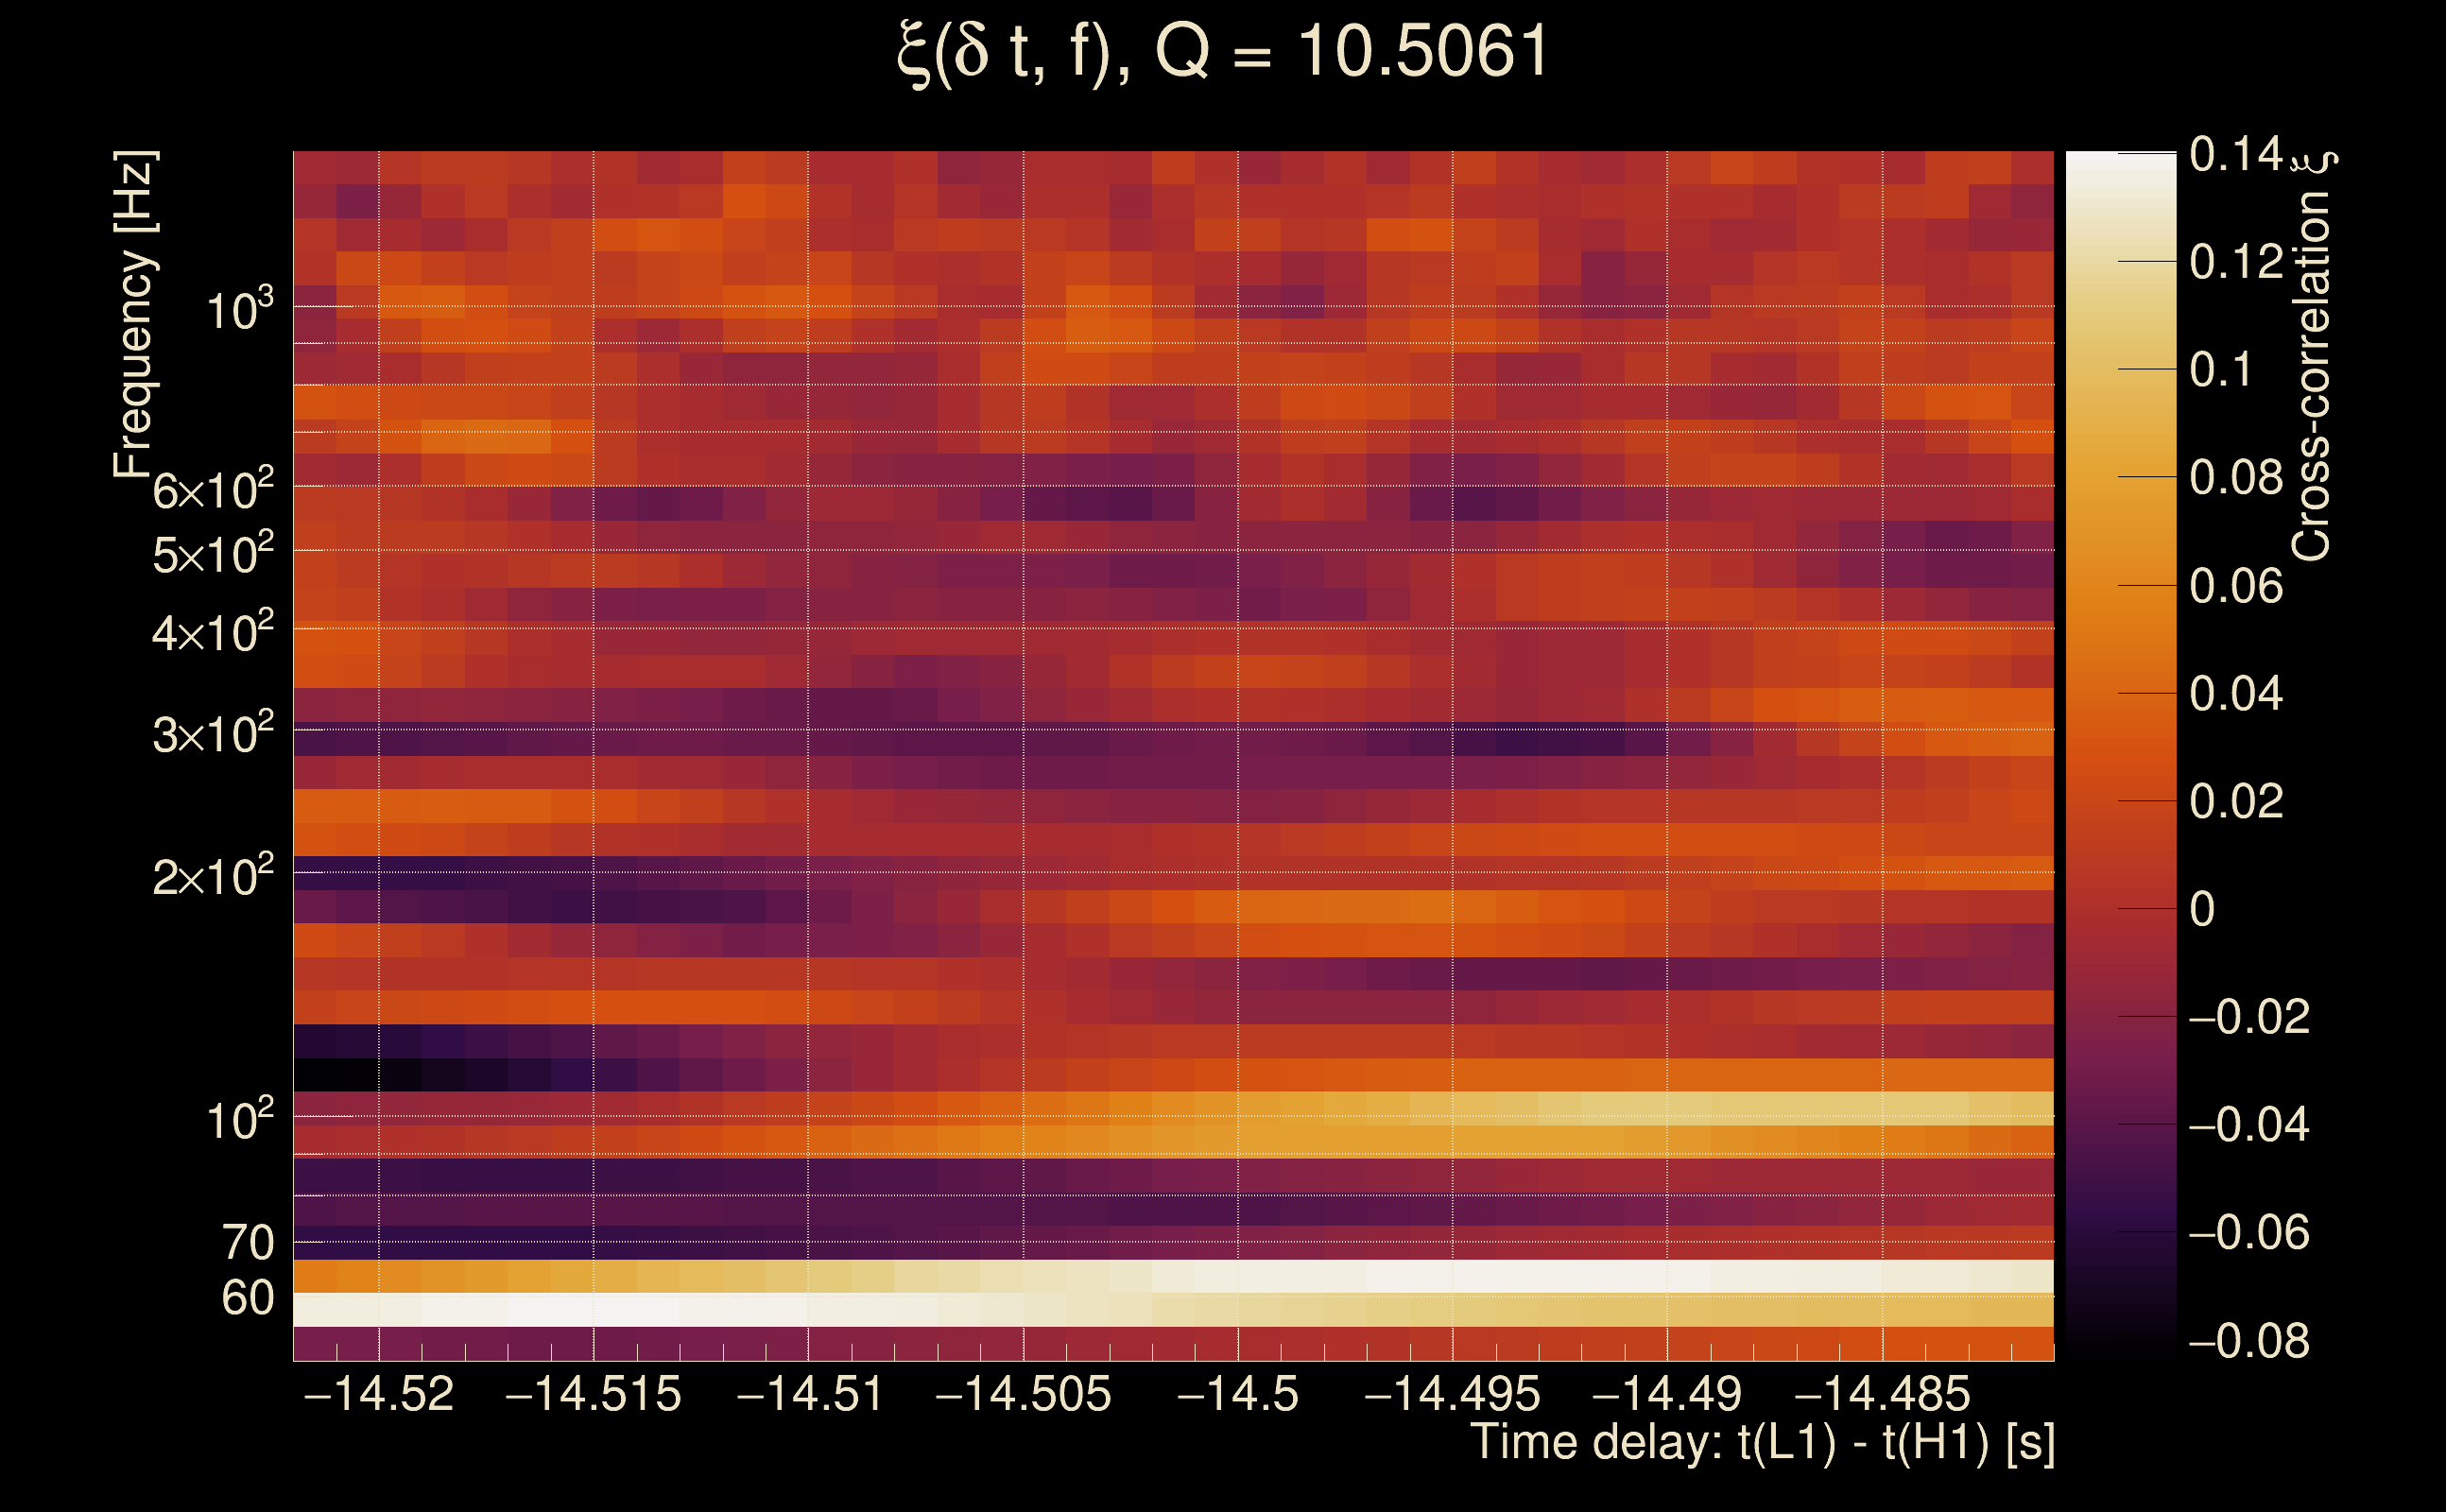
| Time delay between detectors t(L1) - t(H1): | -14.5011 s (slice index = 206 / 217), δt_gw = 0.00691274 s |
| Time delay uncertainty: | 0.00593589 s |
| [targeted mode] Time delay probability: | 0.769643 (0.292842 sigmas), δt_target = 0.00865173 s |
| Frequency: | 81.836 Hz |
| Ξ: | 0.0129738 ± 0.0998154 (variance = 0.00996312): Q0: 0.130631, Q1: 0.168017, Q2: 0.377928, Q3: 0.121082, Q4: 0.112125 |
| Rank: | R_A = 0.00635609 |
| Log of amplitude ratio (L1/H1): | -0.0960375, variance = 0.367171 (L1/H1: -0.328736, variance = 0.484131, H1/L1: -0.175038, variance = 1.0639) |
| Amplitude ratio (L1/H1): | 0.90843 ⋇ 1.83299 (L1/H1: 0.719833 ⋇ 2.0053, H1/L1: 0.839425 ⋇ 2.80515) |
| Amplitude ratio H1|L1 compatibility (probability): | 0.685553 |
| Antenna factor probability: | 0.92852 |
| Number of rejected frequency rows: | Q0: 16 / 18, Q1: 33 / 36, Q2: 68 / 70, Q3: 127 / 134, Q4: 248 / 258 |
| Maximum signal-to-noise ratio: | H1: 5.31006, L1: 4.91984 |
| SNR variance: | H1: 0.521538, L1: 0.527001 |
| Click here for a zoomed plot | Click here for a zoomed plot | Click here for a zoomed plot | Click here for a zoomed plot | Click here for a zoomed plot |
 |
 |
 |
 |
 |
 |
 |
 |
 |
 |
 |
 |
 |
 |
 |
 |
 |
 |
 |
 |
 |
 |
 |
 |
 |
 |
 |
 |
 |
| Event time t(H1): | GPS = 1368195513 (Mon May 15 14:18:15 2023 ) → GPS = 1368195523 (Mon May 15 14:18:25 2023 ) |
| Event time t(L1): | GPS = 1368195503 (Mon May 15 14:18:25 2023 ) → GPS = 1368195513 (Mon May 15 14:18:15 2023 ) |
| Omicron analysis time window (H1): | GPS = 1368195510 → GPS = 1368195526 |
| Omicron analysis time window (L1): | GPS = 1368195500 → GPS = 1368195516 |
| Time delay between detectors t(L1) - t(H1): | -14.1781 s (slice index = 199 / 217), δt_gw = 0.00792433 s |
| Time delay uncertainty: | 0.00494133 s |
| [targeted mode] Time delay probability: | 0.881559 (0.148993 sigmas), δt_target = 0.00865102 s |
| Frequency: | 220.179 Hz |
| Ξ: | 0.0169215 ± 0.031786 (variance = 0.00101035): Q0: 0.0860087, Q1: 0.0337222, Q2: 0.0379819, Q3: 0.091828, Q4: 0.114941 |
| Rank: | R_A = 0.00600395 |
| Log of amplitude ratio (L1/H1): | -0.0335256, variance = 0.391007 (L1/H1: -0.43738, variance = 0.744264, H1/L1: -0.458244, variance = 0.819458) |
| Amplitude ratio (L1/H1): | 0.96703 ⋇ 1.86882 (L1/H1: 0.645726 ⋇ 2.36957, H1/L1: 0.632393 ⋇ 2.47252) |
| Amplitude ratio H1|L1 compatibility (probability): | 0.473856 |
| Antenna factor probability: | 0.849376 |
| Number of rejected frequency rows: | Q0: 12 / 18, Q1: 31 / 36, Q2: 63 / 70, Q3: 123 / 134, Q4: 252 / 258 |
| Maximum signal-to-noise ratio: | H1: 5.16093, L1: 4.67692 |
| SNR variance: | H1: 0.529589, L1: 0.504736 |
| Click here for a zoomed plot | Click here for a zoomed plot | Click here for a zoomed plot | Click here for a zoomed plot | Click here for a zoomed plot |
|
|
|
|
|
|
|
|
|
|
|
|
|
|
|
|
|
|
|
|
|
|
|
|
|
 |
 |
 |
 |
| Event time t(H1): | GPS = 1368195773 (Mon May 15 14:22:35 2023 ) → GPS = 1368195783 (Mon May 15 14:22:45 2023 ) |
| Event time t(L1): | GPS = 1368195763 (Mon May 15 14:22:45 2023 ) → GPS = 1368195773 (Mon May 15 14:22:35 2023 ) |
| Omicron analysis time window (H1): | GPS = 1368195770 → GPS = 1368195786 |
| Omicron analysis time window (L1): | GPS = 1368195760 → GPS = 1368195776 |
| Time delay between detectors t(L1) - t(H1): | -7.88094 s (slice index = 62 / 217), δt_gw = 0.00306226 s |
| Time delay uncertainty: | 0.00801832 s |
| [targeted mode] Time delay probability: | 0.487536 (0.694233 sigmas), δt_target = 0.00866055 s |
| Frequency: | 196.246 Hz |
| Ξ: | 0.0166427 ± 0.0260894 (variance = 0.000680659): Q0: 0.0760627, Q1: 0.0958737, Q2: 0.0673968, Q3: 0.0713183, Q4: 0.138114 |
| Rank: | R_A = 0.00550053 |
| Log of amplitude ratio (L1/H1): | -0.107321, variance = 0.507927 (L1/H1: -0.385621, variance = 0.726346, H1/L1: -0.136981, variance = 1.23137) |
| Amplitude ratio (L1/H1): | 0.898238 ⋇ 2.03947 (L1/H1: 0.680028 ⋇ 2.34494, H1/L1: 0.871987 ⋇ 3.03336) |
| Amplitude ratio H1|L1 compatibility (probability): | 0.708773 |
| Antenna factor probability: | 0.956459 |
| Number of rejected frequency rows: | Q0: 13 / 18, Q1: 29 / 36, Q2: 66 / 70, Q3: 124 / 134, Q4: 245 / 258 |
| Maximum signal-to-noise ratio: | H1: 5.12869, L1: 5.47394 |
| SNR variance: | H1: 0.53251, L1: 0.542573 |
| Click here for a zoomed plot | Click here for a zoomed plot | Click here for a zoomed plot | Click here for a zoomed plot | Click here for a zoomed plot |
 |
 |
 |
 |
 |
 |
 |
 |
 |
 |
 |
 |
 |
 |
 |
 |
 |
 |
 |
 |
 |
 |
 |
 |
 |
 |
 |
 |
 |
| Event time t(H1): | GPS = 1368195728 (Mon May 15 14:21:50 2023 ) → GPS = 1368195738 (Mon May 15 14:22:00 2023 ) |
| Event time t(L1): | GPS = 1368195708 (Mon May 15 14:22:00 2023 ) → GPS = 1368195718 (Mon May 15 14:21:40 2023 ) |
| Omicron analysis time window (H1): | GPS = 1368195725 → GPS = 1368195741 |
| Omicron analysis time window (L1): | GPS = 1368195705 → GPS = 1368195721 |
| Time delay between detectors t(L1) - t(H1): | -23.5821 s (slice index = 186 / 217), δt_gw = 0.00588713 s |
| Time delay uncertainty: | 0.00728581 s |
| [targeted mode] Time delay probability: | 0.706104 (0.377094 sigmas), δt_target = 0.00862885 s |
| Frequency: | 139.732 Hz |
| Ξ: | 0.0216692 ± 0.018447 (variance = 0.000340291): Q0: 0.0666692, Q1: 0.0945626, Q2: 0.118313, Q3: 0.0796992, Q4: 0.0729026 |
| Rank: | R_A = 0.00507947 |
| Log of amplitude ratio (L1/H1): | 0.0285252, variance = 0.51947 (L1/H1: -0.524653, variance = 0.894719, H1/L1: -0.670282, variance = 1.21973) |
| Amplitude ratio (L1/H1): | 1.02894 ⋇ 2.05596 (L1/H1: 0.59176 ⋇ 2.57512, H1/L1: 0.511564 ⋇ 3.01745) |
| Amplitude ratio H1|L1 compatibility (probability): | 0.411212 |
| Antenna factor probability: | 0.80731 |
| Number of rejected frequency rows: | Q0: 10 / 18, Q1: 30 / 36, Q2: 61 / 70, Q3: 123 / 134, Q4: 248 / 258 |
| Maximum signal-to-noise ratio: | H1: 5.18956, L1: 4.81812 |
| SNR variance: | H1: 0.535979, L1: 0.510686 |
| Click here for a zoomed plot | Click here for a zoomed plot | Click here for a zoomed plot | Click here for a zoomed plot | Click here for a zoomed plot |
 |
 |
 |
 |
 |
 |
 |
 |
 |
 |
 |
 |
 |
 |
 |
 |
 |
 |
 |
 |
 |
 |
 |
 |
 |
 |
 |
 |
 |
| Event time t(H1): | GPS = 1368195628 (Mon May 15 14:20:10 2023 ) → GPS = 1368195638 (Mon May 15 14:20:20 2023 ) |
| Event time t(L1): | GPS = 1368195608 (Mon May 15 14:20:20 2023 ) → GPS = 1368195618 (Mon May 15 14:20:00 2023 ) |
| Omicron analysis time window (H1): | GPS = 1368195625 → GPS = 1368195641 |
| Omicron analysis time window (L1): | GPS = 1368195605 → GPS = 1368195621 |
| Time delay between detectors t(L1) - t(H1): | -22.7104 s (slice index = 167 / 217), δt_gw = 0.00357711 s |
| Time delay uncertainty: | 0.006962 s |
| [targeted mode] Time delay probability: | 0.466501 (0.728184 sigmas), δt_target = 0.00863457 s |
| Frequency: | 105.856 Hz |
| Ξ: | 0.01842 ± 0.0327134 (variance = 0.00107016): Q0: 0.150605, Q1: 0.227525, Q2: 0.224252, Q3: 0.159206, Q4: 0.17203 |
| Rank: | R_A = 0.00486438 |
| Log of amplitude ratio (L1/H1): | 0.0719908, variance = 0.504924 (L1/H1: -0.139259, variance = 0.749206, H1/L1: -0.324614, variance = 1.36322) |
| Amplitude ratio (L1/H1): | 1.07465 ⋇ 2.03517 (L1/H1: 0.870003 ⋇ 2.37635, H1/L1: 0.722807 ⋇ 3.21417) |
| Amplitude ratio H1|L1 compatibility (probability): | 0.749605 |
| Antenna factor probability: | 0.755183 |
| Number of rejected frequency rows: | Q0: 16 / 18, Q1: 32 / 36, Q2: 65 / 70, Q3: 121 / 134, Q4: 246 / 258 |
| Maximum signal-to-noise ratio: | H1: 5.33481, L1: 4.87844 |
| SNR variance: | H1: 0.534731, L1: 0.524392 |
| Click here for a zoomed plot | Click here for a zoomed plot | Click here for a zoomed plot | Click here for a zoomed plot | Click here for a zoomed plot |
 |
 |
 |
 |
 |
 |
 |
 |
 |
 |
 |
 |
 |
 |
 |
 |
 |
 |
 |
 |
 |
 |
 |
 |
 |
 |
 |
 |
 |
| Event time t(H1): | GPS = 1368195508 (Mon May 15 14:18:10 2023 ) → GPS = 1368195518 (Mon May 15 14:18:20 2023 ) |
| Event time t(L1): | GPS = 1368195498 (Mon May 15 14:18:20 2023 ) → GPS = 1368195508 (Mon May 15 14:18:10 2023 ) |
| Omicron analysis time window (H1): | GPS = 1368195505 → GPS = 1368195521 |
| Omicron analysis time window (L1): | GPS = 1368195495 → GPS = 1368195511 |
| Time delay between detectors t(L1) - t(H1): | -12.1125 s (slice index = 154 / 217), δt_gw = 0.0034977 s |
| Time delay uncertainty: | 0.00663378 s |
| [targeted mode] Time delay probability: | 0.436369 (0.77834 sigmas), δt_target = 0.00864673 s |
| Frequency: | 177.088 Hz |
| Ξ: | 0.0207585 ± 0.0360451 (variance = 0.00129925): Q0: 0.120461, Q1: 0.141261, Q2: 0.0473212, Q3: 0.0584336, Q4: 0.104945 |
| Rank: | R_A = 0.00485856 |
| Log of amplitude ratio (L1/H1): | 0.190346, variance = 0.440267 (L1/H1: 0.10293, variance = 0.596197, H1/L1: -0.300794, variance = 1.30387) |
| Amplitude ratio (L1/H1): | 1.20967 ⋇ 1.94163 (L1/H1: 1.10841 ⋇ 2.16439, H1/L1: 0.74023 ⋇ 3.13263) |
| Amplitude ratio H1|L1 compatibility (probability): | 0.885862 |
| Antenna factor probability: | 0.60547 |
| Number of rejected frequency rows: | Q0: 14 / 18, Q1: 30 / 36, Q2: 63 / 70, Q3: 124 / 134, Q4: 245 / 258 |
| Maximum signal-to-noise ratio: | H1: 5.12683, L1: 4.56106 |
| SNR variance: | H1: 0.521346, L1: 0.505347 |
| Click here for a zoomed plot | Click here for a zoomed plot | Click here for a zoomed plot | Click here for a zoomed plot | Click here for a zoomed plot |
 |
 |
 |
 |
 |
 |
 |
 |
 |
 |
 |
 |
 |
 |
 |
 |
 |
 |
 |
 |
 |
 |
 |
 |
 |
 |
 |
 |
 |
| Event time t(H1): | GPS = 1368195443 (Mon May 15 14:17:05 2023 ) → GPS = 1368195453 (Mon May 15 14:17:15 2023 ) |
| Event time t(L1): | GPS = 1368195423 (Mon May 15 14:17:15 2023 ) → GPS = 1368195433 (Mon May 15 14:16:55 2023 ) |
| Omicron analysis time window (H1): | GPS = 1368195440 → GPS = 1368195456 |
| Omicron analysis time window (L1): | GPS = 1368195420 → GPS = 1368195436 |
| Time delay between detectors t(L1) - t(H1): | -17.0542 s (slice index = 44 / 217), δt_gw = 0.00181389 s |
| Time delay uncertainty: | 0.0086443 s |
| [targeted mode] Time delay probability: | 0.427772 (0.79301 sigmas), δt_target = 0.00866103 s |
| Frequency: | 108.8 Hz |
| Ξ: | 0.0212435 ± 0.113665 (variance = 0.0129197): Q0: 0.0997537, Q1: 0.166075, Q2: 0.127462, Q3: 0.0885539, Q4: 0.396645 |
| Rank: | R_A = 0.00477274 |
| Log of amplitude ratio (L1/H1): | 0.0566482, variance = 0.560857 (L1/H1: -0.27778, variance = 1.01531, H1/L1: -0.345868, variance = 1.19104) |
| Amplitude ratio (L1/H1): | 1.05828 ⋇ 2.11468 (L1/H1: 0.757464 ⋇ 2.7391, H1/L1: 0.707606 ⋇ 2.97829) |
| Amplitude ratio H1|L1 compatibility (probability): | 0.67459 |
| Antenna factor probability: | 0.778554 |
| Number of rejected frequency rows: | Q0: 14 / 18, Q1: 30 / 36, Q2: 61 / 70, Q3: 125 / 134, Q4: 252 / 258 |
| Maximum signal-to-noise ratio: | H1: 4.82901, L1: 5.19273 |
| SNR variance: | H1: 0.516141, L1: 0.524531 |
| Click here for a zoomed plot | Click here for a zoomed plot | Click here for a zoomed plot | Click here for a zoomed plot | Click here for a zoomed plot |
 |
 |
 |
 |
 |
 |
 |
 |
 |
 |
 |
 |
 |
 |
 |
 |
 |
 |
 |
 |
 |
 |
 |
 |
 |
 |
 |
 |
 |
| Event time t(H1): | GPS = 1368195558 (Mon May 15 14:19:00 2023 ) → GPS = 1368195568 (Mon May 15 14:19:10 2023 ) |
| Event time t(L1): | GPS = 1368195548 (Mon May 15 14:19:10 2023 ) → GPS = 1368195558 (Mon May 15 14:19:00 2023 ) |
| Omicron analysis time window (H1): | GPS = 1368195555 → GPS = 1368195571 |
| Omicron analysis time window (L1): | GPS = 1368195545 → GPS = 1368195561 |
| Time delay between detectors t(L1) - t(H1): | -12.7546 s (slice index = 168 / 217), δt_gw = 0.00536606 s |
| Time delay uncertainty: | 0.0041999 s |
| [targeted mode] Time delay probability: | 0.433526 (0.783172 sigmas), δt_target = 0.0086689 s |
| Frequency: | 121.609 Hz |
| Ξ: | 0.038832 ± 0.0470965 (variance = 0.00221808): Q0: 0.131744, Q1: 0.163385, Q2: 0.088824, Q3: 0.14625, Q4: 0.232796 |
| Rank: | R_A = 0.00472731 |
| Log of amplitude ratio (L1/H1): | 0.32695, variance = 0.821608 (L1/H1: -0.310571, variance = 1.55328, H1/L1: -1.00161, variance = 1.74114) |
| Amplitude ratio (L1/H1): | 1.38673 ⋇ 2.47546 (L1/H1: 0.733028 ⋇ 3.47748, H1/L1: 0.367289 ⋇ 3.74164) |
| Amplitude ratio H1|L1 compatibility (probability): | 0.469716 |
| Antenna factor probability: | 0.597825 |
| Number of rejected frequency rows: | Q0: 10 / 18, Q1: 31 / 36, Q2: 60 / 70, Q3: 120 / 134, Q4: 243 / 258 |
| Maximum signal-to-noise ratio: | H1: 4.9781, L1: 4.83916 |
| SNR variance: | H1: 0.536733, L1: 0.544861 |
| Click here for a zoomed plot | Click here for a zoomed plot | Click here for a zoomed plot | Click here for a zoomed plot | Click here for a zoomed plot |
 |
 |
 |
 |
 |
 |
 |
 |
 |
 |
 |
 |
 |
 |
 |
 |
 |
 |
 |
 |
 |
 |
 |
 |
 |
 |
 |
 |
 |
| Event time t(H1): | GPS = 1368195693 (Mon May 15 14:21:15 2023 ) → GPS = 1368195703 (Mon May 15 14:21:25 2023 ) |
| Event time t(L1): | GPS = 1368195683 (Mon May 15 14:21:25 2023 ) → GPS = 1368195693 (Mon May 15 14:21:15 2023 ) |
| Omicron analysis time window (H1): | GPS = 1368195690 → GPS = 1368195706 |
| Omicron analysis time window (L1): | GPS = 1368195680 → GPS = 1368195696 |
| Time delay between detectors t(L1) - t(H1): | -13.9949 s (slice index = 195 / 217), δt_gw = 0.00712437 s |
| Time delay uncertainty: | 0.00600802 s |
| [targeted mode] Time delay probability: | 0.800981 (0.252077 sigmas), δt_target = 0.00865531 s |
| Frequency: | 206.901 Hz |
| Ξ: | 0.0103539 ± 0.01839 (variance = 0.000338192): Q0: 0.0689331, Q1: 0.0902856, Q2: 0.0459879, Q3: 0.0636506, Q4: 0.0966349 |
| Rank: | R_A = 0.00459176 |
| Log of amplitude ratio (L1/H1): | 0.241384, variance = 0.879133 (L1/H1: 0.0271745, variance = 0.744564, H1/L1: -0.470081, variance = 2.90971) |
| Amplitude ratio (L1/H1): | 1.27301 ⋇ 2.5539 (L1/H1: 1.02755 ⋇ 2.36998, H1/L1: 0.624952 ⋇ 5.50571) |
| Amplitude ratio H1|L1 compatibility (probability): | 0.816777 |
| Antenna factor probability: | 0.677876 |
| Number of rejected frequency rows: | Q0: 15 / 18, Q1: 30 / 36, Q2: 66 / 70, Q3: 128 / 134, Q4: 249 / 258 |
| Maximum signal-to-noise ratio: | H1: 5.13399, L1: 4.96872 |
| SNR variance: | H1: 0.49301, L1: 0.503007 |
| Click here for a zoomed plot | Click here for a zoomed plot | Click here for a zoomed plot | Click here for a zoomed plot | Click here for a zoomed plot |
 |
 |
 |
 |
 |
 |
 |
 |
 |
 |
 |
 |
 |
 |
 |
 |
 |
 |
 |
 |
 |
 |
 |
 |
 |
 |
 |
 |
 |
| Event time t(H1): | GPS = 1368195598 (Mon May 15 14:19:40 2023 ) → GPS = 1368195608 (Mon May 15 14:19:50 2023 ) |
| Event time t(L1): | GPS = 1368195588 (Mon May 15 14:19:50 2023 ) → GPS = 1368195598 (Mon May 15 14:19:40 2023 ) |
| Omicron analysis time window (H1): | GPS = 1368195595 → GPS = 1368195611 |
| Omicron analysis time window (L1): | GPS = 1368195585 → GPS = 1368195601 |
| Time delay between detectors t(L1) - t(H1): | -11.5128 s (slice index = 141 / 217), δt_gw = 0.00521851 s |
| Time delay uncertainty: | 0.00816585 s |
| [targeted mode] Time delay probability: | 0.674273 (0.420291 sigmas), δt_target = 0.00863886 s |
| Frequency: | 92.4351 Hz |
| Ξ: | 0.0130032 ± 0.0357129 (variance = 0.00127541): Q0: 0.107126, Q1: 0.123331, Q2: 0.0293138, Q3: 0.0573683, Q4: 0.108534 |
| Rank: | R_A = 0.00456601 |
| Log of amplitude ratio (L1/H1): | -0.0247368, variance = 0.428323 (L1/H1: -0.346071, variance = 0.881321, H1/L1: -0.313013, variance = 0.828267) |
| Amplitude ratio (L1/H1): | 0.975567 ⋇ 1.92411 (L1/H1: 0.707462 ⋇ 2.55688, H1/L1: 0.73124 ⋇ 2.48455) |
| Amplitude ratio H1|L1 compatibility (probability): | 0.614209 |
| Antenna factor probability: | 0.847881 |
| Number of rejected frequency rows: | Q0: 15 / 18, Q1: 32 / 36, Q2: 68 / 70, Q3: 129 / 134, Q4: 248 / 258 |
| Maximum signal-to-noise ratio: | H1: 5.06029, L1: 4.93578 |
| SNR variance: | H1: 0.52841, L1: 0.531144 |
| Click here for a zoomed plot | Click here for a zoomed plot | Click here for a zoomed plot | Click here for a zoomed plot | Click here for a zoomed plot |
 |
 |
 |
 |
 |
 |
 |
 |
 |
 |
 |
 |
 |
 |
 |
 |
 |
 |
 |
 |
 |
 |
 |
 |
 |
 |
 |
 |
 |
| Event time t(H1): | GPS = 1368195438 (Mon May 15 14:17:00 2023 ) → GPS = 1368195448 (Mon May 15 14:17:10 2023 ) |
| Event time t(L1): | GPS = 1368195418 (Mon May 15 14:17:10 2023 ) → GPS = 1368195428 (Mon May 15 14:16:50 2023 ) |
| Omicron analysis time window (H1): | GPS = 1368195435 → GPS = 1368195451 |
| Omicron analysis time window (L1): | GPS = 1368195415 → GPS = 1368195431 |
| Time delay between detectors t(L1) - t(H1): | -21.0507 s (slice index = 131 / 217), δt_gw = 0.00732988 s |
| Time delay uncertainty: | 0.00684171 s |
| [targeted mode] Time delay probability: | 0.844779 (0.195784 sigmas), δt_target = 0.00865054 s |
| Frequency: | 109.725 Hz |
| Ξ: | 0.017161 ± 0.0348419 (variance = 0.00121396): Q0: 0.086765, Q1: 0.141079, Q2: 0.166069, Q3: 0.109026, Q4: 0.0708517 |
| Rank: | R_A = 0.00439592 |
| Log of amplitude ratio (L1/H1): | 0.494206, variance = 0.609724 (L1/H1: 0.242582, variance = 0.672509, H1/L1: -0.750235, variance = 1.78552) |
| Amplitude ratio (L1/H1): | 1.6392 ⋇ 2.18332 (L1/H1: 1.27454 ⋇ 2.27065, H1/L1: 0.472255 ⋇ 3.80468) |
| Amplitude ratio H1|L1 compatibility (probability): | 0.746091 |
| Antenna factor probability: | 0.406417 |
| Number of rejected frequency rows: | Q0: 14 / 18, Q1: 31 / 36, Q2: 64 / 70, Q3: 127 / 134, Q4: 250 / 258 |
| Maximum signal-to-noise ratio: | H1: 5.2285, L1: 5.18333 |
| SNR variance: | H1: 0.506429, L1: 0.509076 |
| Click here for a zoomed plot | Click here for a zoomed plot | Click here for a zoomed plot | Click here for a zoomed plot | Click here for a zoomed plot |
|
|
|
|
|
|
|
|
|
|
|
|
|
|
|
|
|
|
|
|
|
|
|
|
|
 |
 |
 |
 |
| Event time t(H1): | GPS = 1368195468 (Mon May 15 14:17:30 2023 ) → GPS = 1368195478 (Mon May 15 14:17:40 2023 ) |
| Event time t(L1): | GPS = 1368195448 (Mon May 15 14:17:40 2023 ) → GPS = 1368195458 (Mon May 15 14:17:20 2023 ) |
| Omicron analysis time window (H1): | GPS = 1368195465 → GPS = 1368195481 |
| Omicron analysis time window (L1): | GPS = 1368195445 → GPS = 1368195461 |
| Time delay between detectors t(L1) - t(H1): | -21.97 s (slice index = 151 / 217), δt_gw = 0.00802188 s |
| Time delay uncertainty: | 0.00449126 s |
| [targeted mode] Time delay probability: | 0.885997 (0.143371 sigmas), δt_target = 0.00866938 s |
| Frequency: | 320.689 Hz |
| Ξ: | 0.0115777 ± 0.0308169 (variance = 0.000949682): Q0: 0.0440422, Q1: 0.06479, Q2: 0.0446969, Q3: 0.0979342, Q4: 0.122348 |
| Rank: | R_A = 0.00420135 |
| Log of amplitude ratio (L1/H1): | -0.0260859, variance = 0.968791 (L1/H1: -0.712264, variance = 1.80102, H1/L1: -0.75757, variance = 2.09615) |
| Amplitude ratio (L1/H1): | 0.974251 ⋇ 2.67586 (L1/H1: 0.490533 ⋇ 3.82677, H1/L1: 0.468804 ⋇ 4.25378) |
| Amplitude ratio H1|L1 compatibility (probability): | 0.456544 |
| Antenna factor probability: | 0.897122 |
| Number of rejected frequency rows: | Q0: 14 / 18, Q1: 25 / 36, Q2: 62 / 70, Q3: 122 / 134, Q4: 242 / 258 |
| Maximum signal-to-noise ratio: | H1: 5.37646, L1: 5.03098 |
| SNR variance: | H1: 0.53288, L1: 0.509304 |
| Click here for a zoomed plot | Click here for a zoomed plot | Click here for a zoomed plot | Click here for a zoomed plot | Click here for a zoomed plot |
 |
 |
 |
 |
 |
 |
 |
 |
 |
 |
 |
 |
 |
 |
 |
 |
 |
 |
 |
 |
 |
 |
 |
 |
 |
 |
 |
 |
 |
| Event time t(H1): | GPS = 1368195513 (Mon May 15 14:18:15 2023 ) → GPS = 1368195523 (Mon May 15 14:18:25 2023 ) |
| Event time t(L1): | GPS = 1368195503 (Mon May 15 14:18:25 2023 ) → GPS = 1368195513 (Mon May 15 14:18:15 2023 ) |
| Omicron analysis time window (H1): | GPS = 1368195510 → GPS = 1368195526 |
| Omicron analysis time window (L1): | GPS = 1368195500 → GPS = 1368195516 |
| Time delay between detectors t(L1) - t(H1): | -9.44203 s (slice index = 96 / 217), δt_gw = 0.0059719 s |
| Time delay uncertainty: | 0.00620533 s |
| [targeted mode] Time delay probability: | 0.66481 (0.433281 sigmas), δt_target = 0.0086658 s |
| Frequency: | 306.855 Hz |
| Ξ: | 0.0155436 ± 0.0109947 (variance = 0.000120884): Q0: 0.0759694, Q1: 0.0465115, Q2: 0.0562174, Q3: 0.0453191, Q4: 0.0546438 |
| Rank: | R_A = 0.00417348 |
| Log of amplitude ratio (L1/H1): | -0.0439122, variance = 0.653833 (L1/H1: -0.584892, variance = 1.38818, H1/L1: -0.614834, variance = 1.1573) |
| Amplitude ratio (L1/H1): | 0.957038 ⋇ 2.24476 (L1/H1: 0.557166 ⋇ 3.24855, H1/L1: 0.540731 ⋇ 2.93228) |
| Amplitude ratio H1|L1 compatibility (probability): | 0.452072 |
| Antenna factor probability: | 0.893388 |
| Number of rejected frequency rows: | Q0: 13 / 18, Q1: 27 / 36, Q2: 56 / 70, Q3: 123 / 134, Q4: 246 / 258 |
| Maximum signal-to-noise ratio: | H1: 5.16093, L1: 4.67692 |
| SNR variance: | H1: 0.529589, L1: 0.504736 |
| Click here for a zoomed plot | Click here for a zoomed plot | Click here for a zoomed plot | Click here for a zoomed plot | Click here for a zoomed plot |
|
|
|
|
|
|
|
|
|
|
|
|
|
|
|
|
|
|
|
|
|
|
|
|
|
 |
 |
 |
 |
| Event time t(H1): | GPS = 1368195728 (Mon May 15 14:21:50 2023 ) → GPS = 1368195738 (Mon May 15 14:22:00 2023 ) |
| Event time t(L1): | GPS = 1368195718 (Mon May 15 14:22:00 2023 ) → GPS = 1368195728 (Mon May 15 14:21:50 2023 ) |
| Omicron analysis time window (H1): | GPS = 1368195725 → GPS = 1368195741 |
| Omicron analysis time window (L1): | GPS = 1368195715 → GPS = 1368195731 |
| Time delay between detectors t(L1) - t(H1): | -8.65731 s (slice index = 79 / 217), δt_gw = 0.00868504 s |
| Time delay uncertainty: | 0.00439826 s |
| [targeted mode] Time delay probability: | 0.990843 (0.0114766 sigmas), δt_target = 0.00866055 s |
| Frequency: | 165.257 Hz |
| Ξ: | 0.0197997 ± 0.0244611 (variance = 0.000598348): Q0: 0.0926075, Q1: 0.121679, Q2: 0.090059, Q3: 0.0646032, Q4: 0.0510606 |
| Rank: | R_A = 0.00408799 |
| Log of amplitude ratio (L1/H1): | 0.0820734, variance = 0.448276 (L1/H1: -0.61754, variance = 0.870572, H1/L1: -0.815678, variance = 0.924059) |
| Amplitude ratio (L1/H1): | 1.08554 ⋇ 1.95333 (L1/H1: 0.539269 ⋇ 2.54224, H1/L1: 0.442339 ⋇ 2.61504) |
| Amplitude ratio H1|L1 compatibility (probability): | 0.284685 |
| Antenna factor probability: | 0.731951 |
| Number of rejected frequency rows: | Q0: 13 / 18, Q1: 30 / 36, Q2: 63 / 70, Q3: 125 / 134, Q4: 253 / 258 |
| Maximum signal-to-noise ratio: | H1: 5.18956, L1: 5.06791 |
| SNR variance: | H1: 0.535979, L1: 0.518322 |
| Click here for a zoomed plot | Click here for a zoomed plot | Click here for a zoomed plot | Click here for a zoomed plot | Click here for a zoomed plot |
 |
 |
 |
 |
 |
 |
 |
 |
 |
 |
 |
 |
 |
 |
 |
|
|
|
|
|
 |
 |
 |
 |
 |
 |
 |
 |
 |
| Event time t(H1): | GPS = 1368195773 (Mon May 15 14:22:35 2023 ) → GPS = 1368195783 (Mon May 15 14:22:45 2023 ) |
| Event time t(L1): | GPS = 1368195763 (Mon May 15 14:22:45 2023 ) → GPS = 1368195773 (Mon May 15 14:22:35 2023 ) |
| Omicron analysis time window (H1): | GPS = 1368195770 → GPS = 1368195786 |
| Omicron analysis time window (L1): | GPS = 1368195760 → GPS = 1368195776 |
| Time delay between detectors t(L1) - t(H1): | -5.67255 s (slice index = 14 / 217), δt_gw = 0.00345099 s |
| Time delay uncertainty: | 0.00628996 s |
| [targeted mode] Time delay probability: | 0.410398 (0.823194 sigmas), δt_target = 0.00863457 s |
| Frequency: | 199.898 Hz |
| Ξ: | 0.018586 ± 0.00748134 (variance = 5.59705e-05): Q0: 0.0839351, Q1: 0.096229, Q2: 0.0876482, Q3: 0.105191, Q4: 0.0896731 |
| Rank: | R_A = 0.00406933 |
| Log of amplitude ratio (L1/H1): | 0.0170219, variance = 0.542049 (L1/H1: -0.33299, variance = 0.650183, H1/L1: -0.324275, variance = 1.41038) |
| Amplitude ratio (L1/H1): | 1.01717 ⋇ 2.08807 (L1/H1: 0.716777 ⋇ 2.23969, H1/L1: 0.723051 ⋇ 3.27919) |
| Amplitude ratio H1|L1 compatibility (probability): | 0.647042 |
| Antenna factor probability: | 0.824516 |
| Number of rejected frequency rows: | Q0: 14 / 18, Q1: 27 / 36, Q2: 59 / 70, Q3: 117 / 134, Q4: 240 / 258 |
| Maximum signal-to-noise ratio: | H1: 5.12869, L1: 5.47394 |
| SNR variance: | H1: 0.53251, L1: 0.542573 |
| Click here for a zoomed plot | Click here for a zoomed plot | Click here for a zoomed plot | Click here for a zoomed plot | Click here for a zoomed plot |
|
|
|
|
|
|
|
|
|
|
|
|
|
|
|
|
|
|
|
|
|
|
|
|
|
 |
 |
 |
 |
| Event time t(H1): | GPS = 1368195513 (Mon May 15 14:18:15 2023 ) → GPS = 1368195523 (Mon May 15 14:18:25 2023 ) |
| Event time t(L1): | GPS = 1368195503 (Mon May 15 14:18:25 2023 ) → GPS = 1368195513 (Mon May 15 14:18:15 2023 ) |
| Omicron analysis time window (H1): | GPS = 1368195510 → GPS = 1368195526 |
| Omicron analysis time window (L1): | GPS = 1368195500 → GPS = 1368195516 |
| Time delay between detectors t(L1) - t(H1): | -8.98124 s (slice index = 86 / 217), δt_gw = 0.00675997 s |
| Time delay uncertainty: | 0.00607663 s |
| [targeted mode] Time delay probability: | 0.754456 (0.31277 sigmas), δt_target = 0.00862885 s |
| Frequency: | 173.982 Hz |
| Ξ: | 0.0244521 ± 0.0236972 (variance = 0.000561559): Q0: 0.113777, Q1: 0.0683192, Q2: 0.0586599, Q3: 0.0495448, Q4: 0.094024 |
| Rank: | R_A = 0.00398091 |
| Log of amplitude ratio (L1/H1): | -0.111169, variance = 0.541335 (L1/H1: -0.916593, variance = 1.00924, H1/L1: -0.869589, variance = 1.1659) |
| Amplitude ratio (L1/H1): | 0.894787 ⋇ 2.08706 (L1/H1: 0.399879 ⋇ 2.73084, H1/L1: 0.419124 ⋇ 2.94399) |
| Amplitude ratio H1|L1 compatibility (probability): | 0.225855 |
| Antenna factor probability: | 0.955441 |
| Number of rejected frequency rows: | Q0: 12 / 18, Q1: 28 / 36, Q2: 63 / 70, Q3: 126 / 134, Q4: 237 / 258 |
| Maximum signal-to-noise ratio: | H1: 5.16093, L1: 4.67692 |
| SNR variance: | H1: 0.529589, L1: 0.504736 |
| Click here for a zoomed plot | Click here for a zoomed plot | Click here for a zoomed plot | Click here for a zoomed plot | Click here for a zoomed plot |
|
|
|
|
|
|
|
|
|
|
|
|
|
|
|
|
|
|
|
|
|
|
|
|
|
 |
 |
 |
 |
| florent.robinet@ijclab.in2p3.fr |