| Omicron version: | 4.2.0: documentation gitlab repository |
| Omicron run by: | unknown |
| Report produced on: | Fri Apr 3 09:24:14 2026 UTC |
| Ox option file: | TargIxf_feb2026_SN7_30s_options.txt |
| Omicron option files: | detector 0, detector 1 |
| Detector channel names: | H1:GDS-CALIB_STRAIN_CLEAN_AR_4096Hz, L1:GDS-CALIB_STRAIN_CLEAN_AR_4096Hz |
| Omicron analysis time window and overlap: | 16 s, 6 s |
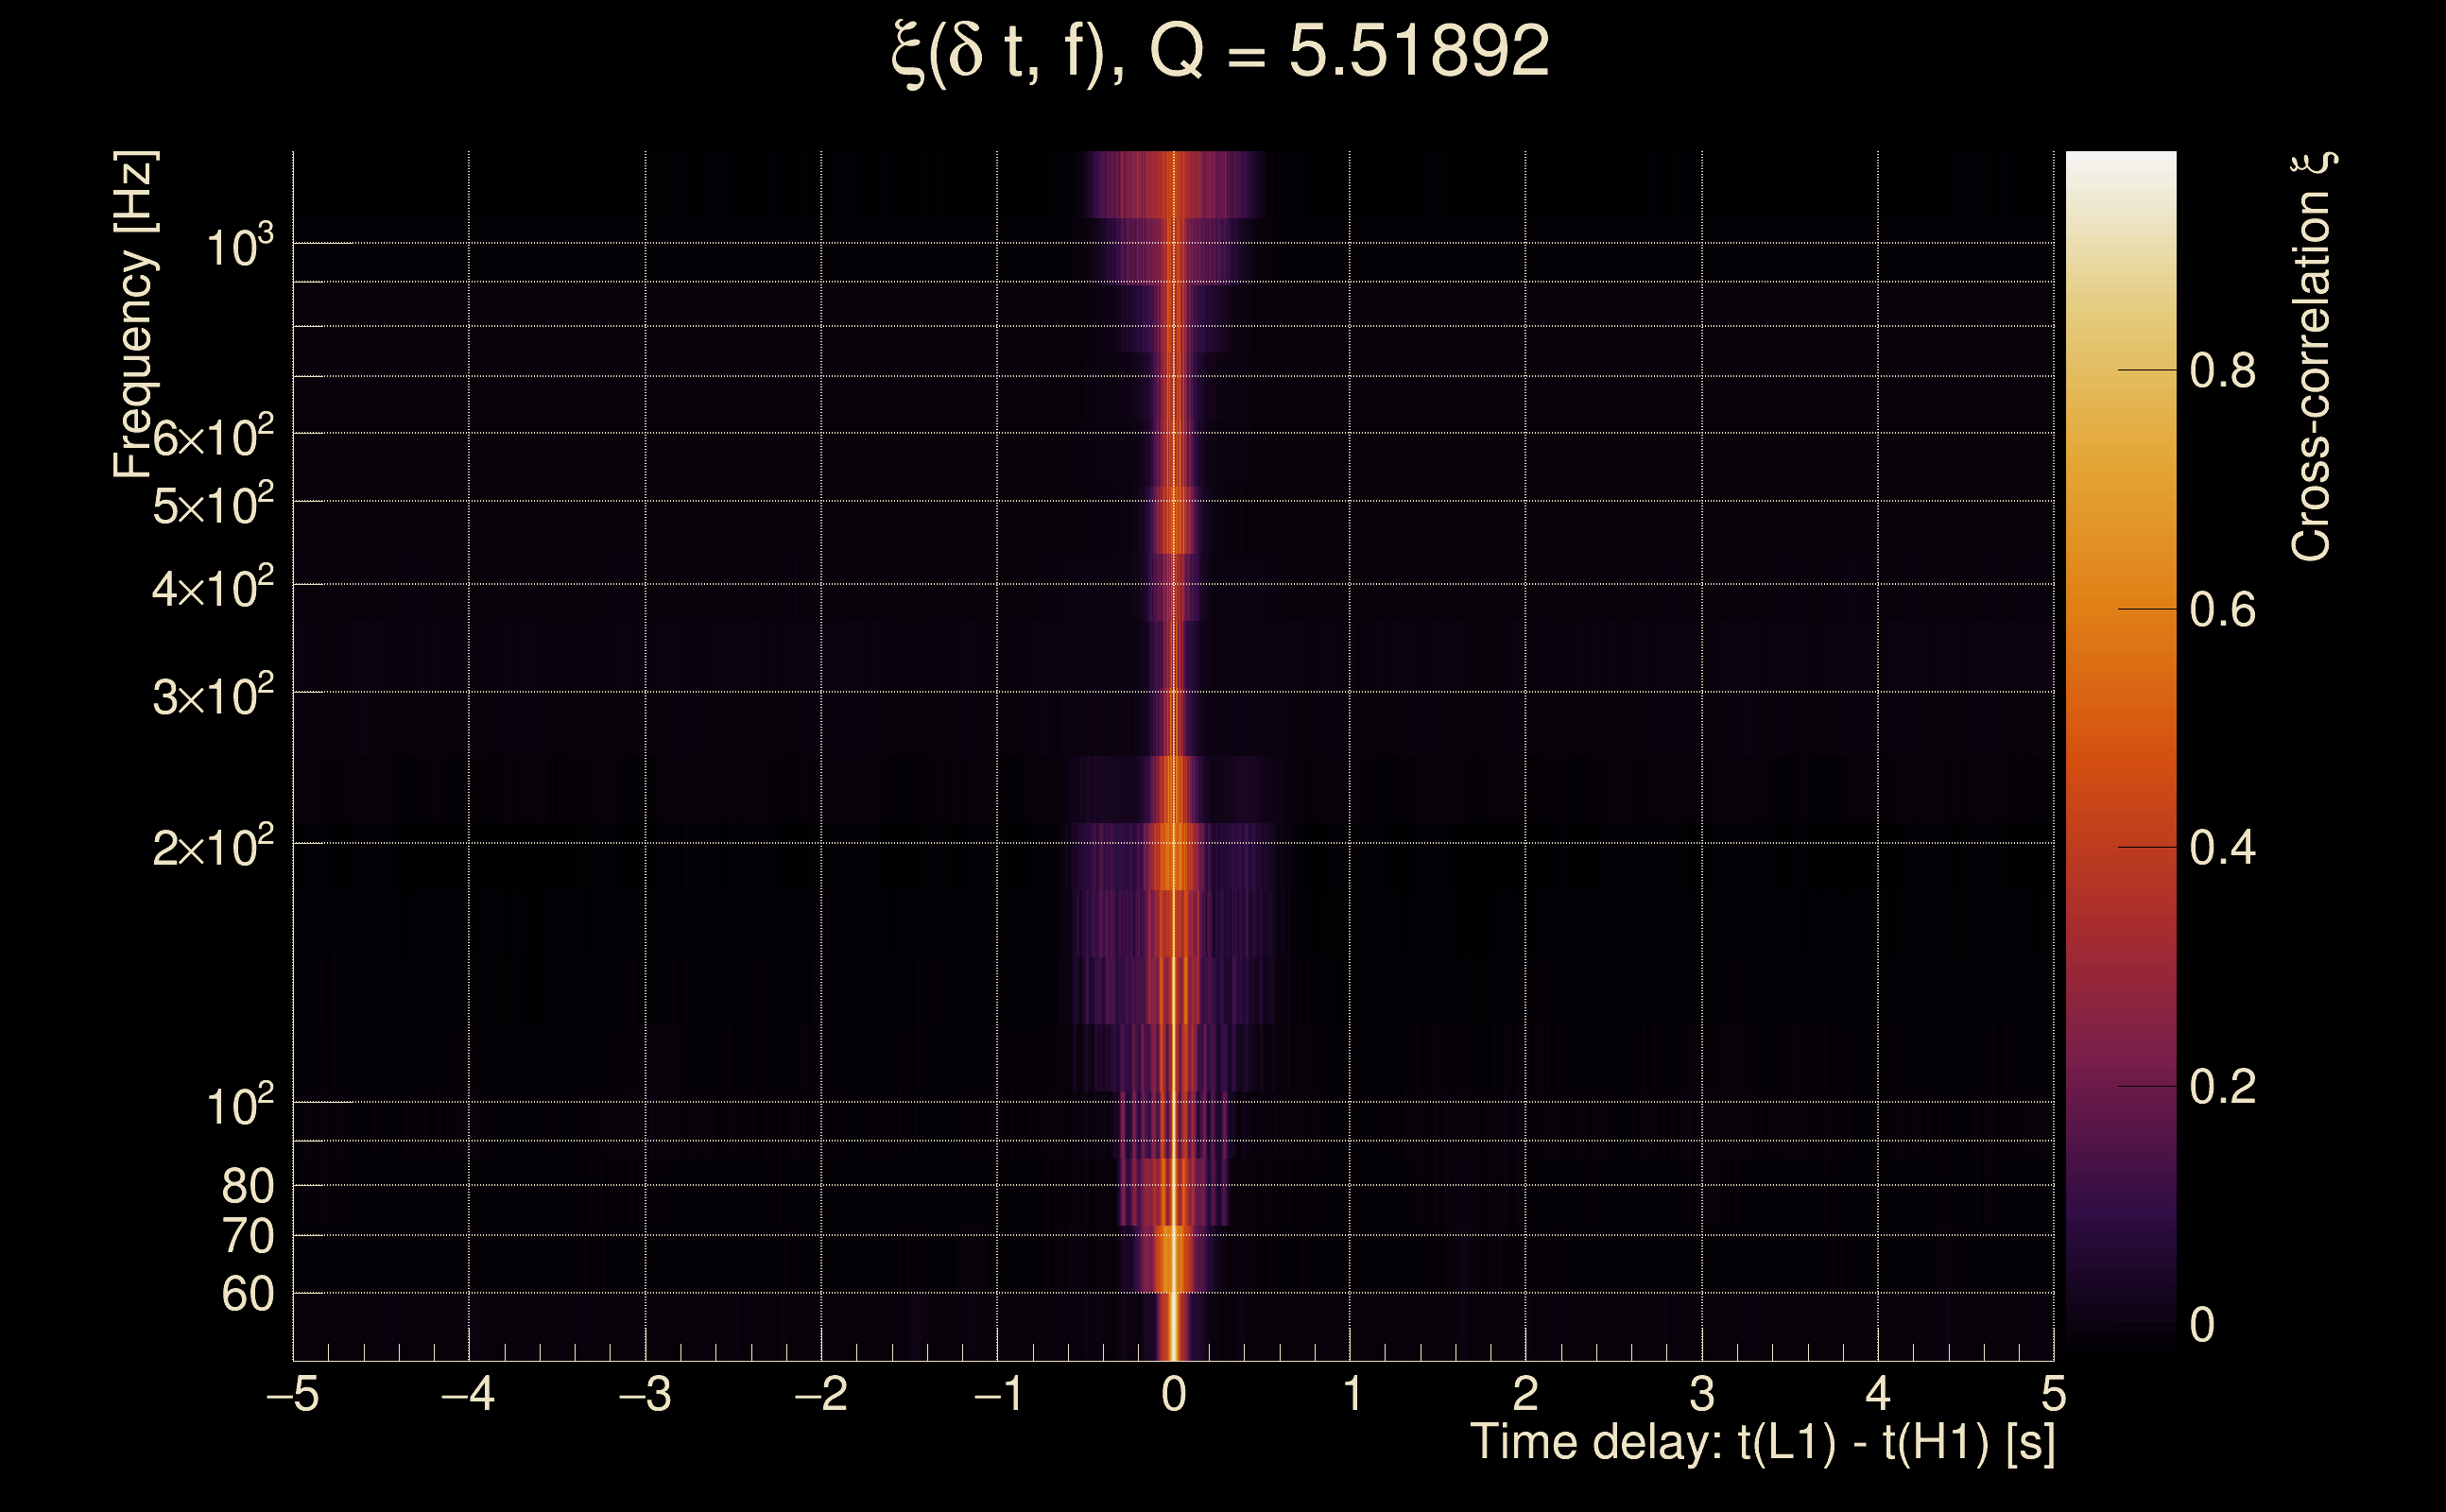
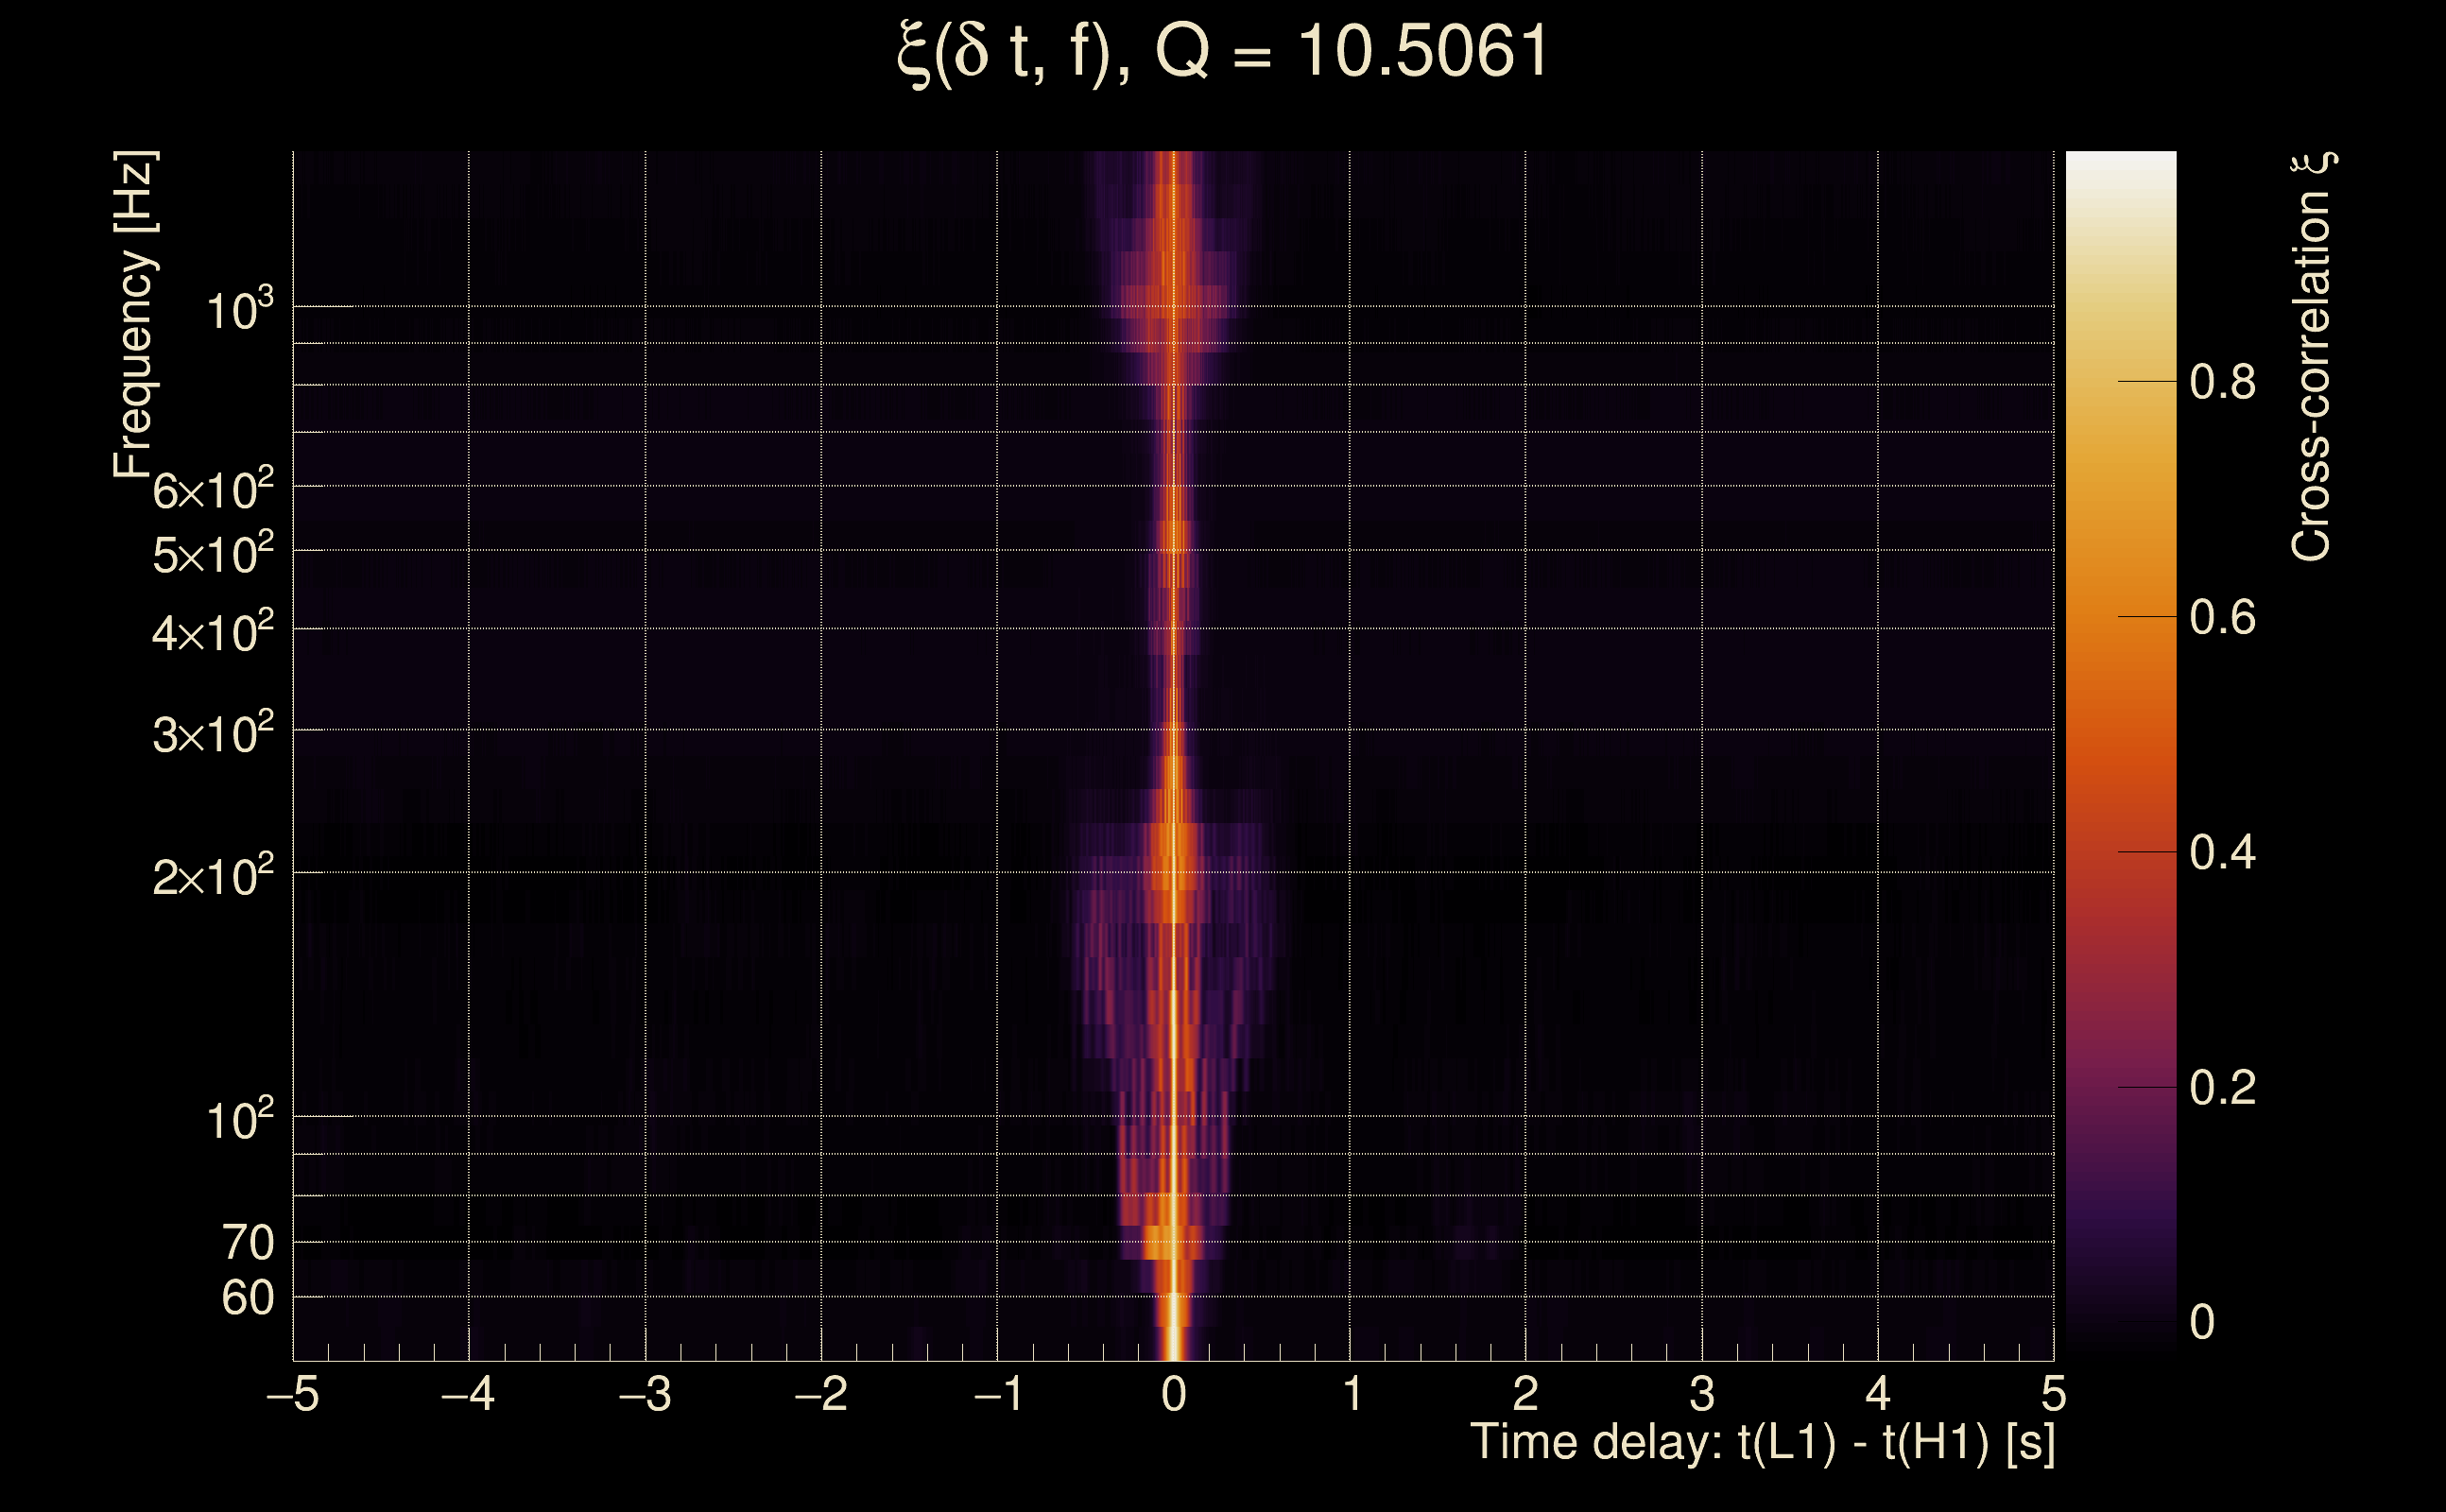
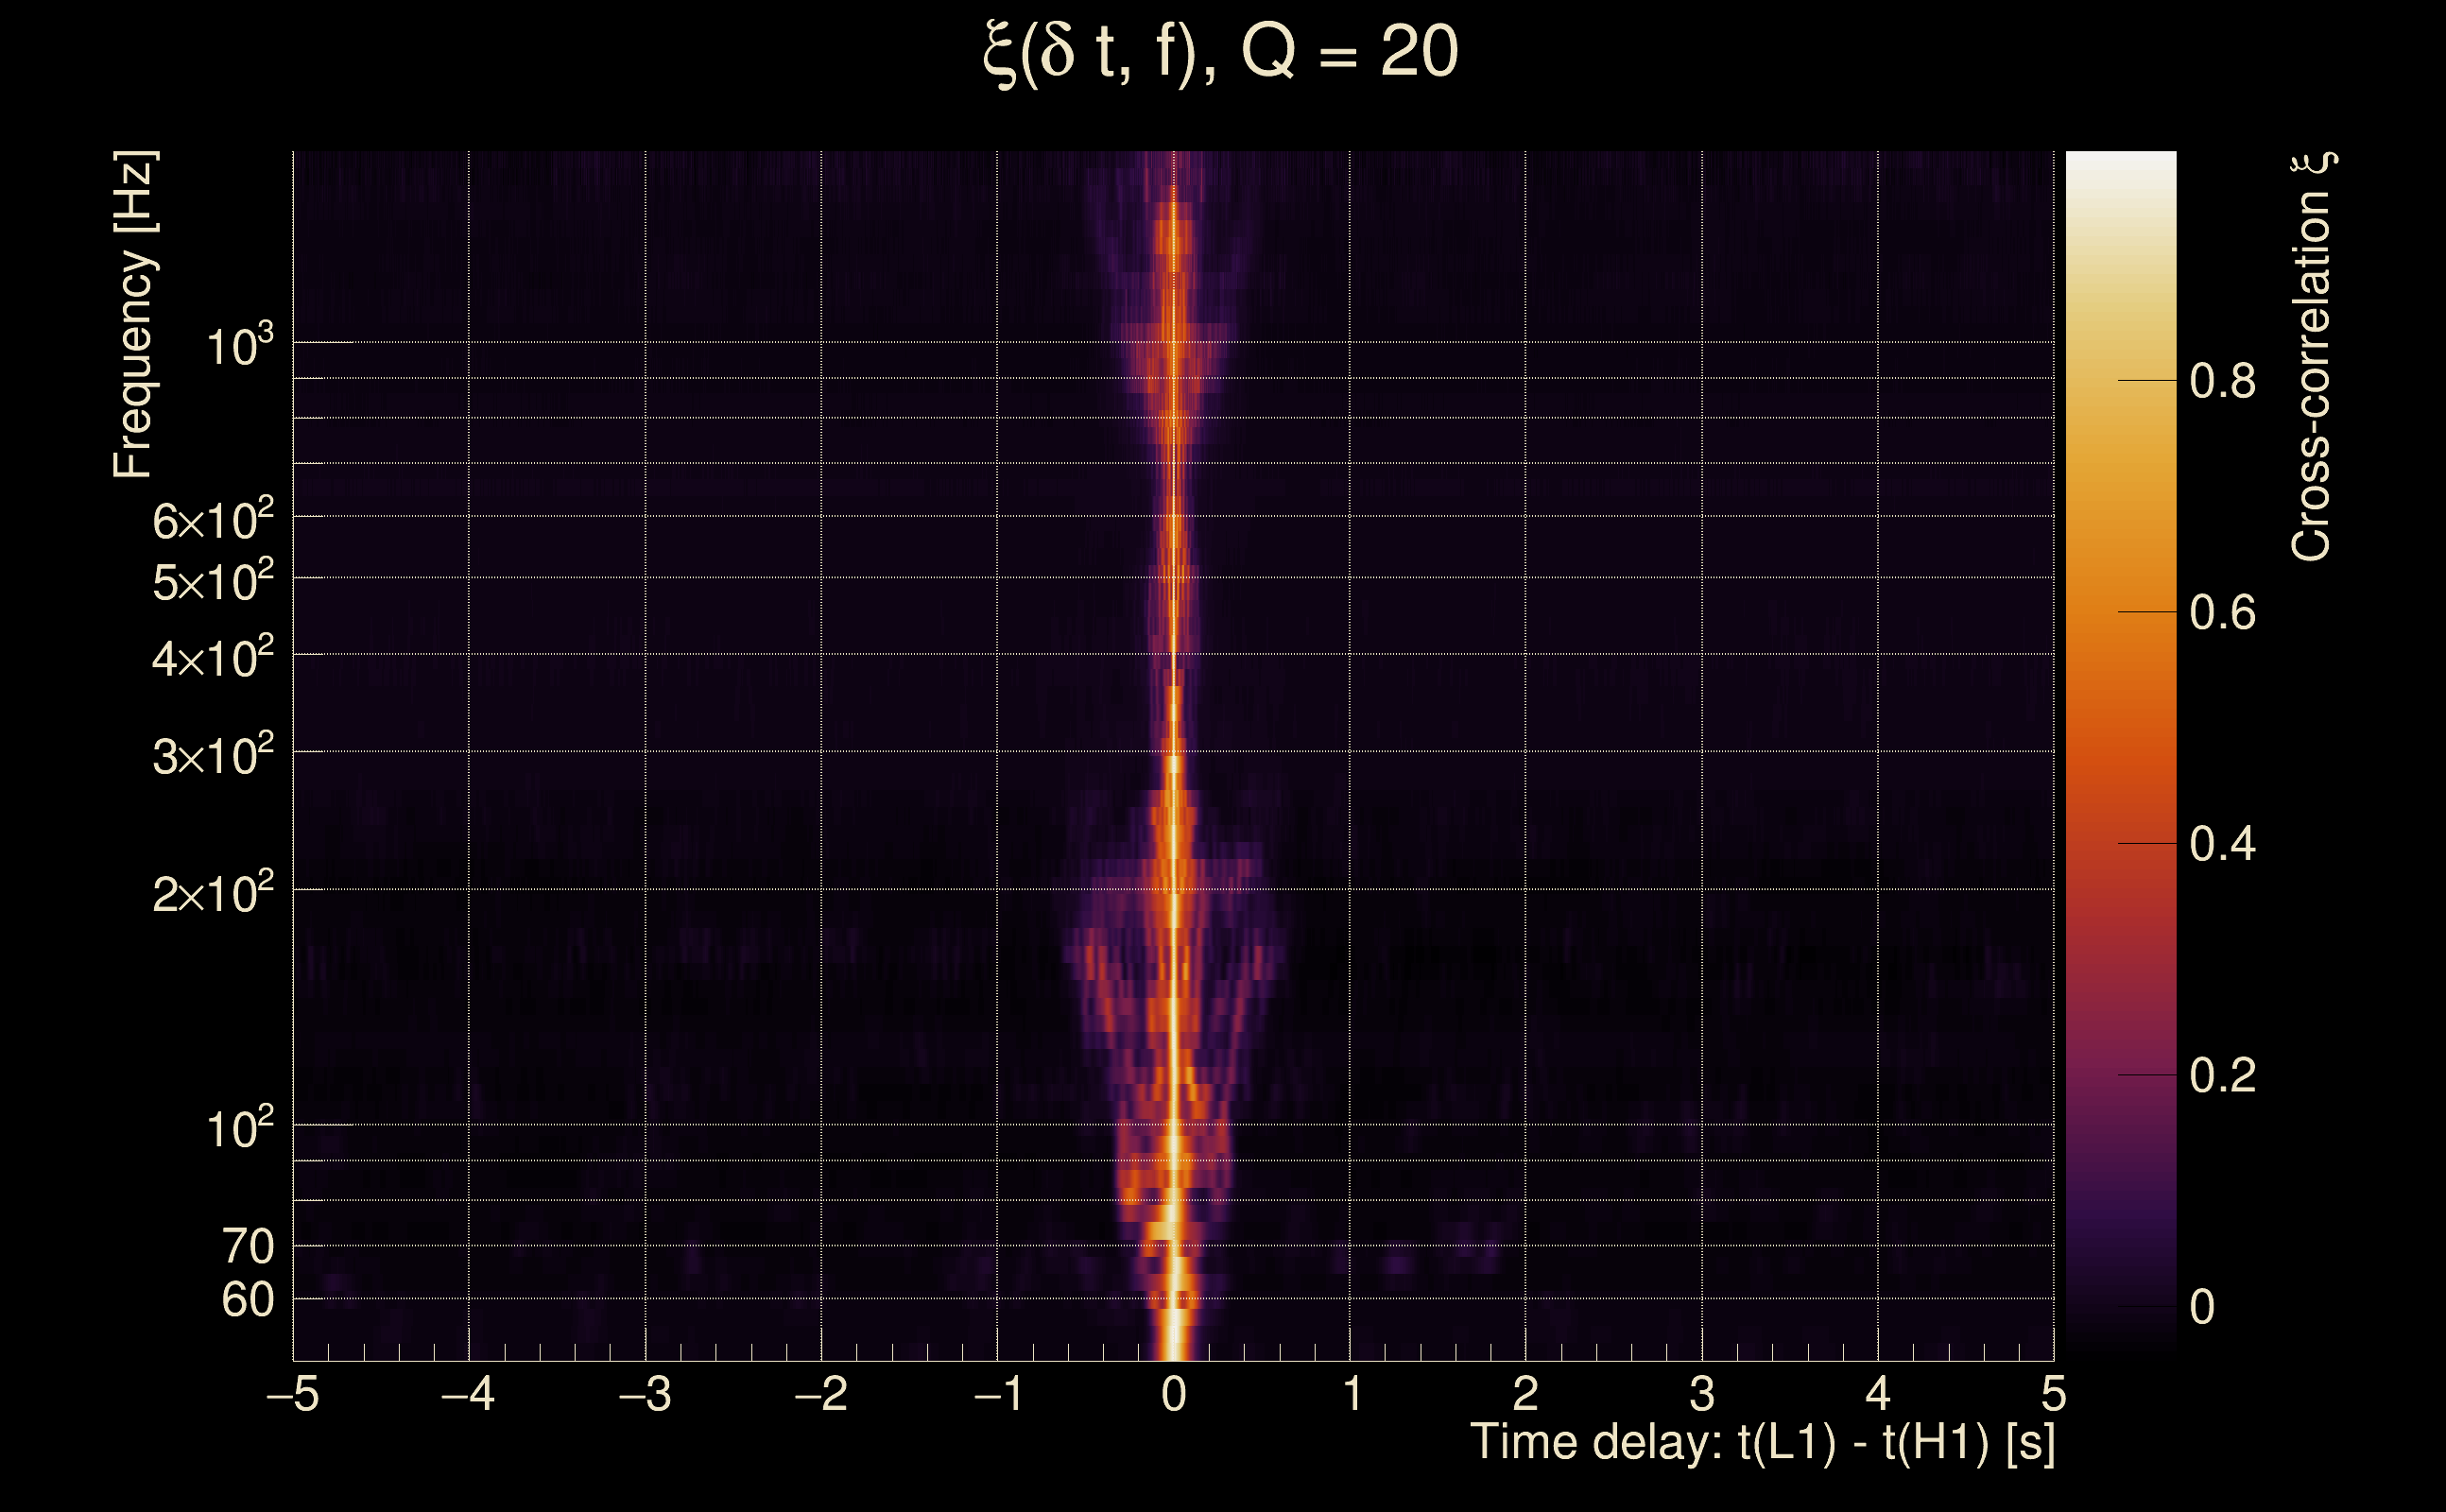
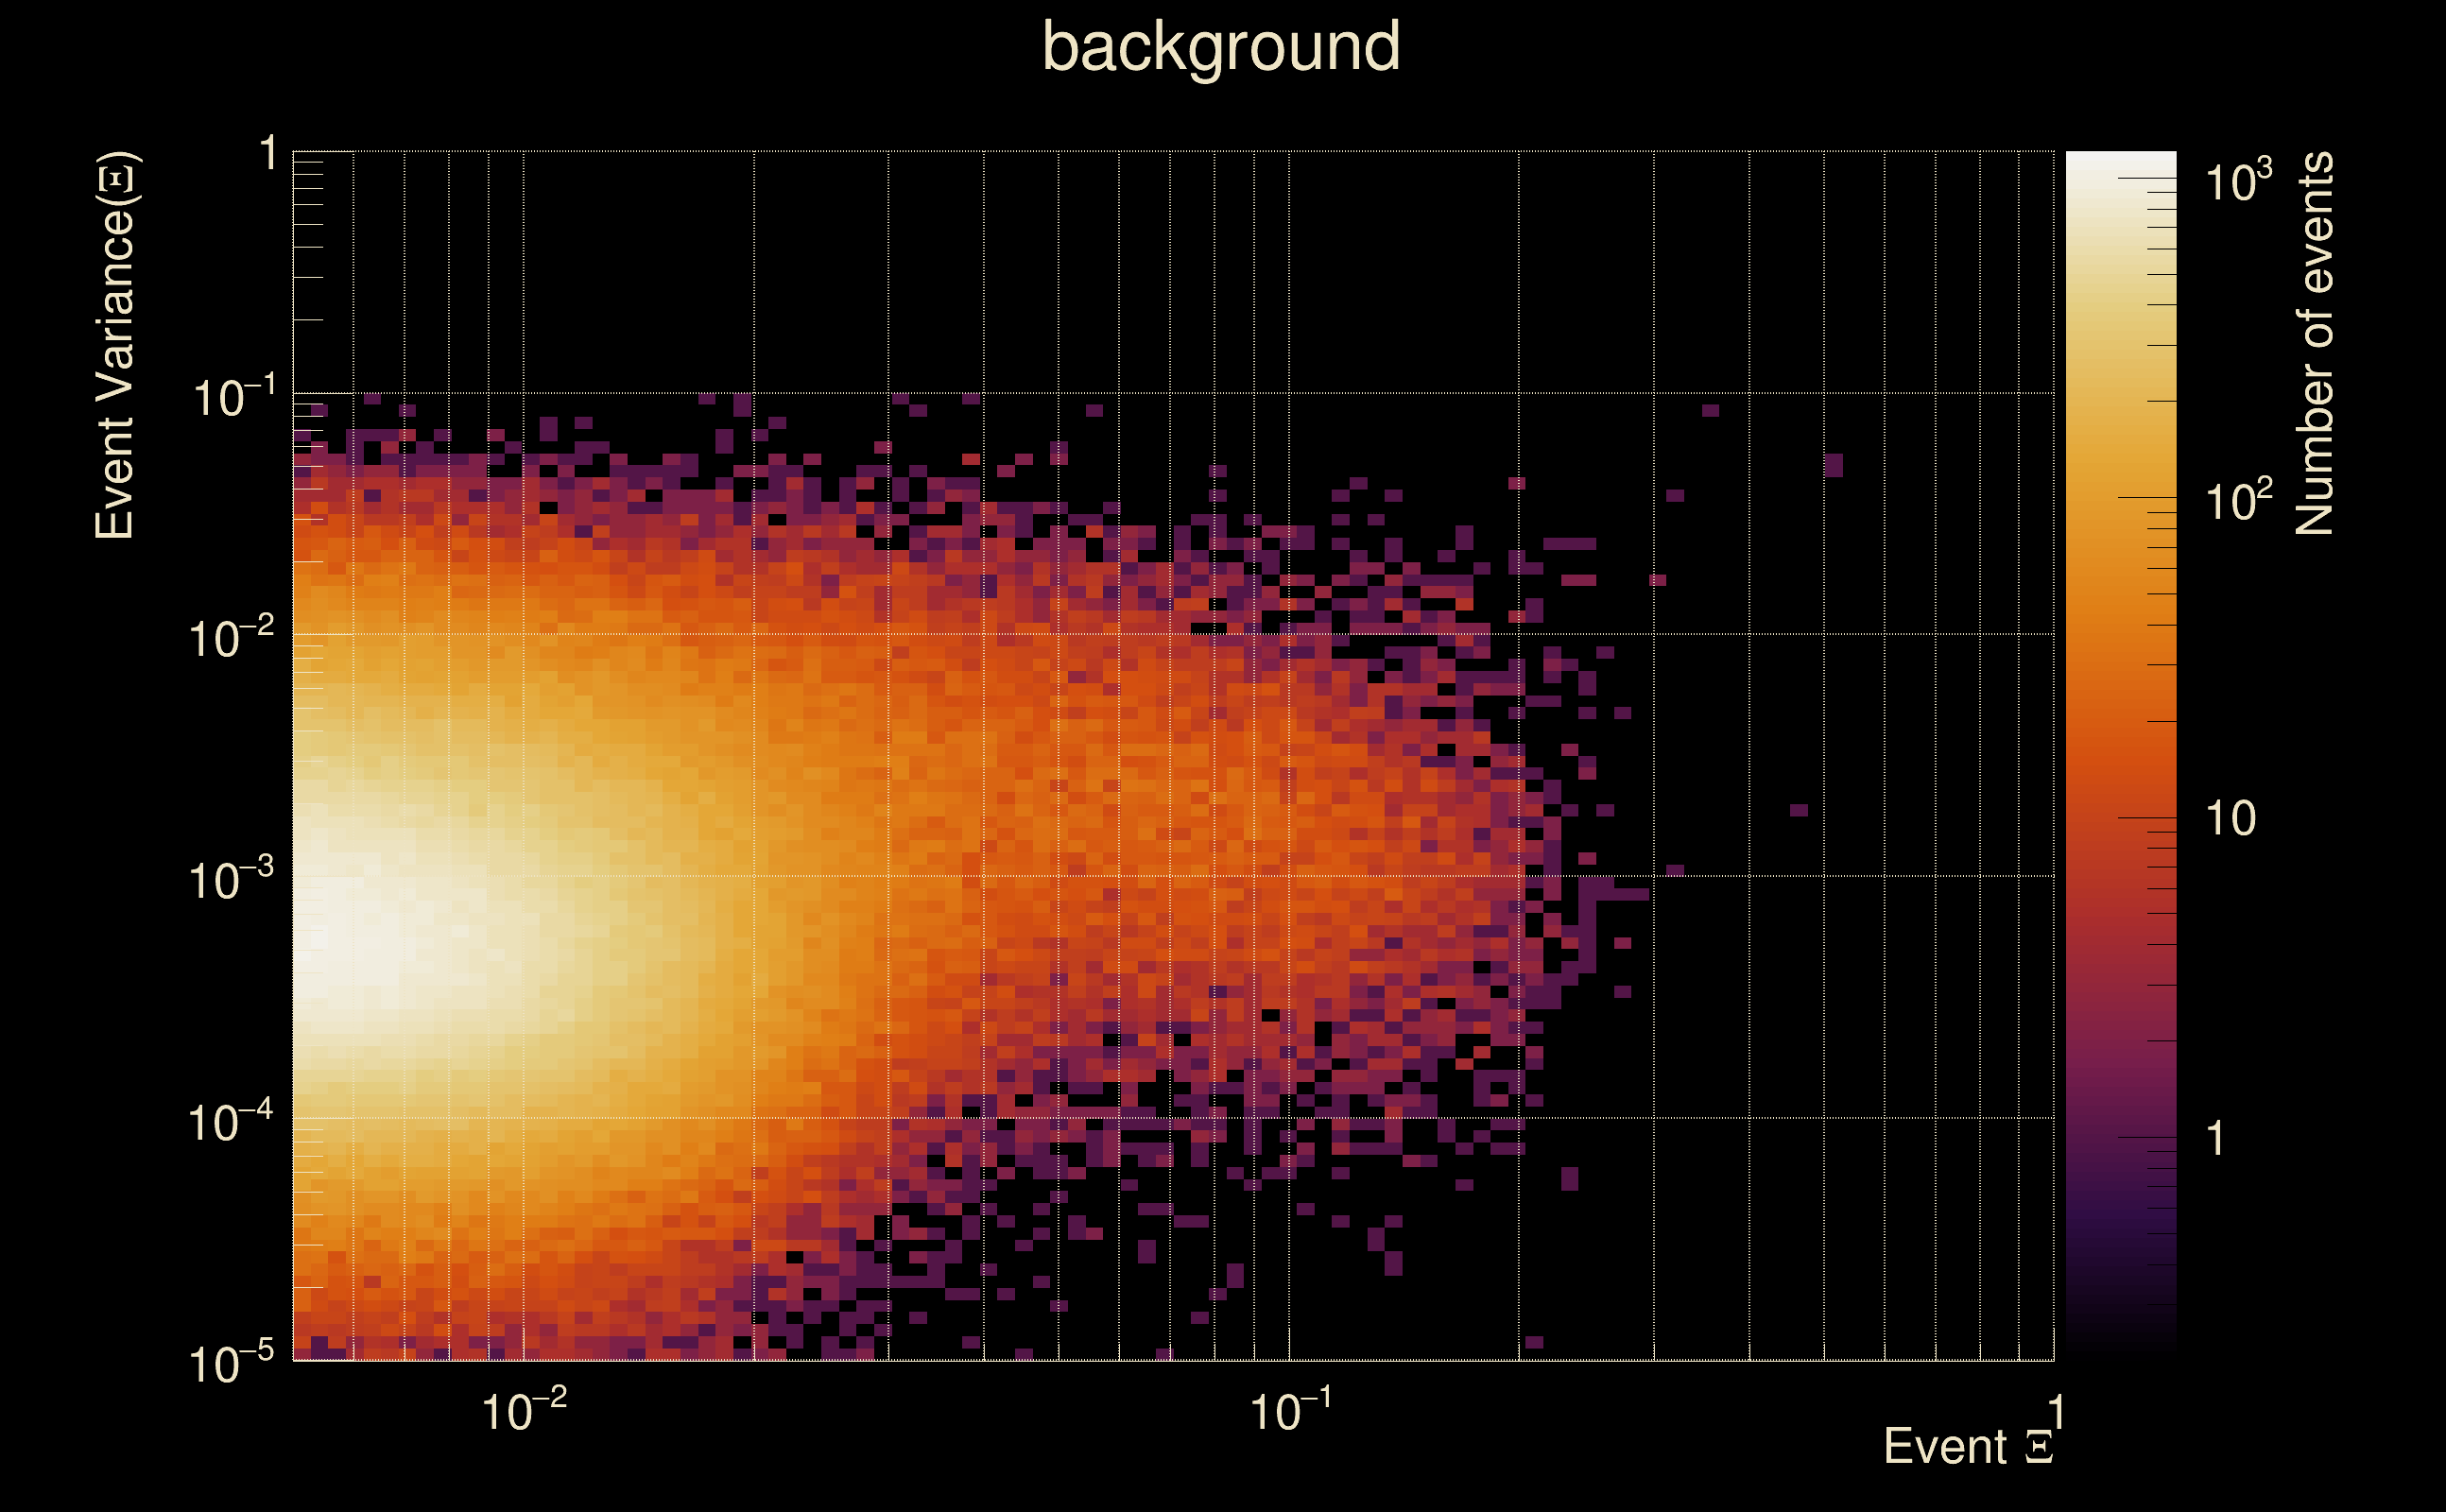
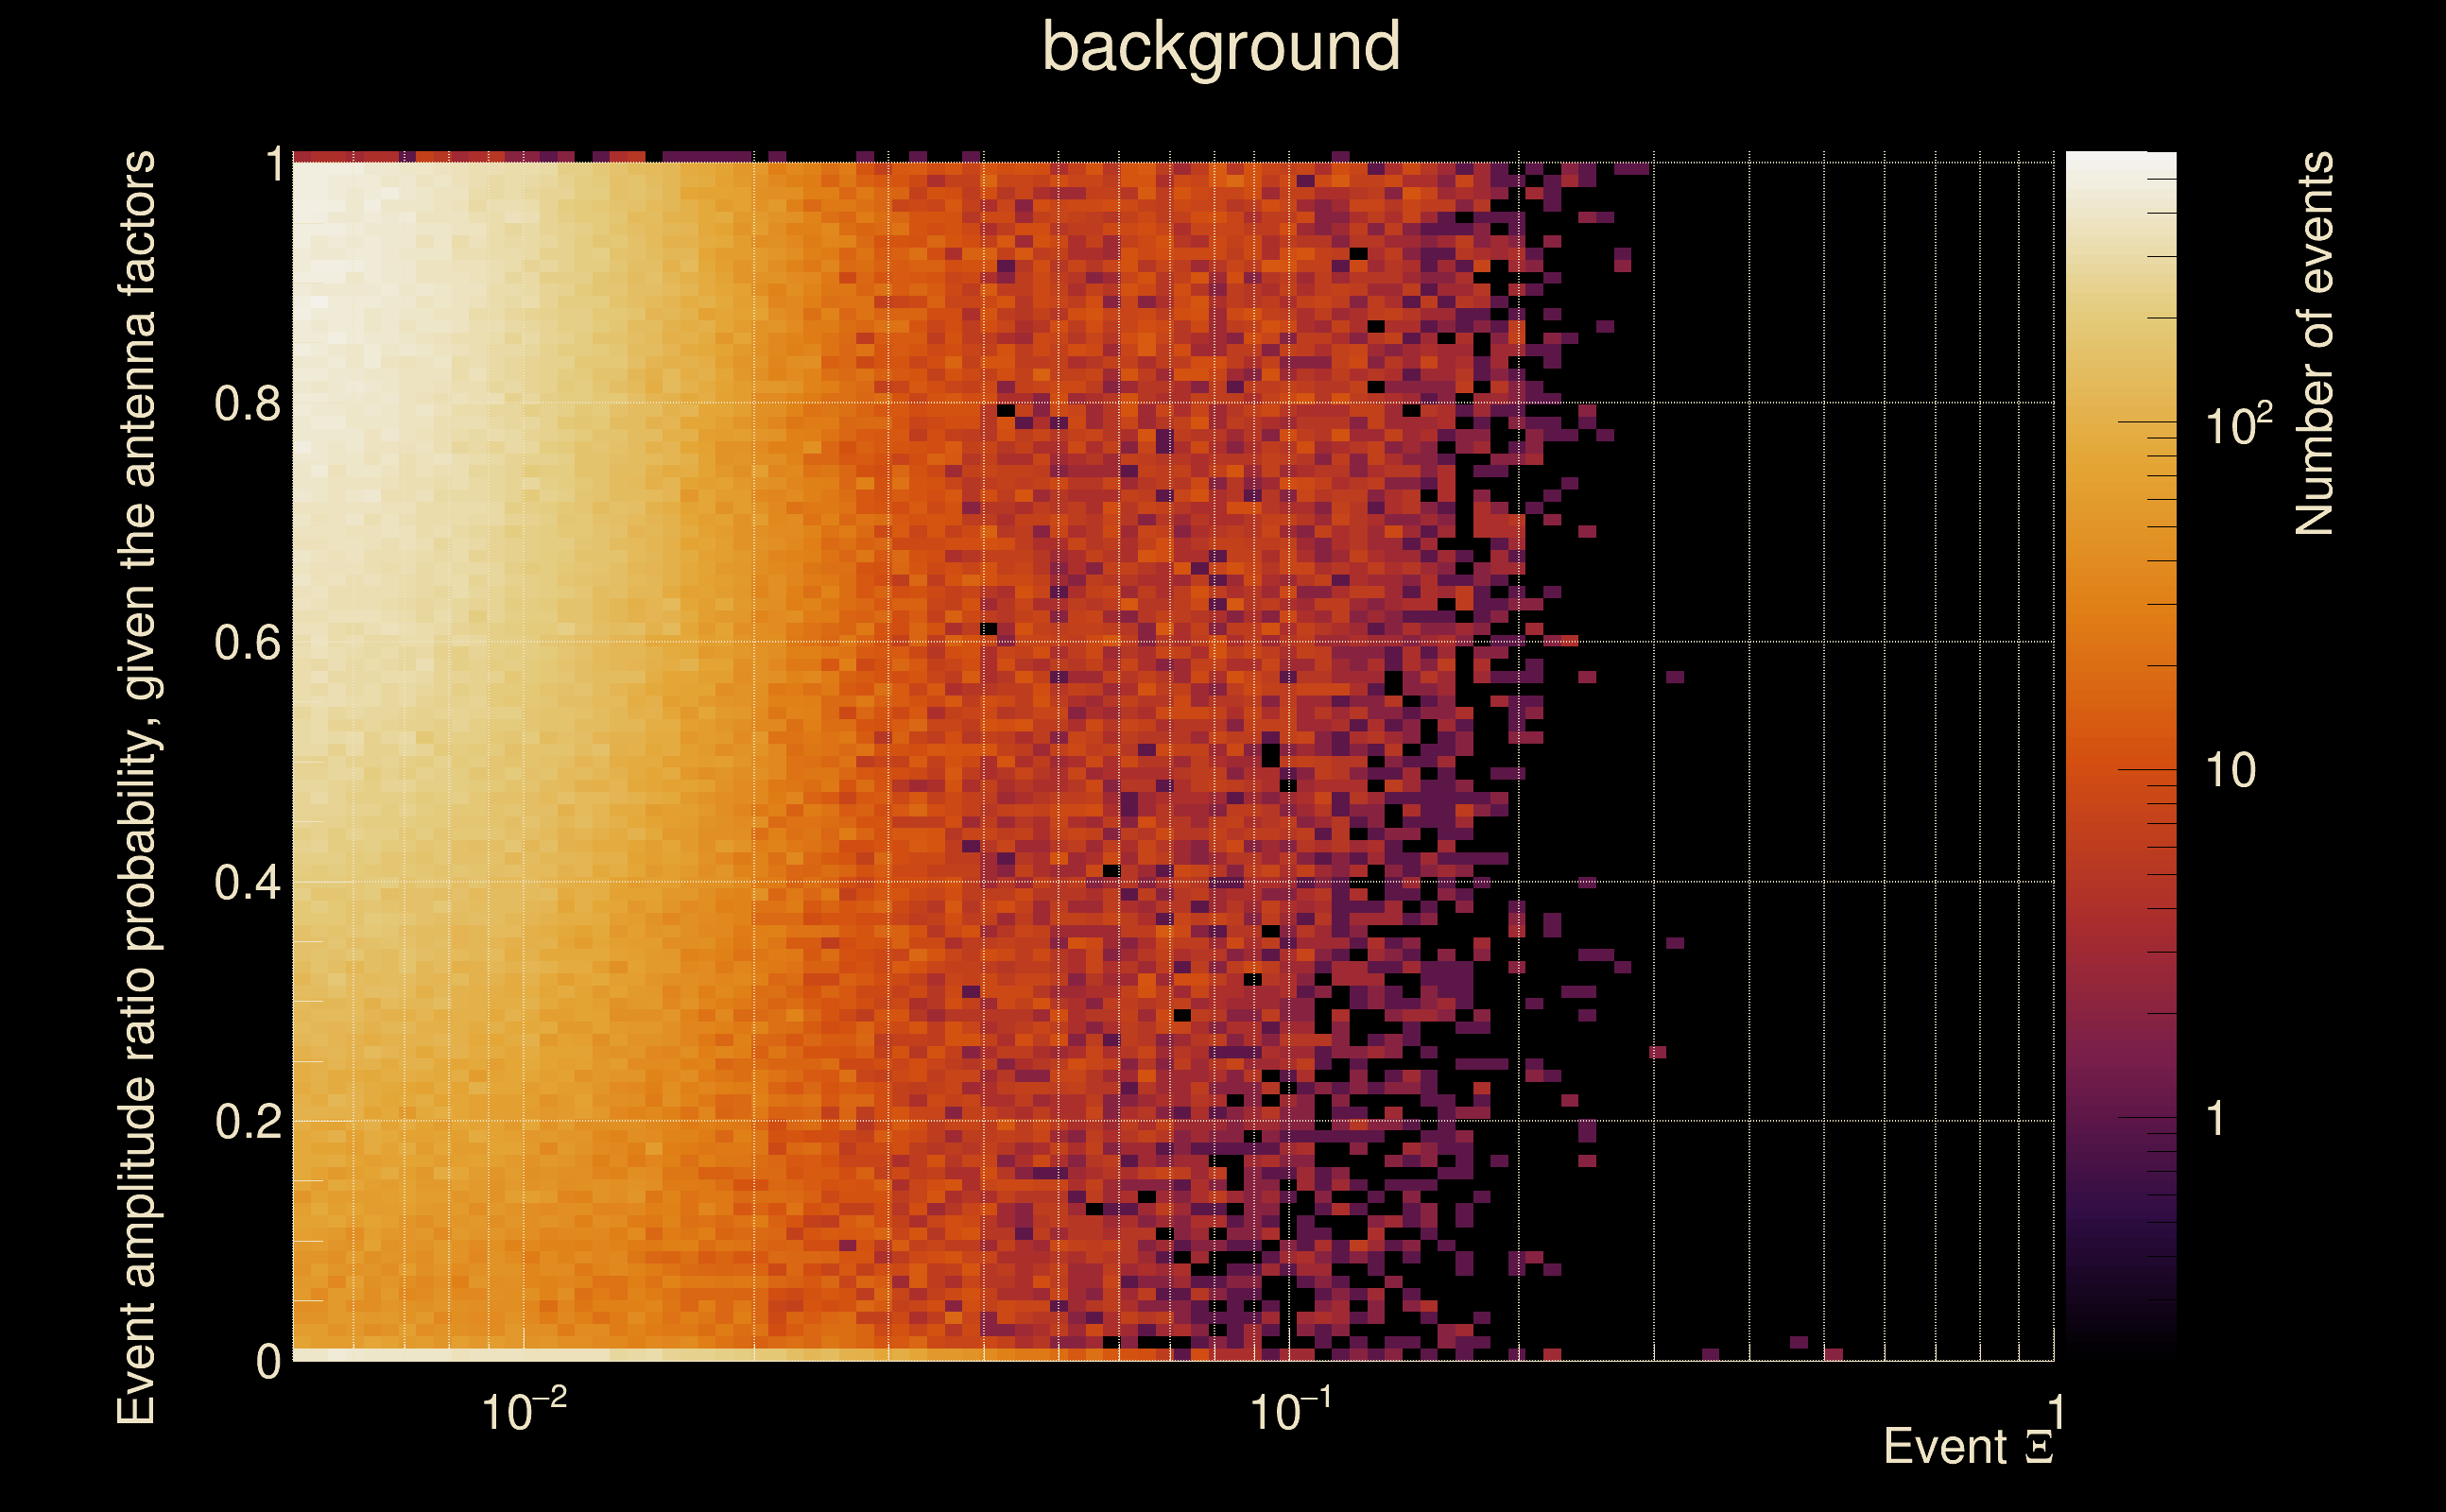
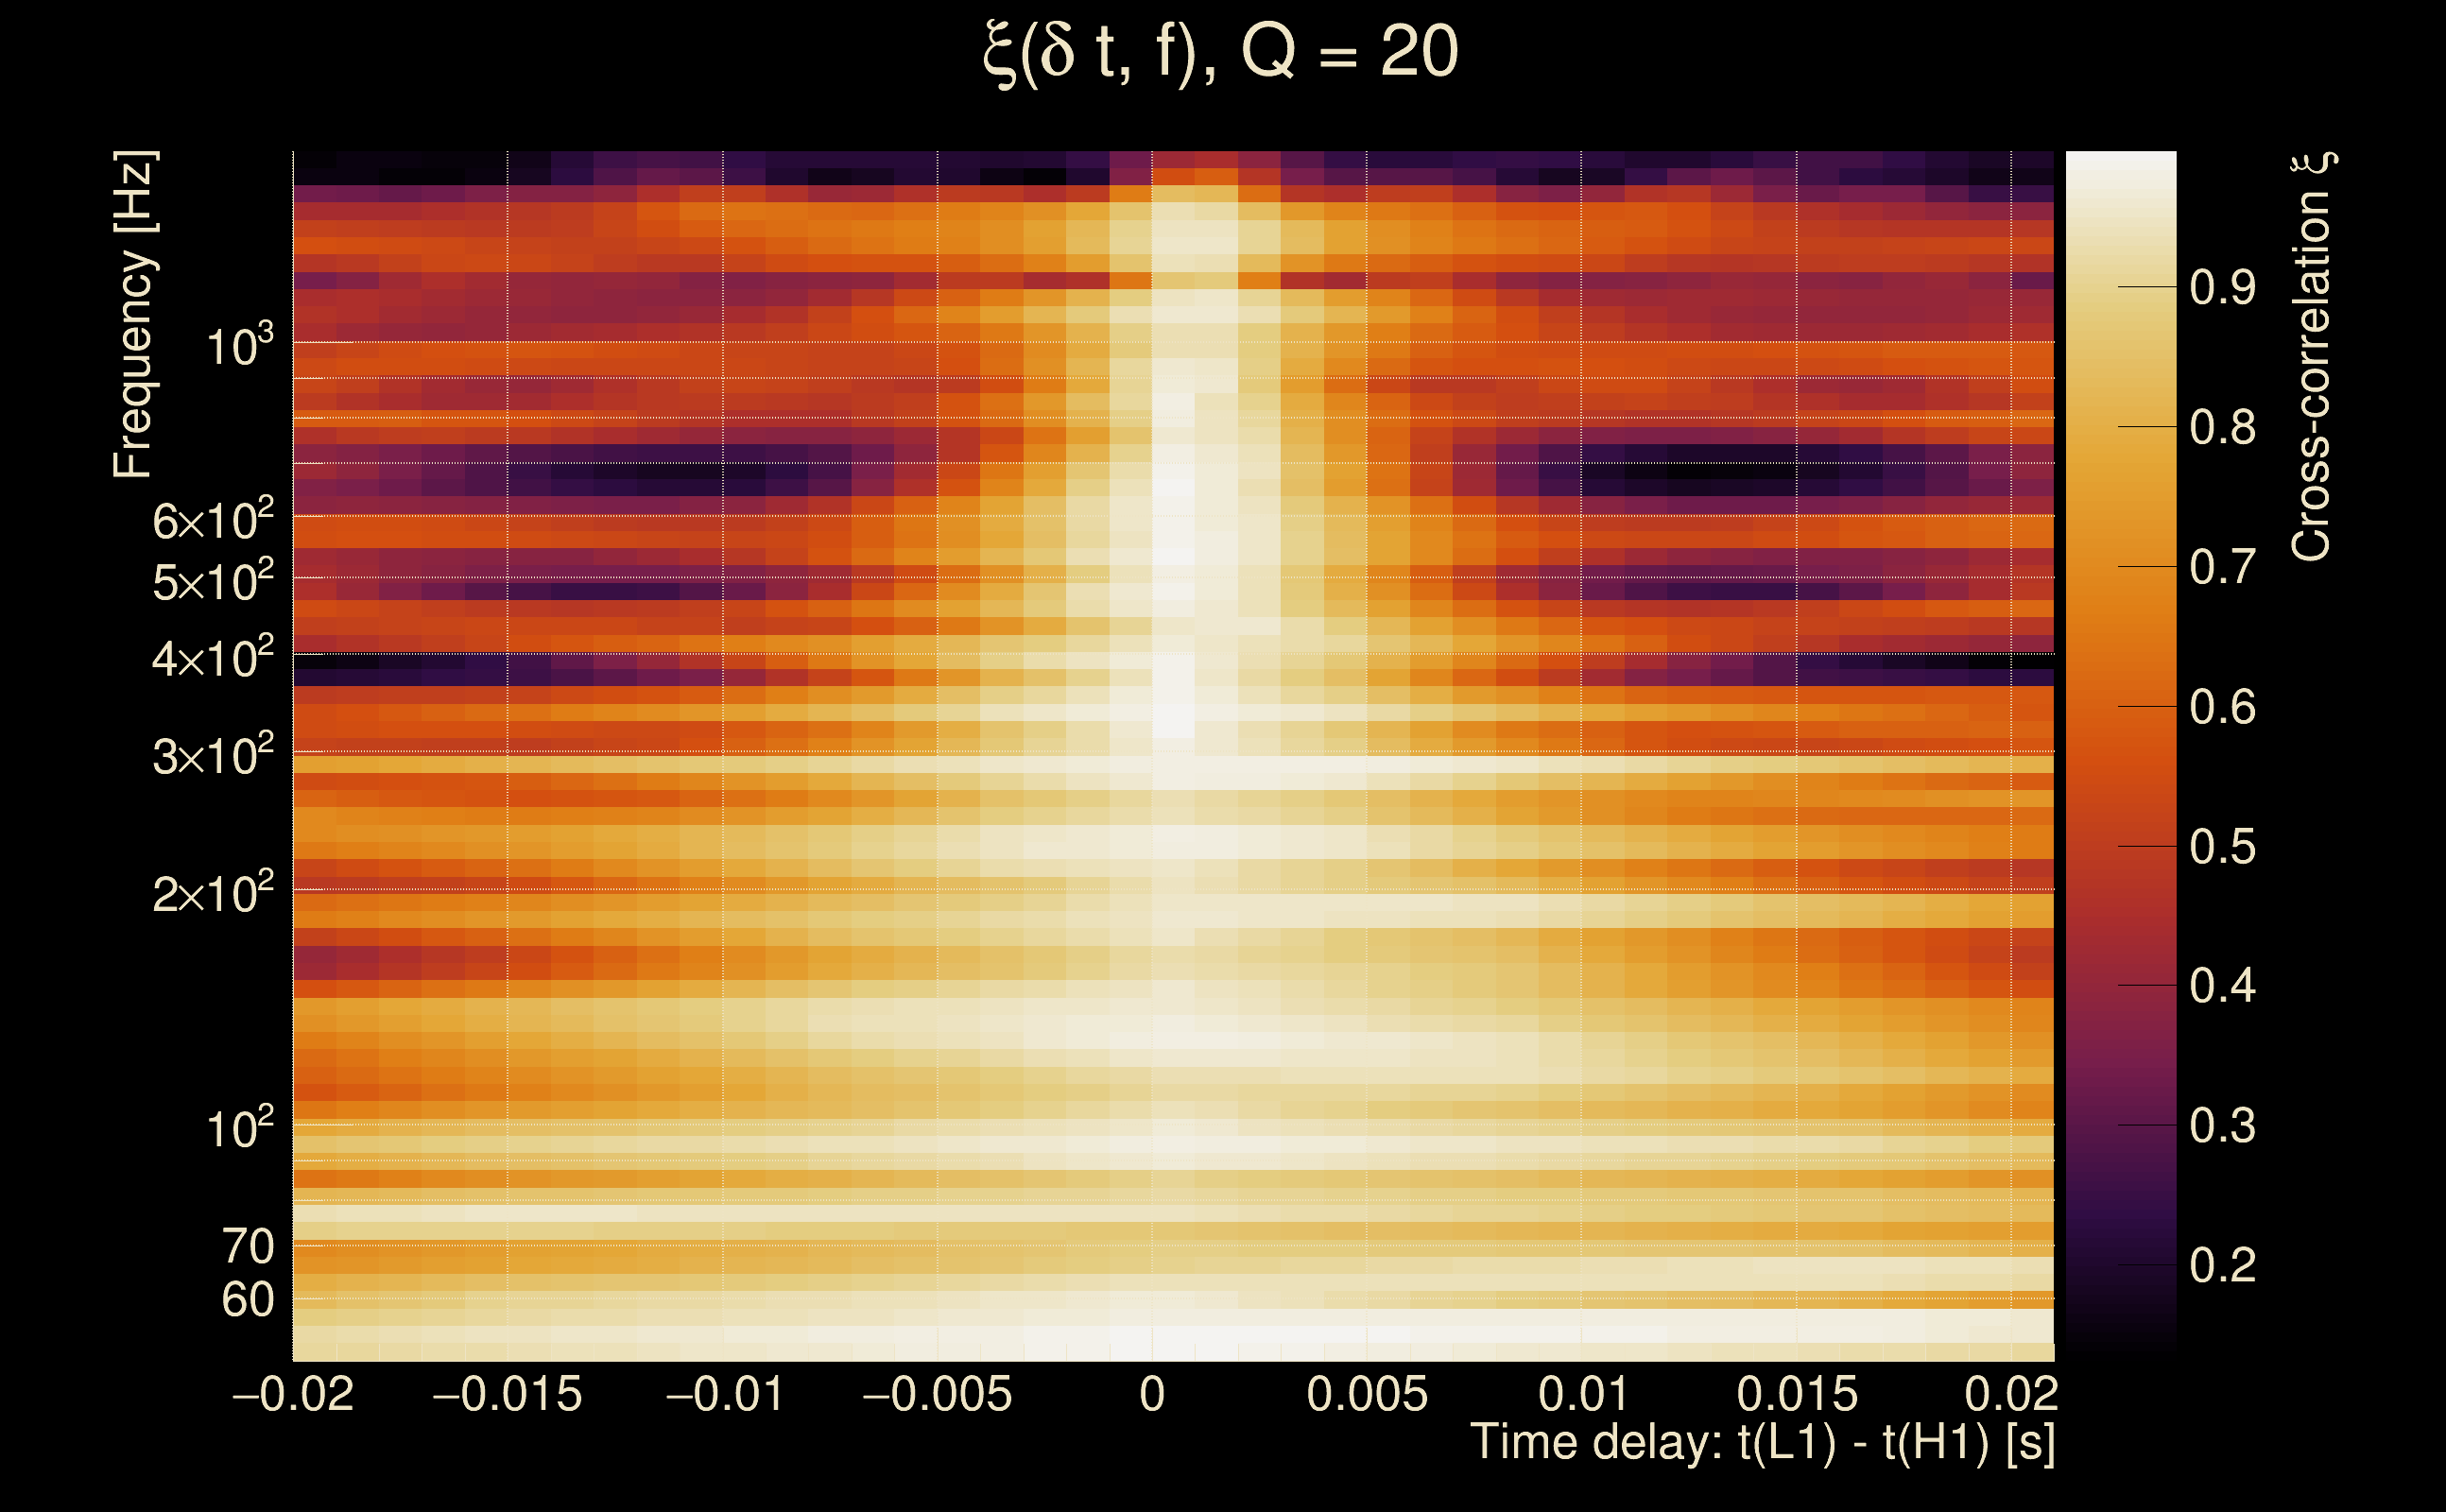
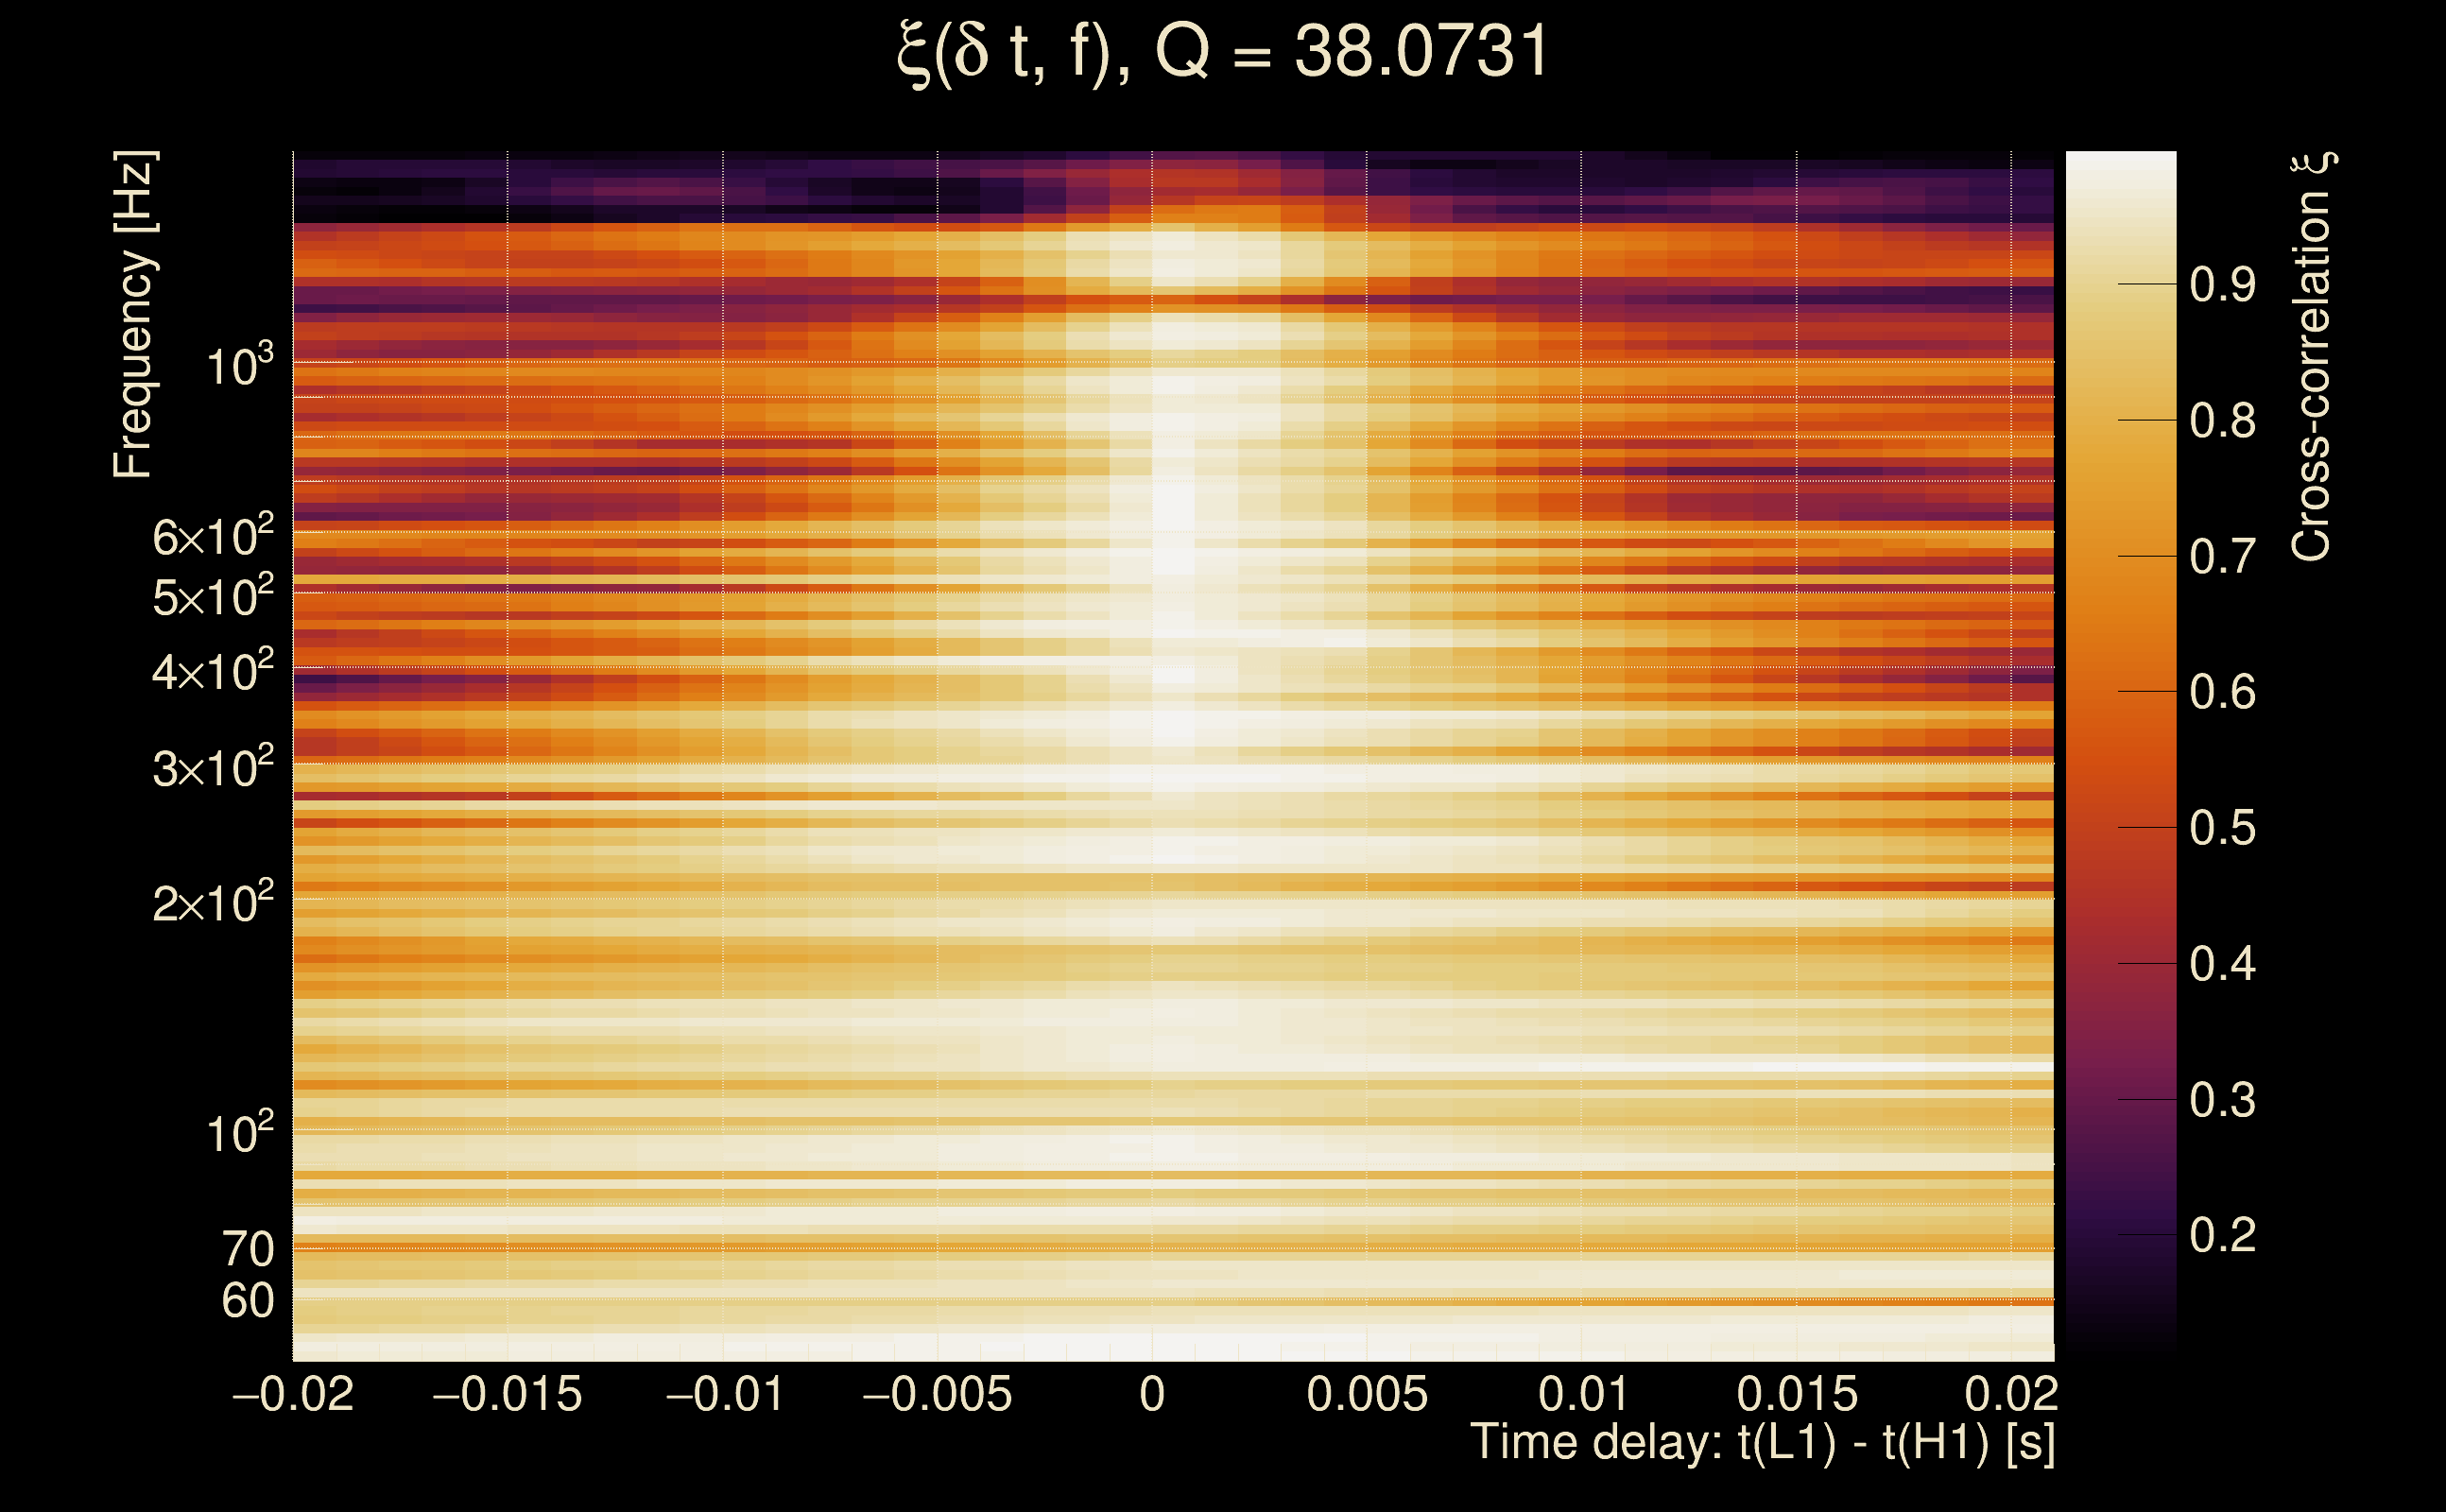
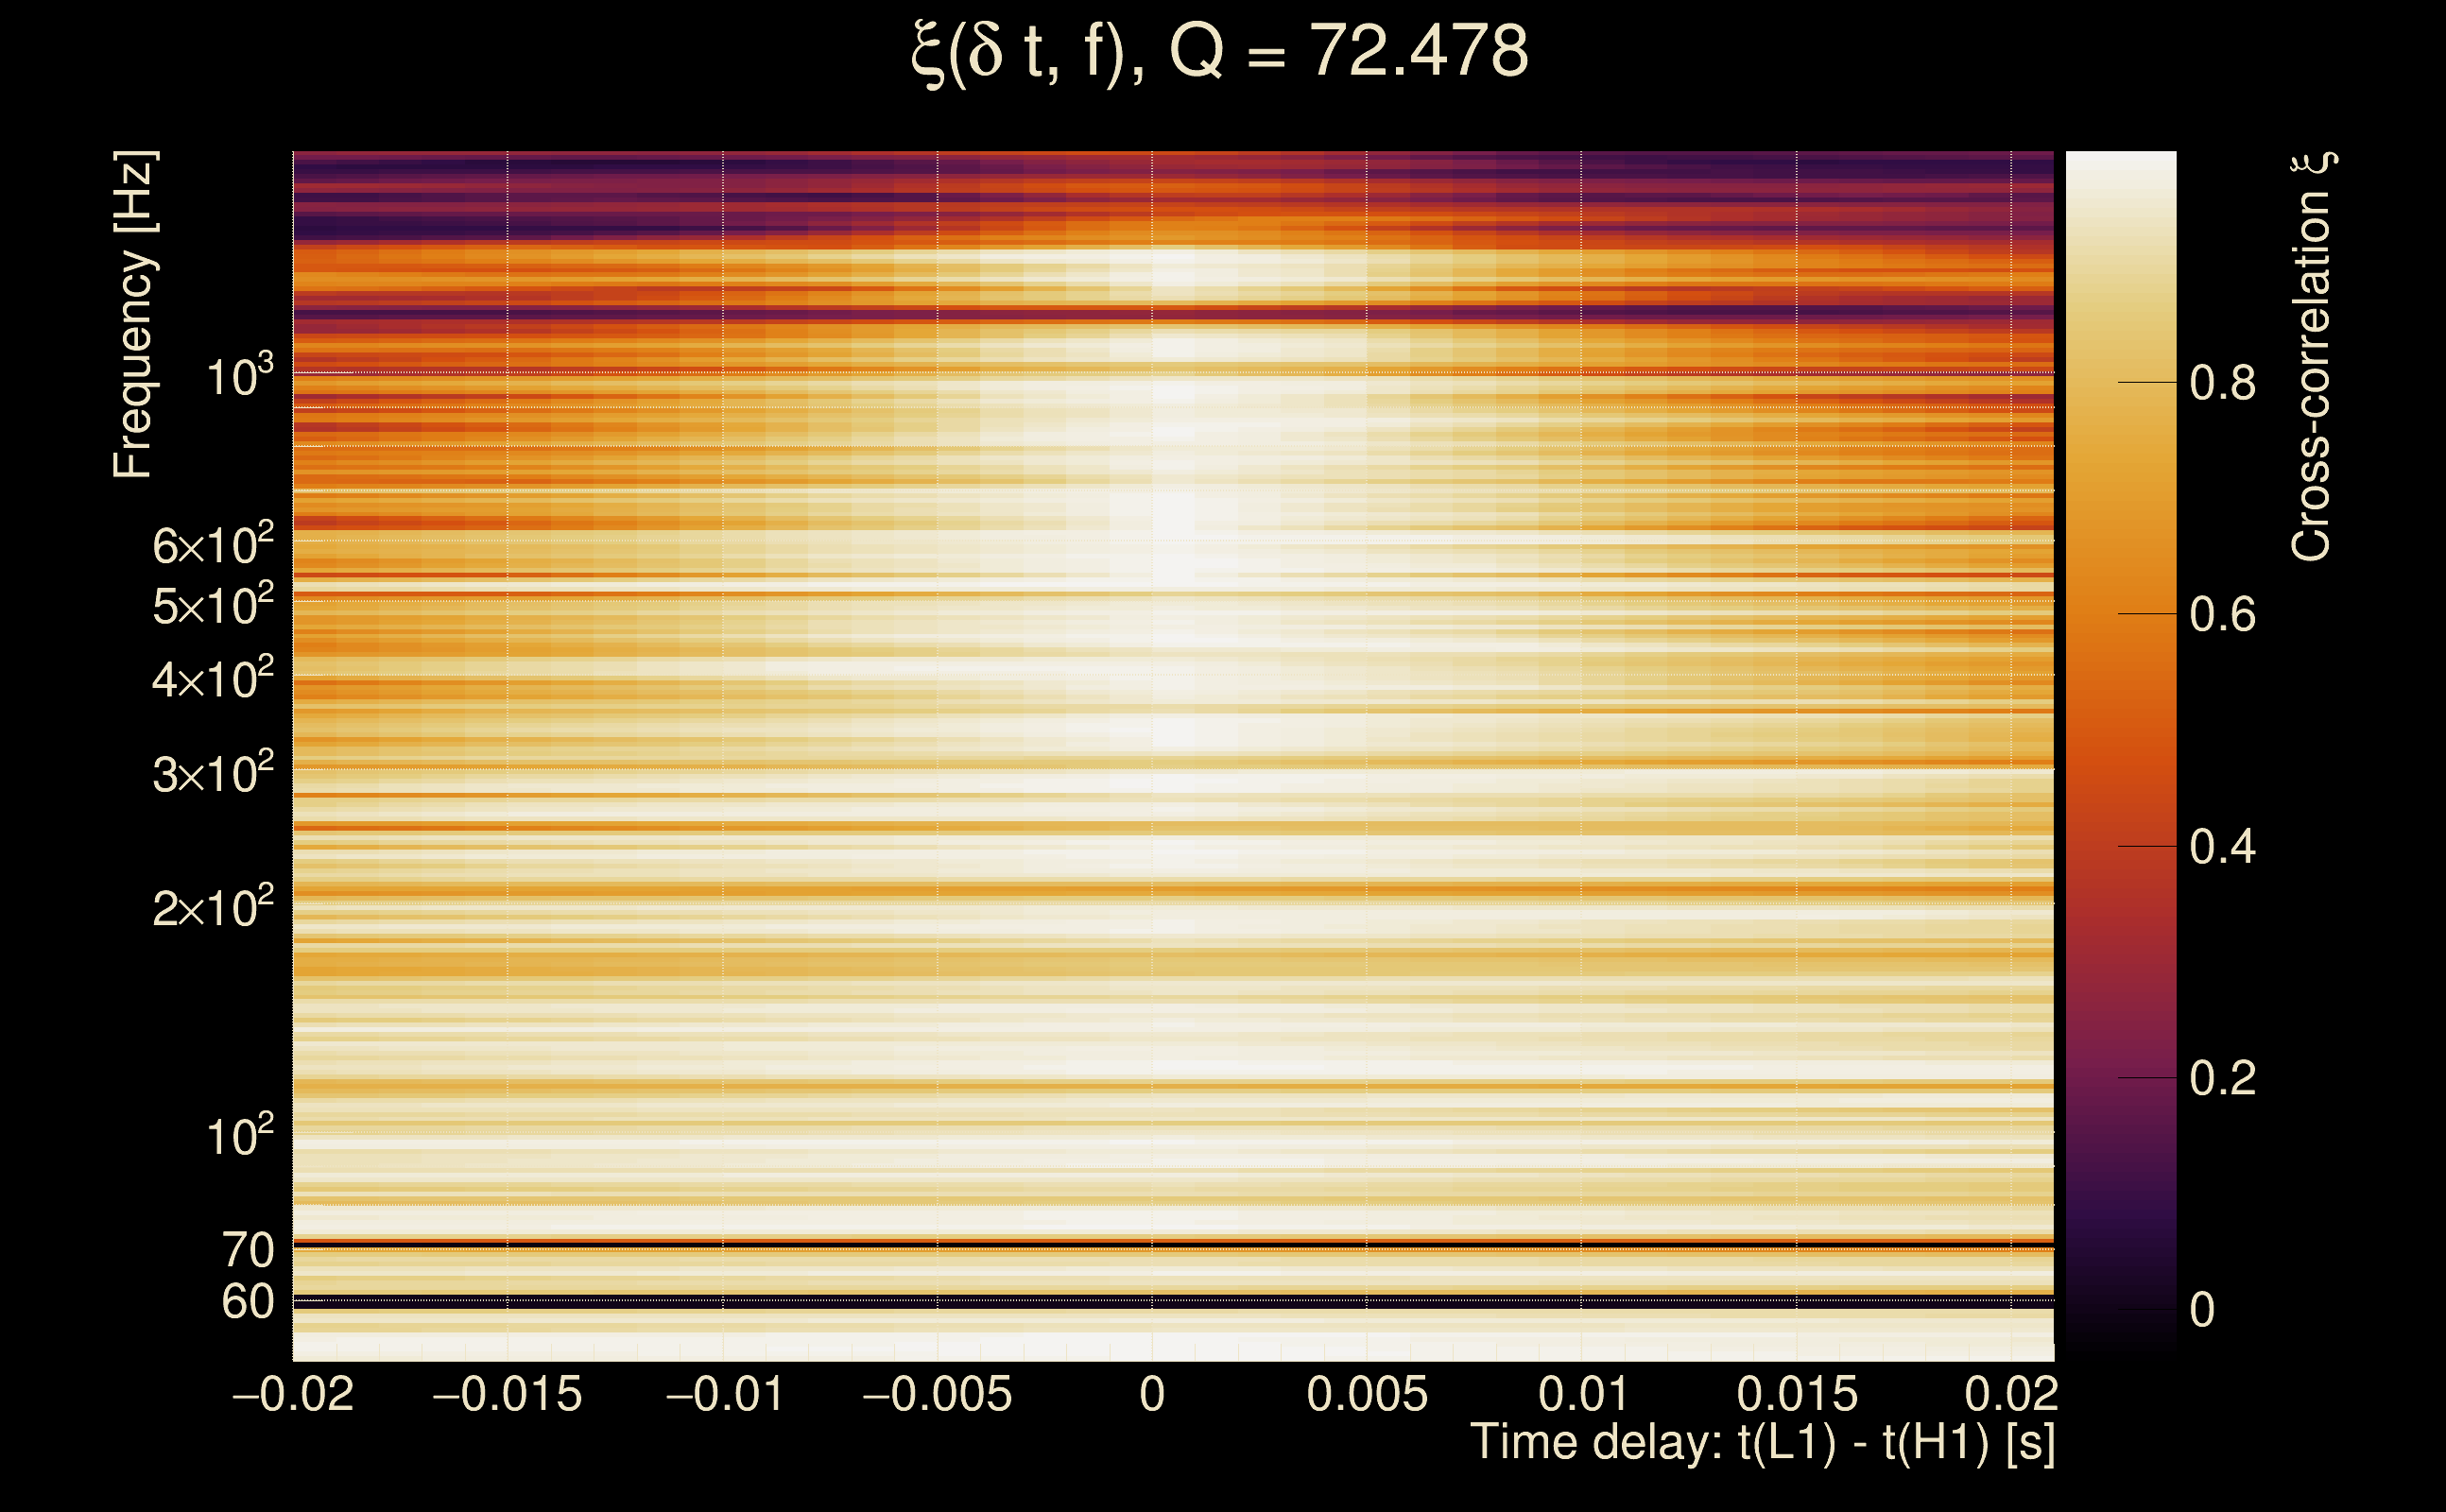
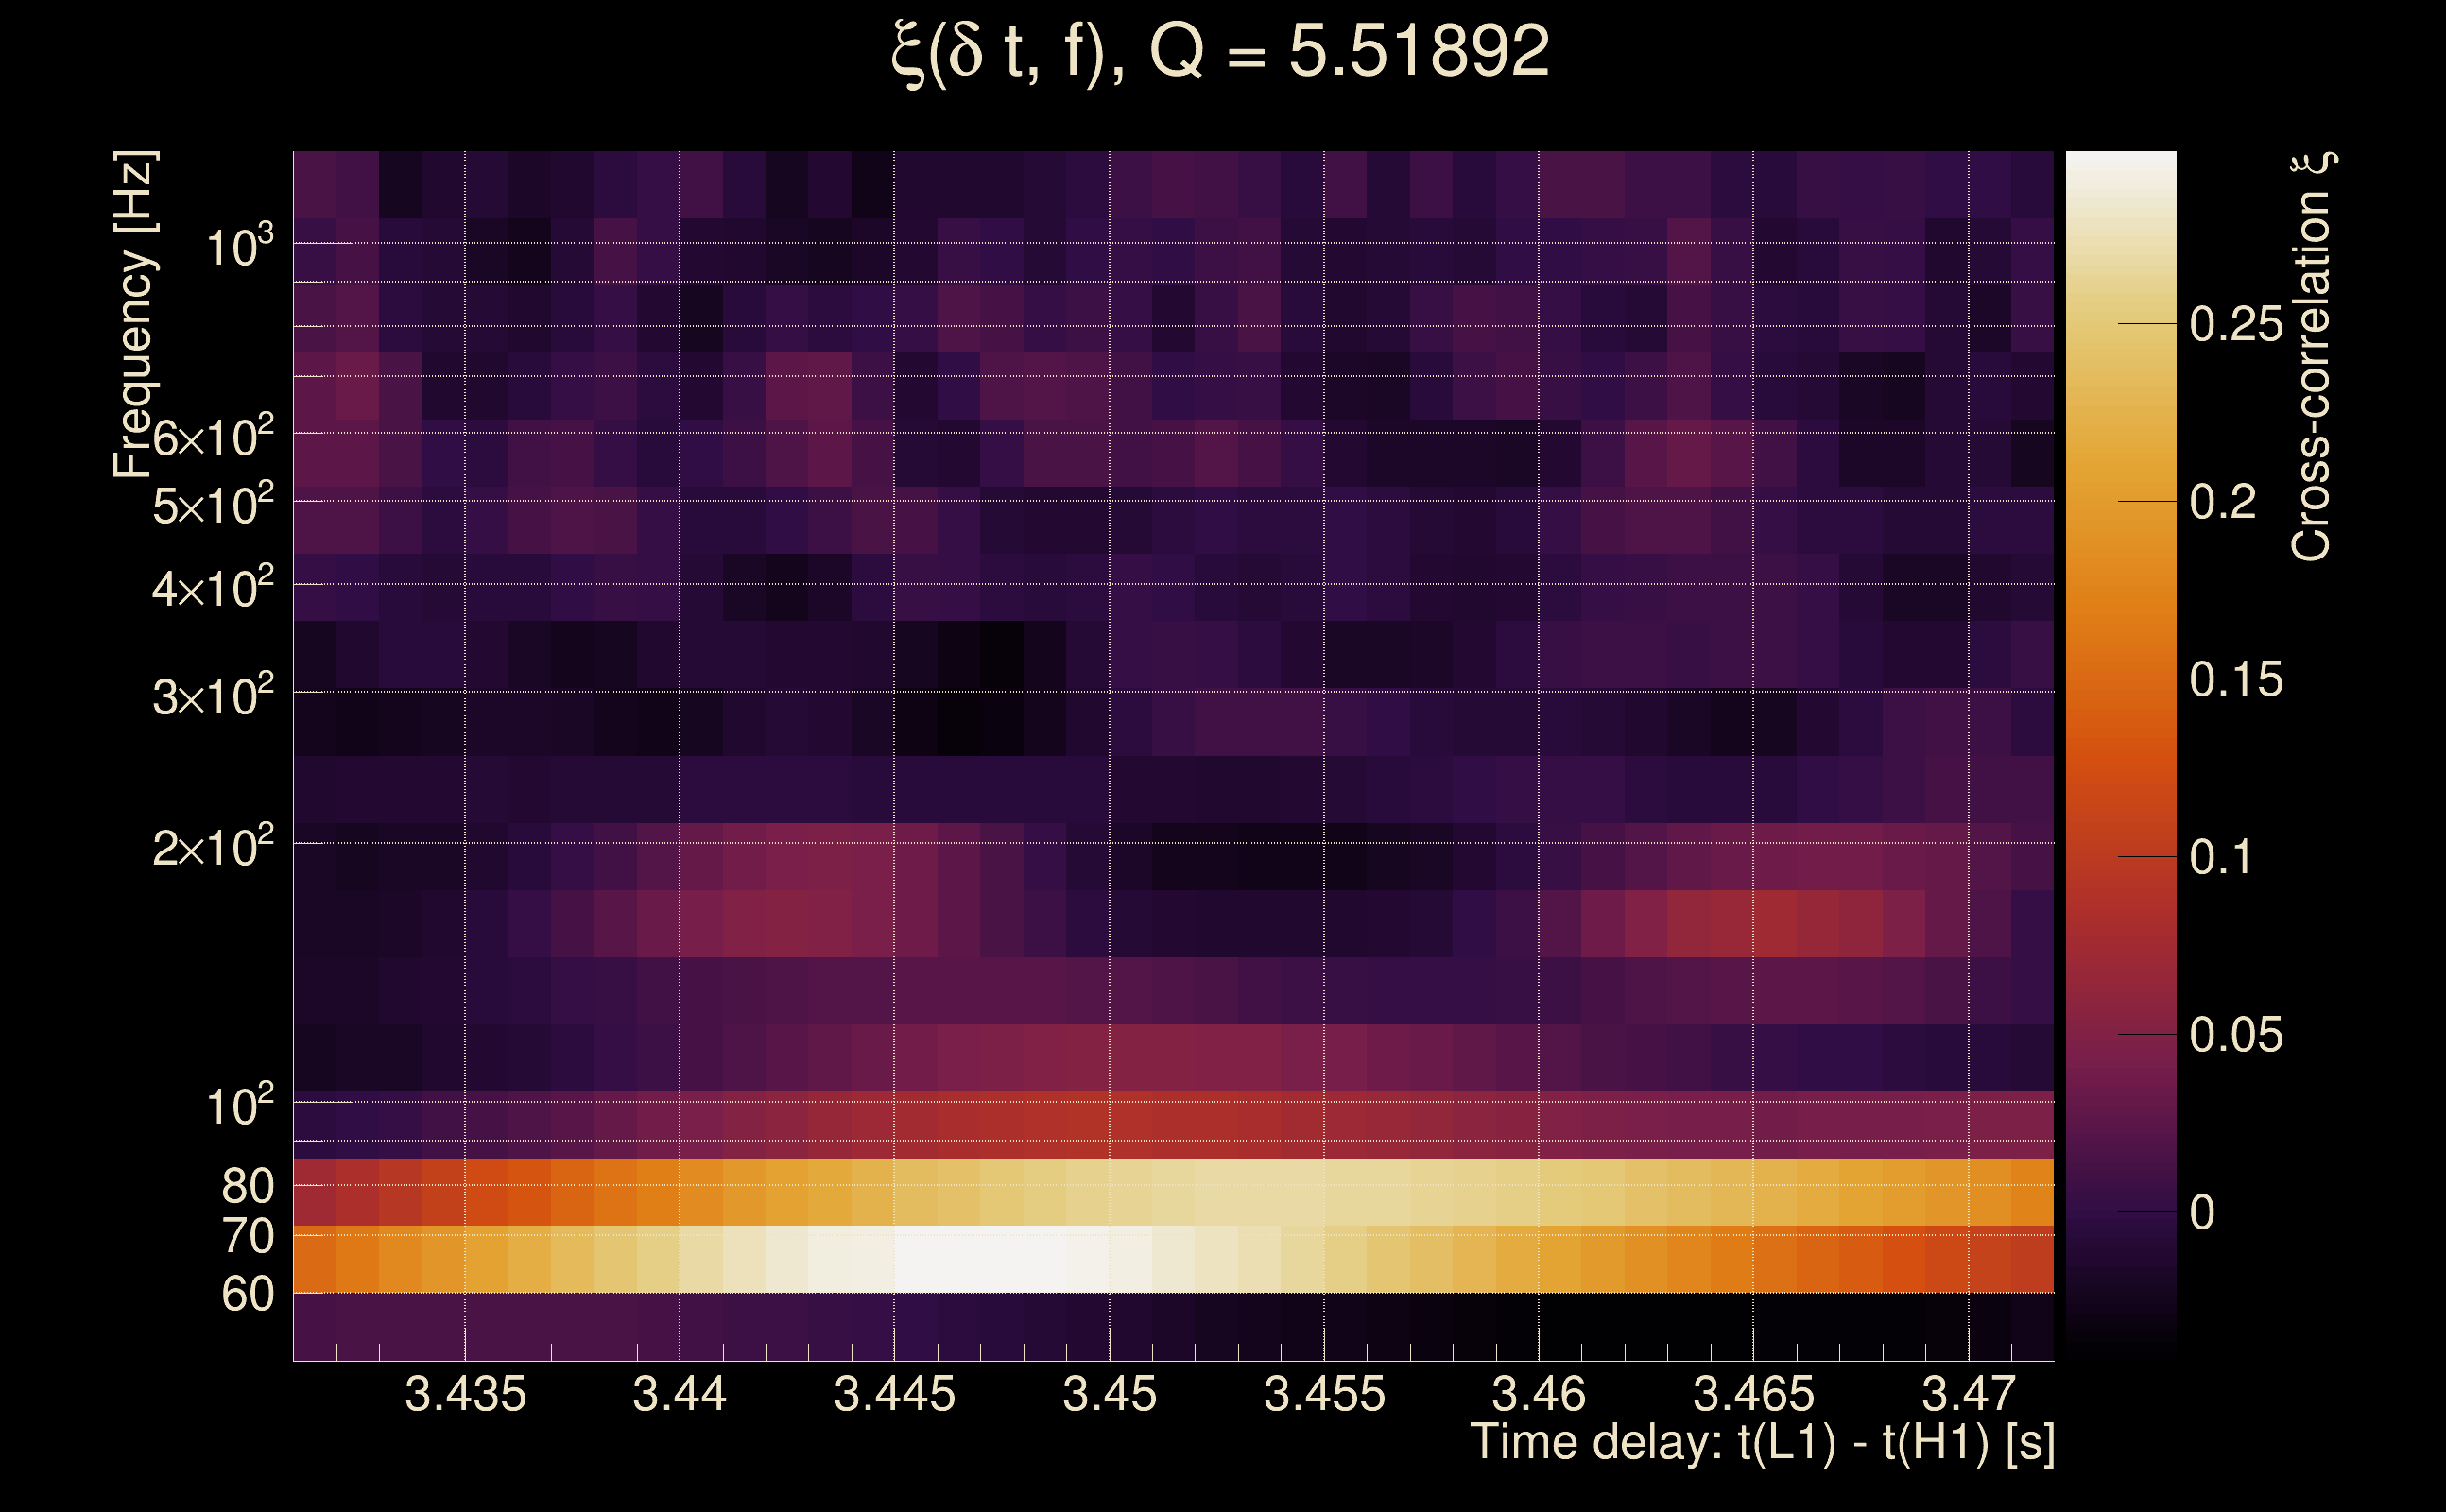
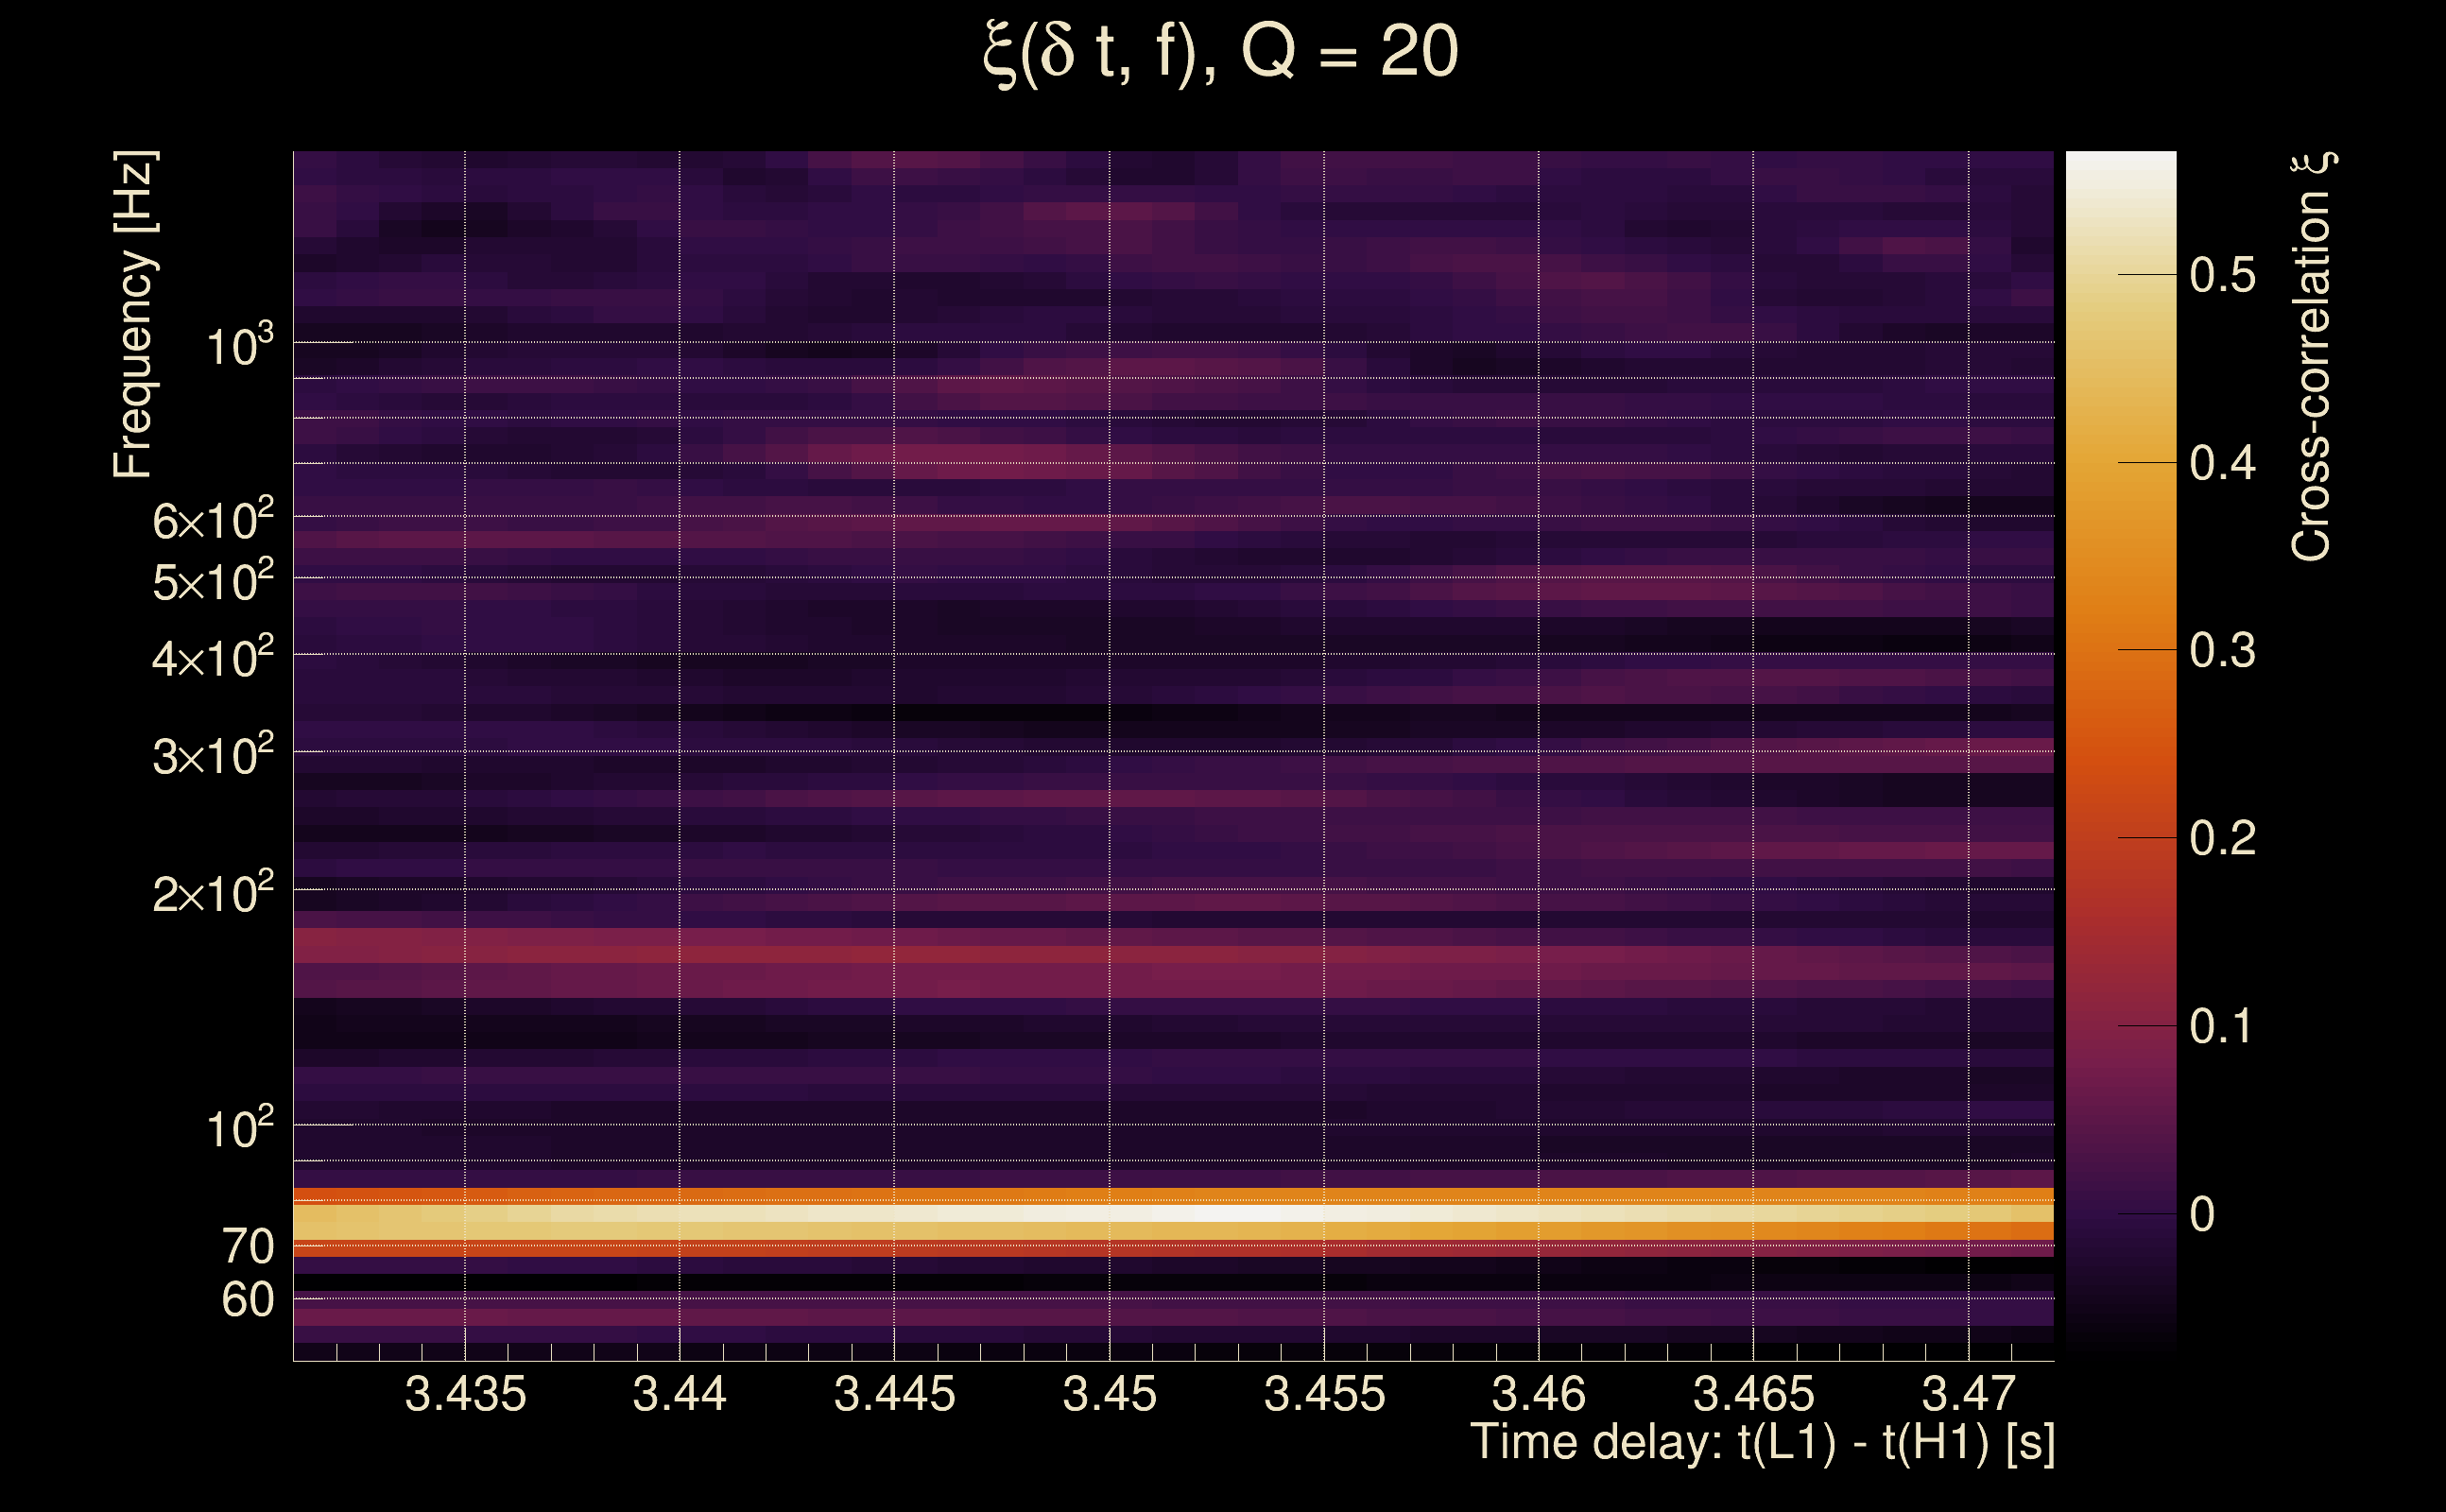
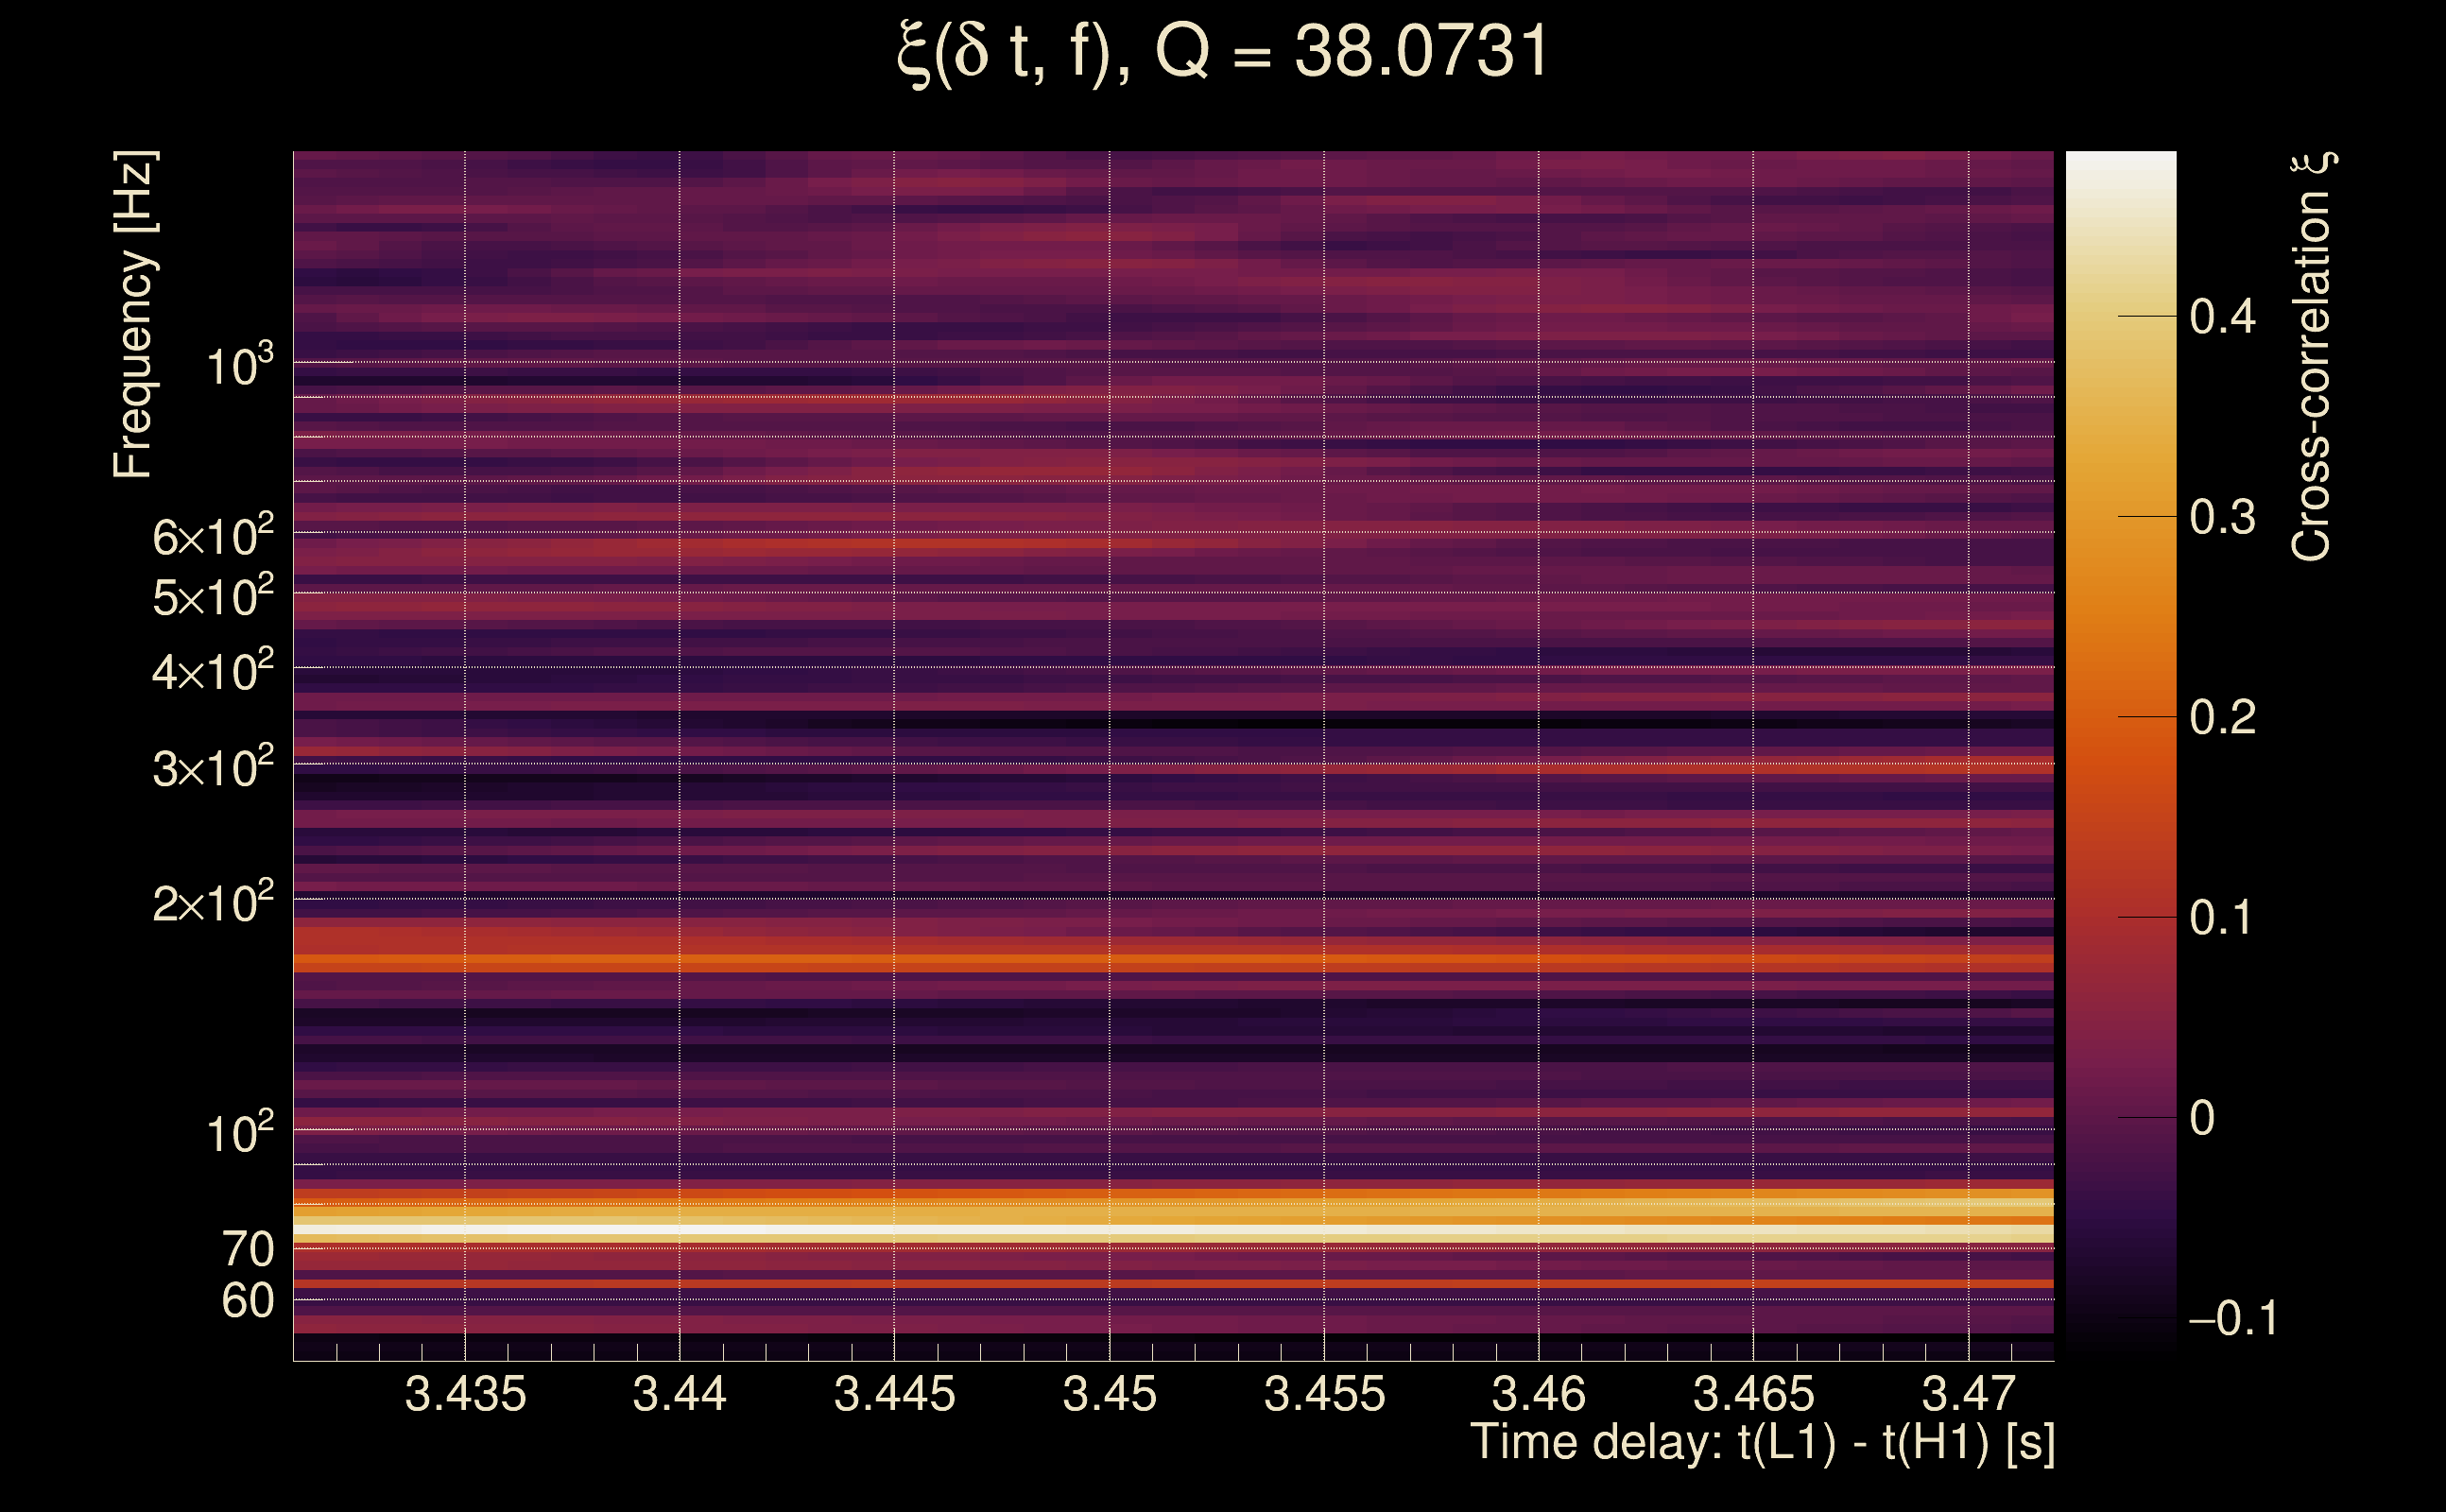
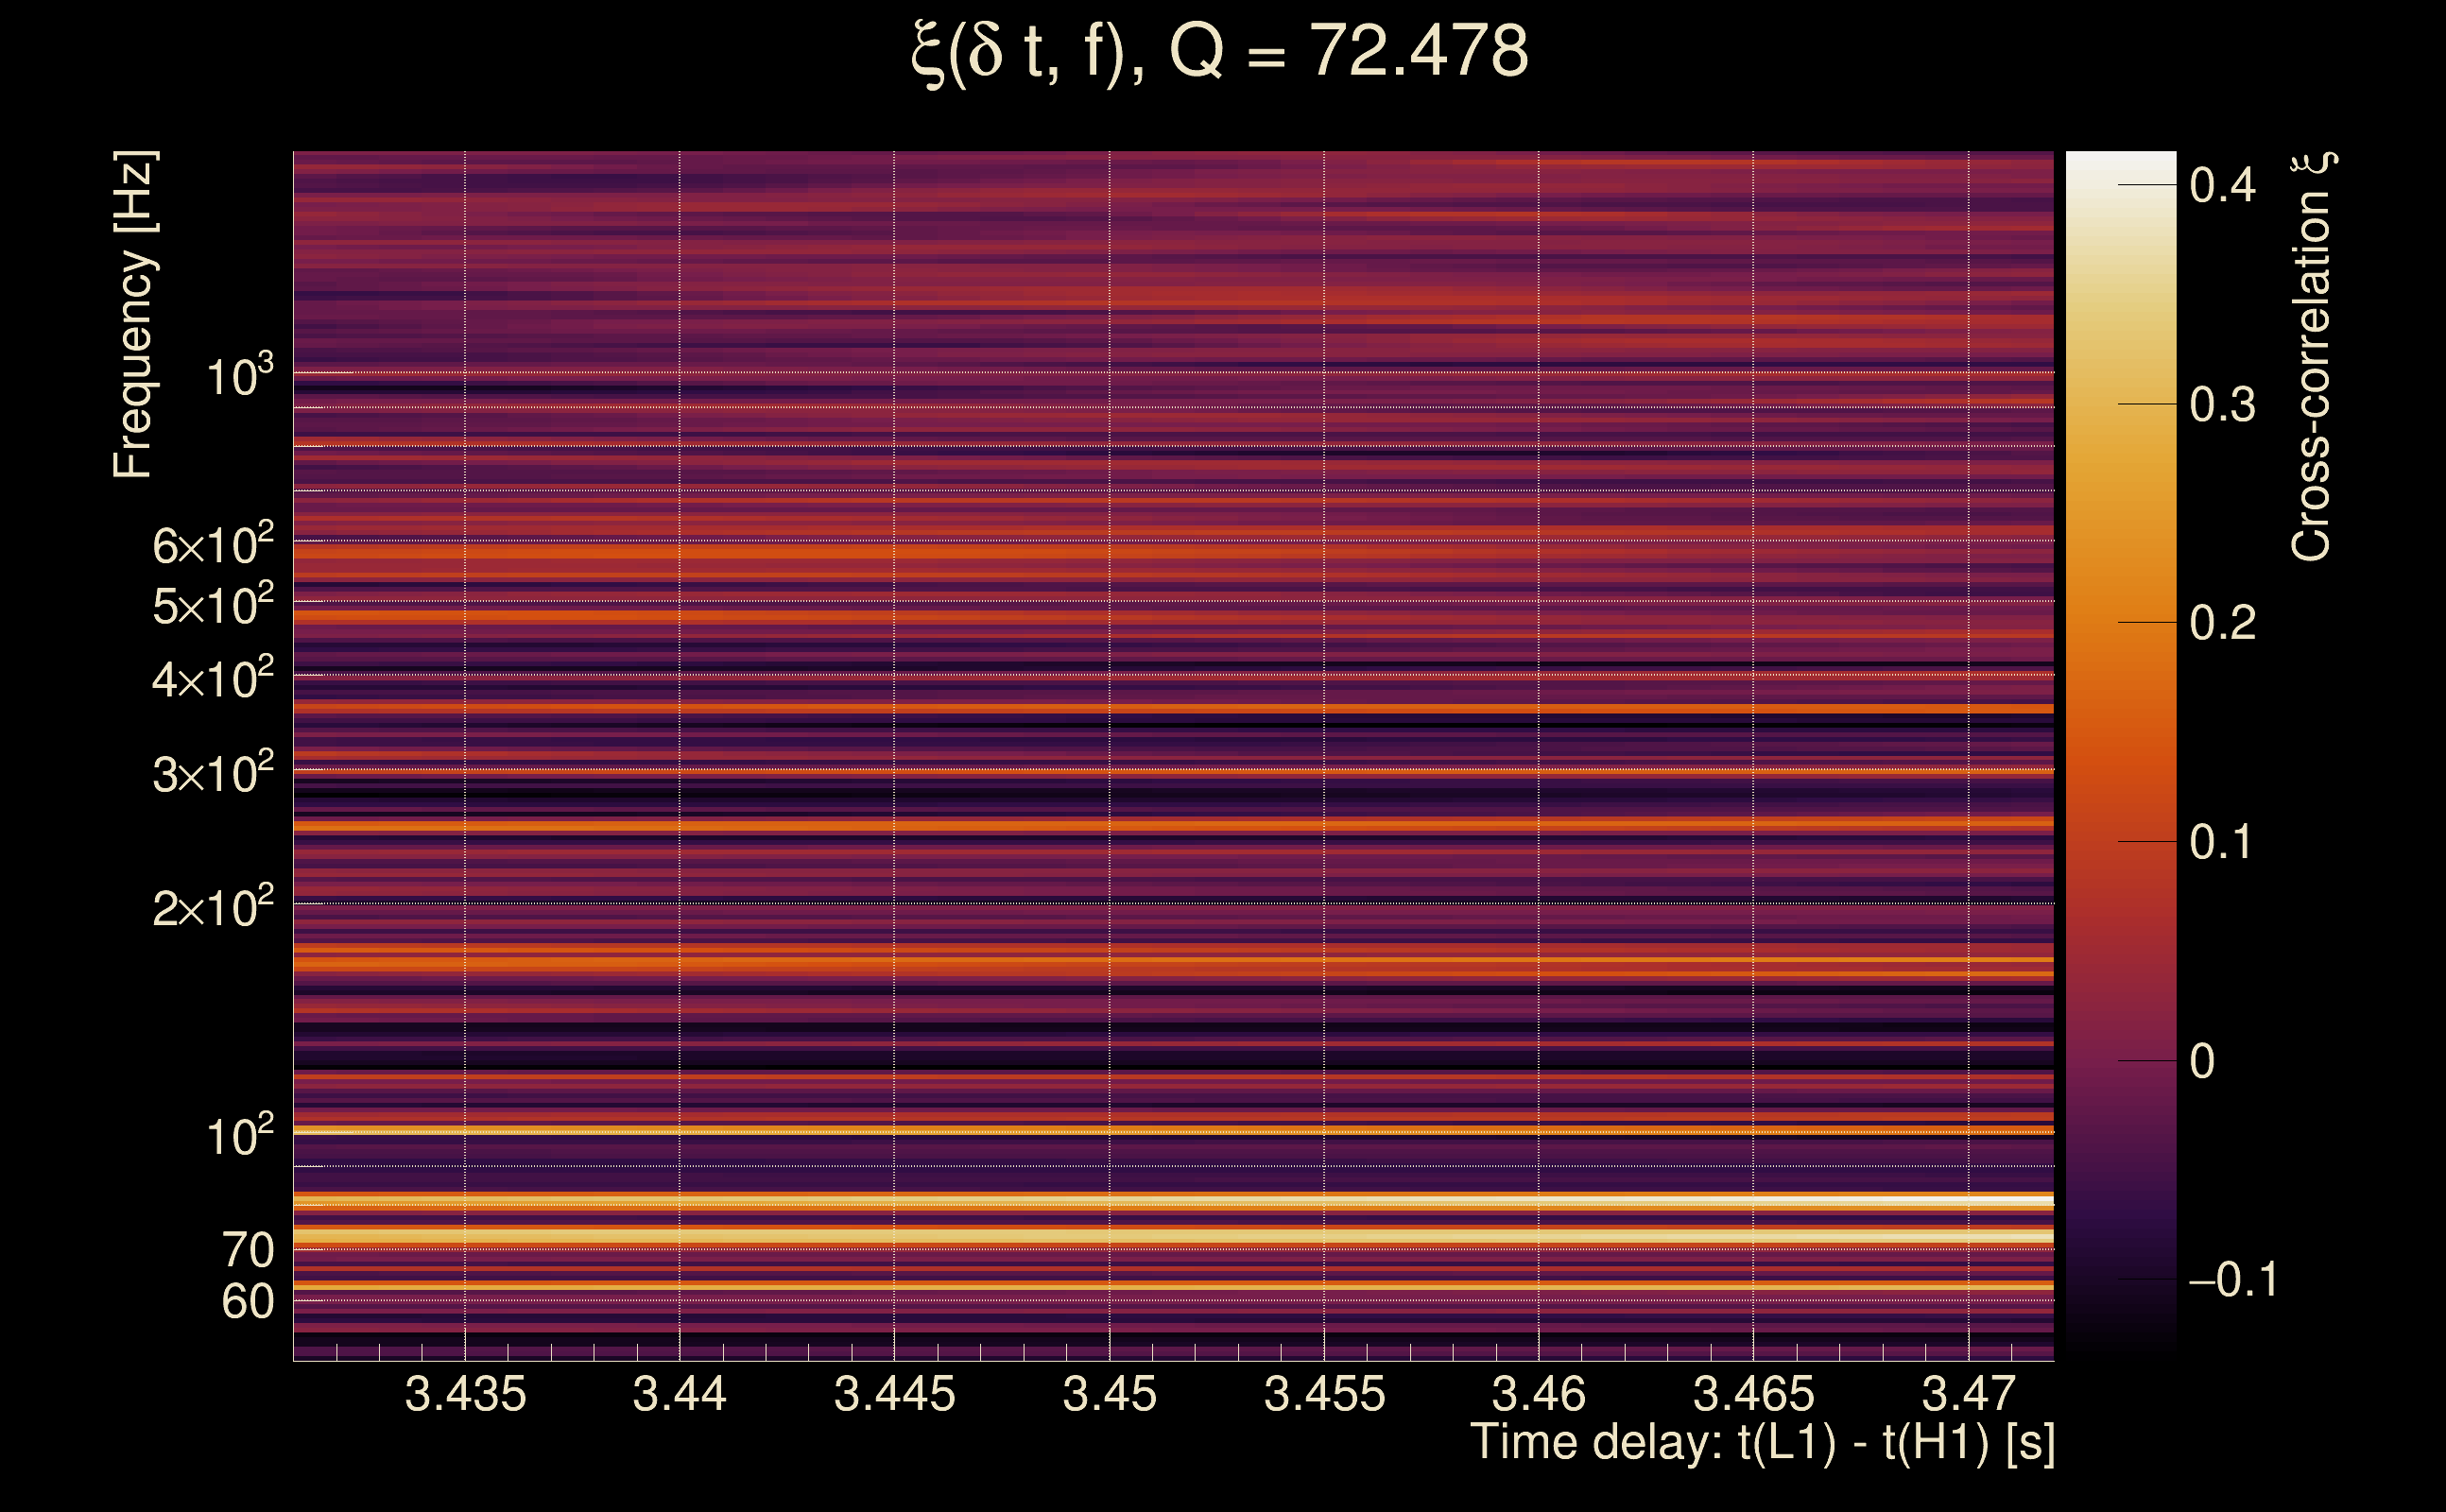
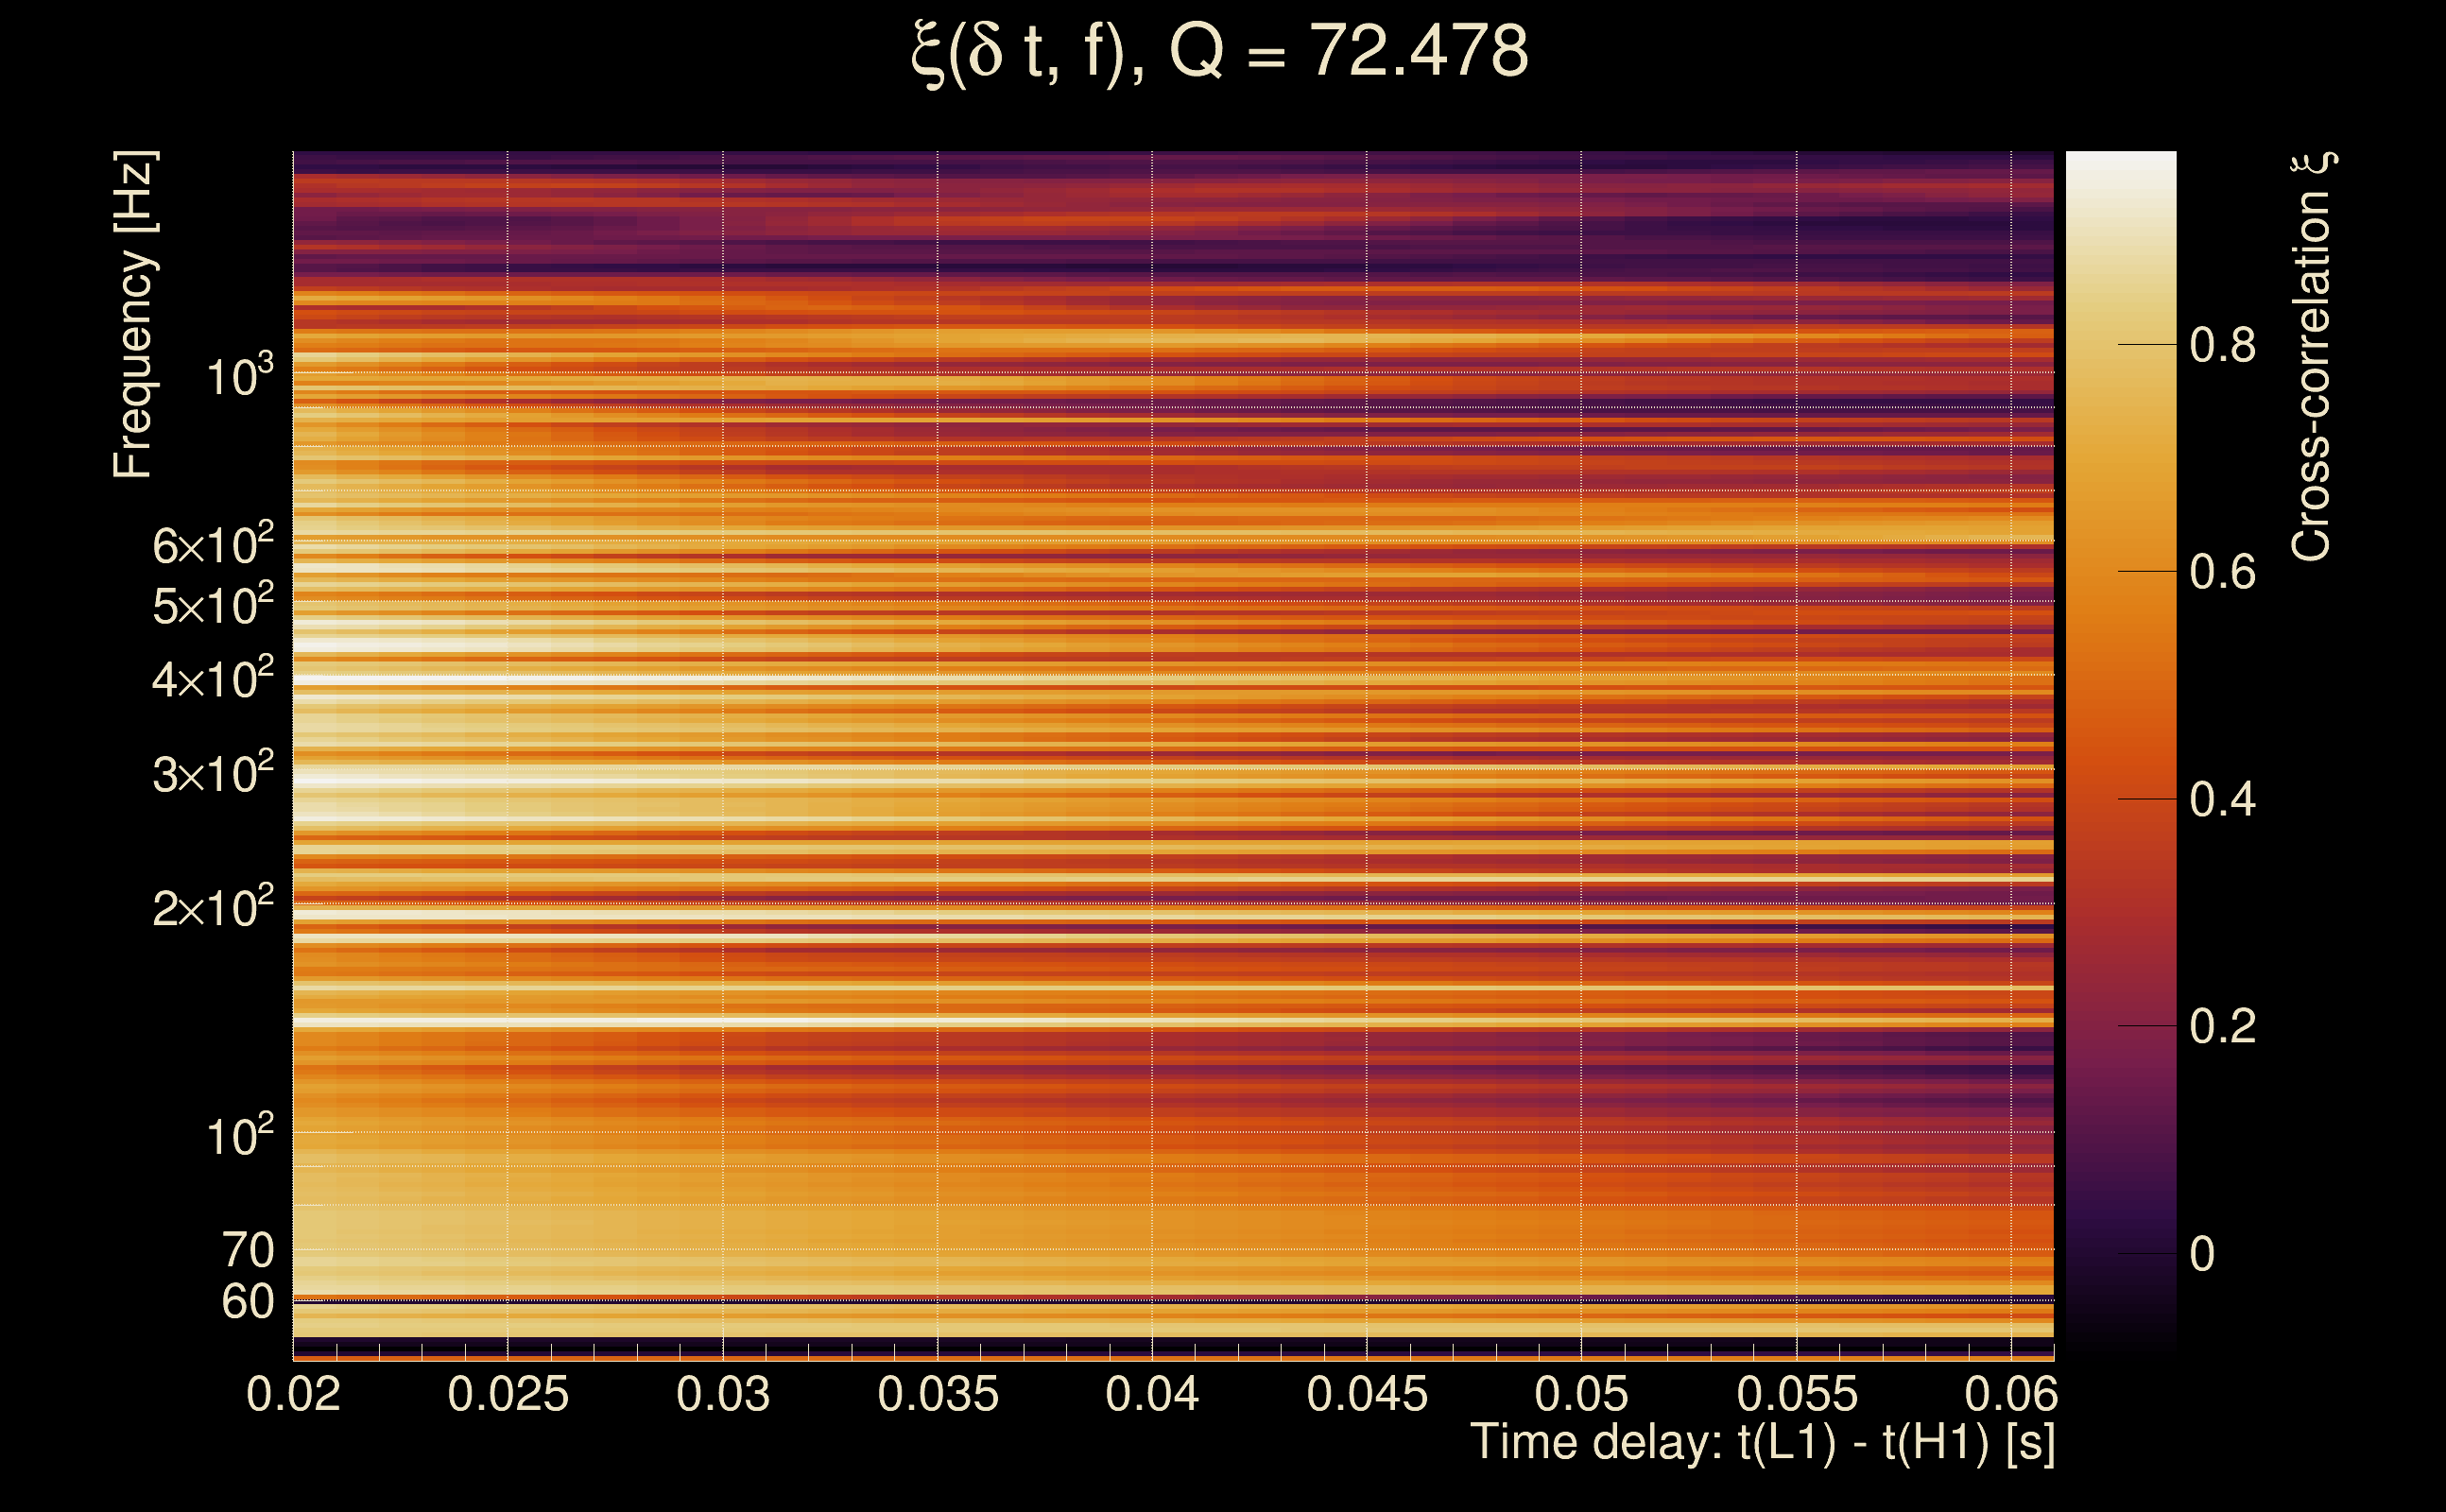
| Number of Q planes: | 5 (Q = 5.51892 → Q = 72.478) |
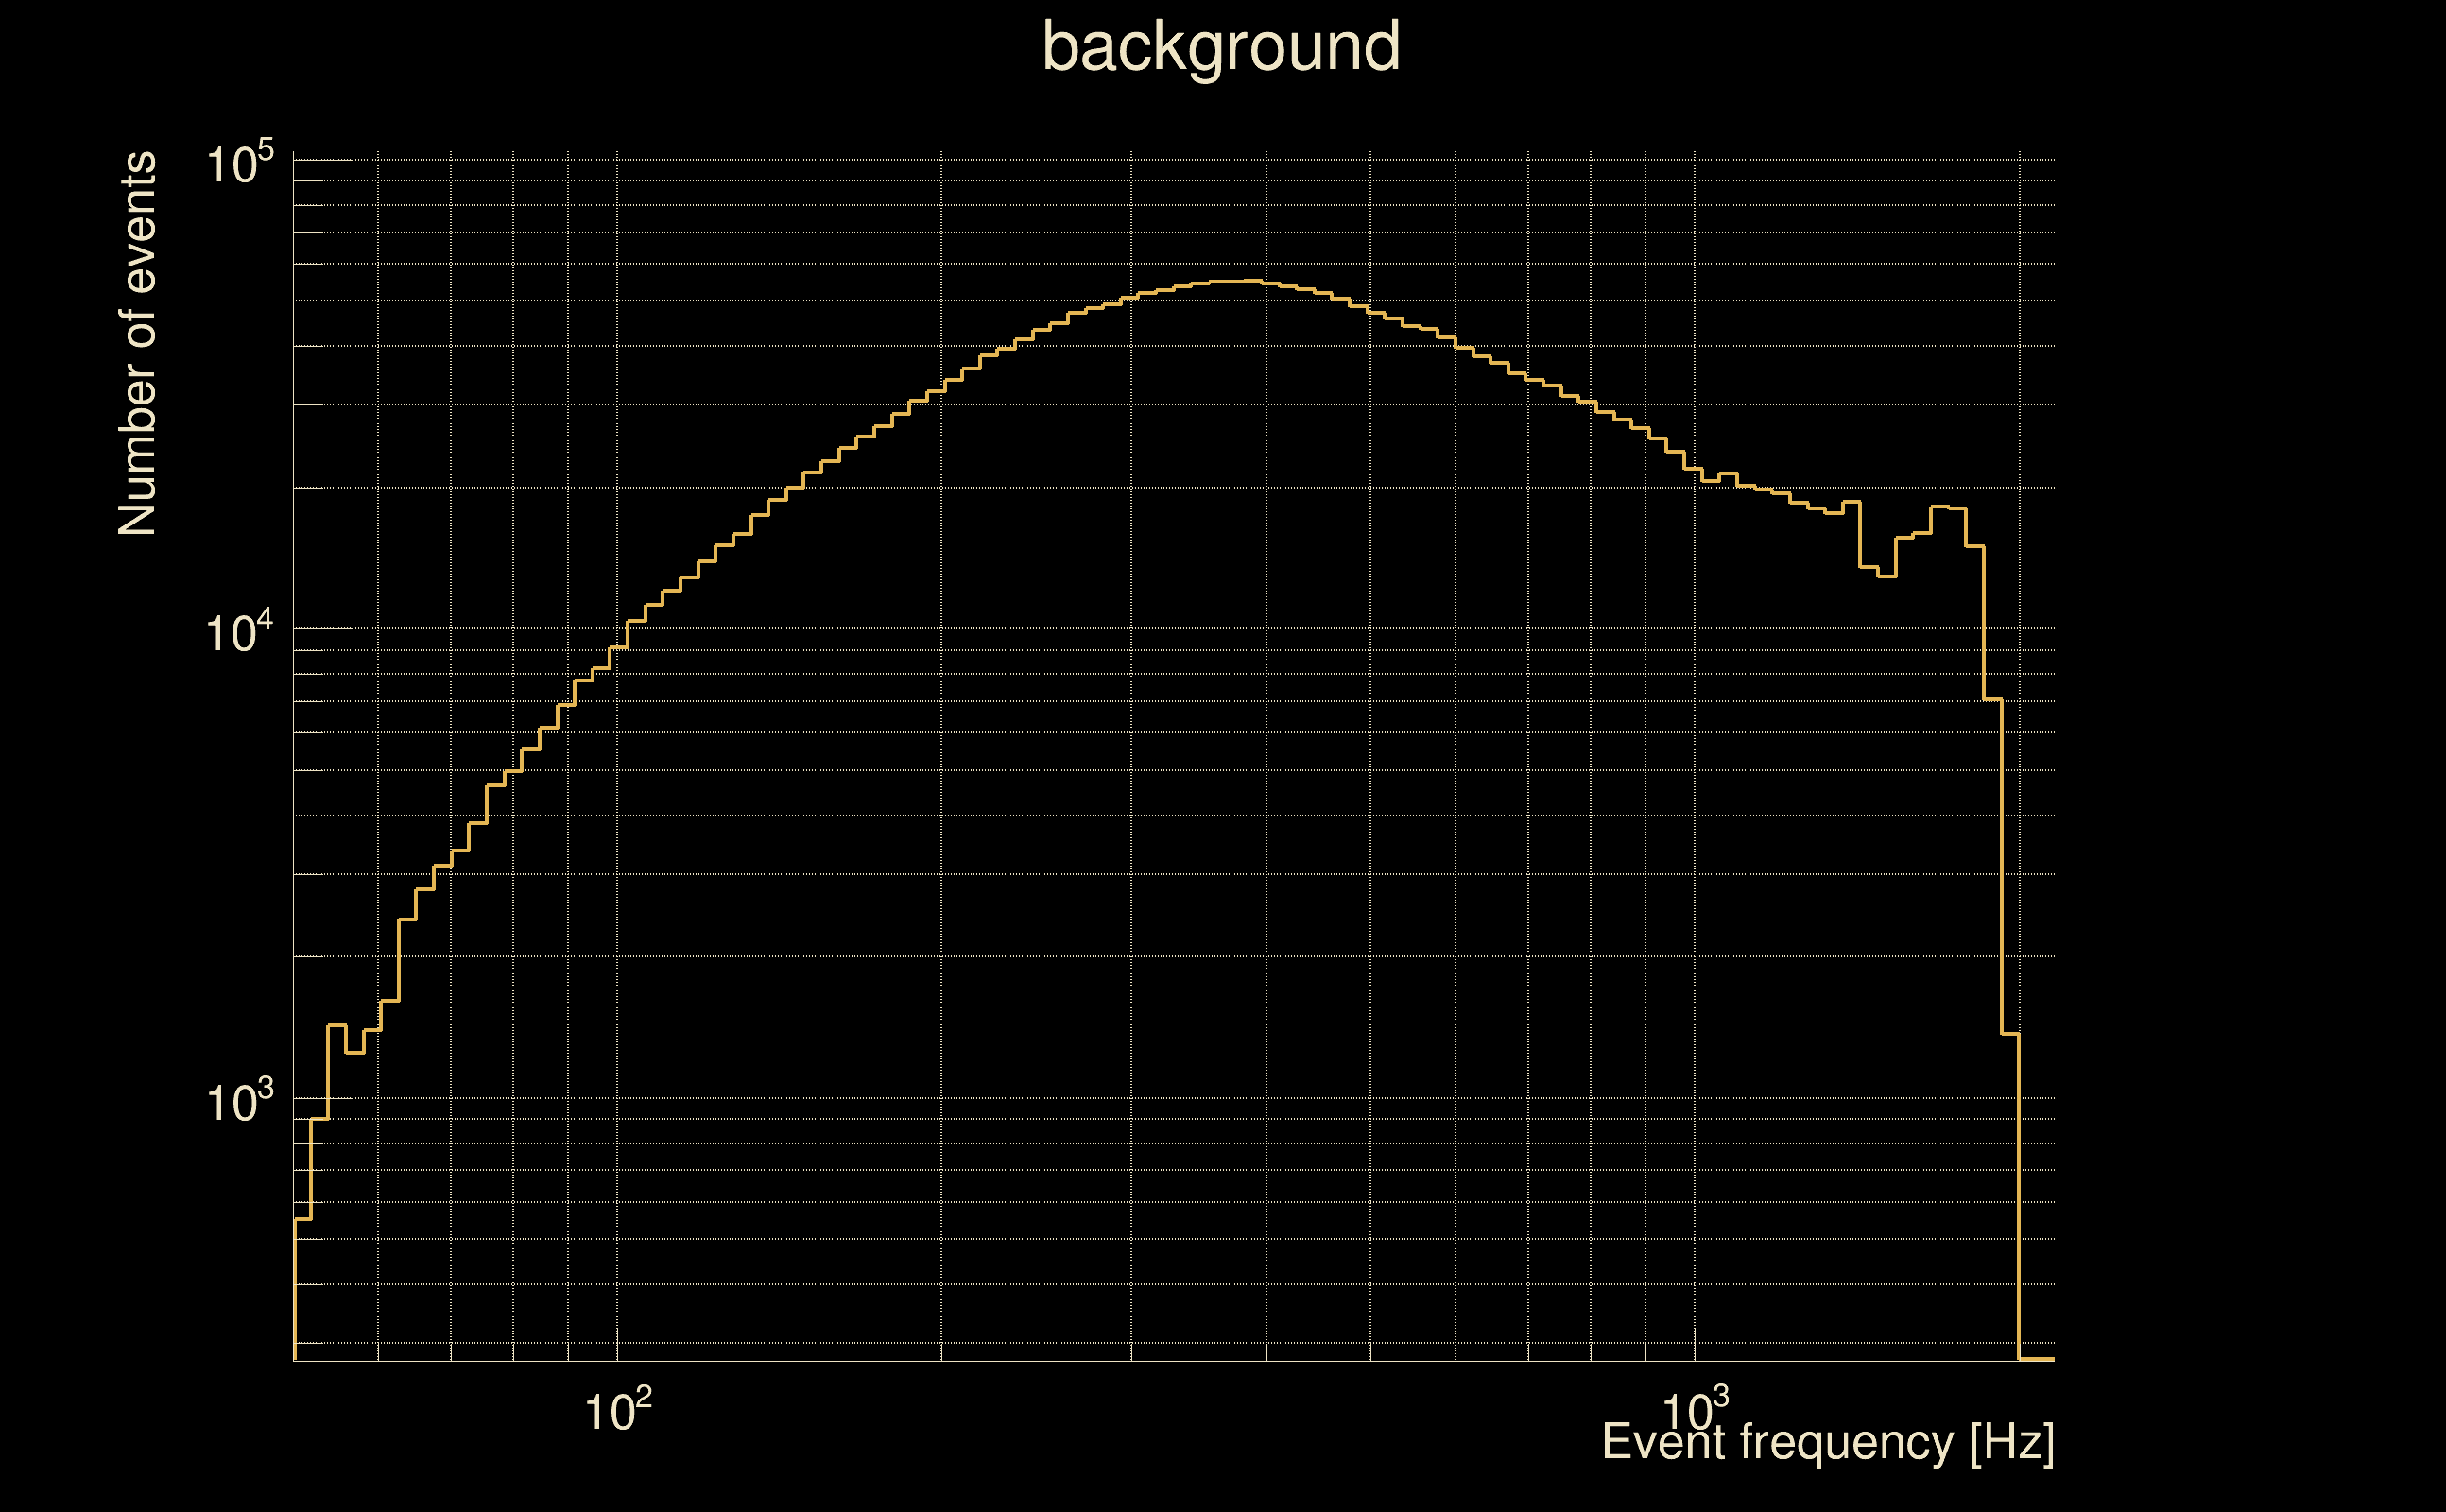
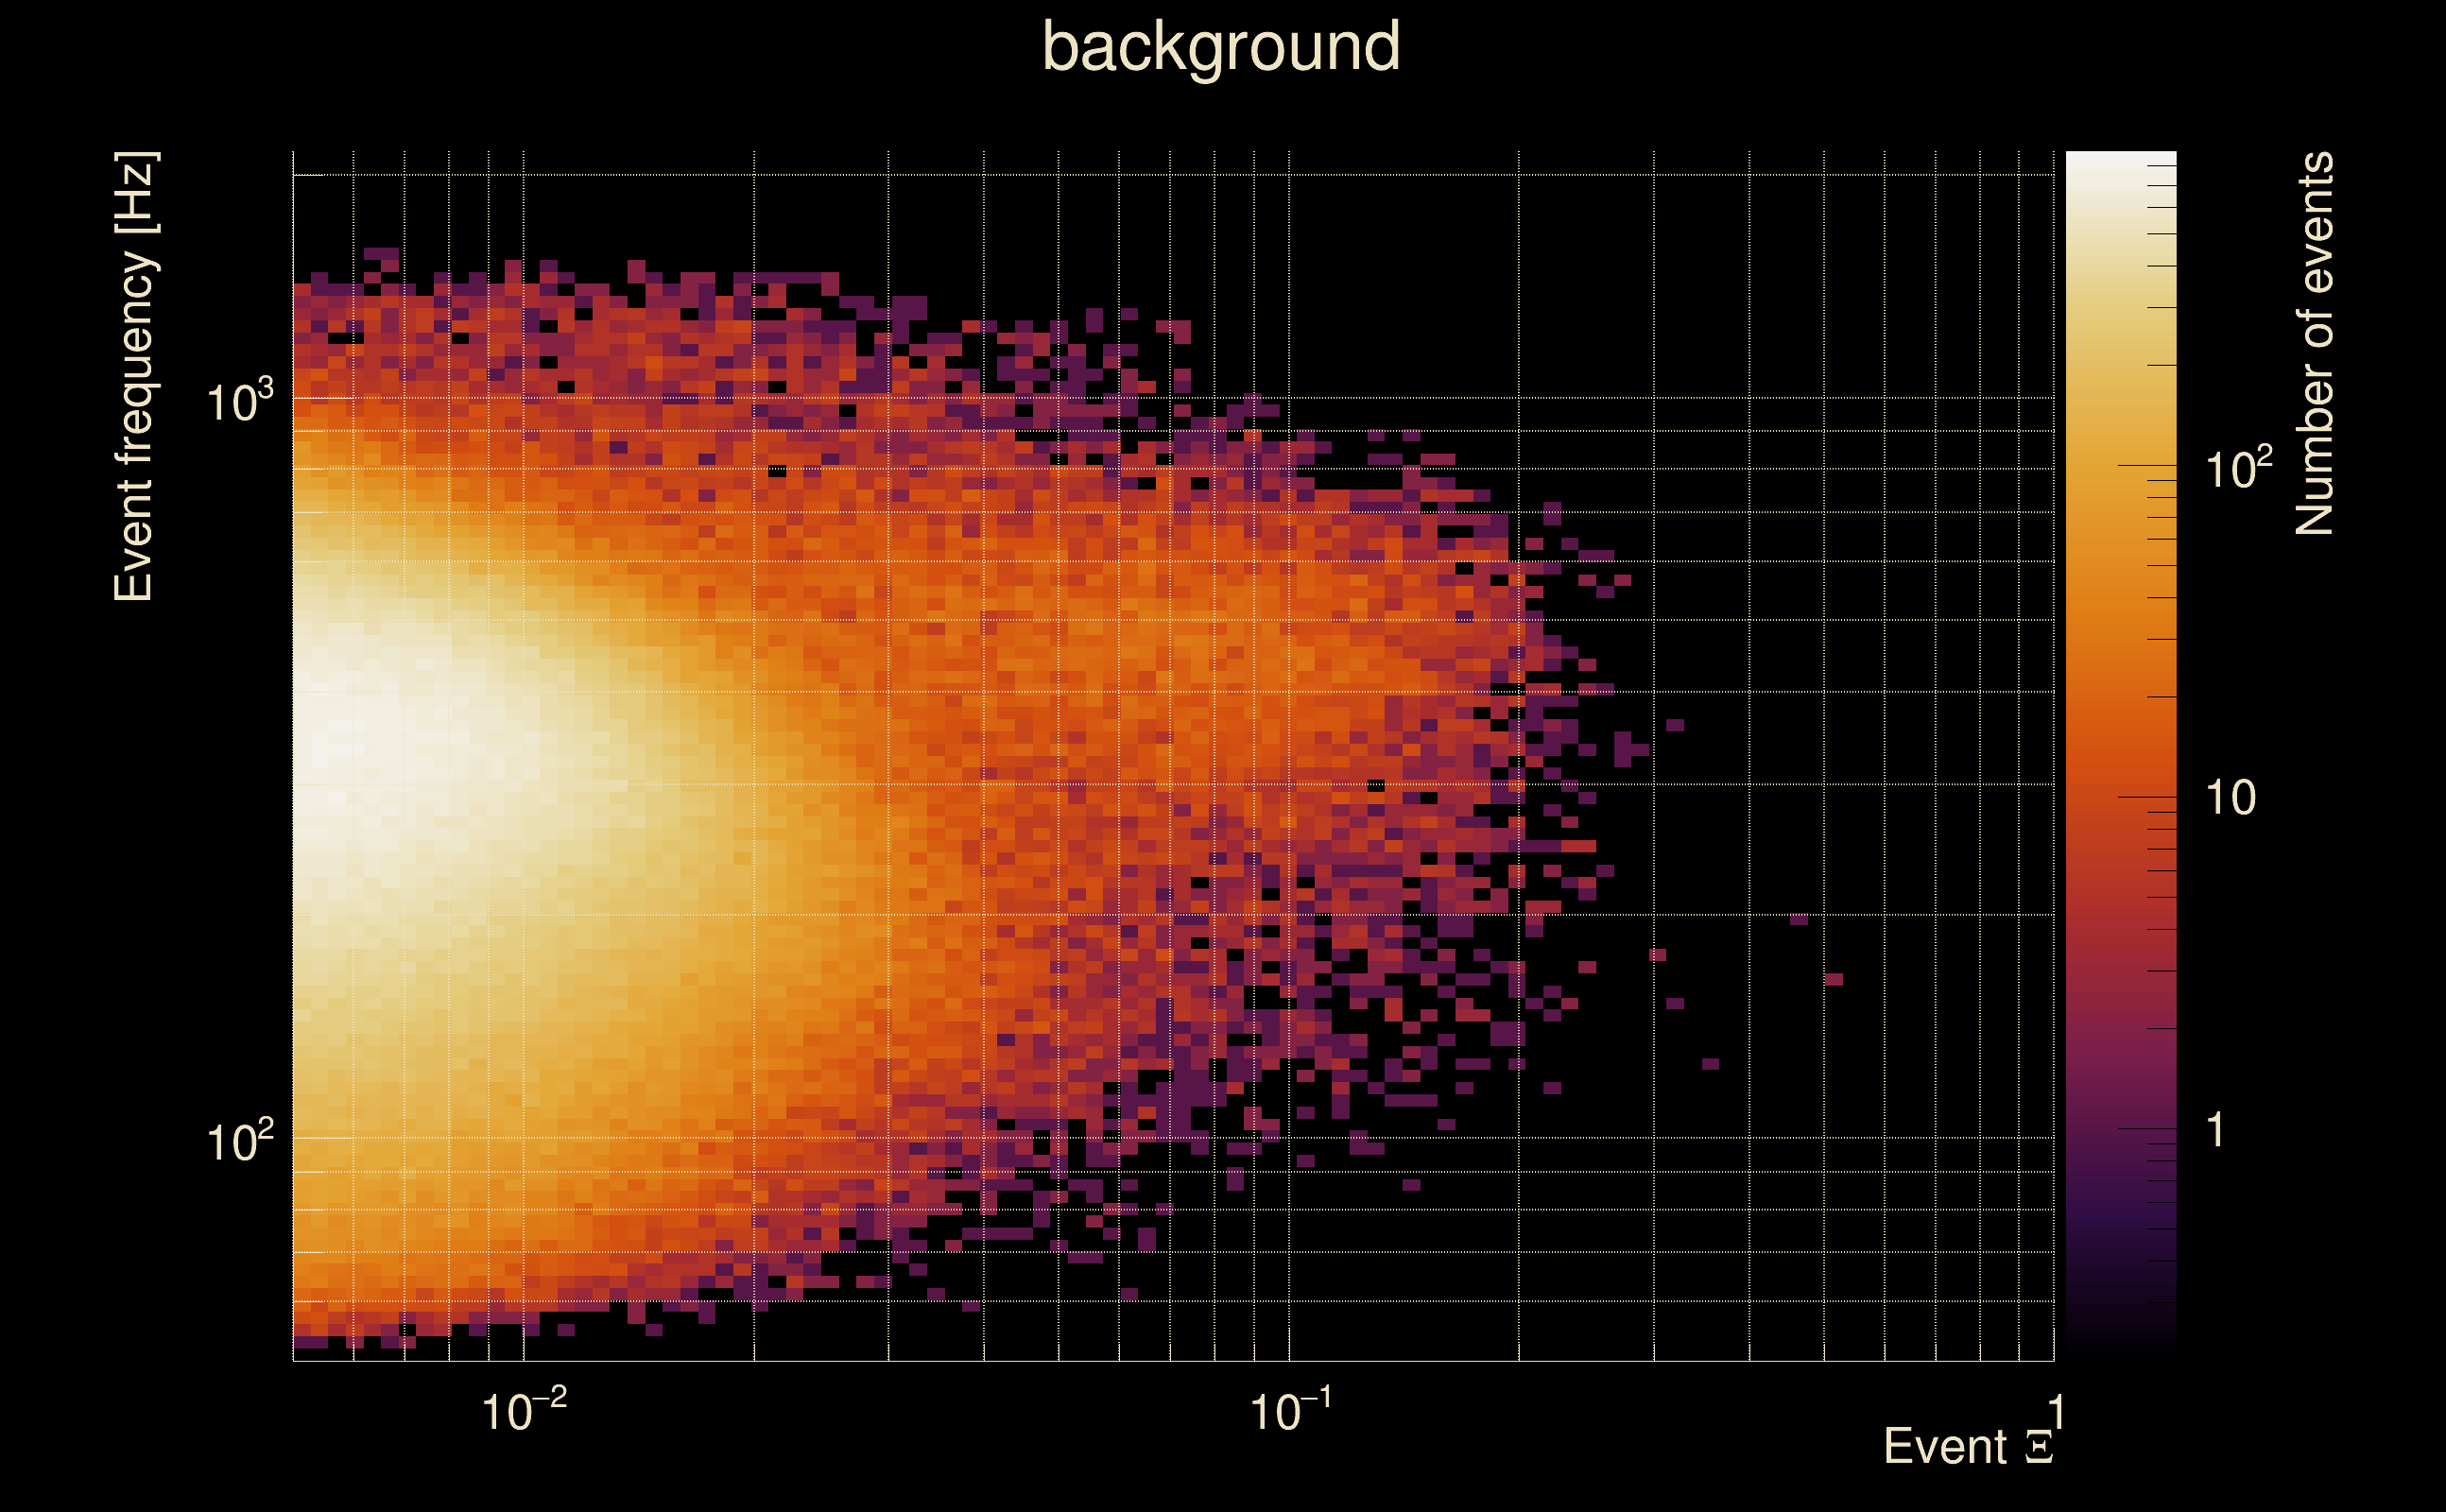
| Omicron frequency range: | 50 Hz → 1958.38 Hz |
| Light travel time between detectors: | 0.0100128 s |
| Slice extra-time (calibration uncertainty + slice veto): | 0.0129872 s |
| Number of time-delay bins in a cross-correlation map: | 10000 |
| Number of slices in a cross-correlation map: | 217 |
| Number of time-delay bins in a slice: | 46 |
| SNR gating: | < 100 (detector 0), < 100 (detector 1) |
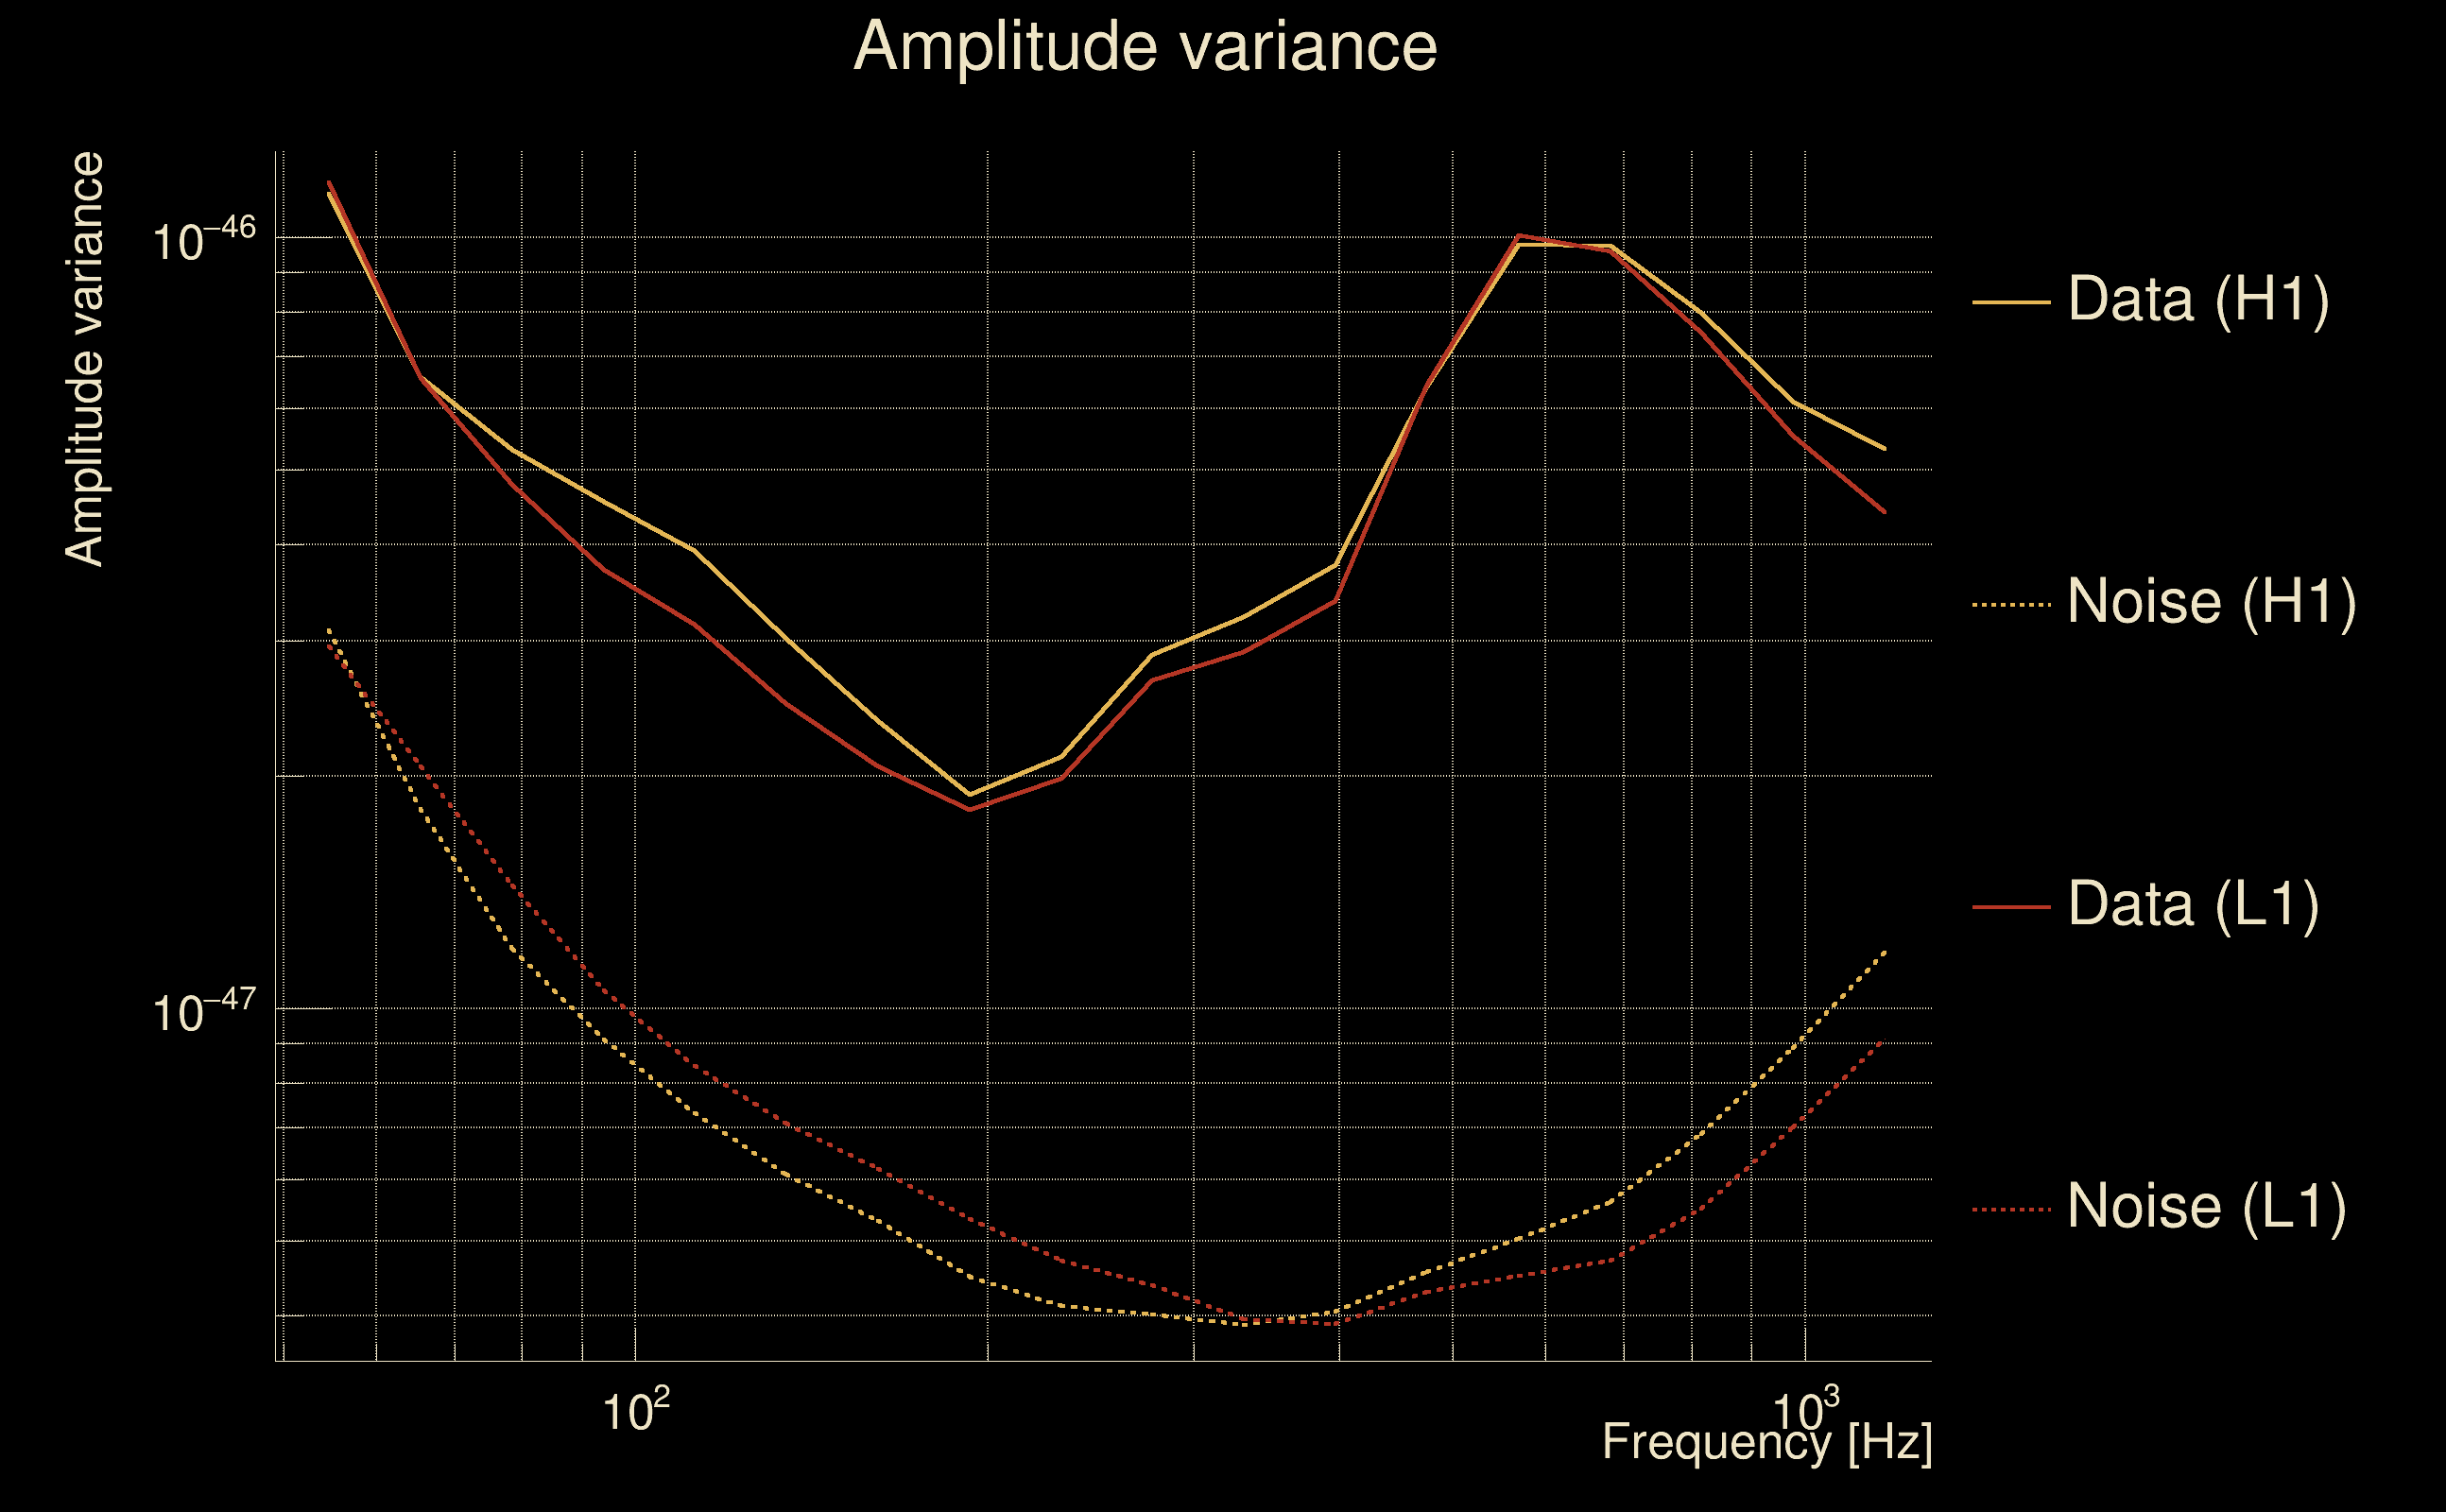
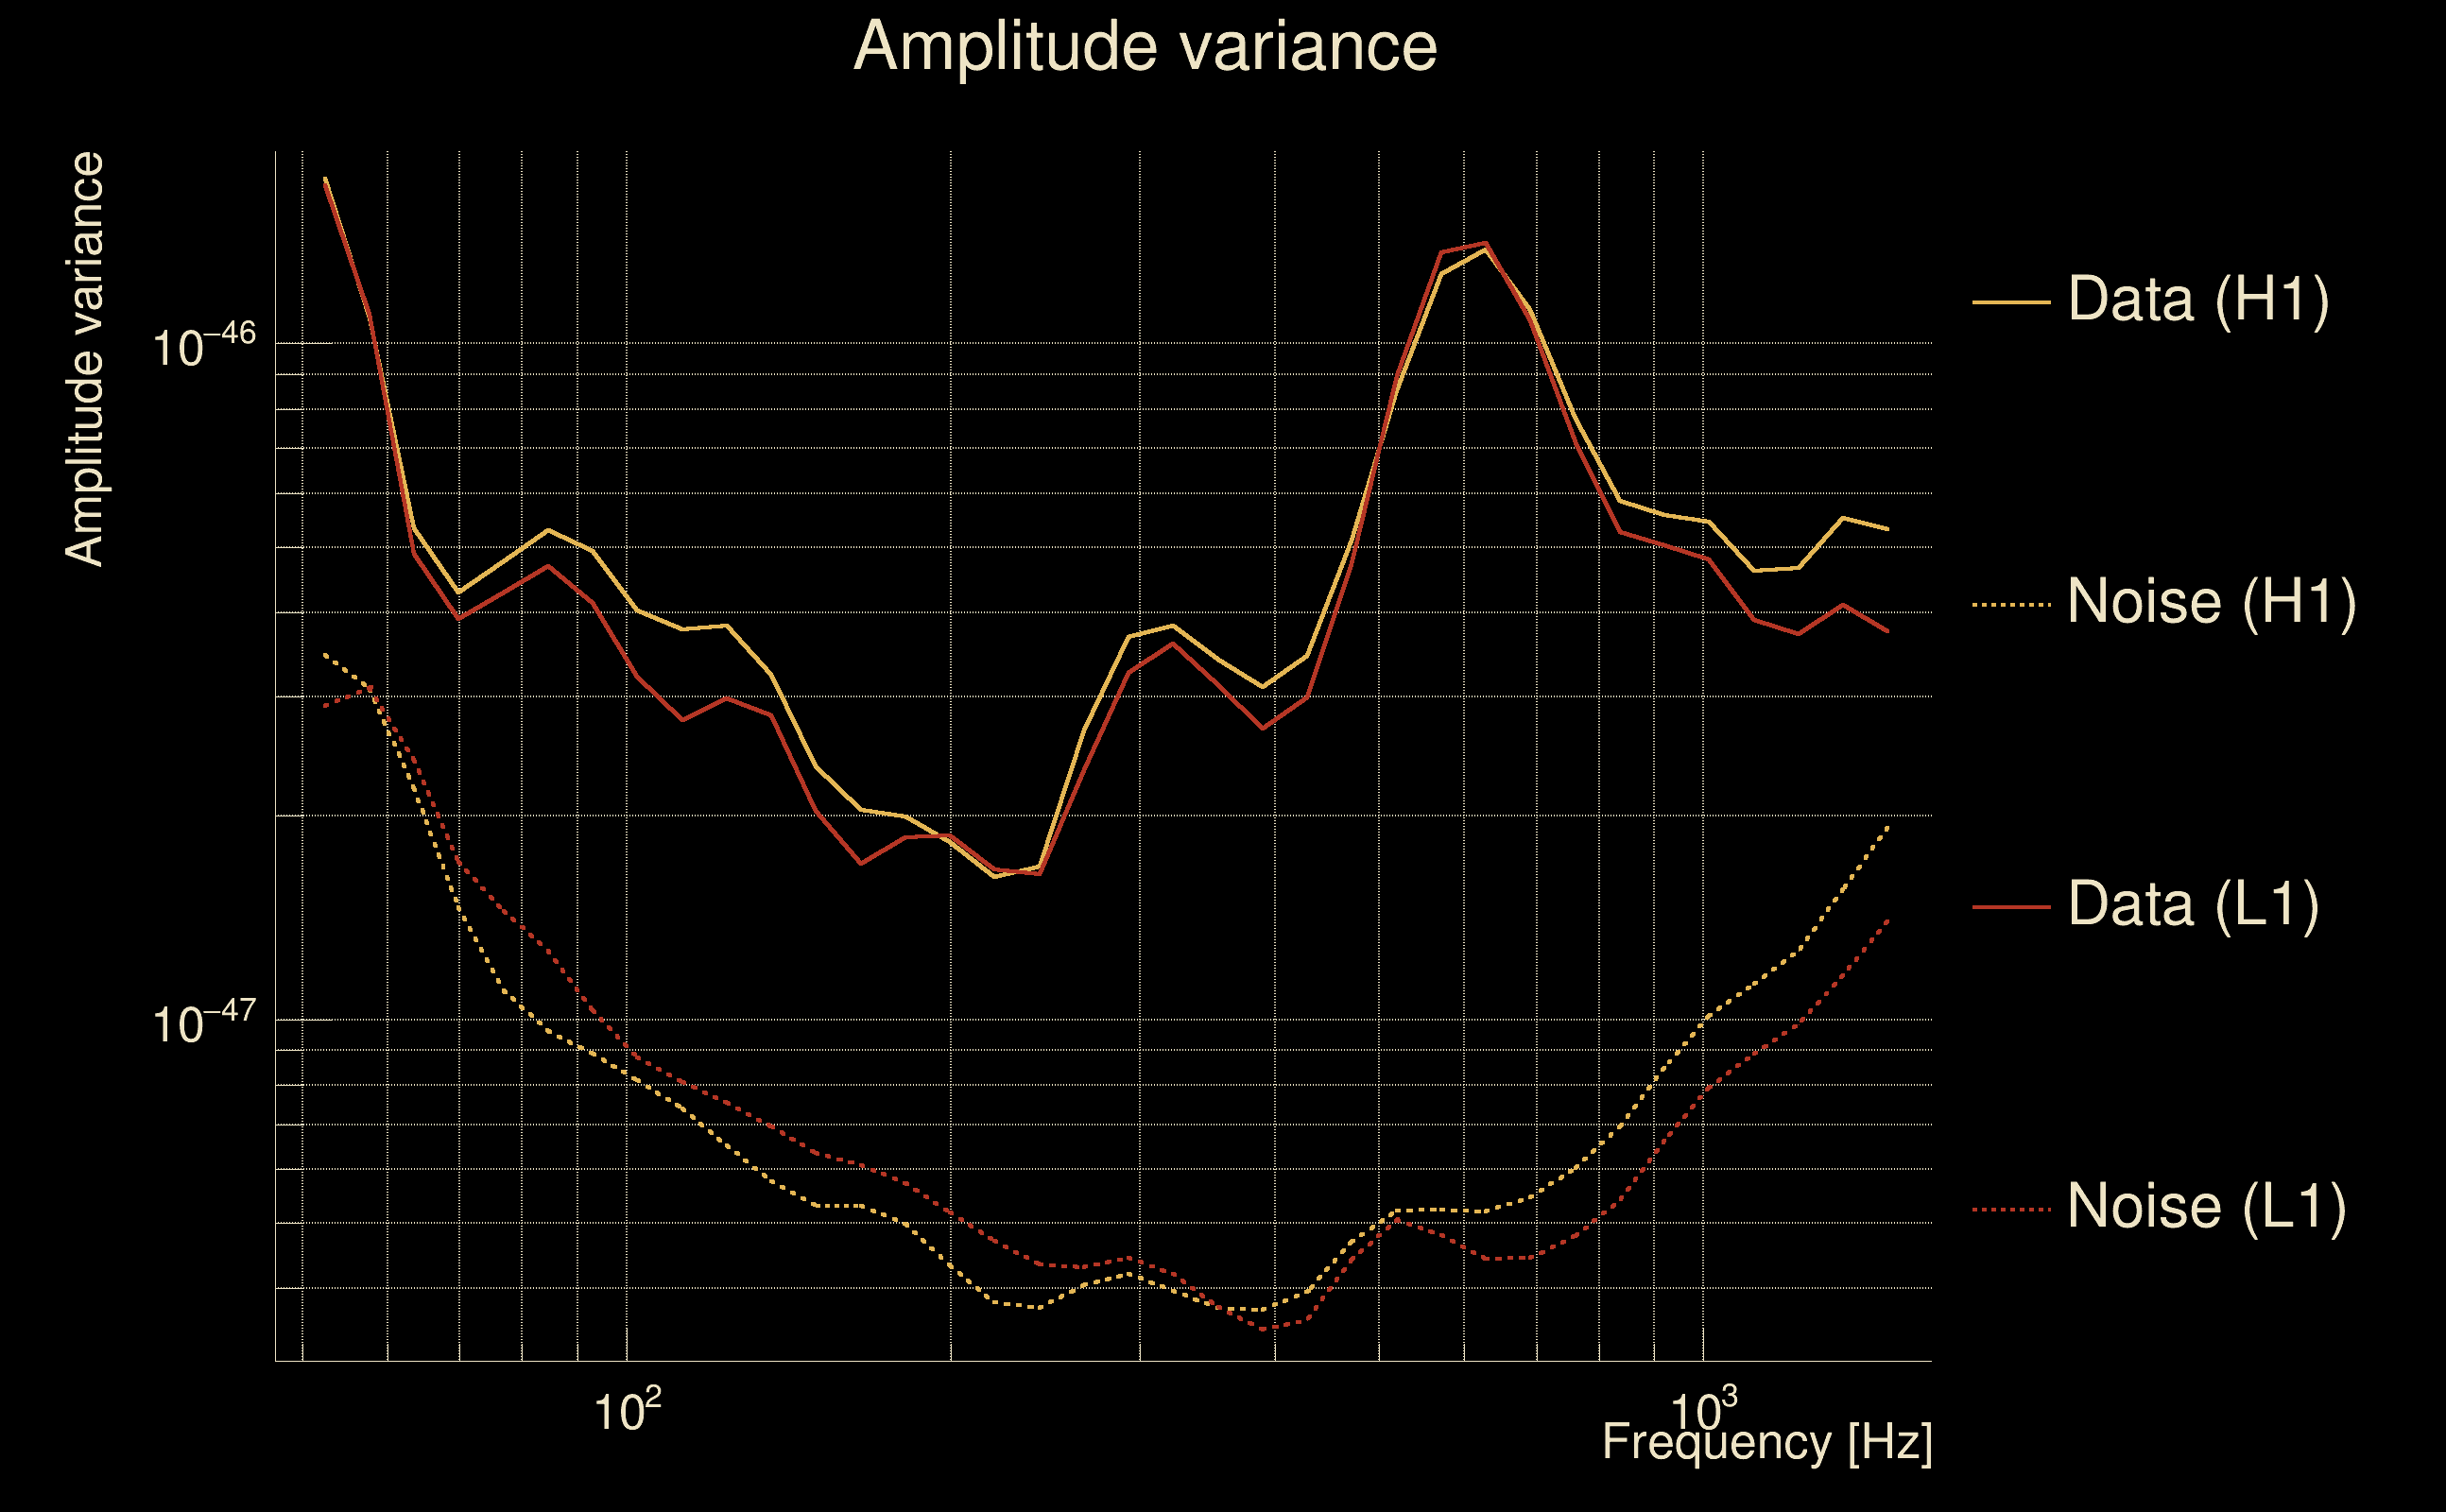
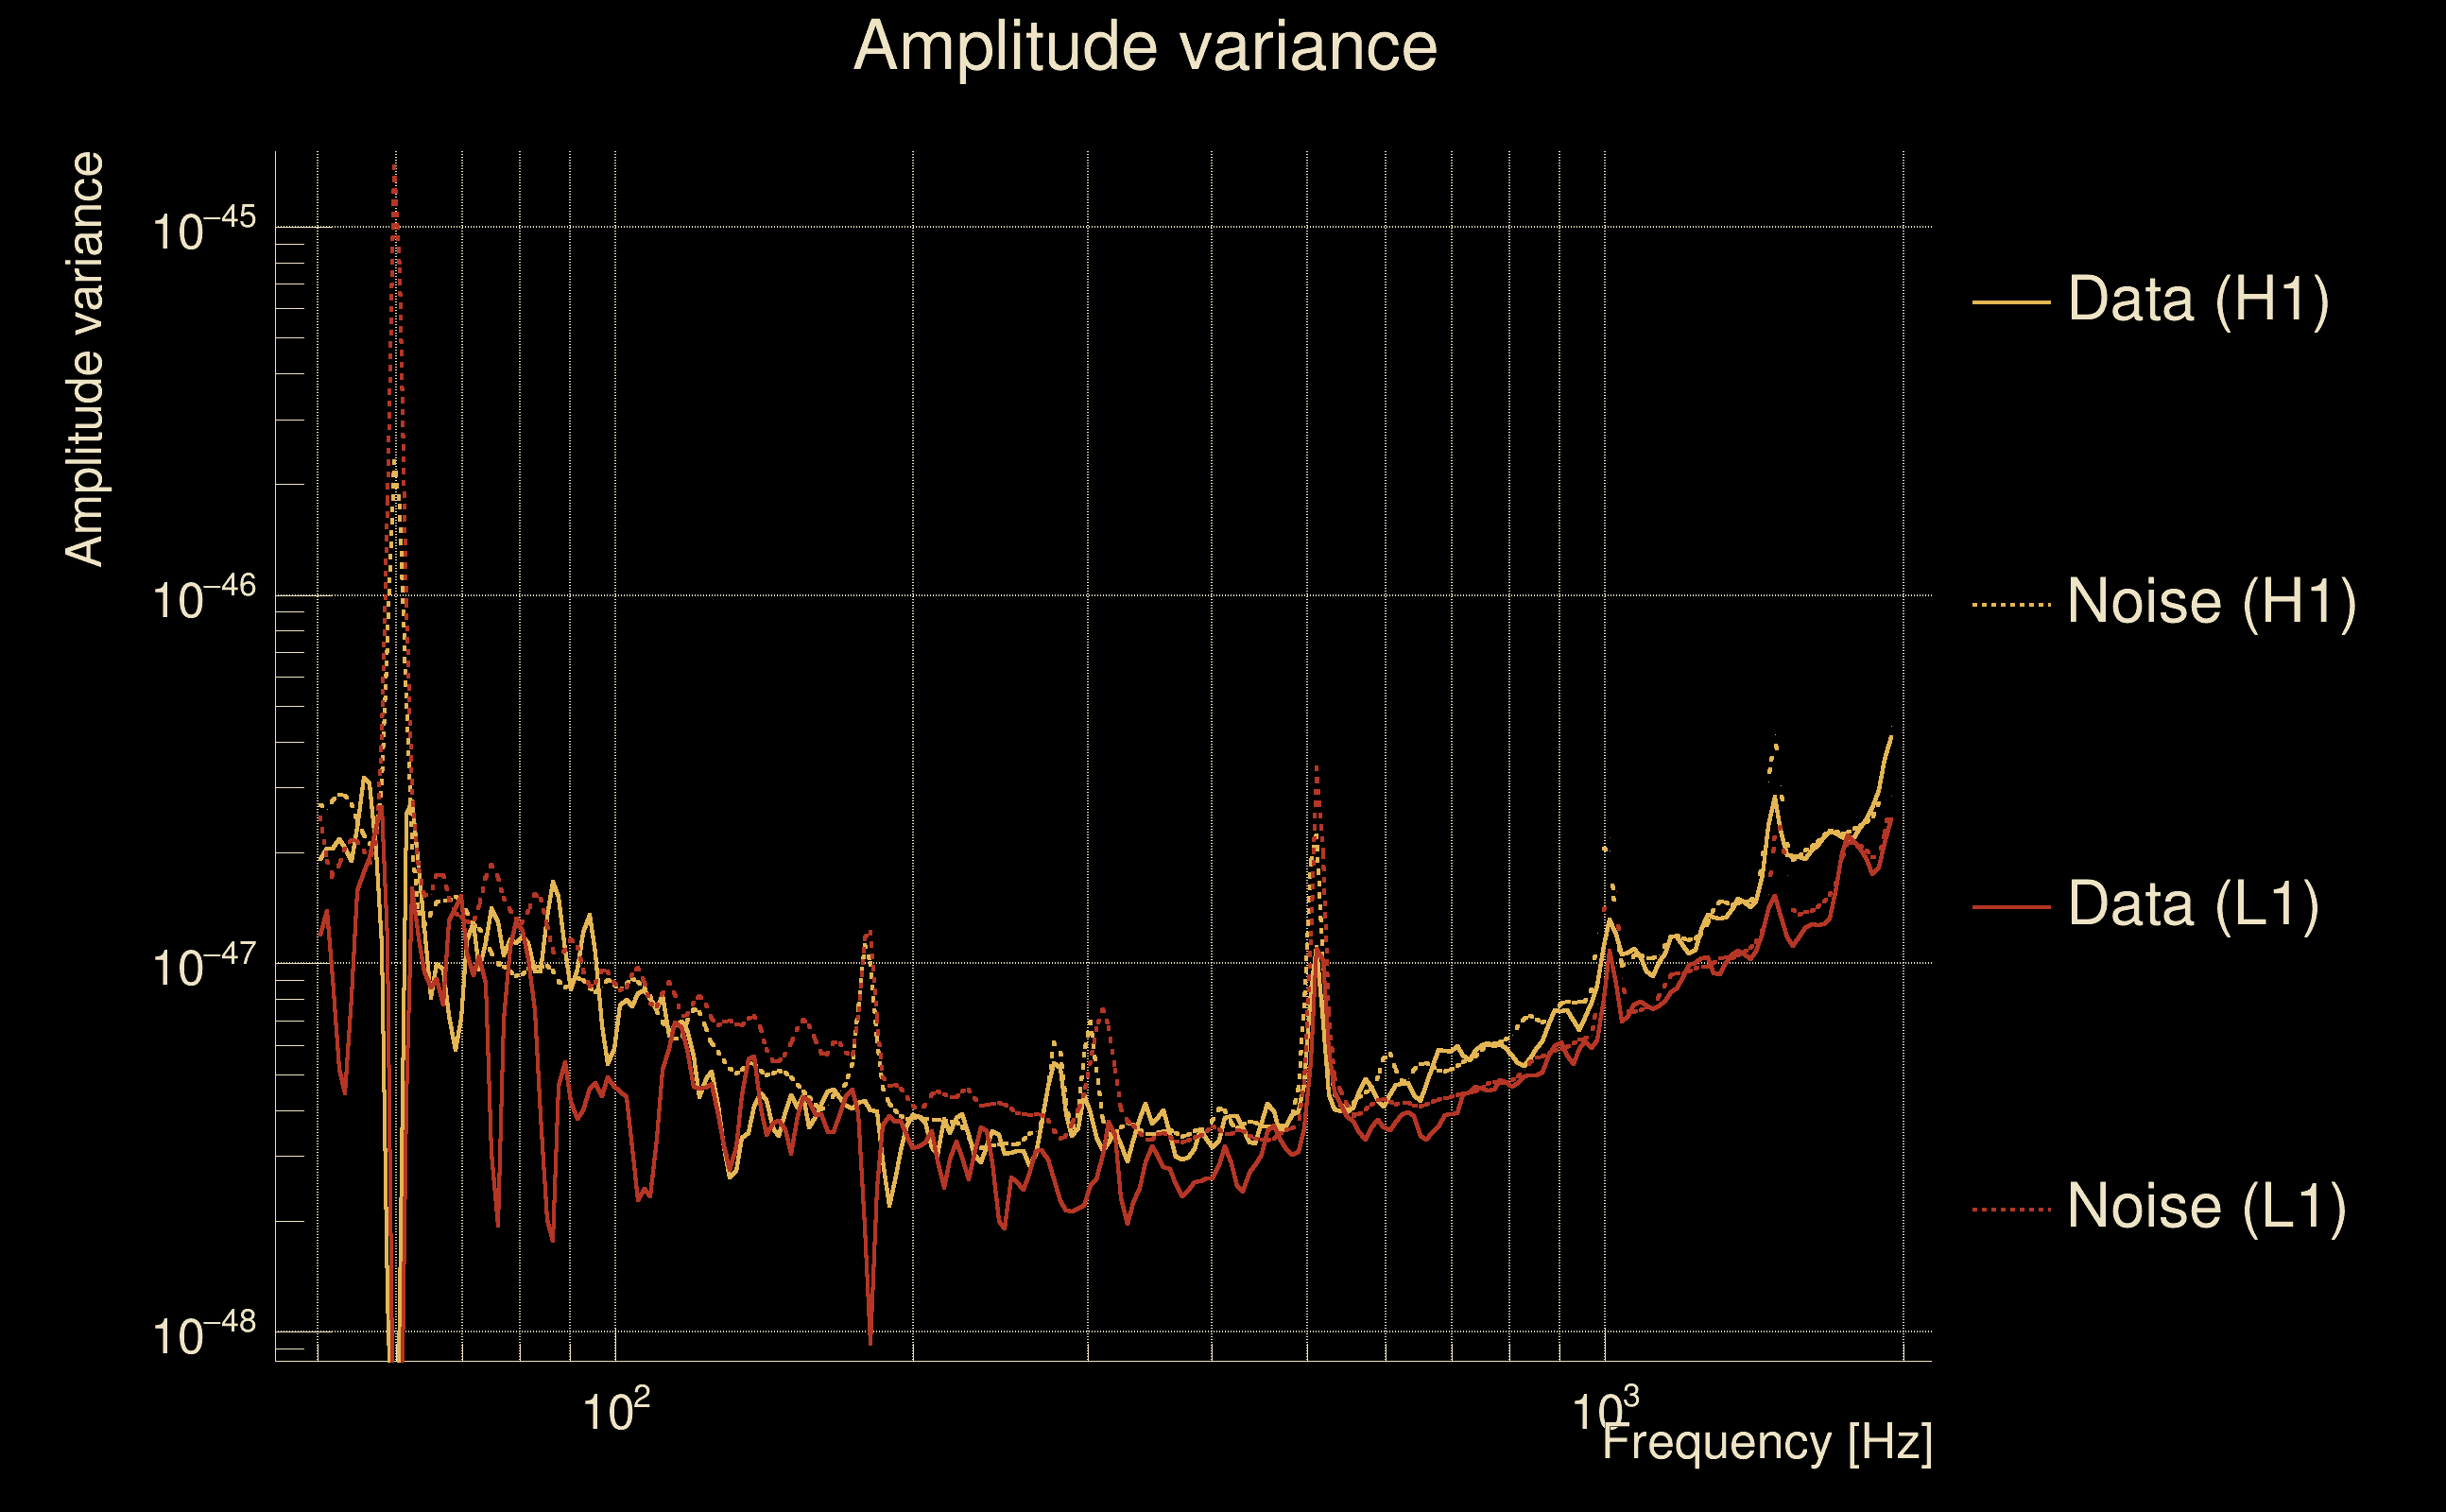
| Amplitude spectrograms: | normalization = 1e-22, power index = 2 |
| White noise SNR variance: | 0.523175 (after applying a correction factor = 1) |
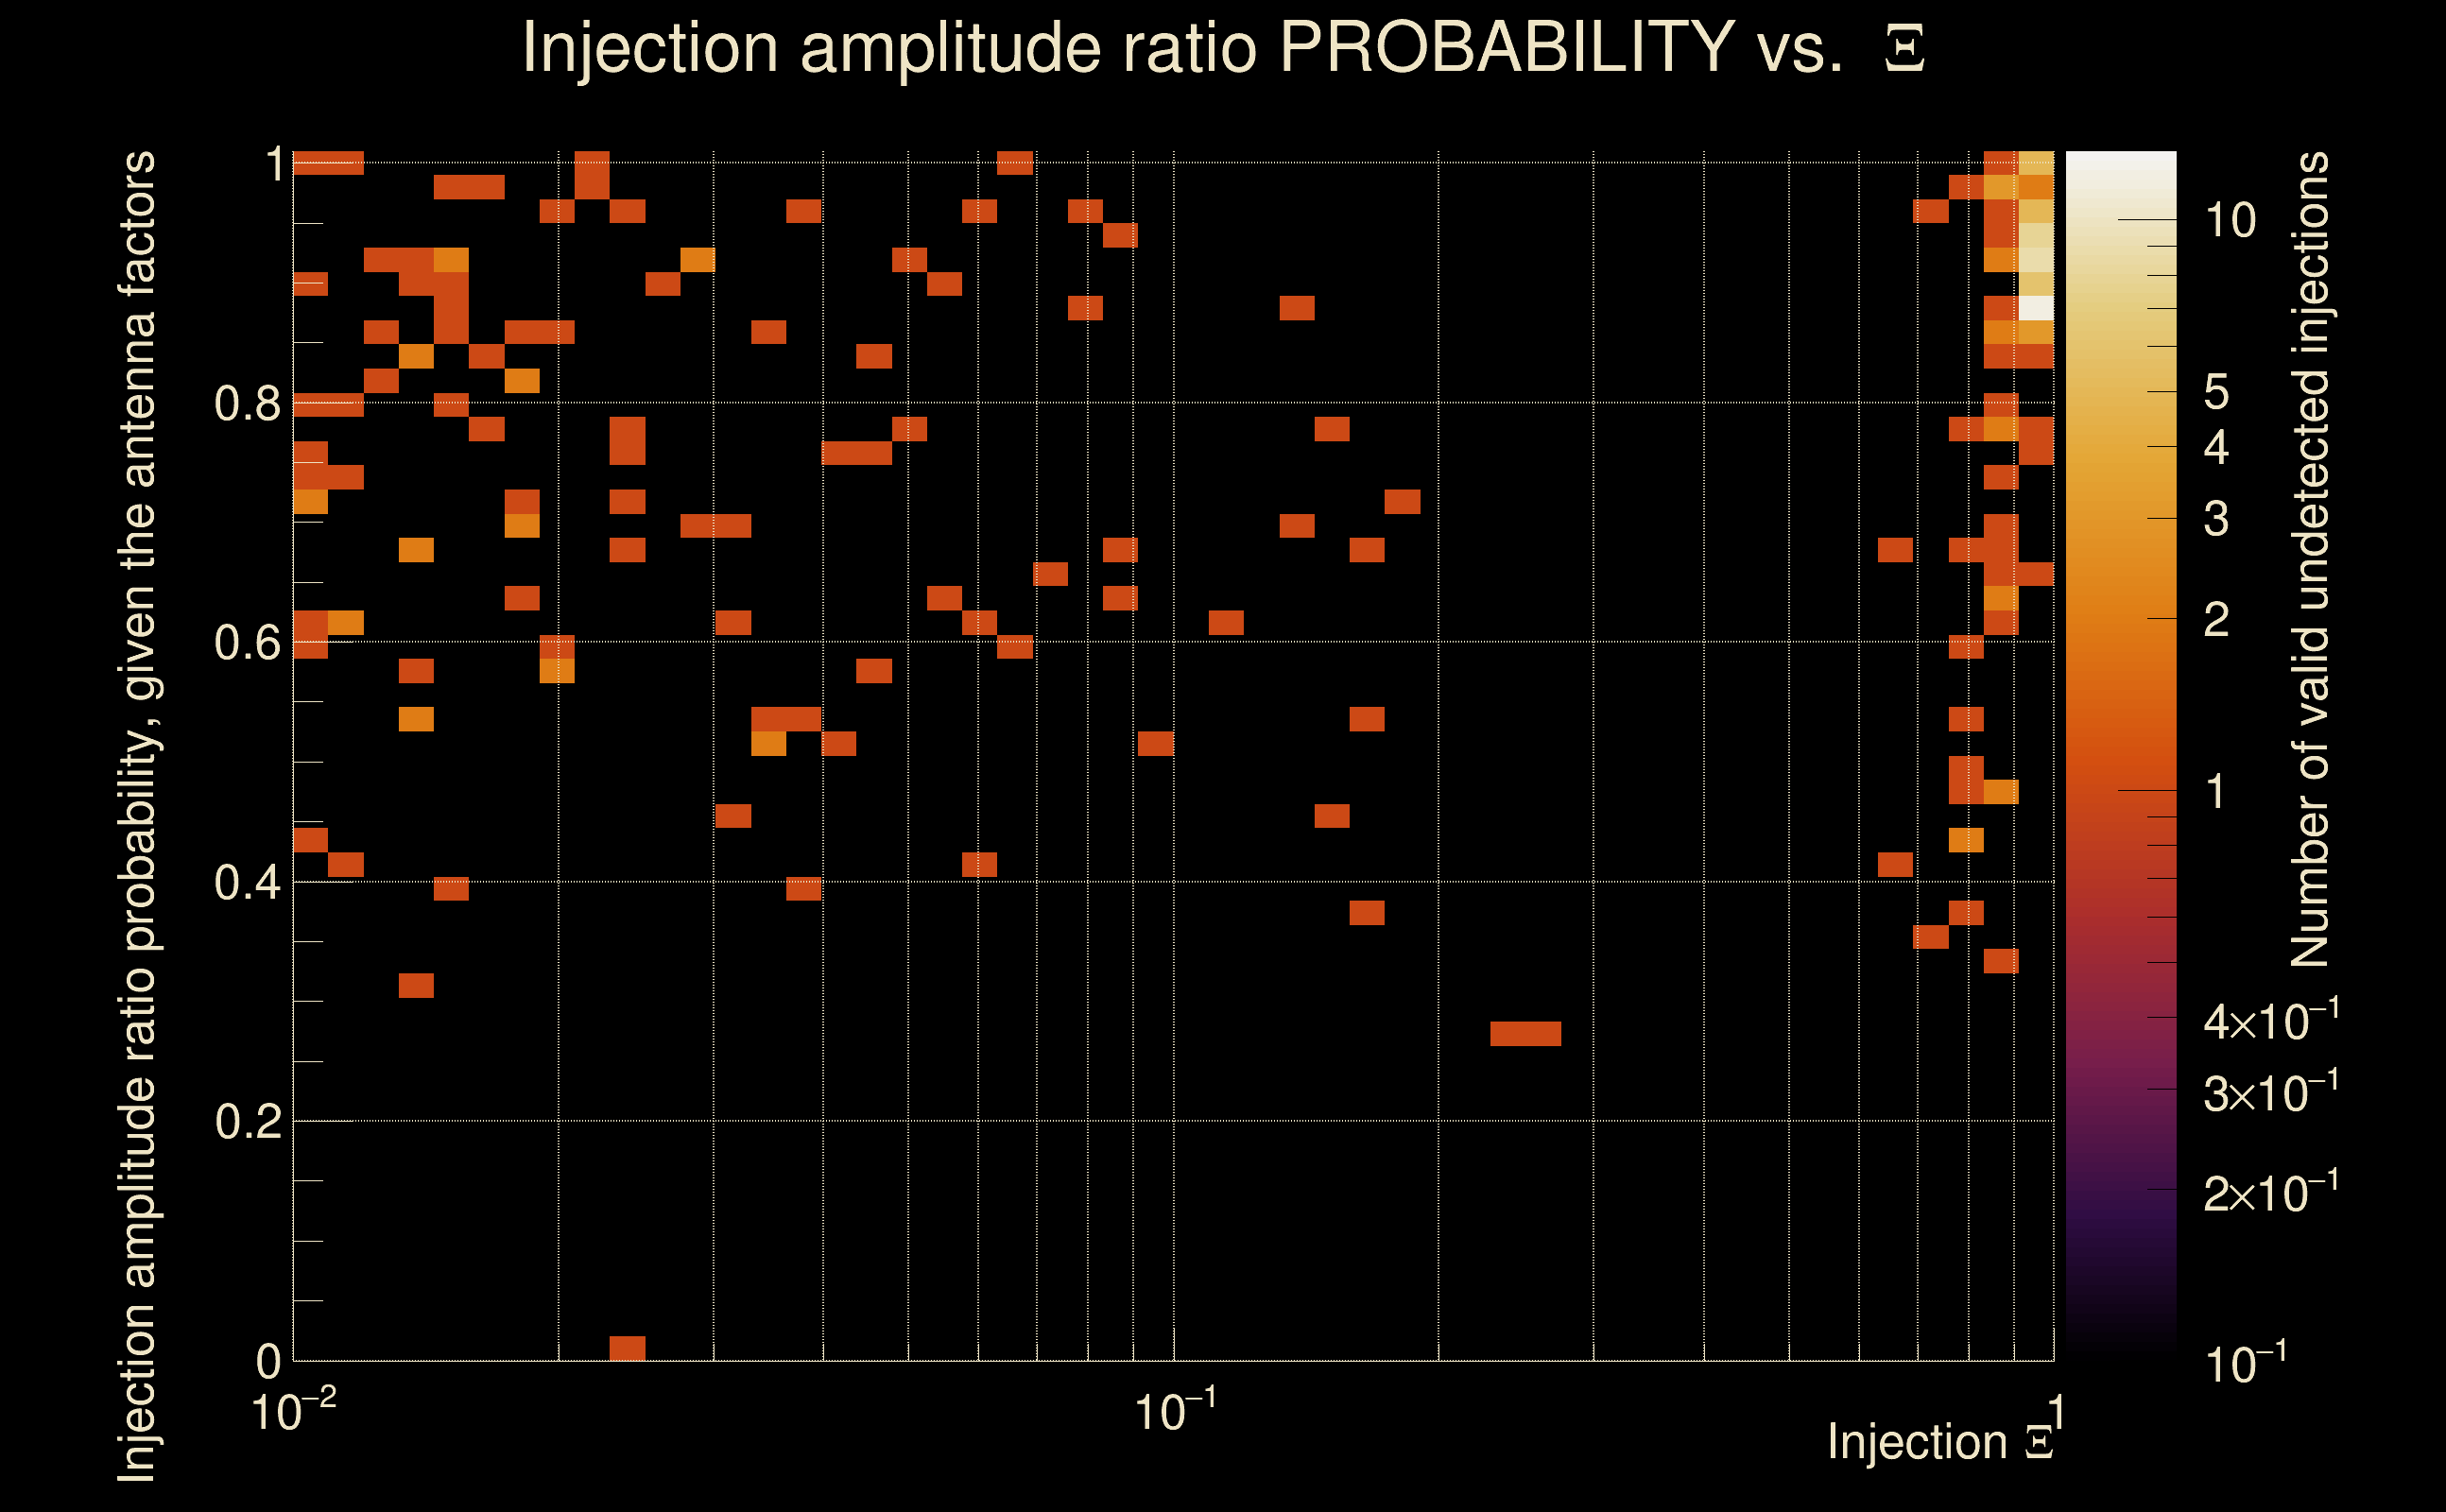
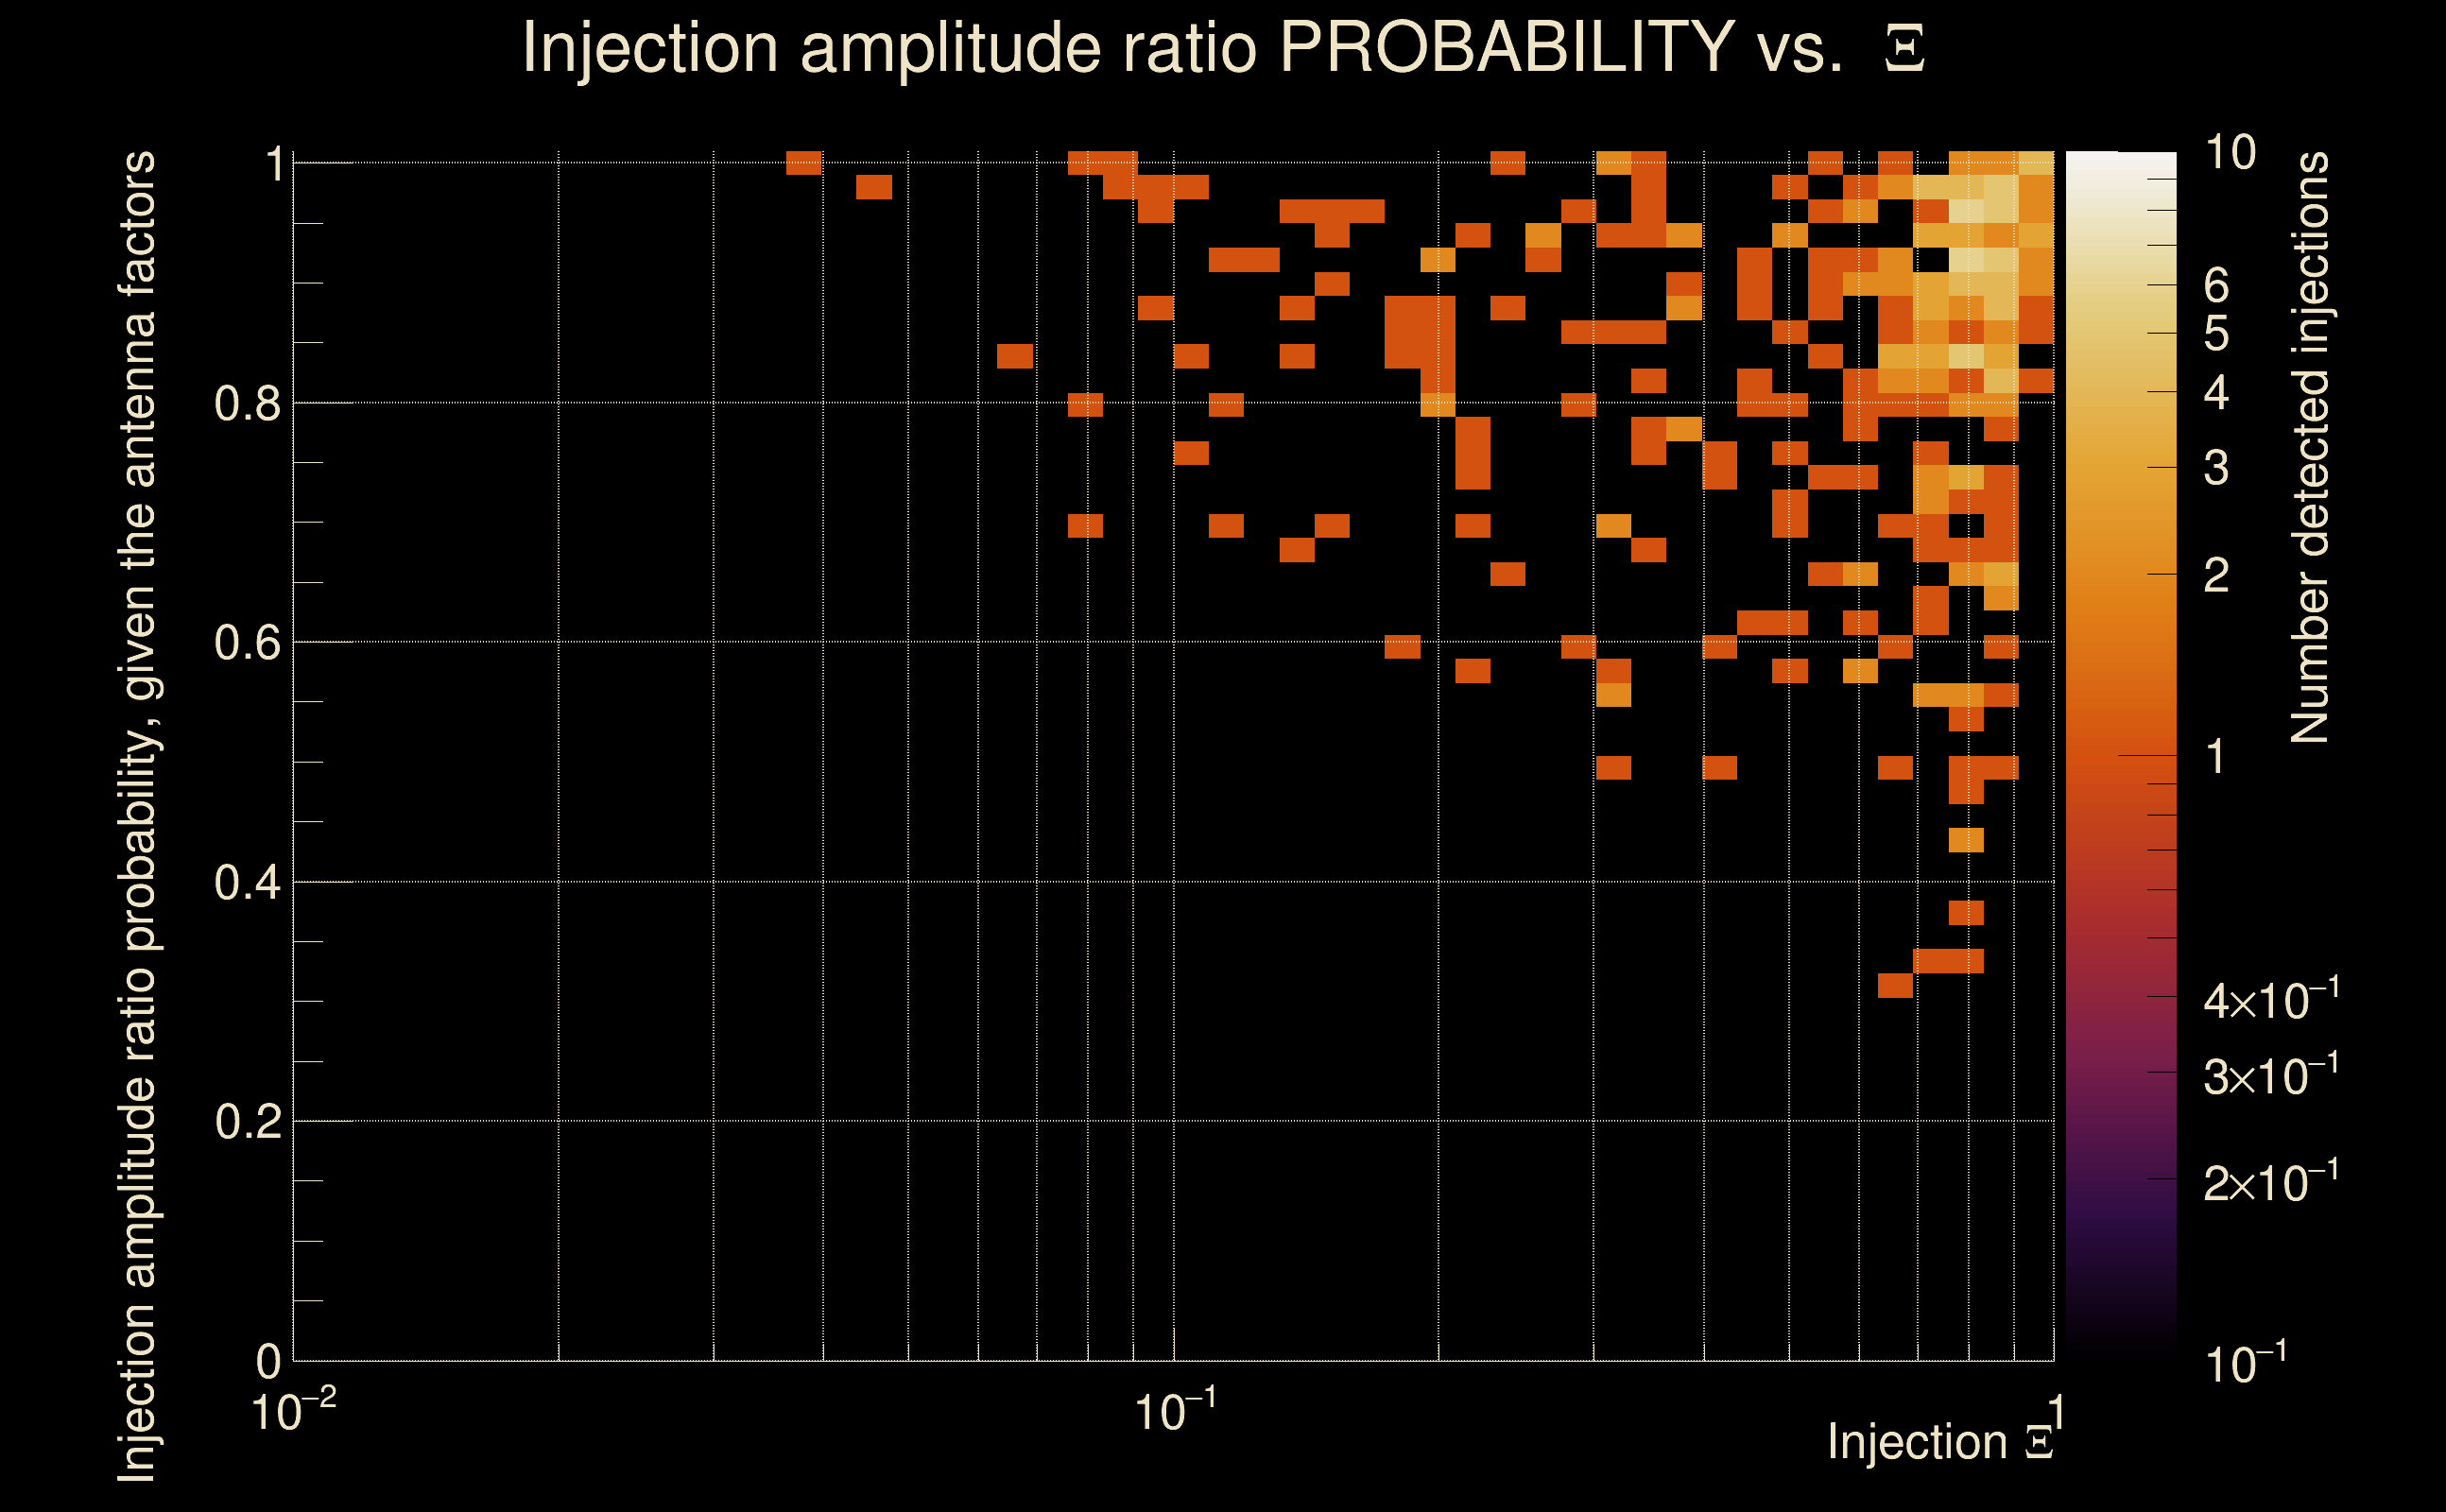
| Amplitude ratio confidence level: | 3 sigma |
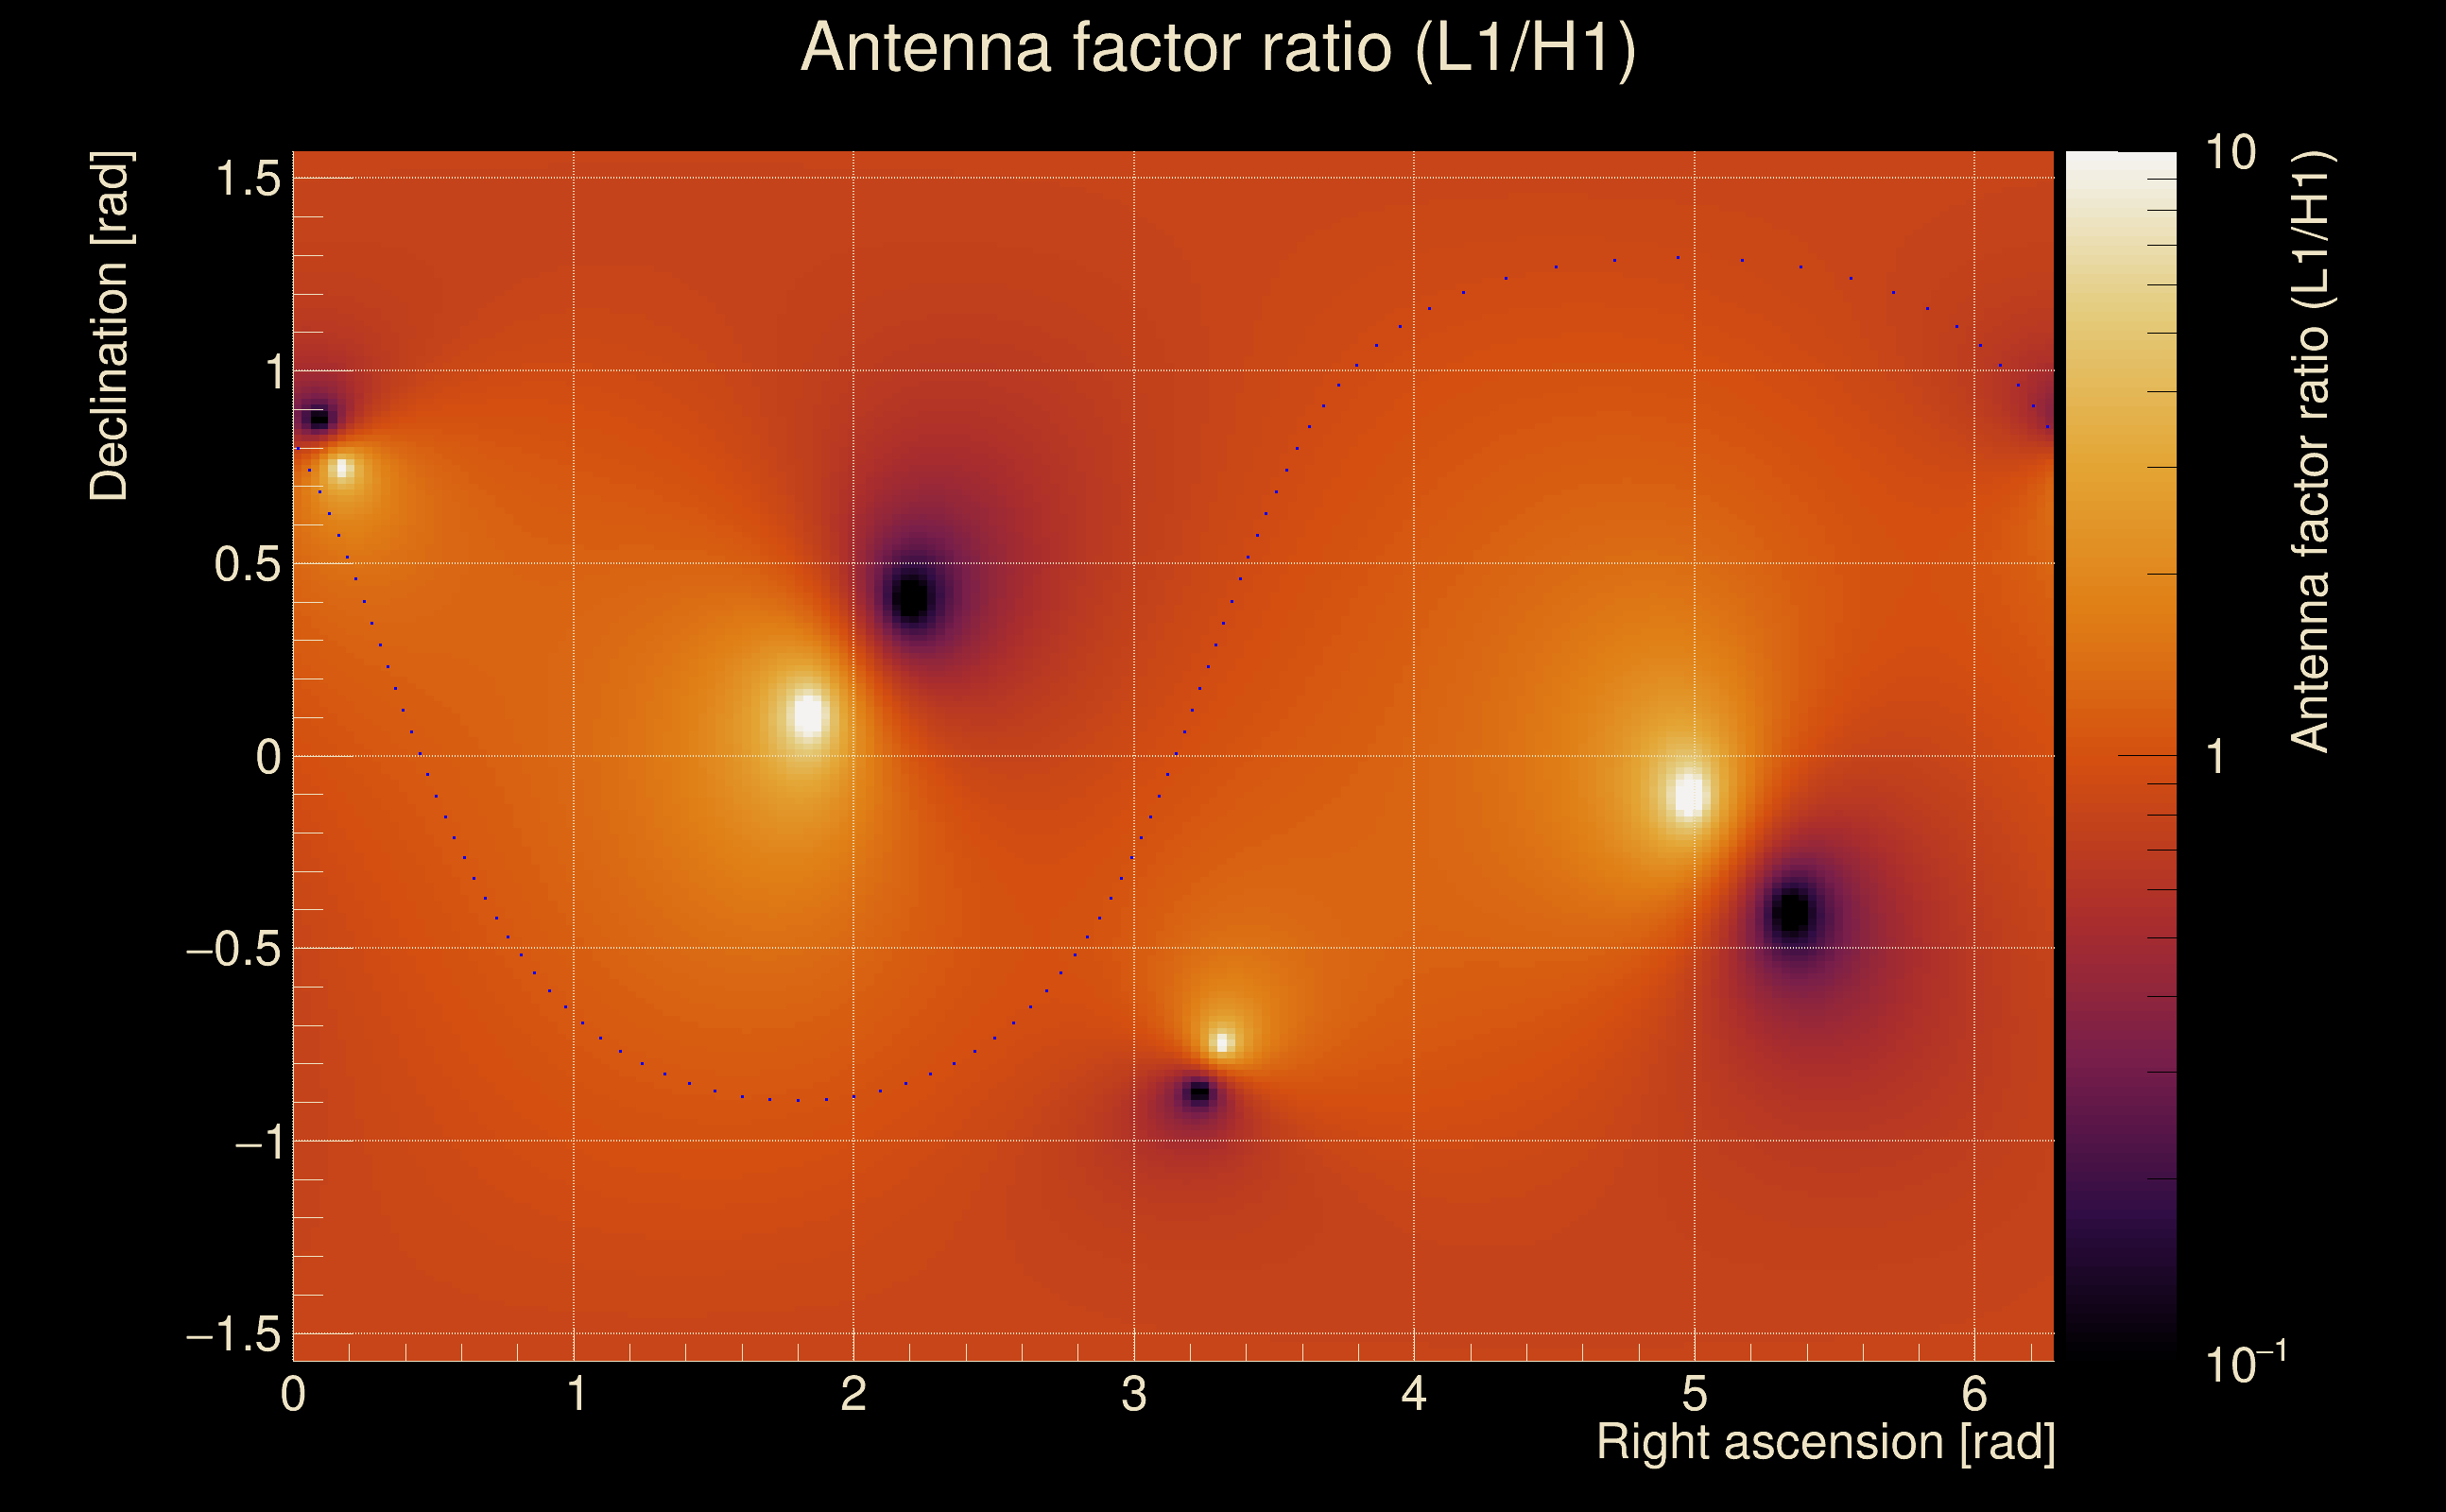
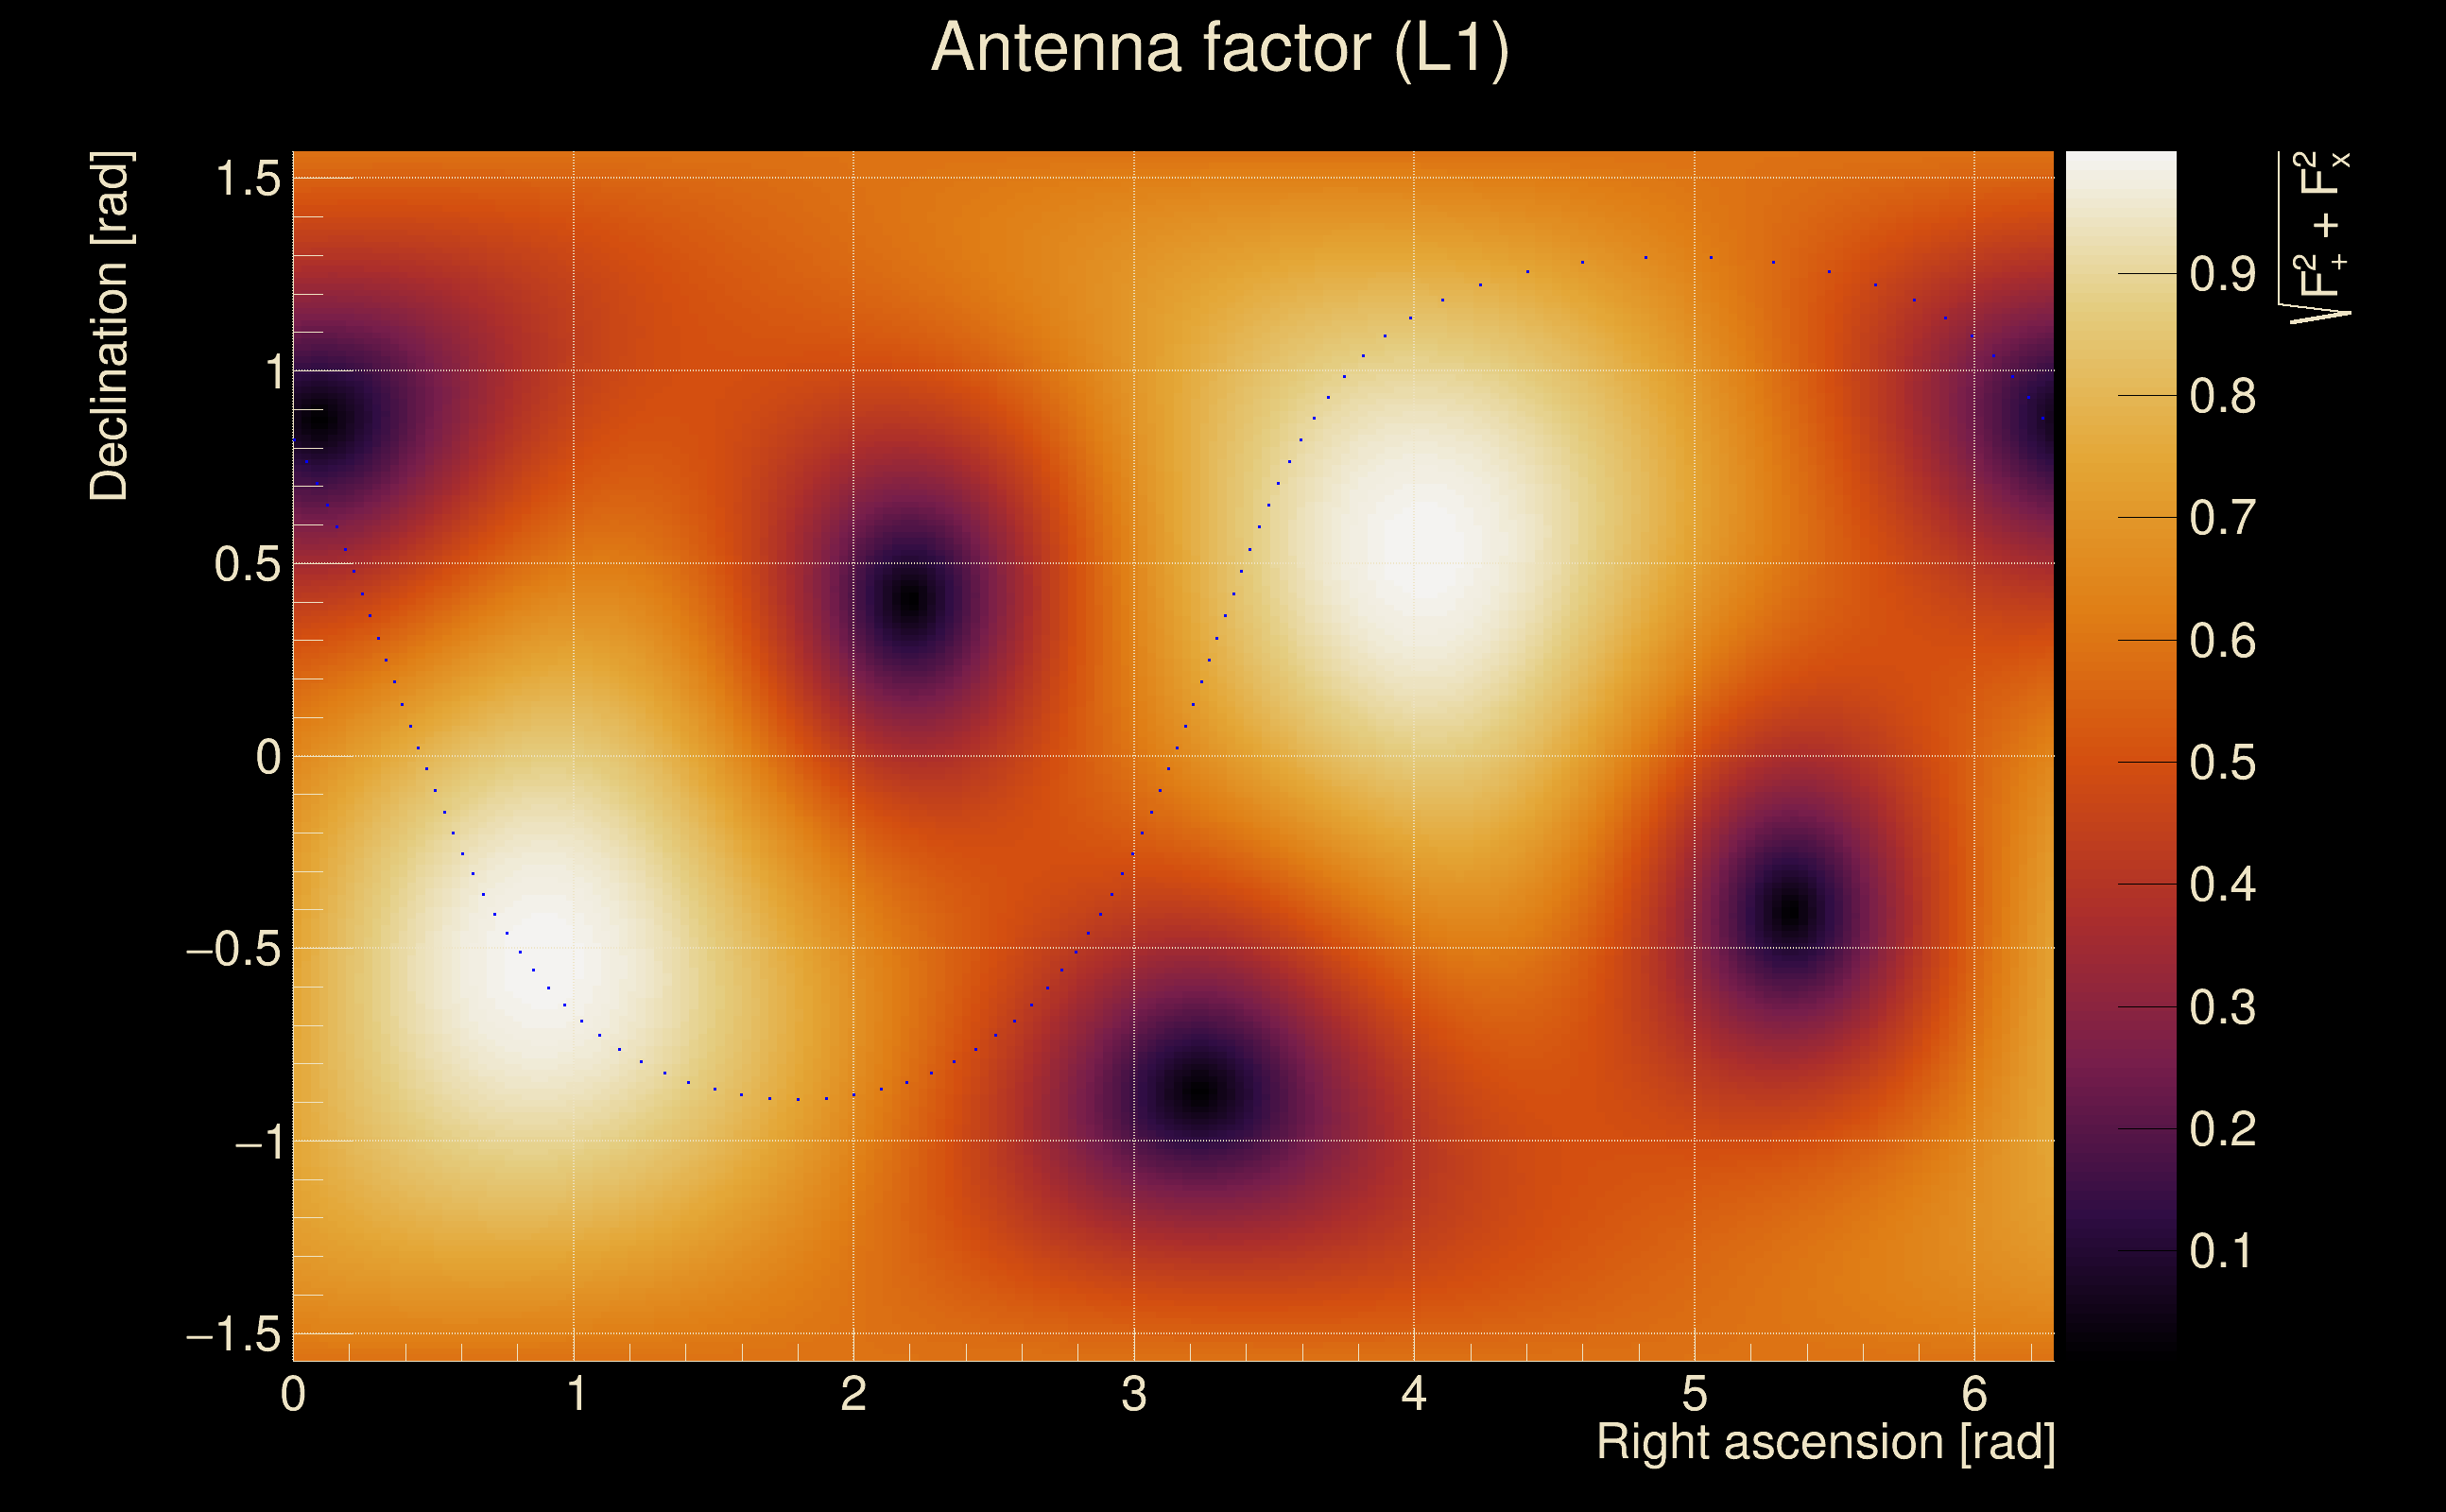
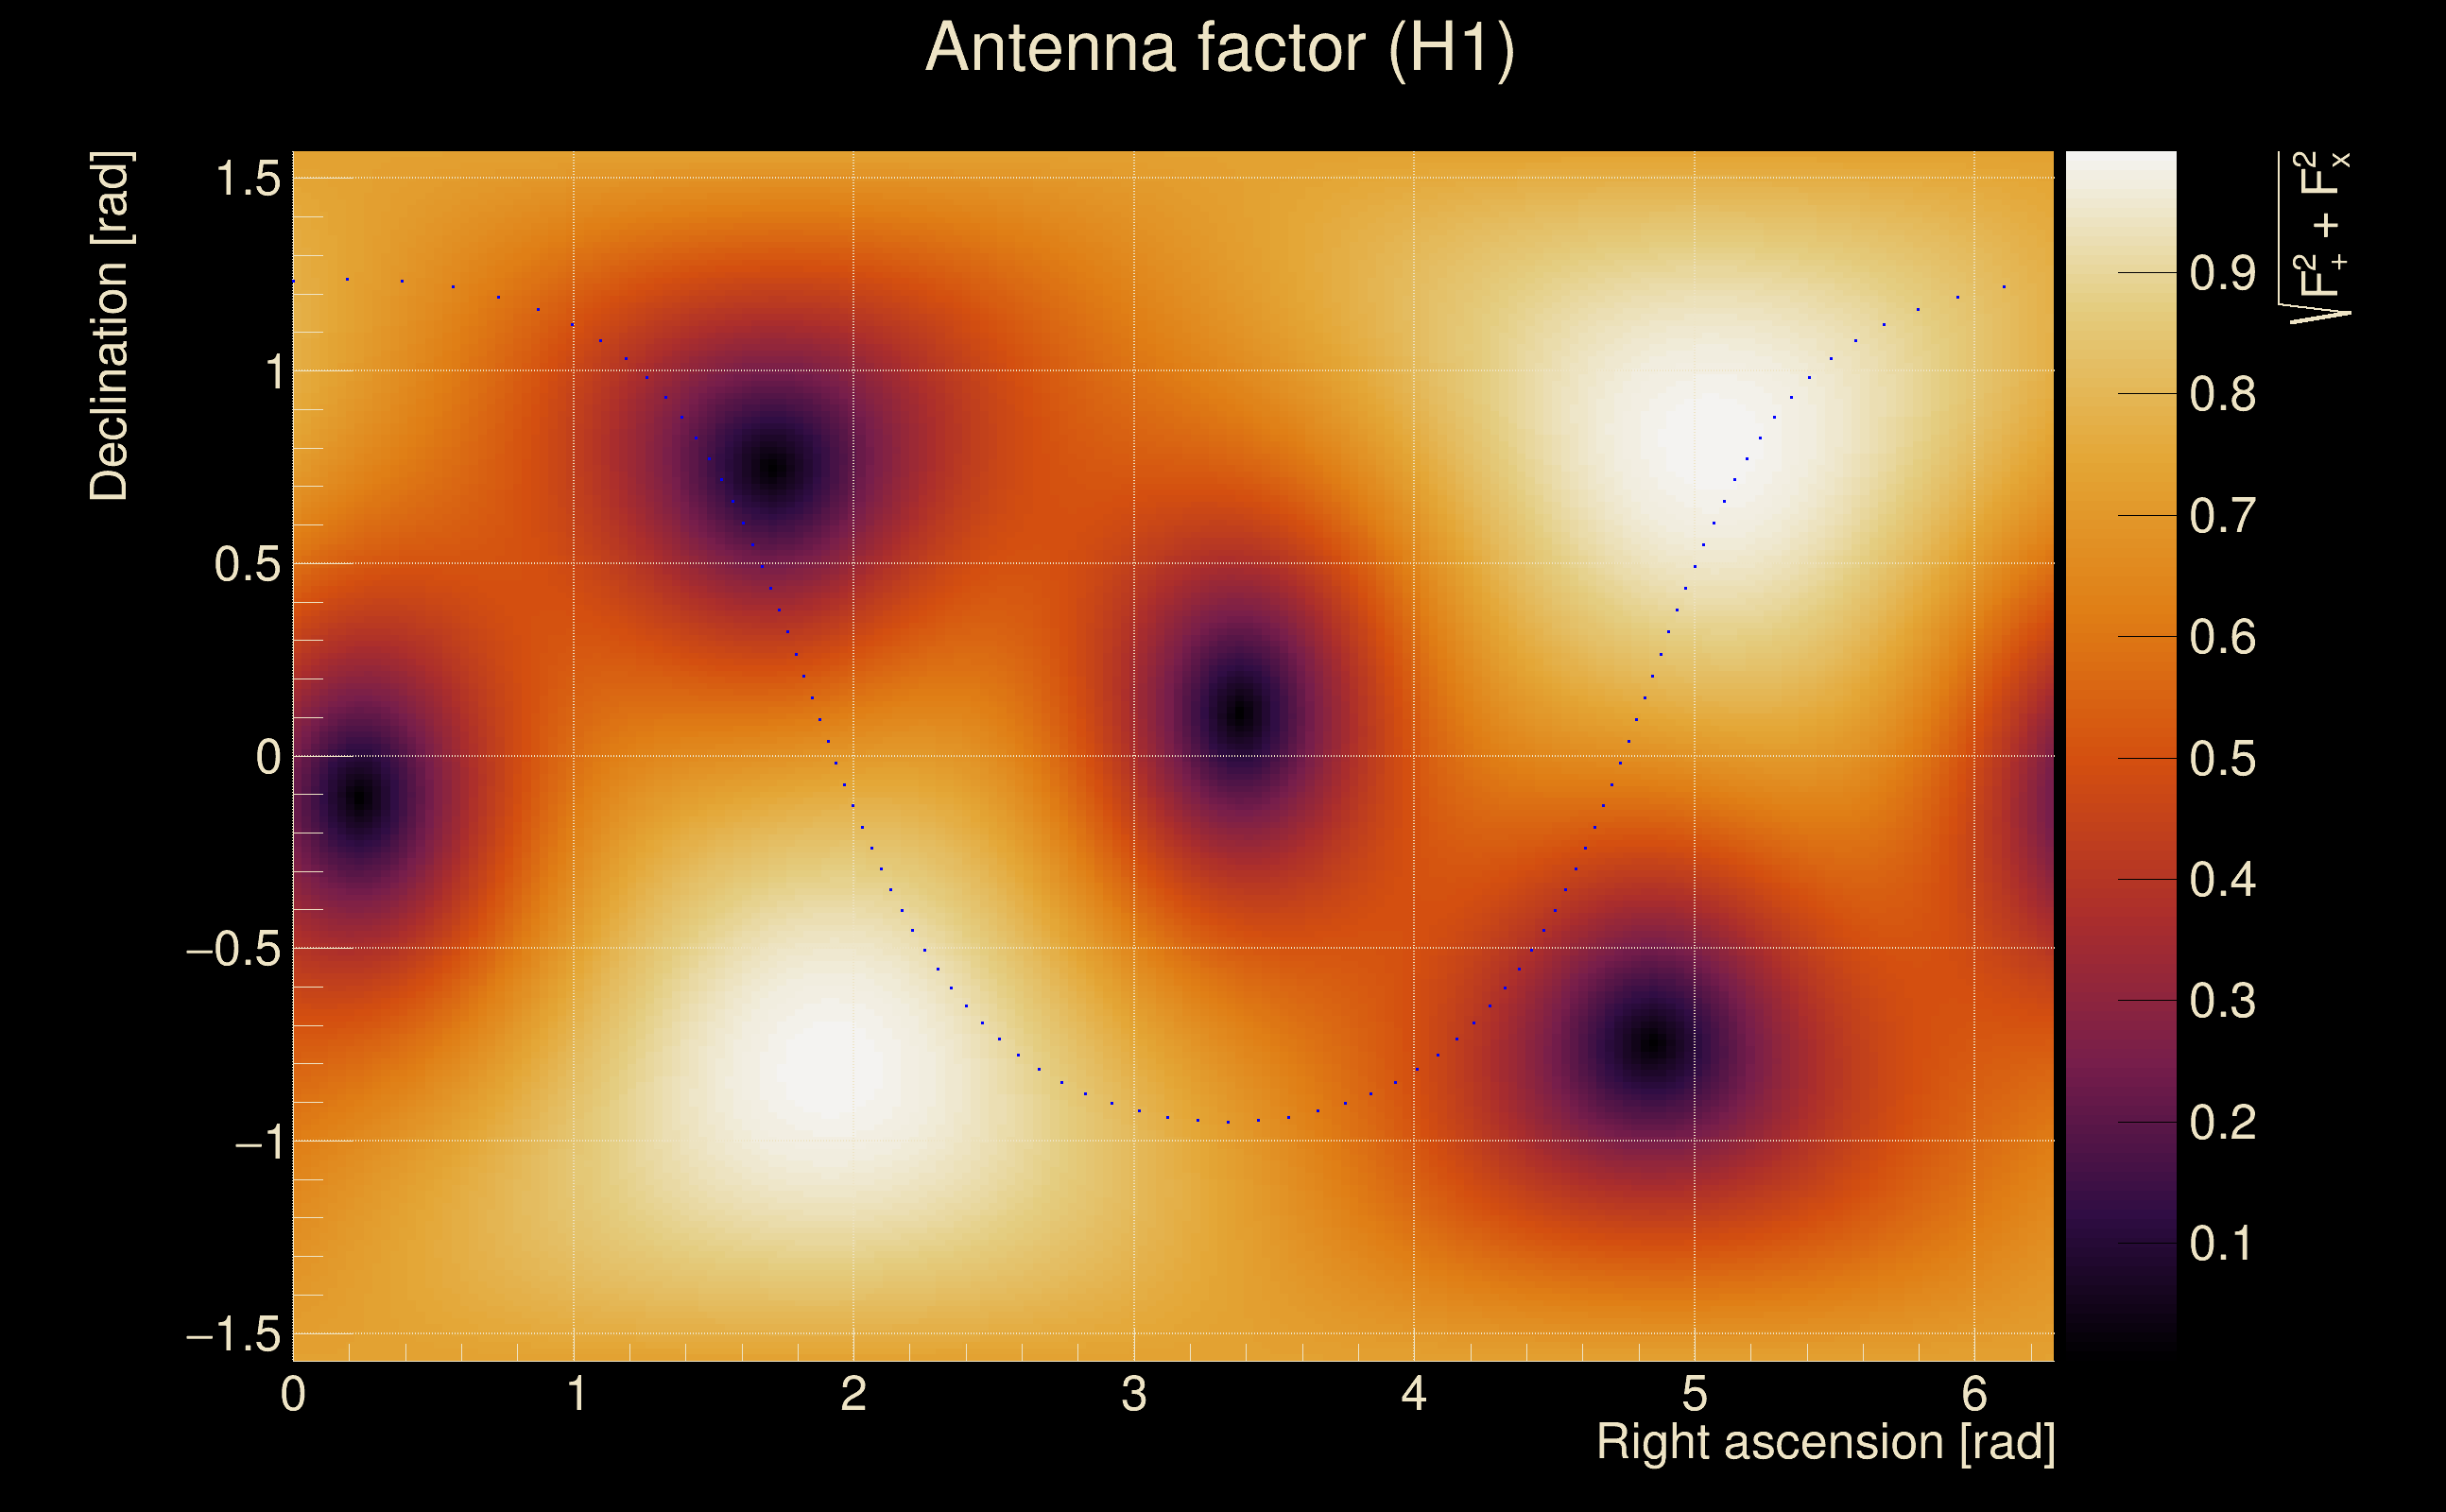
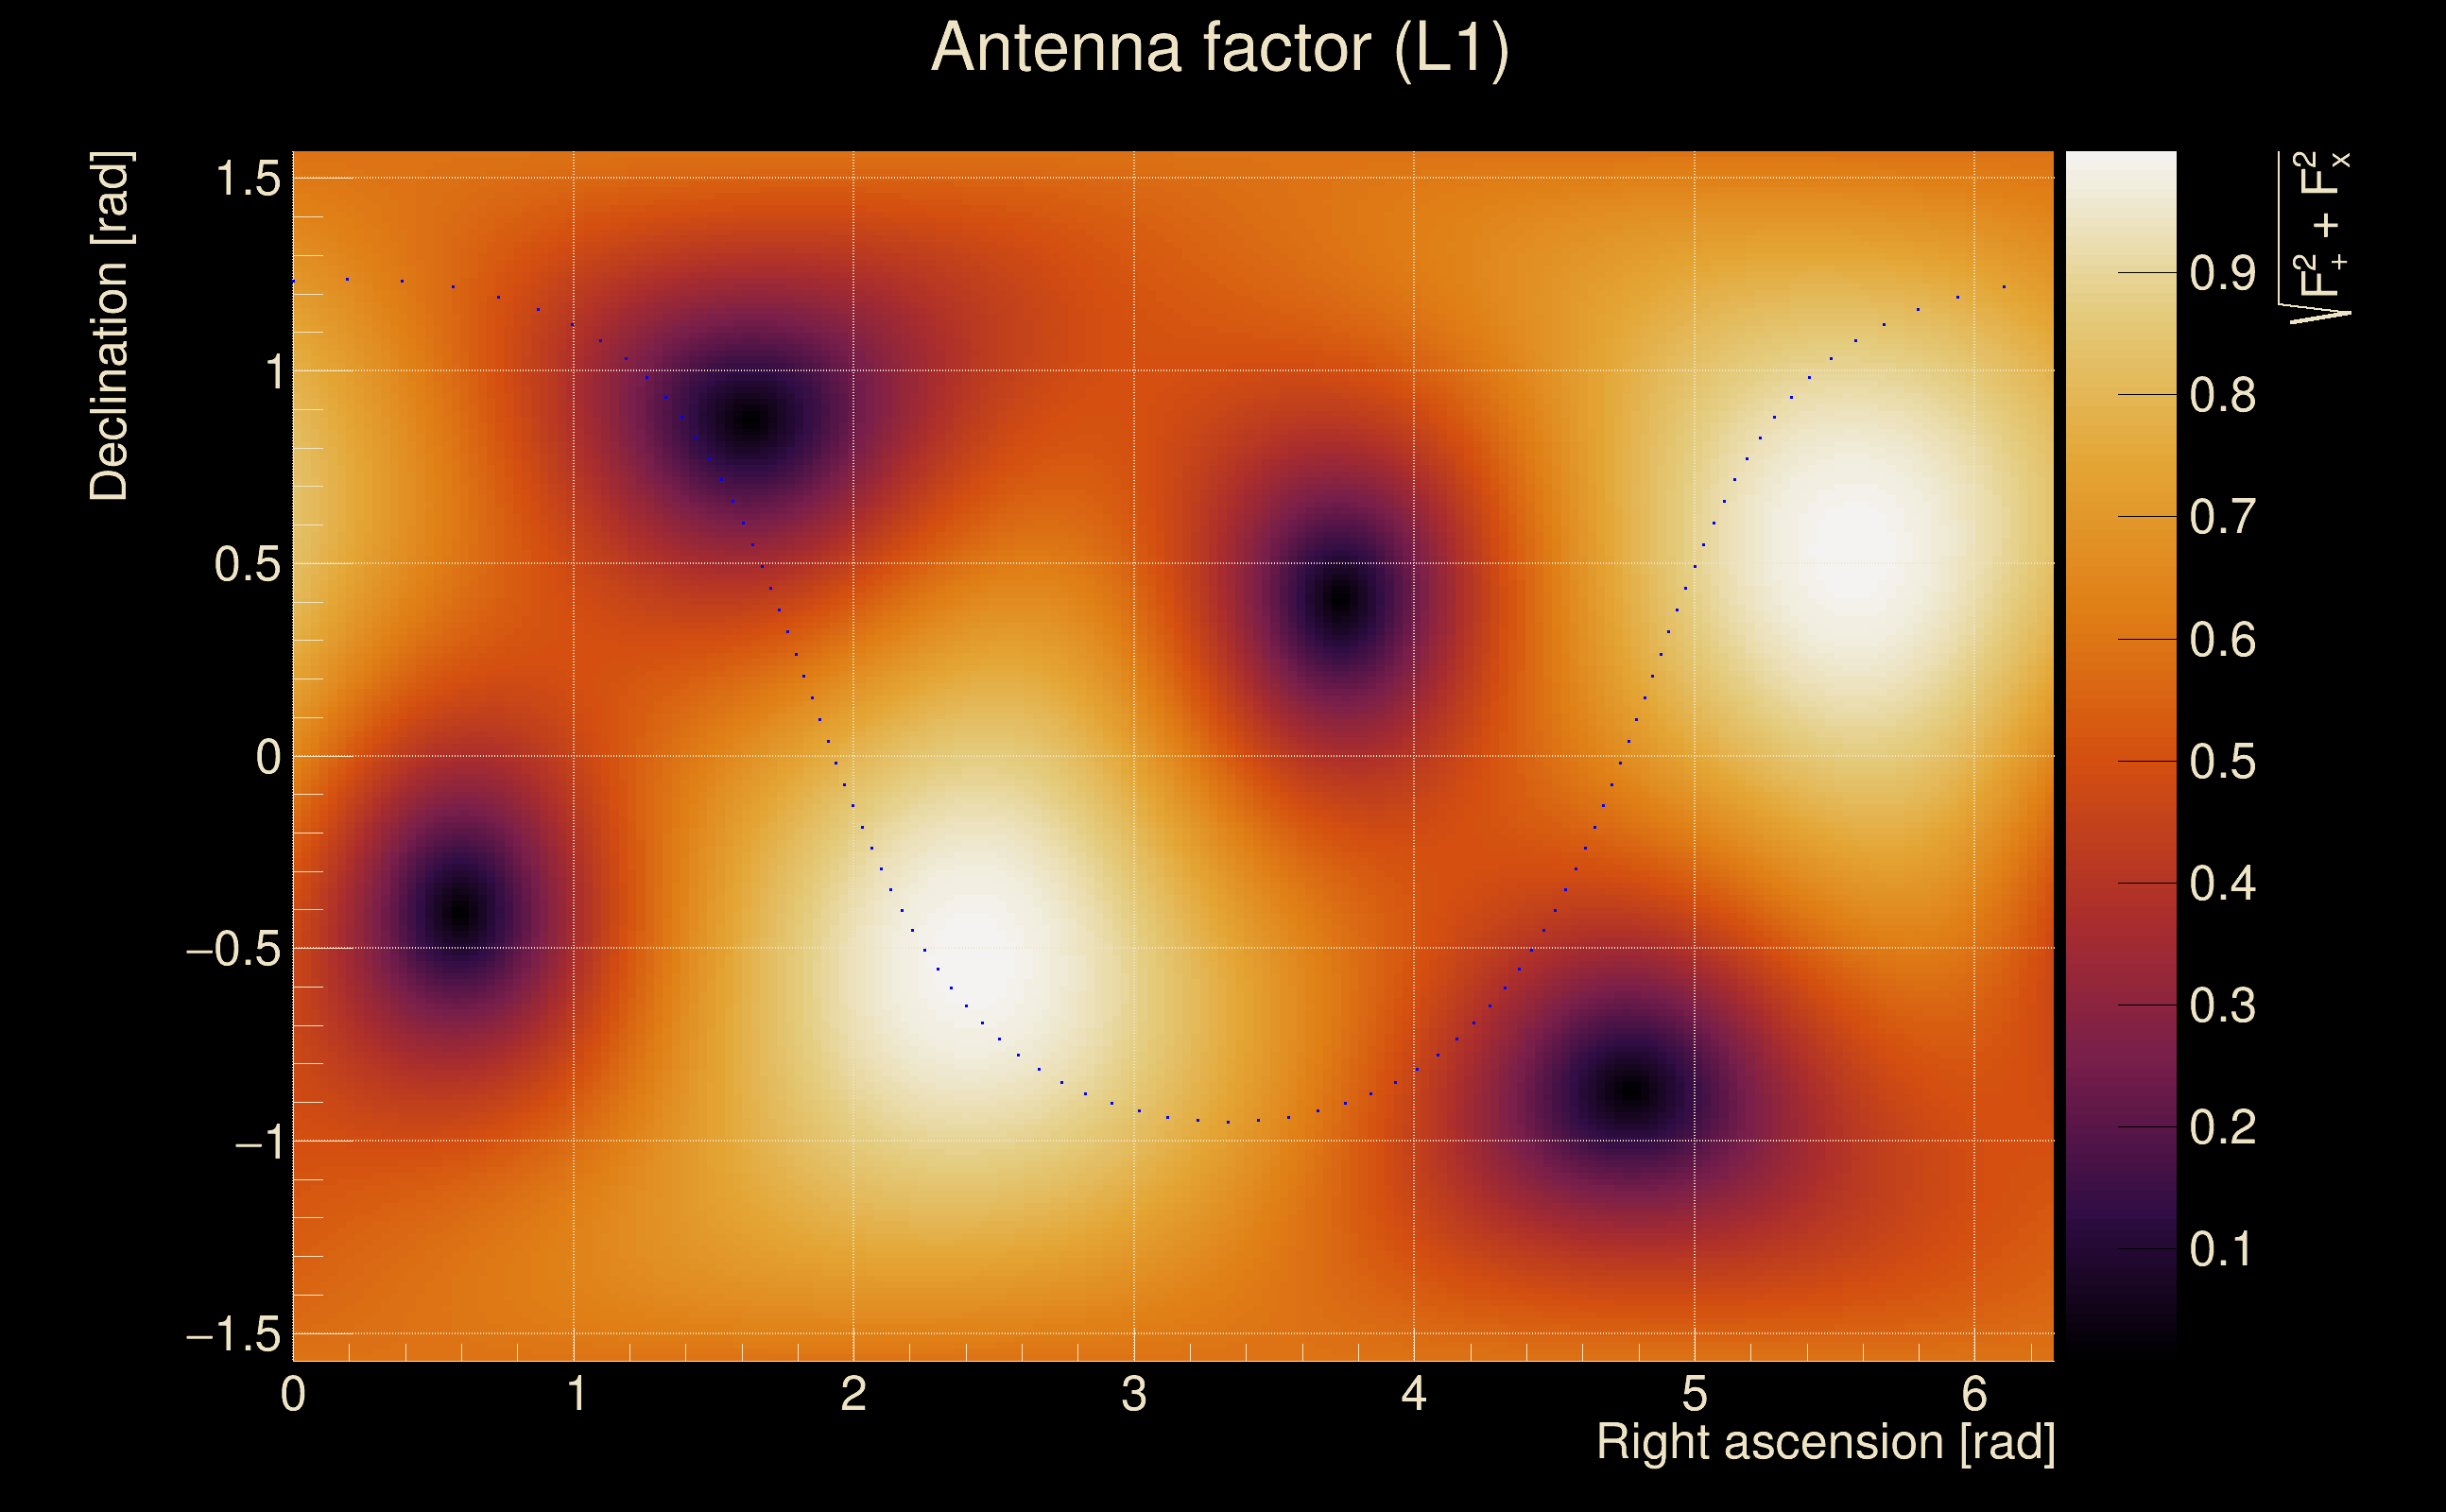
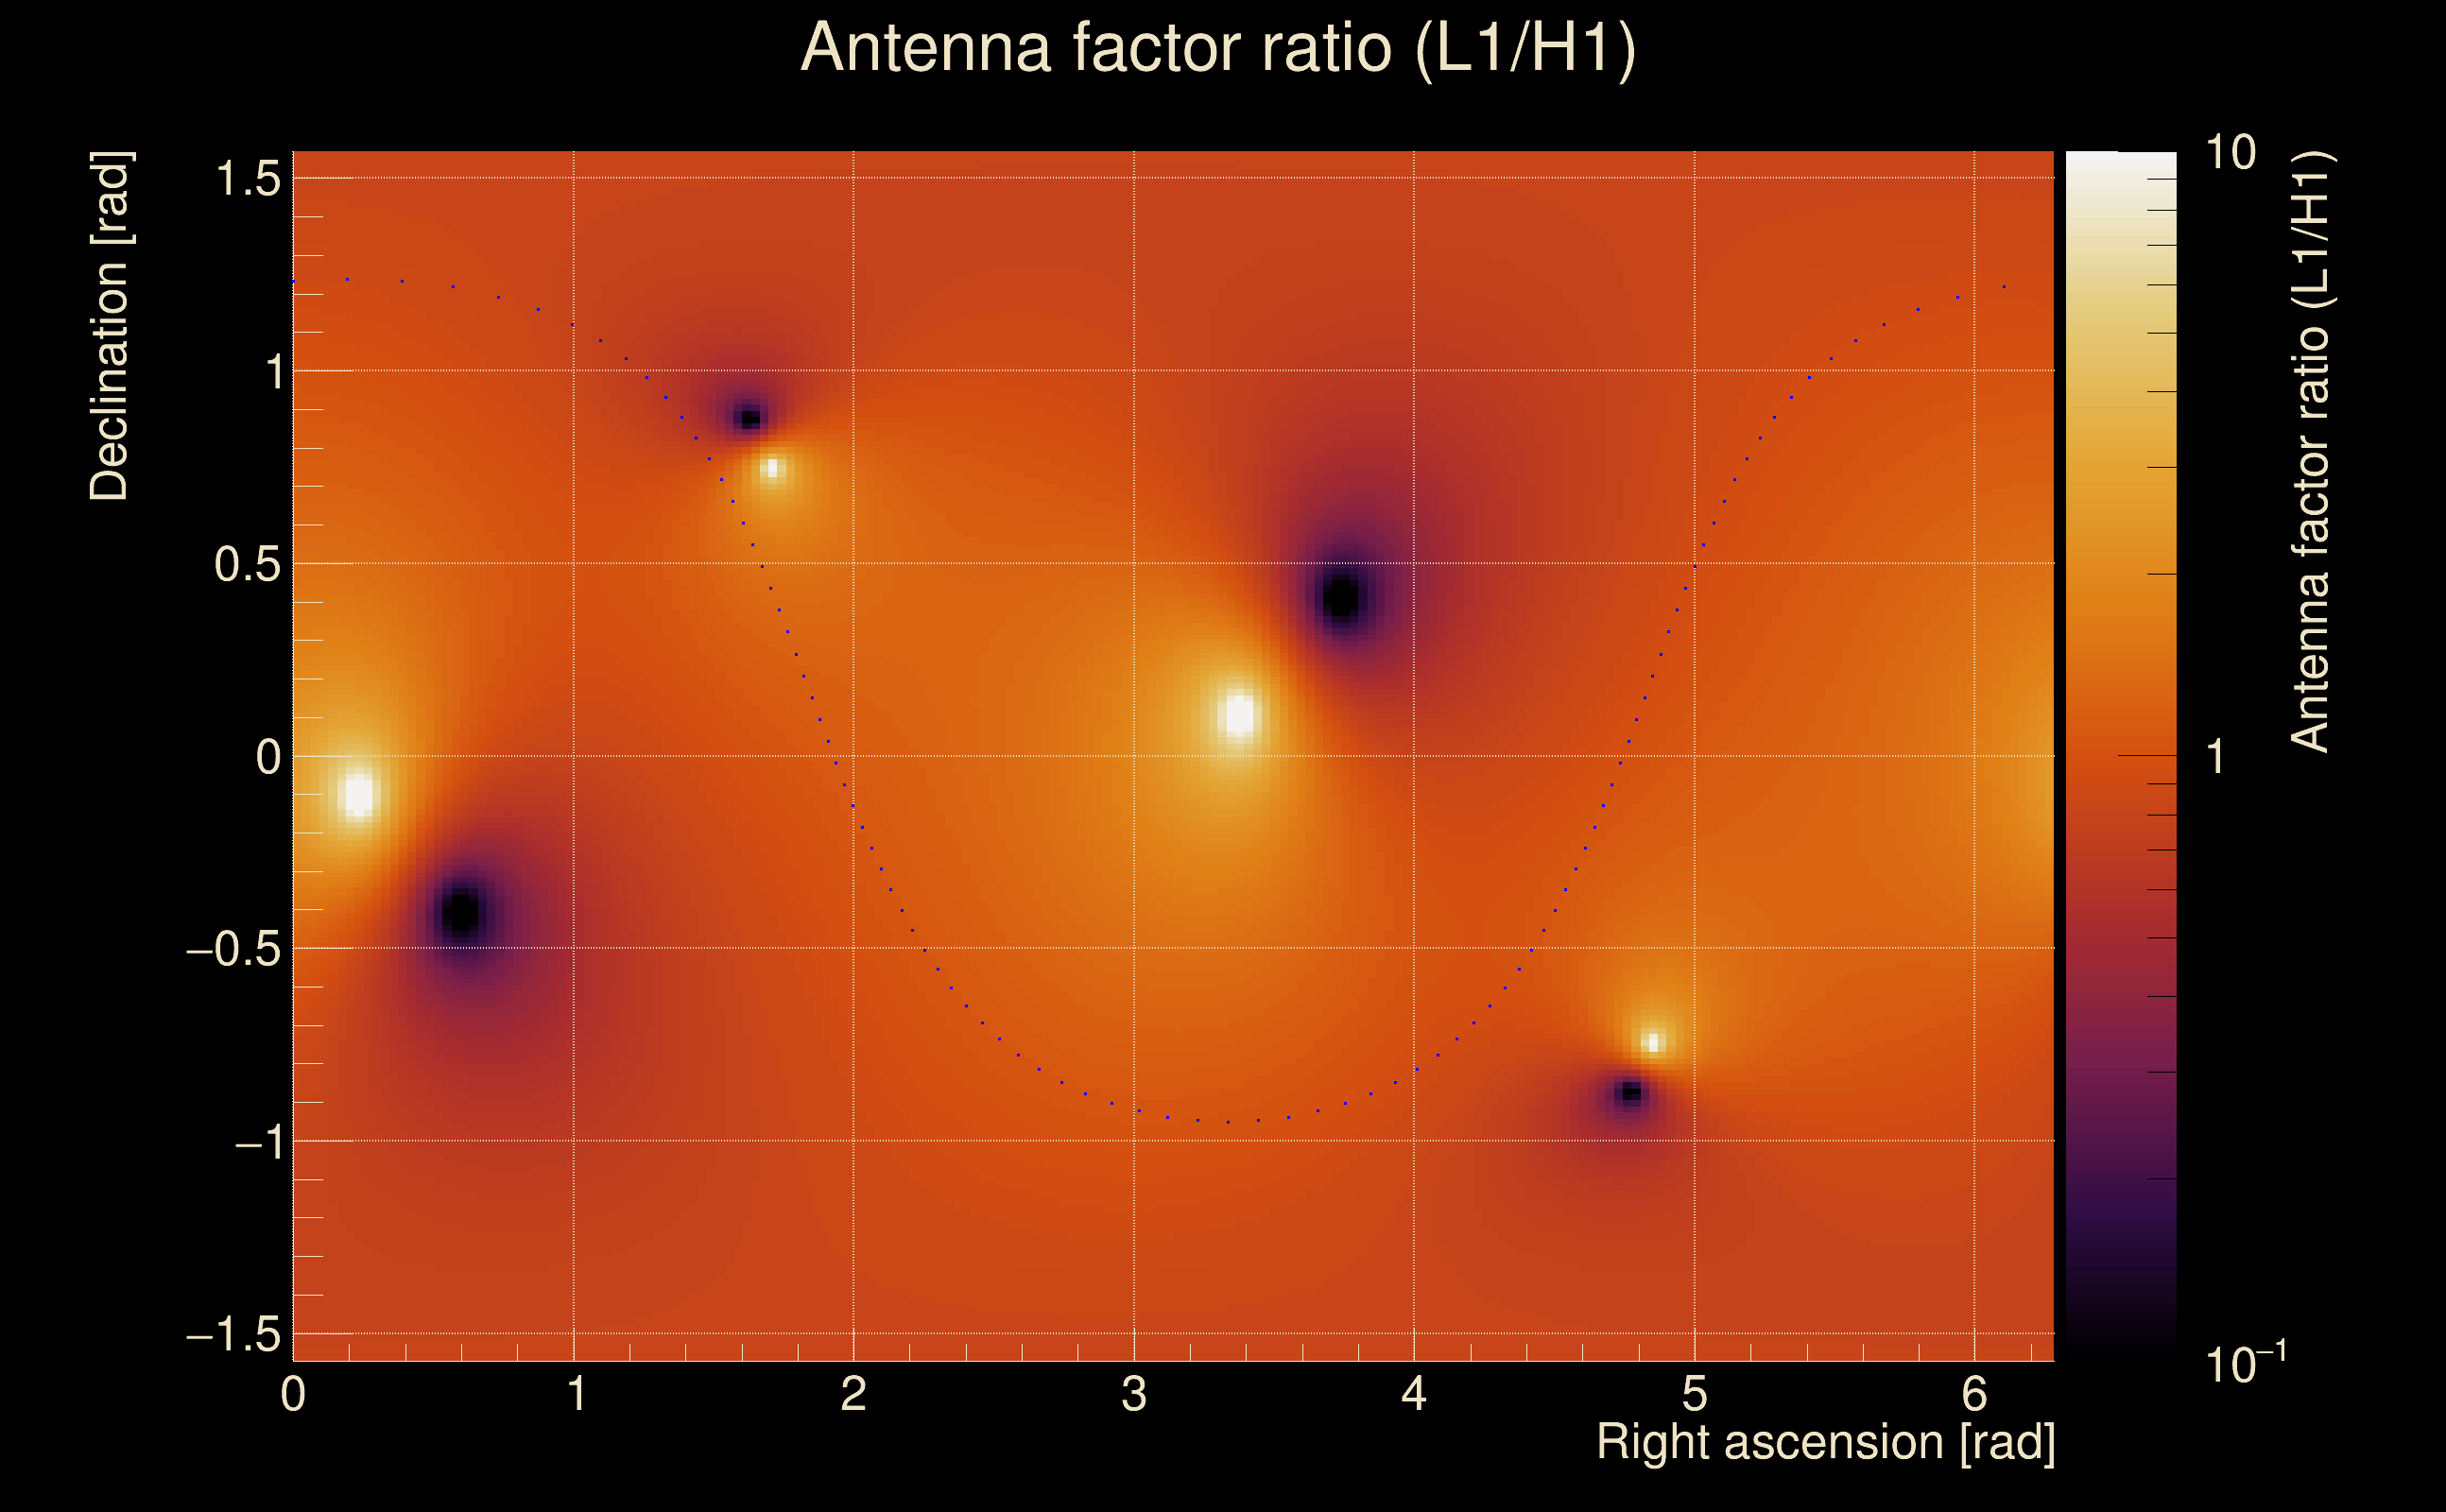
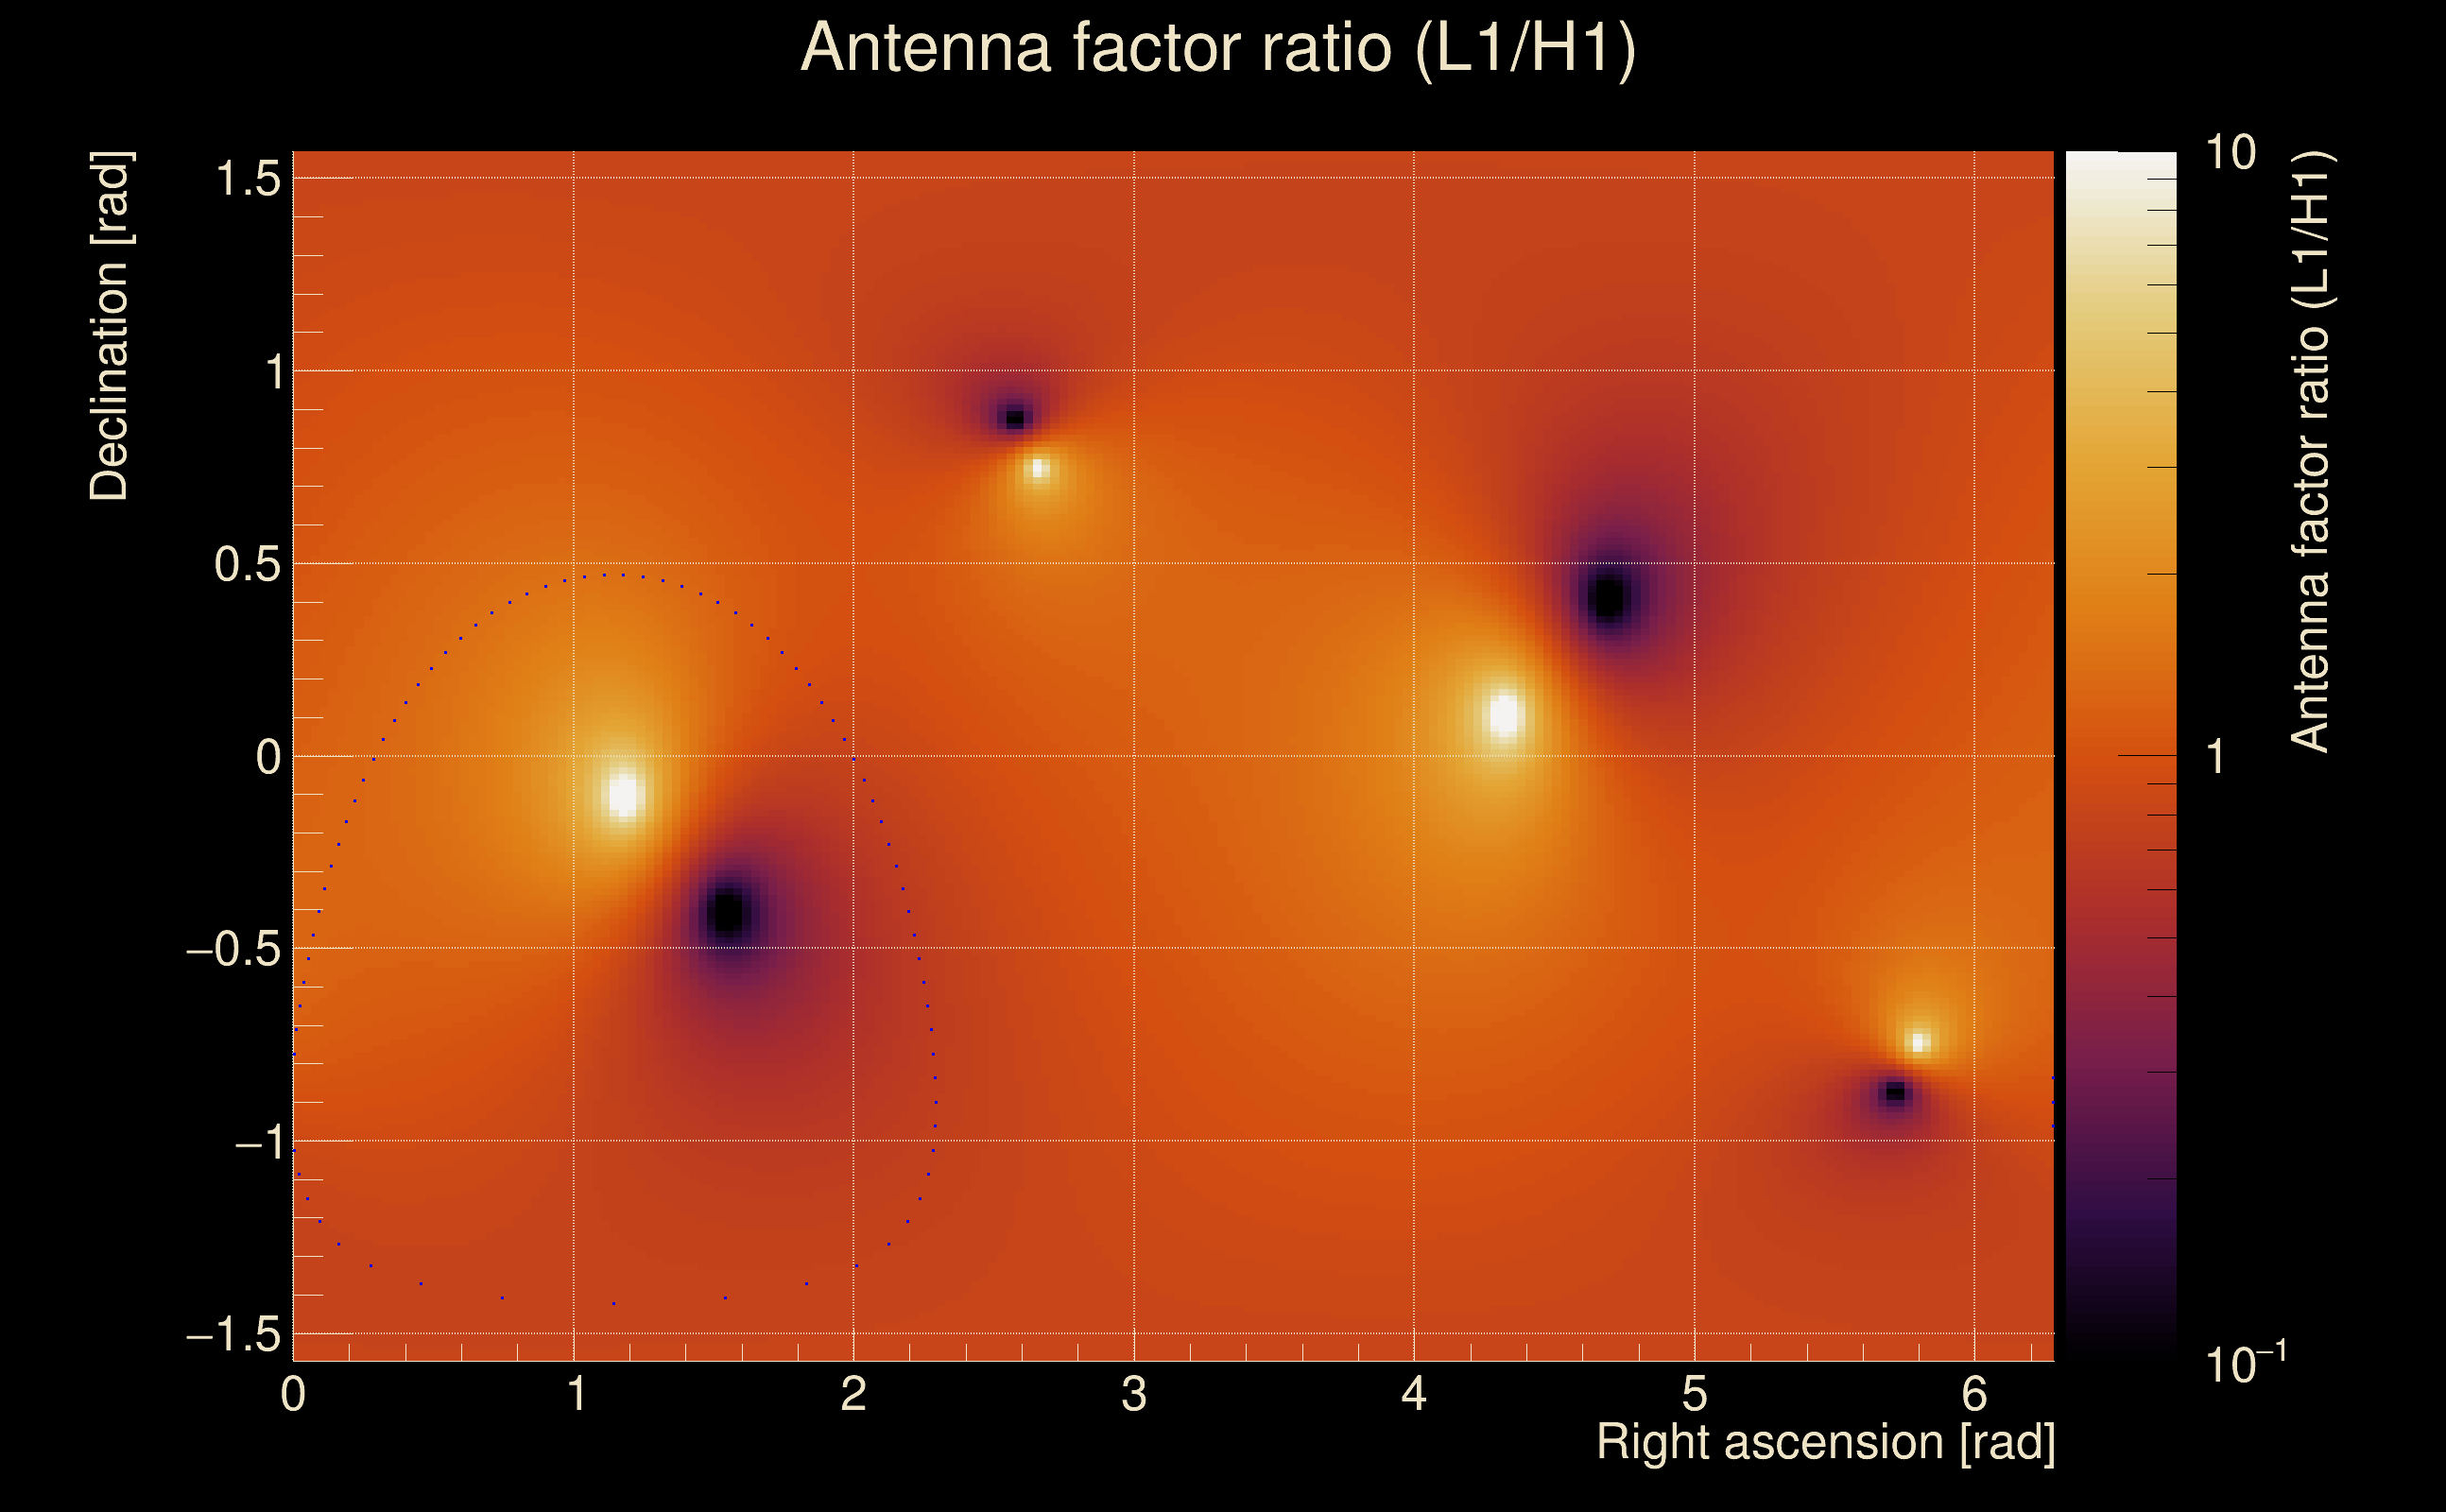
| Target sky positon: | Ra: 10, Dec: 10 [rad] |
| List of input Ox files: | TargIxf_feb2026_SN7_30s_file_list.txt (71 files) |
| Analysis result file: | TargIxf_feb2026_SN7_30s_results-0.root |
| Slice selected for the the fakeground: | slice index=33 (3.45 s), time lag = 0 s |
| Foreground | Fakeground | Background | ||
|---|---|---|---|---|
| Number of processed ox events | 12111 | 12111 | 2603865 | |
| Start Date (detector 0) | Mon May 15 14:13:25 2023 UTC | Mon May 15 14:13:25 2023 UTC | Mon May 15 14:13:25 2023 UTC | |
| End Date (detector 0) | Thu May 18 15:54:40 2023 UTC | Thu May 18 15:54:40 2023 UTC | Thu May 18 15:54:40 2023 UTC | |
| Start GPS (detector 0) | 1368195223 | 1368195223 | 1368195223 | |
| End GPS (detector 0) | 1368460498 | 1368460498 | 1368460498 | |
| Used livetime (detector 0) | 60875 s | 60875 s | 60875 s | |
| Start Date (detector 1) | Mon May 15 14:13:25 2023 UTC | Mon May 15 14:13:25 2023 UTC | Mon May 15 14:13:25 2023 UTC | |
| End Date (detector 1) | Thu May 18 15:54:40 2023 UTC | Thu May 18 15:54:40 2023 UTC | Thu May 18 15:54:40 2023 UTC | |
| Start GPS (detector 1) | 1368195223 | 1368195223 | 1368195223 | |
| End GPS (detector 1) | 1368460498 | 1368460498 | 1368460498 | |
| Used livetime (detector 1) | 60875 s | 60875 s | 60875 s | |
| Cumulative livetime | 121110 s | 121110 s | 26038650 s | |
| 0 years, 1 days, 9 hours, 38 min, 30 s | 0 years, 1 days, 9 hours, 38 min, 30 s | 0 years, 301 days, 8 hours, 57 min, 30 s |
|
|
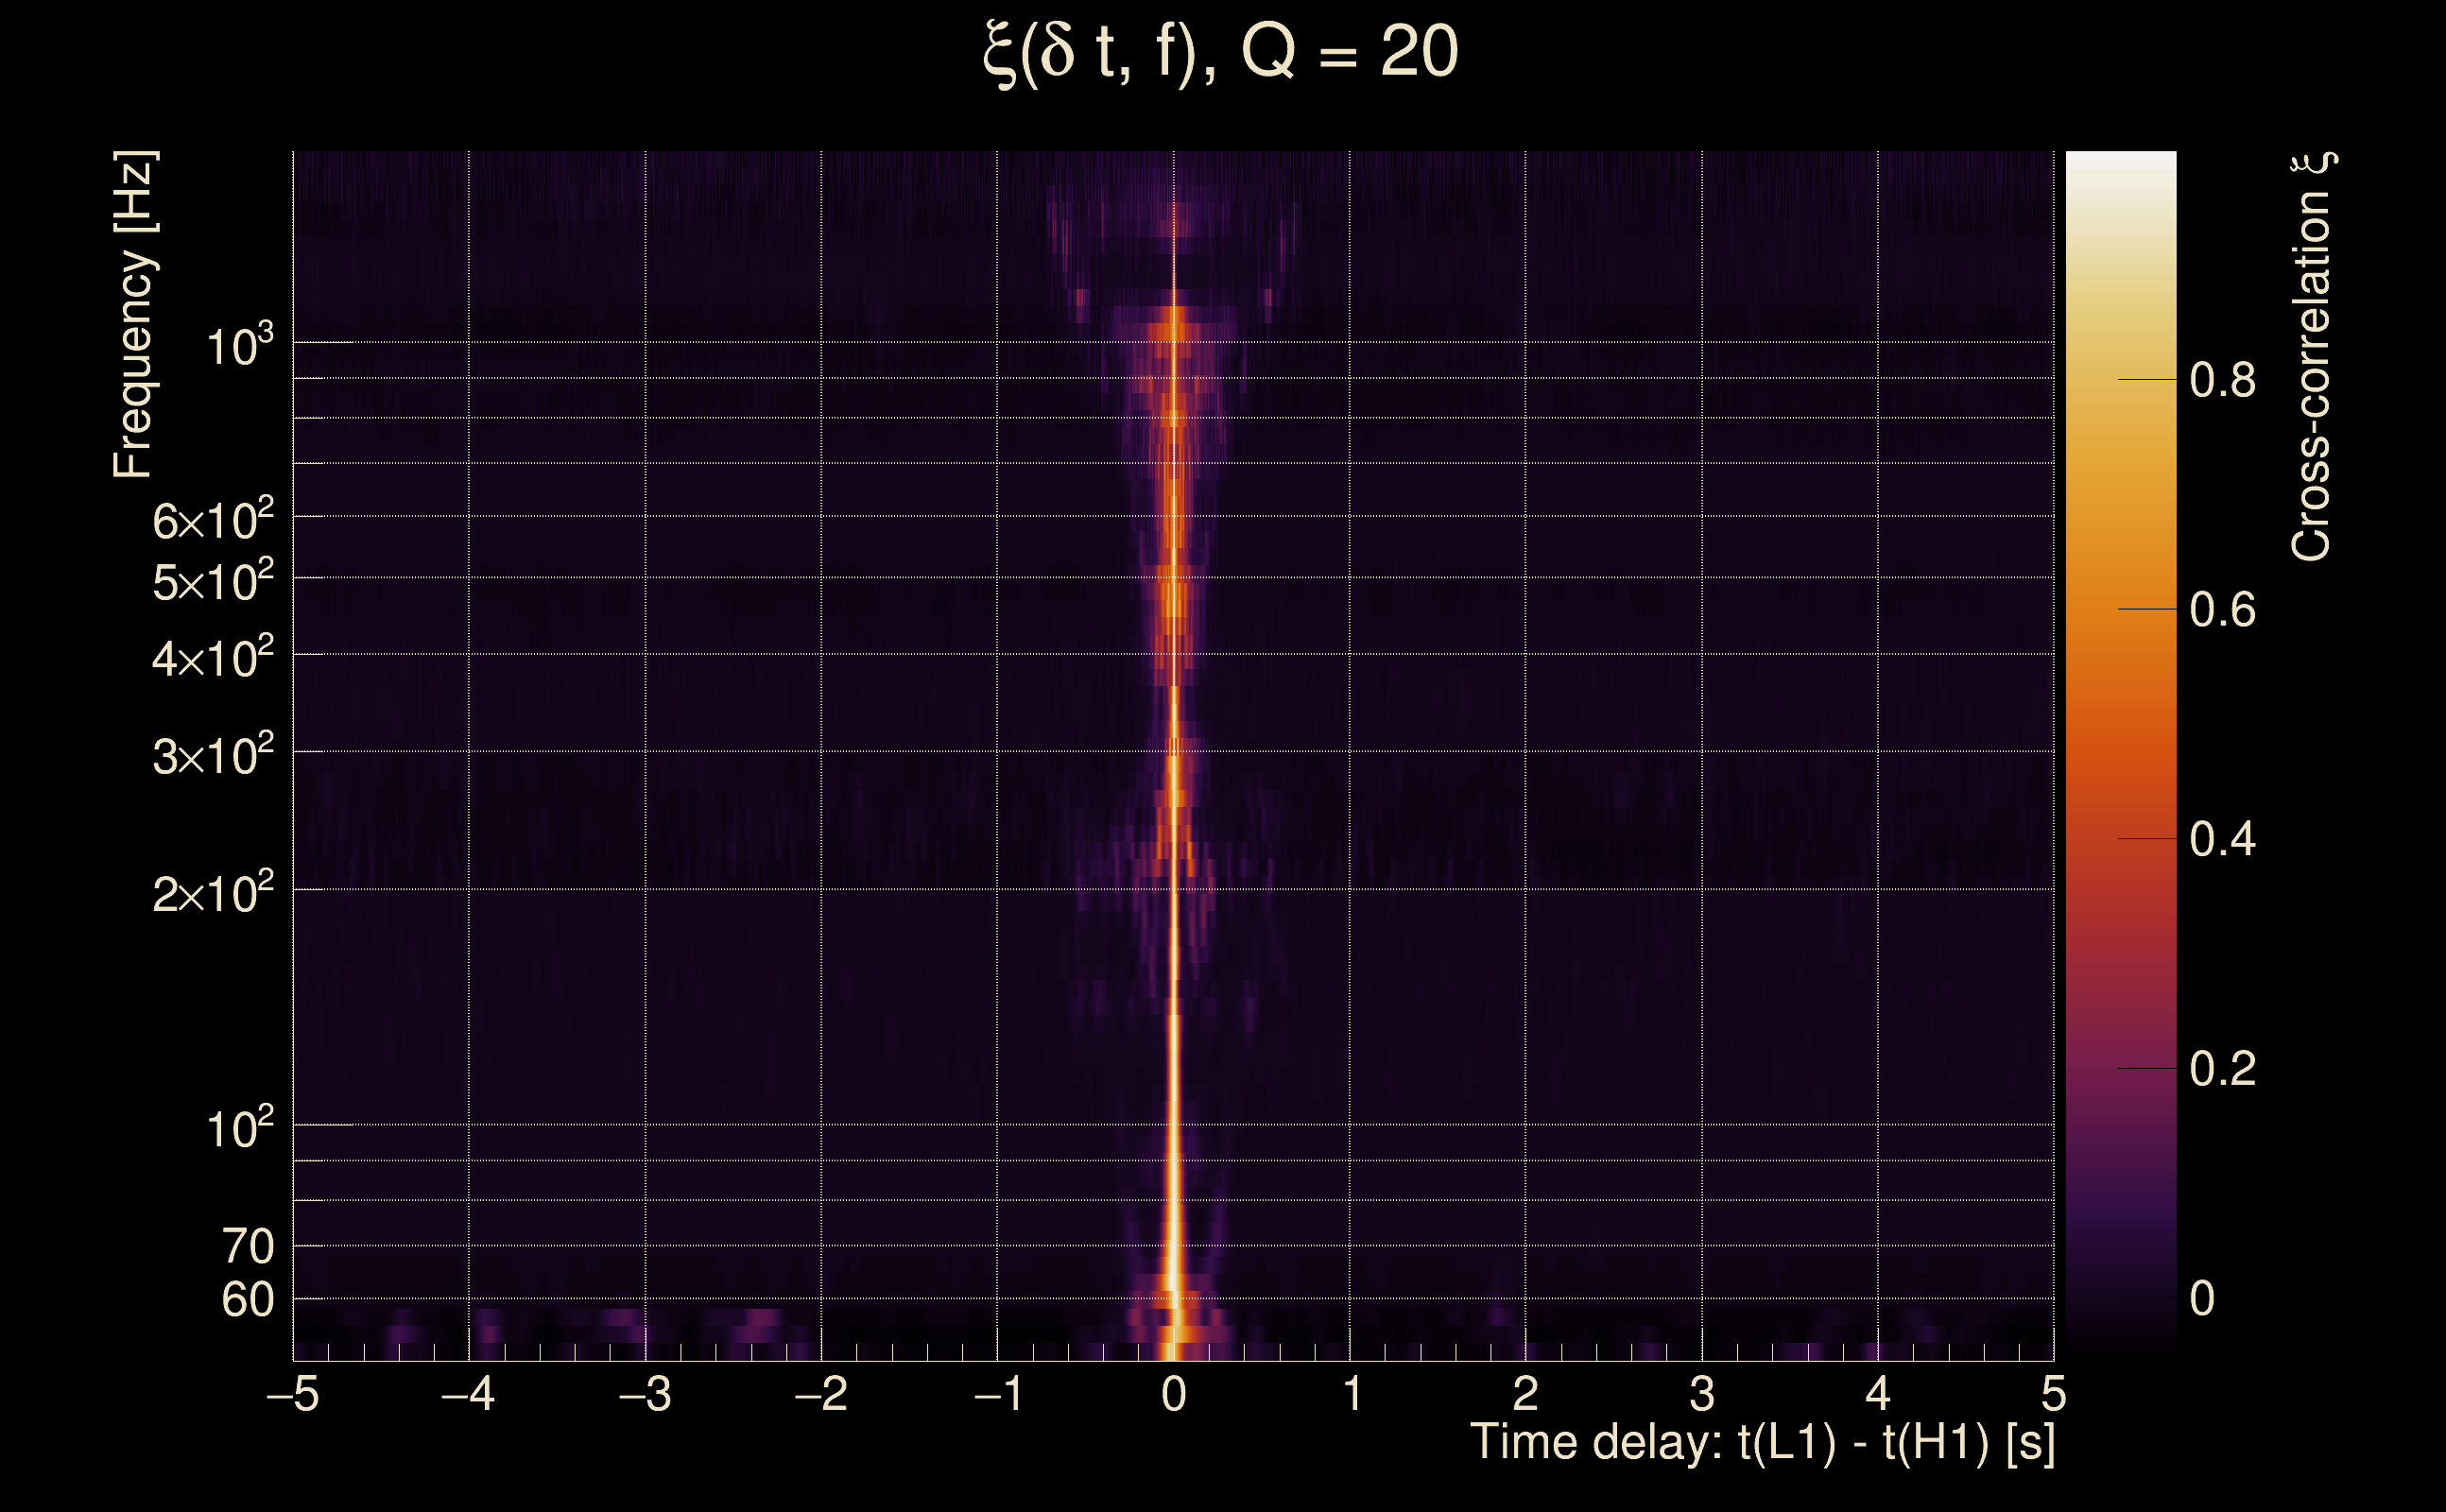
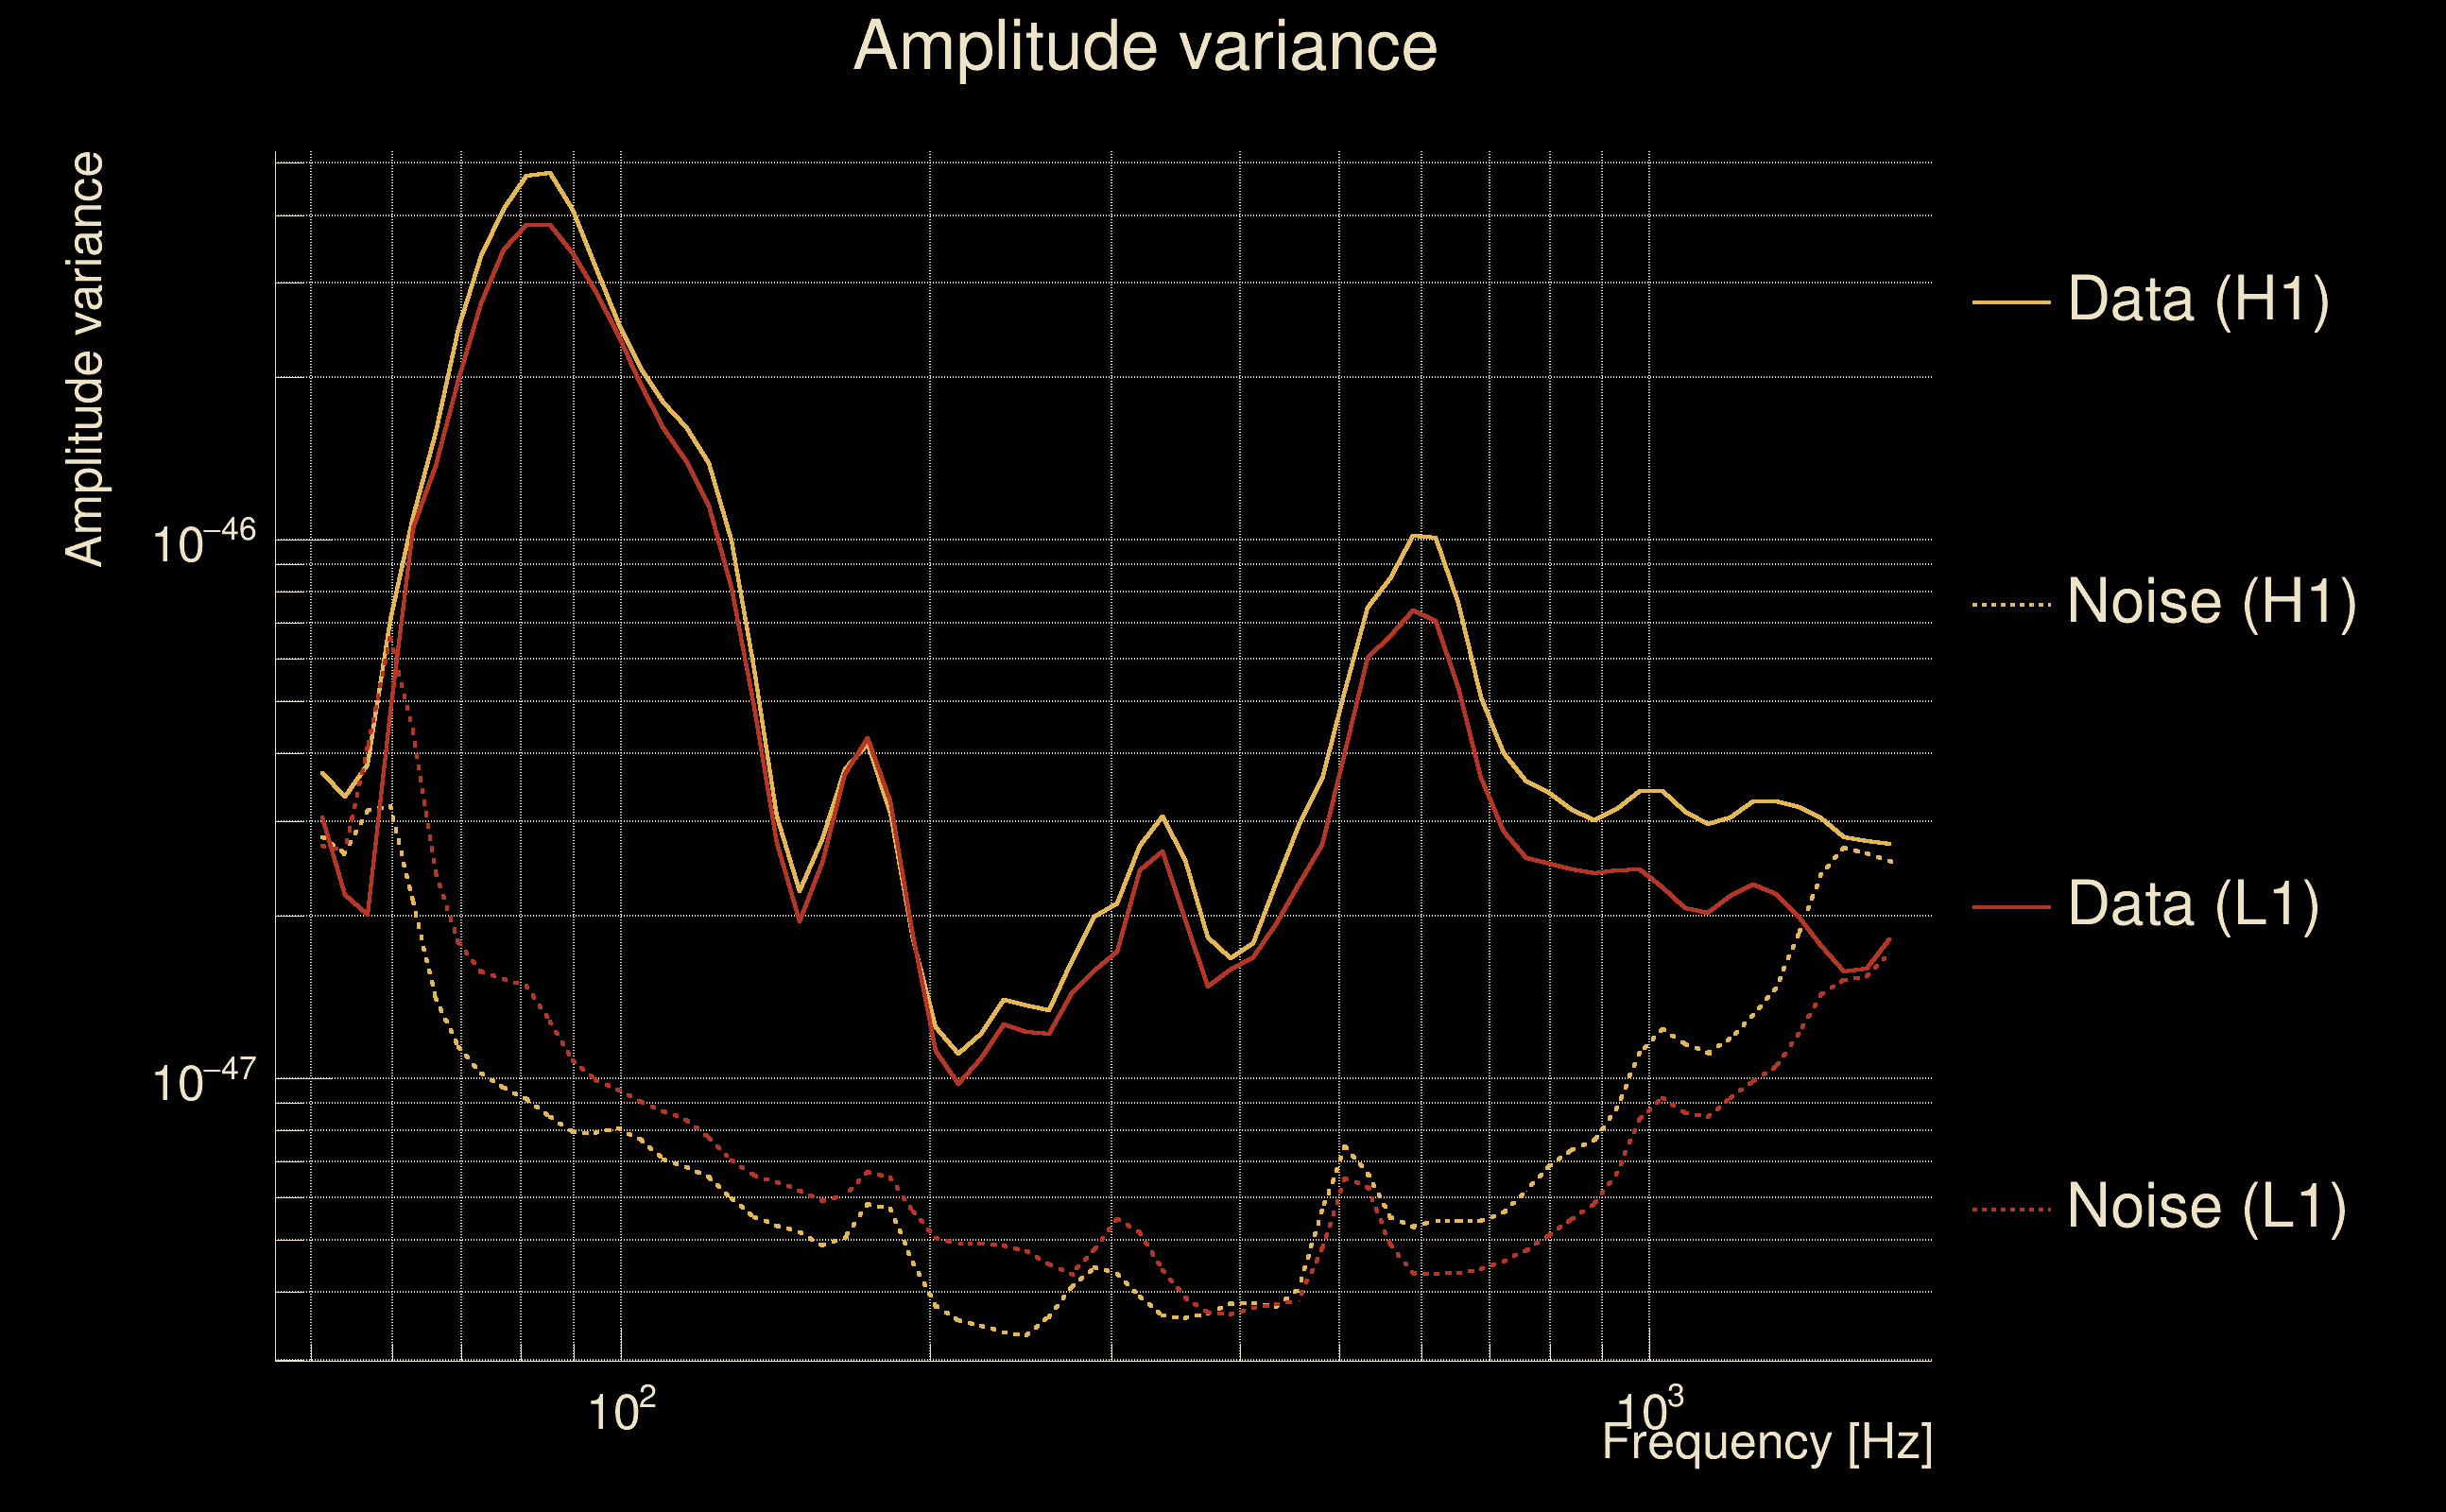
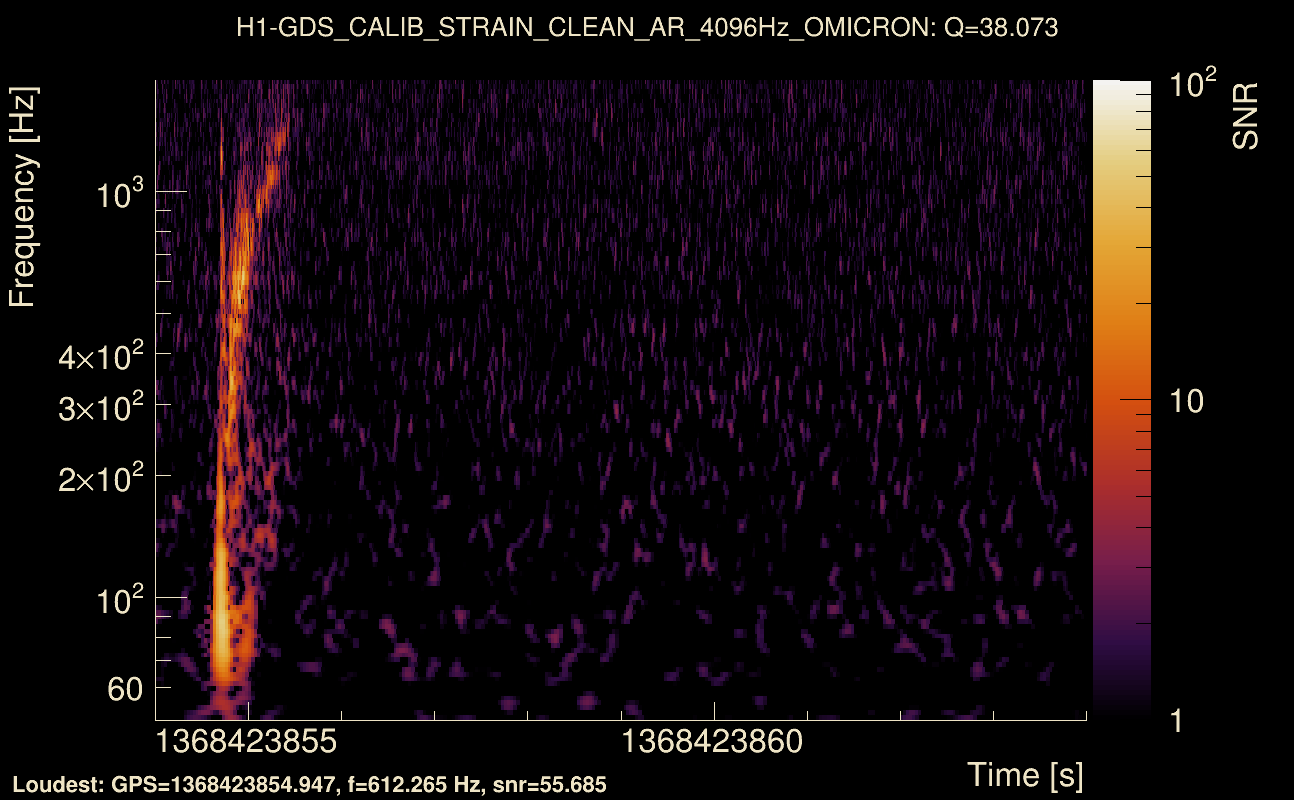
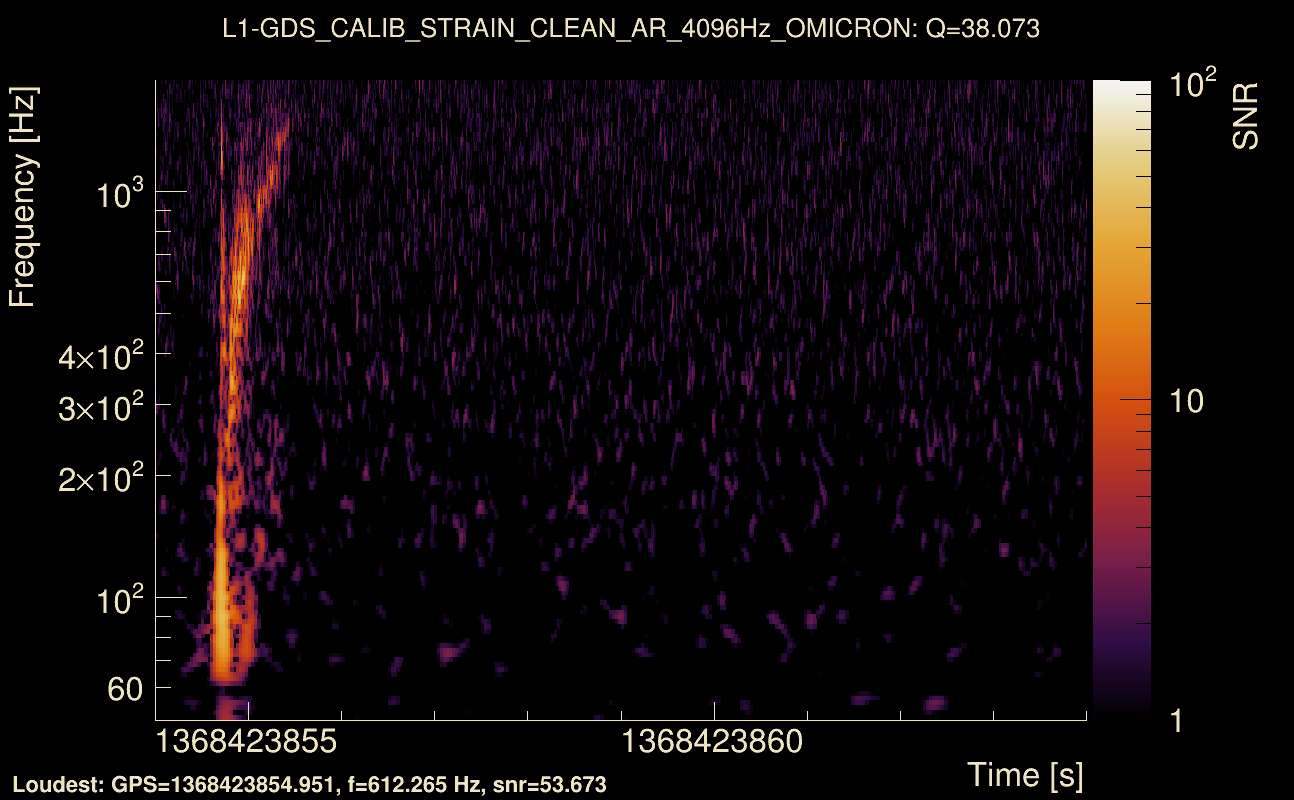
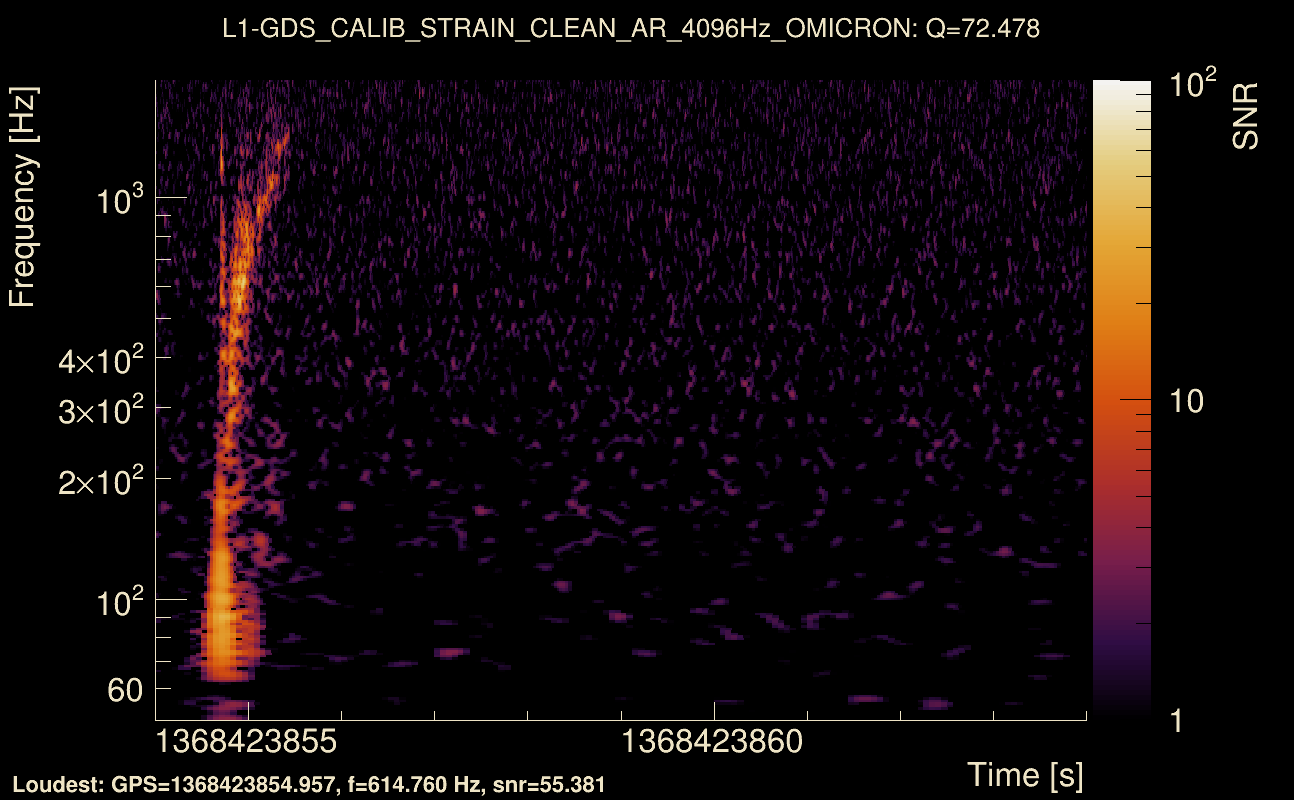
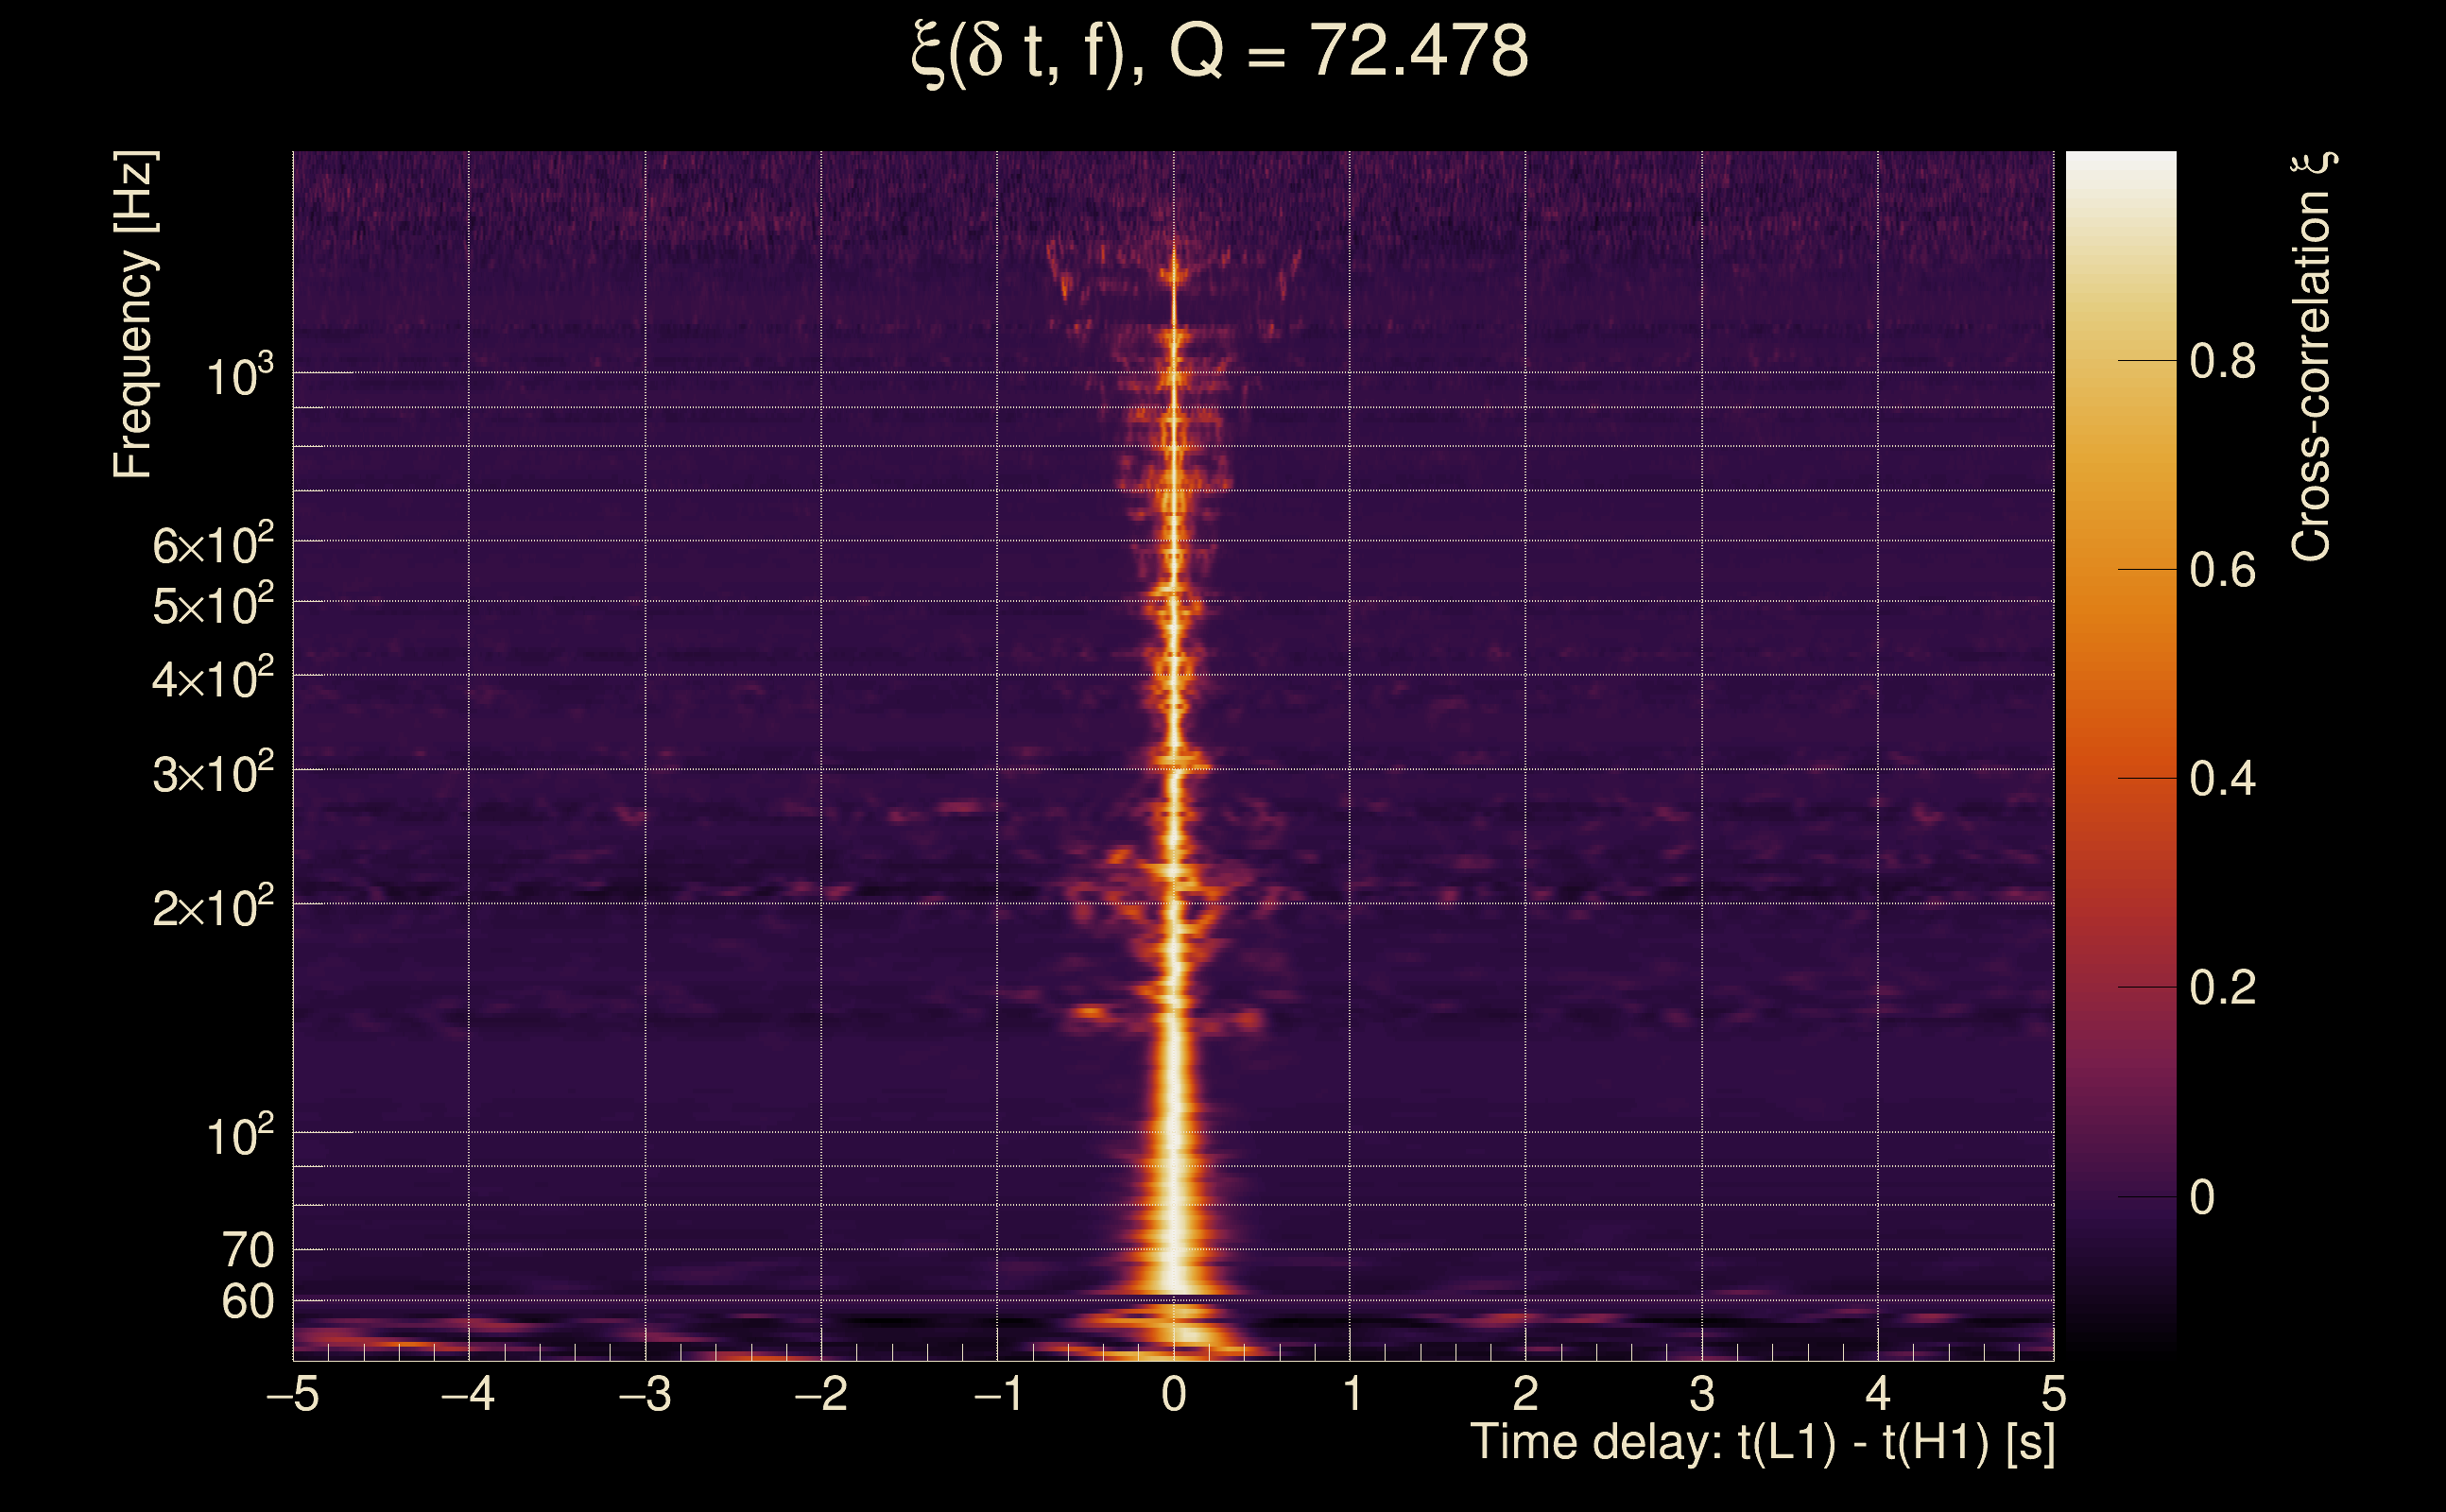
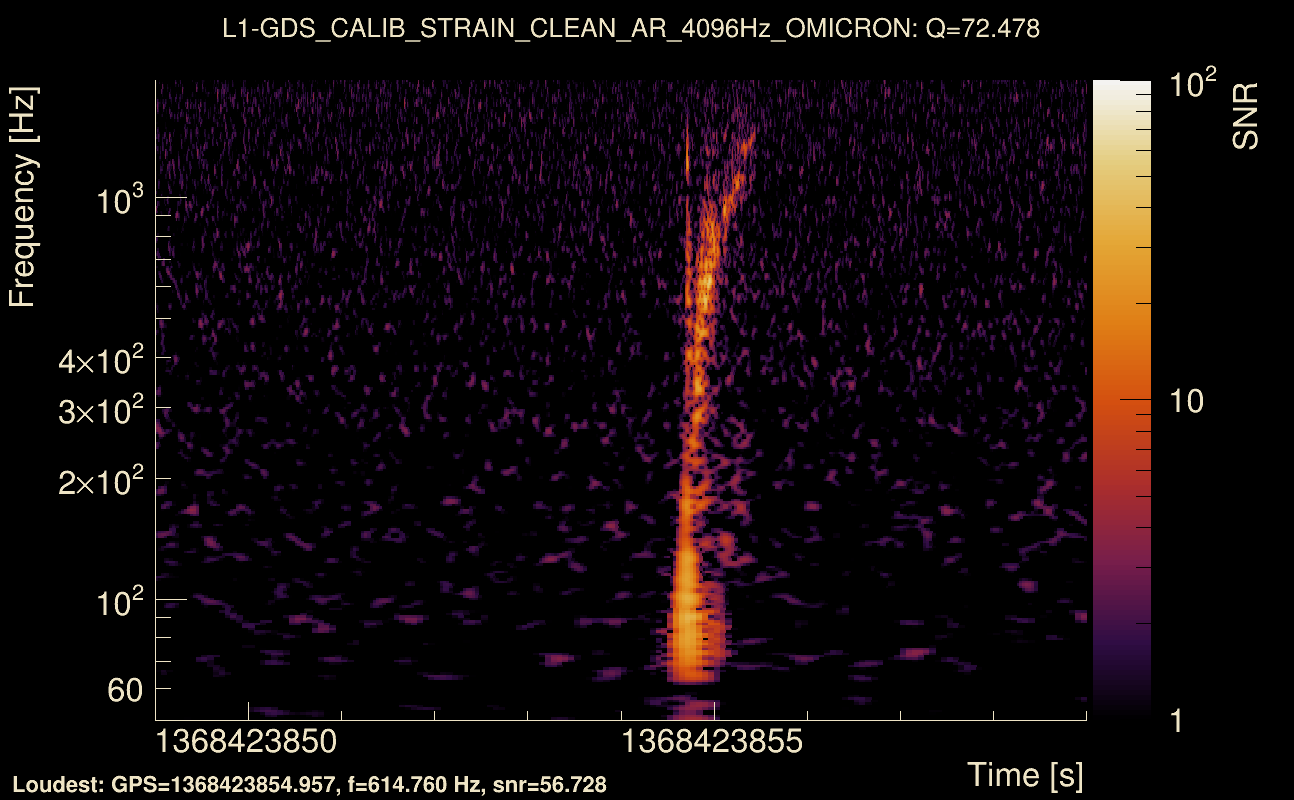
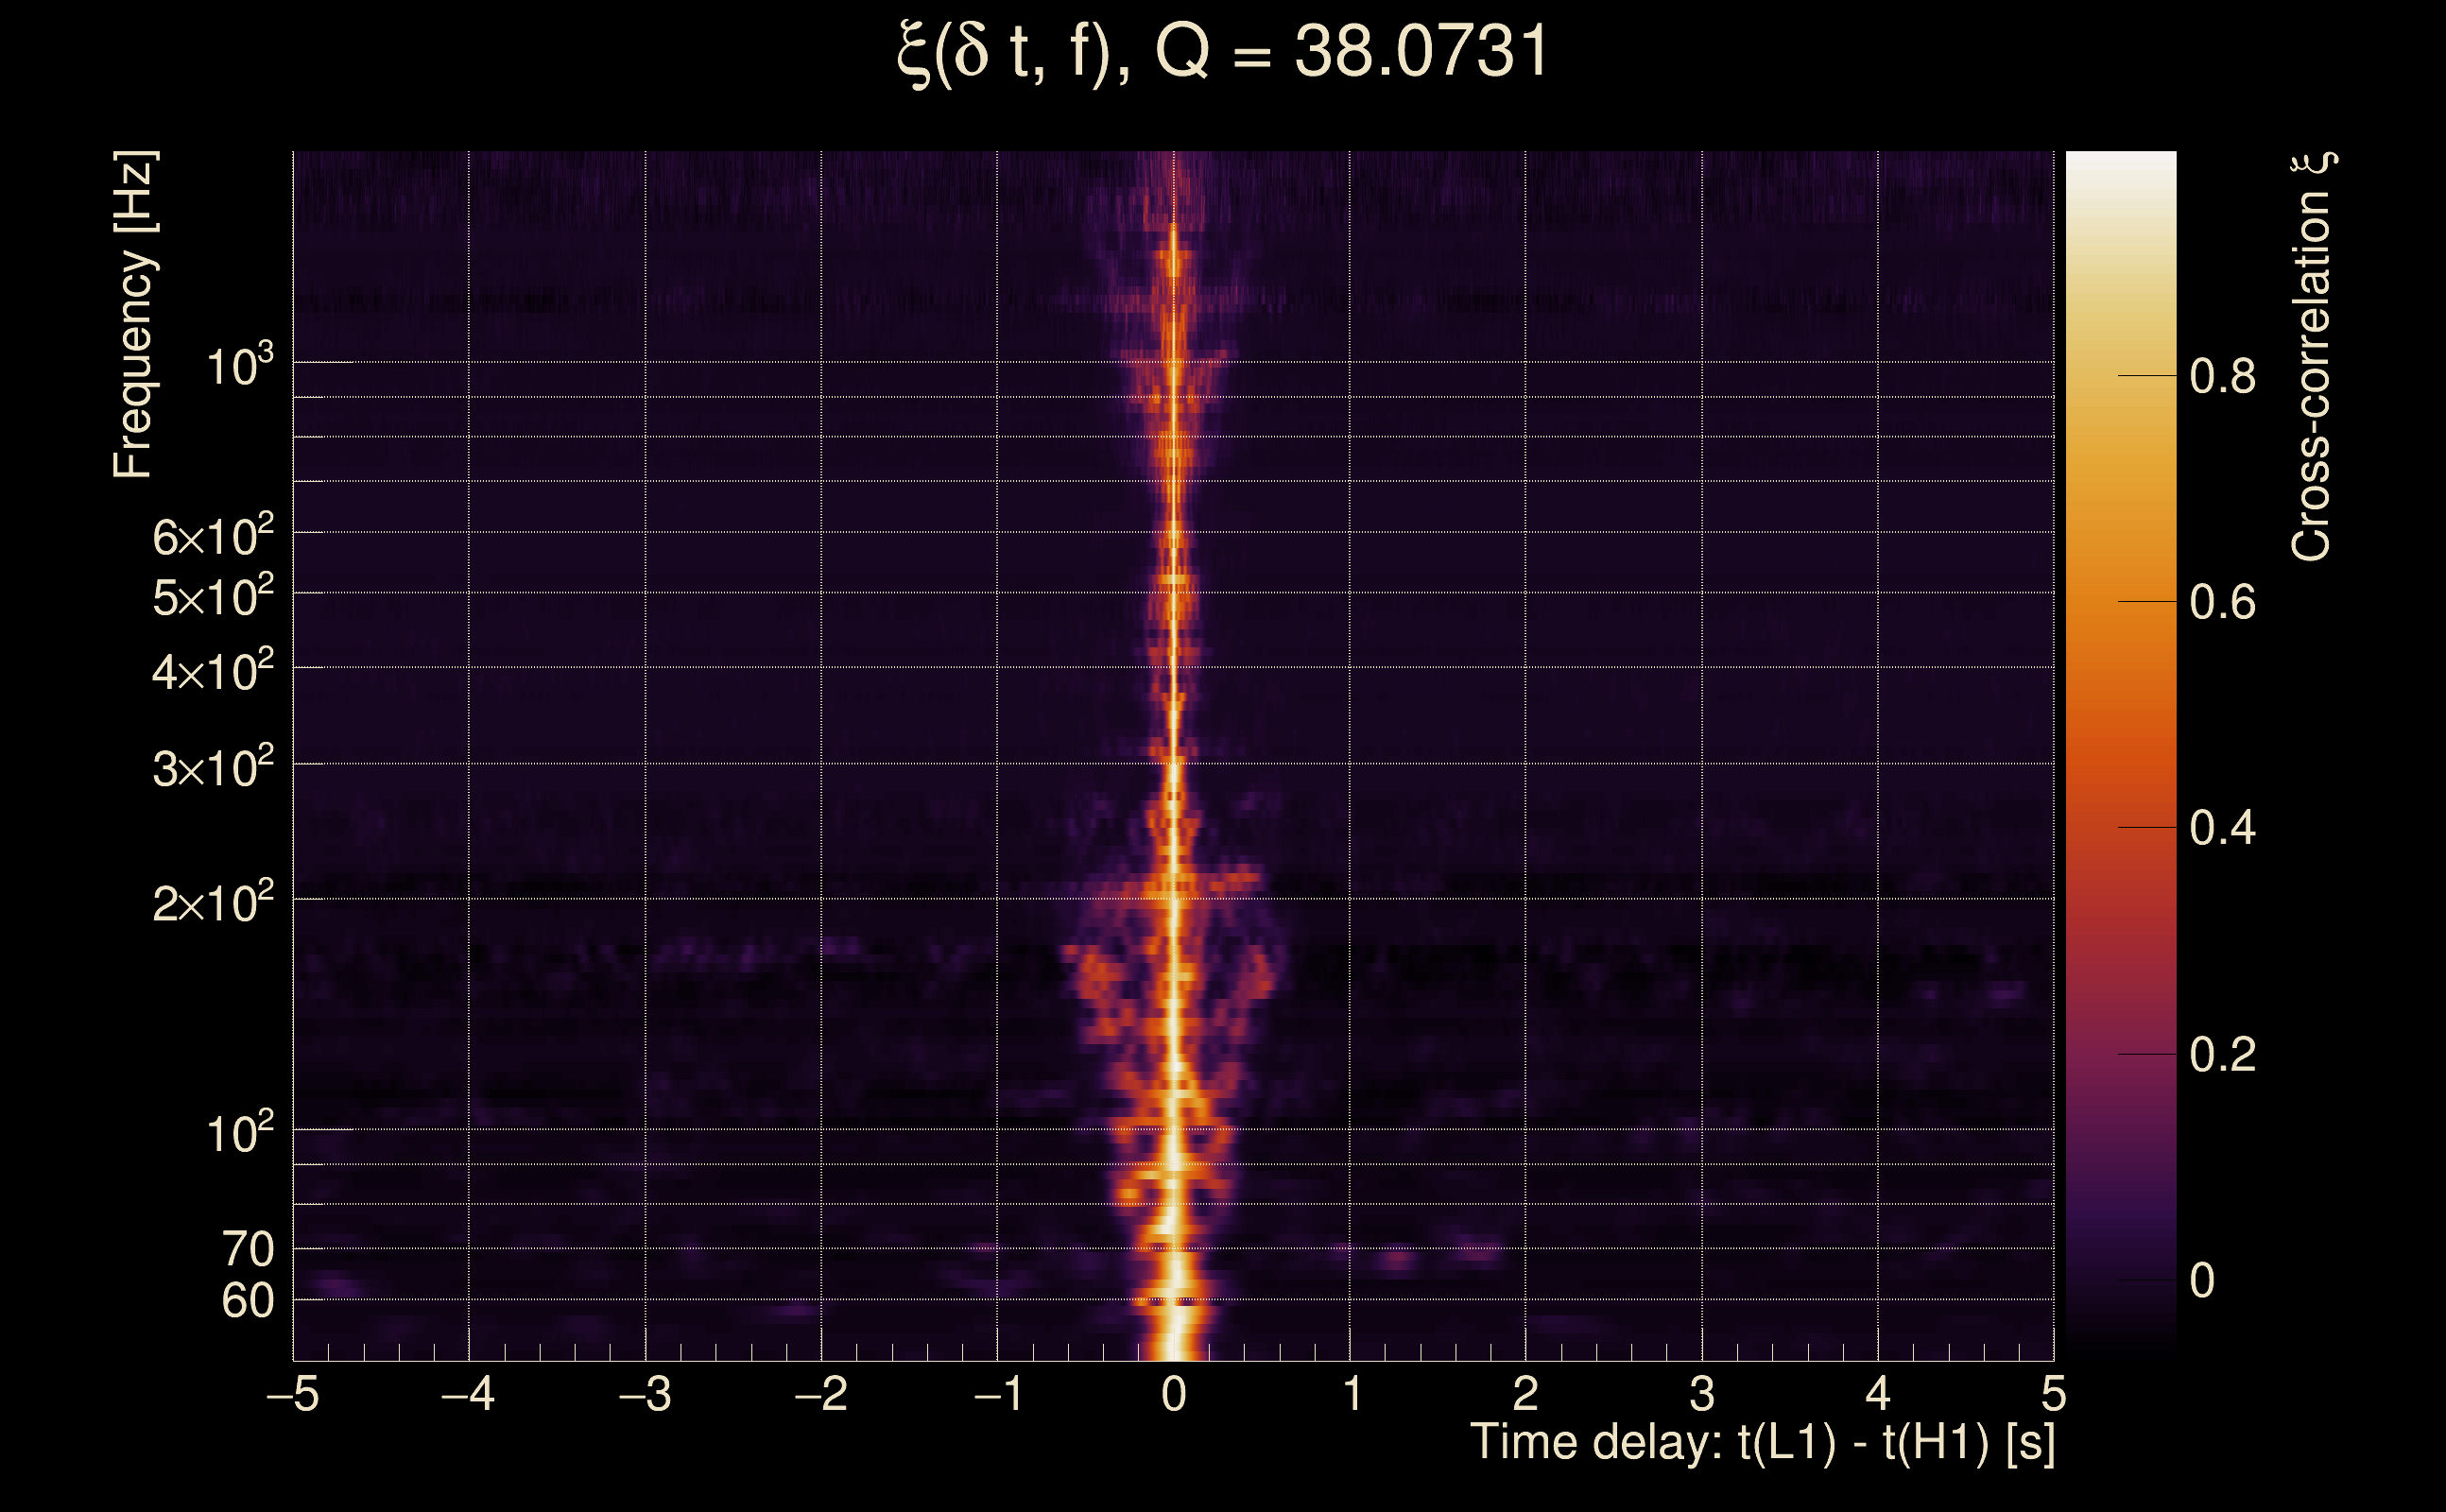
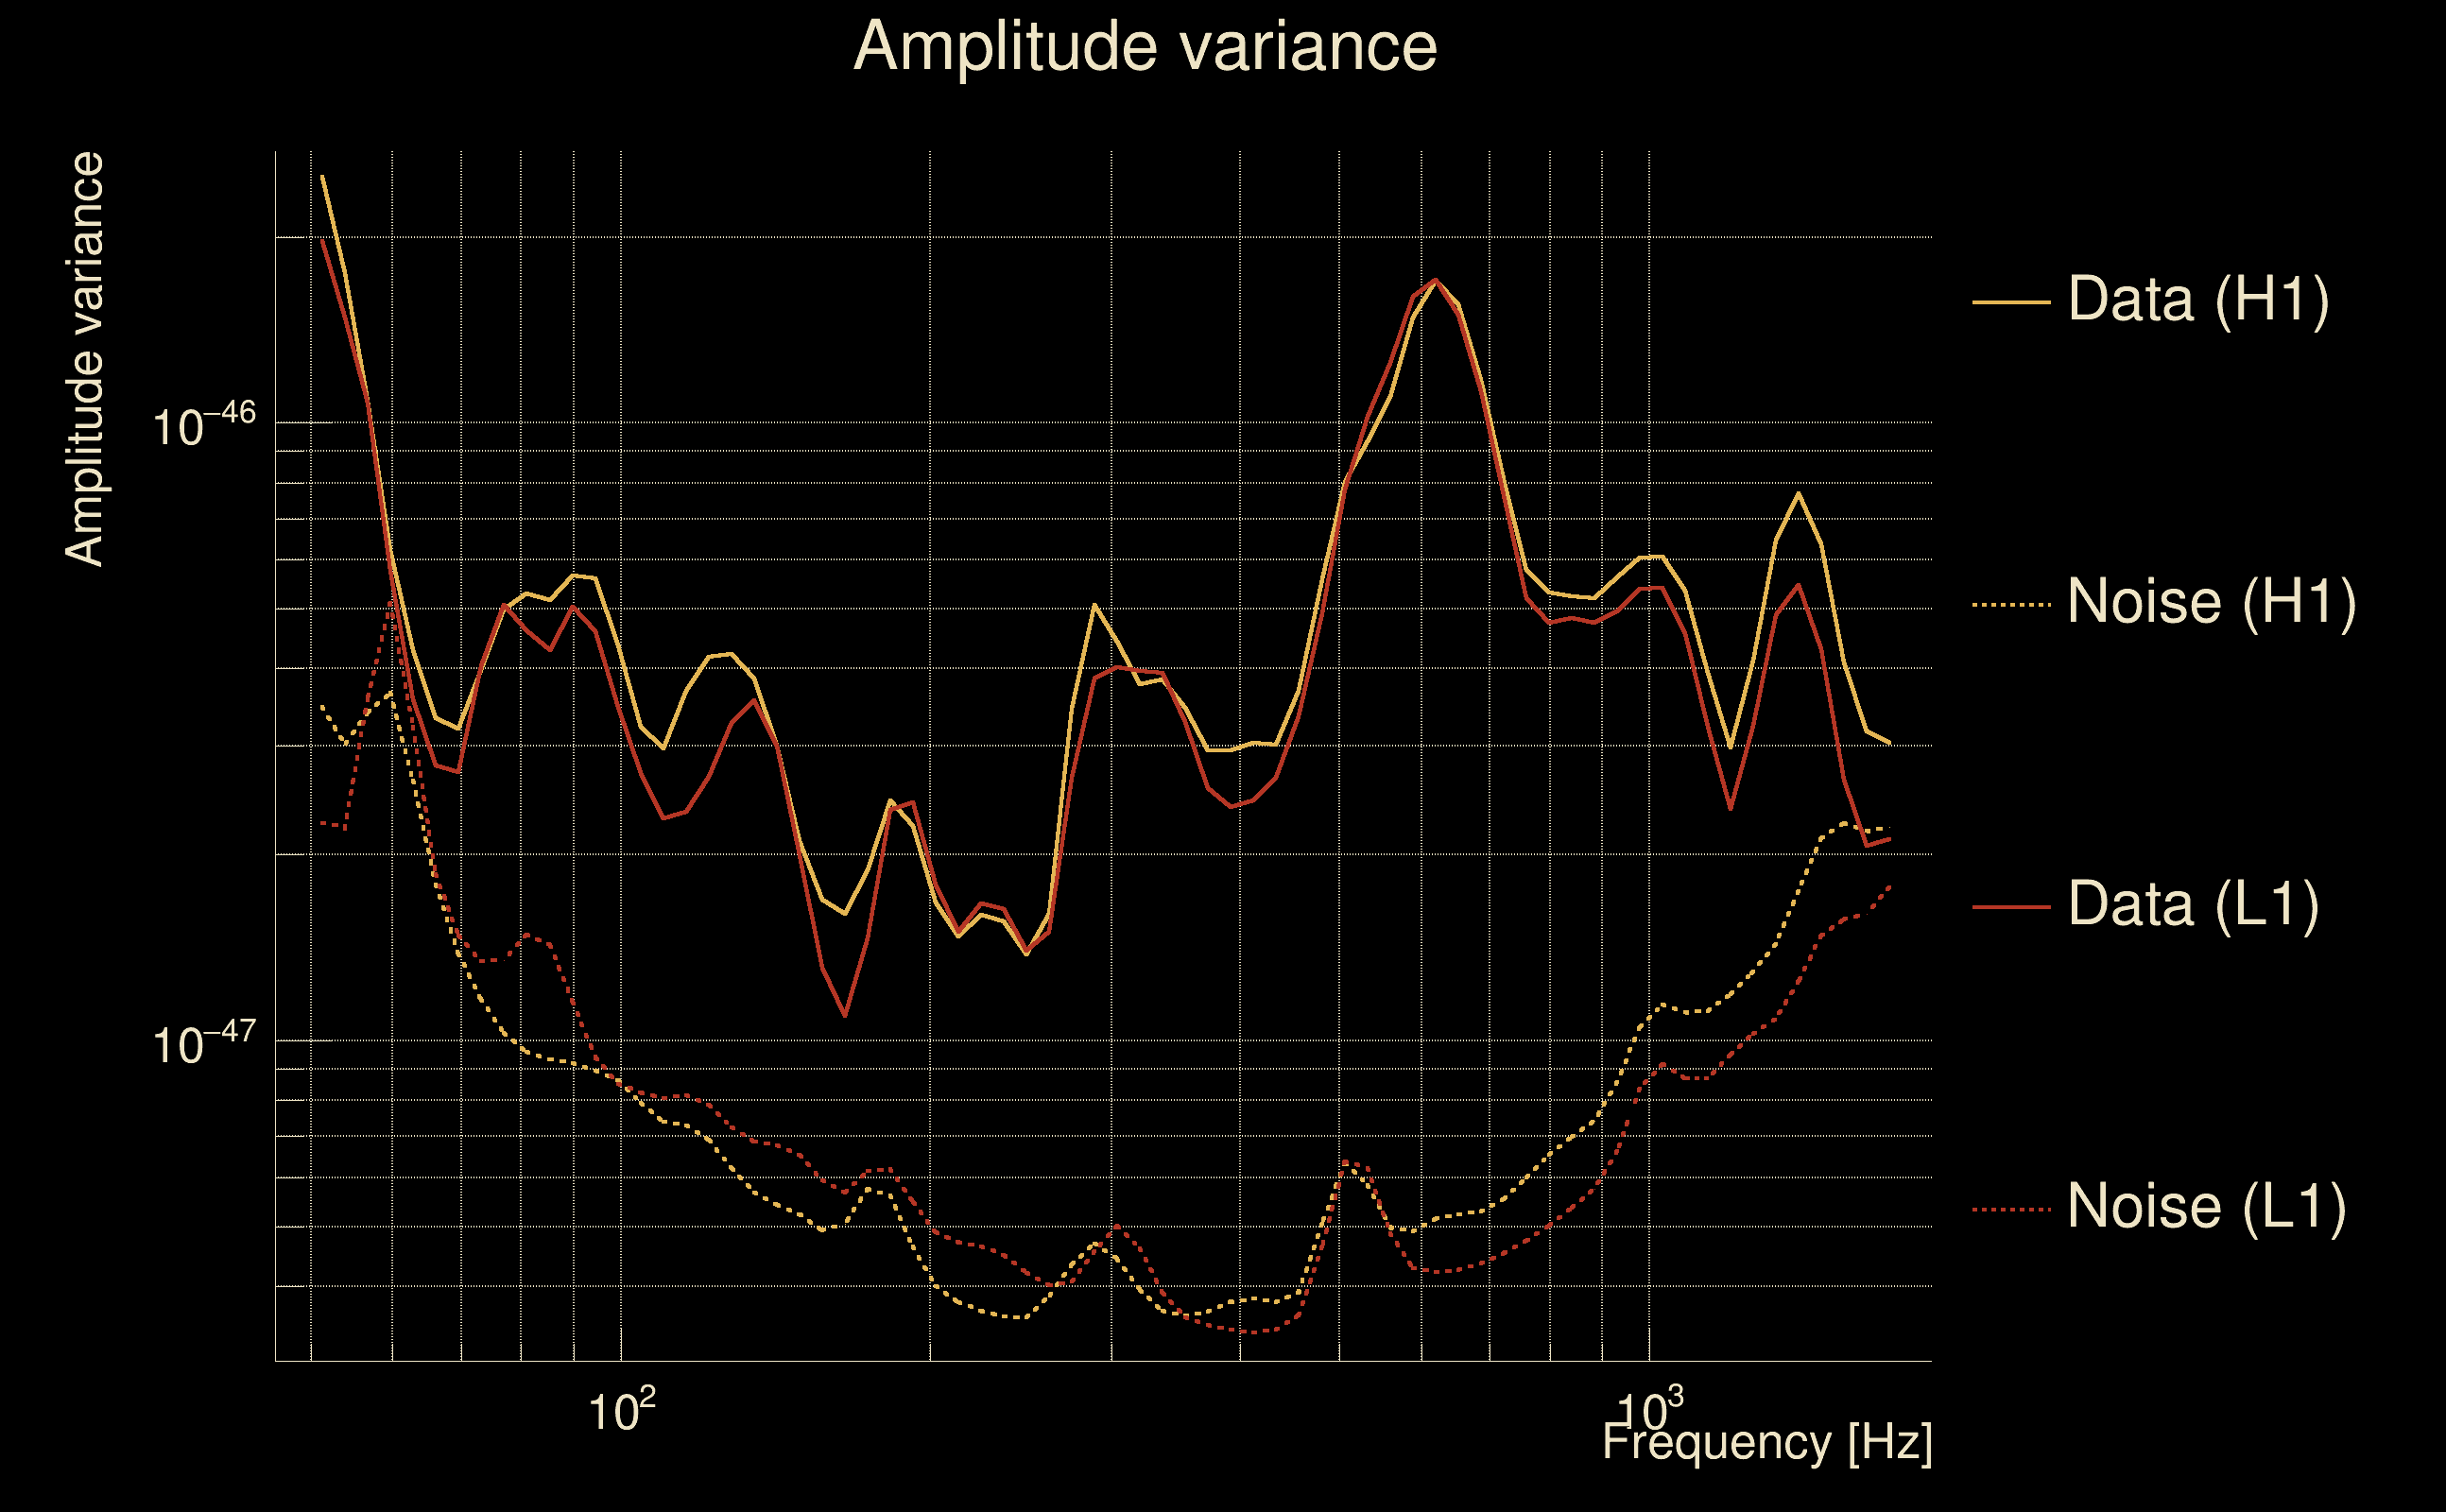
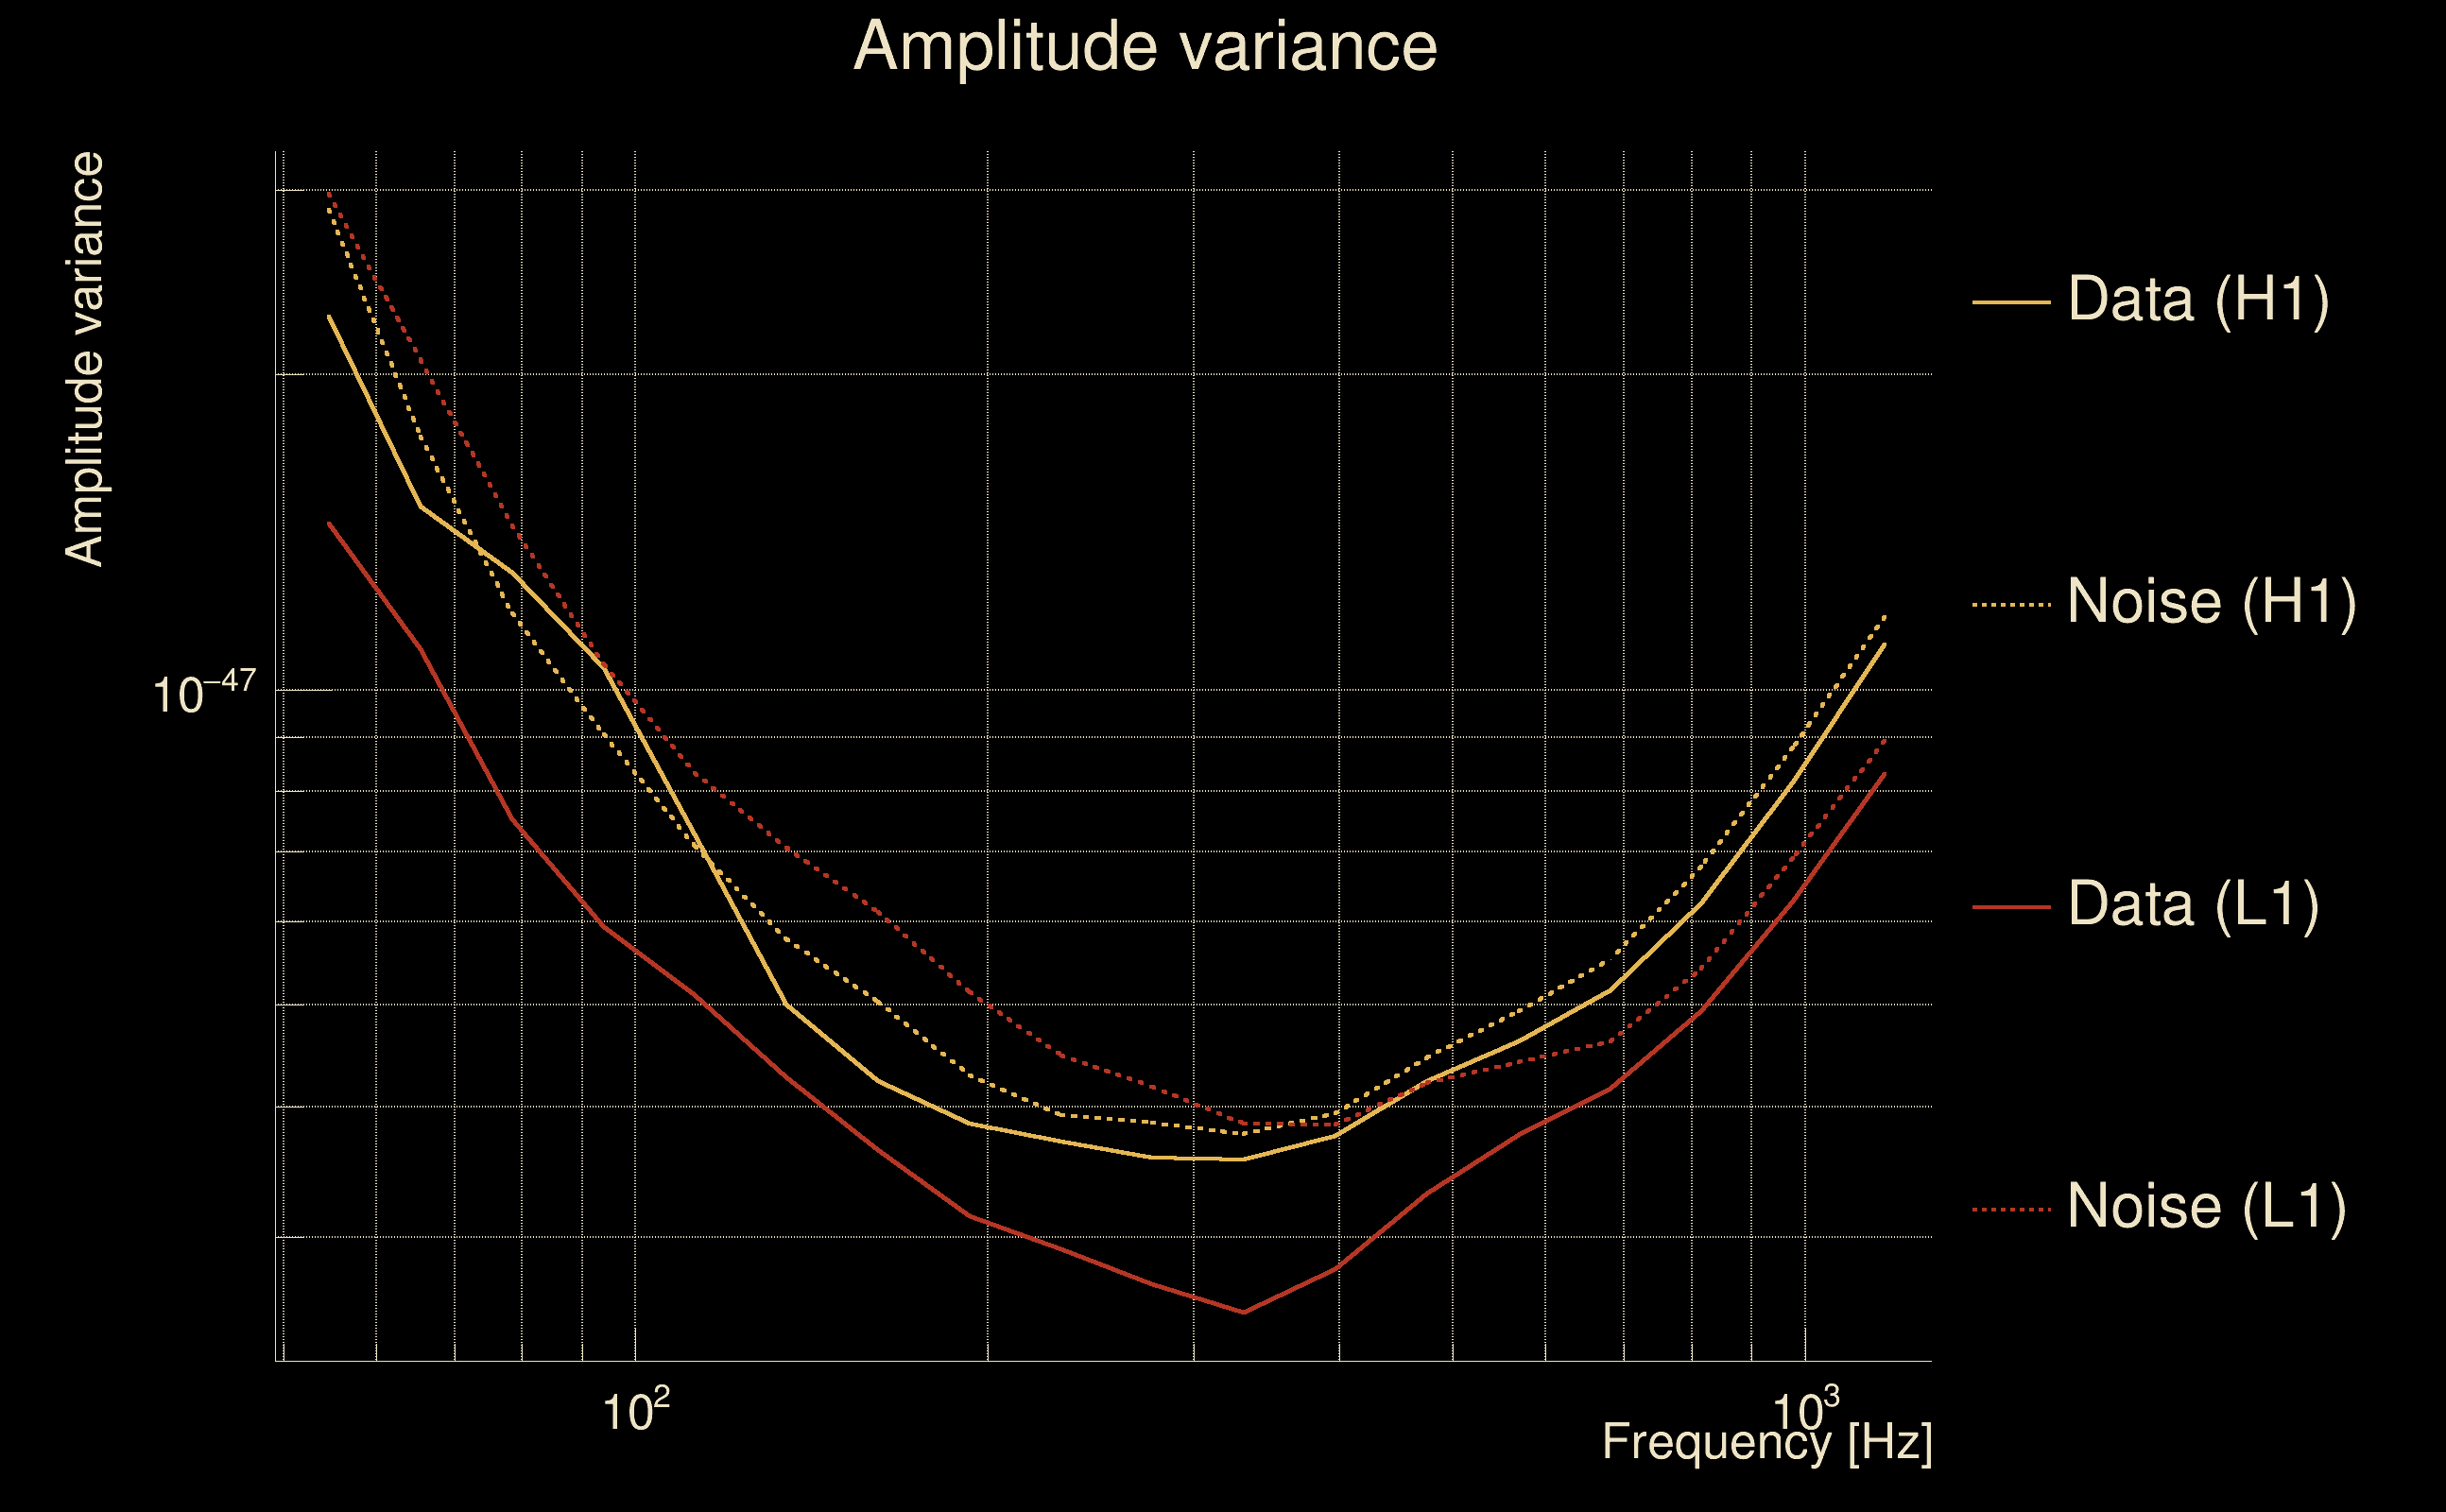
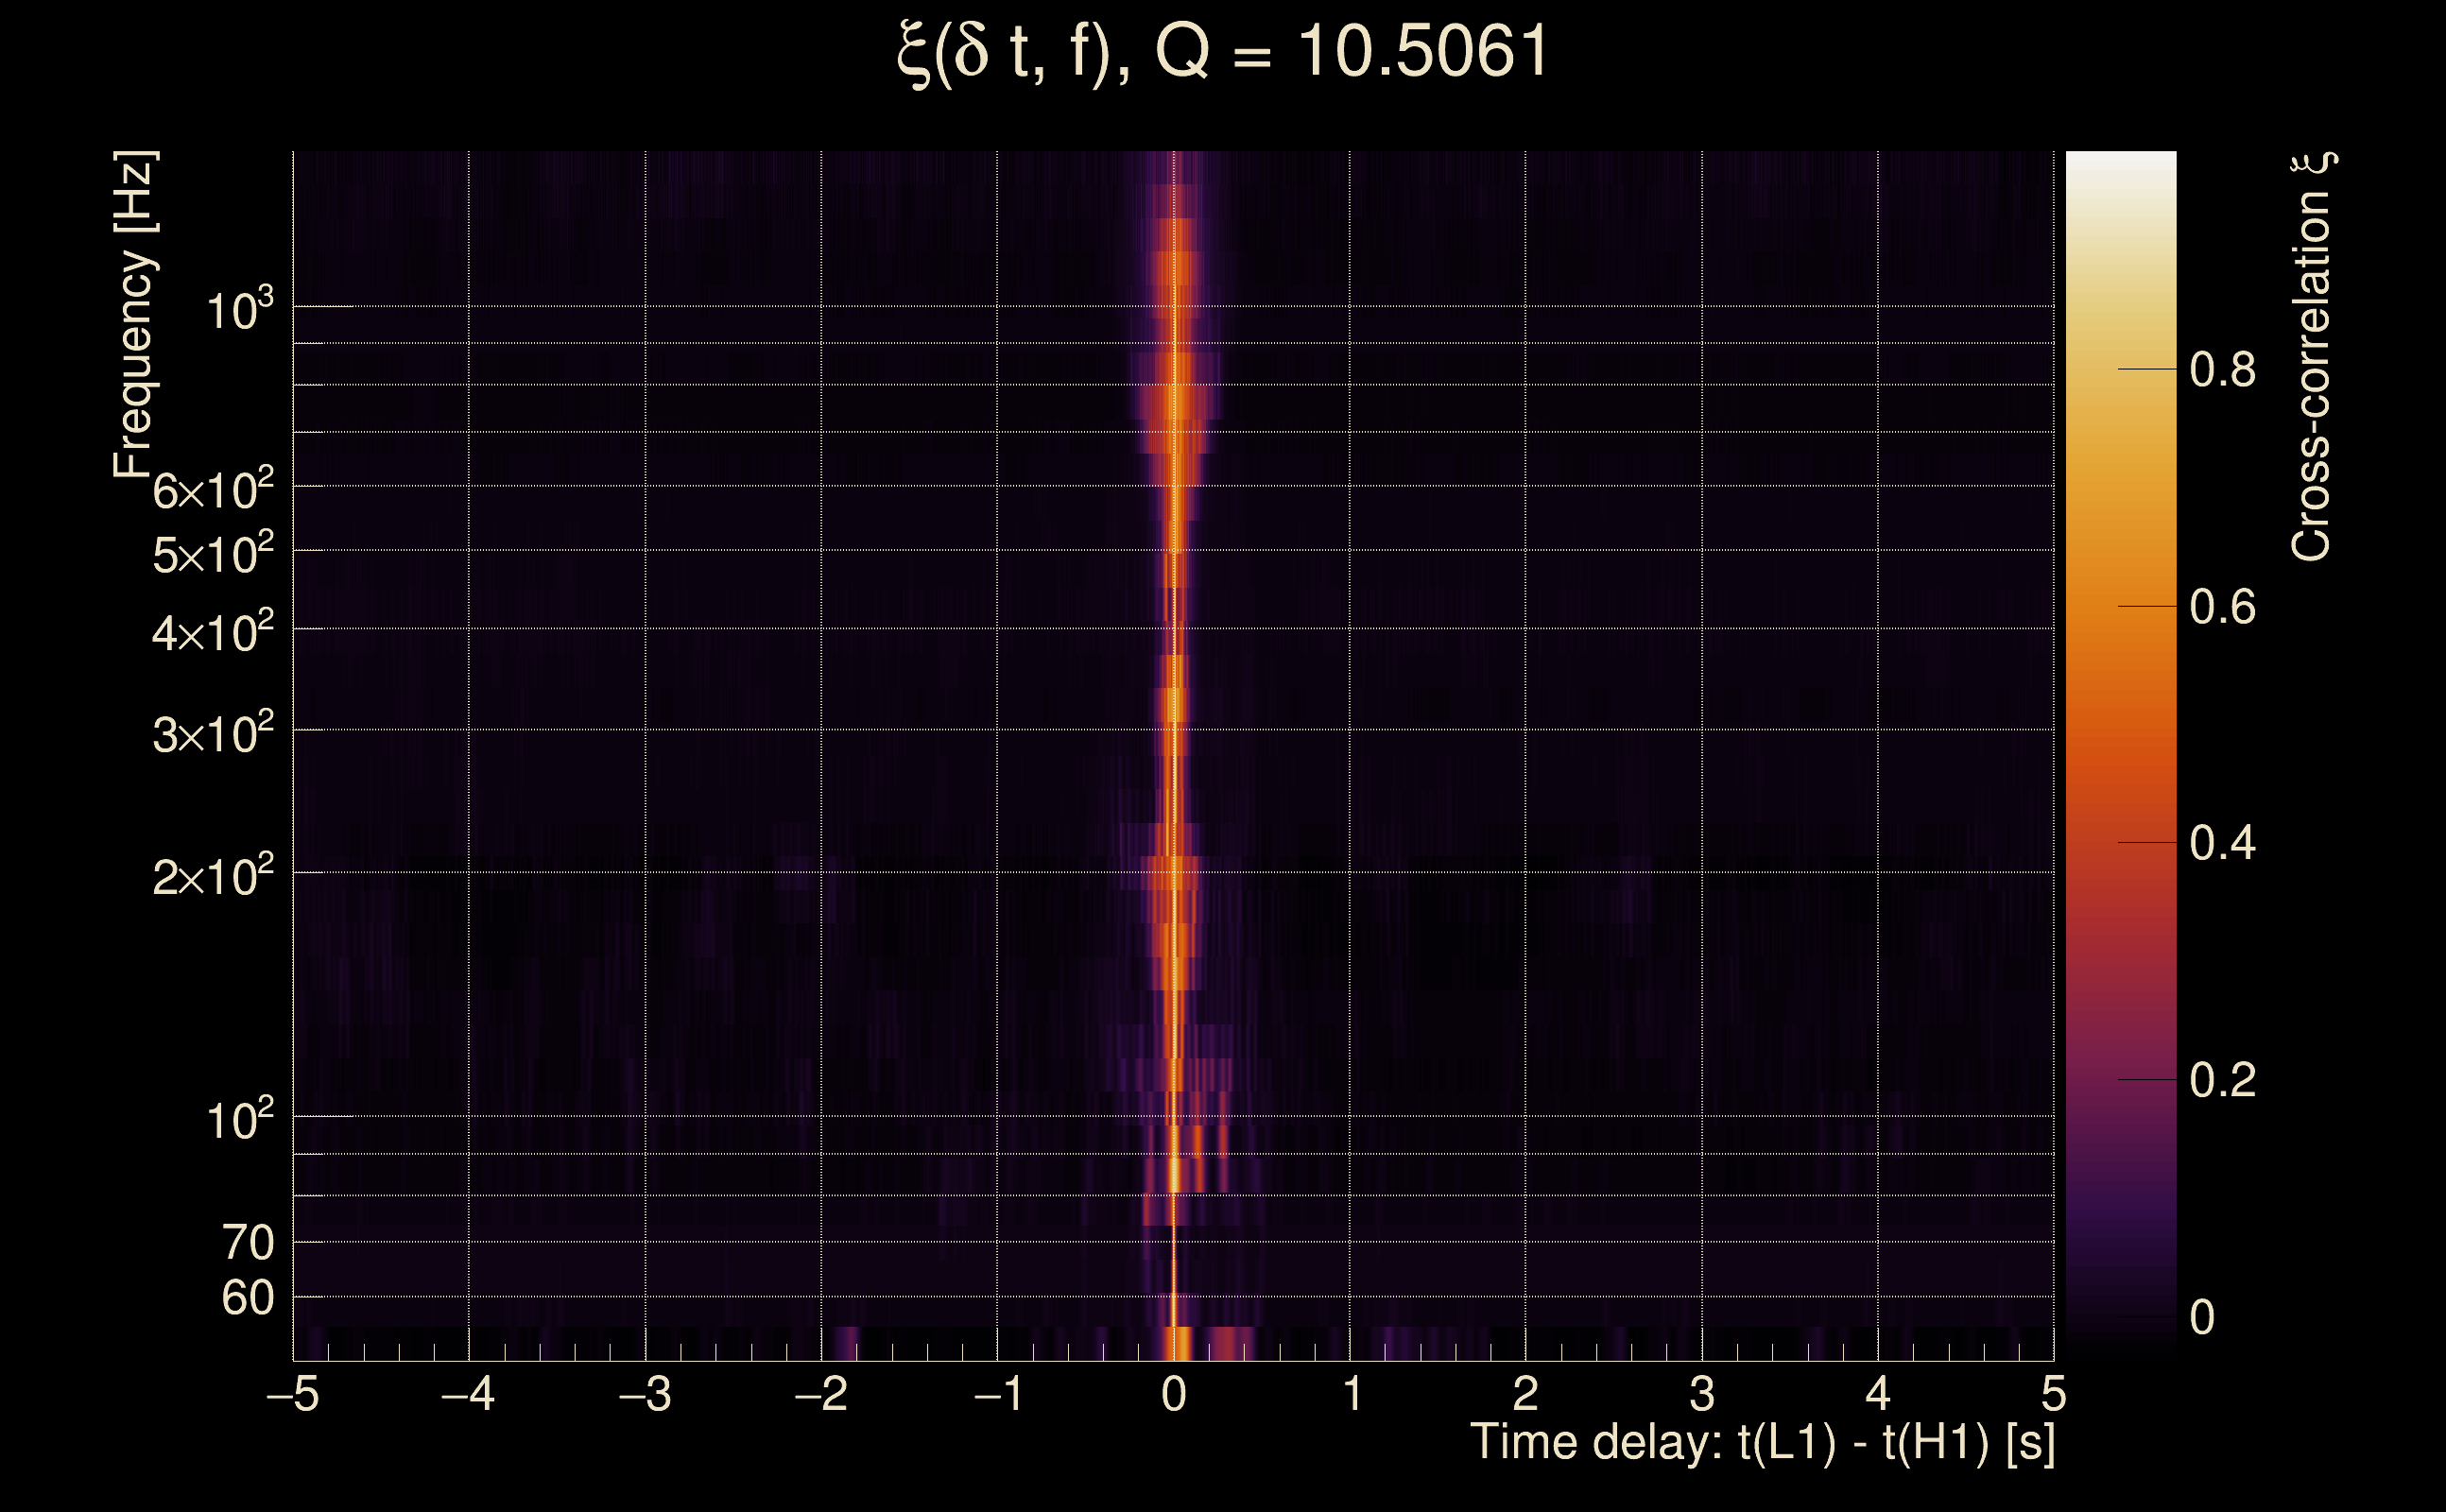
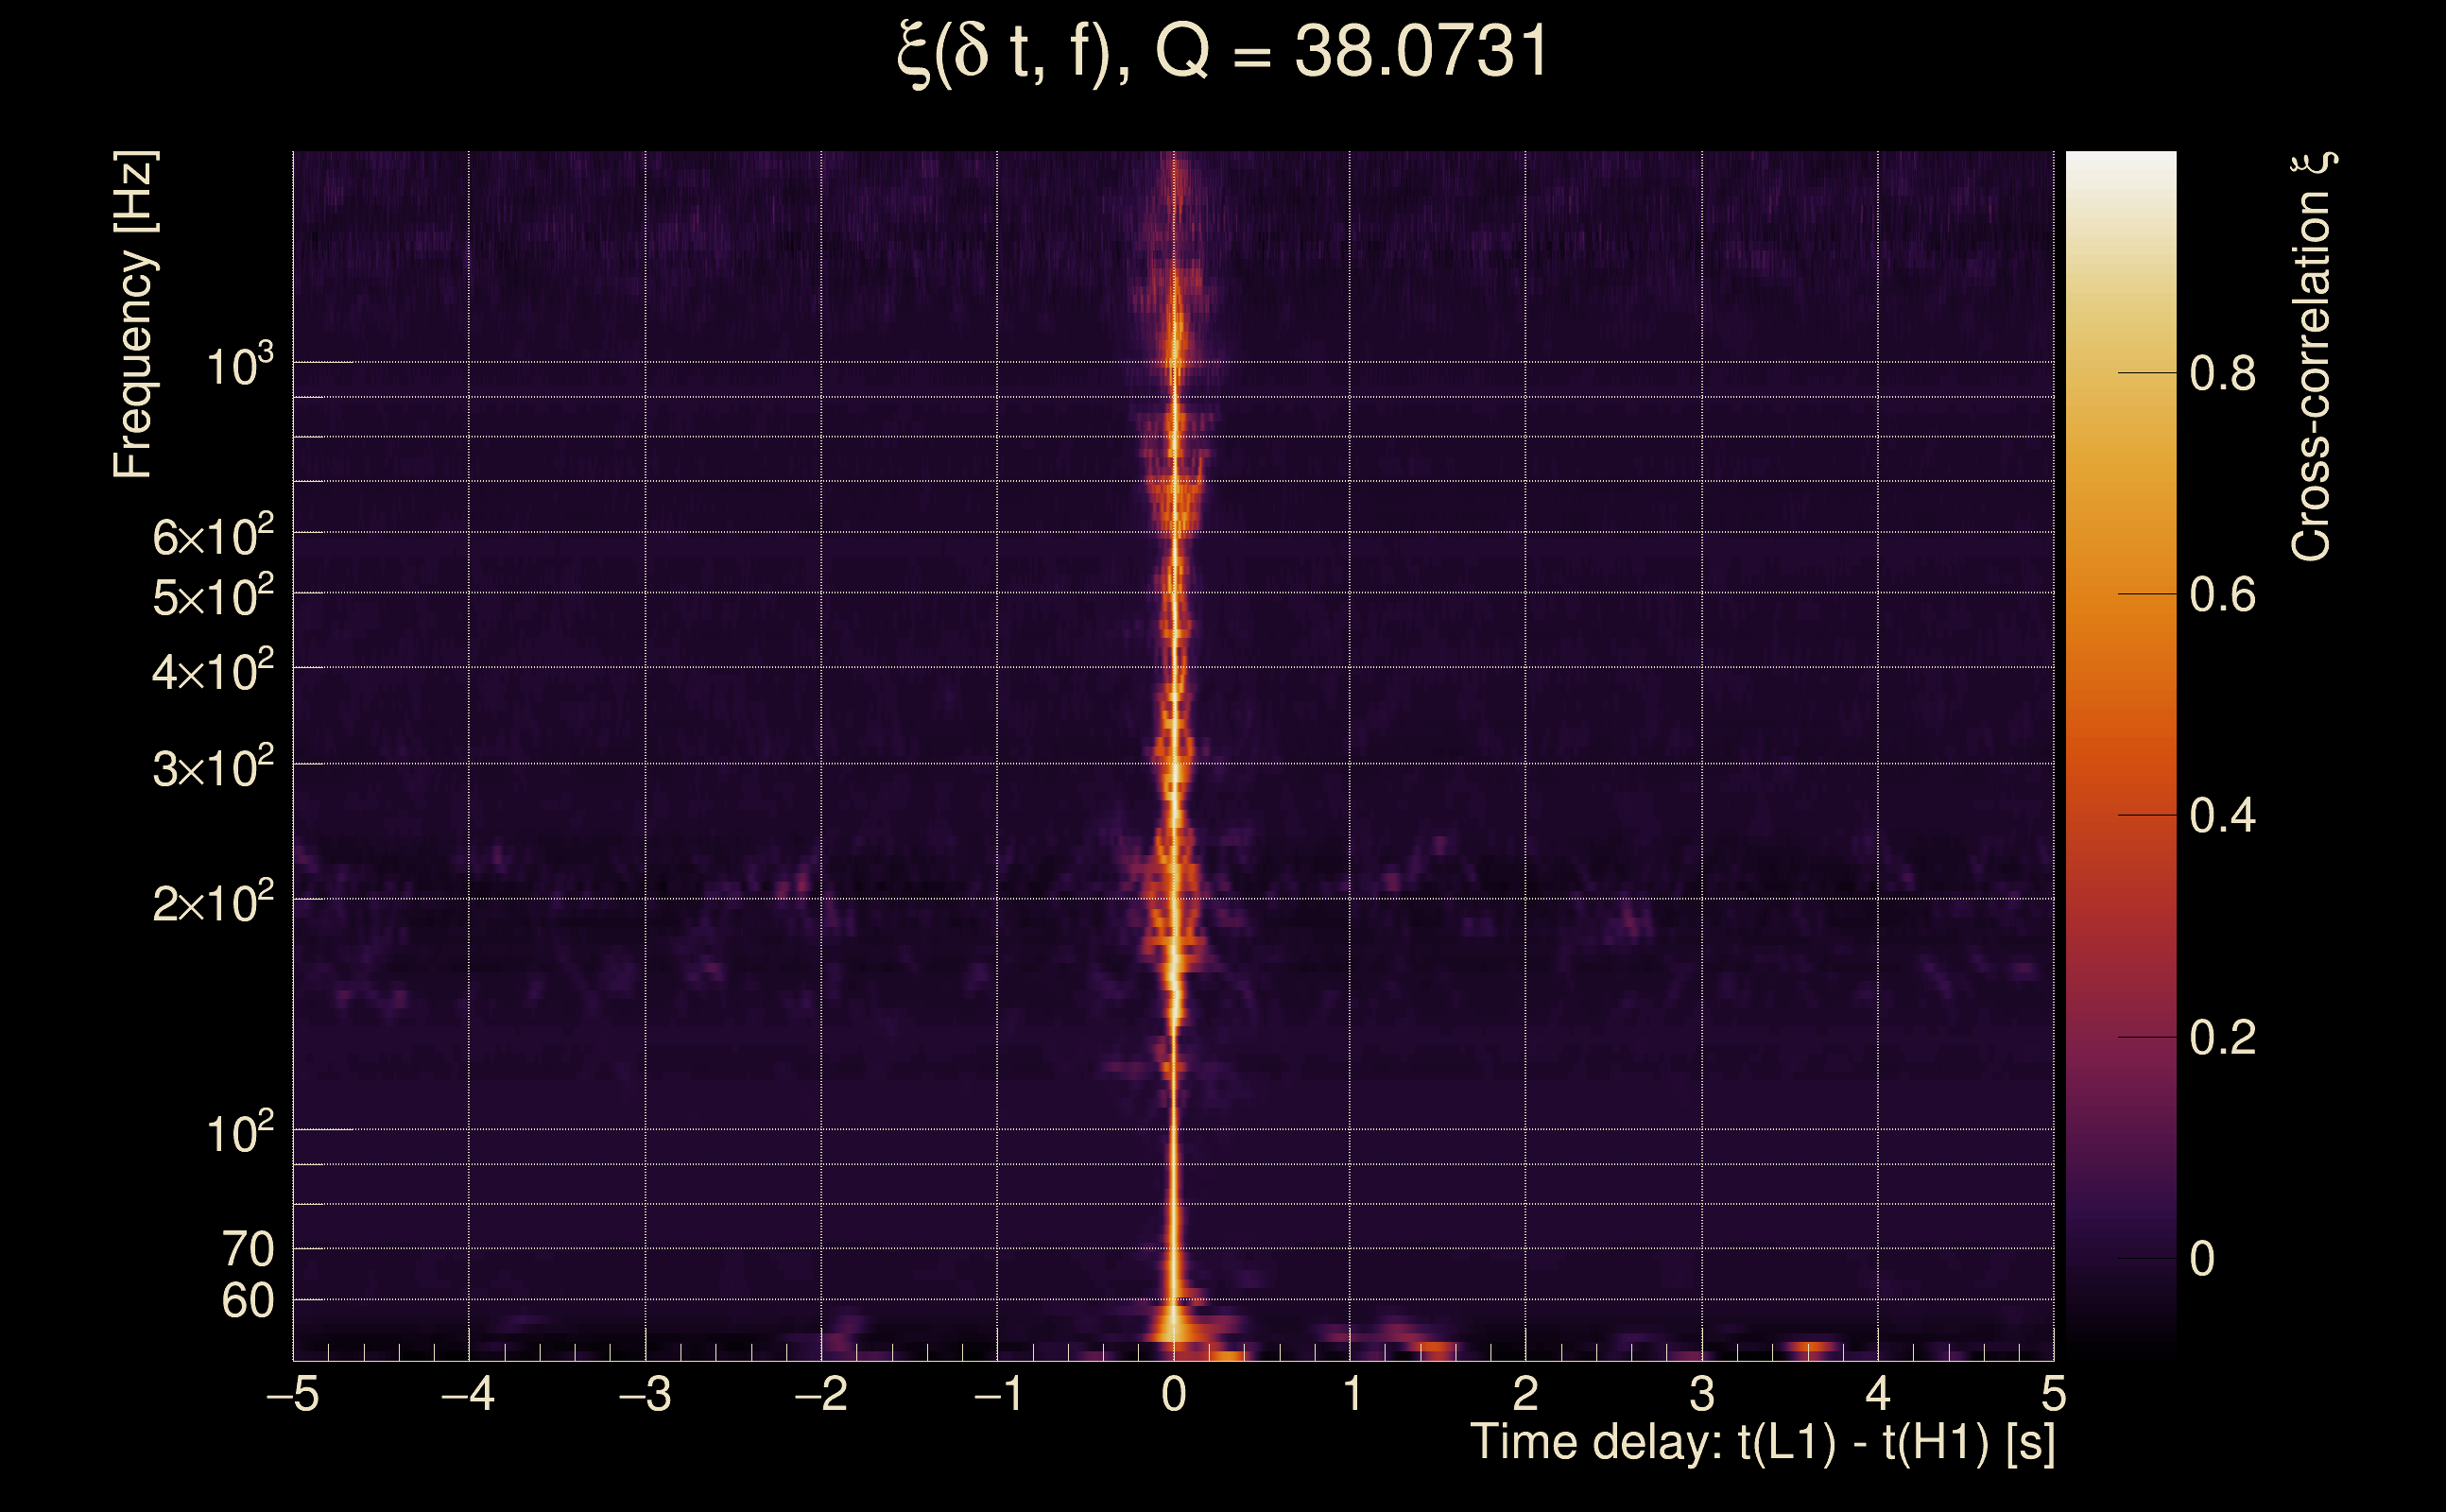
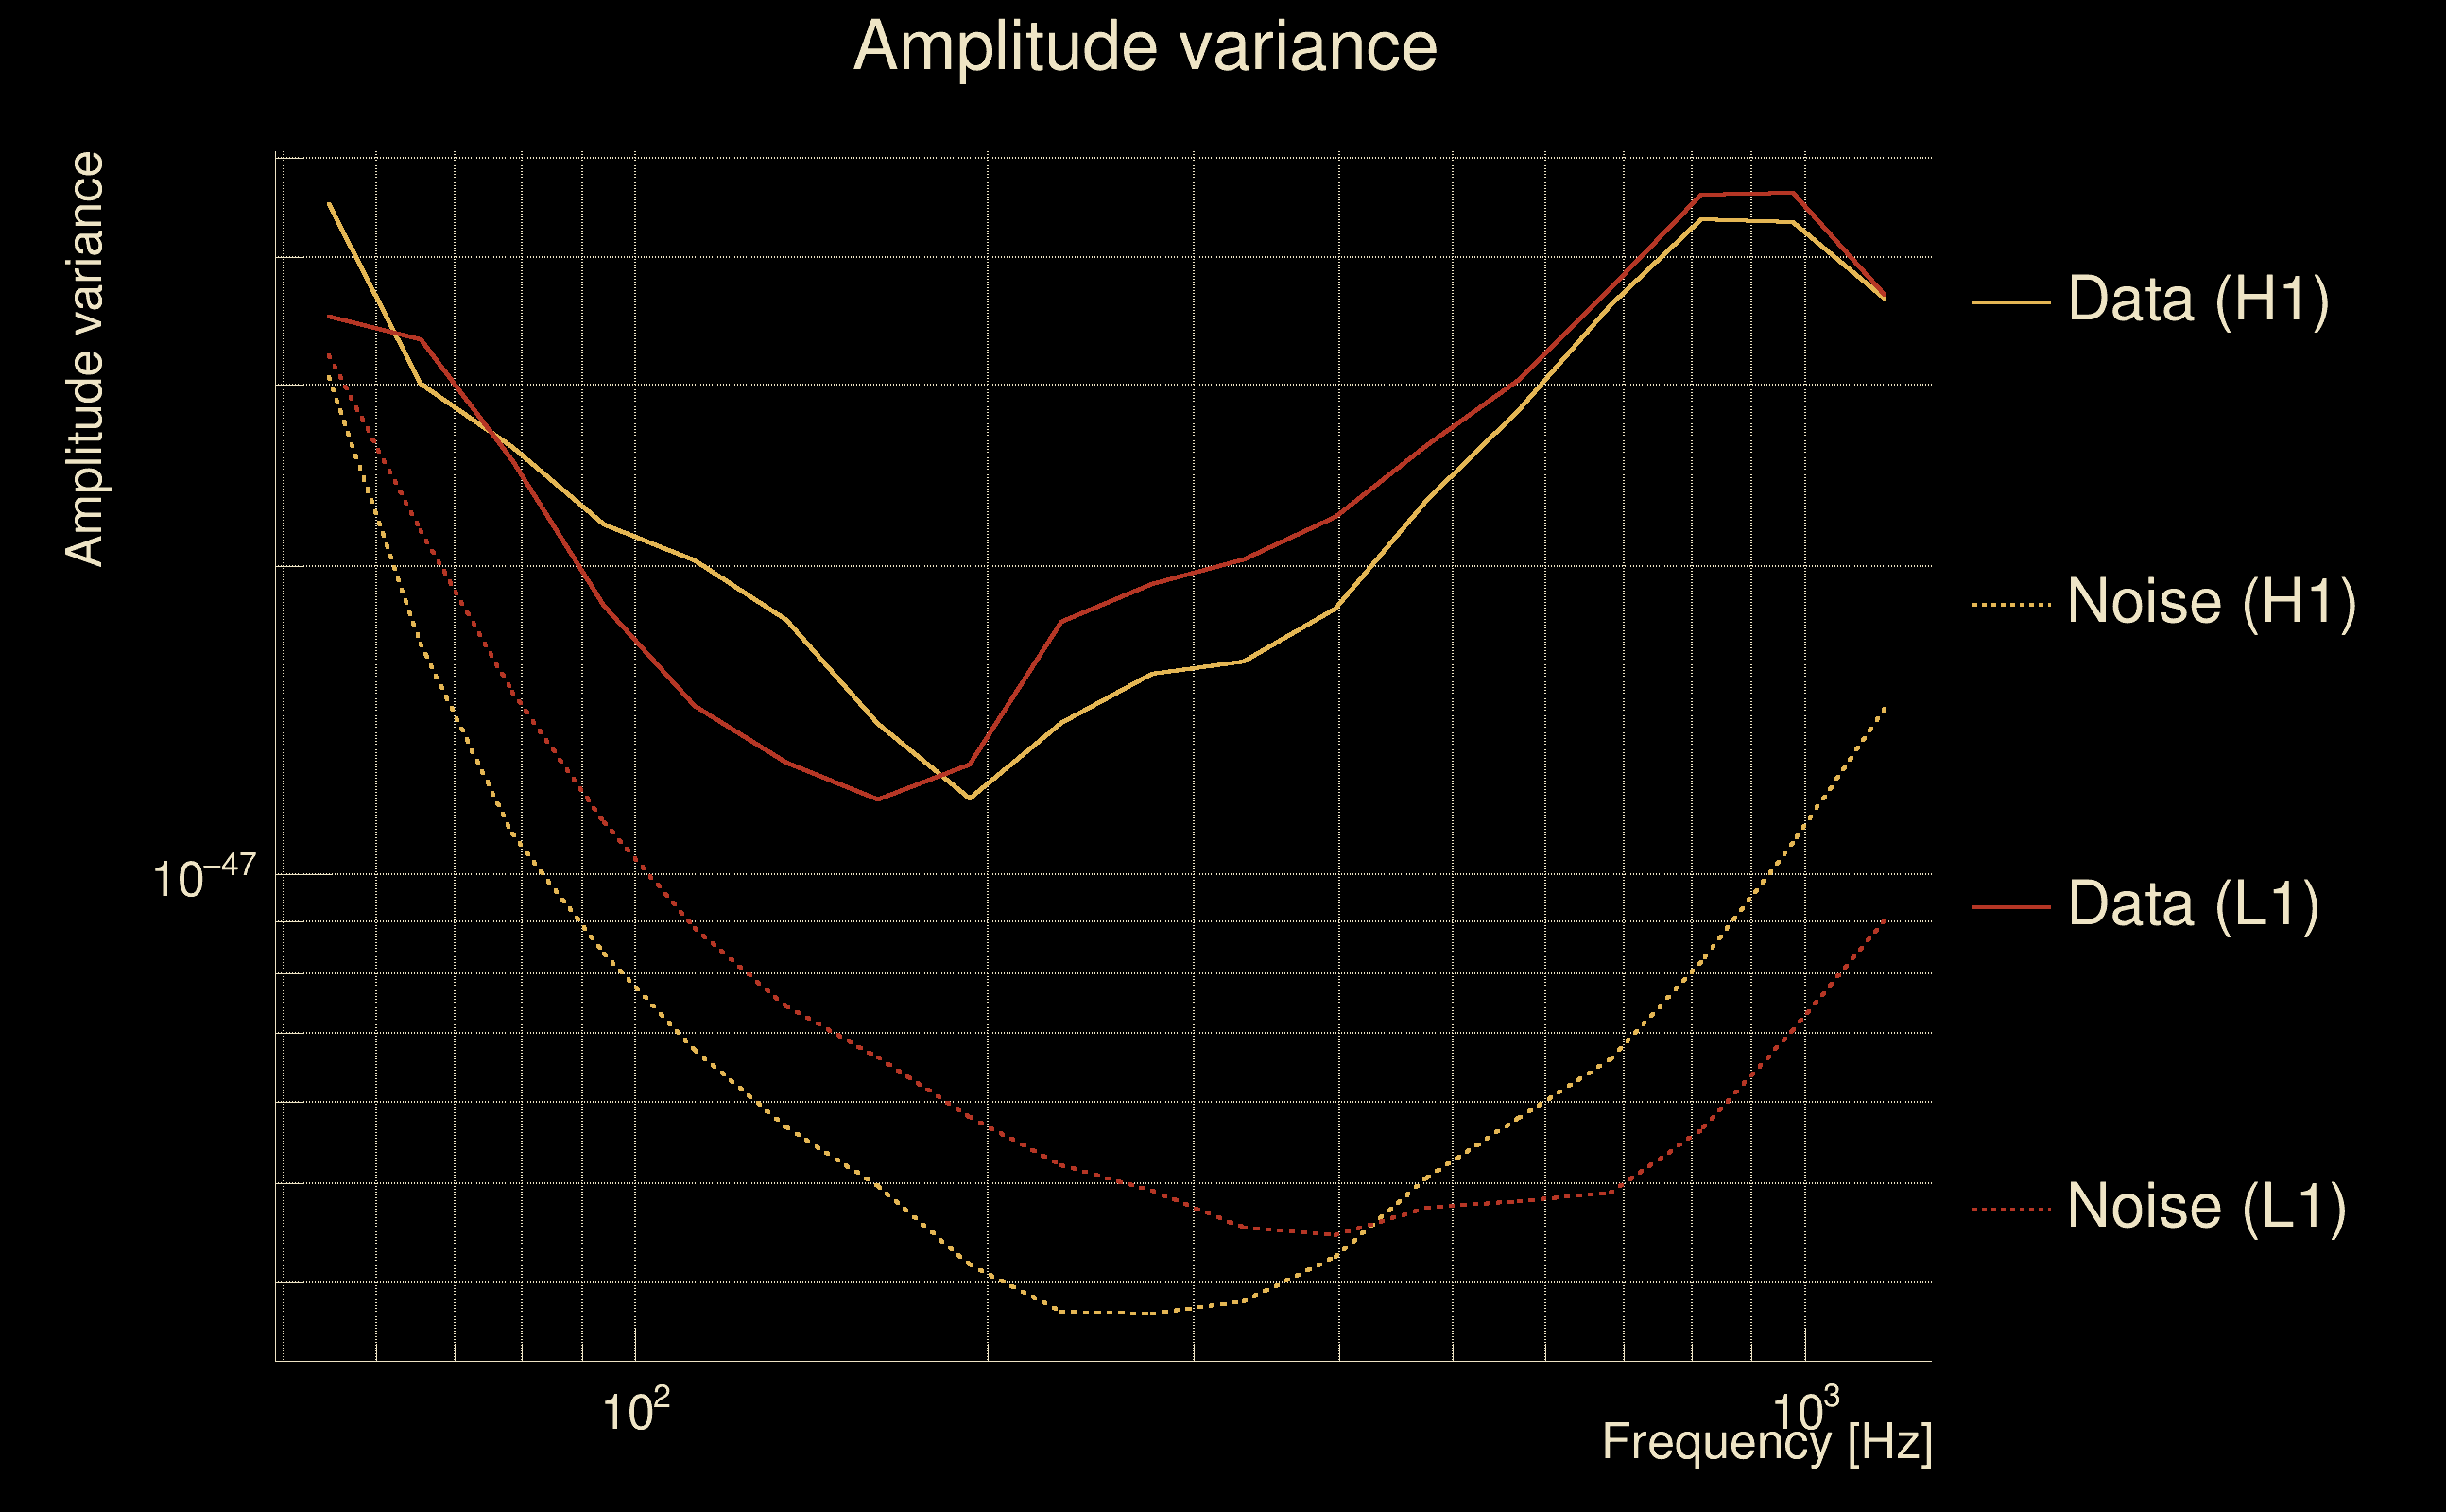
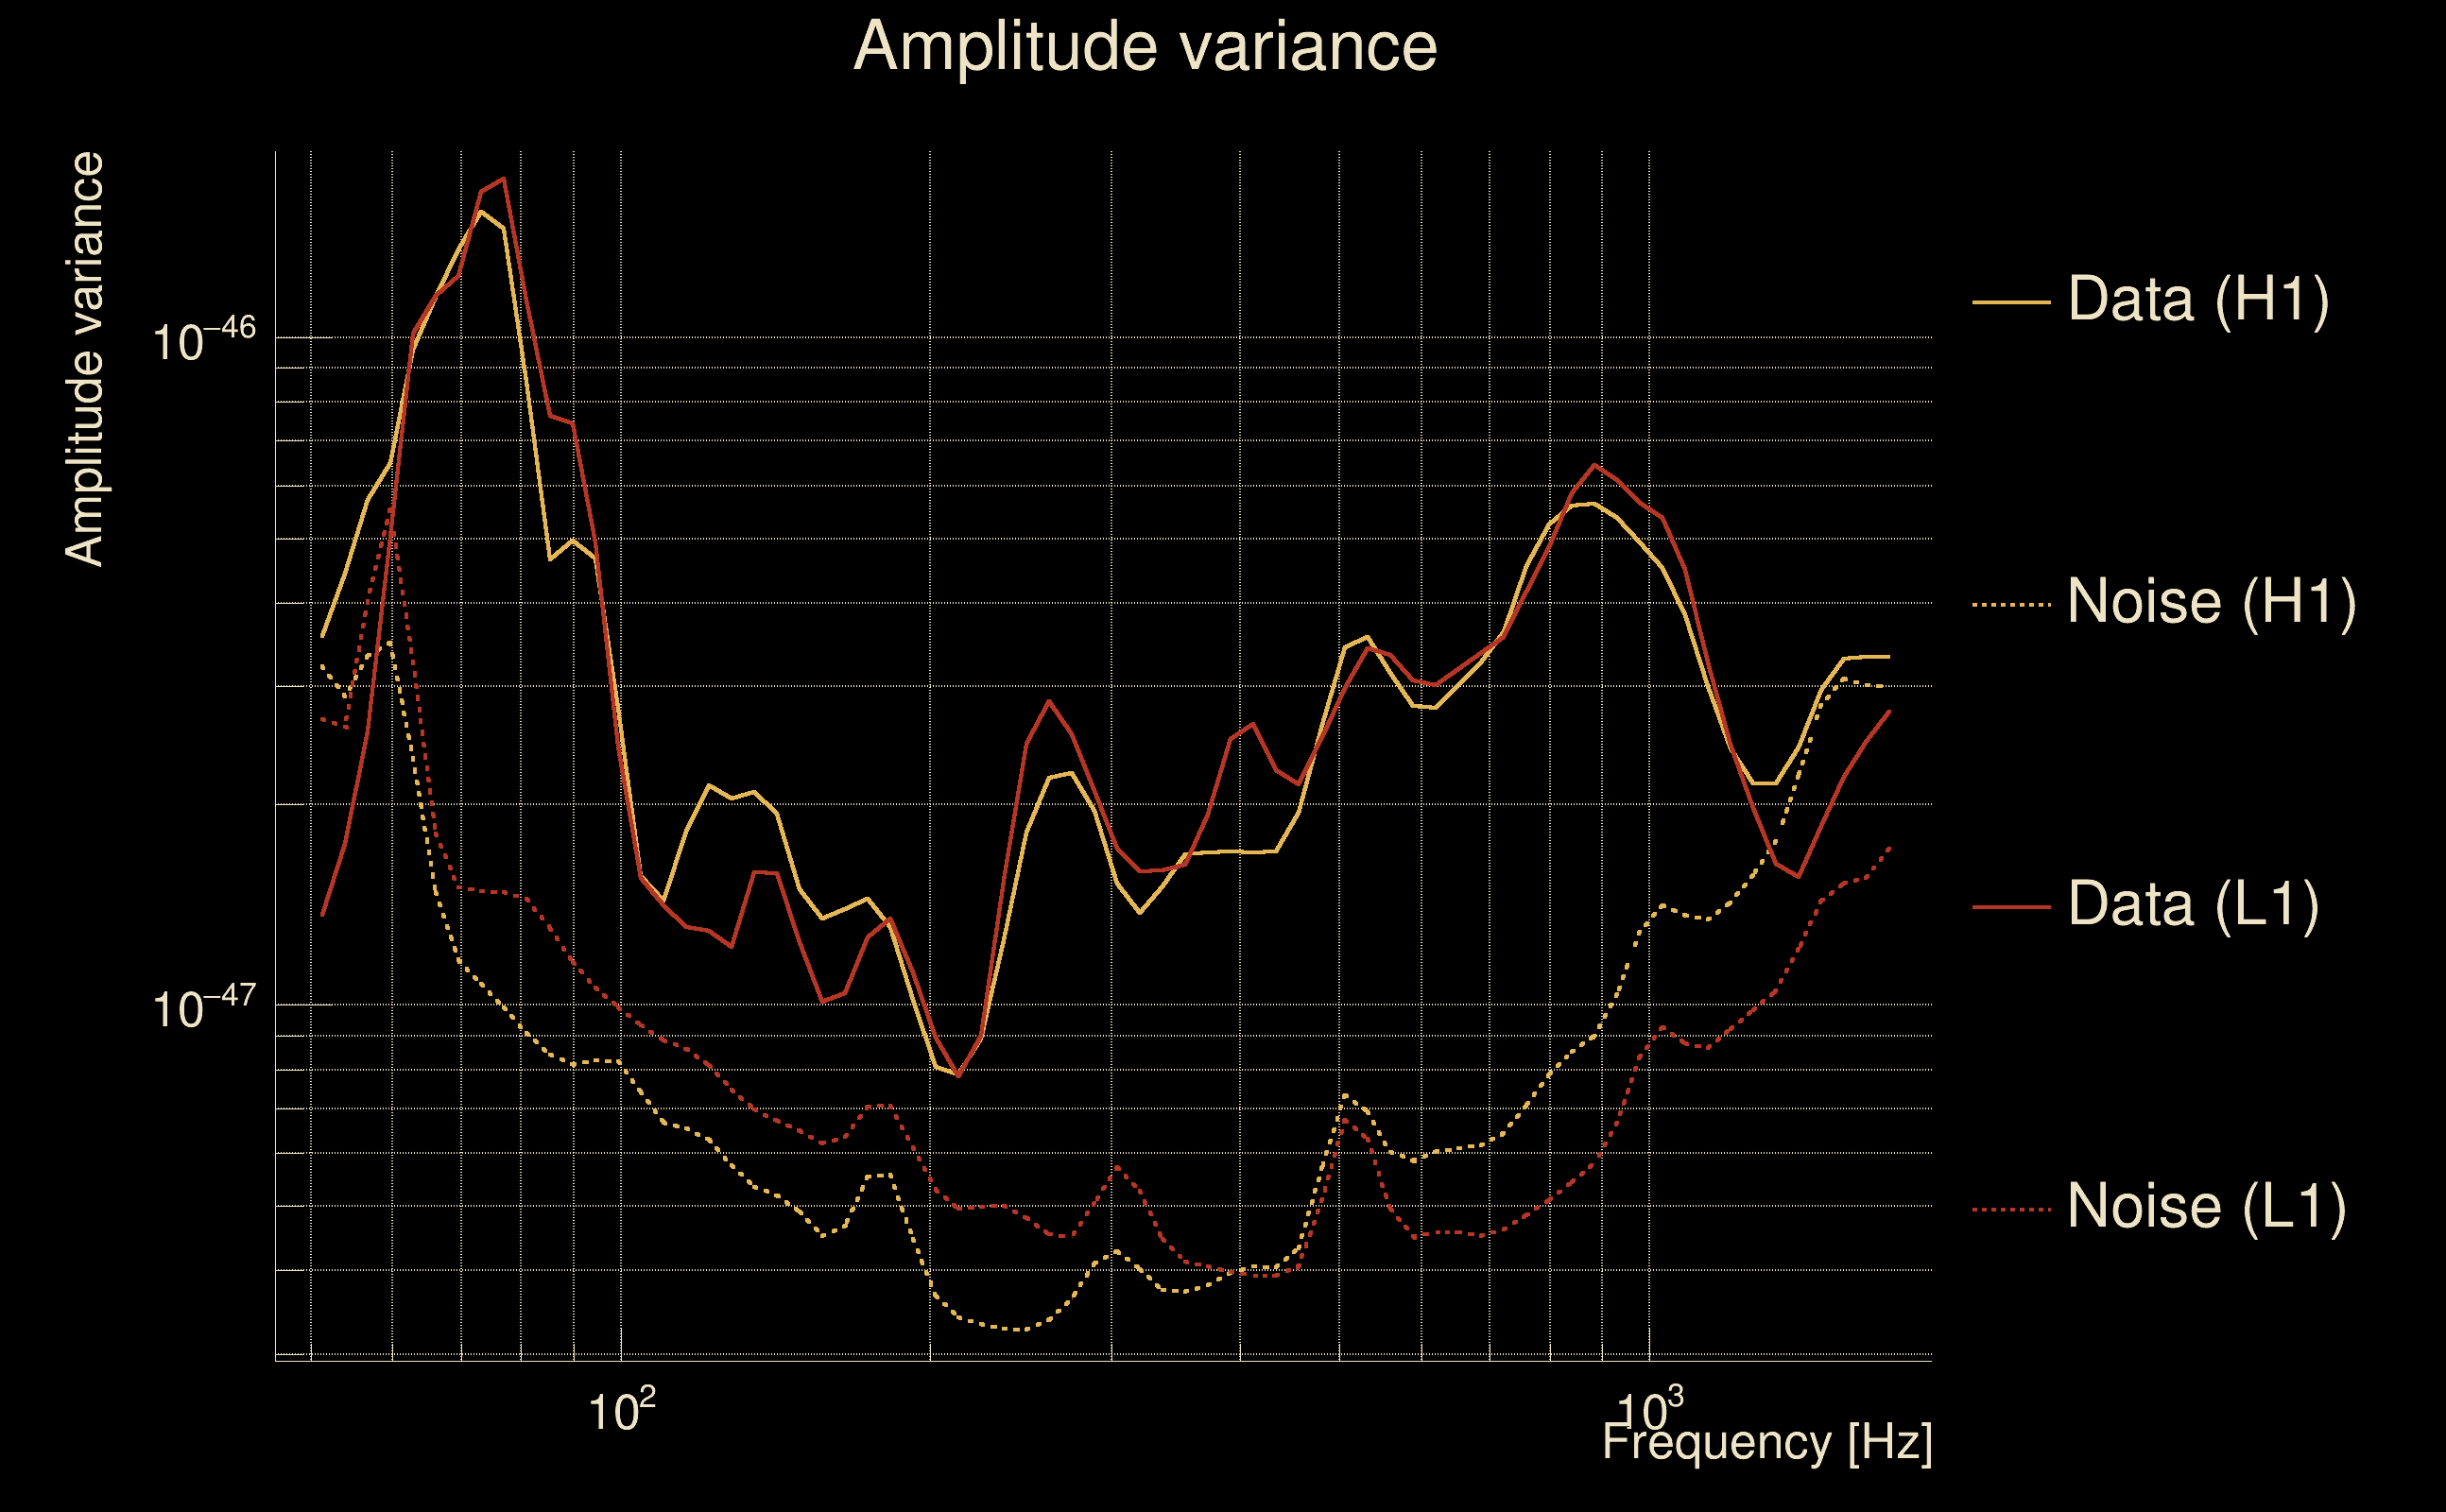
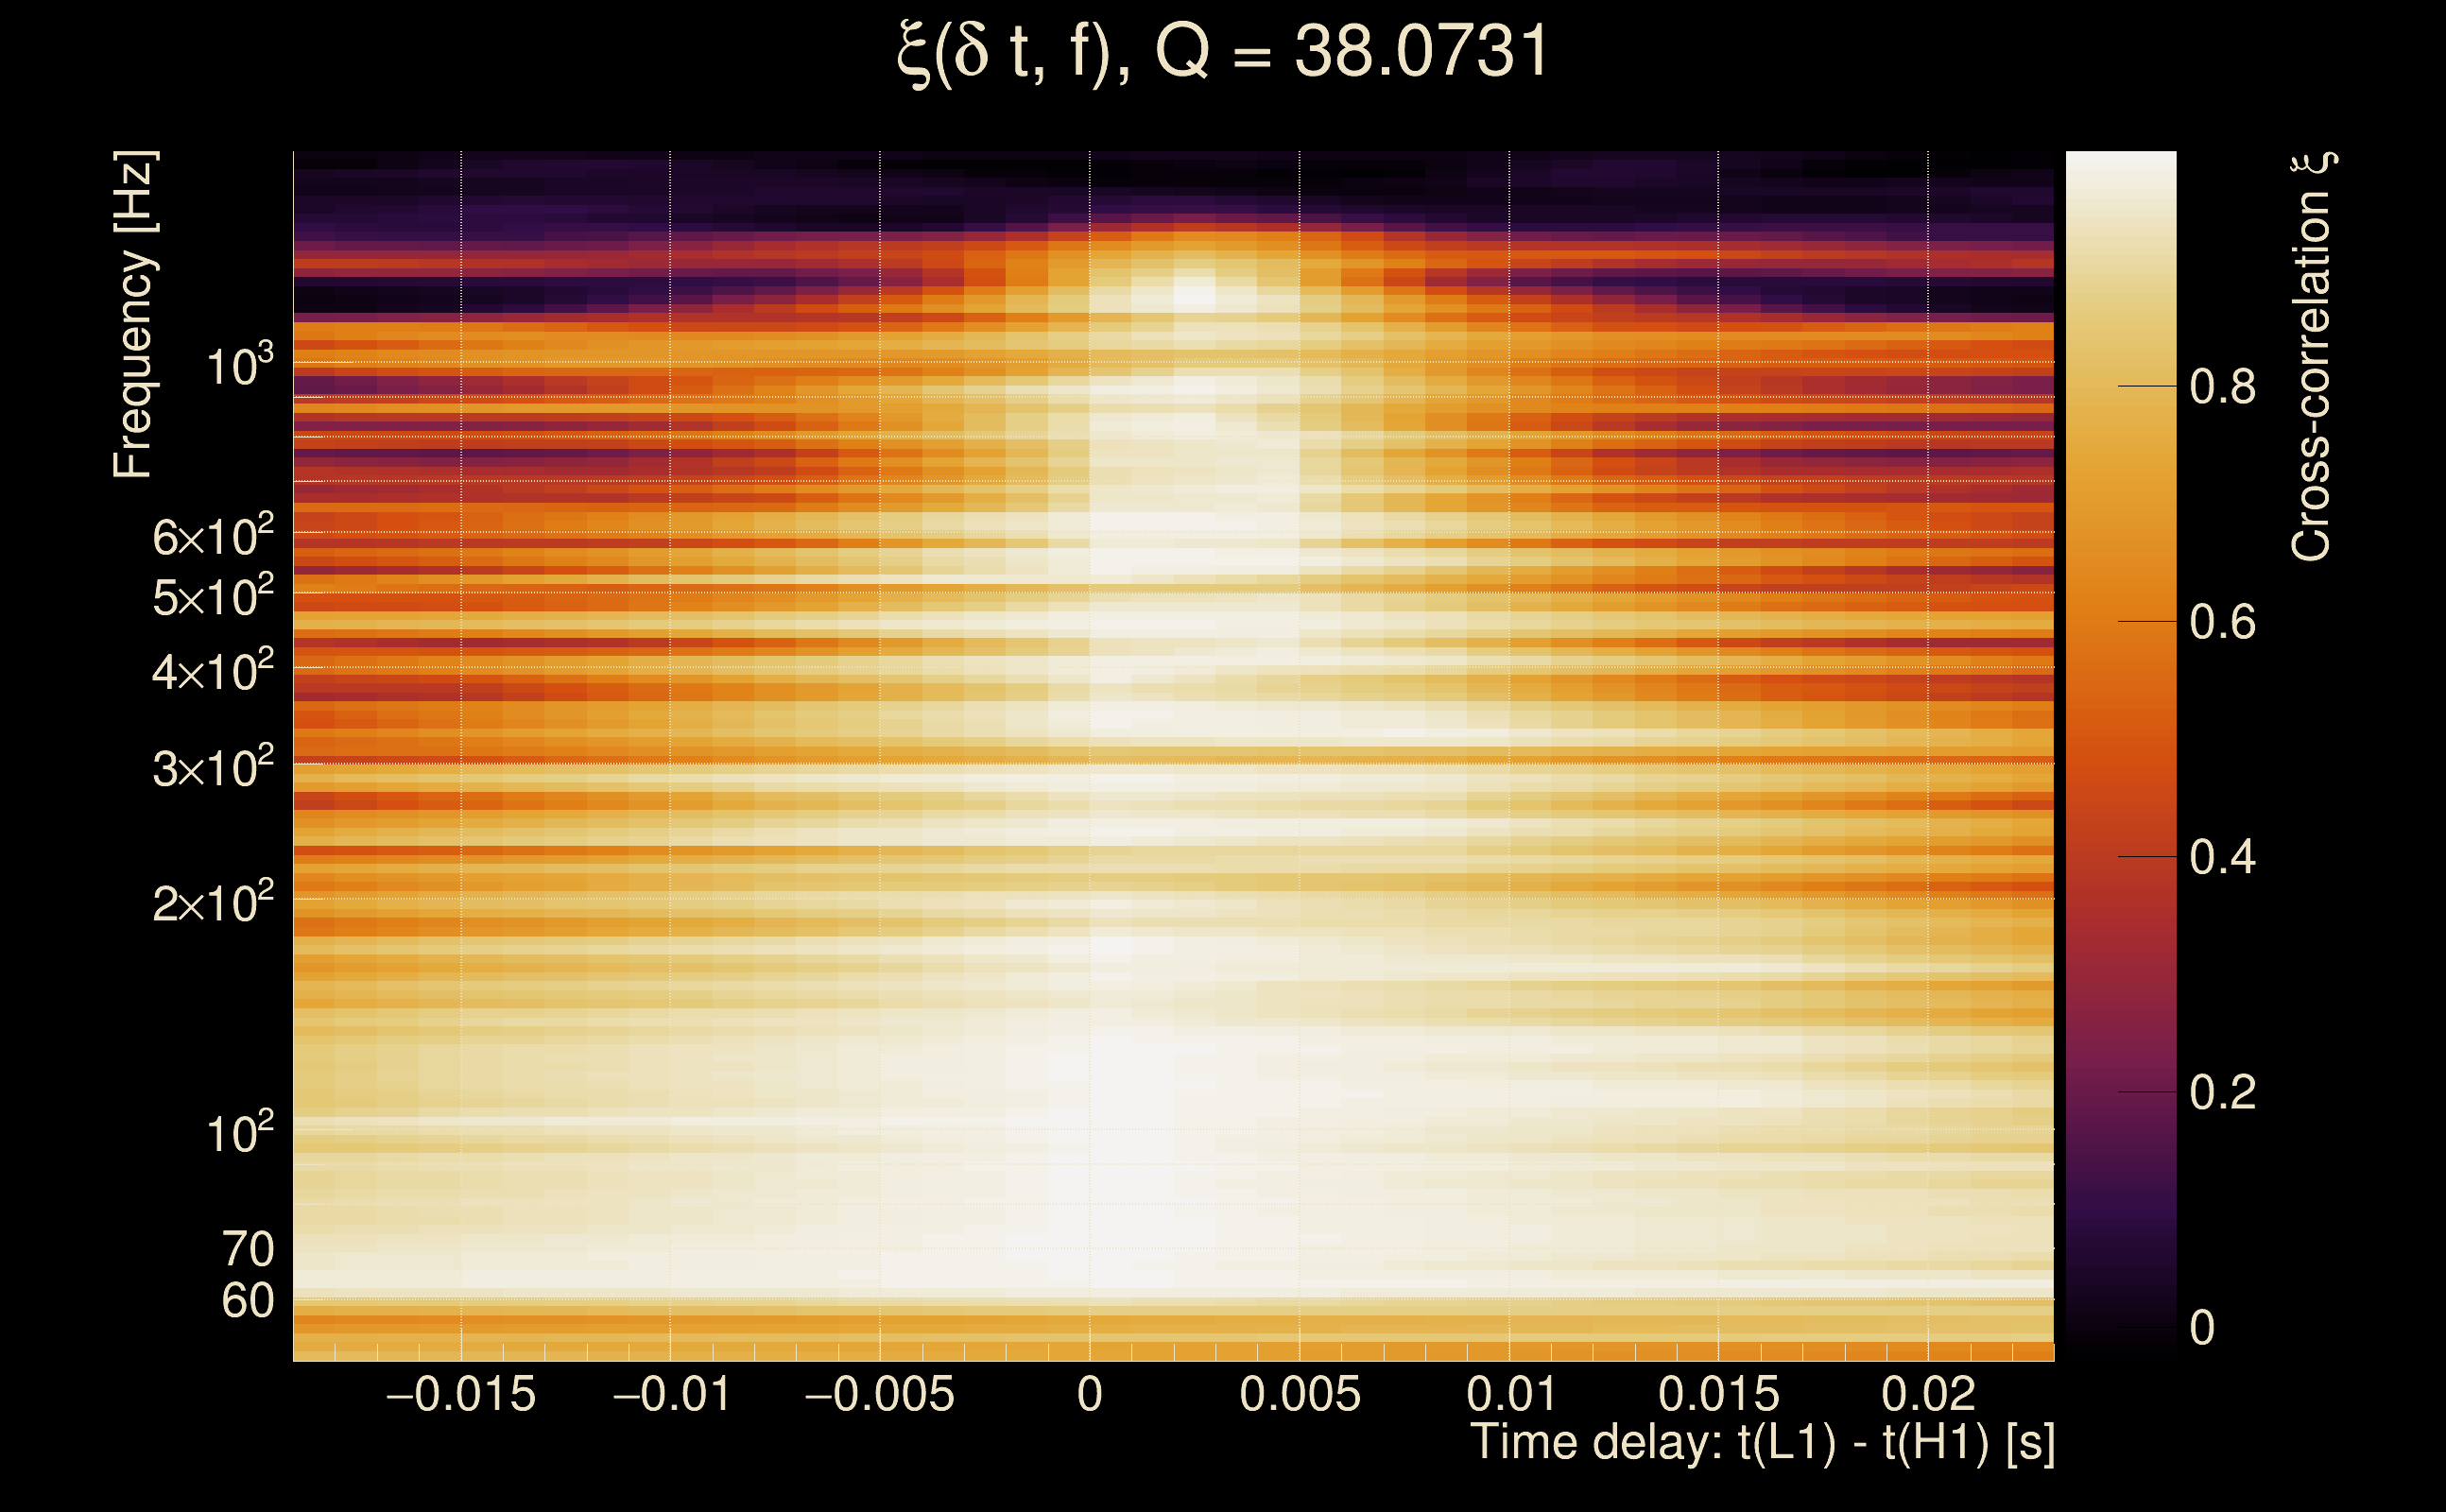
| Event time t(H1): | GPS = 1368423854 (Thu May 18 05:43:56 2023 ) → GPS = 1368423864 (Thu May 18 05:44:06 2023 ) |
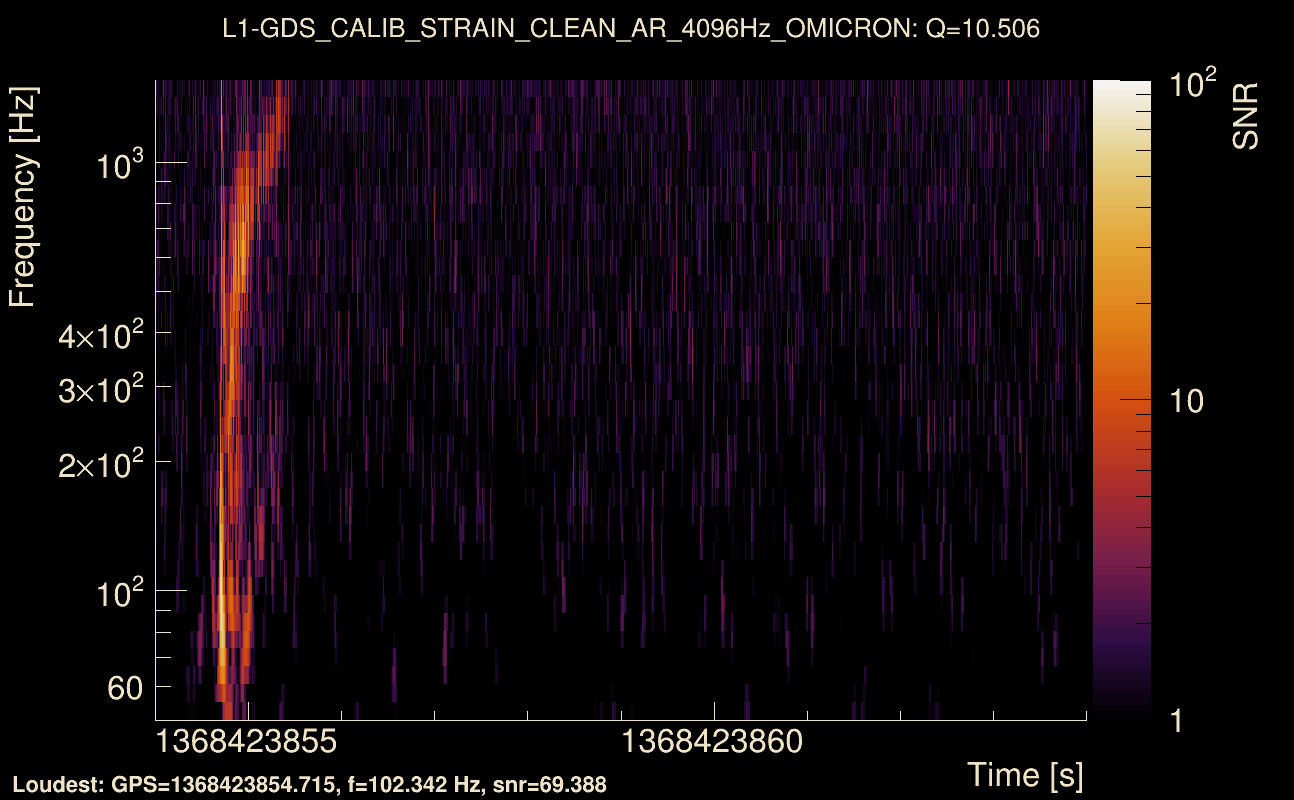
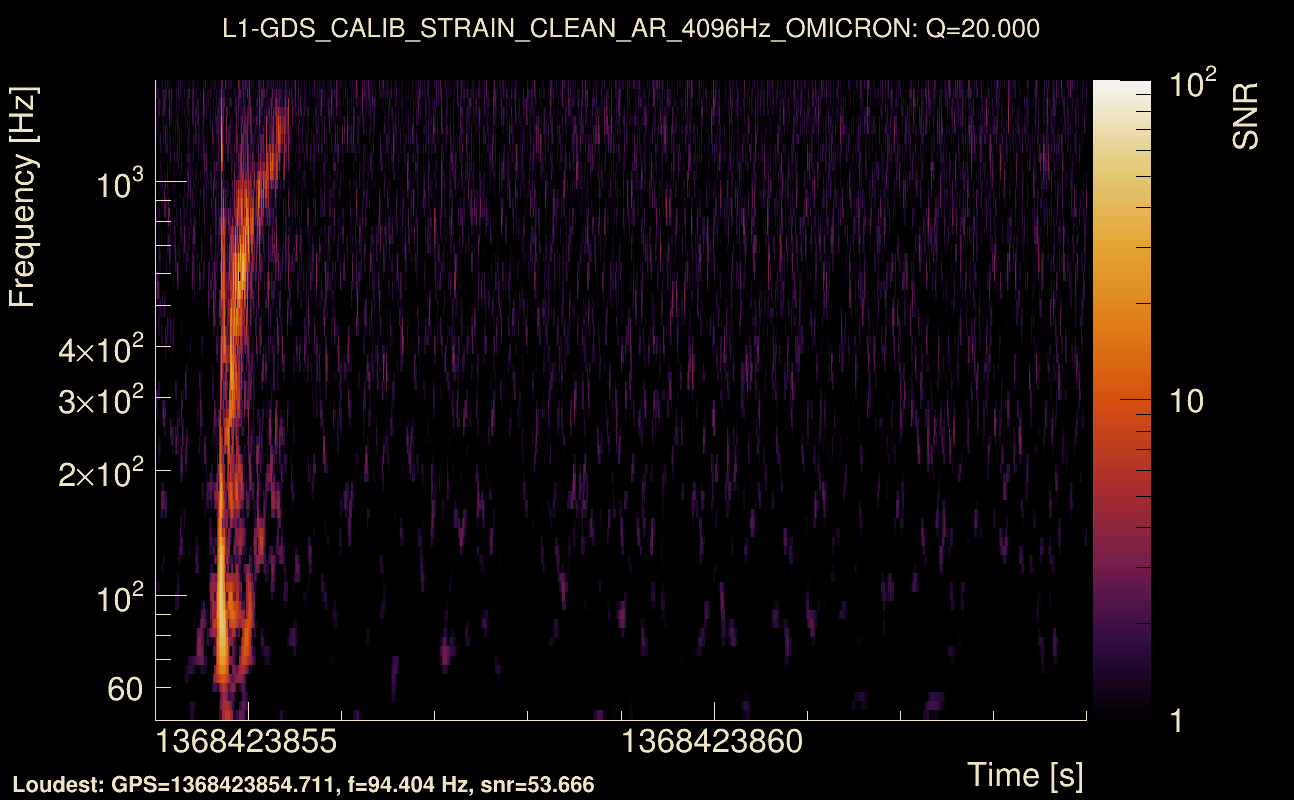
| Event time t(L1): | GPS = 1368423854 (Thu May 18 05:44:06 2023 ) → GPS = 1368423864 (Thu May 18 05:44:06 2023 ) |
| Omicron analysis time window (H1): | GPS = 1368423851 → GPS = 1368423867 |
| Omicron analysis time window (L1): | GPS = 1368423851 → GPS = 1368423867 |
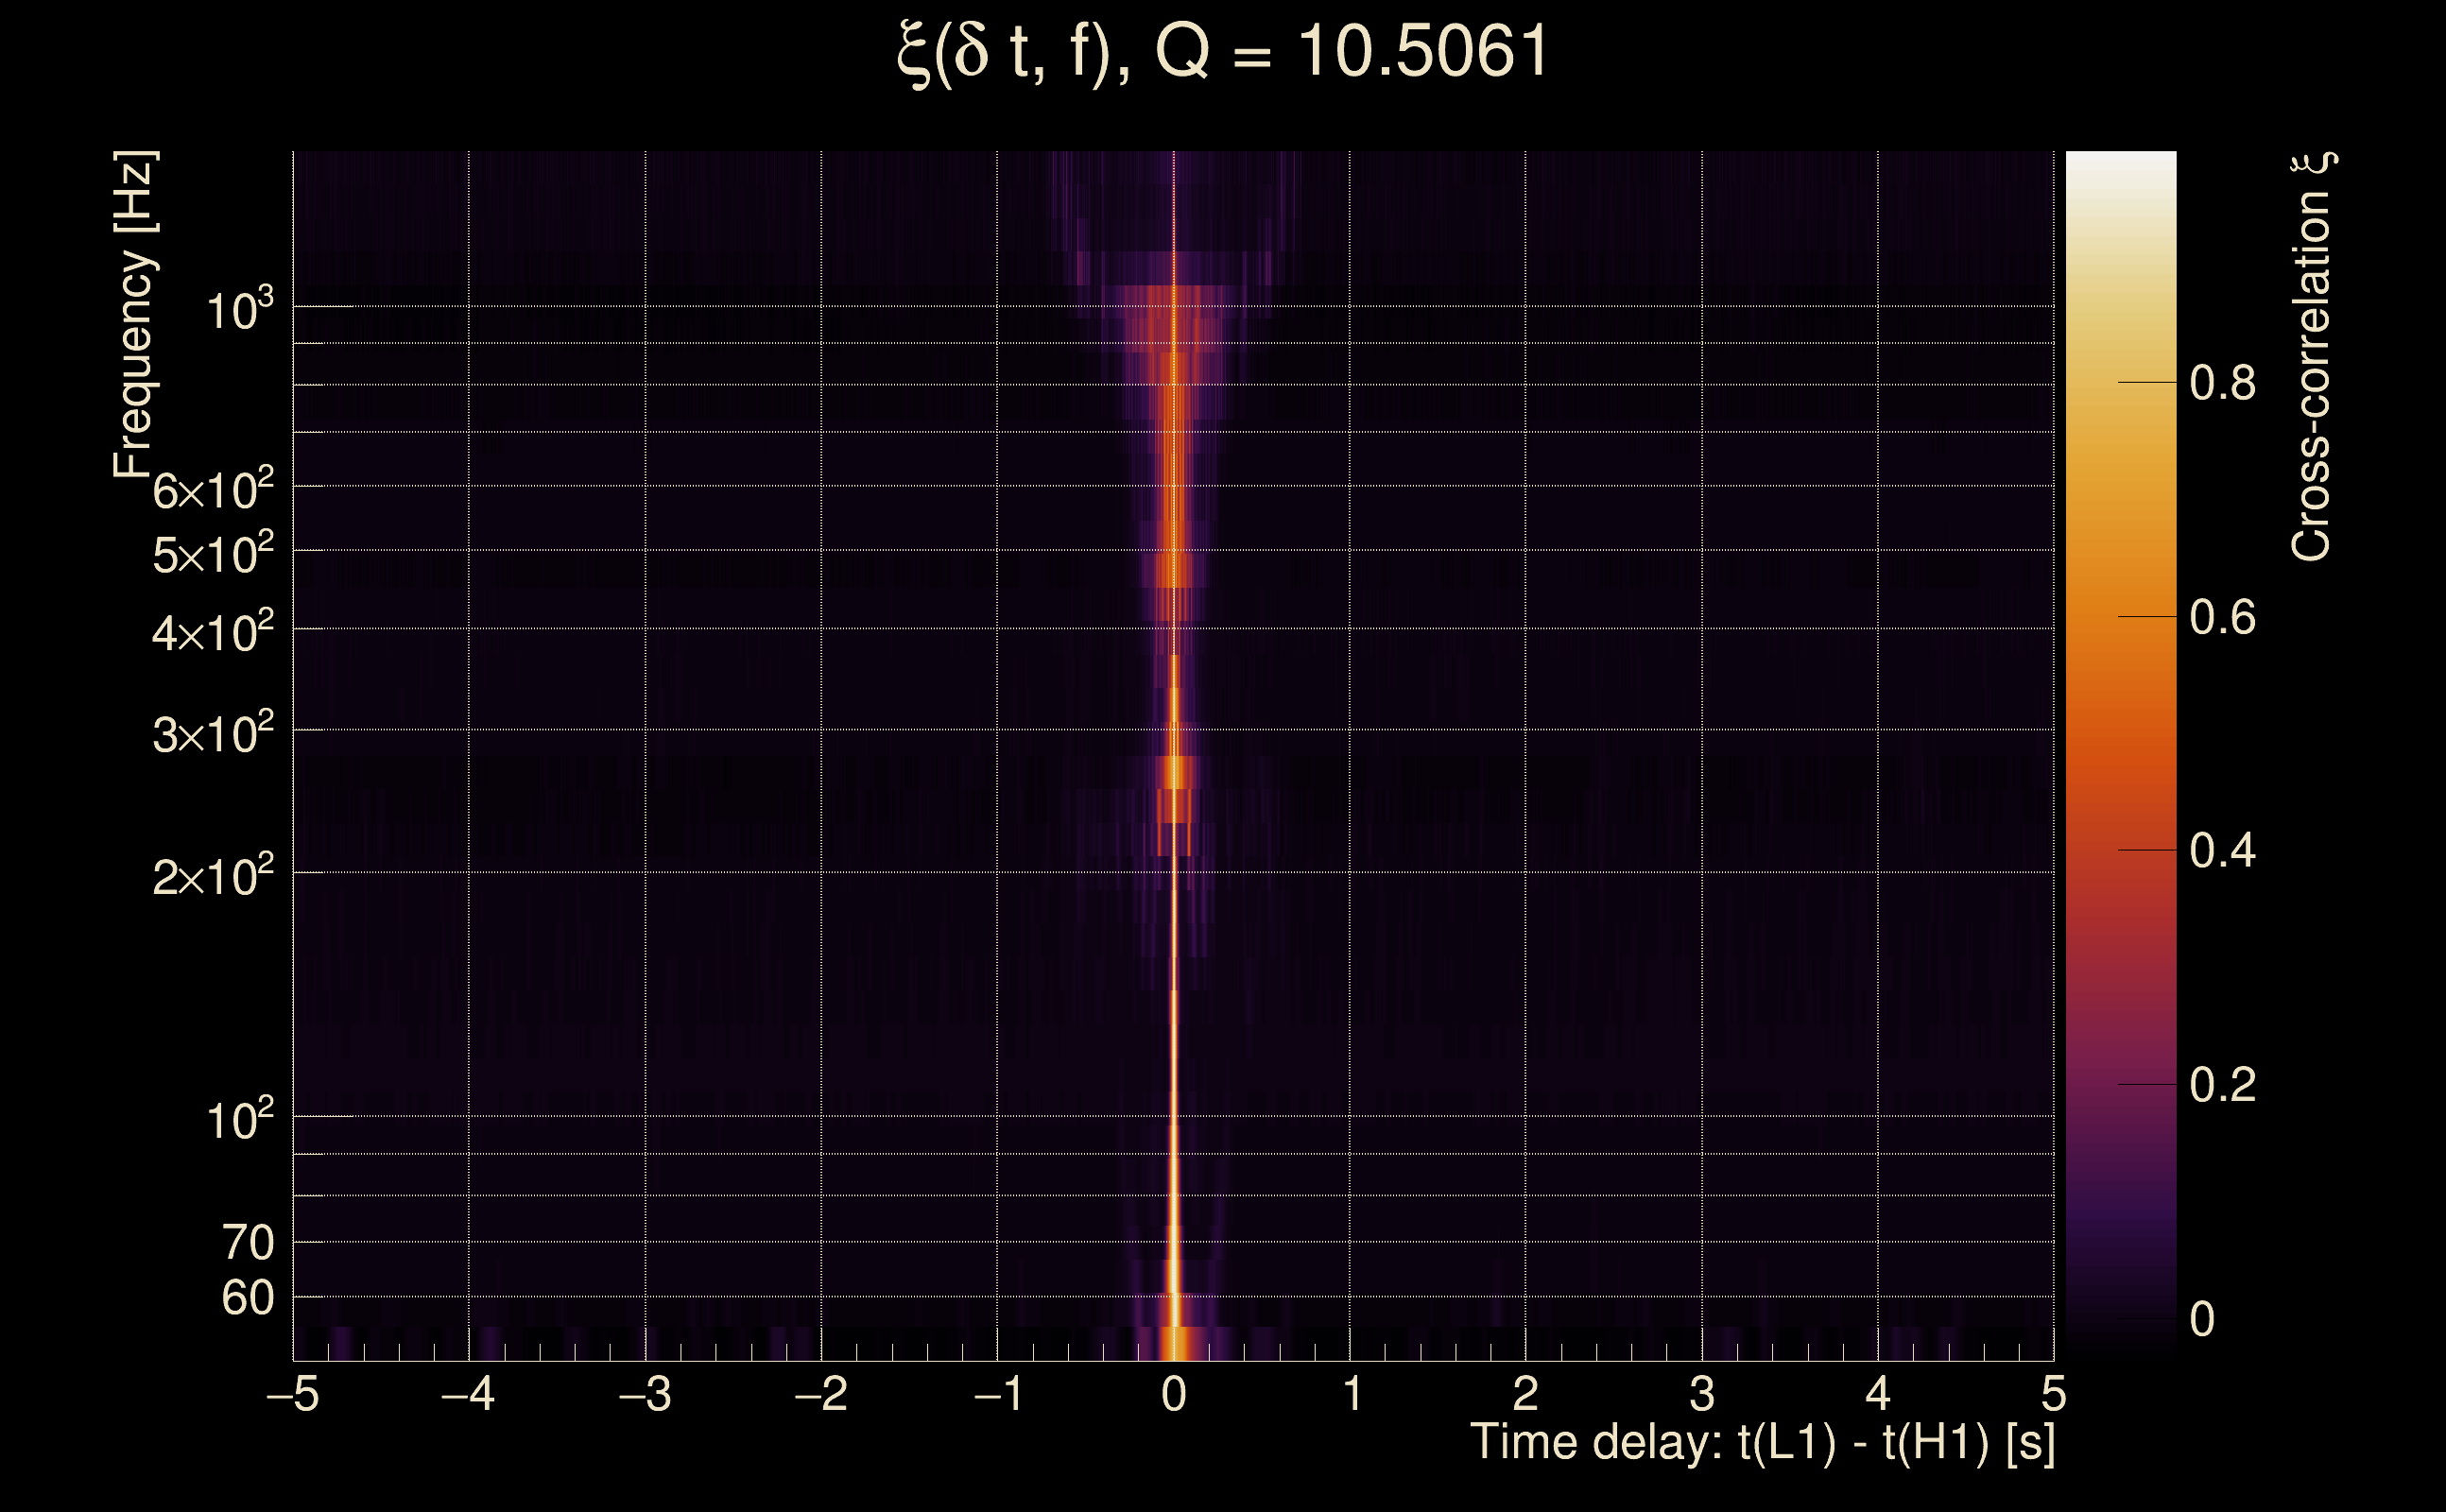
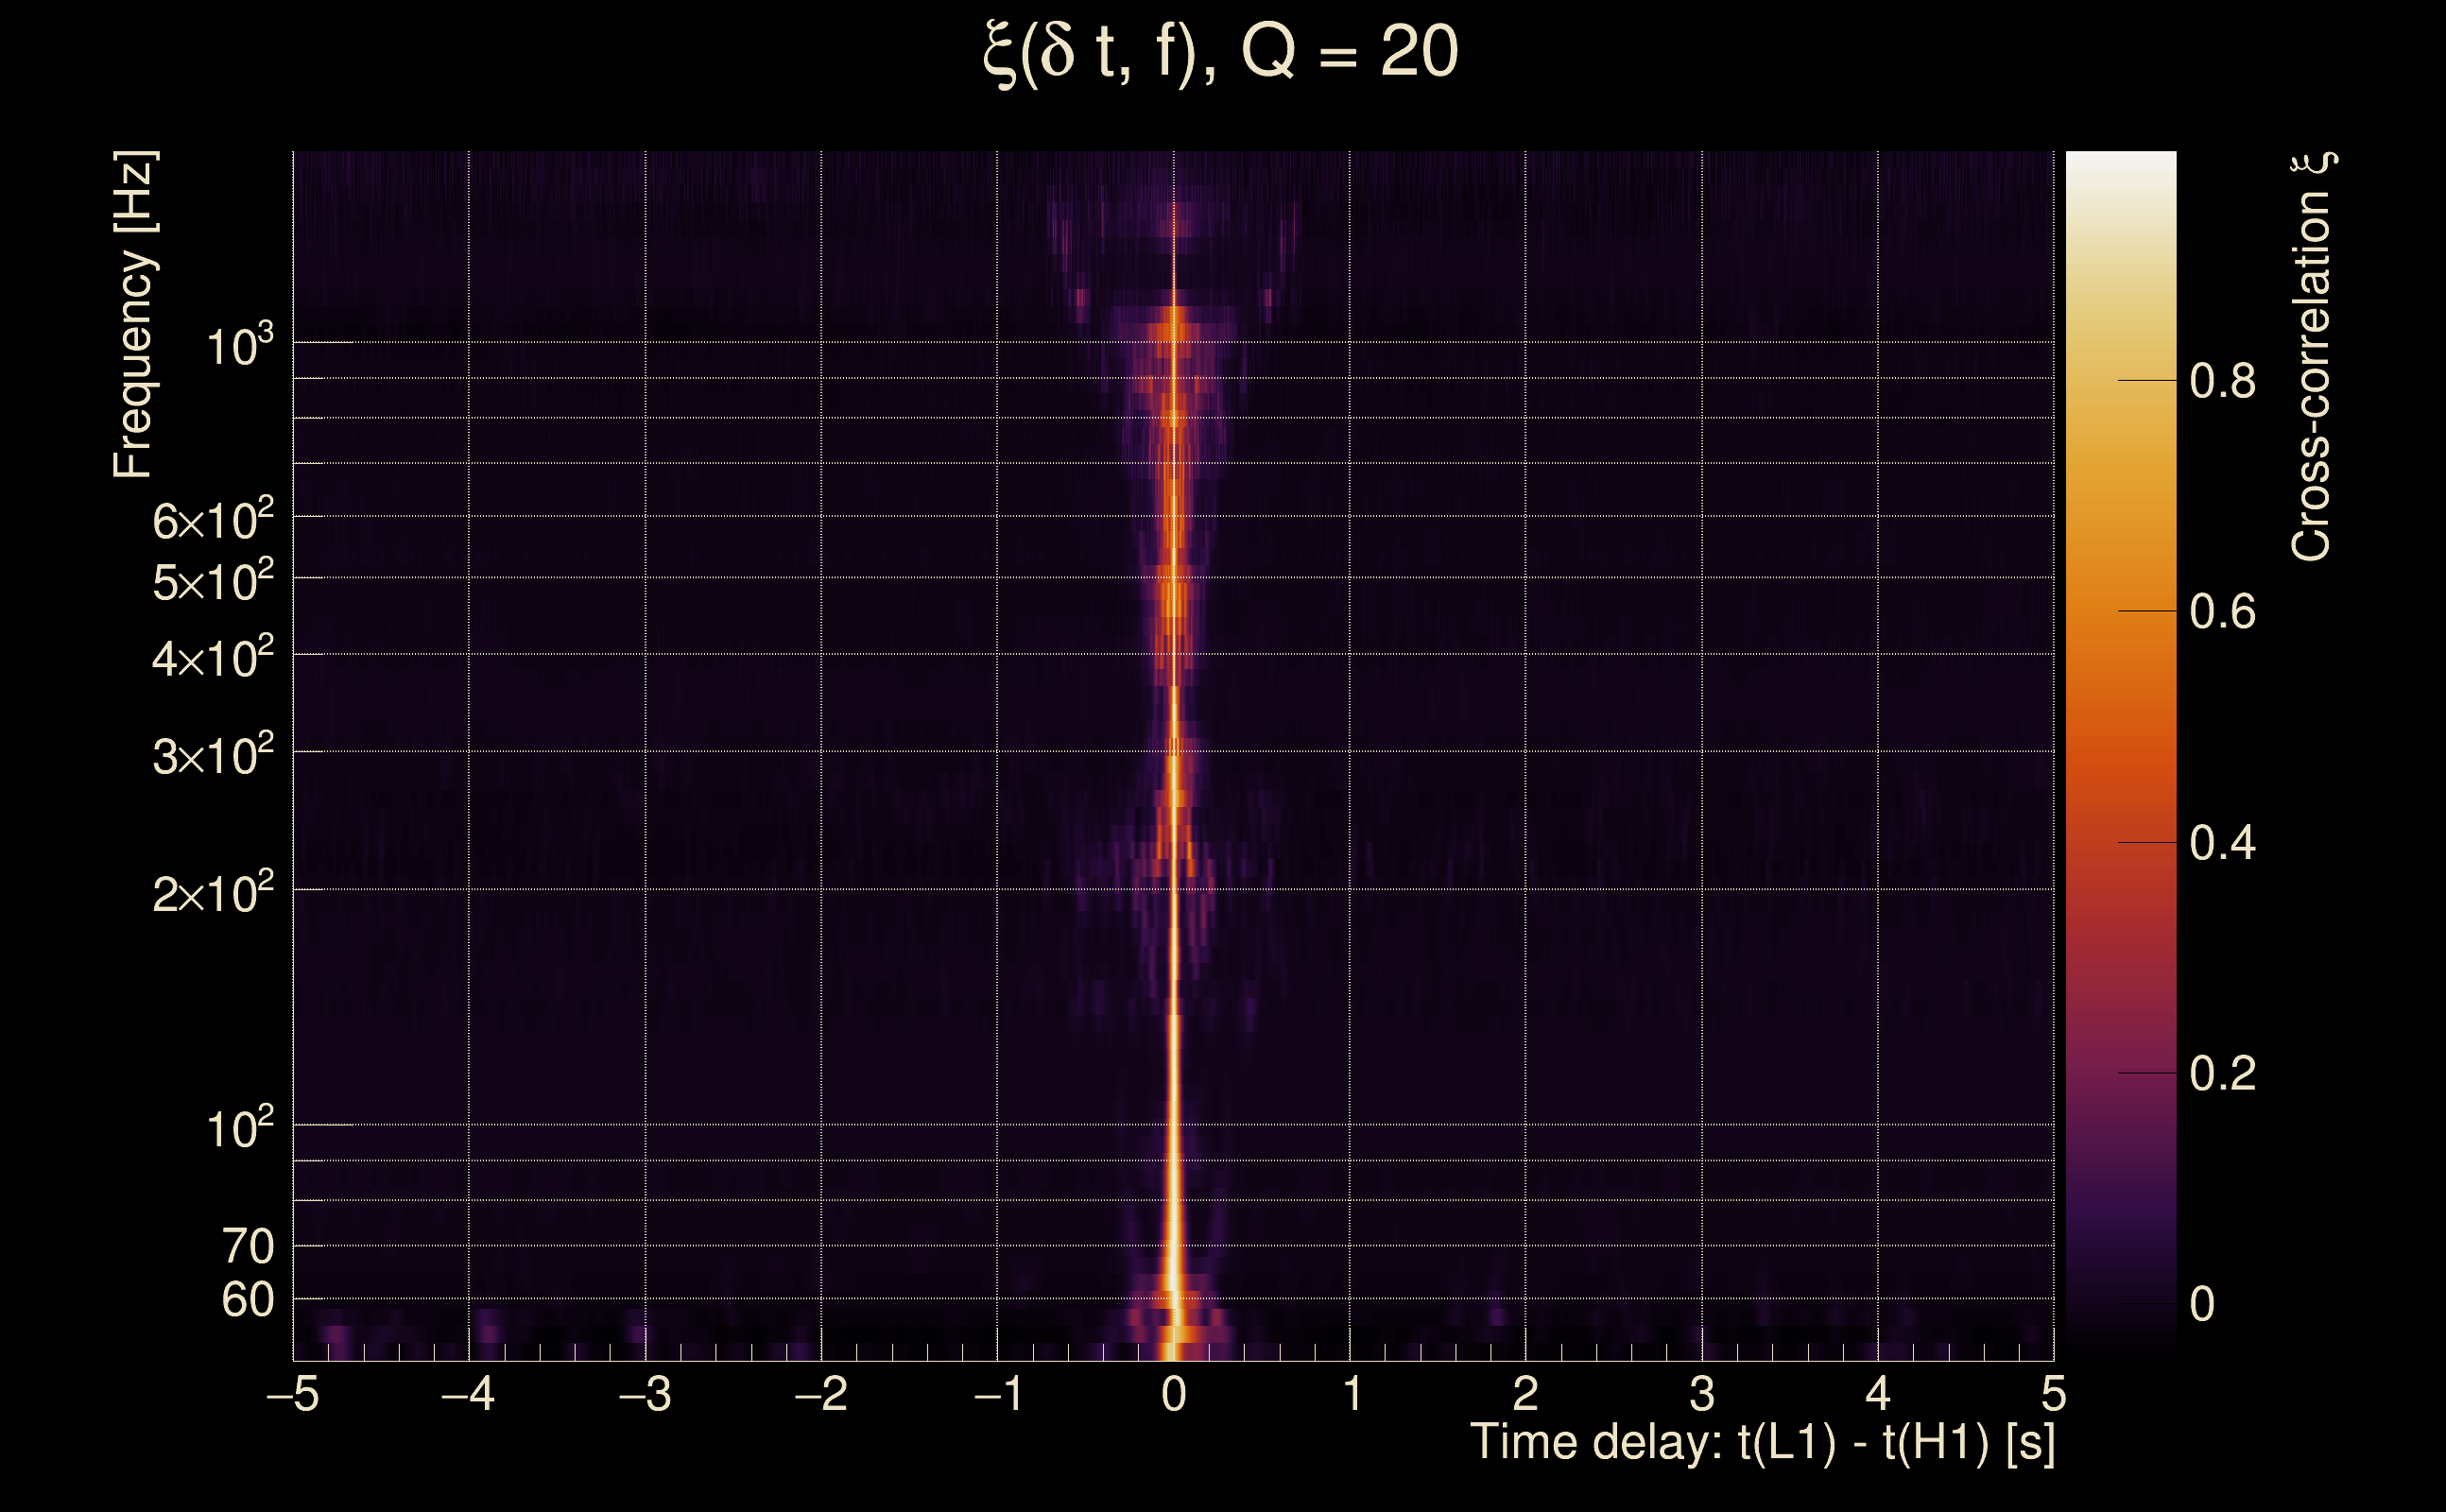
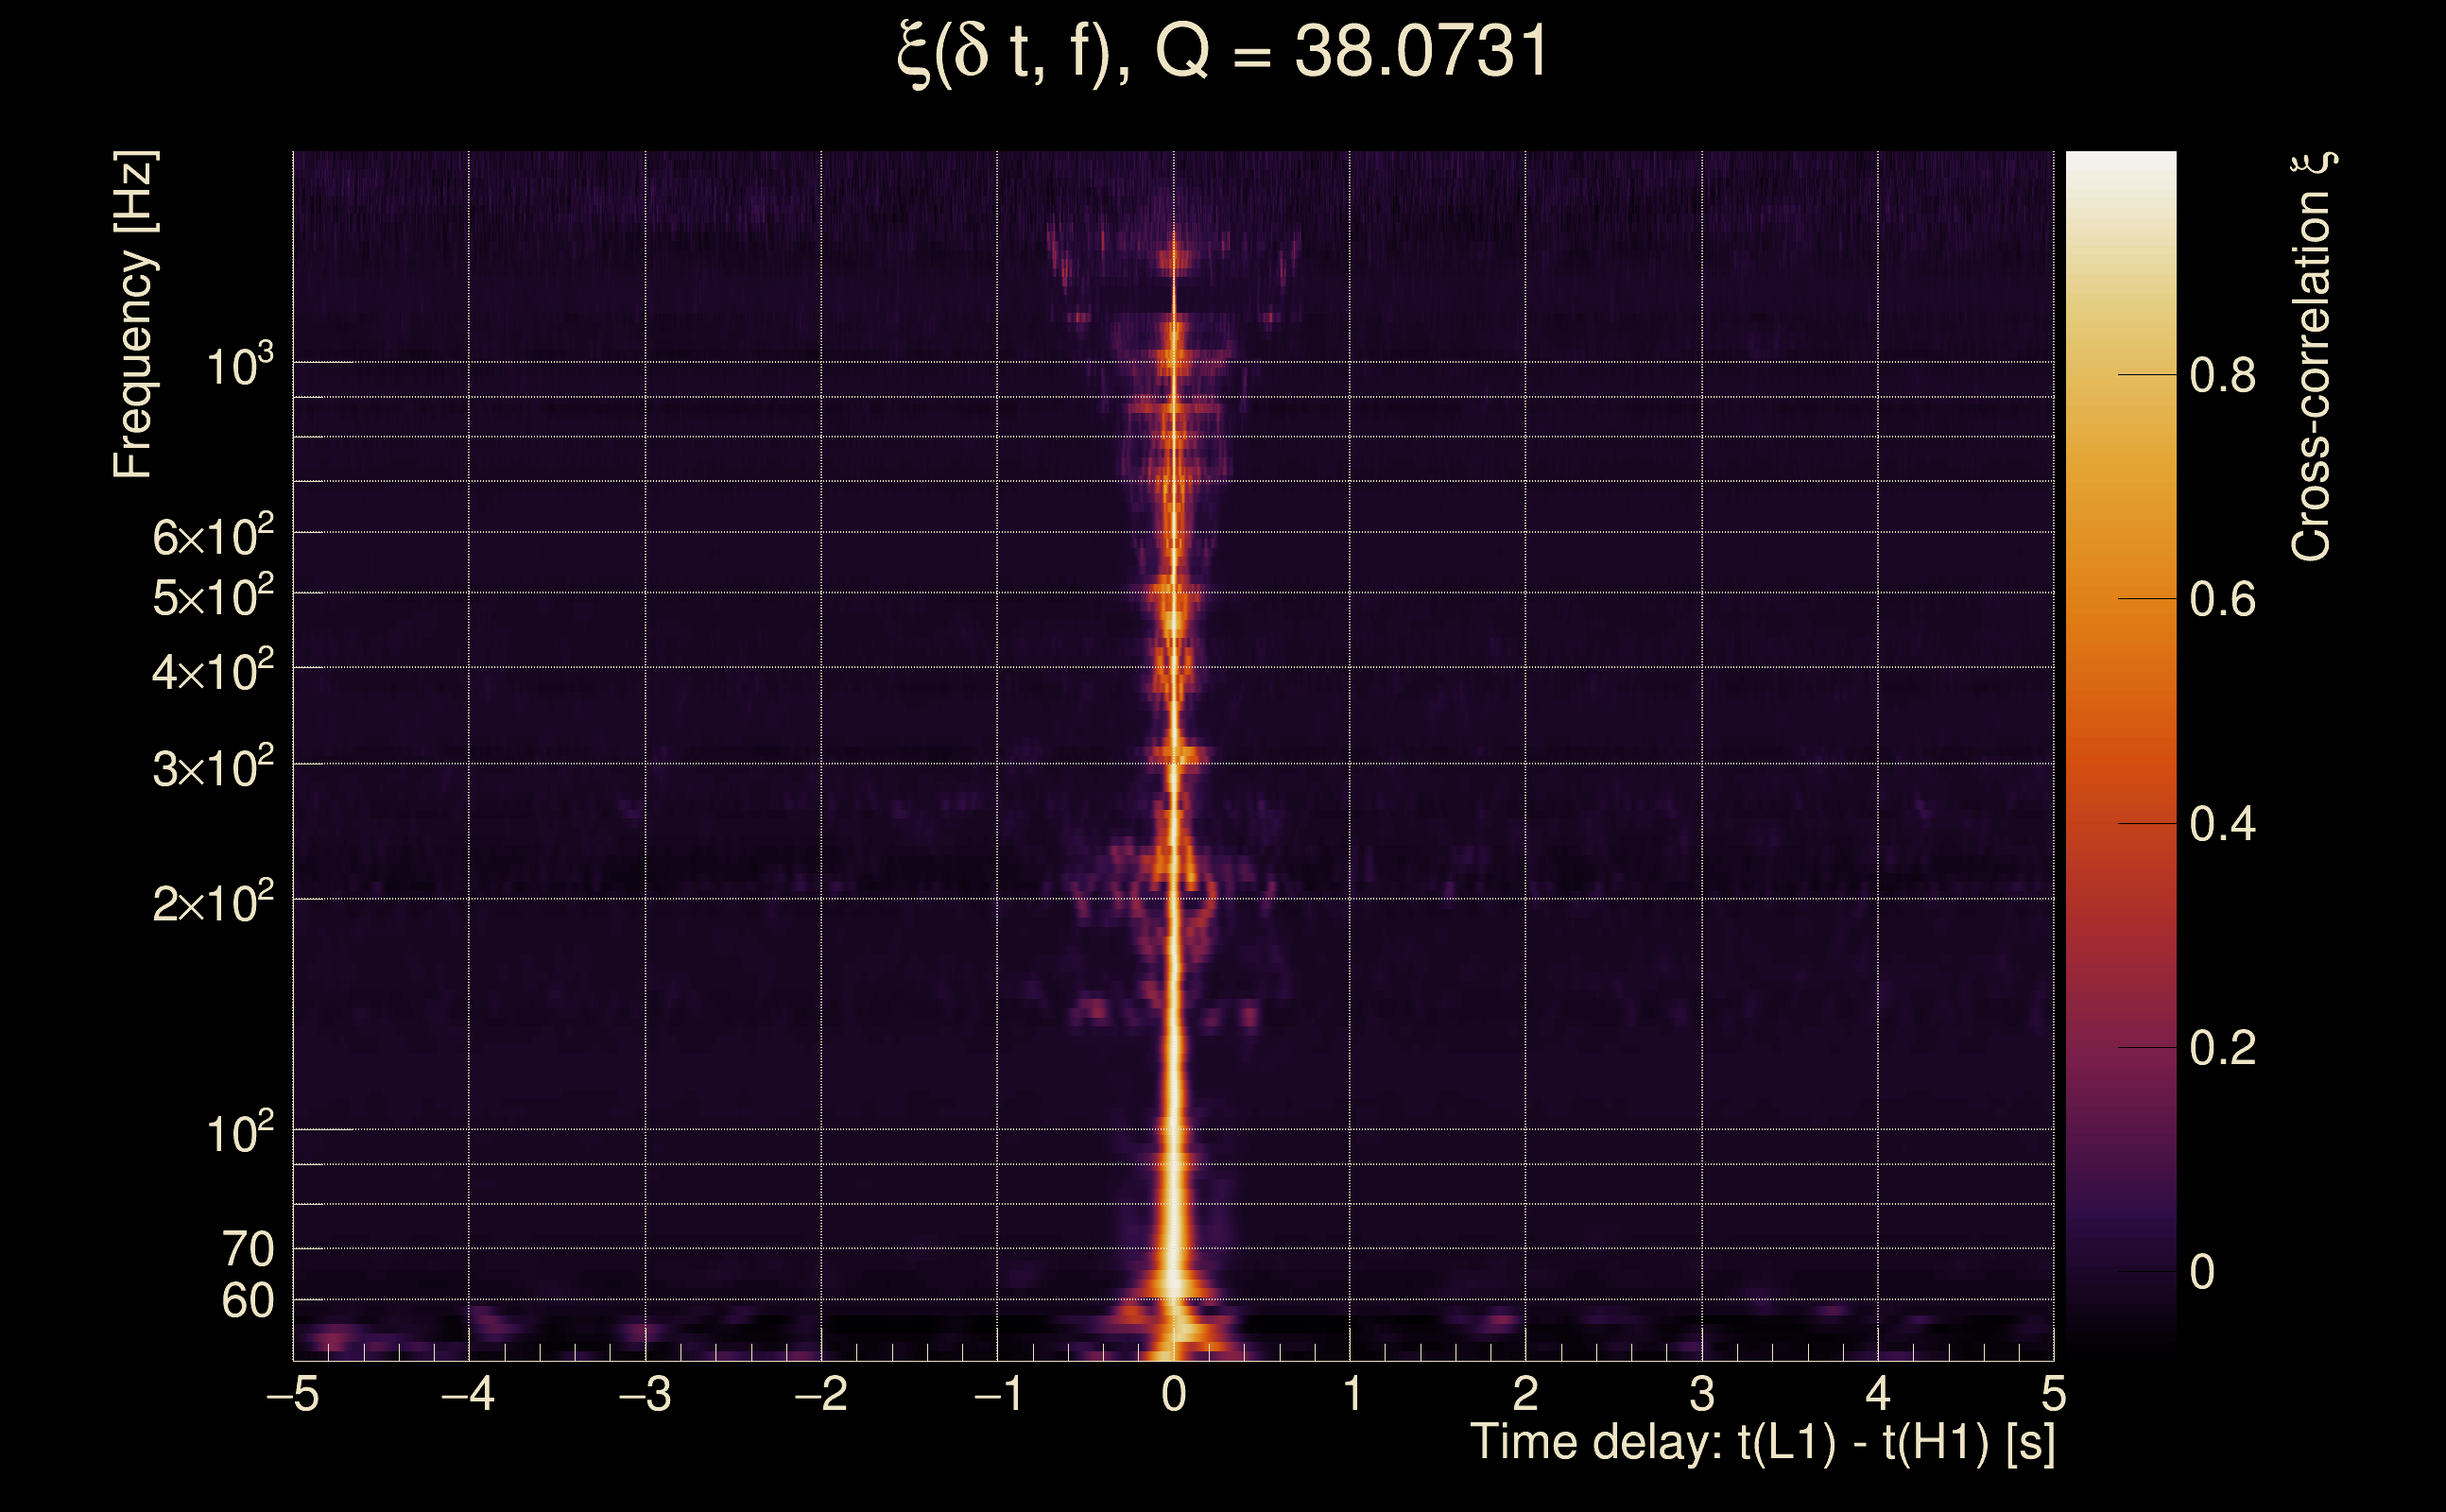
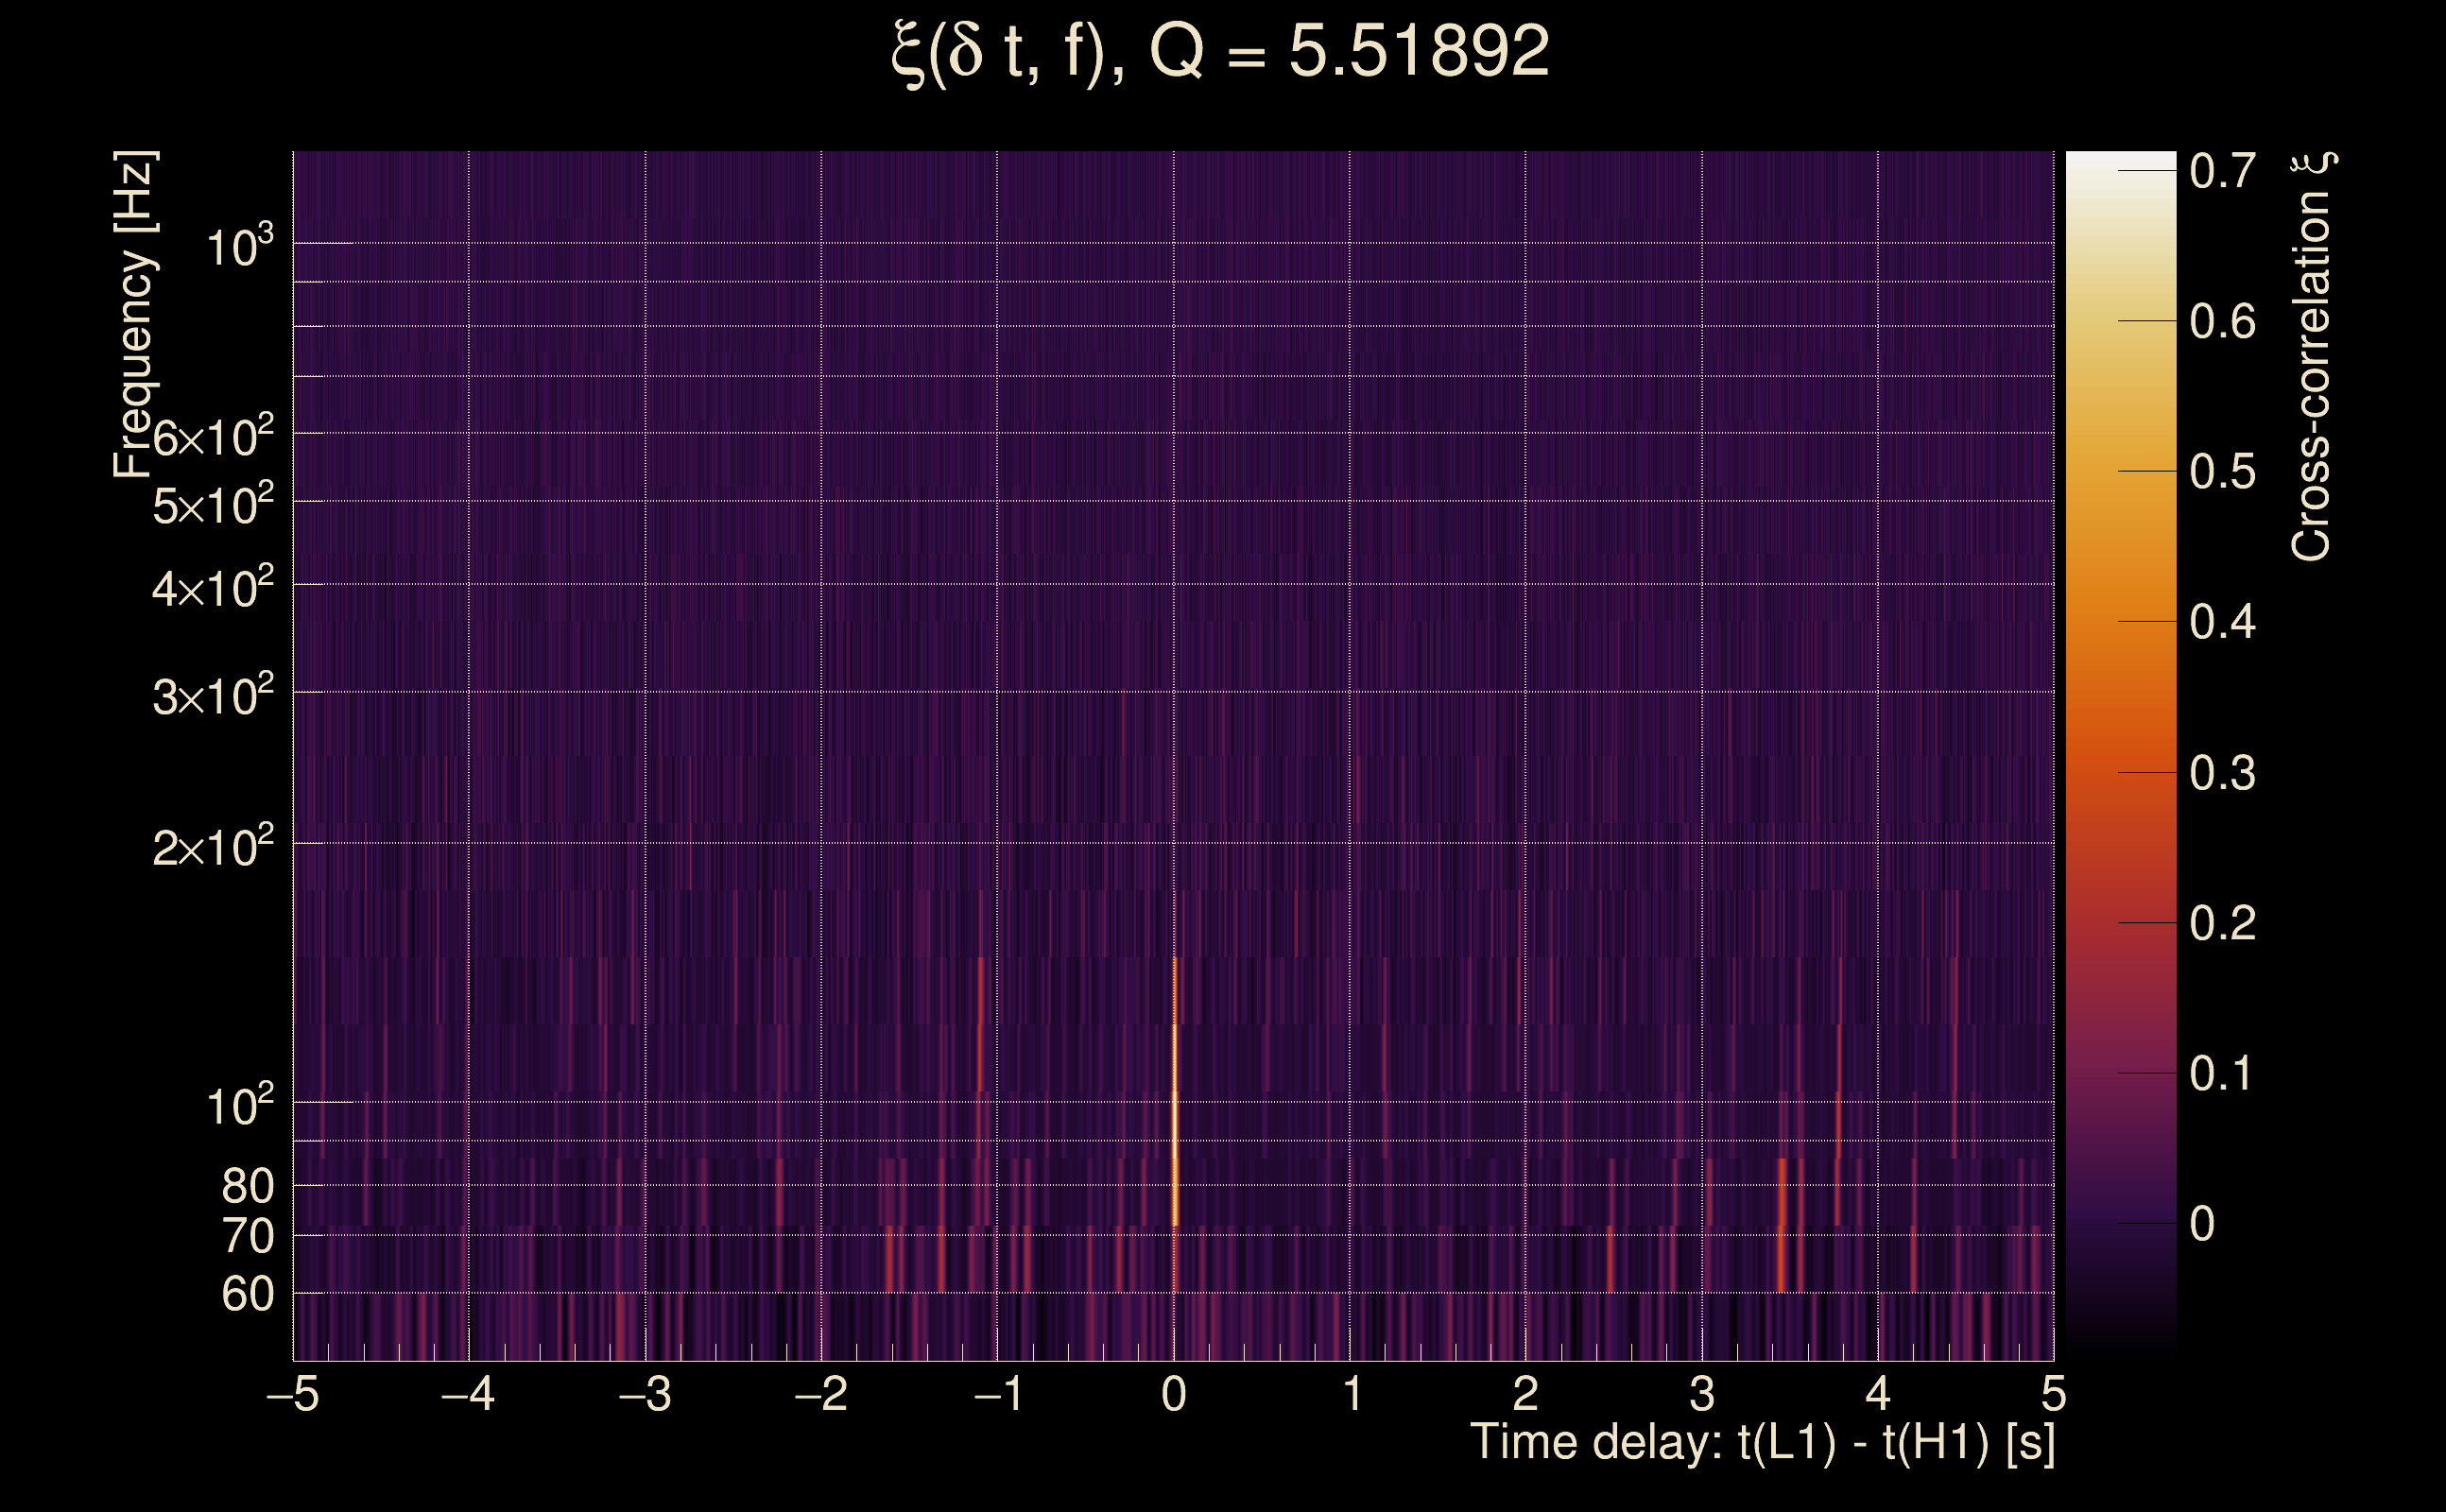
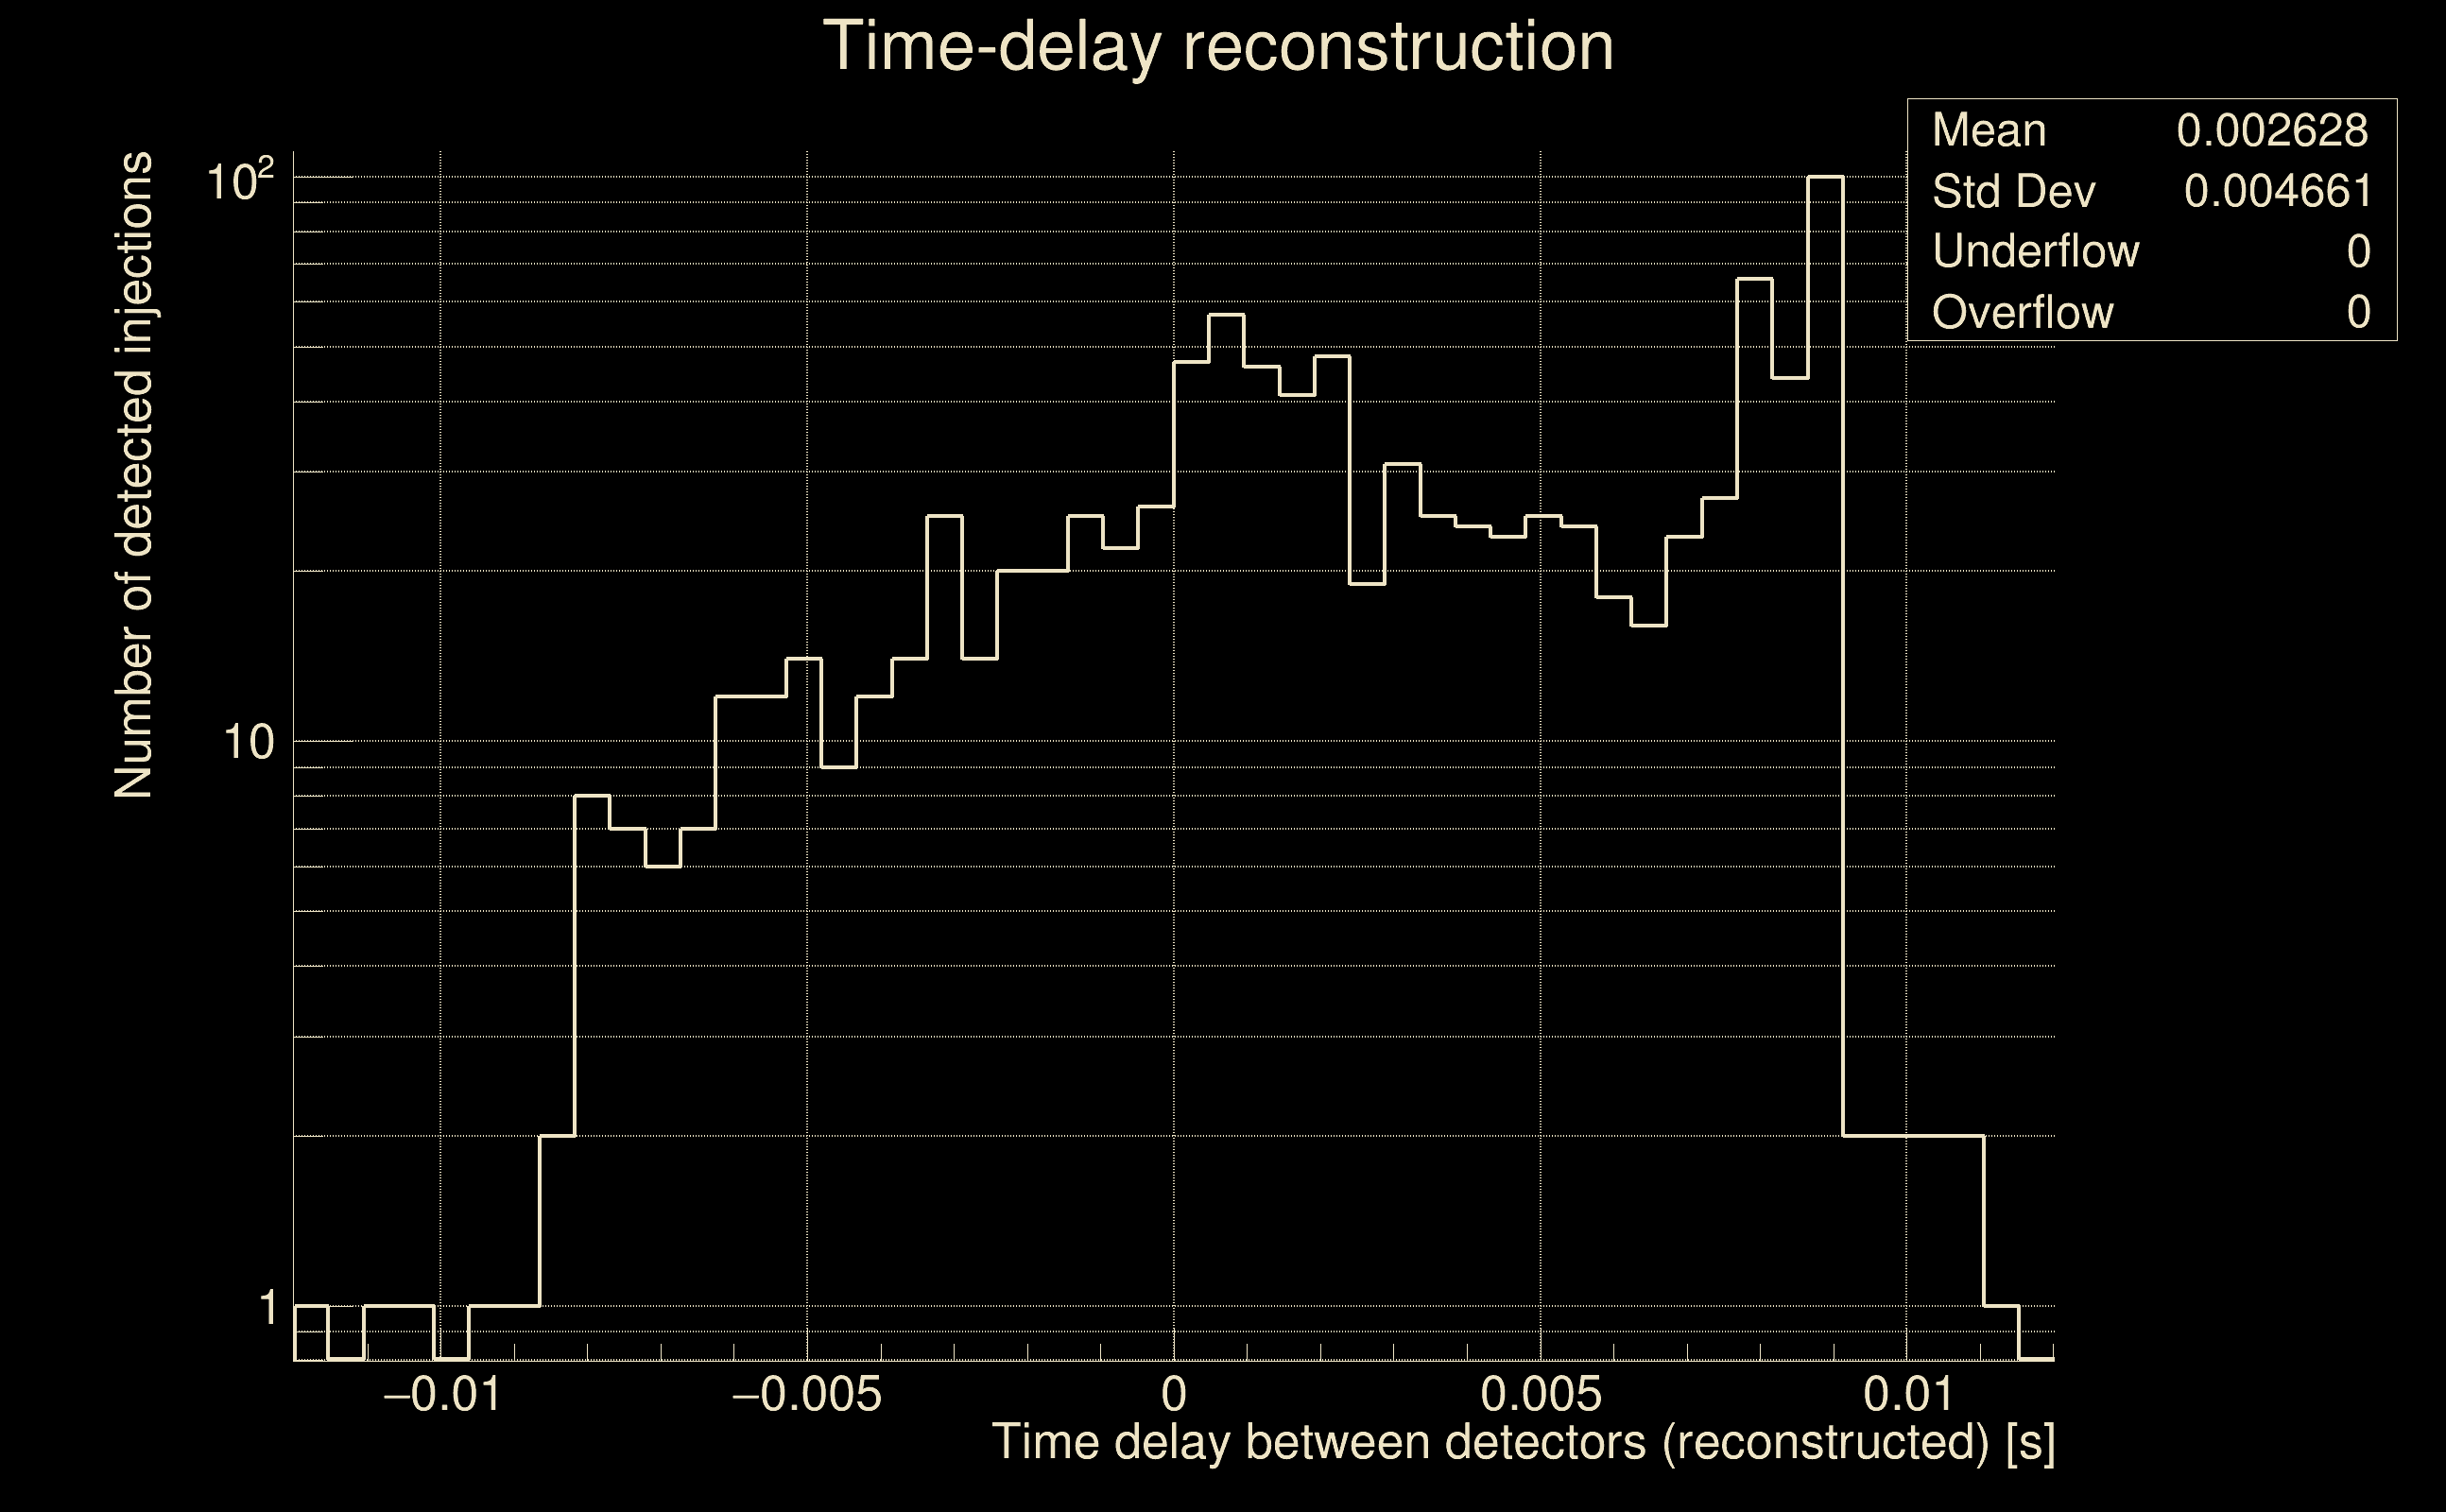
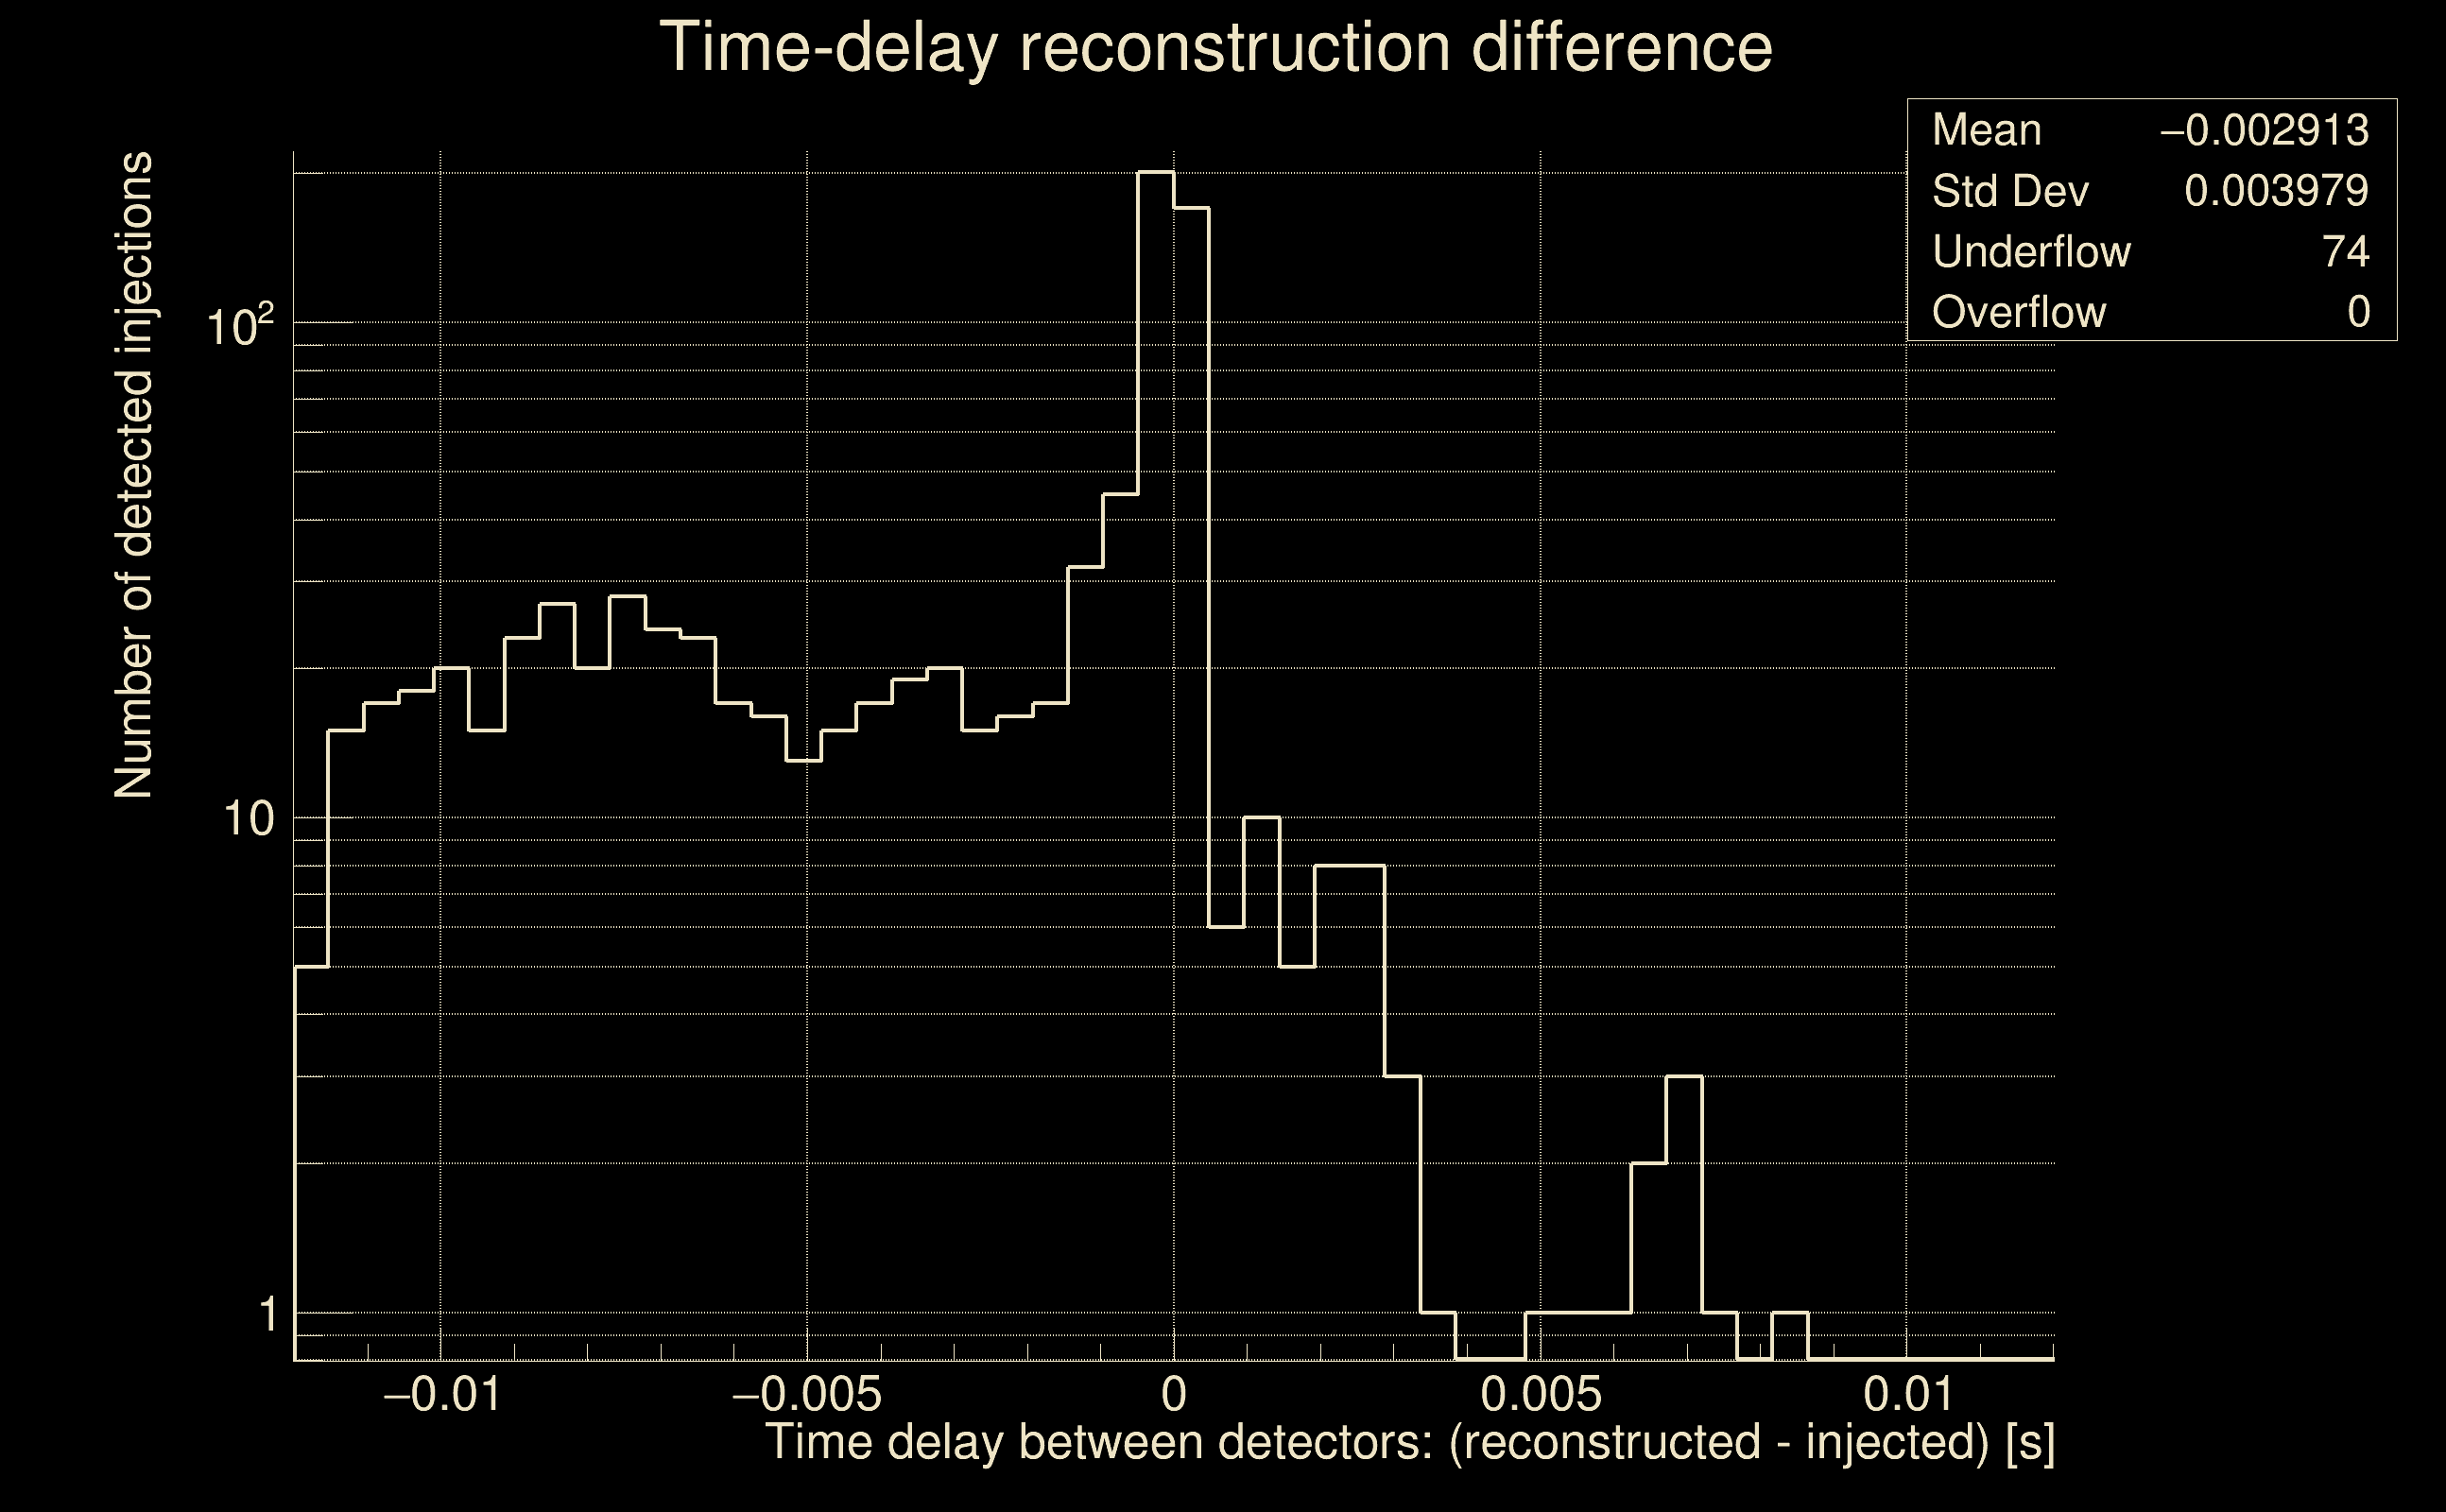
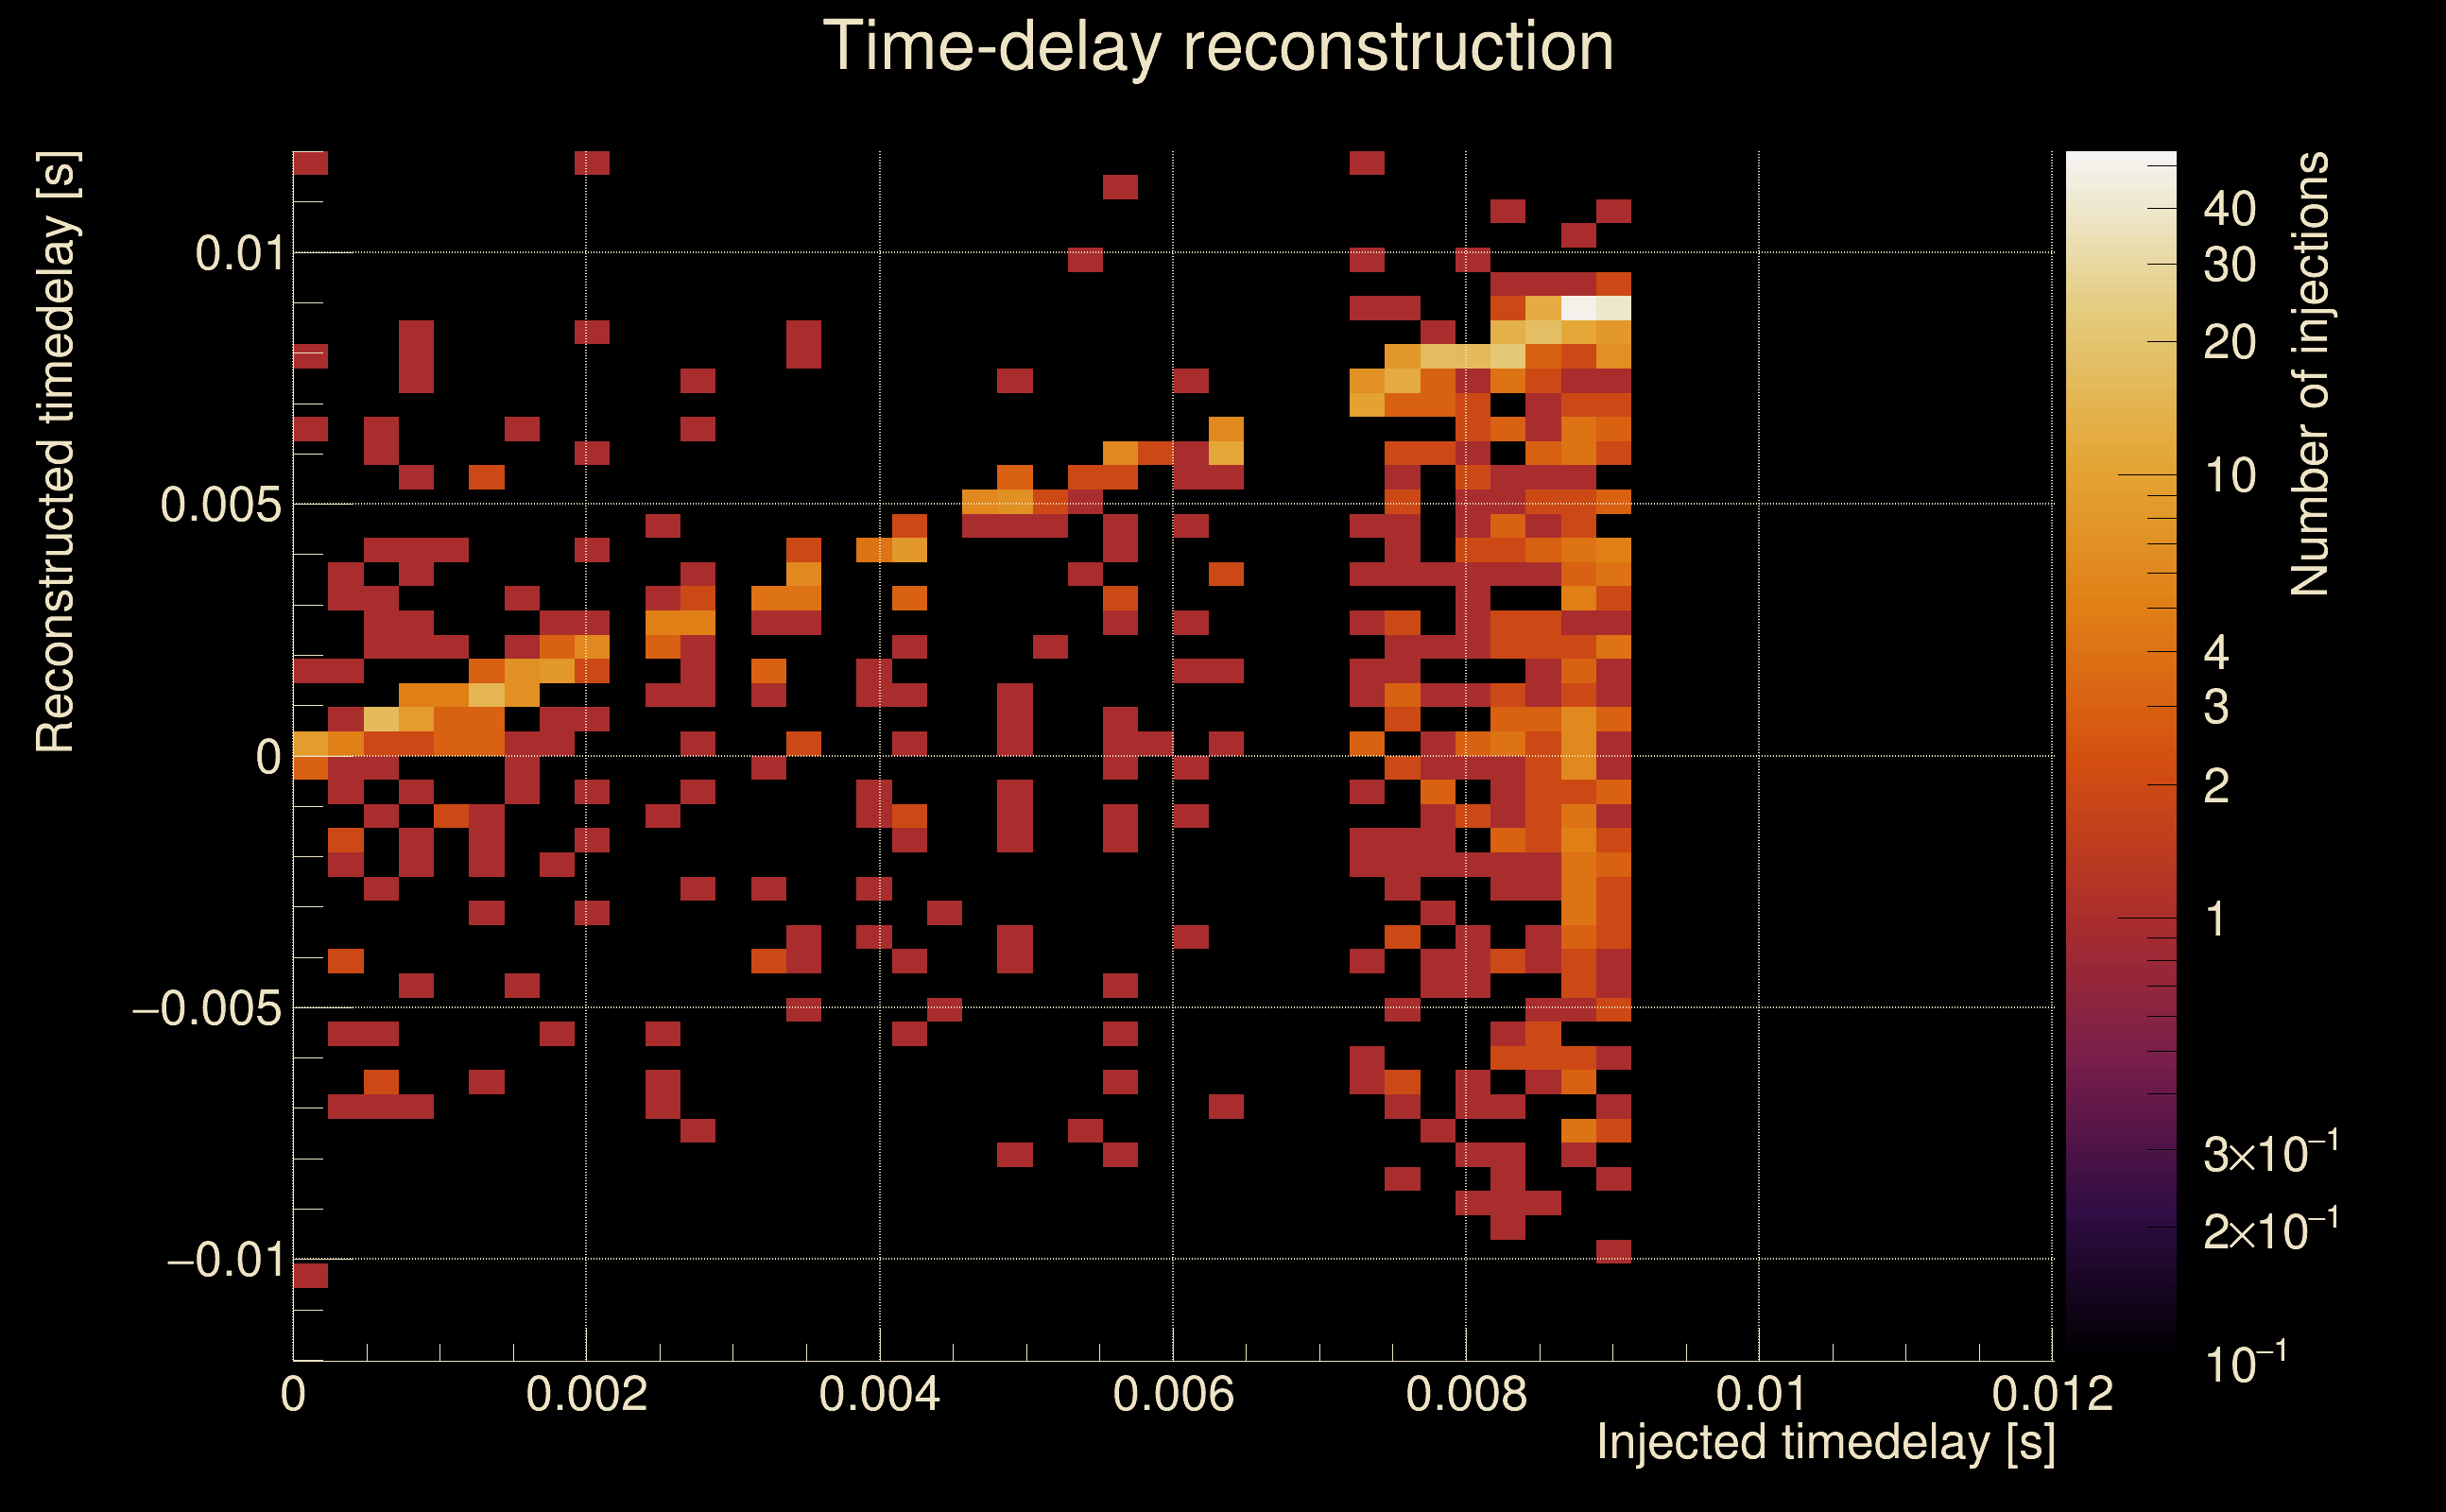
| Time delay between detectors t(L1) - t(H1): | 0.00199073 s (slice index = 108 / 217), δt_gw = 0.00199073 s |
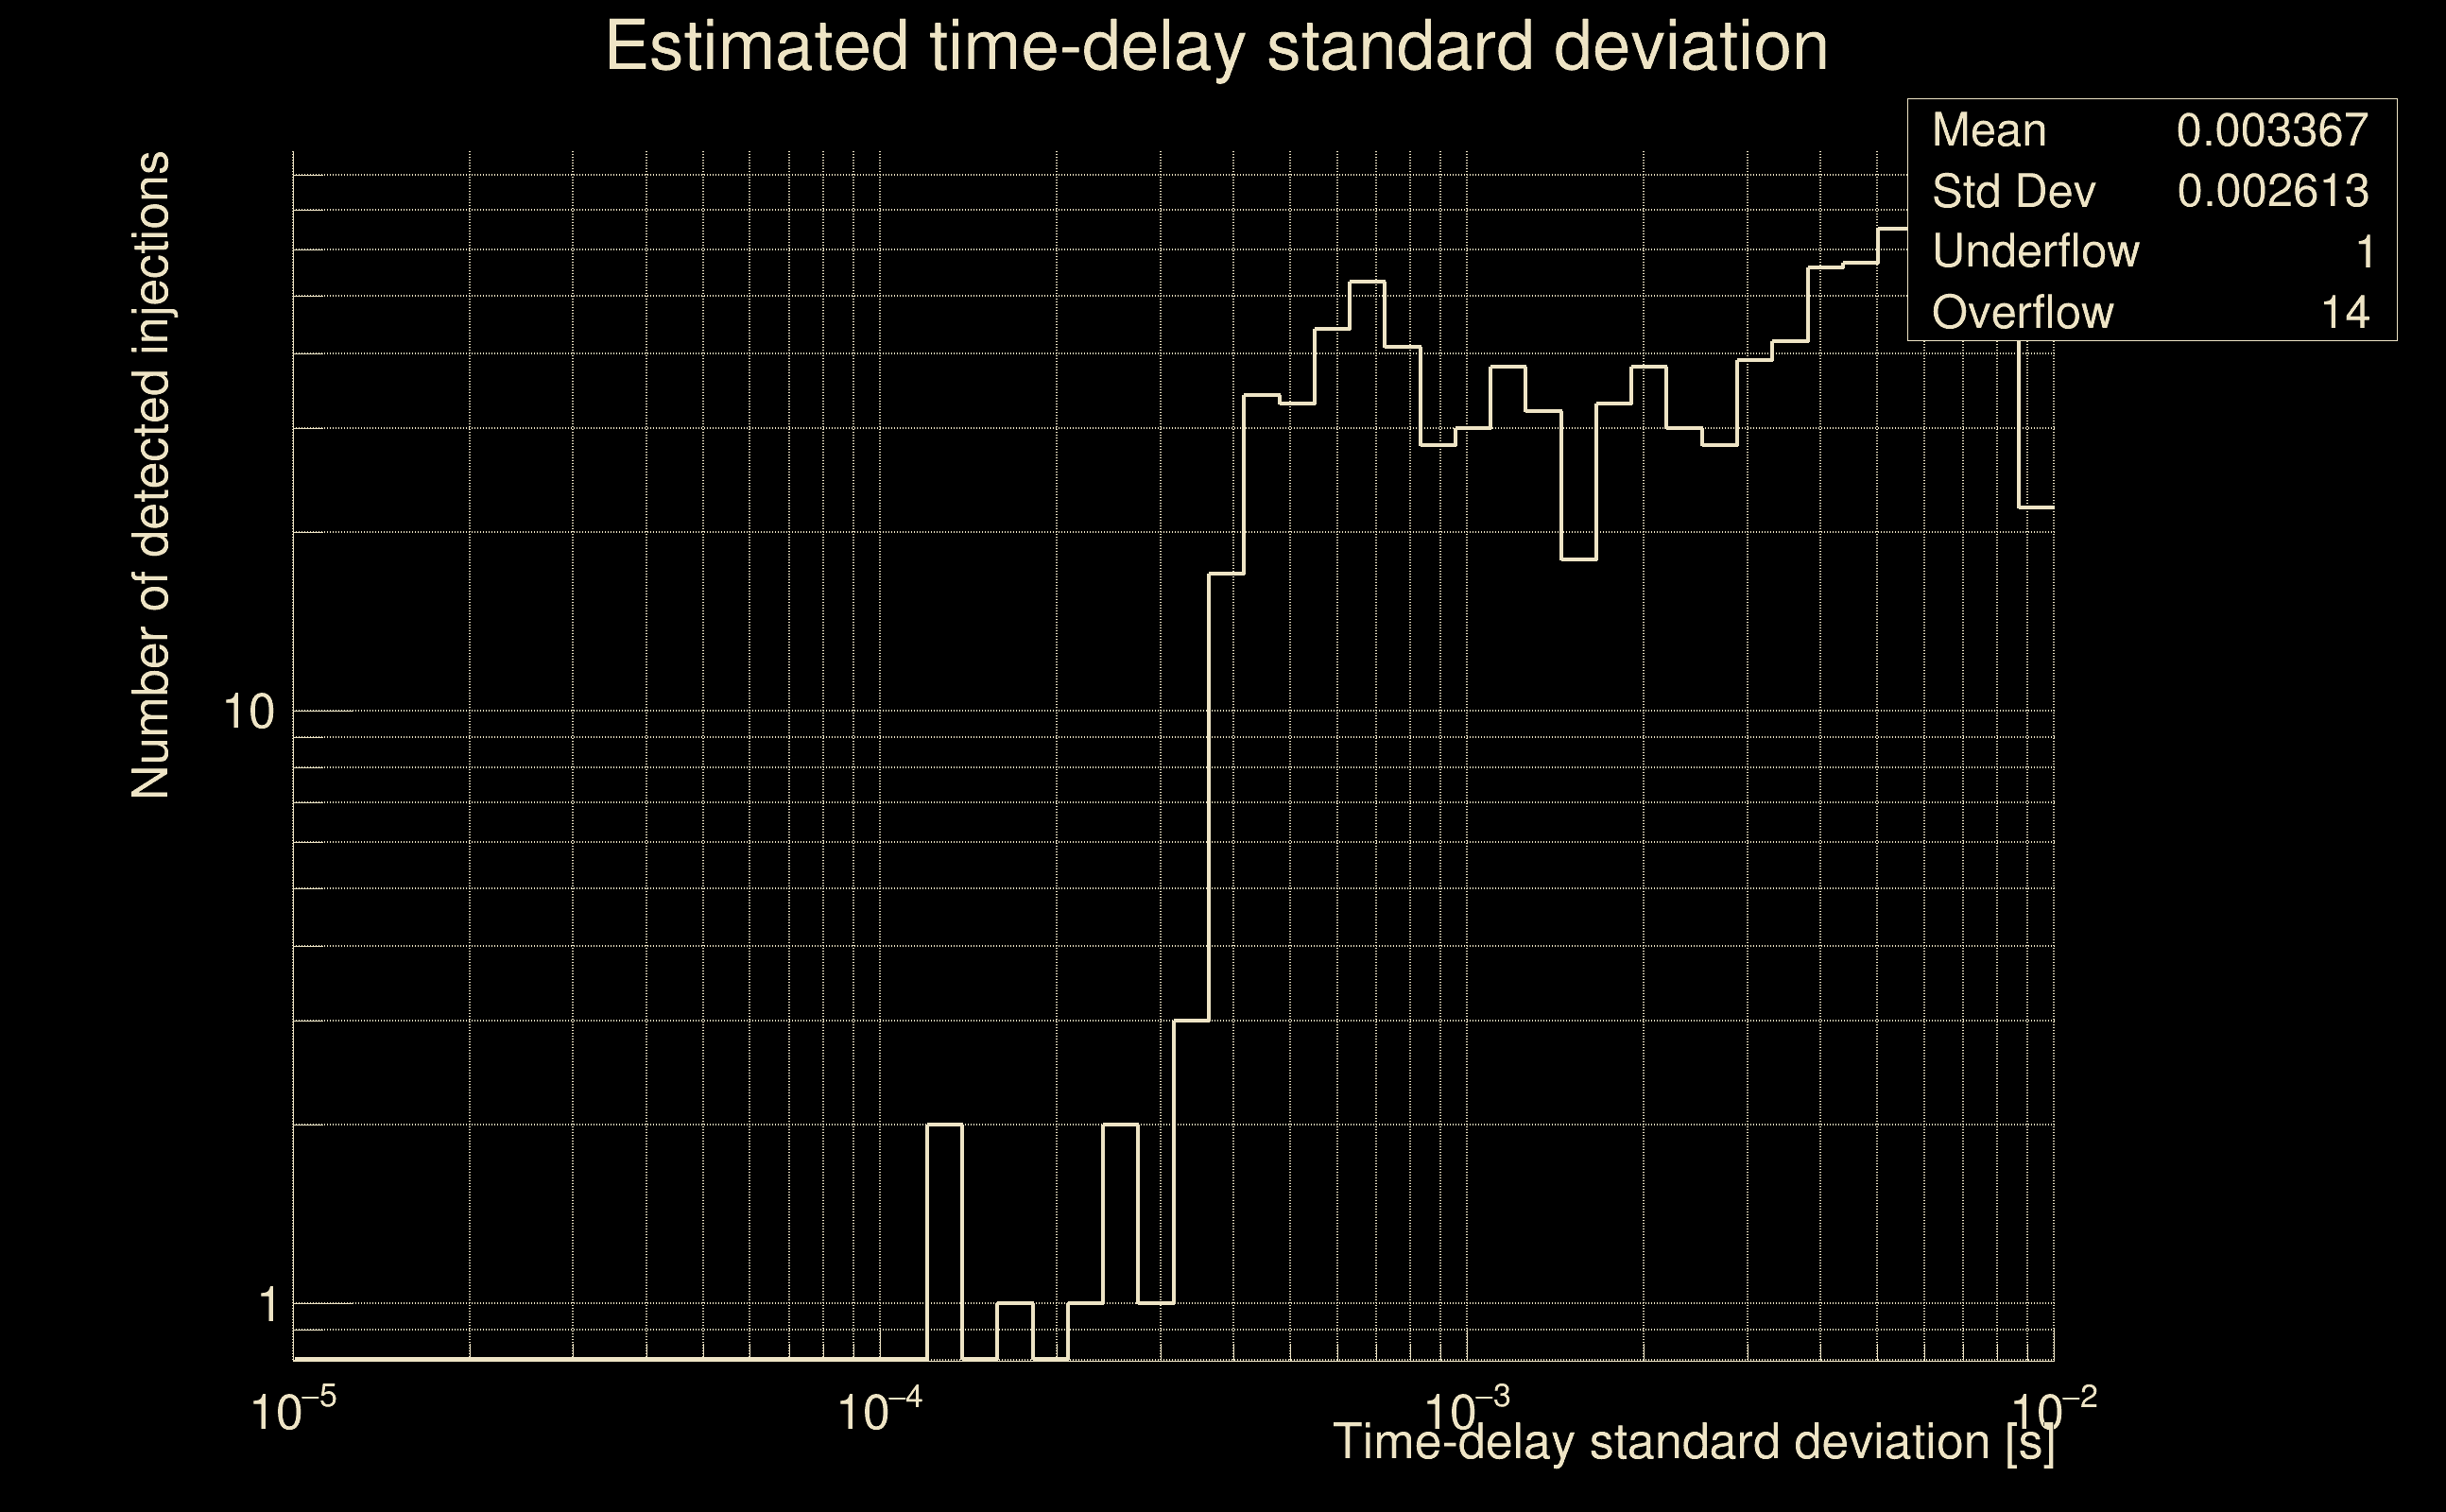
| Time delay standard deviation: | 0.0279053 s |
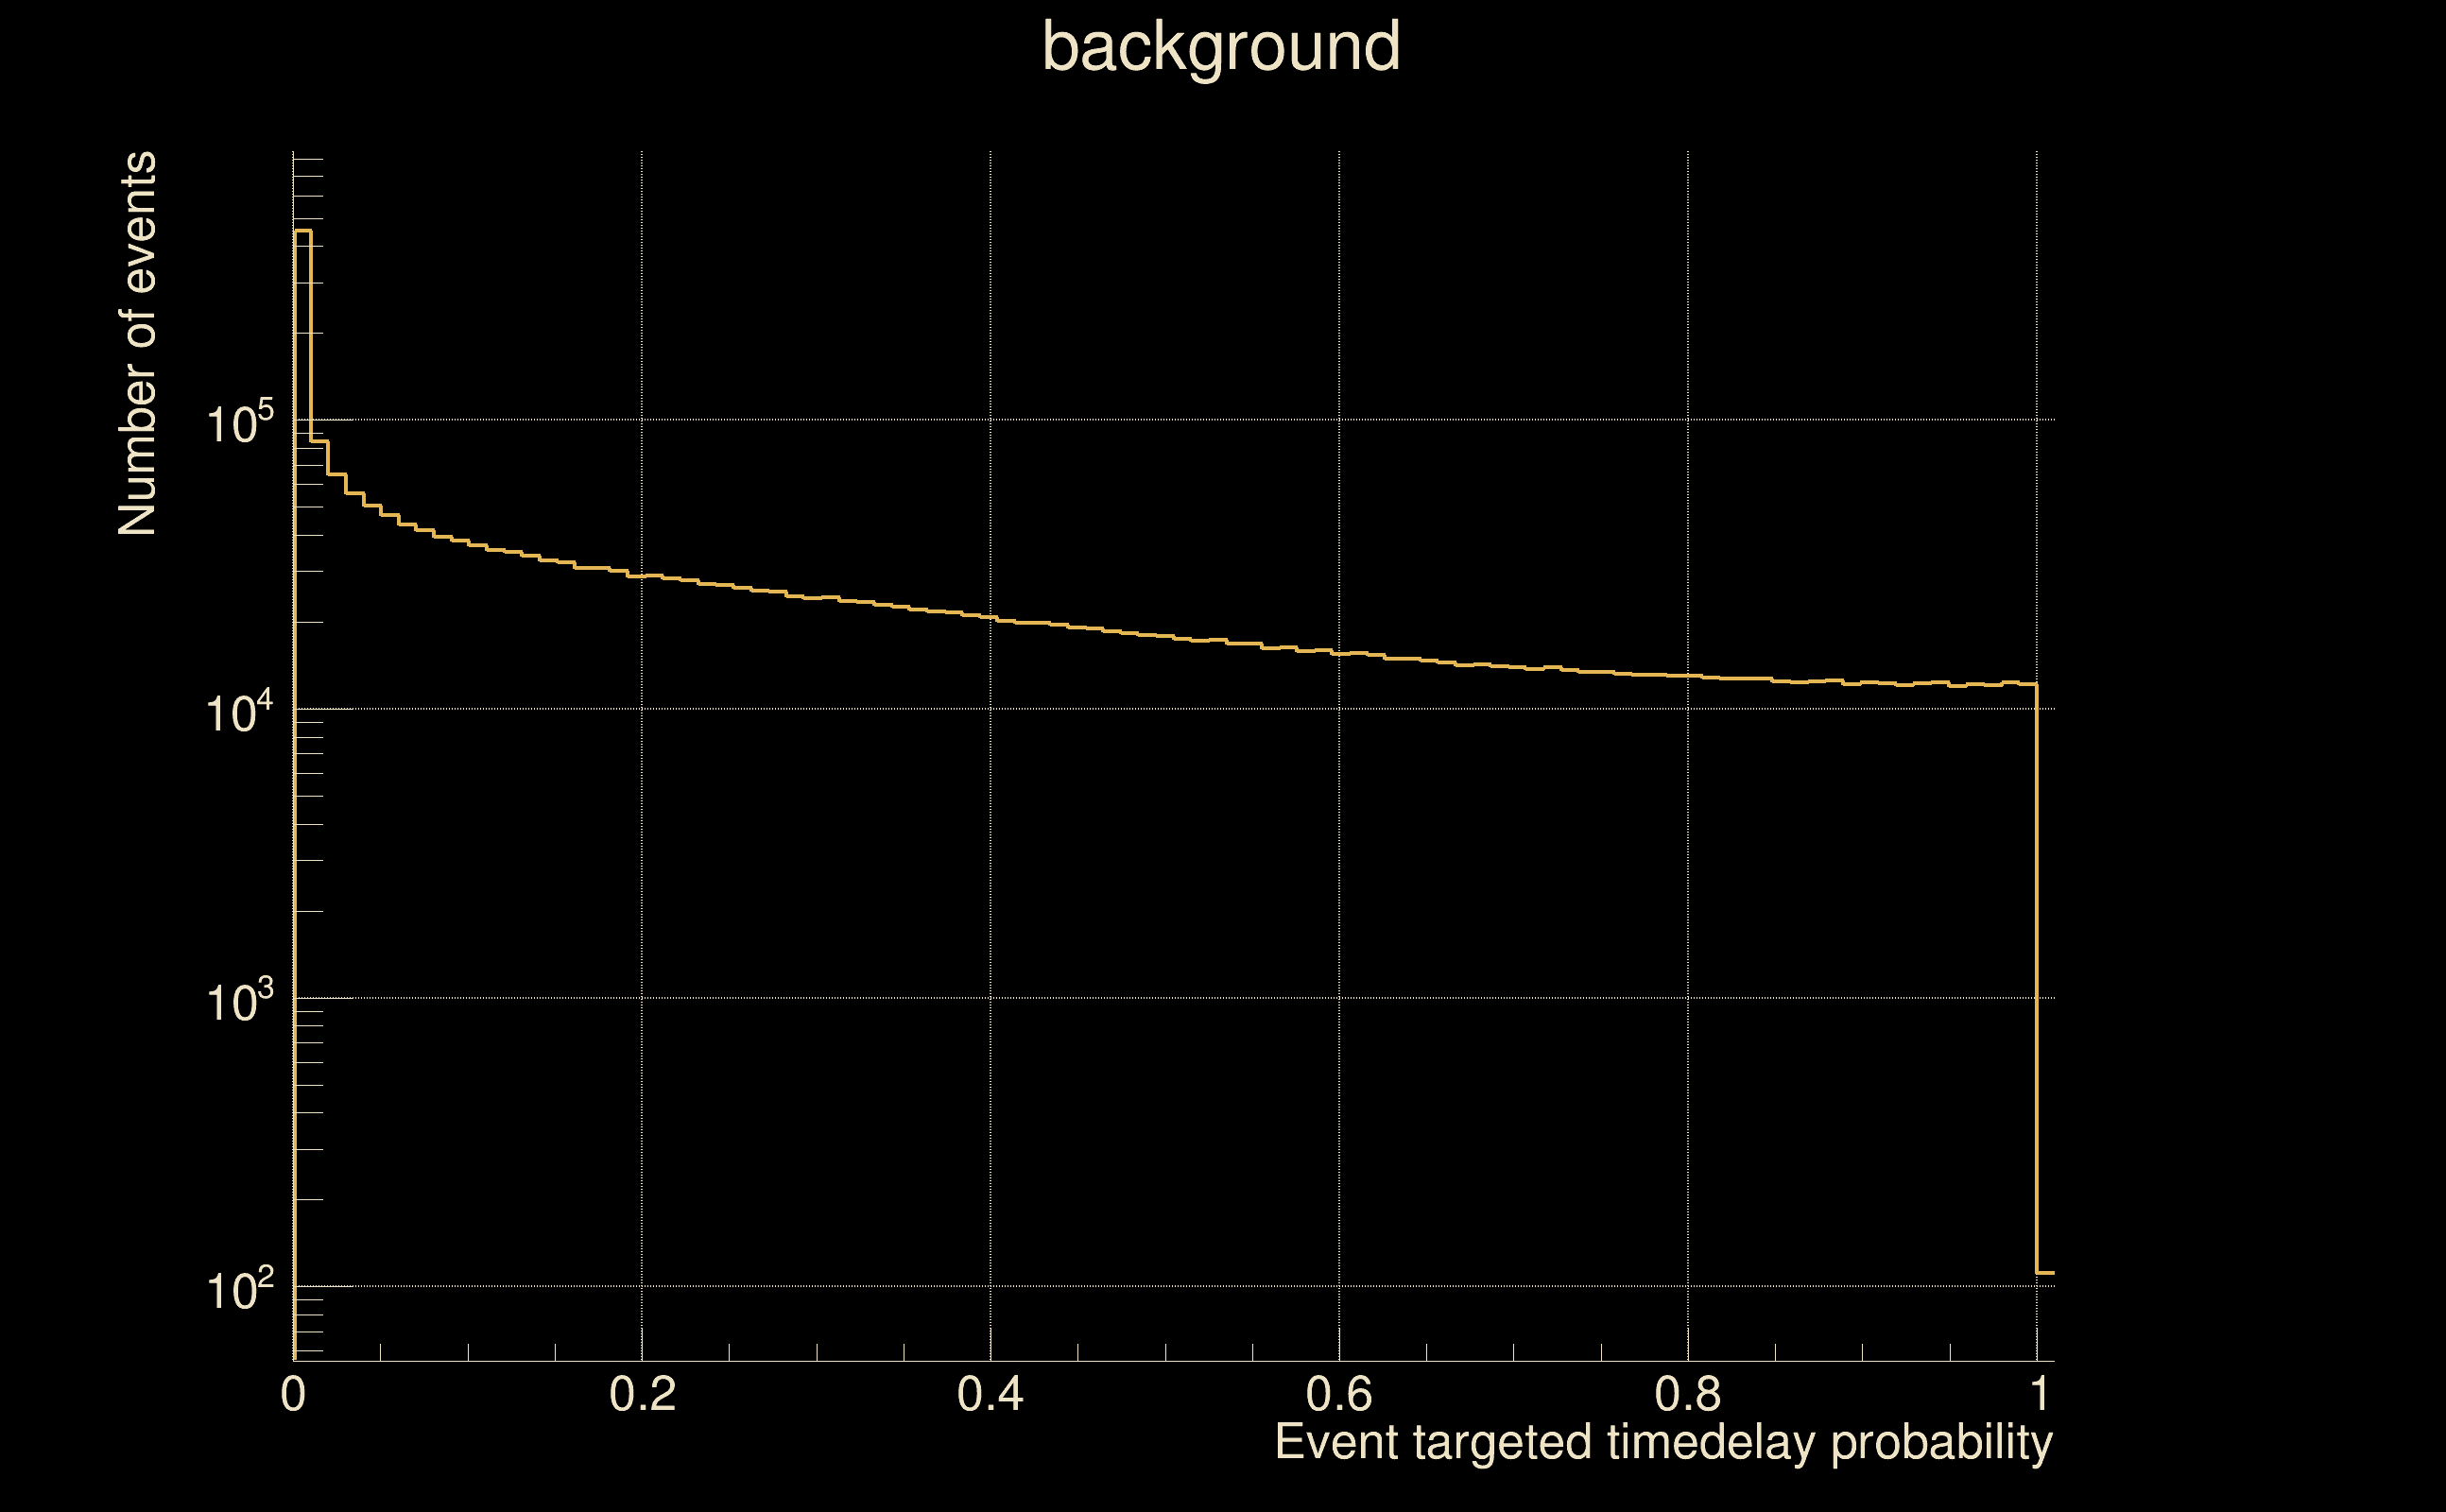
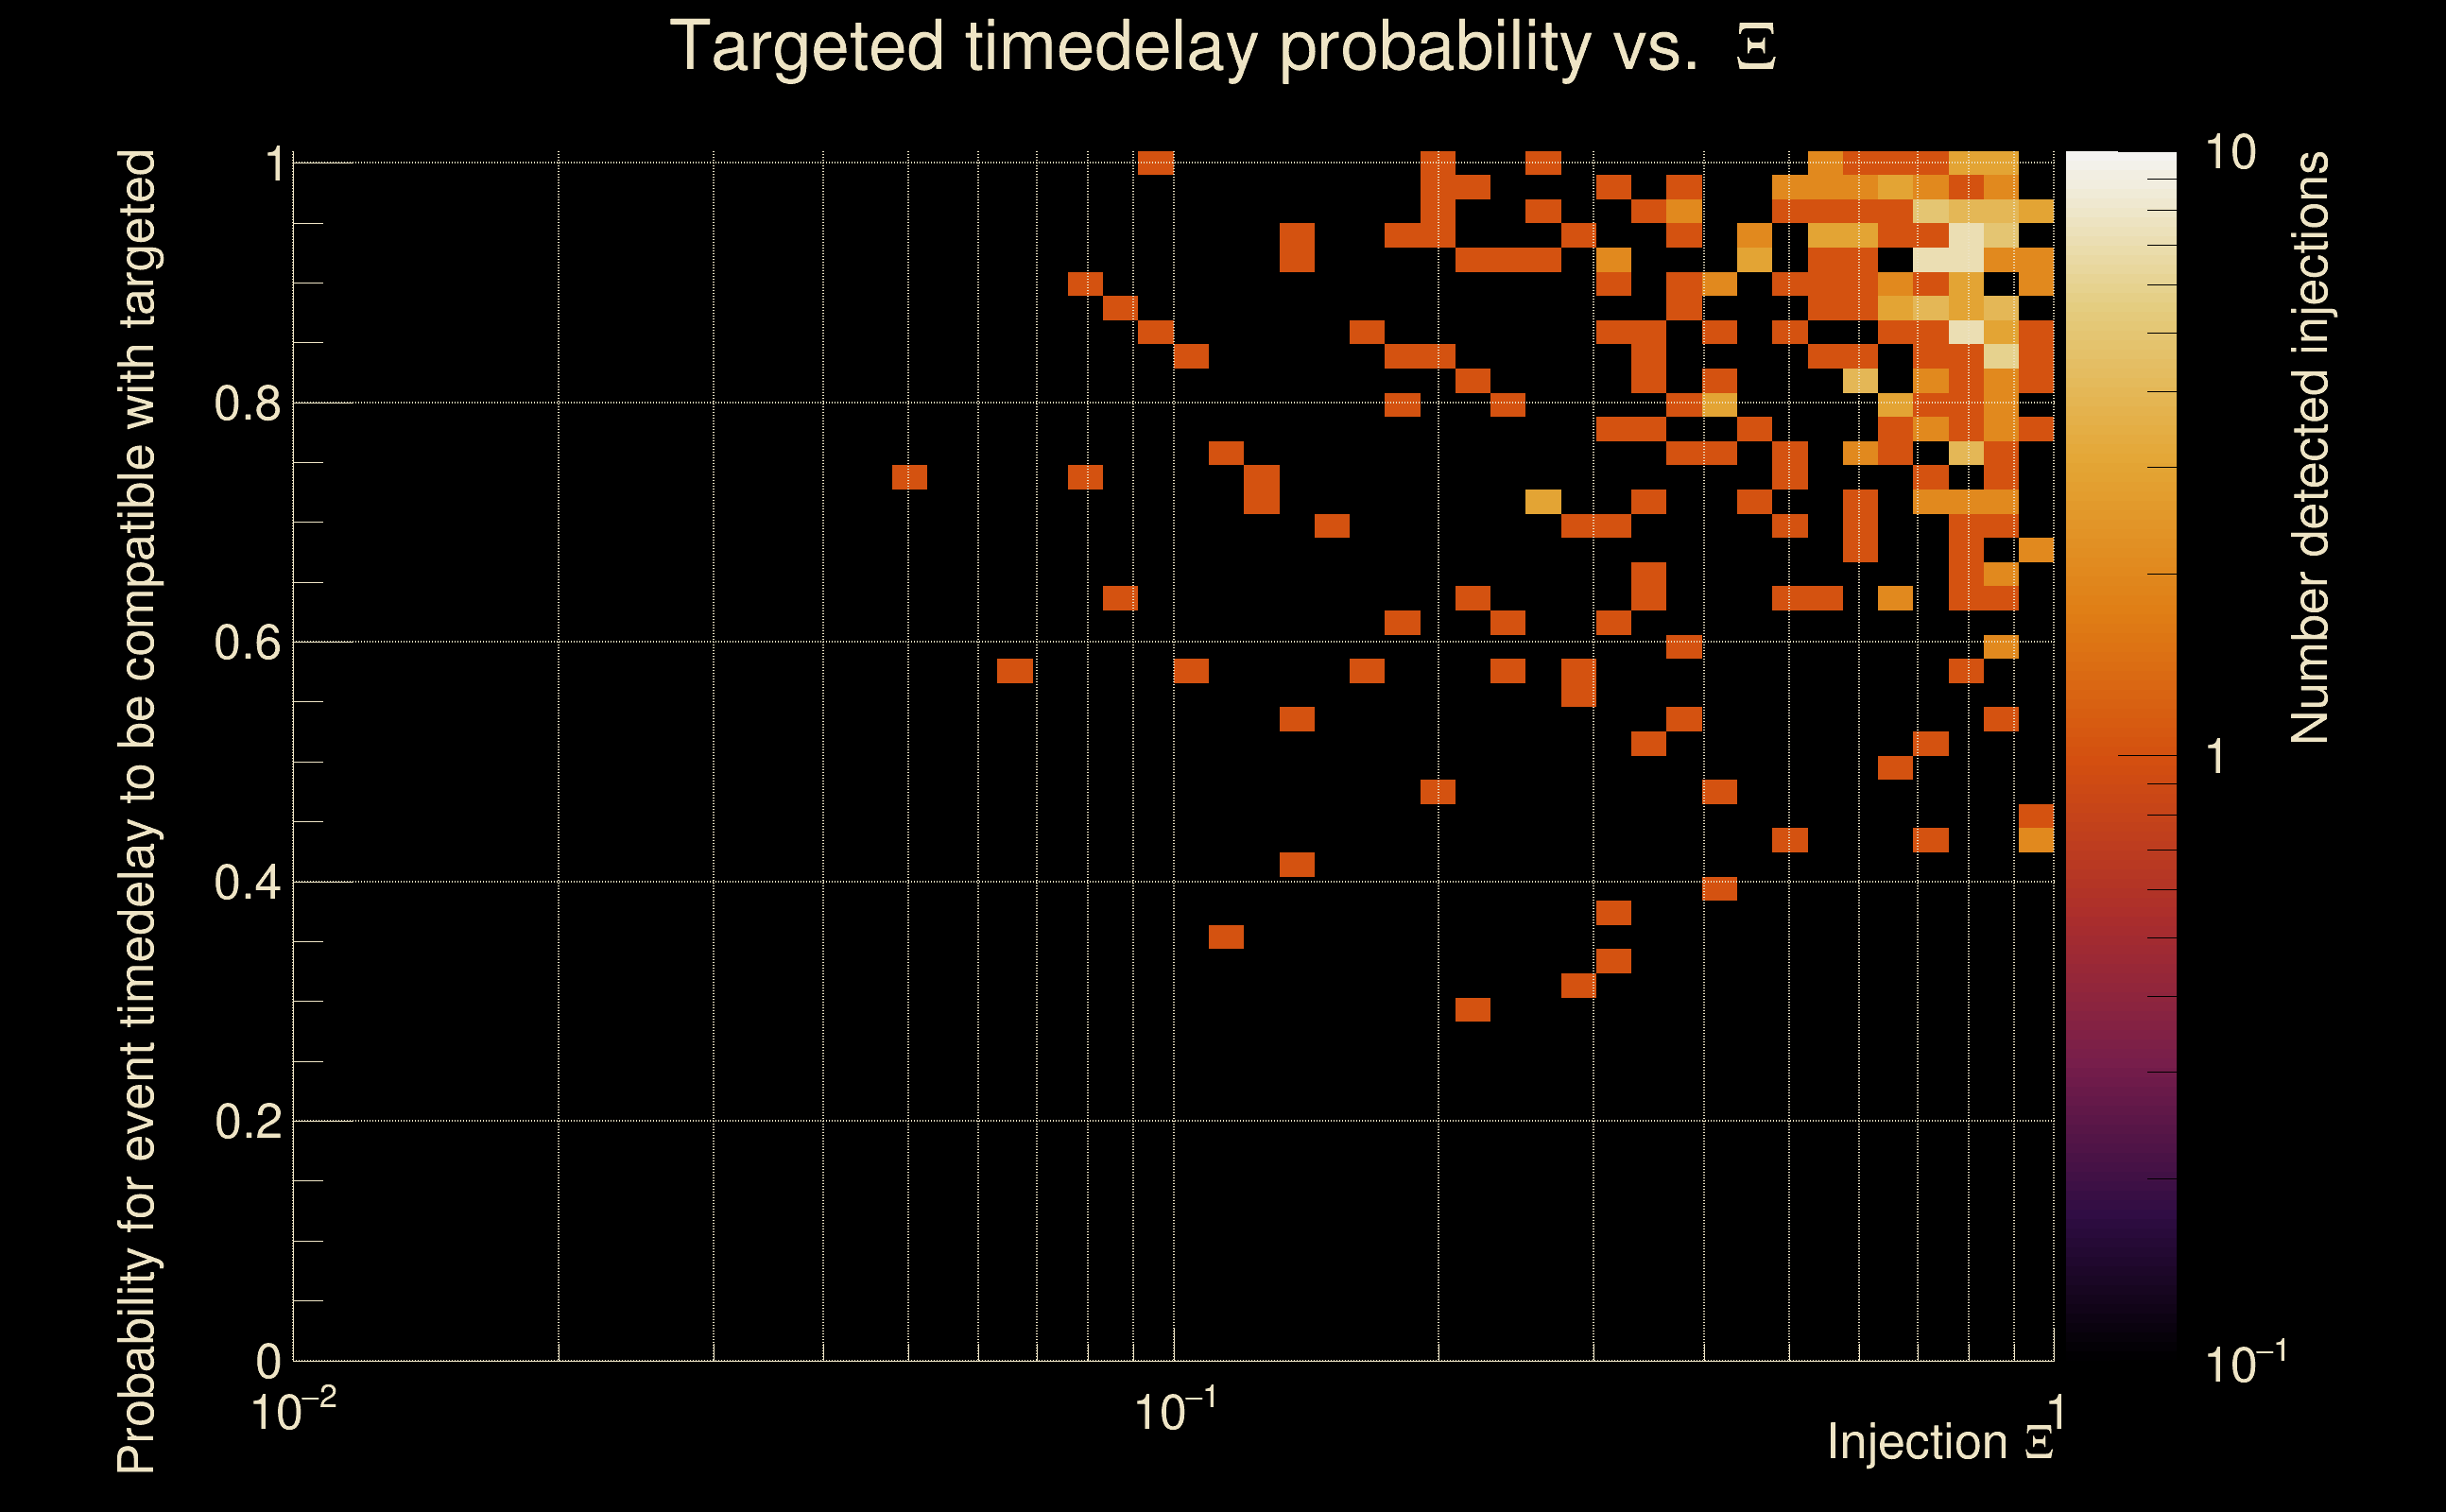
| [targeted mode] Time delay probability: | 0.847225 (0.19266 sigmas), δt_target = 1.72247e+45 s |
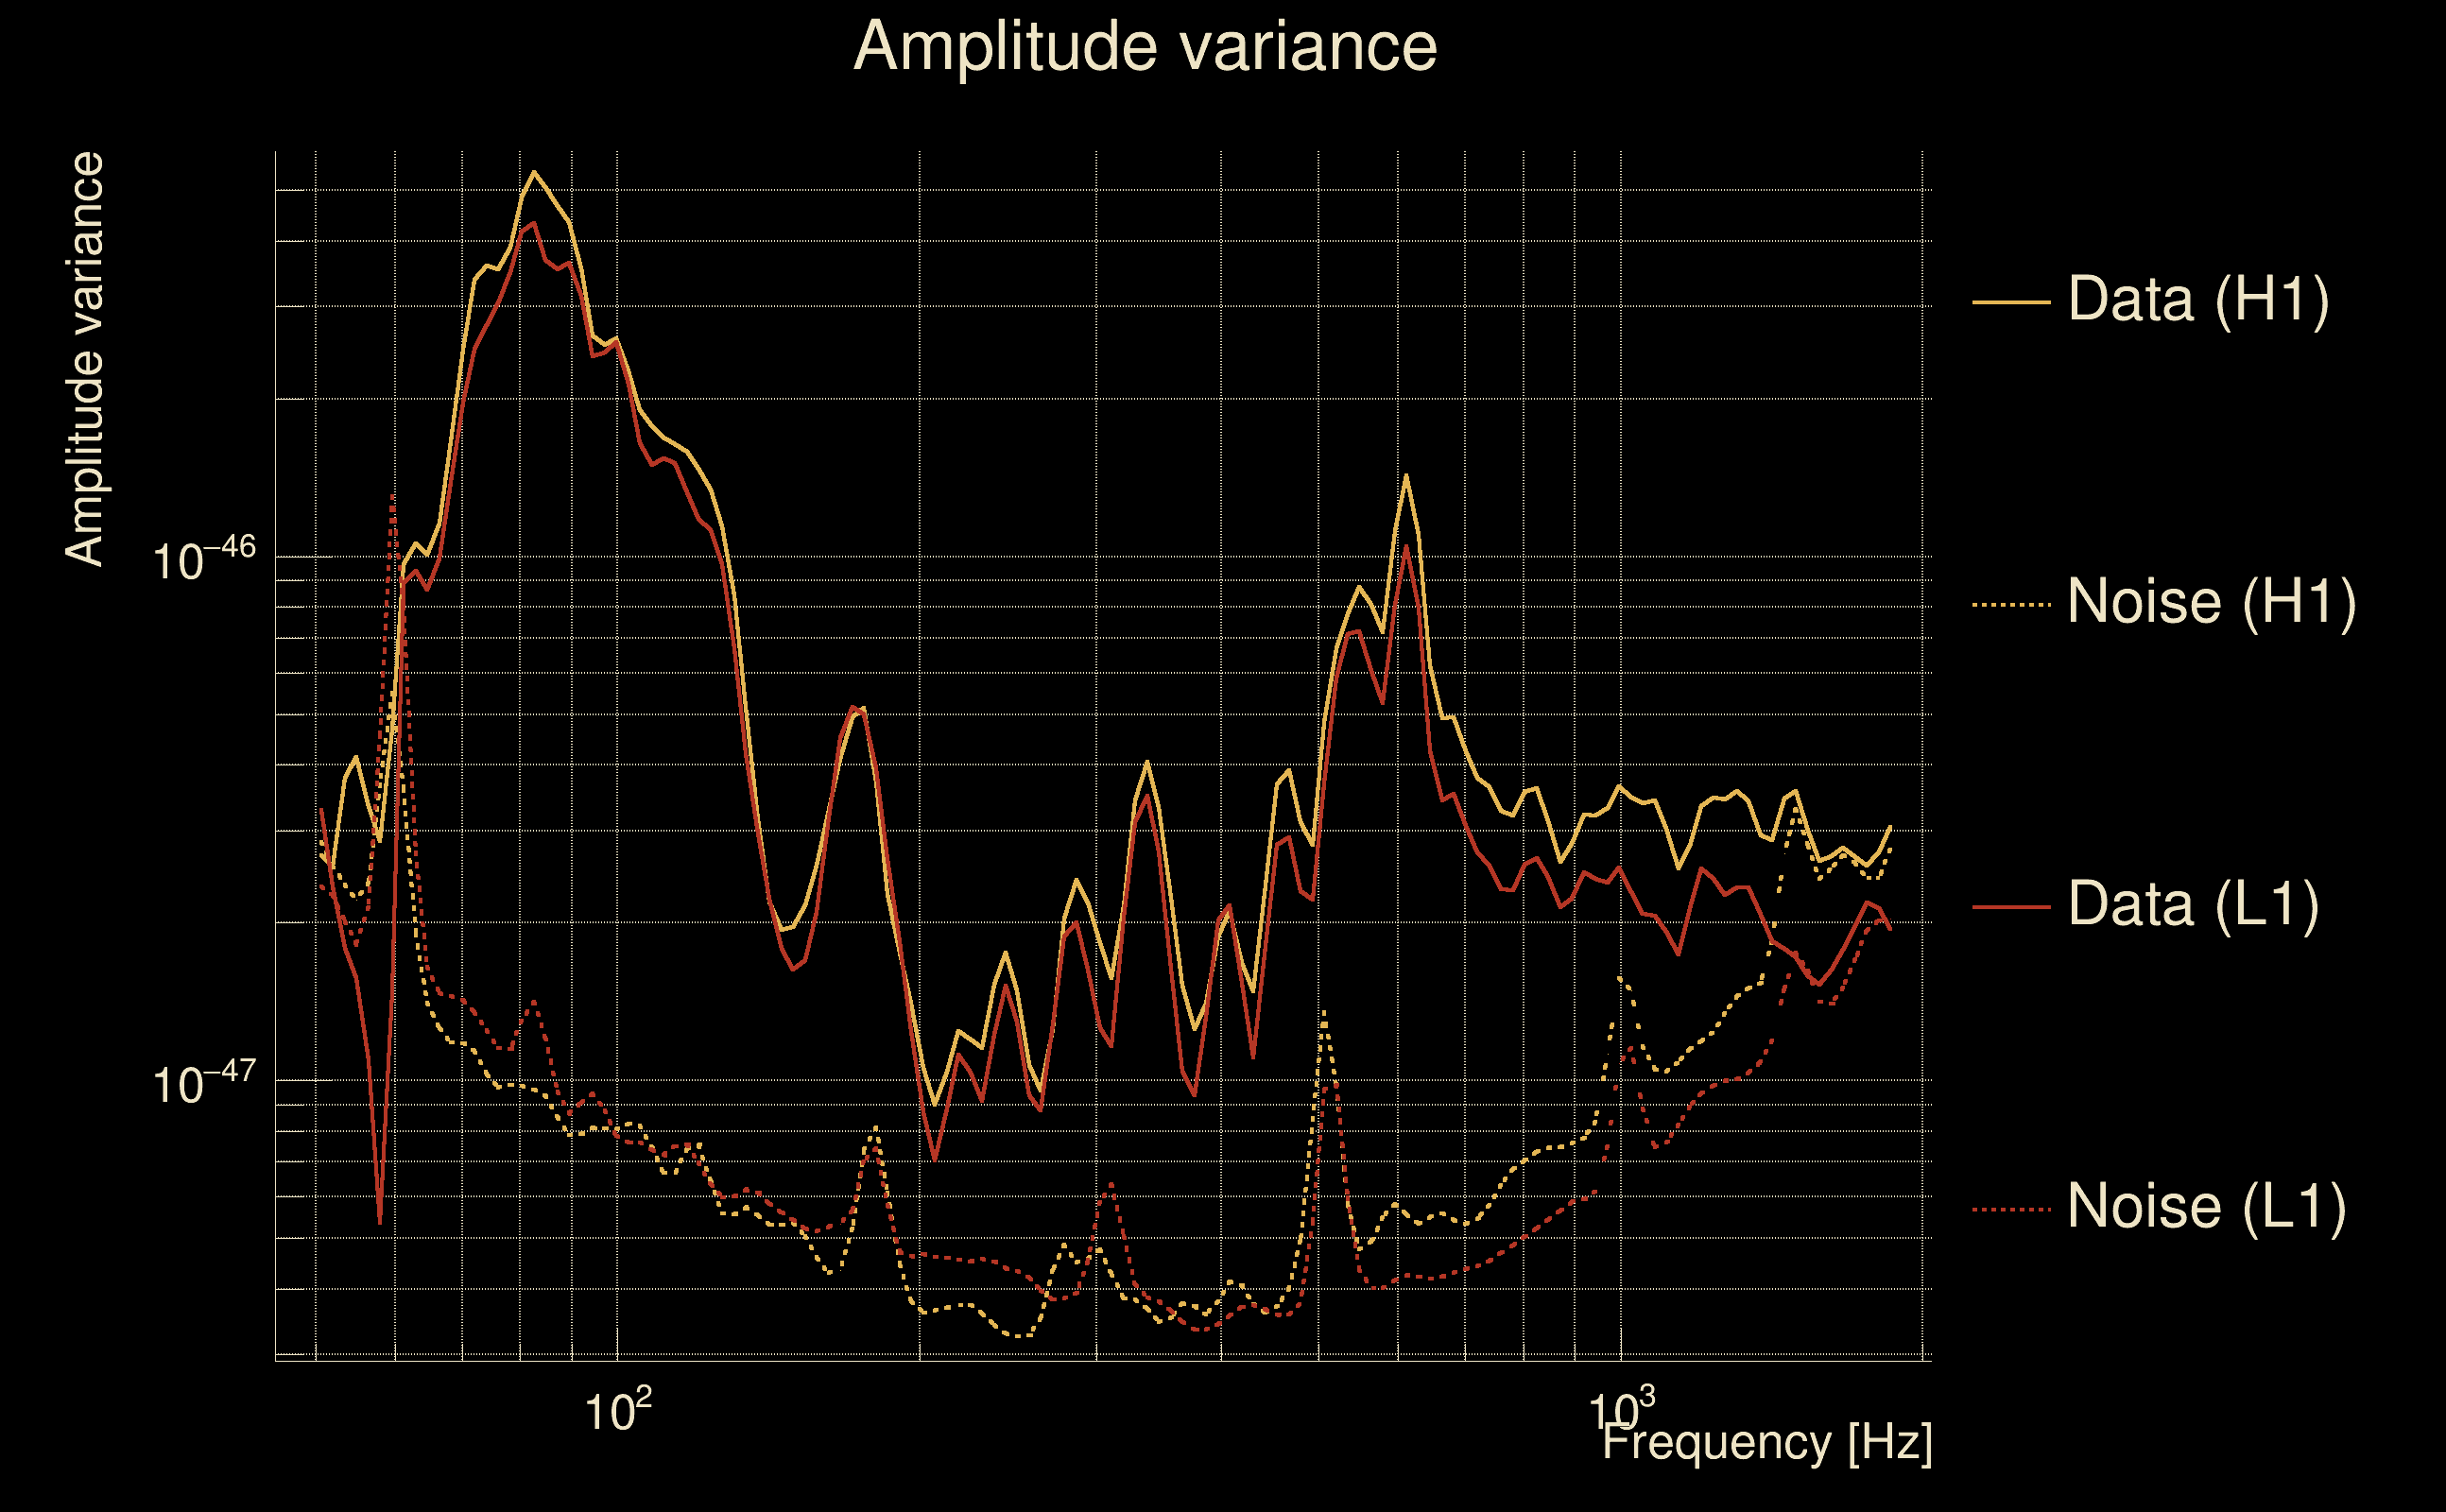
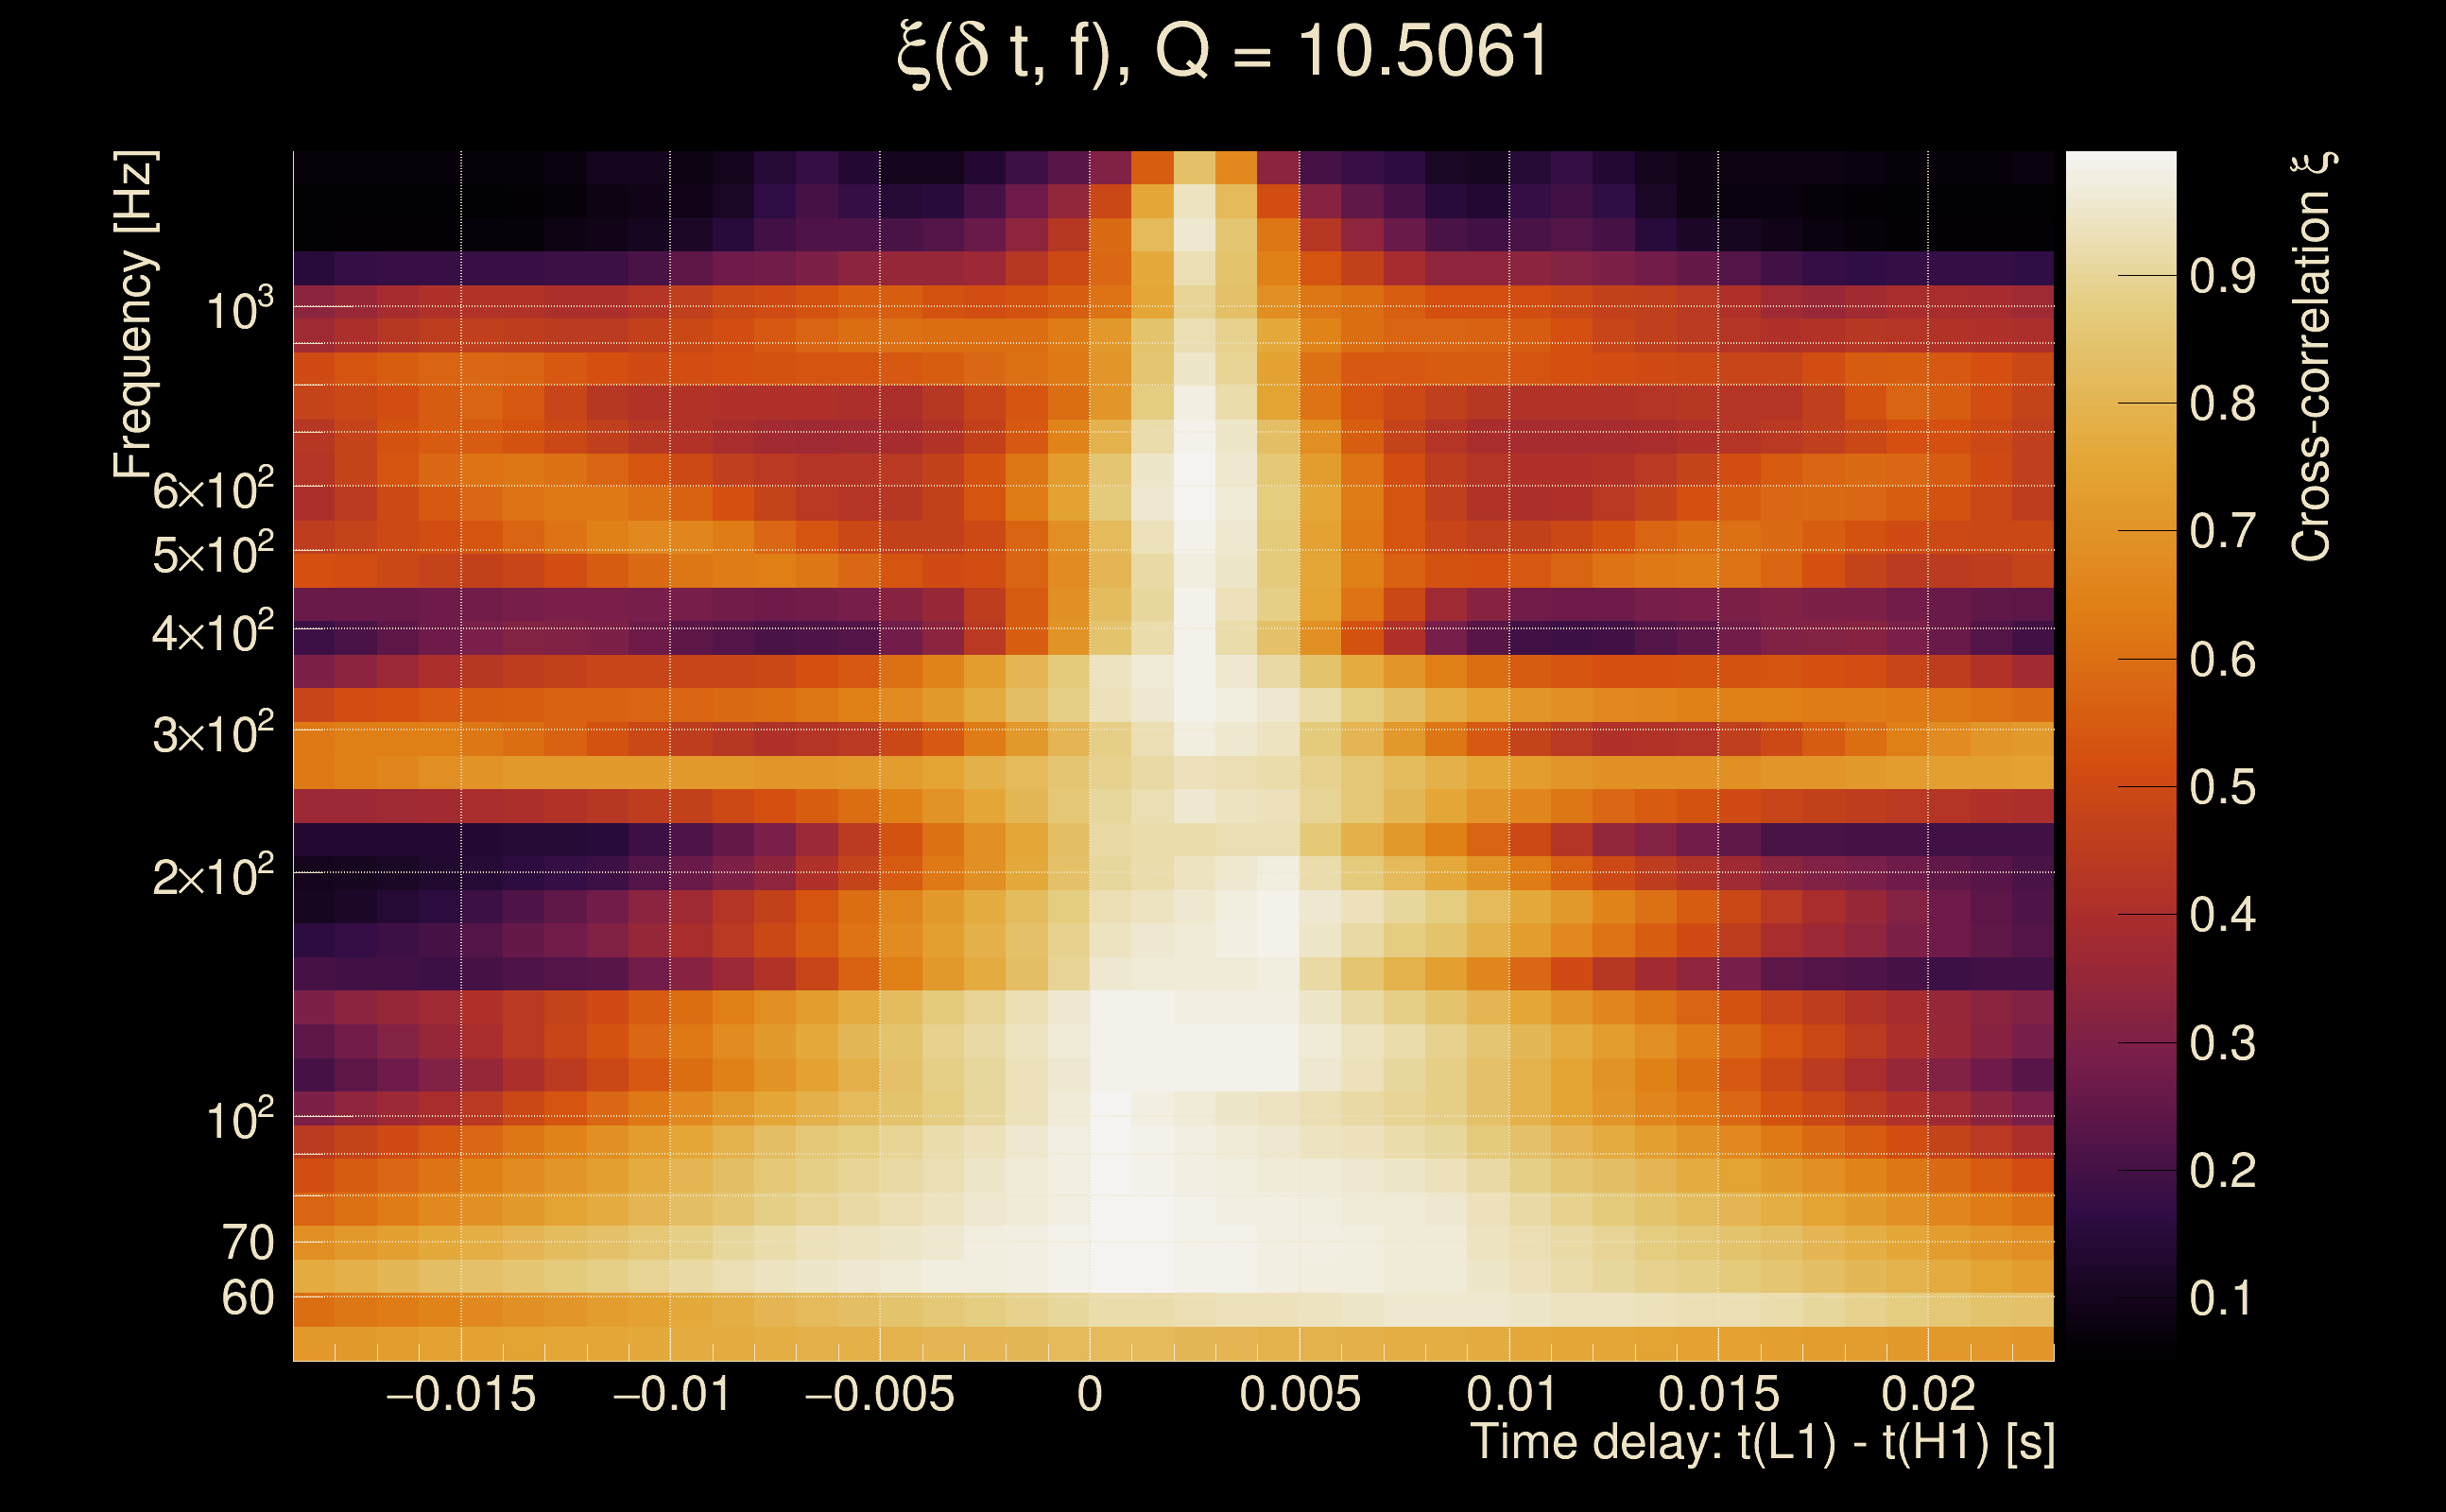
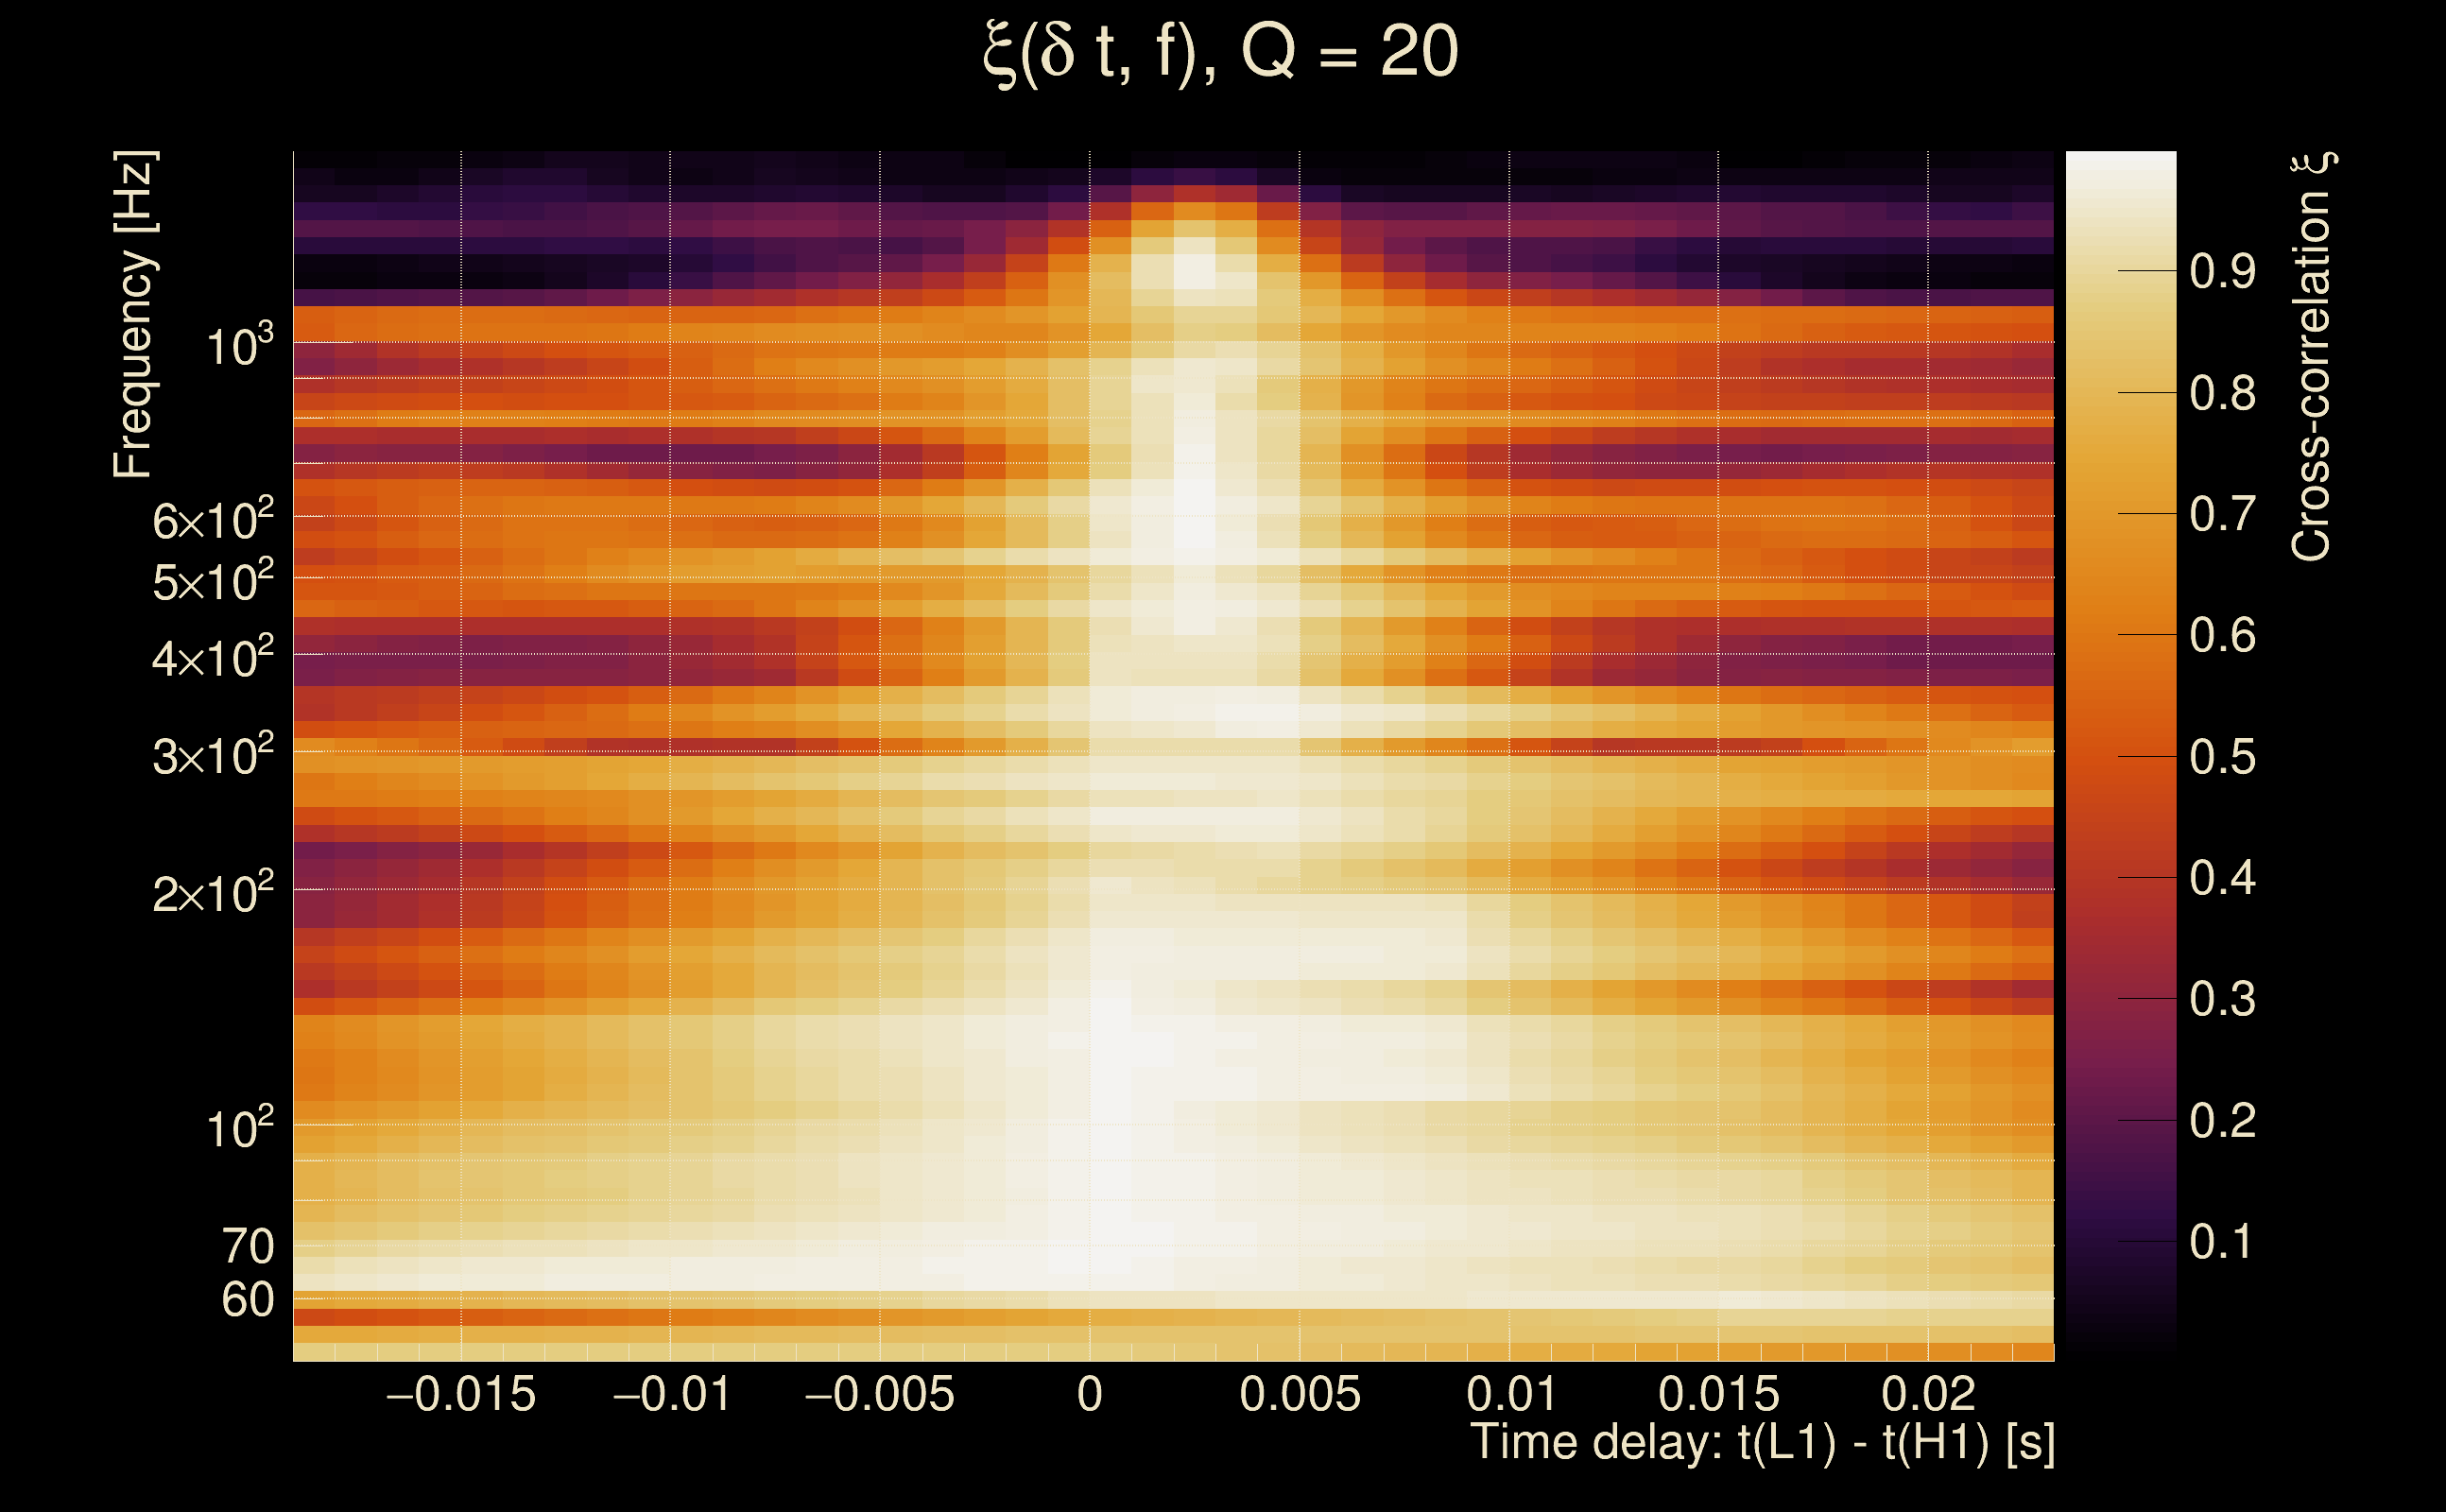
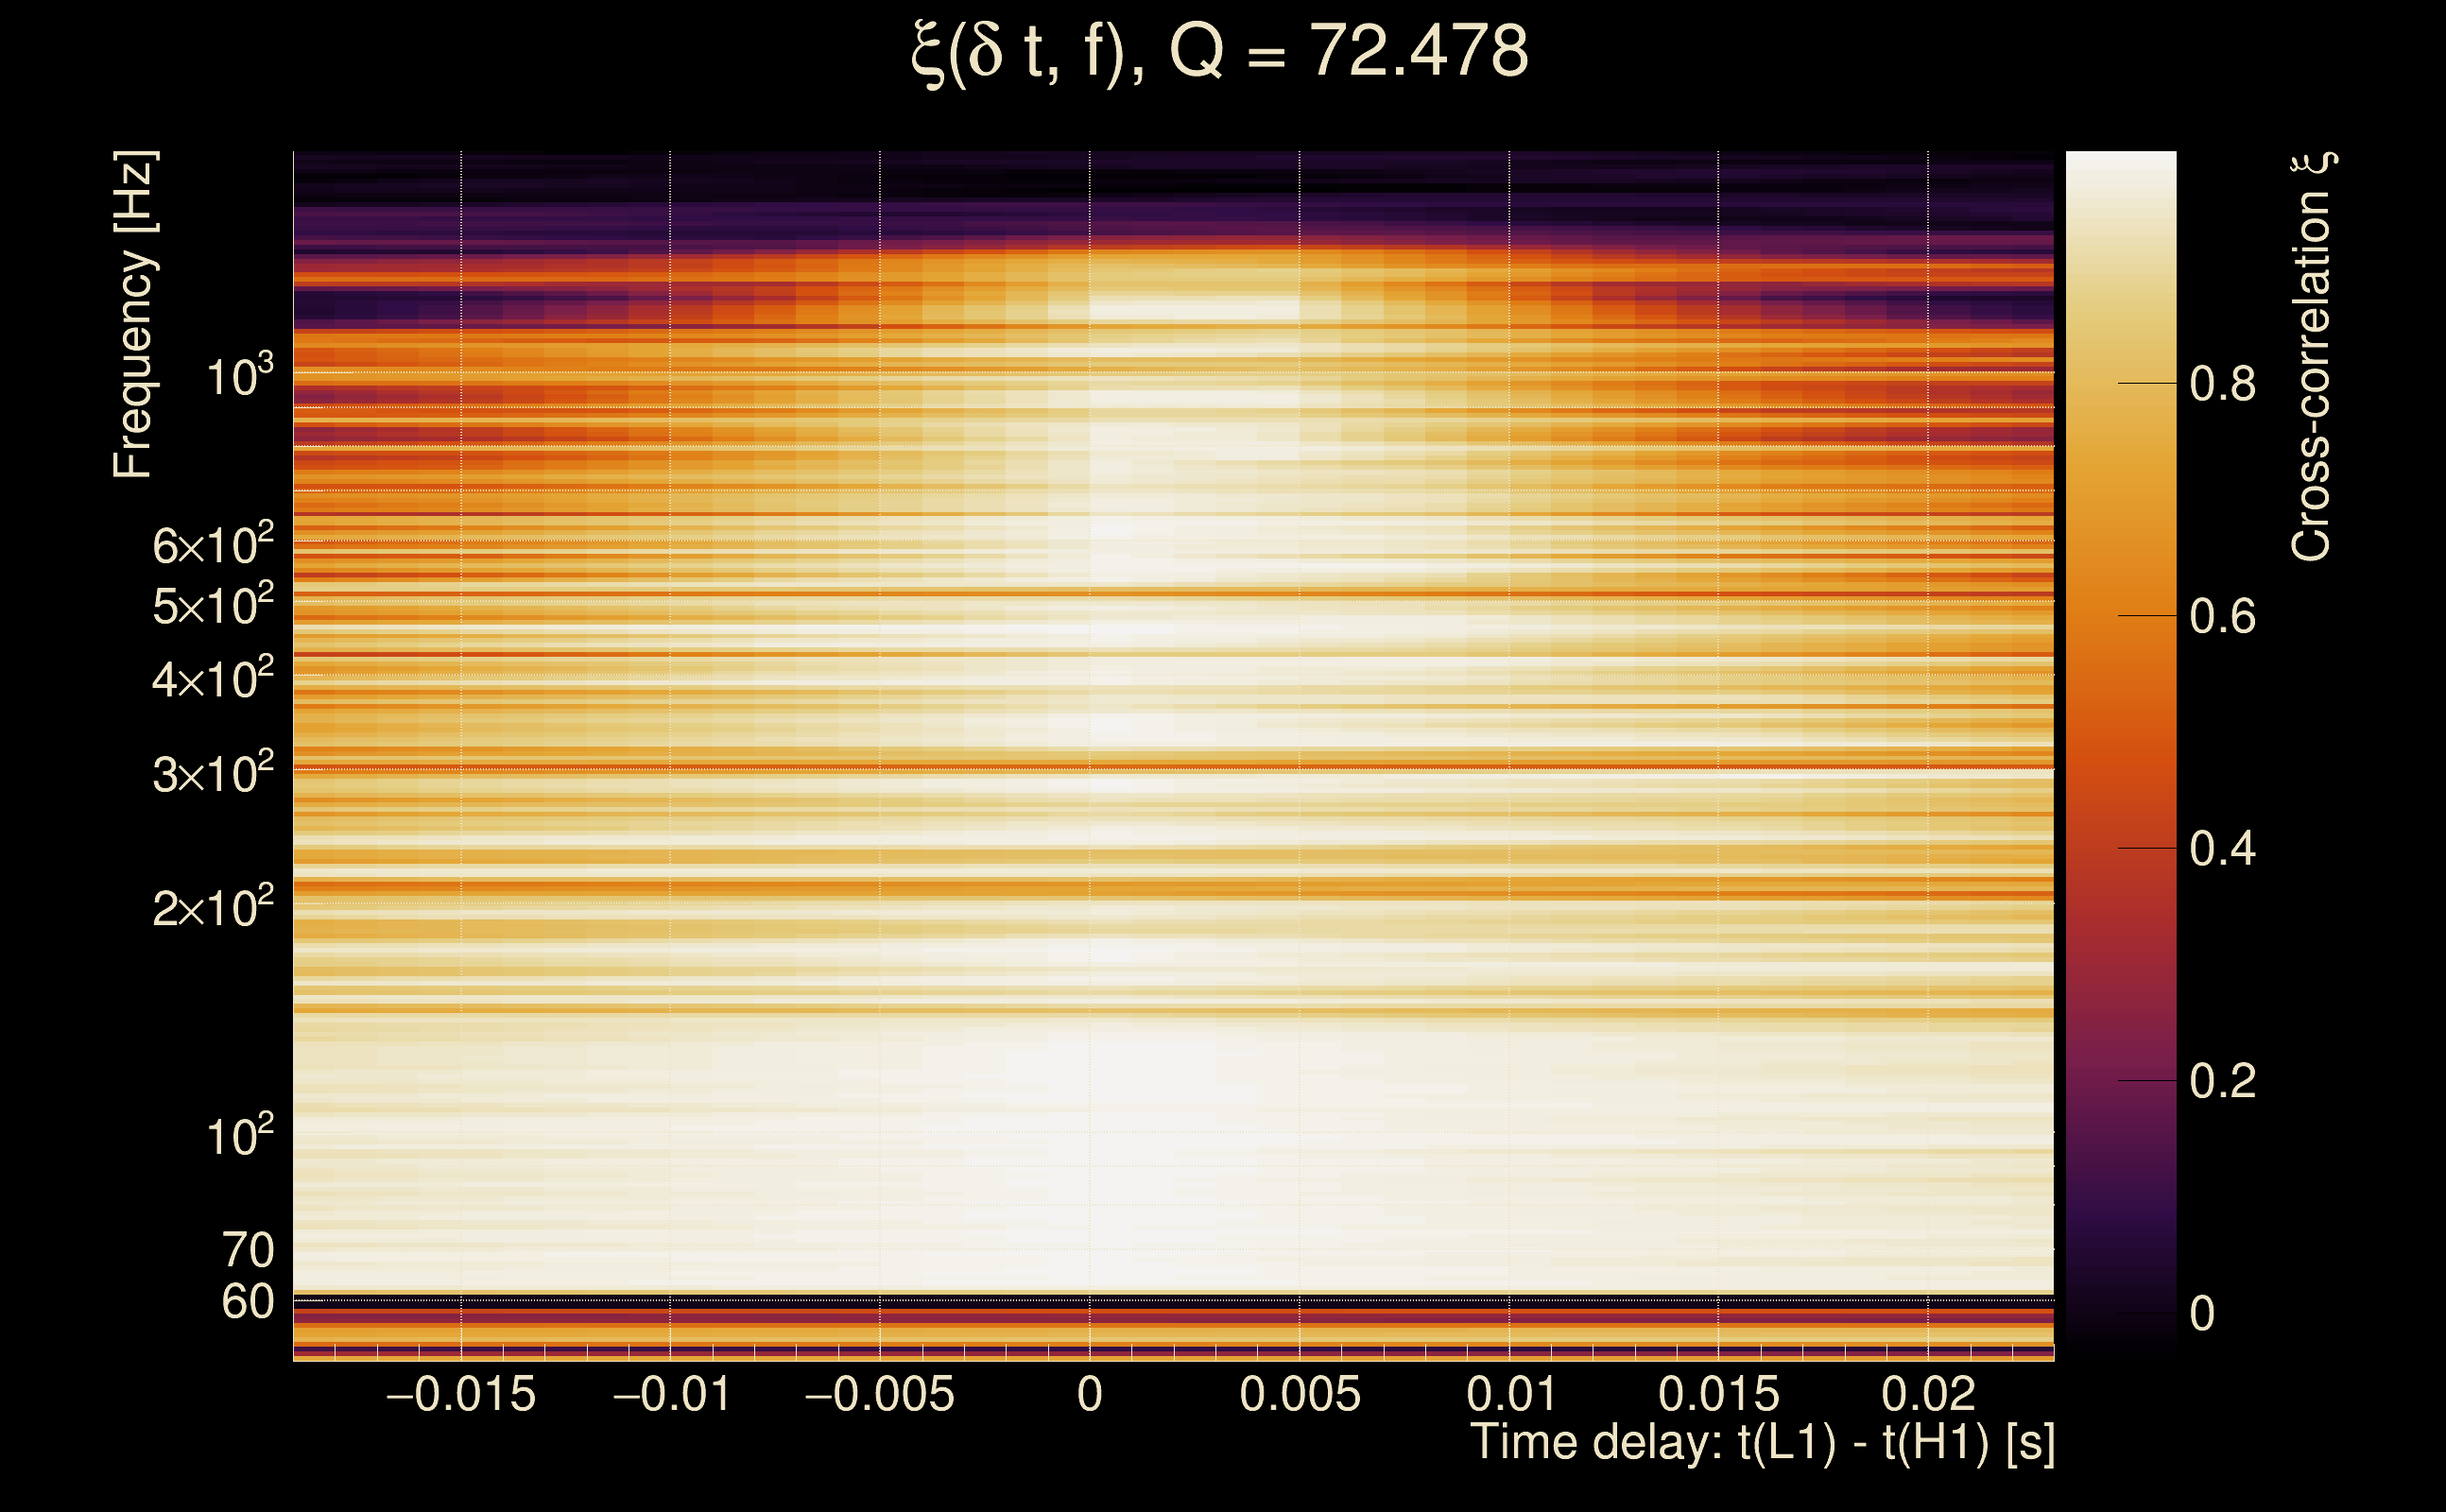
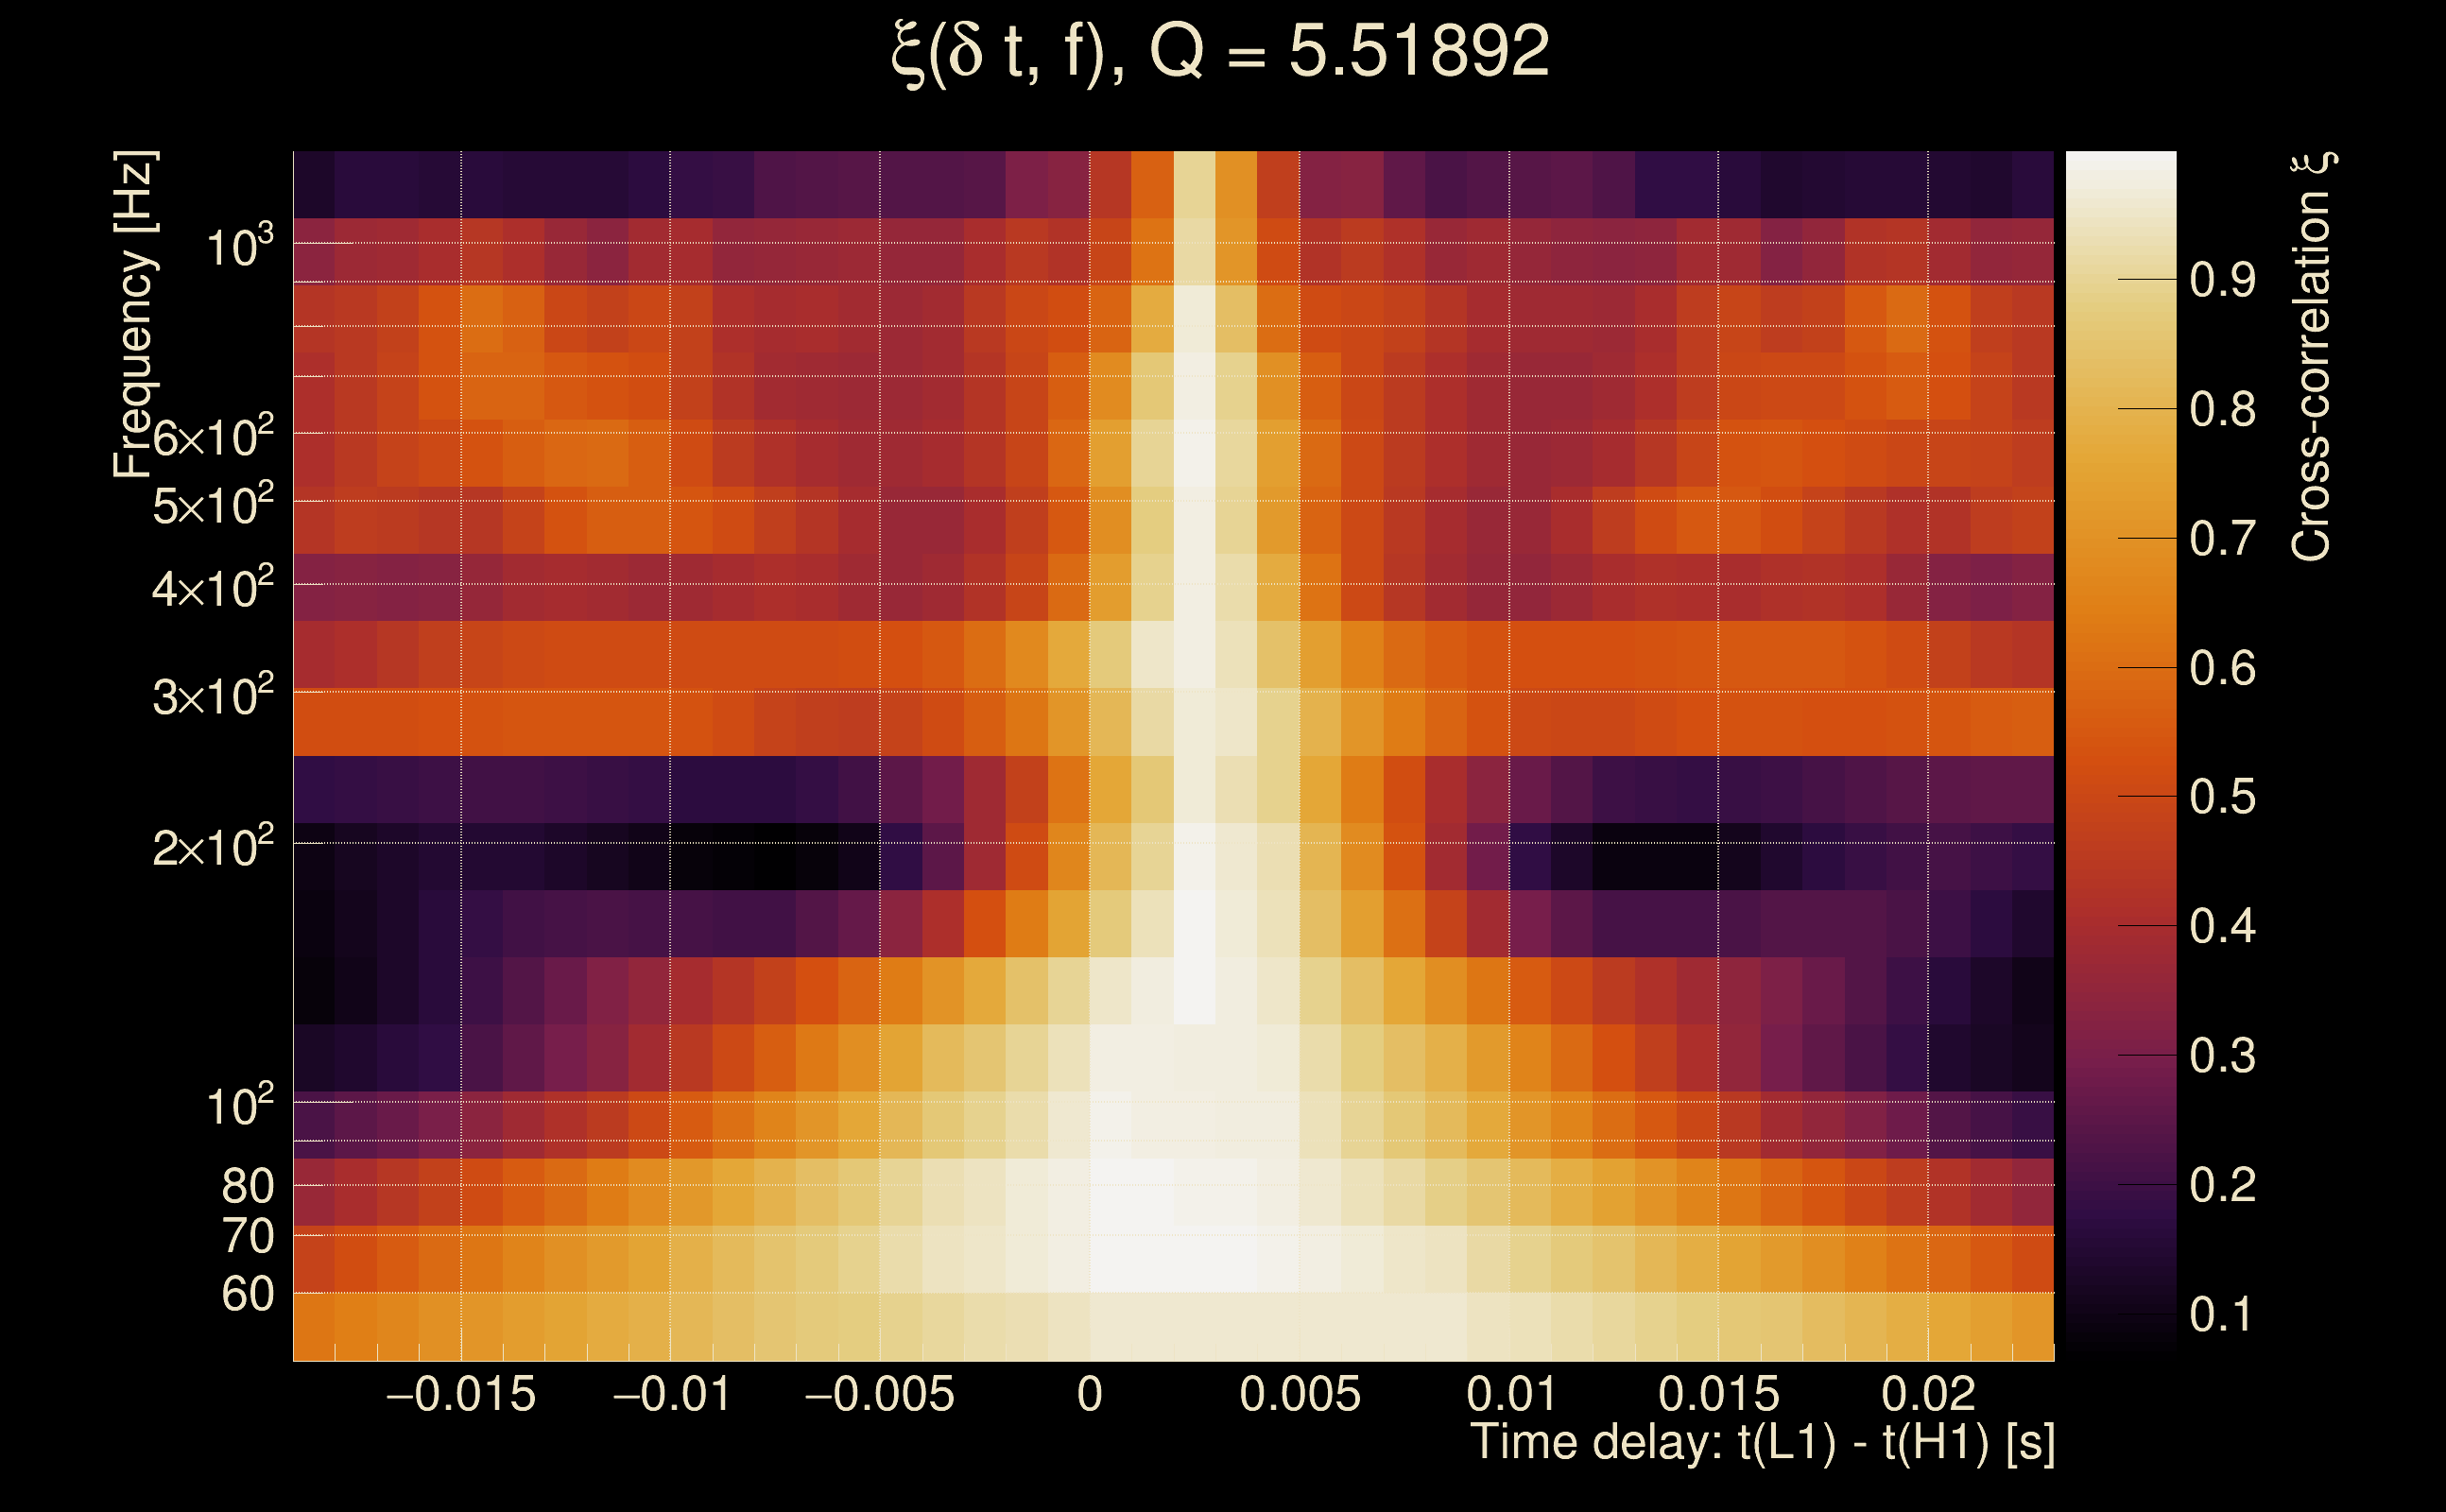
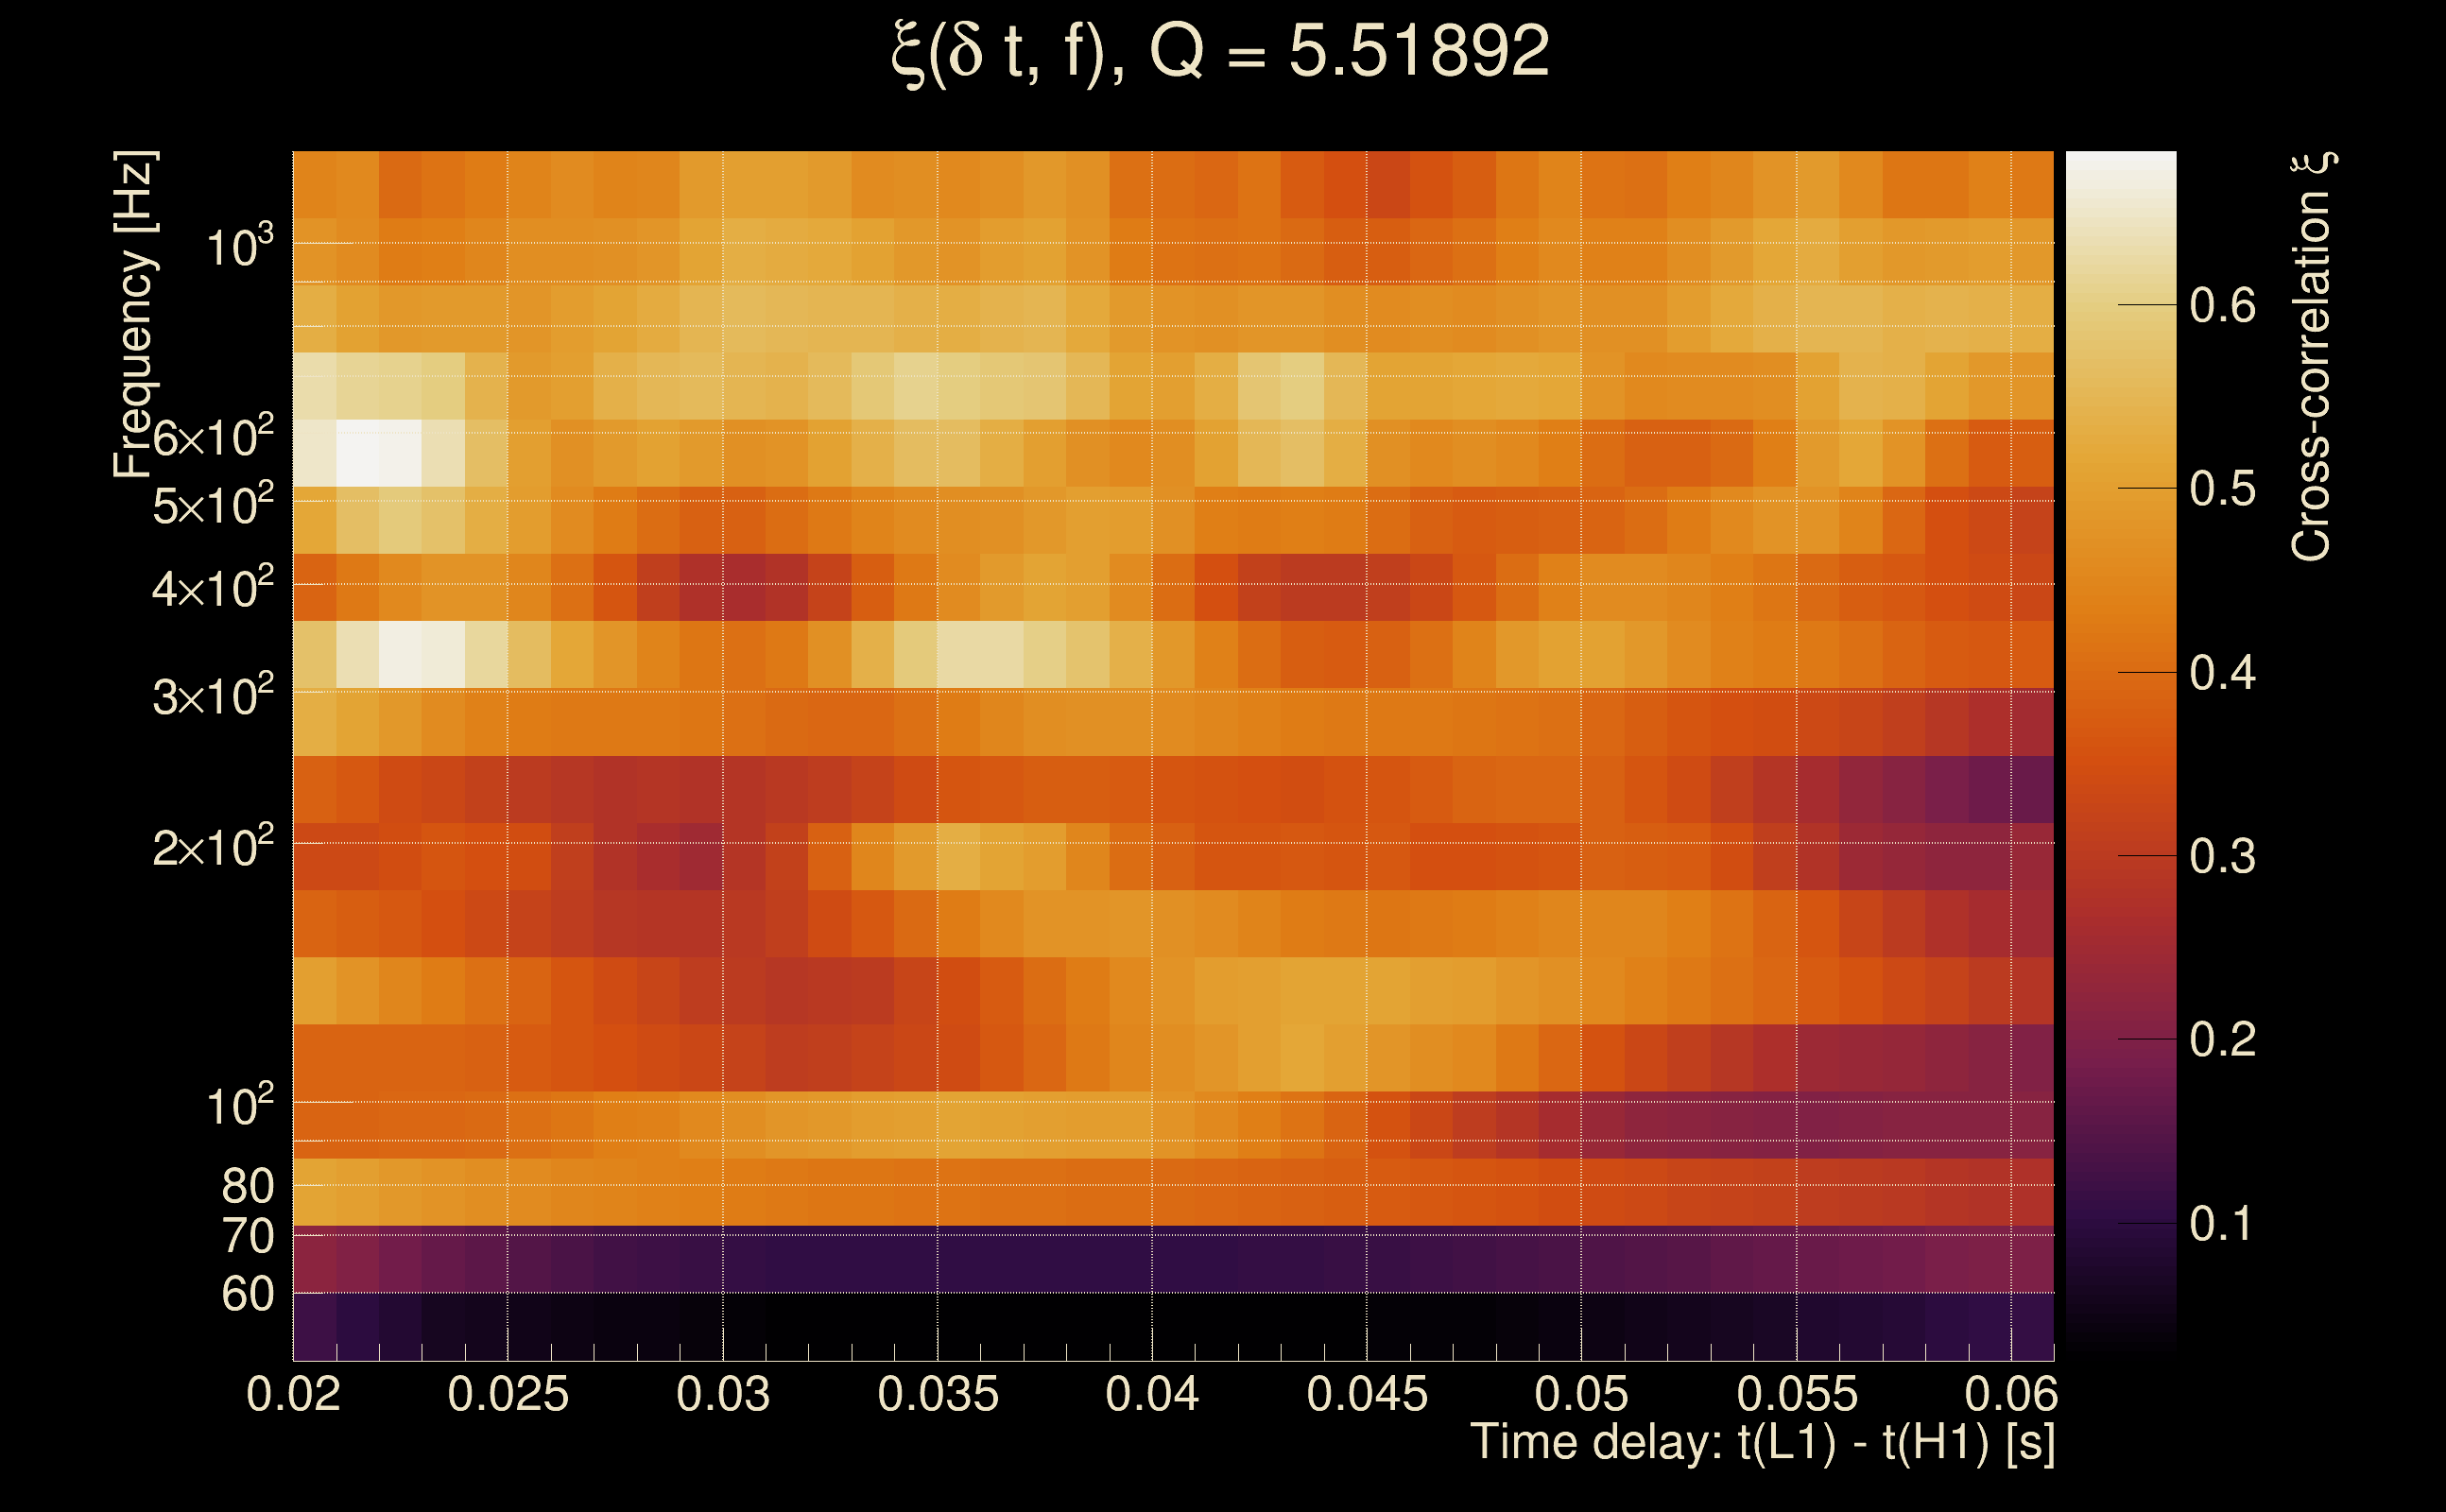
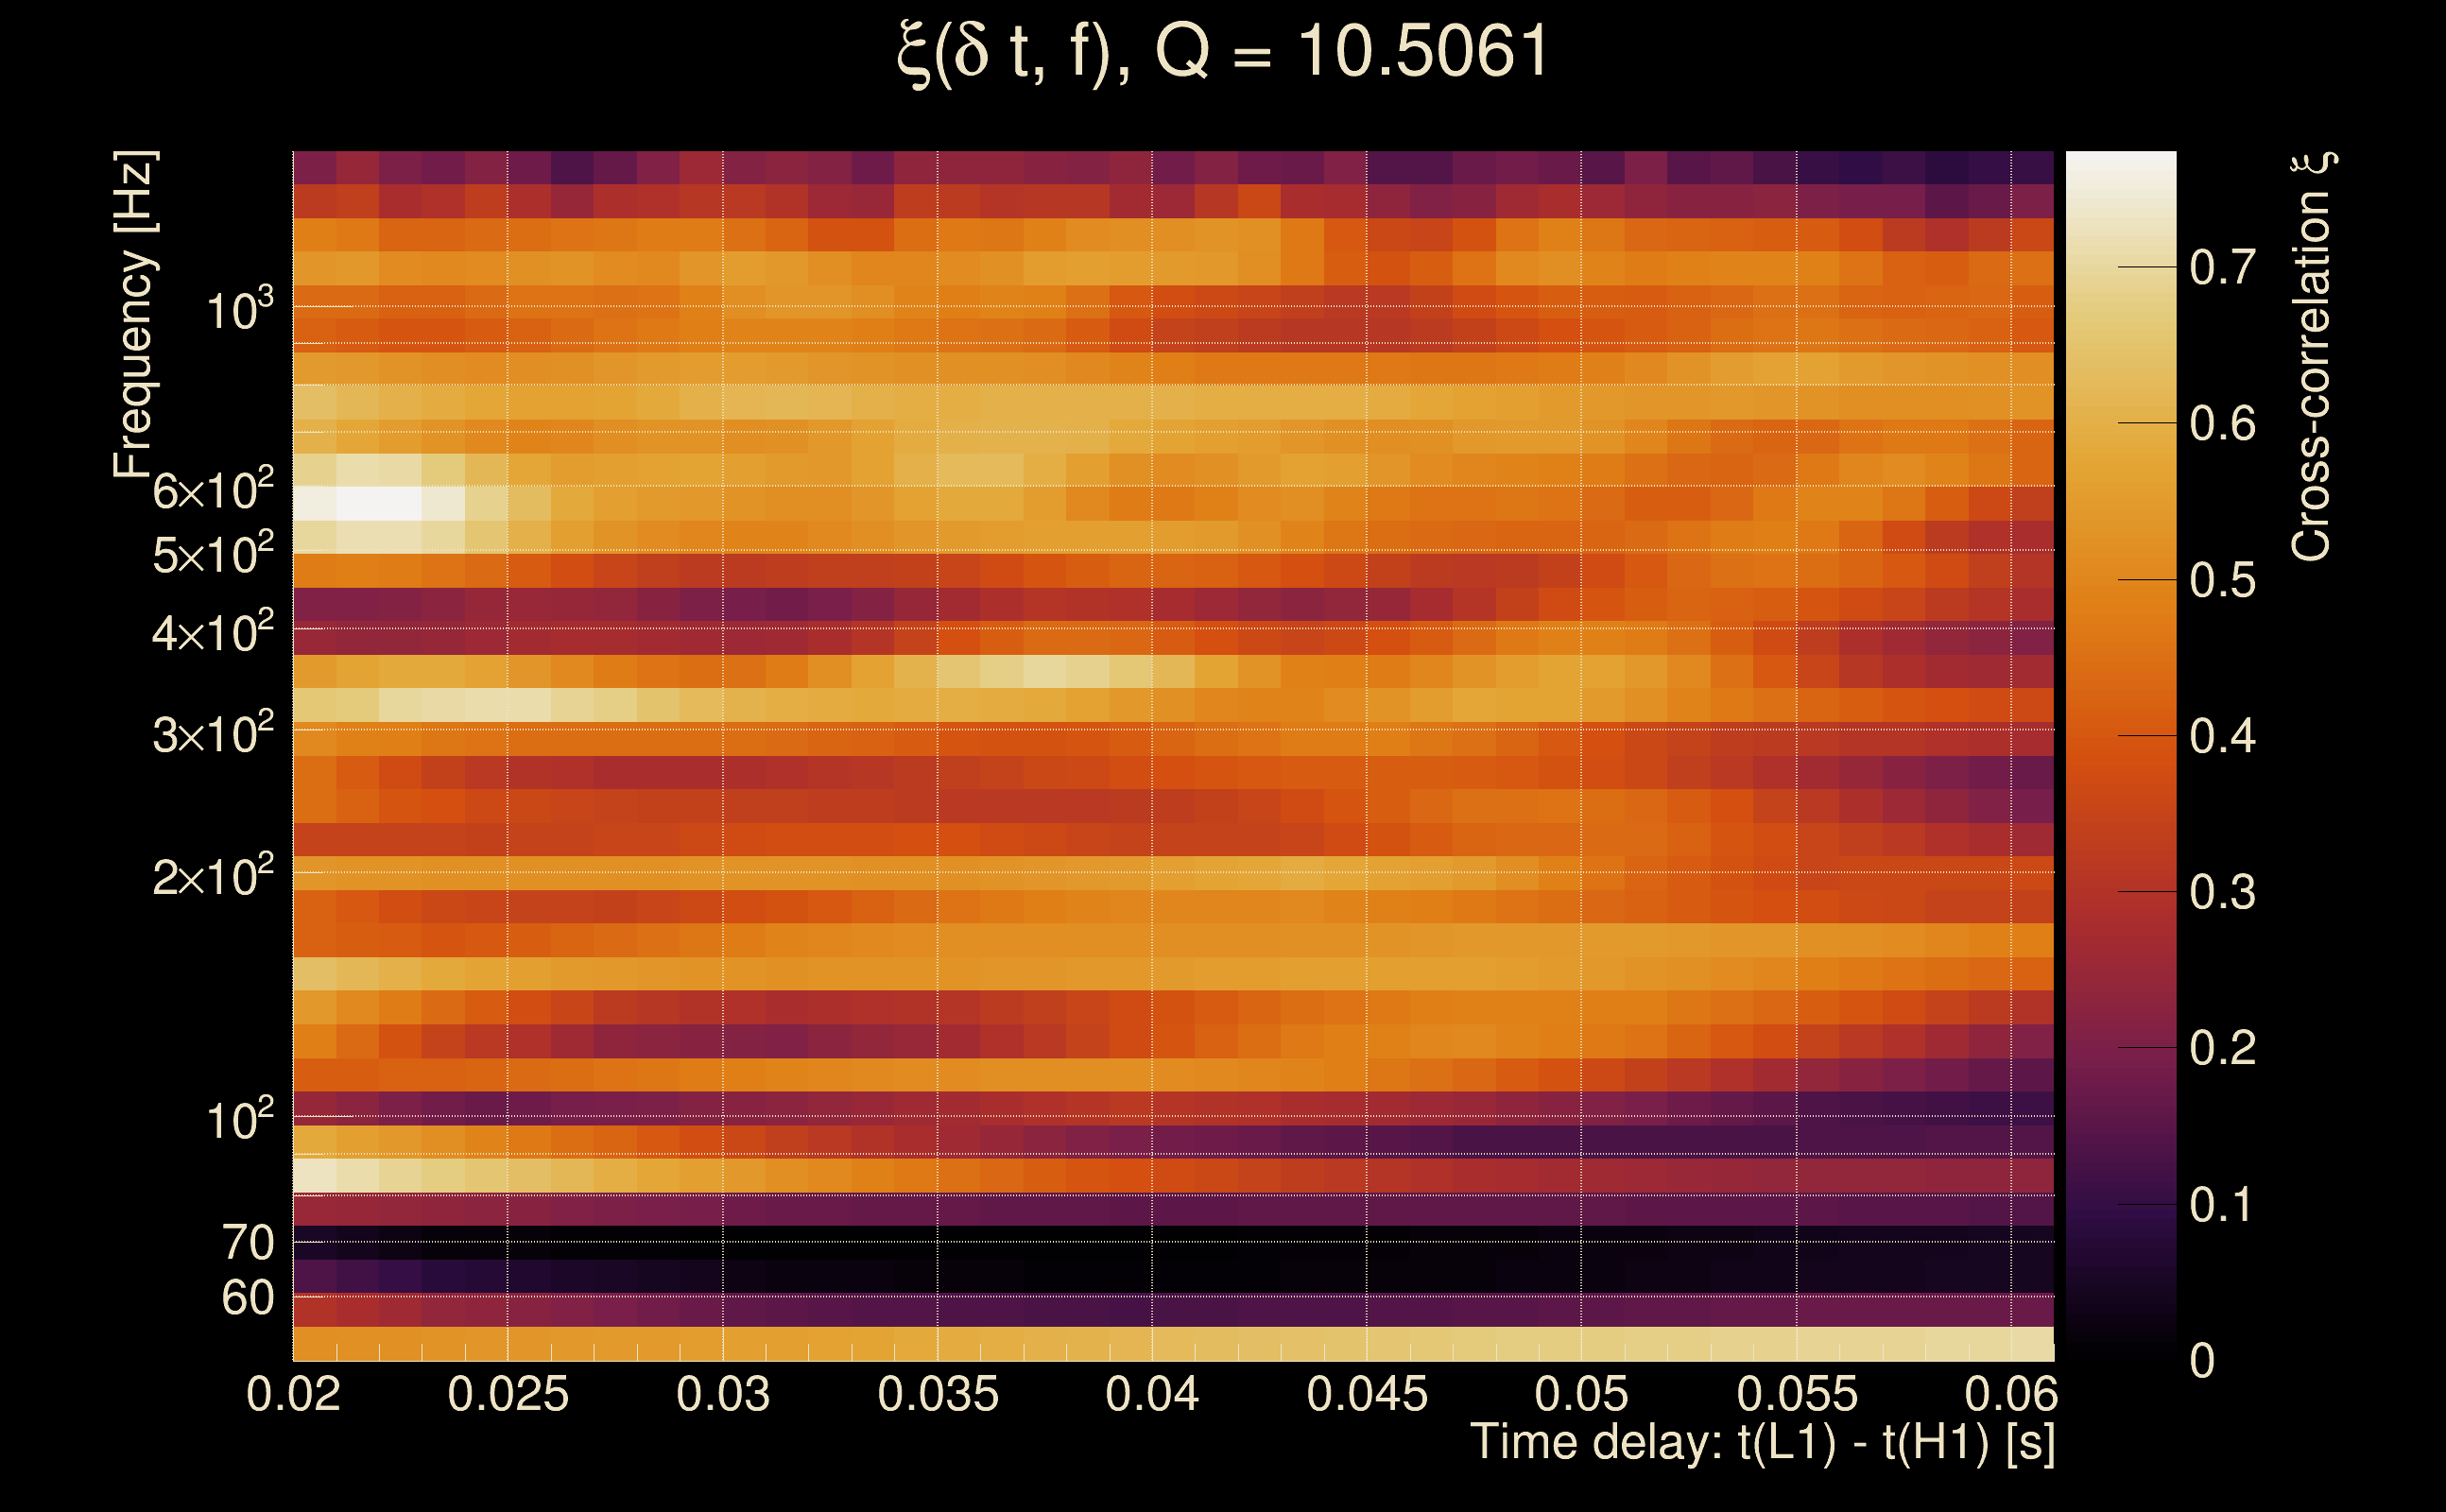
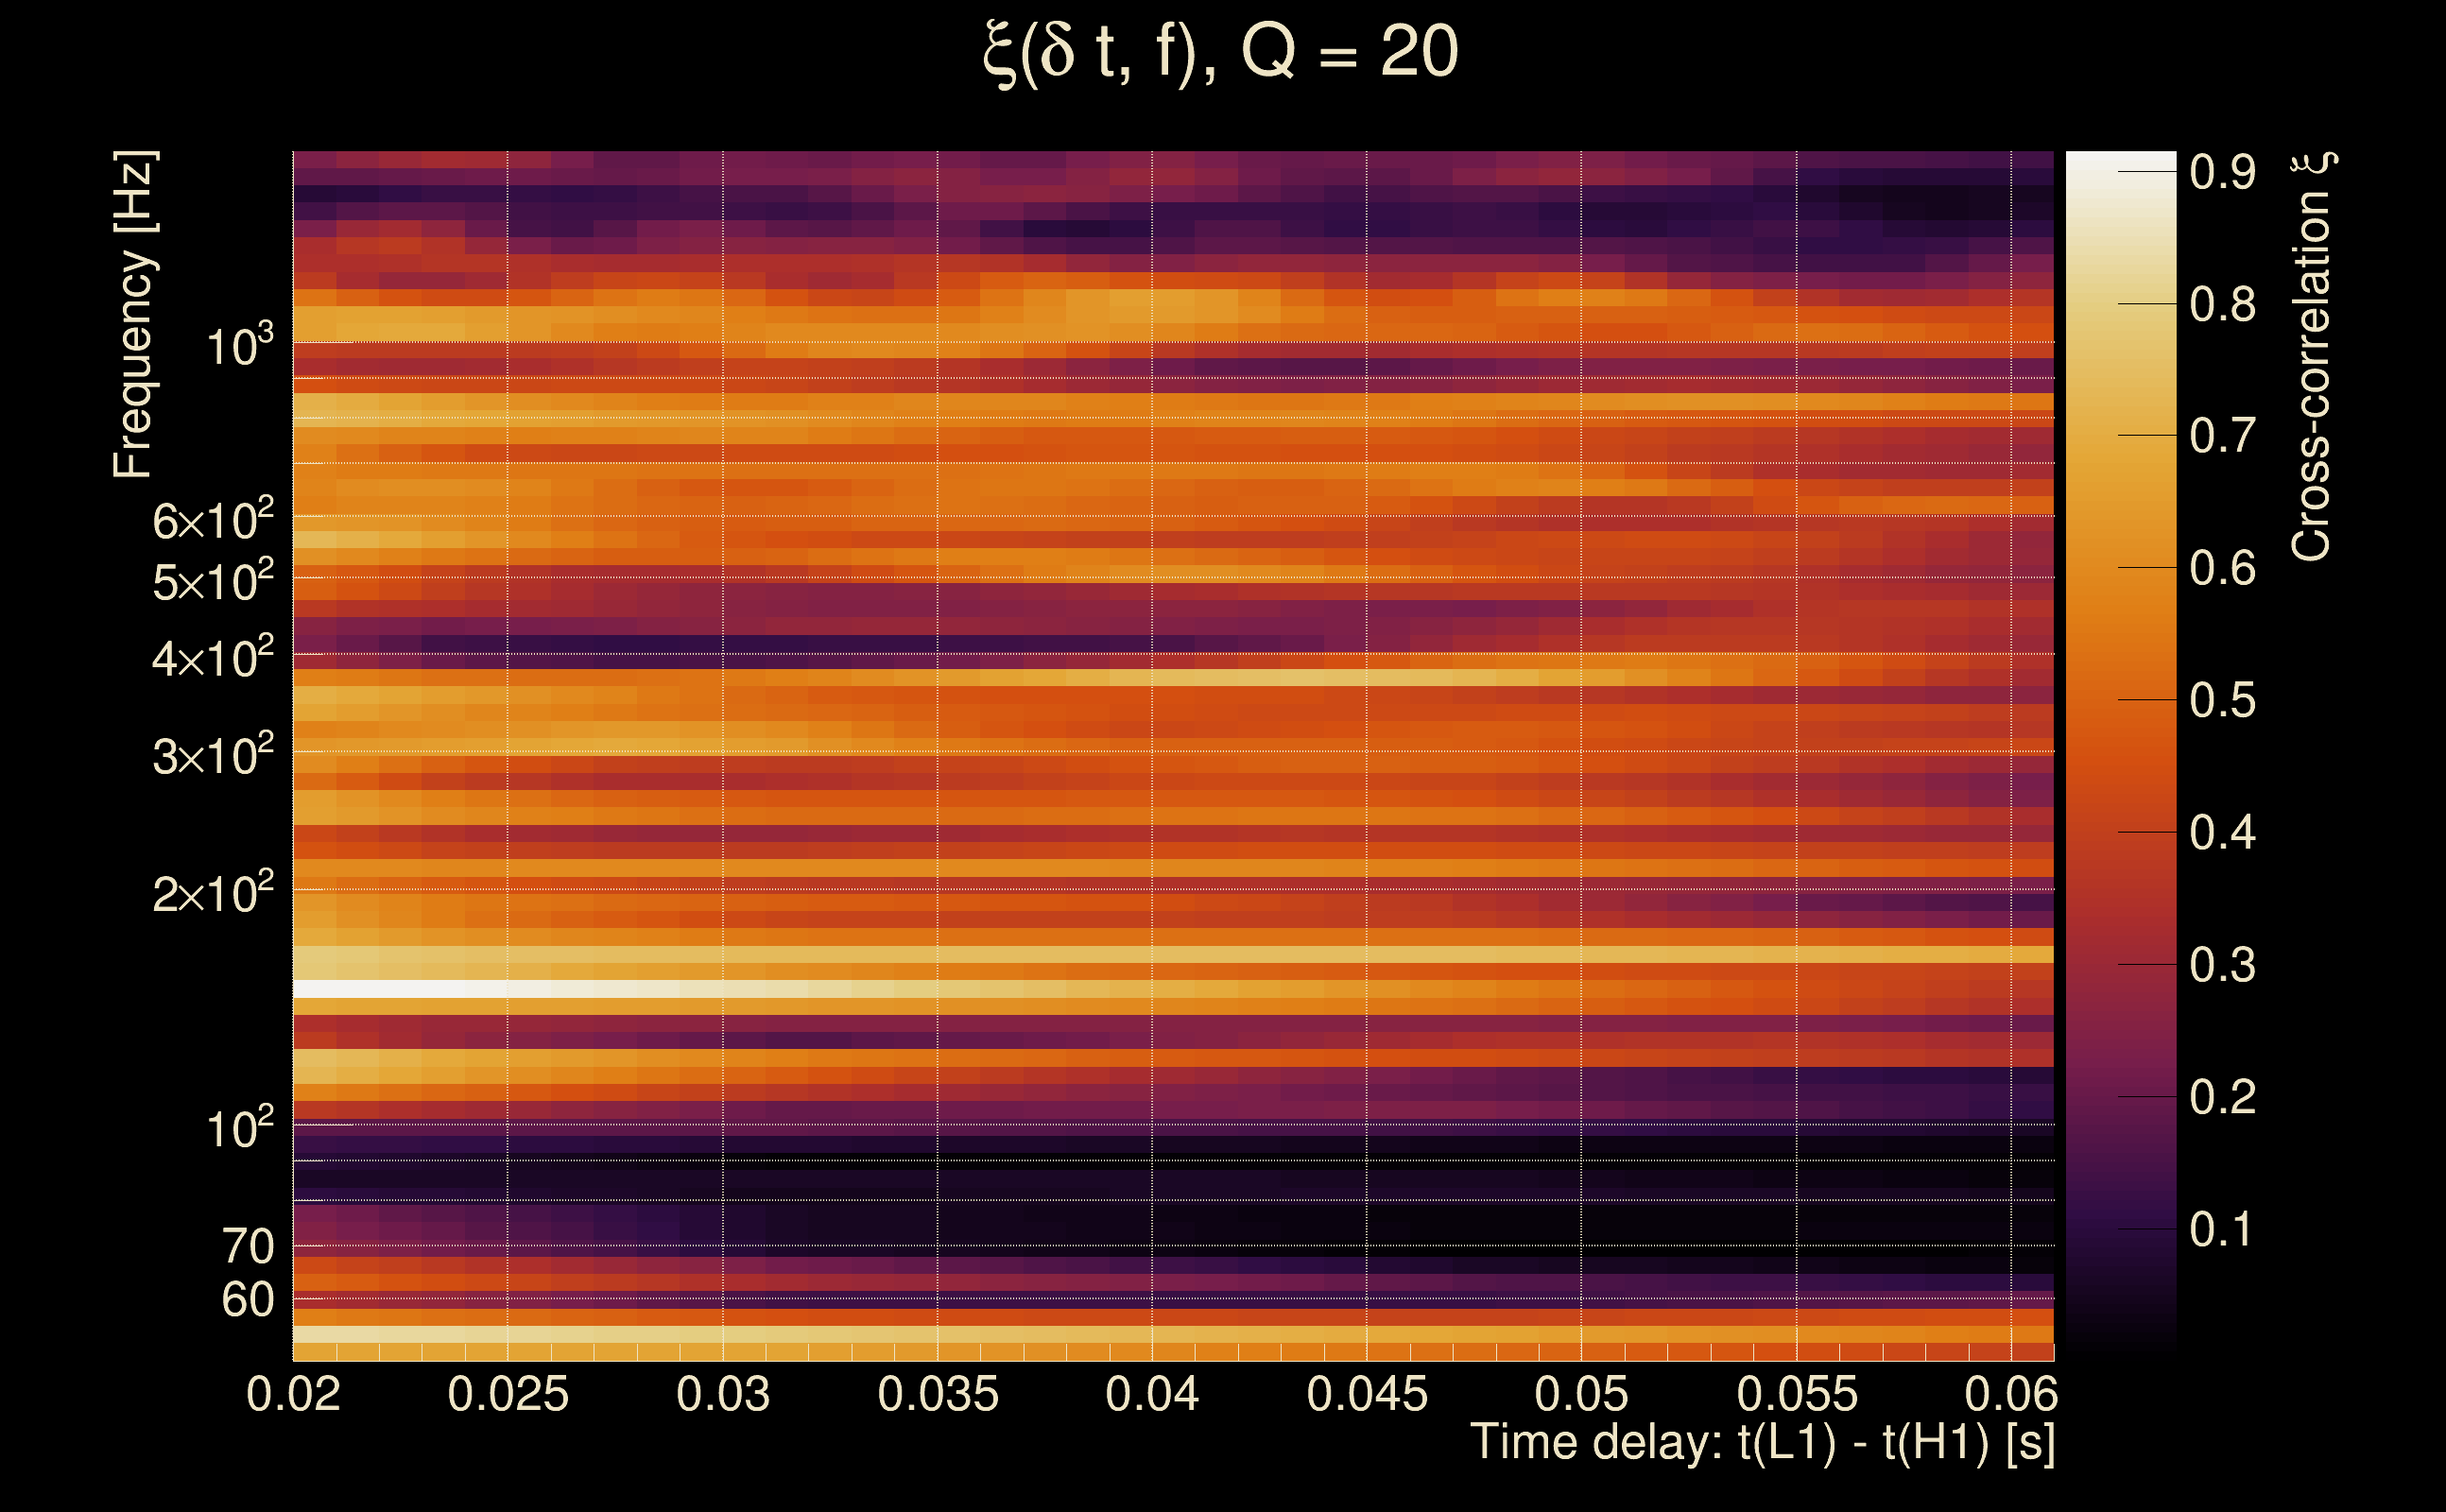
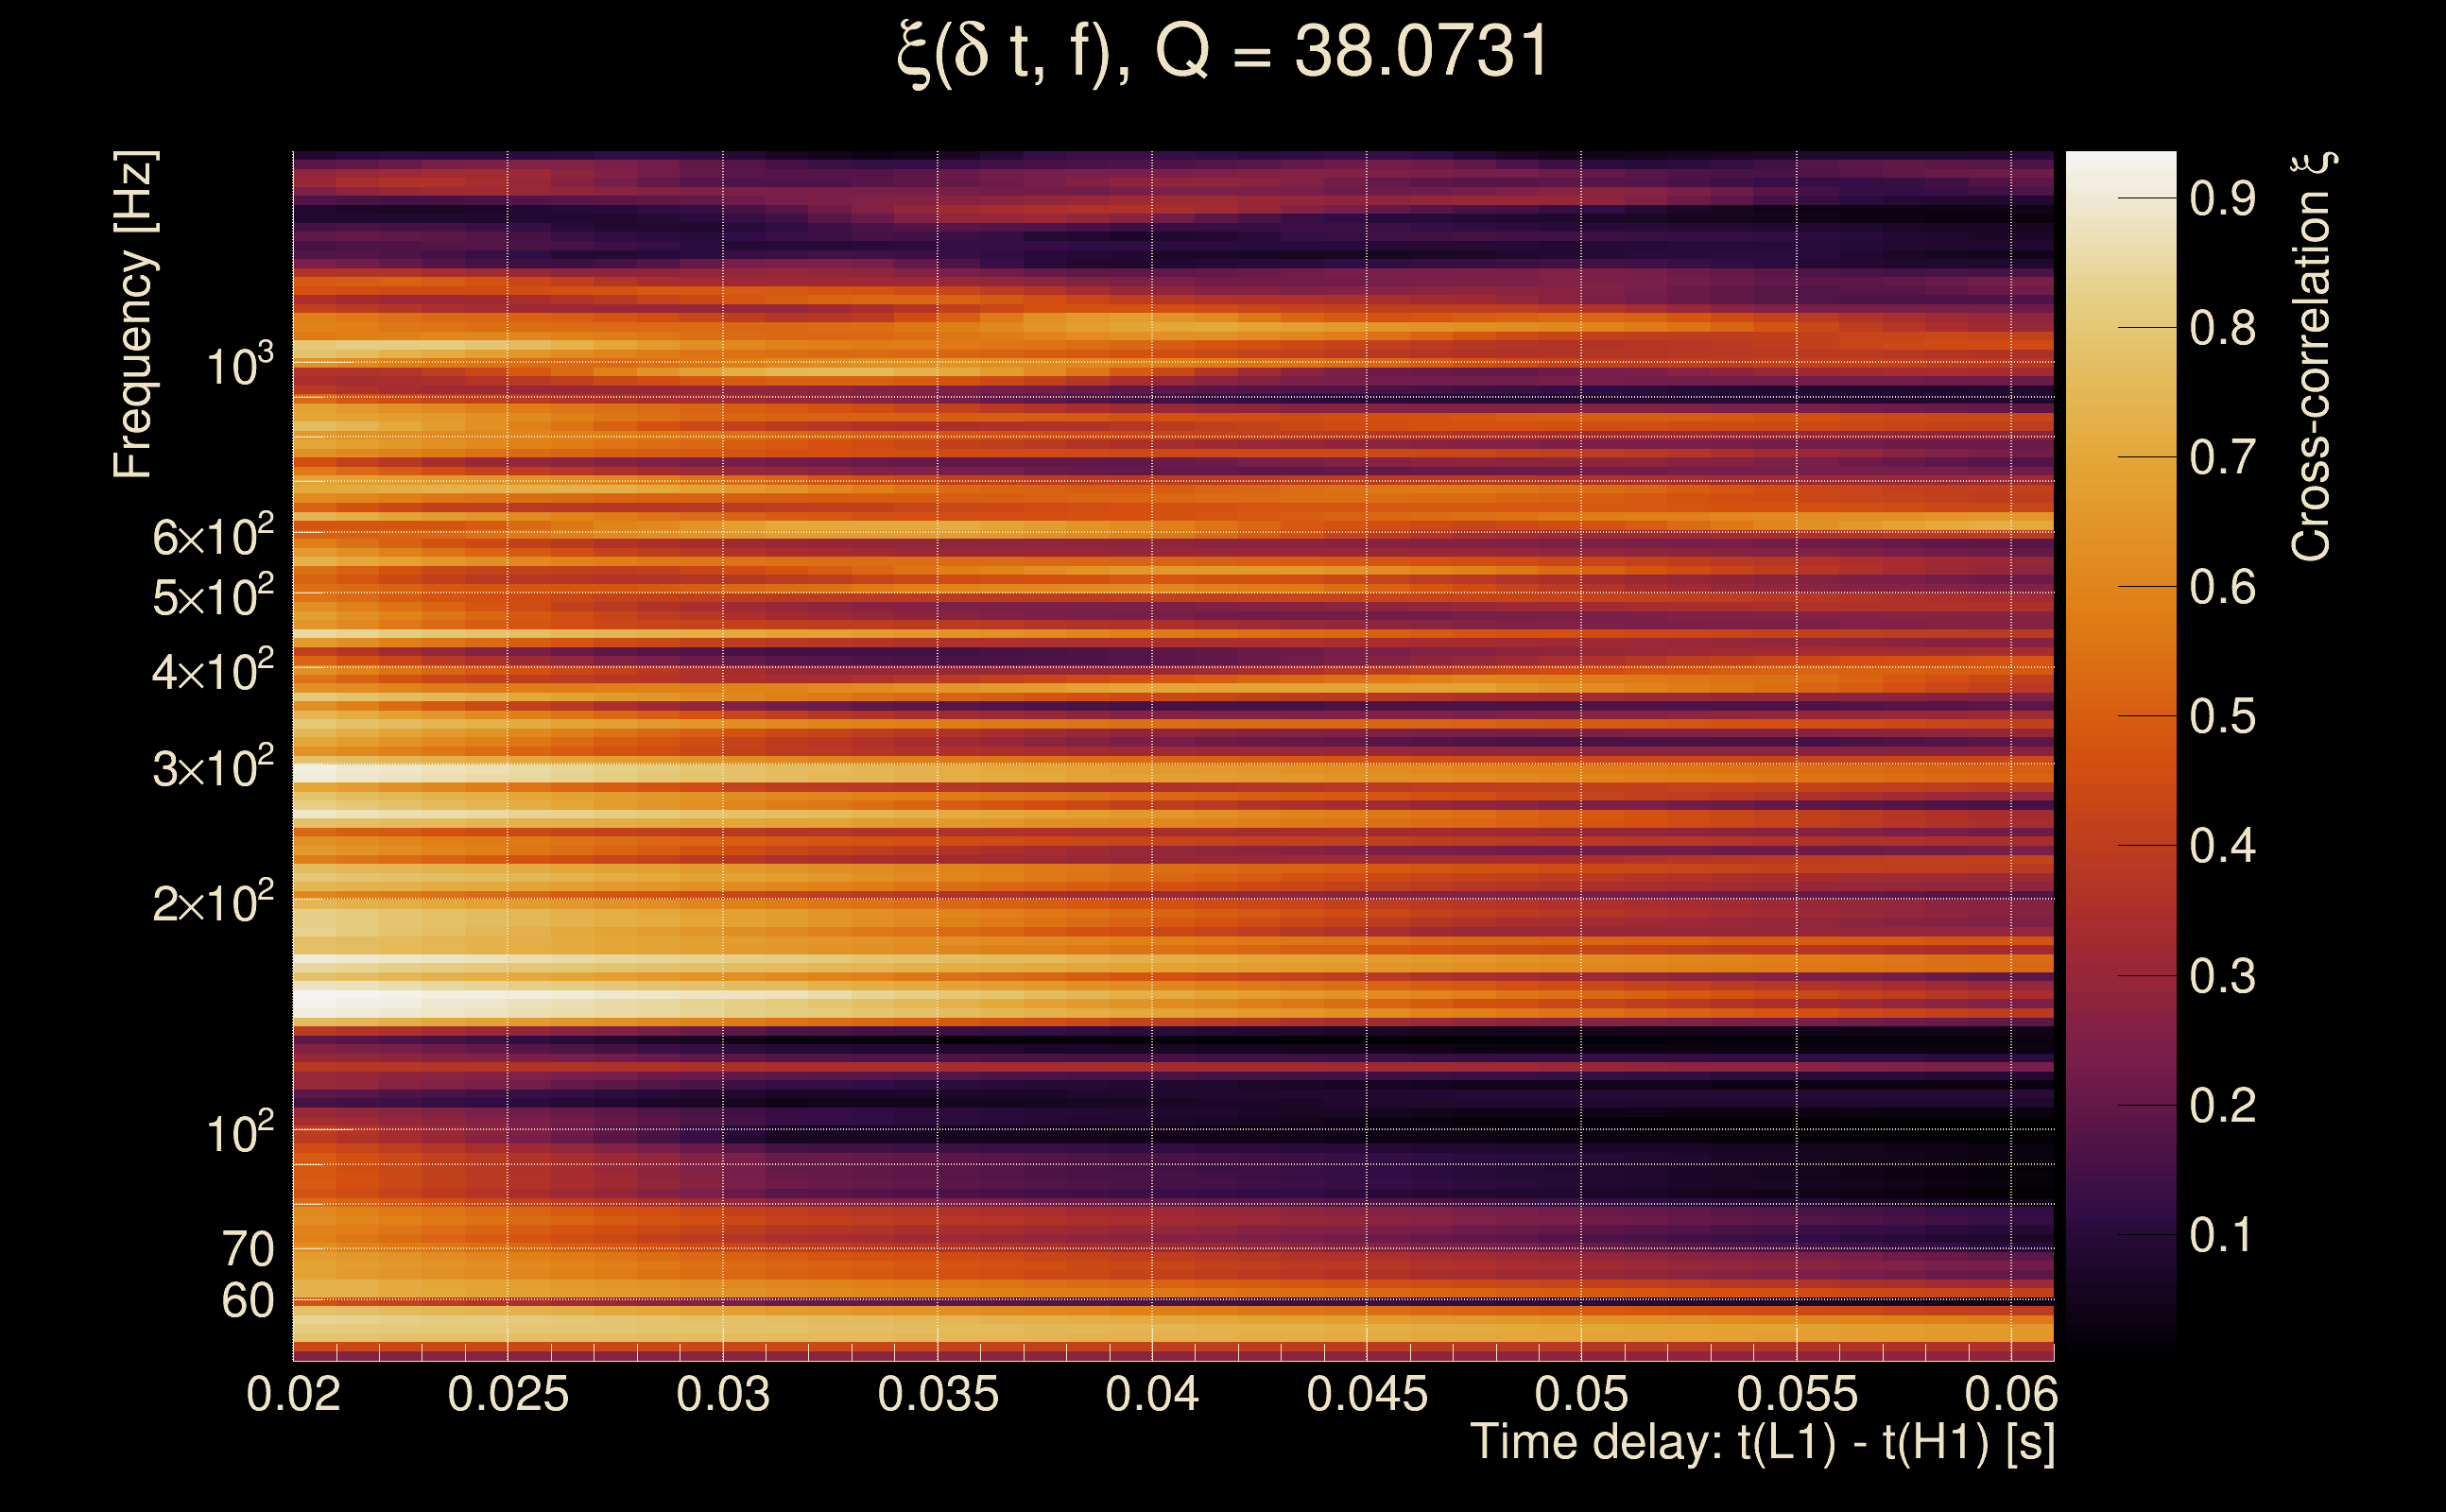
| Frequency: | 278.663 Hz |
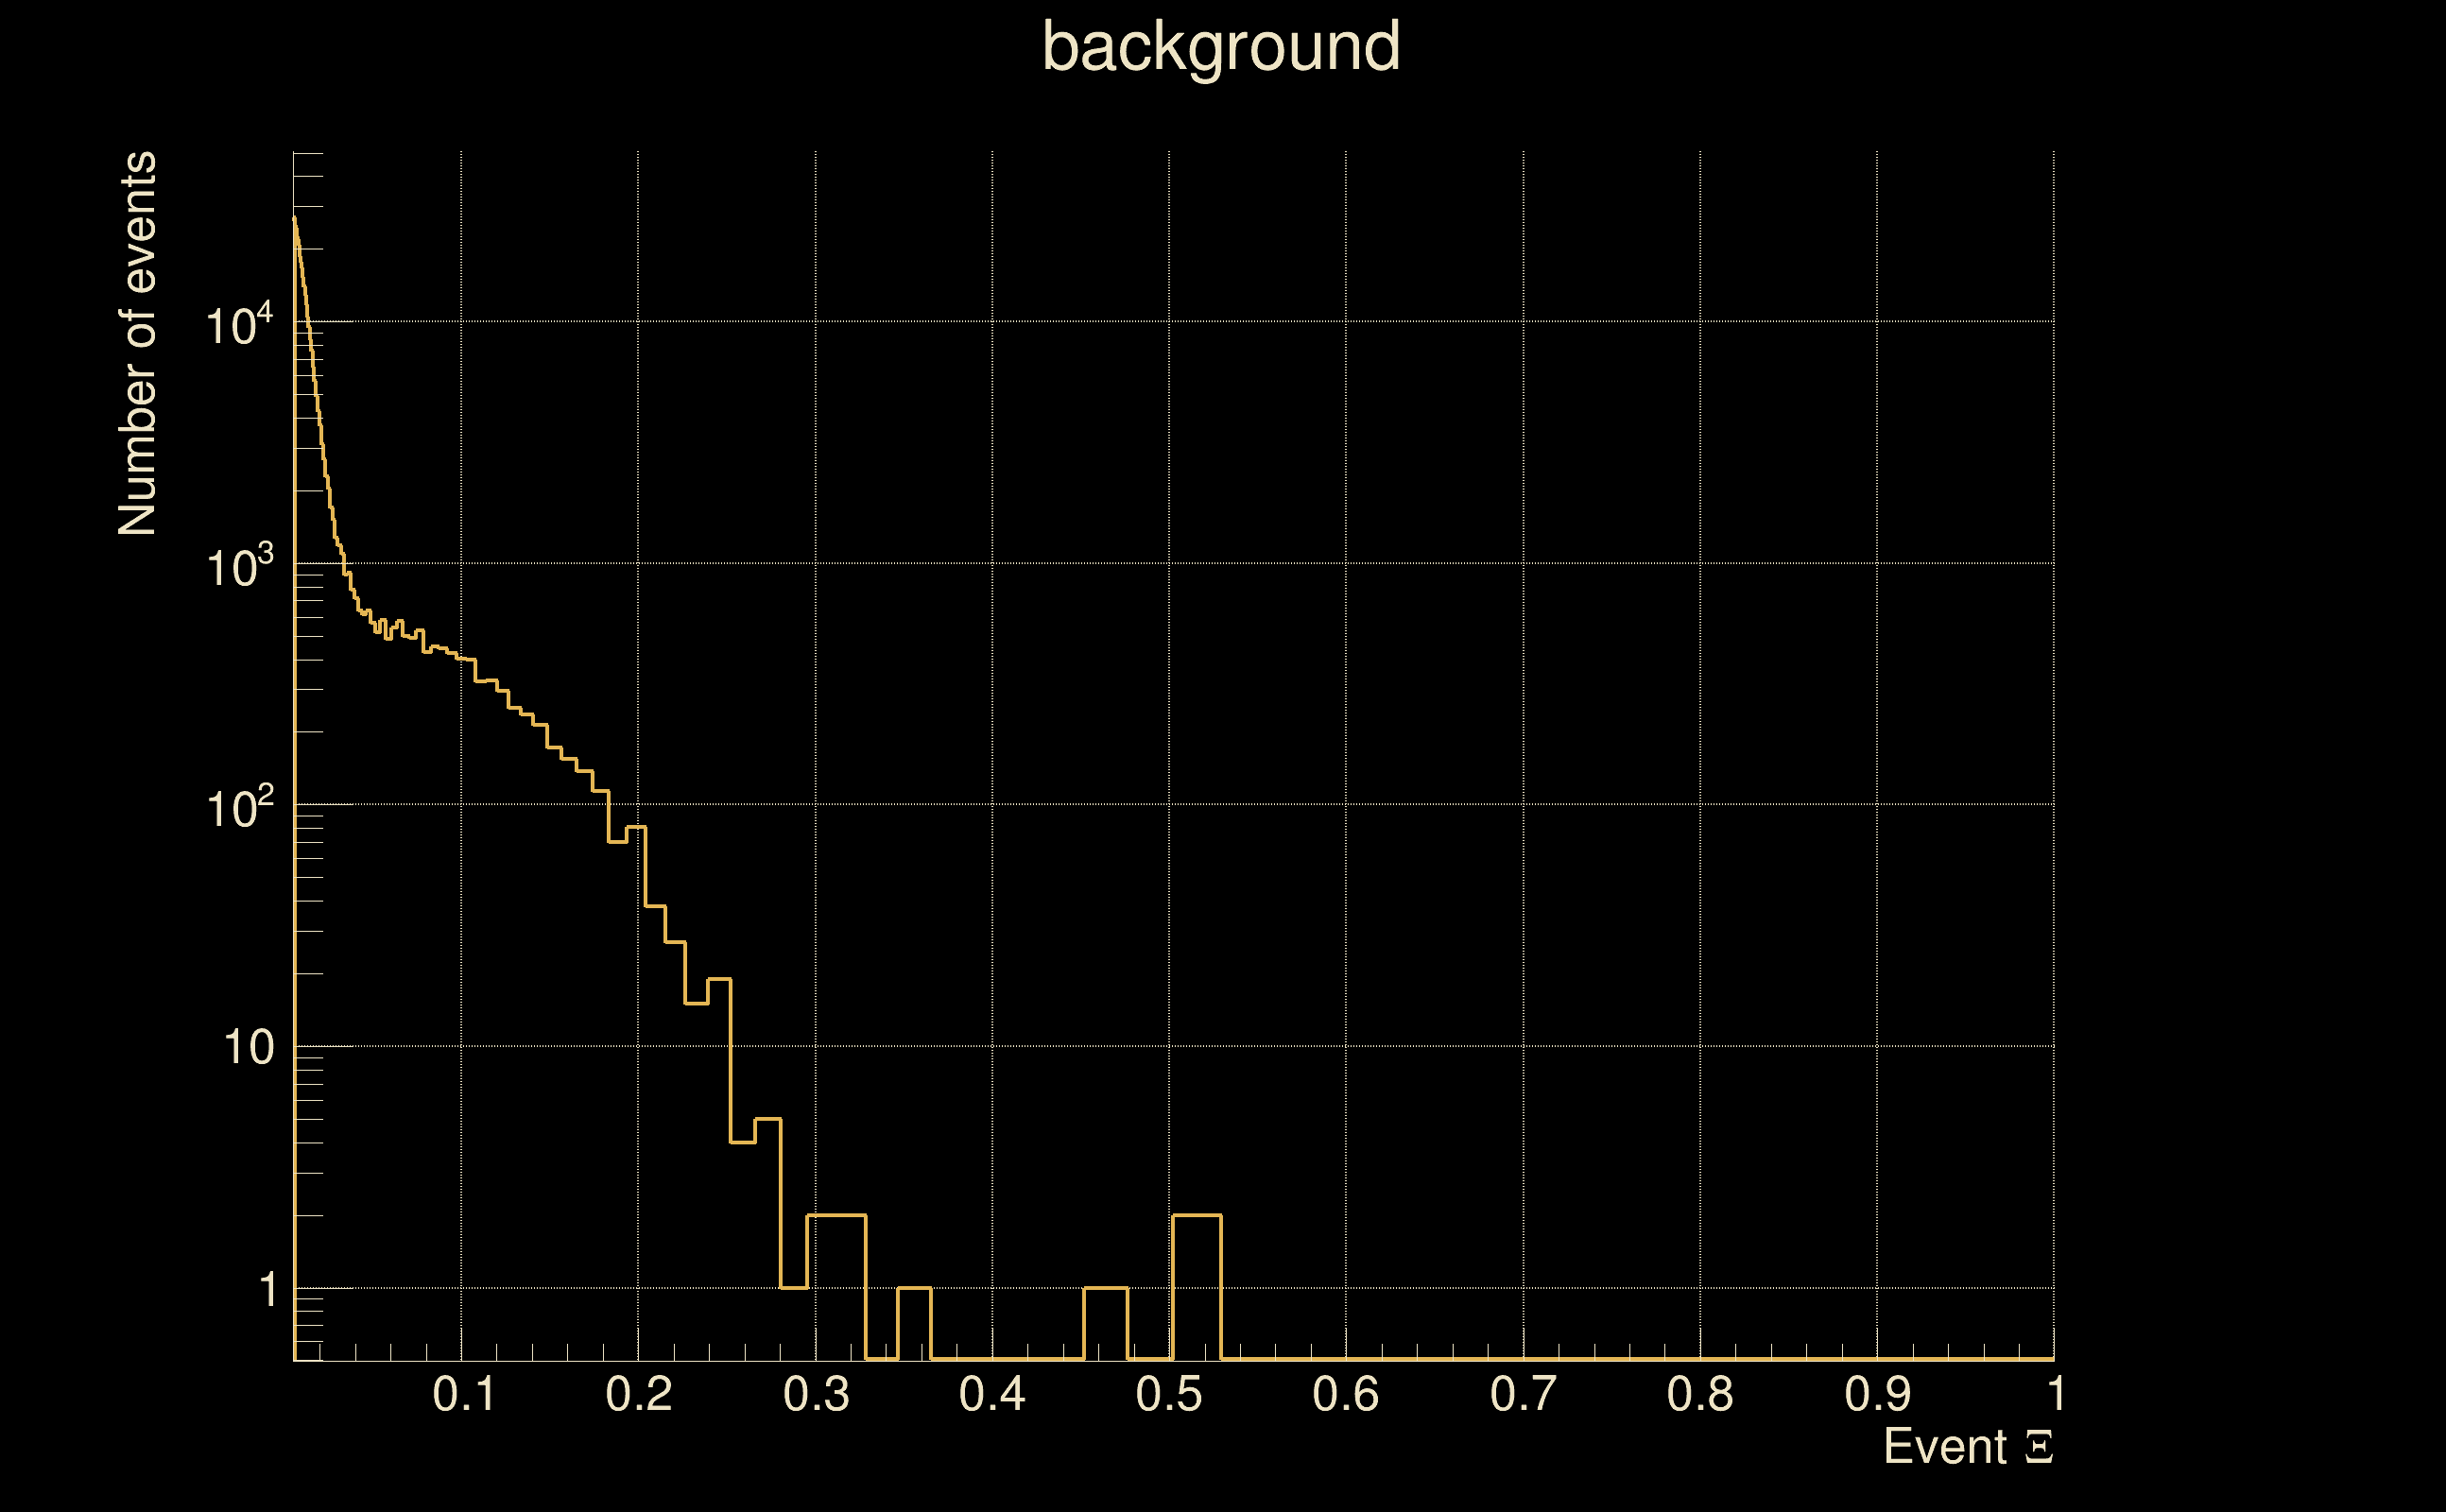
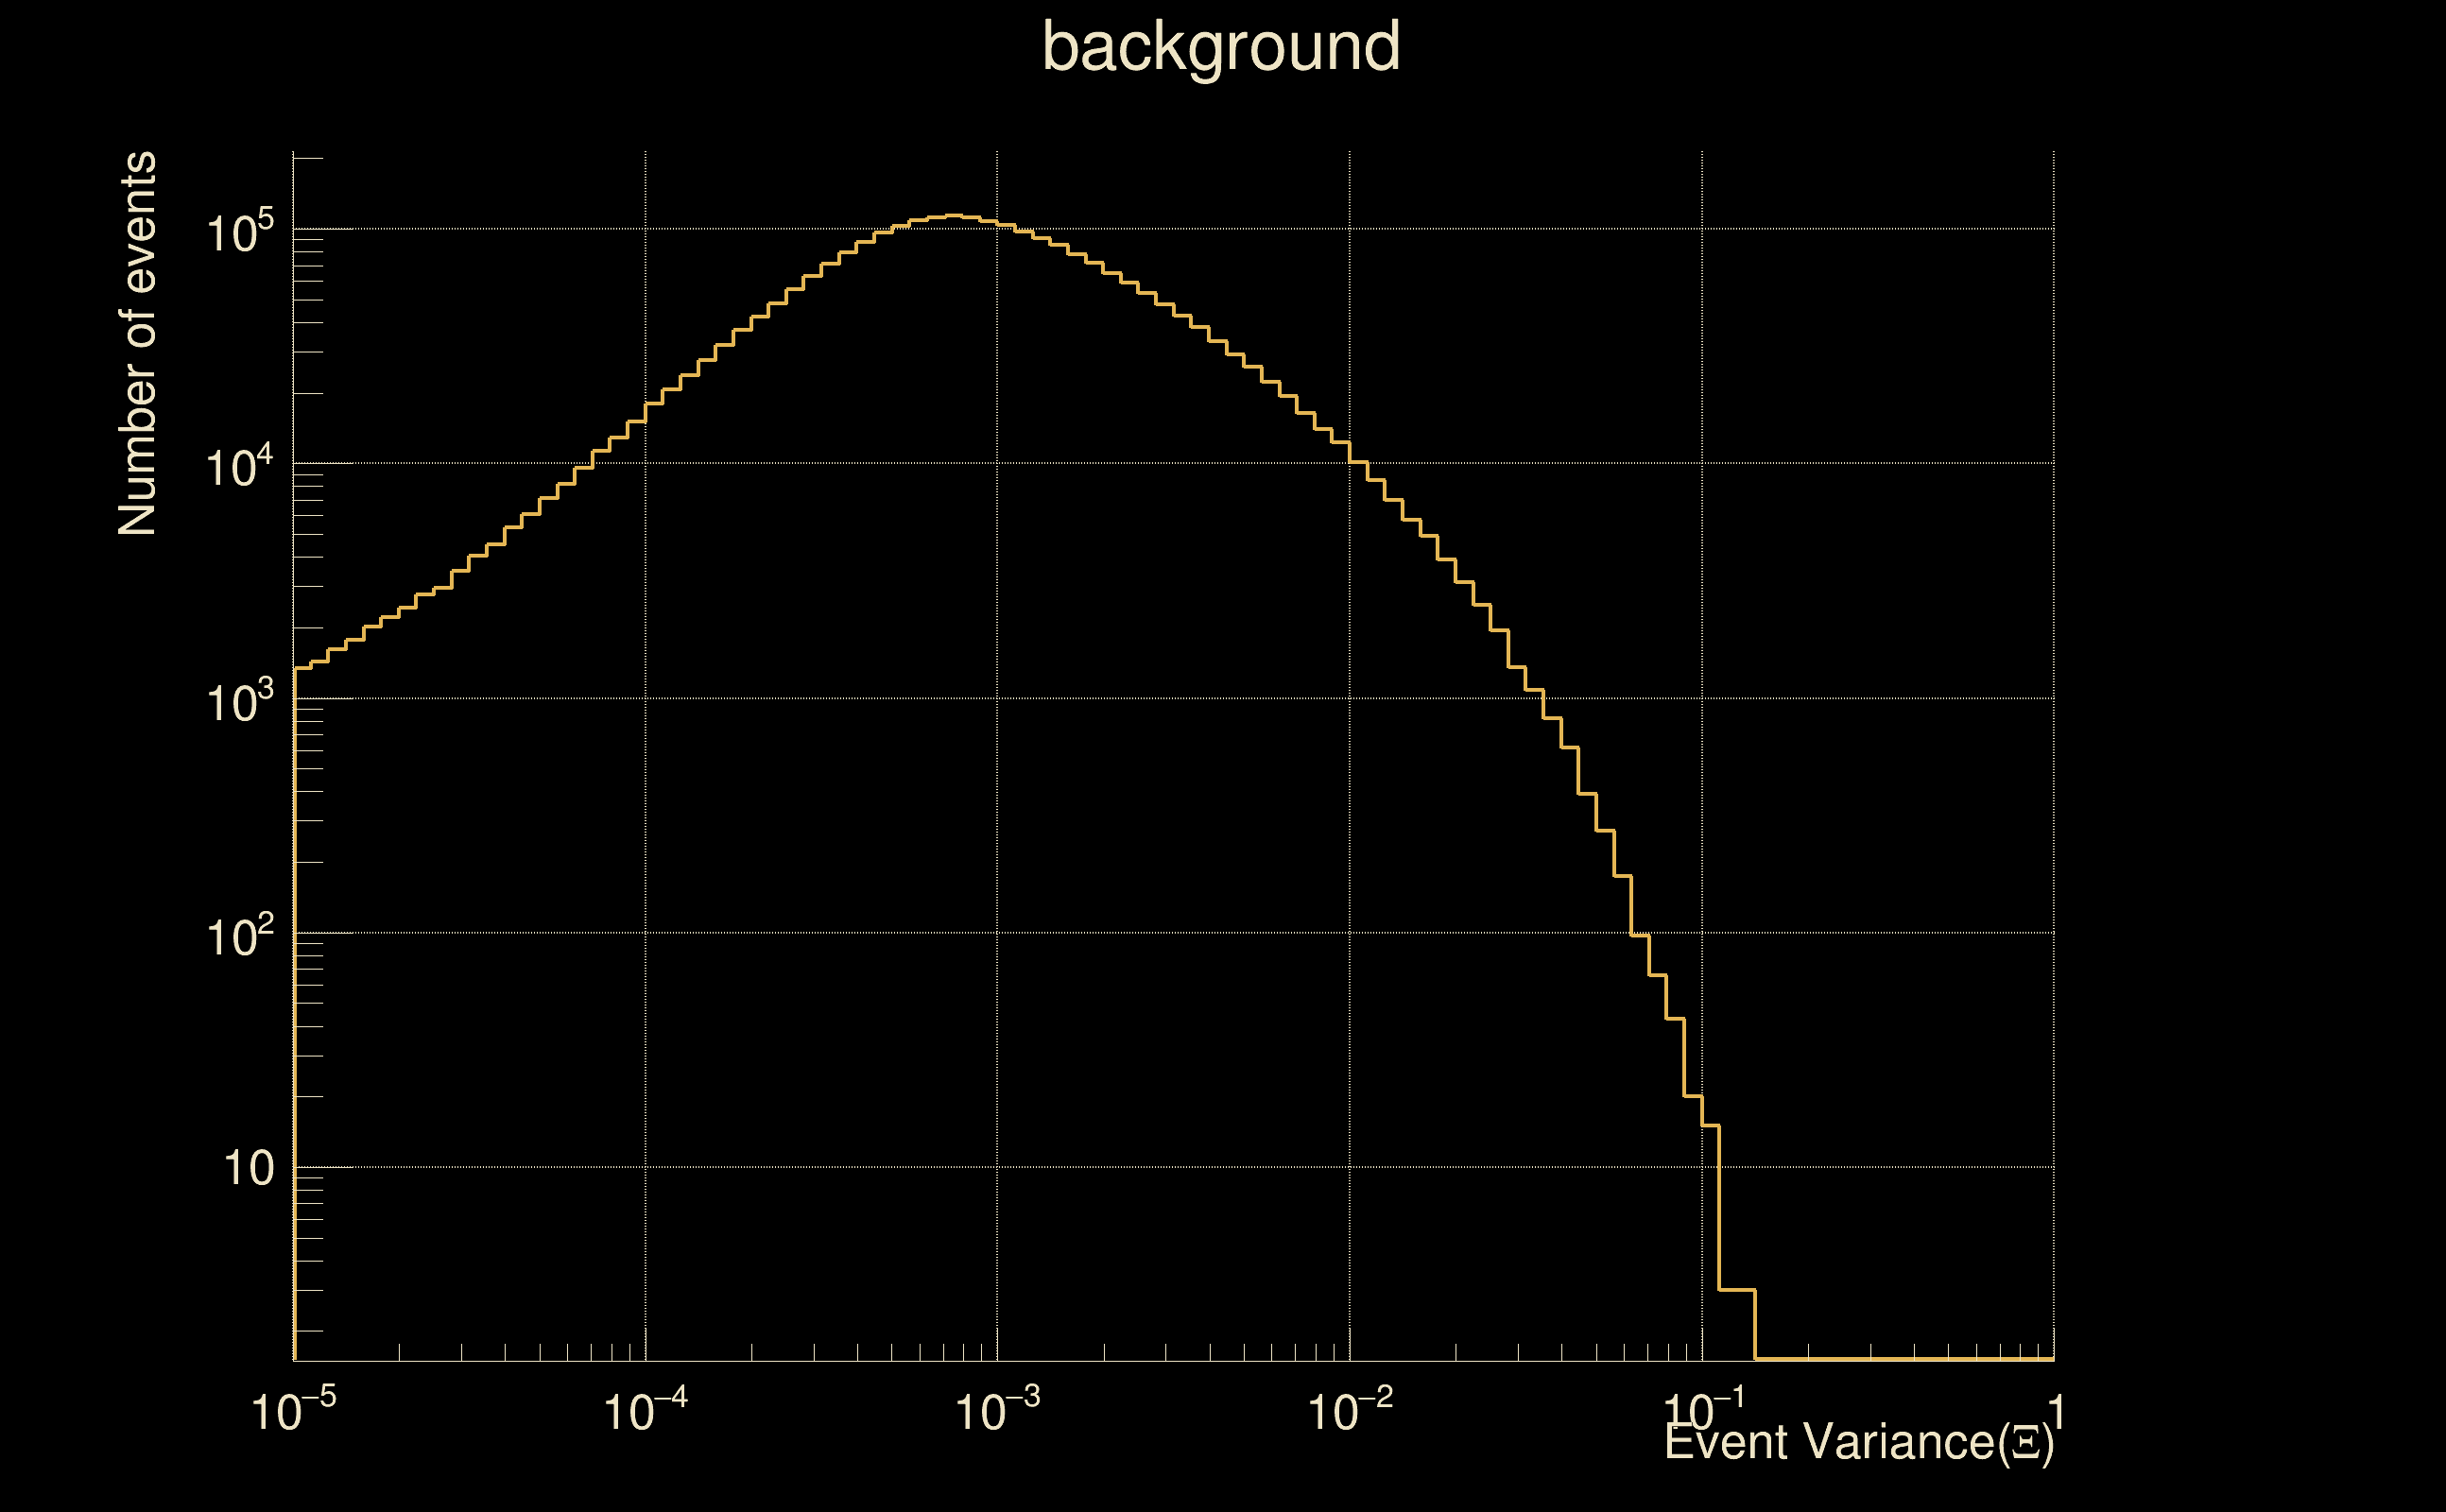
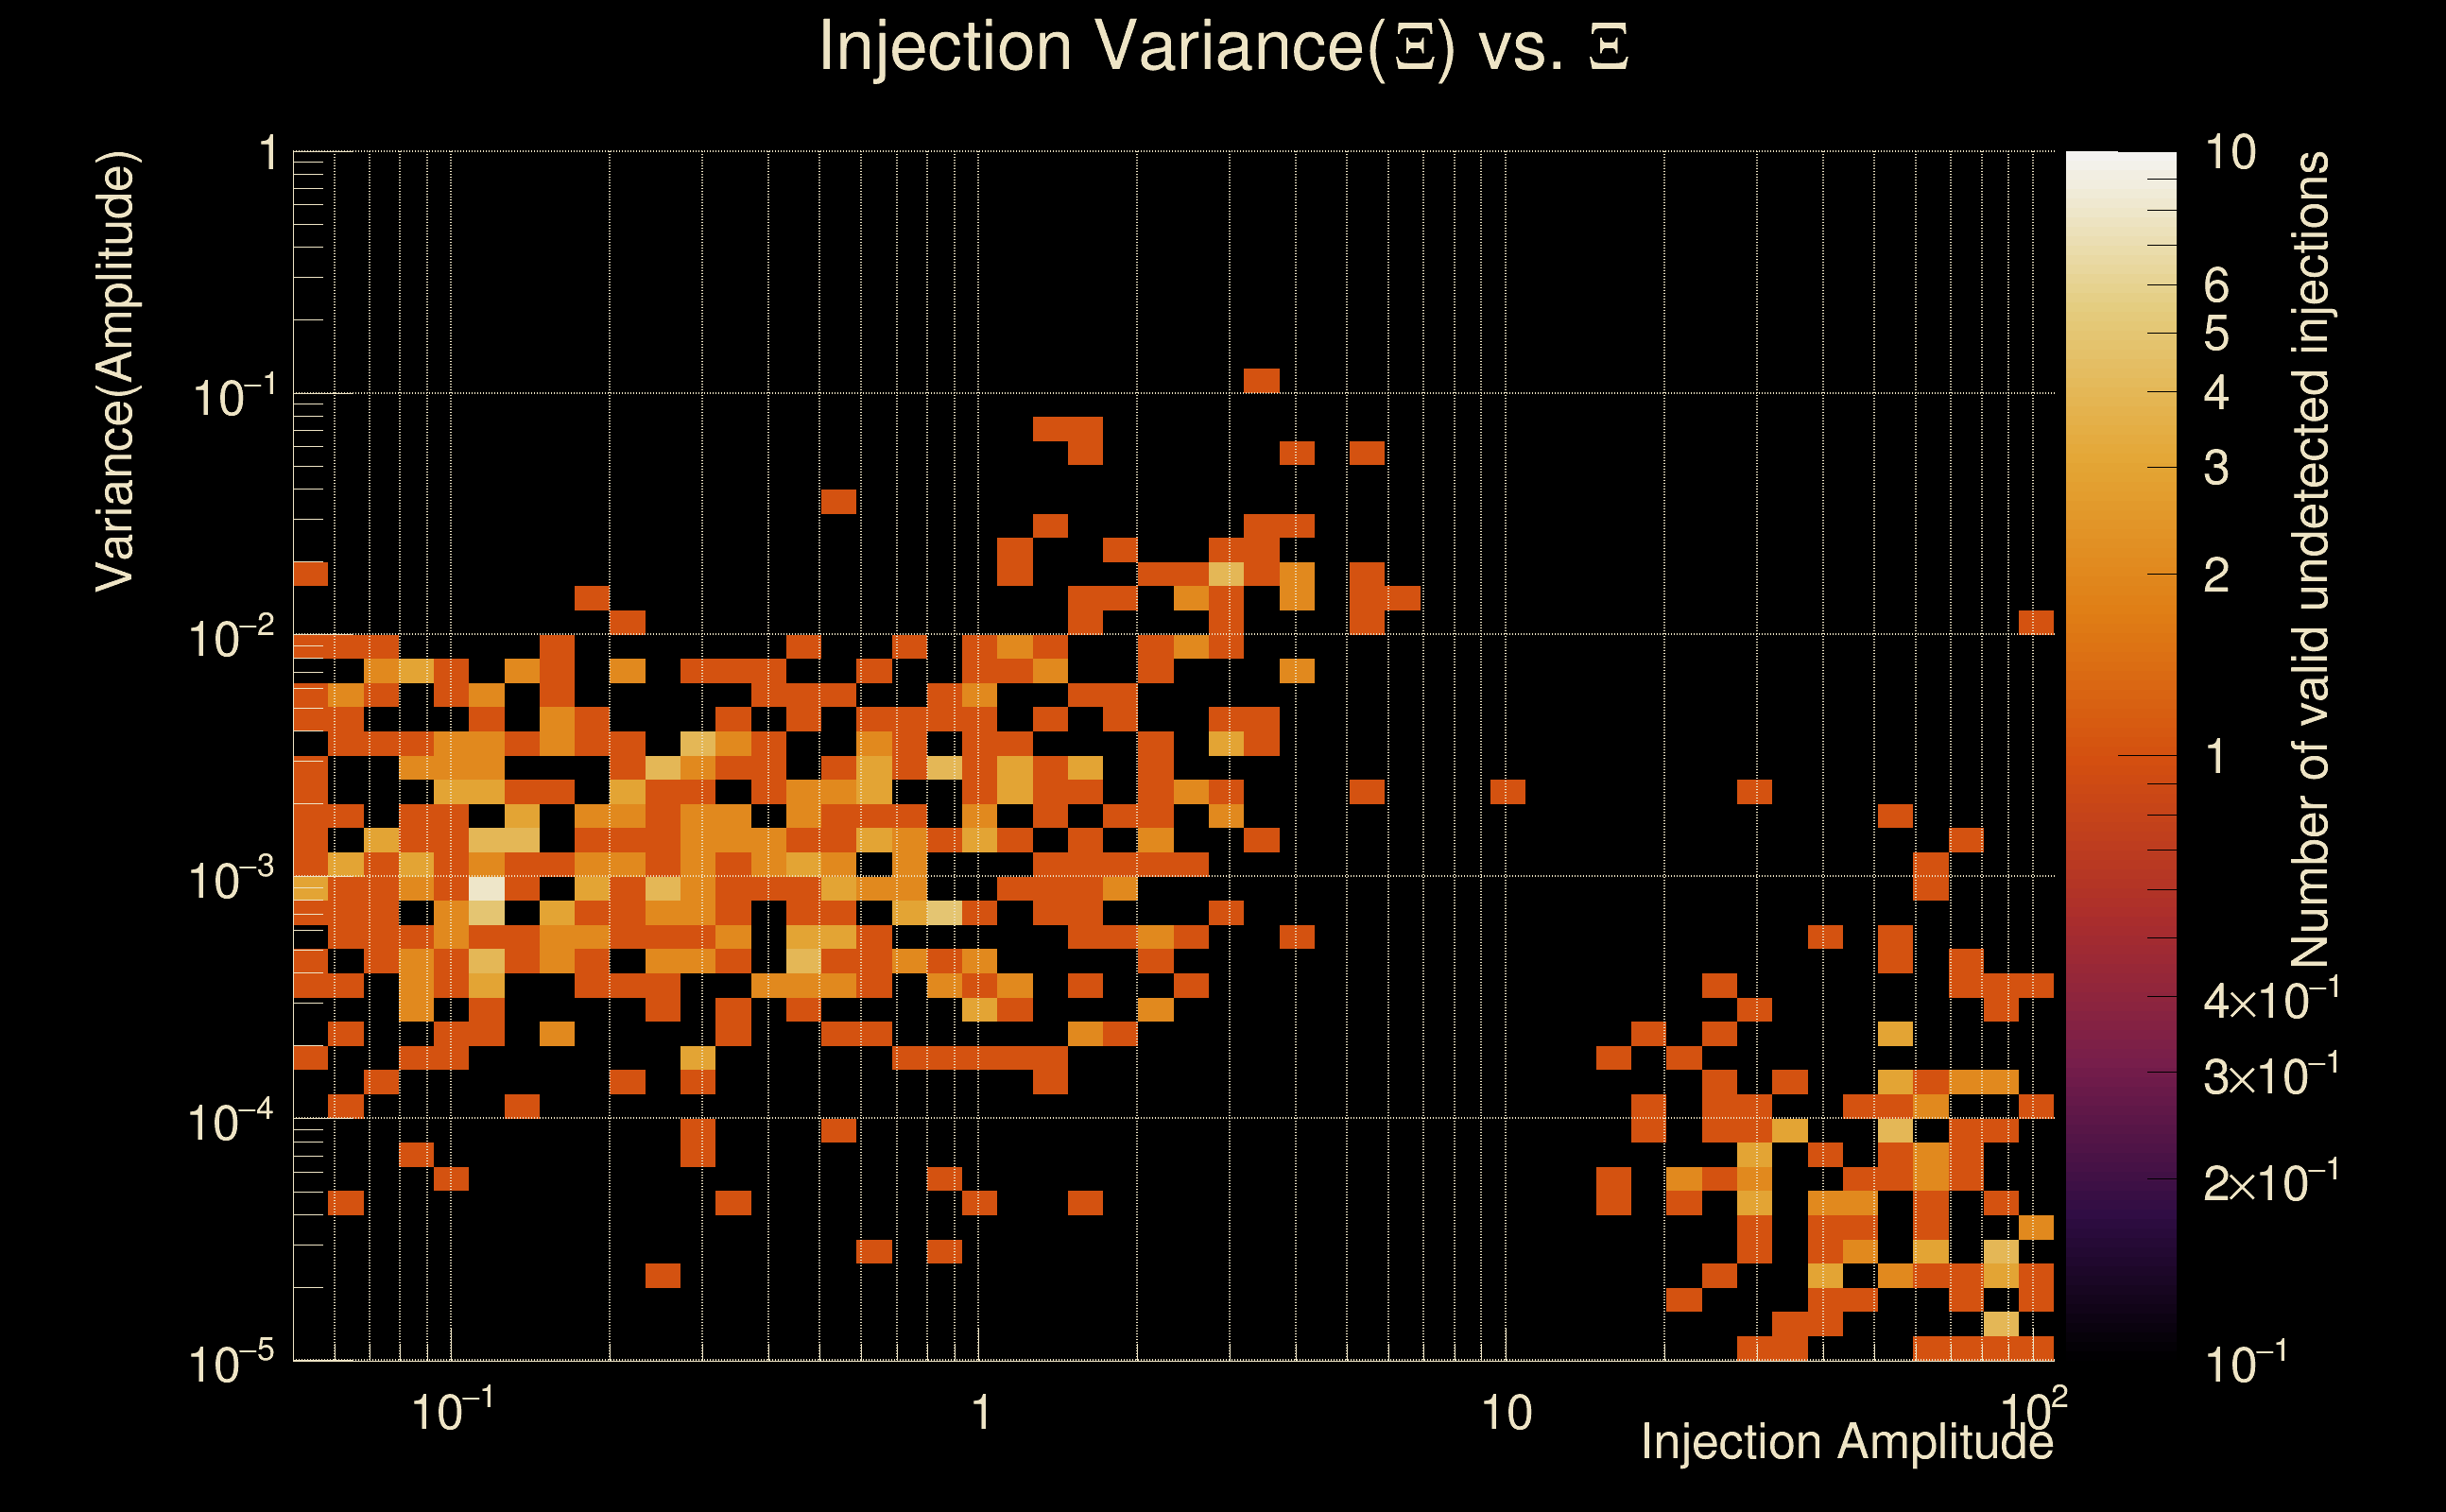
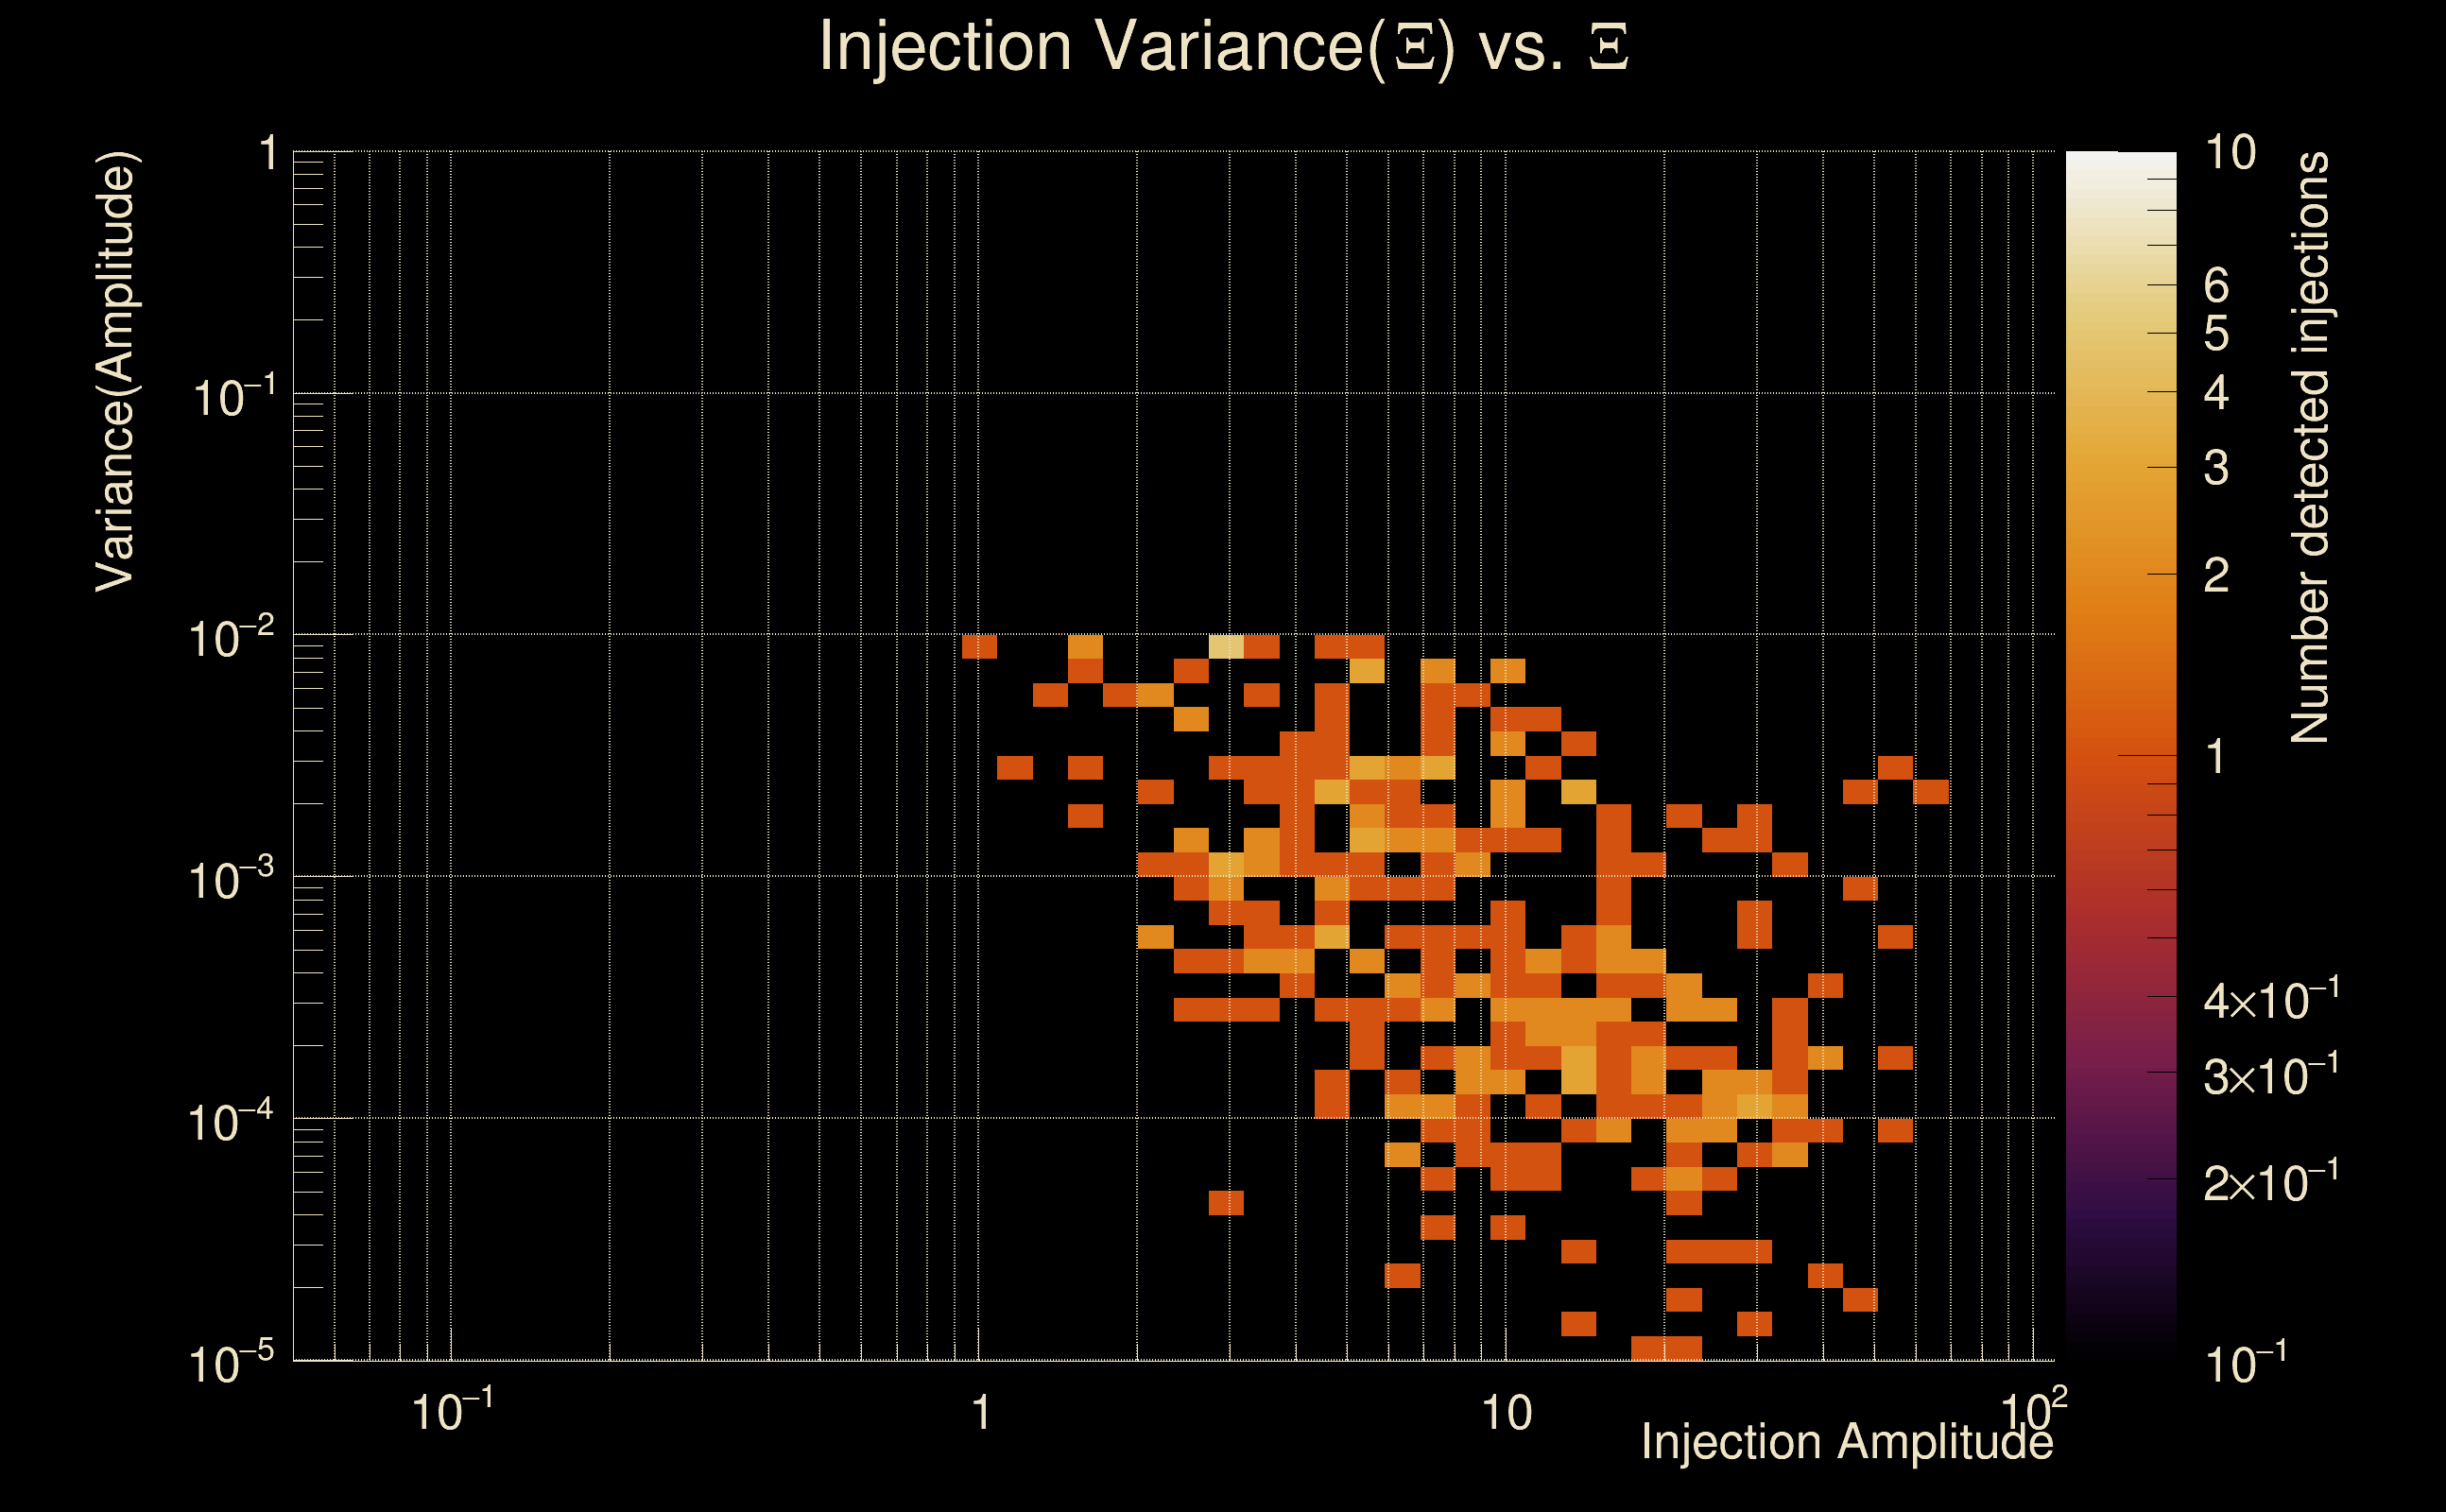
| Ξ: | 0.952988 ± 0.00666579 (variance = 4.44328e-05): Q0: 0.974908, Q1: 0.965904, Q2: 0.959887, Q3: 0.960995, Q4: 0.955317 |
| Rank: | R_A = 0.942037 |
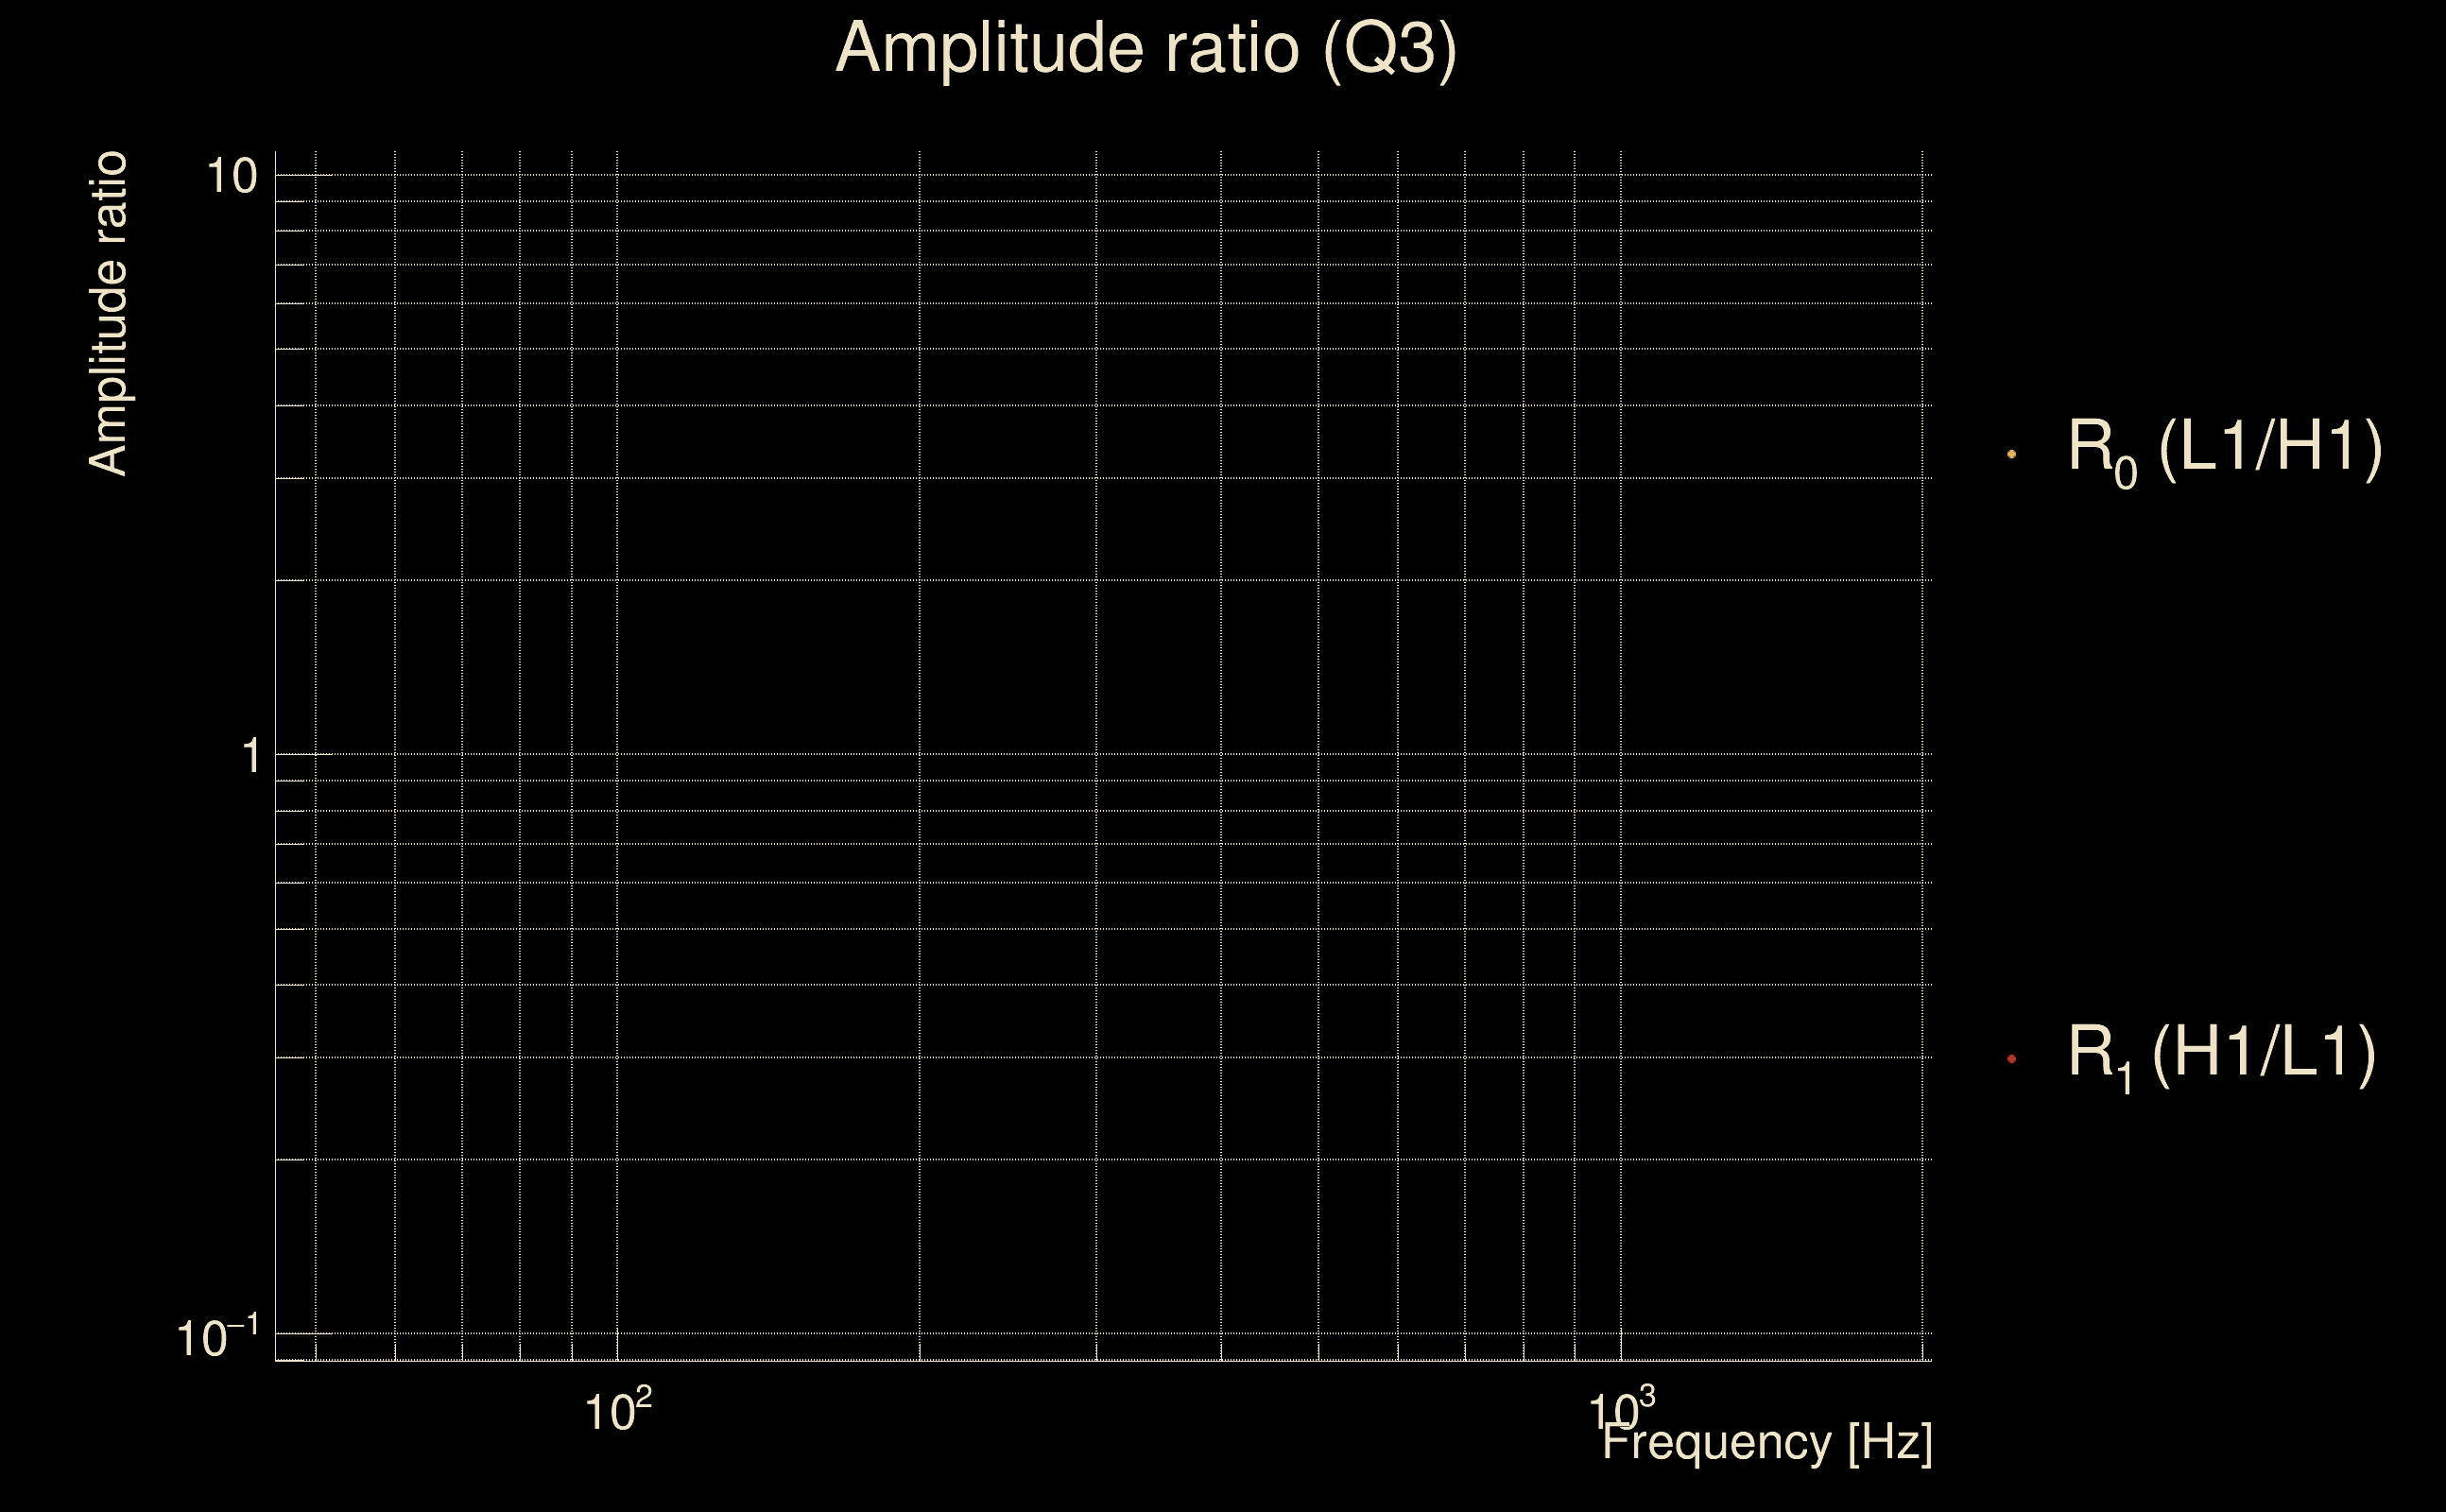
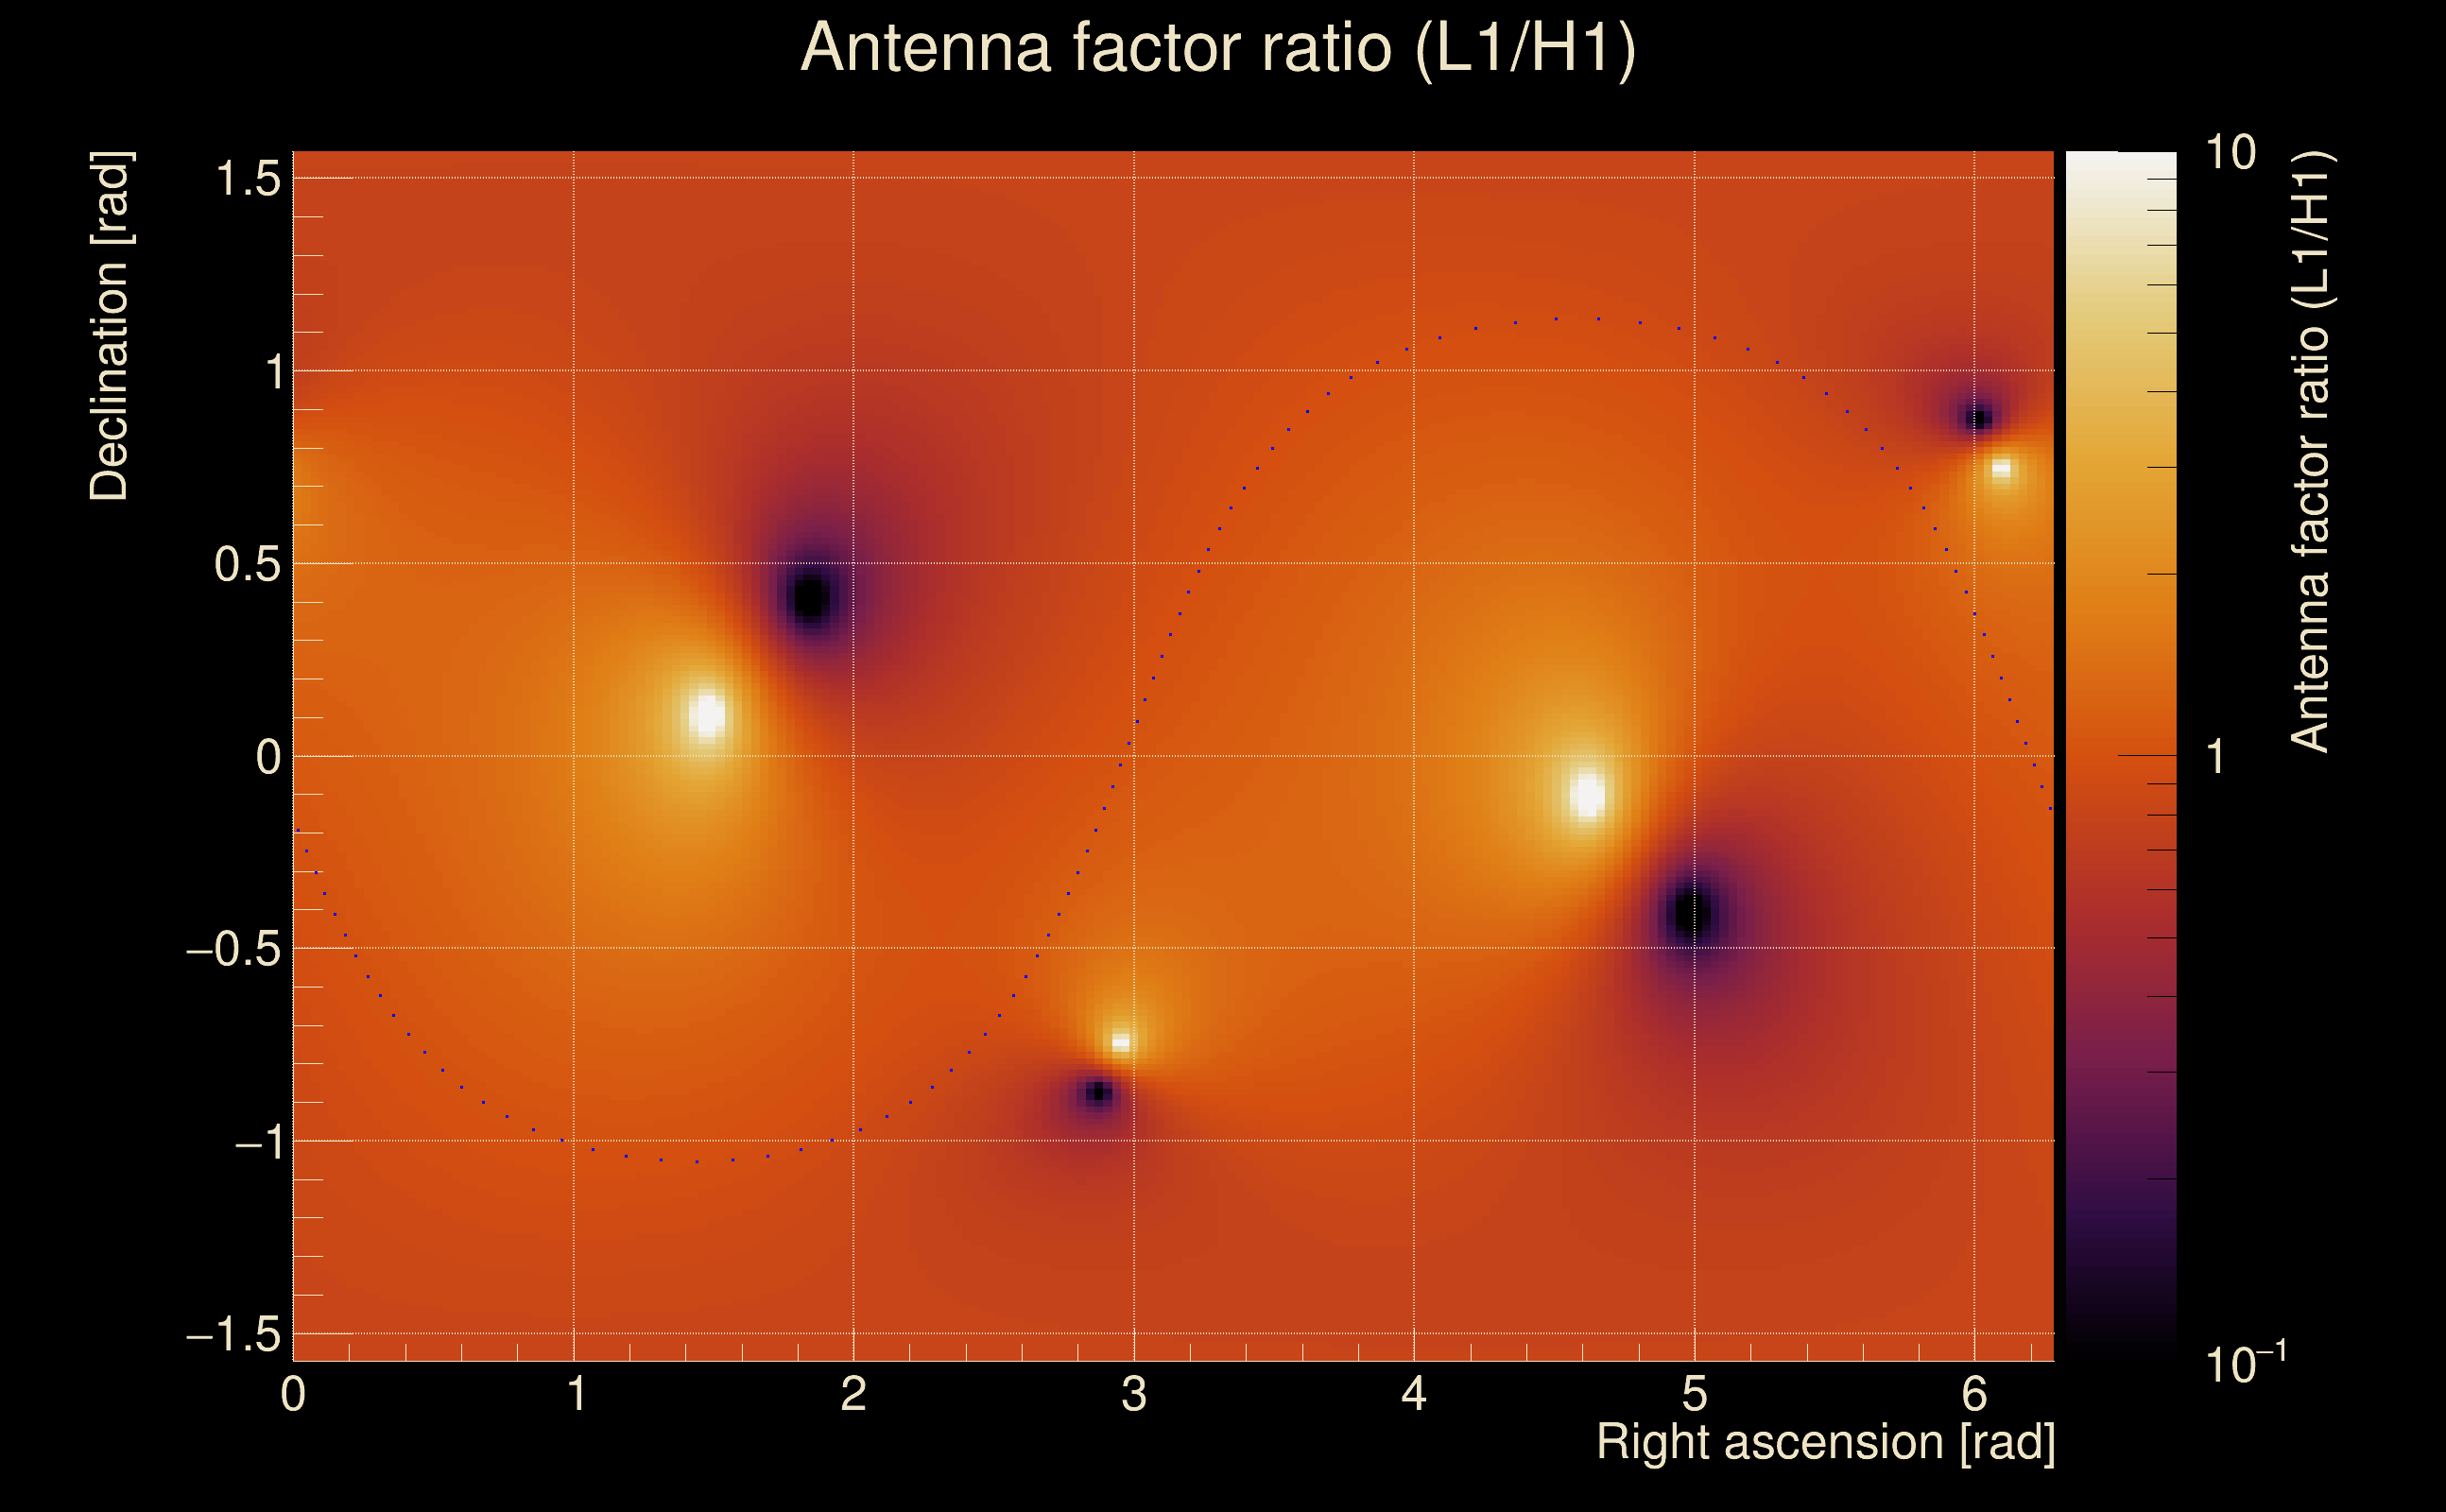
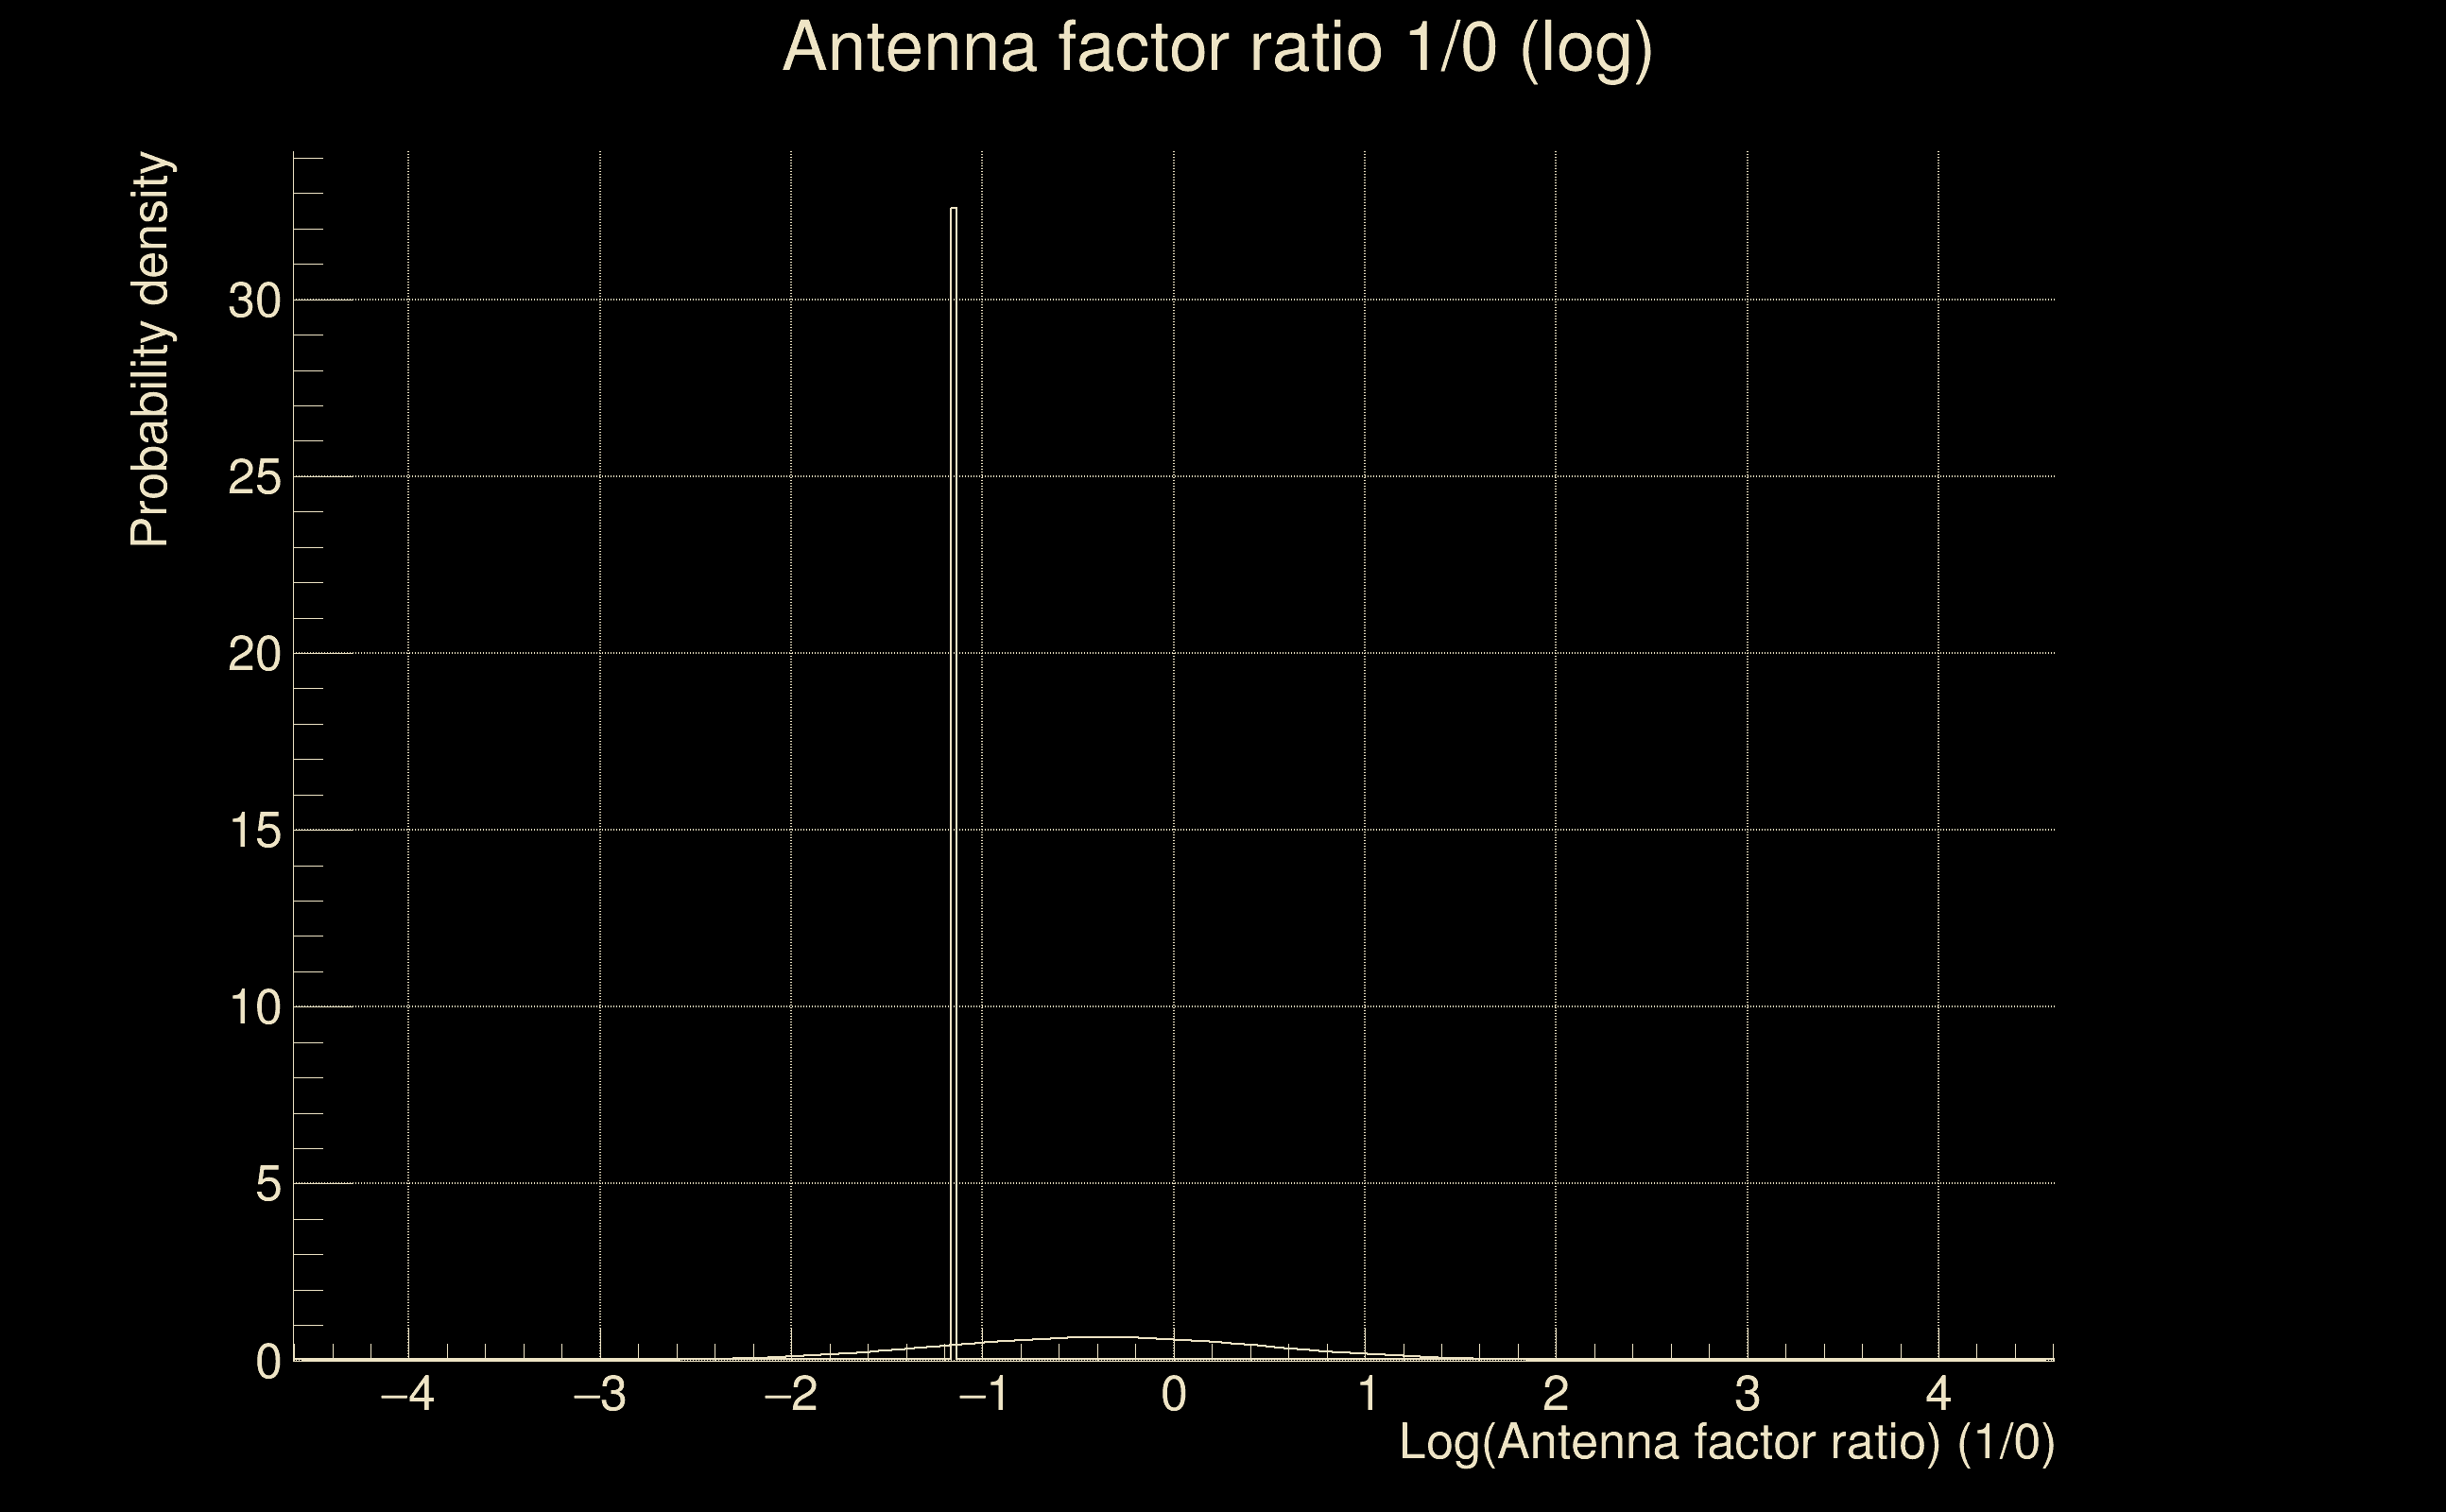
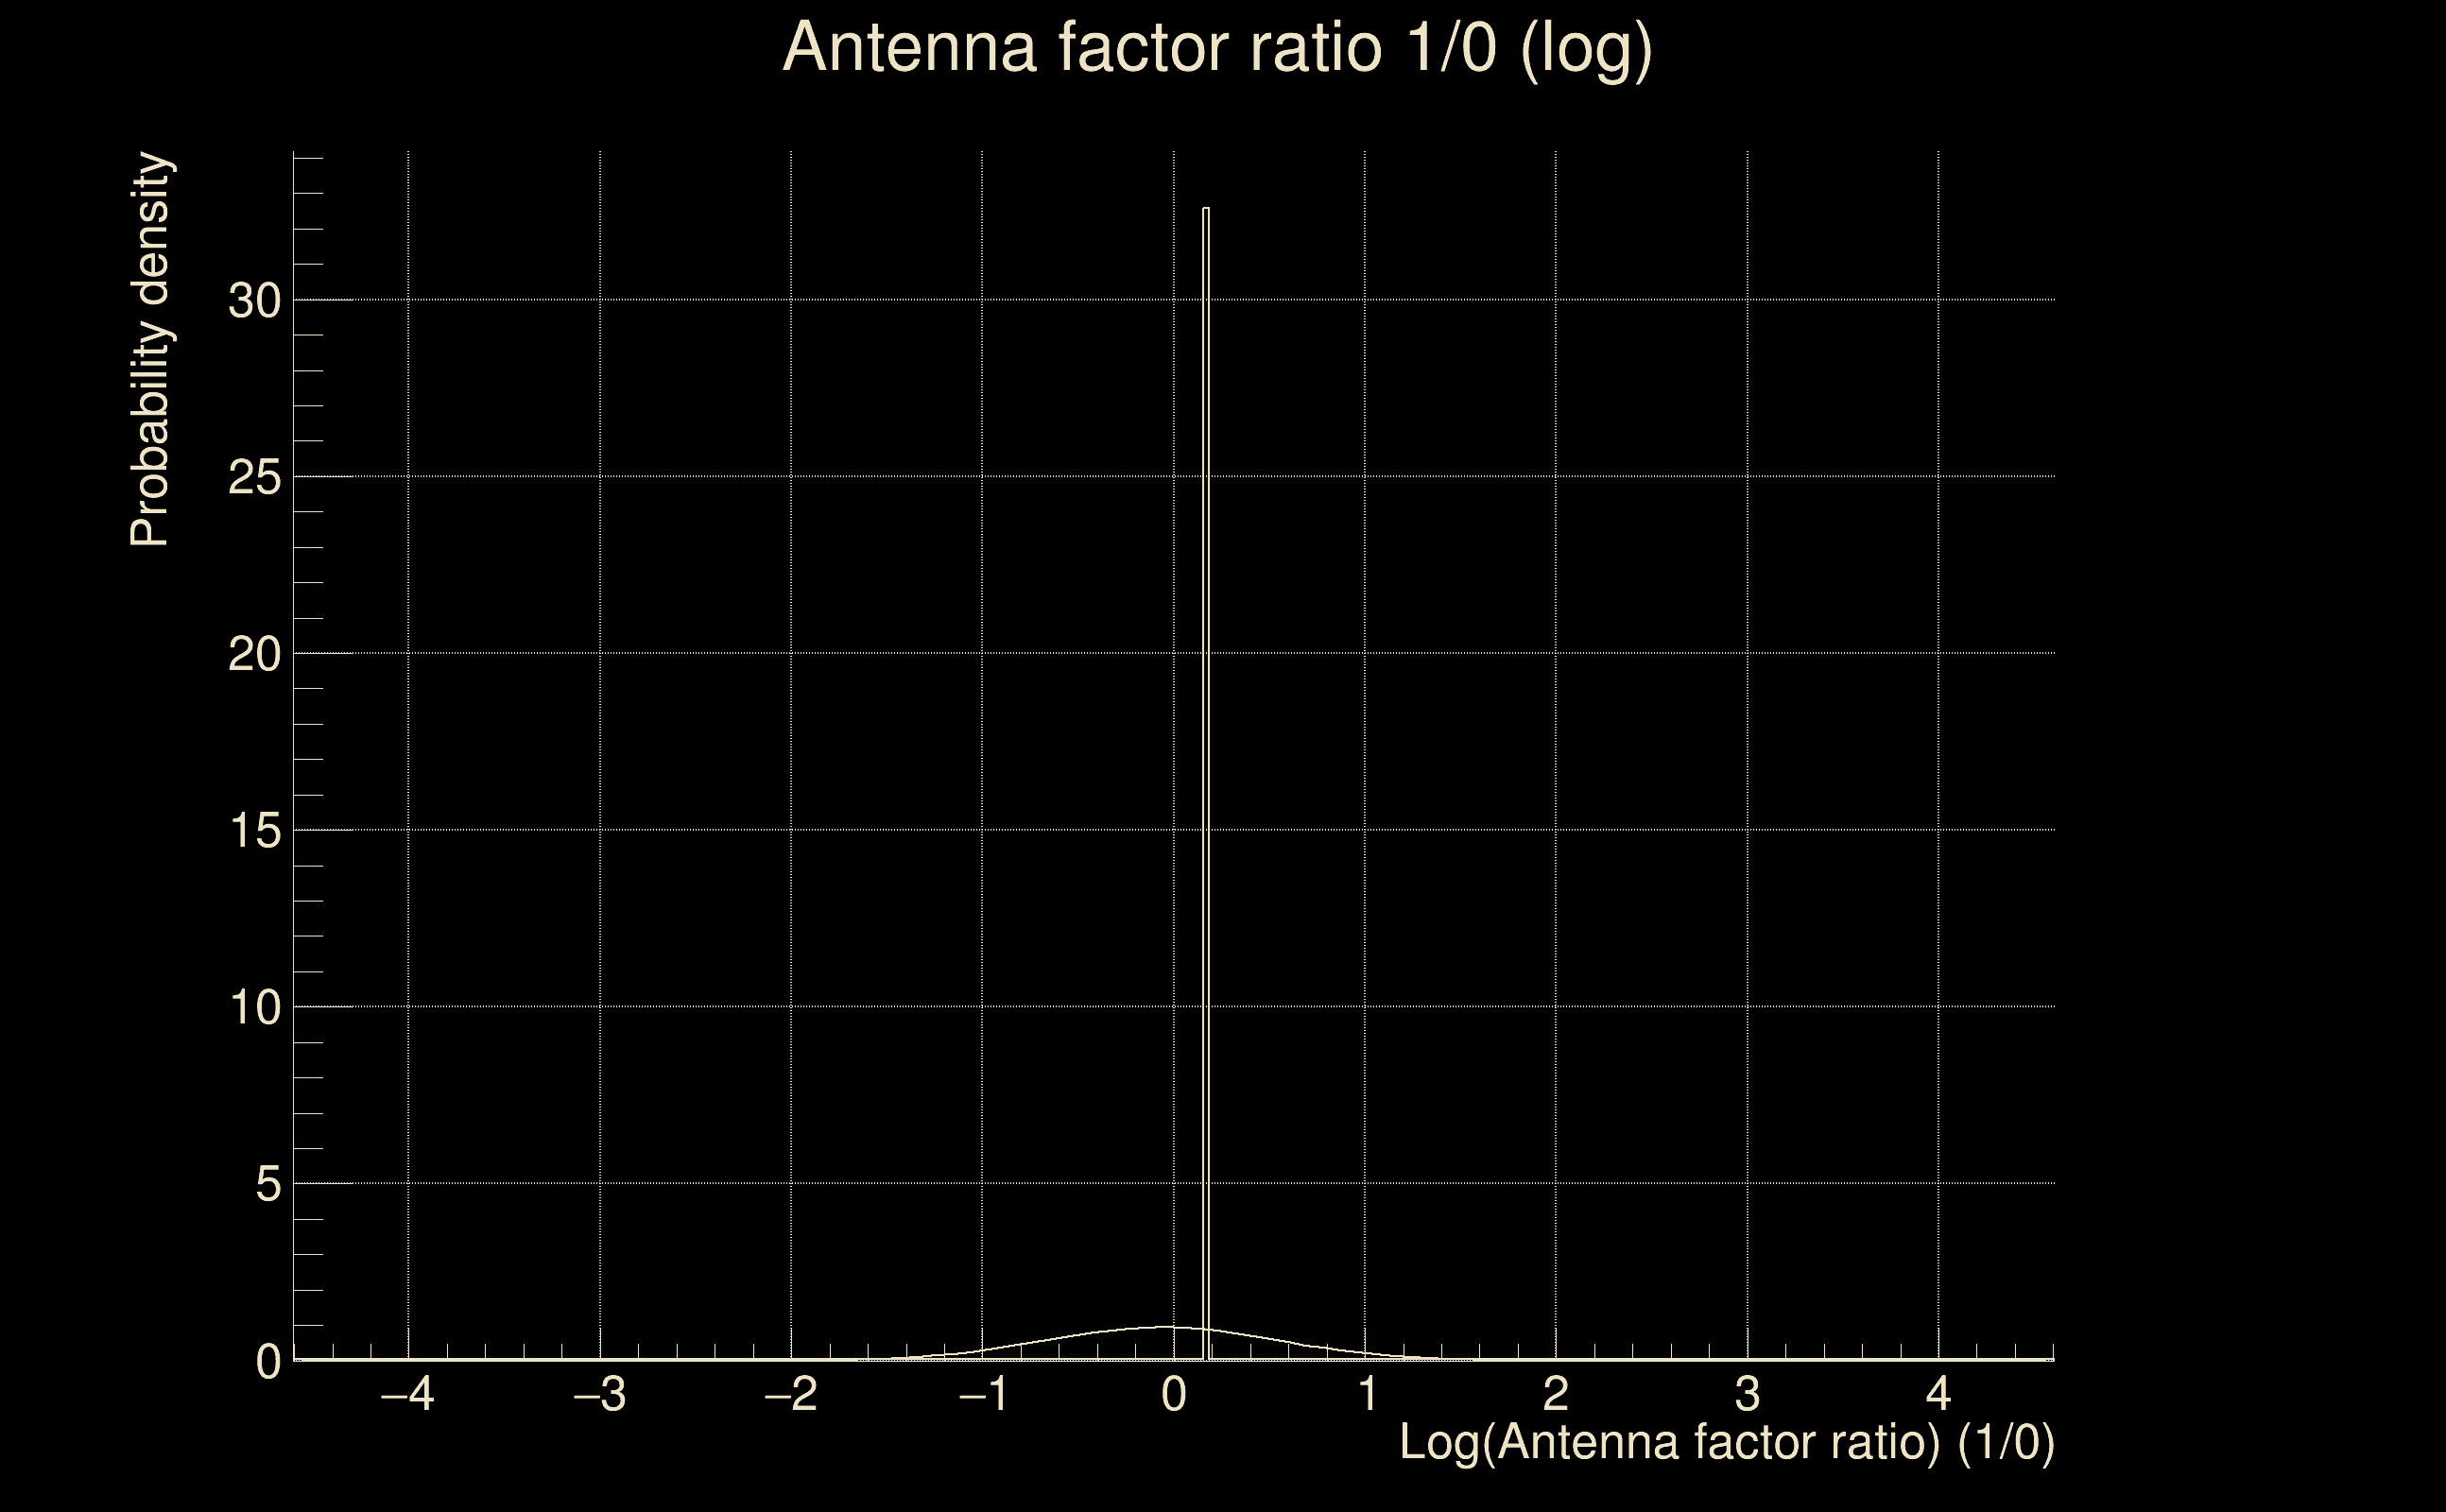
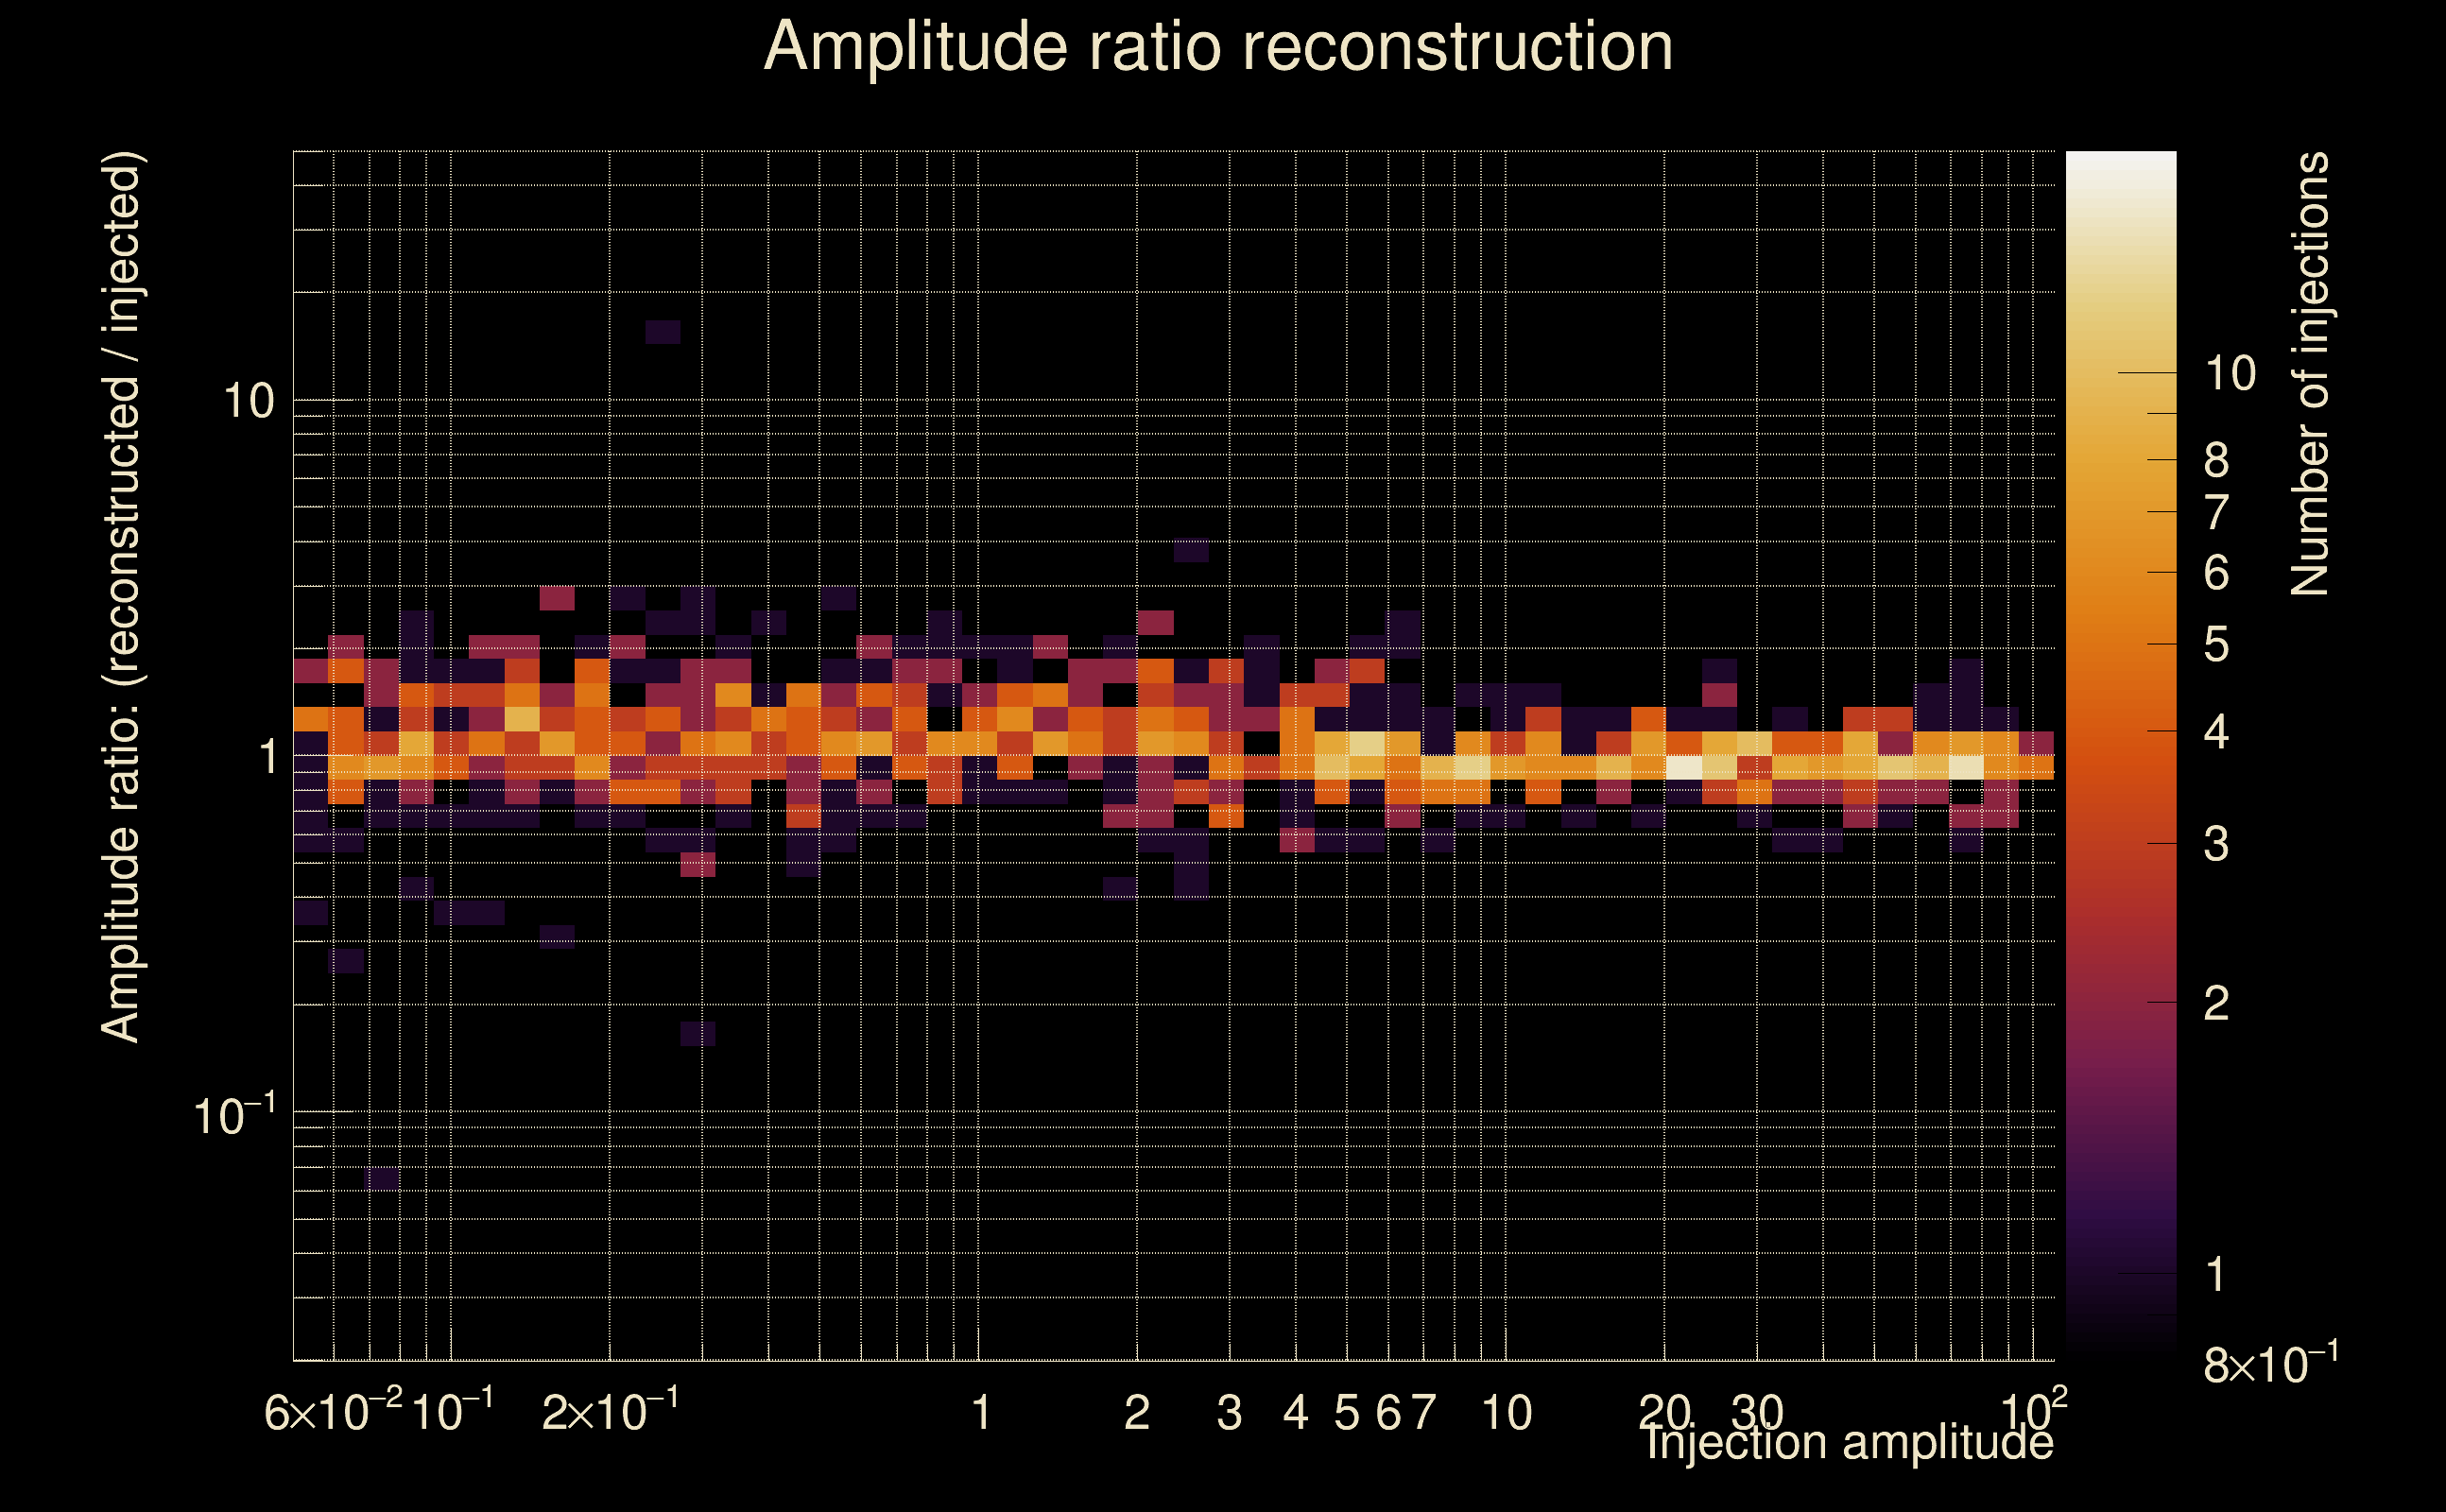
| Log of amplitude ratio (L1/H1): | -0.104459, variance = 0.153041 (L1/H1: -0.105645, variance = 0.30304, H1/L1: 0.103014, variance = 0.303334) |
| Amplitude ratio (L1/H1): | 0.900812 ⋇ 1.47876 (L1/H1: 0.899744 ⋇ 1.7341, H1/L1: 1.10851 ⋇ 1.73457) |
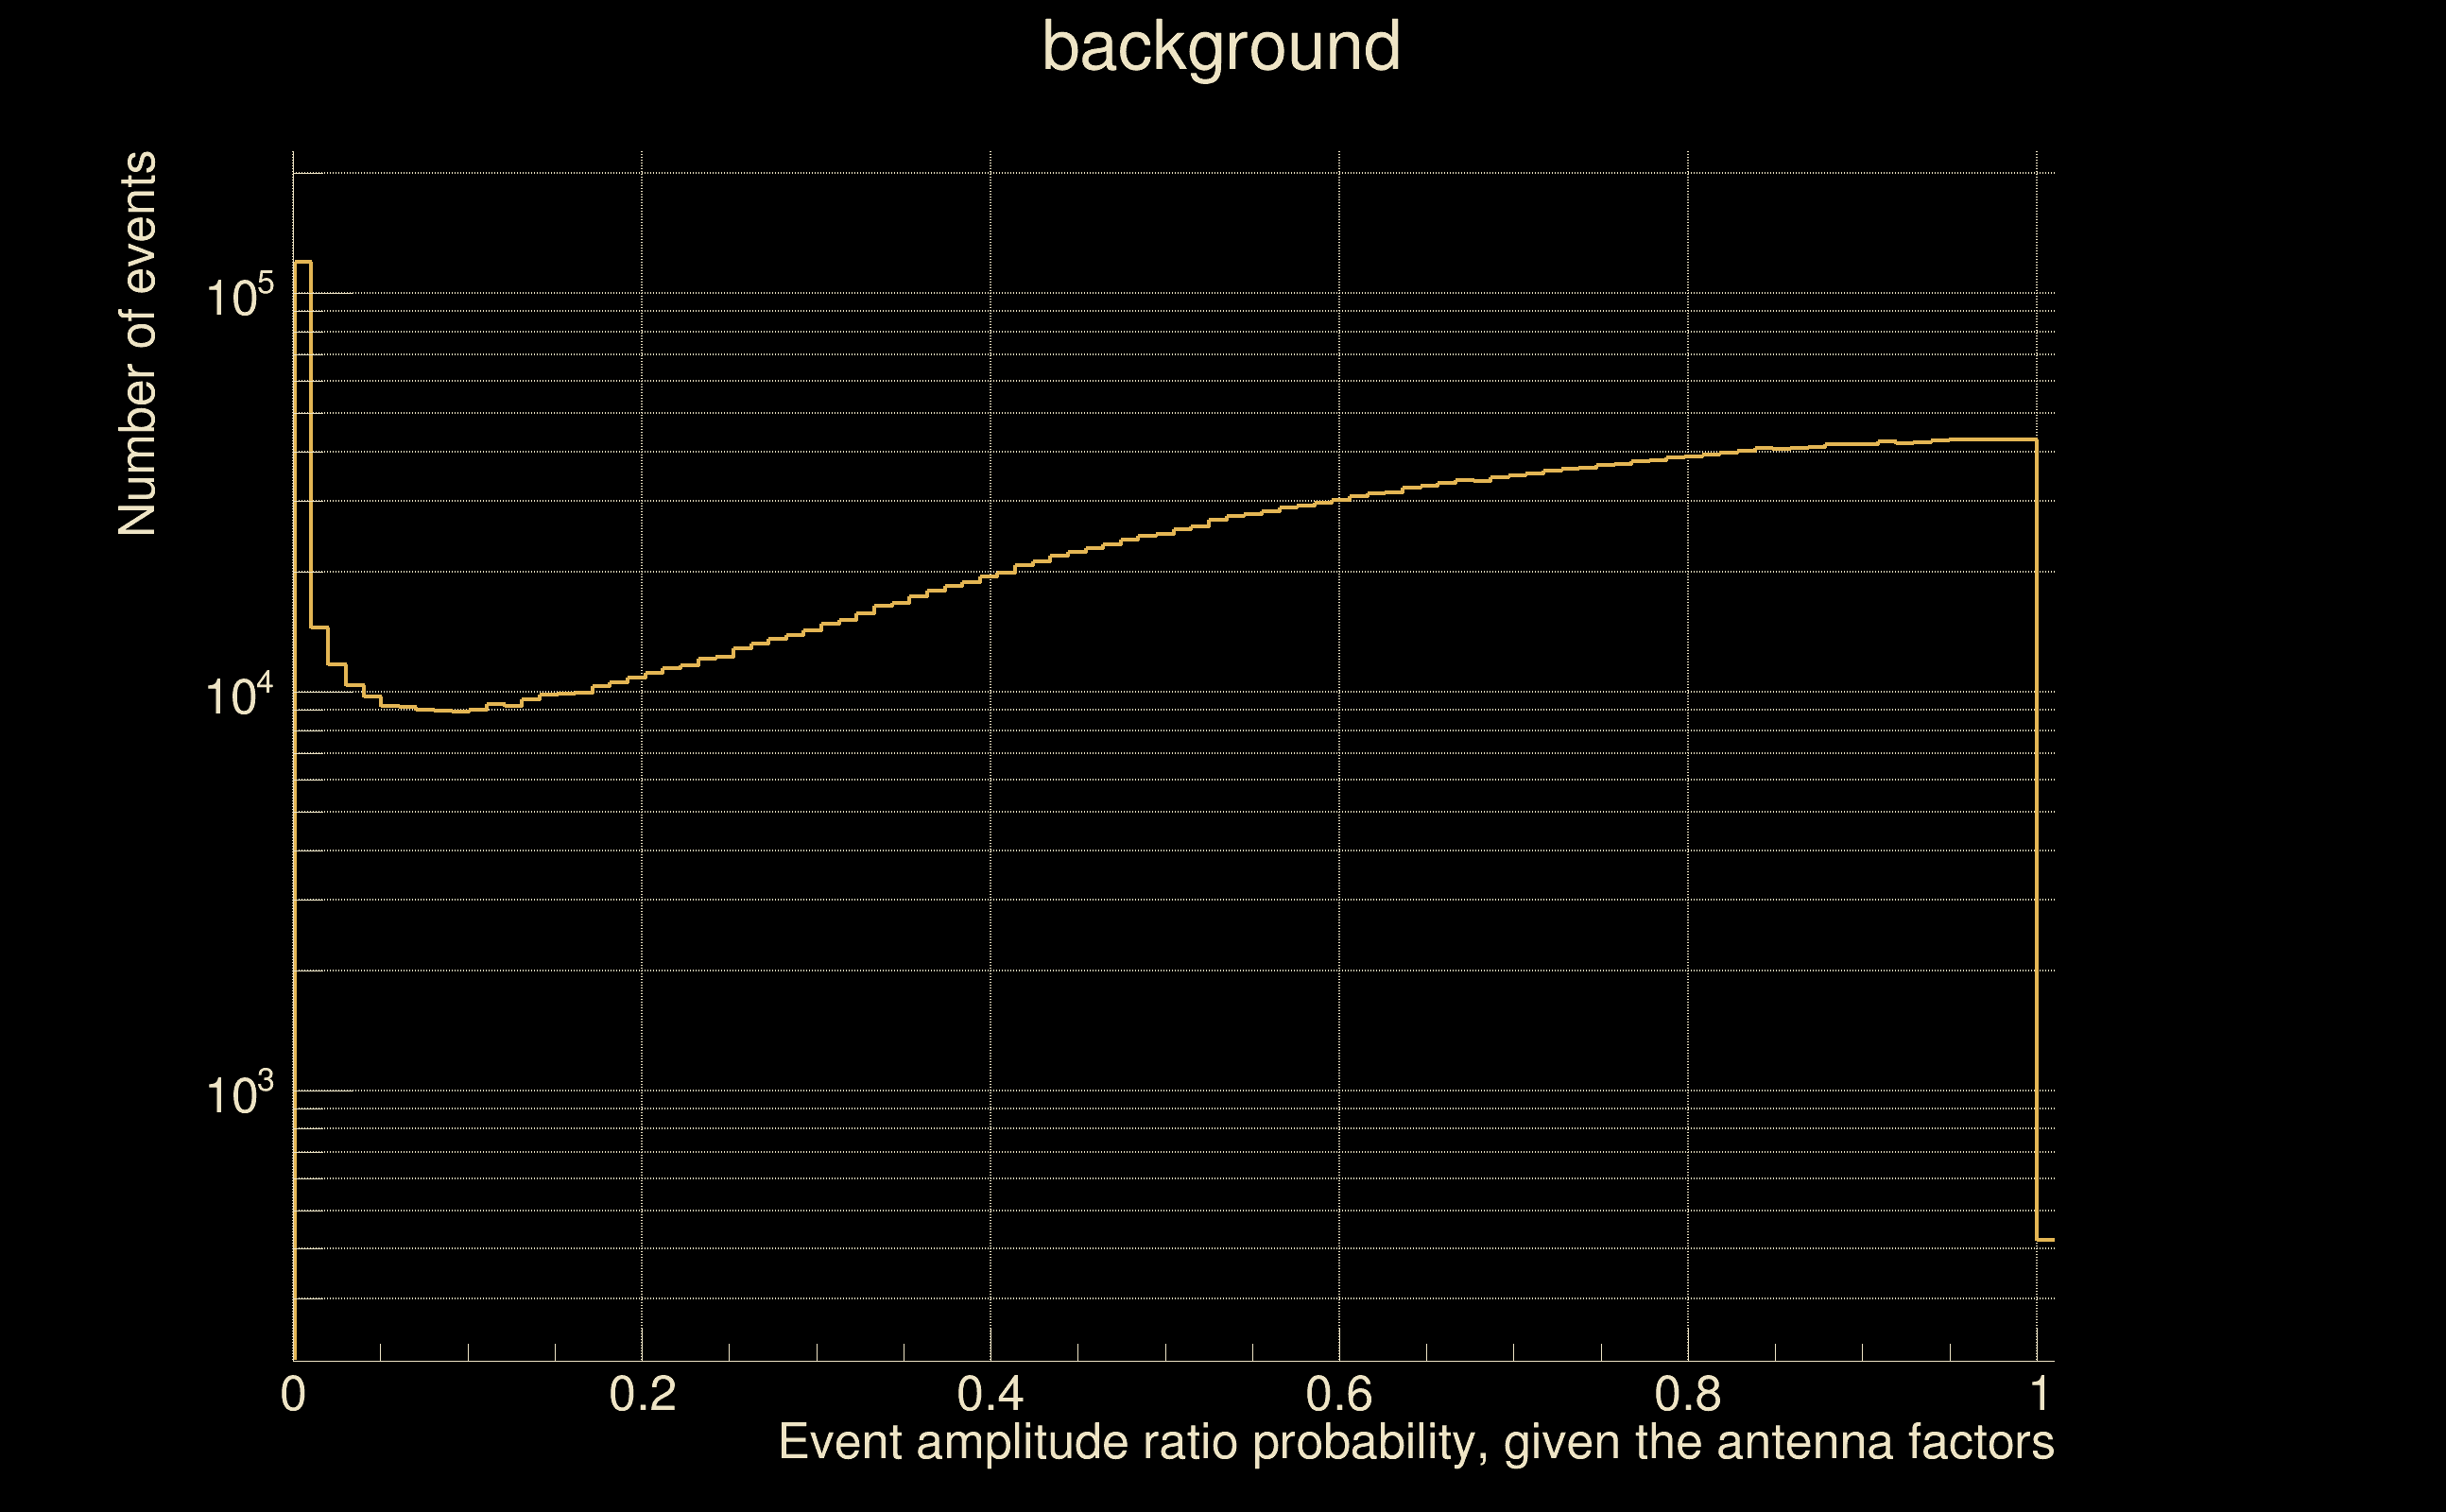
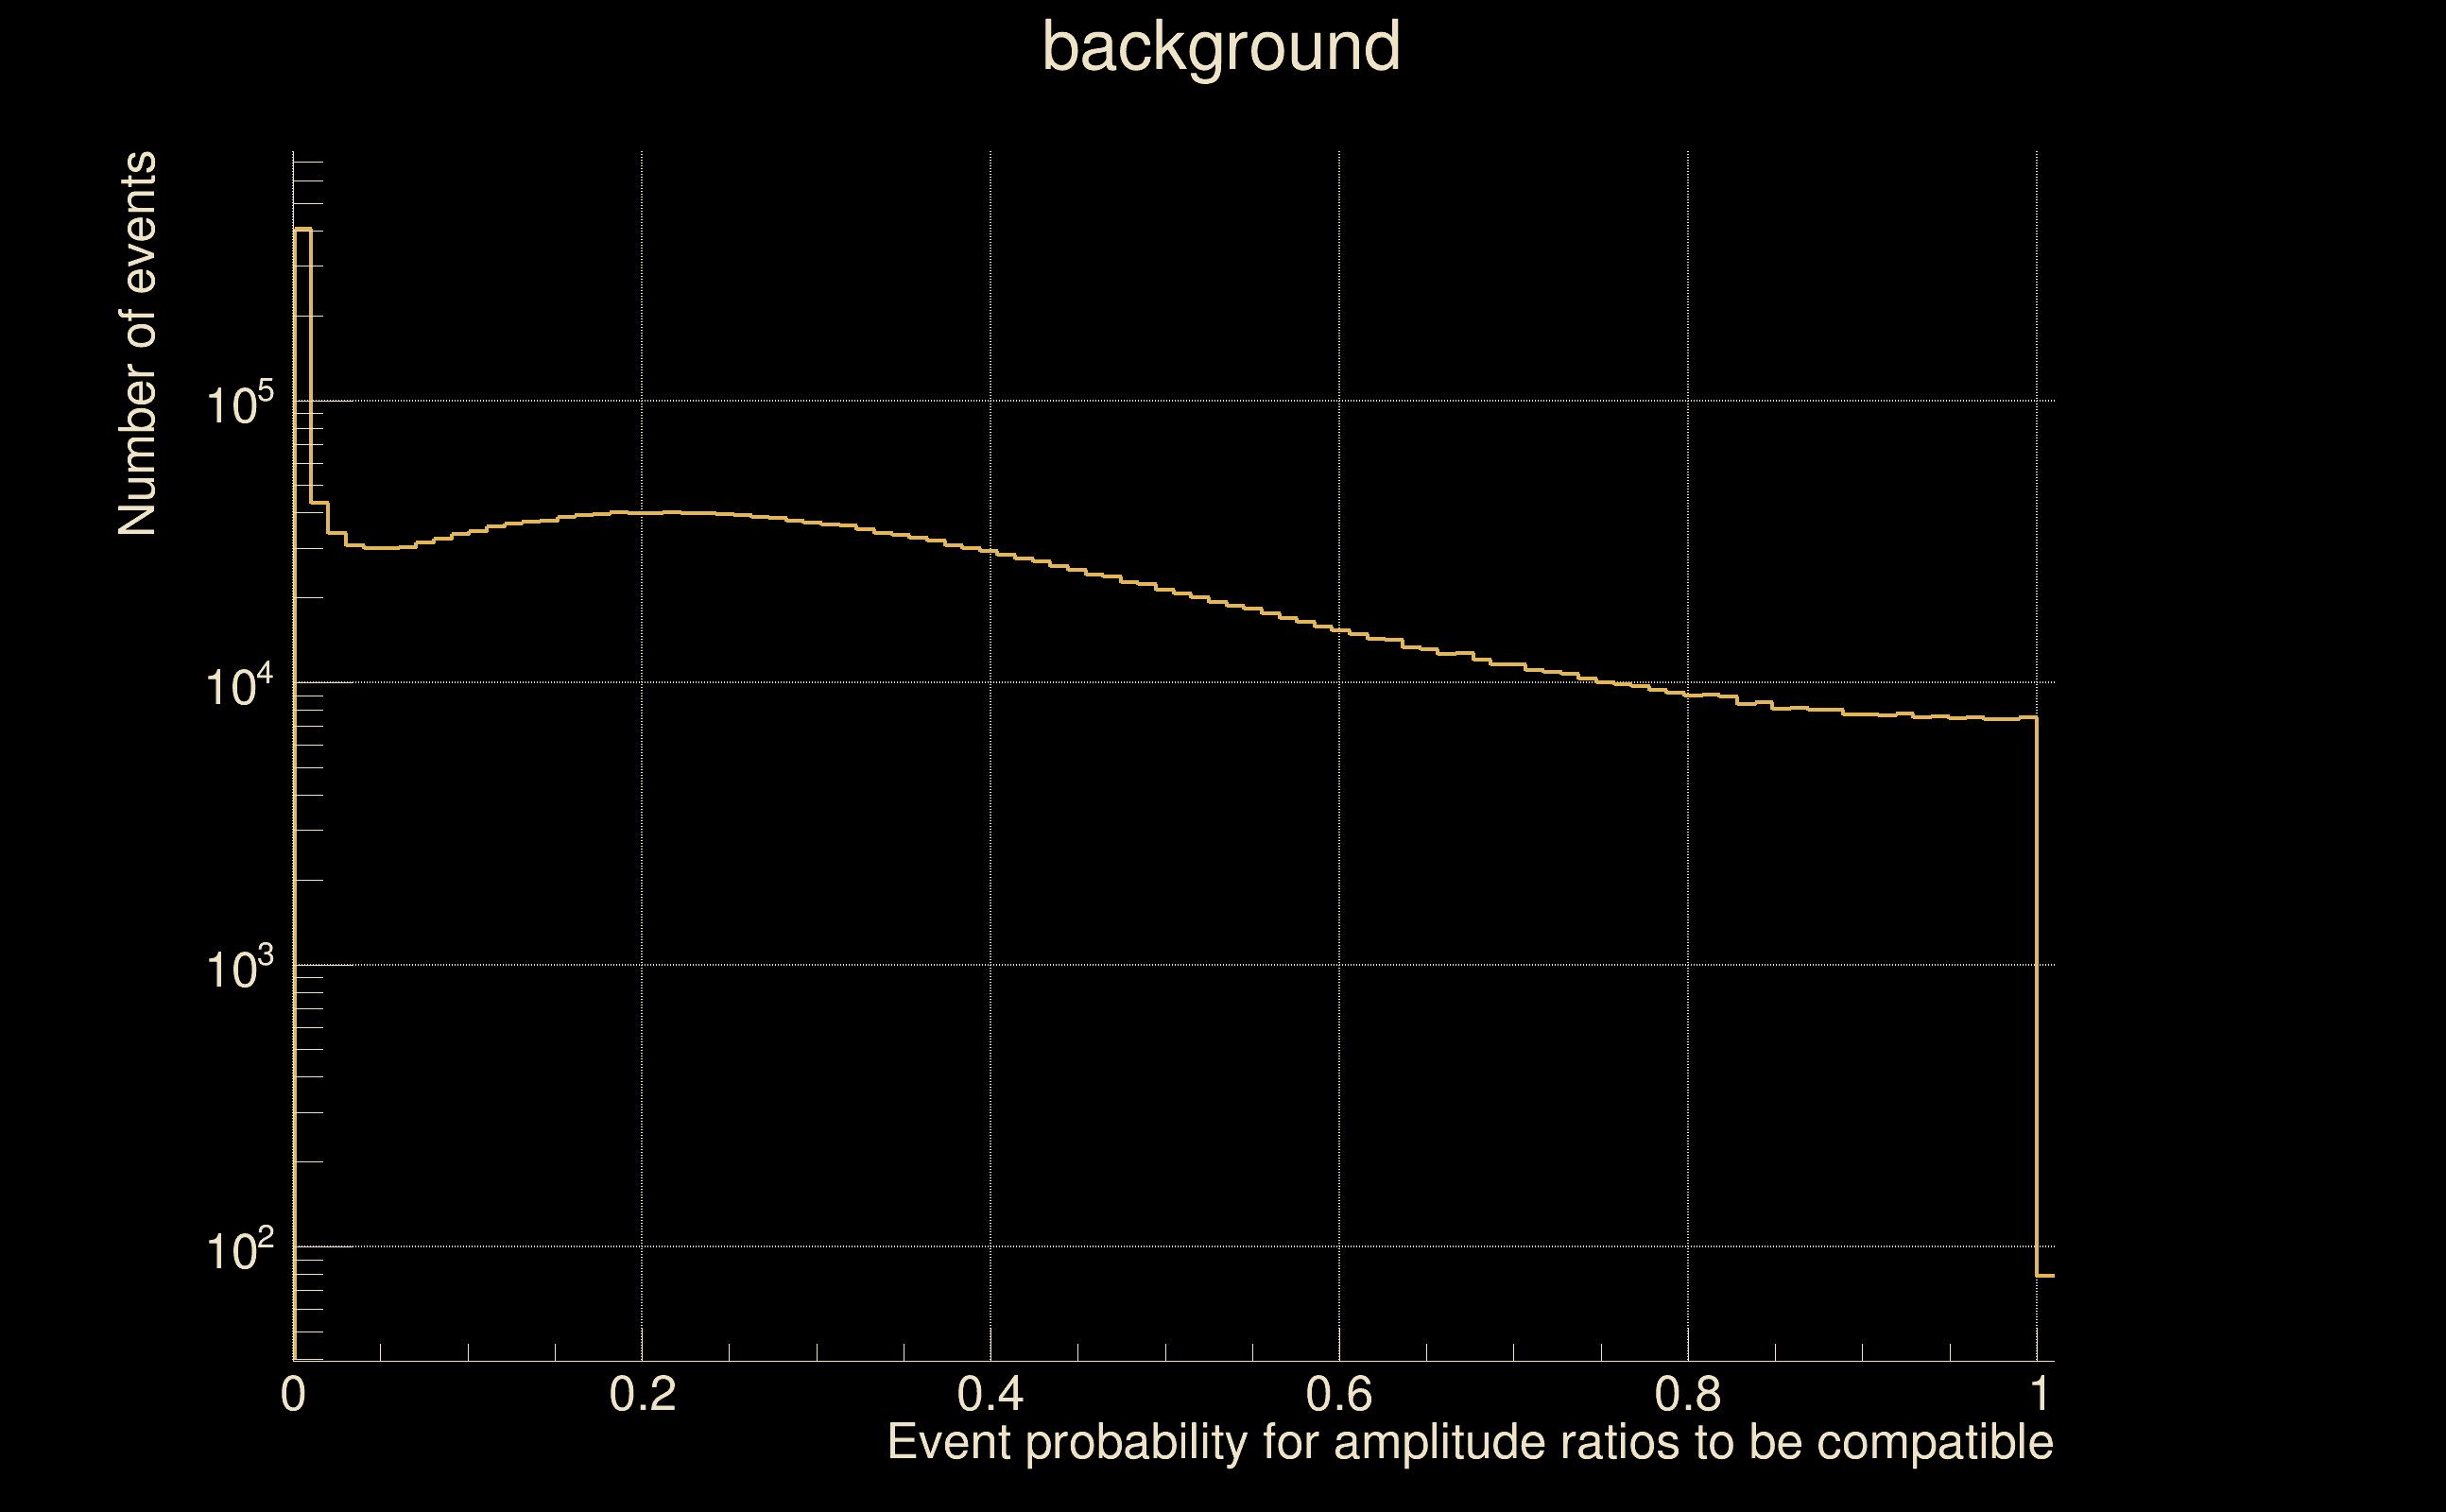
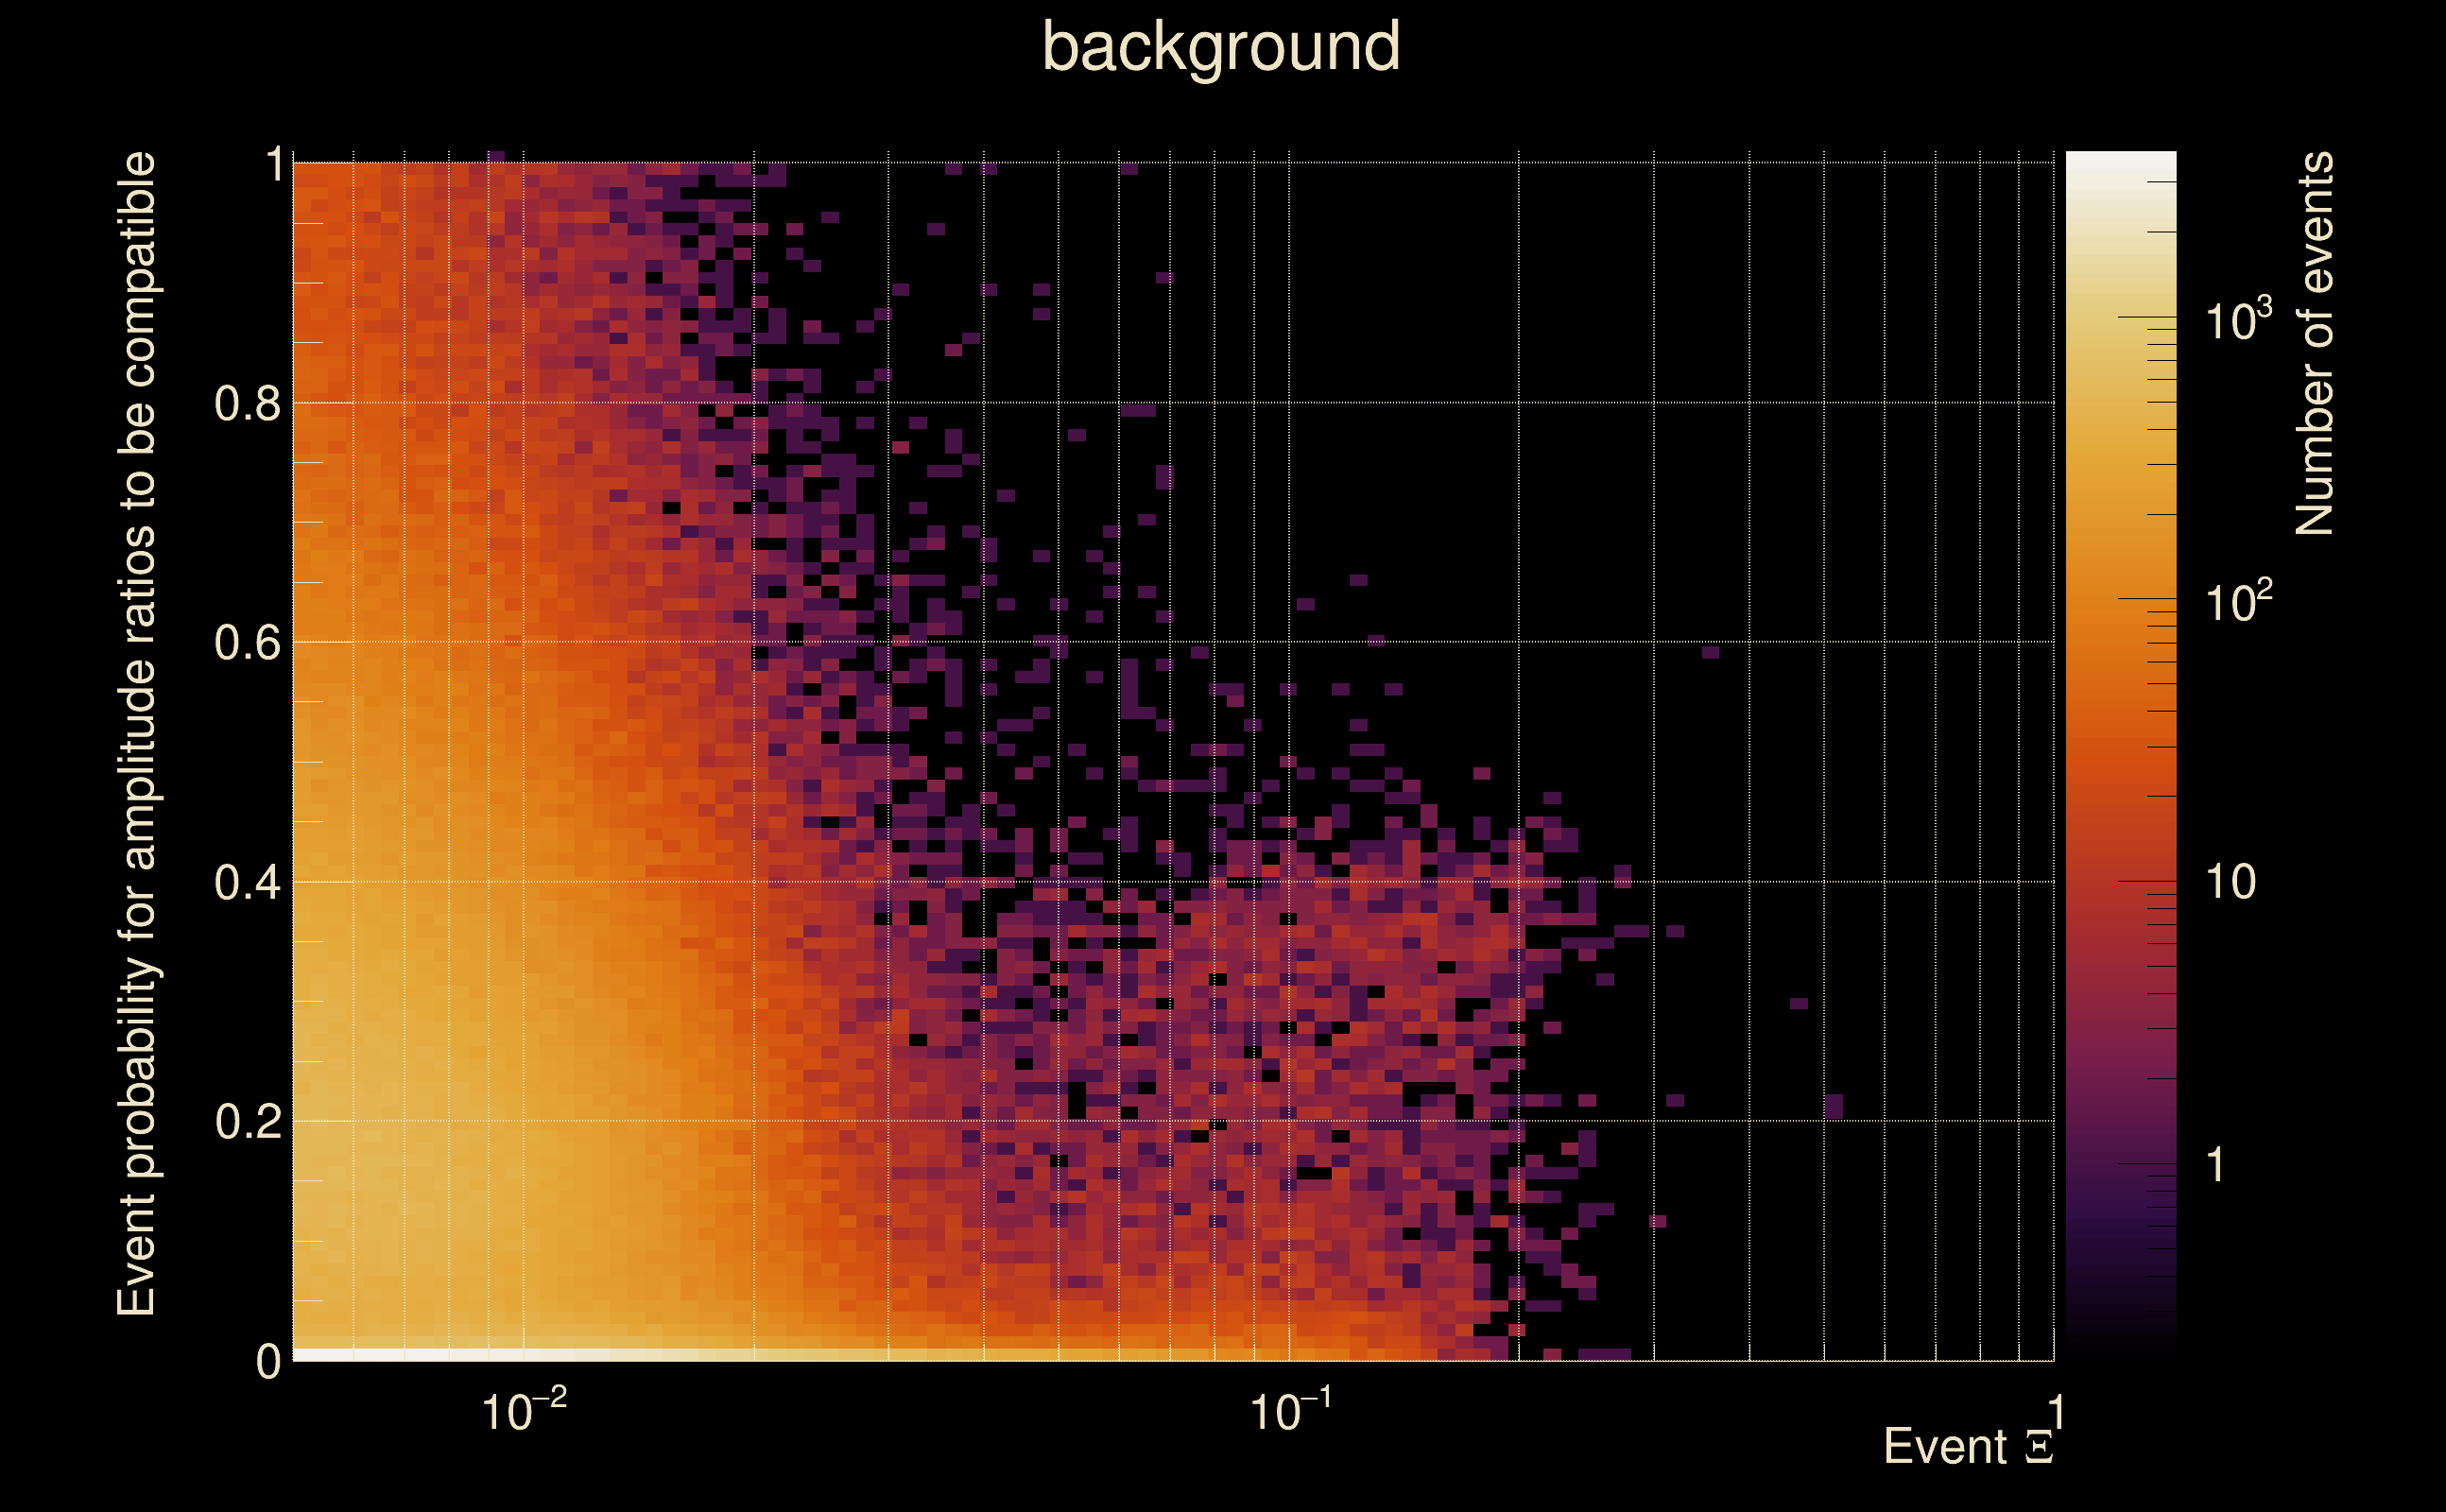
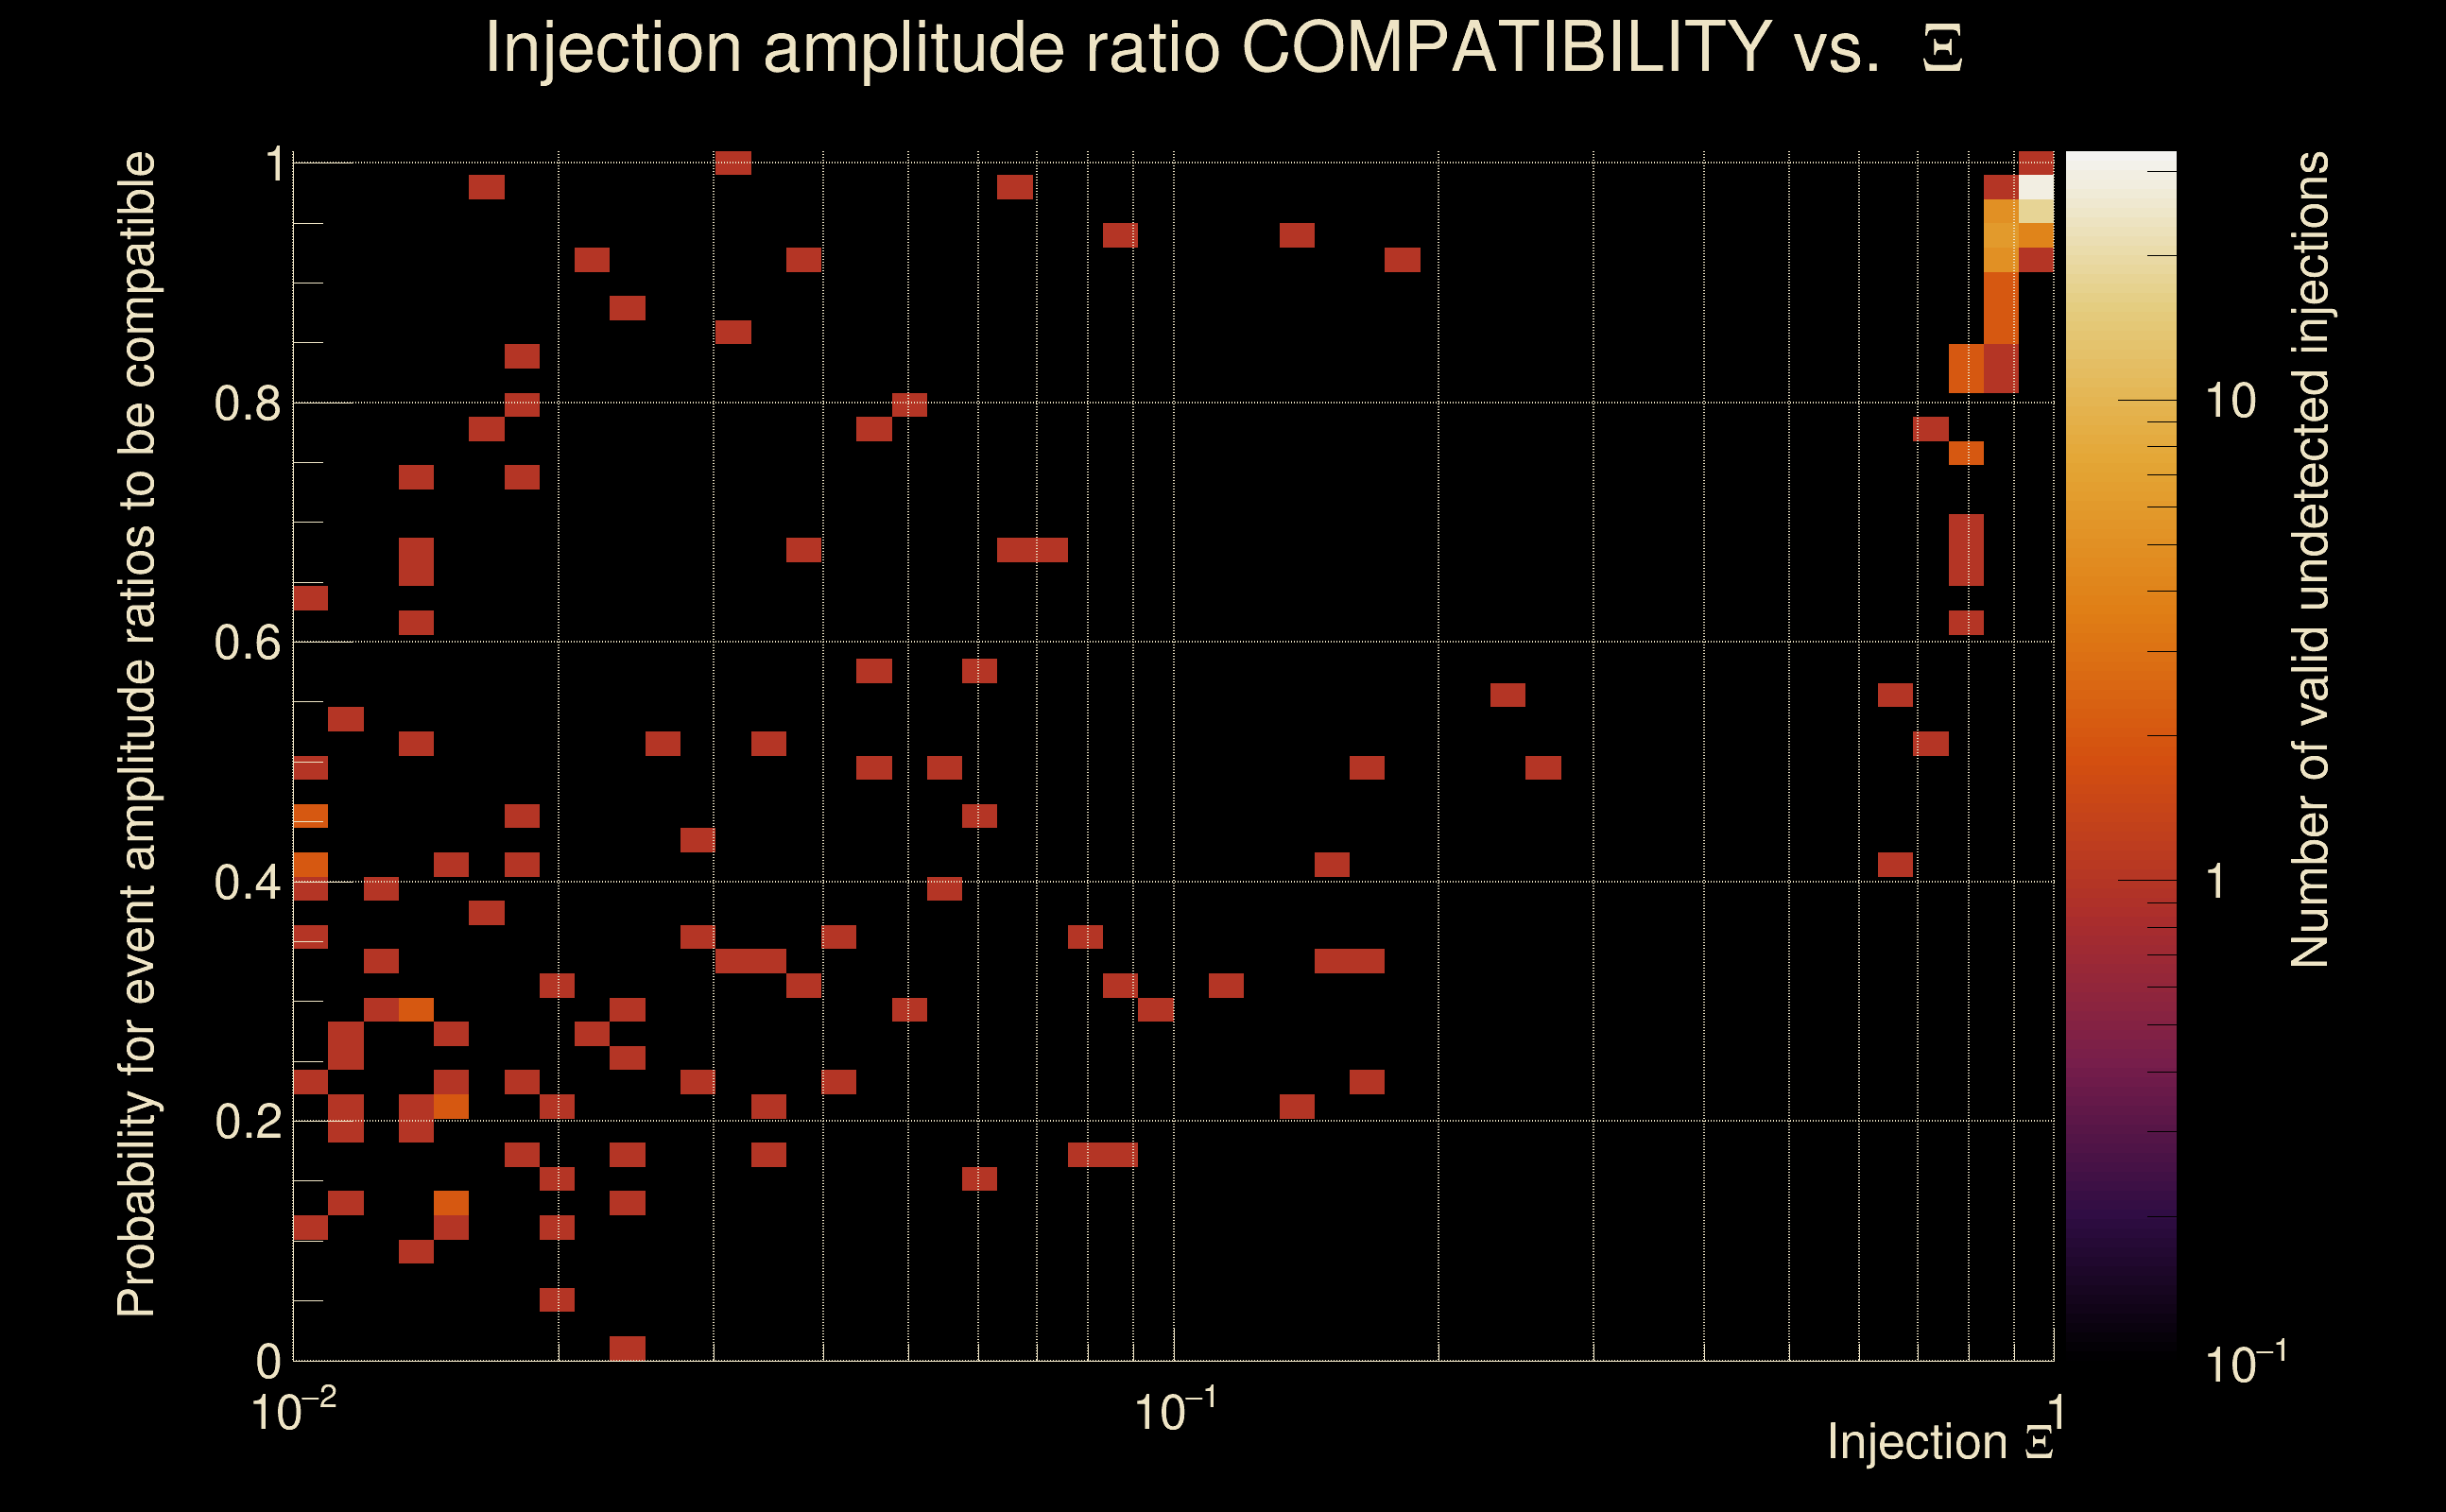
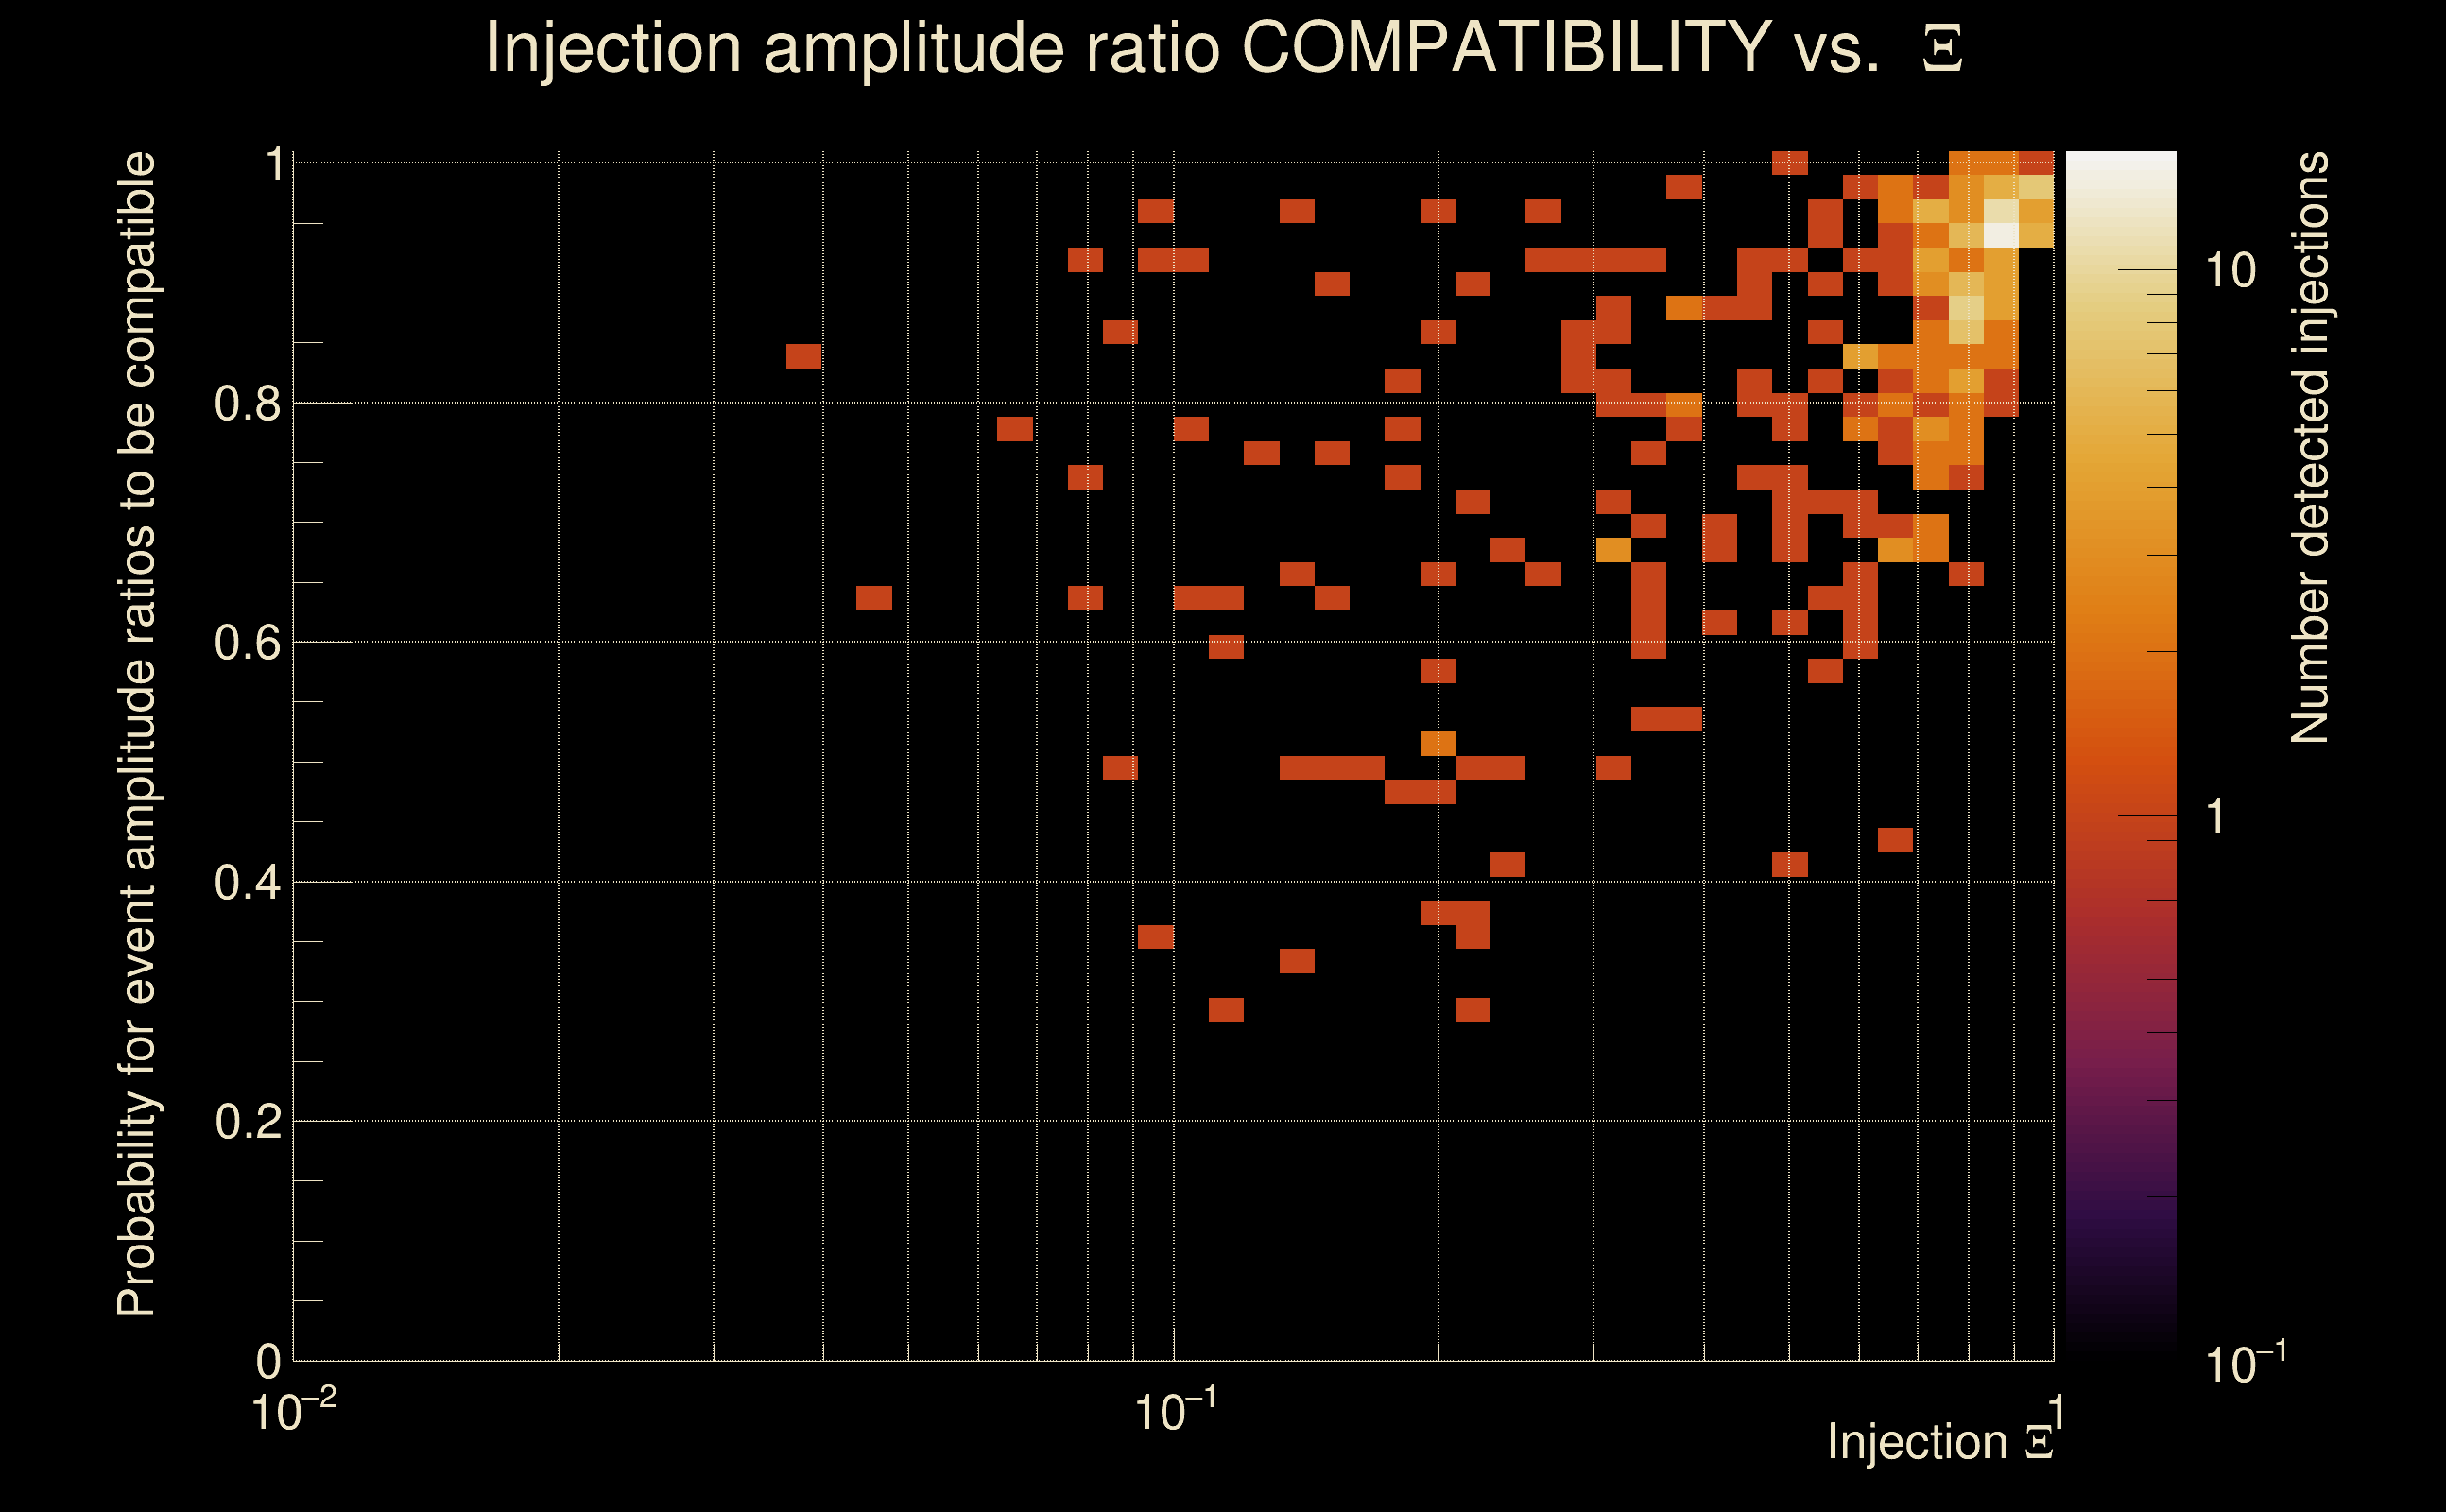
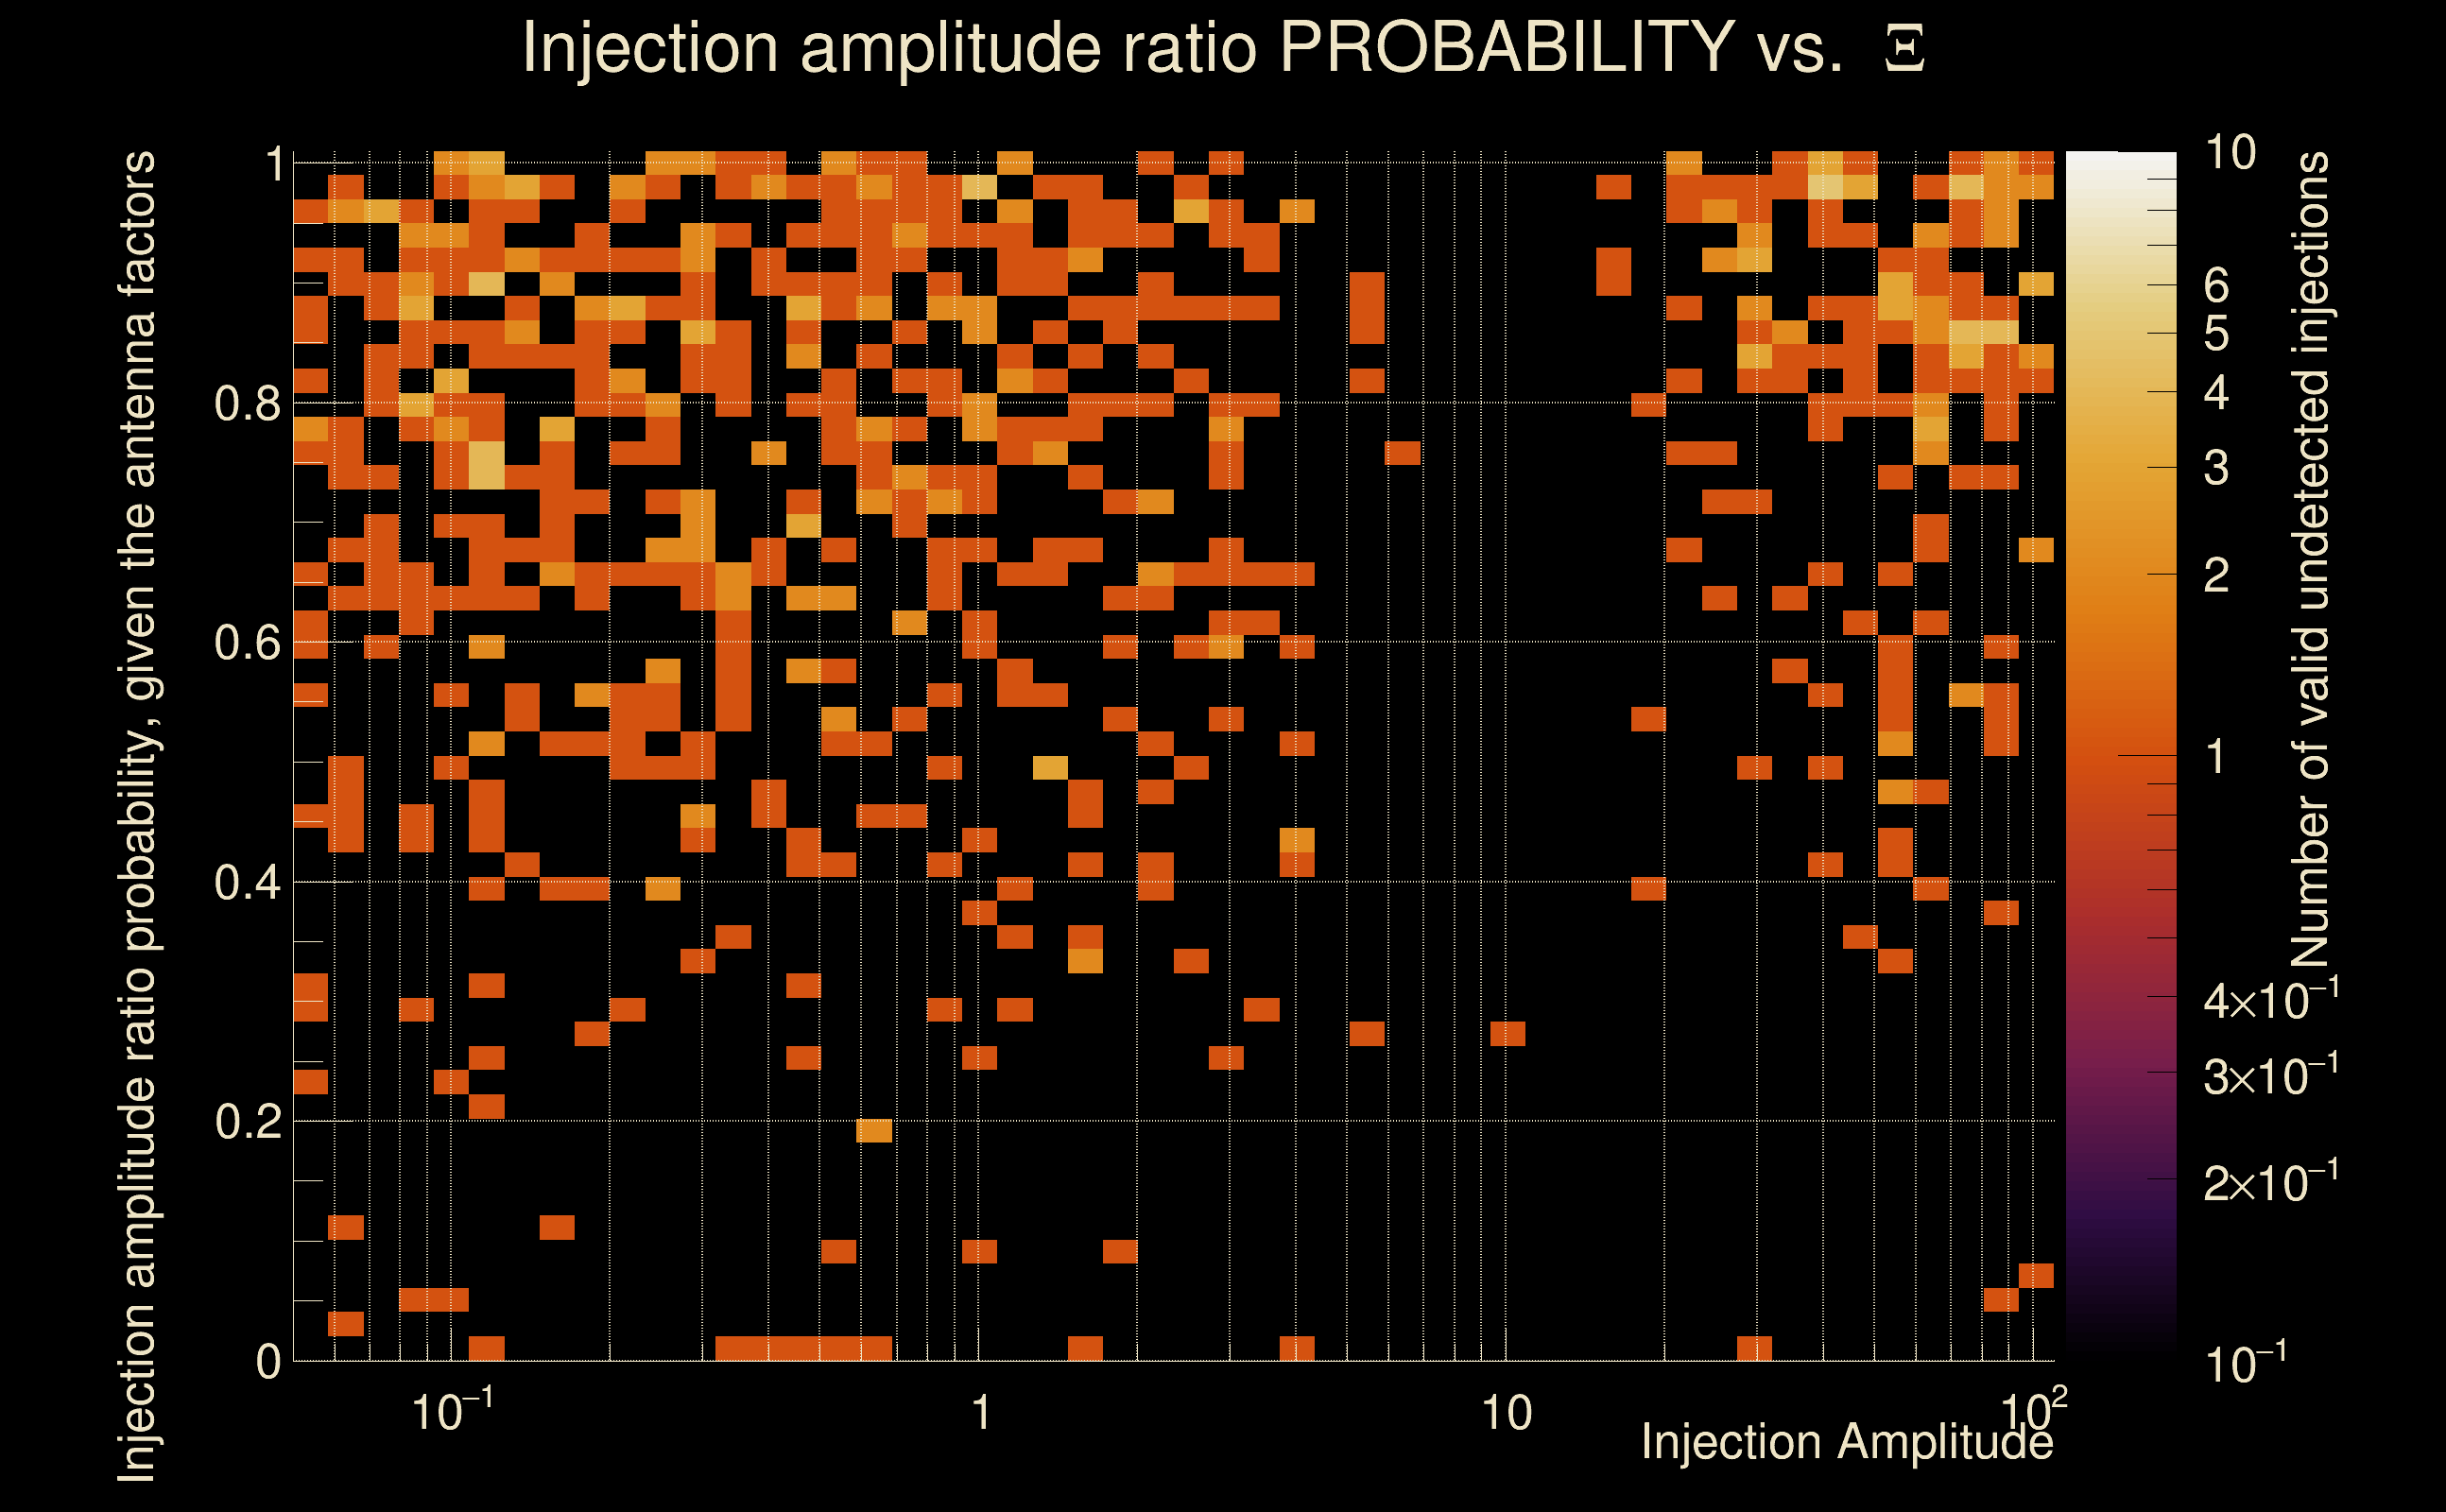
| Amplitude ratio H1|L1 compatibility (probability): | 0.997305 |
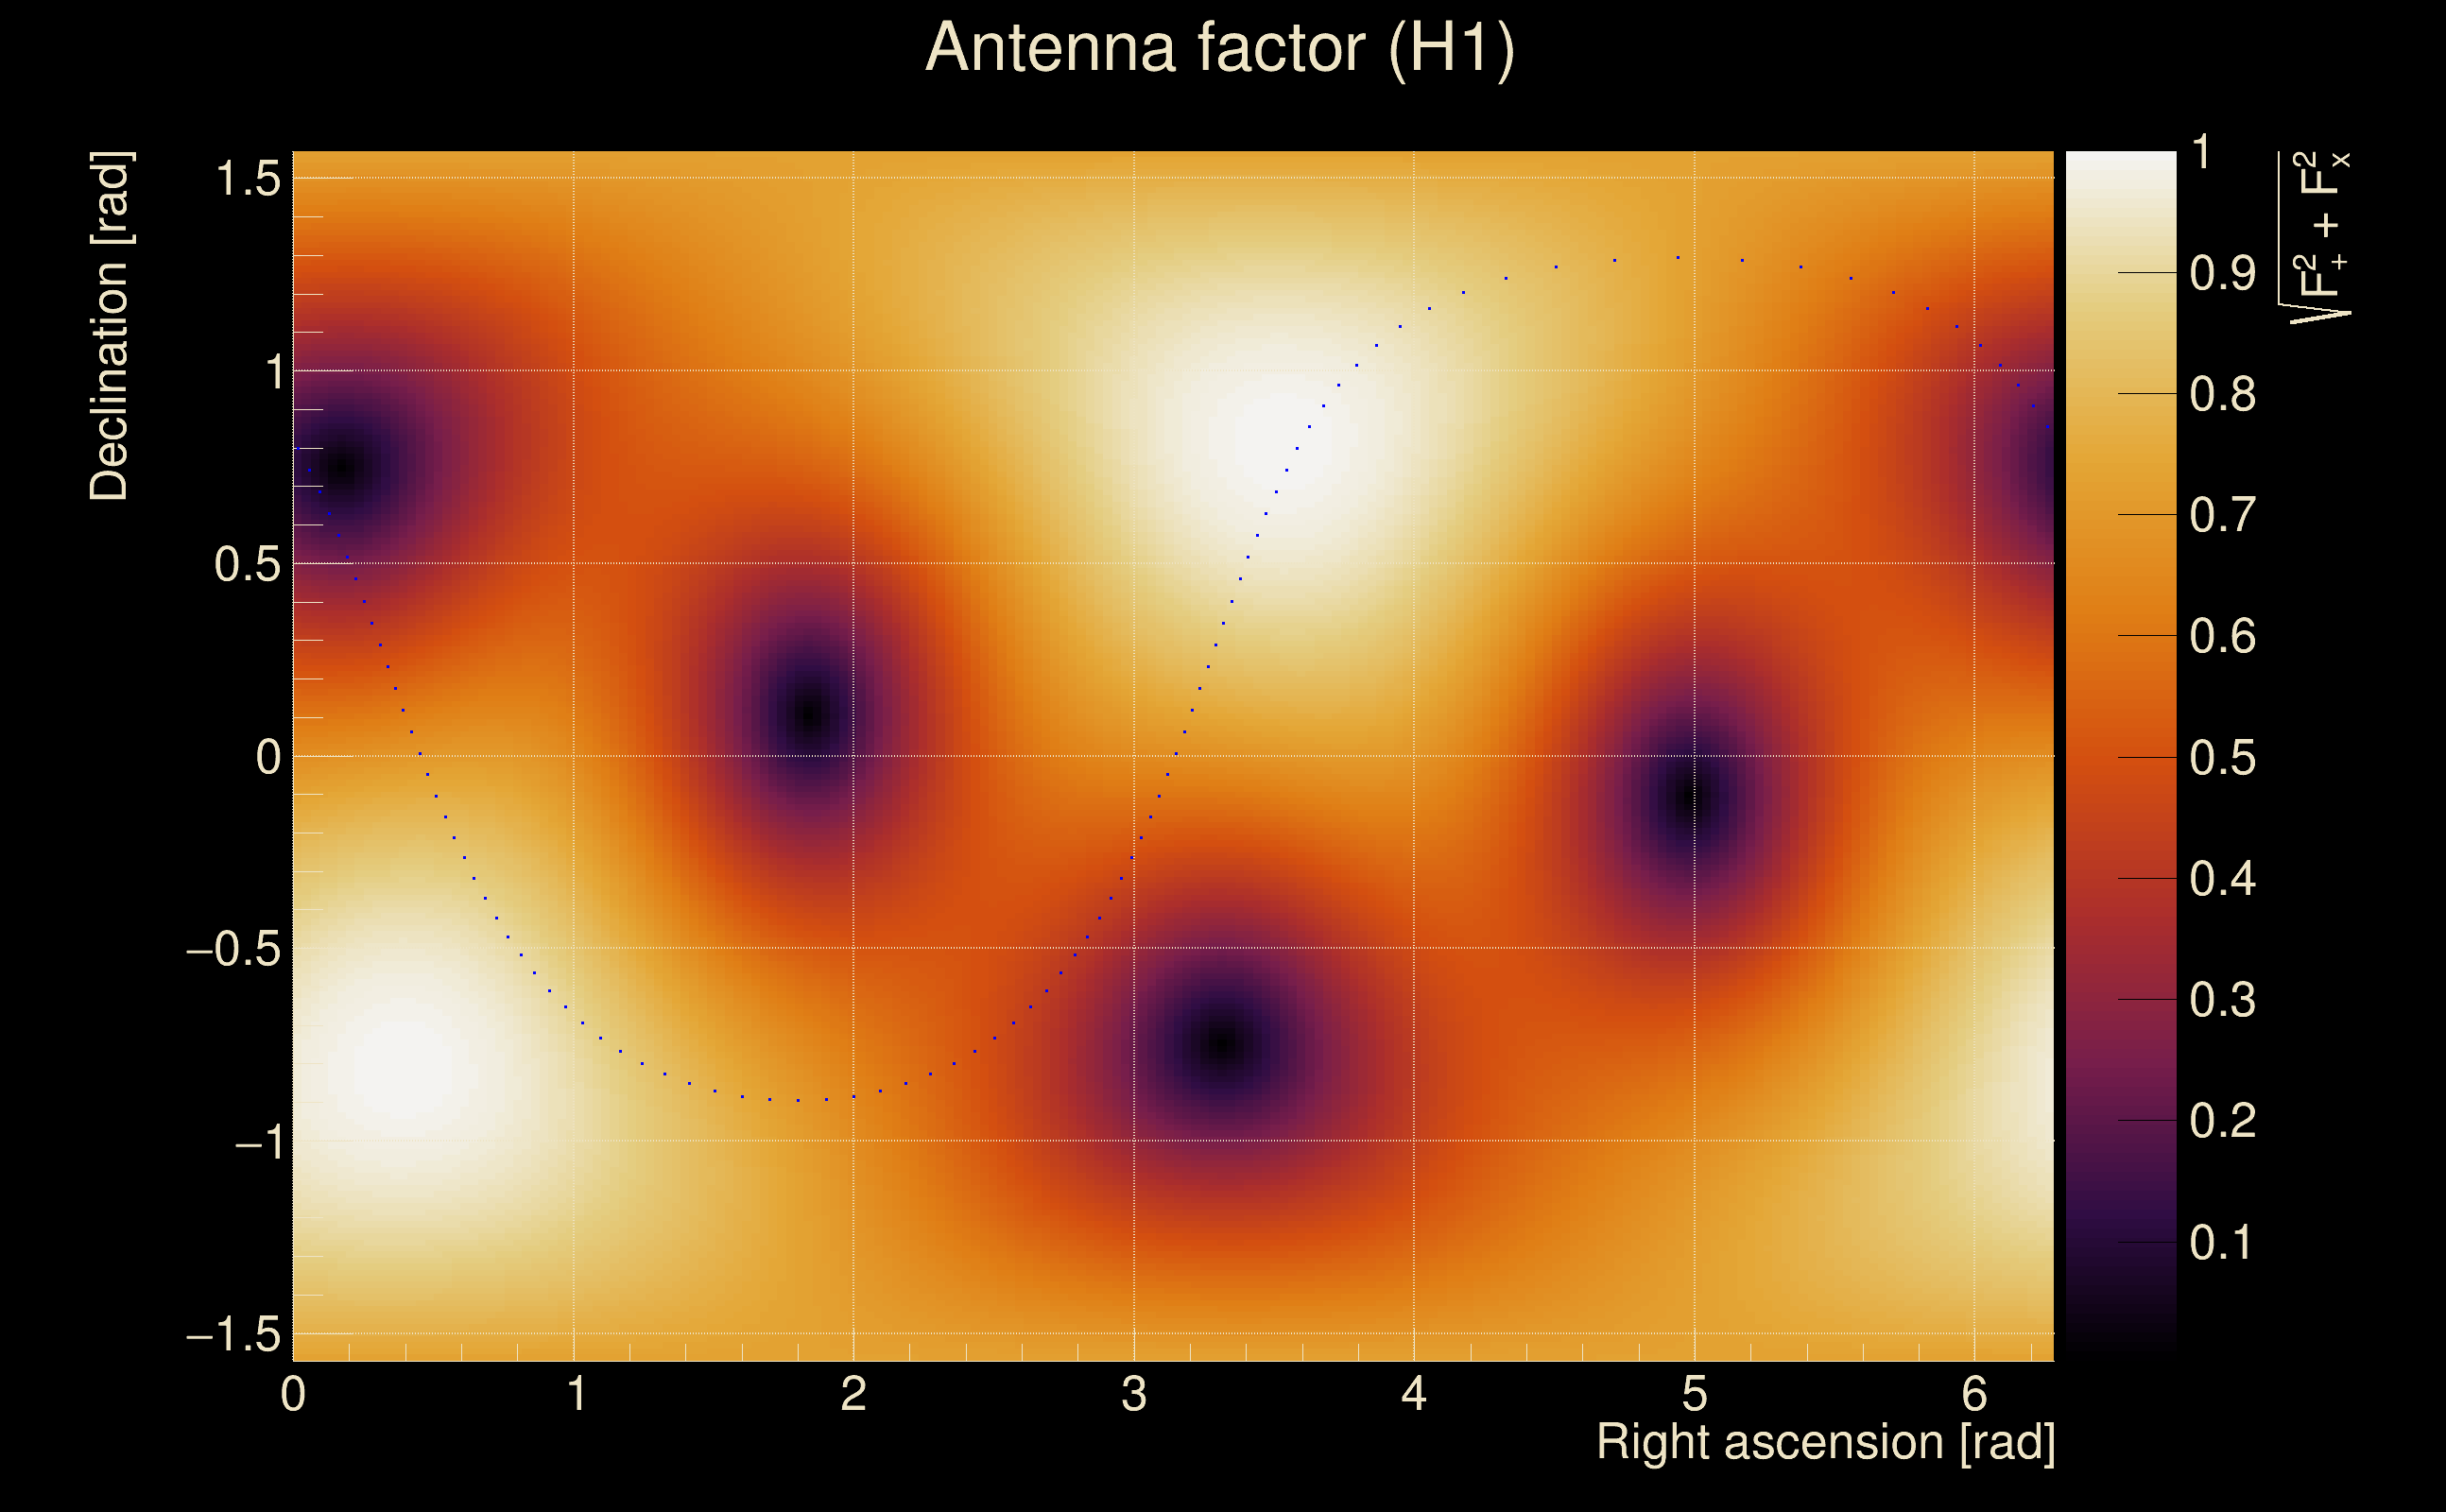
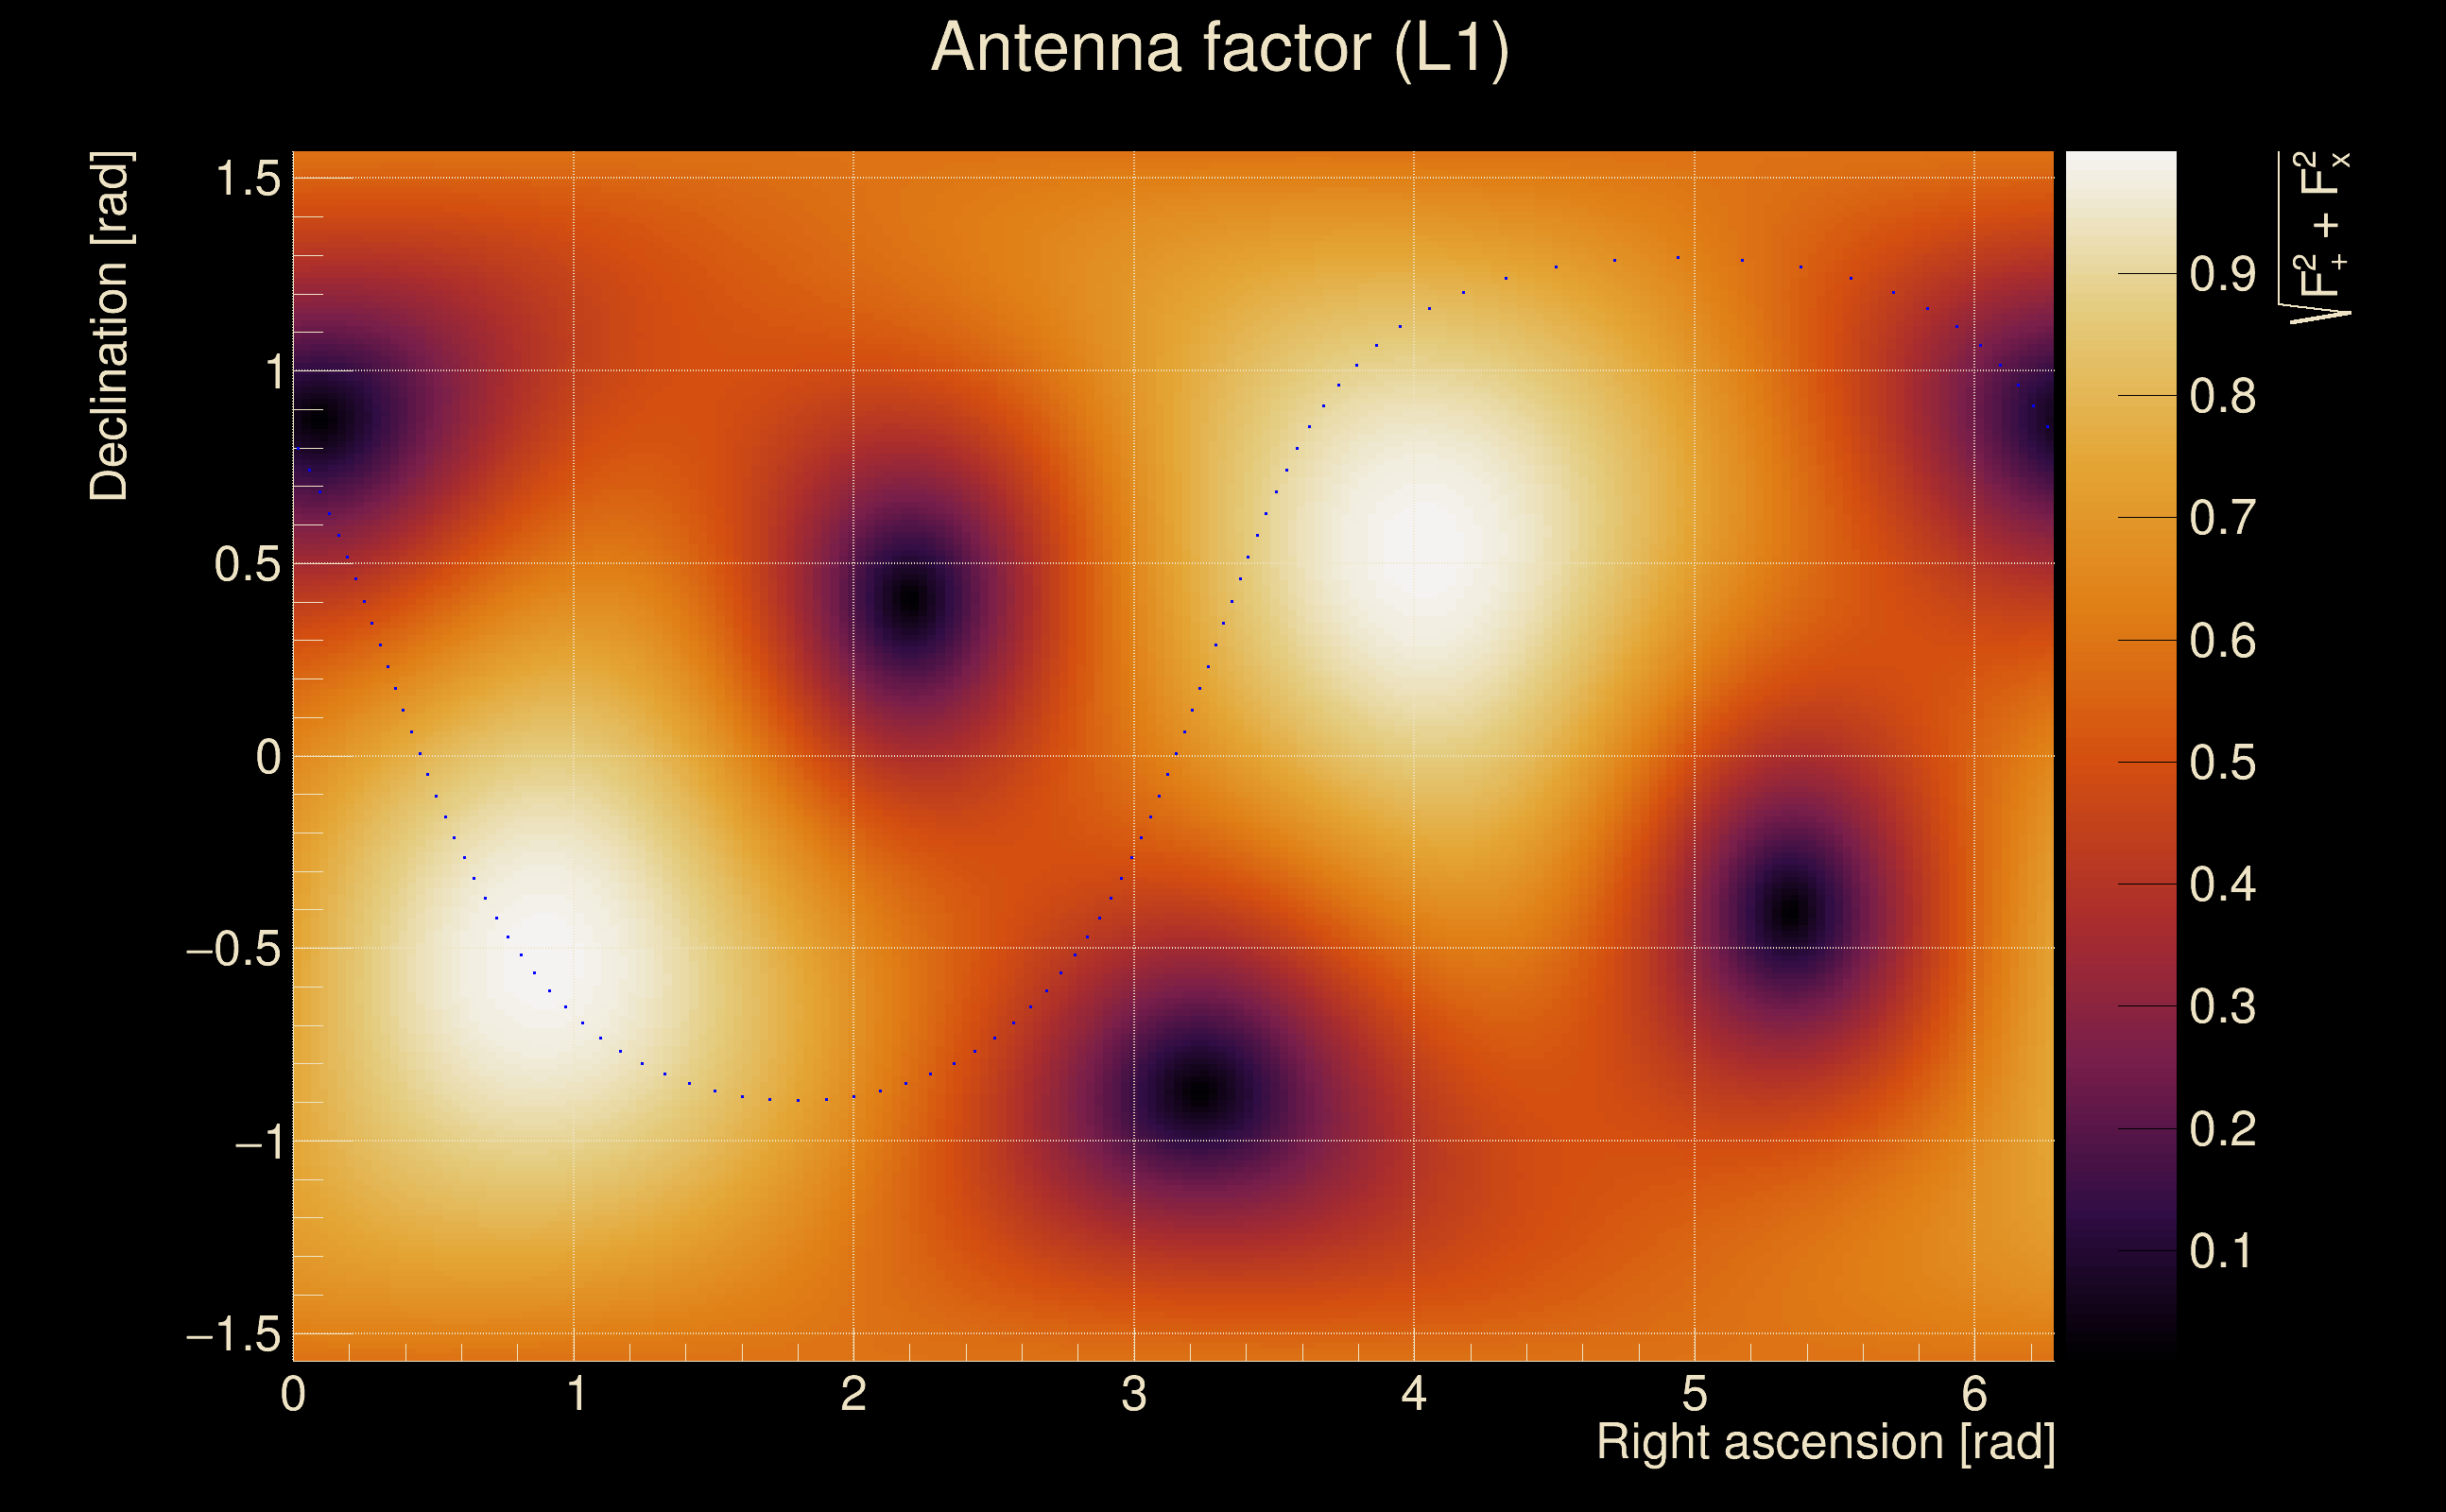
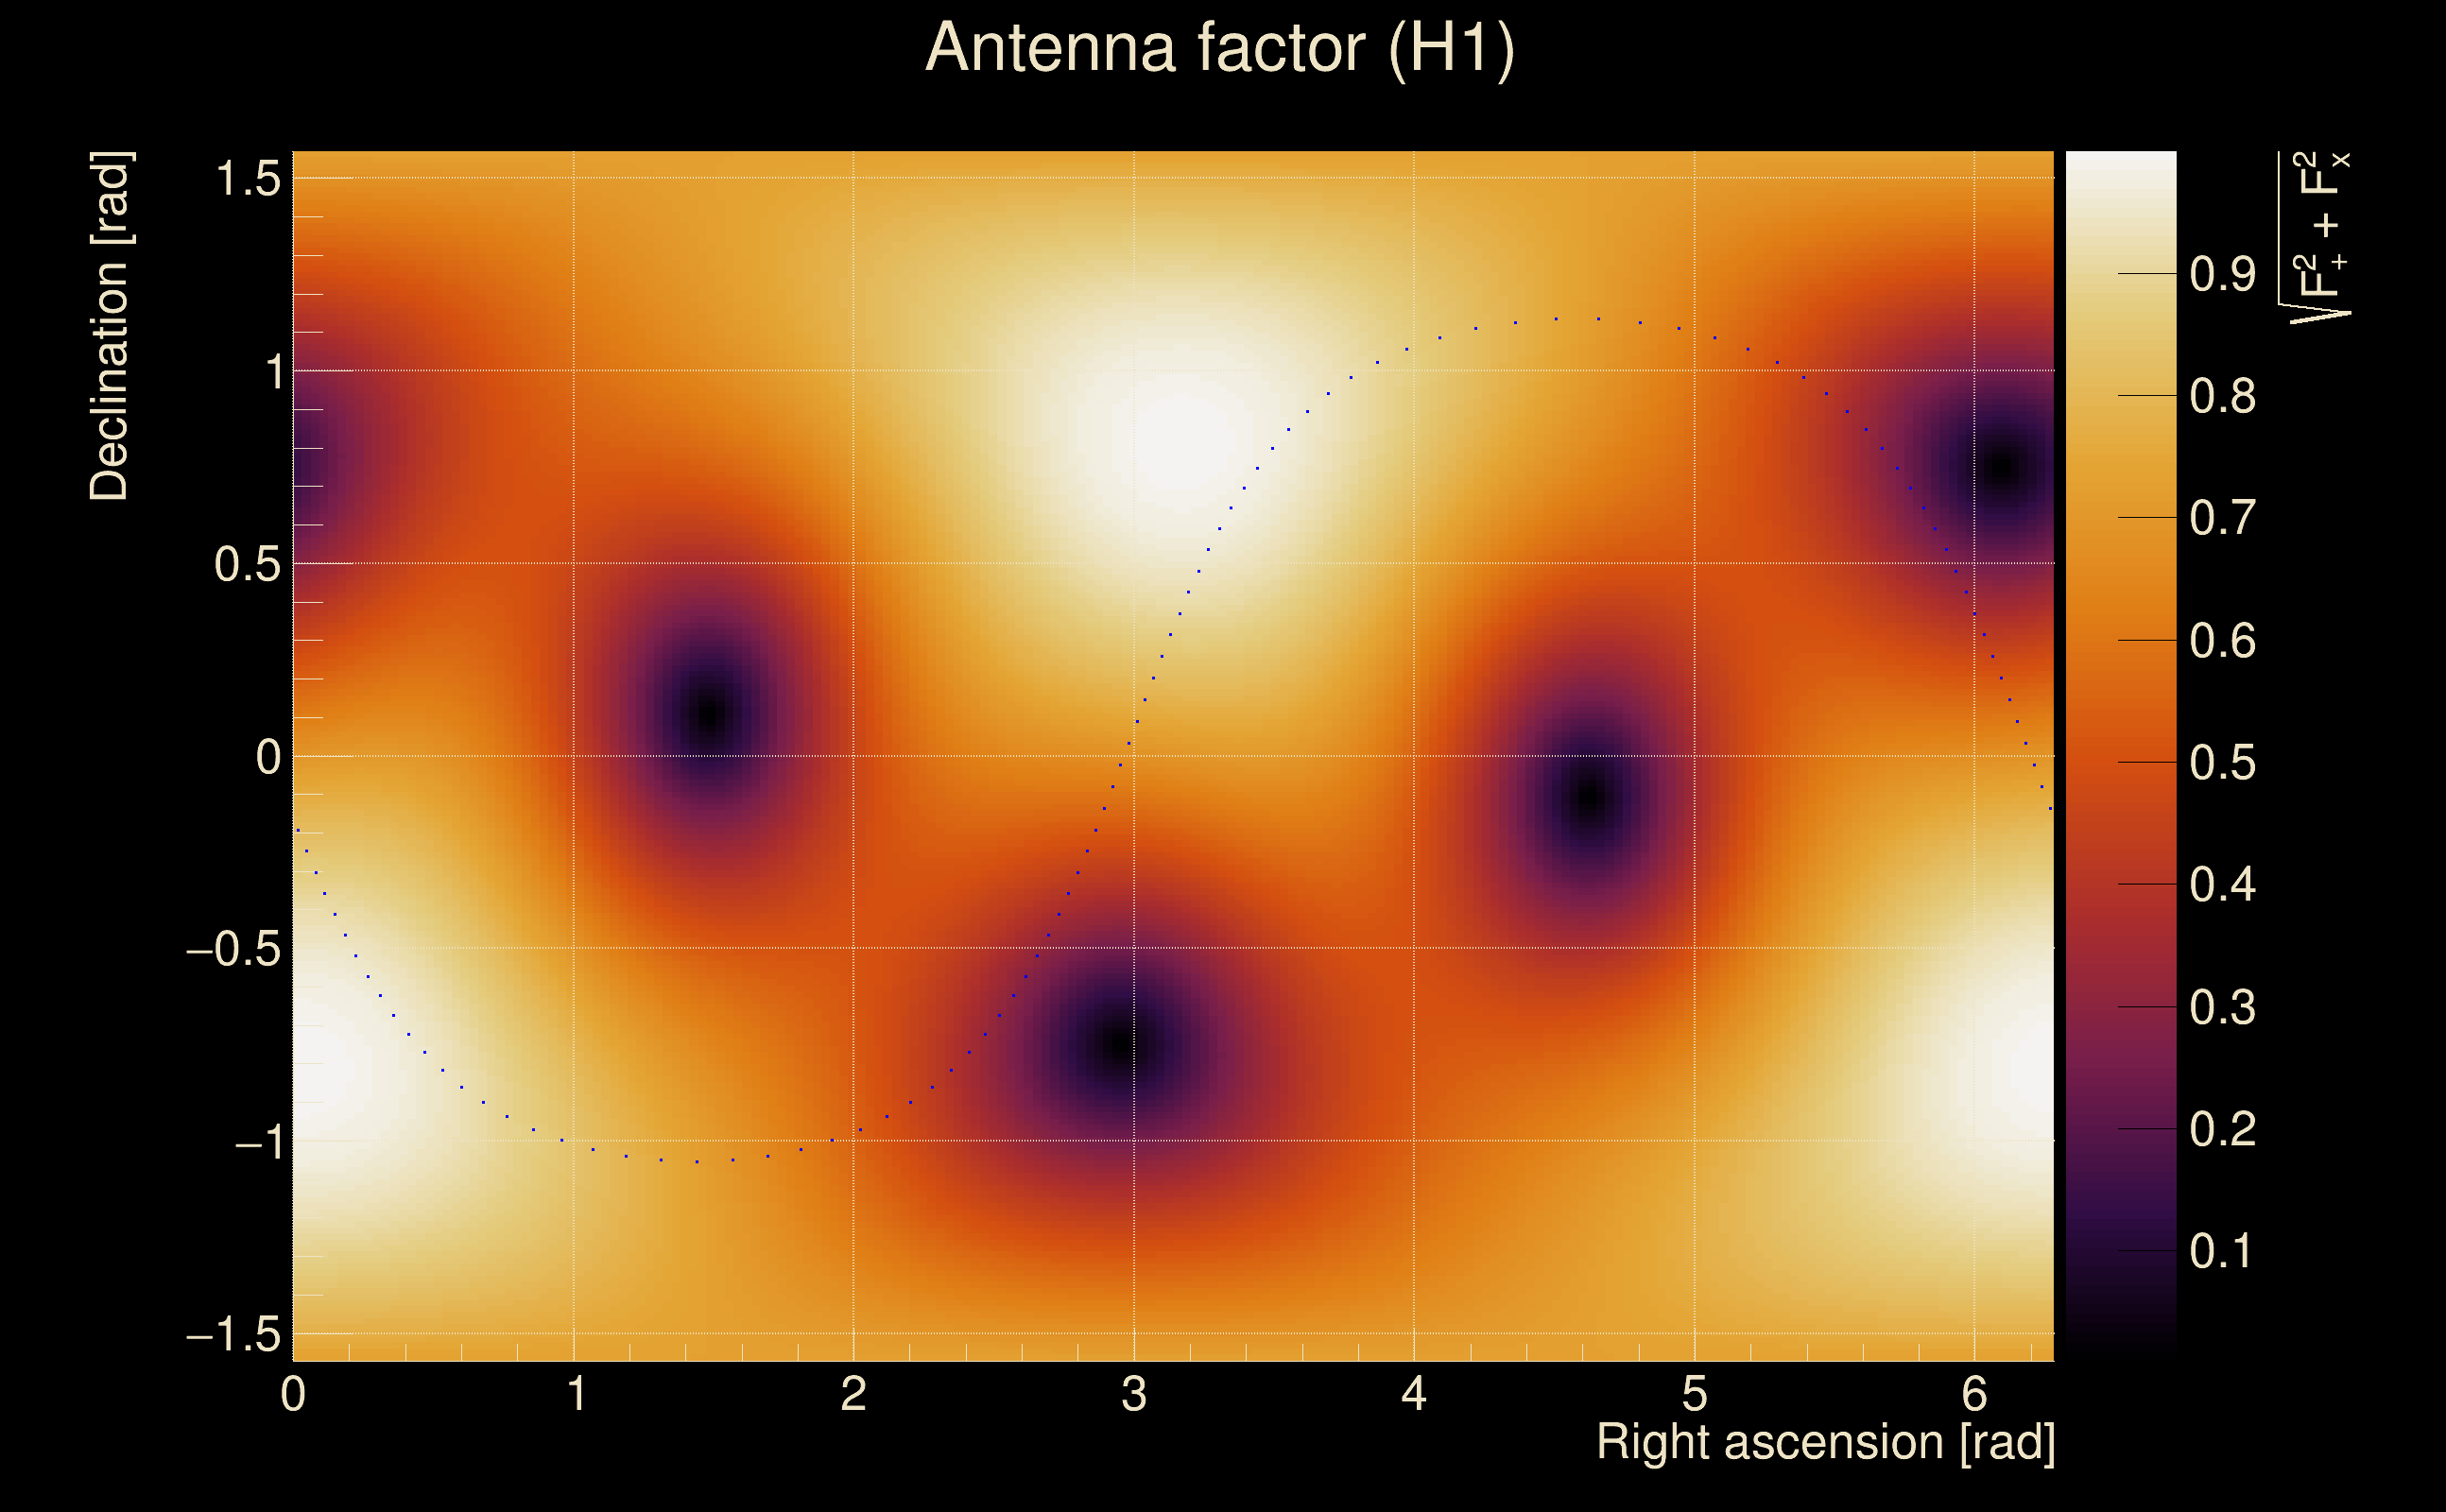
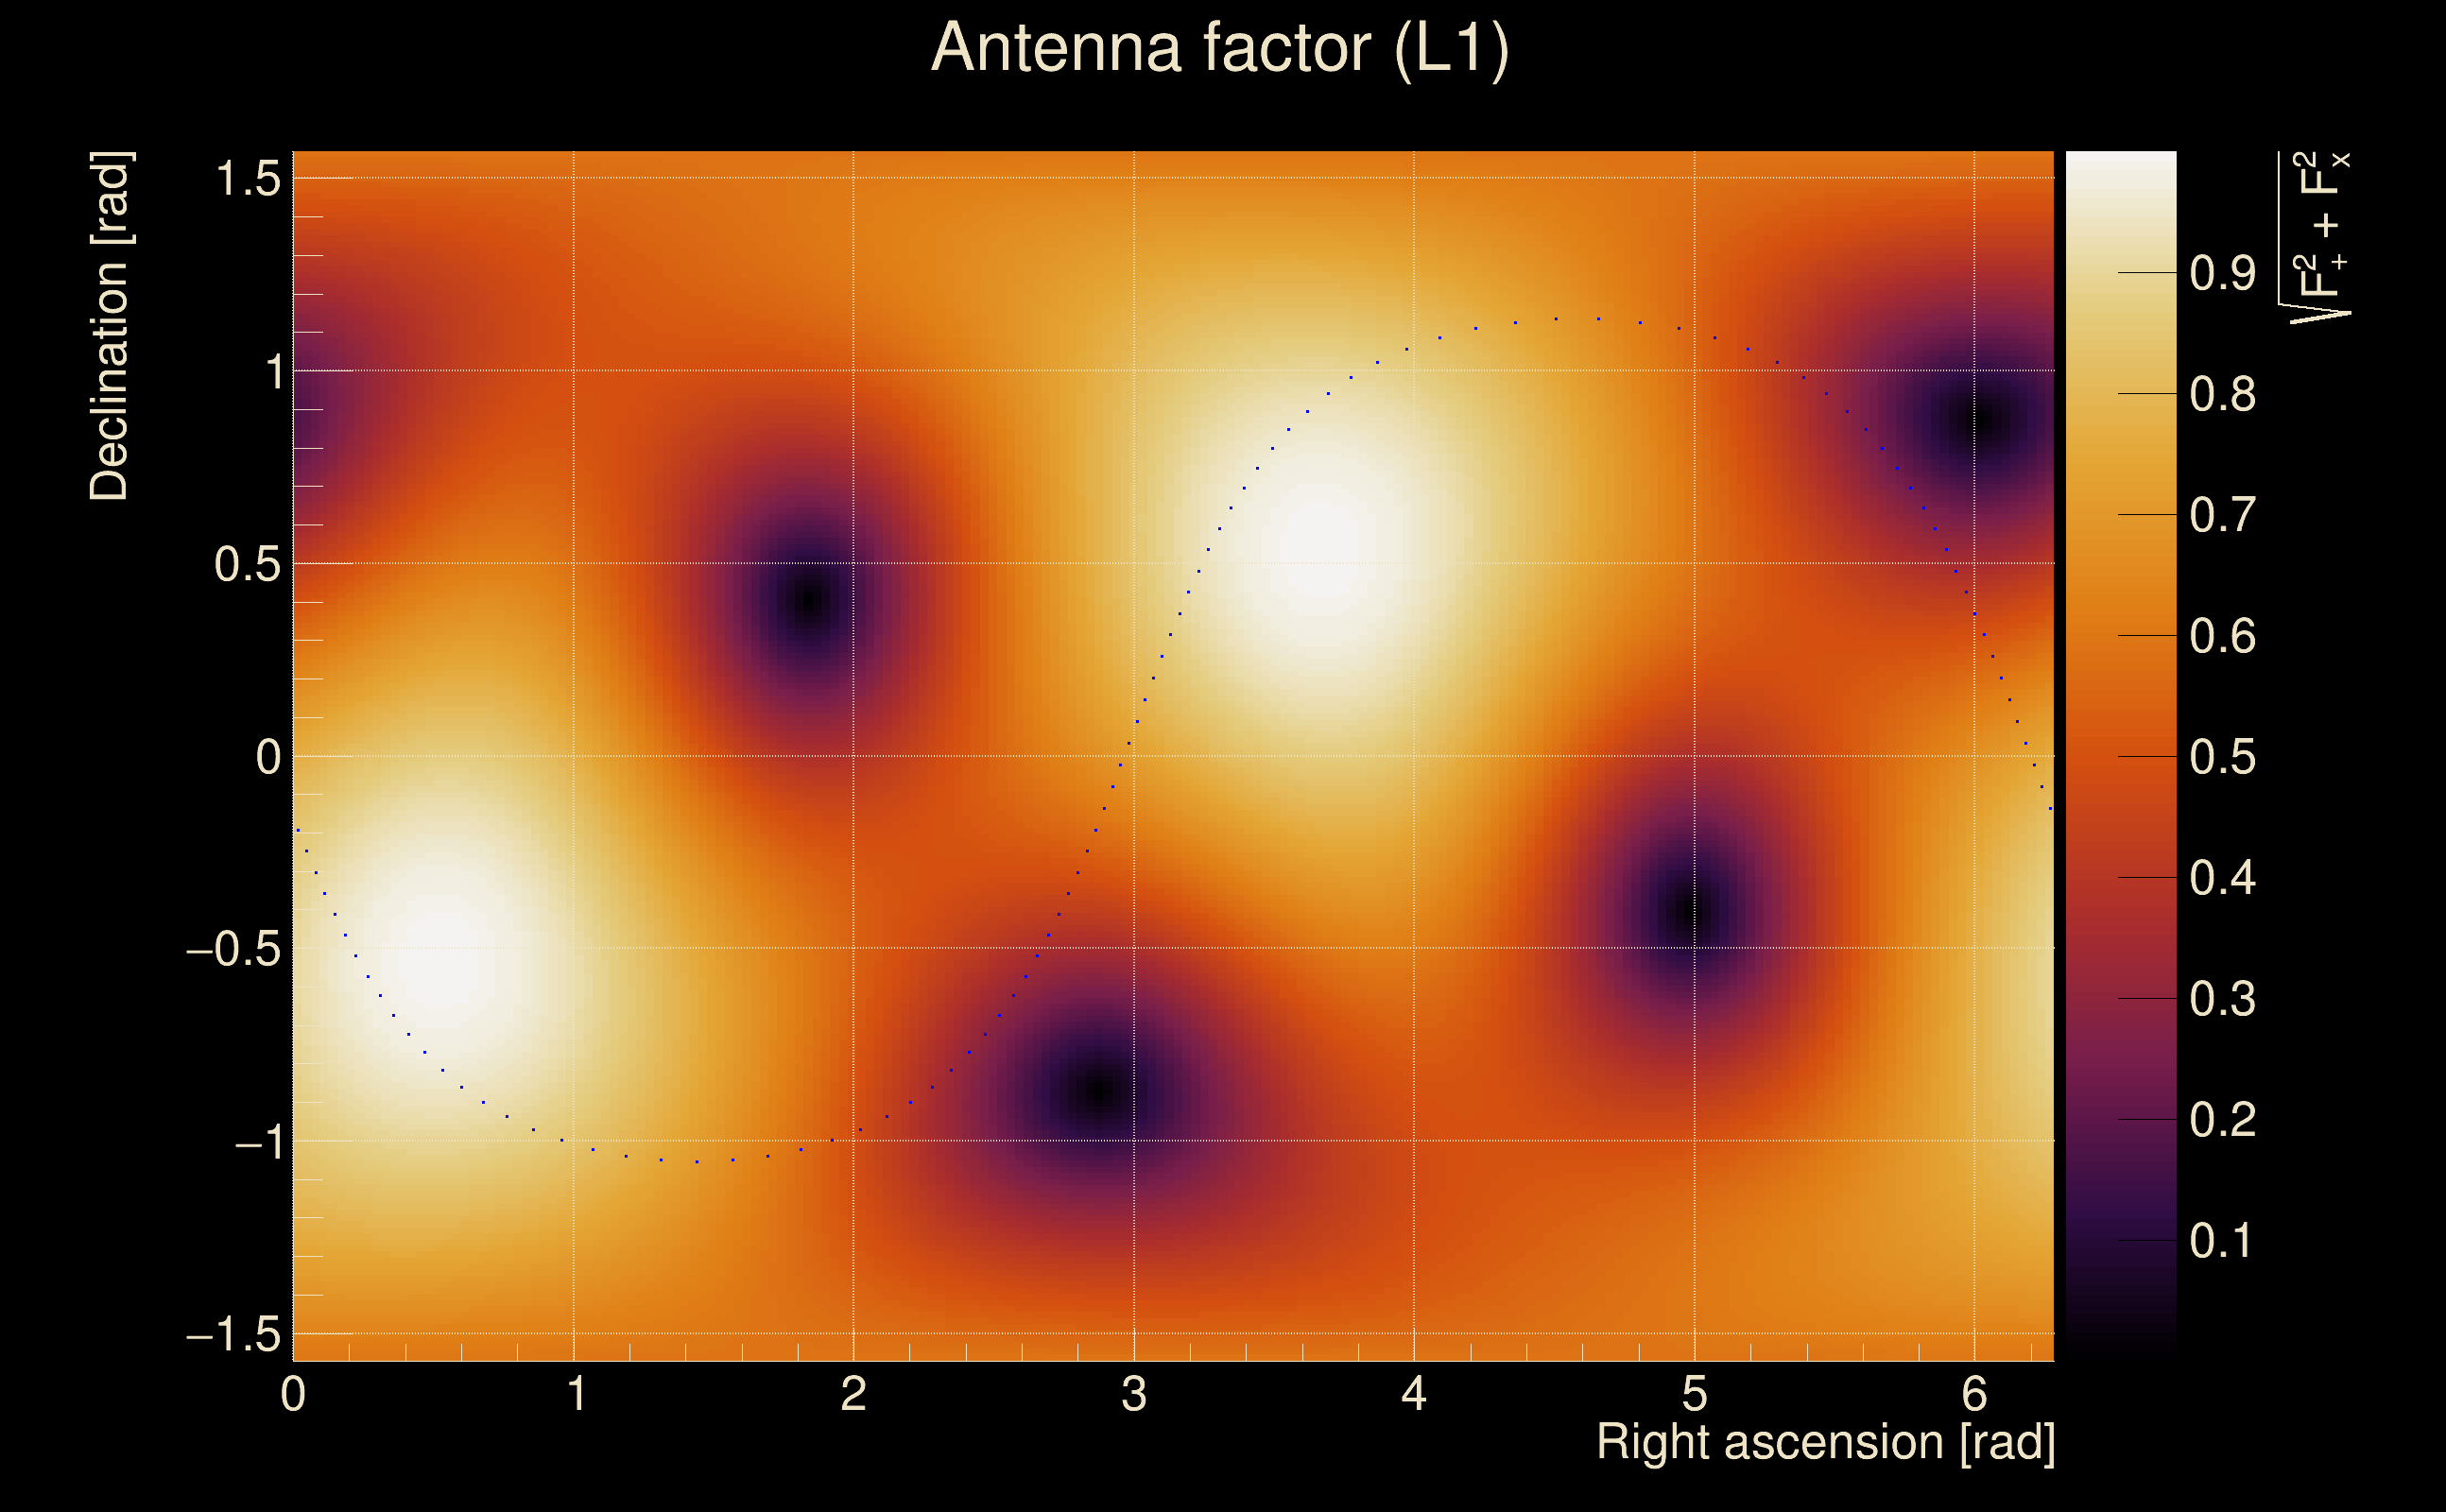
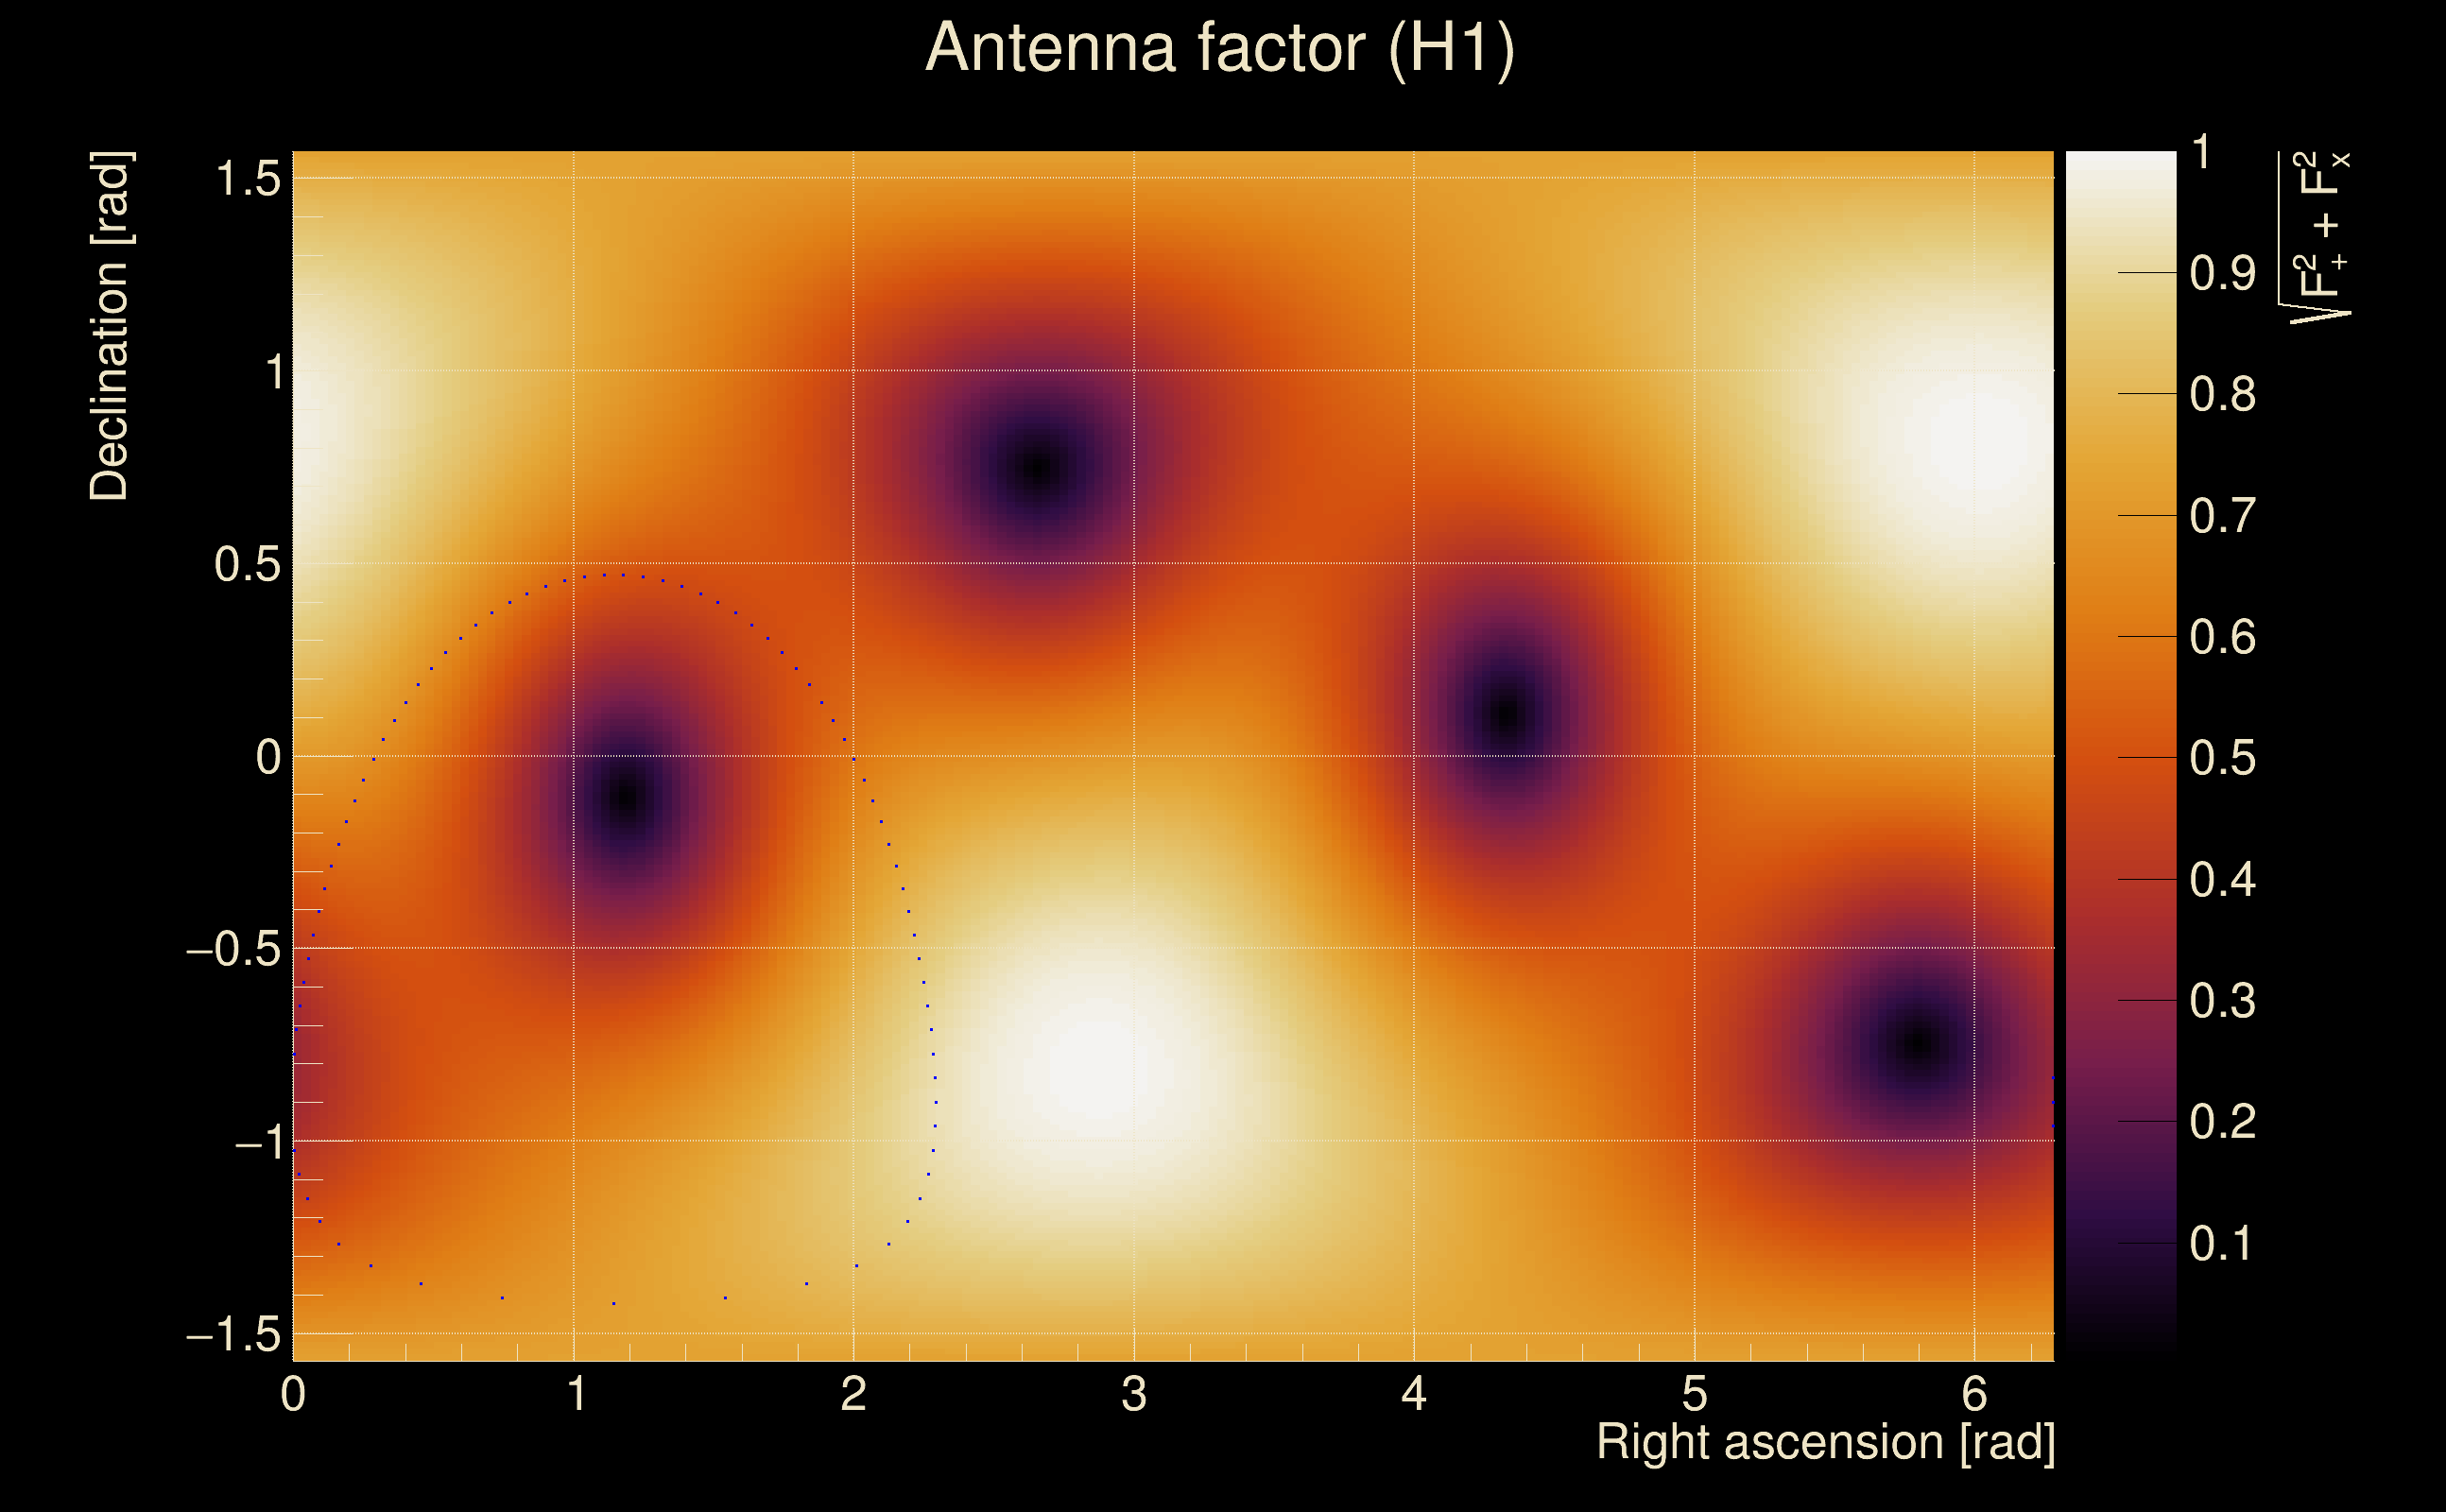
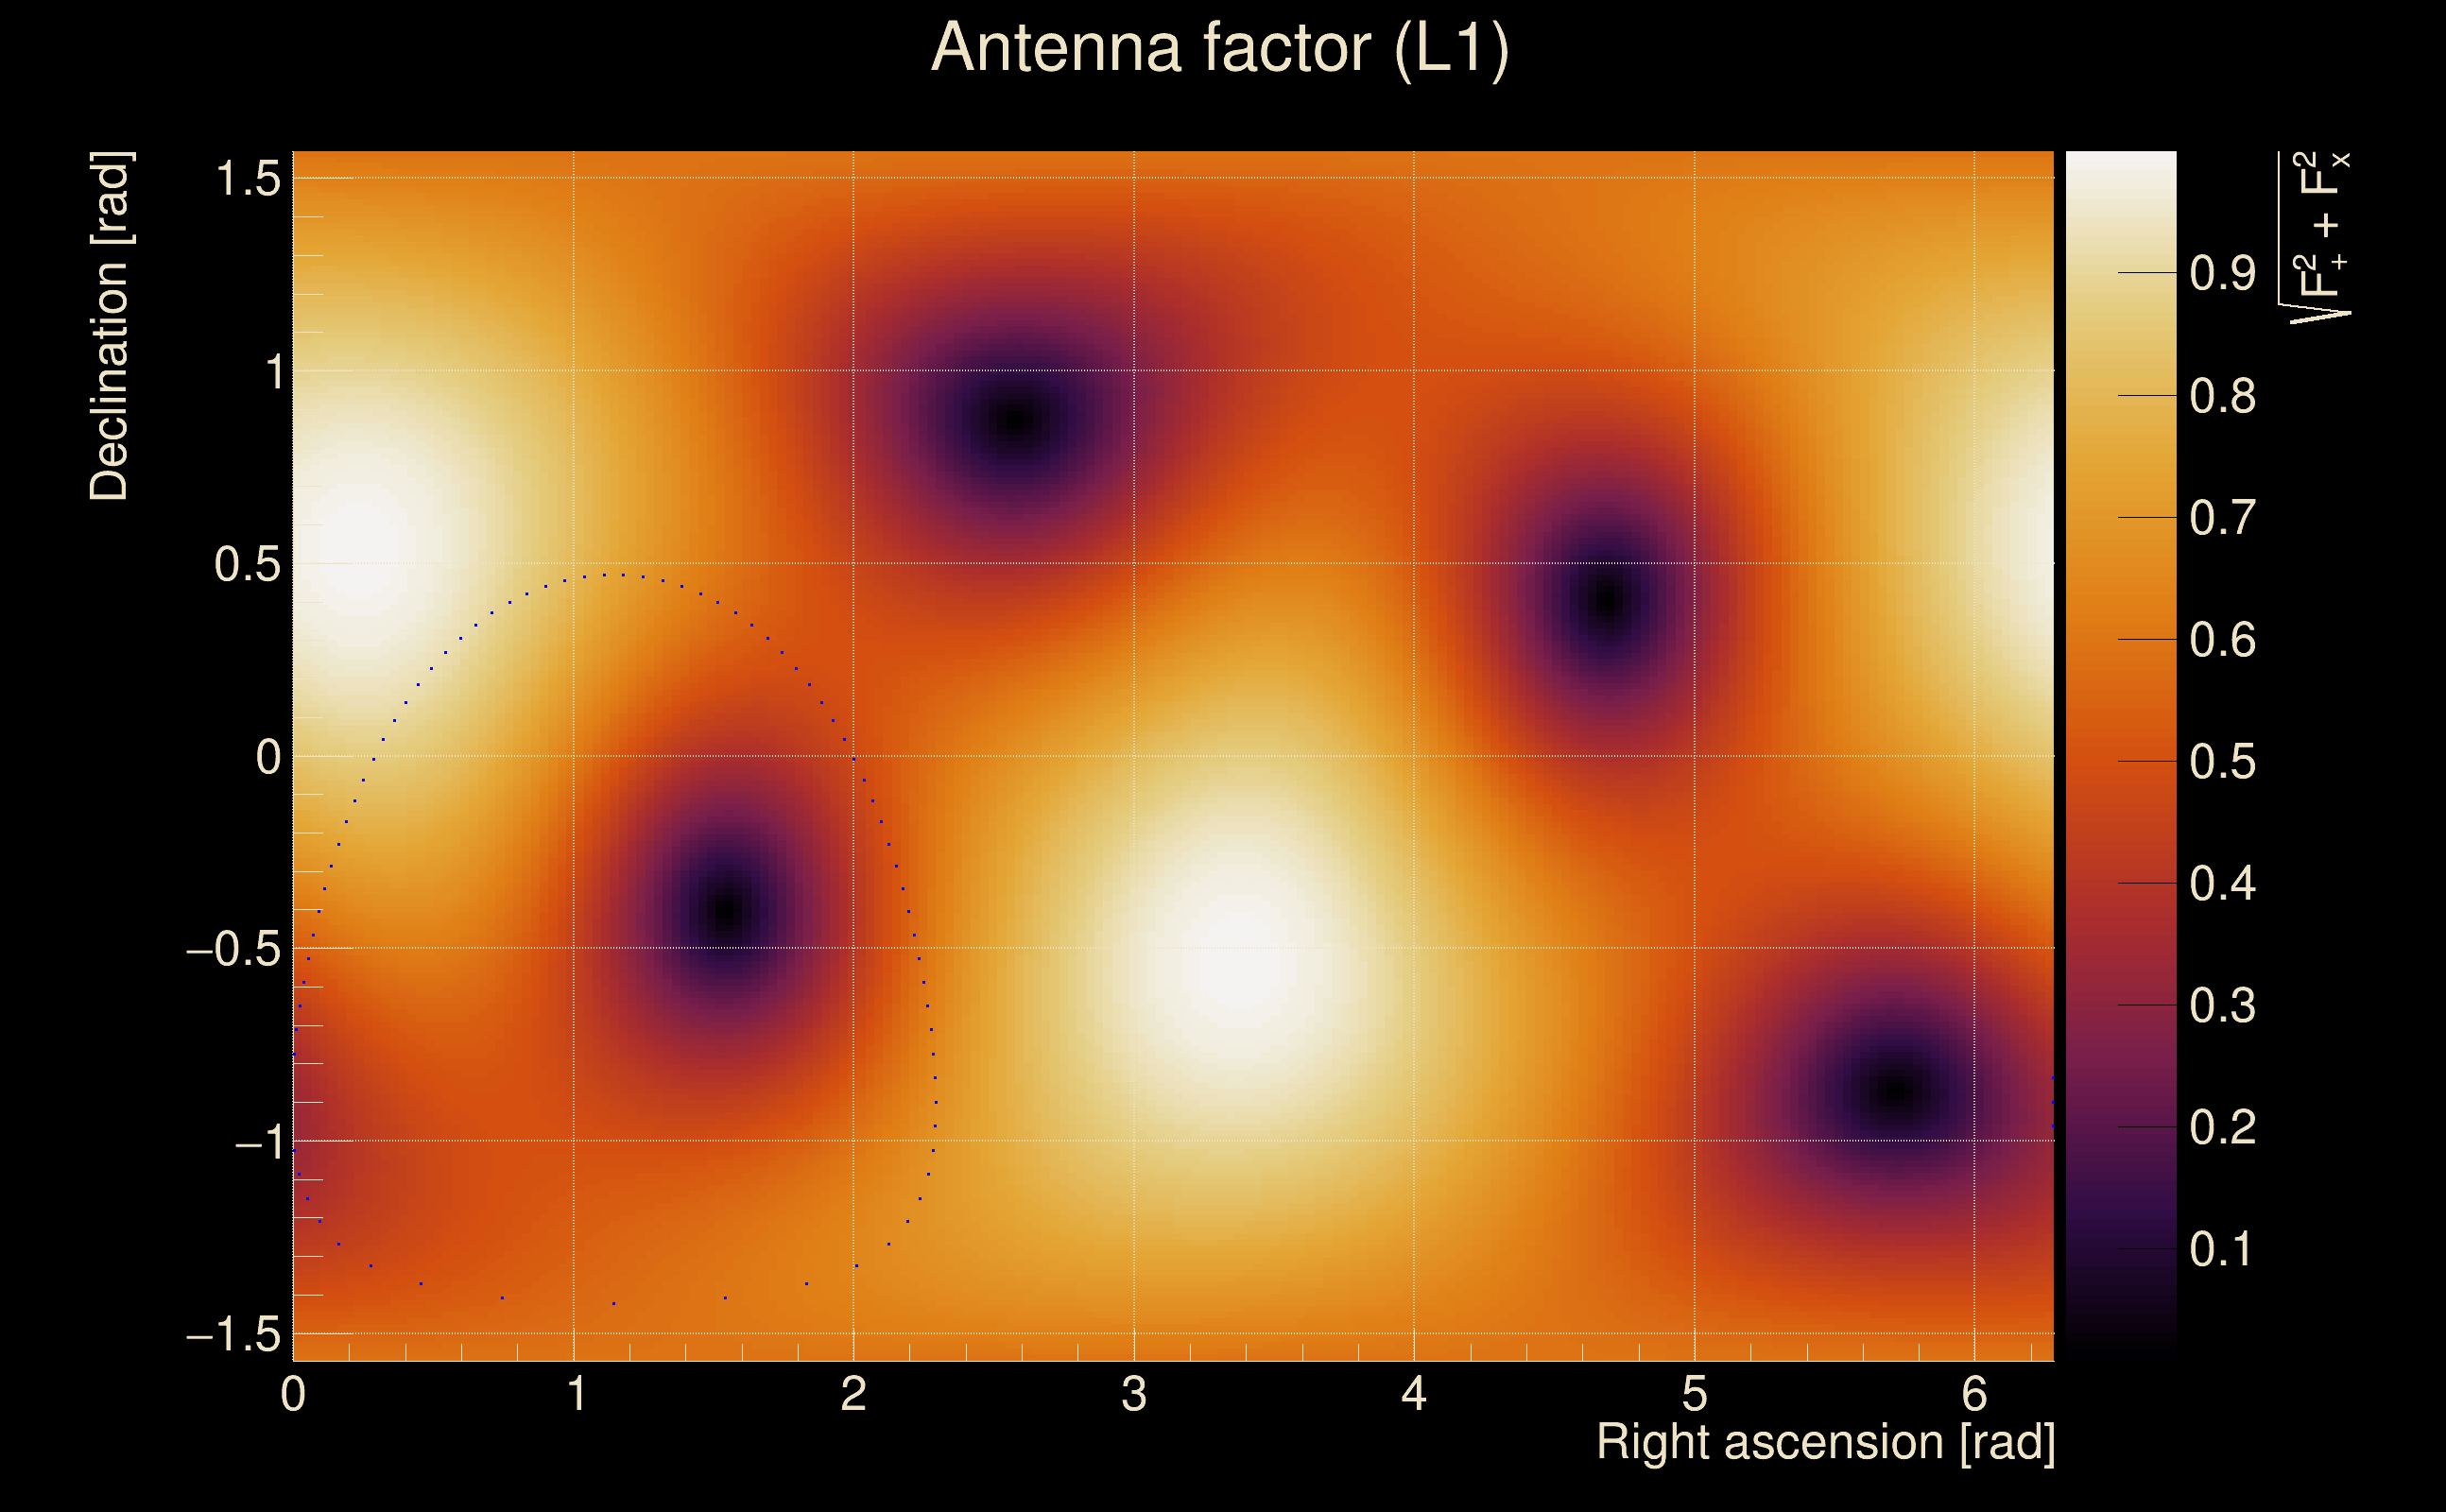
| Antenna factor probability: | 0.993664 |
| Number of rejected frequency rows: | Q0: 0 / 18, Q1: 0 / 36, Q2: 2 / 70, Q3: 14 / 134, Q4: 42 / 258 |
| Maximum signal-to-noise ratio: | H1: 94.5466, L1: 85.6759 |
| SNR variance: | H1: 5.69097, L1: 4.64801 |
| Click here for a zoomed plot | Click here for a zoomed plot | Click here for a zoomed plot | Click here for a zoomed plot | Click here for a zoomed plot |
 |
 |
 |
 |
 |
 |
 |
 |
 |
 |
 |
 |
 |
 |
 |
 |
 |
 |
 |
 |
 |
 |
 |
 |
 |
 |
 |
 |
 |
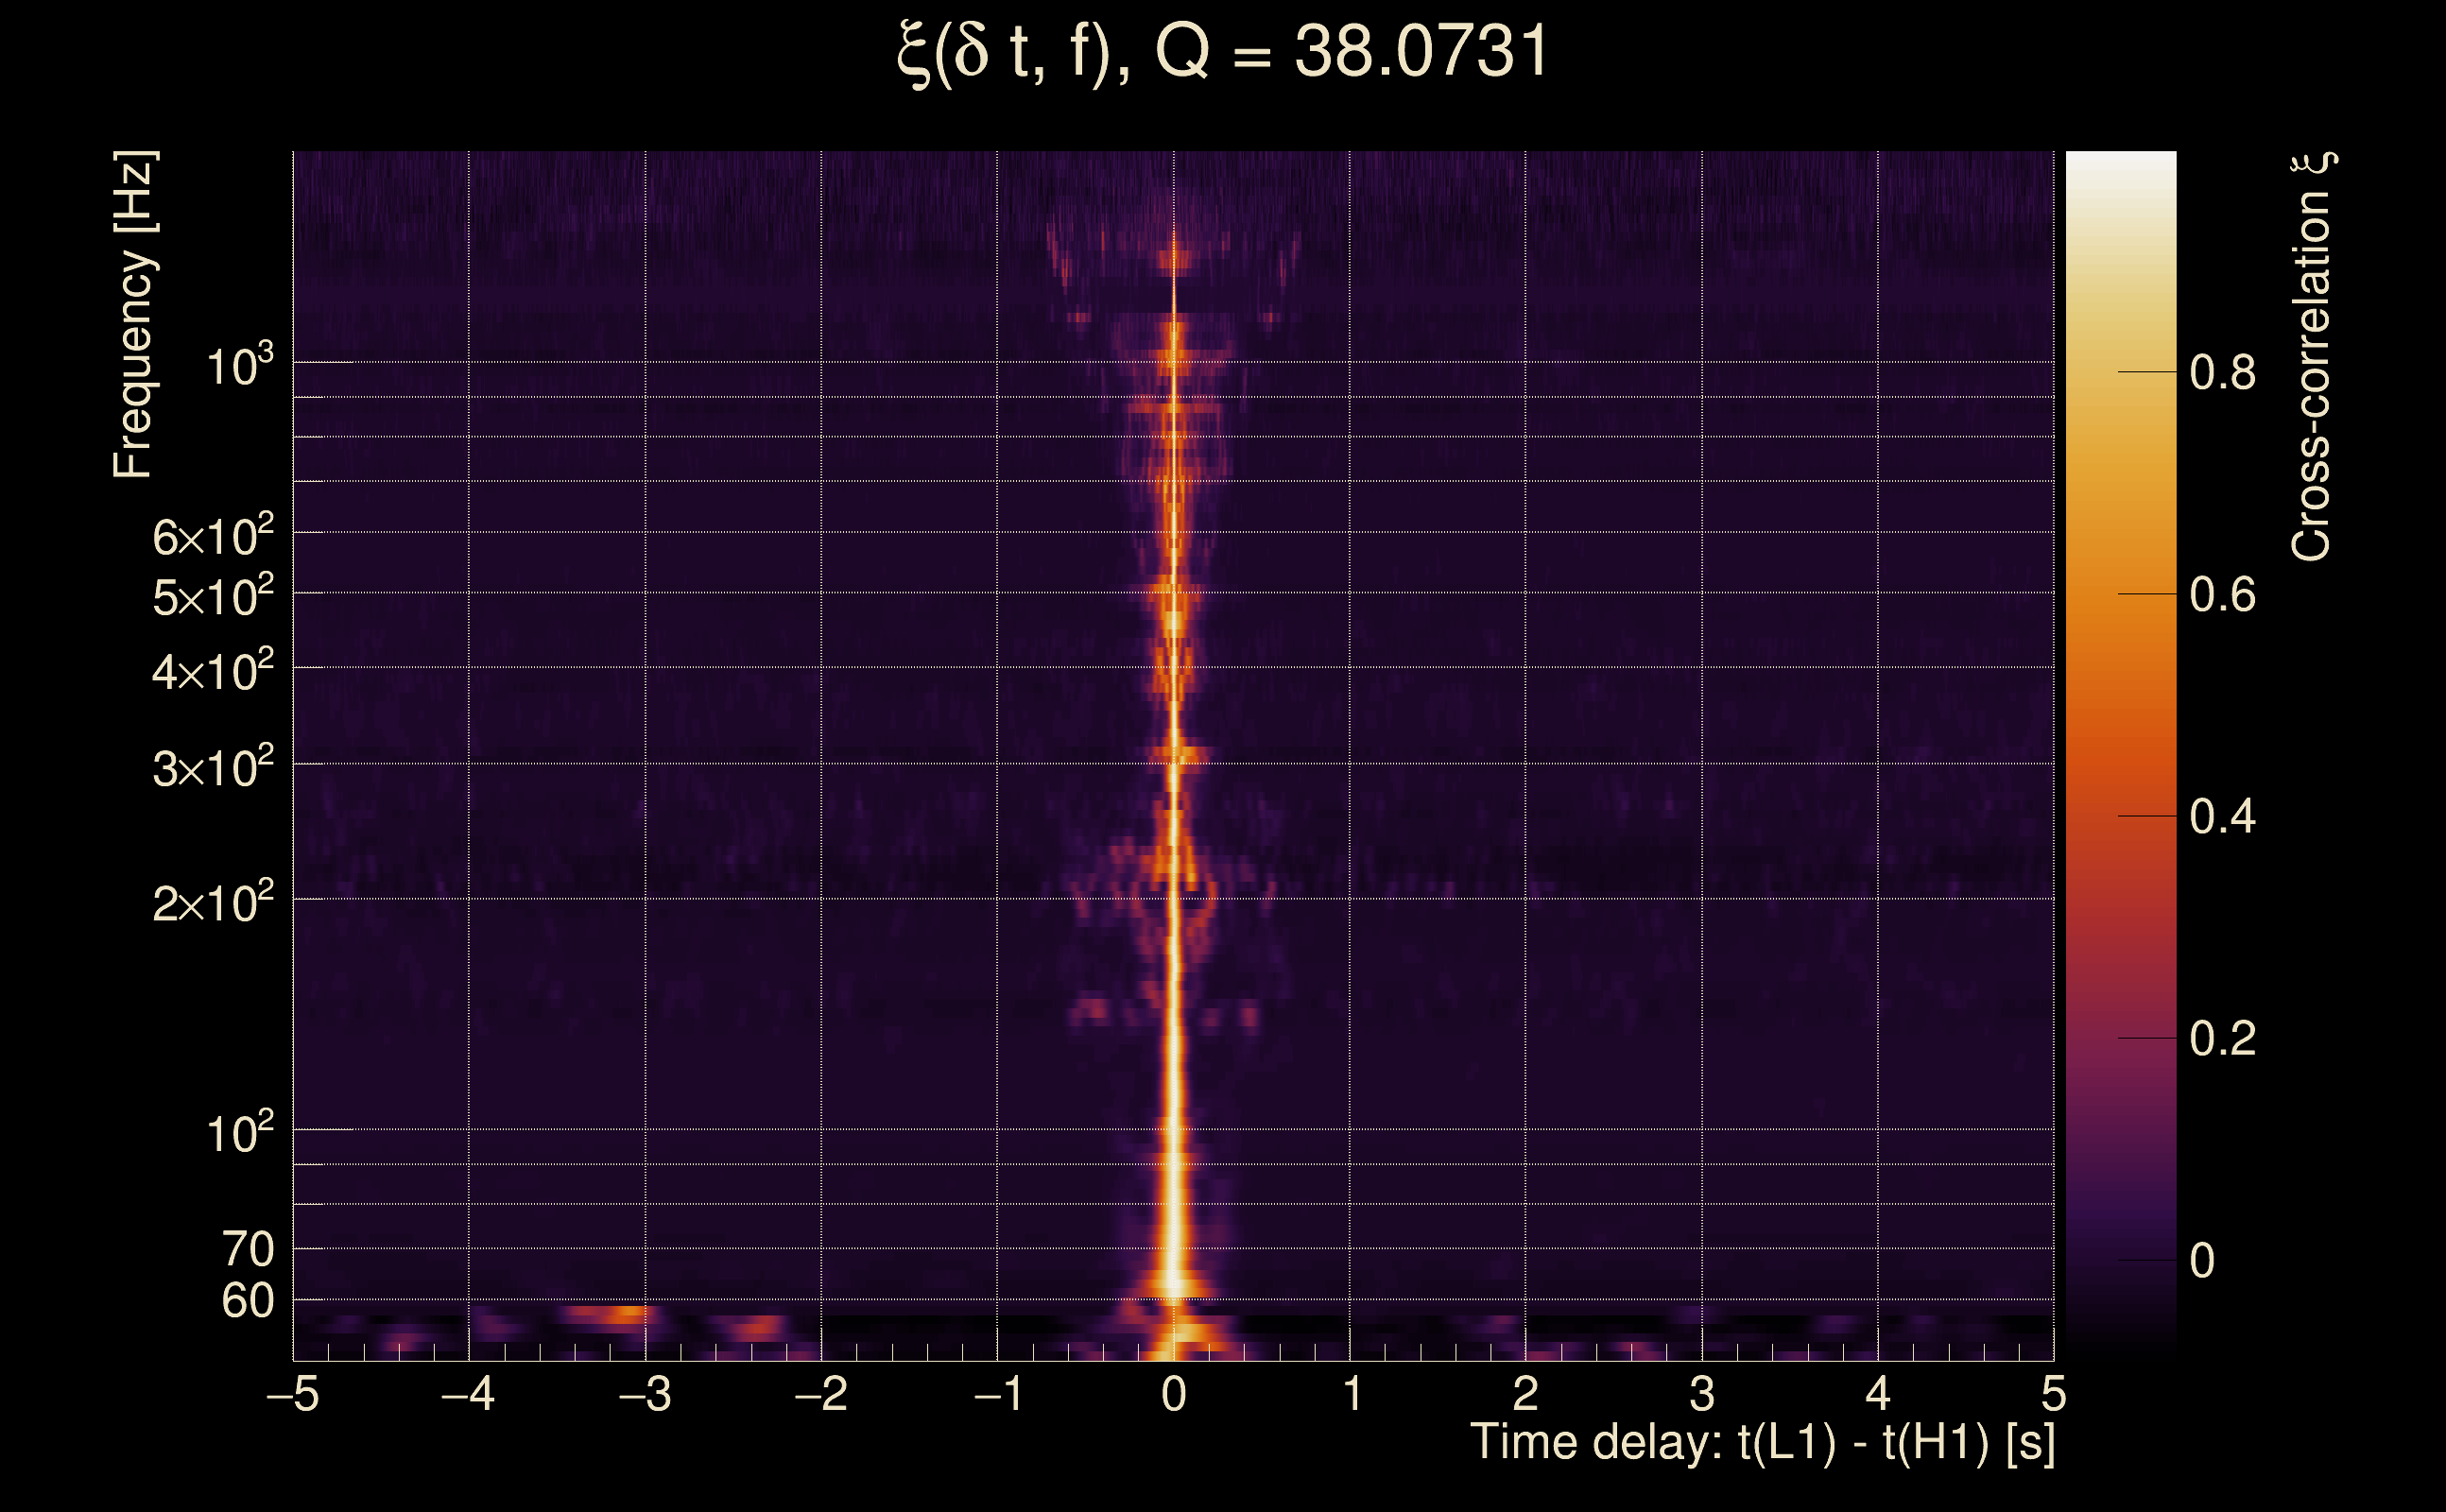
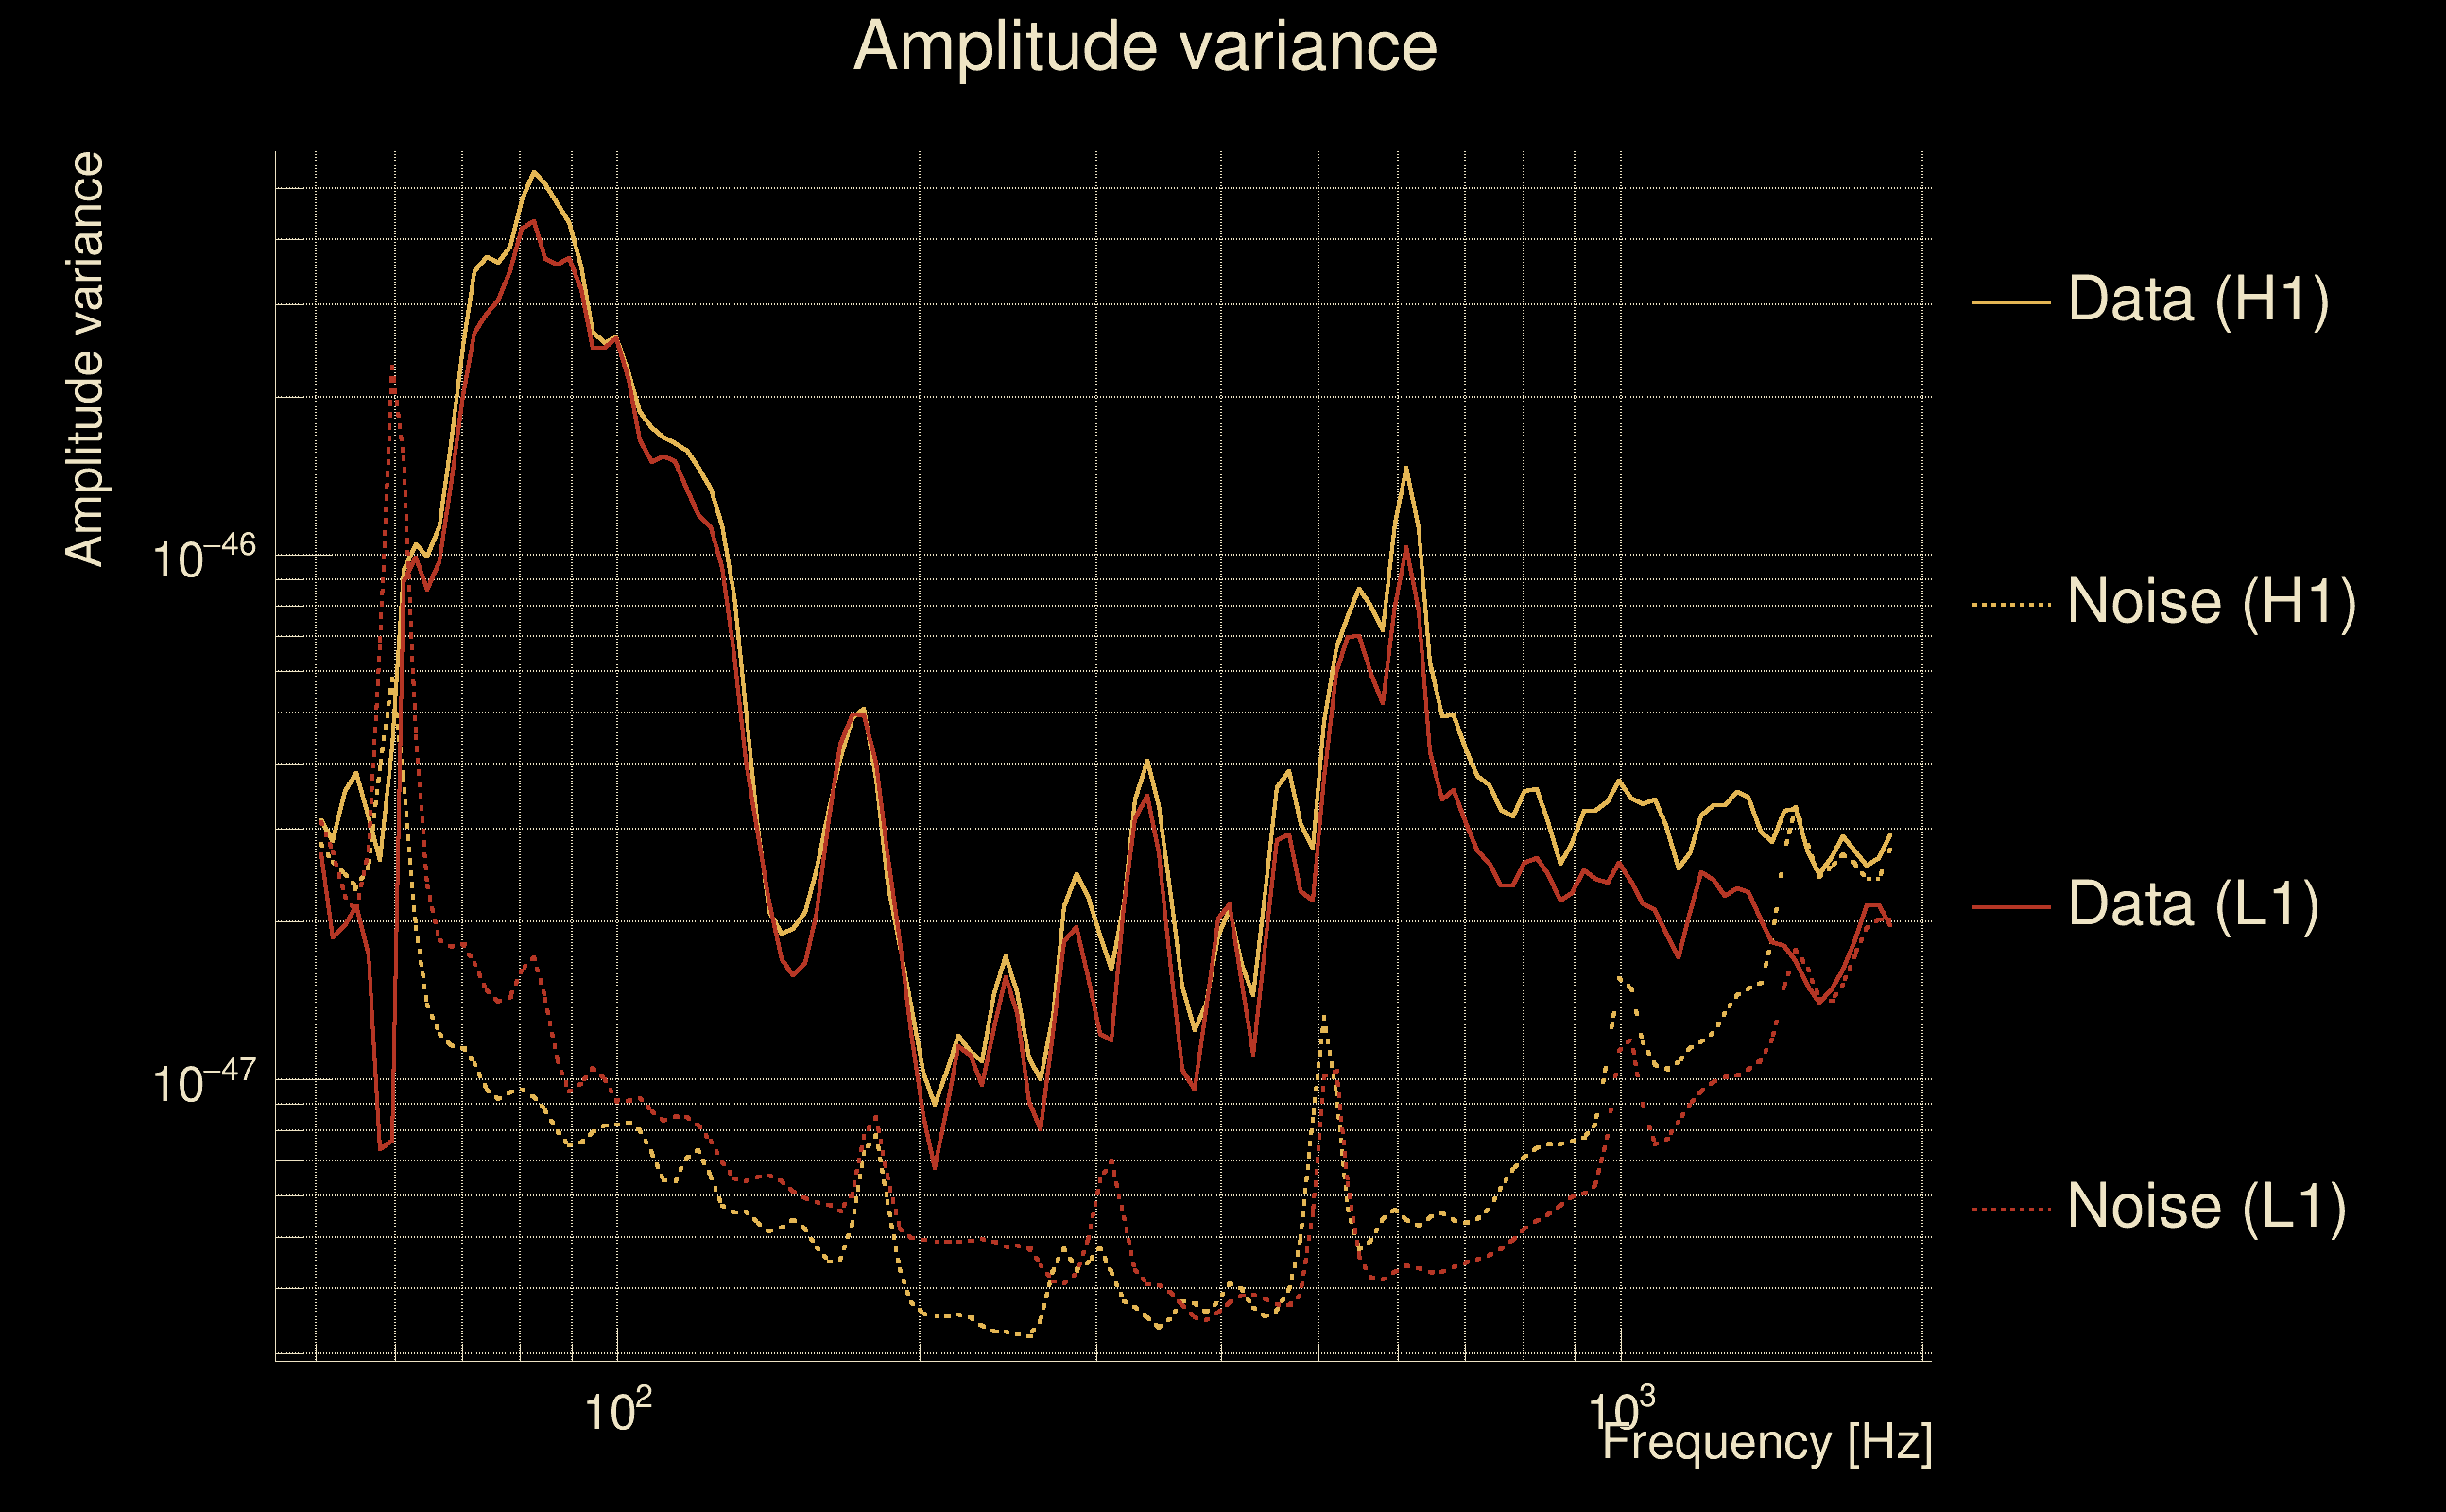
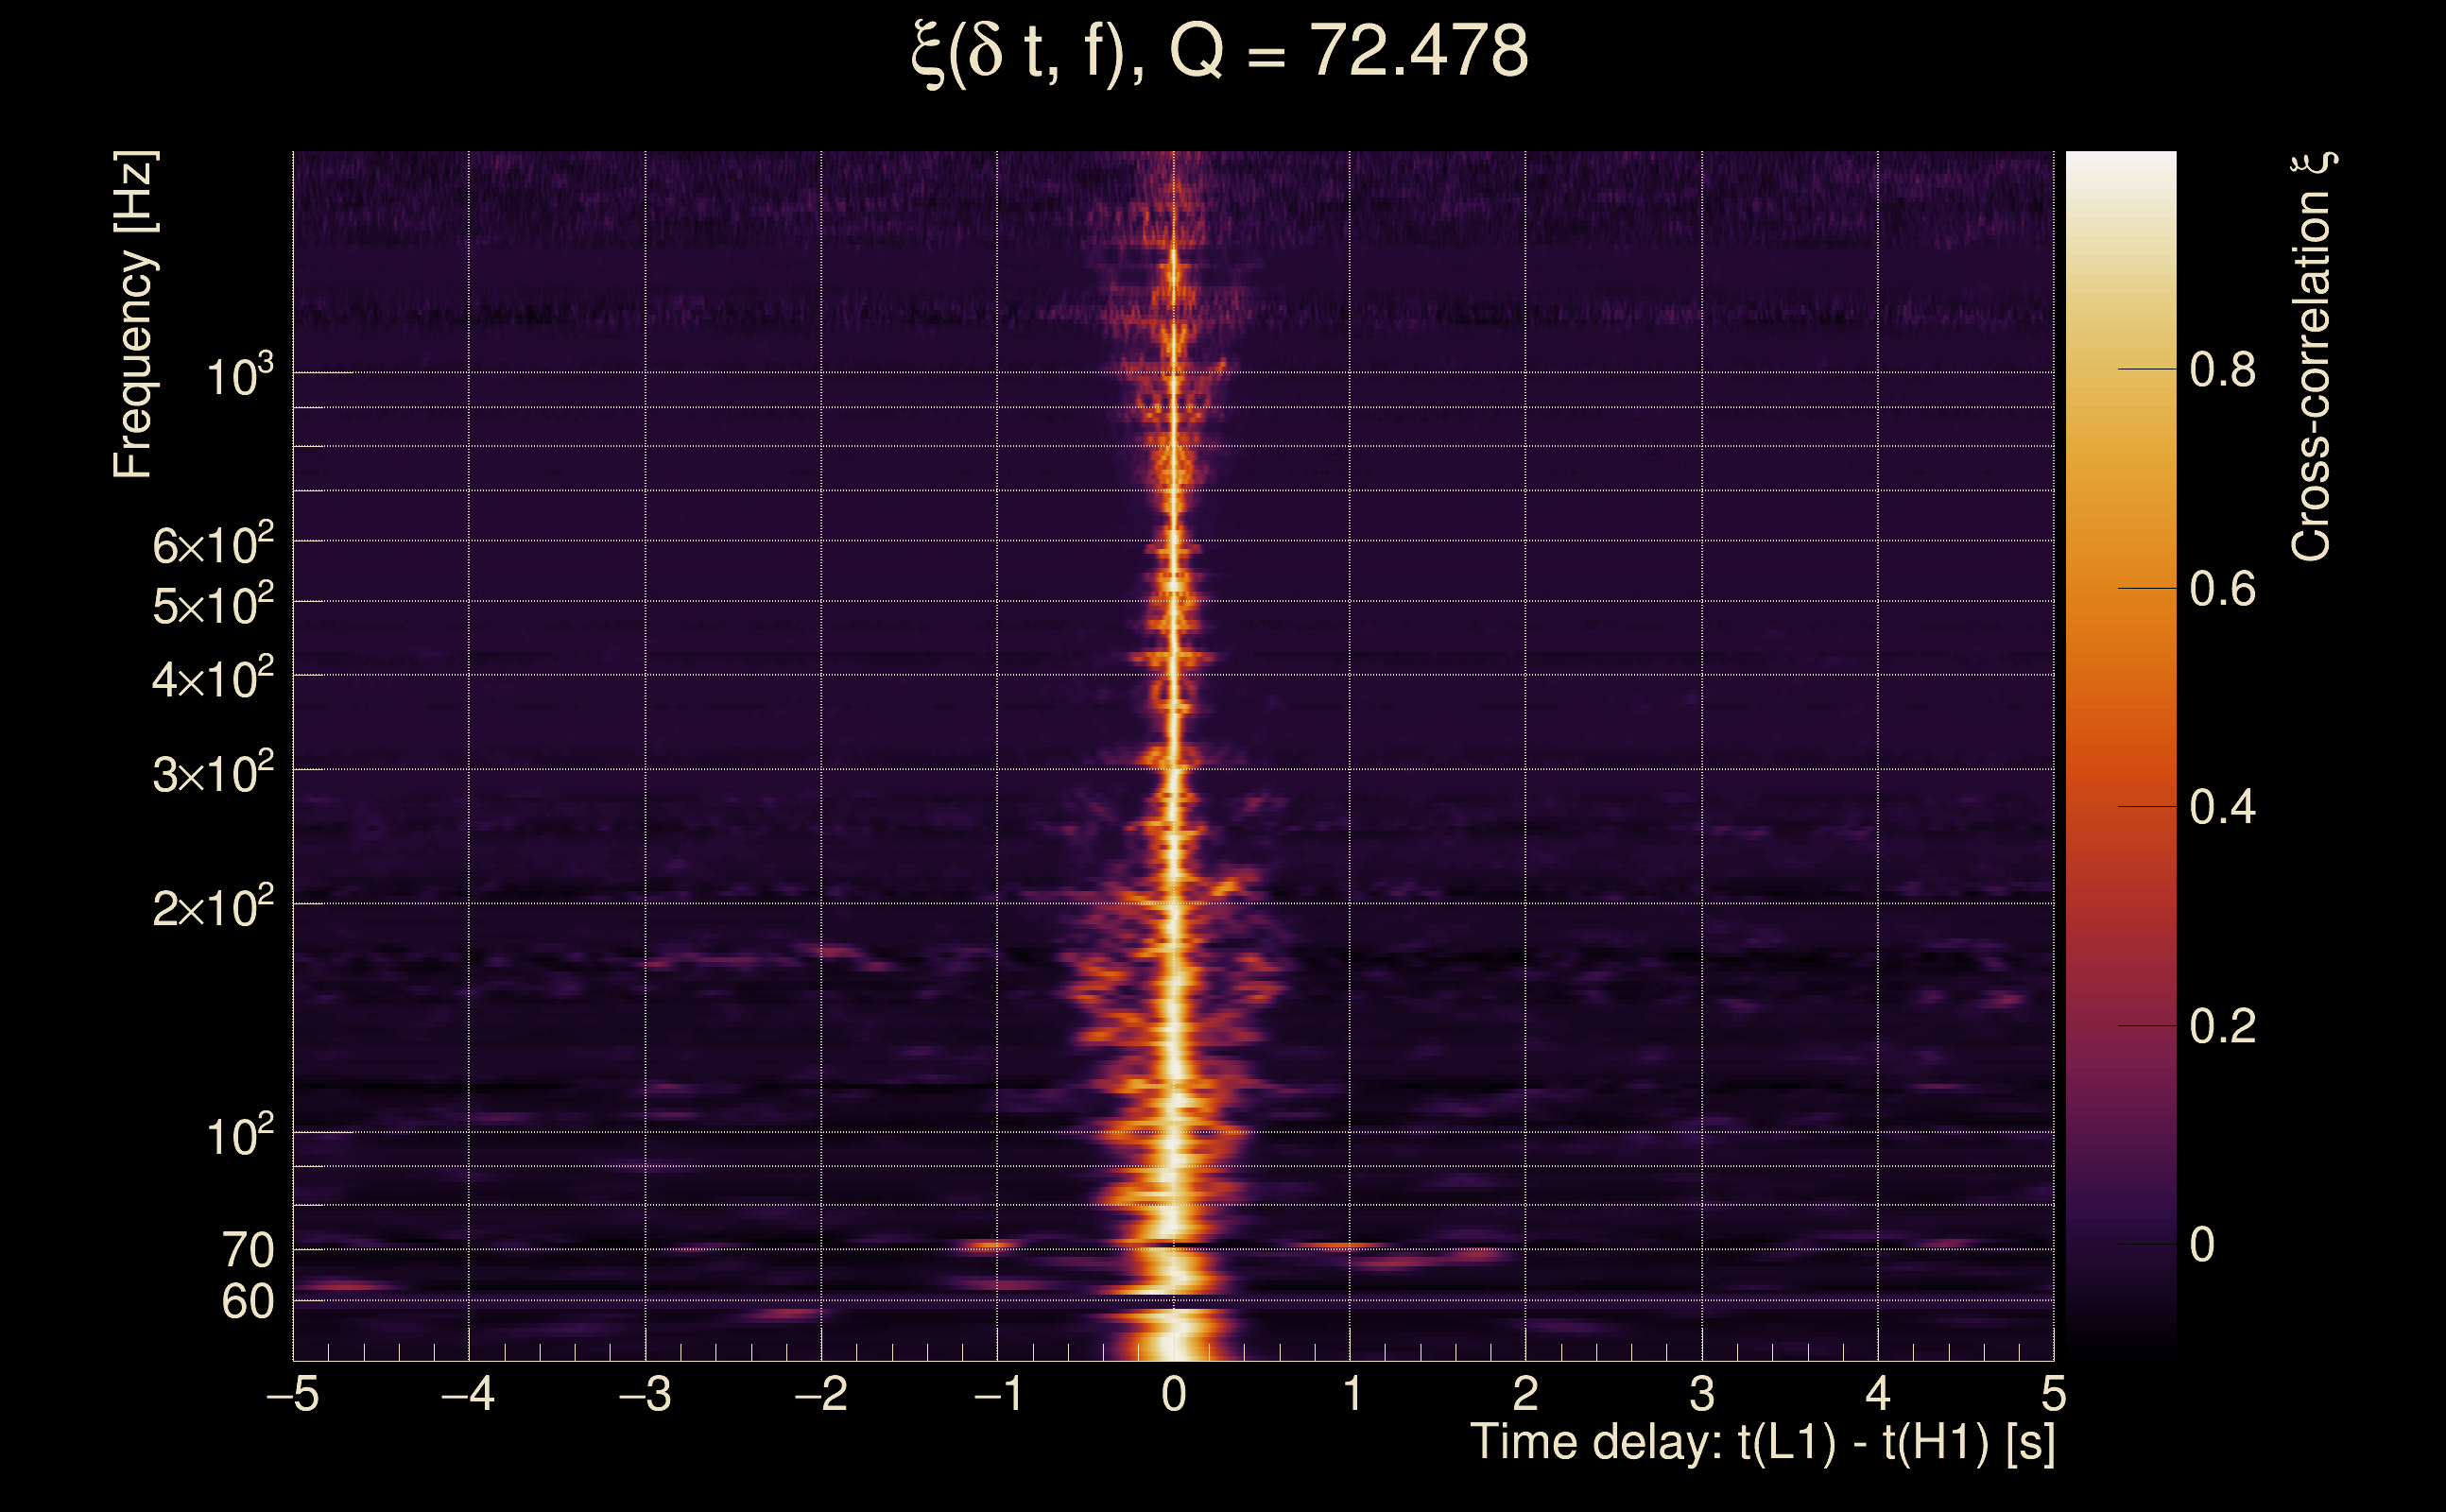
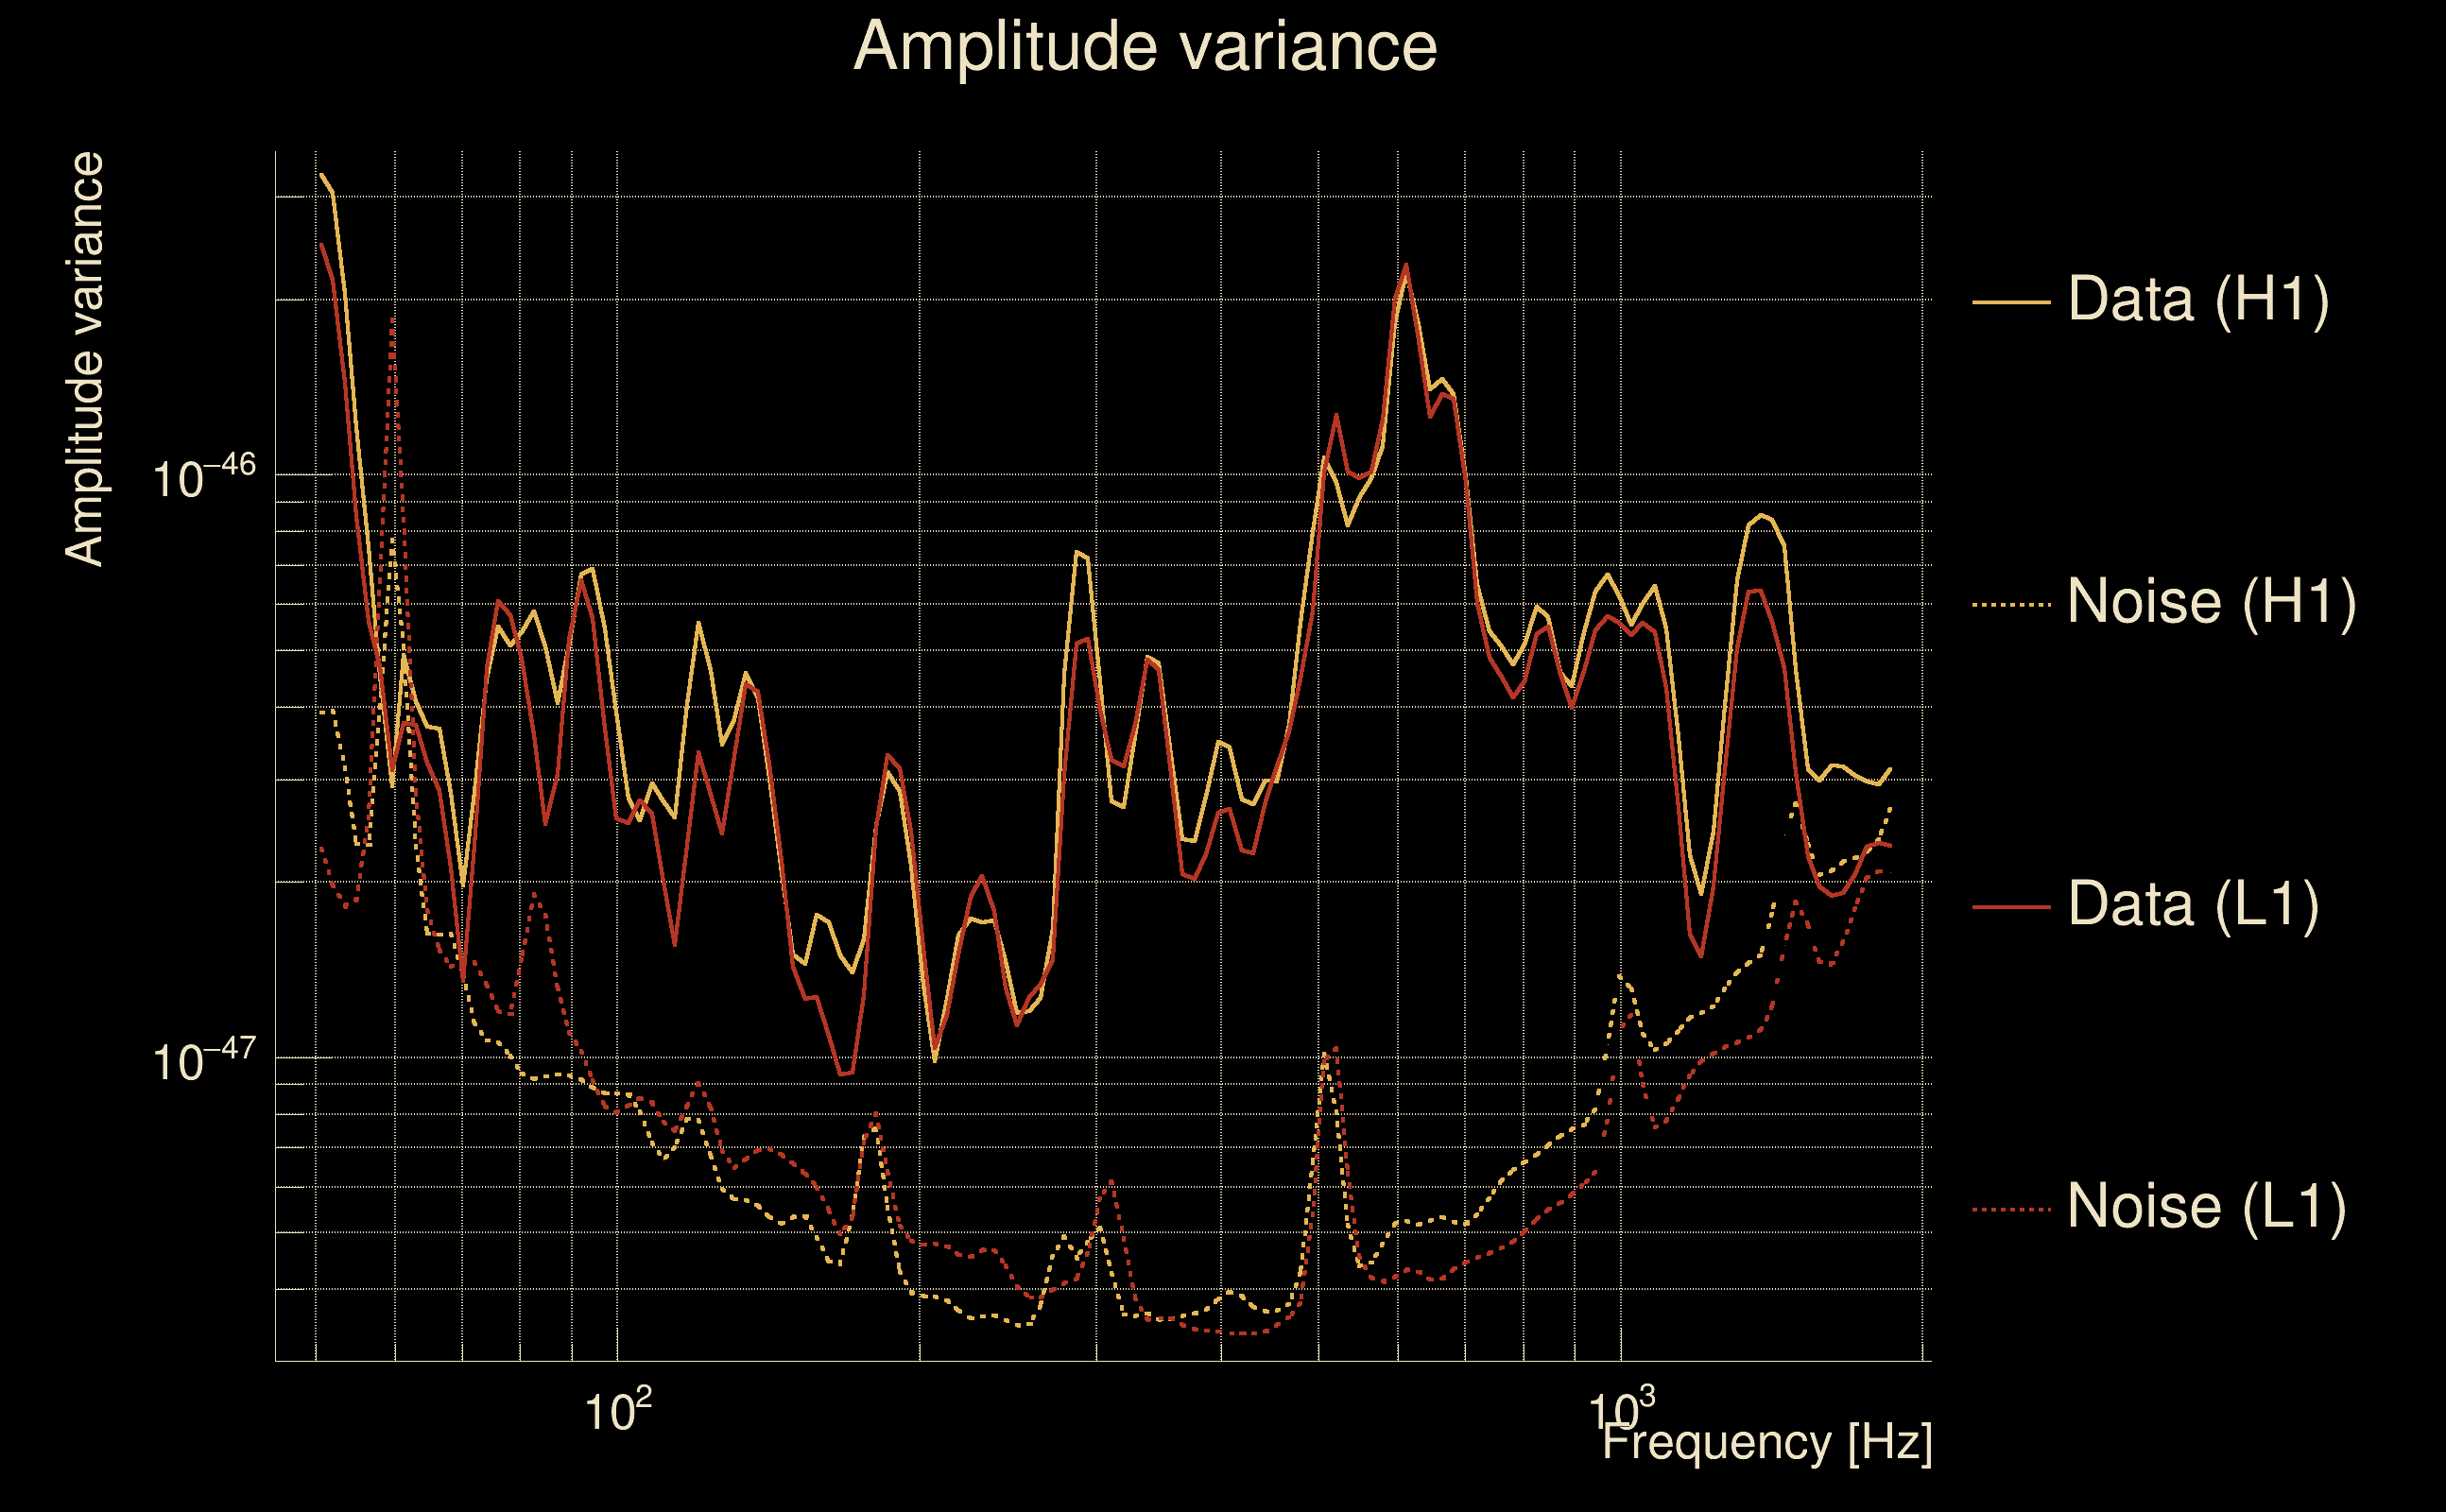
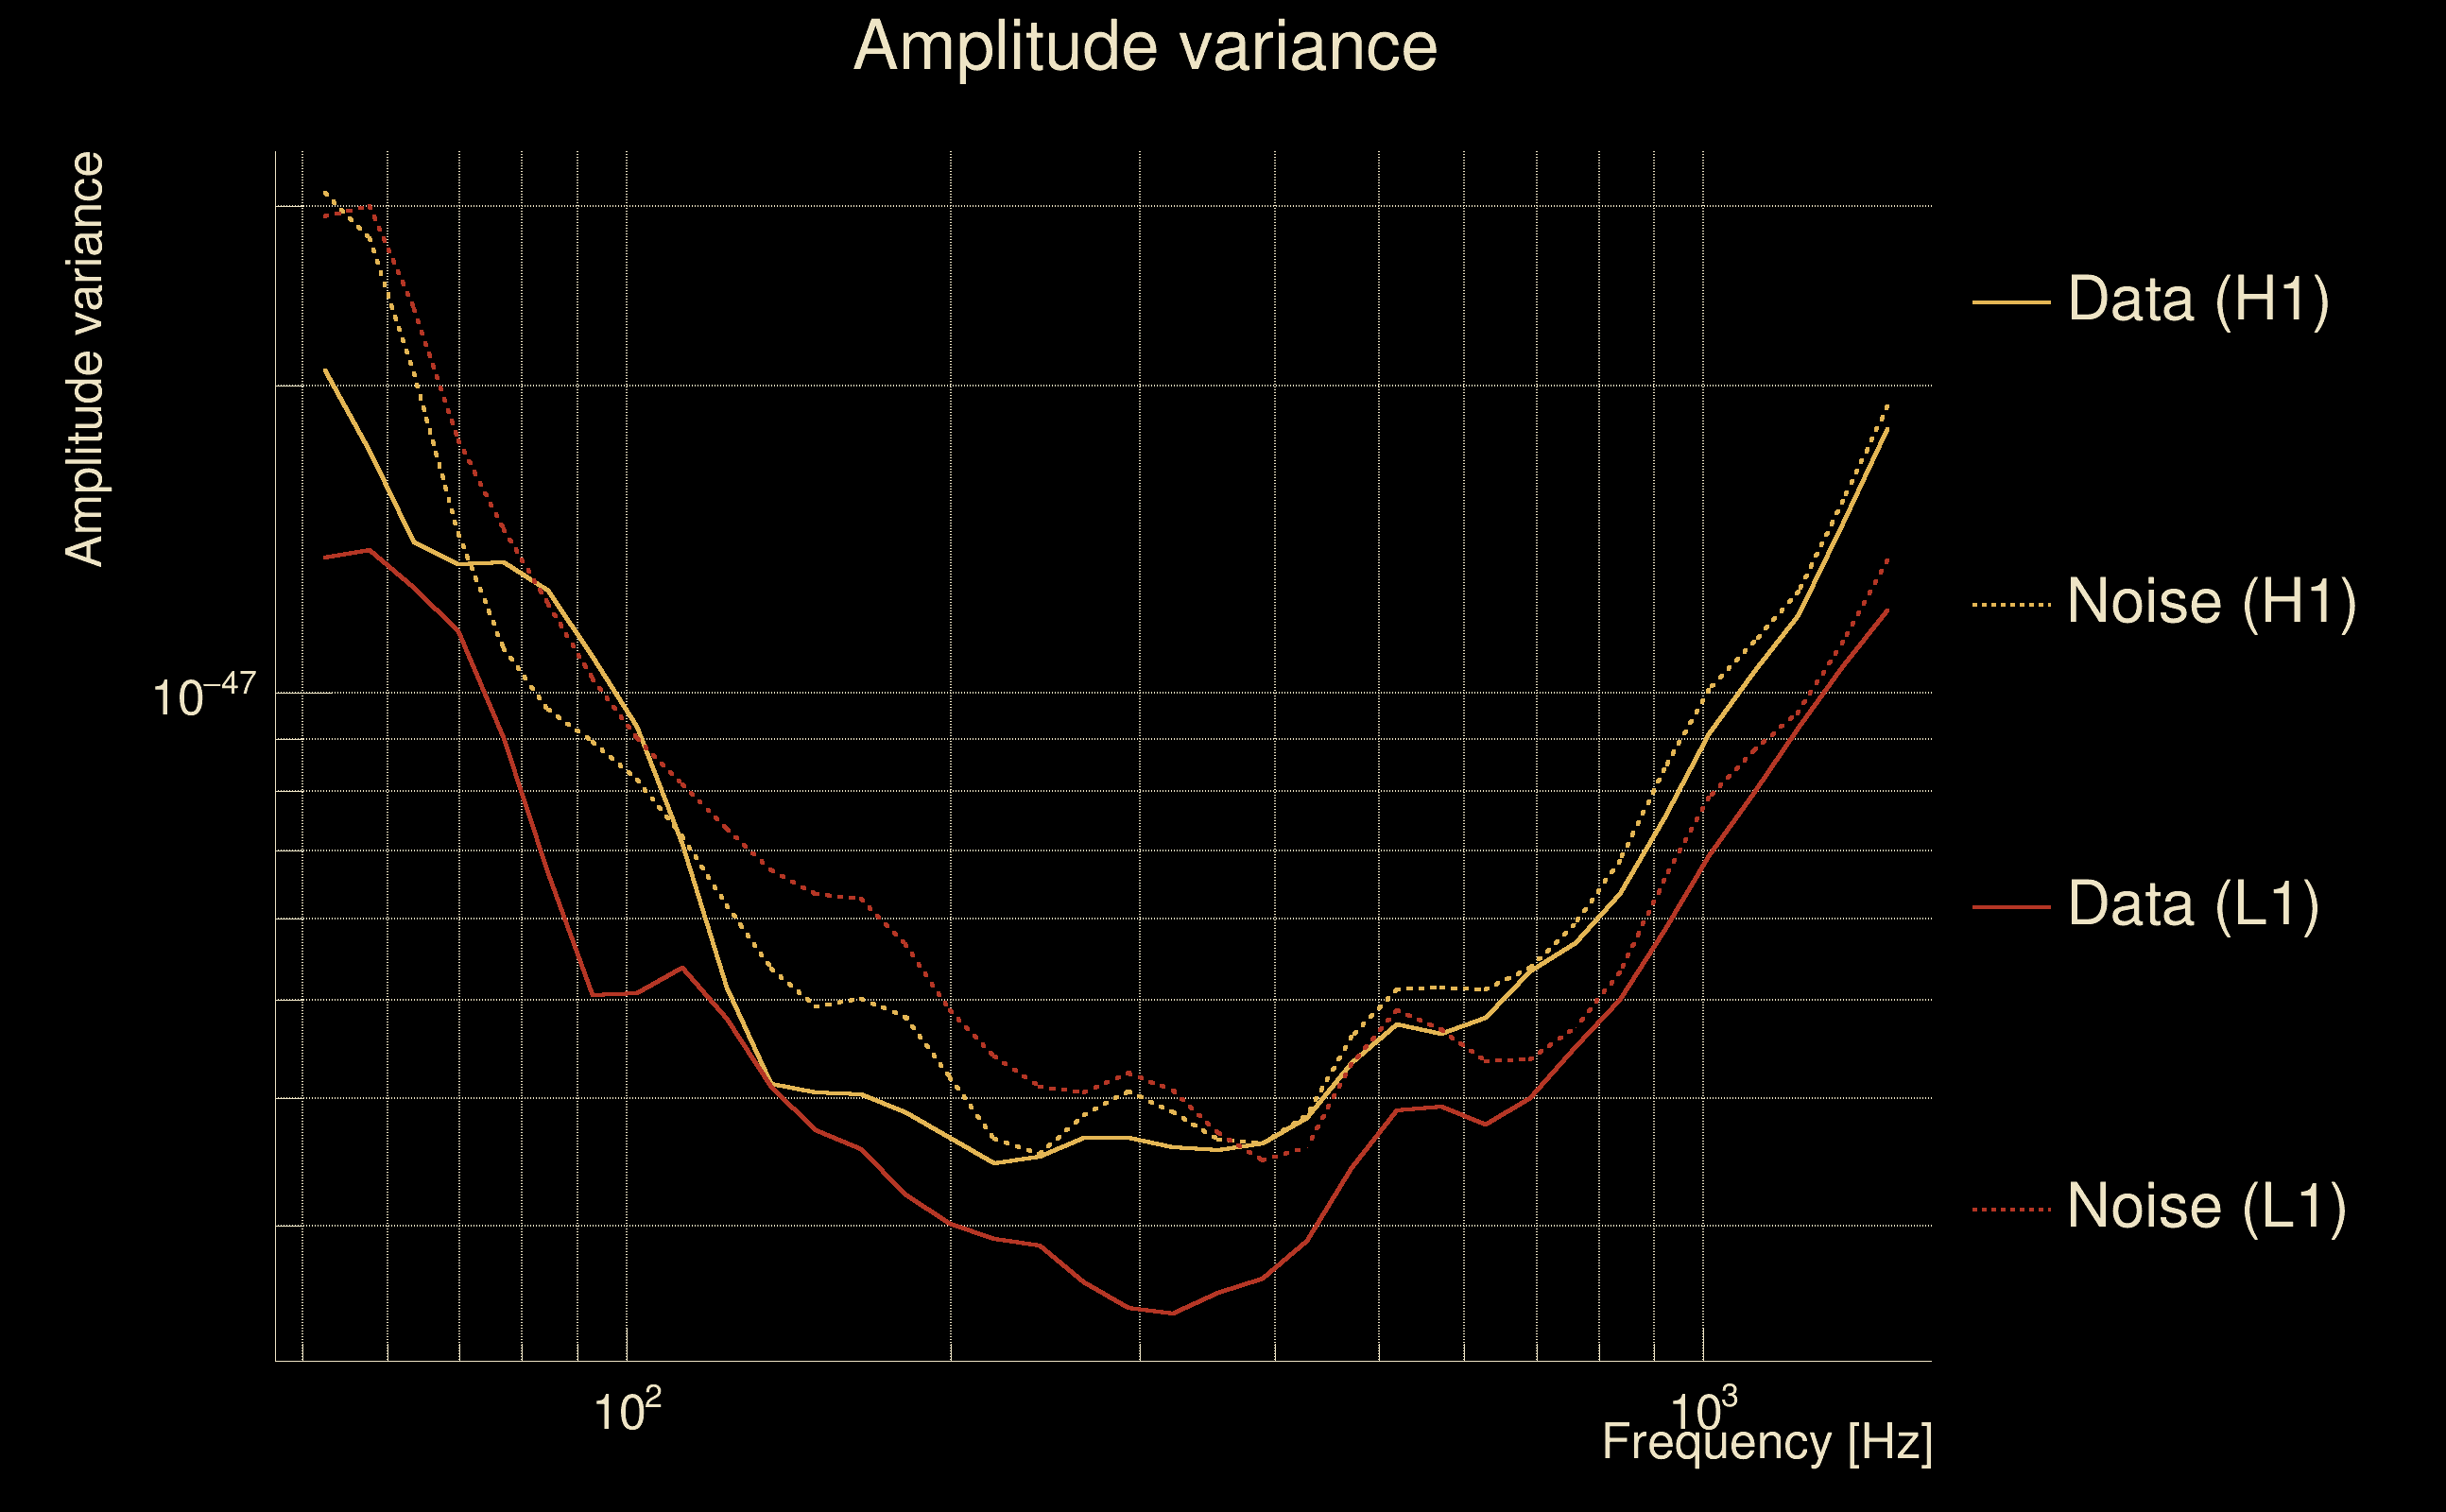
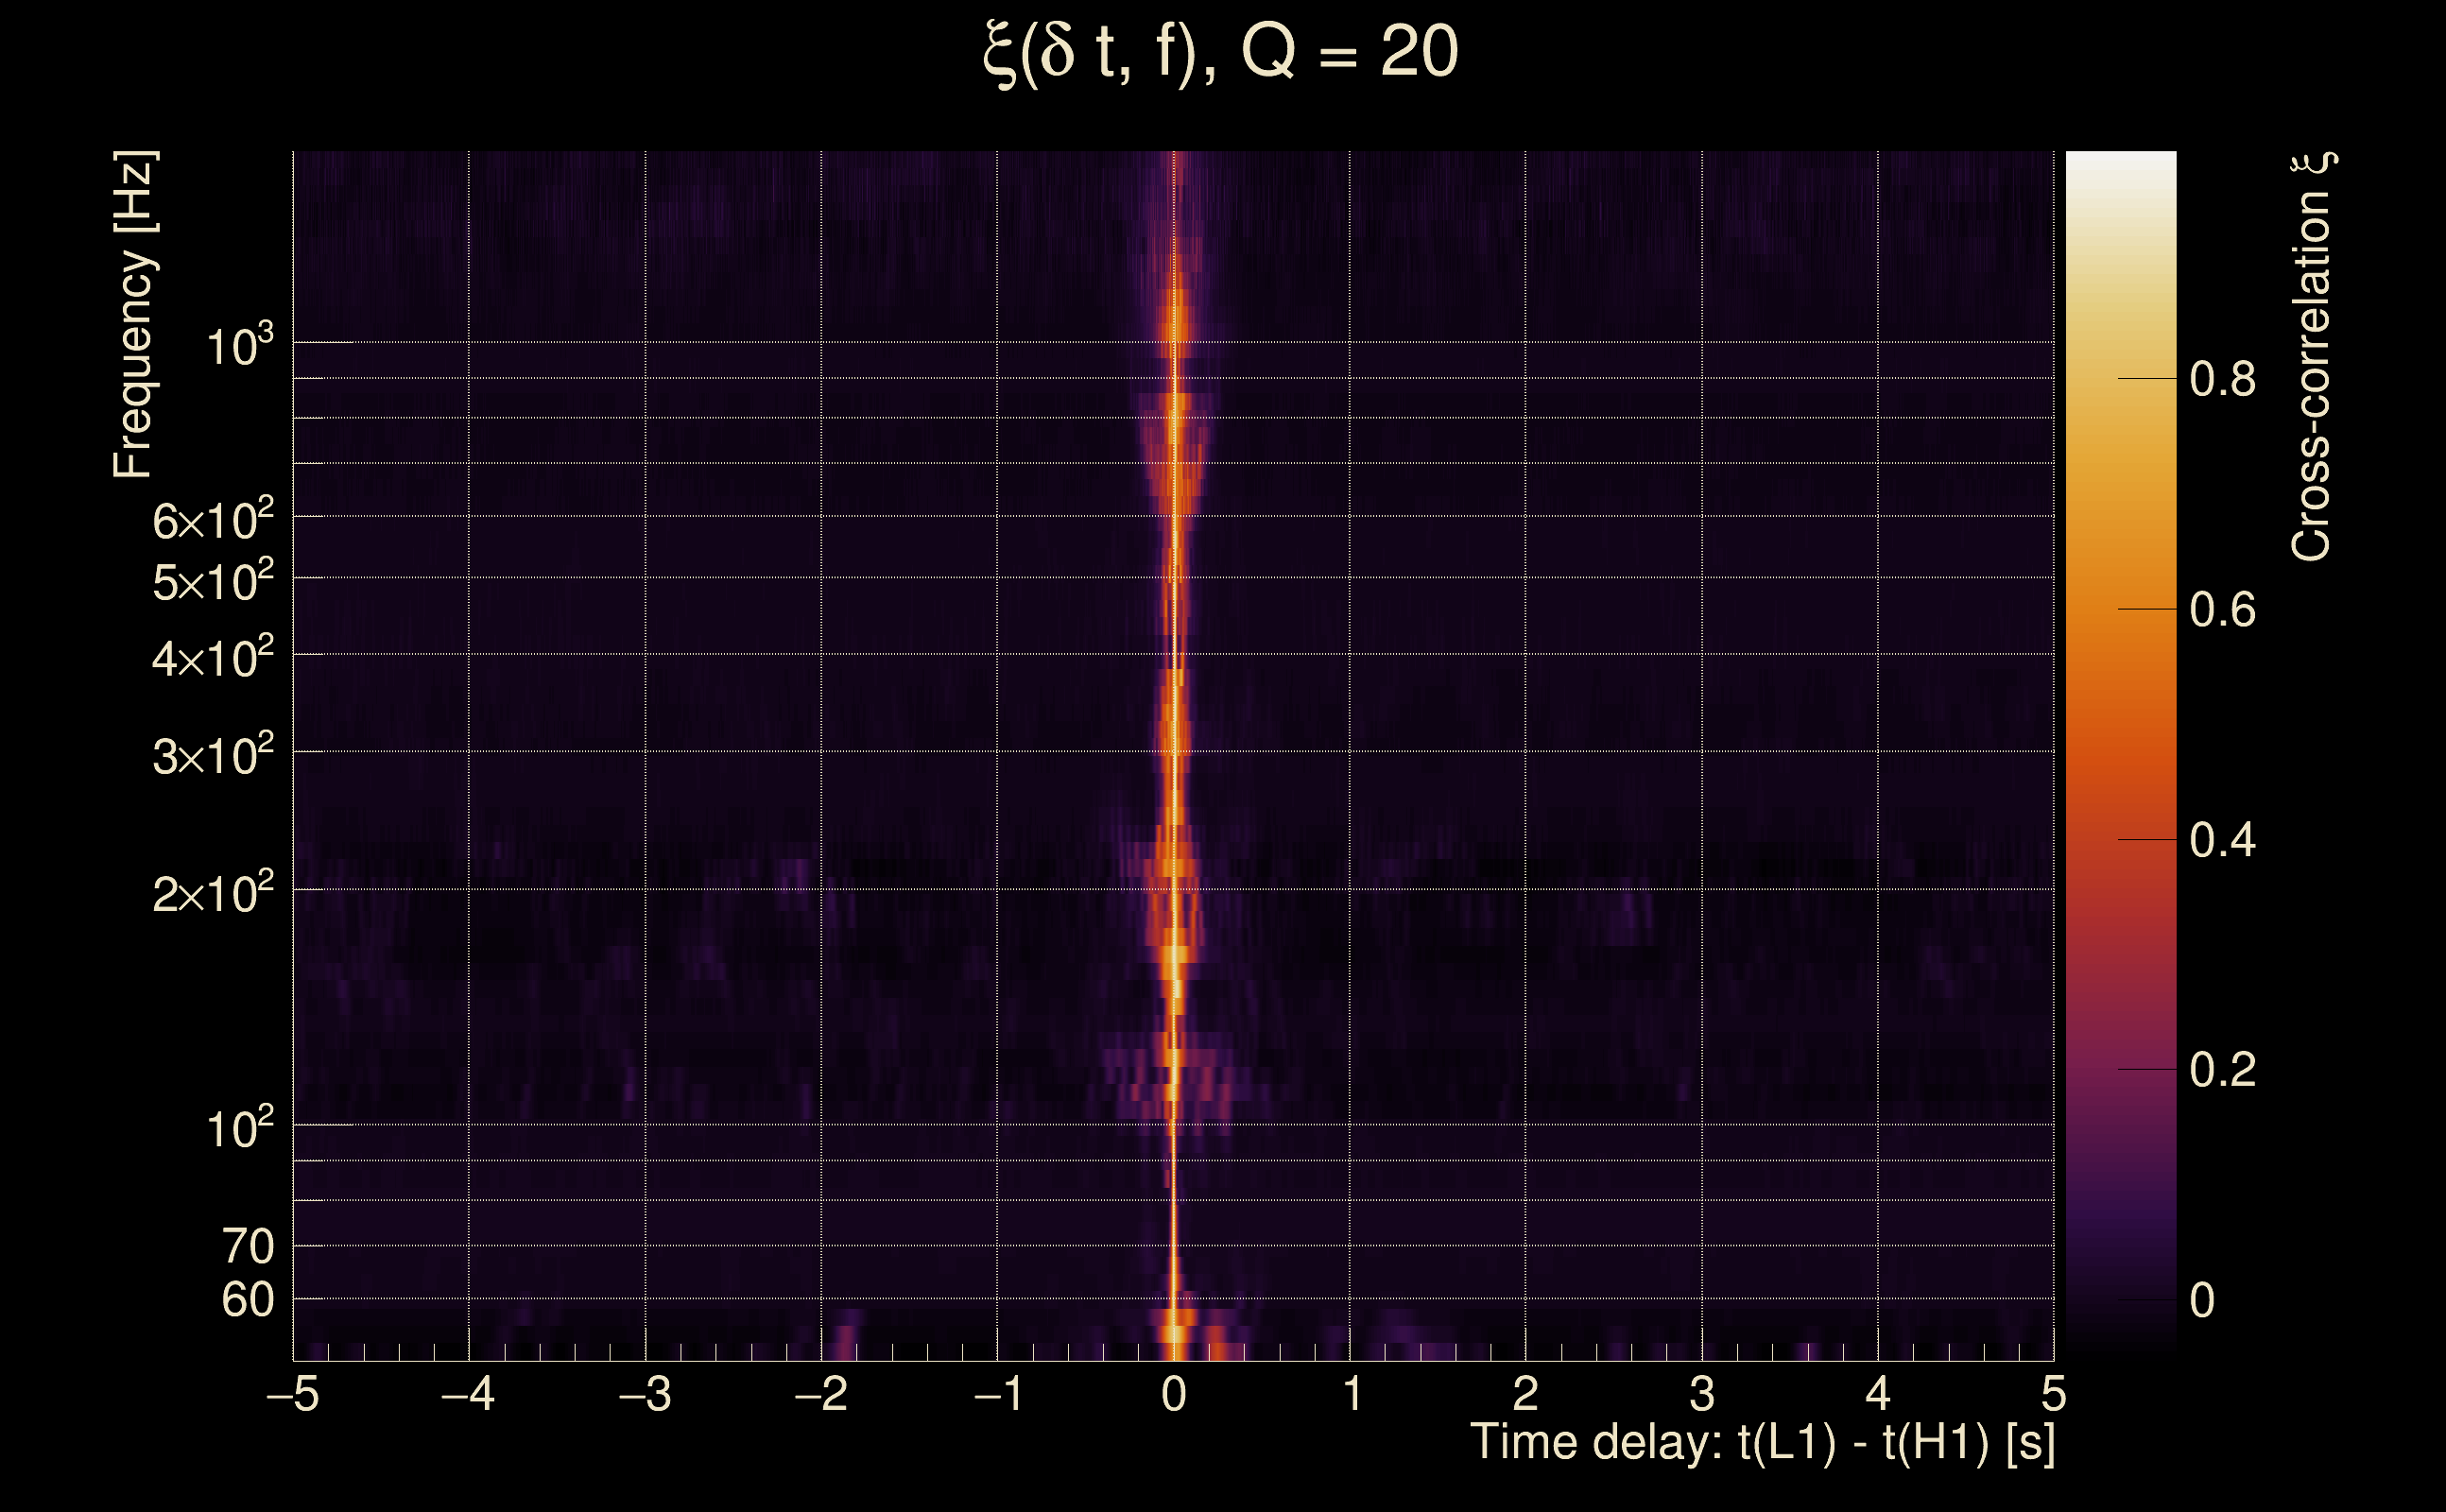
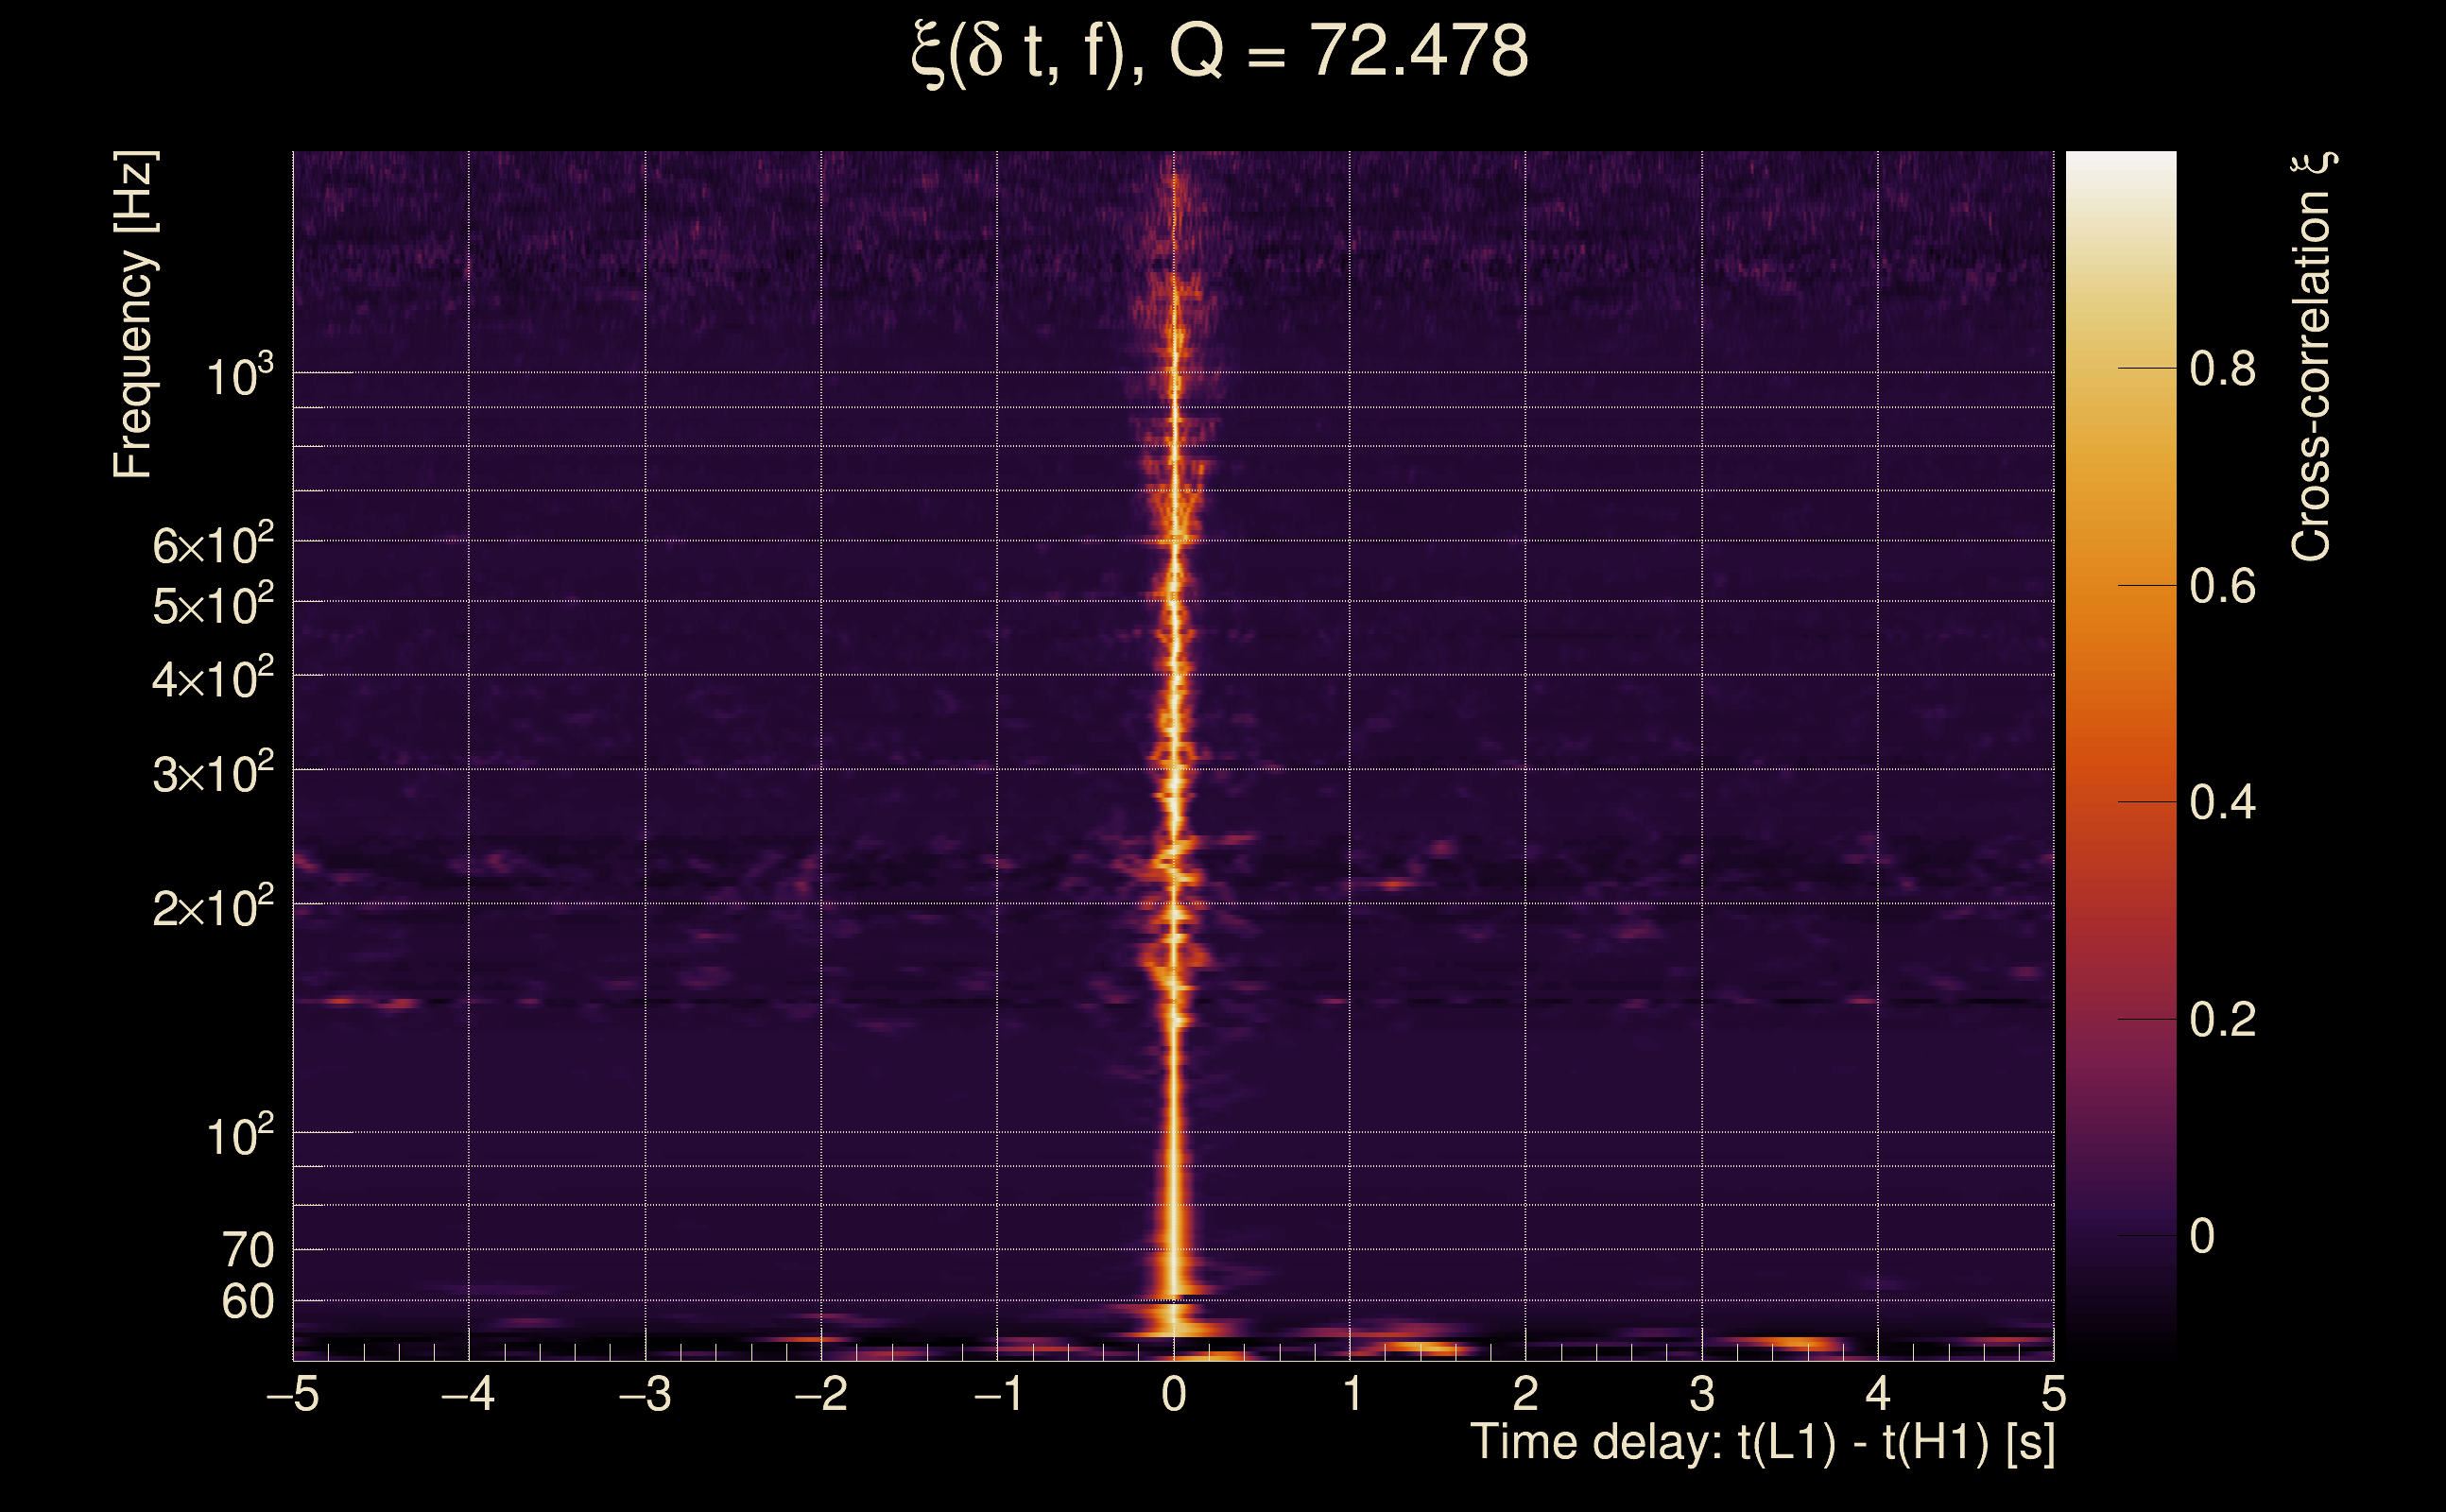
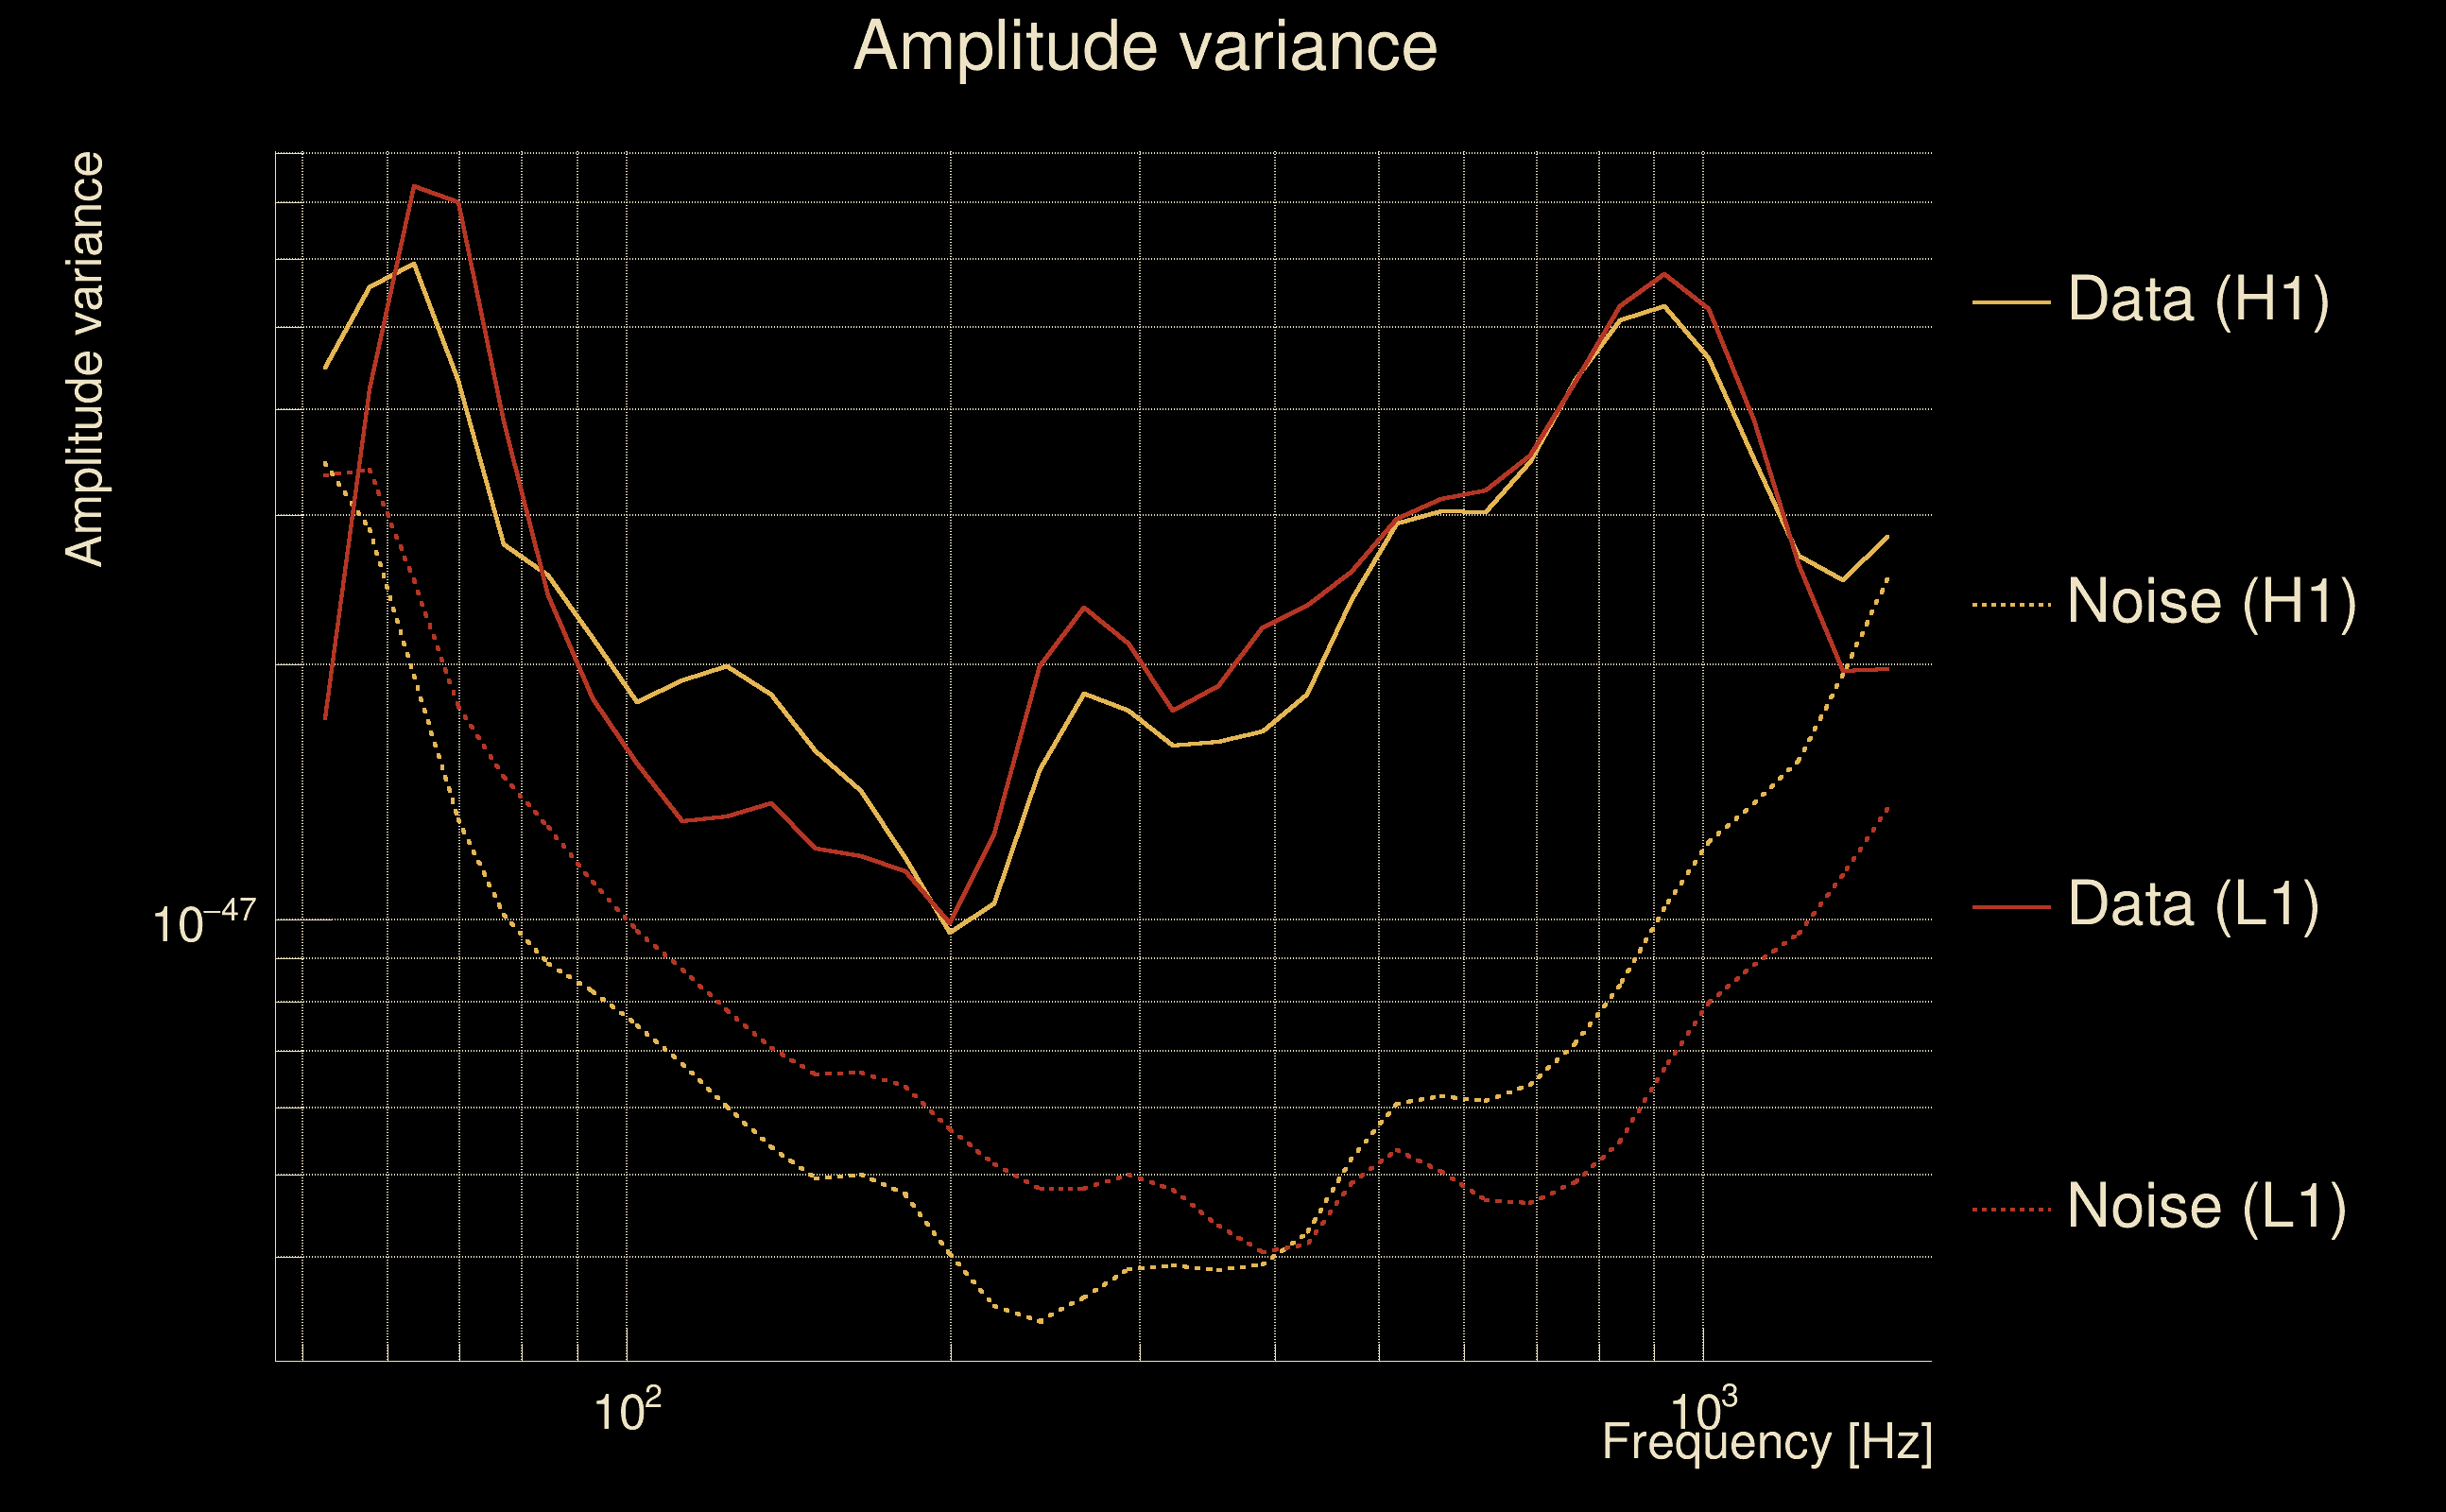
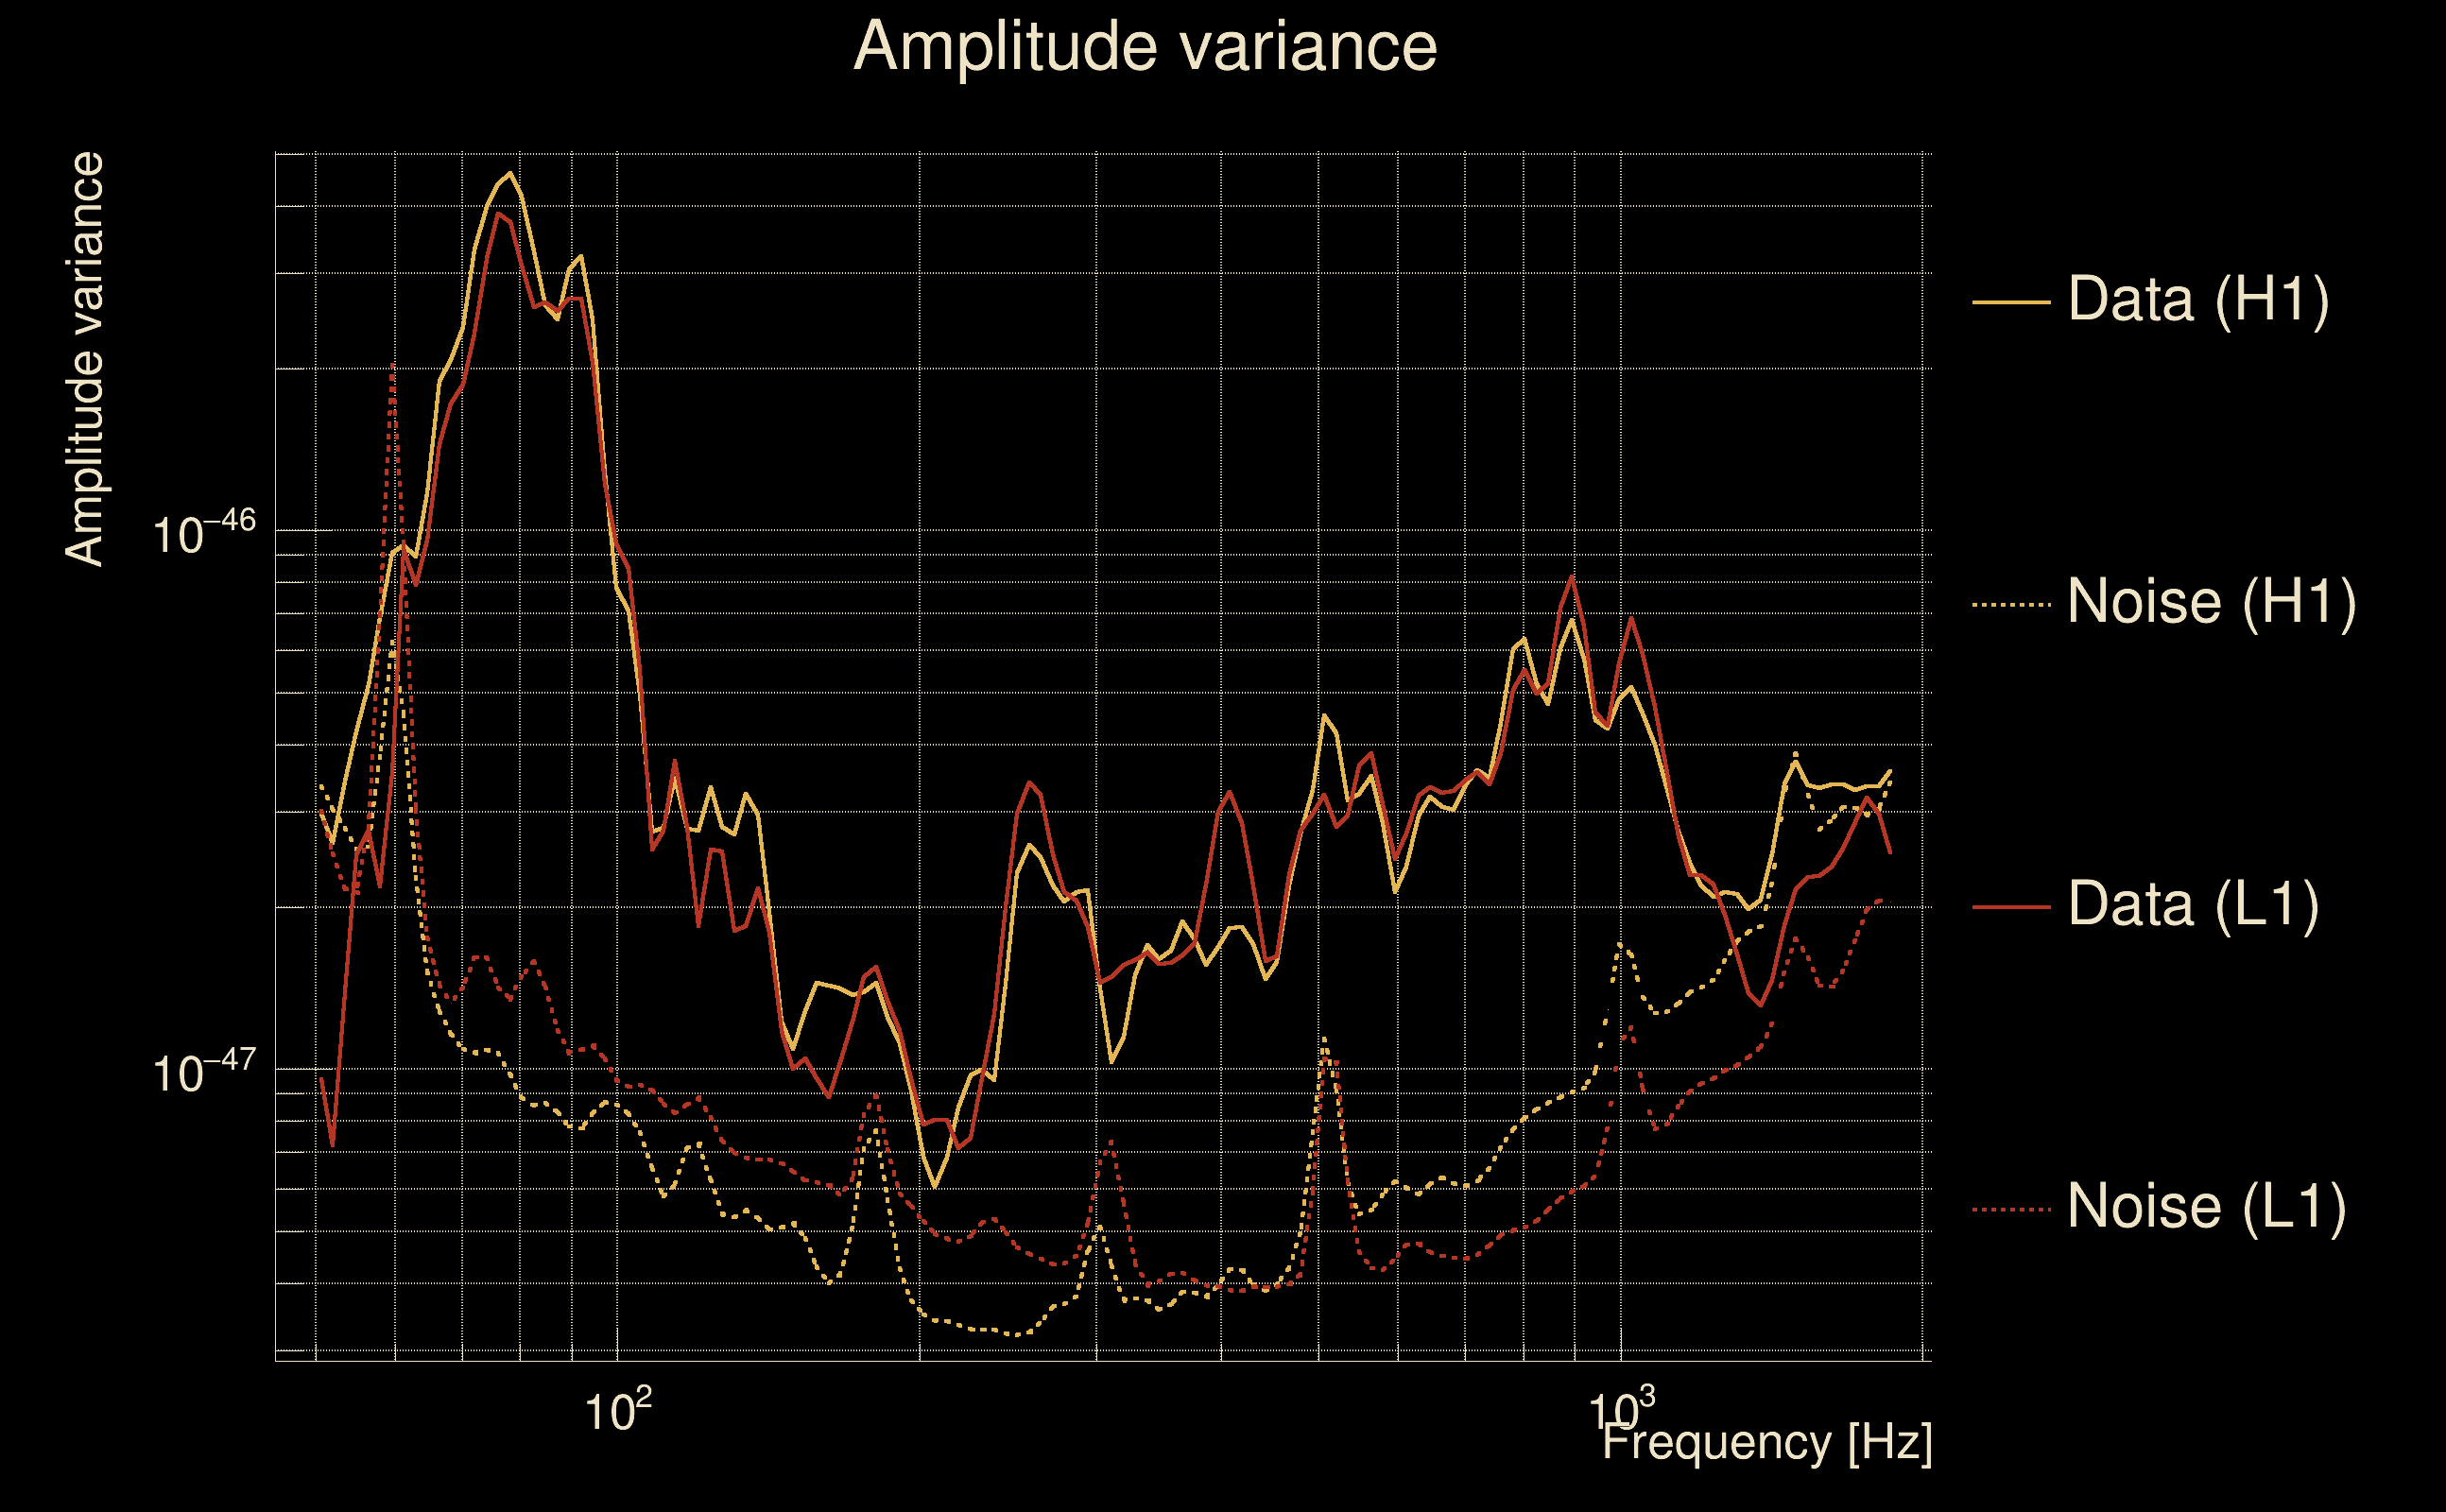
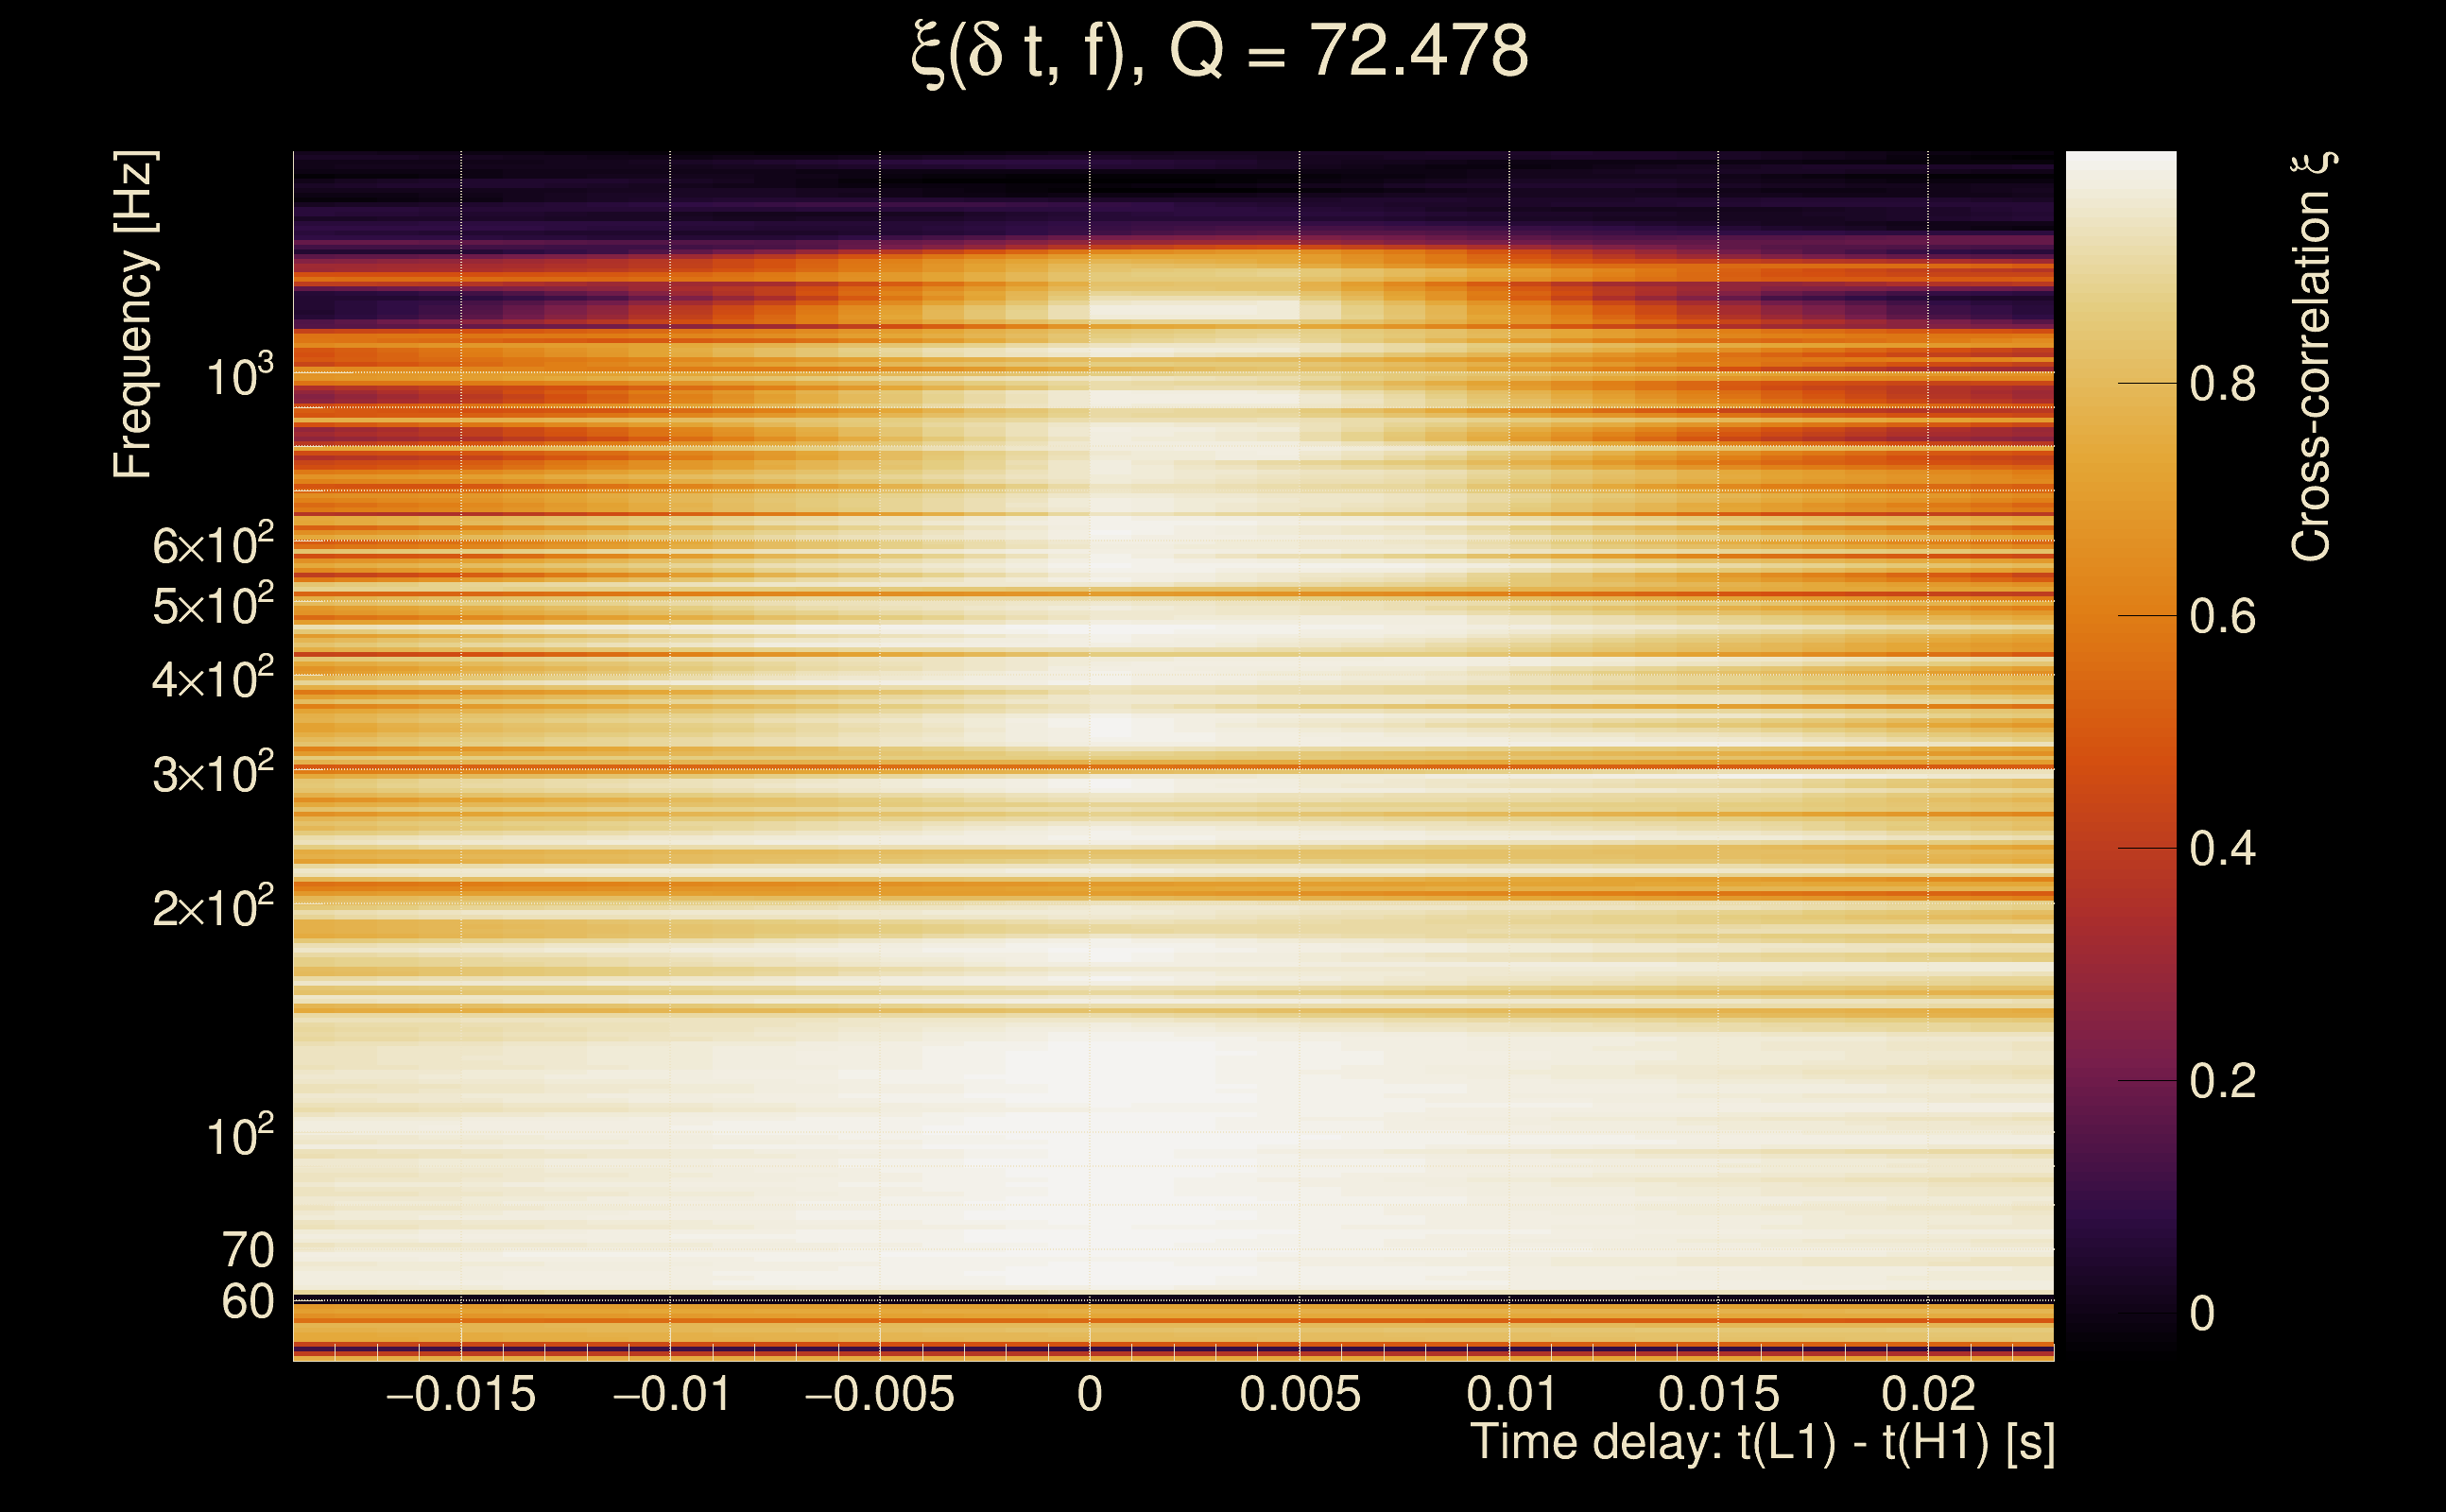
| Event time t(H1): | GPS = 1368423849 (Thu May 18 05:43:51 2023 ) → GPS = 1368423859 (Thu May 18 05:44:01 2023 ) |
| Event time t(L1): | GPS = 1368423849 (Thu May 18 05:44:01 2023 ) → GPS = 1368423859 (Thu May 18 05:44:01 2023 ) |
| Omicron analysis time window (H1): | GPS = 1368423846 → GPS = 1368423862 |
| Omicron analysis time window (L1): | GPS = 1368423846 → GPS = 1368423862 |
| Time delay between detectors t(L1) - t(H1): | 0.00201994 s (slice index = 108 / 217), δt_gw = 0.00201994 s |
| Time delay standard deviation: | 0.0236461 s |
| [targeted mode] Time delay probability: | 0.831252 (0.213096 sigmas), δt_target = 3.8147e-05 s |
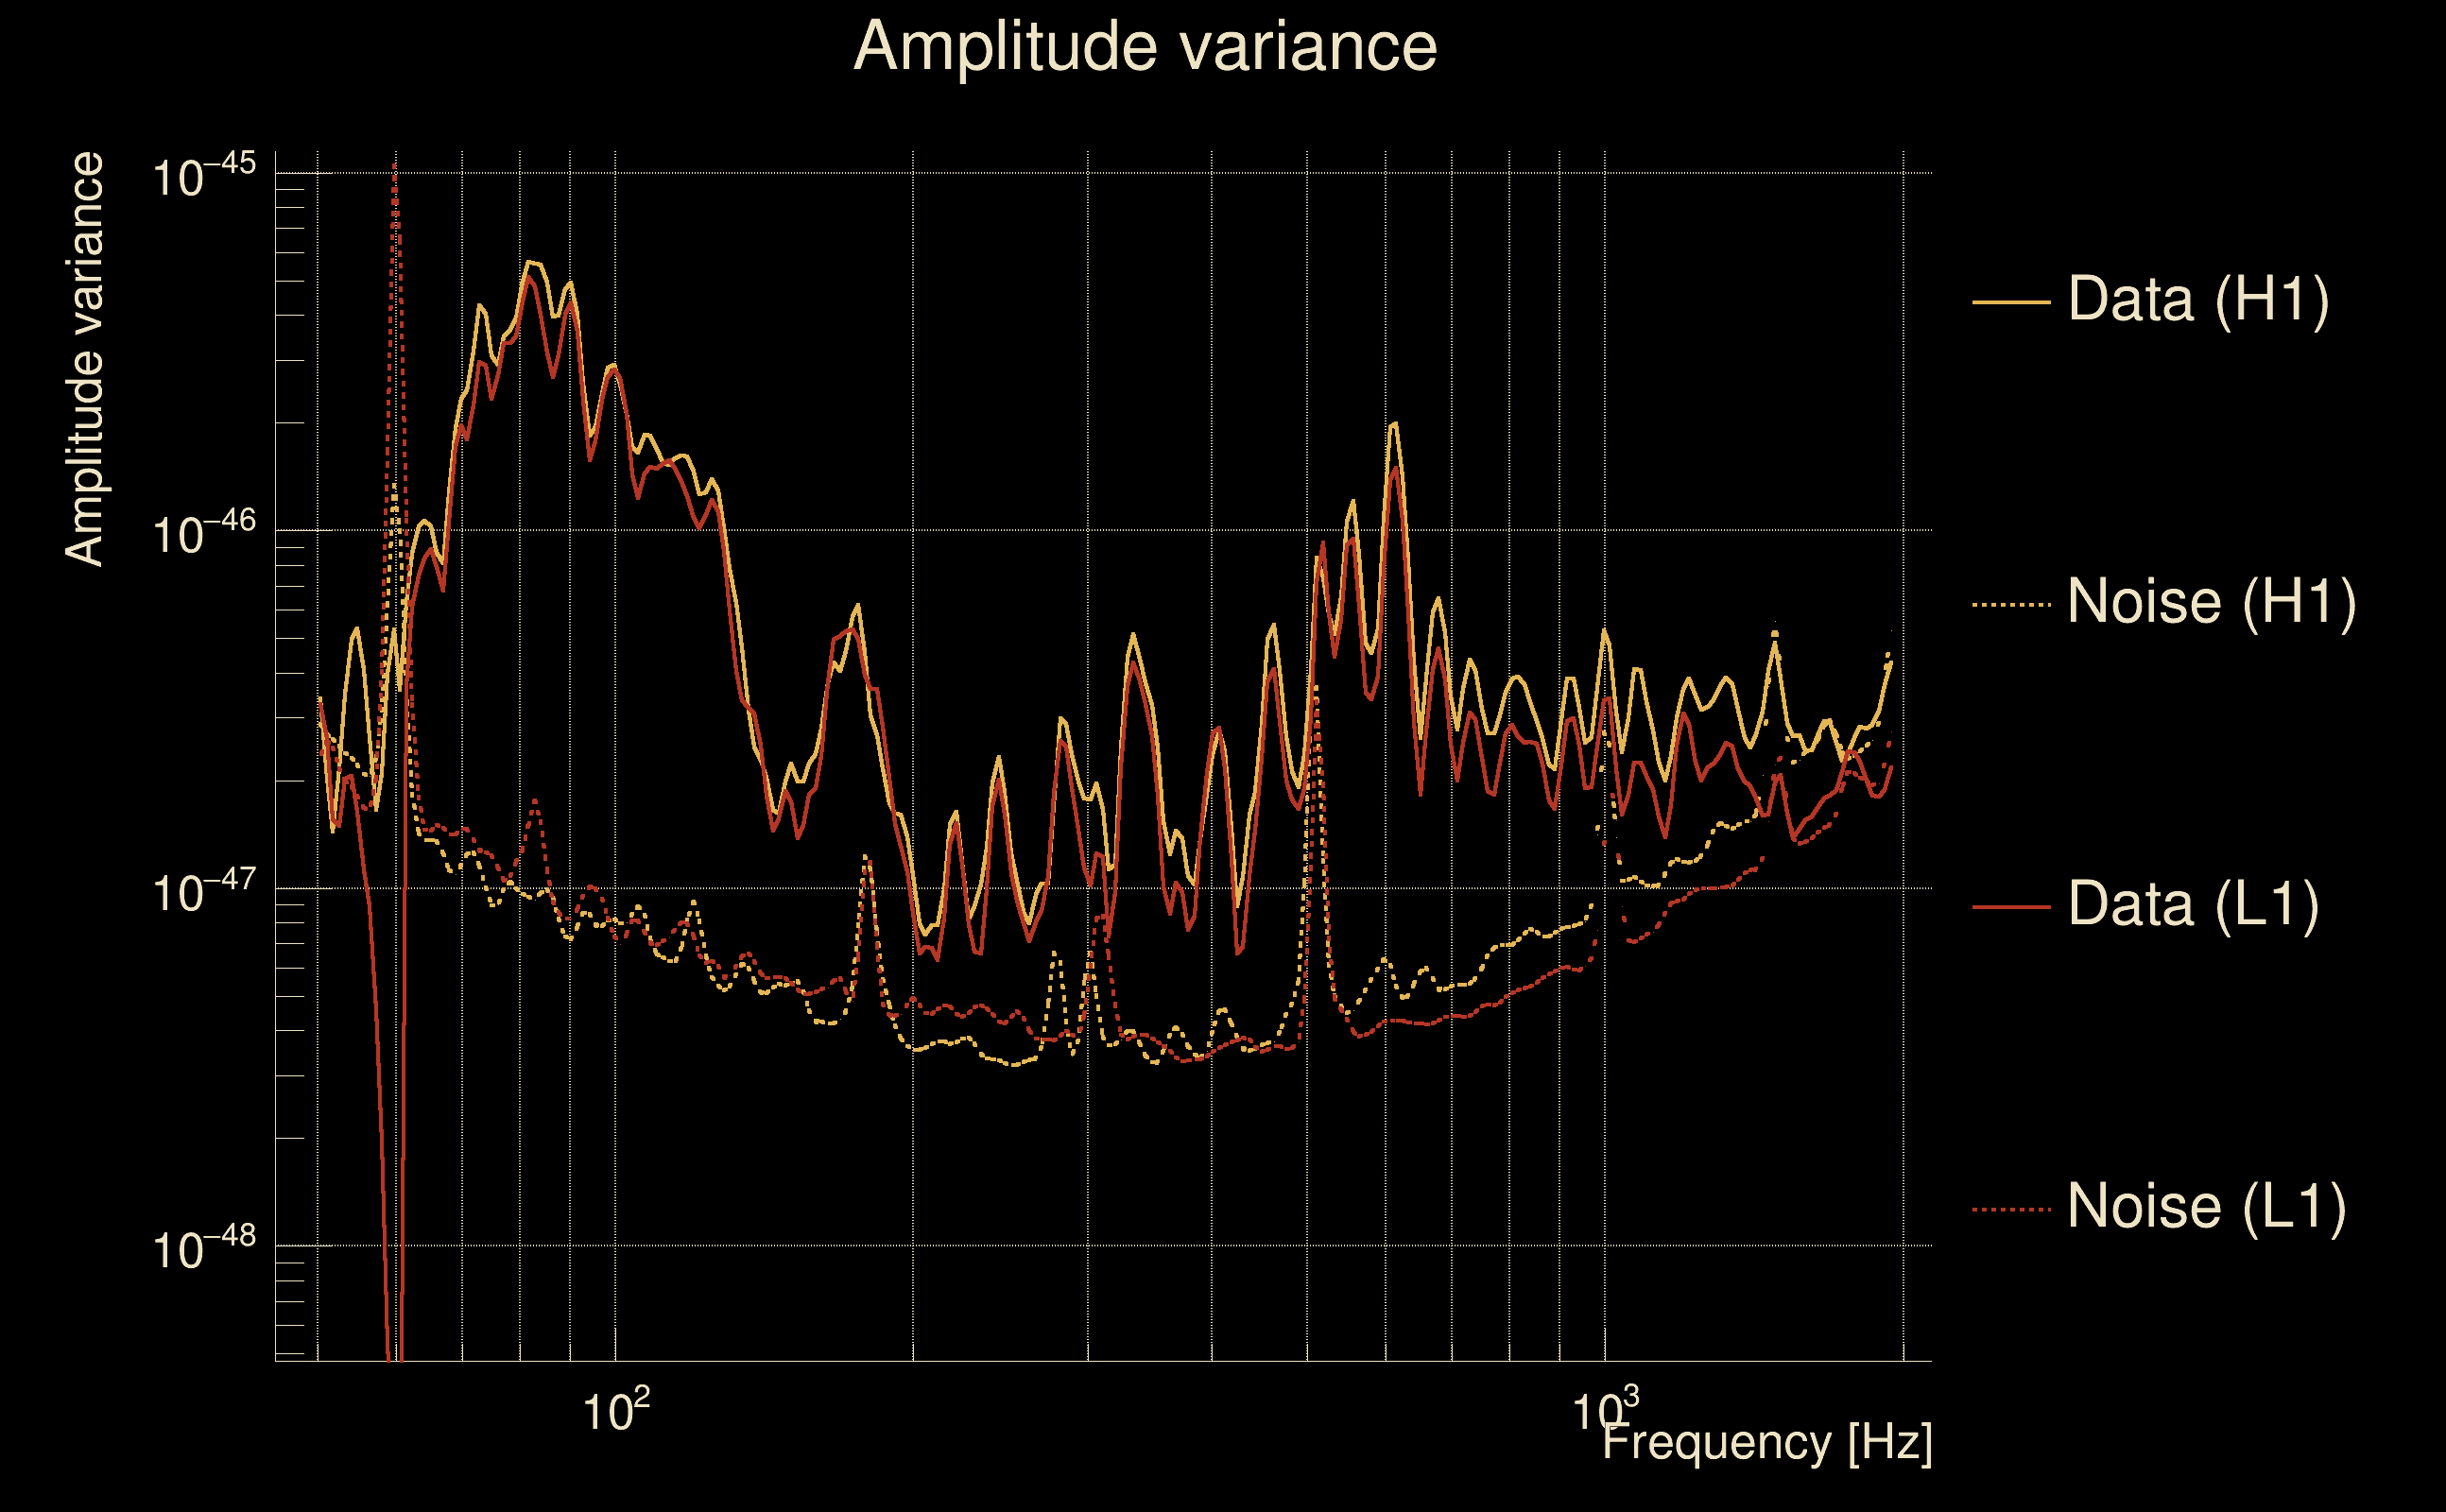
| Frequency: | 278.807 Hz |
| Ξ: | 0.952419 ± 0.00653458 (variance = 4.27008e-05): Q0: 0.974782, Q1: 0.965998, Q2: 0.961124, Q3: 0.959098, Q4: 0.956084 |
| Rank: | R_A = 0.9323 |
| Log of amplitude ratio (L1/H1): | -0.106849, variance = 0.153327 (L1/H1: -0.109276, variance = 0.303148, H1/L1: 0.103844, variance = 0.303356) |
| Amplitude ratio (L1/H1): | 0.898662 ⋇ 1.4793 (L1/H1: 0.896483 ⋇ 1.73427, H1/L1: 1.10943 ⋇ 1.7346) |
| Amplitude ratio H1|L1 compatibility (probability): | 0.994435 |
| Antenna factor probability: | 0.988622 |
| Number of rejected frequency rows: | Q0: 0 / 18, Q1: 0 / 36, Q2: 3 / 70, Q3: 11 / 134, Q4: 44 / 258 |
| Maximum signal-to-noise ratio: | H1: 95.0158, L1: 85.4022 |
| SNR variance: | H1: 0.476461, L1: 0.433496 |
| Click here for a zoomed plot | Click here for a zoomed plot | Click here for a zoomed plot | Click here for a zoomed plot | Click here for a zoomed plot |
 |
 |
 |
 |
 |
 |
 |
 |
 |
 |
 |
 |
 |
 |
 |
 |
 |
 |
 |
 |
 |
 |
 |
 |
 |
 |
 |
 |
 |
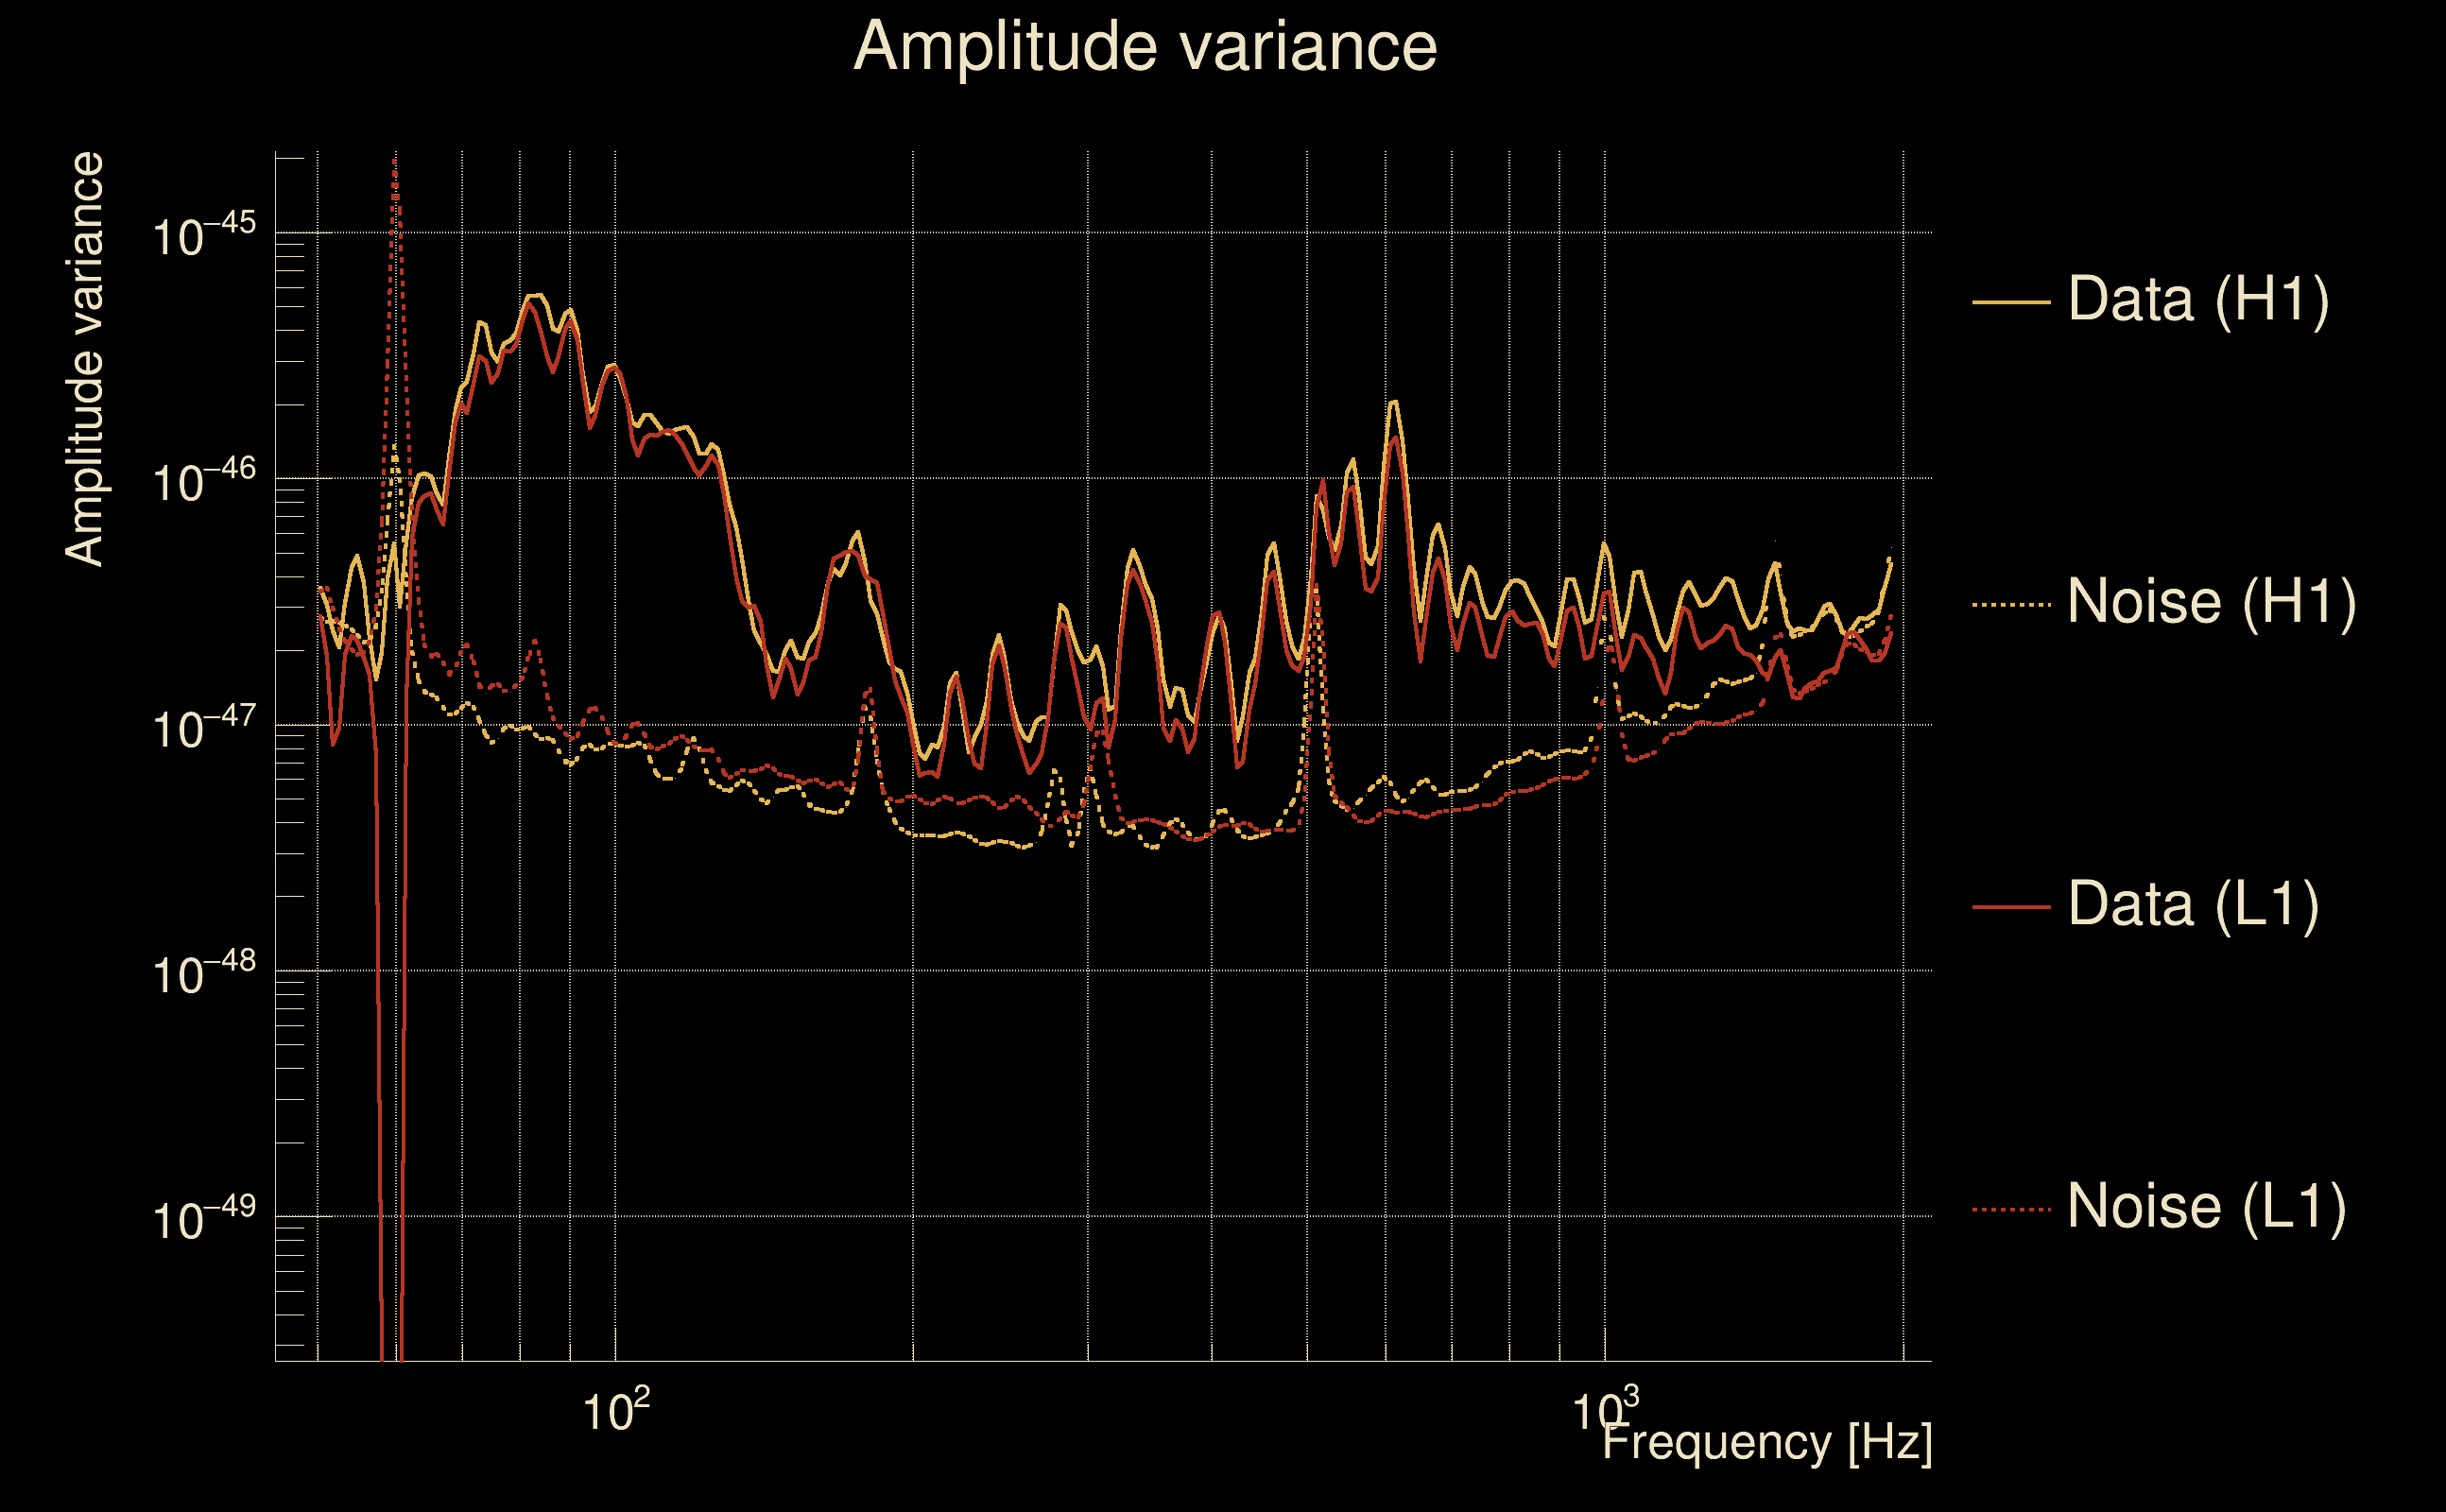
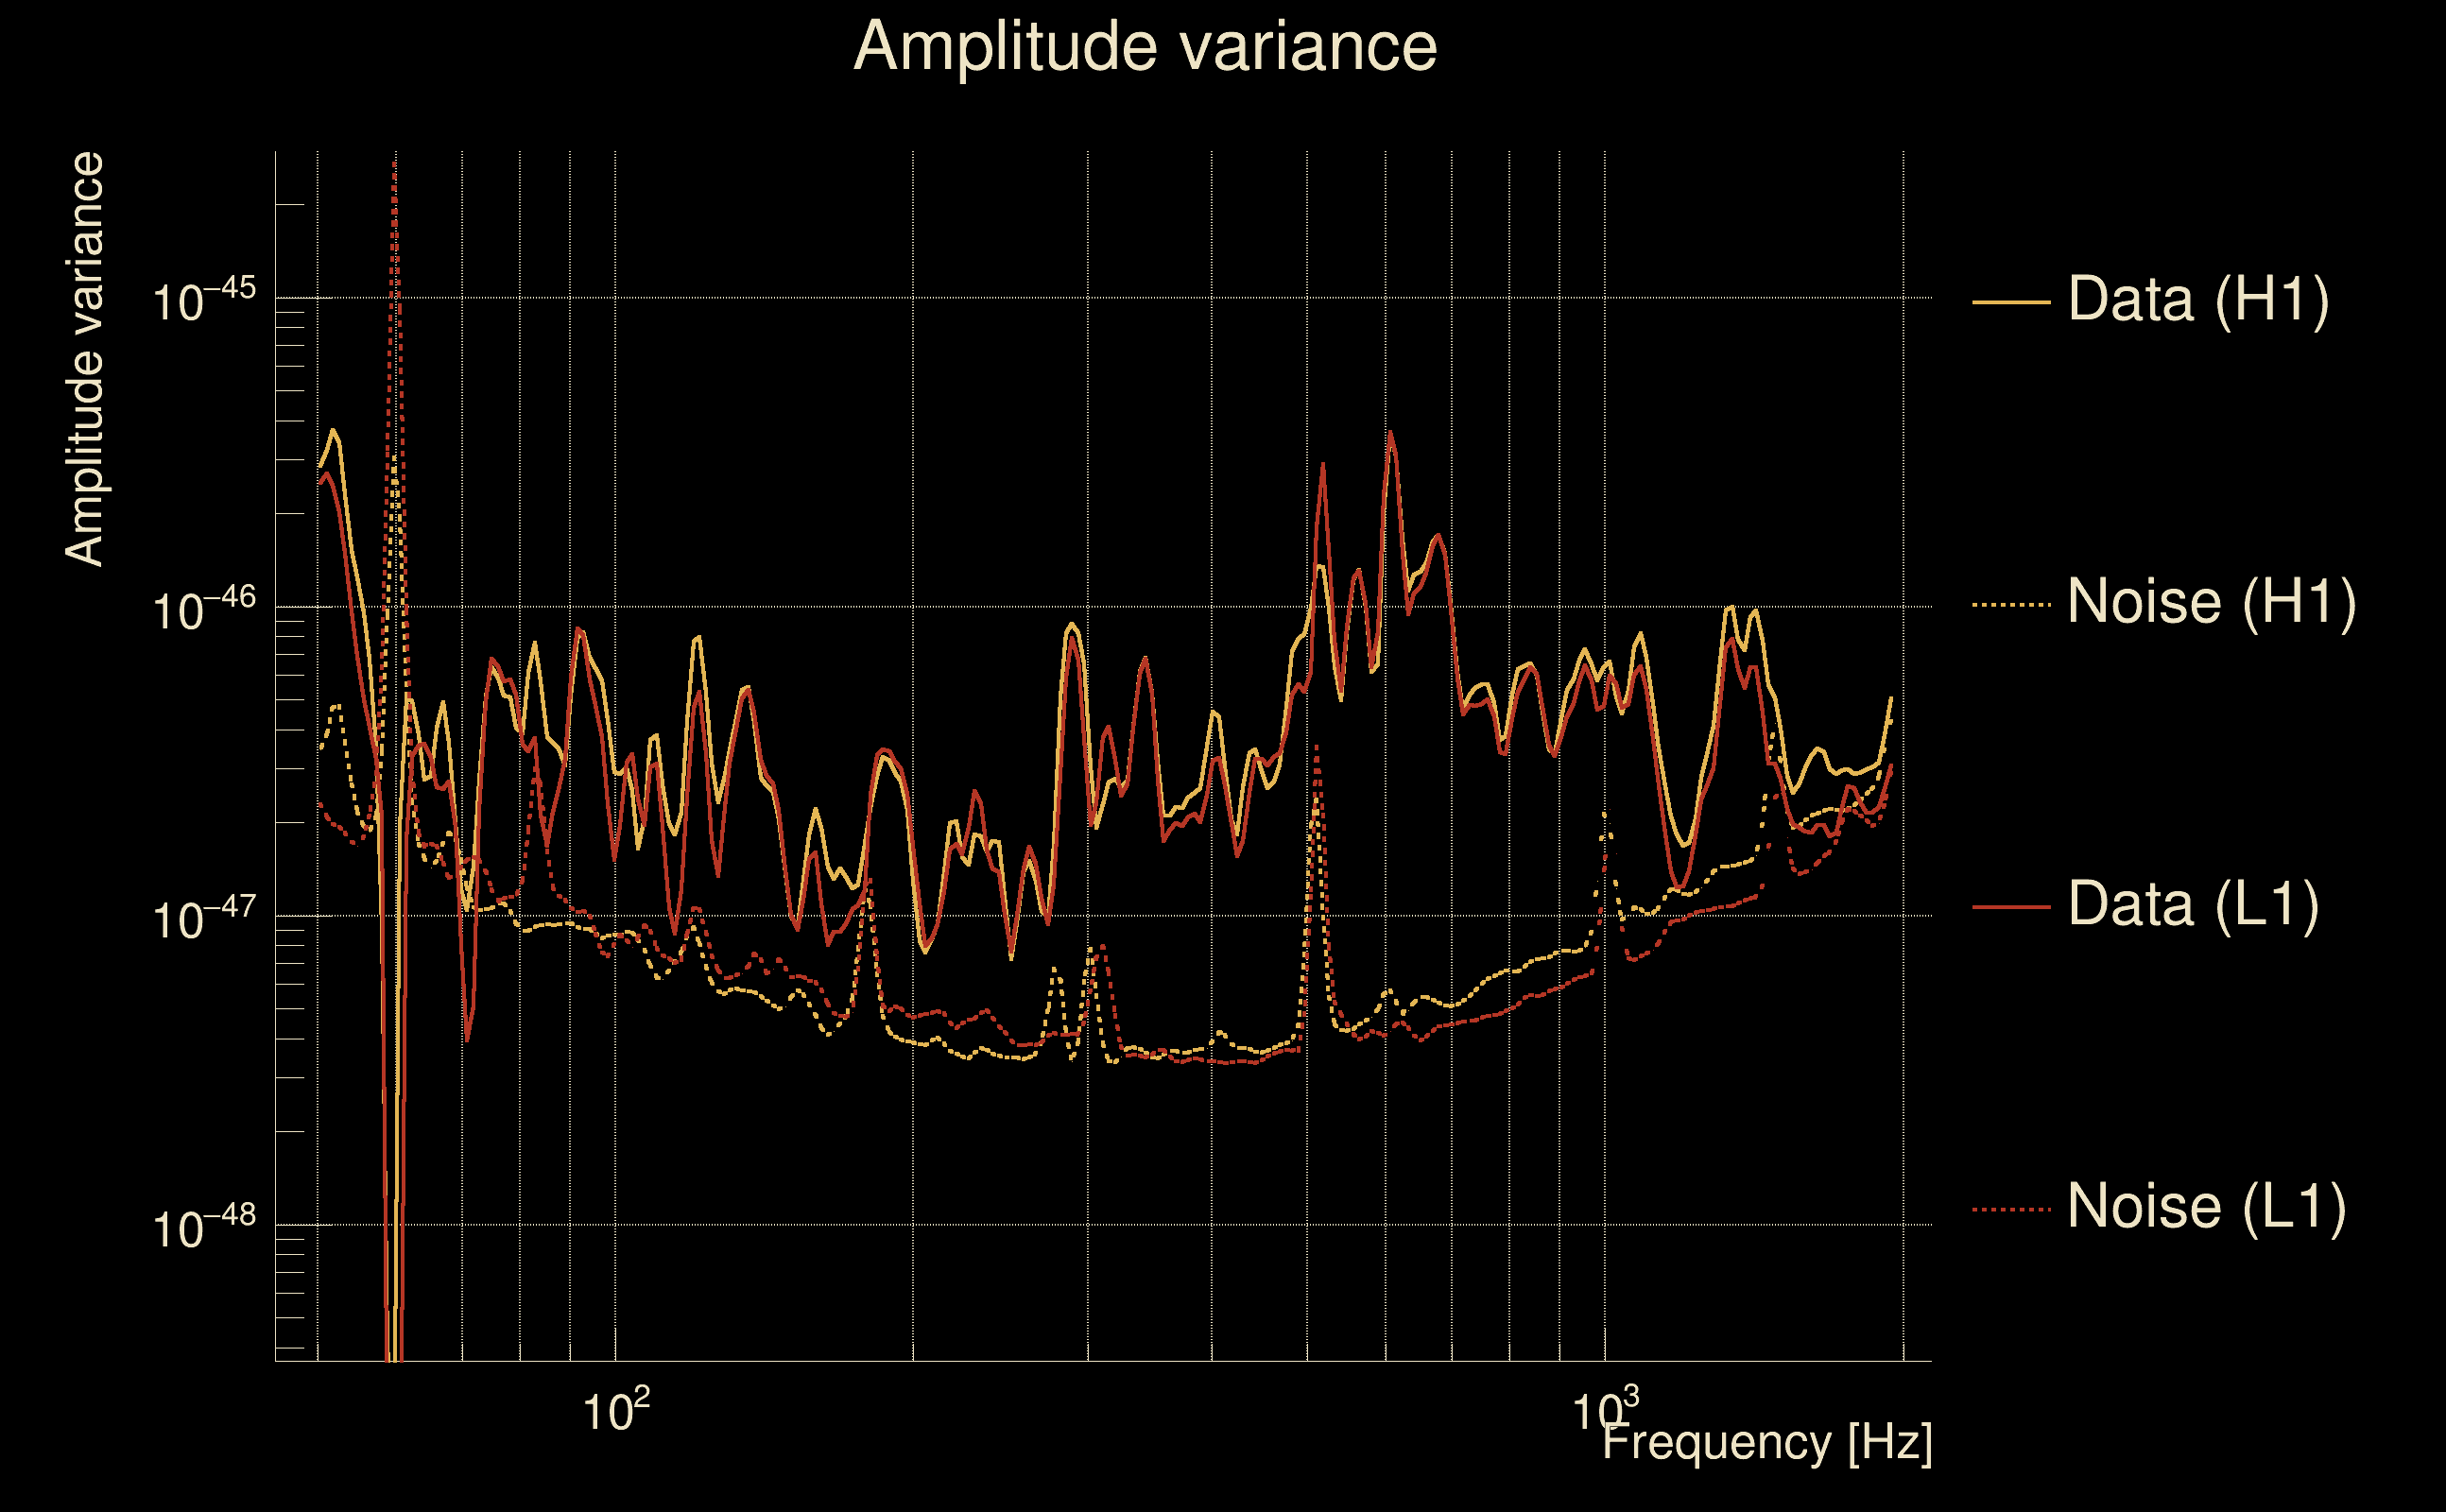
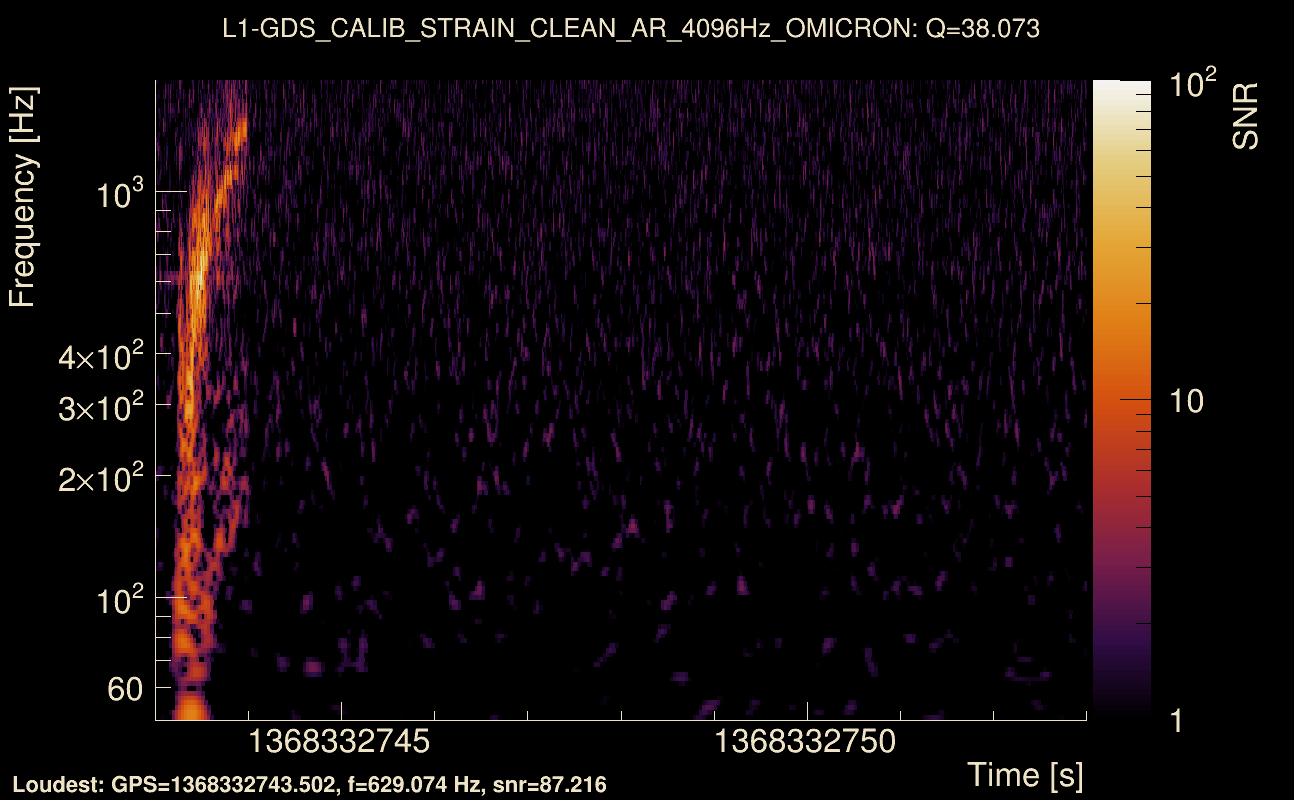
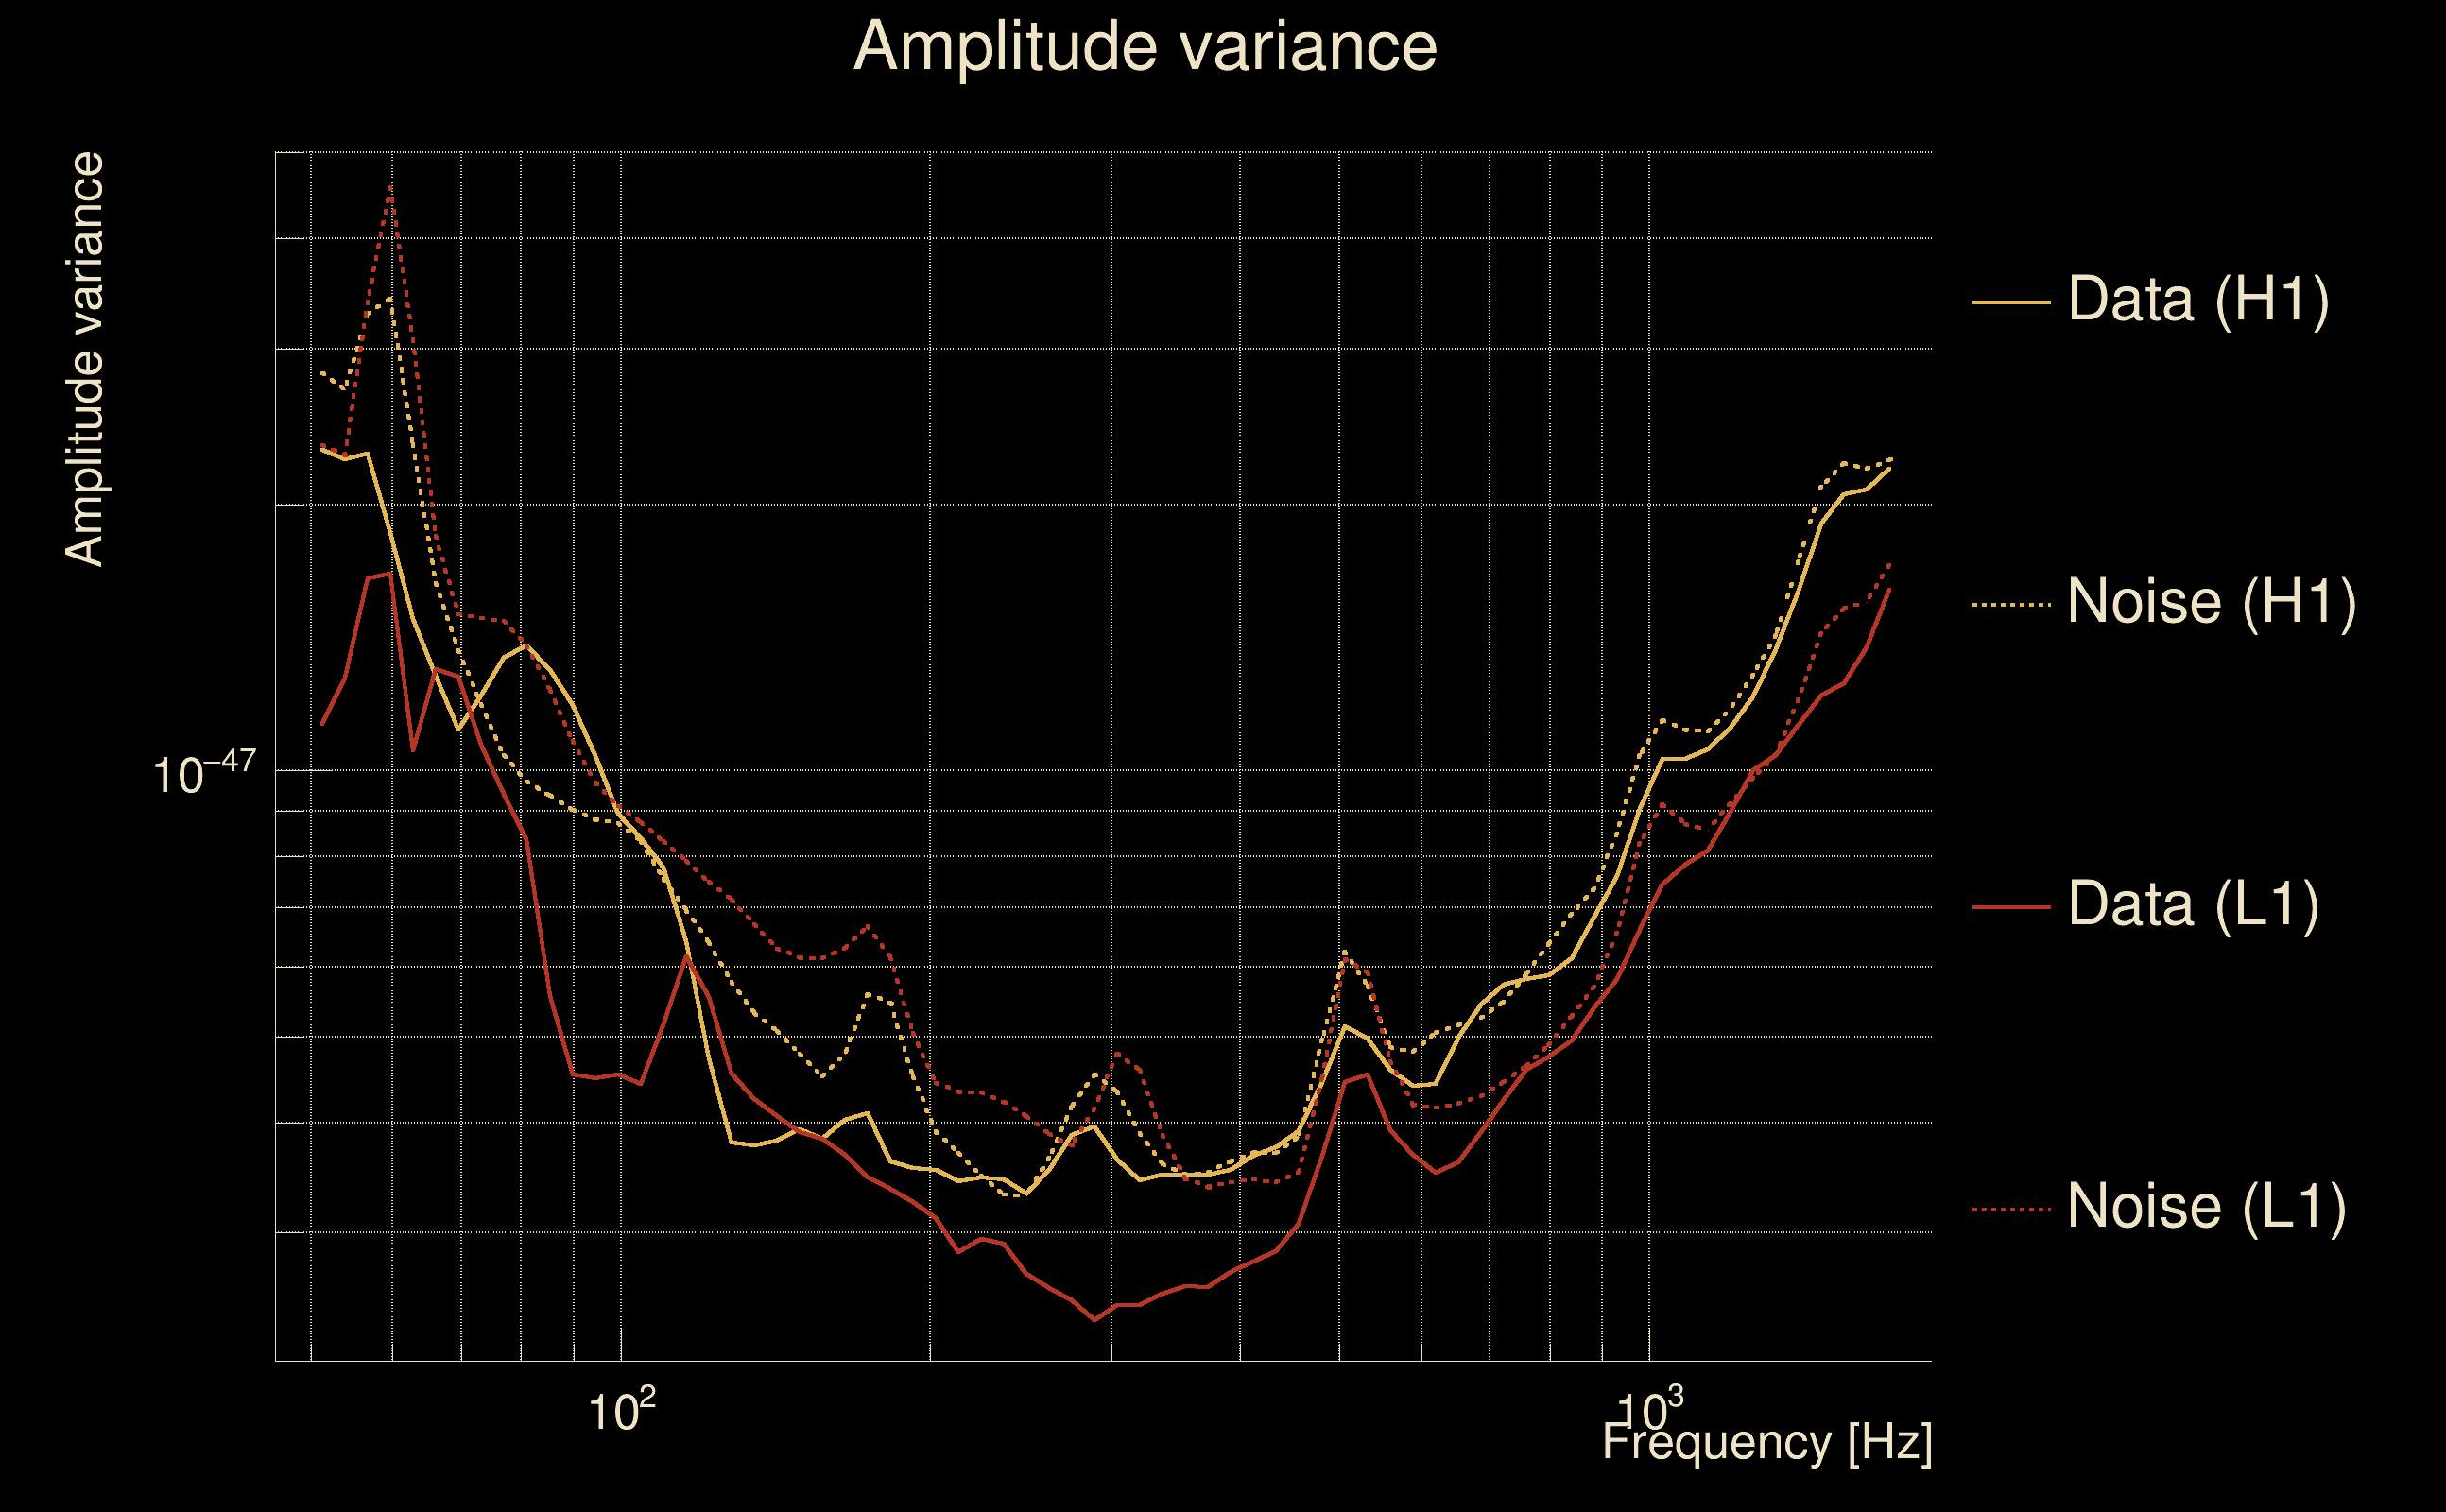
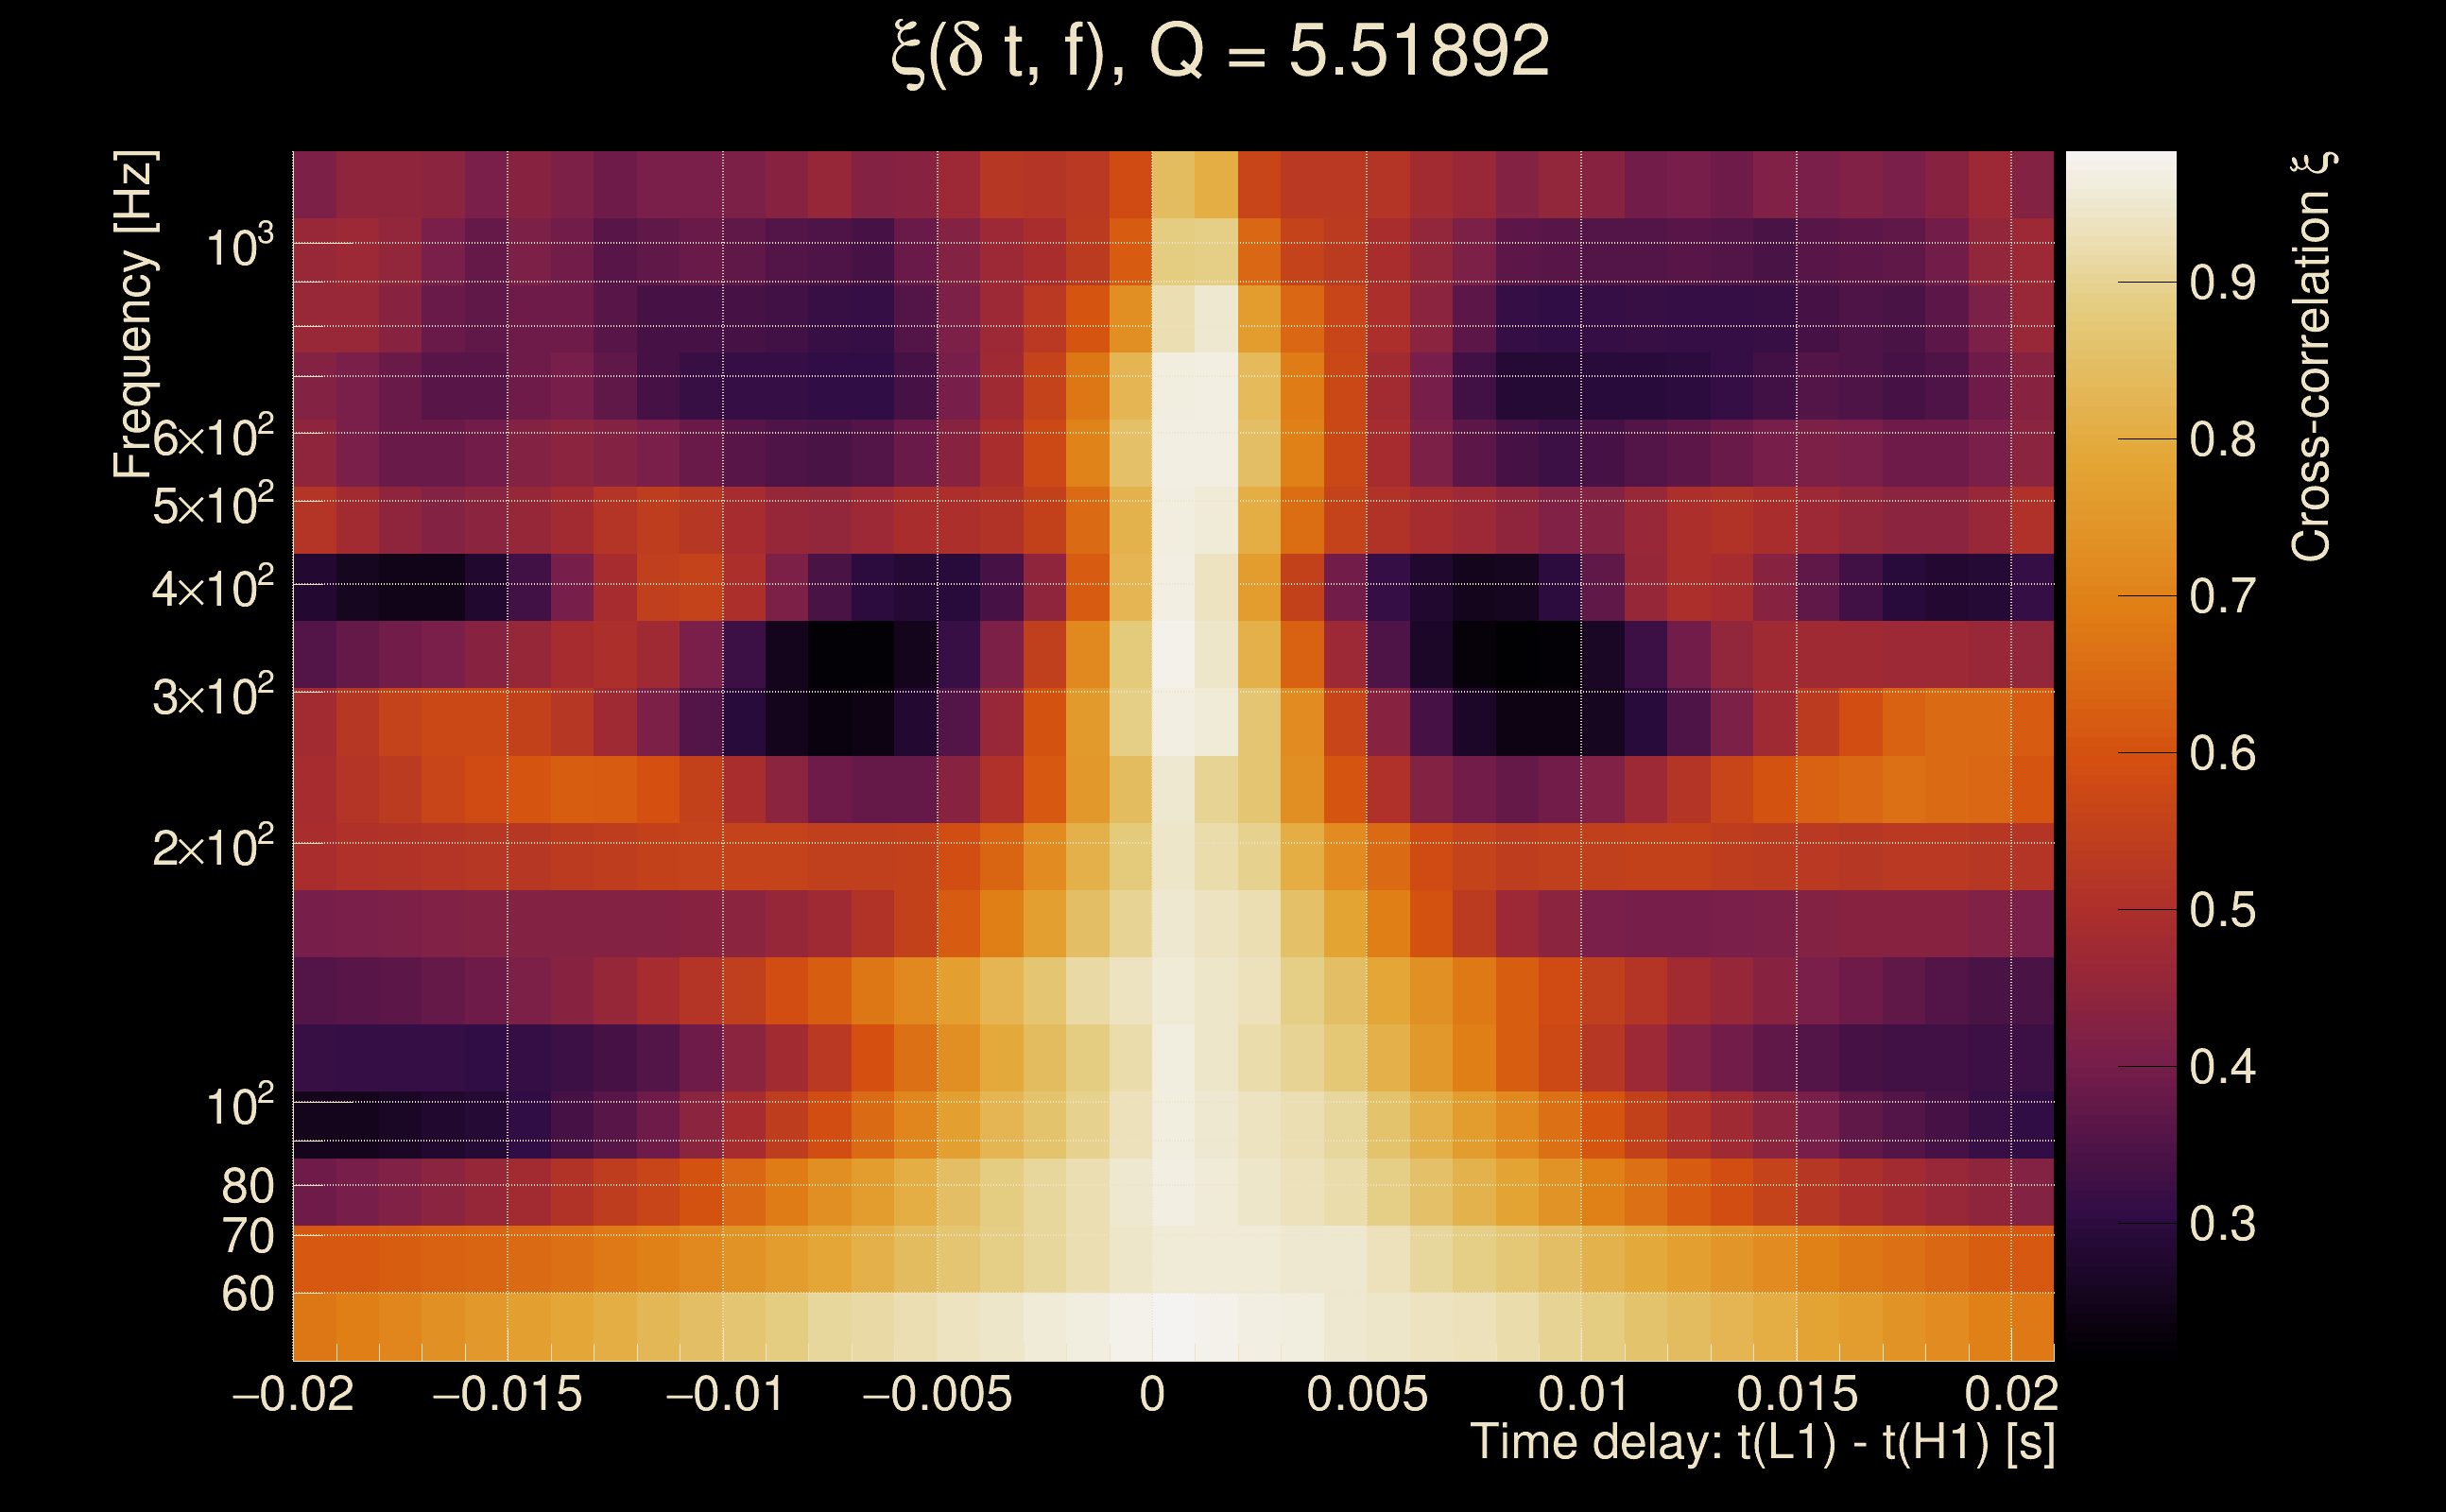
| Event time t(H1): | GPS = 1368332743 (Wed May 17 04:25:25 2023 ) → GPS = 1368332753 (Wed May 17 04:25:35 2023 ) |
| Event time t(L1): | GPS = 1368332743 (Wed May 17 04:25:35 2023 ) → GPS = 1368332753 (Wed May 17 04:25:35 2023 ) |
| Omicron analysis time window (H1): | GPS = 1368332740 → GPS = 1368332756 |
| Omicron analysis time window (L1): | GPS = 1368332740 → GPS = 1368332756 |
| Time delay between detectors t(L1) - t(H1): | 0.000415932 s (slice index = 108 / 217), δt_gw = 0.000415932 s |
| Time delay standard deviation: | 0.0235069 s |
| [targeted mode] Time delay probability: | 0.881171 (0.149485 sigmas), δt_target = 4.07696e-05 s |
| Frequency: | 296.249 Hz |
| Ξ: | 0.938263 ± 0.00769051 (variance = 5.9144e-05): Q0: 0.95478, Q1: 0.956963, Q2: 0.955048, Q3: 0.943645, Q4: 0.937371 |
| Rank: | R_A = 0.918806 |
| Log of amplitude ratio (L1/H1): | -0.0272469, variance = 0.153879 (L1/H1: -0.037929, variance = 0.3062, H1/L1: 0.0180658, variance = 0.30587) |
| Amplitude ratio (L1/H1): | 0.973121 ⋇ 1.48034 (L1/H1: 0.962781 ⋇ 1.73907, H1/L1: 1.01823 ⋇ 1.73856) |
| Amplitude ratio H1|L1 compatibility (probability): | 0.979745 |
| Antenna factor probability: | 0.996268 |
| Number of rejected frequency rows: | Q0: 0 / 18, Q1: 0 / 36, Q2: 4 / 70, Q3: 10 / 134, Q4: 29 / 258 |
| Maximum signal-to-noise ratio: | H1: 84.6809, L1: 91.3412 |
| SNR variance: | H1: 4.01255, L1: 4.41656 |
| Click here for a zoomed plot | Click here for a zoomed plot | Click here for a zoomed plot | Click here for a zoomed plot | Click here for a zoomed plot |
 |
 |
 |
 |
 |
 |
 |
 |
 |
 |
 |
 |
 |
 |
 |
 |
 |
 |
 |
 |
 |
 |
 |
 |
 |
 |
 |
 |
 |
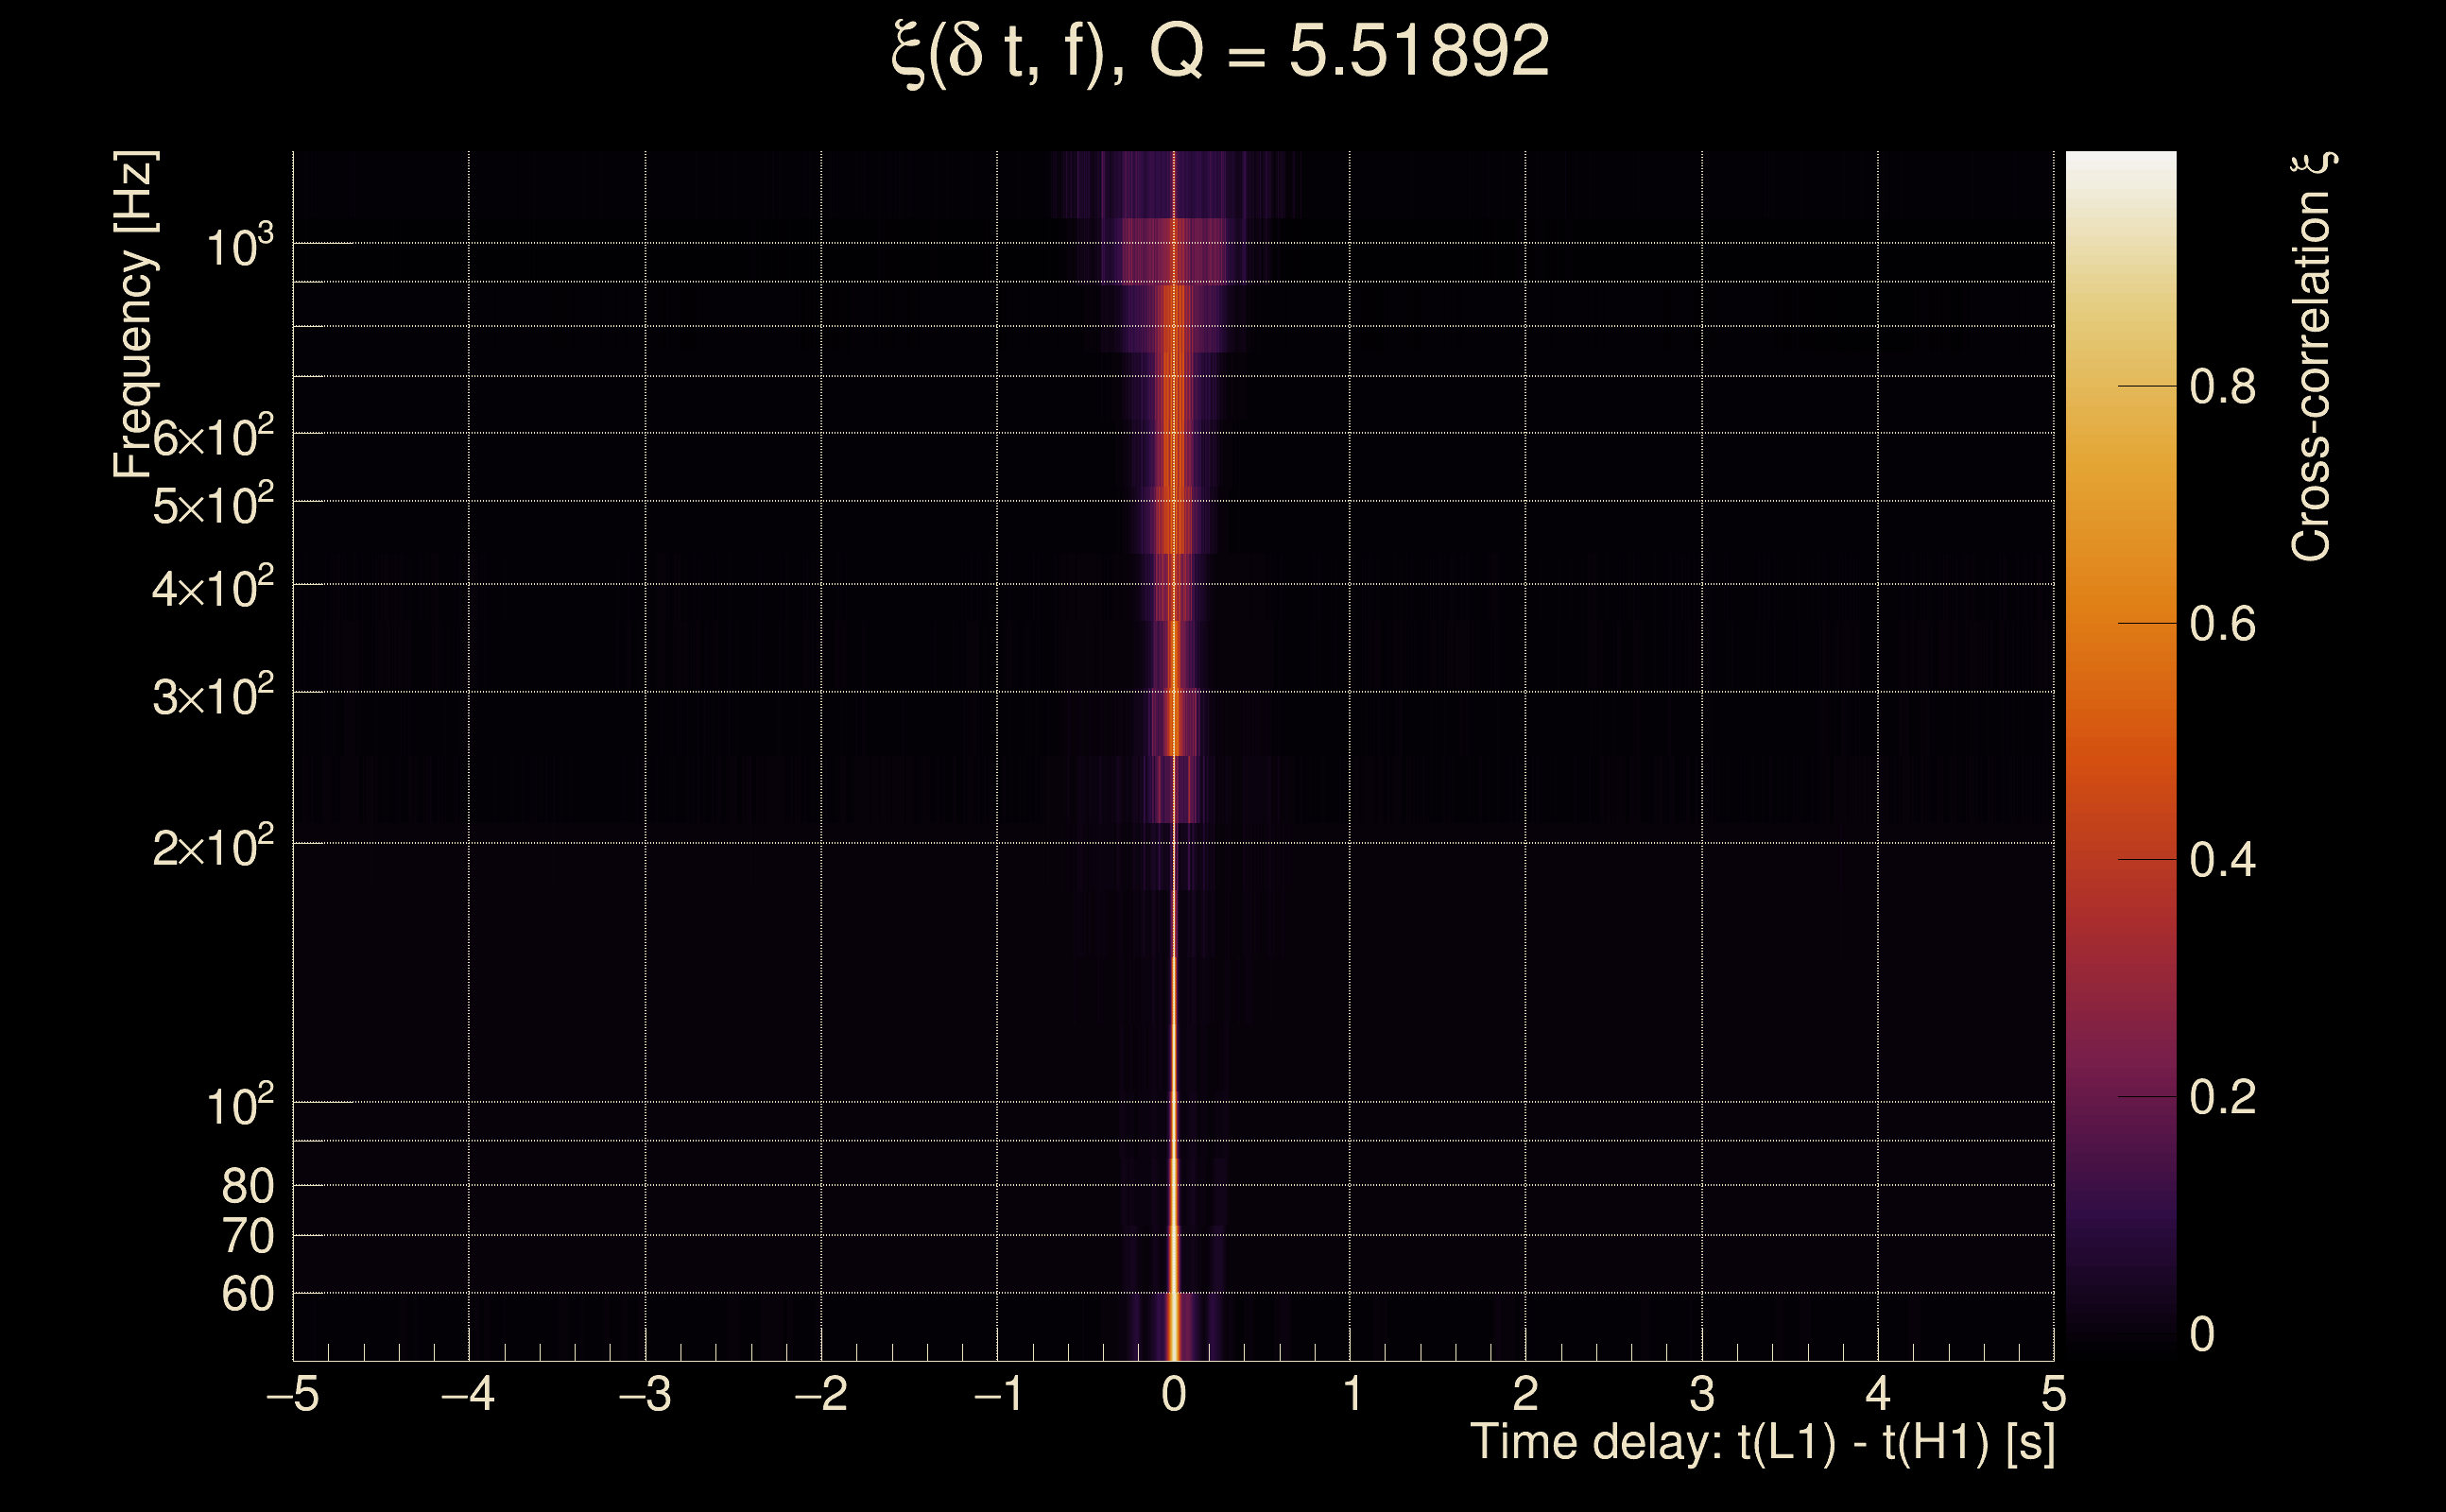
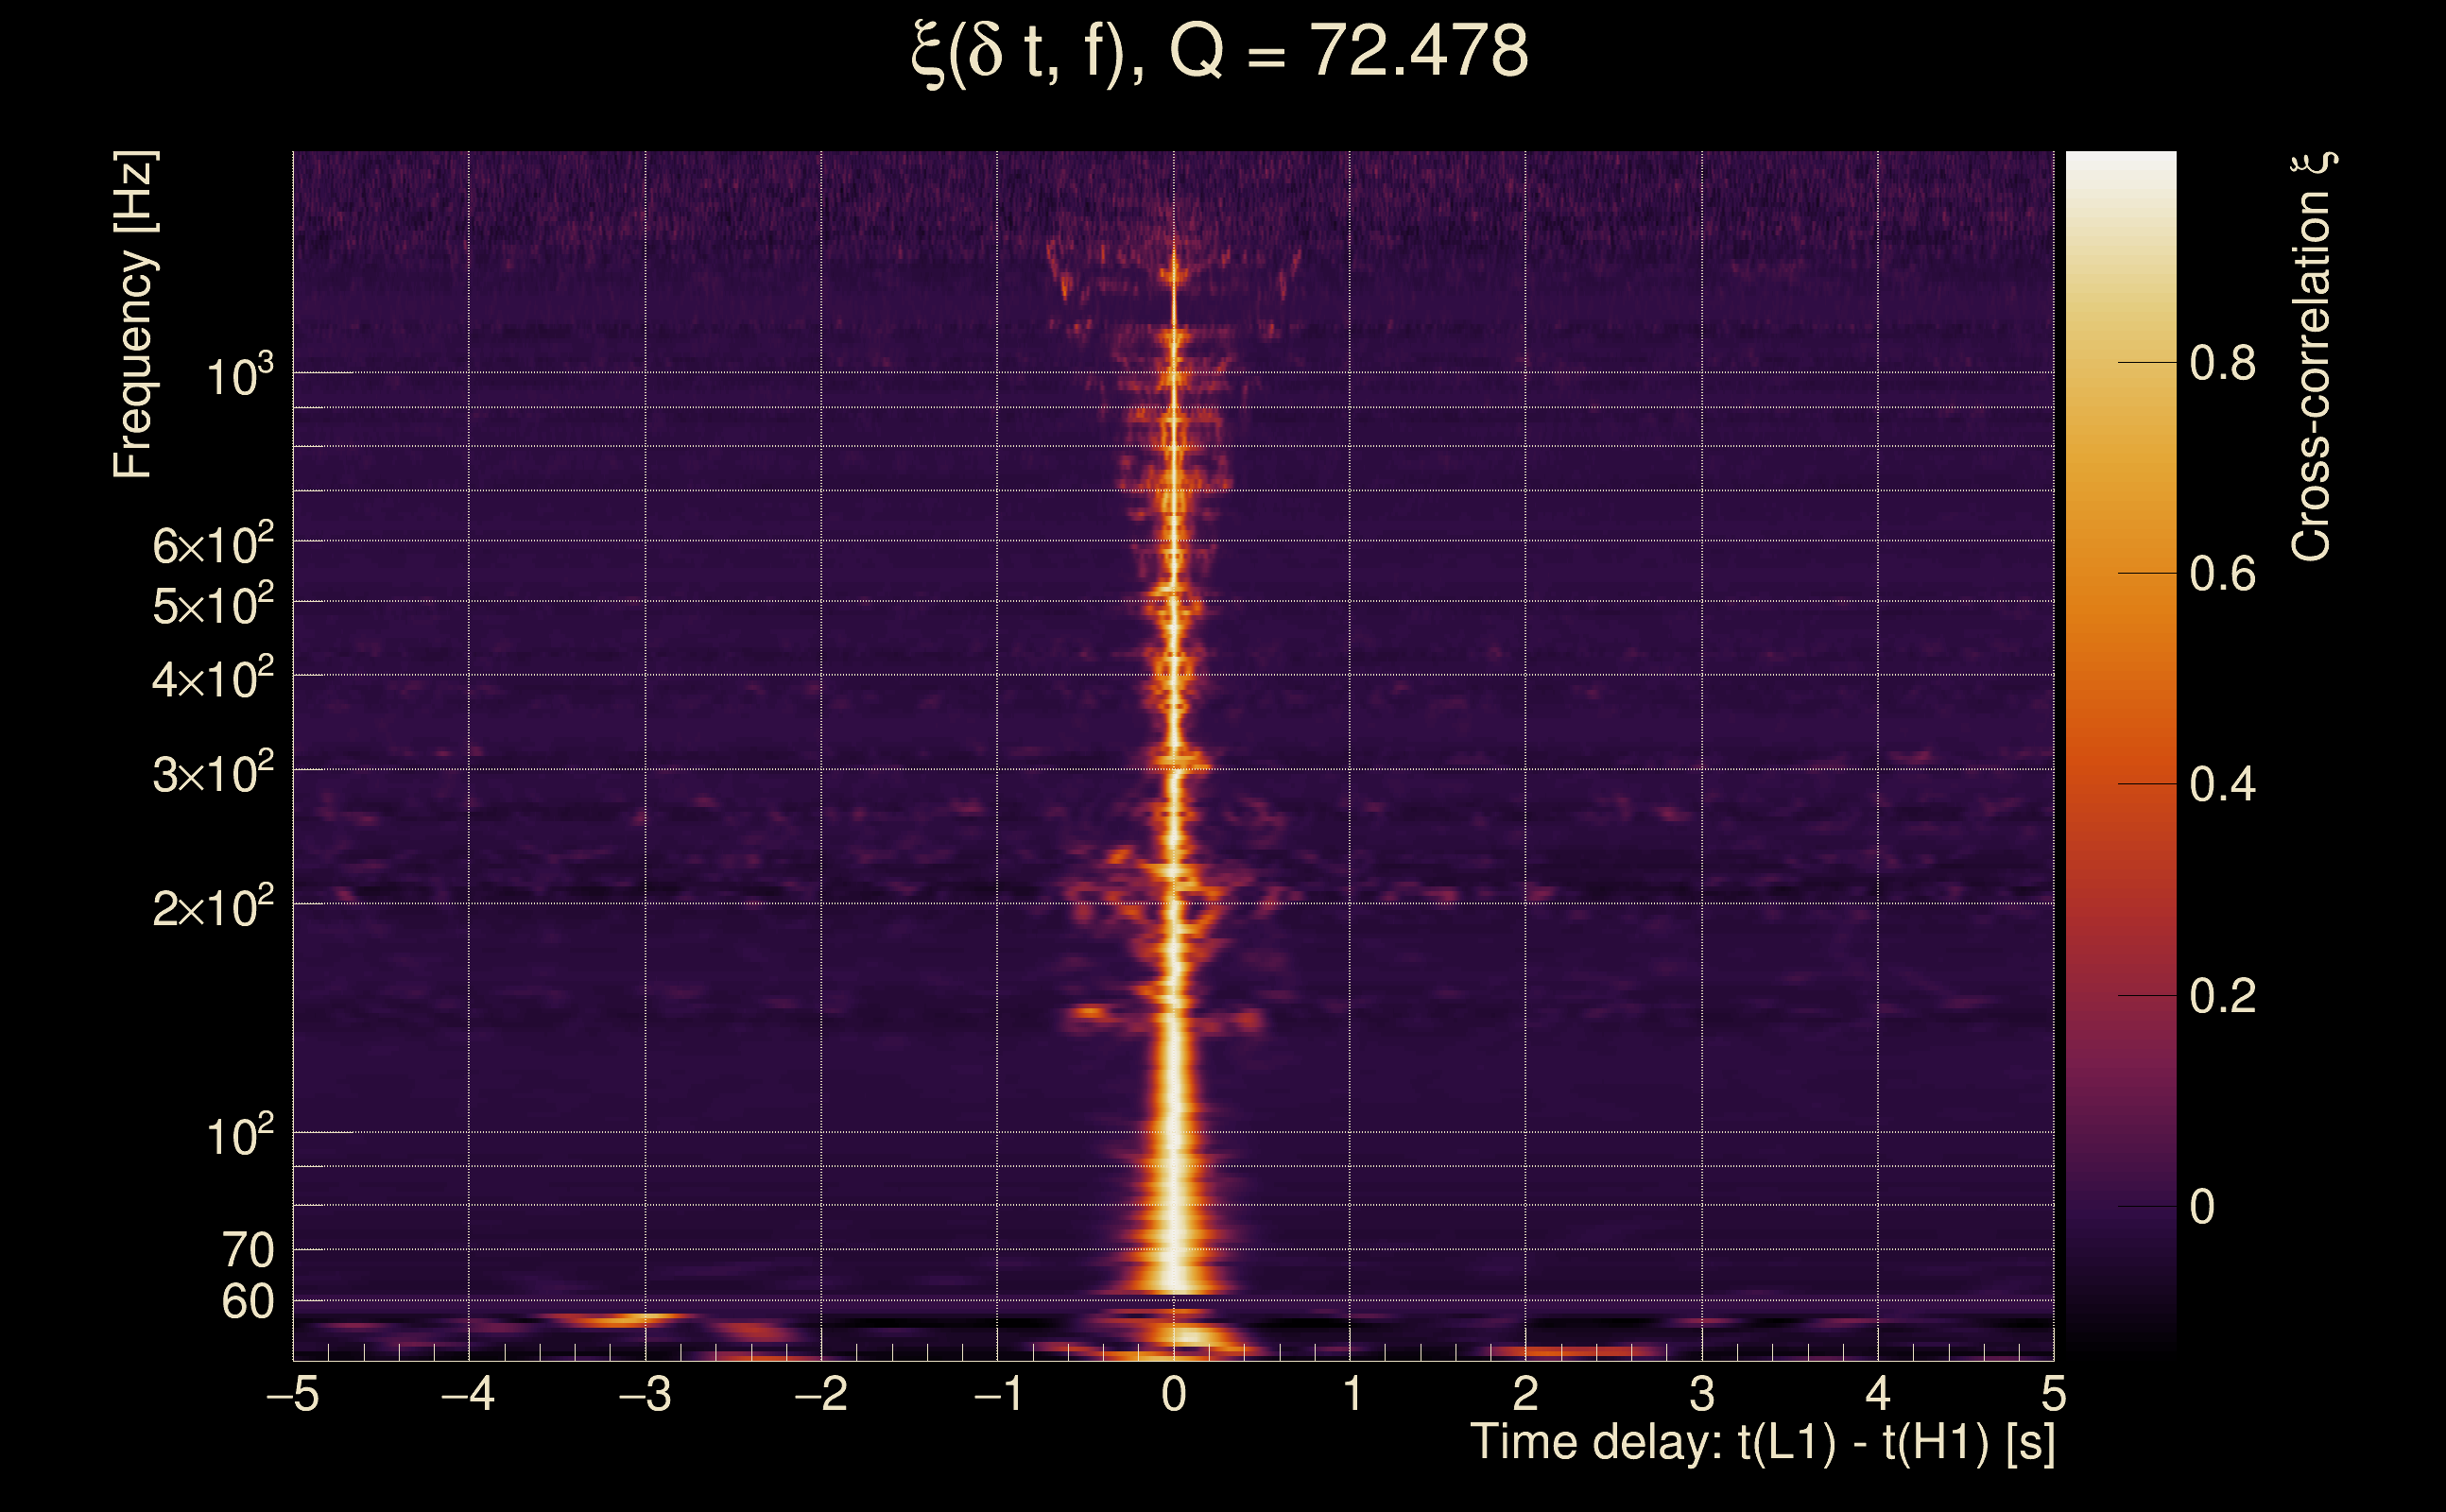
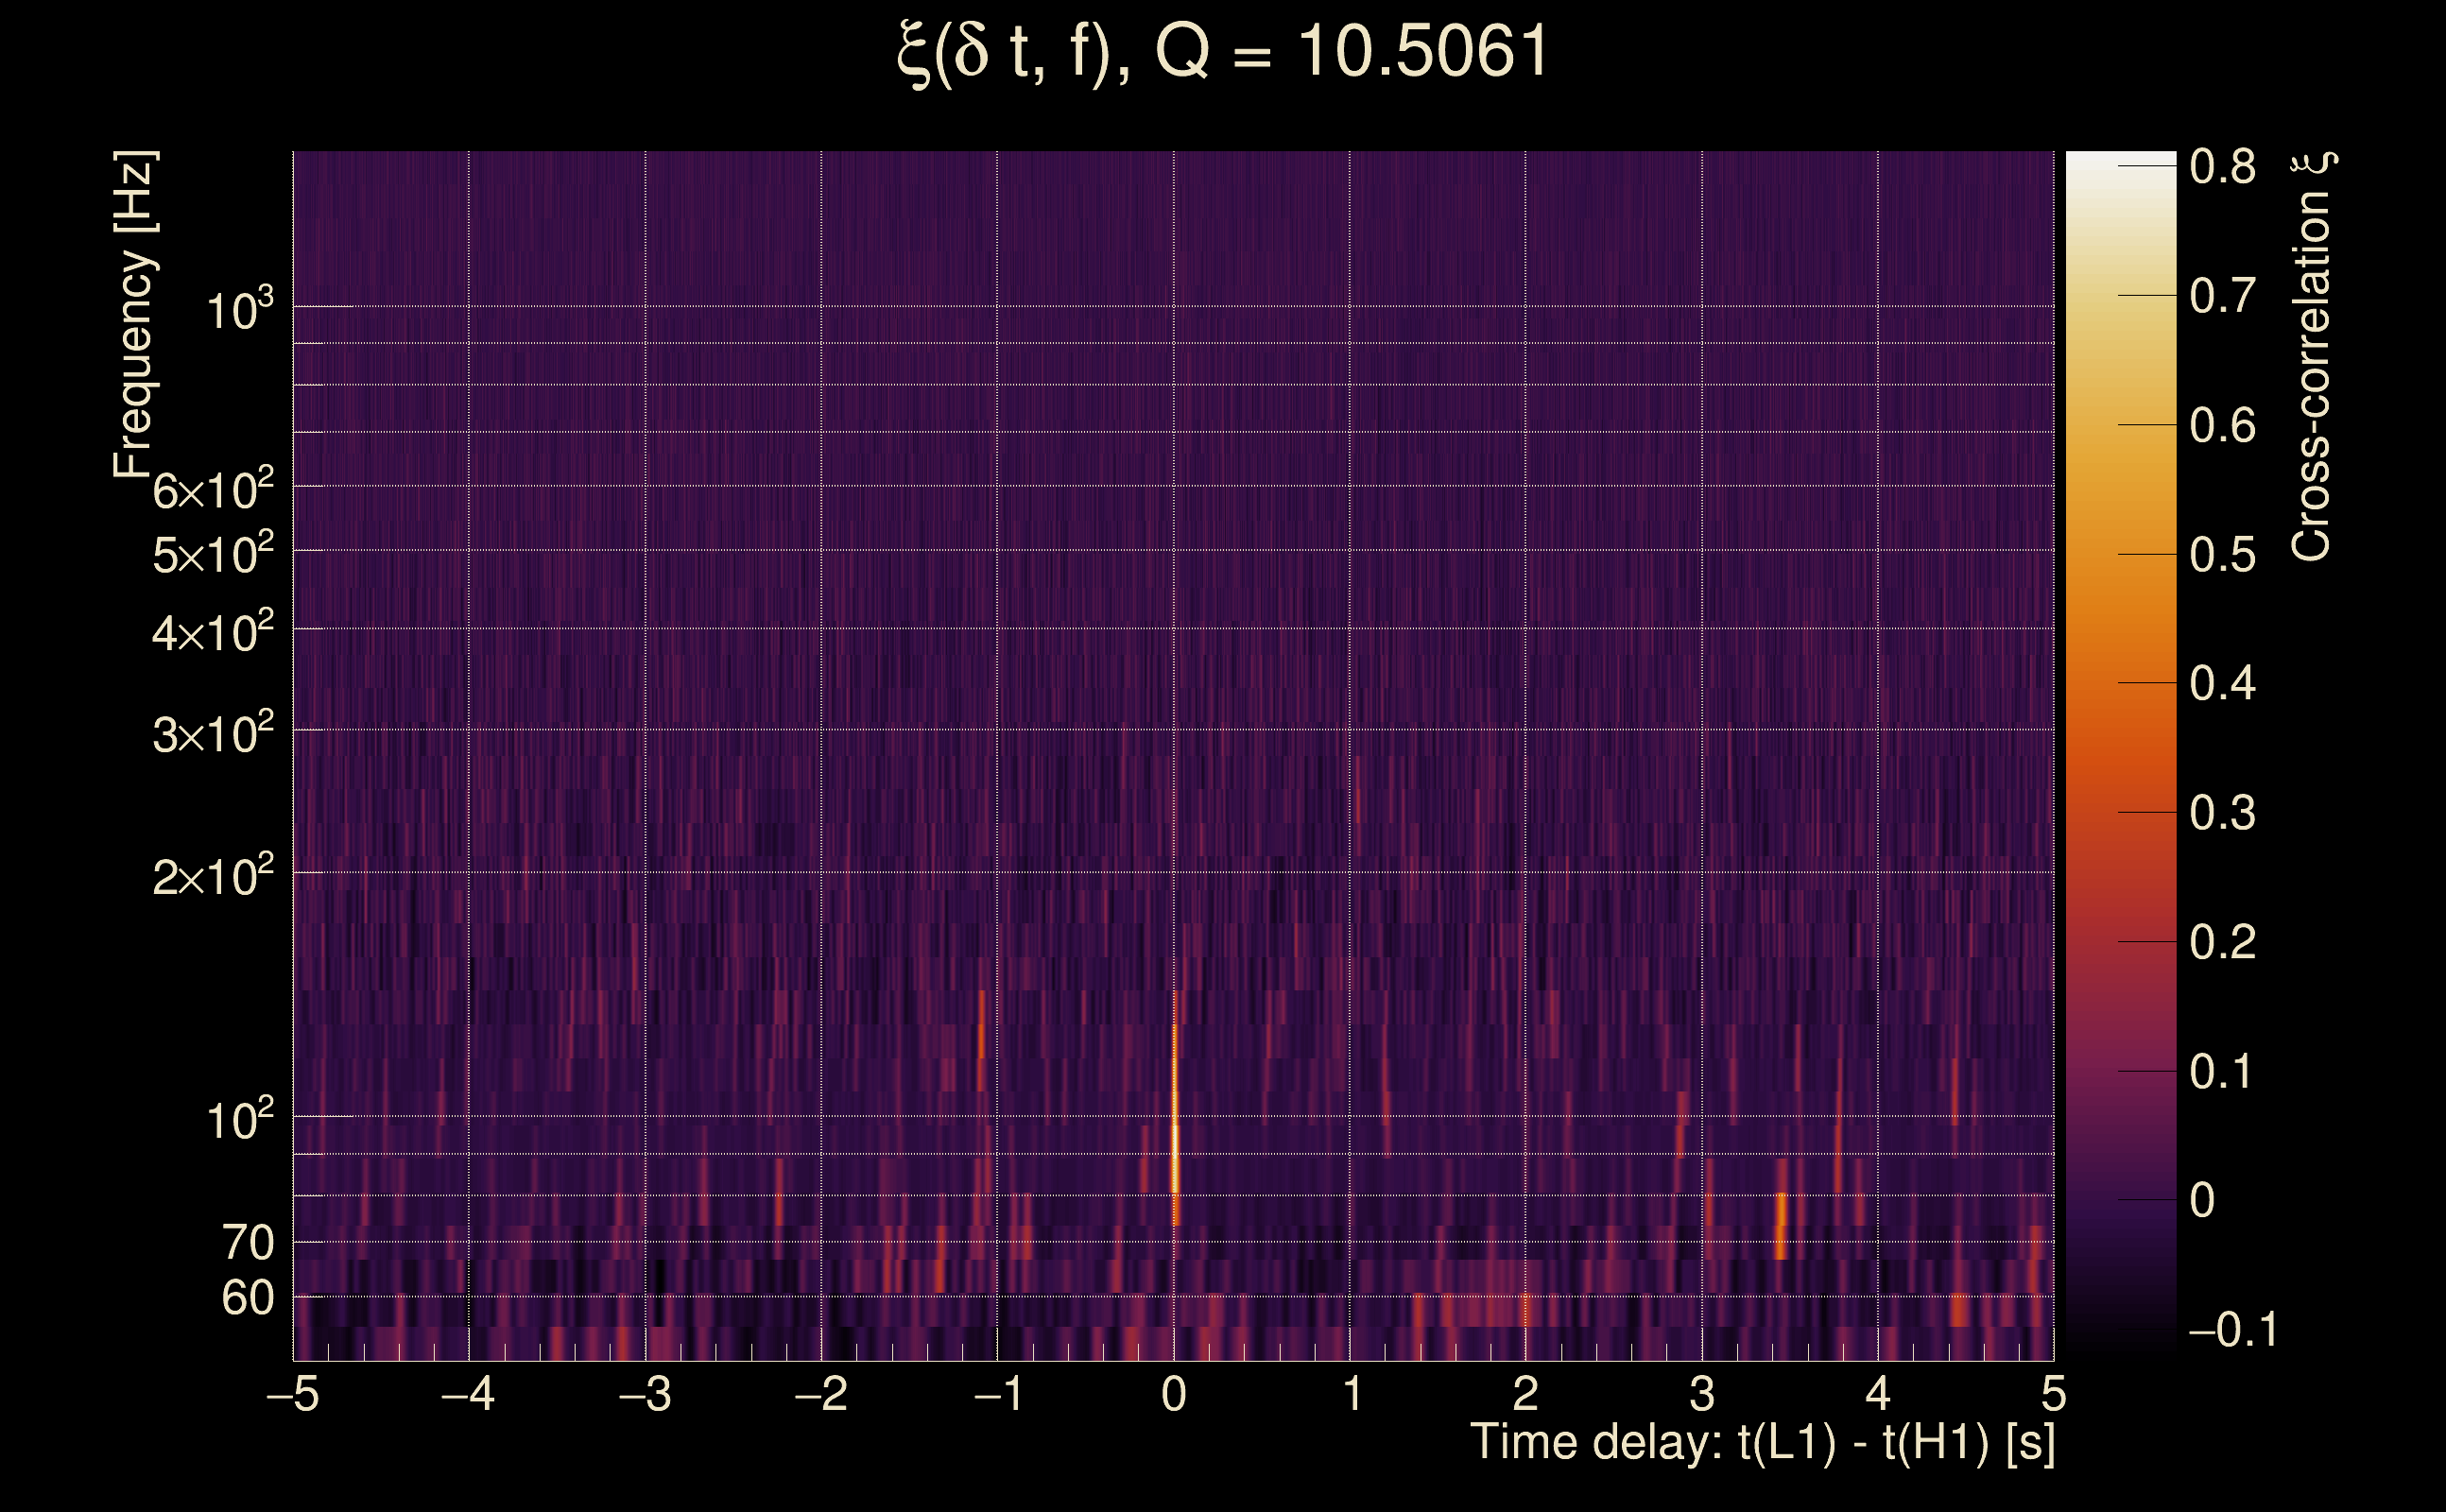
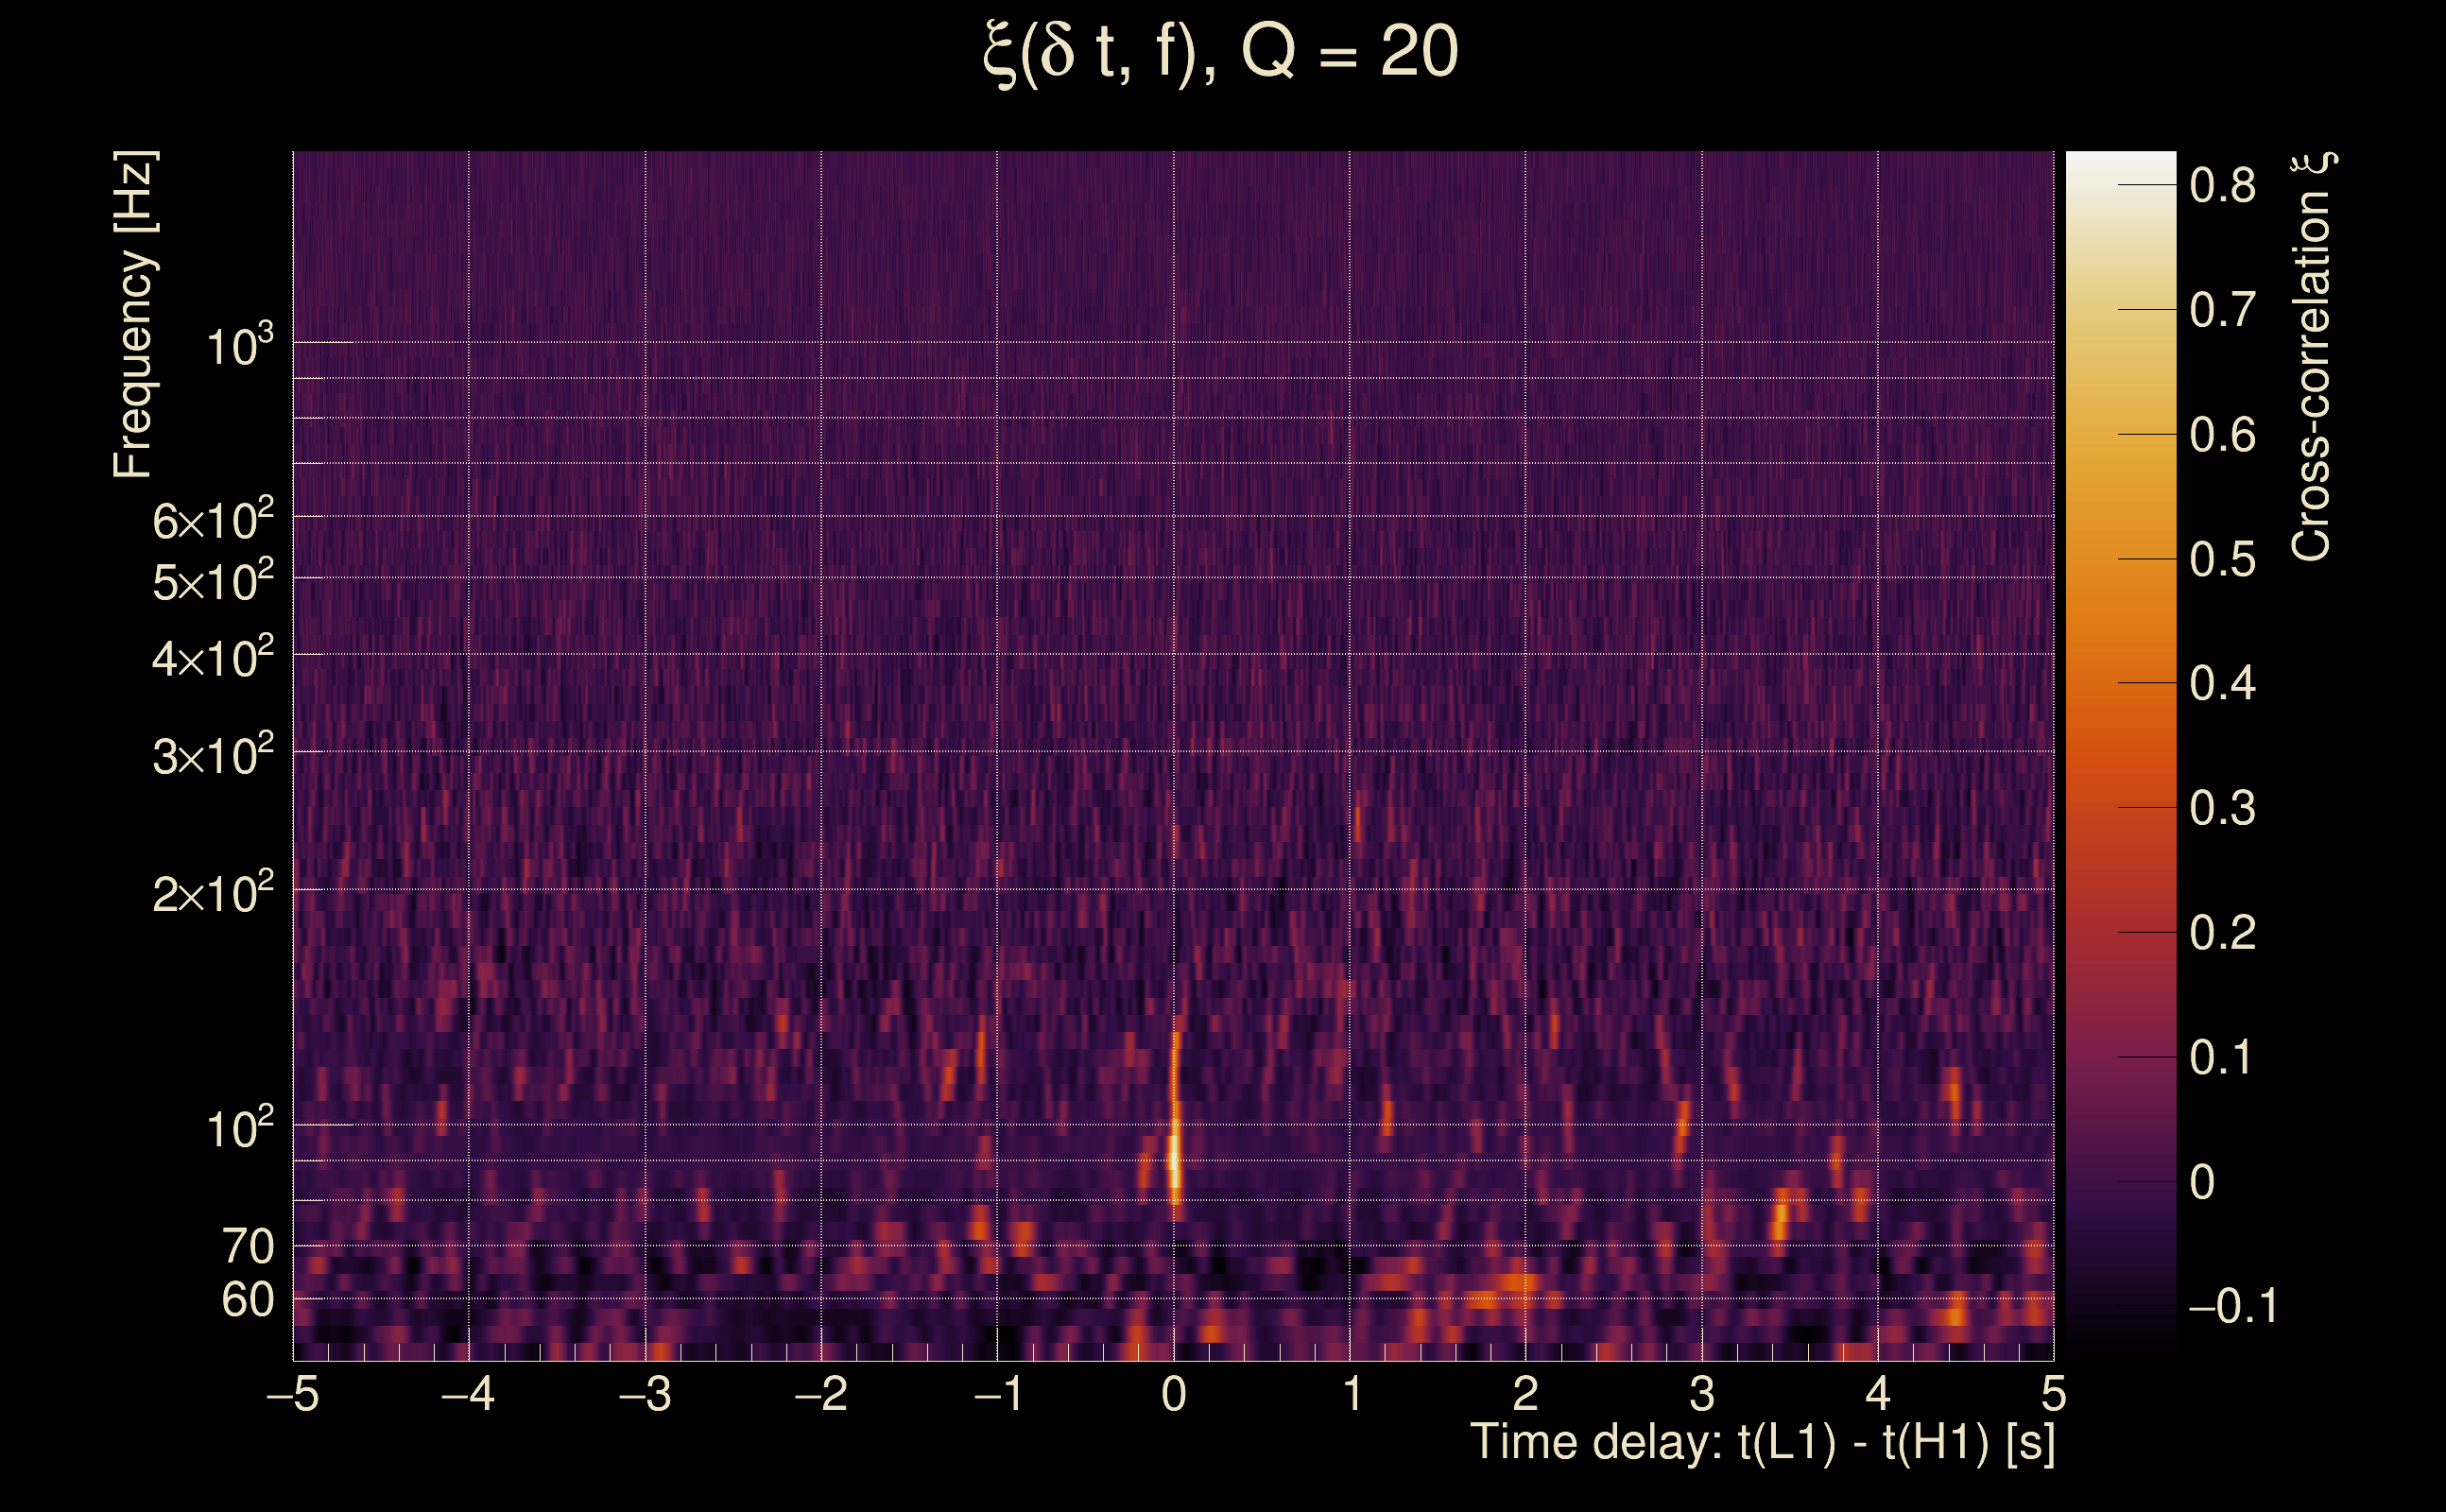
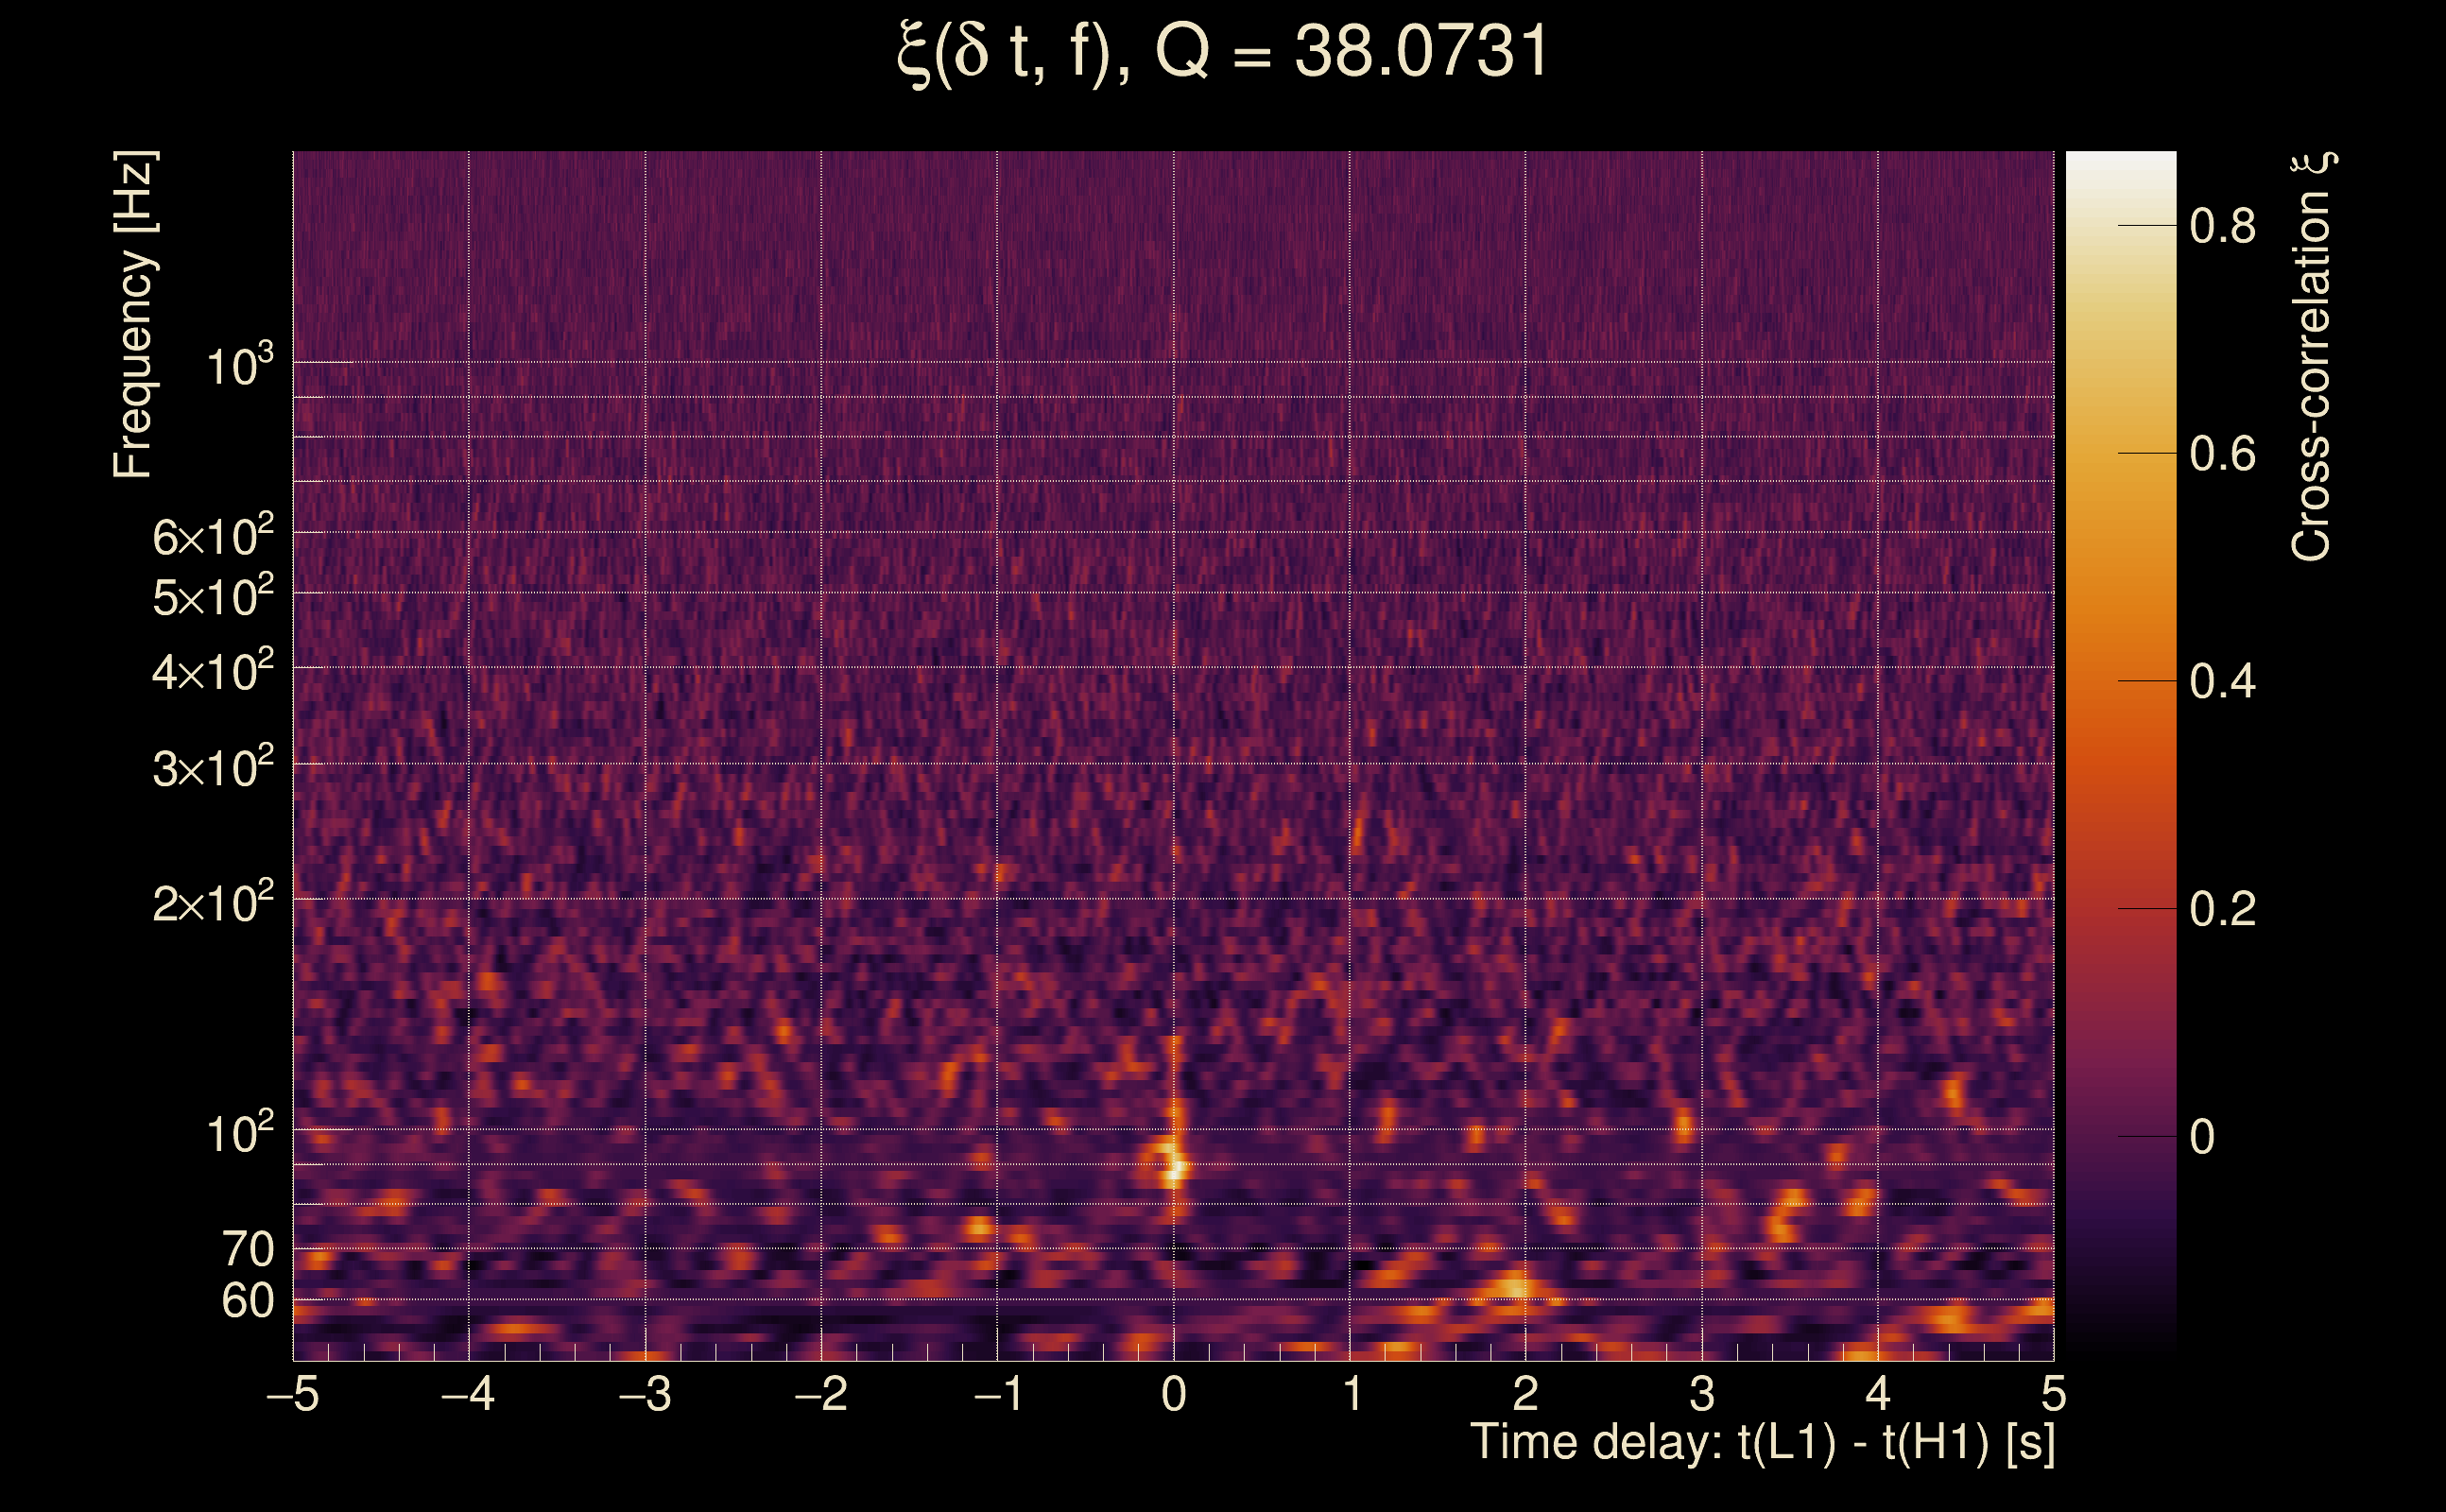
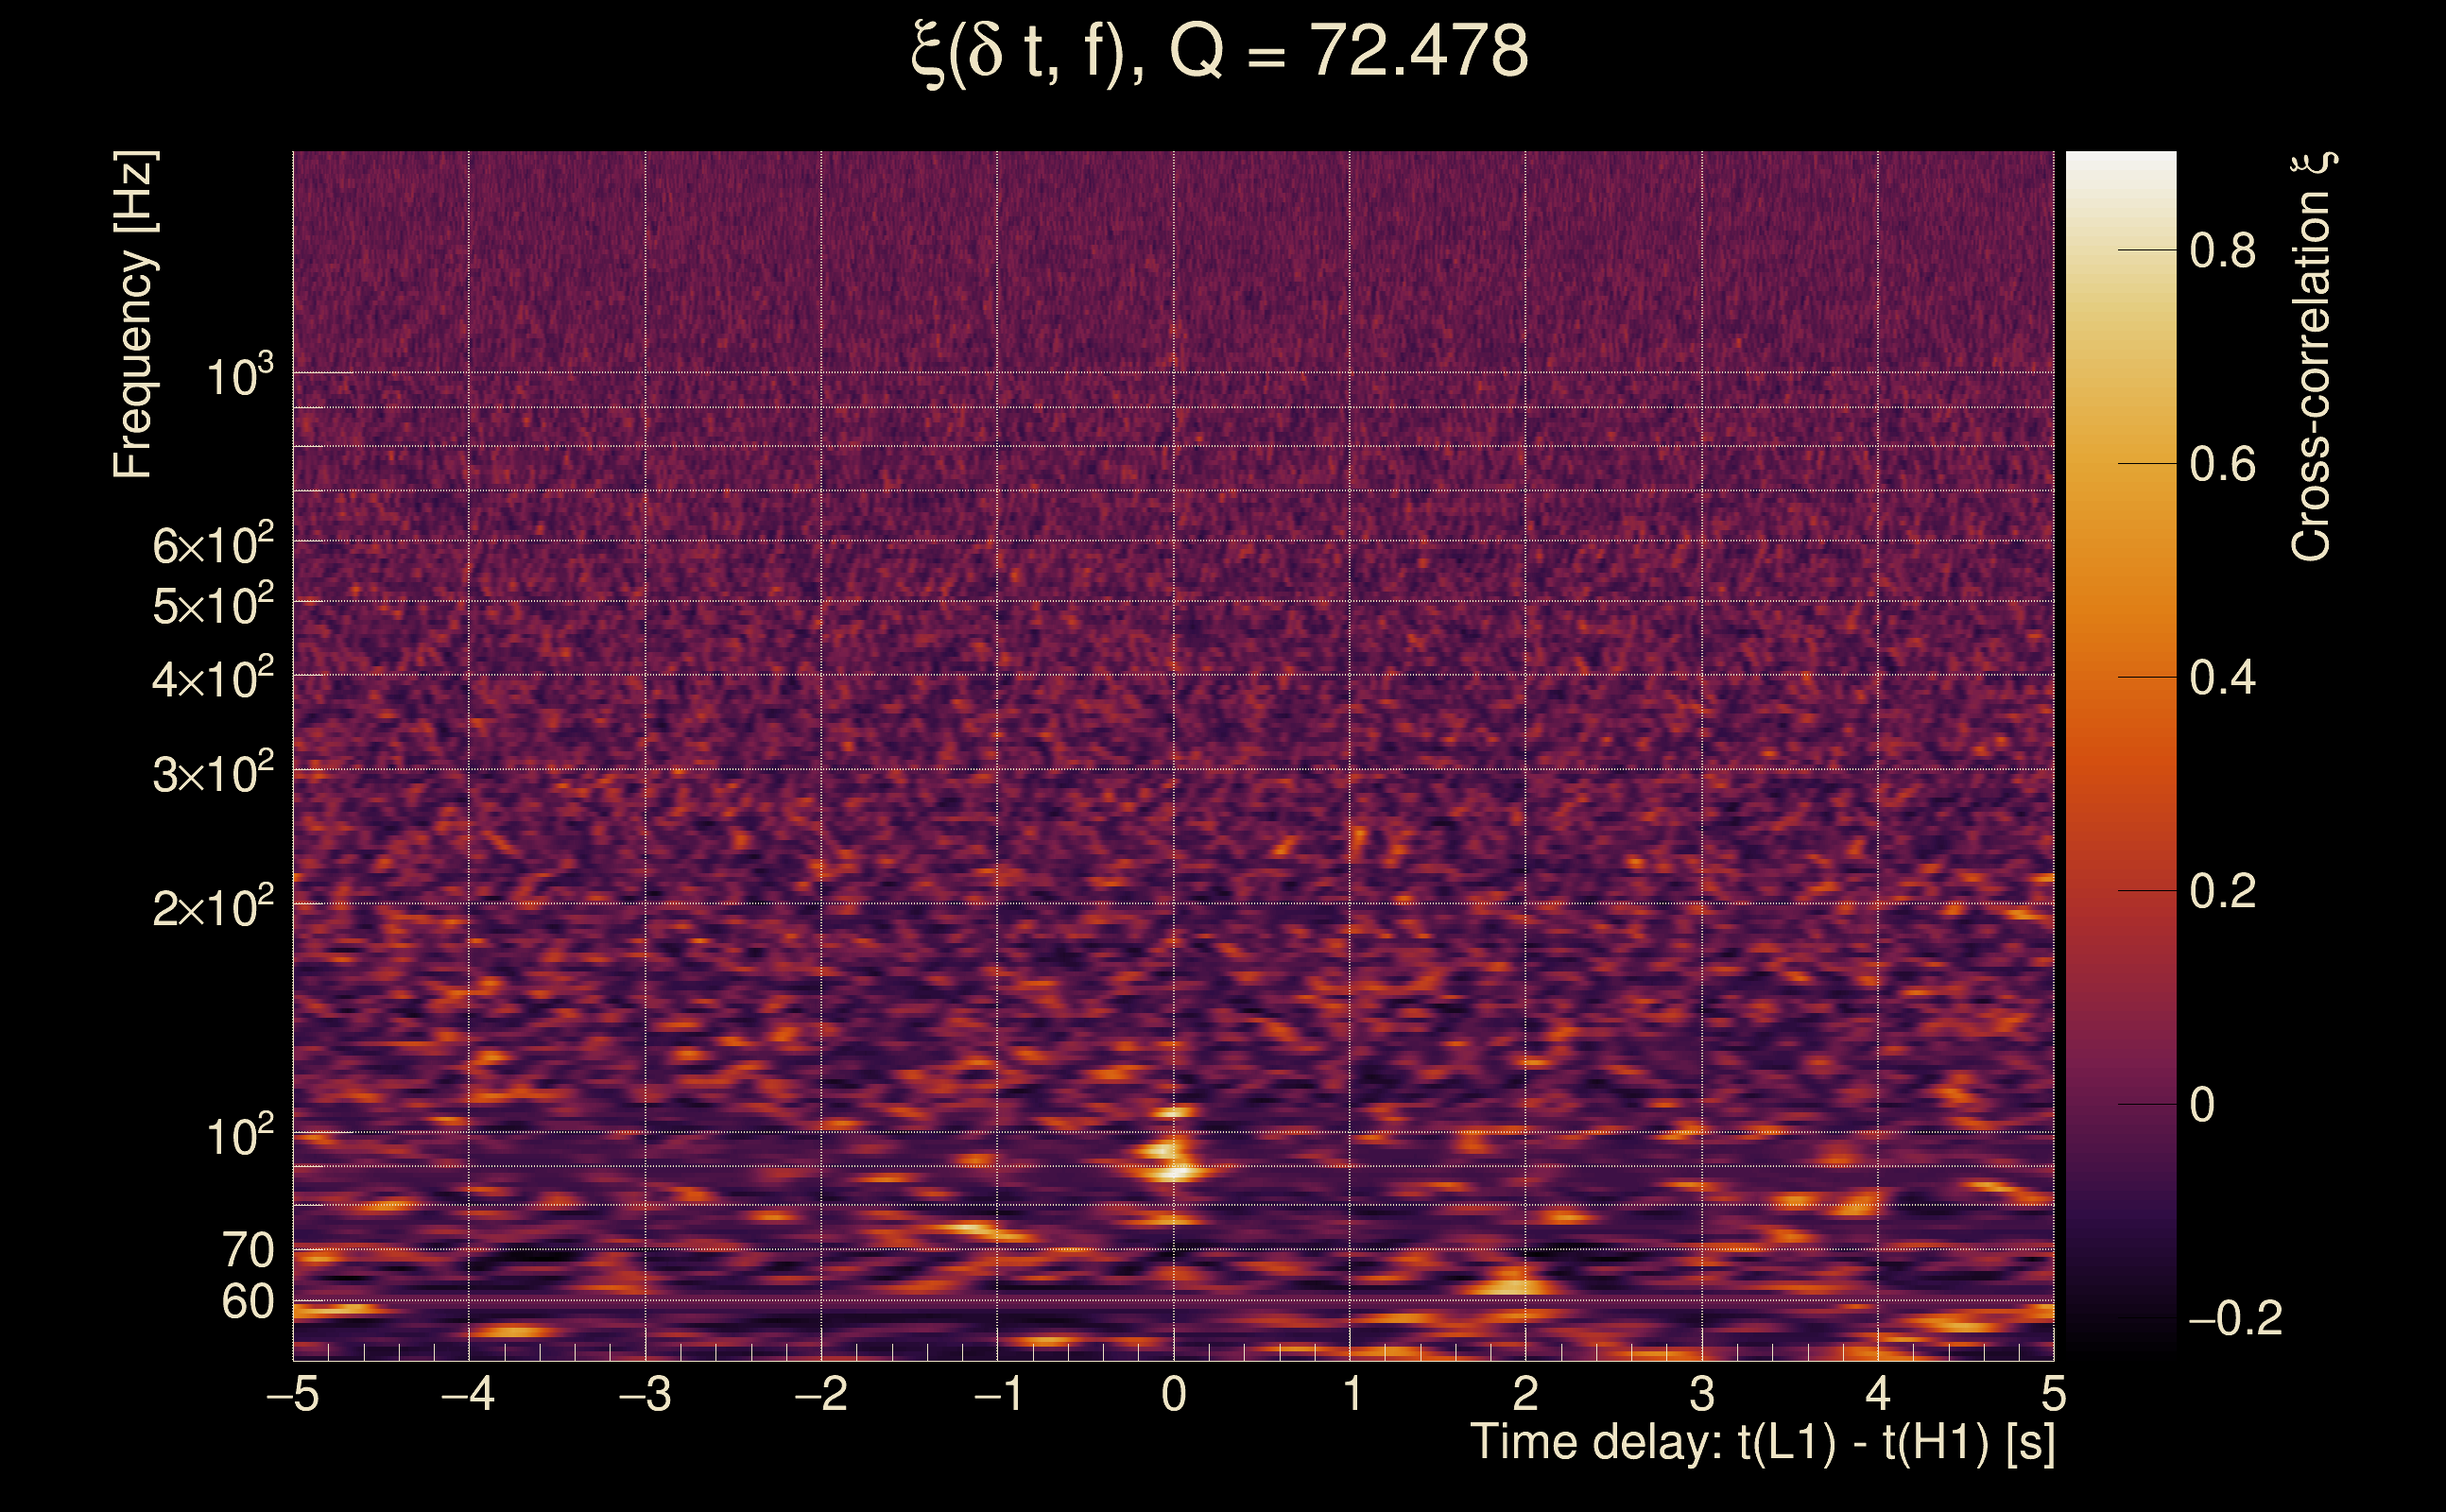
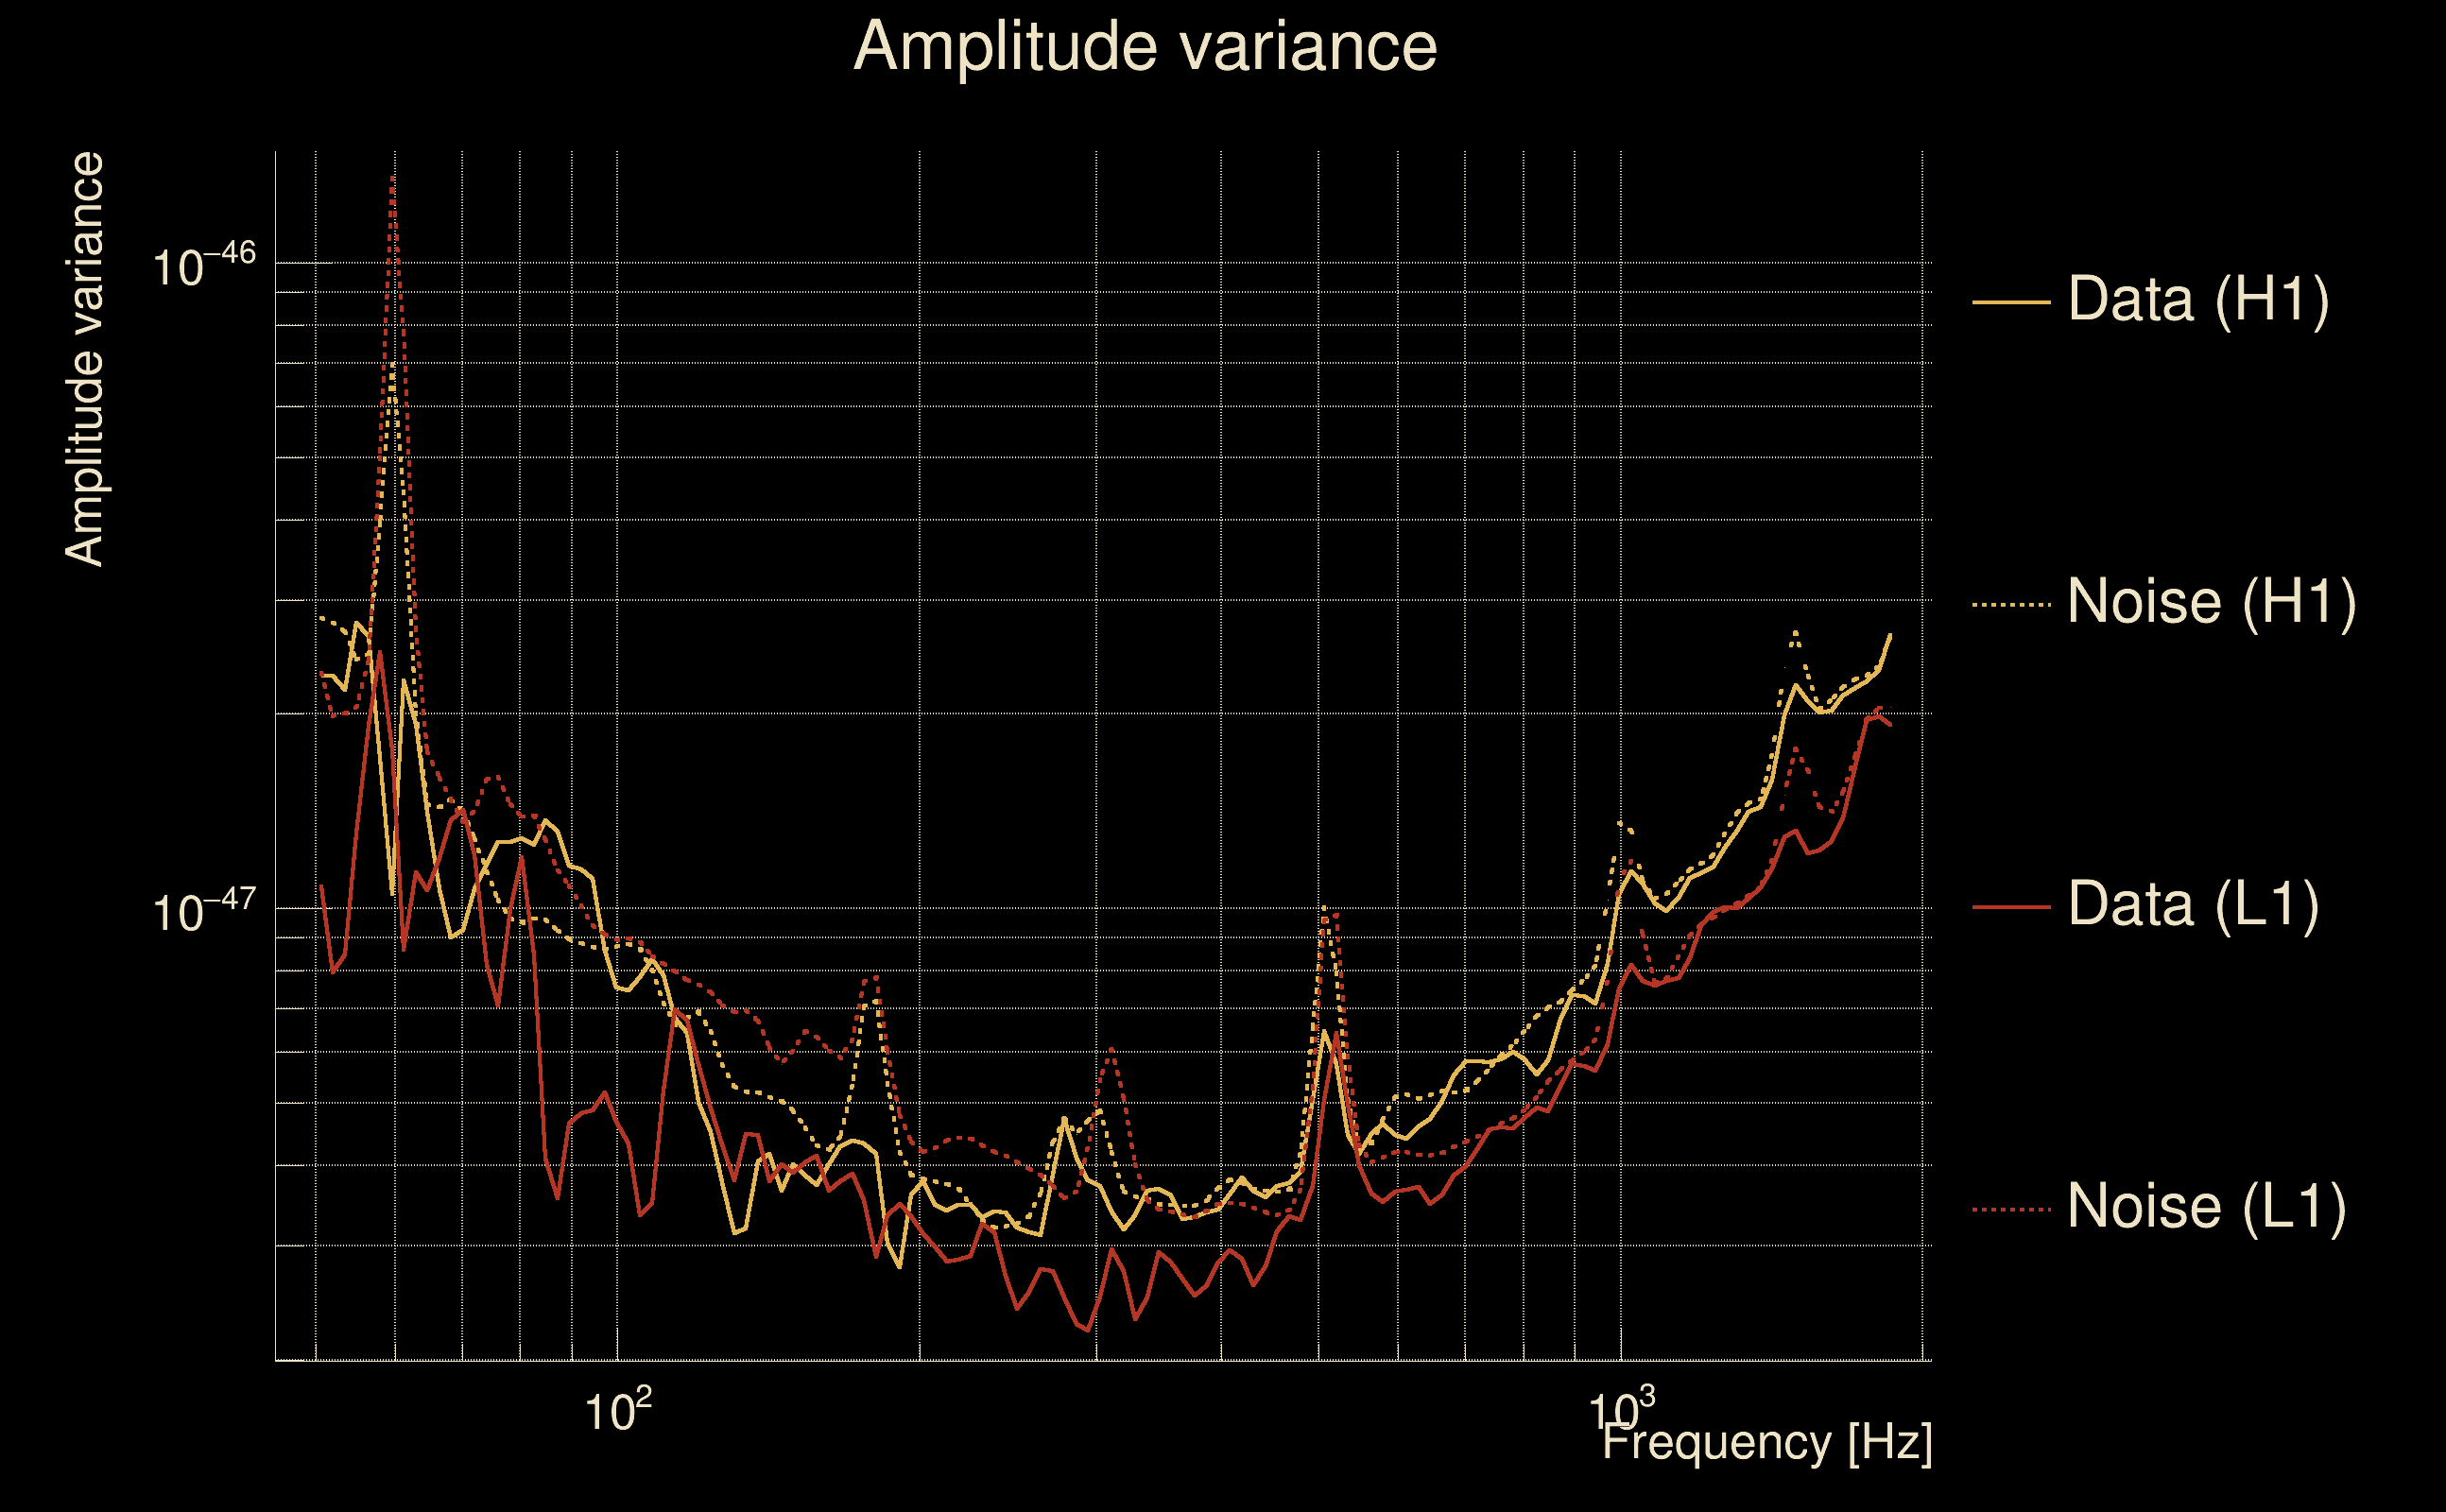
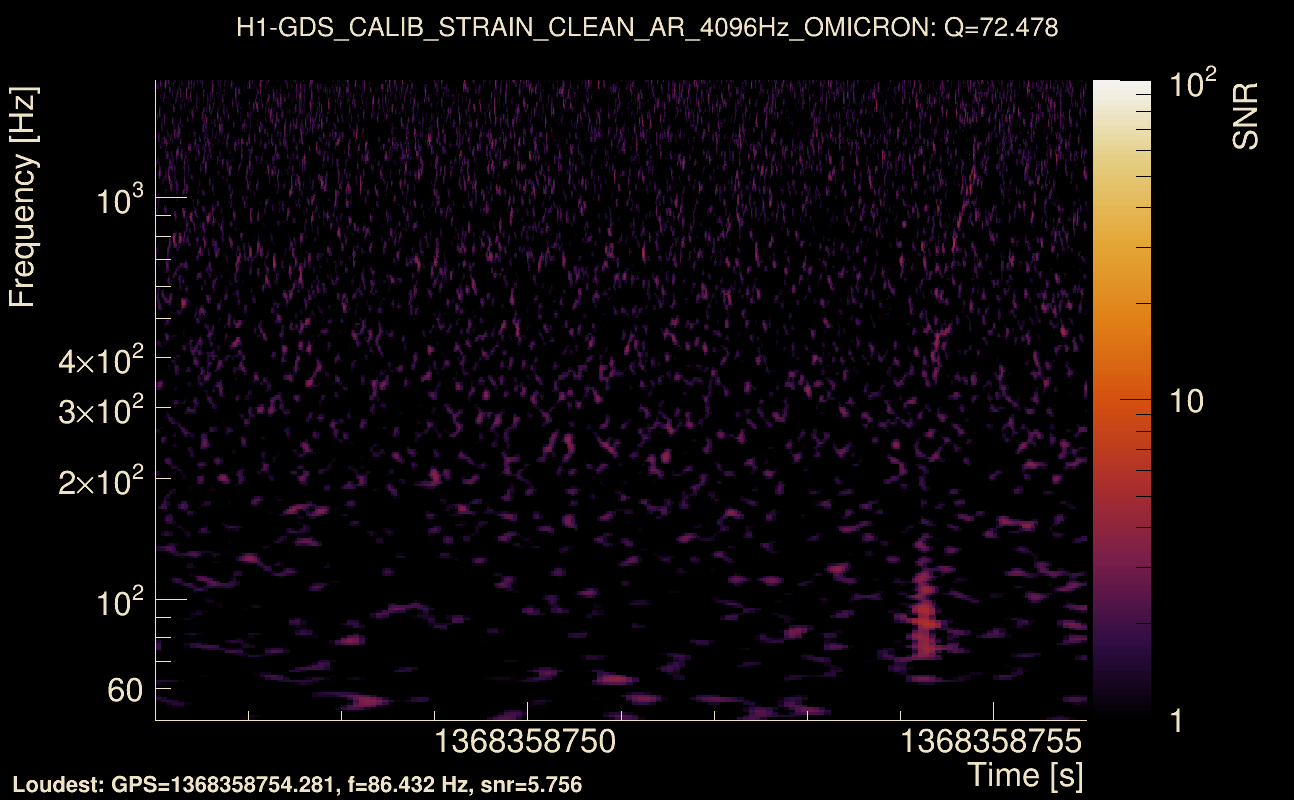
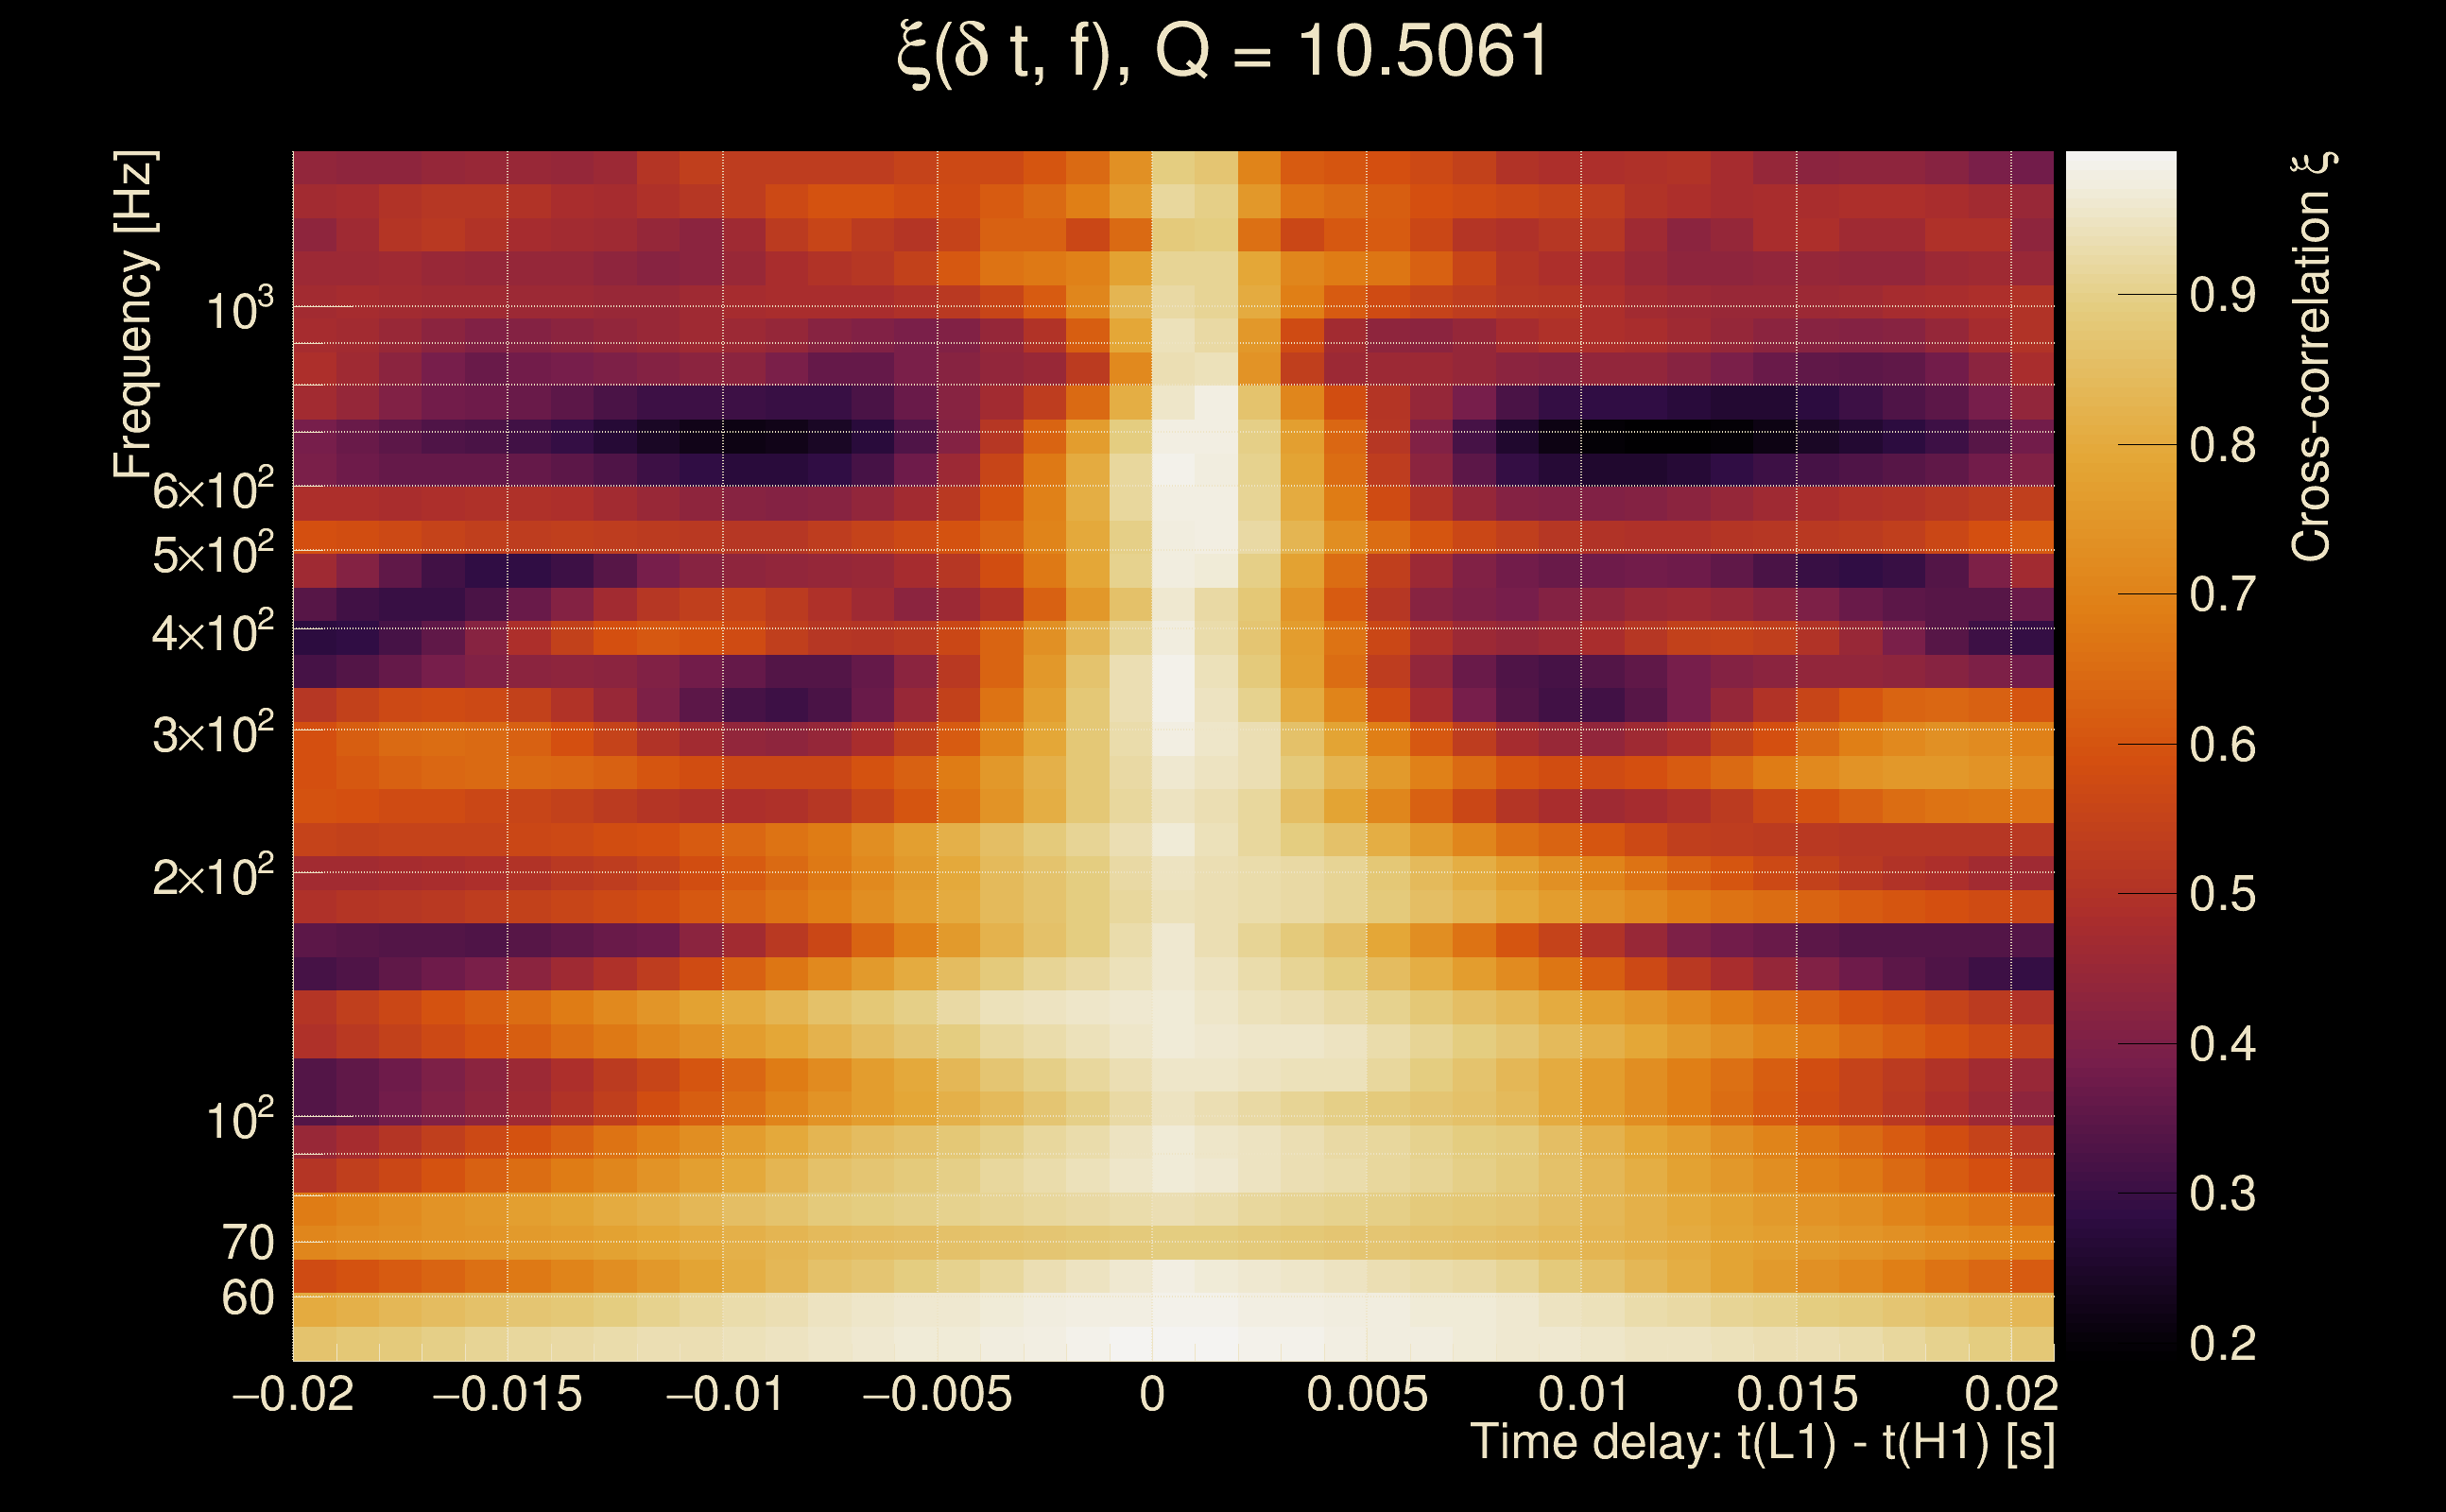
| Event time t(H1): | GPS = 1368358746 (Wed May 17 11:38:48 2023 ) → GPS = 1368358756 (Wed May 17 11:38:58 2023 ) |
| Event time t(L1): | GPS = 1368358746 (Wed May 17 11:38:58 2023 ) → GPS = 1368358756 (Wed May 17 11:38:58 2023 ) |
| Omicron analysis time window (H1): | GPS = 1368358743 → GPS = 1368358759 |
| Omicron analysis time window (L1): | GPS = 1368358743 → GPS = 1368358759 |
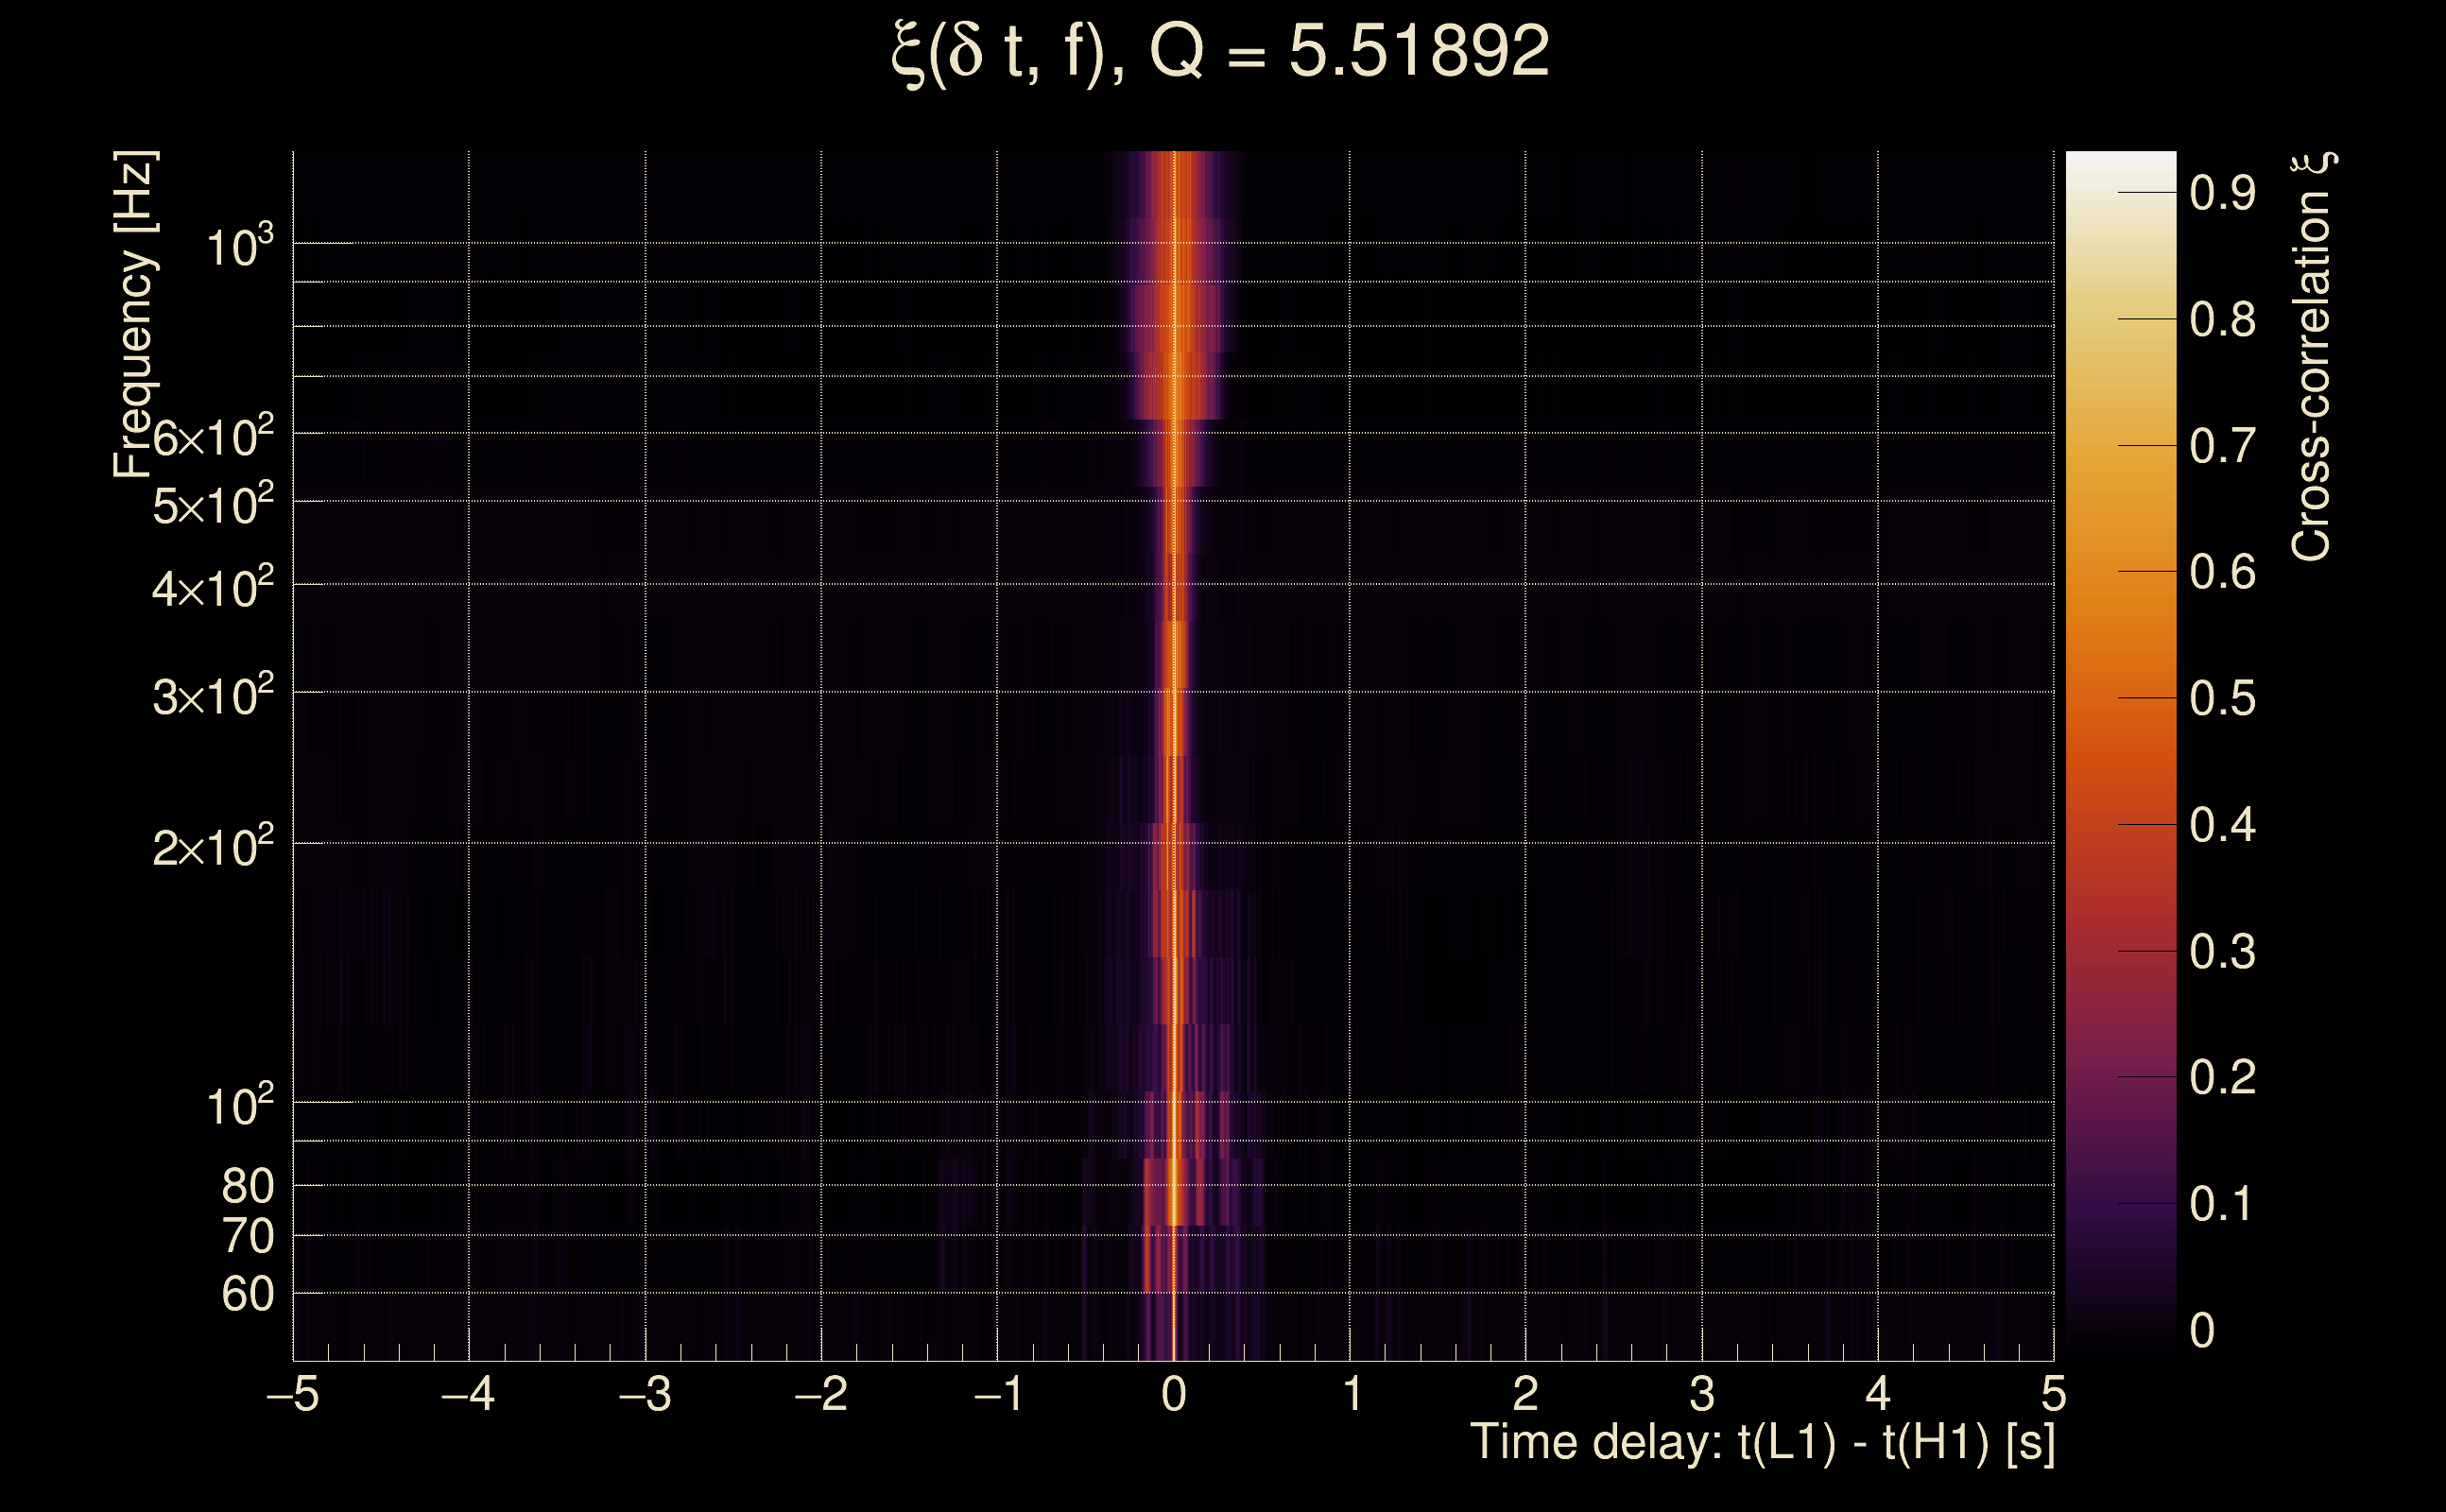
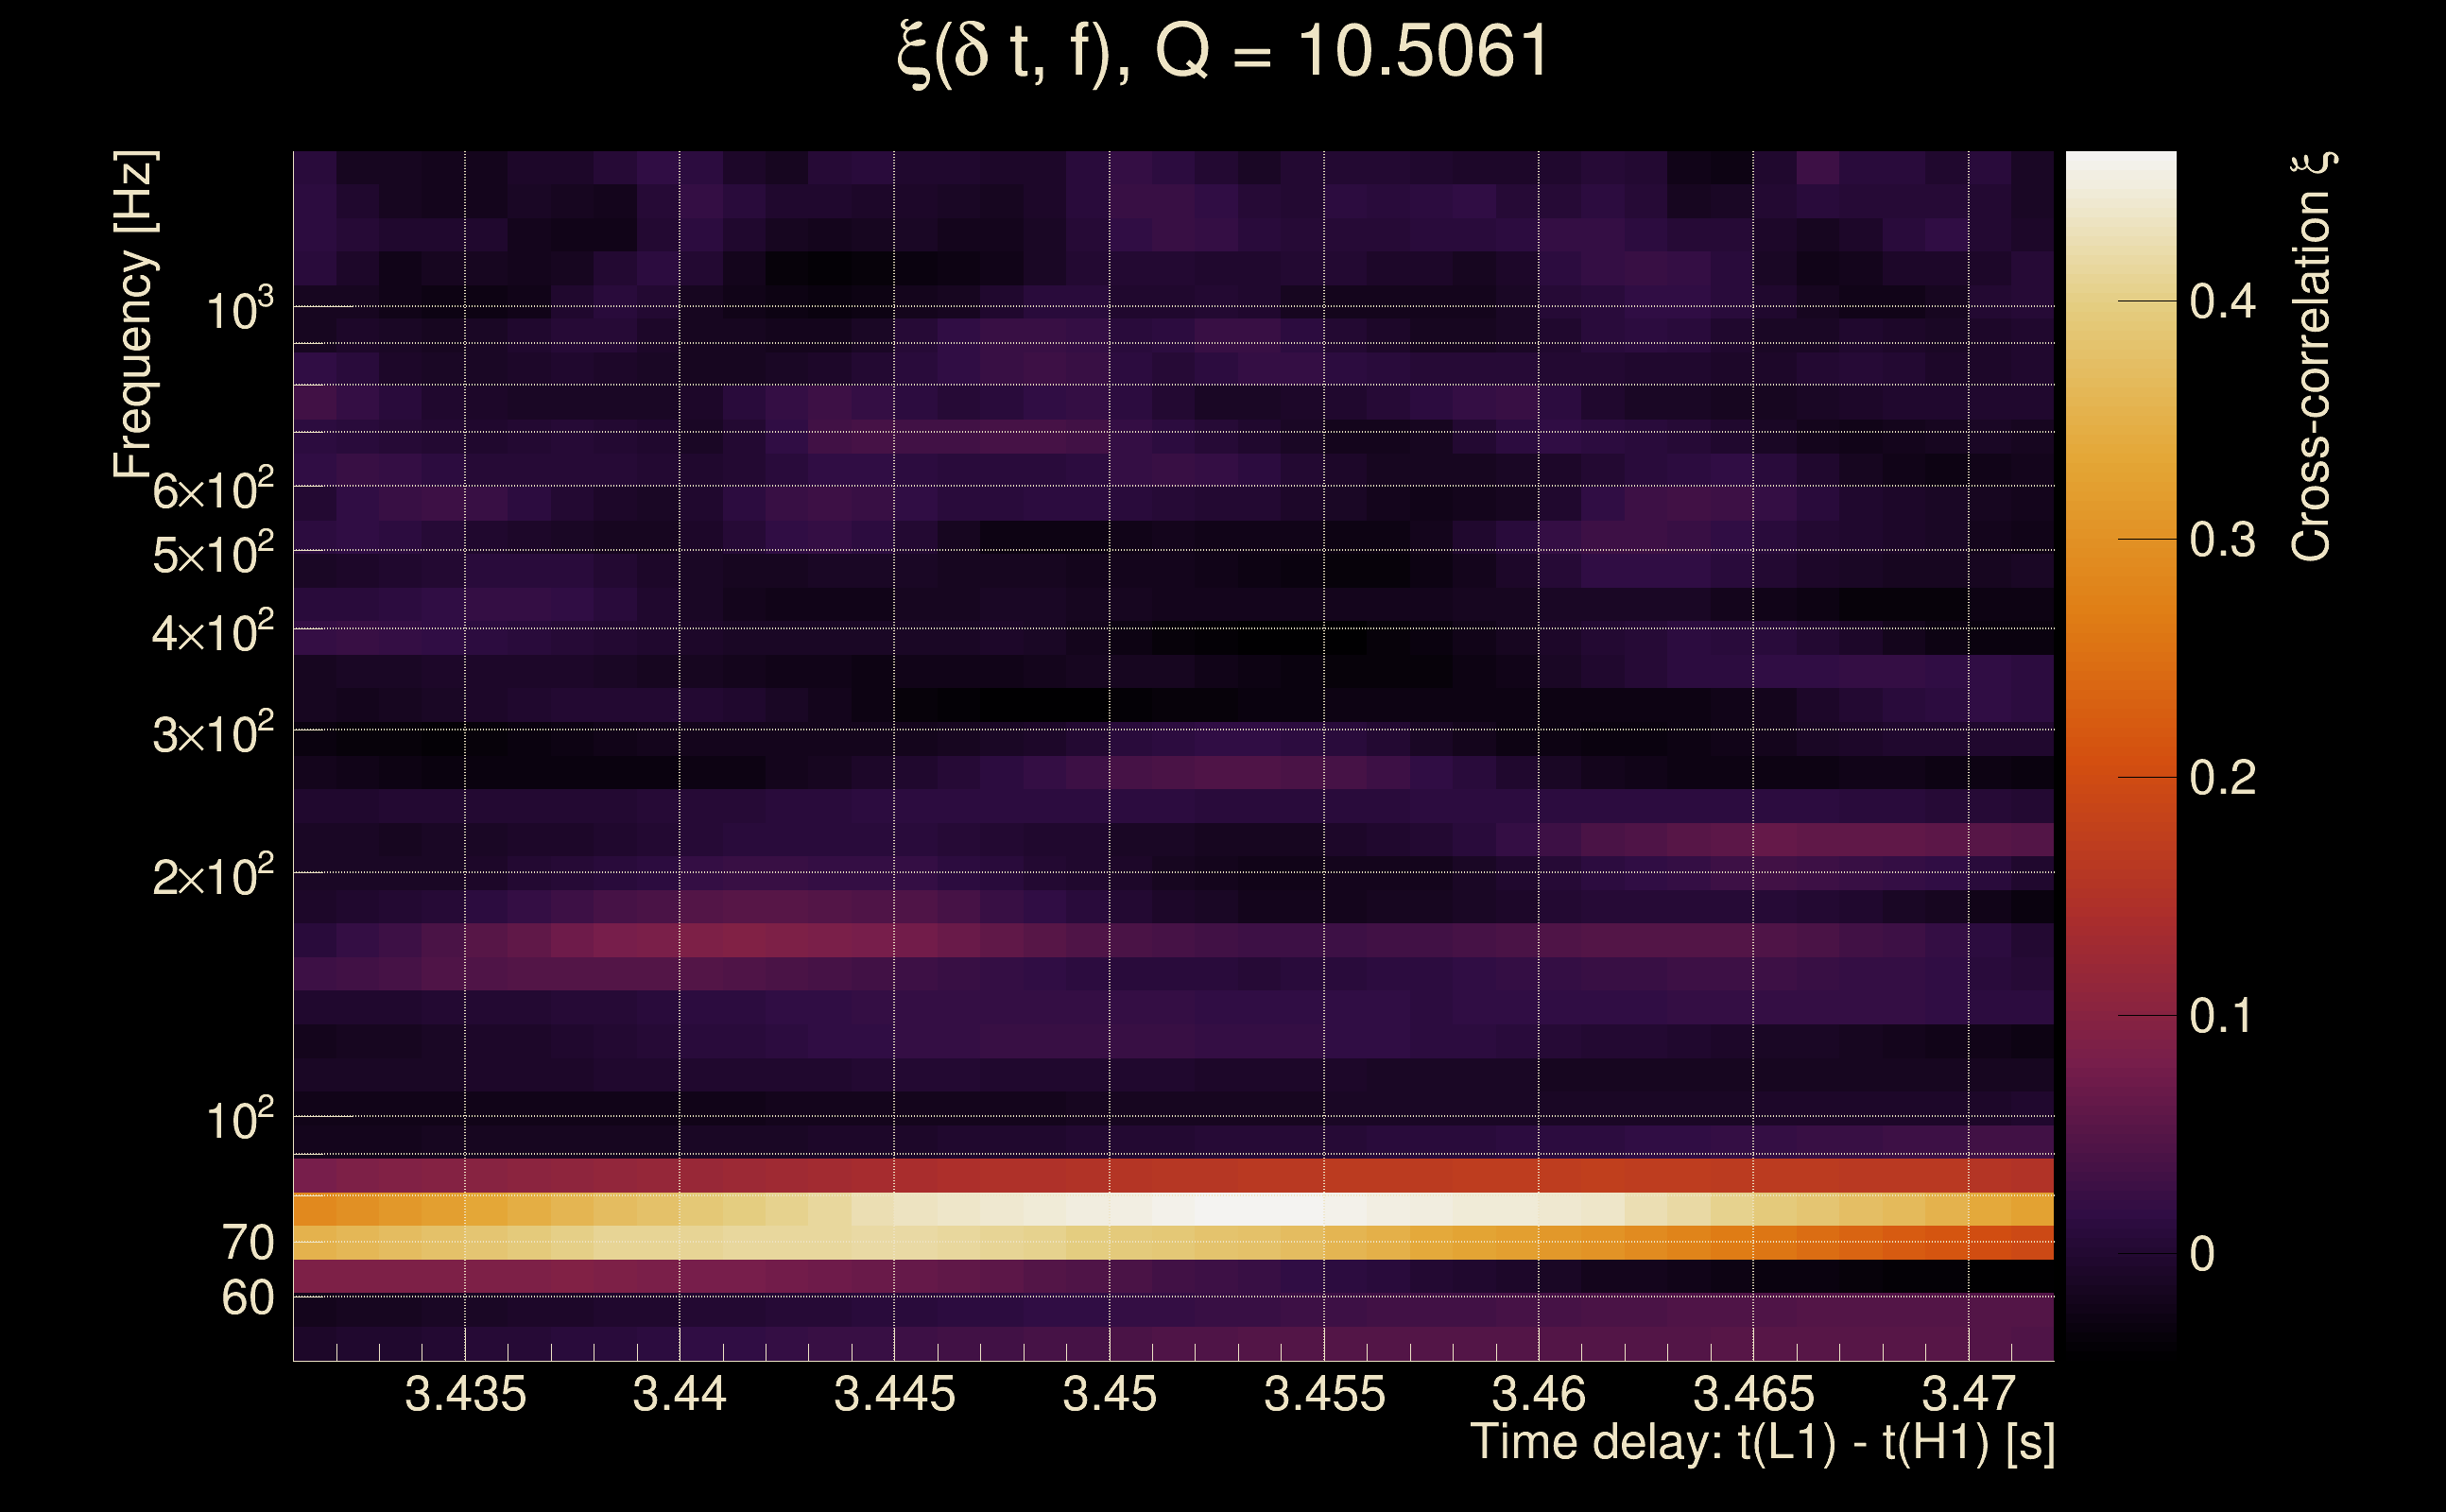
| Time delay between detectors t(L1) - t(H1): | 3.45144 s (slice index = 33 / 217), δt_gw = 0.00144275 s |
| Time delay standard deviation: | 0.0733599 s |
| [targeted mode] Time delay probability: | 0.182828 (1.3321 sigmas), δt_target = 0.00235391 s |
| Frequency: | 79.1949 Hz |
| Ξ: | 0.033862 ± 0.0824587 (variance = 0.00679943): Q0: 0.191601, Q1: 0.347739, Q2: 0.422909, Q3: 0.348523, Q4: 0.244219 |
| Rank: | R_A = 0.01173 |
| Log of amplitude ratio (L1/H1): | -0.326442, variance = 0.361856 (L1/H1: -0.627425, variance = 0.518443, H1/L1: -0.624514, variance = 1.08531) |
| Amplitude ratio (L1/H1): | 0.721486 ⋇ 1.82494 (L1/H1: 0.533965 ⋇ 2.05449, H1/L1: 0.535522 ⋇ 2.83426) |
| Amplitude ratio H1|L1 compatibility (probability): | 0.322866 |
| Antenna factor probability: | 0.868052 |
| Number of rejected frequency rows: | Q0: 14 / 18, Q1: 33 / 36, Q2: 65 / 70, Q3: 131 / 134, Q4: 250 / 258 |
| Maximum signal-to-noise ratio: | H1: 11.4438, L1: 6.43815 |
| SNR variance: | H1: 0.472381, L1: 0.479349 |
| Click here for a zoomed plot | Click here for a zoomed plot | Click here for a zoomed plot | Click here for a zoomed plot | Click here for a zoomed plot |
 |
 |
 |
 |
 |
 |
 |
 |
 |
 |
 |
 |
 |
 |
 |
 |
 |
 |
 |
 |
 |
 |
 |
 |
 |
 |
 |
 |
 |
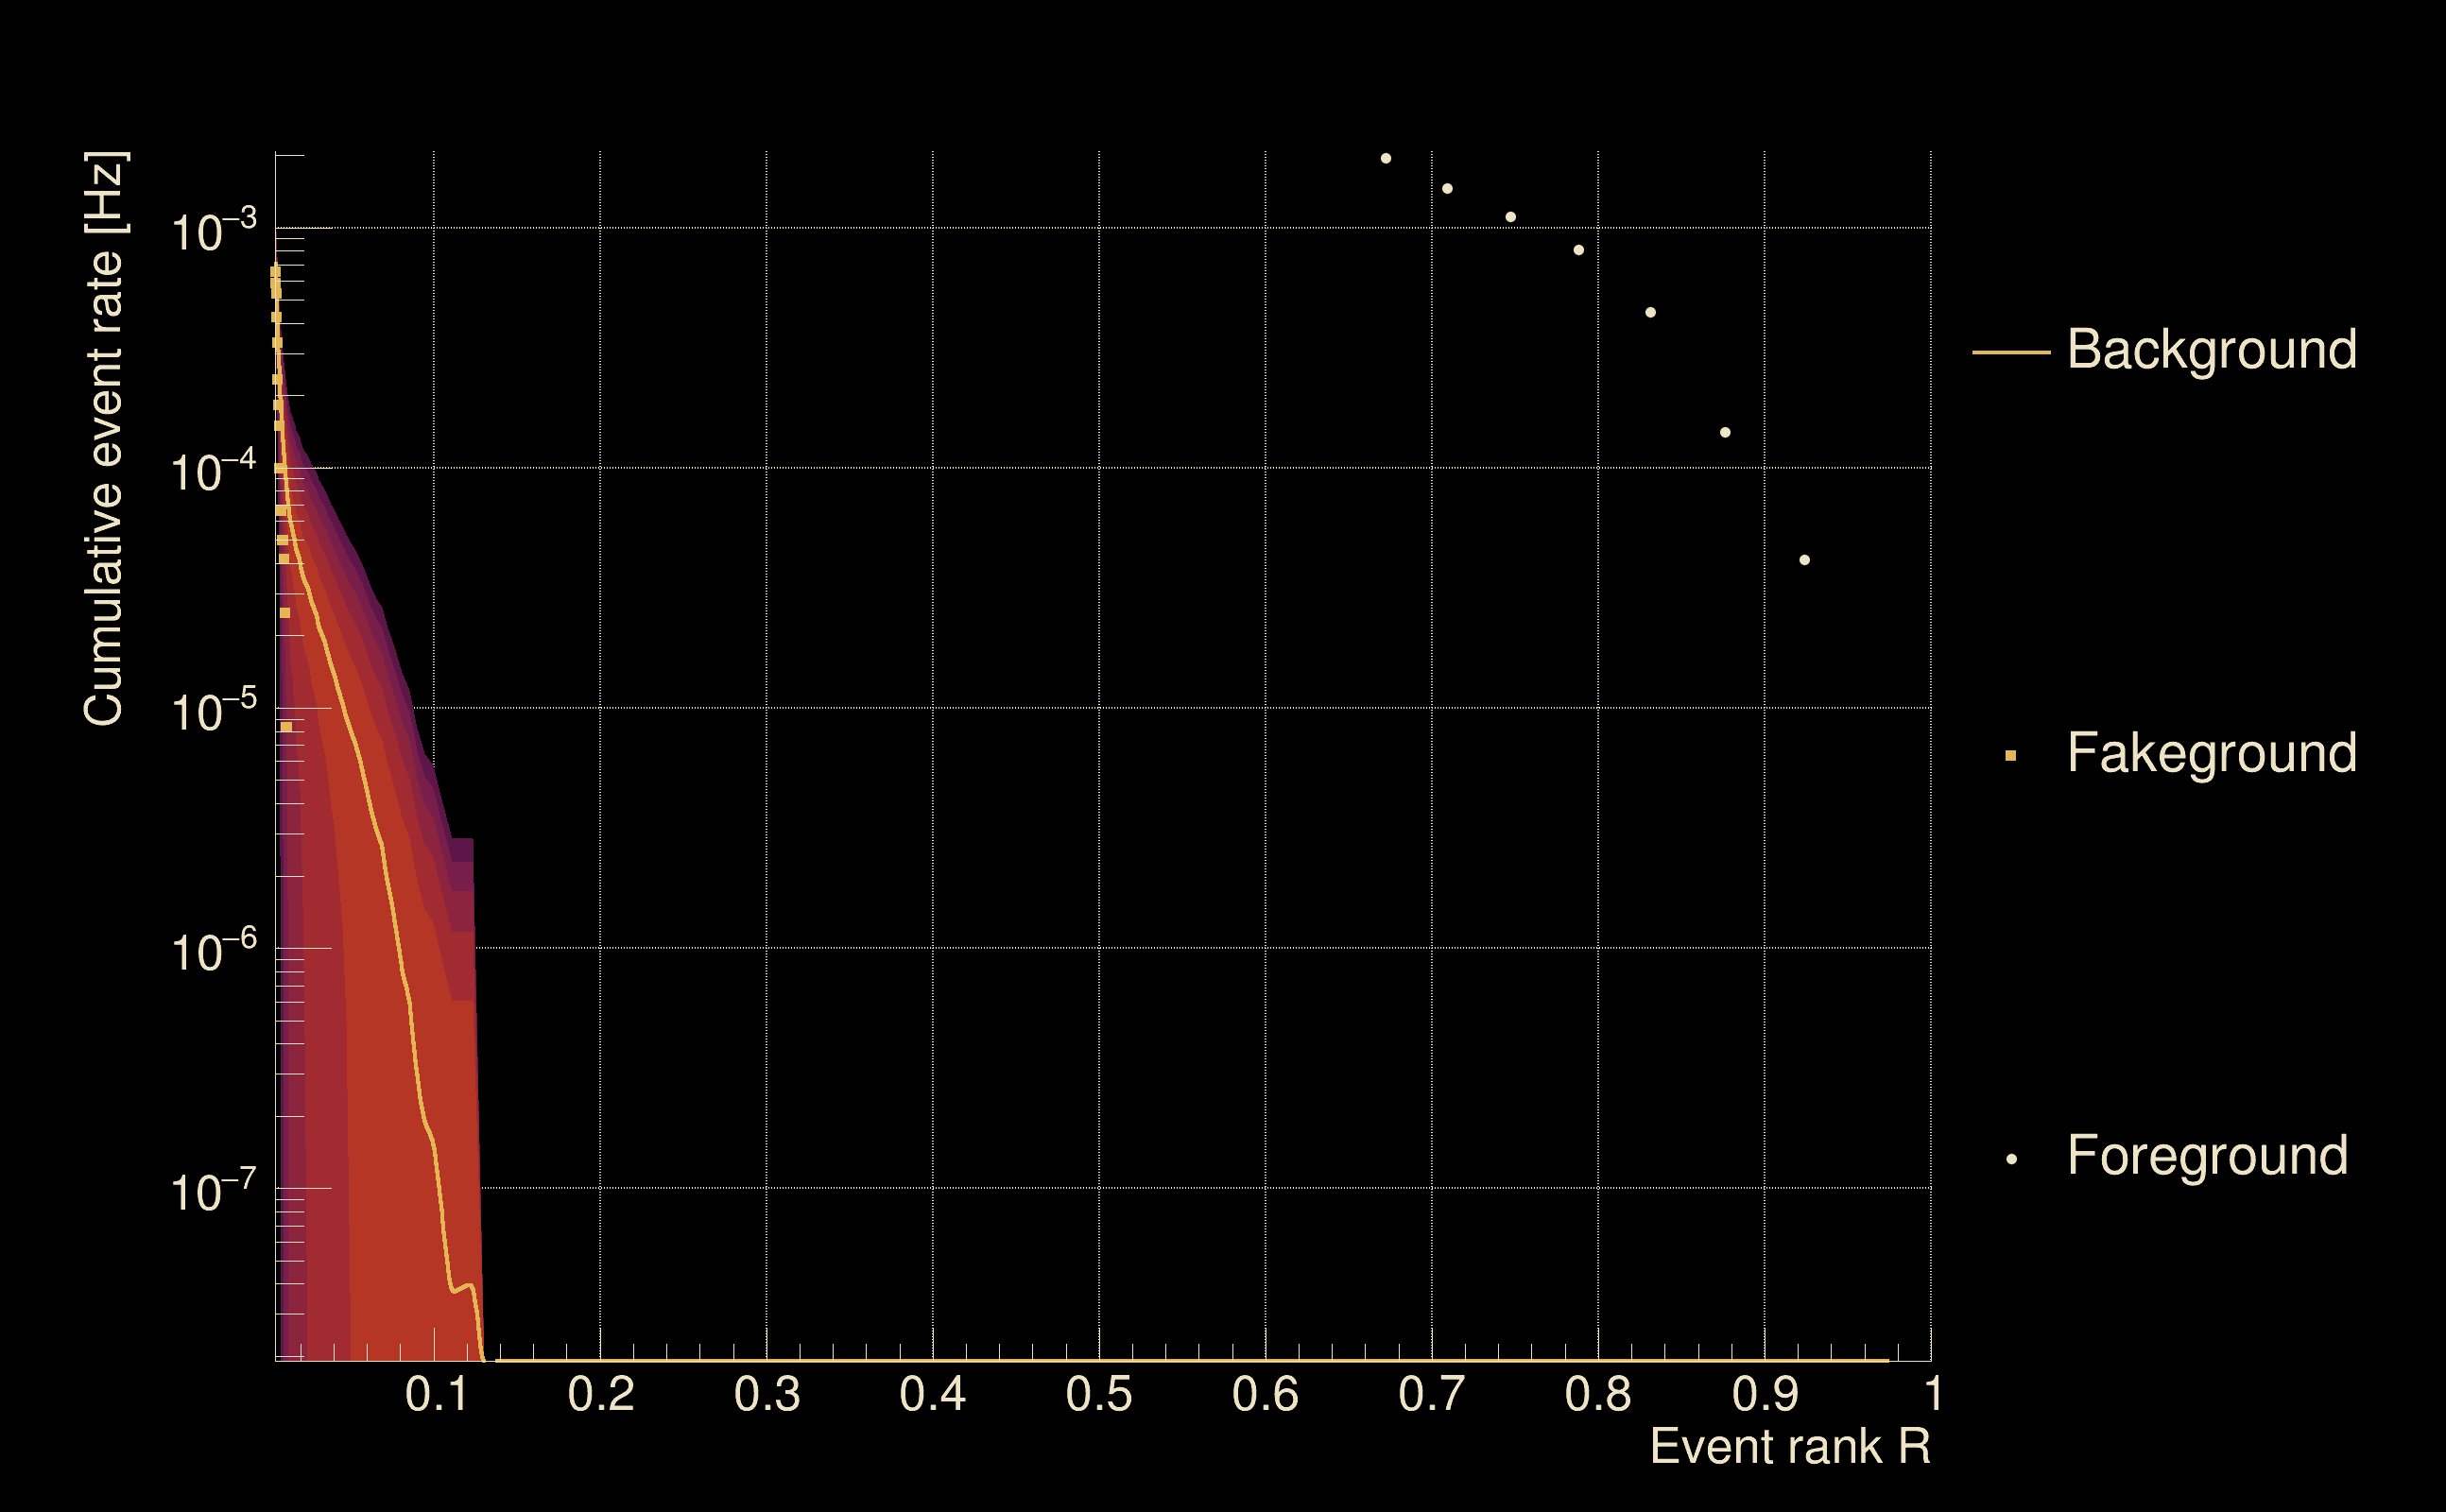
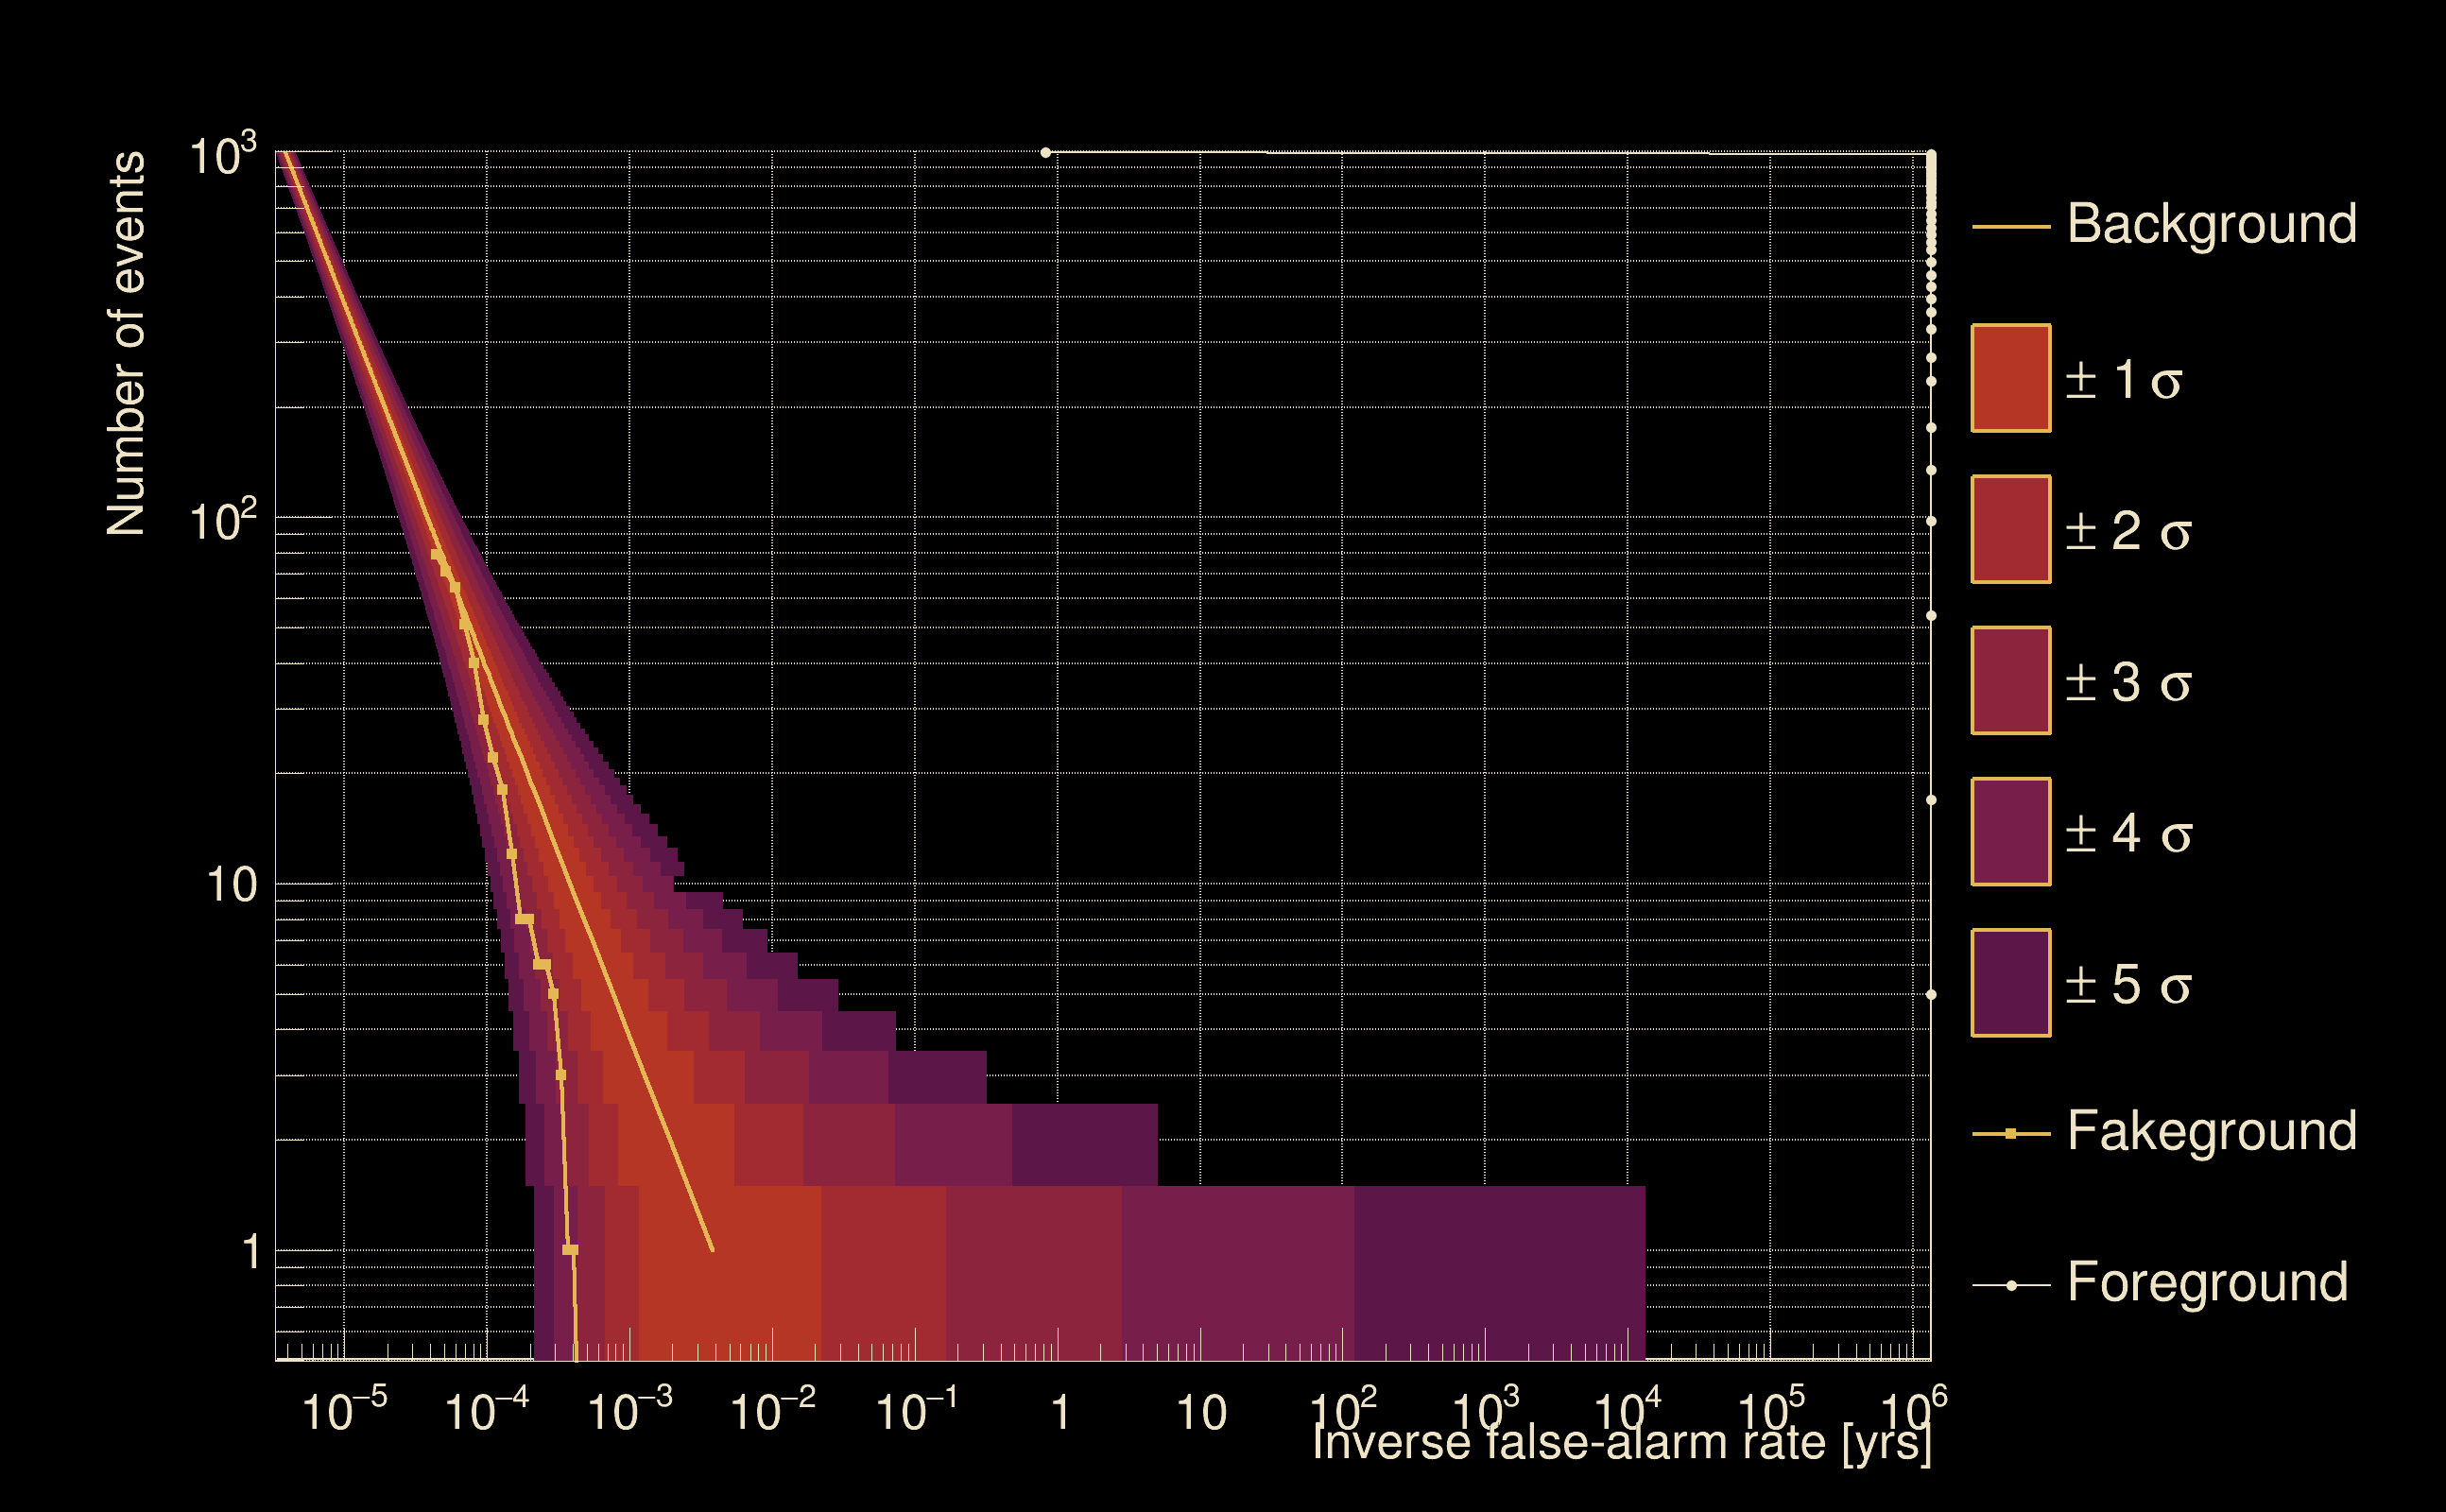
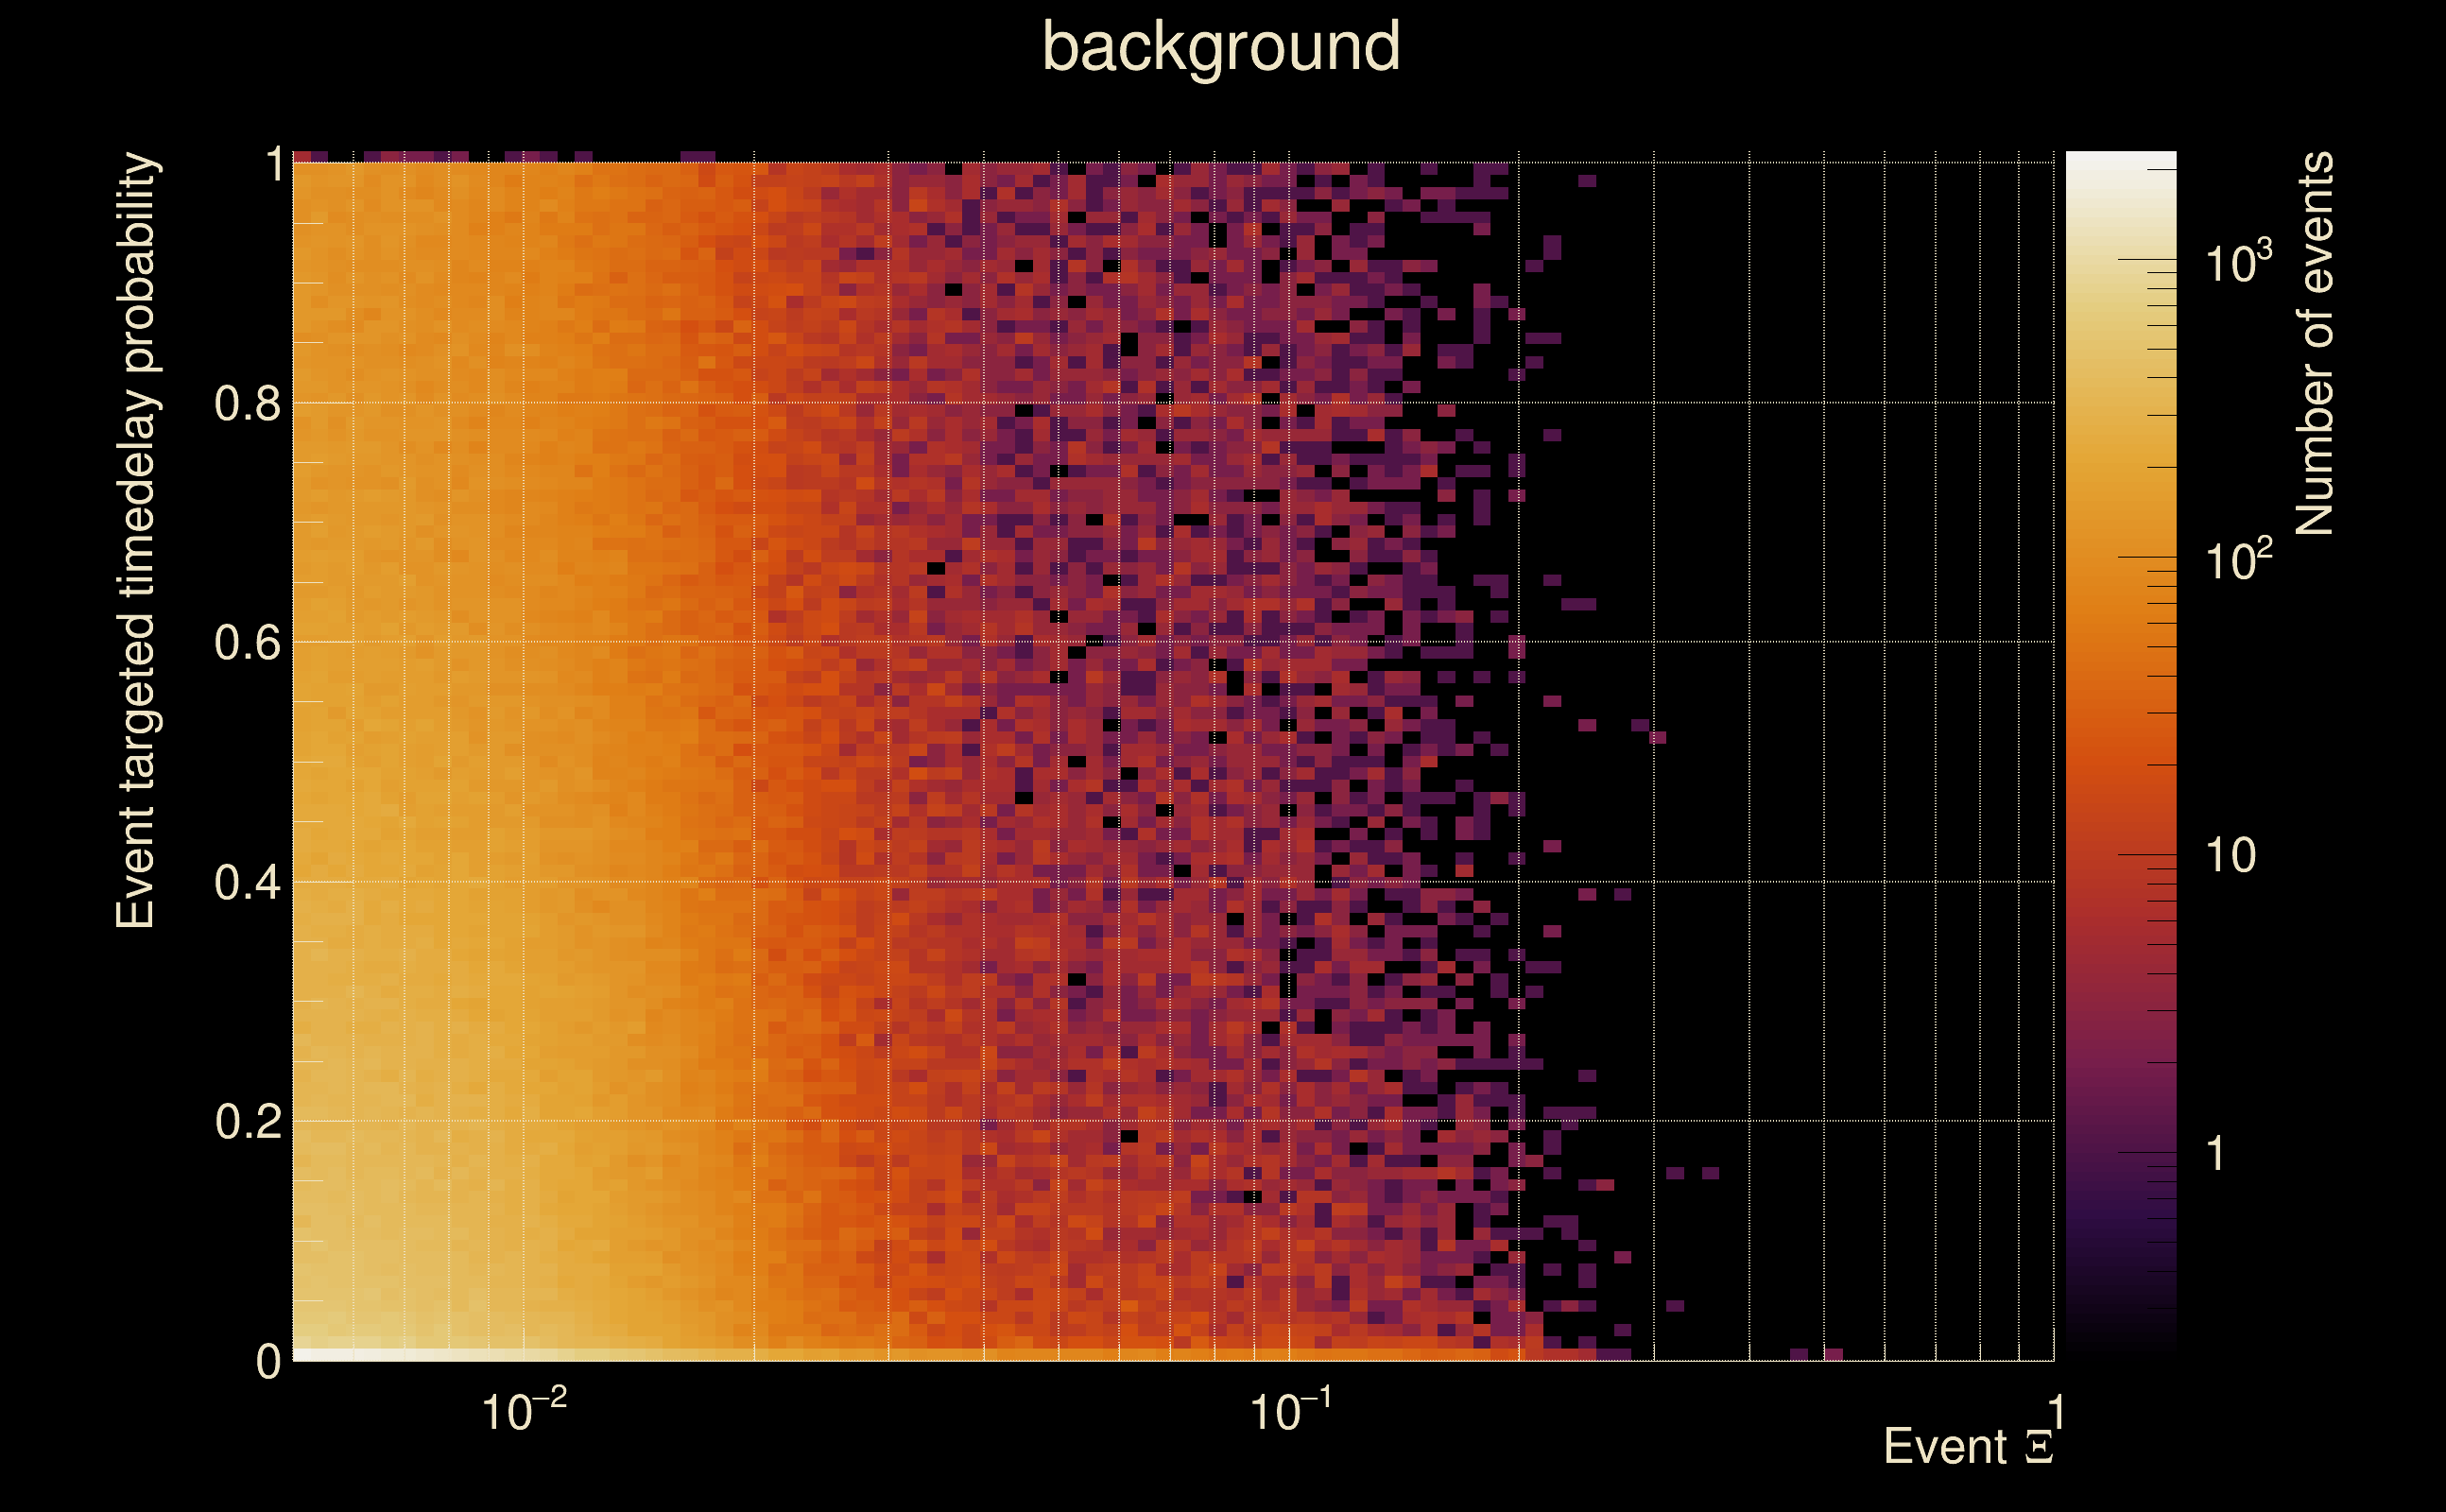
| Detection threshold: | R > 0.0314818 |
| False-alarm rate above that detection threshold: | 2.08857e-05 |
| Alternative threshold at 1/1000 yrs: | R > 0.12338 |
| Alternative threshold at 1/100 yrs: | R > 0.12338 |
| Alternative threshold at 1/10 yrs: | R > 0.12338 |
| Alternative threshold at 1/1 yr: | R > 0.12338 |
| Alternative threshold at 1/1 d: | R > 0.0427748 |
 |
|
 |
 |
 |
 |
 |
 |
 |
 |
 |
 |
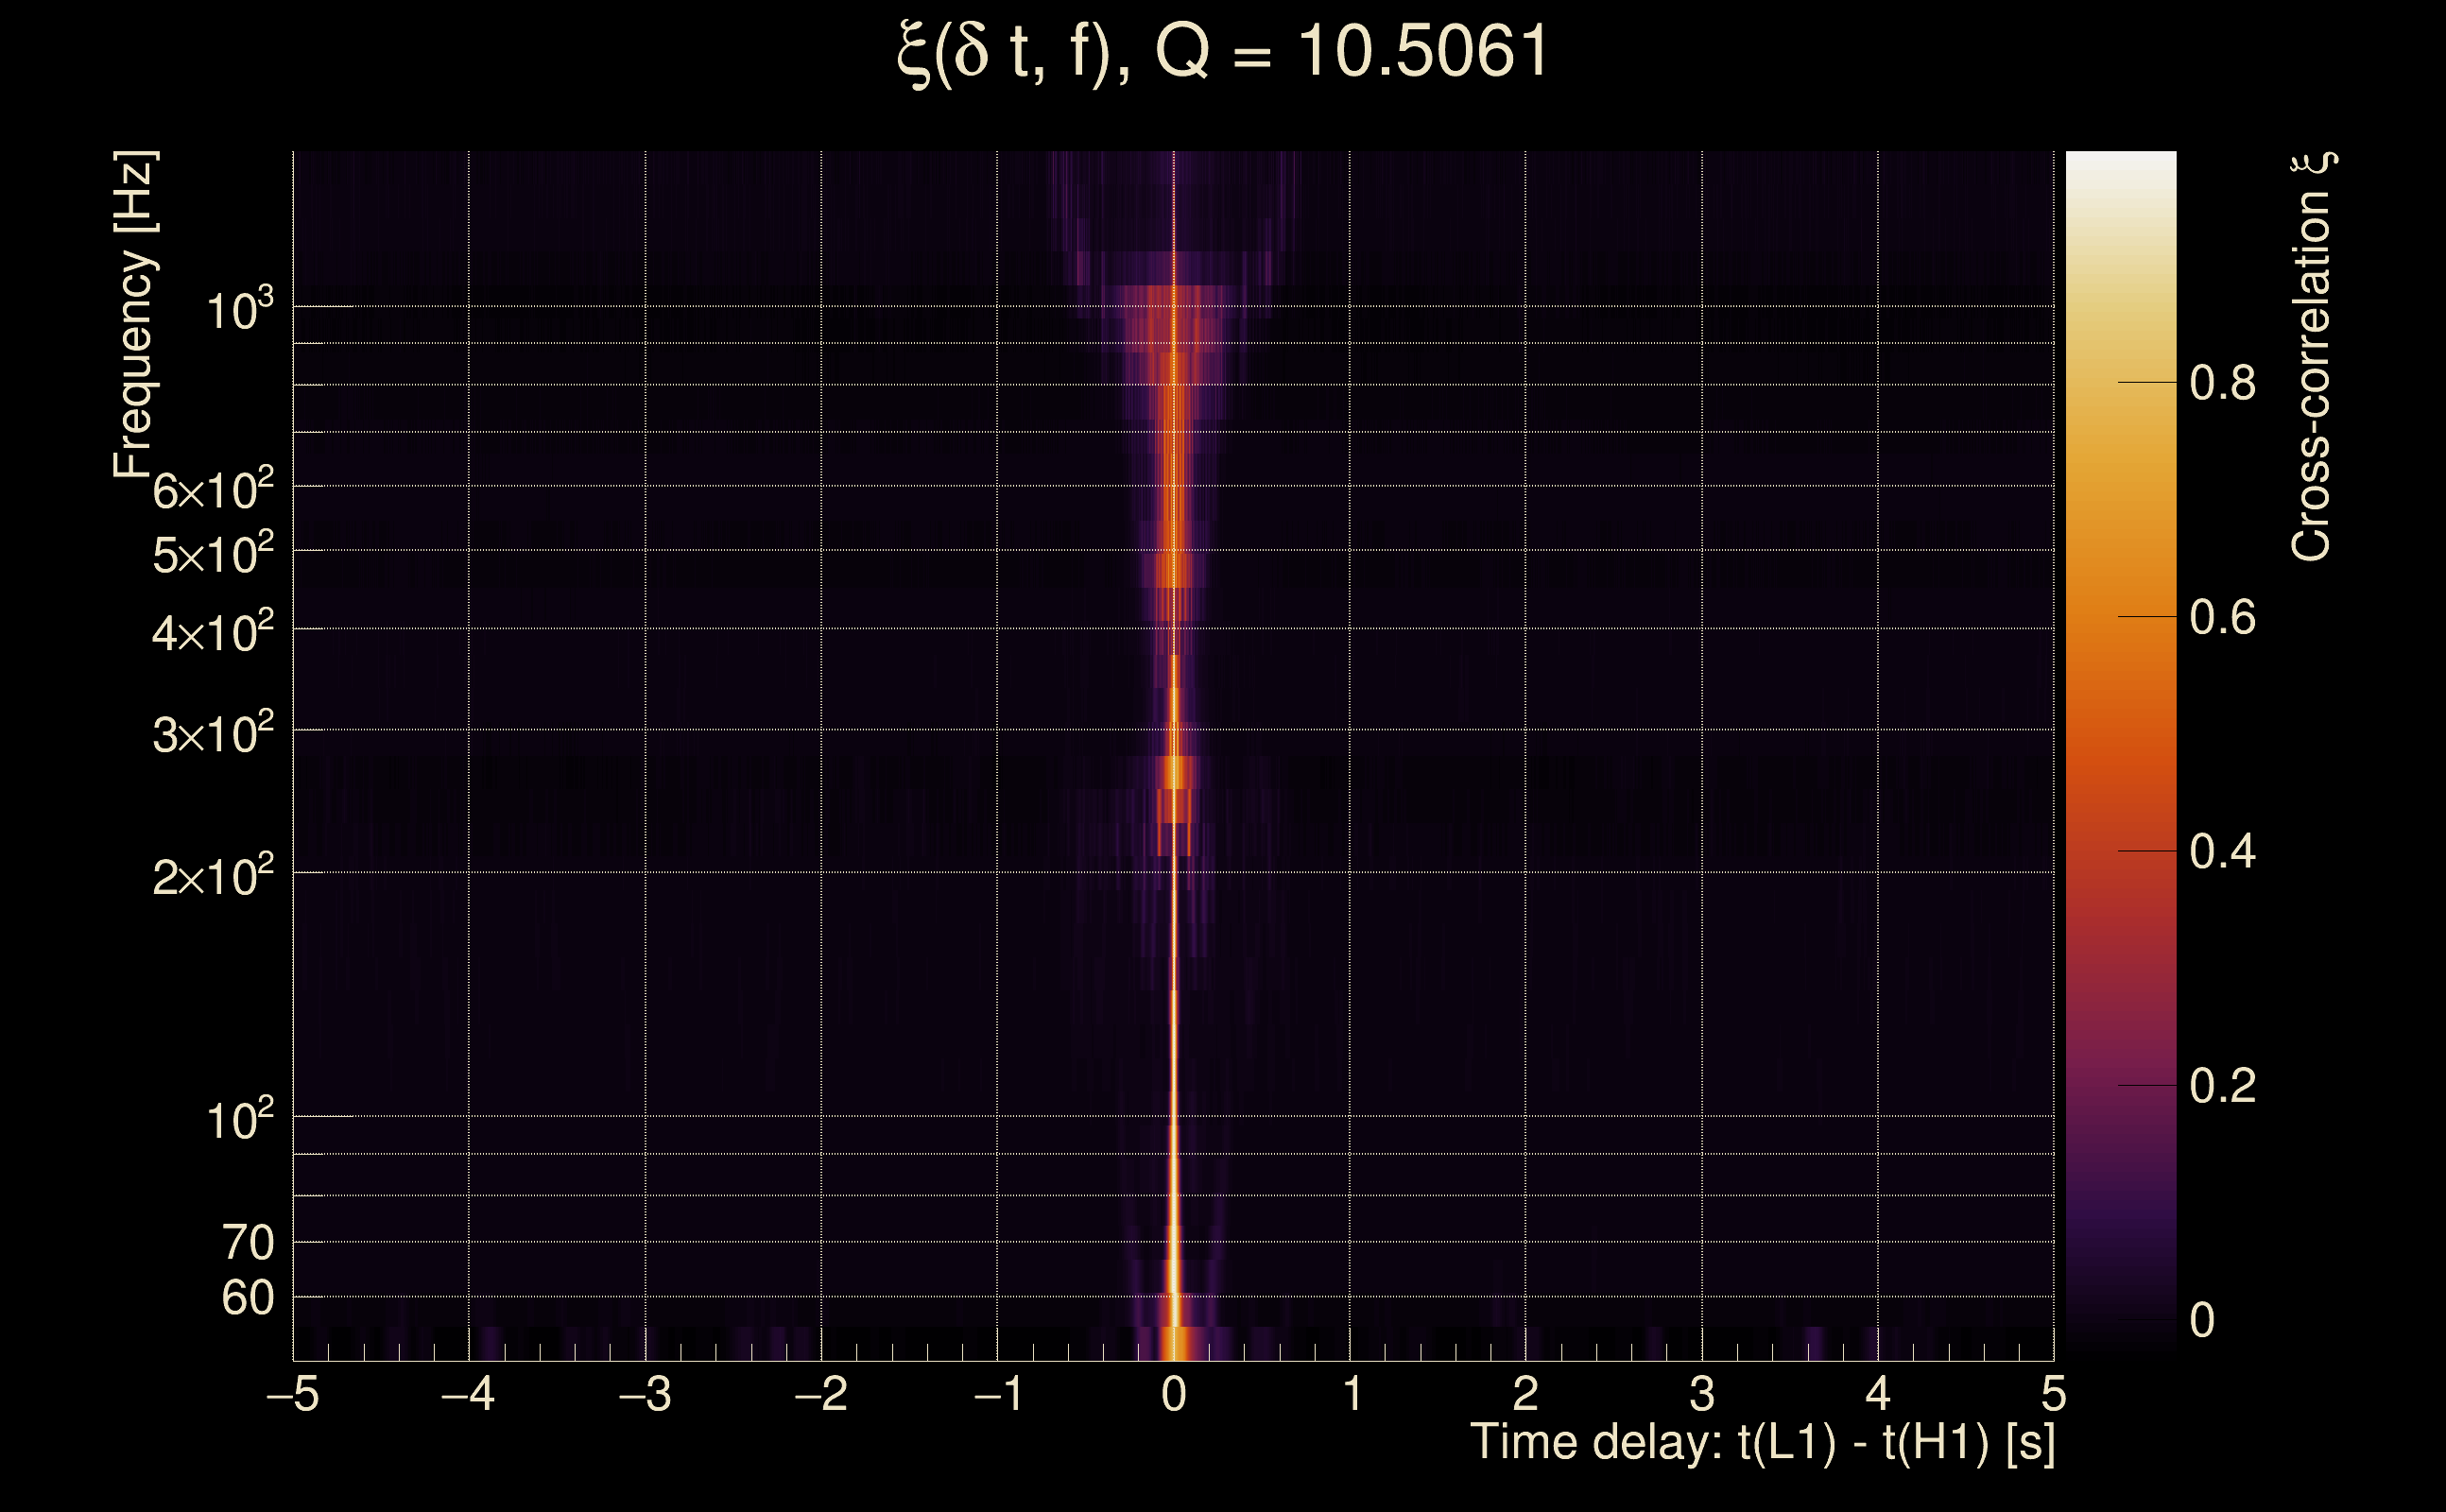
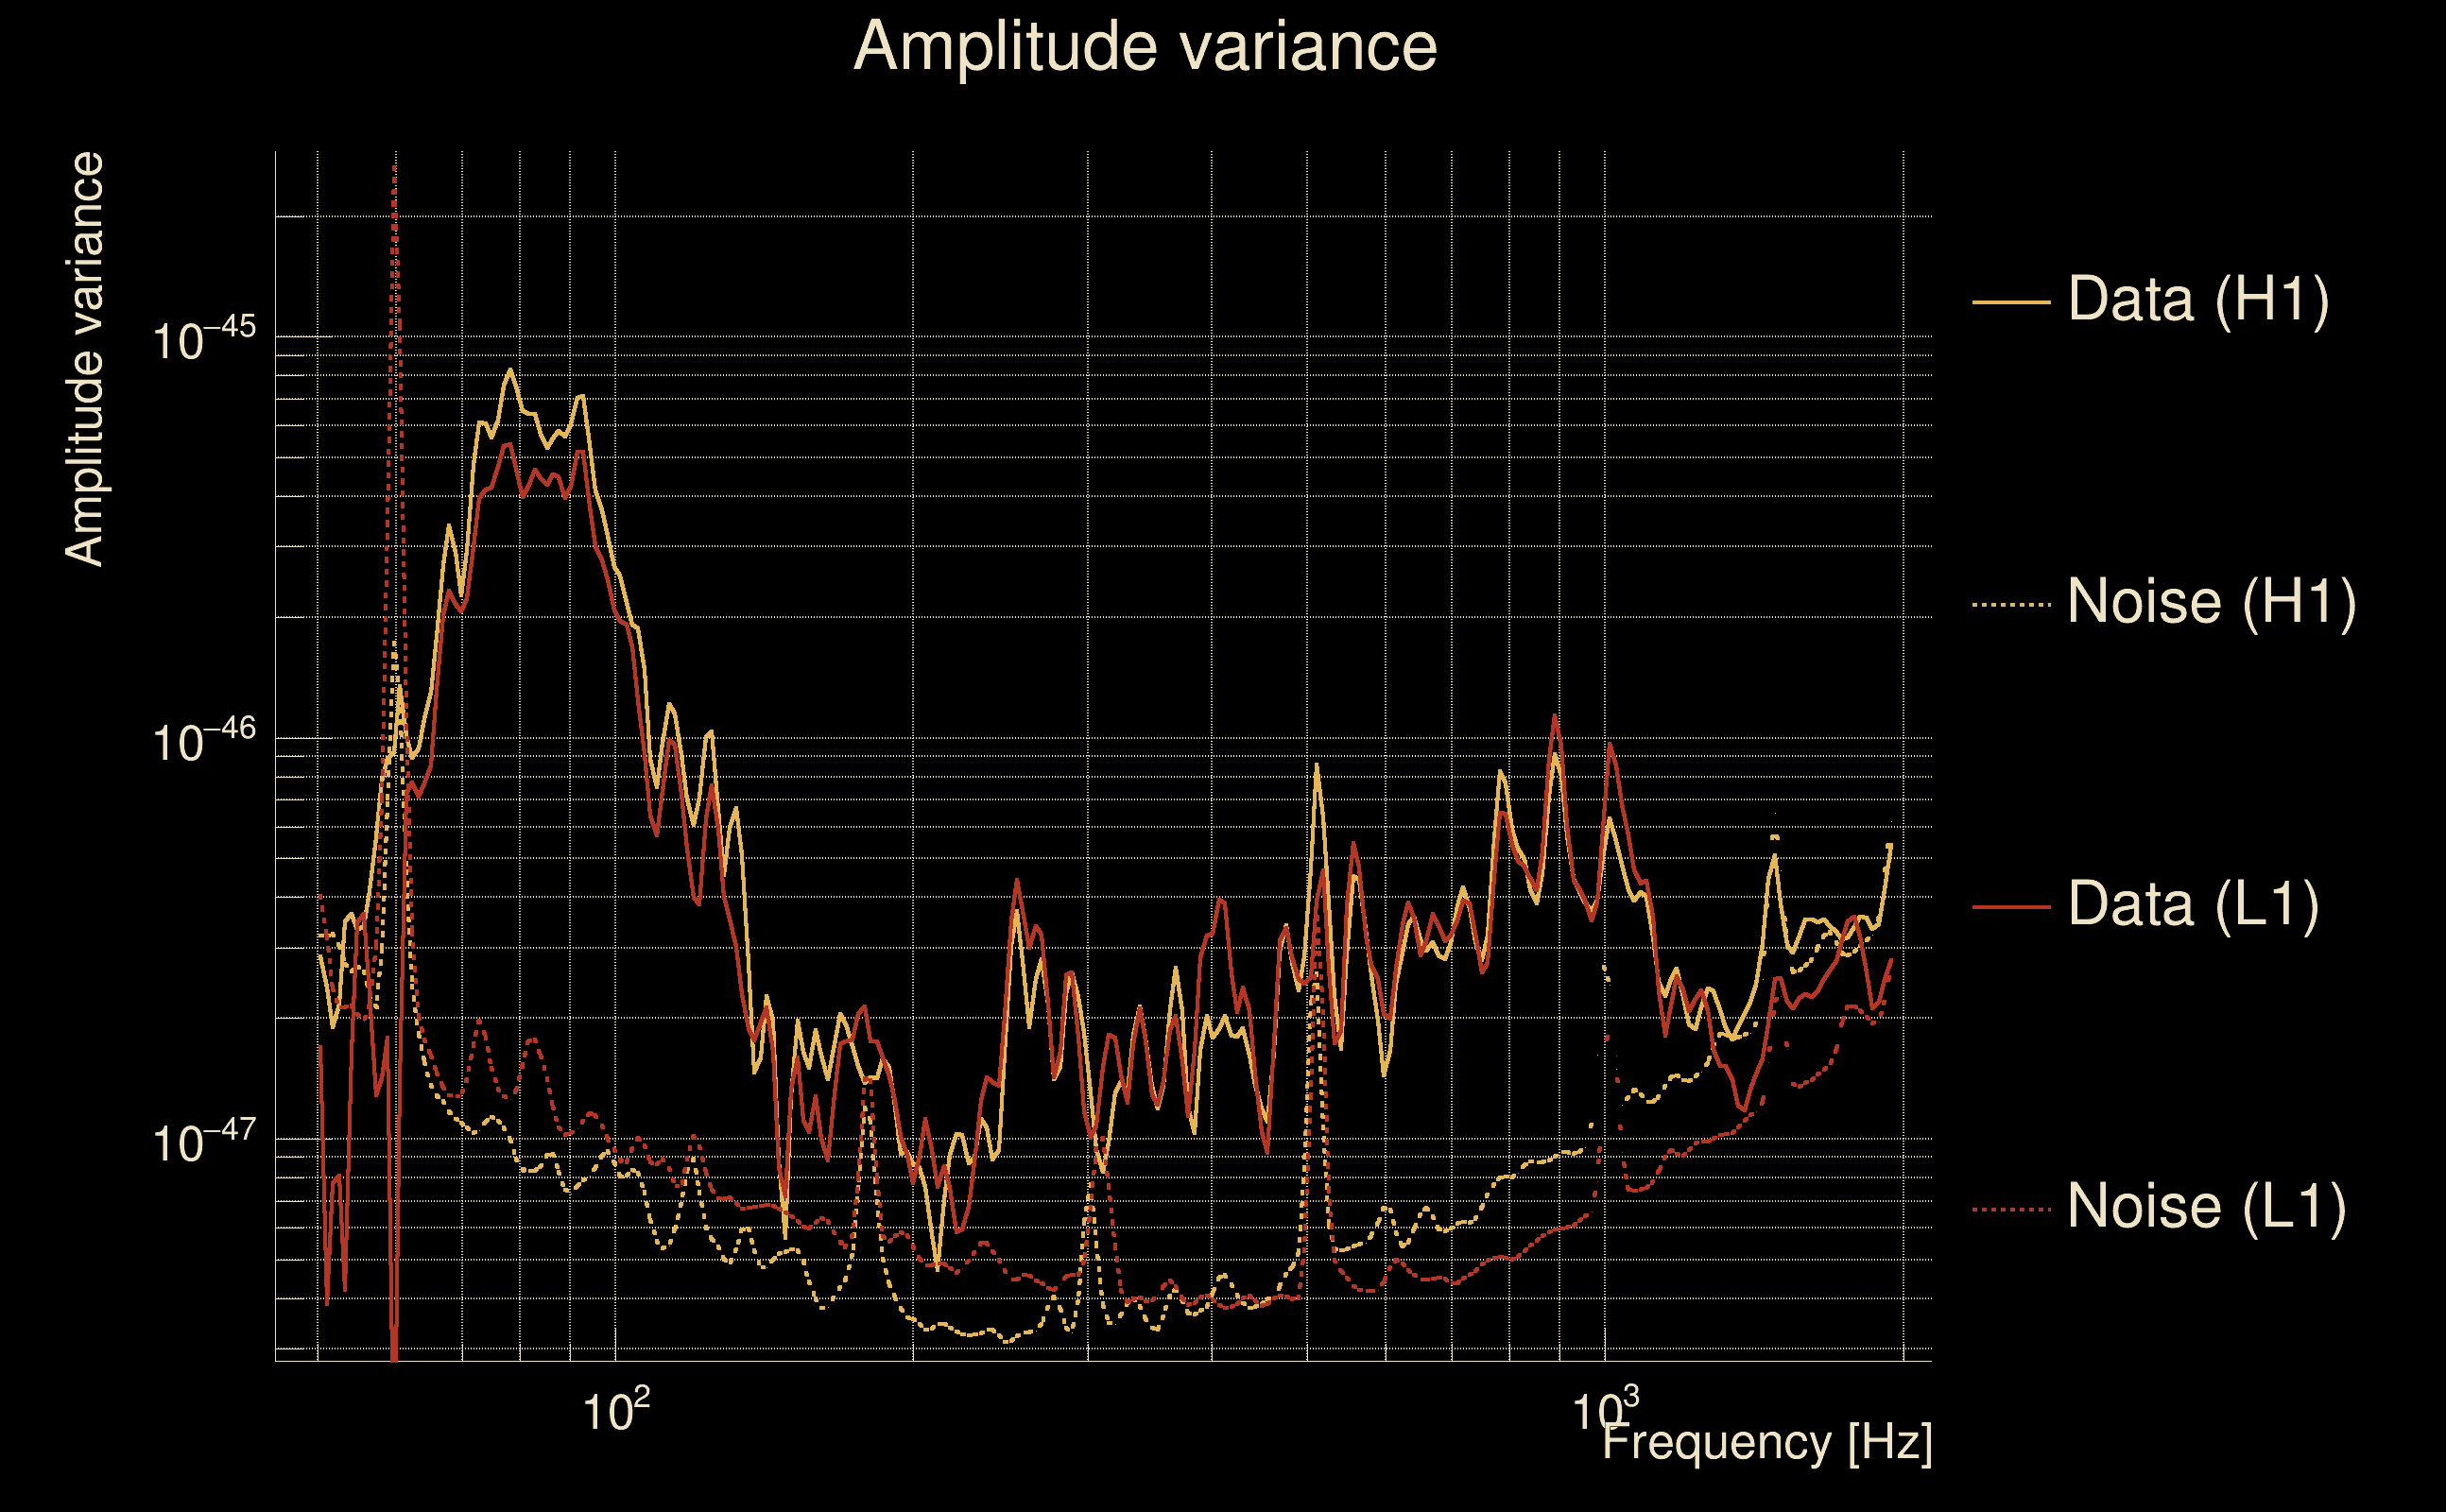
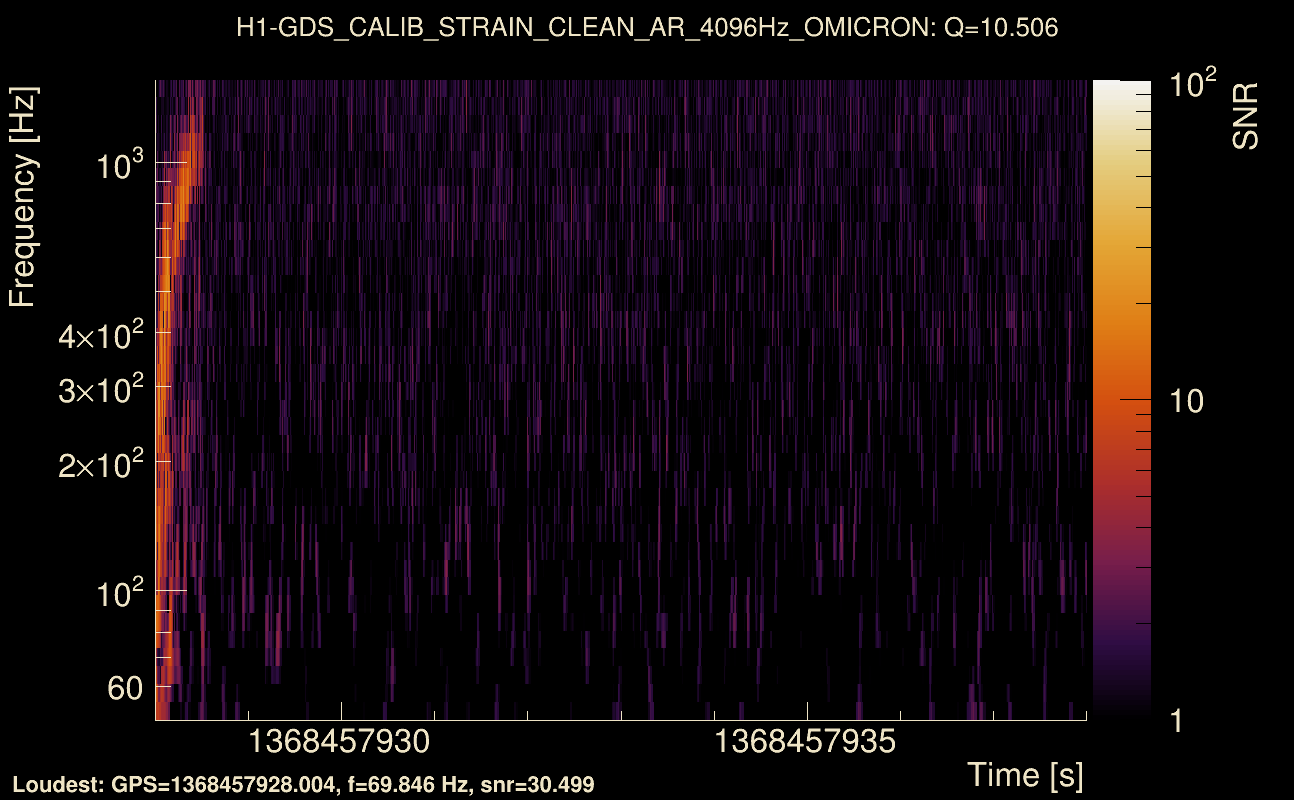
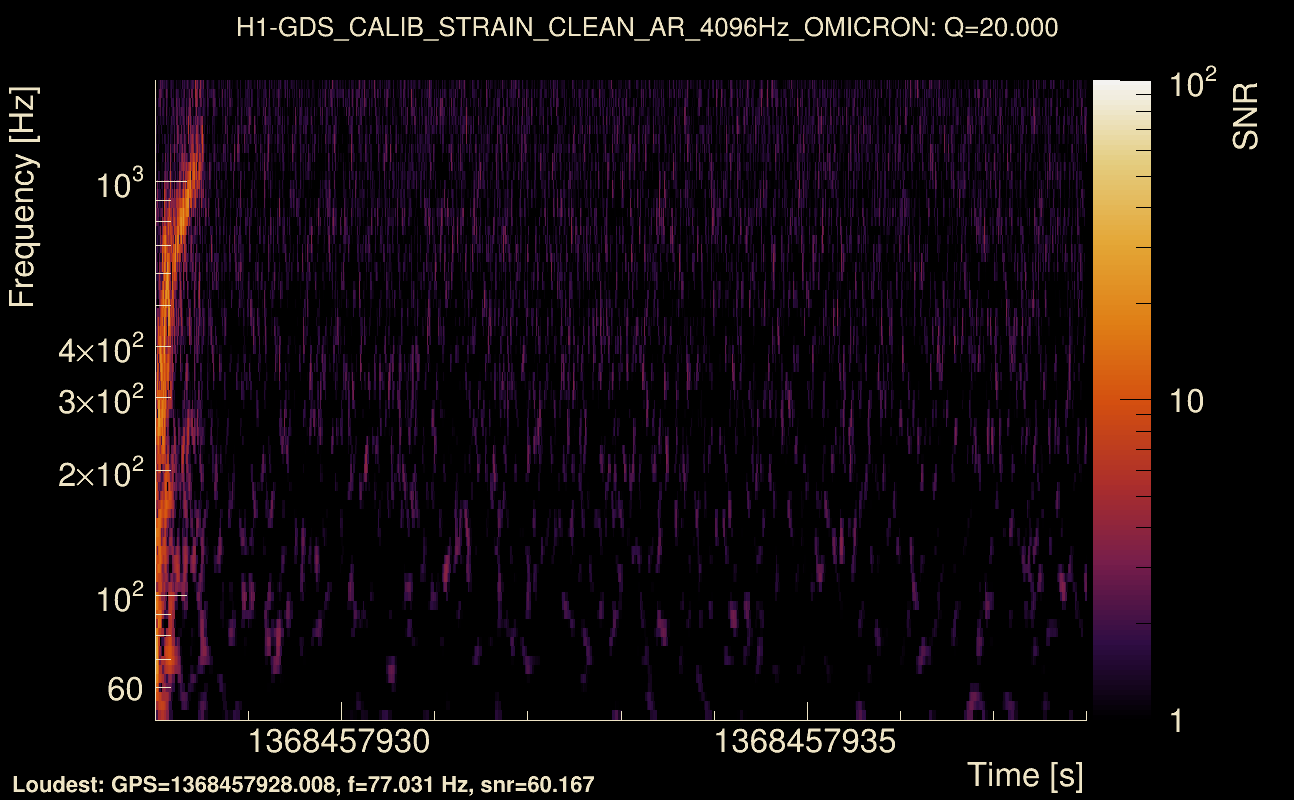
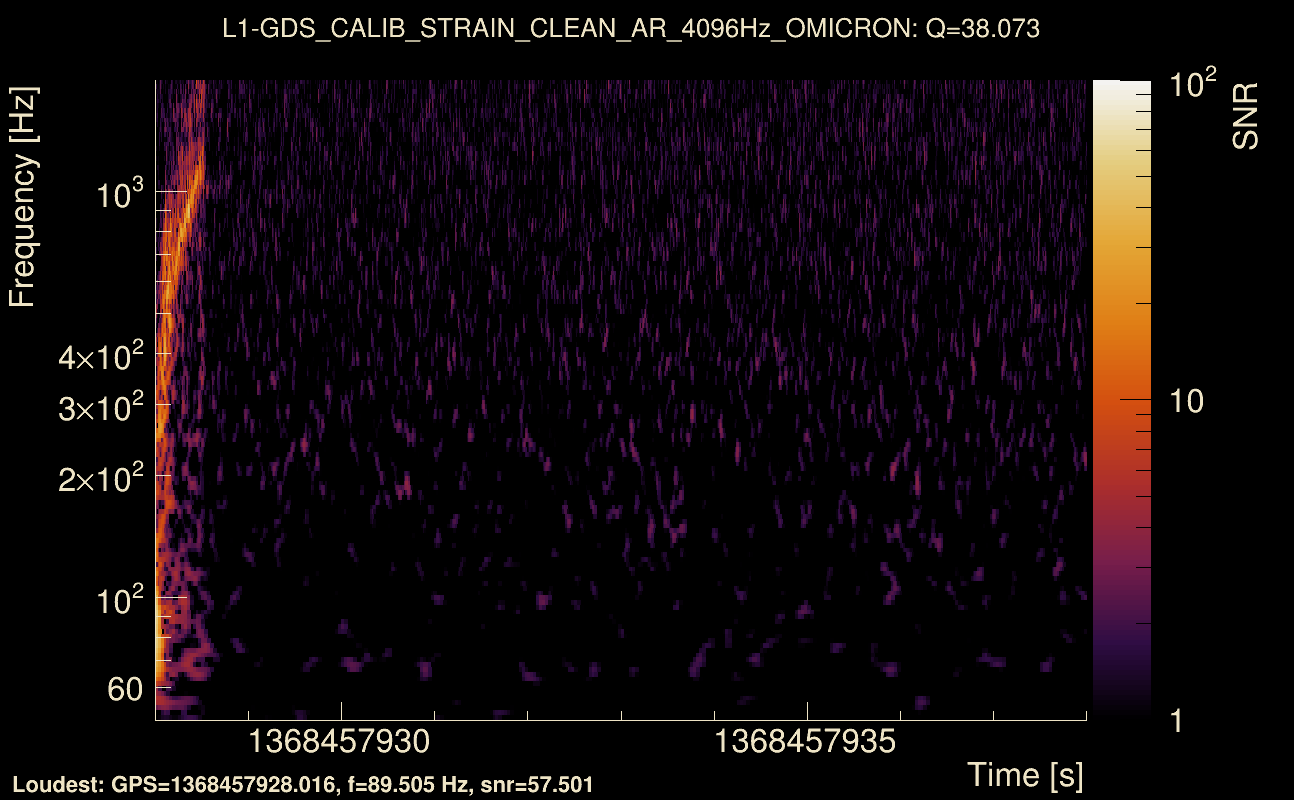
| Event time t(H1): | GPS = 1368457928 (Thu May 18 15:11:50 2023 ) → GPS = 1368457938 (Thu May 18 15:12:00 2023 ) |
| Event time t(L1): | GPS = 1368457928 (Thu May 18 15:12:00 2023 ) → GPS = 1368457938 (Thu May 18 15:12:00 2023 ) |
| Omicron analysis time window (H1): | GPS = 1368457925 → GPS = 1368457941 |
| Omicron analysis time window (L1): | GPS = 1368457925 → GPS = 1368457941 |
| Time delay between detectors t(L1) - t(H1): | 0.0401464 s (slice index = 107 / 217), δt_gw = -0.00585358 s |
| Time delay standard deviation: | 0.0705706 s |
| [targeted mode] Time delay probability: | 0.00539627 (2.78237 sigmas), δt_target = -0.00942612 s |
| Frequency: | 348.883 Hz |
| Ξ: | 0.275615 ± 0.0180857 (variance = 0.000327094): Q0: 0.537638, Q1: 0.531009, Q2: 0.510155, Q3: 0.566613, Q4: 0.538371 |
| Rank: | R_A = 0.124235 |
| Log of amplitude ratio (L1/H1): | -0.0442394, variance = 0.175961 (L1/H1: -0.302846, variance = 0.334324, H1/L1: -0.376717, variance = 0.329204) |
| Amplitude ratio (L1/H1): | 0.956725 ⋇ 1.52117 (L1/H1: 0.738713 ⋇ 1.78284, H1/L1: 0.68611 ⋇ 1.77493) |
| Amplitude ratio H1|L1 compatibility (probability): | 0.404136 |
| Antenna factor probability: | 0.924762 |
| Number of rejected frequency rows: | Q0: 7 / 18, Q1: 15 / 36, Q2: 47 / 70, Q3: 116 / 134, Q4: 232 / 258 |
| Maximum signal-to-noise ratio: | H1: 83.5887, L1: 65.5162 |
| SNR variance: | H1: 19.5751, L1: 10.8492 |
| Click here for a zoomed plot | Click here for a zoomed plot | Click here for a zoomed plot | Click here for a zoomed plot | Click here for a zoomed plot |
 |
 |
 |
 |
 |
 |
 |
 |
 |
 |
 |
 |
 |
 |
 |
 |
 |
 |
 |
 |
 |
 |
 |
 |
 |
 |
 |
 |
 |
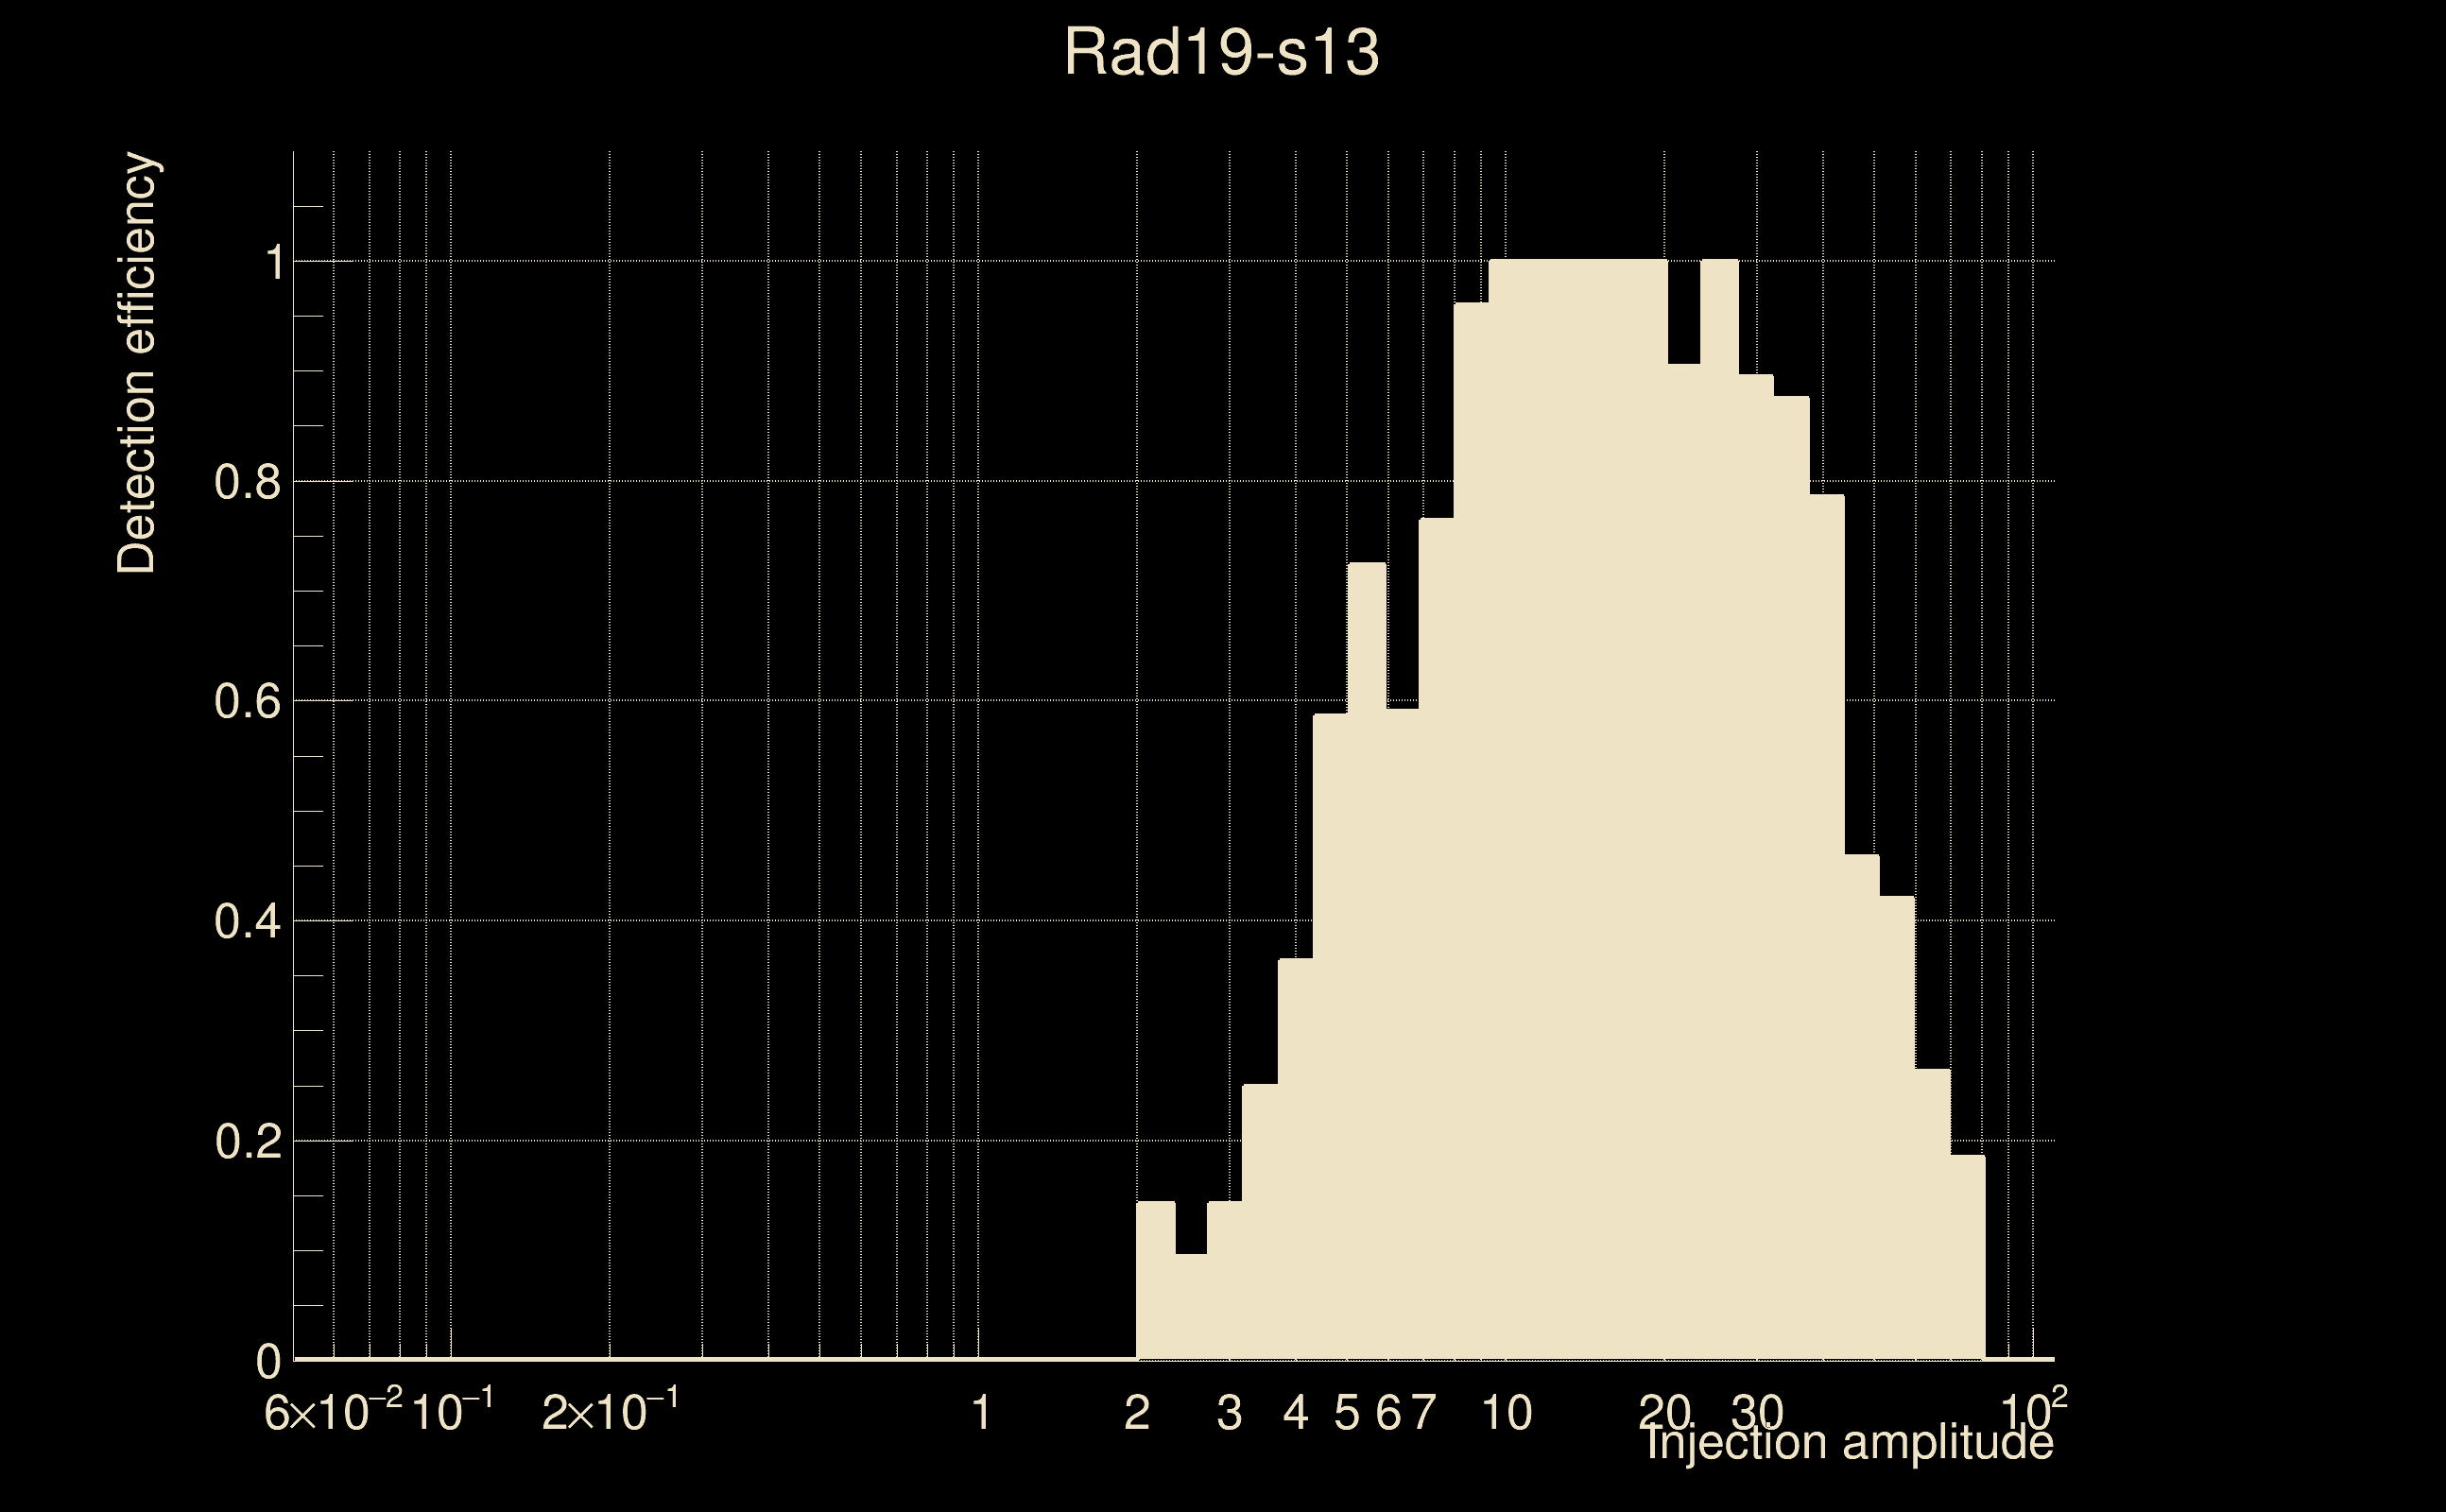
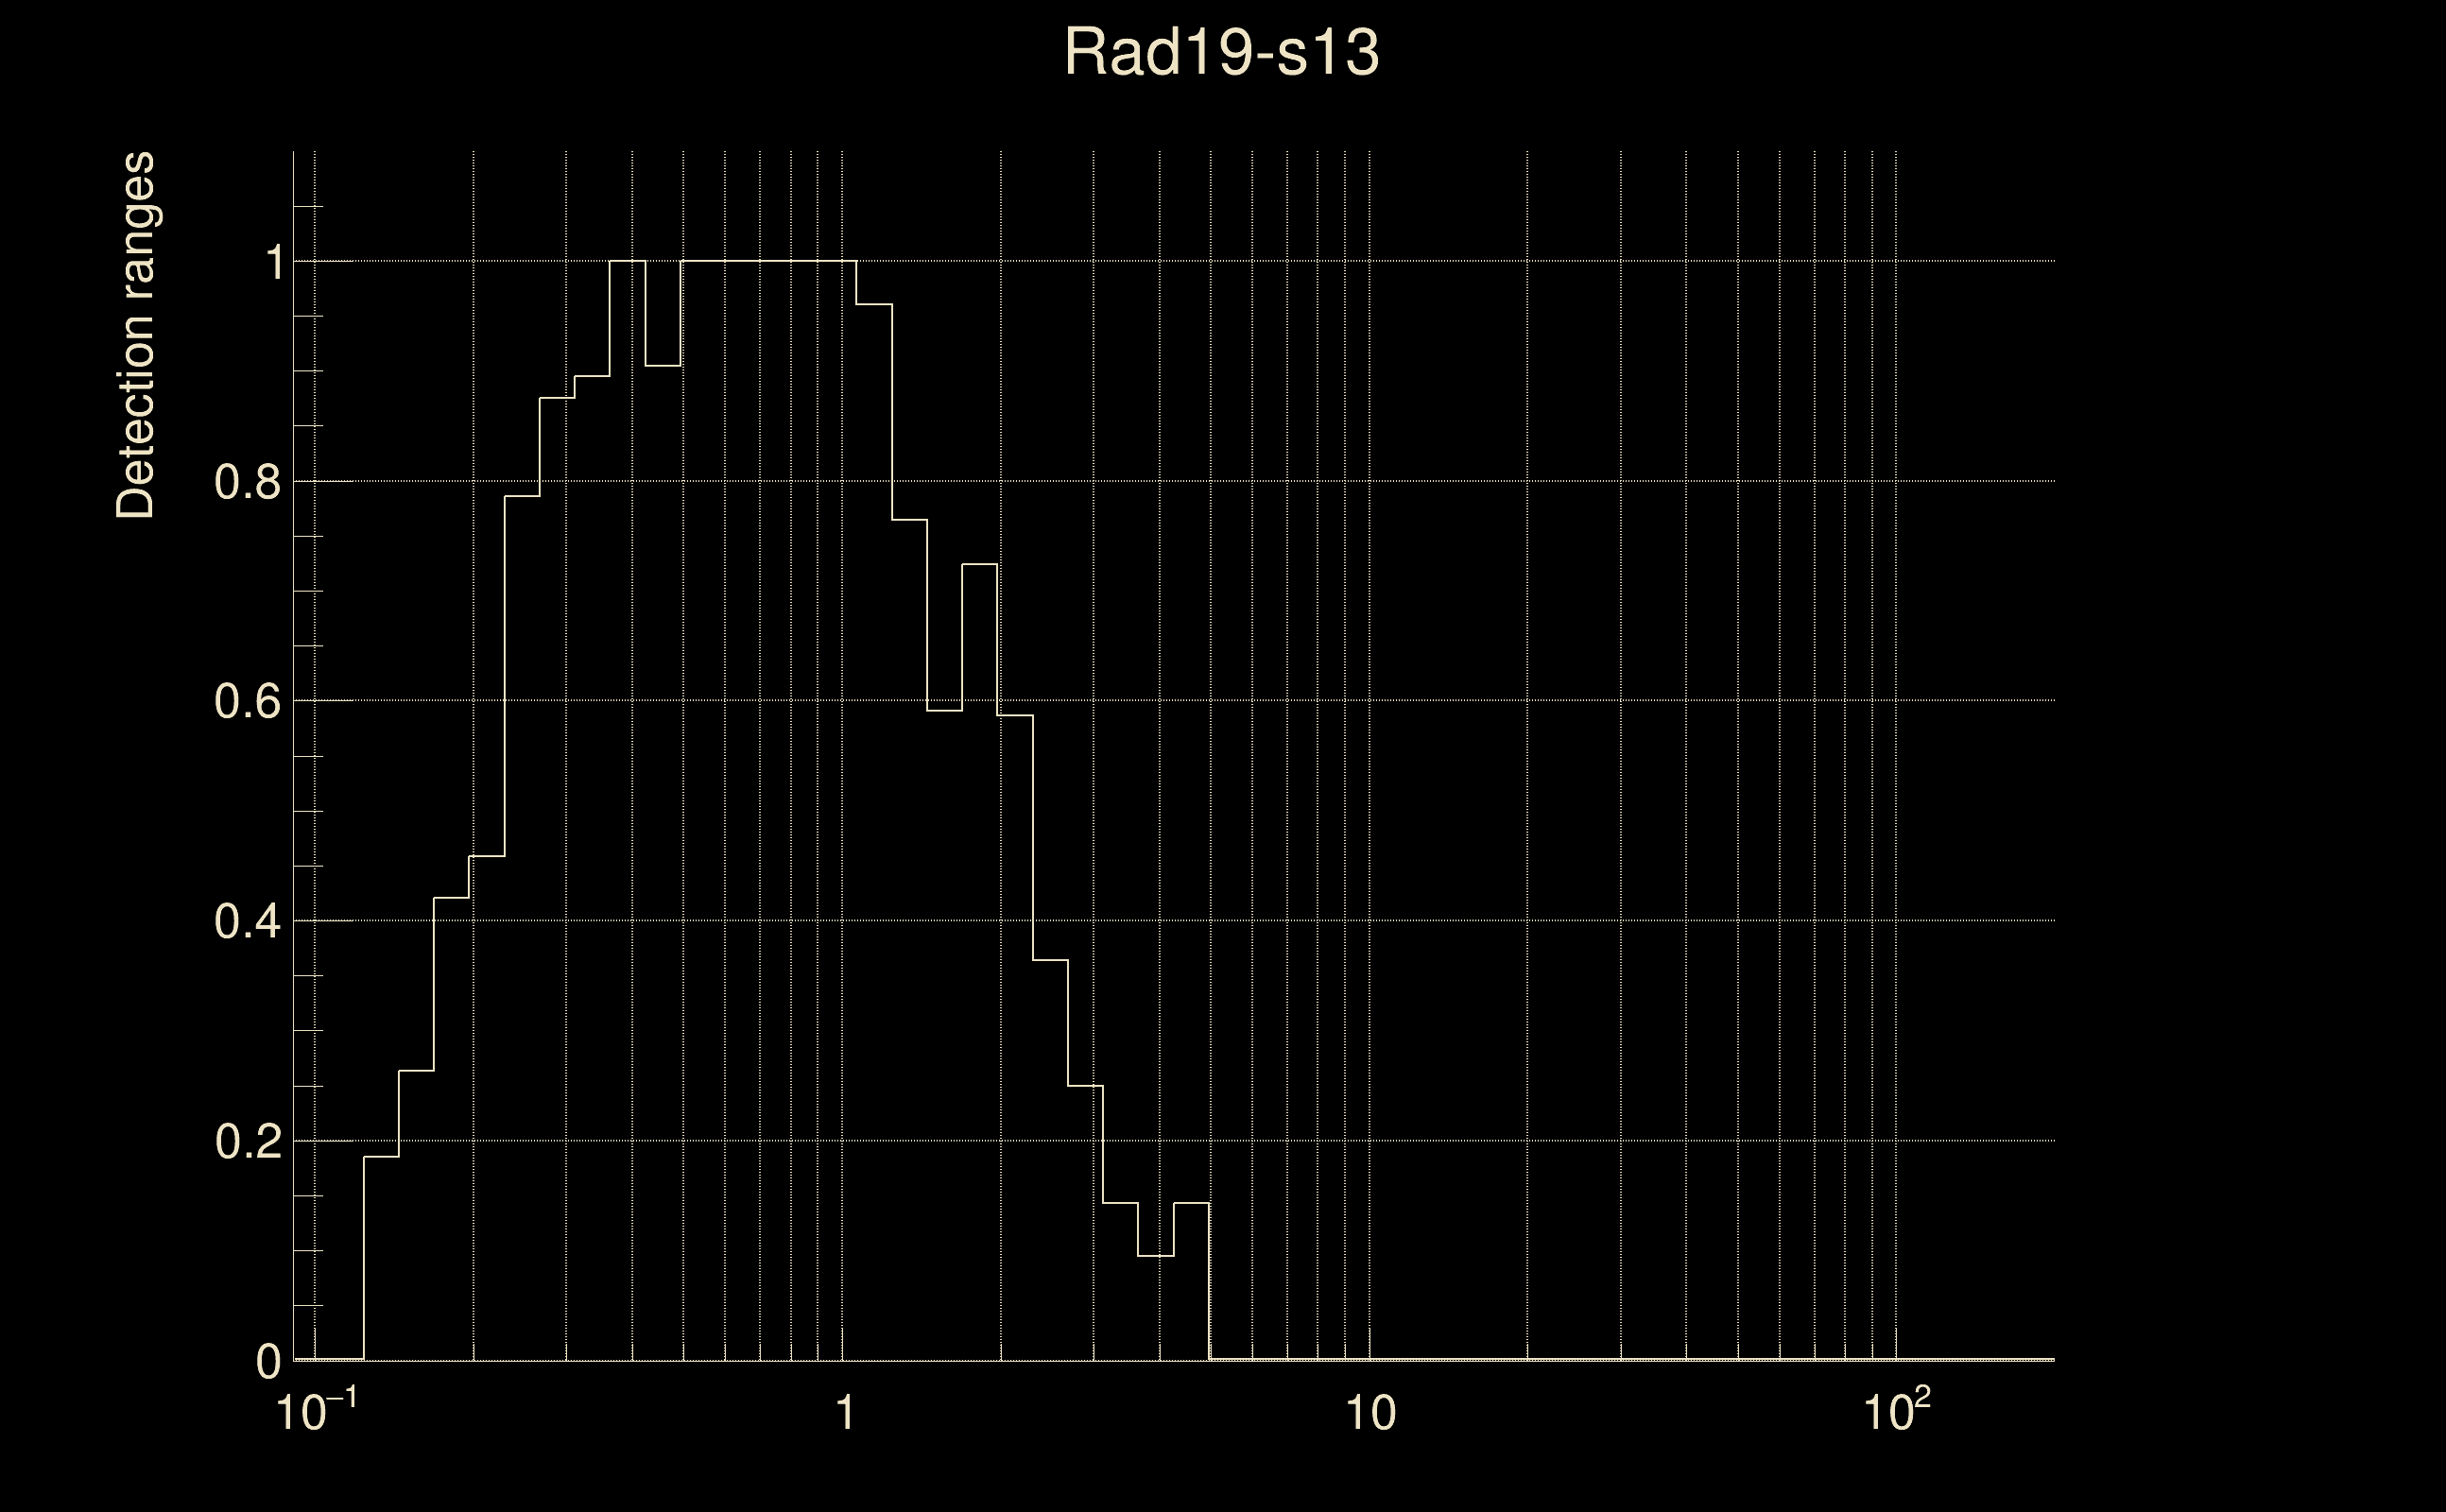
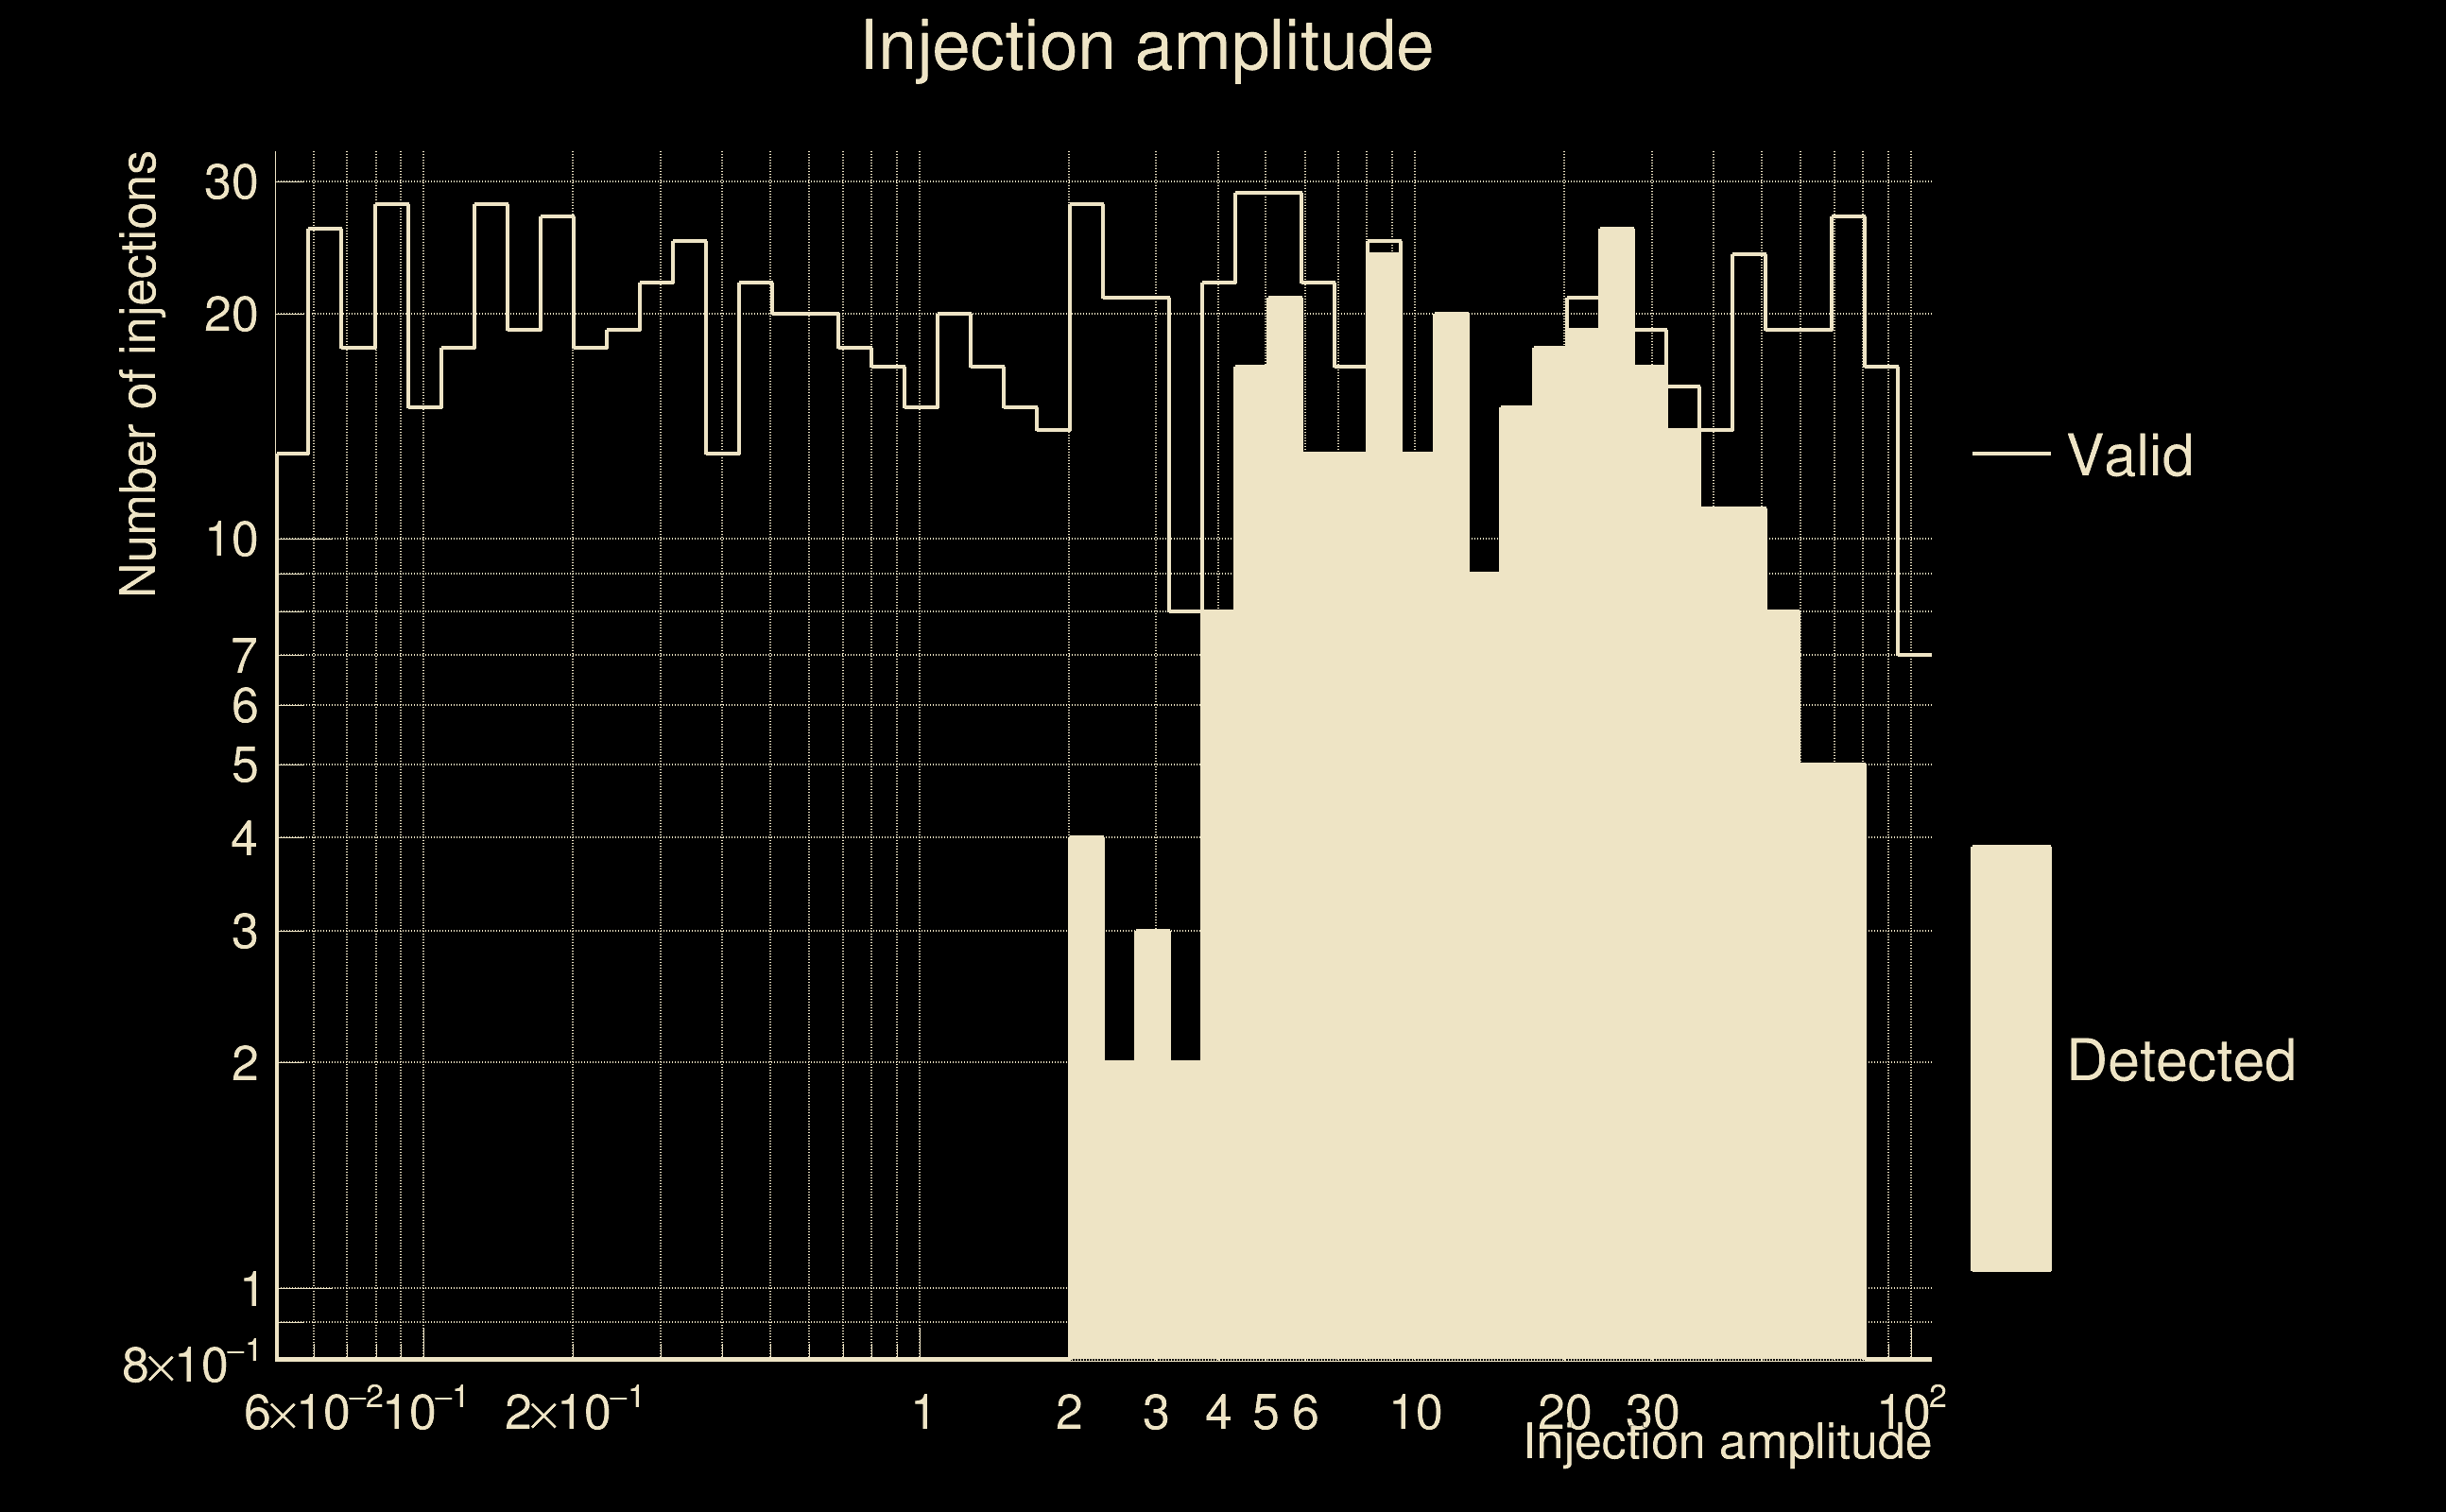
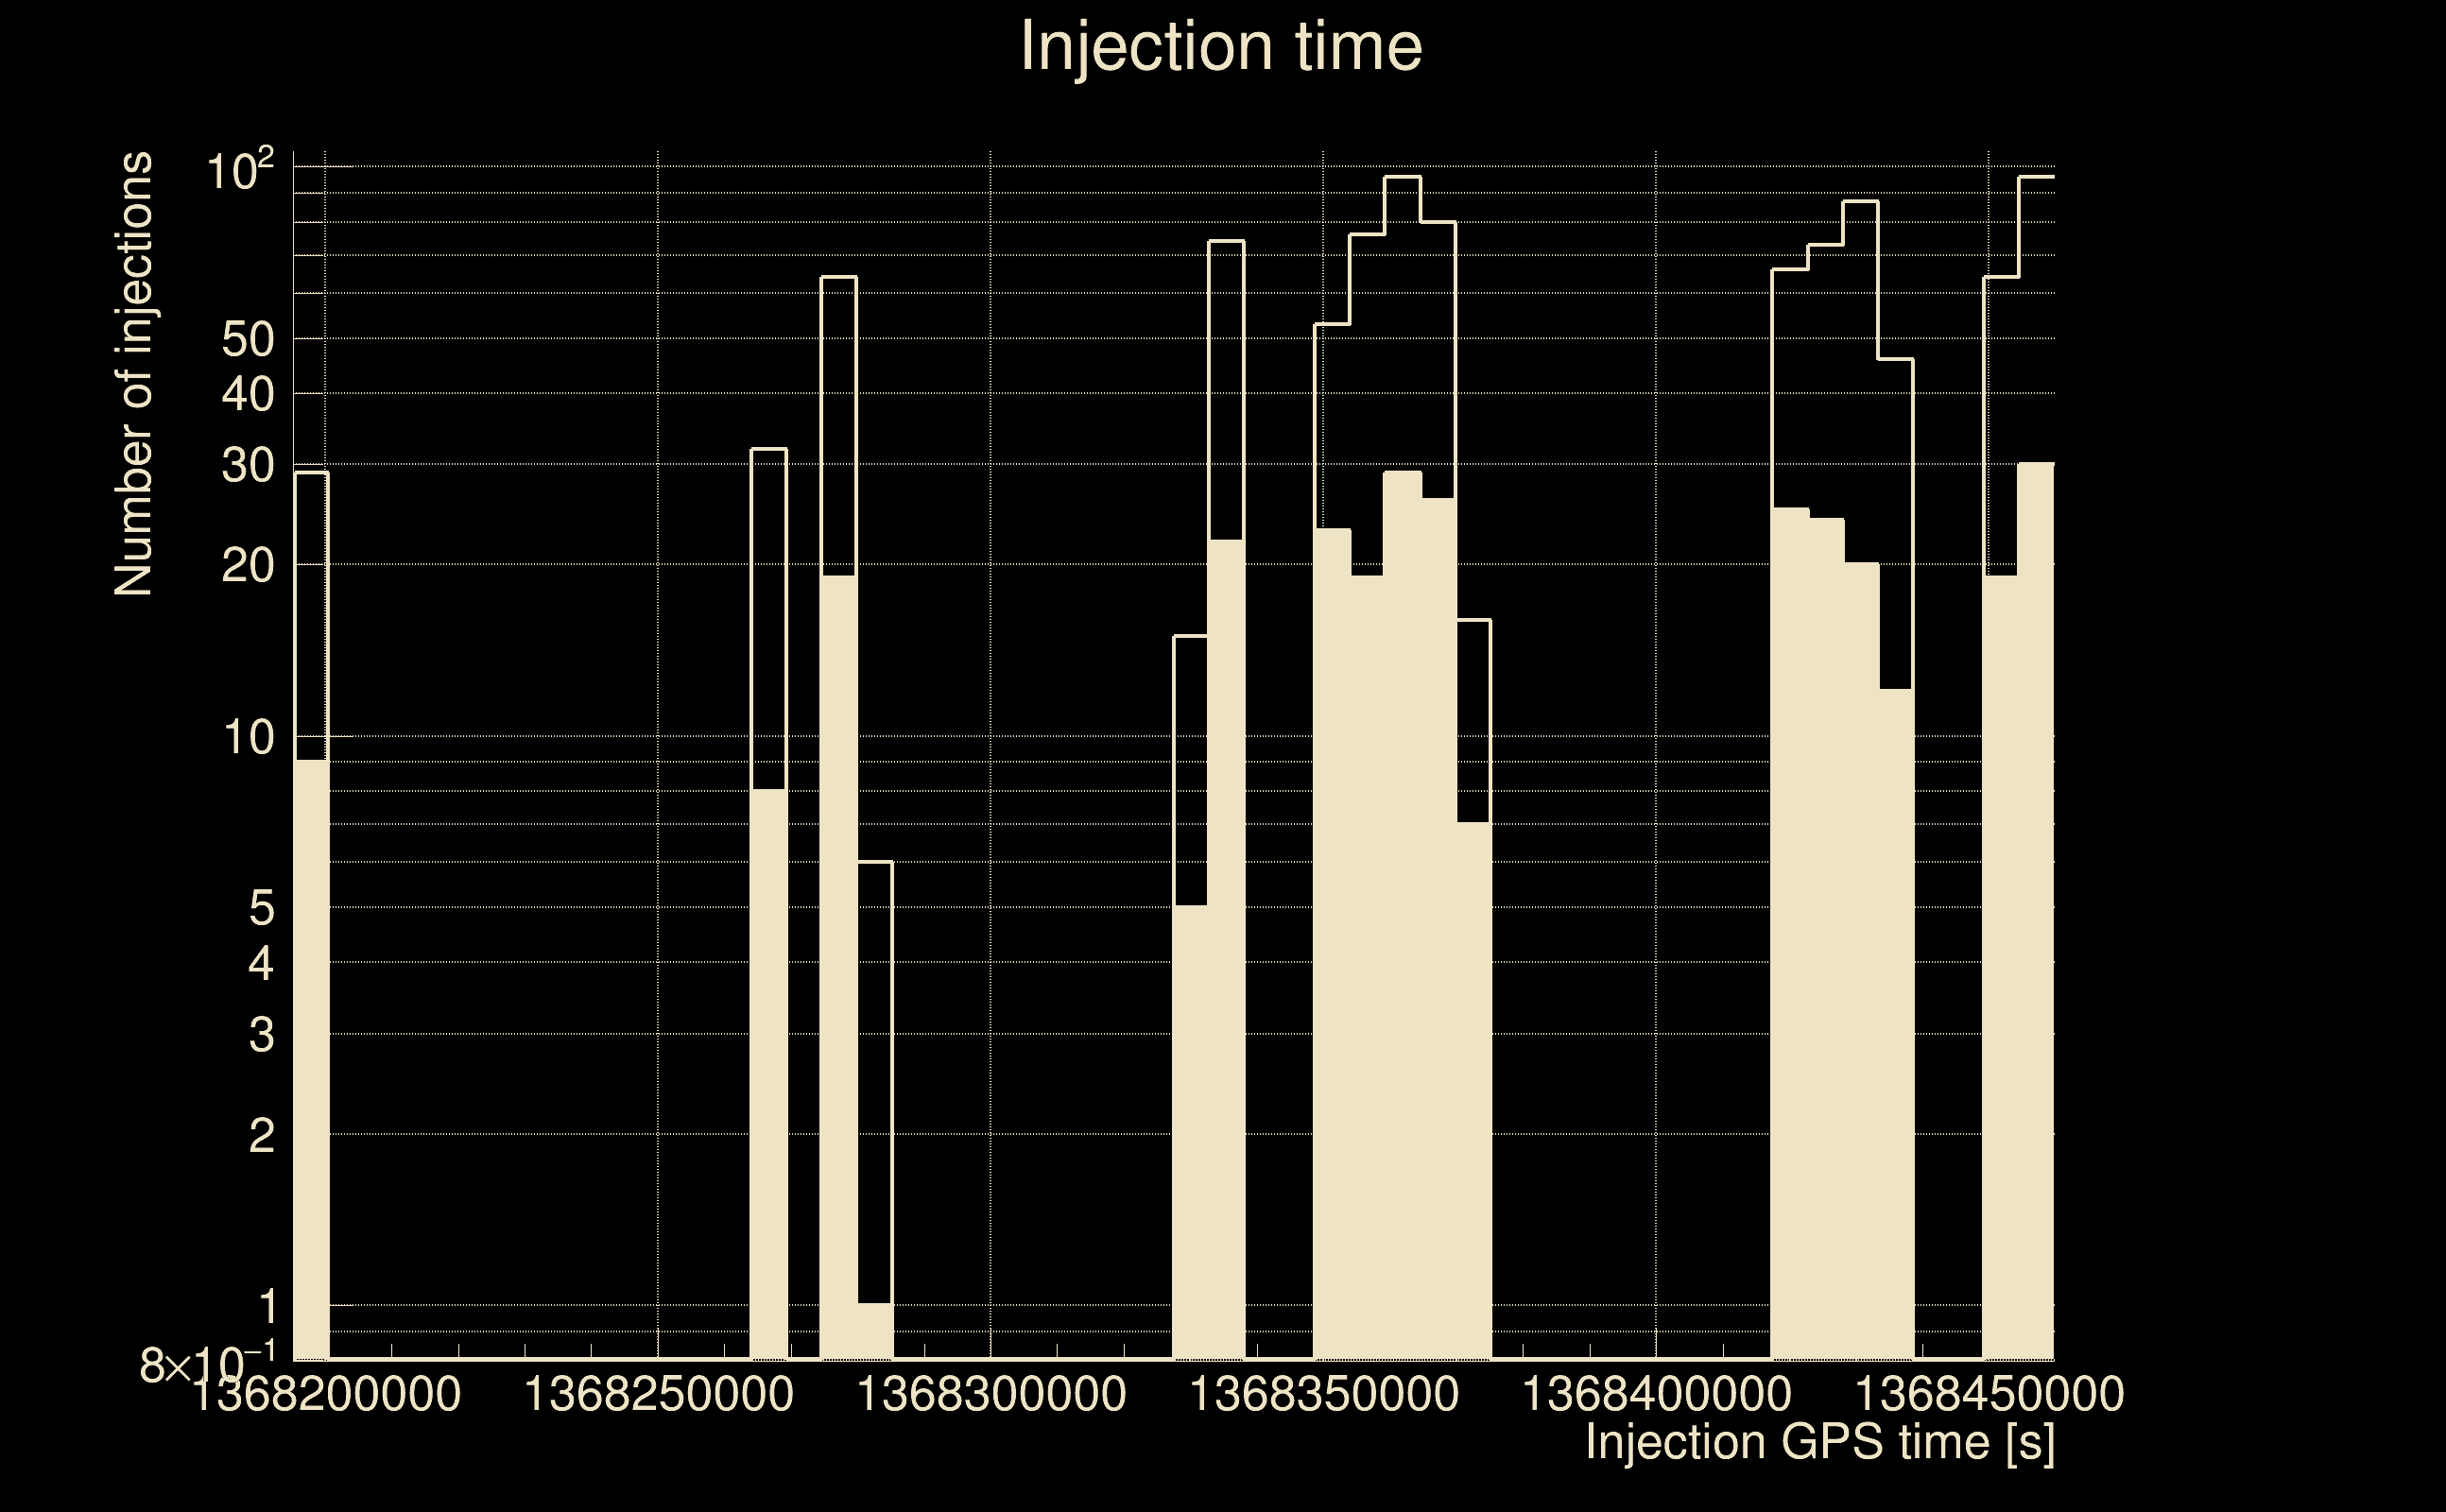
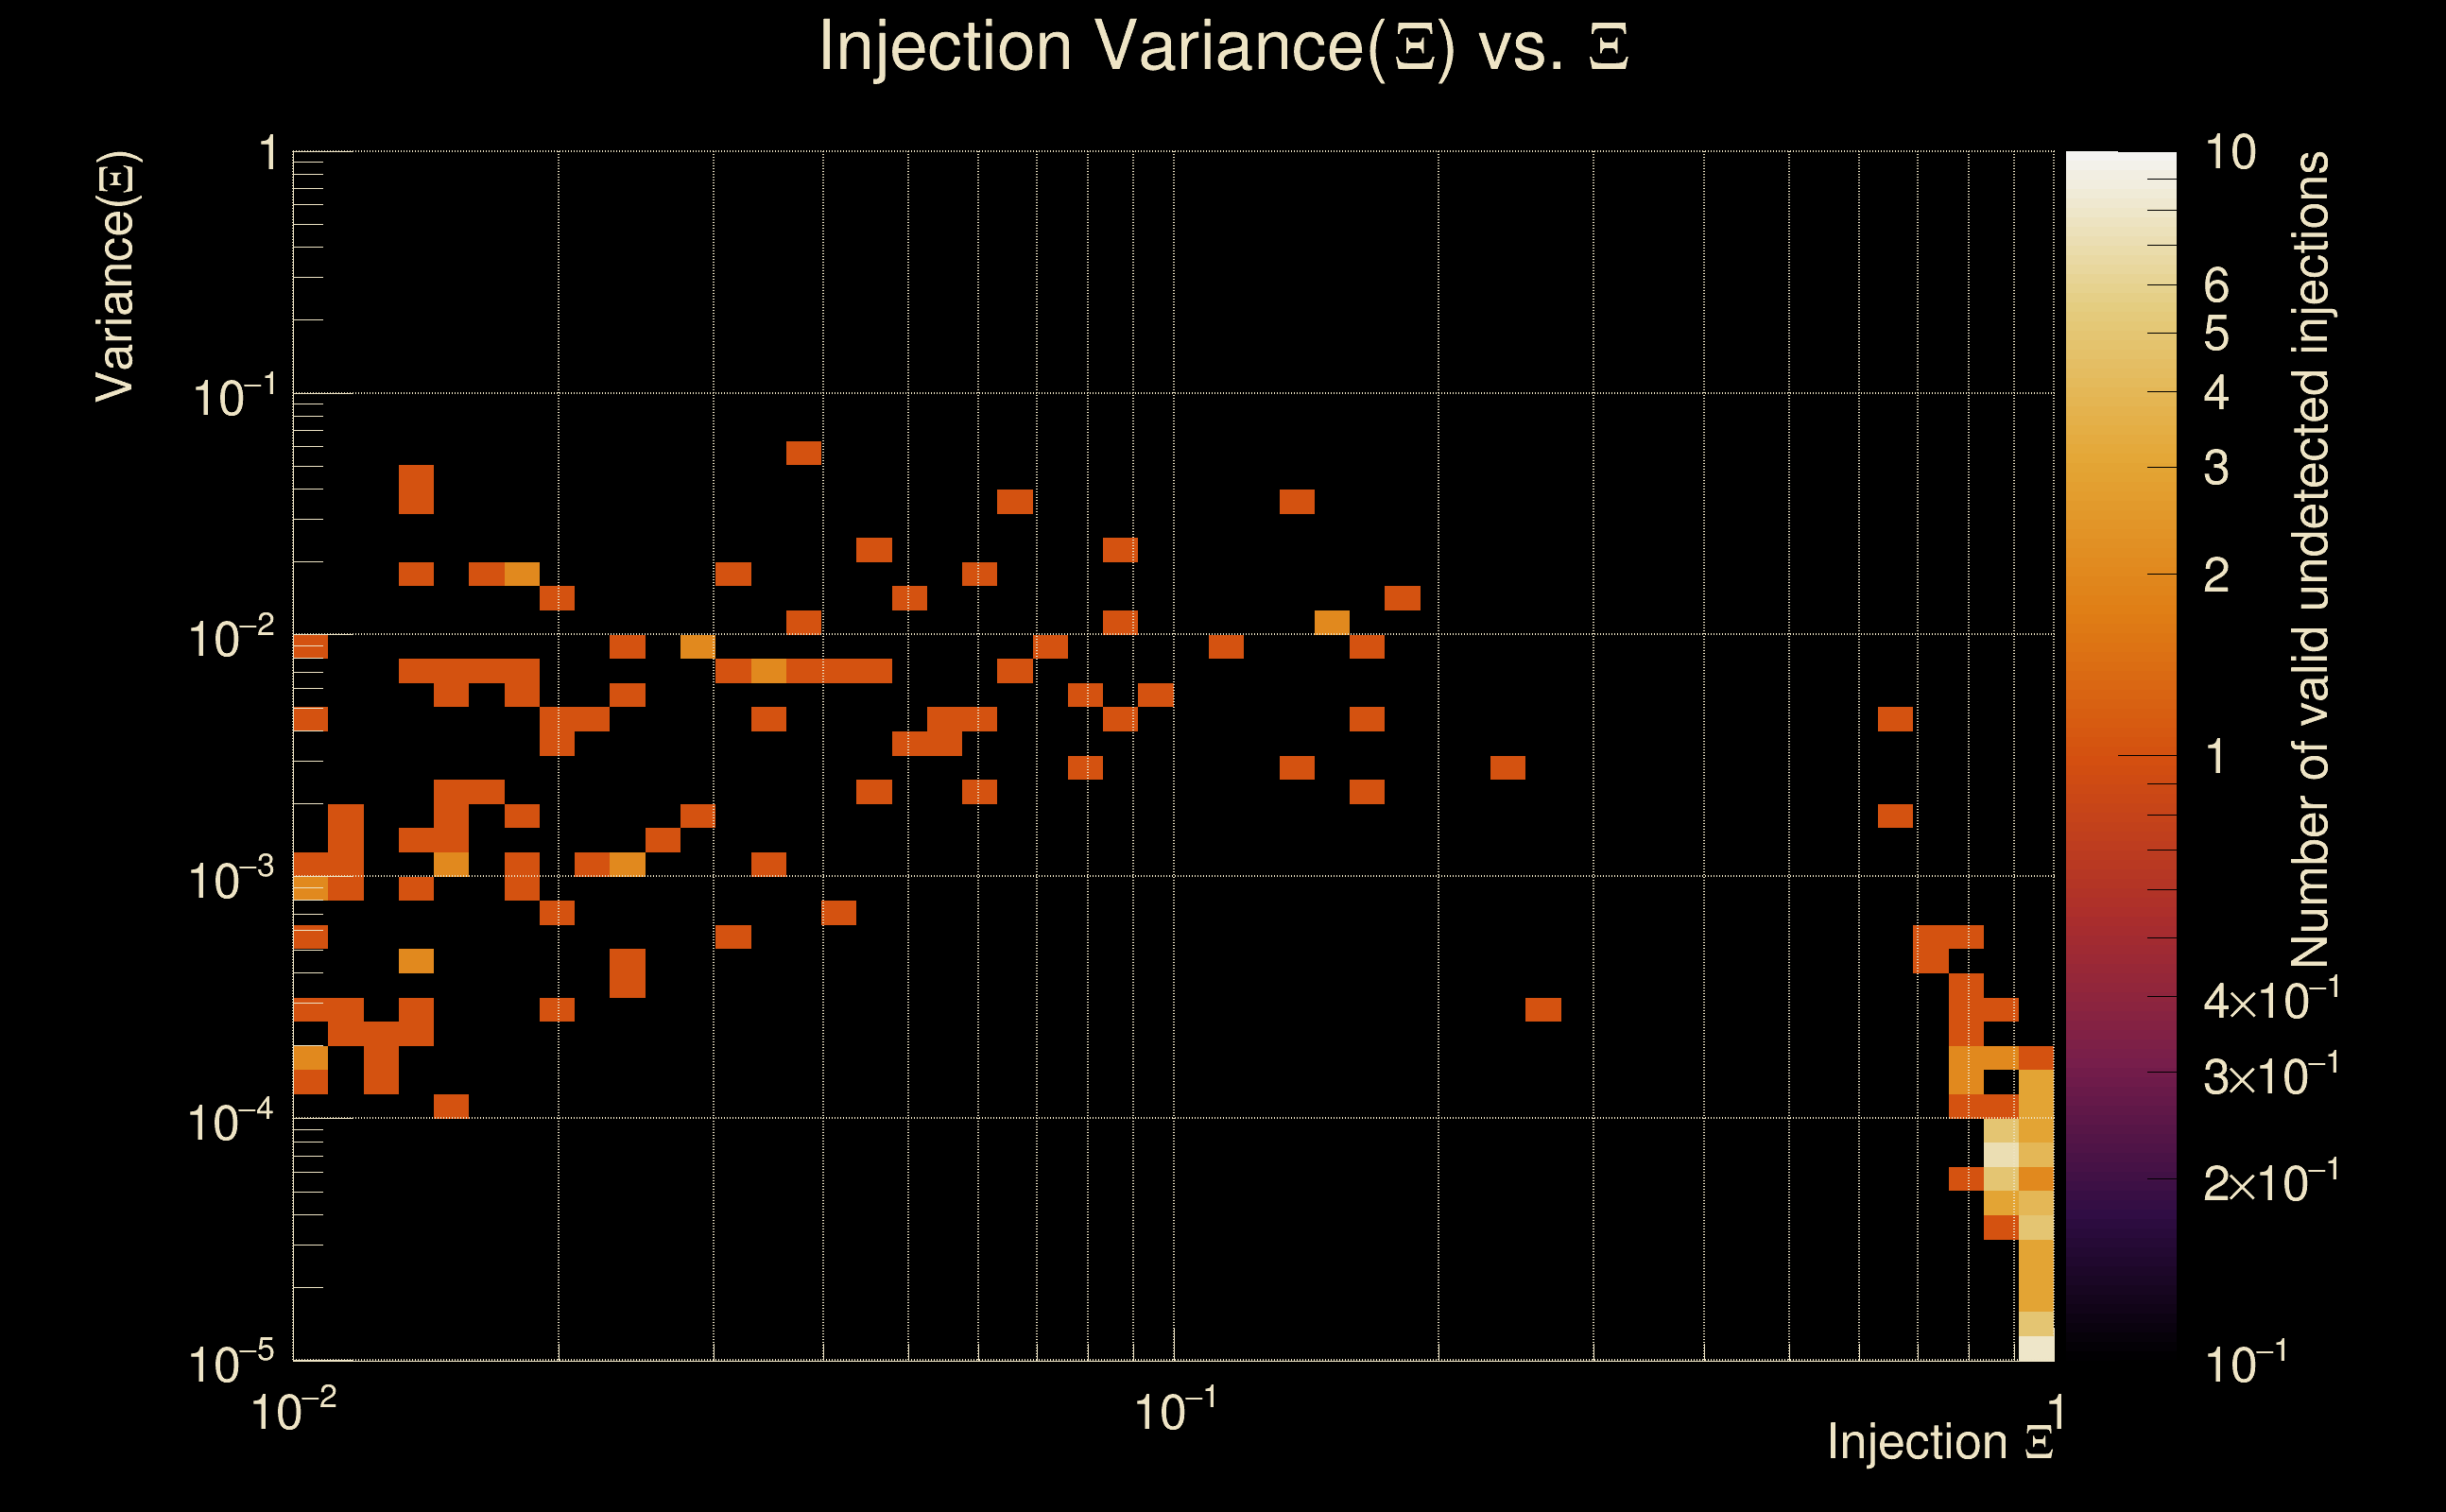
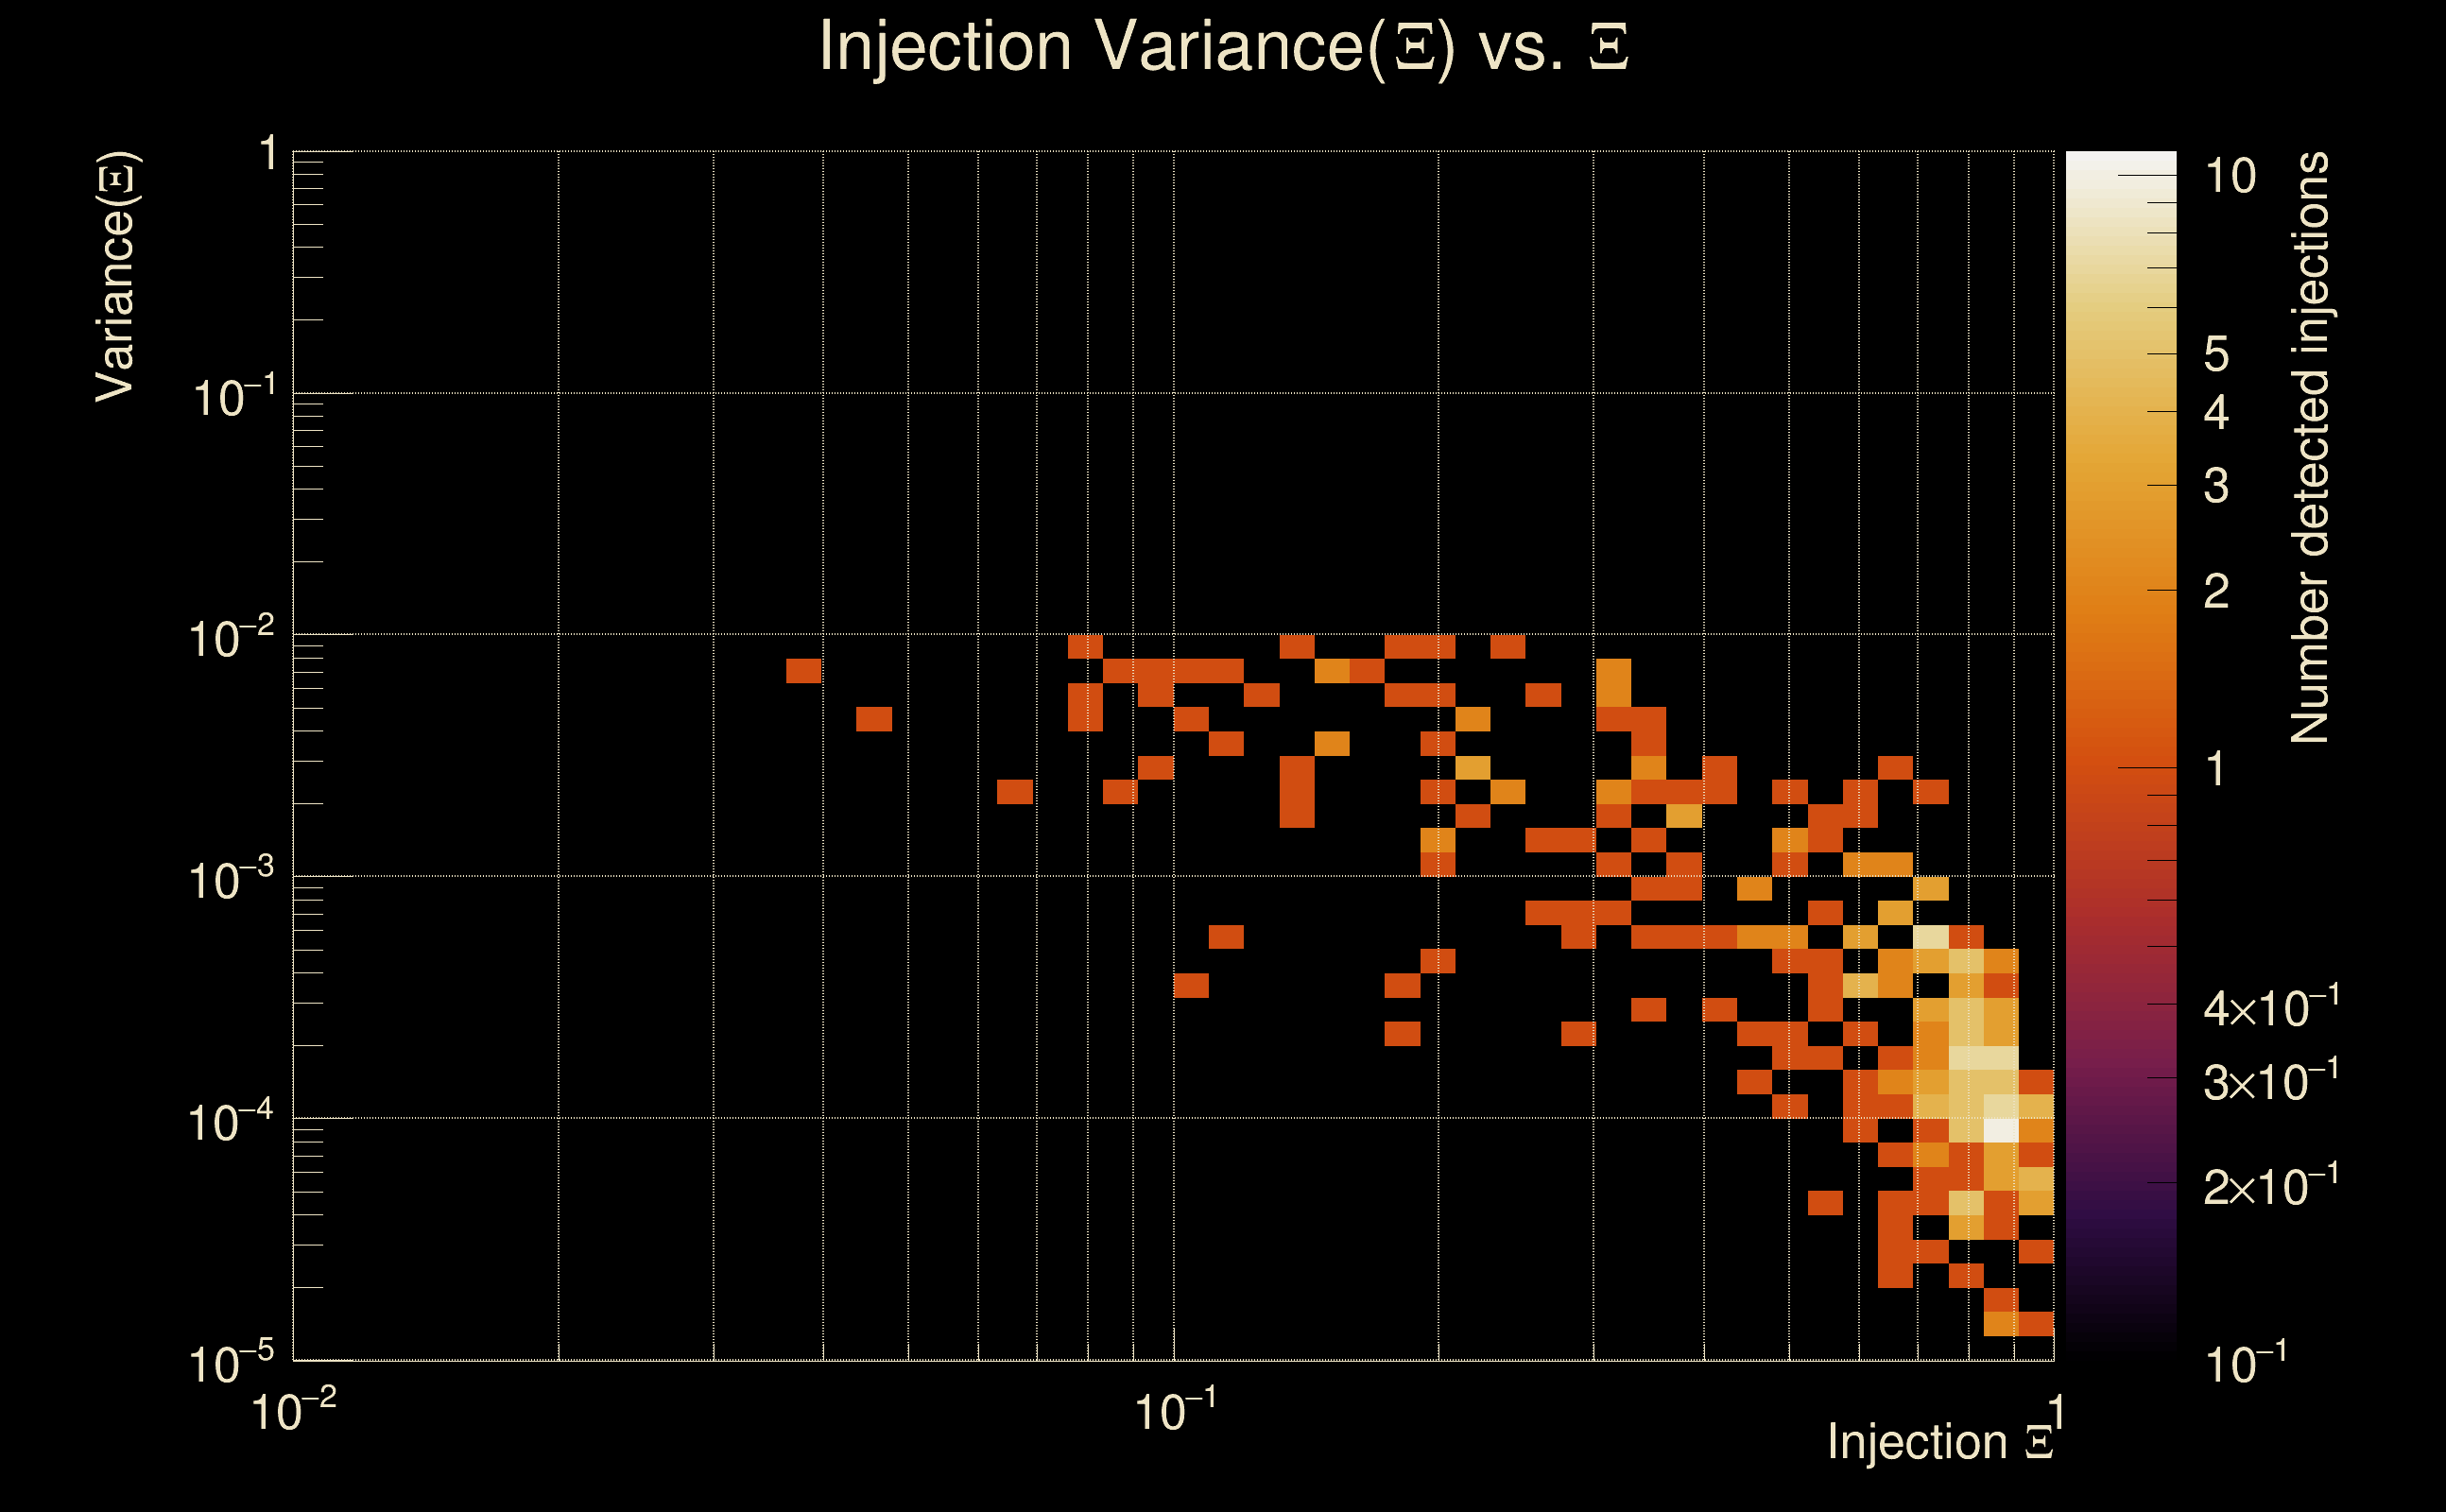
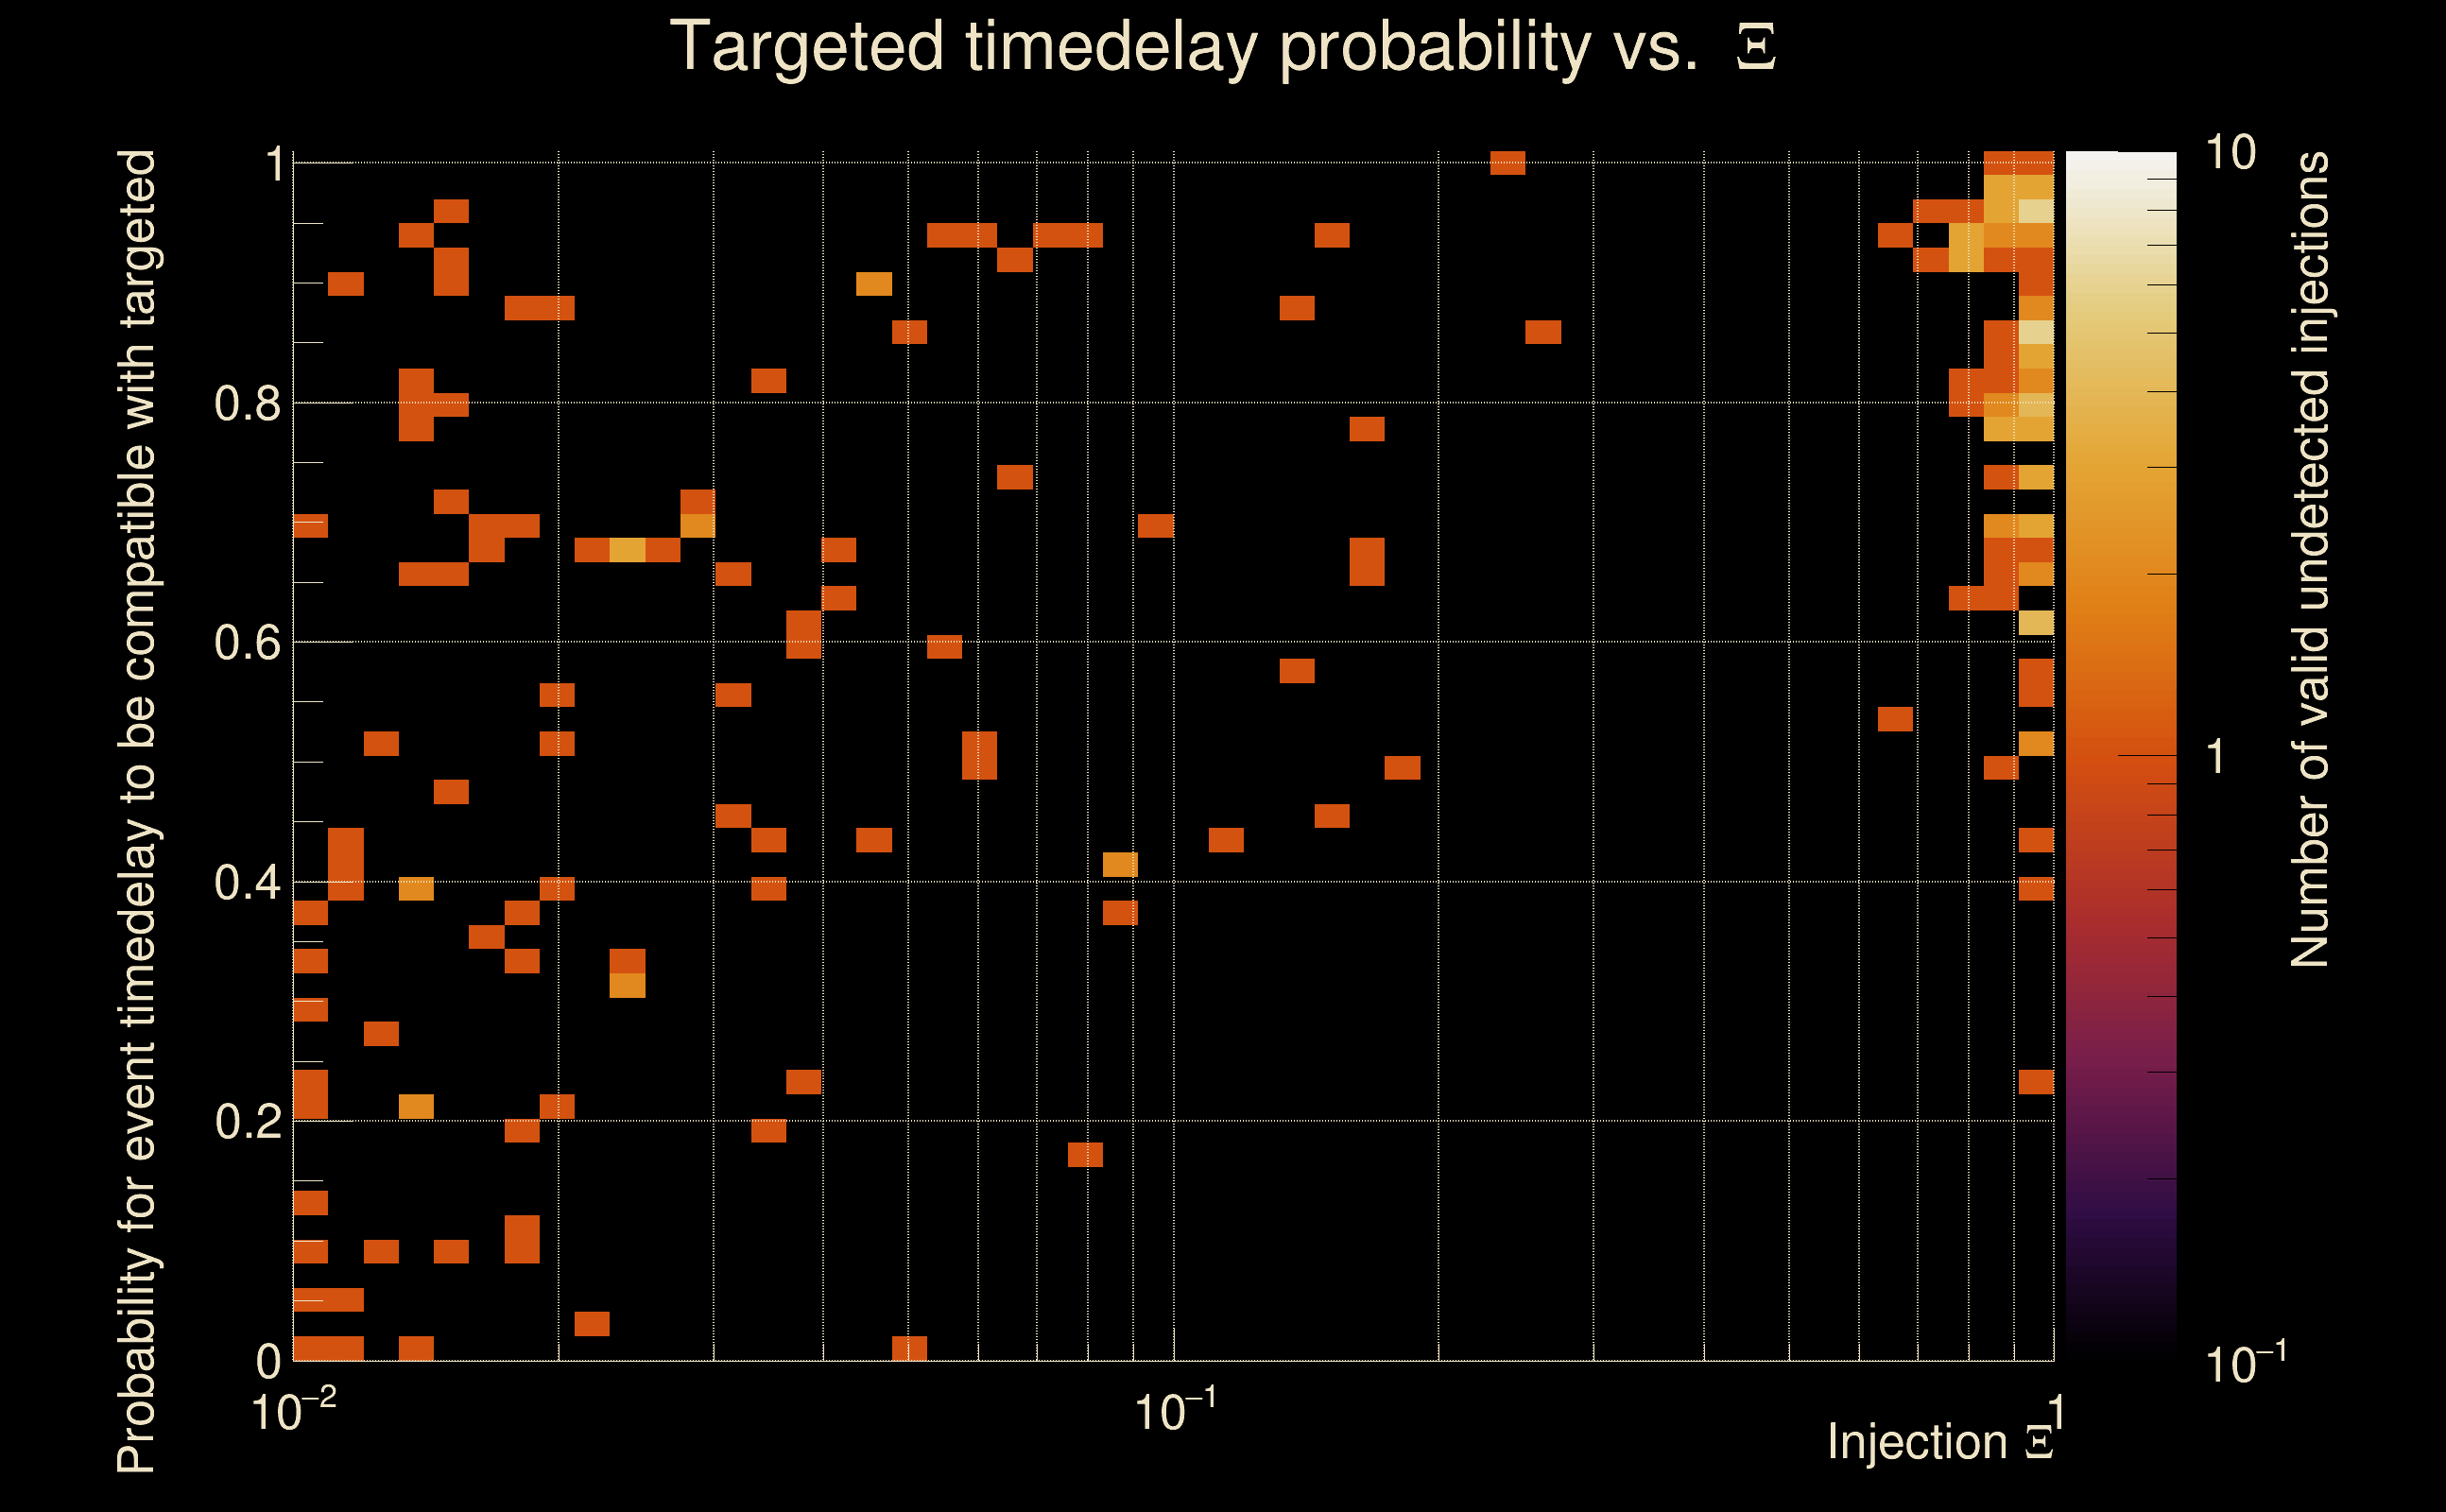
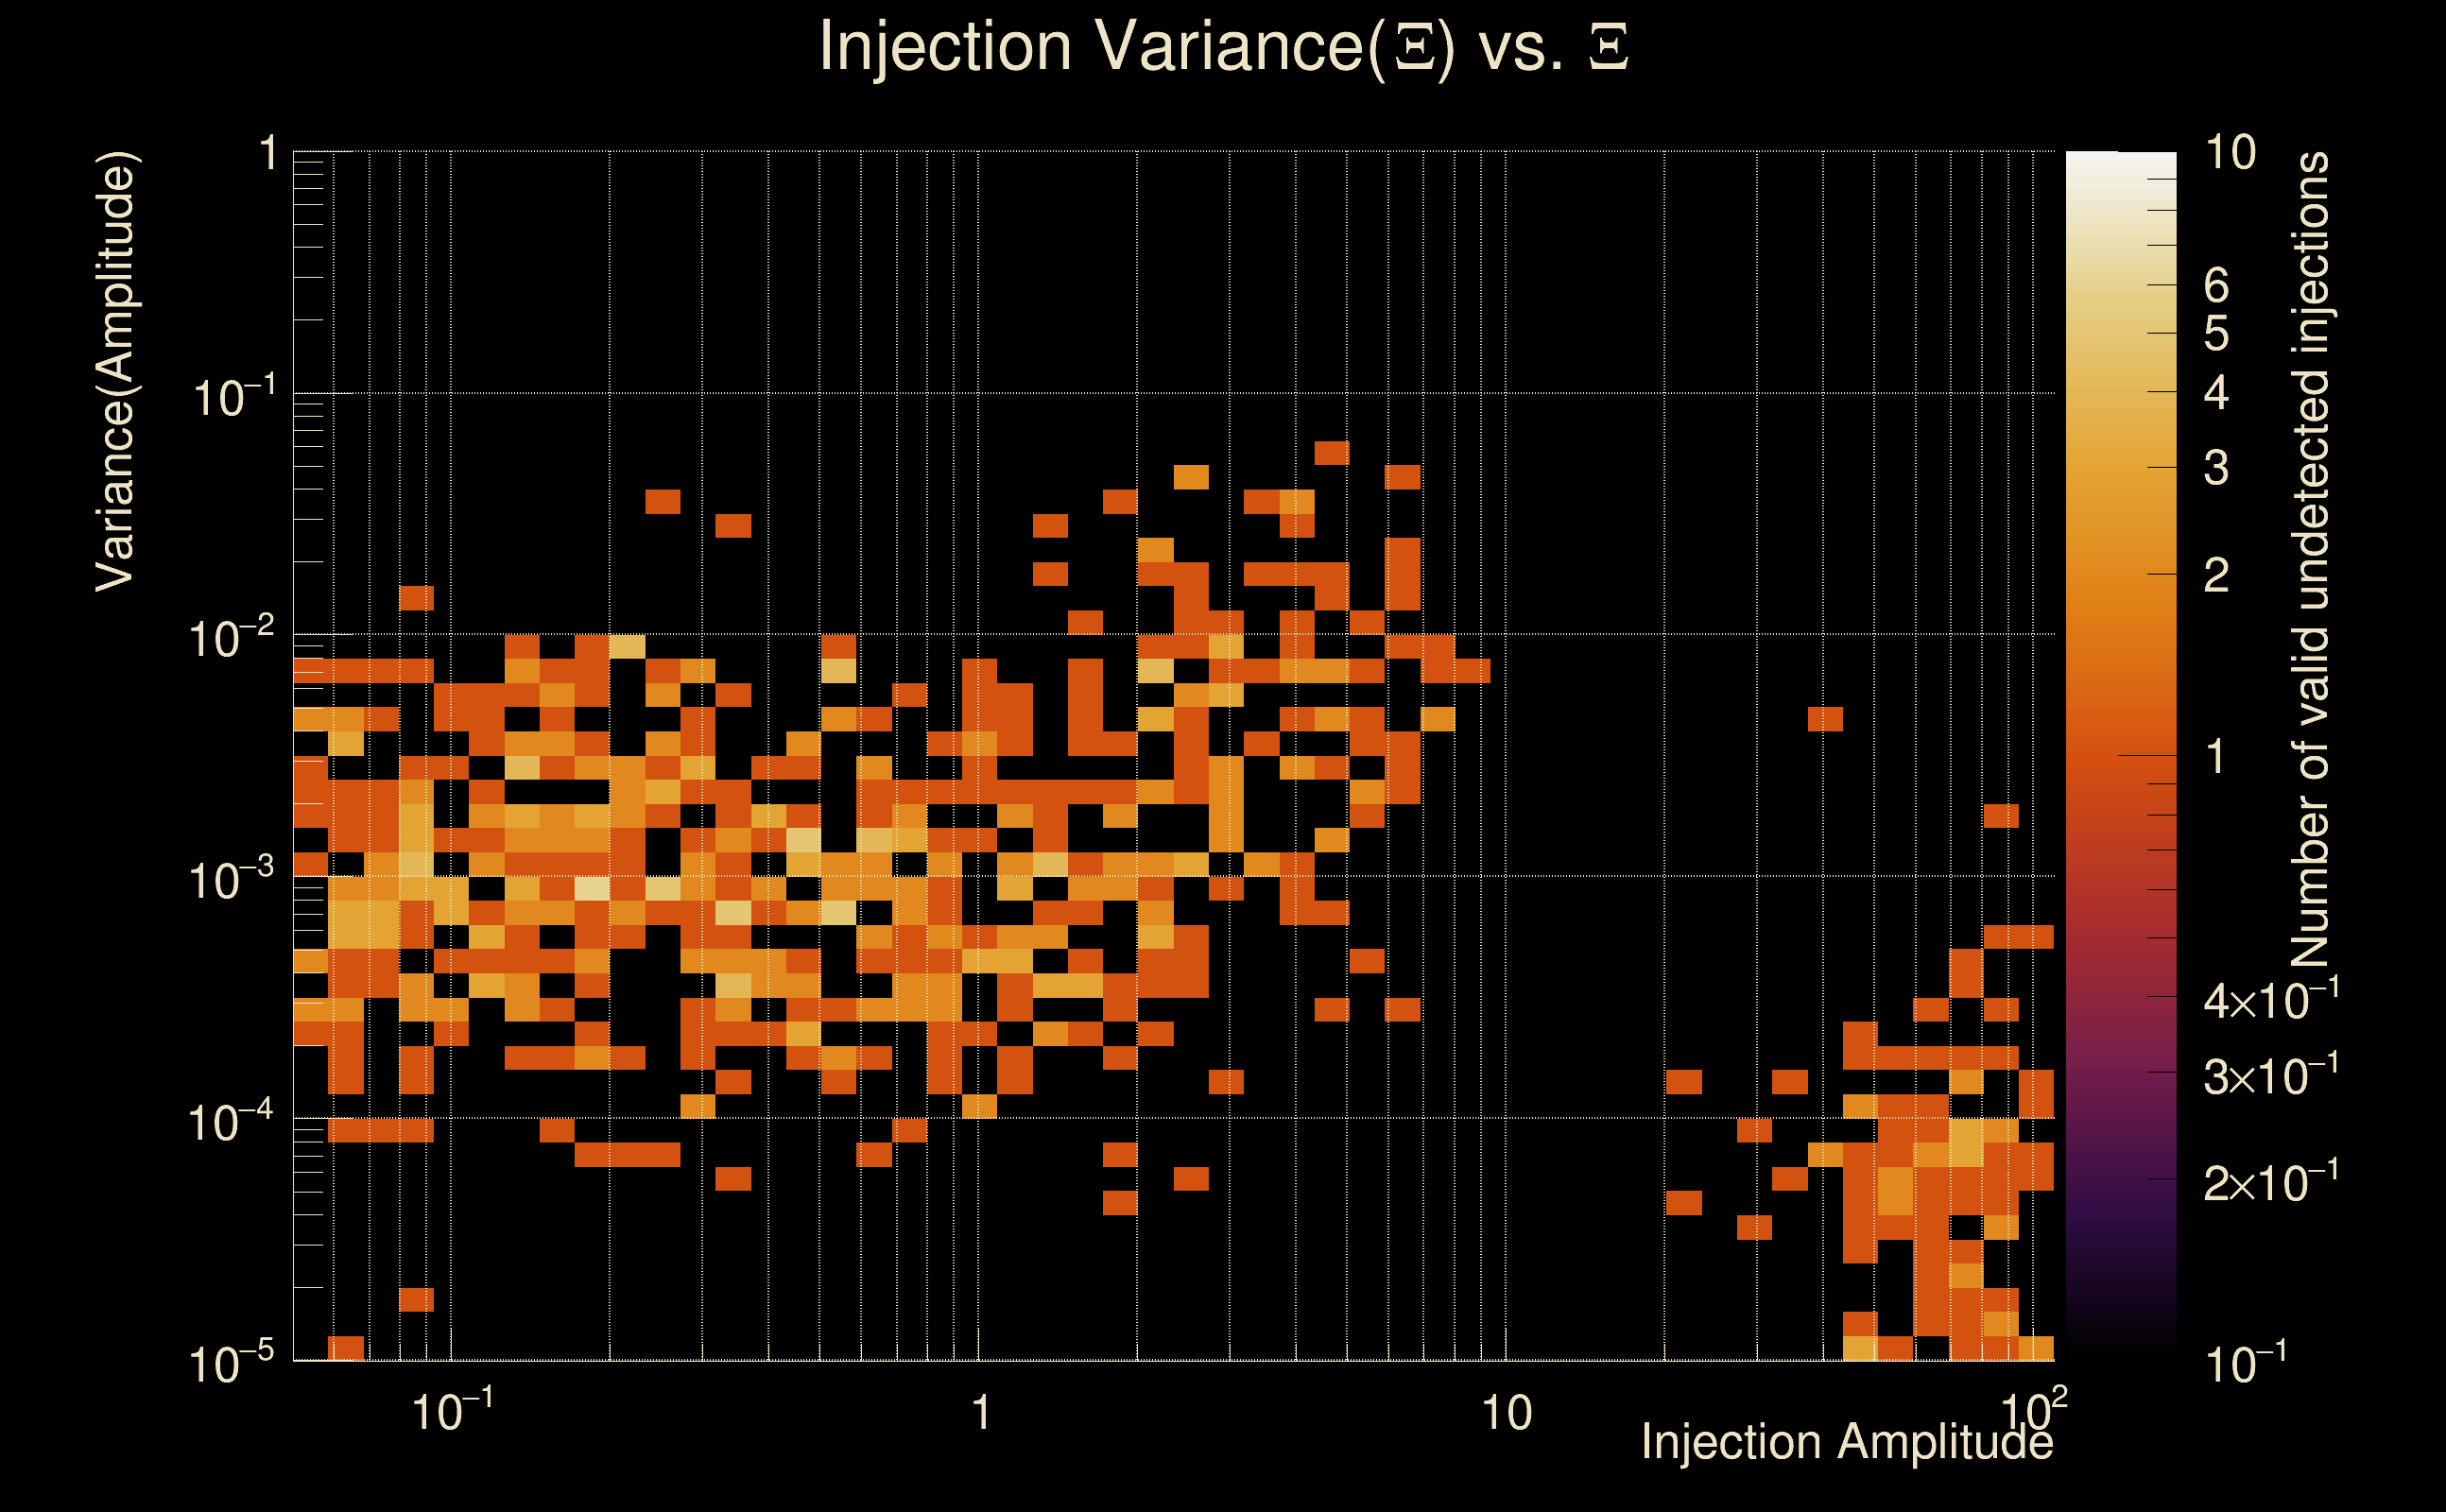
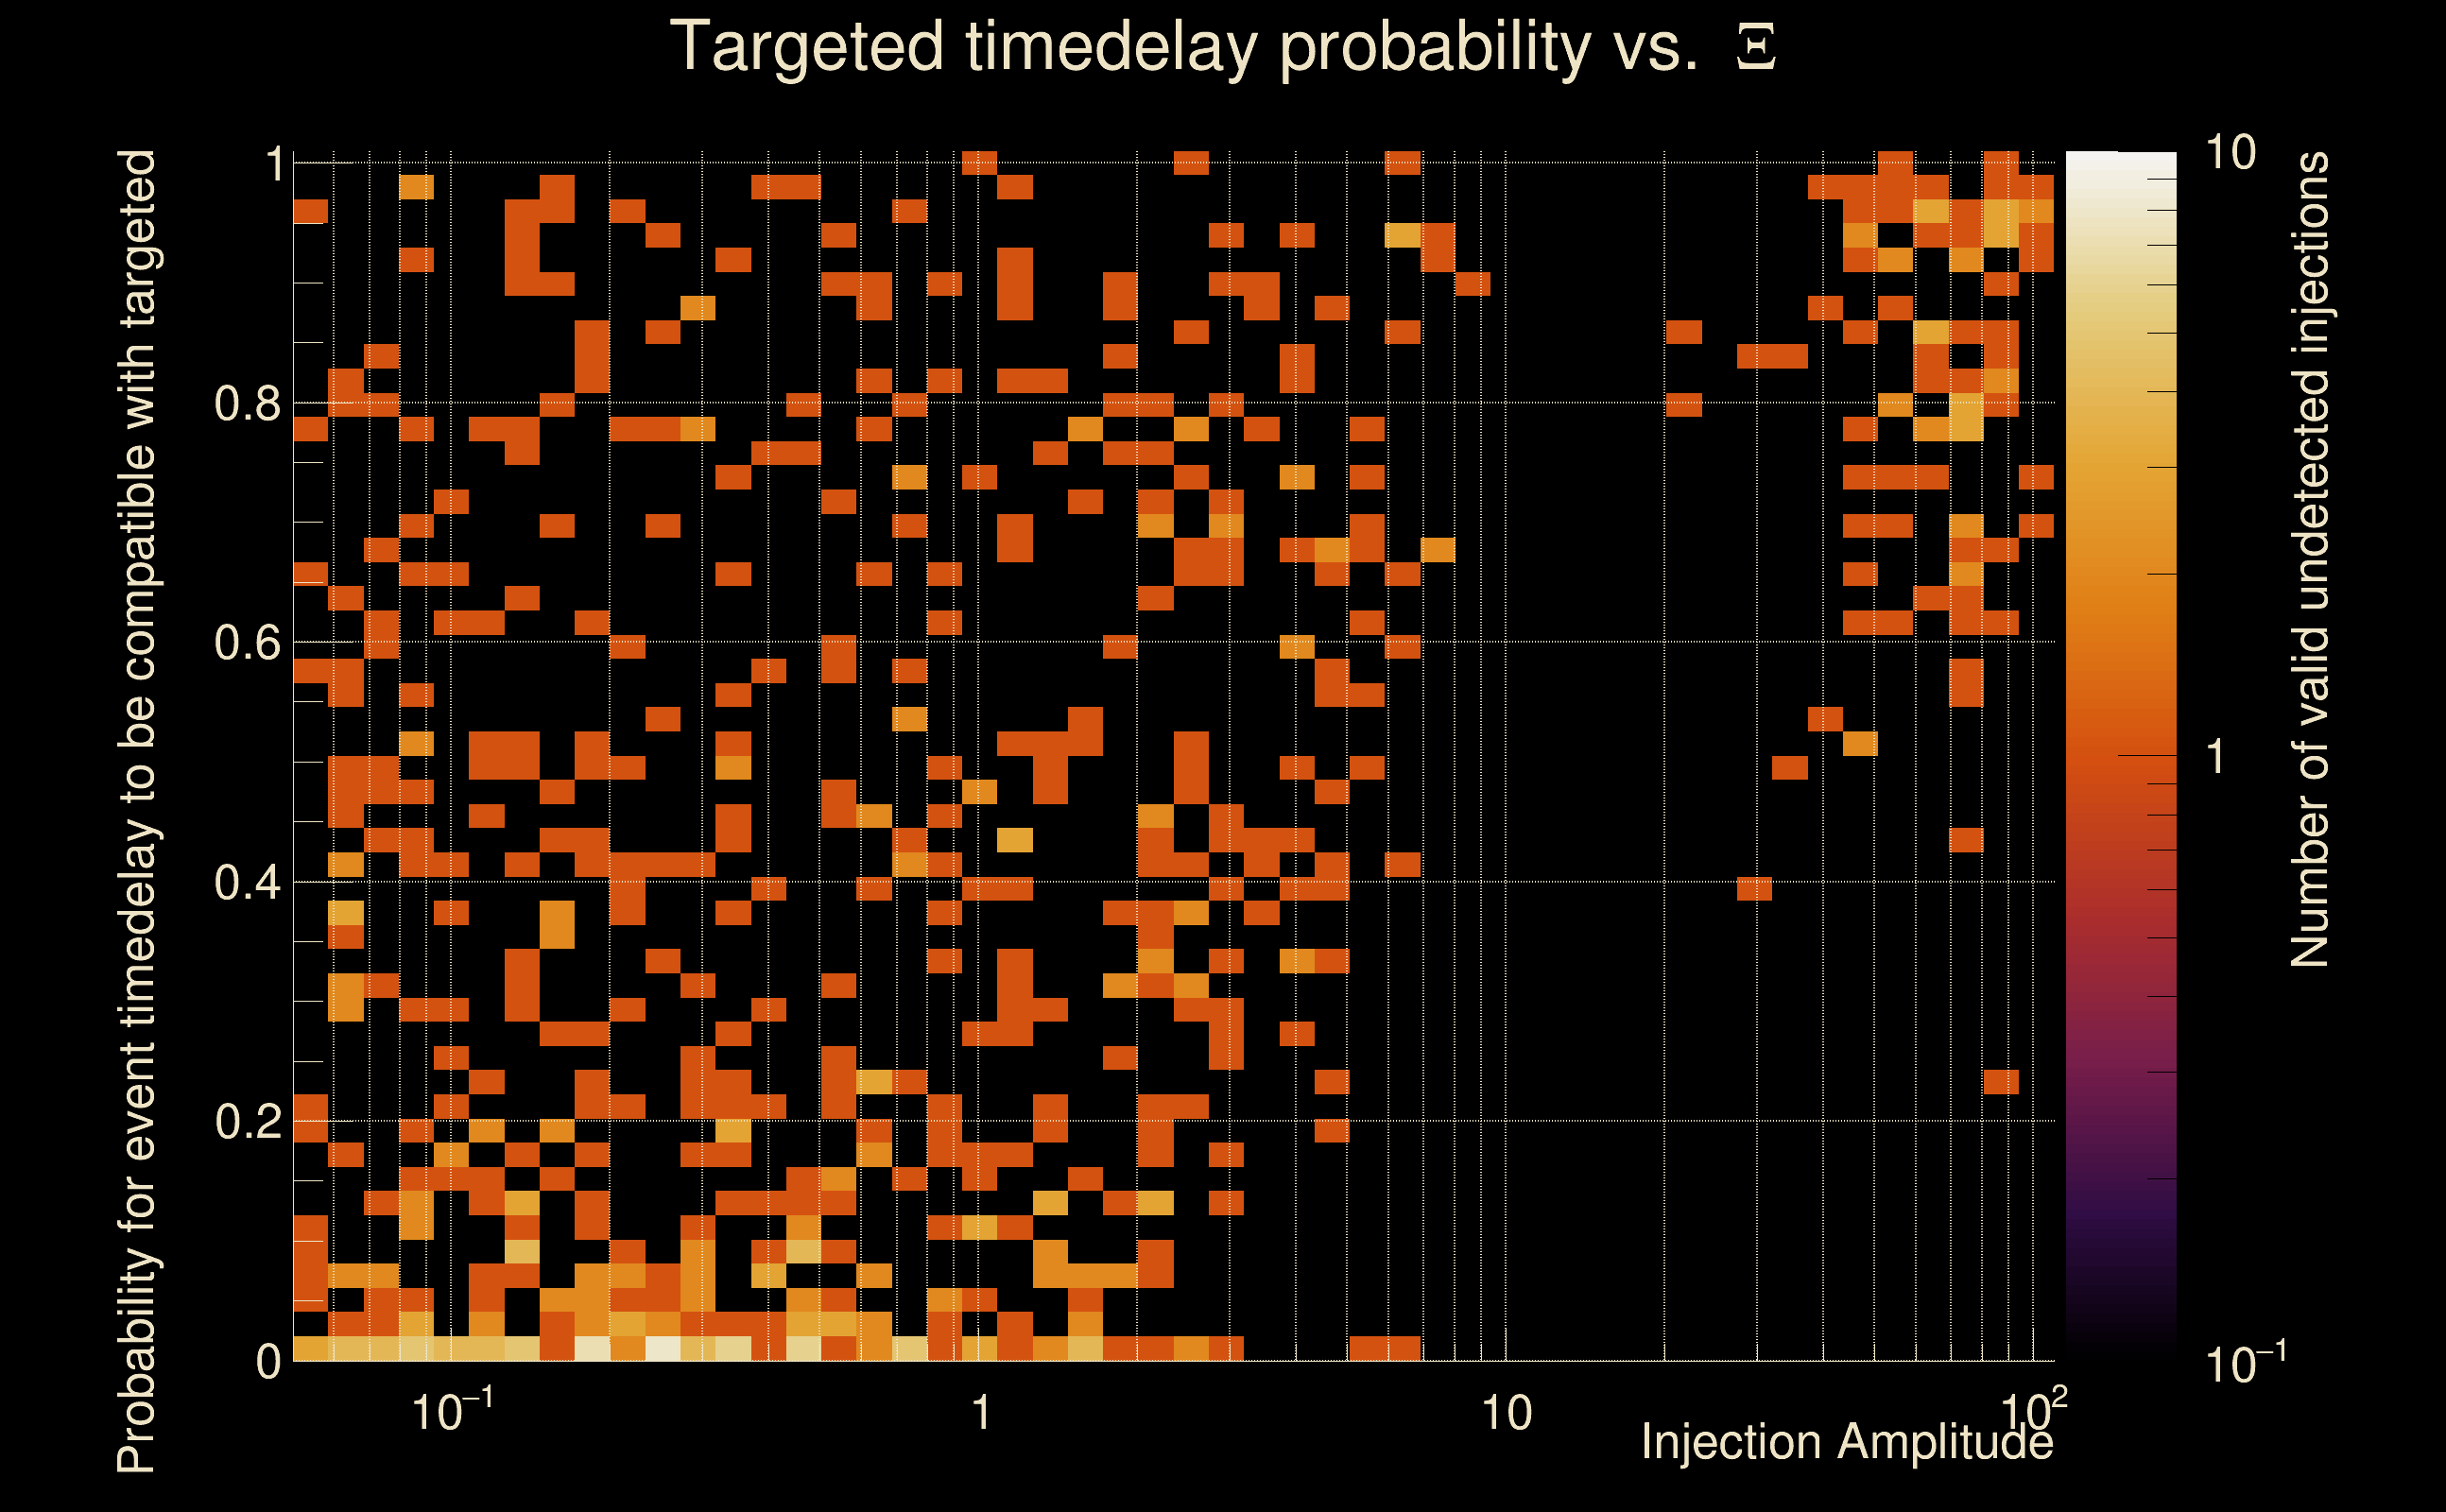
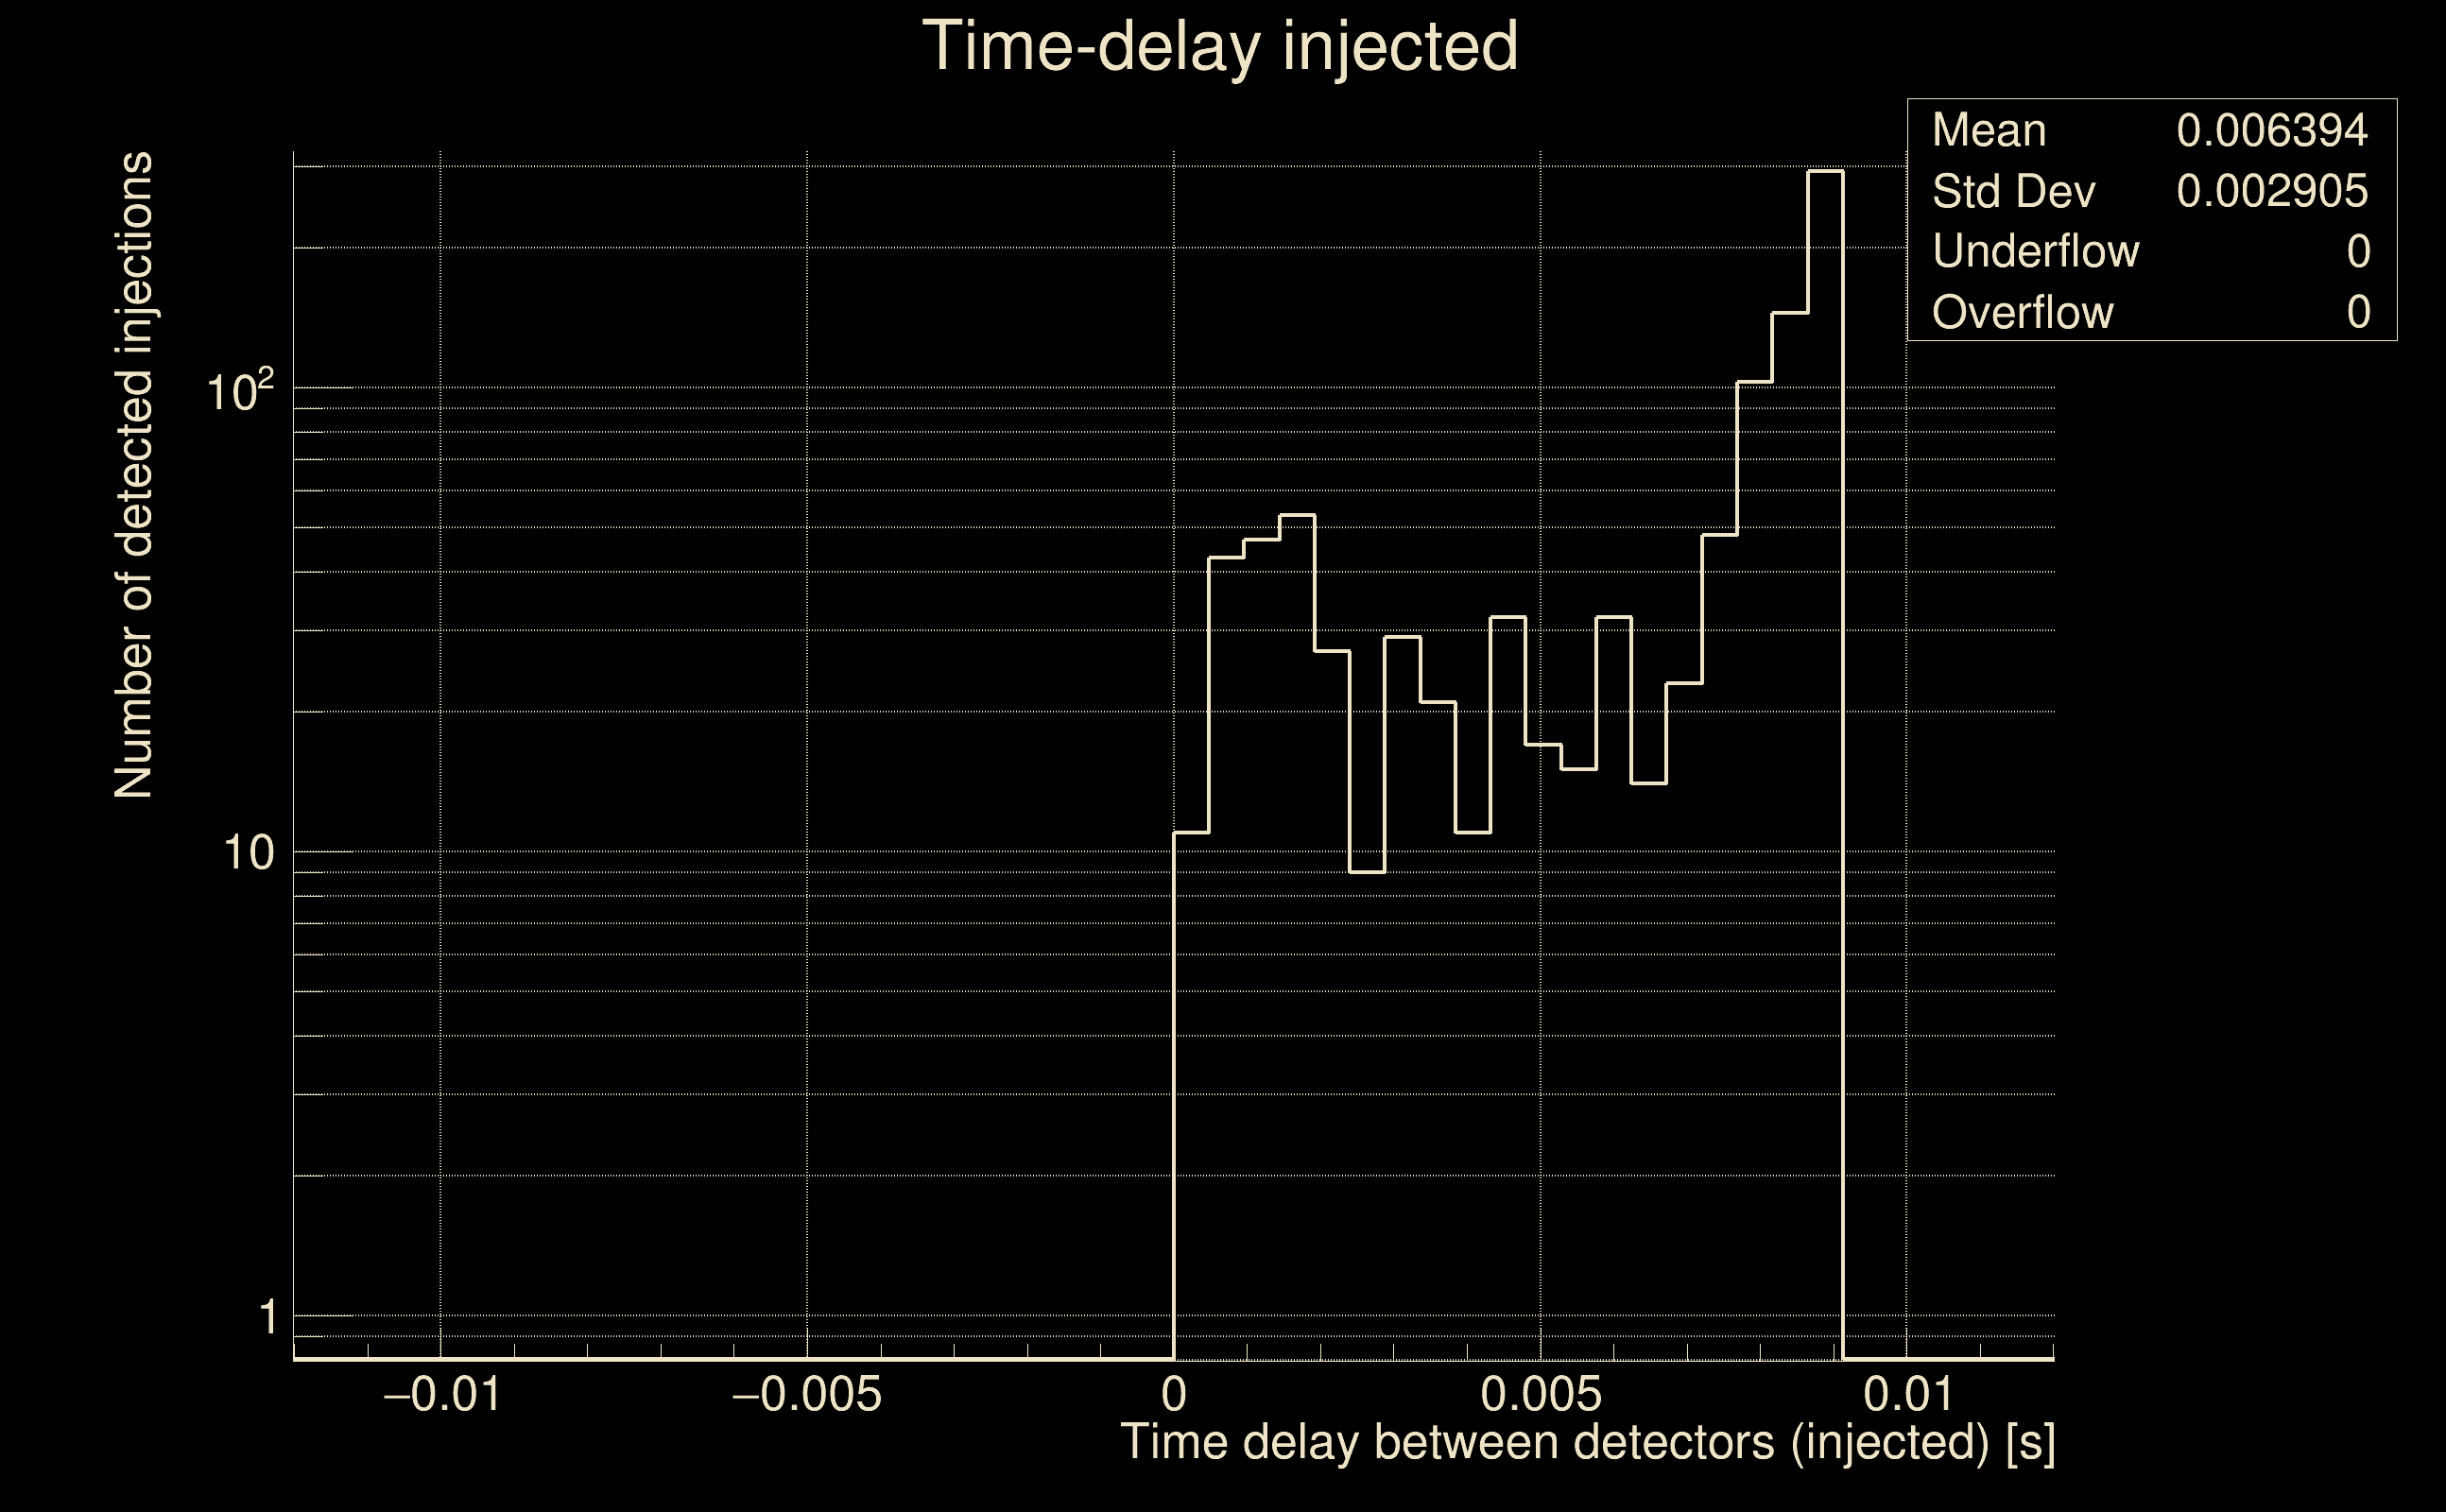
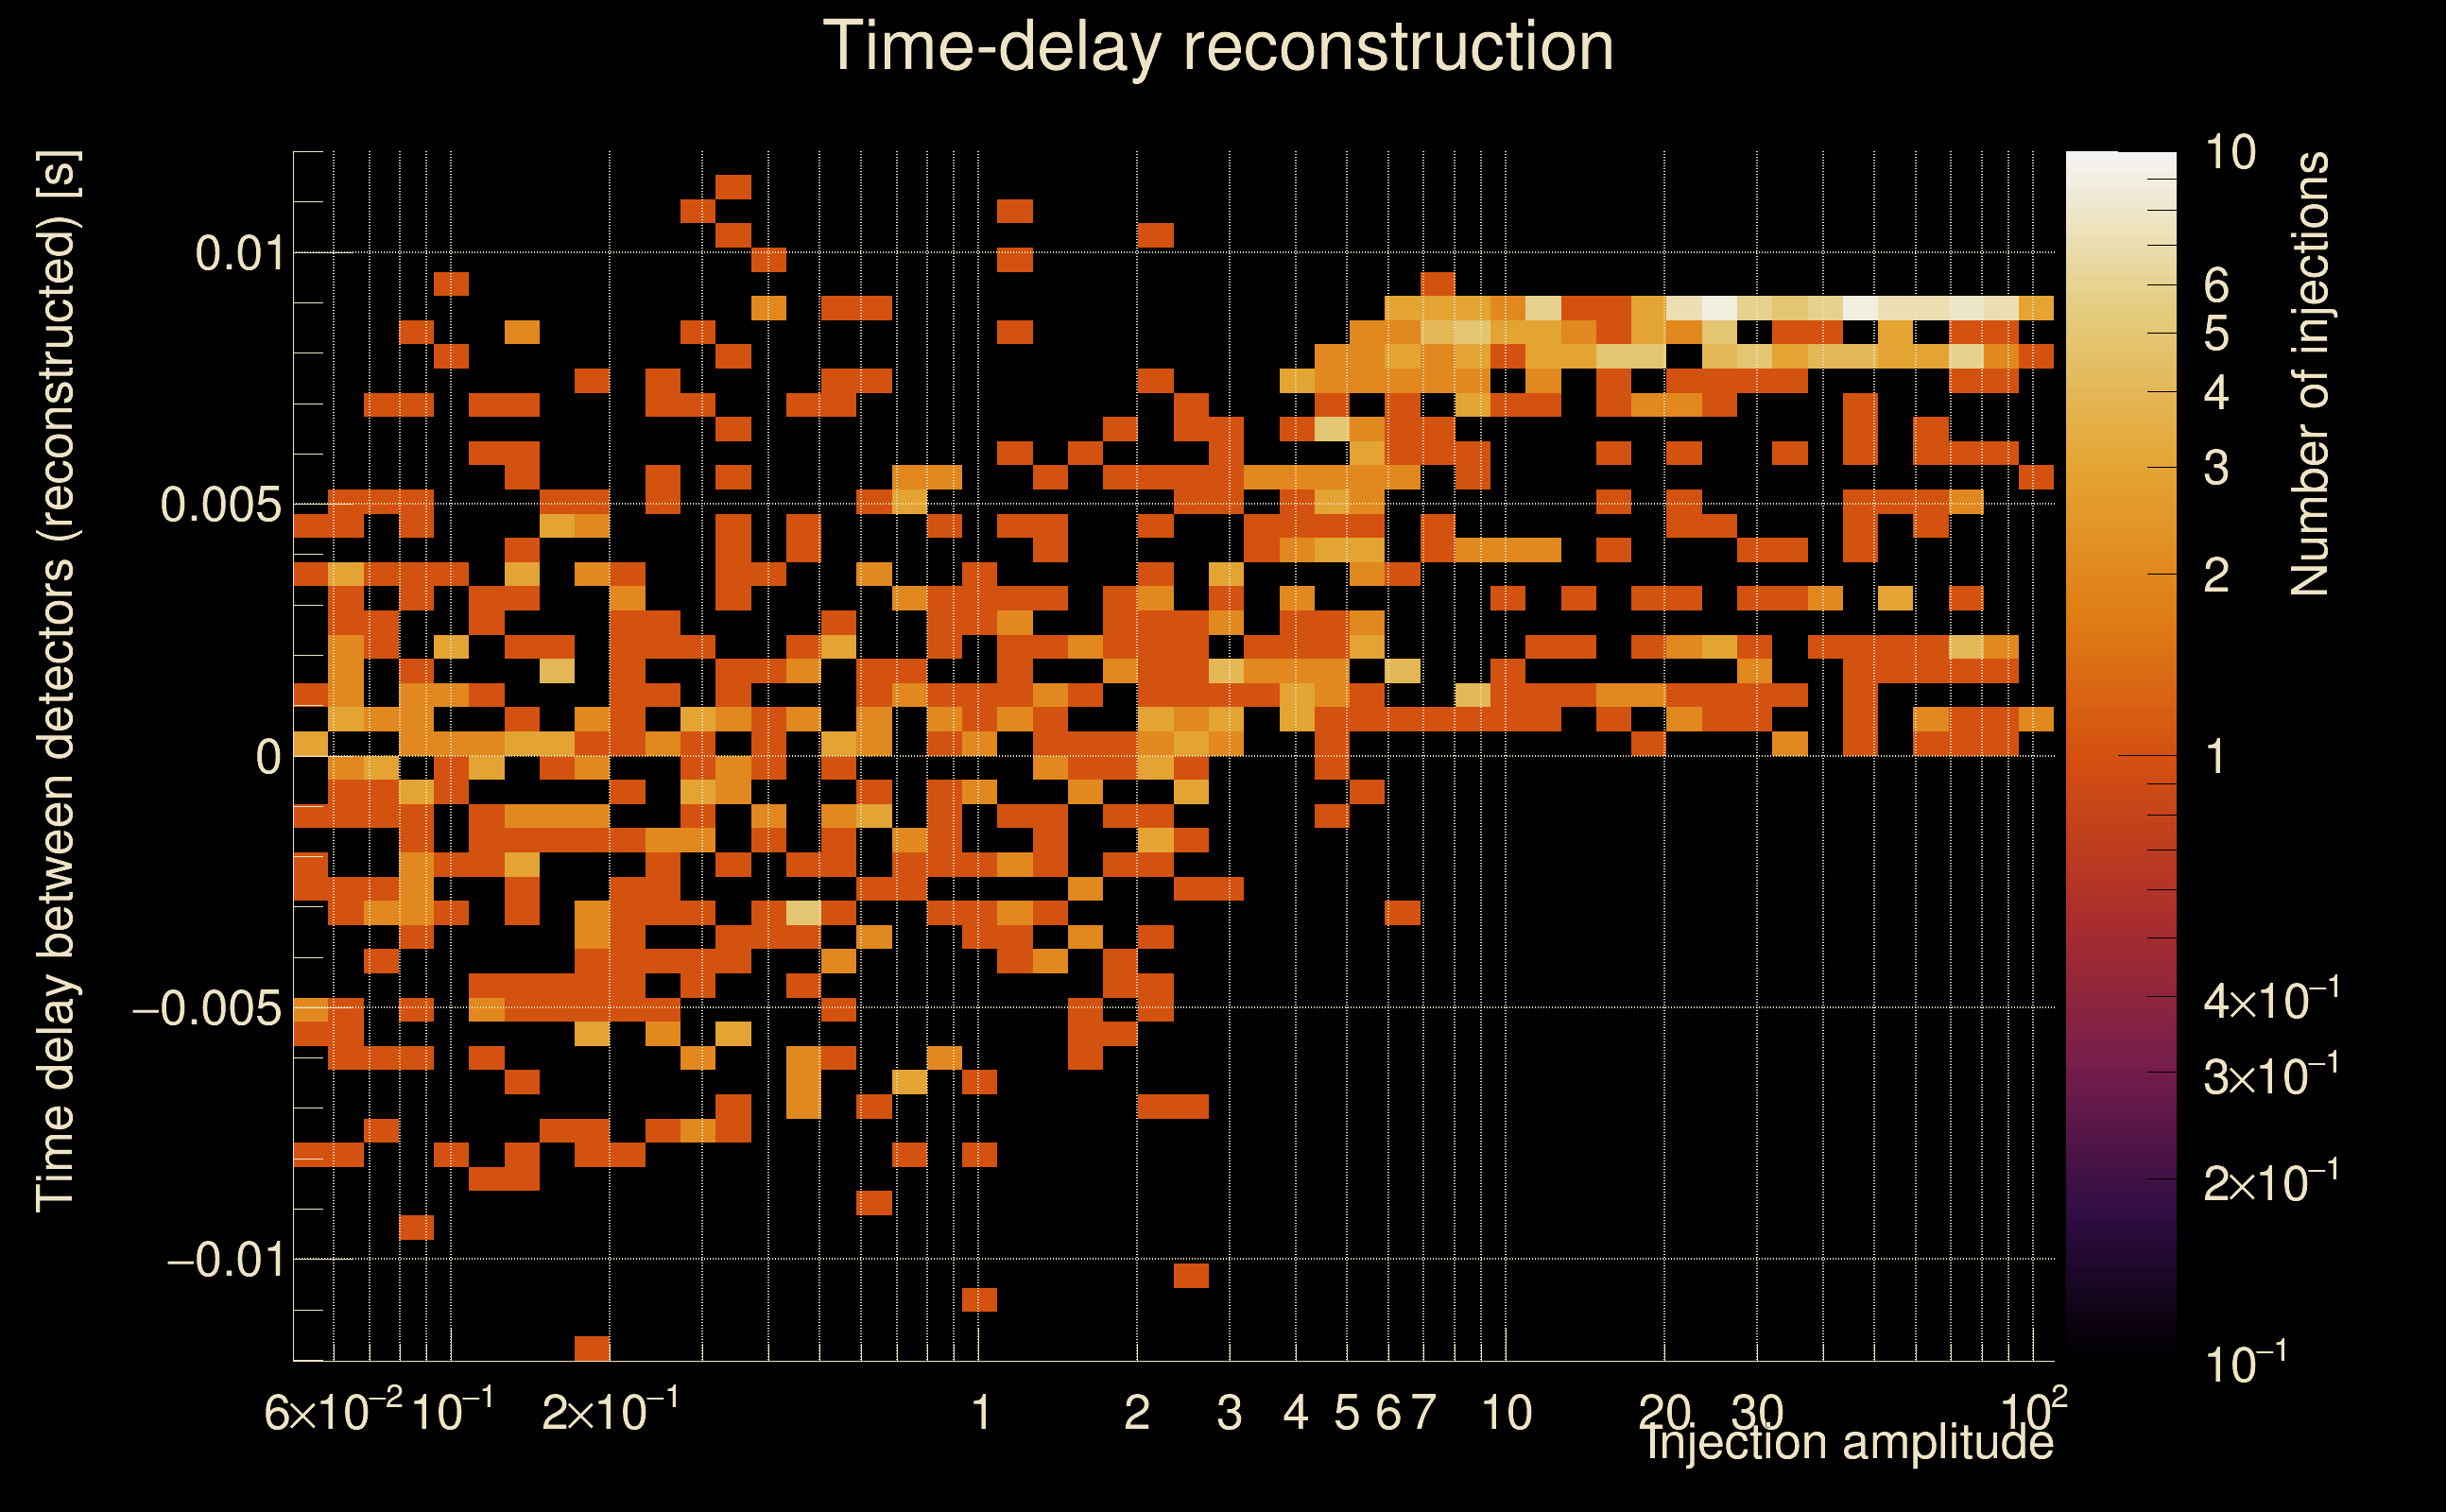
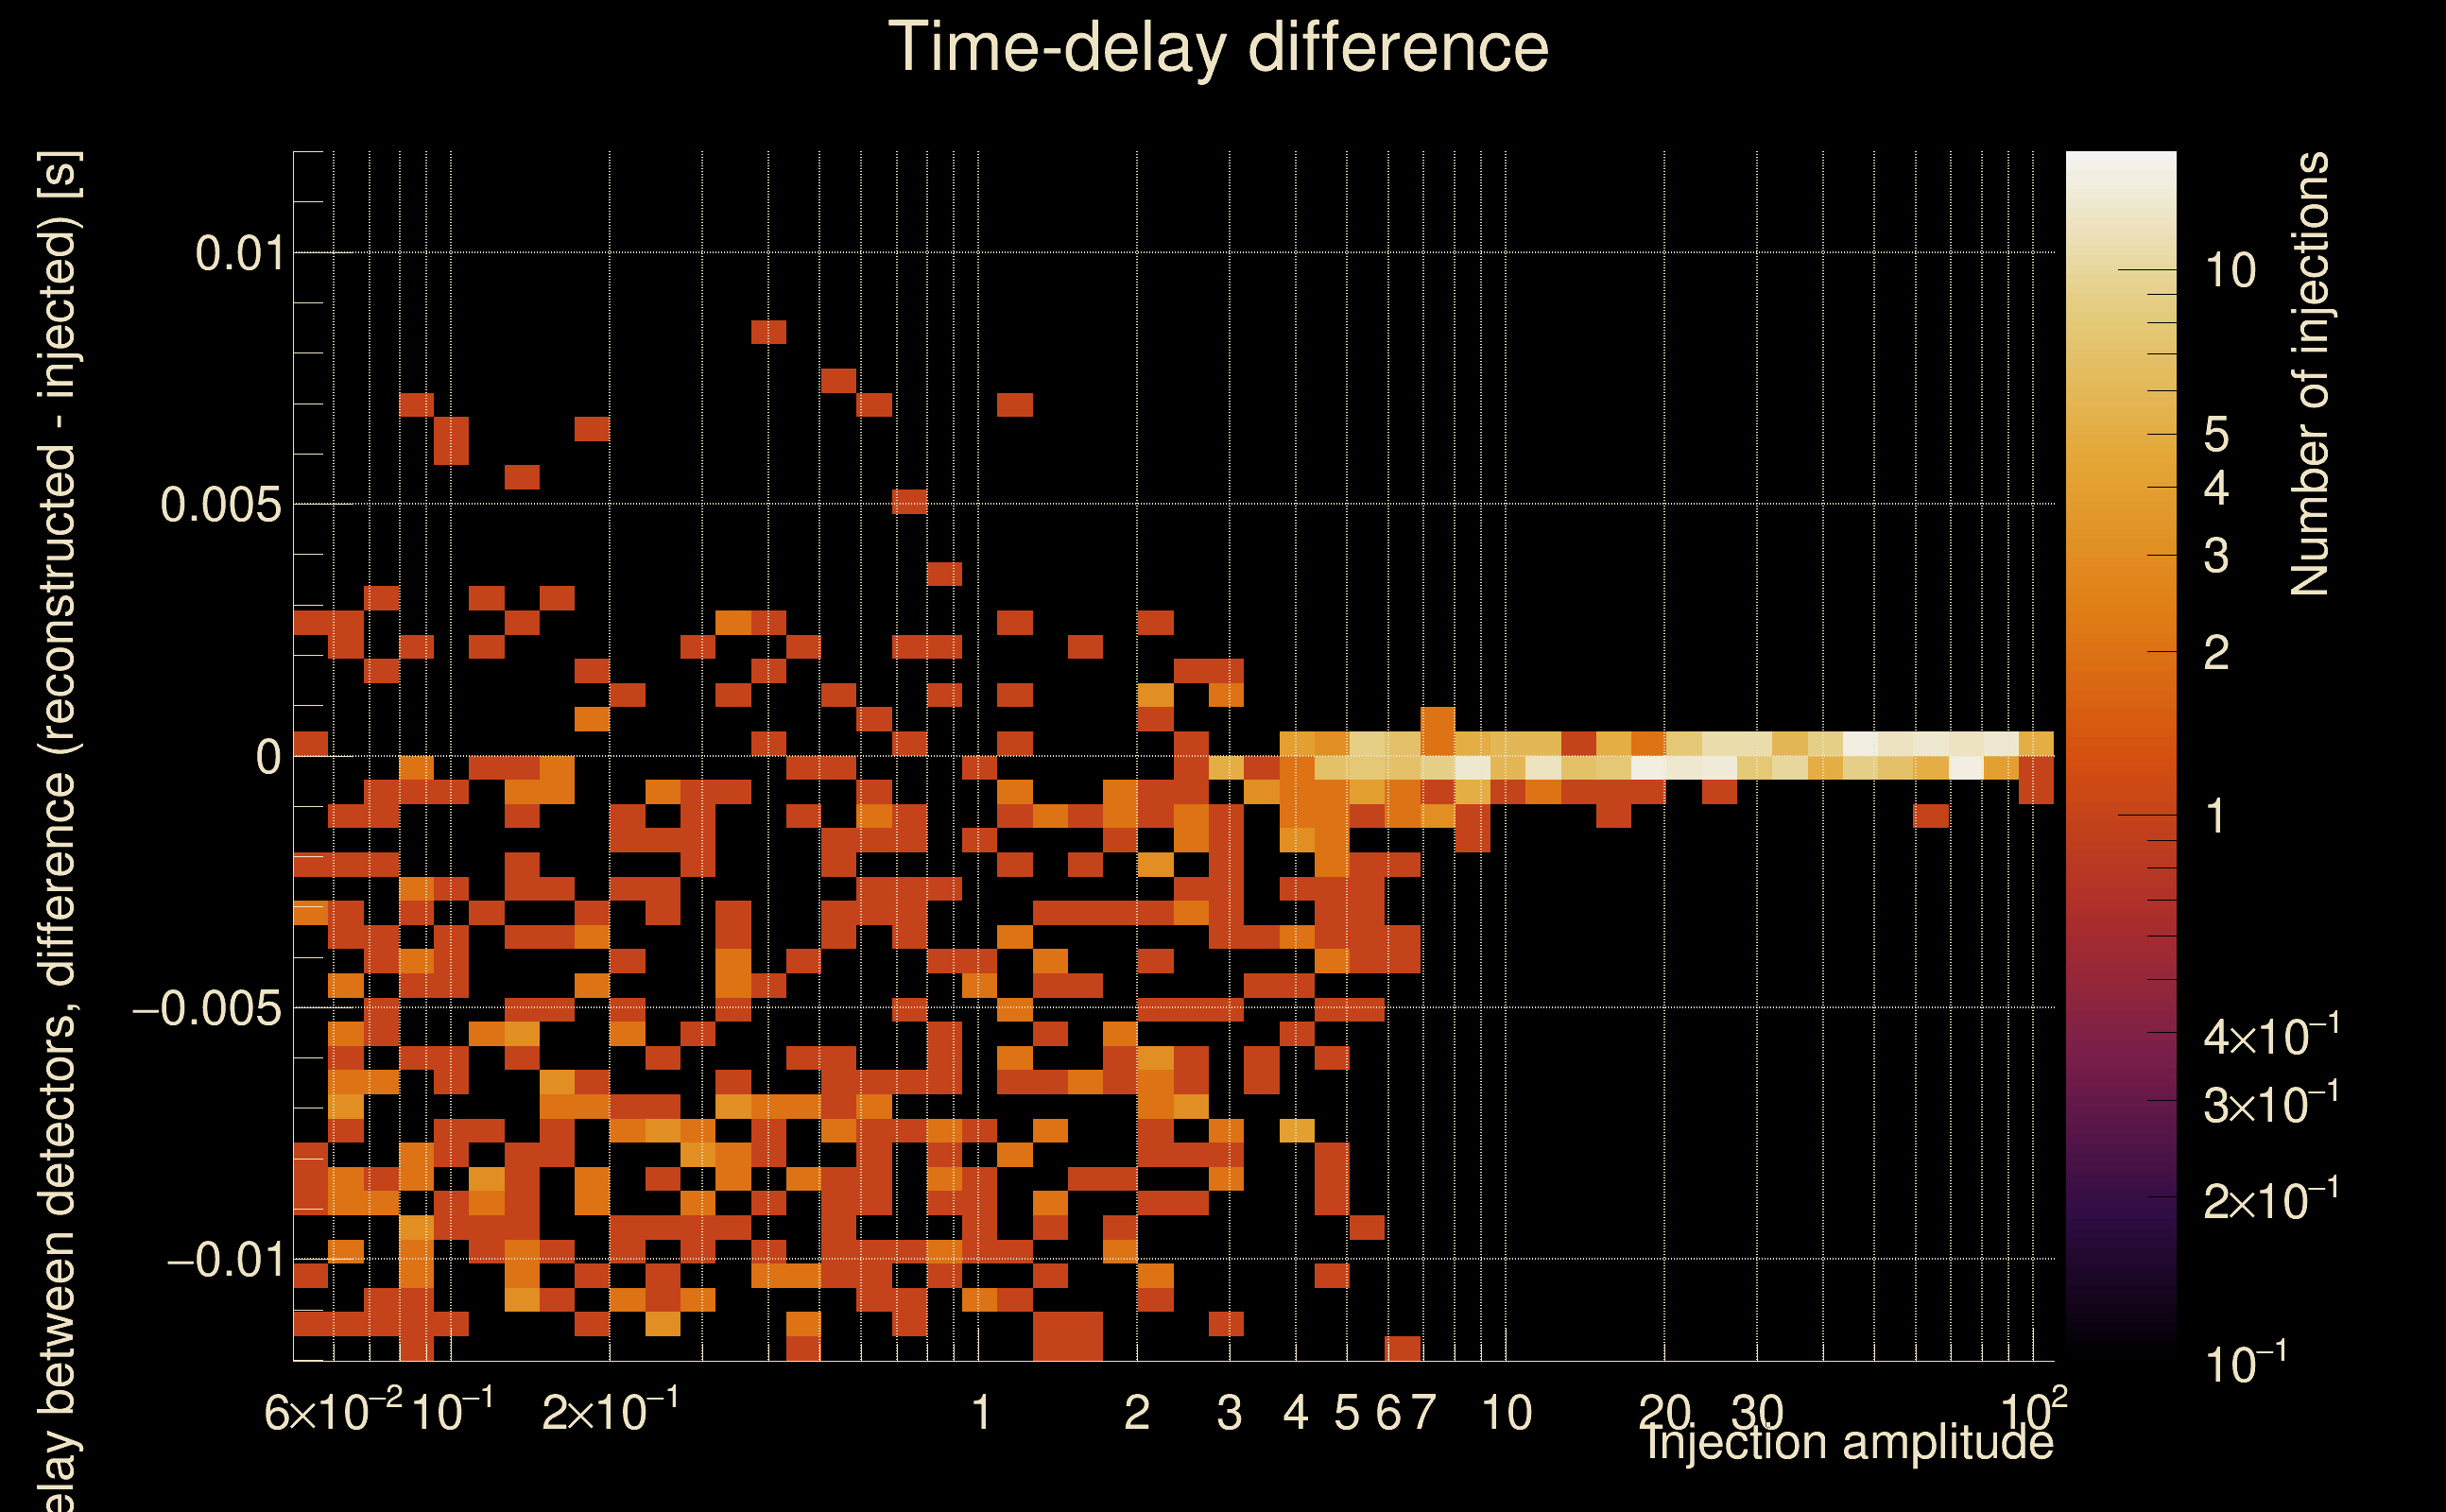
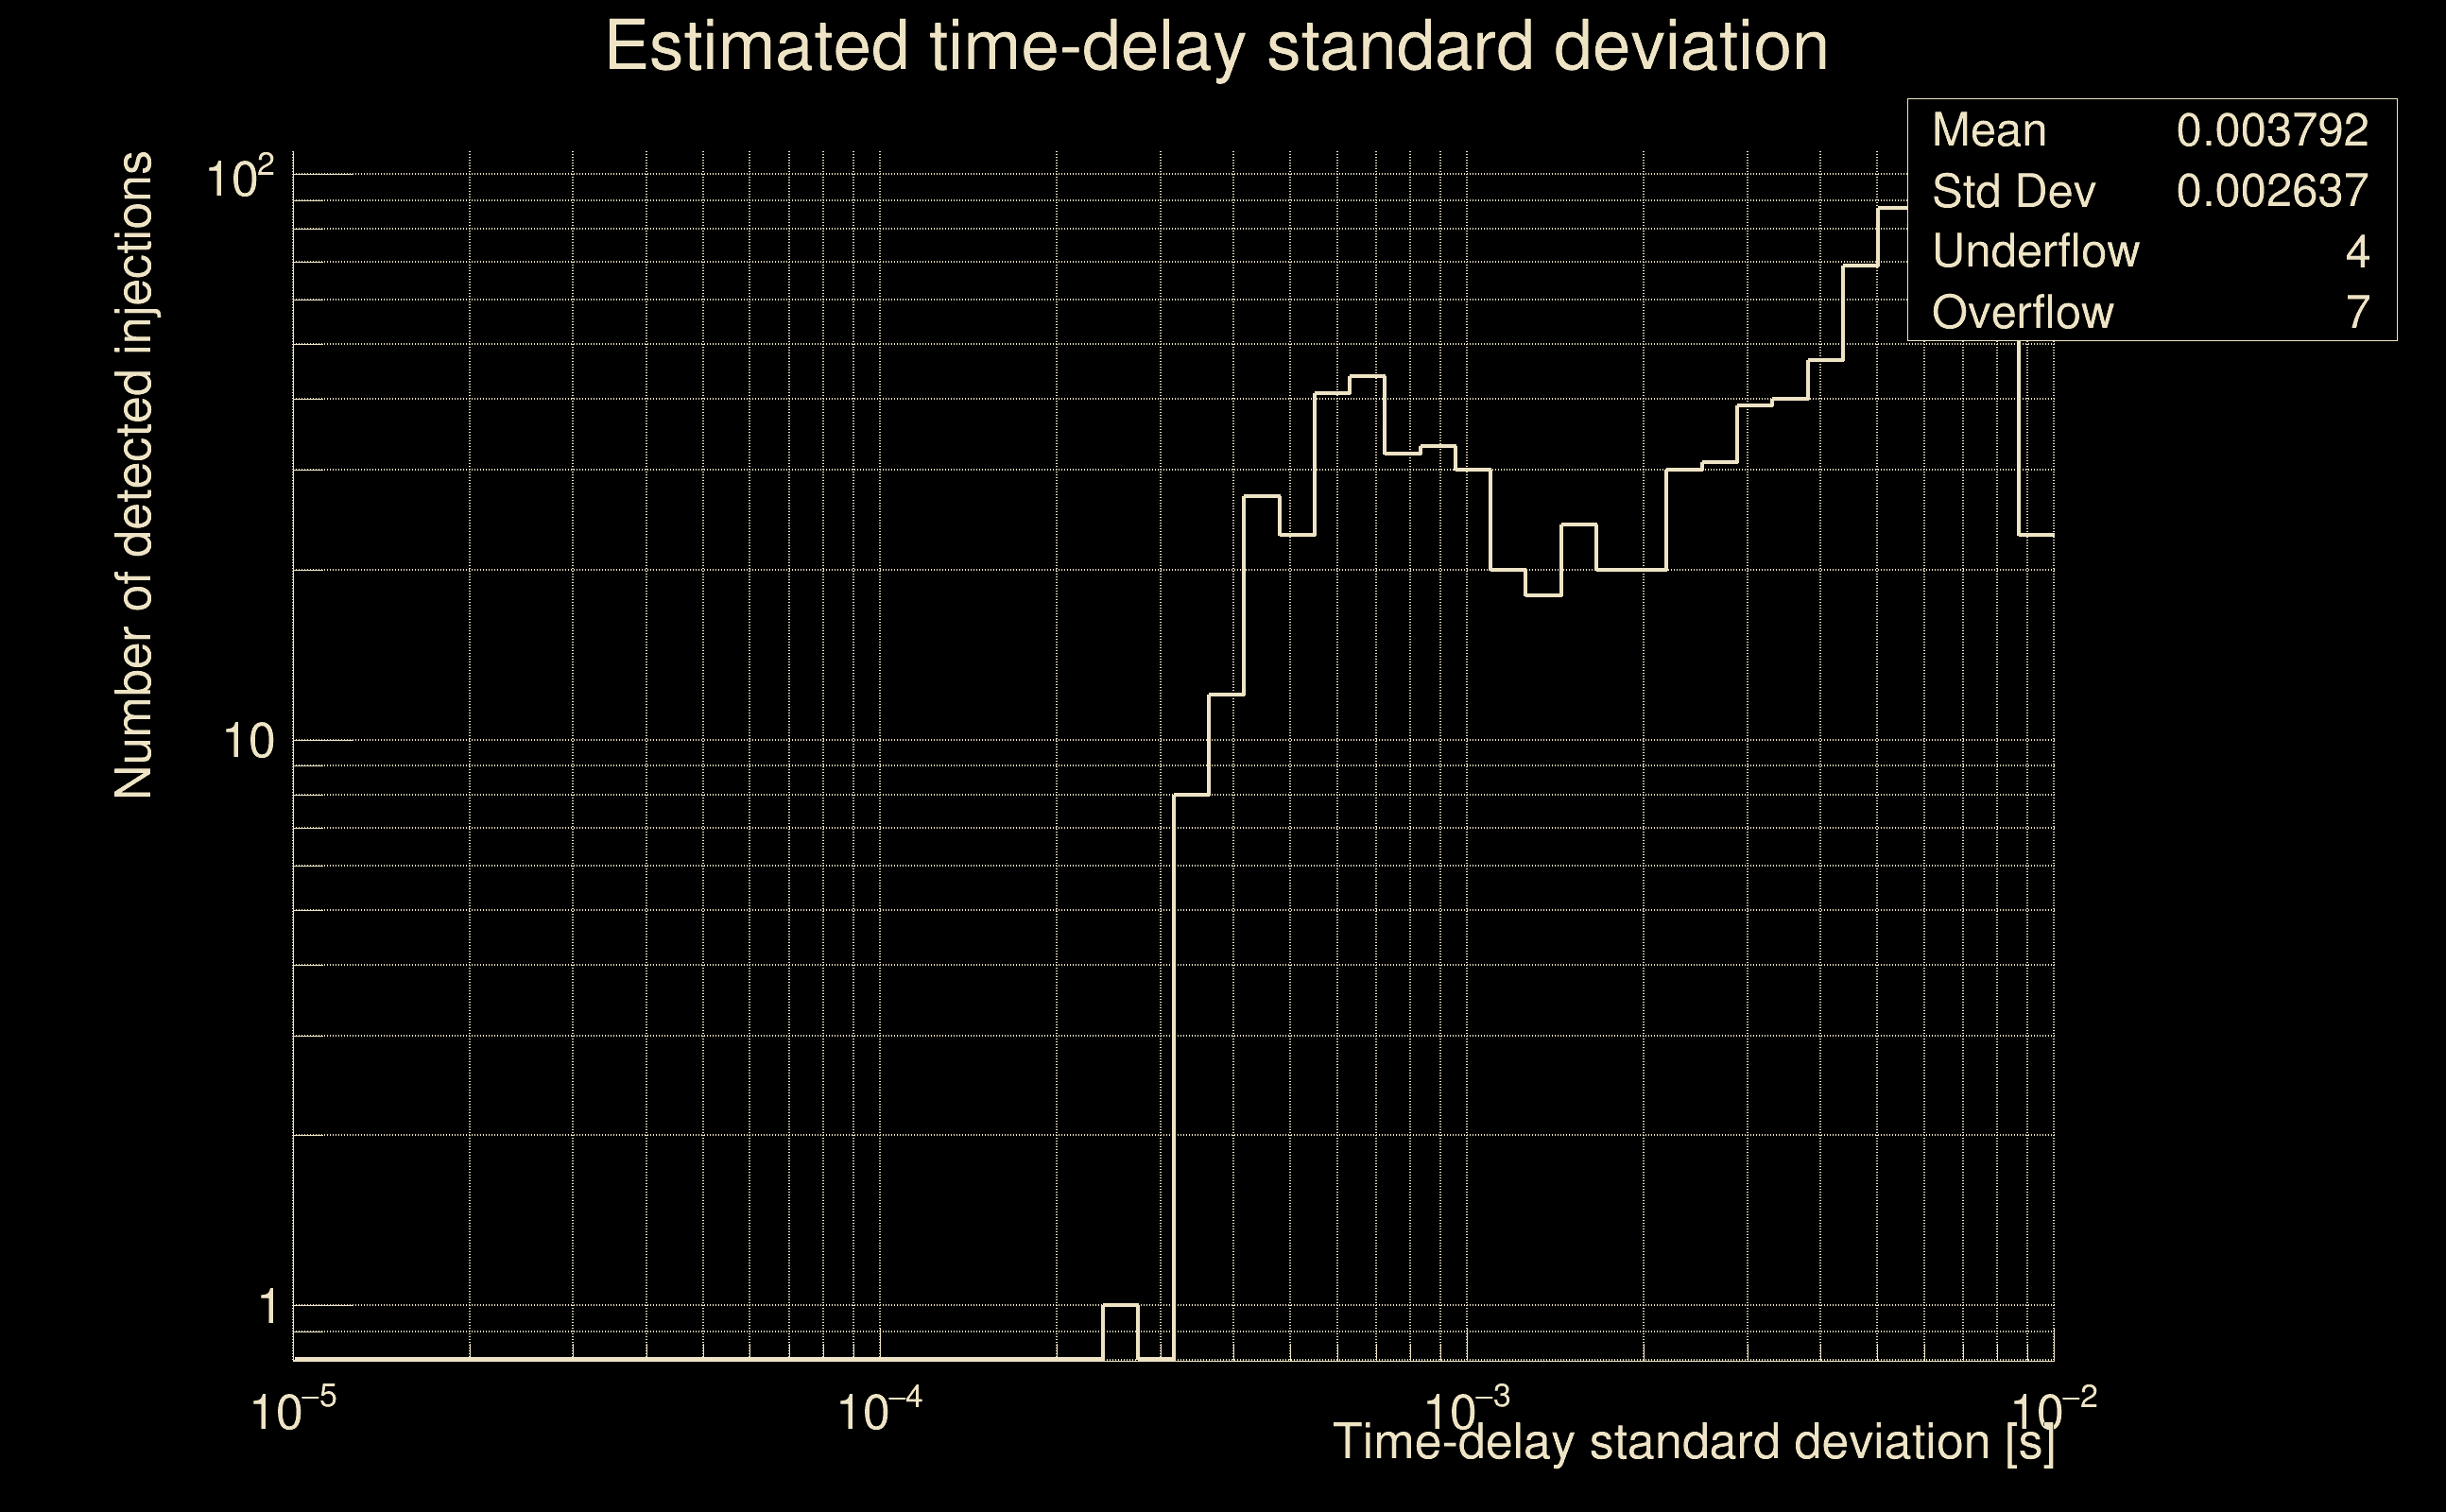
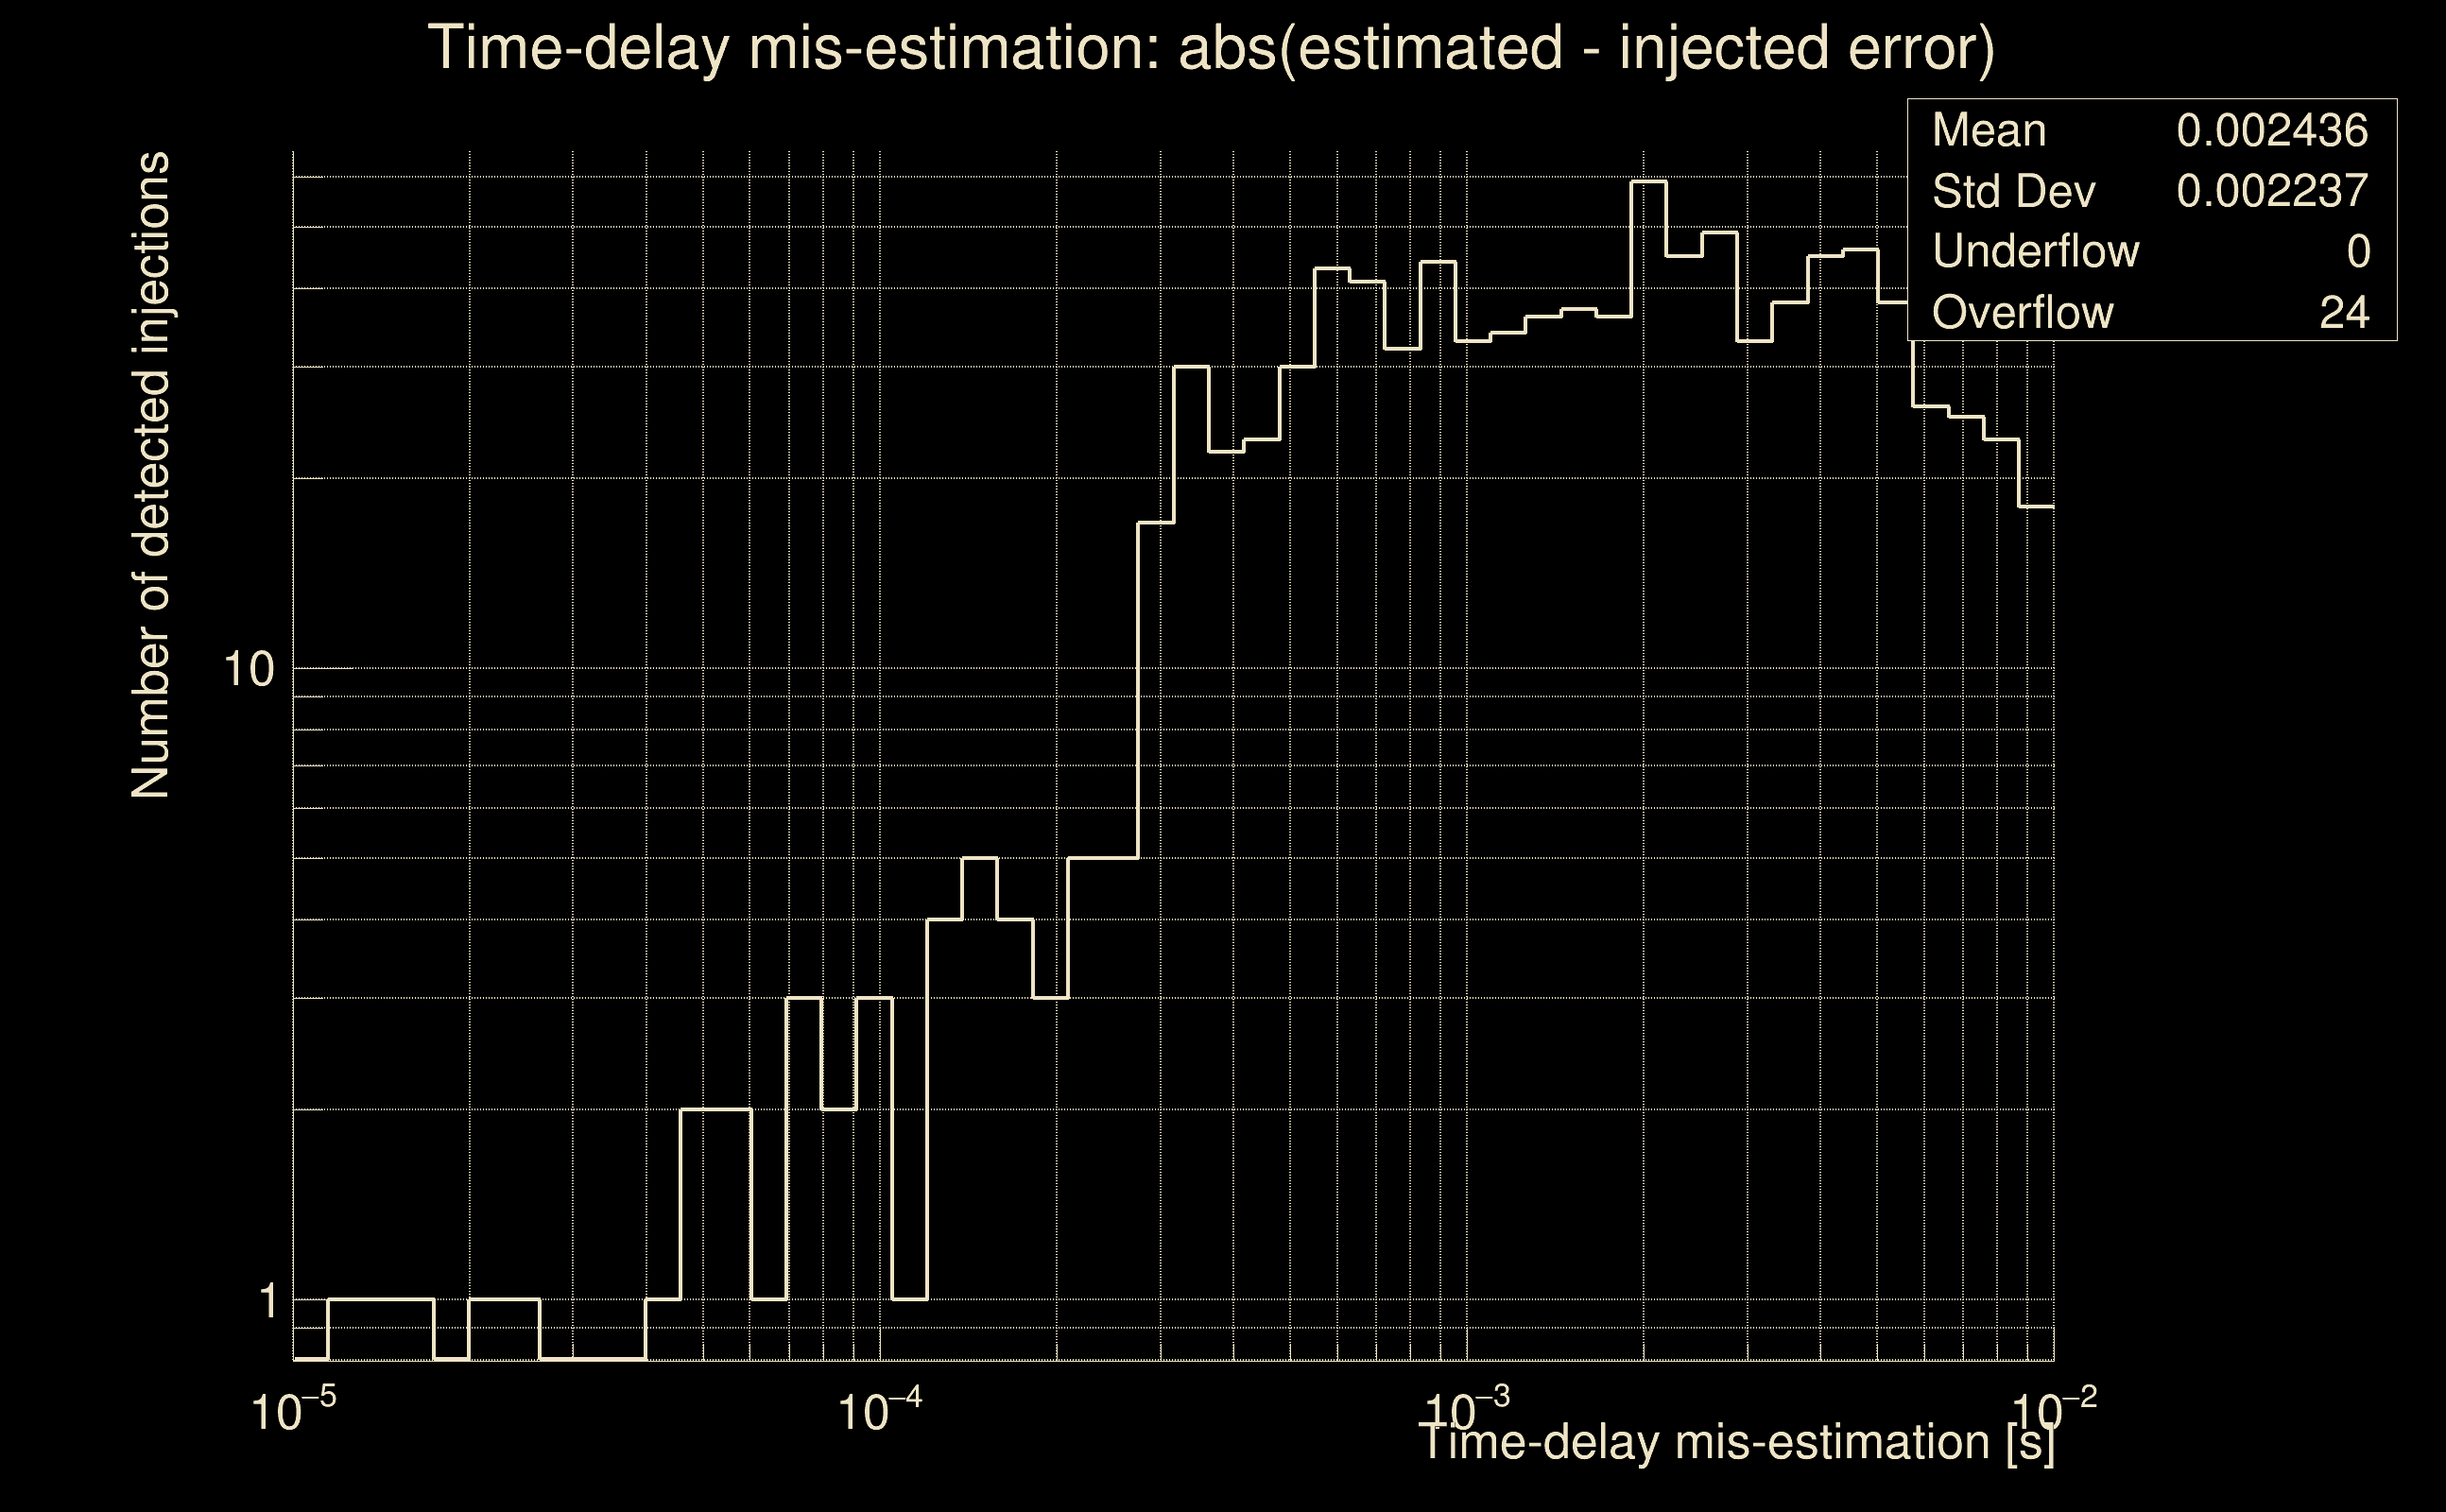
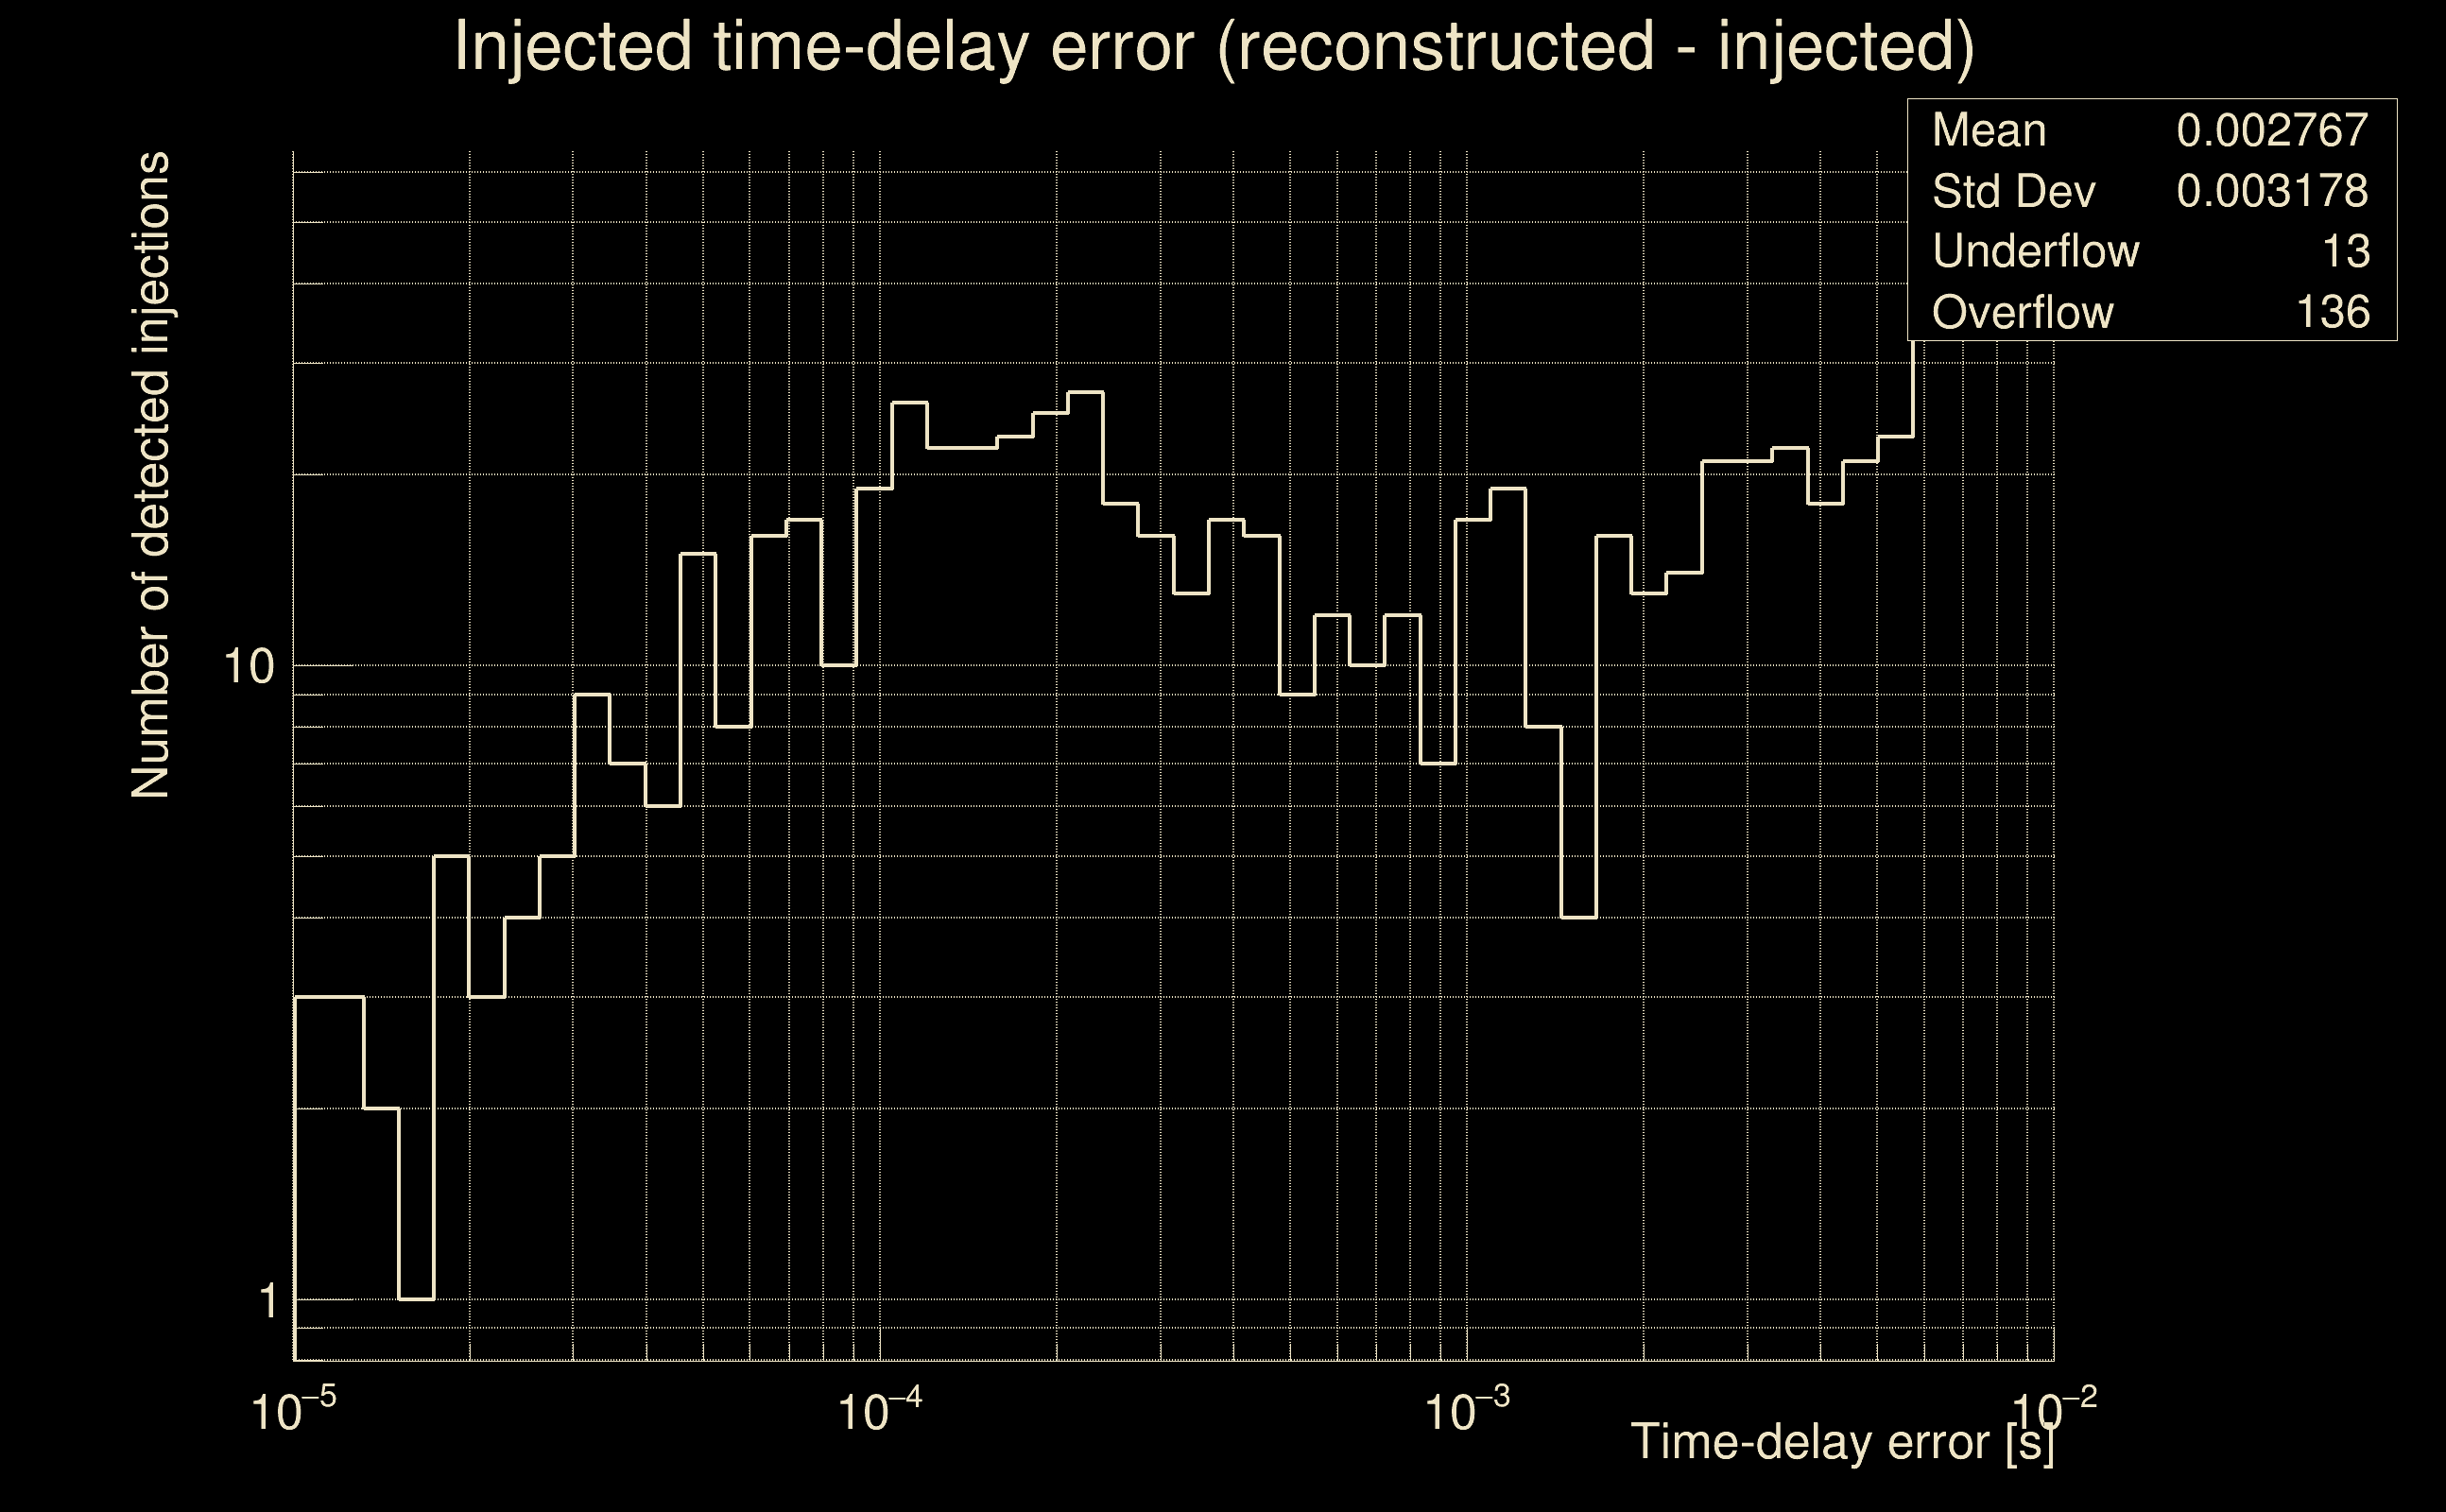
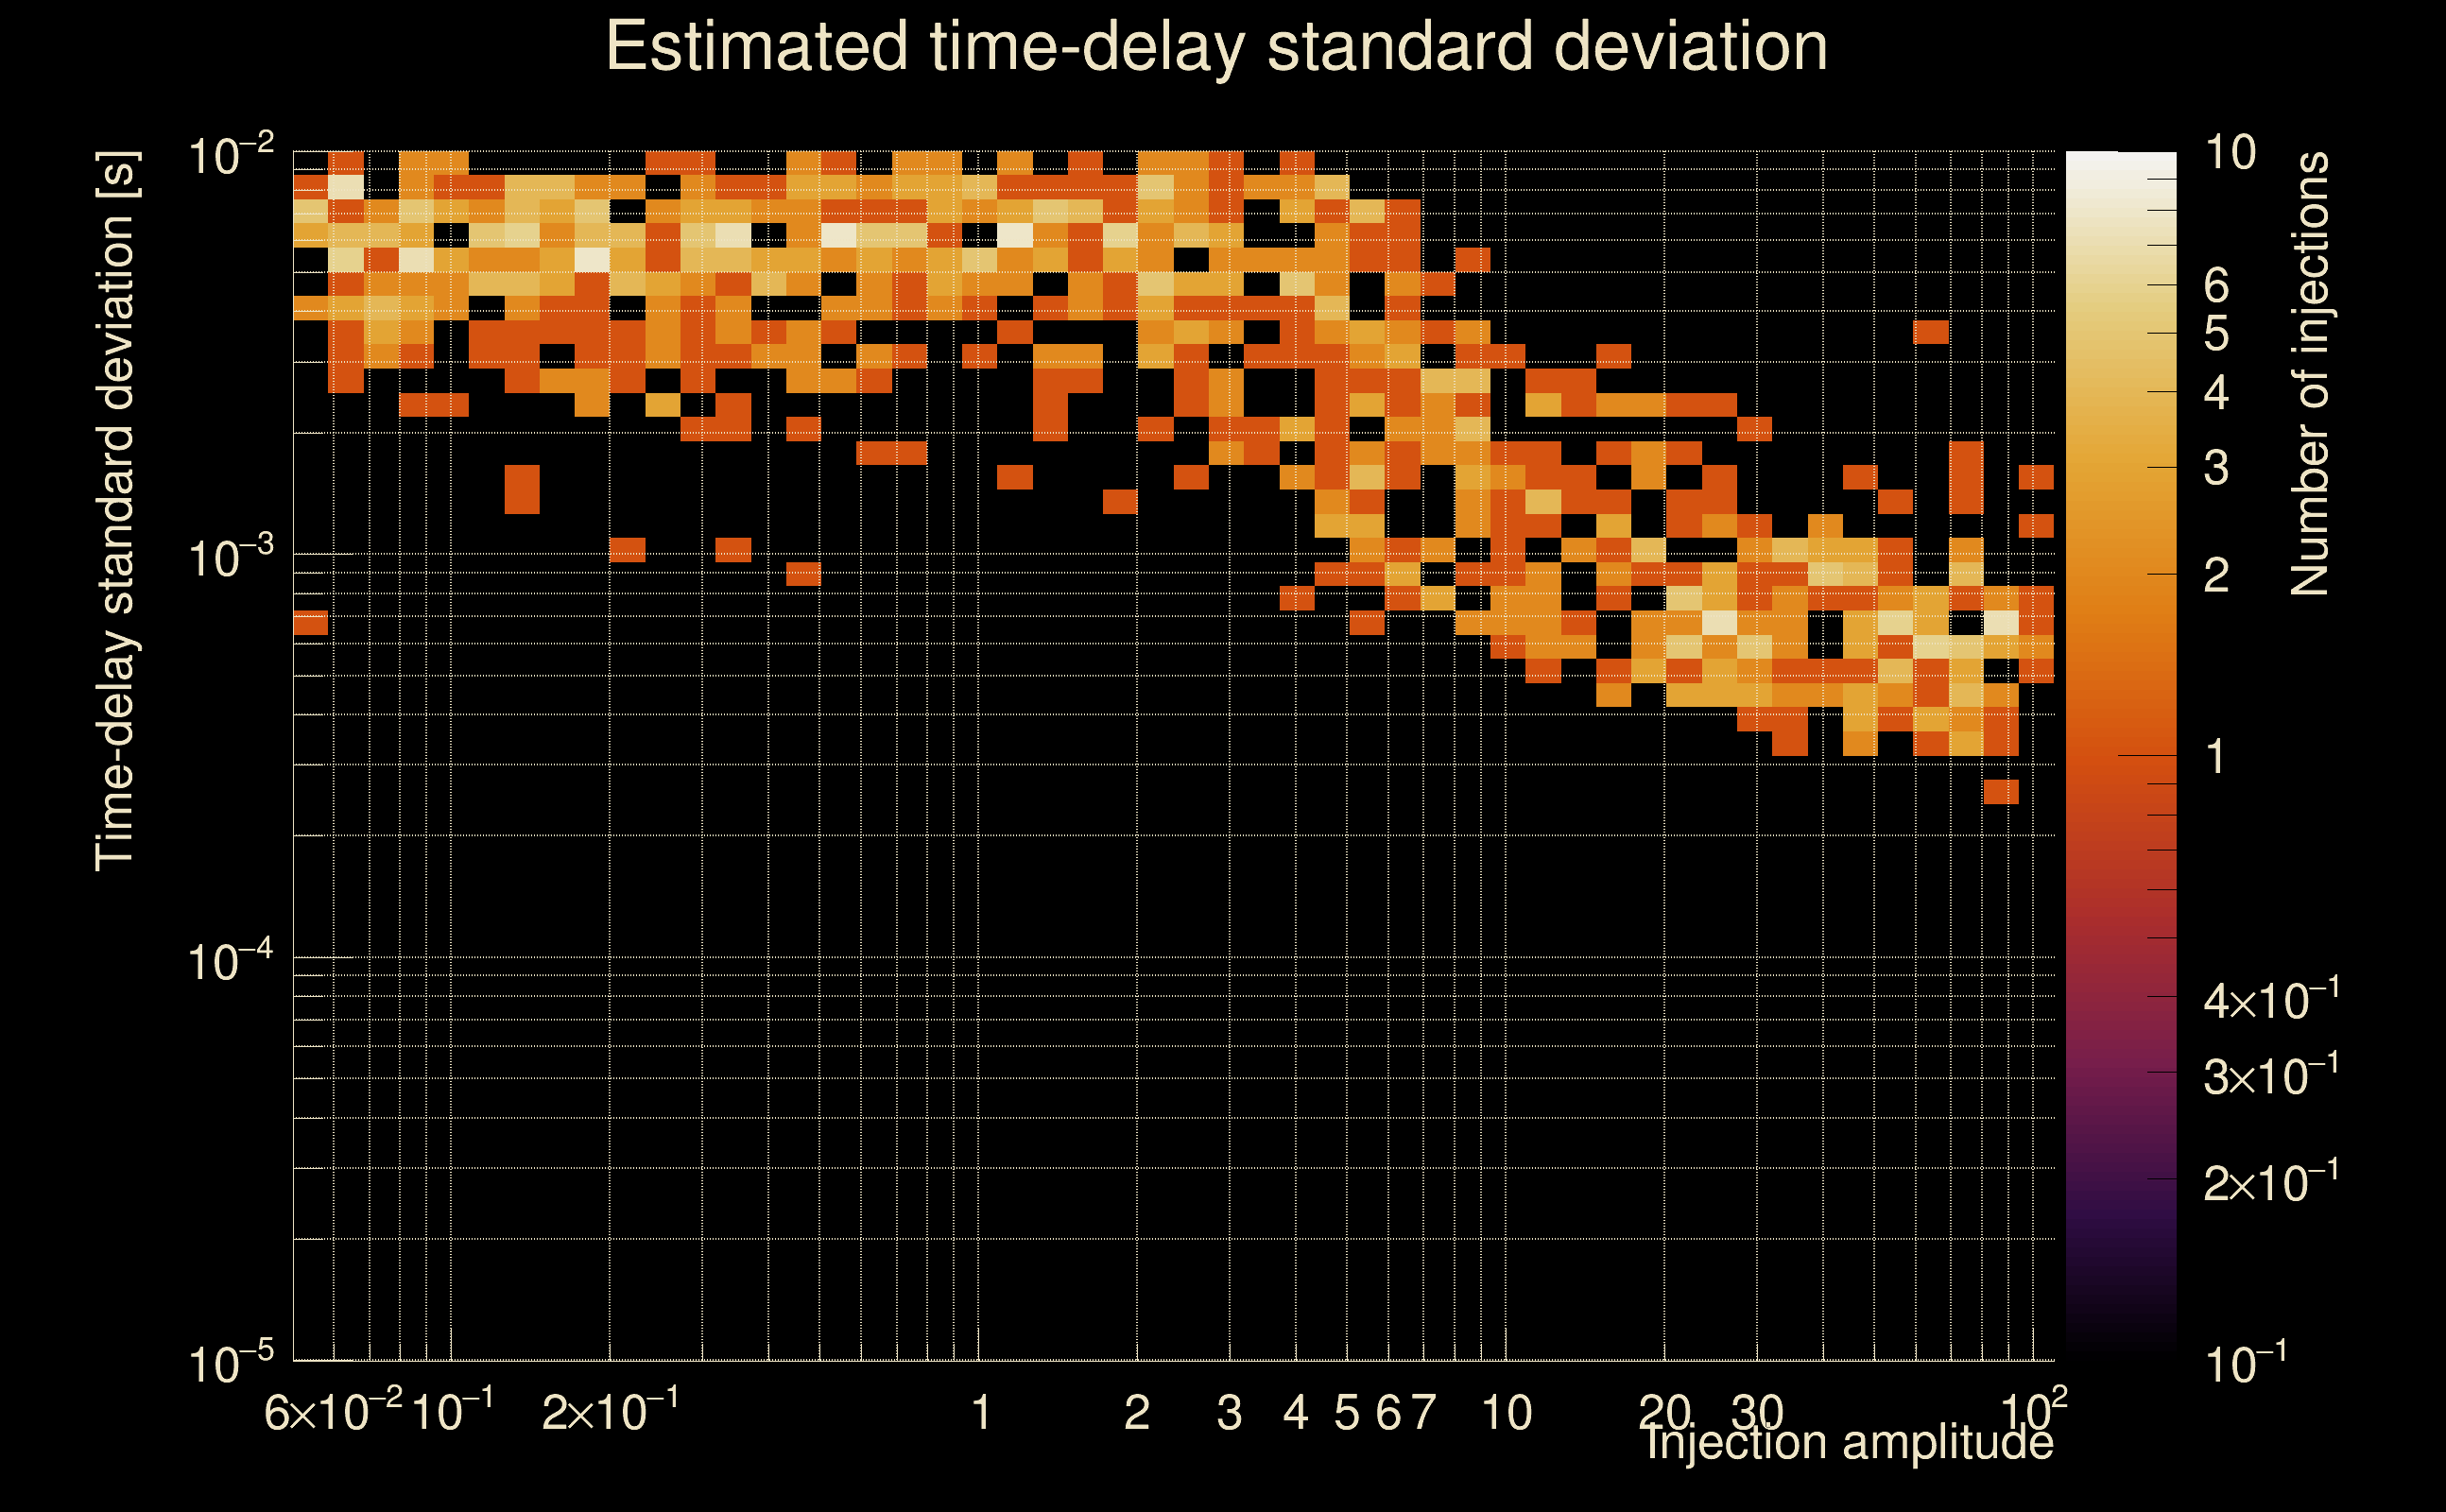
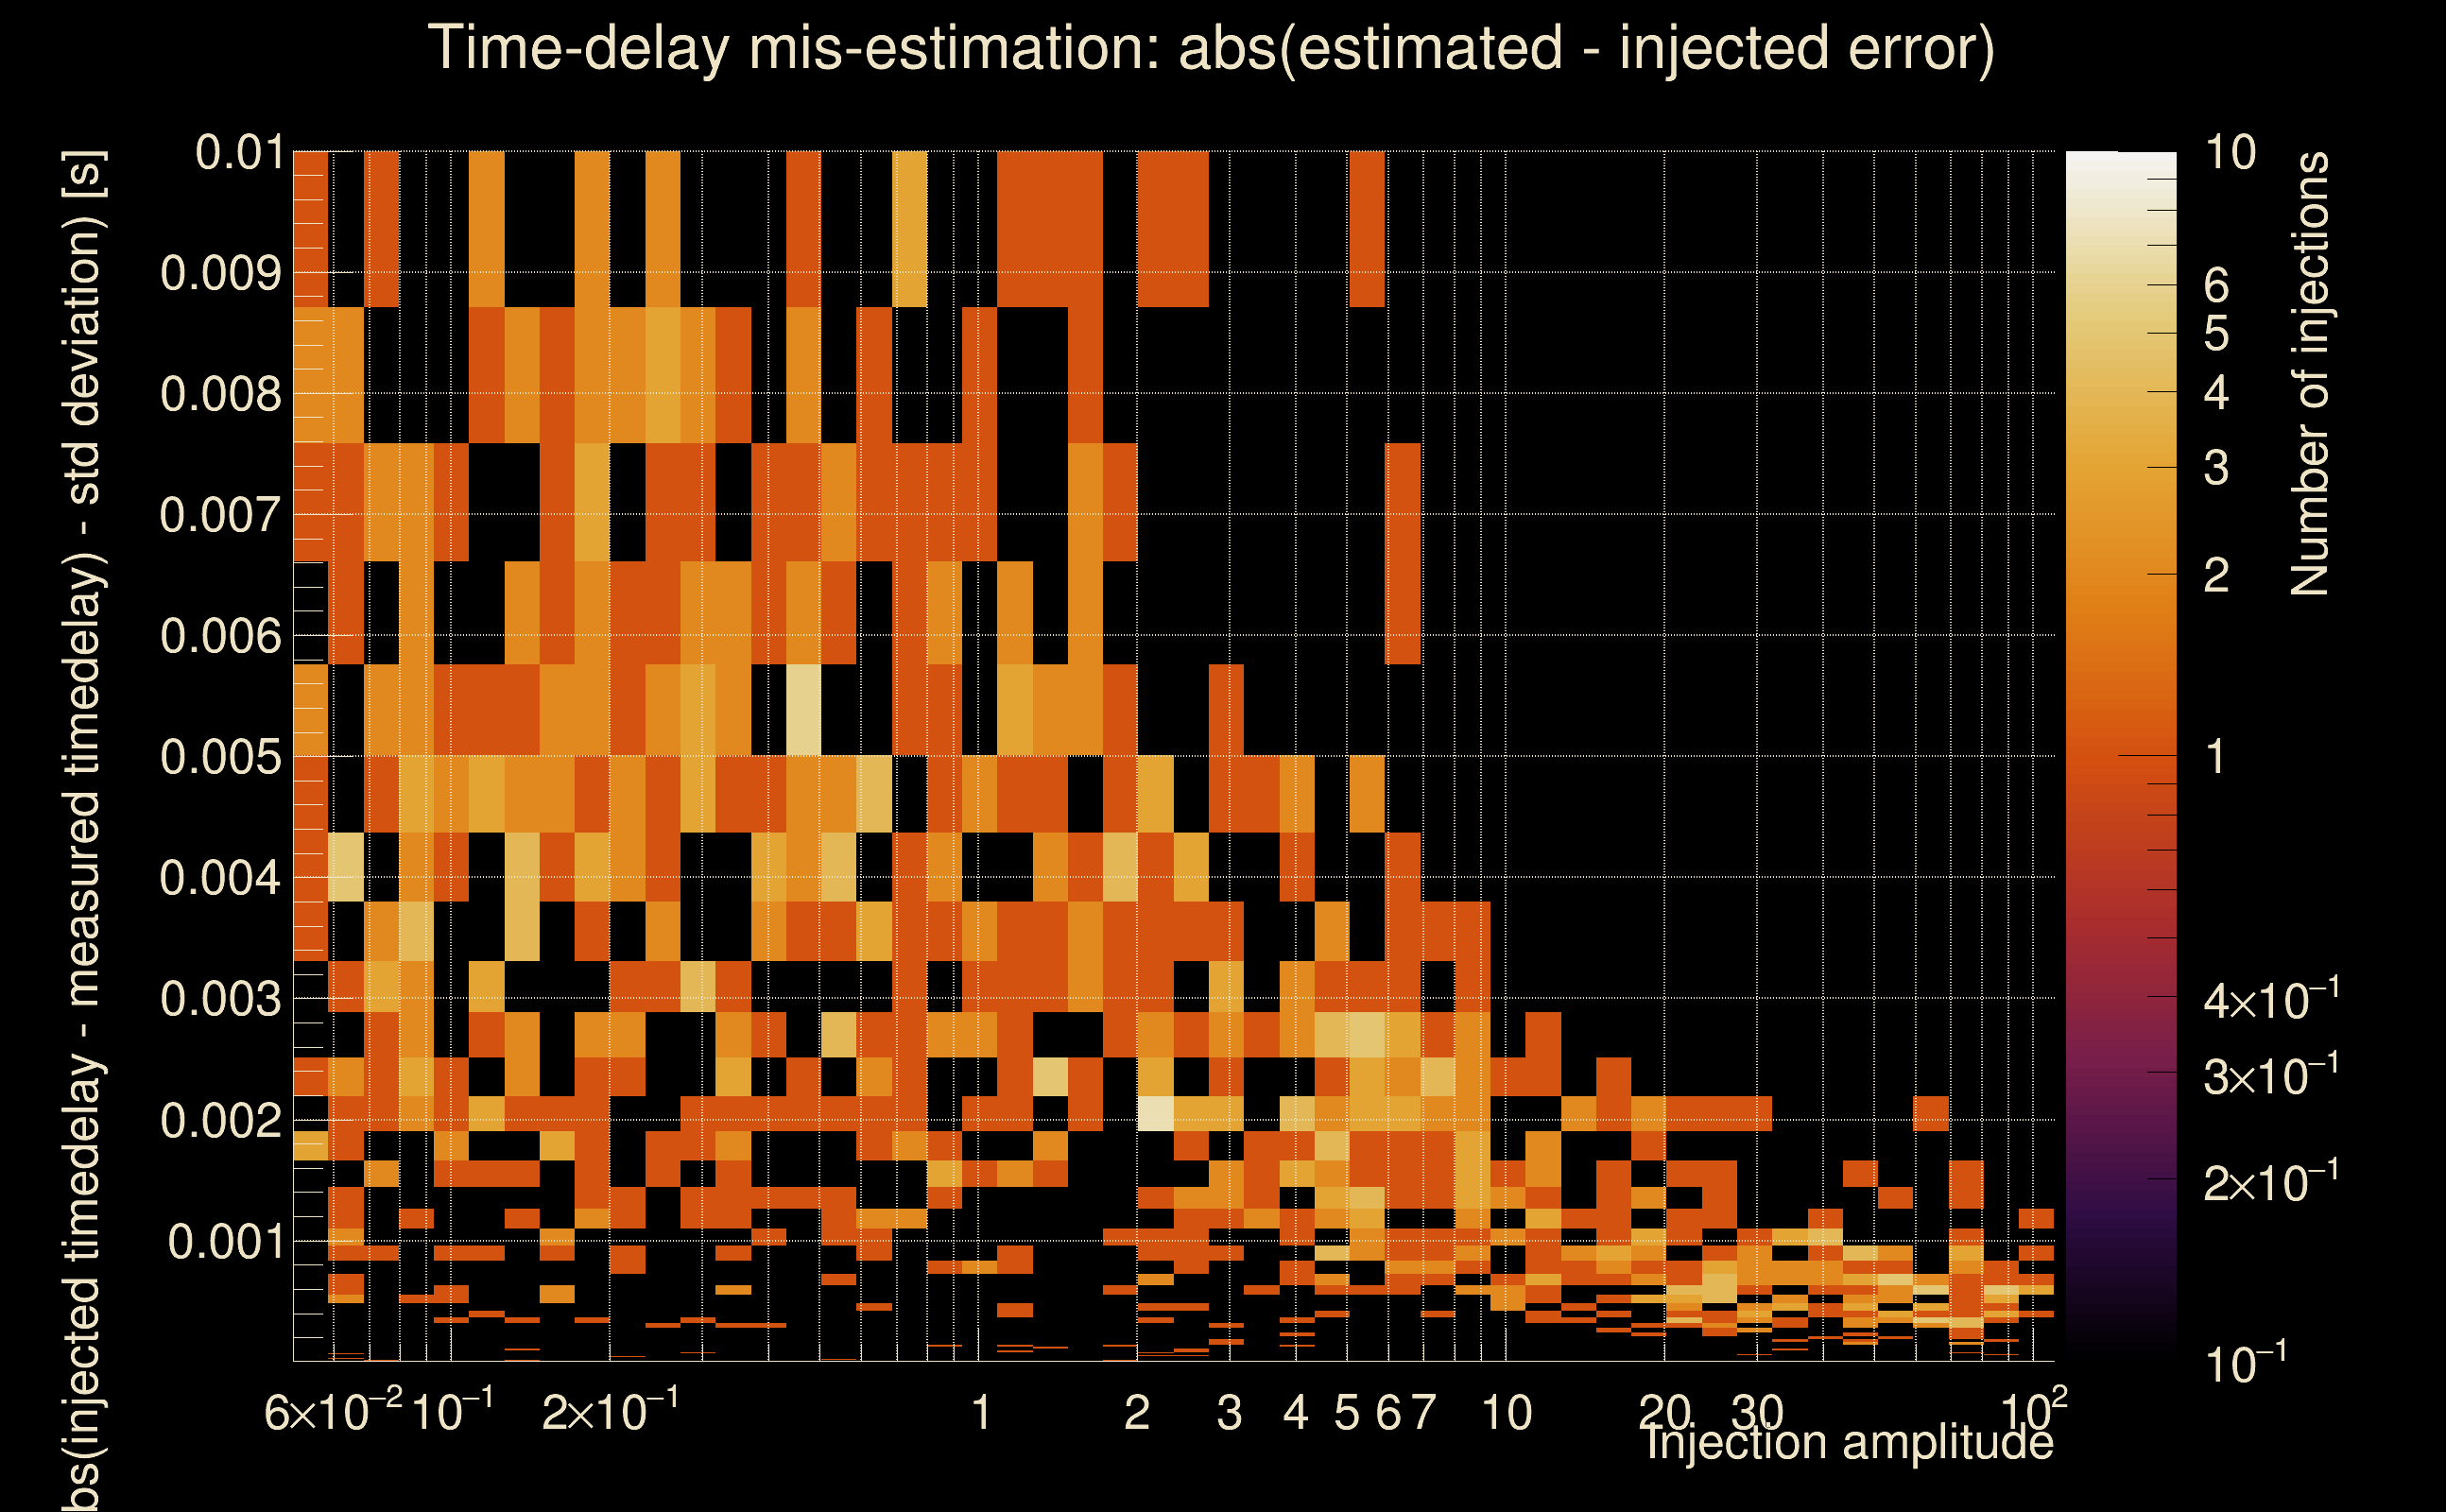
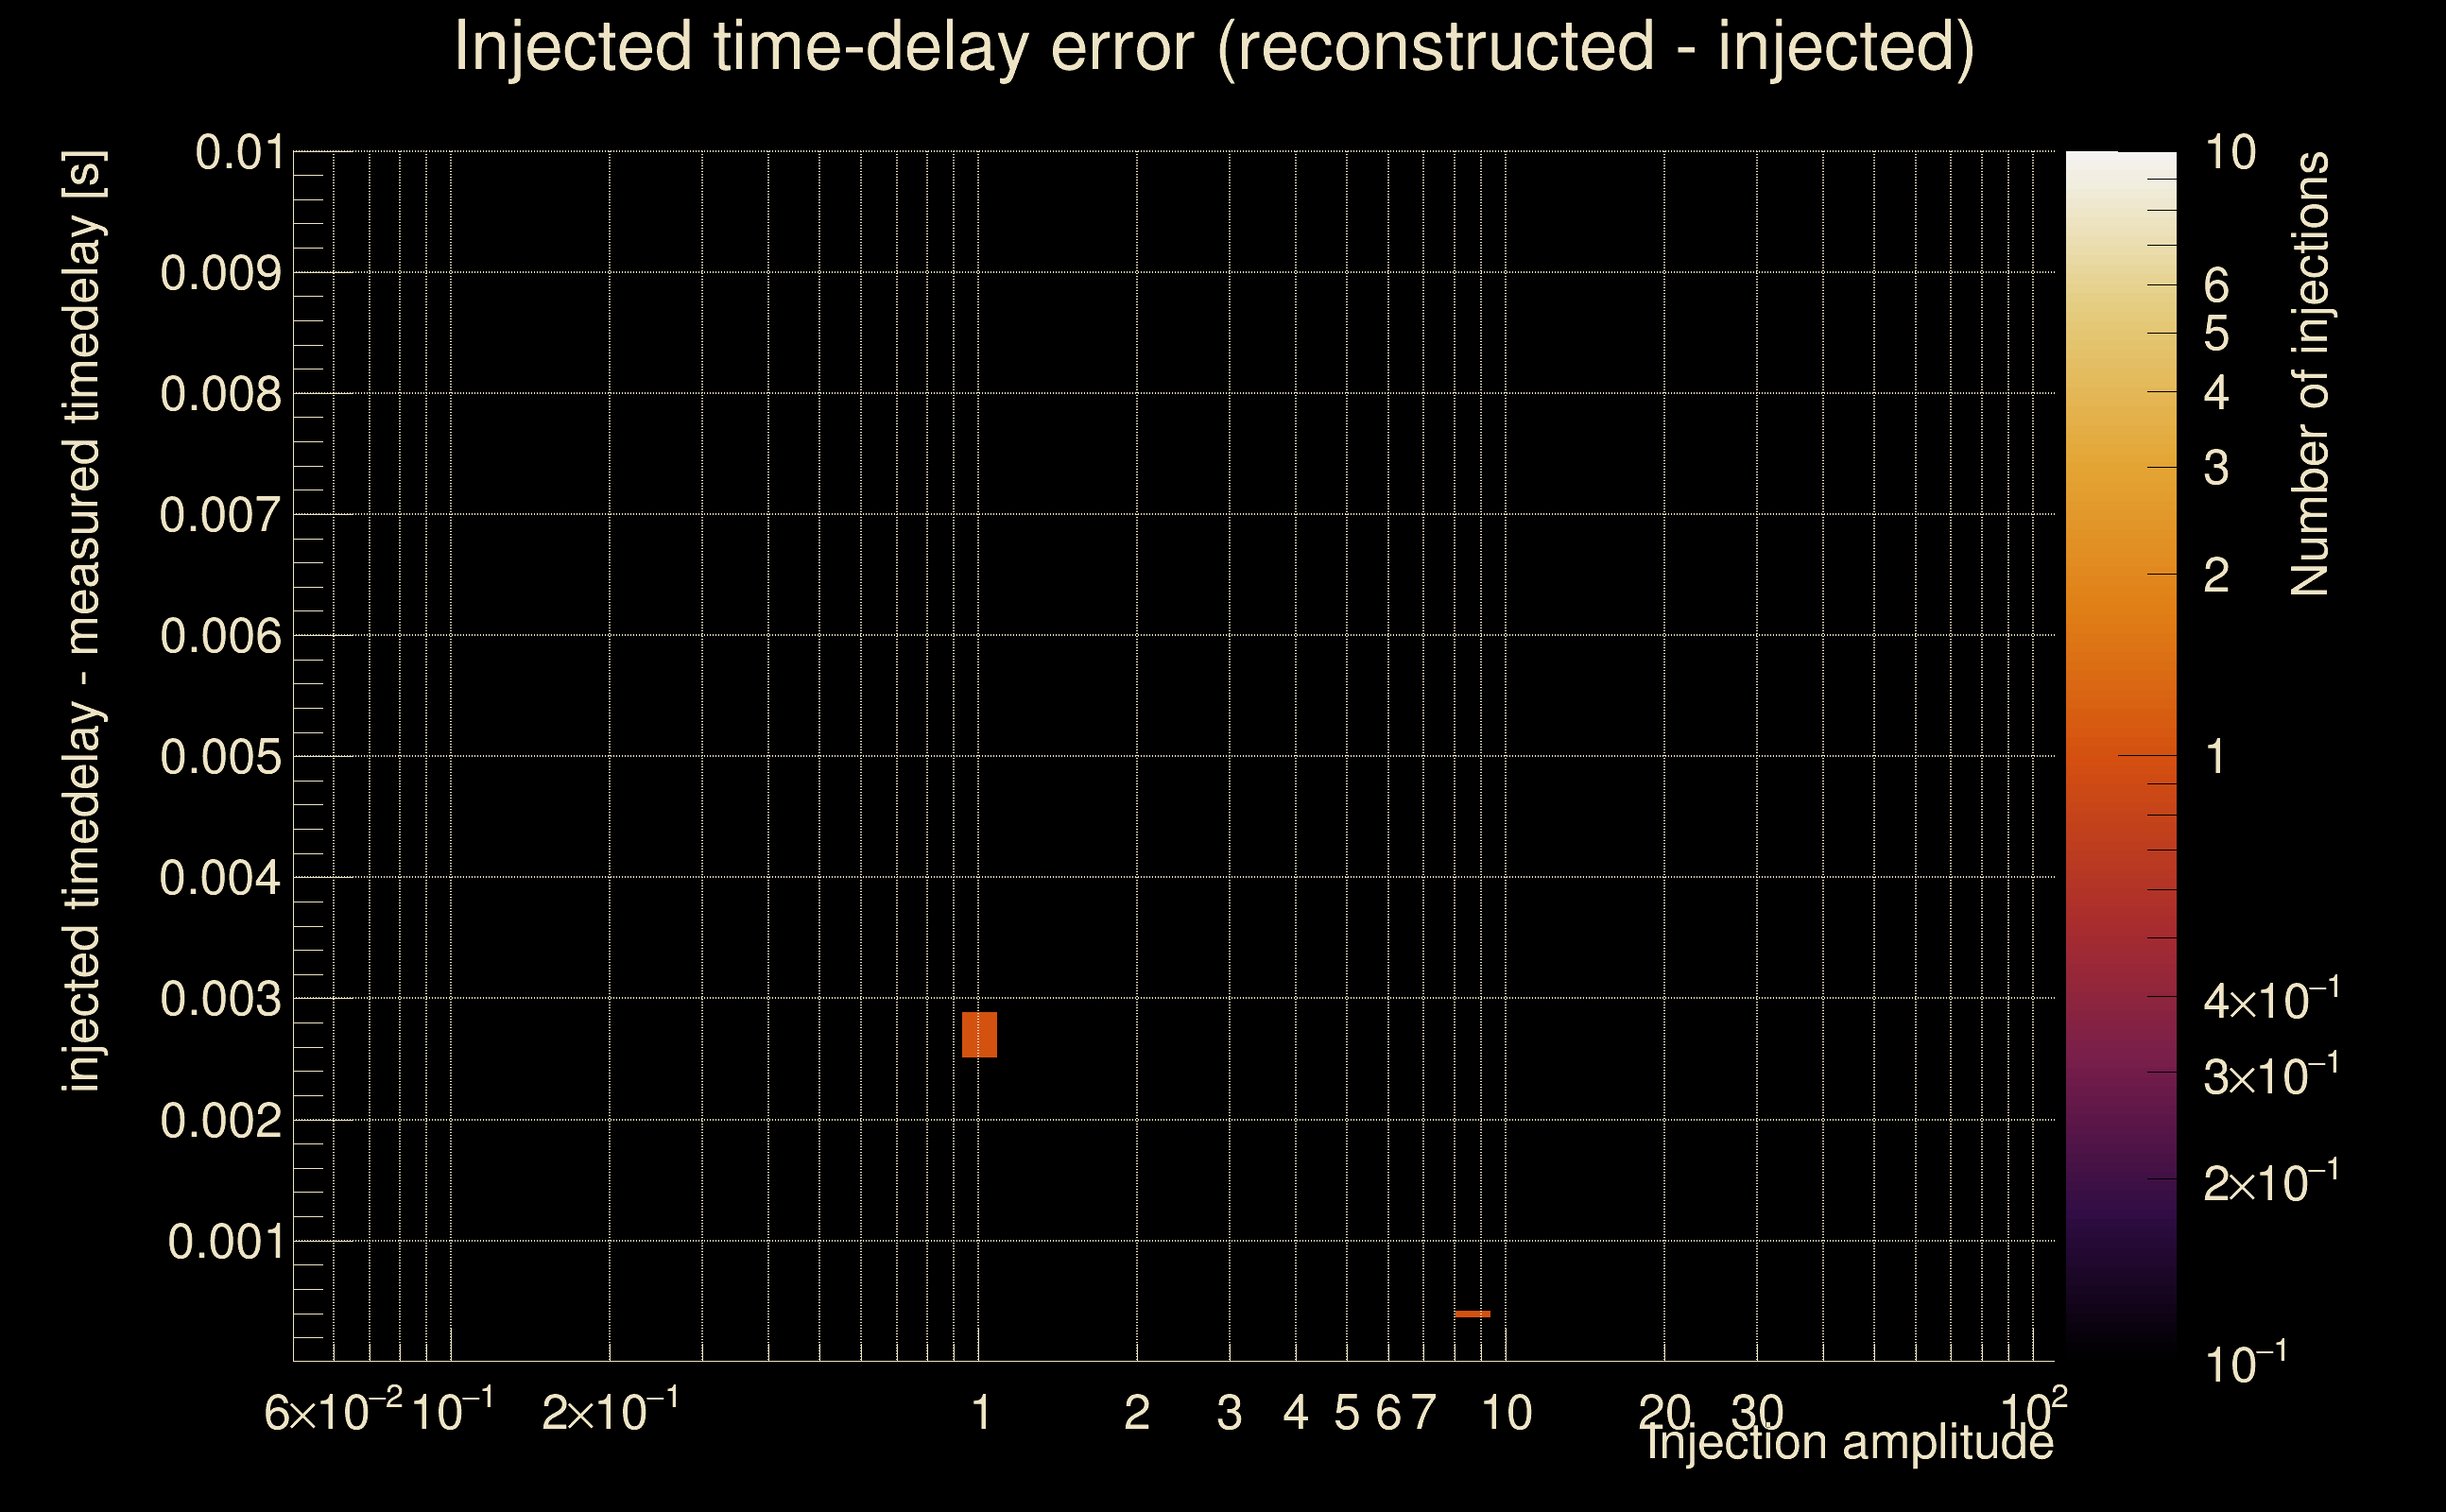
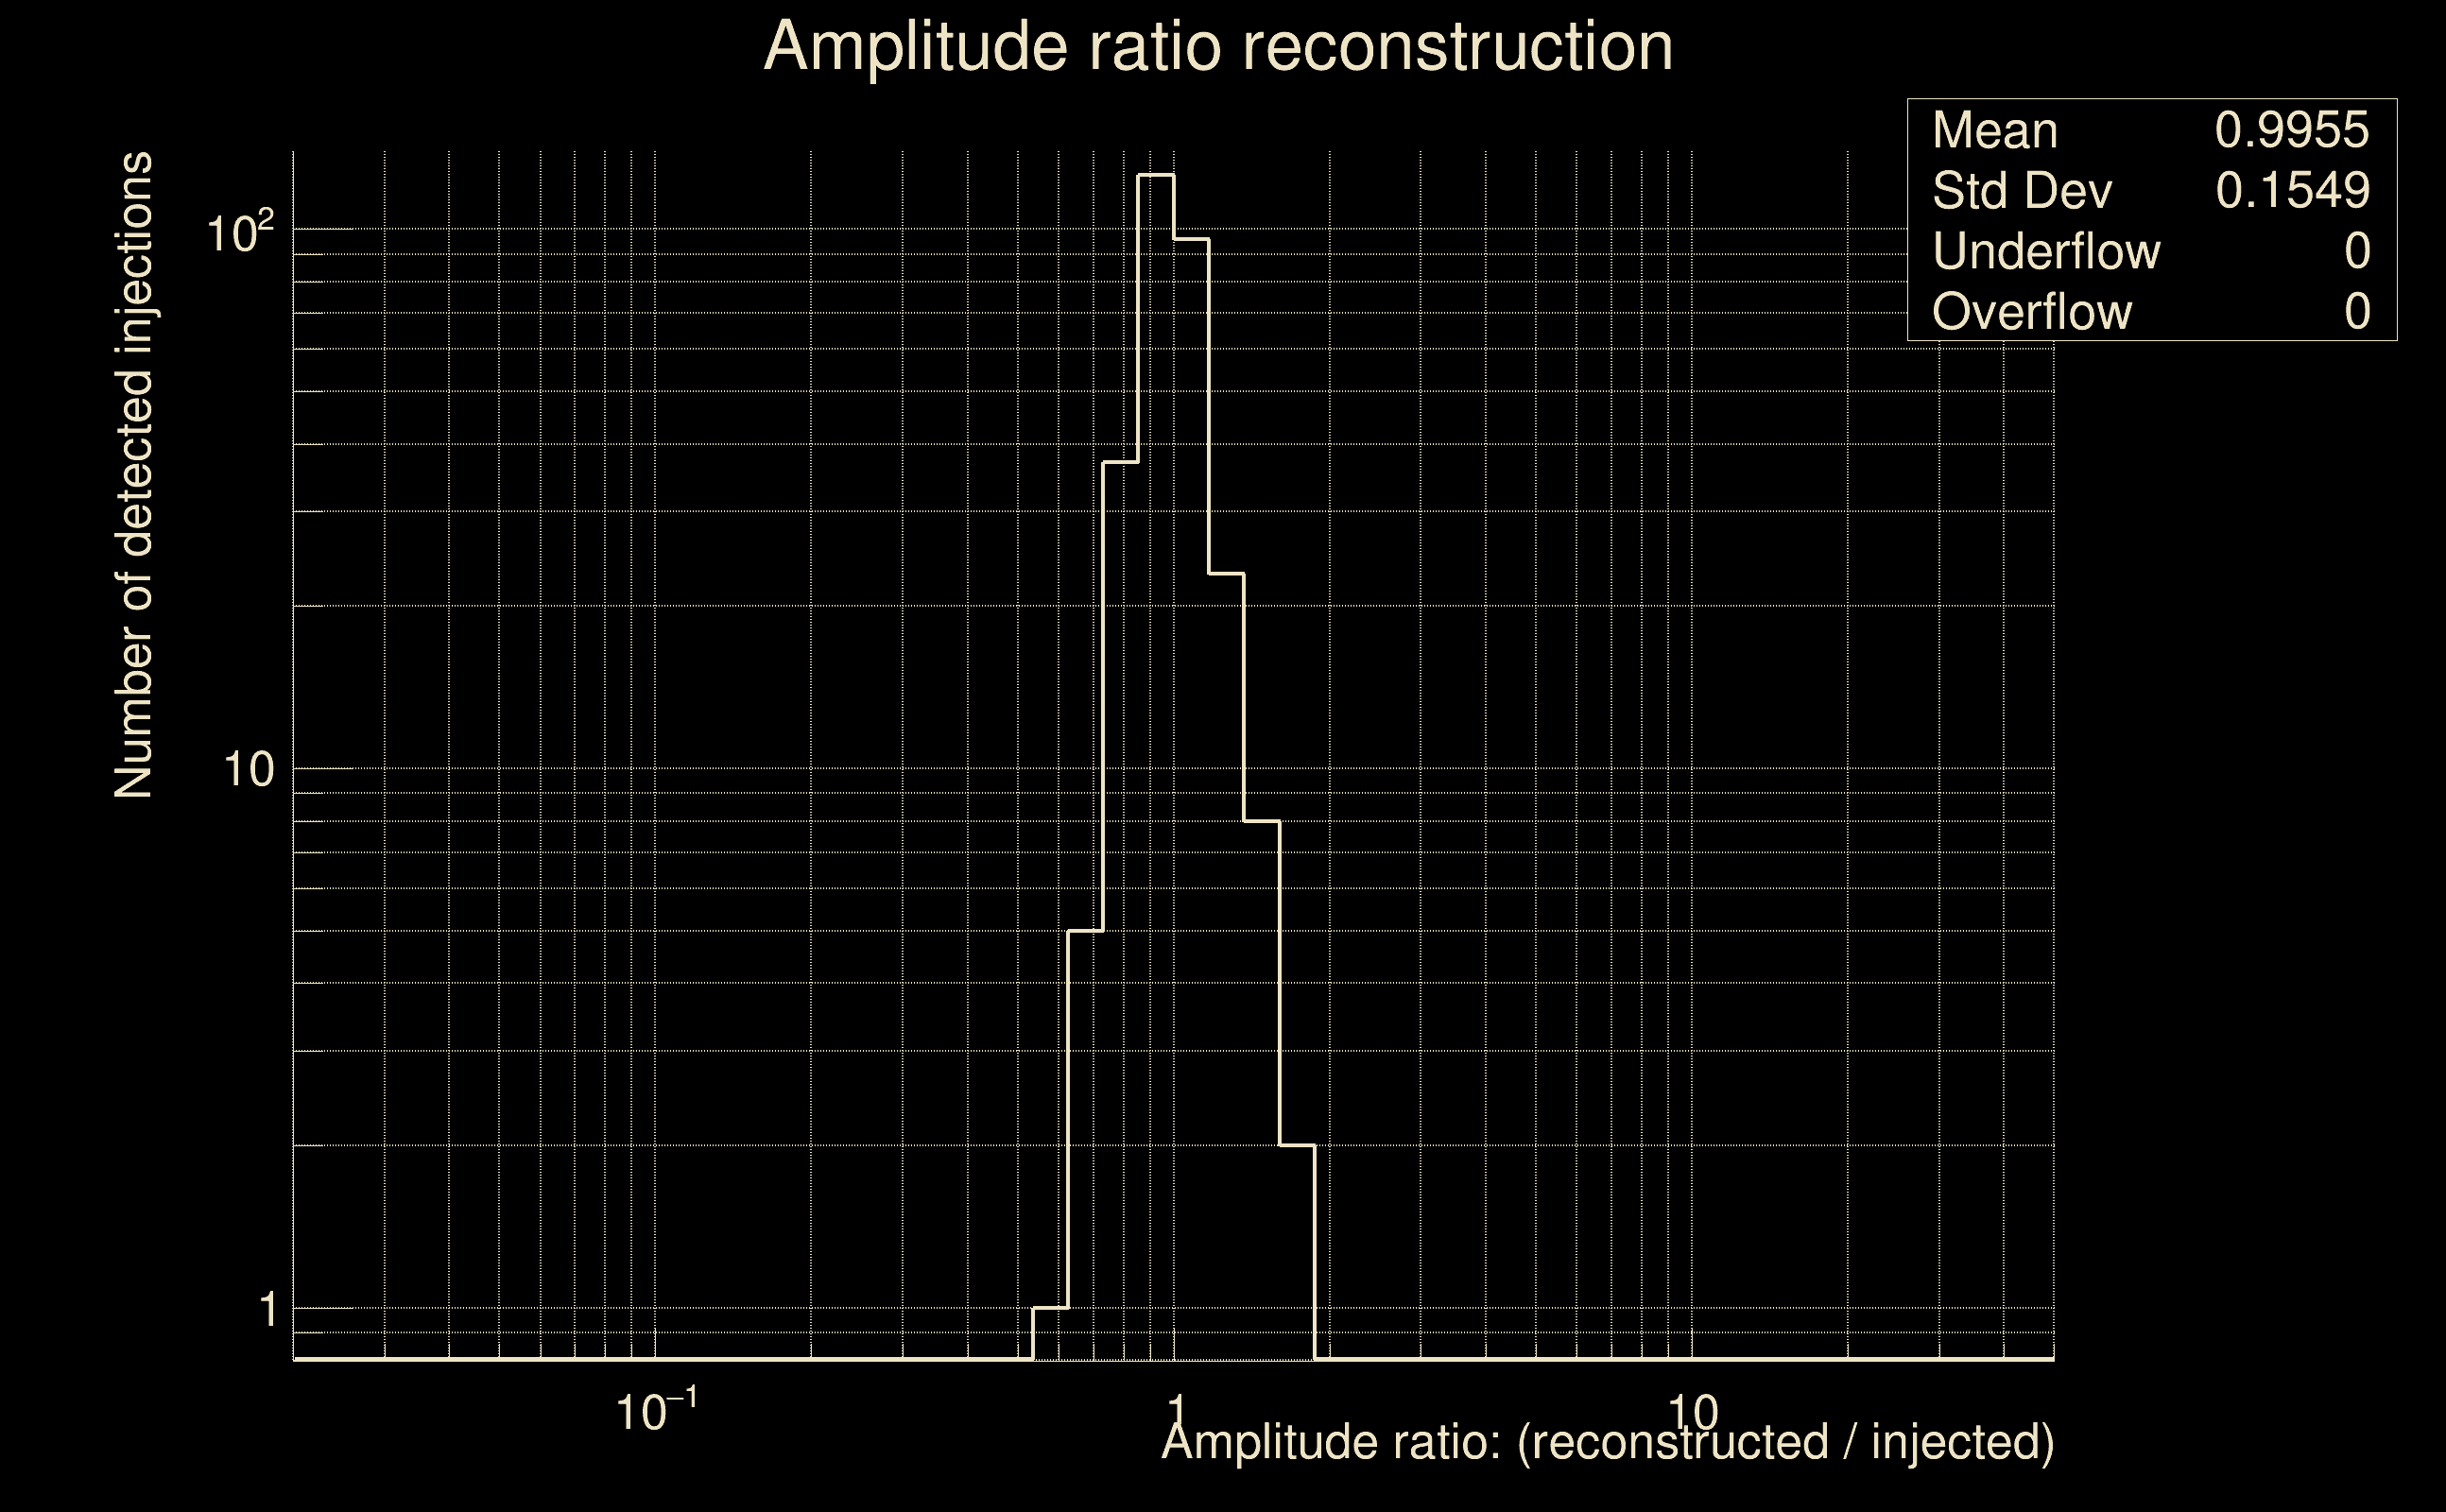
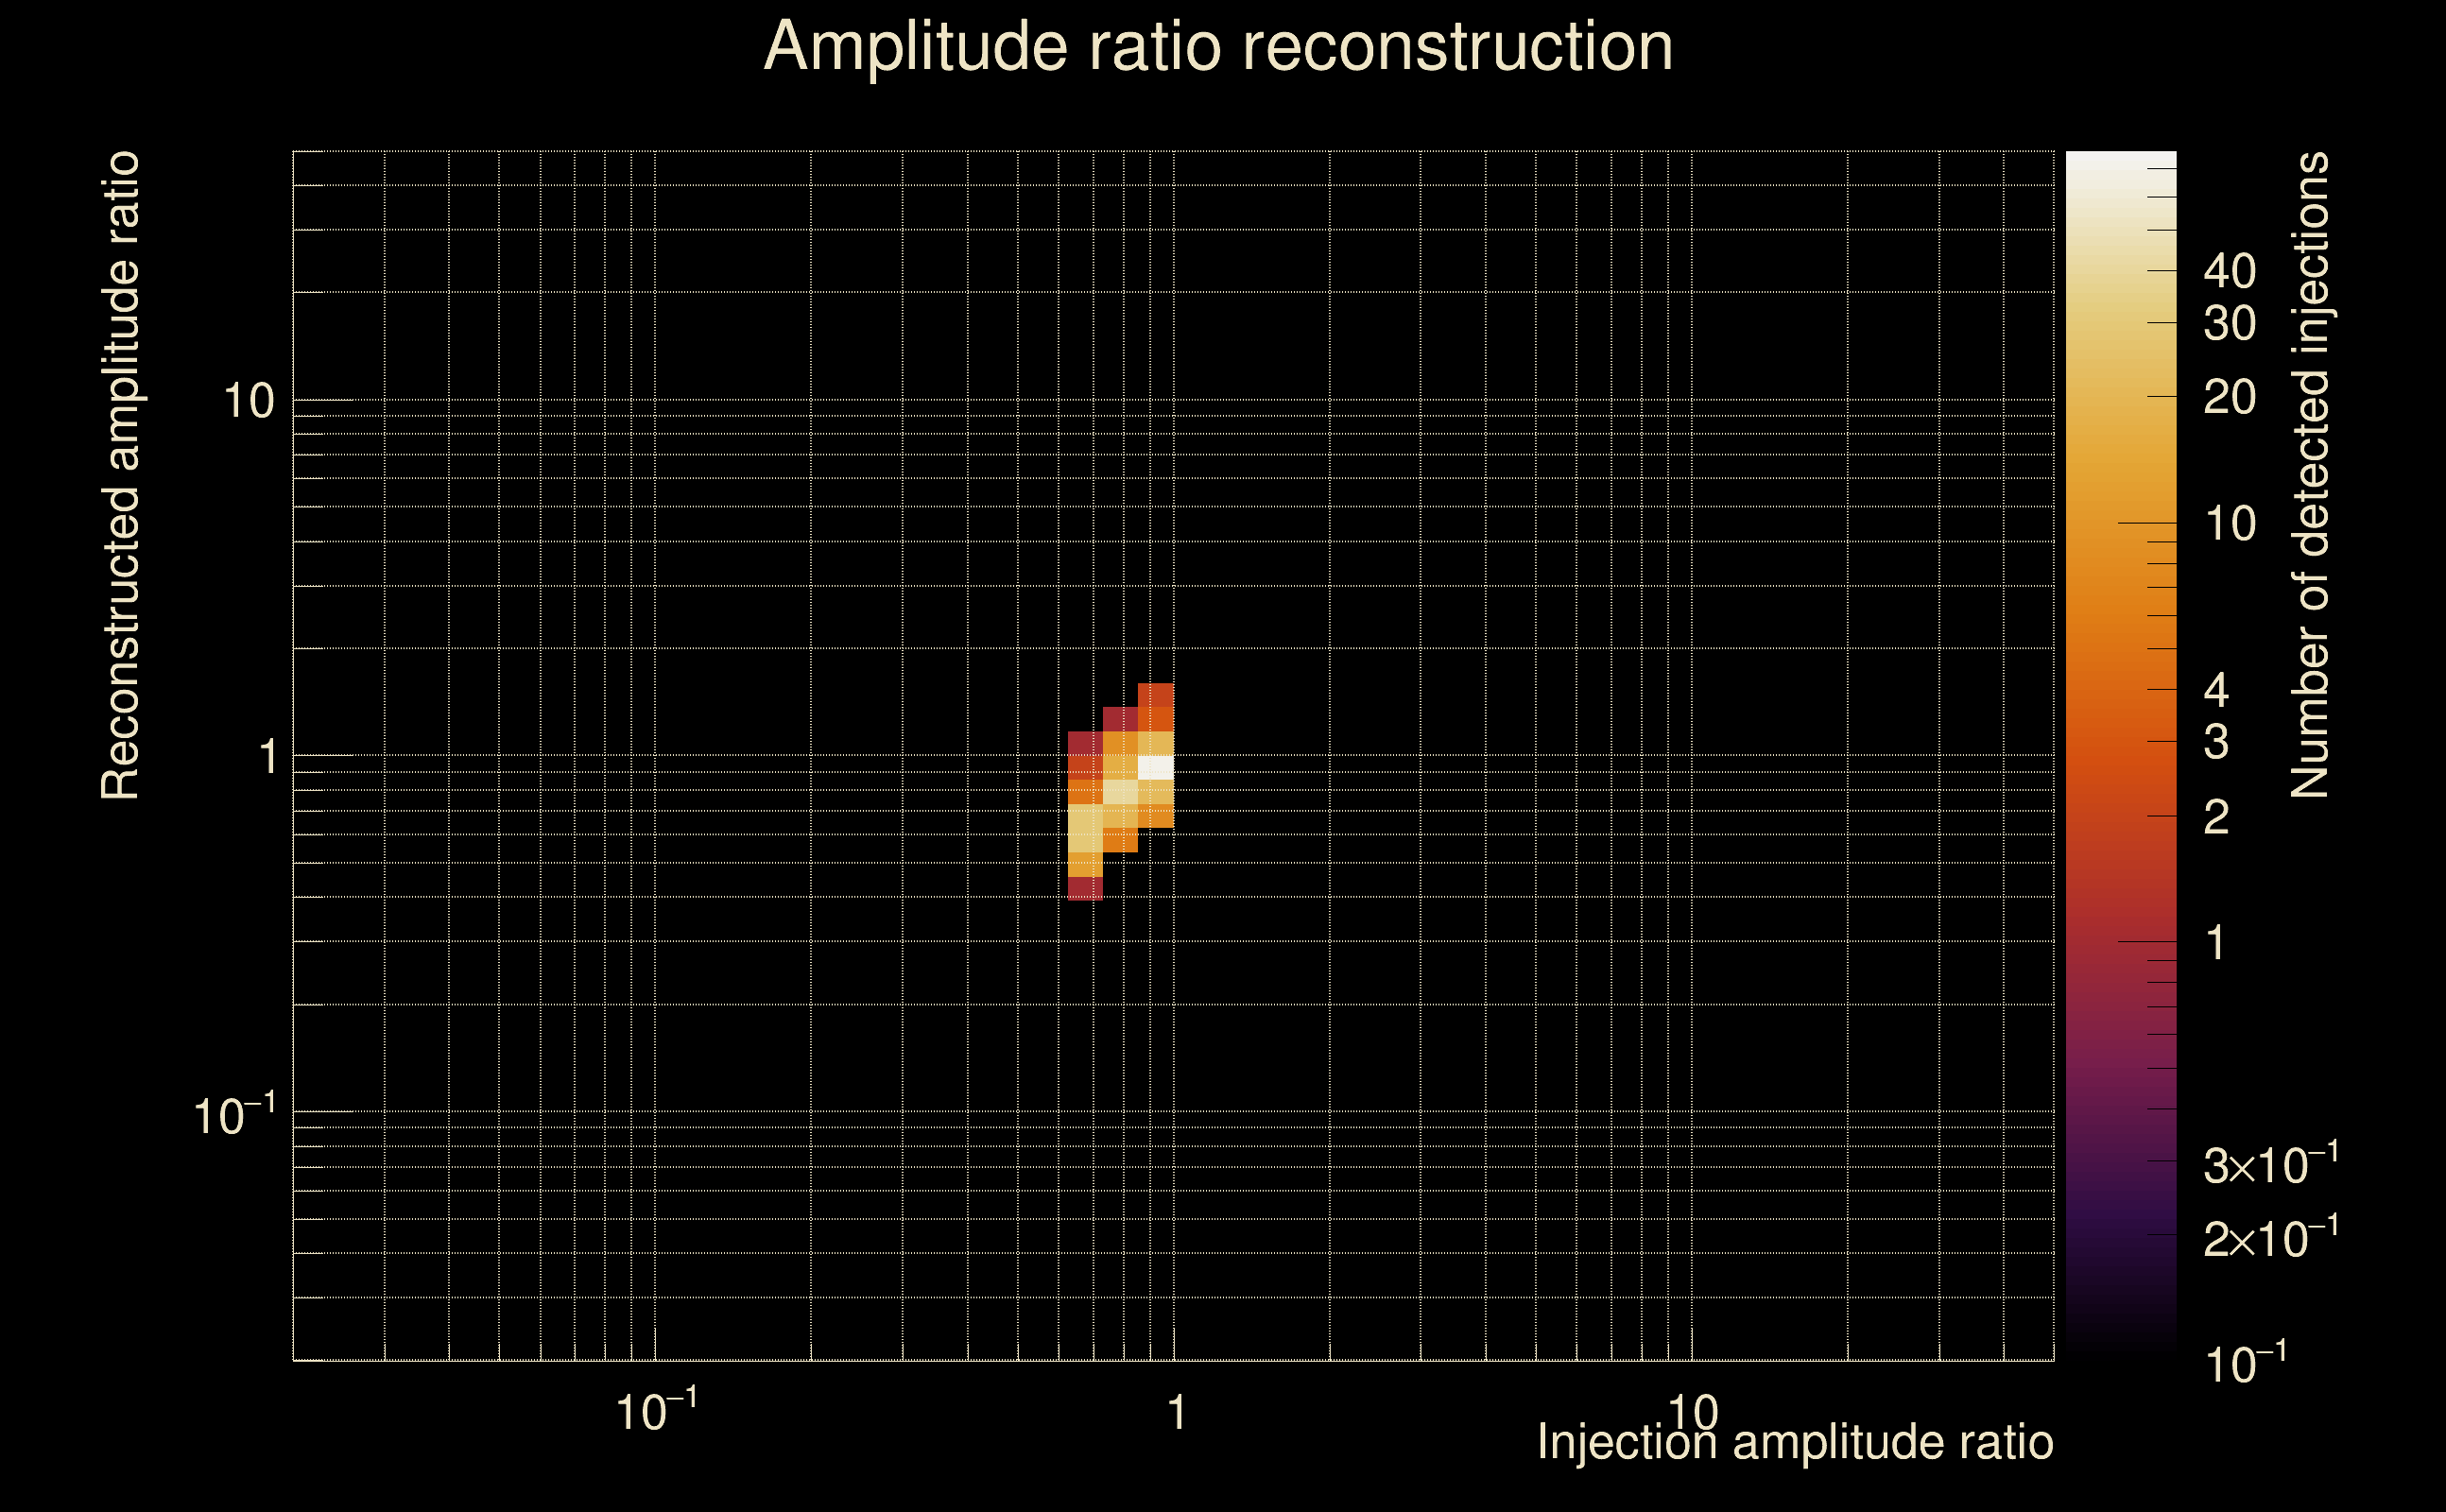
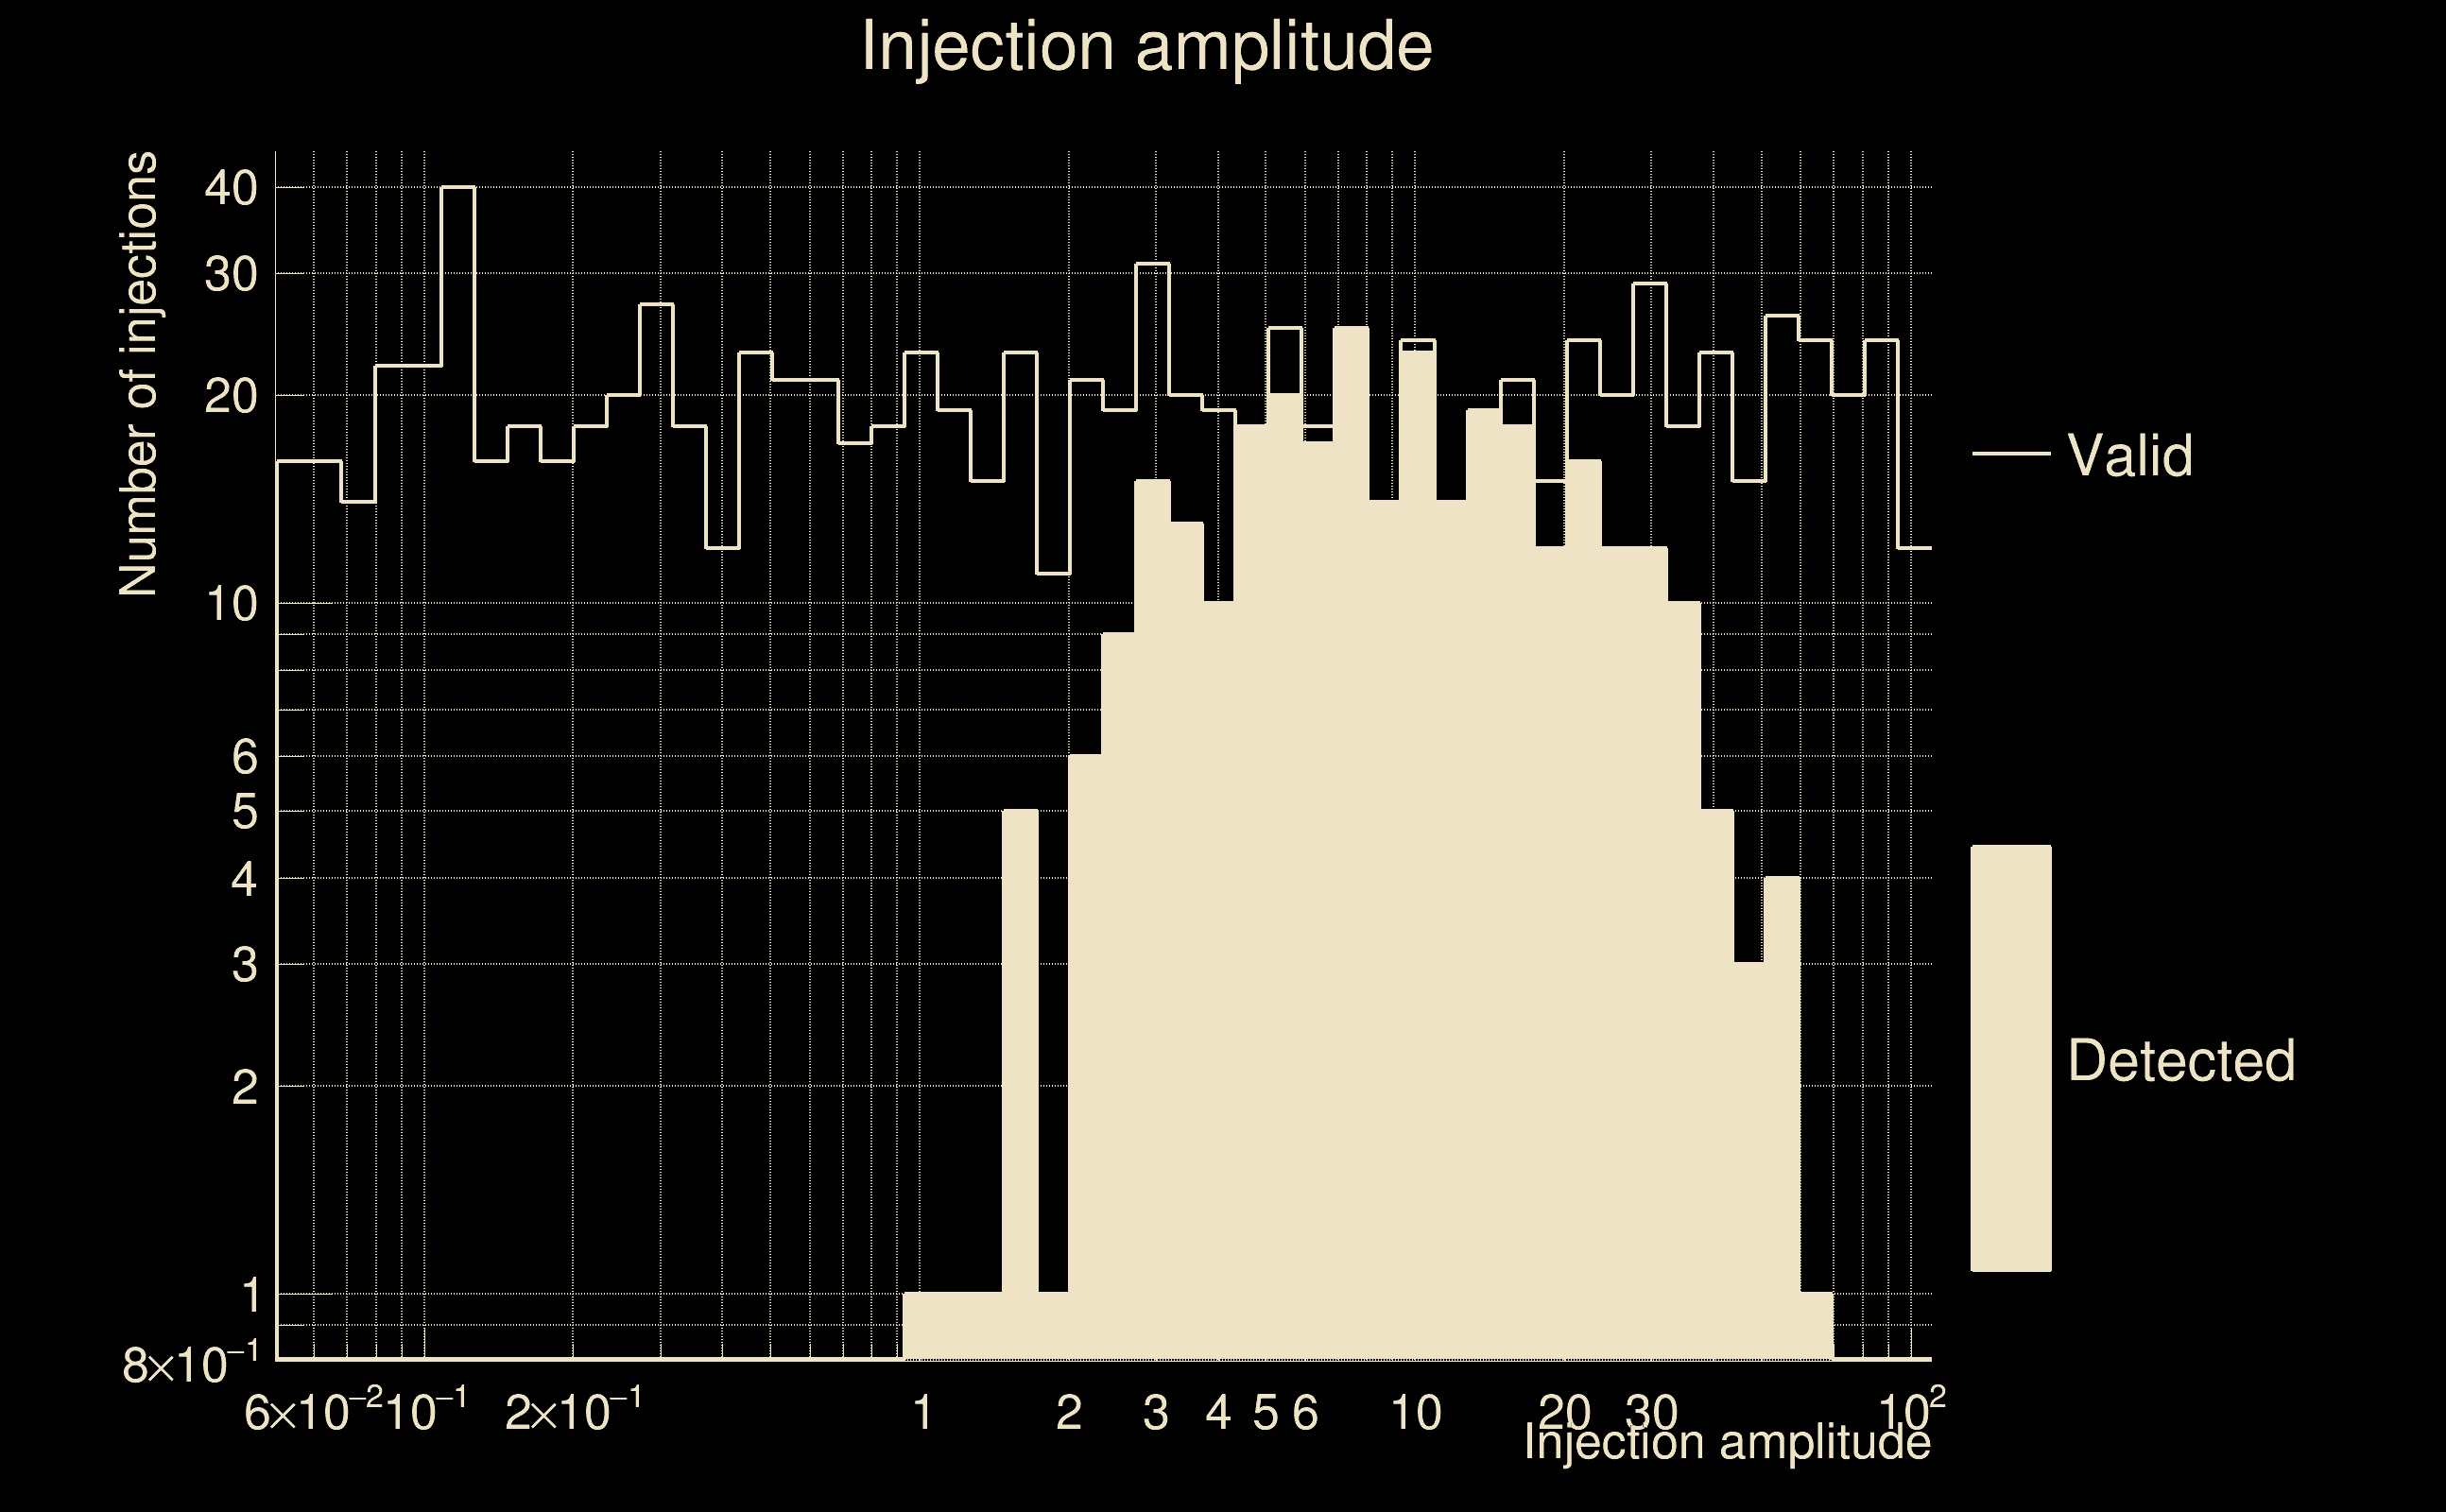
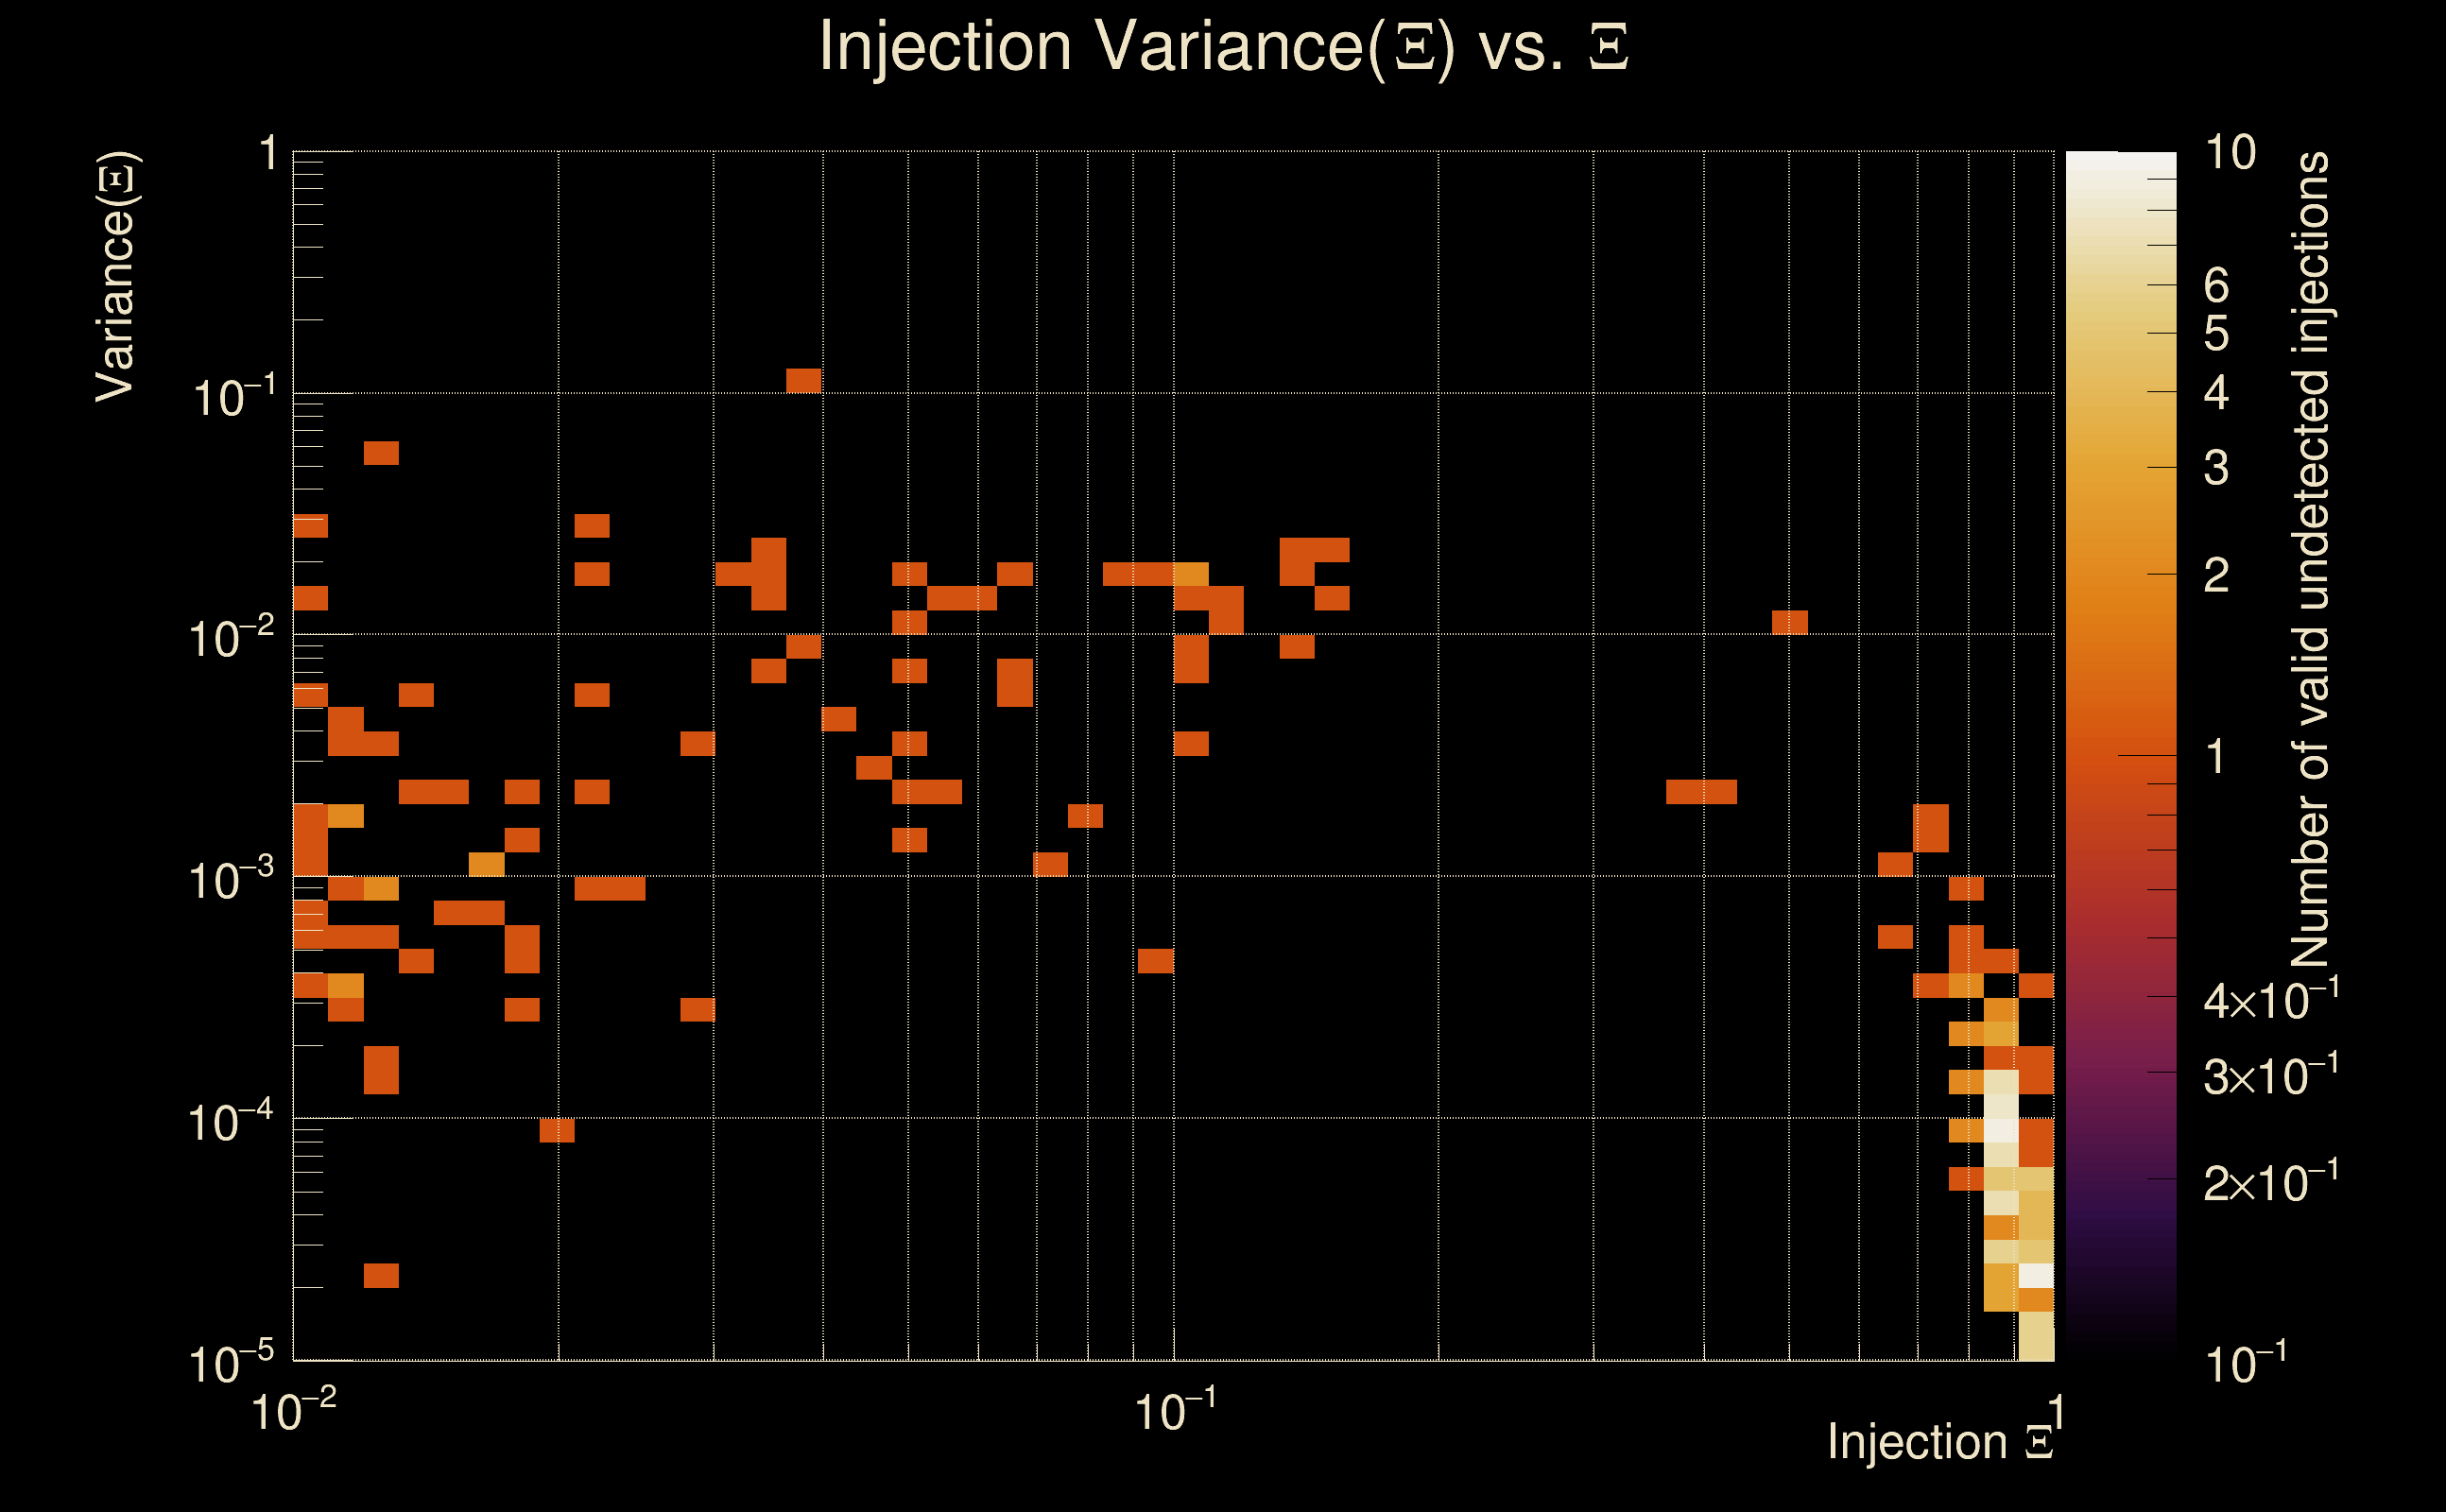
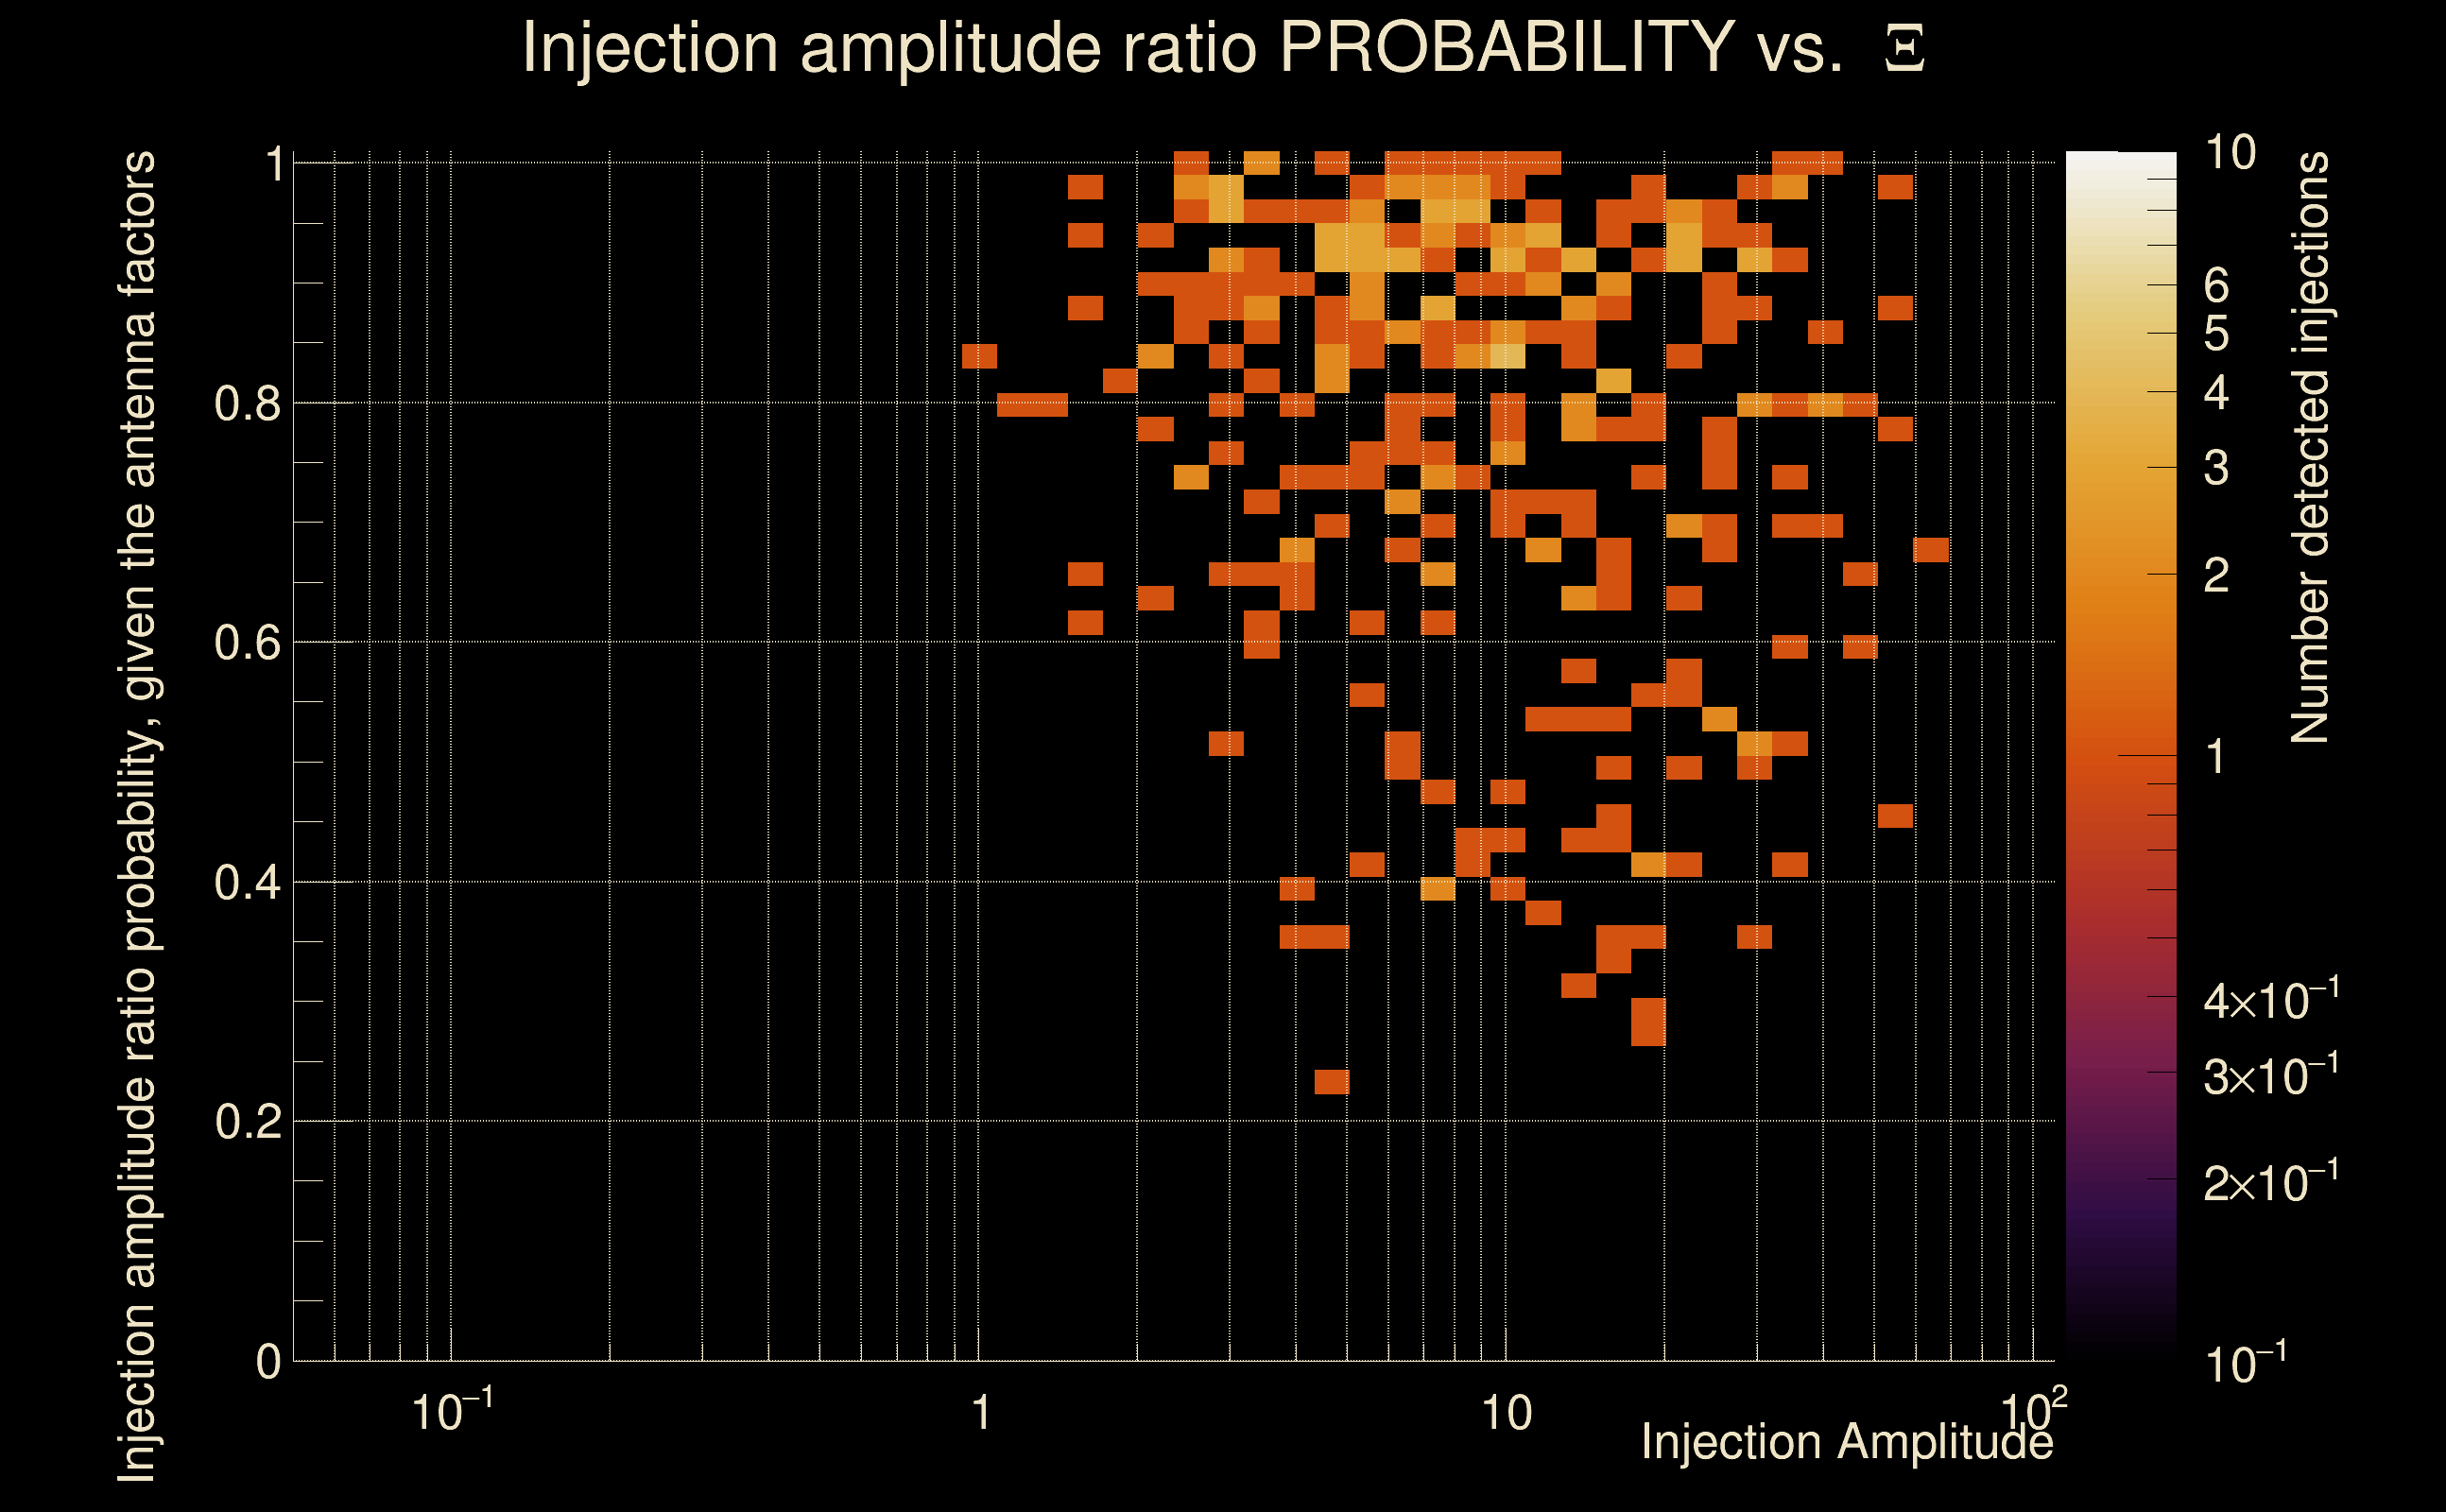
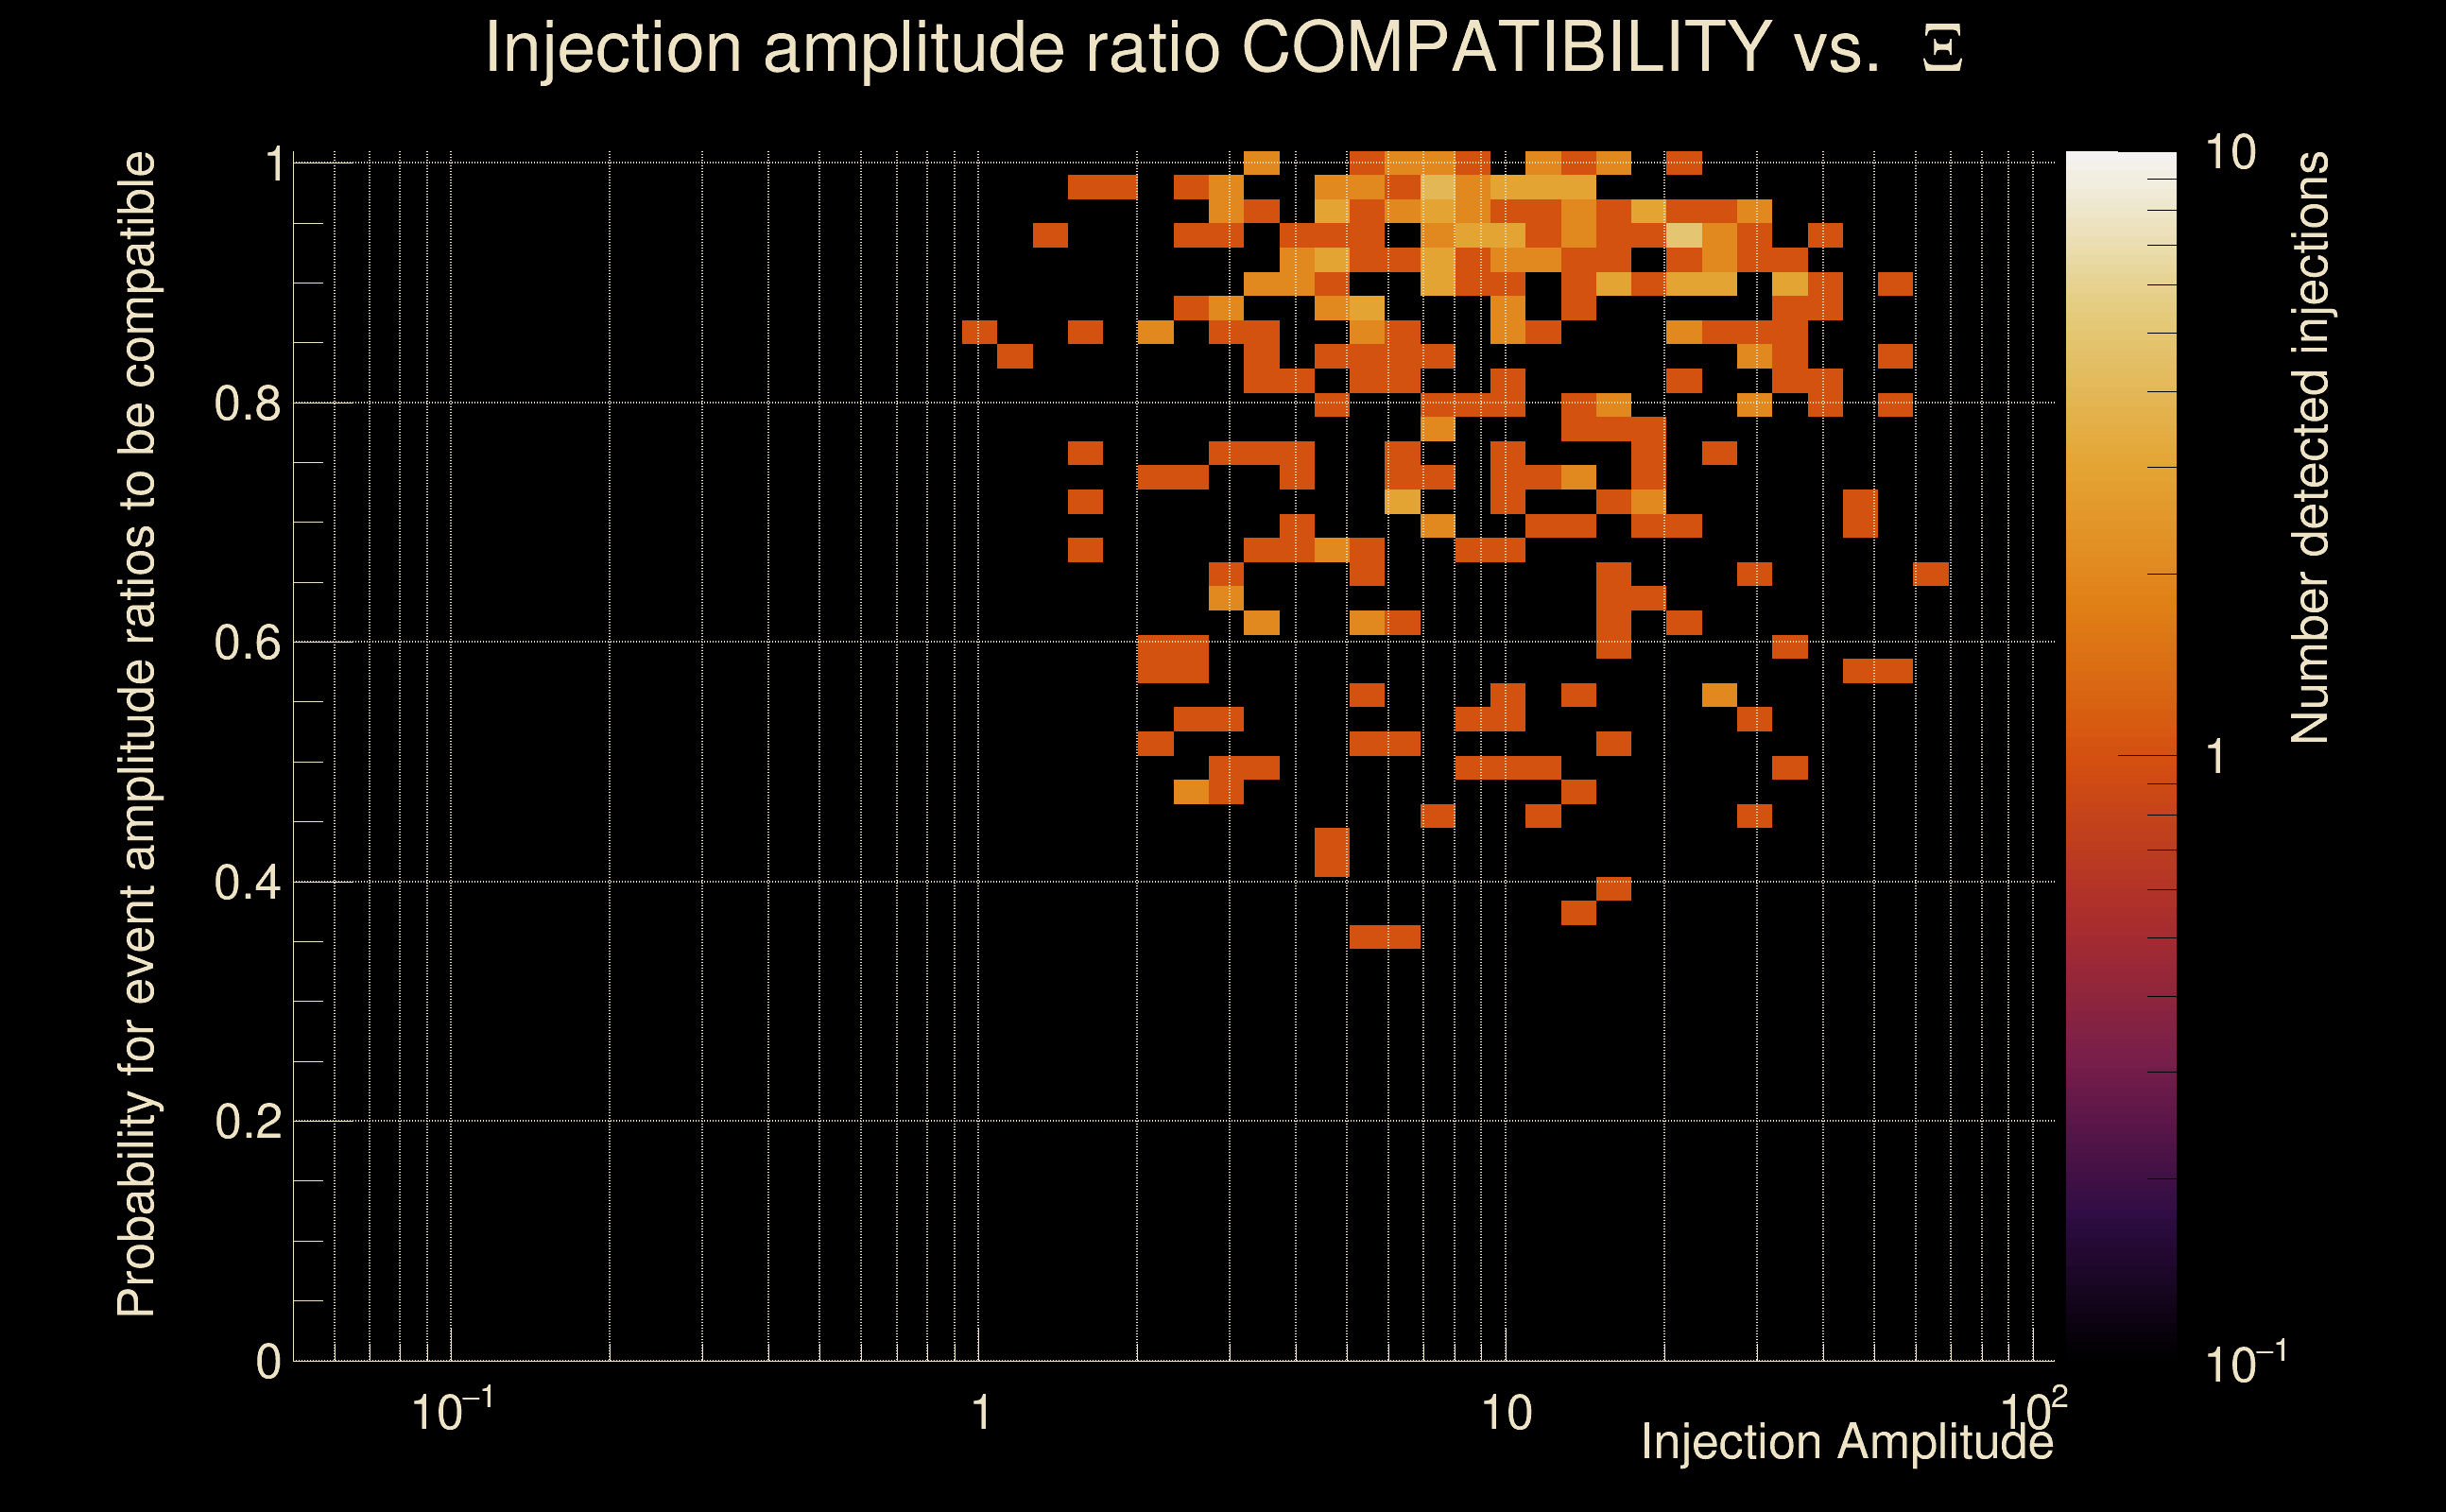
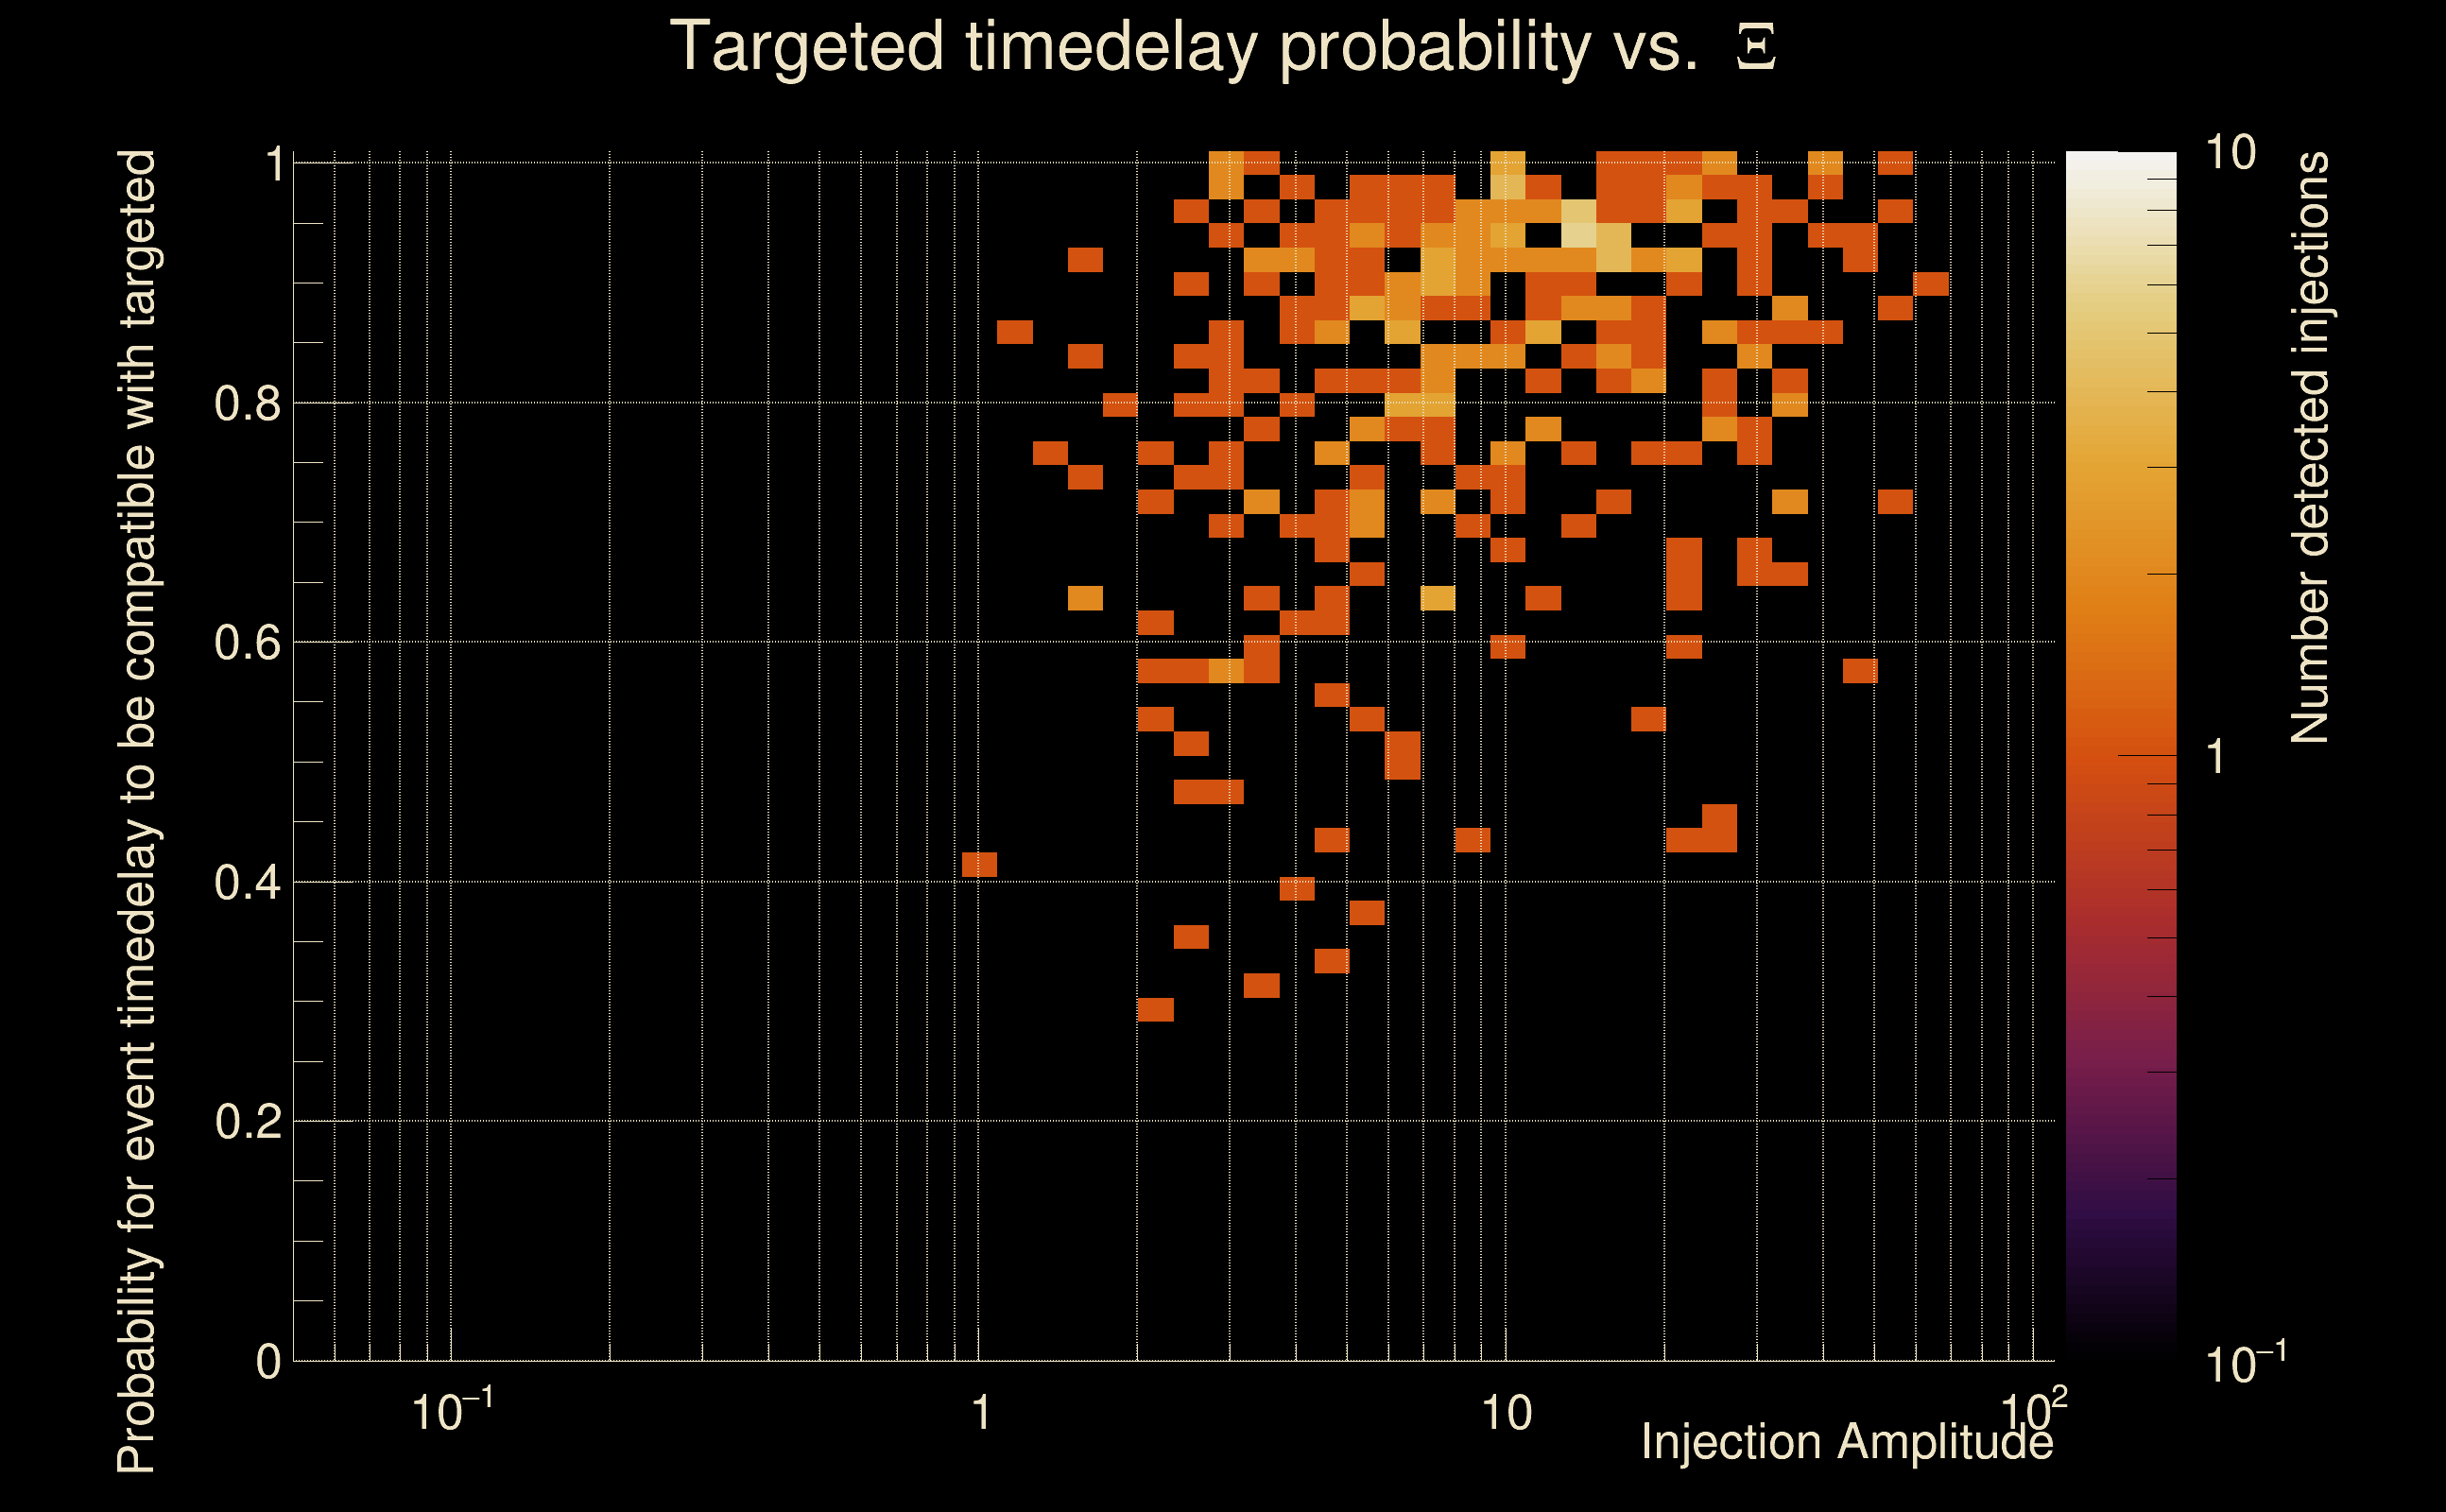
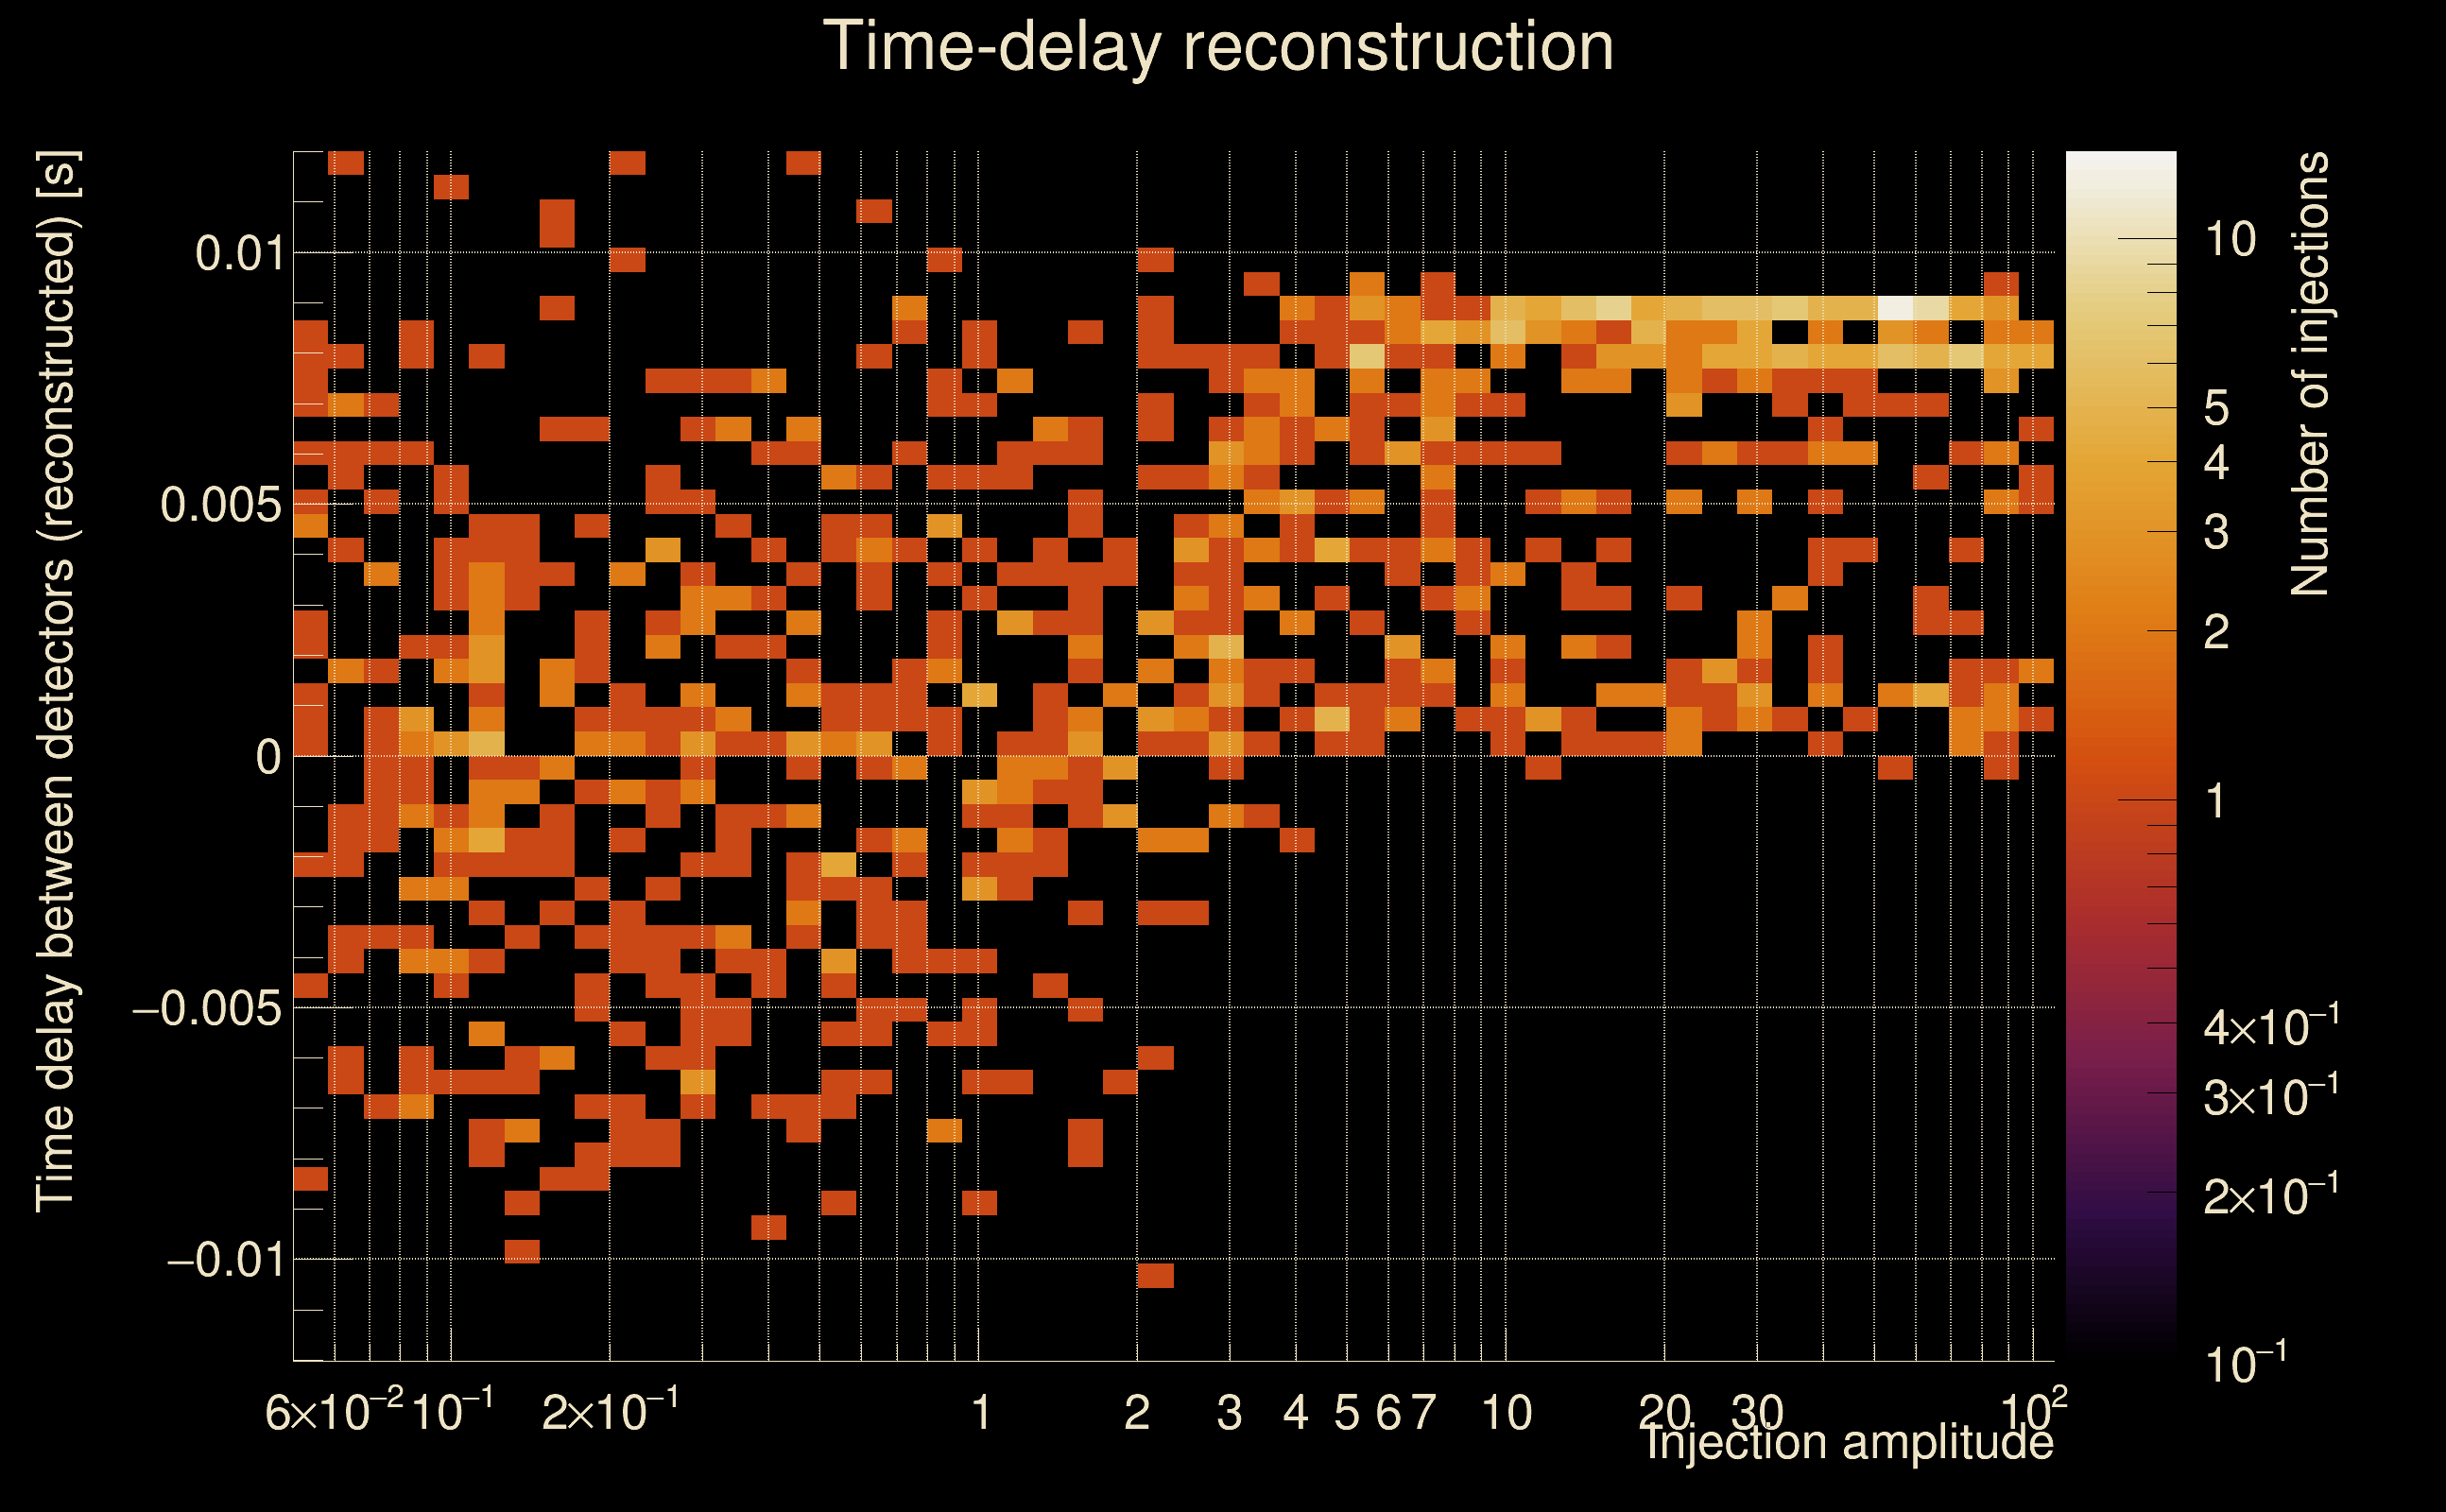
| Number of injections (total/valid/detected): | 1116 / 973 / 298 |
| List of missed injections: | ./Rad19-s13_missed.txt |
| Injection amplitude at 90% detection efficiency: | 8.29728 |
| Injection amplitude at 50% detection efficiency: | 4.43137 |
| Injection amplitude at 10% detection efficiency: | 2.57743 |
 |
 |
 |
 |
 |
 |
 |
|
 |
 |
|
 |
 |
|
 |
 |
|
 |
 |
|
 |
 |
|
 |
 |
|
 |
 |
|
 |
 |
 |
 |
 |
 |
 |
 |
 |
 |
 |
 |
 |
 |
 |
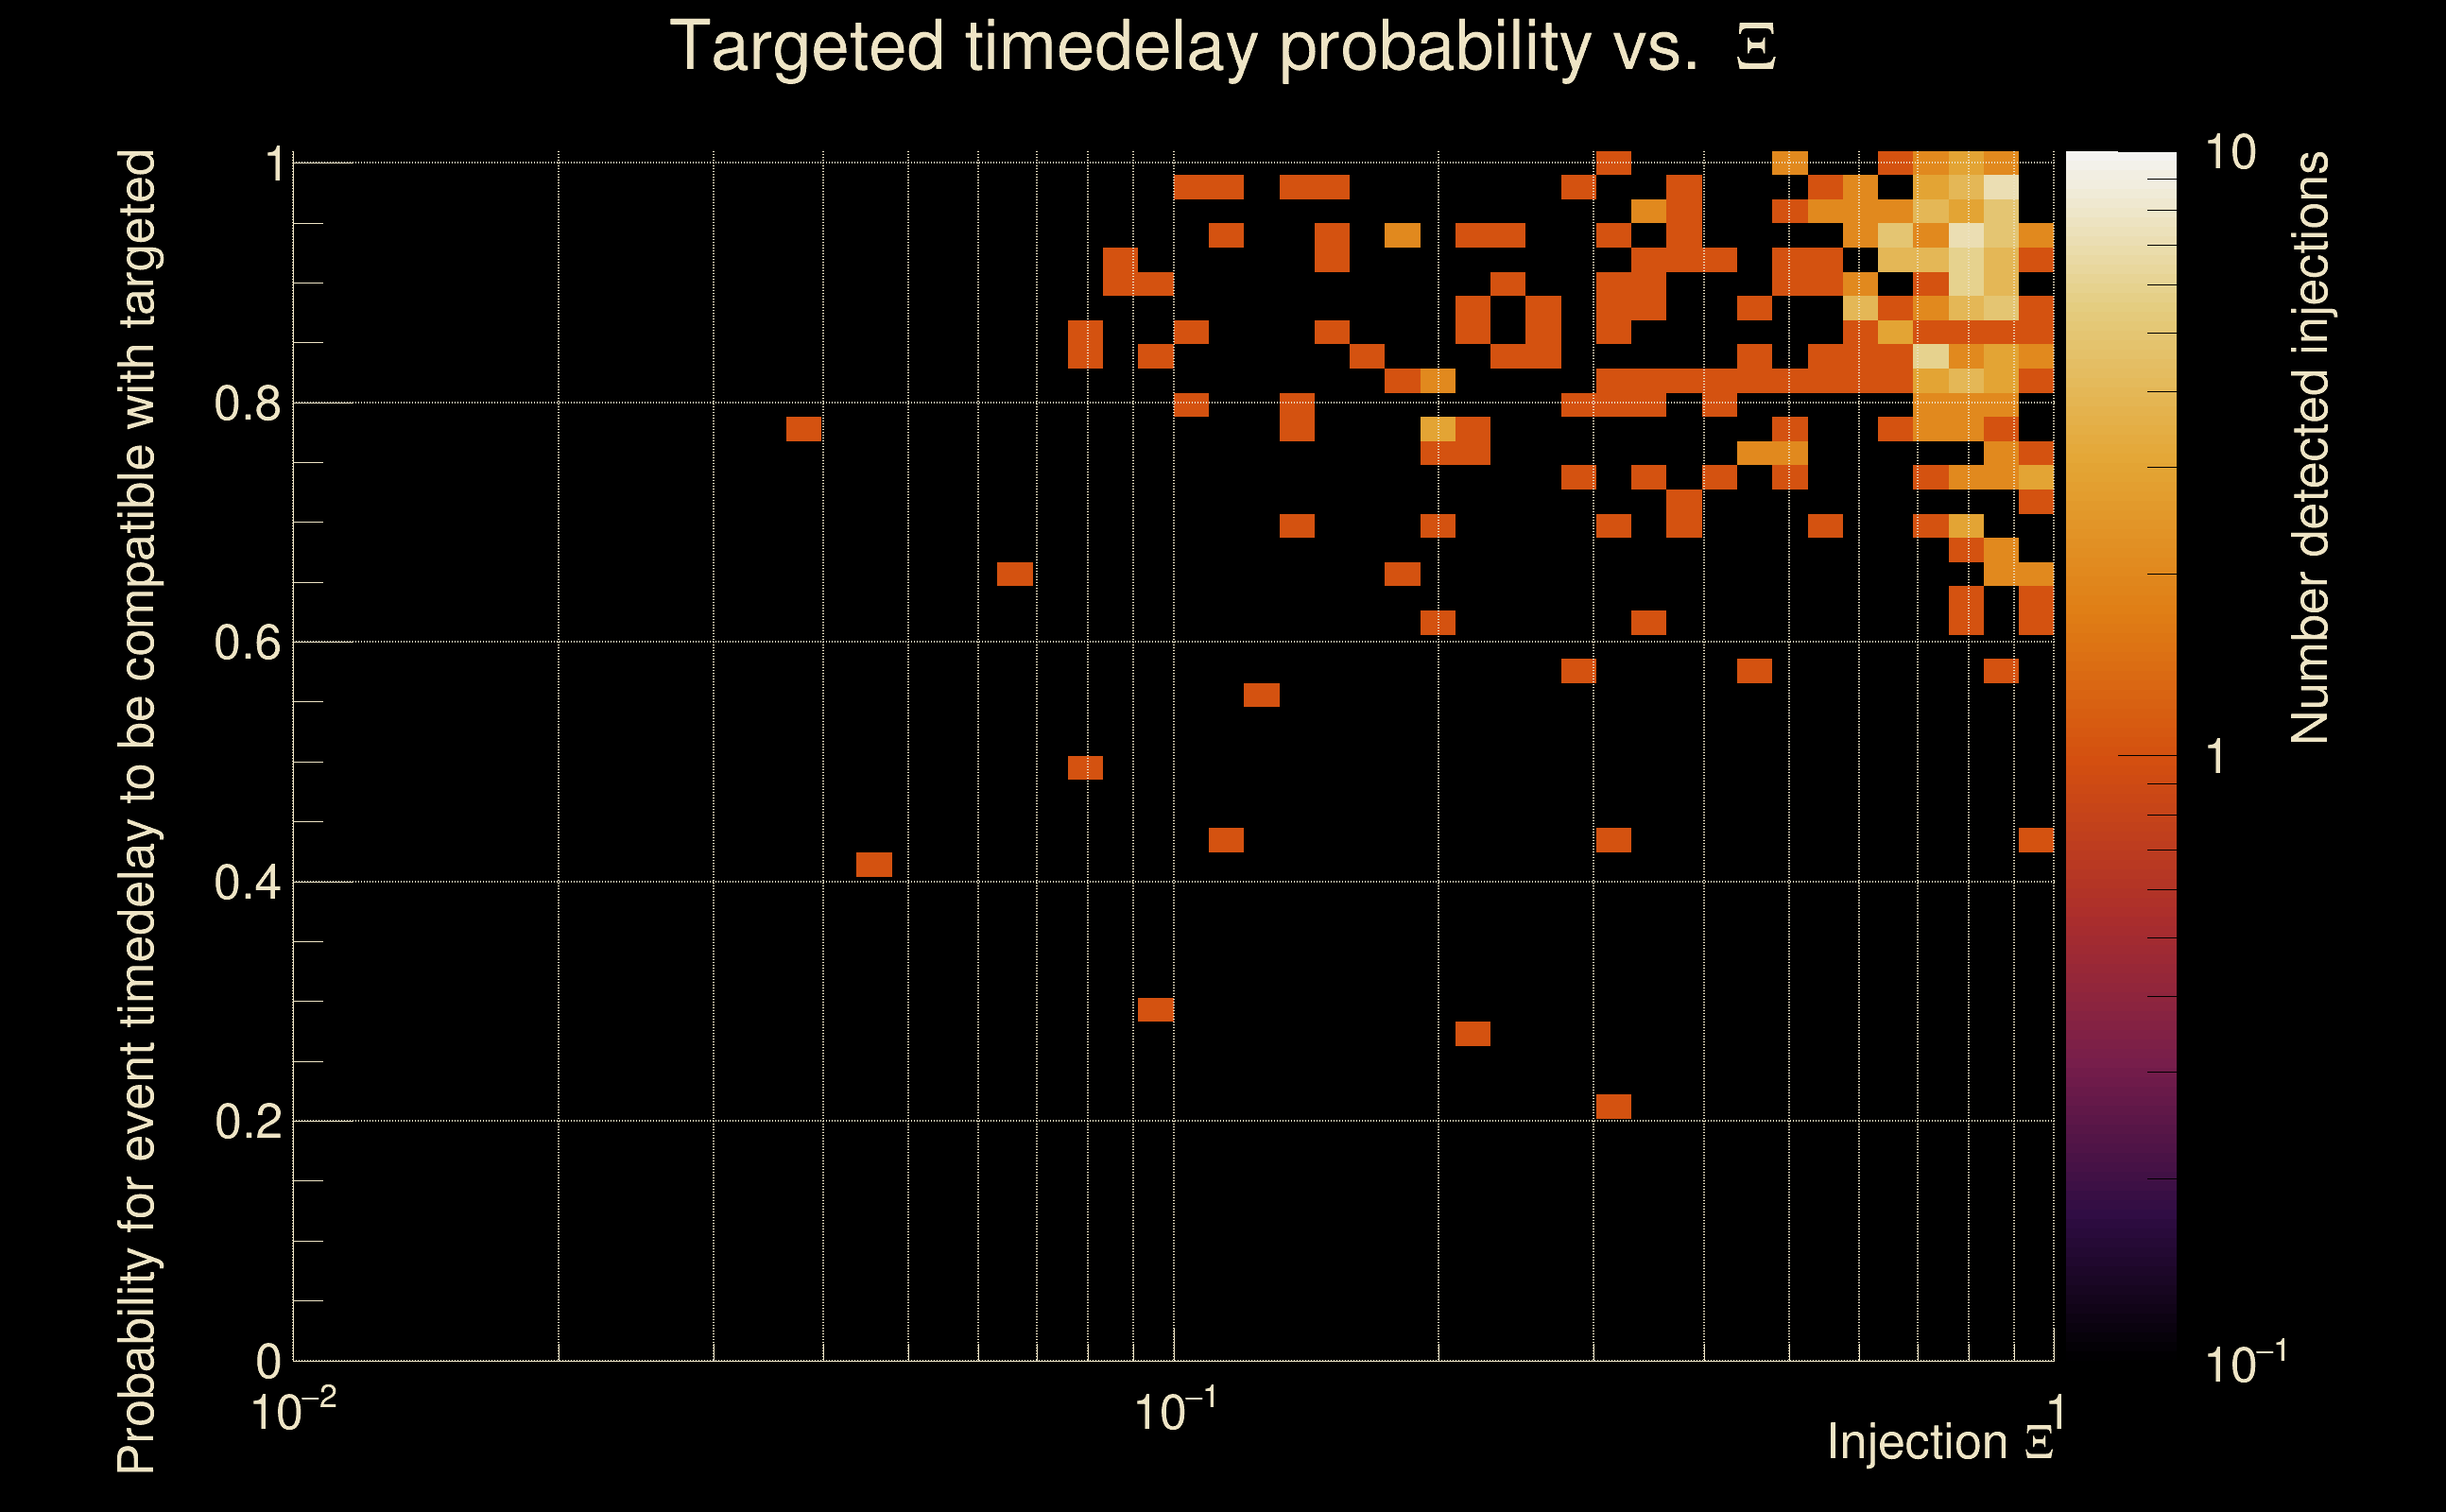
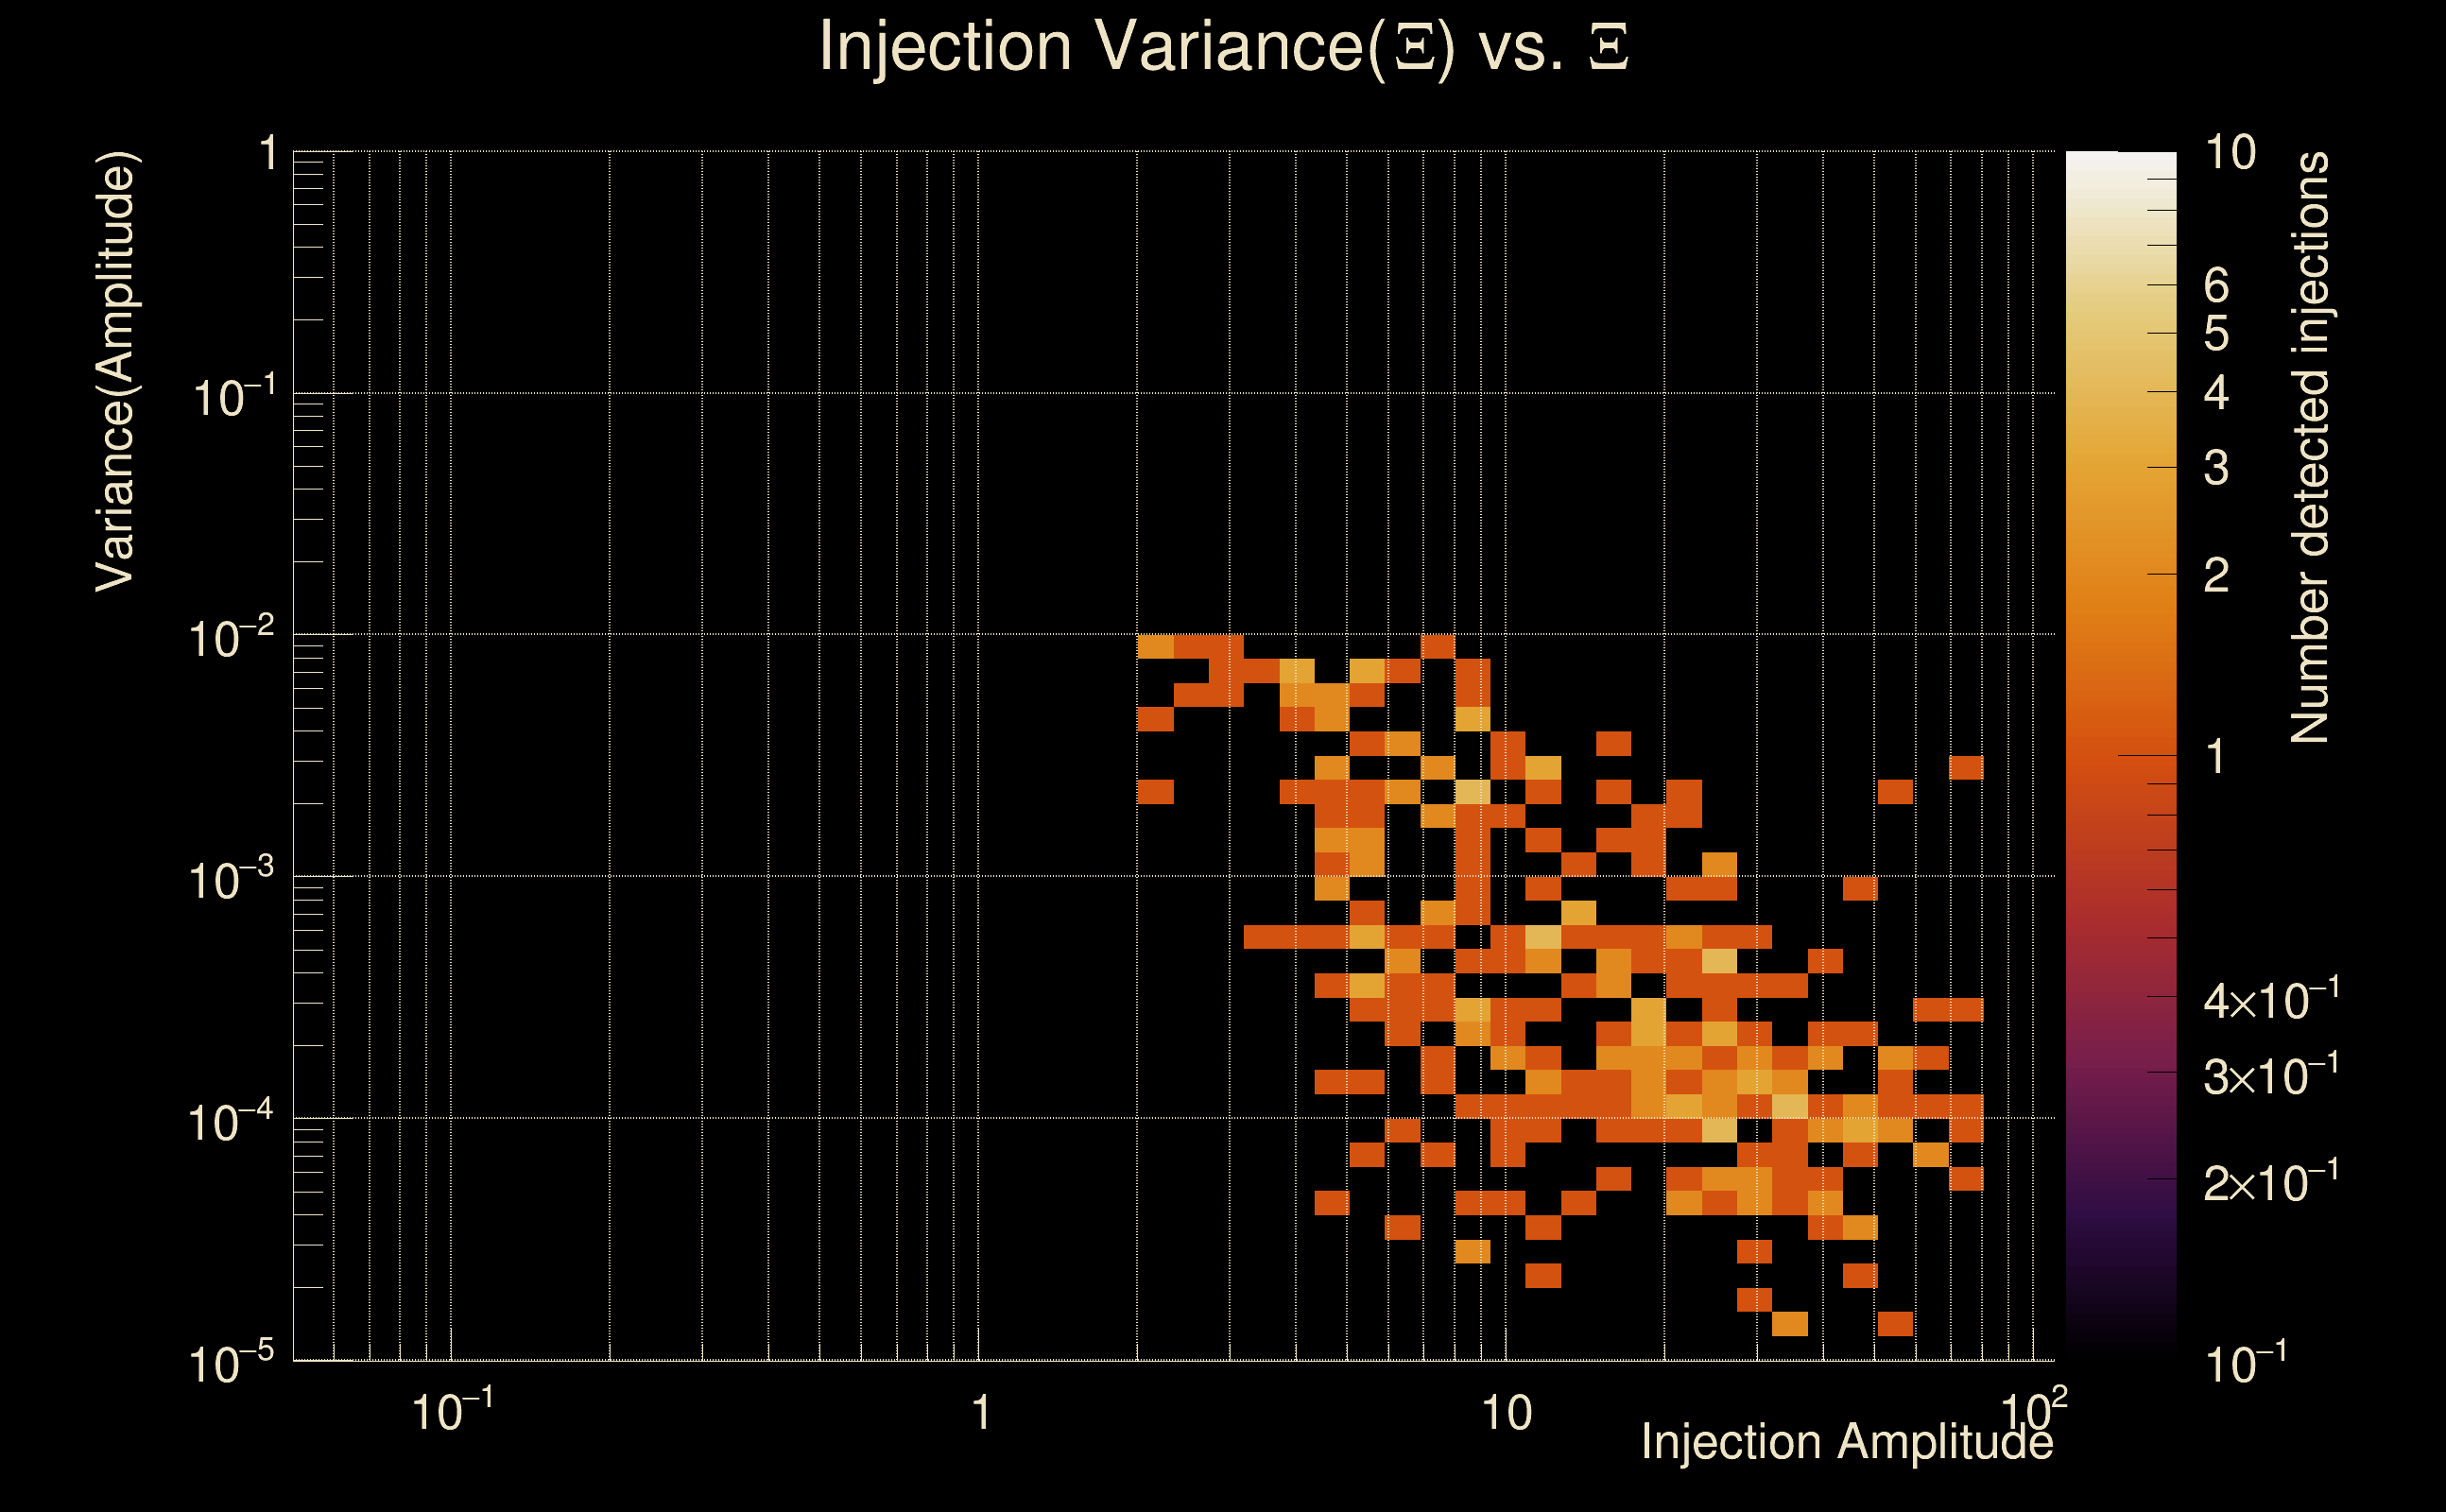
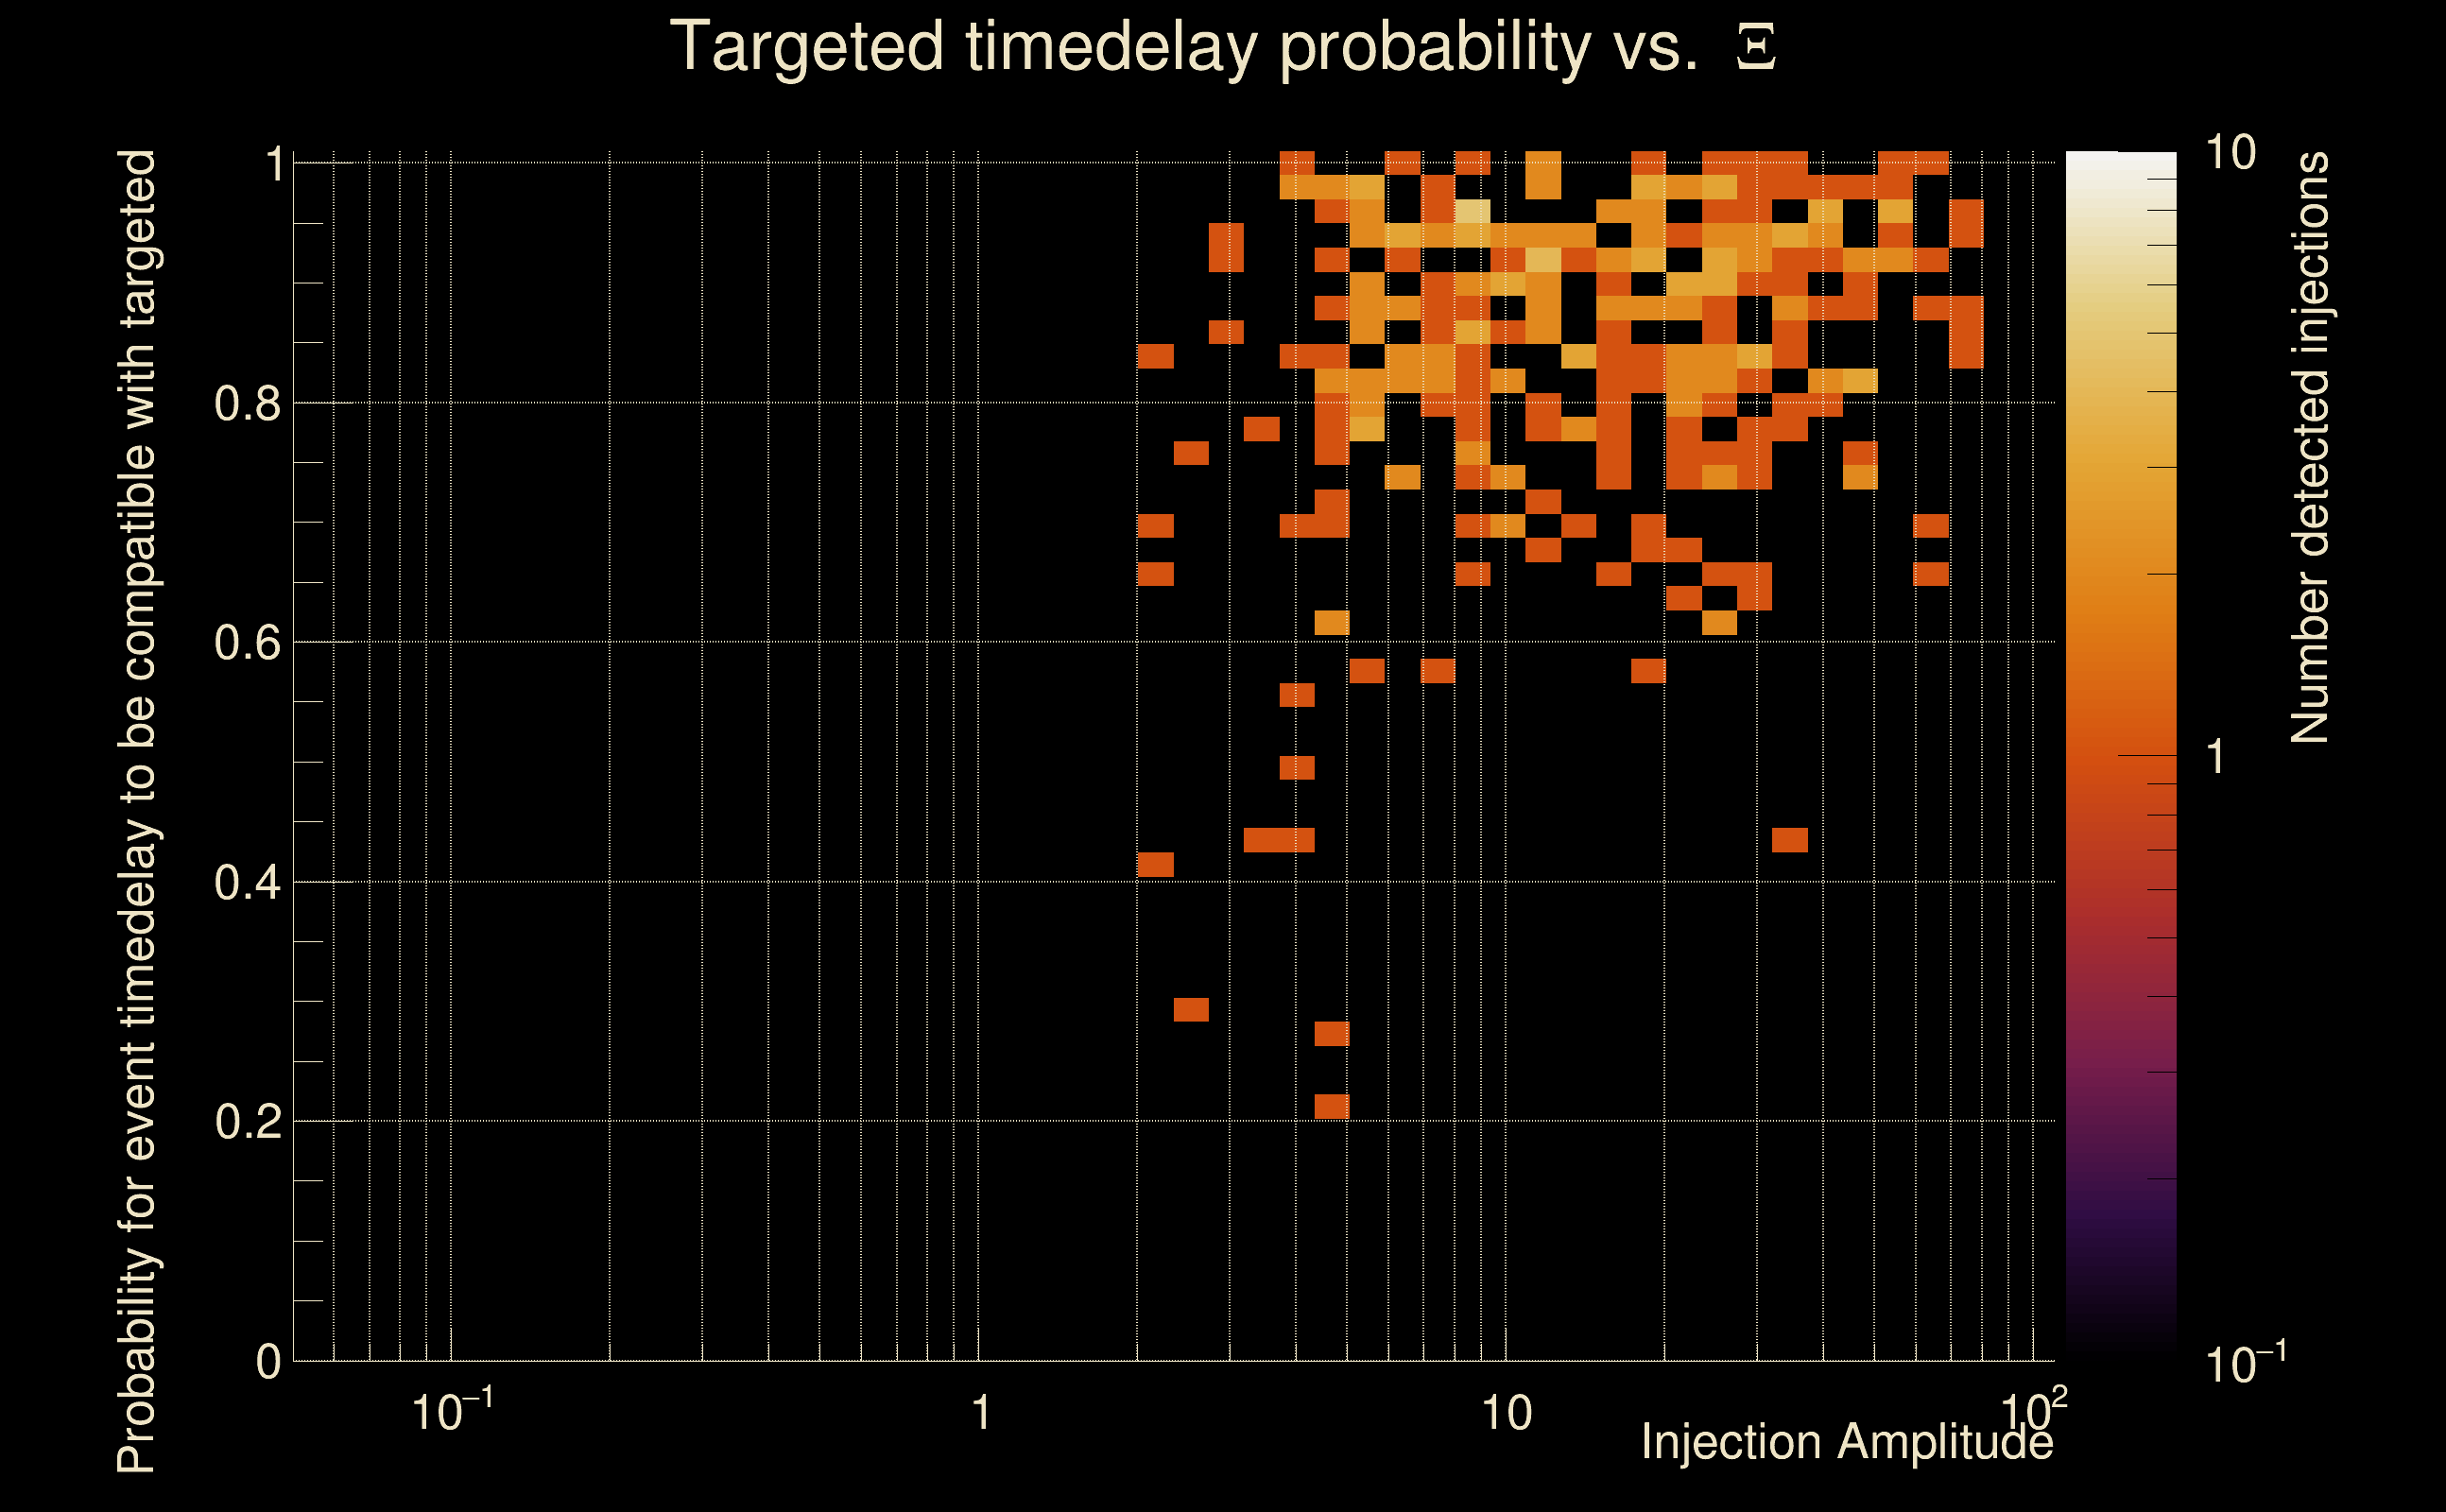
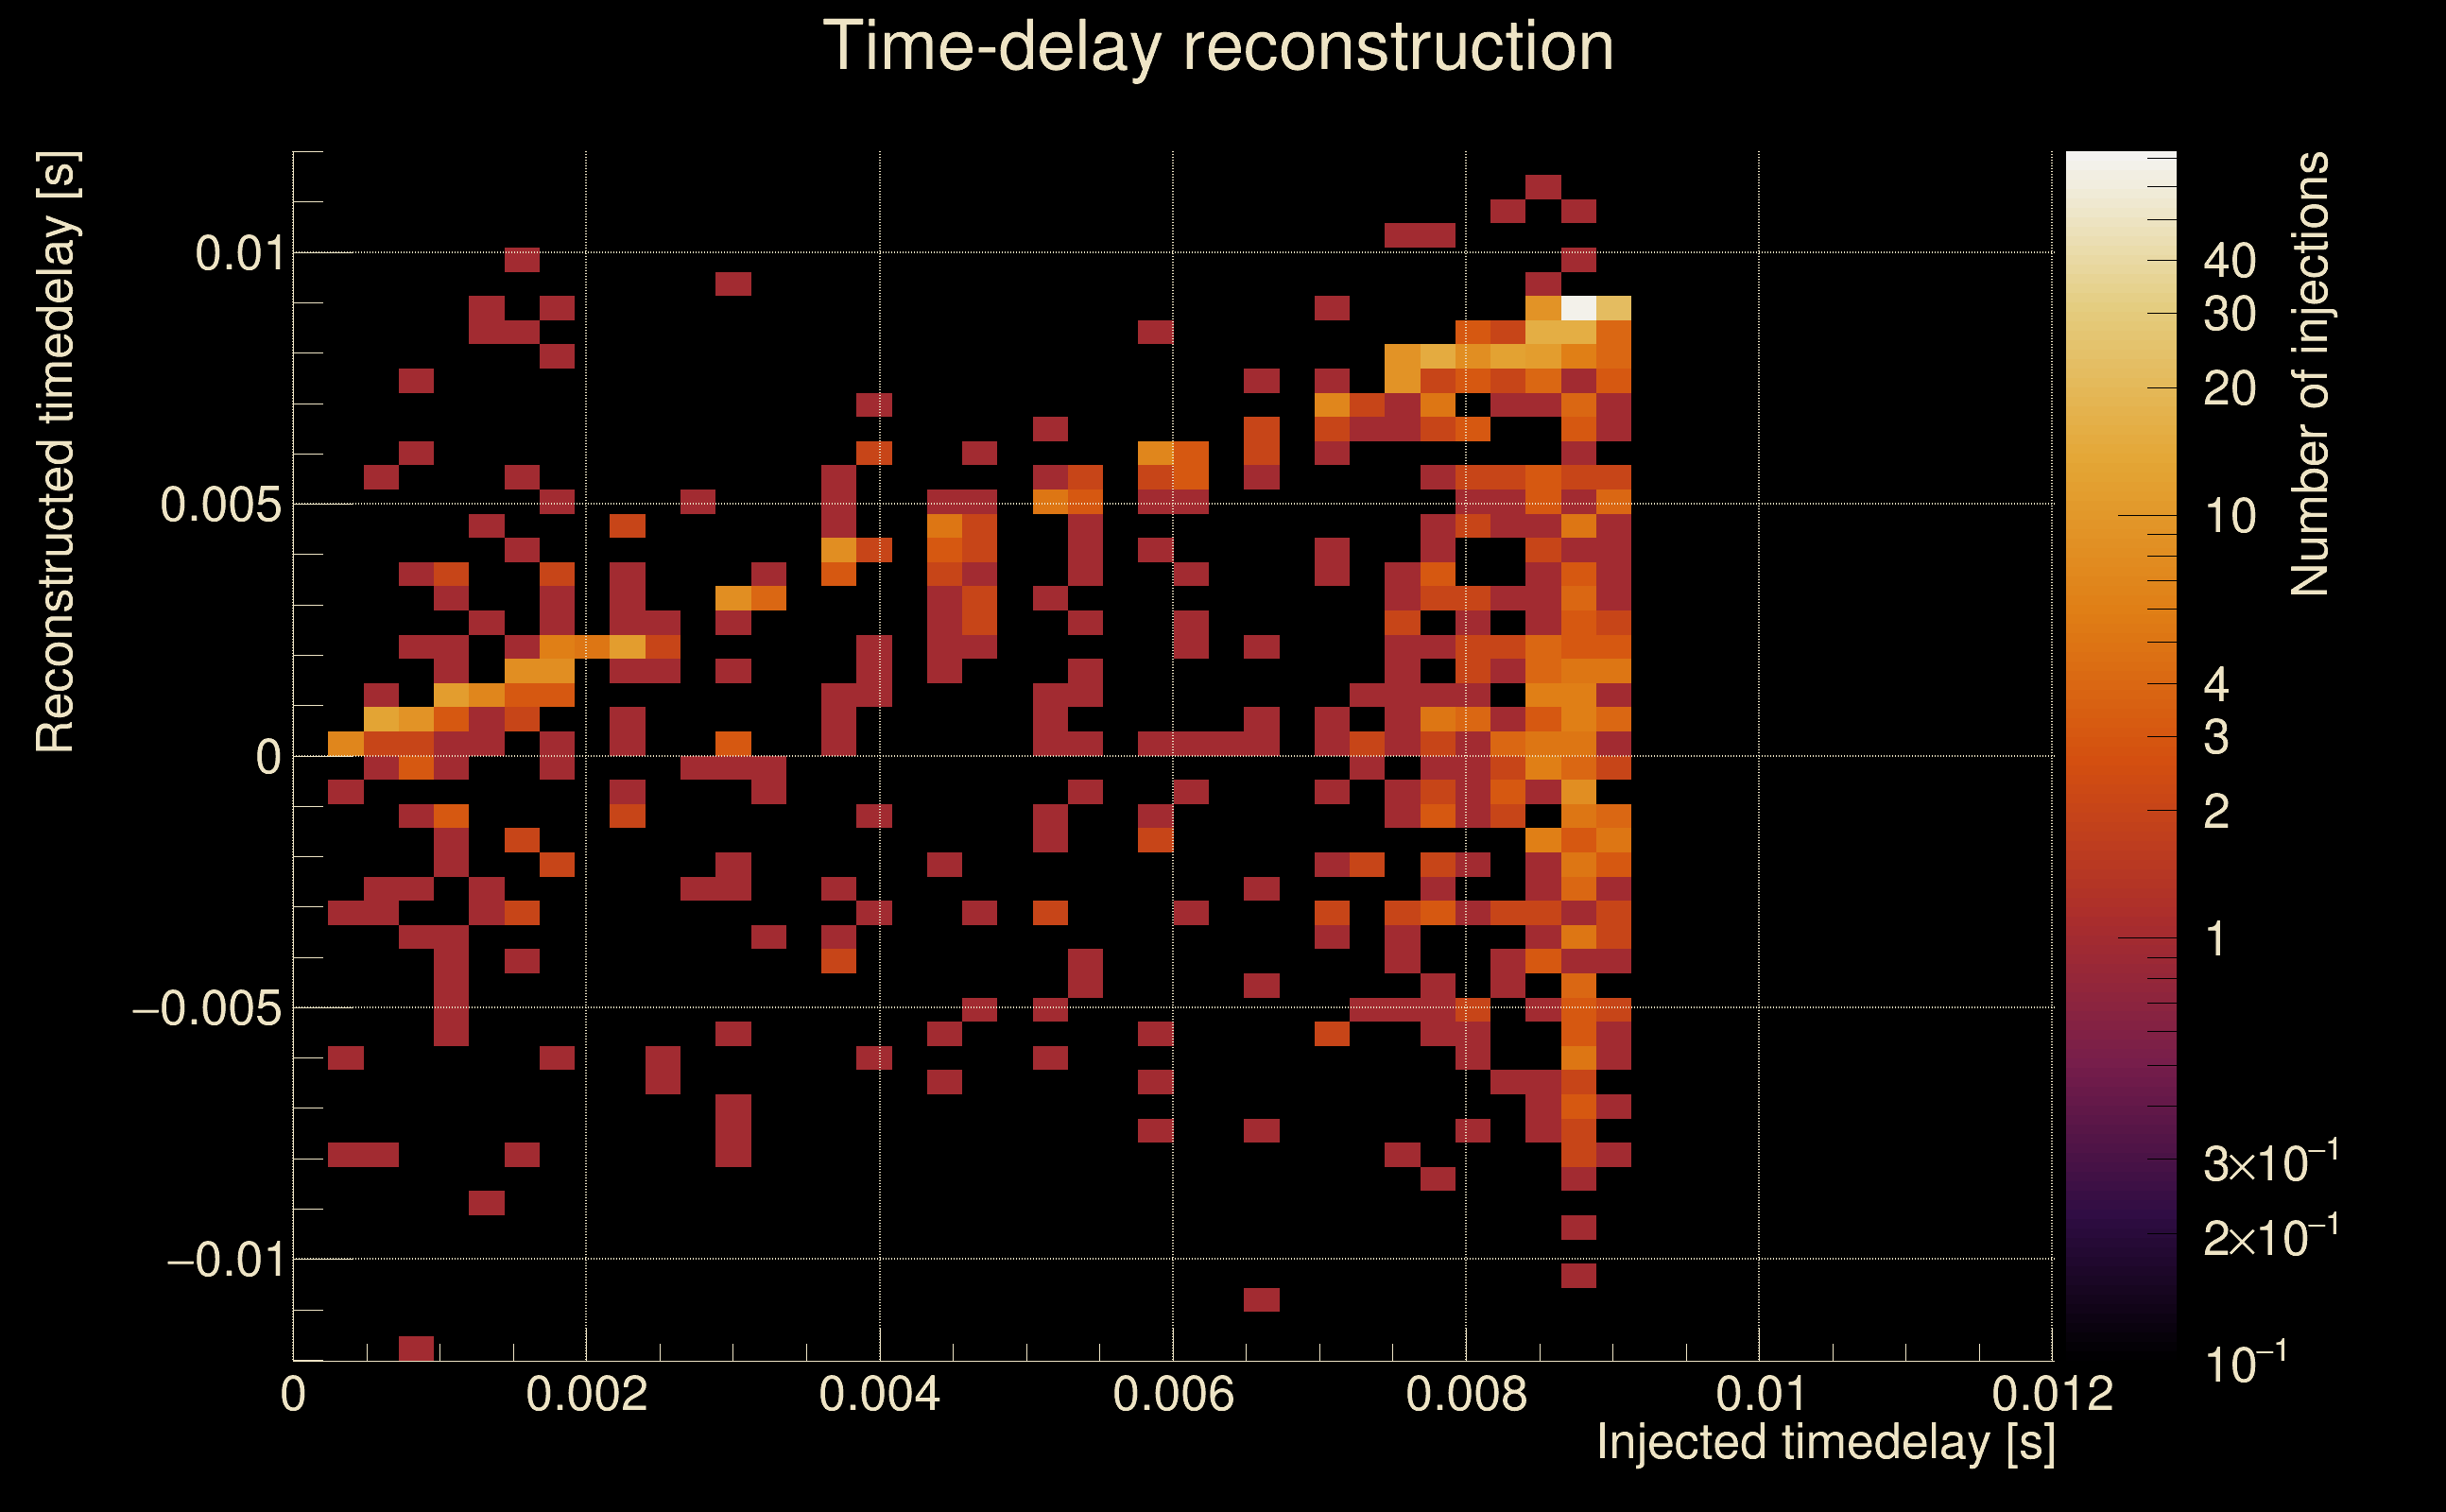
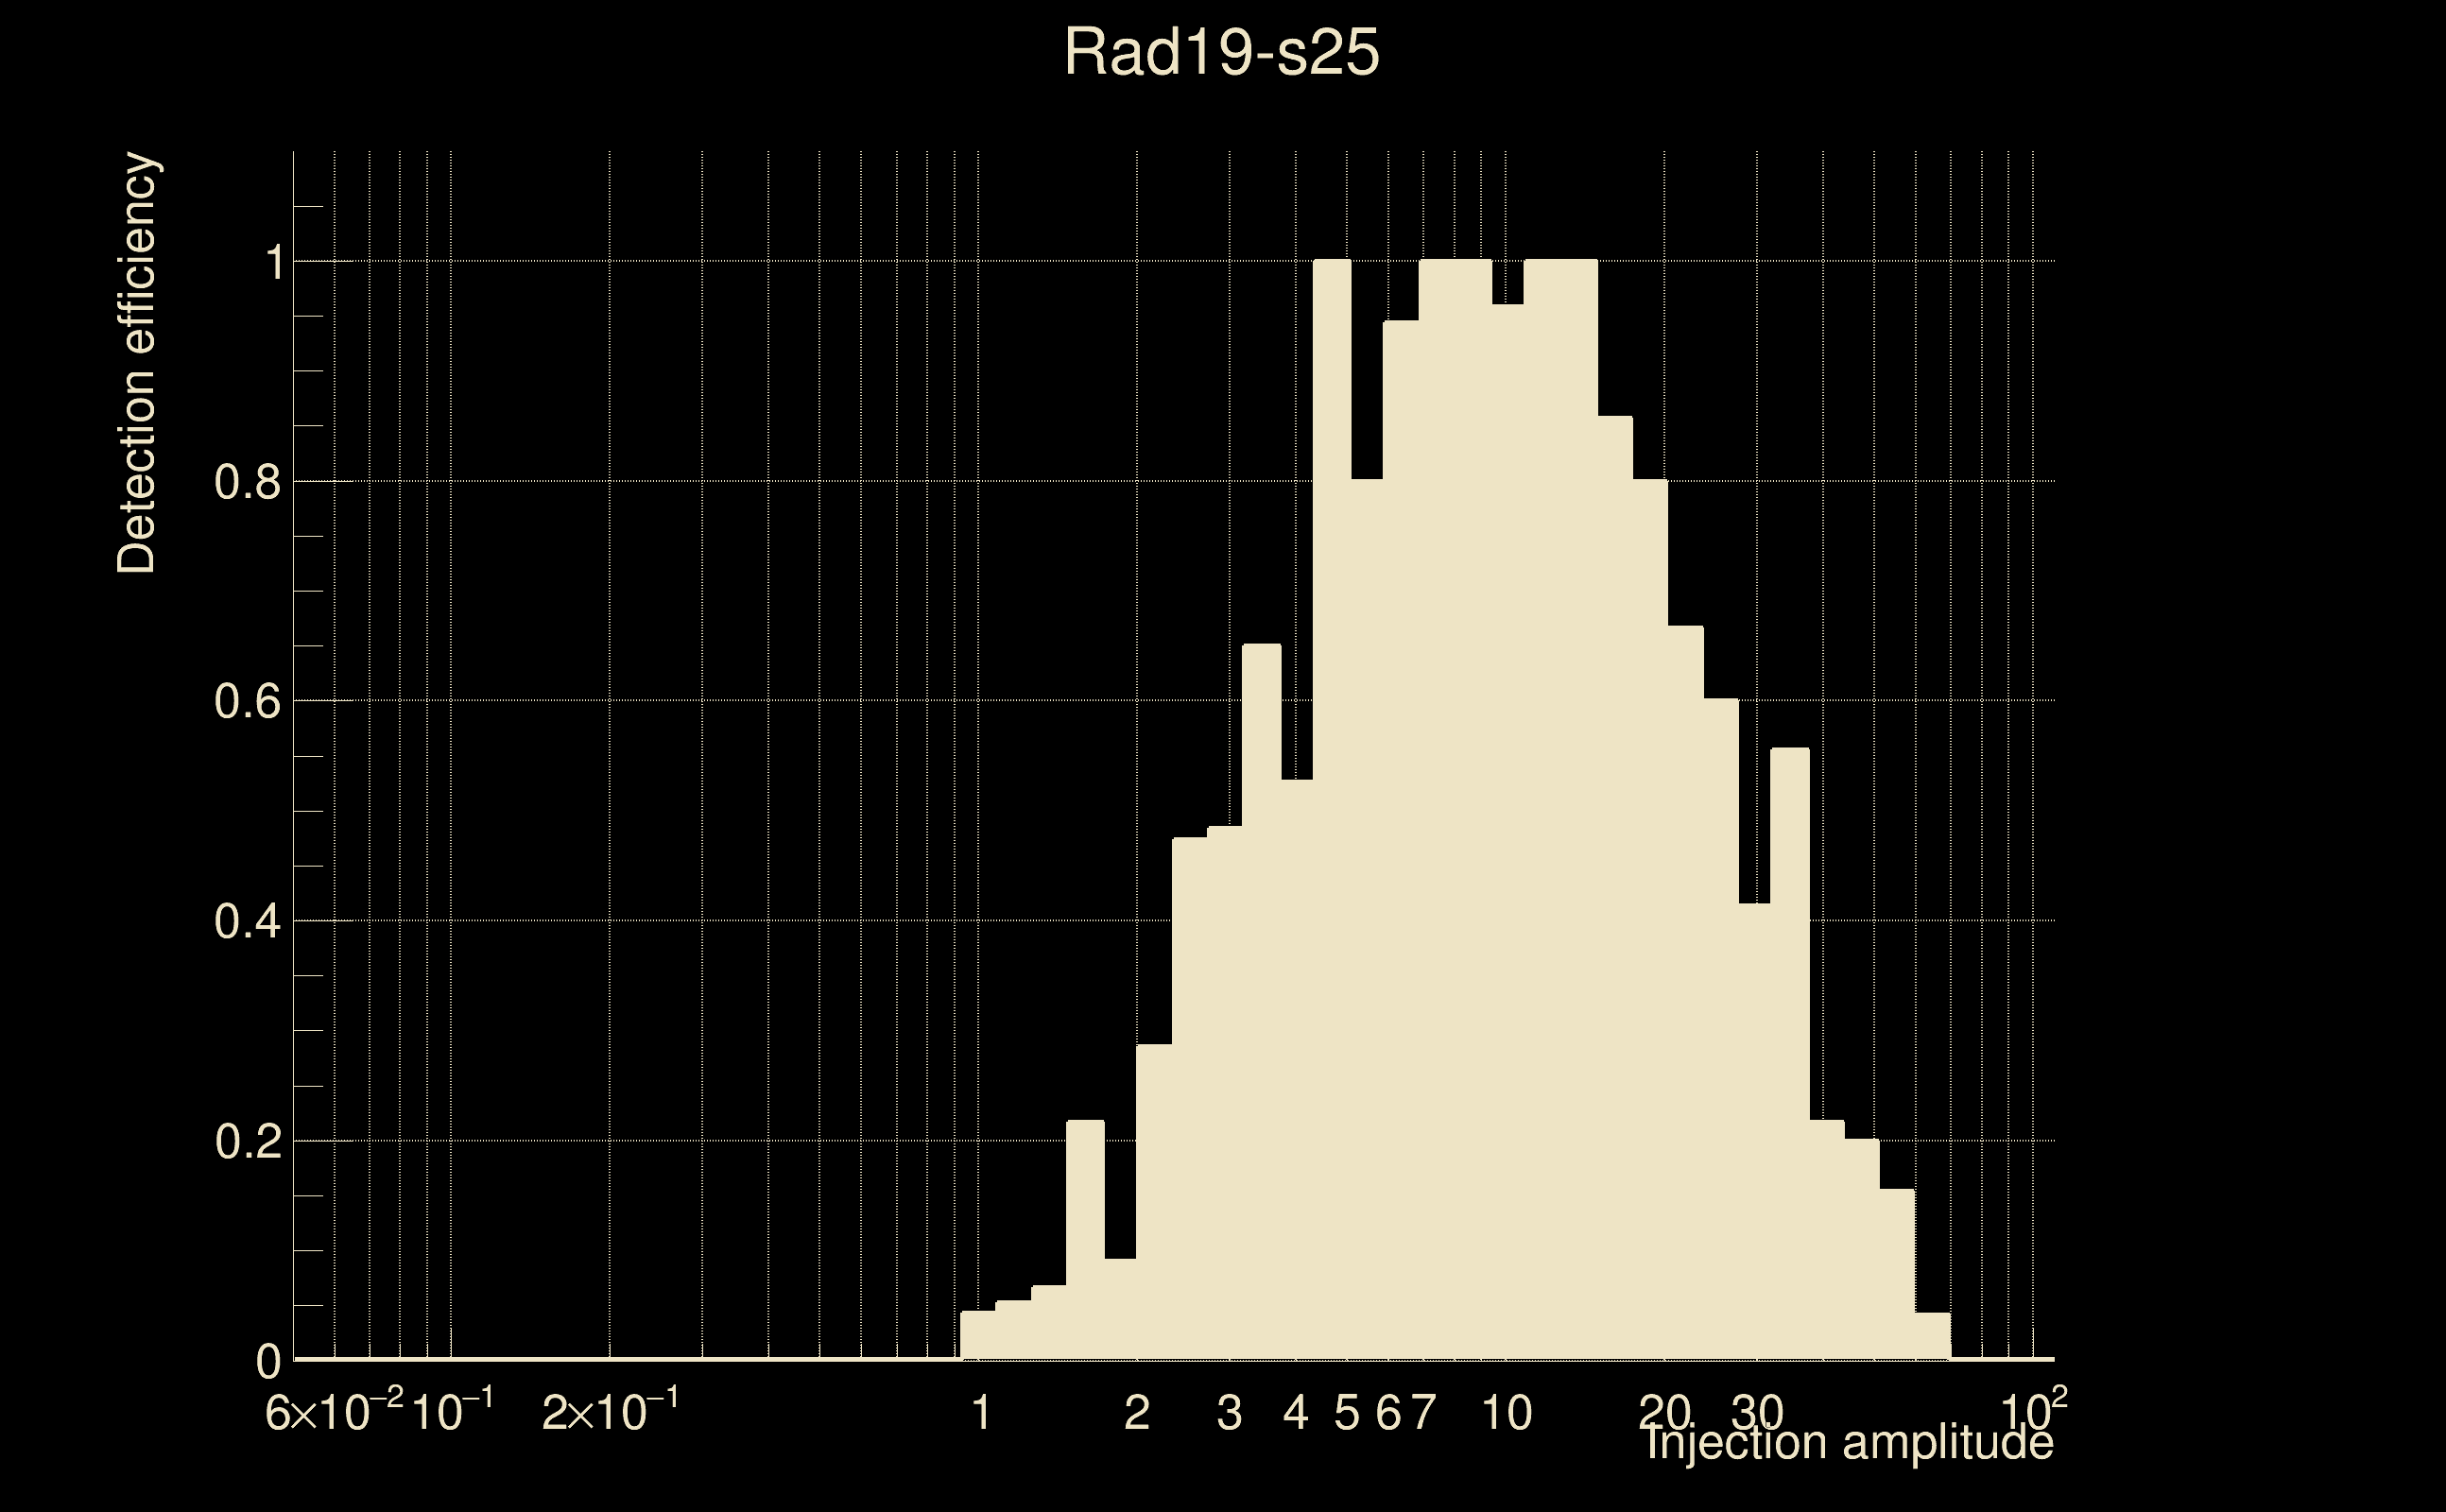
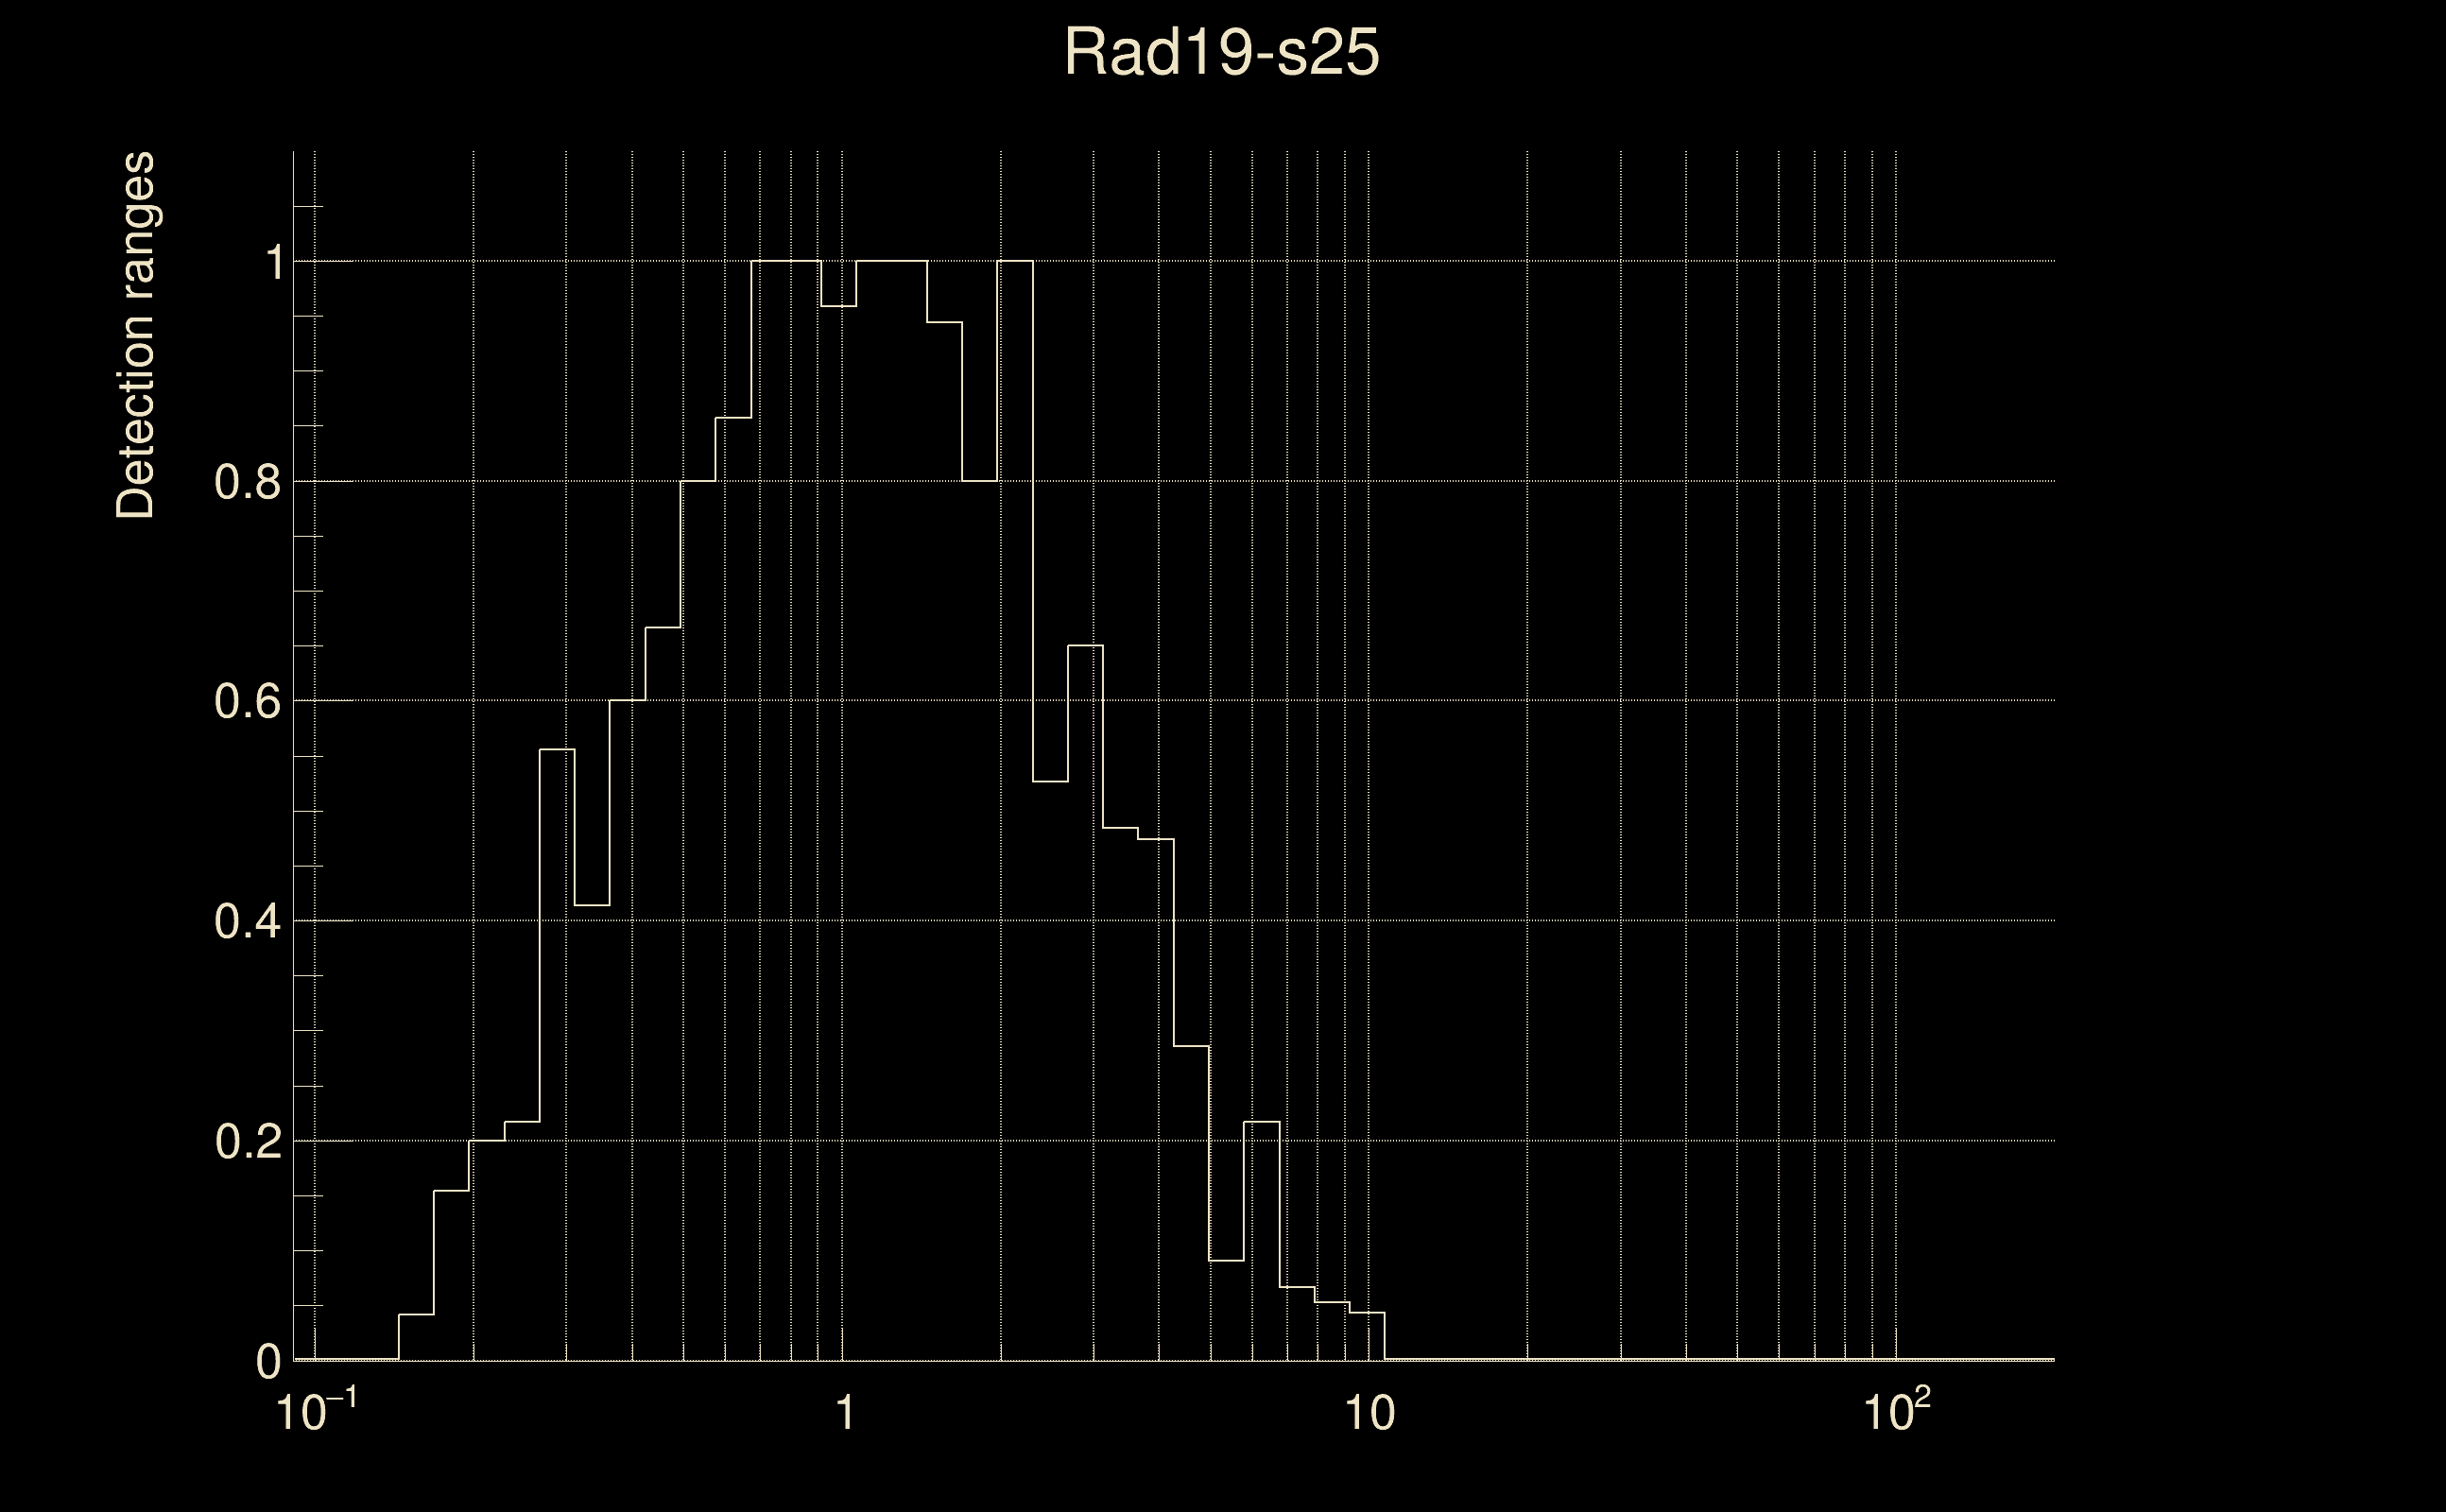
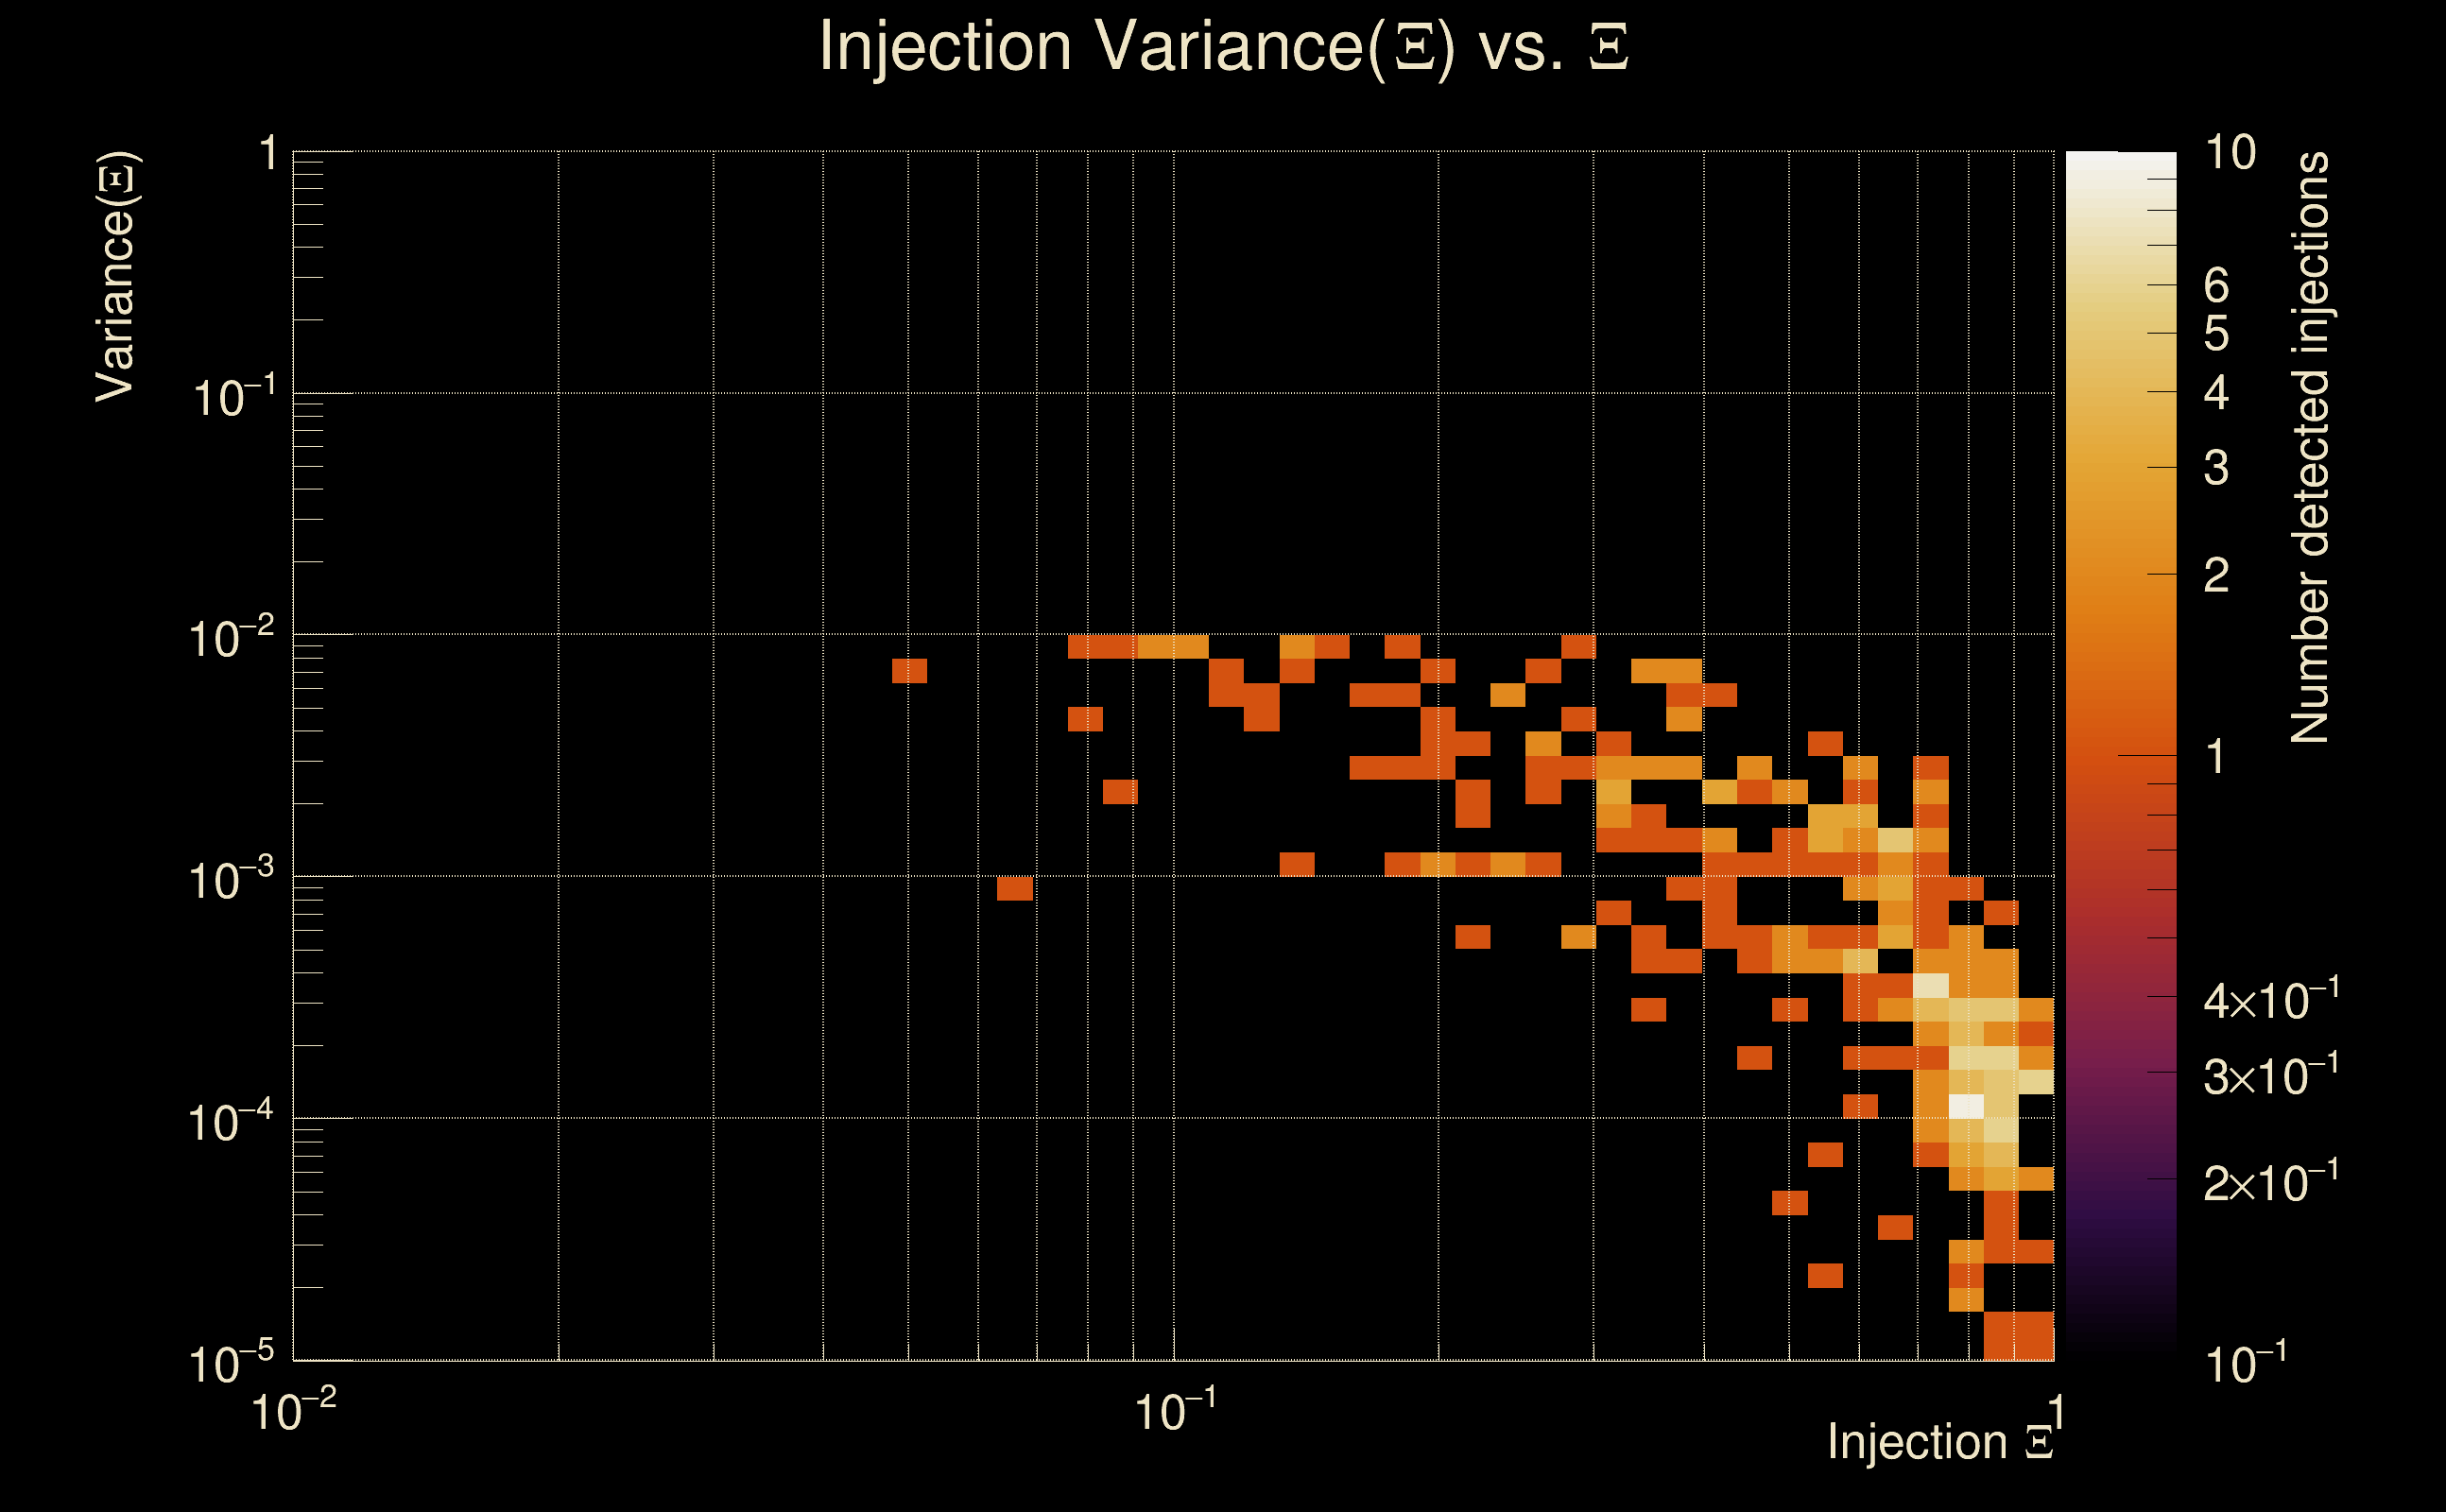
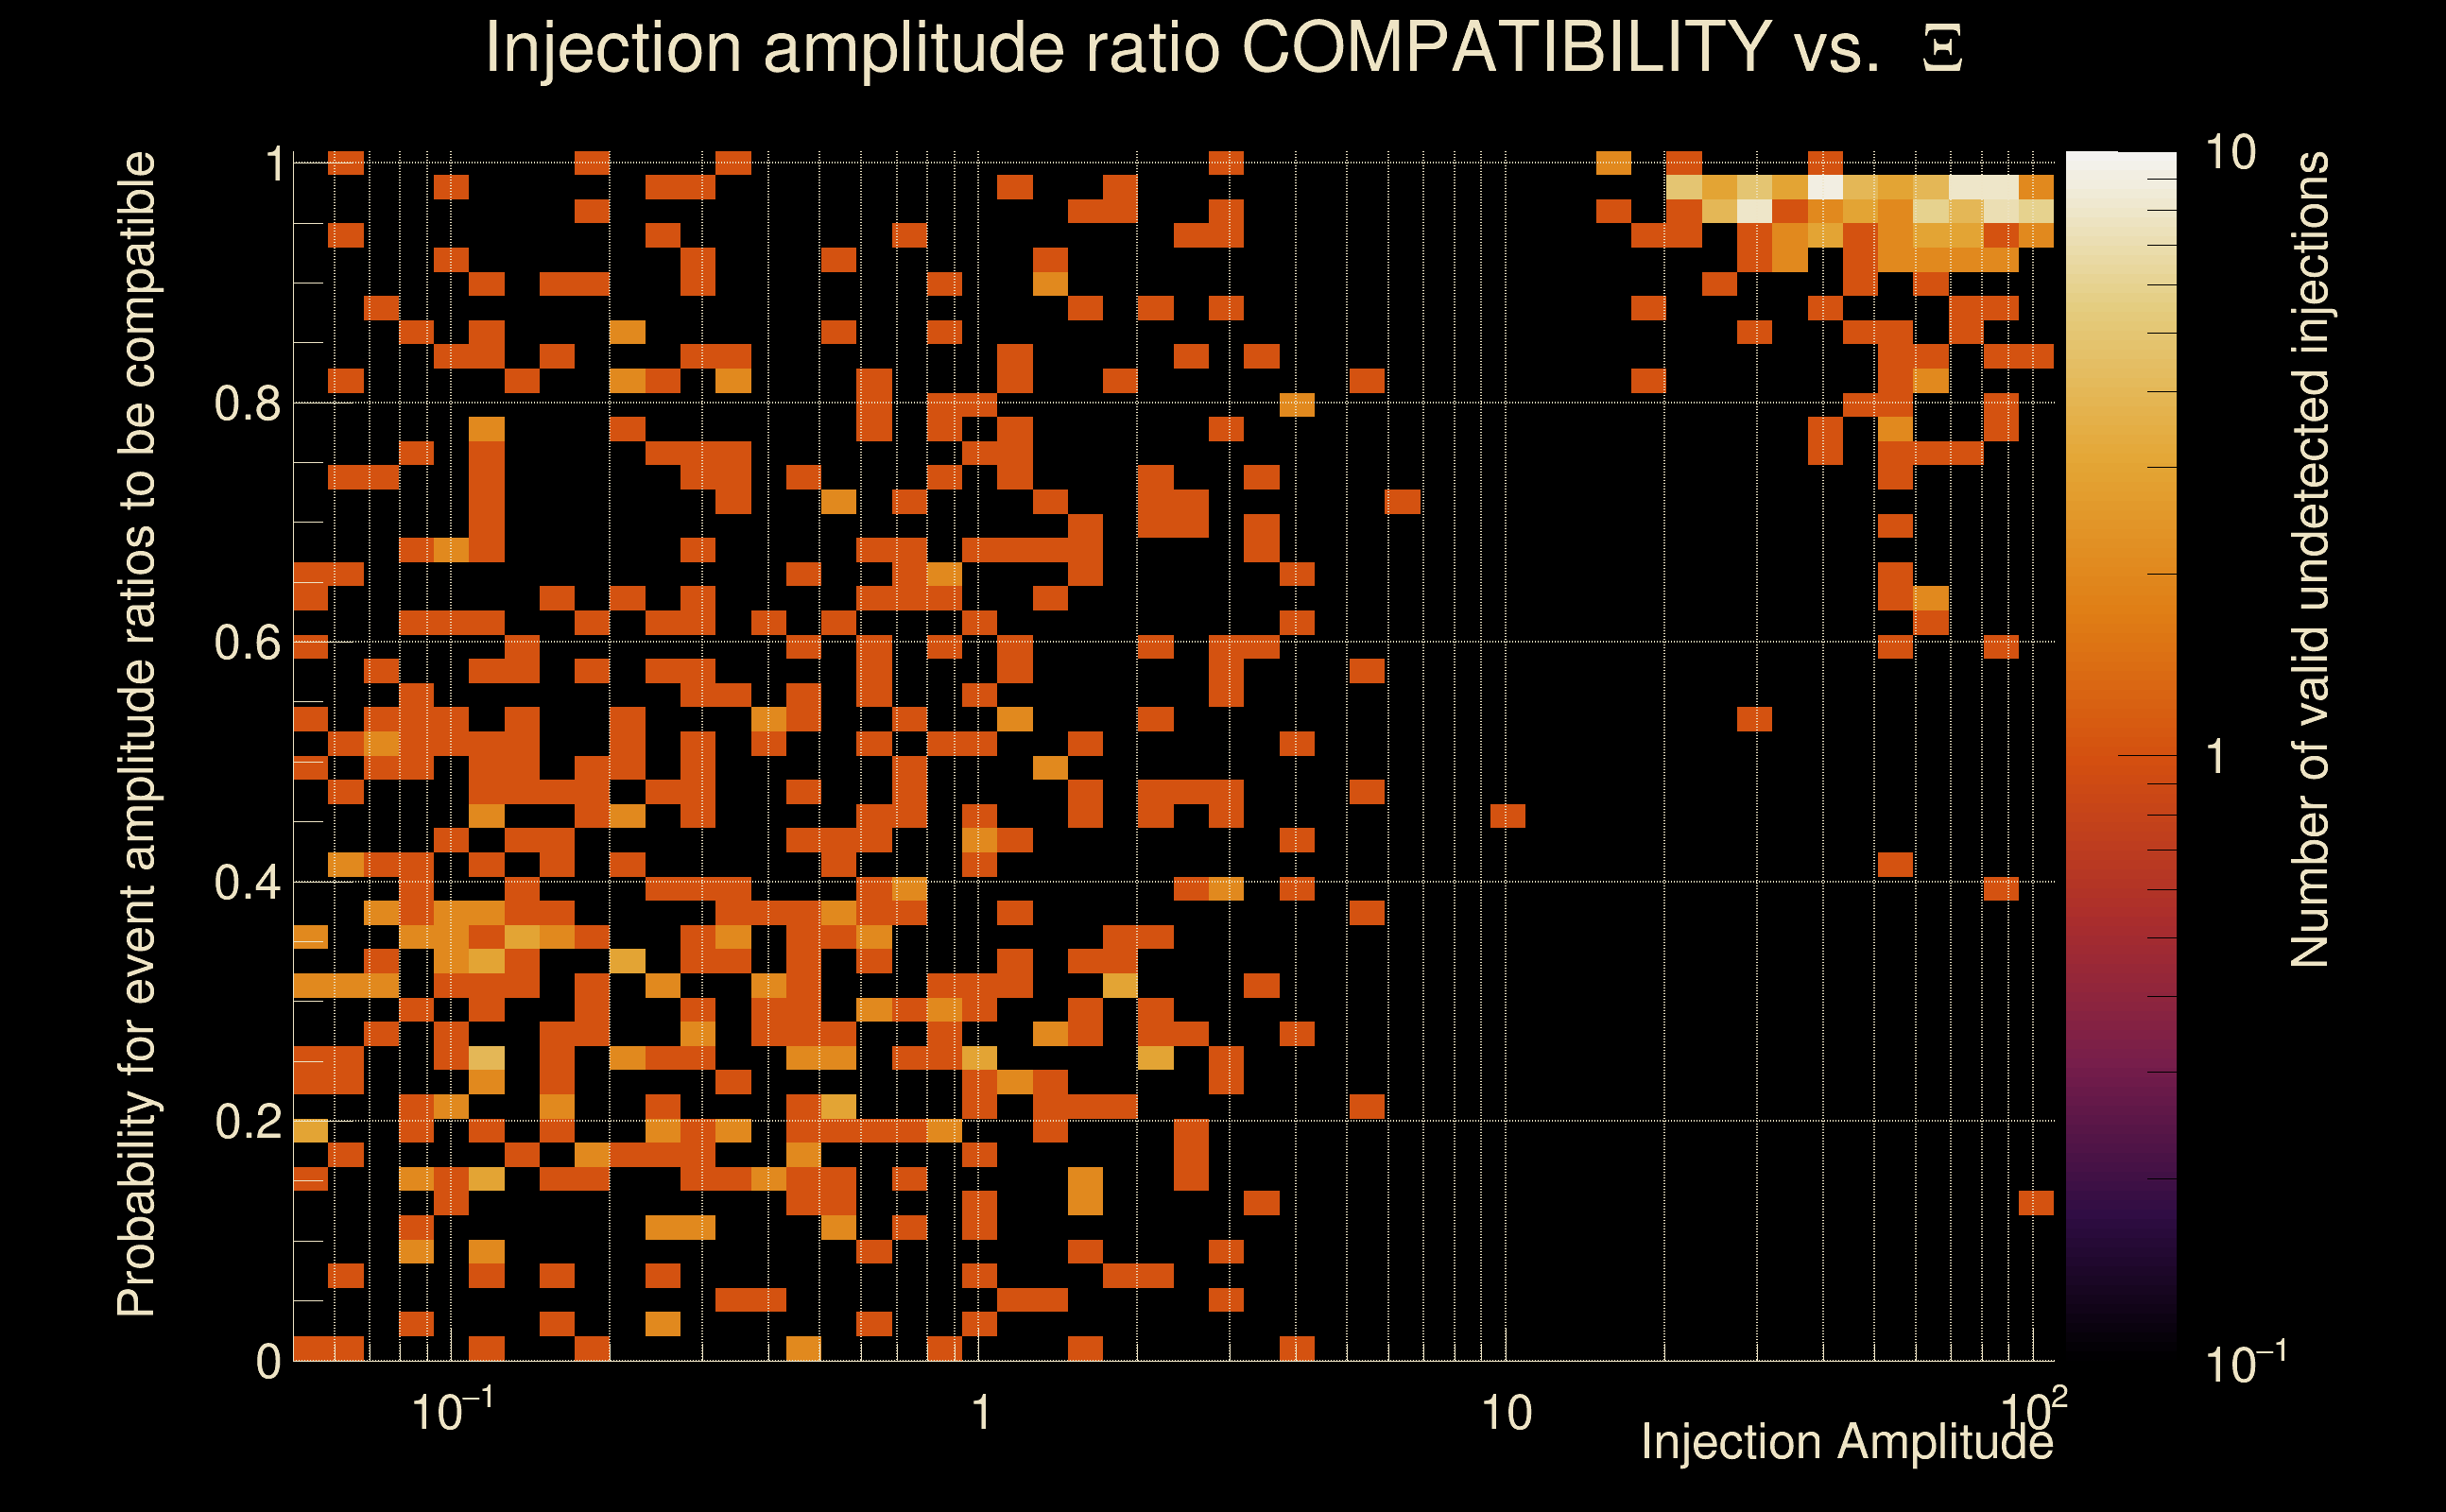
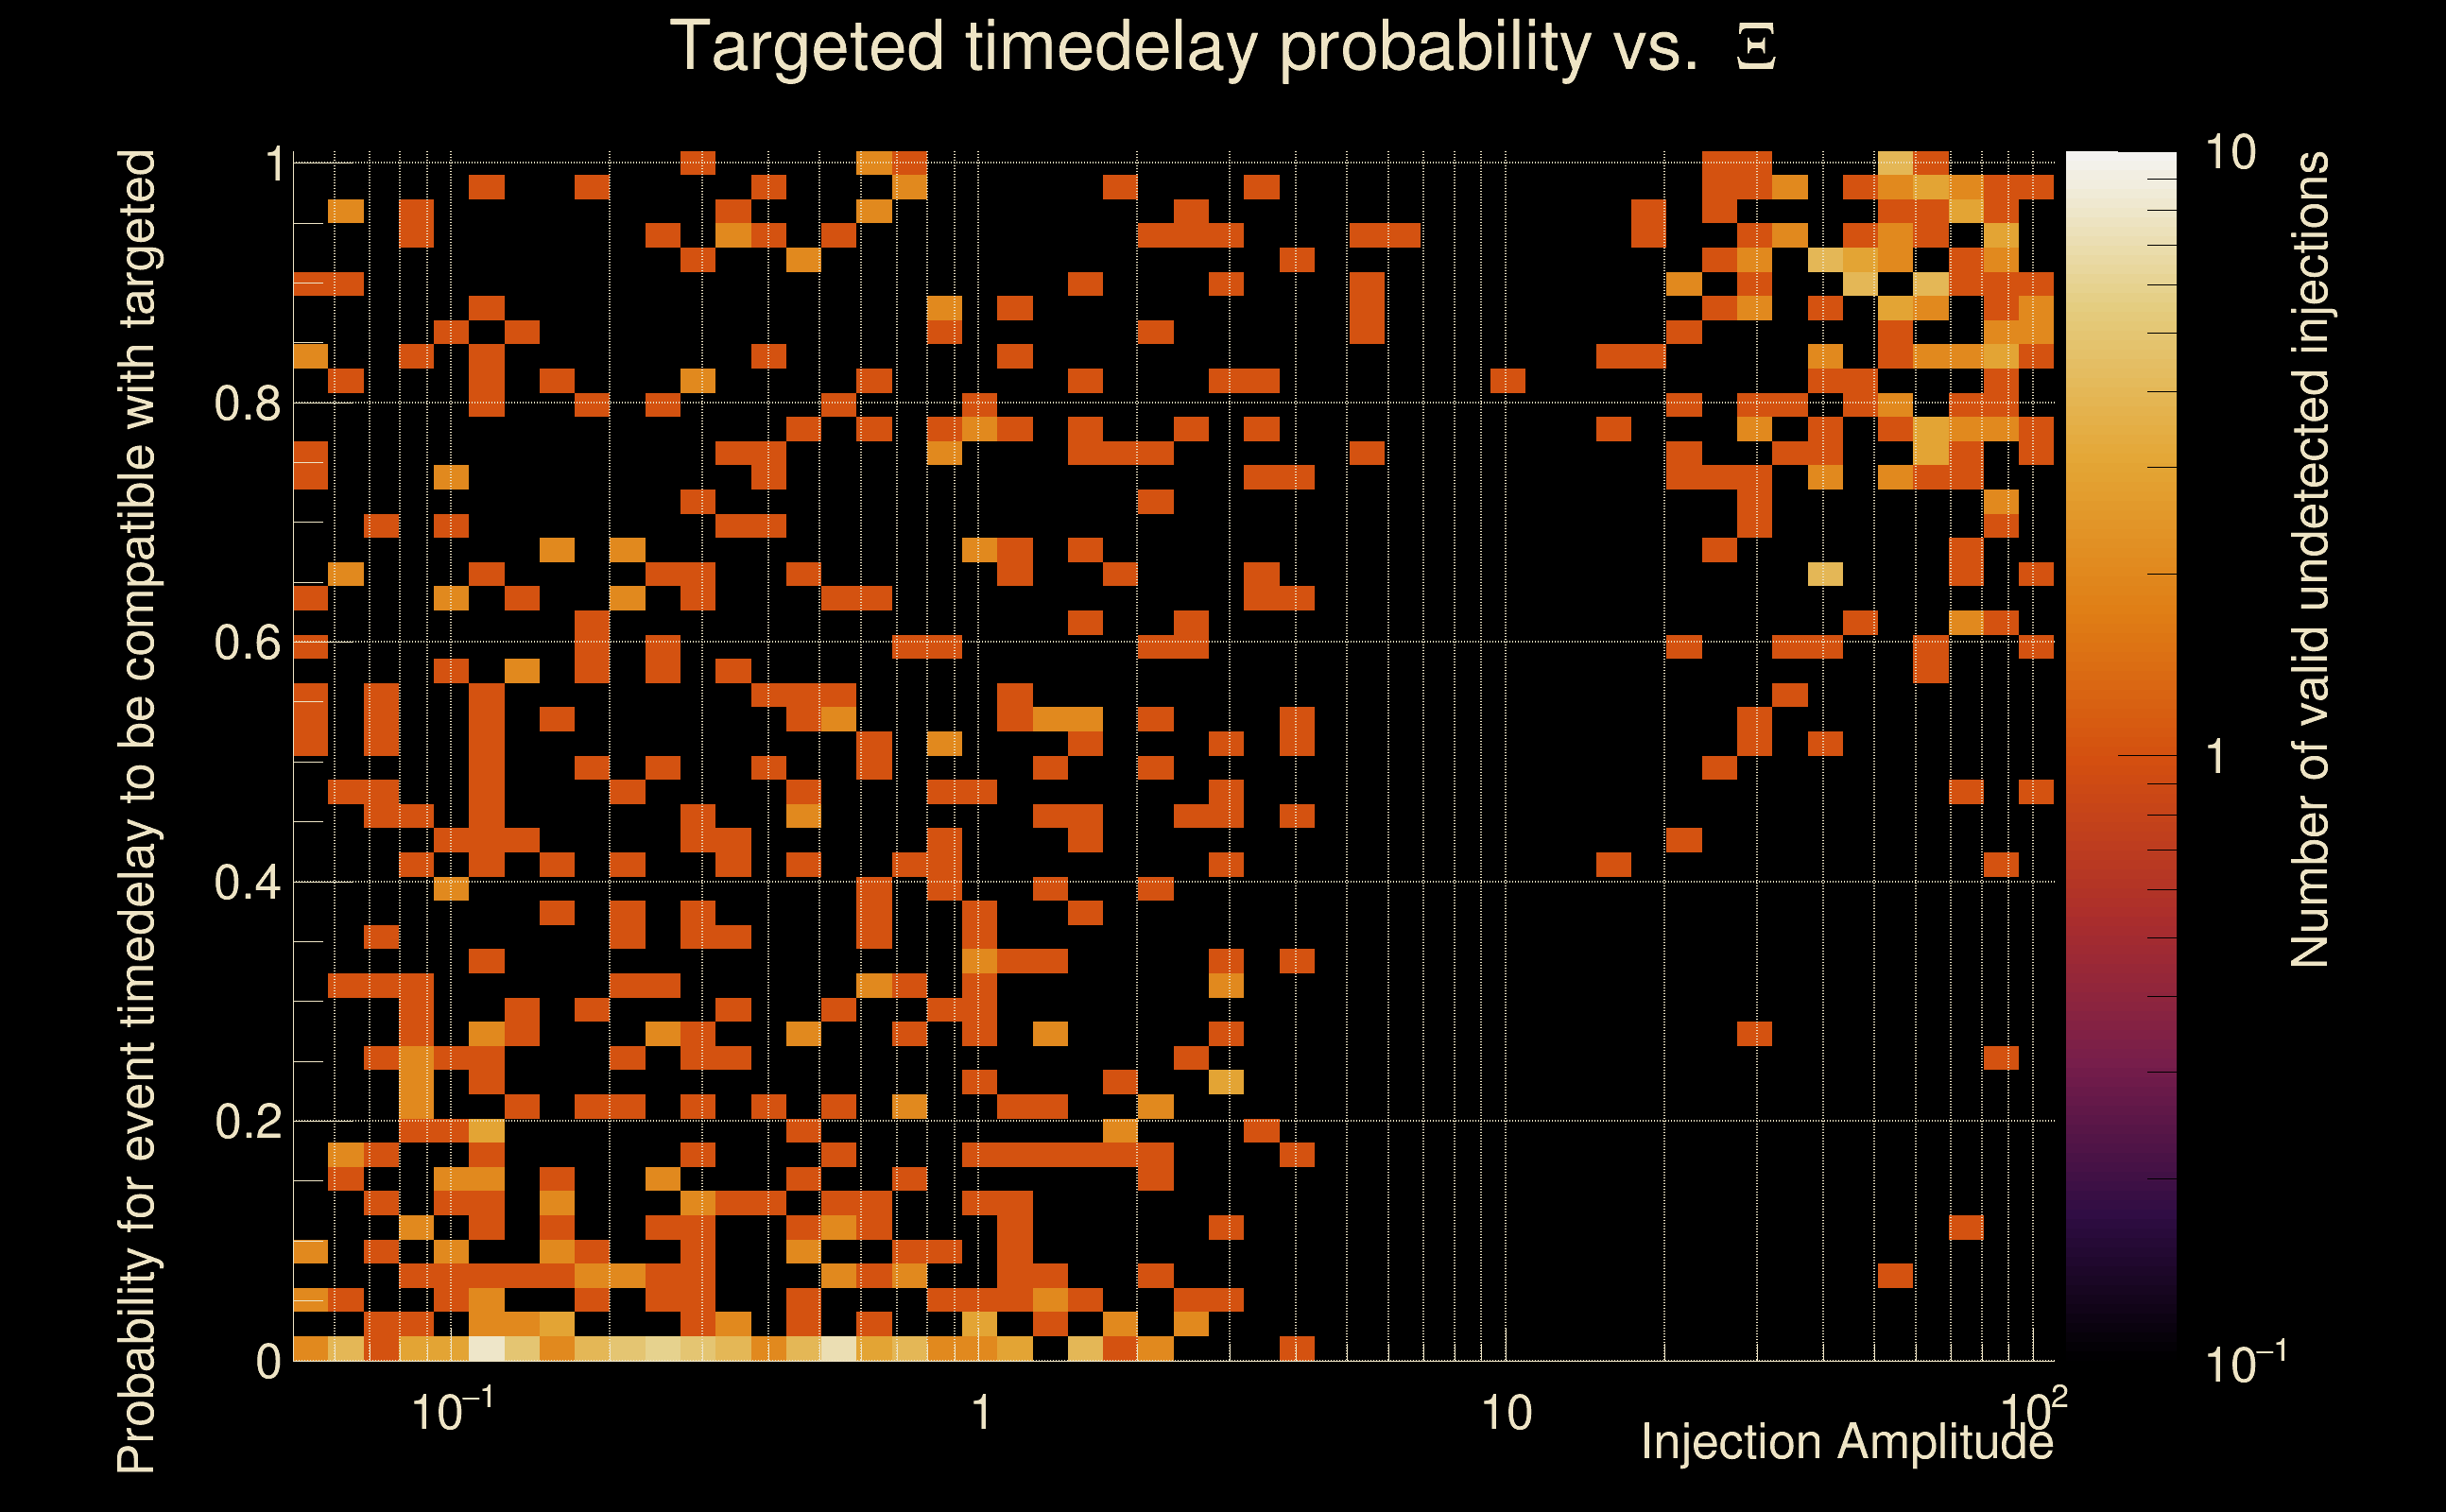
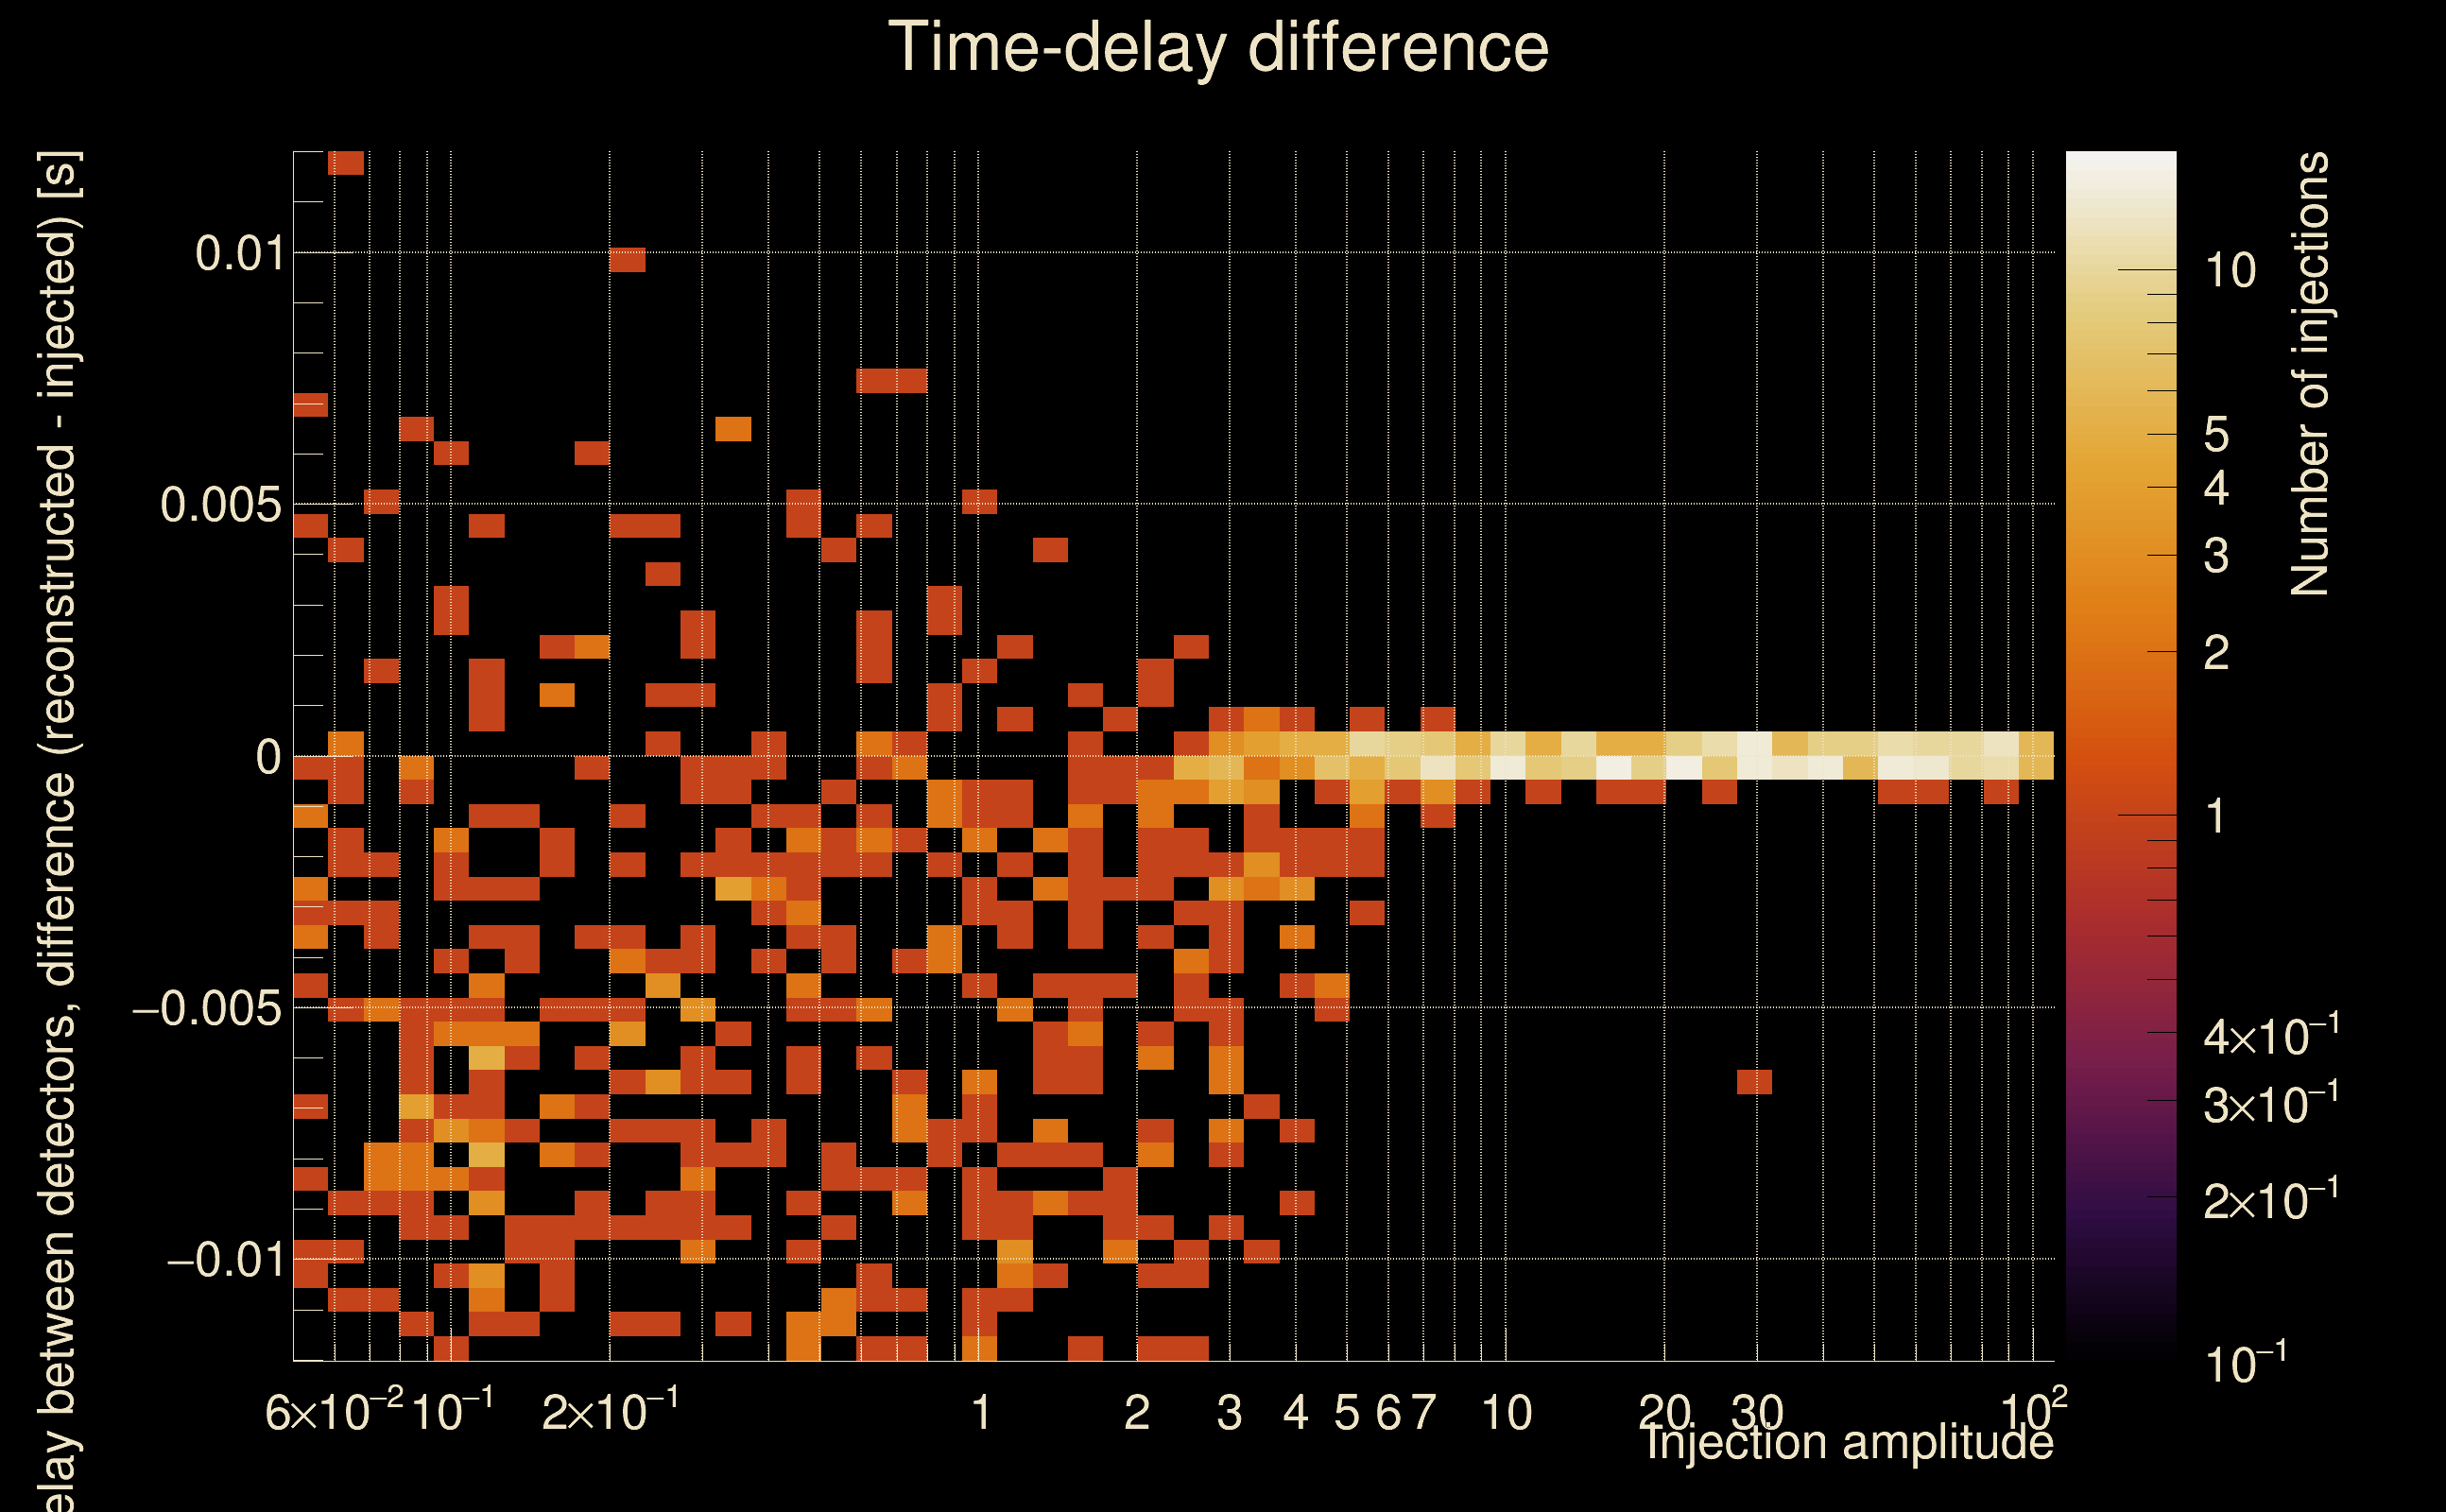
| Number of injections (total/valid/detected): | 1162 / 1004 / 305 |
| List of missed injections: | ./Rad19-s25_missed.txt |
| Injection amplitude at 90% detection efficiency: | 4.54917 |
| Injection amplitude at 50% detection efficiency: | 3.00417 |
| Injection amplitude at 10% detection efficiency: | 1.87797 |
 |
 |
 |
 |
 |
 |
 |
|
 |
 |
|
 |
 |
|
 |
 |
|
 |
 |
|
 |
 |
|
 |
 |
|
 |
 |
|
 |
 |
 |
 |
 |
 |
 |
 |
 |
 |
 |
 |
 |
 |
 |
| florent.robinet@ijclab.in2p3.fr |