| Omicron version: | 4.2.0: documentation gitlab repository |
| Omicron run by: | unknown |
| Report produced on: | Fri Apr 3 09:20:31 2026 UTC |
| Ox option file: | TargIxf_feb2026_SN7_30s_options.txt |
| Omicron option files: | detector 0, detector 1 |
| Detector channel names: | H1:GDS-CALIB_STRAIN_CLEAN_AR_4096Hz, L1:GDS-CALIB_STRAIN_CLEAN_AR_4096Hz |
| Omicron analysis time window and overlap: | 16 s, 6 s |
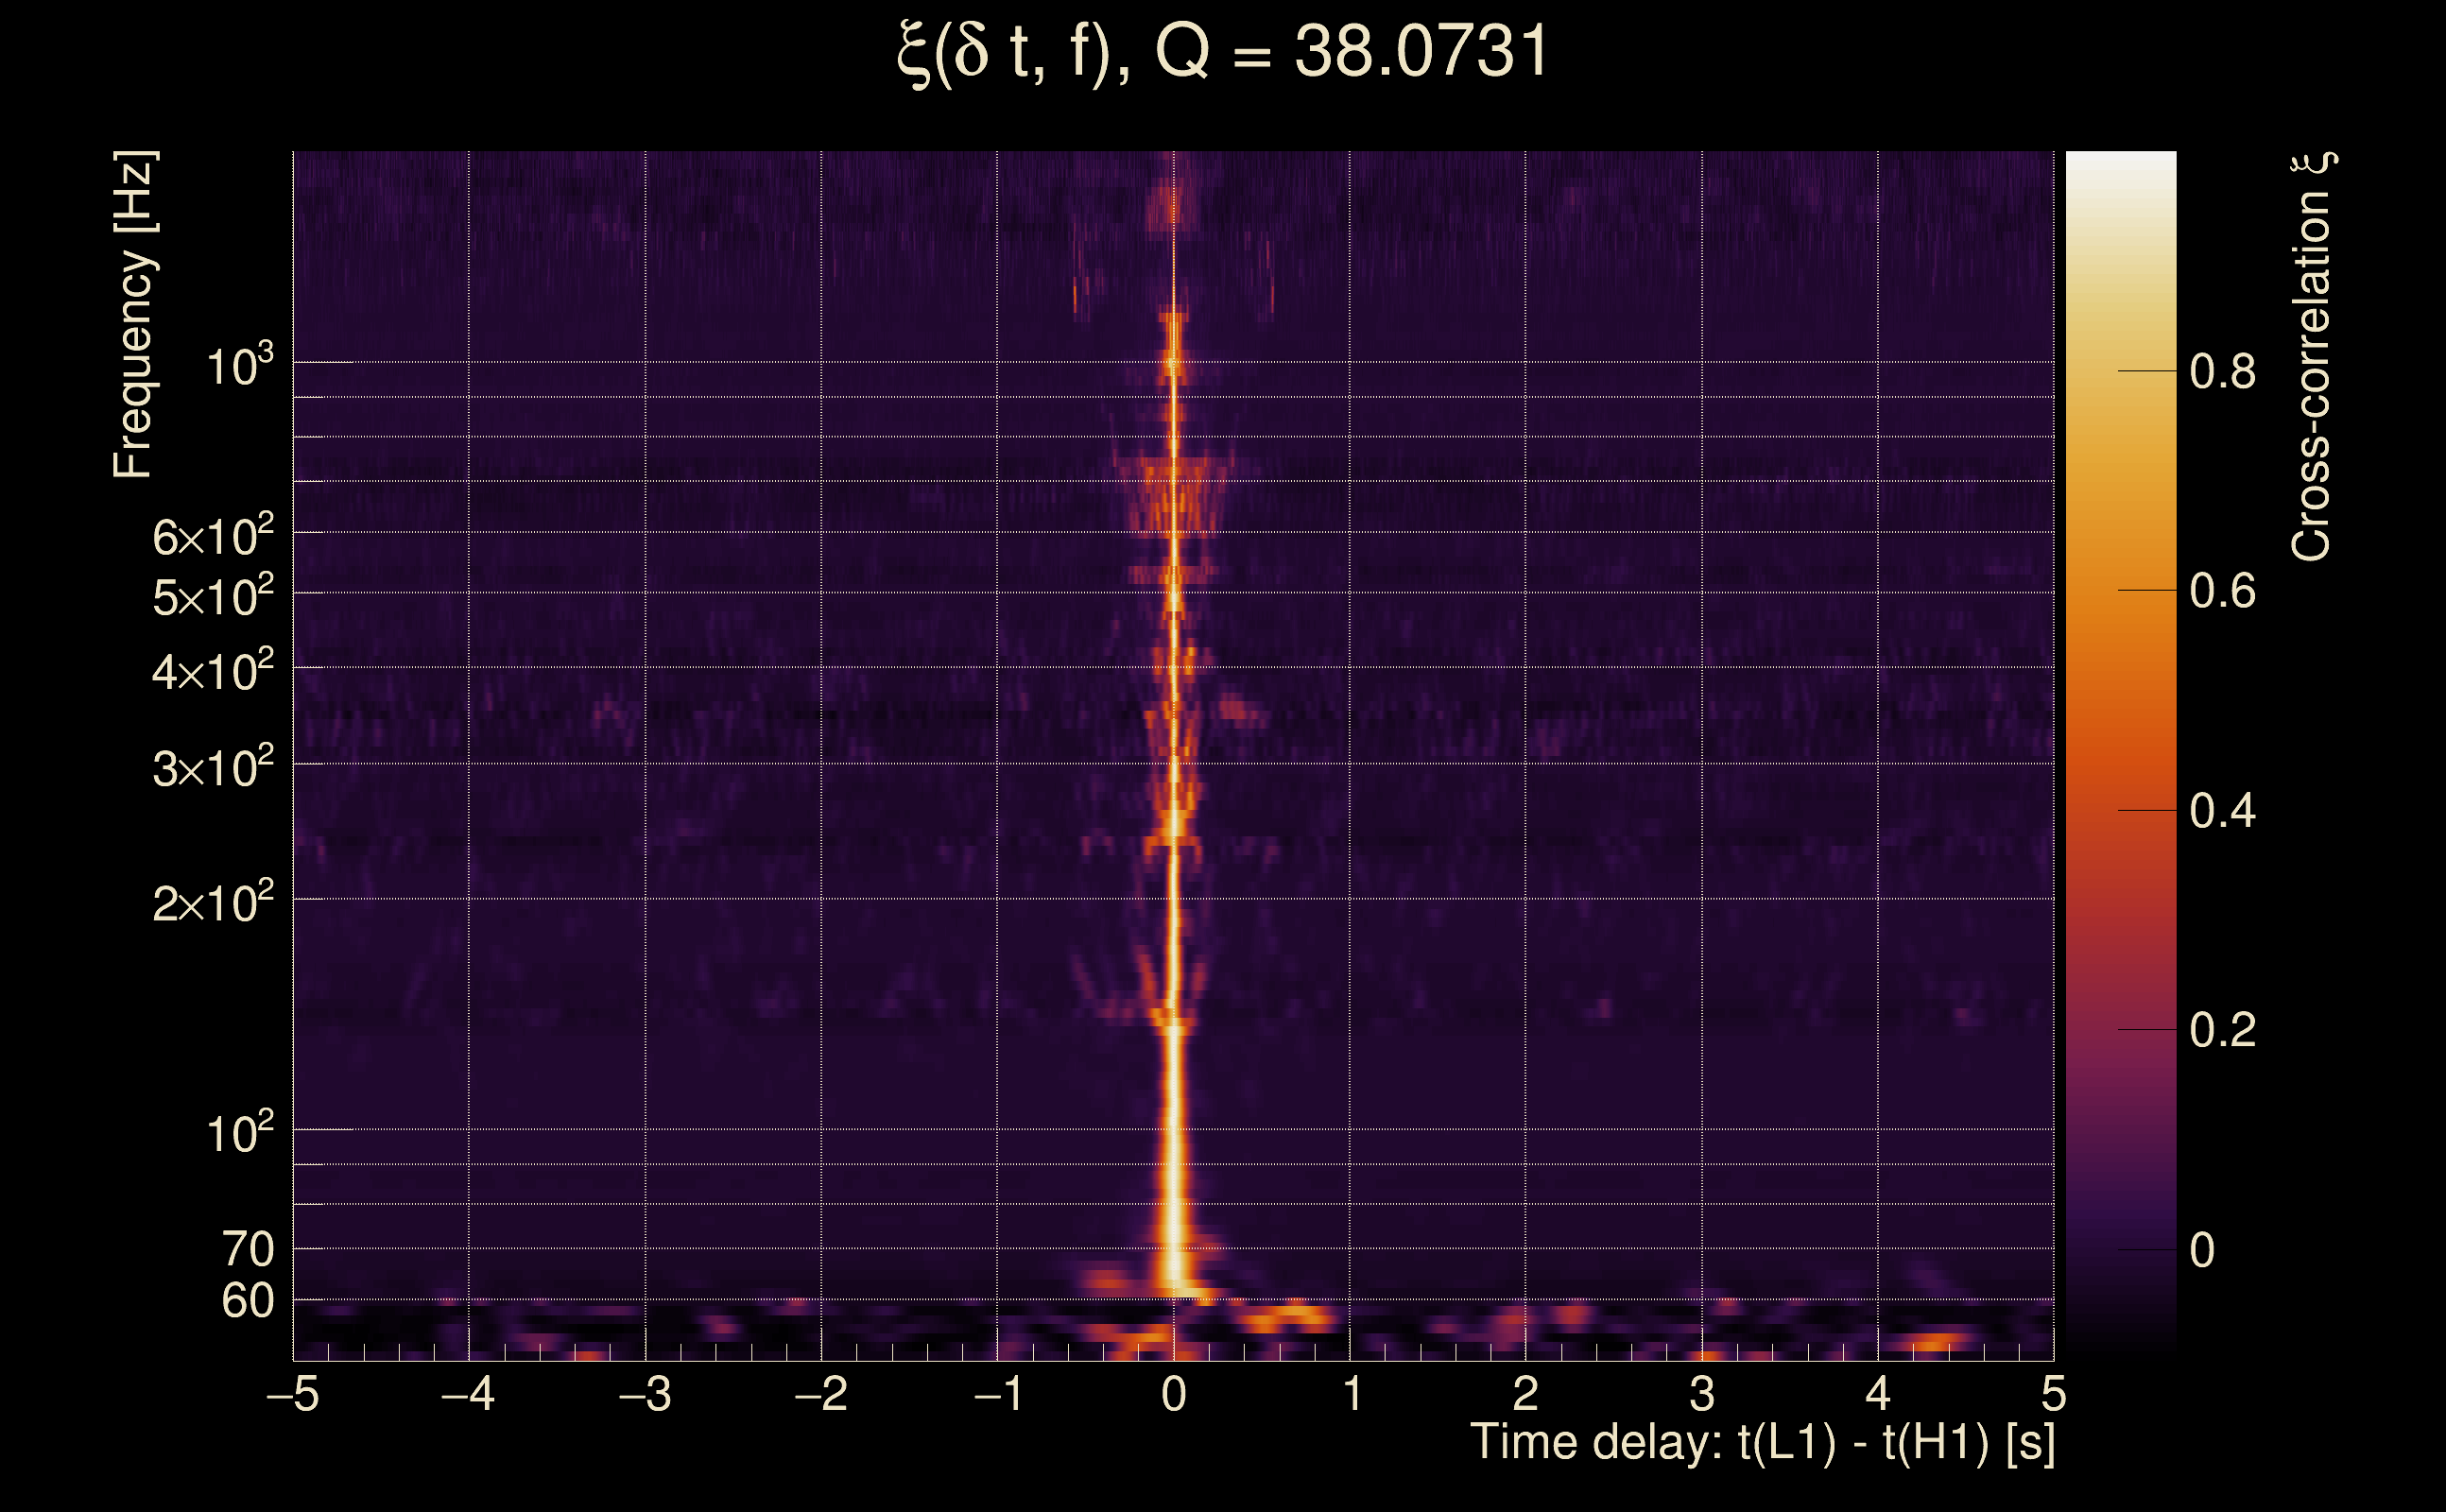
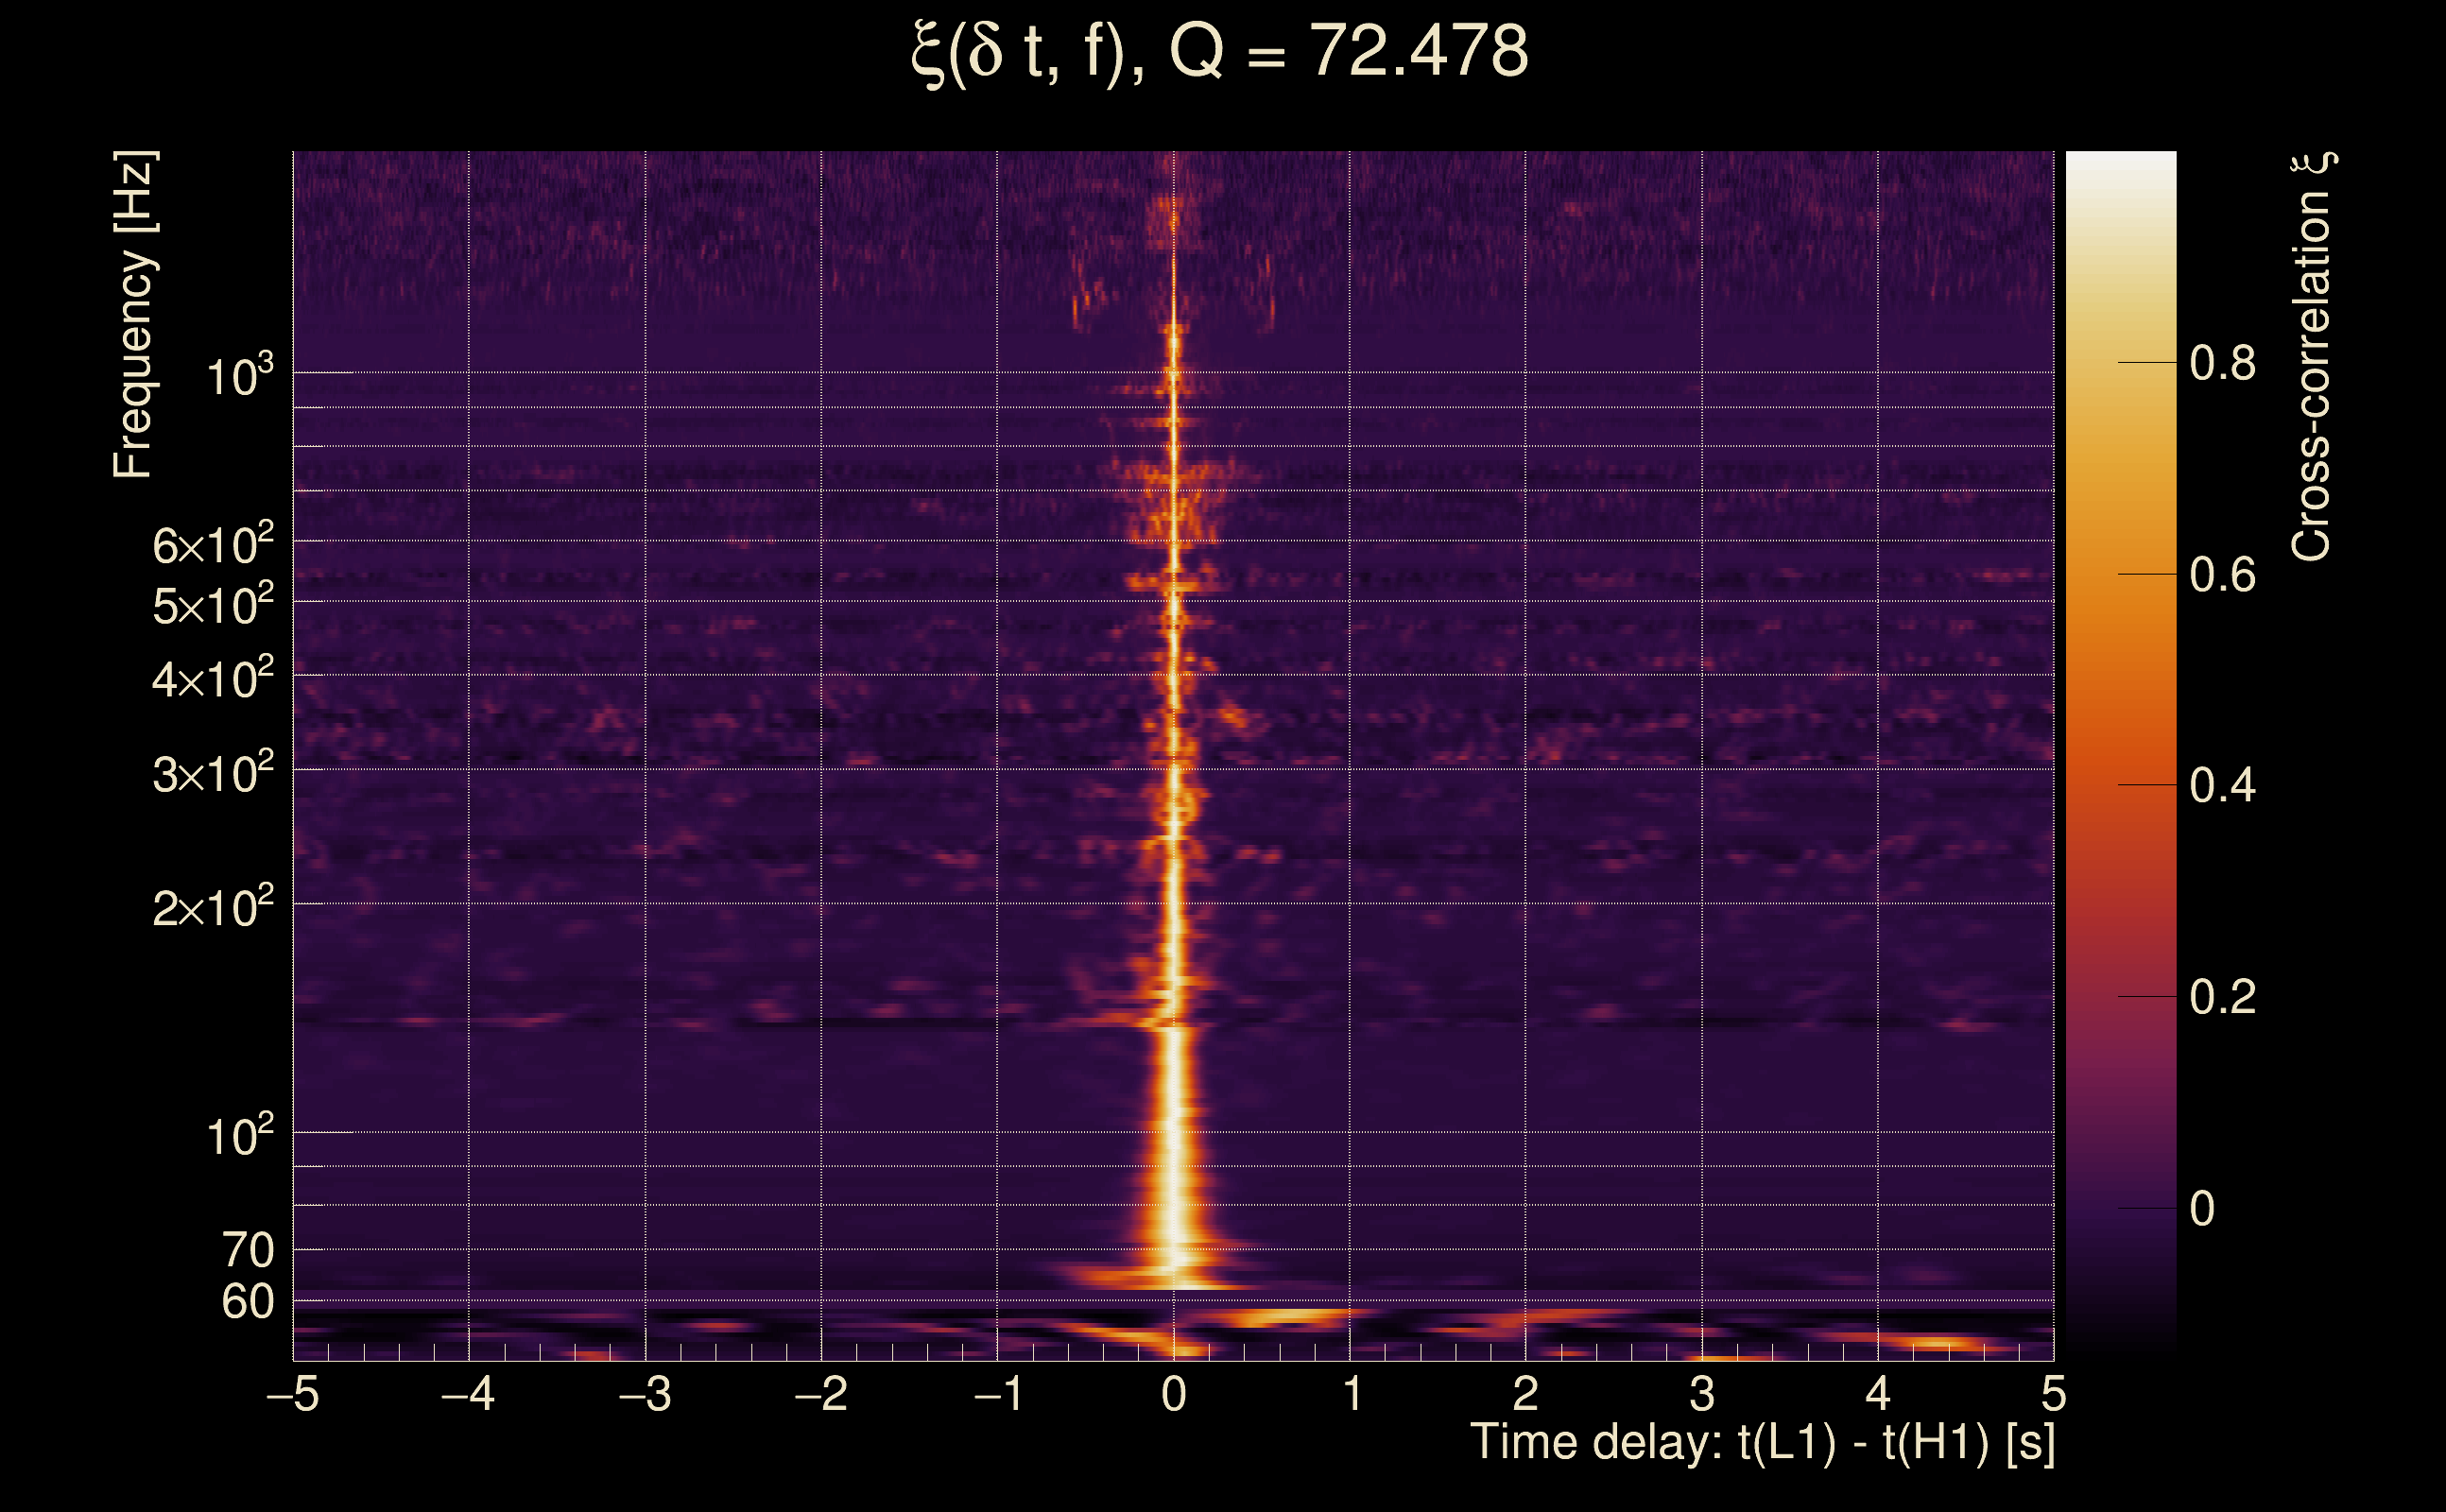
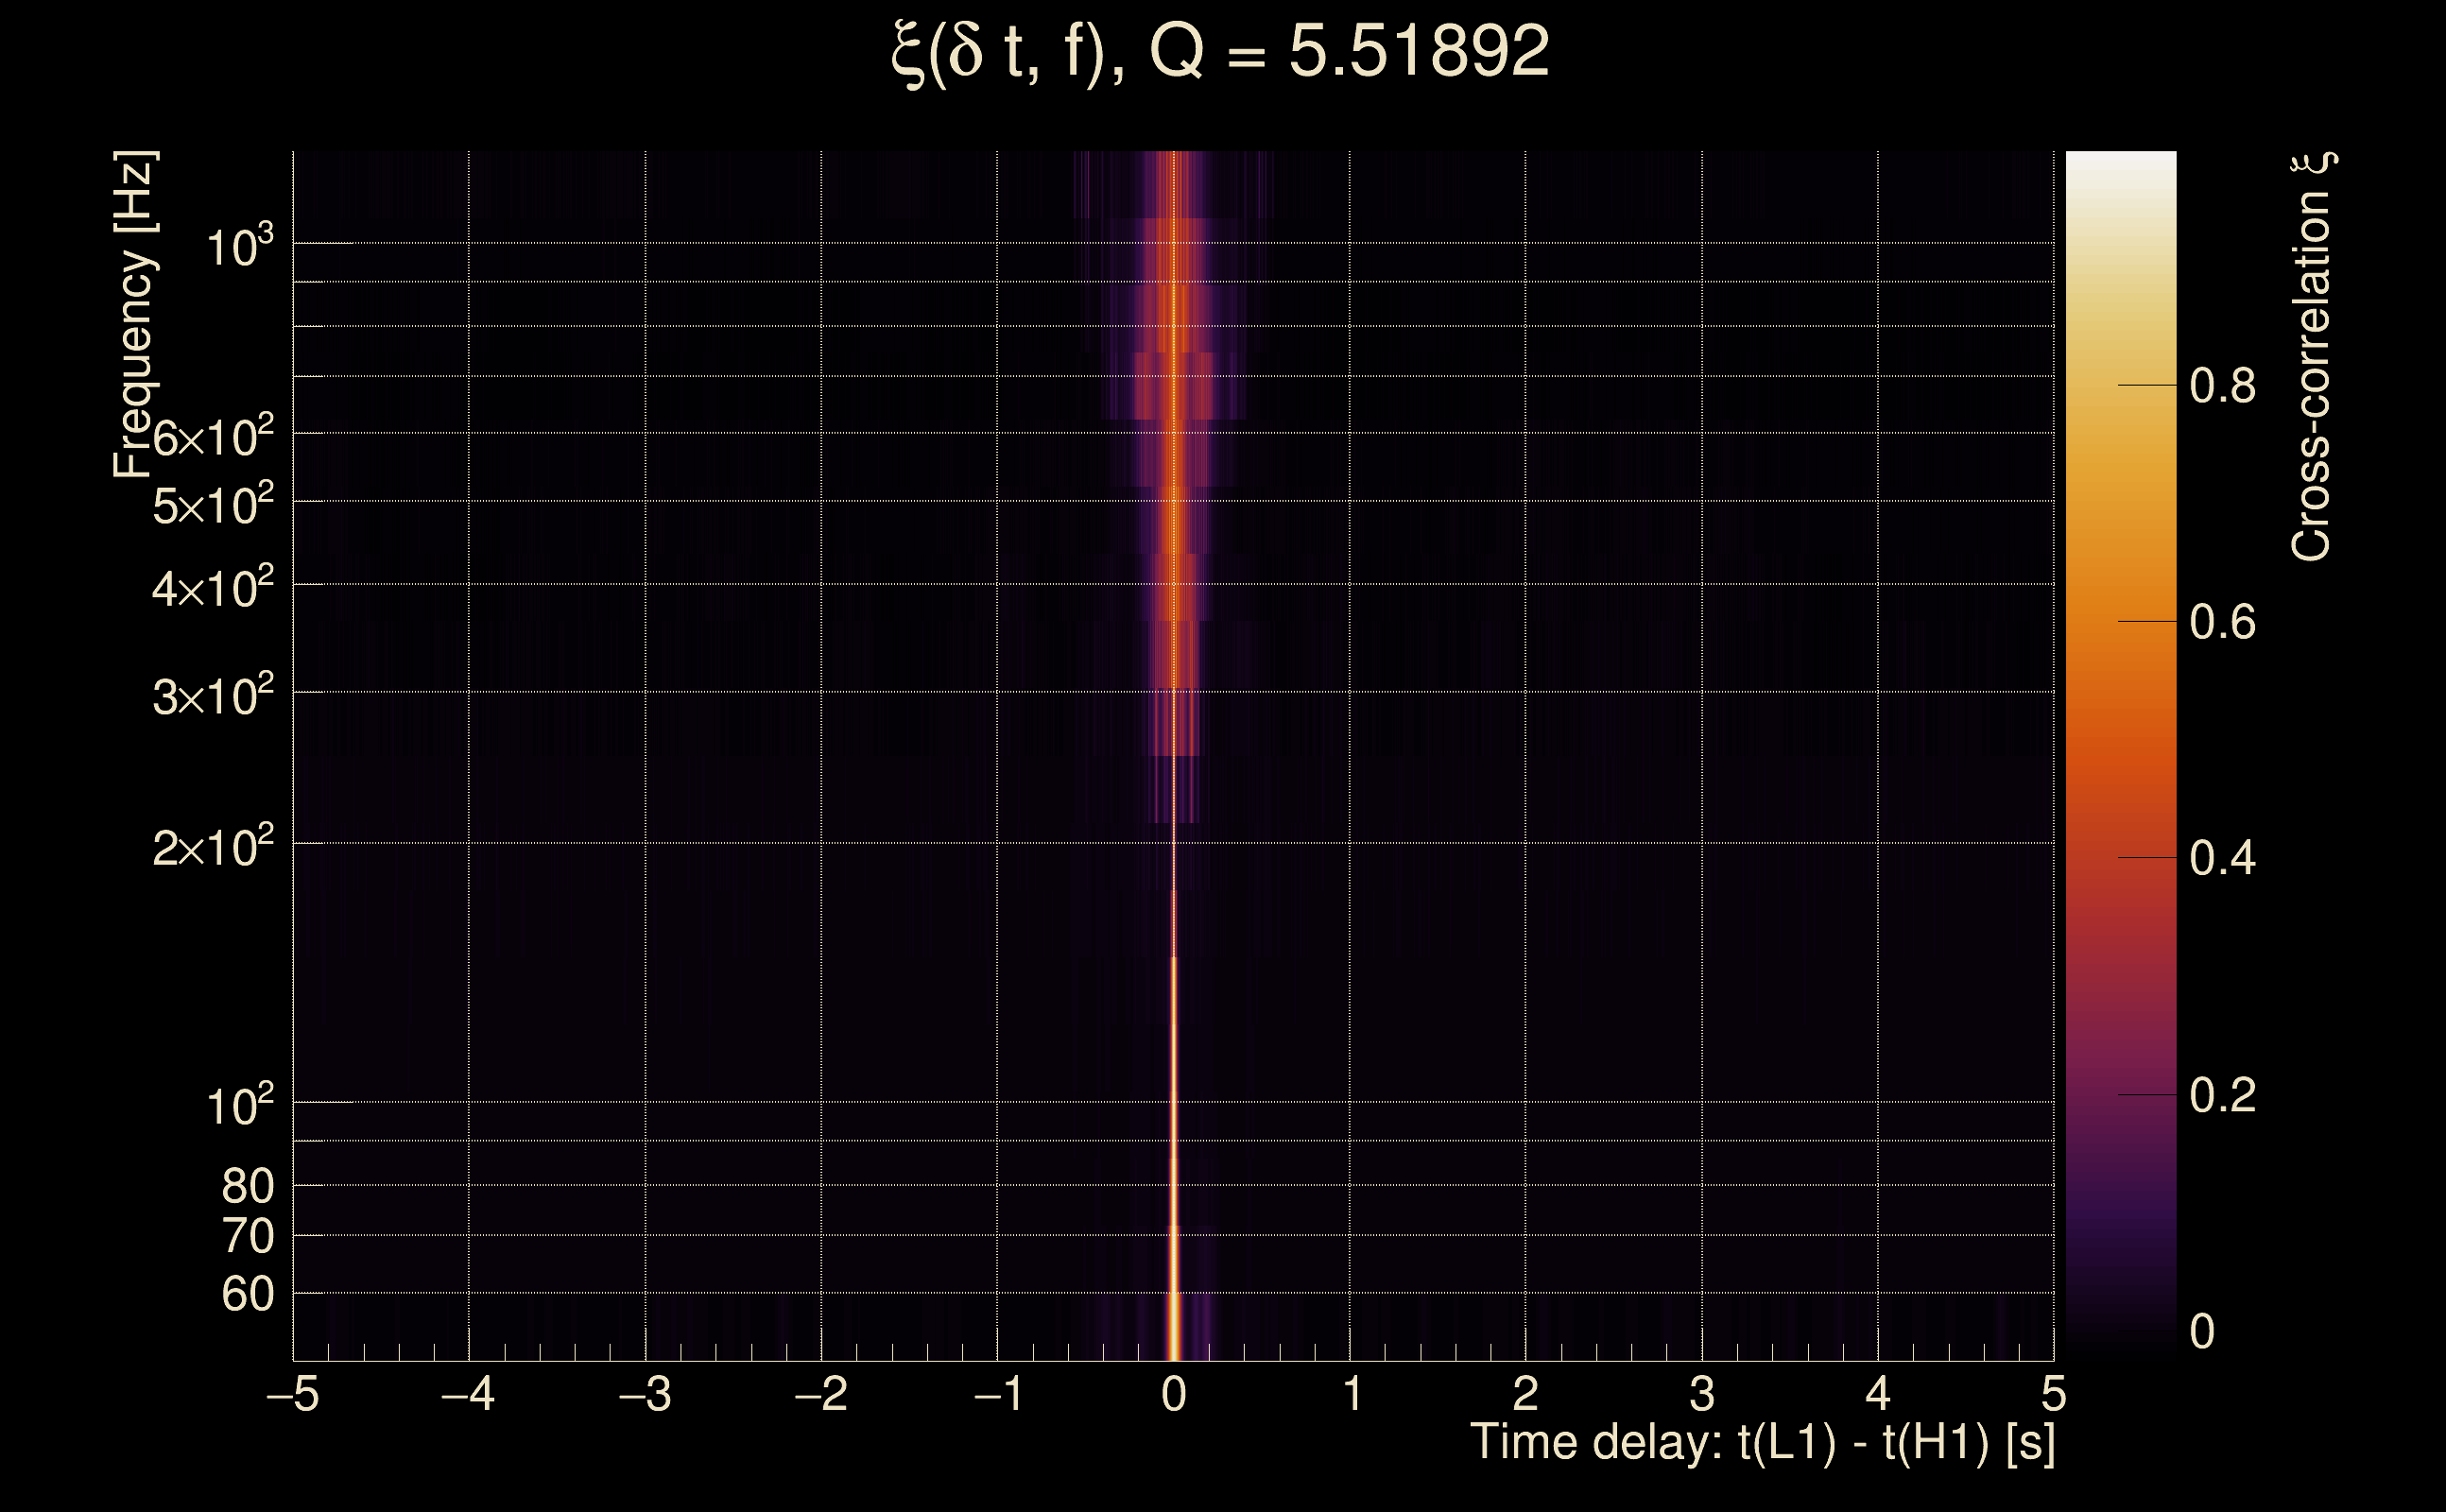
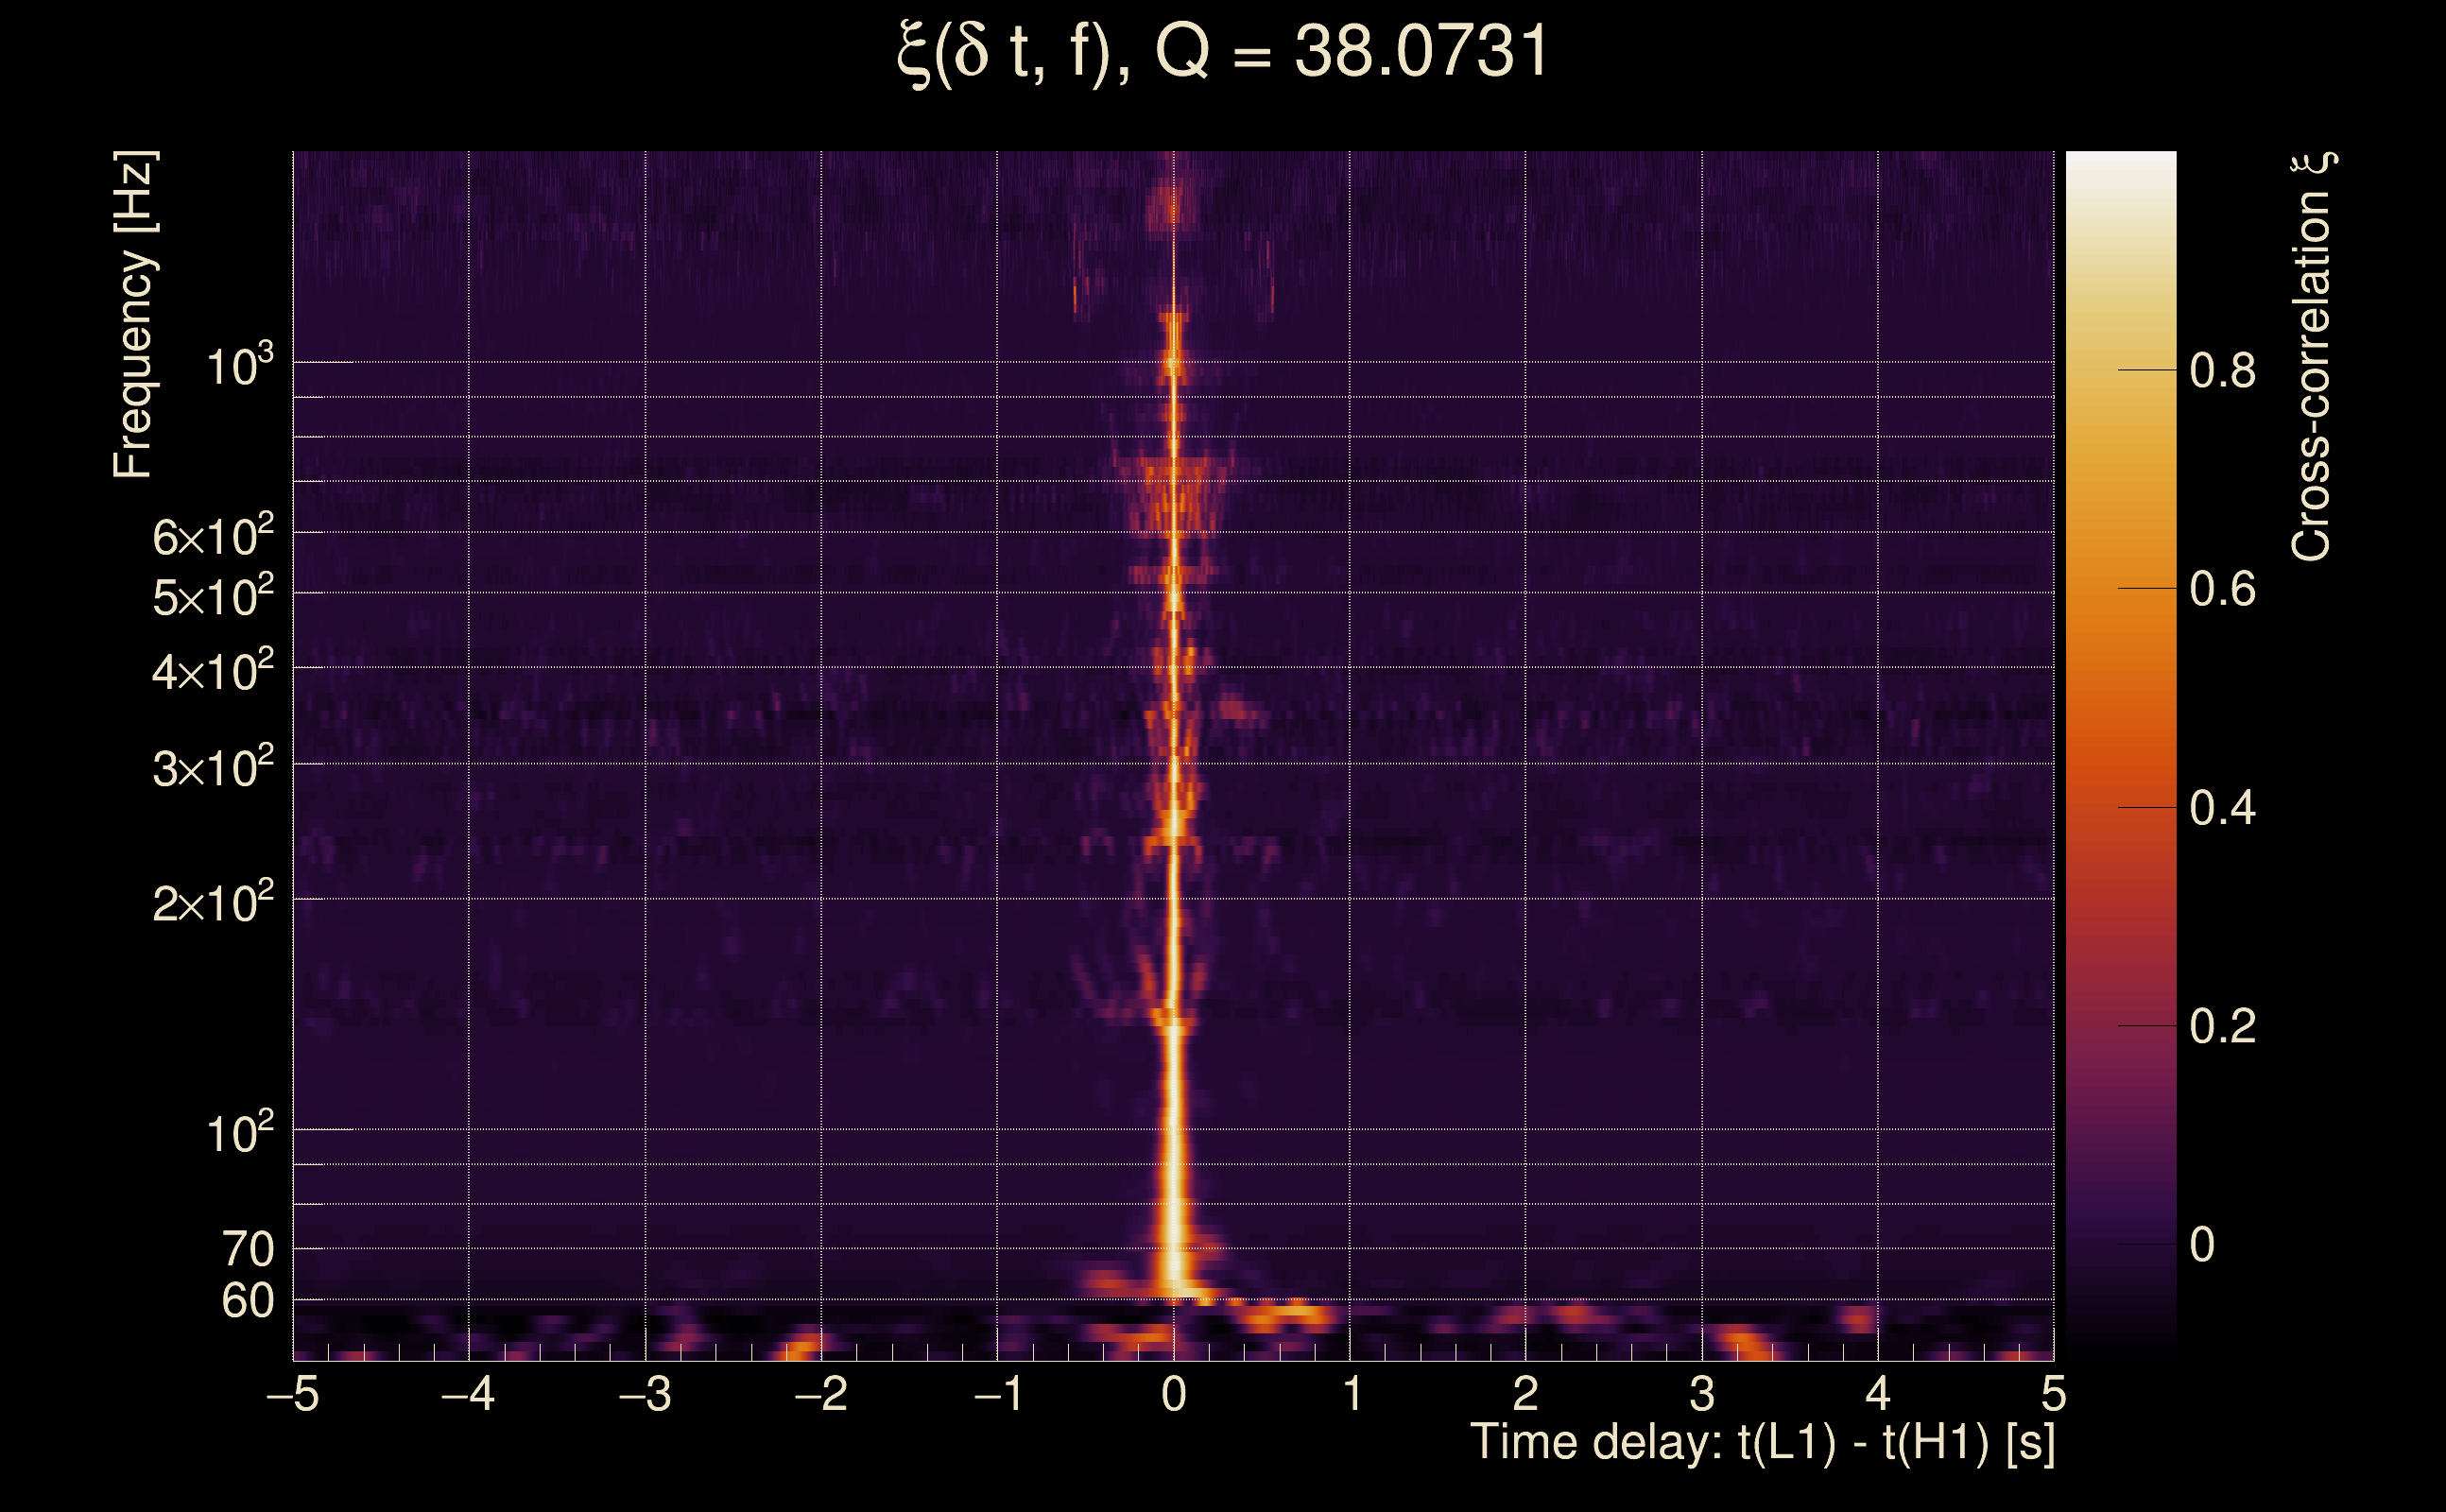
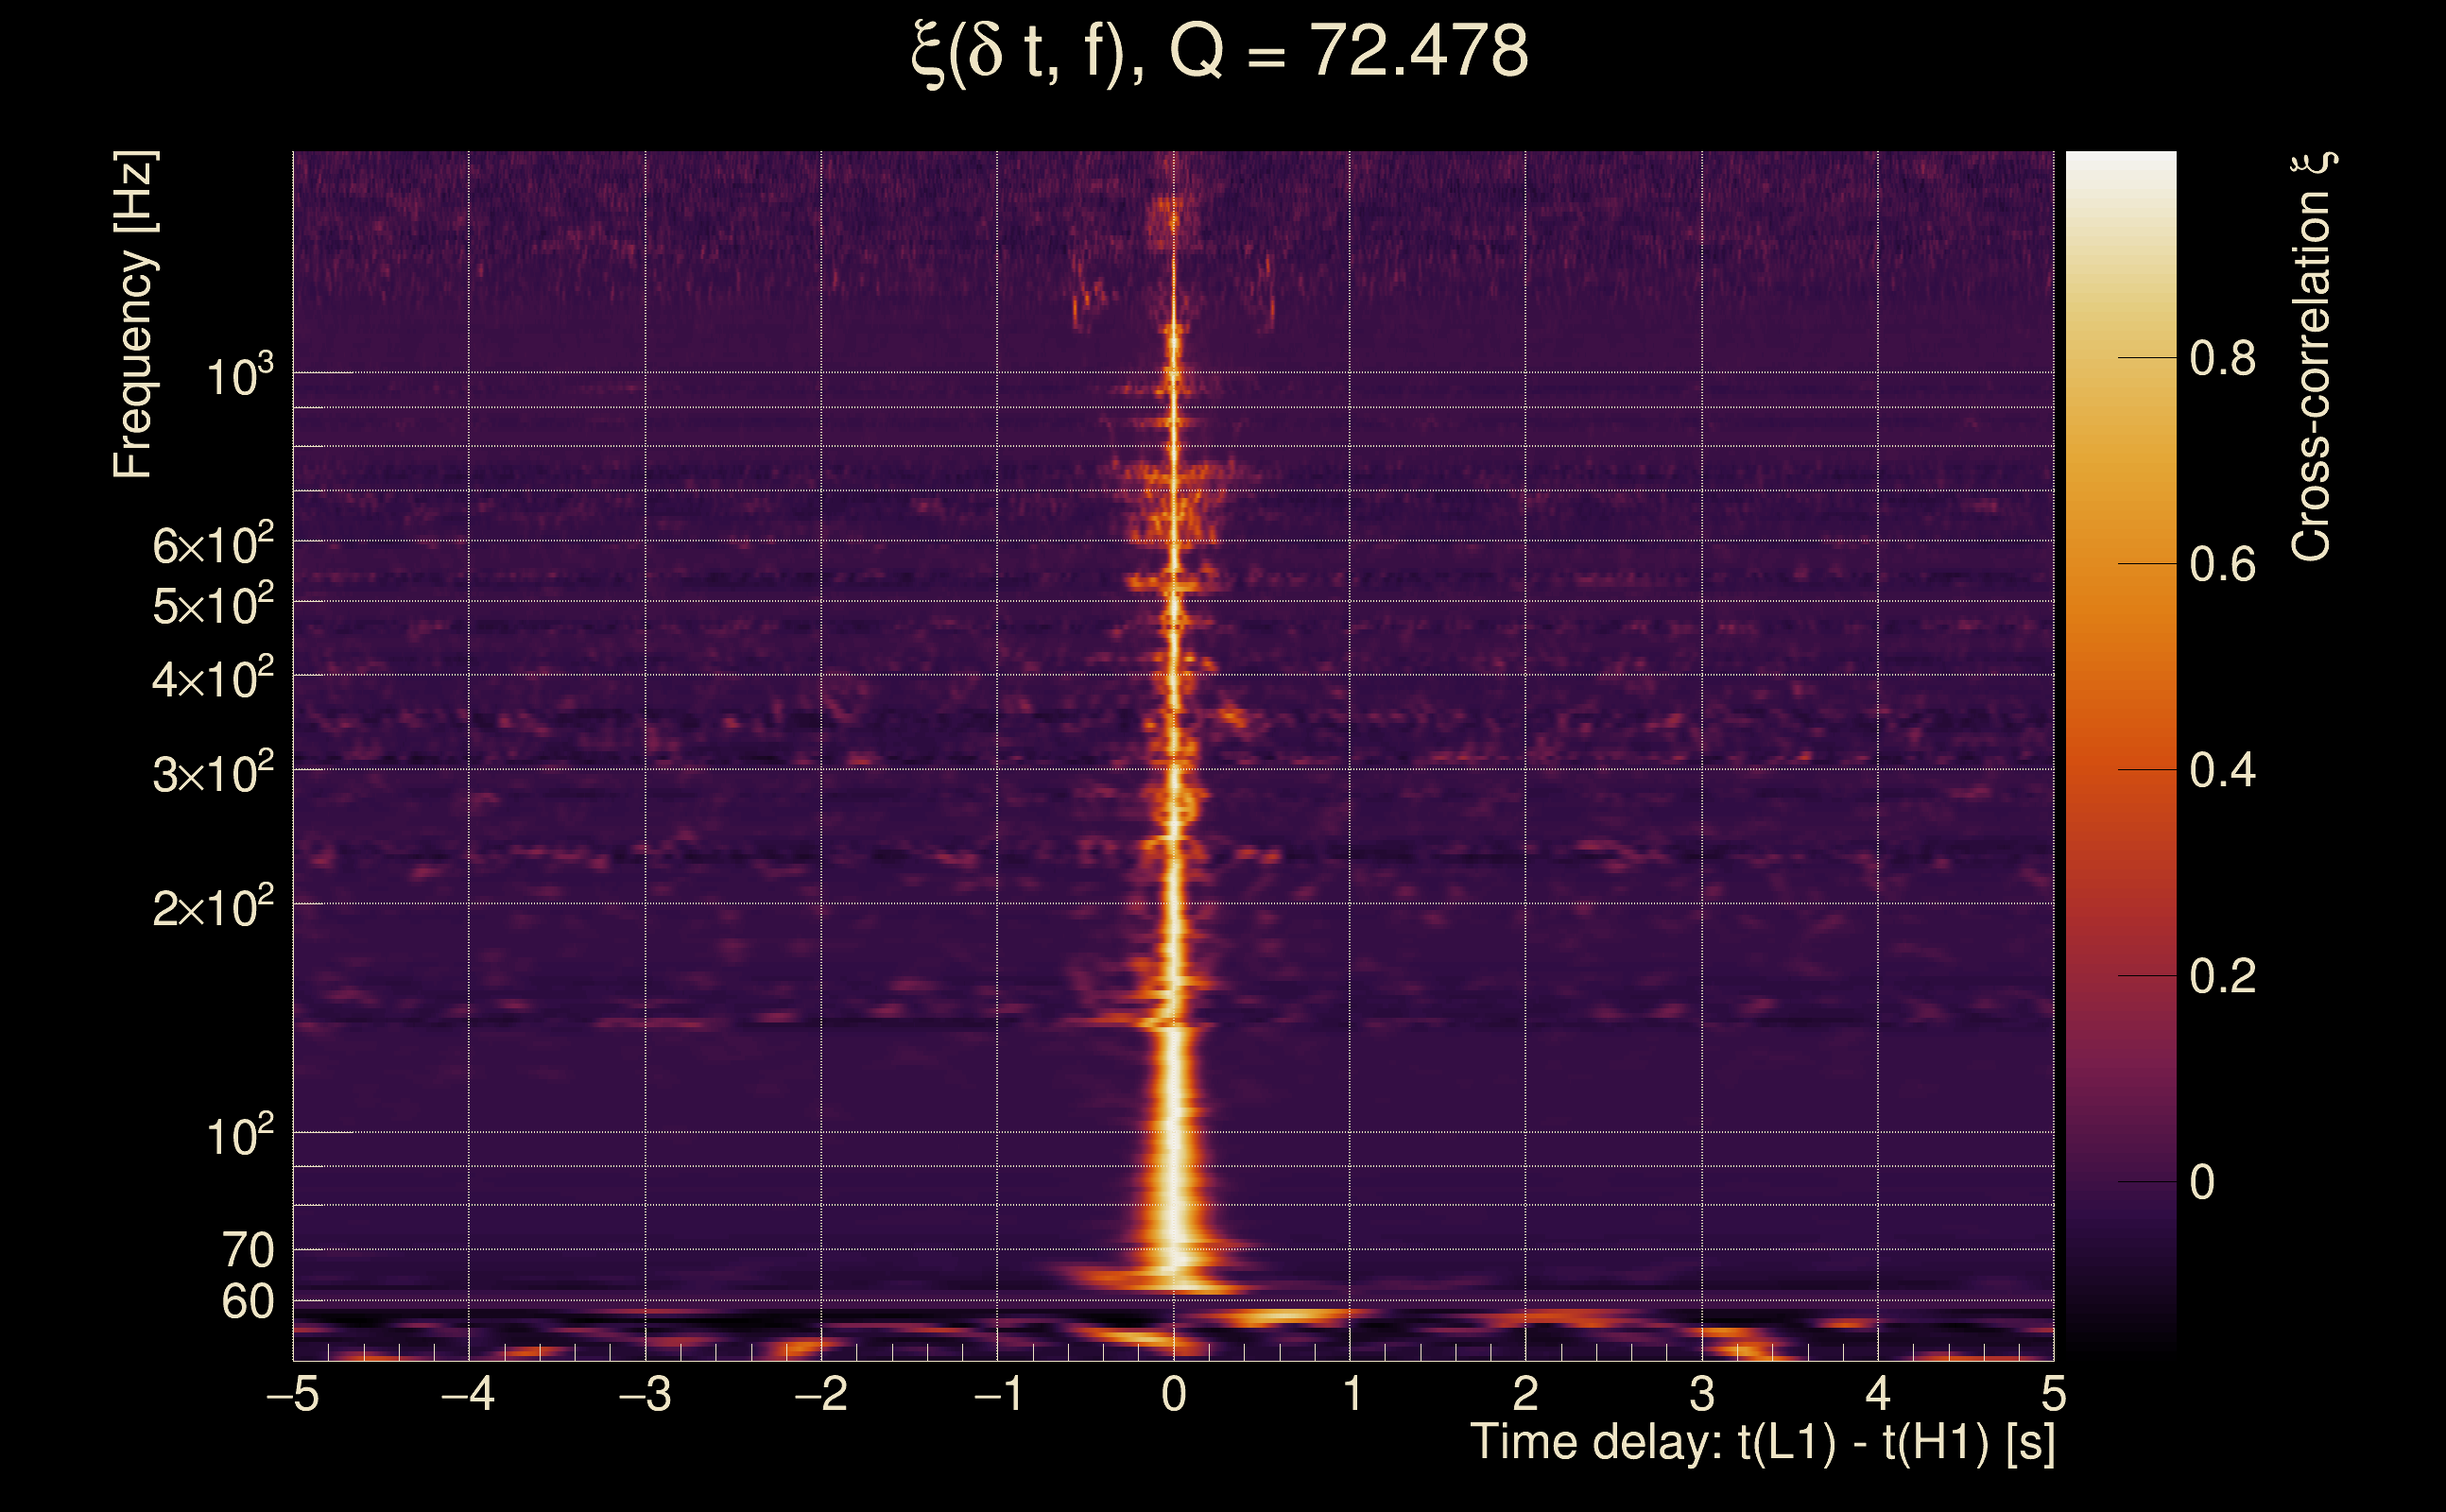
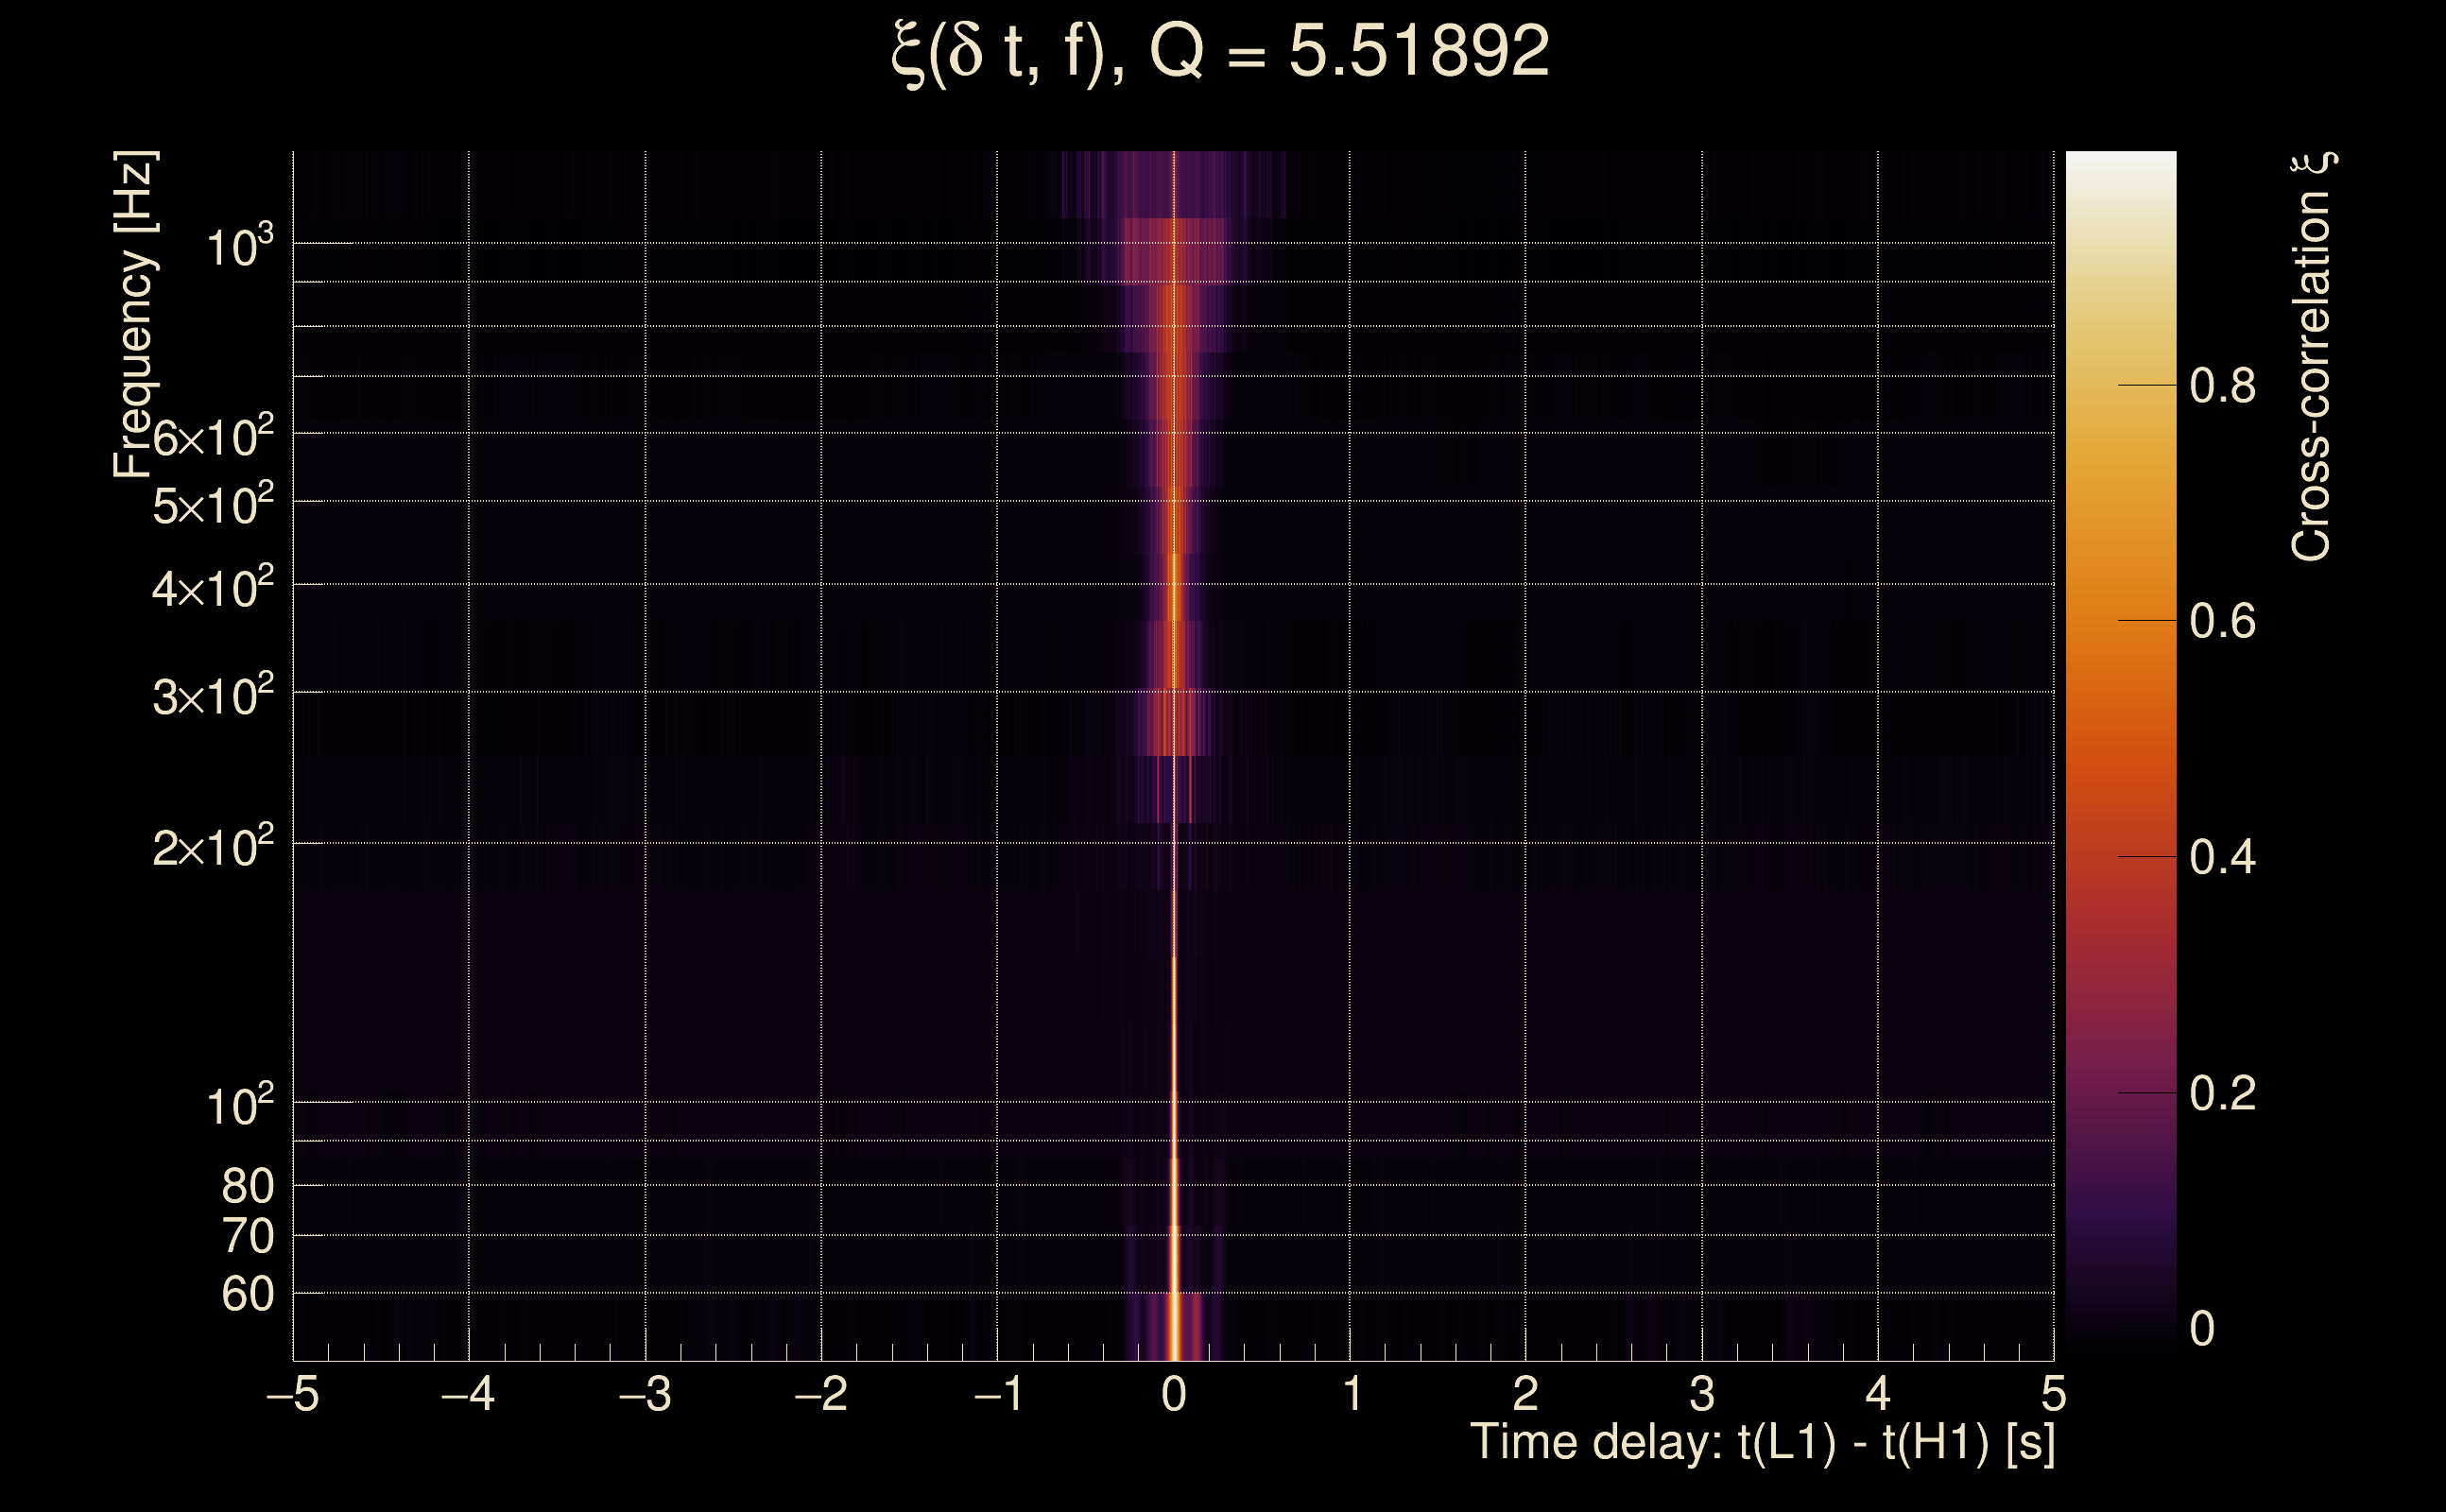
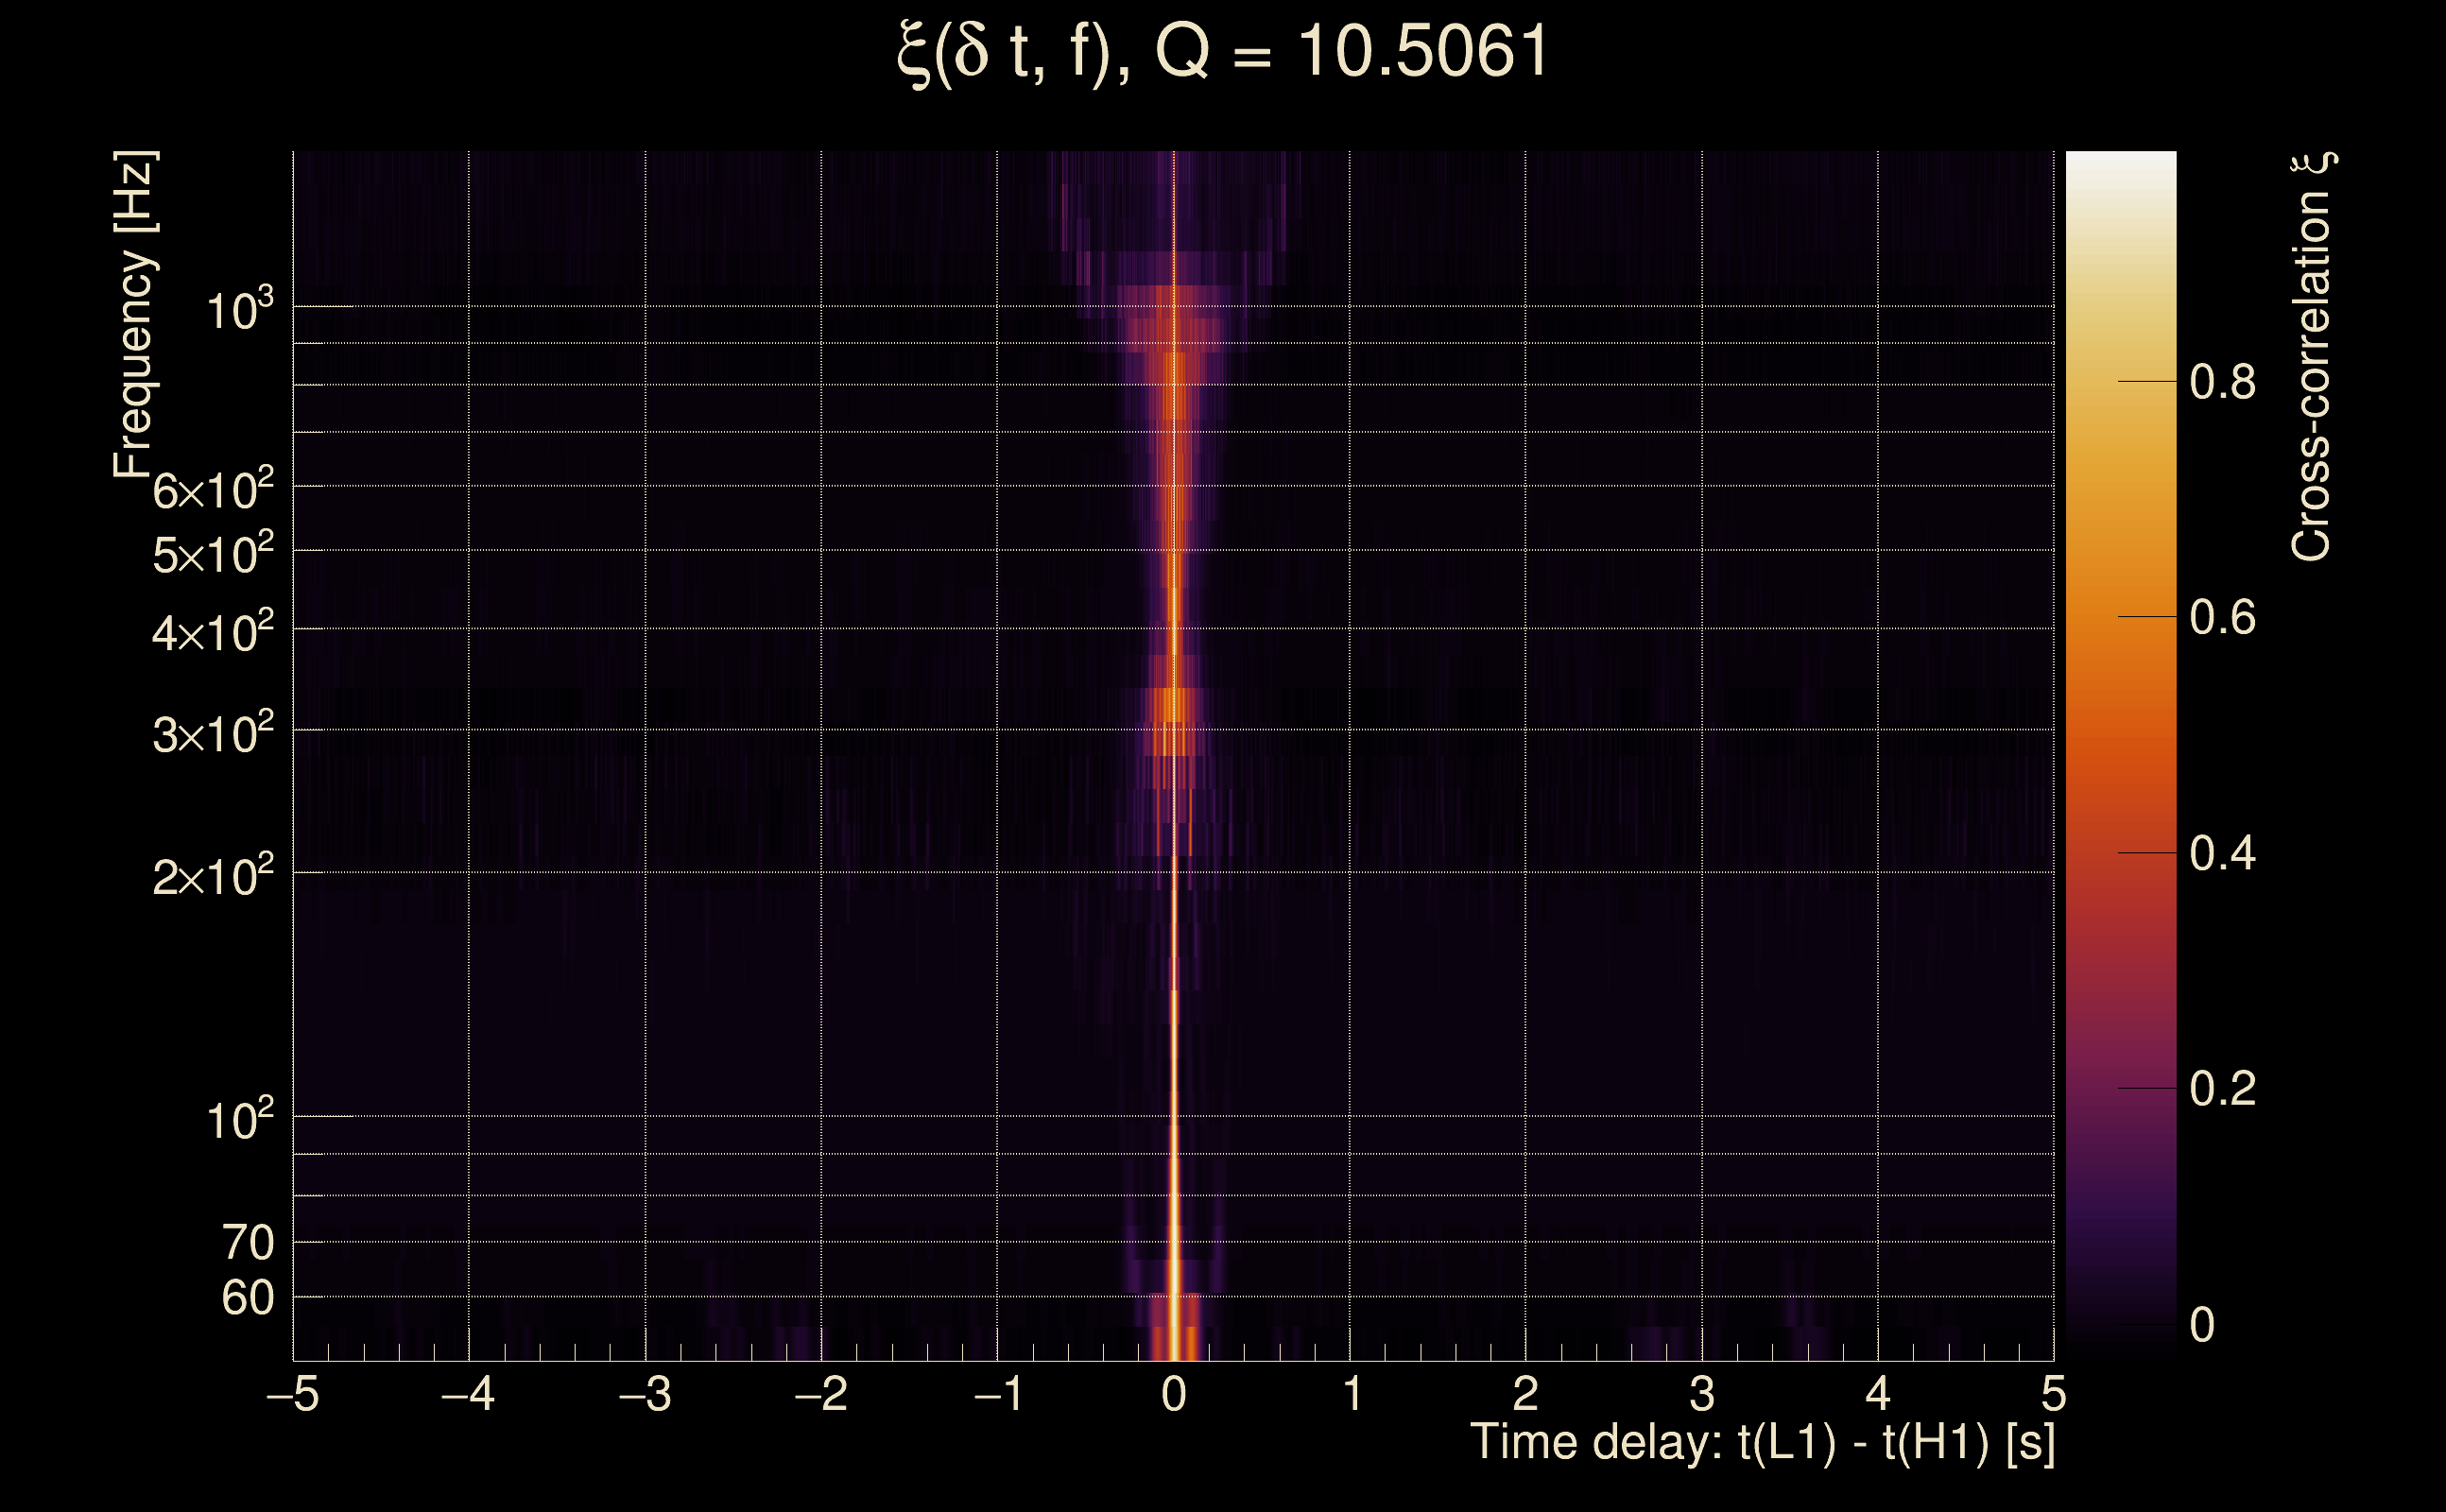
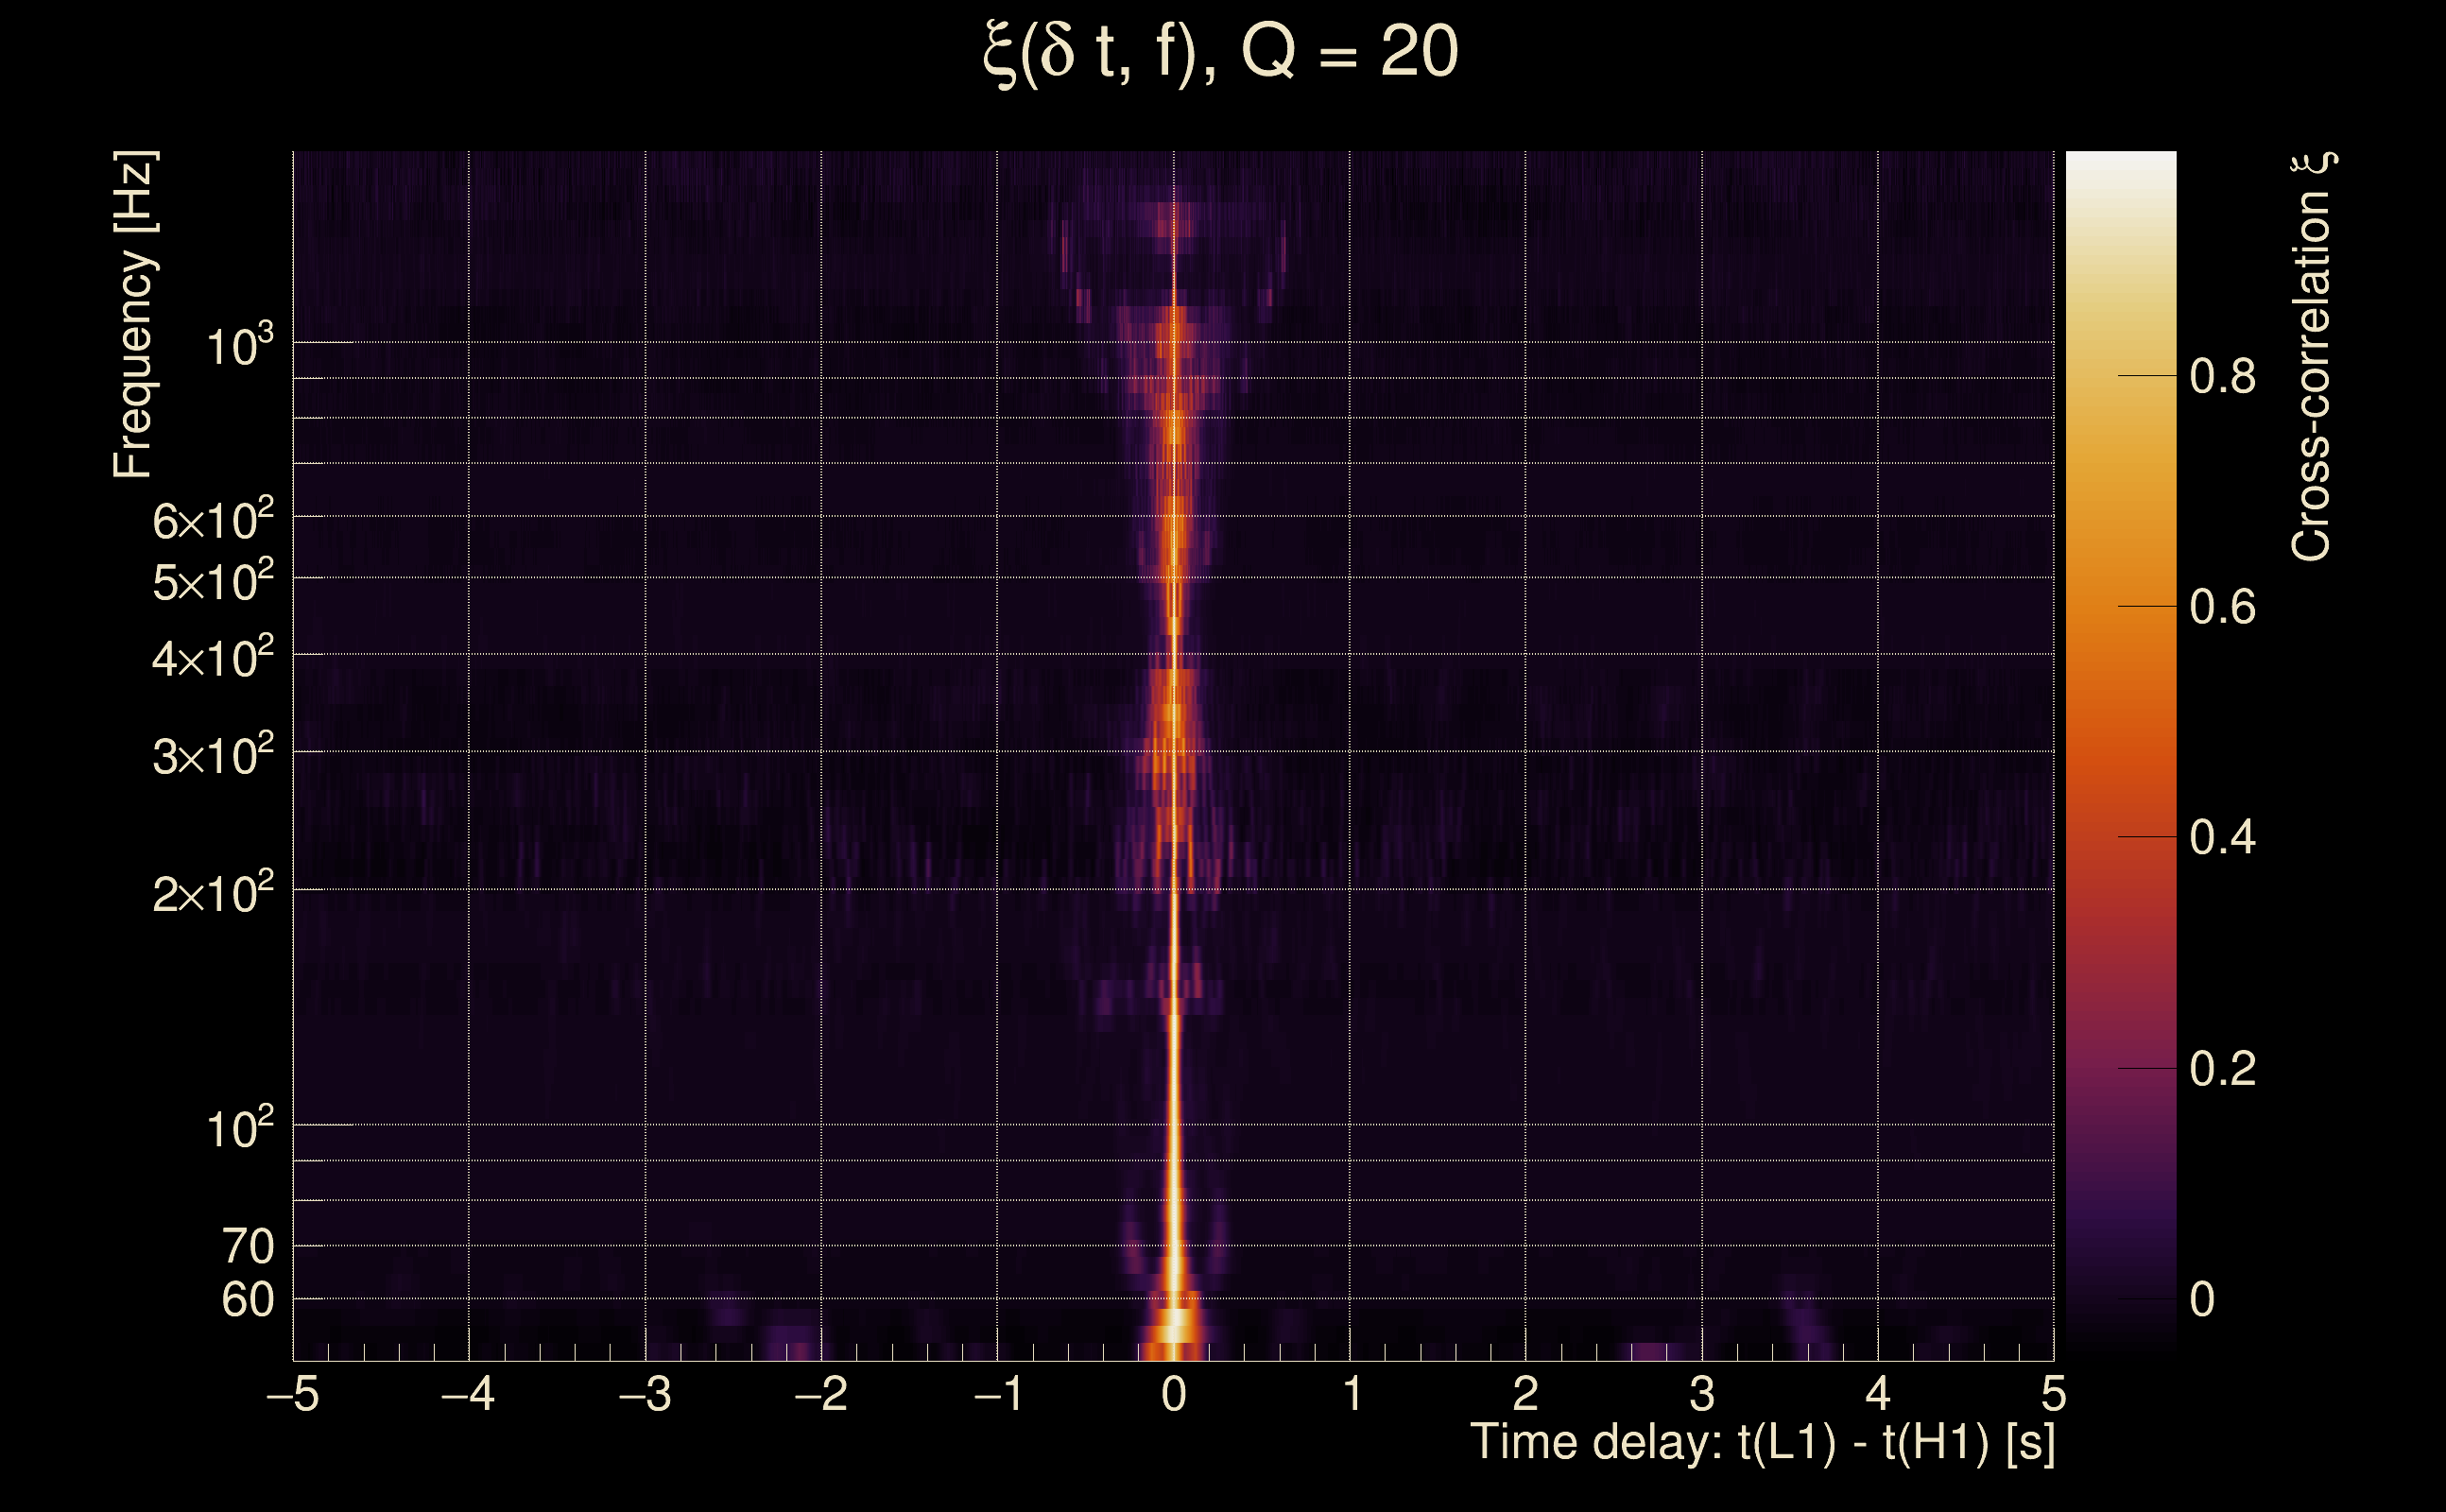
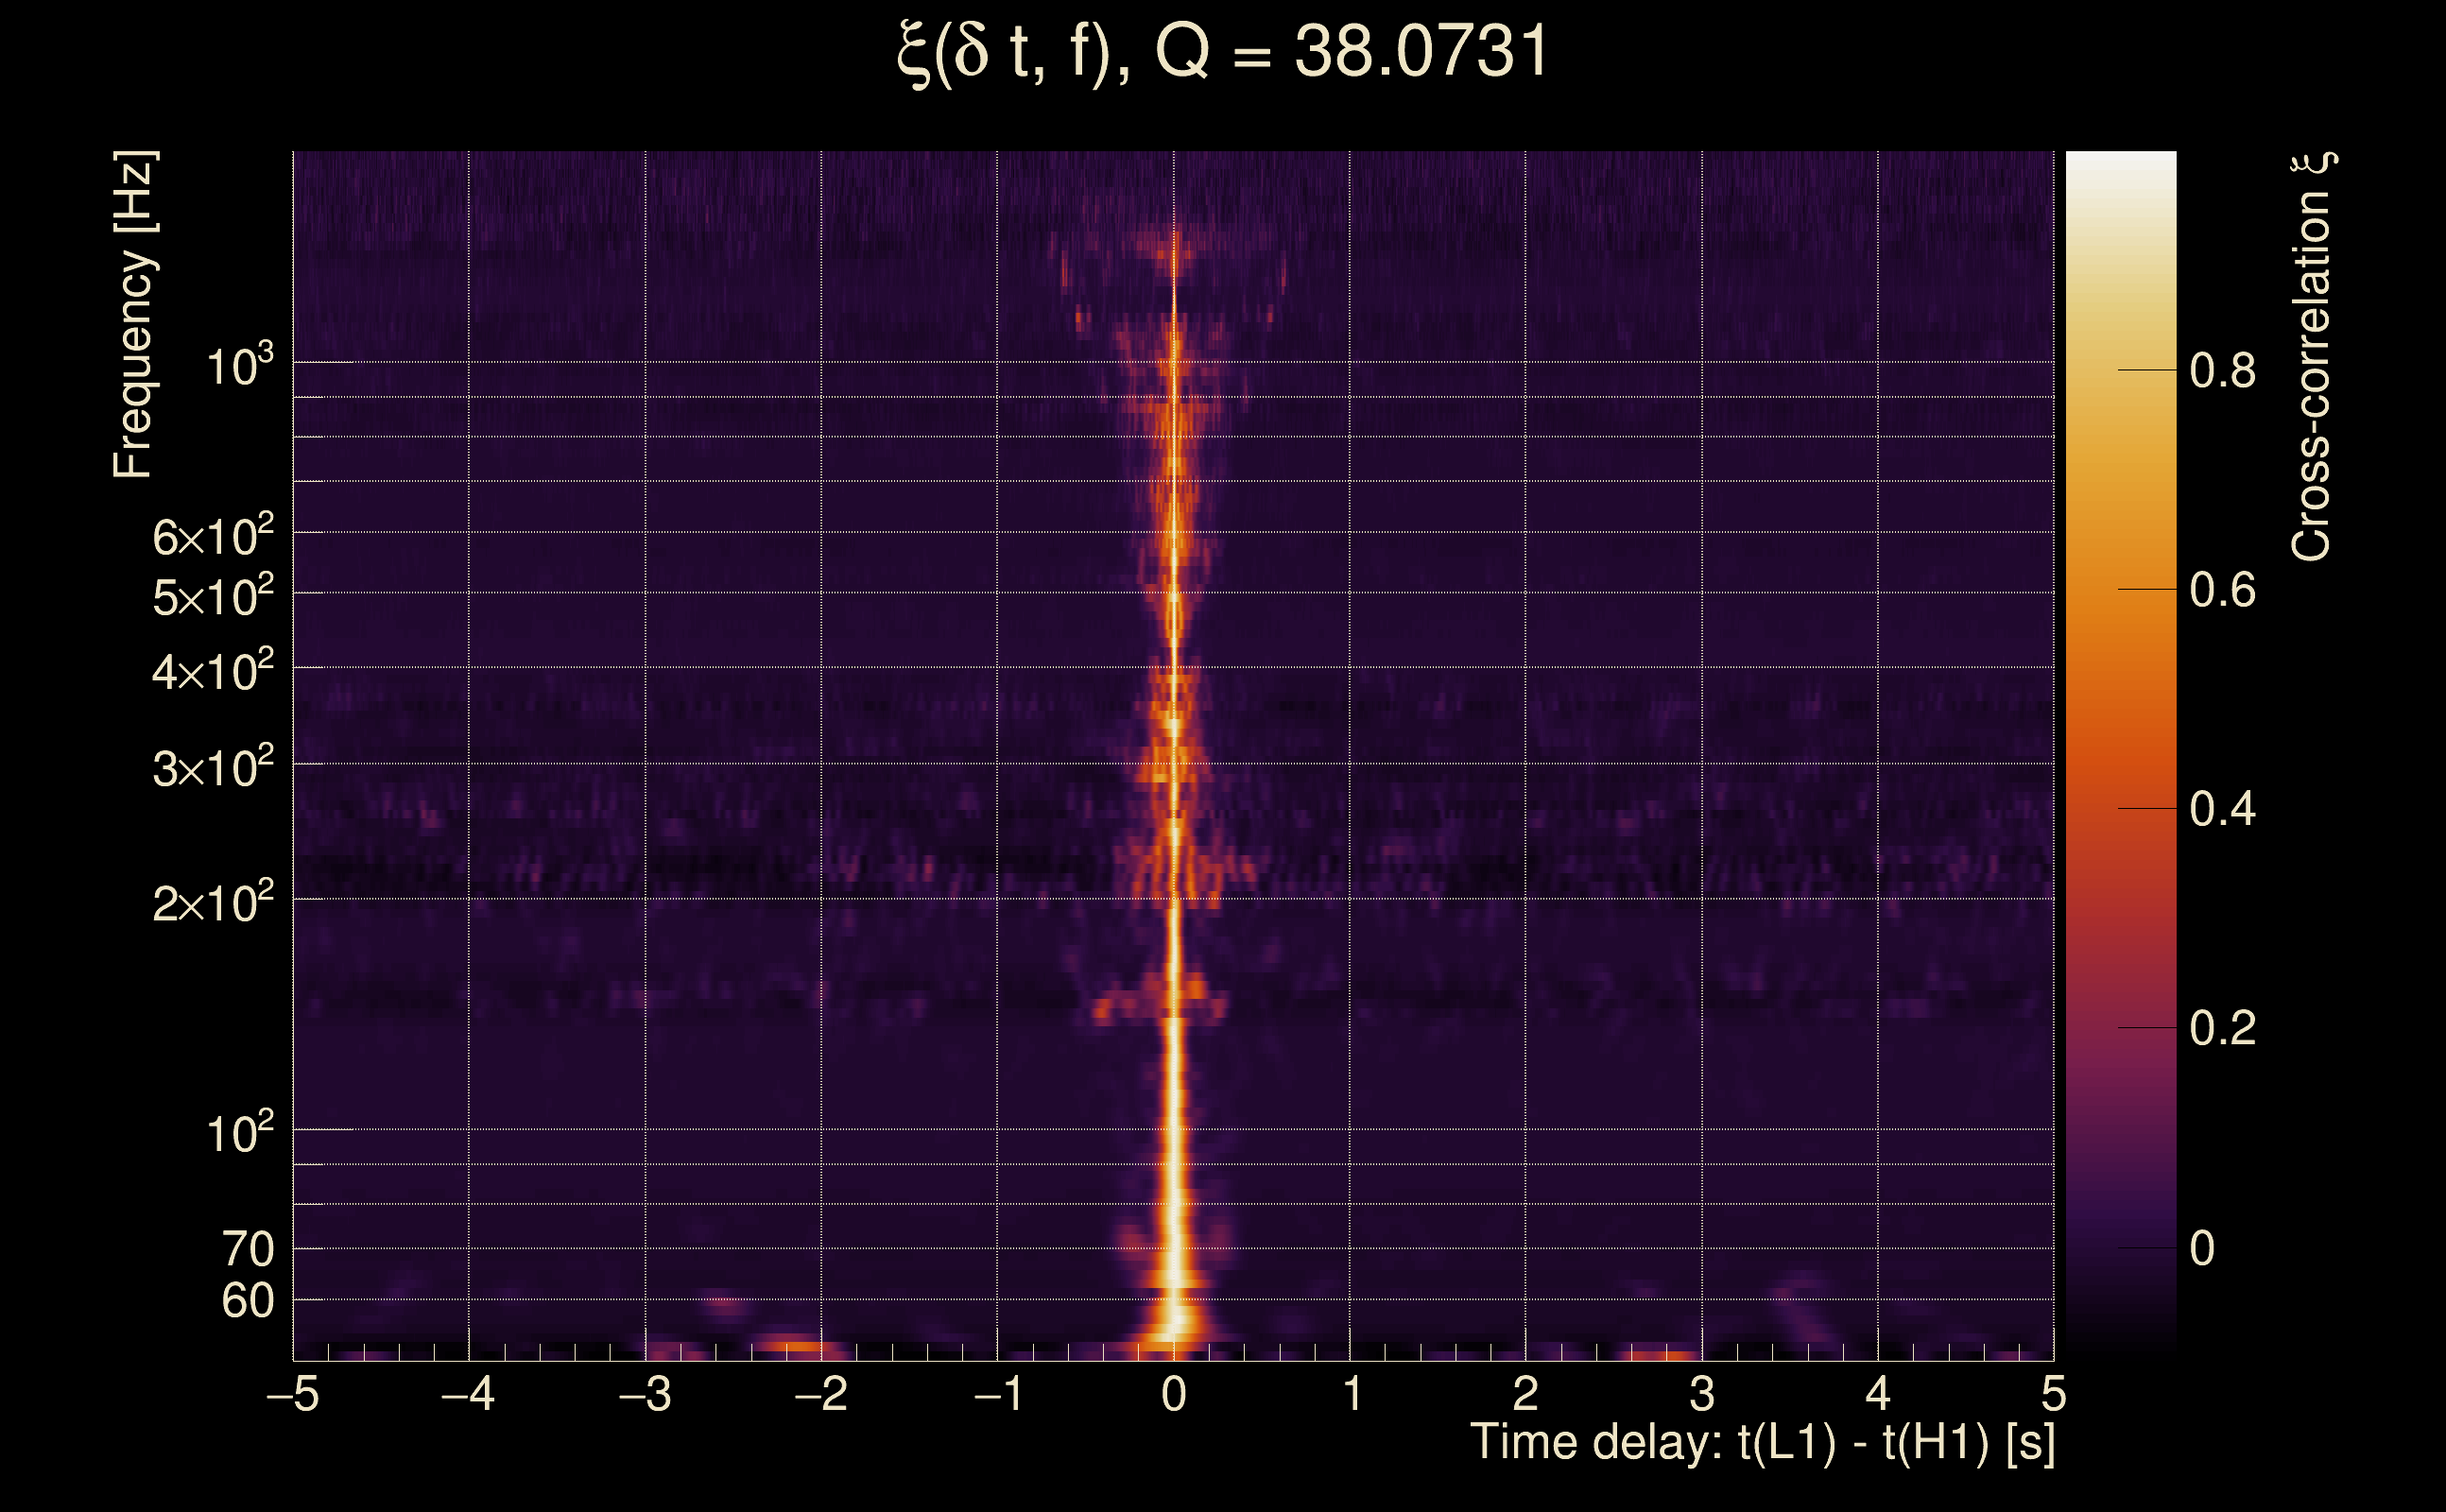
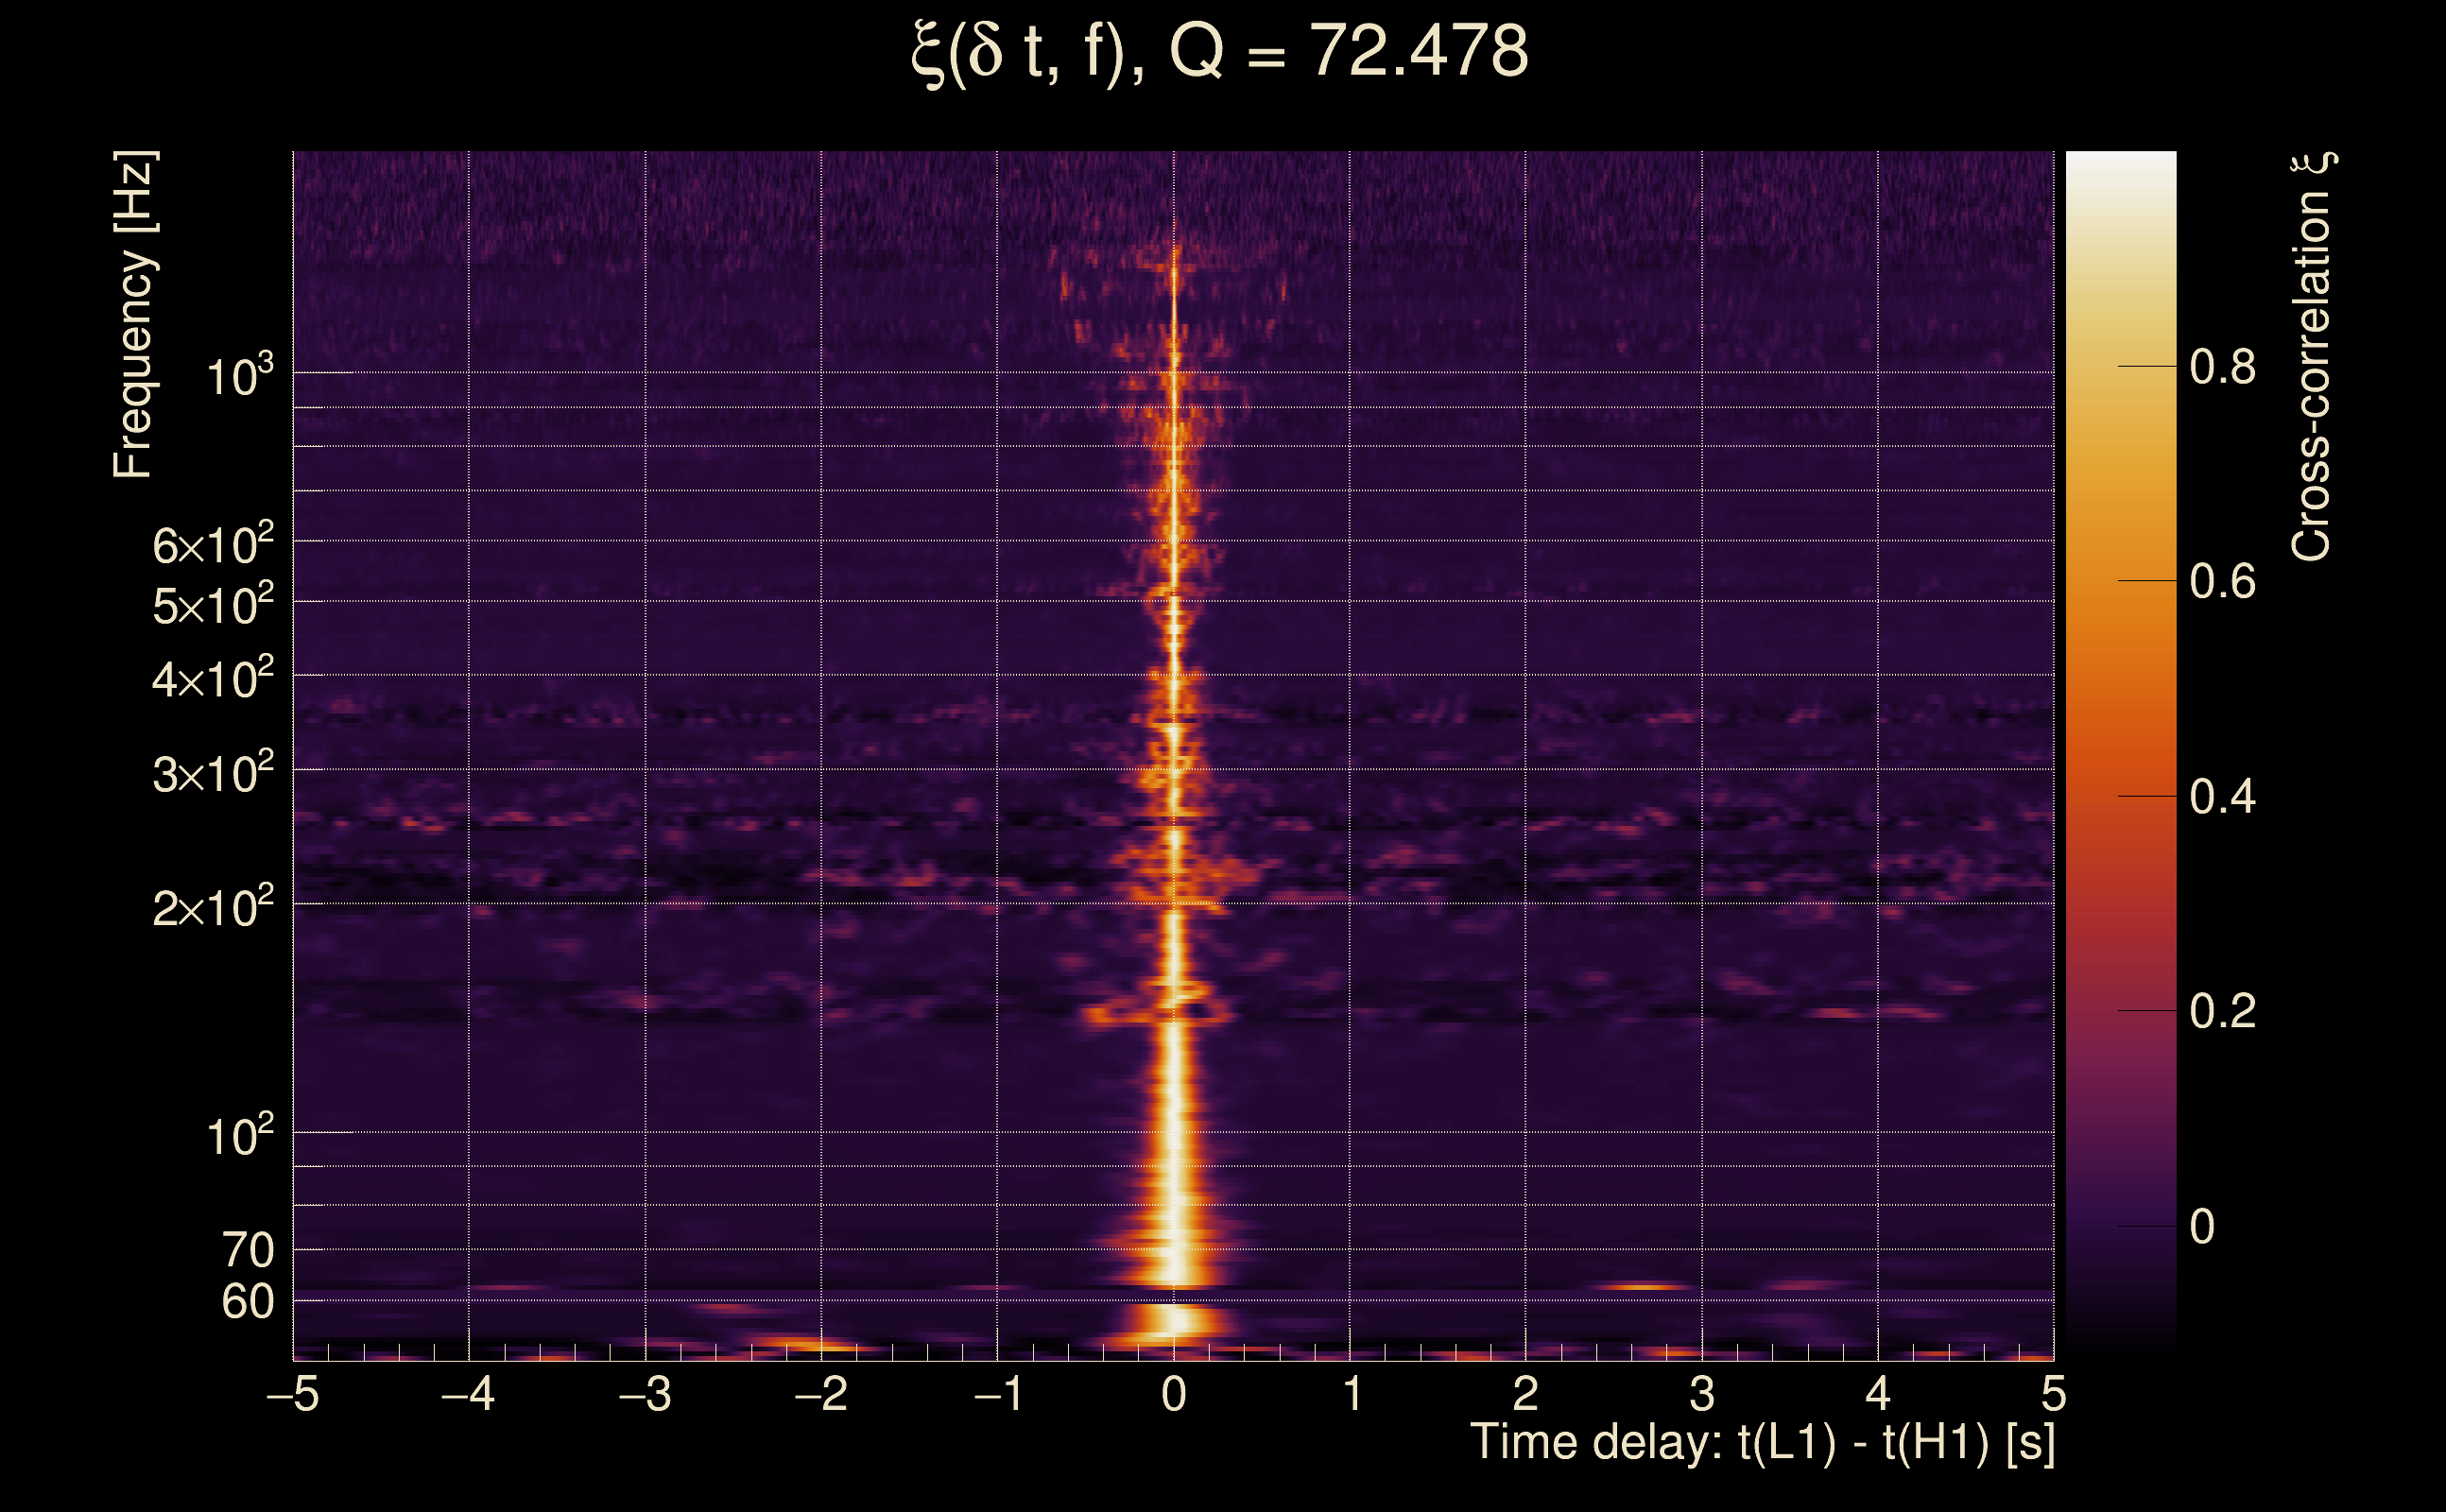
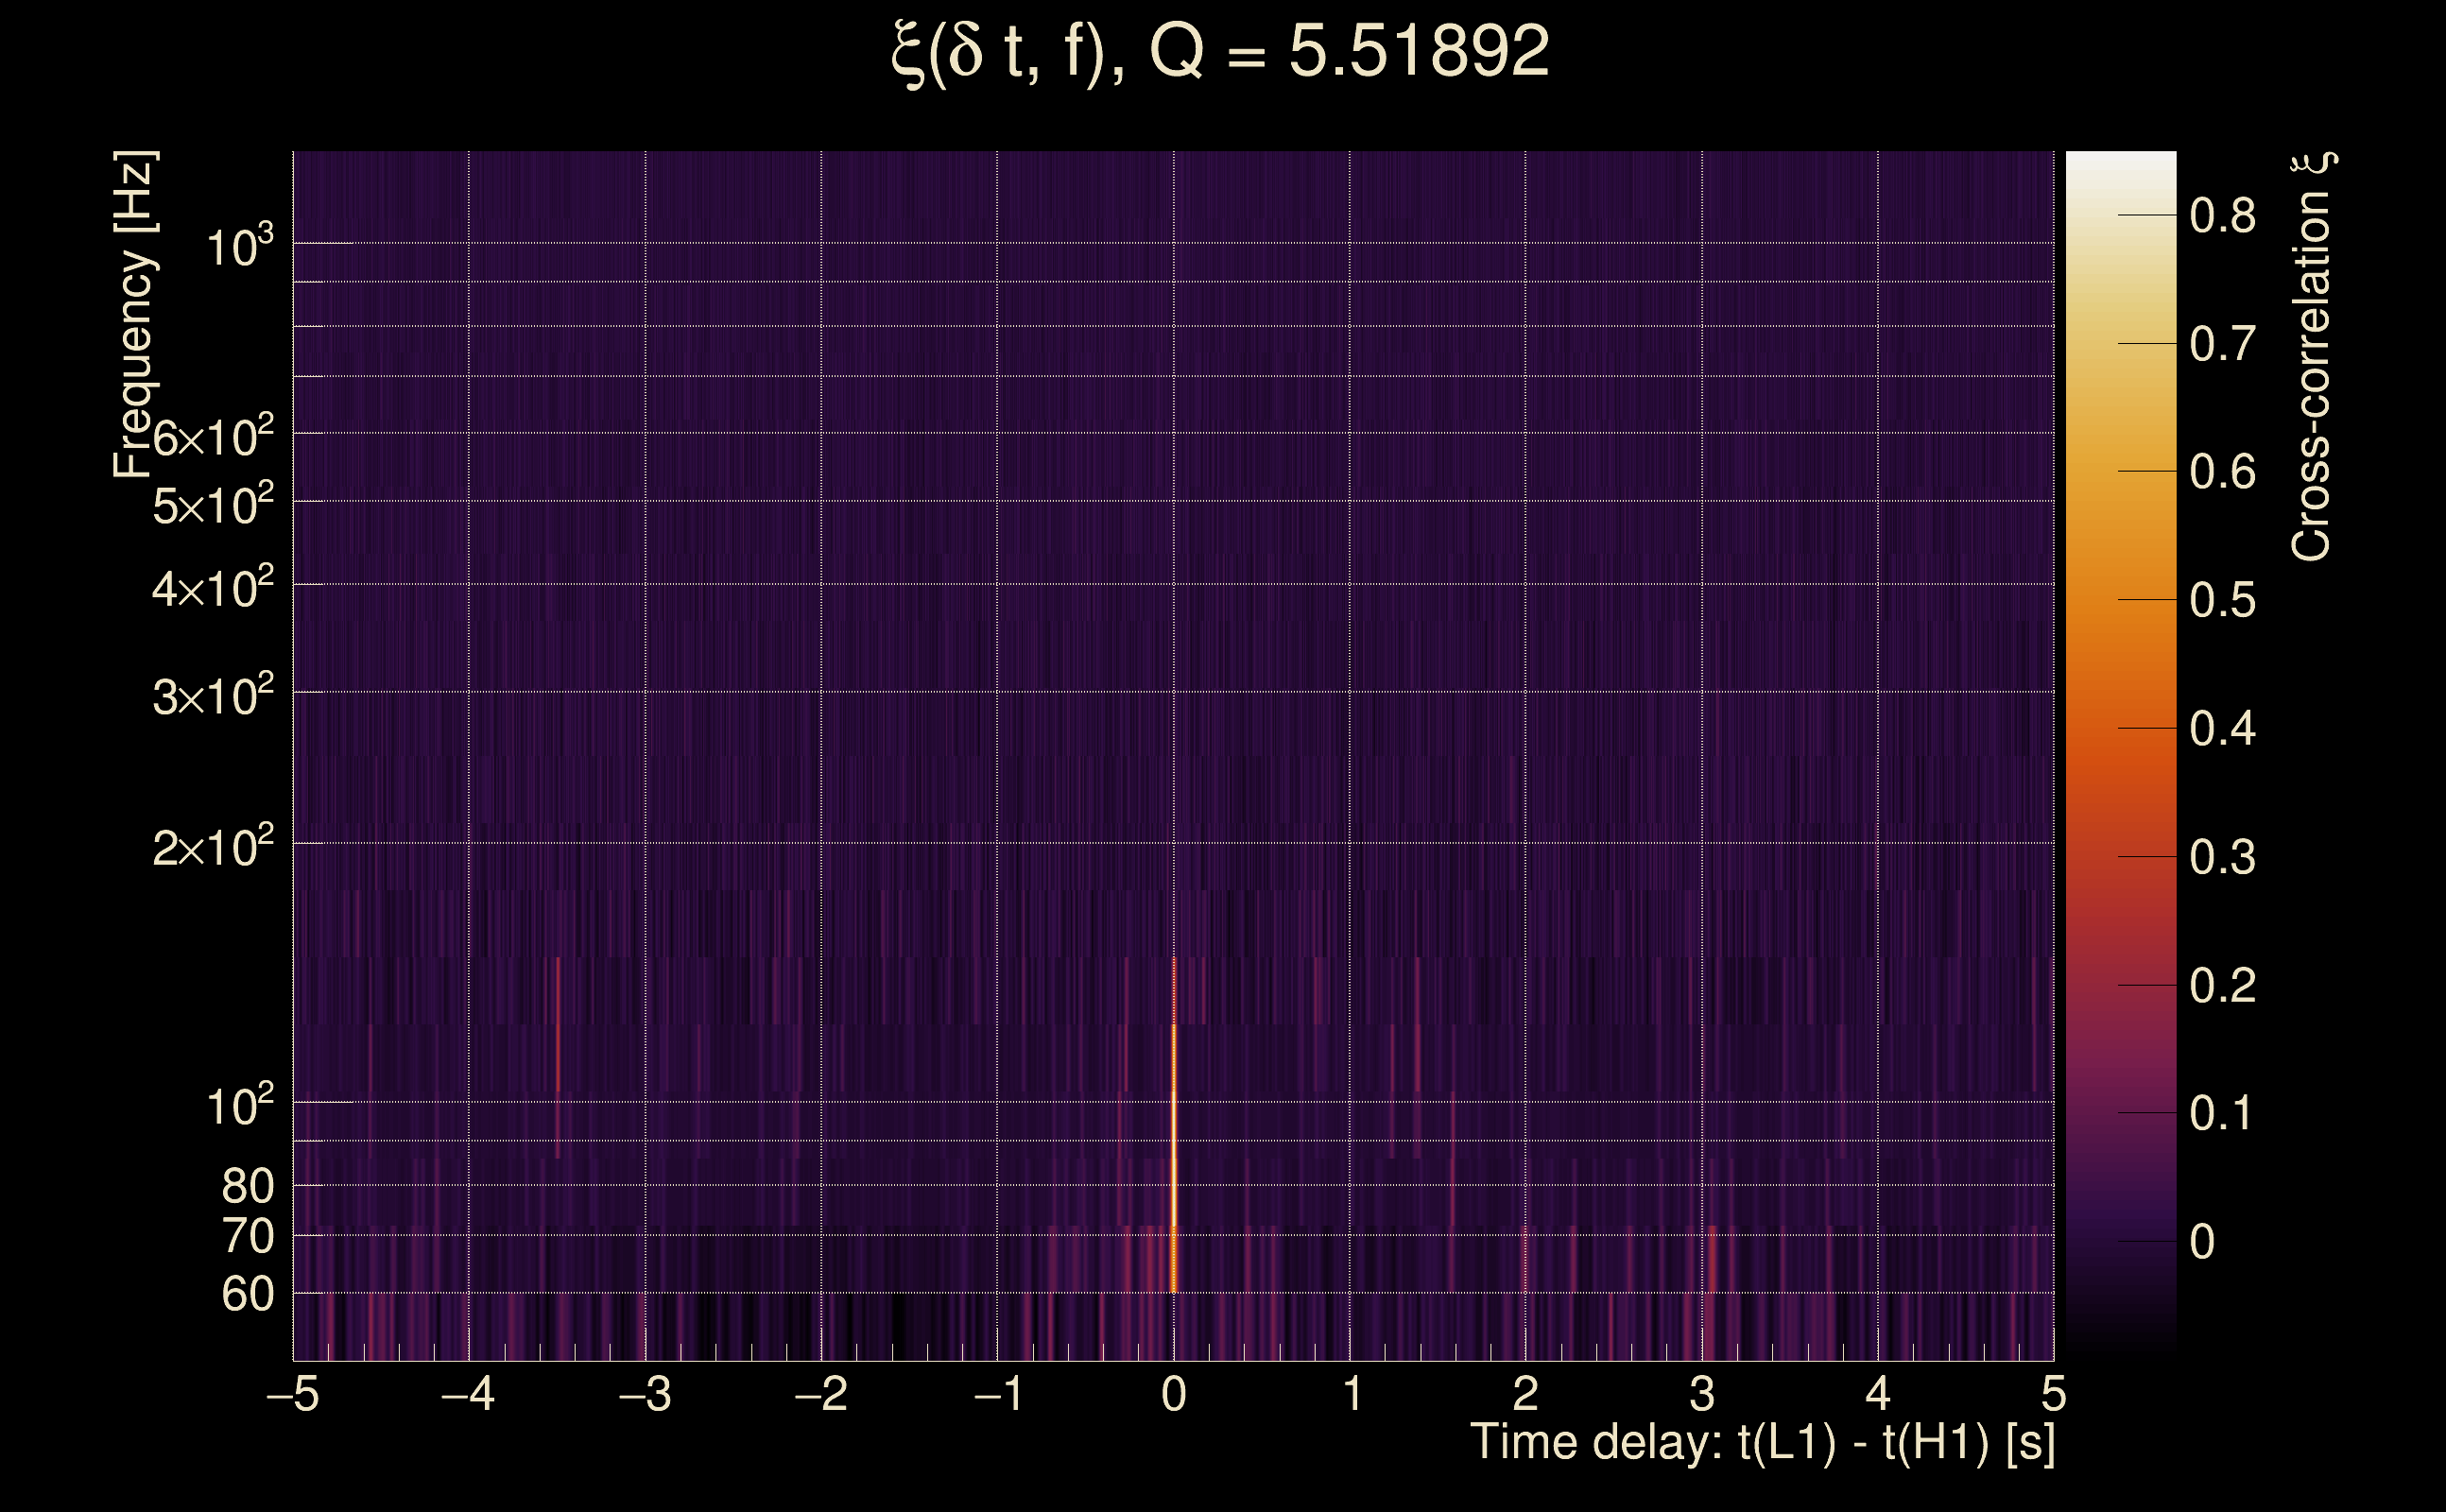
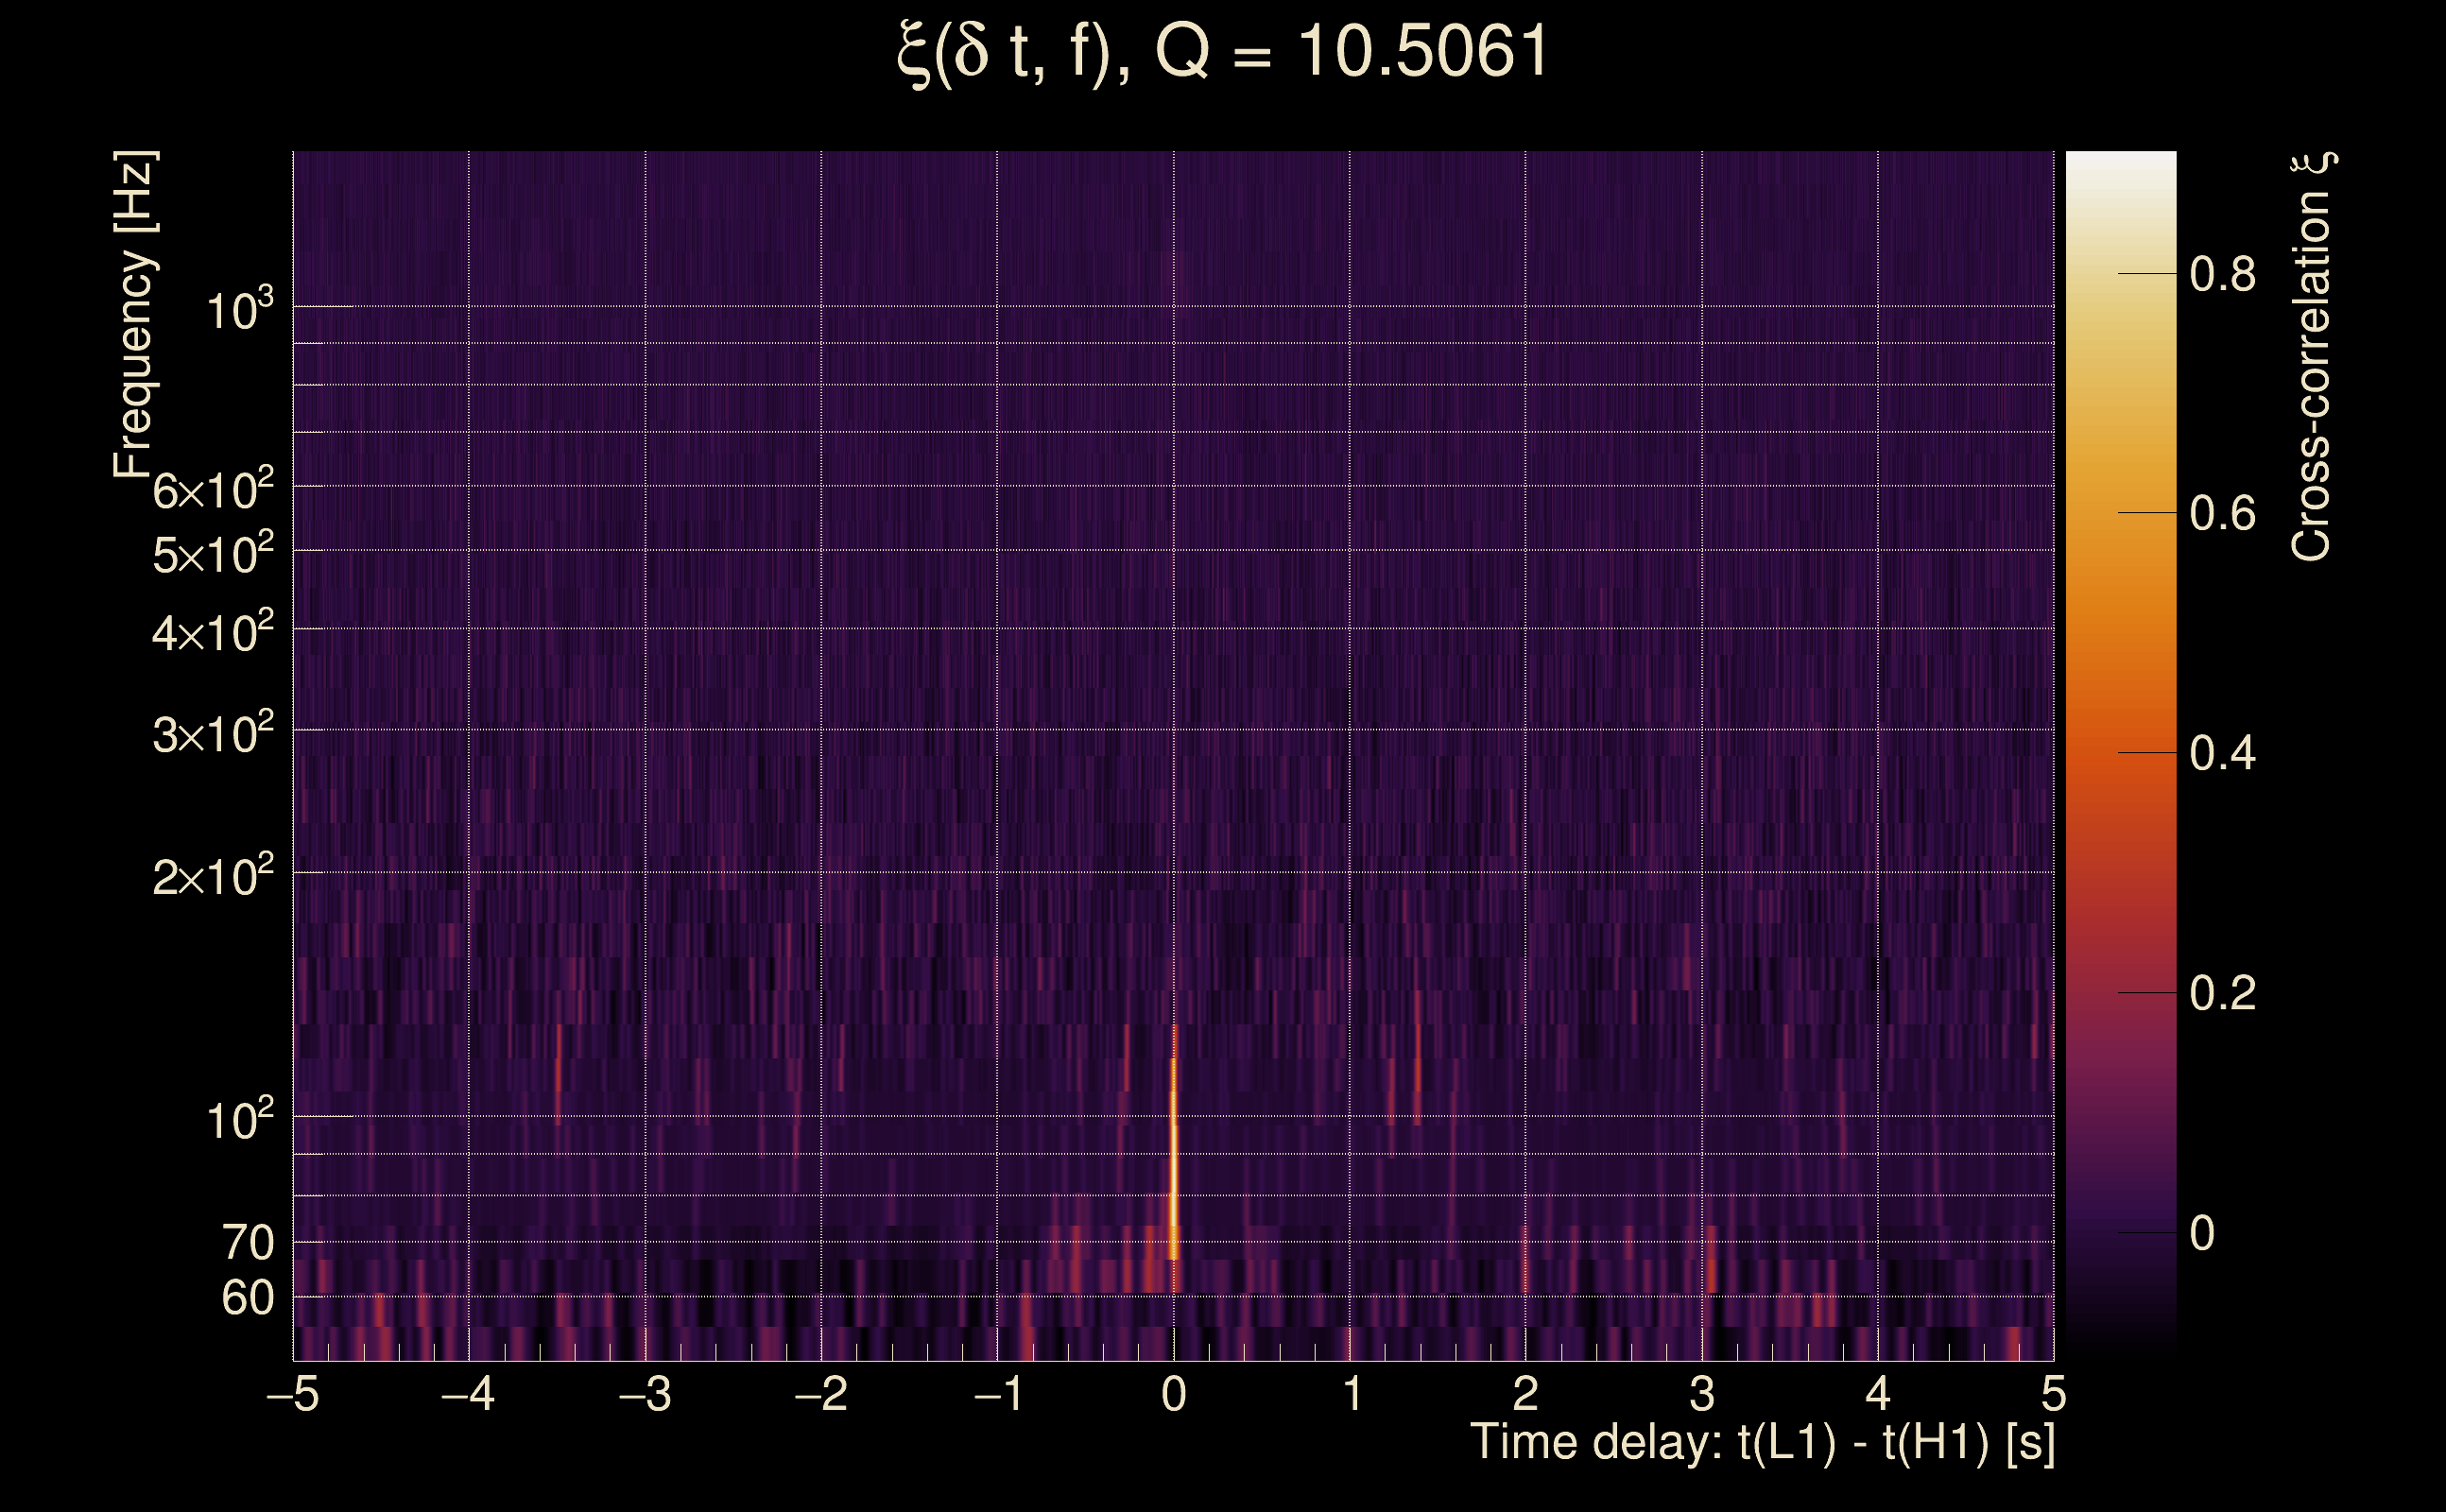
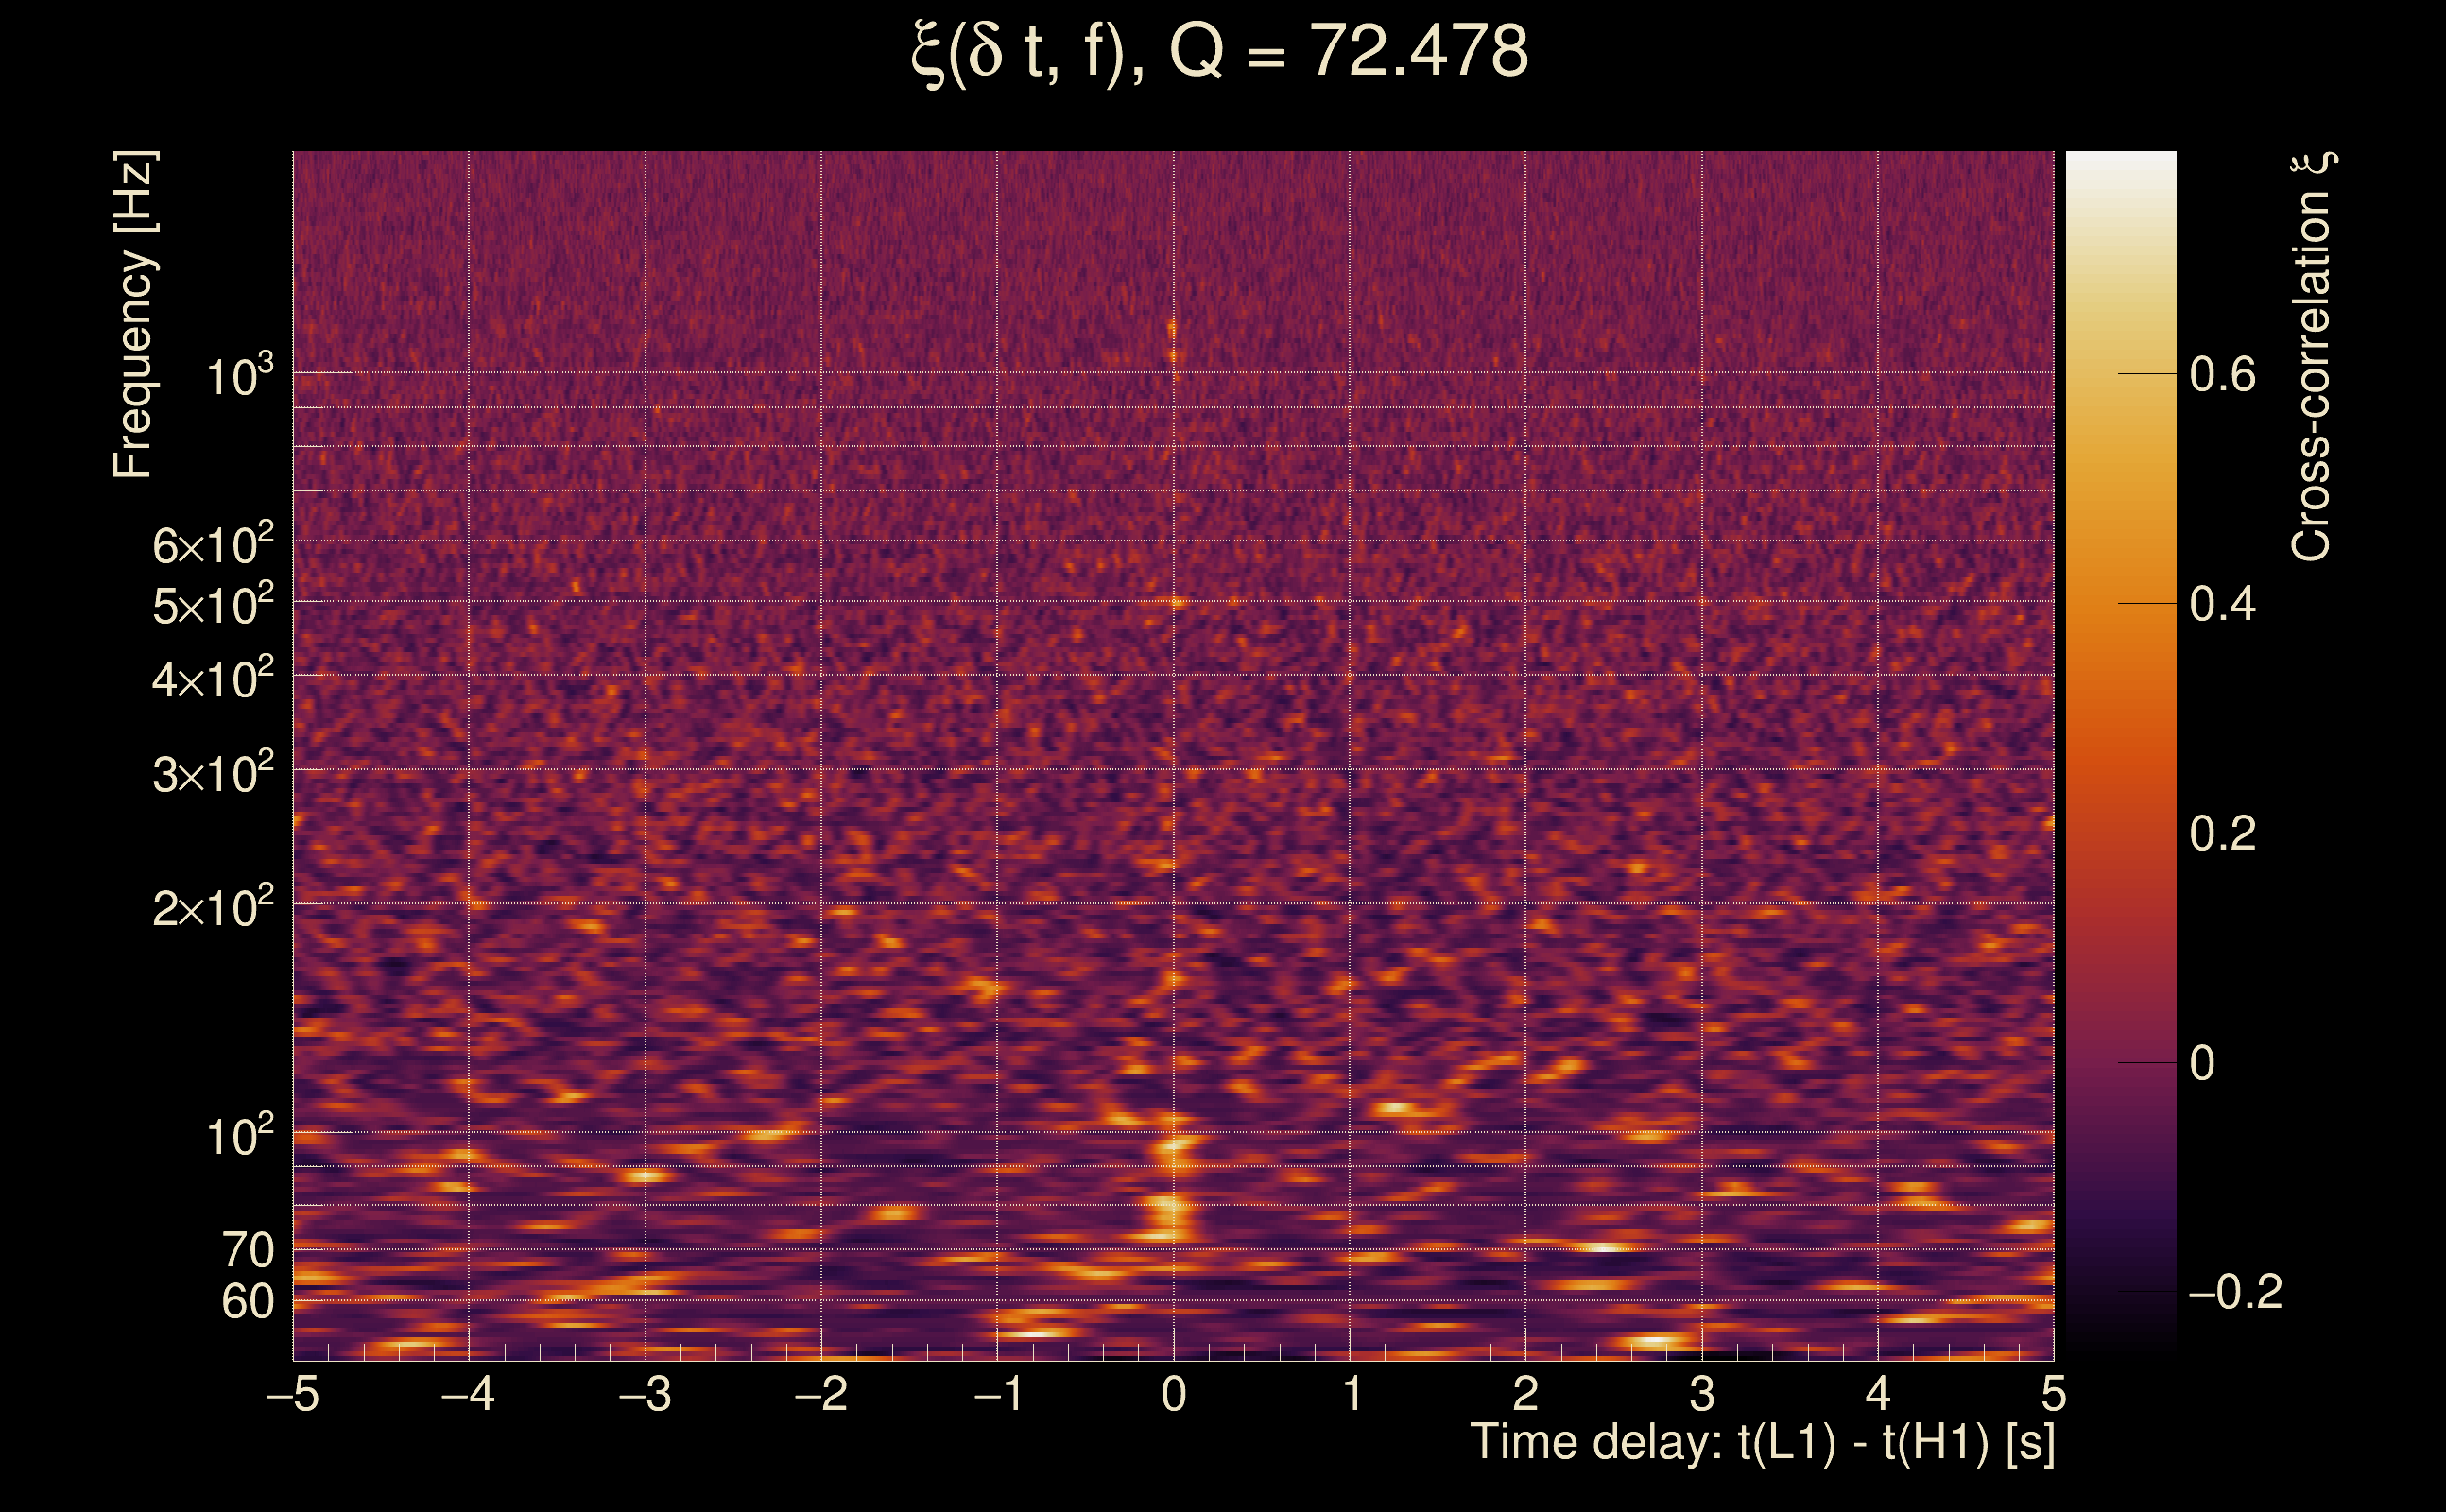
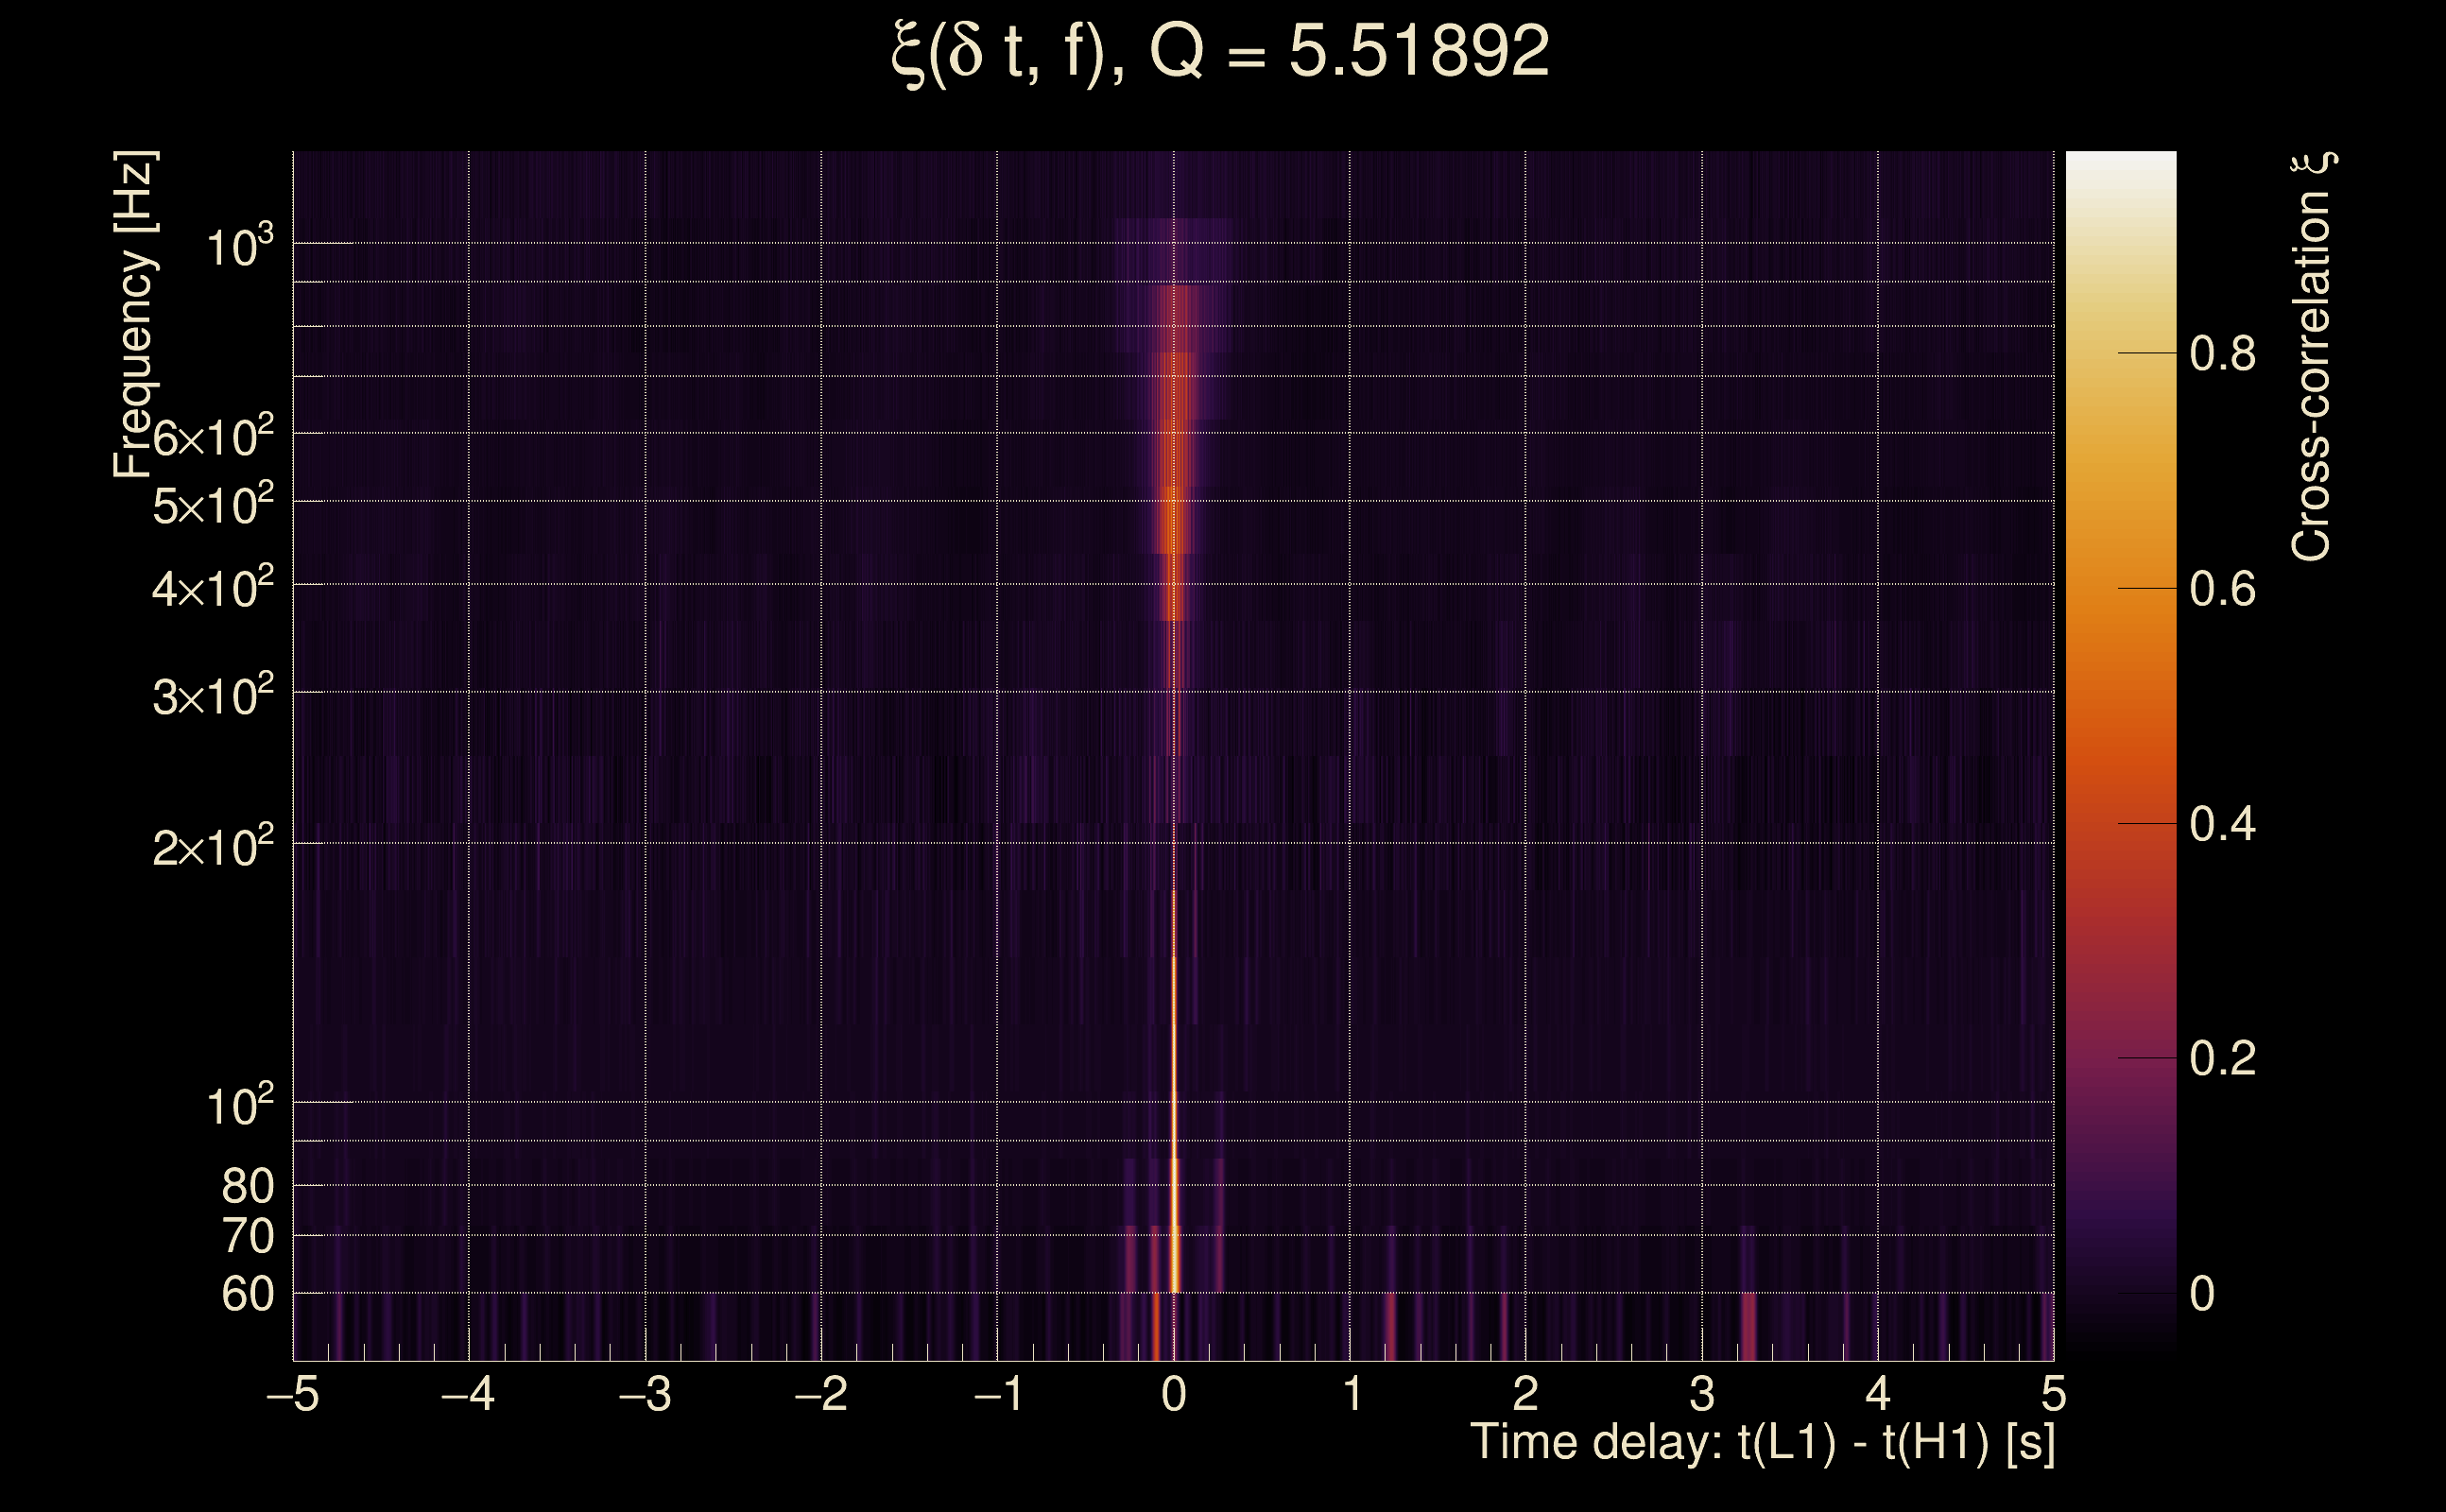
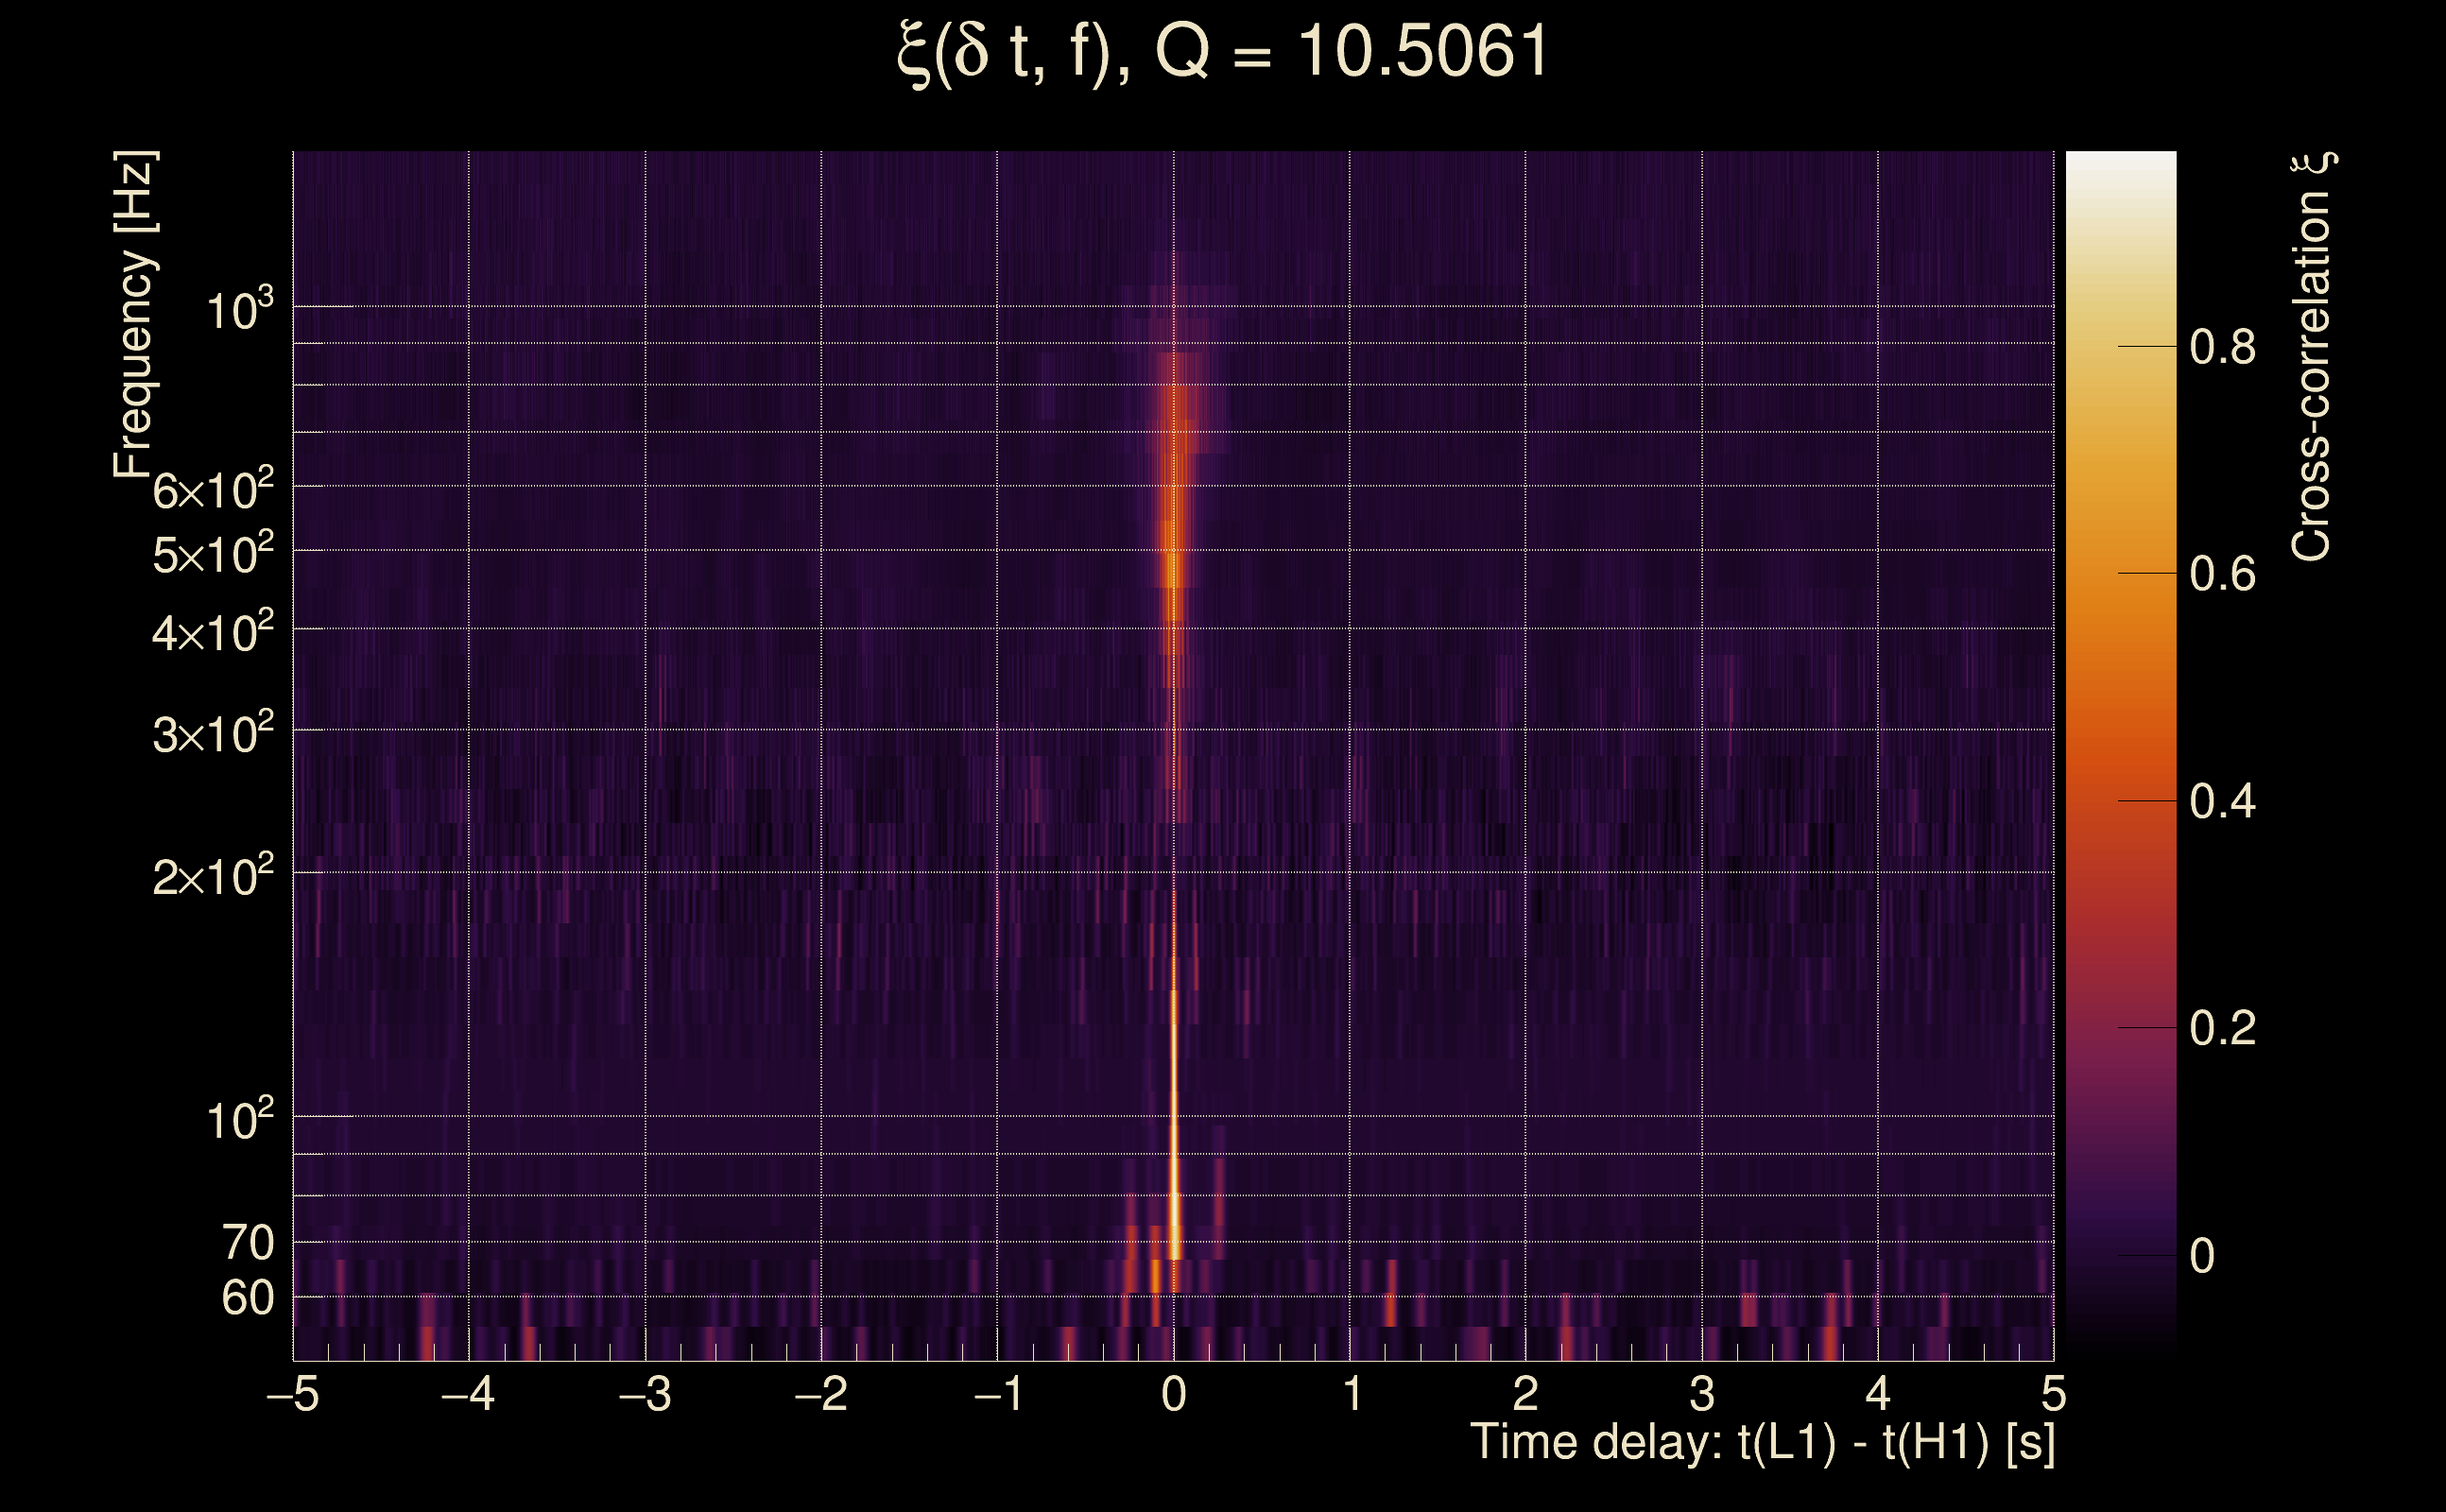
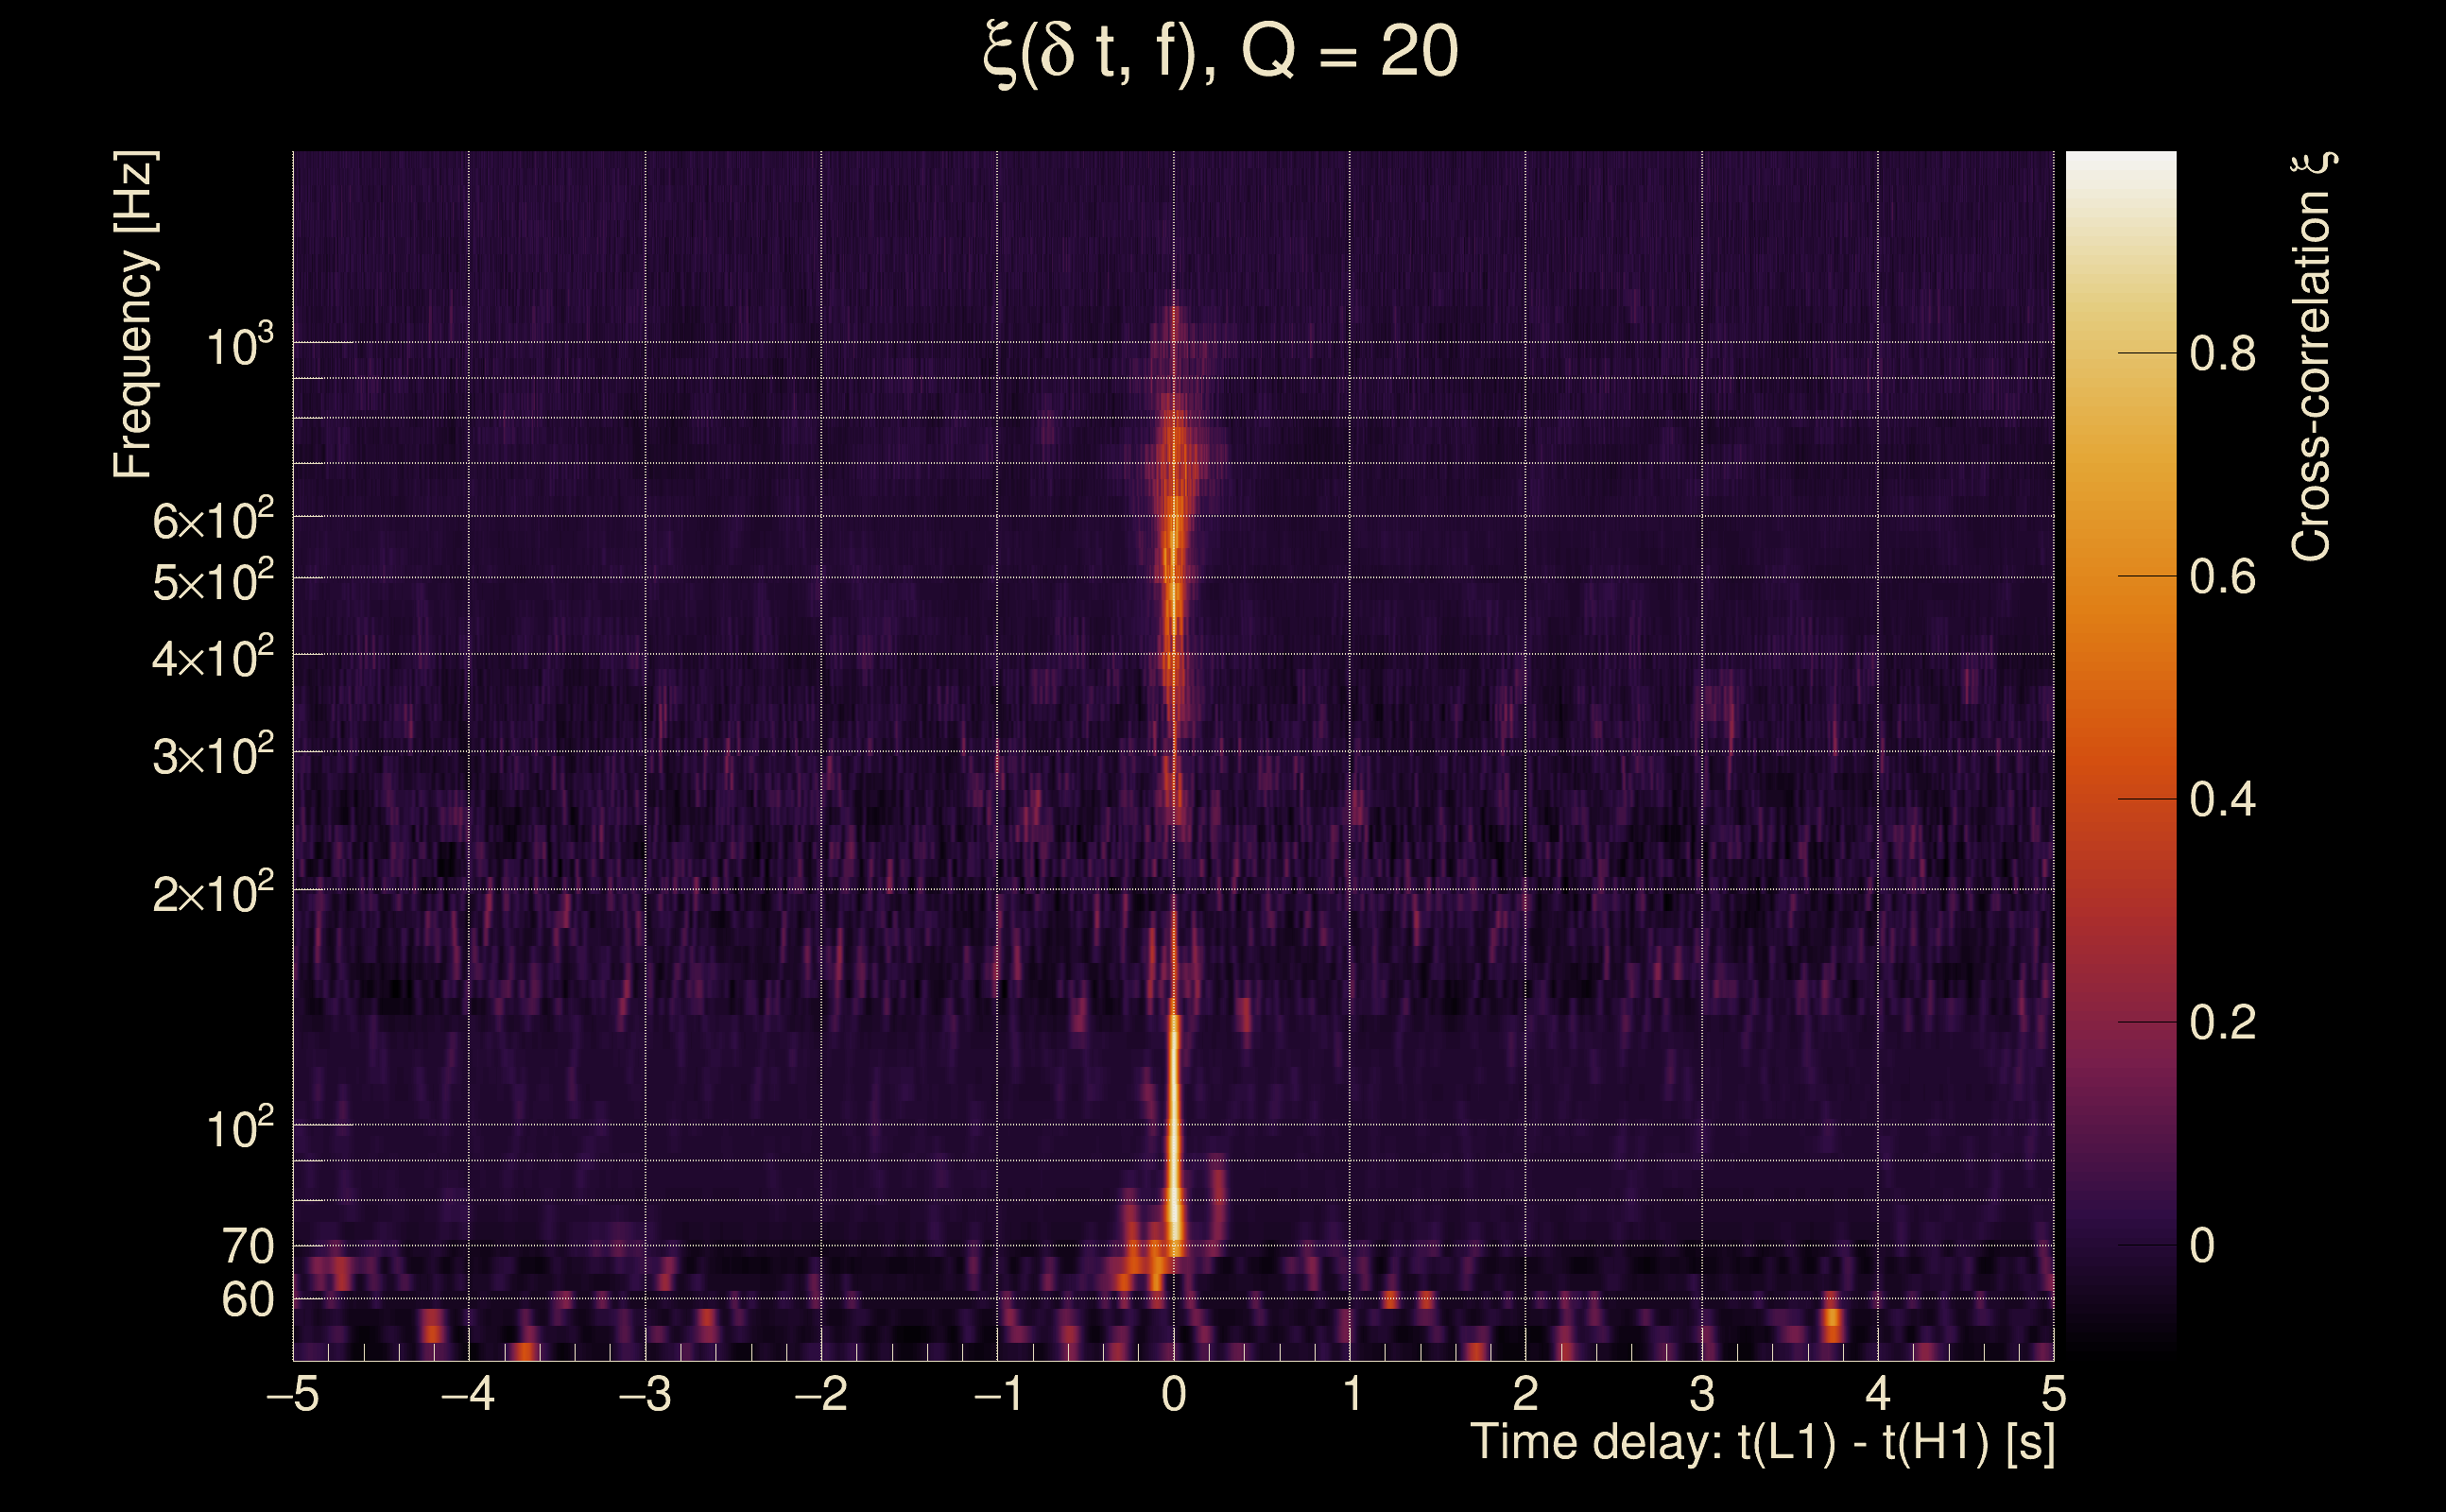
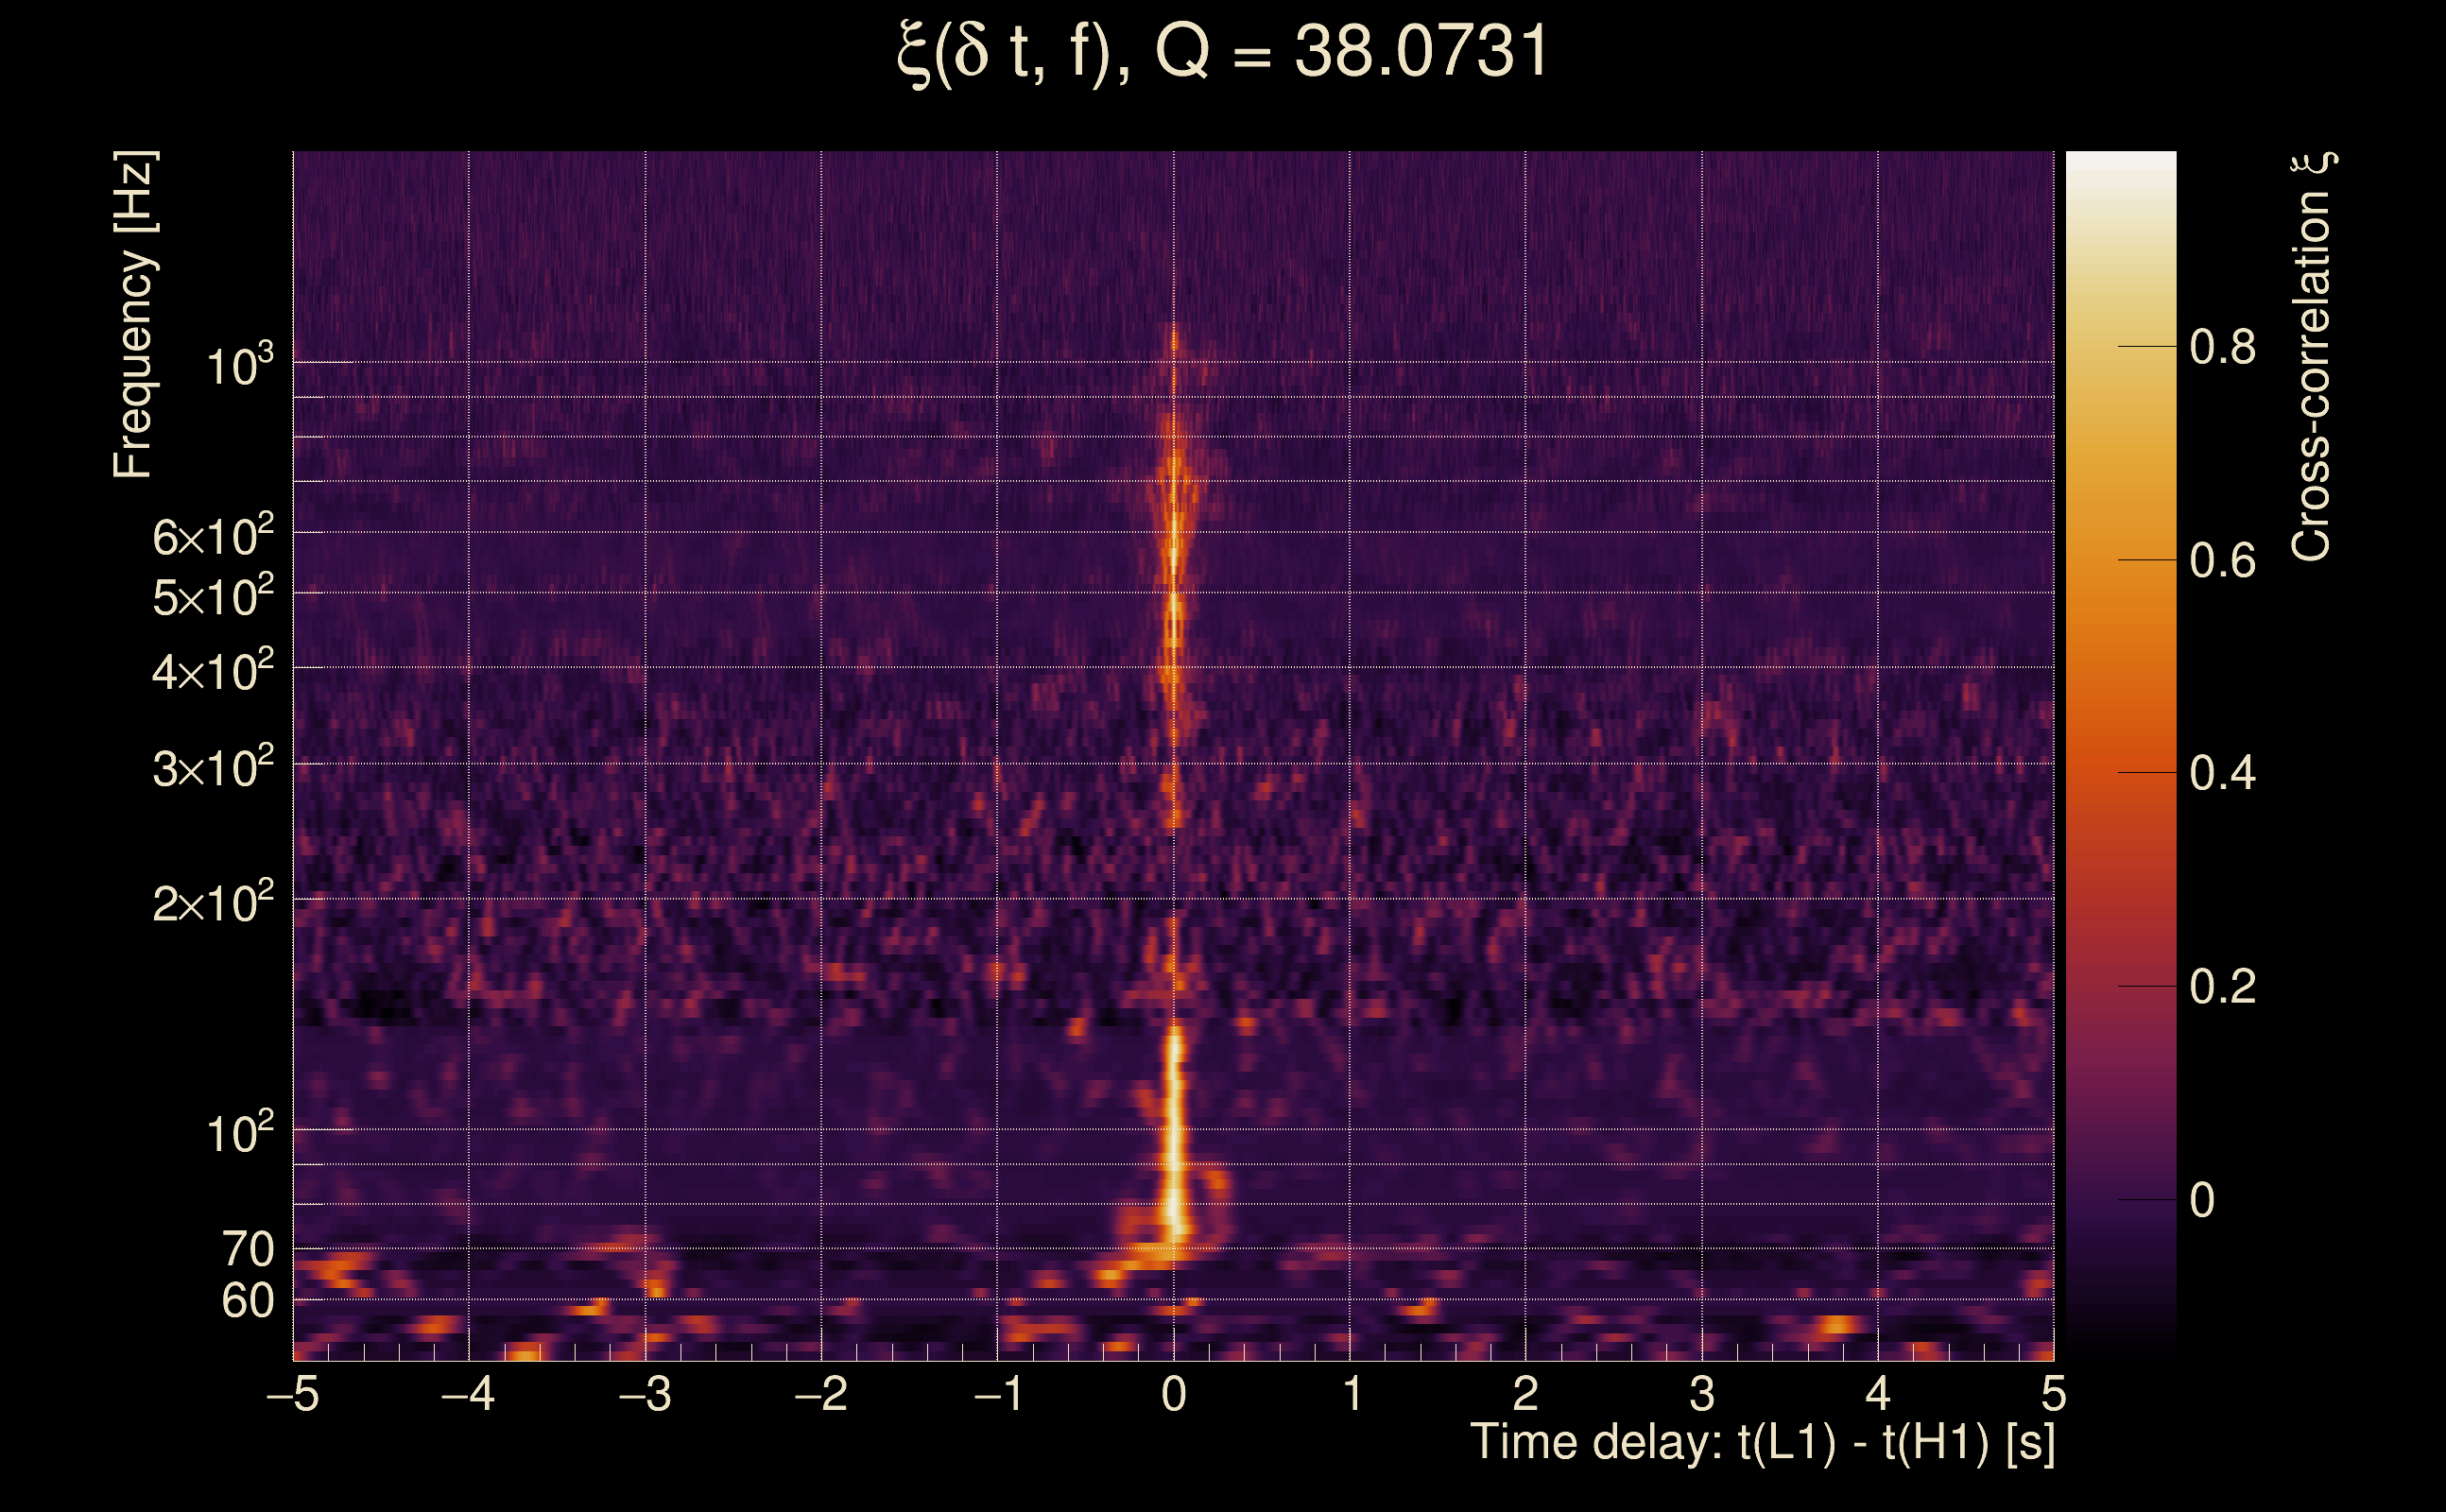
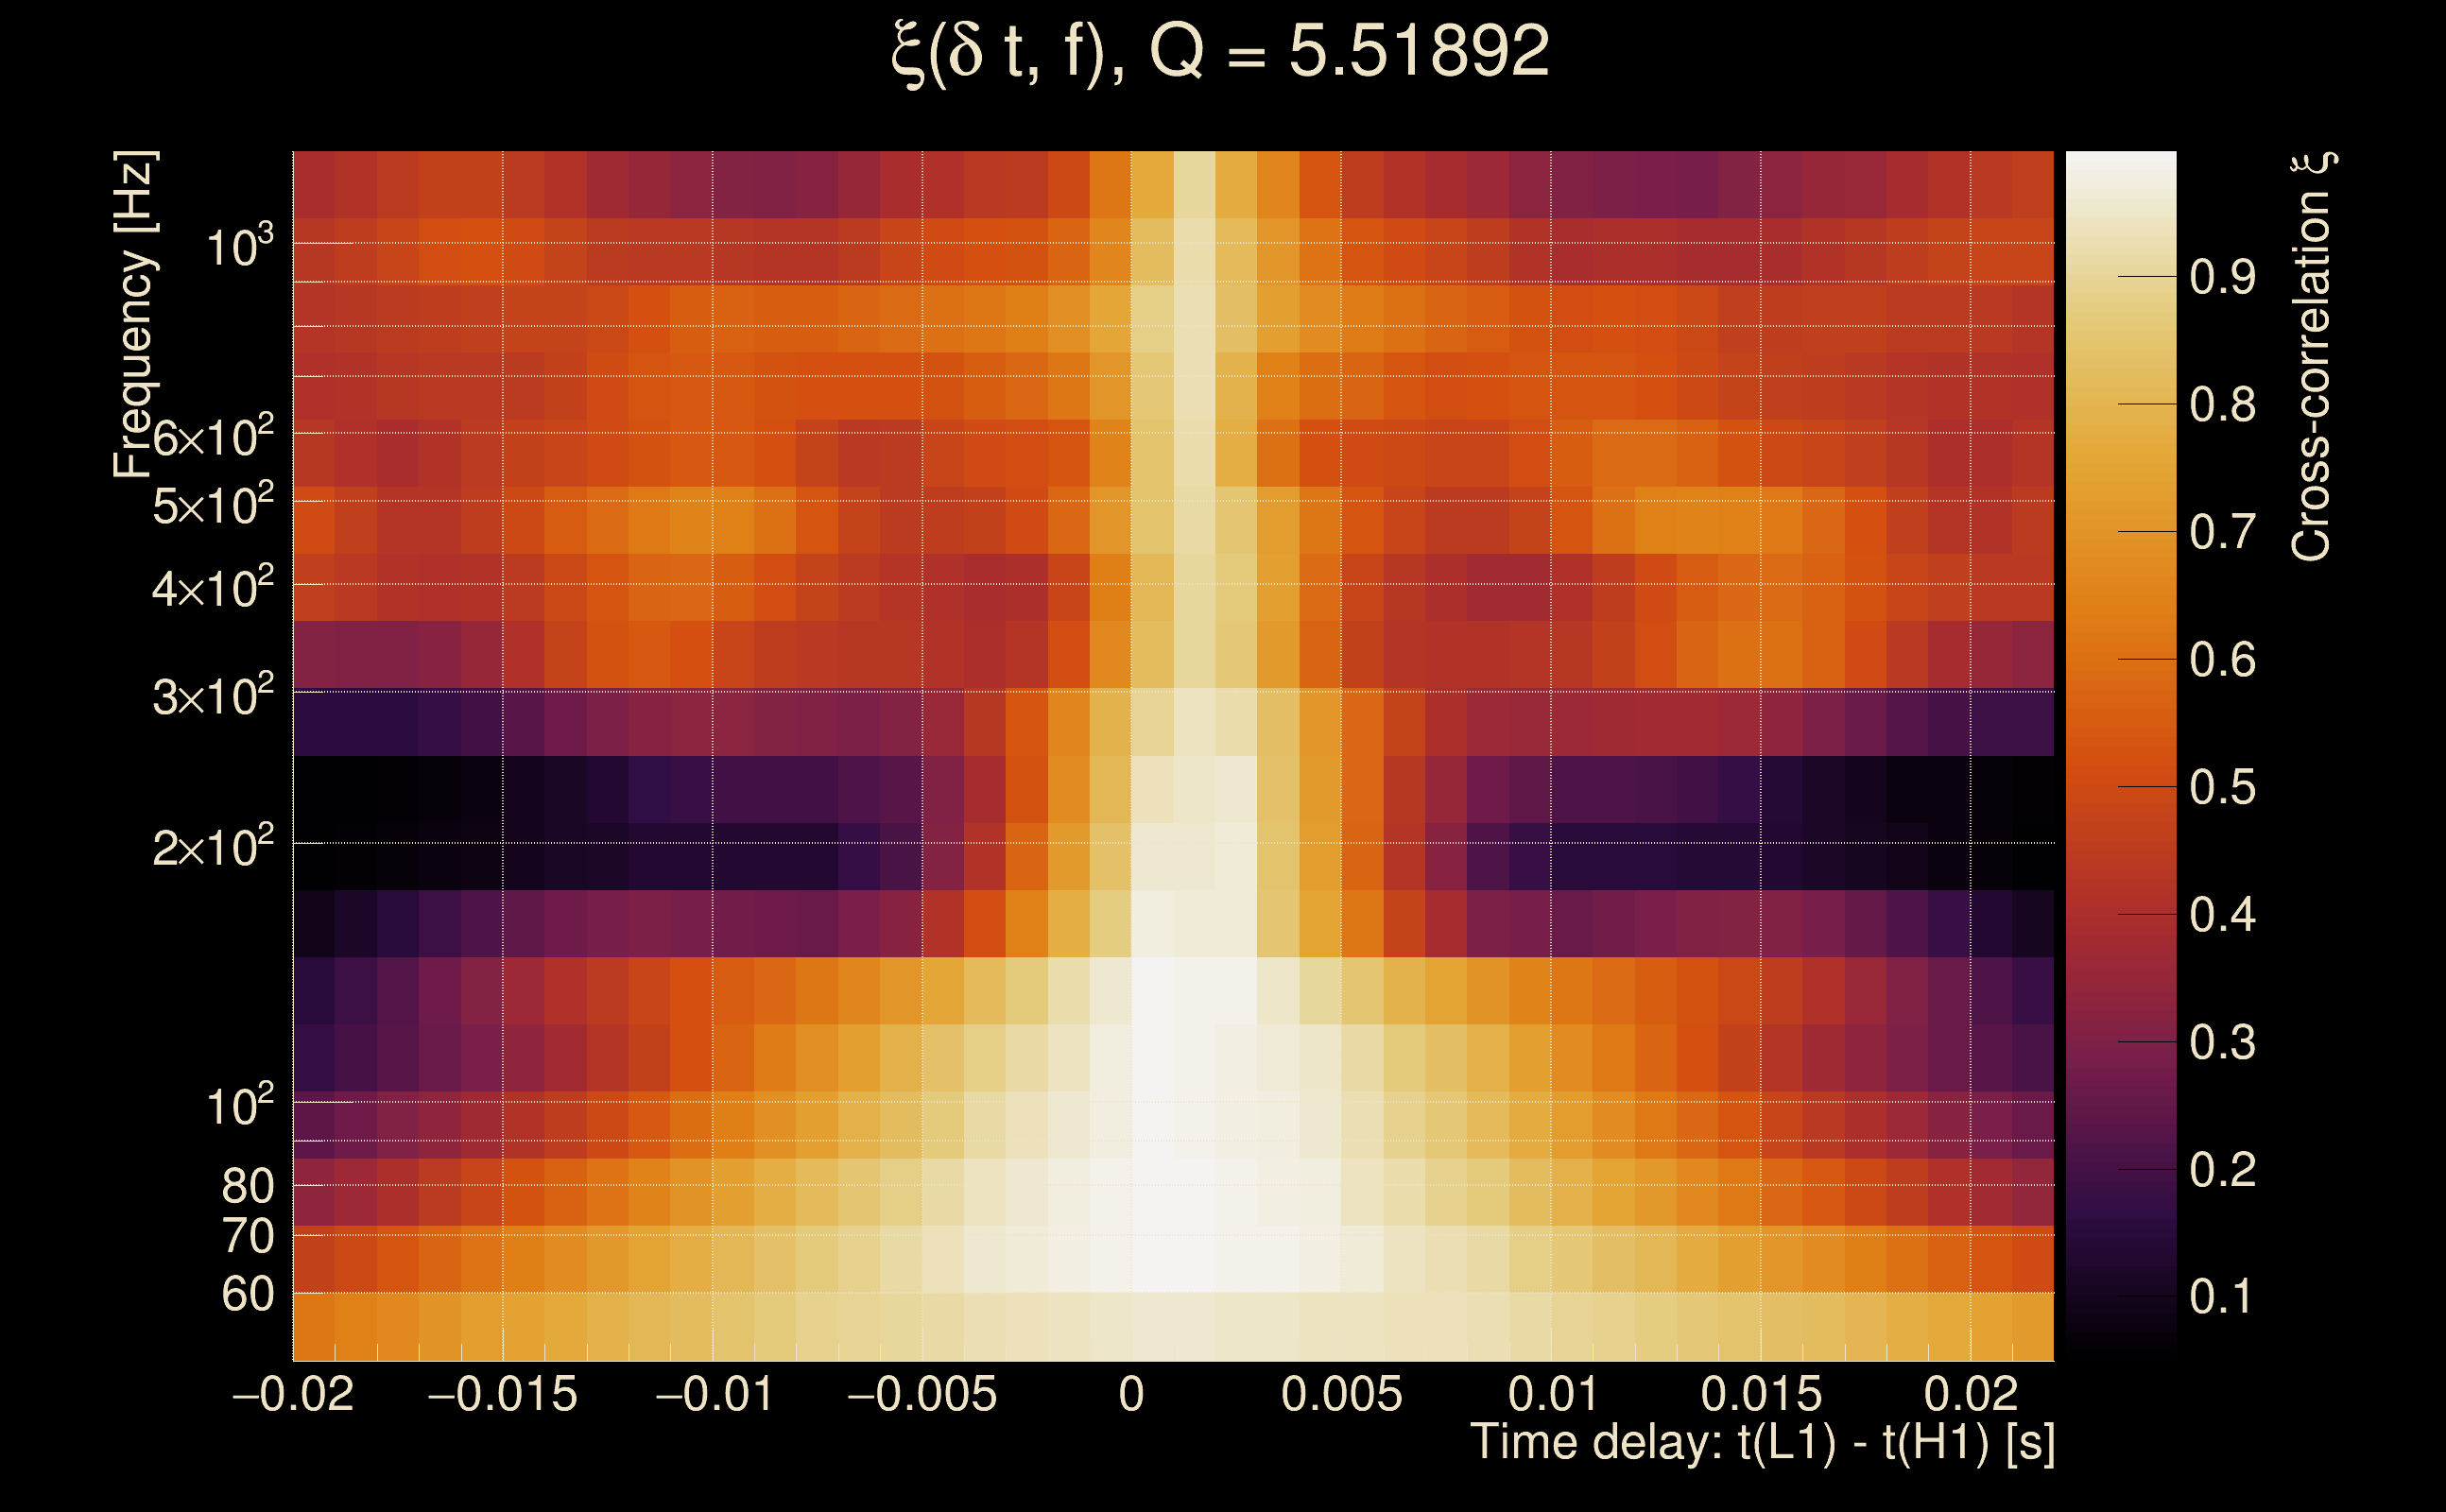
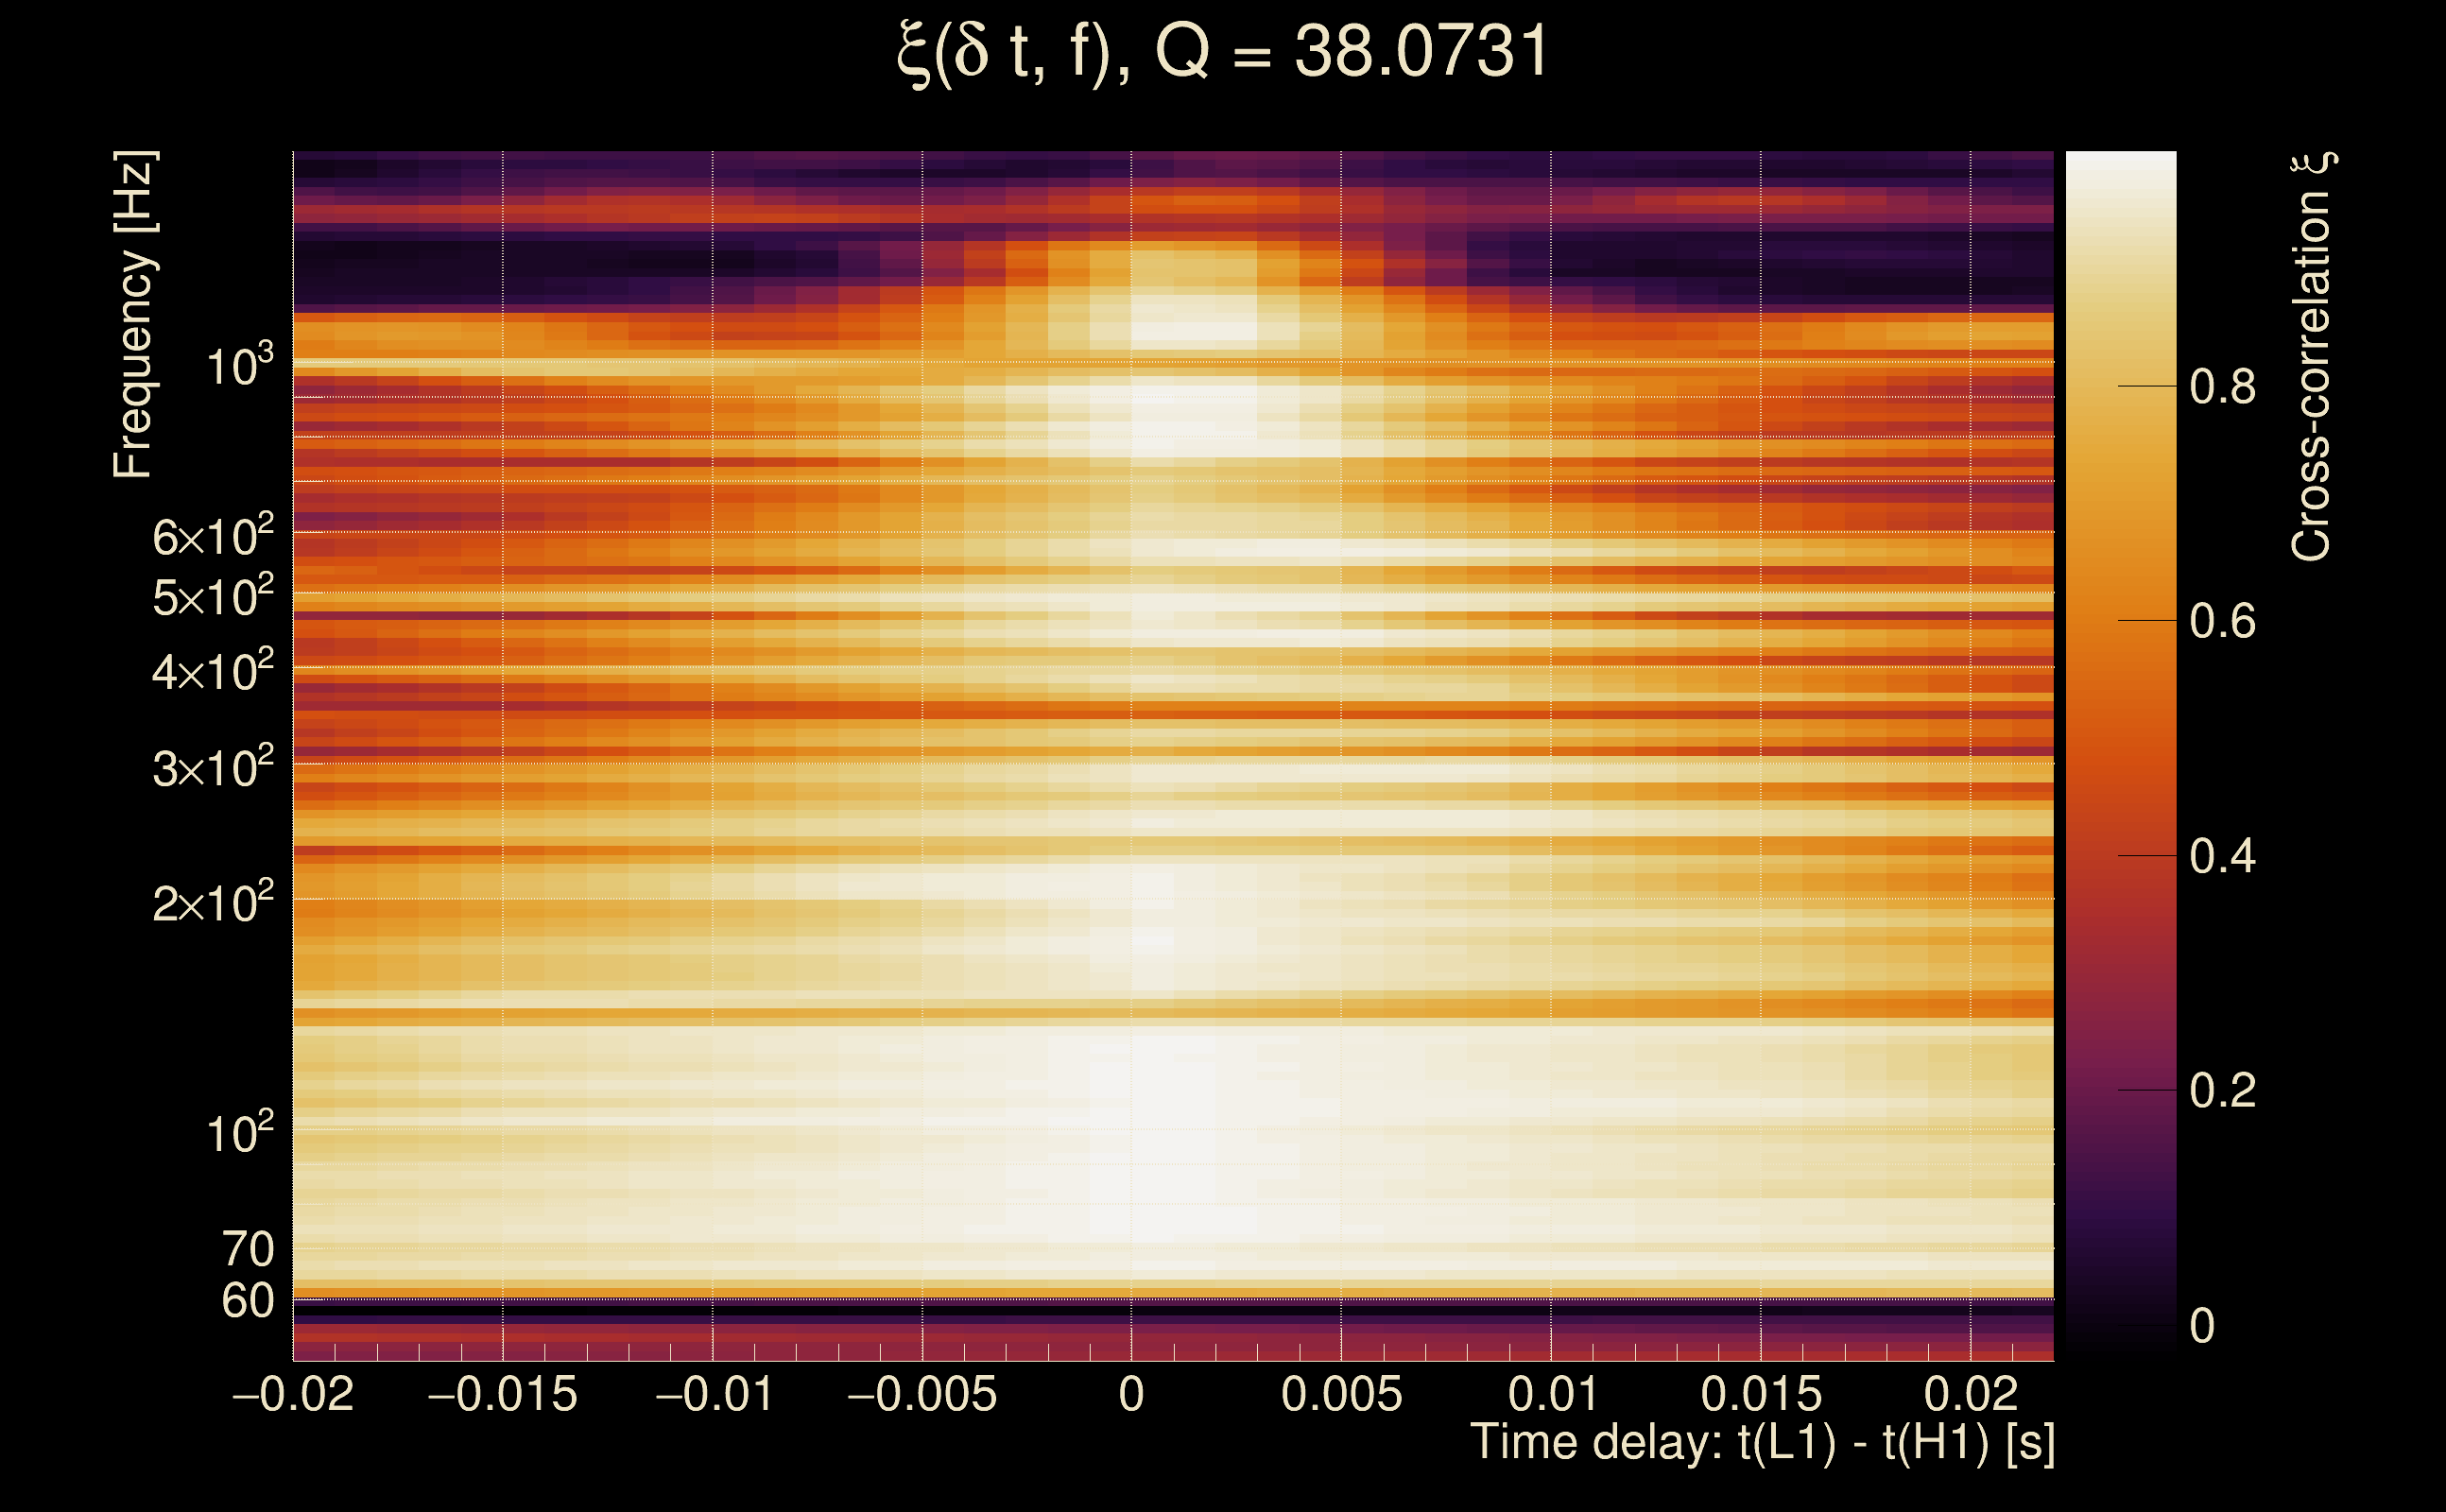
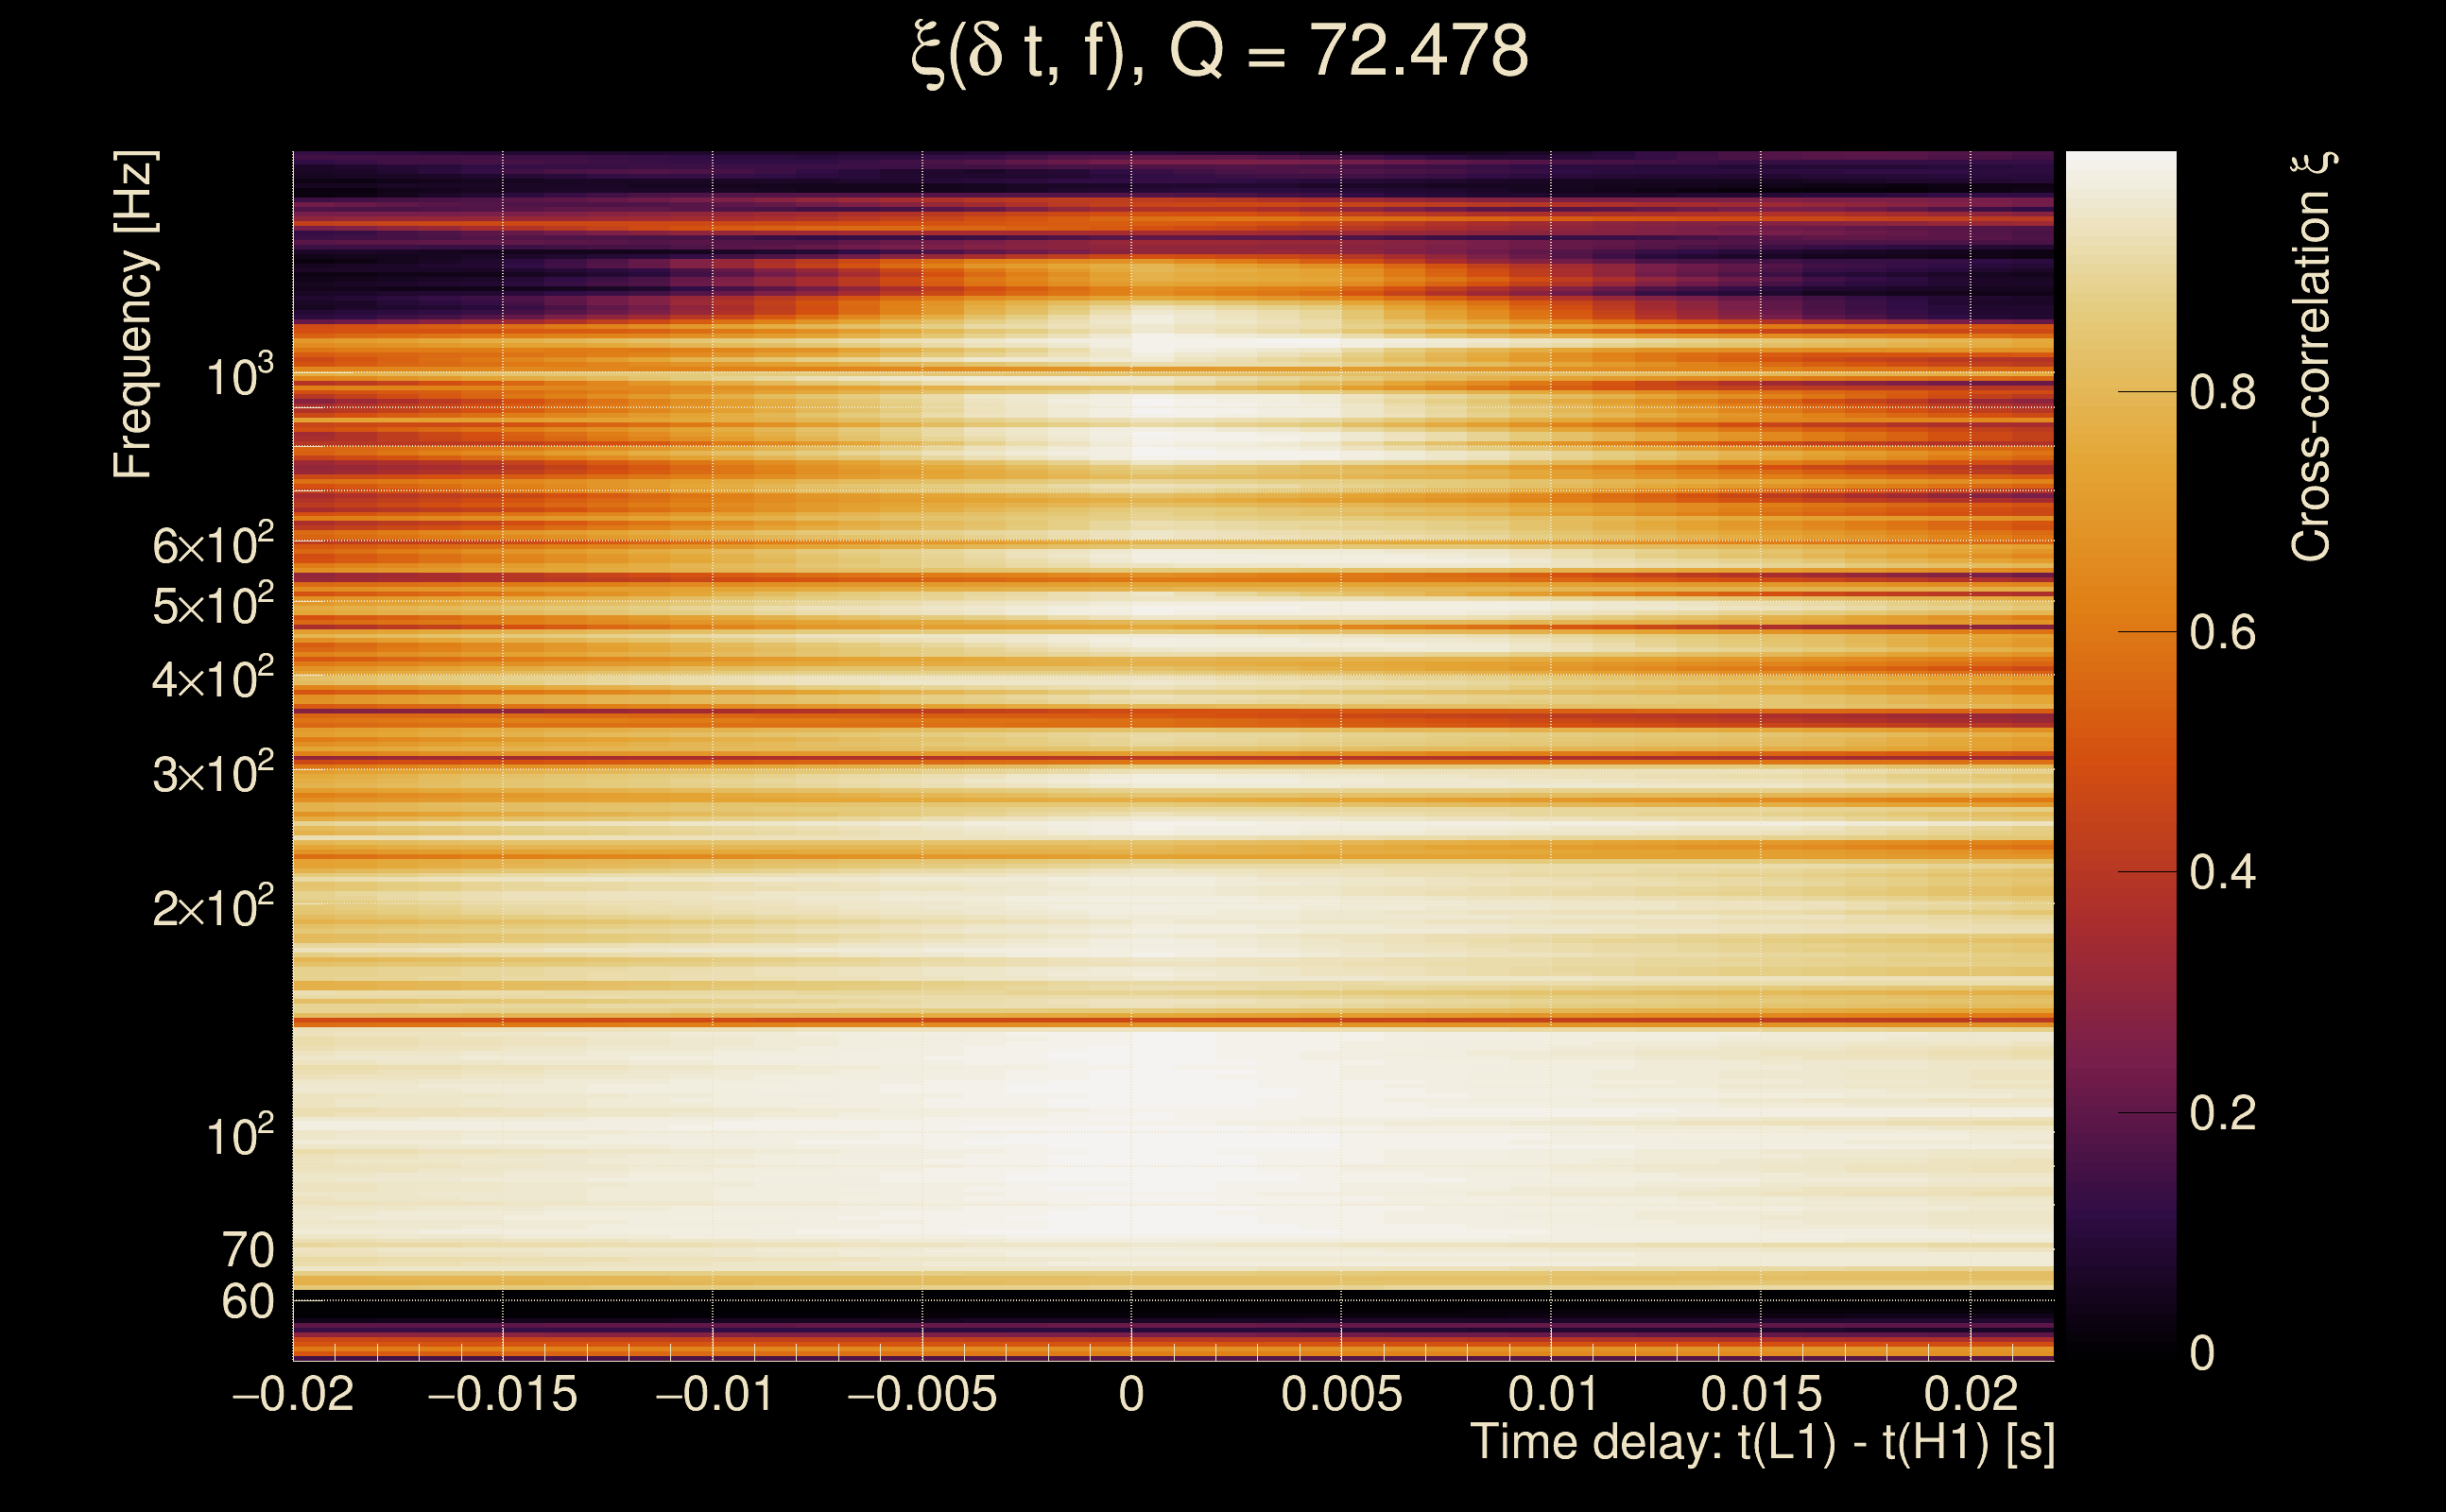
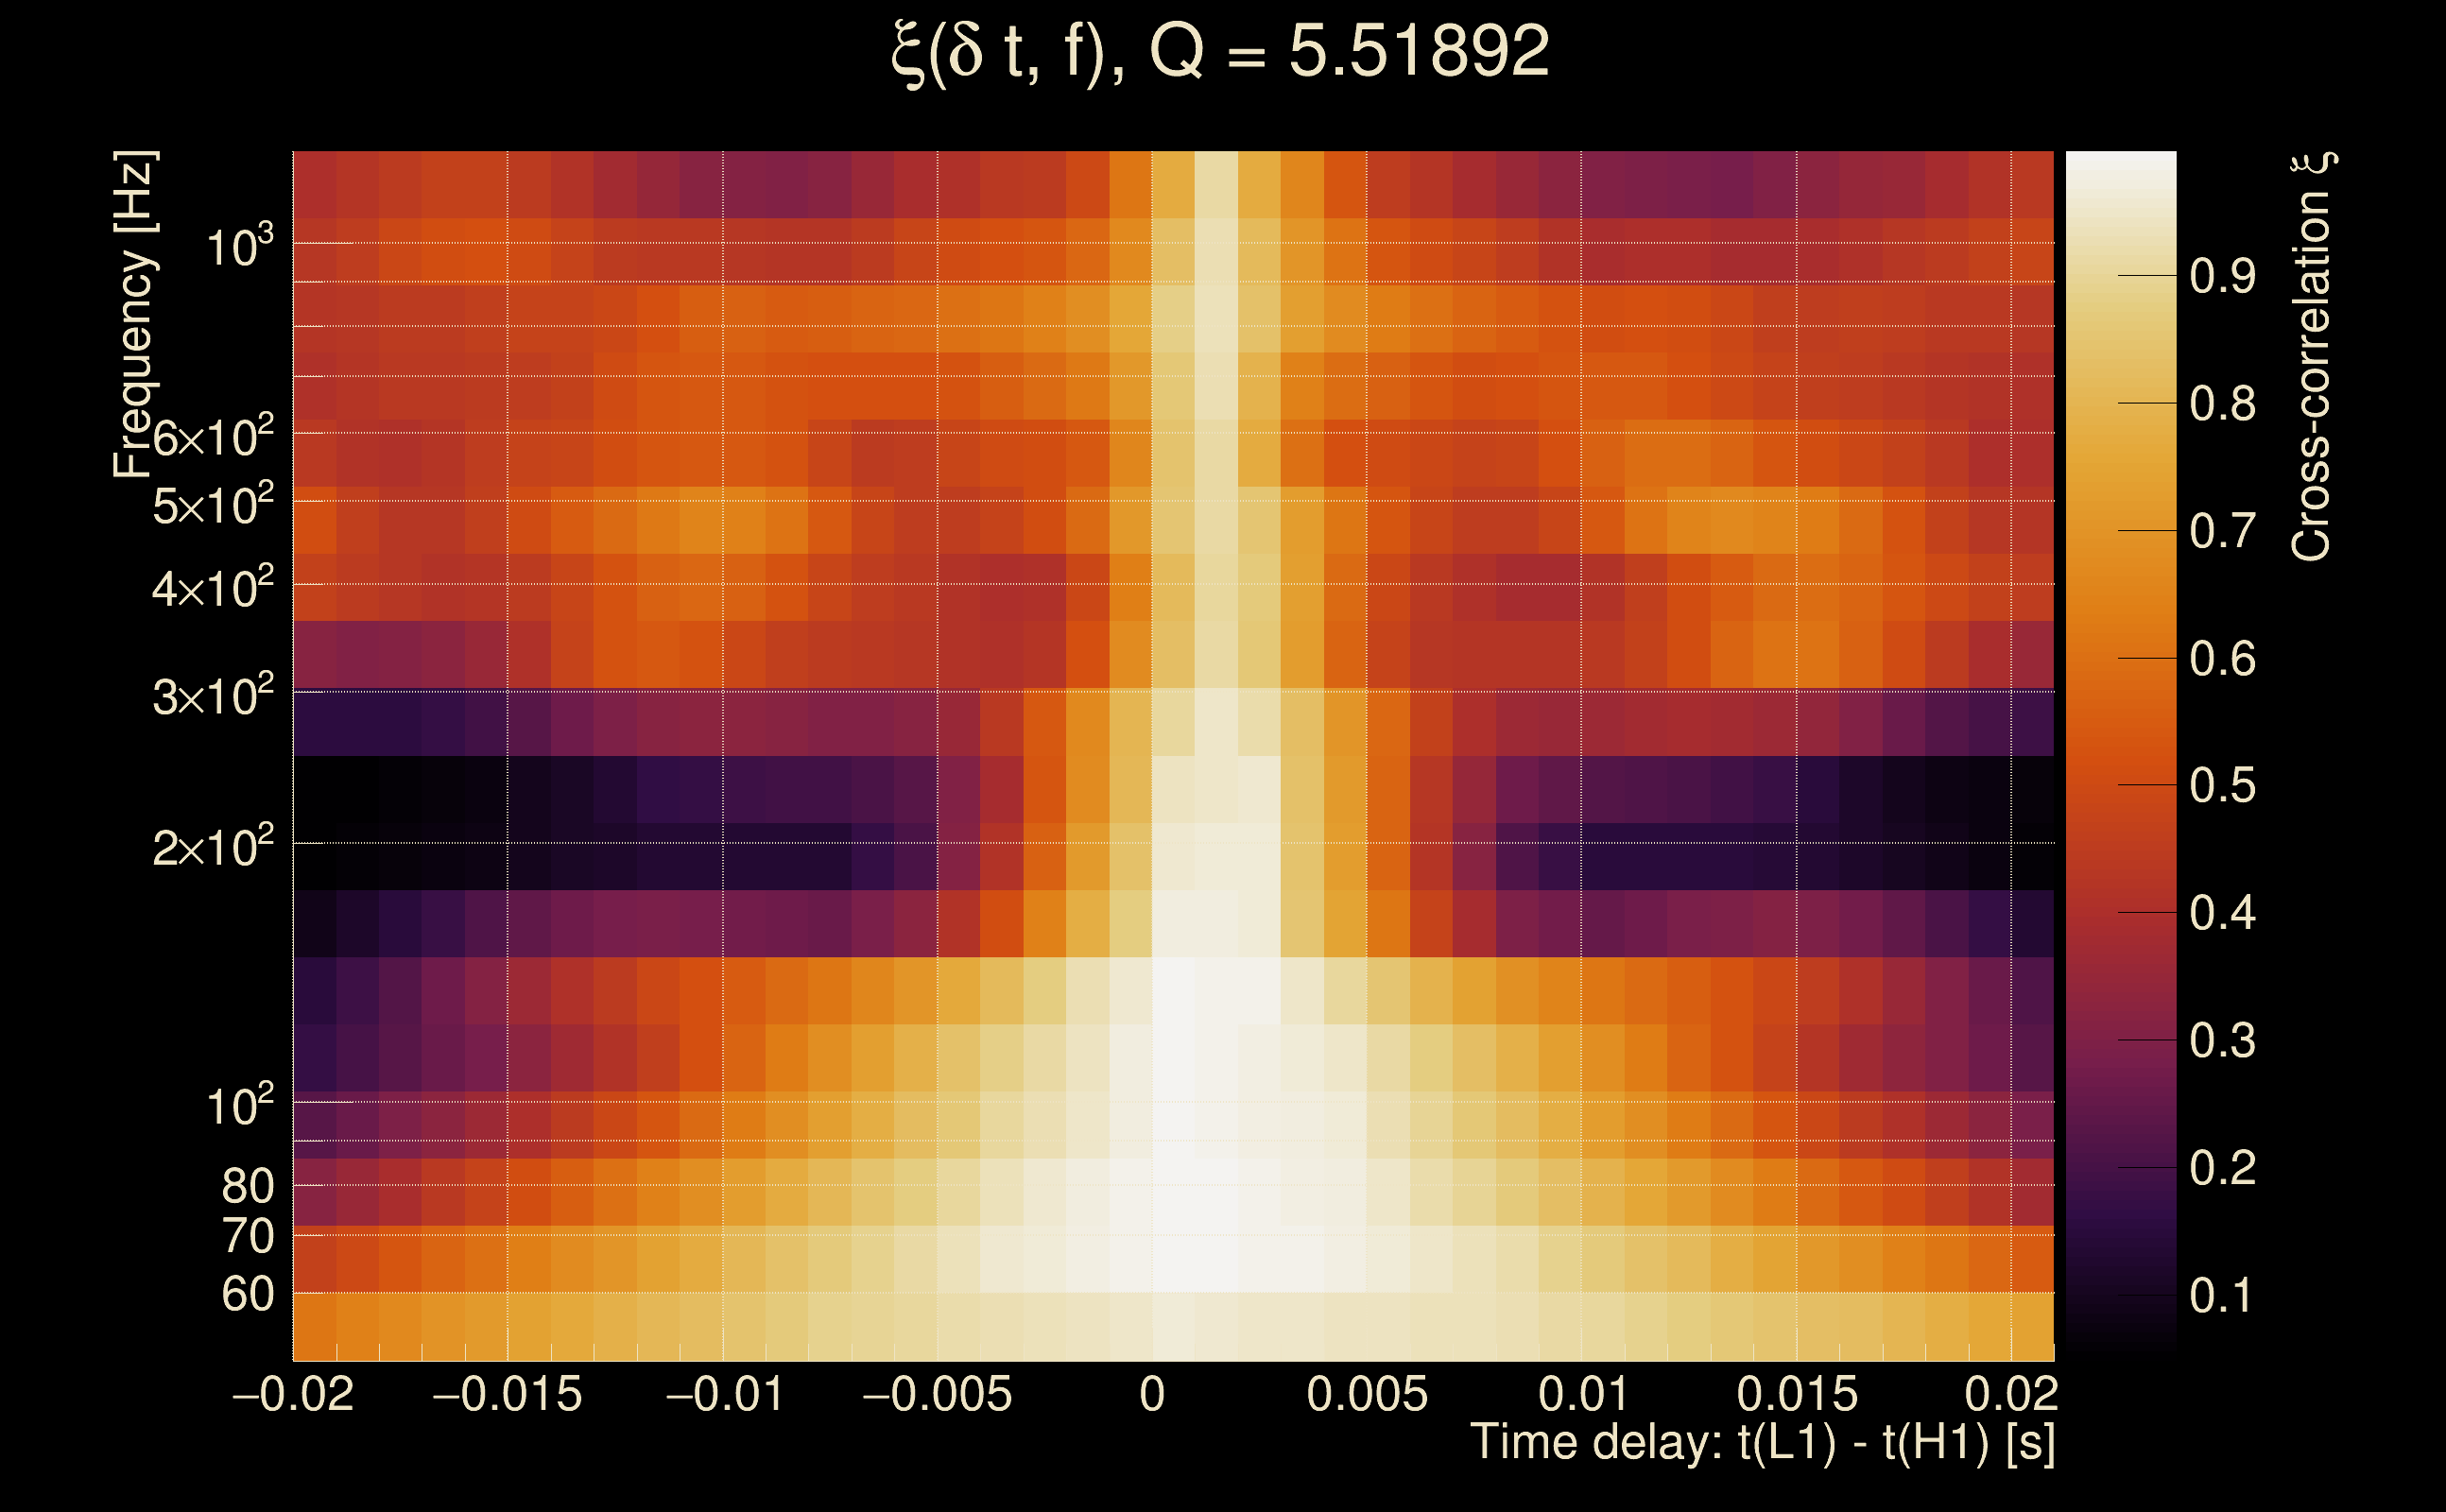
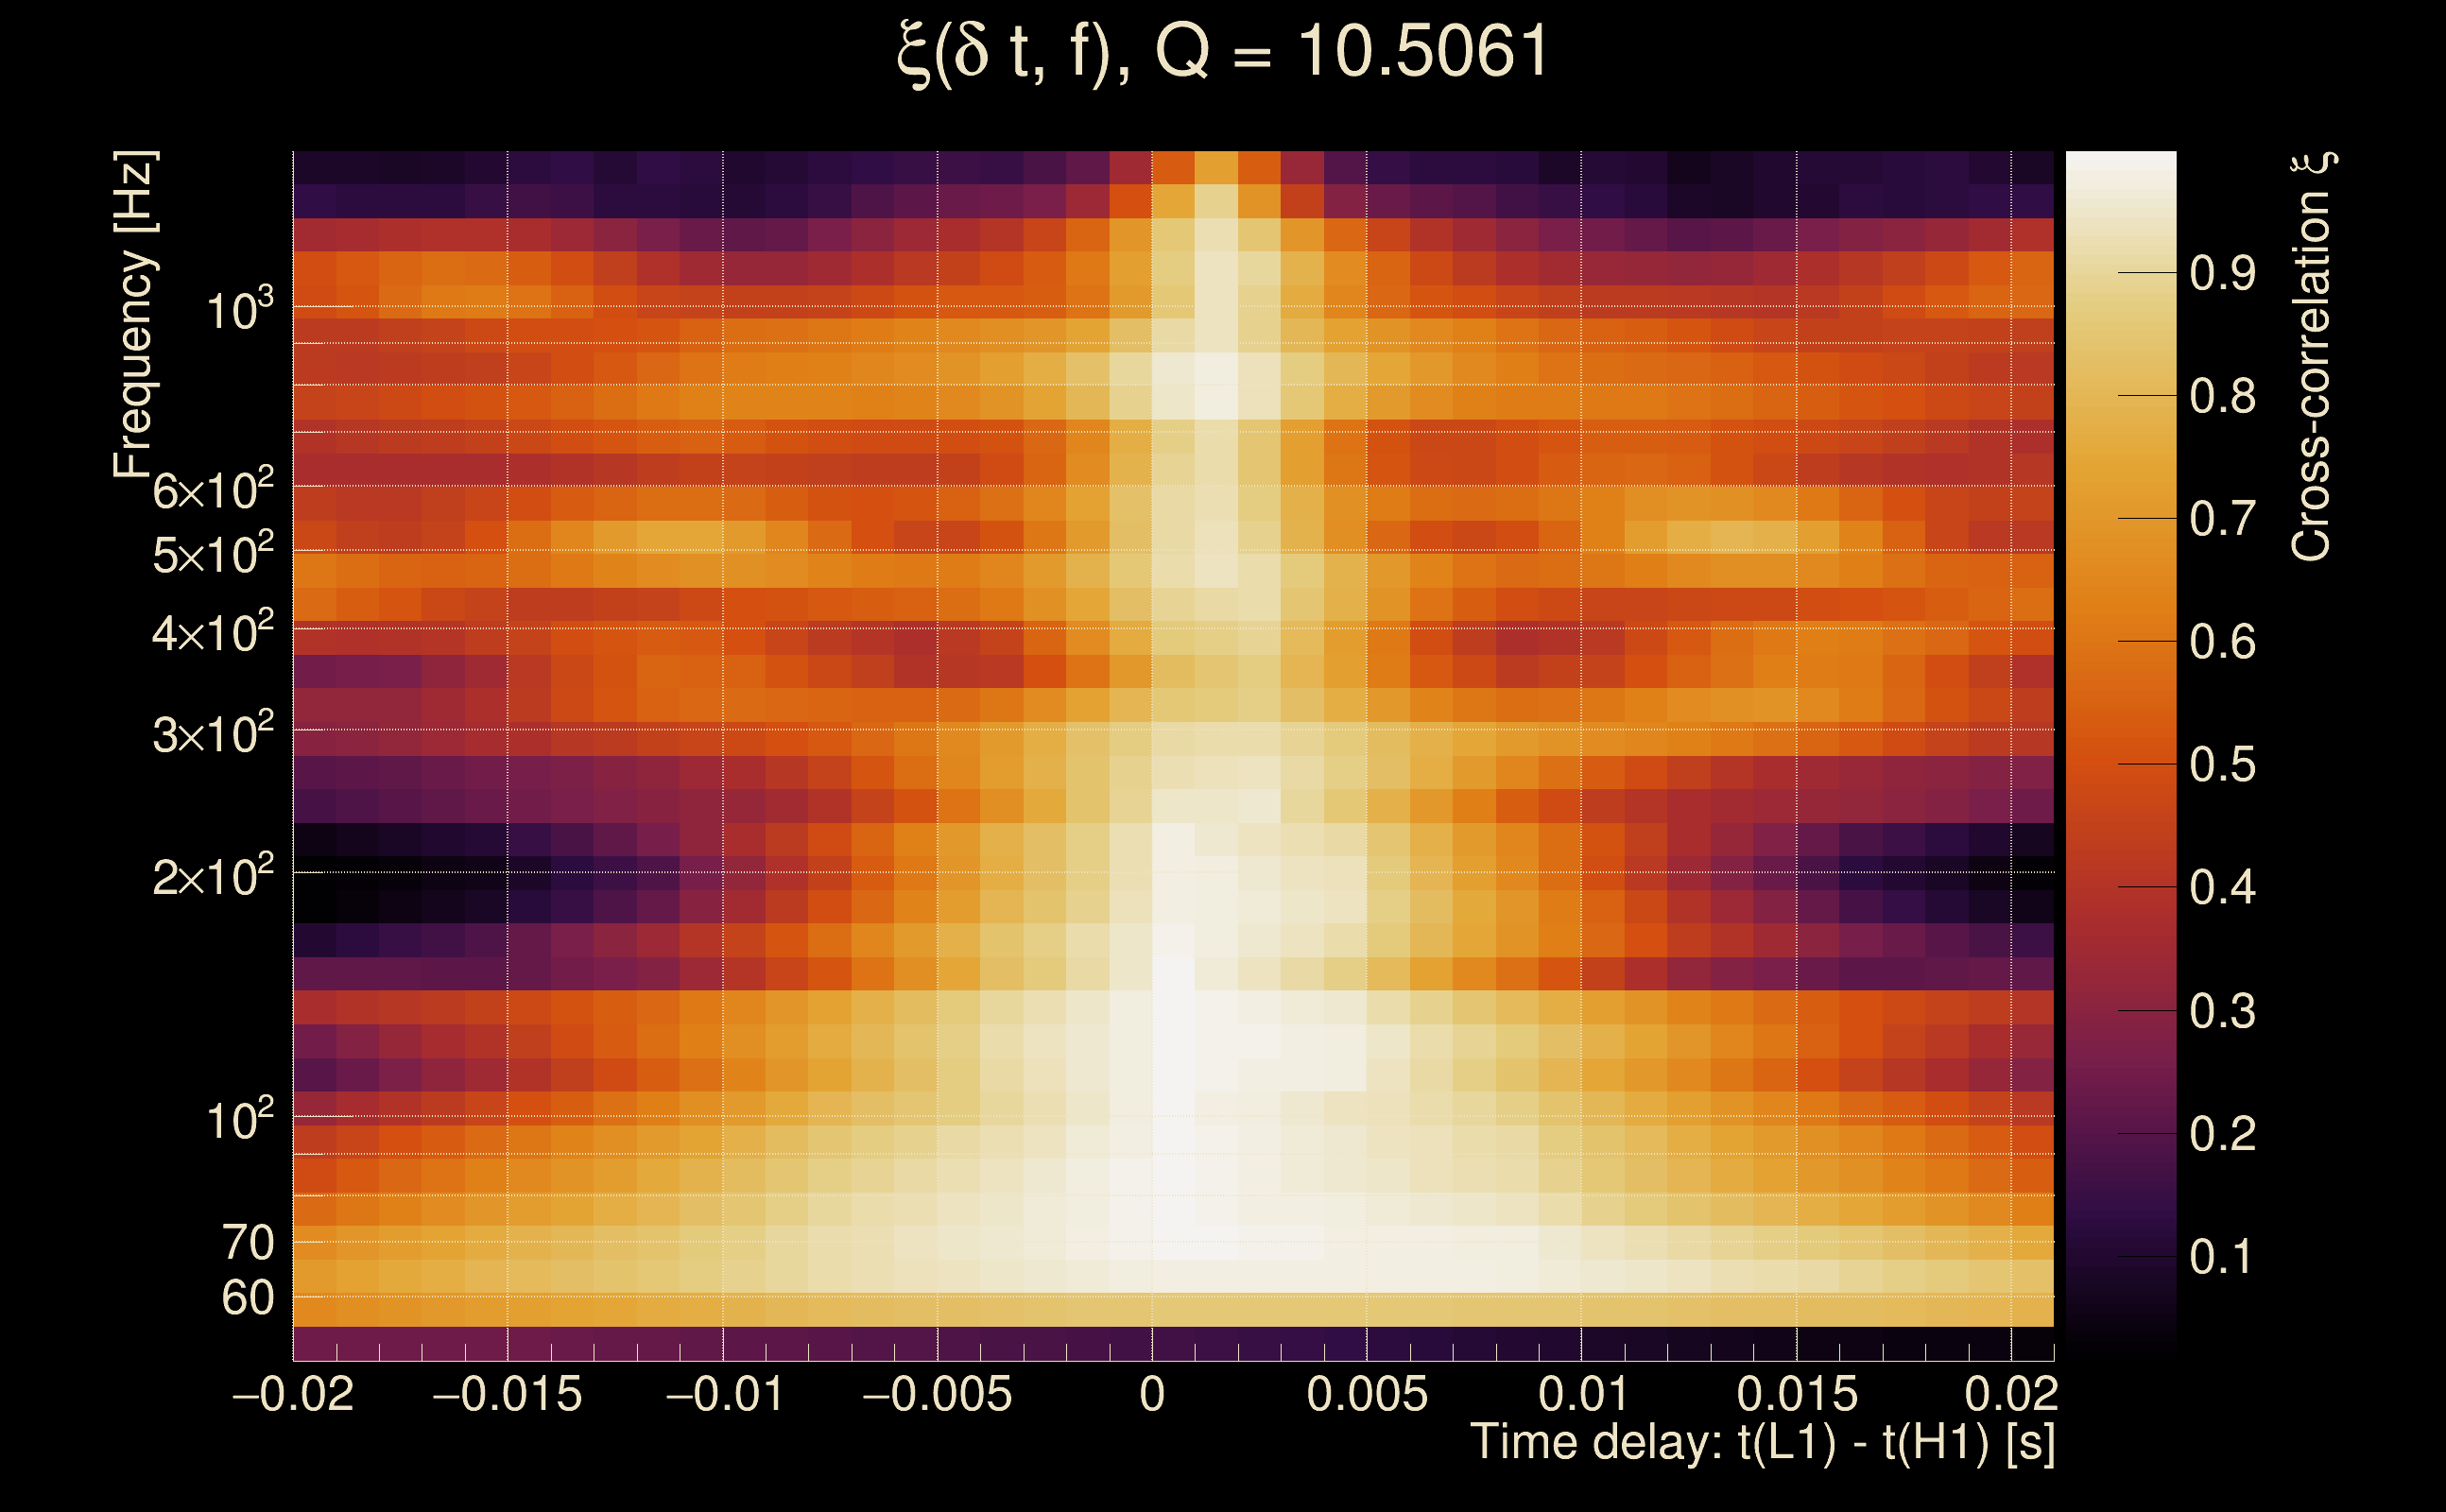
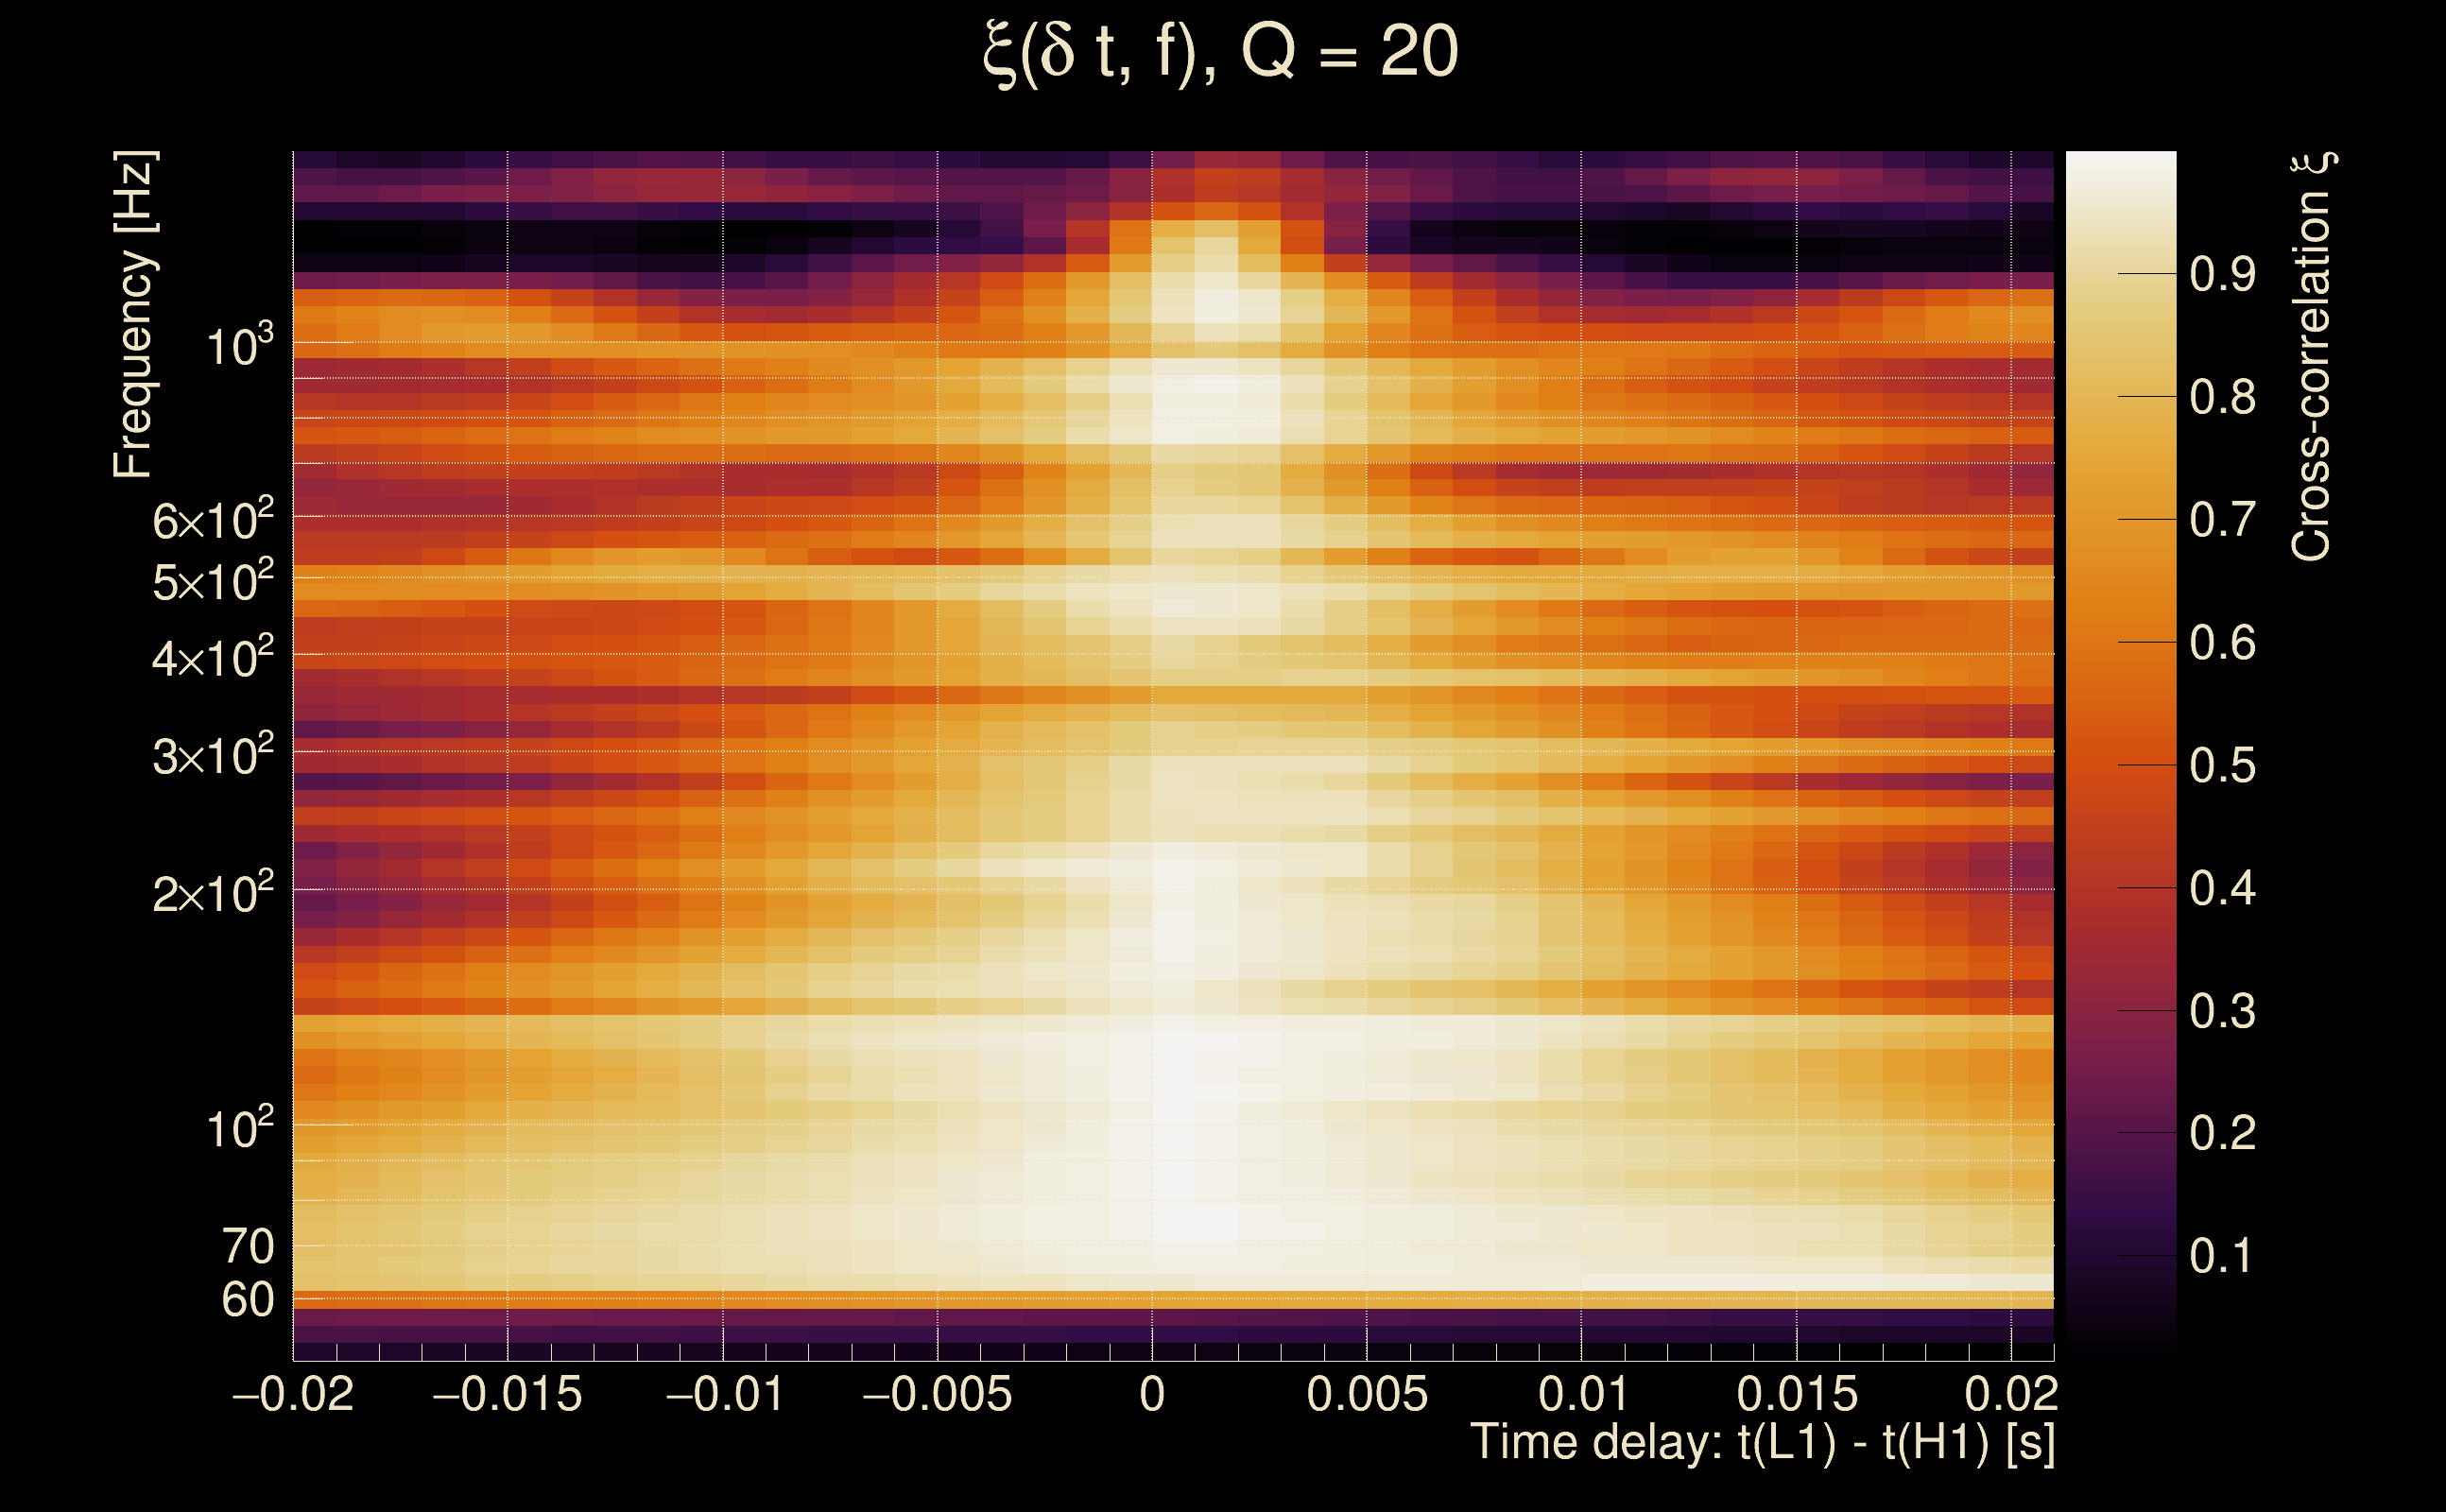
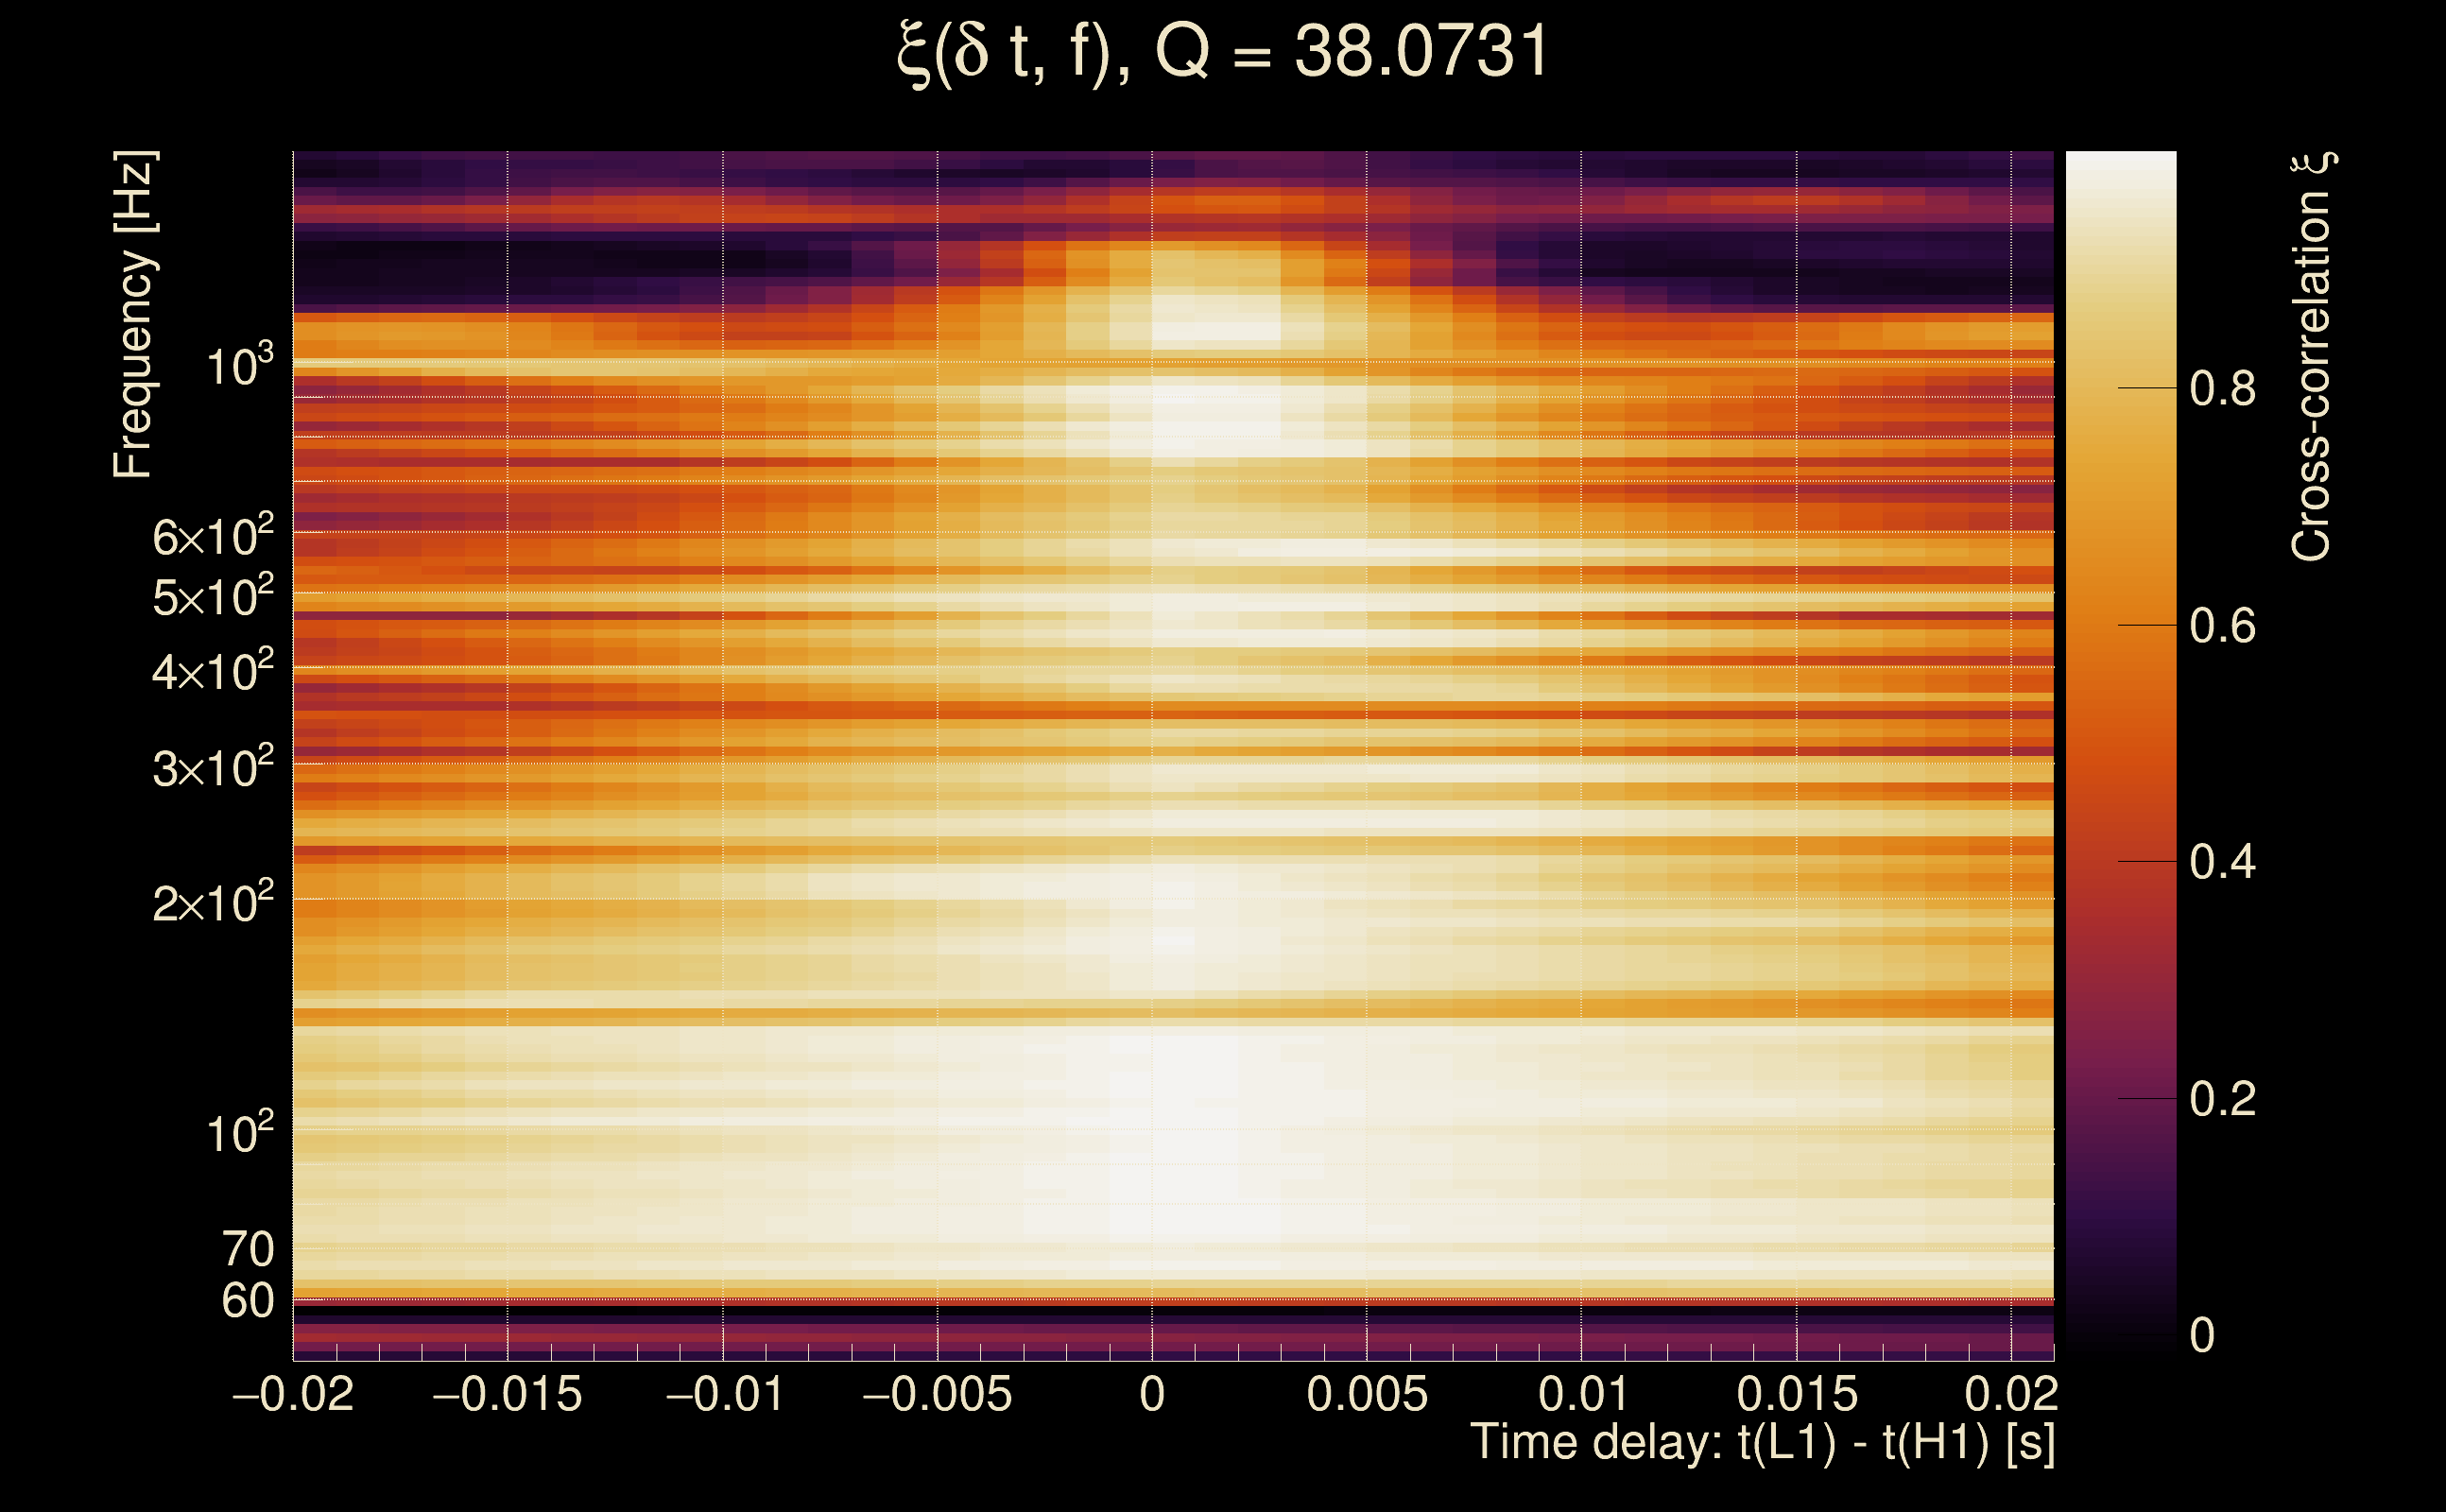
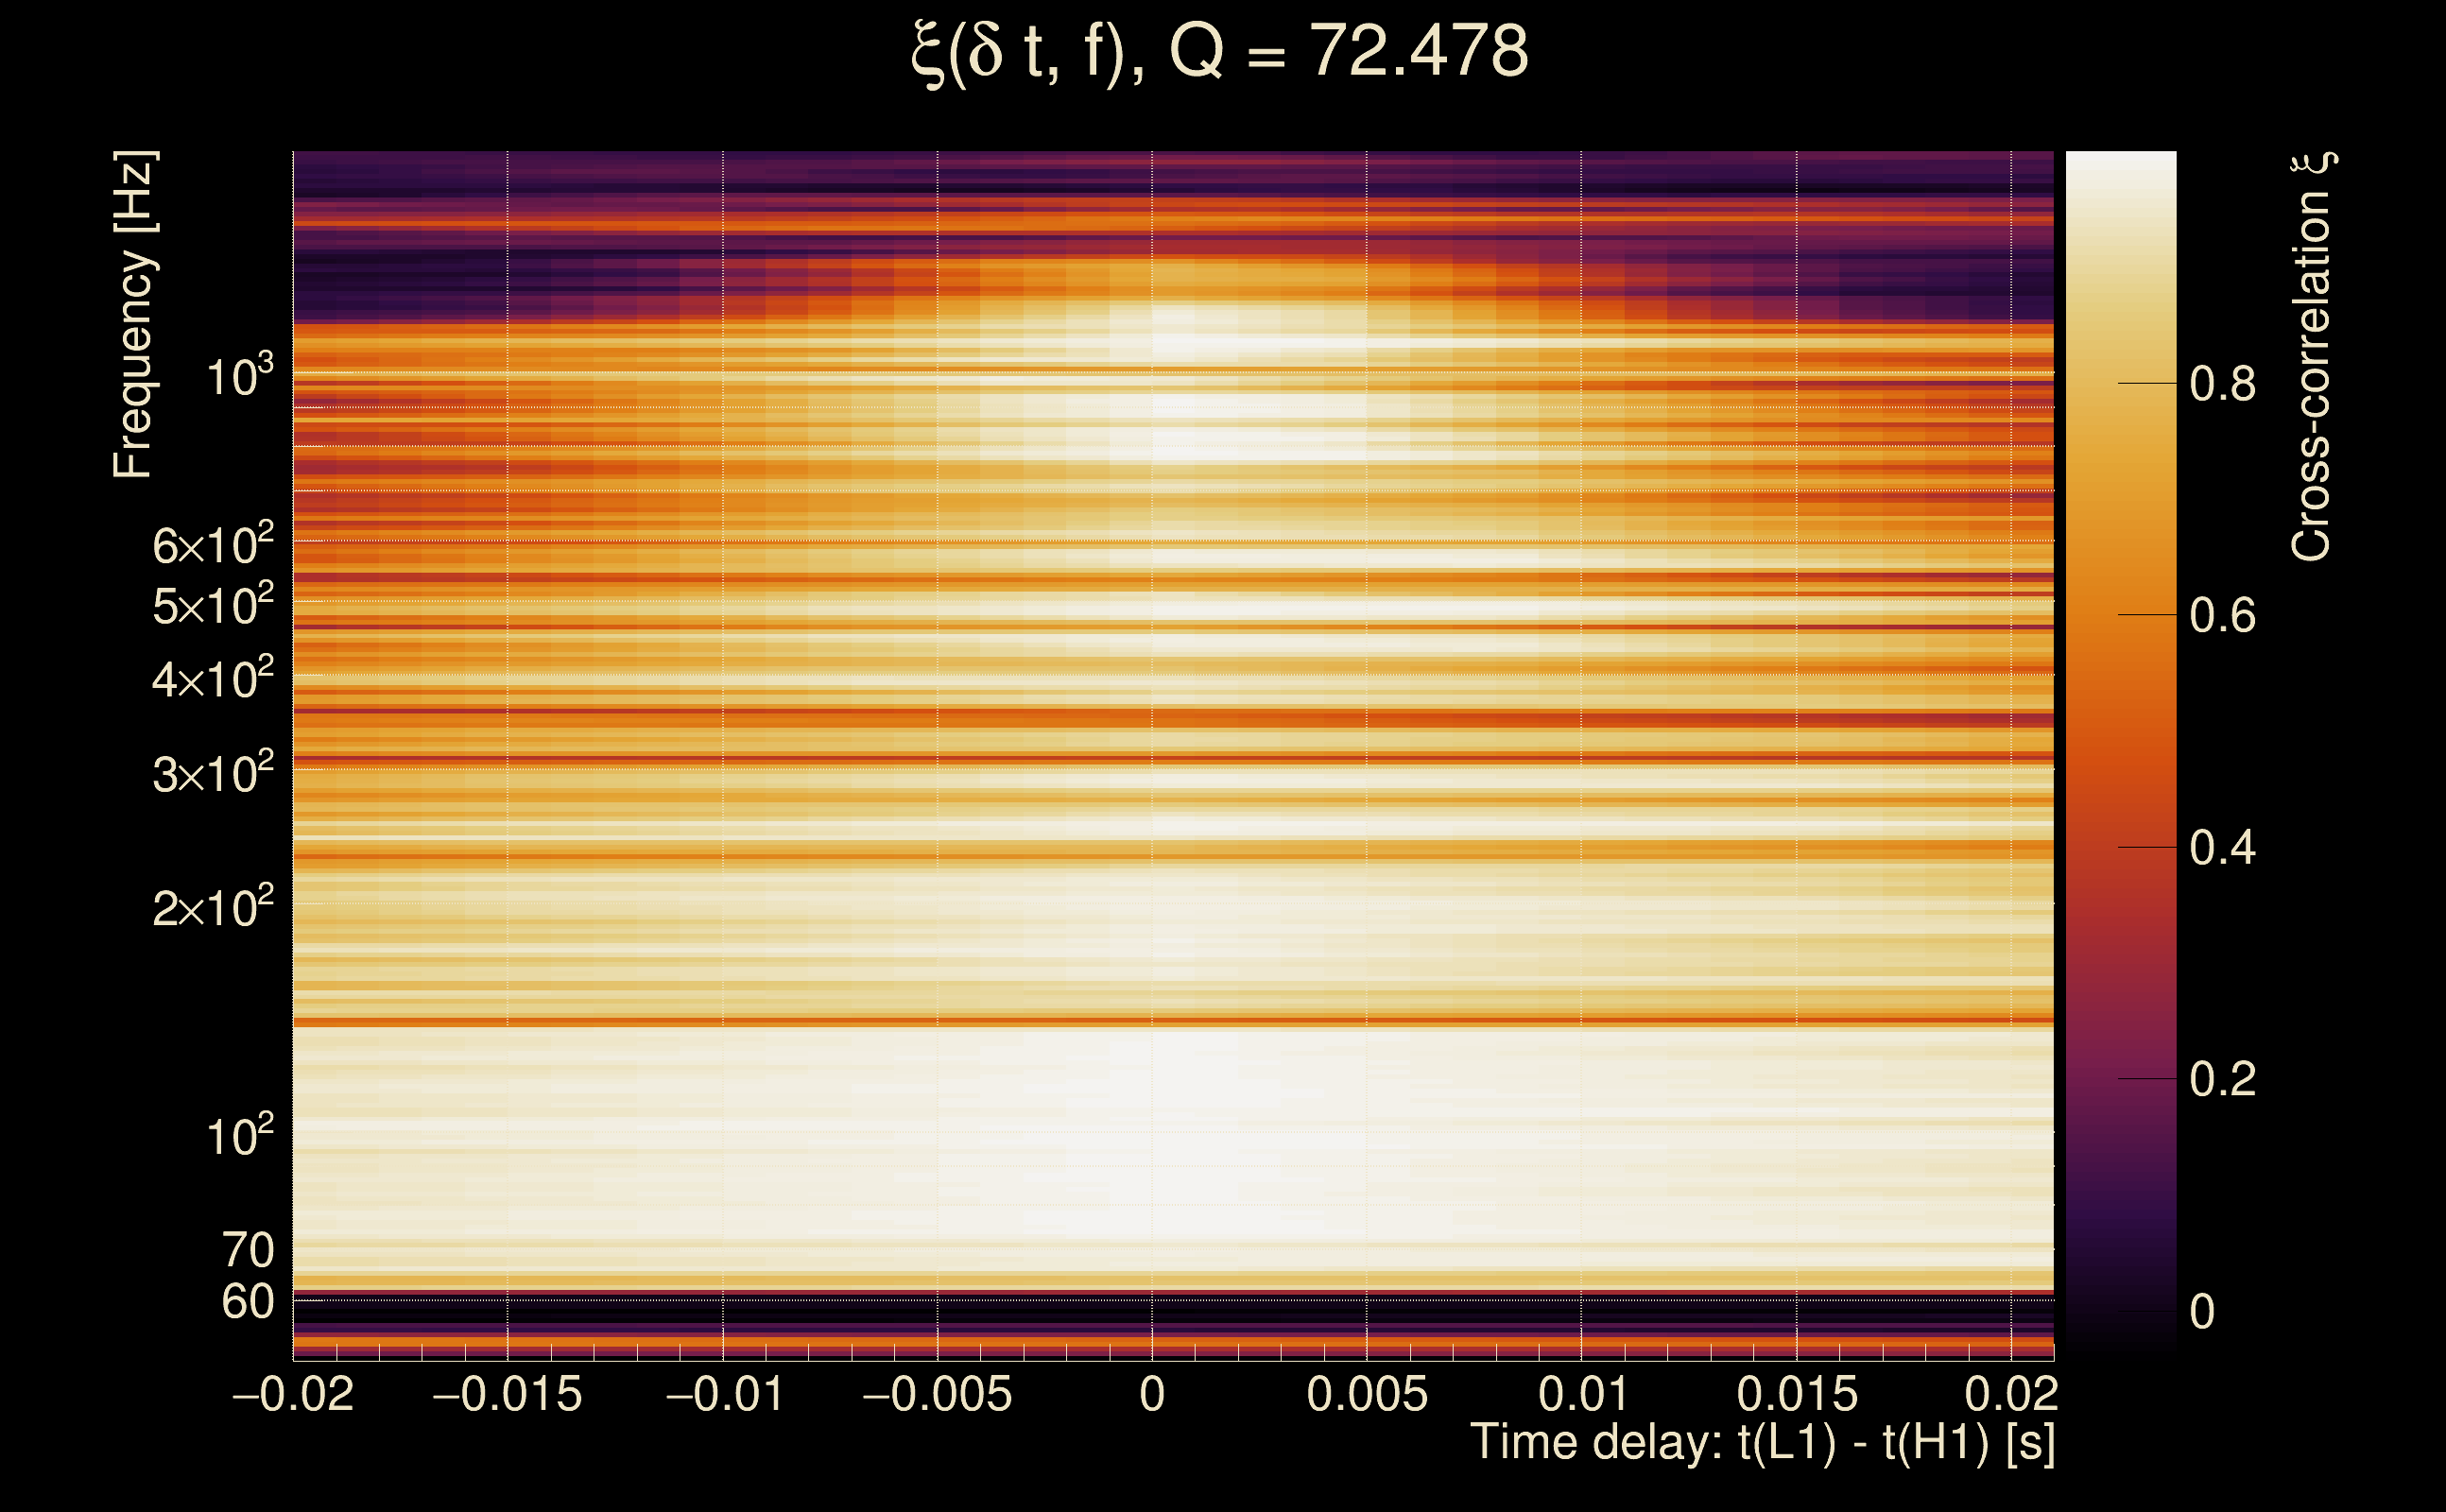
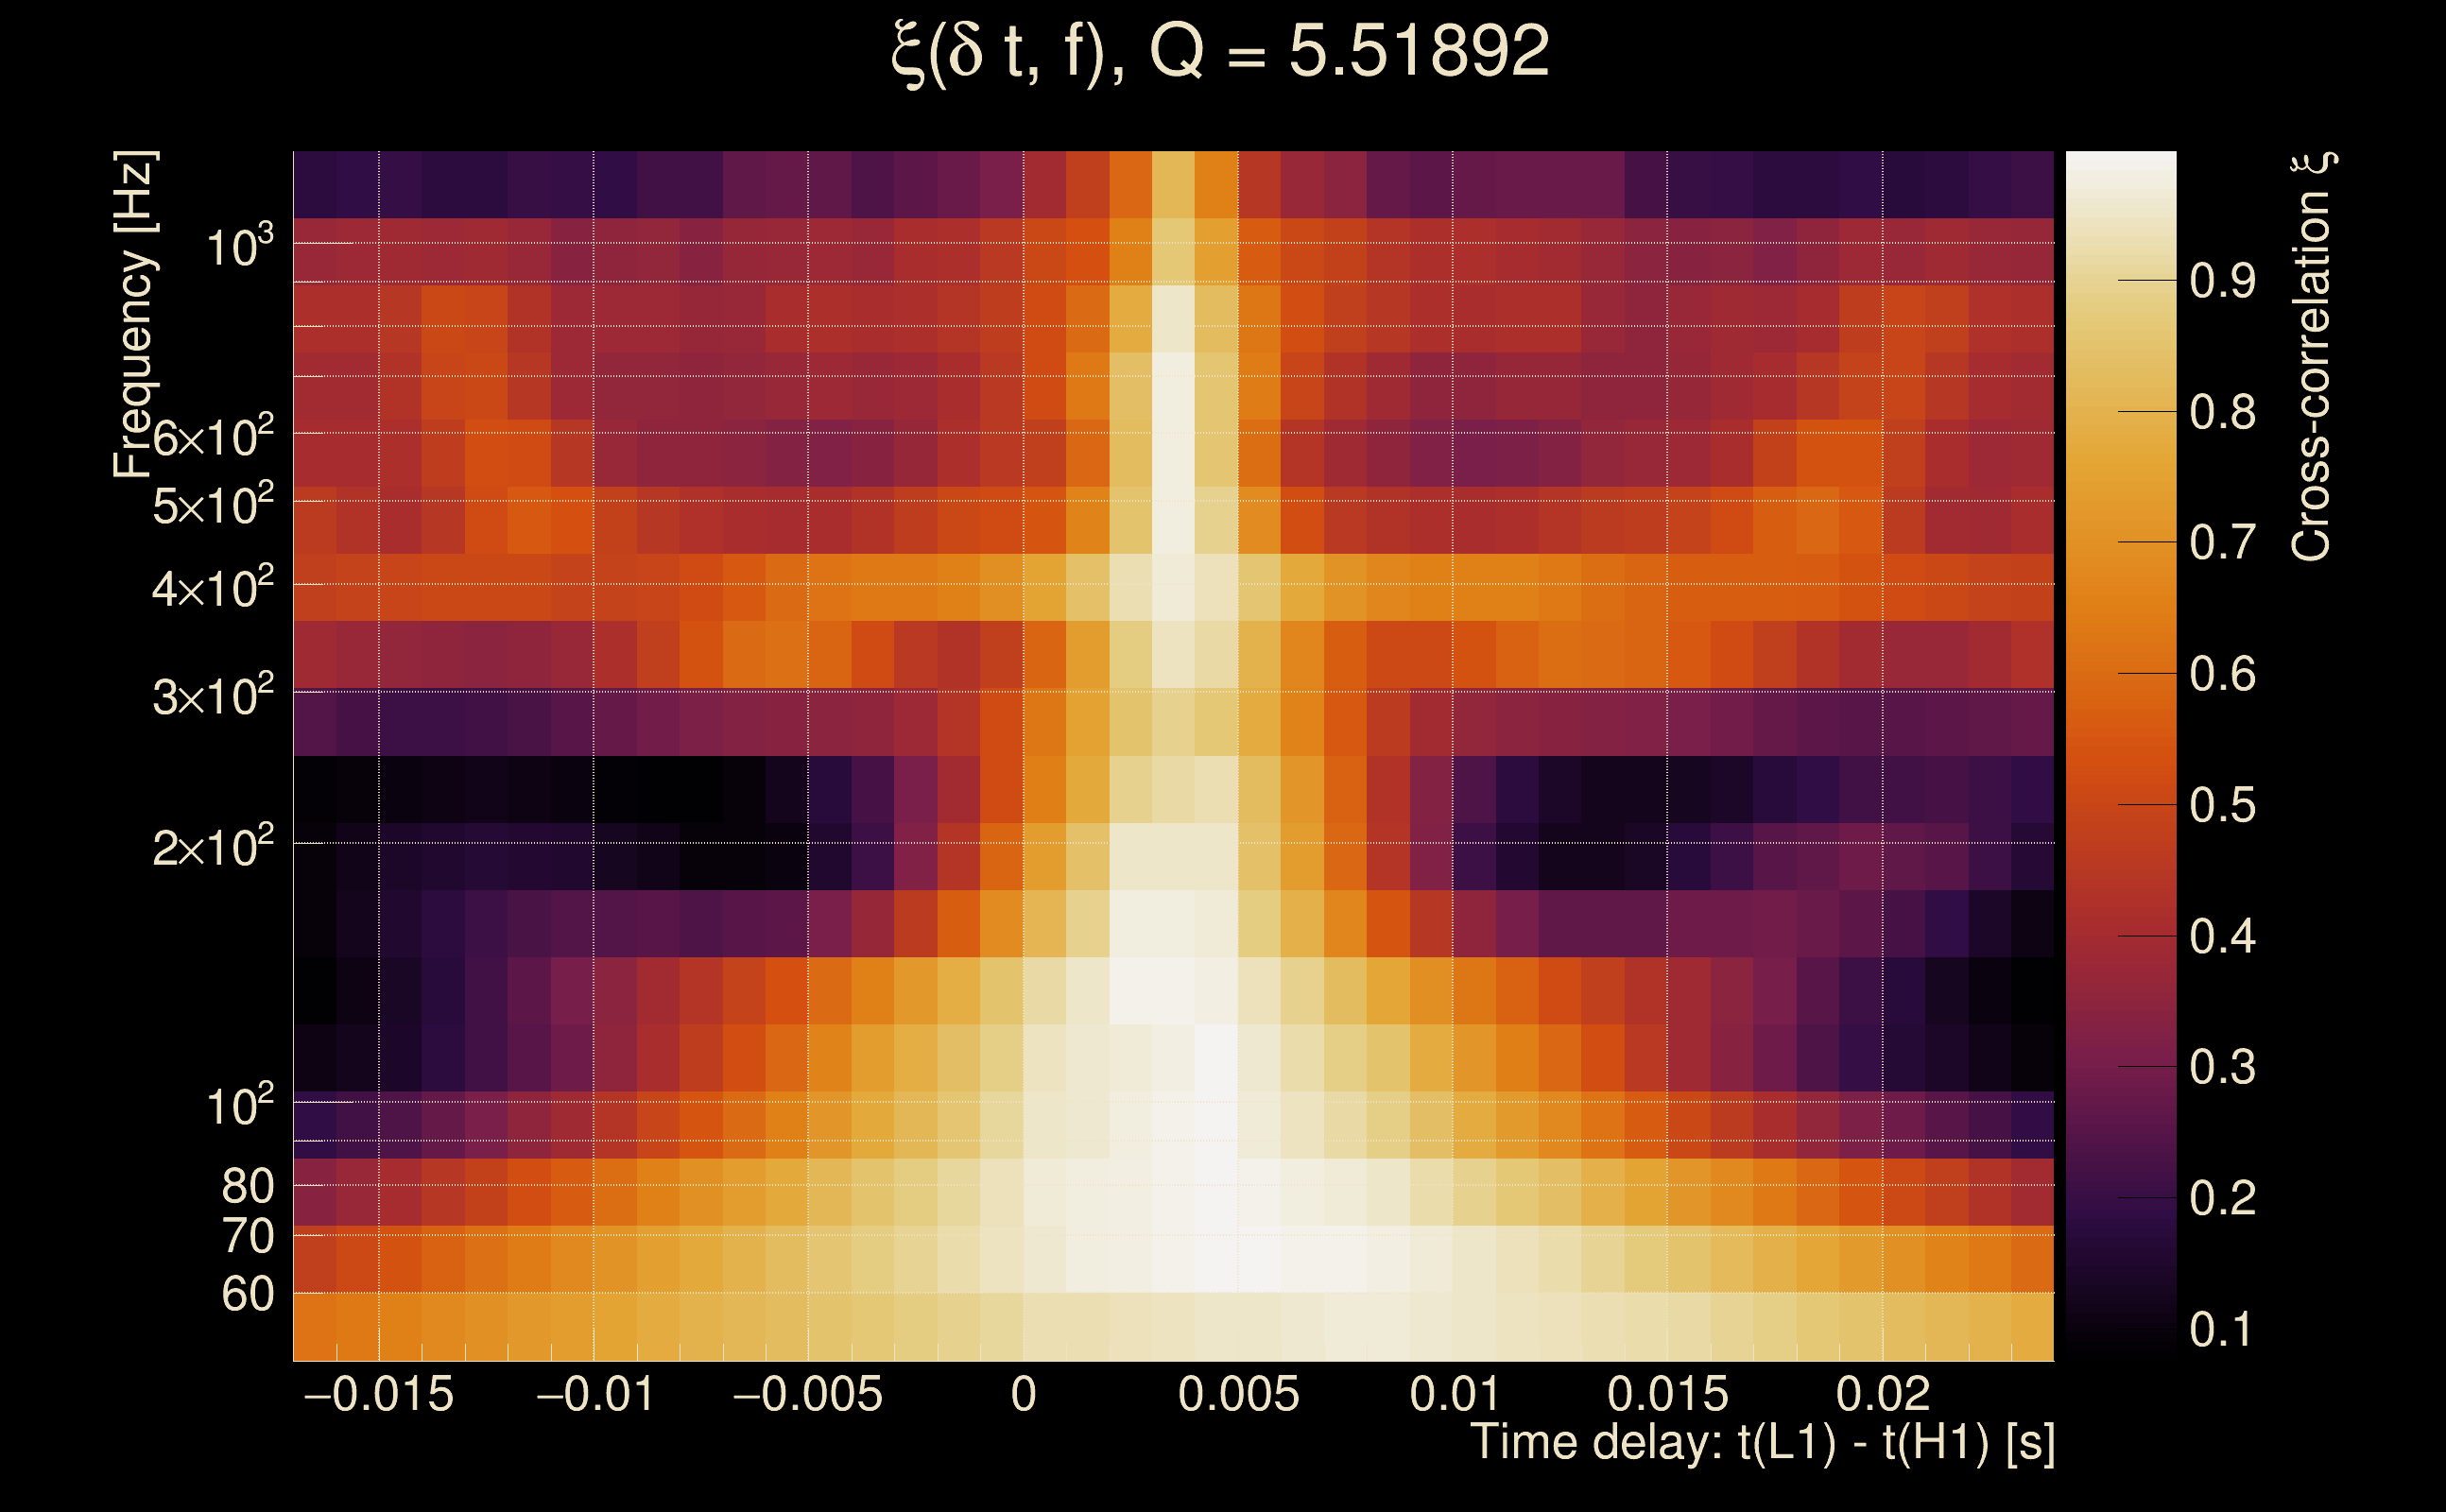
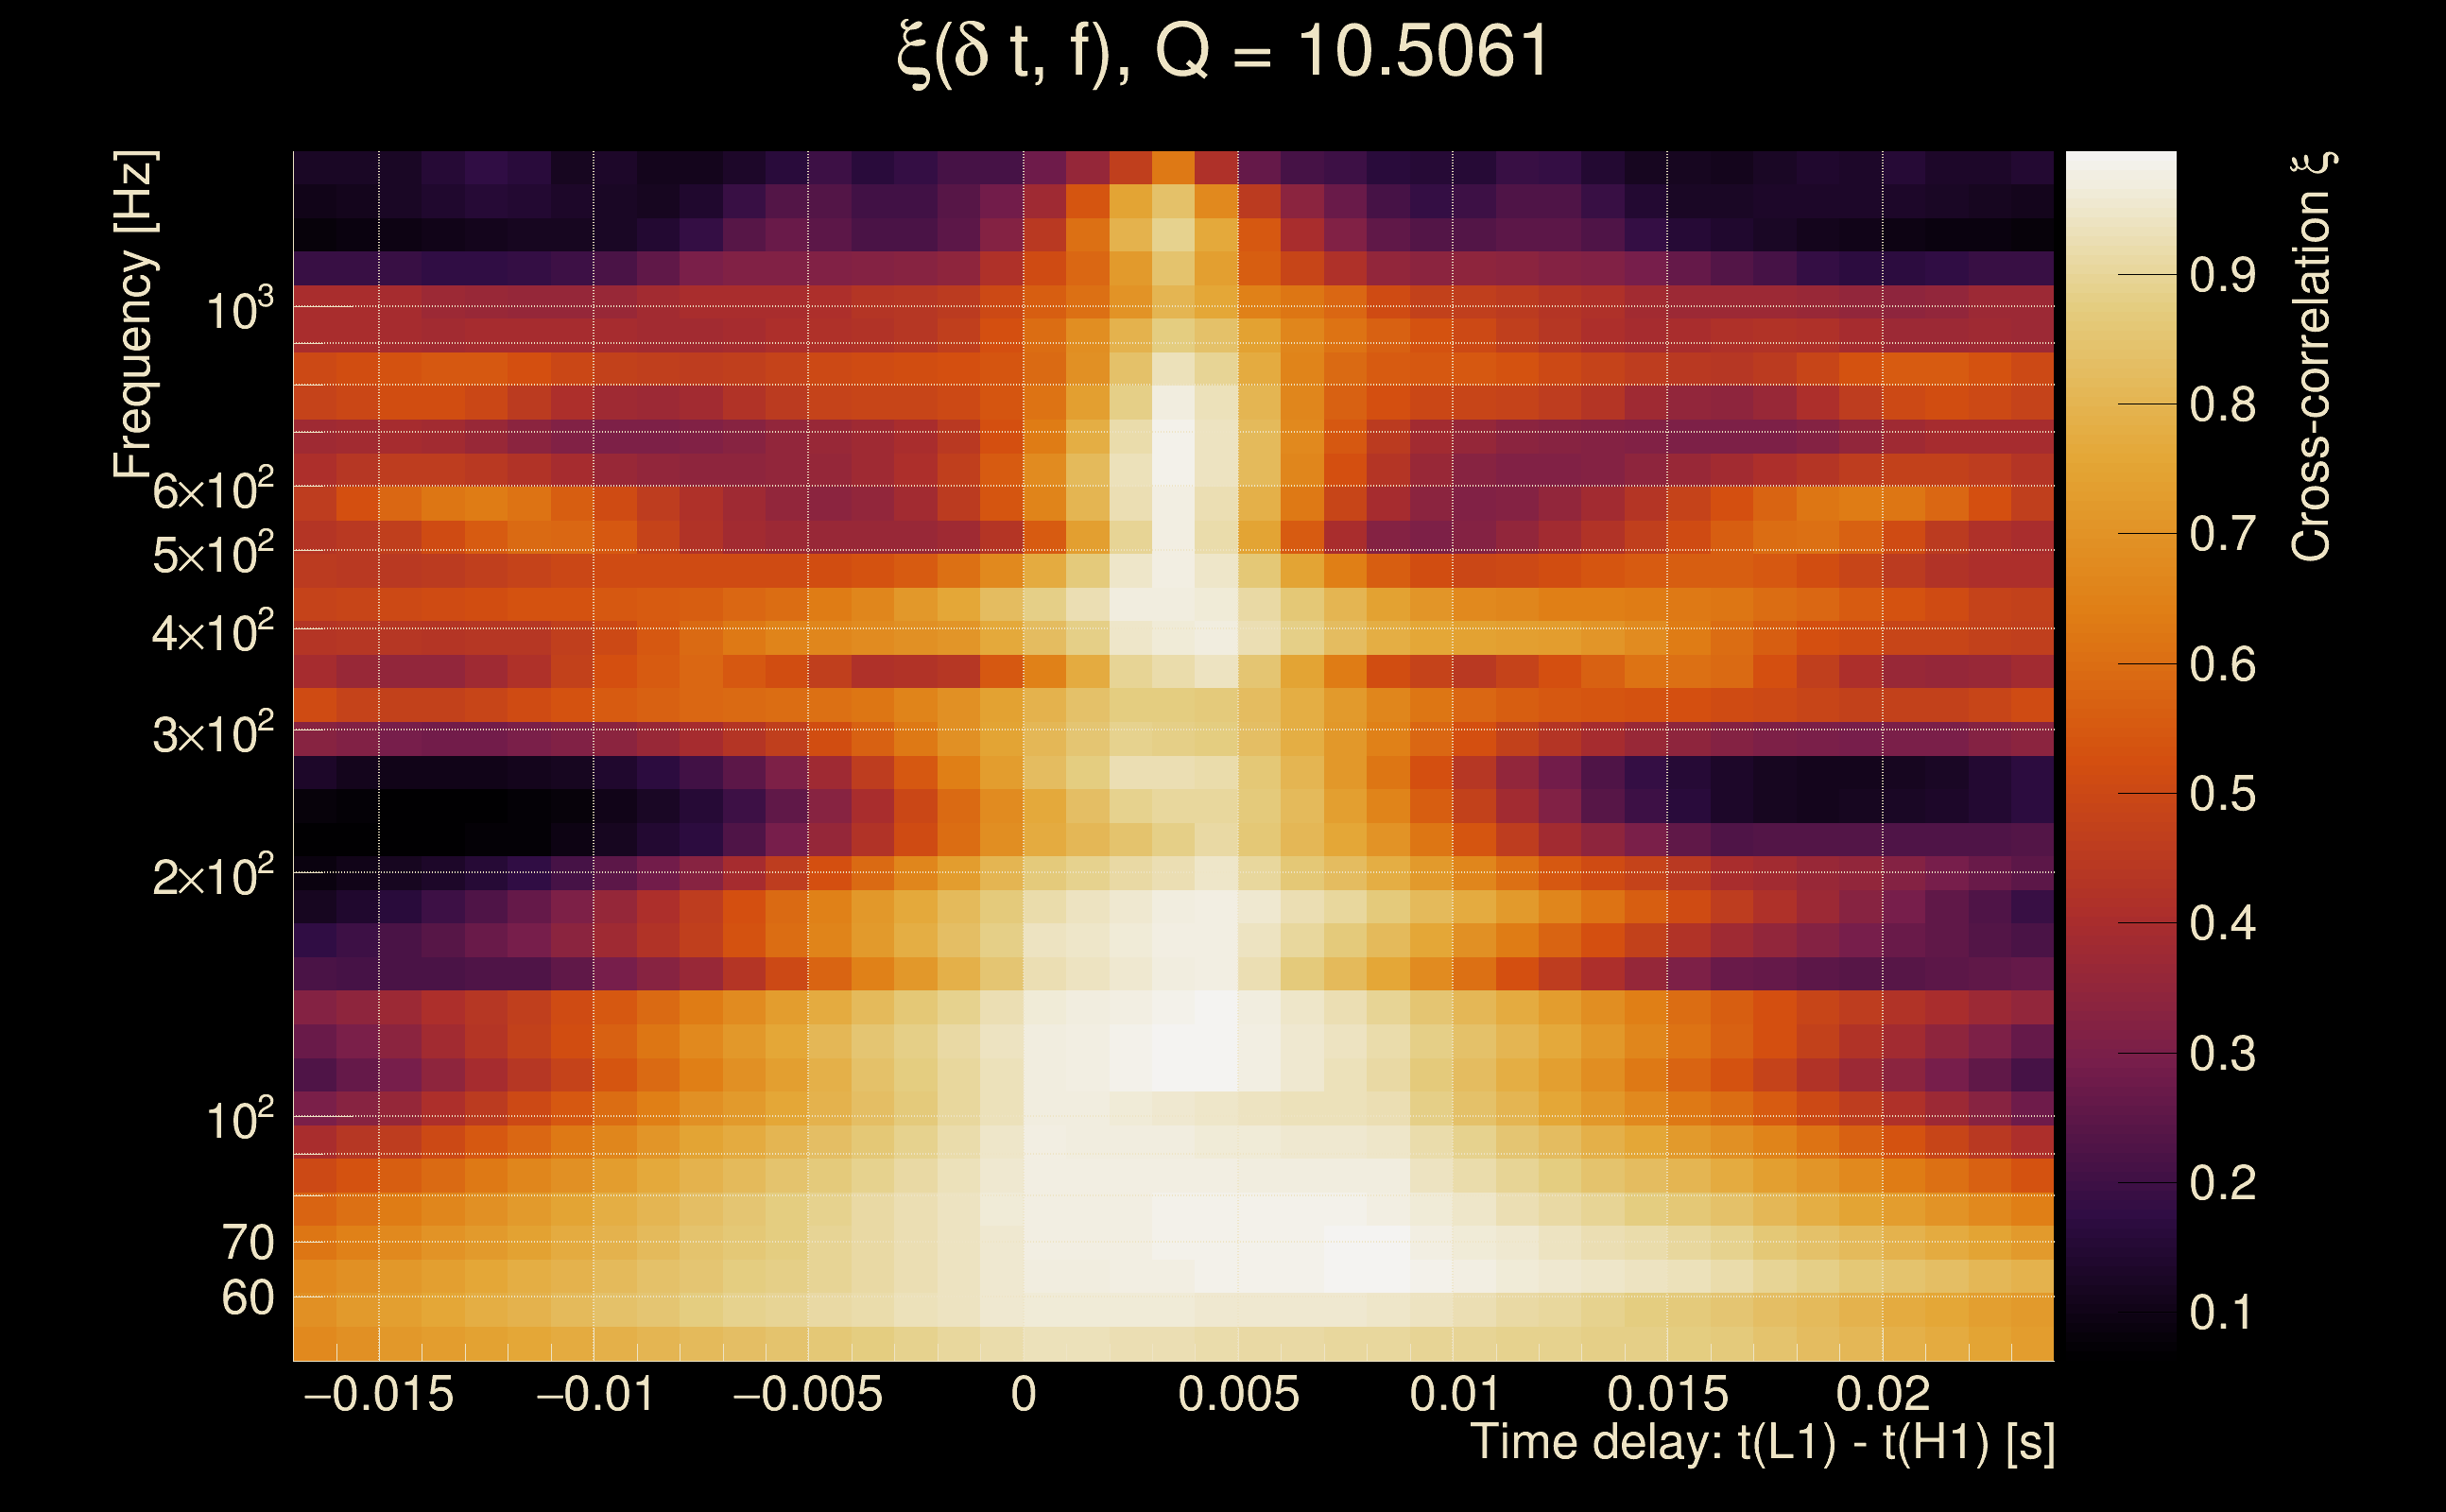
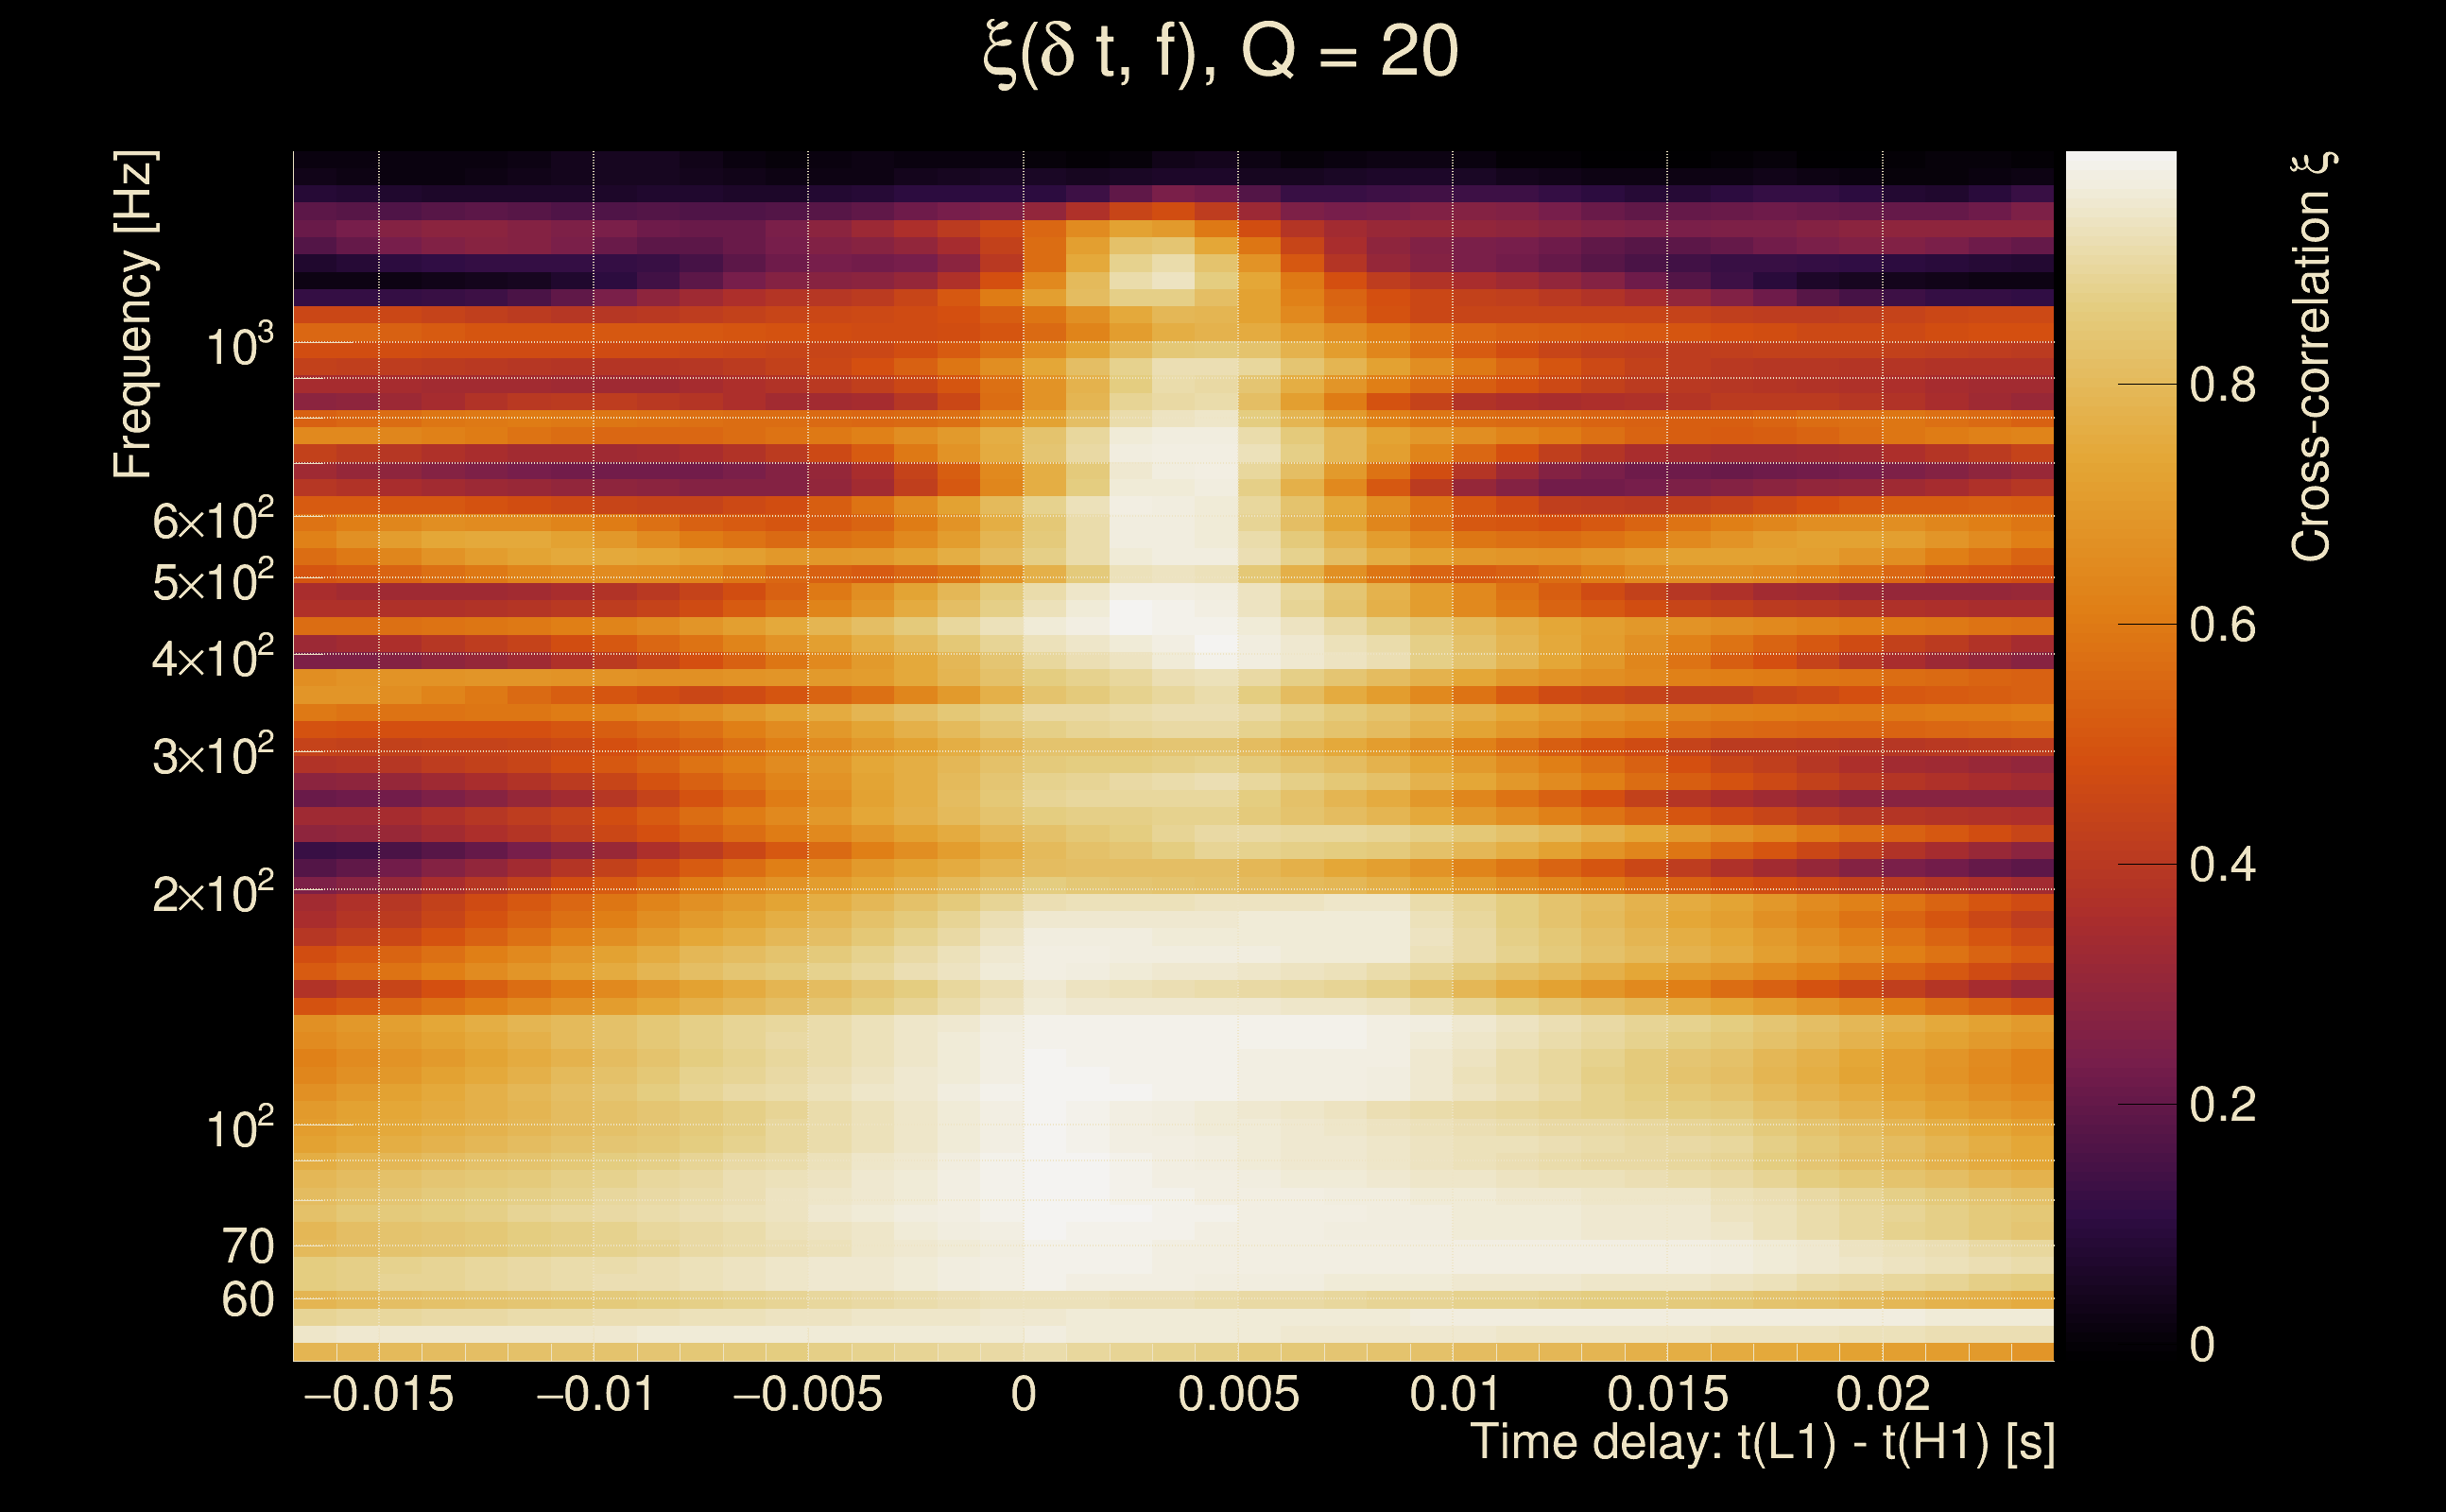
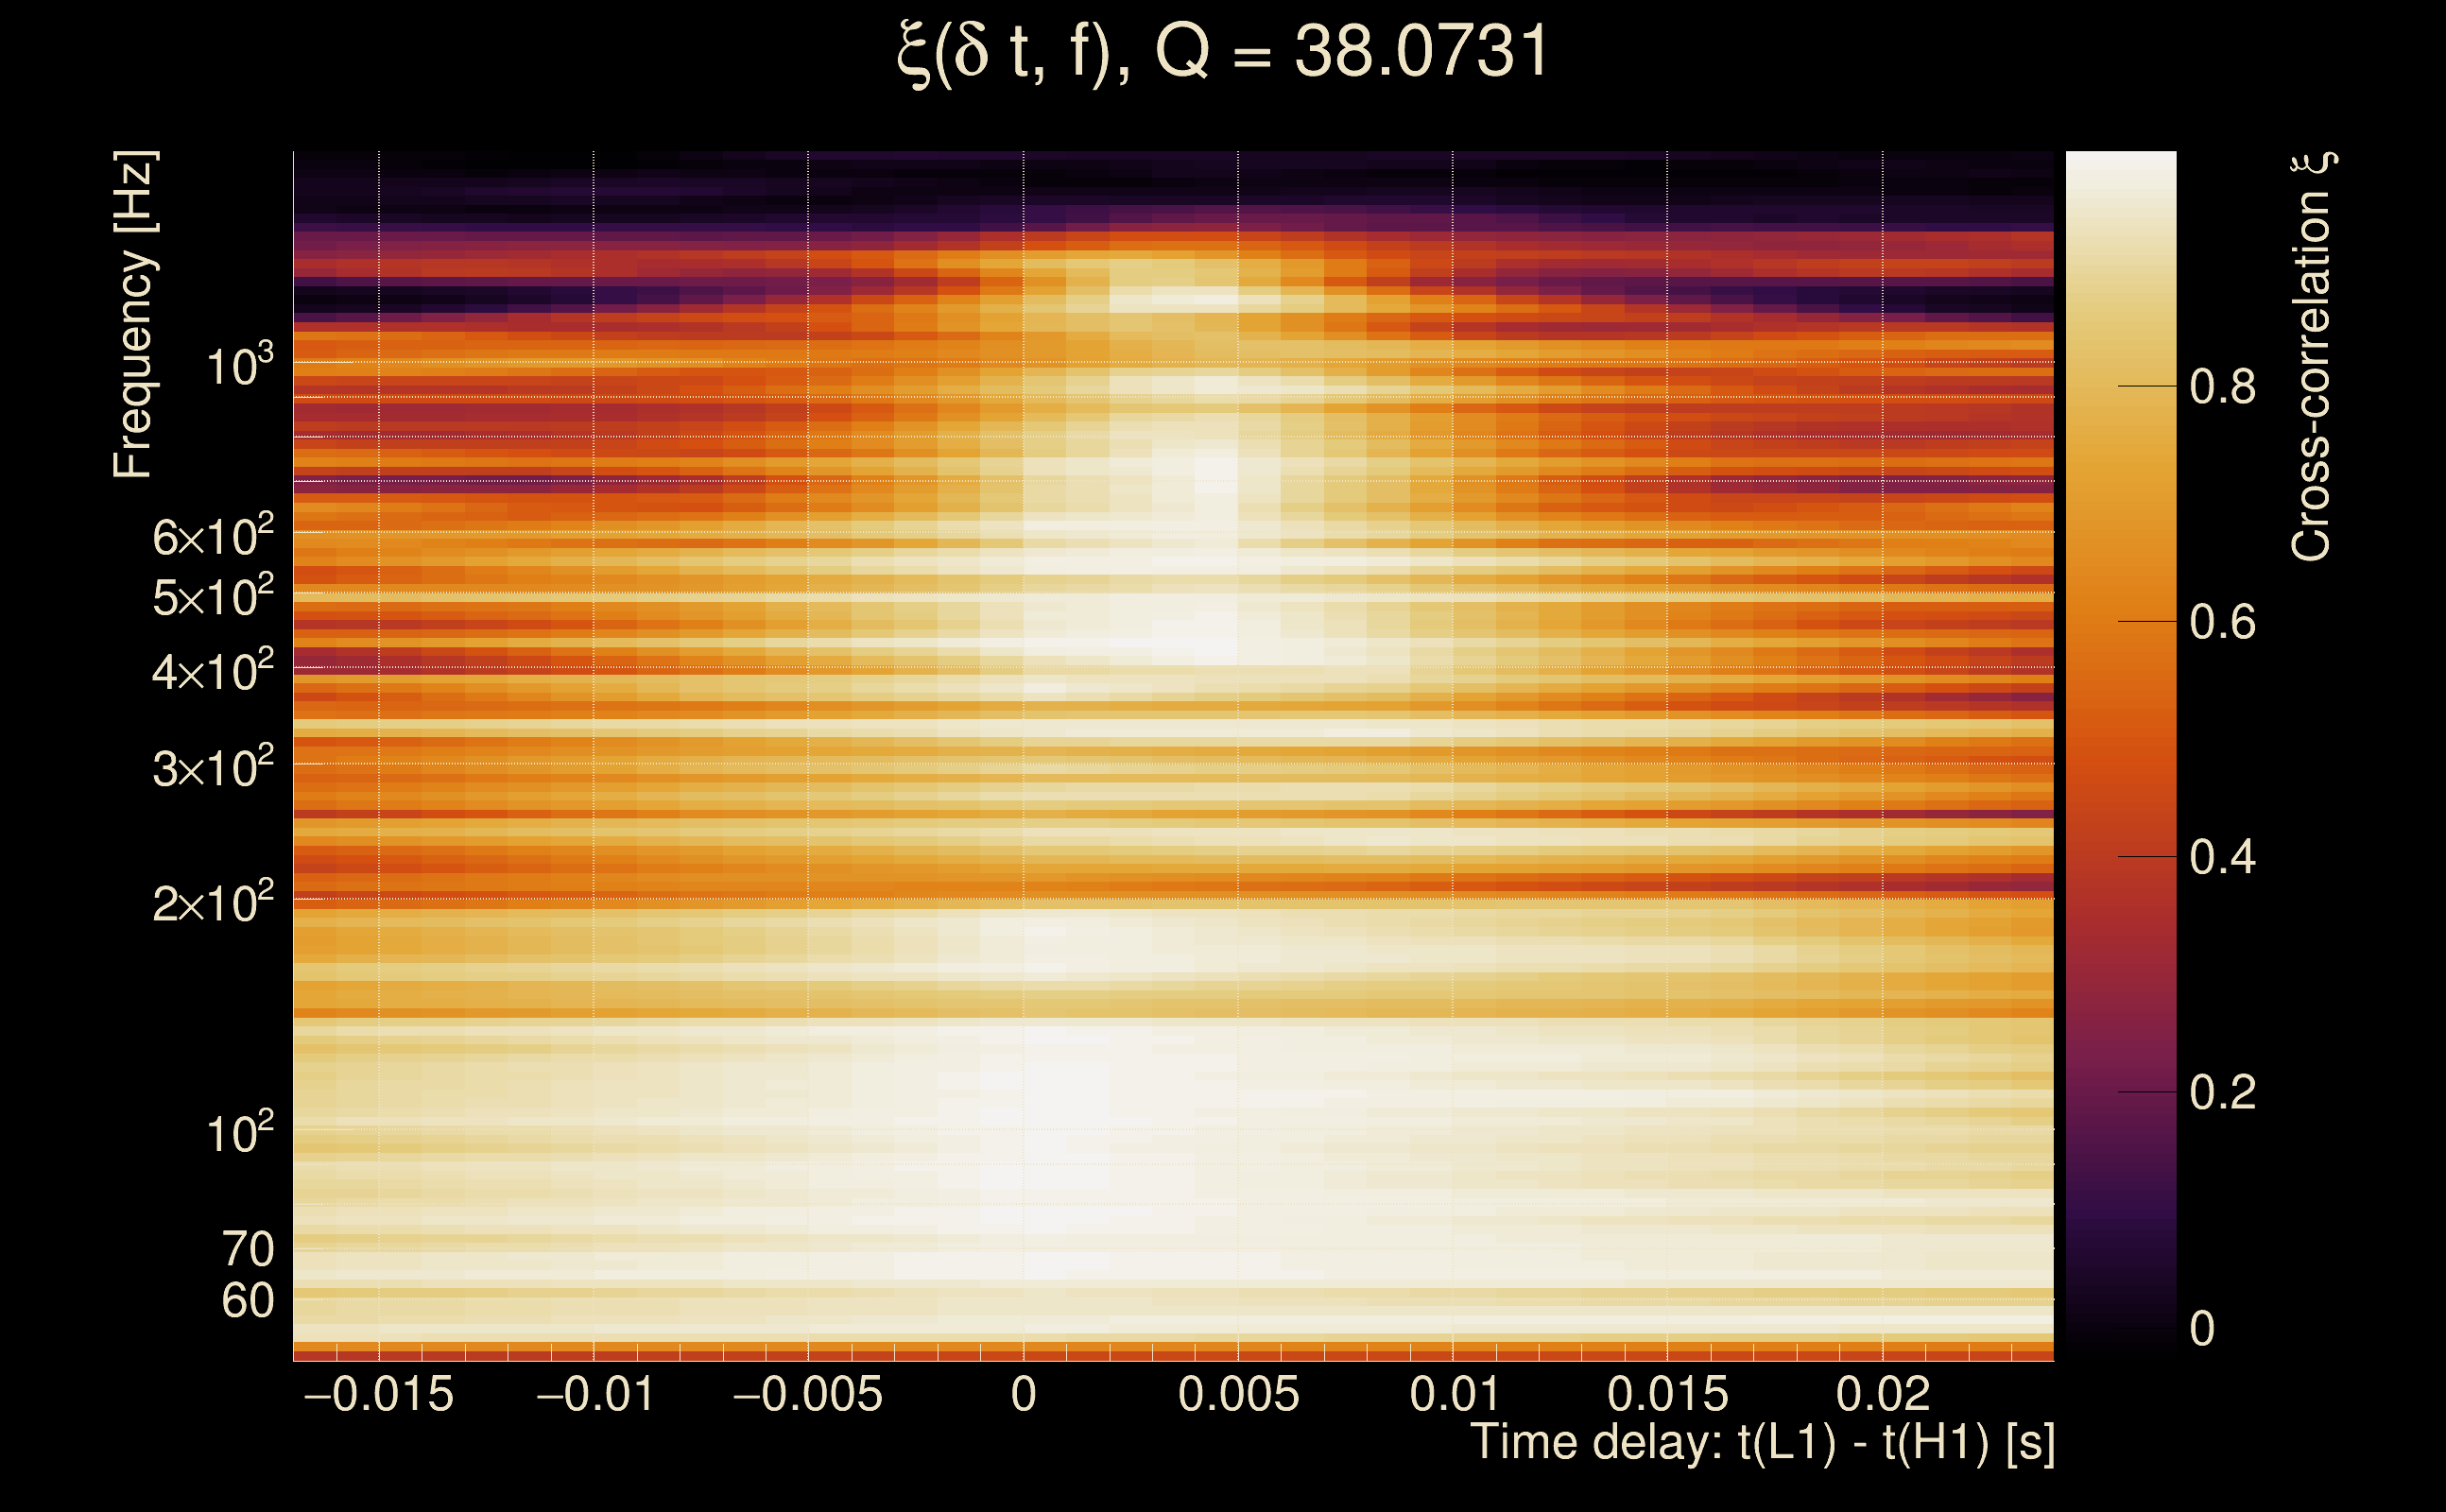
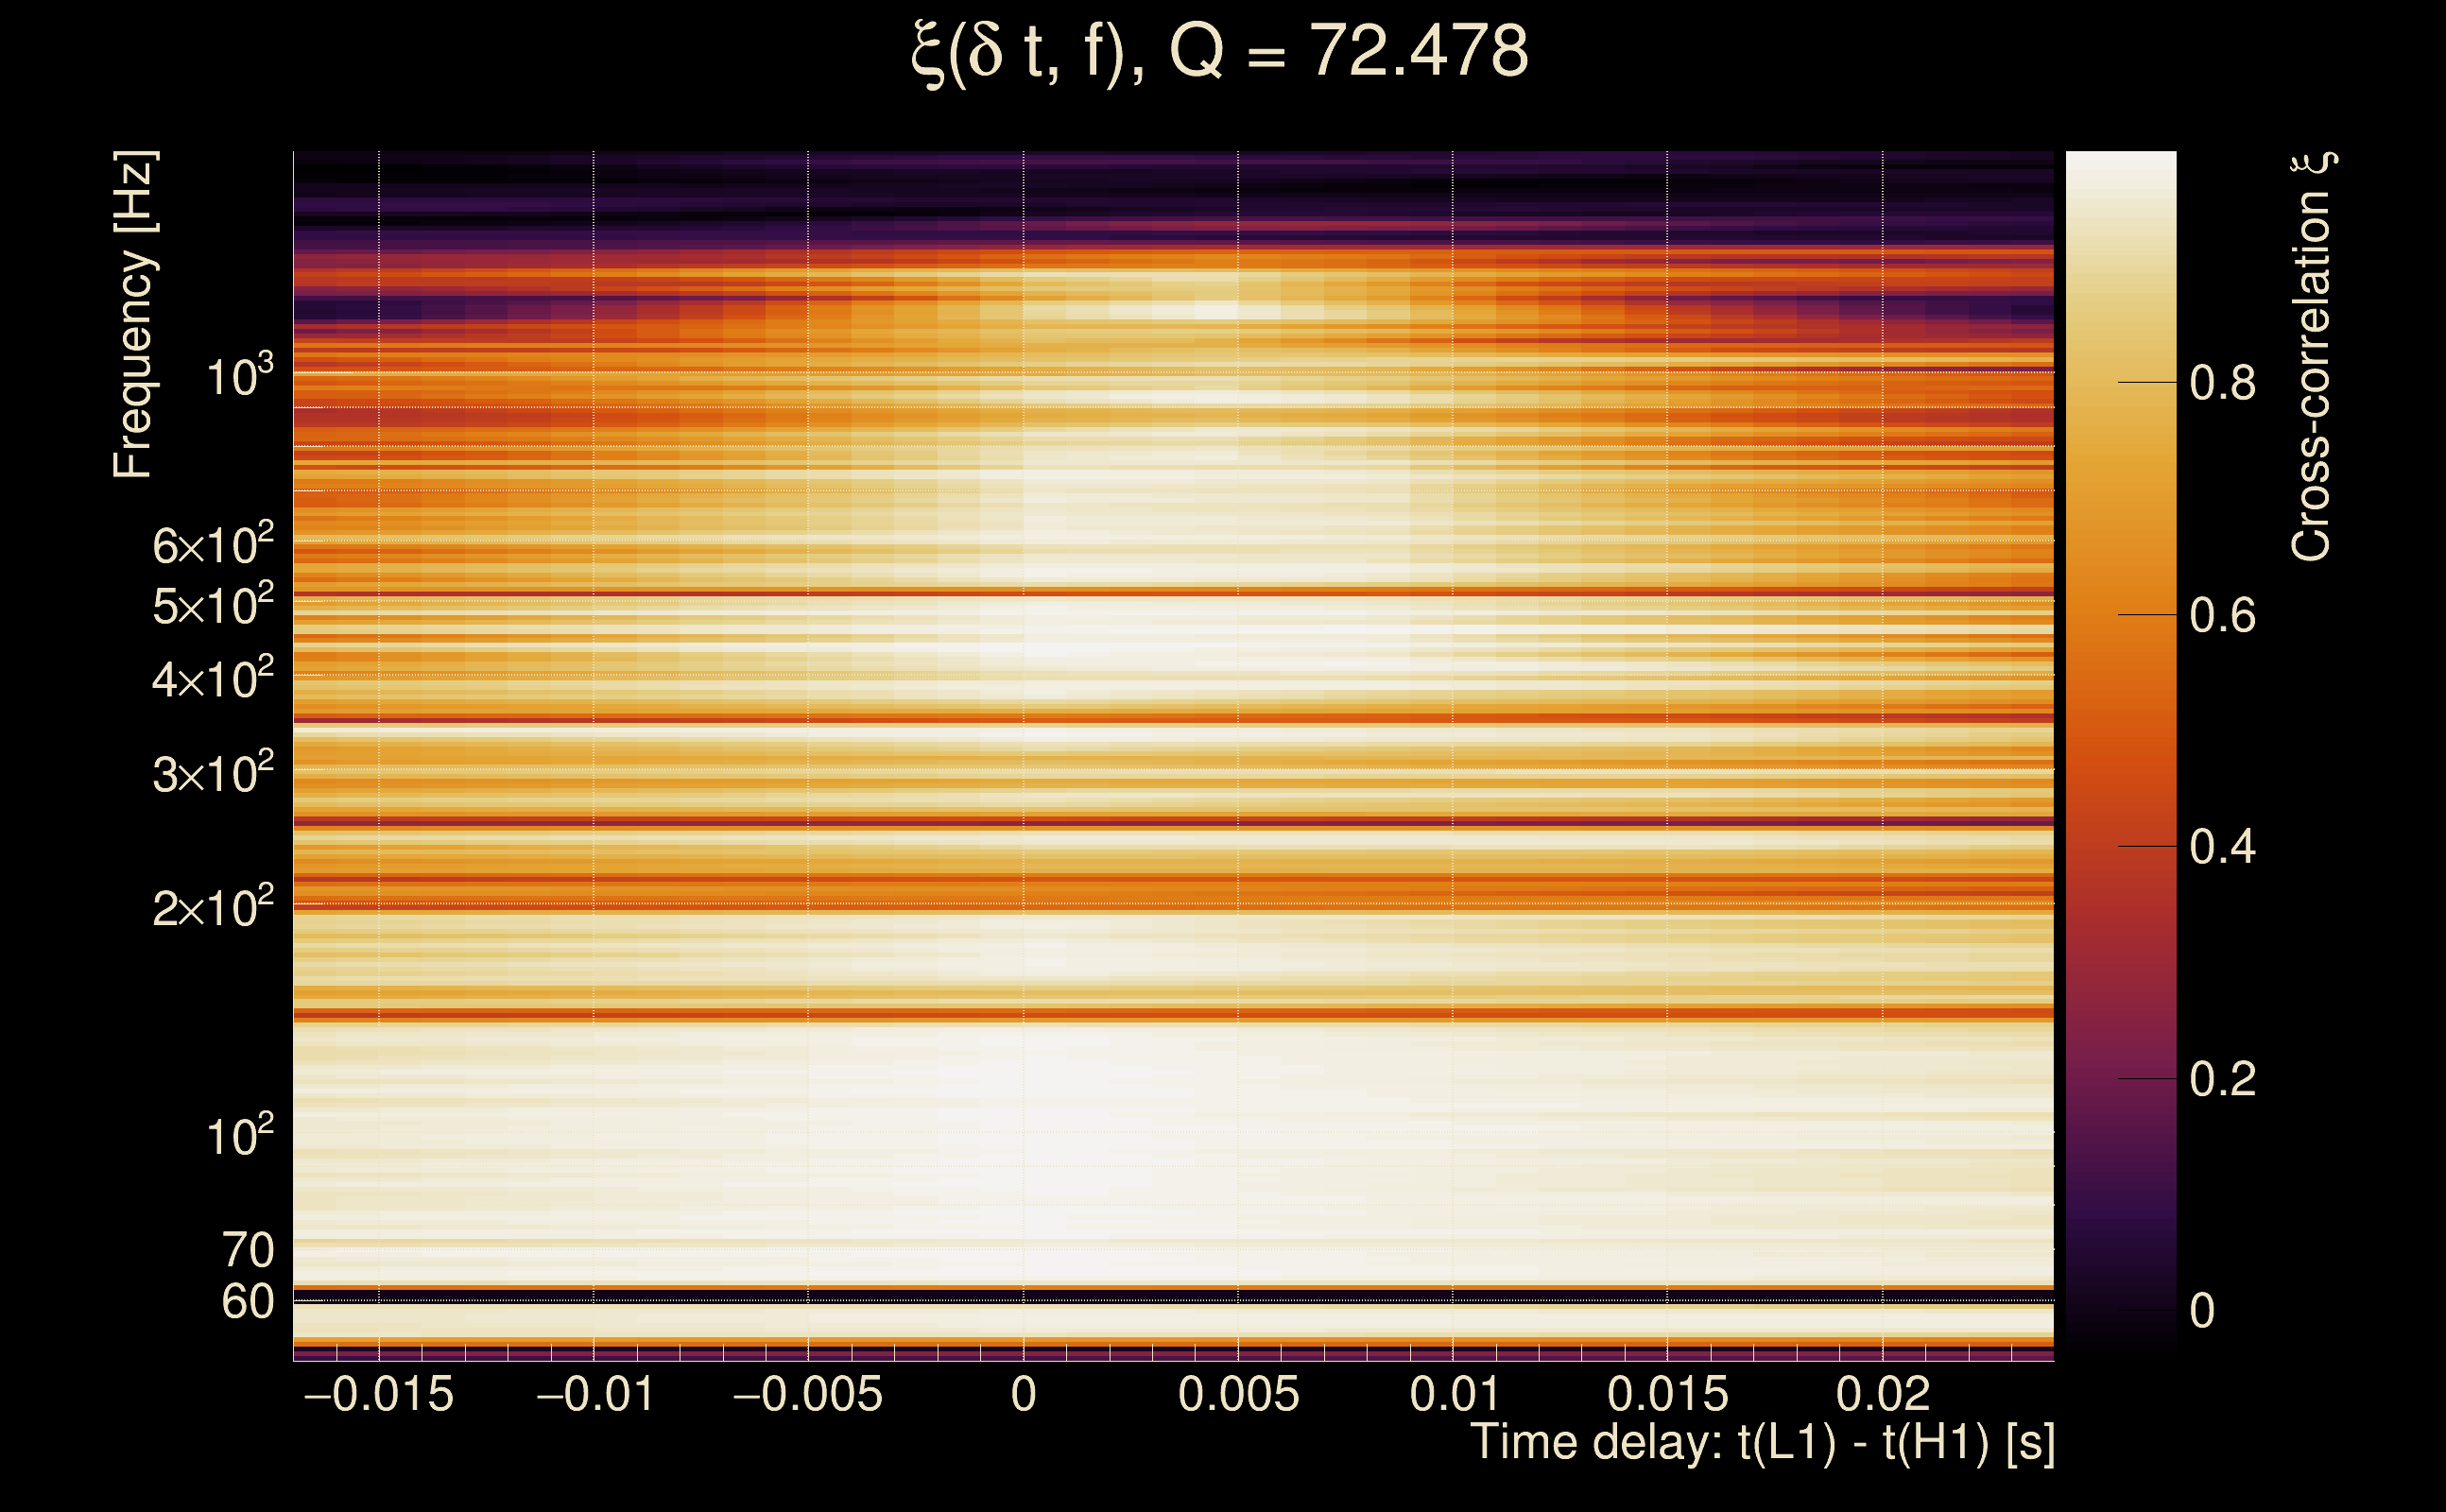
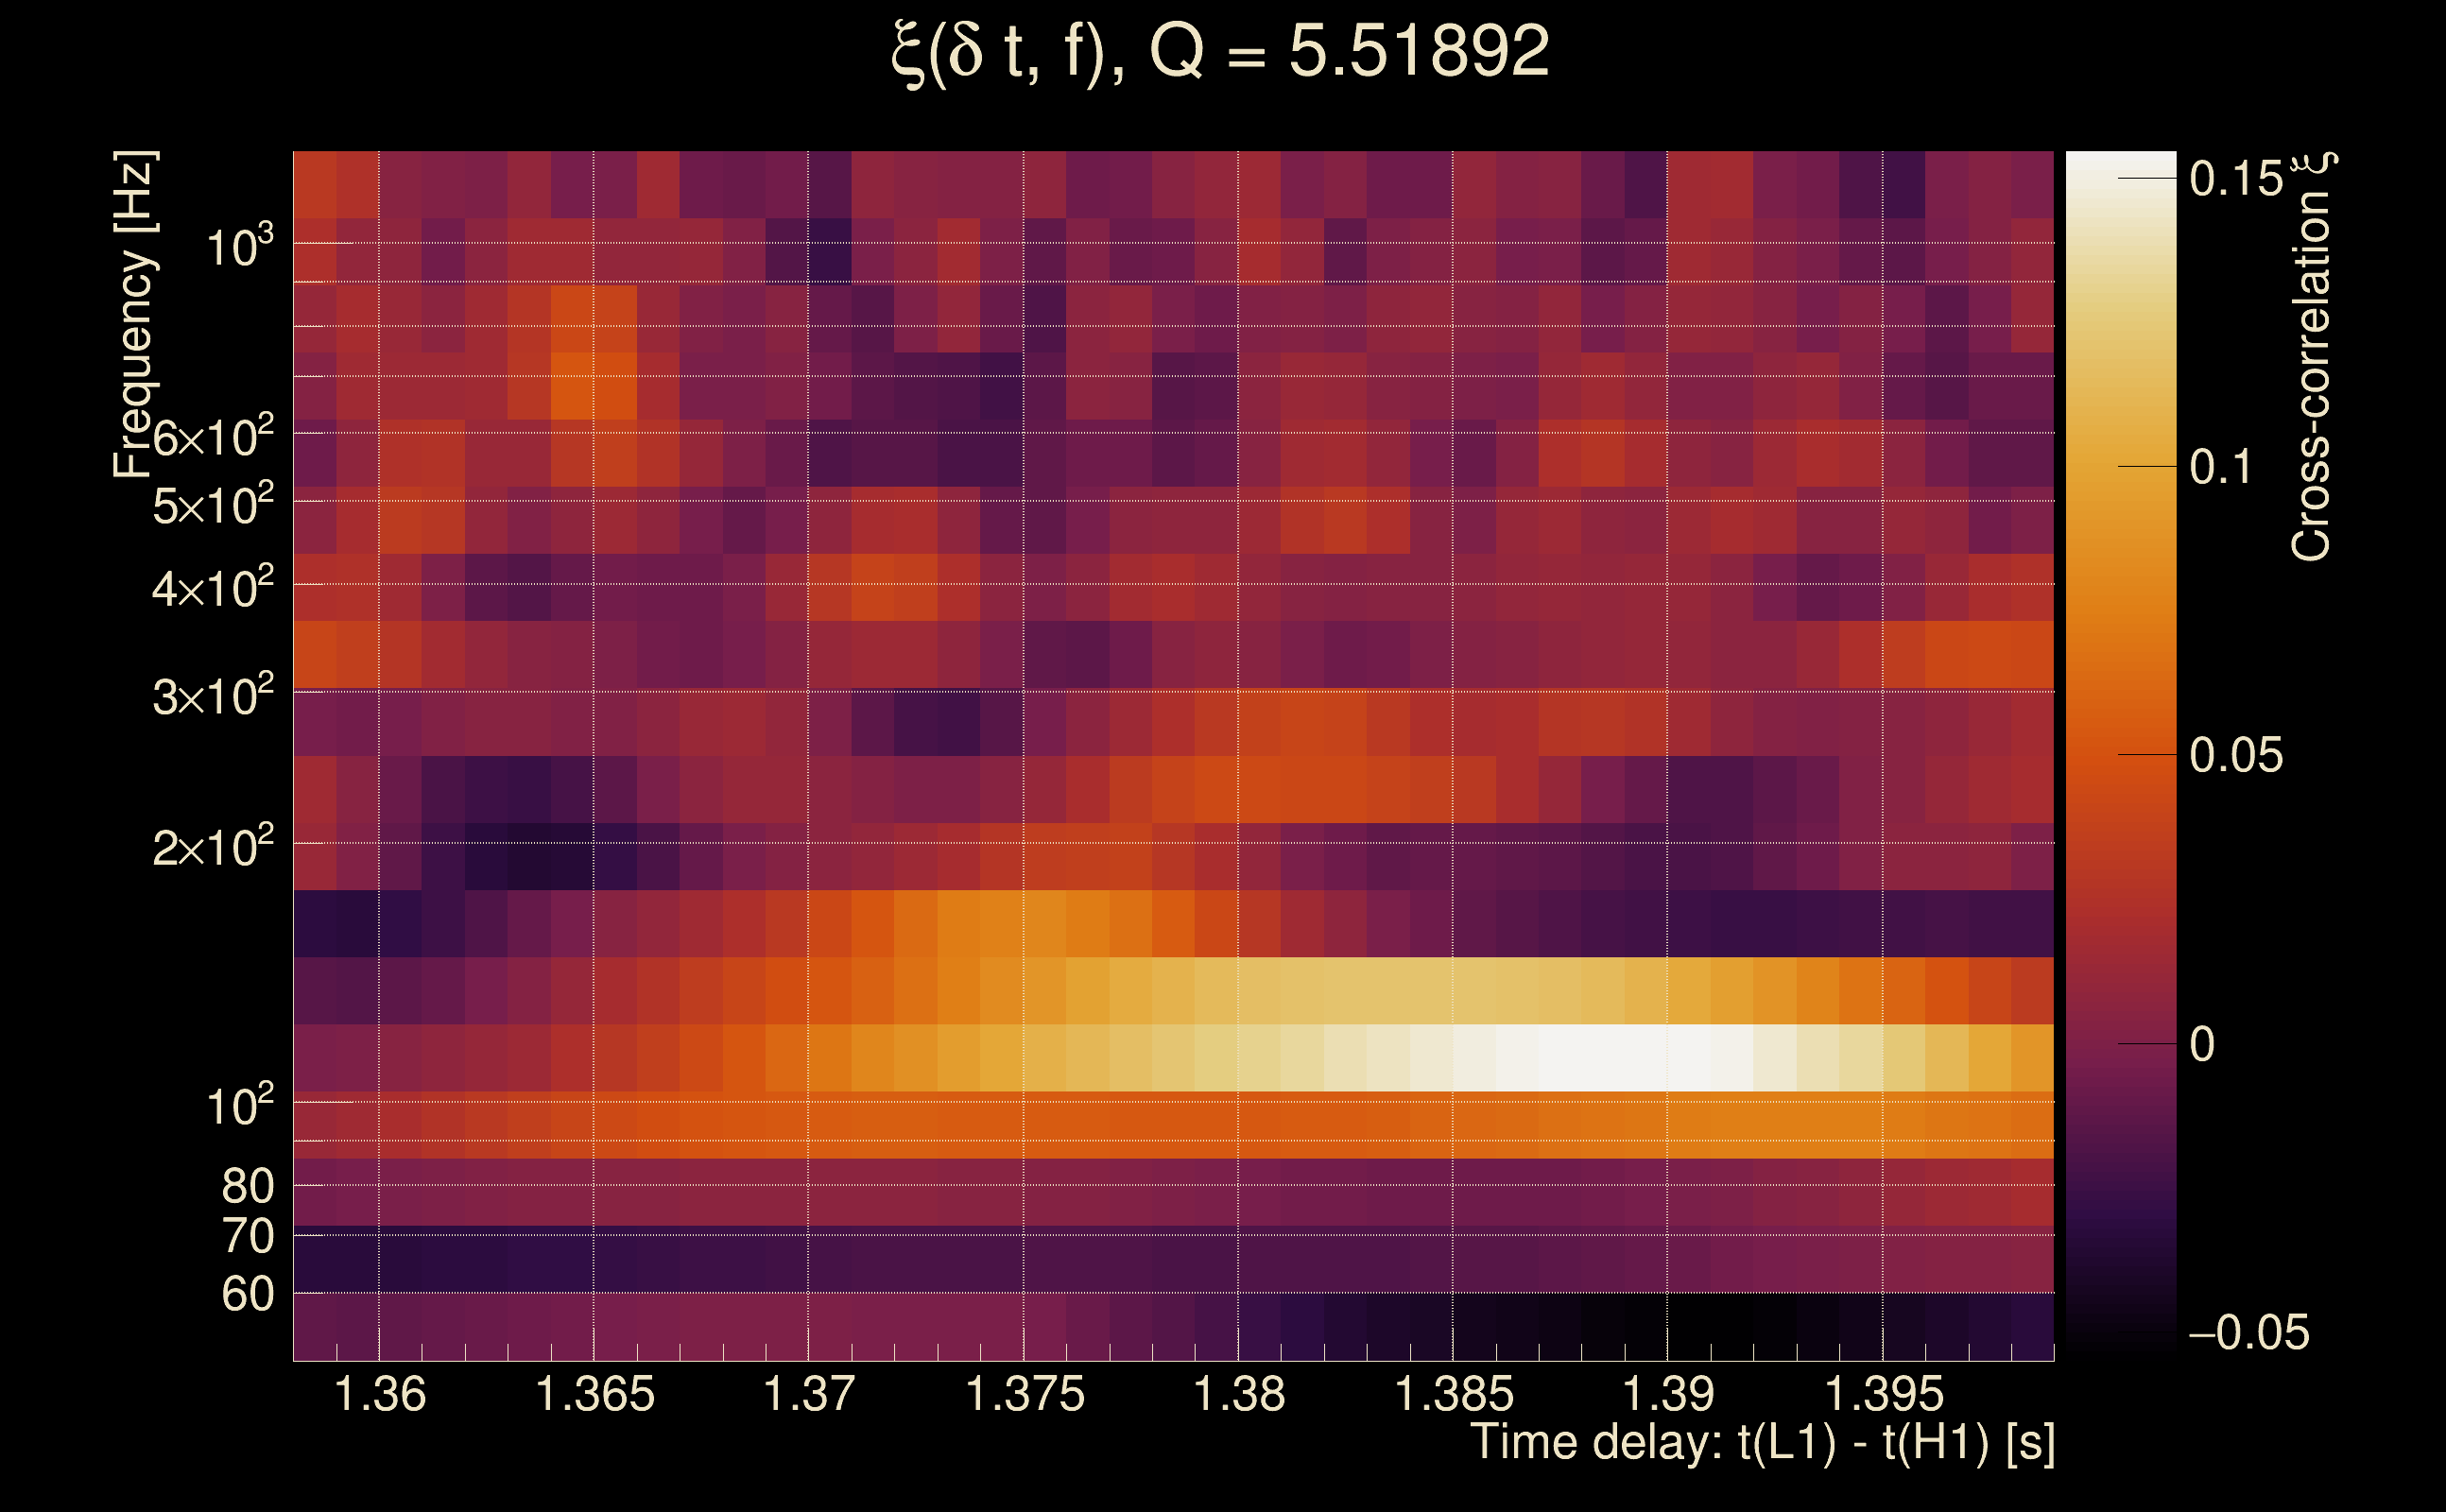
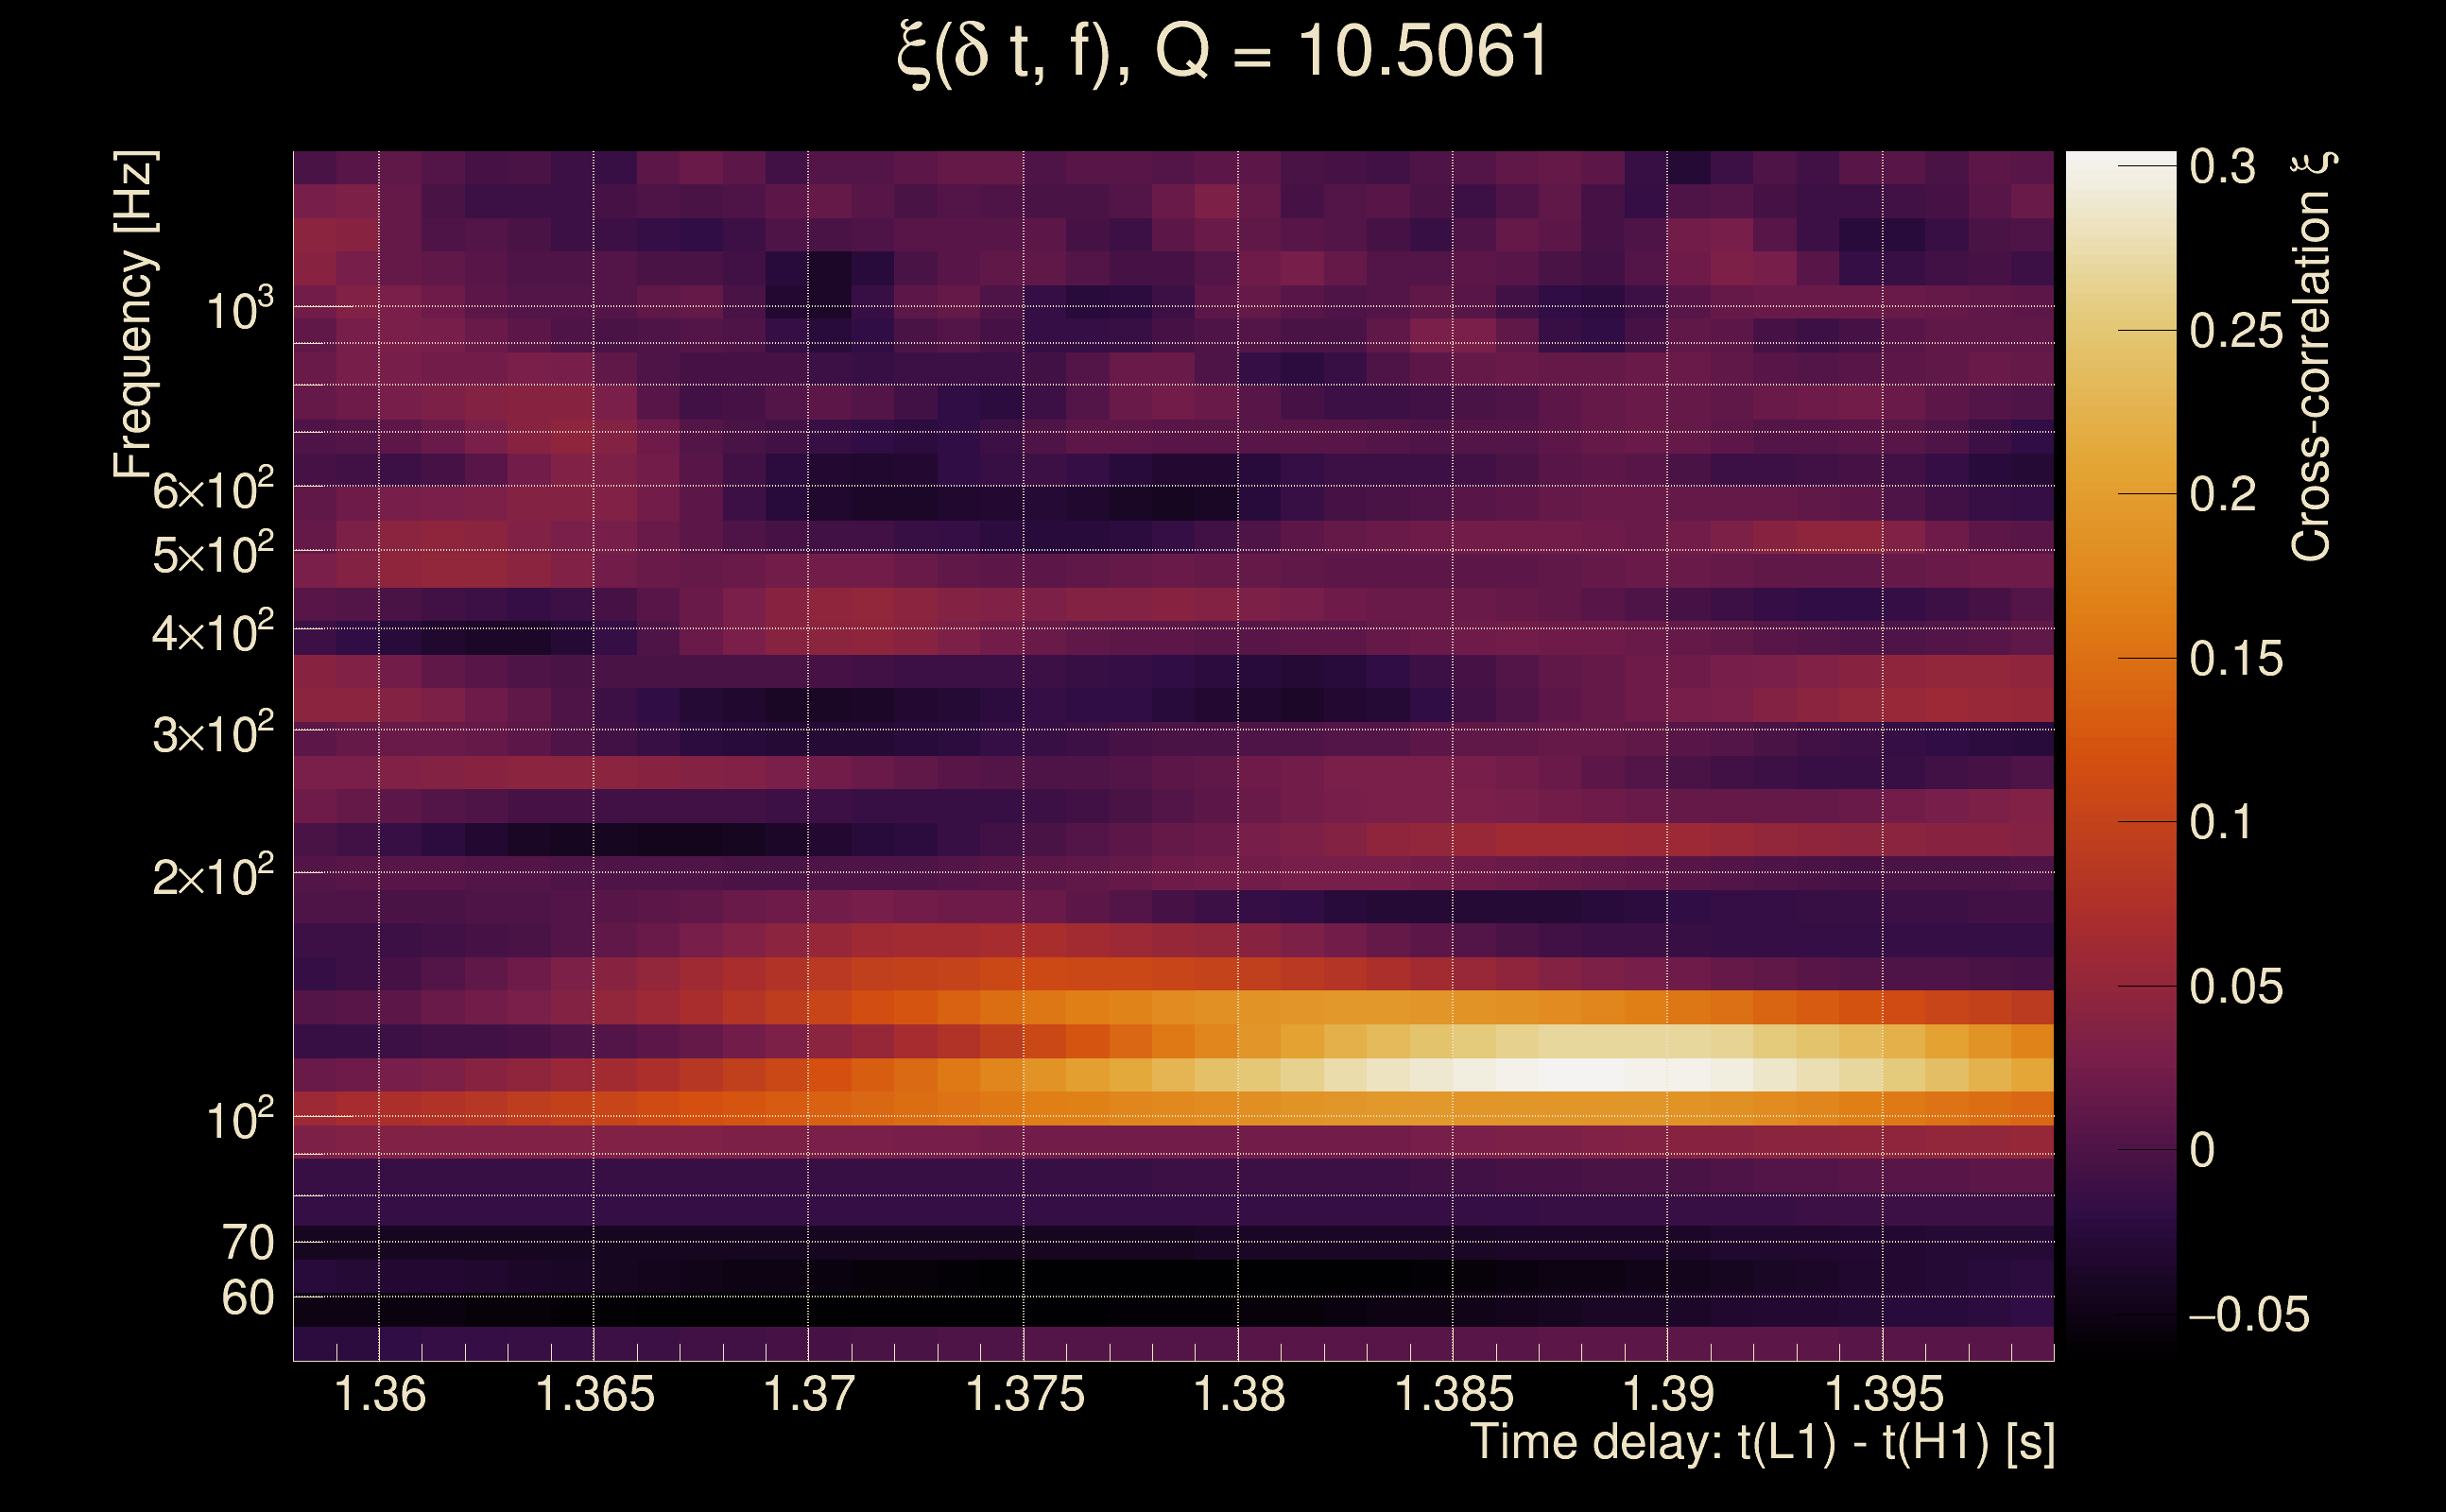
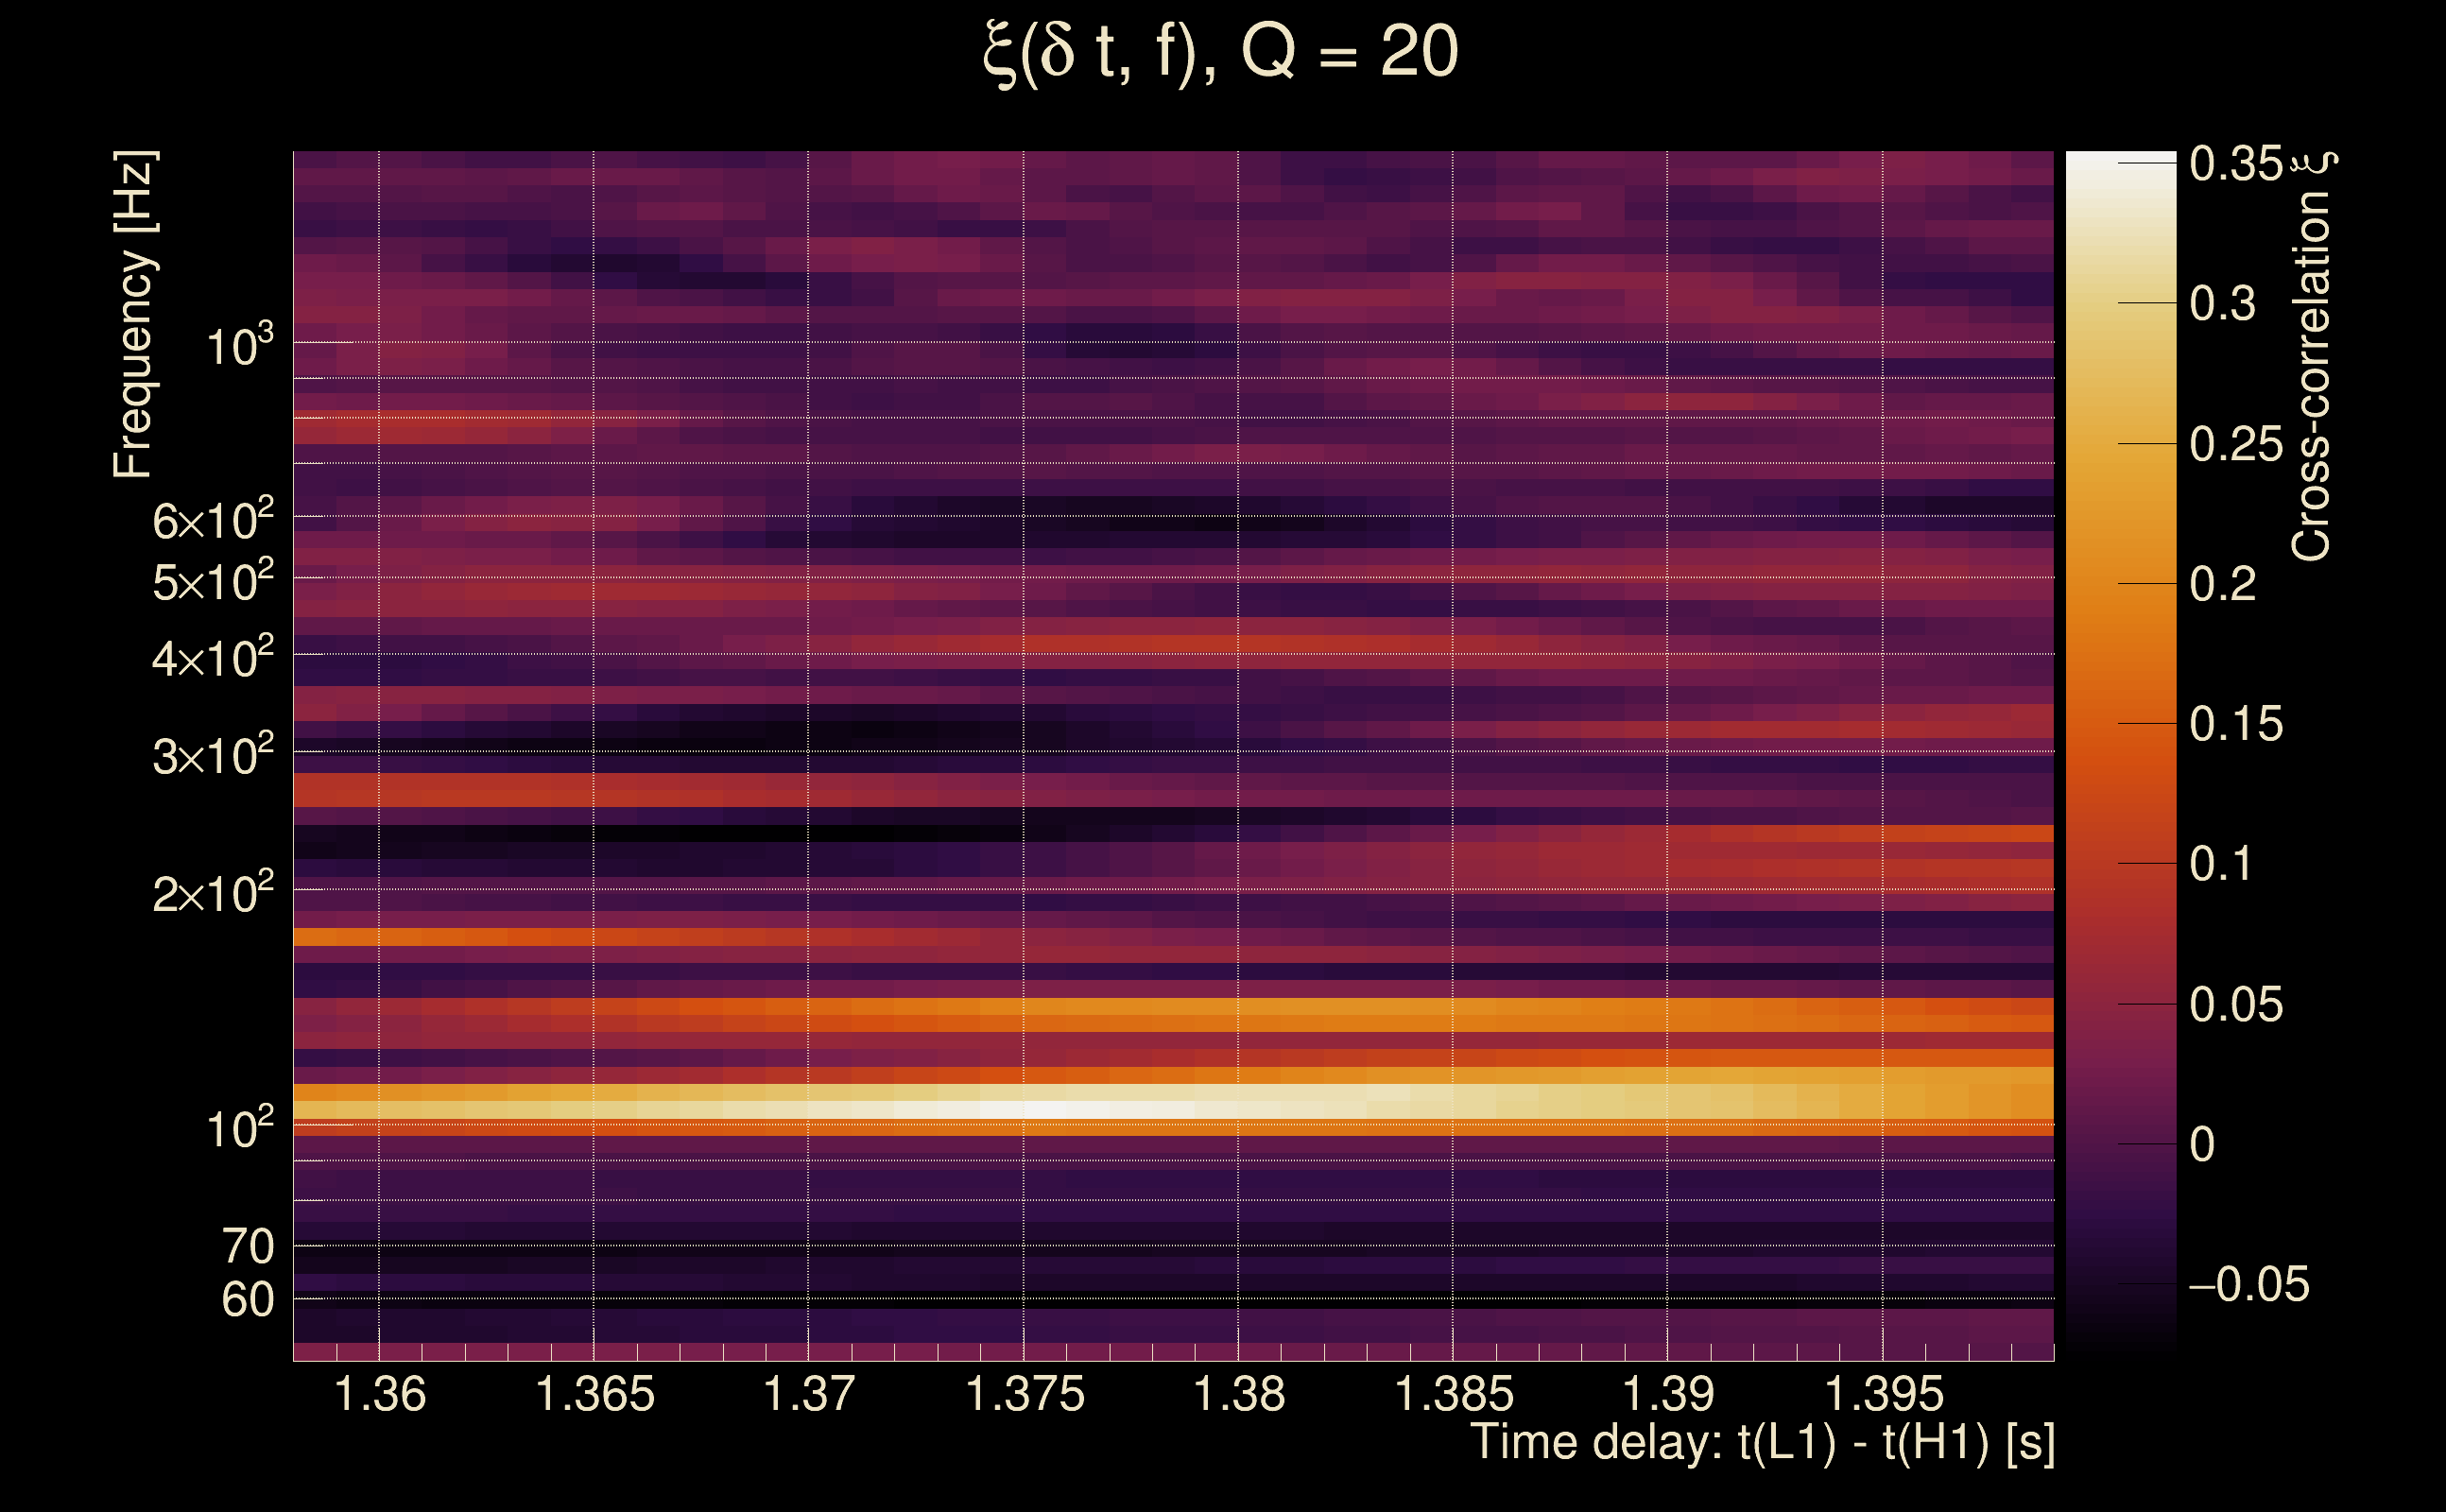
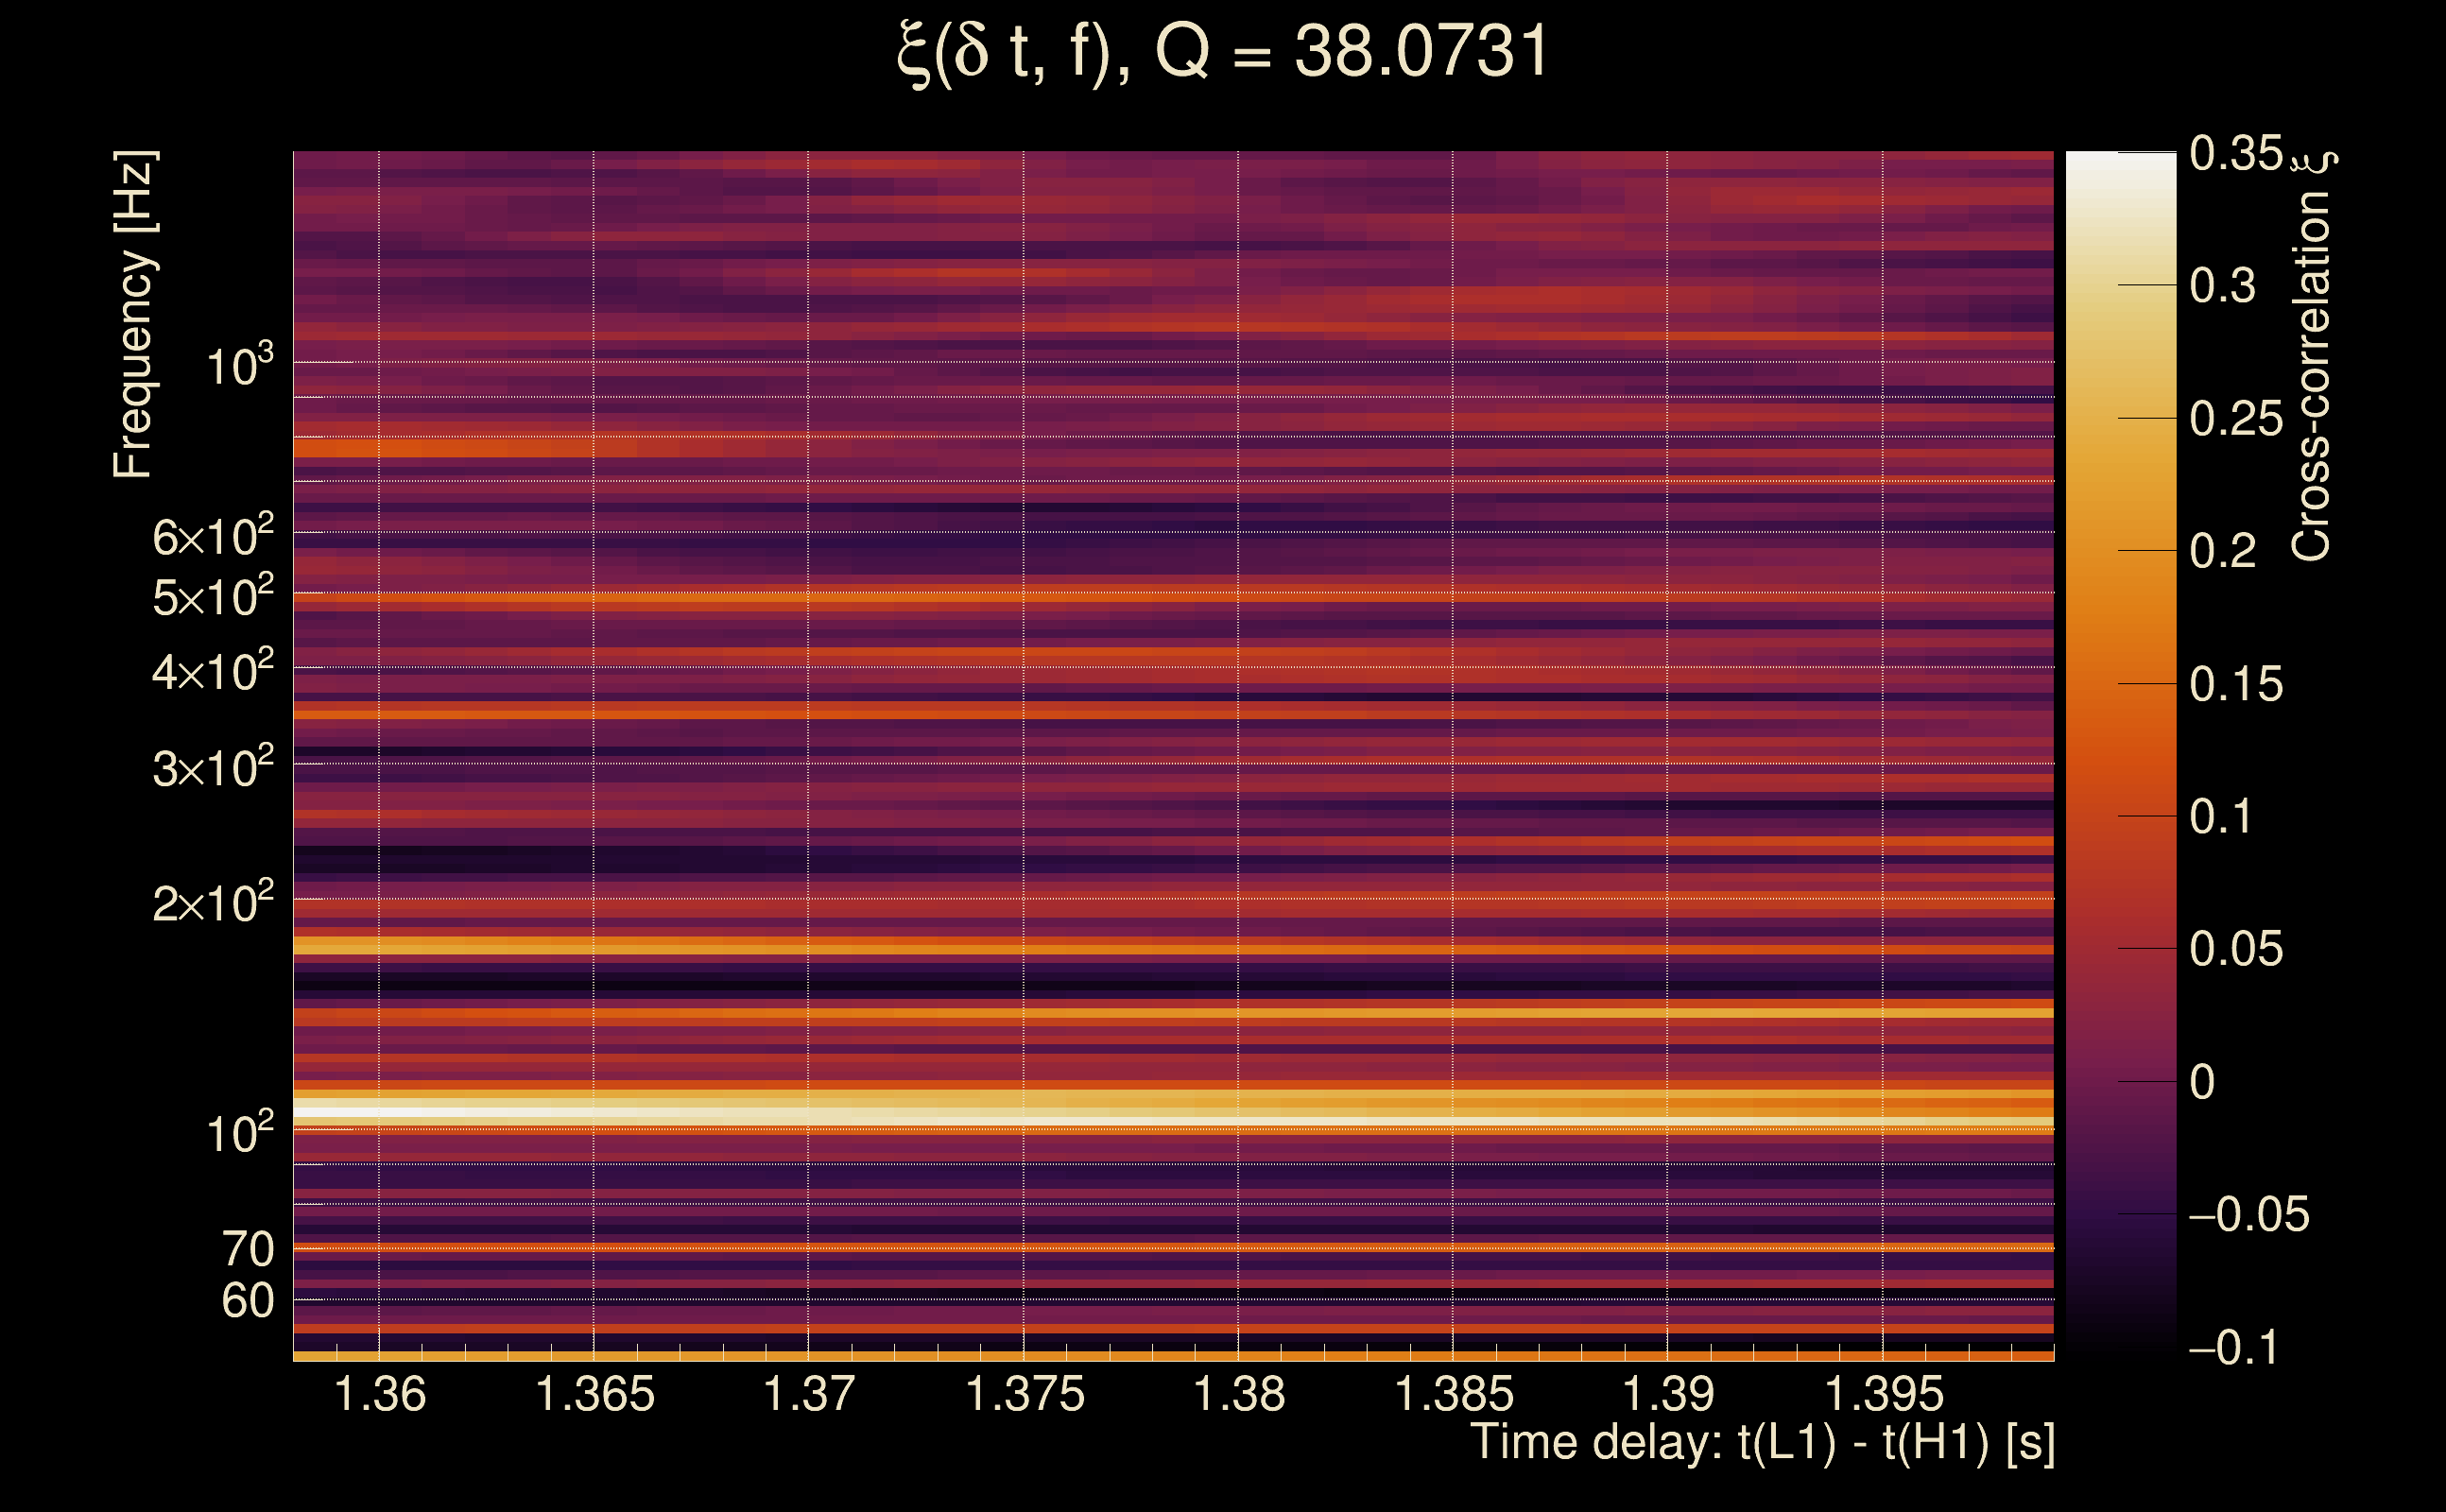
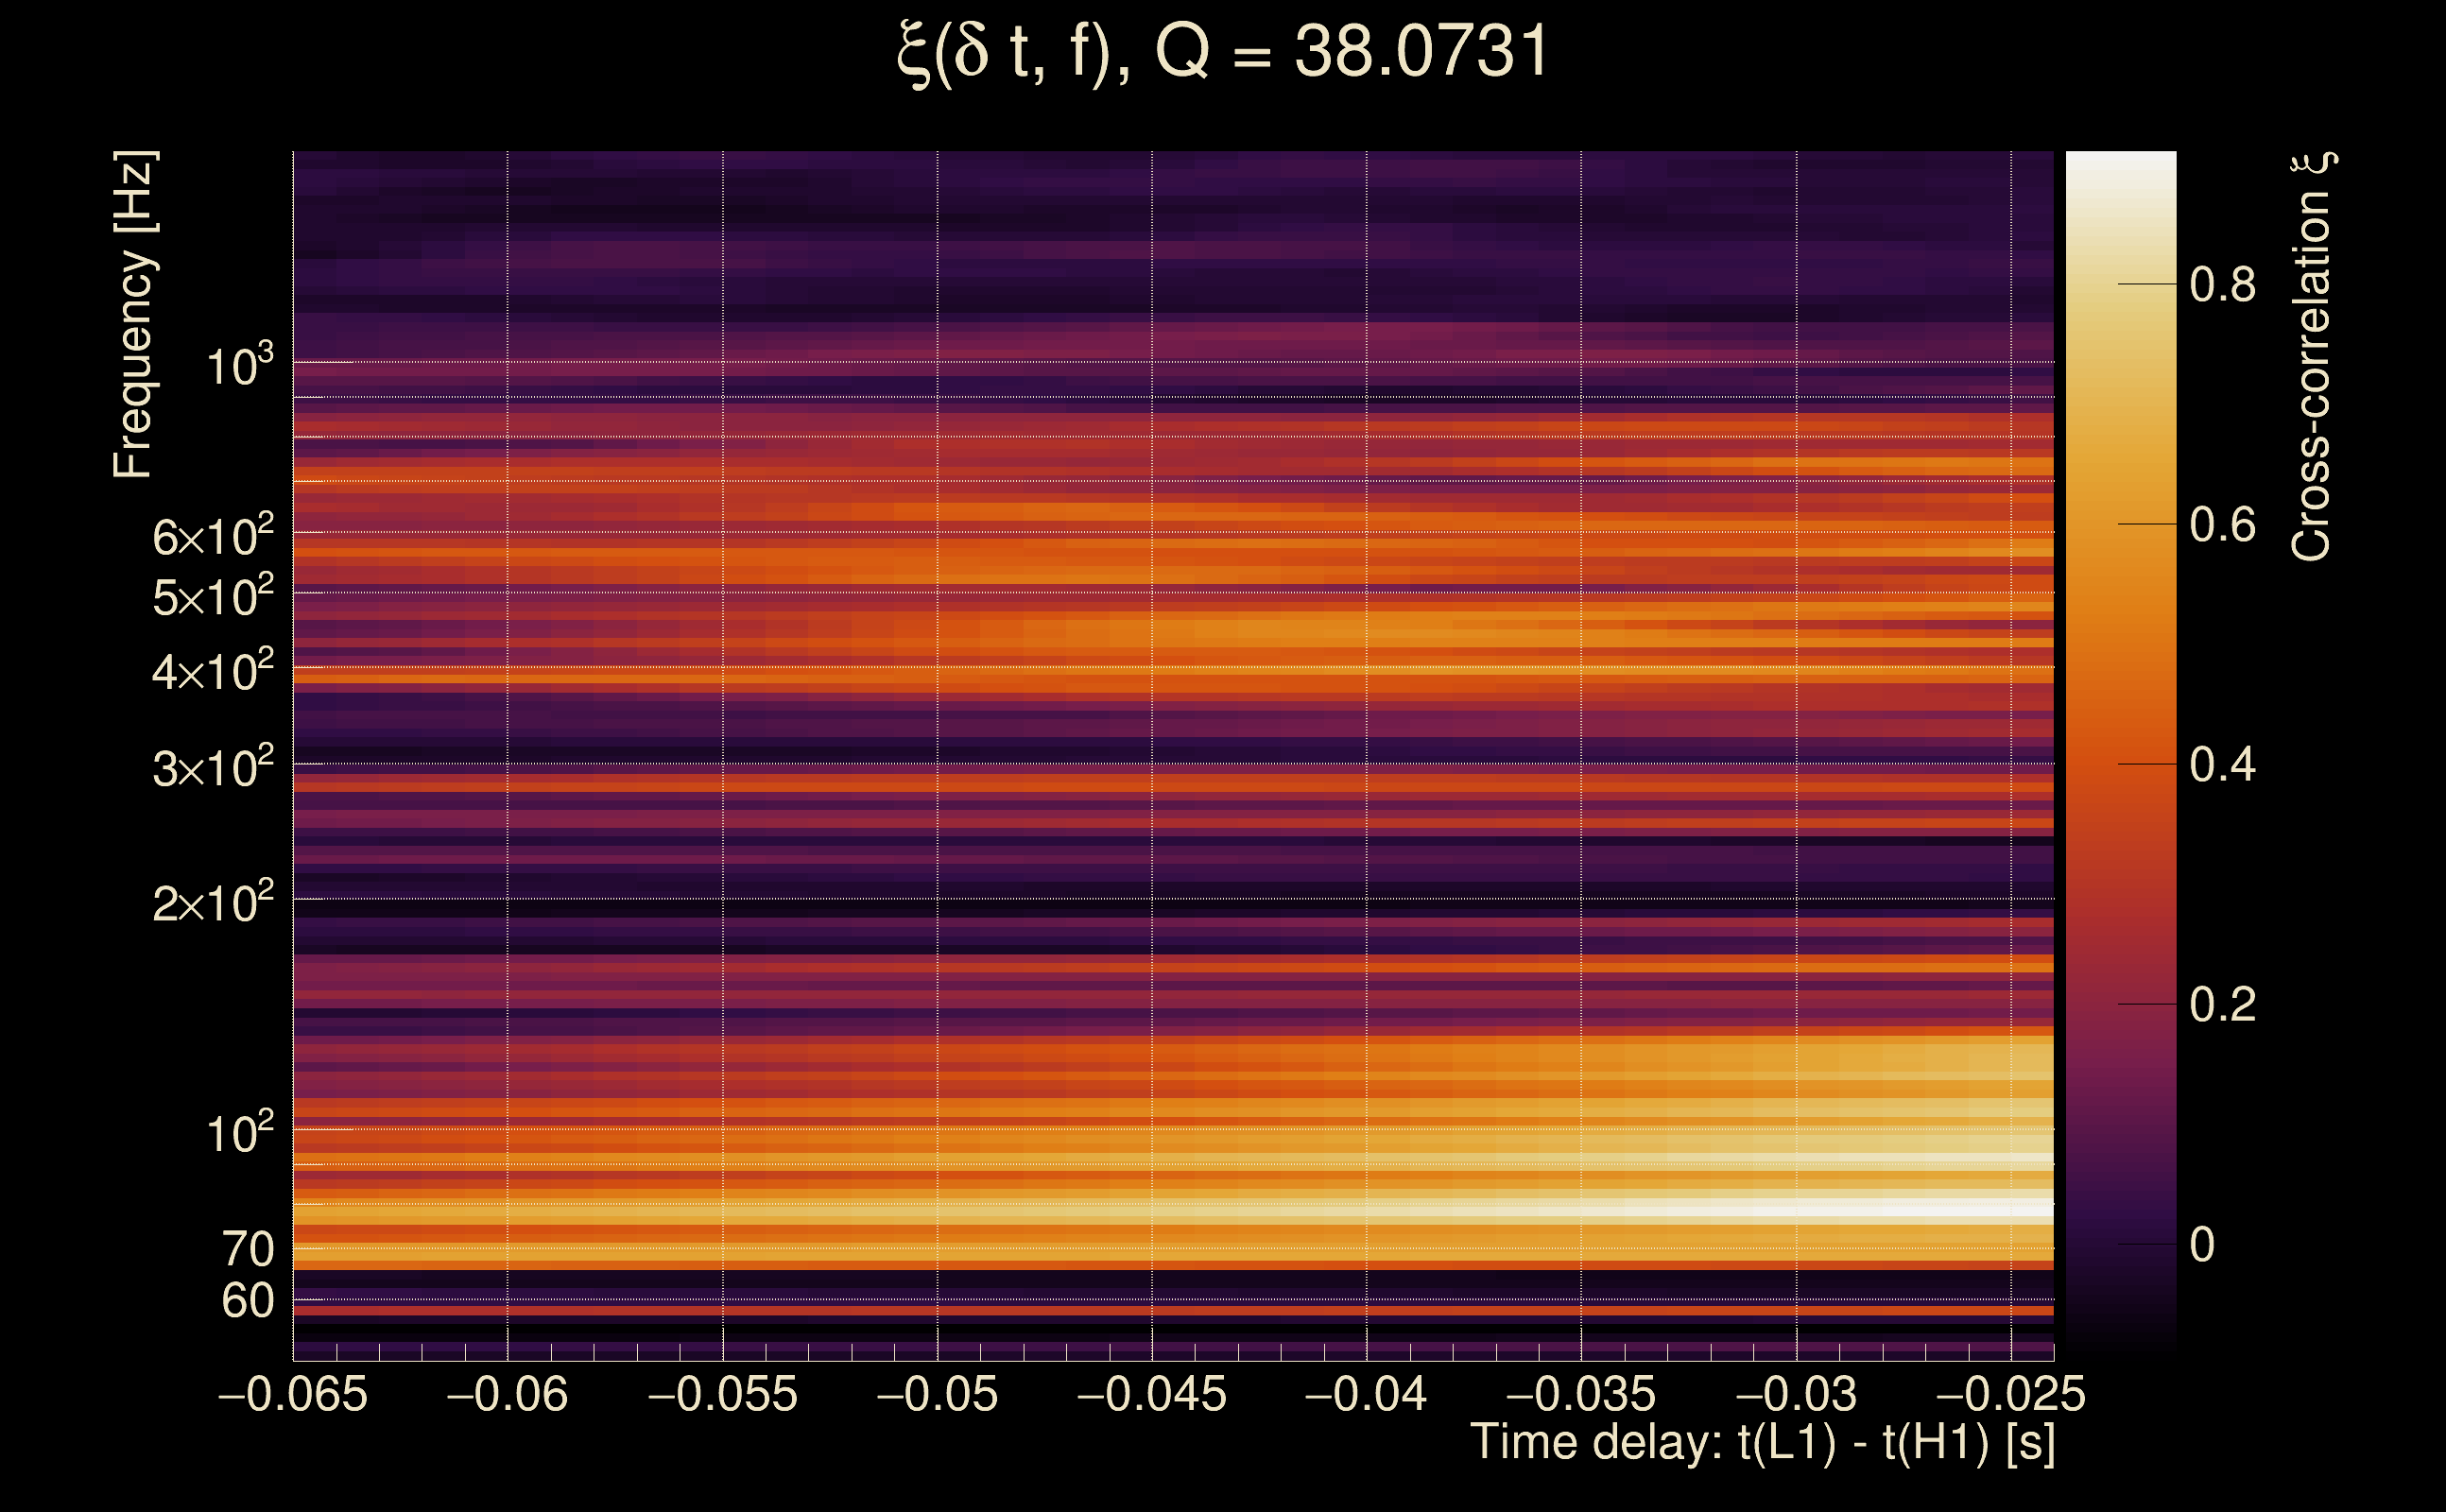
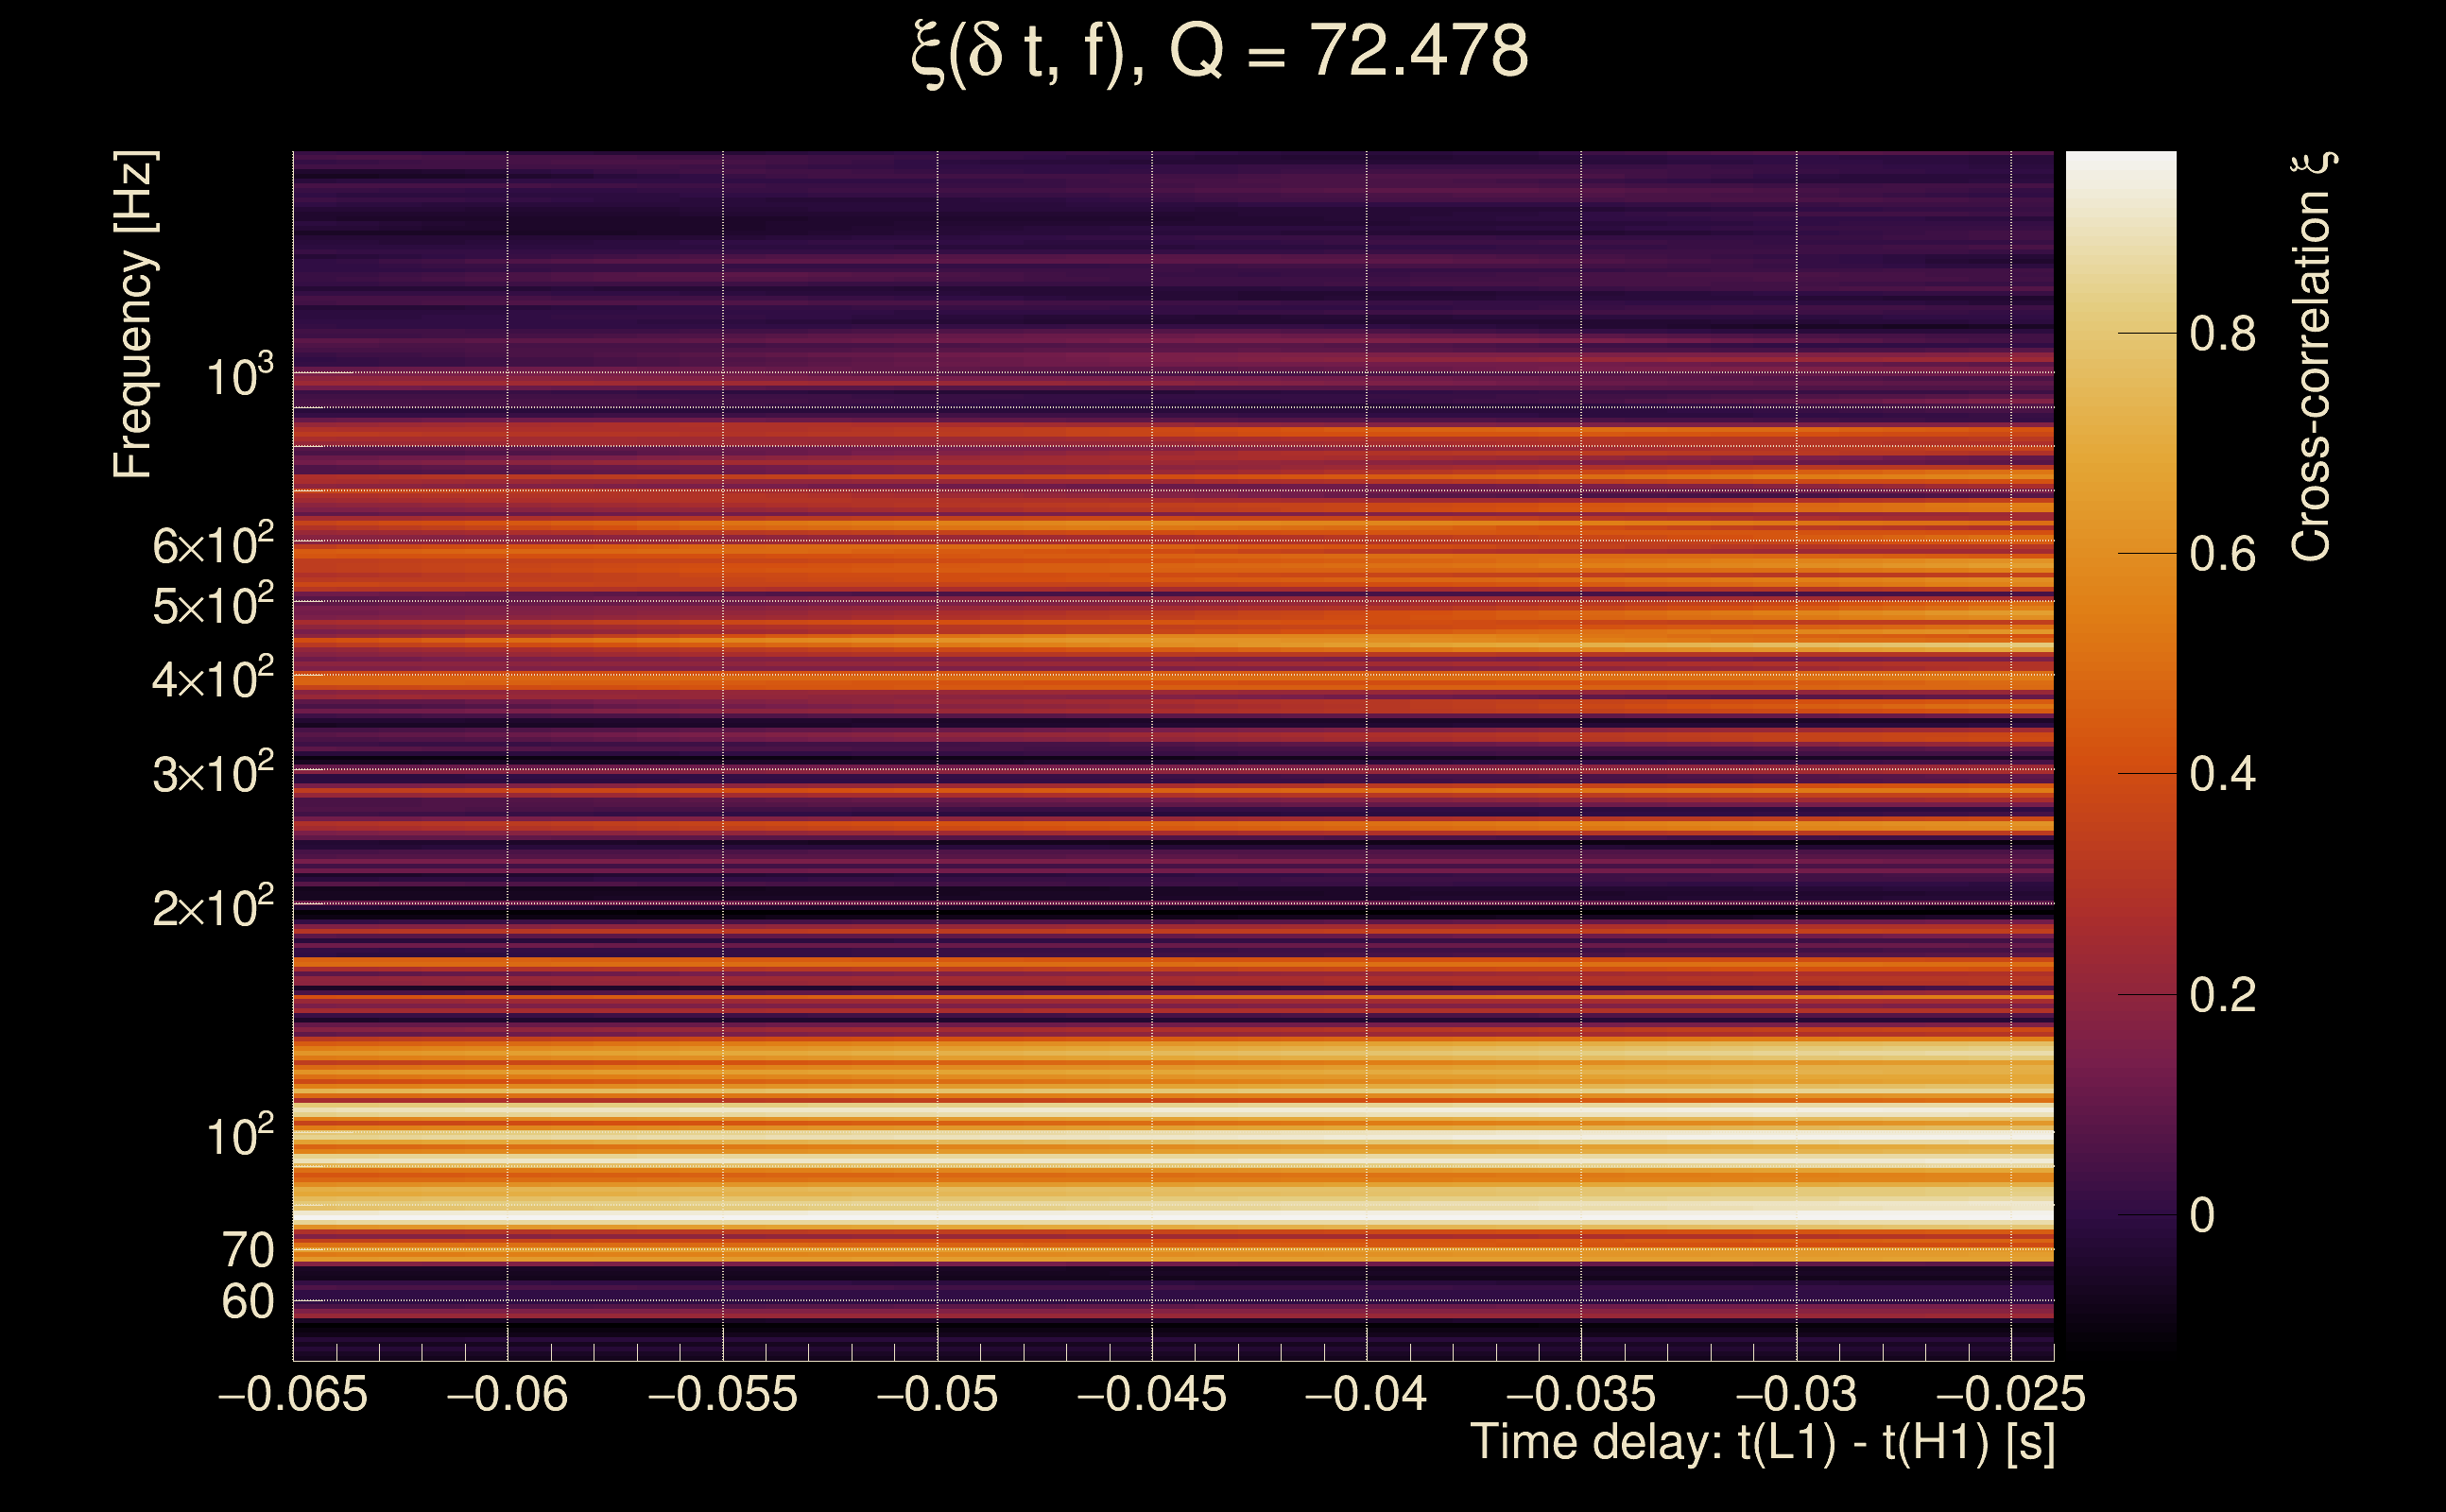
| Number of Q planes: | 5 (Q = 5.51892 → Q = 72.478) |
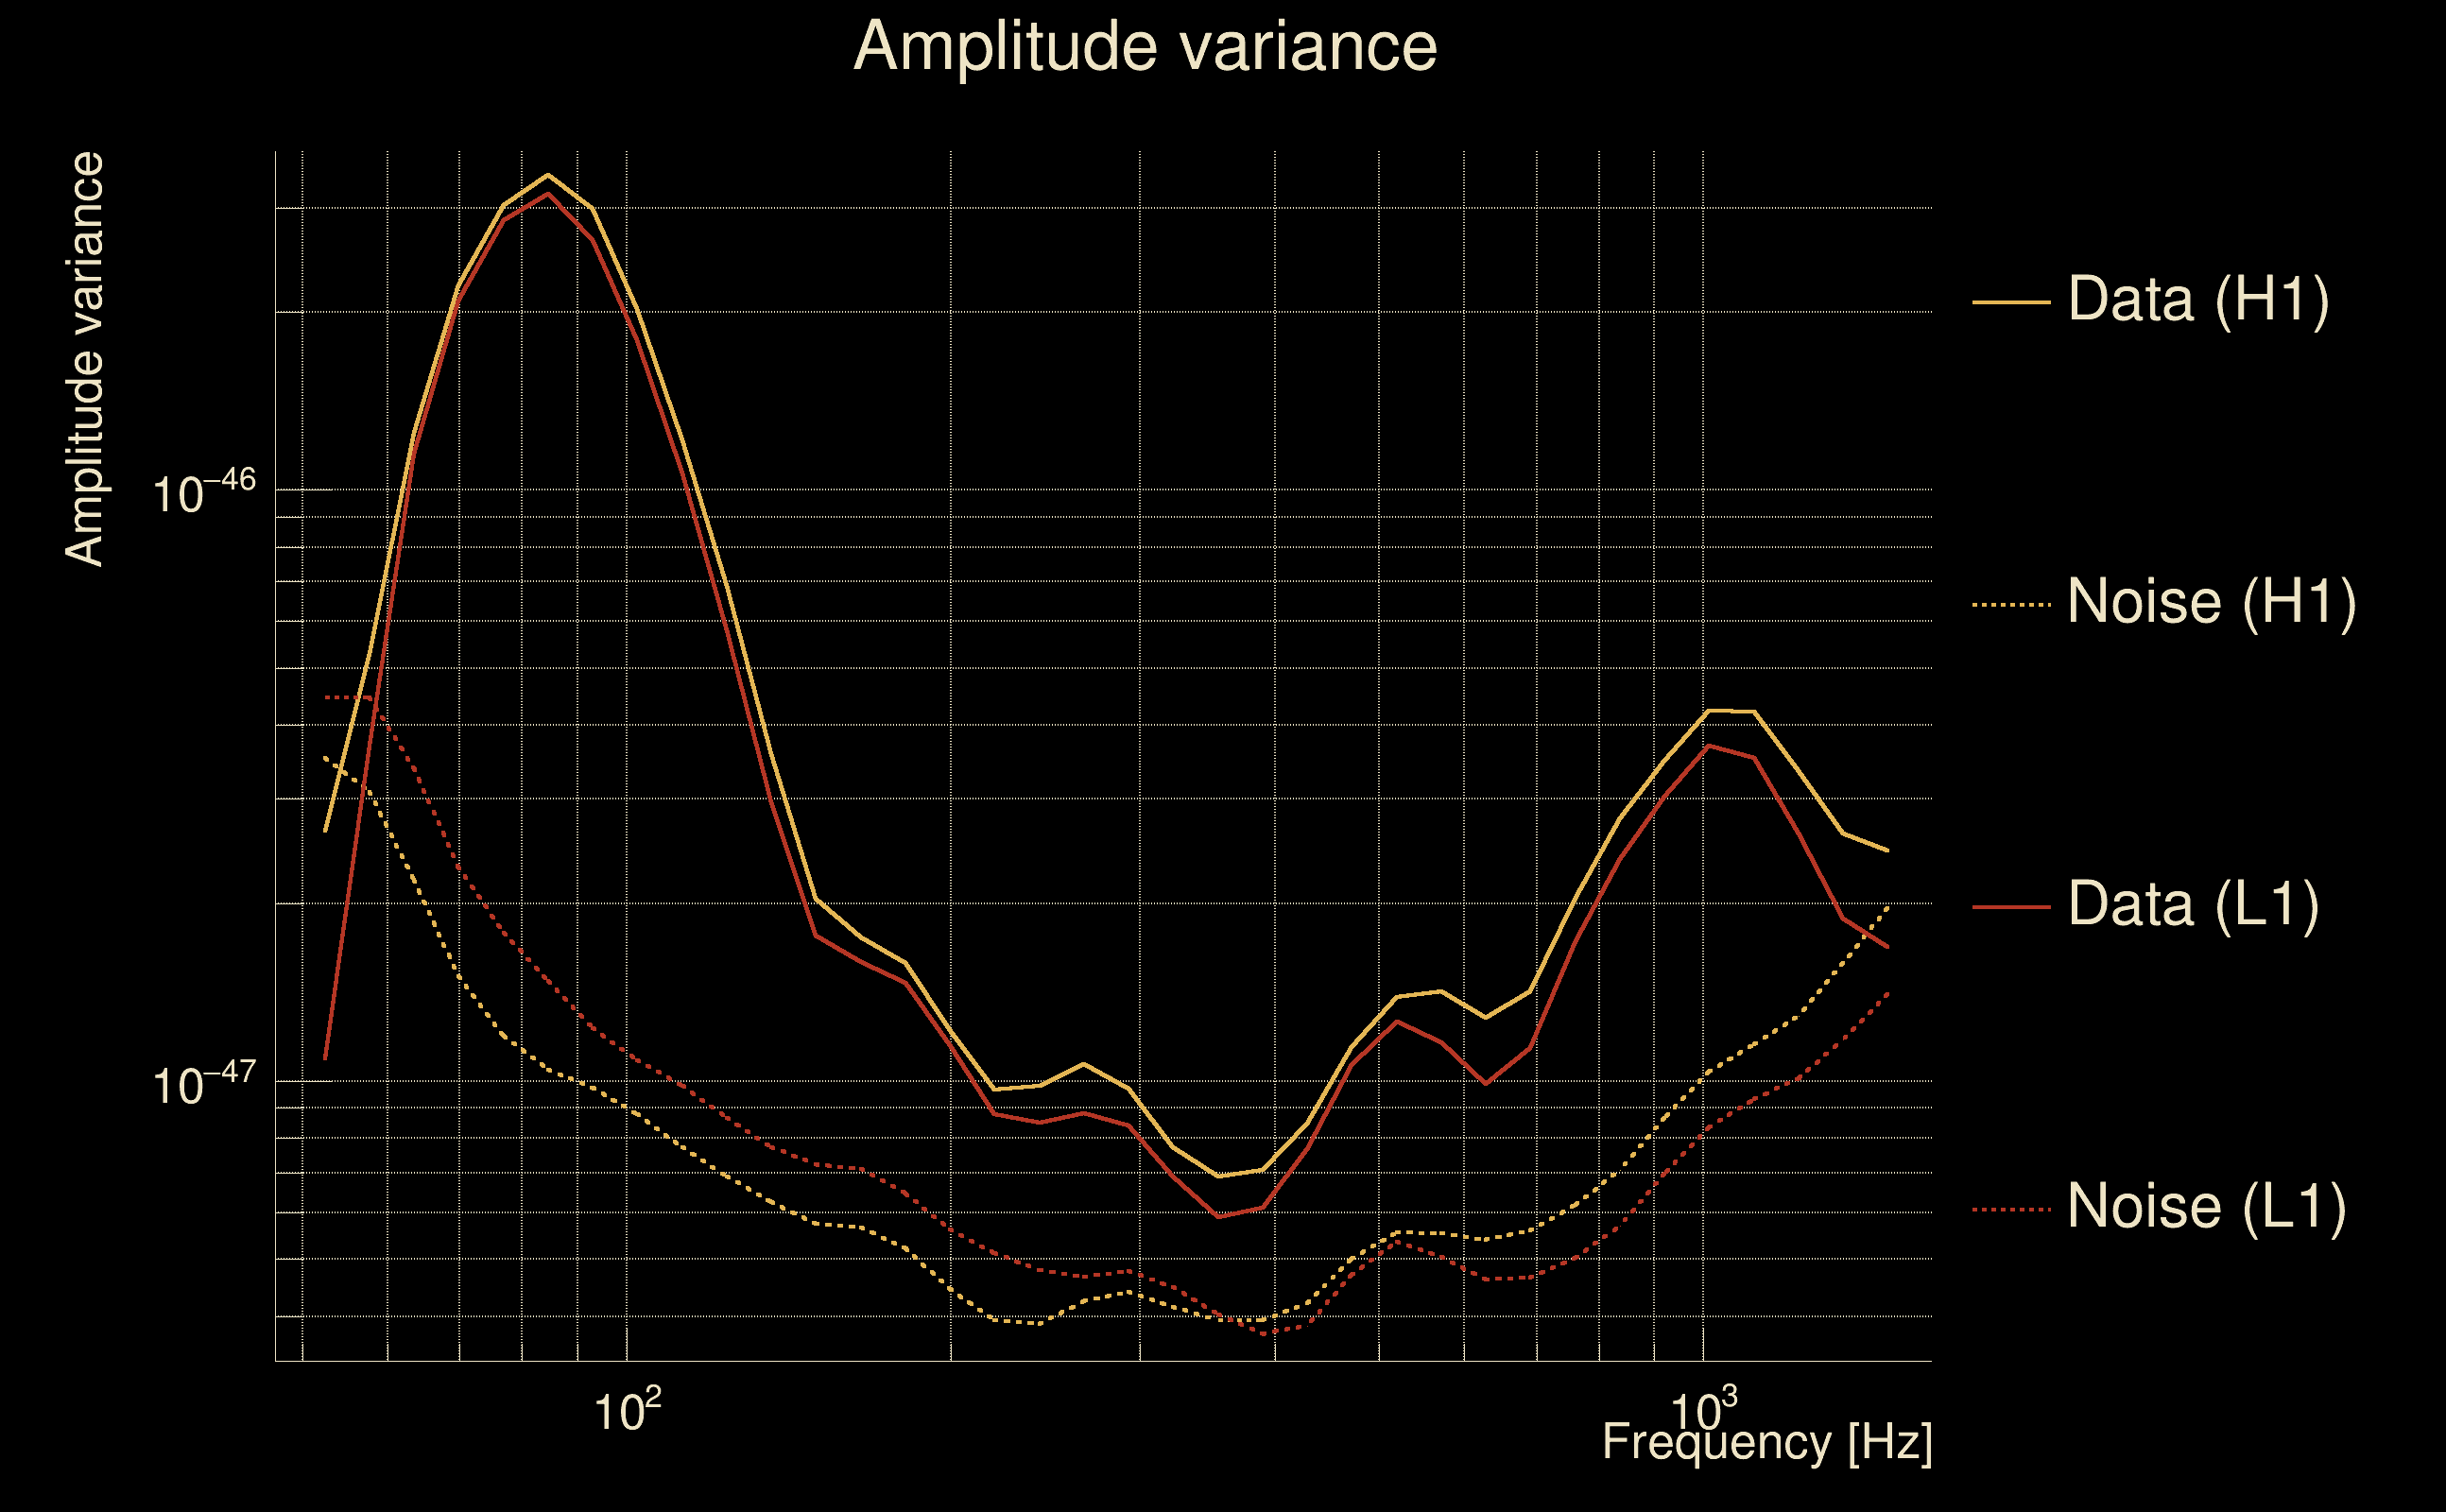
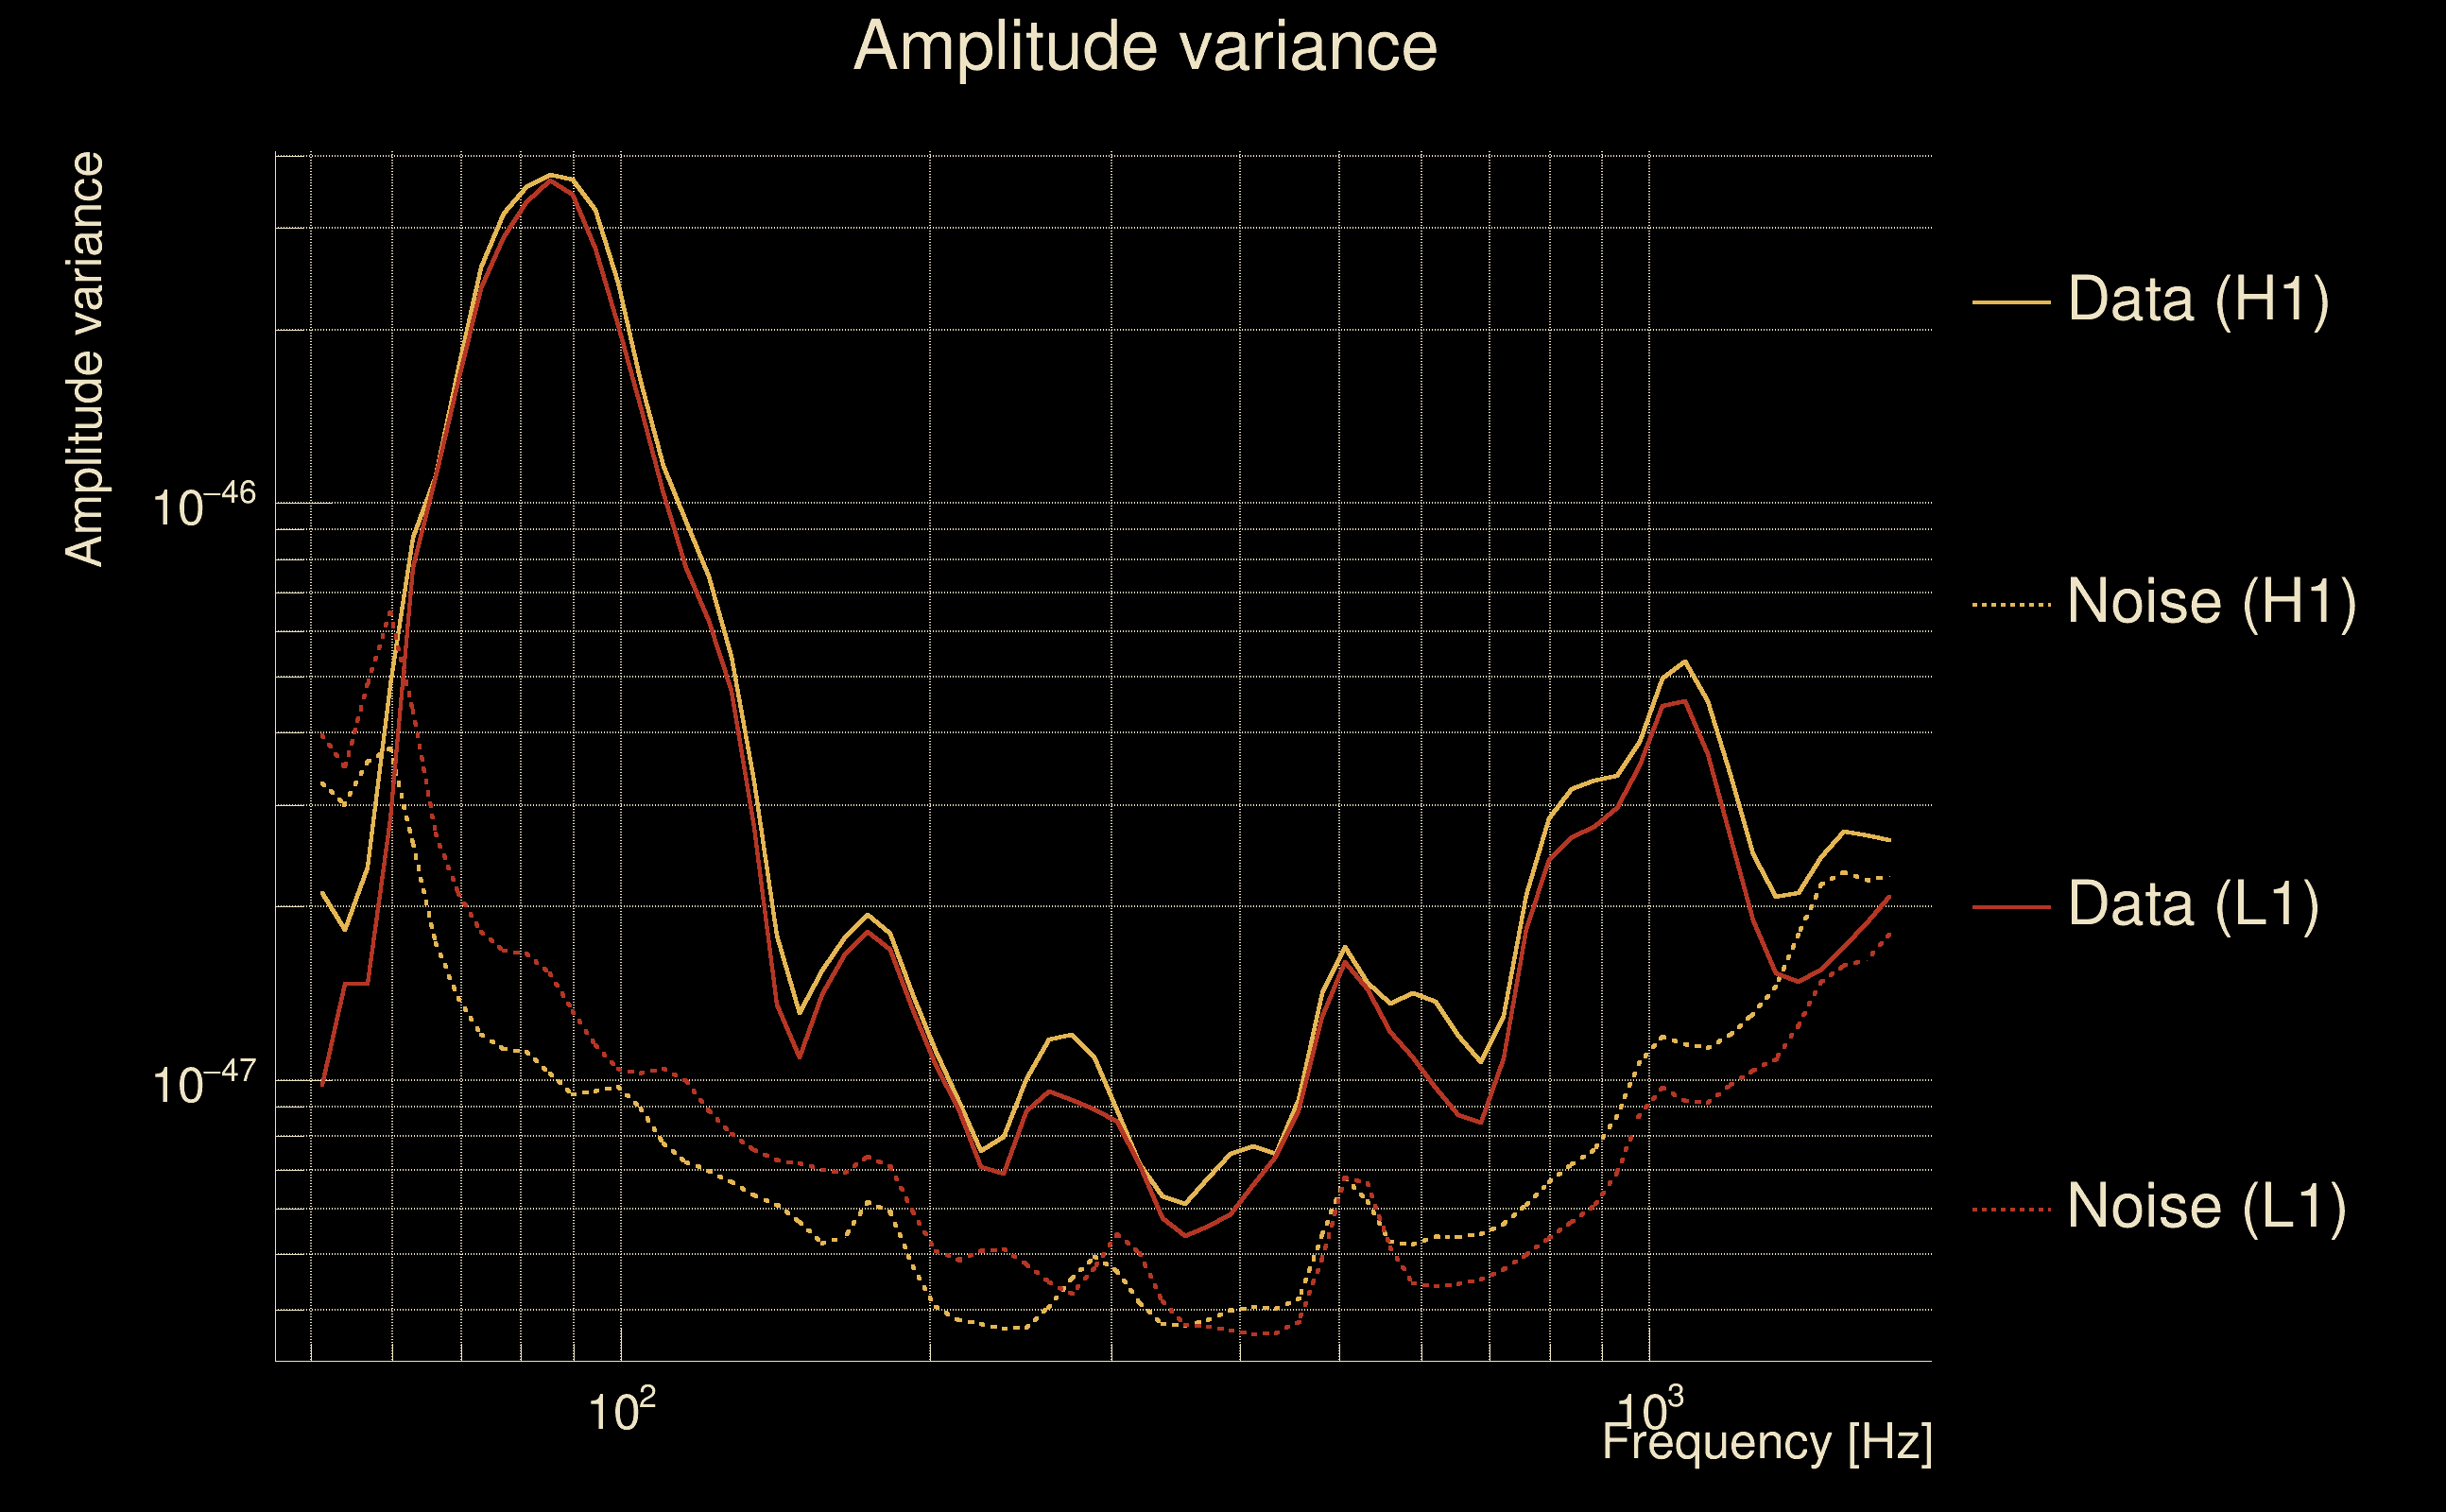
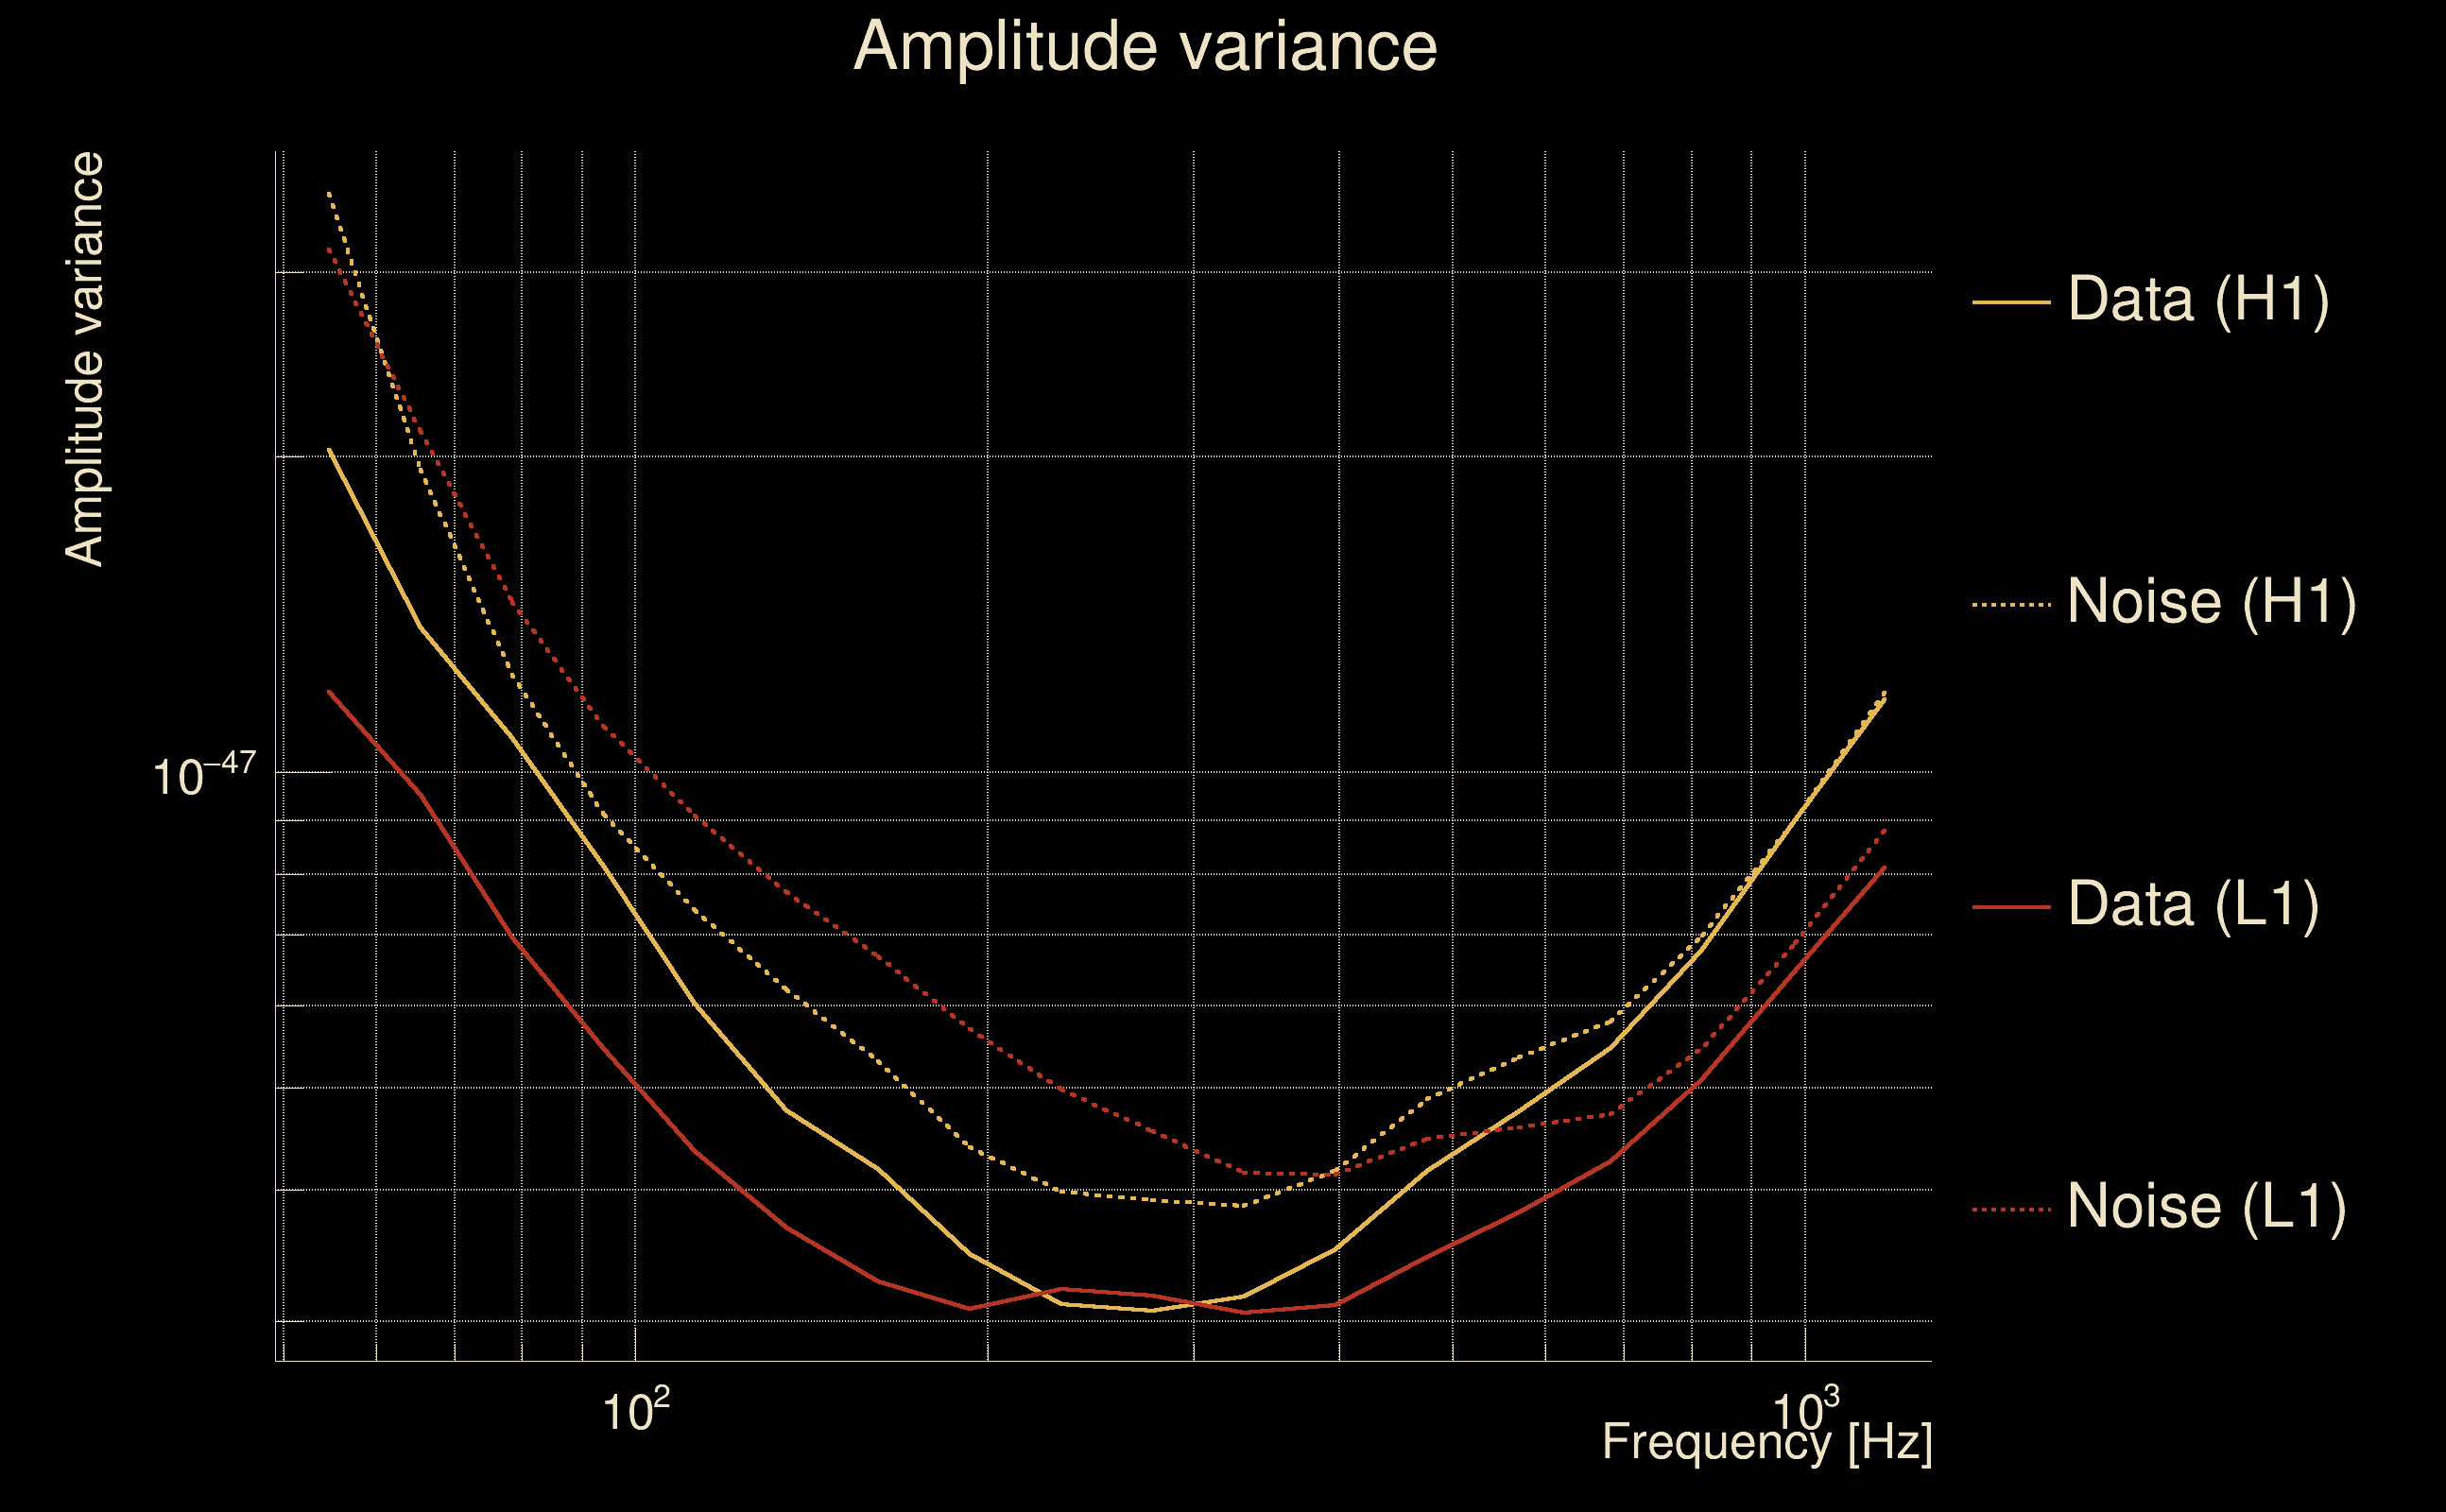
| Omicron frequency range: | 50 Hz → 1958.38 Hz |
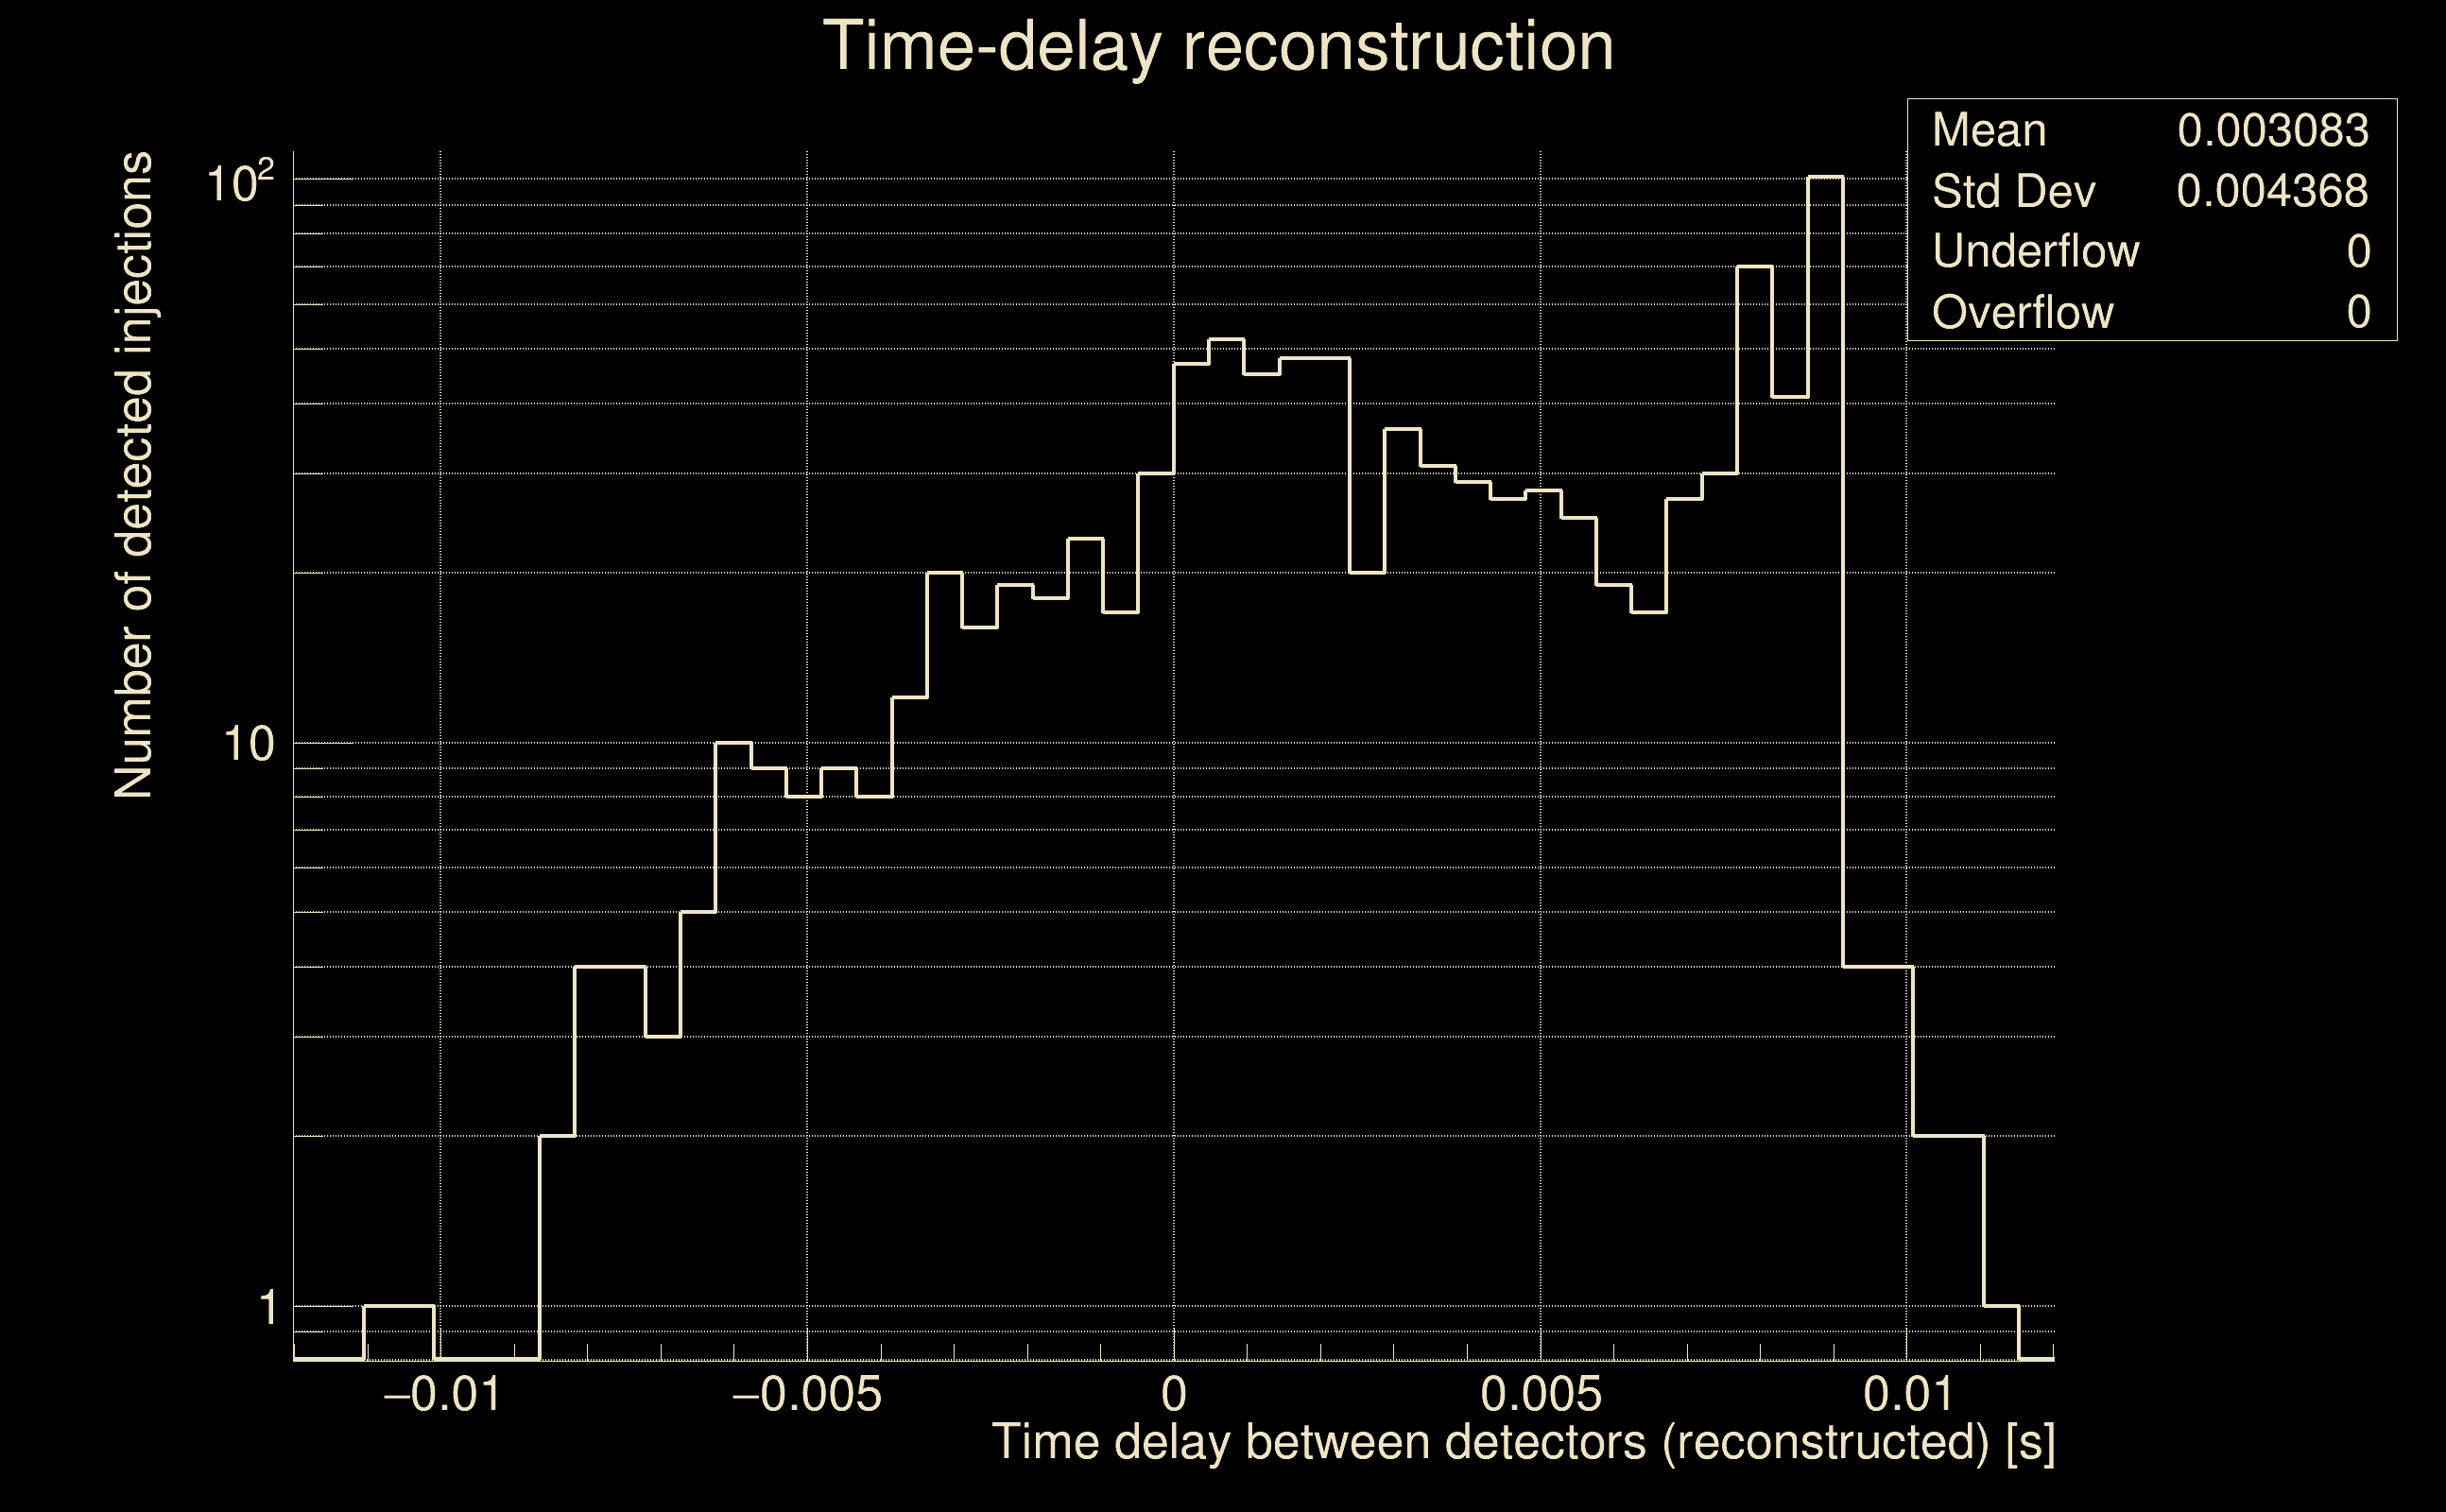
| Light travel time between detectors: | 0.0100128 s |
| Slice extra-time (calibration uncertainty + slice veto): | 0.0129872 s |
| Number of time-delay bins in a cross-correlation map: | 10000 |
| Number of slices in a cross-correlation map: | 217 |
| Number of time-delay bins in a slice: | 46 |
| SNR gating: | < 100 (detector 0), < 100 (detector 1) |
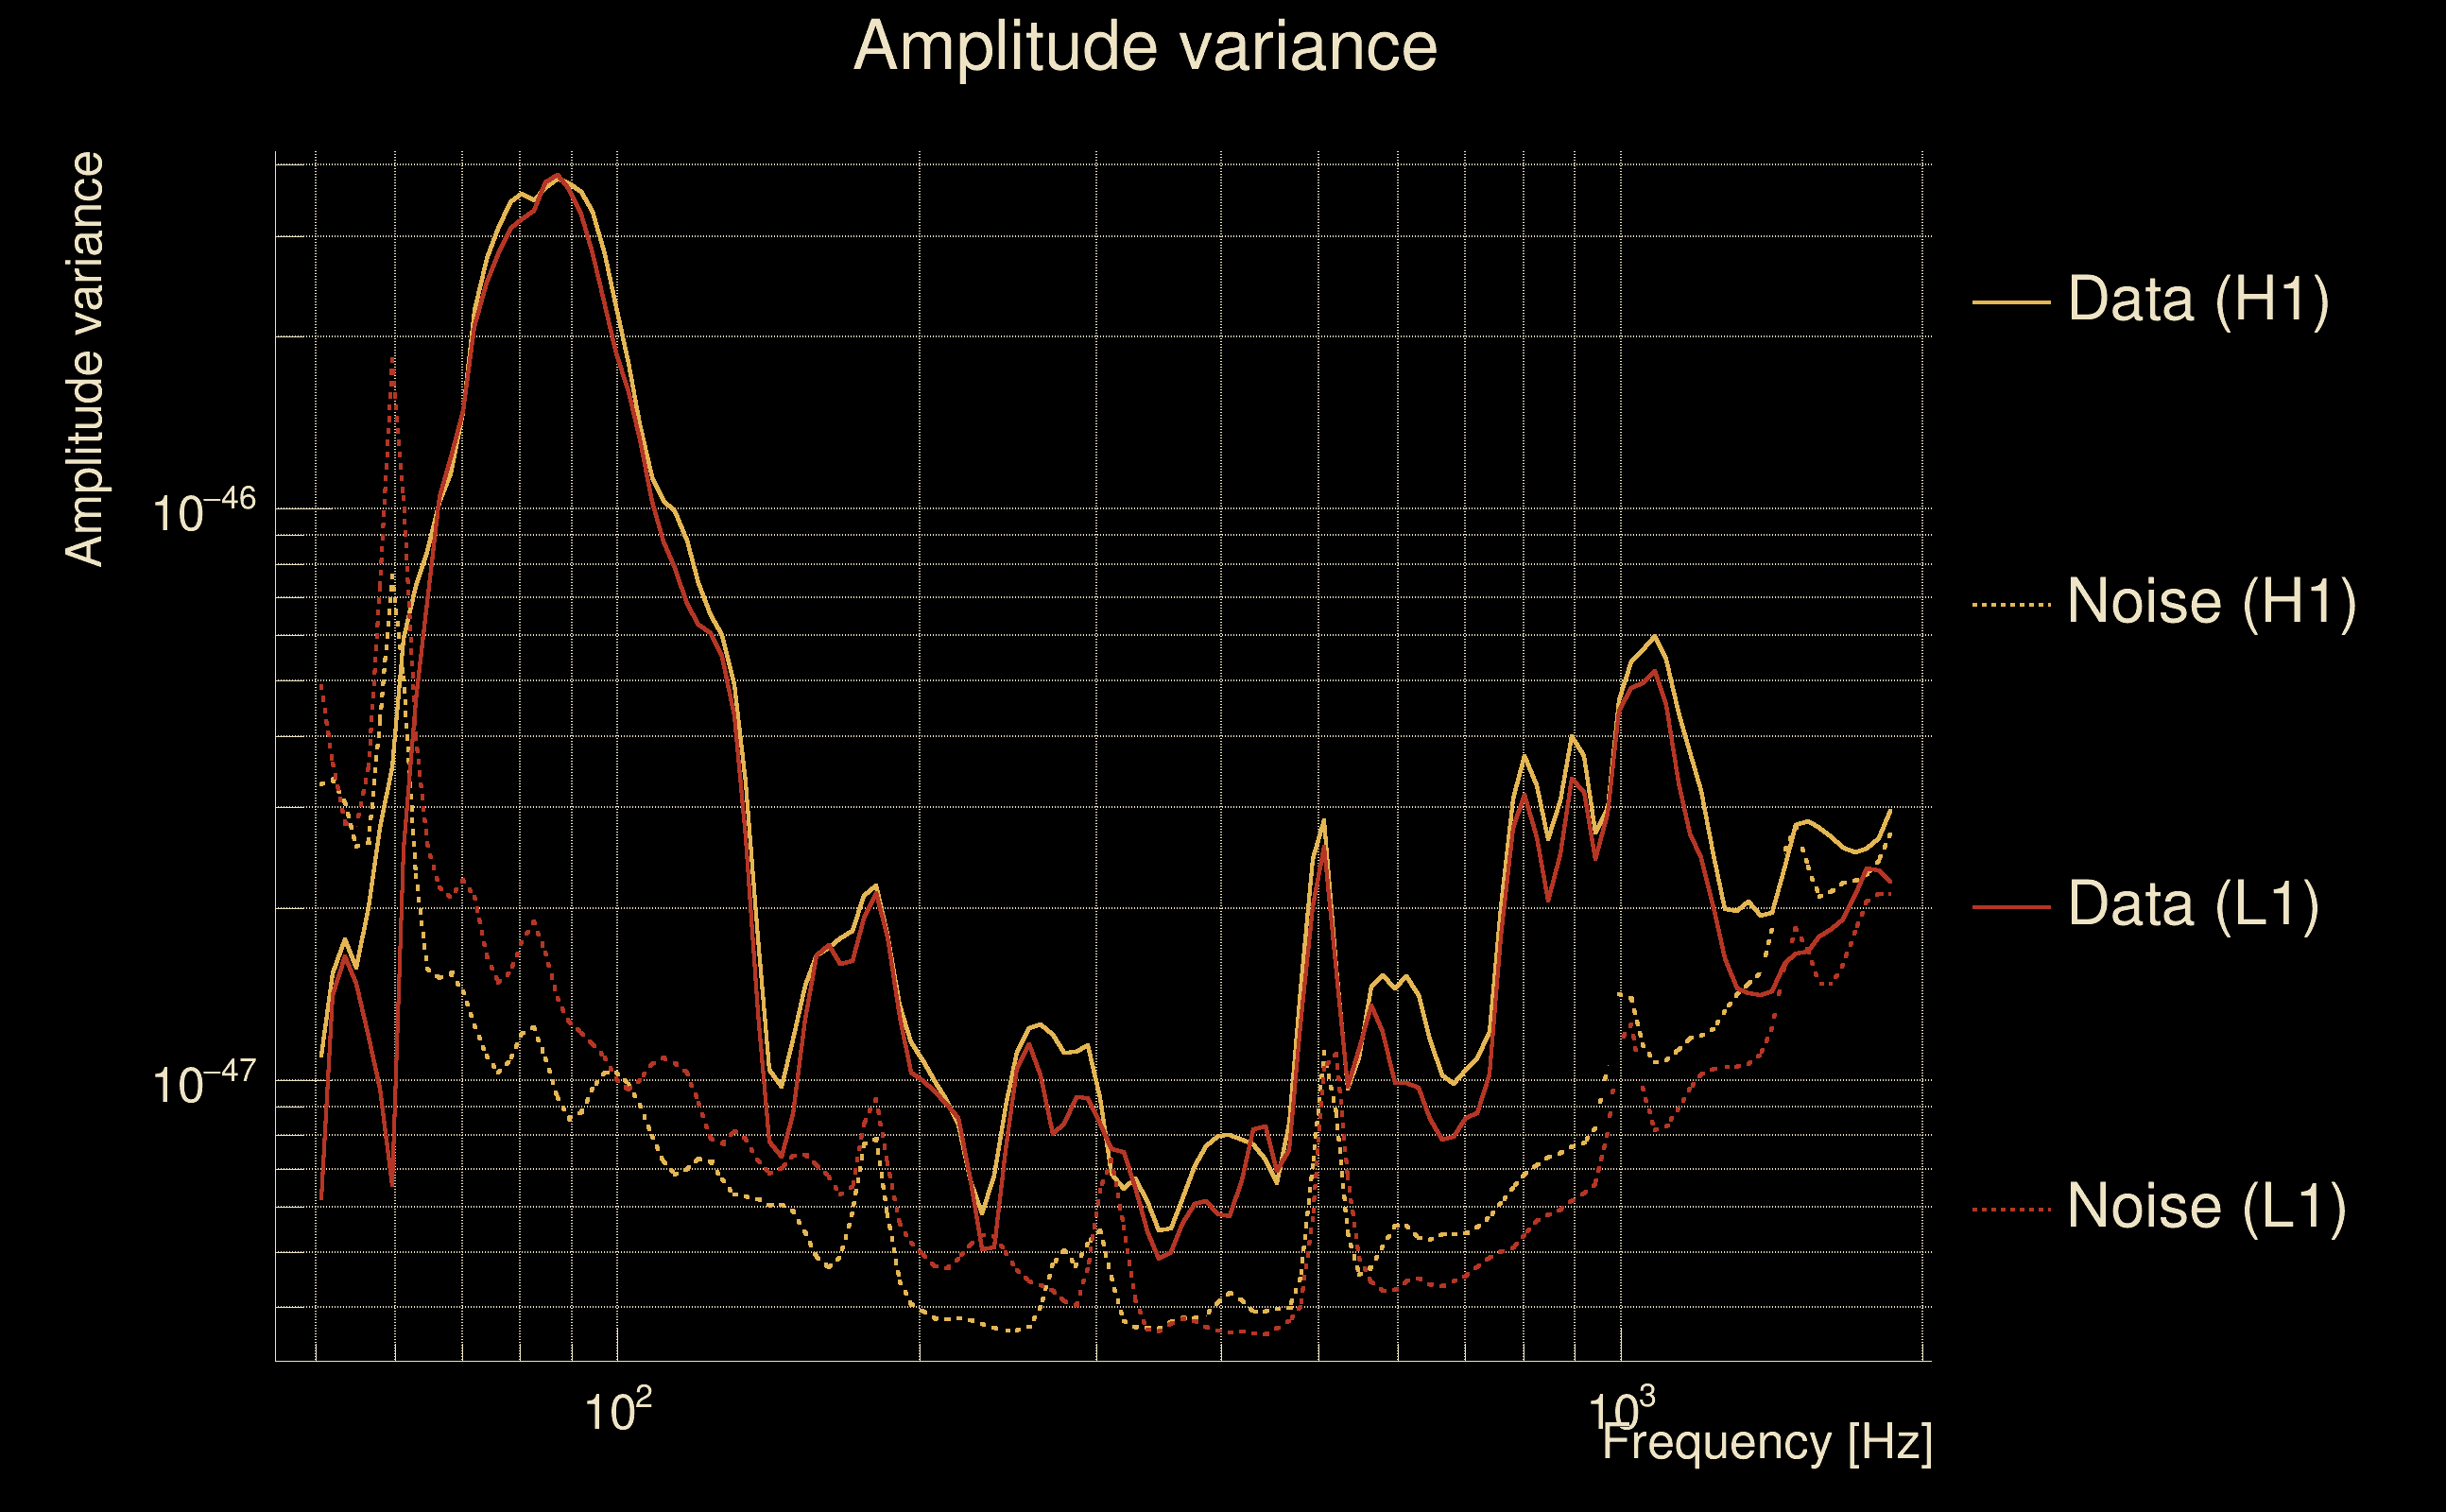
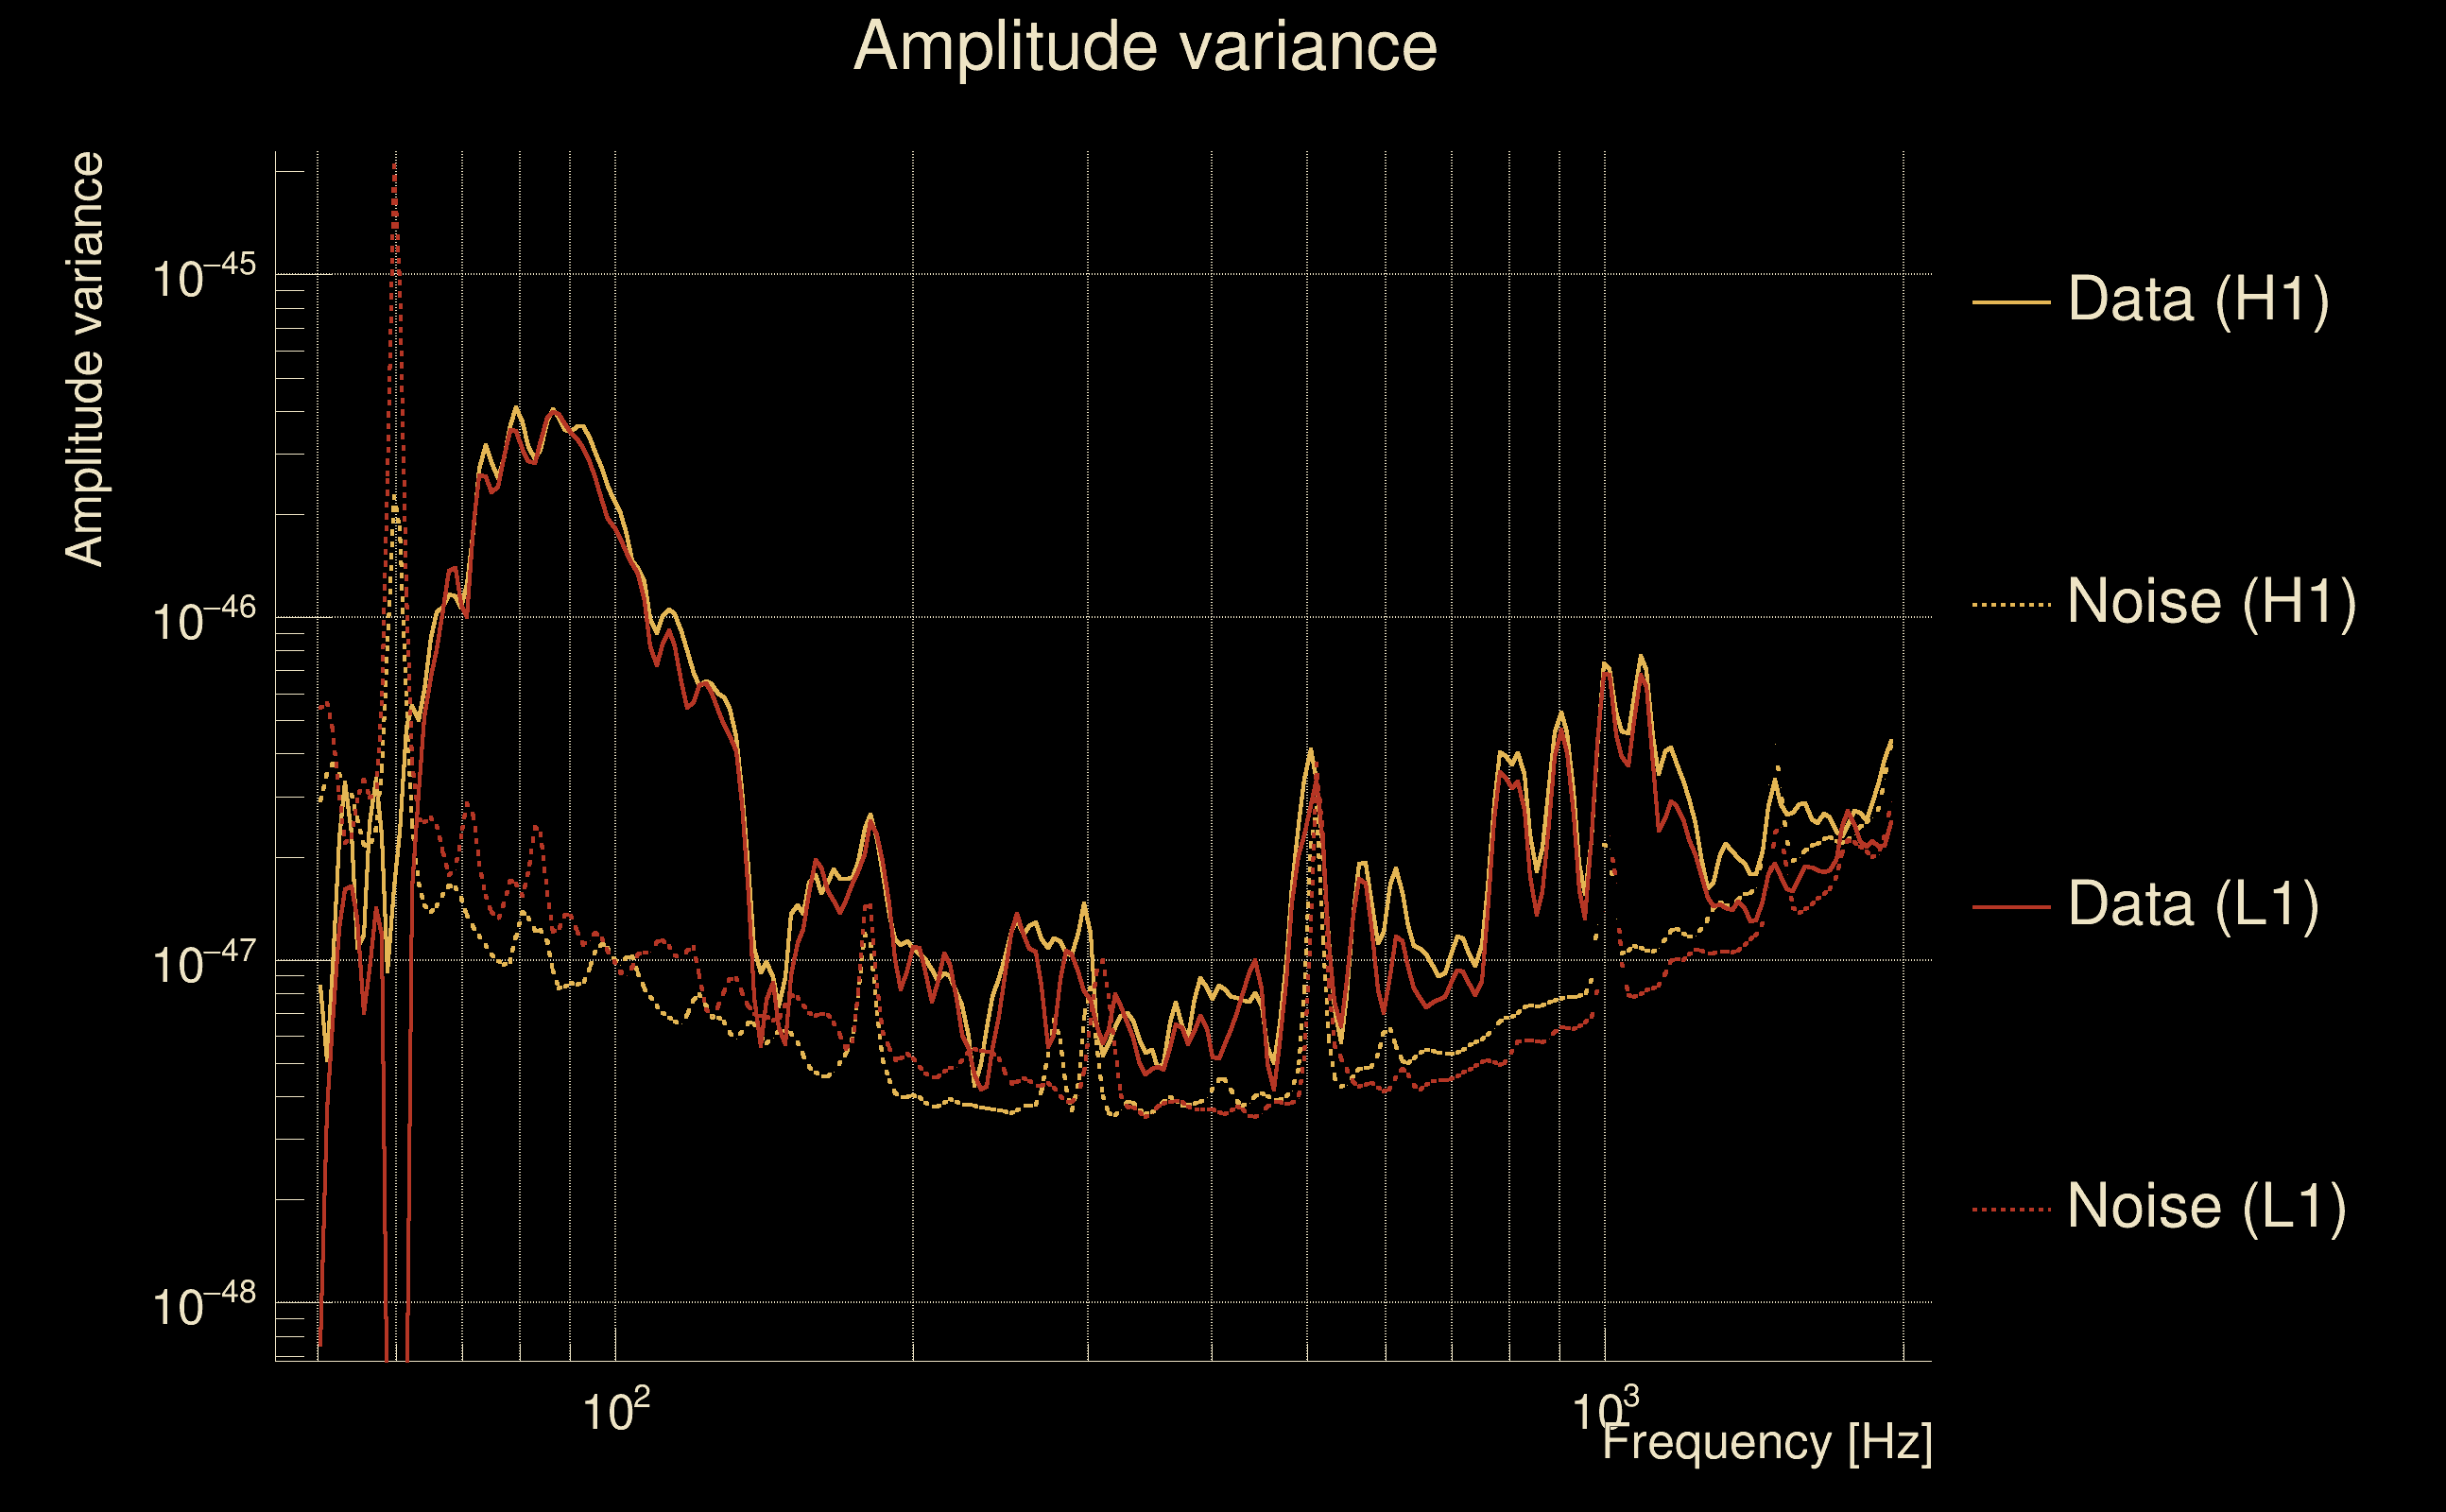
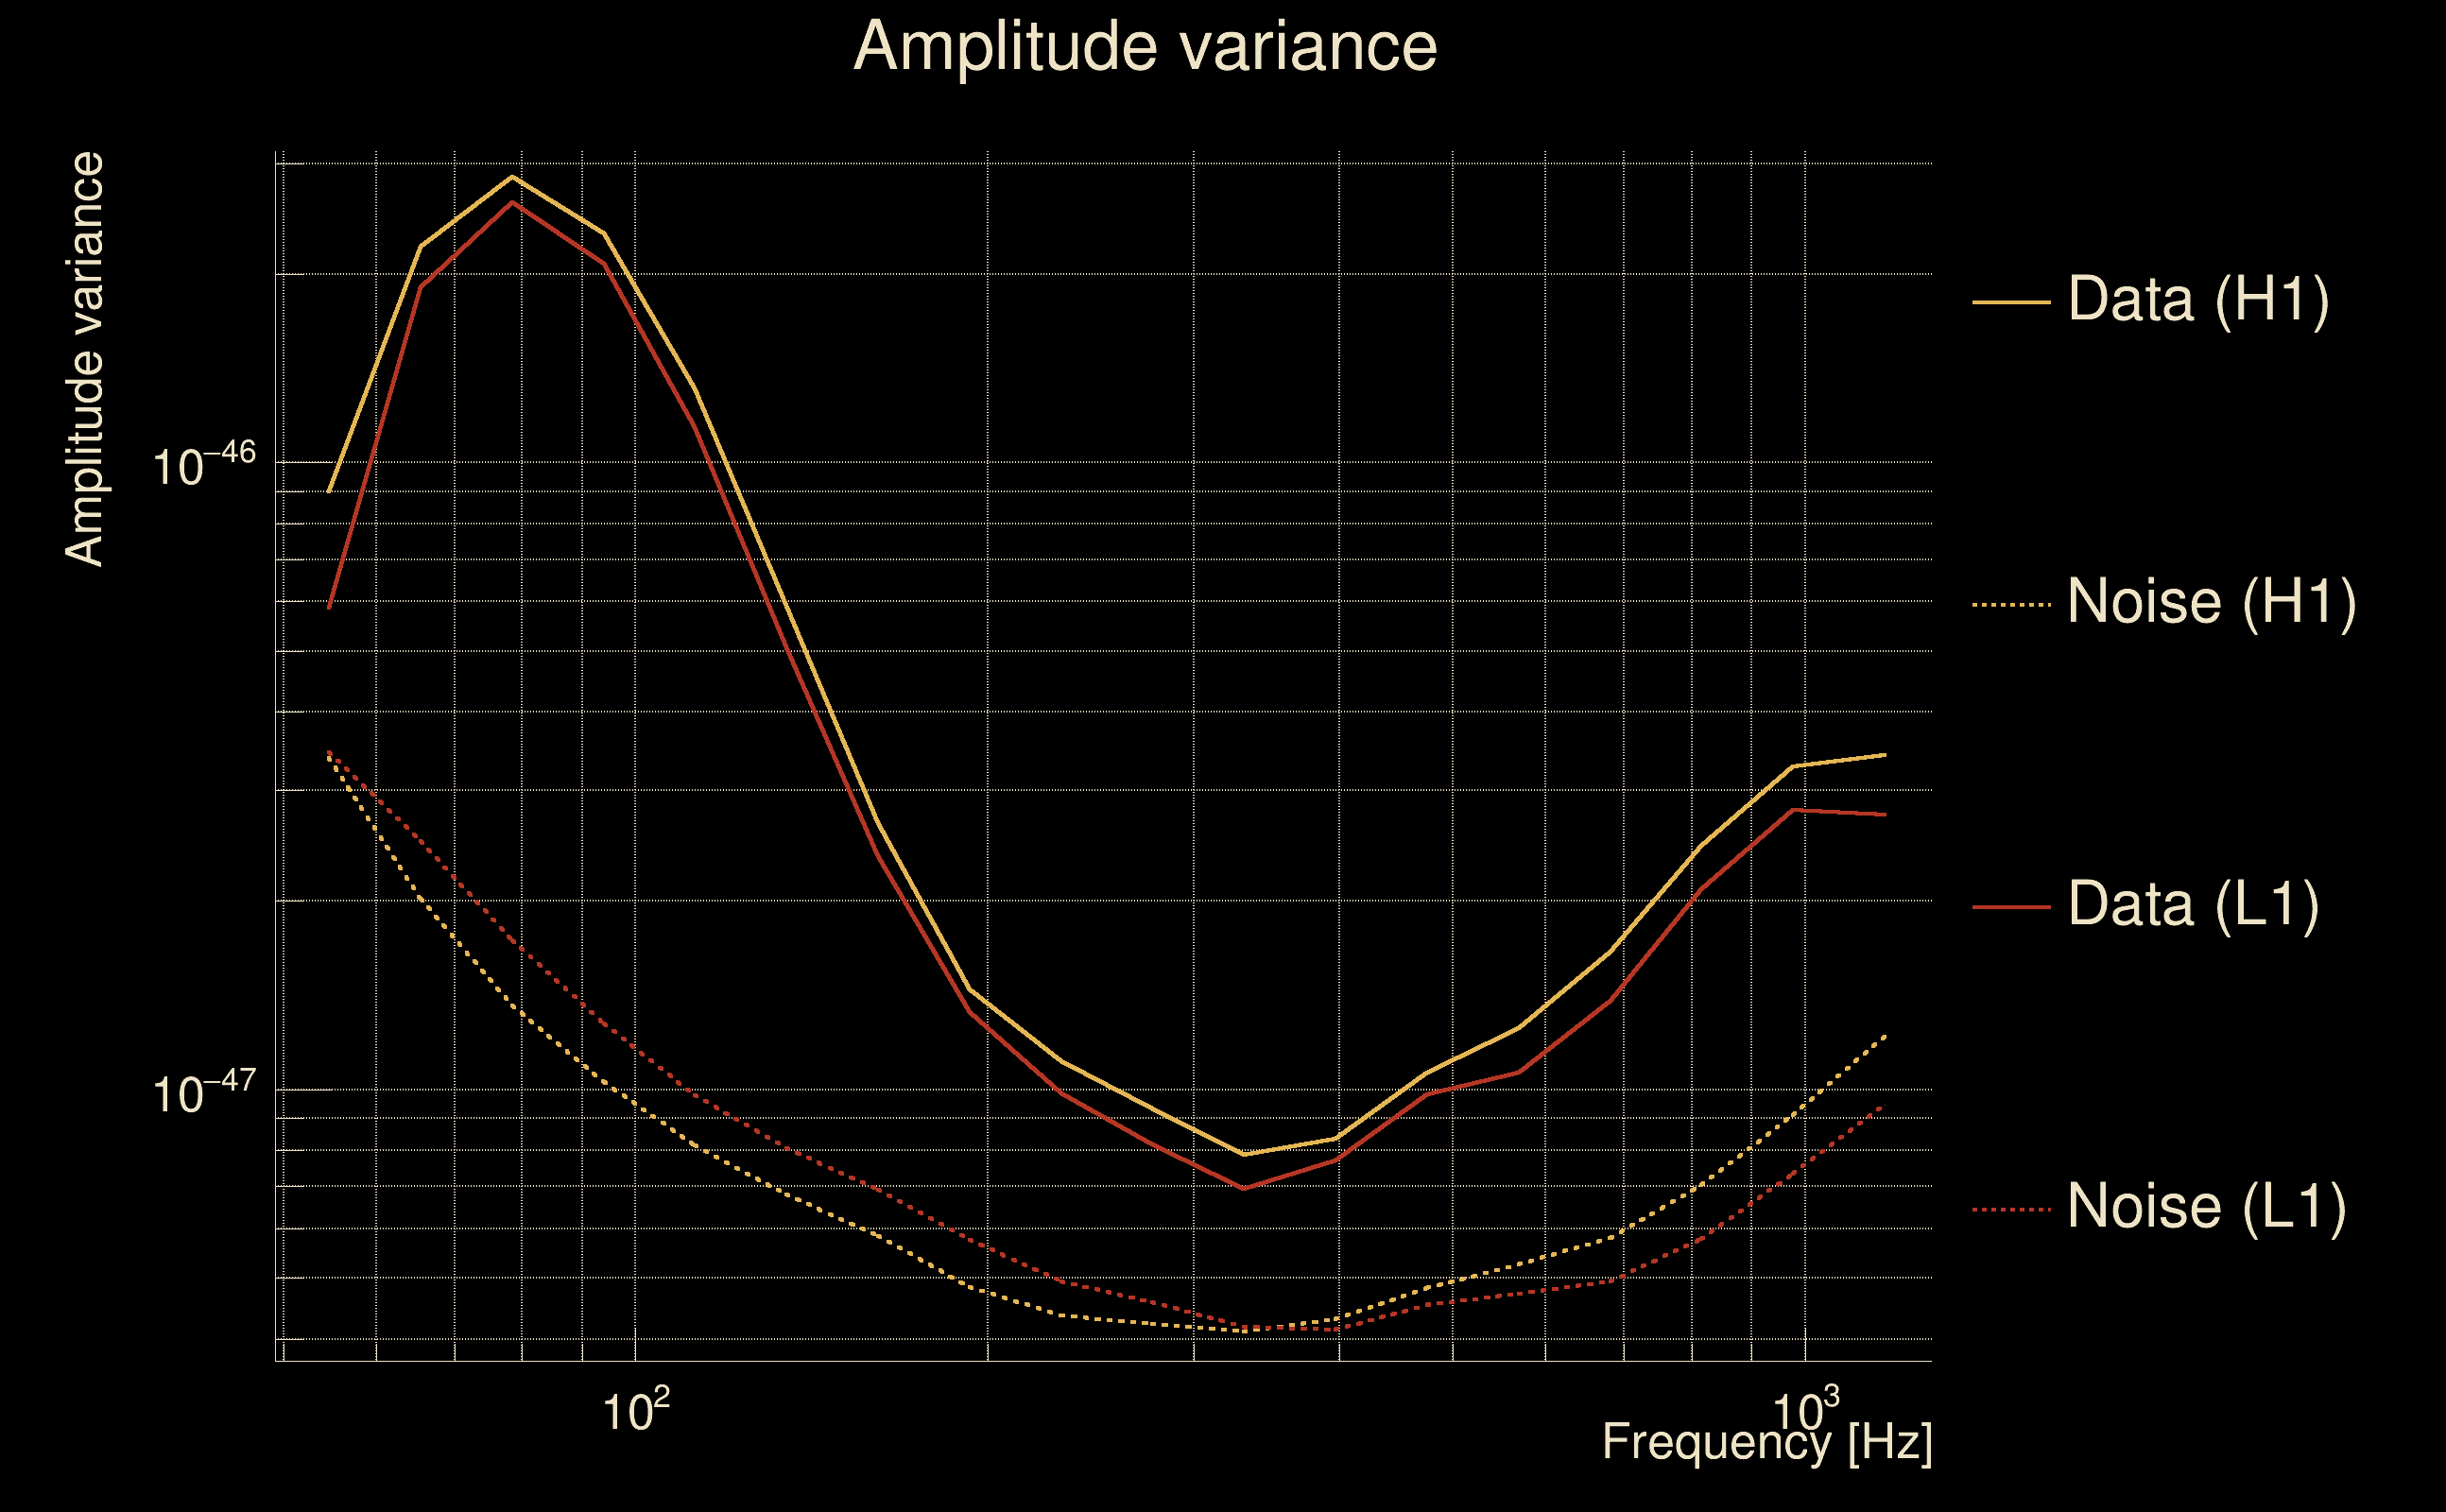
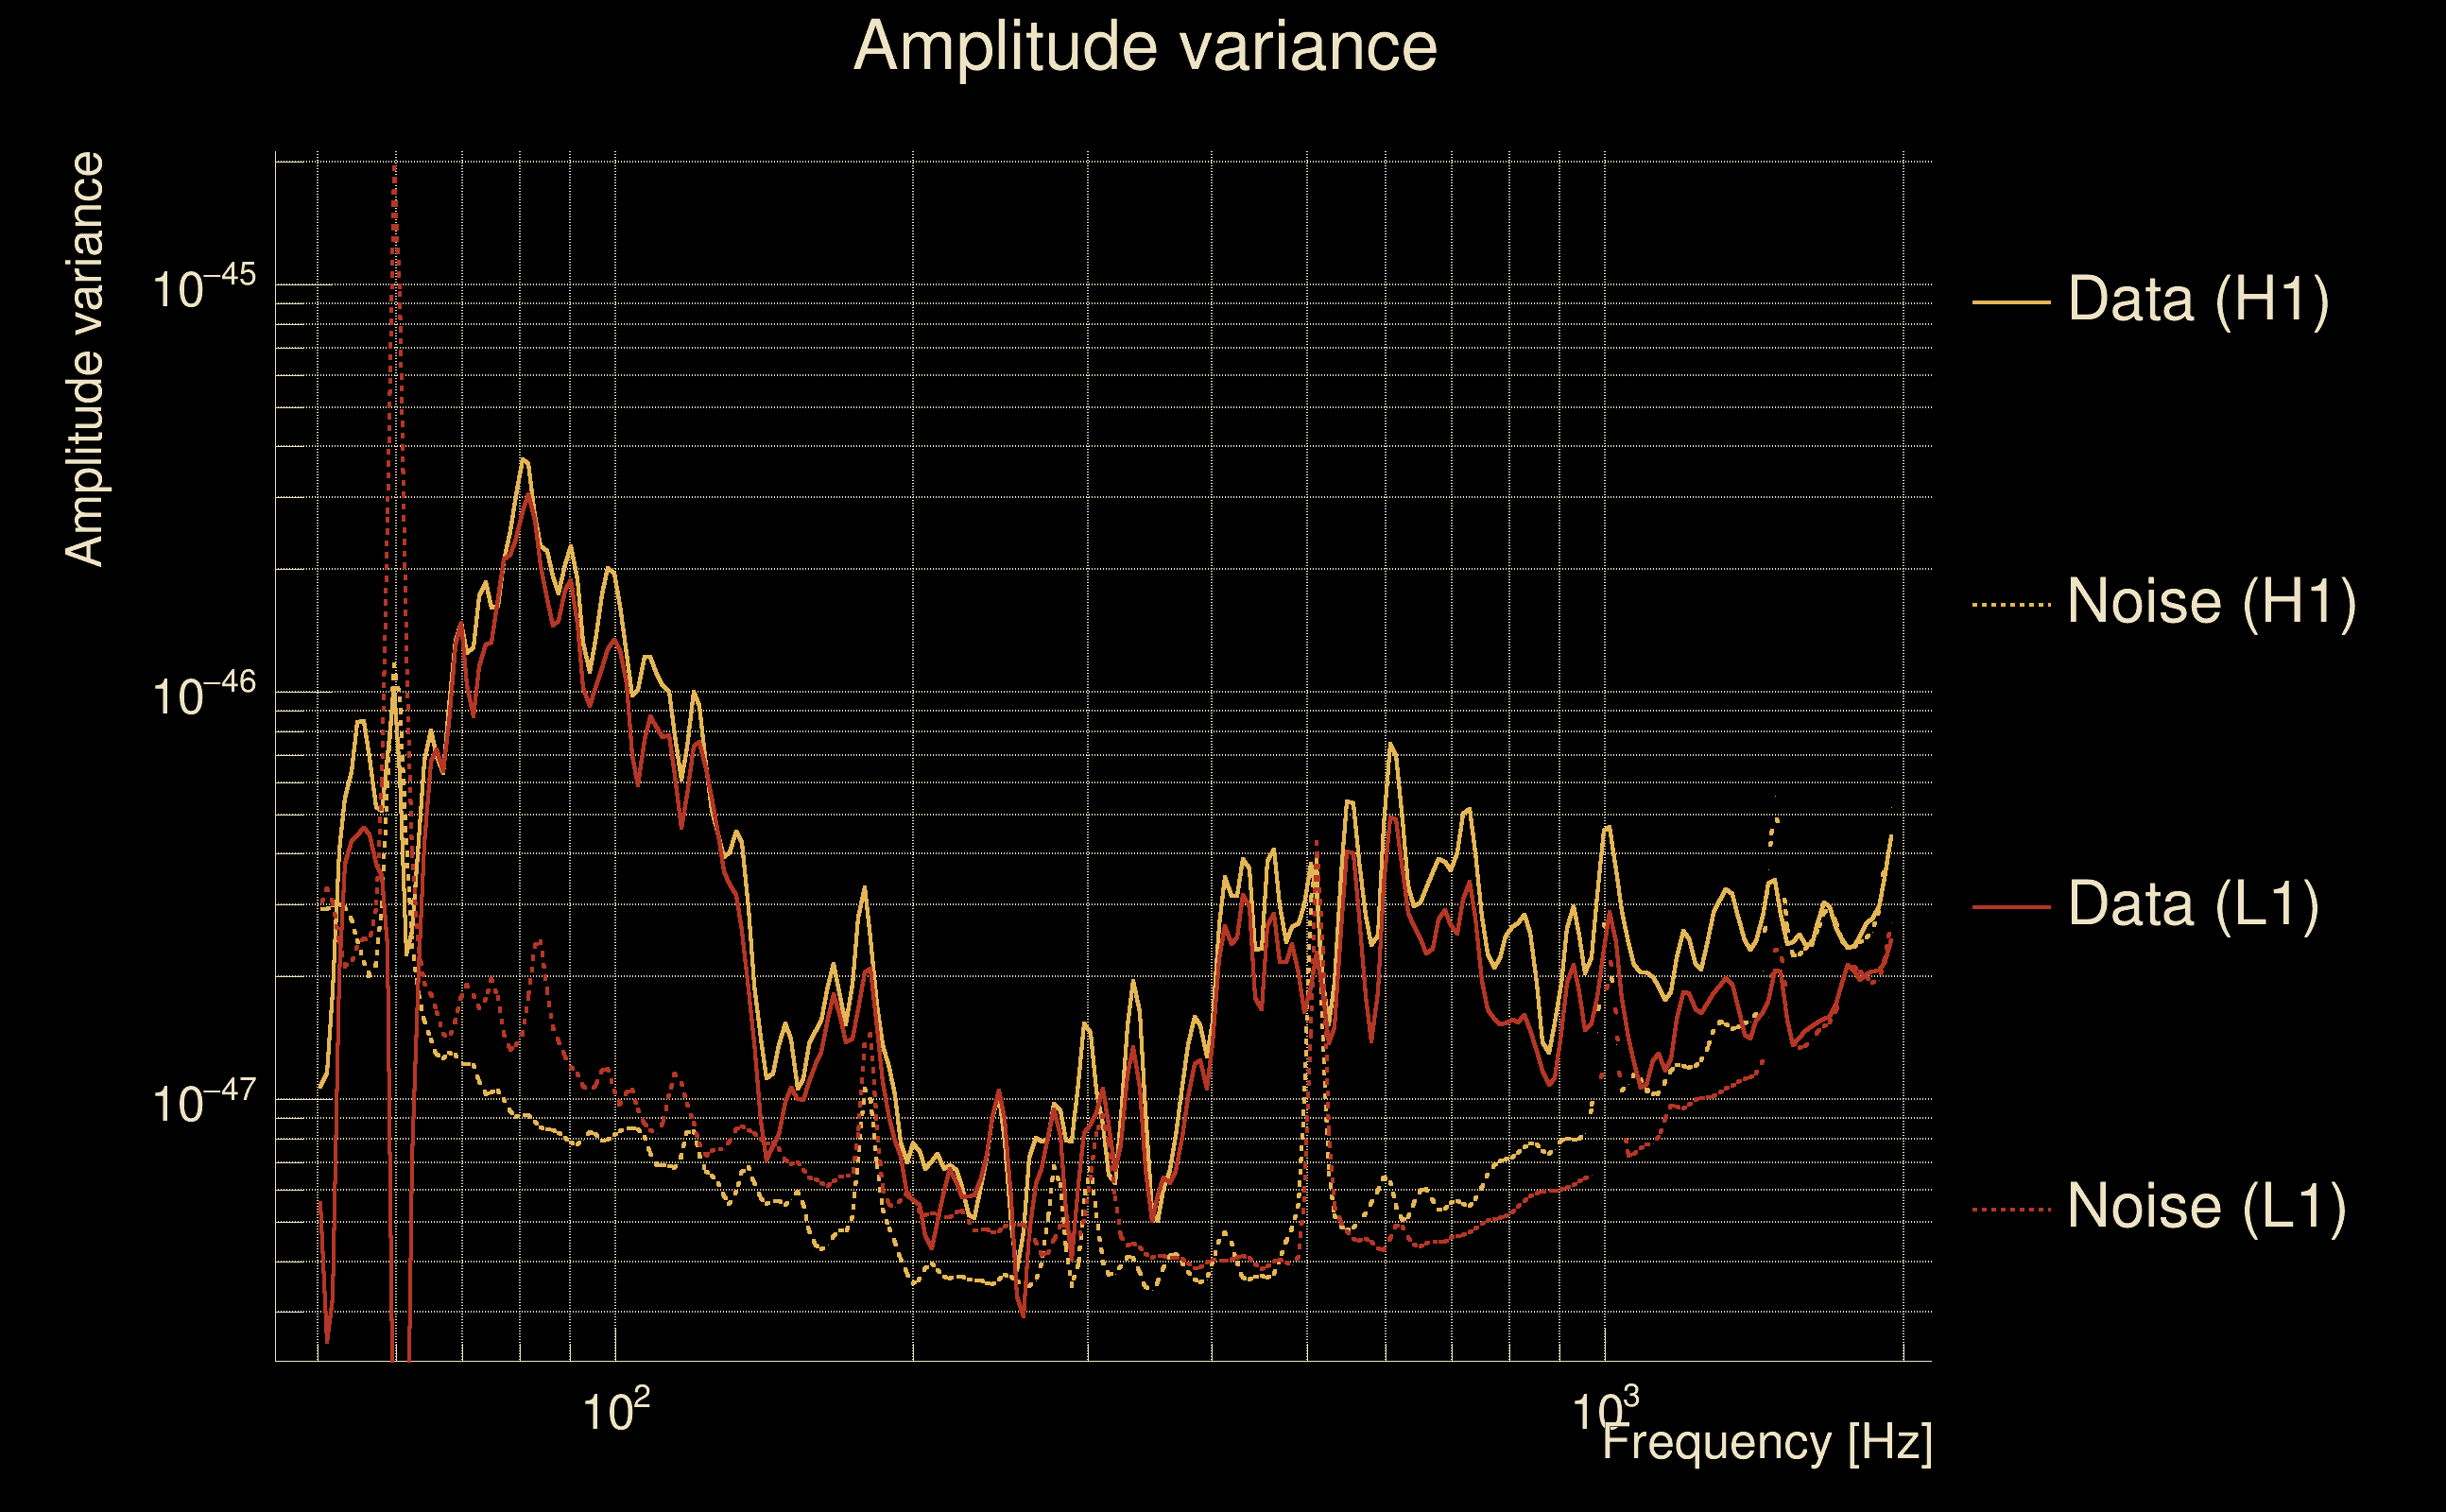
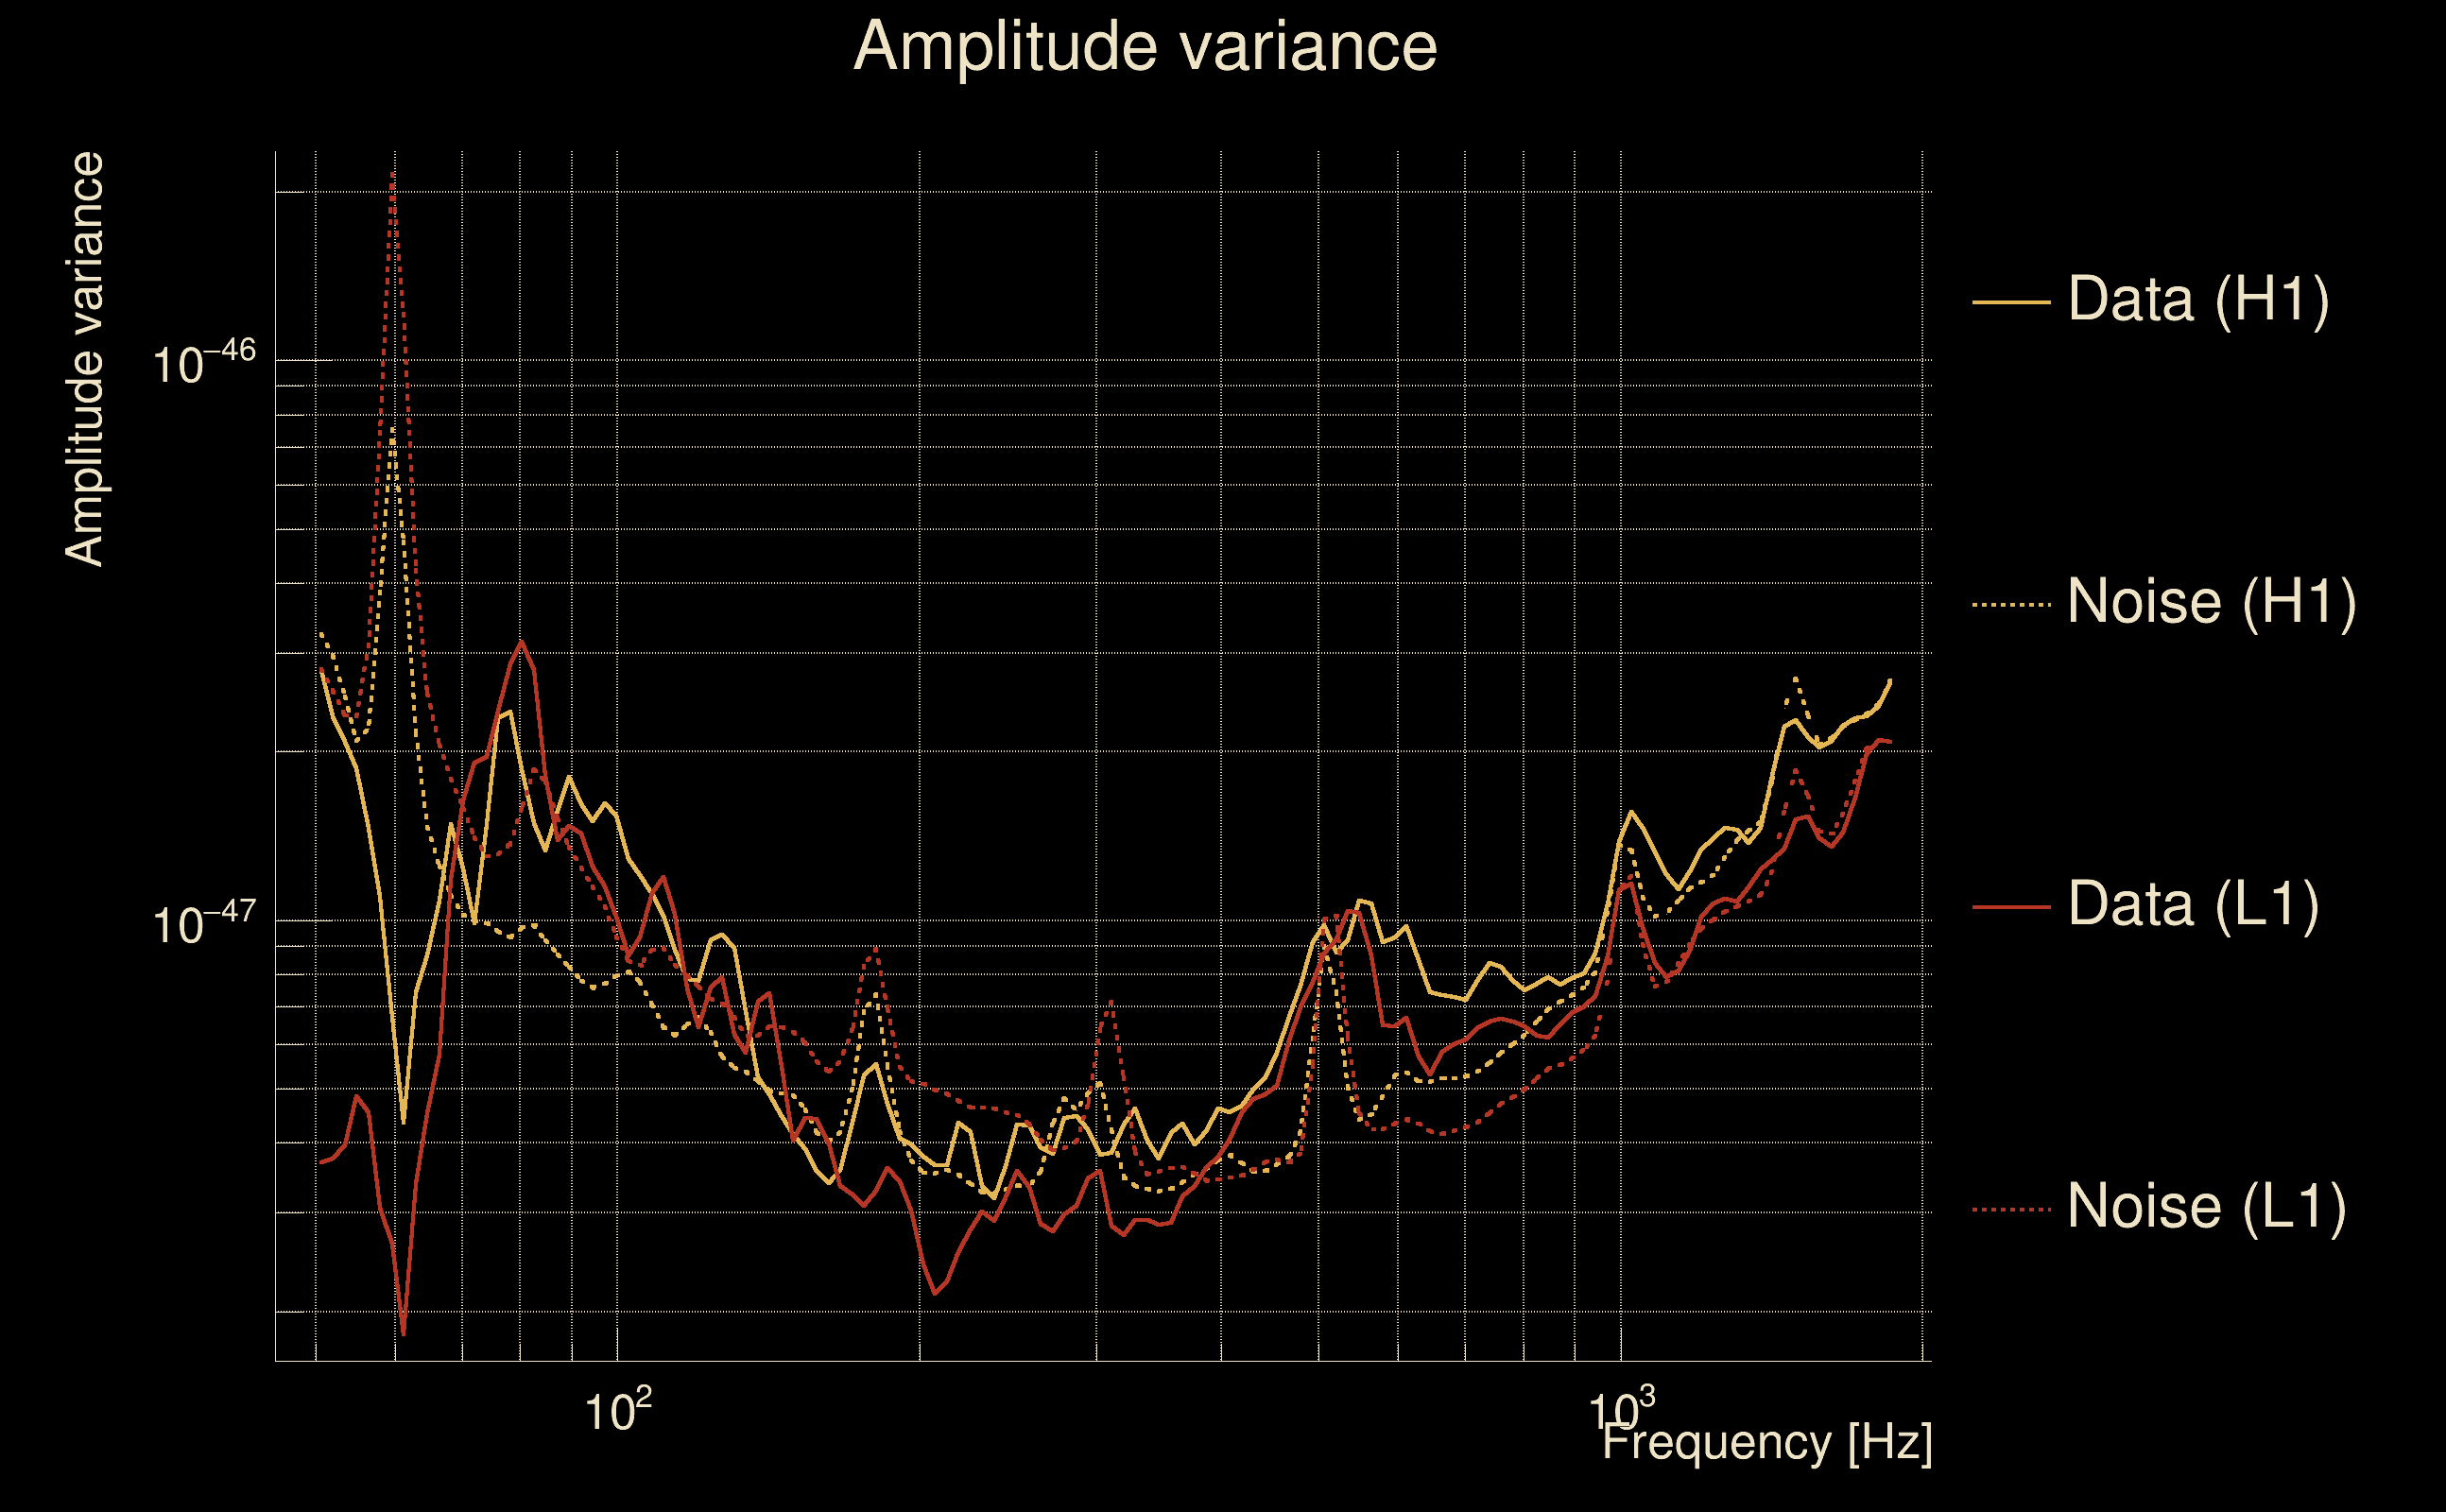
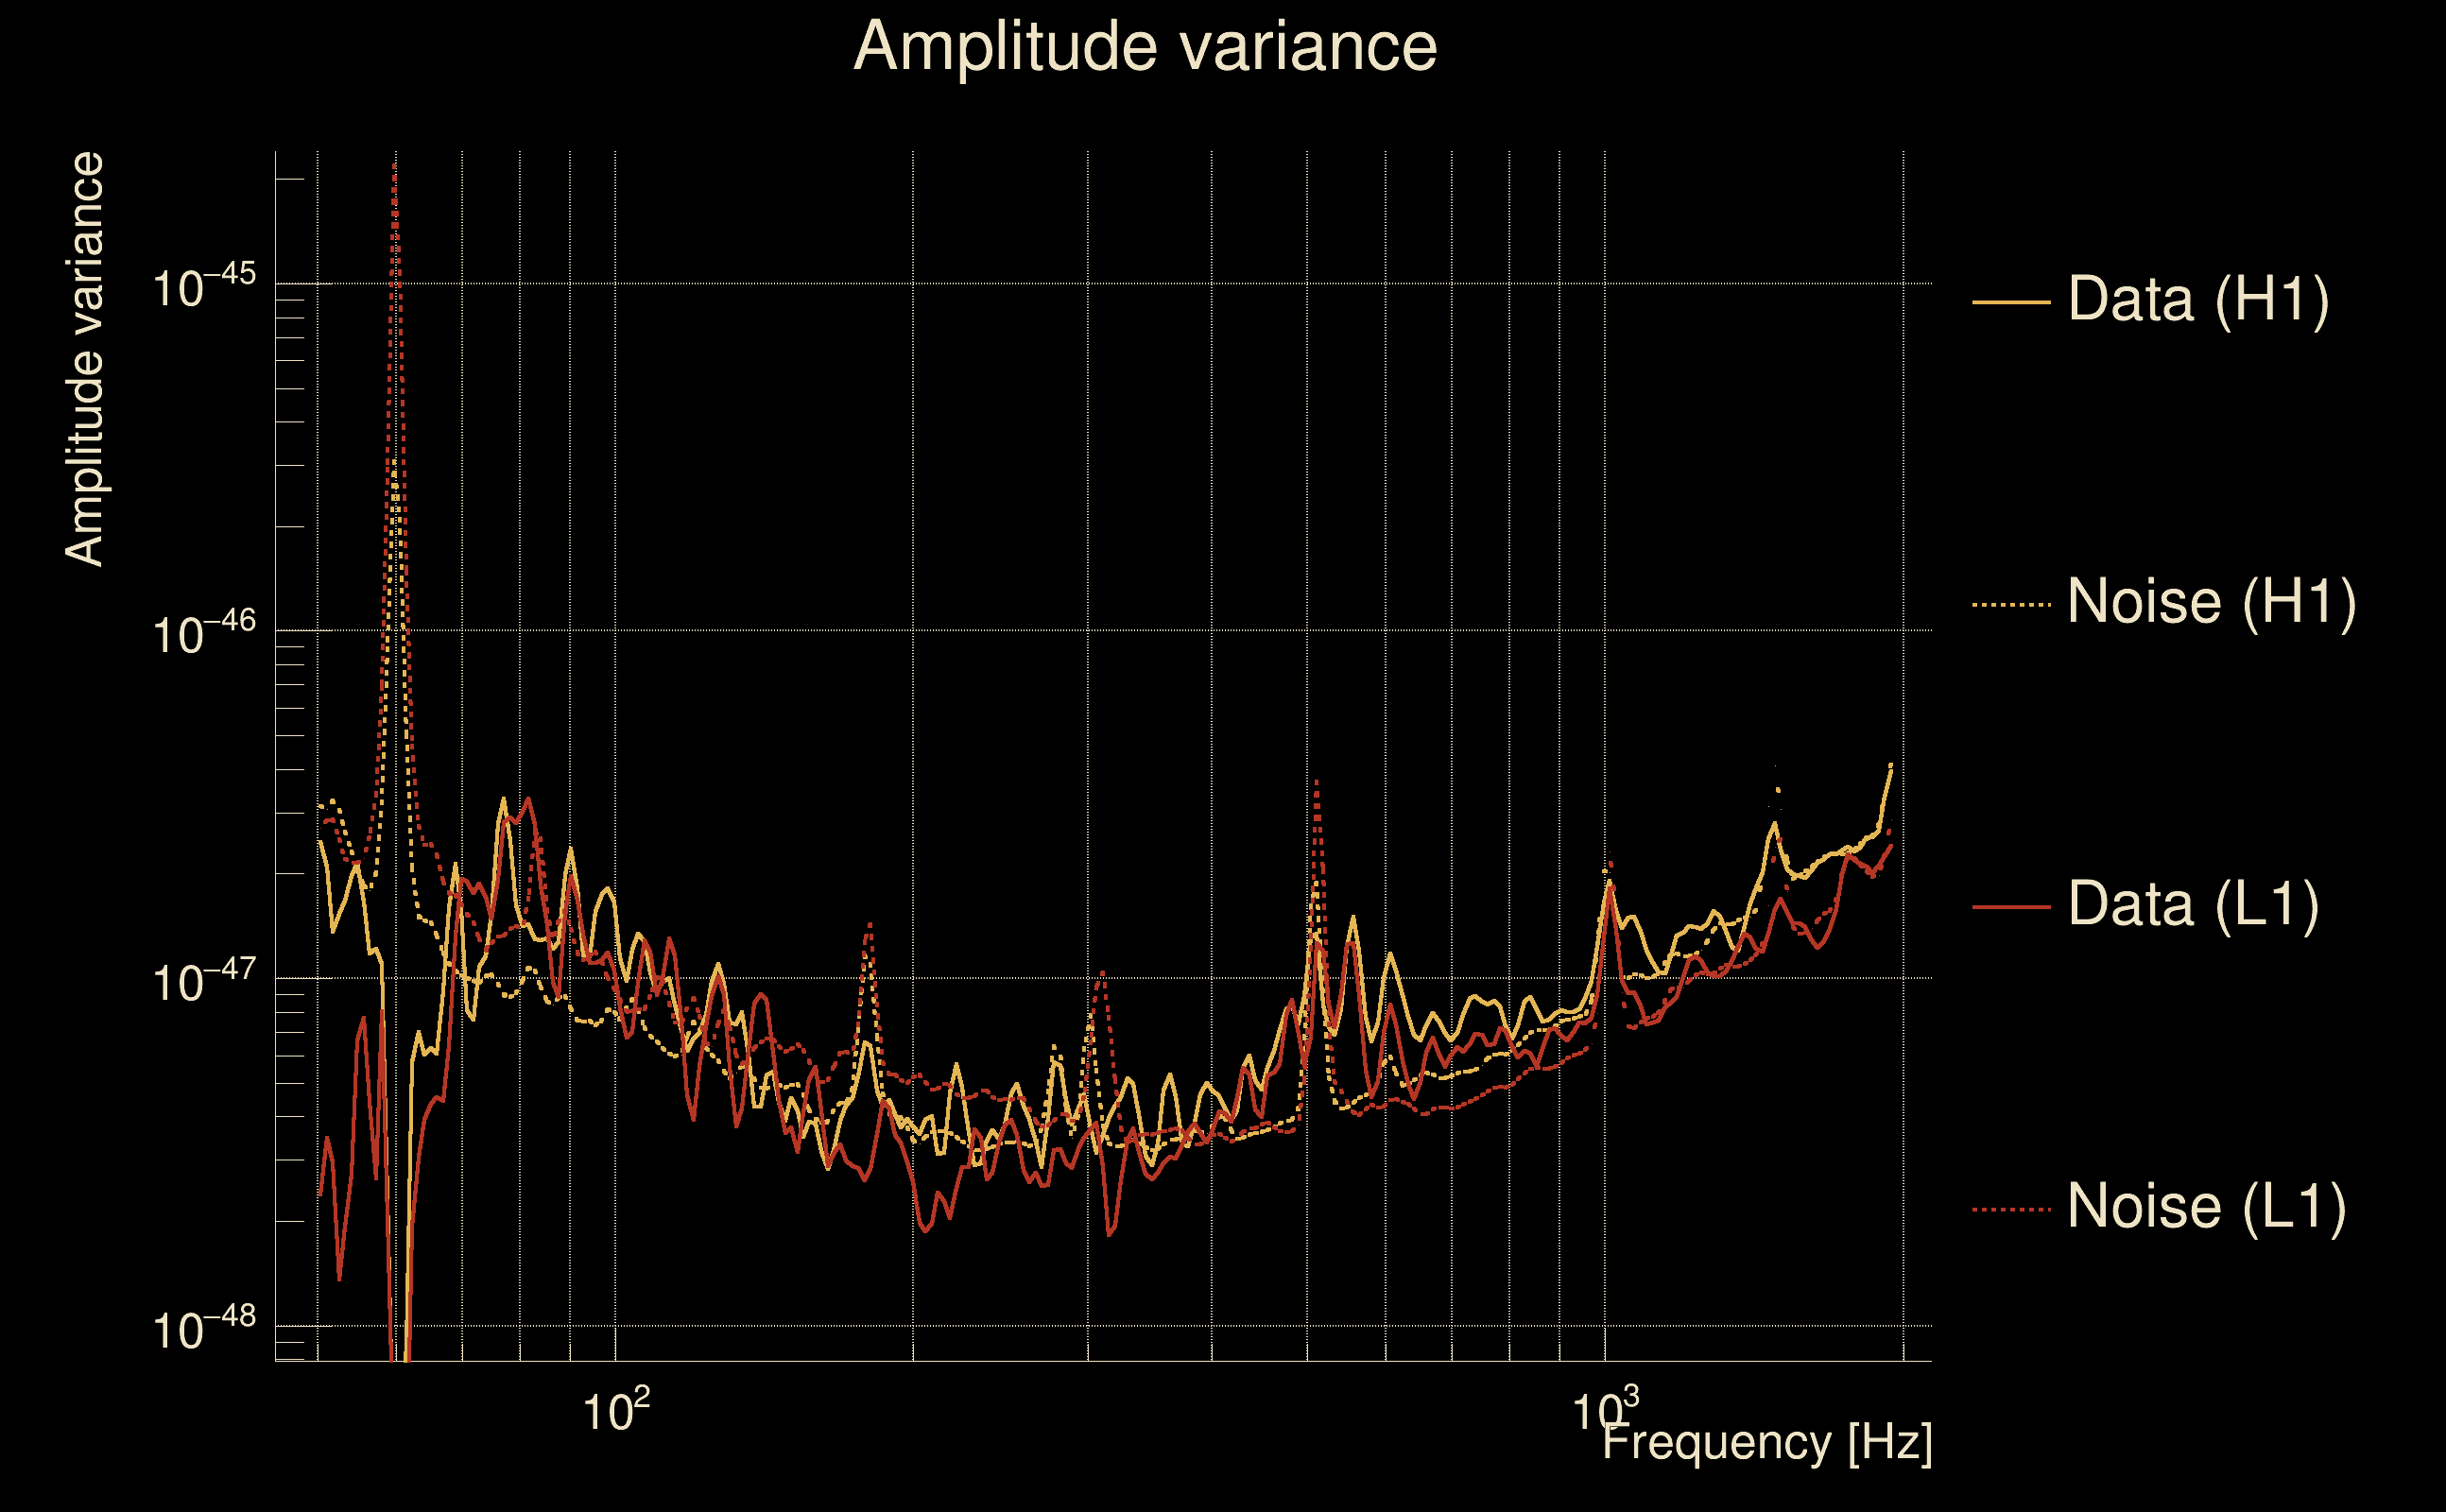
| Amplitude spectrograms: | normalization = 1e-22, power index = 2 |
| White noise SNR variance: | 0.523175 (after applying a correction factor = 1) |
| Amplitude ratio confidence level: | 3 sigma |
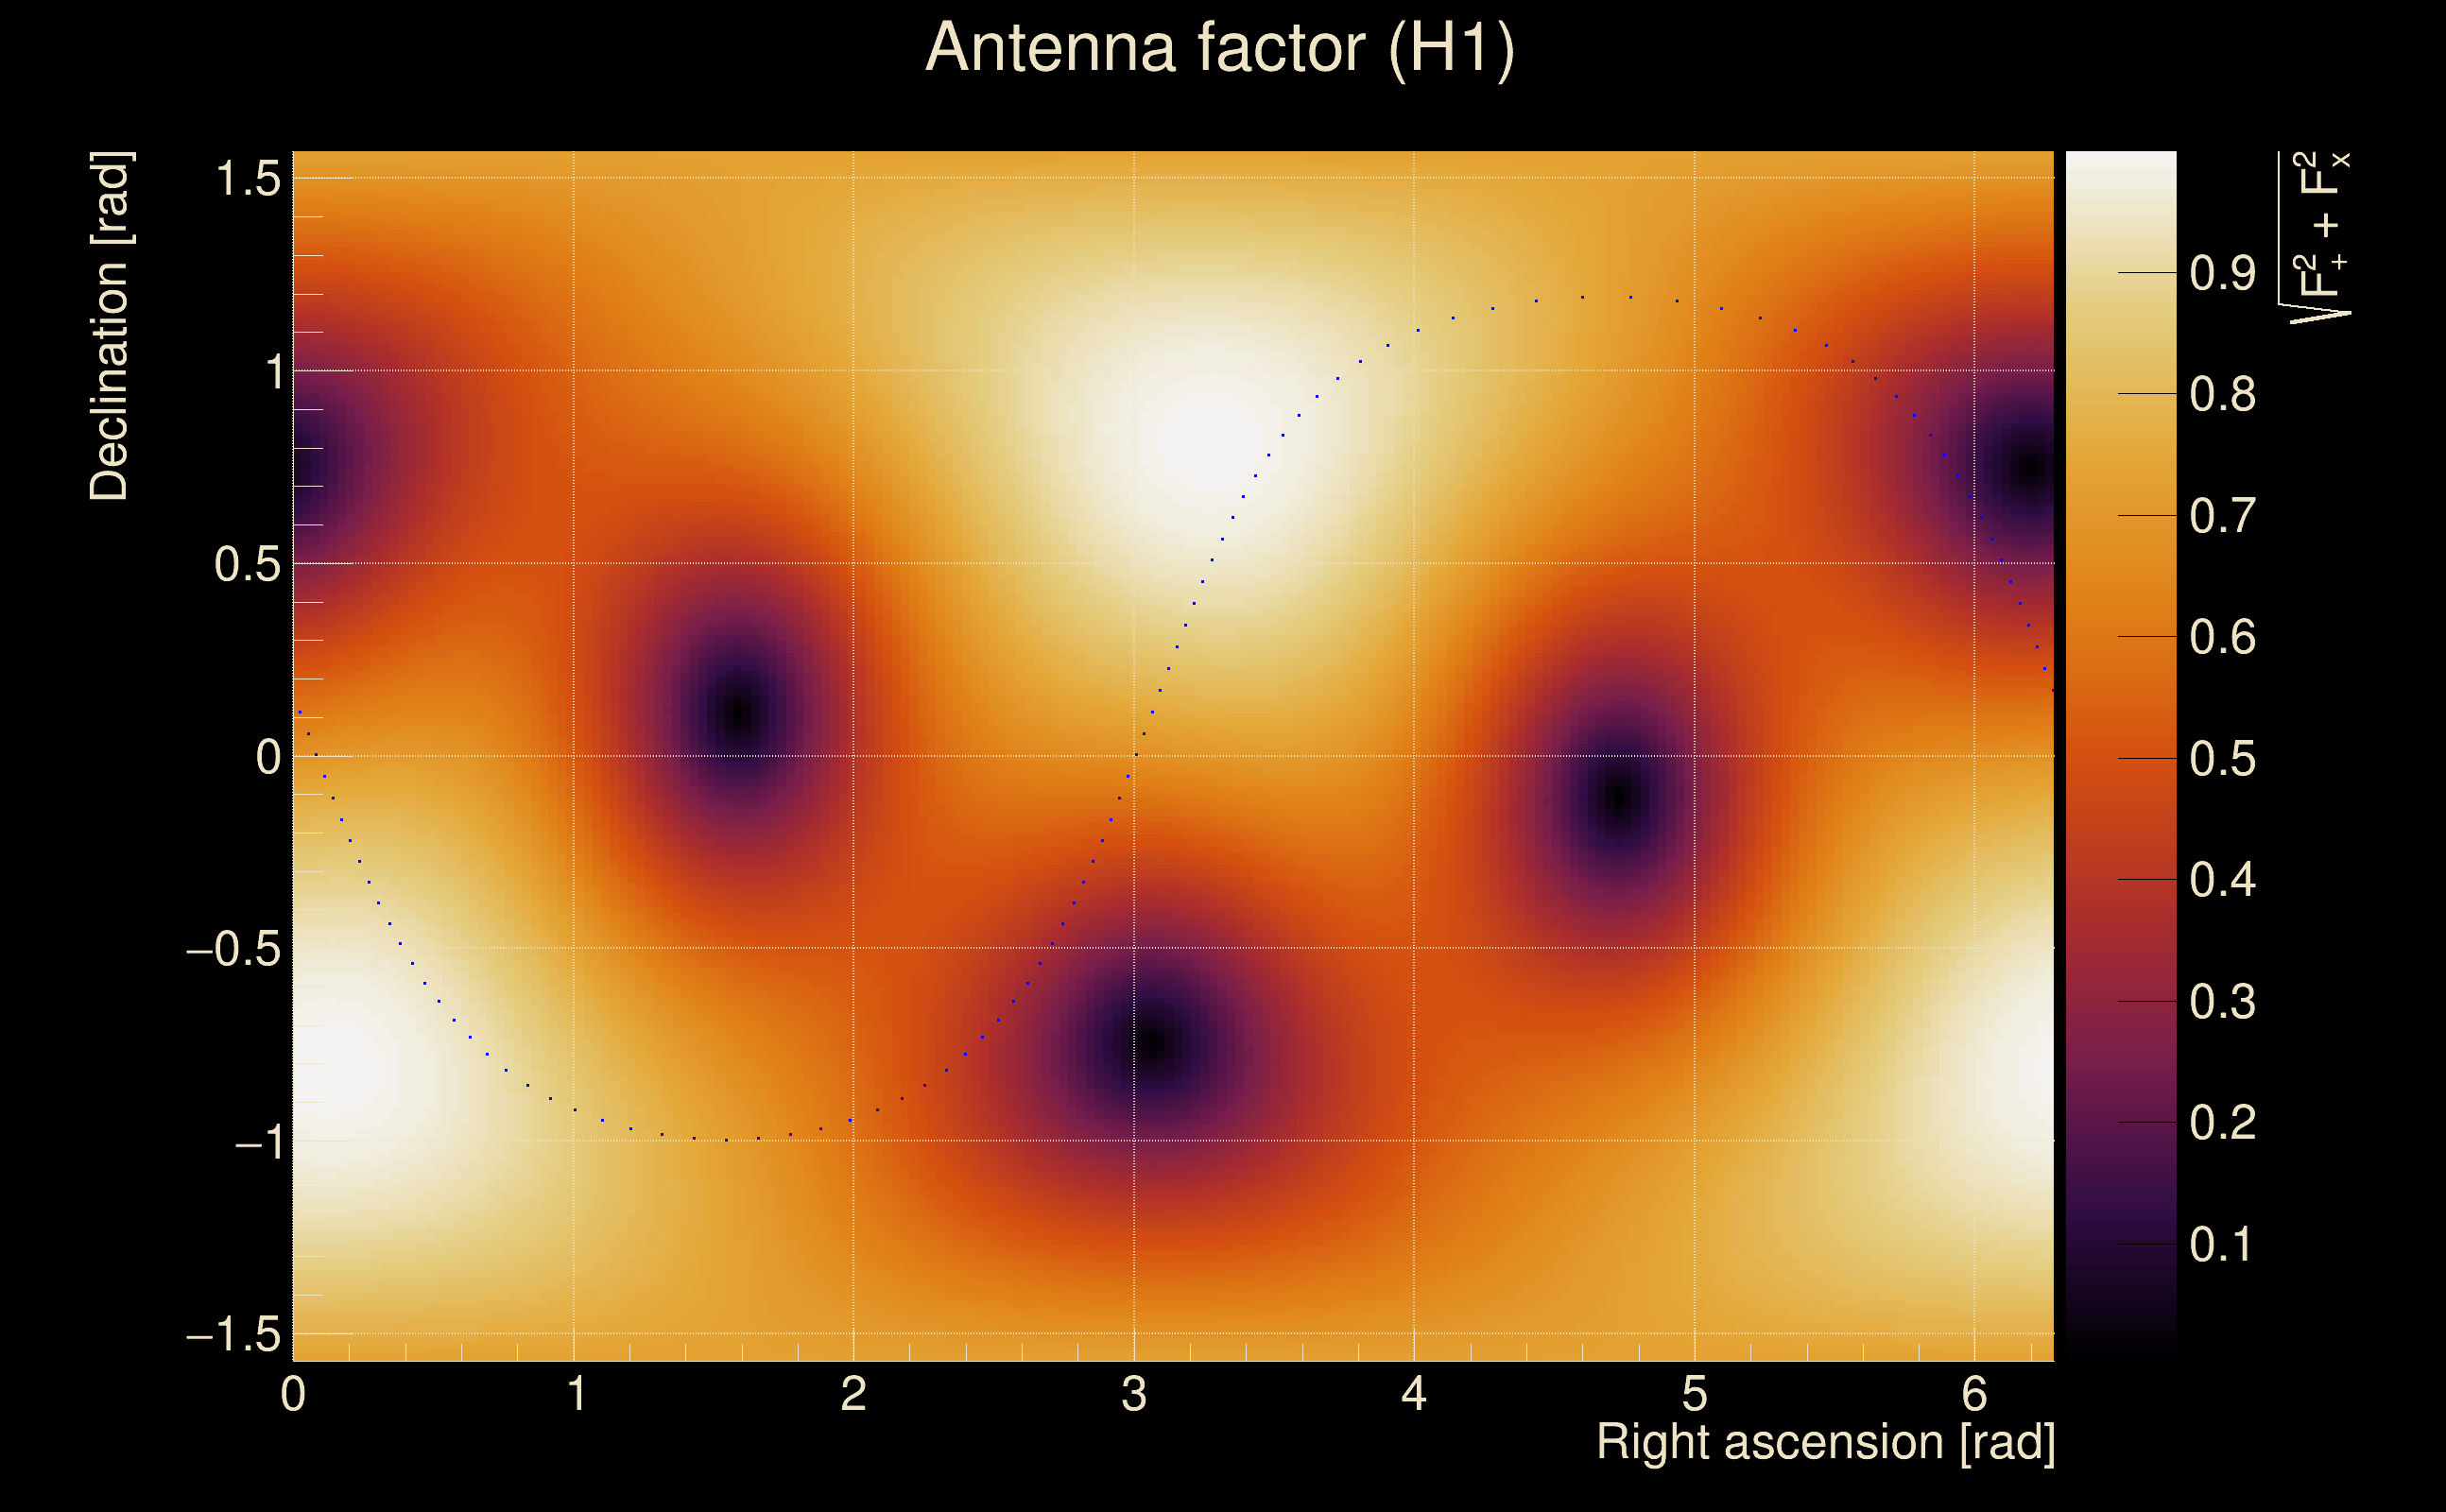
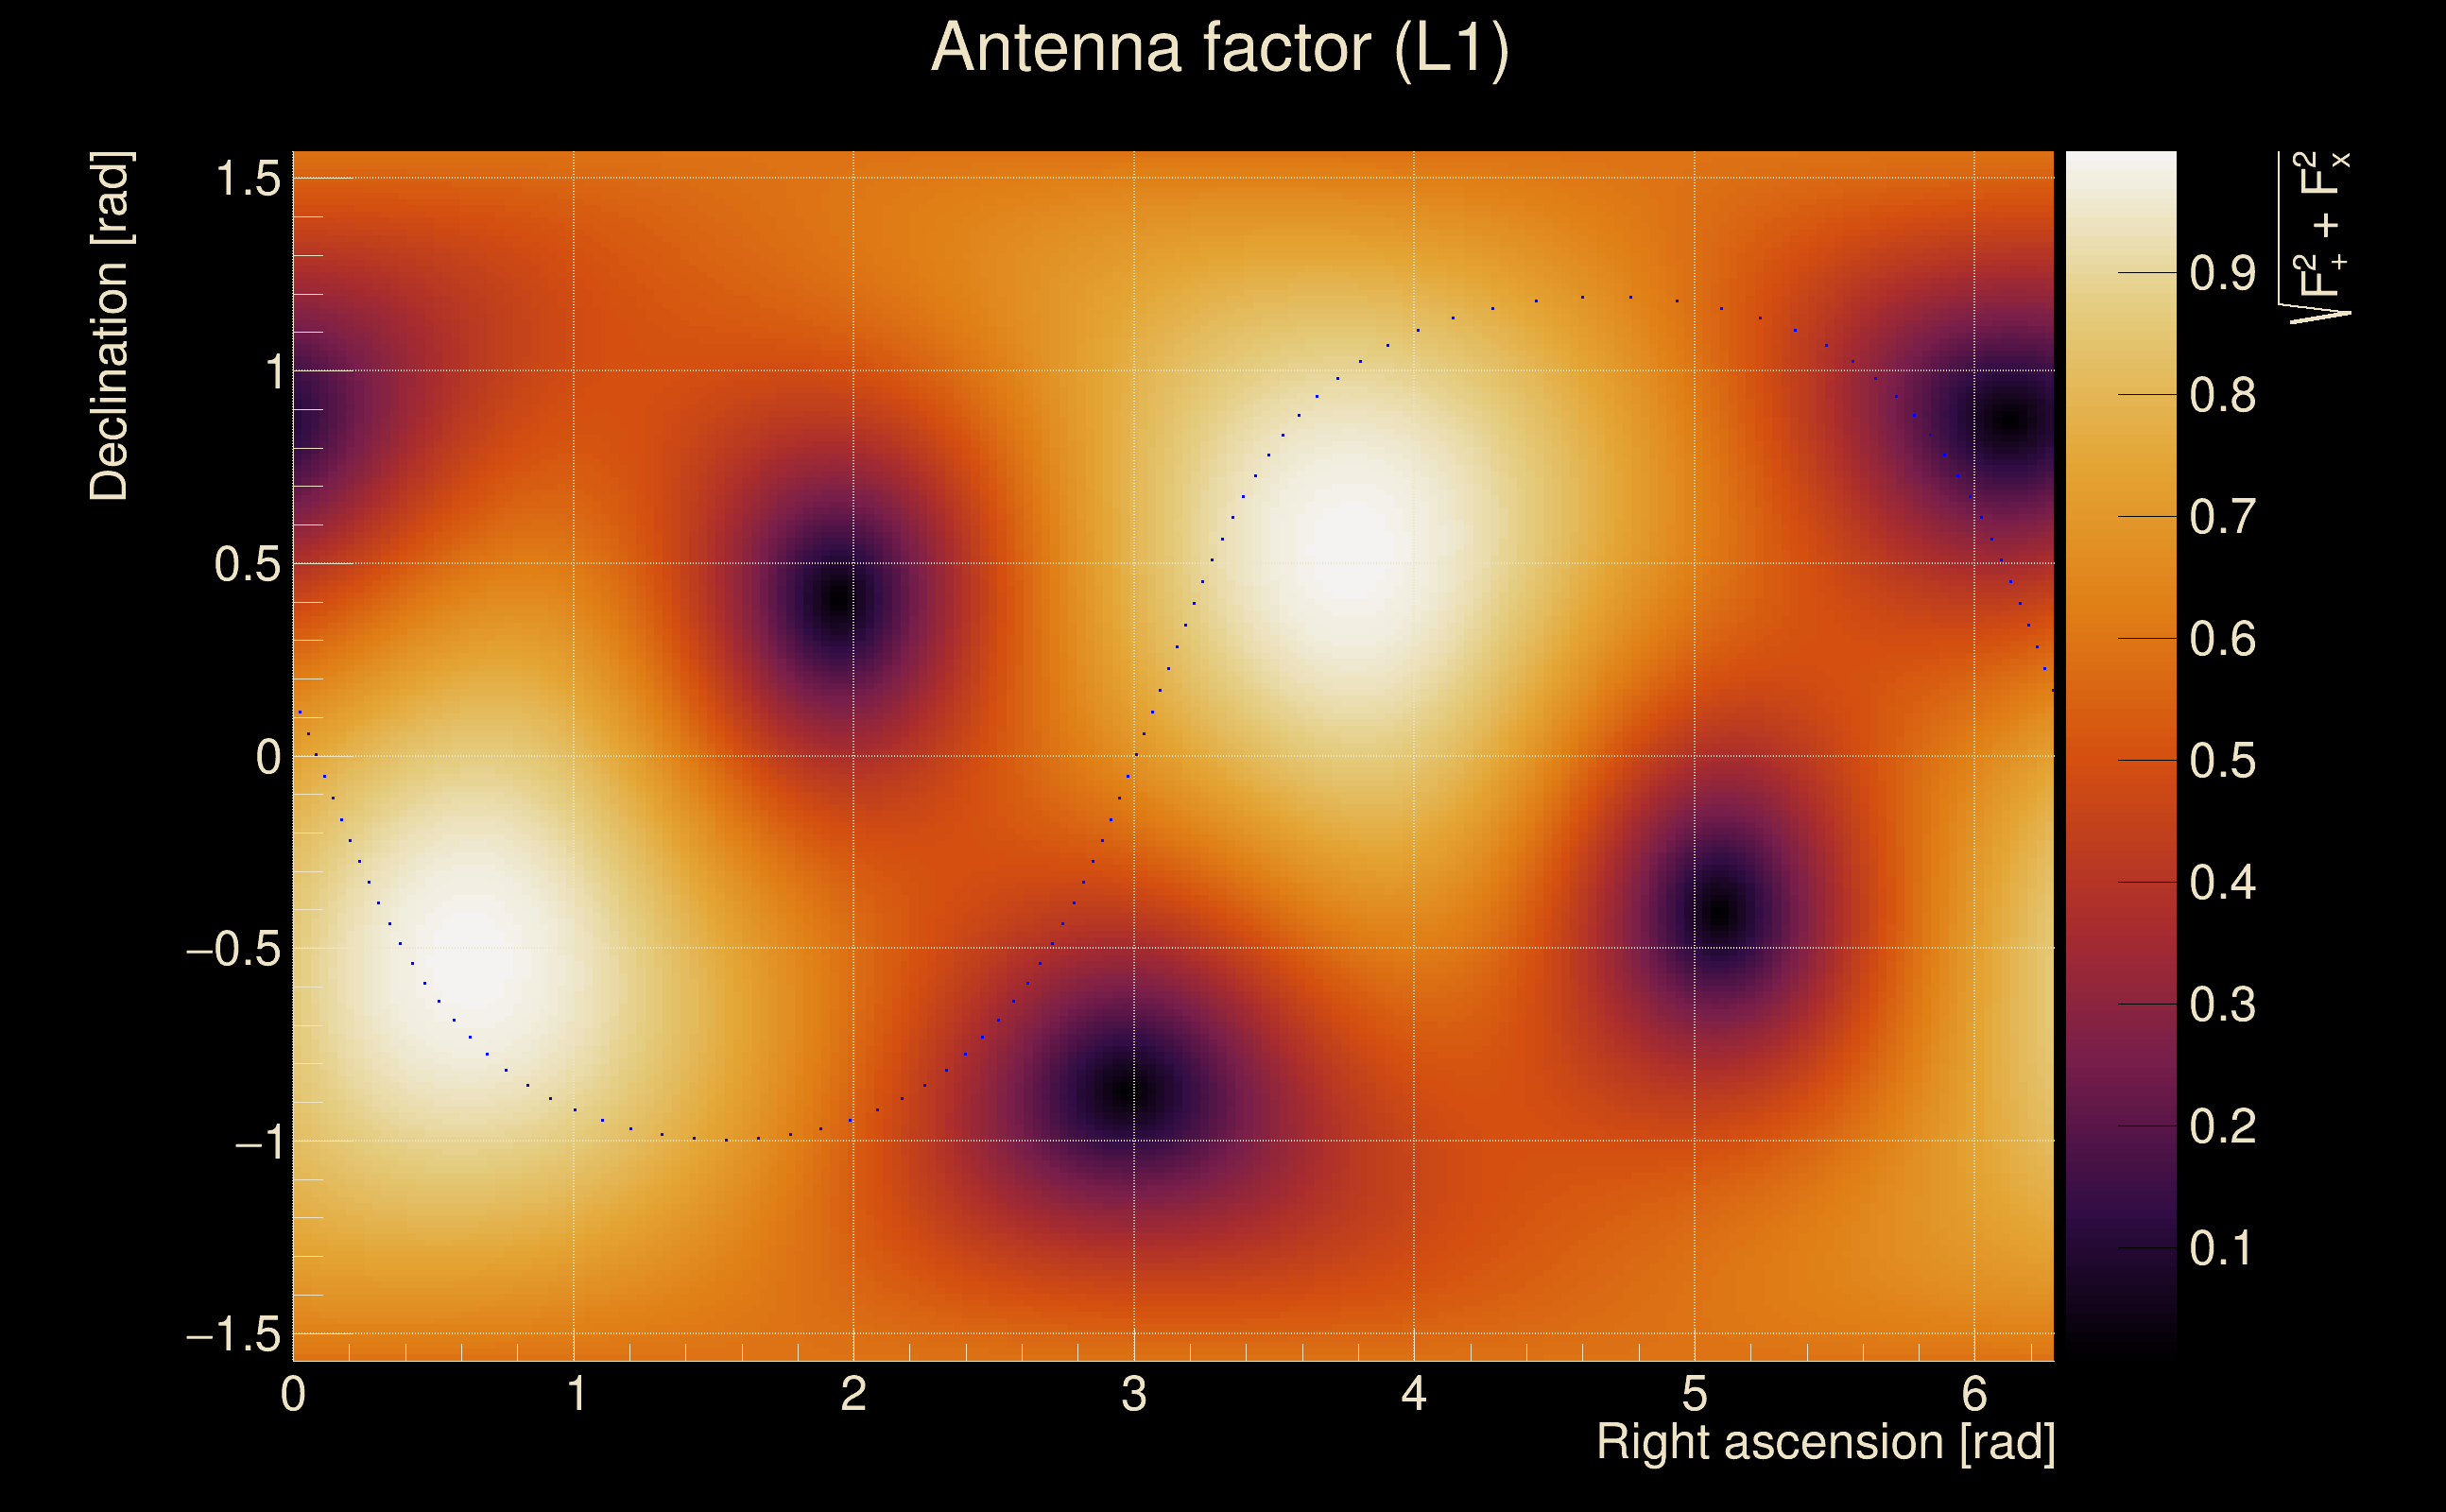
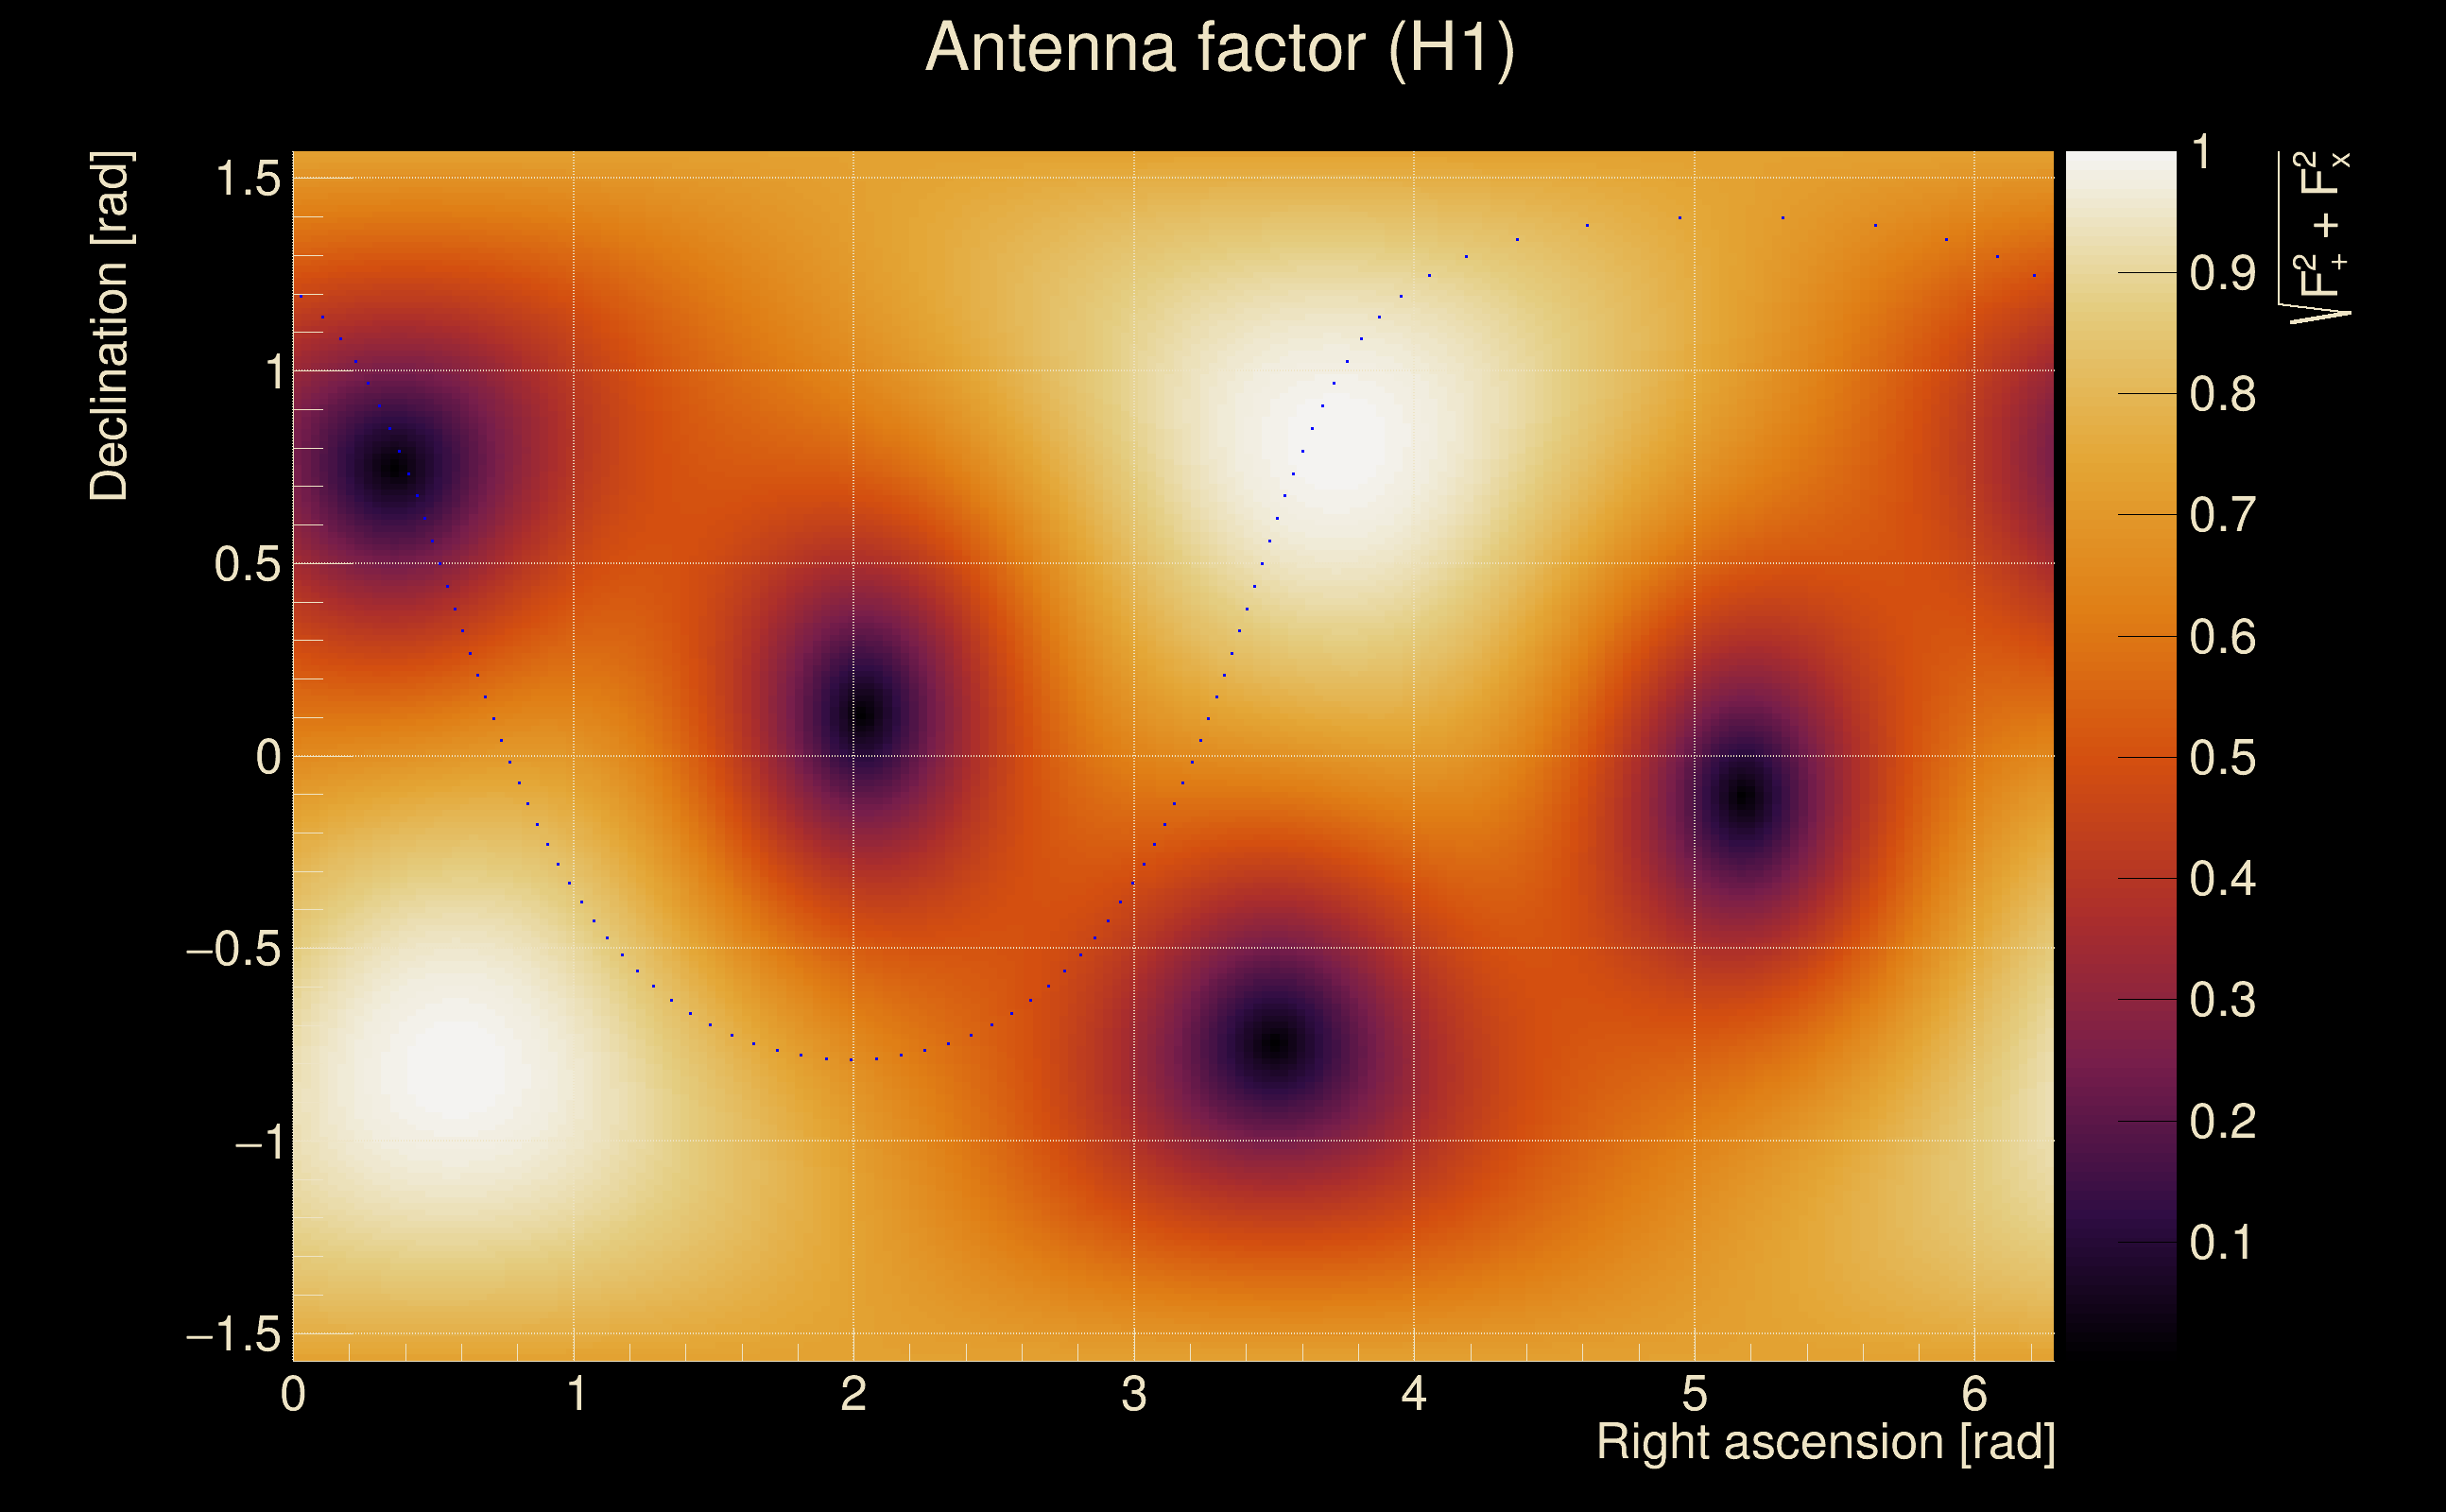
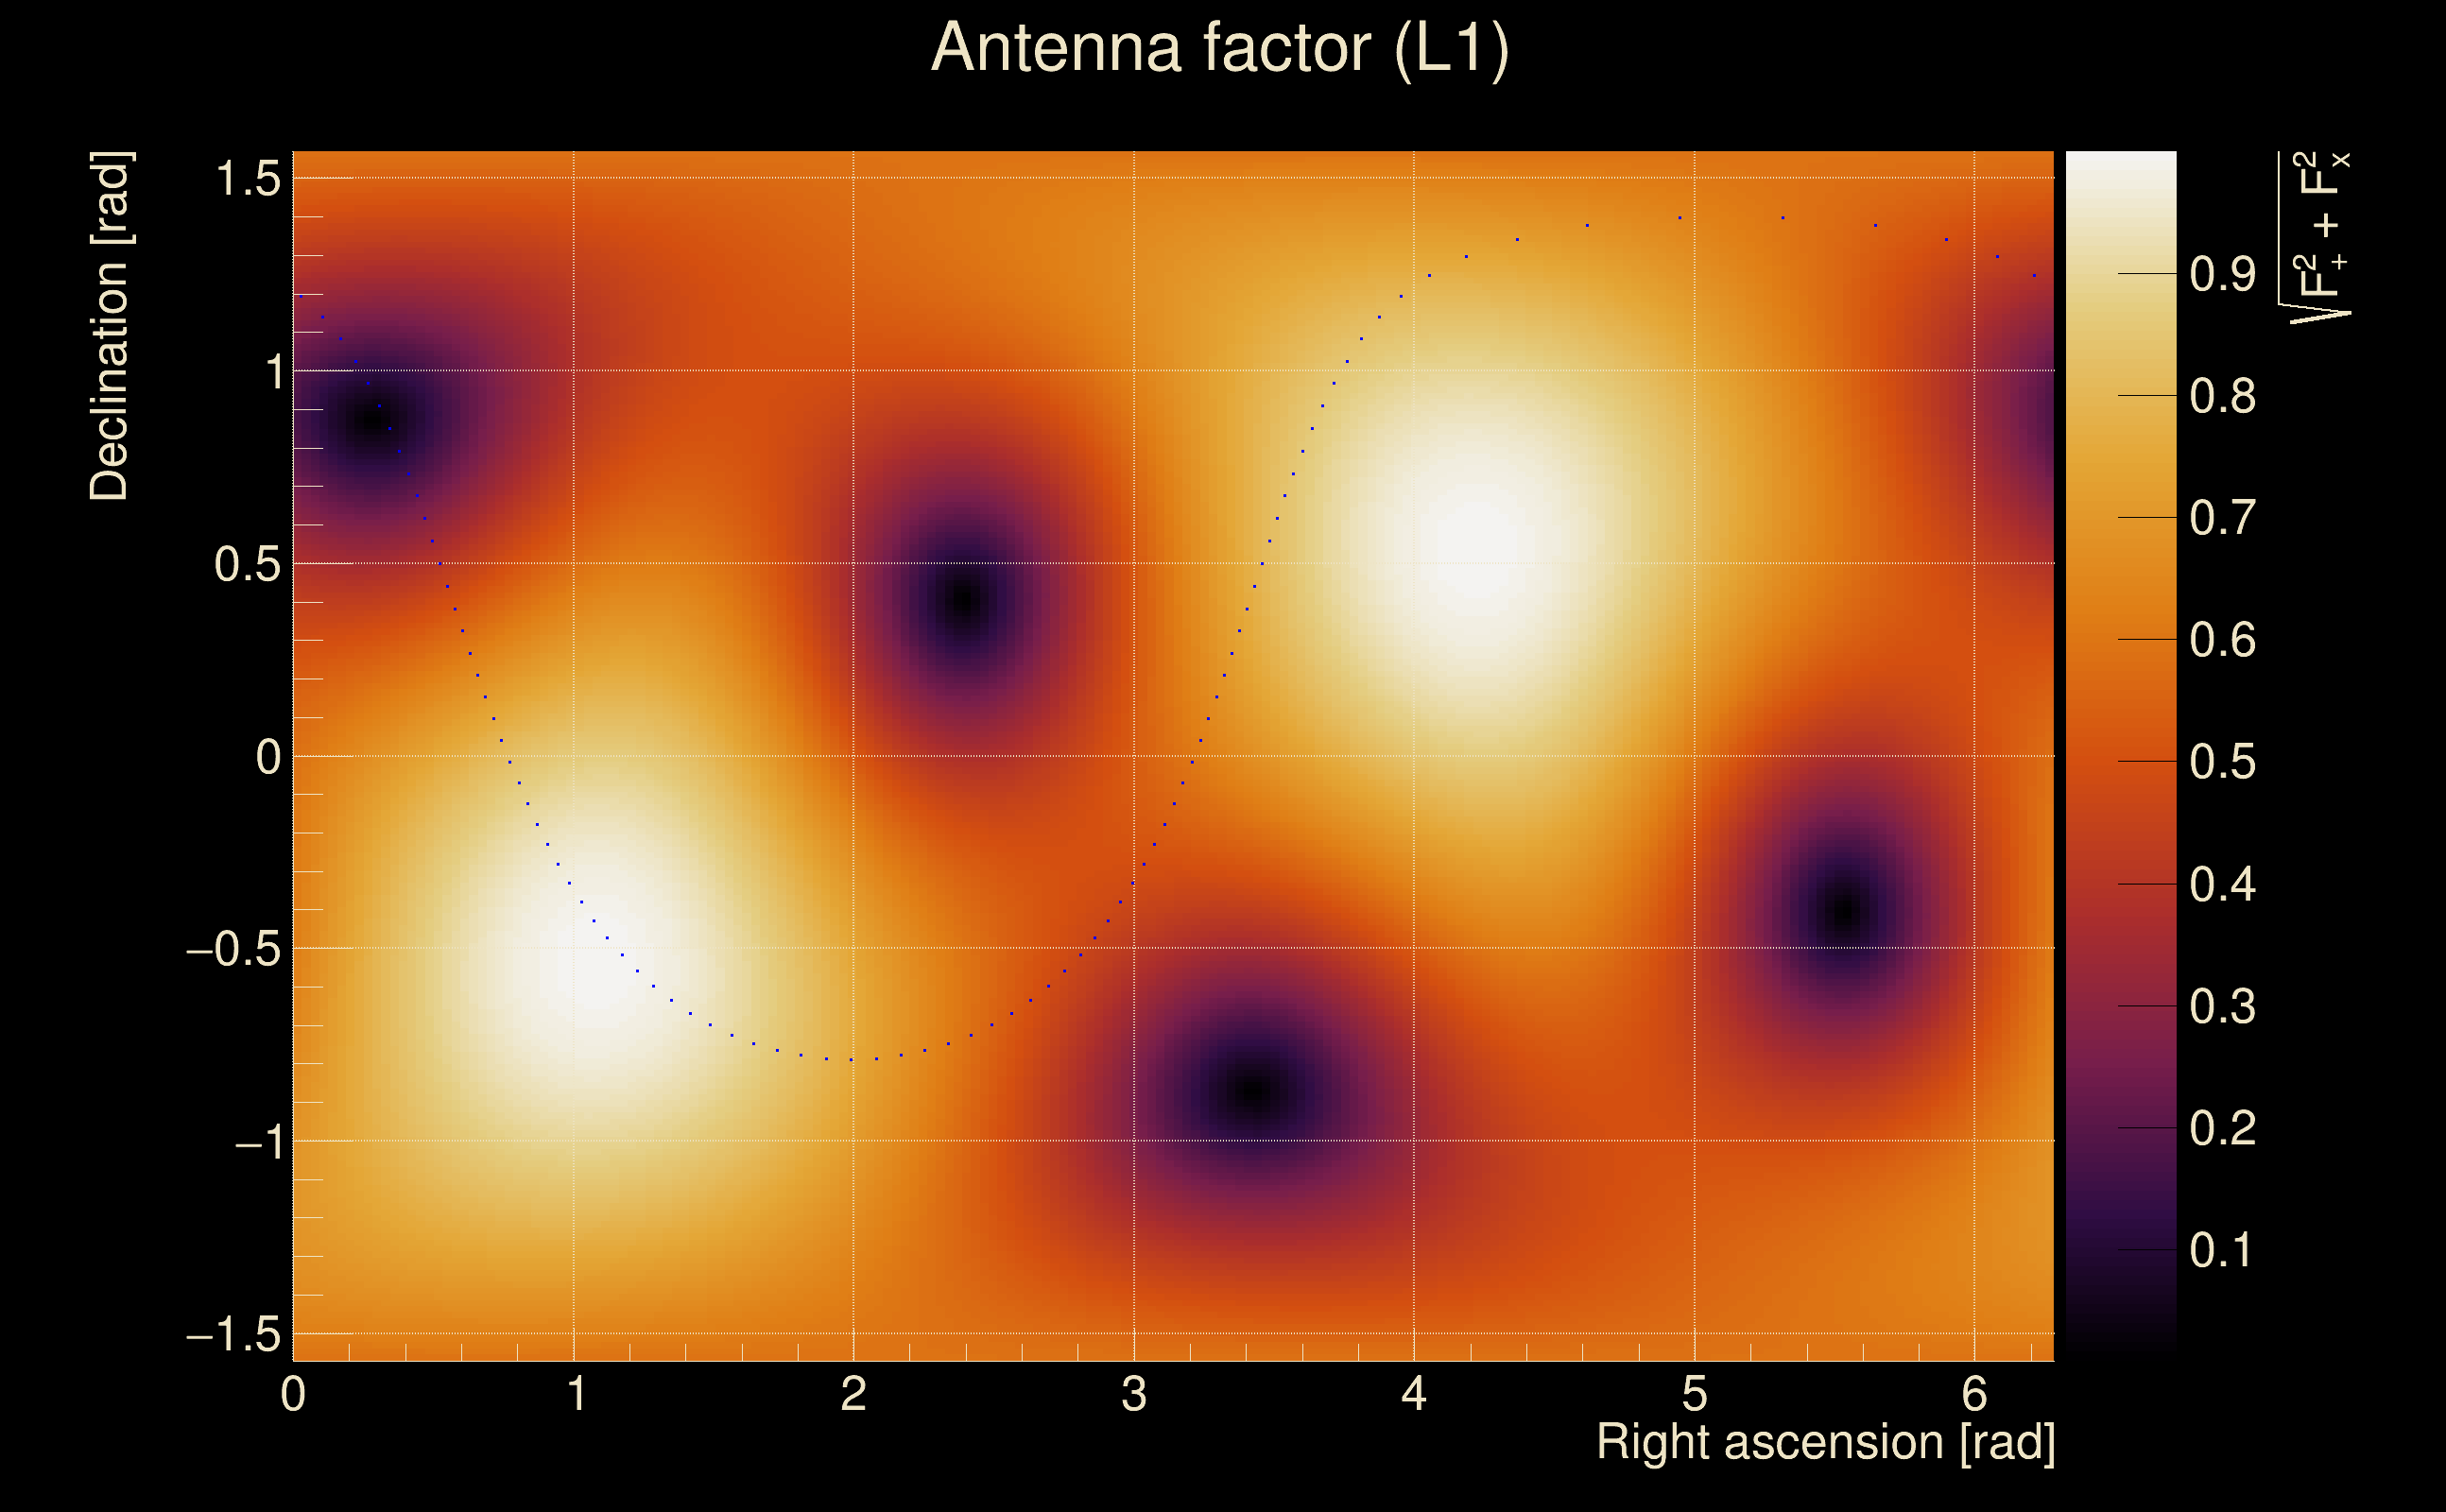
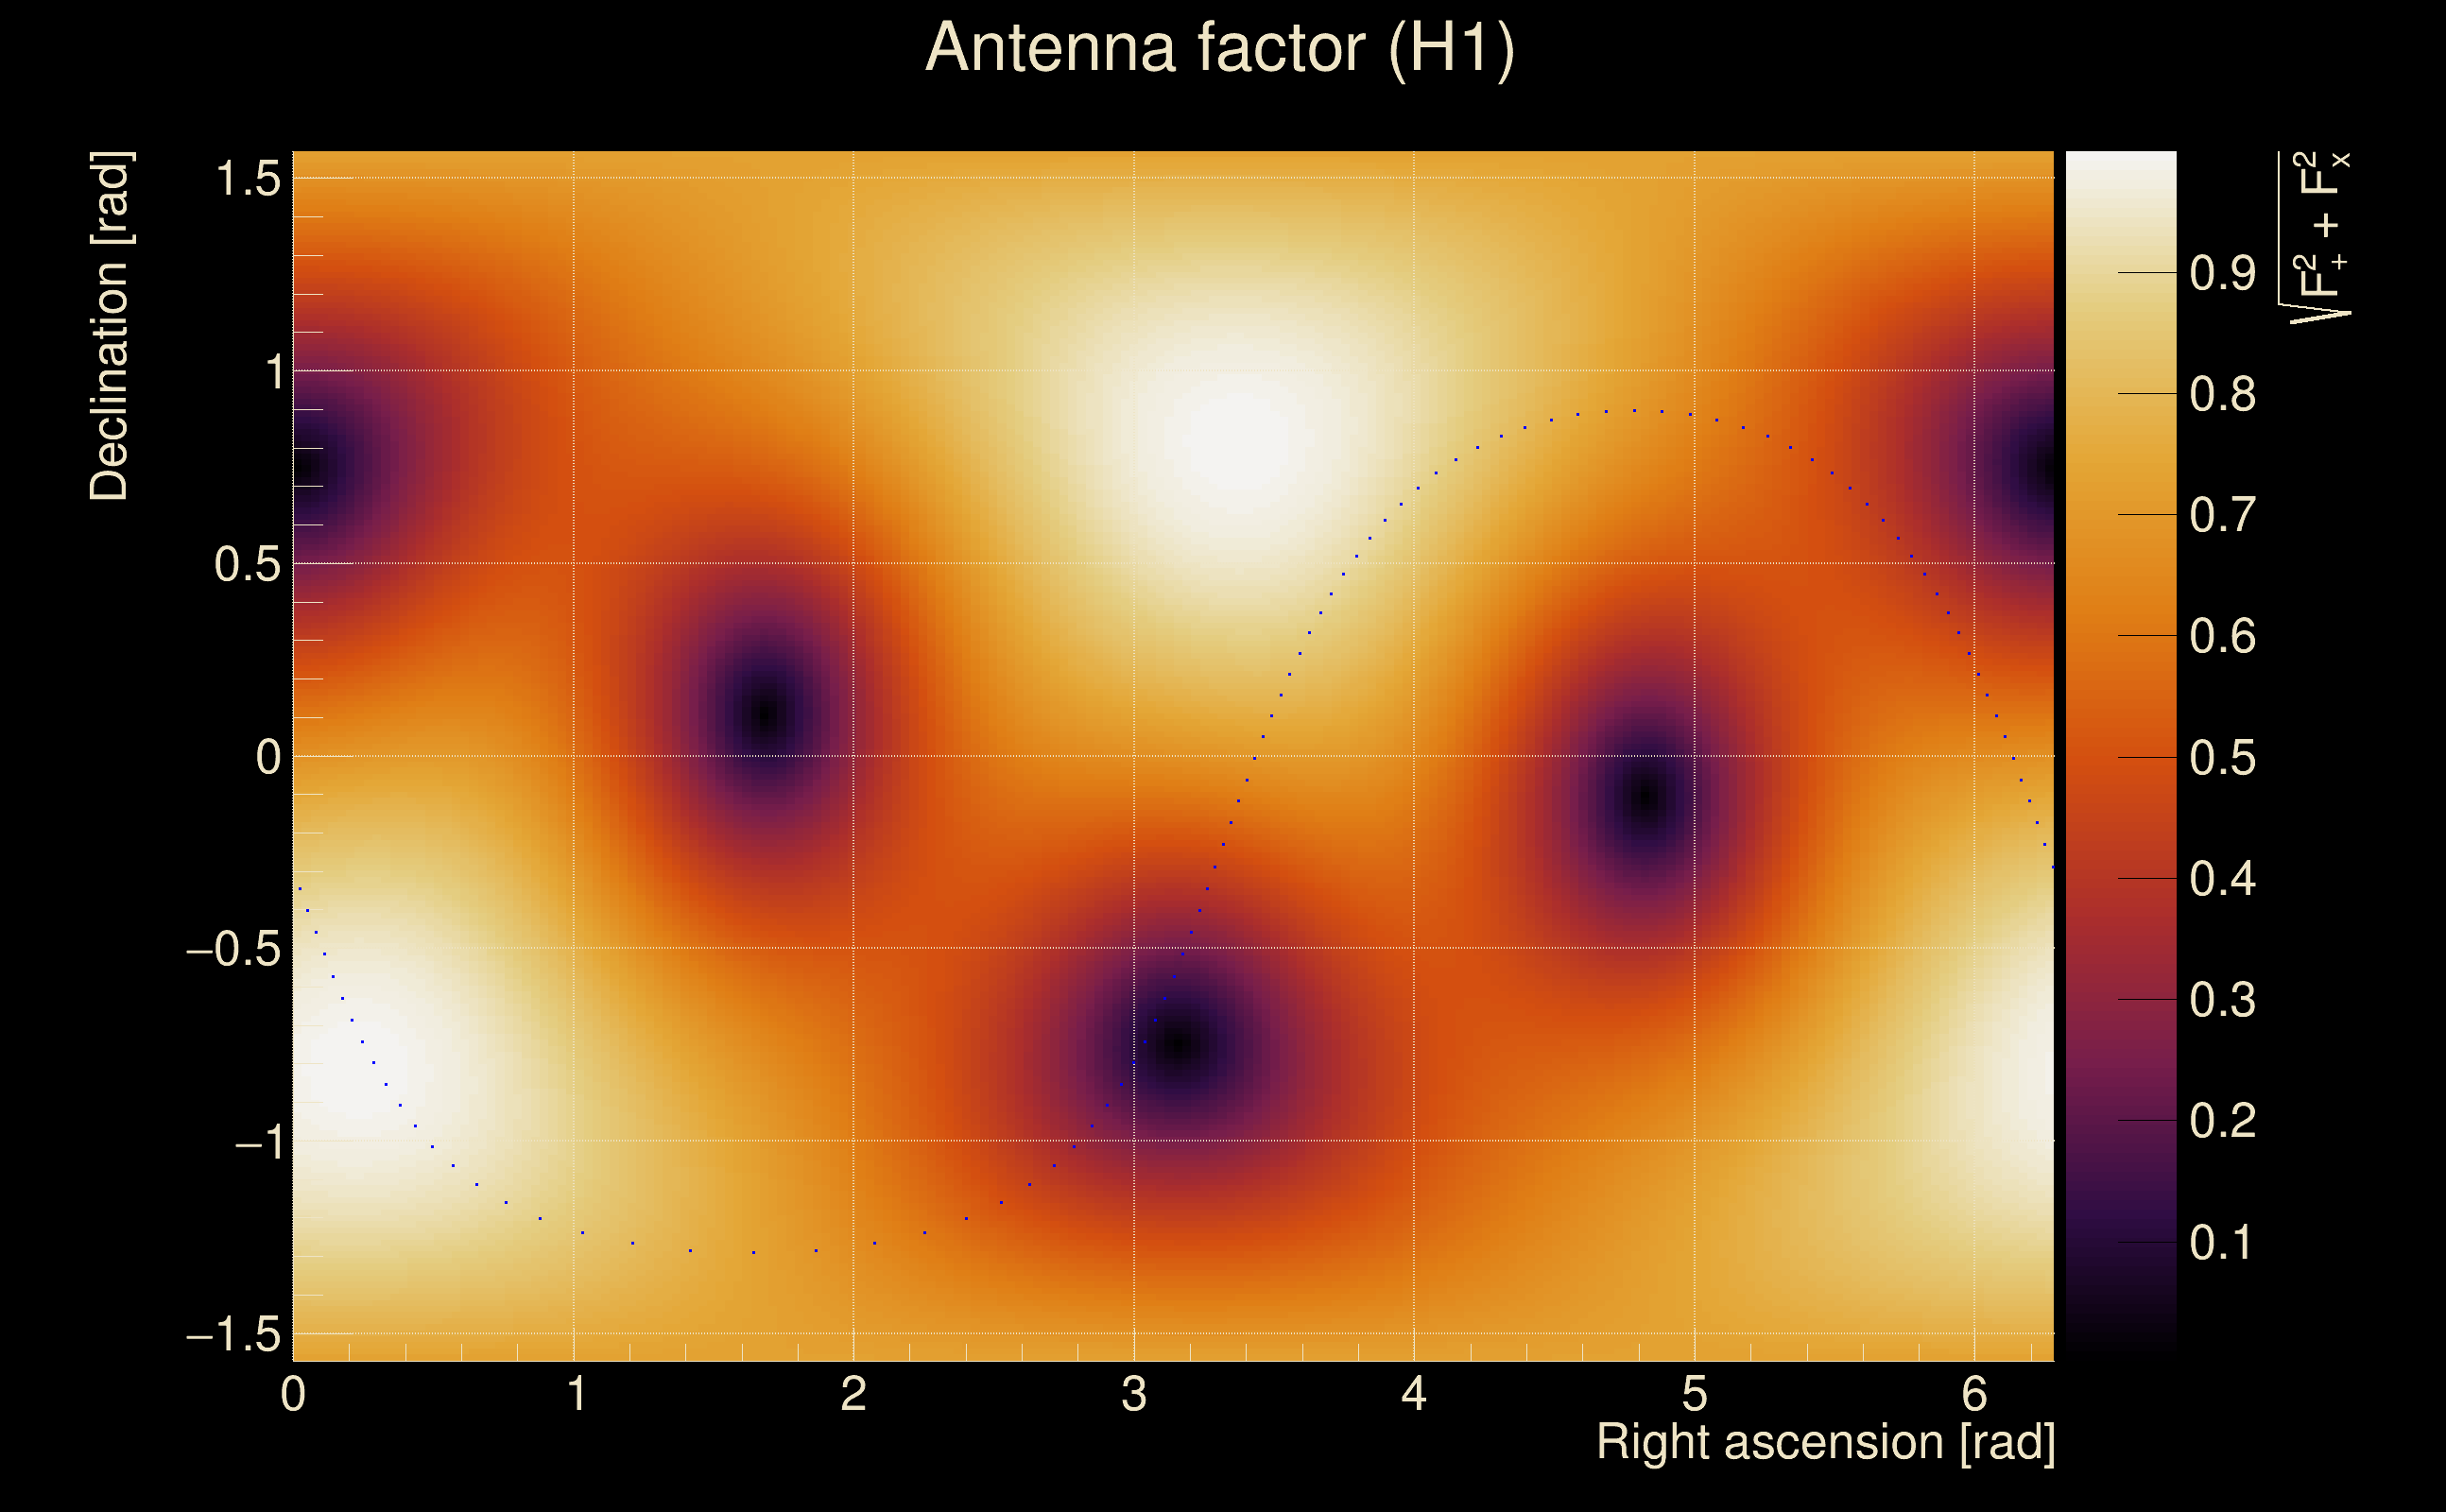
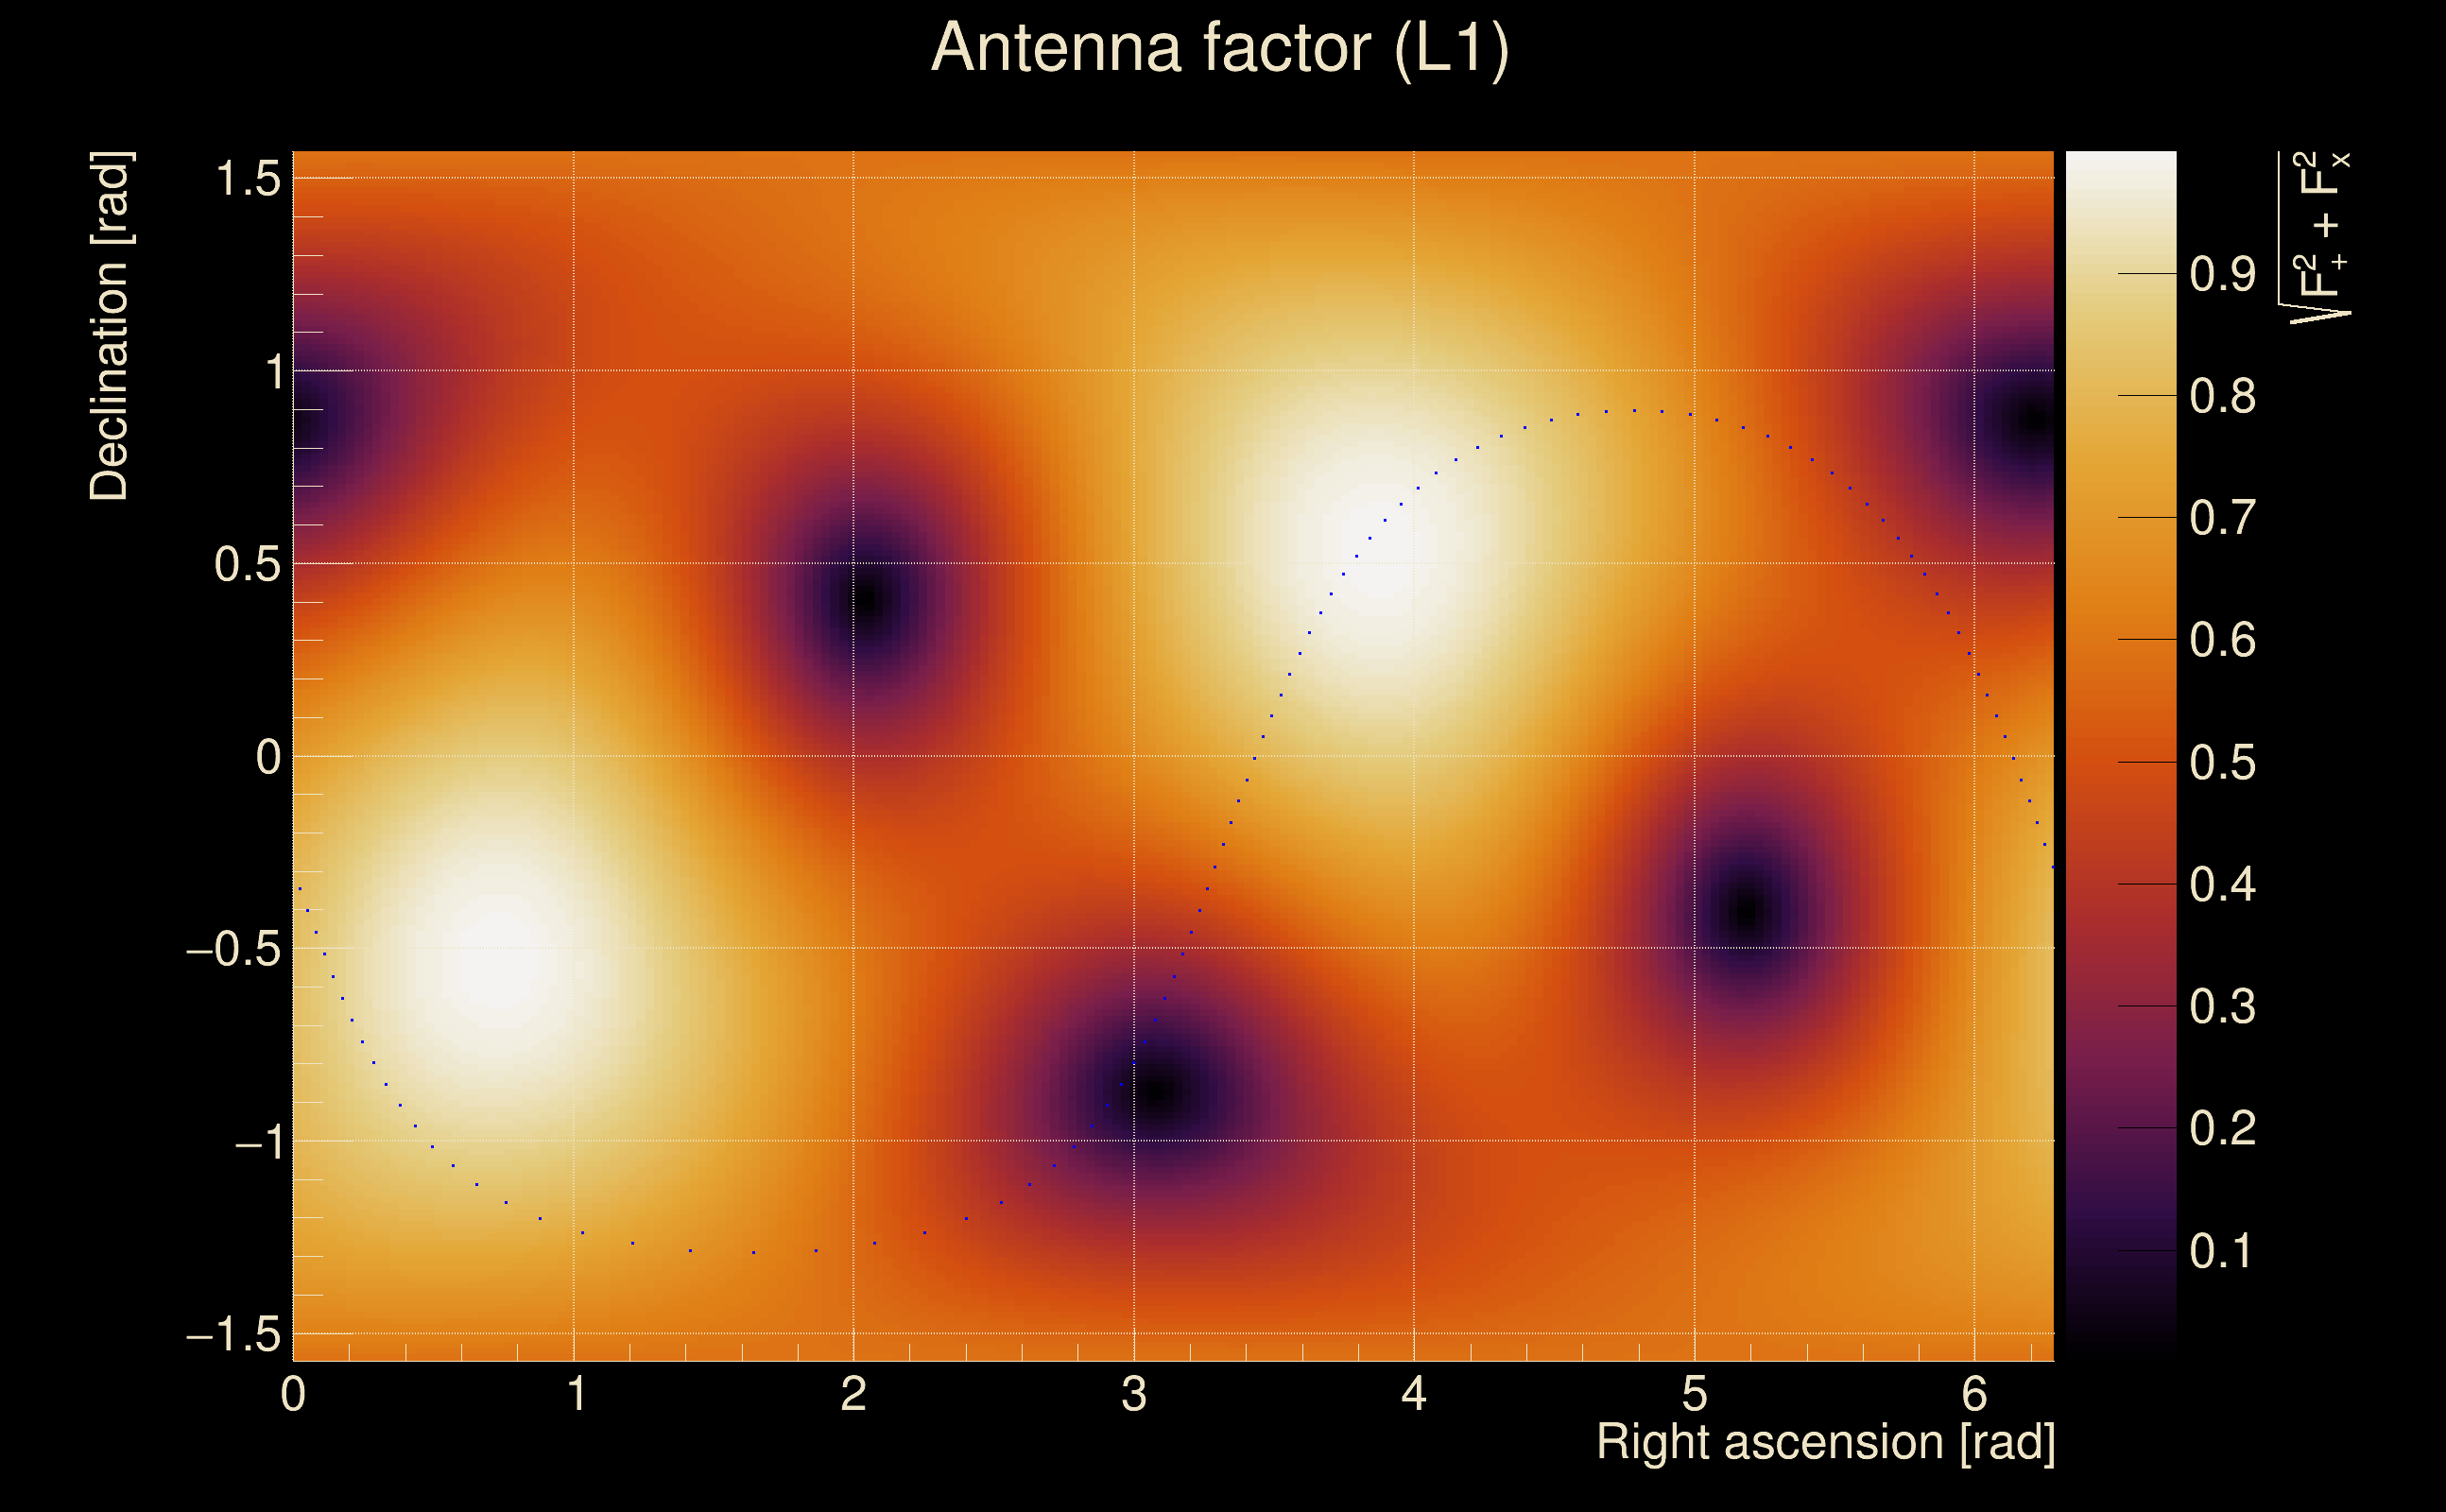
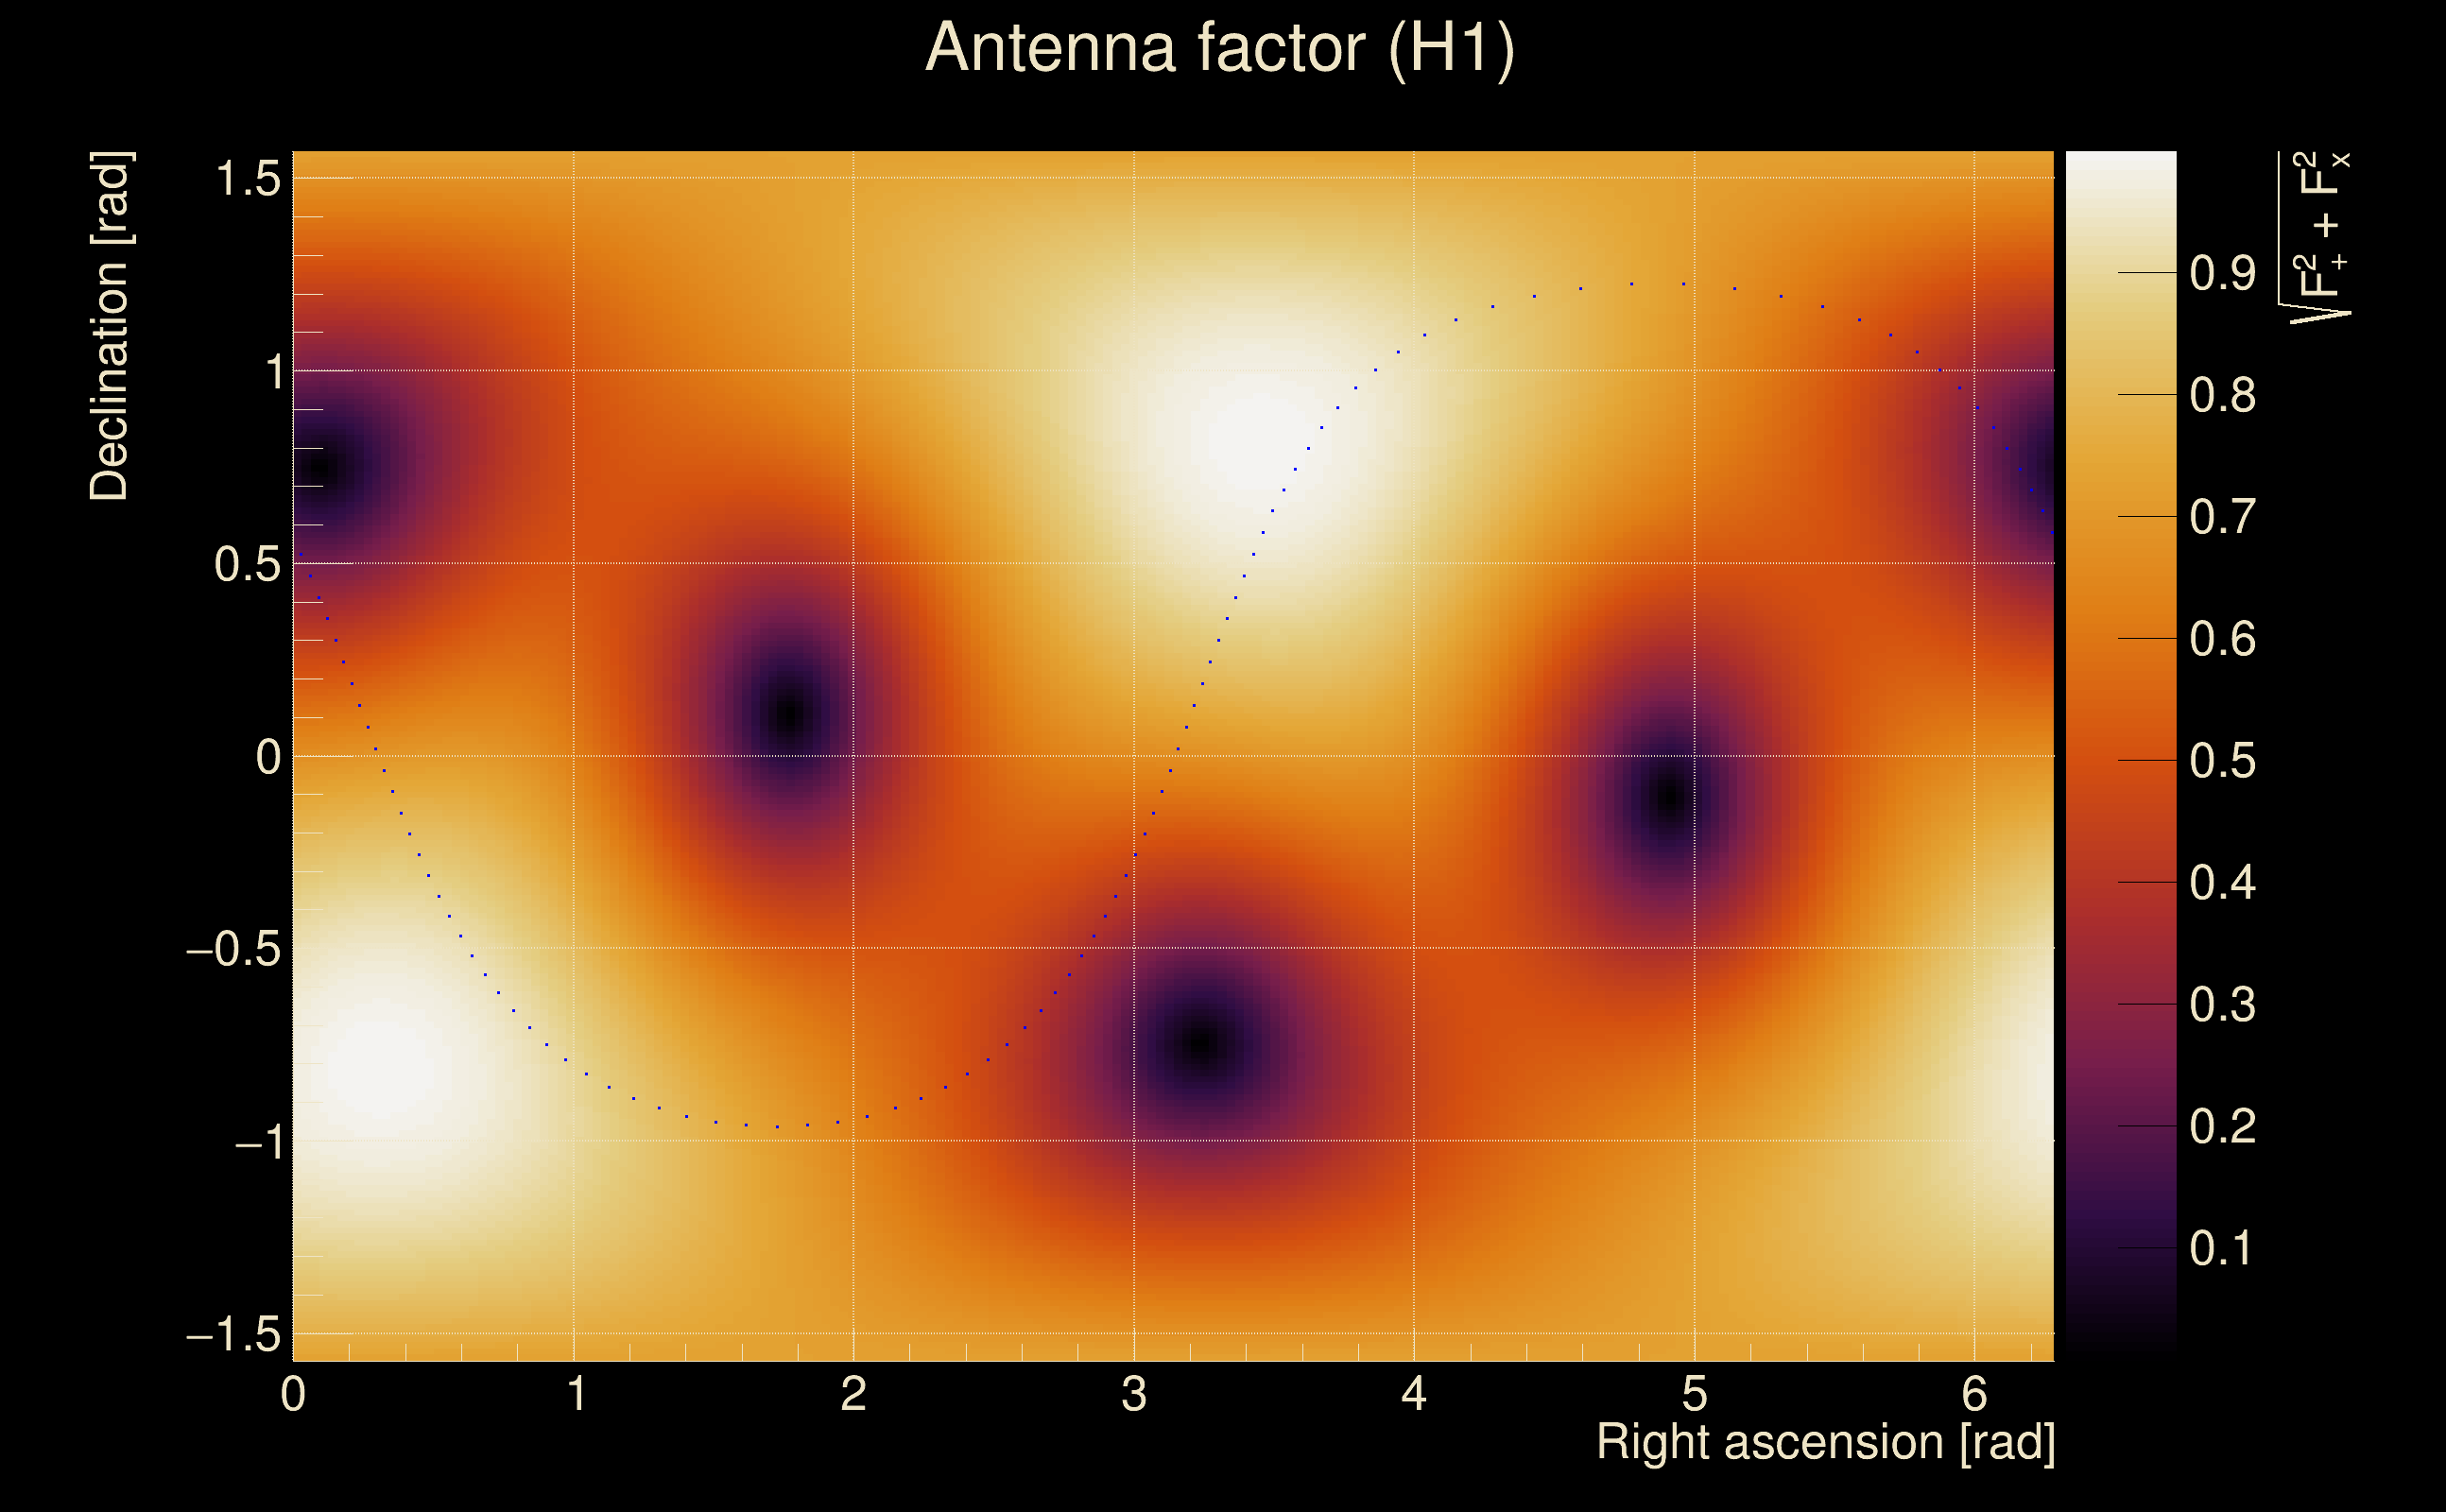
| Target sky positon: | Ra: 3.68109, Dec: 0.94792 [rad] |
| List of input Ox files: | TargIxf_feb2026_SN7_30s_file_list.txt (71 files) |
| Analysis result file: | TargIxf_feb2026_SN7_30s_results-0.root |
| Slice selected for the the fakeground: | slice index=78 (1.38 s), time lag = 0 s |
| Foreground | Fakeground | Background | ||
|---|---|---|---|---|
| Number of processed ox events | 12111 | 12111 | 2603865 | |
| Start Date (detector 0) | Mon May 15 14:13:25 2023 UTC | Mon May 15 14:13:25 2023 UTC | Mon May 15 14:13:25 2023 UTC | |
| End Date (detector 0) | Thu May 18 15:54:40 2023 UTC | Thu May 18 15:54:40 2023 UTC | Thu May 18 15:54:40 2023 UTC | |
| Start GPS (detector 0) | 1368195223 | 1368195223 | 1368195223 | |
| End GPS (detector 0) | 1368460498 | 1368460498 | 1368460498 | |
| Used livetime (detector 0) | 60875 s | 60875 s | 60875 s | |
| Start Date (detector 1) | Mon May 15 14:13:25 2023 UTC | Mon May 15 14:13:25 2023 UTC | Mon May 15 14:13:25 2023 UTC | |
| End Date (detector 1) | Thu May 18 15:54:40 2023 UTC | Thu May 18 15:54:40 2023 UTC | Thu May 18 15:54:40 2023 UTC | |
| Start GPS (detector 1) | 1368195223 | 1368195223 | 1368195223 | |
| End GPS (detector 1) | 1368460498 | 1368460498 | 1368460498 | |
| Used livetime (detector 1) | 60875 s | 60875 s | 60875 s | |
| Cumulative livetime | 121110 s | 121110 s | 26038650 s | |
| 0 years, 1 days, 9 hours, 38 min, 30 s | 0 years, 1 days, 9 hours, 38 min, 30 s | 0 years, 301 days, 8 hours, 57 min, 30 s |
|
|
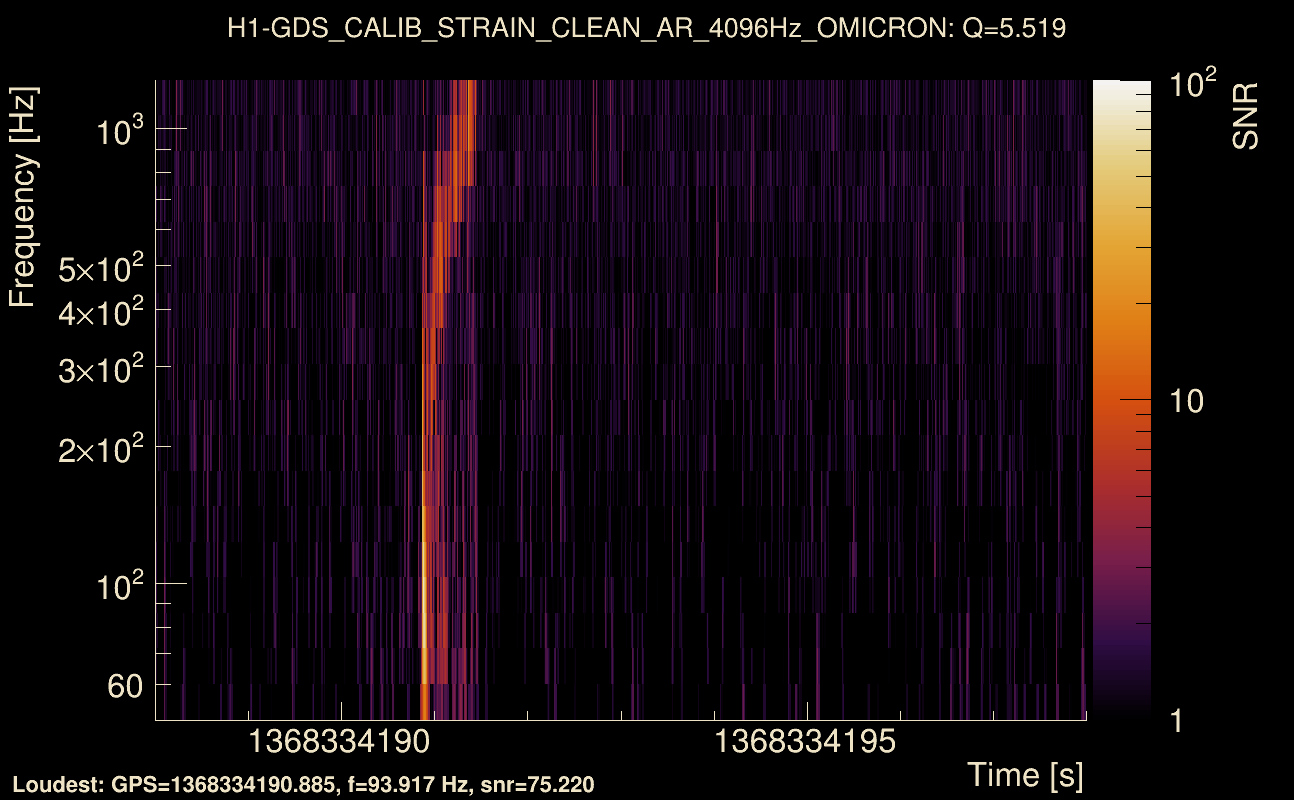
| Event time t(H1): | GPS = 1368334188 (Wed May 17 04:49:30 2023 ) → GPS = 1368334198 (Wed May 17 04:49:40 2023 ) |
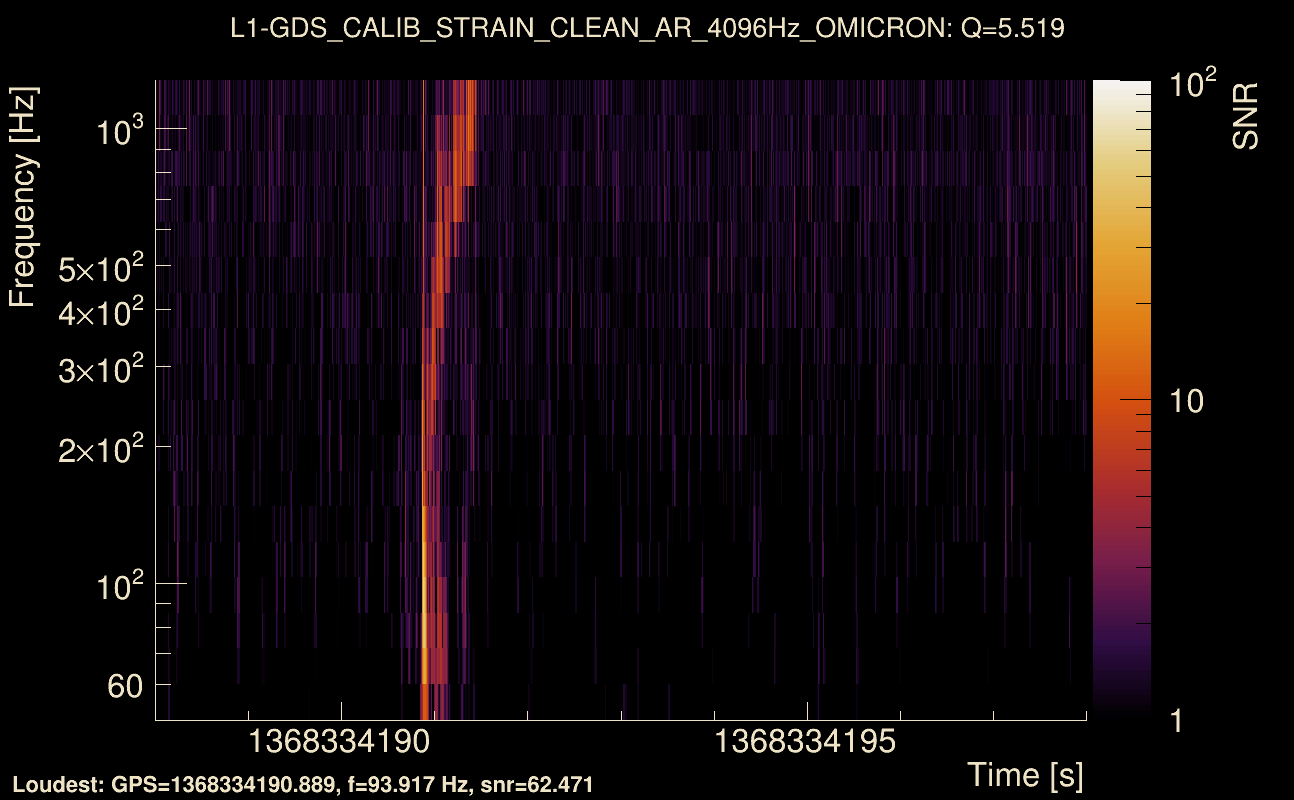
| Event time t(L1): | GPS = 1368334188 (Wed May 17 04:49:40 2023 ) → GPS = 1368334198 (Wed May 17 04:49:40 2023 ) |
| Omicron analysis time window (H1): | GPS = 1368334185 → GPS = 1368334201 |
| Omicron analysis time window (L1): | GPS = 1368334185 → GPS = 1368334201 |
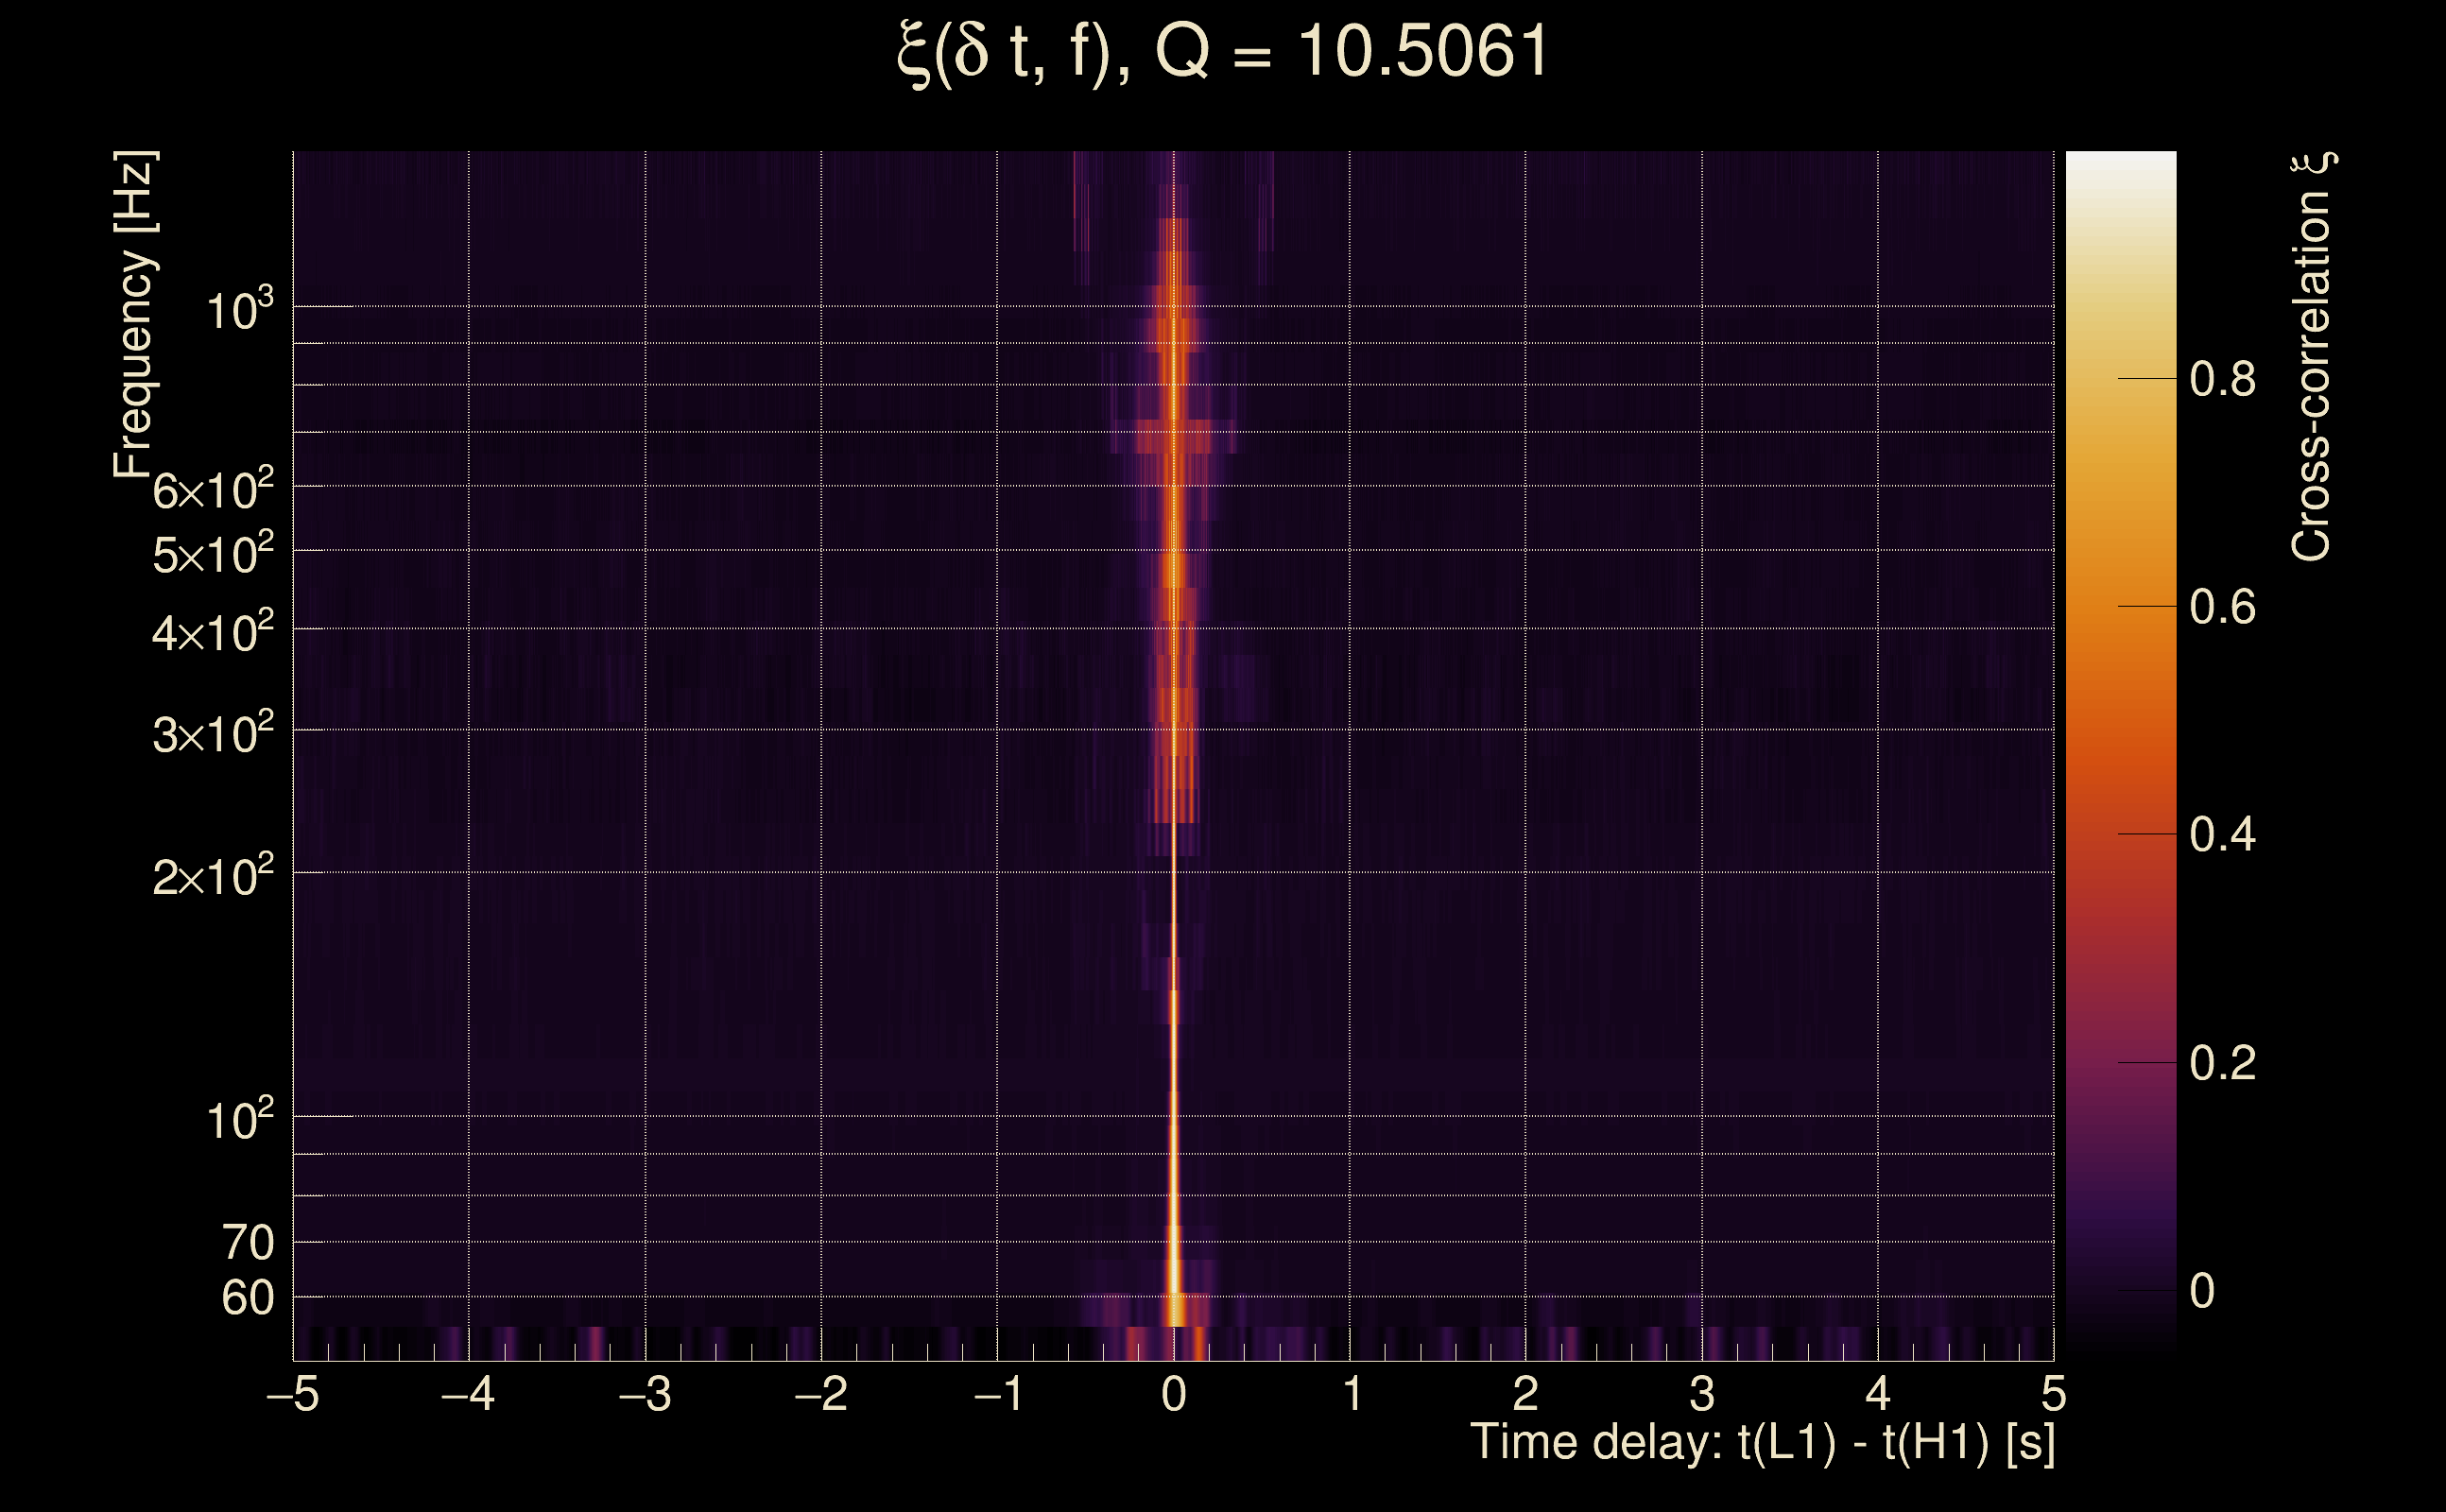
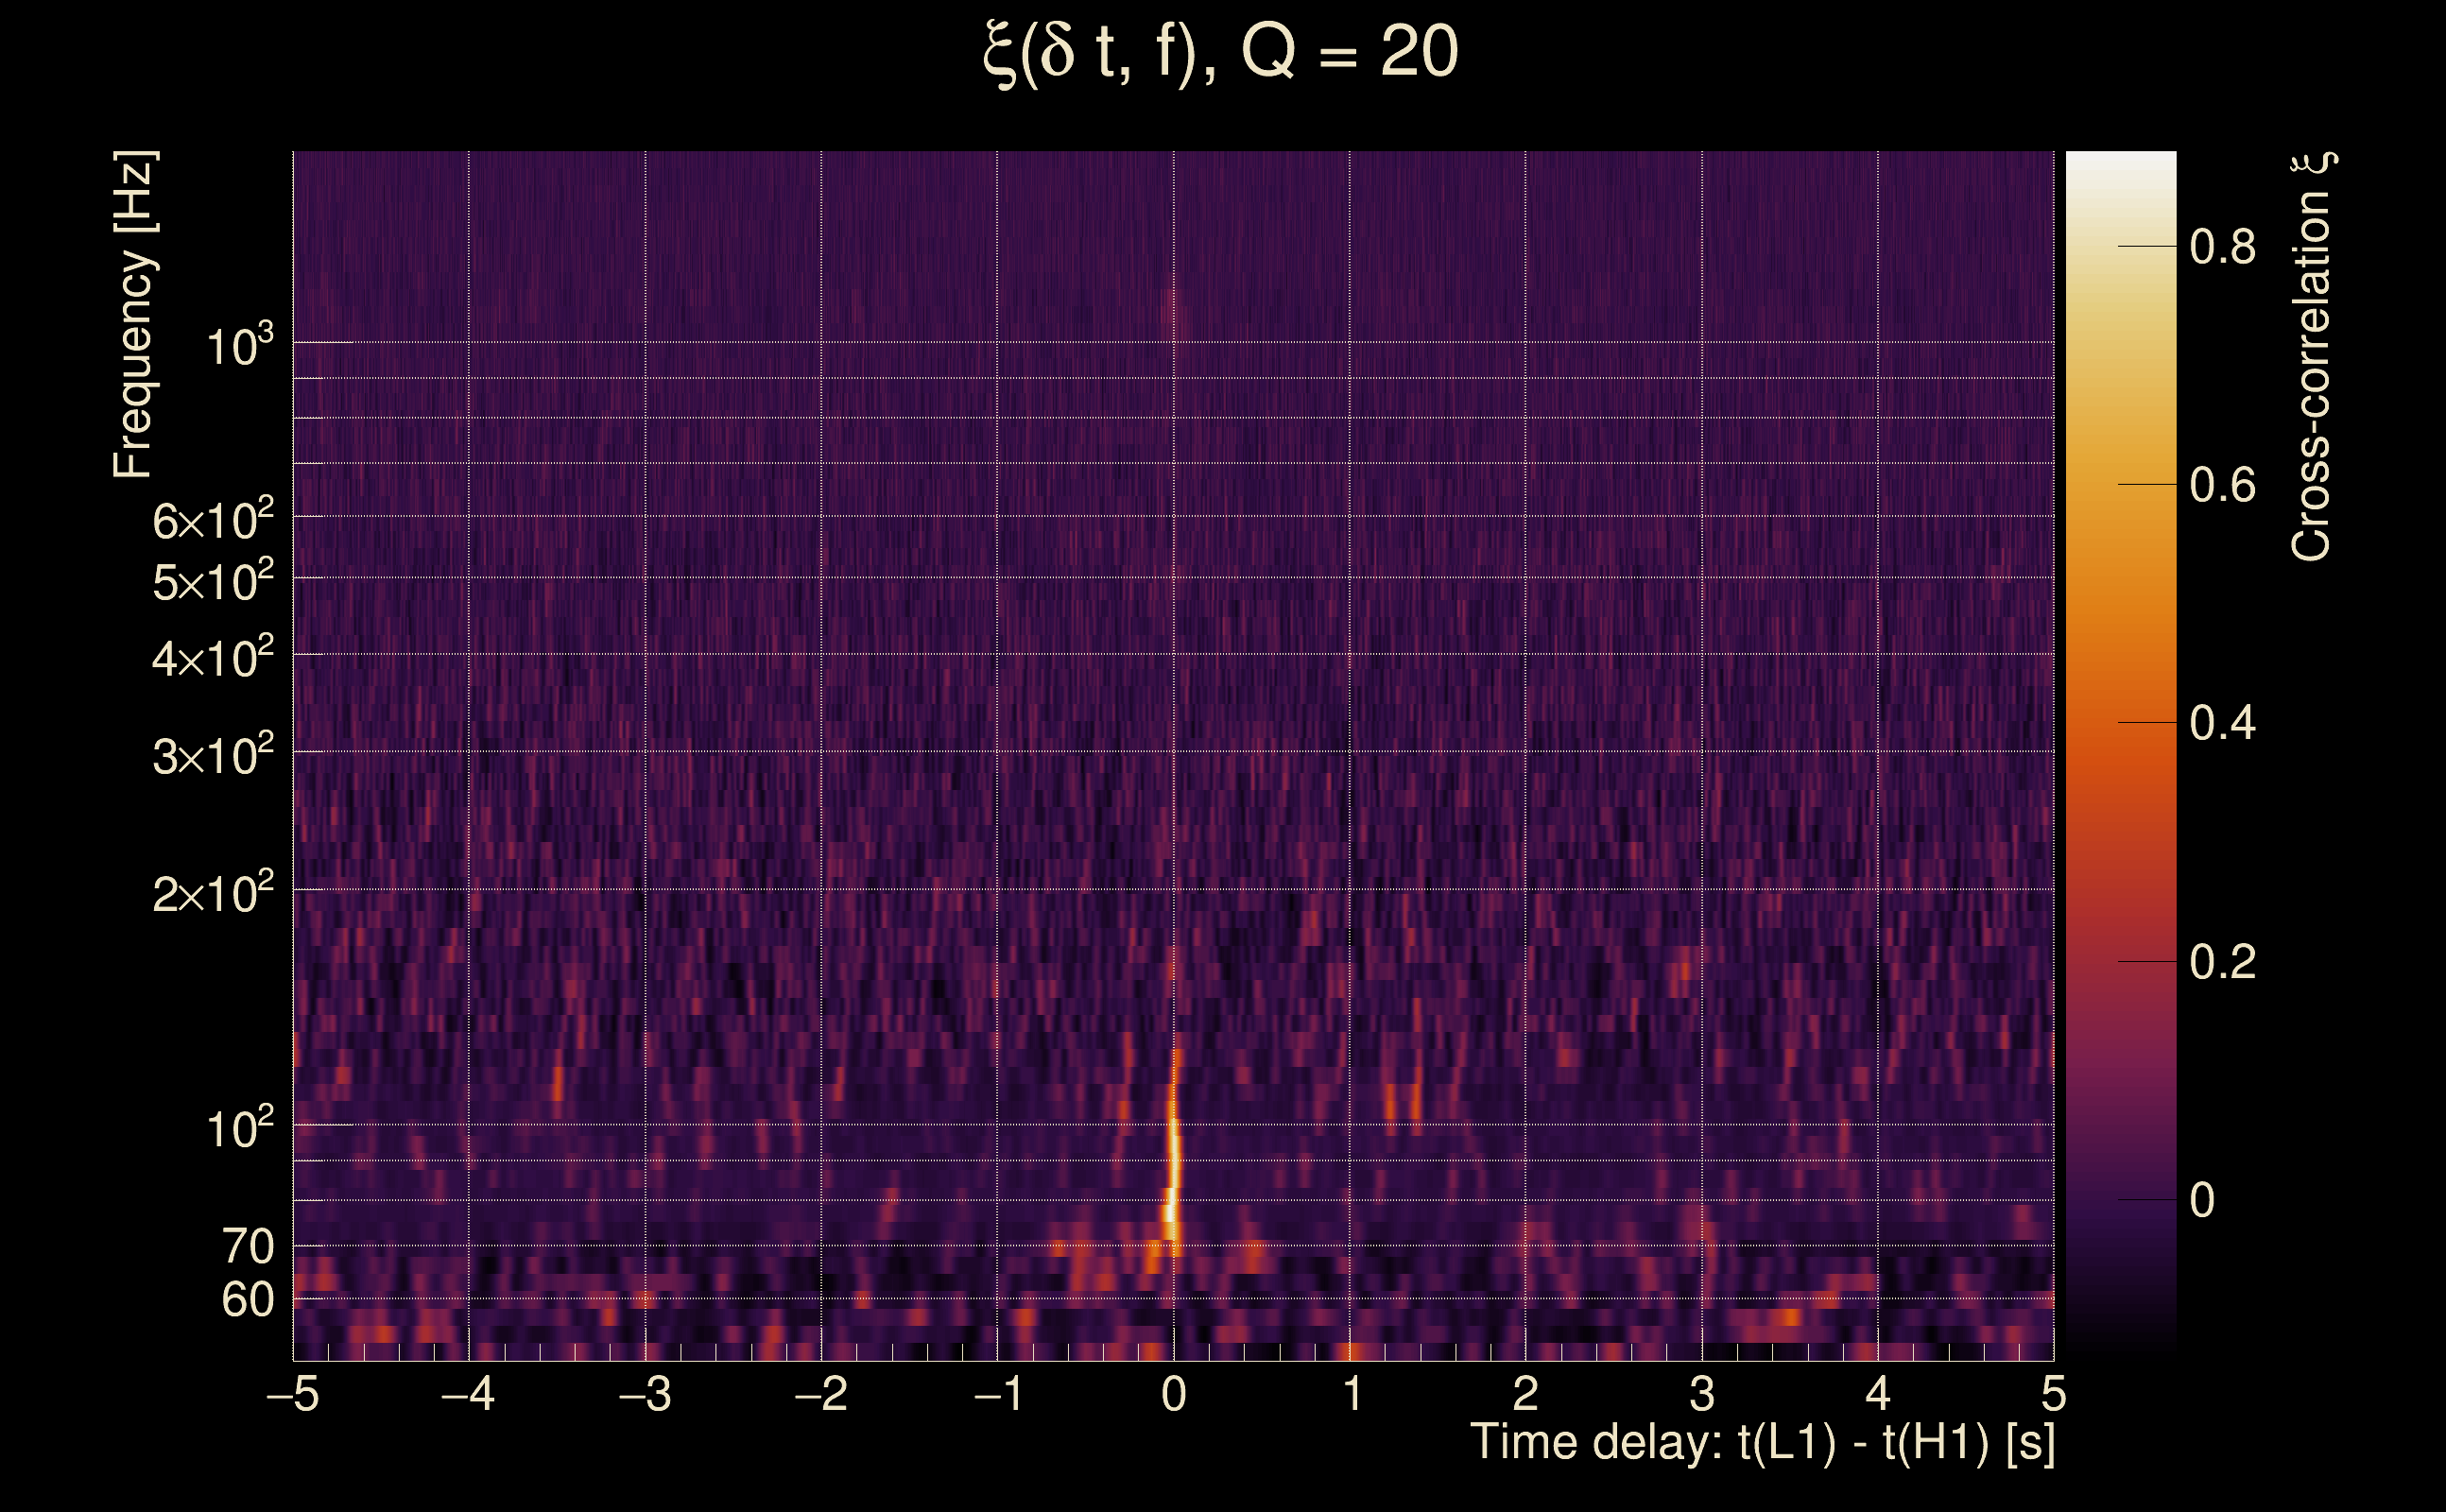
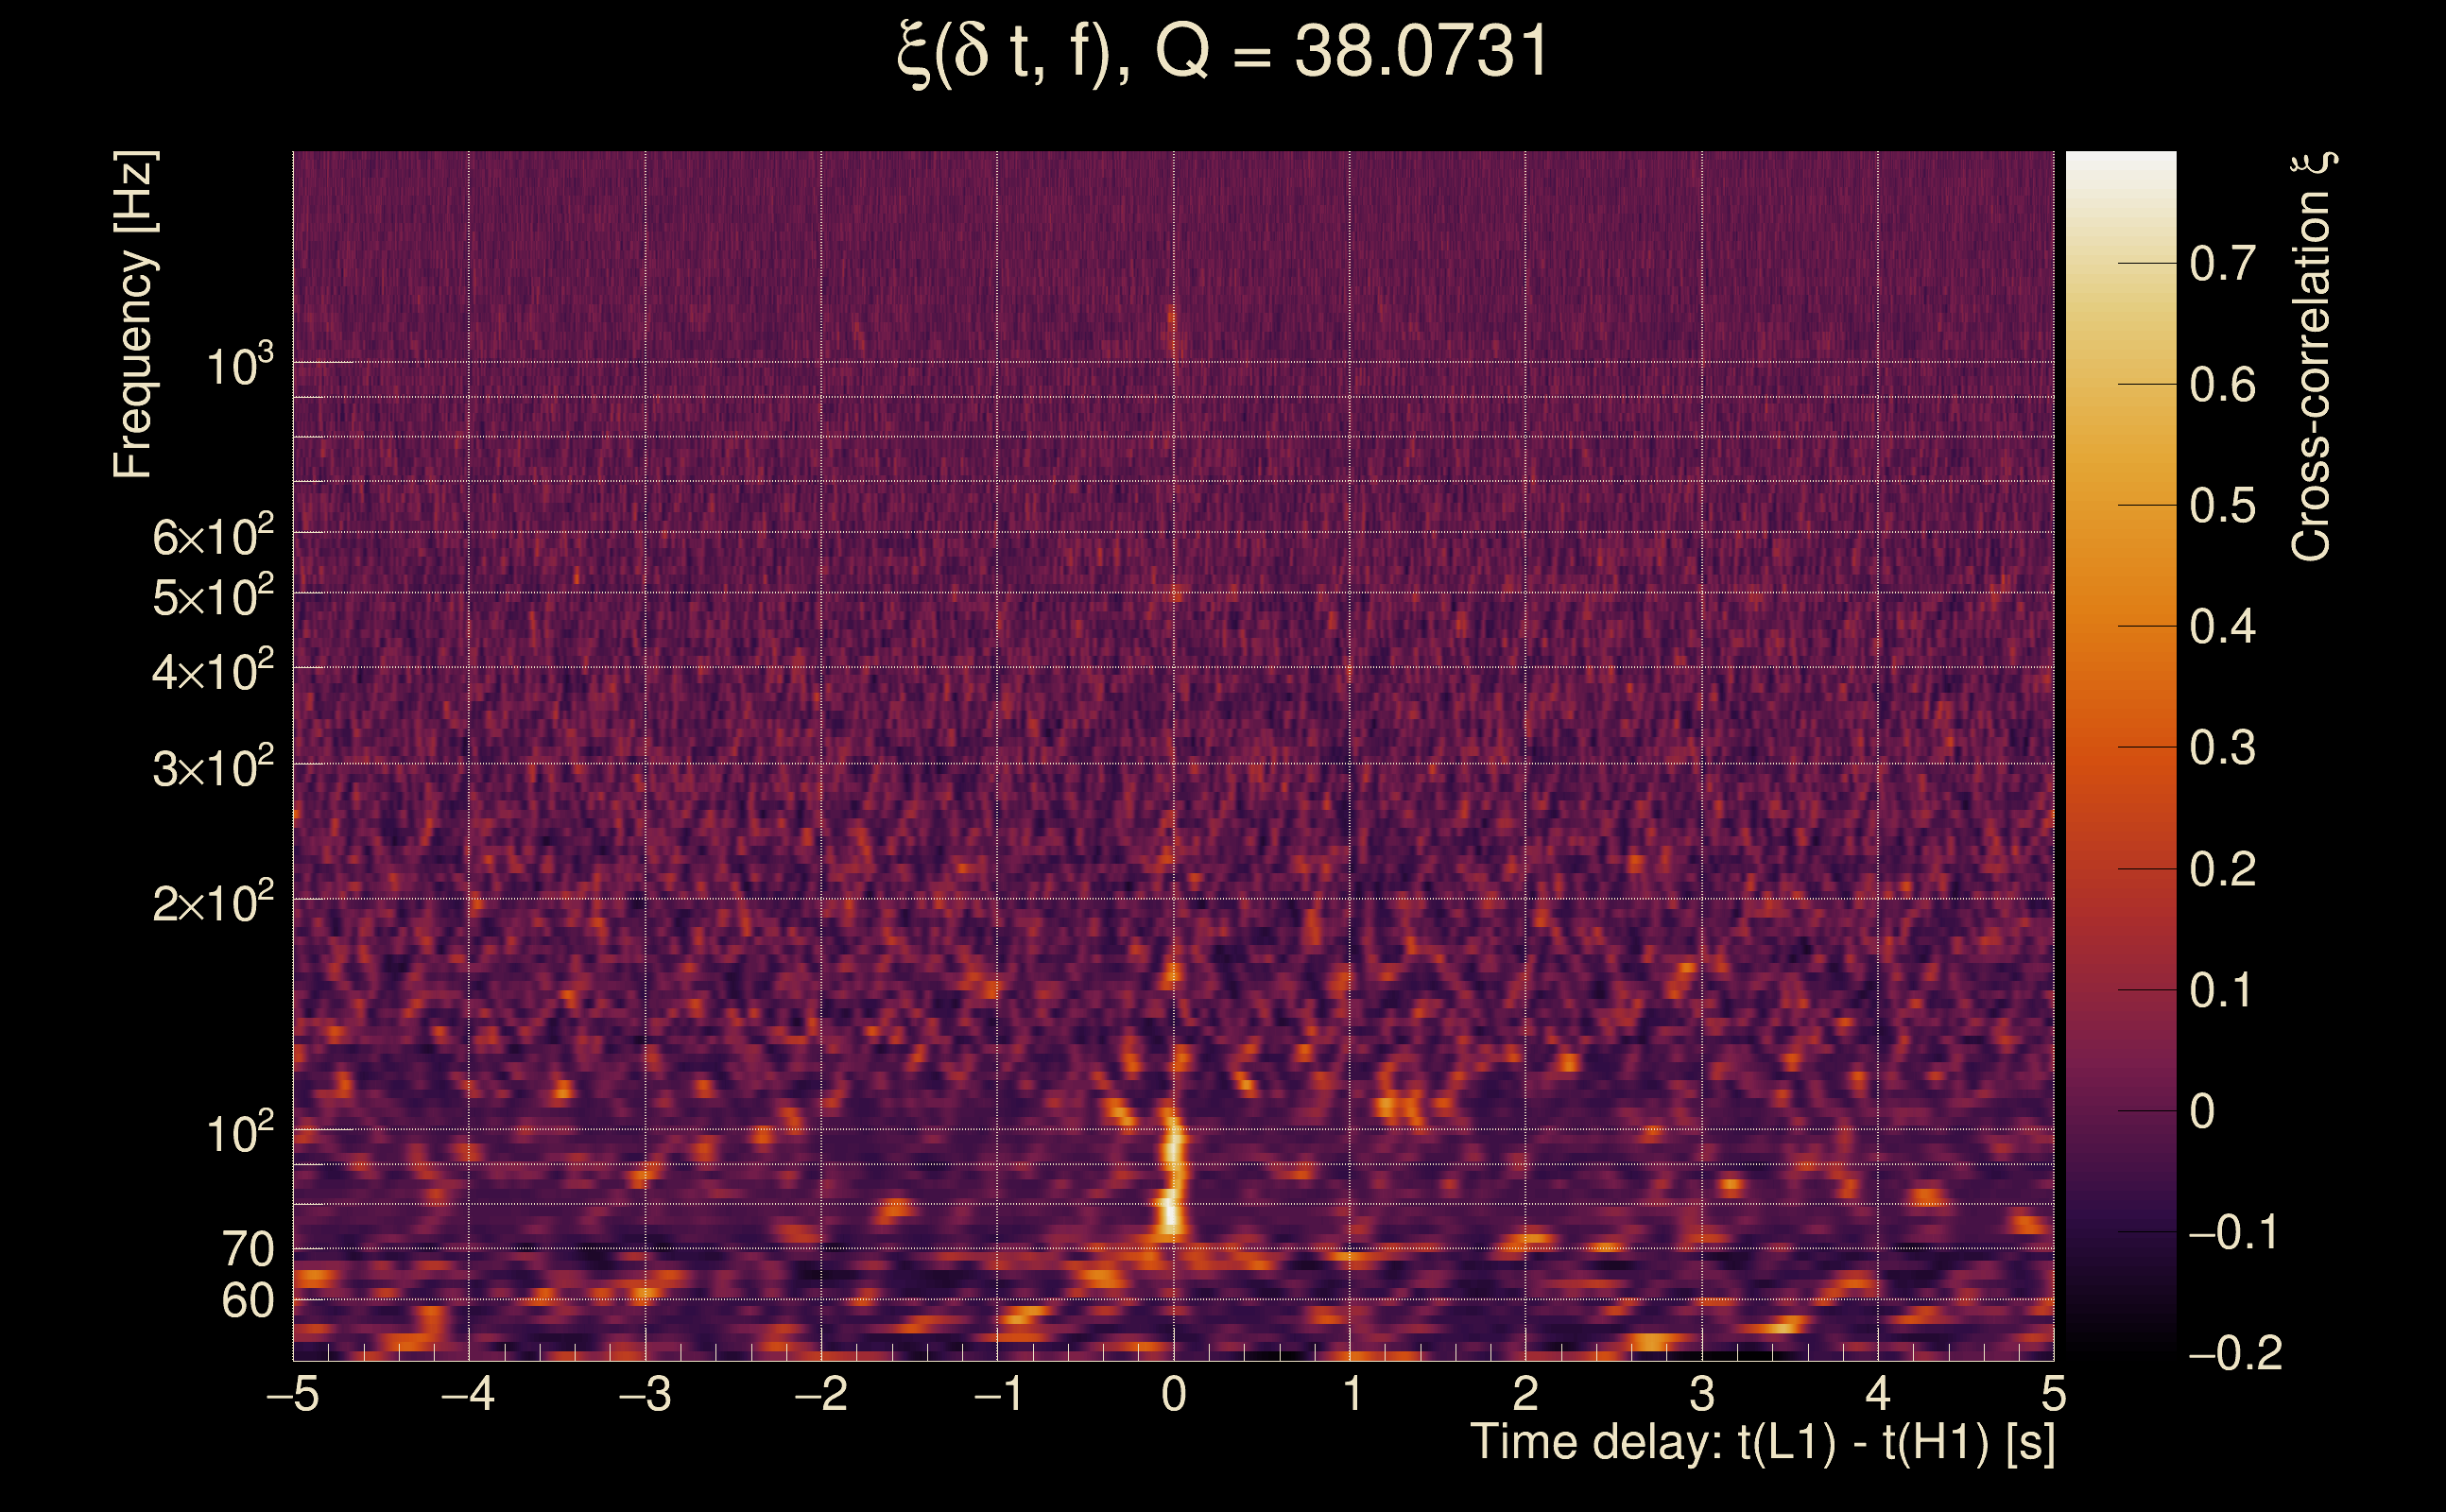
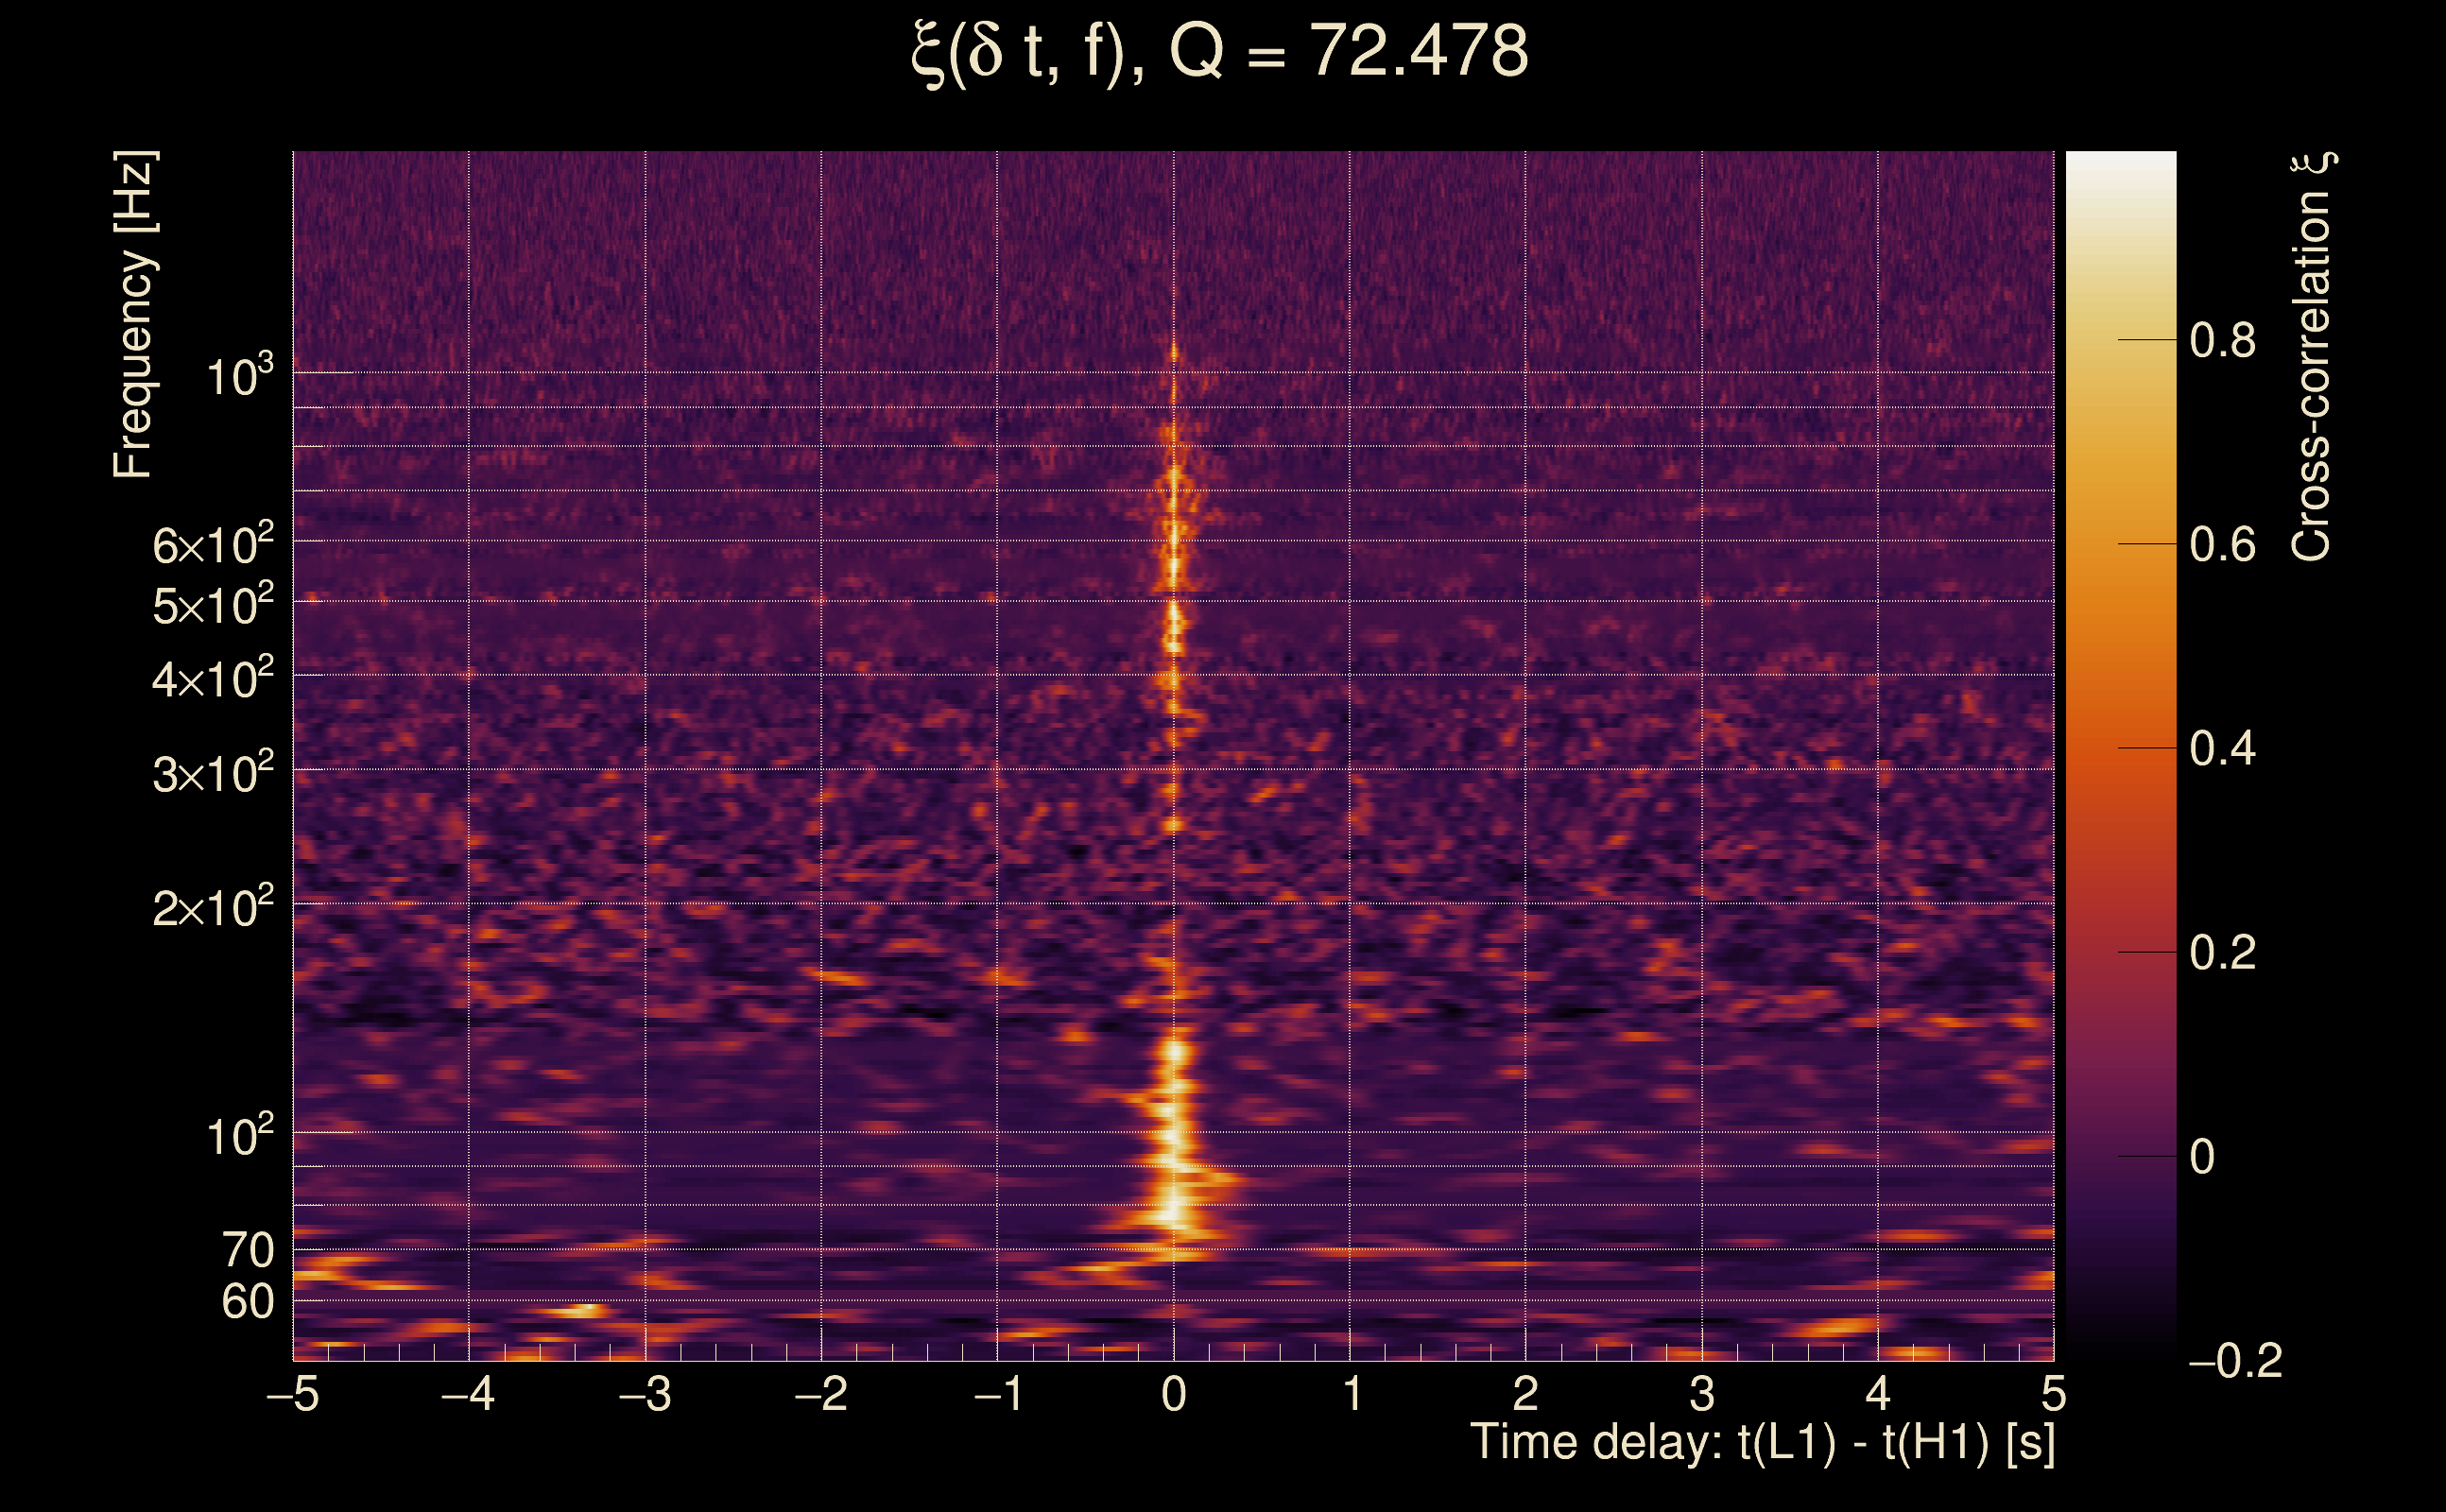
| Time delay between detectors t(L1) - t(H1): | 0.00097583 s (slice index = 108 / 217), δt_gw = 0.00097583 s |
| Time delay standard deviation: | 0.0238503 s |
| [targeted mode] Time delay probability: | 0.955235 (0.0561341 sigmas), δt_target = 1.72247e+45 s |
| Frequency: | 287.146 Hz |
| Ξ: | 0.920374 ± 0.0123874 (variance = 0.000153447): Q0: 0.951885, Q1: 0.946613, Q2: 0.93655, Q3: 0.926869, Q4: 0.918151 |
| Rank: | R_A = 0.855631 |
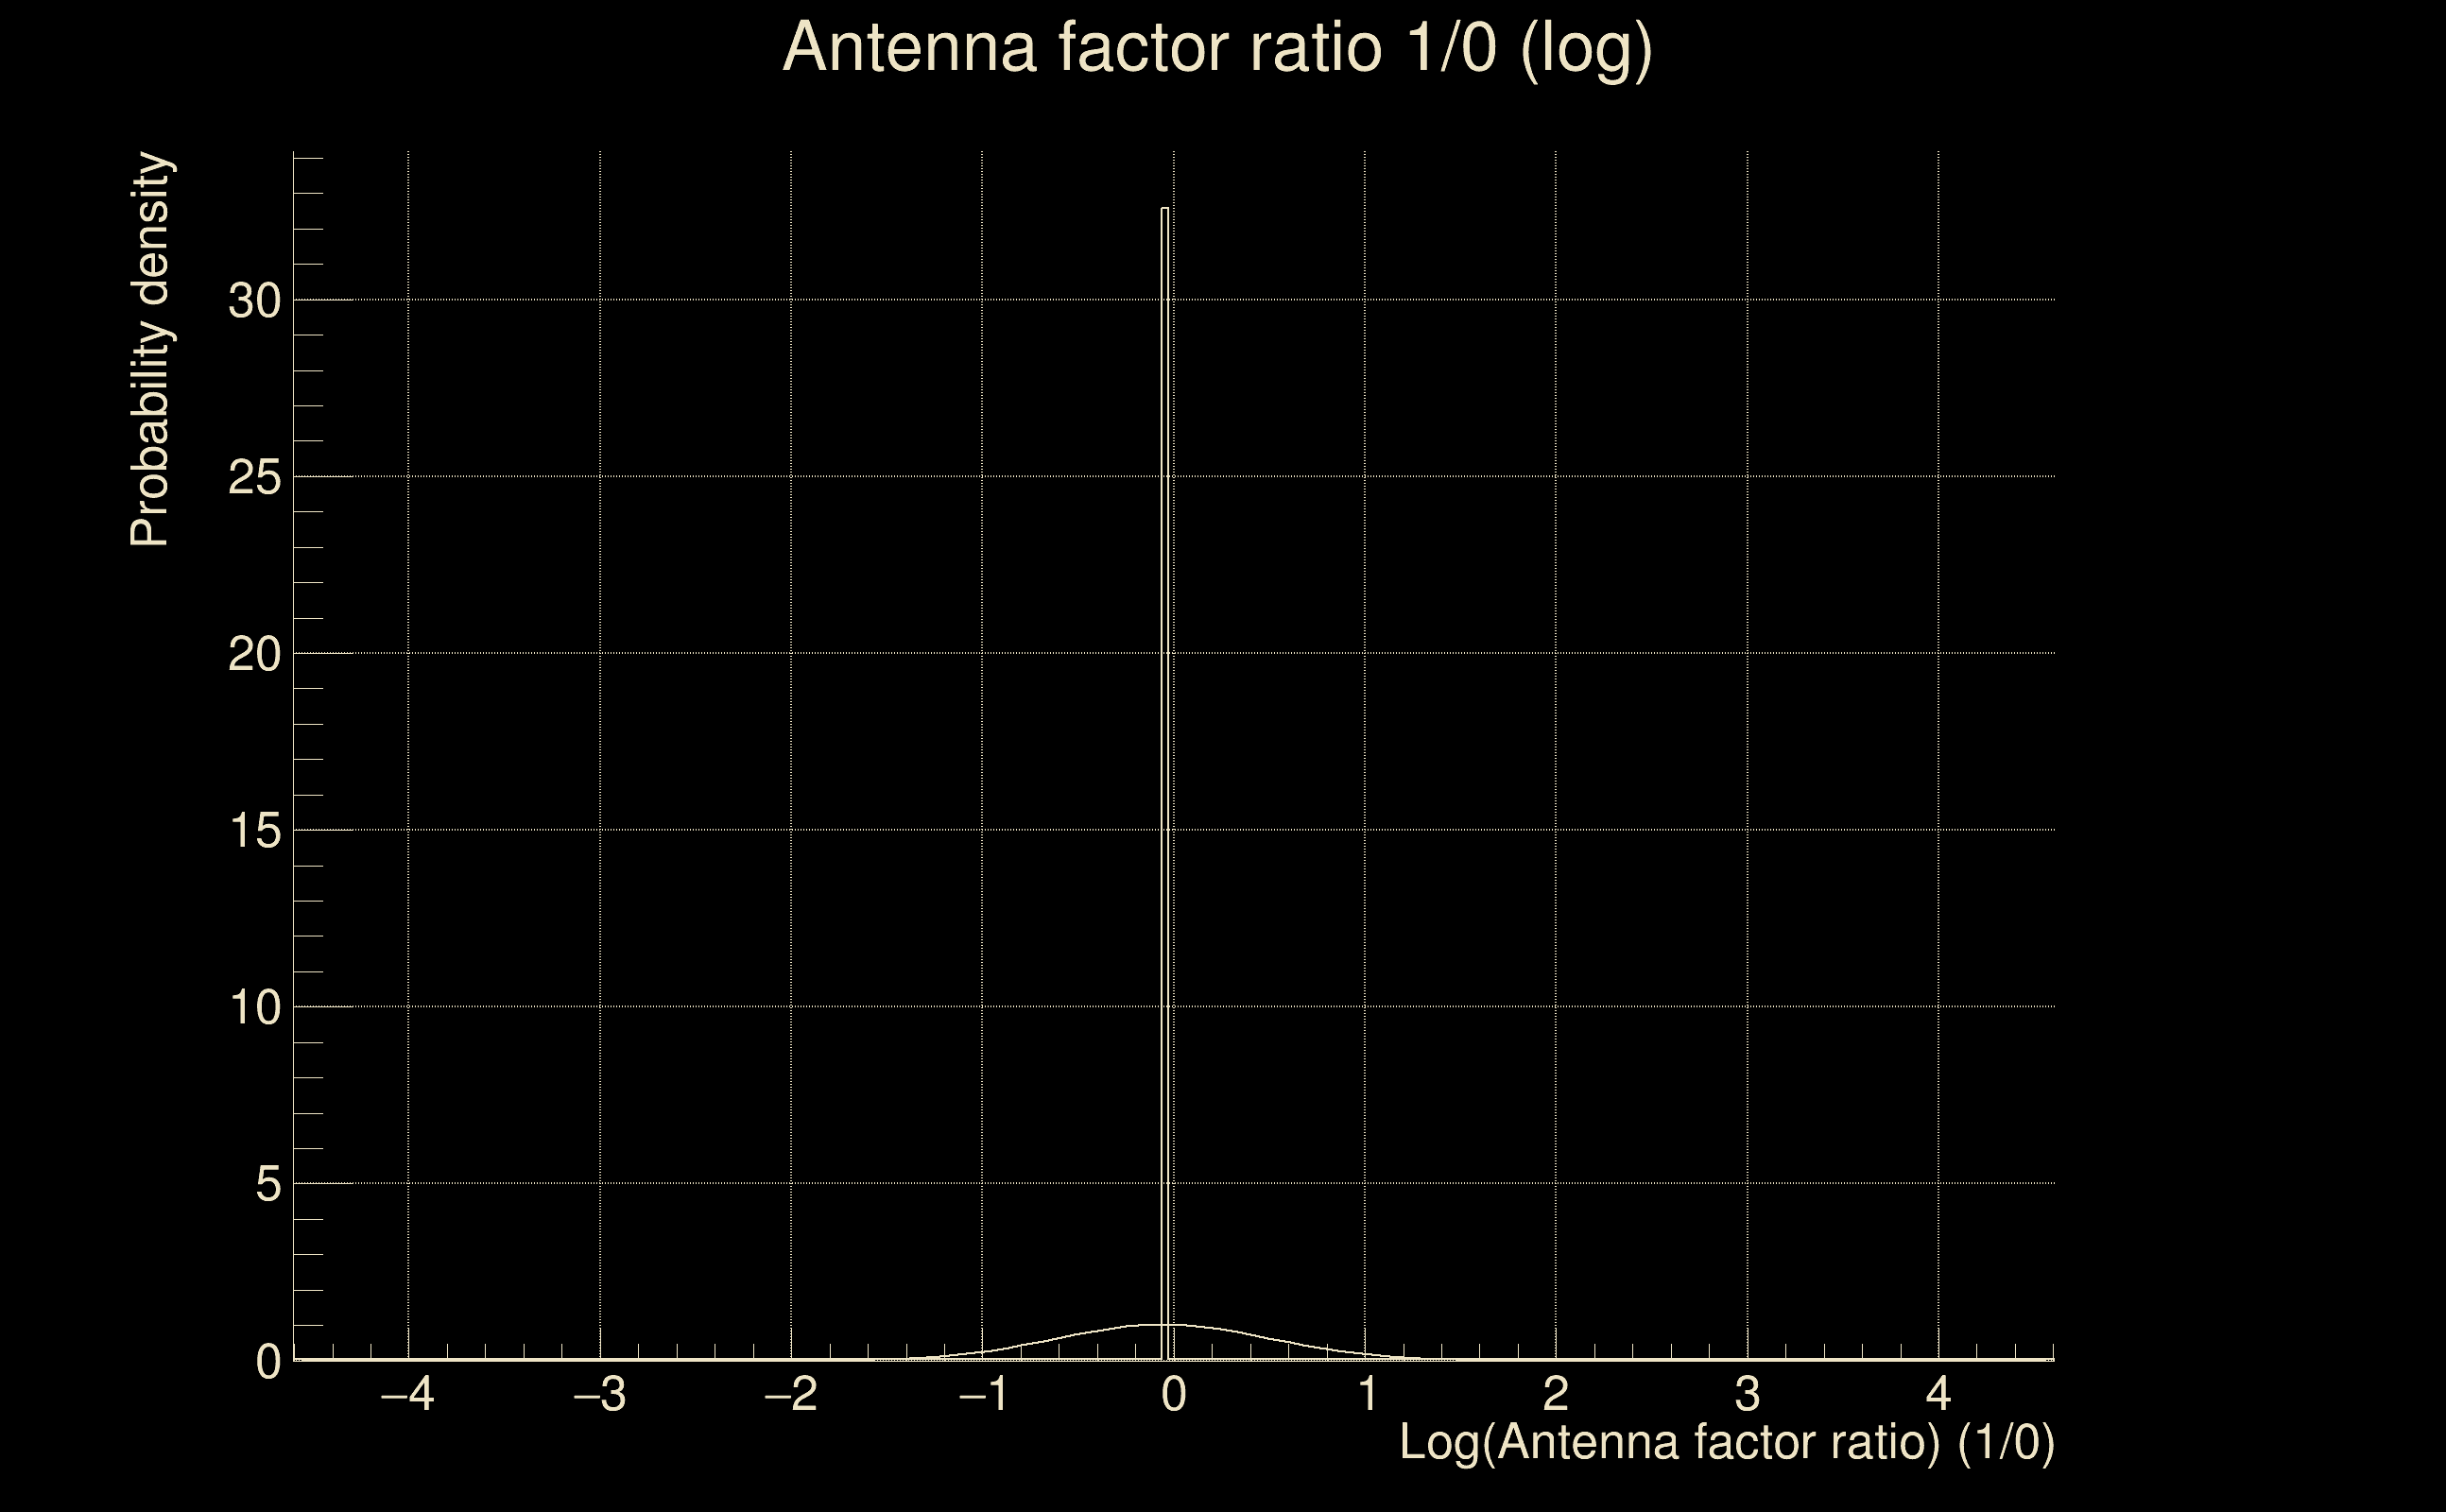
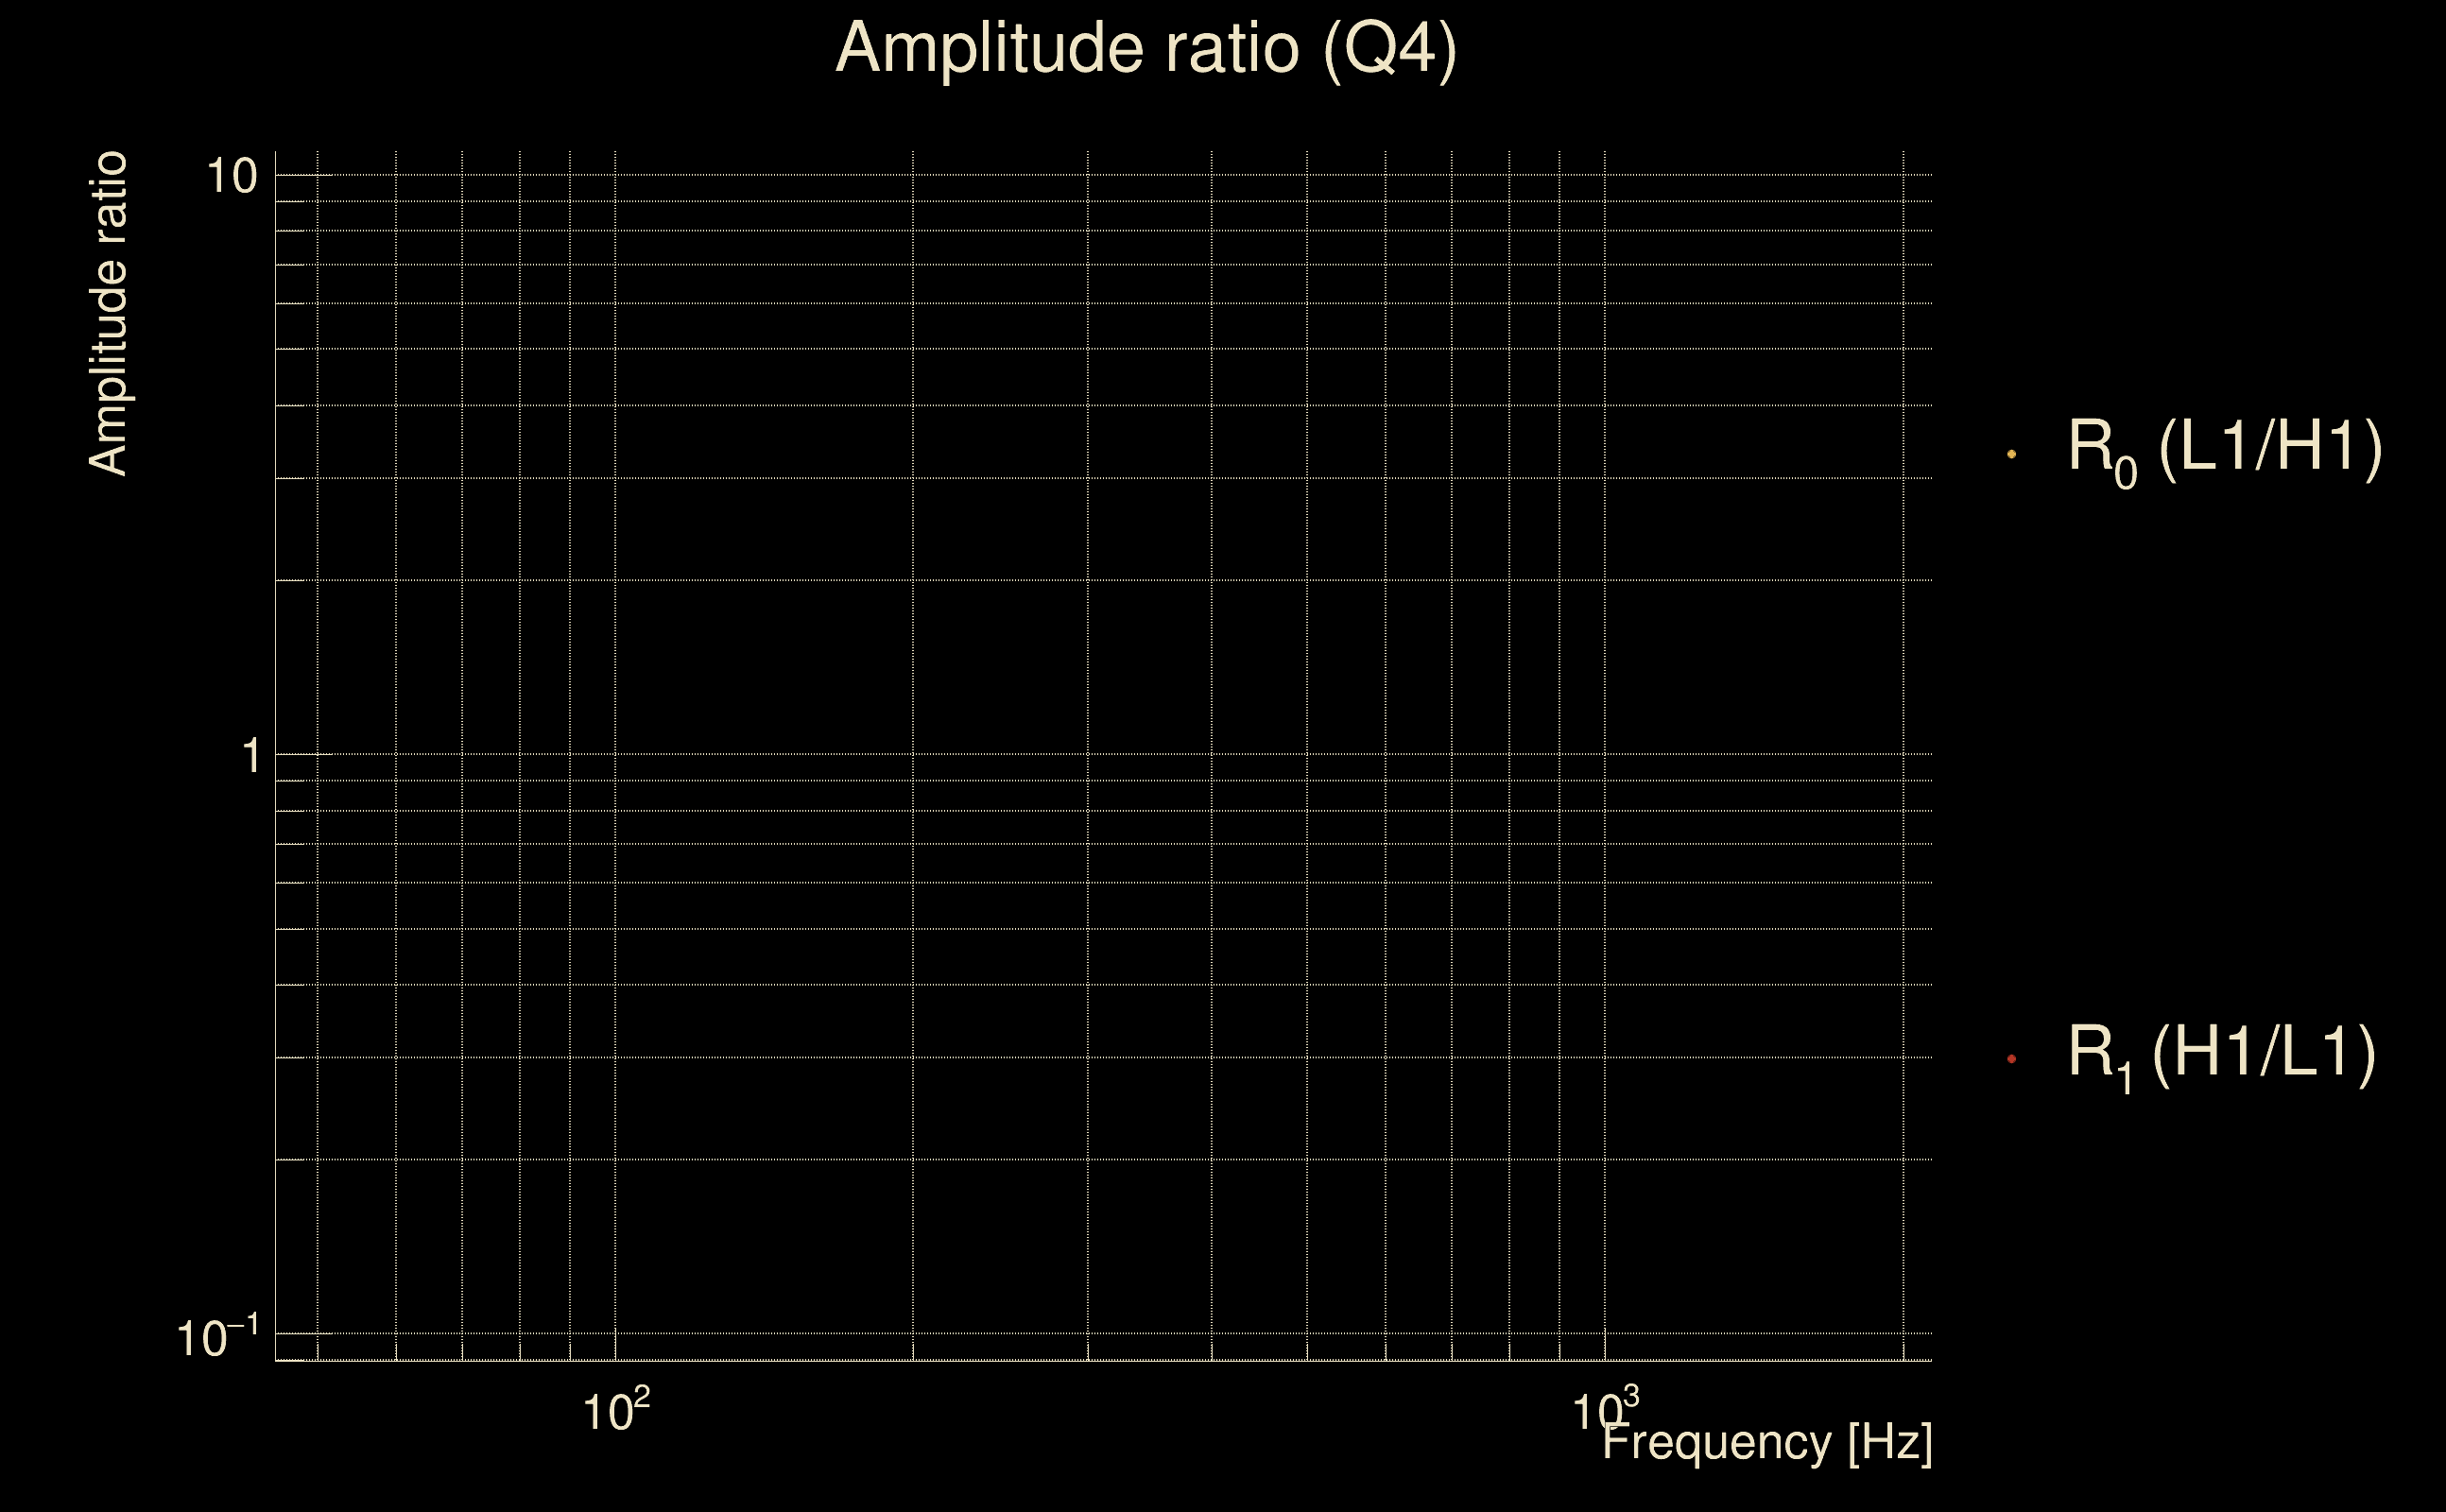
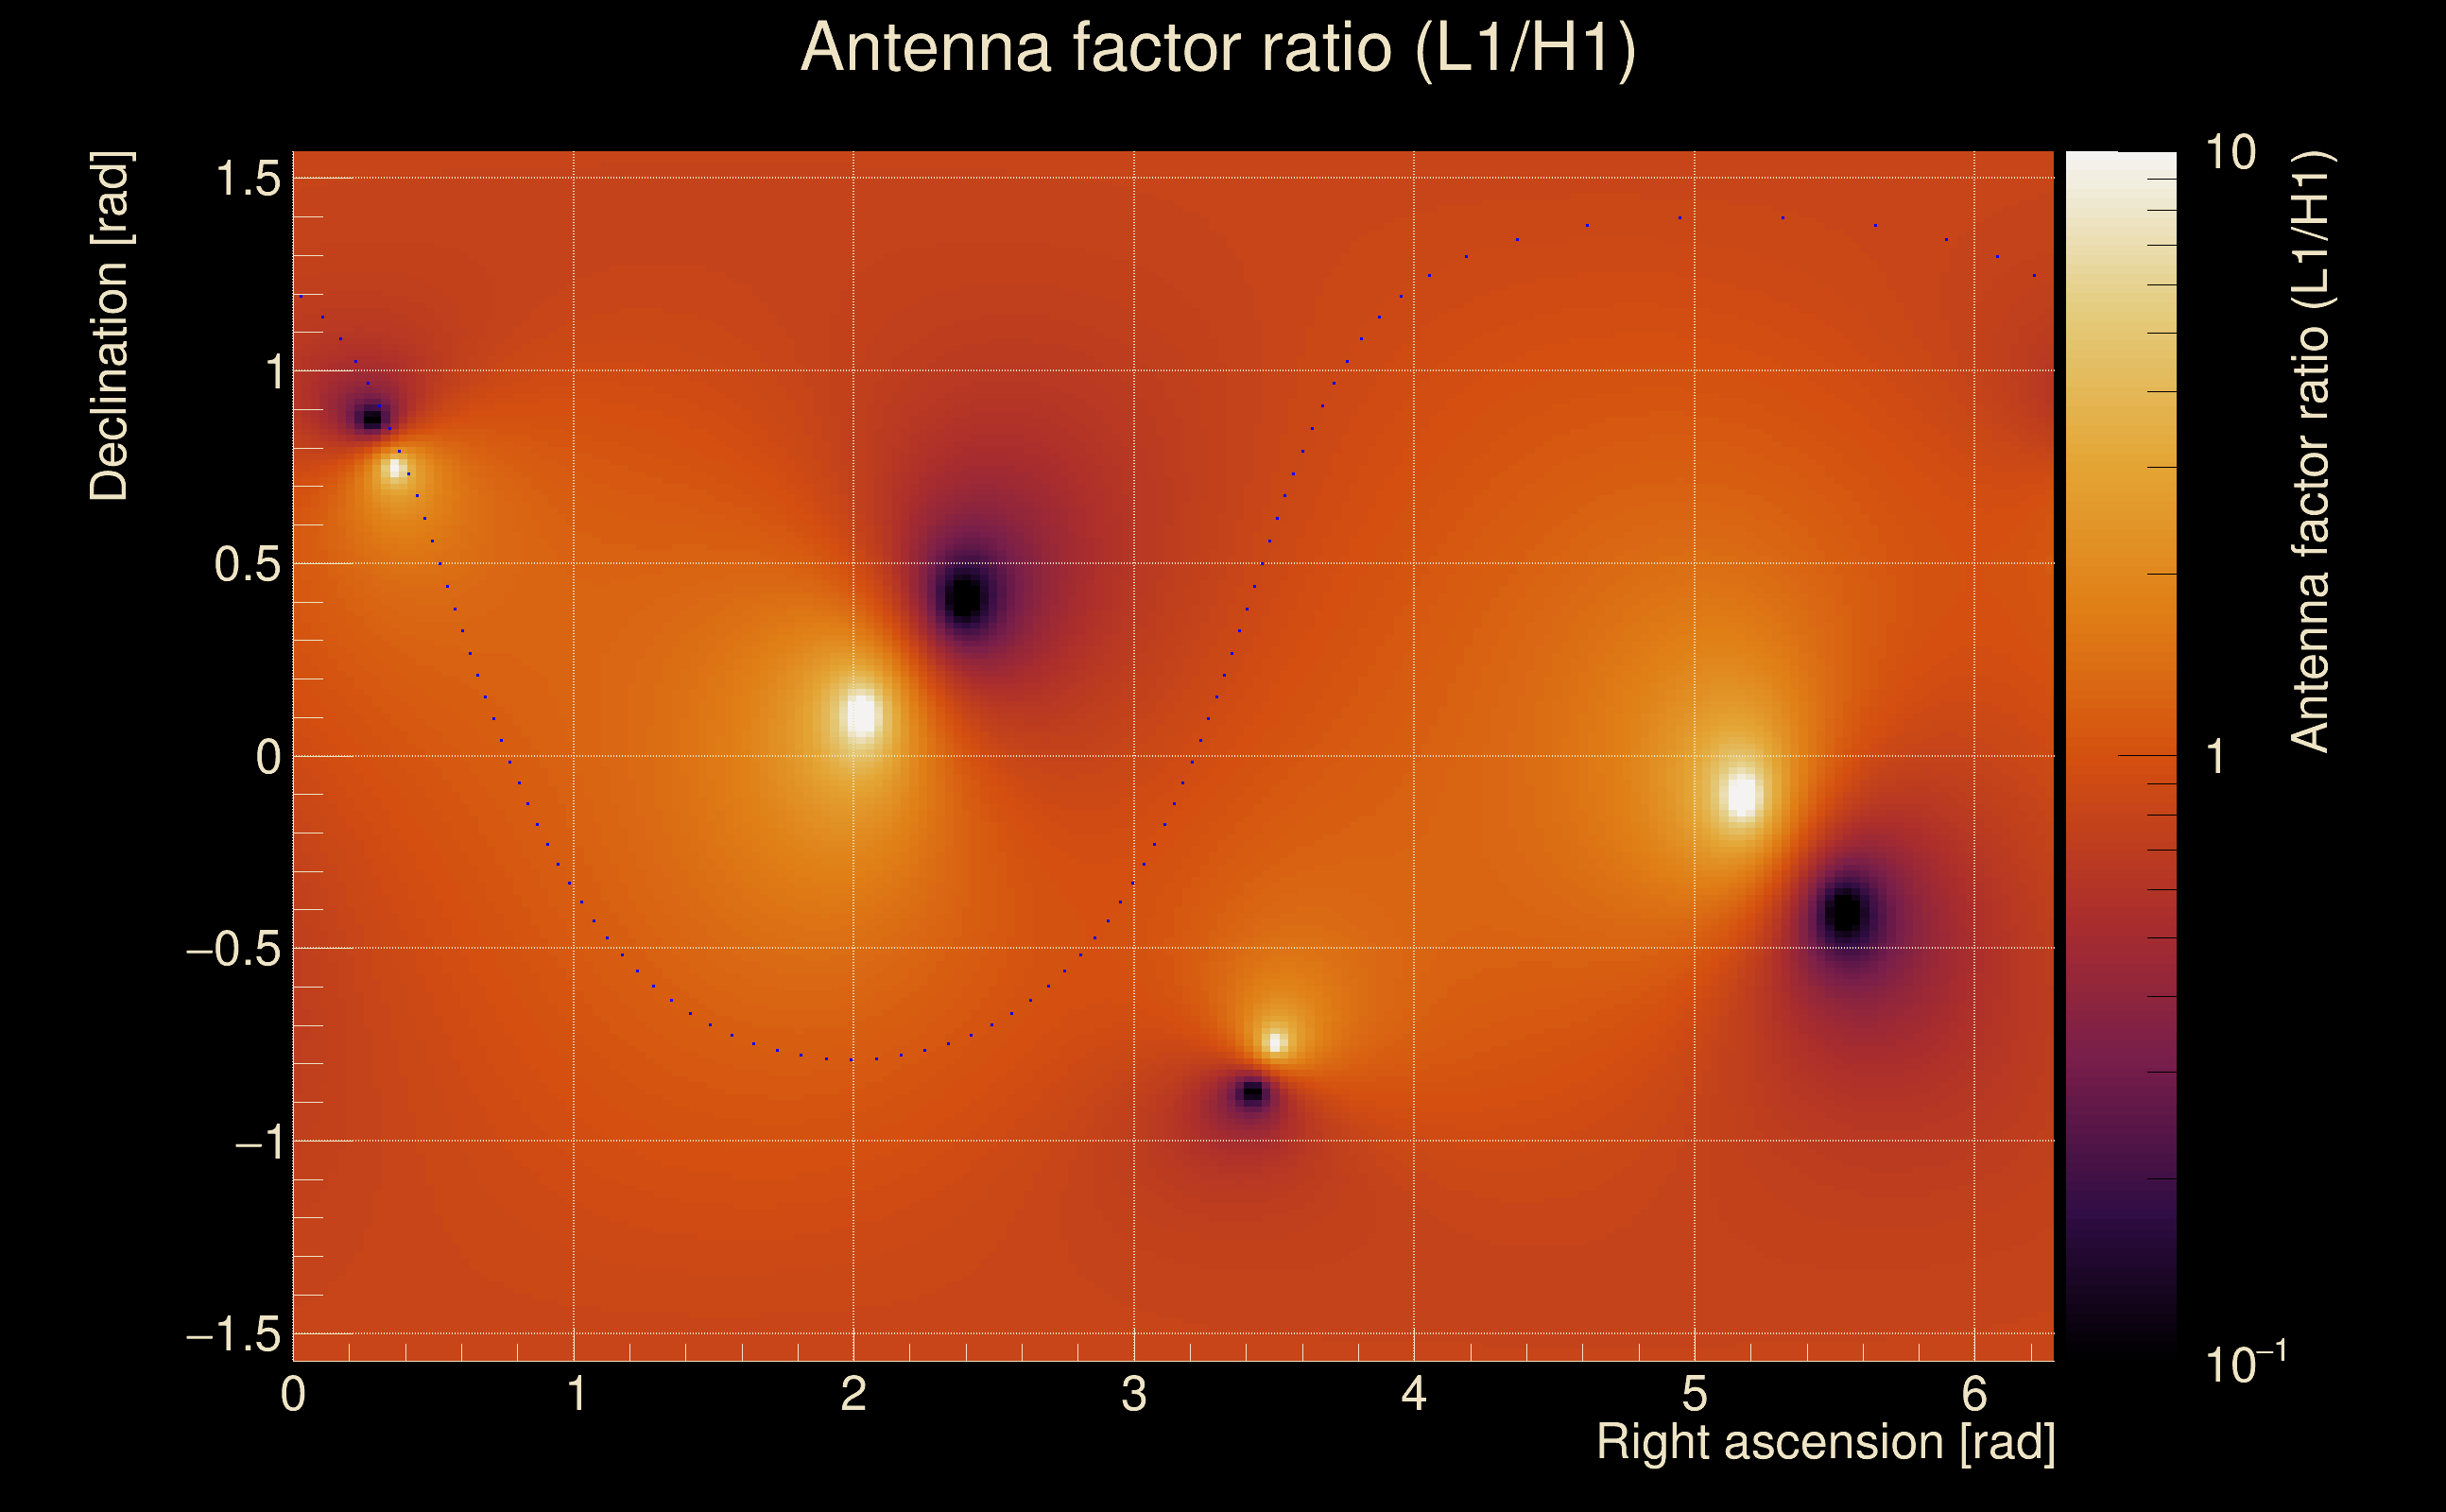
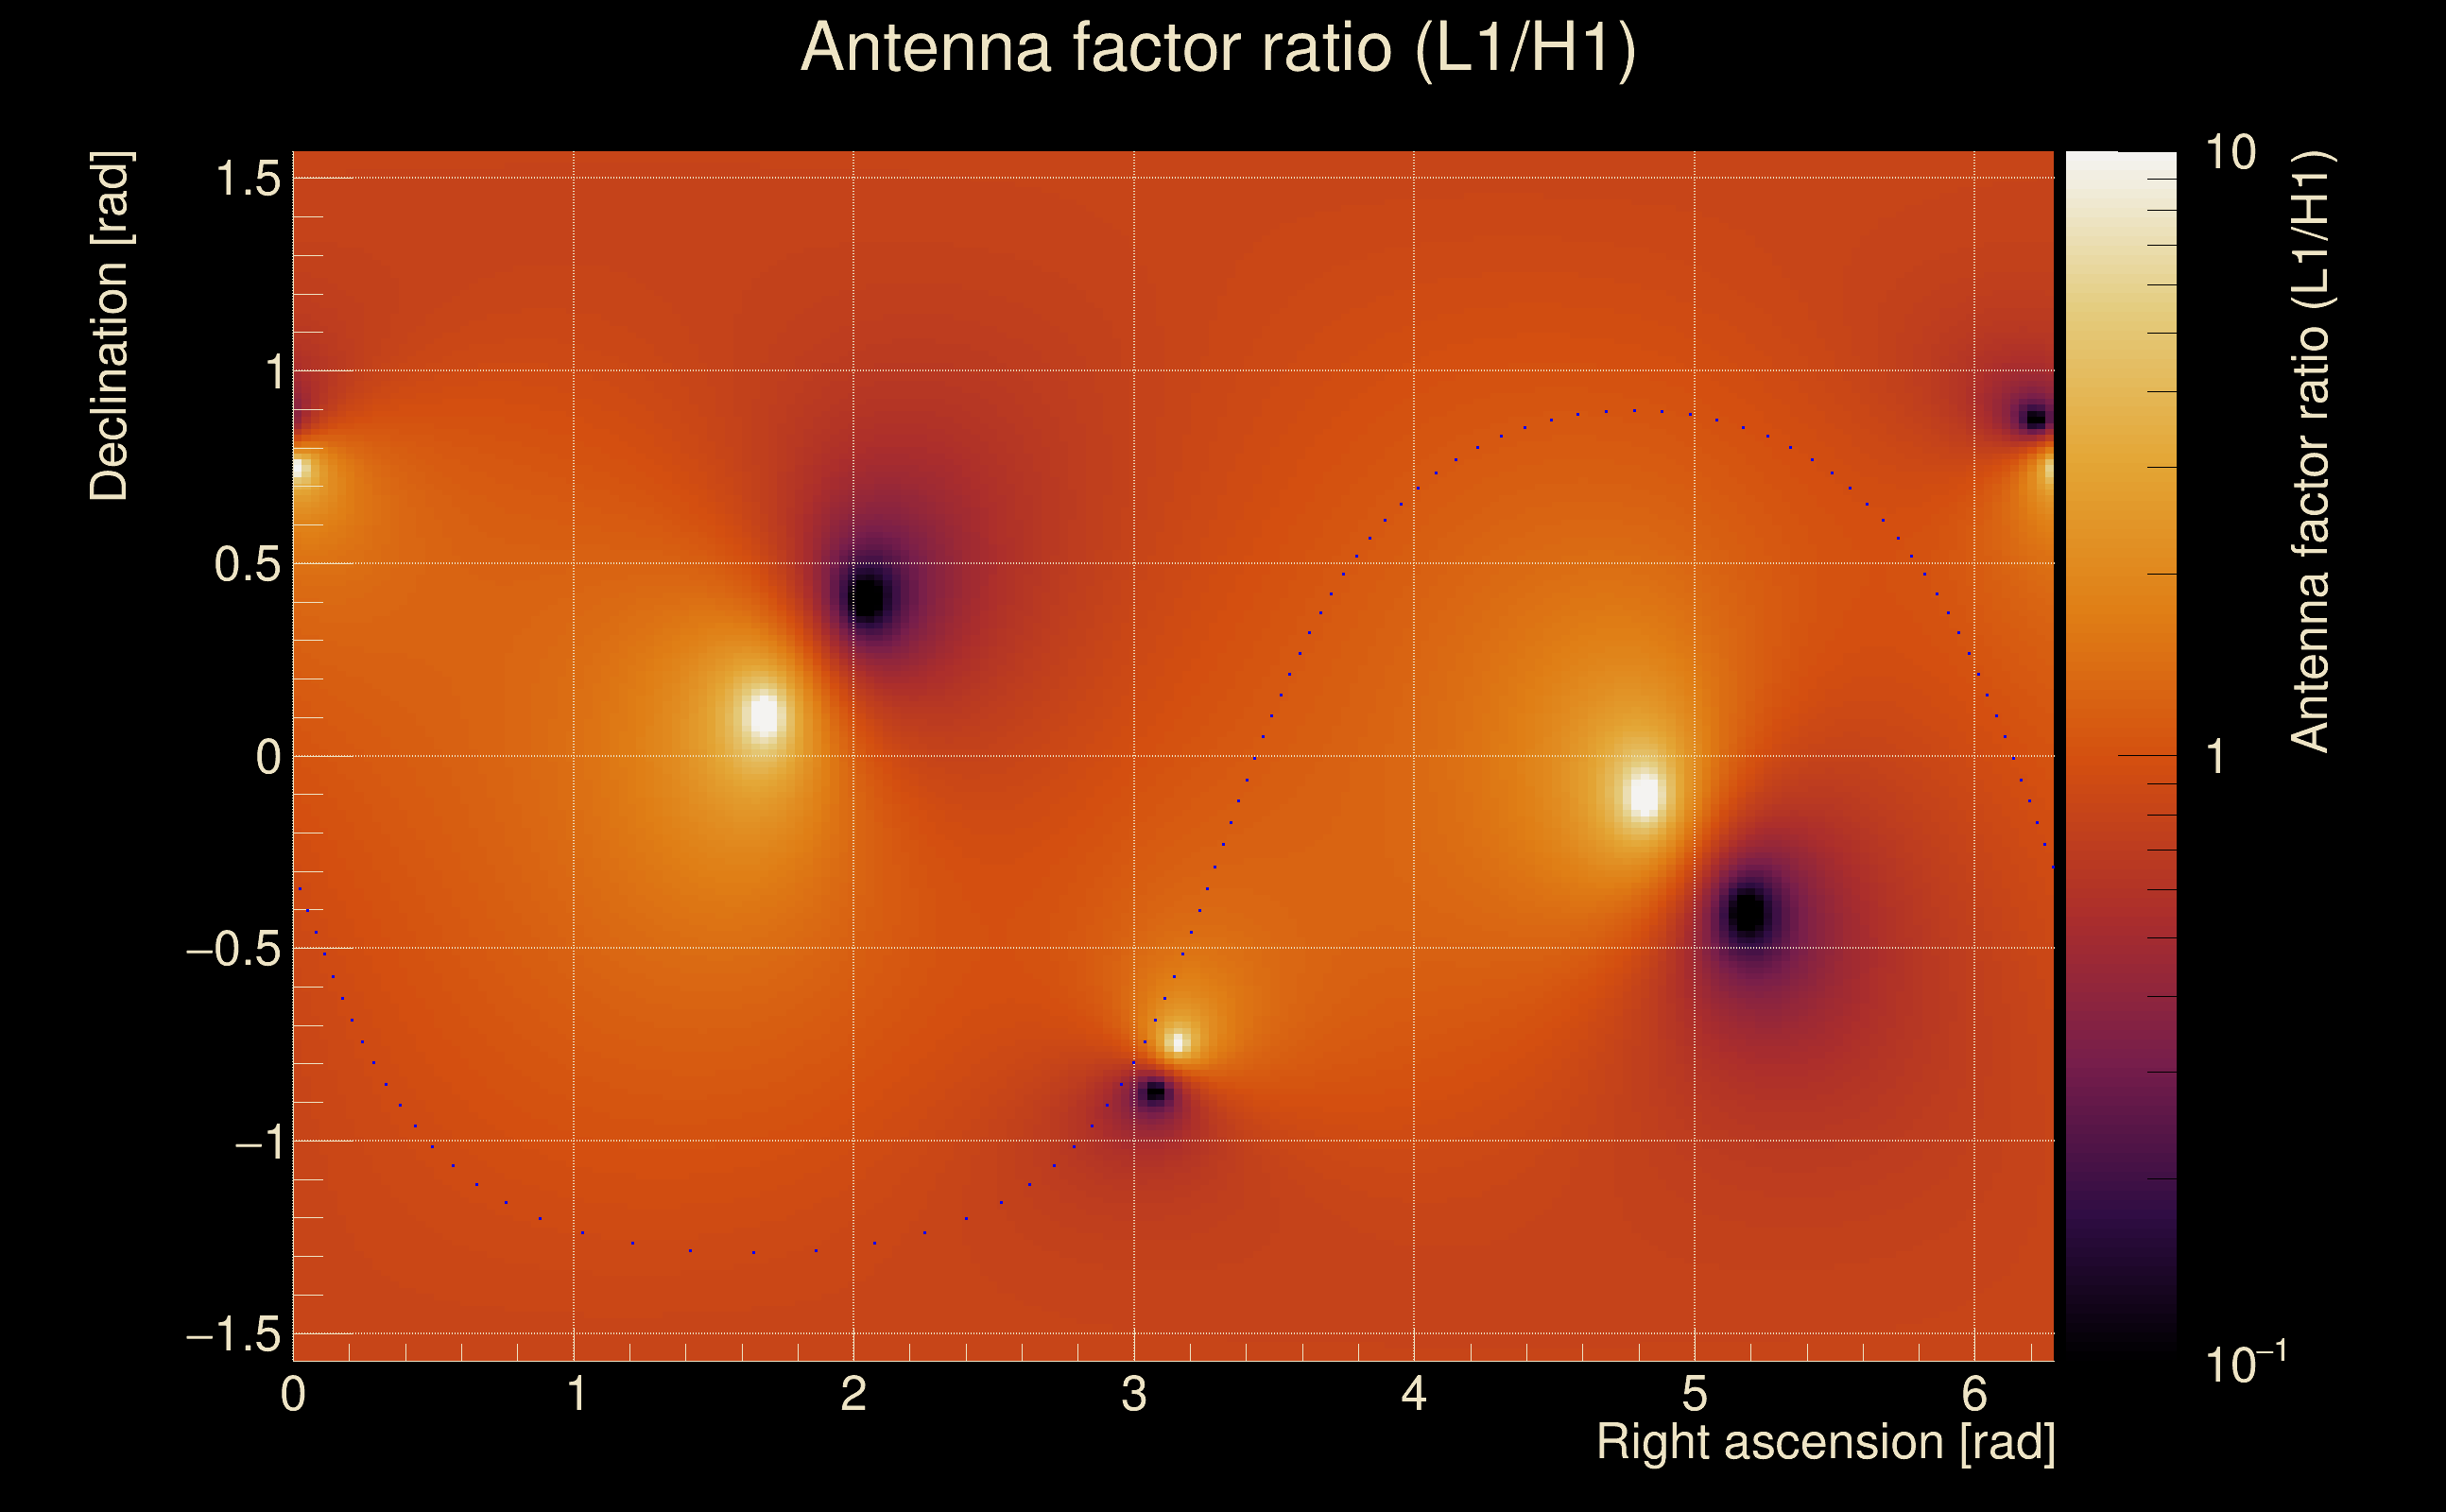
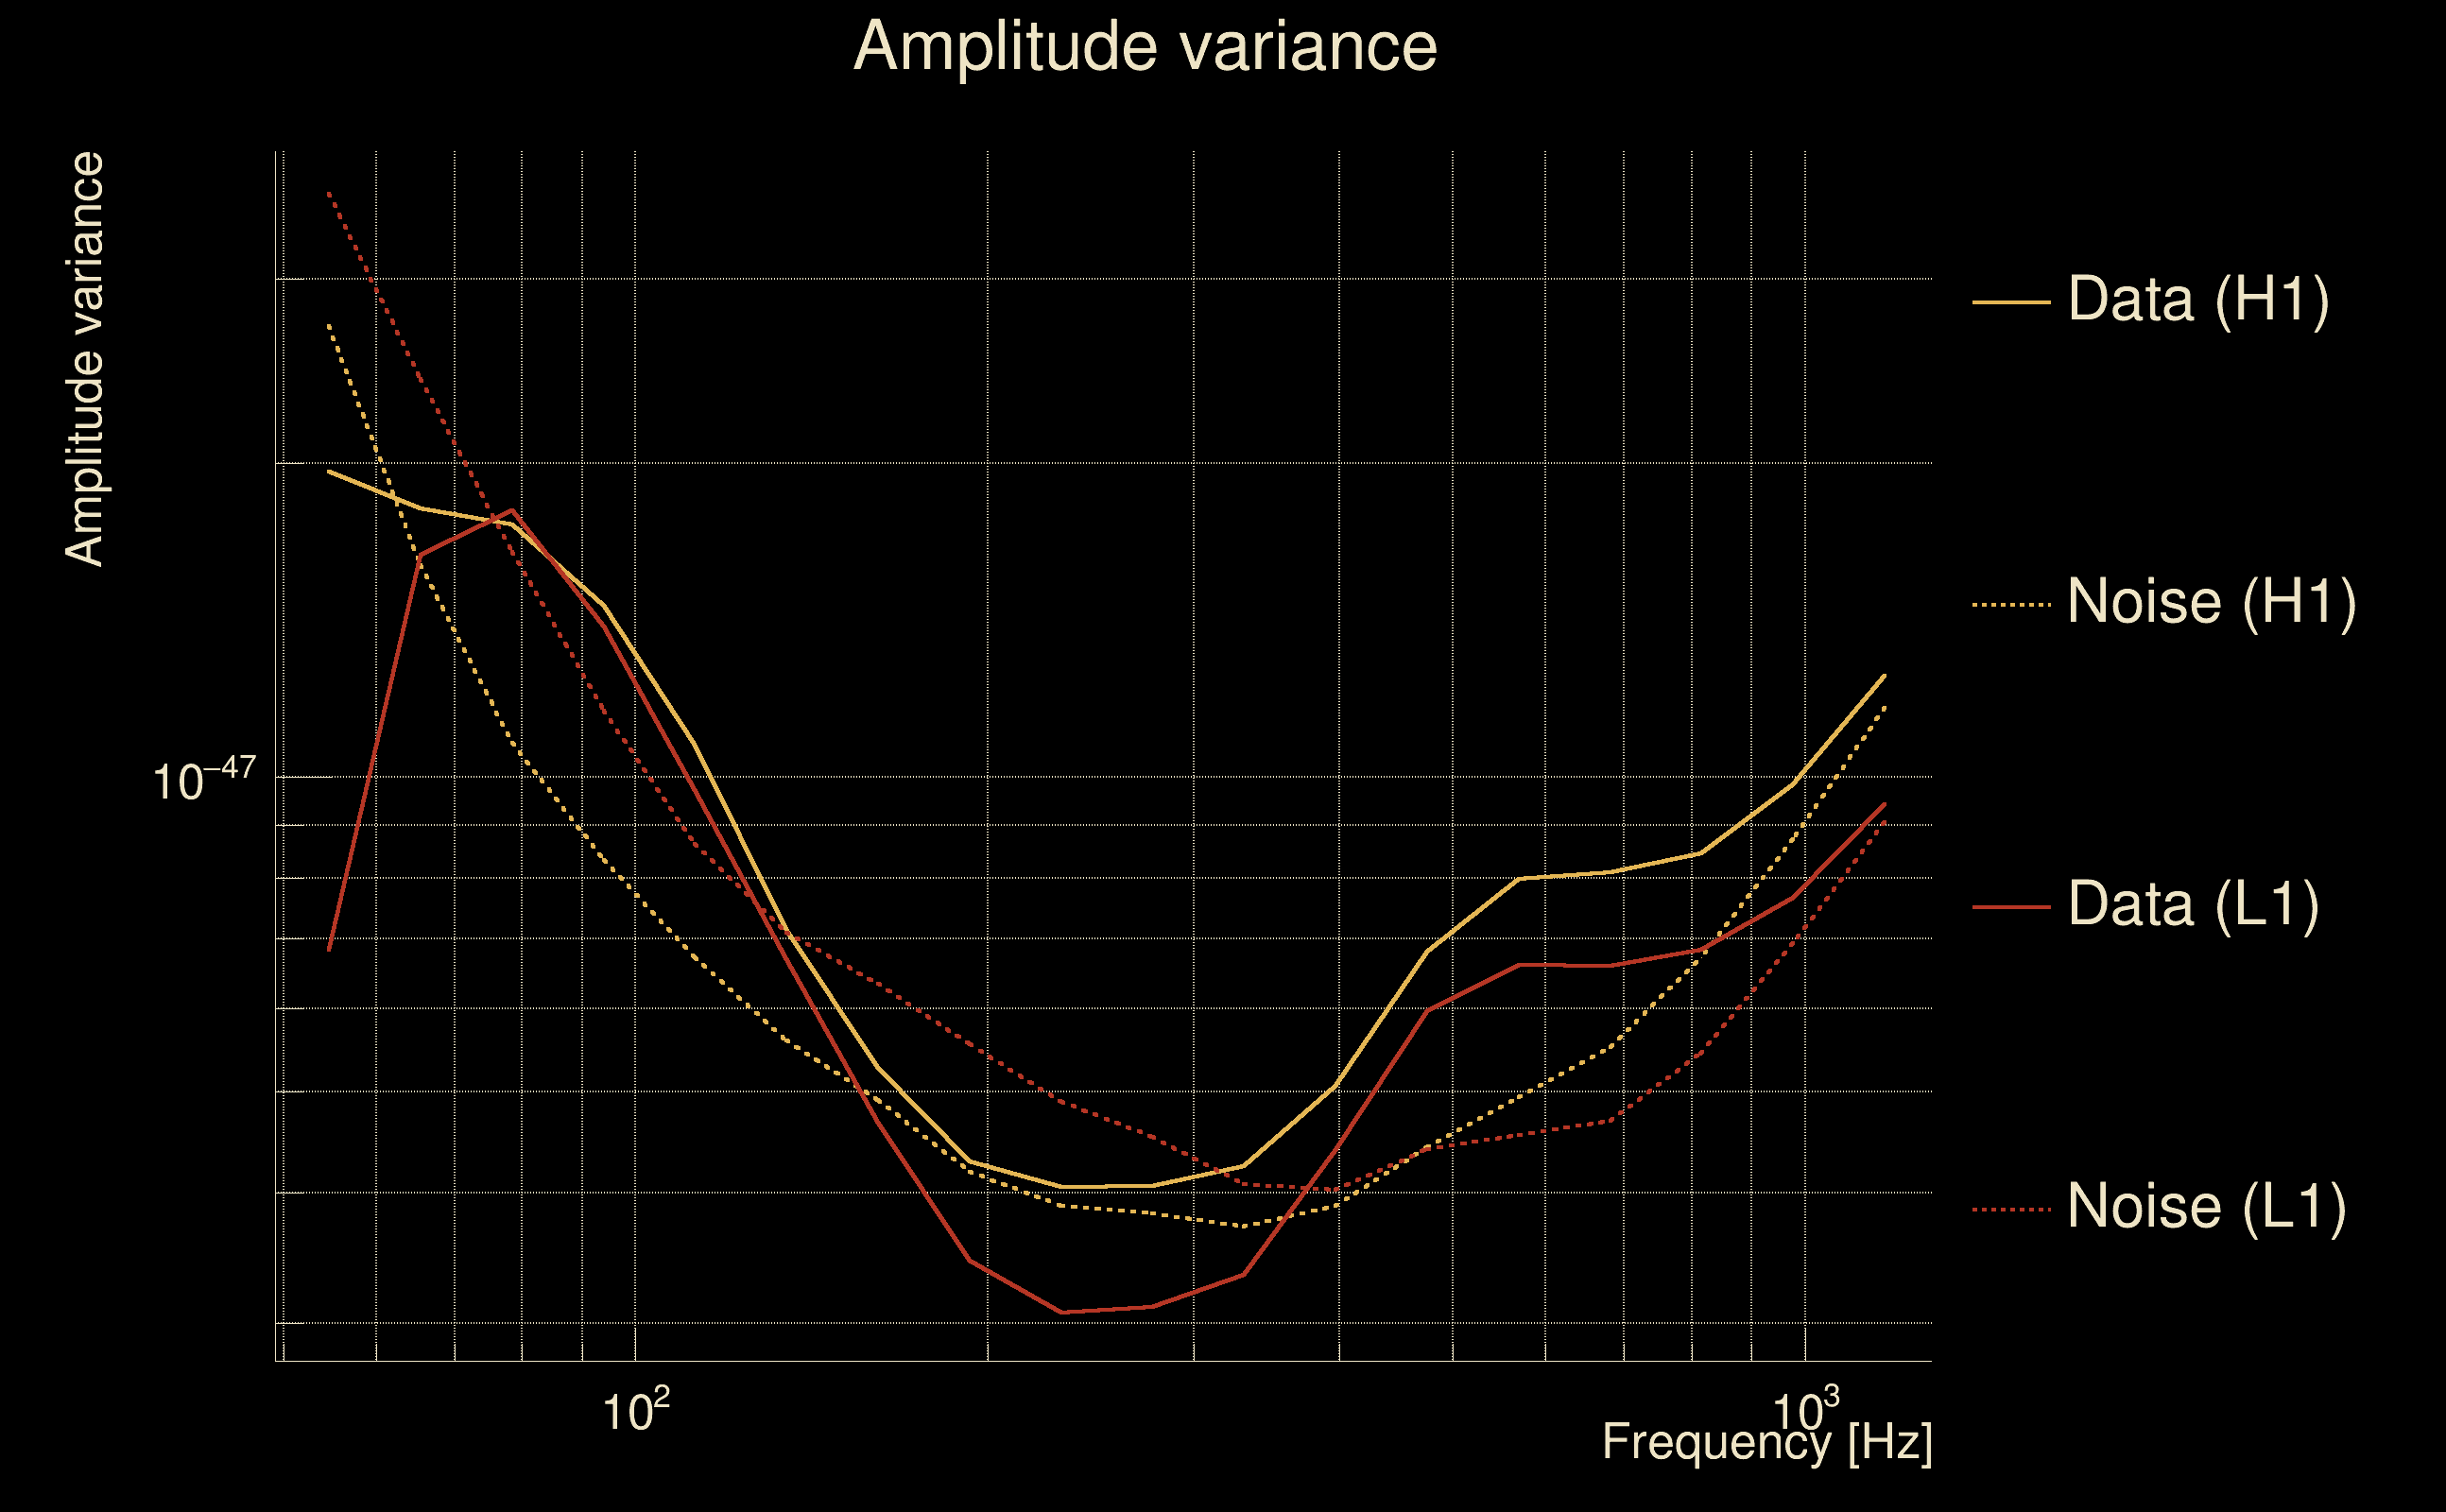
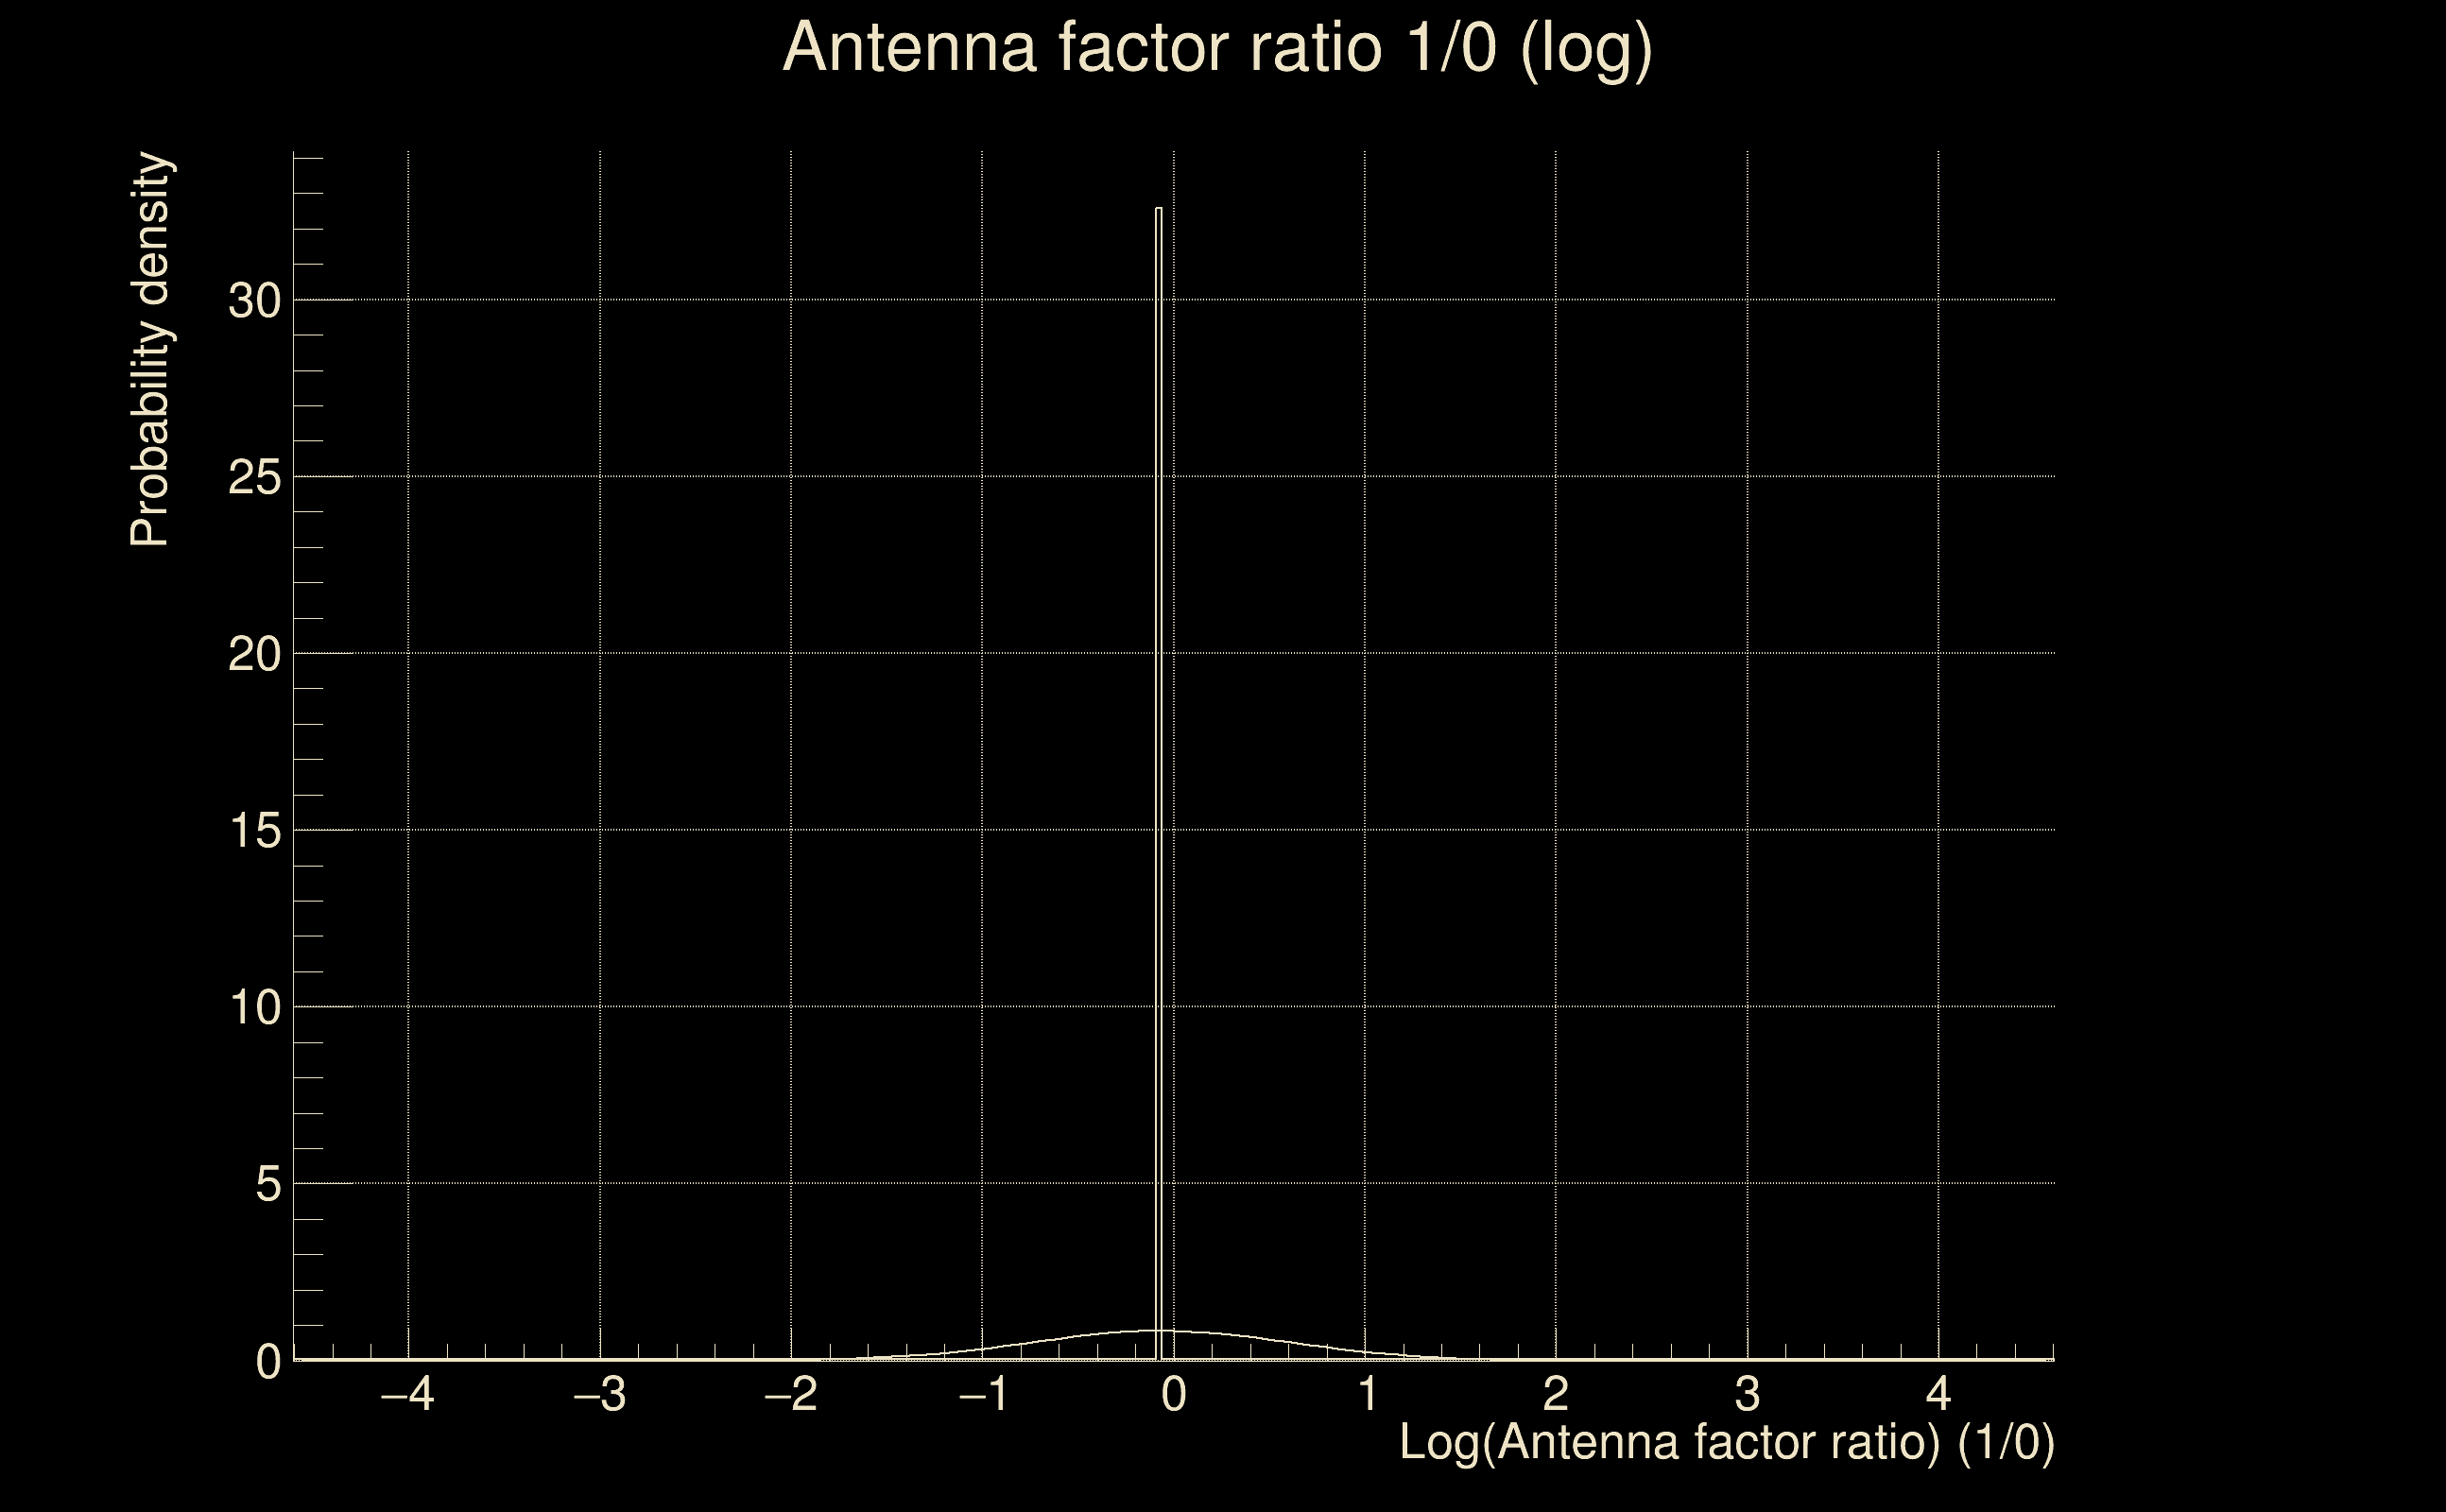
| Log of amplitude ratio (L1/H1): | -0.0494286, variance = 0.151449 (L1/H1: -0.0563282, variance = 0.302755, H1/L1: 0.0428882, variance = 0.302615) |
| Amplitude ratio (L1/H1): | 0.951773 ⋇ 1.47575 (L1/H1: 0.945229 ⋇ 1.73365, H1/L1: 1.04382 ⋇ 1.73343) |
| Amplitude ratio H1|L1 compatibility (probability): | 0.986218 |
| Antenna factor probability: | 0.991601 |
| Number of rejected frequency rows: | Q0: 0 / 18, Q1: 1 / 36, Q2: 5 / 70, Q3: 11 / 134, Q4: 36 / 258 |
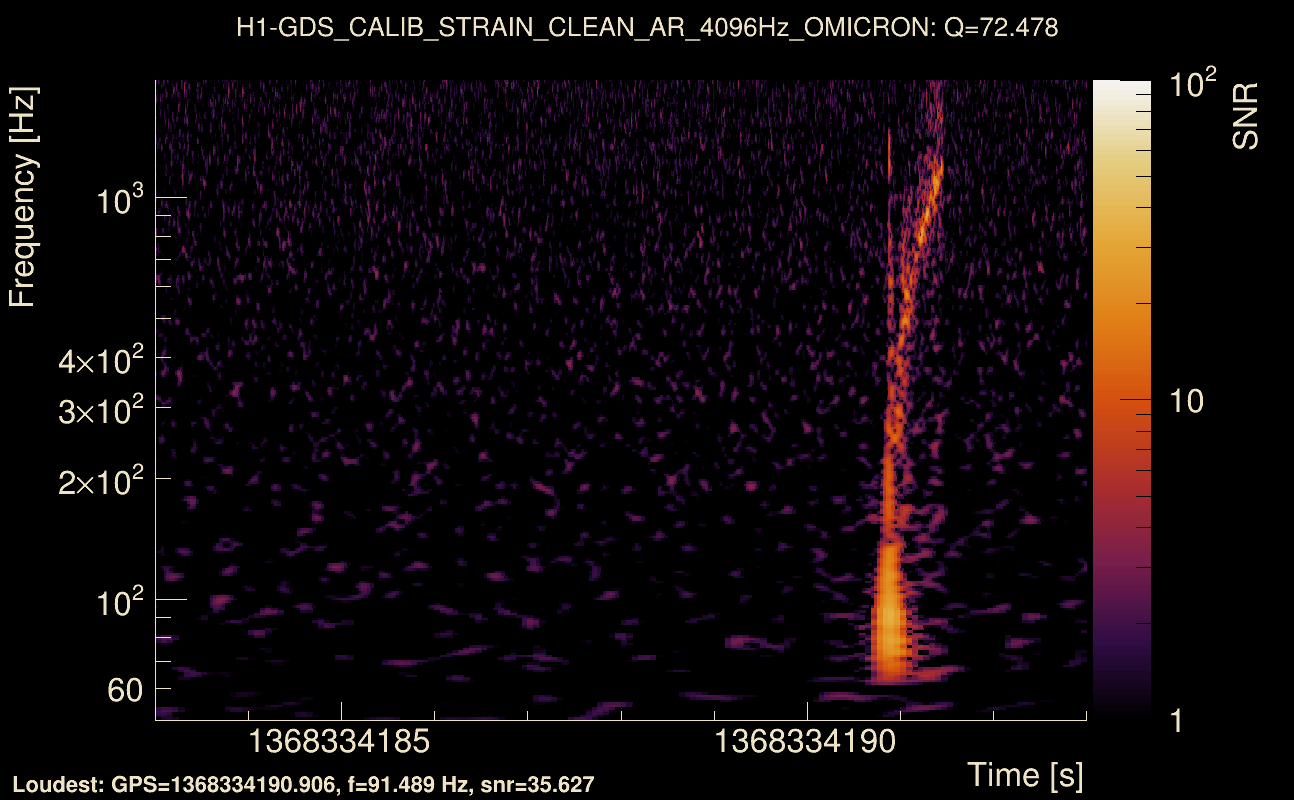
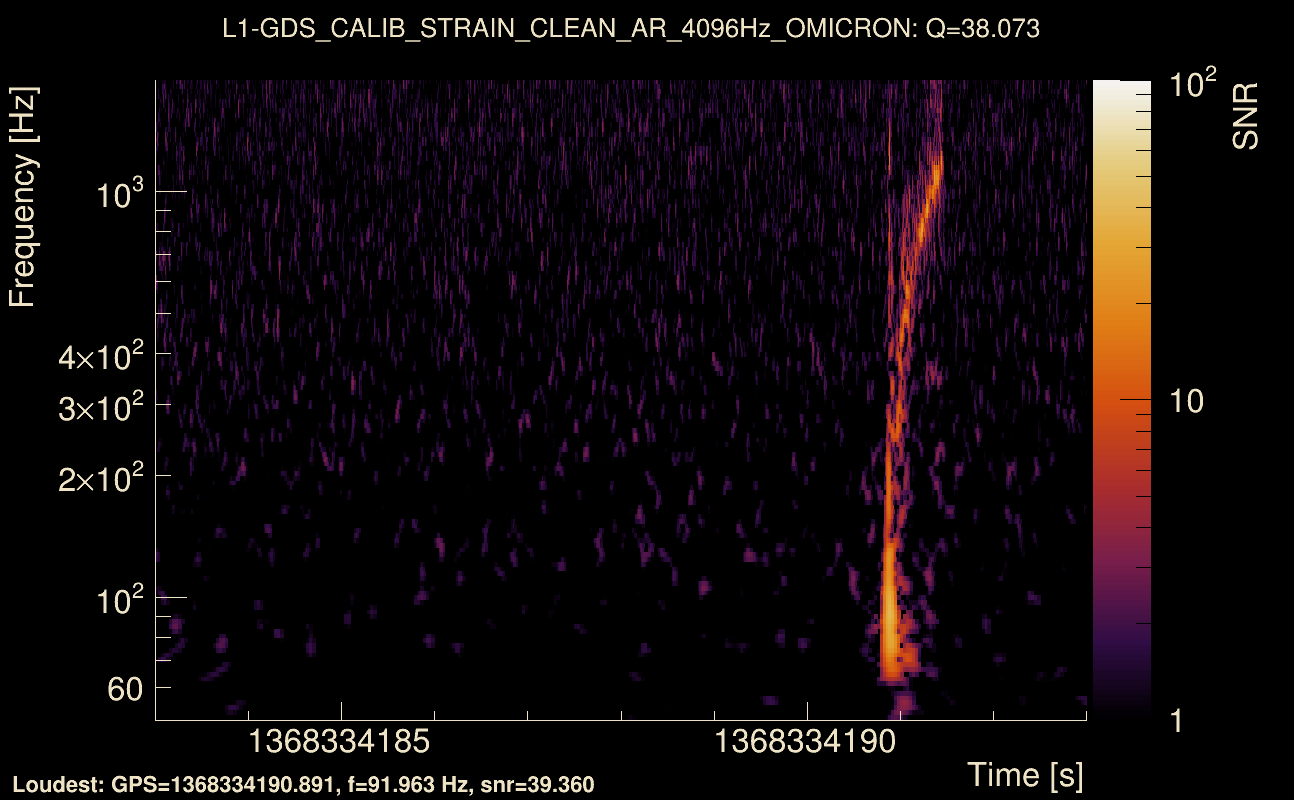
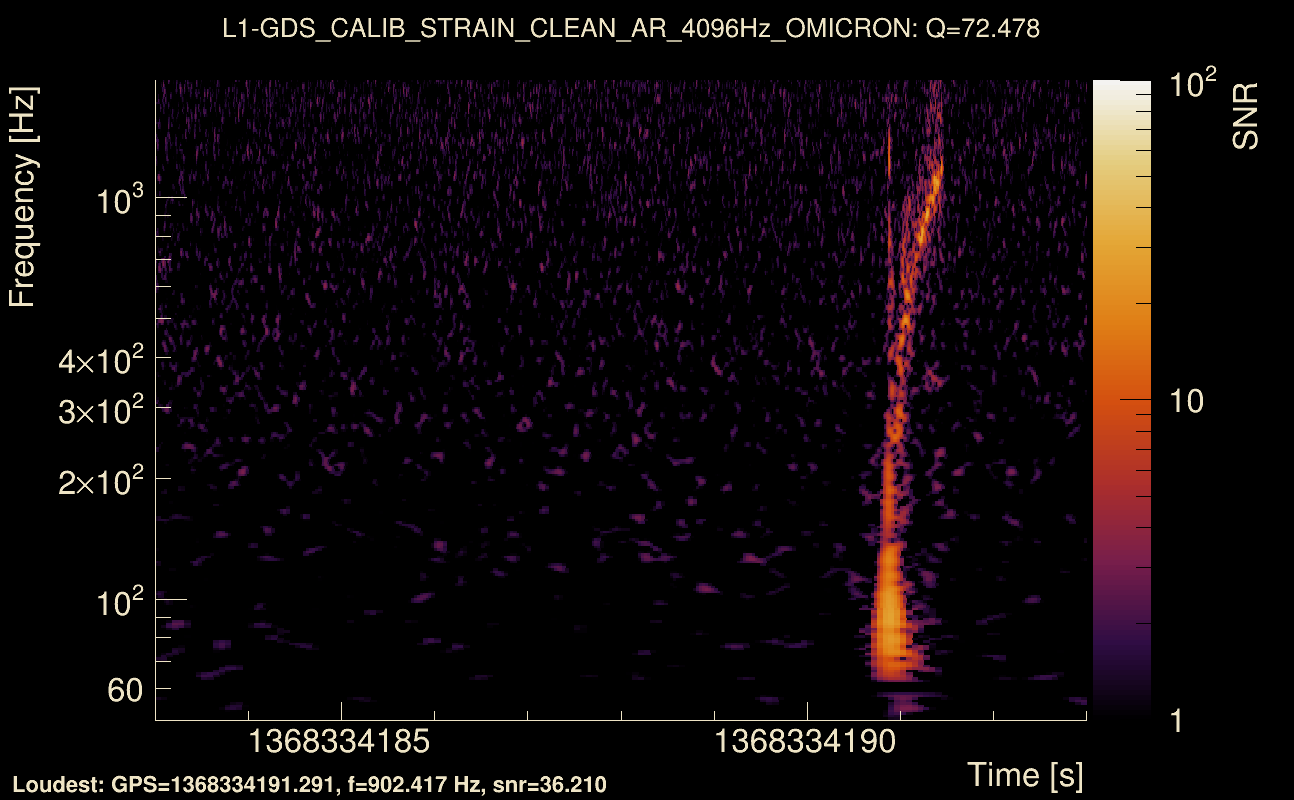
| Maximum signal-to-noise ratio: | H1: 83.0241, L1: 85.2742 |
| SNR variance: | H1: 3.79081, L1: 3.98412 |
| Click here for a zoomed plot | Click here for a zoomed plot | Click here for a zoomed plot | Click here for a zoomed plot | Click here for a zoomed plot |
 |
 |
 |
 |
 |
 |
 |
 |
 |
 |
 |
 |
 |
 |
 |
 |
 |
 |
 |
 |
 |
 |
 |
 |
 |
 |
 |
 |
 |
| Event time t(H1): | GPS = 1368334183 (Wed May 17 04:49:25 2023 ) → GPS = 1368334193 (Wed May 17 04:49:35 2023 ) |
| Event time t(L1): | GPS = 1368334183 (Wed May 17 04:49:35 2023 ) → GPS = 1368334193 (Wed May 17 04:49:35 2023 ) |
| Omicron analysis time window (H1): | GPS = 1368334180 → GPS = 1368334196 |
| Omicron analysis time window (L1): | GPS = 1368334180 → GPS = 1368334196 |
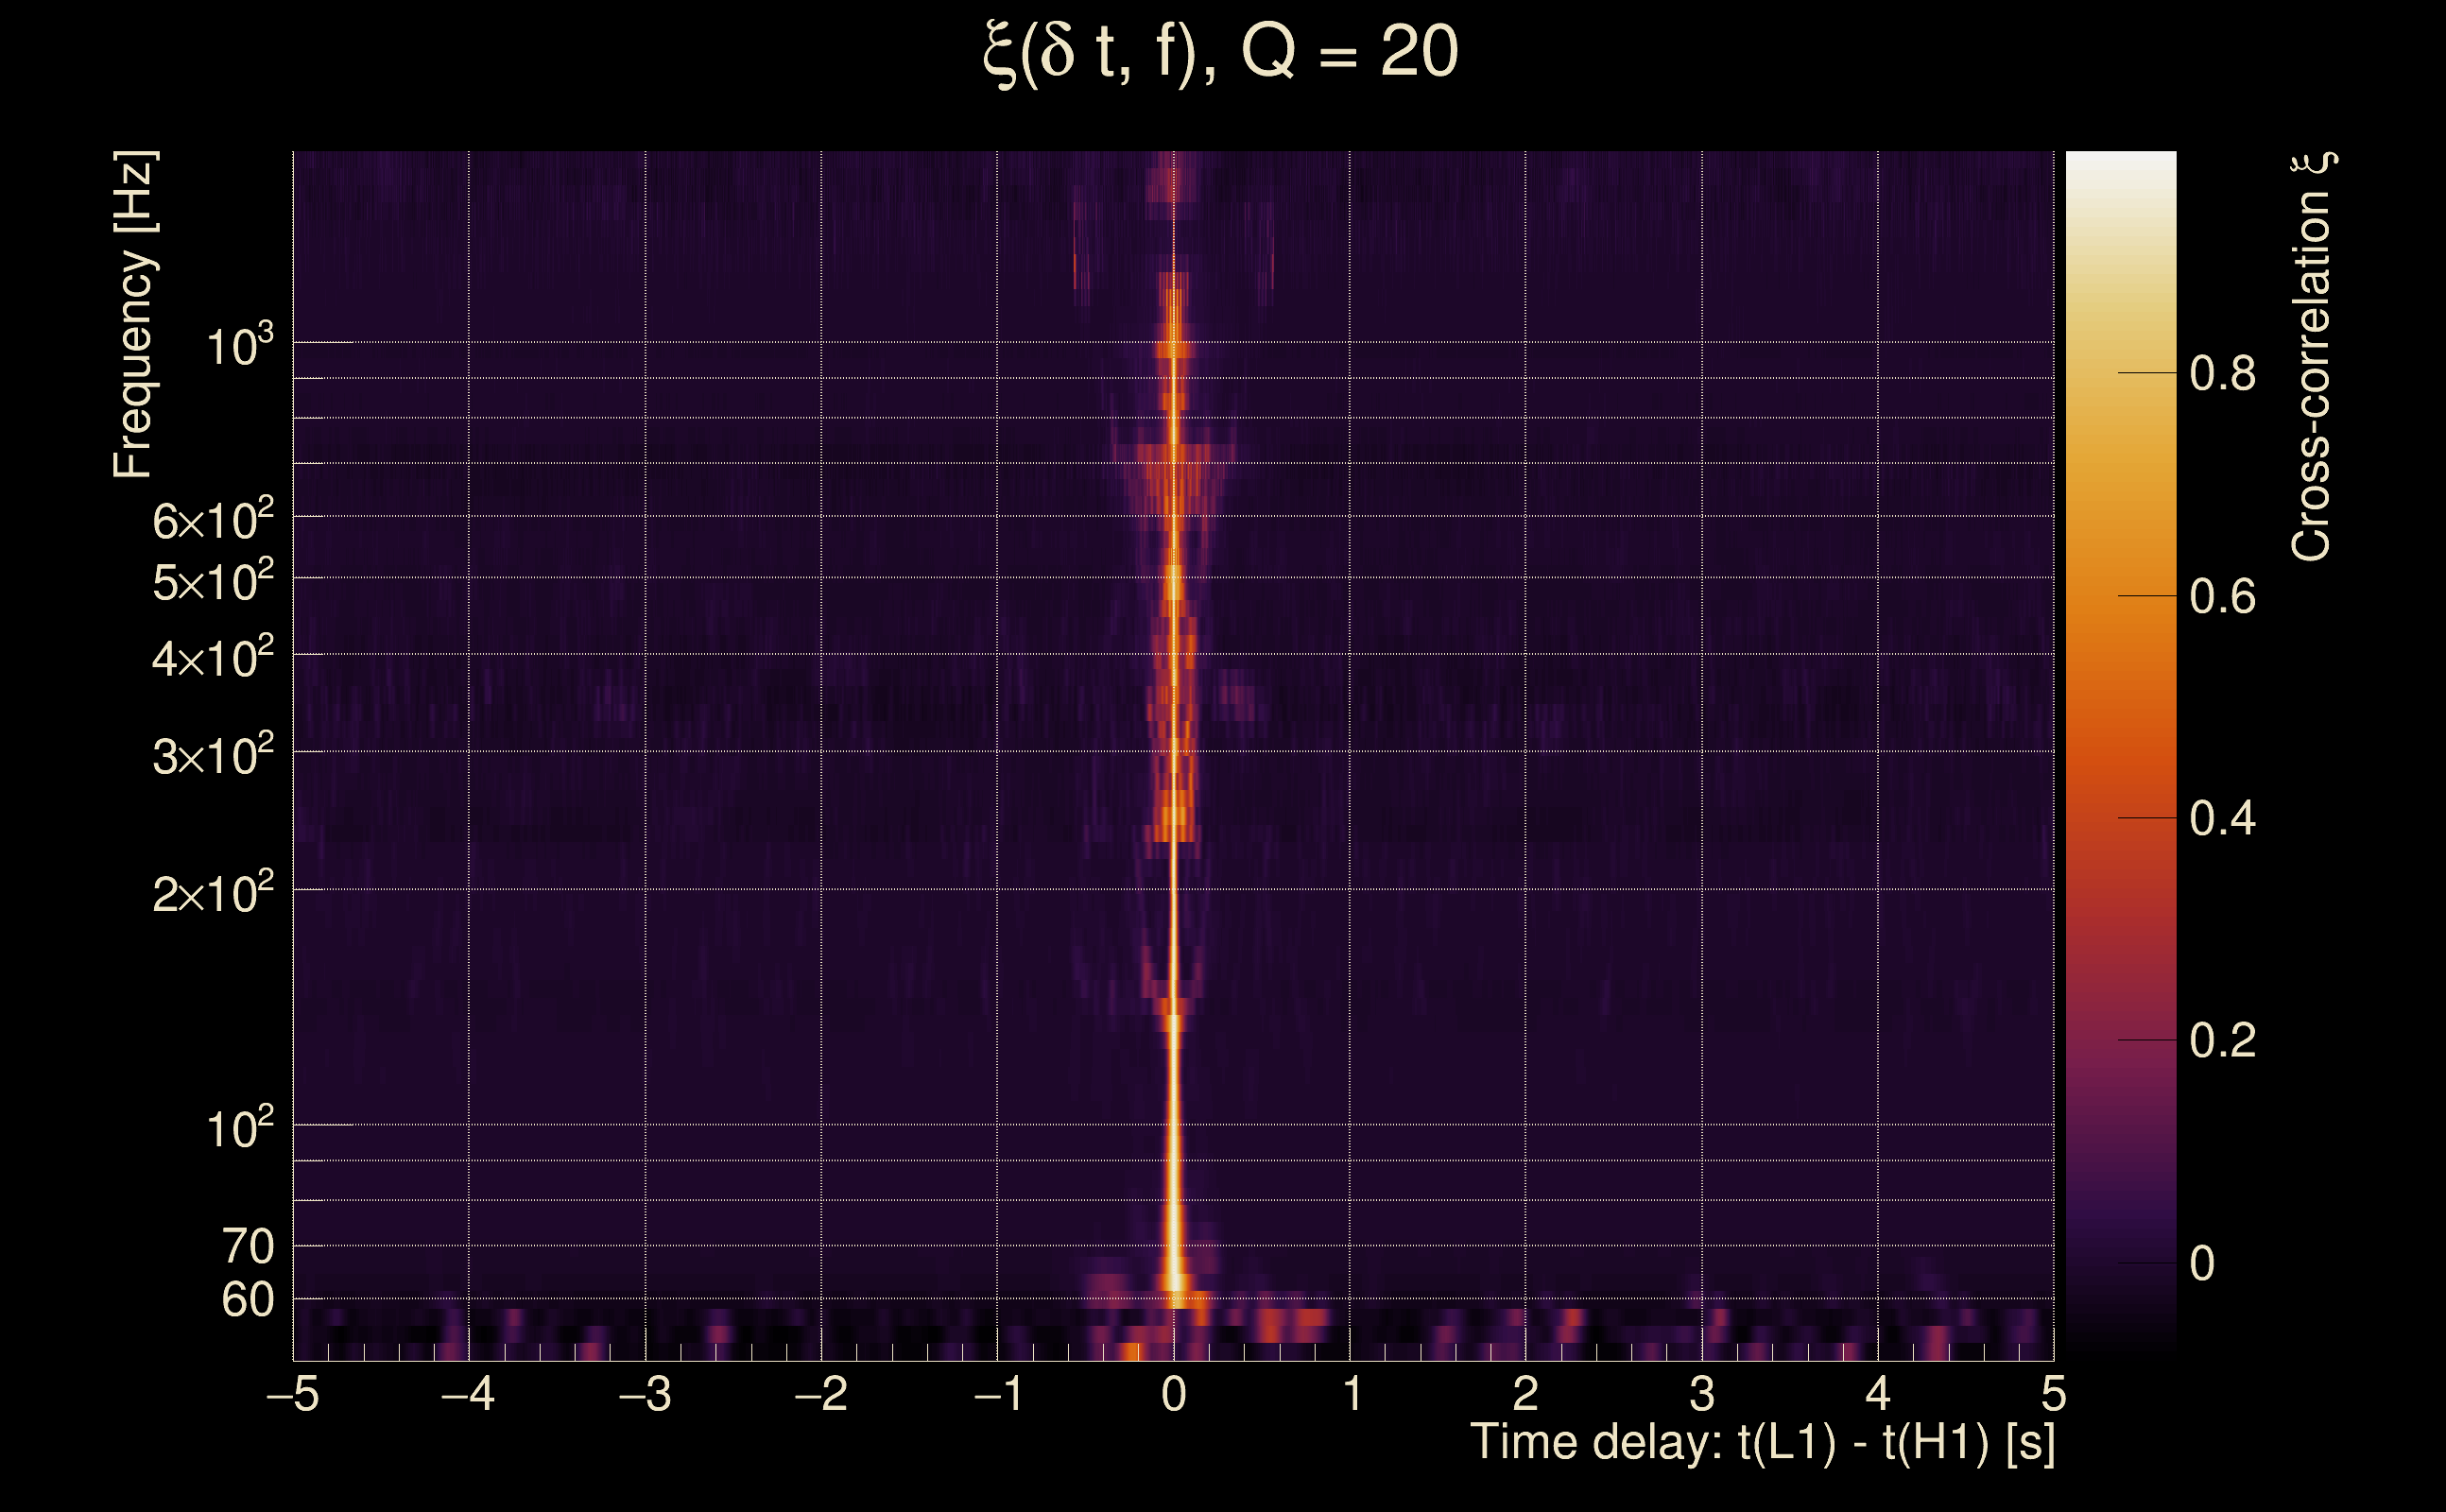
| Time delay between detectors t(L1) - t(H1): | 0.000971403 s (slice index = 108 / 217), δt_gw = 0.000971403 s |
| Time delay standard deviation: | 0.0238529 s |
| [targeted mode] Time delay probability: | 0.959442 (0.0508538 sigmas), δt_target = 0.000943899 s |
| Frequency: | 286.681 Hz |
| Ξ: | 0.920911 ± 0.012435 (variance = 0.000154629): Q0: 0.95221, Q1: 0.947485, Q2: 0.937294, Q3: 0.927802, Q4: 0.918349 |
| Rank: | R_A = 0.848567 |
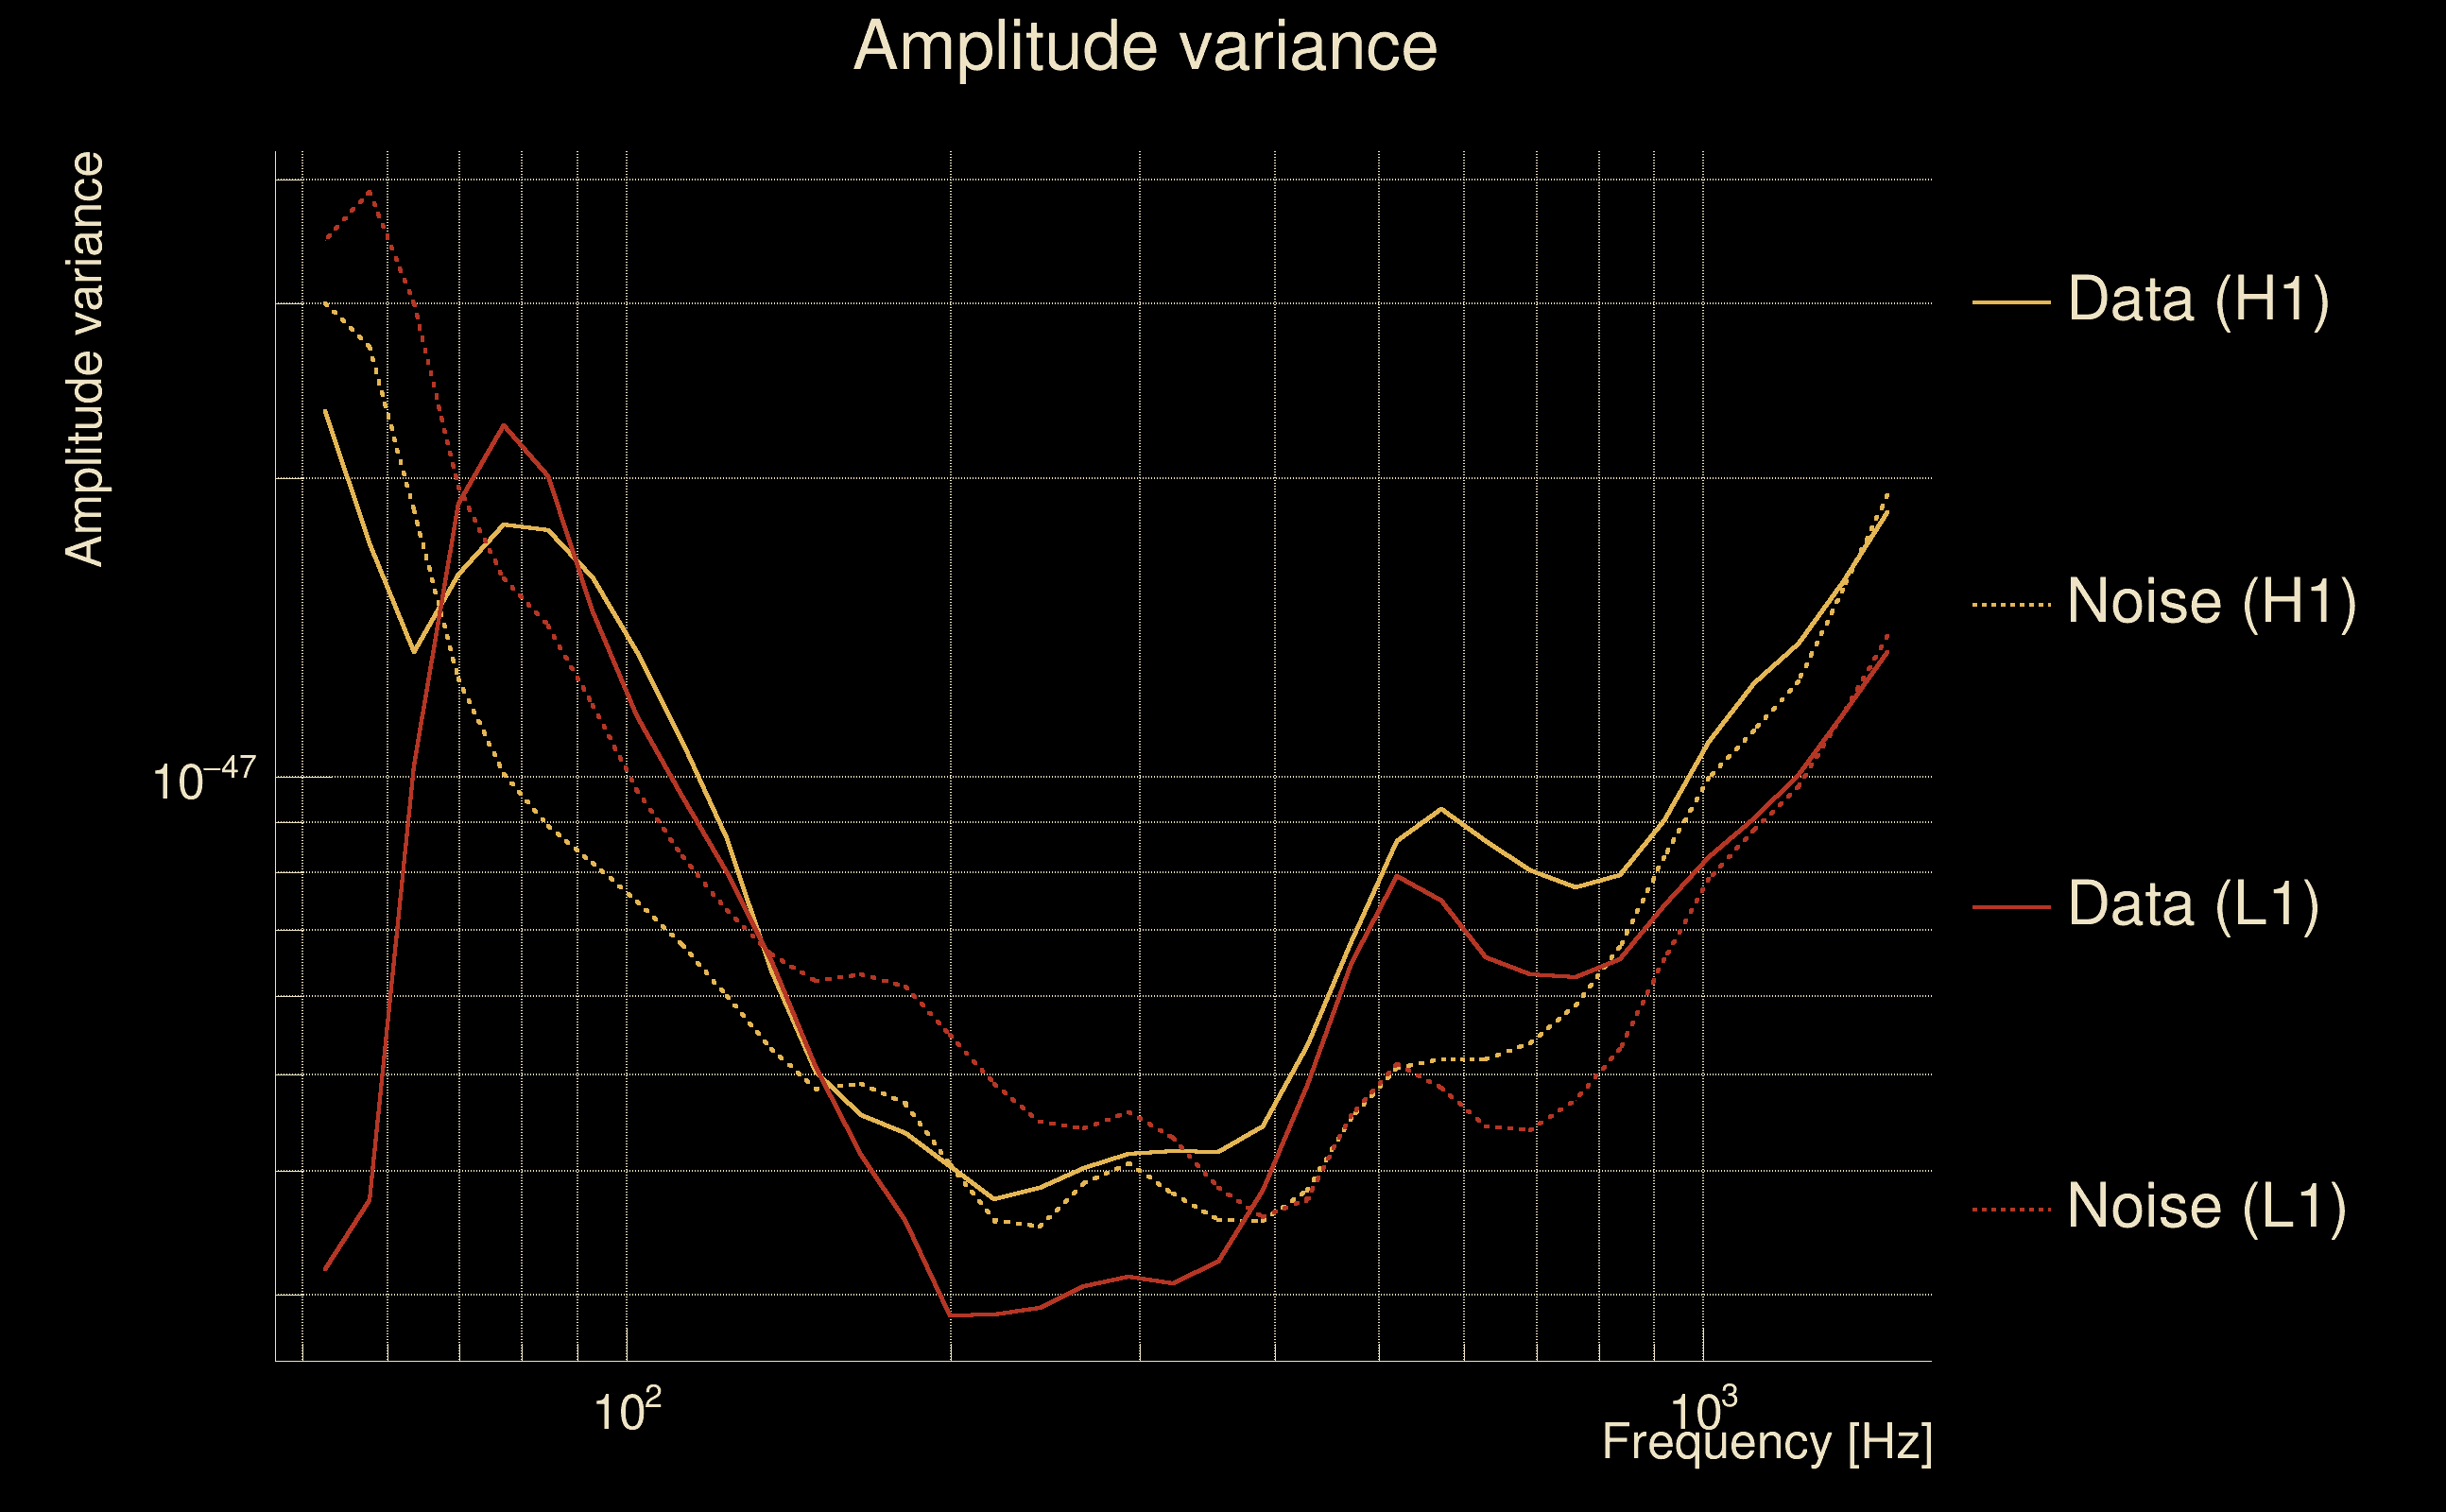
| Log of amplitude ratio (L1/H1): | -0.0502616, variance = 0.151283 (L1/H1: -0.0610408, variance = 0.302393, H1/L1: 0.0400367, variance = 0.302323) |
| Amplitude ratio (L1/H1): | 0.950981 ⋇ 1.47543 (L1/H1: 0.940785 ⋇ 1.73308, H1/L1: 1.04085 ⋇ 1.73297) |
| Amplitude ratio H1|L1 compatibility (probability): | 0.978452 |
| Antenna factor probability: | 0.989739 |
| Number of rejected frequency rows: | Q0: 0 / 18, Q1: 1 / 36, Q2: 5 / 70, Q3: 11 / 134, Q4: 36 / 258 |
| Maximum signal-to-noise ratio: | H1: 83.4979, L1: 85.7312 |
| SNR variance: | H1: 0.464532, L1: 0.488895 |
| Click here for a zoomed plot | Click here for a zoomed plot | Click here for a zoomed plot | Click here for a zoomed plot | Click here for a zoomed plot |
 |
 |
 |
 |
 |
 |
 |
 |
 |
 |
 |
 |
 |
 |
 |
 |
 |
 |
 |
 |
 |
 |
 |
 |
 |
 |
 |
 |
 |
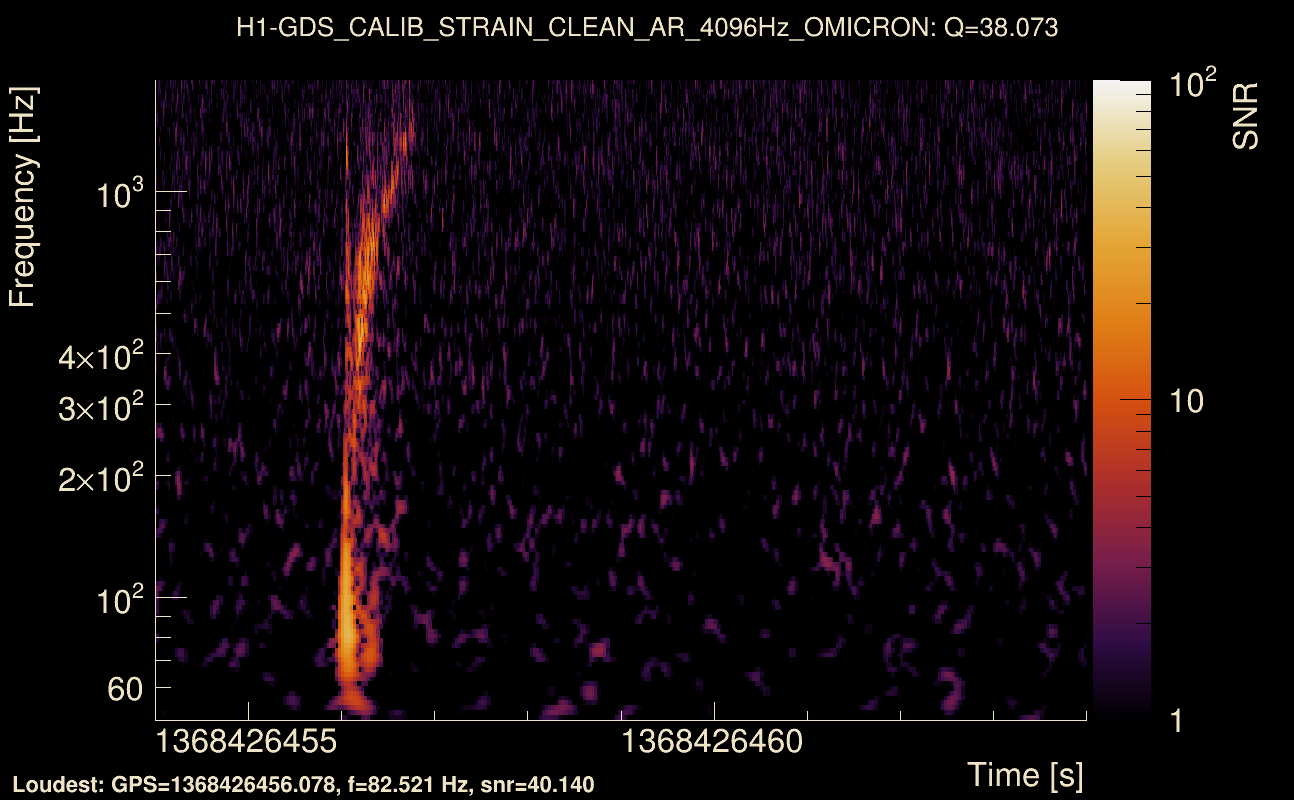
| Event time t(H1): | GPS = 1368426454 (Thu May 18 06:27:16 2023 ) → GPS = 1368426464 (Thu May 18 06:27:26 2023 ) |
| Event time t(L1): | GPS = 1368426454 (Thu May 18 06:27:26 2023 ) → GPS = 1368426464 (Thu May 18 06:27:26 2023 ) |
| Omicron analysis time window (H1): | GPS = 1368426451 → GPS = 1368426467 |
| Omicron analysis time window (L1): | GPS = 1368426451 → GPS = 1368426467 |
| Time delay between detectors t(L1) - t(H1): | 0.00302632 s (slice index = 108 / 217), δt_gw = 0.00302632 s |
| Time delay standard deviation: | 0.0305673 s |
| [targeted mode] Time delay probability: | 0.936409 (0.0797845 sigmas), δt_target = 0.000942469 s |
| Frequency: | 267.619 Hz |
| Ξ: | 0.93957 ± 0.0108985 (variance = 0.000118778): Q0: 0.956286, Q1: 0.941651, Q2: 0.932414, Q3: 0.930176, Q4: 0.925472 |
| Rank: | R_A = 0.835868 |
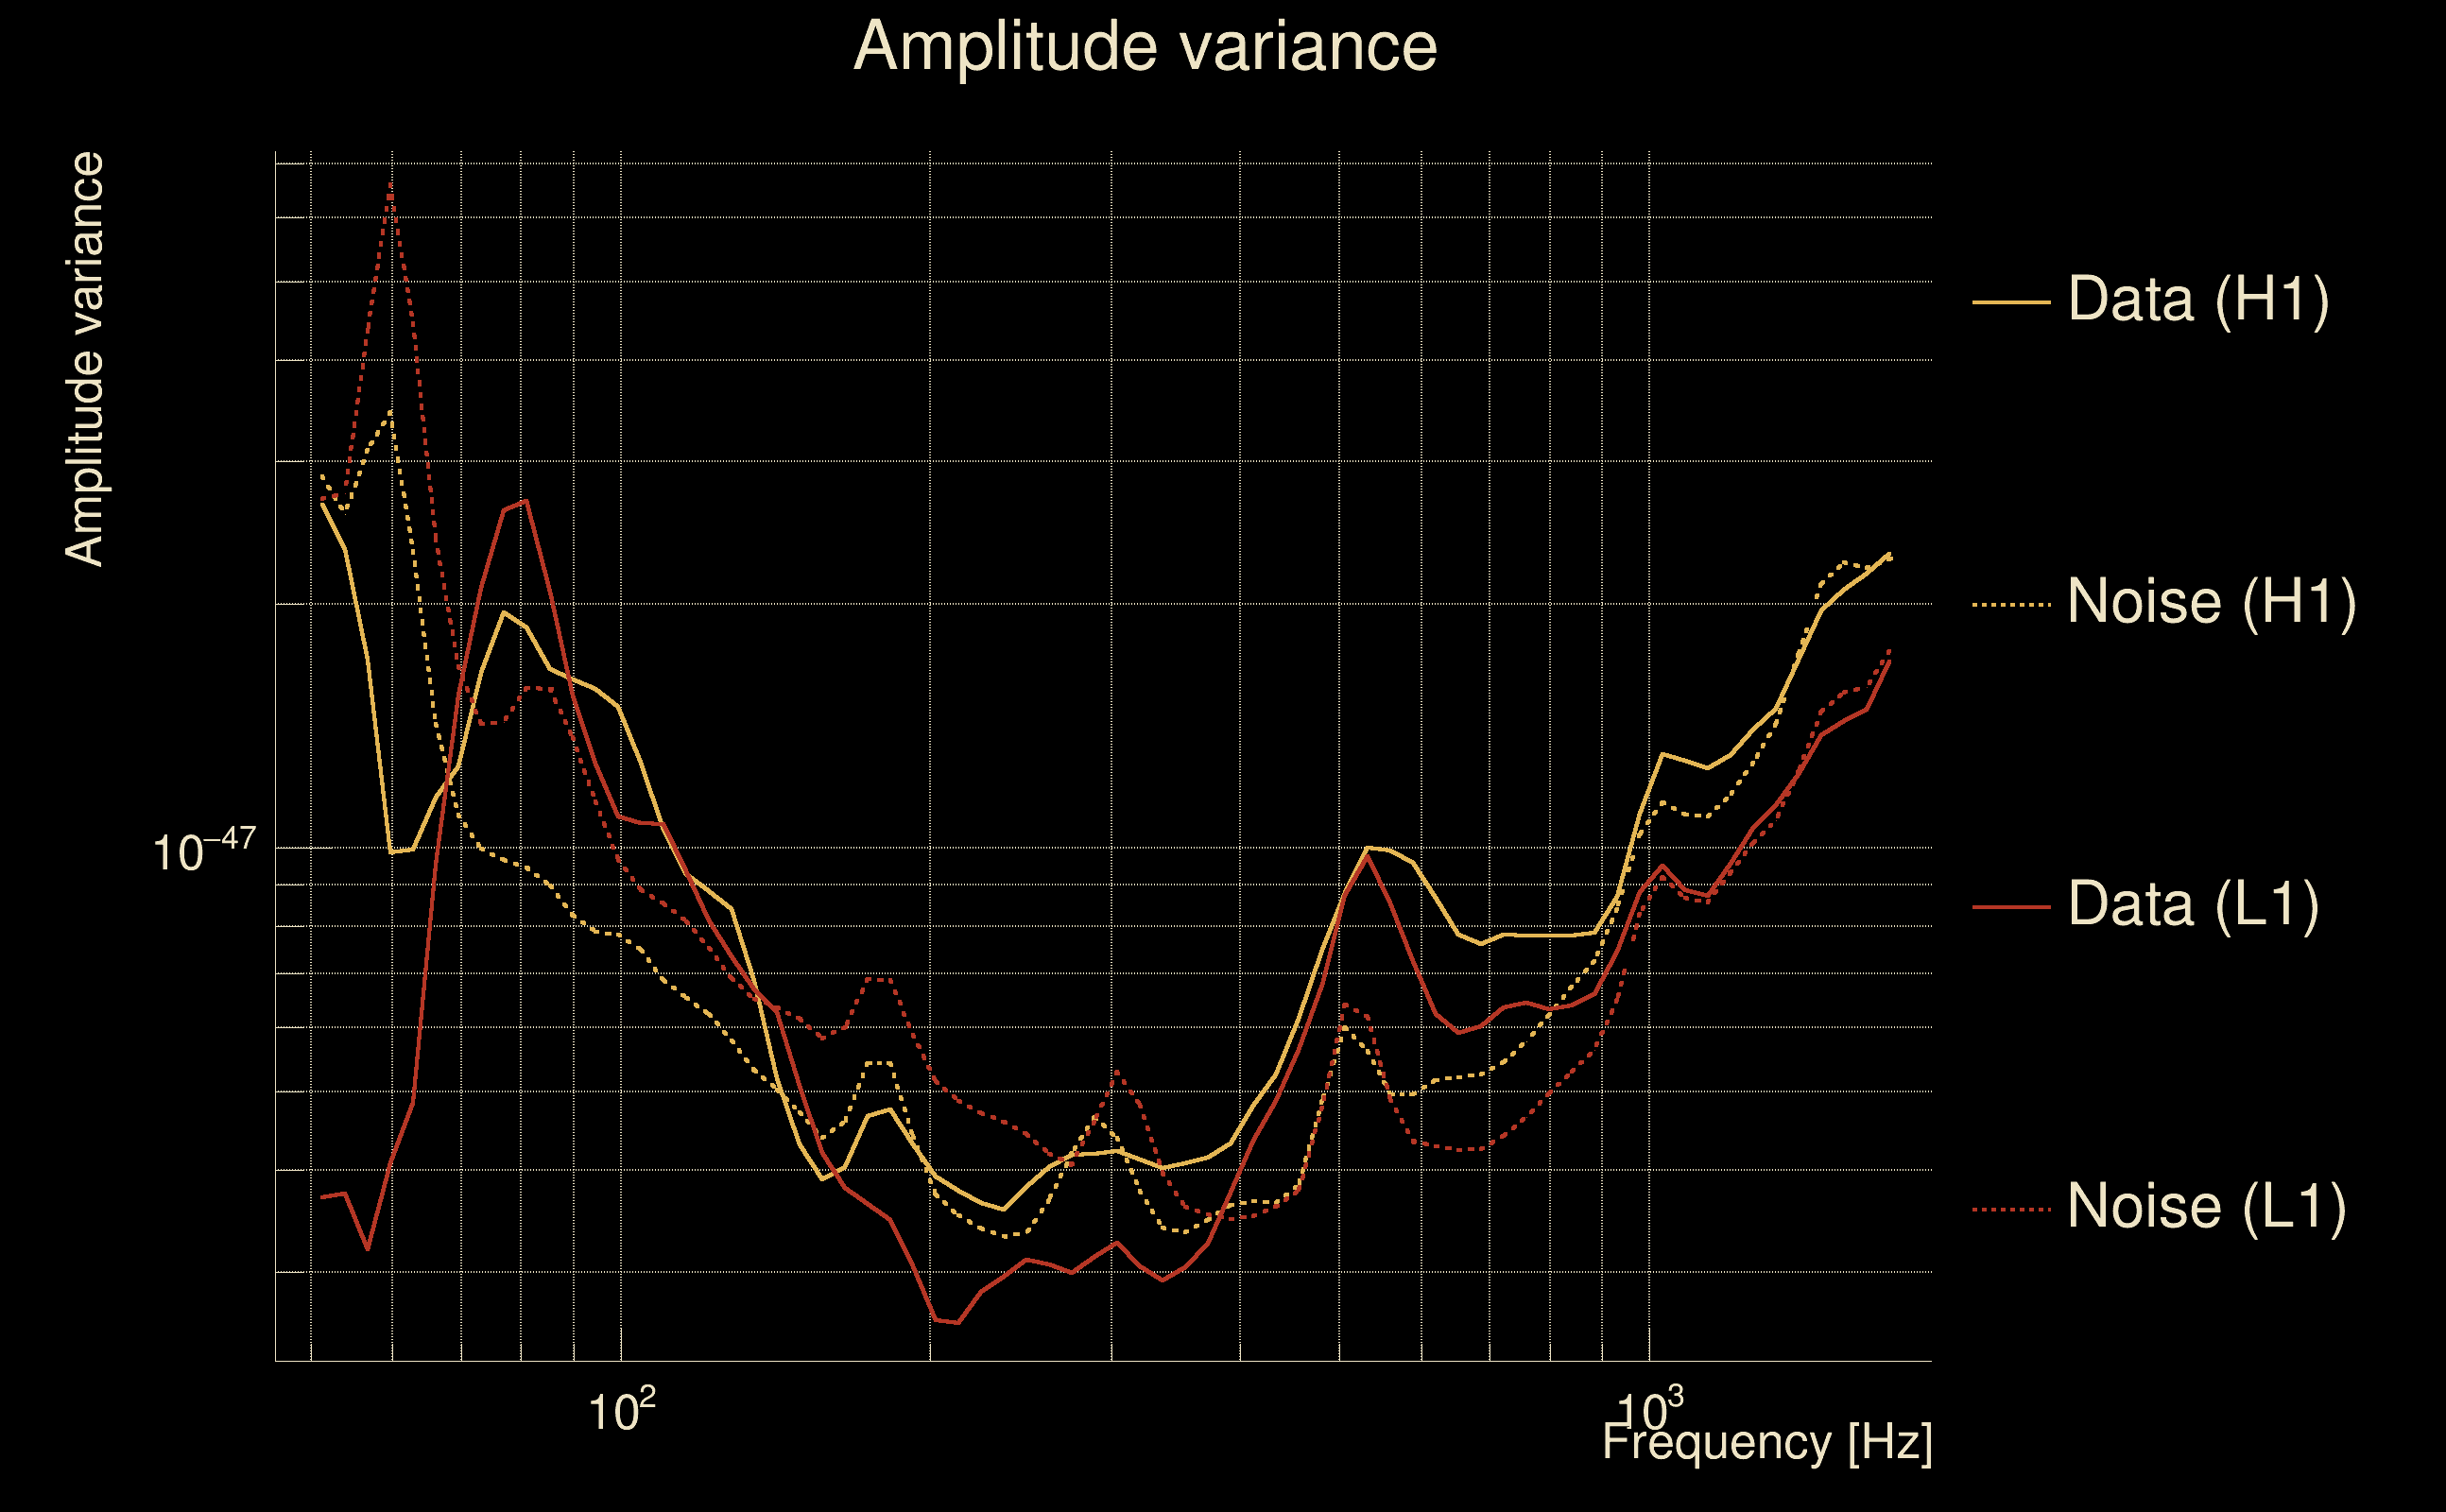
| Log of amplitude ratio (L1/H1): | -0.143628, variance = 0.15506 (L1/H1: -0.155264, variance = 0.304021, H1/L1: 0.128187, variance = 0.304291) |
| Amplitude ratio (L1/H1): | 0.86621 ⋇ 1.48257 (L1/H1: 0.856189 ⋇ 1.73565, H1/L1: 1.13677 ⋇ 1.73607) |
| Amplitude ratio H1|L1 compatibility (probability): | 0.972305 |
| Antenna factor probability: | 0.987915 |
| Number of rejected frequency rows: | Q0: 0 / 18, Q1: 0 / 36, Q2: 0 / 70, Q3: 5 / 134, Q4: 36 / 258 |
| Maximum signal-to-noise ratio: | H1: 75.4244, L1: 65.4781 |
| SNR variance: | H1: 3.69911, L1: 3.04717 |
| Click here for a zoomed plot | Click here for a zoomed plot | Click here for a zoomed plot | Click here for a zoomed plot | Click here for a zoomed plot |
 |
 |
 |
 |
 |
 |
 |
 |
 |
 |
 |
 |
 |
 |
 |
 |
 |
 |
 |
 |
 |
 |
 |
 |
 |
 |
 |
 |
 |
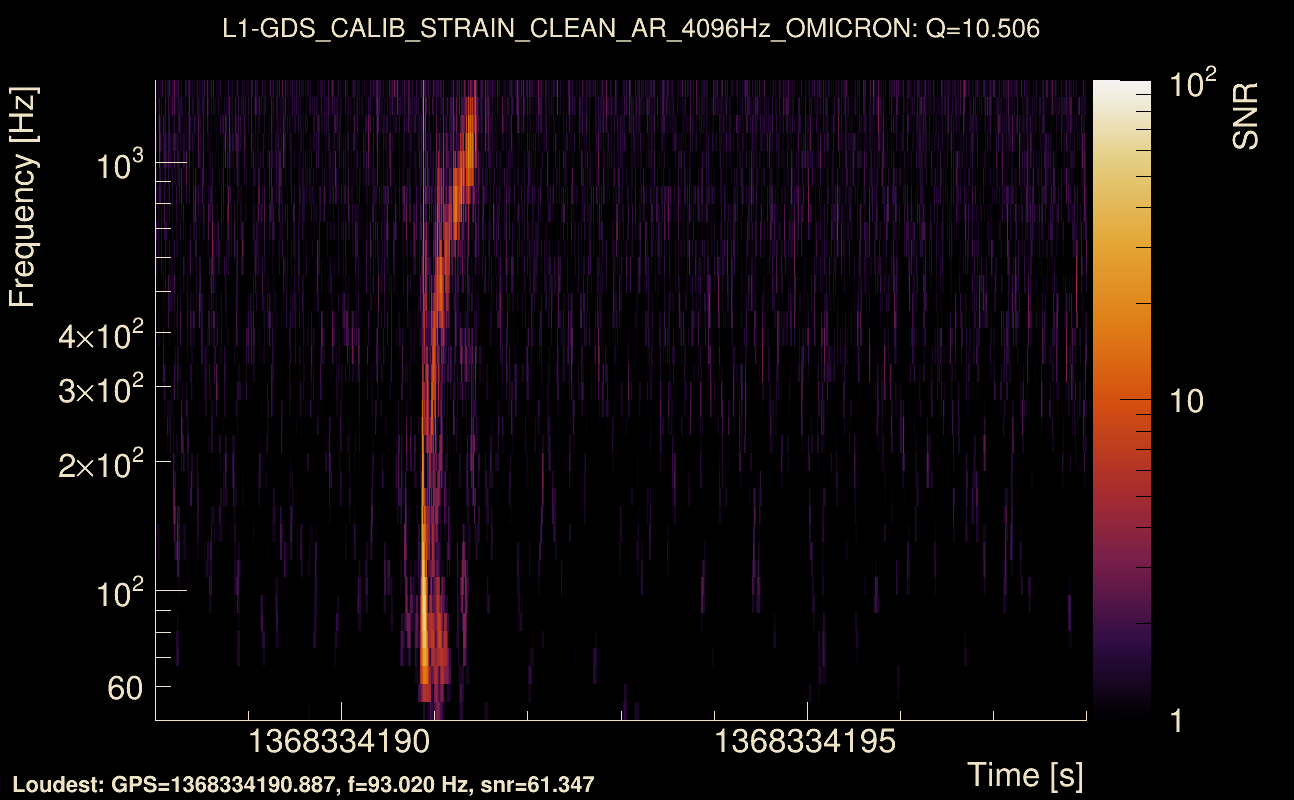
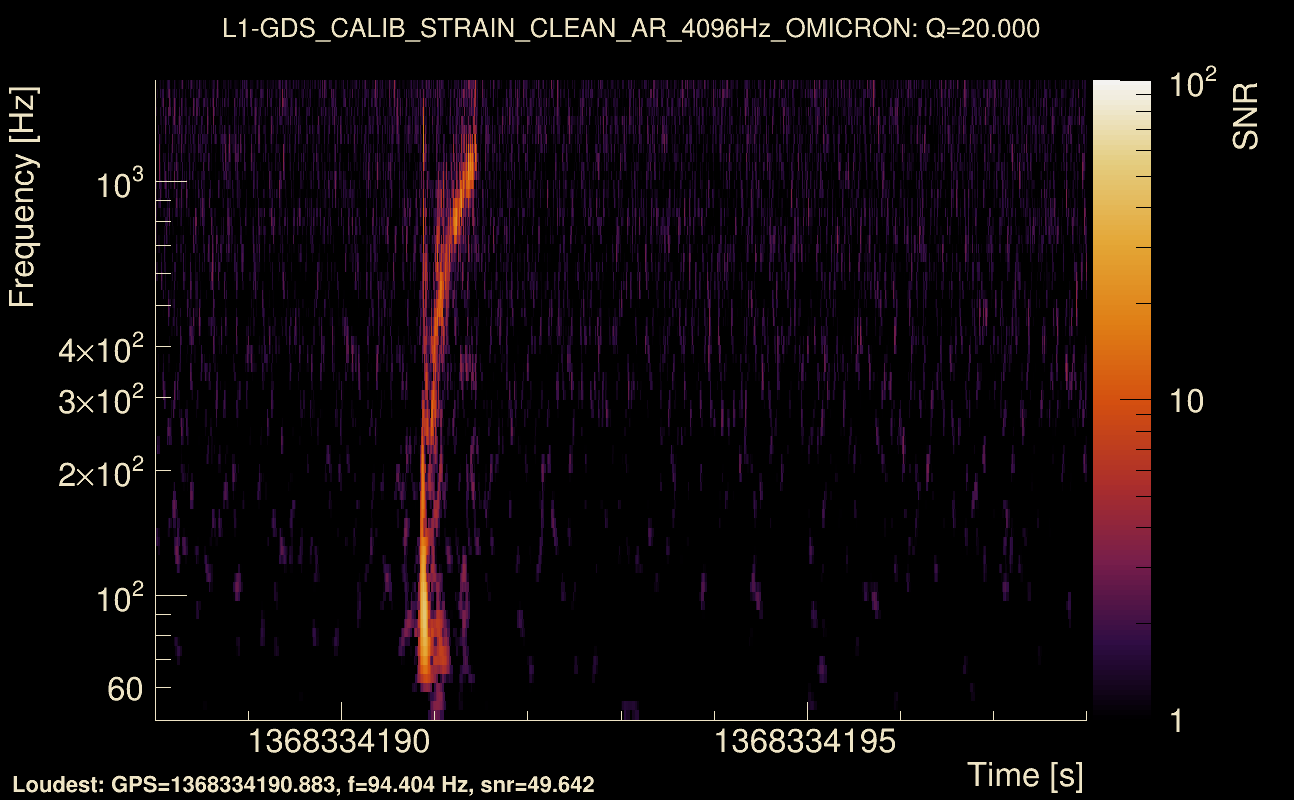
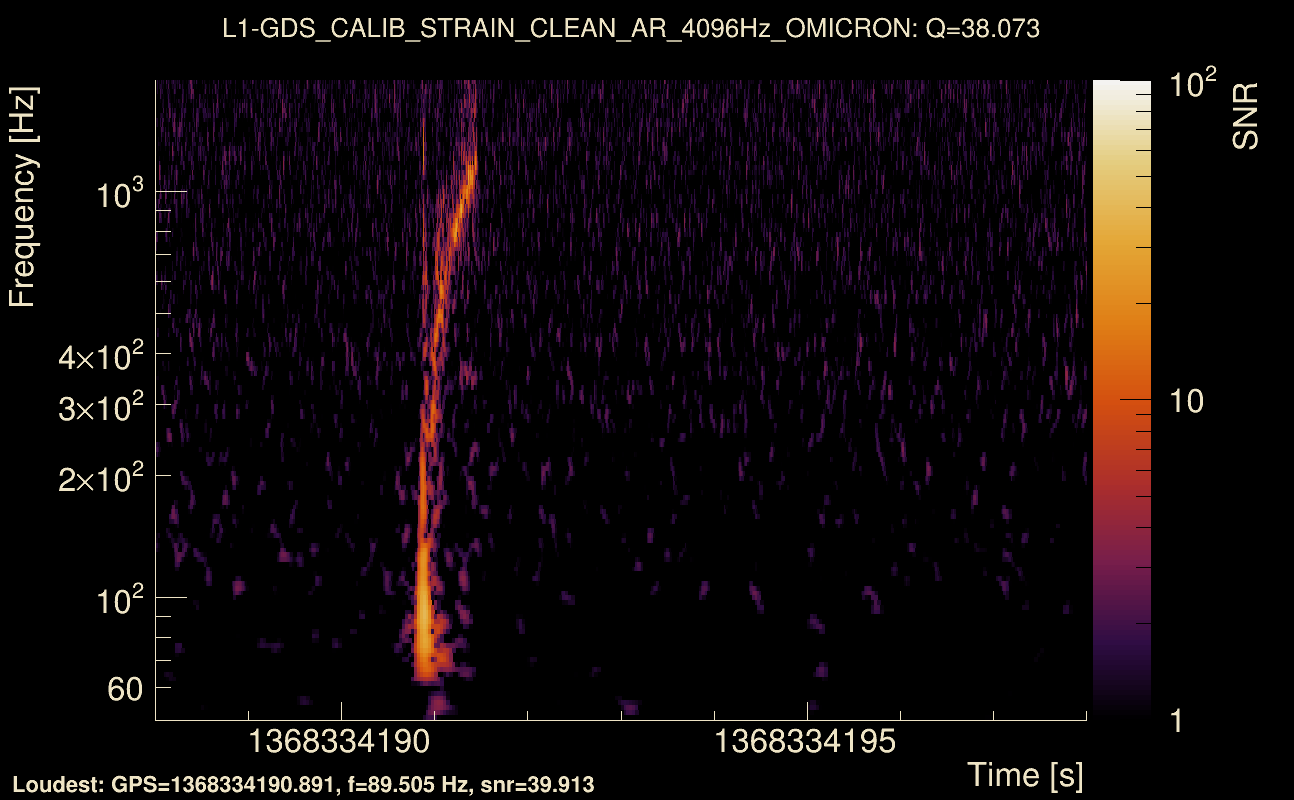
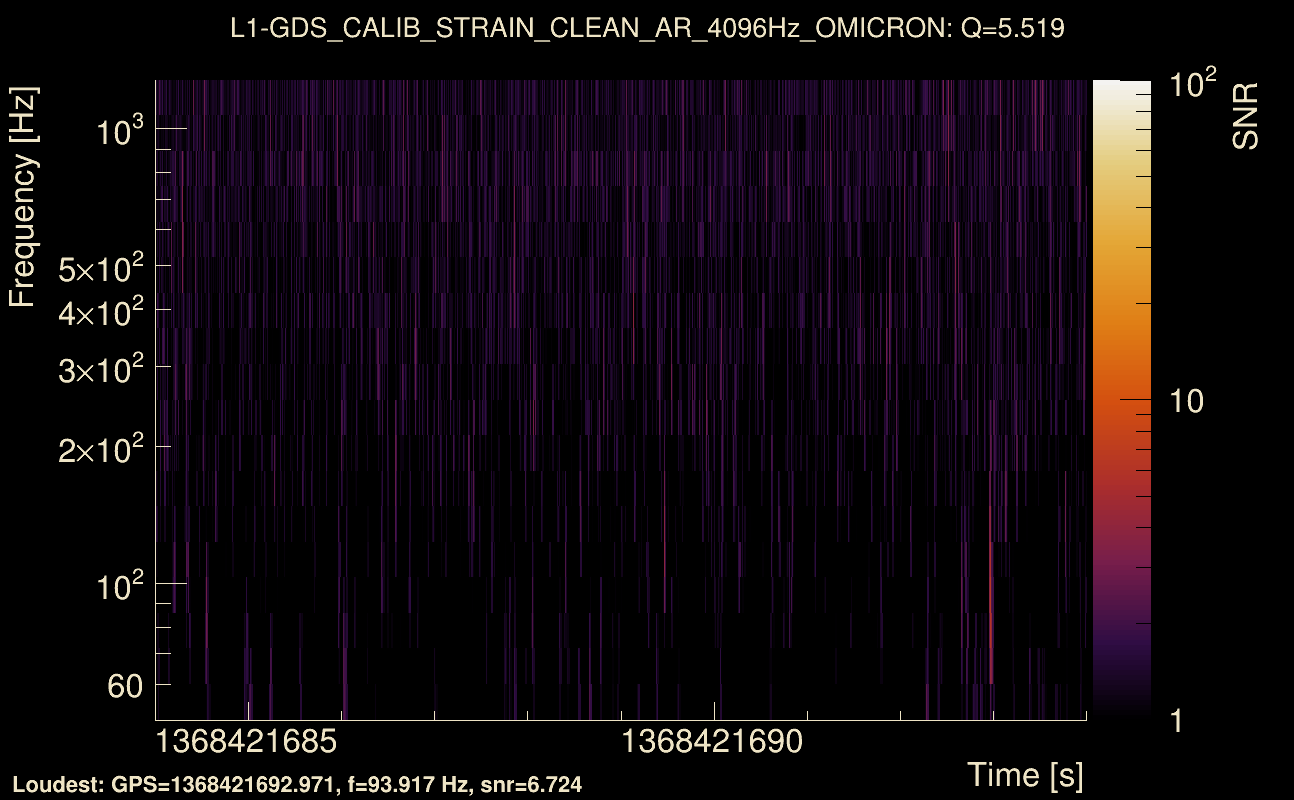
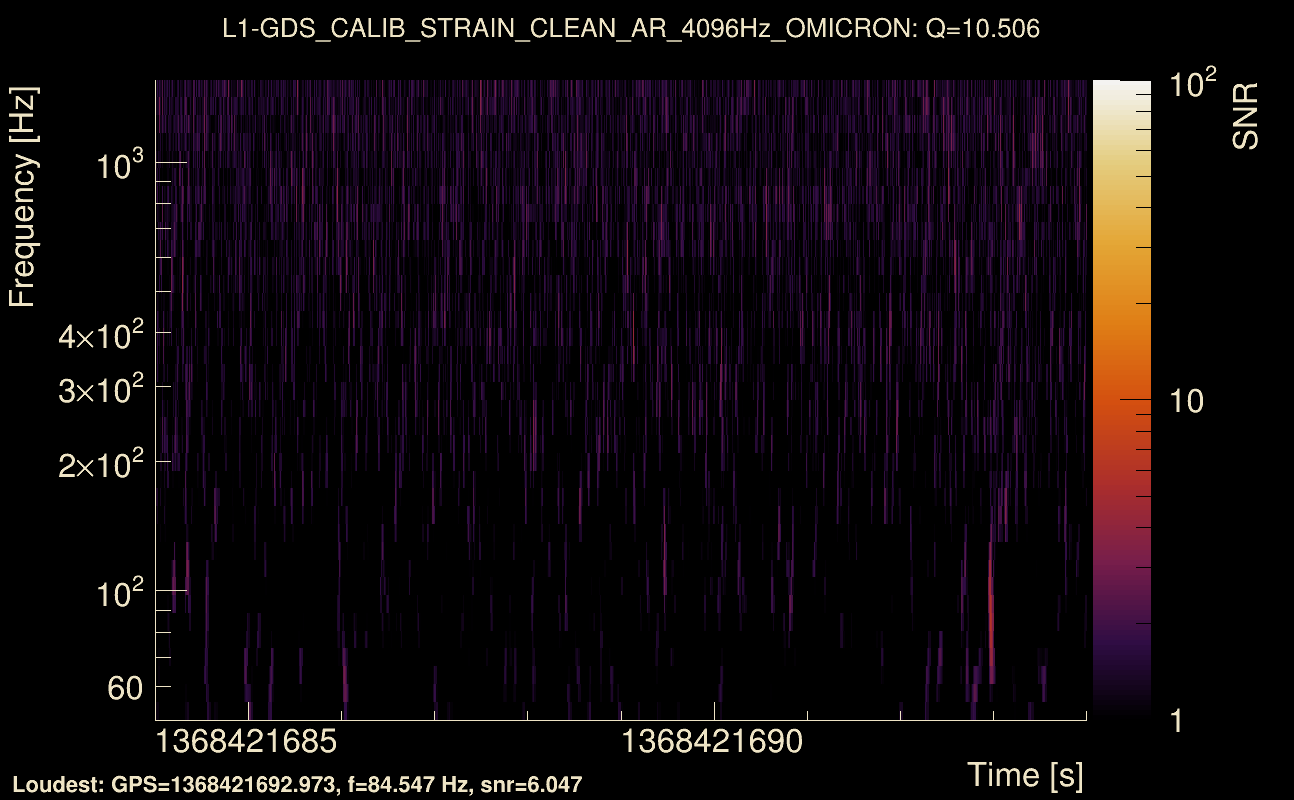
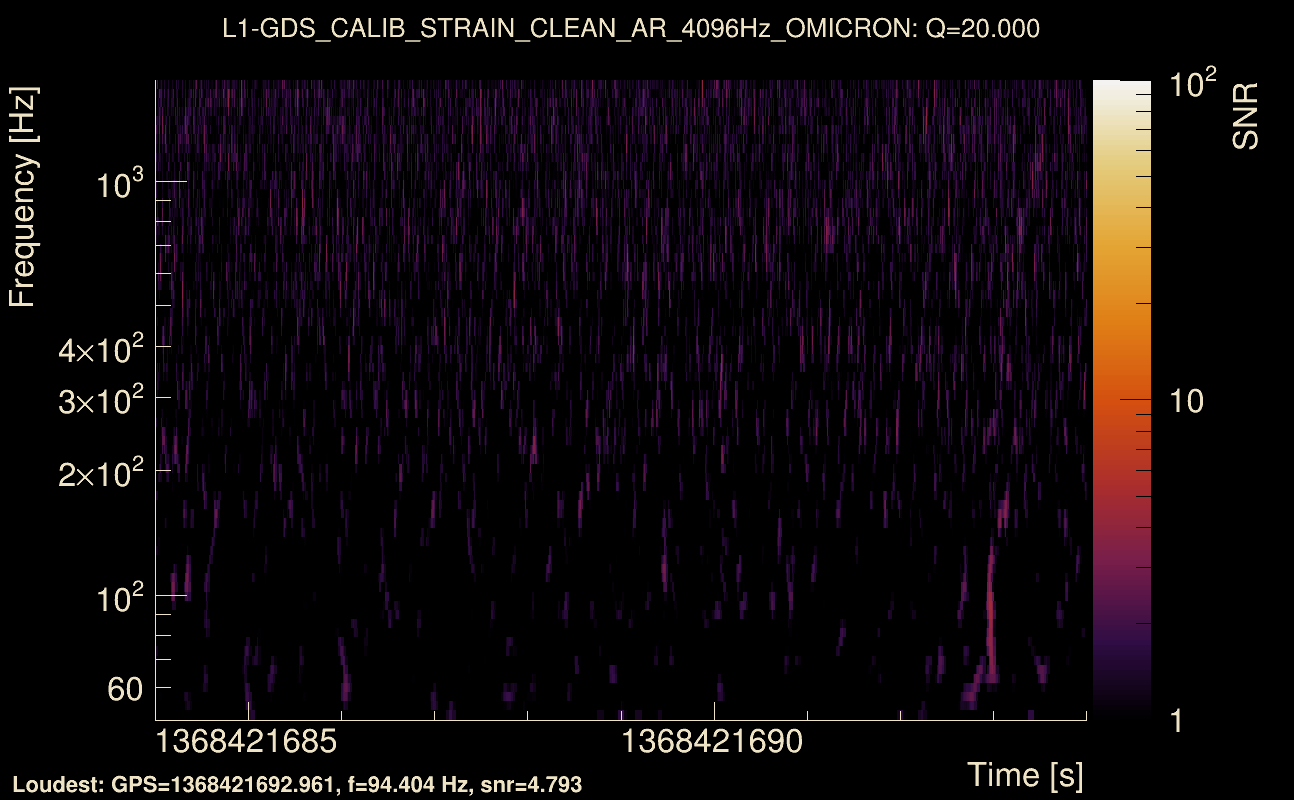
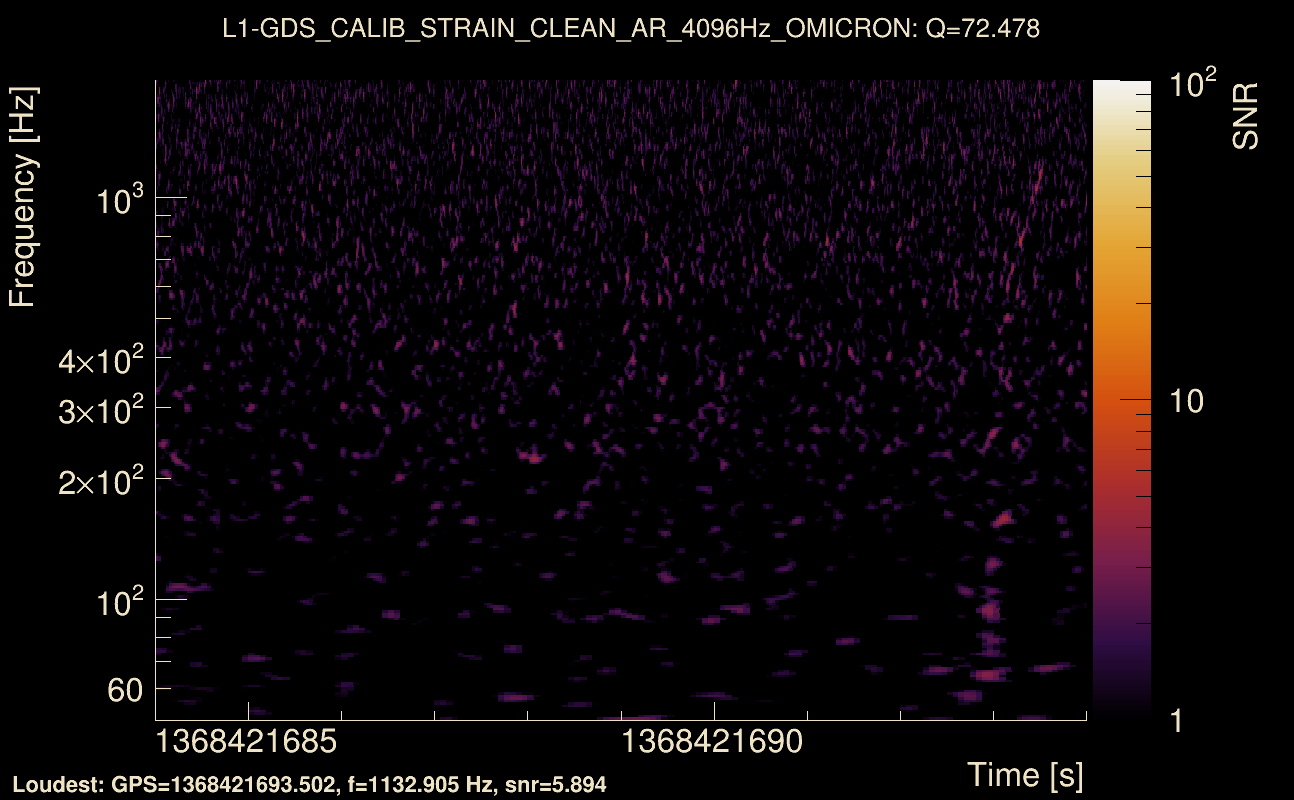
| Event time t(H1): | GPS = 1368421684 (Thu May 18 05:07:46 2023 ) → GPS = 1368421694 (Thu May 18 05:07:56 2023 ) |
| Event time t(L1): | GPS = 1368421684 (Thu May 18 05:07:56 2023 ) → GPS = 1368421694 (Thu May 18 05:07:56 2023 ) |
| Omicron analysis time window (H1): | GPS = 1368421681 → GPS = 1368421697 |
| Omicron analysis time window (L1): | GPS = 1368421681 → GPS = 1368421697 |
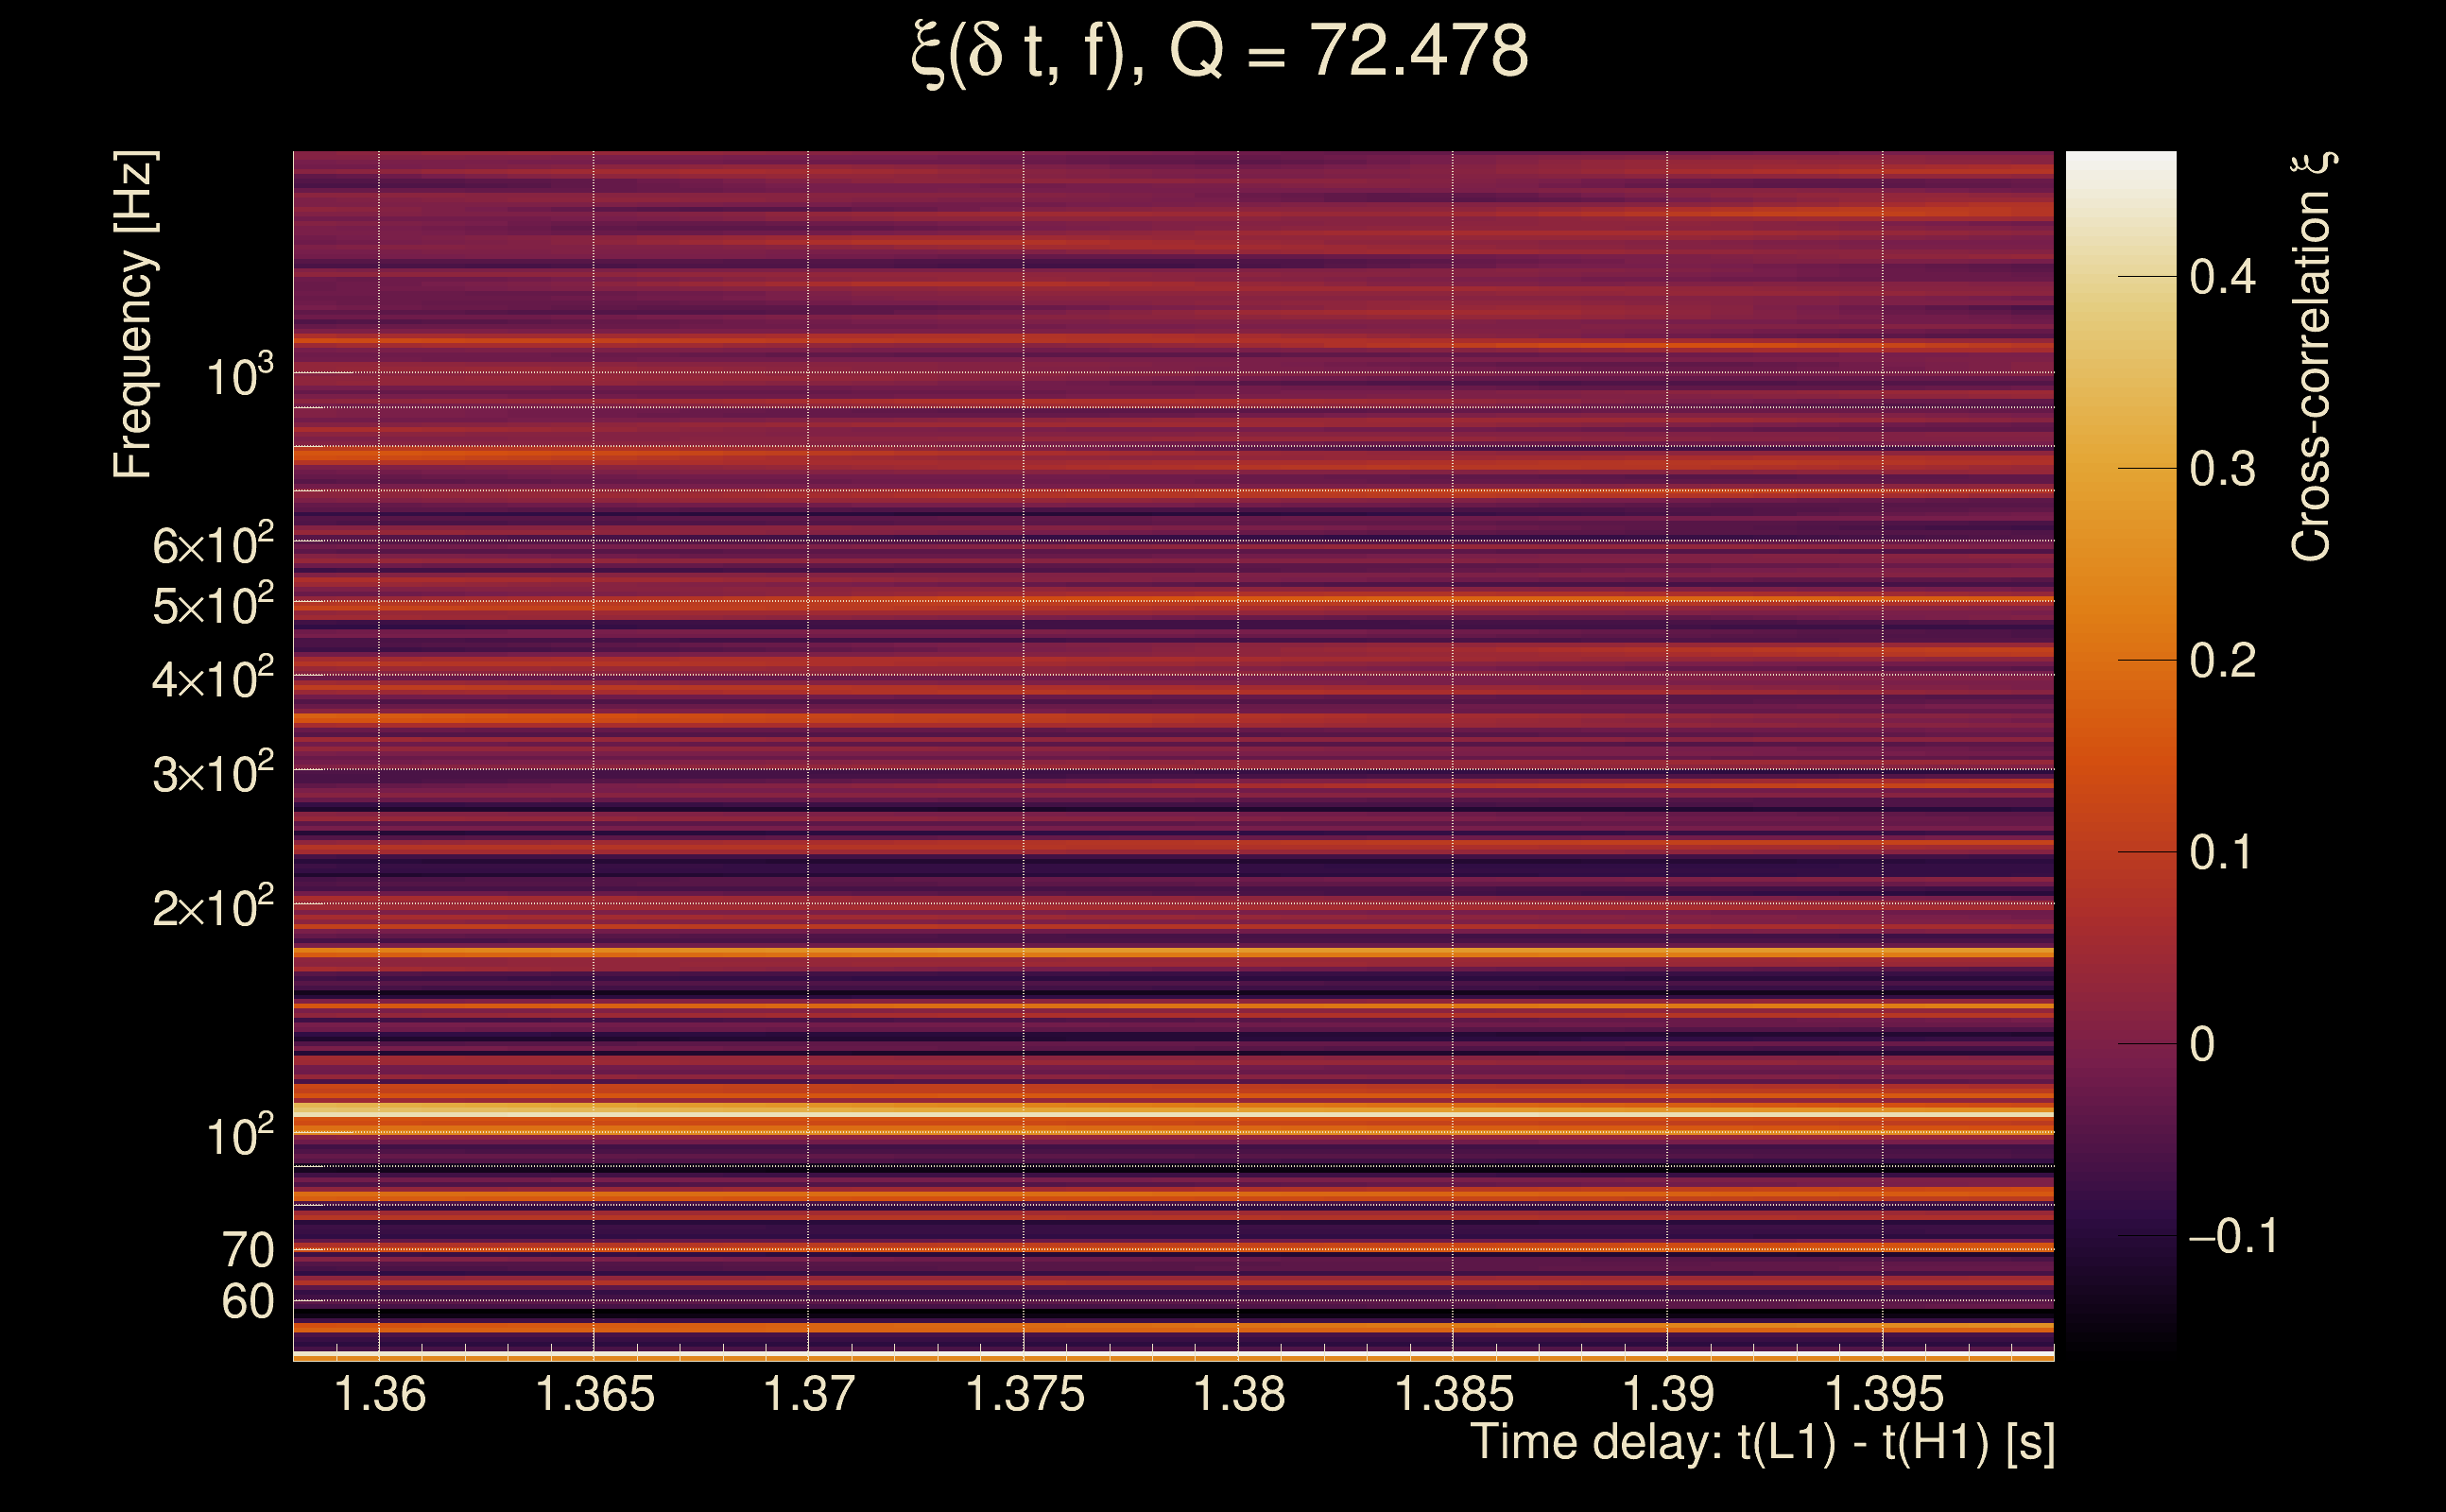
| Time delay between detectors t(L1) - t(H1): | 1.37805 s (slice index = 78 / 217), δt_gw = -0.00195253 s |
| Time delay standard deviation: | 0.0849326 s |
| [targeted mode] Time delay probability: | 0.643908 (0.462241 sigmas), δt_target = 0.00310087 s |
| Frequency: | 118.491 Hz |
| Ξ: | 0.0150704 ± 0.0683687 (variance = 0.00467428): Q0: 0.132382, Q1: 0.212744, Q2: 0.264011, Q3: 0.2473, Q4: 0.0861525 |
| Rank: | R_A = 0.00673294 |
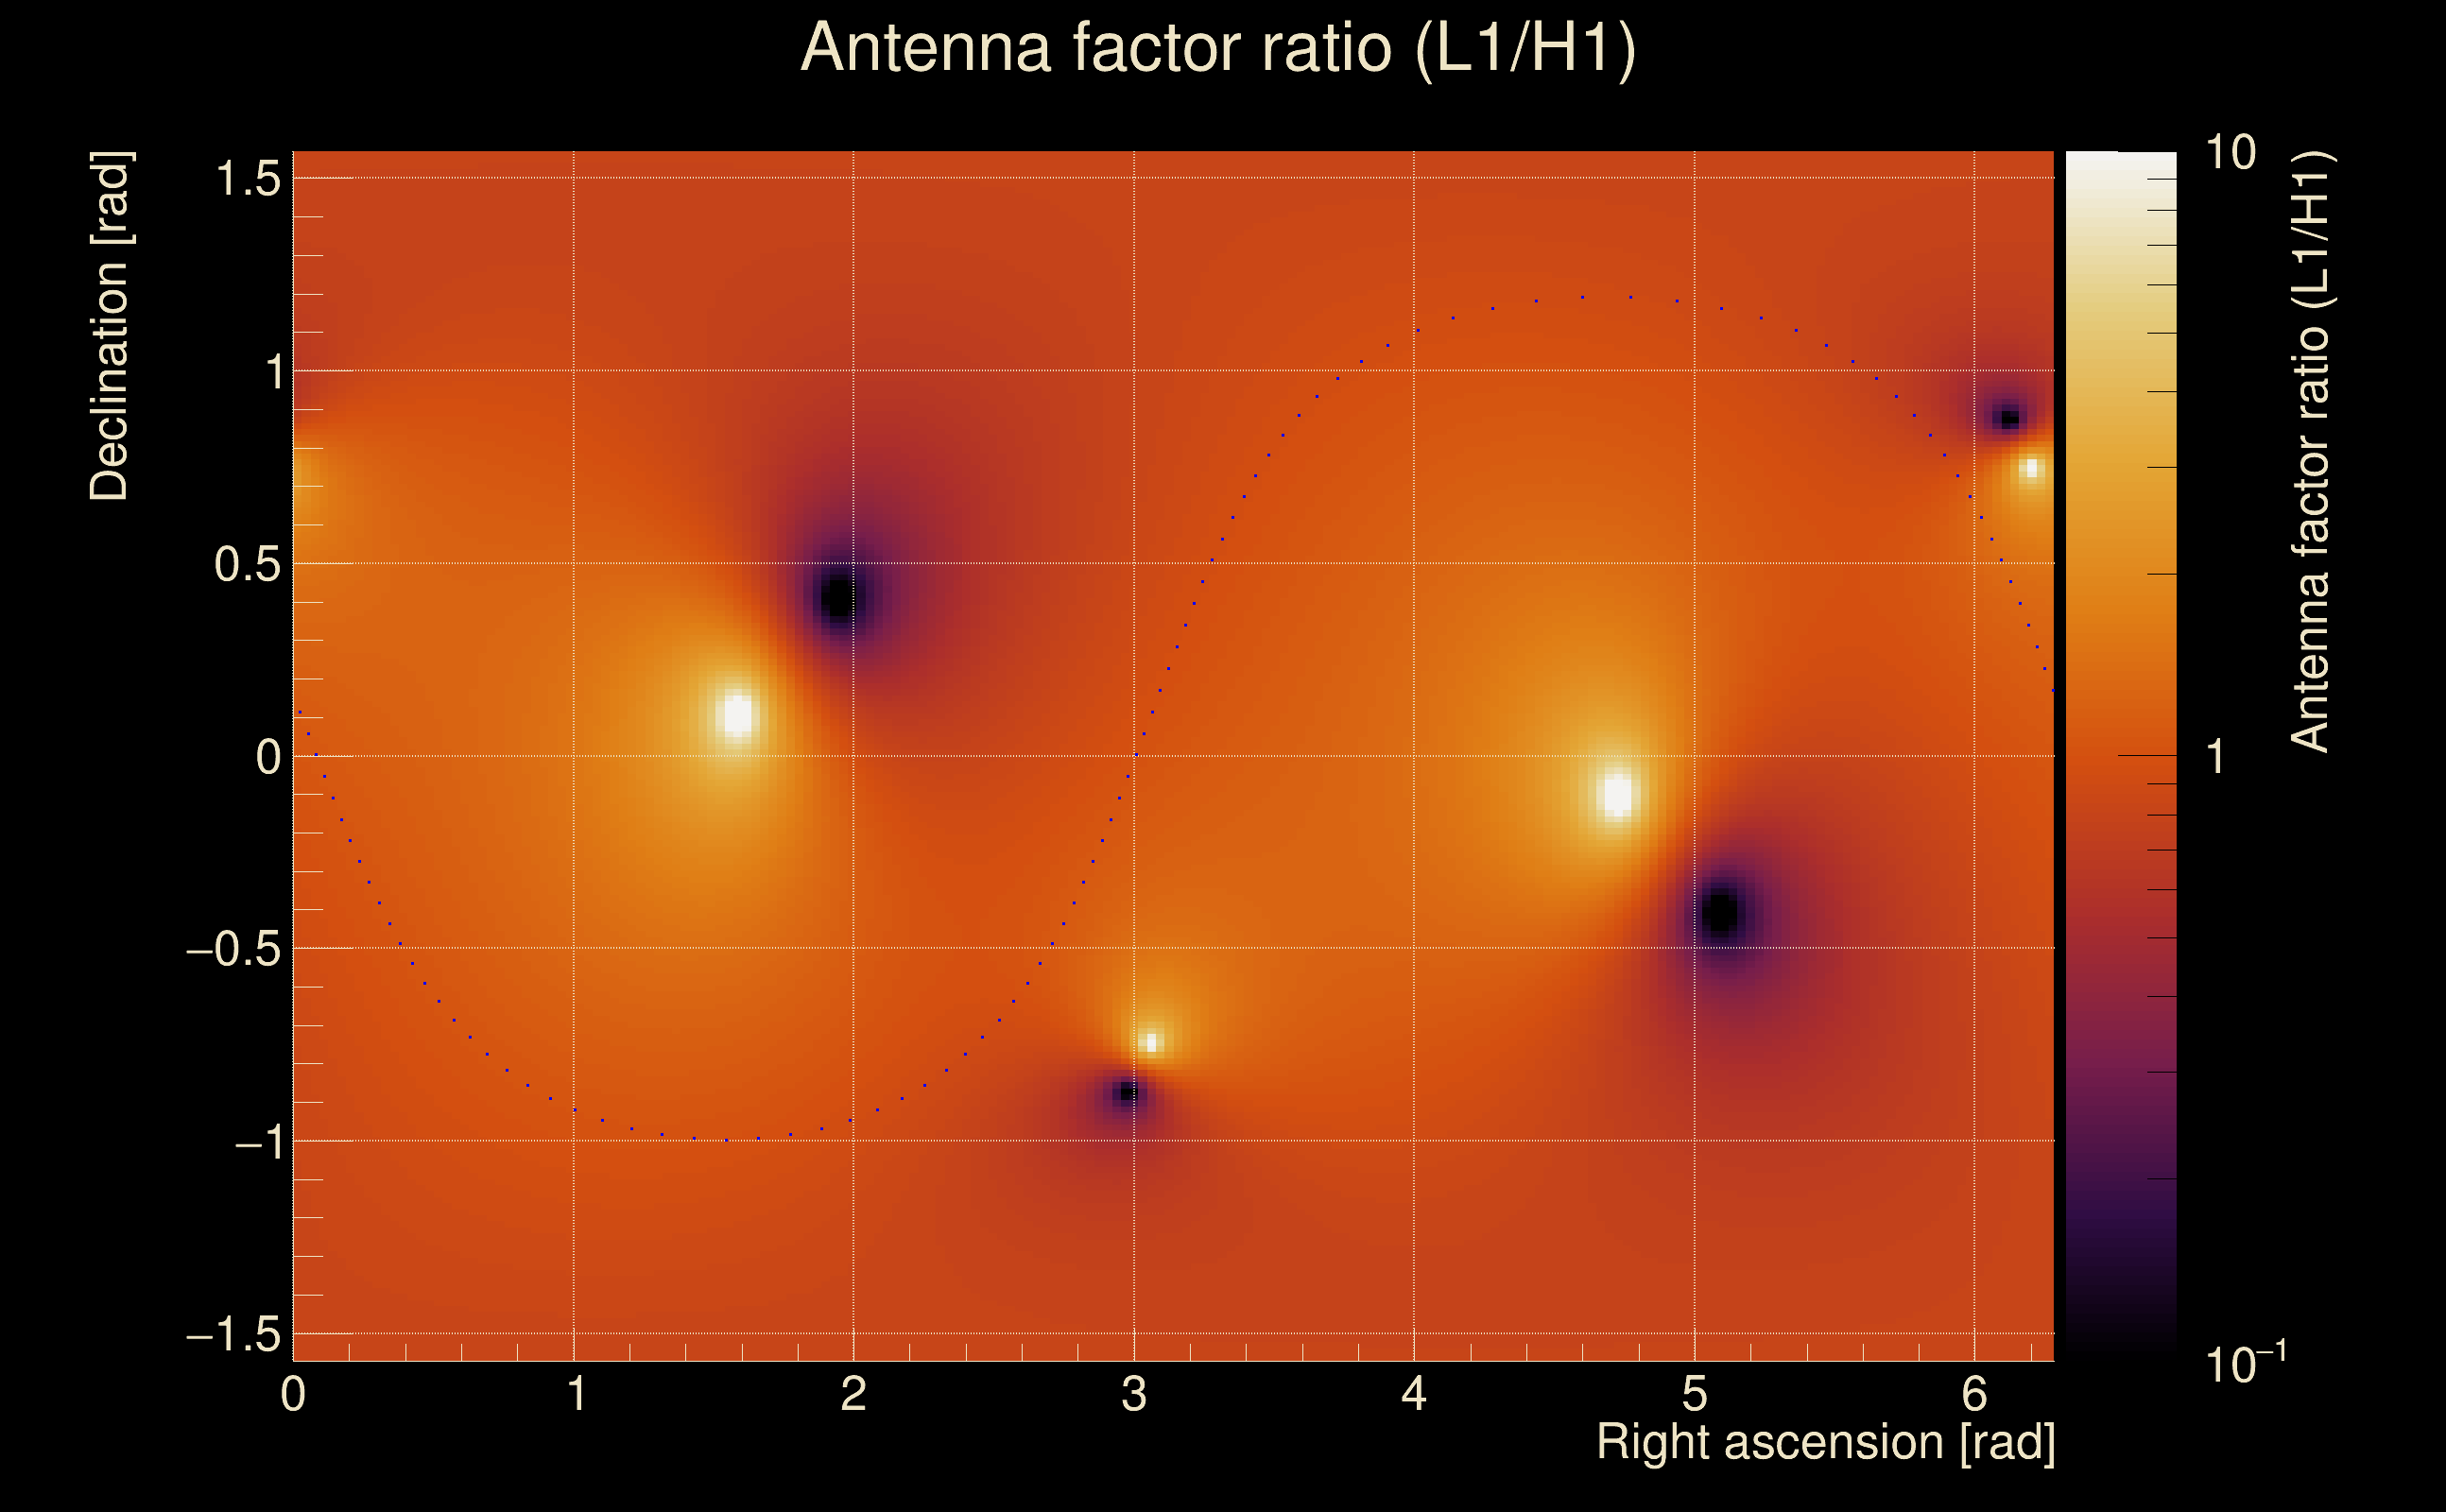
| Log of amplitude ratio (L1/H1): | -0.216227, variance = 0.469426 (L1/H1: -0.30163, variance = 1.07766, H1/L1: 0.0854034, variance = 0.480368) |
| Amplitude ratio (L1/H1): | 0.805553 ⋇ 1.98406 (L1/H1: 0.739612 ⋇ 2.82385, H1/L1: 1.08916 ⋇ 1.99988) |
| Amplitude ratio H1|L1 compatibility (probability): | 0.862471 |
| Antenna factor probability: | 0.825756 |
| Number of rejected frequency rows: | Q0: 15 / 18, Q1: 35 / 36, Q2: 66 / 70, Q3: 132 / 134, Q4: 251 / 258 |
| Maximum signal-to-noise ratio: | H1: 10.2881, L1: 8.31245 |
| SNR variance: | H1: 0.46774, L1: 0.48428 |
| Click here for a zoomed plot | Click here for a zoomed plot | Click here for a zoomed plot | Click here for a zoomed plot | Click here for a zoomed plot |
 |
 |
 |
 |
 |
 |
 |
 |
 |
 |
 |
 |
 |
 |
 |
 |
 |
 |
 |
 |
 |
 |
 |
 |
 |
 |
 |
 |
 |
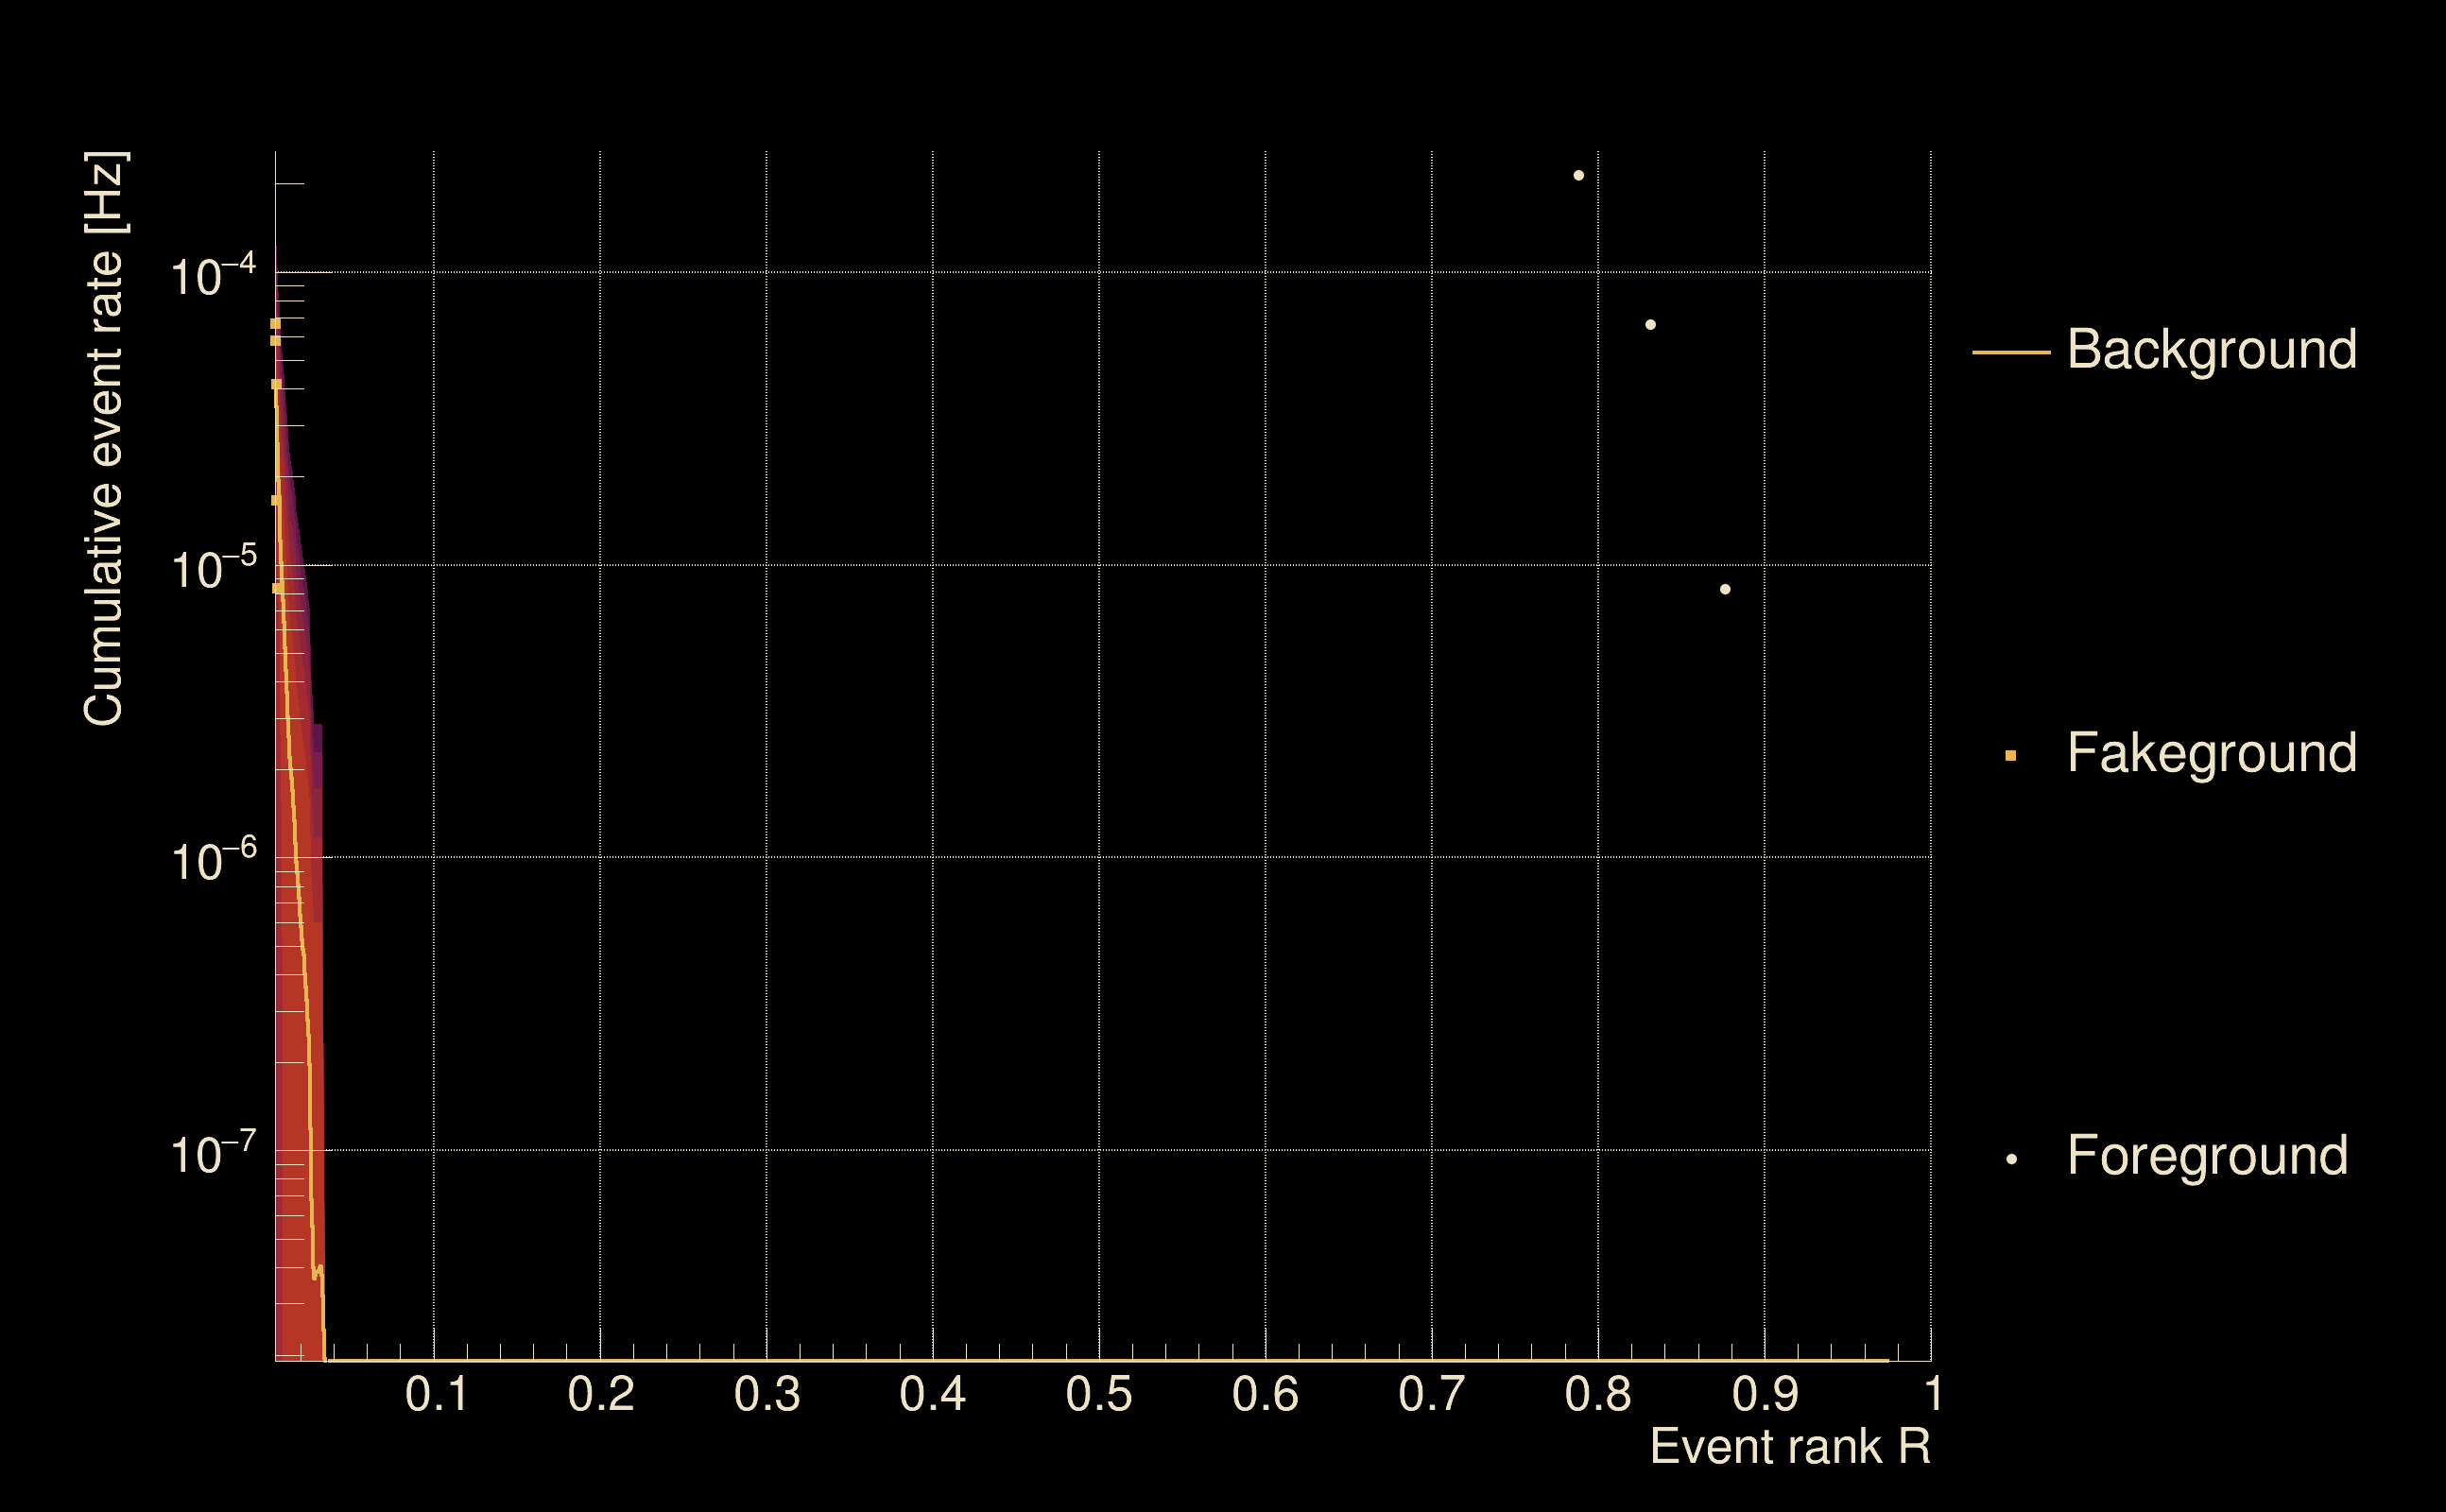
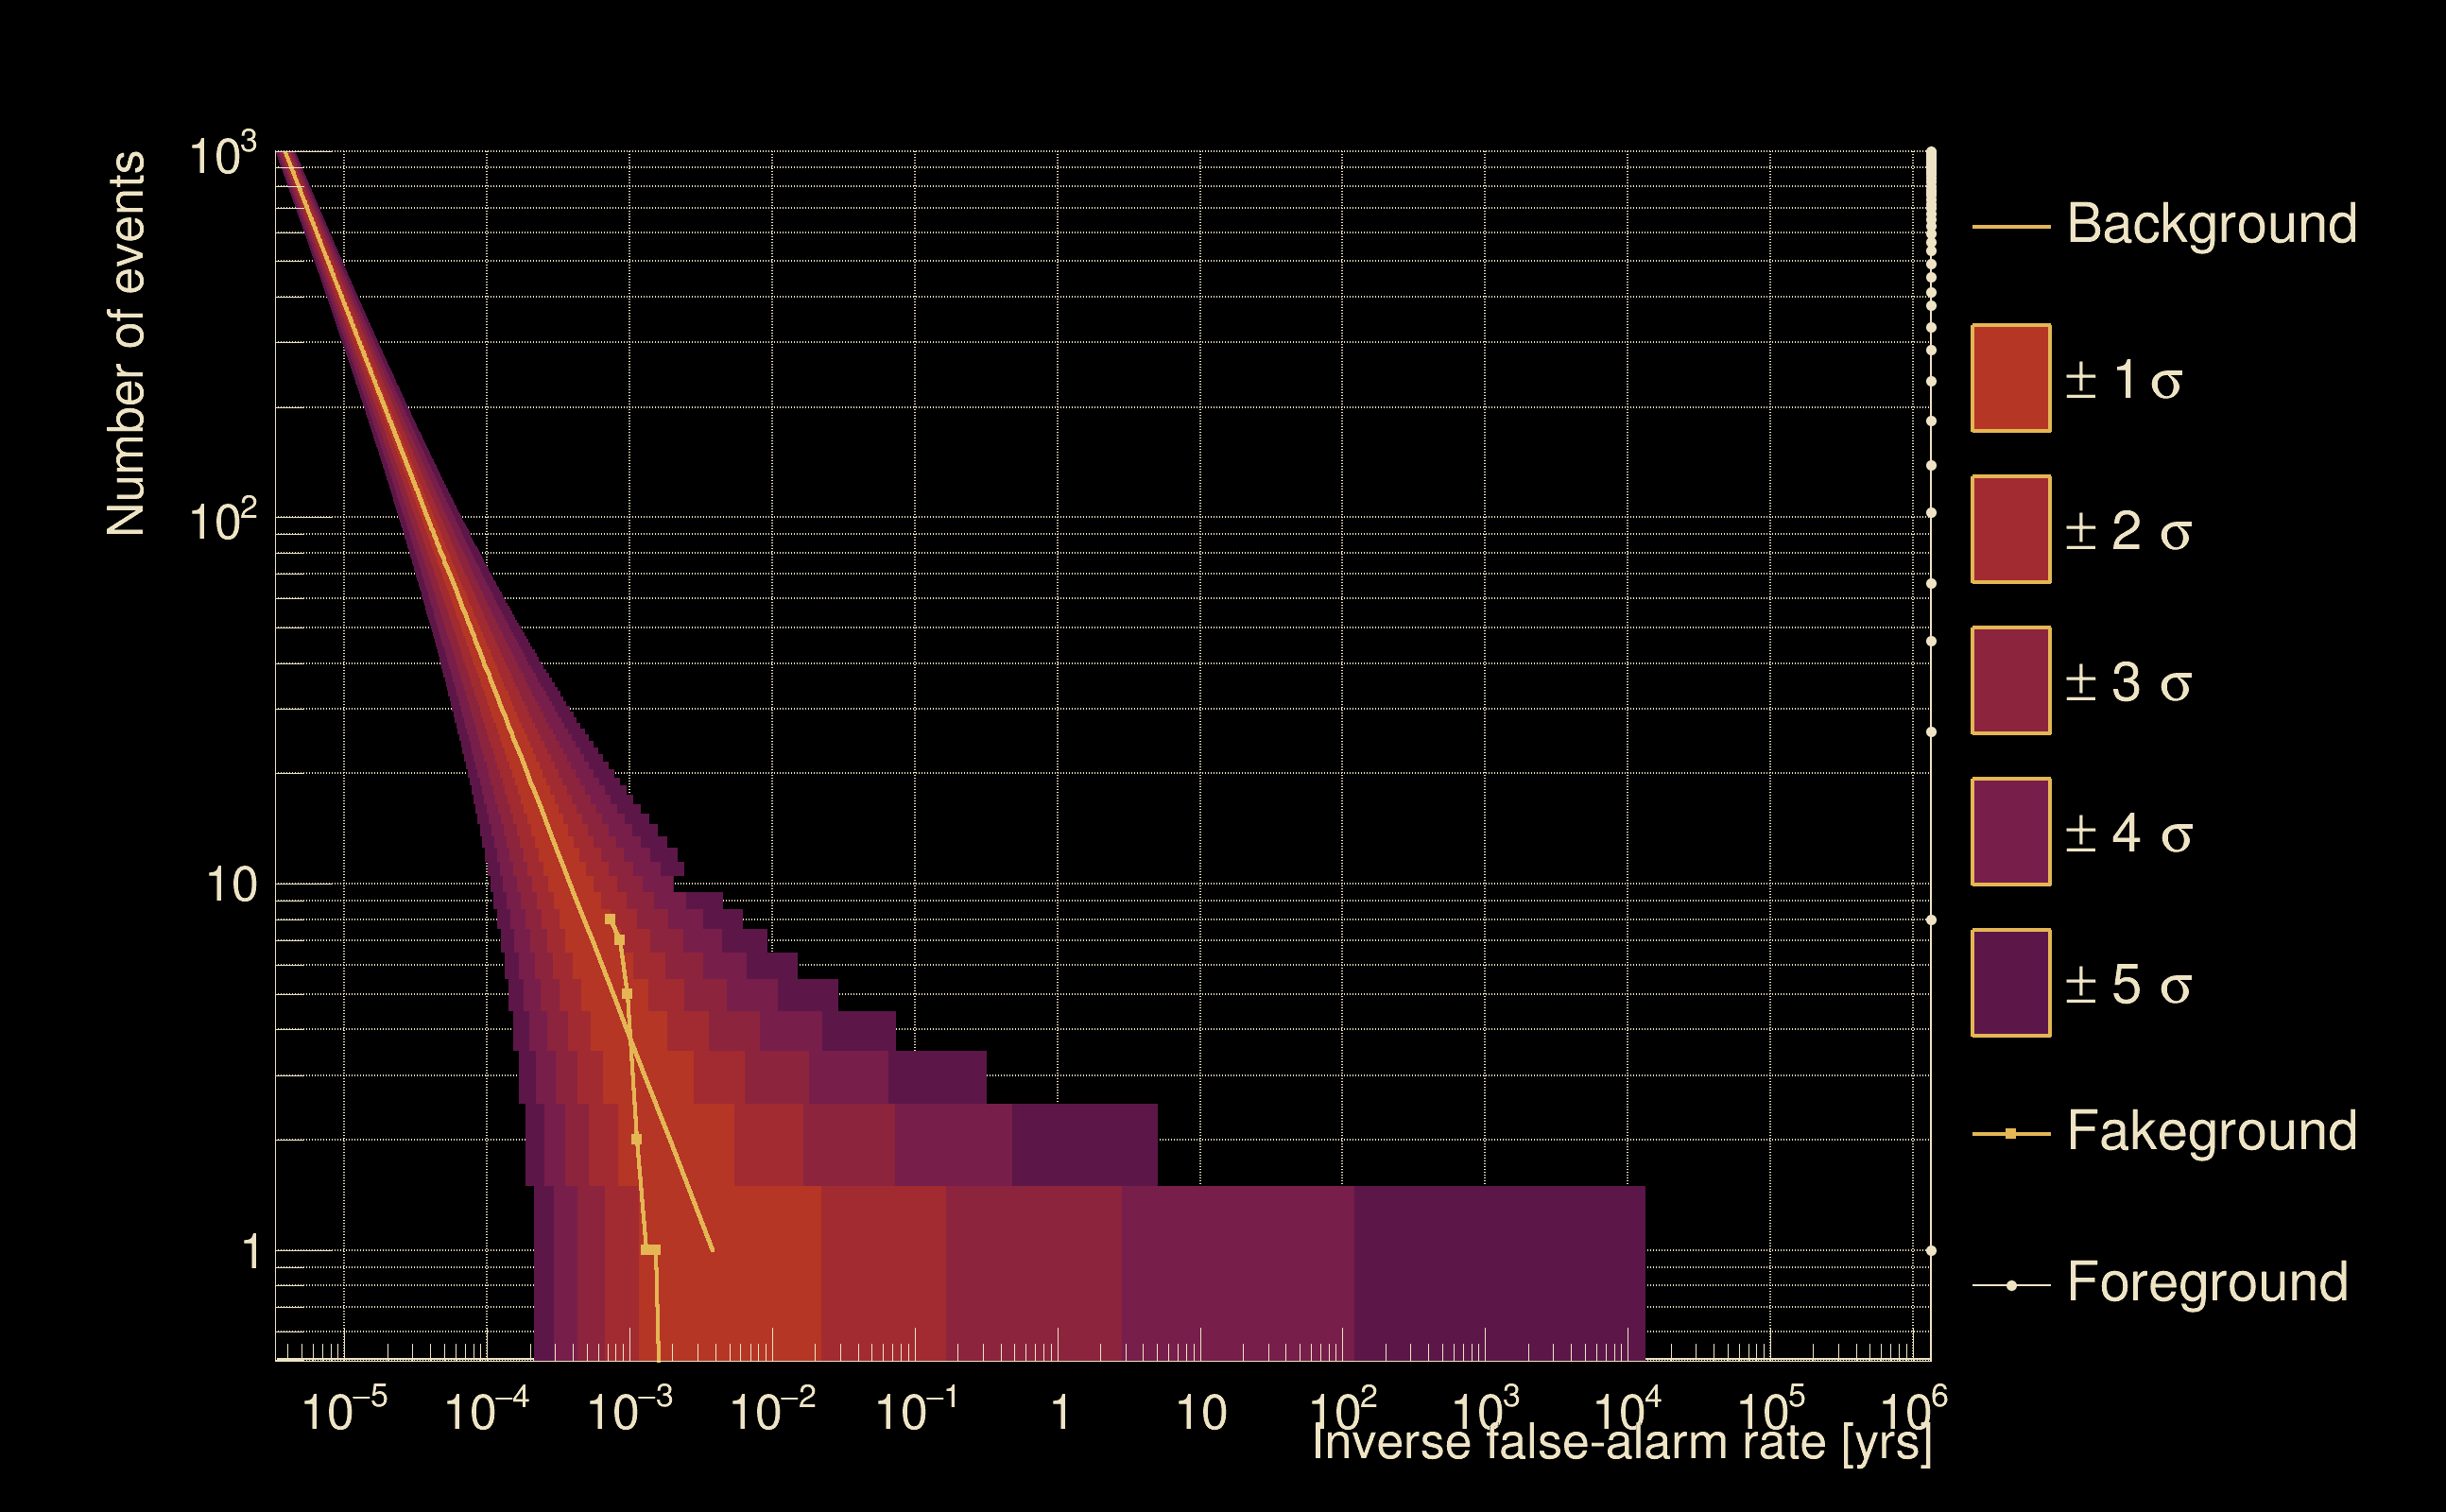
| Detection threshold: | R > 0.0332803 |
| False-alarm rate above that detection threshold: | 8.77905e-09 |
| Alternative threshold at 1/1000 yrs: | R > 0.0328086 |
| Alternative threshold at 1/100 yrs: | R > 0.0328086 |
| Alternative threshold at 1/10 yrs: | R > 0.0328086 |
| Alternative threshold at 1/1 yr: | R > 0.0328086 |
| Alternative threshold at 1/1 d: | R > 0.00786002 |
 |
|
 |
 |
 |
 |
 |
 |
 |
 |
 |
 |
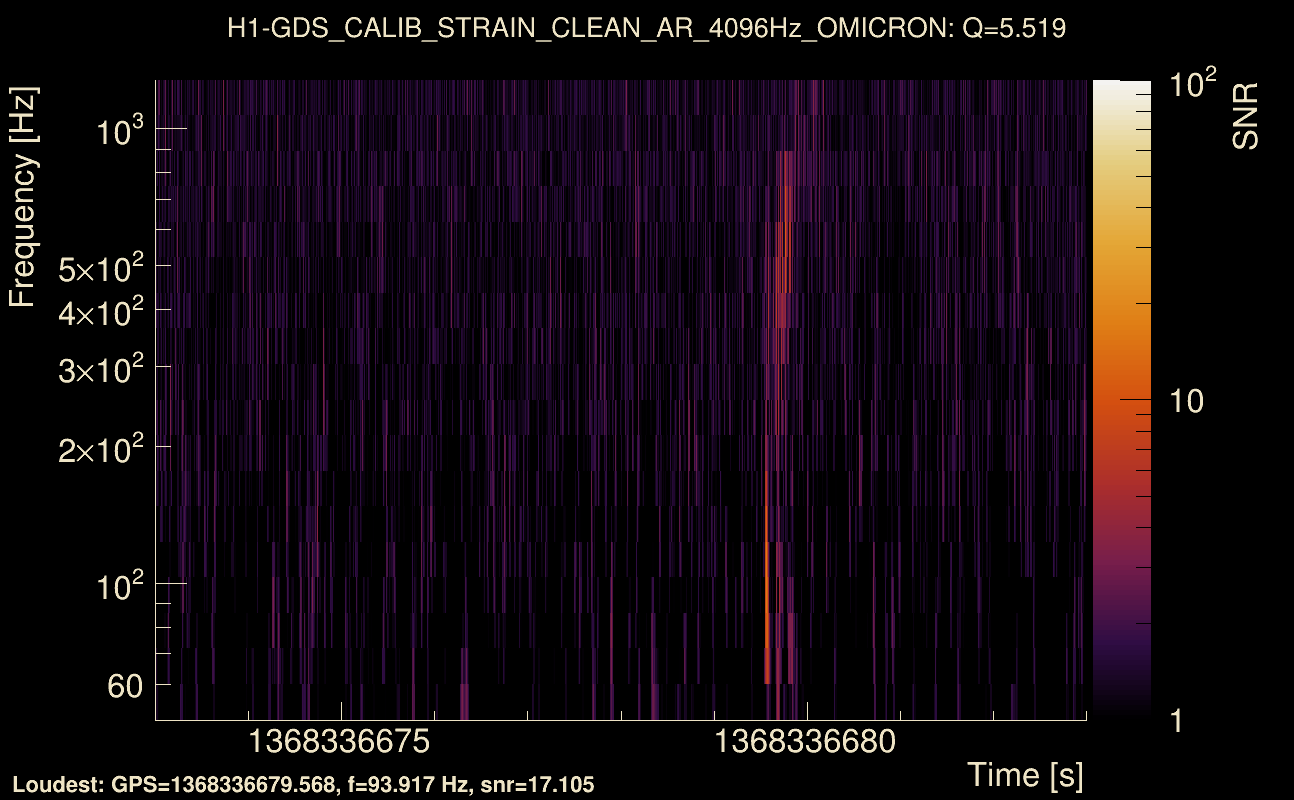
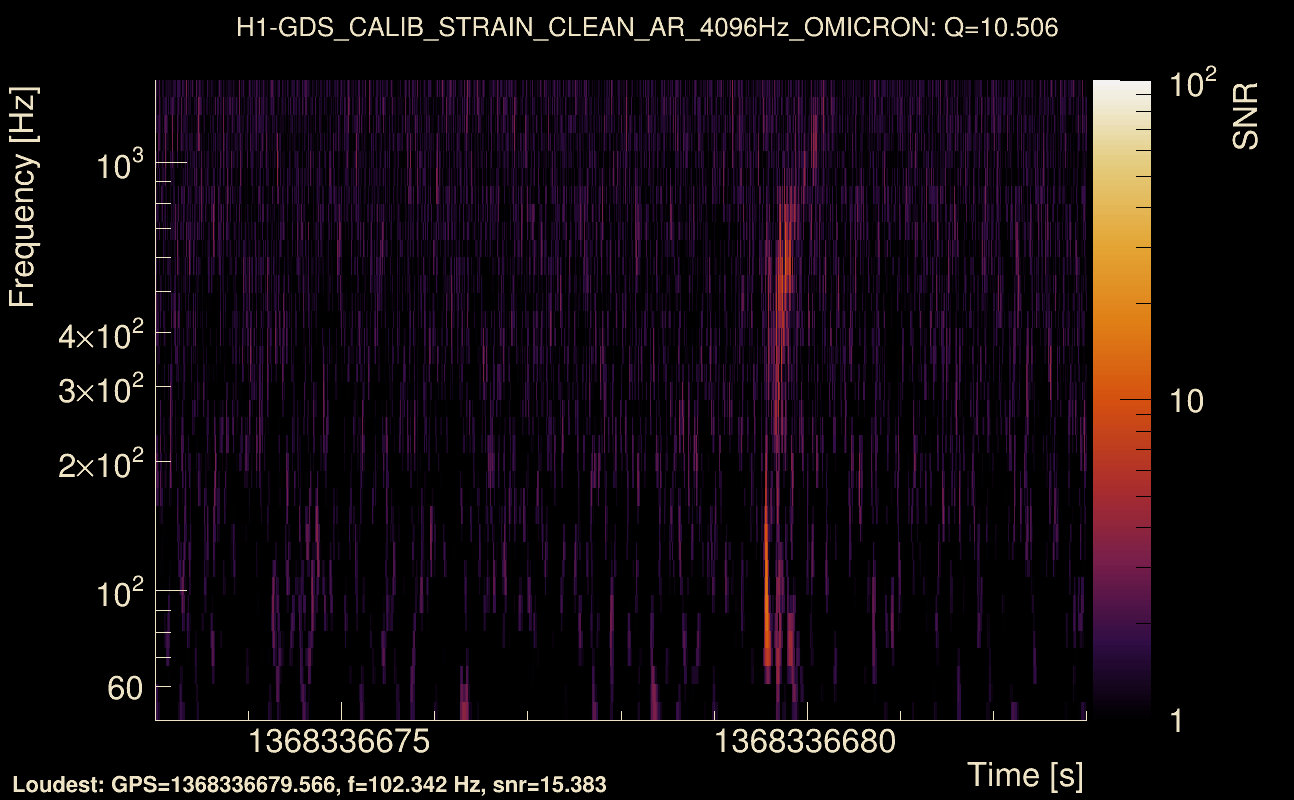
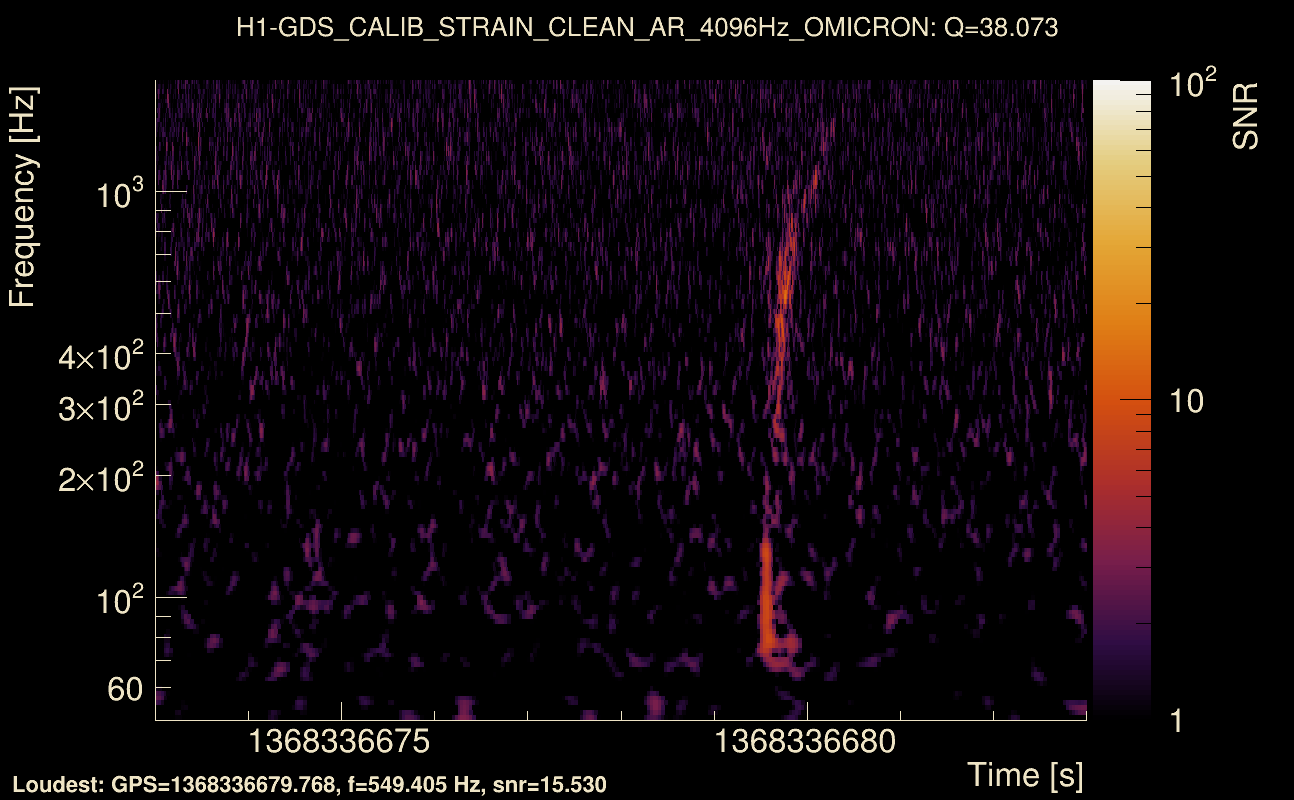
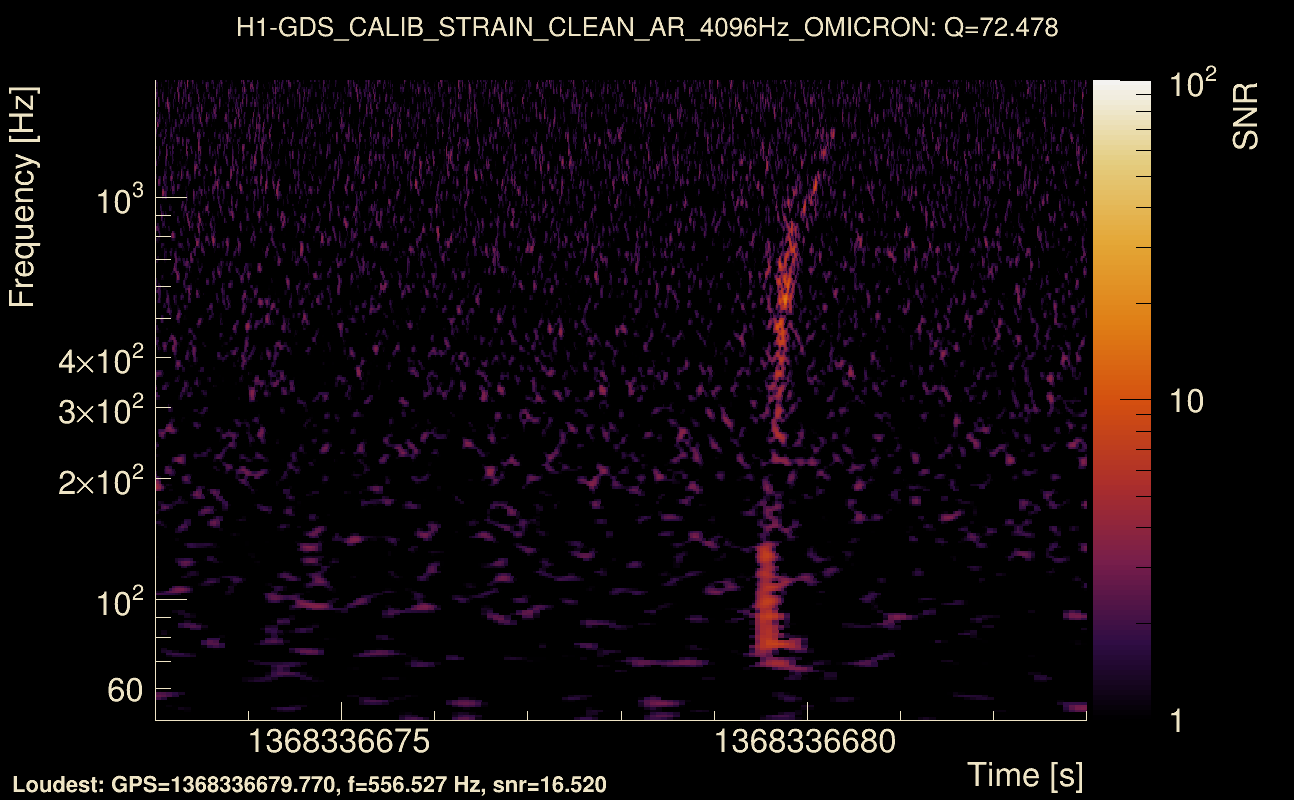
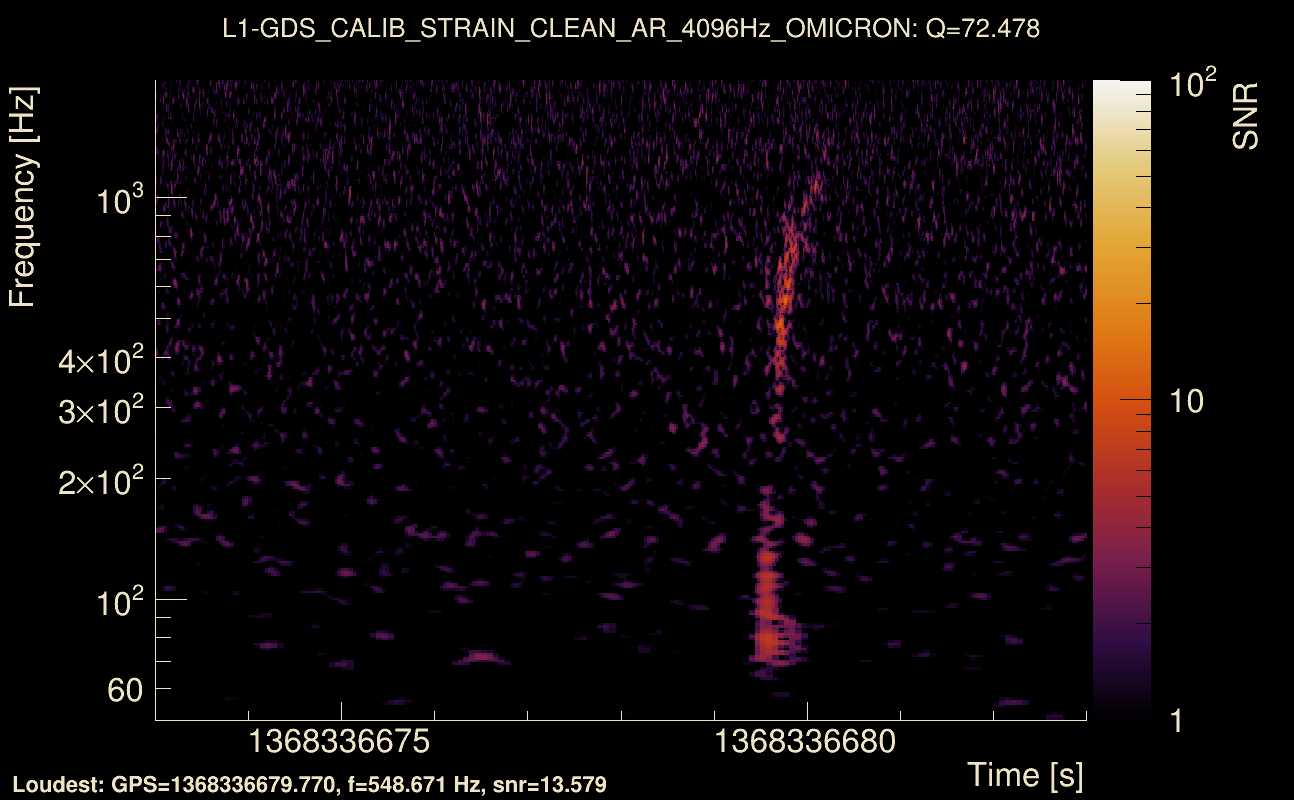
| Event time t(H1): | GPS = 1368336673 (Wed May 17 05:30:55 2023 ) → GPS = 1368336683 (Wed May 17 05:31:05 2023 ) |
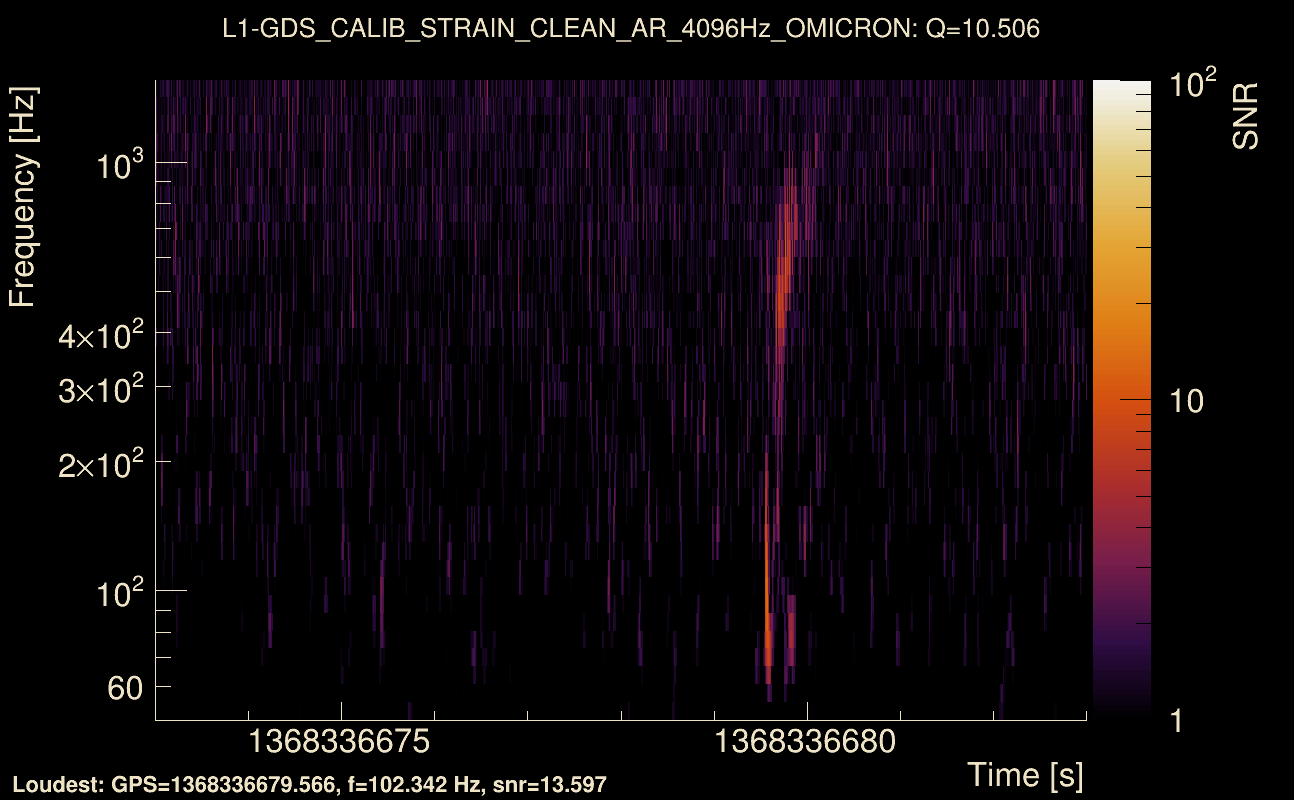
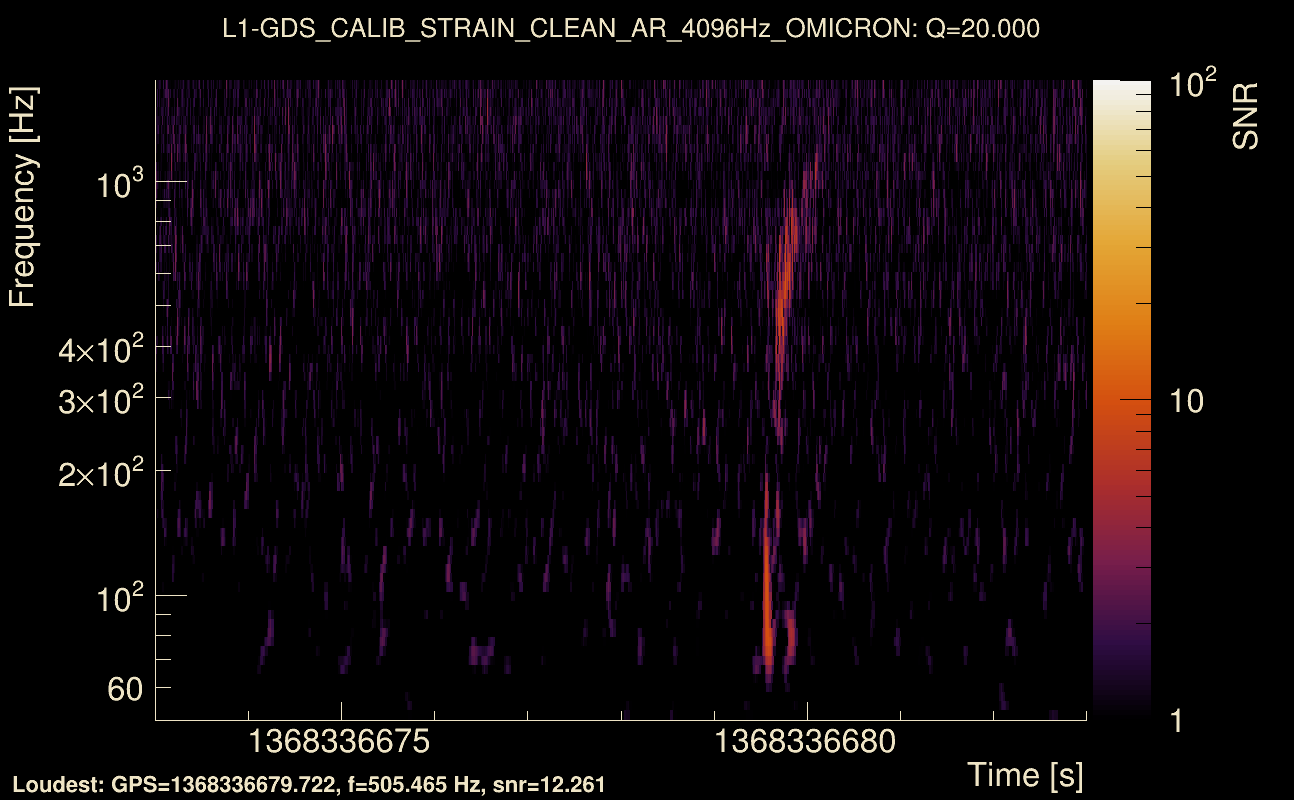
| Event time t(L1): | GPS = 1368336673 (Wed May 17 05:31:05 2023 ) → GPS = 1368336683 (Wed May 17 05:31:05 2023 ) |
| Omicron analysis time window (H1): | GPS = 1368336670 → GPS = 1368336686 |
| Omicron analysis time window (L1): | GPS = 1368336670 → GPS = 1368336686 |
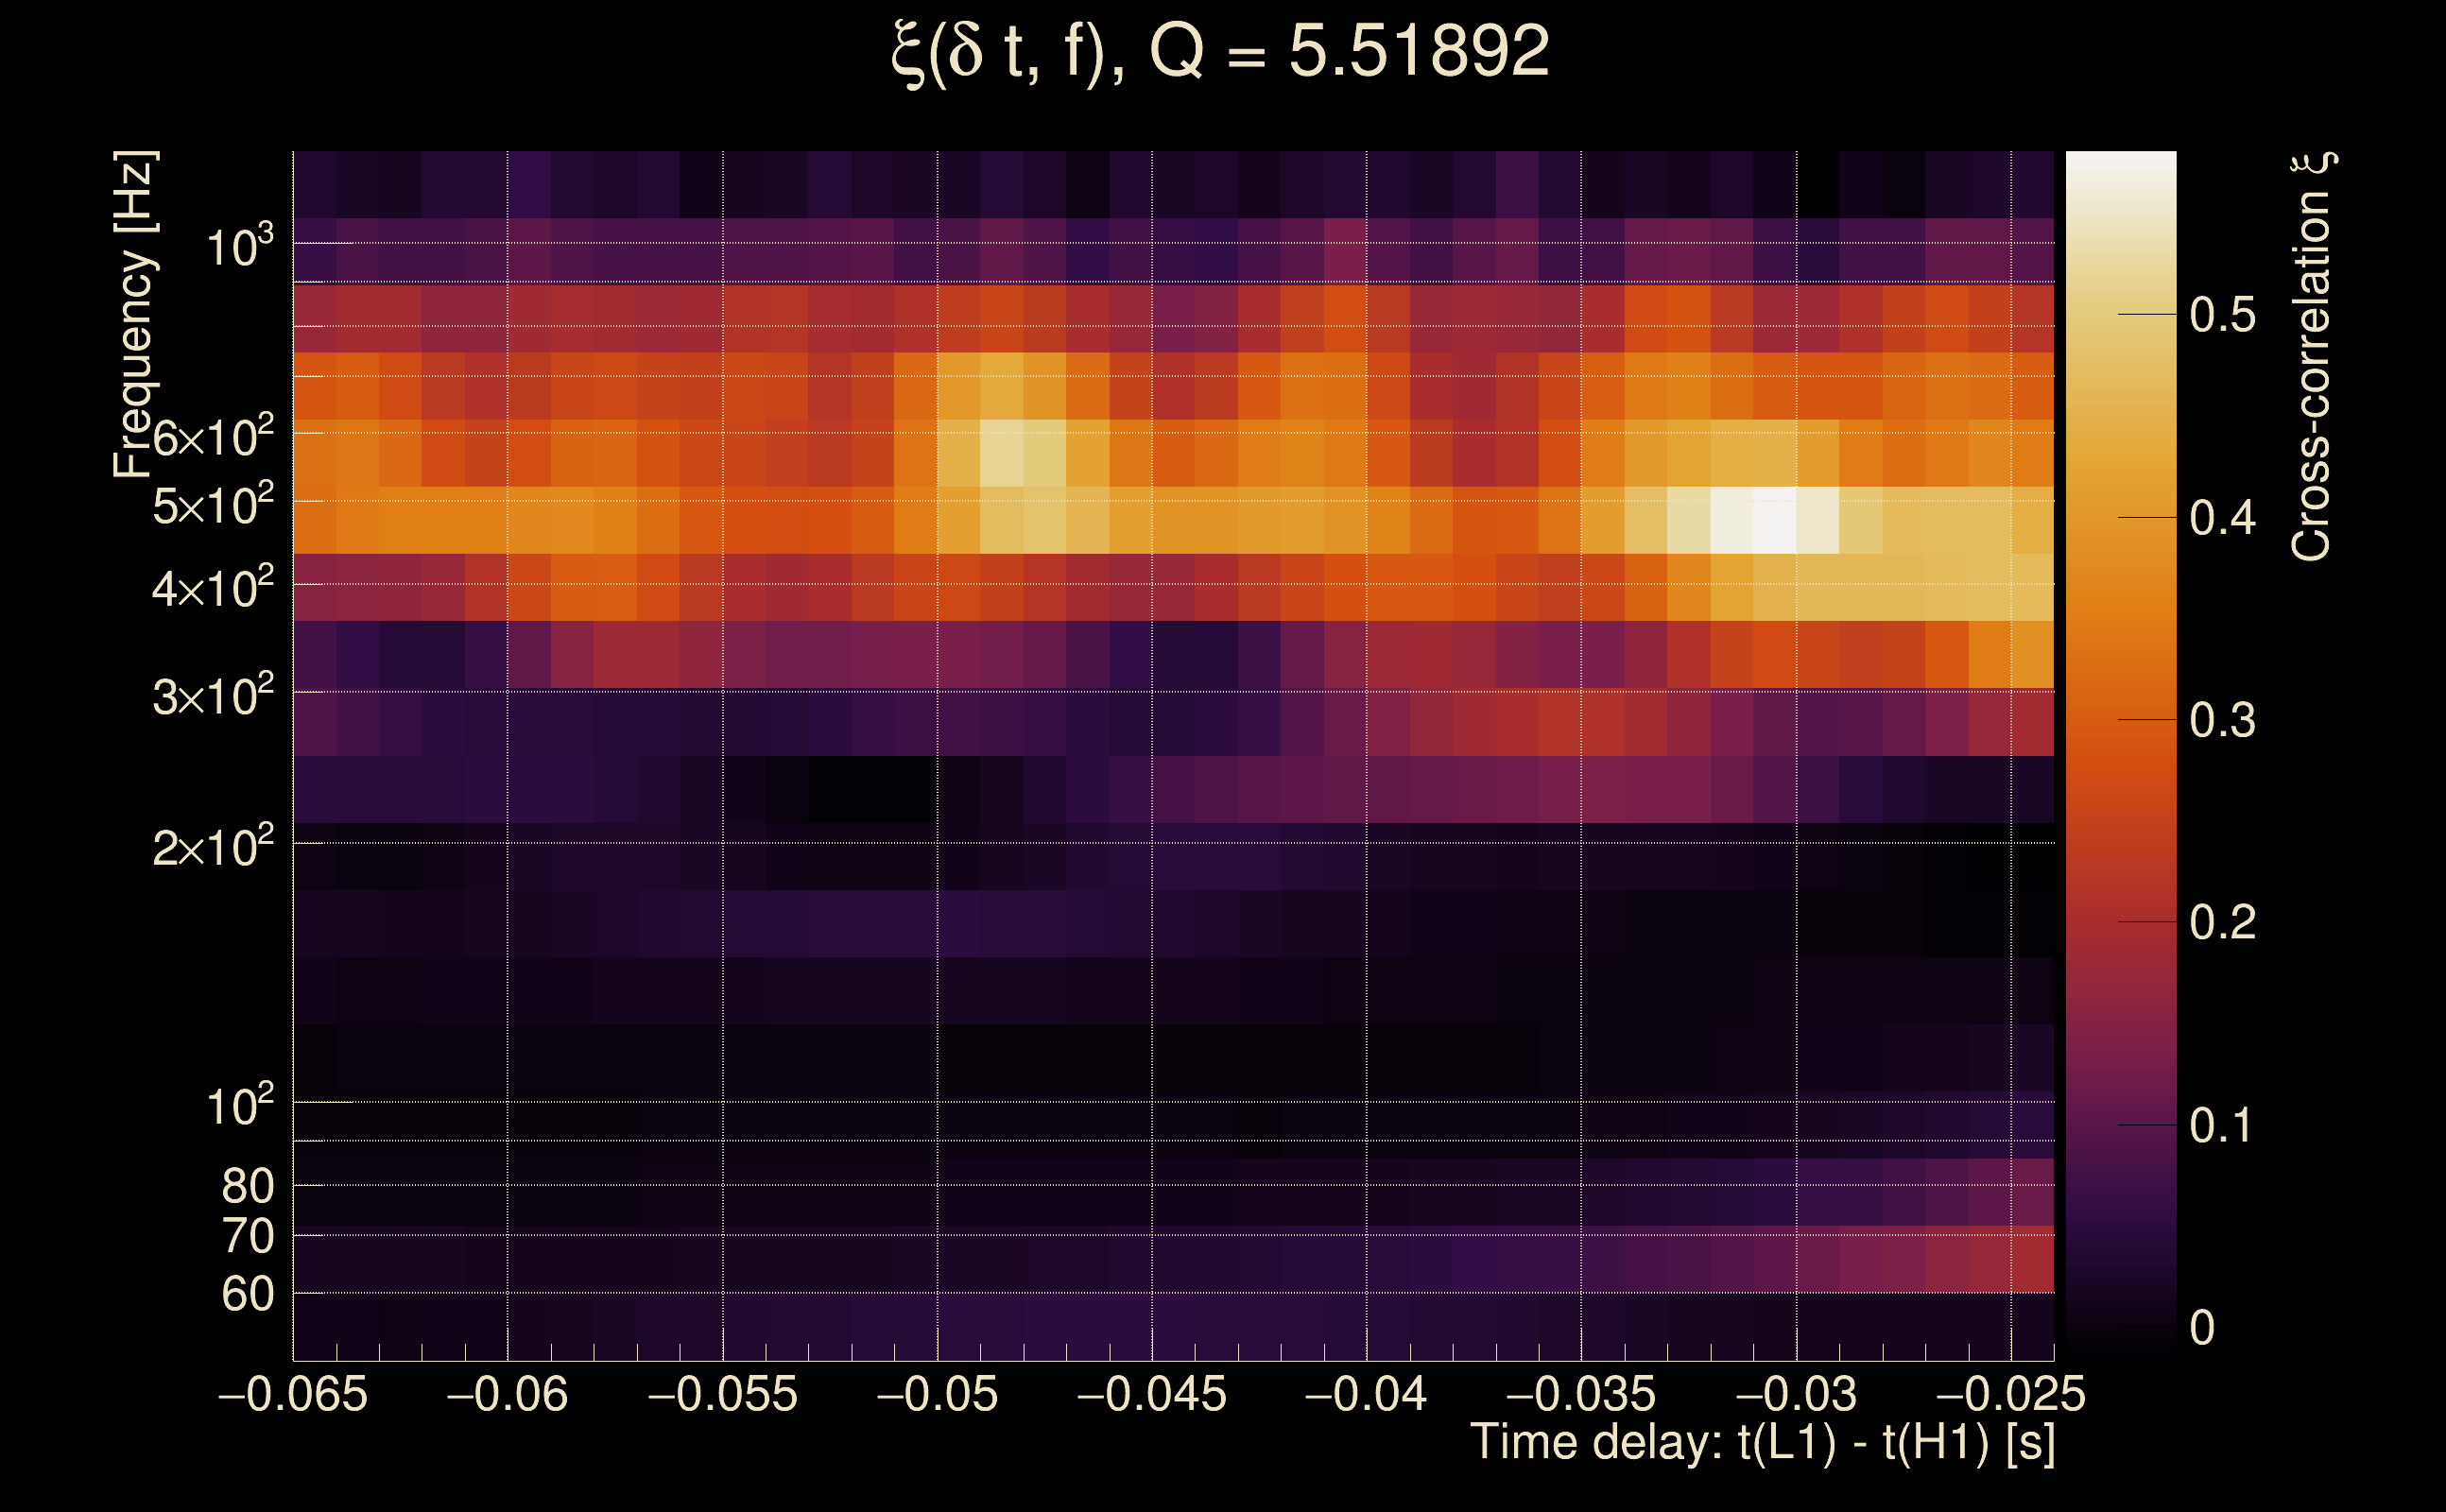
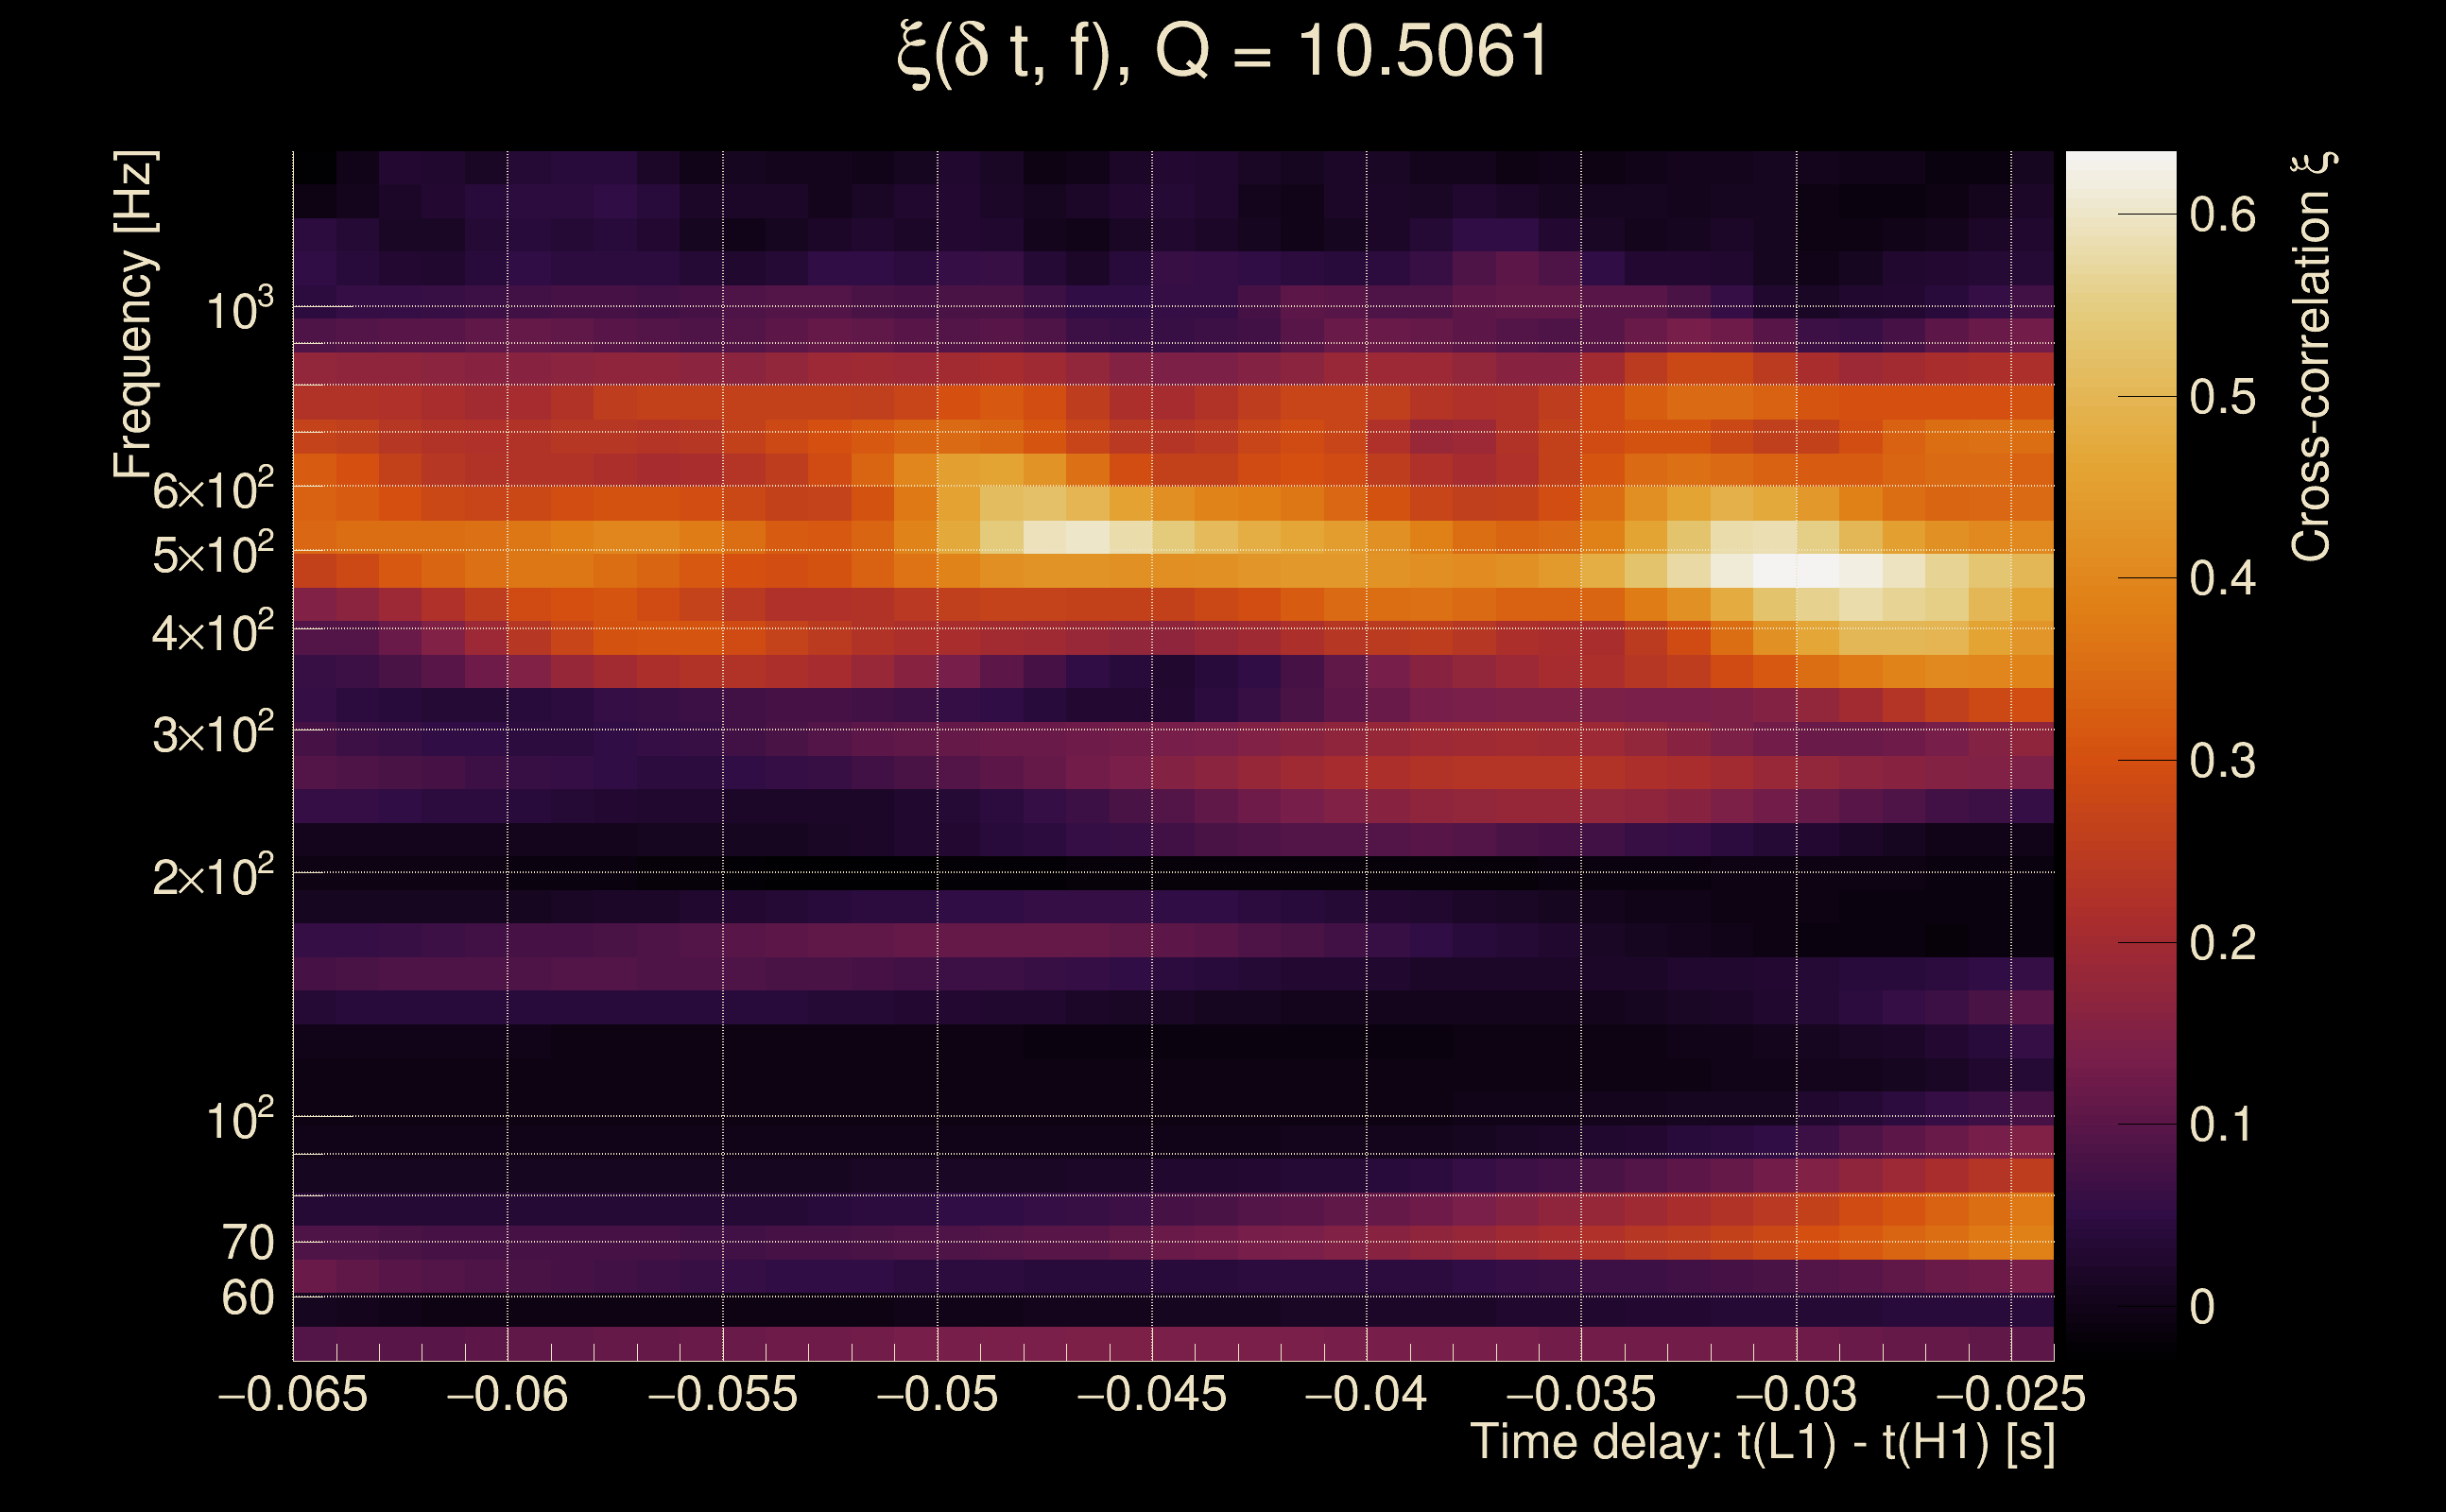
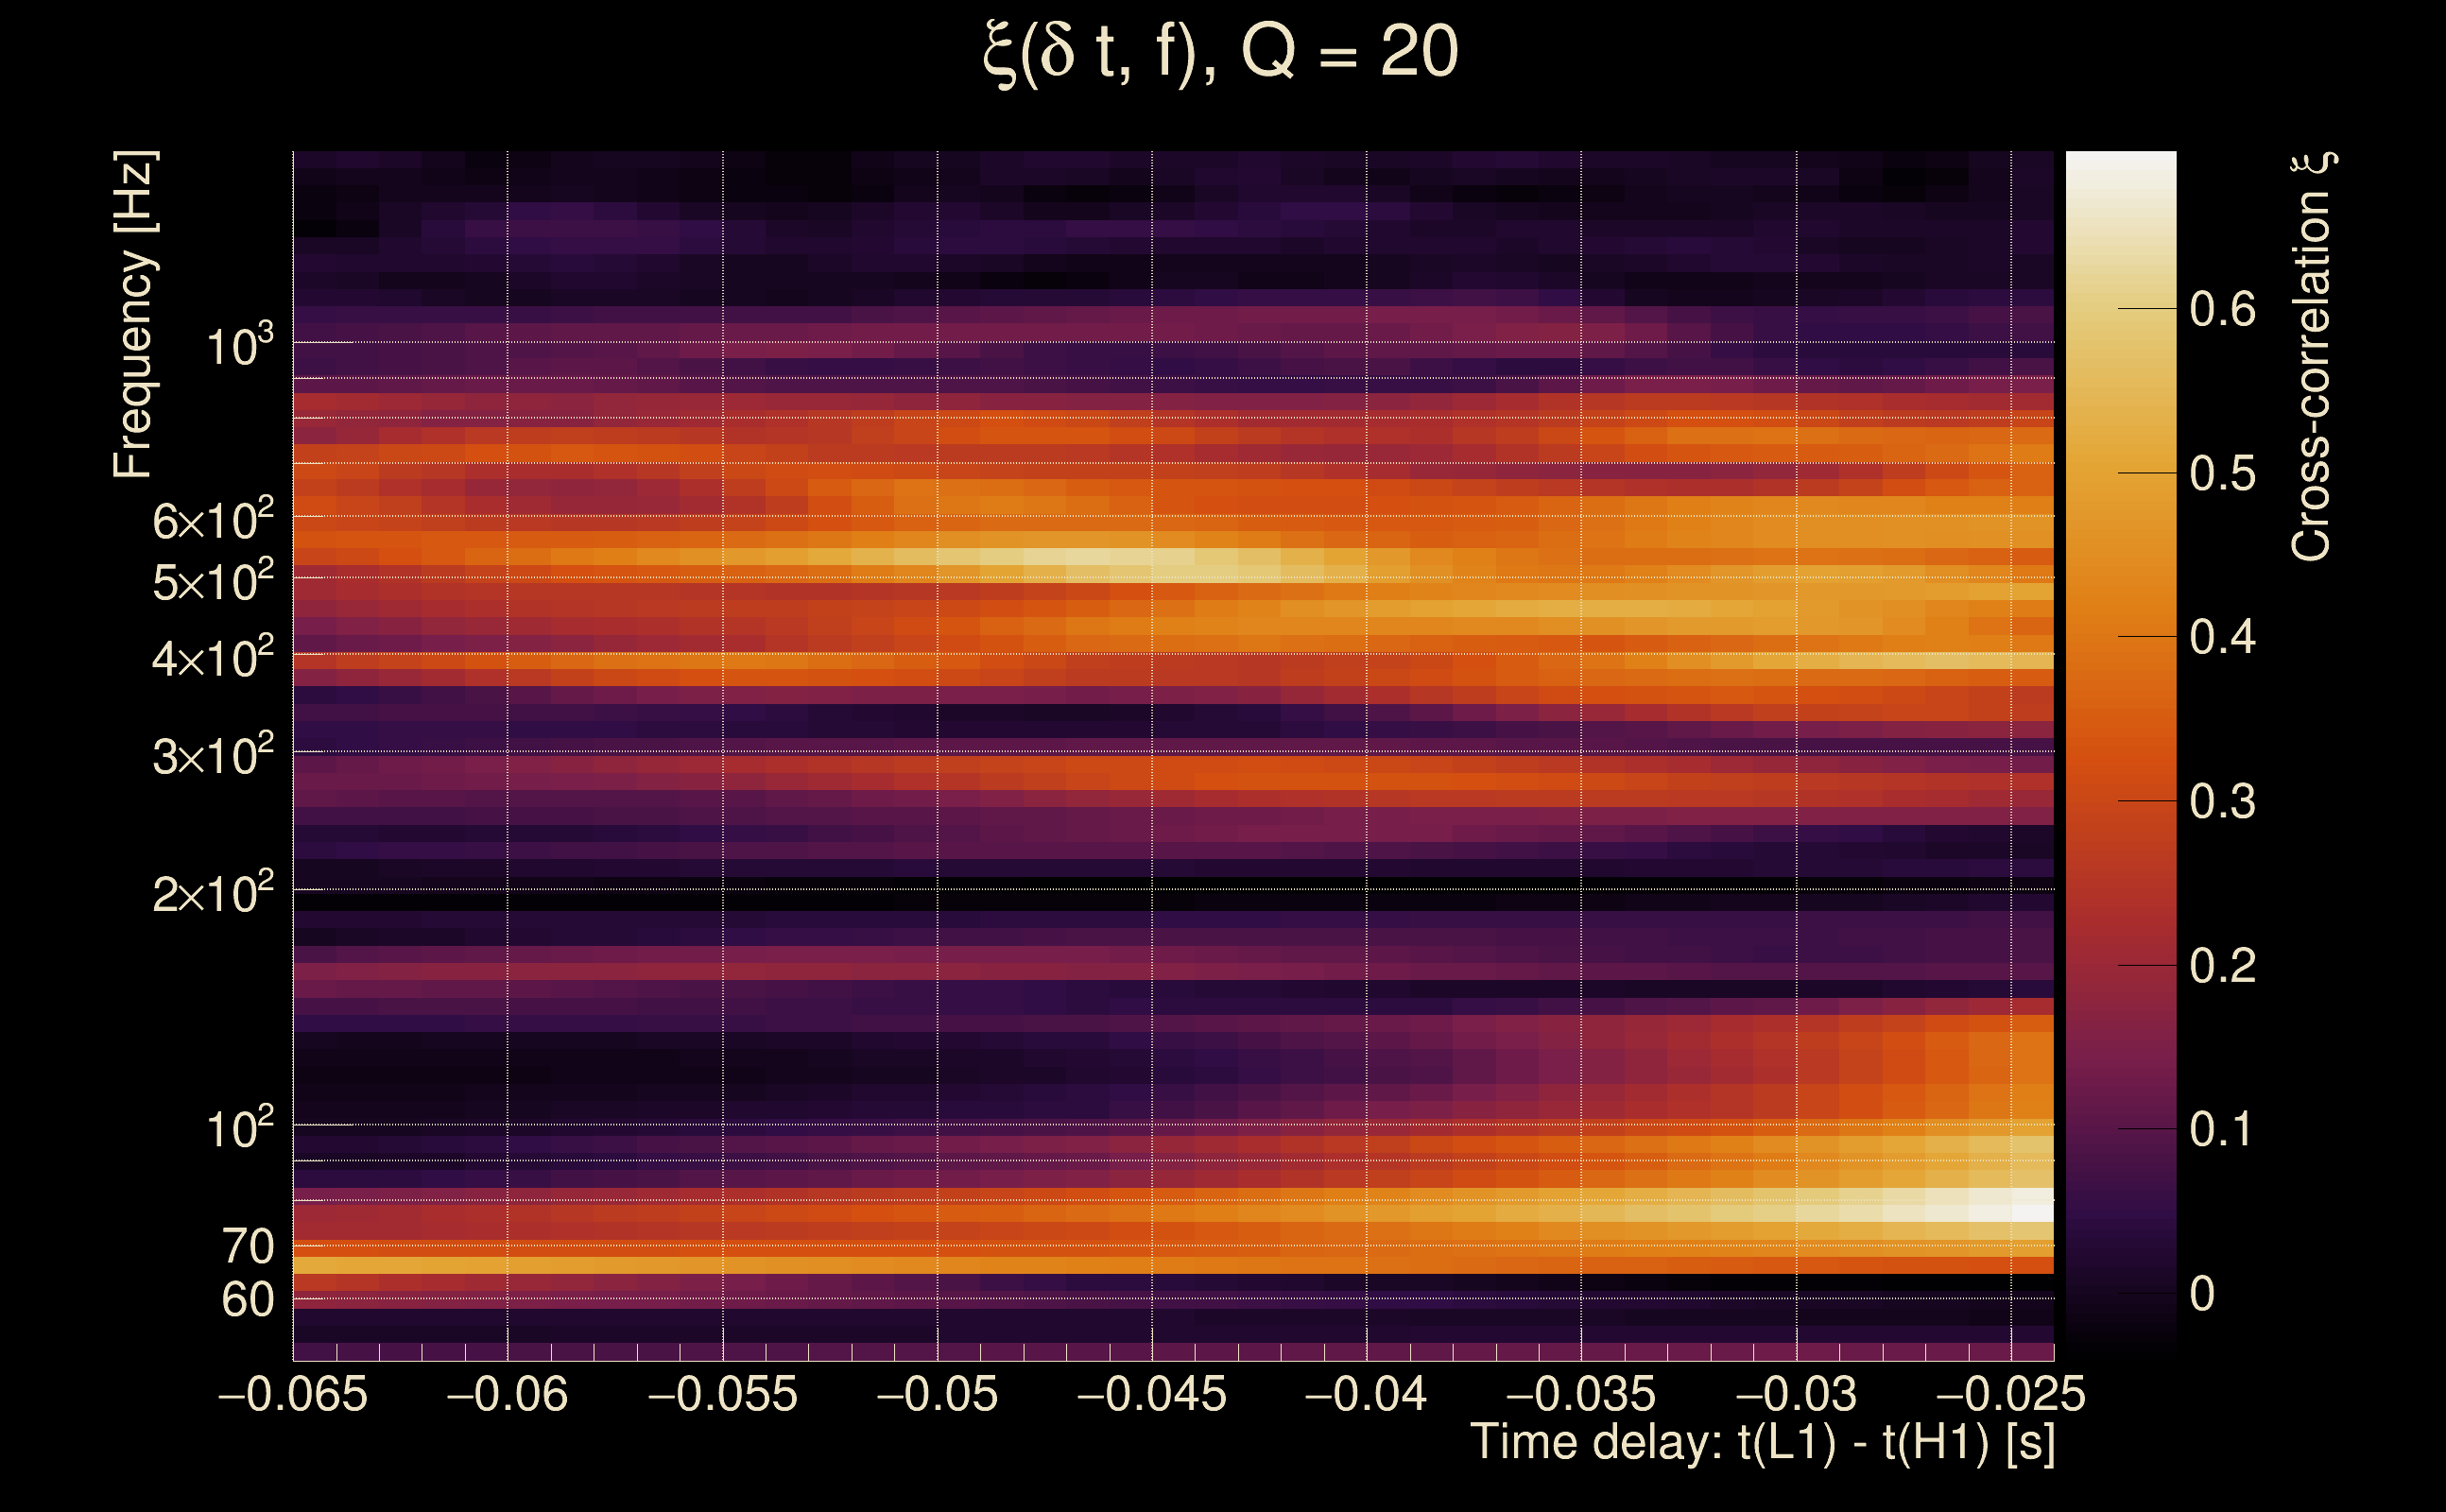
| Time delay between detectors t(L1) - t(H1): | -0.0446785 s (slice index = 109 / 217), δt_gw = 0.00132145 s |
| Time delay standard deviation: | 0.0707426 s |
| [targeted mode] Time delay probability: | 0.927141 (0.0914429 sigmas), δt_target = 0.00138187 s |
| Frequency: | 488.975 Hz |
| Ξ: | 0.117525 ± 0.0322792 (variance = 0.00104195): Q0: 0.352601, Q1: 0.392017, Q2: 0.412894, Q3: 0.439862, Q4: 0.437189 |
| Rank: | R_A = 0.033348 |
| Log of amplitude ratio (L1/H1): | 0.000847242, variance = 0.237345 (L1/H1: -0.358834, variance = 0.406883, H1/L1: -0.306294, variance = 0.518193) |
| Amplitude ratio (L1/H1): | 1.00085 ⋇ 1.62772 (L1/H1: 0.698491 ⋇ 1.89245, H1/L1: 0.73617 ⋇ 2.05414) |
| Amplitude ratio H1|L1 compatibility (probability): | 0.489228 |
| Antenna factor probability: | 0.861729 |
| Number of rejected frequency rows: | Q0: 11 / 18, Q1: 26 / 36, Q2: 54 / 70, Q3: 108 / 134, Q4: 231 / 258 |
| Maximum signal-to-noise ratio: | H1: 17.9752, L1: 19.5058 |
| SNR variance: | H1: 0.470731, L1: 0.470244 |
| Click here for a zoomed plot | Click here for a zoomed plot | Click here for a zoomed plot | Click here for a zoomed plot | Click here for a zoomed plot |
 |
 |
 |
 |
 |
 |
 |
 |
 |
 |
 |
 |
 |
 |
 |
 |
 |
 |
 |
 |
 |
 |
 |
 |
 |
 |
 |
 |
 |
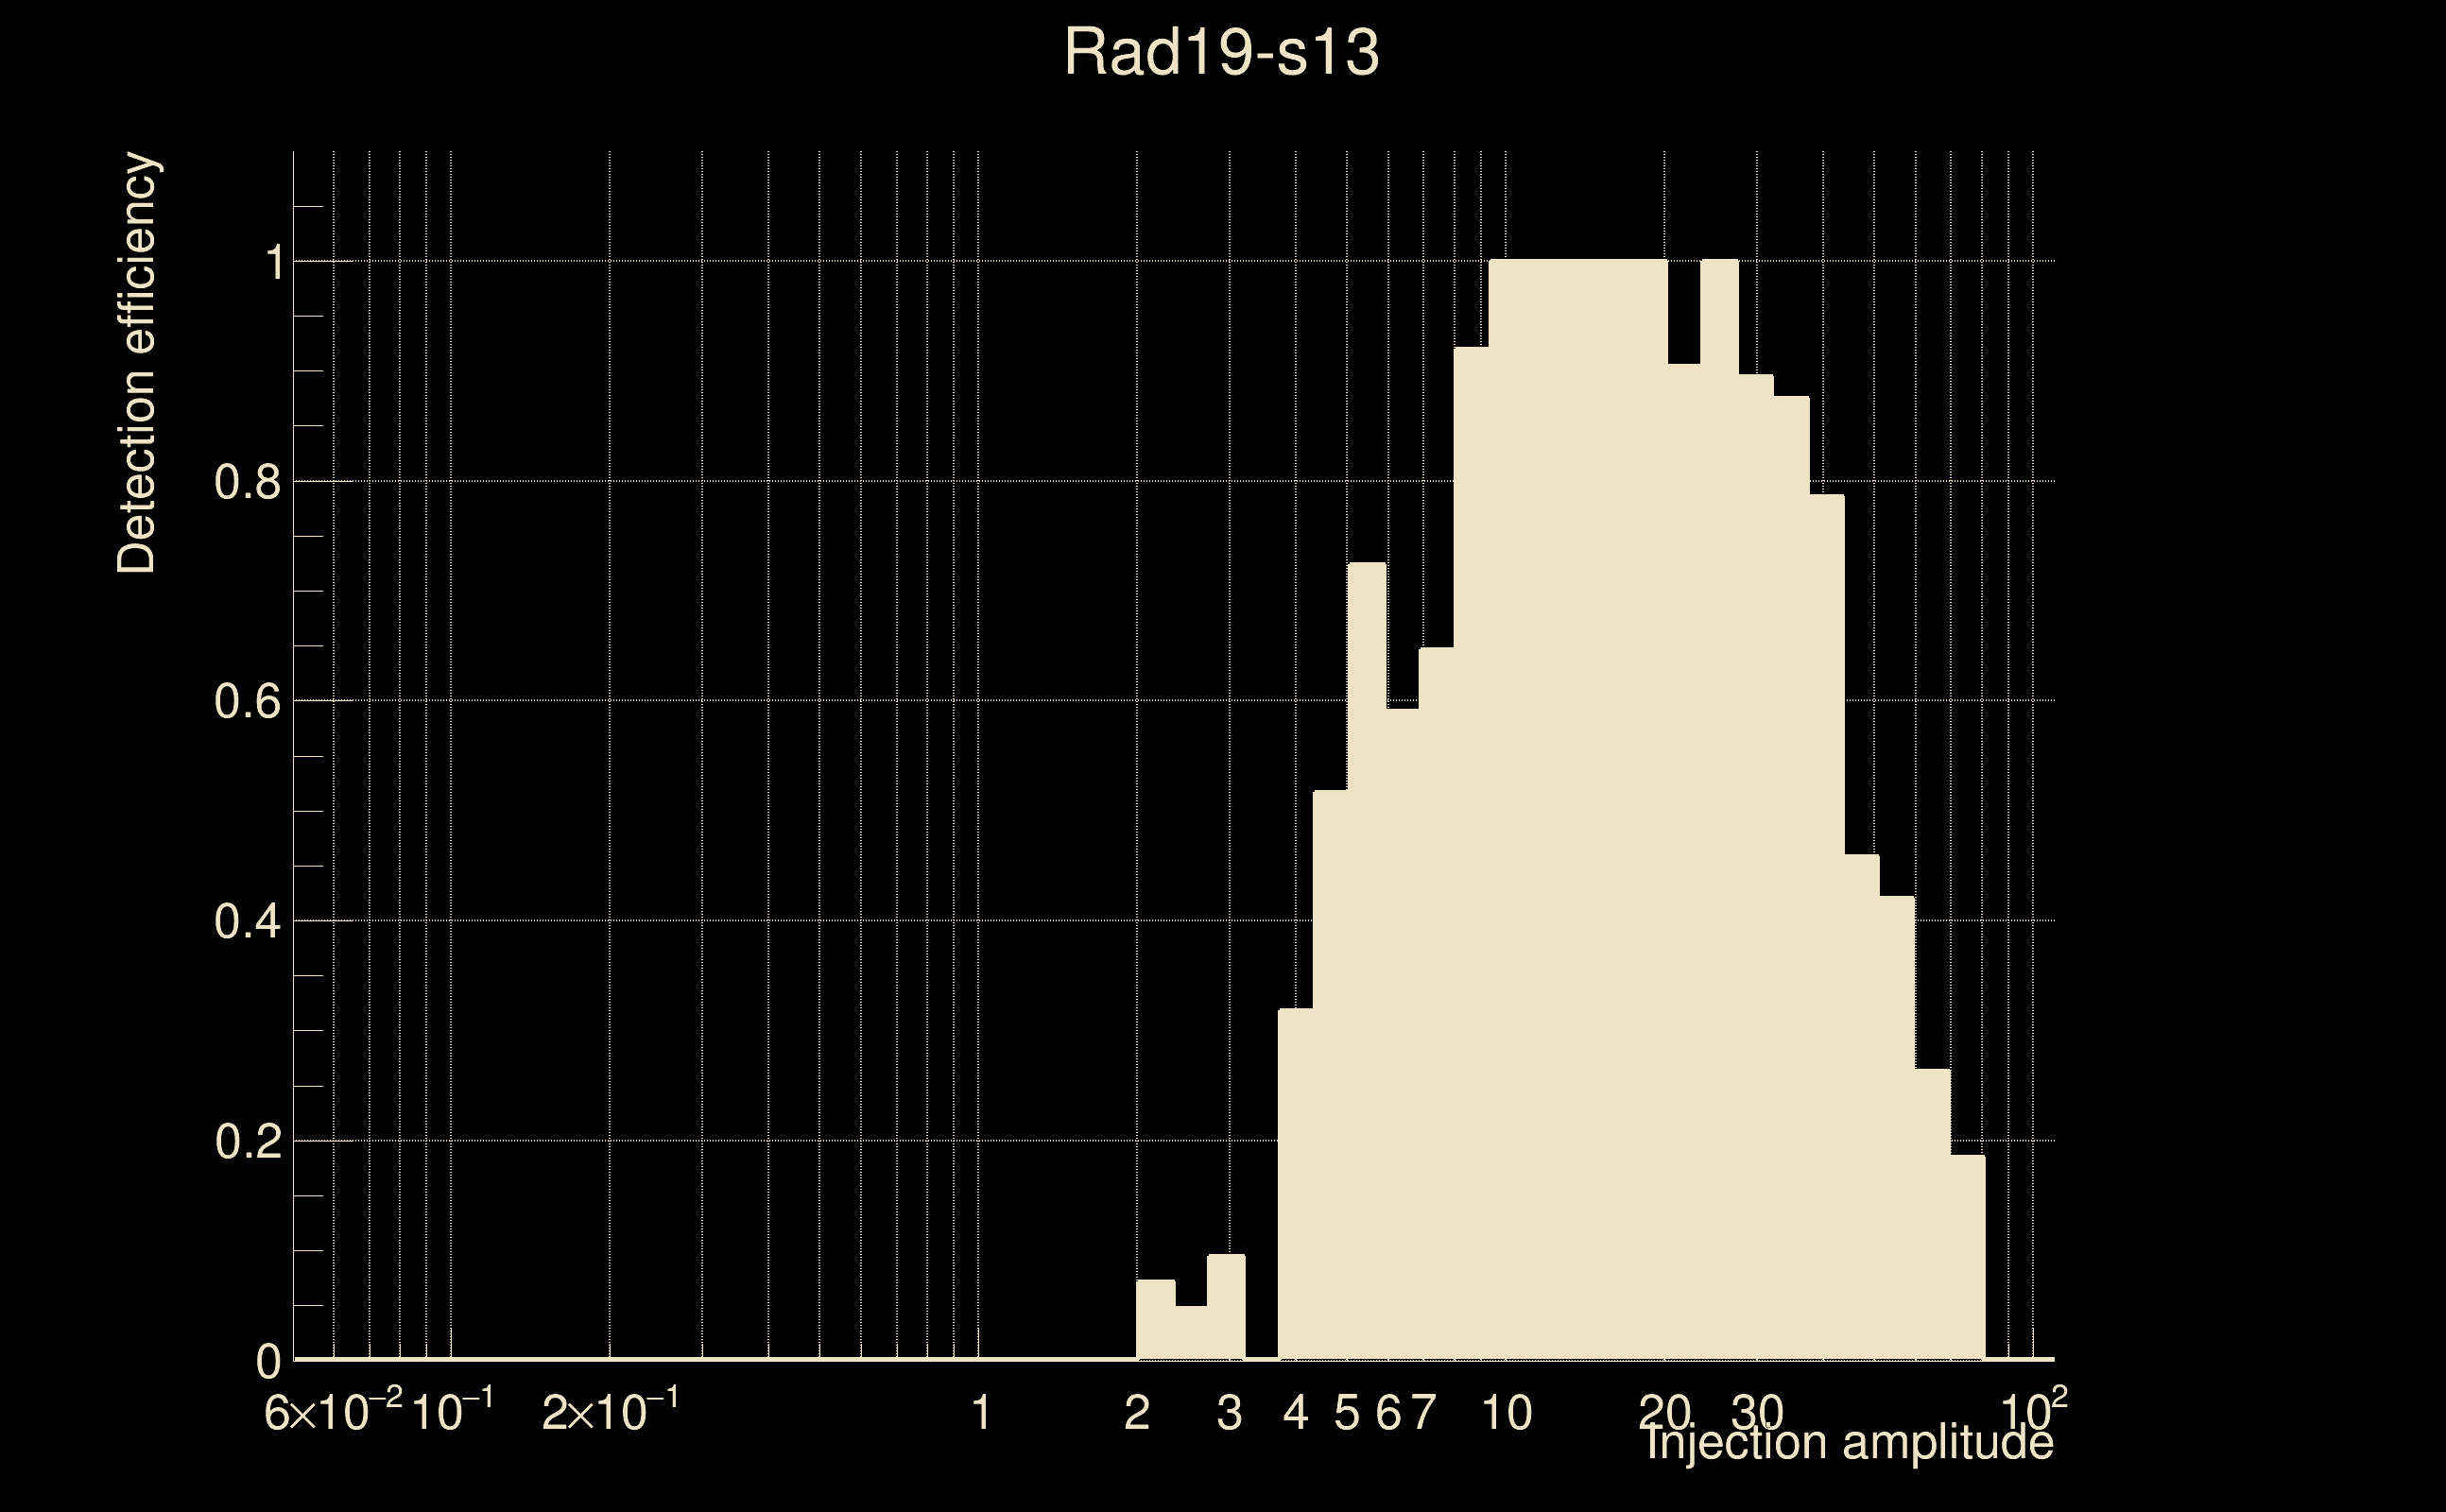
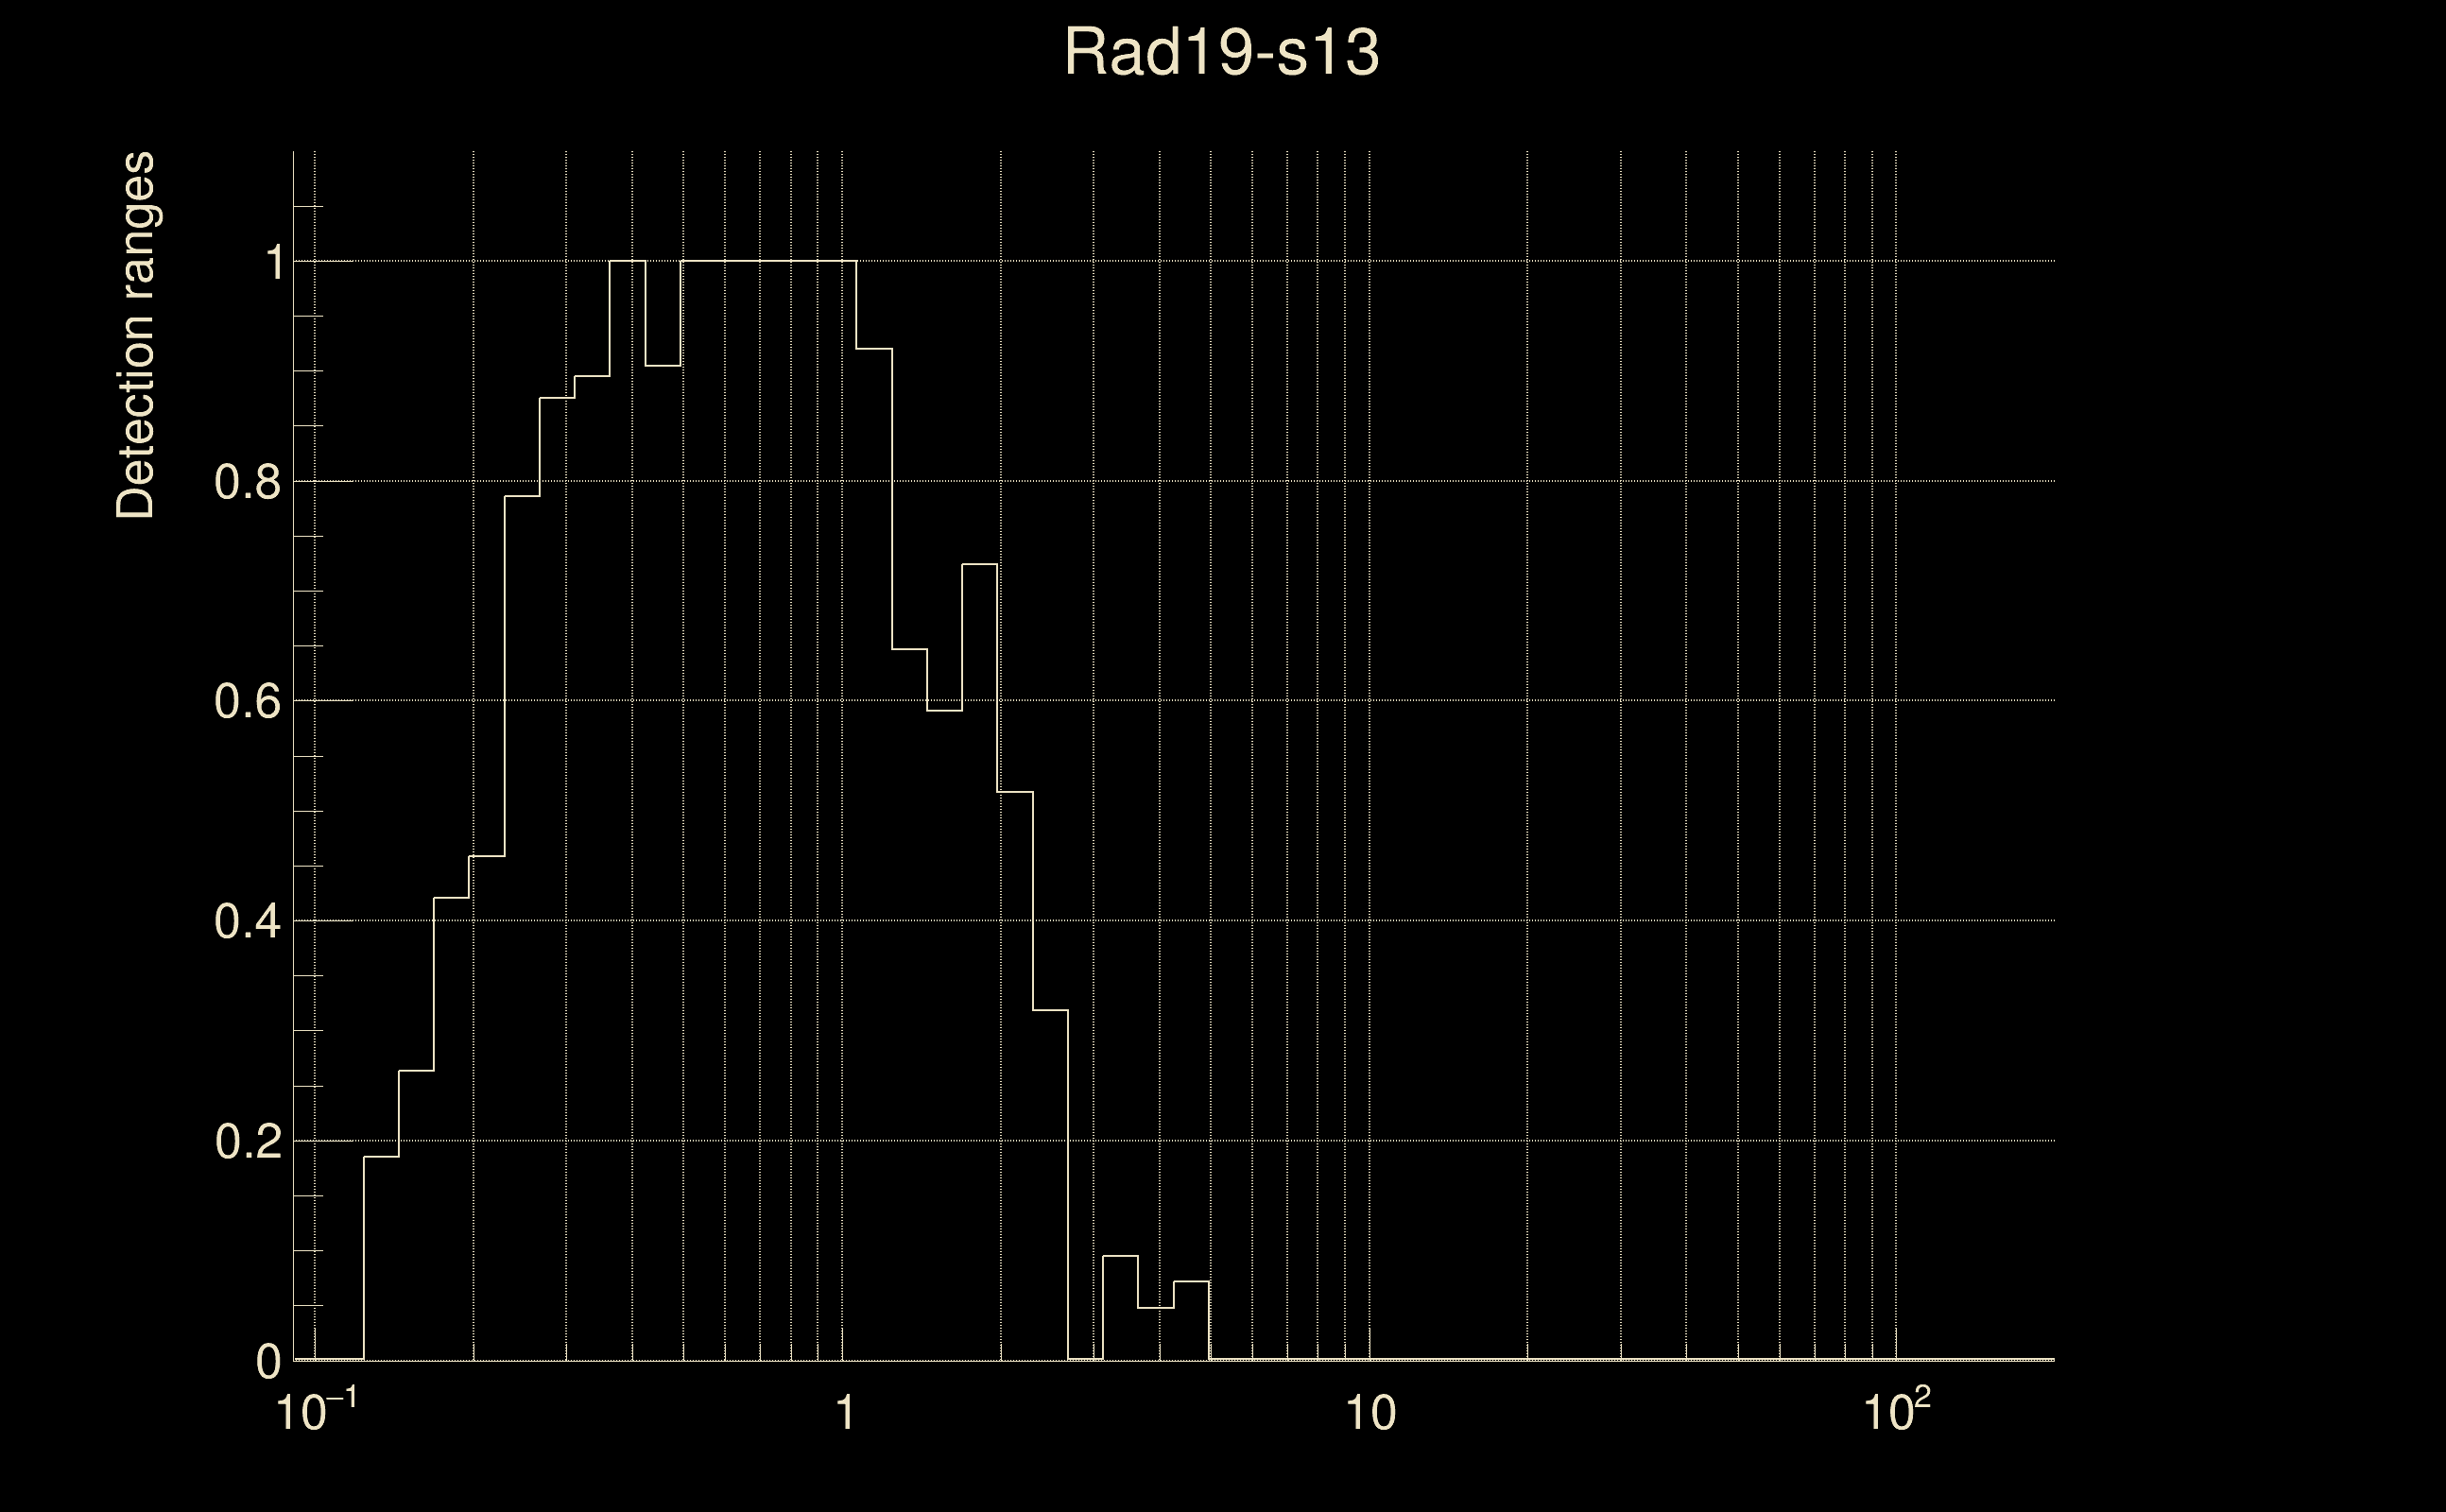
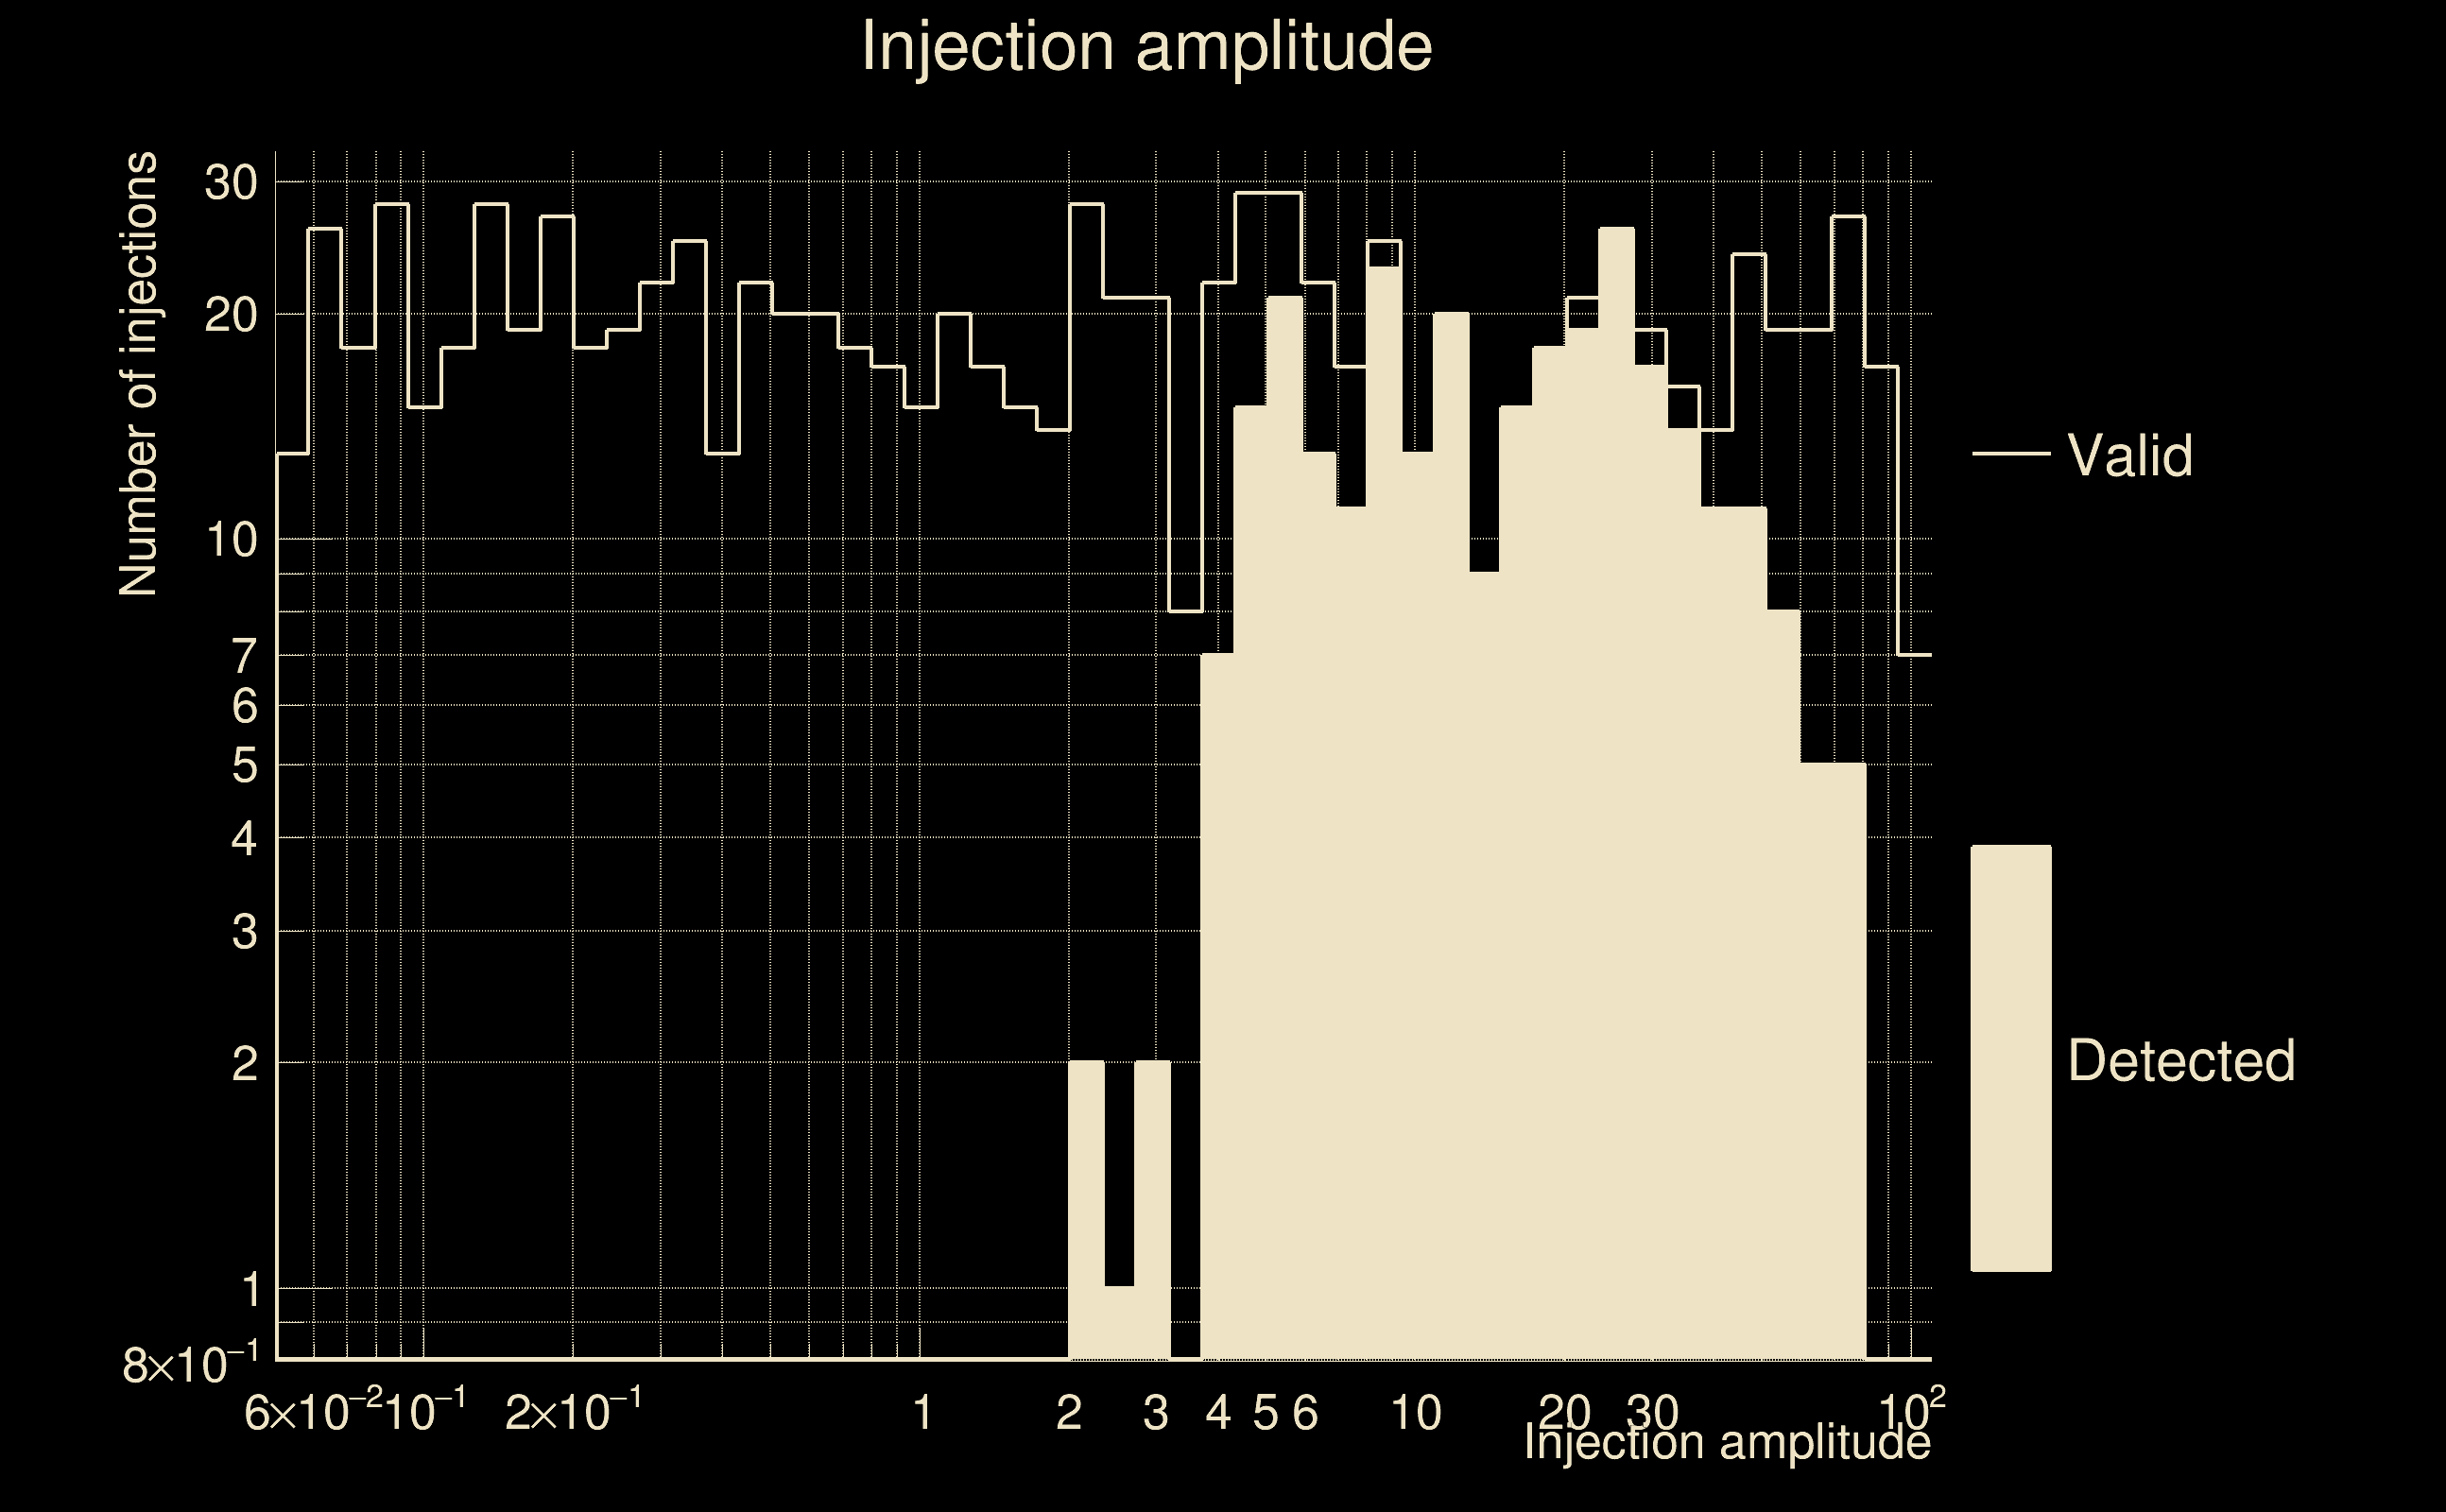
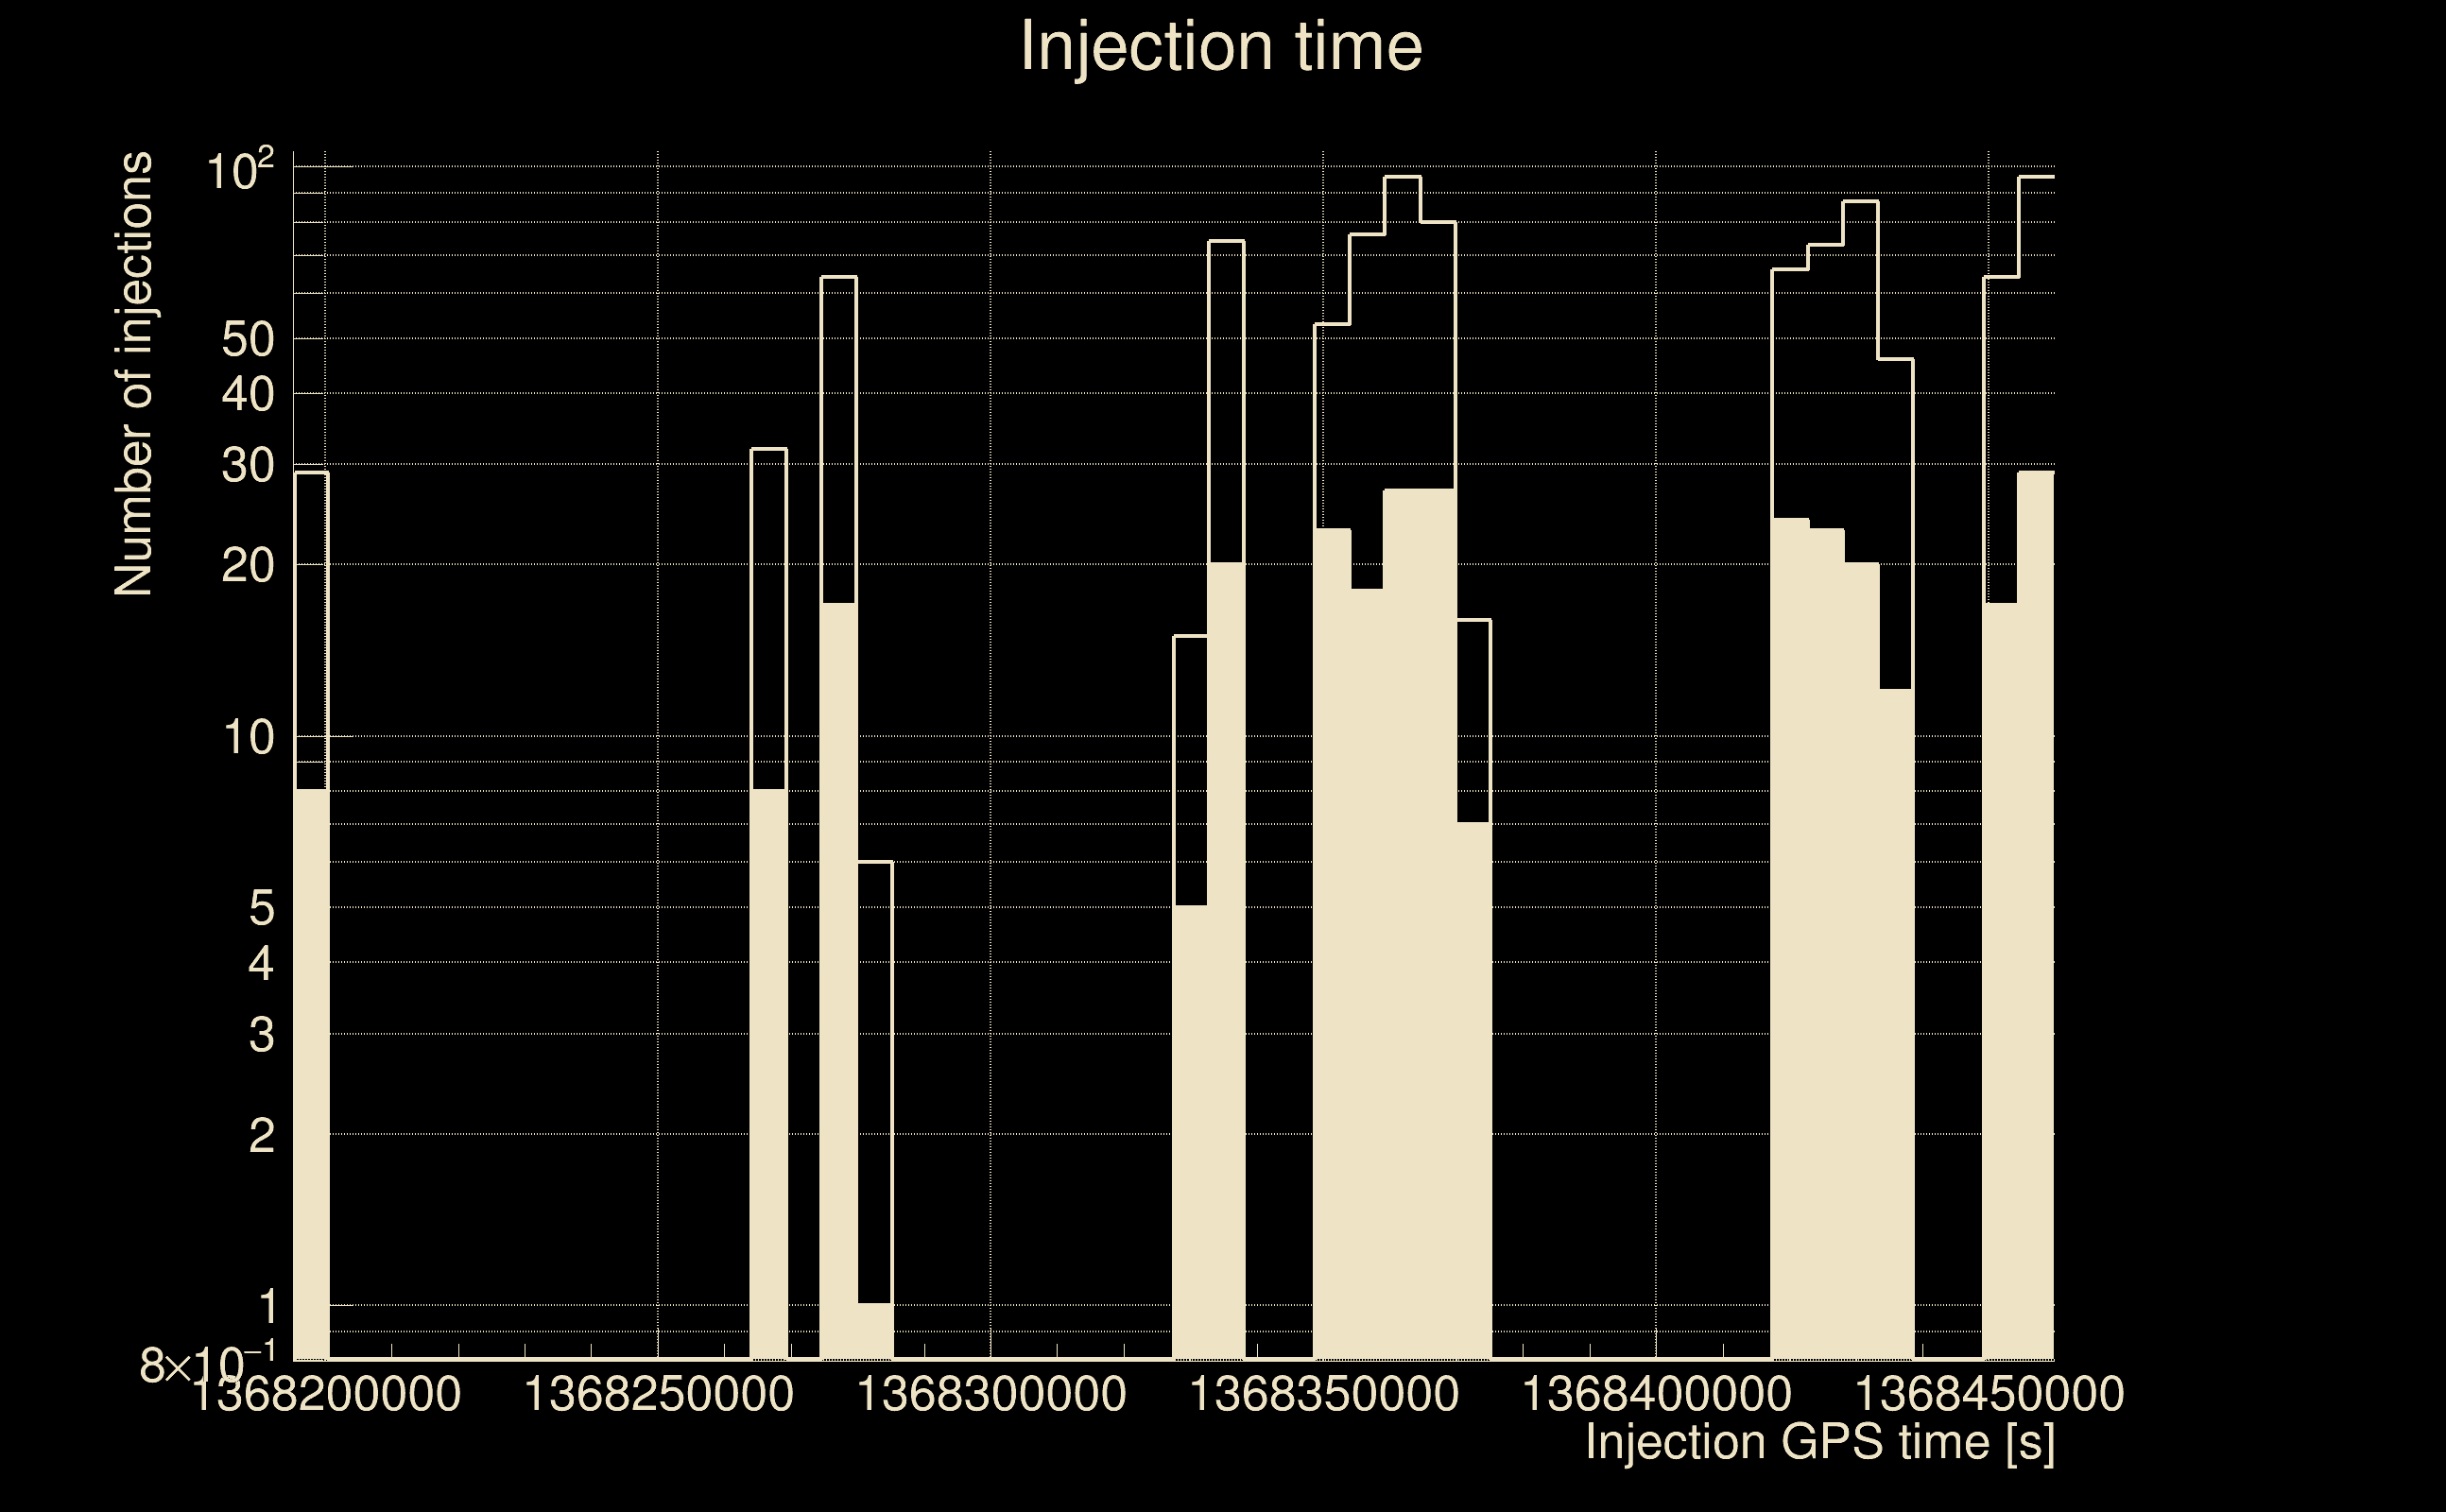
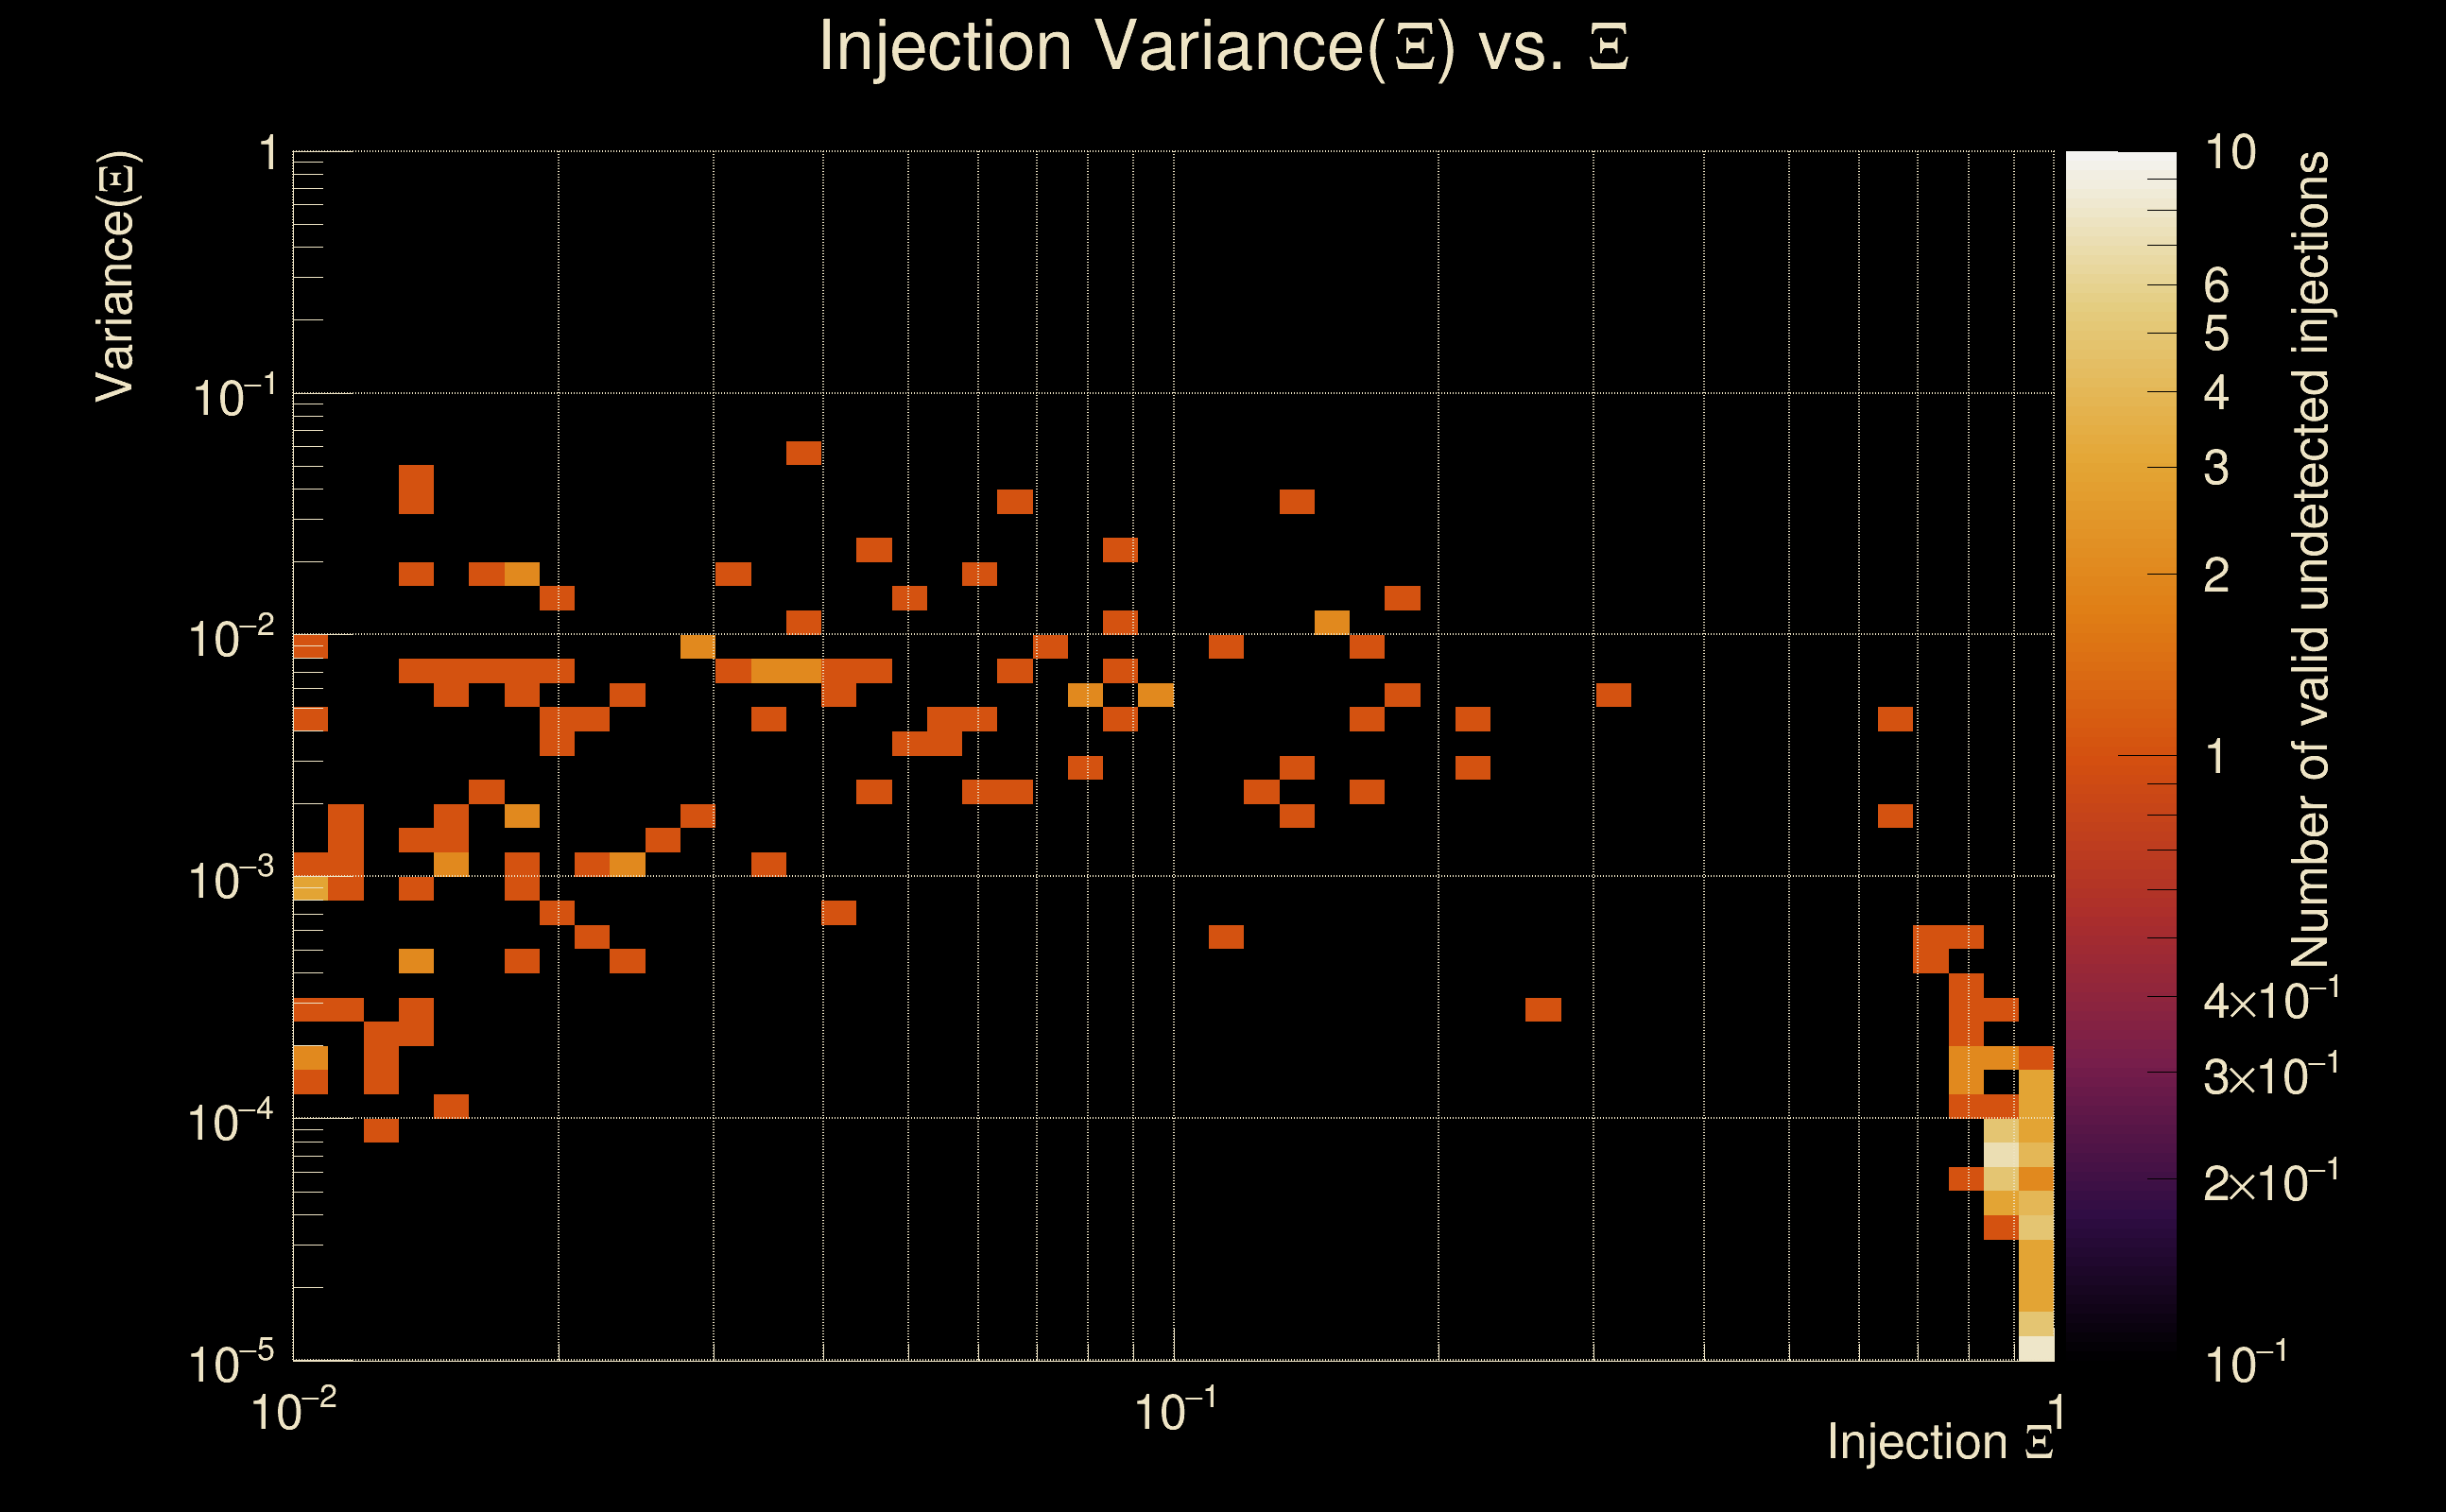
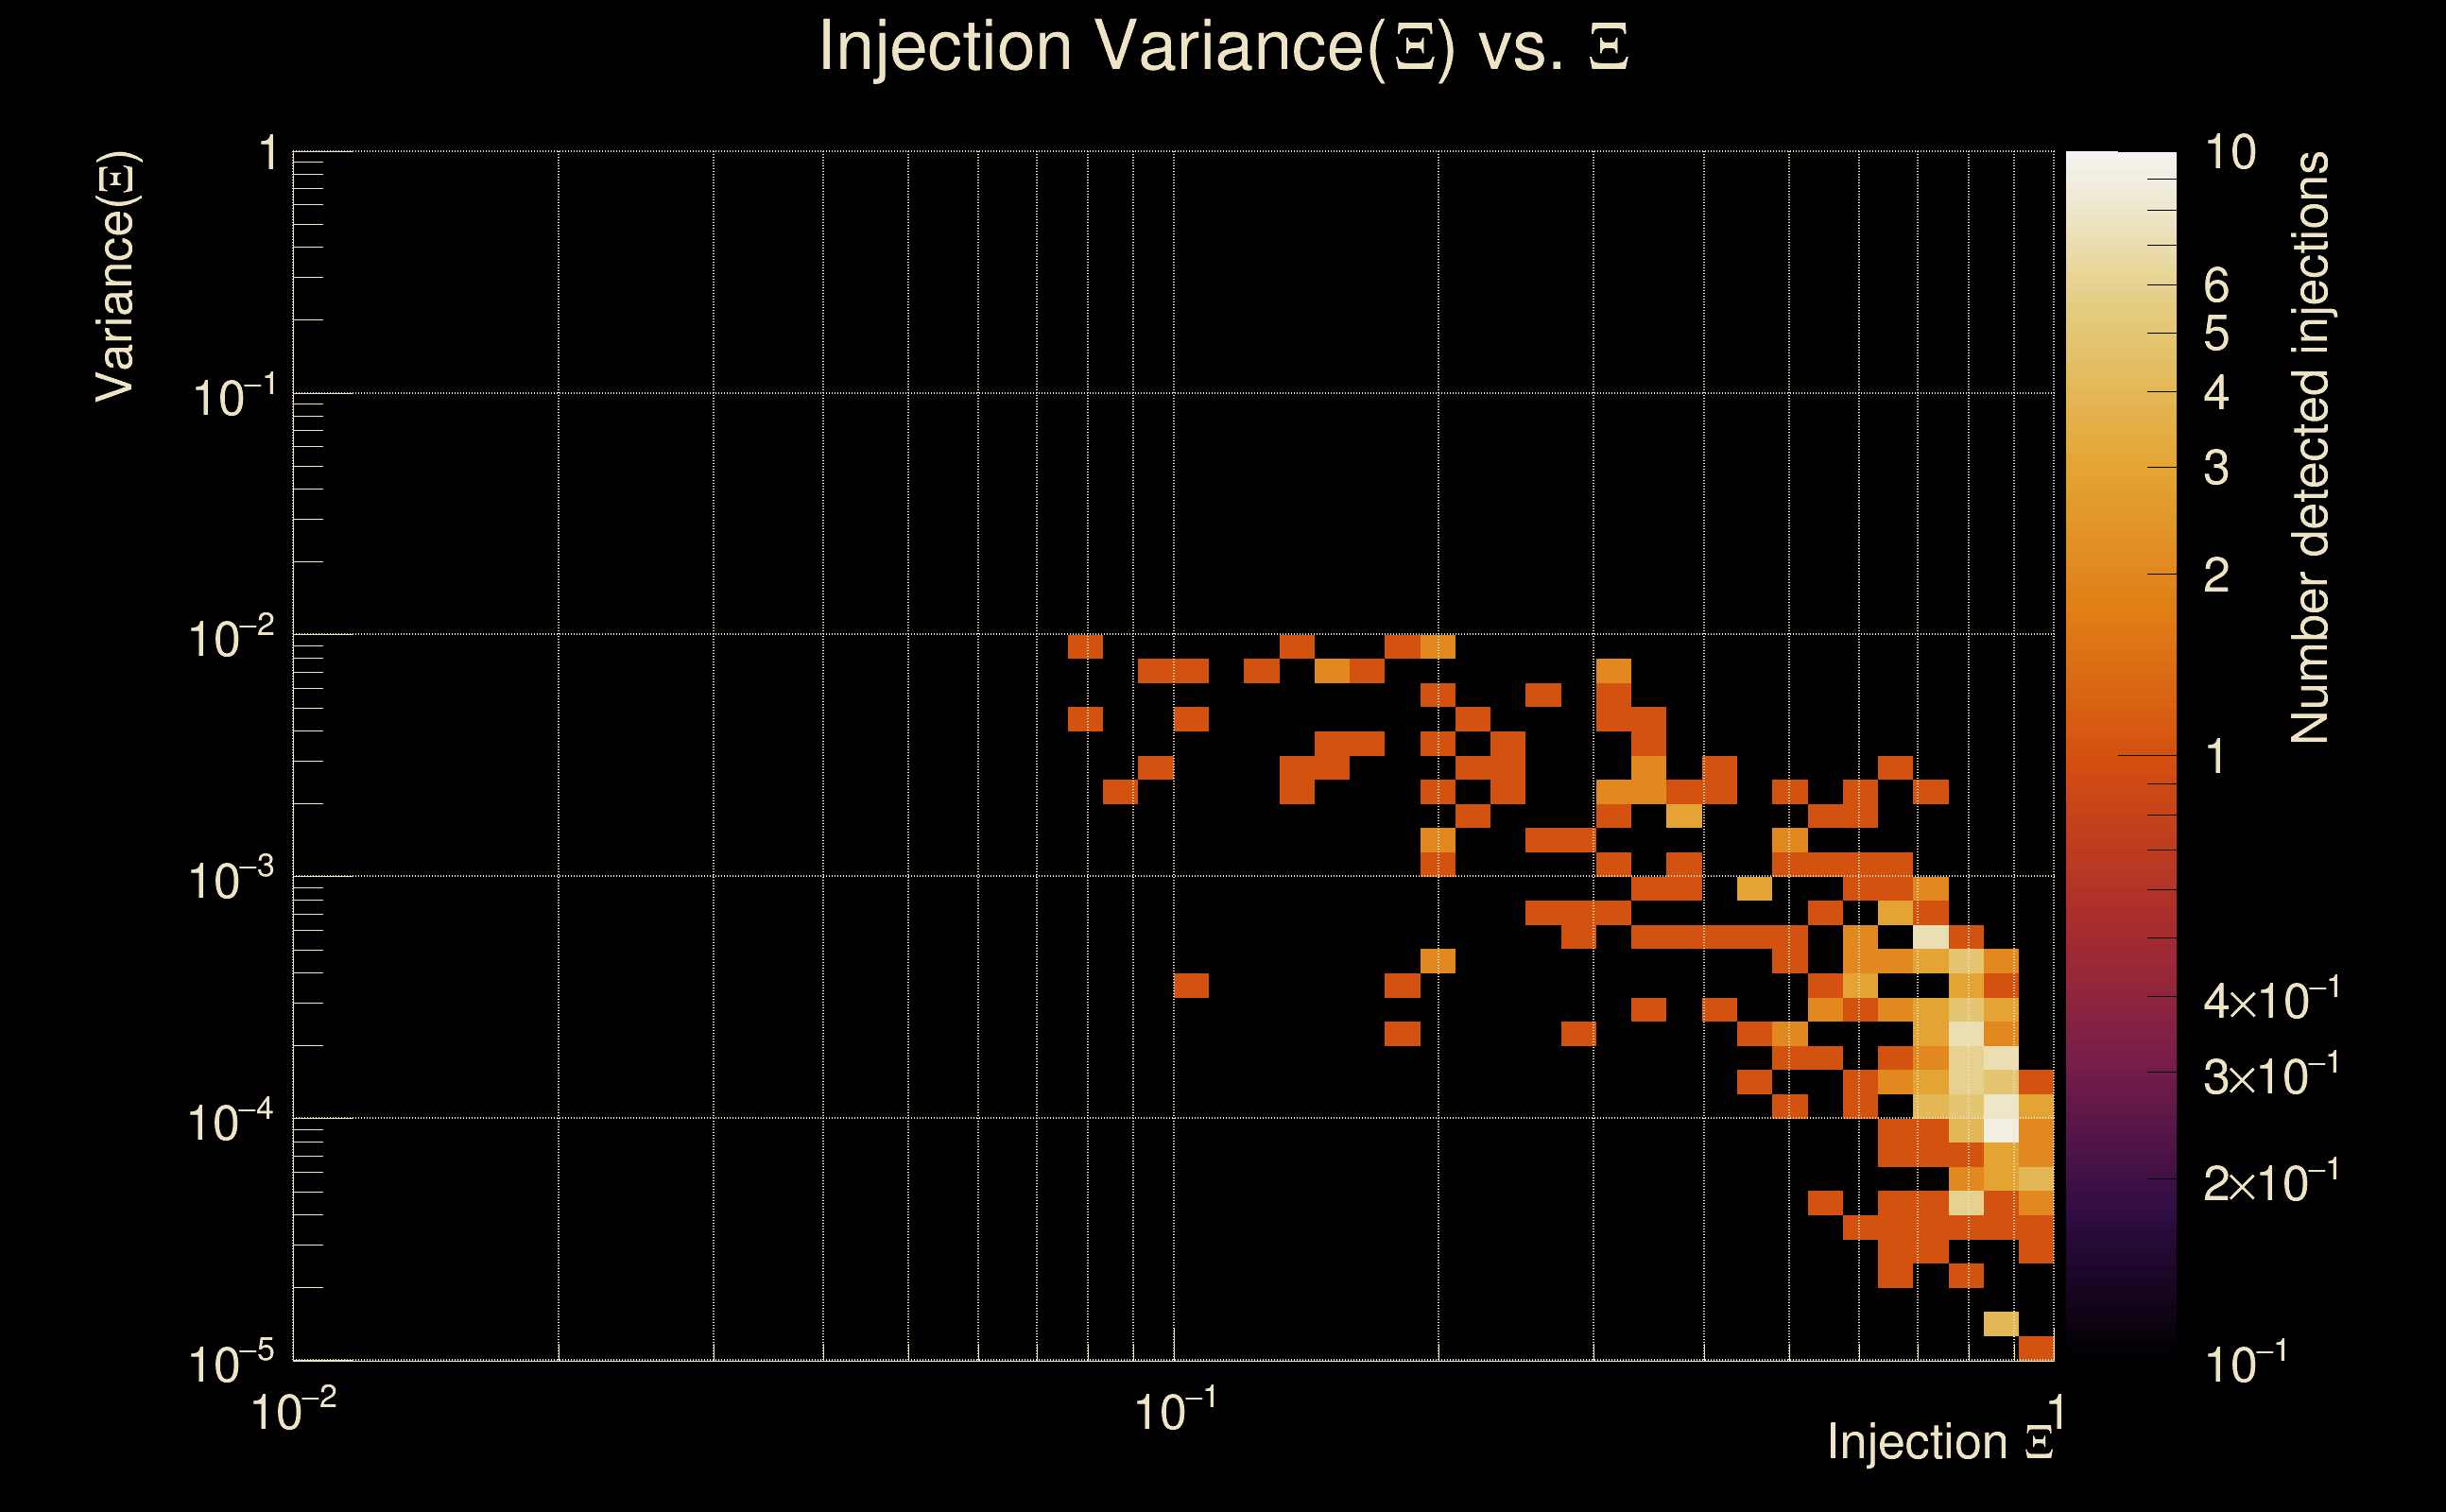
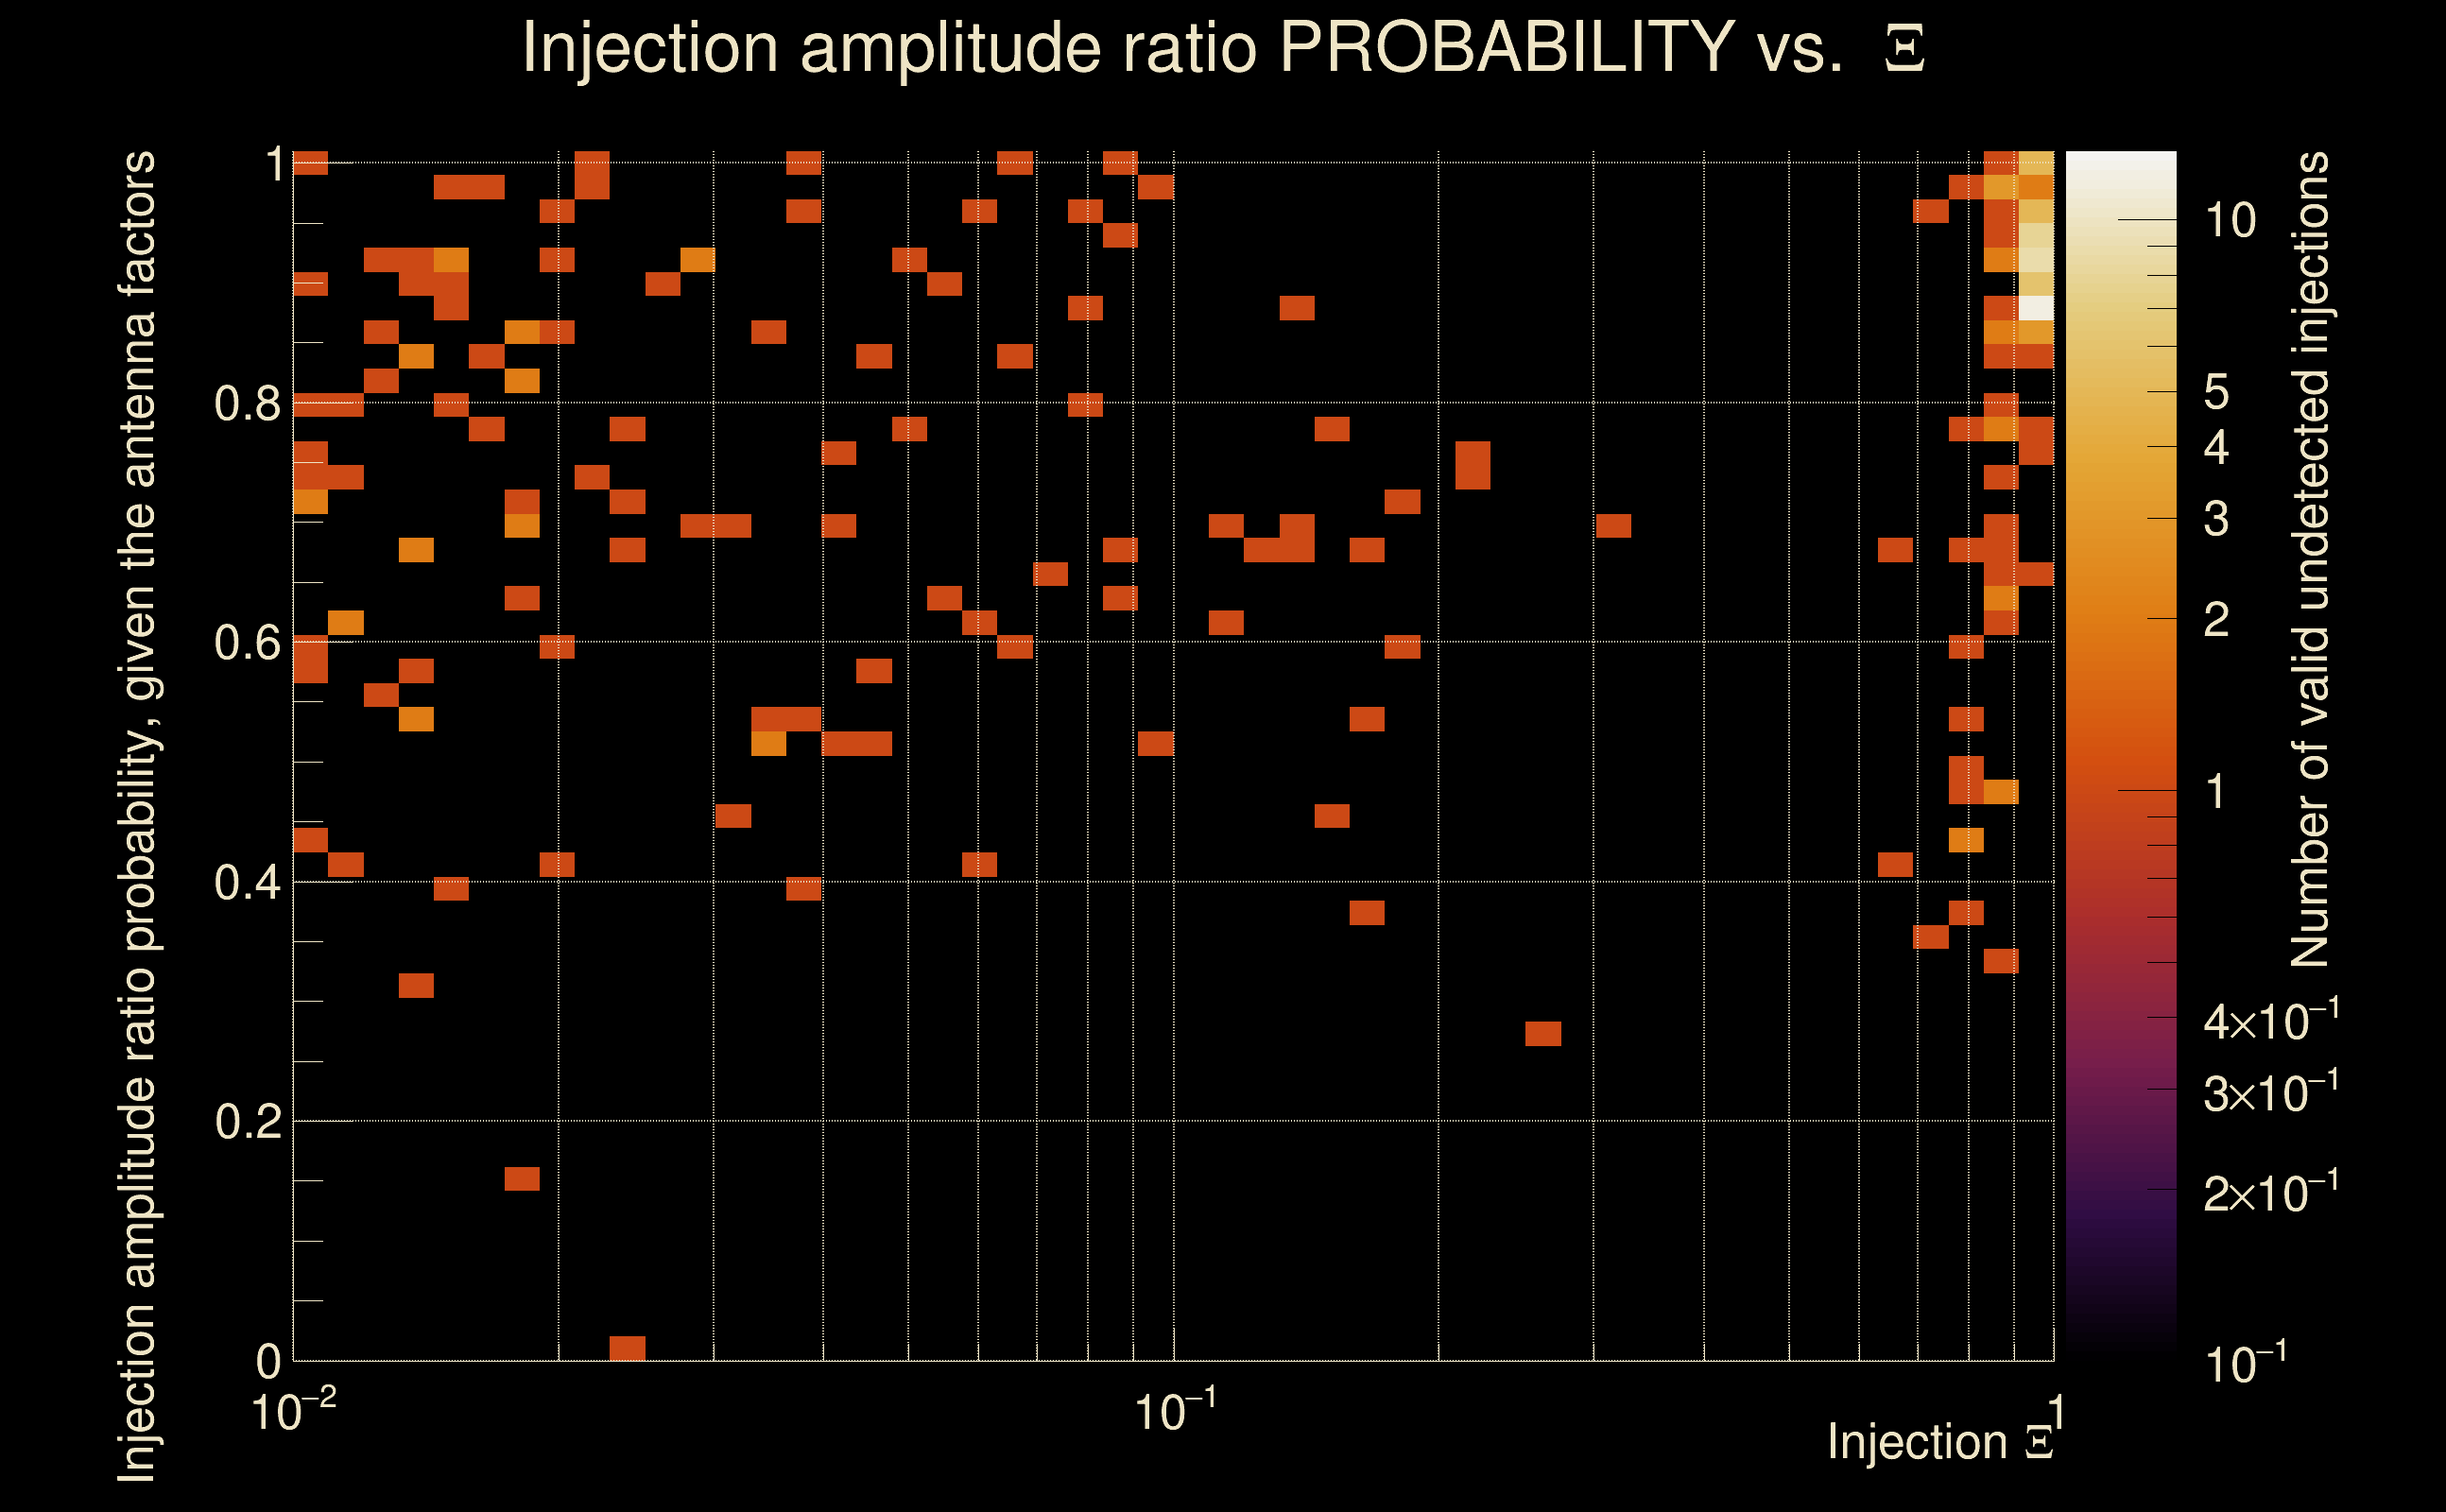
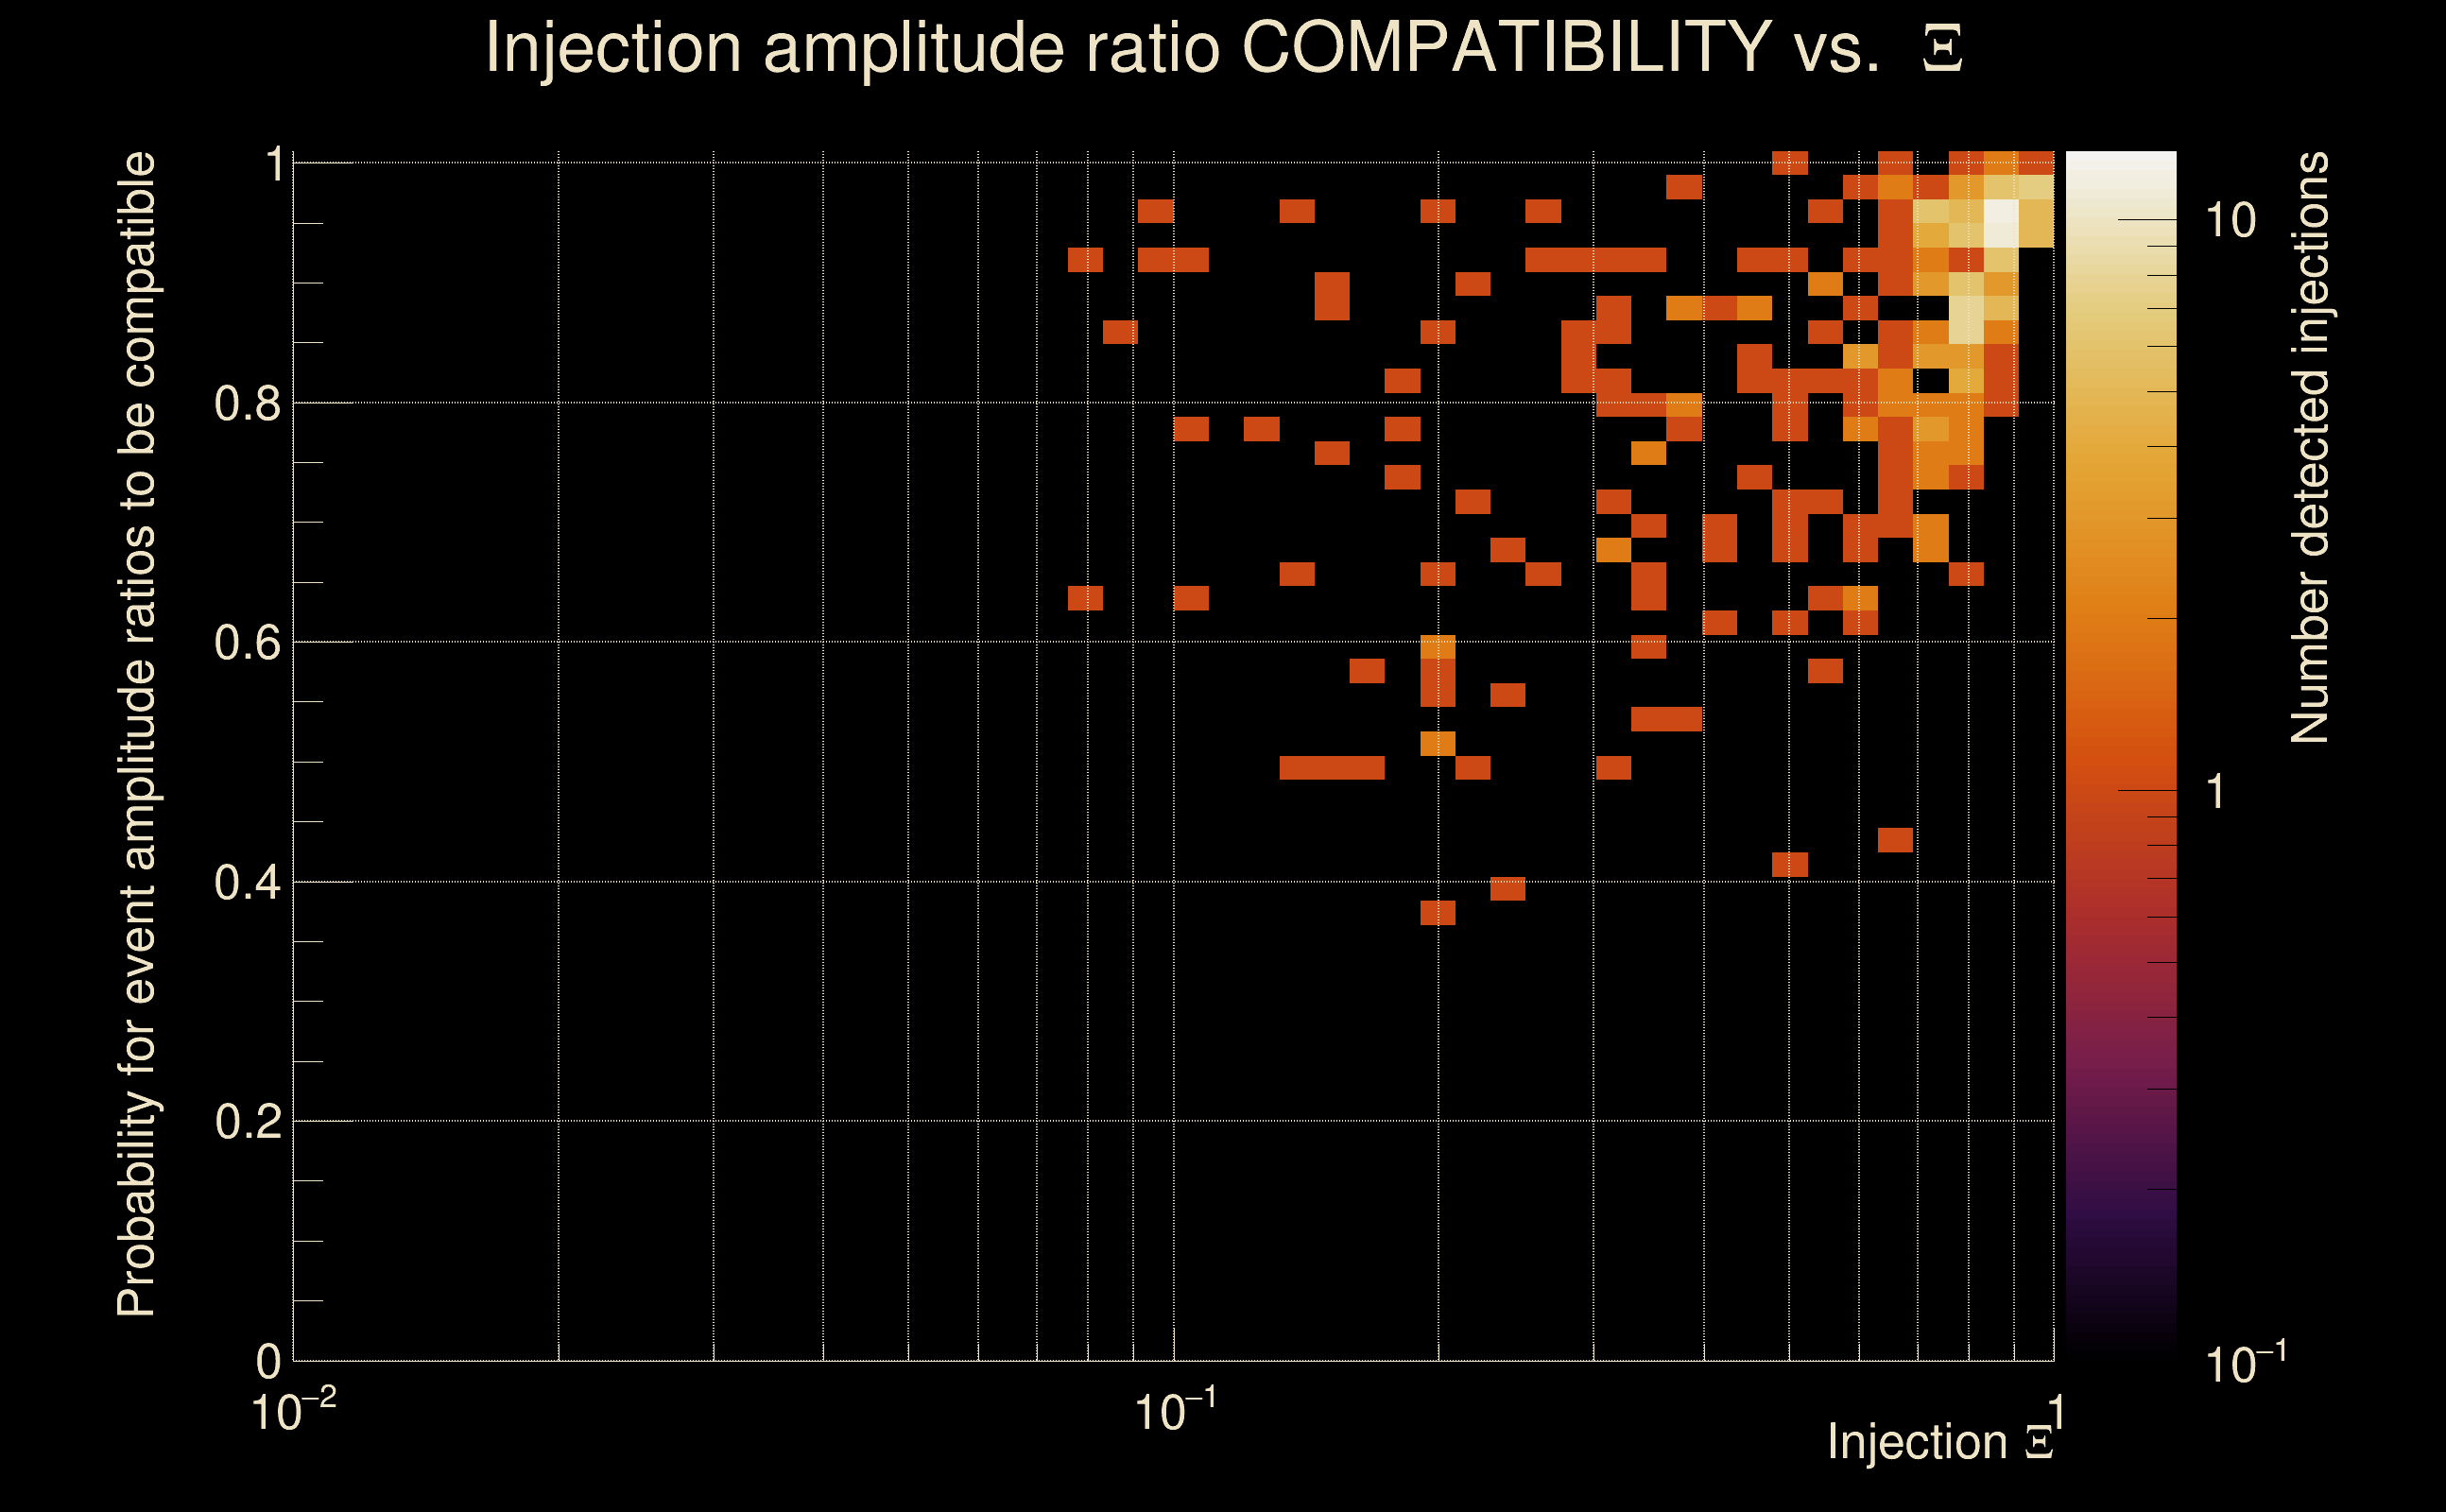
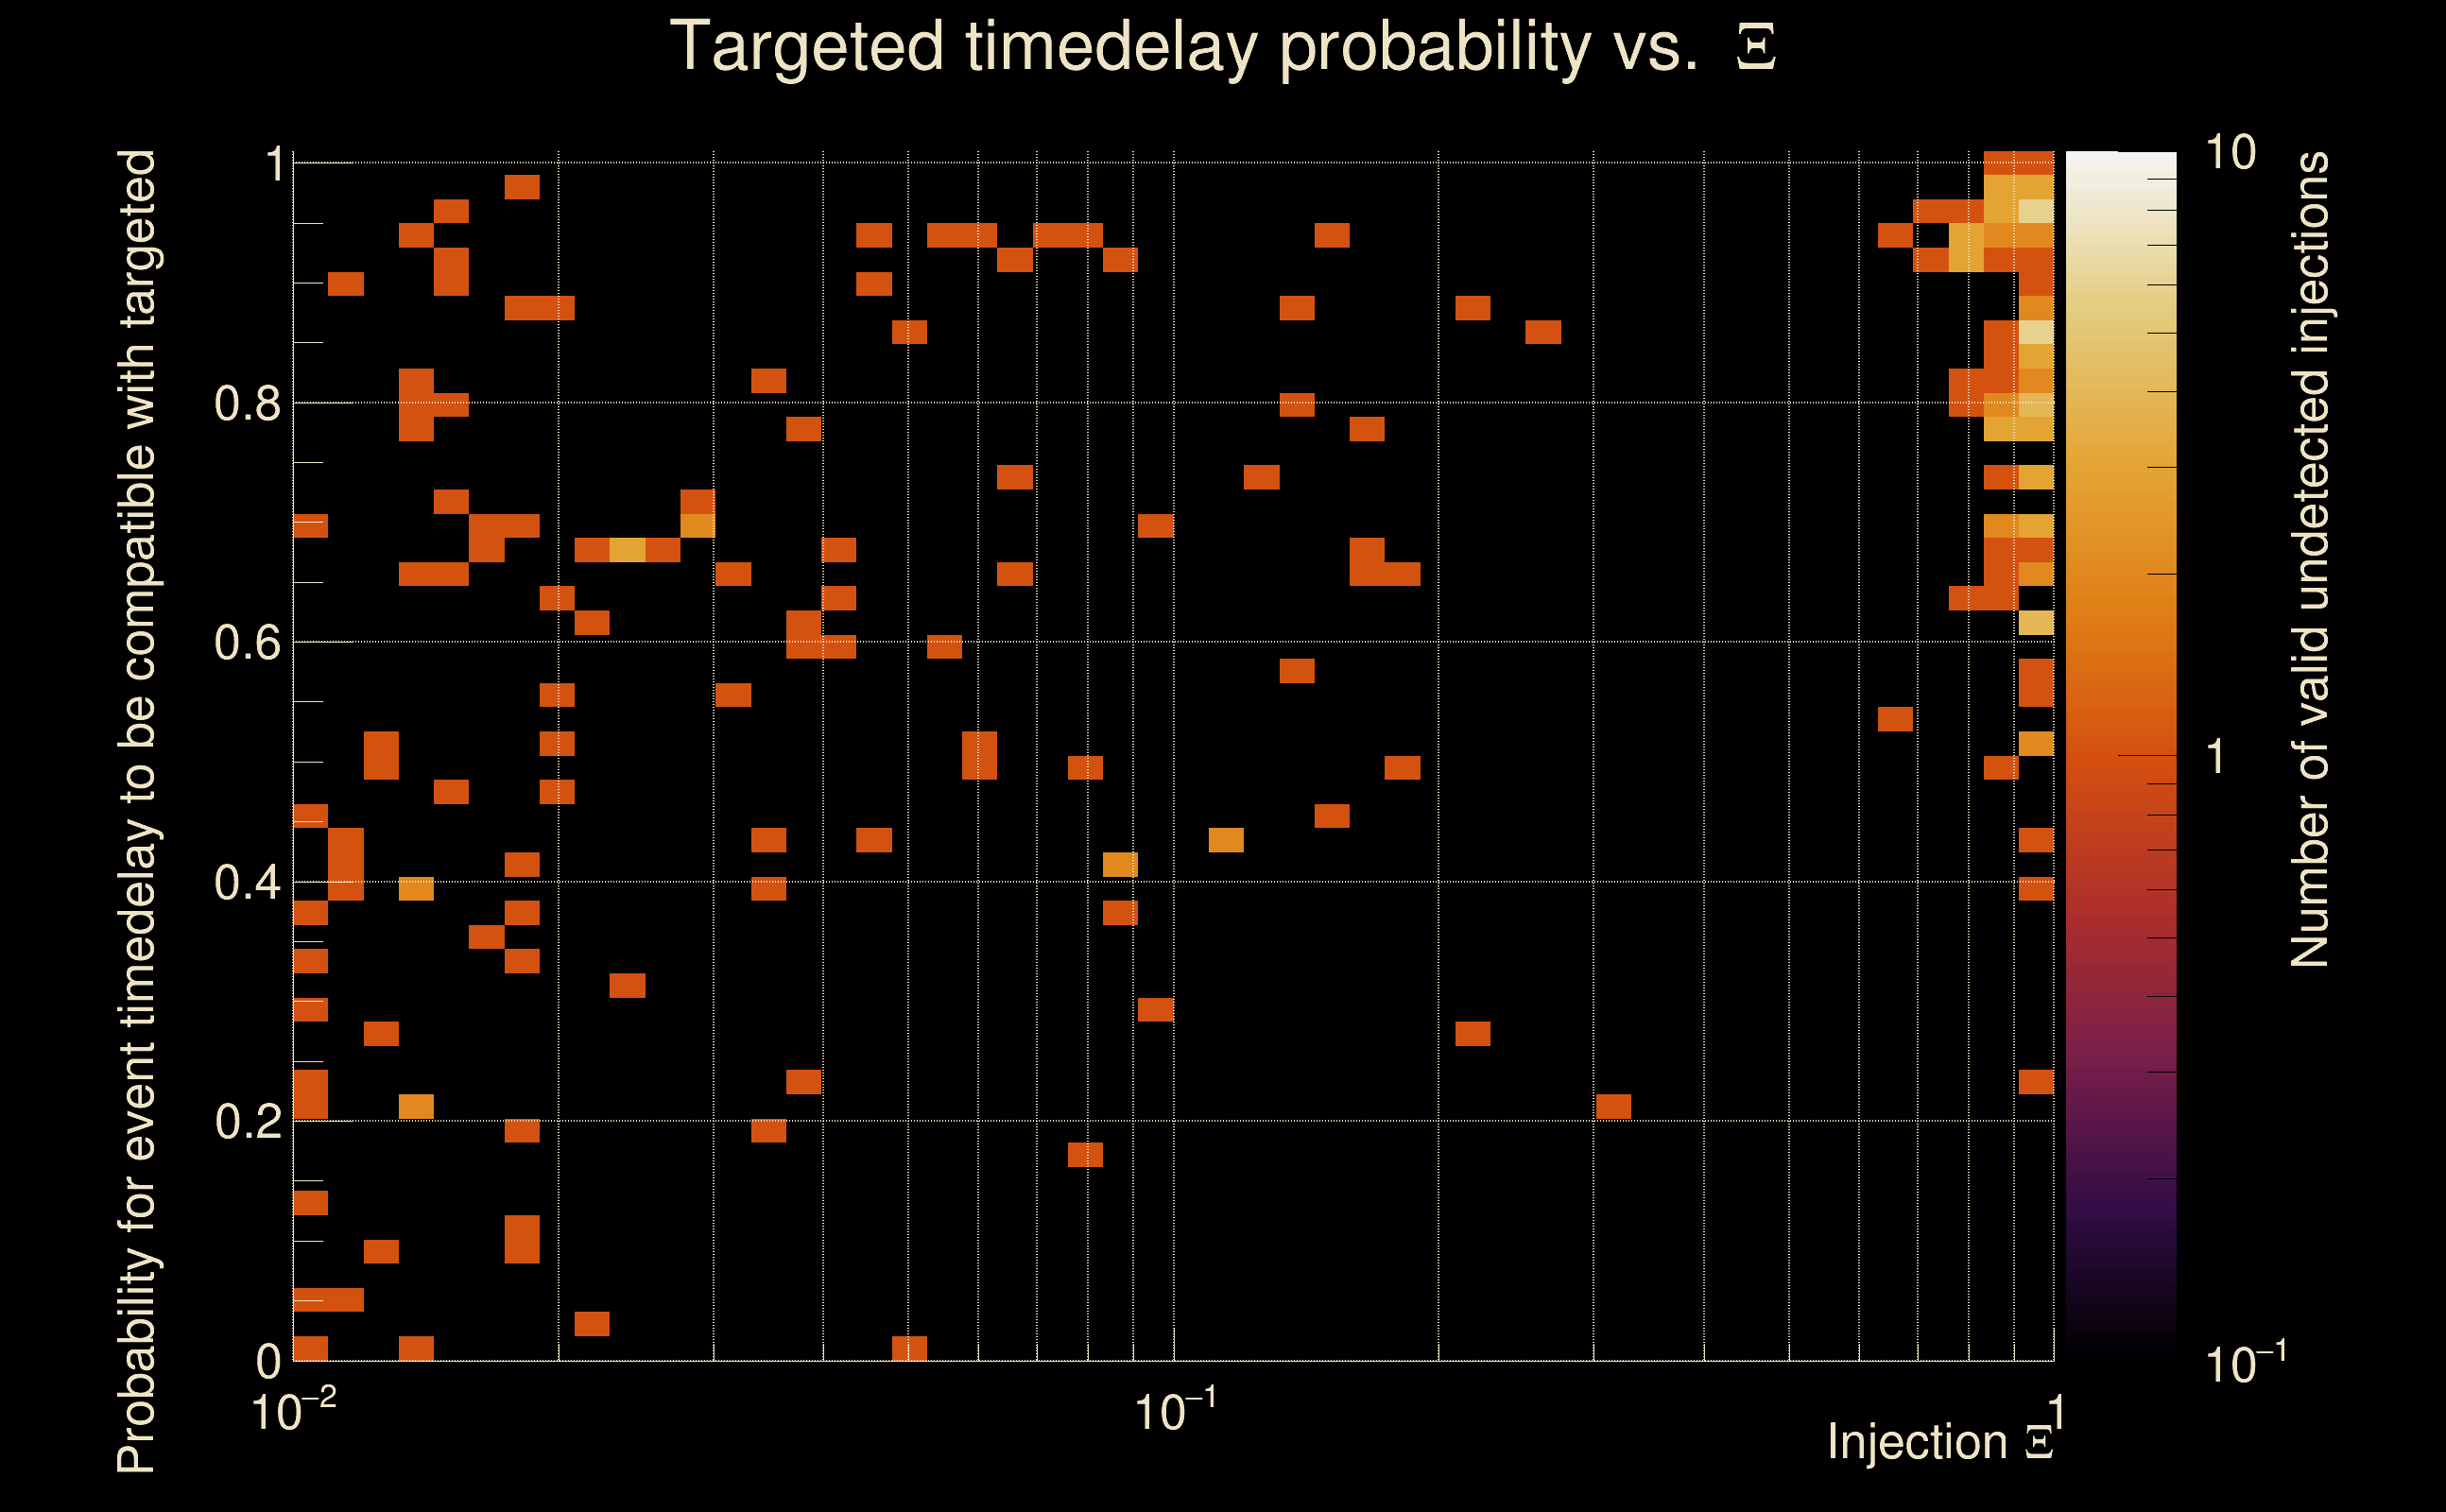
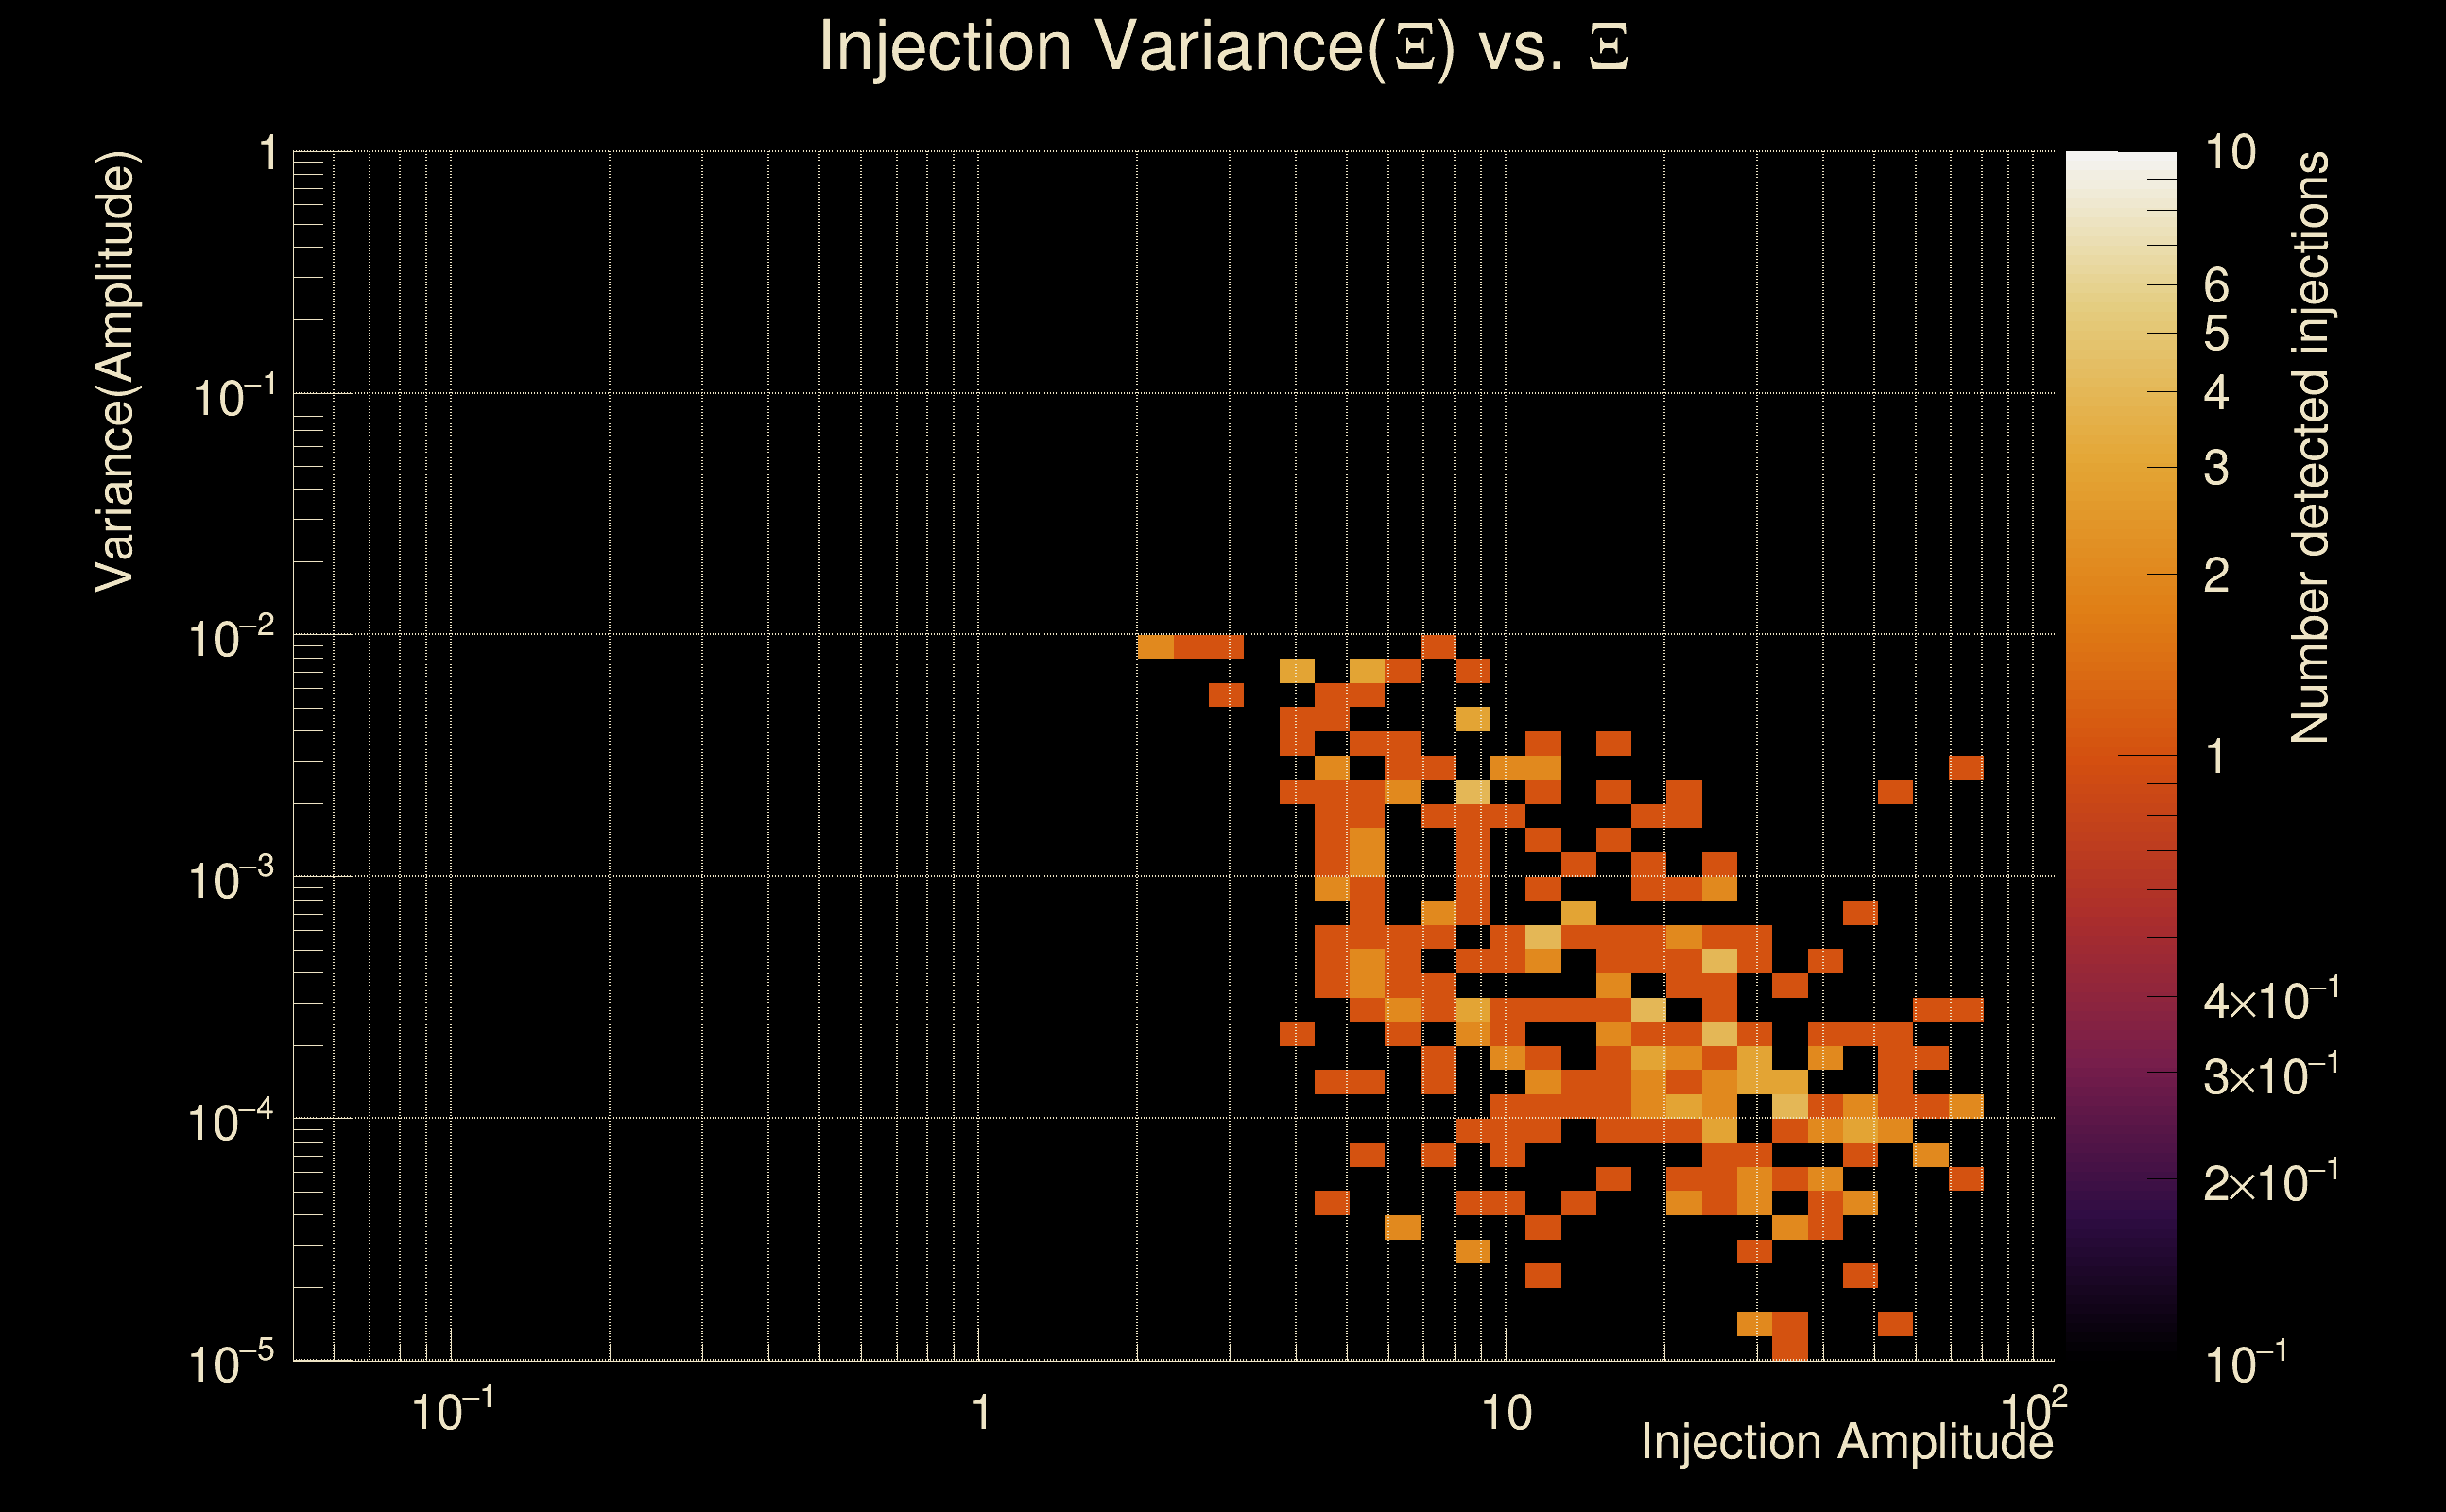
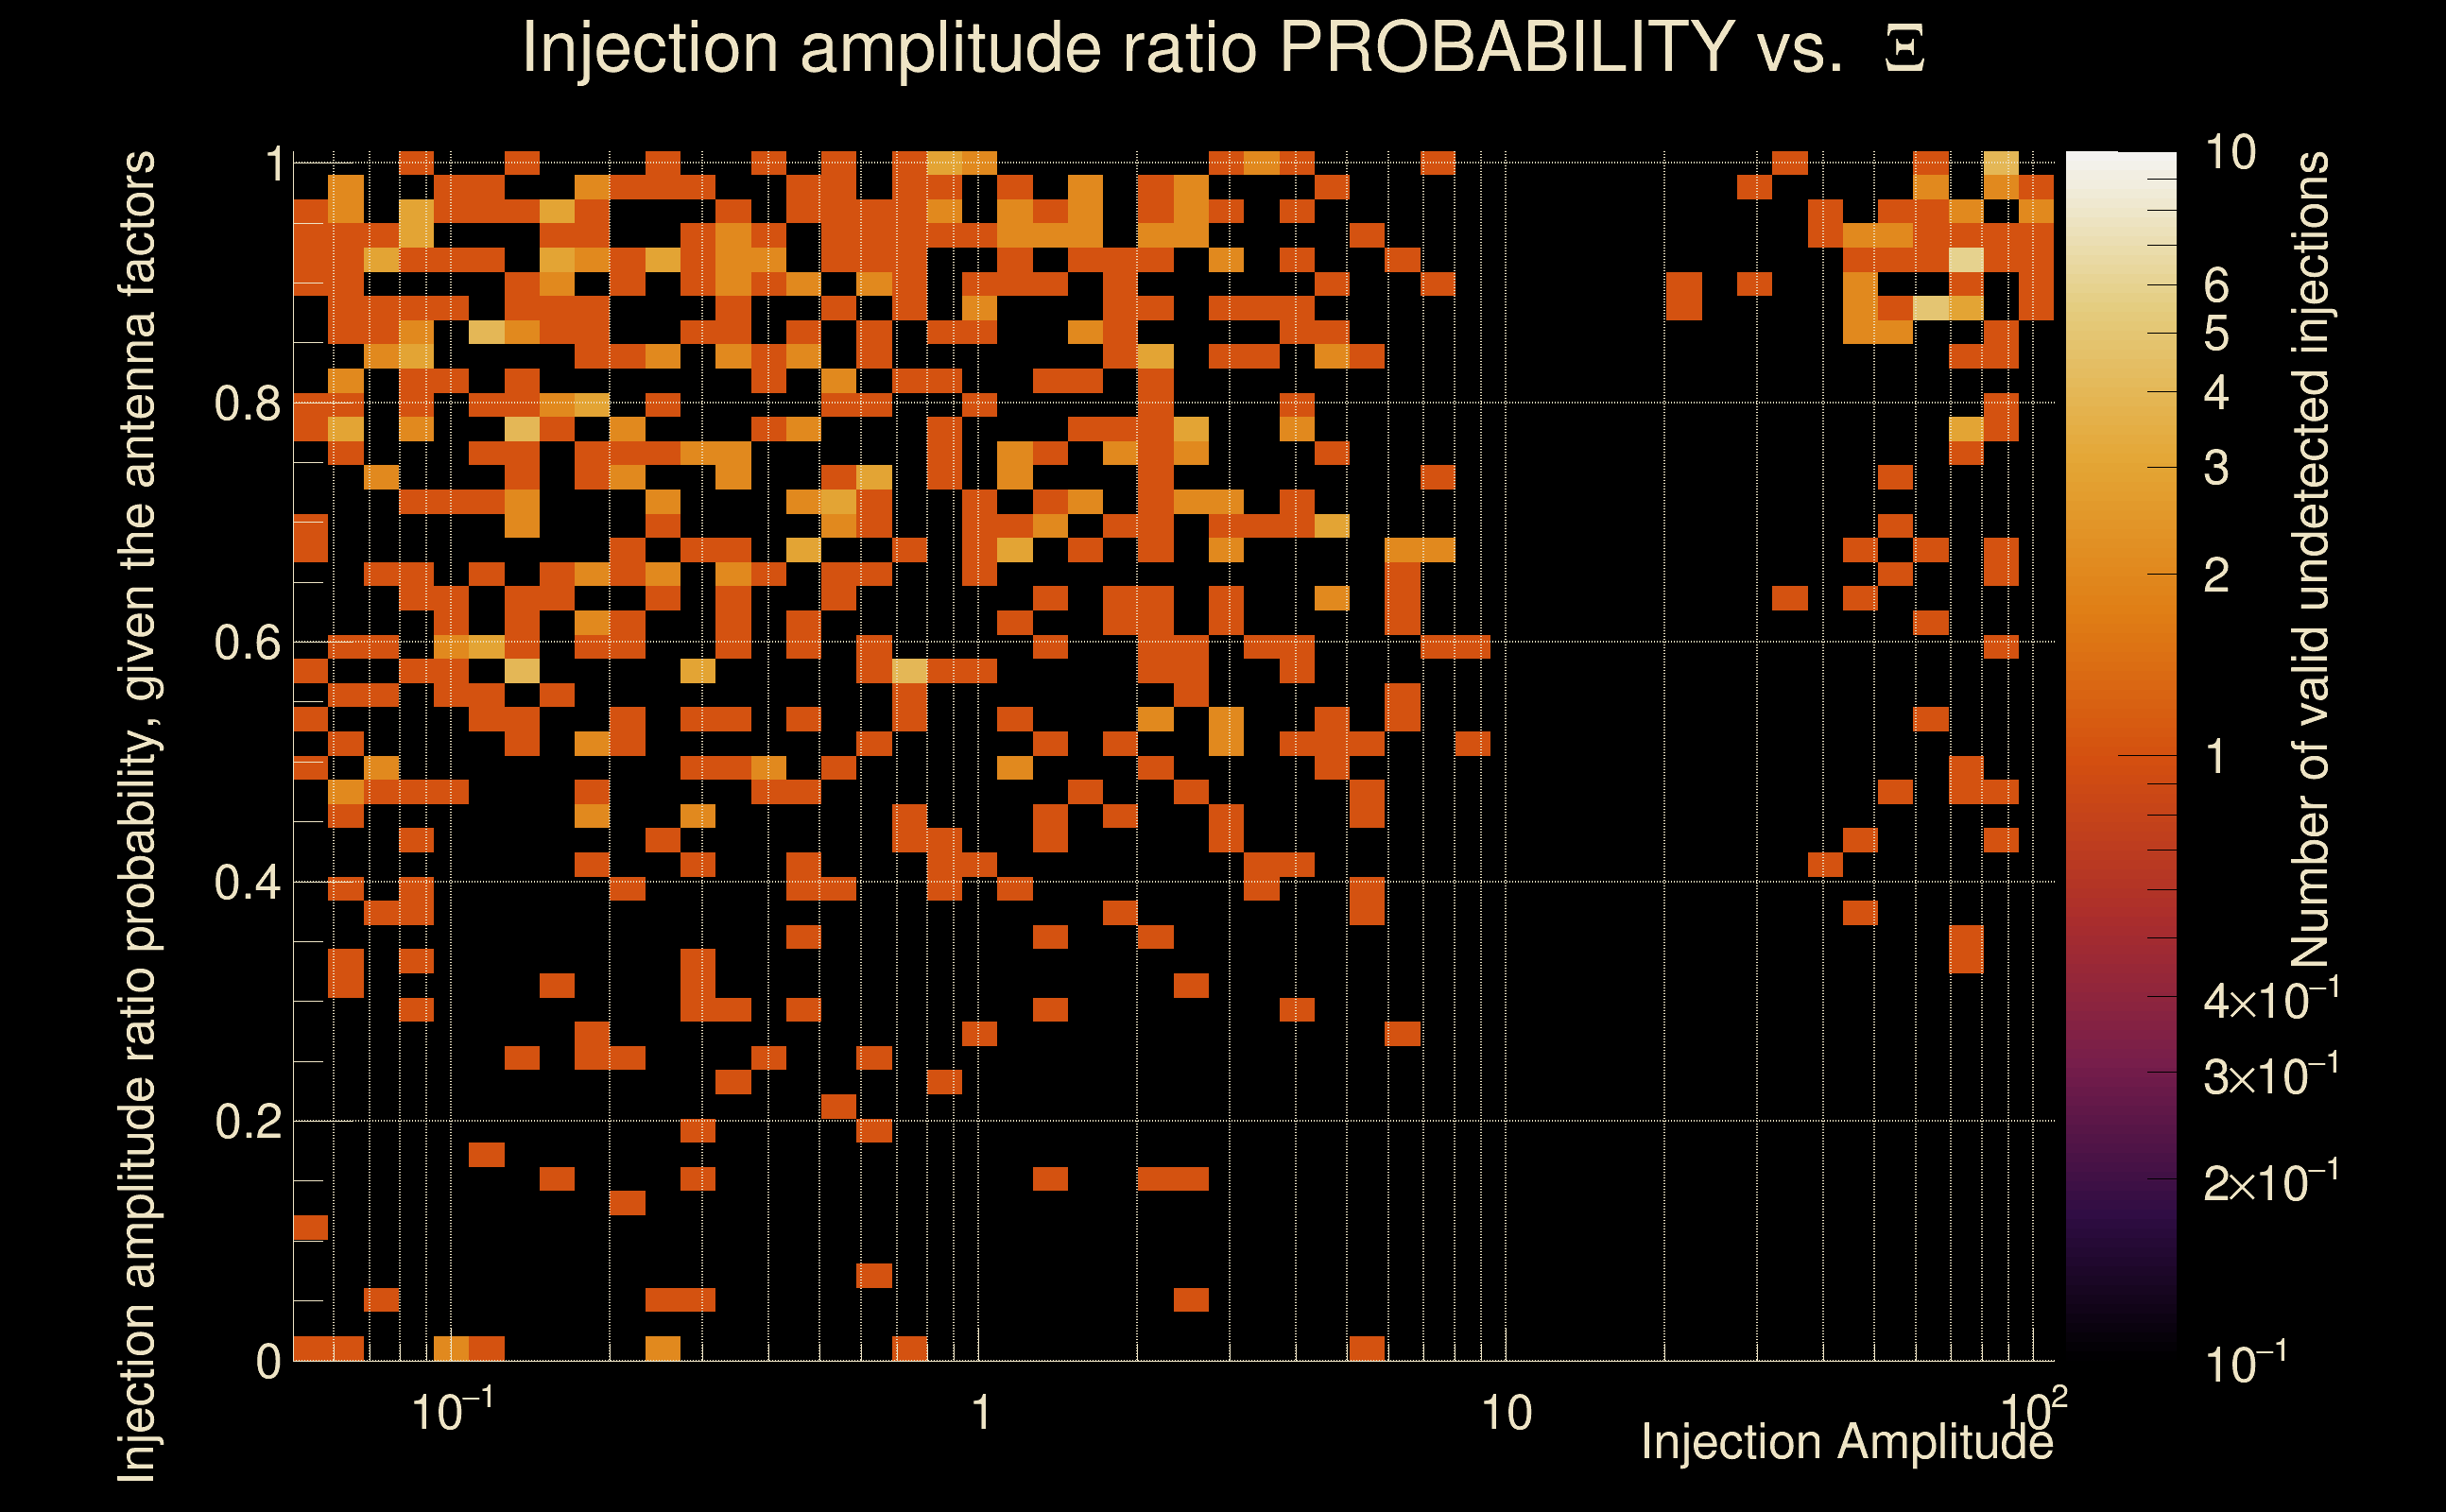
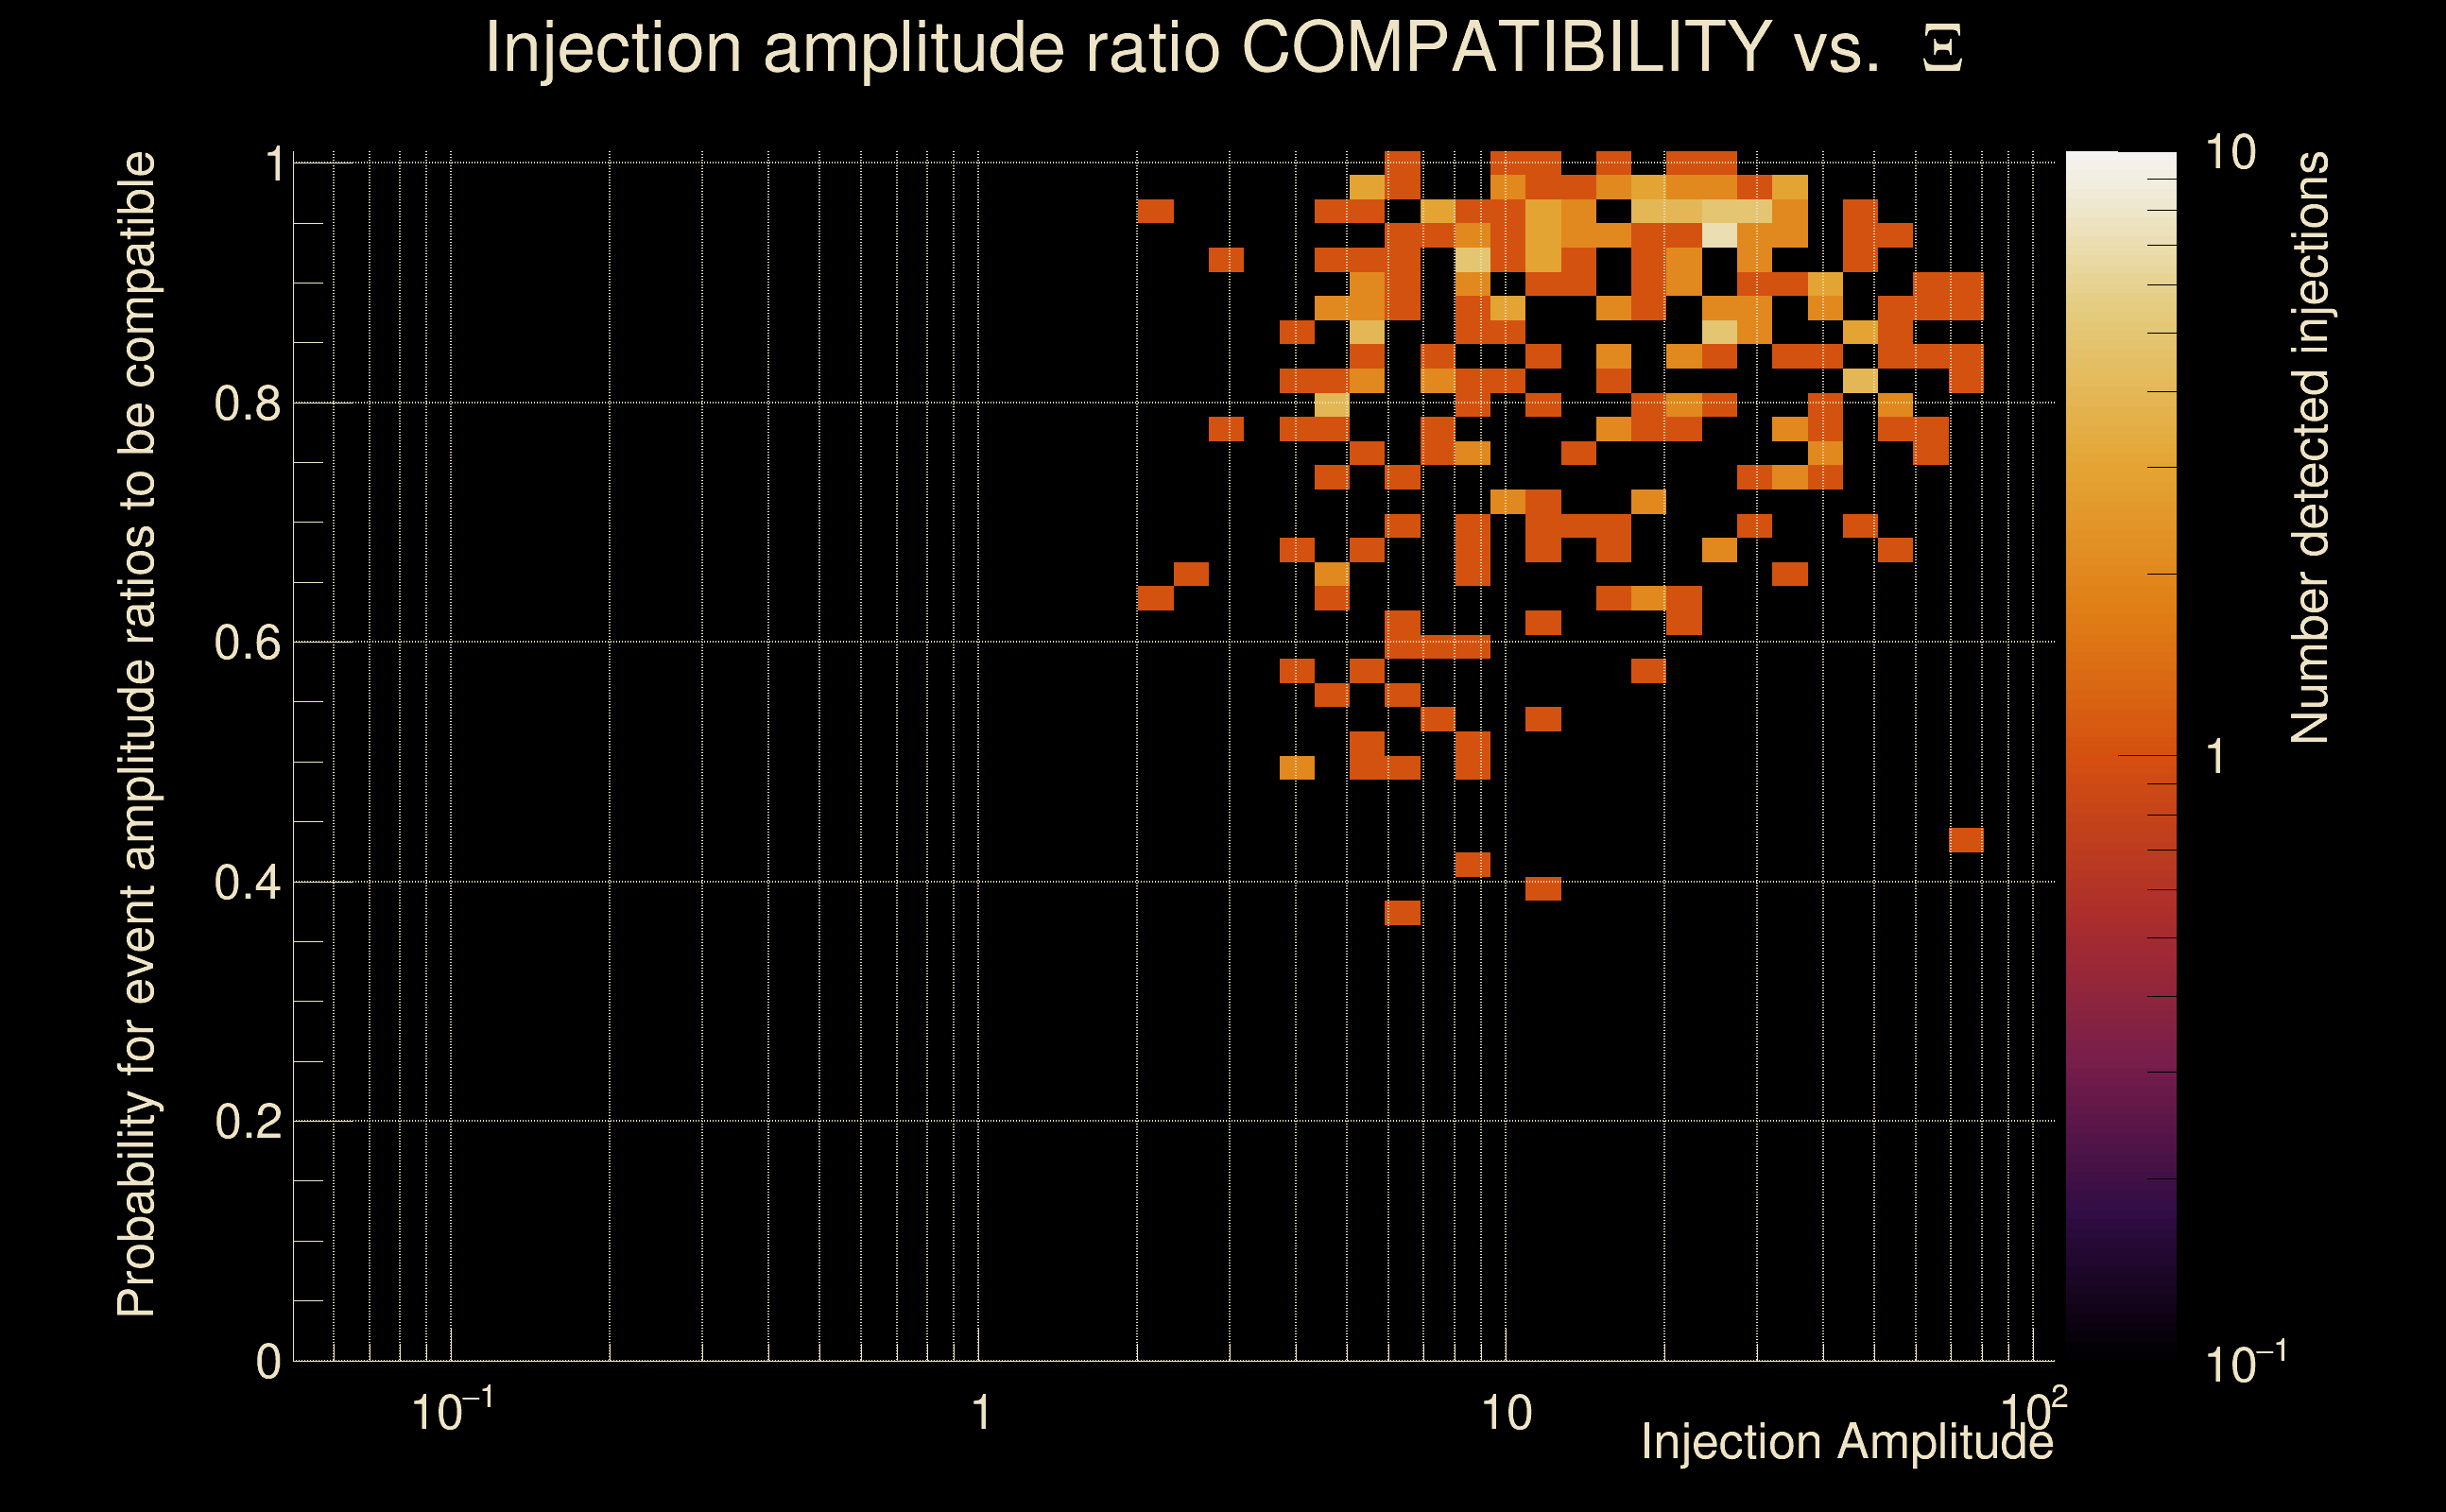
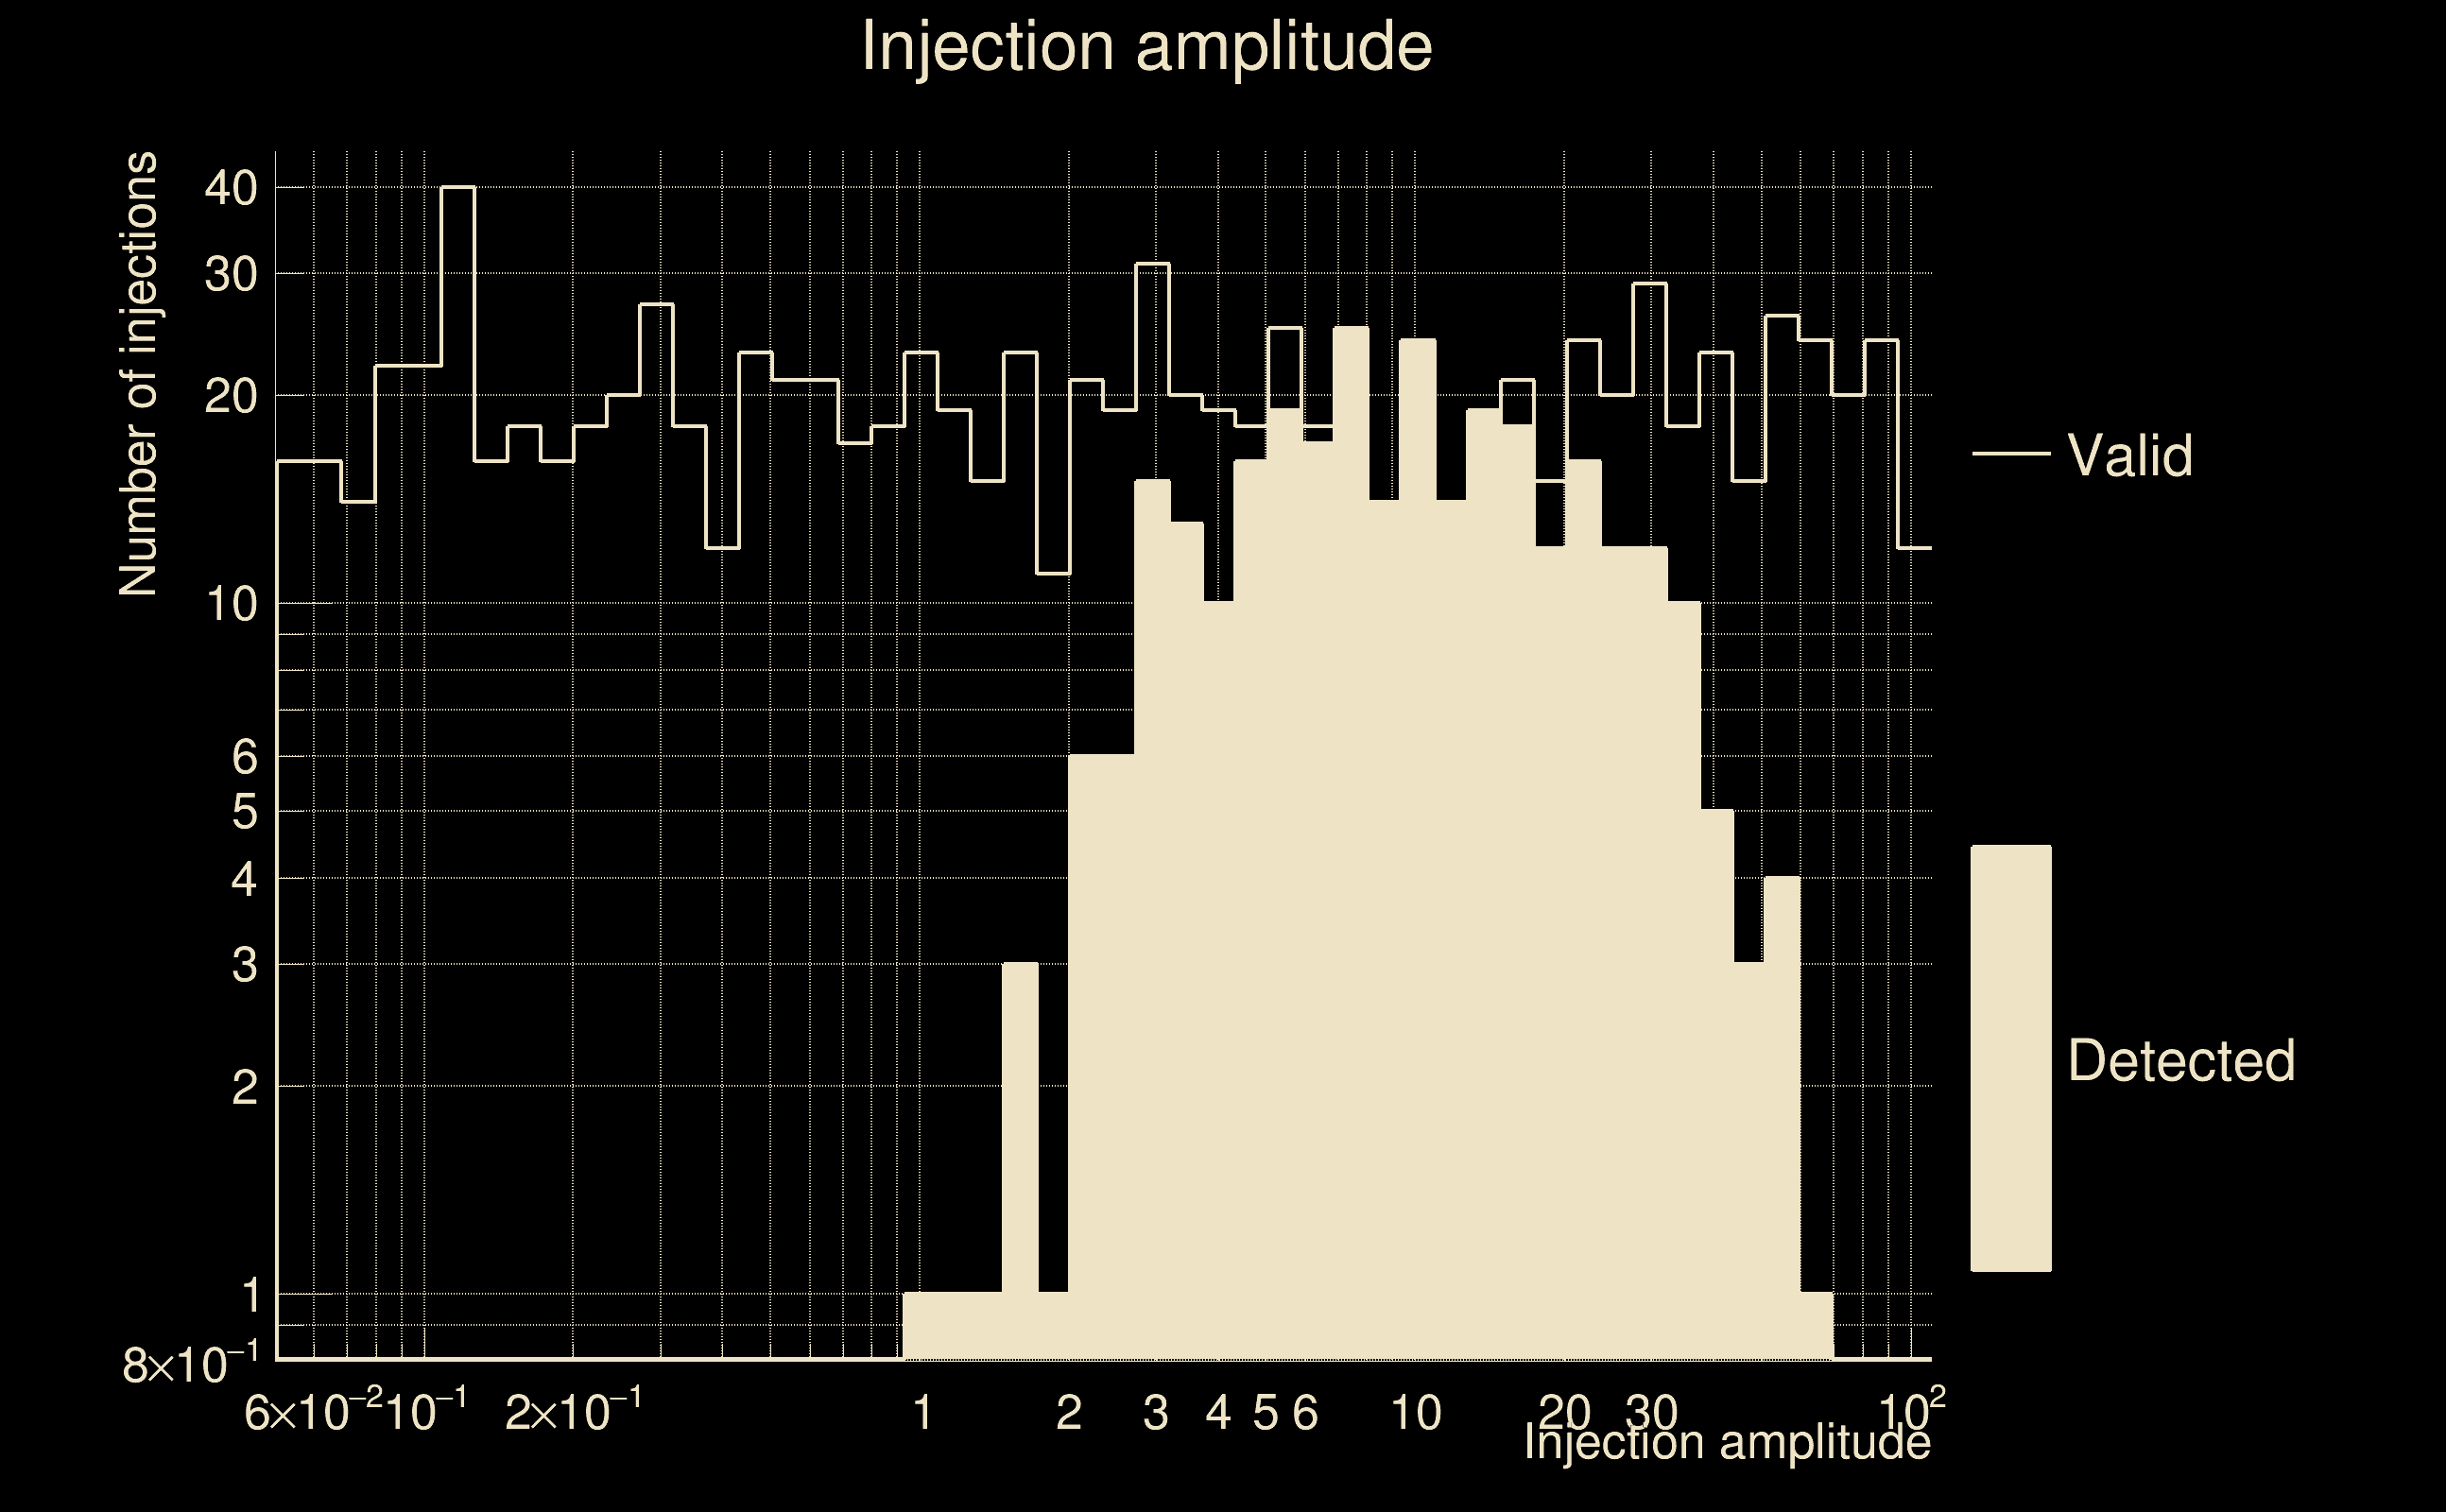
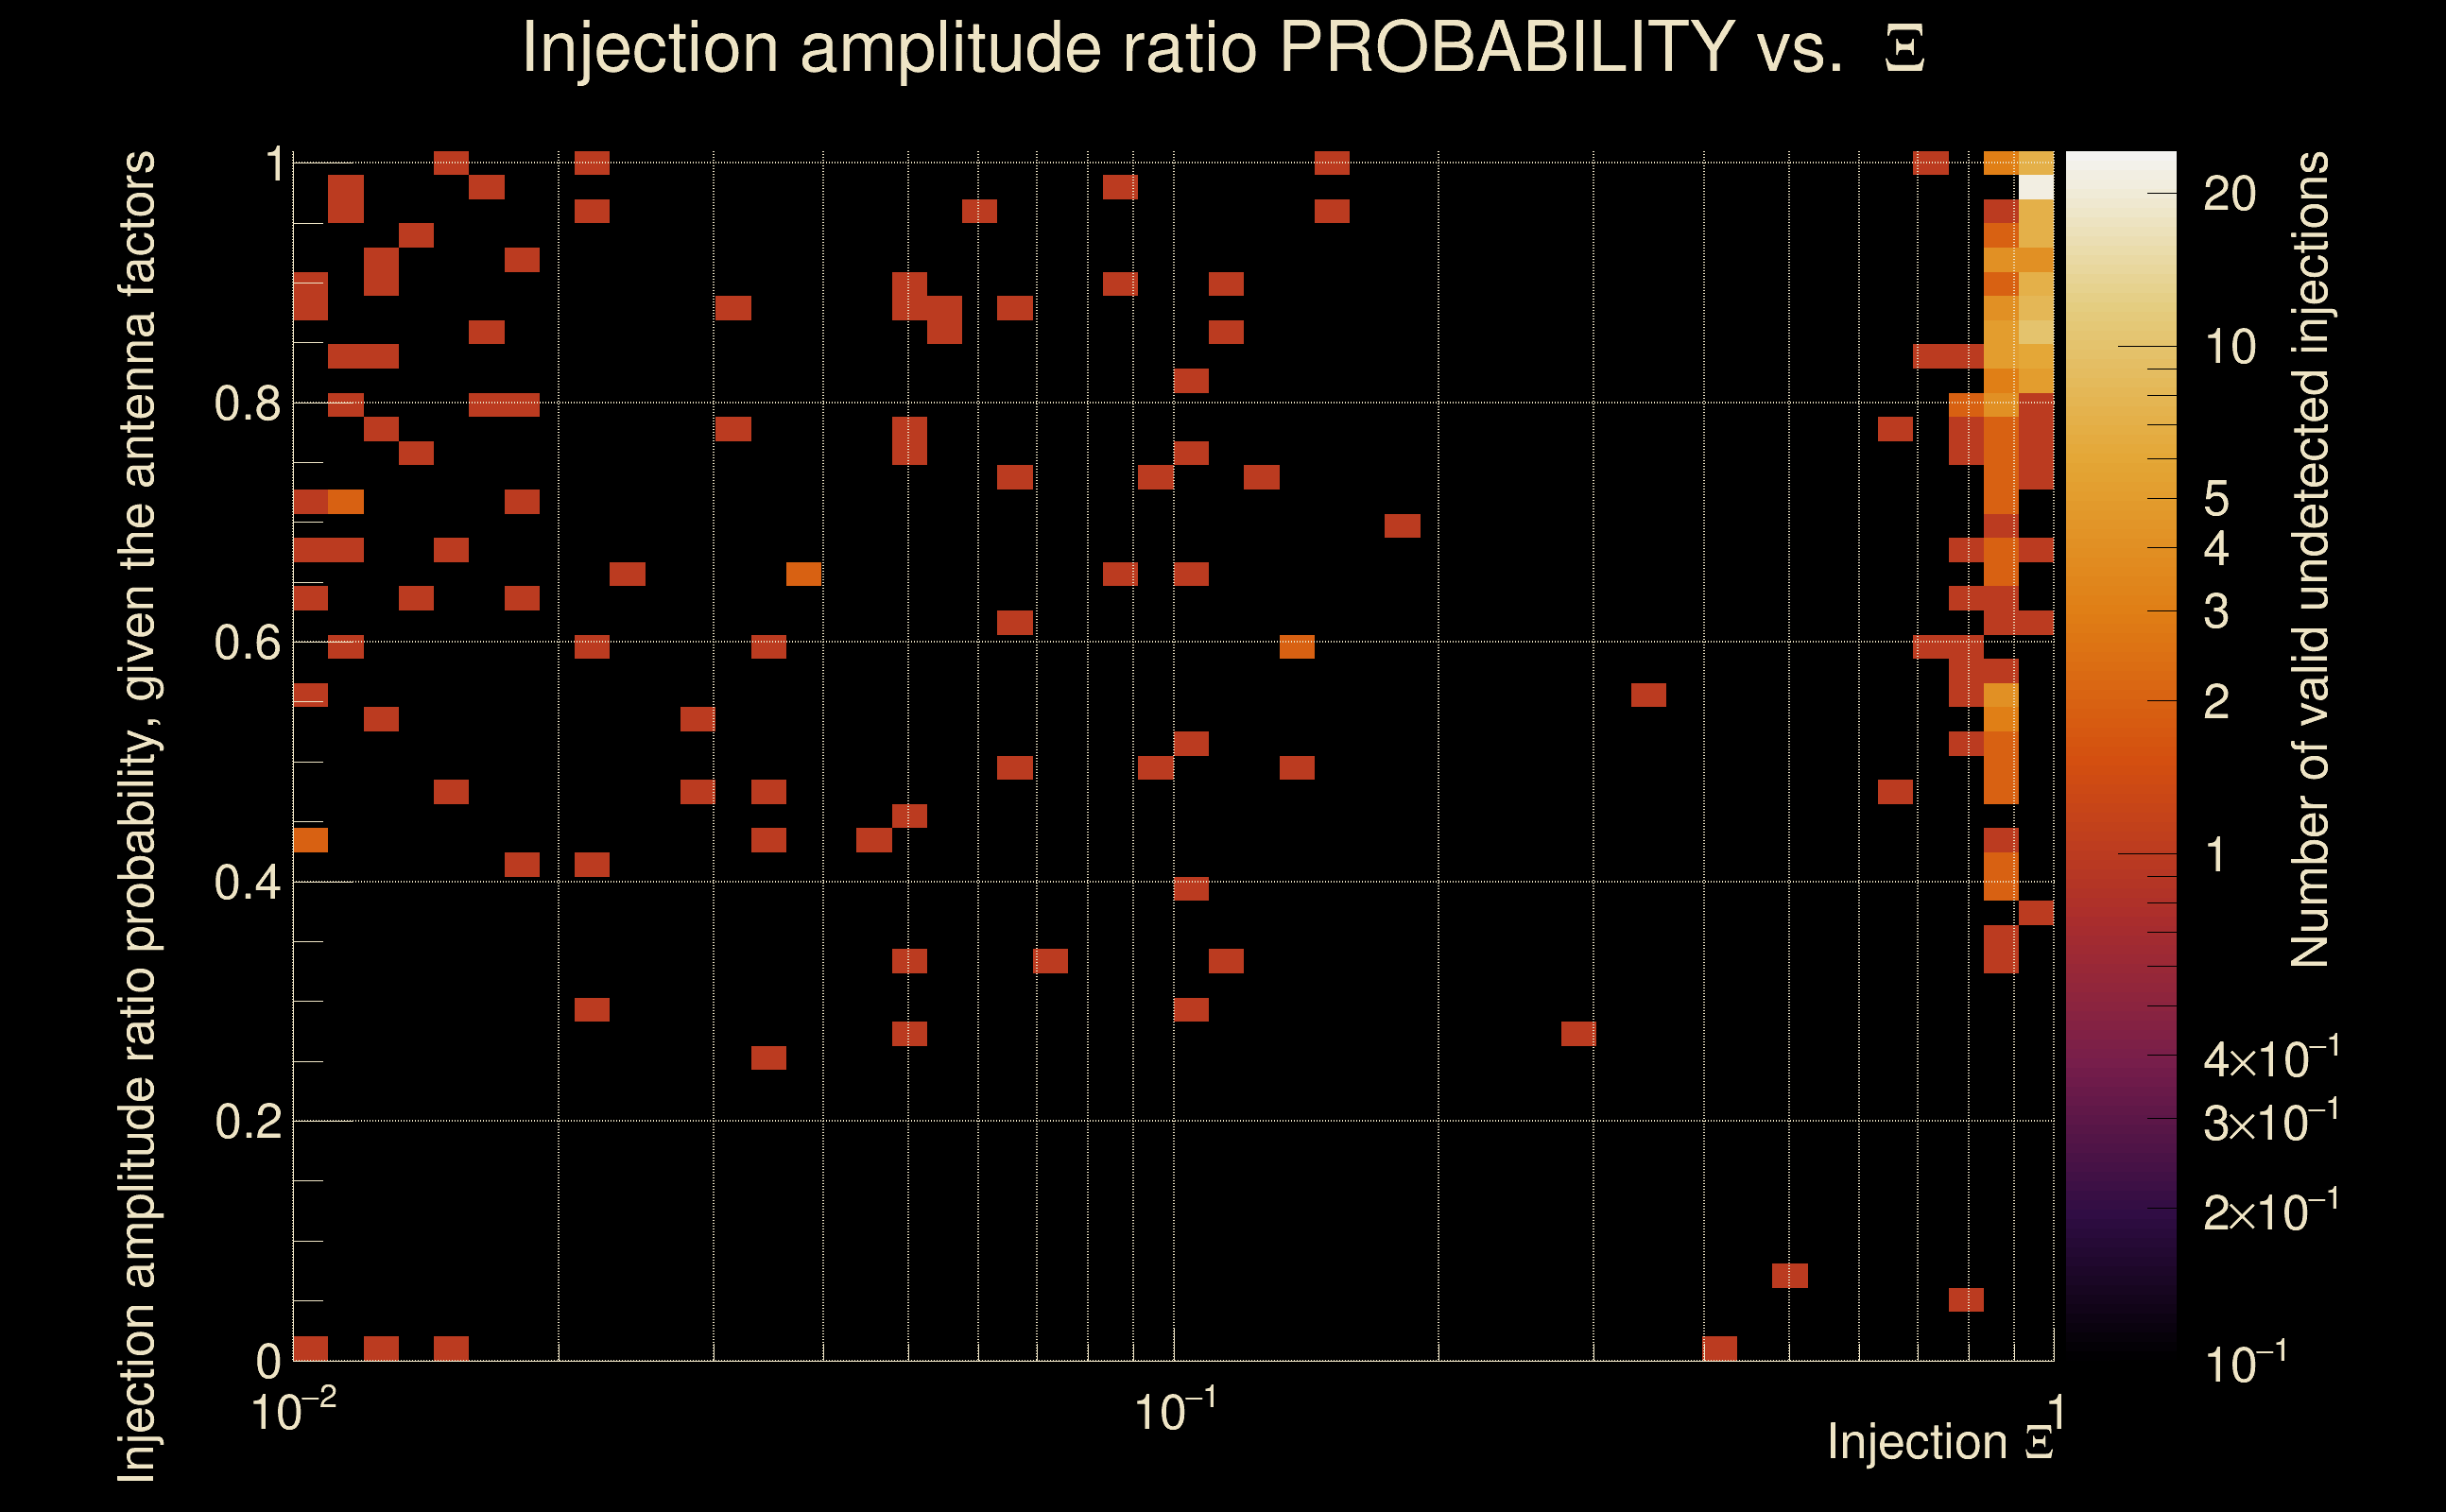
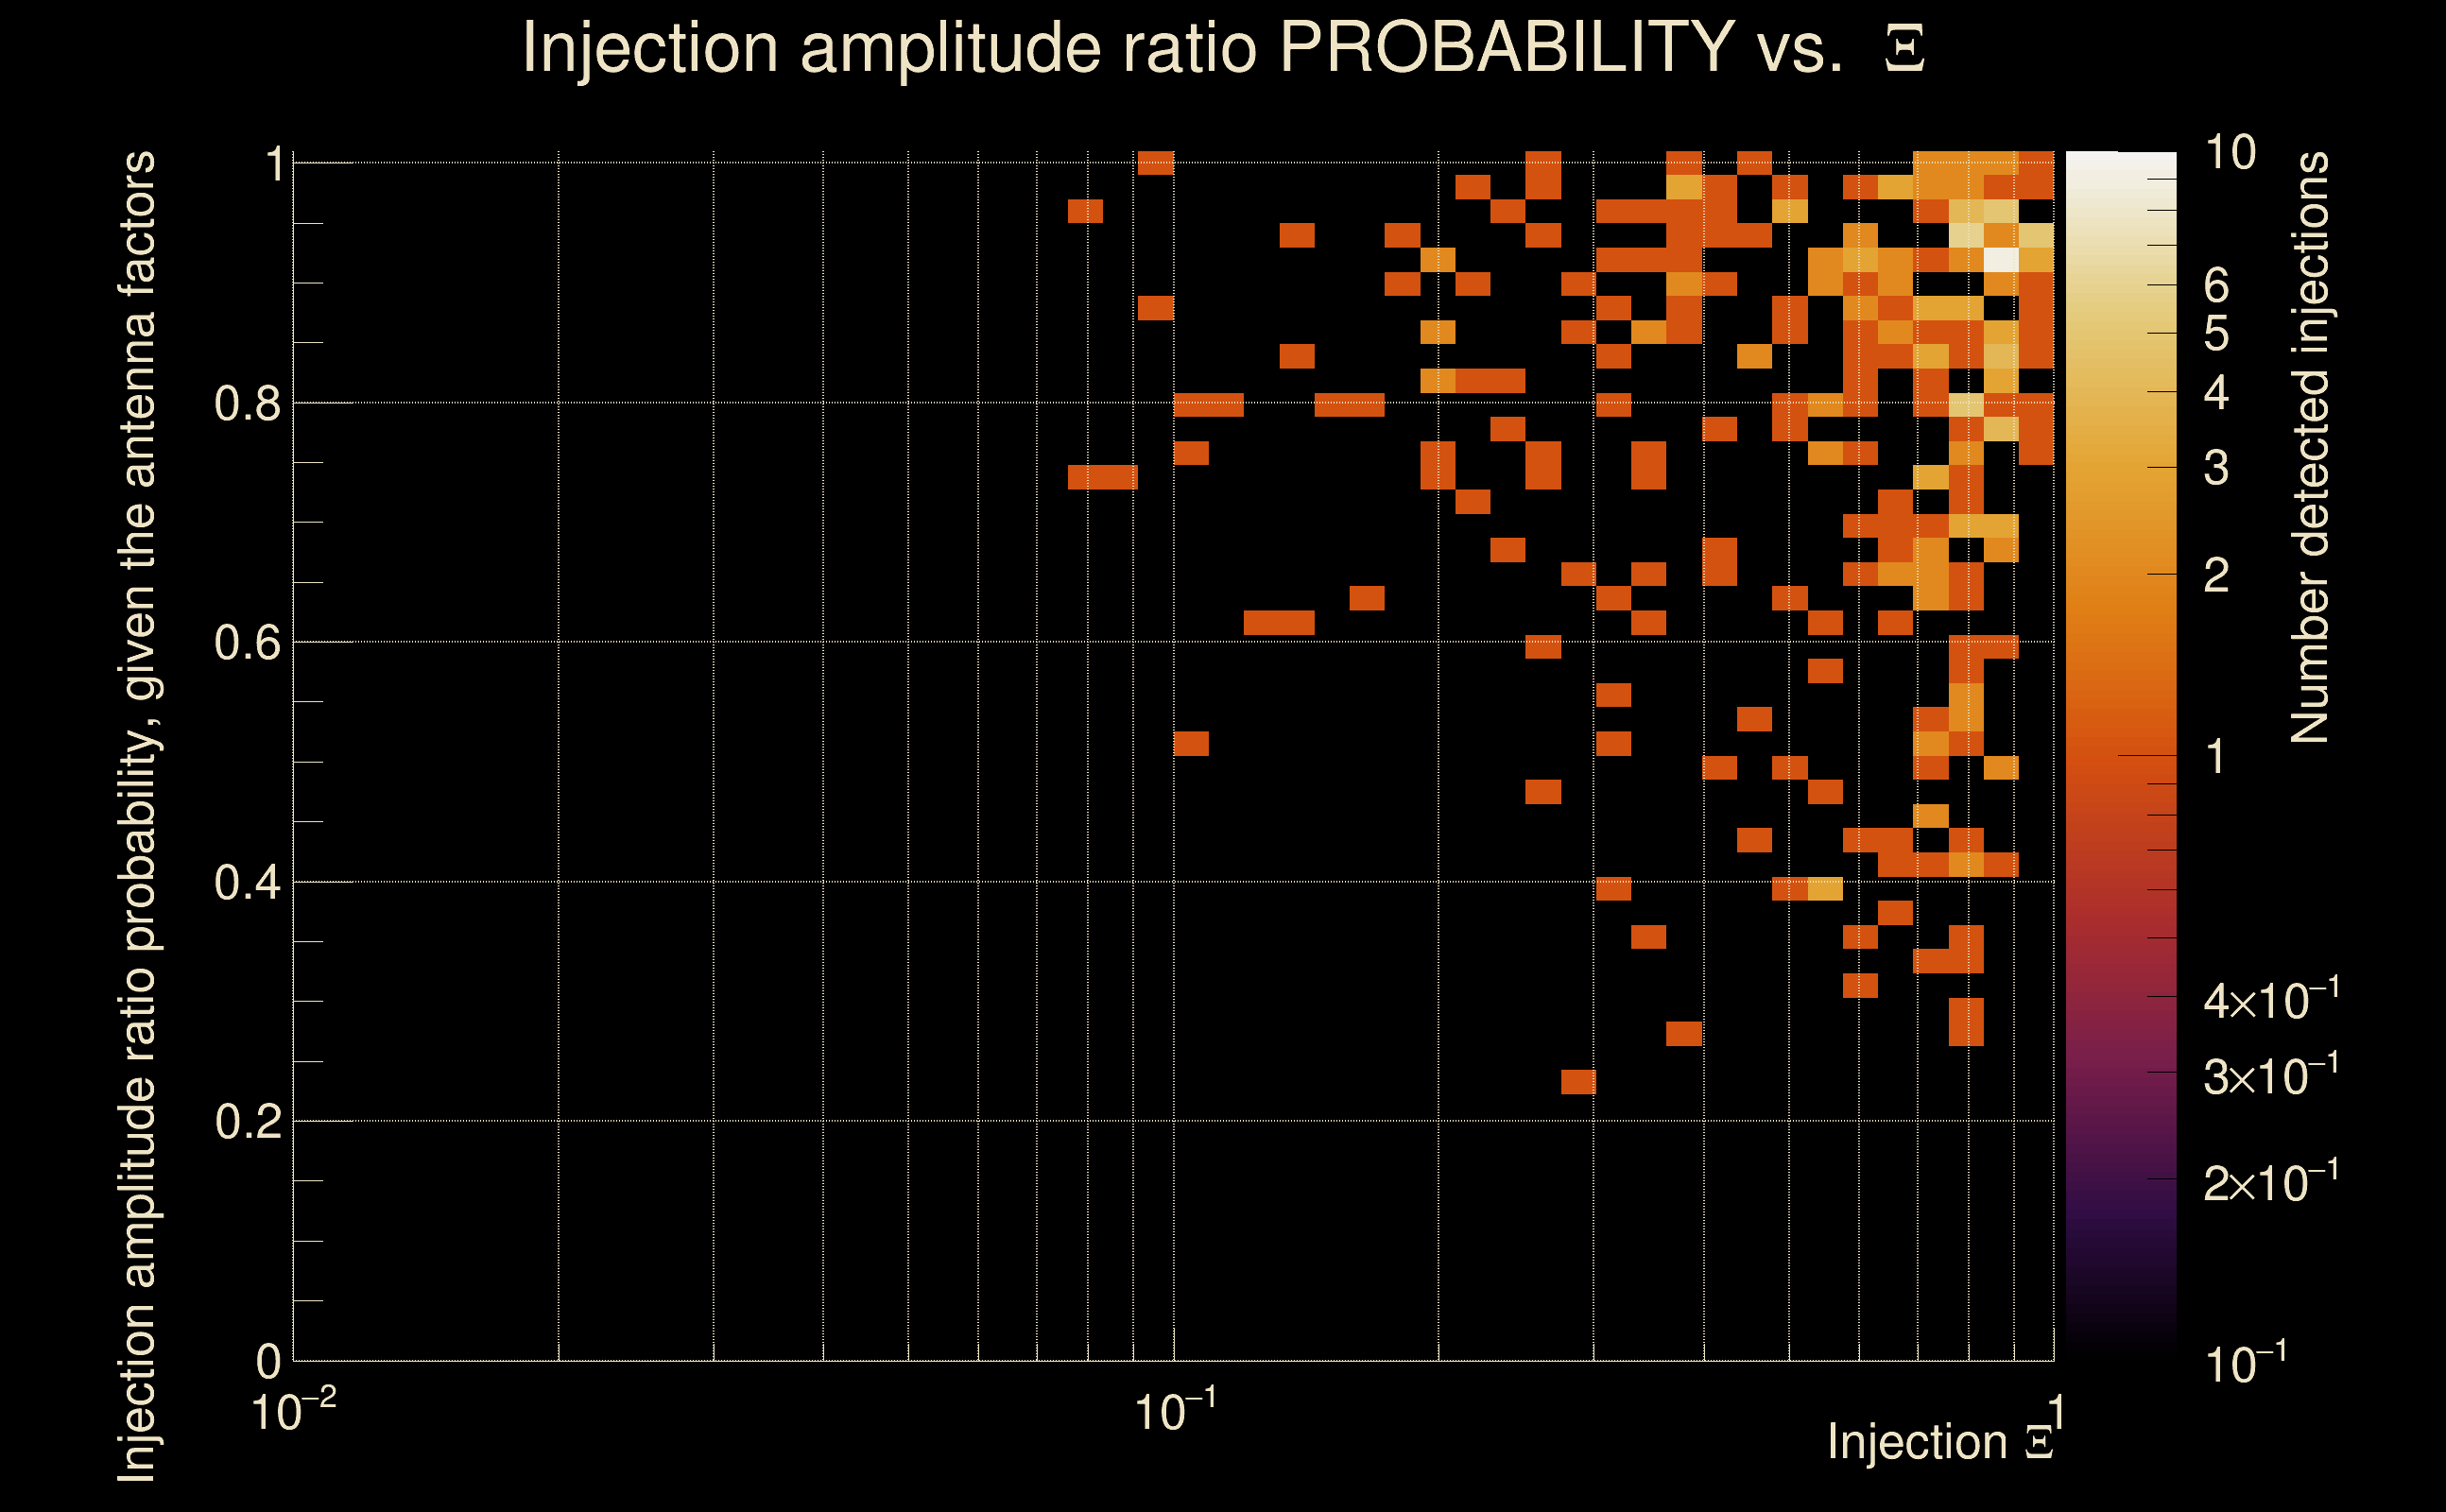
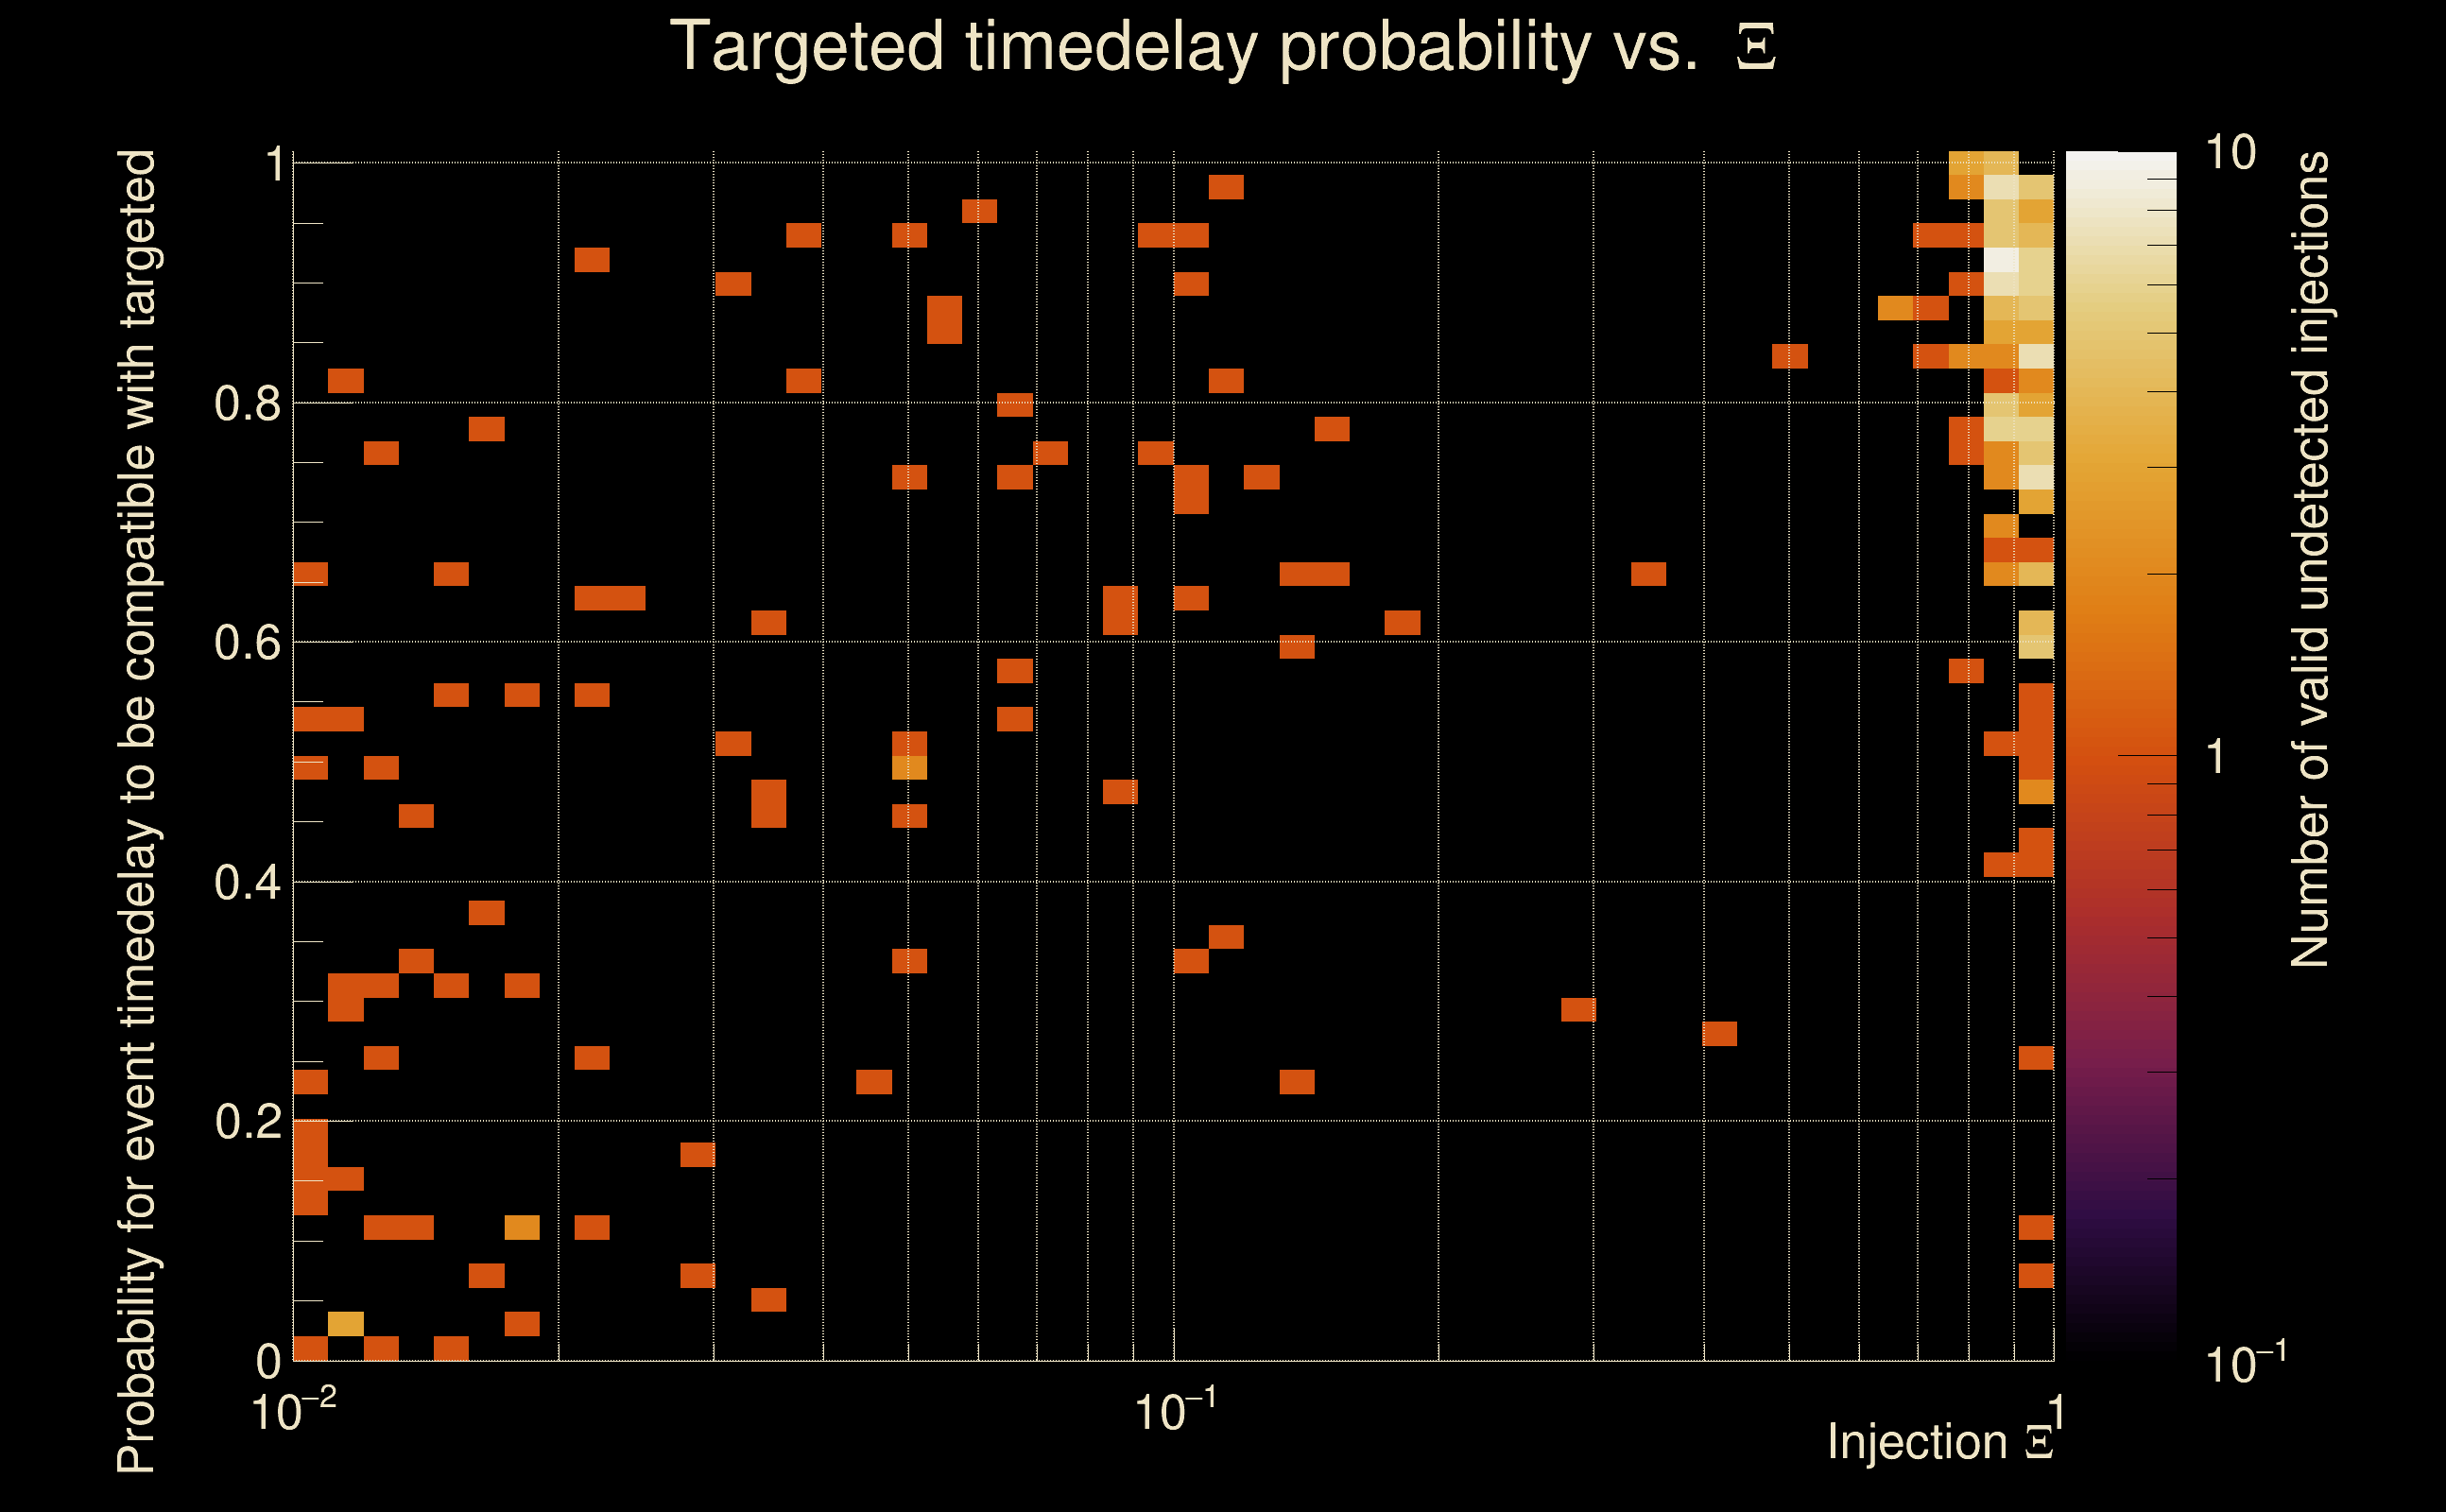
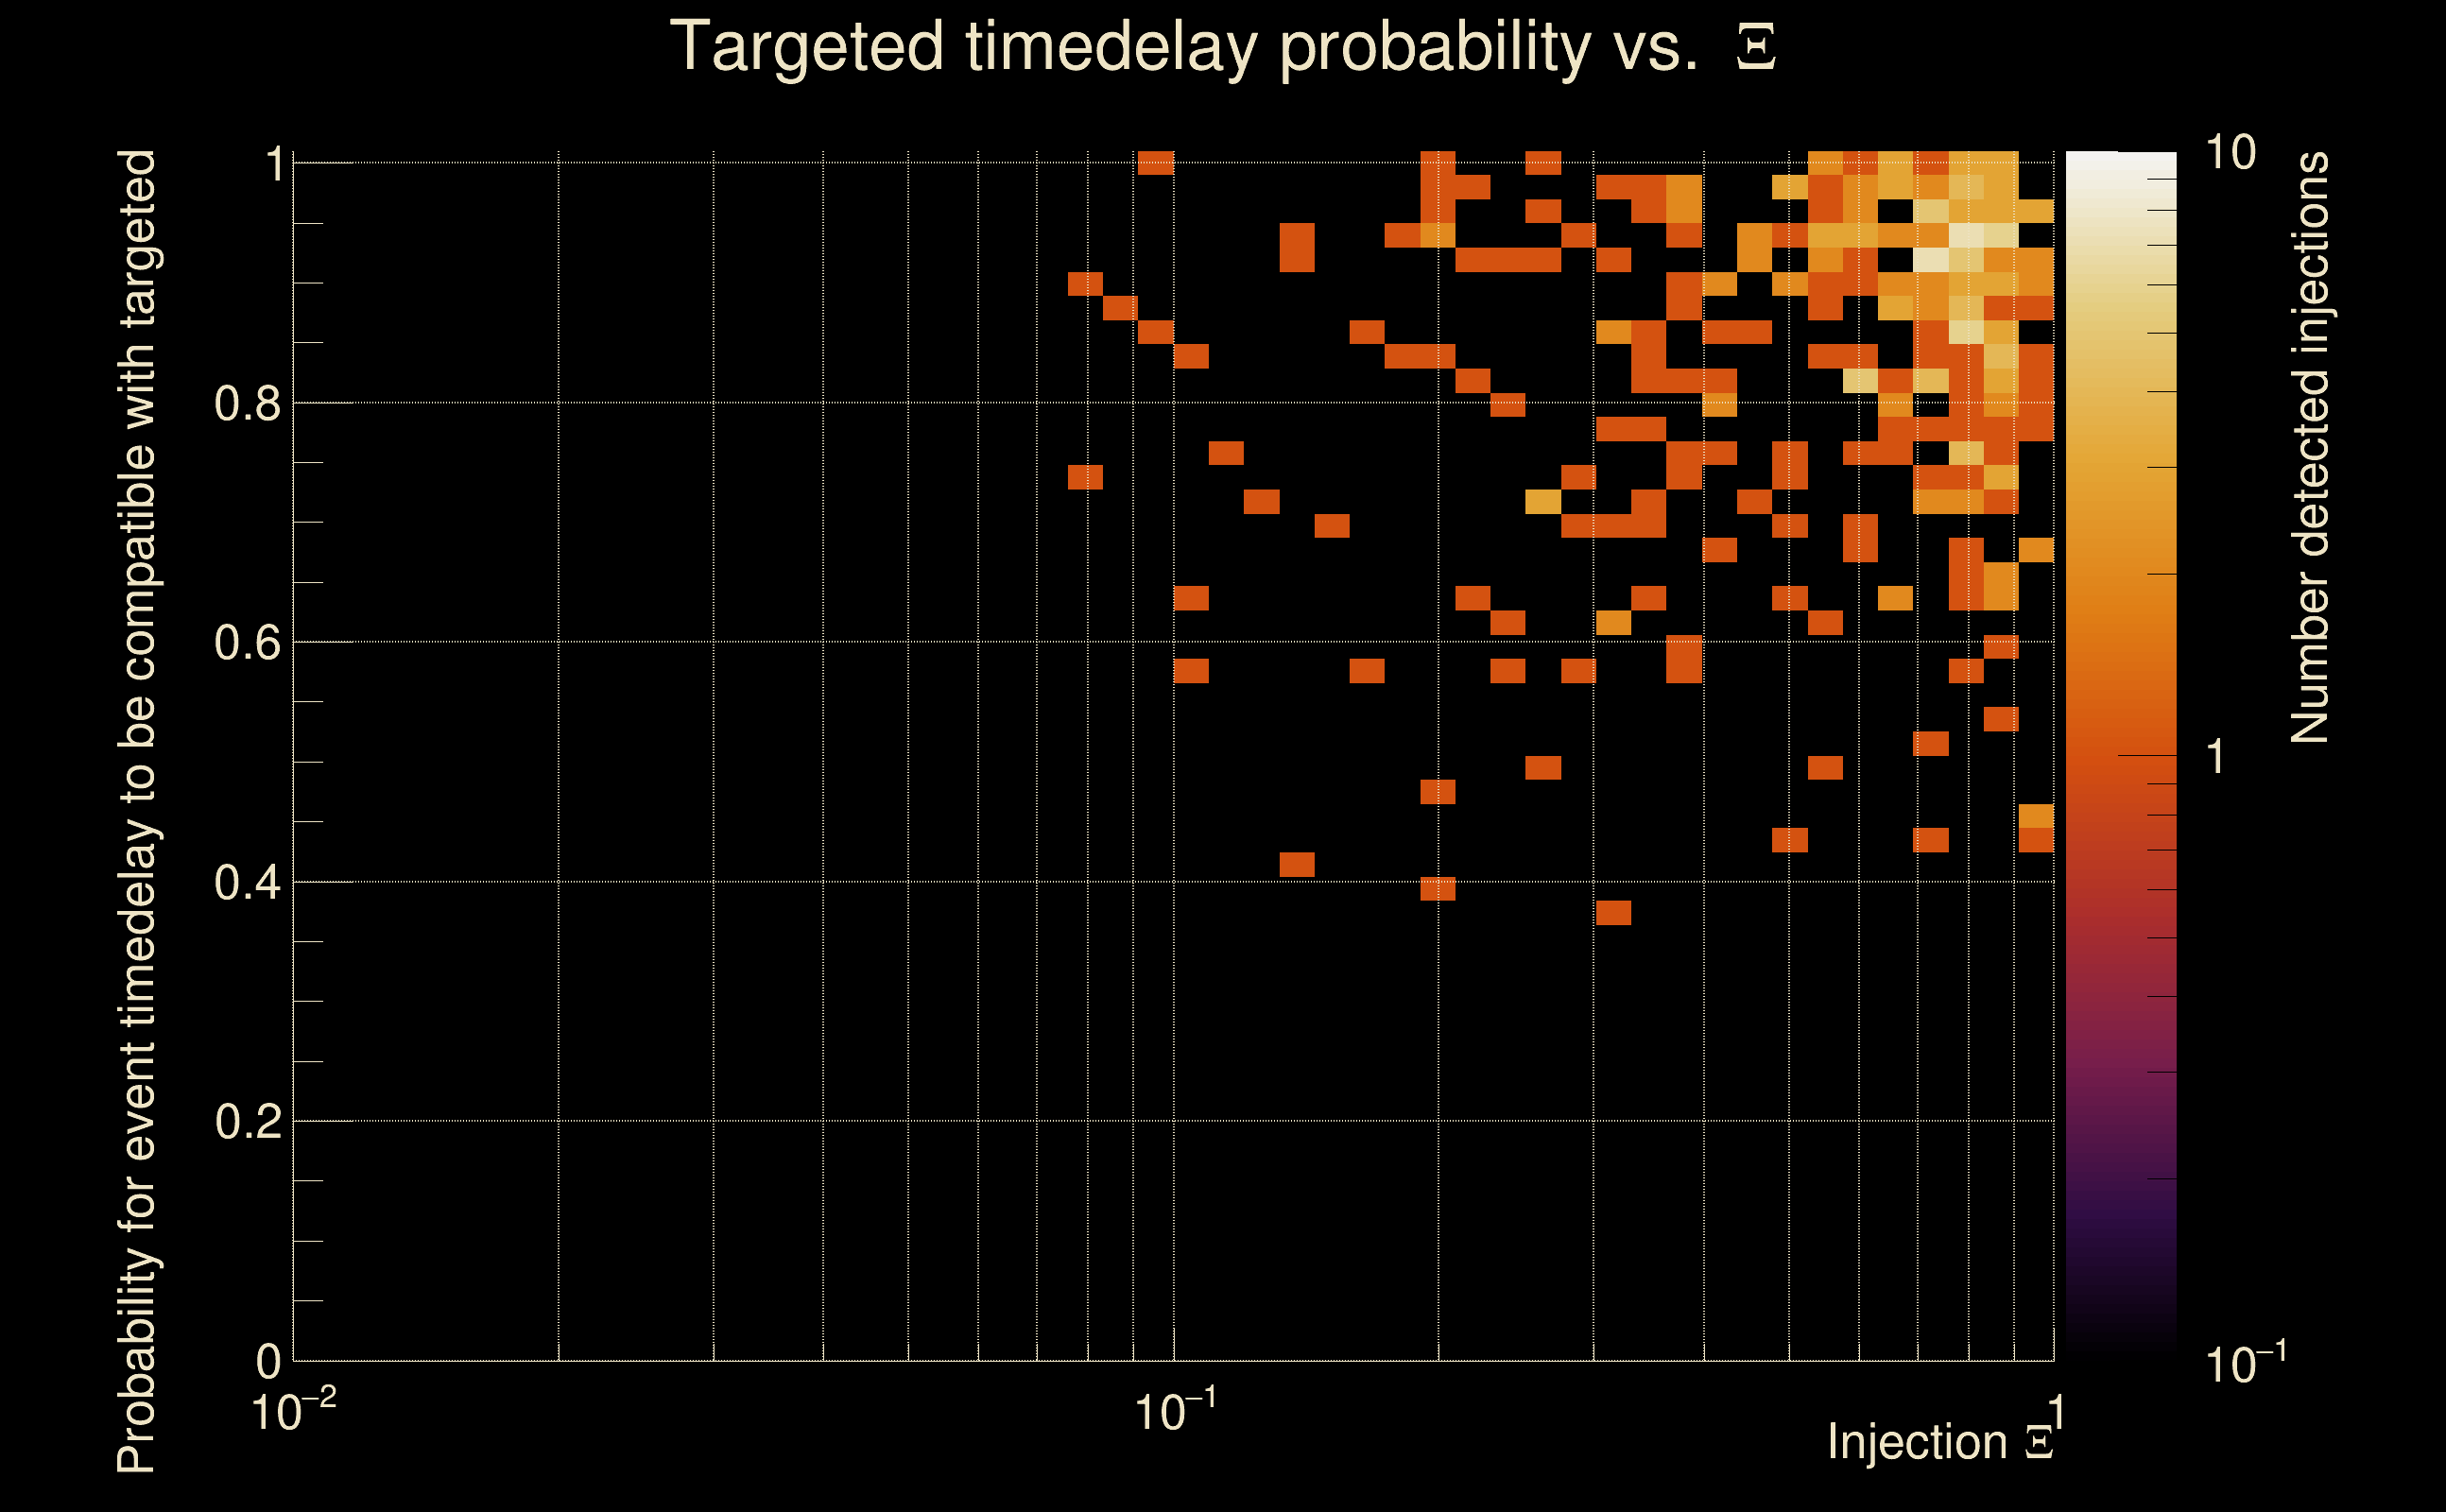
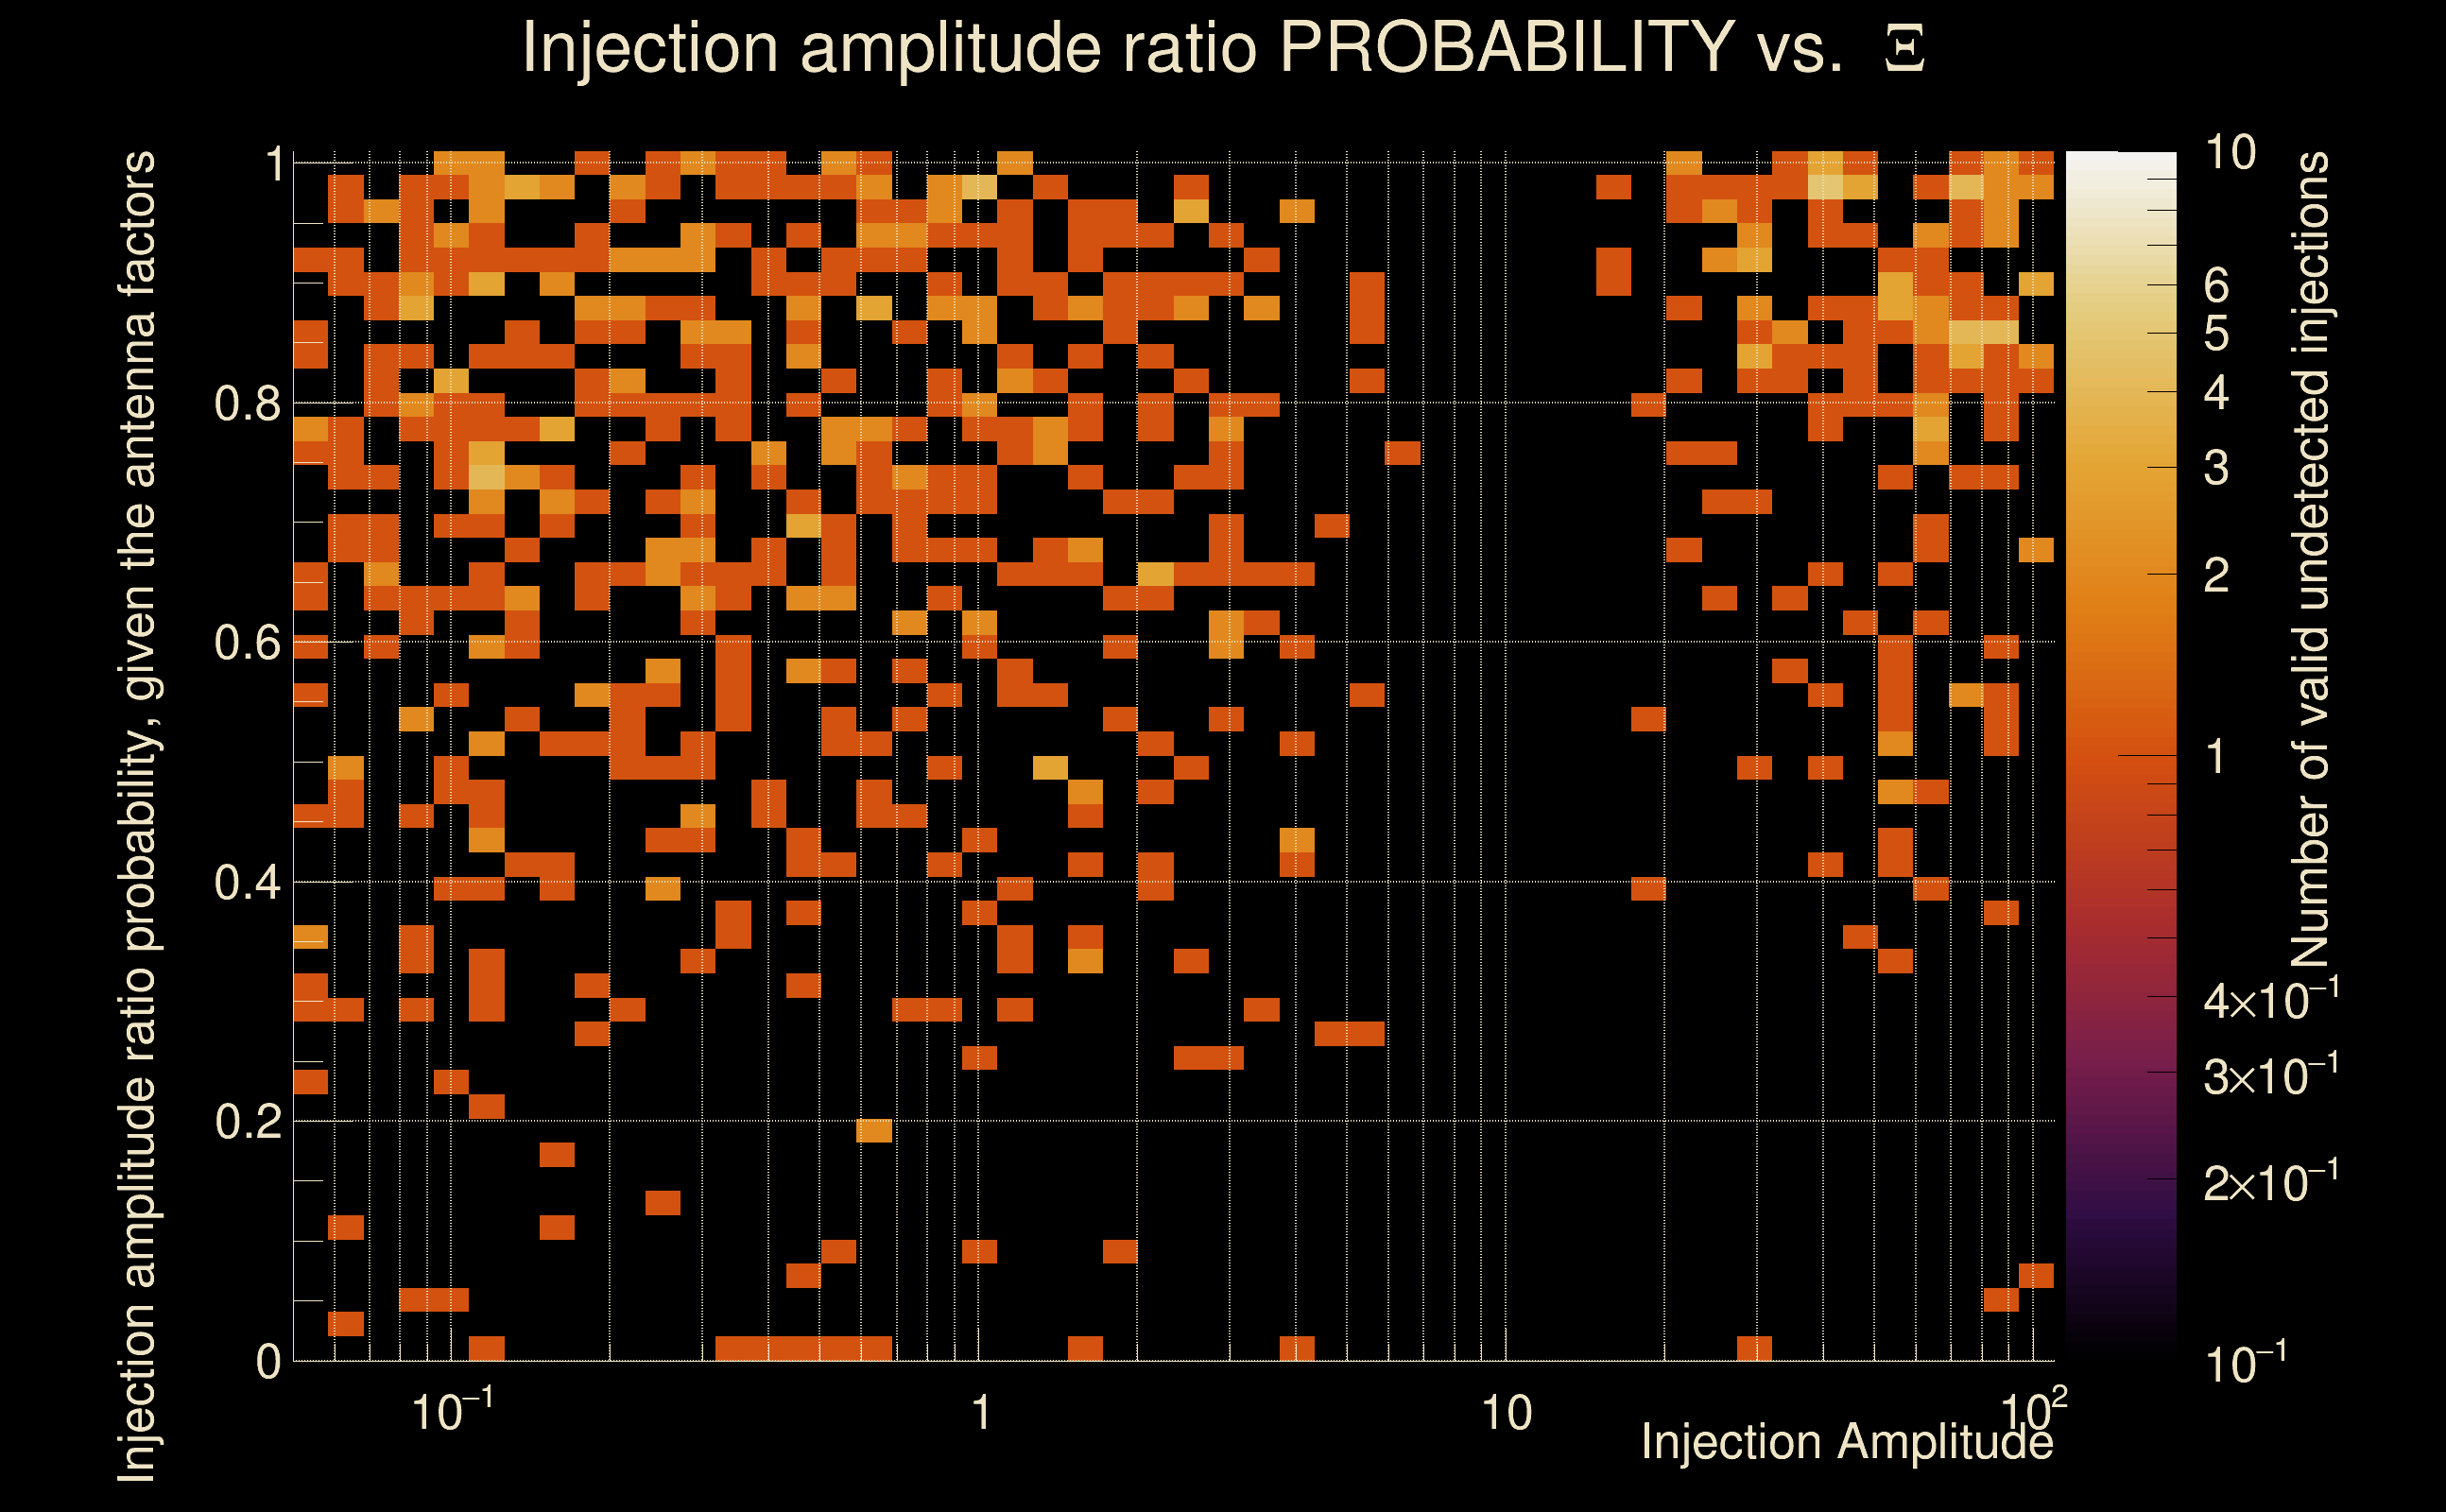
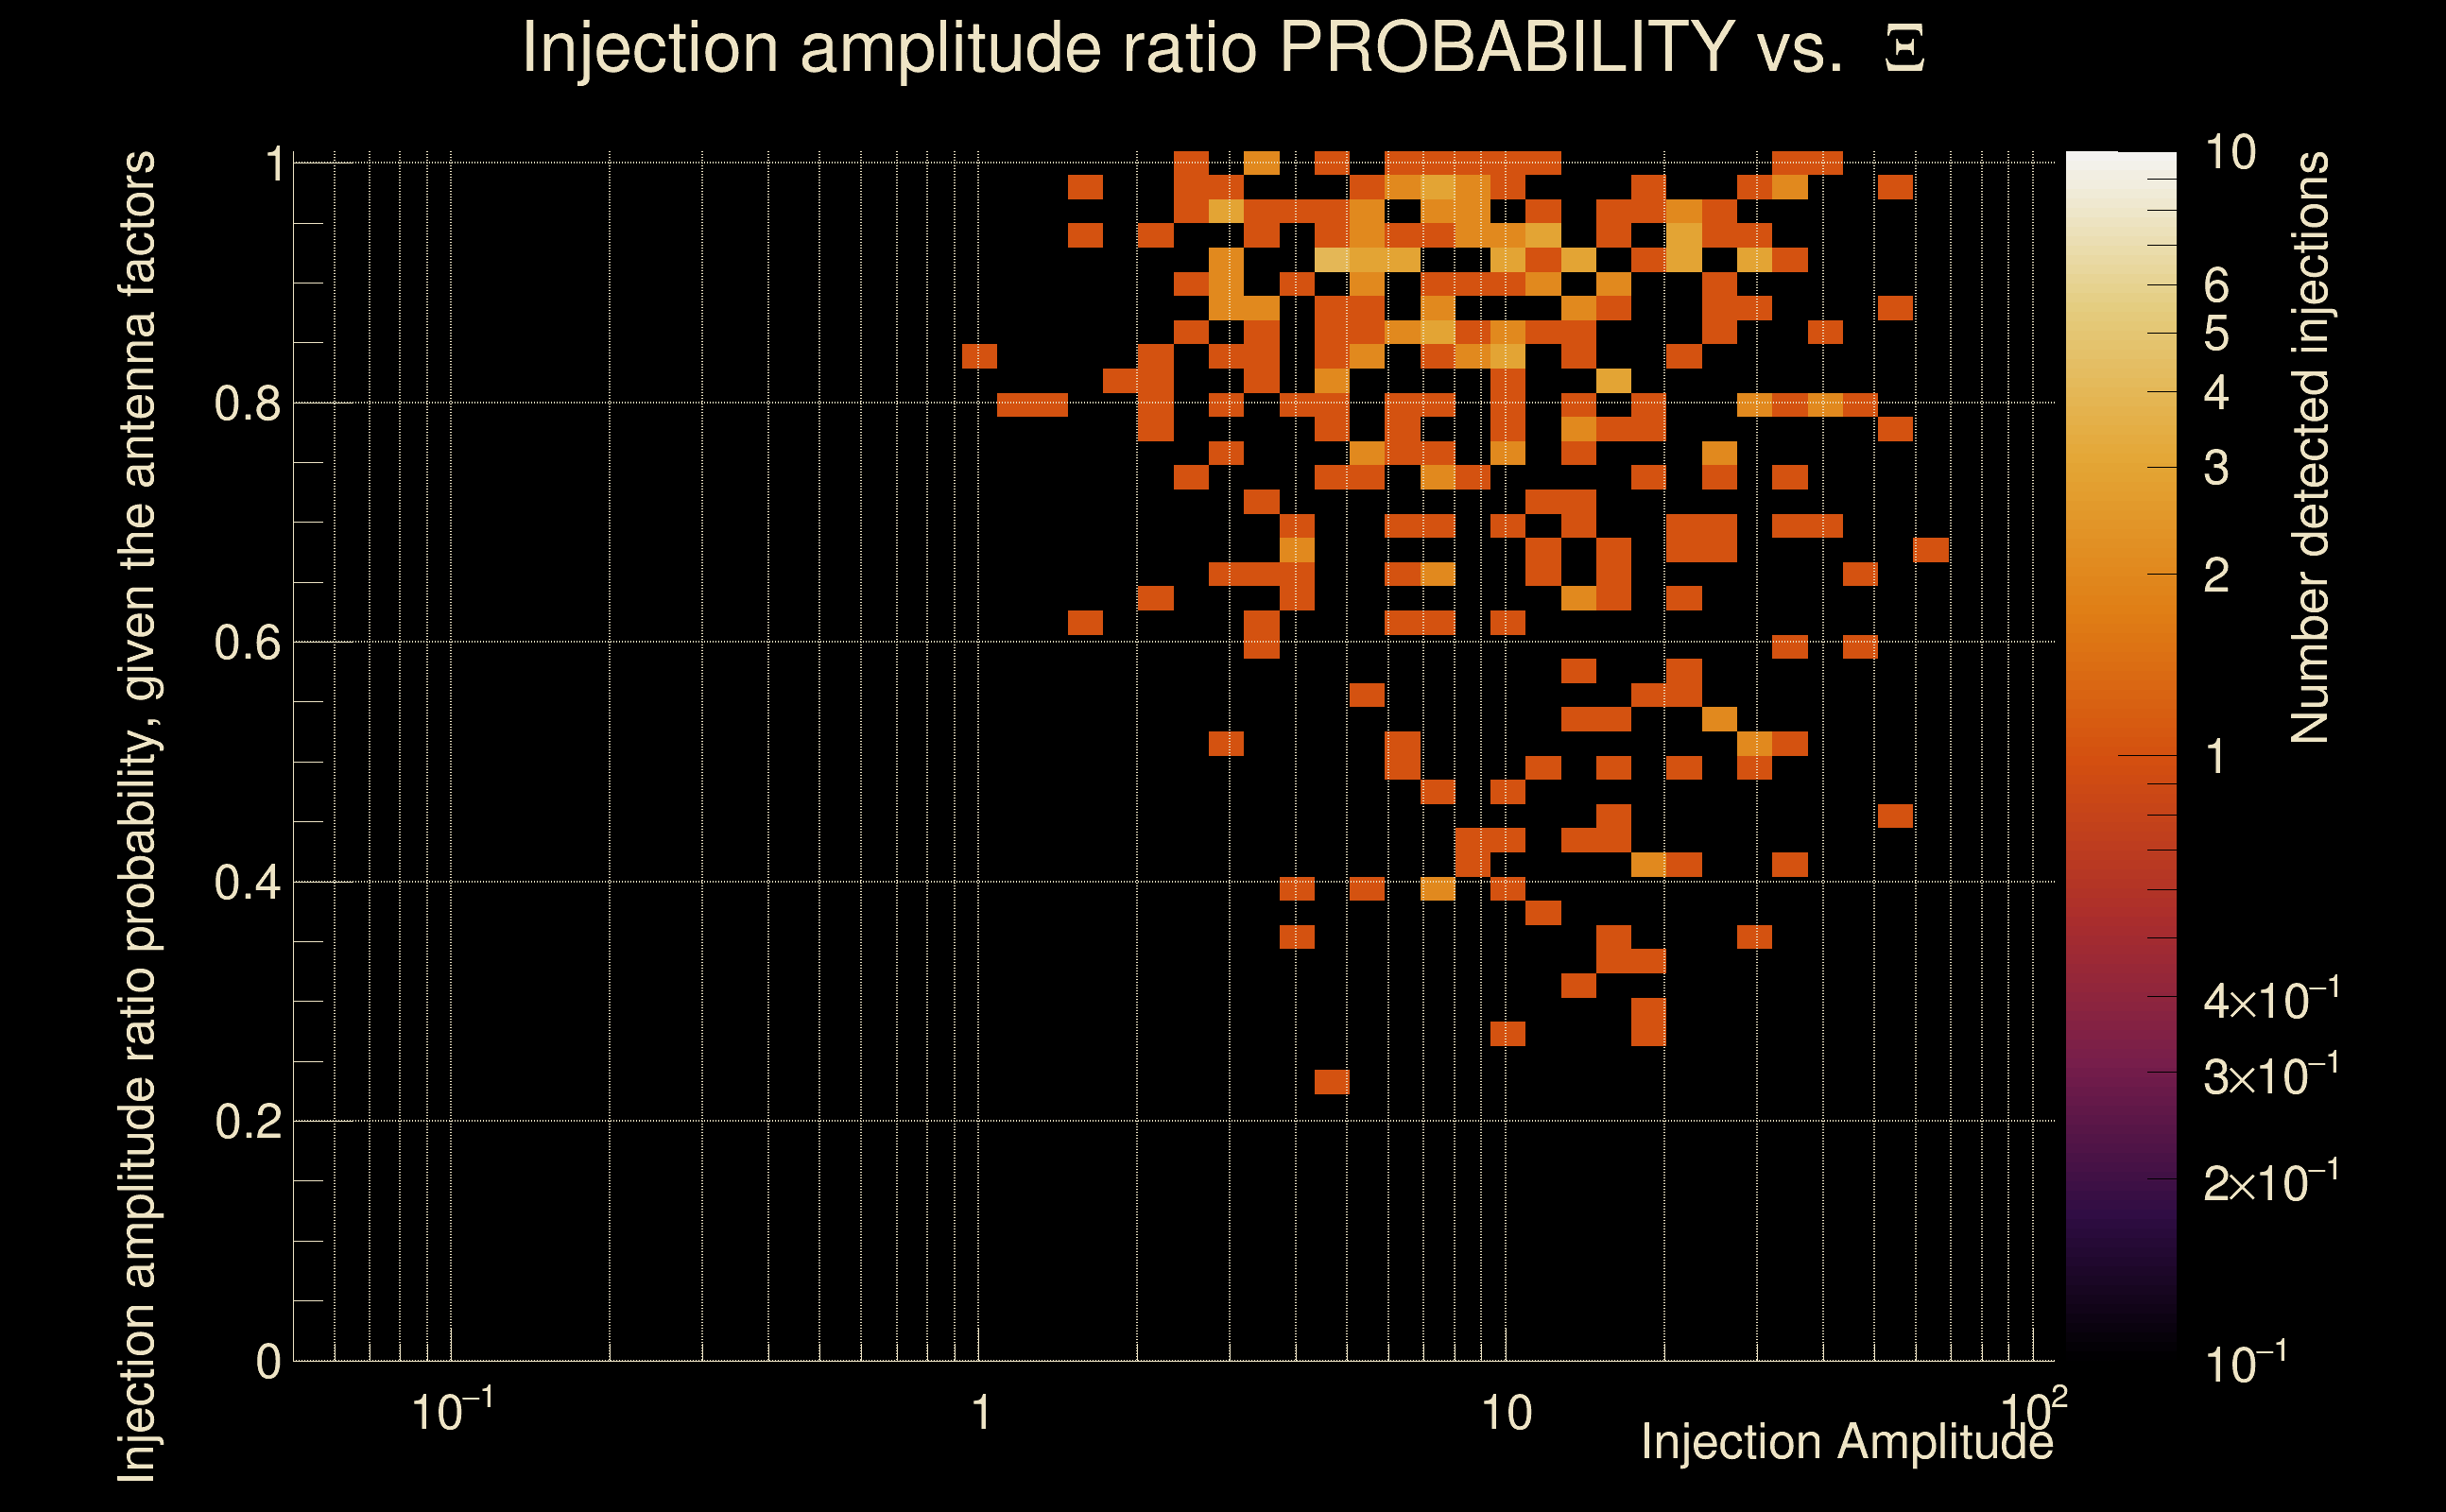
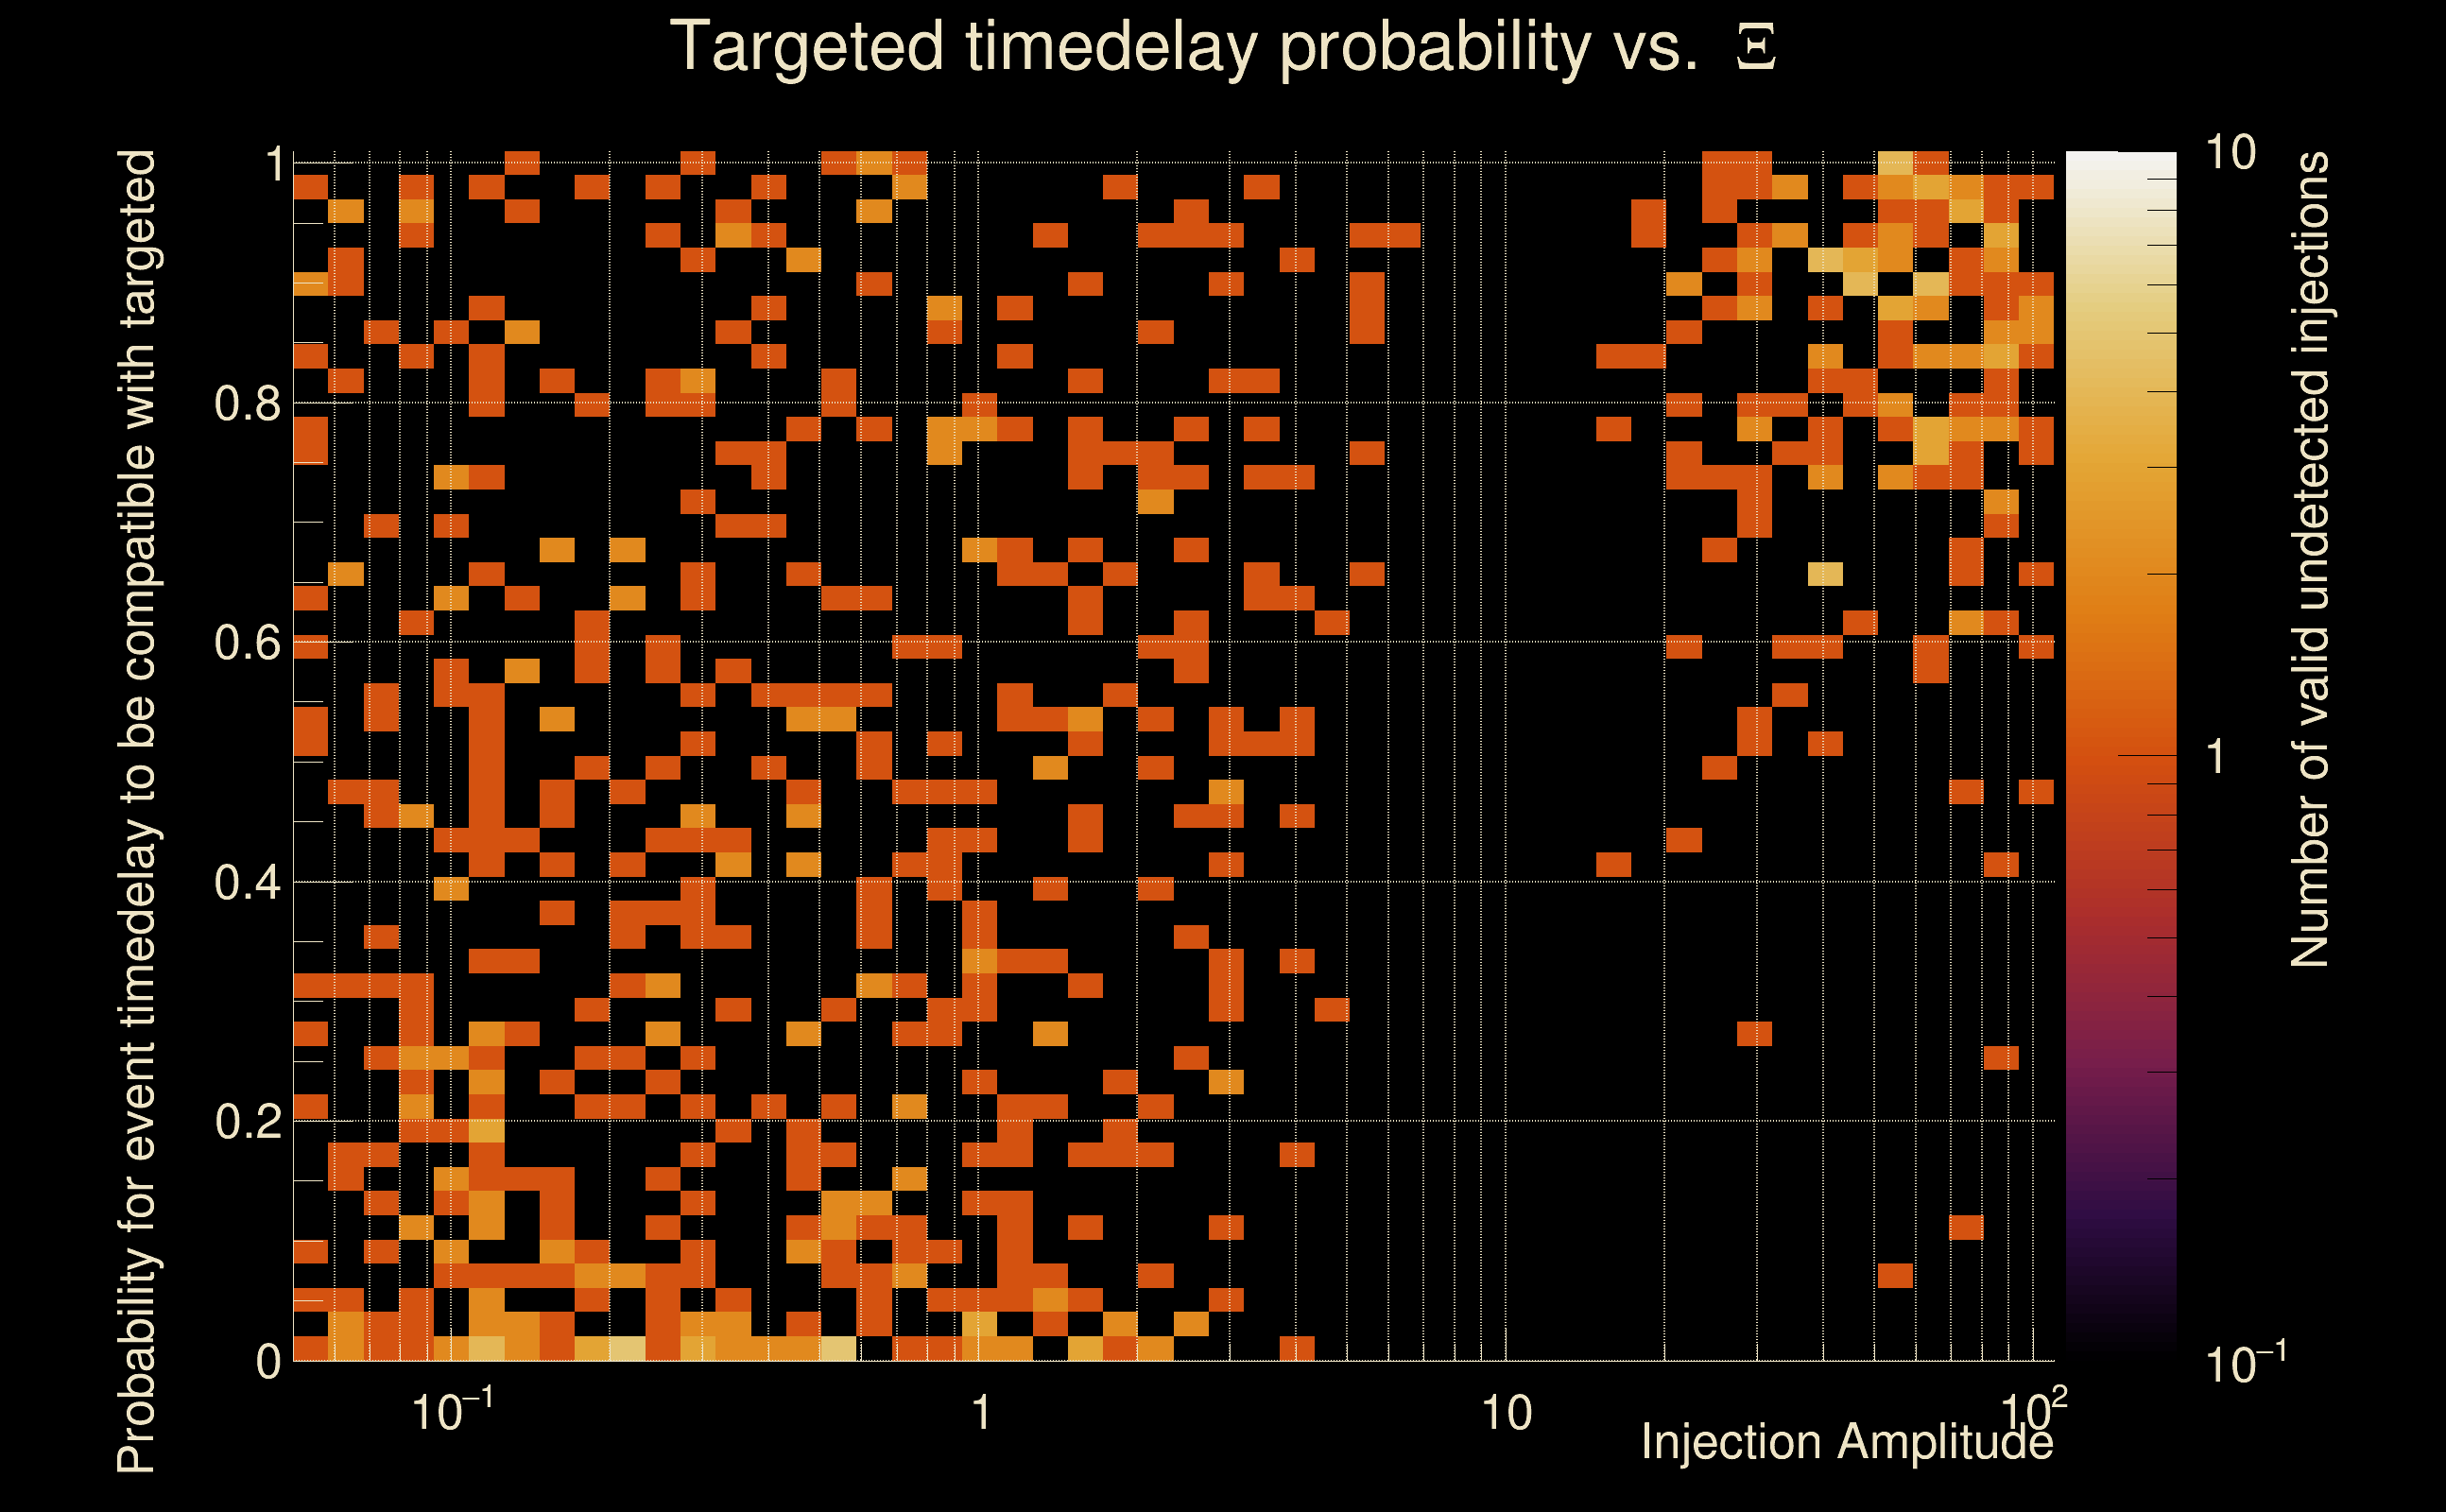
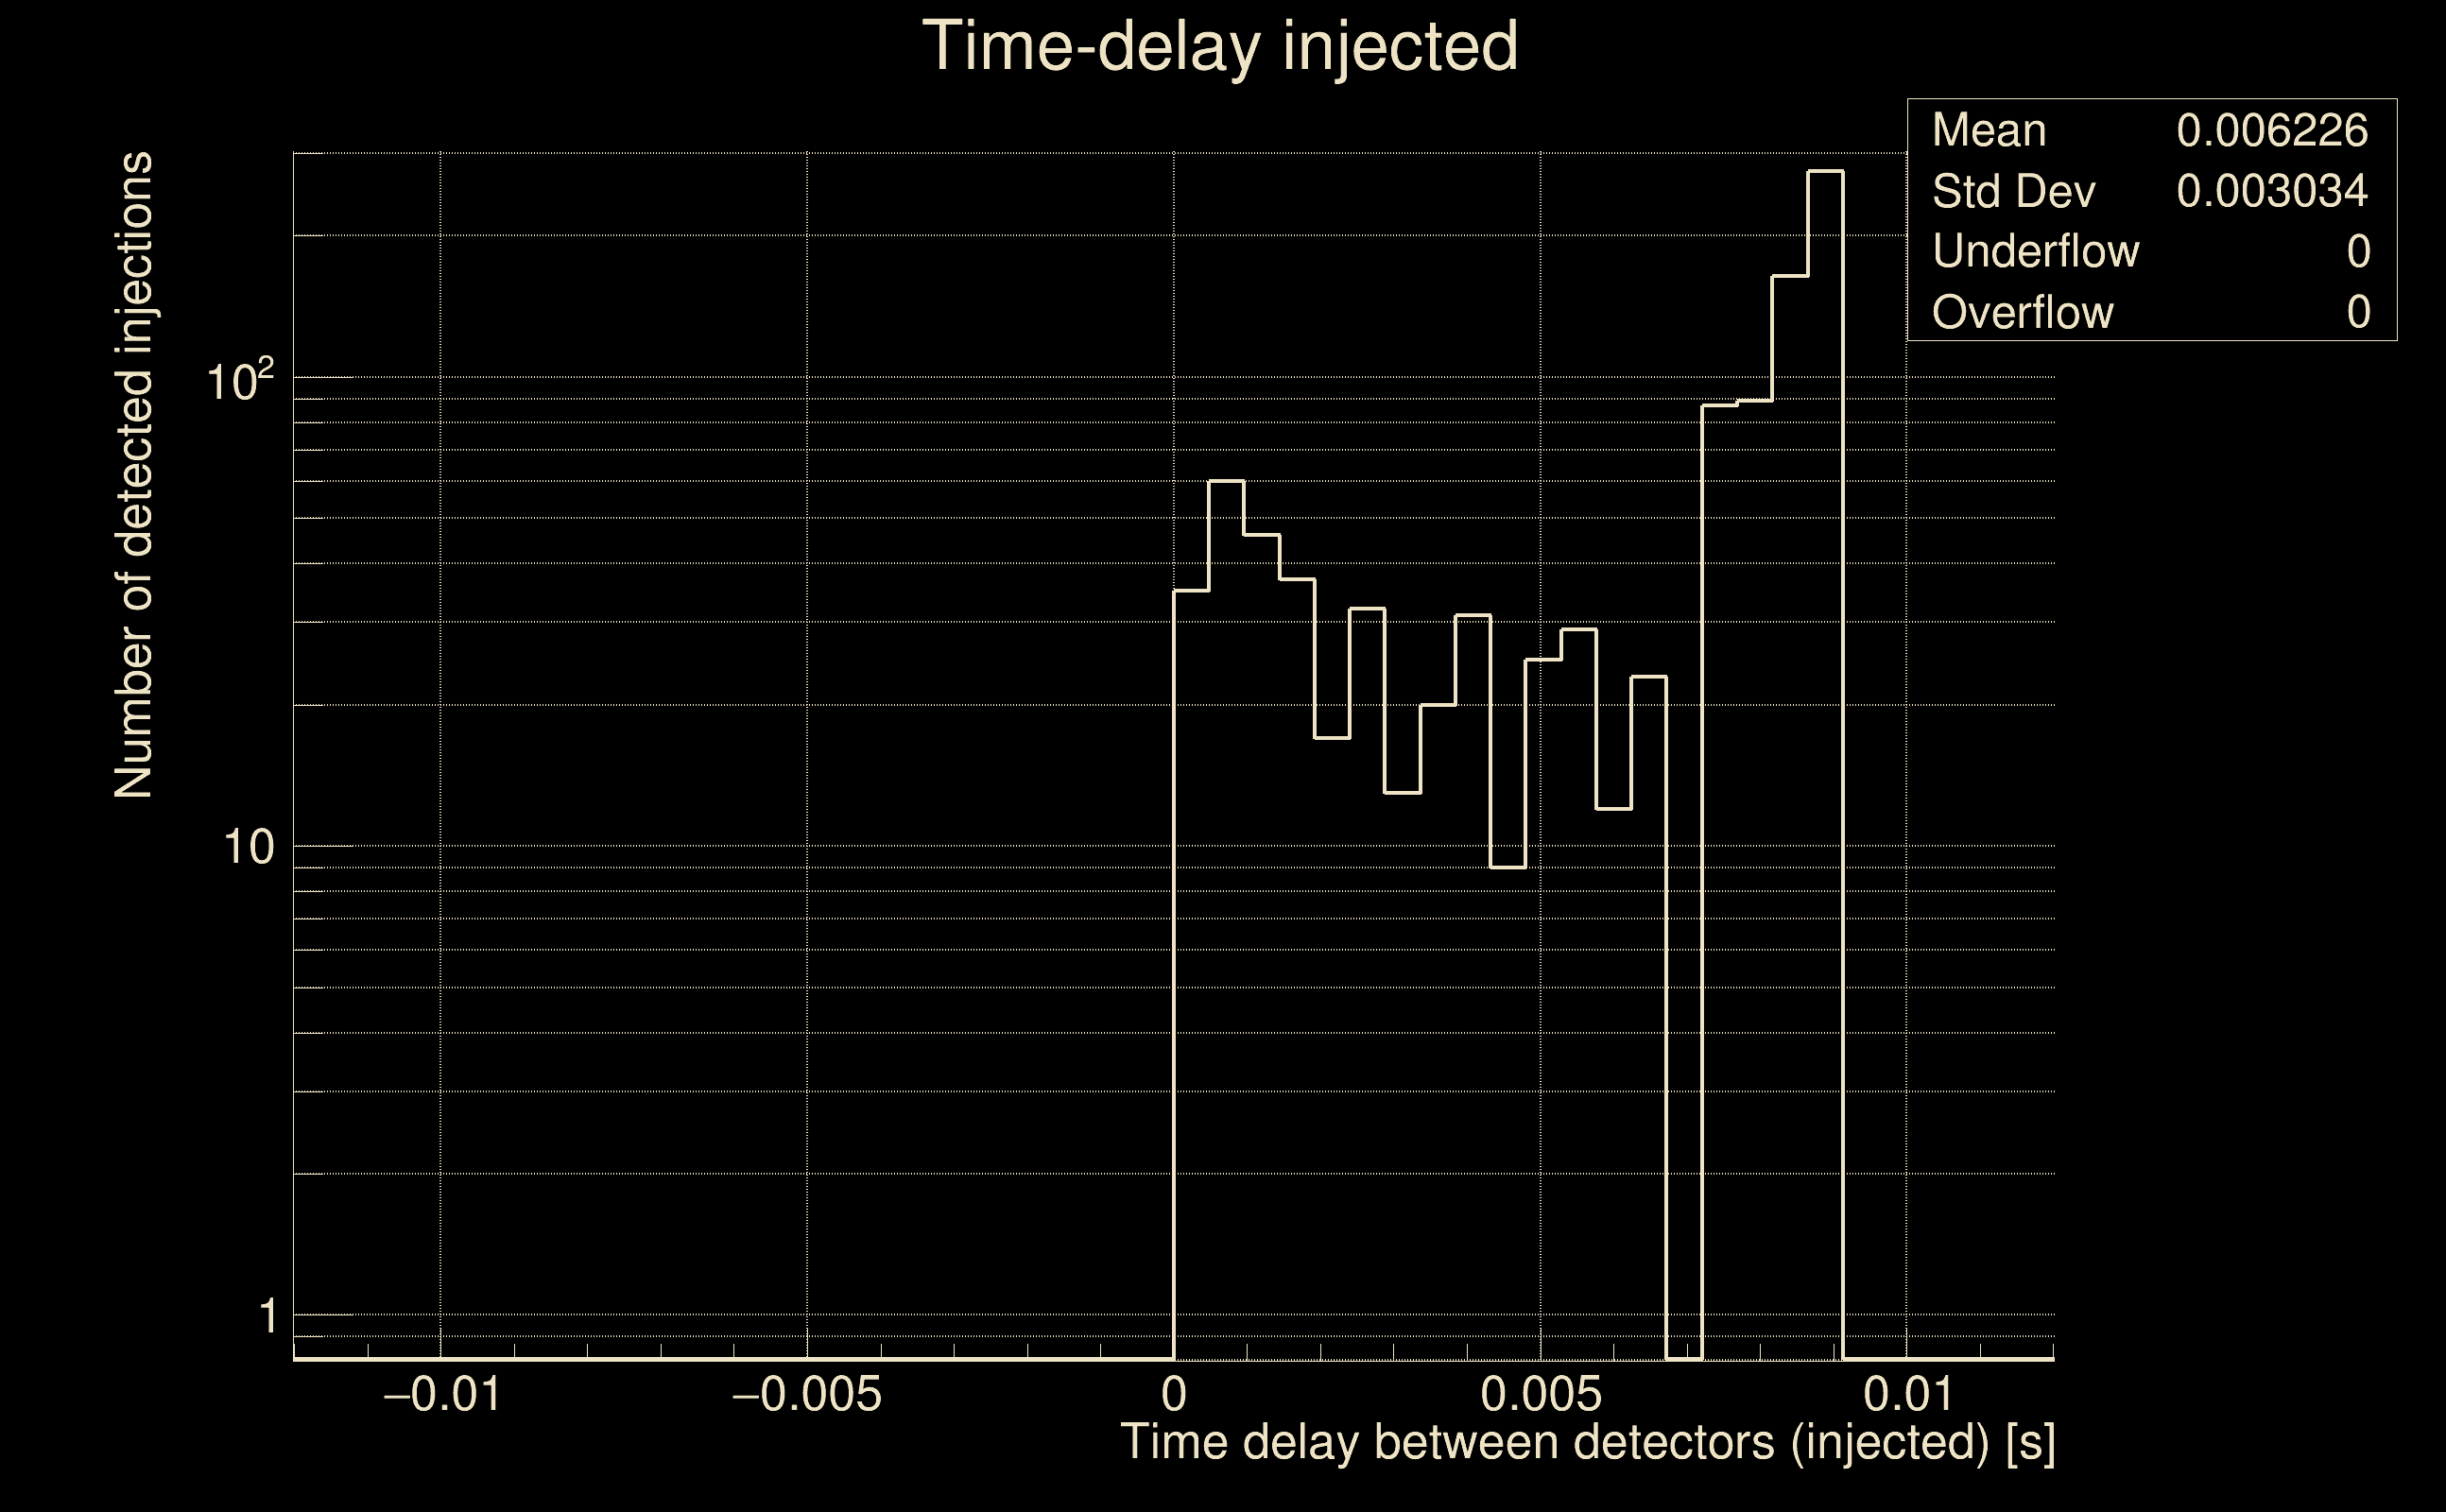
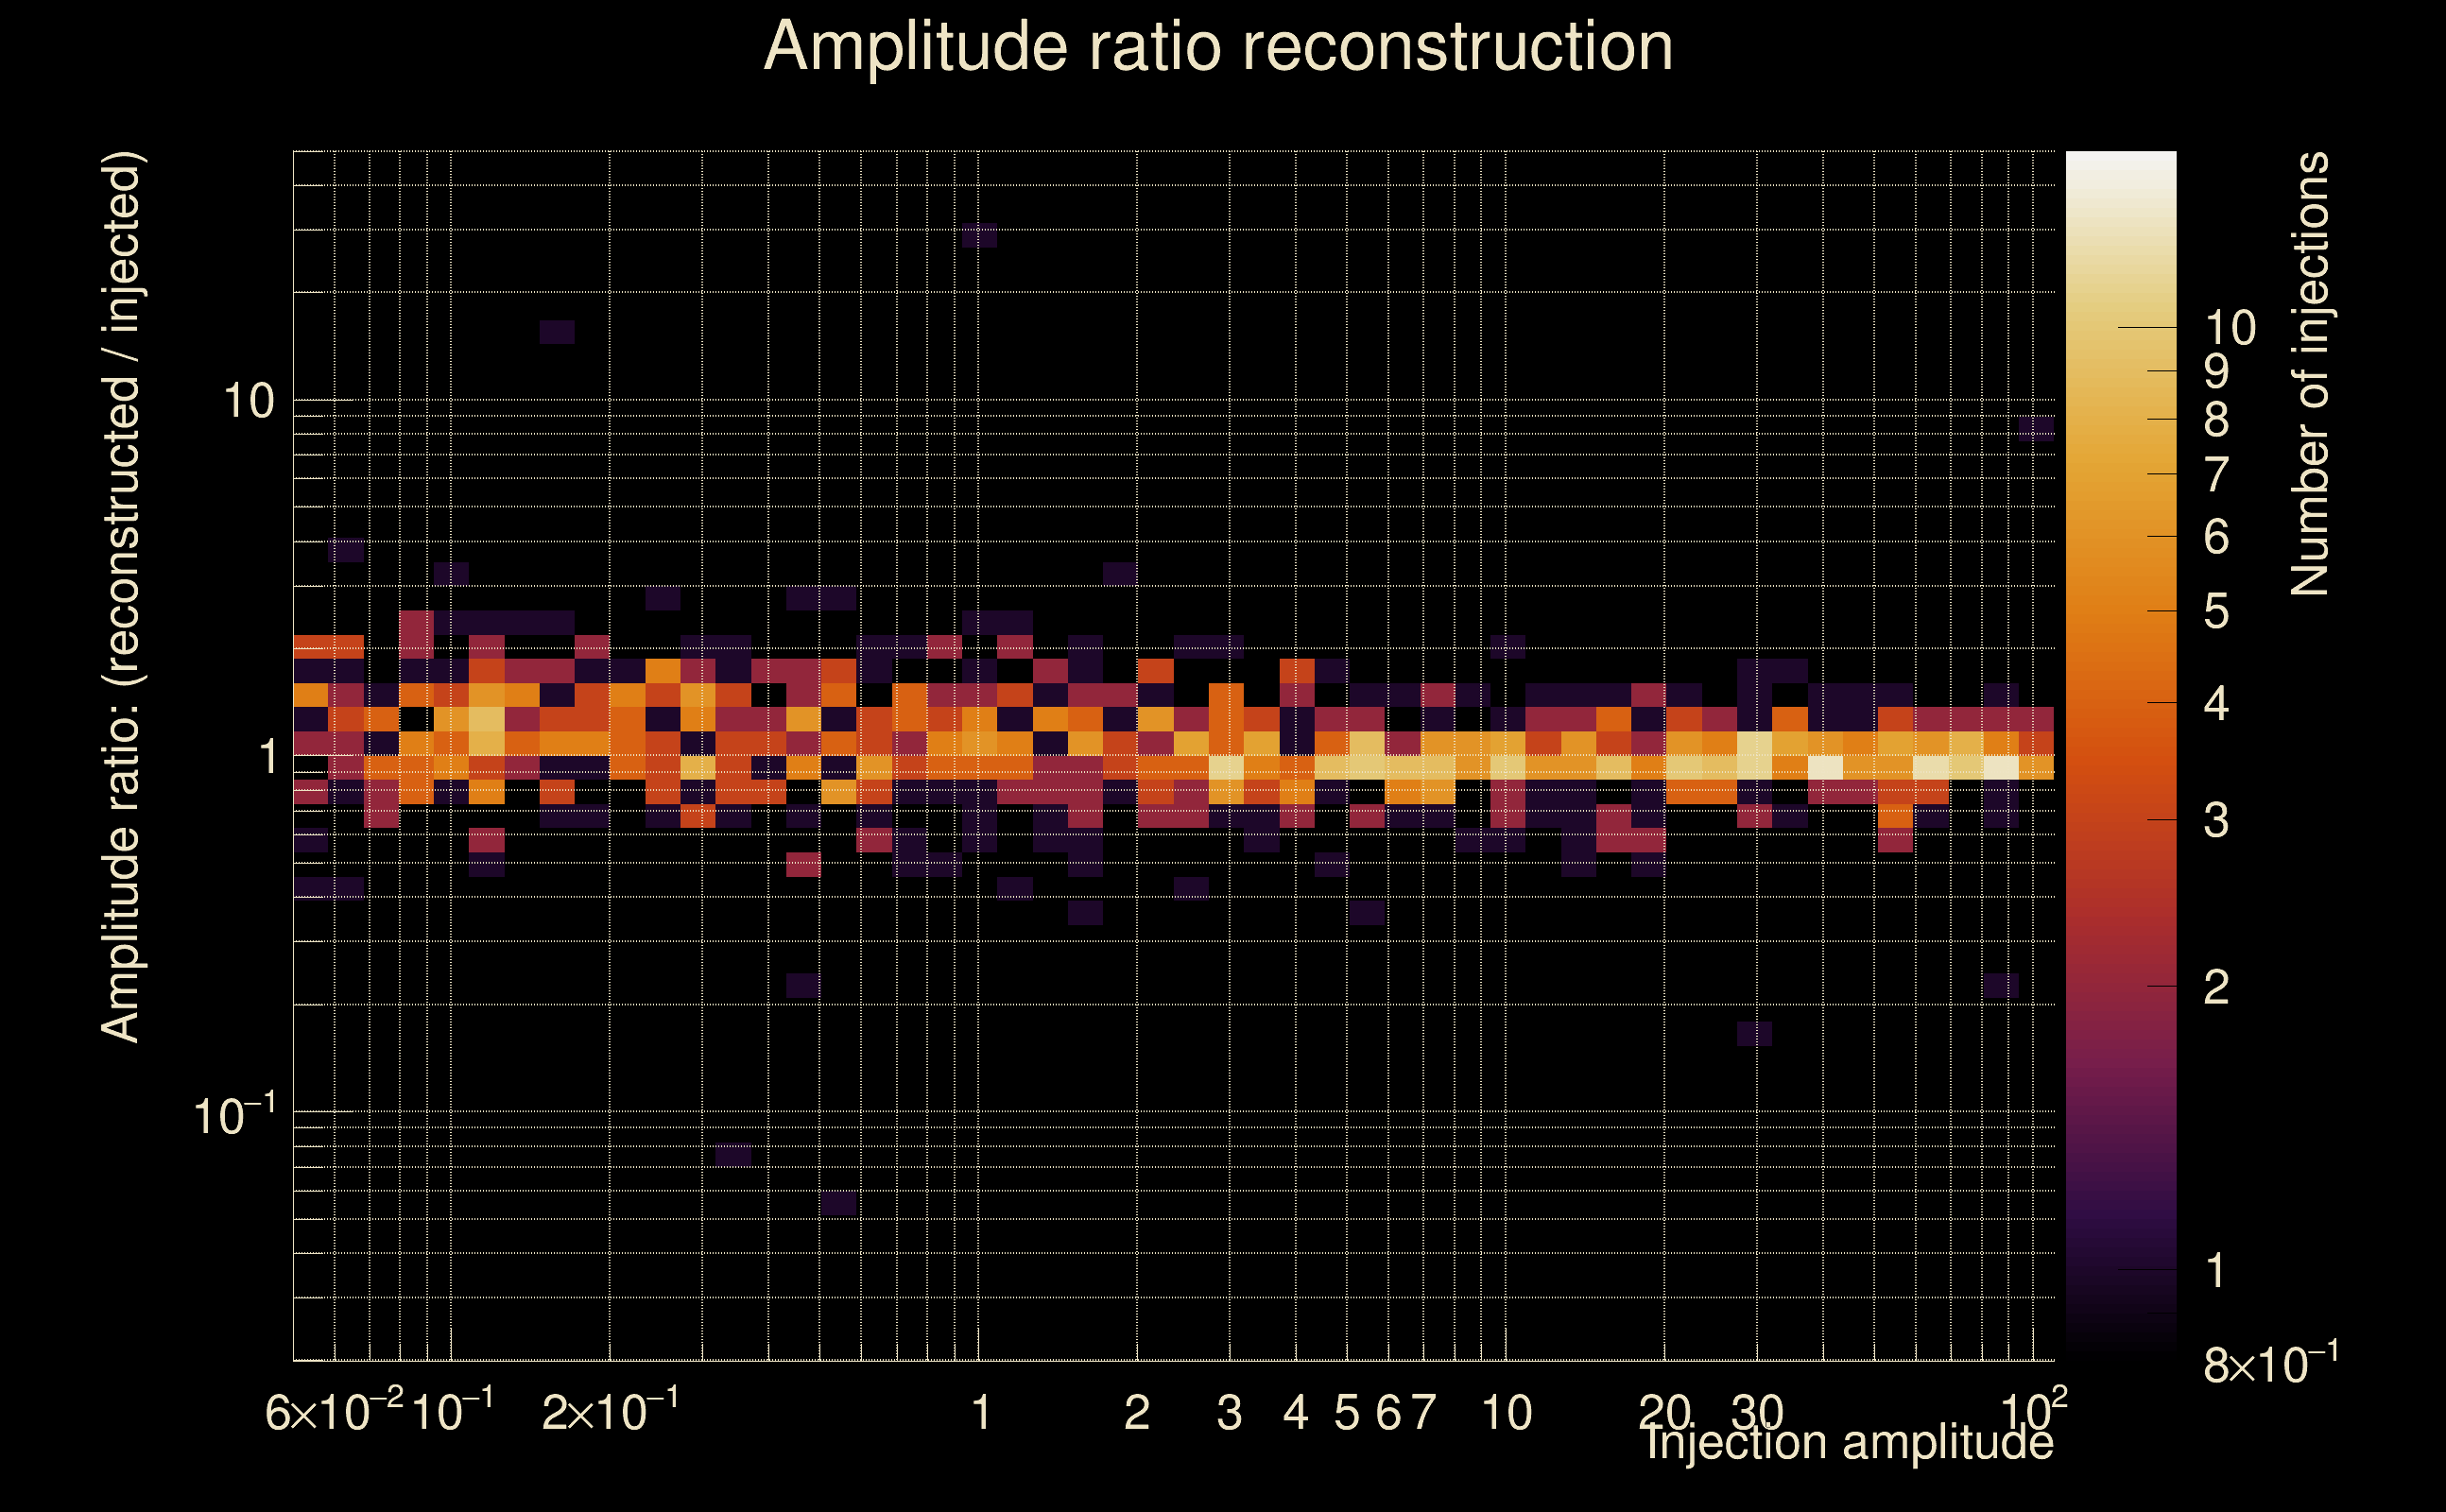
| Number of injections (total/valid/detected): | 1116 / 973 / 286 |
| List of missed injections: | ./Rad19-s13_missed.txt |
| Injection amplitude at 90% detection efficiency: | 8.58669 |
| Injection amplitude at 50% detection efficiency: | 4.63244 |
| Injection amplitude at 10% detection efficiency: | 3.62857 |
 |
 |
 |
 |
 |
 |
 |
|
 |
 |
|
 |
 |
|
 |
 |
|
 |
 |
|
 |
 |
|
 |
 |
|
 |
 |
|
 |
 |
 |
 |
 |
 |
 |
 |
 |
 |
 |
 |
 |
 |
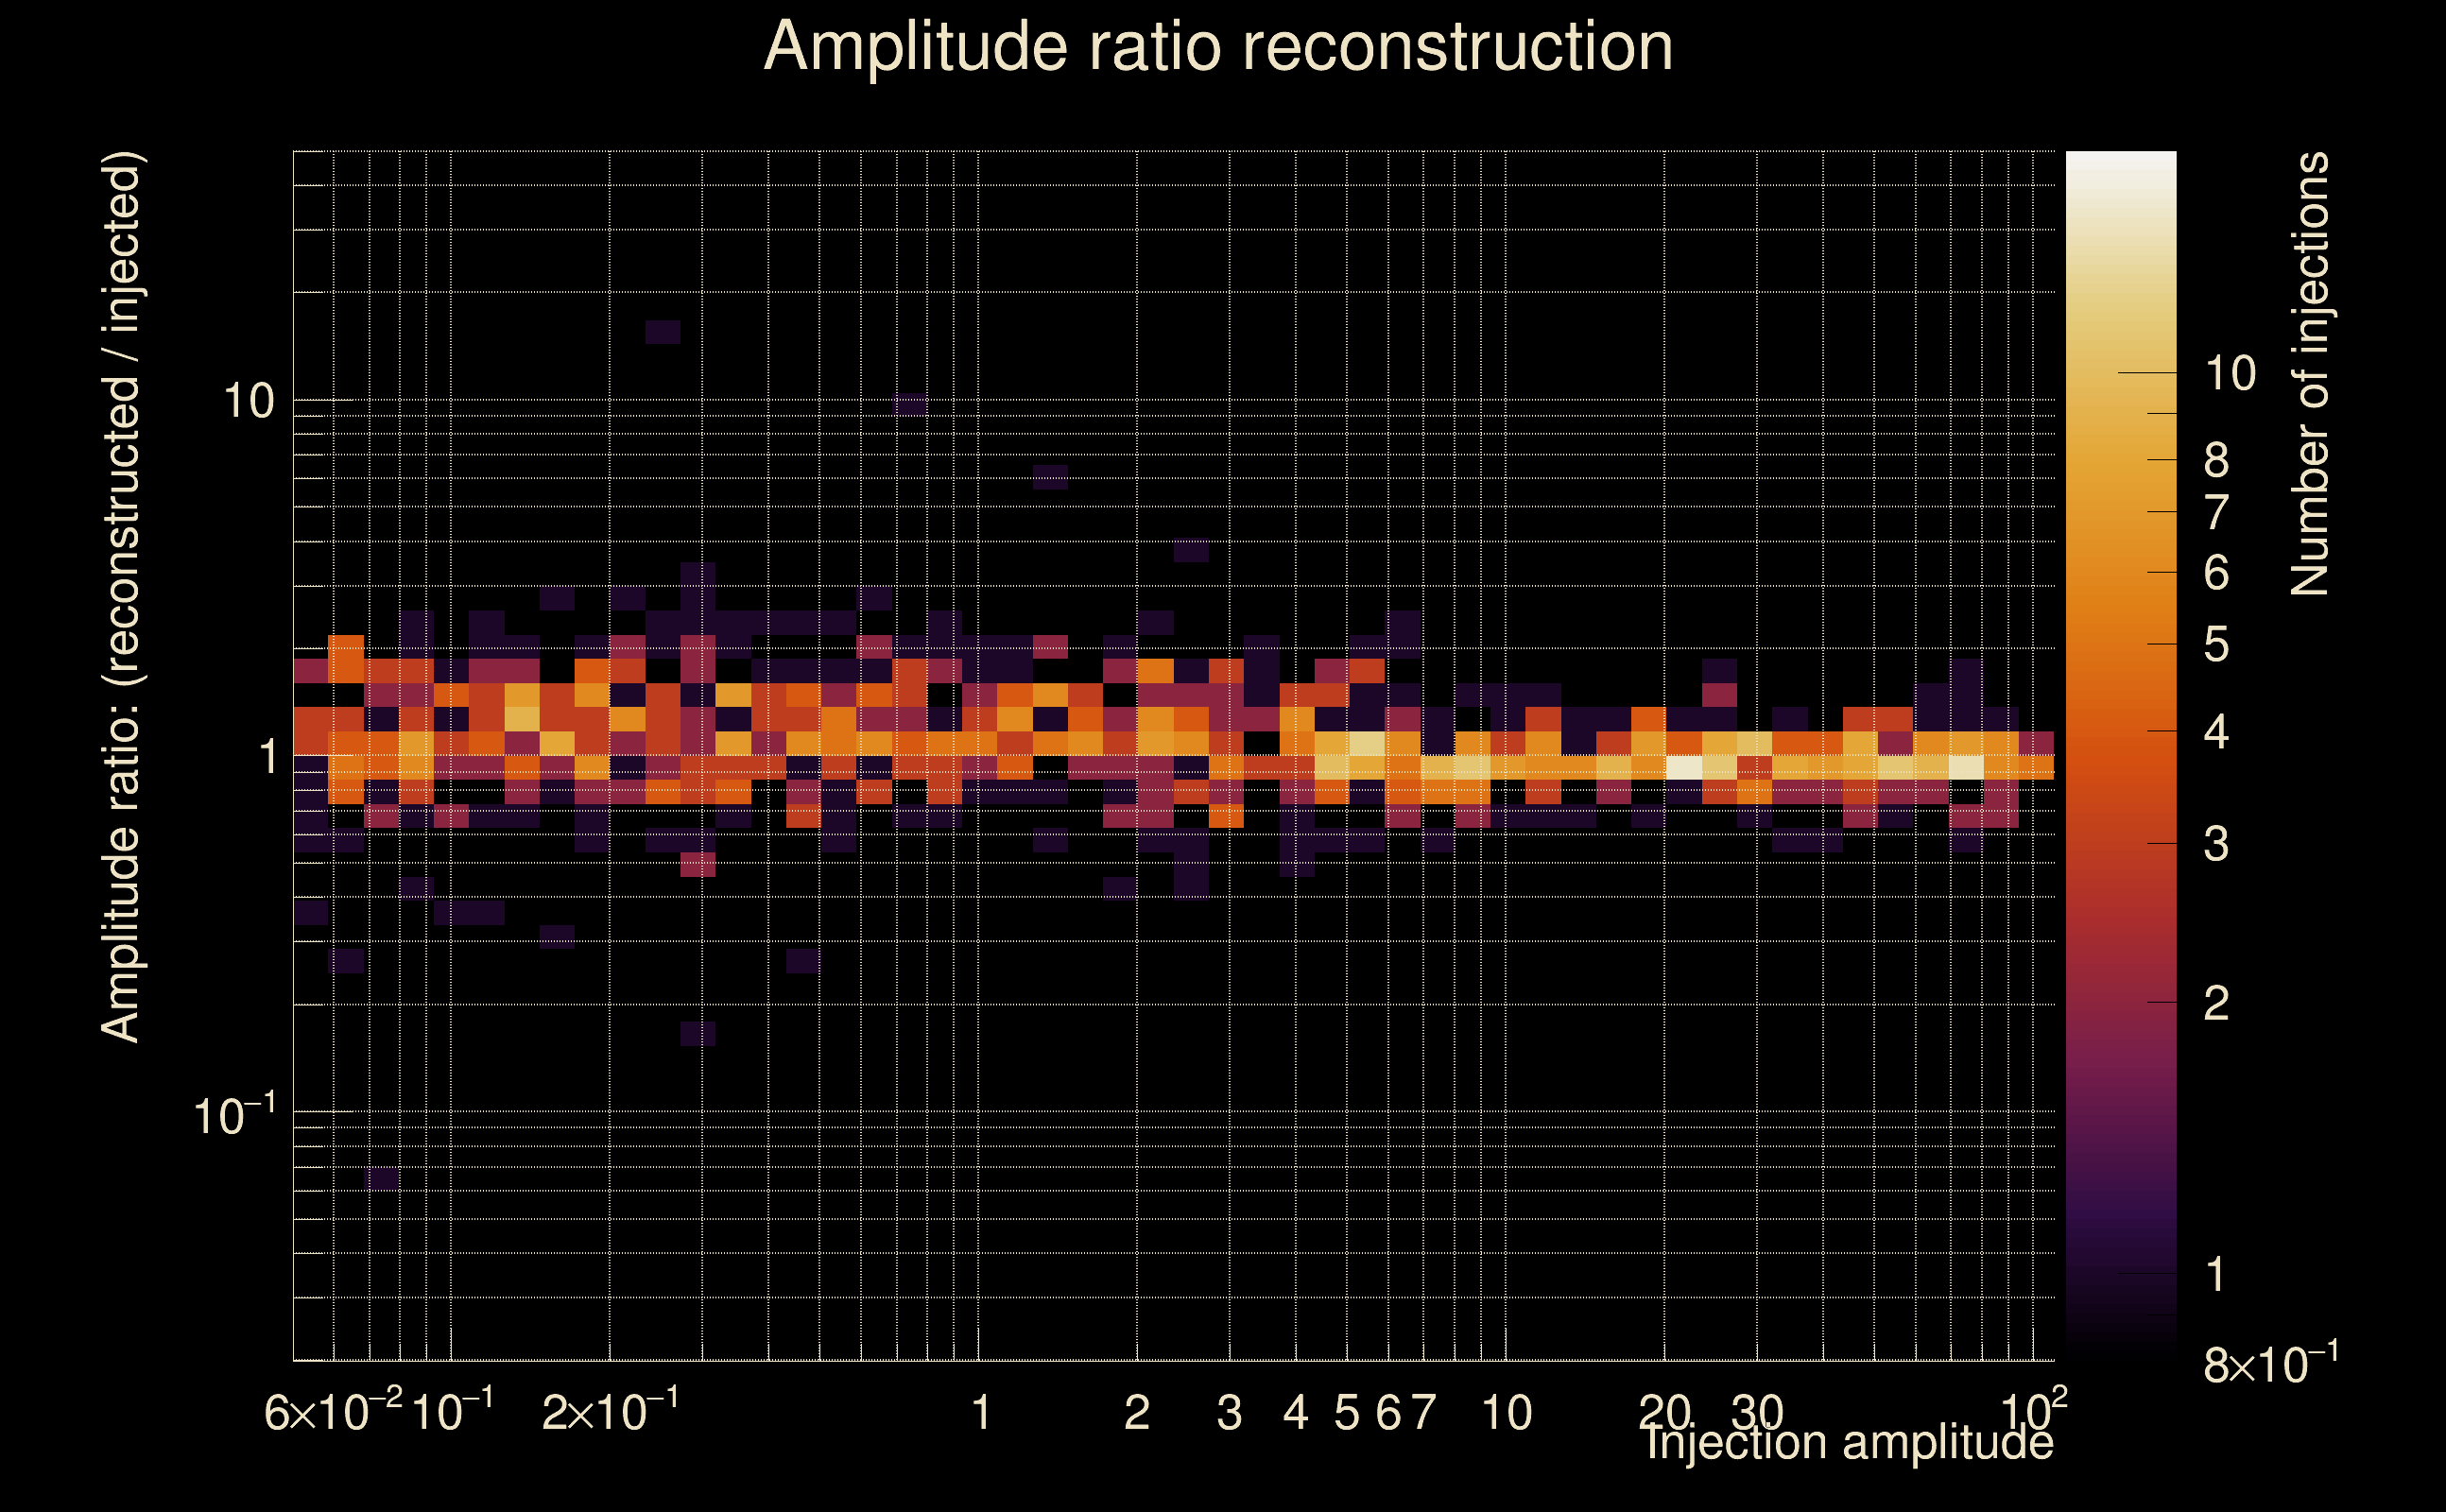 |
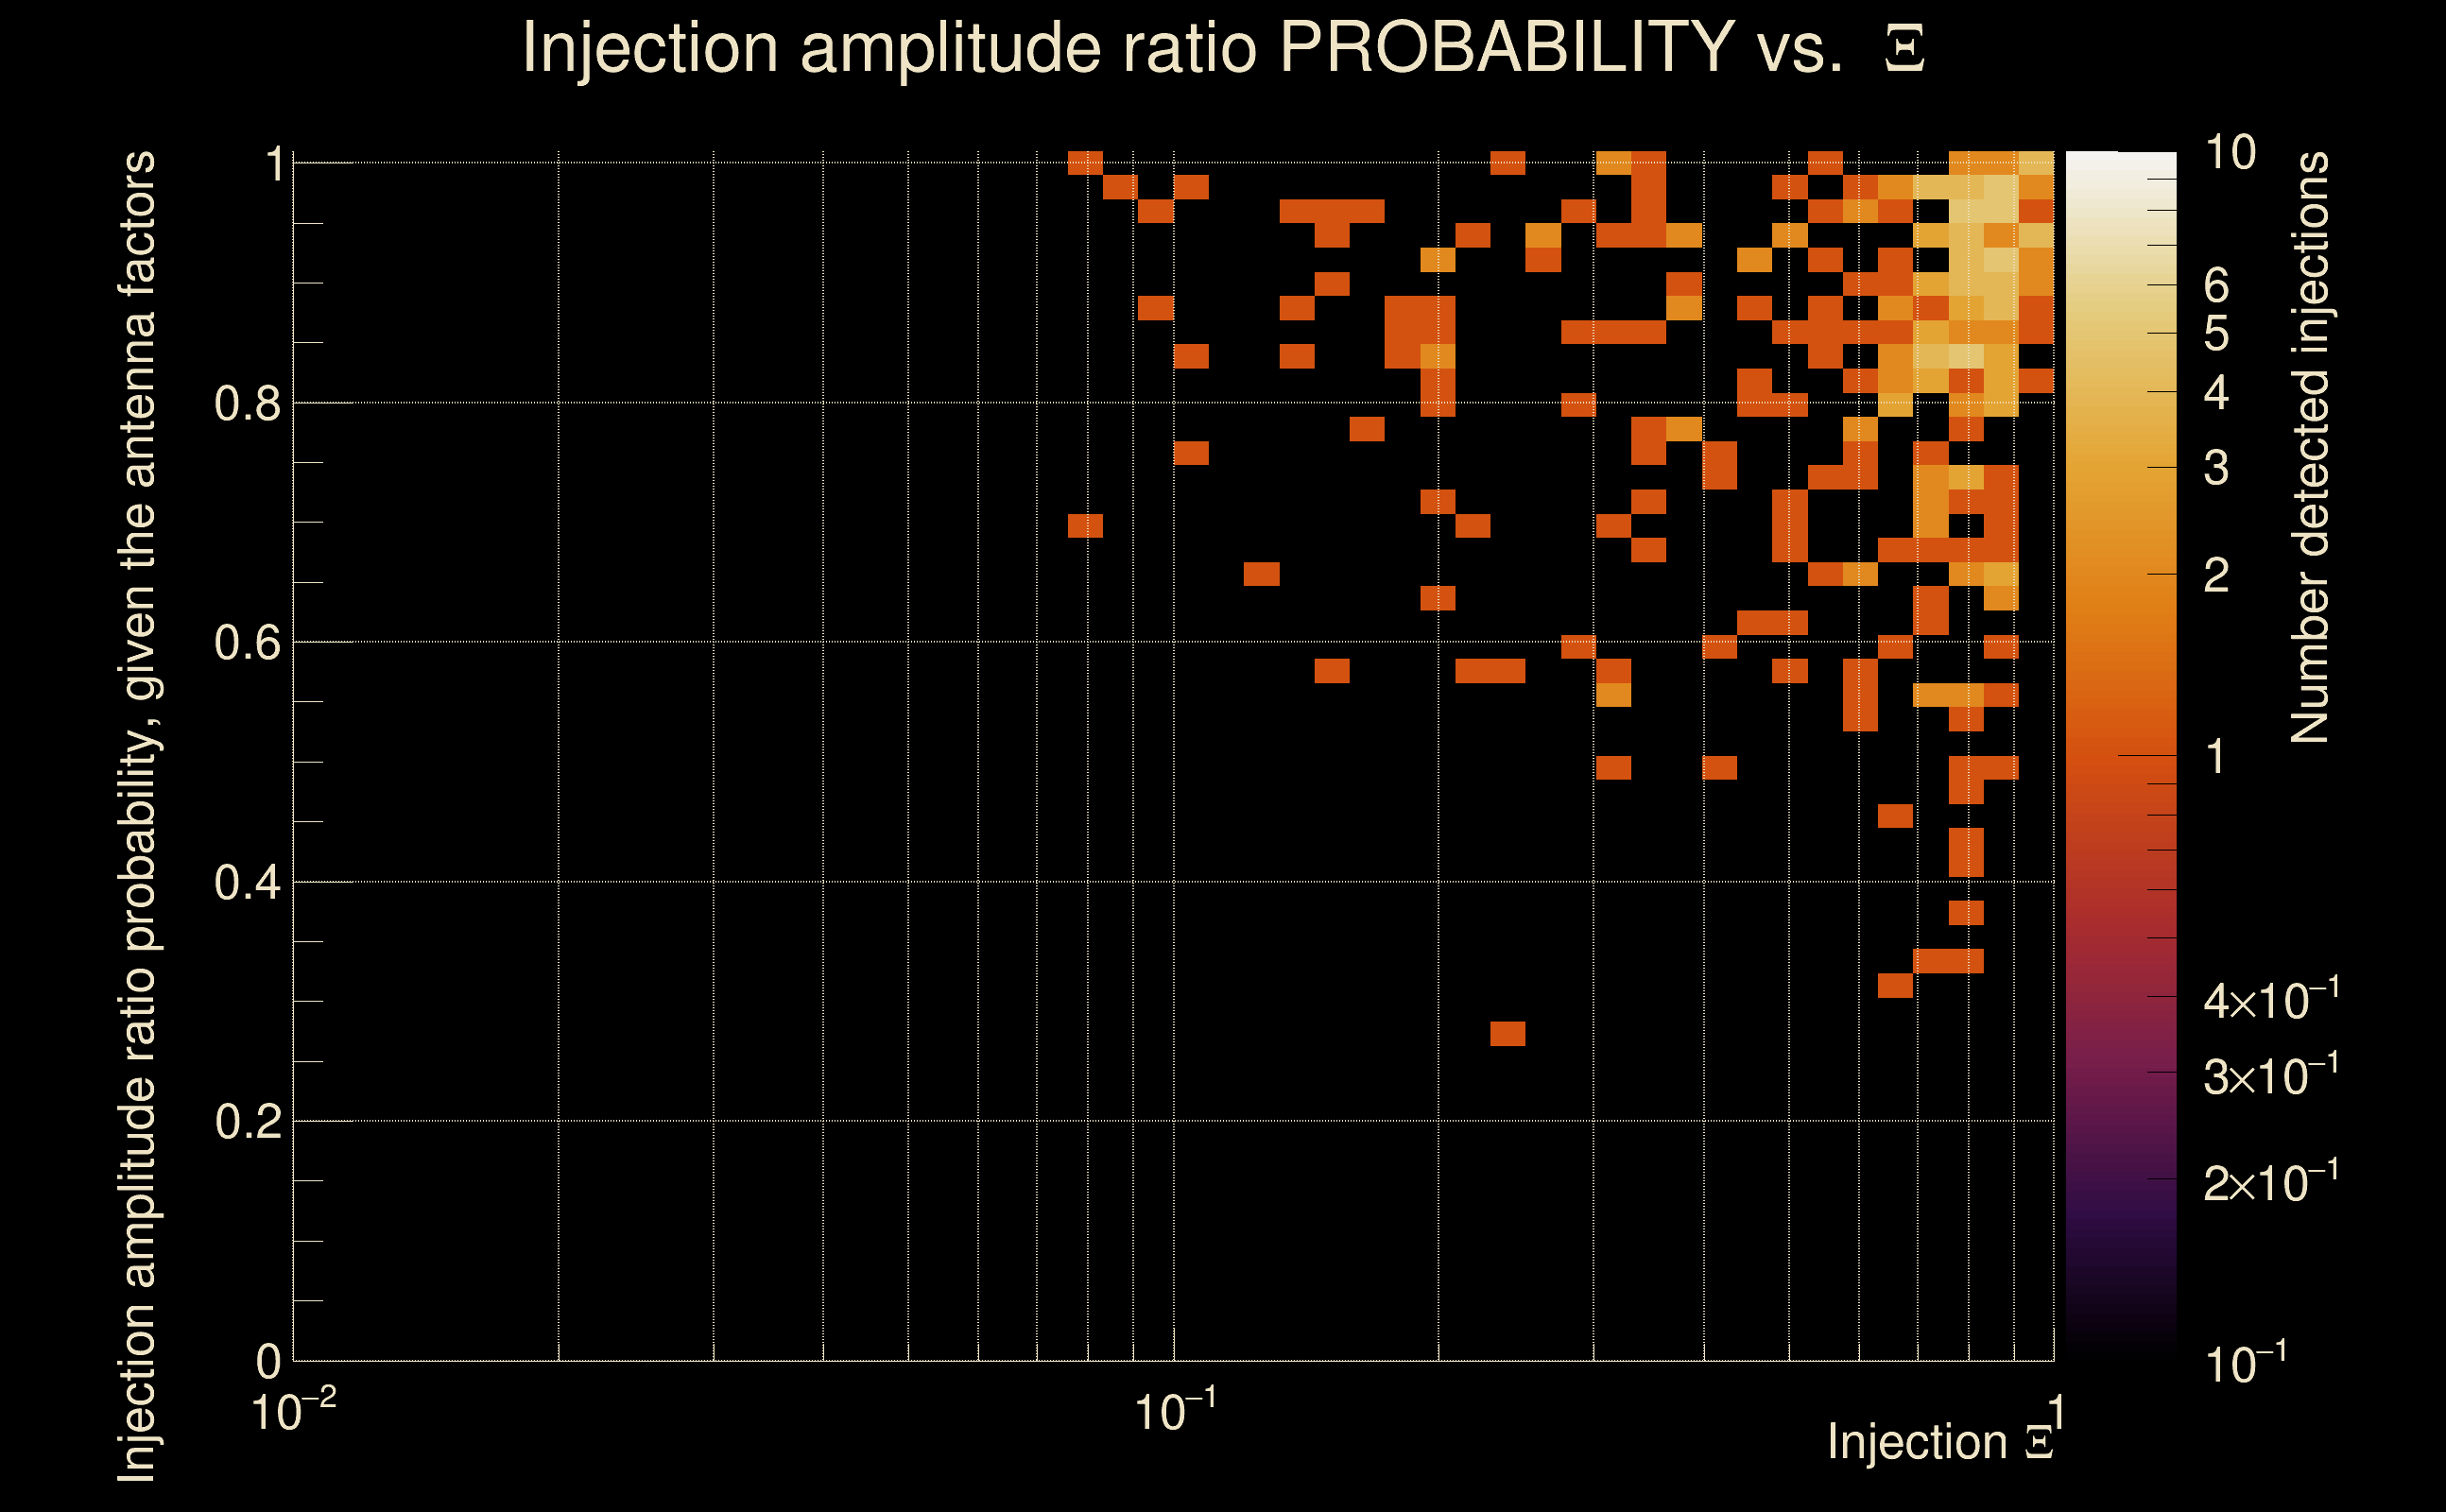
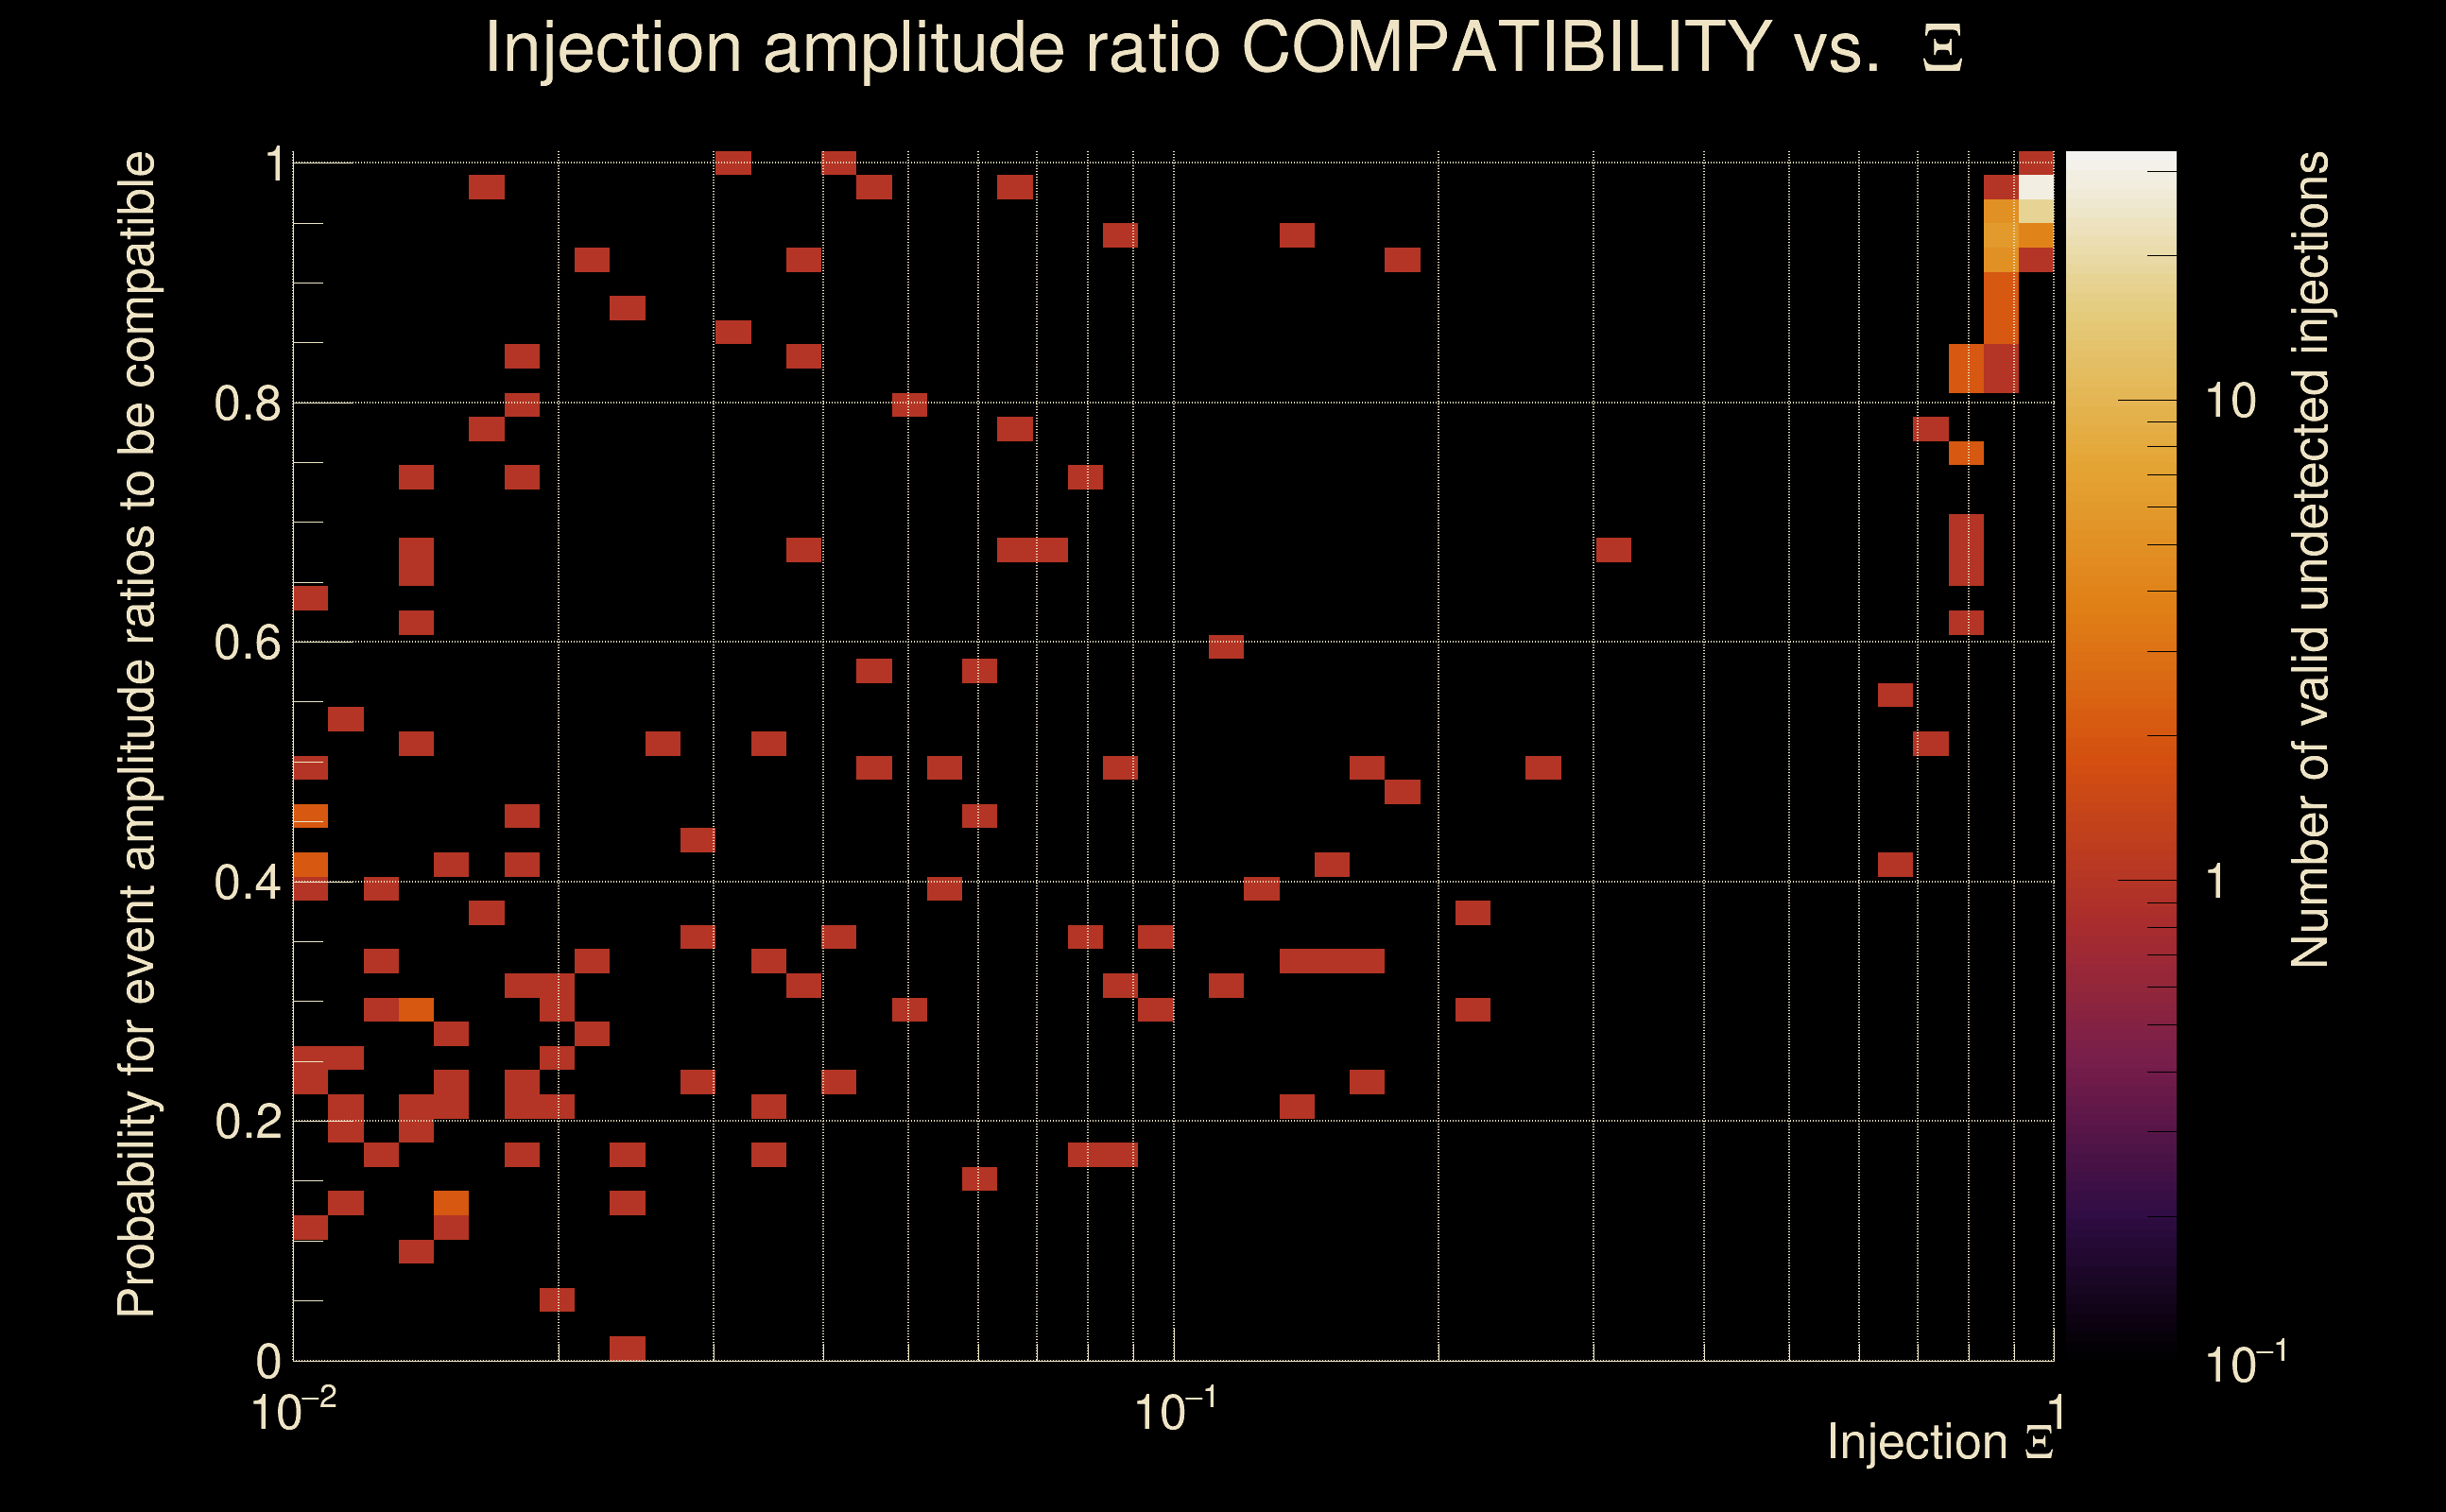
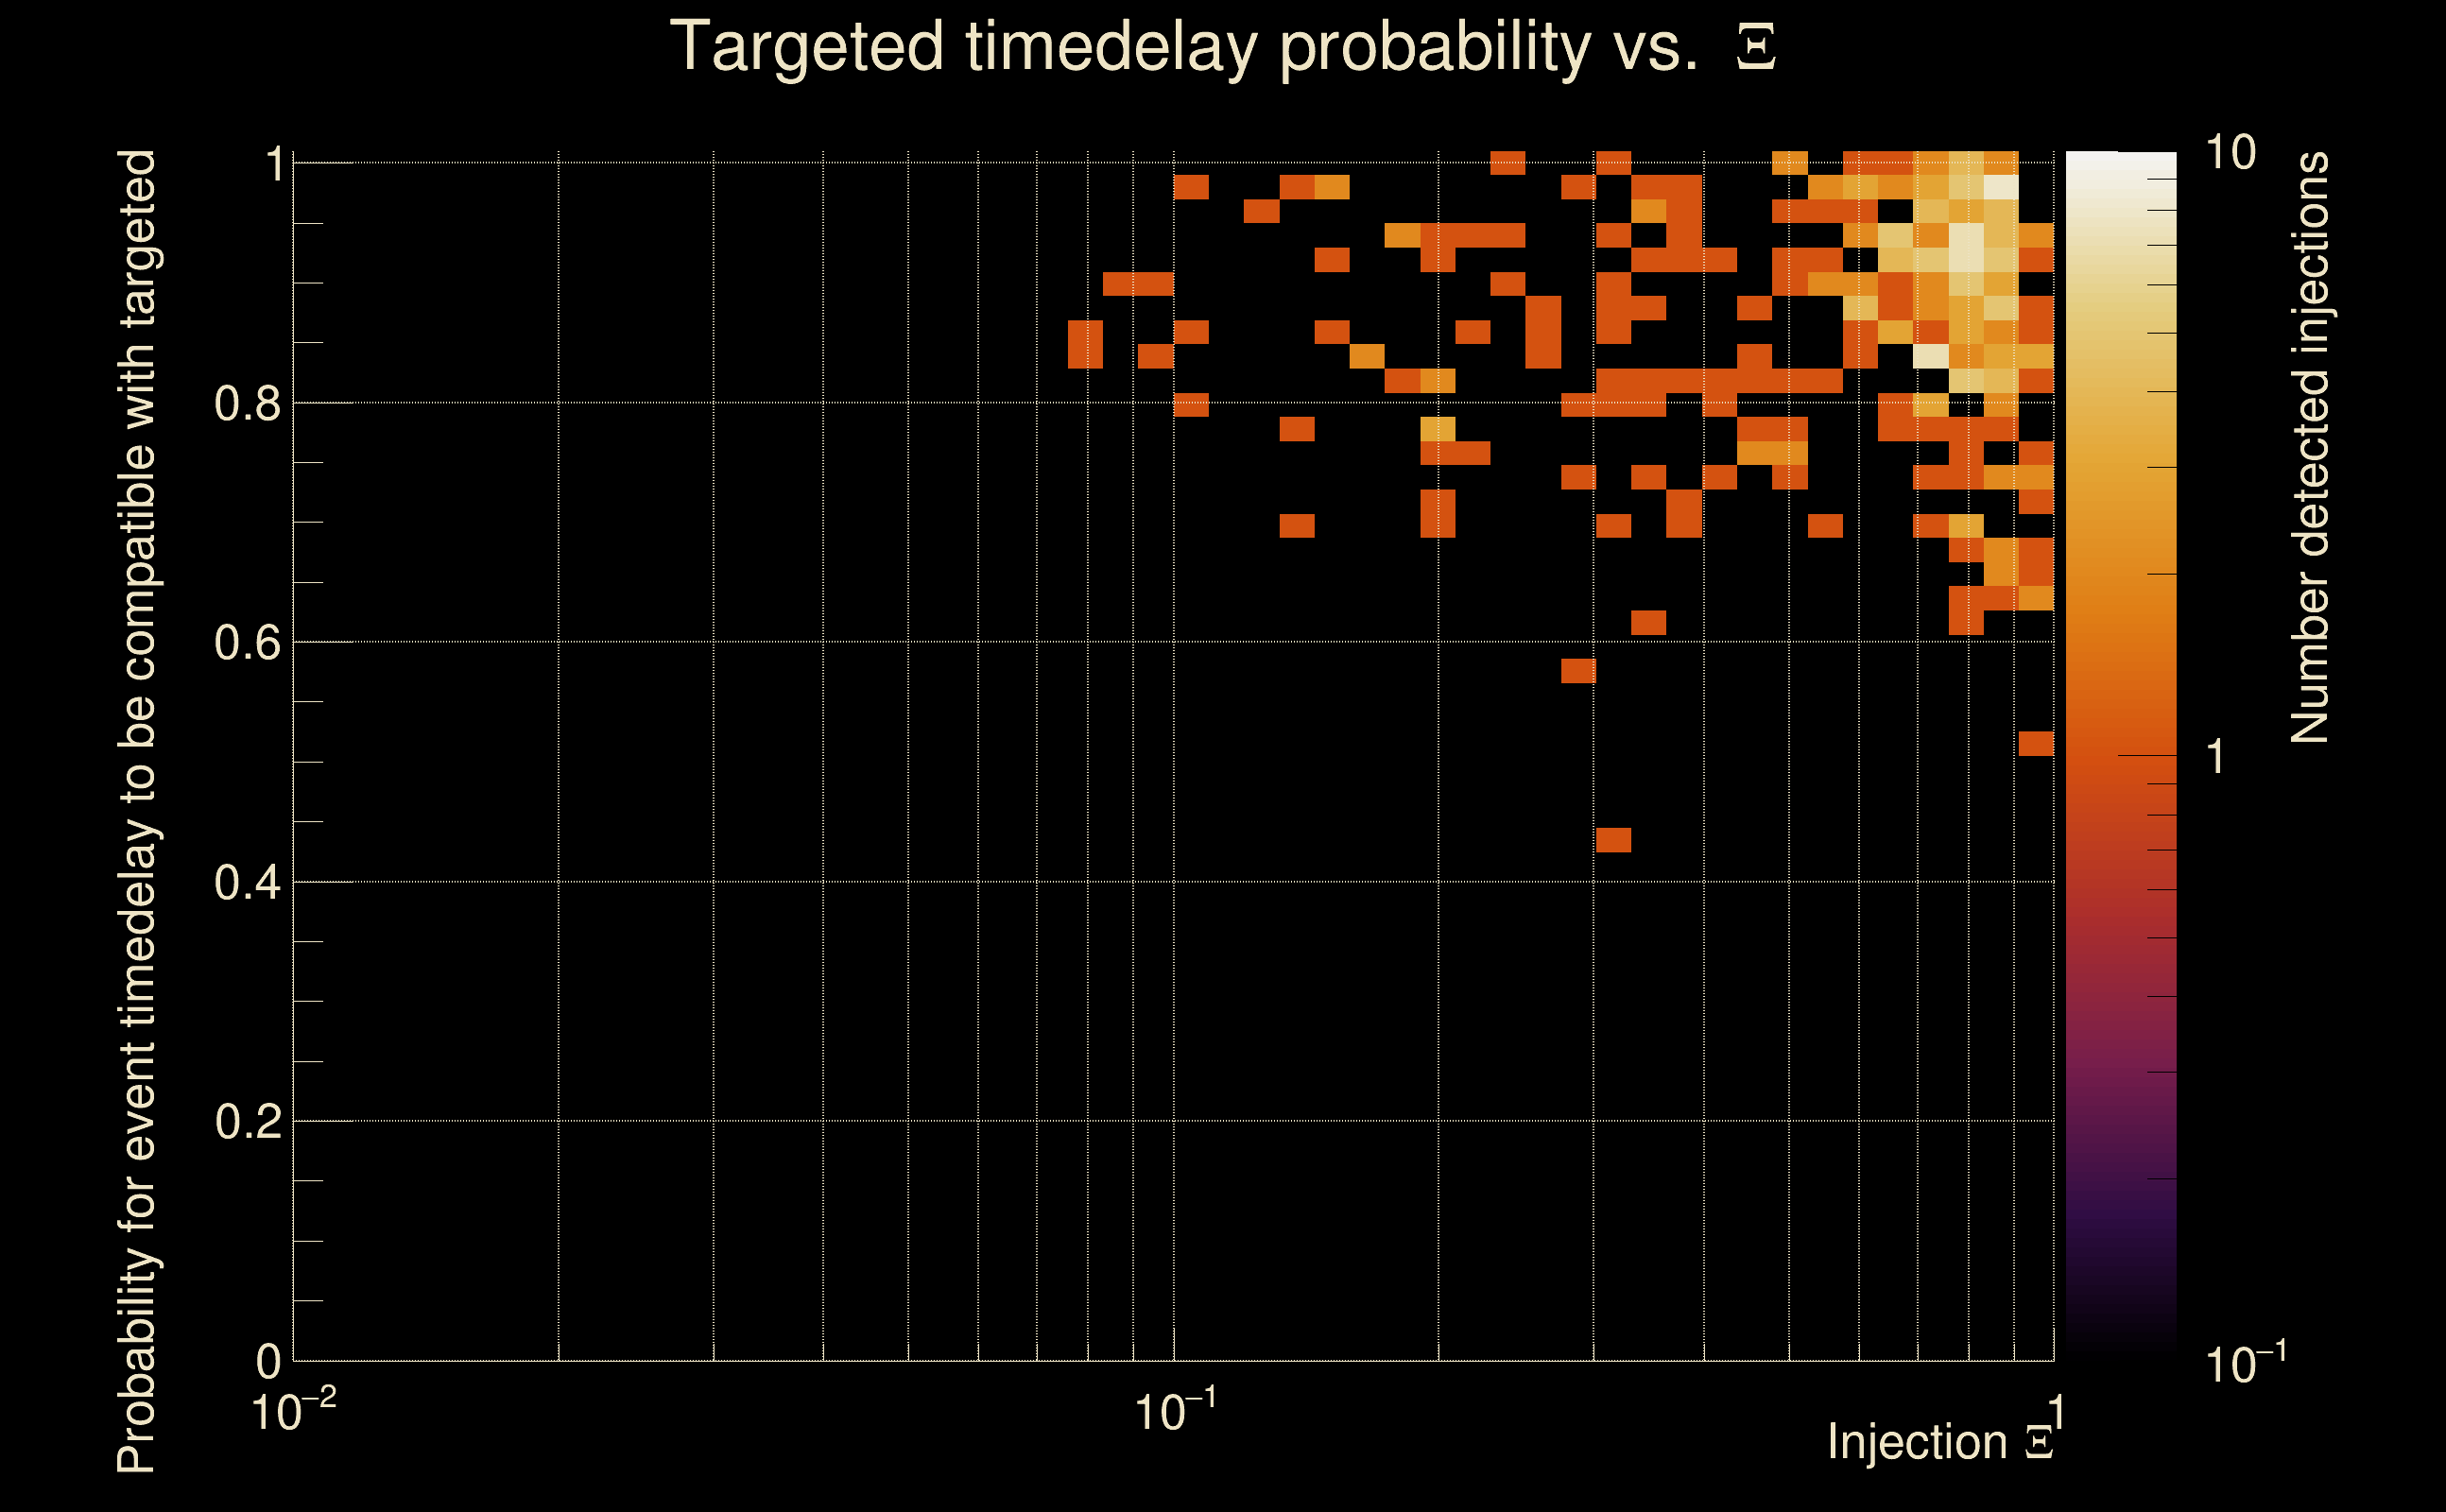
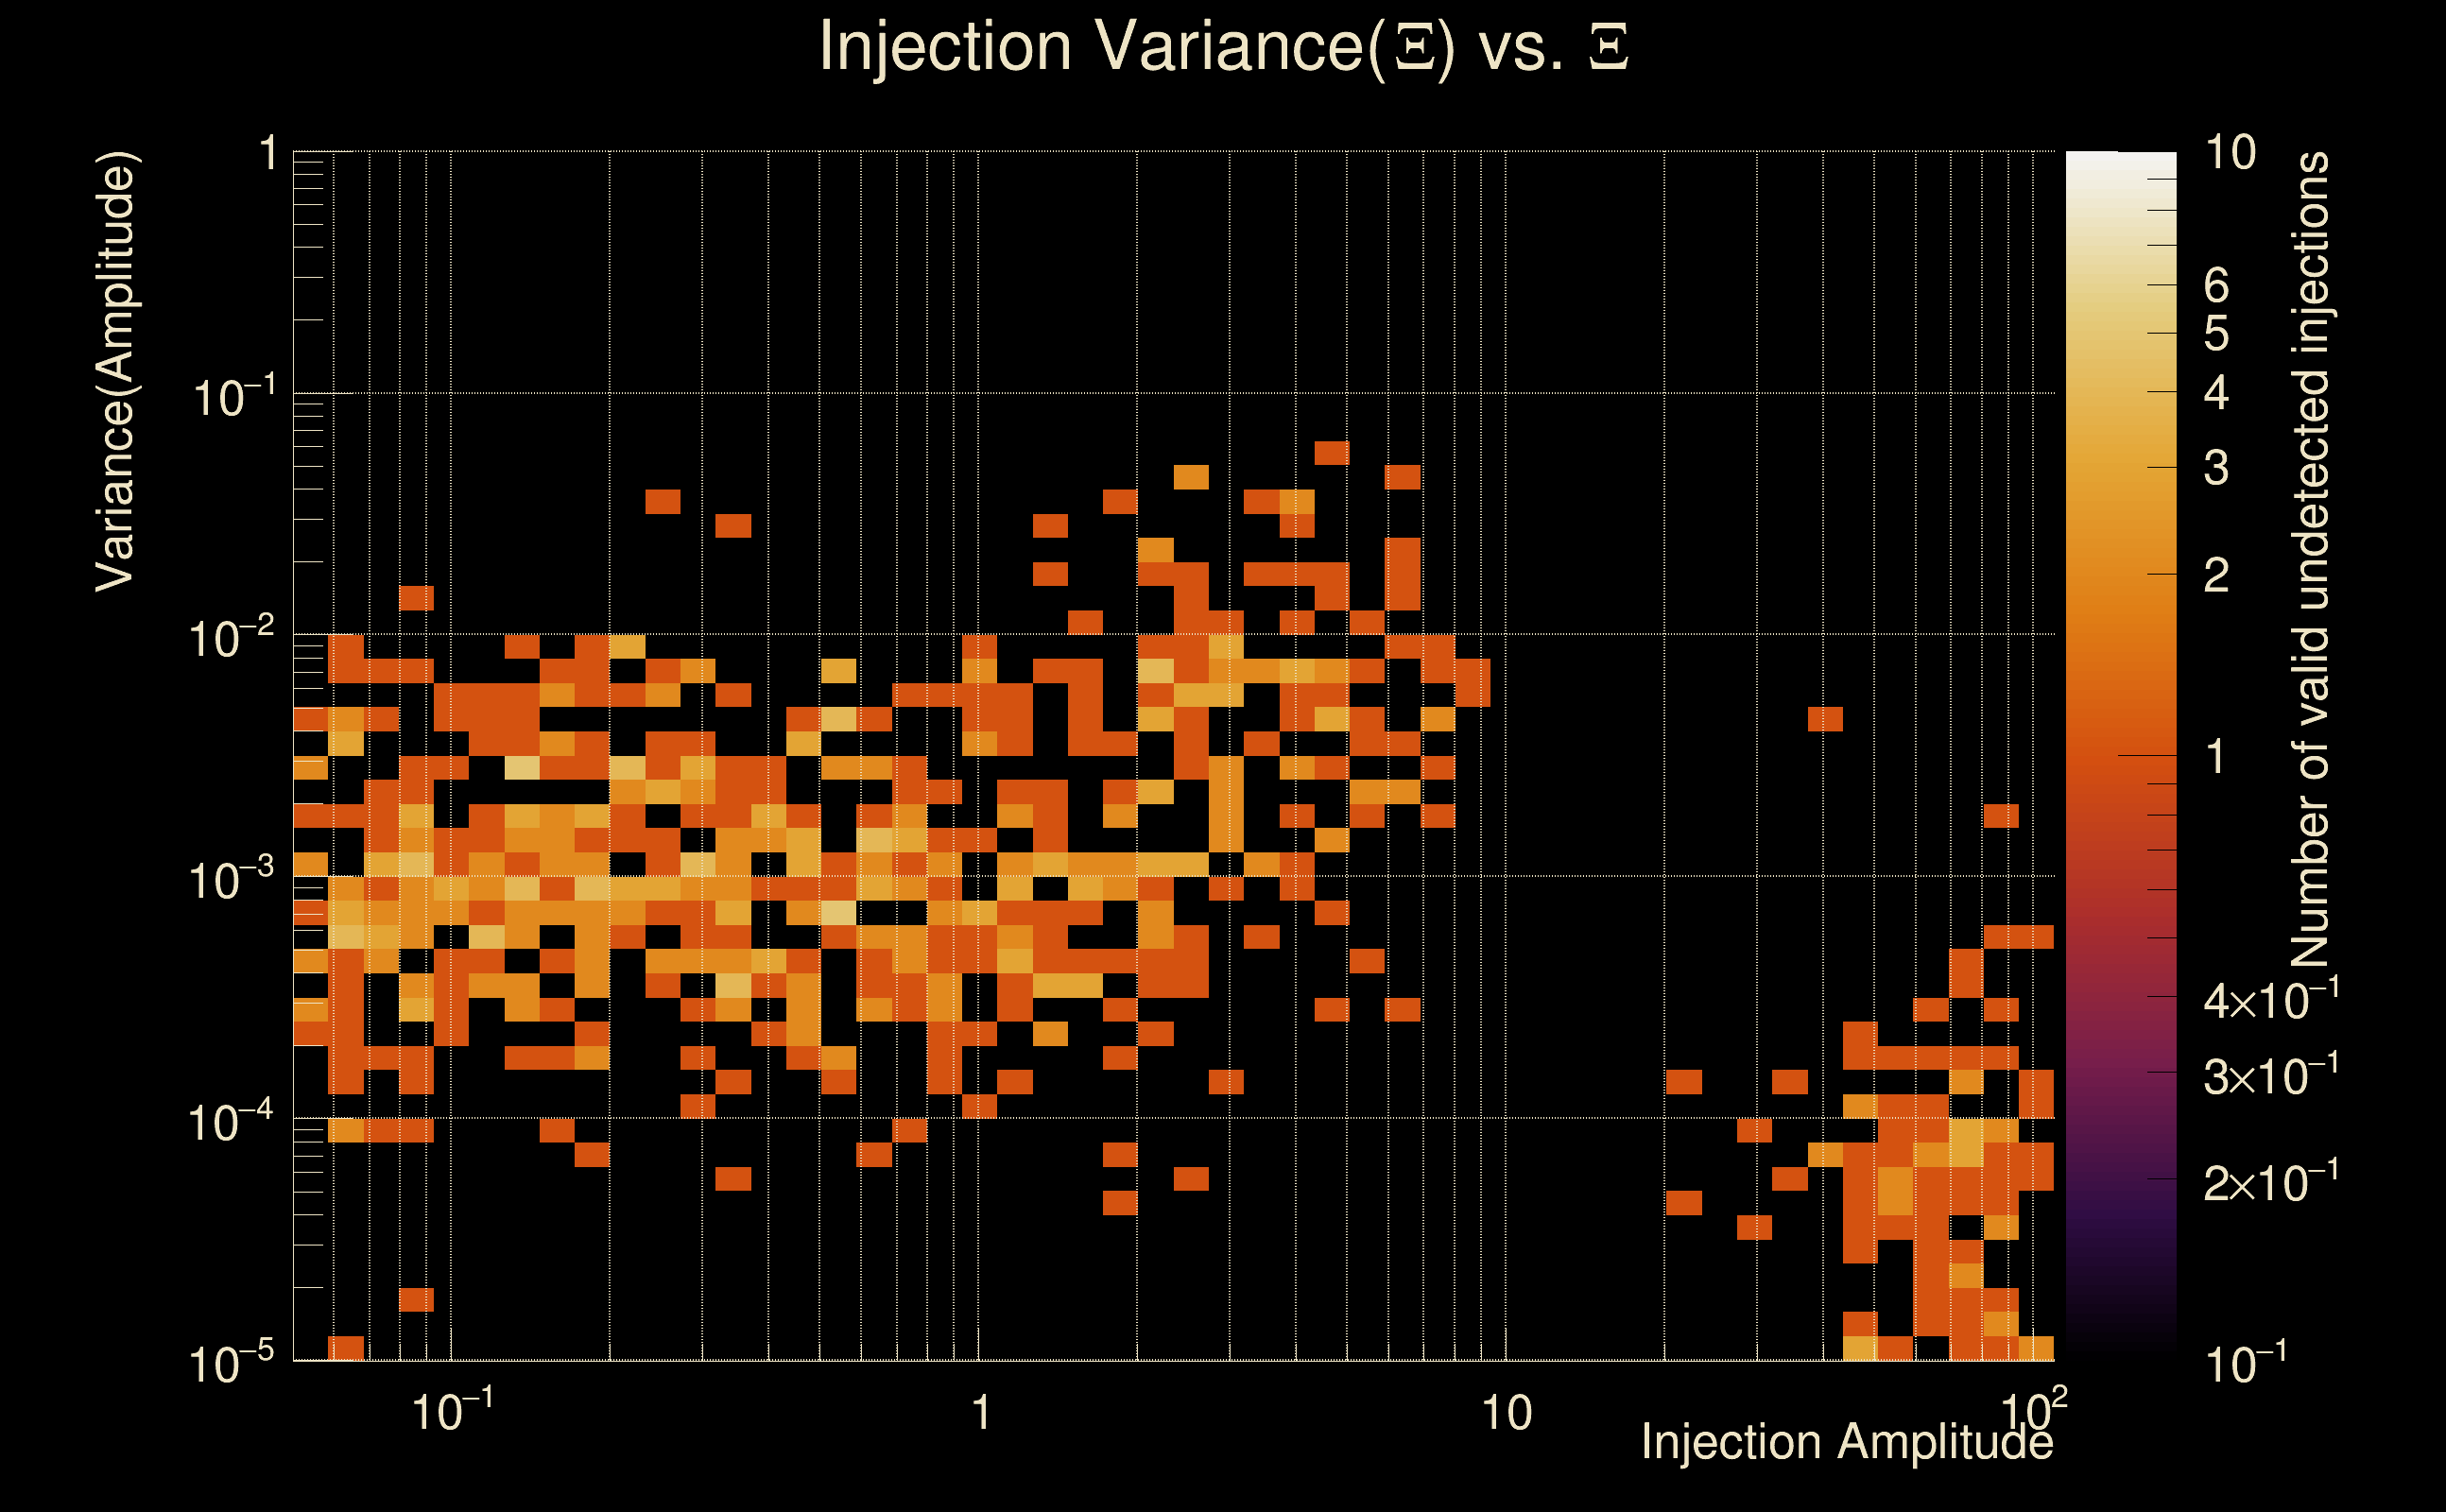
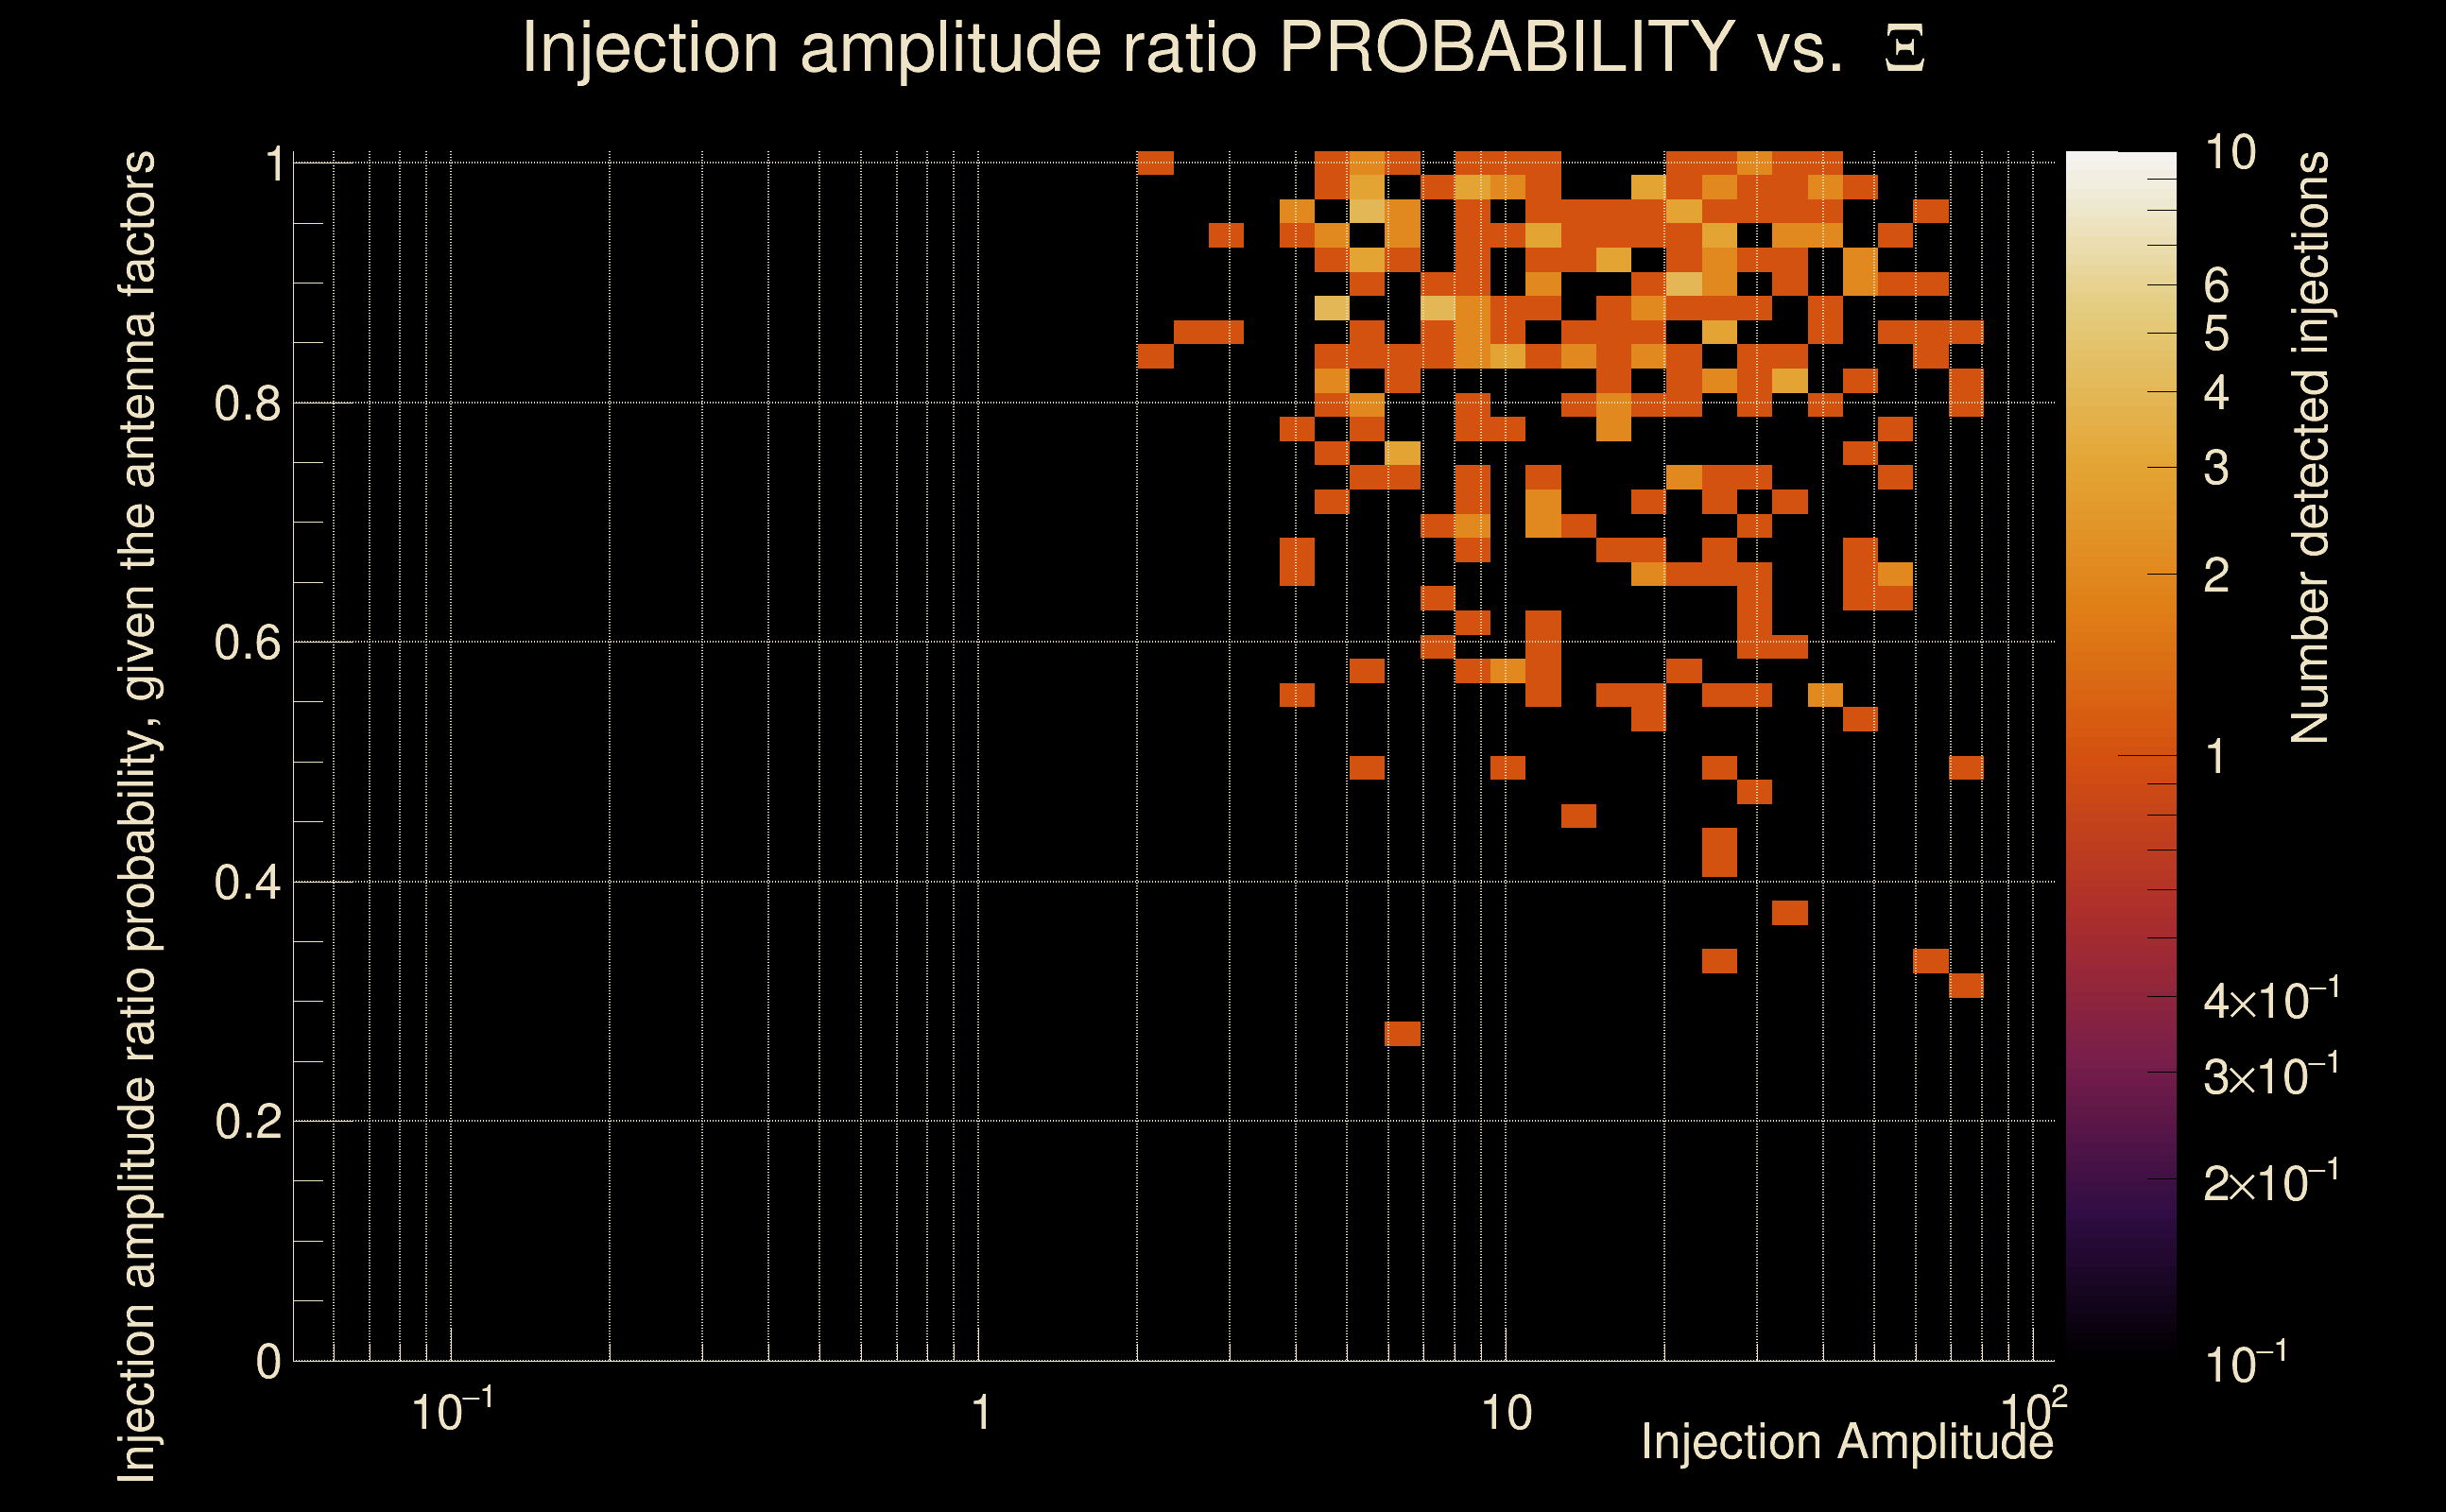
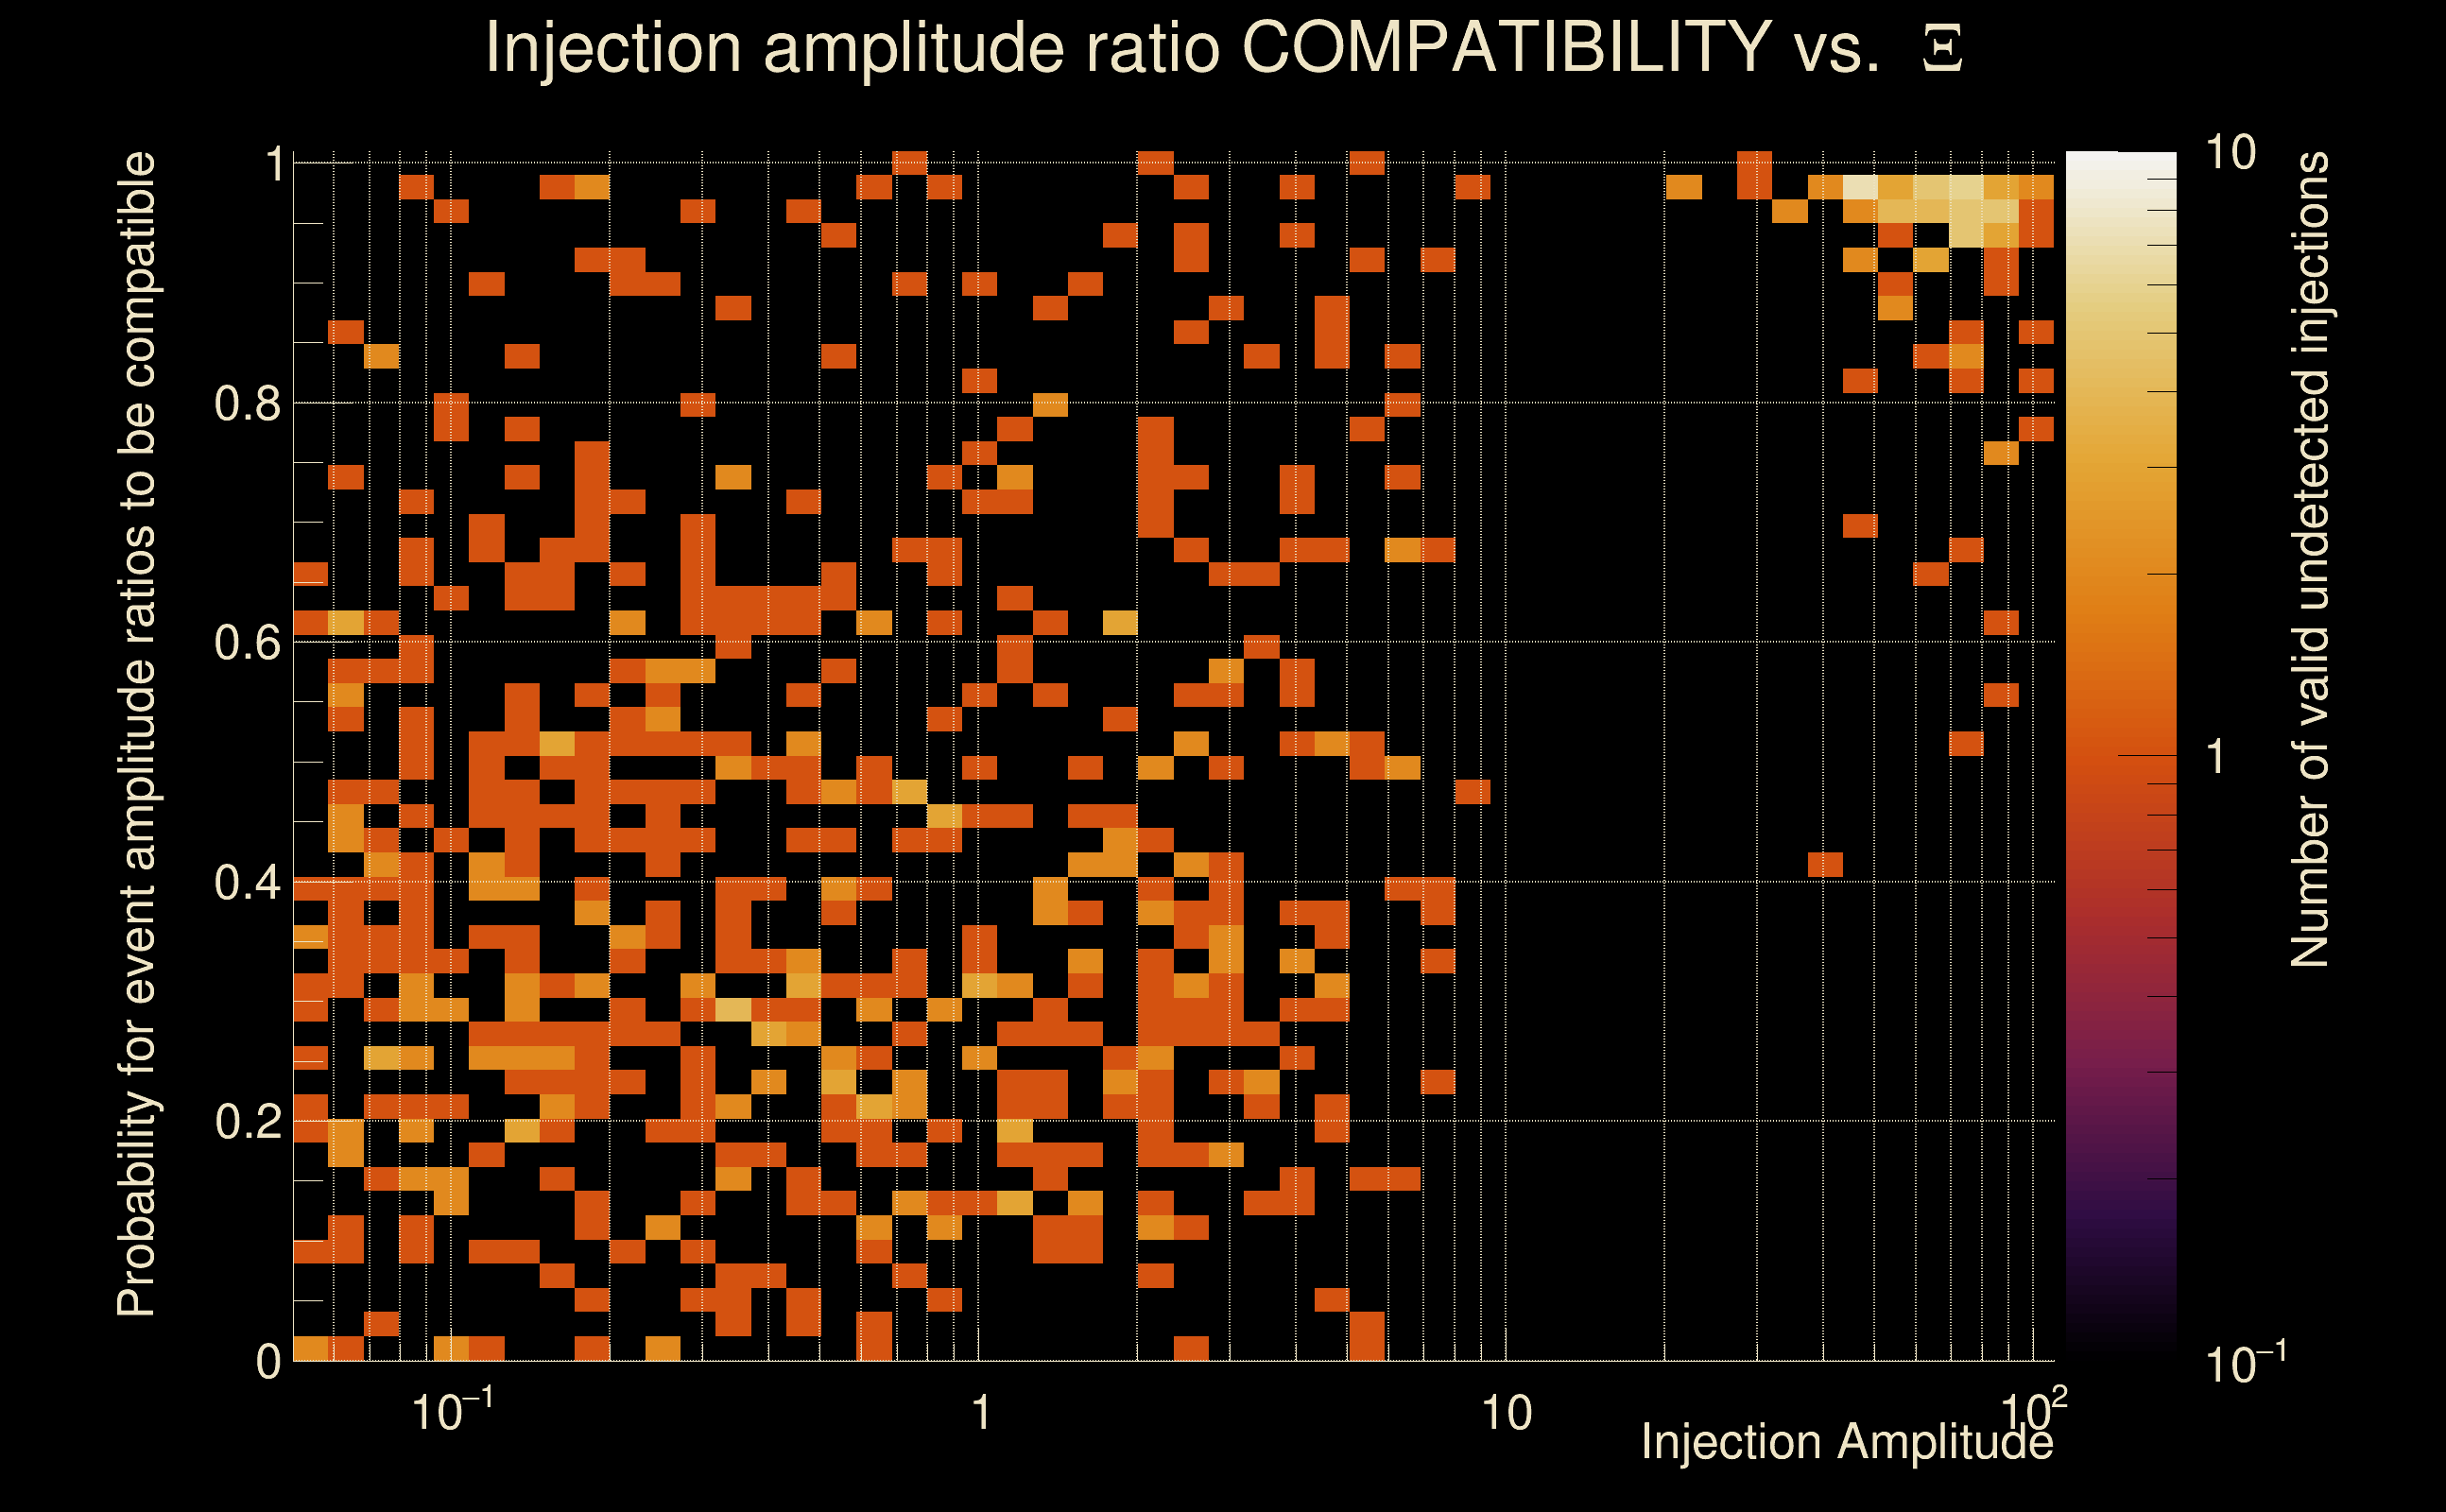
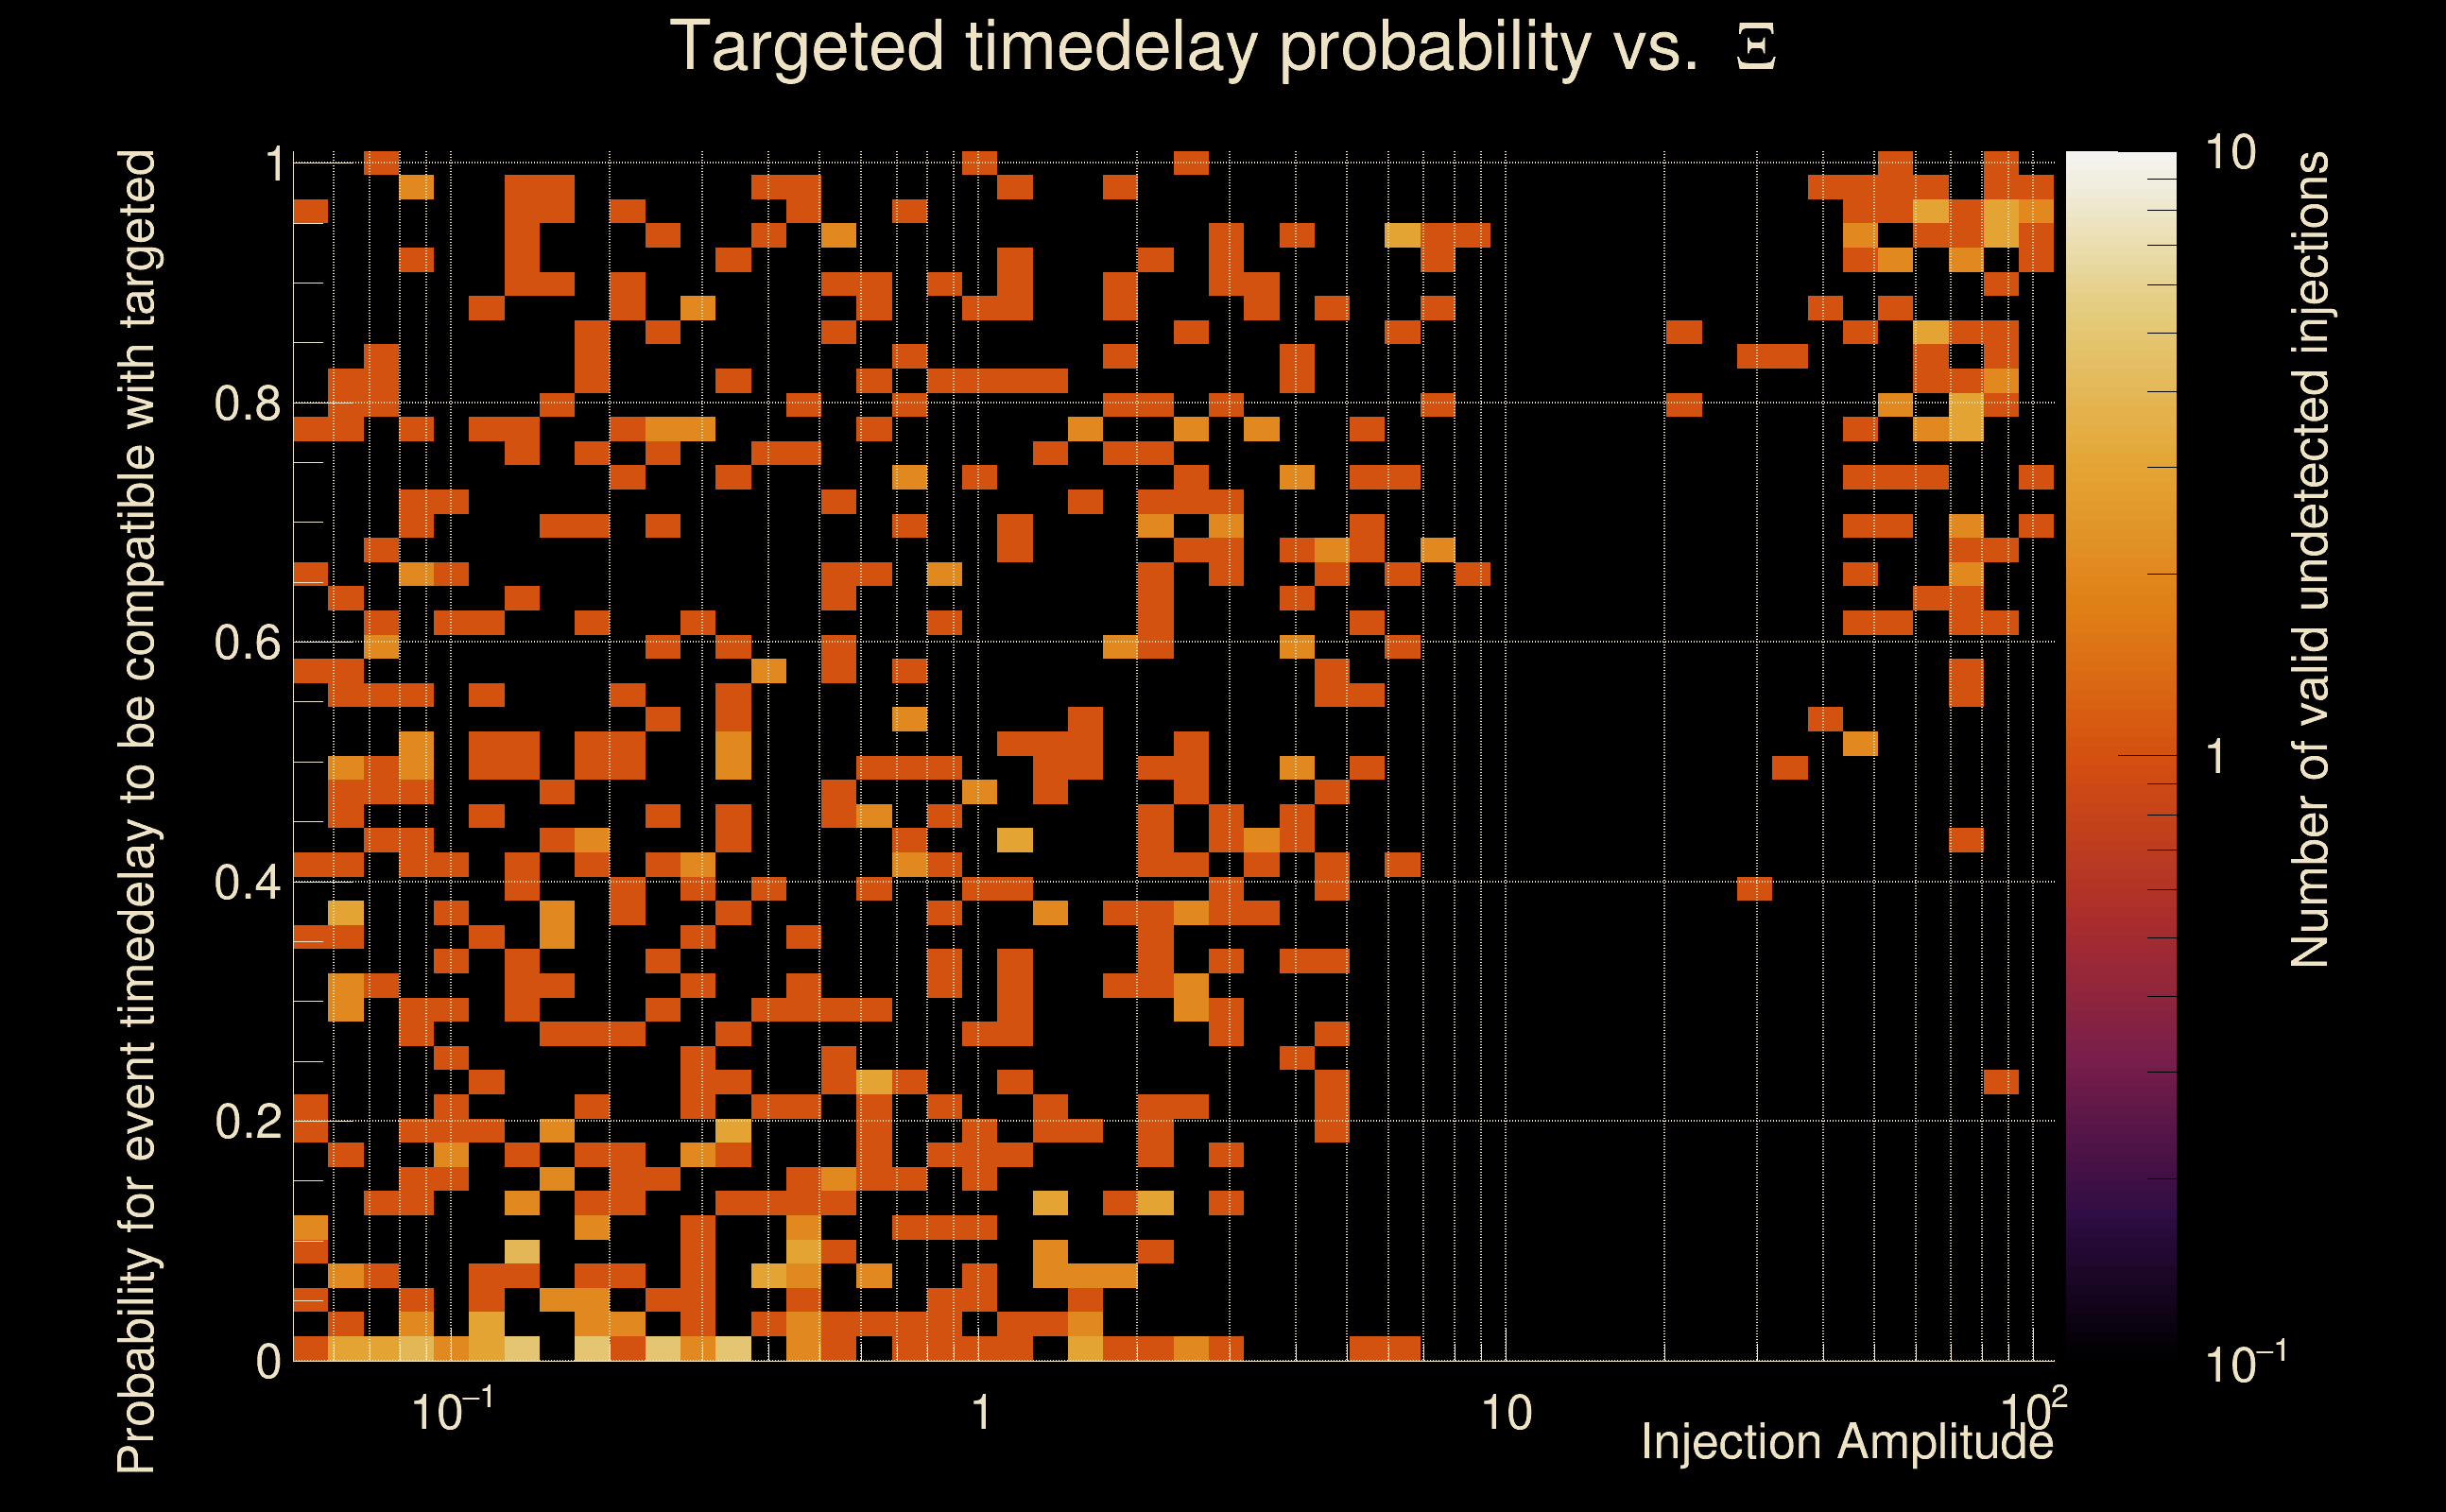
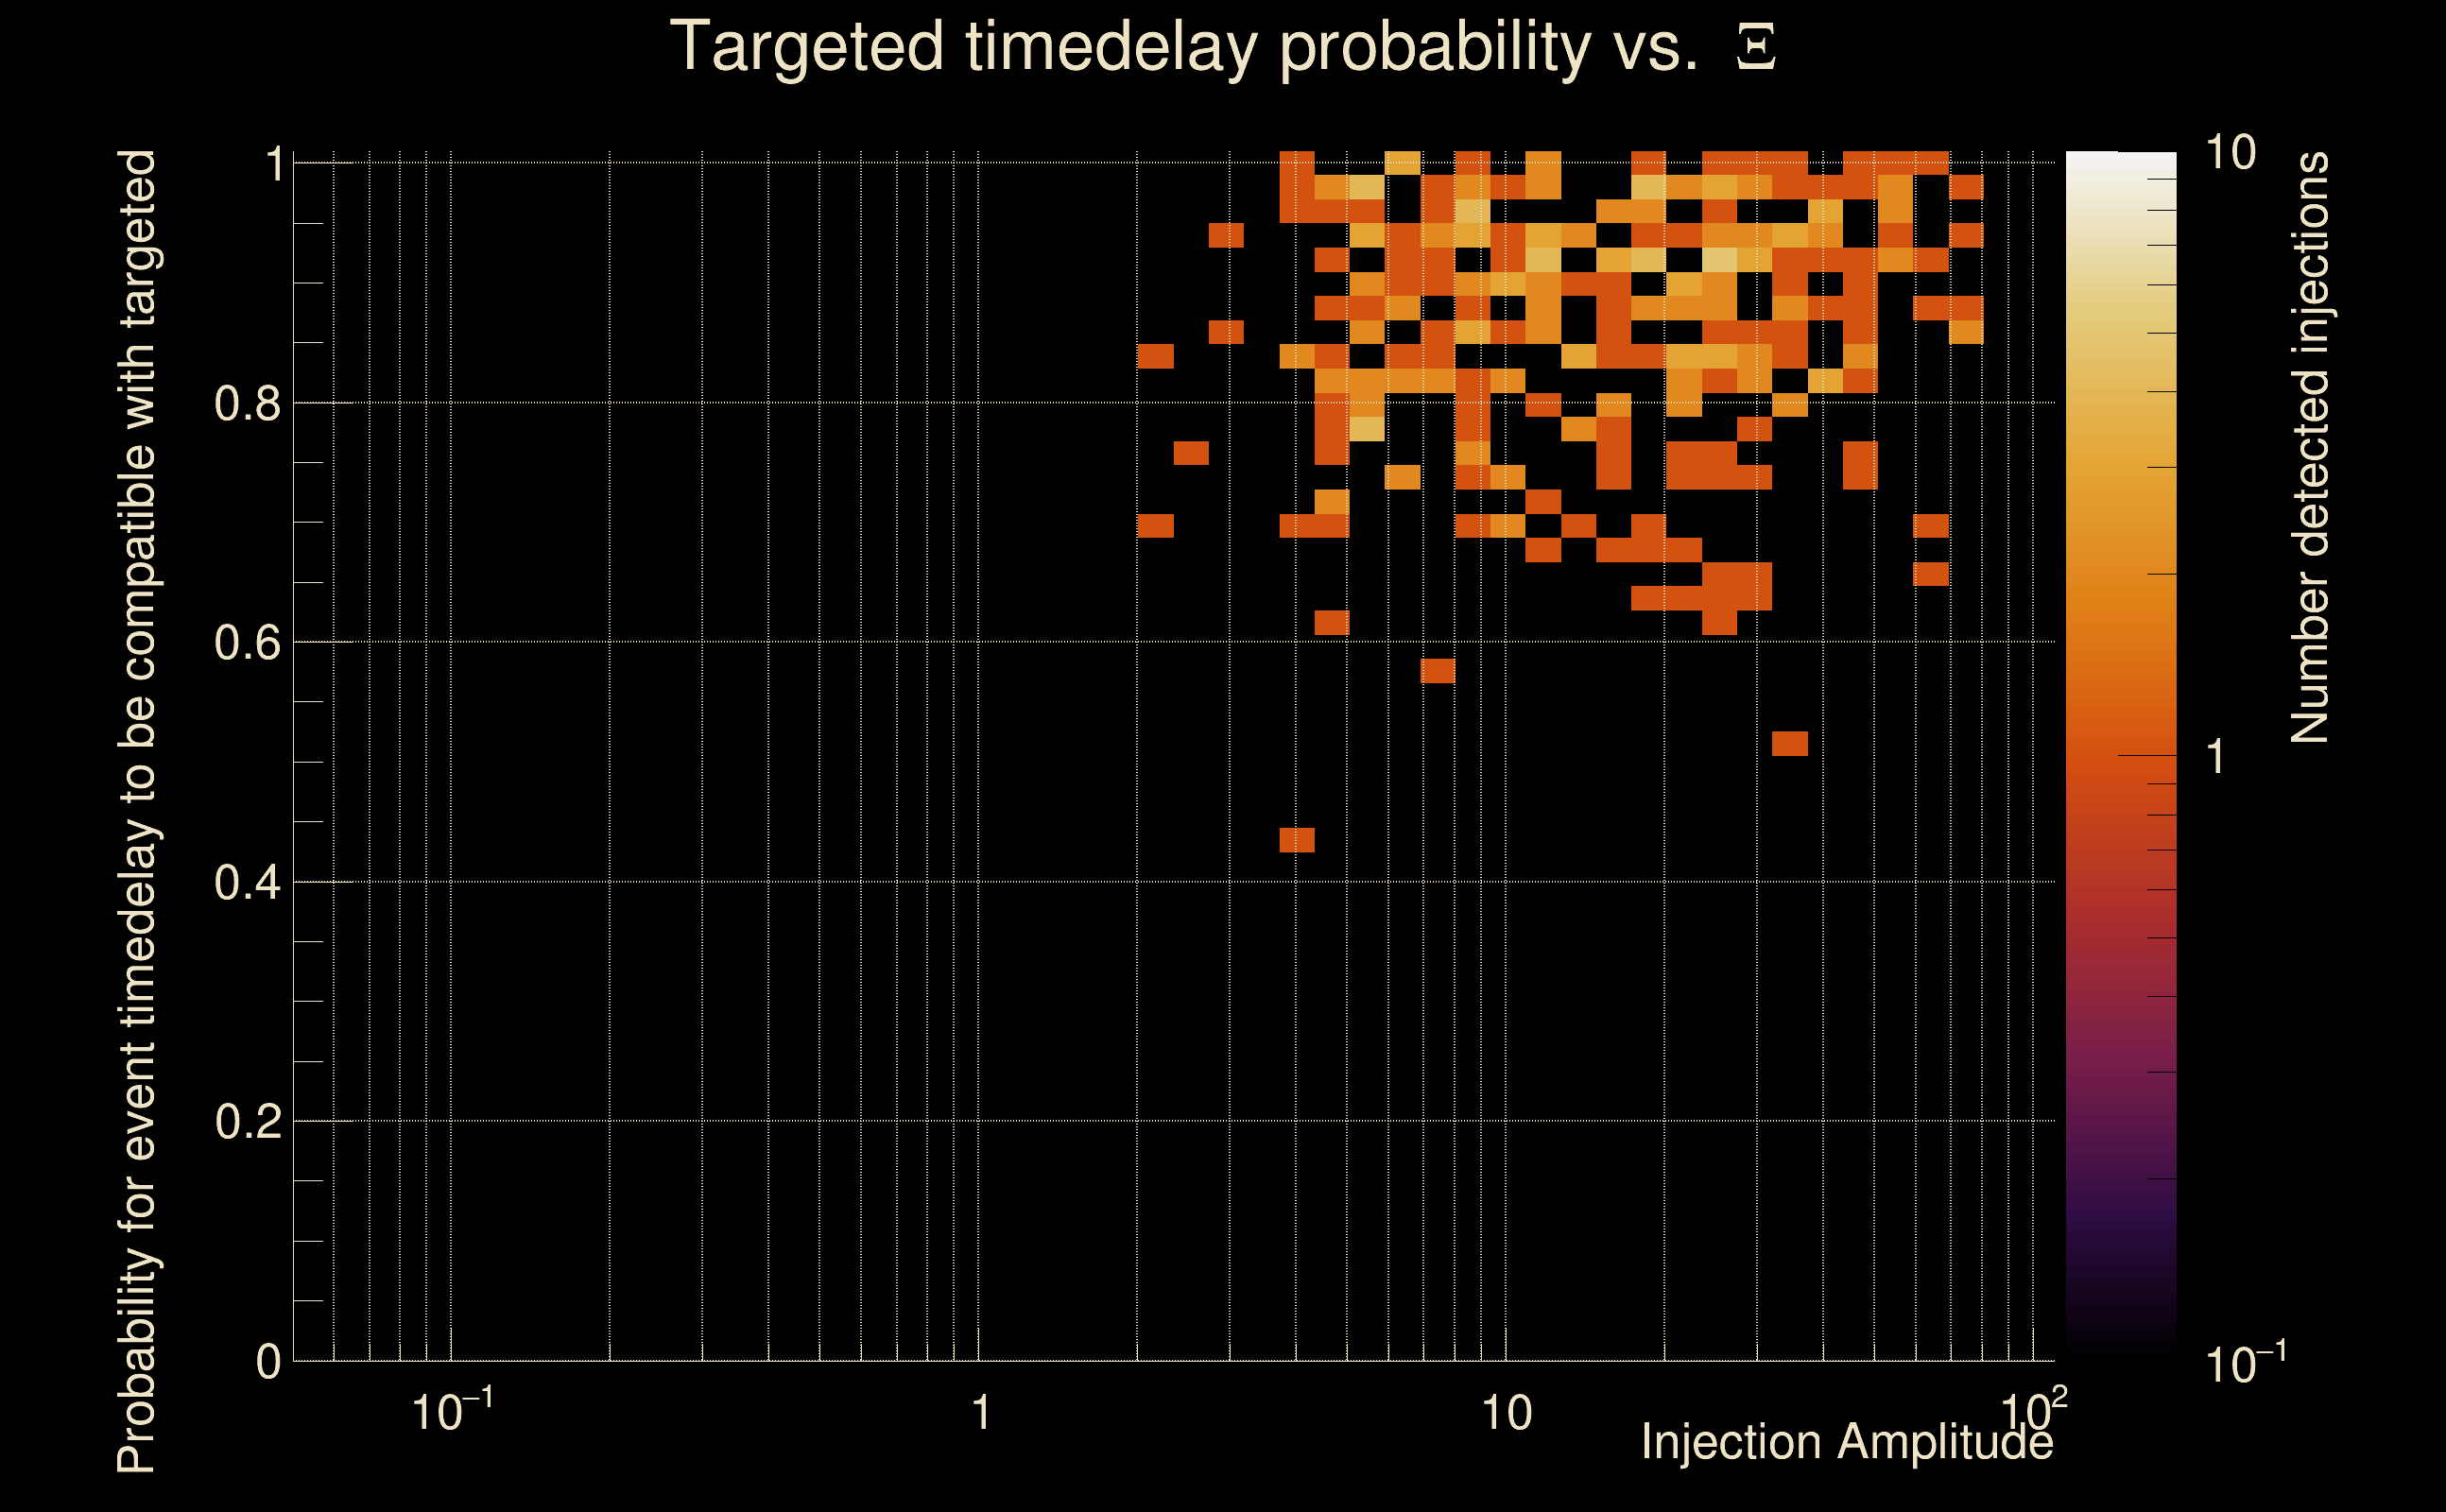
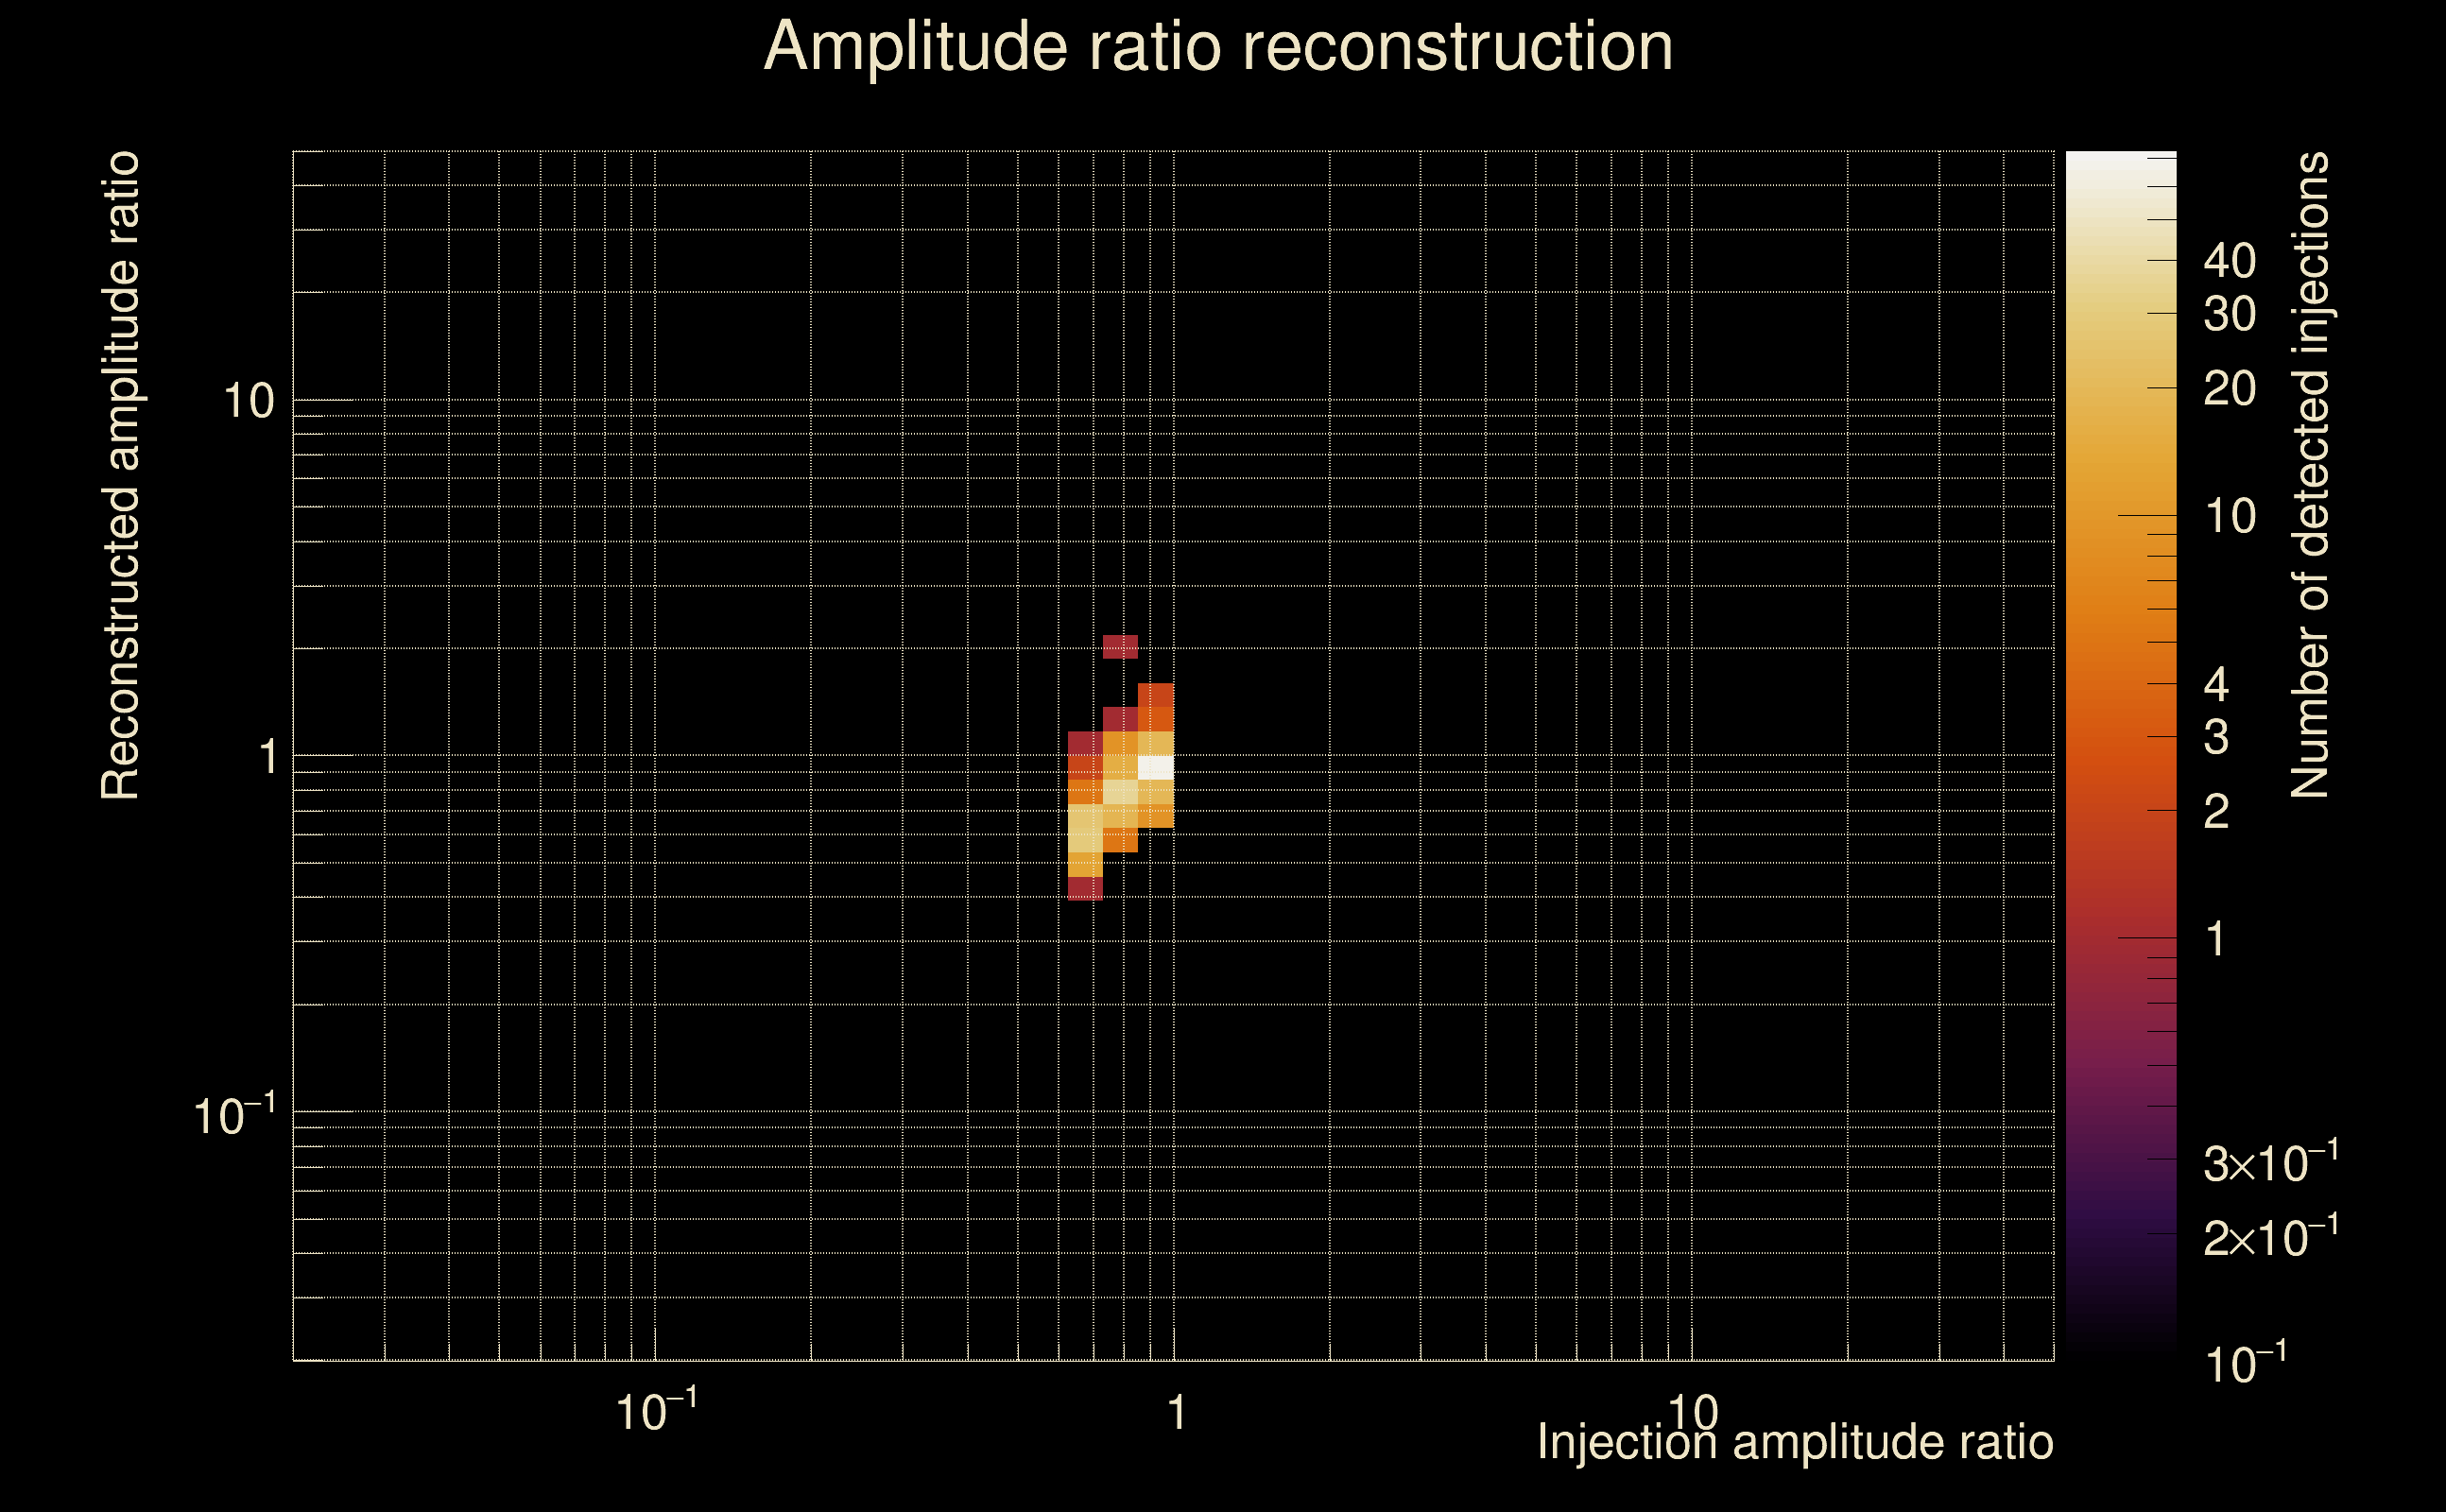
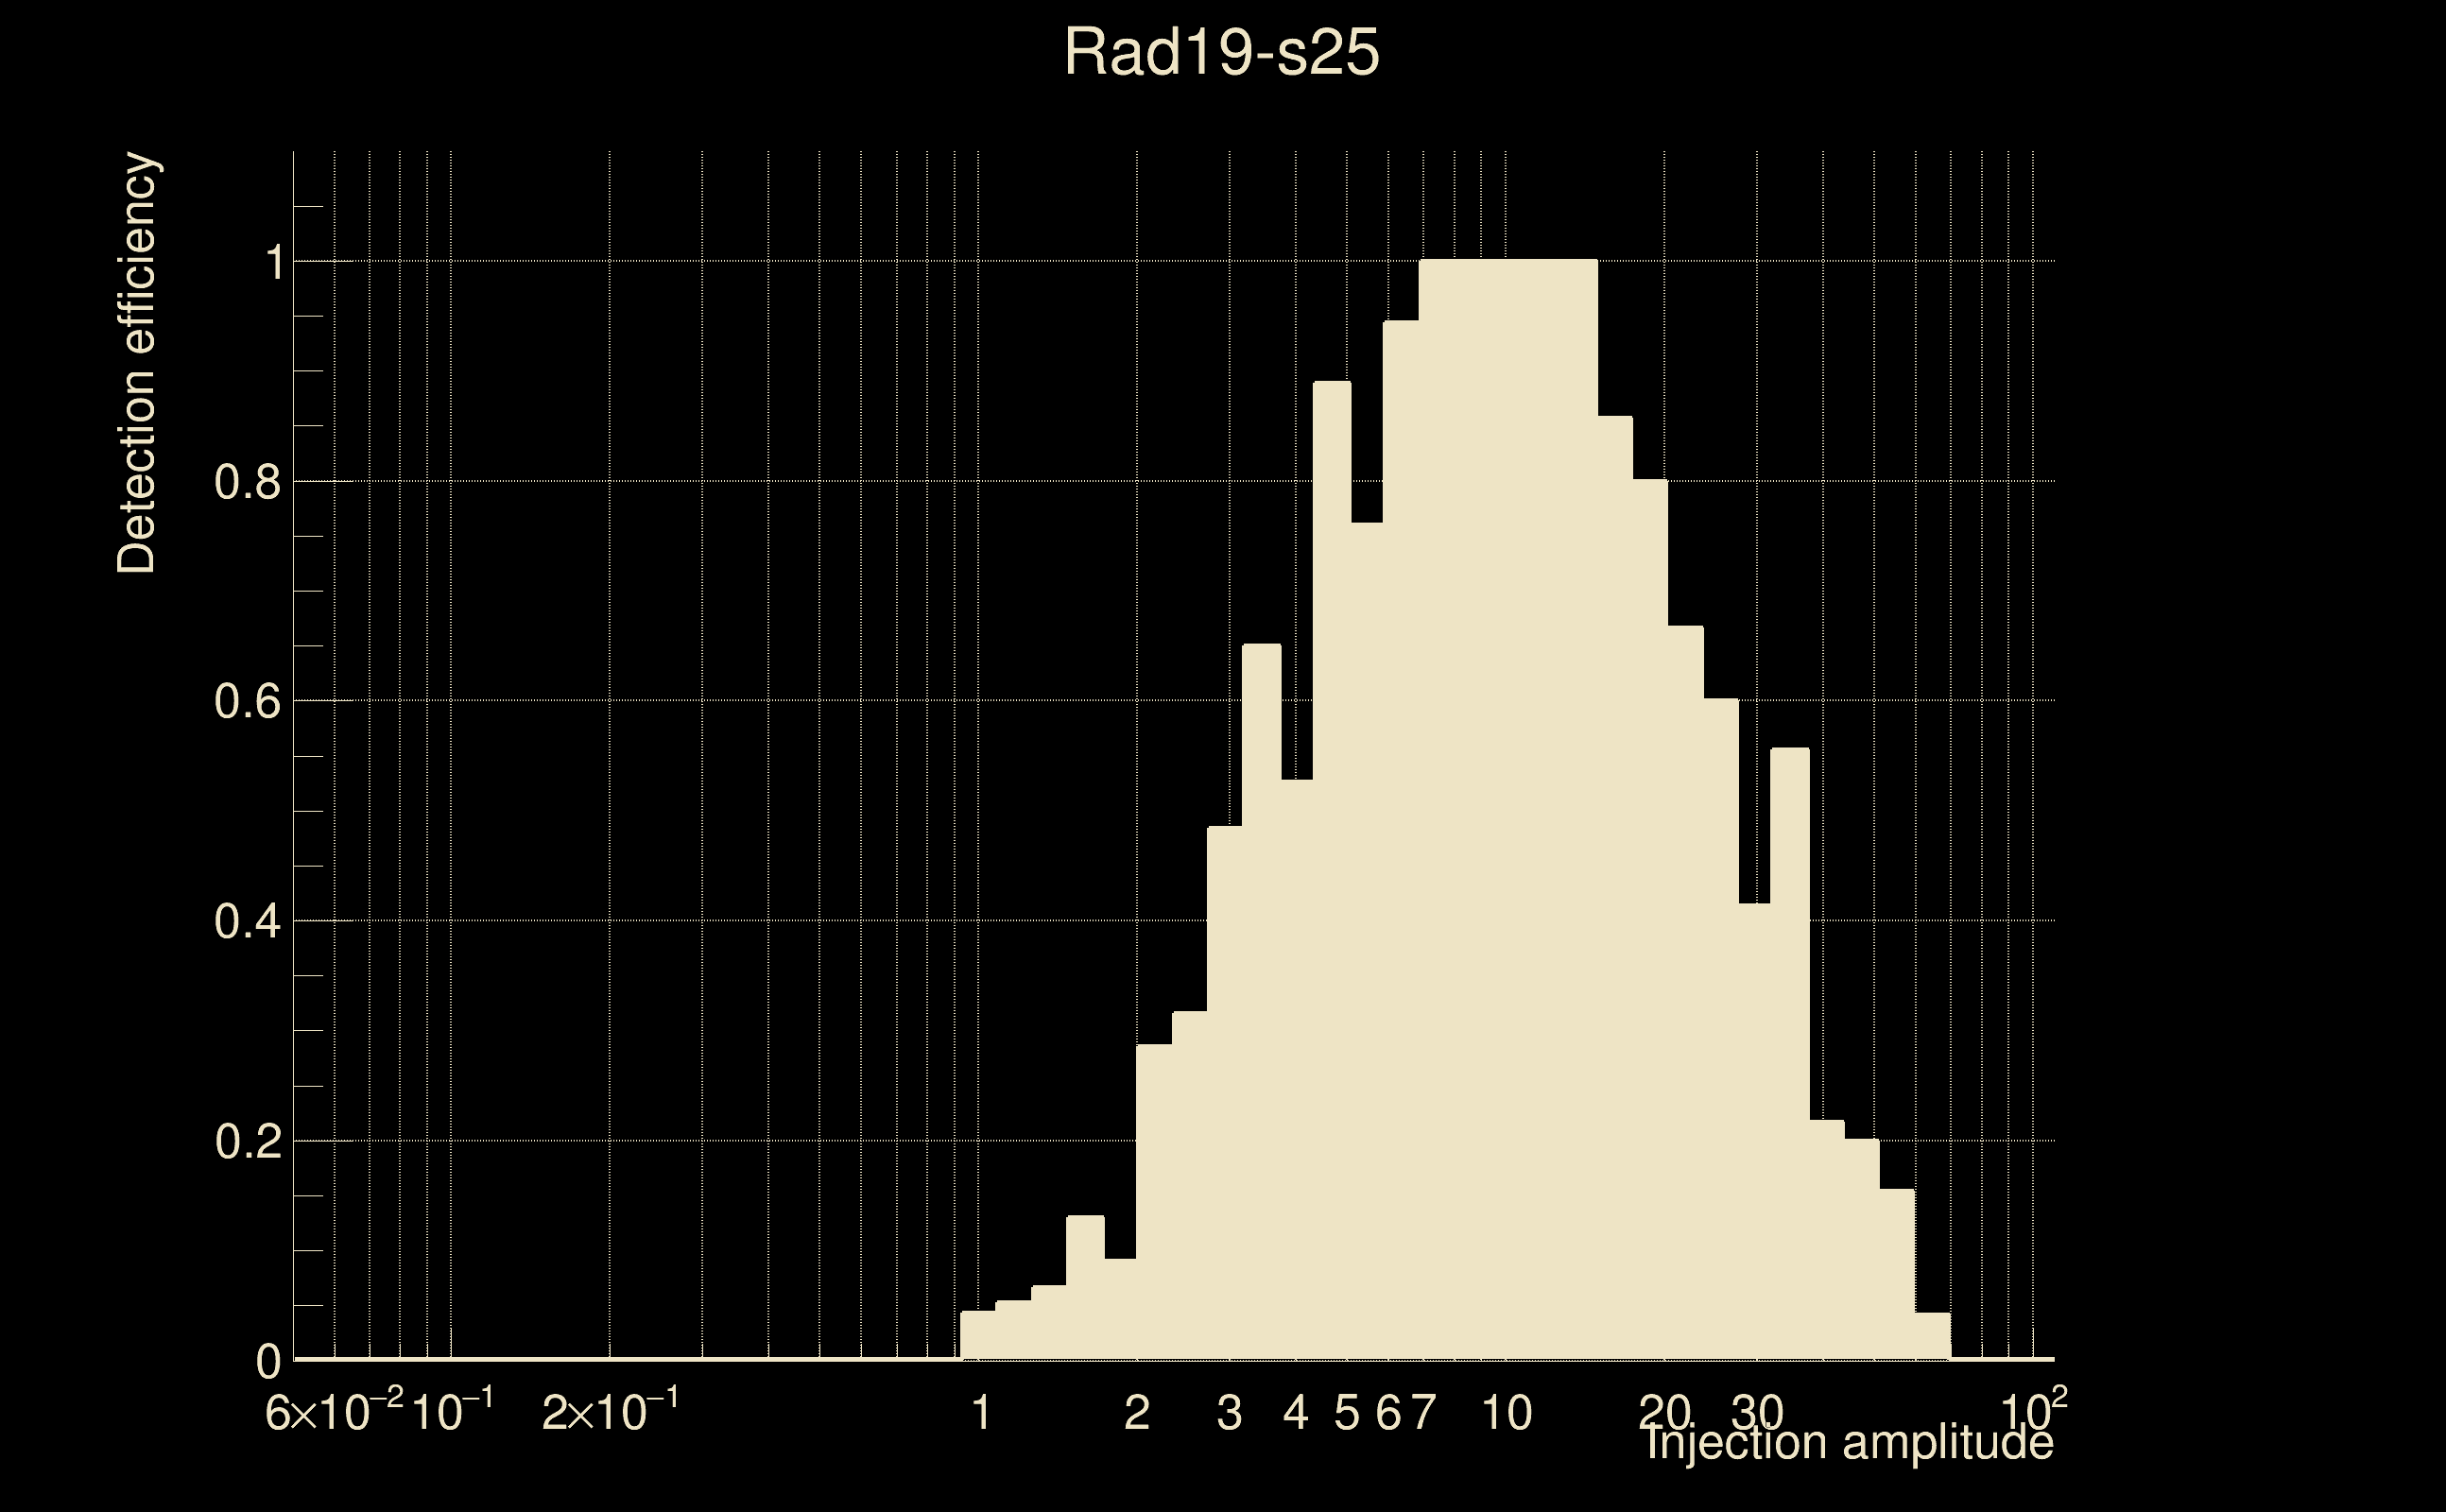
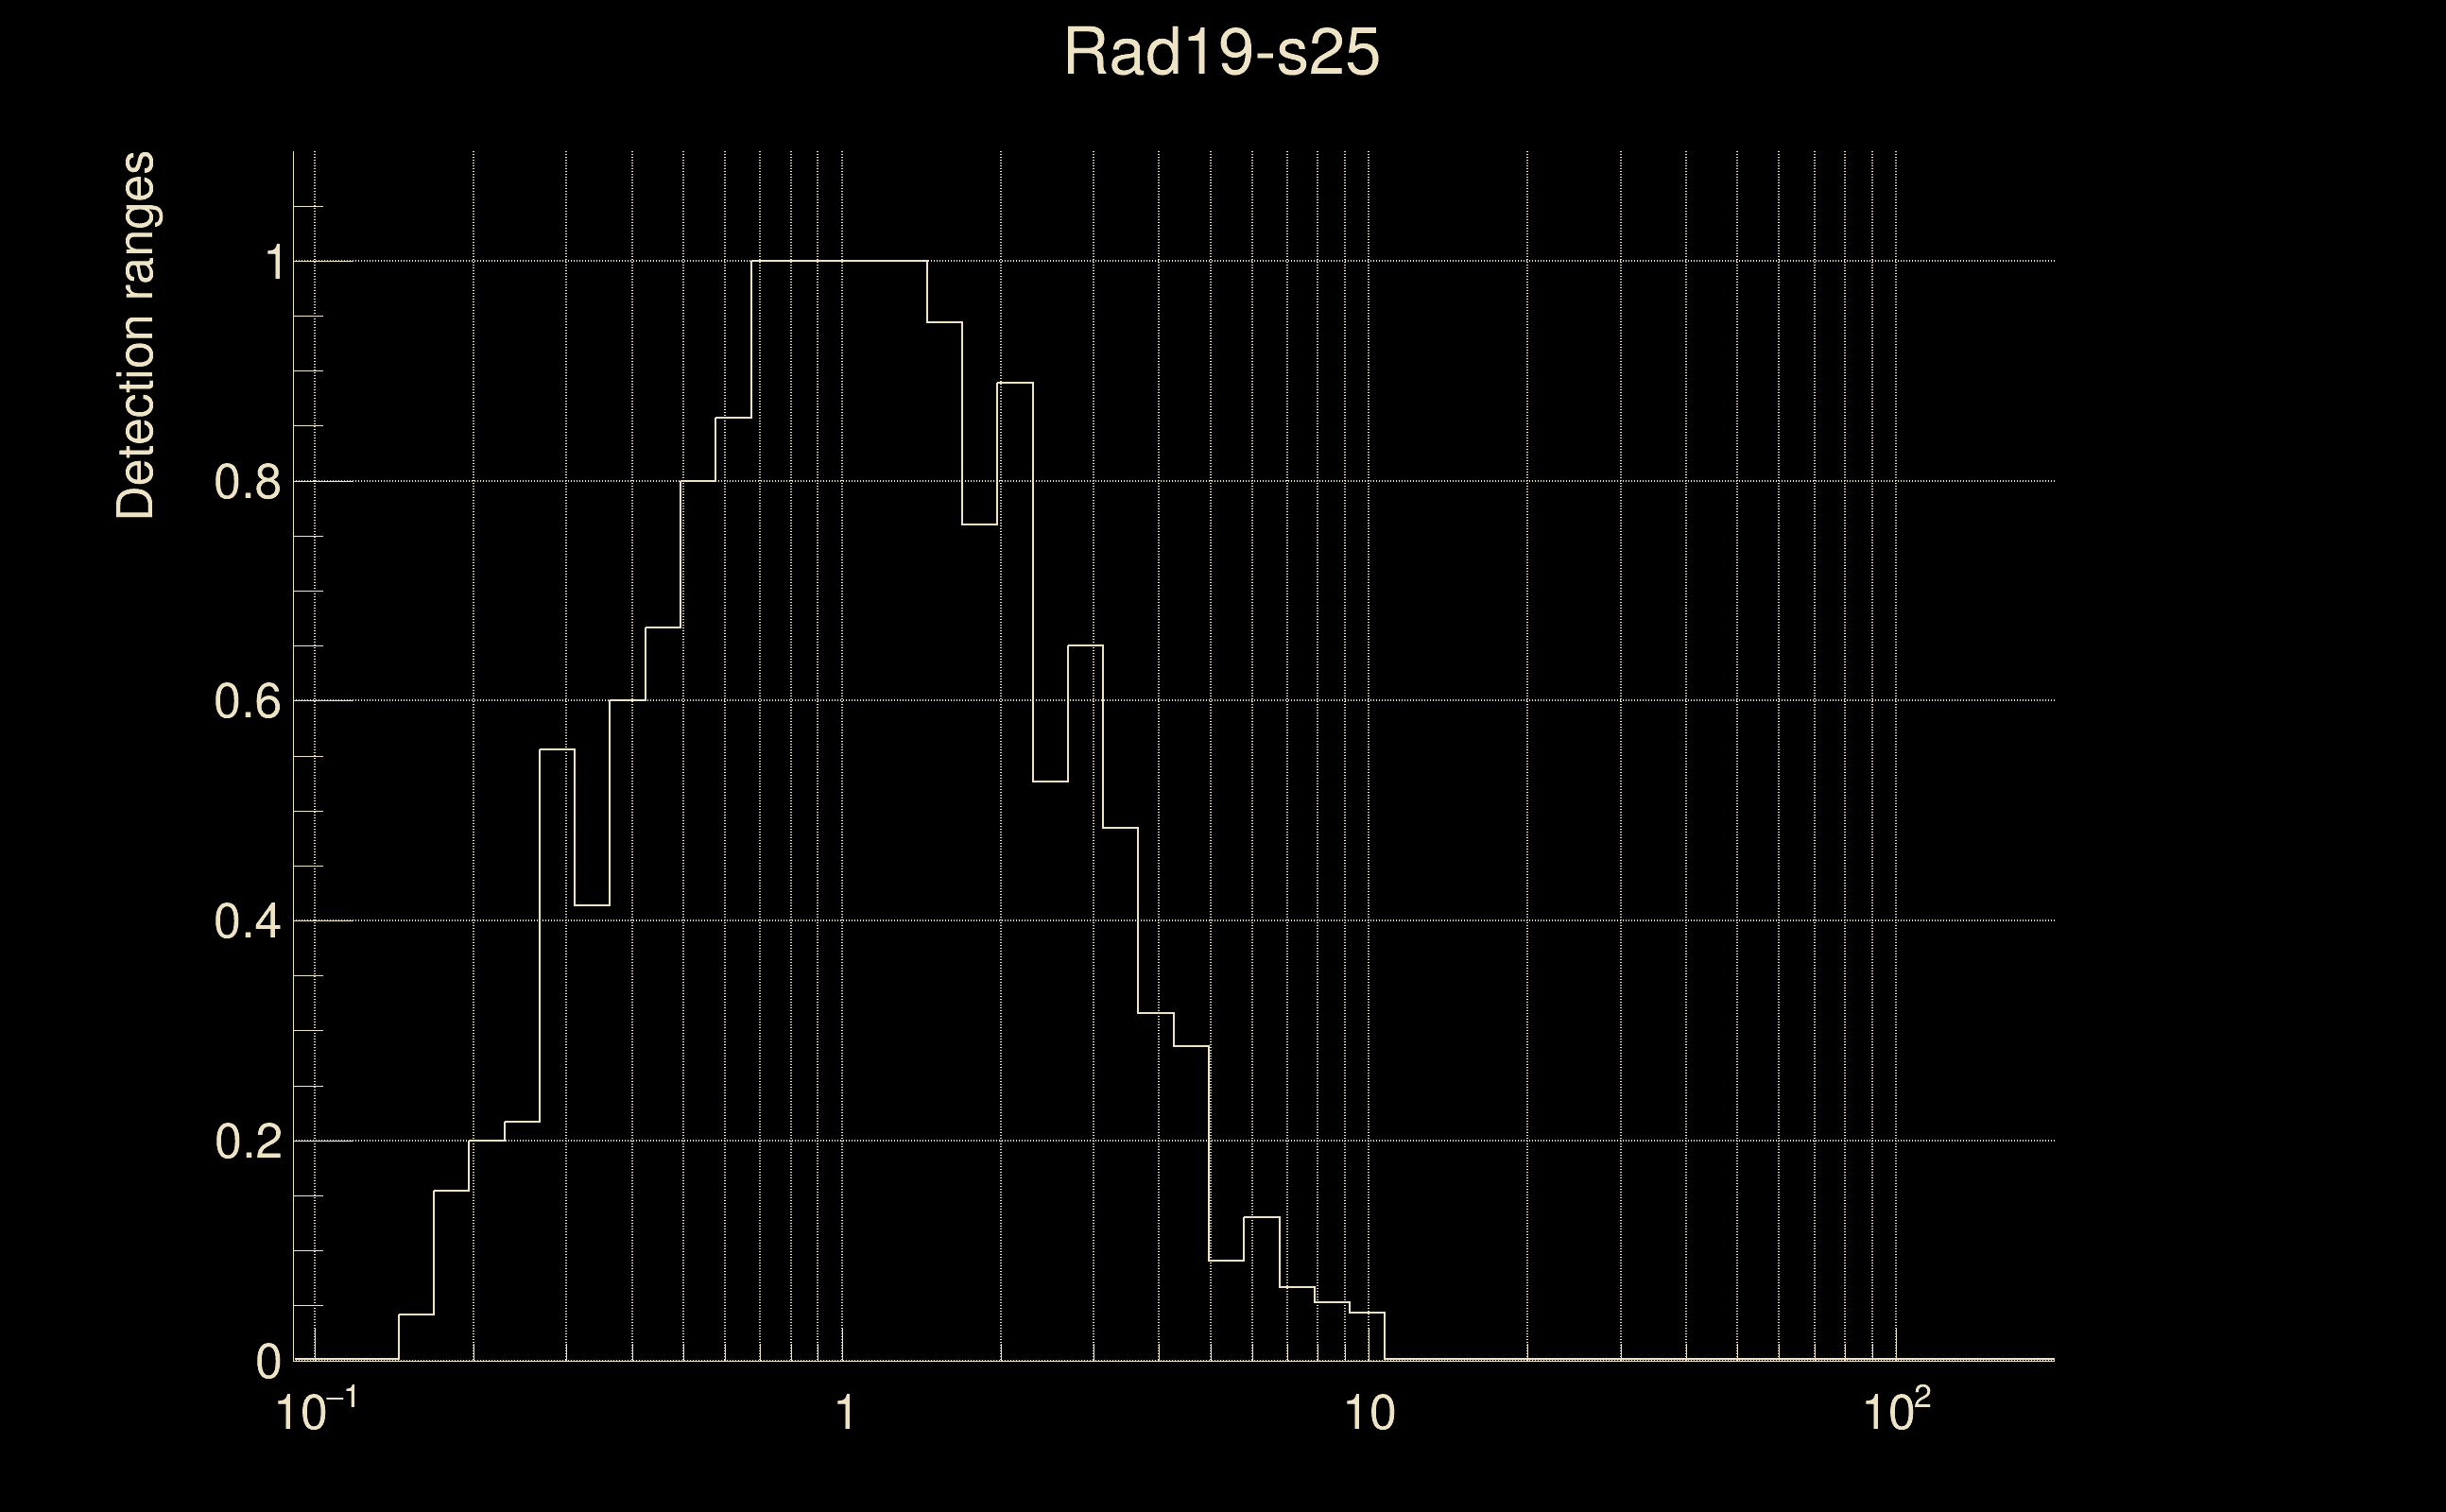
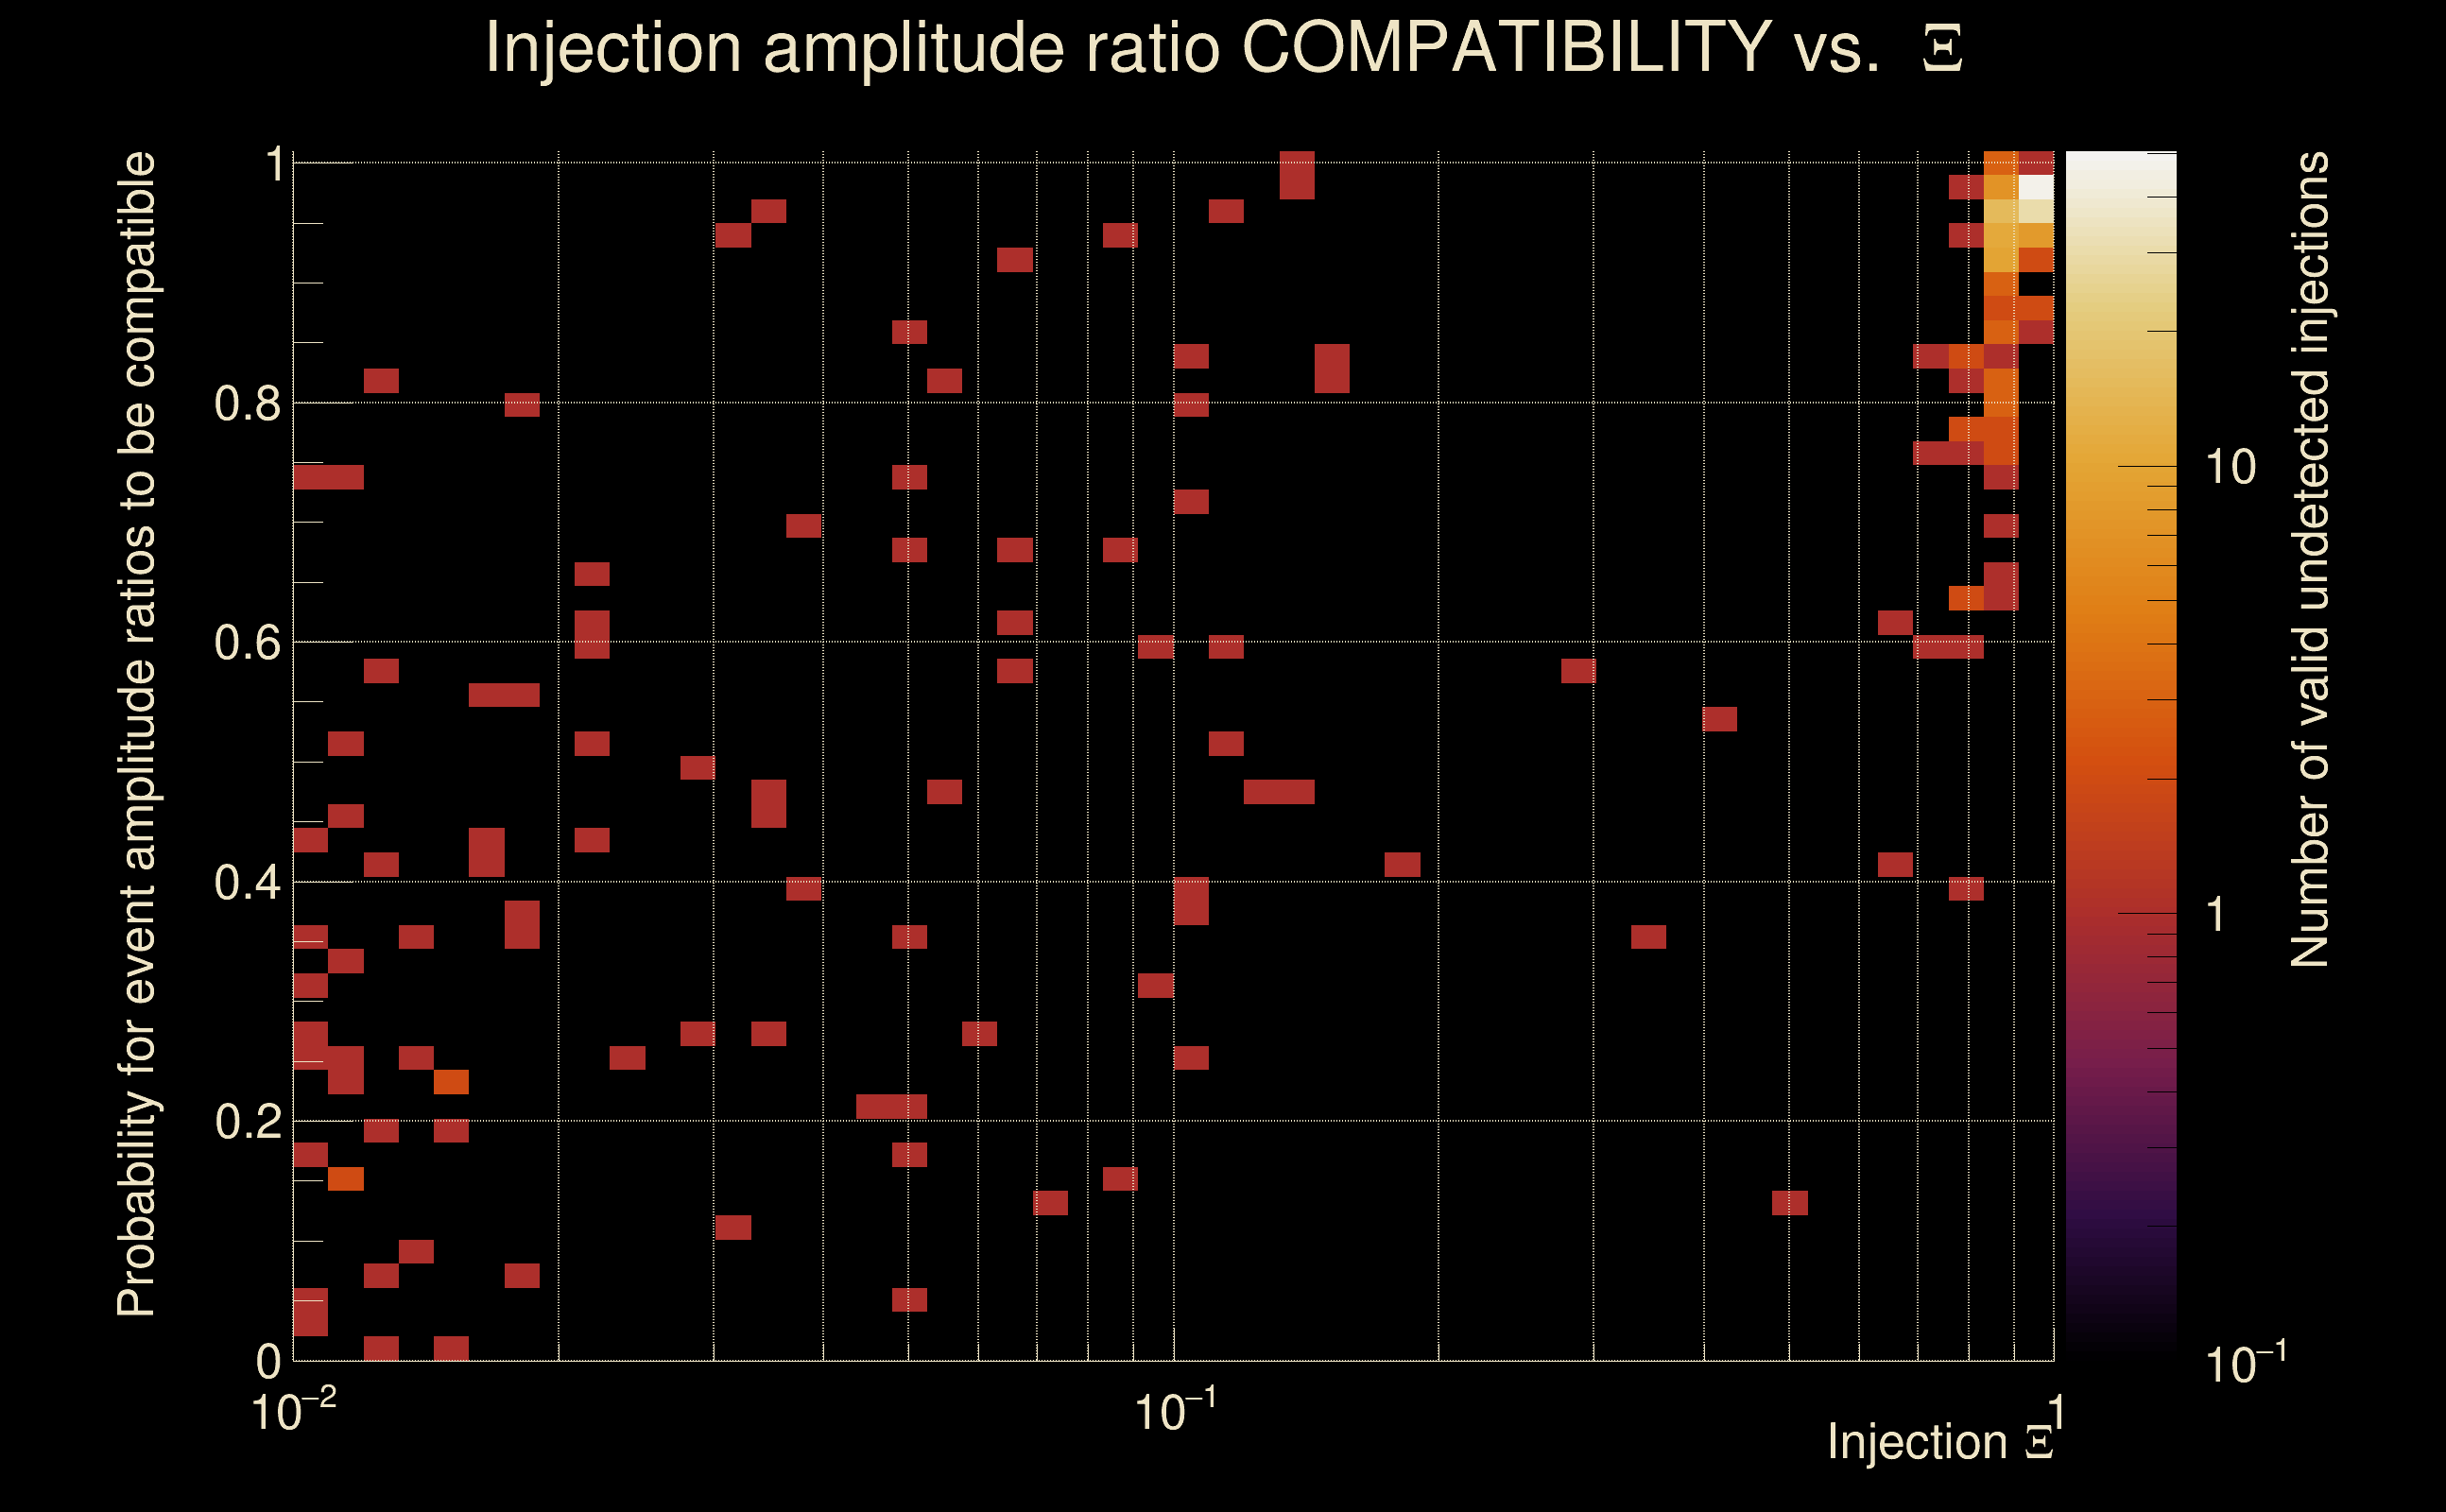
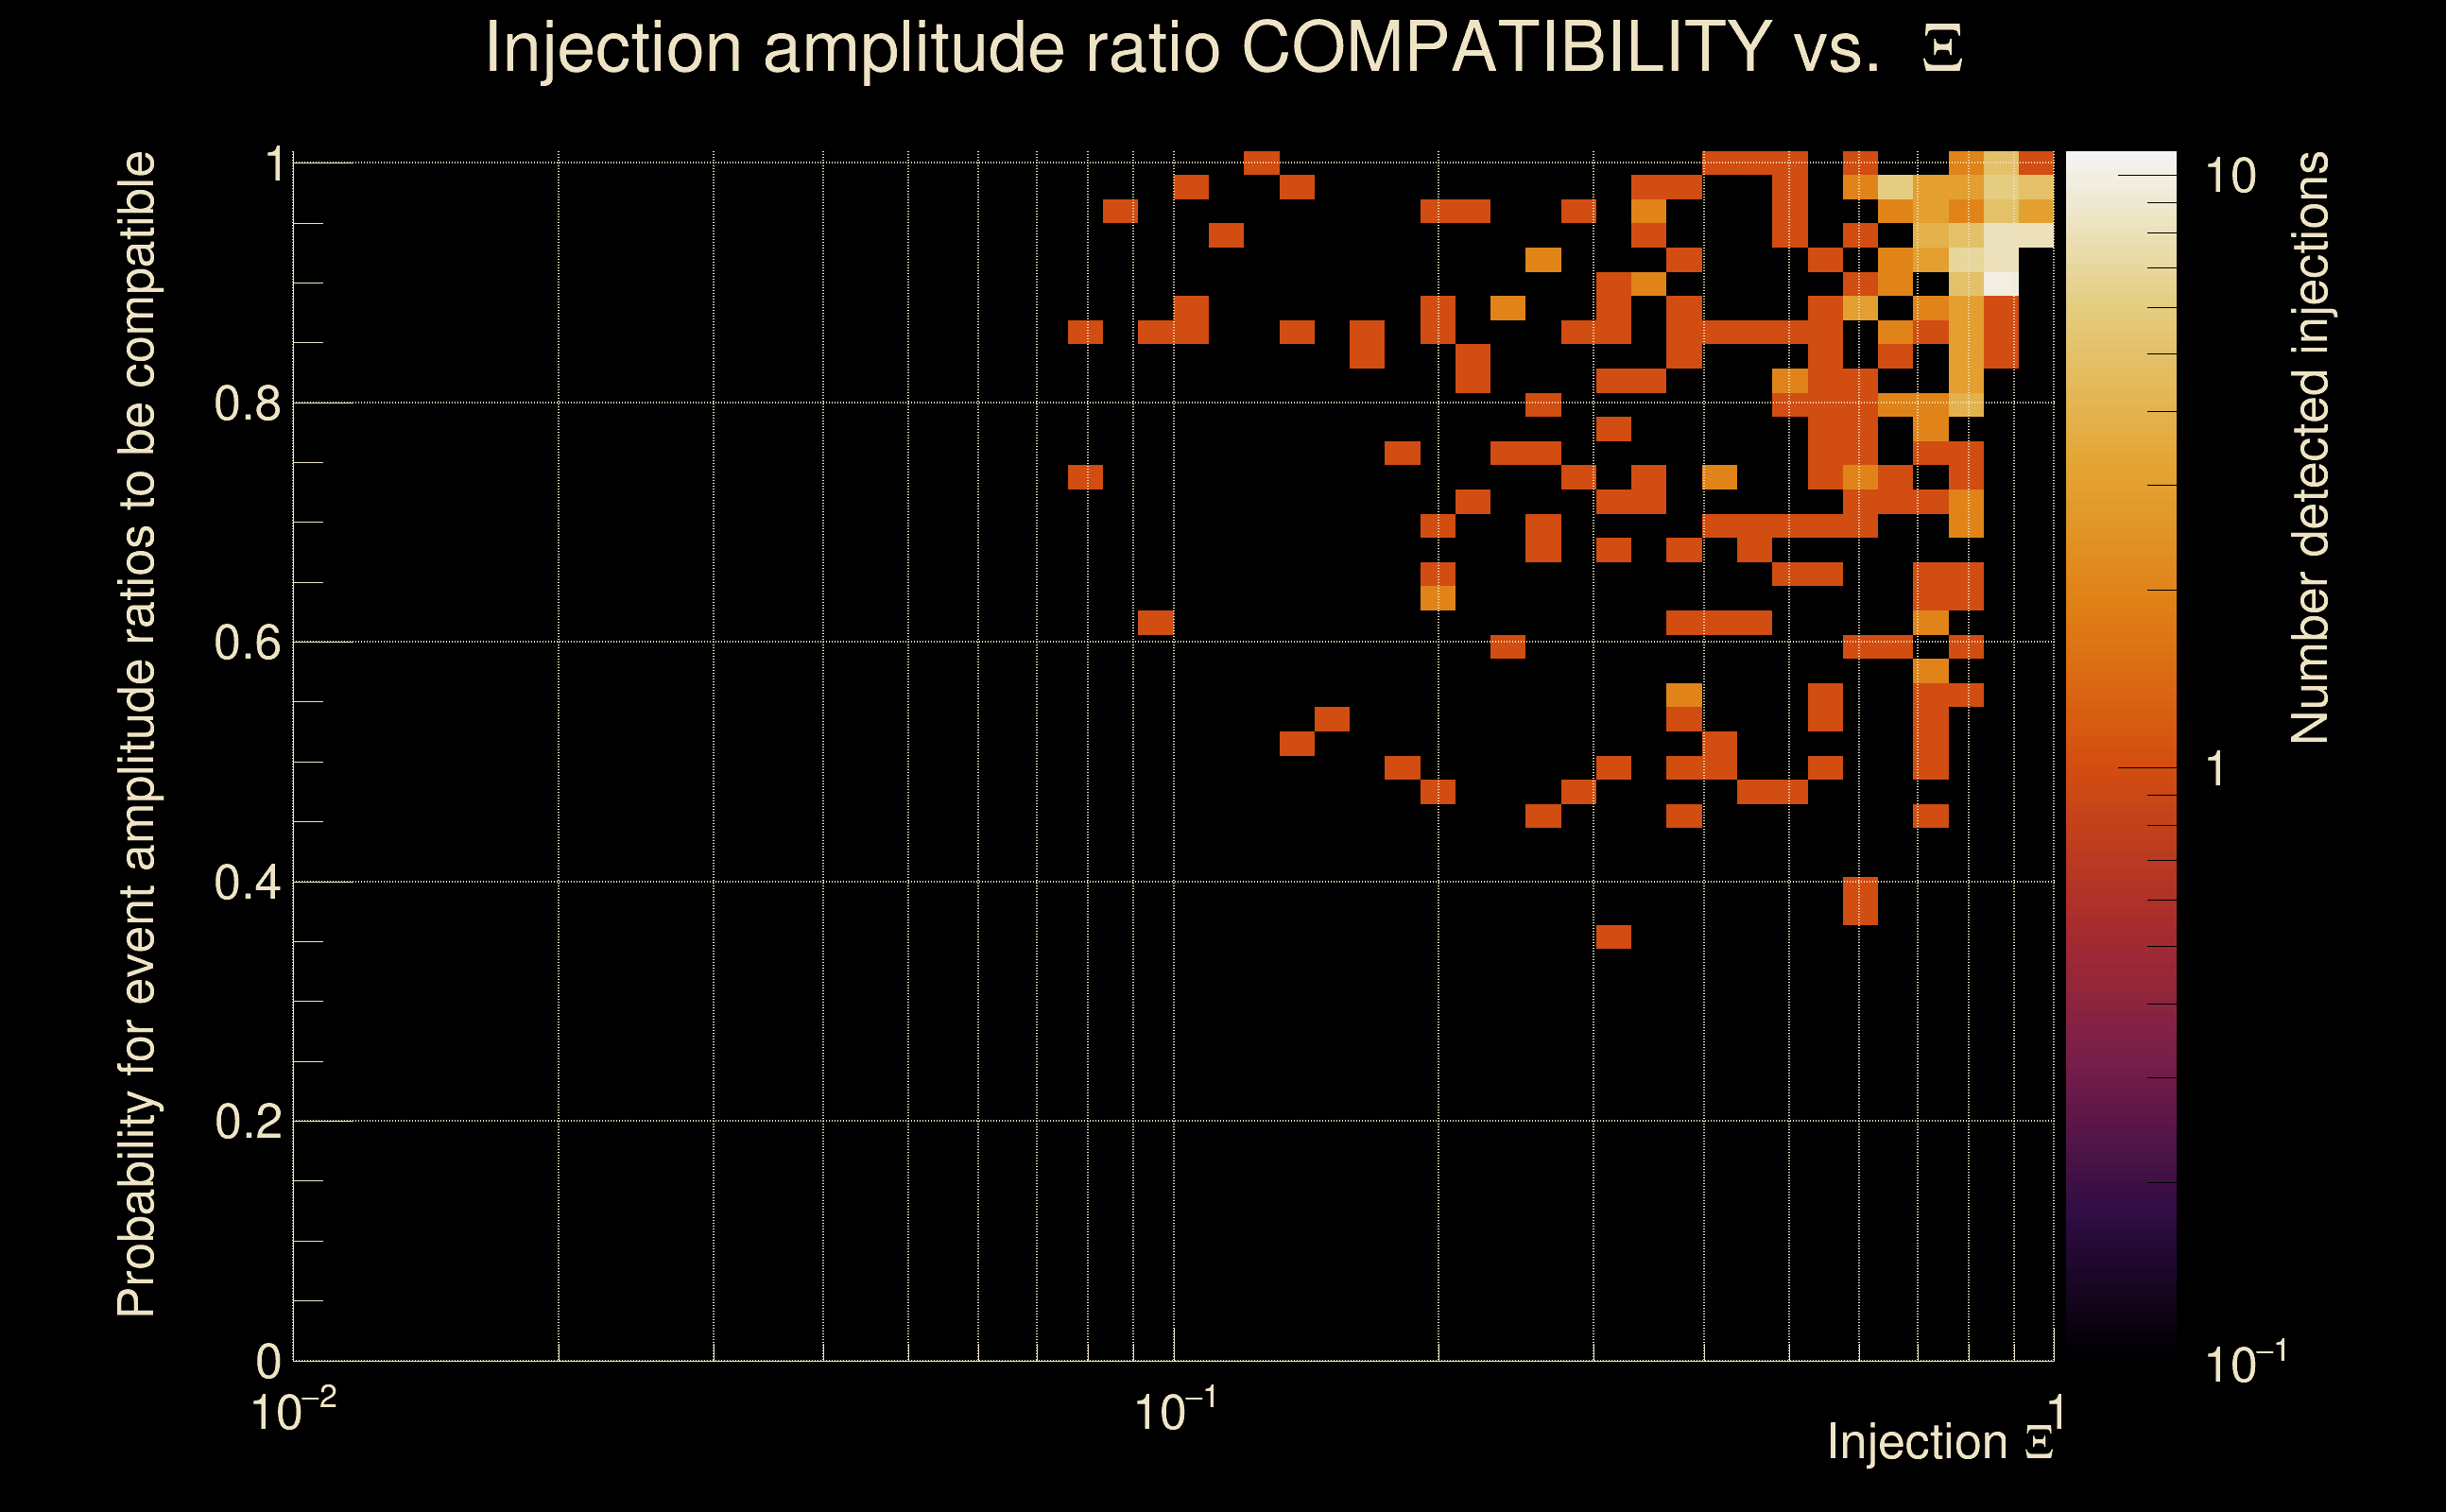
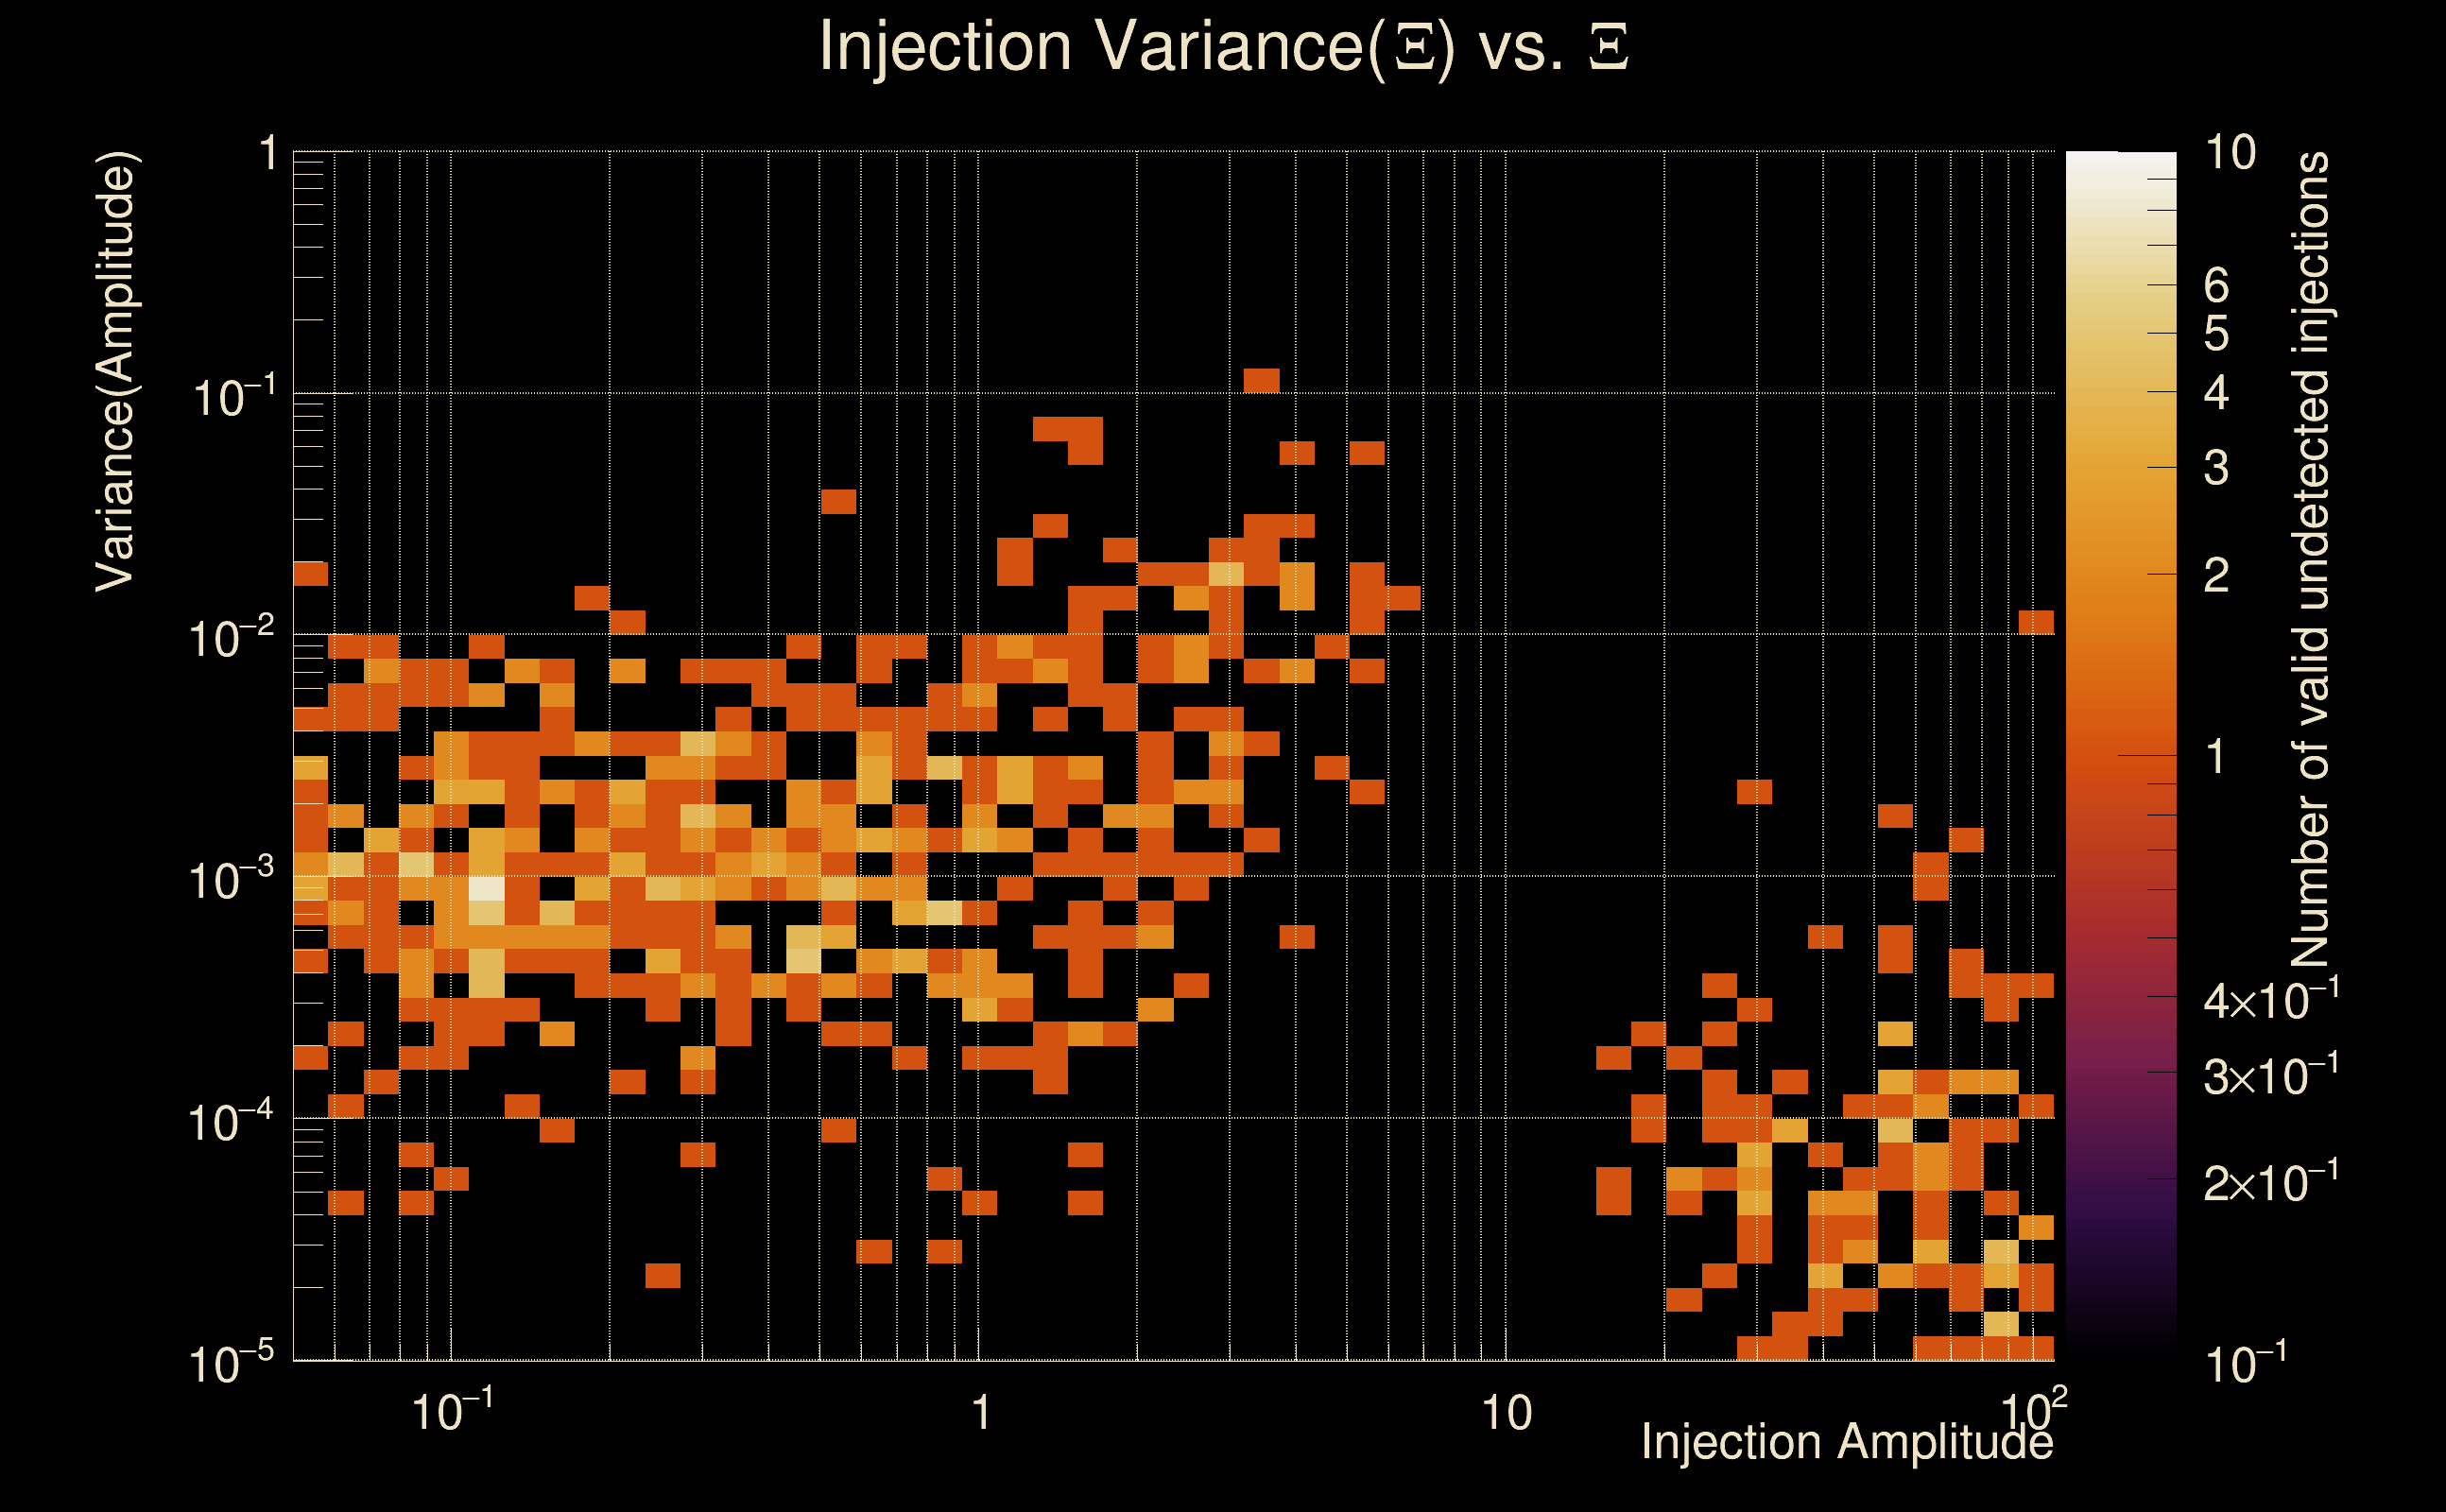
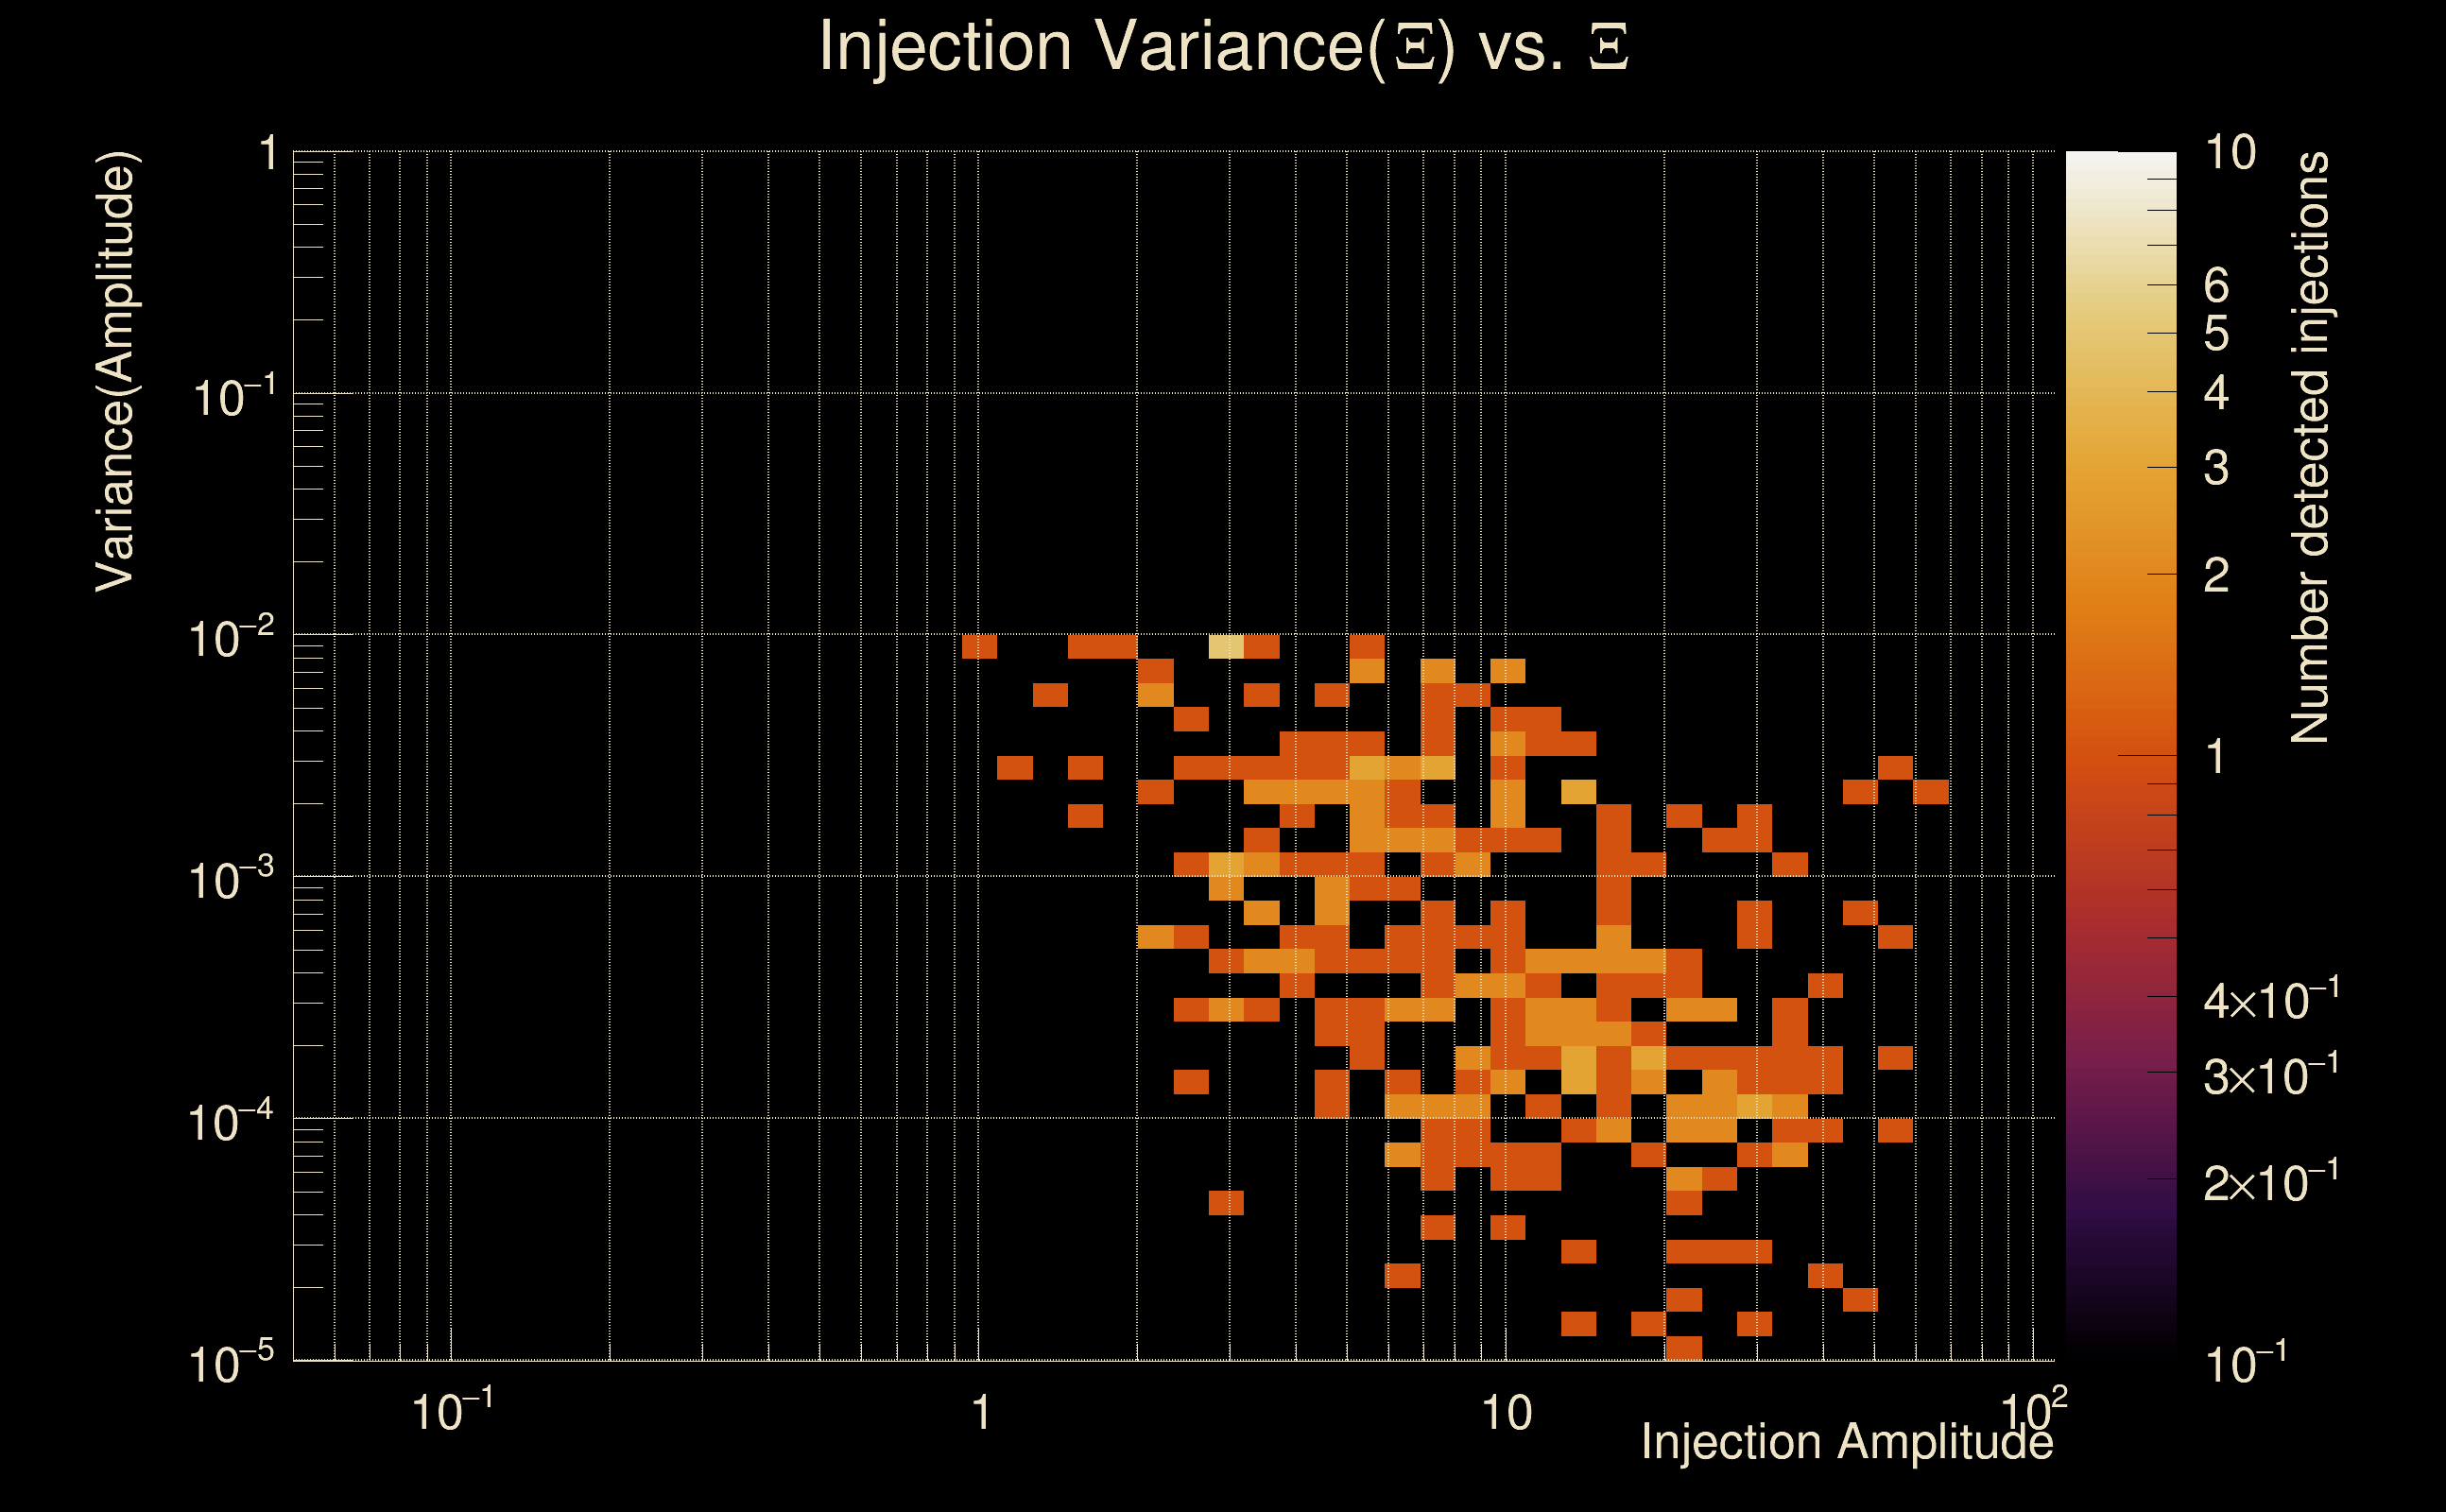
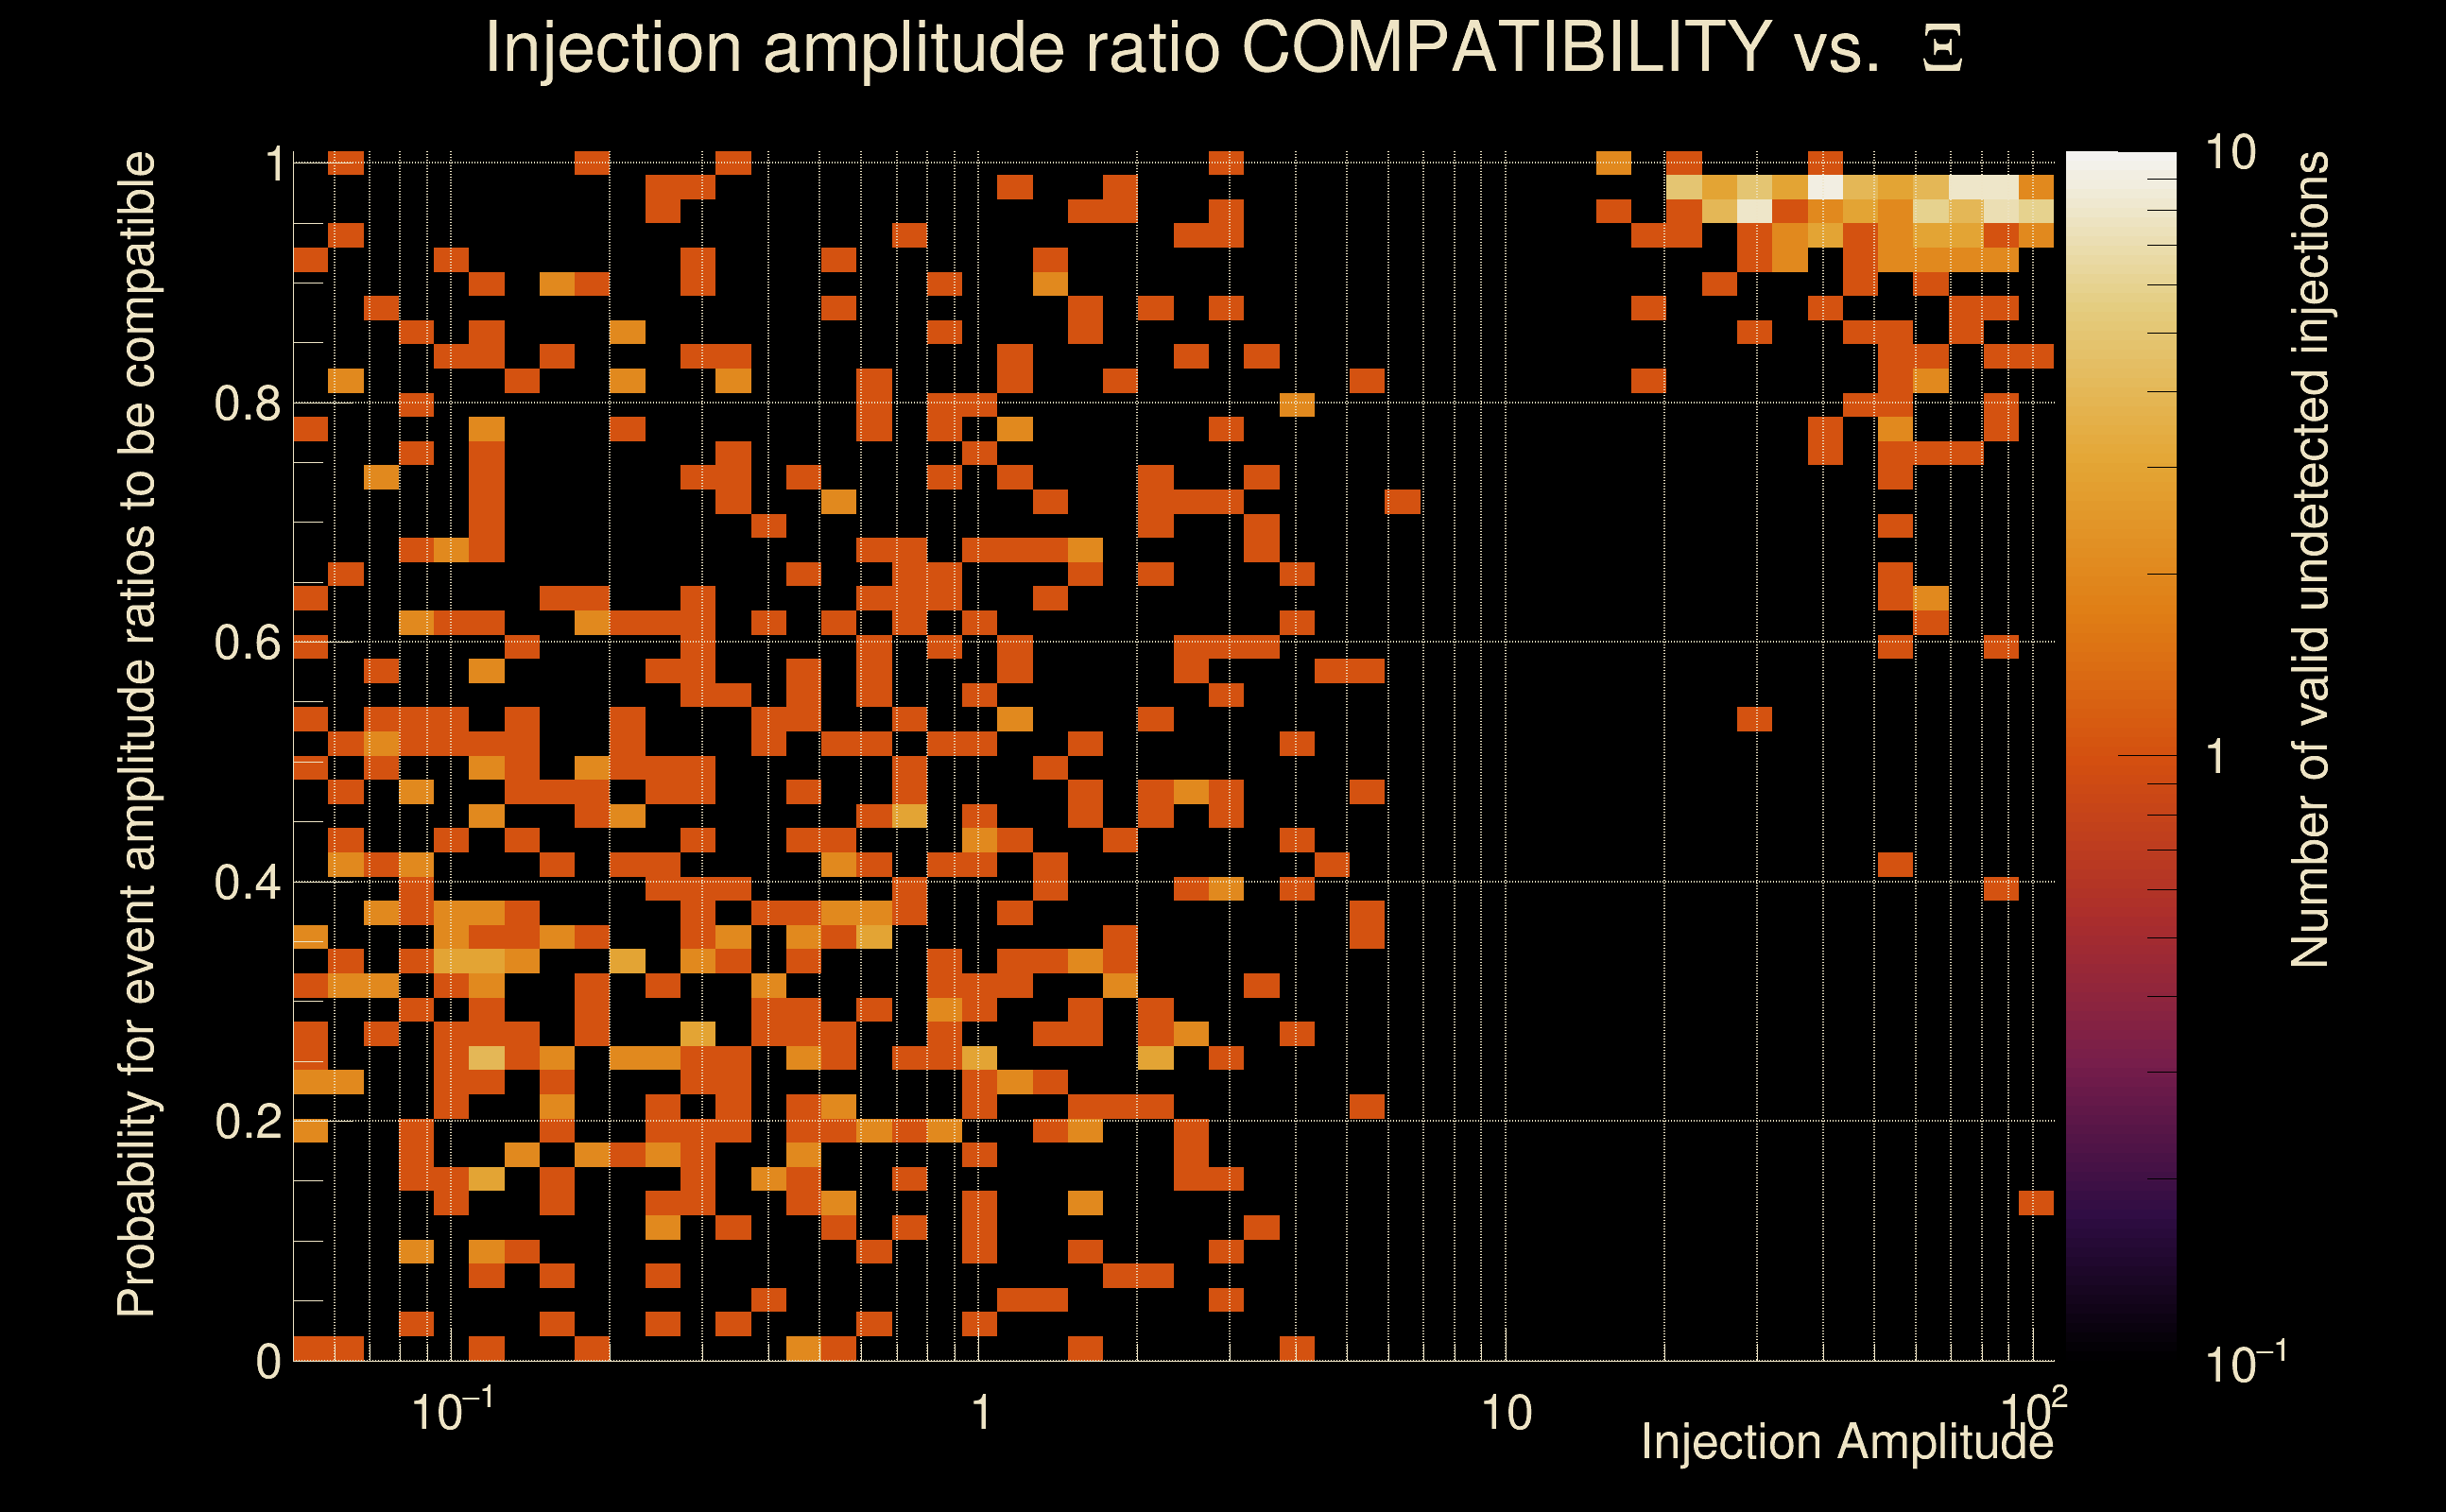
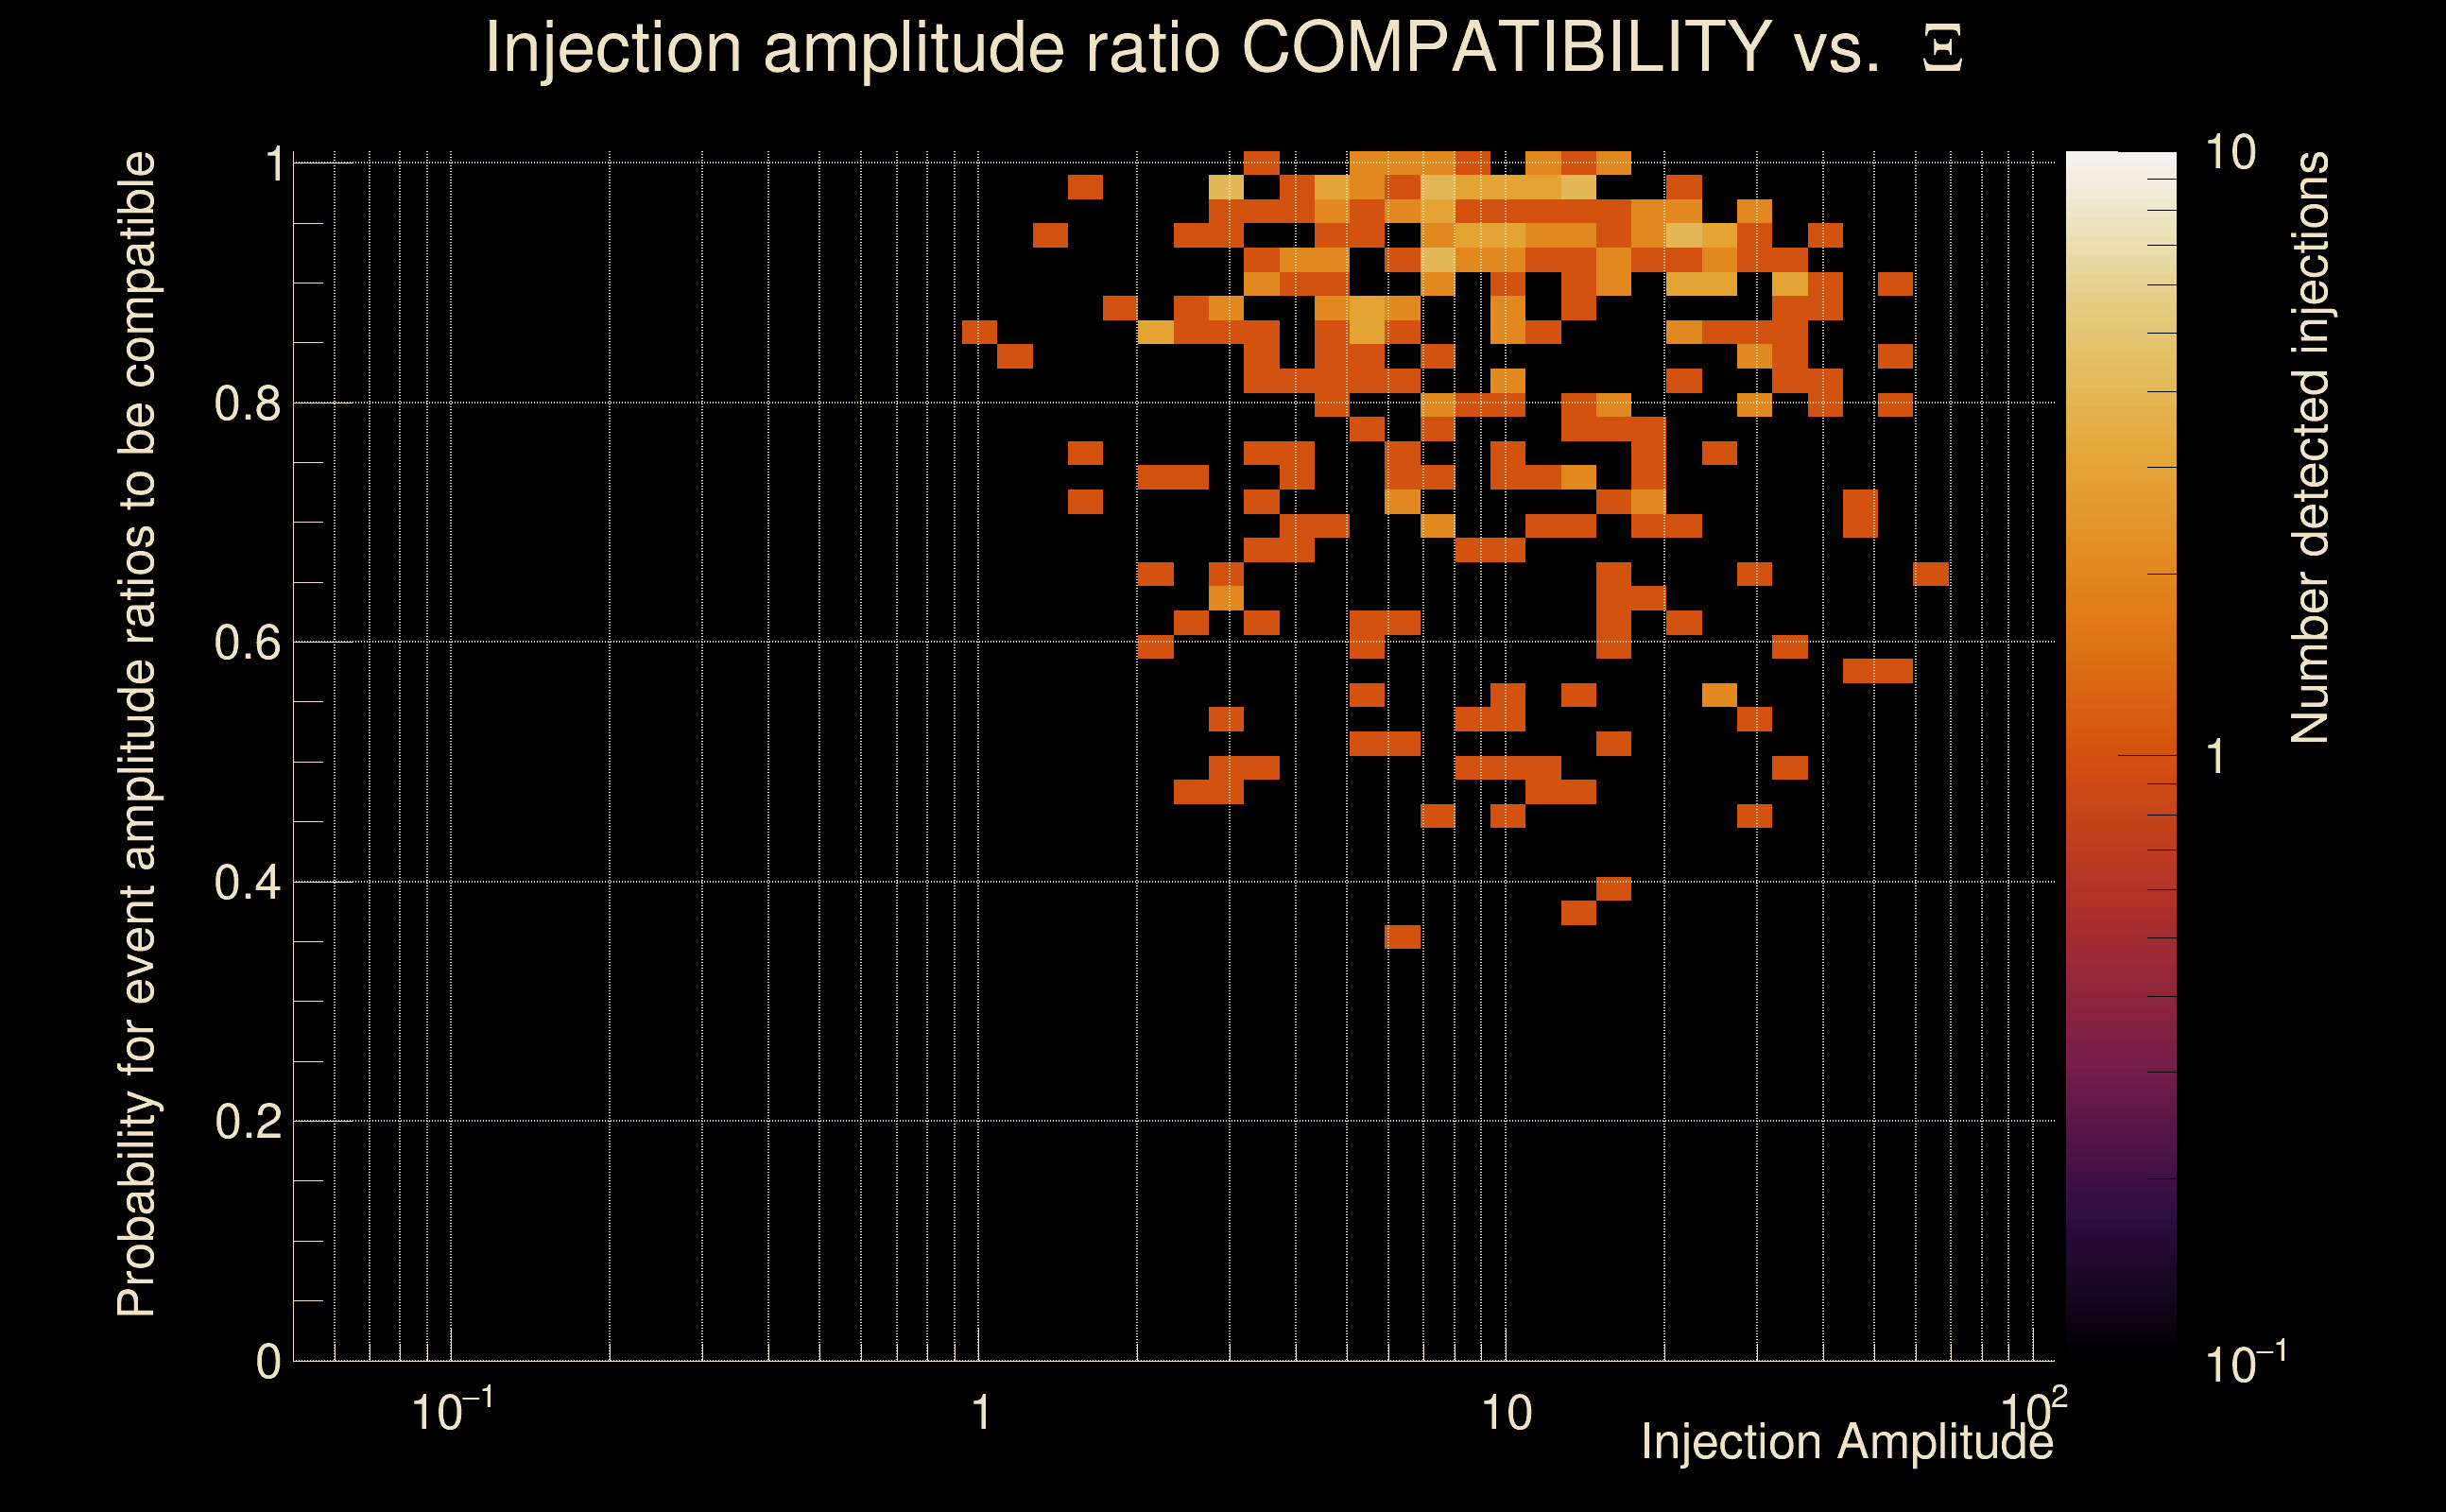
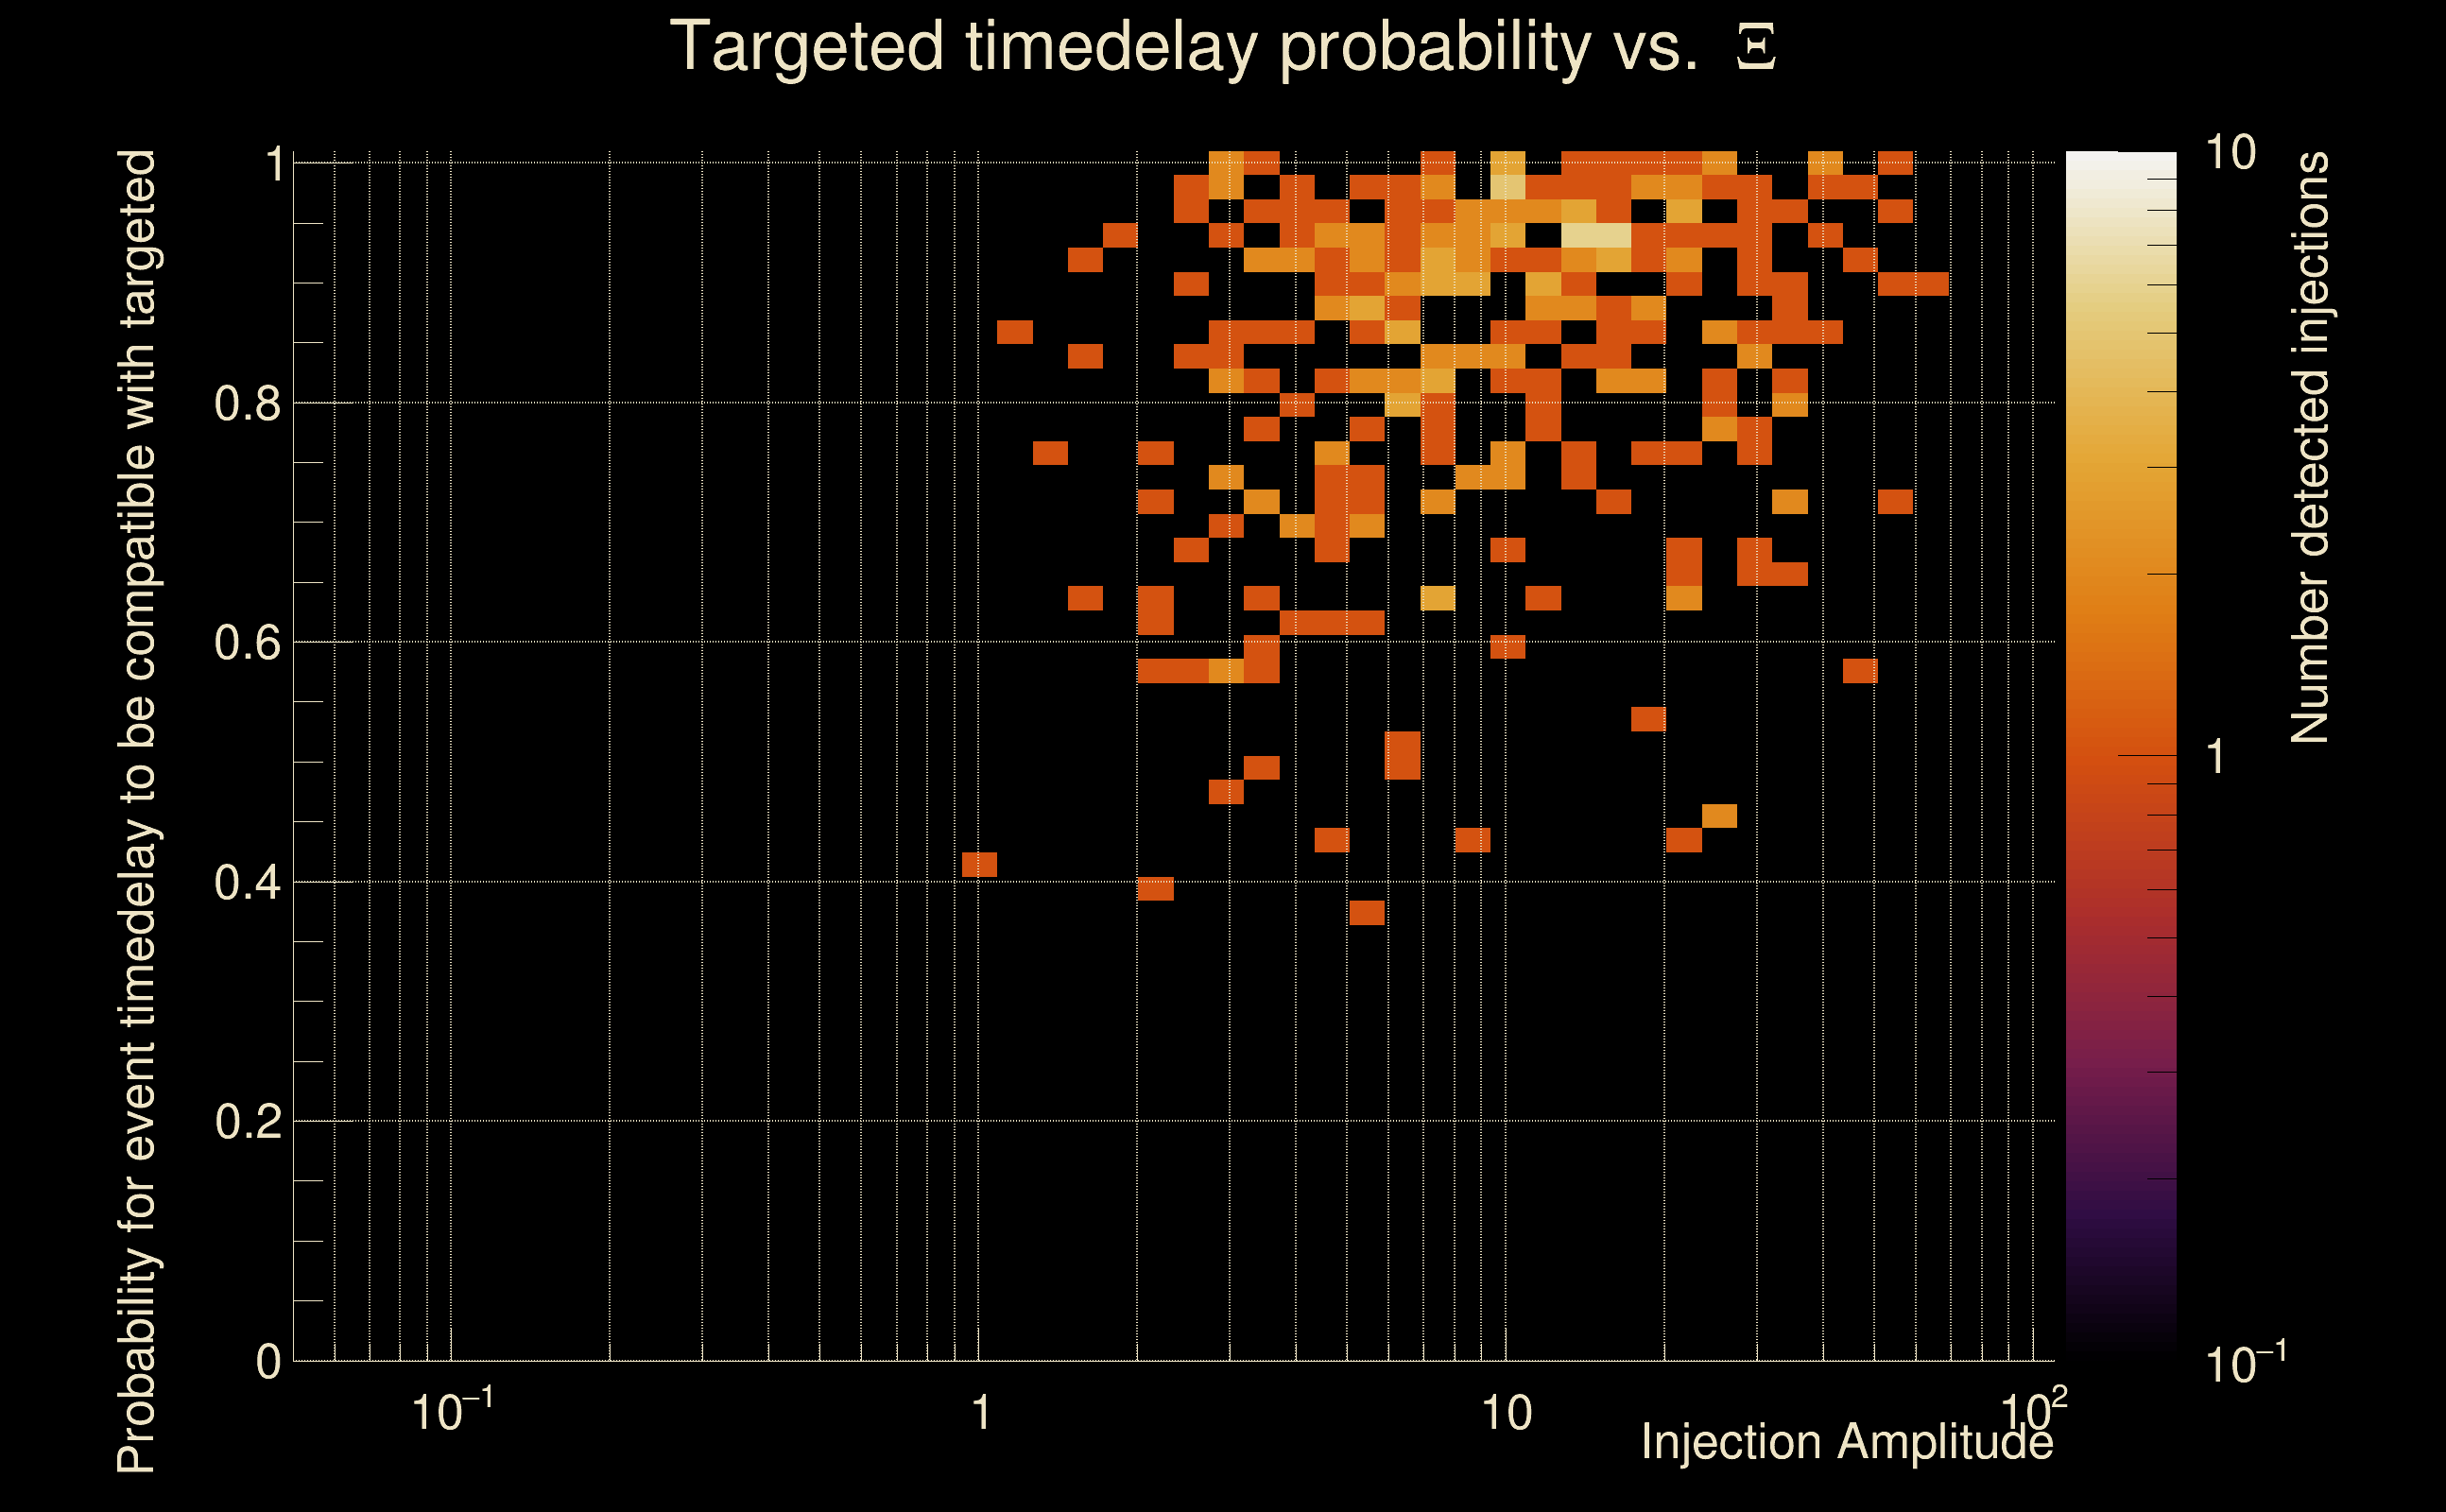
| Number of injections (total/valid/detected): | 1162 / 1004 / 298 |
| List of missed injections: | ./Rad19-s25_missed.txt |
| Injection amplitude at 90% detection efficiency: | 6.16094 |
| Injection amplitude at 50% detection efficiency: | 3.00417 |
| Injection amplitude at 10% detection efficiency: | 1.87797 |
 |
 |
 |
 |
 |
 |
 |
|
 |
 |
|
 |
 |
|
 |
 |
|
 |
 |
|
 |
 |
|
 |
 |
|
 |
 |
|
 |
 |
 |
 |
 |
 |
 |
 |
 |
 |
 |
 |
 |
 |
 |
| florent.robinet@ijclab.in2p3.fr |