| Omicron version: | 4.2.0: documentation gitlab repository |
| Omicron run by: | unknown |
| Report produced on: | Fri Mar 6 17:56:40 2026 UTC |
| Ox option file: | TargIxf_feb2026_SG1_10min_options.txt |
| Omicron option files: | detector 0, detector 1 |
| Detector channel names: | H1:GDS-CALIB_STRAIN_CLEAN_AR_4096Hz, L1:GDS-CALIB_STRAIN_CLEAN_AR_4096Hz |
| Omicron analysis time window and overlap: | 16 s, 6 s |
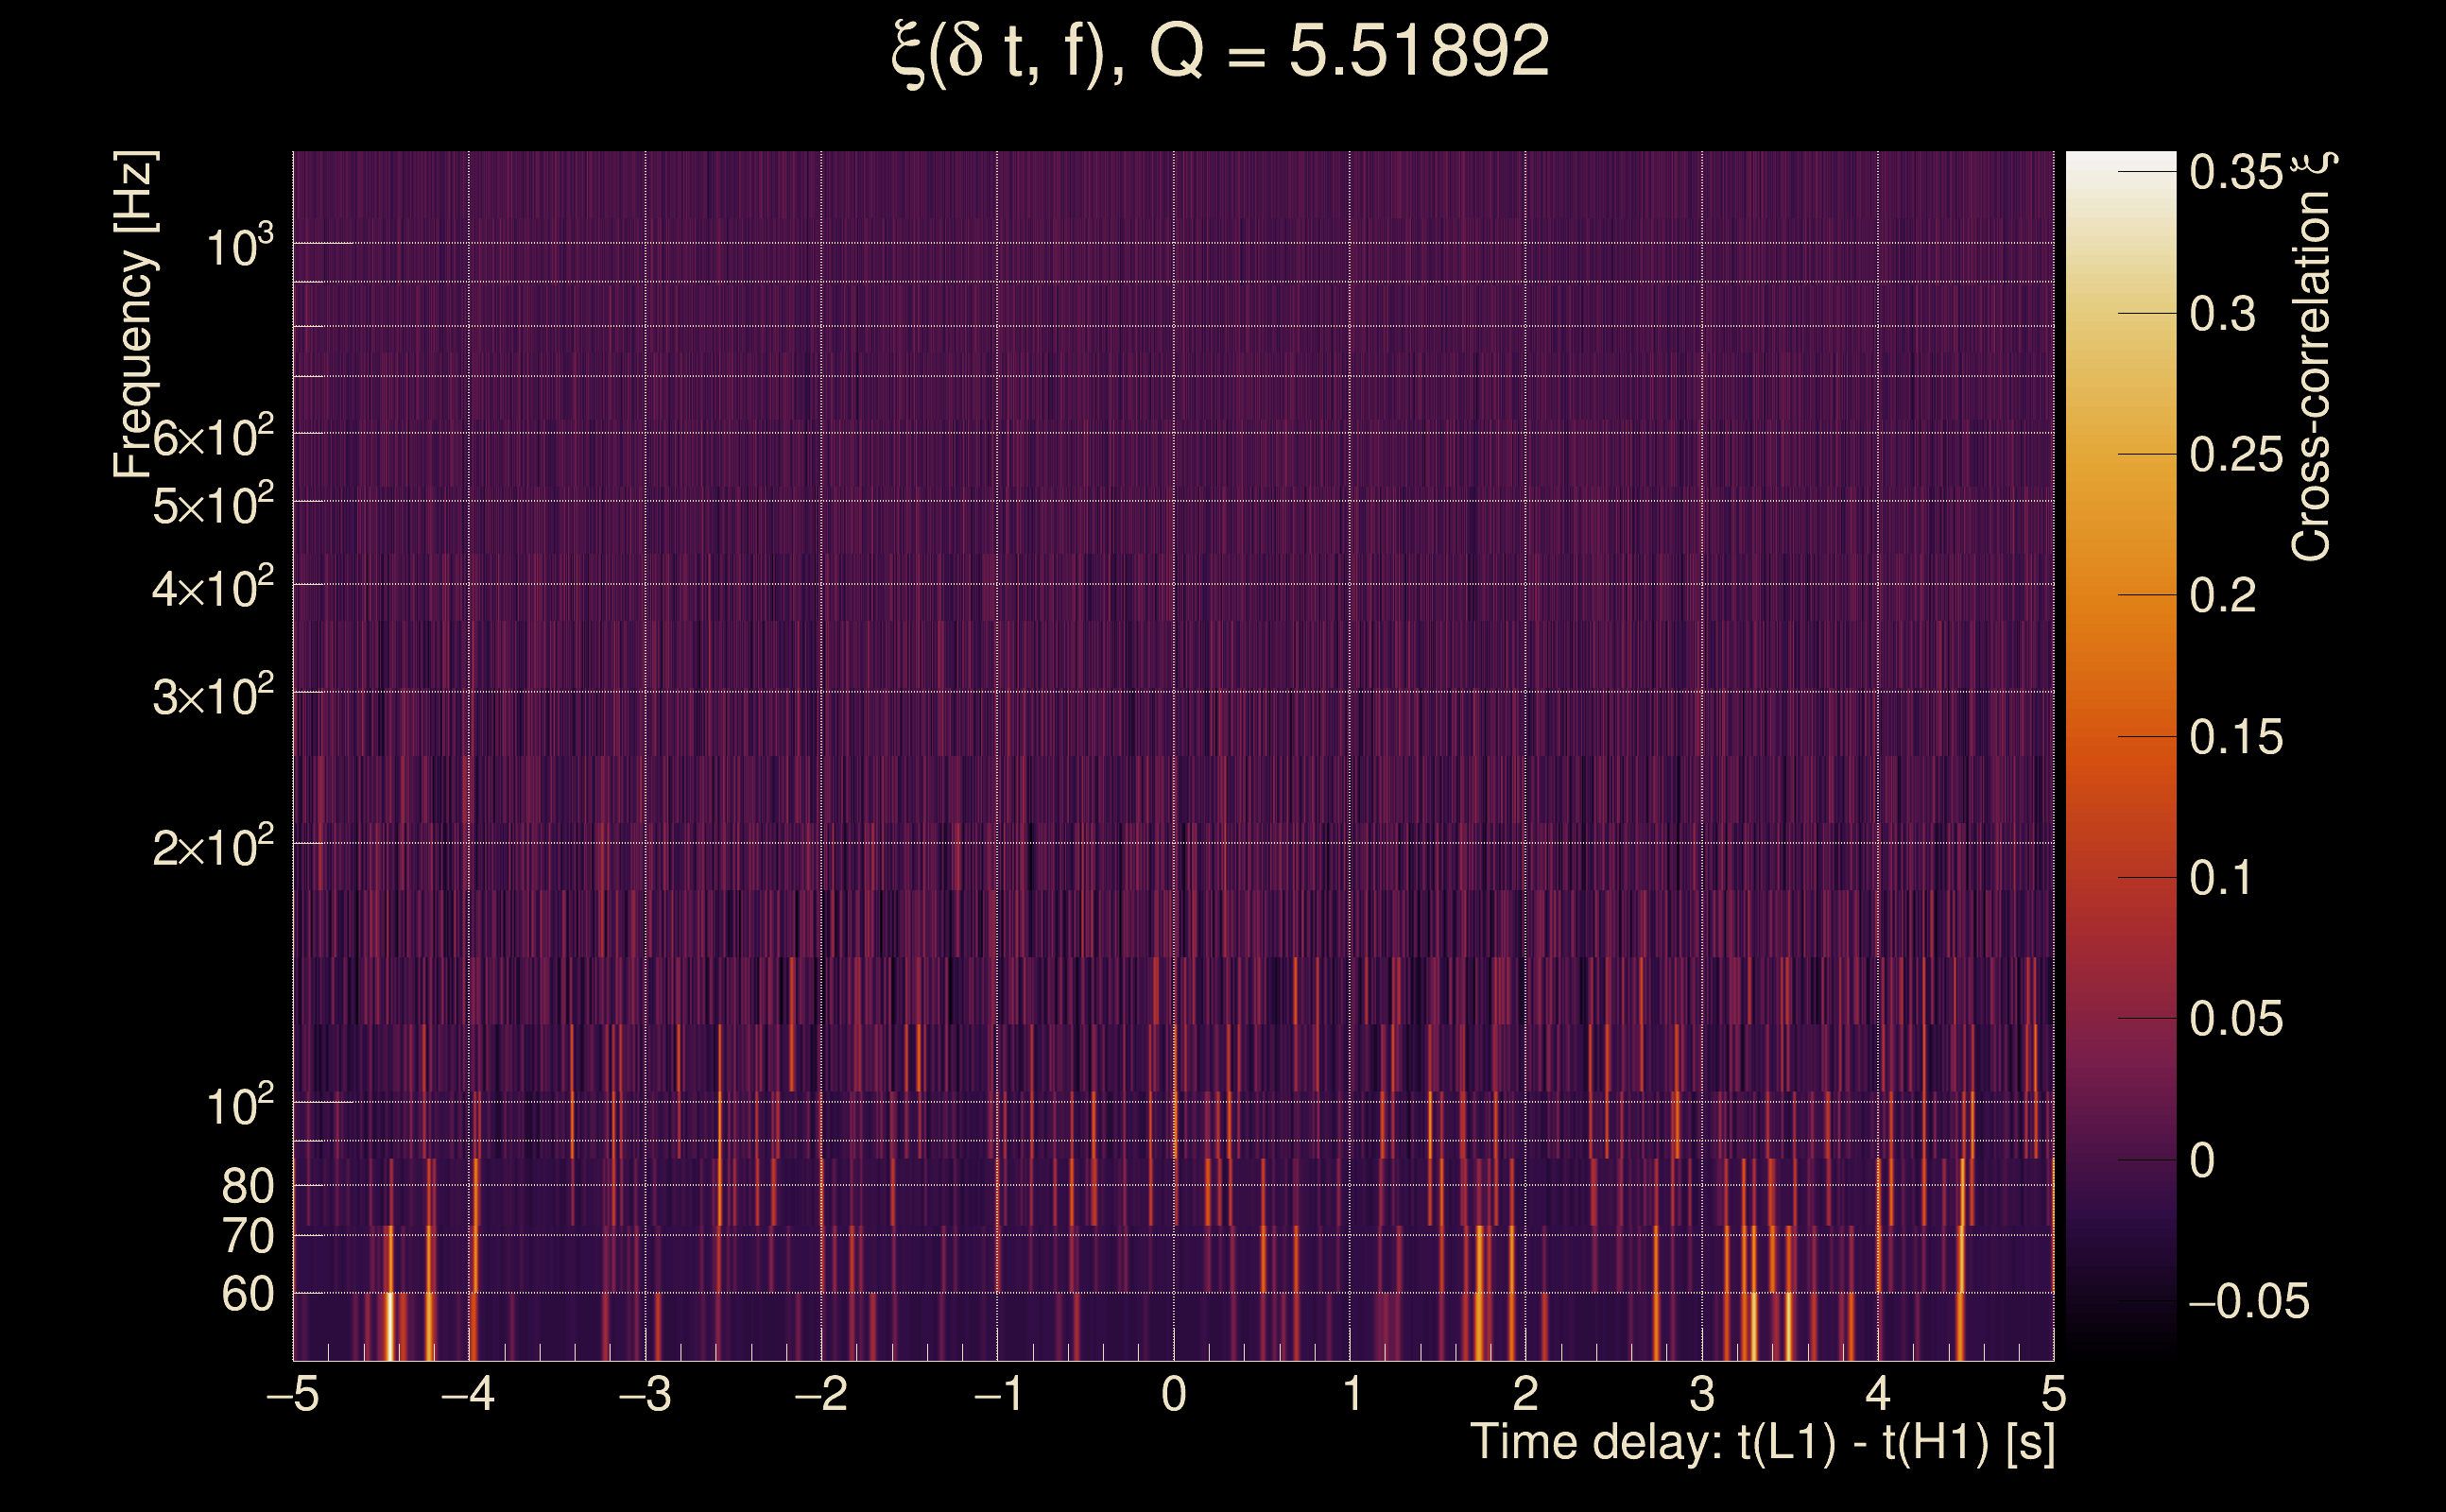
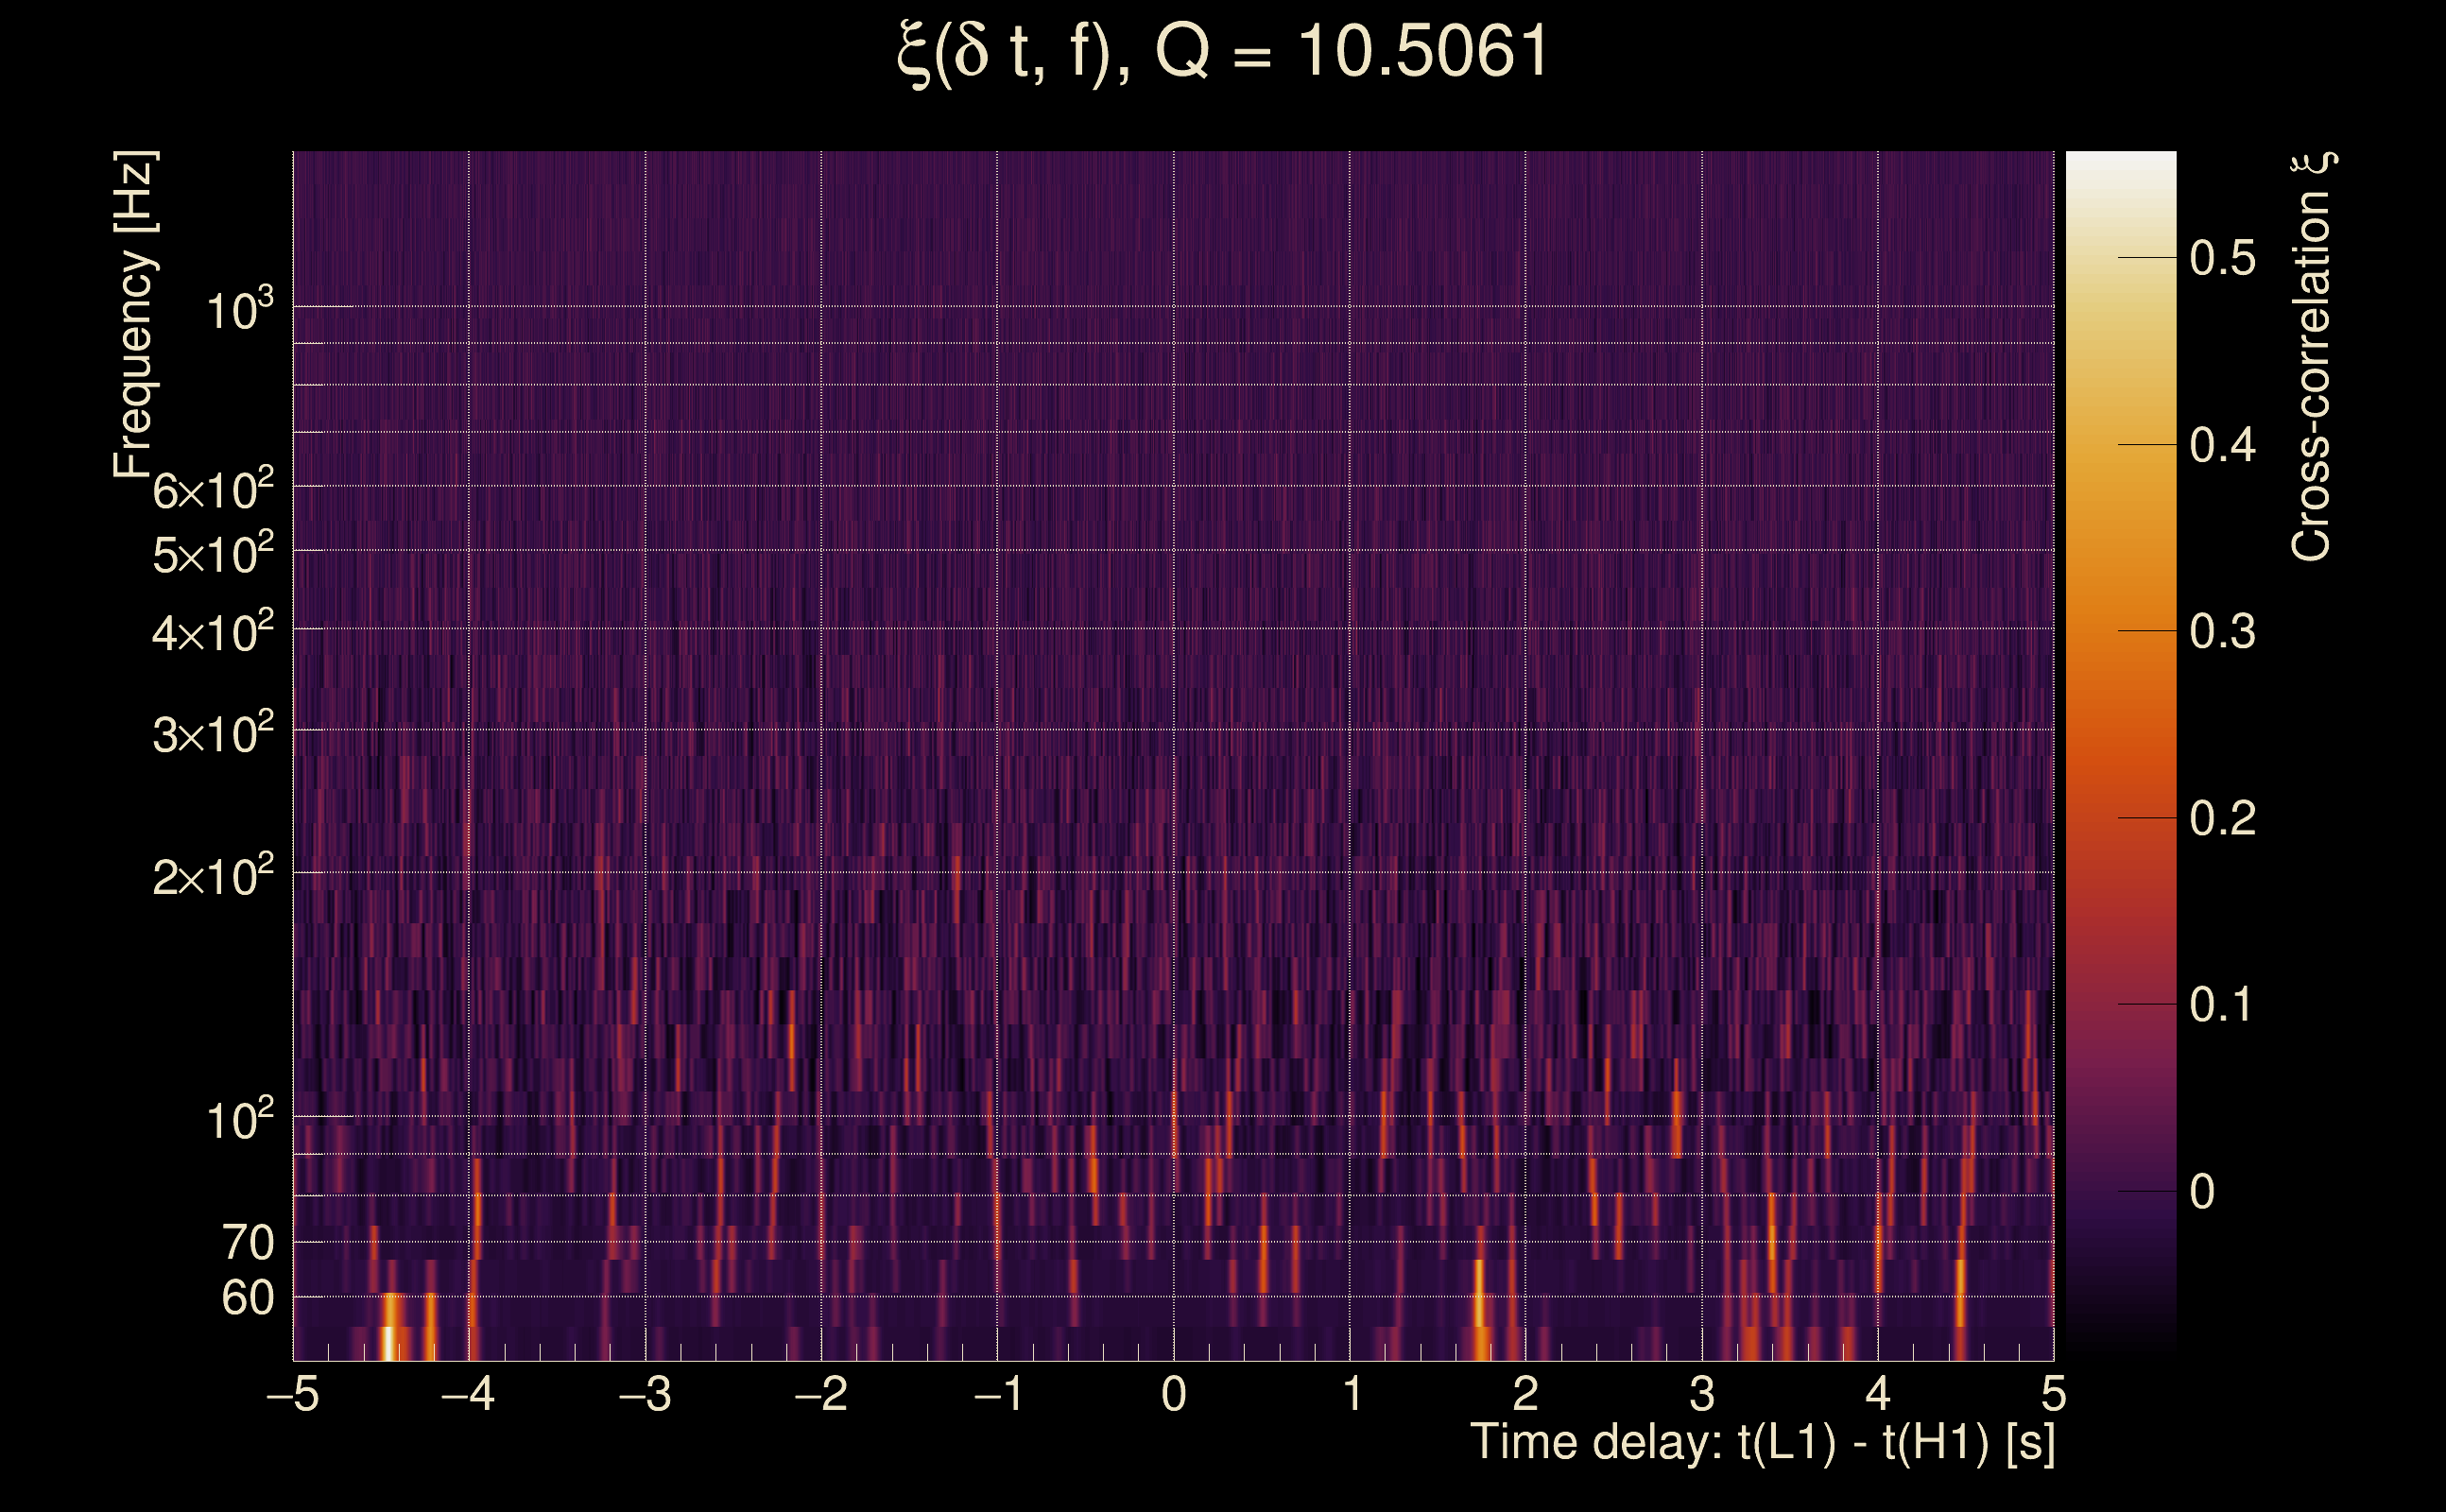
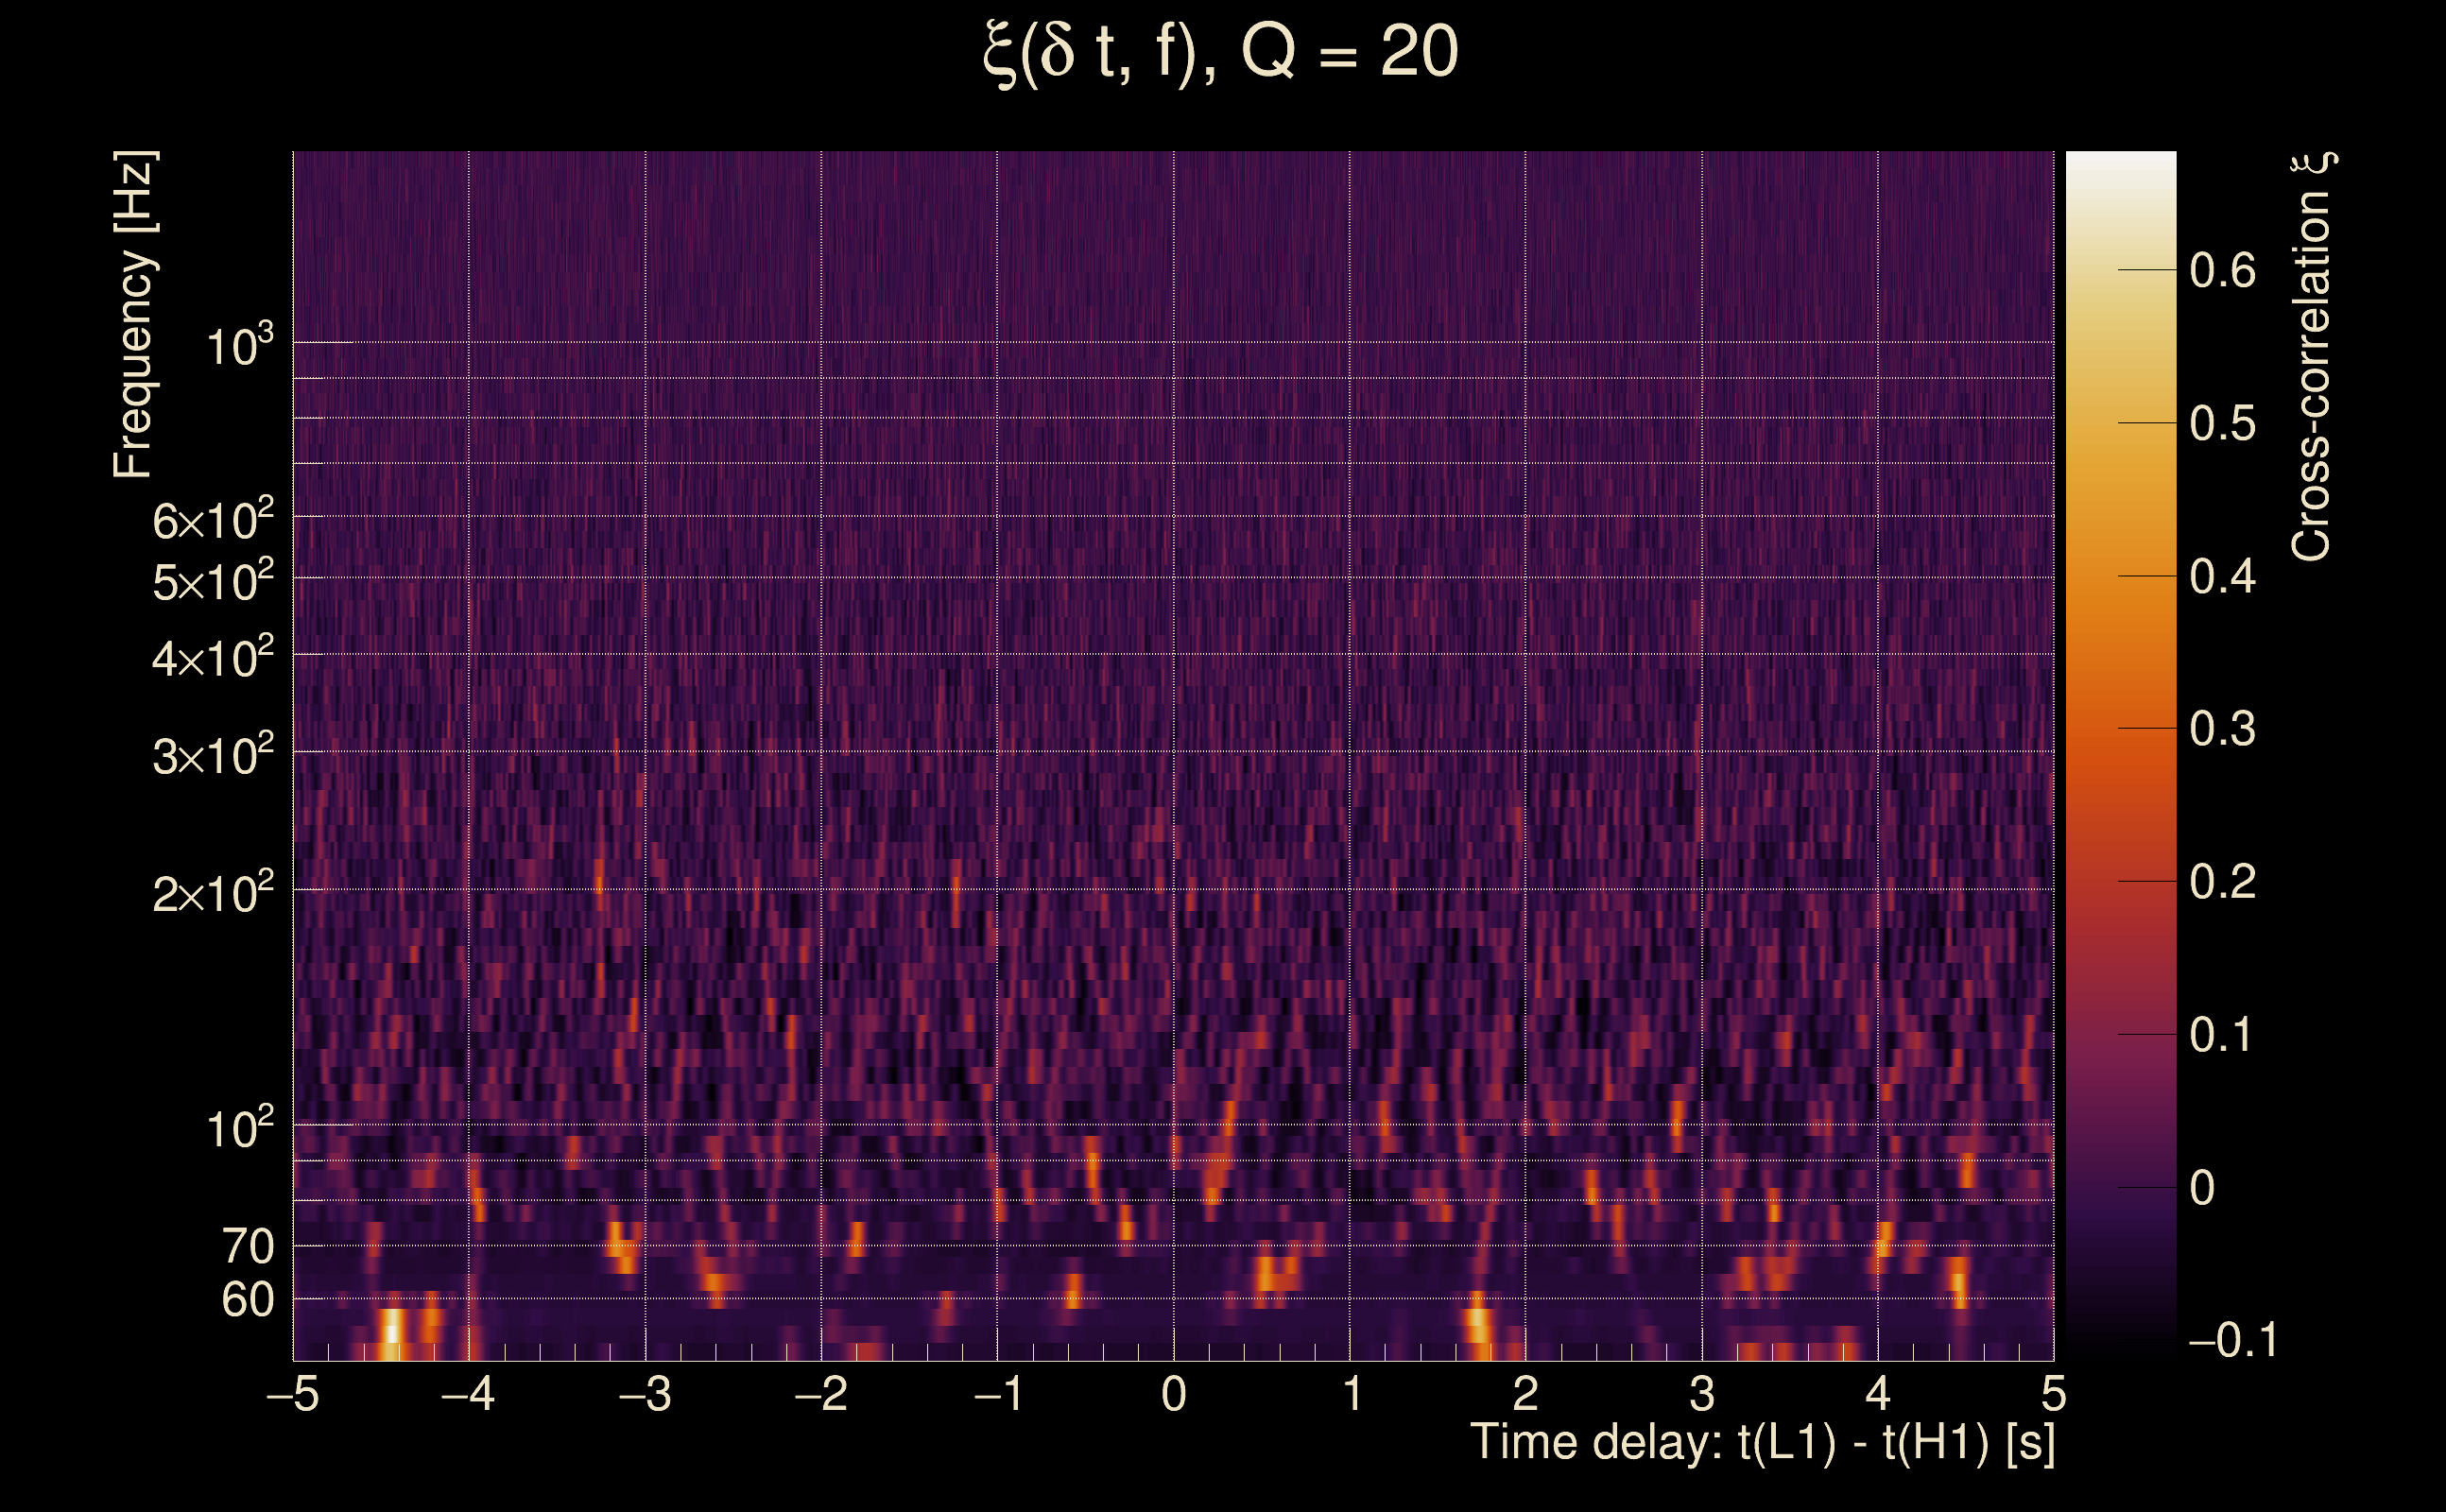
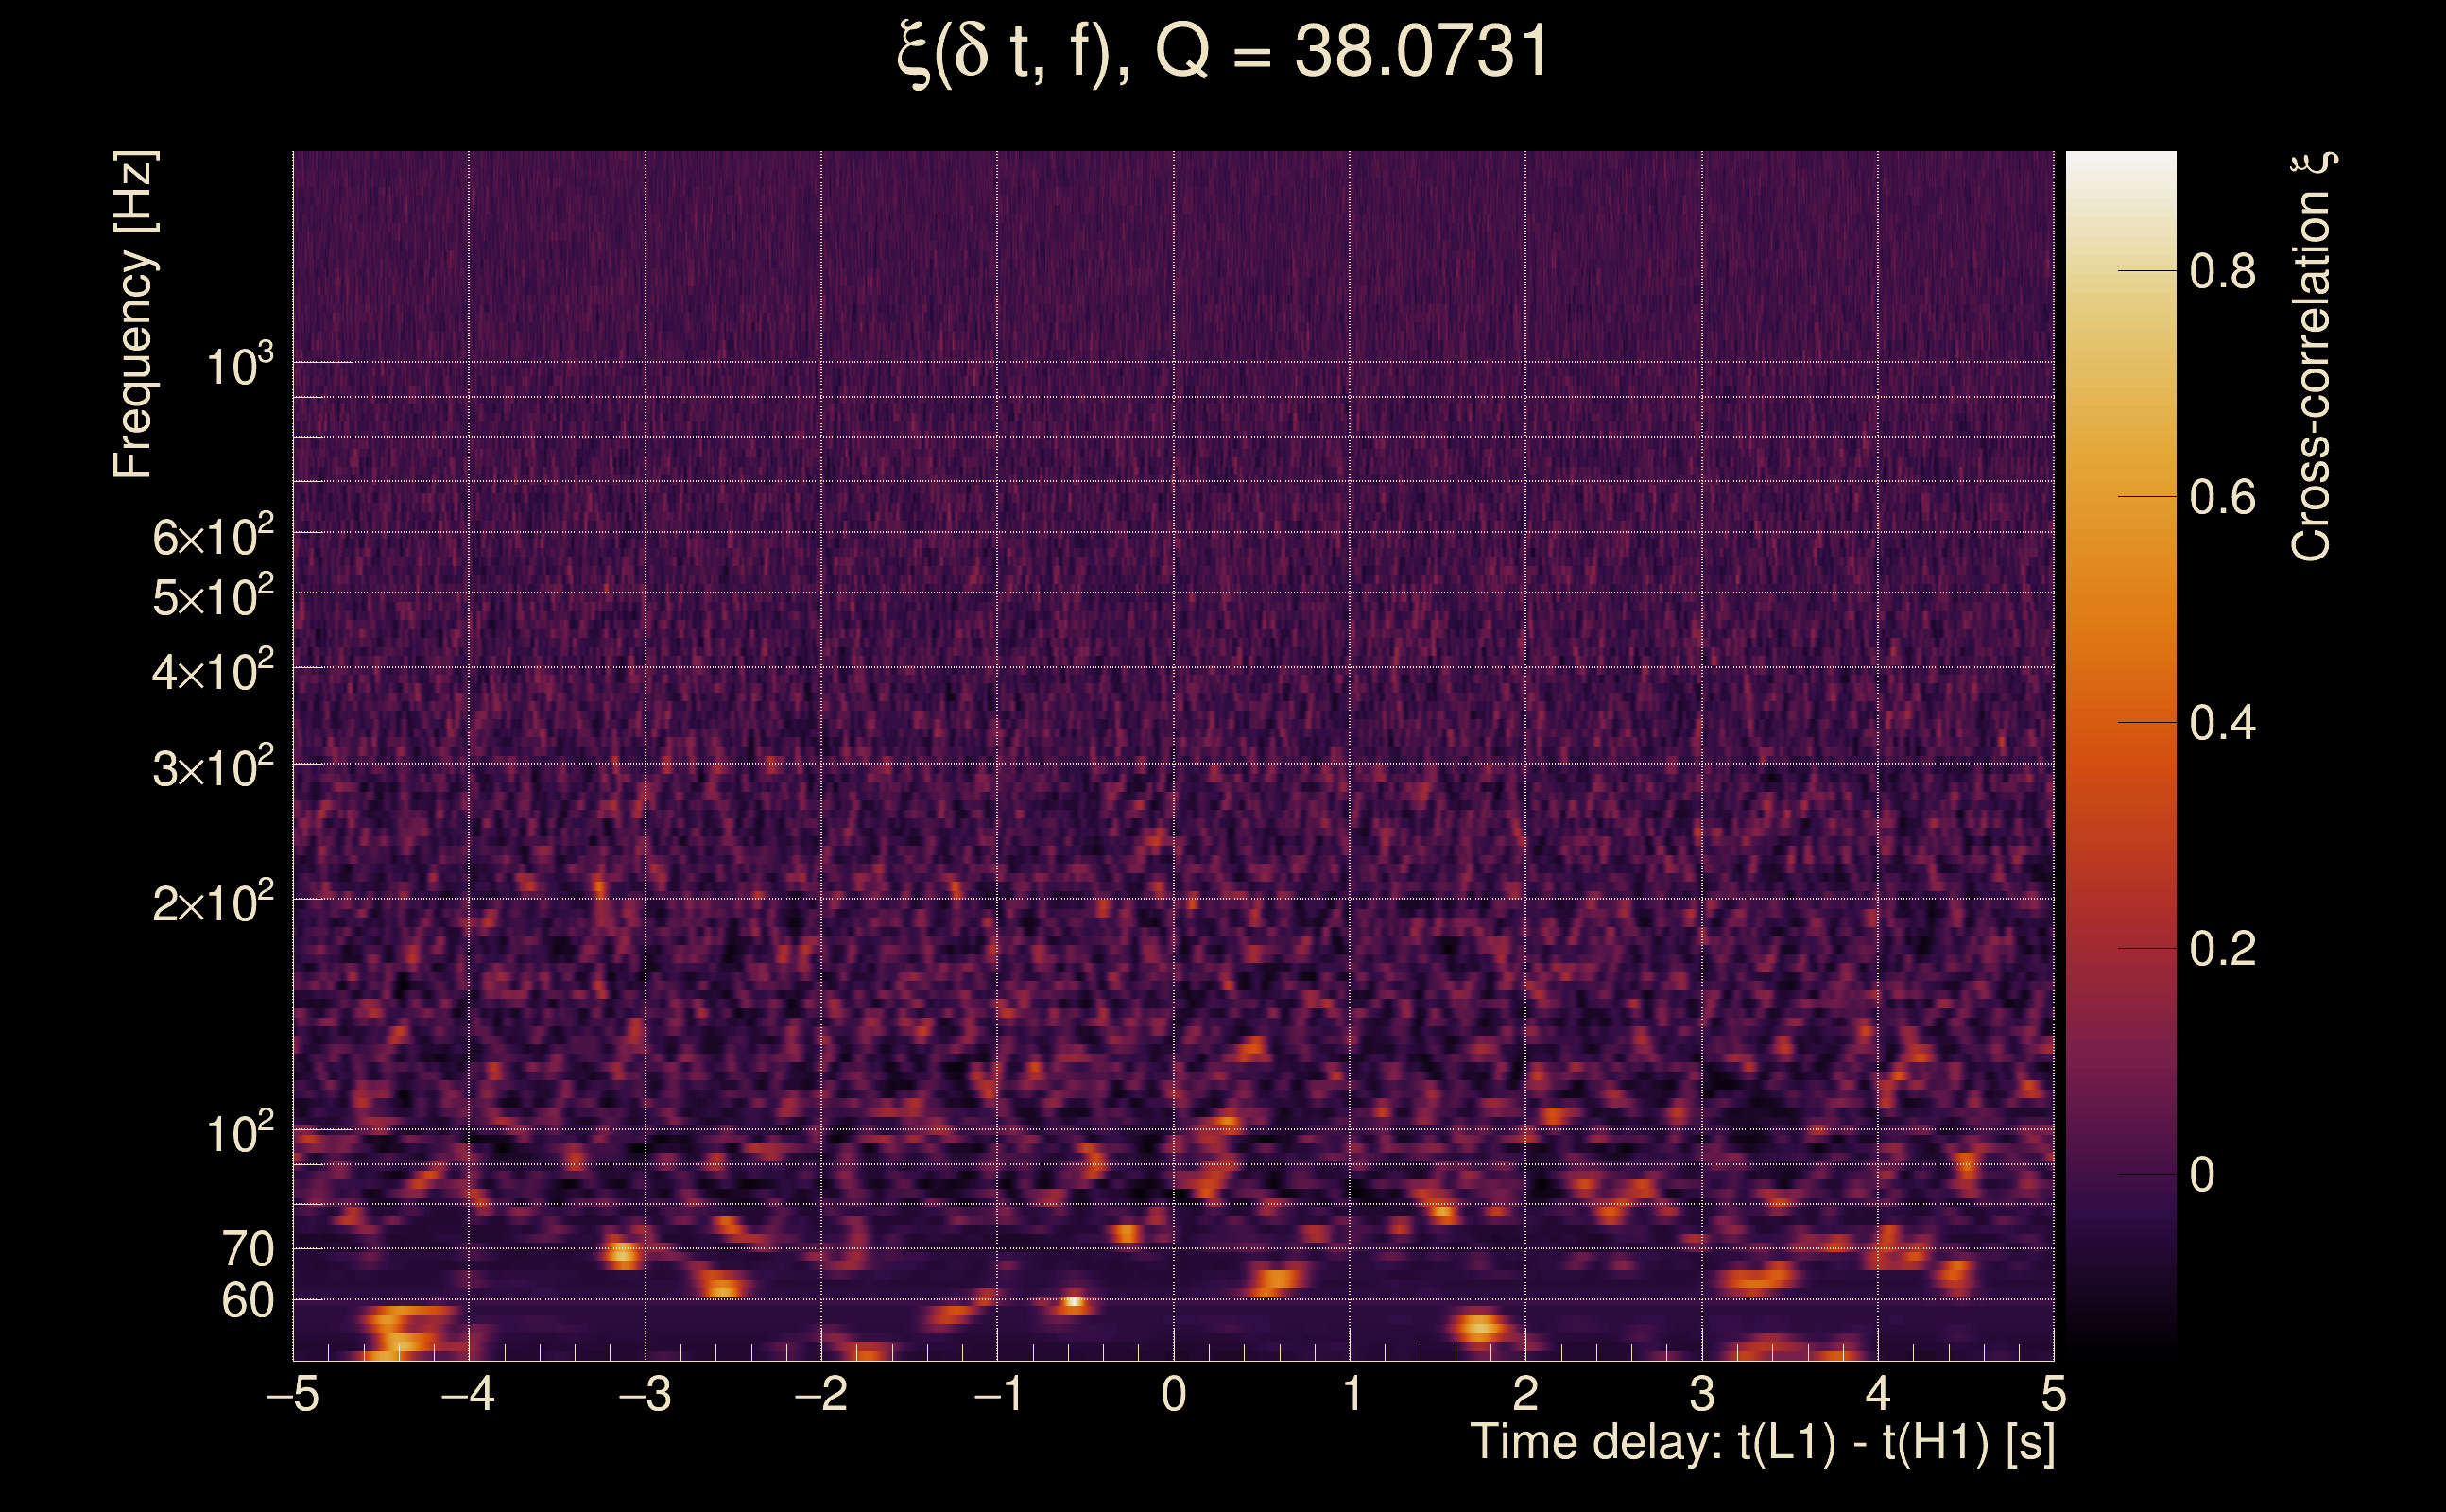
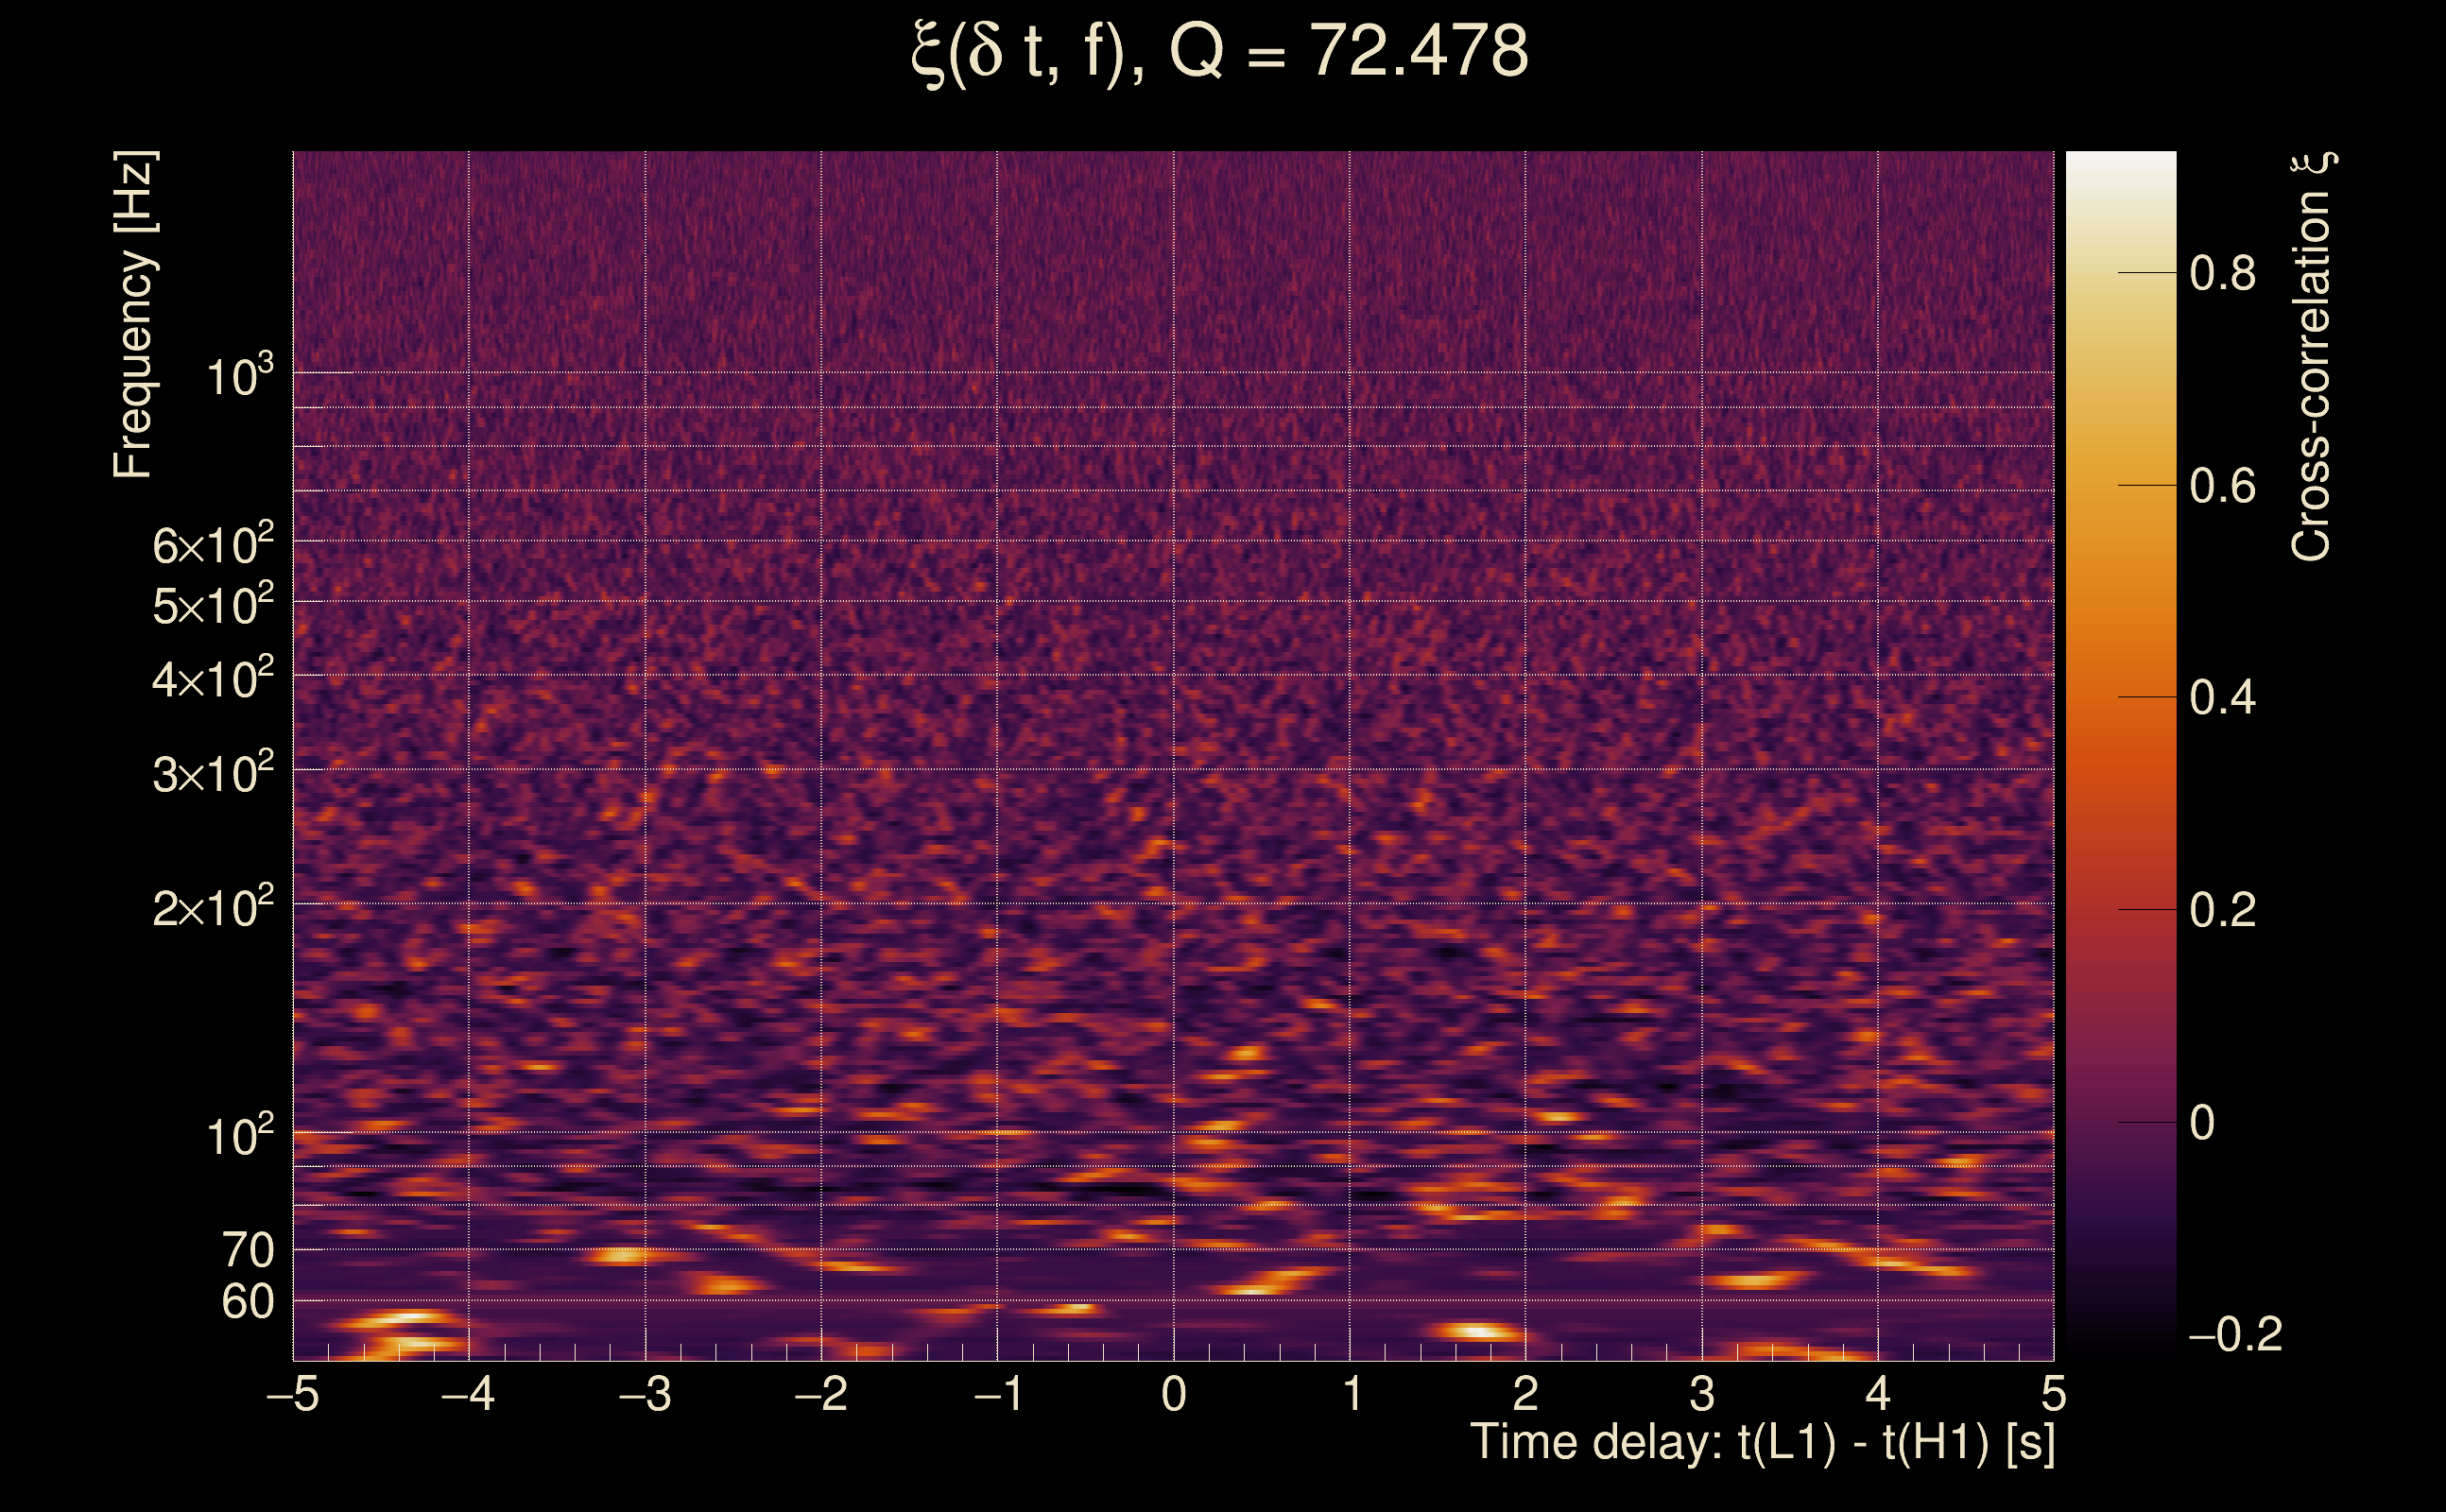
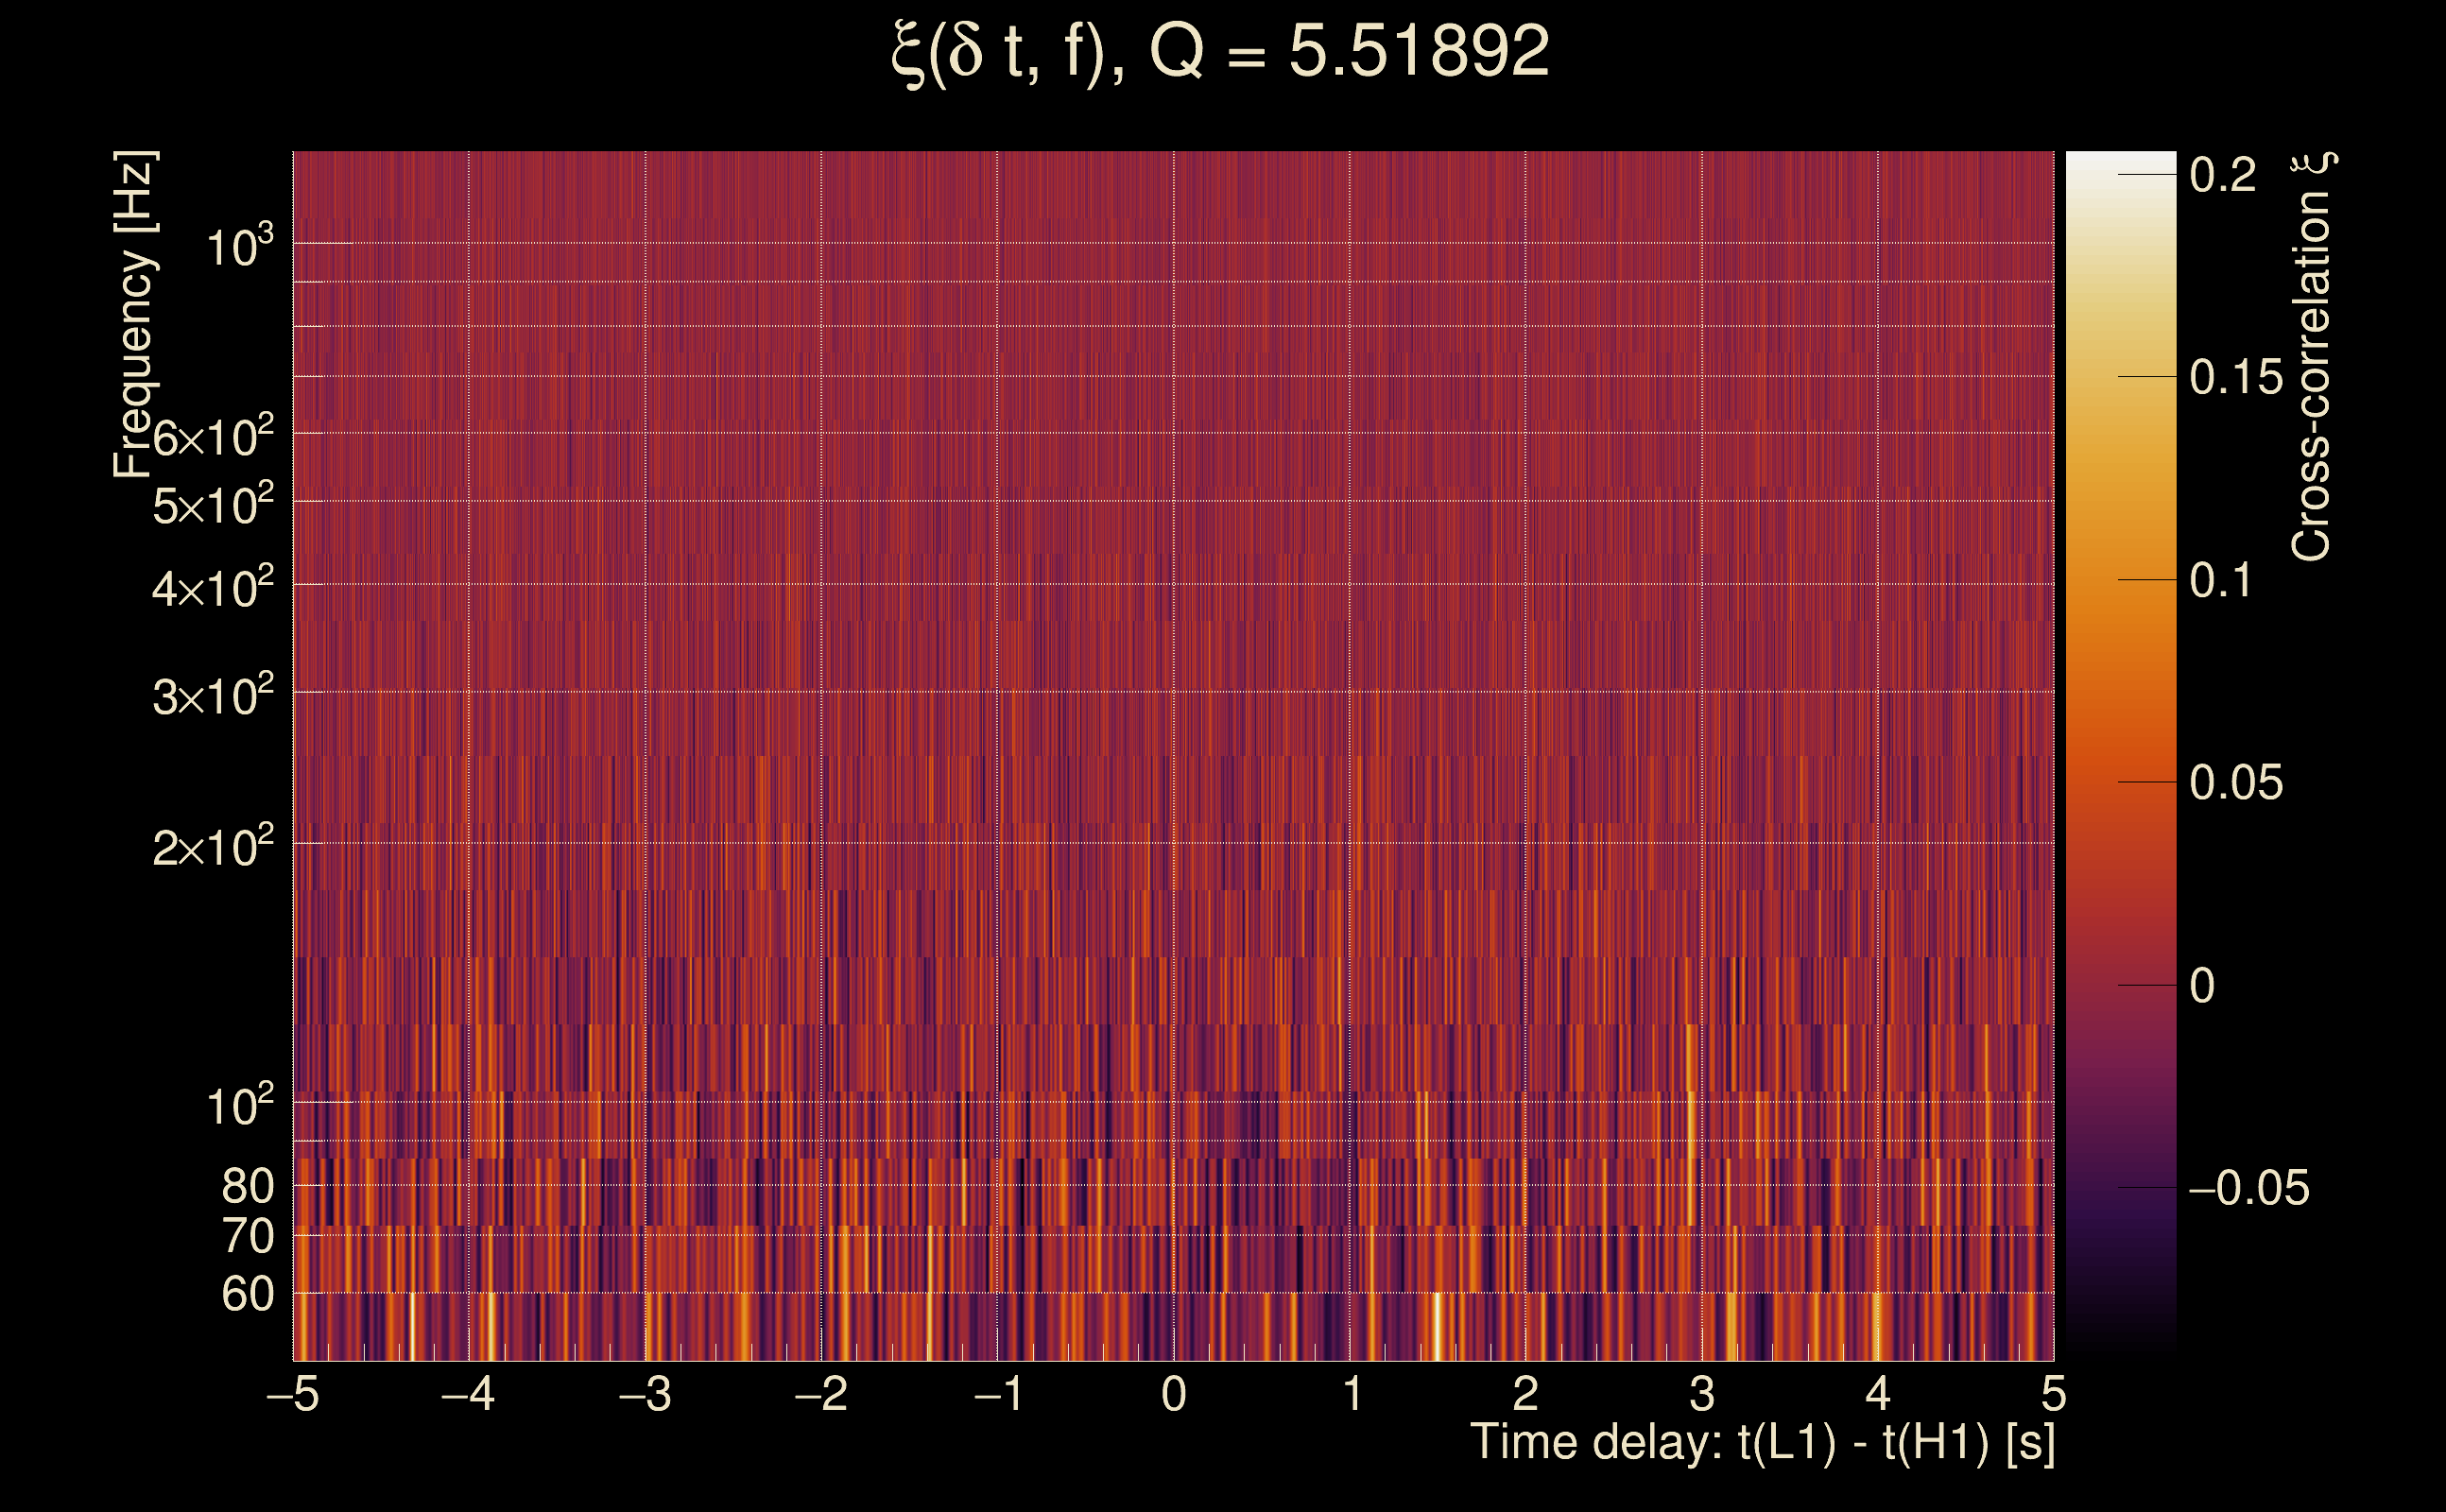
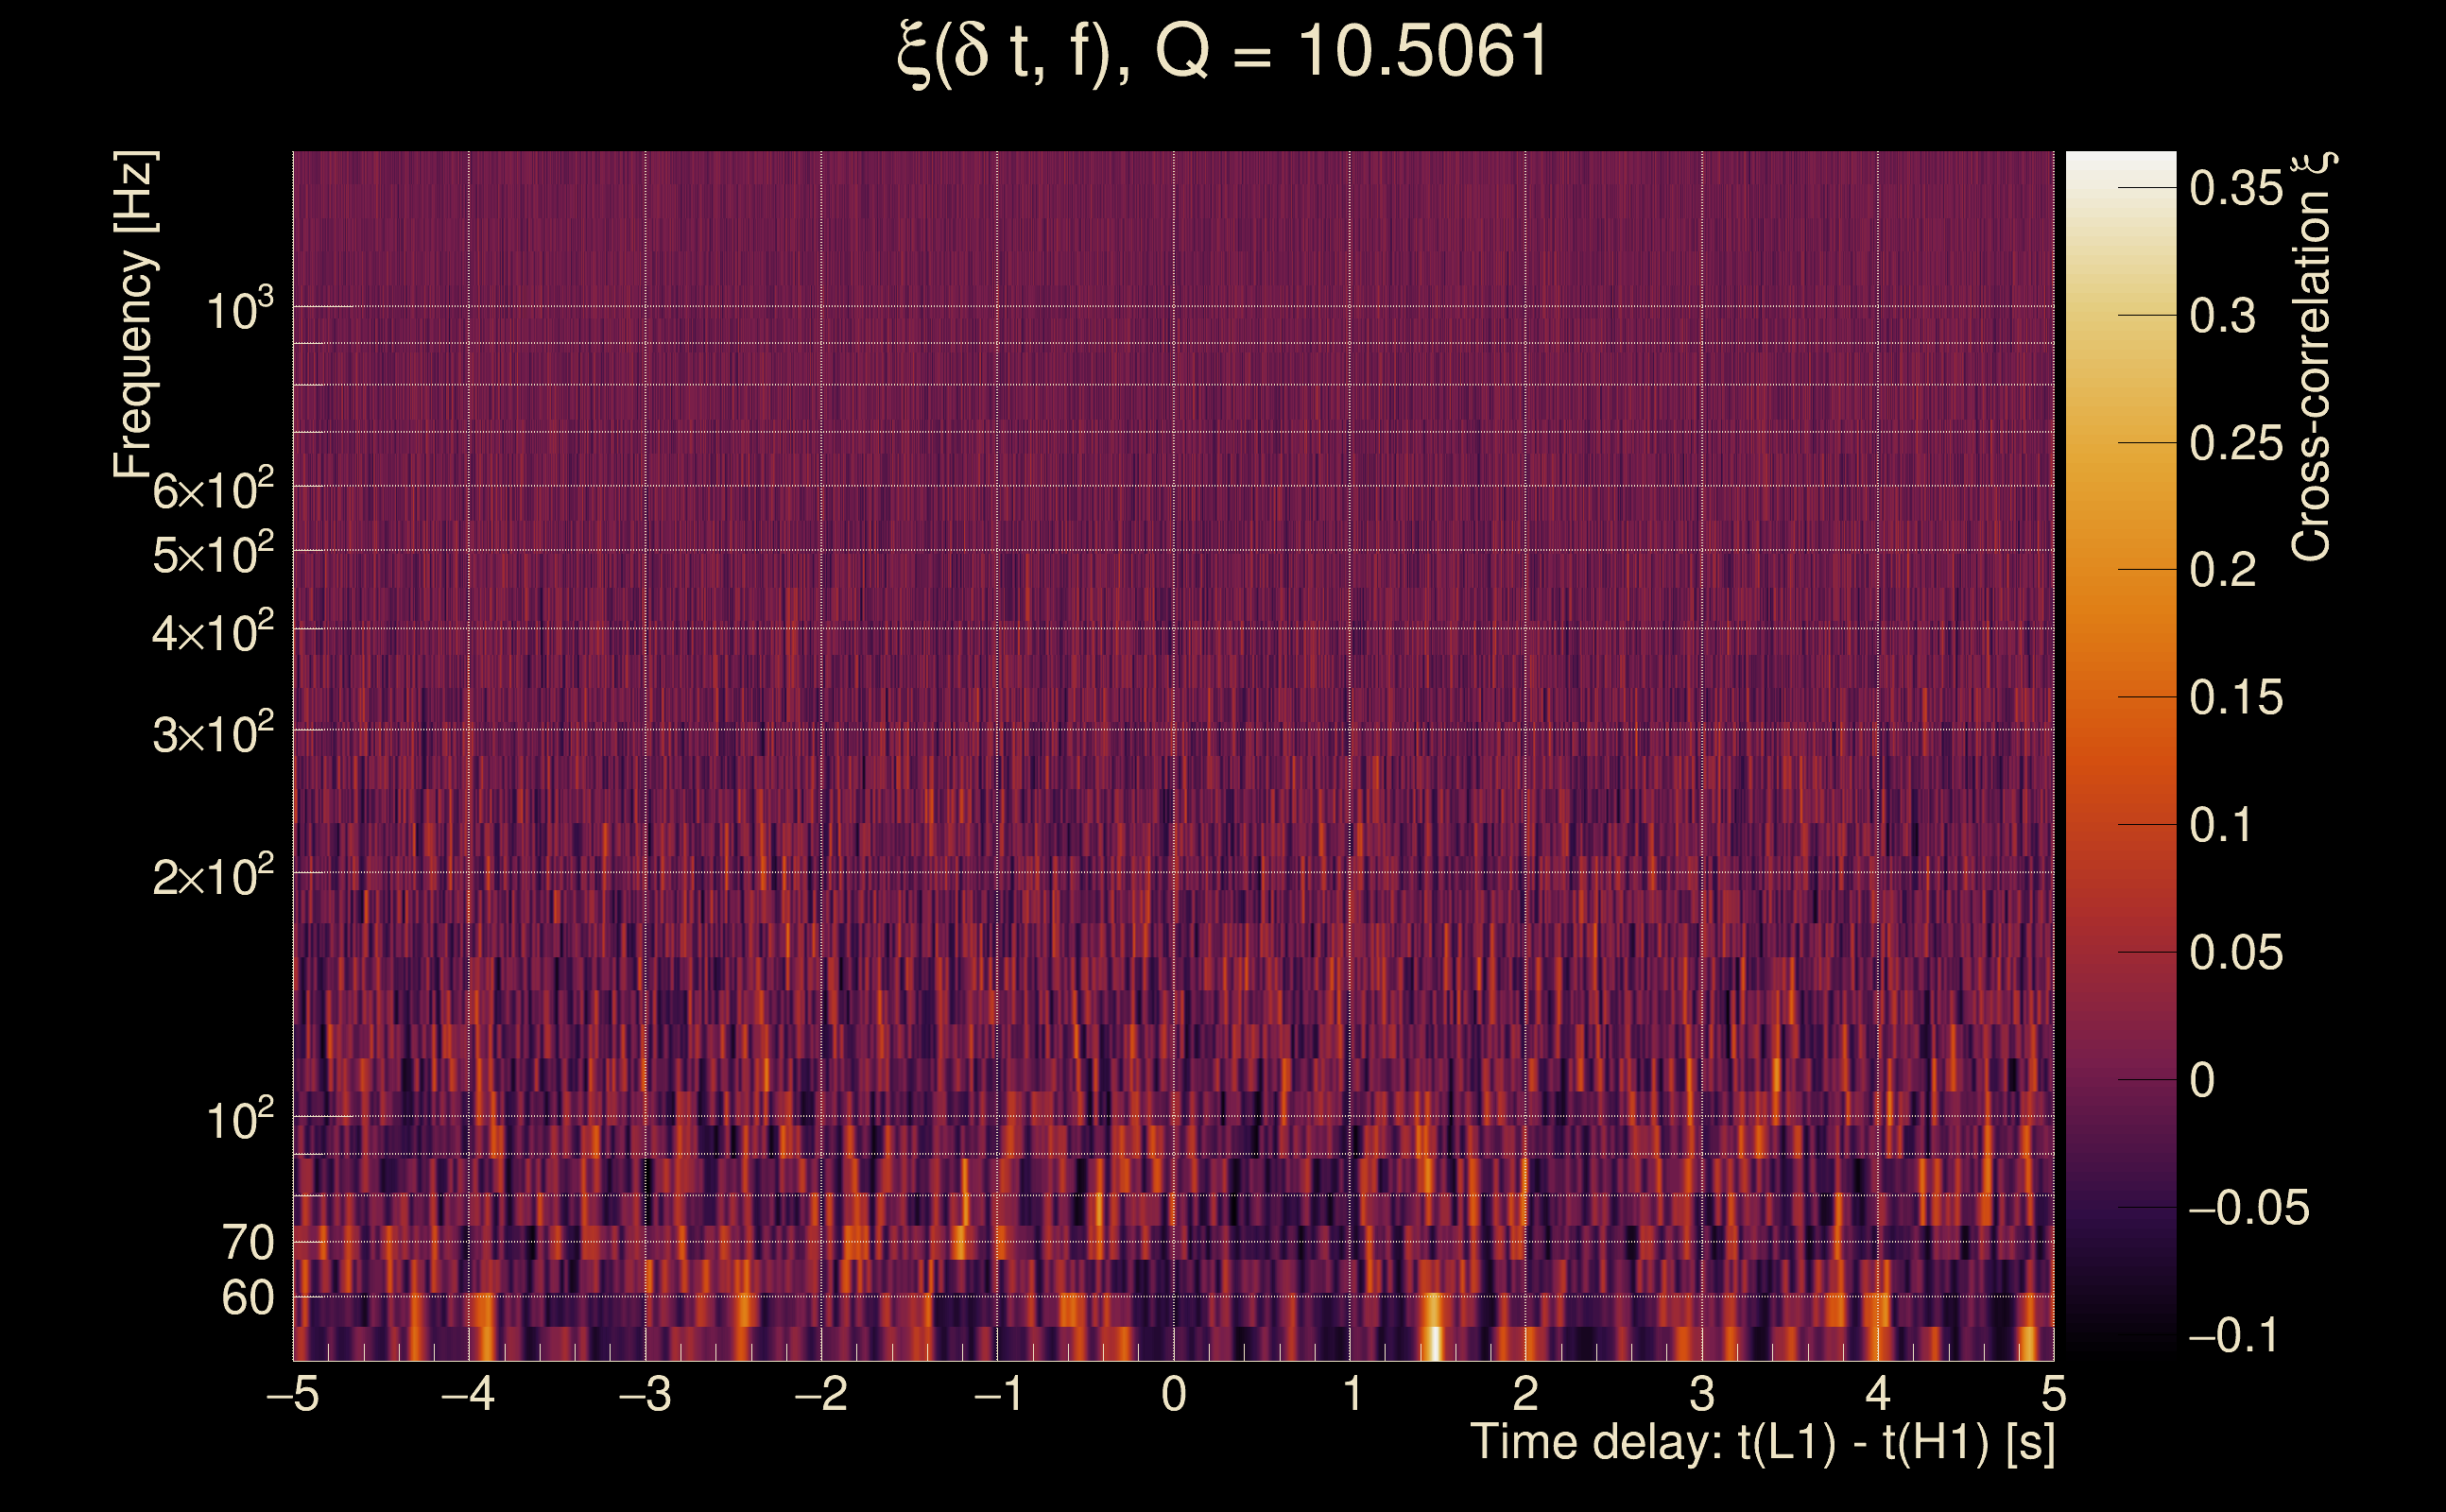
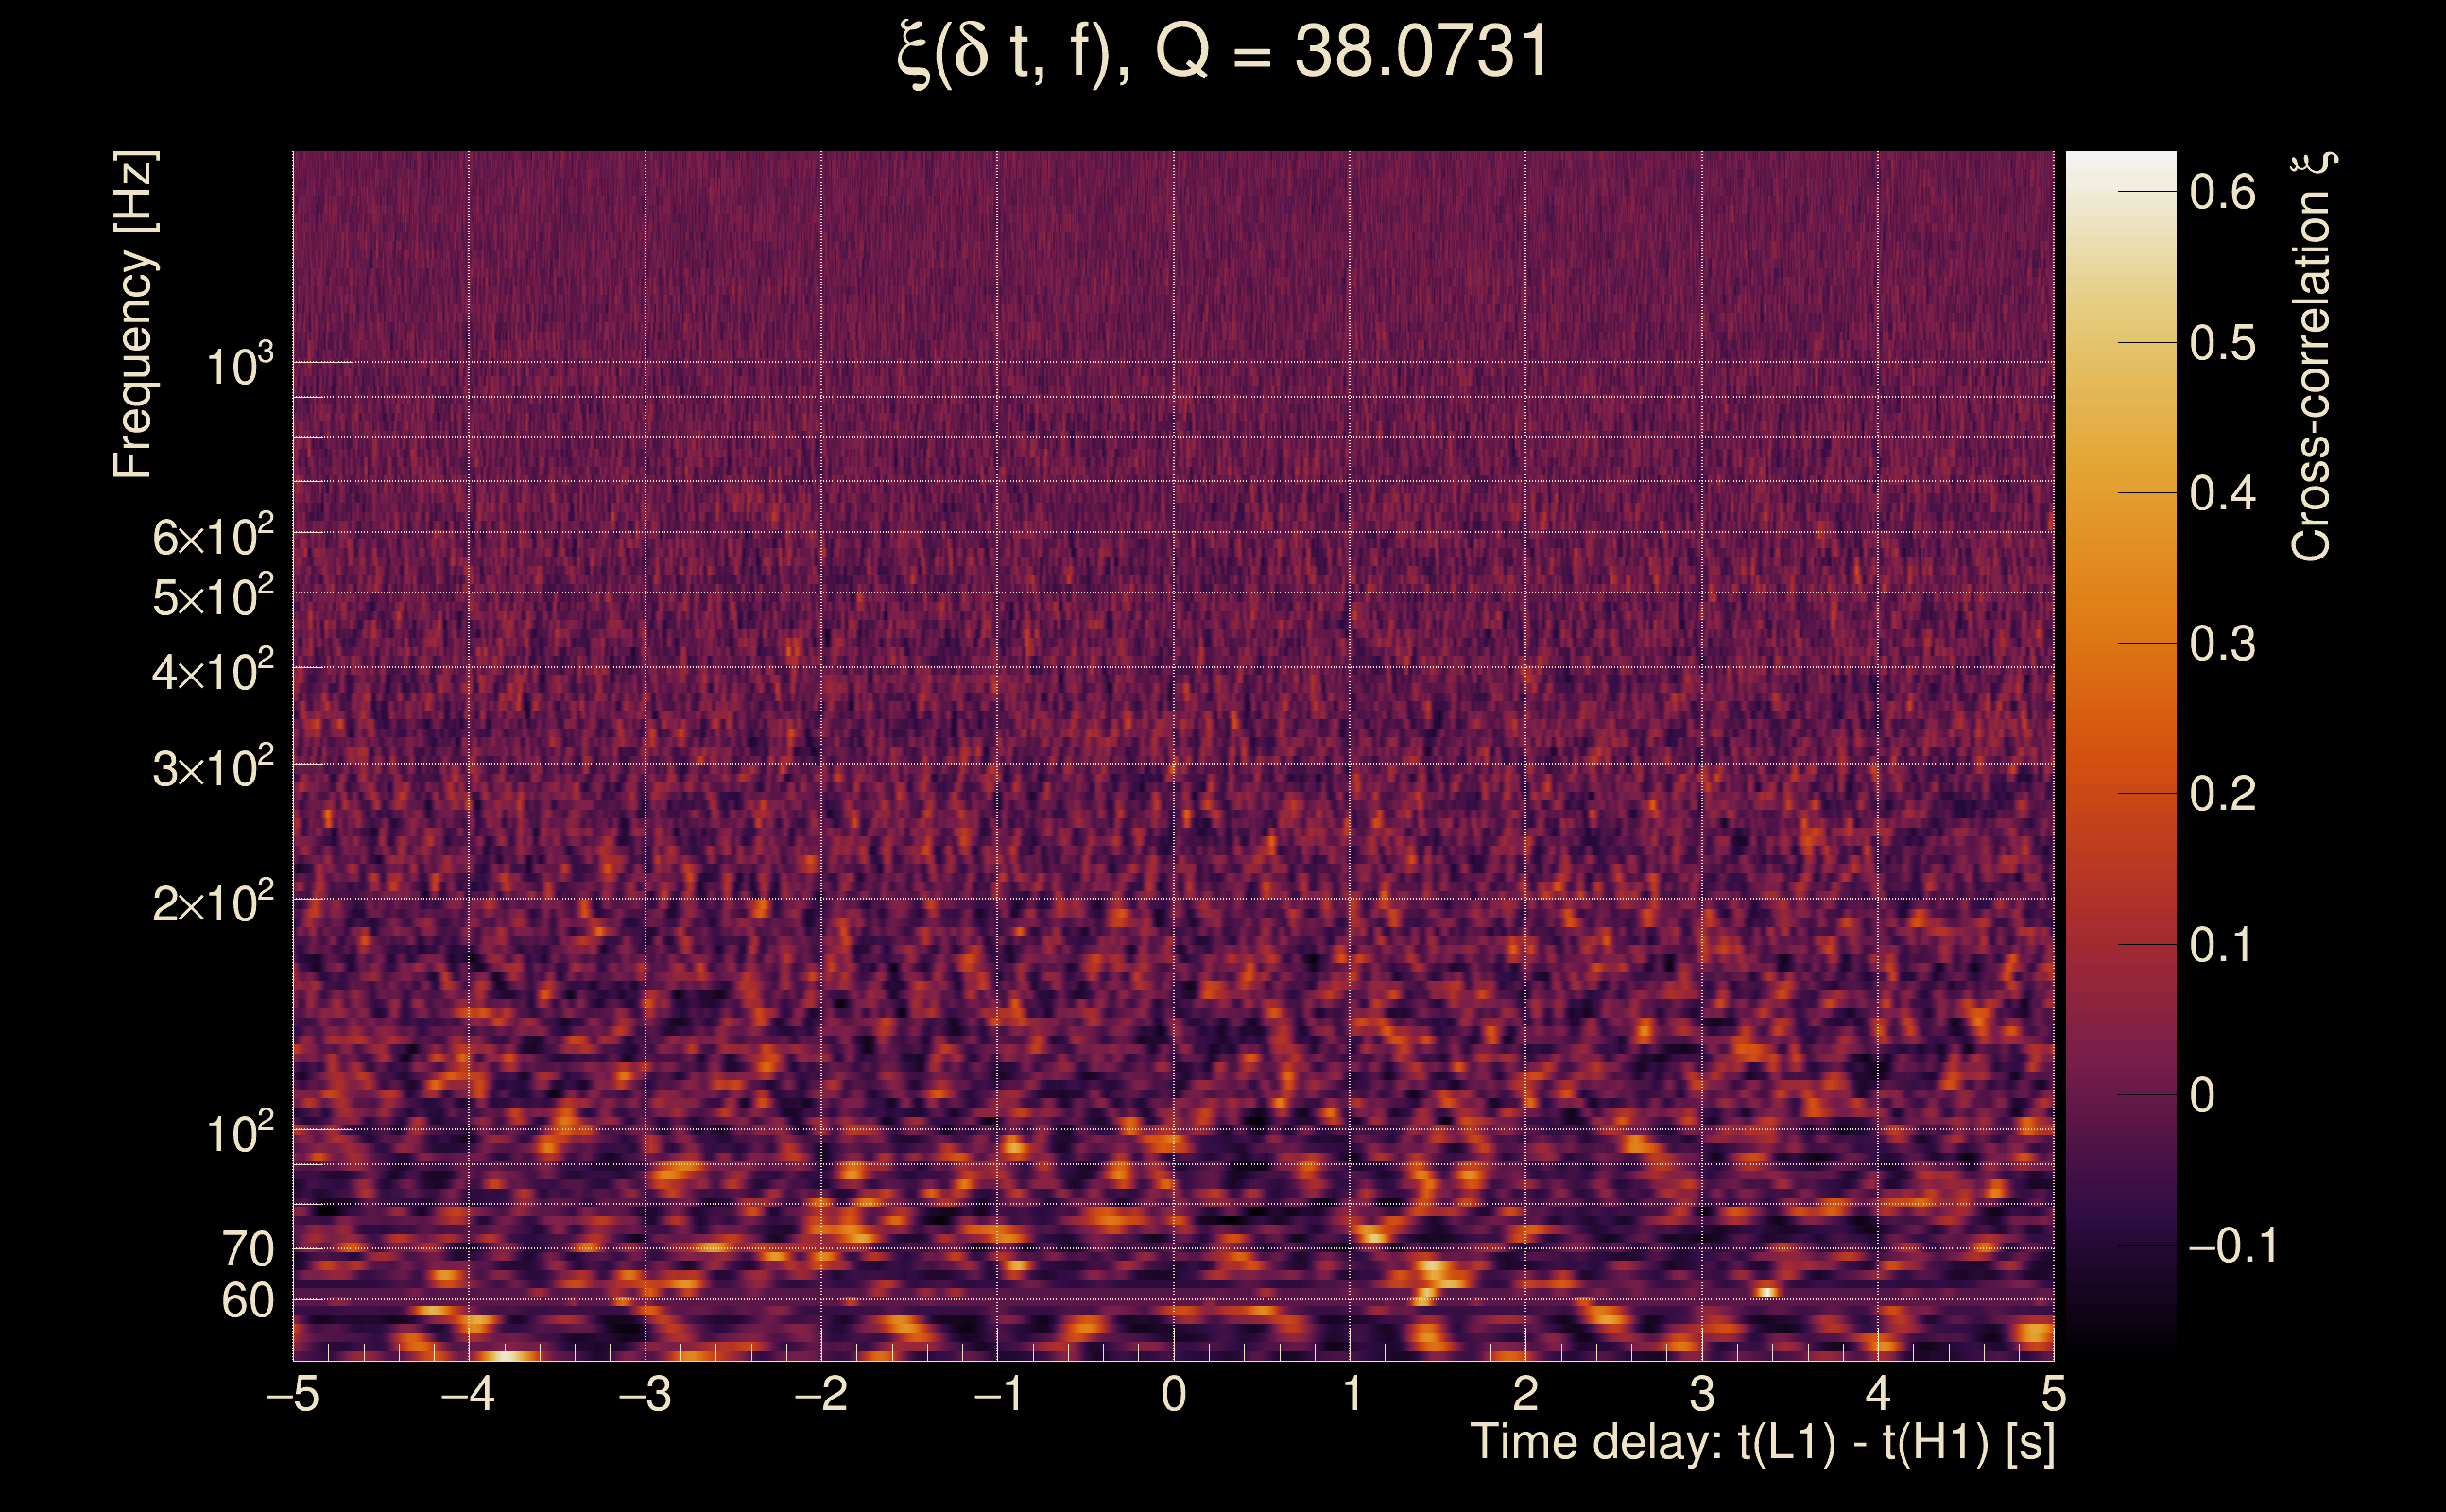
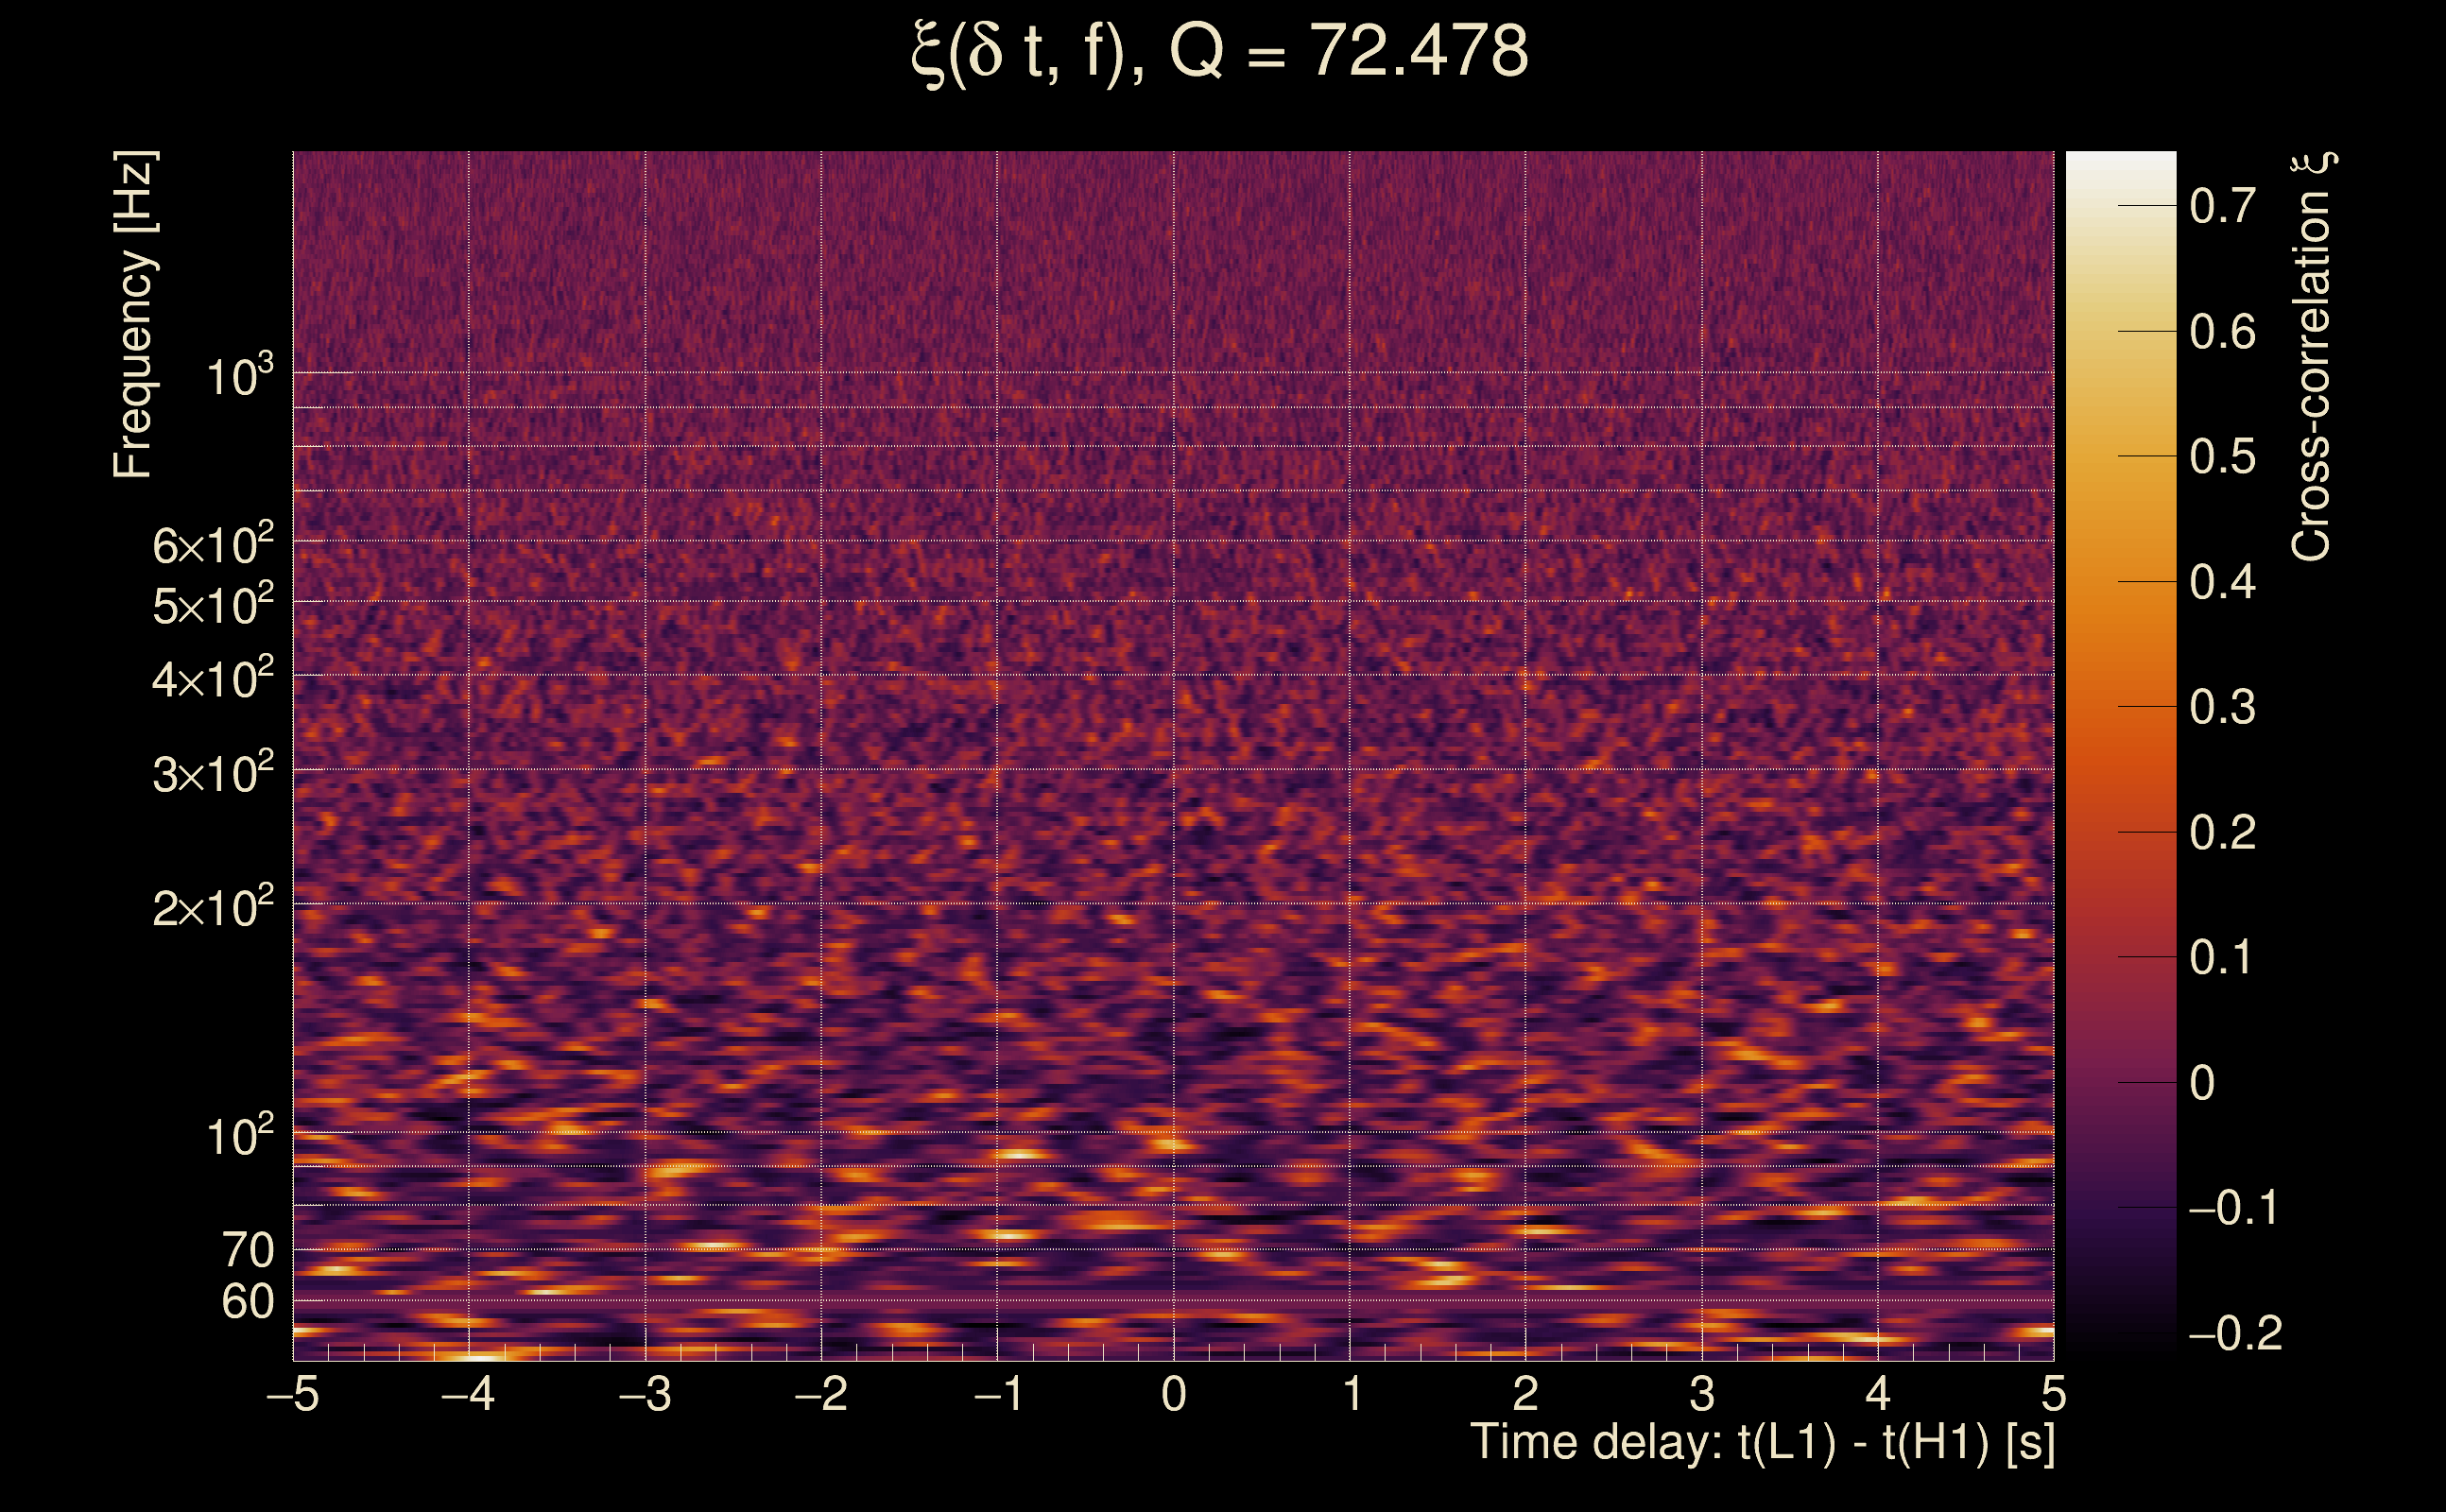
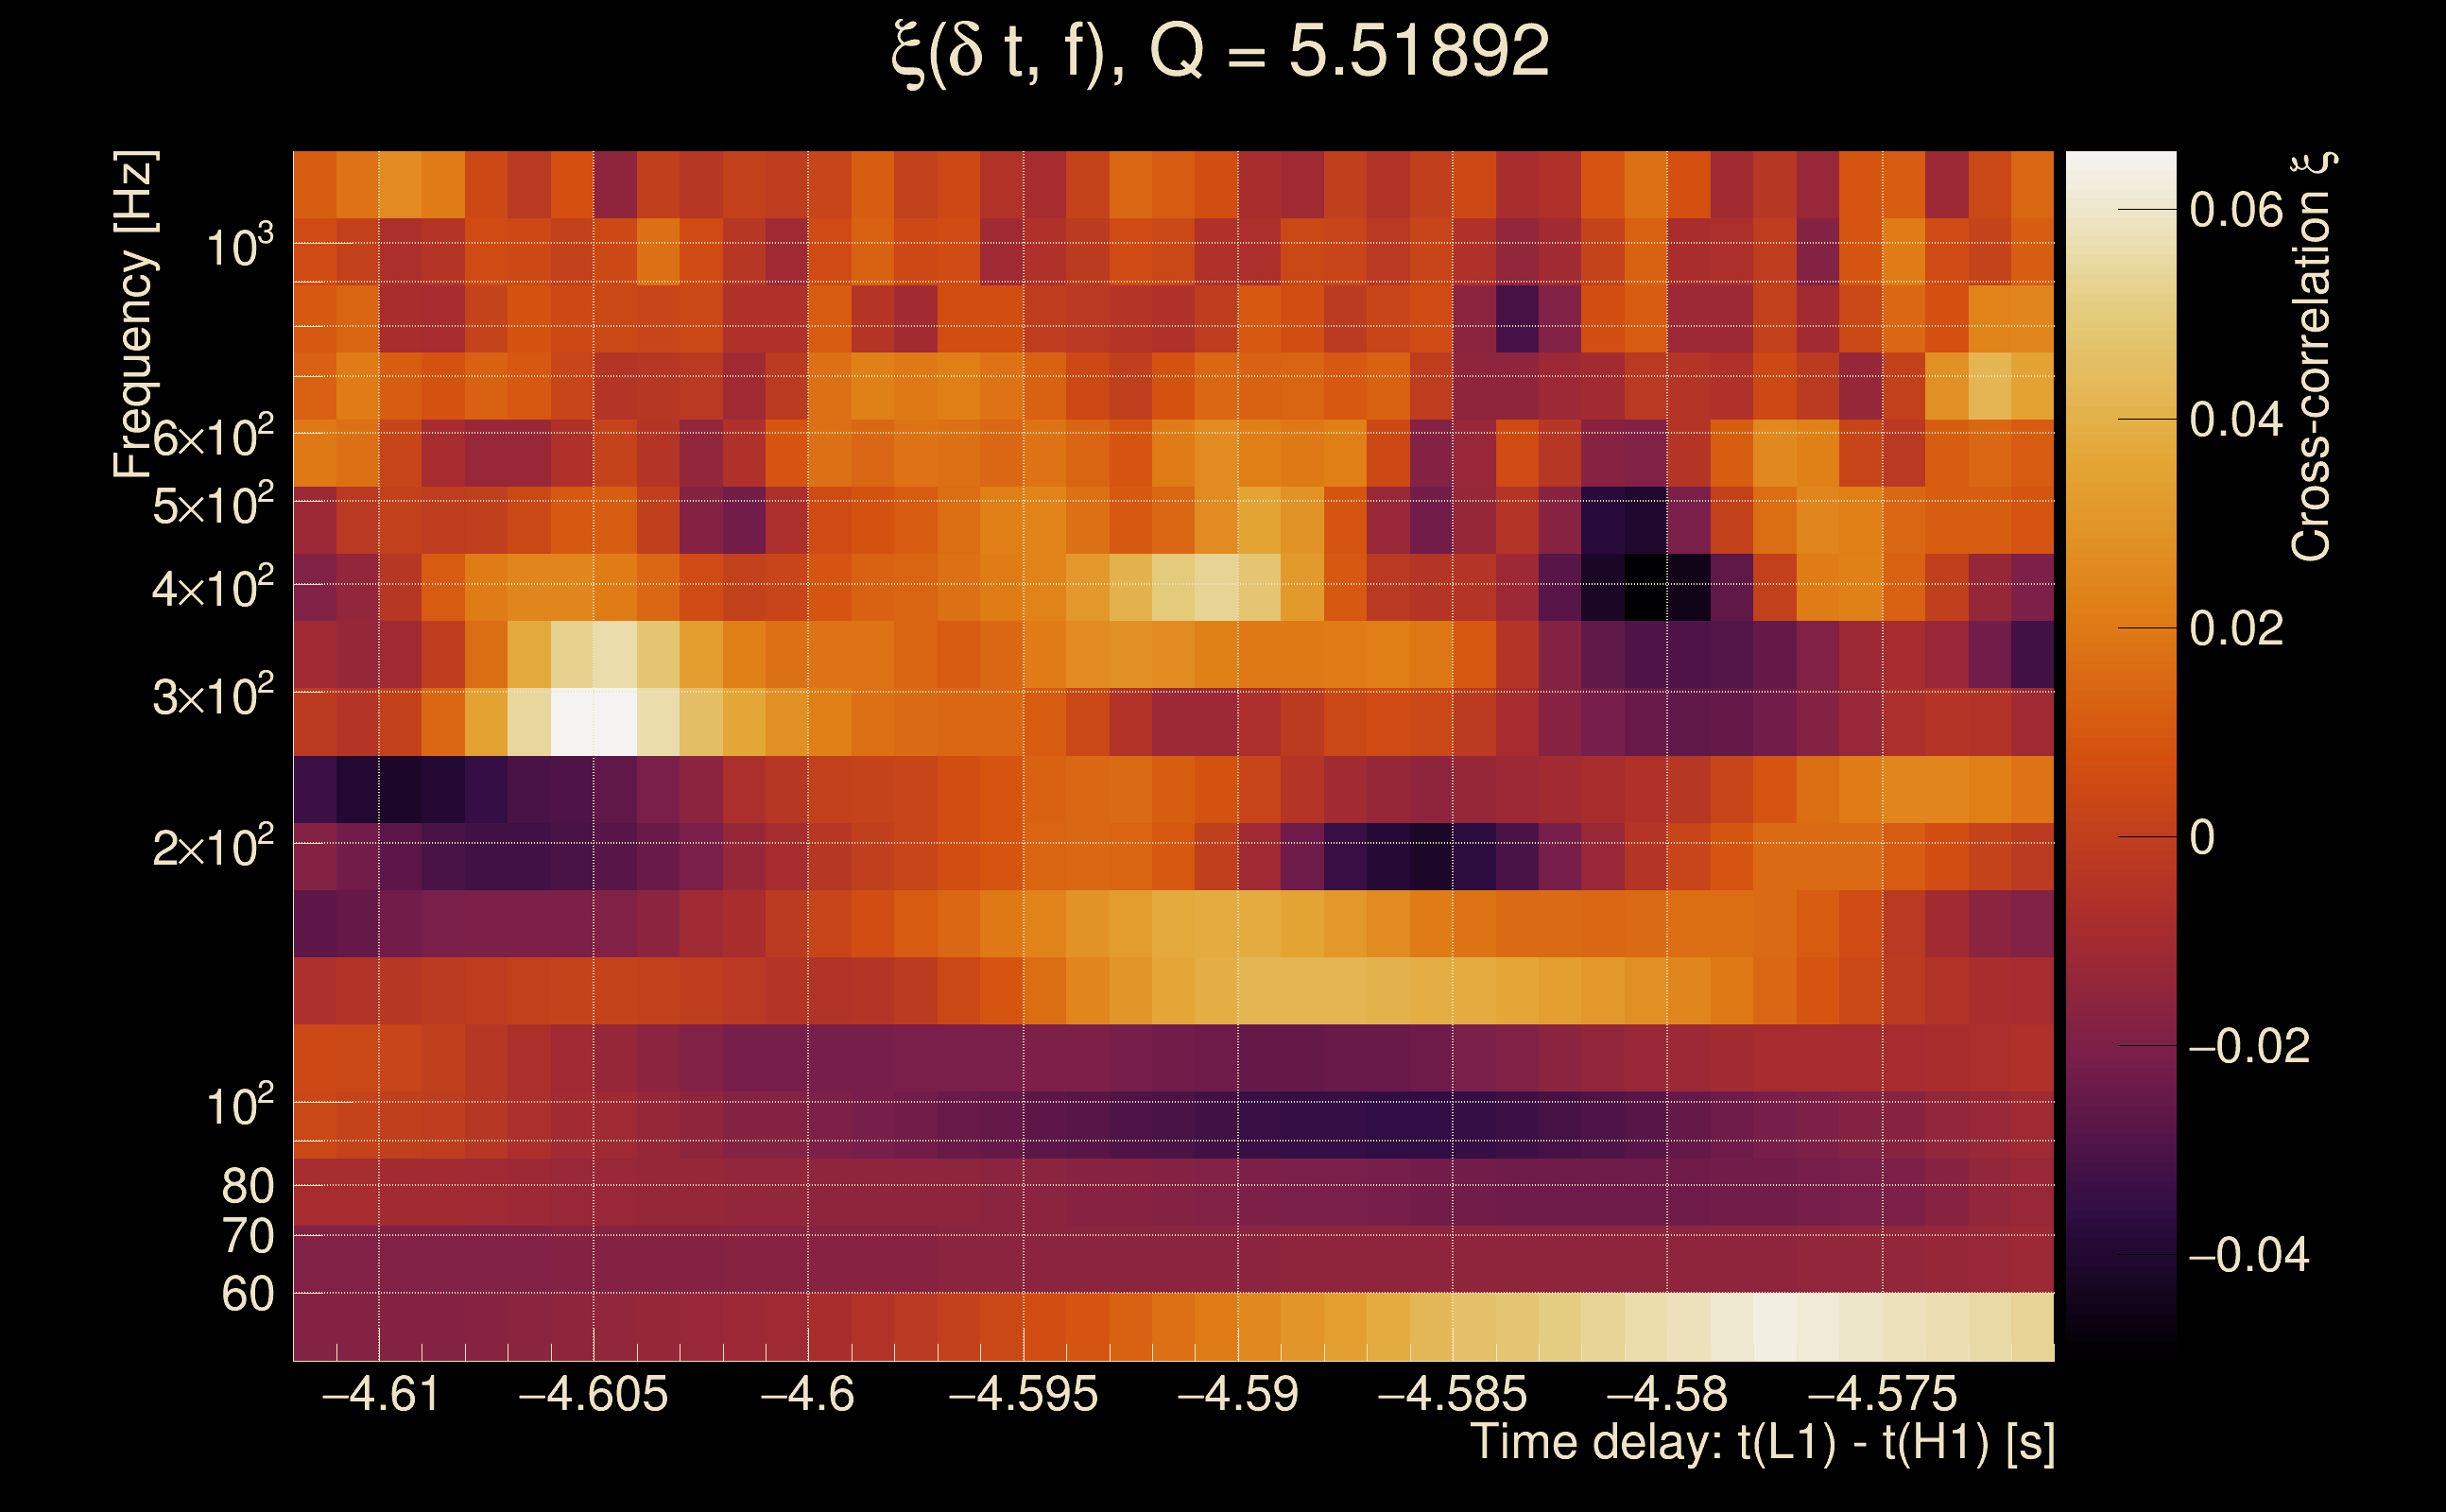
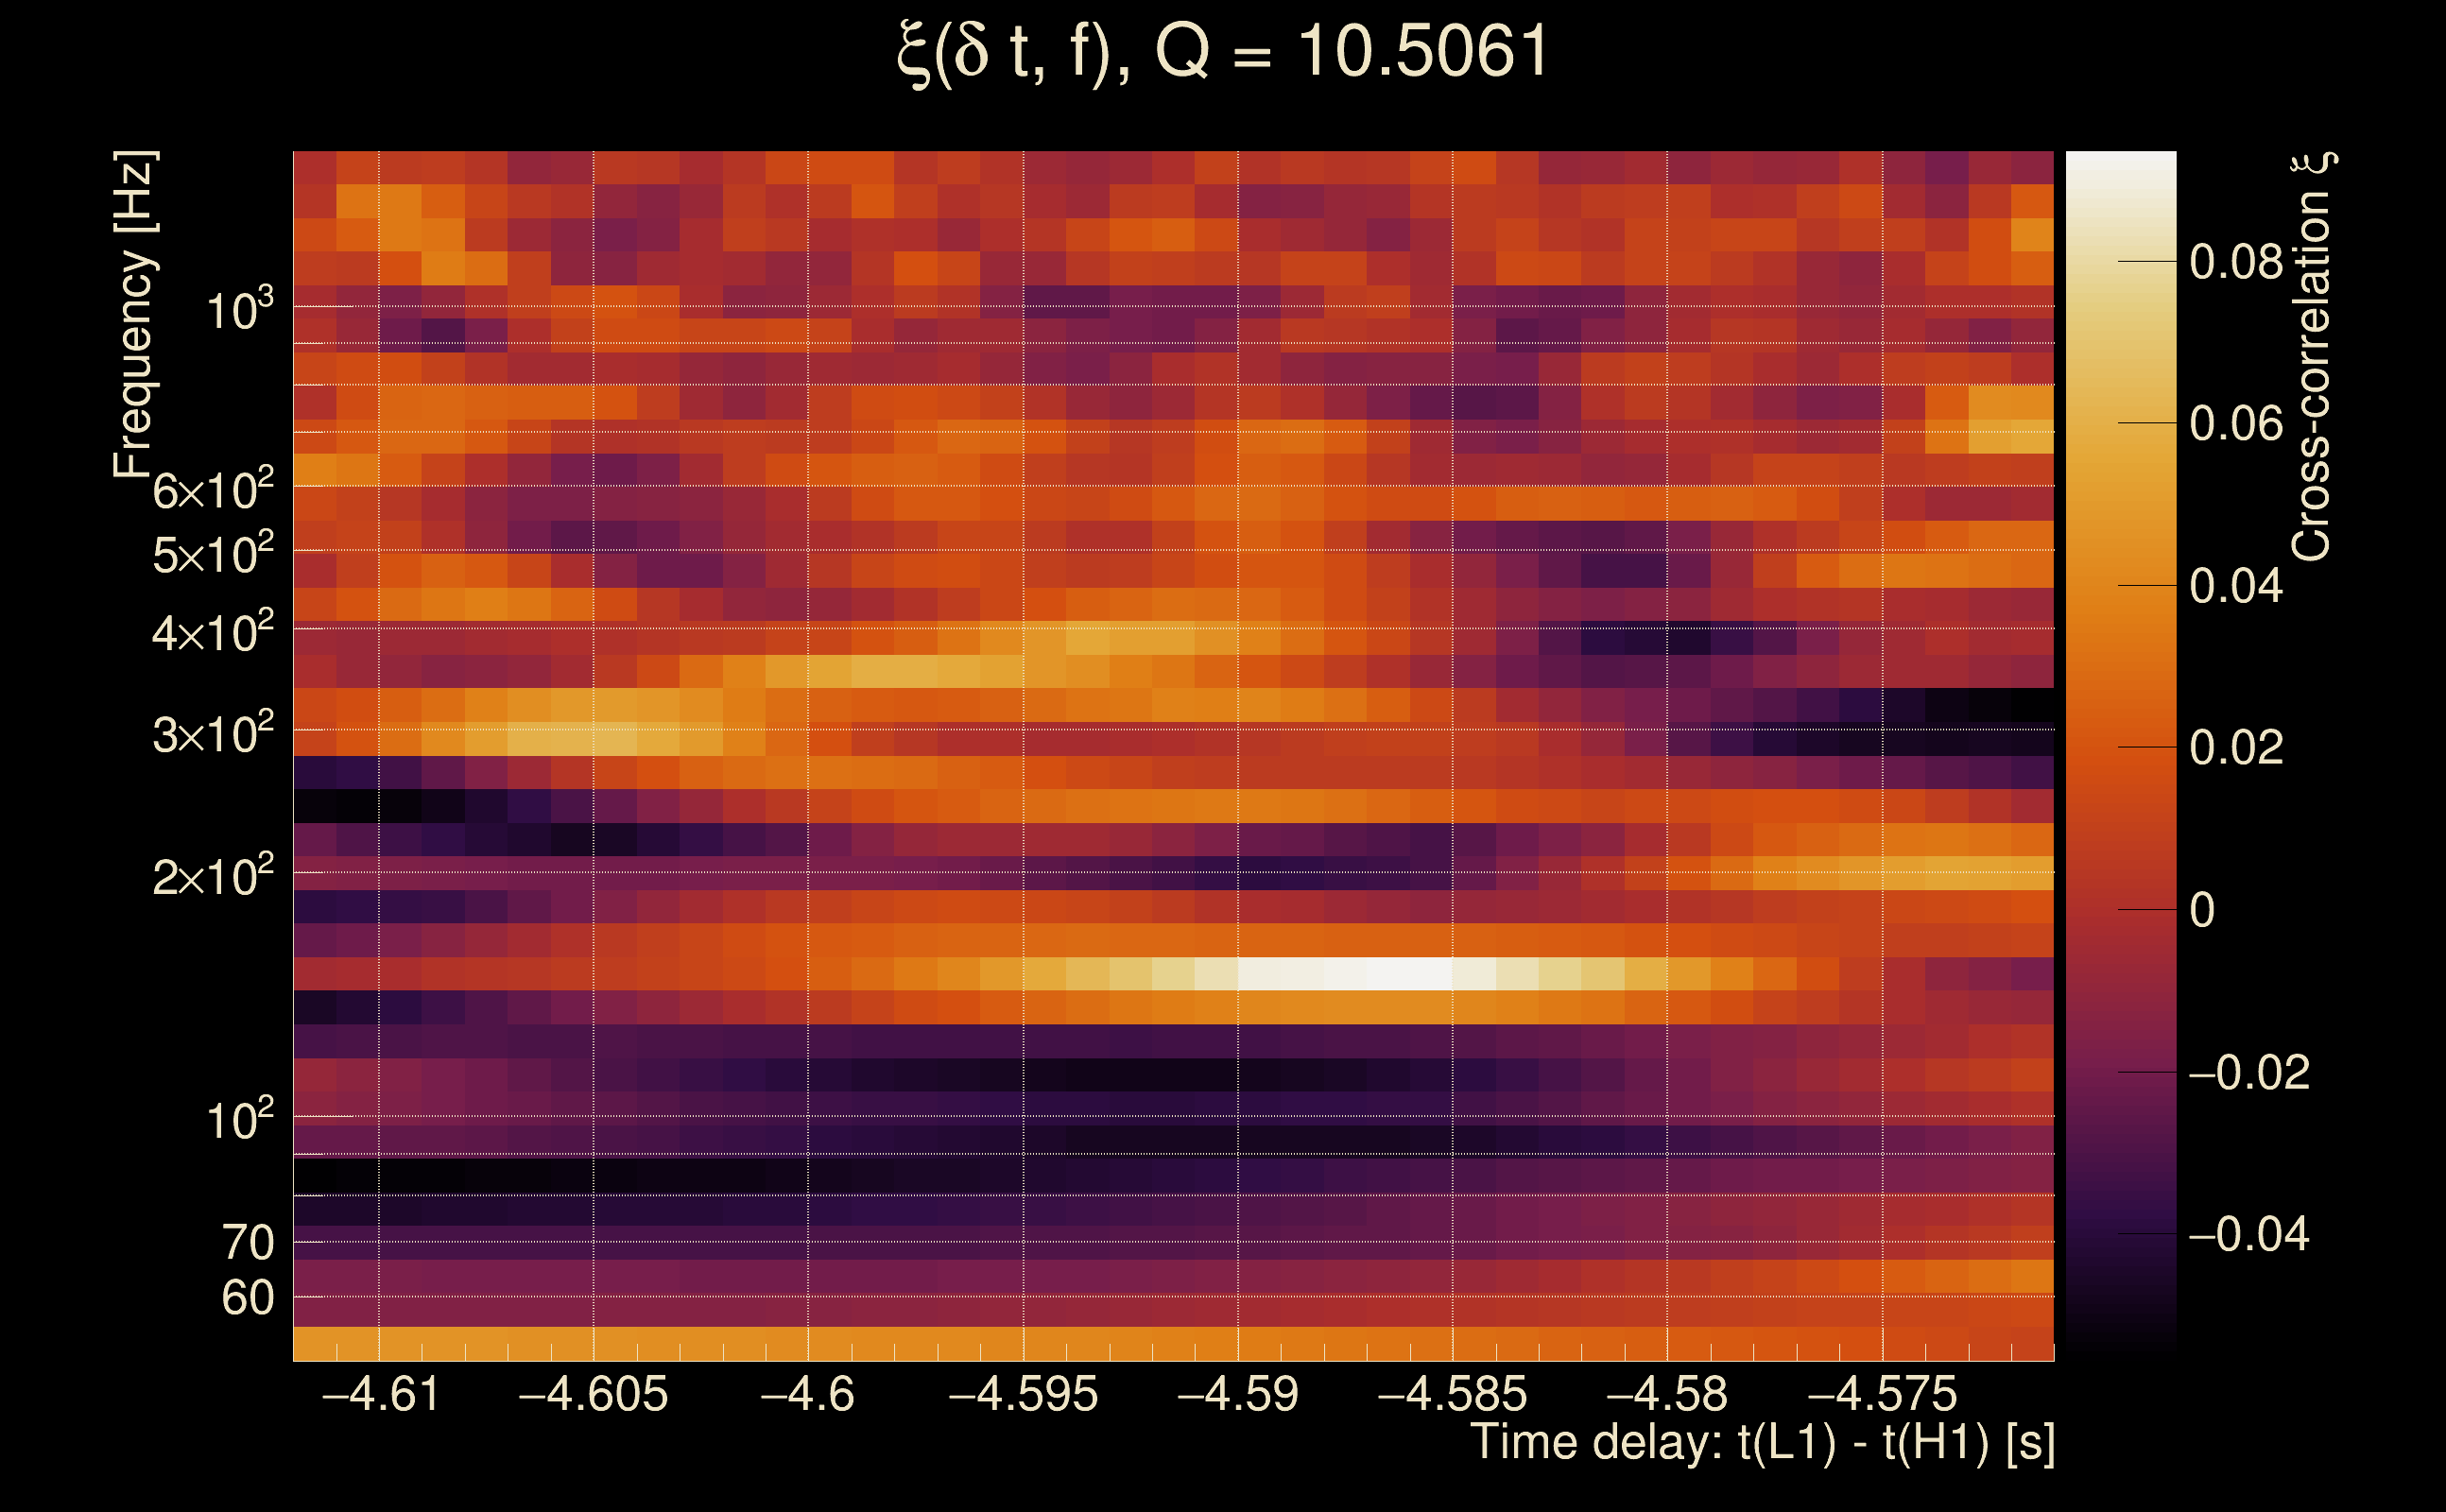
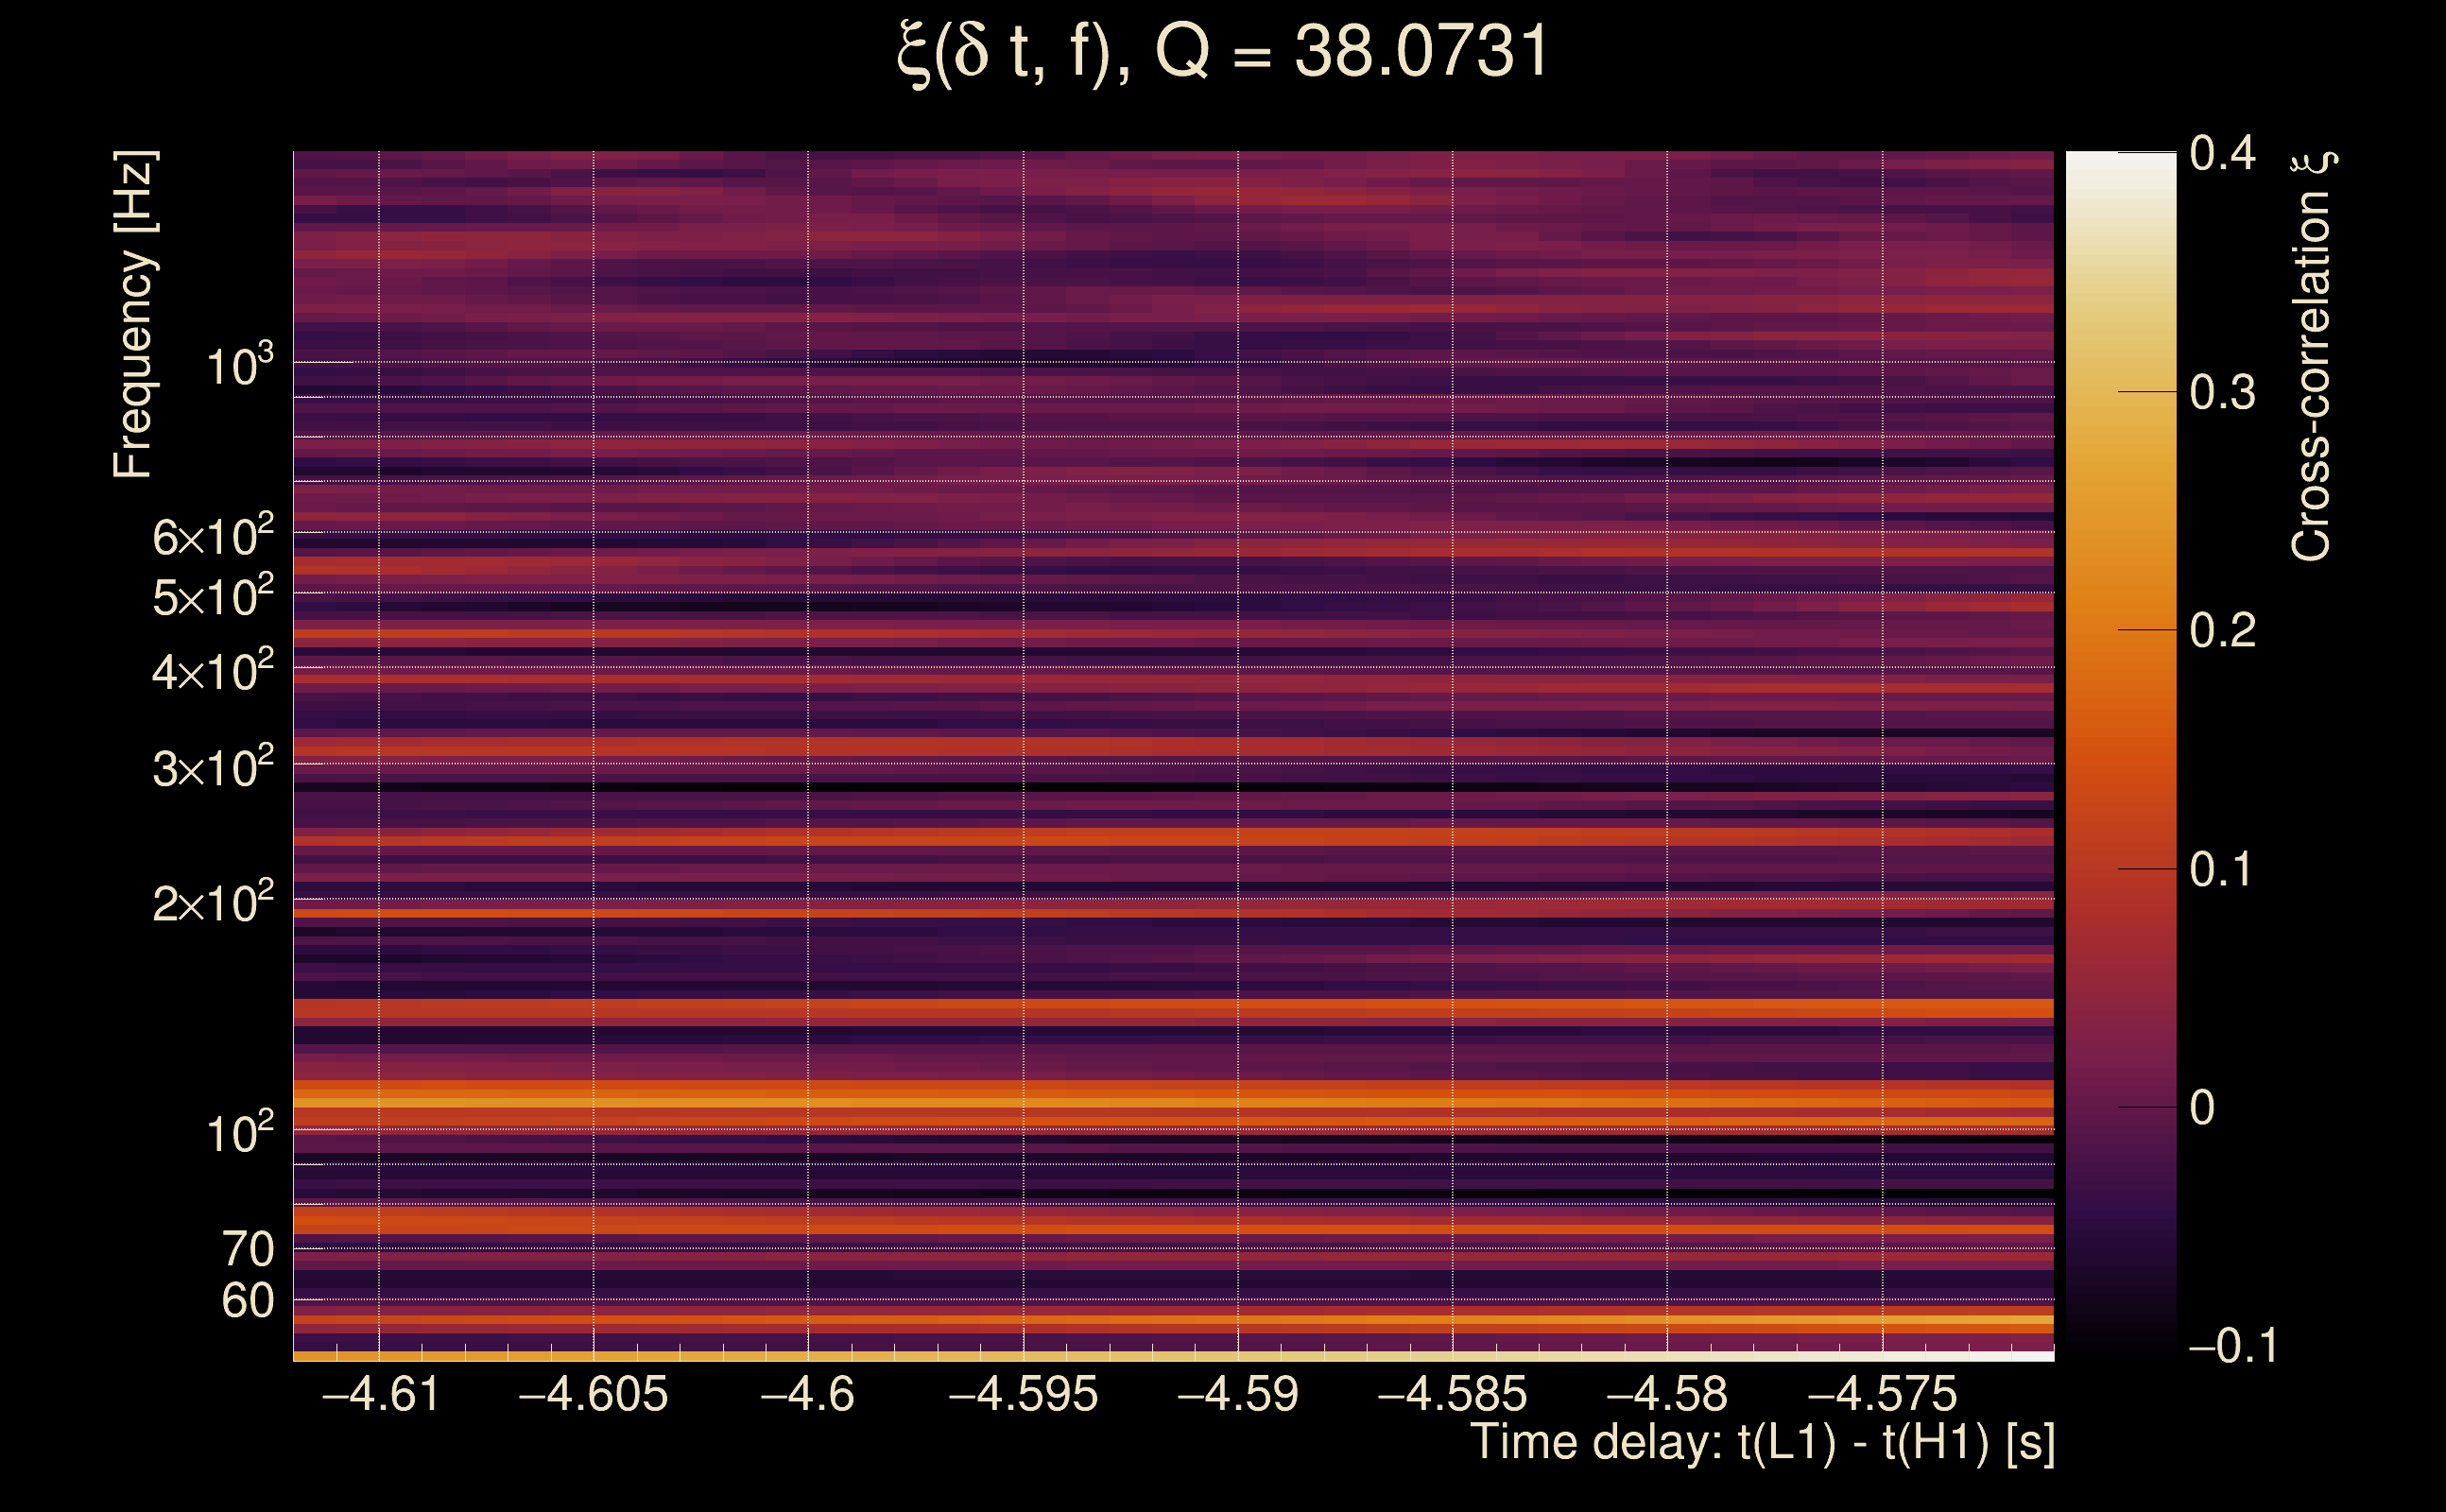
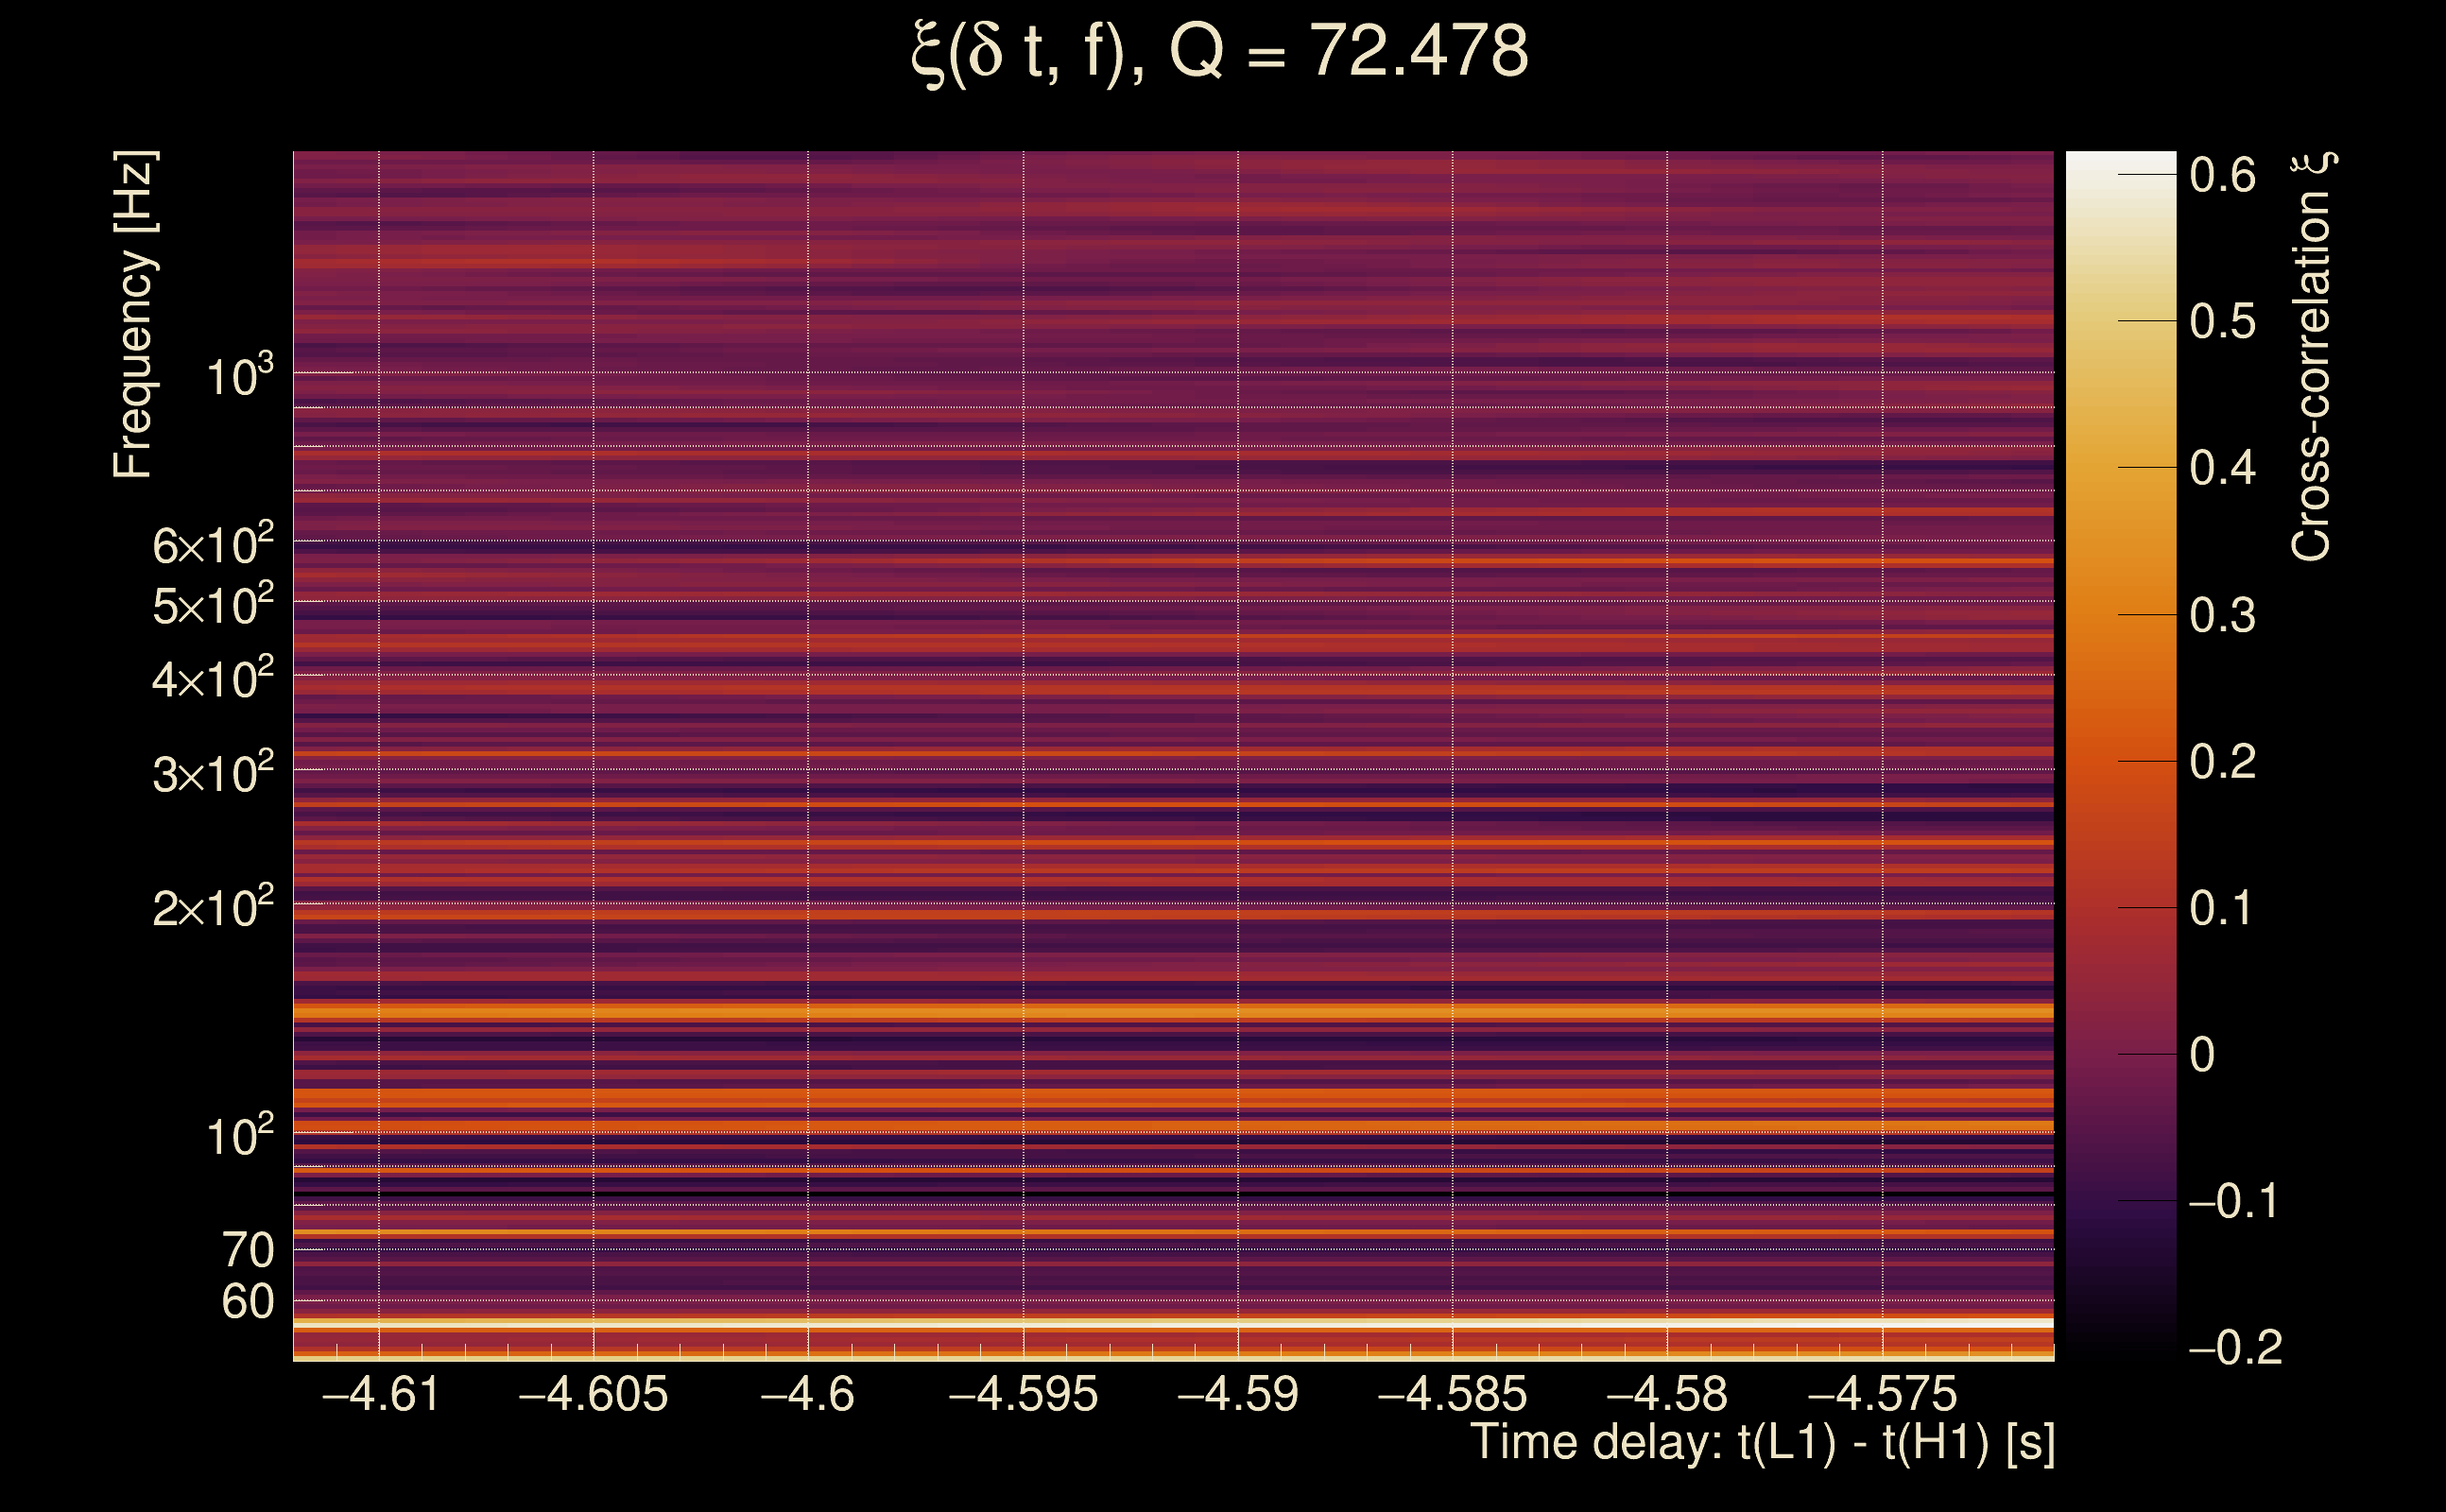
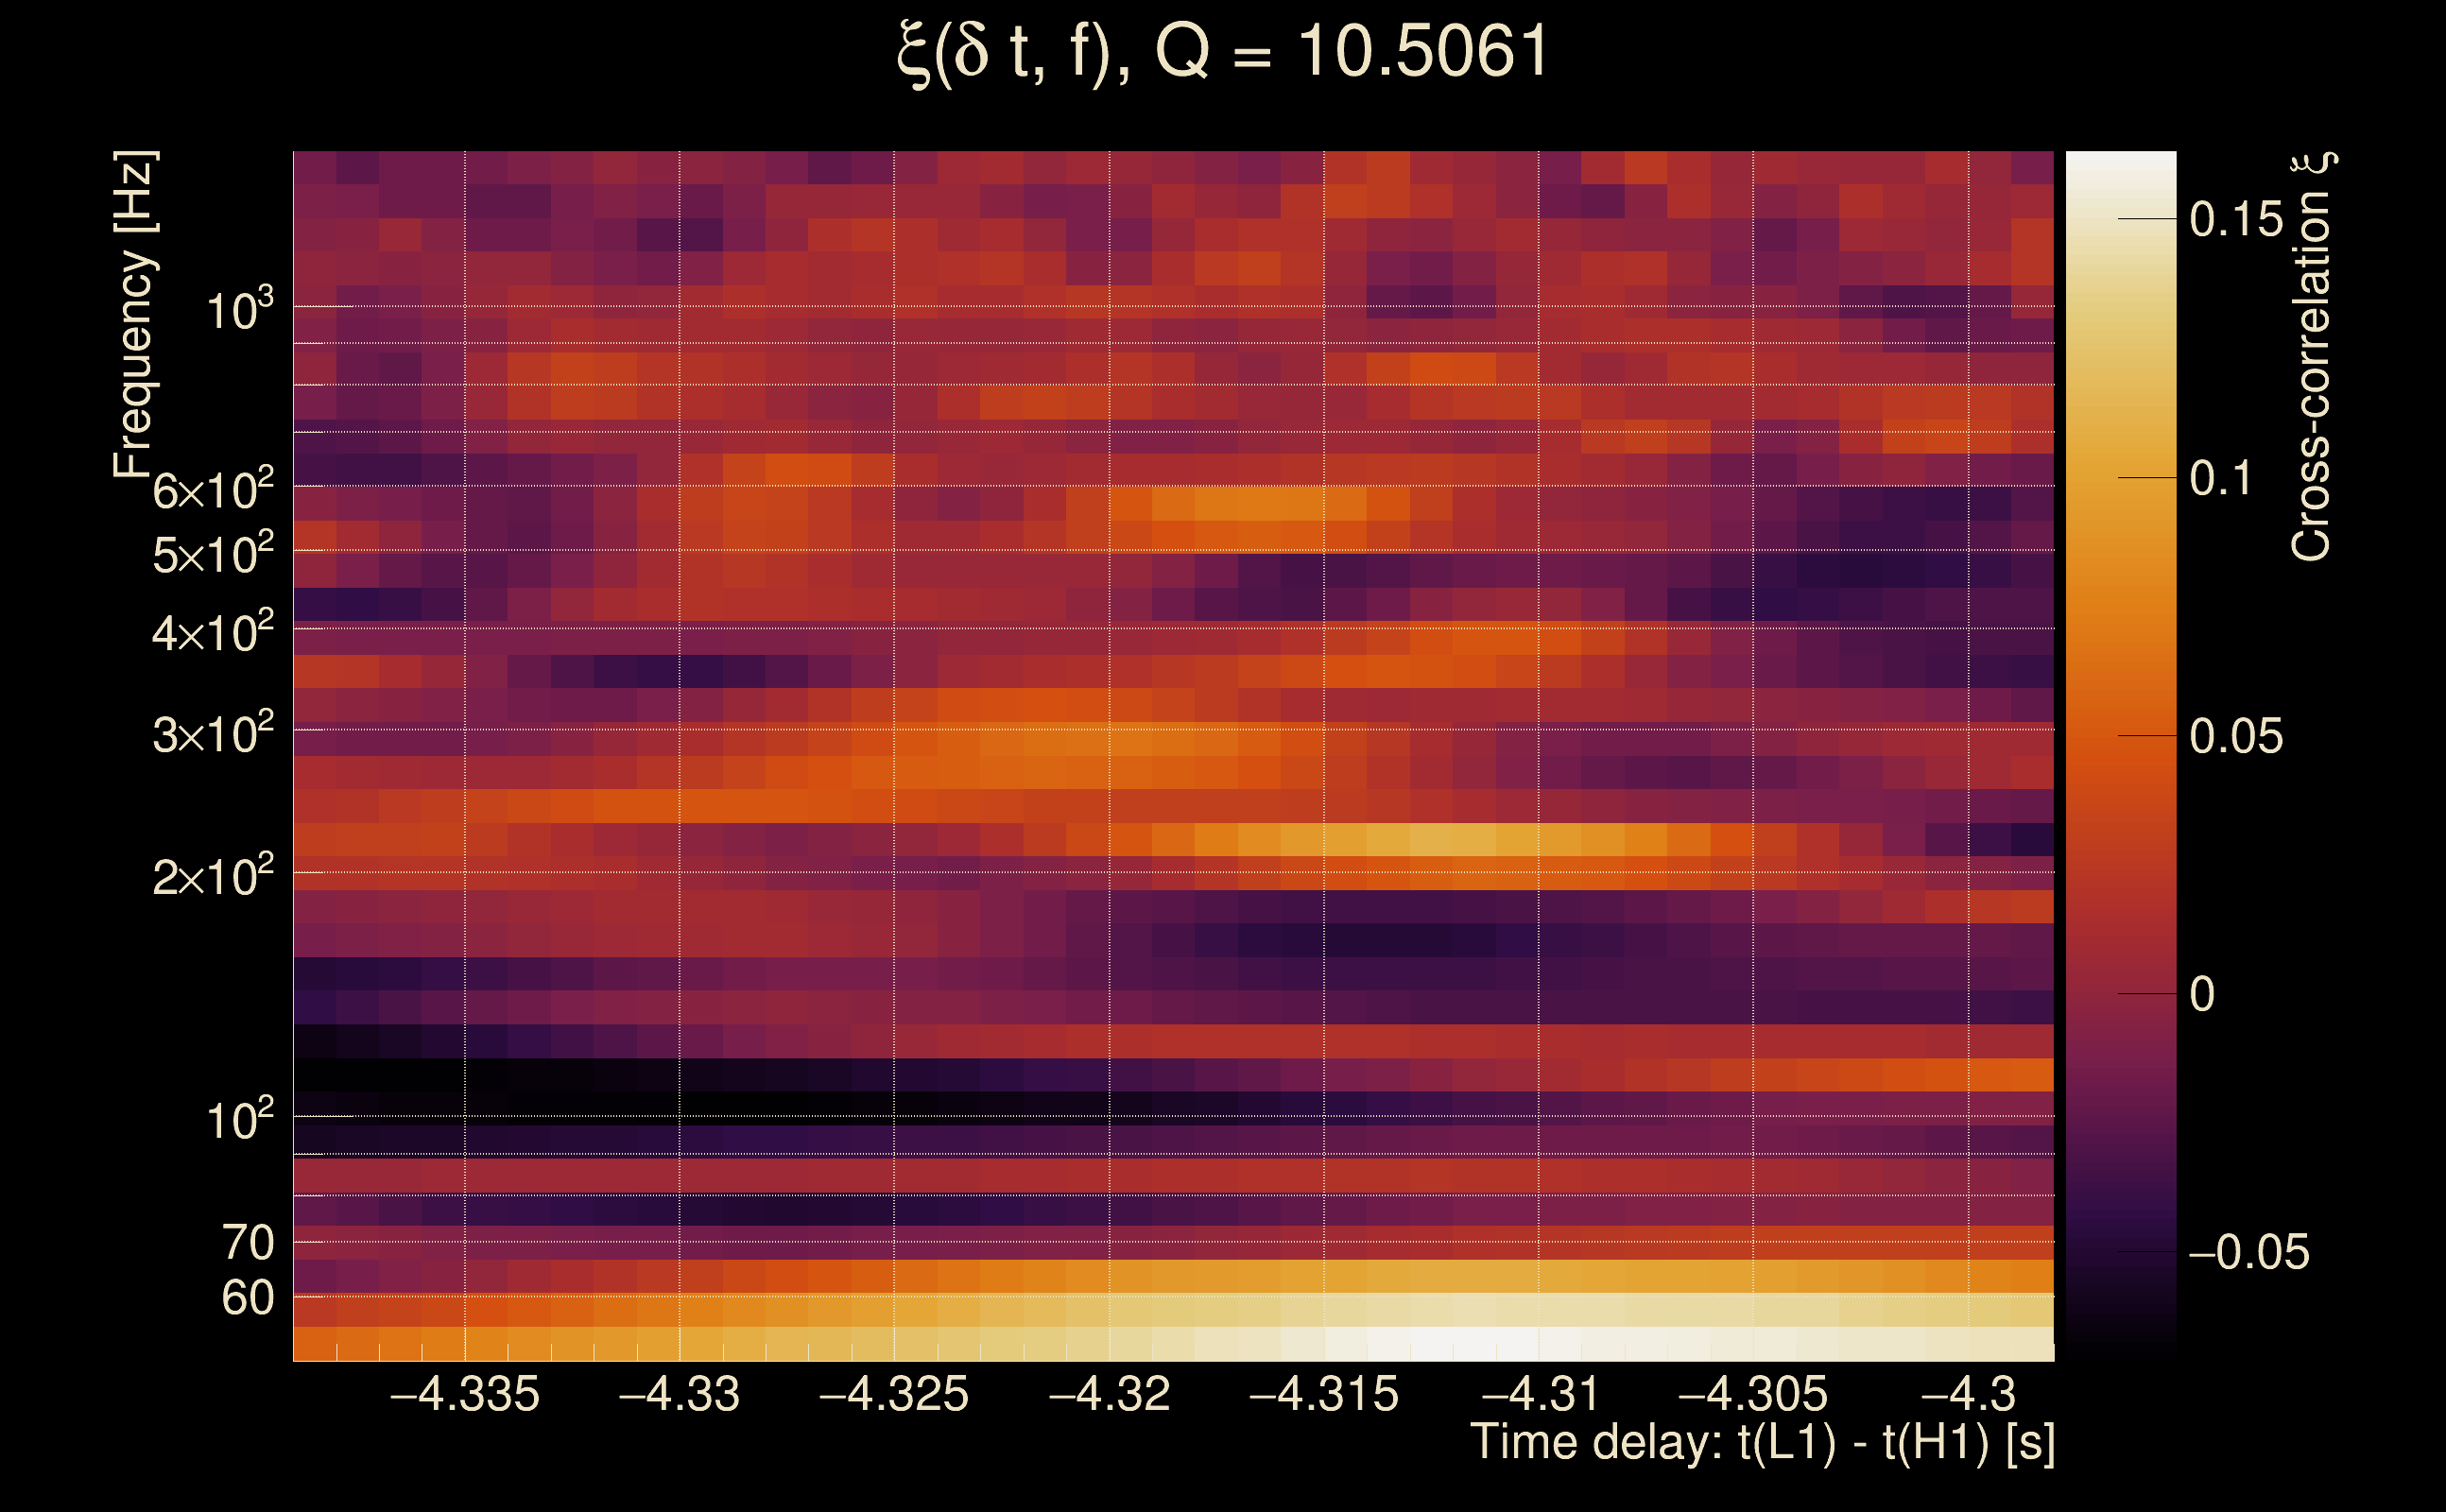
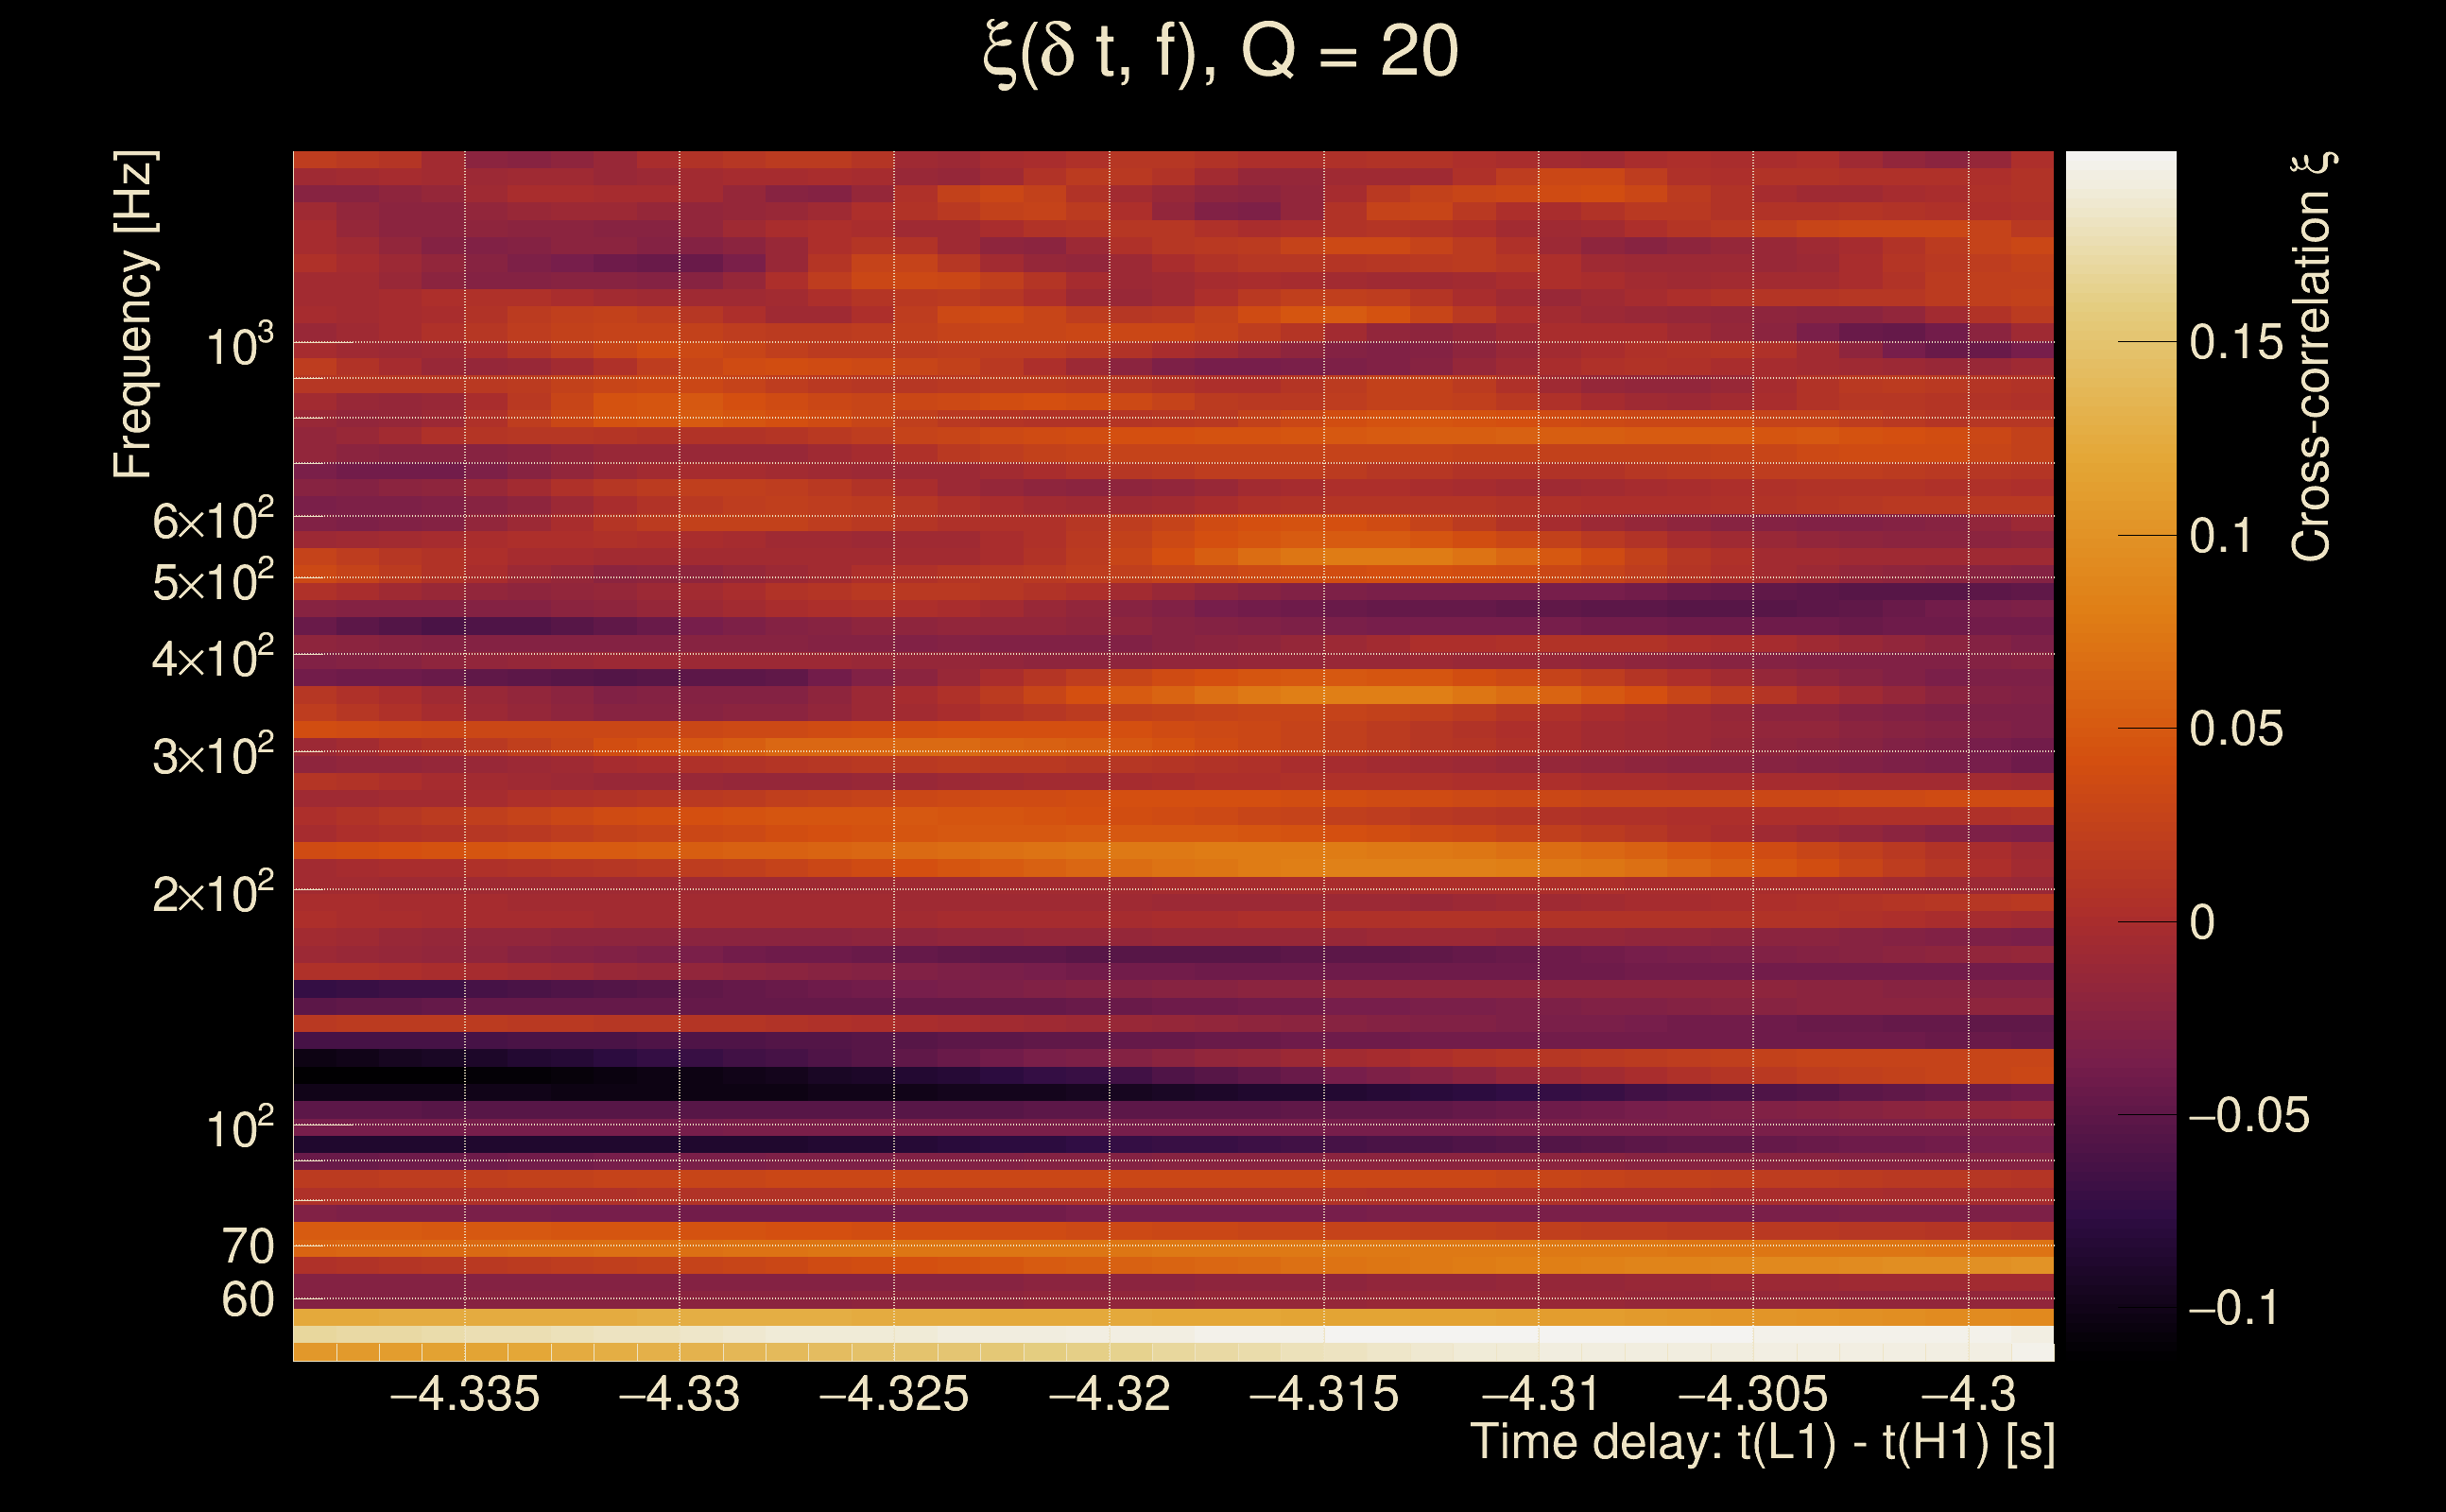
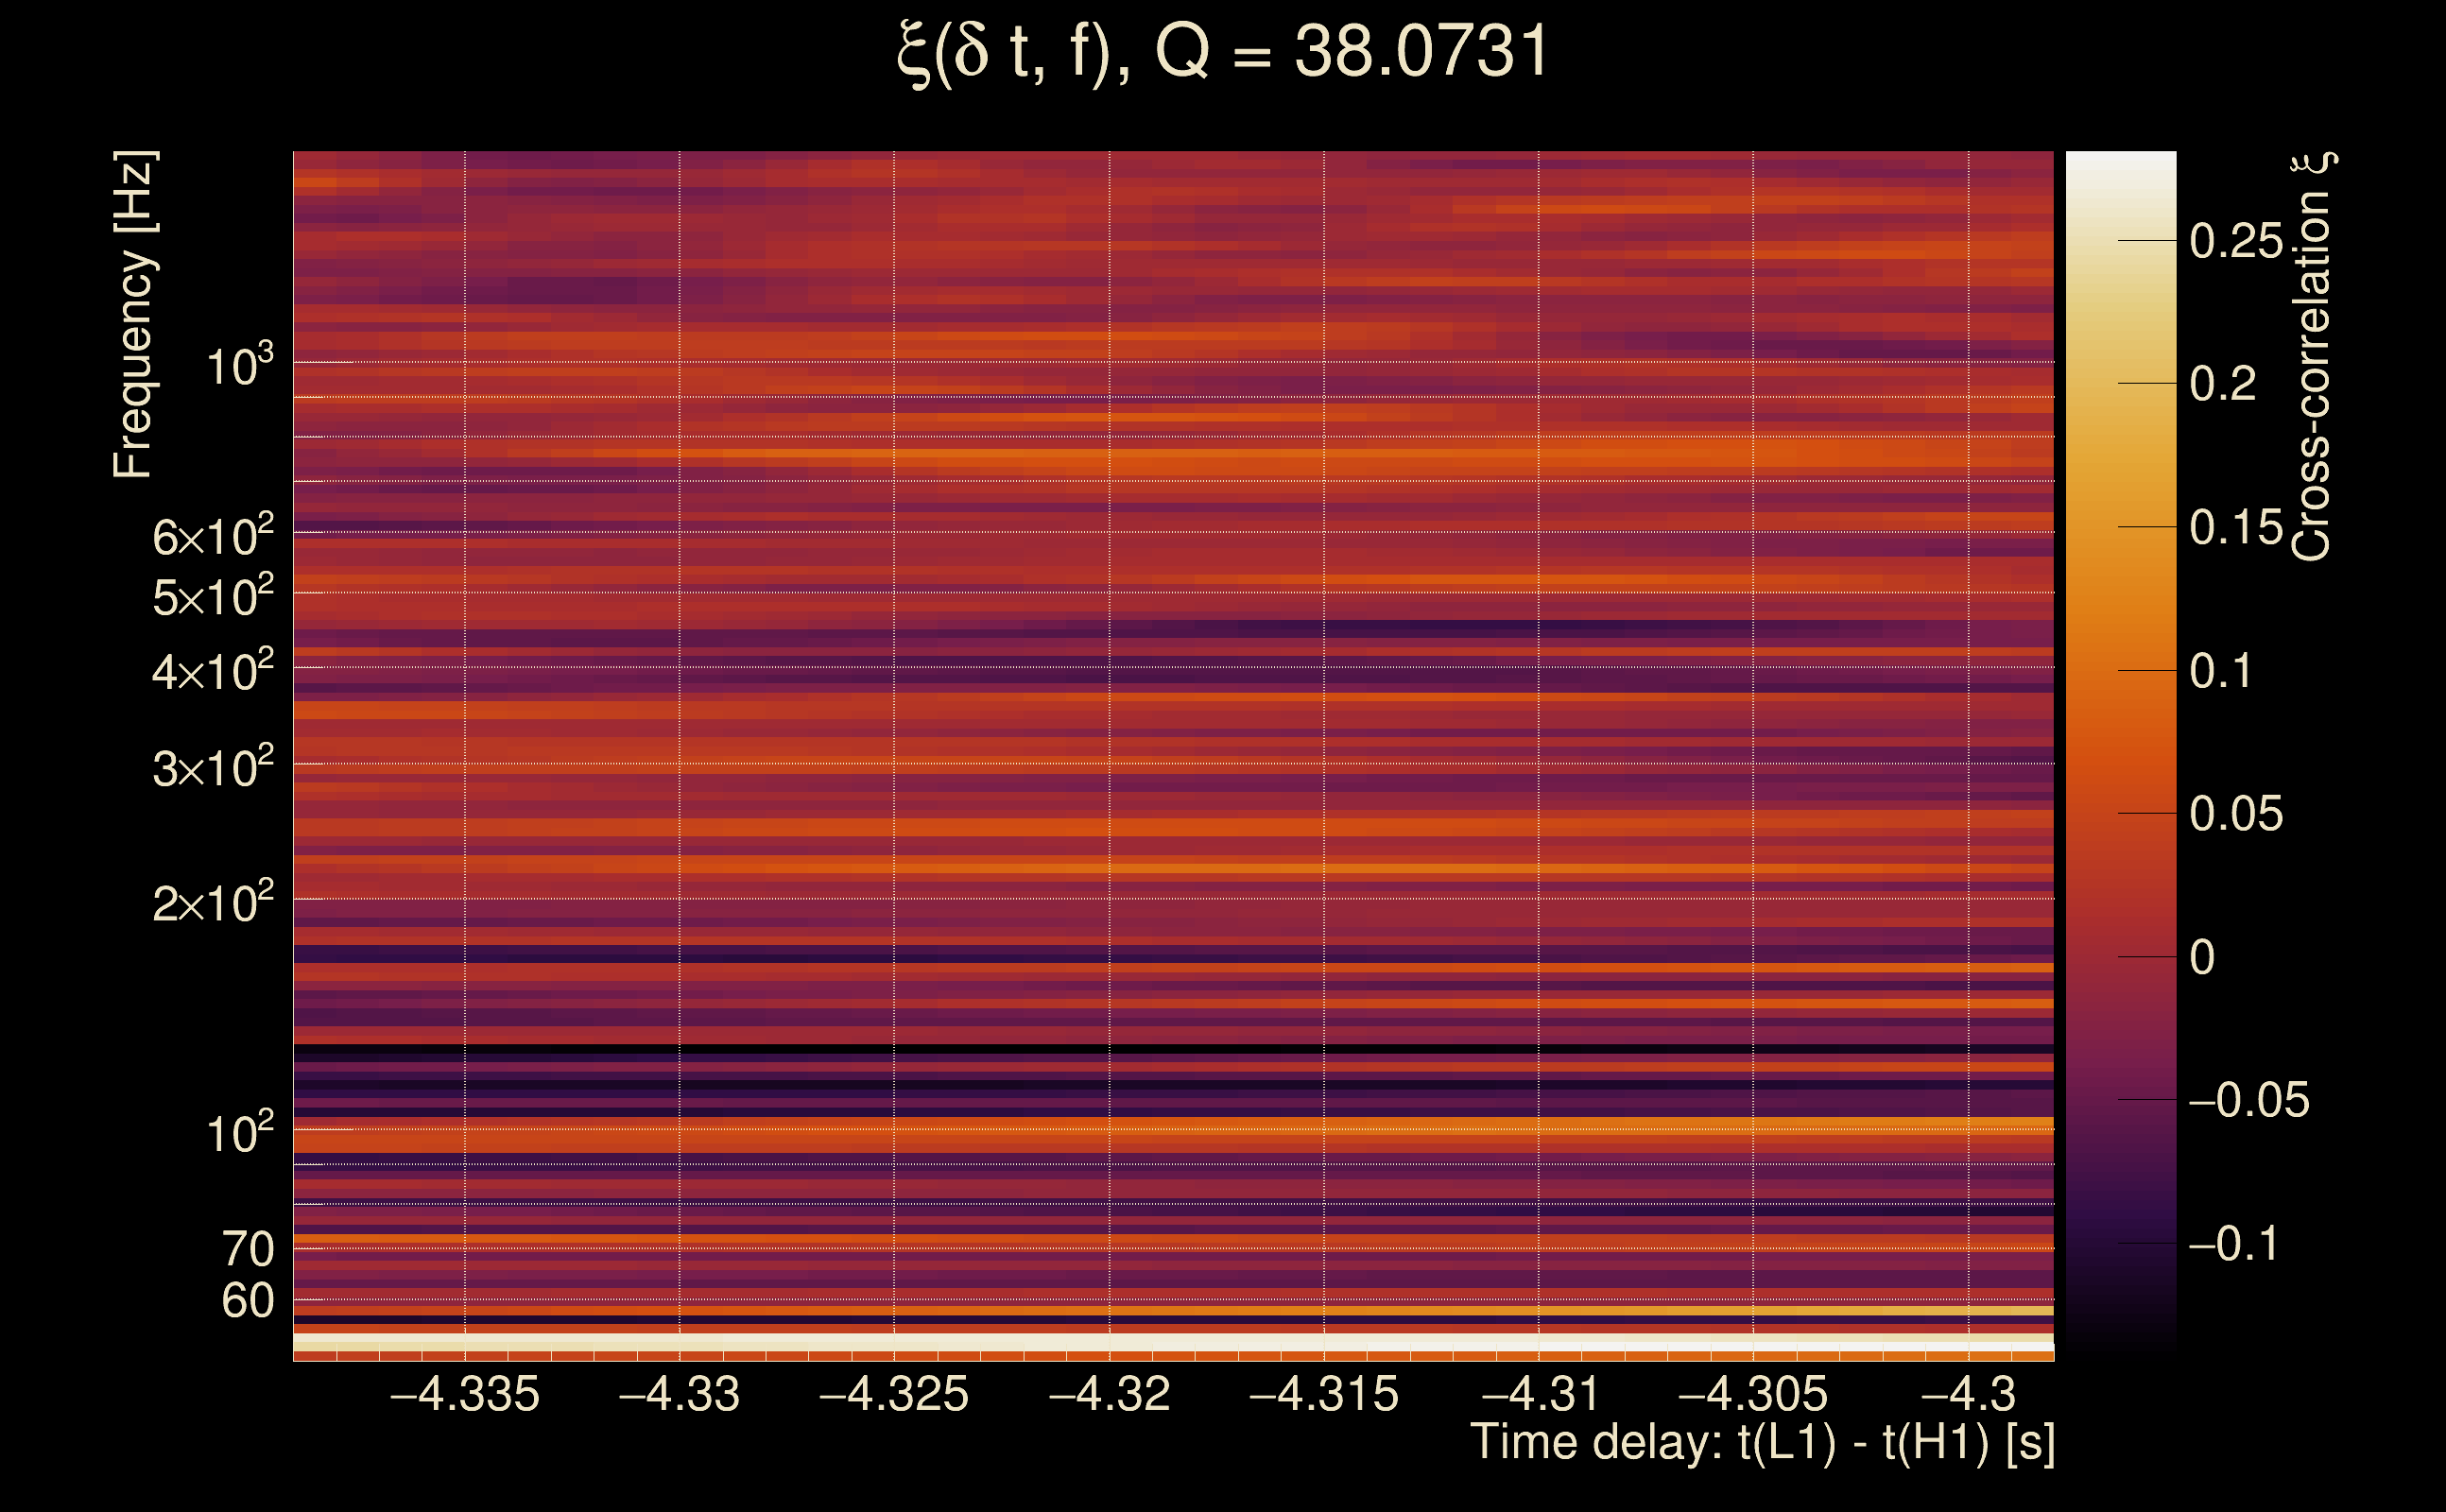
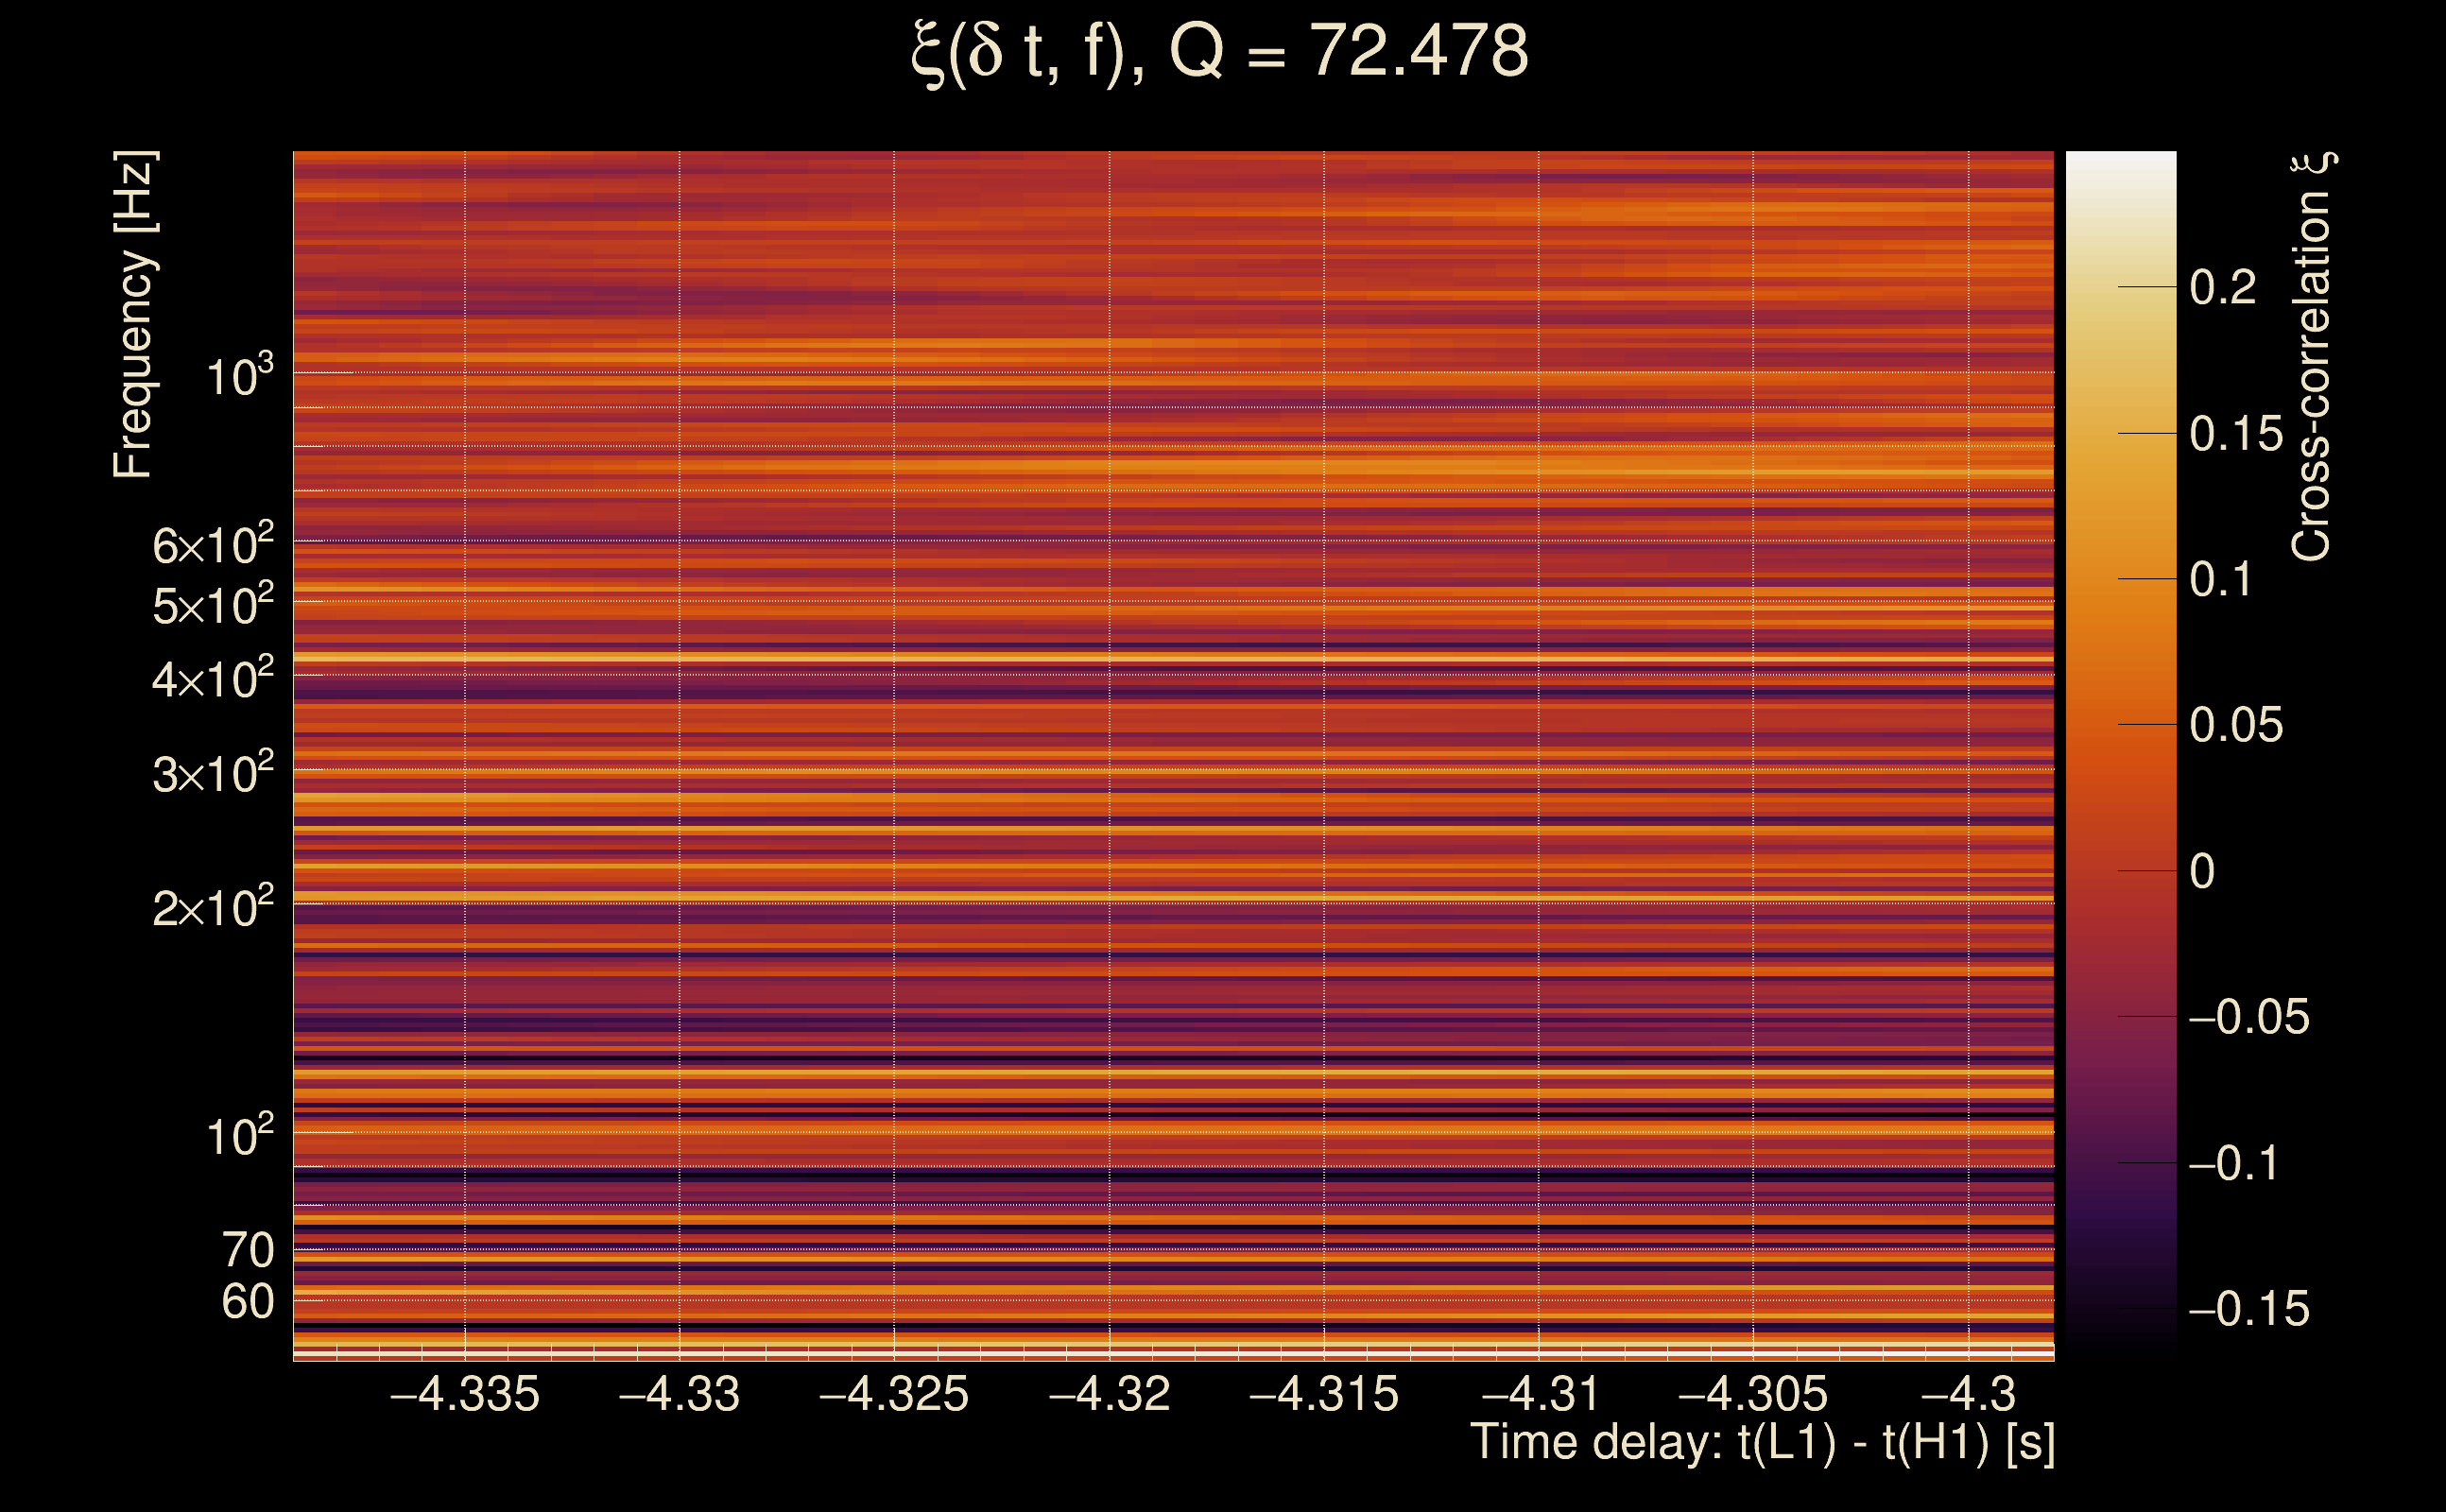
| Number of Q planes: | 5 (Q = 5.51892 → Q = 72.478) |
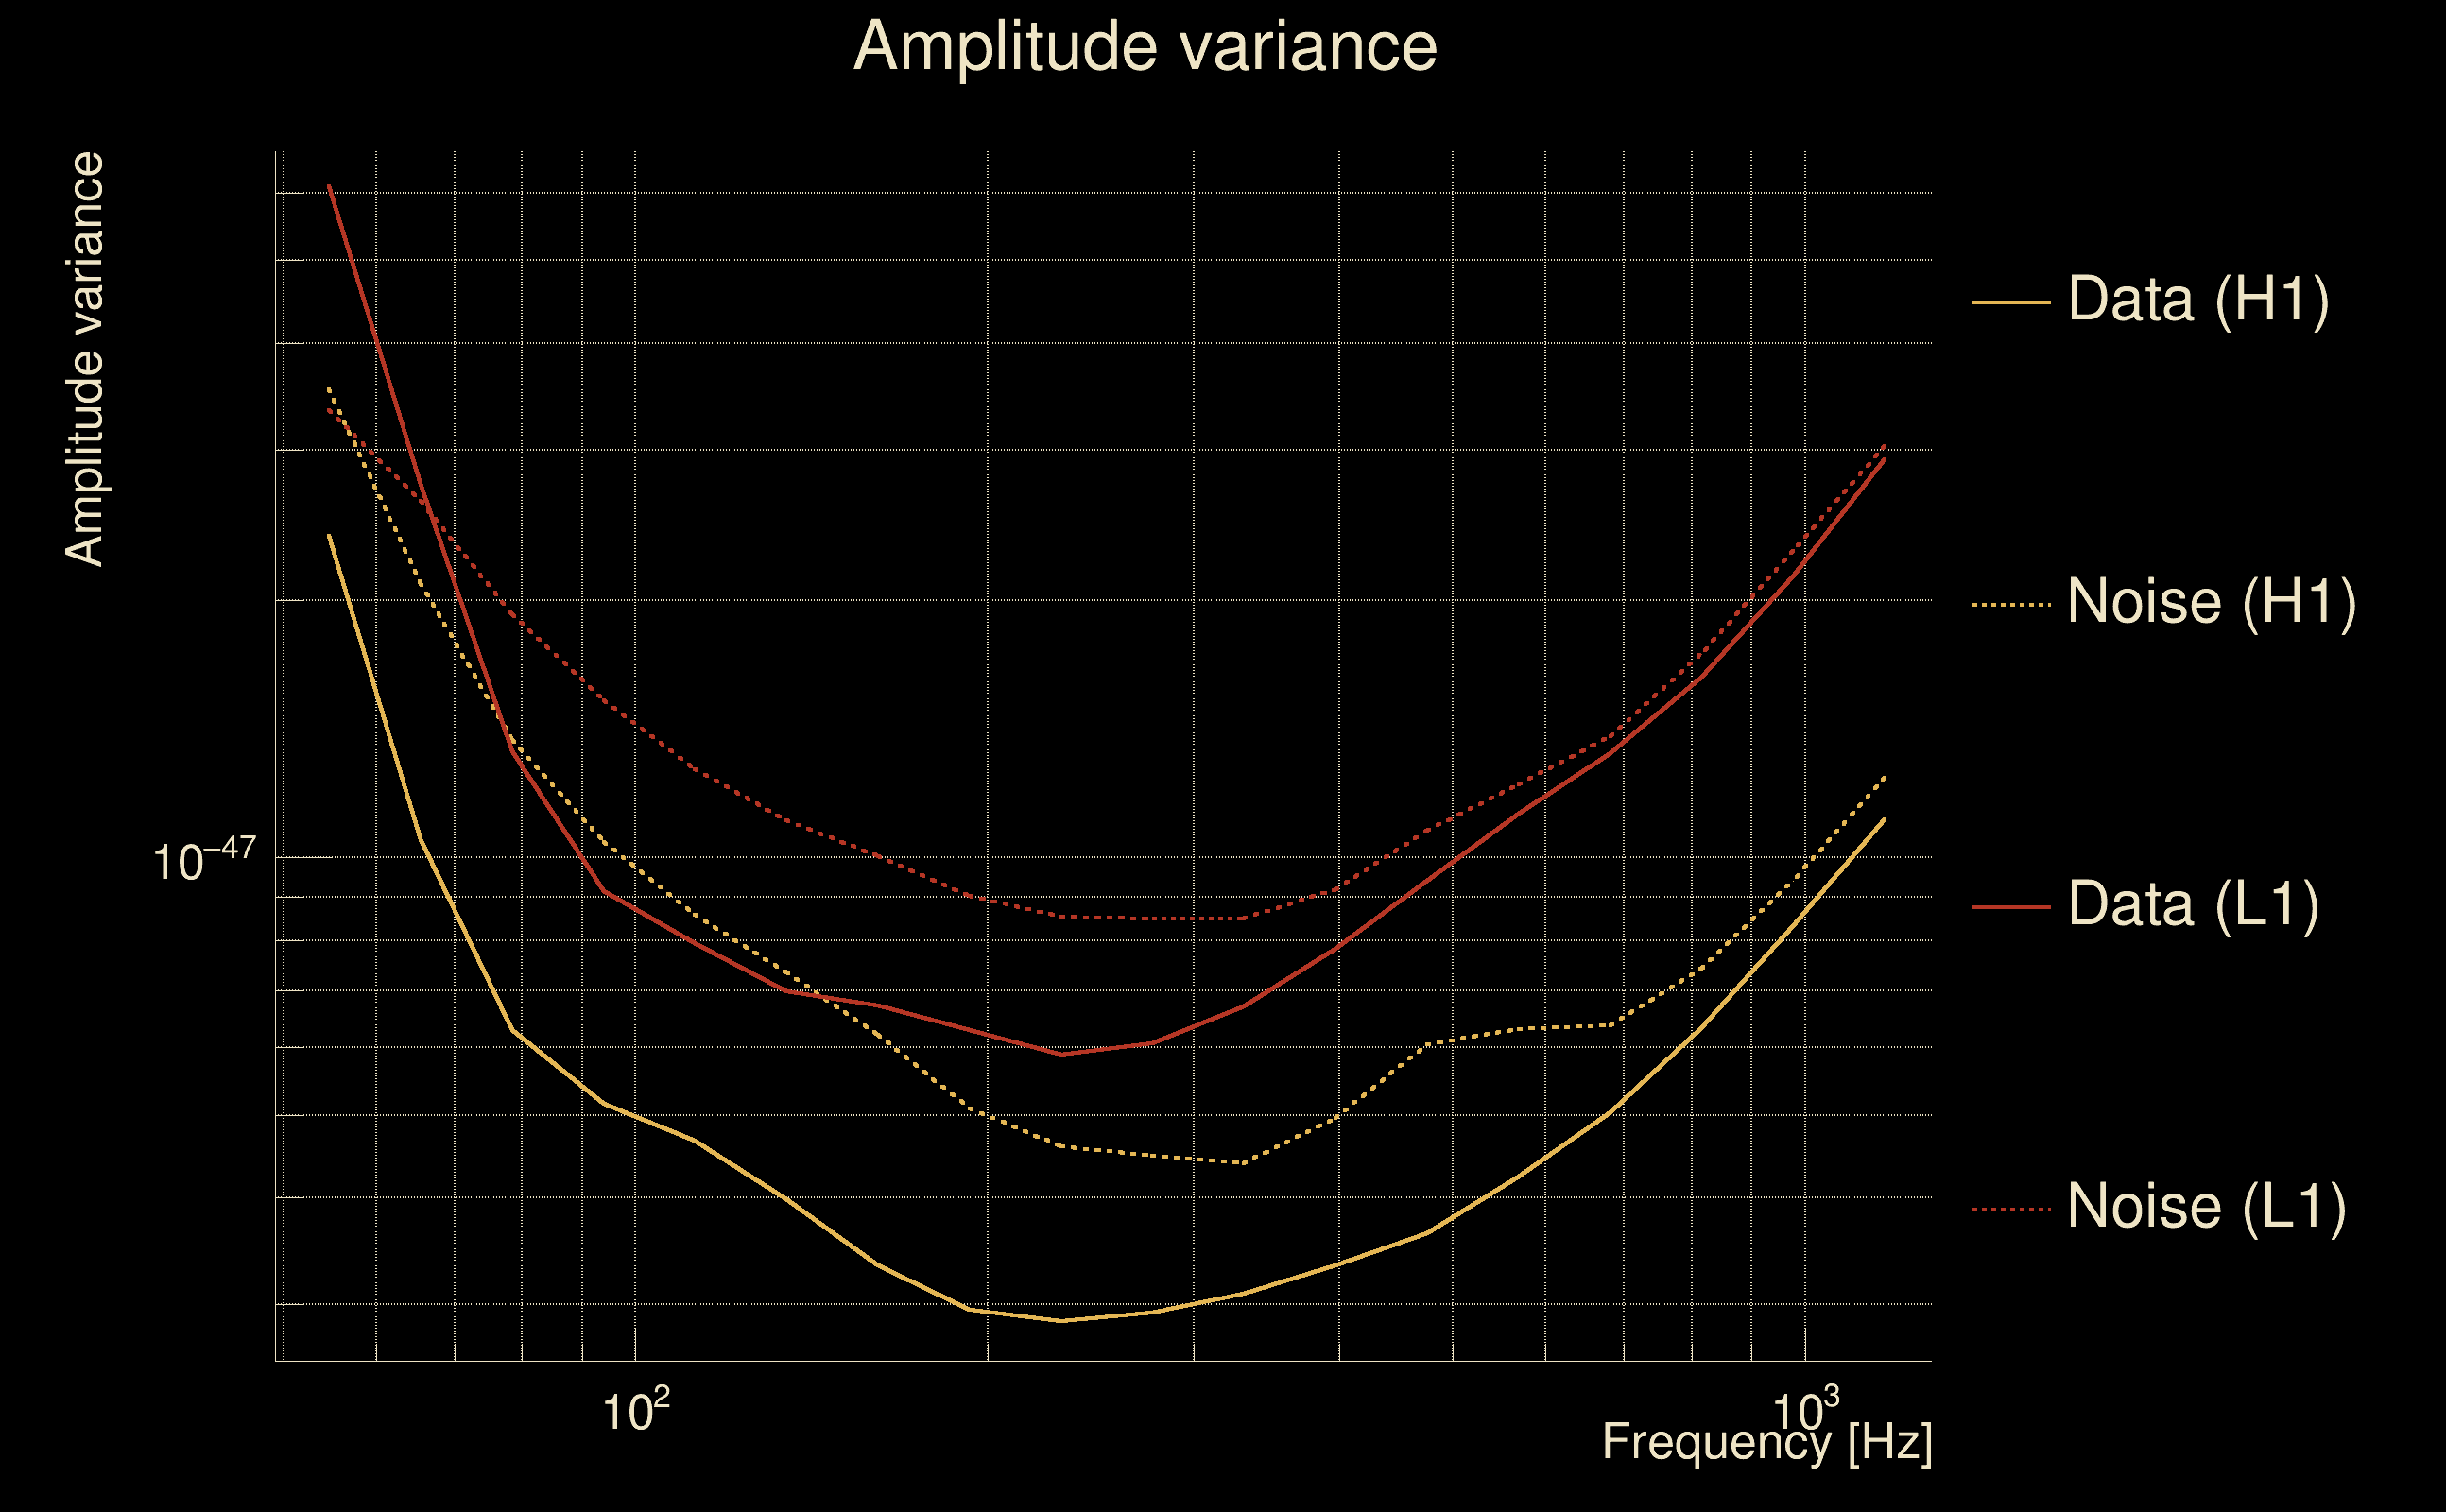
| Omicron frequency range: | 50 Hz → 1958.38 Hz |
| Light travel time between detectors: | 0.0100128 s |
| Slice extra-time (calibration uncertainty + slice veto): | 0.0129872 s |
| Number of time-delay bins in a cross-correlation map: | 10000 |
| Number of slices in a cross-correlation map: | 217 |
| Number of time-delay bins in a slice: | 46 |
| SNR gating: | < 100 (detector 0), < 100 (detector 1) |
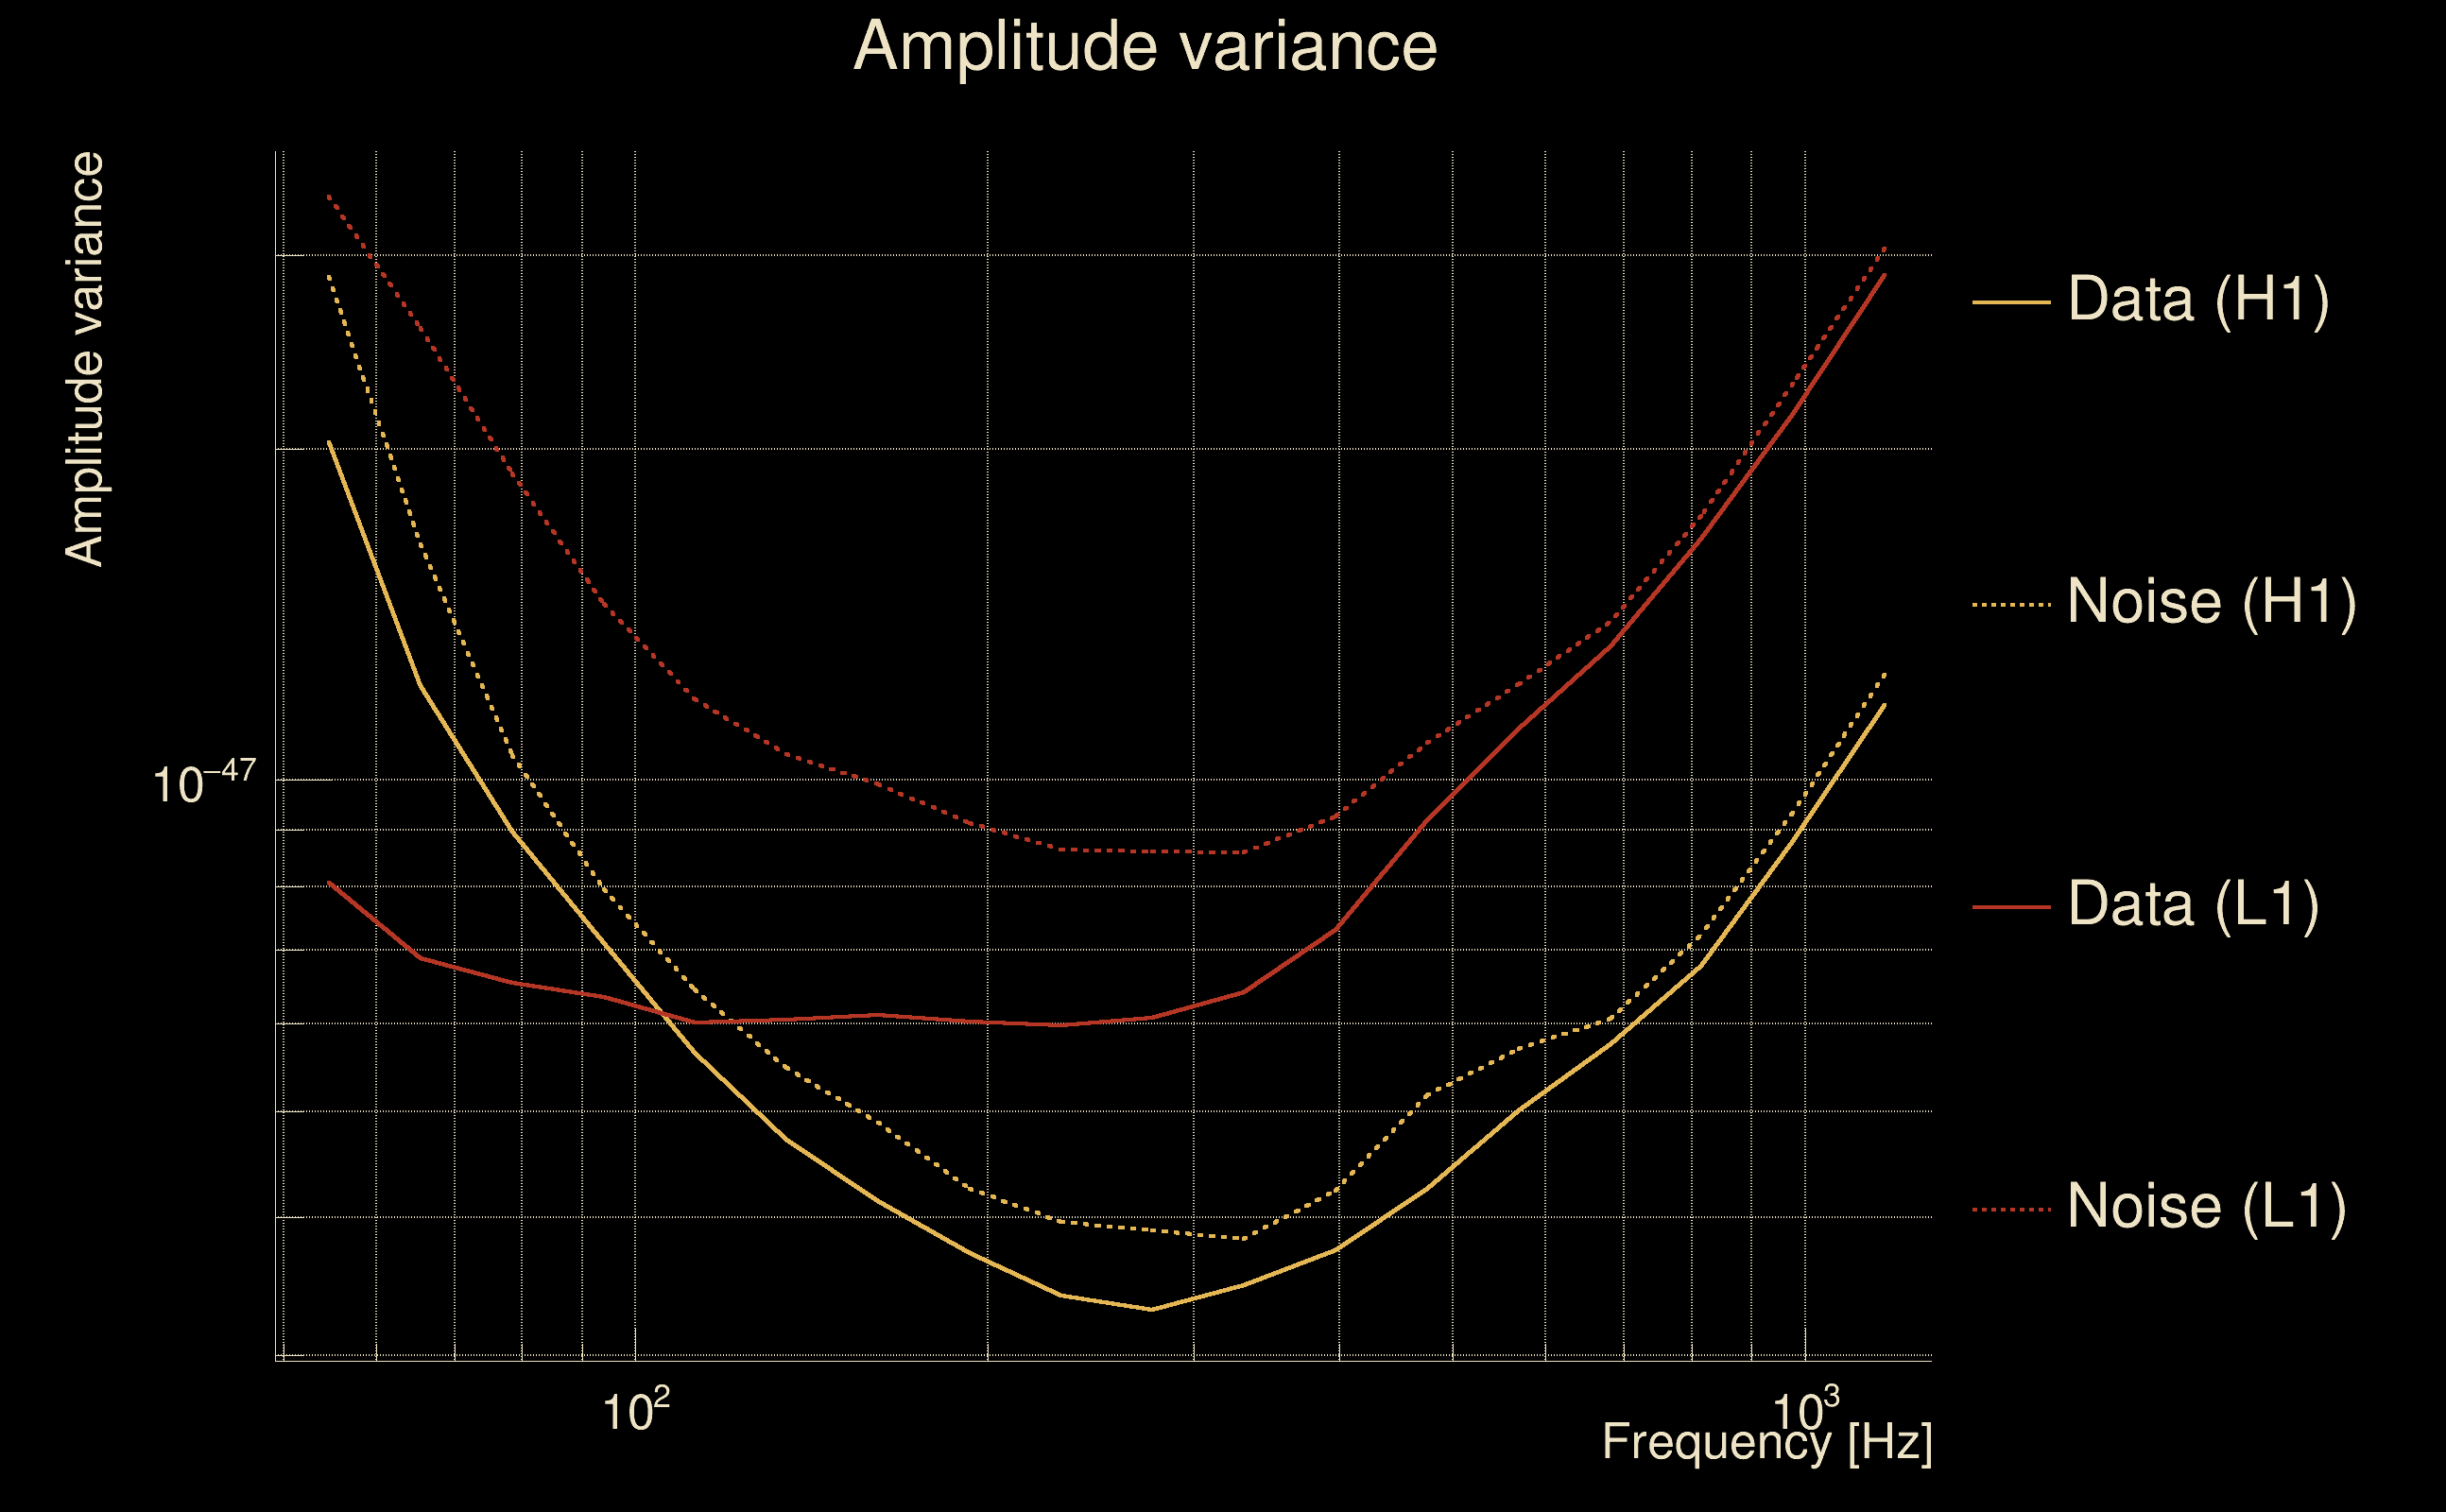
| Amplitude spectrograms: | normalization = 1e-22, power index = 2 |
| White noise SNR variance: | 0.523175 (after applying a correction factor = 1) |
| Amplitude ratio confidence level: | 3 sigma |
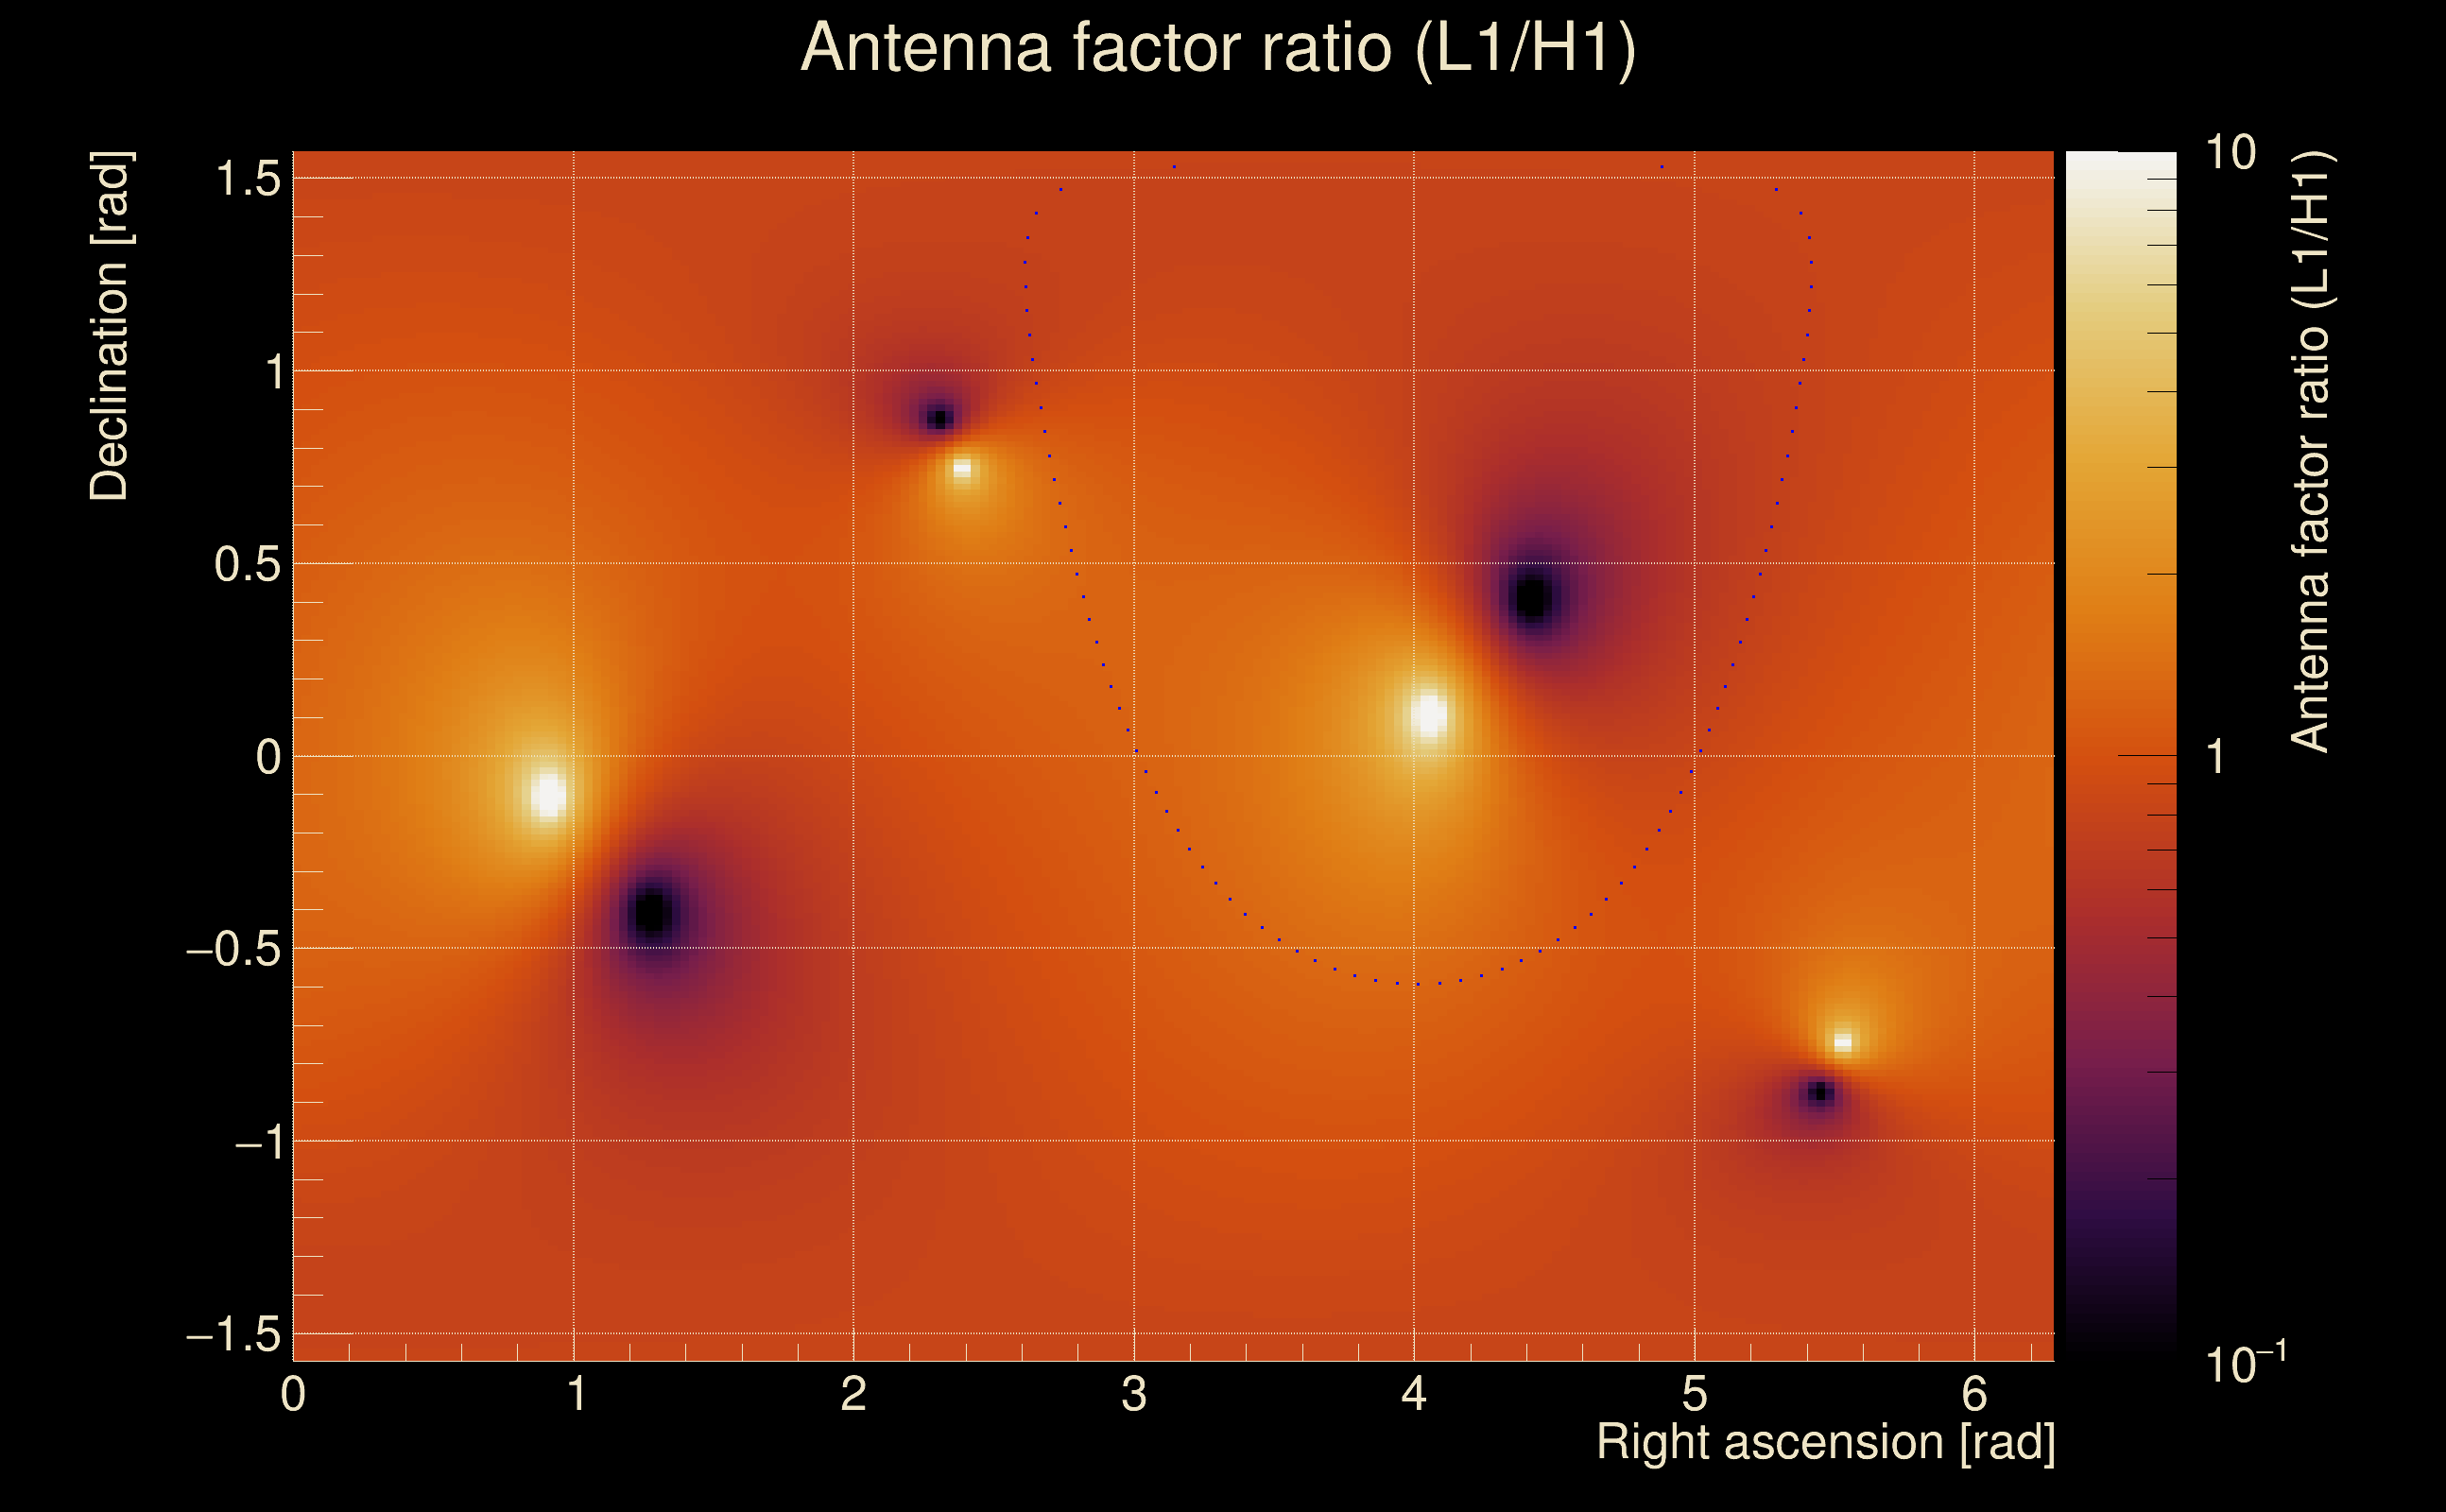
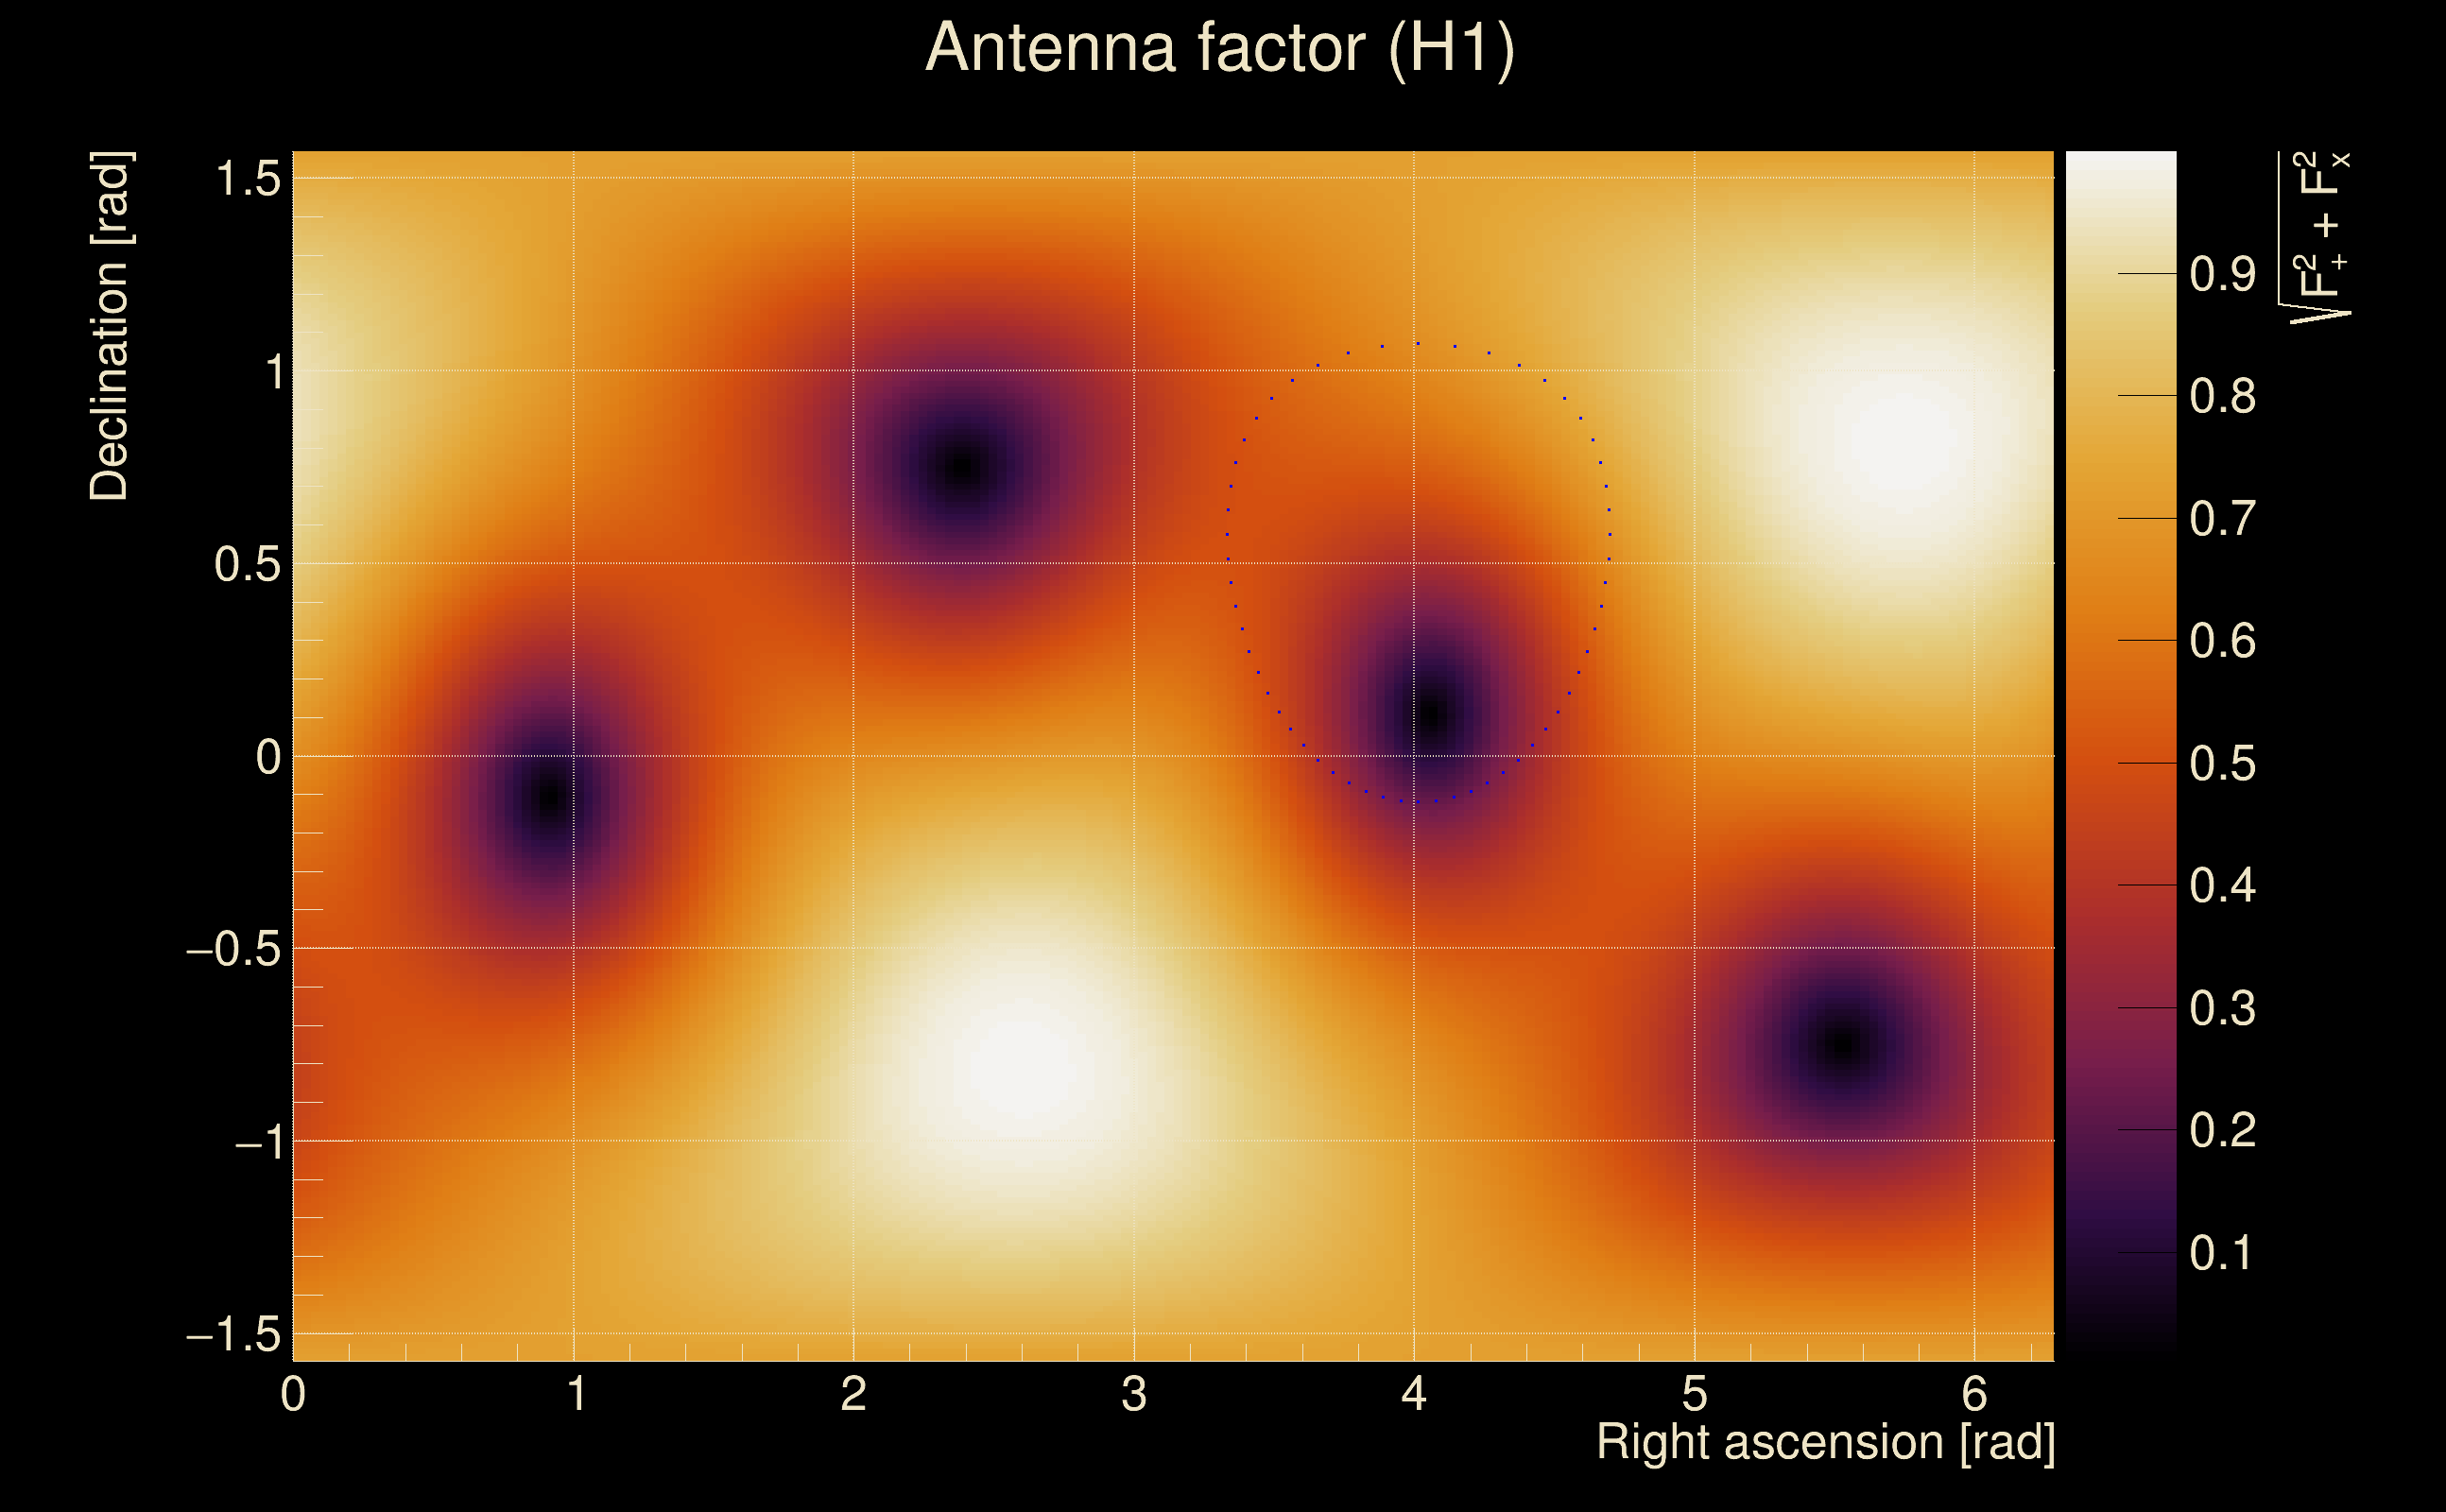
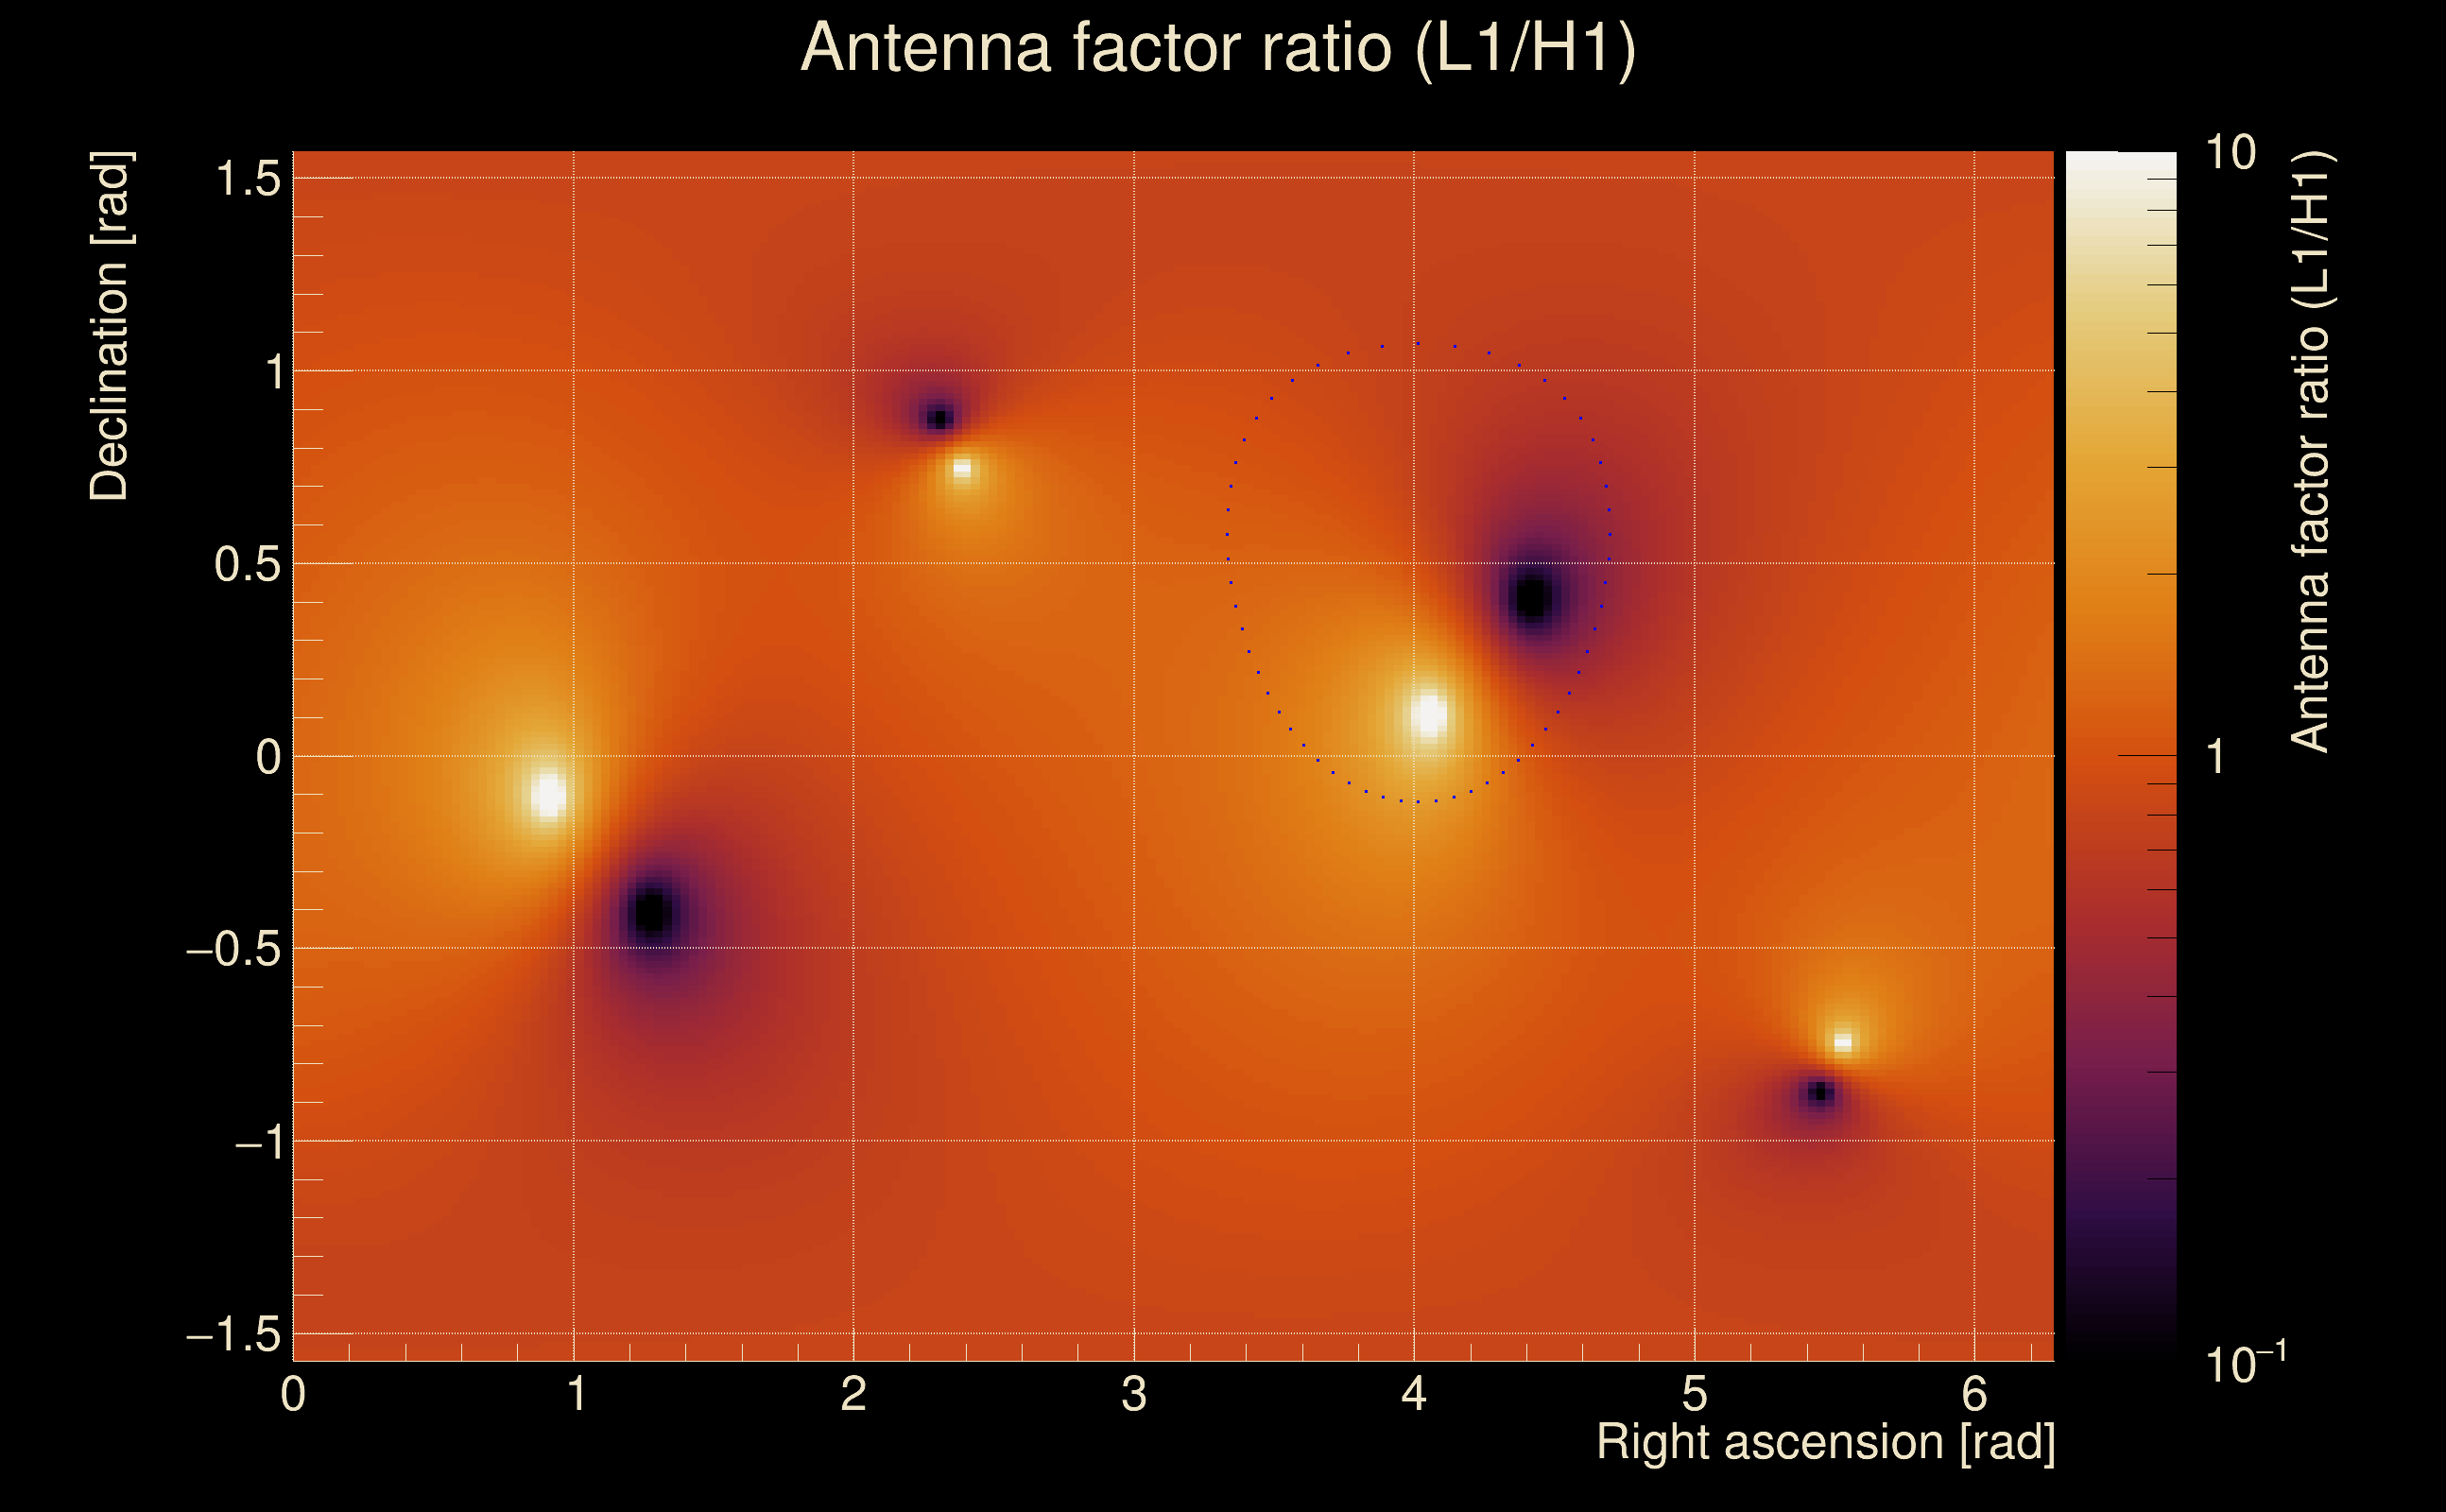
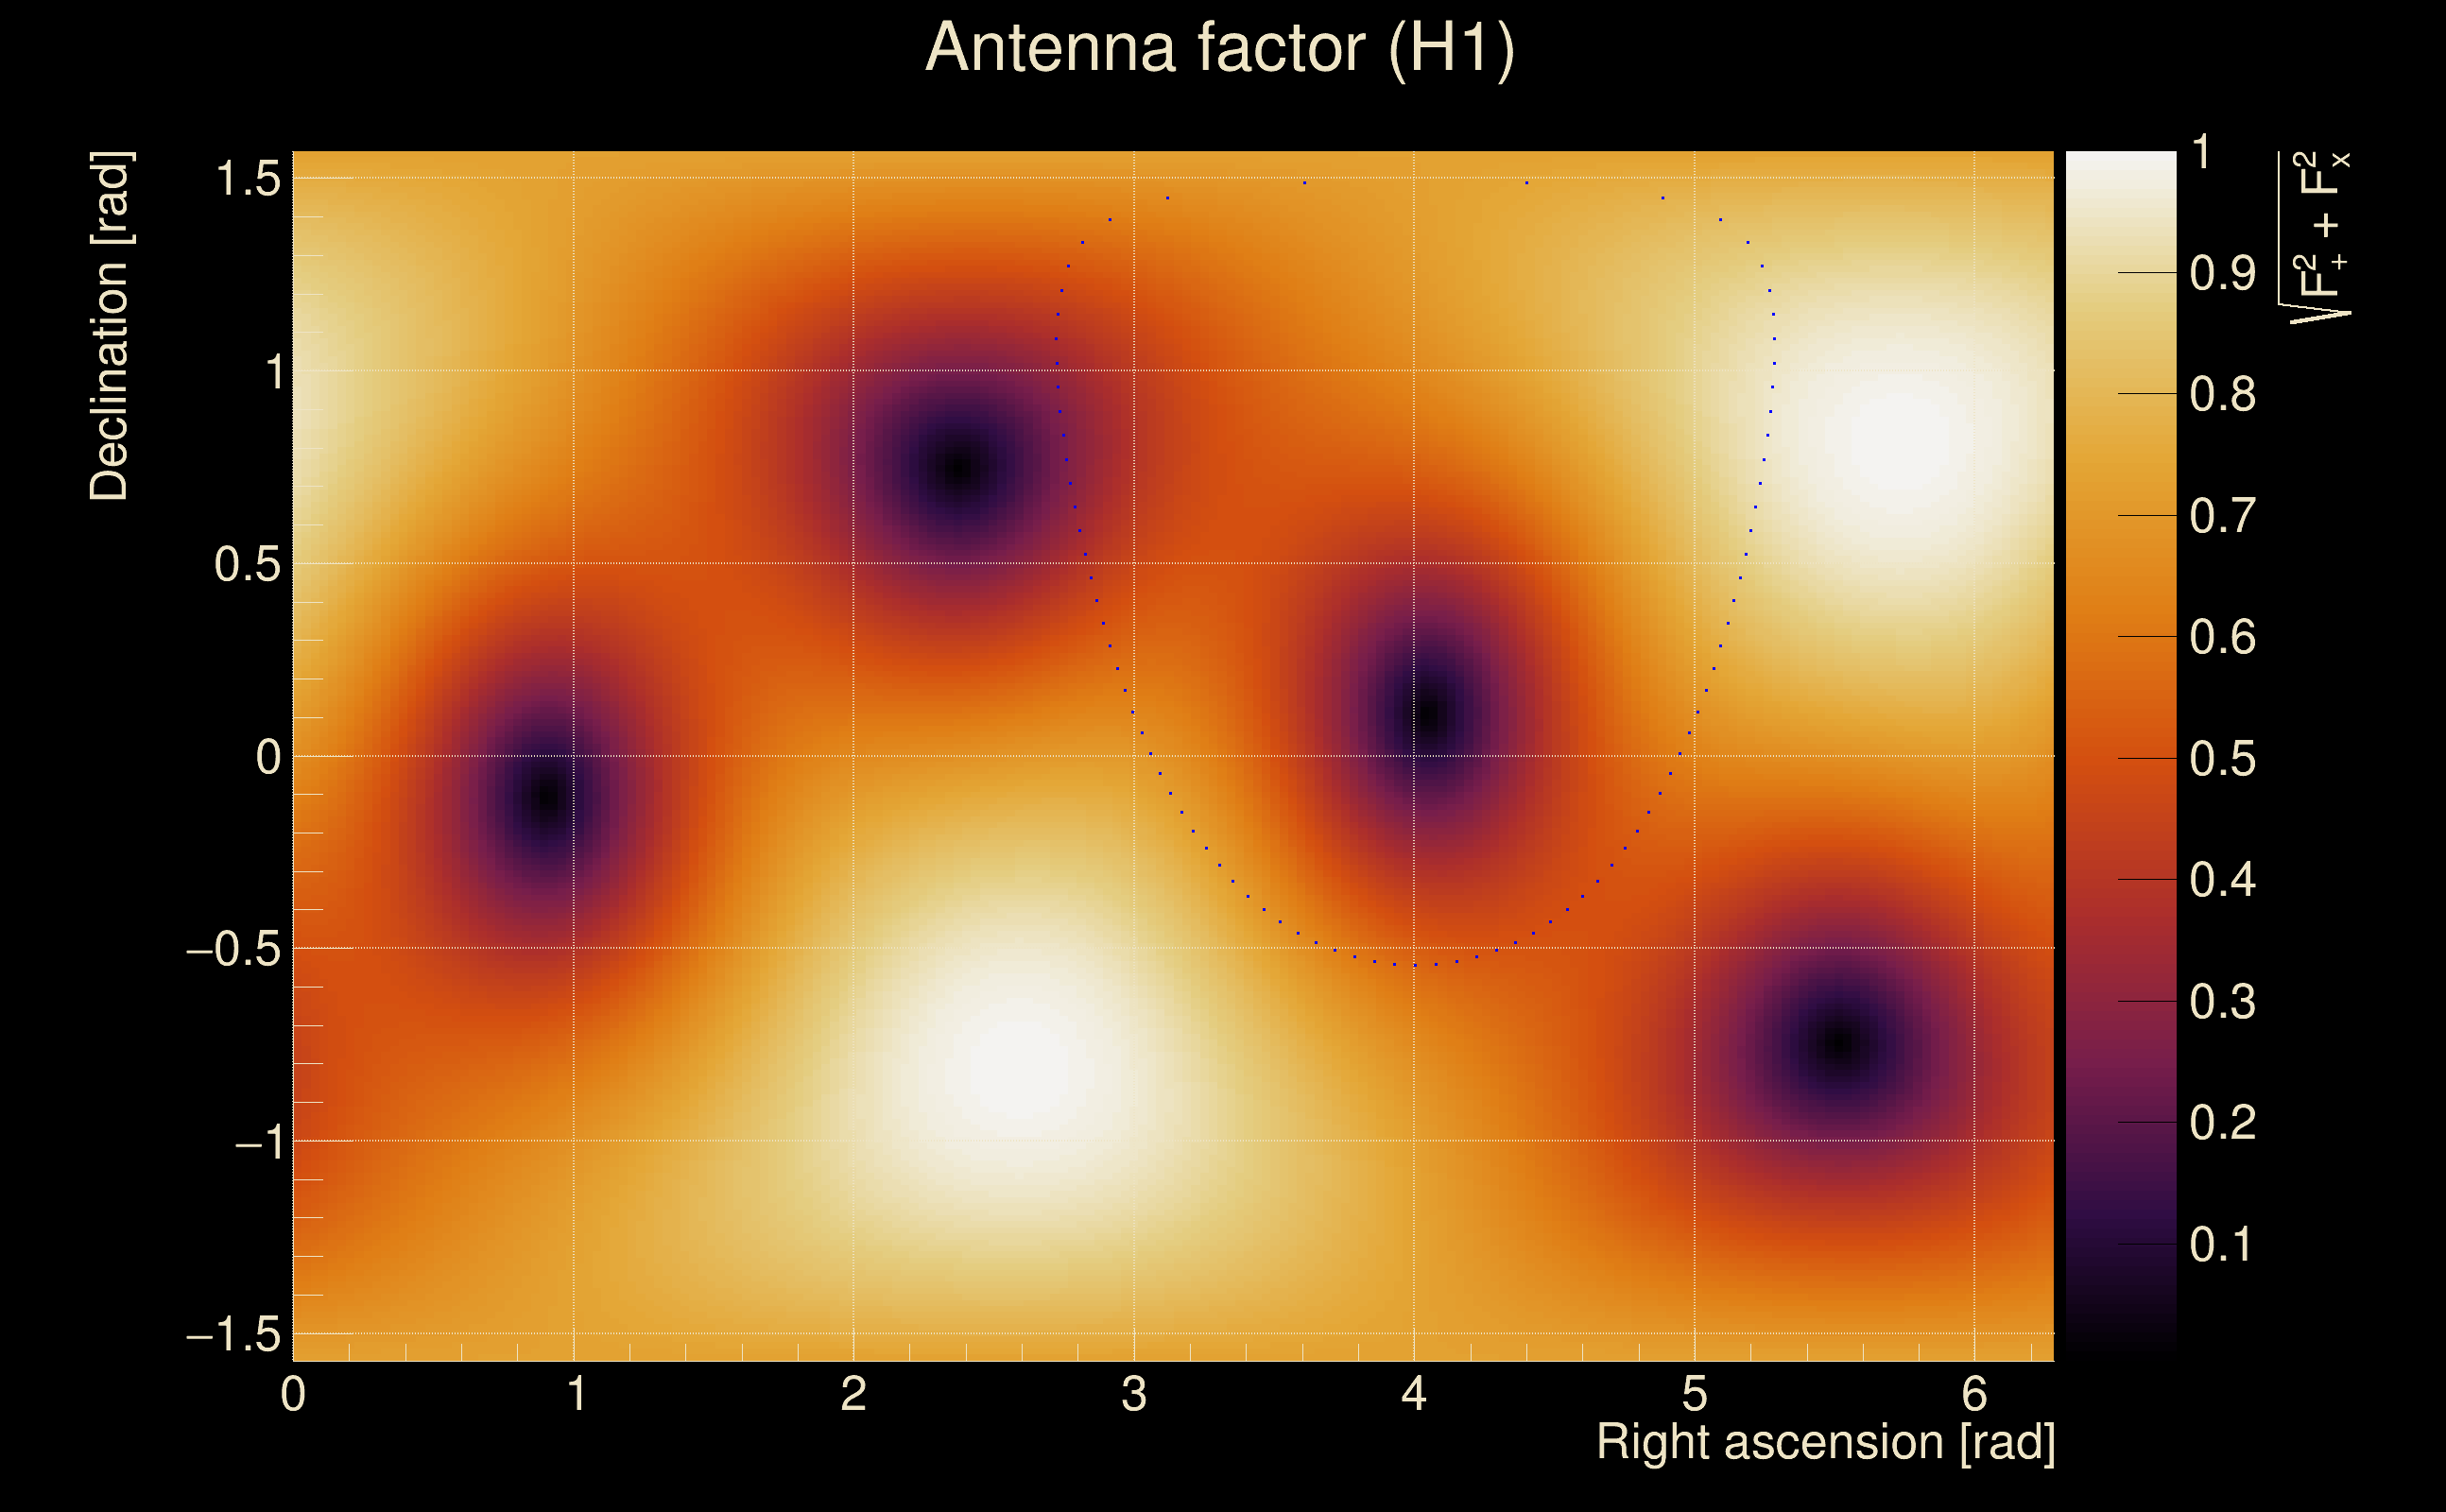
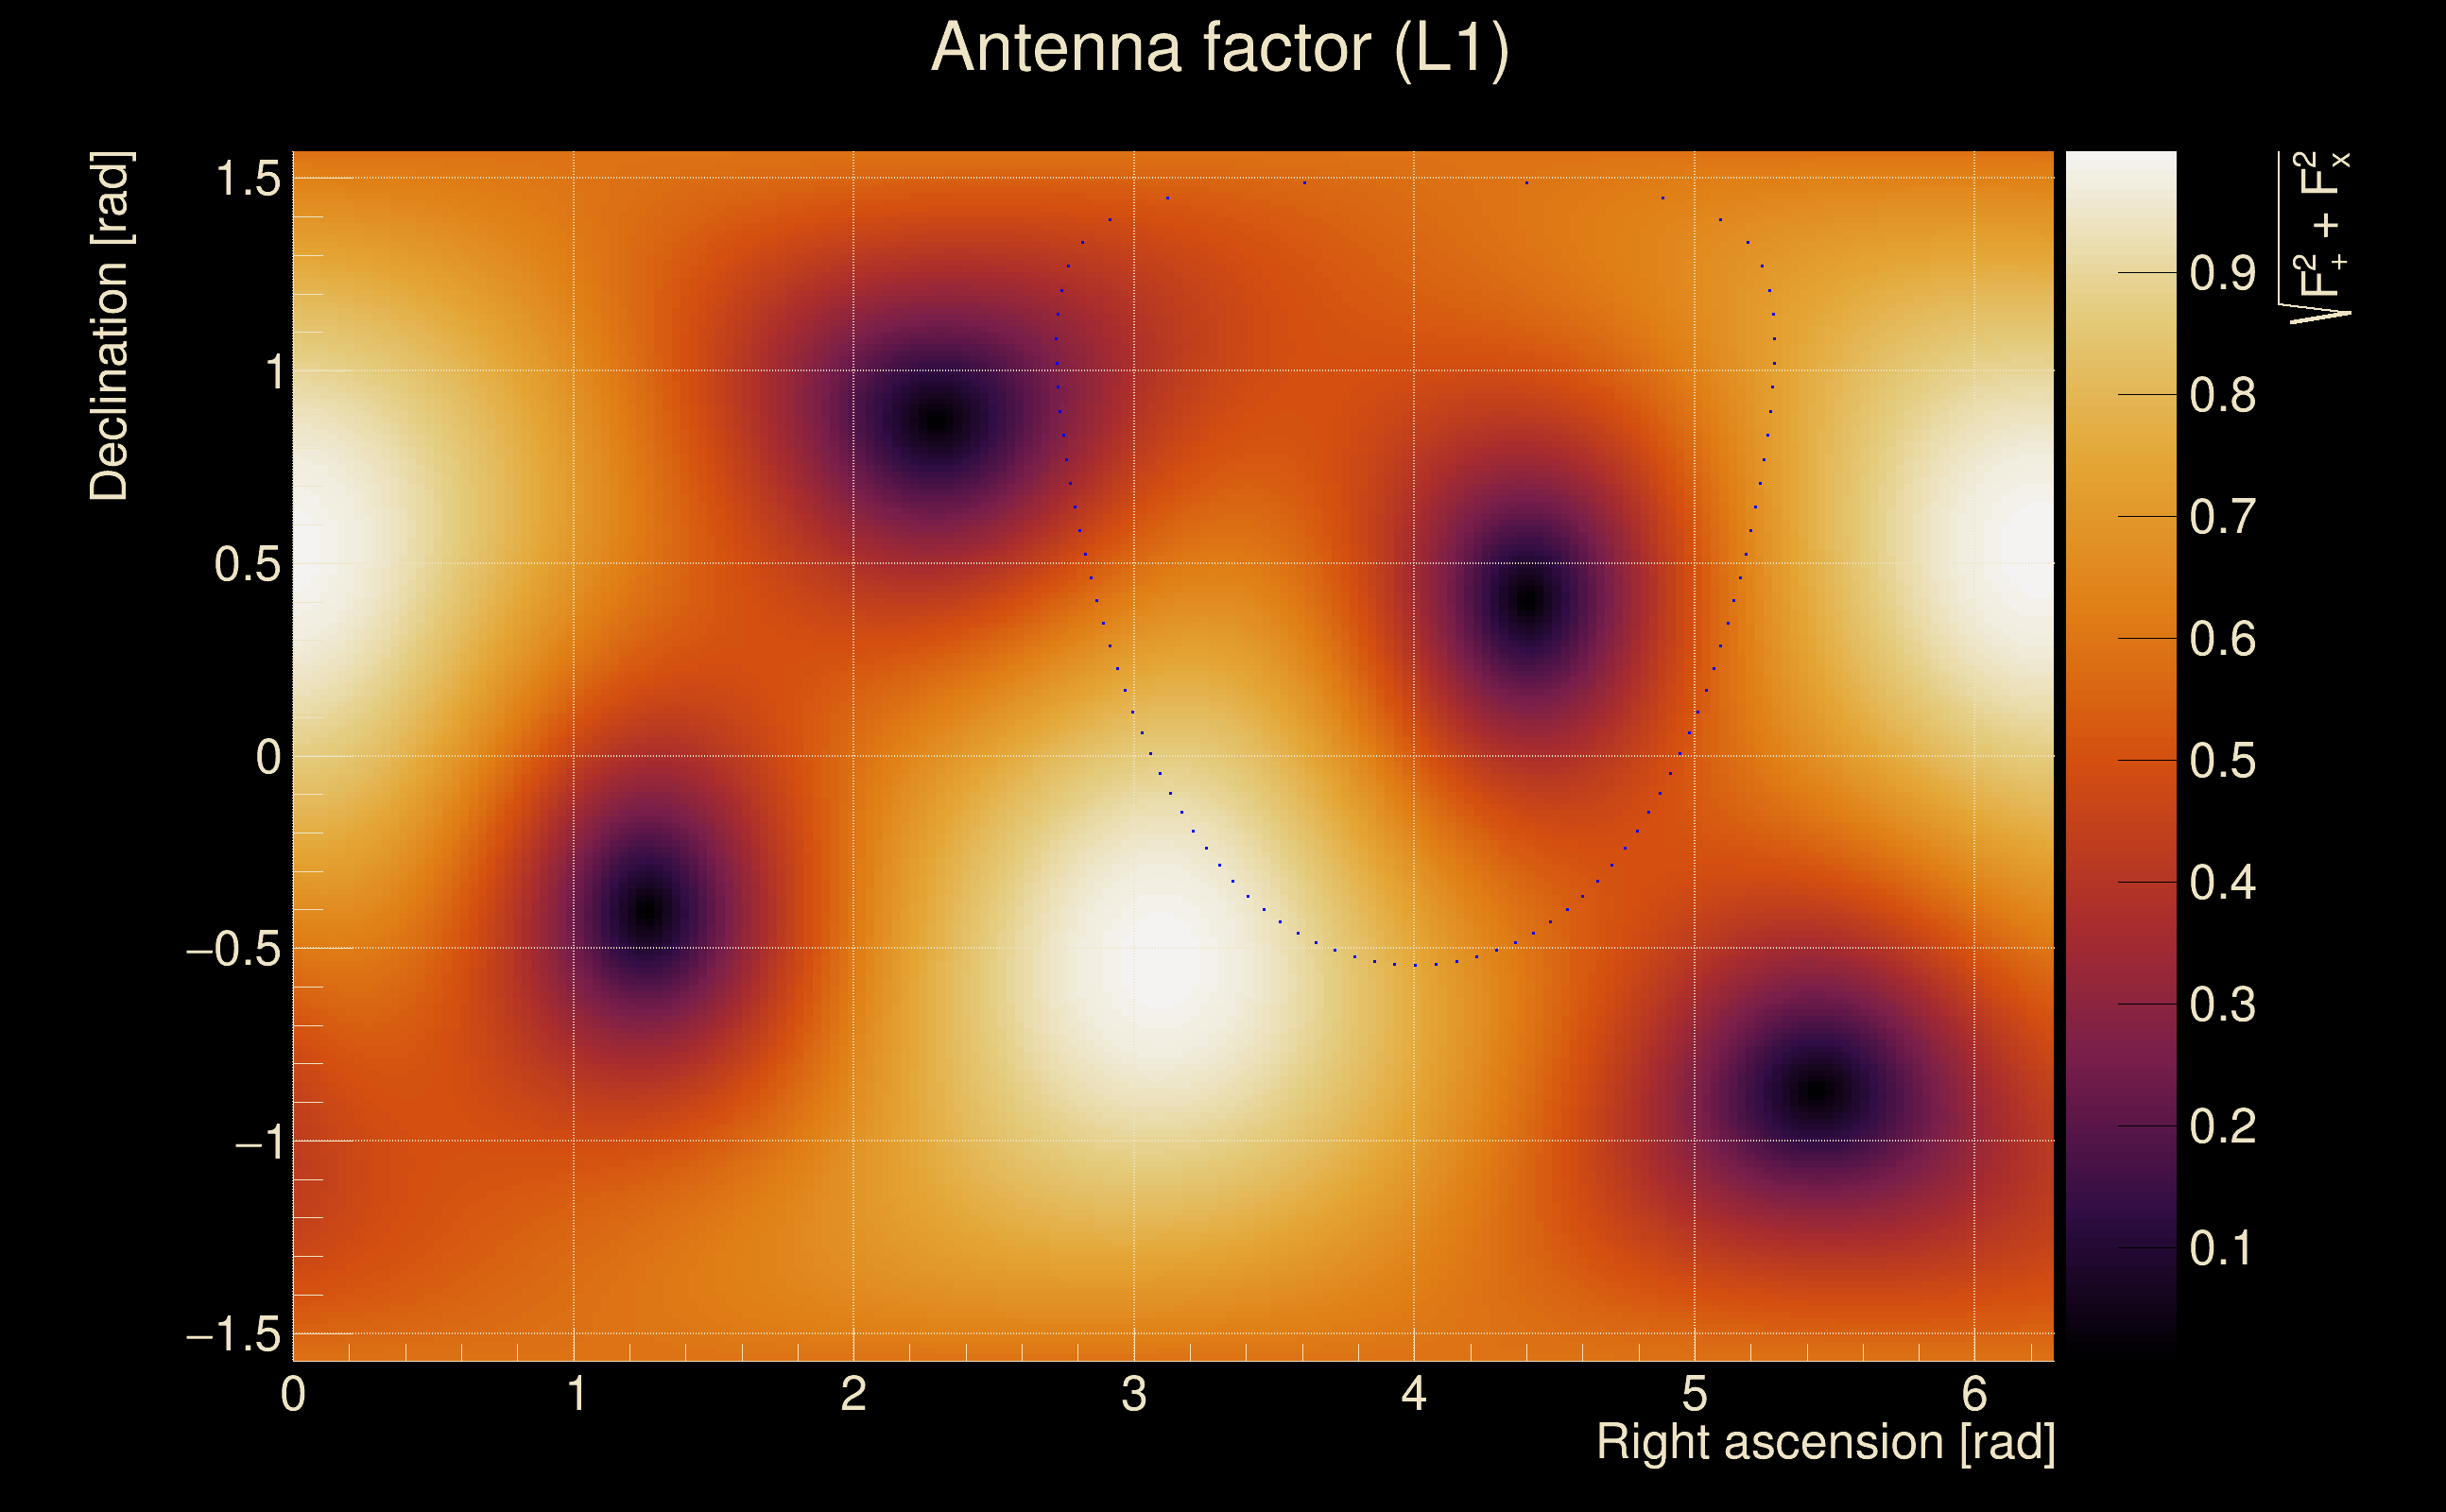
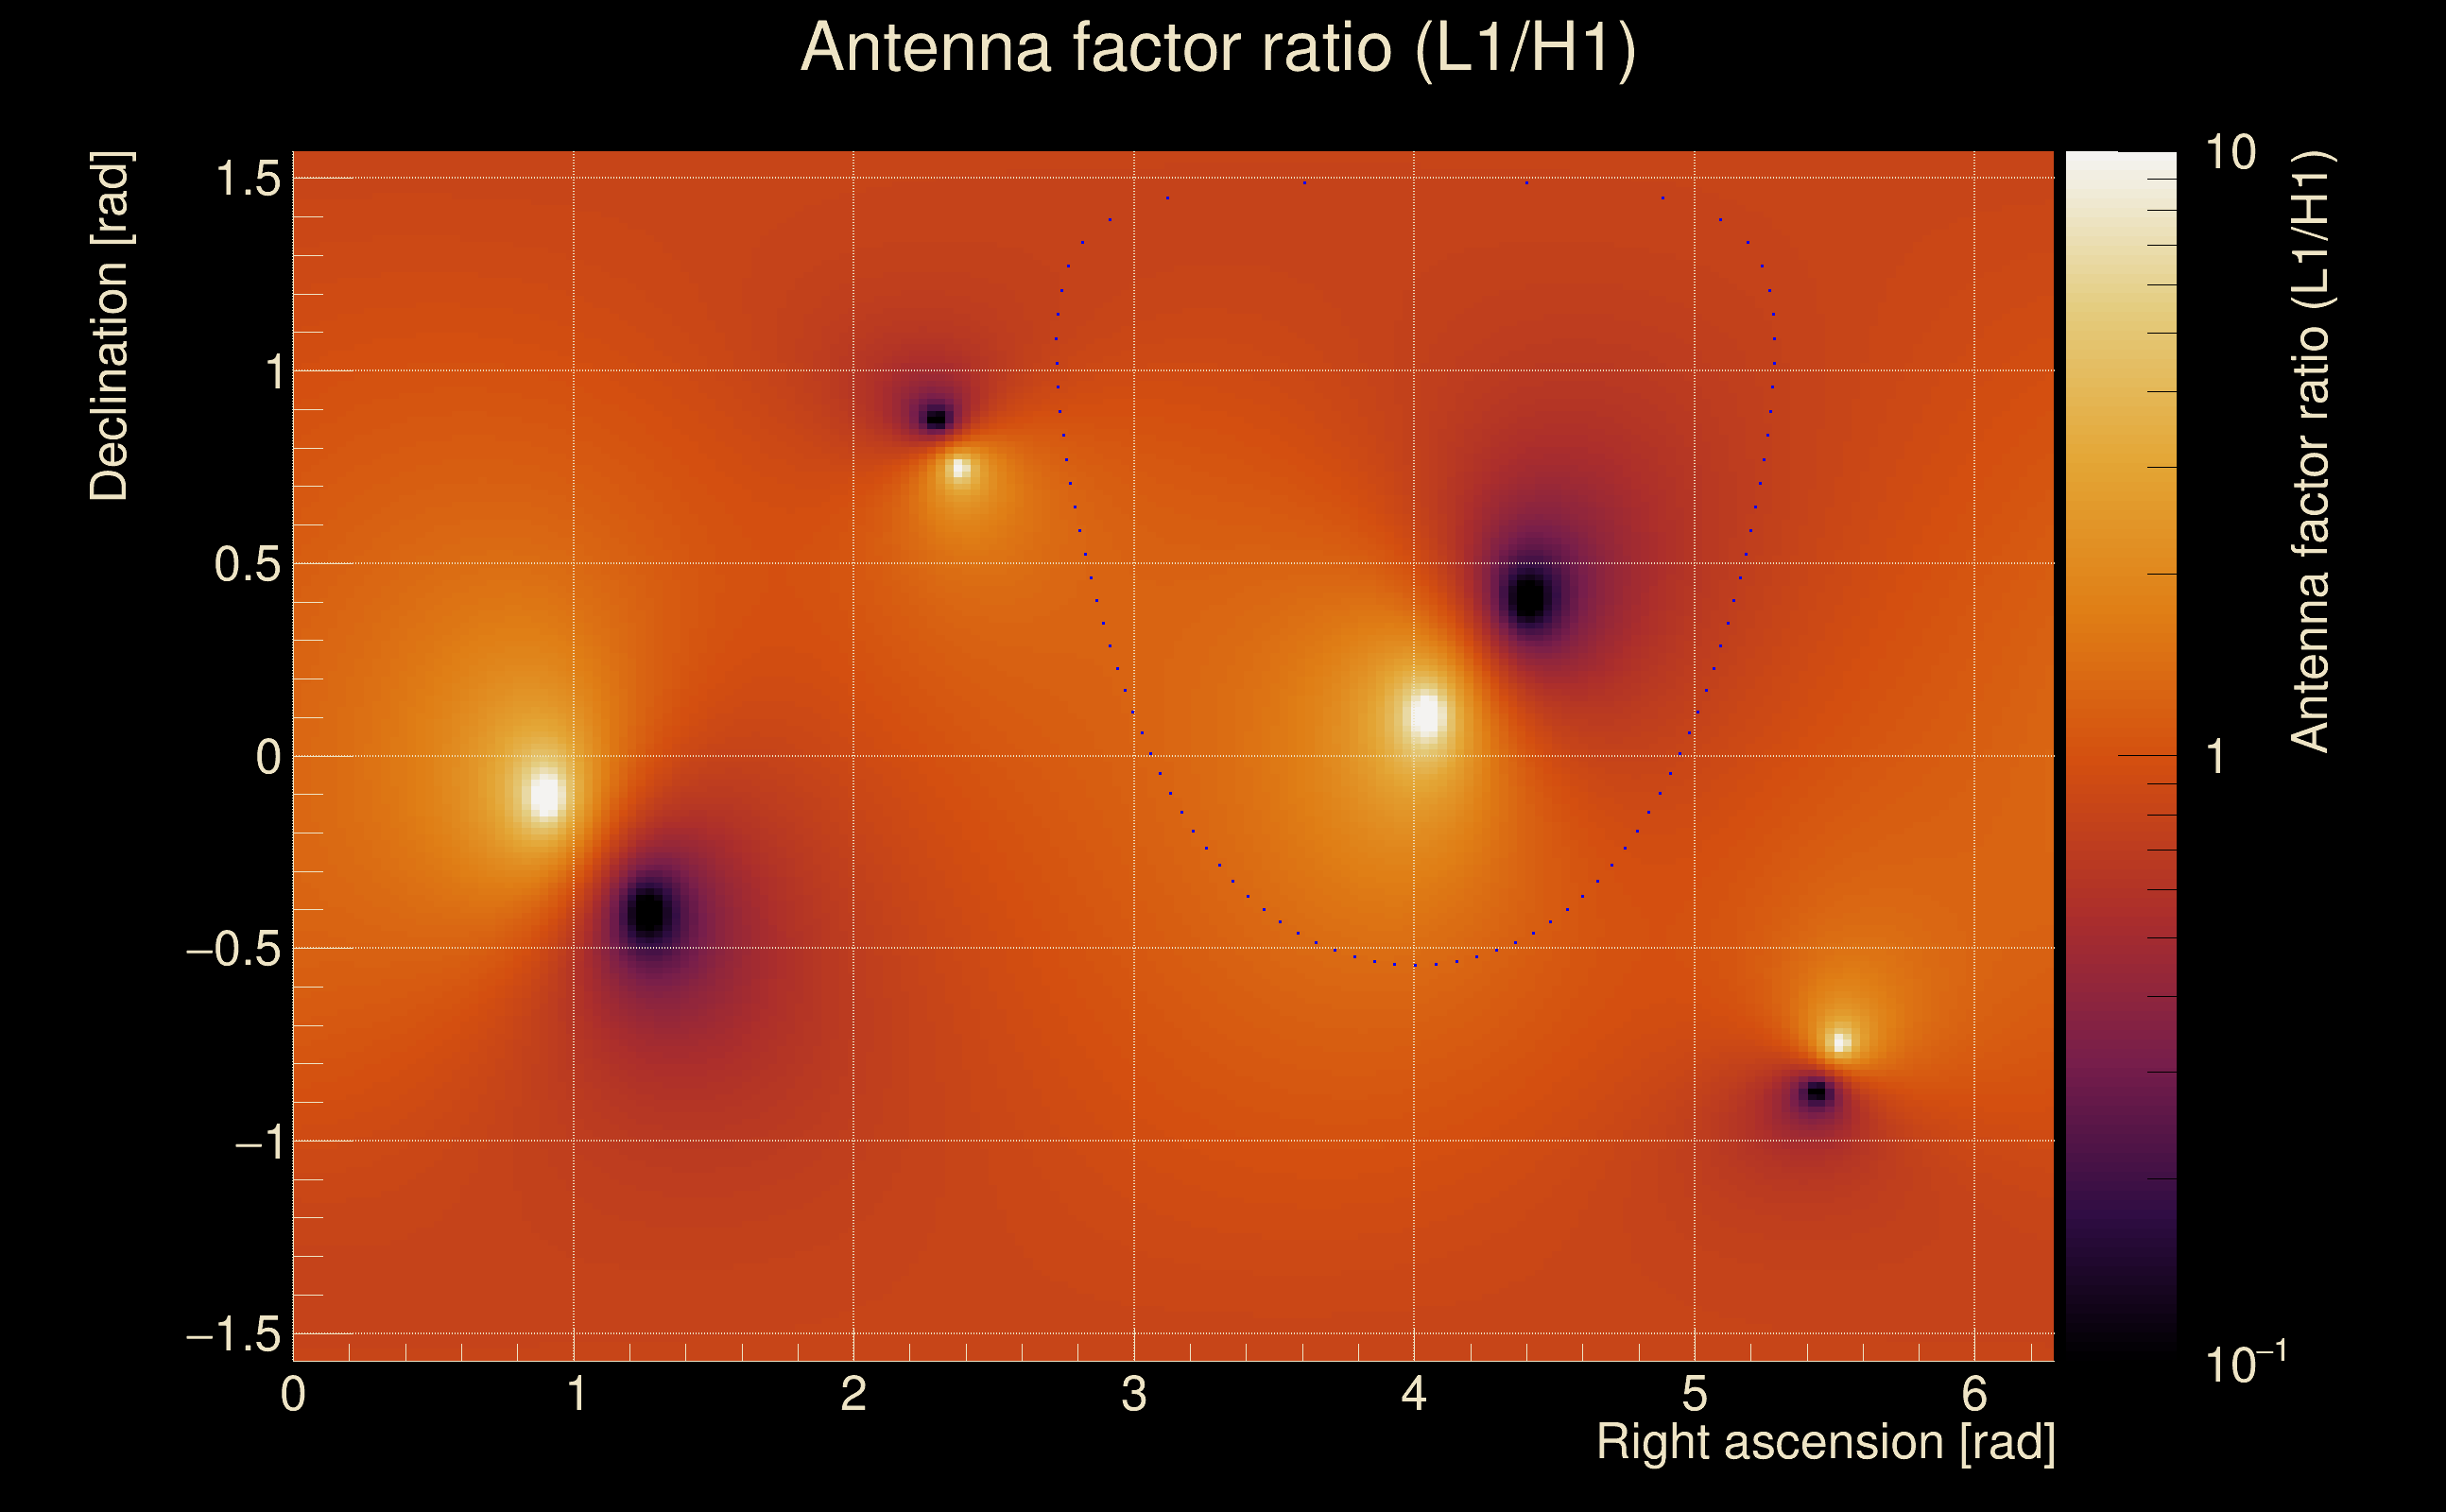
| Target sky positon: | Ra: 3.68109, Dec: 0.94792 [rad] |
| List of input Ox files: | TargIxf_feb2026_SG1_10min_file_list.txt (1 files) |
| Analysis result file: | TargIxf_feb2026_SG1_10min_results-2.root |
| Slice selected for the the fakeground: | slice index=208 (-4.6 s), time lag = 0 s |
| Foreground | Fakeground | Background | ||
|---|---|---|---|---|
| Number of processed ox events | 117 | 117 | 25155 | |
| Start Date (detector 0) | Mon May 15 14:13:25 2023 UTC | Mon May 15 14:13:25 2023 UTC | Mon May 15 14:13:25 2023 UTC | |
| End Date (detector 0) | Mon May 15 14:23:15 2023 UTC | Mon May 15 14:23:15 2023 UTC | Mon May 15 14:23:15 2023 UTC | |
| Start GPS (detector 0) | 1368195223 | 1368195223 | 1368195223 | |
| End GPS (detector 0) | 1368195813 | 1368195813 | 1368195813 | |
| Used livetime (detector 0) | 590 s | 590 s | 590 s | |
| Start Date (detector 1) | Mon May 15 14:13:25 2023 UTC | Mon May 15 14:13:25 2023 UTC | Mon May 15 14:13:25 2023 UTC | |
| End Date (detector 1) | Mon May 15 14:23:15 2023 UTC | Mon May 15 14:23:15 2023 UTC | Mon May 15 14:23:15 2023 UTC | |
| Start GPS (detector 1) | 1368195223 | 1368195223 | 1368195223 | |
| End GPS (detector 1) | 1368195813 | 1368195813 | 1368195813 | |
| Used livetime (detector 1) | 590 s | 590 s | 590 s | |
| Cumulative livetime | 1170 s | 1170 s | 251550 s | |
| 0 years, 0 days, 0 hours, 19 min, 30 s | 0 years, 0 days, 0 hours, 19 min, 30 s | 0 years, 2 days, 21 hours, 52 min, 30 s |
|
|
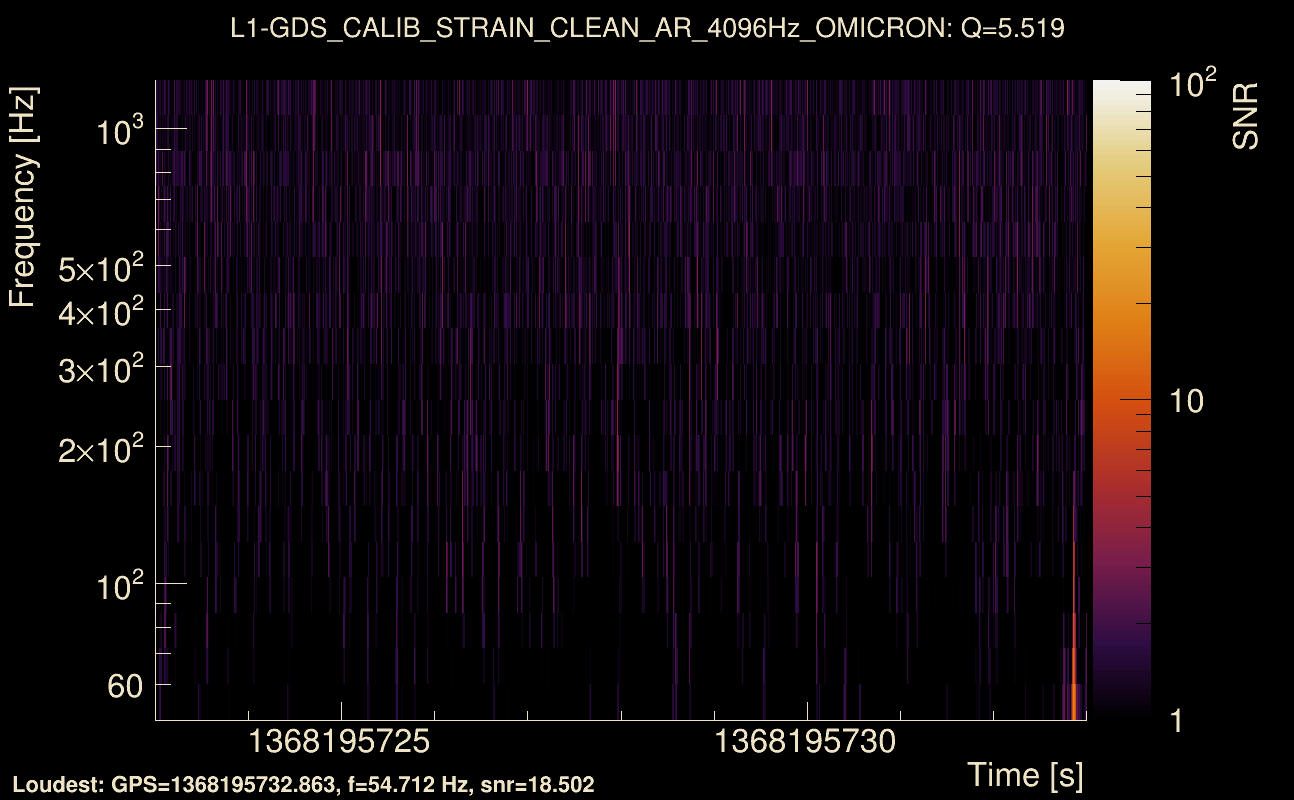
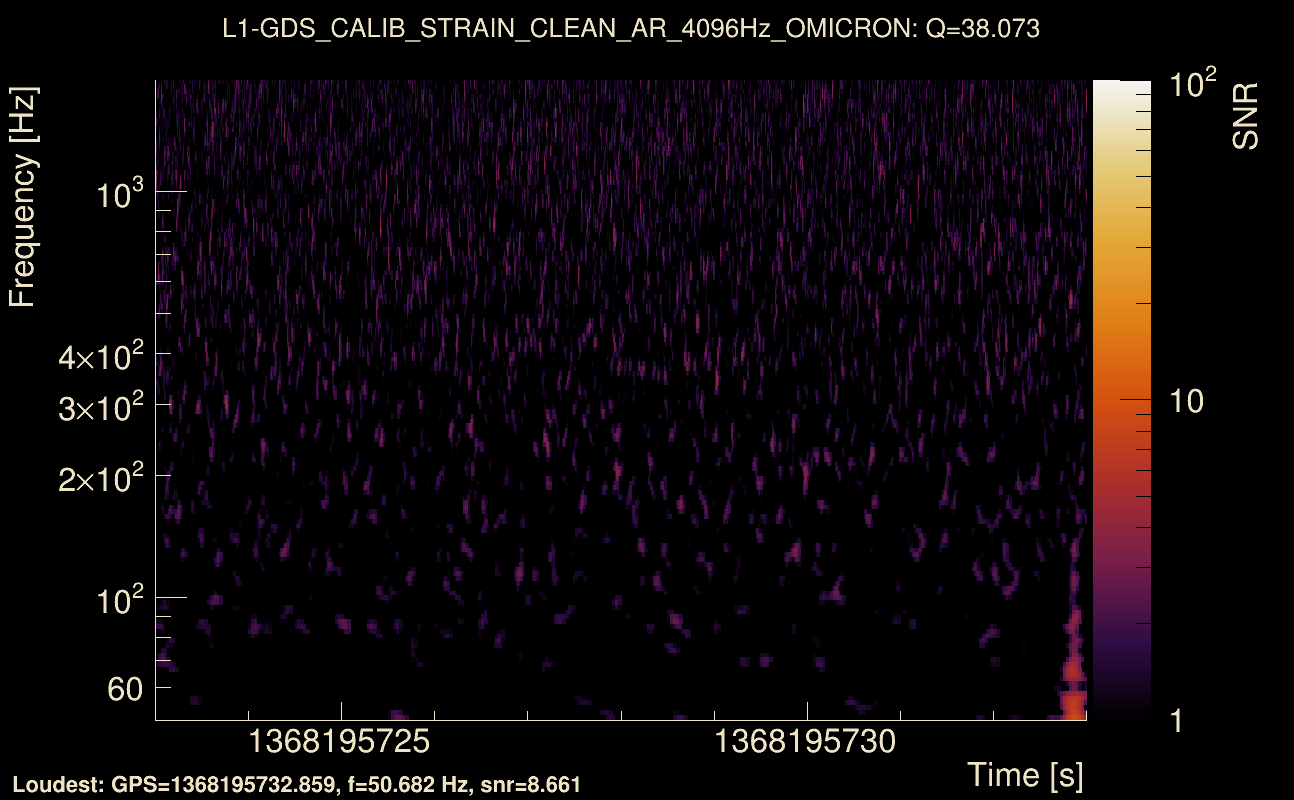
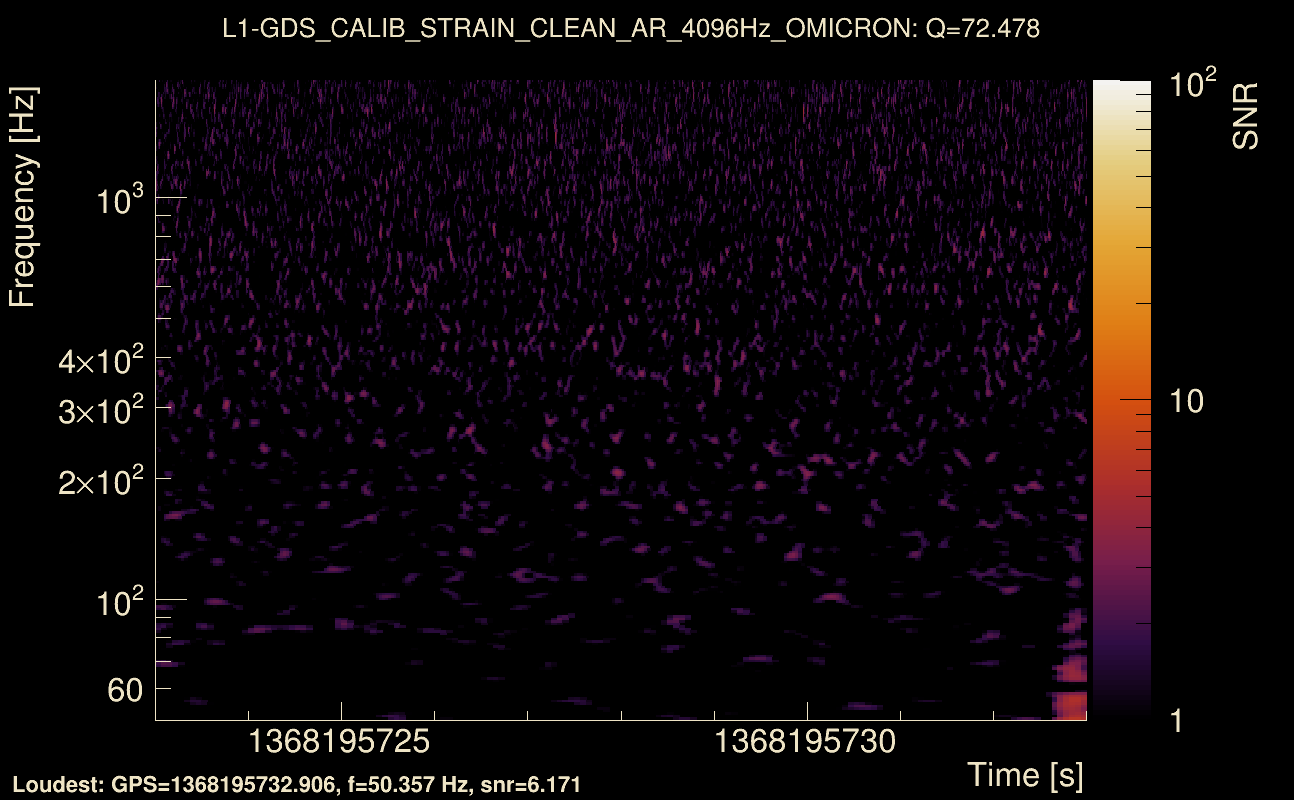
| Event time t(H1): | GPS = 1368195723 (Mon May 15 14:21:45 2023 ) → GPS = 1368195733 (Mon May 15 14:21:55 2023 ) |
| Event time t(L1): | GPS = 1368195723 (Mon May 15 14:21:55 2023 ) → GPS = 1368195733 (Mon May 15 14:21:55 2023 ) |
| Omicron analysis time window (H1): | GPS = 1368195720 → GPS = 1368195736 |
| Omicron analysis time window (L1): | GPS = 1368195720 → GPS = 1368195736 |
| Time delay between detectors t(L1) - t(H1): | 0.004821 s (slice index = 108 / 217), δt_gw = 0.004821 s |
| Time delay standard deviation: | 0.0696154 s |
| [targeted mode] Time delay probability: | 0.431281 (0.787001 sigmas), δt_target = 1.72247e+45 s |
| Frequency: | 92.8111 Hz |
| Ξ: | 0.293175 ± 0.0176958 (variance = 0.00031314): Q0: 0.888964, Q1: 0.923335, Q2: 0.923269, Q3: 0.944053, Q4: 0.921563 |
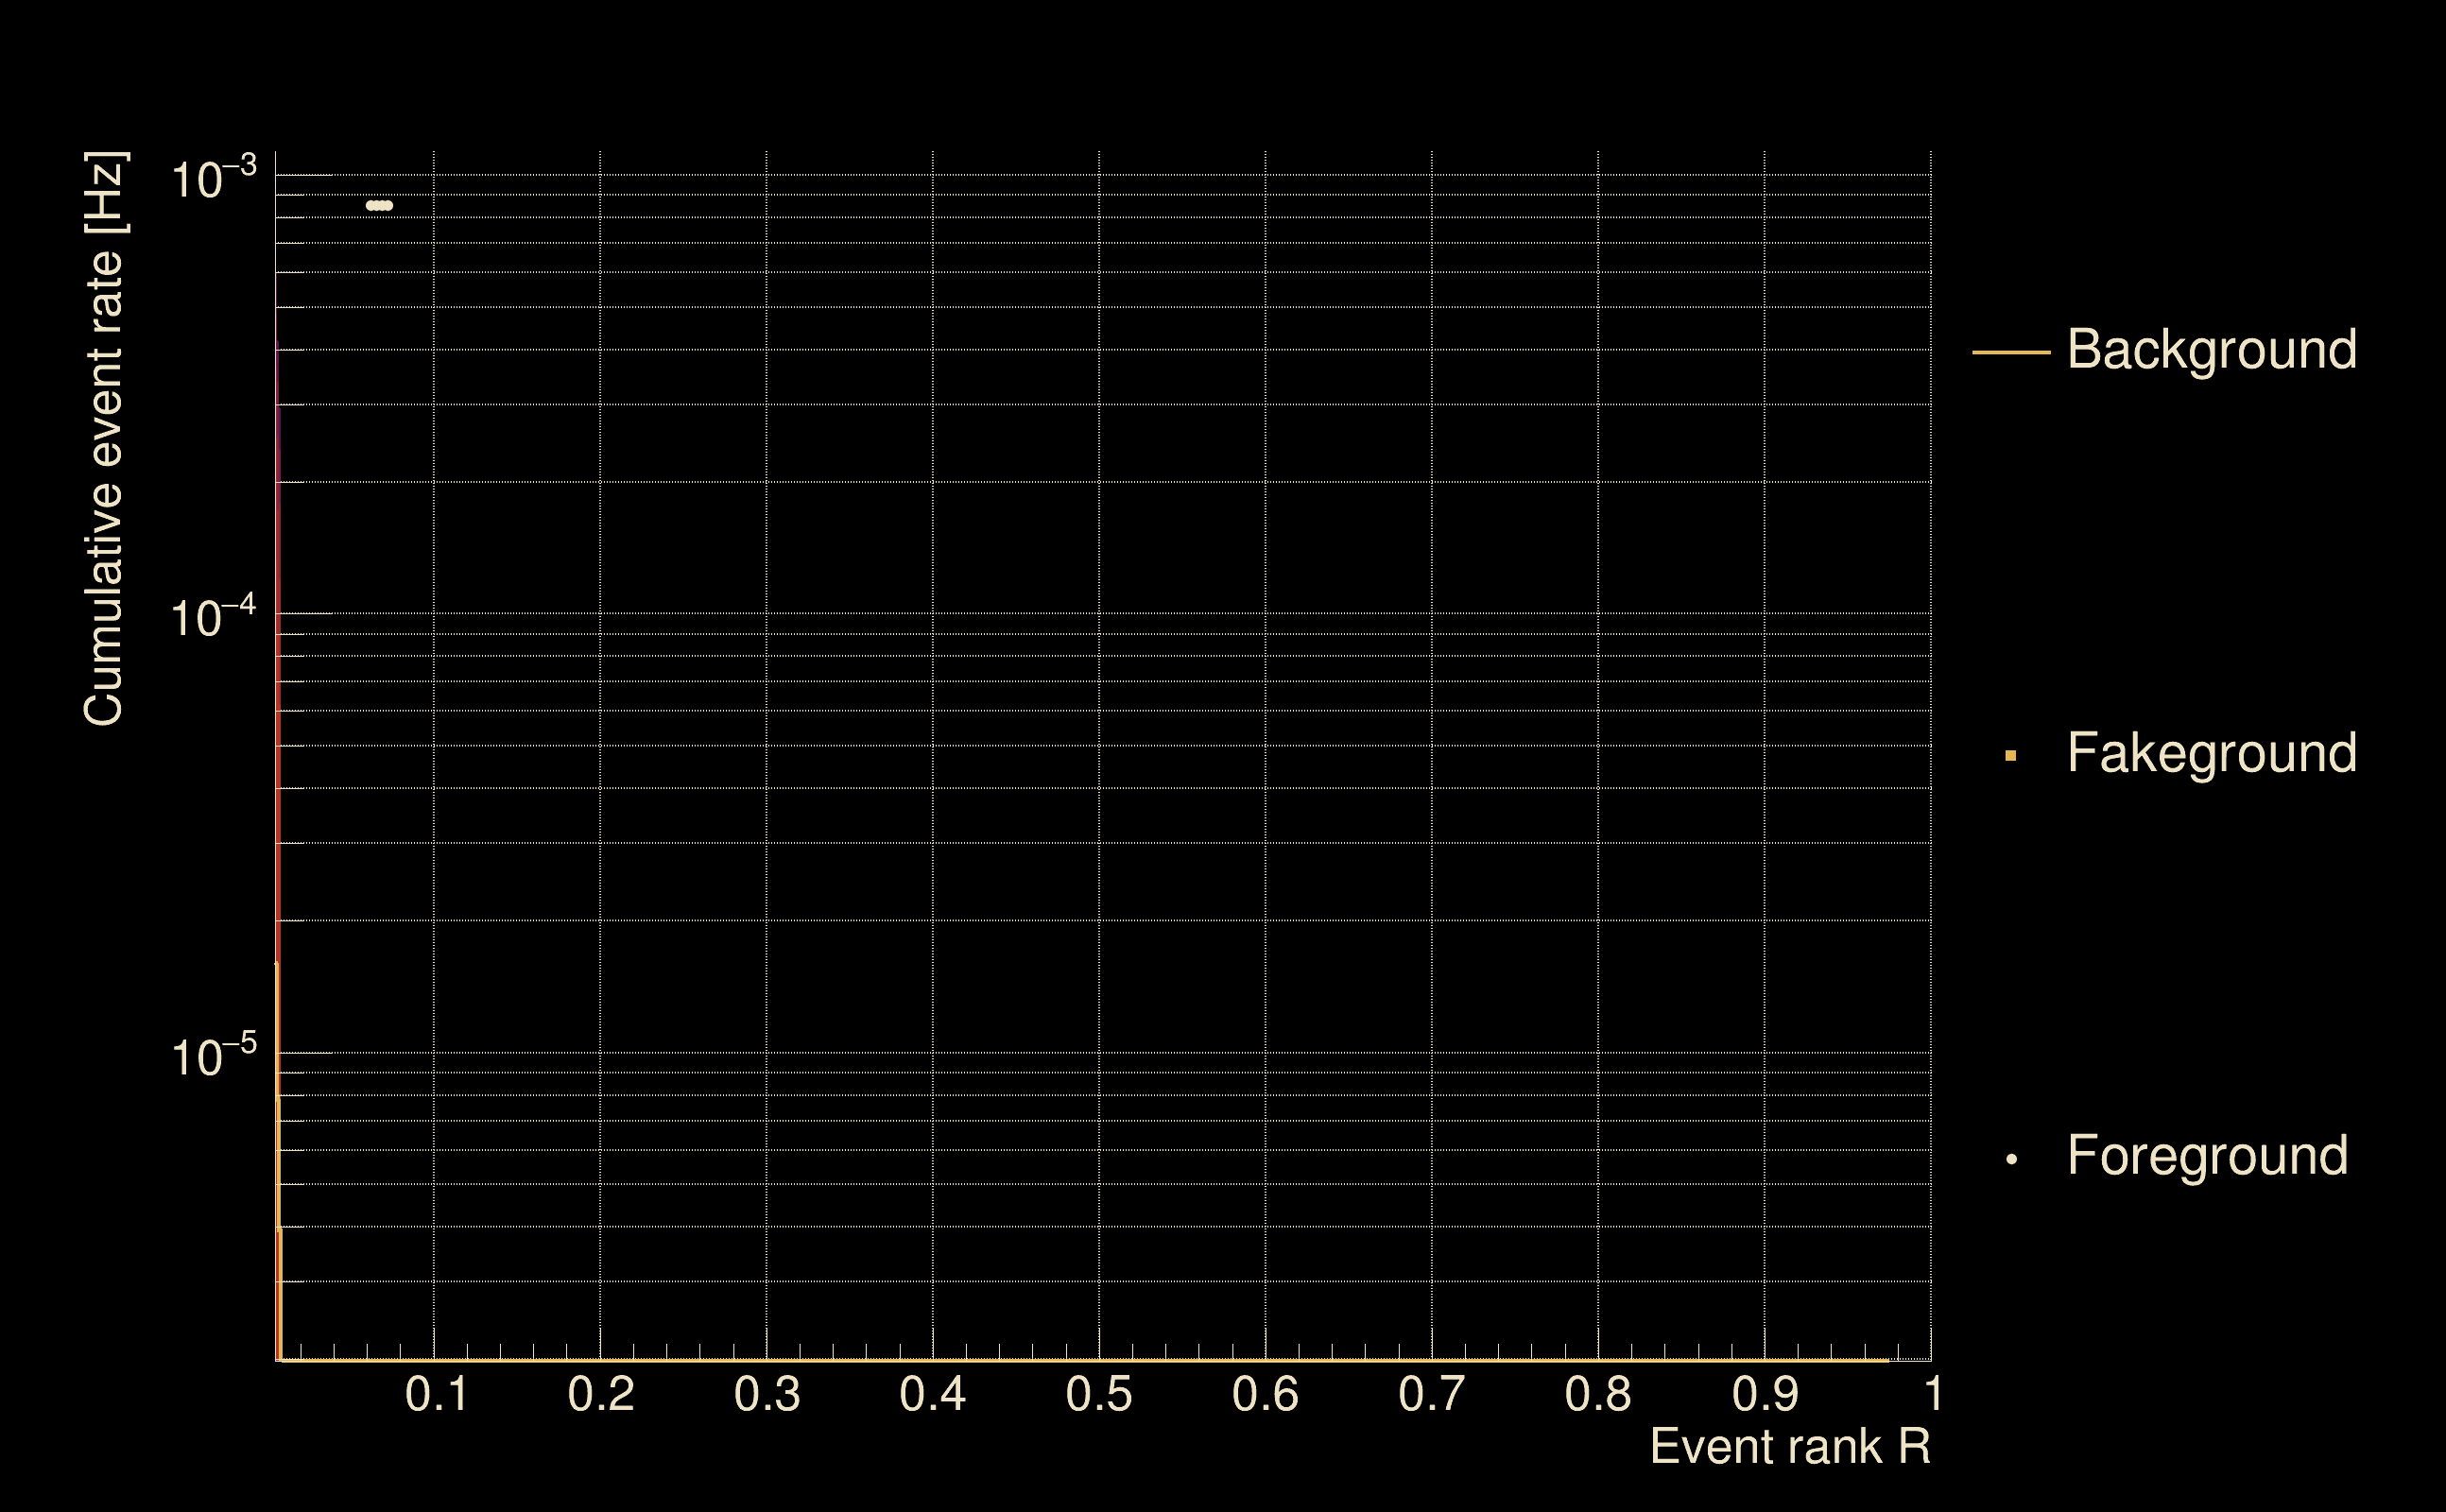
| Rank: | R_A = 0.0736493 |
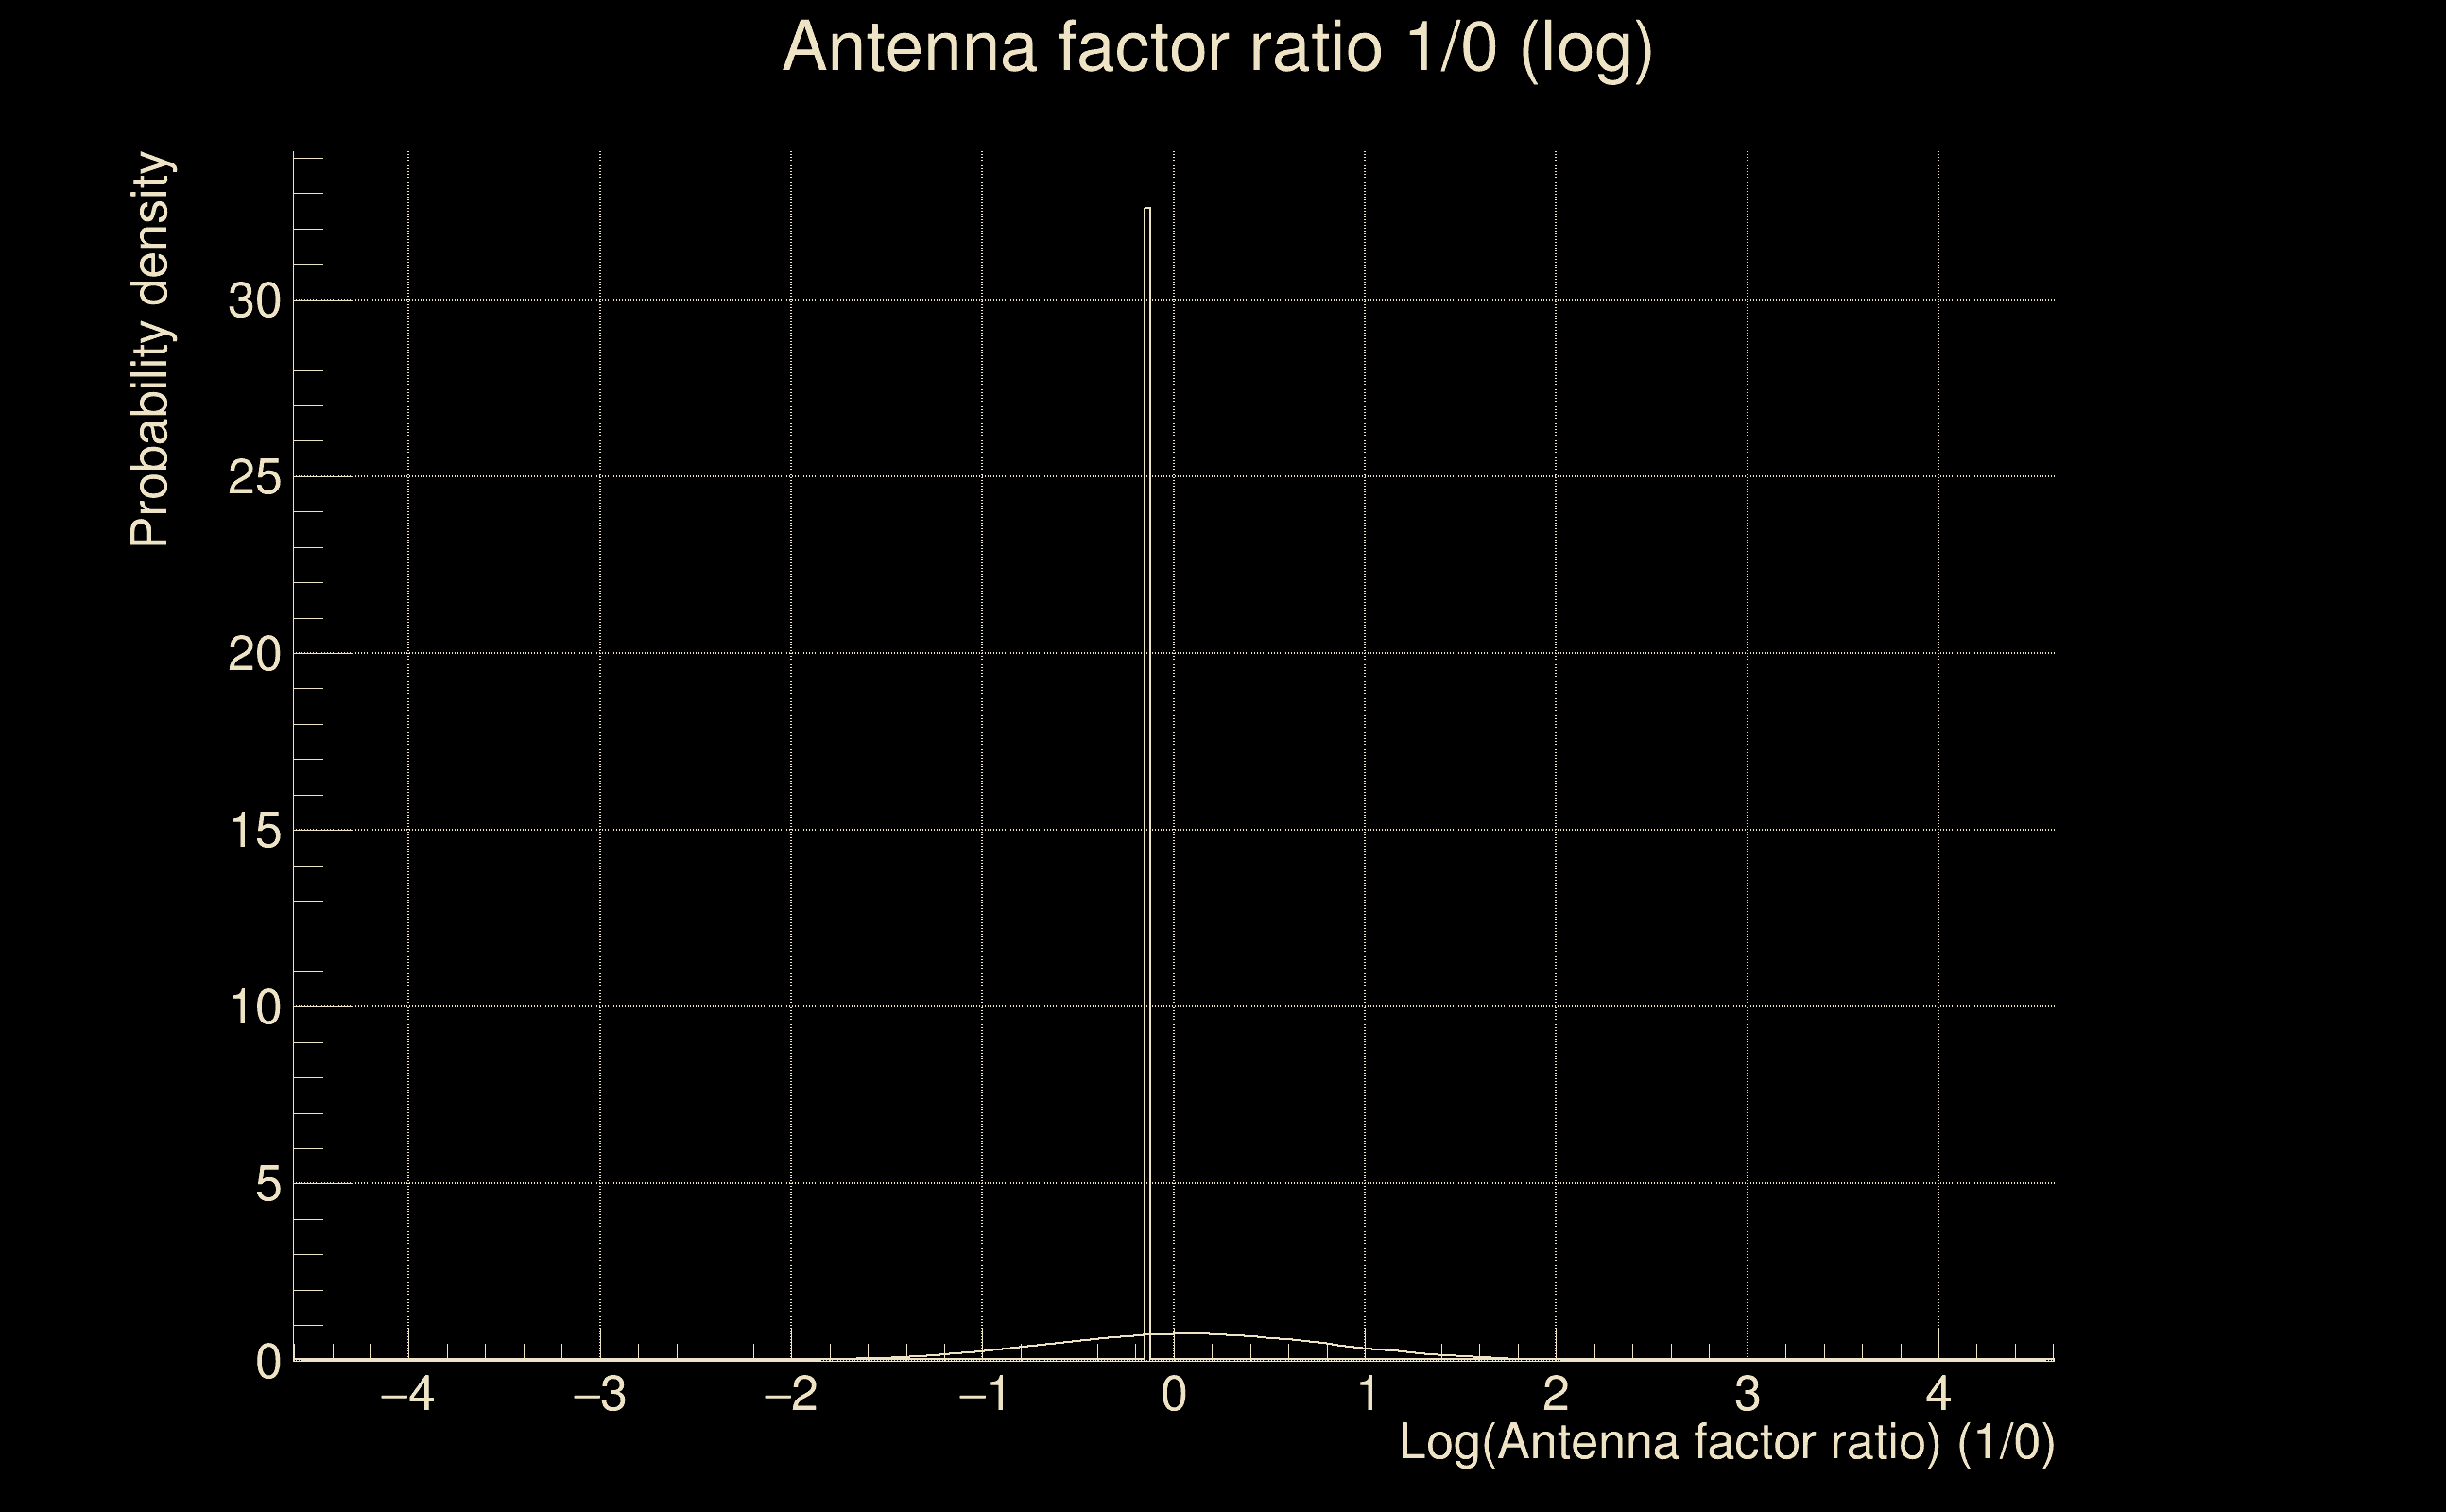
| Log of amplitude ratio (L1/H1): | 0.0560124, variance = 0.157857 (L1/H1: 0.0371298, variance = 0.311221, H1/L1: -0.0797951, variance = 0.312212) |
| Amplitude ratio (L1/H1): | 1.05761 ⋇ 1.48782 (L1/H1: 1.03783 ⋇ 1.74695, H1/L1: 0.923306 ⋇ 1.7485) |
| Amplitude ratio H1|L1 compatibility (probability): | 0.956907 |
| Antenna factor probability: | 0.608711 |
| Number of rejected frequency rows: | Q0: 10 / 18, Q1: 26 / 36, Q2: 60 / 70, Q3: 120 / 134, Q4: 240 / 258 |
| Maximum signal-to-noise ratio: | H1: 55.6248, L1: 49.5642 |
| SNR variance: | H1: 0.511045, L1: 0.504721 |
| Click here for a zoomed plot | Click here for a zoomed plot | Click here for a zoomed plot | Click here for a zoomed plot | Click here for a zoomed plot |
 |
 |
 |
 |
 |
 |
 |
 |
 |
 |
 |
 |
 |
 |
 |
 |
 |
 |
 |
 |
 |
 |
 |
 |
 |
 |
 |
 |
 |
| Event time t(H1): | GPS = 1368195728 (Mon May 15 14:21:50 2023 ) → GPS = 1368195738 (Mon May 15 14:22:00 2023 ) |
| Event time t(L1): | GPS = 1368195728 (Mon May 15 14:22:00 2023 ) → GPS = 1368195738 (Mon May 15 14:22:00 2023 ) |
| Omicron analysis time window (H1): | GPS = 1368195725 → GPS = 1368195741 |
| Omicron analysis time window (L1): | GPS = 1368195725 → GPS = 1368195741 |
| Time delay between detectors t(L1) - t(H1): | 0.00542288 s (slice index = 108 / 217), δt_gw = 0.00542288 s |
| Time delay standard deviation: | 0.0643865 s |
| [targeted mode] Time delay probability: | 0.438507 (0.774718 sigmas), δt_target = 0.00863504 s |
| Frequency: | 91.5144 Hz |
| Ξ: | 0.229516 ± 0.0192934 (variance = 0.000372234): Q0: 0.905808, Q1: 0.938029, Q2: 0.904029, Q3: 0.954736, Q4: 0.926628 |
| Rank: | R_A = 0.0593792 |
| Log of amplitude ratio (L1/H1): | 0.0541513, variance = 0.155304 (L1/H1: 0.0405205, variance = 0.306913, H1/L1: -0.0715706, variance = 0.304646) |
| Amplitude ratio (L1/H1): | 1.05564 ⋇ 1.48303 (L1/H1: 1.04135 ⋇ 1.7402, H1/L1: 0.930931 ⋇ 1.73663) |
| Amplitude ratio H1|L1 compatibility (probability): | 0.968328 |
| Antenna factor probability: | 0.609288 |
| Number of rejected frequency rows: | Q0: 12 / 18, Q1: 29 / 36, Q2: 57 / 70, Q3: 124 / 134, Q4: 241 / 258 |
| Maximum signal-to-noise ratio: | H1: 55.5221, L1: 49.1146 |
| SNR variance: | H1: 1.59039, L1: 1.46189 |
| Event time t(H1): | GPS = 1368195303 (Mon May 15 14:14:45 2023 ) → GPS = 1368195313 (Mon May 15 14:14:55 2023 ) |
| Event time t(L1): | GPS = 1368195303 (Mon May 15 14:14:55 2023 ) → GPS = 1368195313 (Mon May 15 14:14:55 2023 ) |
| Omicron analysis time window (H1): | GPS = 1368195300 → GPS = 1368195316 |
| Omicron analysis time window (L1): | GPS = 1368195300 → GPS = 1368195316 |
| Time delay between detectors t(L1) - t(H1): | 0.00208508 s (slice index = 108 / 217), δt_gw = 0.00208508 s |
| Time delay standard deviation: | 0.0763103 s |
| [targeted mode] Time delay probability: | 0.257084 (1.13331 sigmas), δt_target = 0.00863504 s |
| Frequency: | 82.2053 Hz |
| Ξ: | 0.0845625 ± 0.0995341 (variance = 0.00990703): Q0: 0.634358, Q1: 0.789028, Q2: 0.874548, Q3: 0.899686, Q4: 0.889433 |
| Rank: | R_A = 0.00686026 |
| Log of amplitude ratio (L1/H1): | 0.176431, variance = 0.173601 (L1/H1: 0.318865, variance = 0.333742, H1/L1: -0.0497092, variance = 0.355742) |
| Amplitude ratio (L1/H1): | 1.19295 ⋇ 1.51688 (L1/H1: 1.37557 ⋇ 1.78194, H1/L1: 0.951506 ⋇ 1.81565) |
| Amplitude ratio H1|L1 compatibility (probability): | 0.745827 |
| Antenna factor probability: | 0.423105 |
| Number of rejected frequency rows: | Q0: 15 / 18, Q1: 32 / 36, Q2: 68 / 70, Q3: 126 / 134, Q4: 247 / 258 |
| Maximum signal-to-noise ratio: | H1: 11.8321, L1: 12.5442 |
| SNR variance: | H1: 0.492972, L1: 0.487528 |
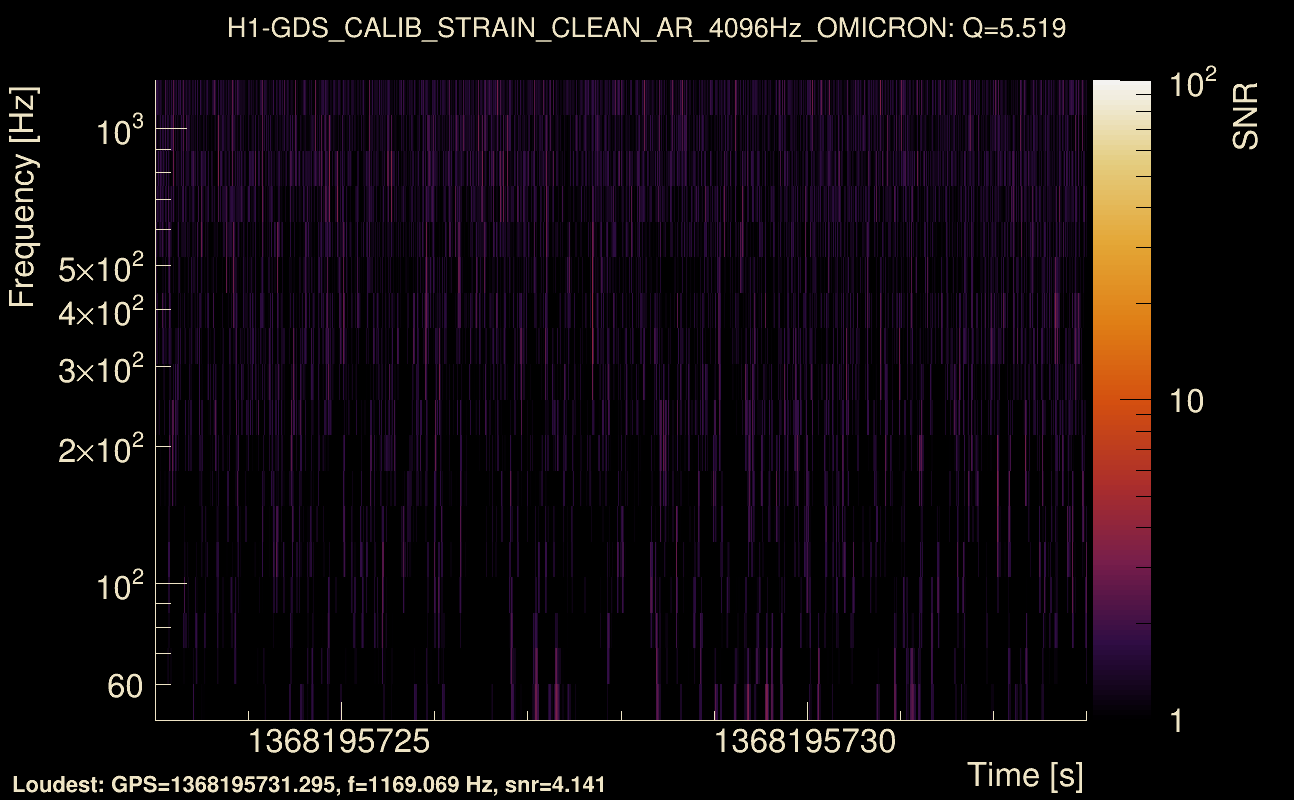
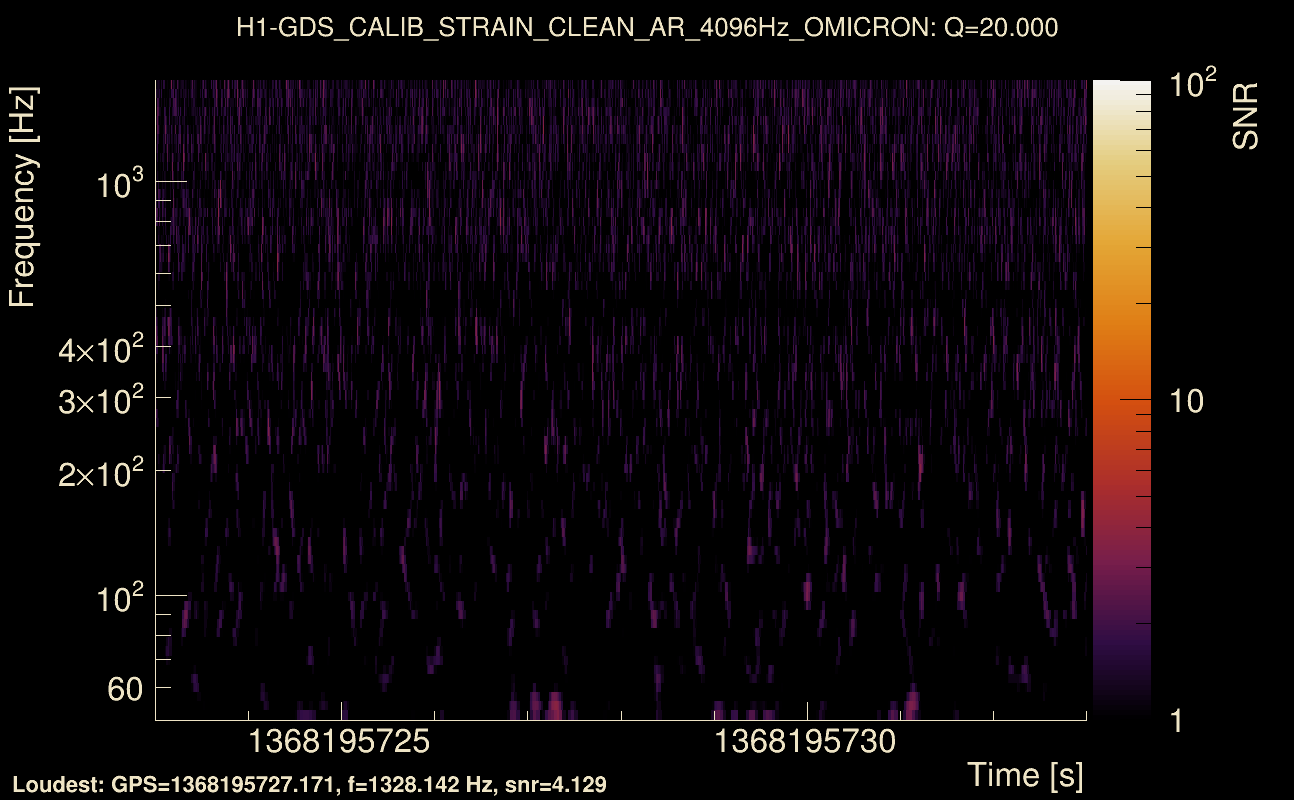
| Event time t(H1): | GPS = 1368195723 (Mon May 15 14:21:45 2023 ) → GPS = 1368195733 (Mon May 15 14:21:55 2023 ) |
| Event time t(L1): | GPS = 1368195723 (Mon May 15 14:21:55 2023 ) → GPS = 1368195733 (Mon May 15 14:21:55 2023 ) |
| Omicron analysis time window (H1): | GPS = 1368195720 → GPS = 1368195736 |
| Omicron analysis time window (L1): | GPS = 1368195720 → GPS = 1368195736 |
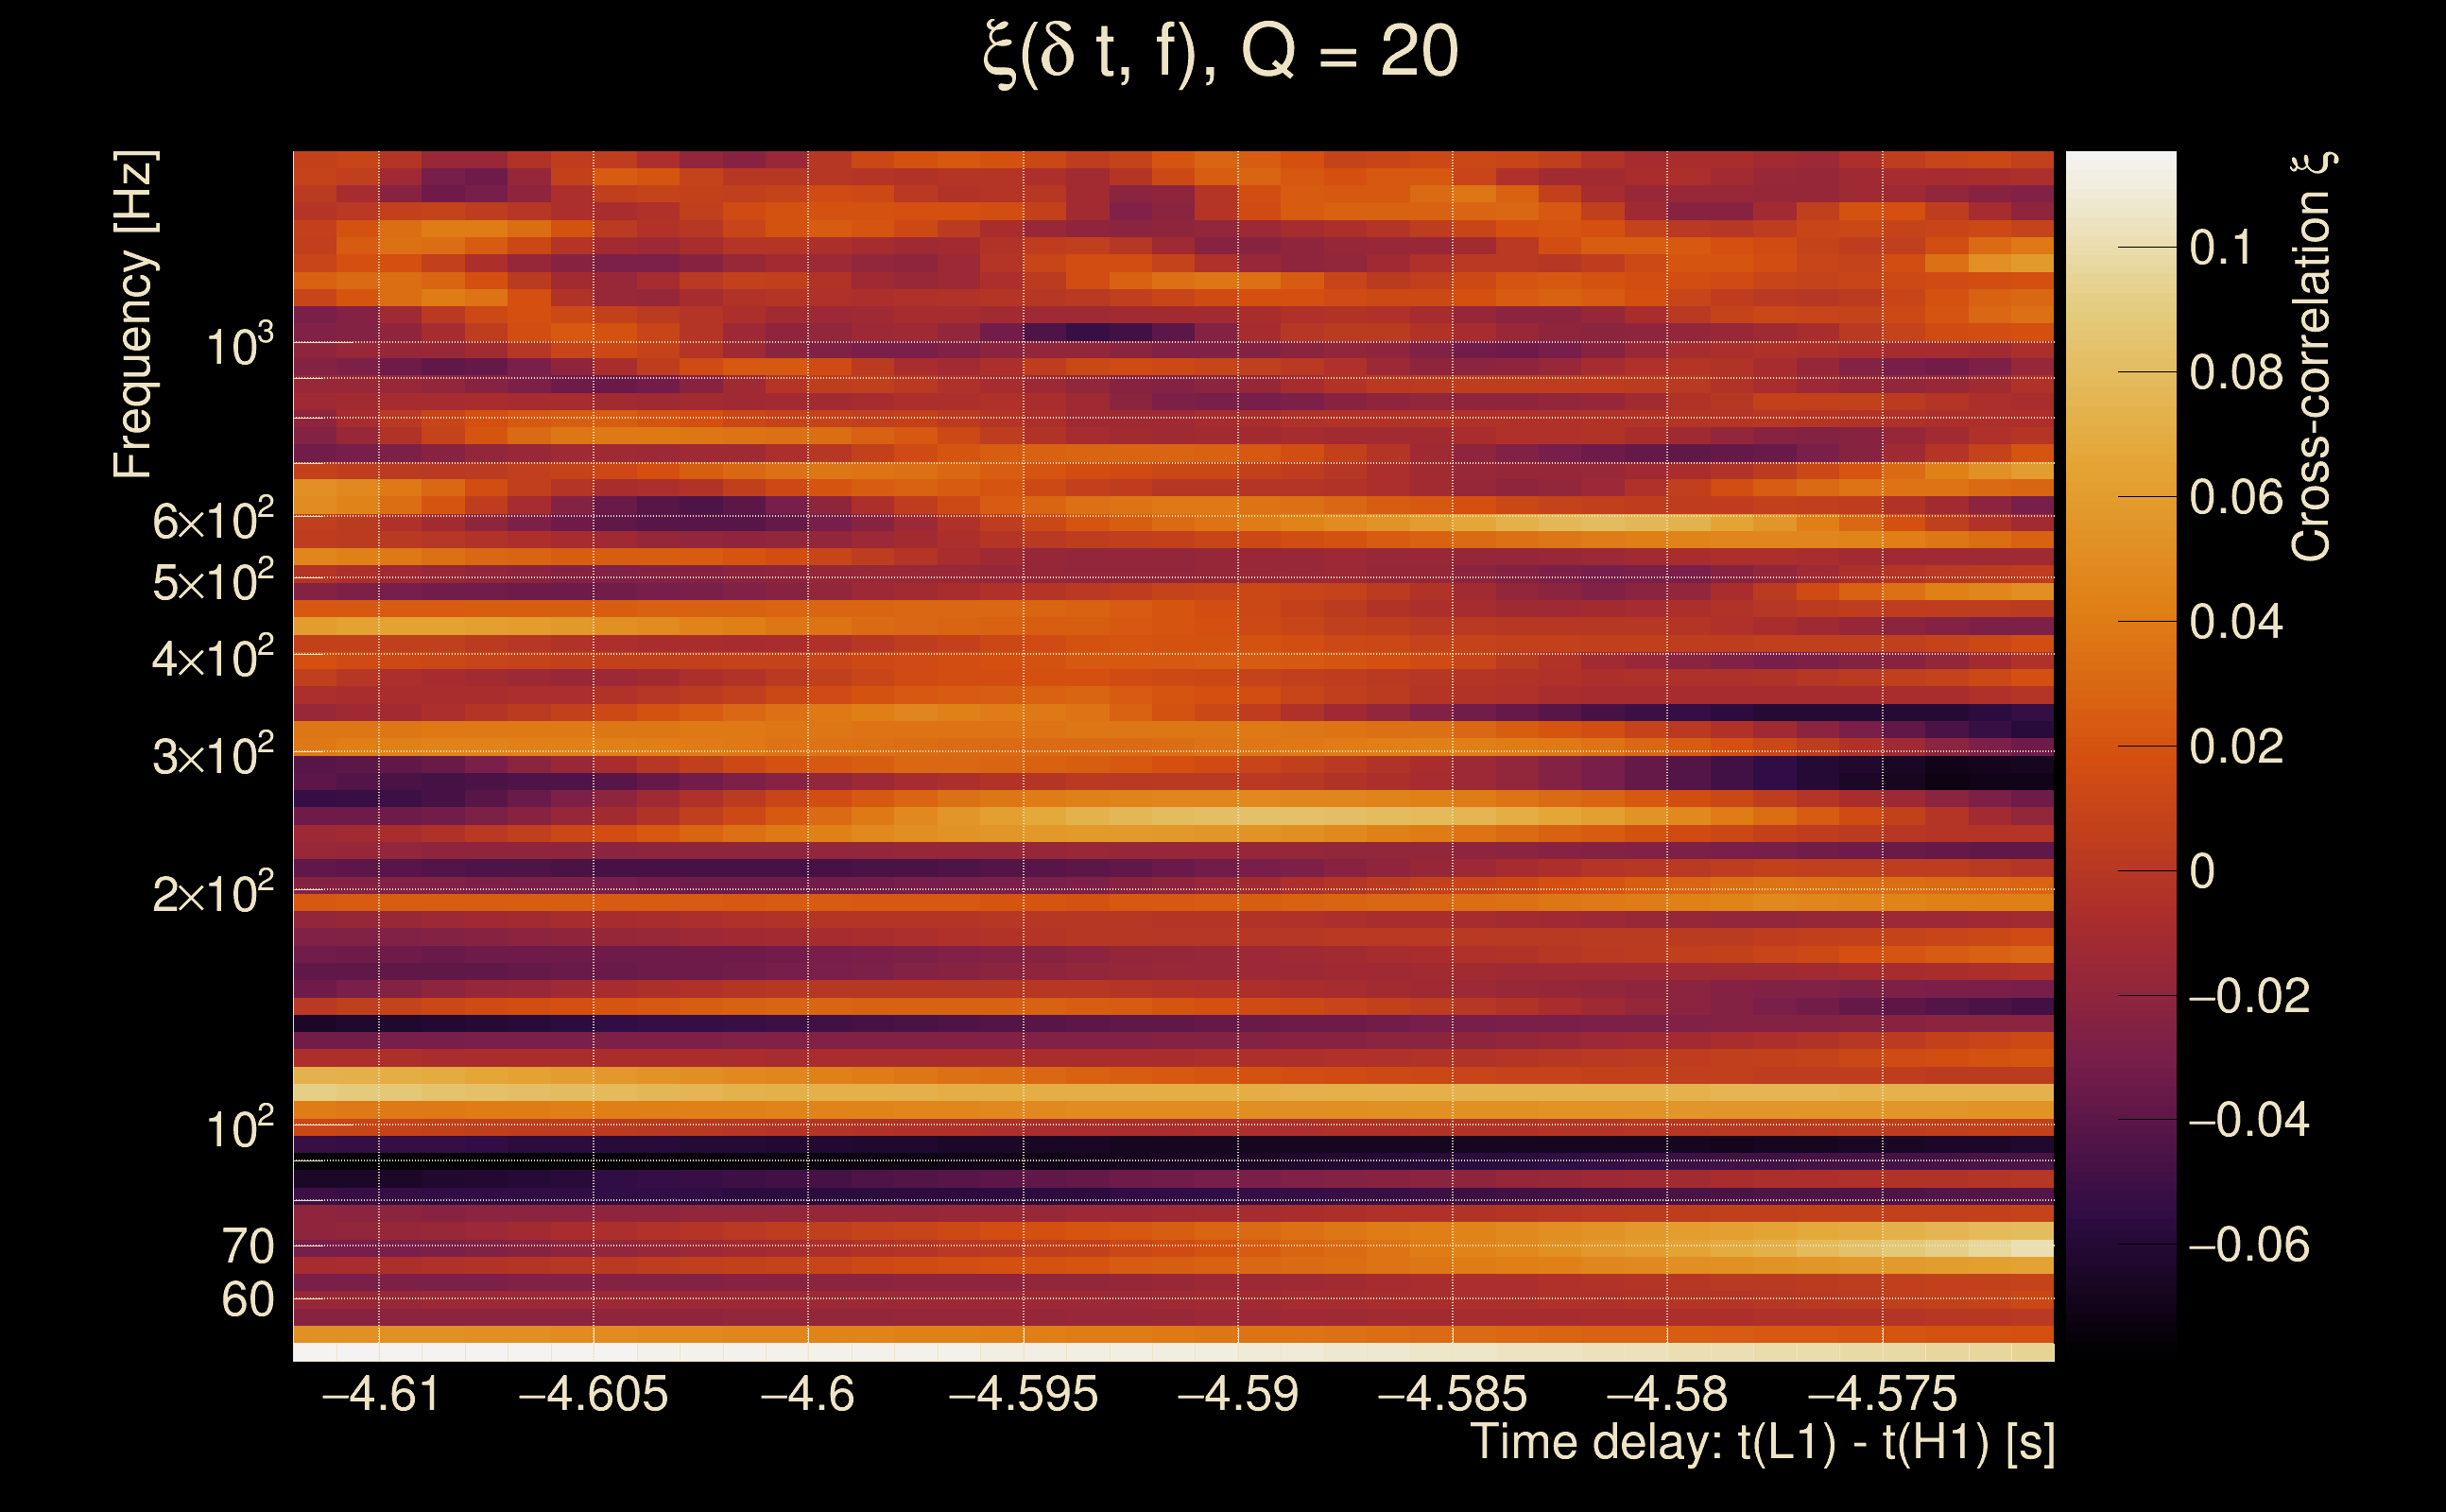
| Time delay between detectors t(L1) - t(H1): | -4.59171 s (slice index = 208 / 217), δt_gw = 0.00829081 s |
| Time delay standard deviation: | 0.0724699 s |
| [targeted mode] Time delay probability: | 0.94774 (0.065545 sigmas), δt_target = 0.00863504 s |
| Frequency: | 296.008 Hz |
| Ξ: | 0.00727913 ± 0.0497669 (variance = 0.00247675): Q0: 0.0437882, Q1: 0.0395394, Q2: 0.0310076, Q3: 0.141395, Q4: 0.137234 |
| Rank: | R_A = 0.00128804 |
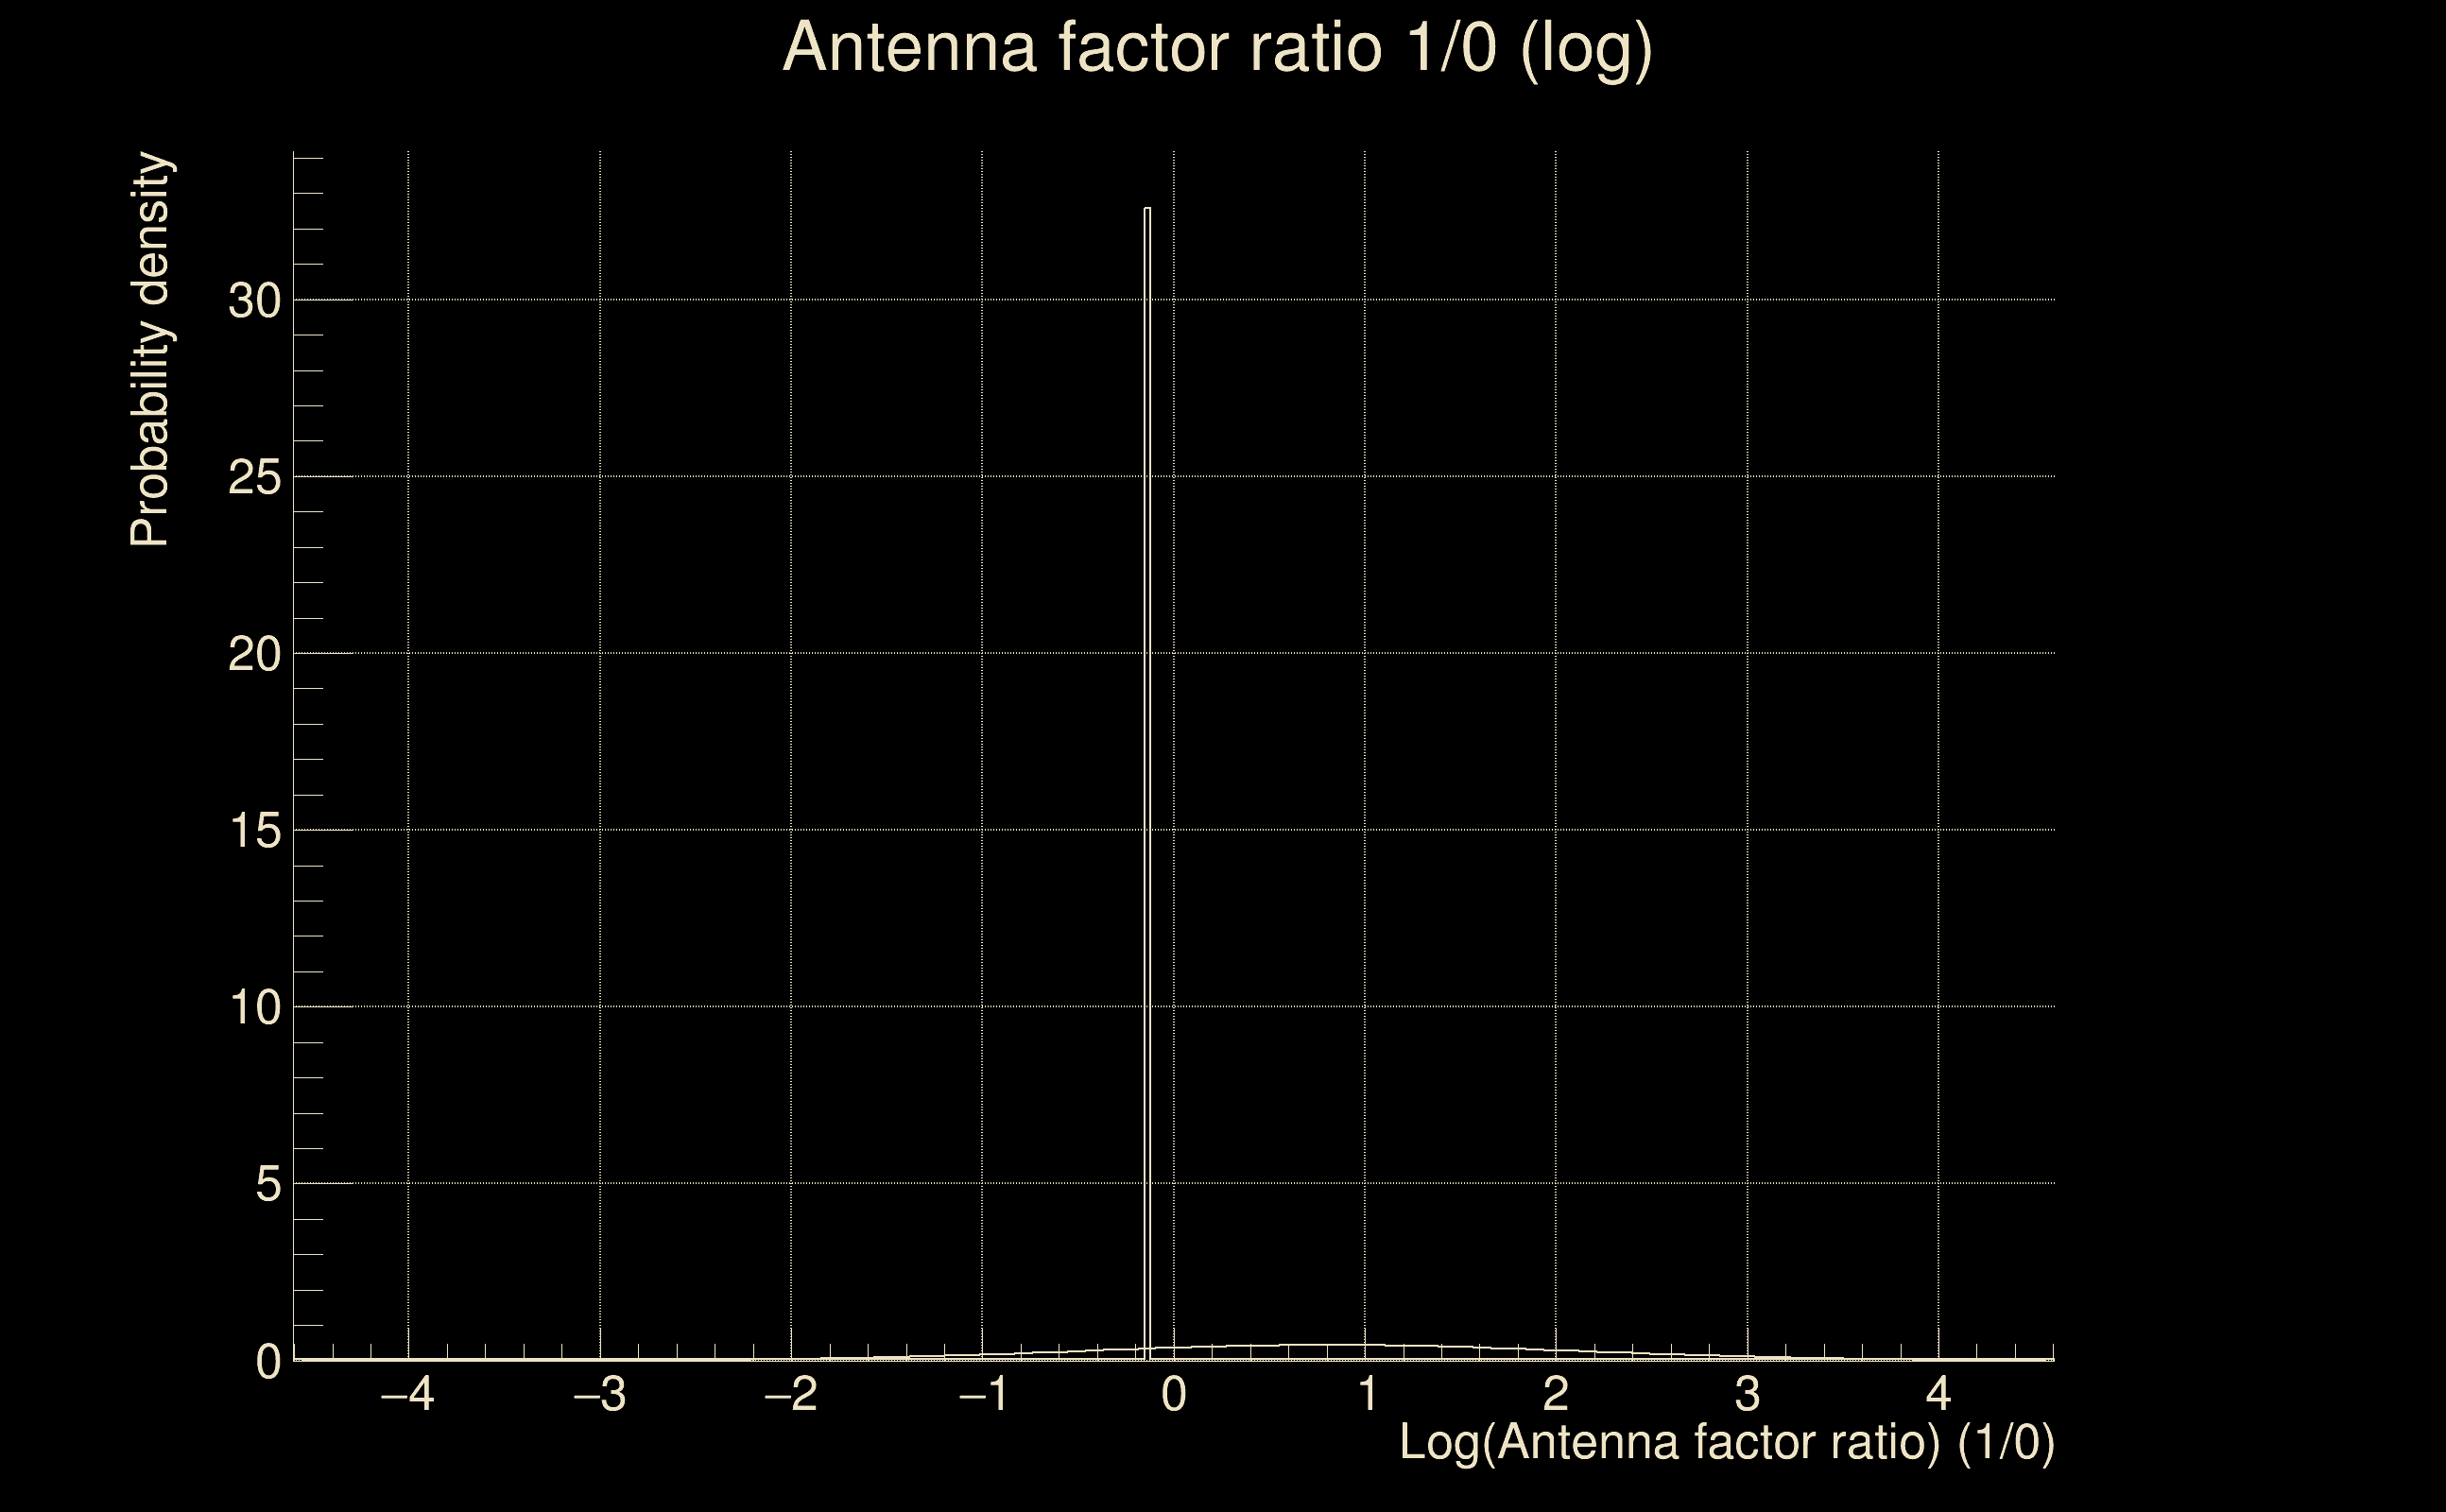
| Log of amplitude ratio (L1/H1): | 0.0745554, variance = 0.426088 (L1/H1: -0.58691, variance = 0.776922, H1/L1: -0.907678, variance = 0.942862) |
| Amplitude ratio (L1/H1): | 1.07741 ⋇ 1.92082 (L1/H1: 0.556043 ⋇ 2.41435, H1/L1: 0.40346 ⋇ 2.64061) |
| Amplitude ratio H1|L1 compatibility (probability): | 0.254418 |
| Antenna factor probability: | 0.733861 |
| Number of rejected frequency rows: | Q0: 14 / 18, Q1: 32 / 36, Q2: 66 / 70, Q3: 123 / 134, Q4: 249 / 258 |
| Maximum signal-to-noise ratio: | H1: 55.6248, L1: 49.5642 |
| SNR variance: | H1: 0.511045, L1: 0.504721 |
| Click here for a zoomed plot | Click here for a zoomed plot | Click here for a zoomed plot | Click here for a zoomed plot | Click here for a zoomed plot |
|
|
|
|
|
|
|
|
|
|
|
|
|
|
|
|
|
|
|
|
|
|
|
|
|
 |
 |
 |
 |
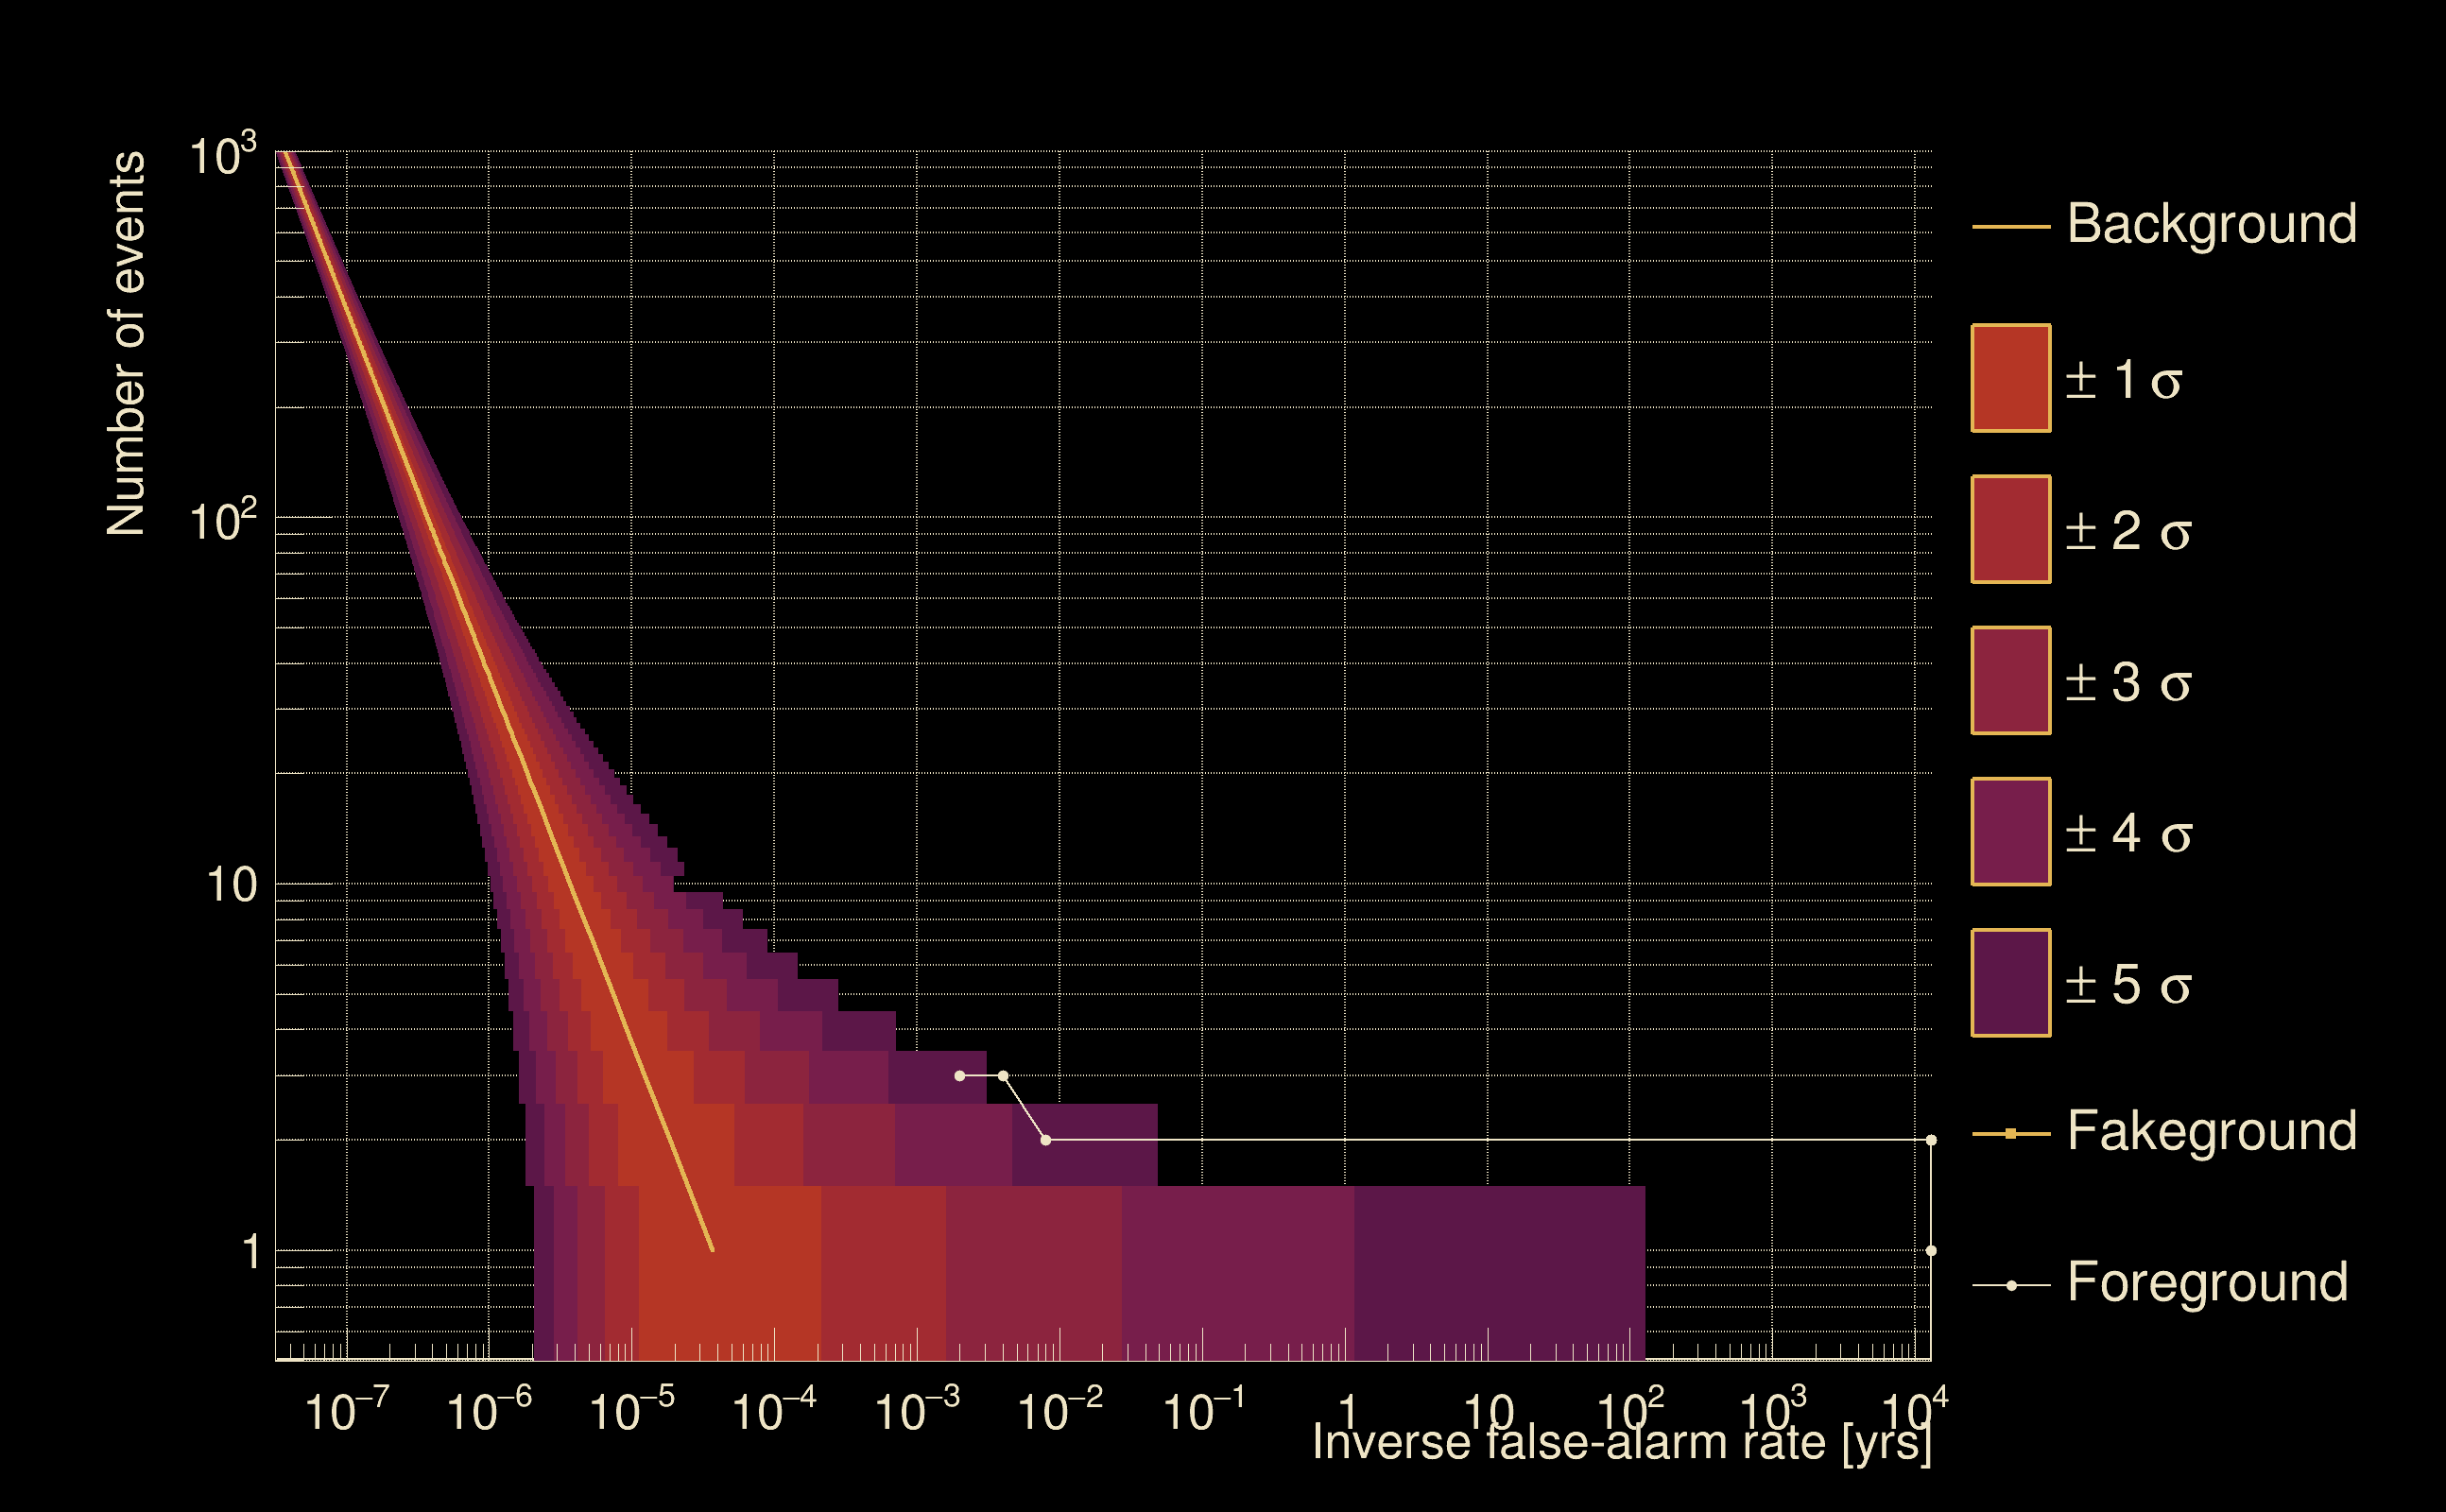
| Detection threshold: | R > 0.00784711 |
| False-alarm rate above that detection threshold: | 1.98768e-06 |
| Alternative threshold at 1/1000 yrs: | R > 0.00784711 |
| Alternative threshold at 1/100 yrs: | R > 0.00784711 |
| Alternative threshold at 1/10 yrs: | R > 0.00784711 |
| Alternative threshold at 1/1 yr: | R > 0.00784711 |
| Alternative threshold at 1/1 d: | R > 0.00585254 |
 |
|
 |
 |
 |
 |
 |
 |
 |
 |
 |
 |
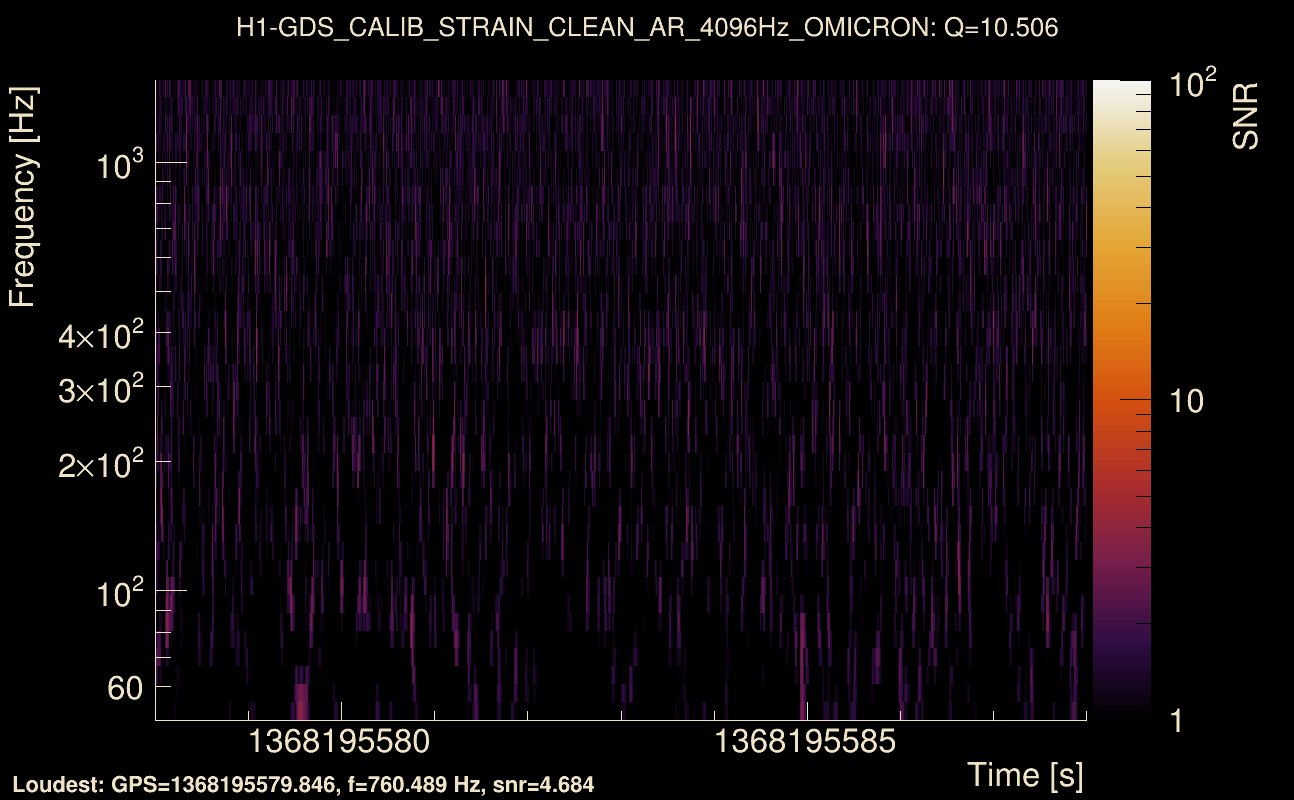
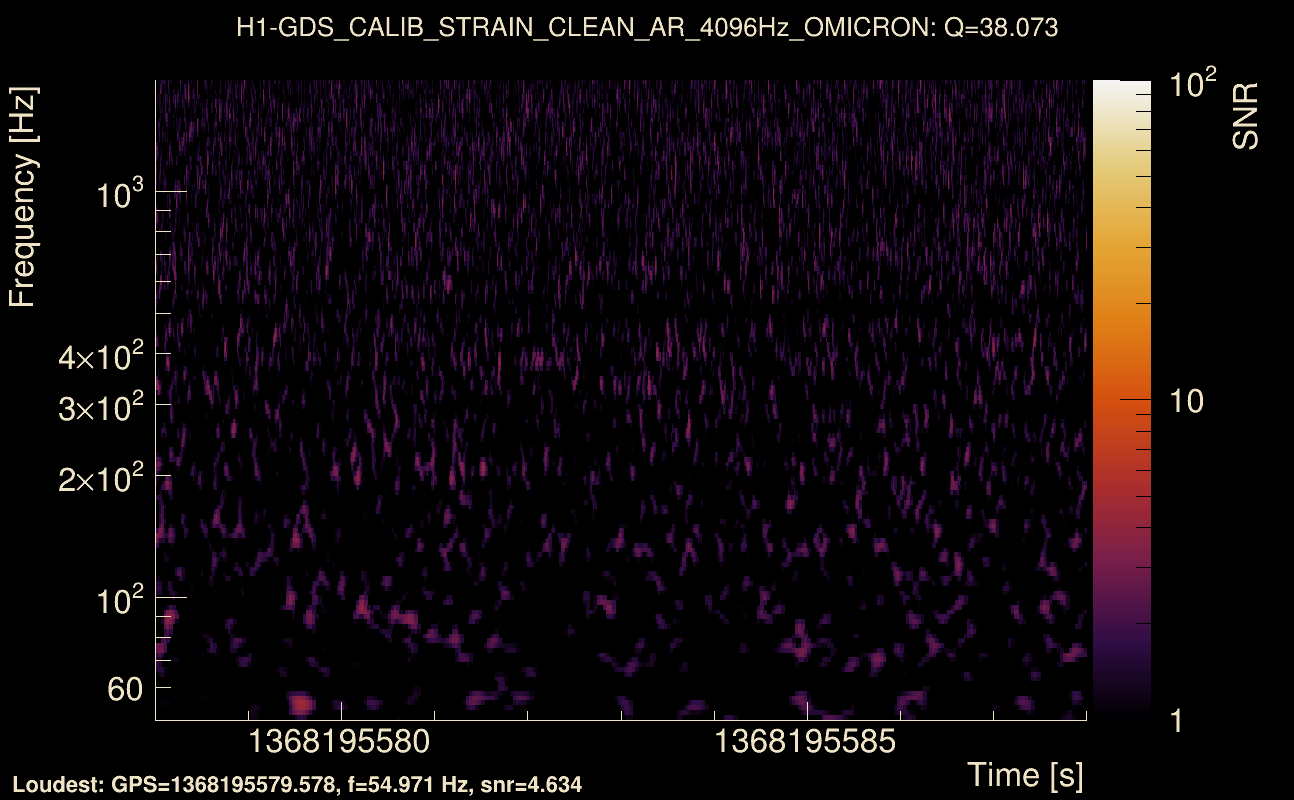
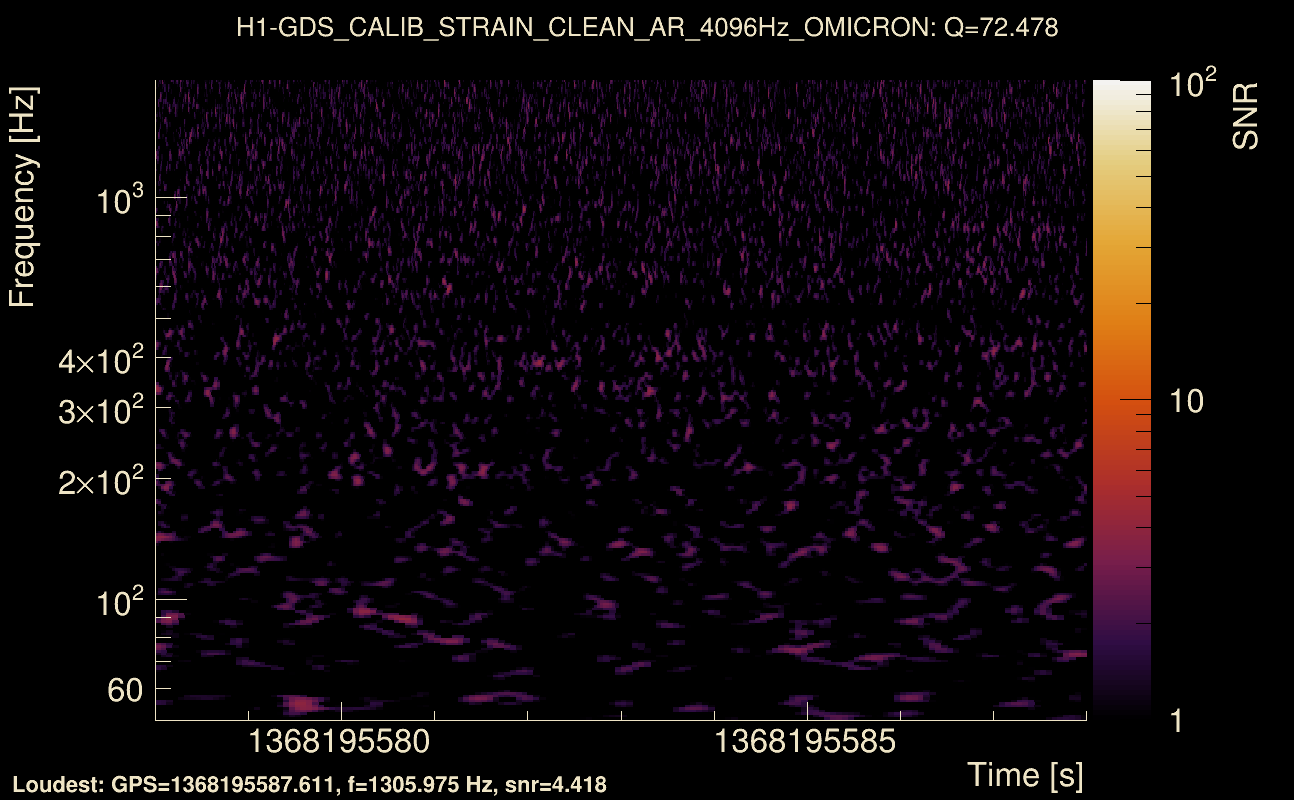
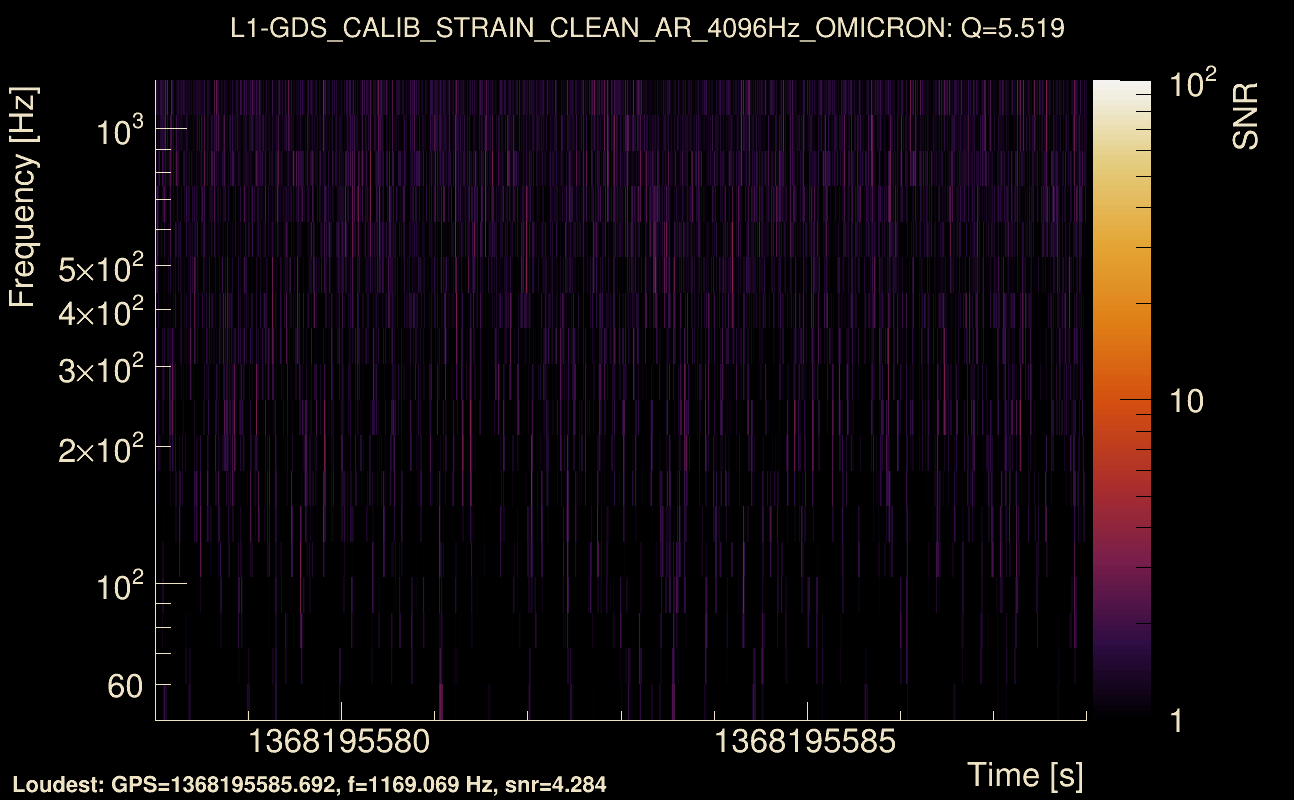
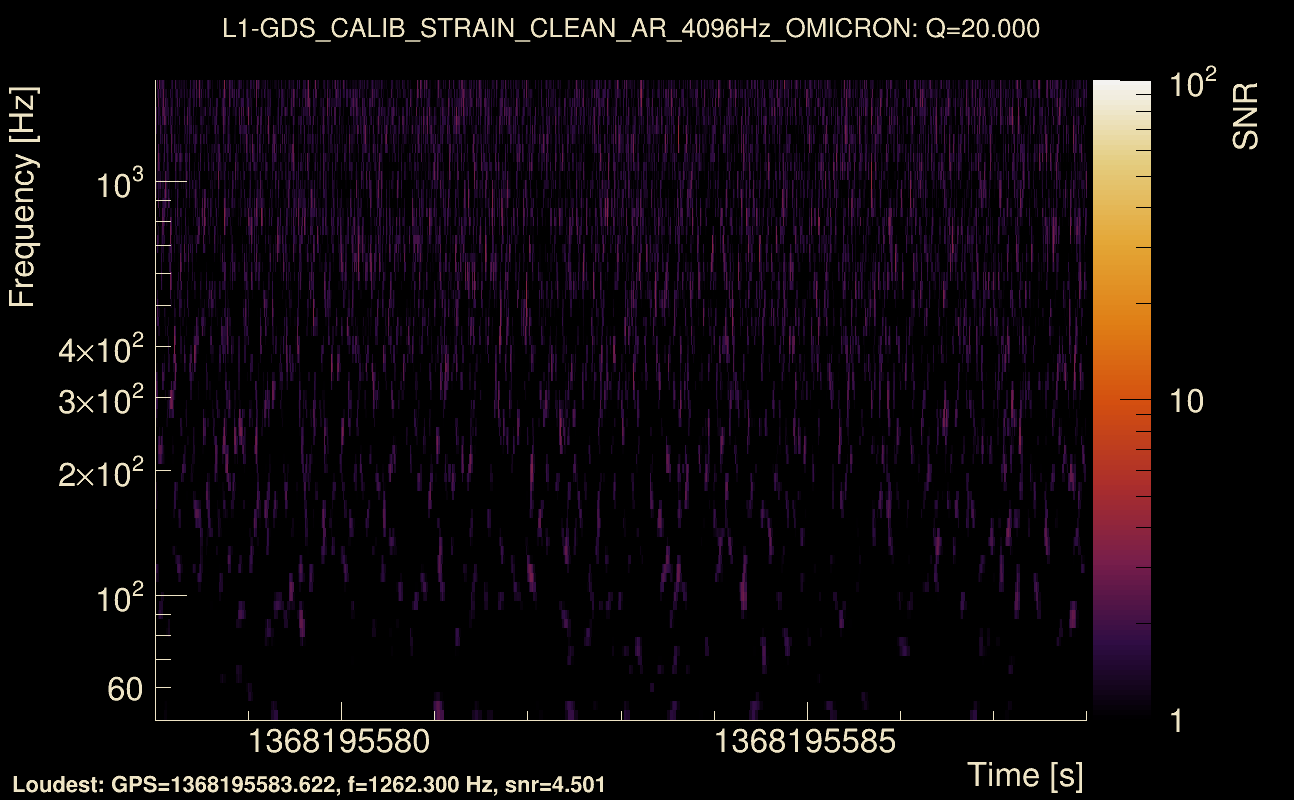
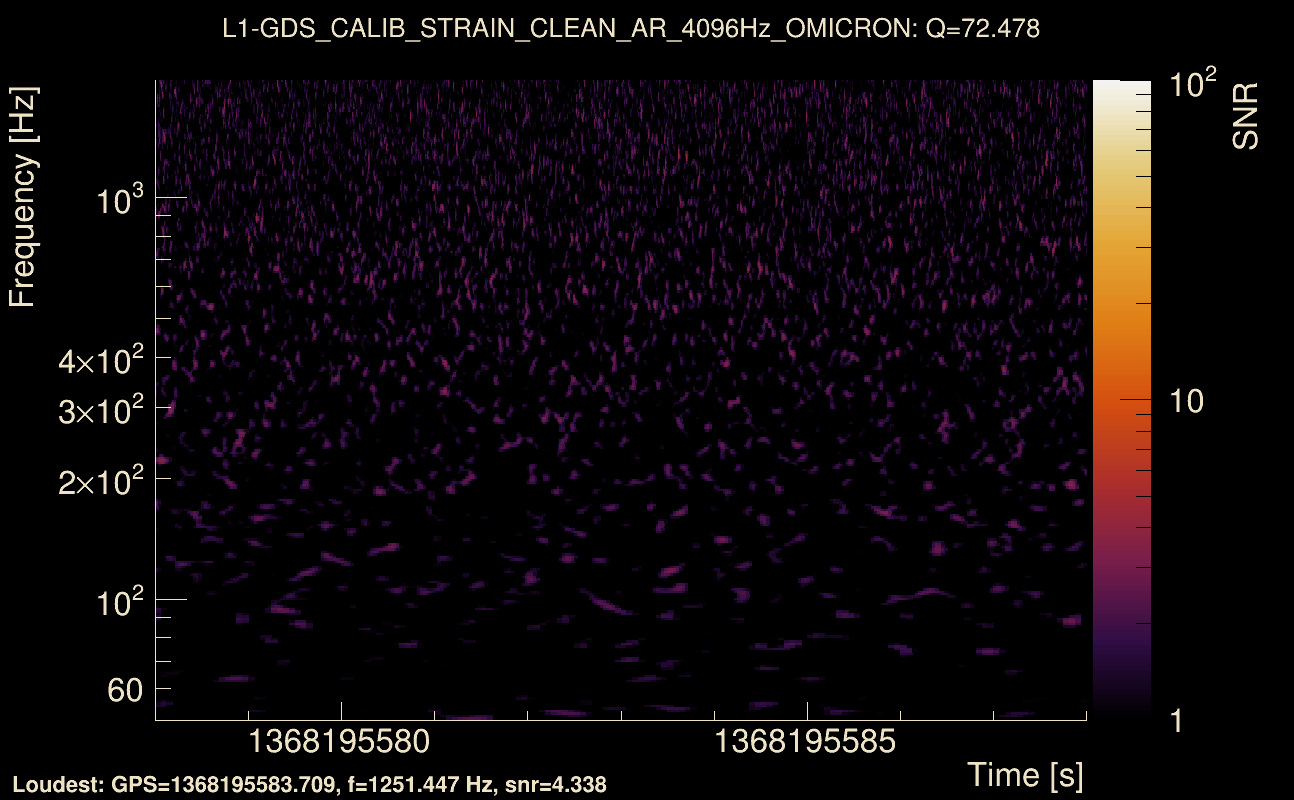
| Event time t(H1): | GPS = 1368195578 (Mon May 15 14:19:20 2023 ) → GPS = 1368195588 (Mon May 15 14:19:30 2023 ) |
| Event time t(L1): | GPS = 1368195578 (Mon May 15 14:19:30 2023 ) → GPS = 1368195588 (Mon May 15 14:19:30 2023 ) |
| Omicron analysis time window (H1): | GPS = 1368195575 → GPS = 1368195591 |
| Omicron analysis time window (L1): | GPS = 1368195575 → GPS = 1368195591 |
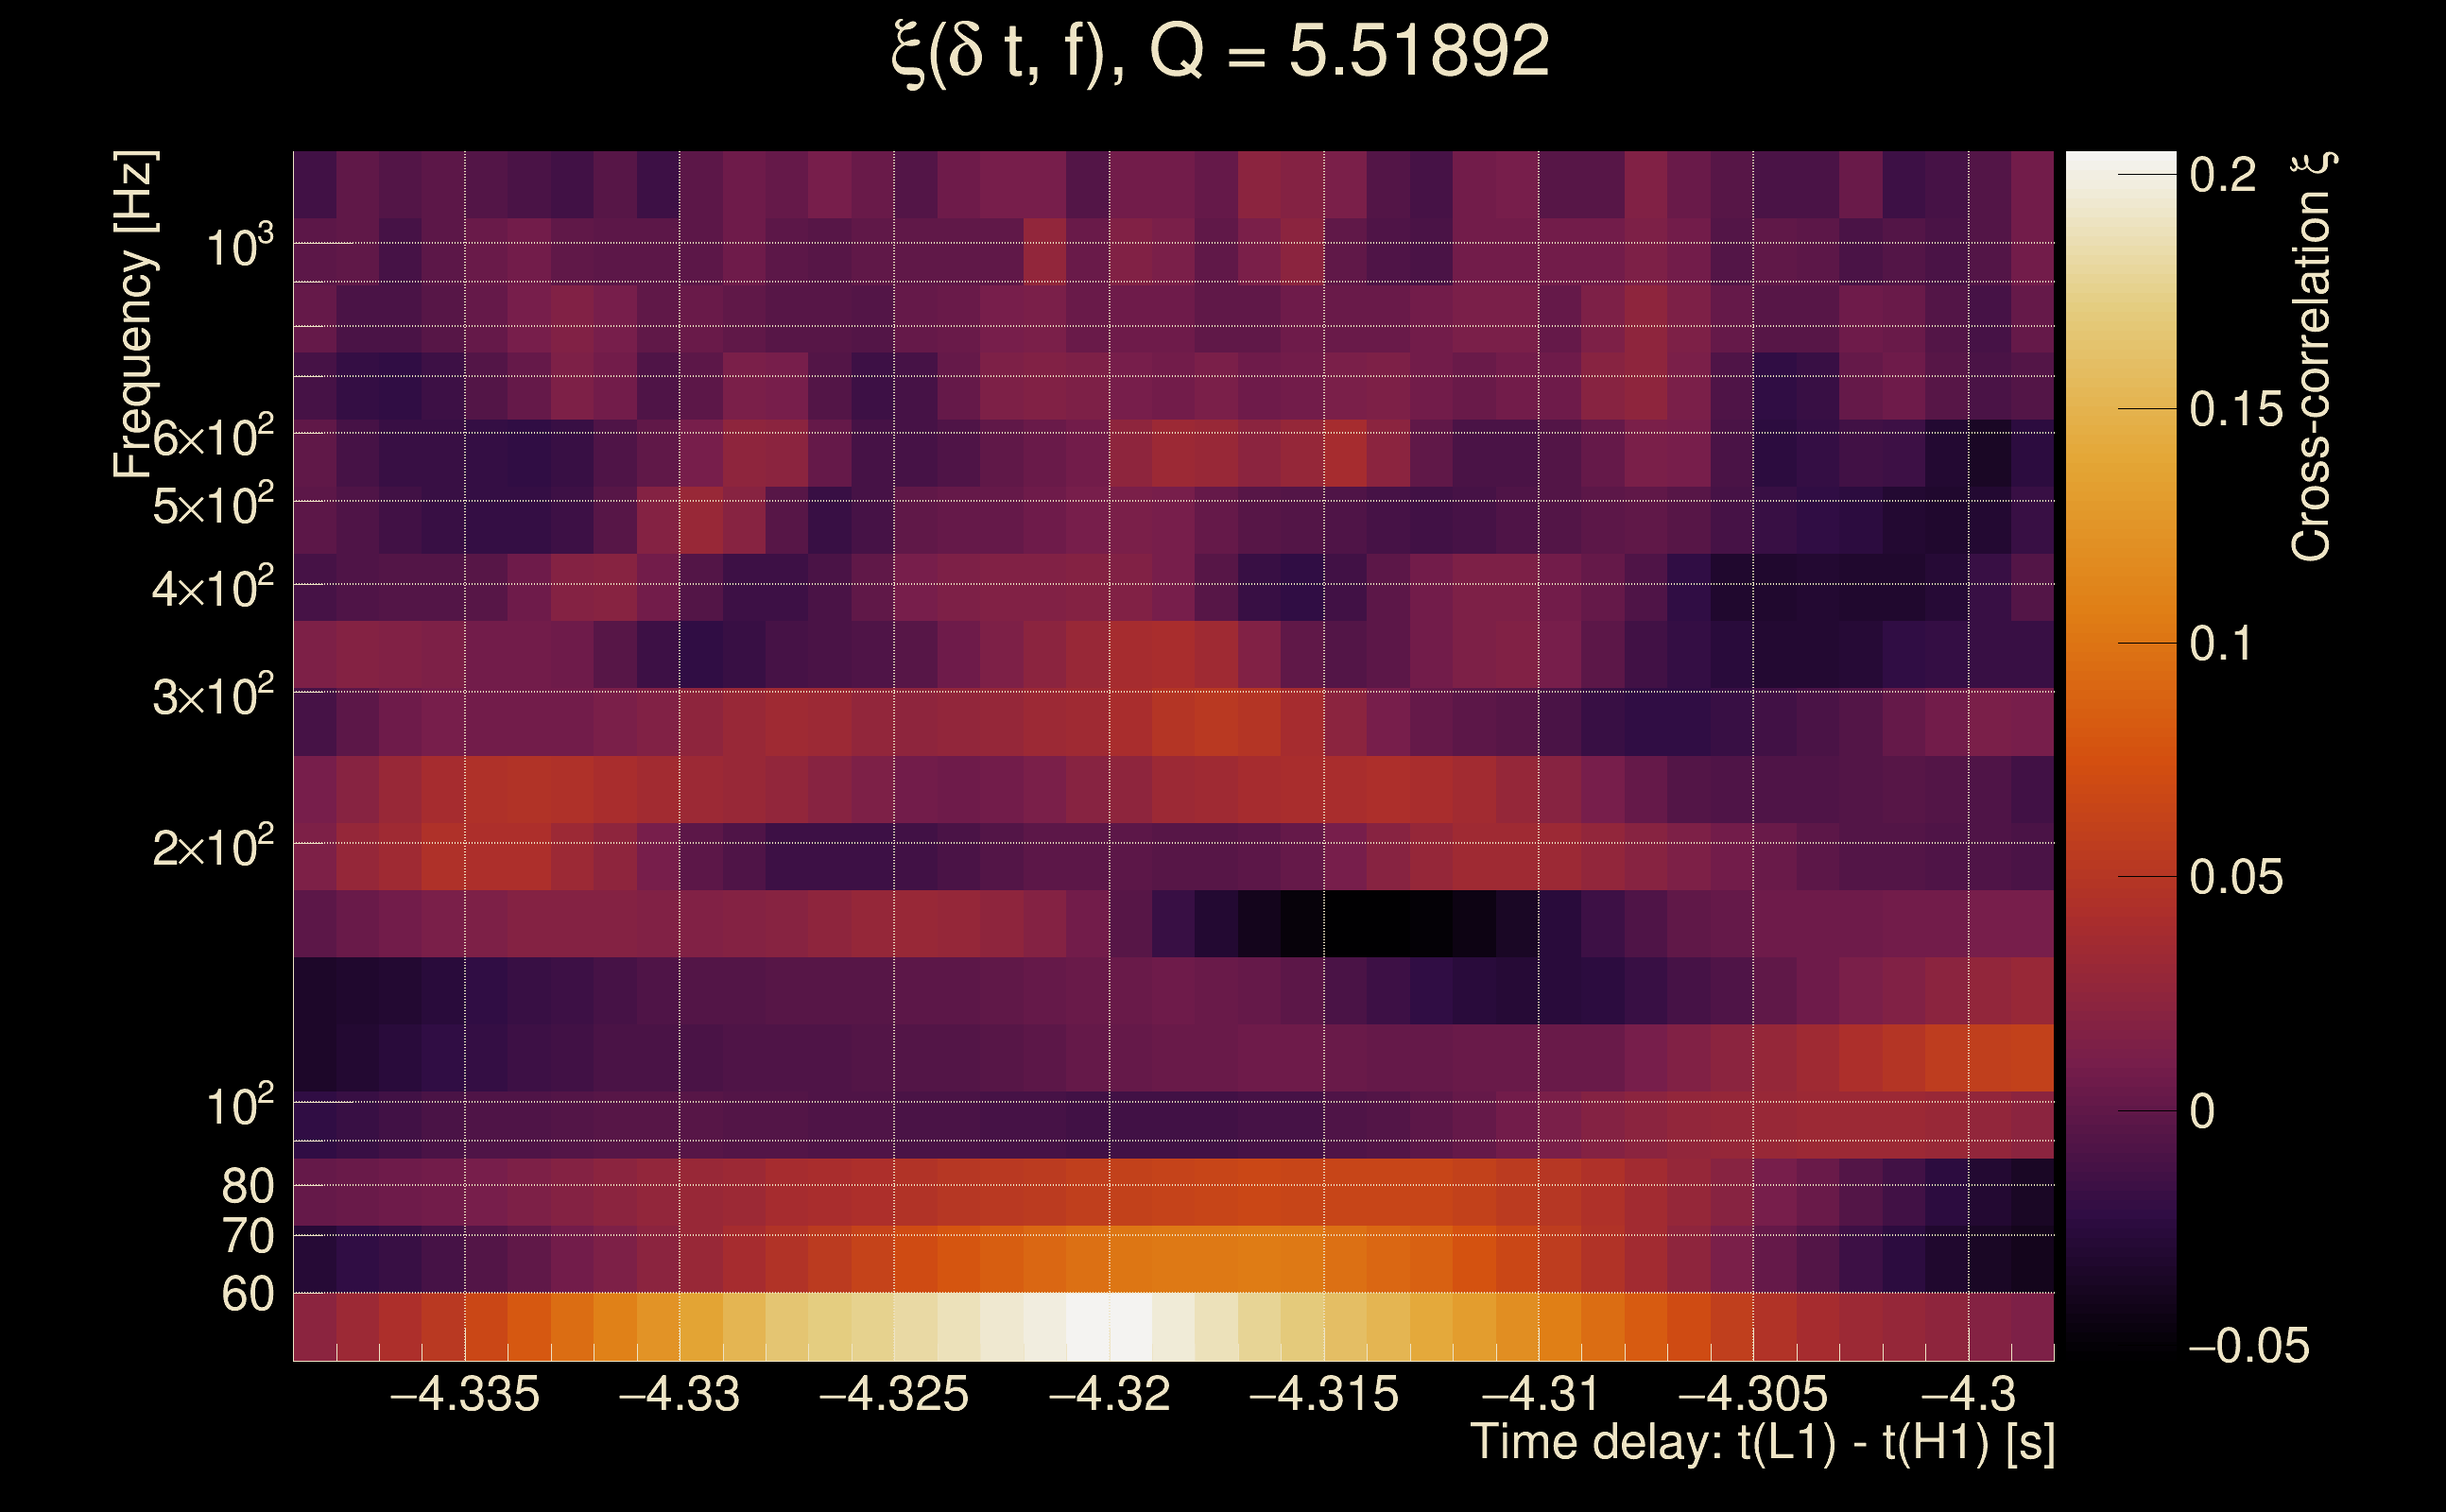
| Time delay between detectors t(L1) - t(H1): | -4.31875 s (slice index = 202 / 217), δt_gw = 0.00525054 s |
| Time delay standard deviation: | 0.0707756 s |
| [targeted mode] Time delay probability: | 0.497024 (0.67918 sigmas), δt_target = 0.00863504 s |
| Frequency: | 112.262 Hz |
| Ξ: | 0.0249367 ± 0.0426562 (variance = 0.00181956): Q0: 0.156848, Q1: 0.146433, Q2: 0.152491, Q3: 0.0519846, Q4: 0.082892 |
| Rank: | R_A = 0.00780787 |
| Log of amplitude ratio (L1/H1): | -0.194316, variance = 0.872745 (L1/H1: -0.59177, variance = 1.47112, H1/L1: -0.251841, variance = 2.07812) |
| Amplitude ratio (L1/H1): | 0.823397 ⋇ 2.5452 (L1/H1: 0.553347 ⋇ 3.36322, H1/L1: 0.777369 ⋇ 4.22731) |
| Amplitude ratio H1|L1 compatibility (probability): | 0.654305 |
| Antenna factor probability: | 0.962802 |
| Number of rejected frequency rows: | Q0: 14 / 18, Q1: 31 / 36, Q2: 64 / 70, Q3: 127 / 134, Q4: 251 / 258 |
| Maximum signal-to-noise ratio: | H1: 5.03867, L1: 4.7557 |
| SNR variance: | H1: 12.6674, L1: 9.40803 |
| Click here for a zoomed plot | Click here for a zoomed plot | Click here for a zoomed plot | Click here for a zoomed plot | Click here for a zoomed plot |
 |
 |
 |
 |
 |
 |
 |
 |
 |
 |
 |
 |
 |
 |
 |
 |
 |
 |
 |
 |
 |
 |
 |
 |
 |
 |
 |
 |
 |
| florent.robinet@ijclab.in2p3.fr |