| Omicron version: | 4.2.0: documentation gitlab repository |
| Omicron run by: | unknown |
| Report produced on: | Fri Feb 20 14:42:26 2026 UTC |
| Ox option file: | TargIxf_feb2026_SG1_10min_options.txt |
| Omicron option files: | detector 0, detector 1 |
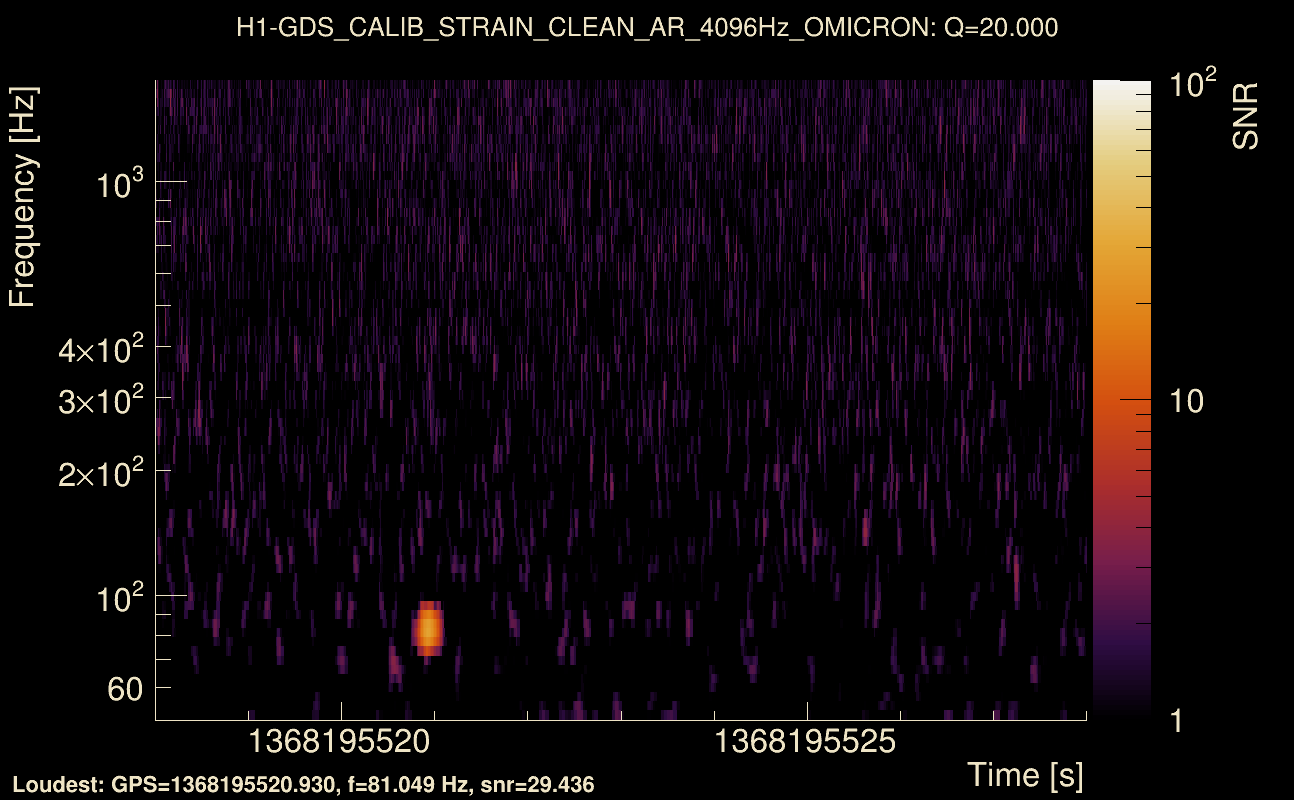
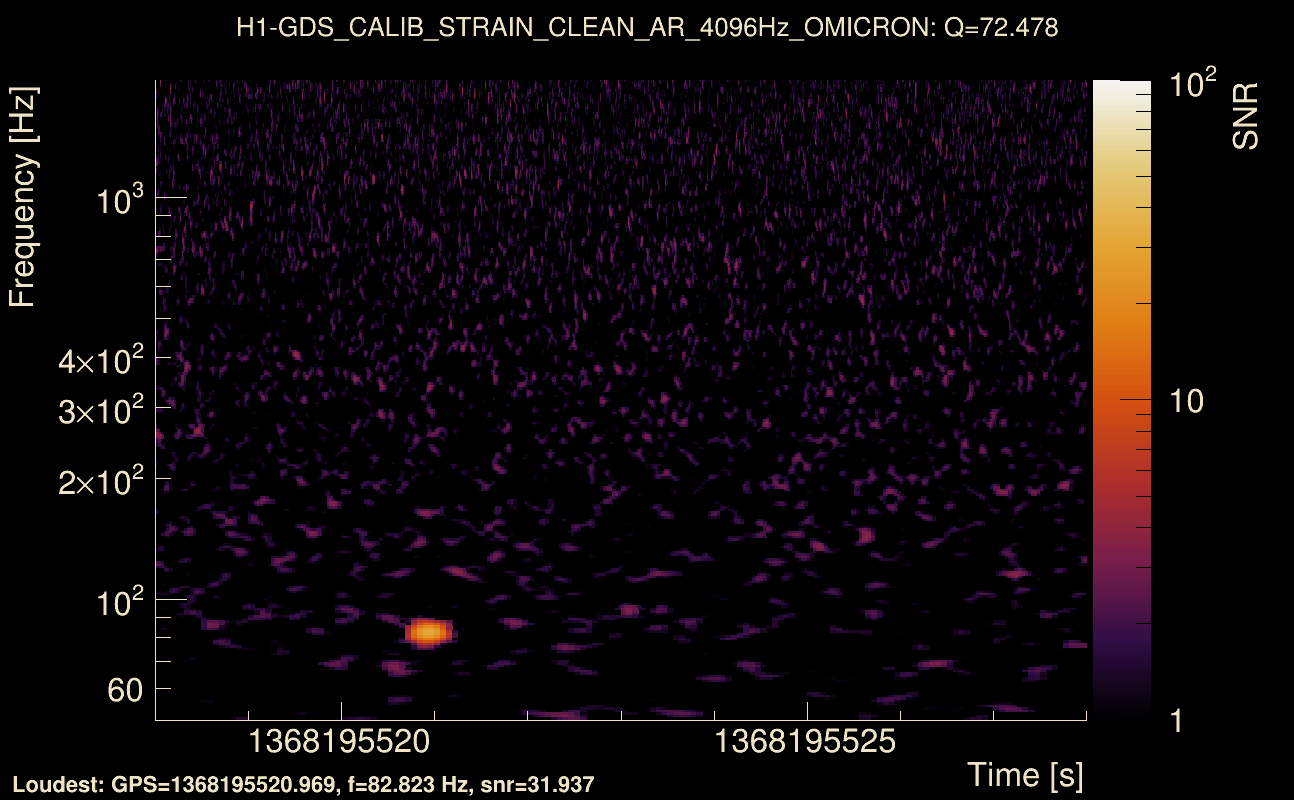
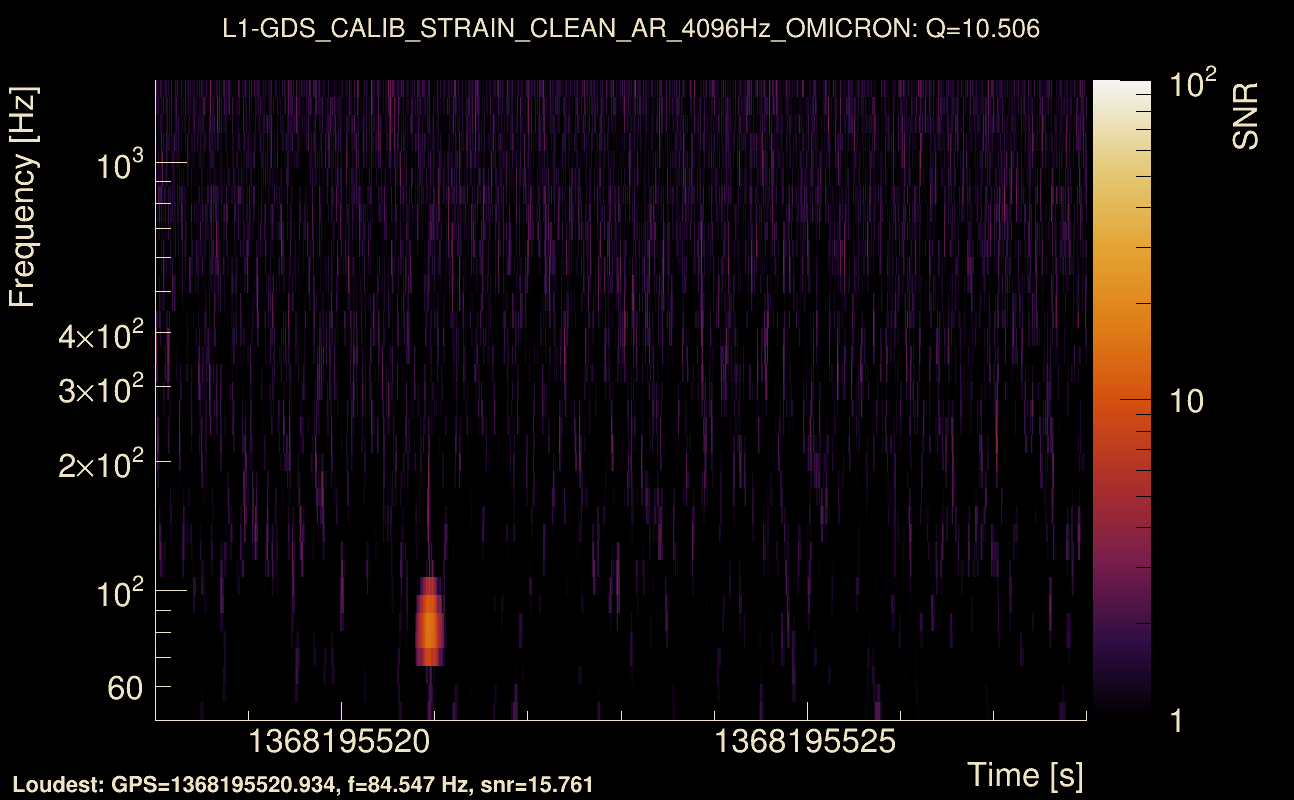
| Detector channel names: | H1:GDS-CALIB_STRAIN_CLEAN_AR_4096Hz, L1:GDS-CALIB_STRAIN_CLEAN_AR_4096Hz |
| Omicron analysis time window and overlap: | 16 s, 6 s |
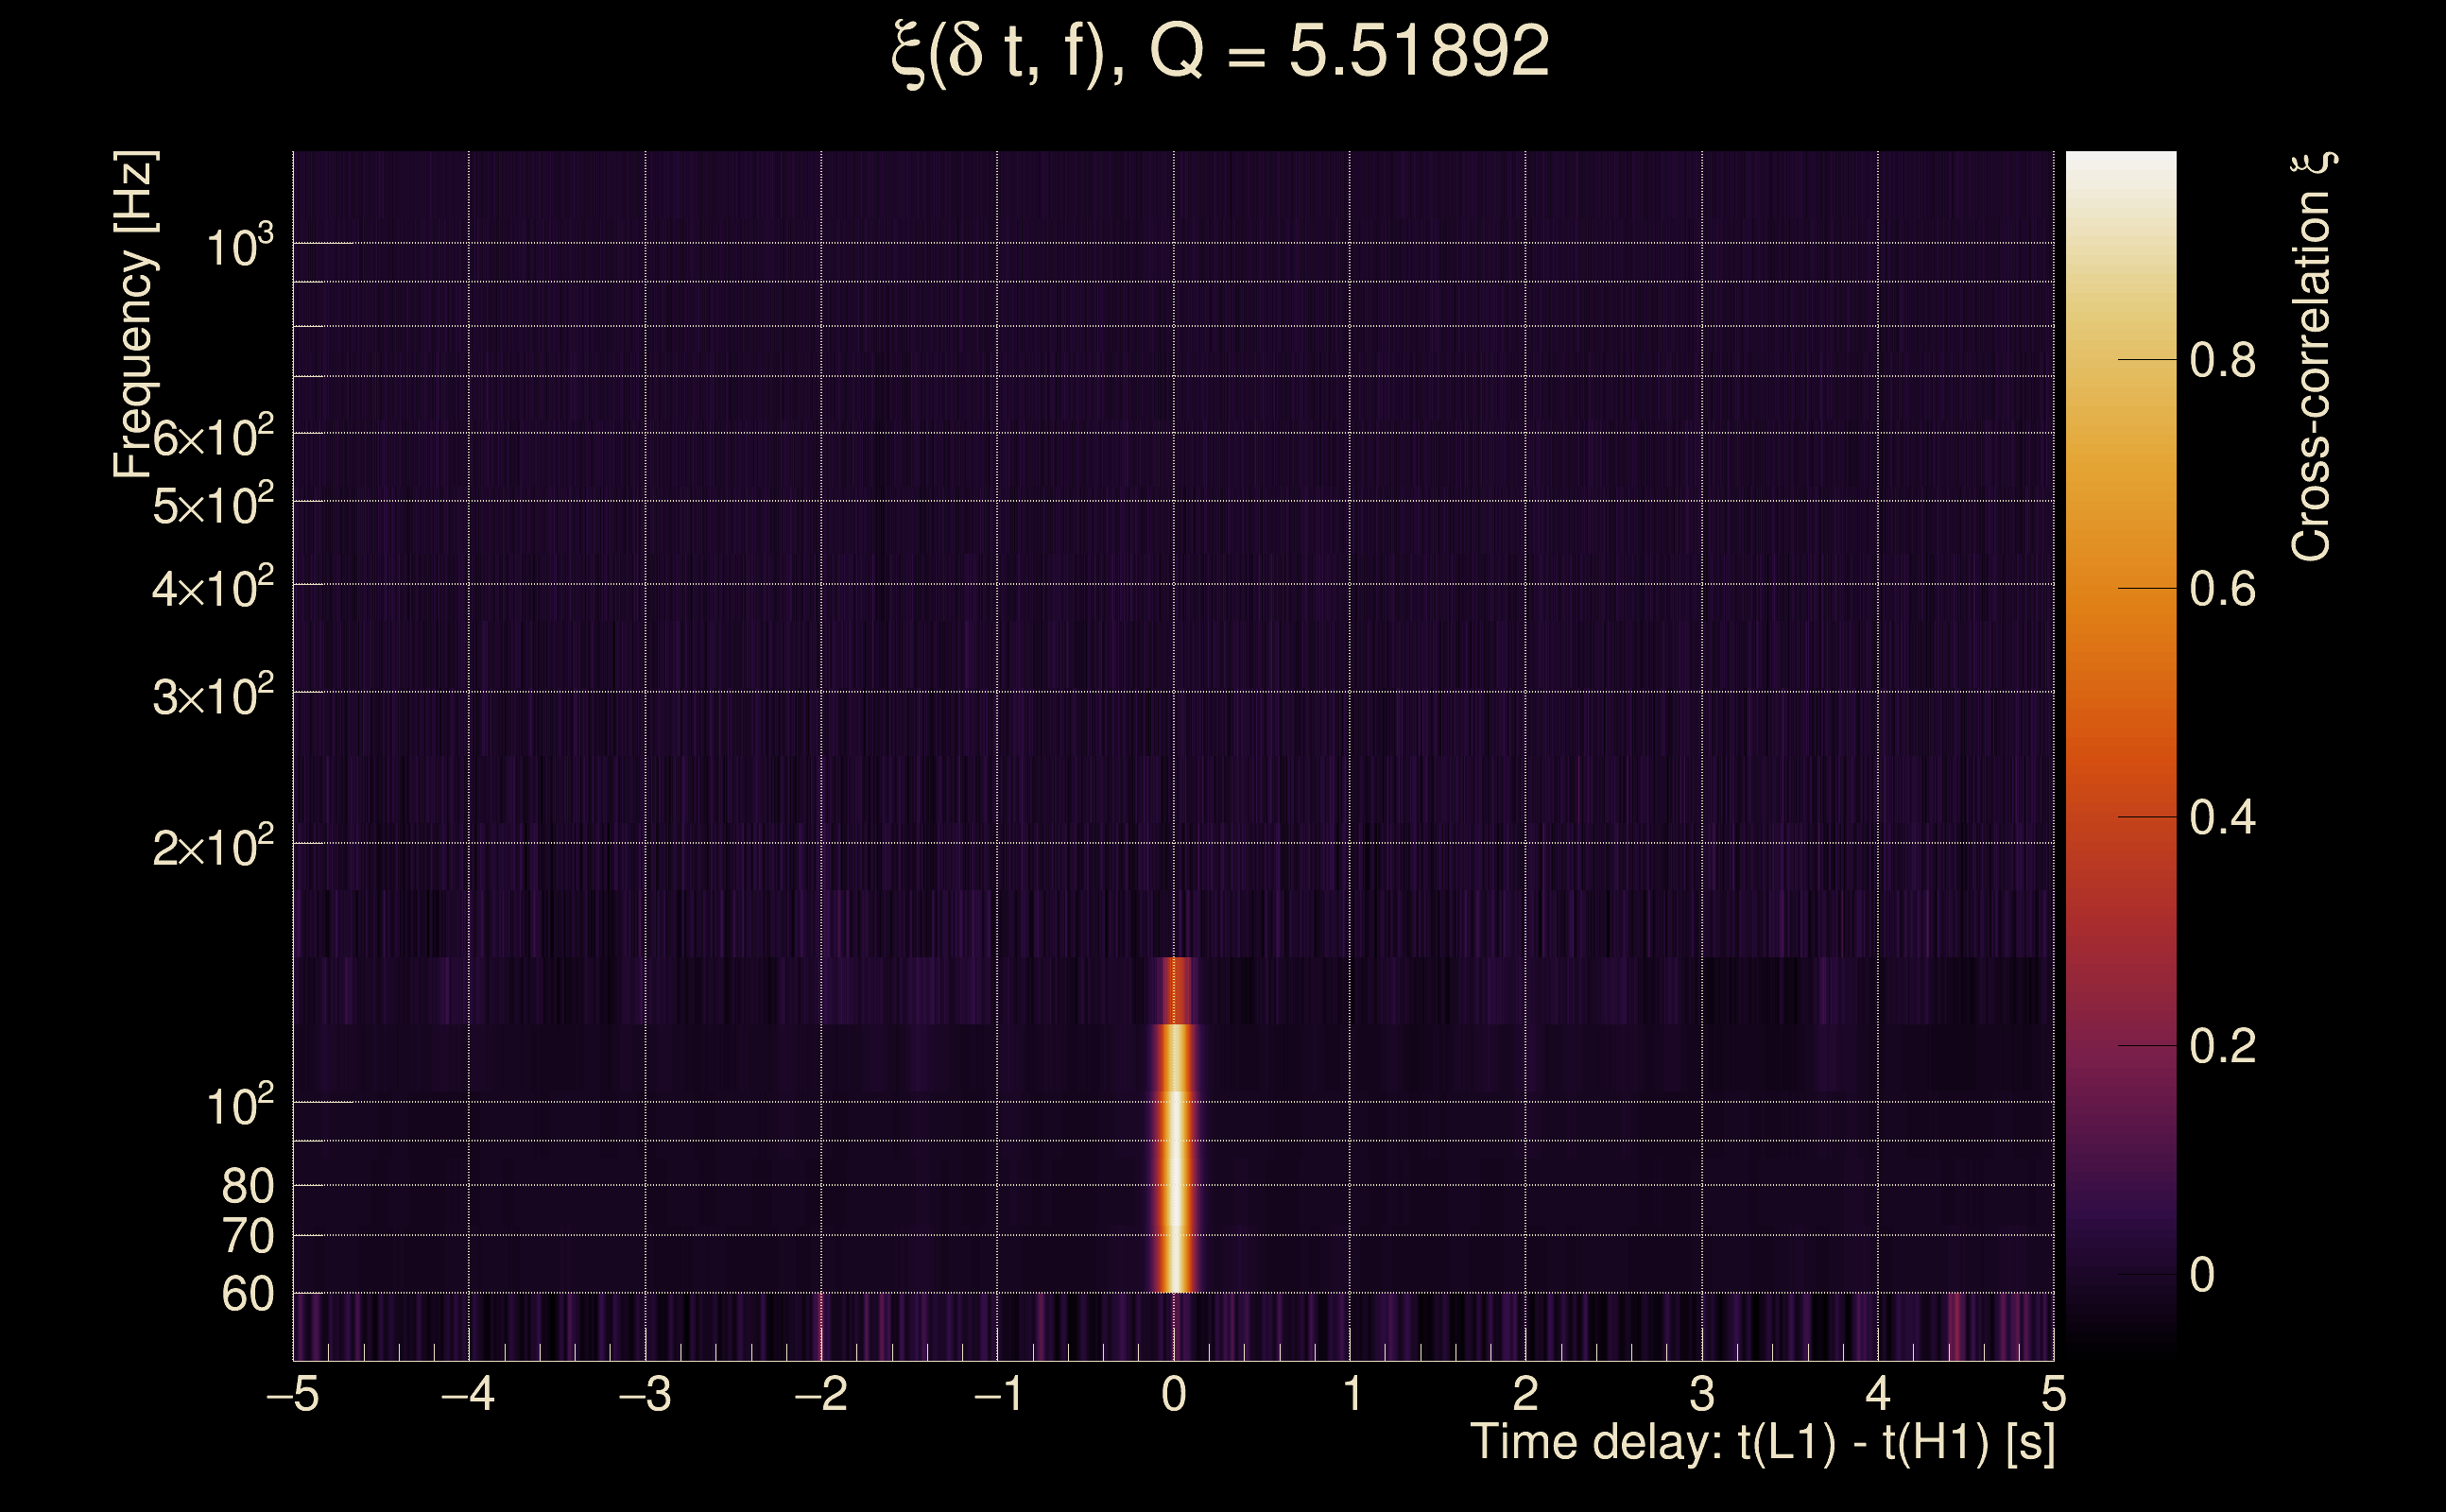
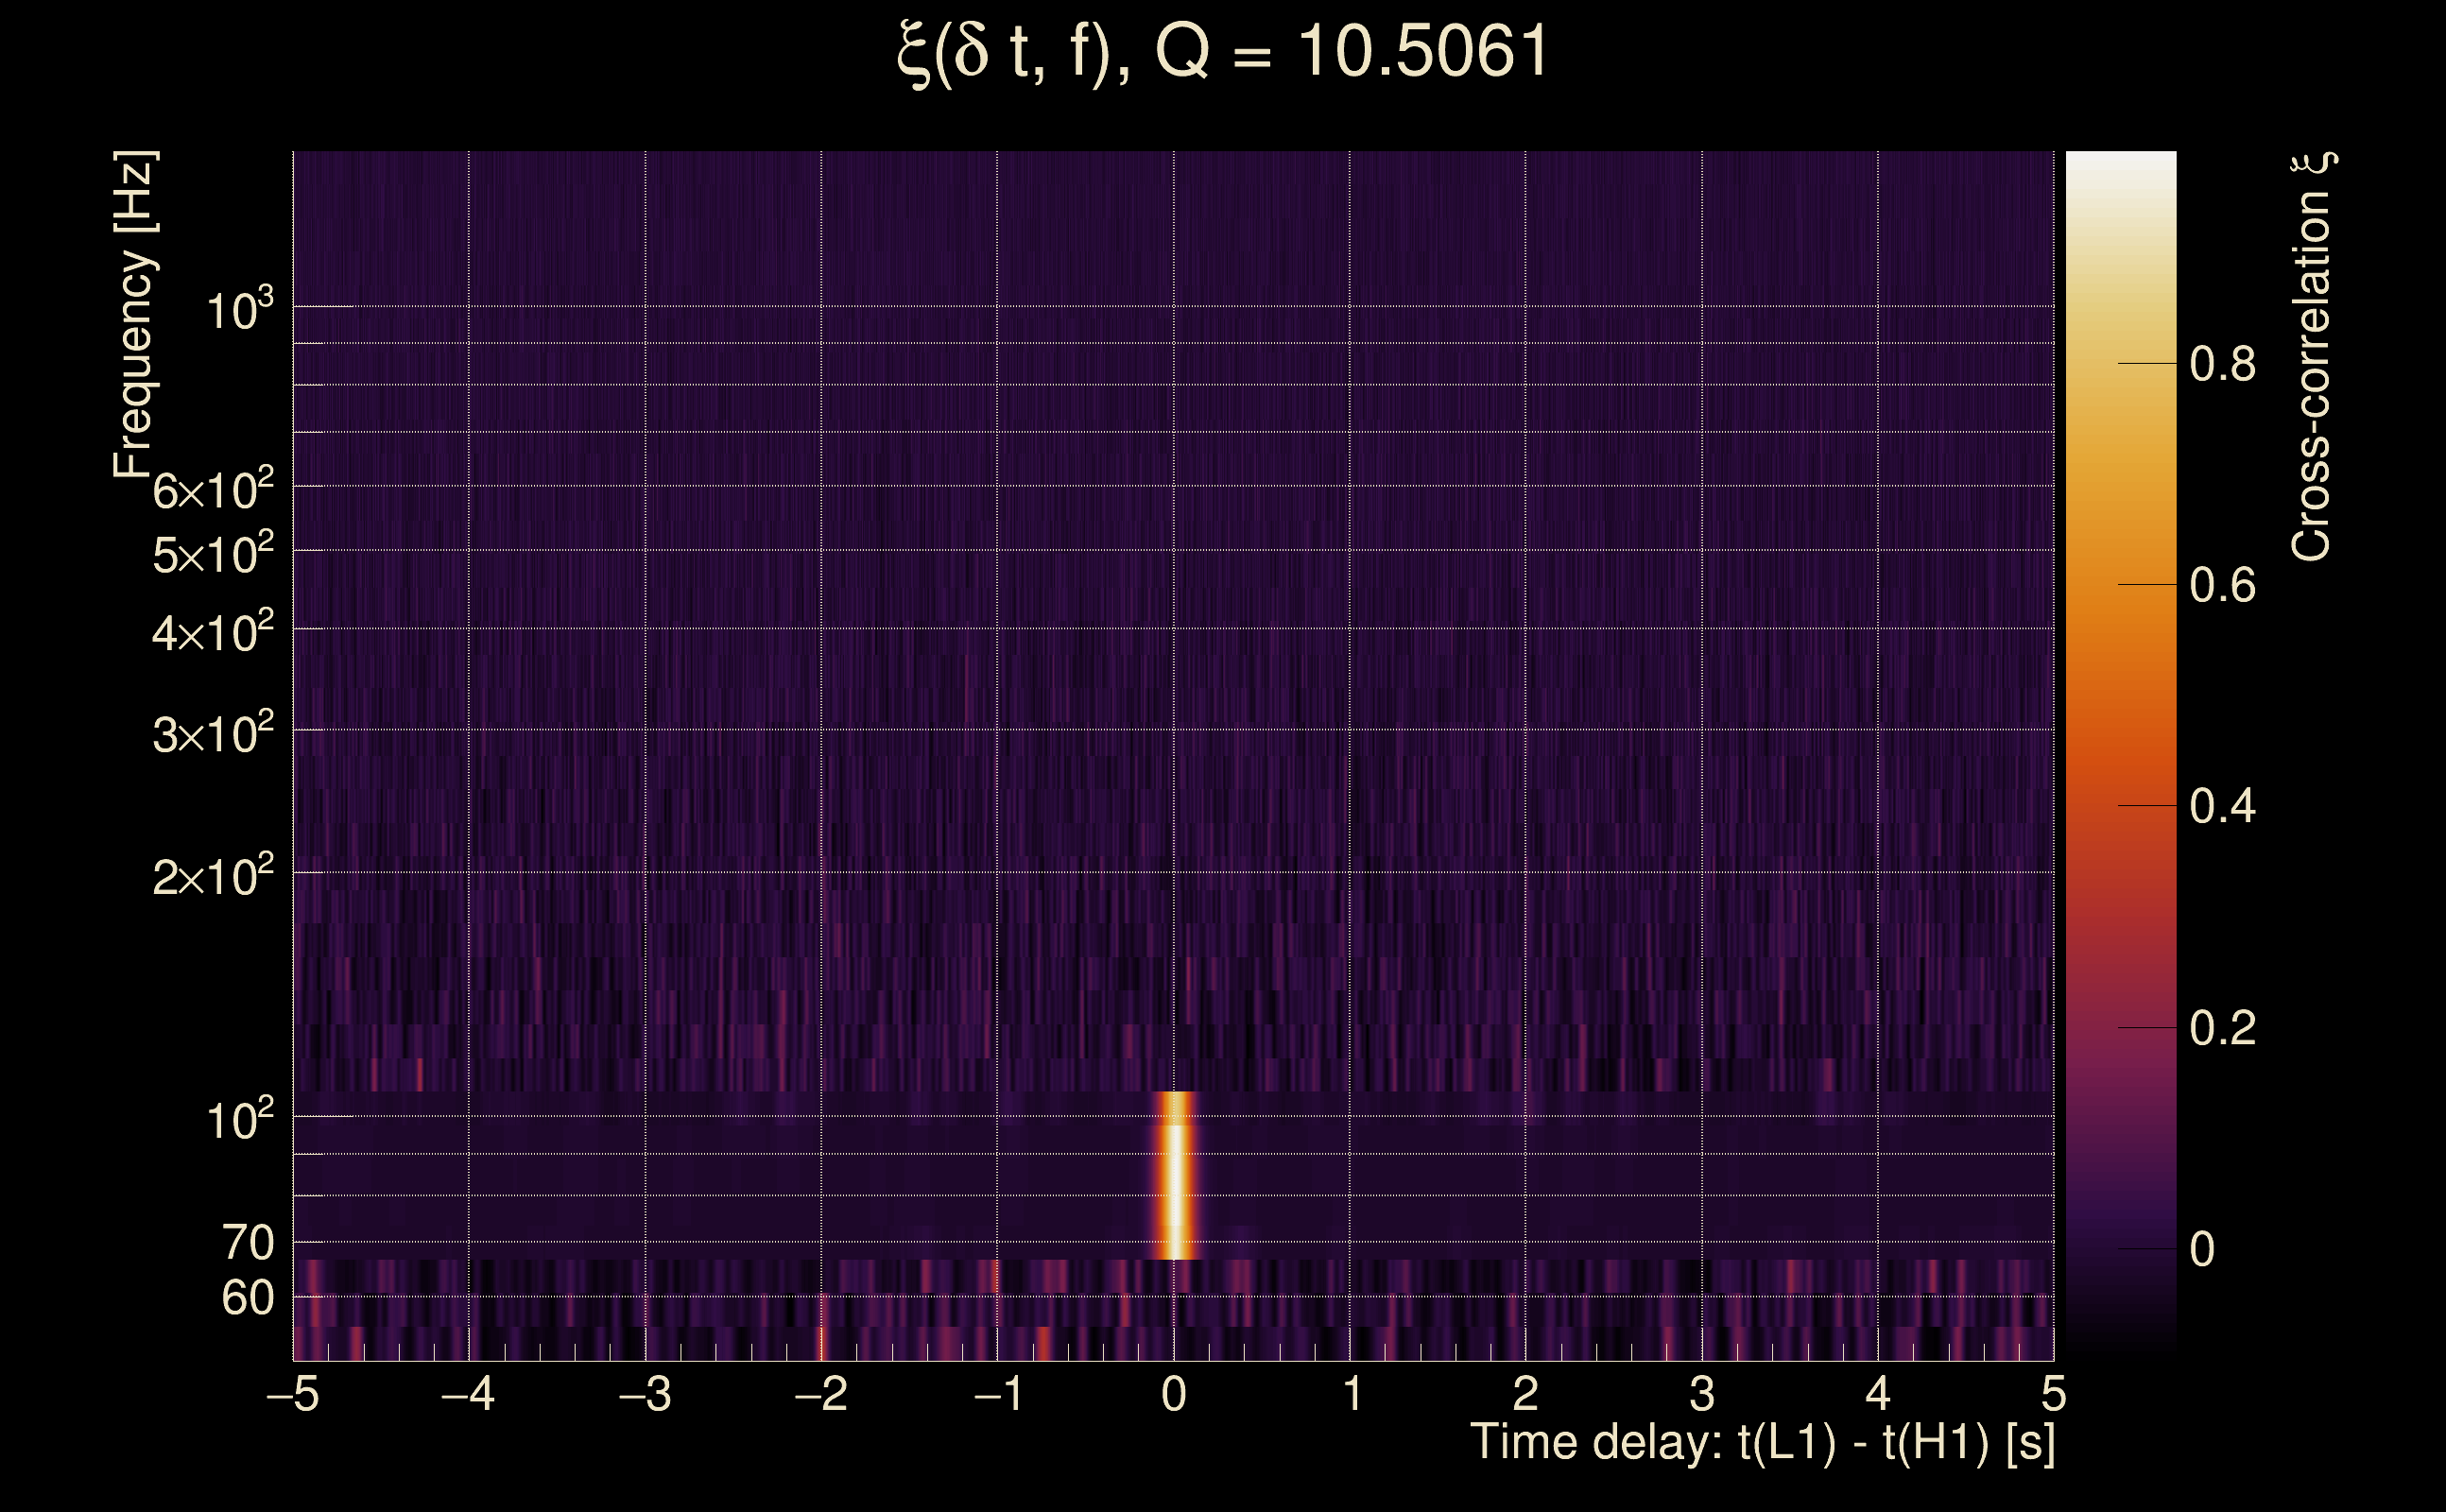
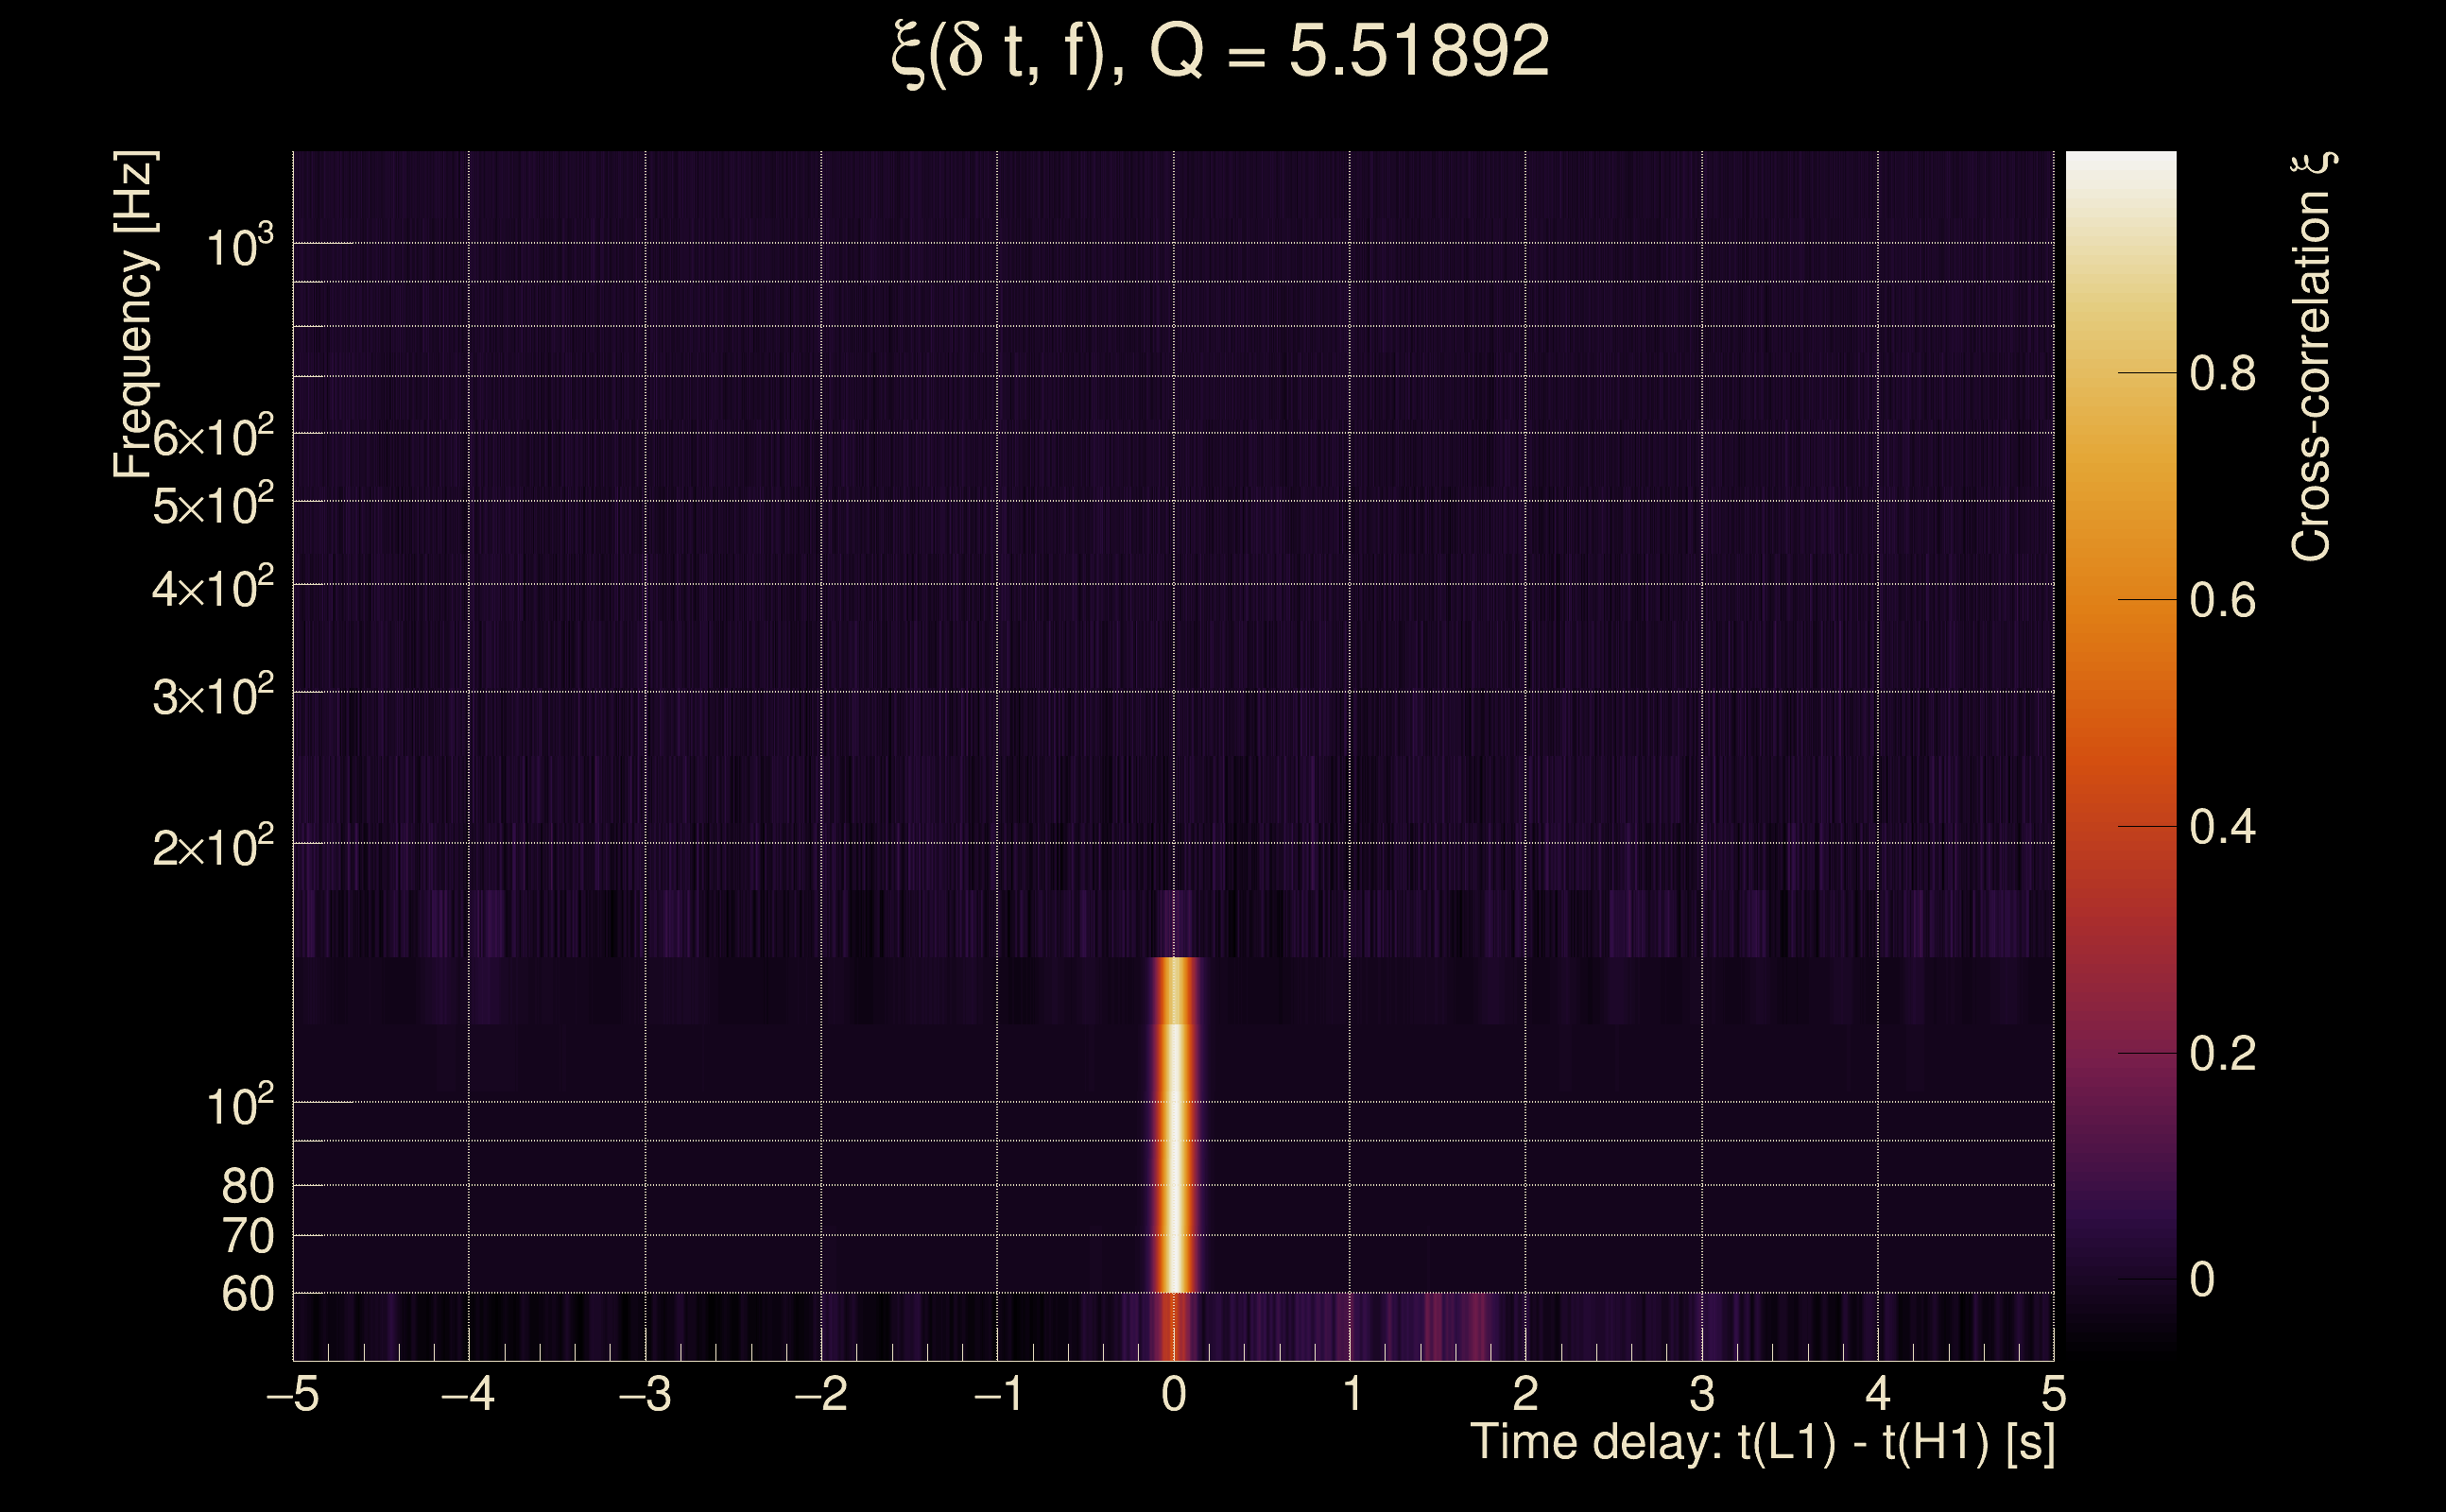
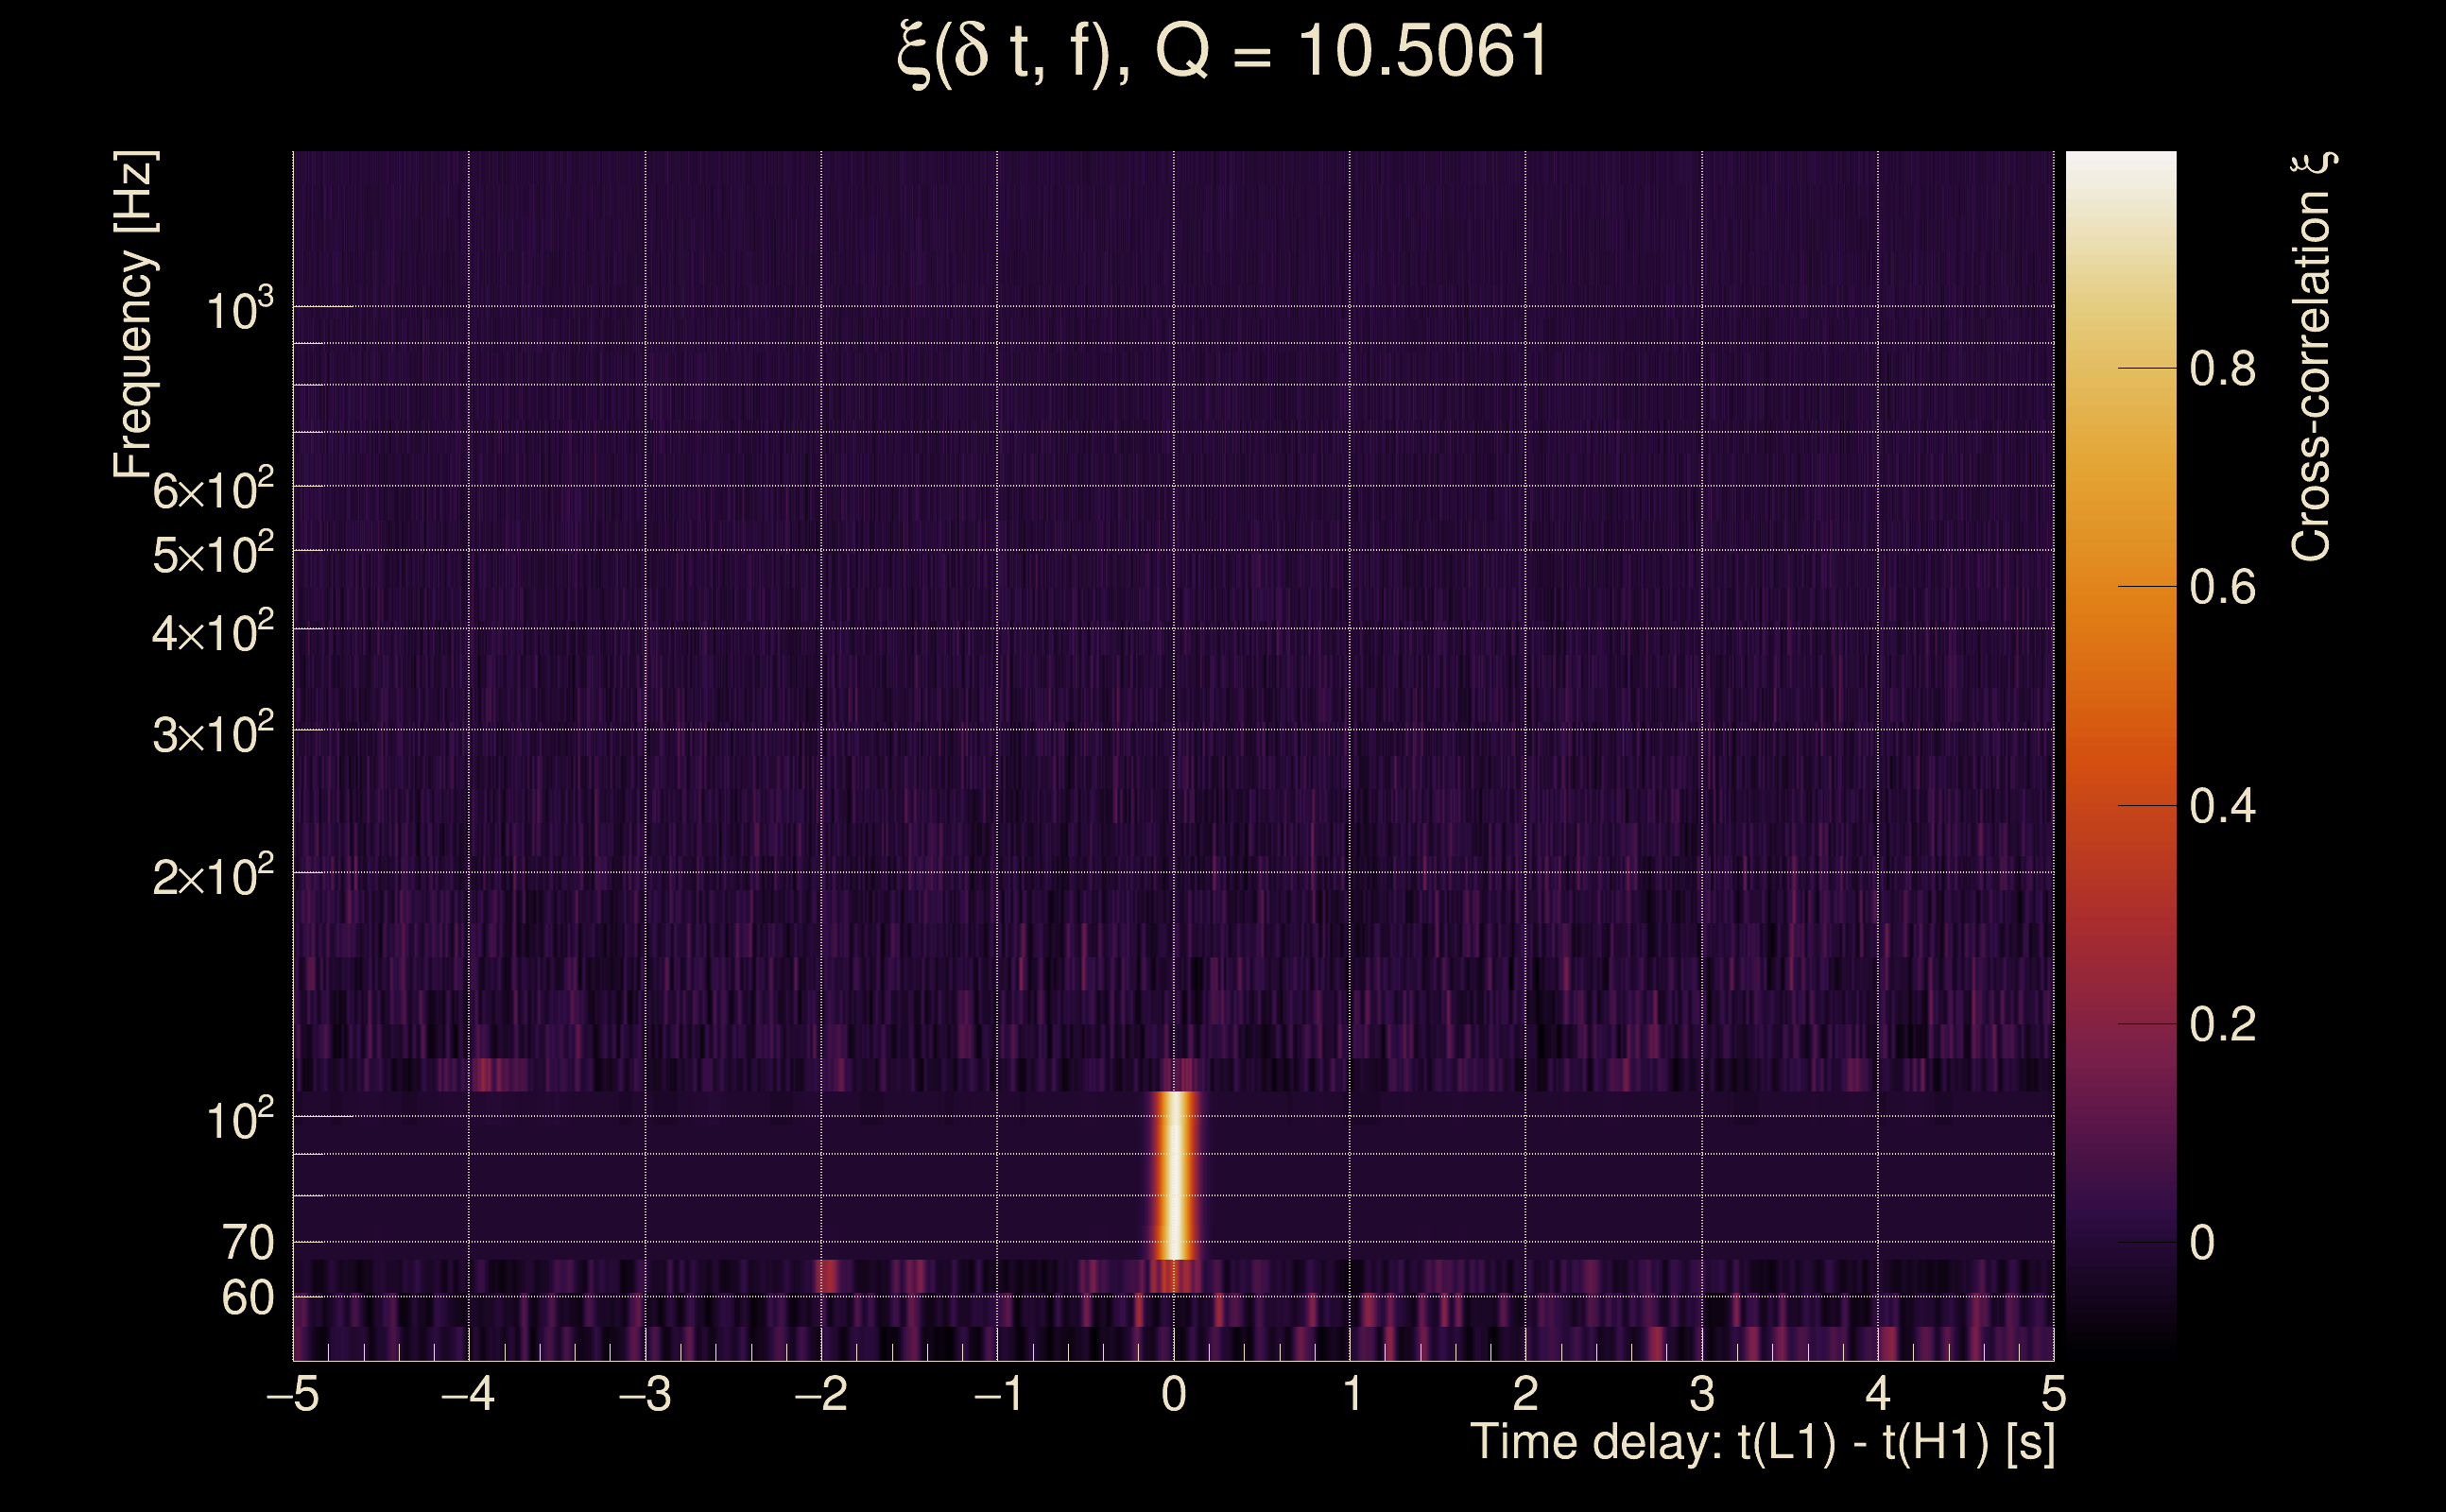
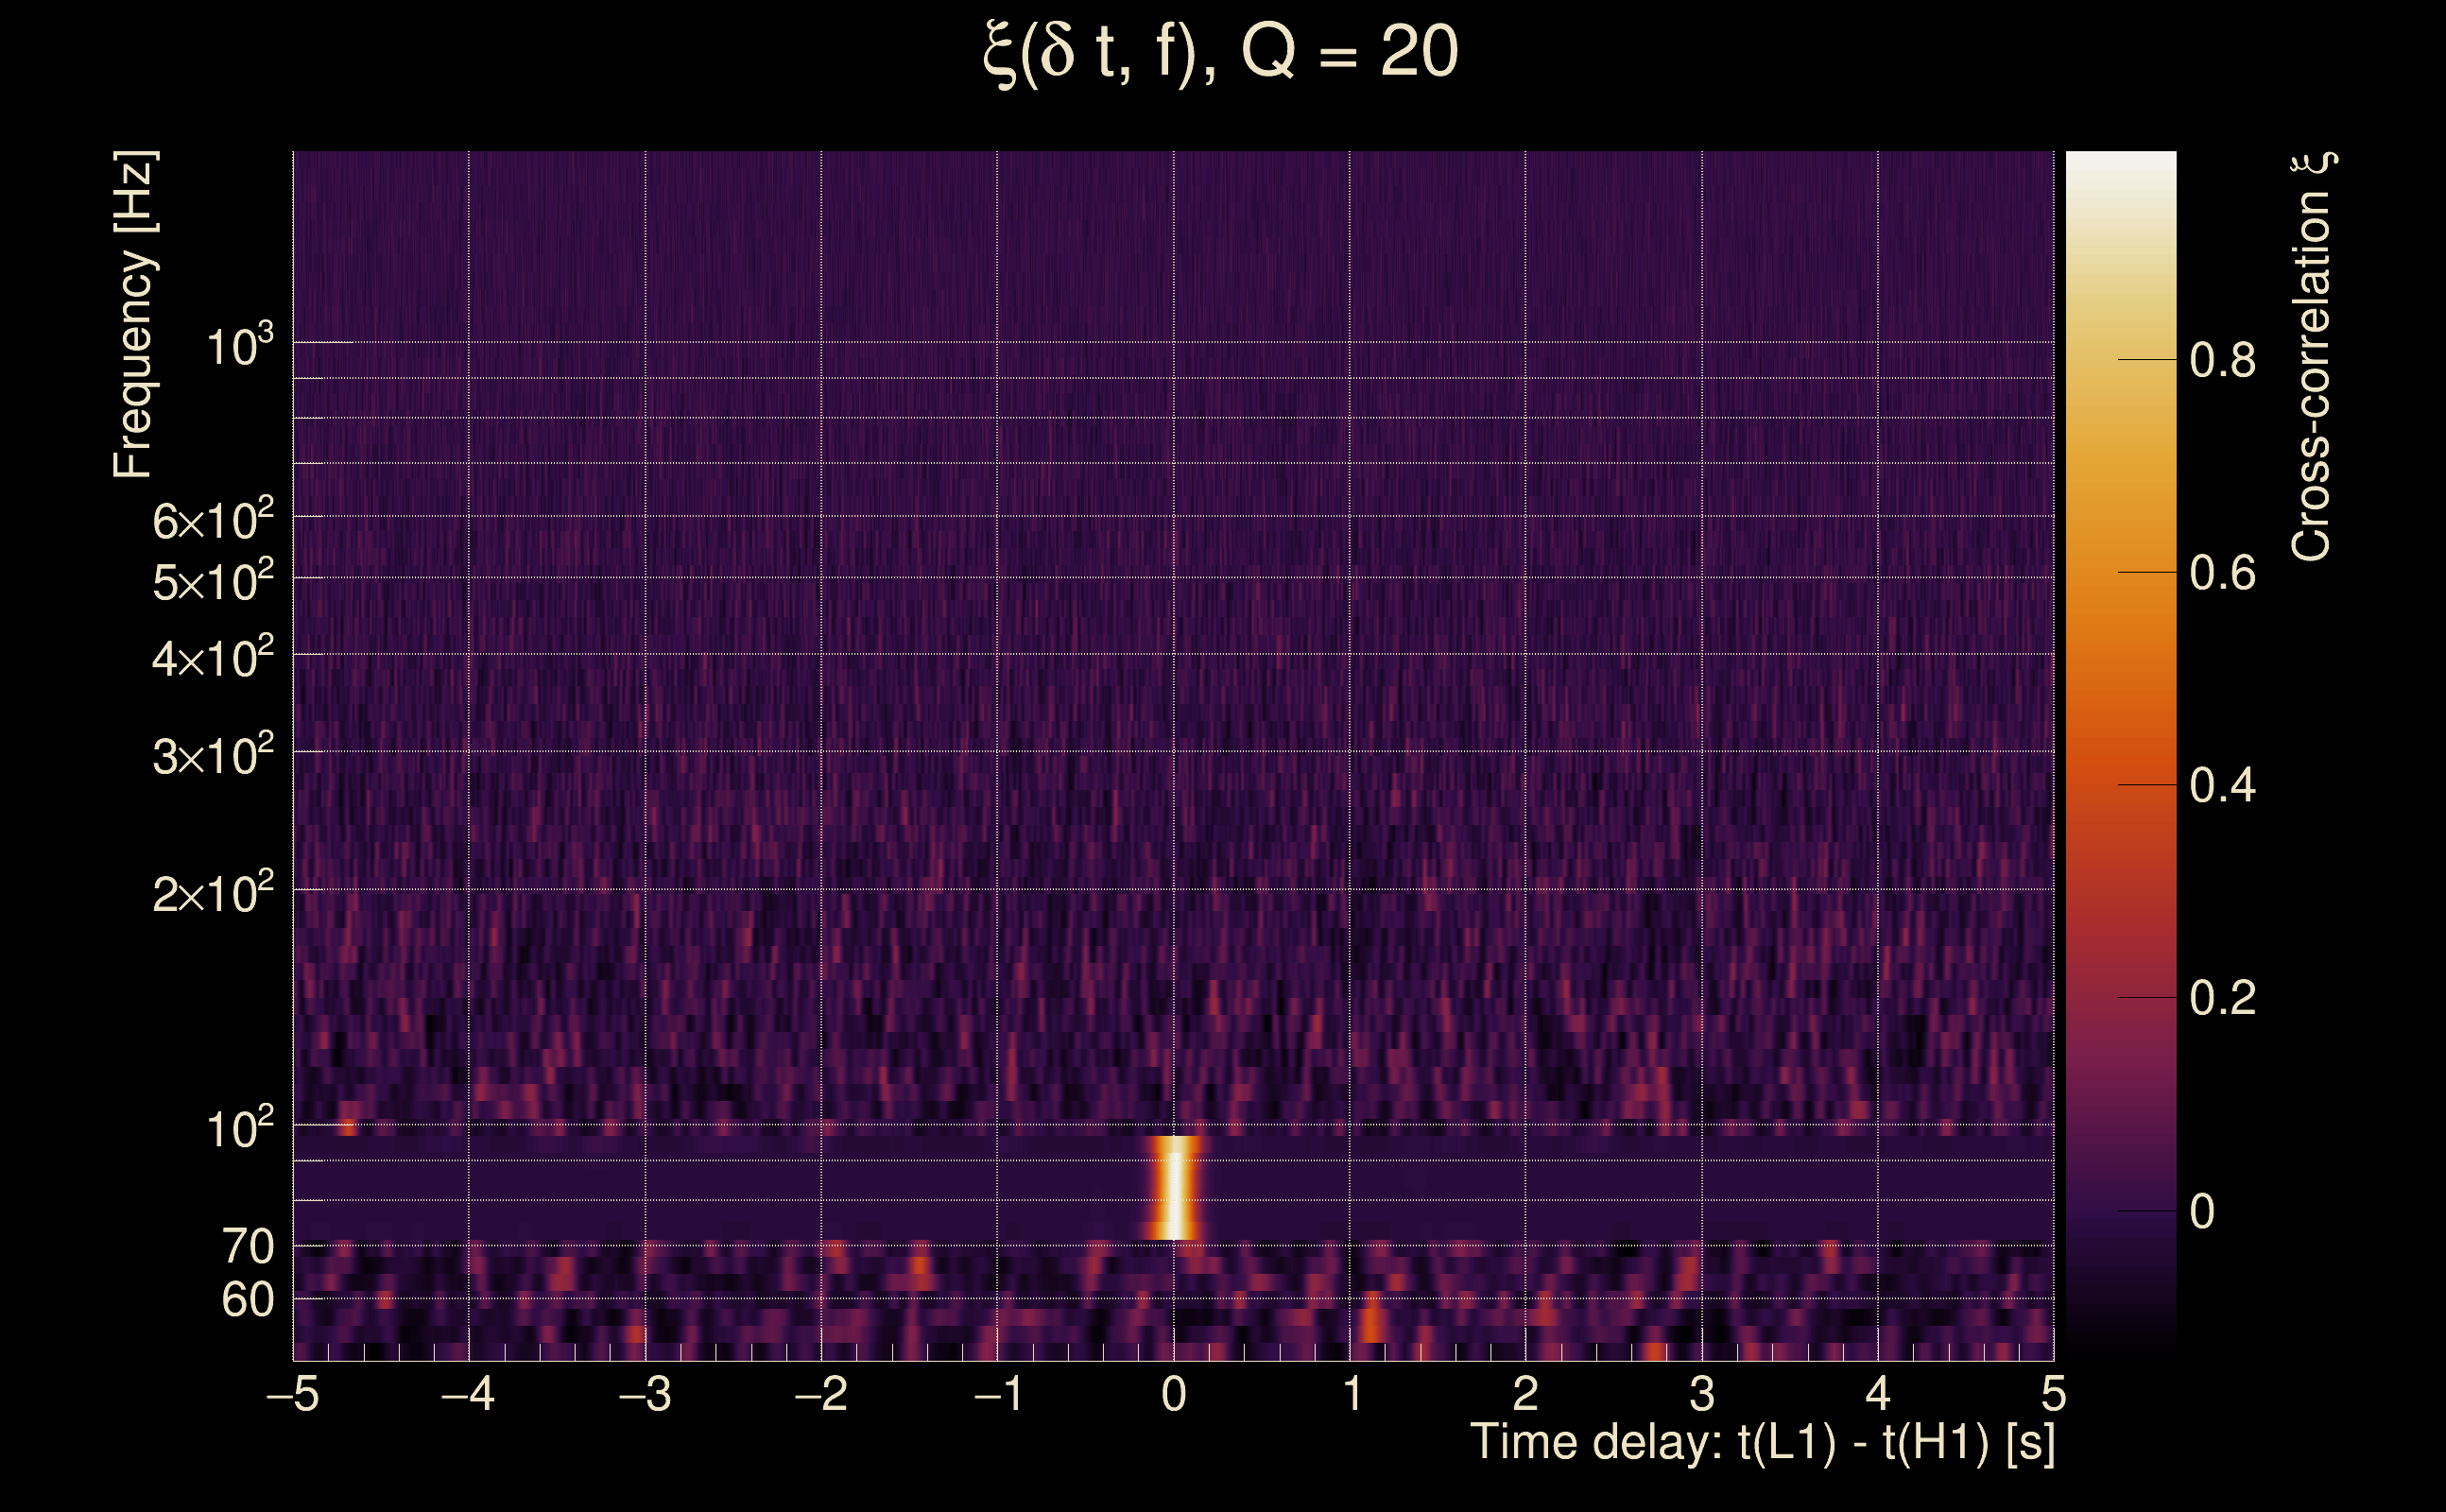
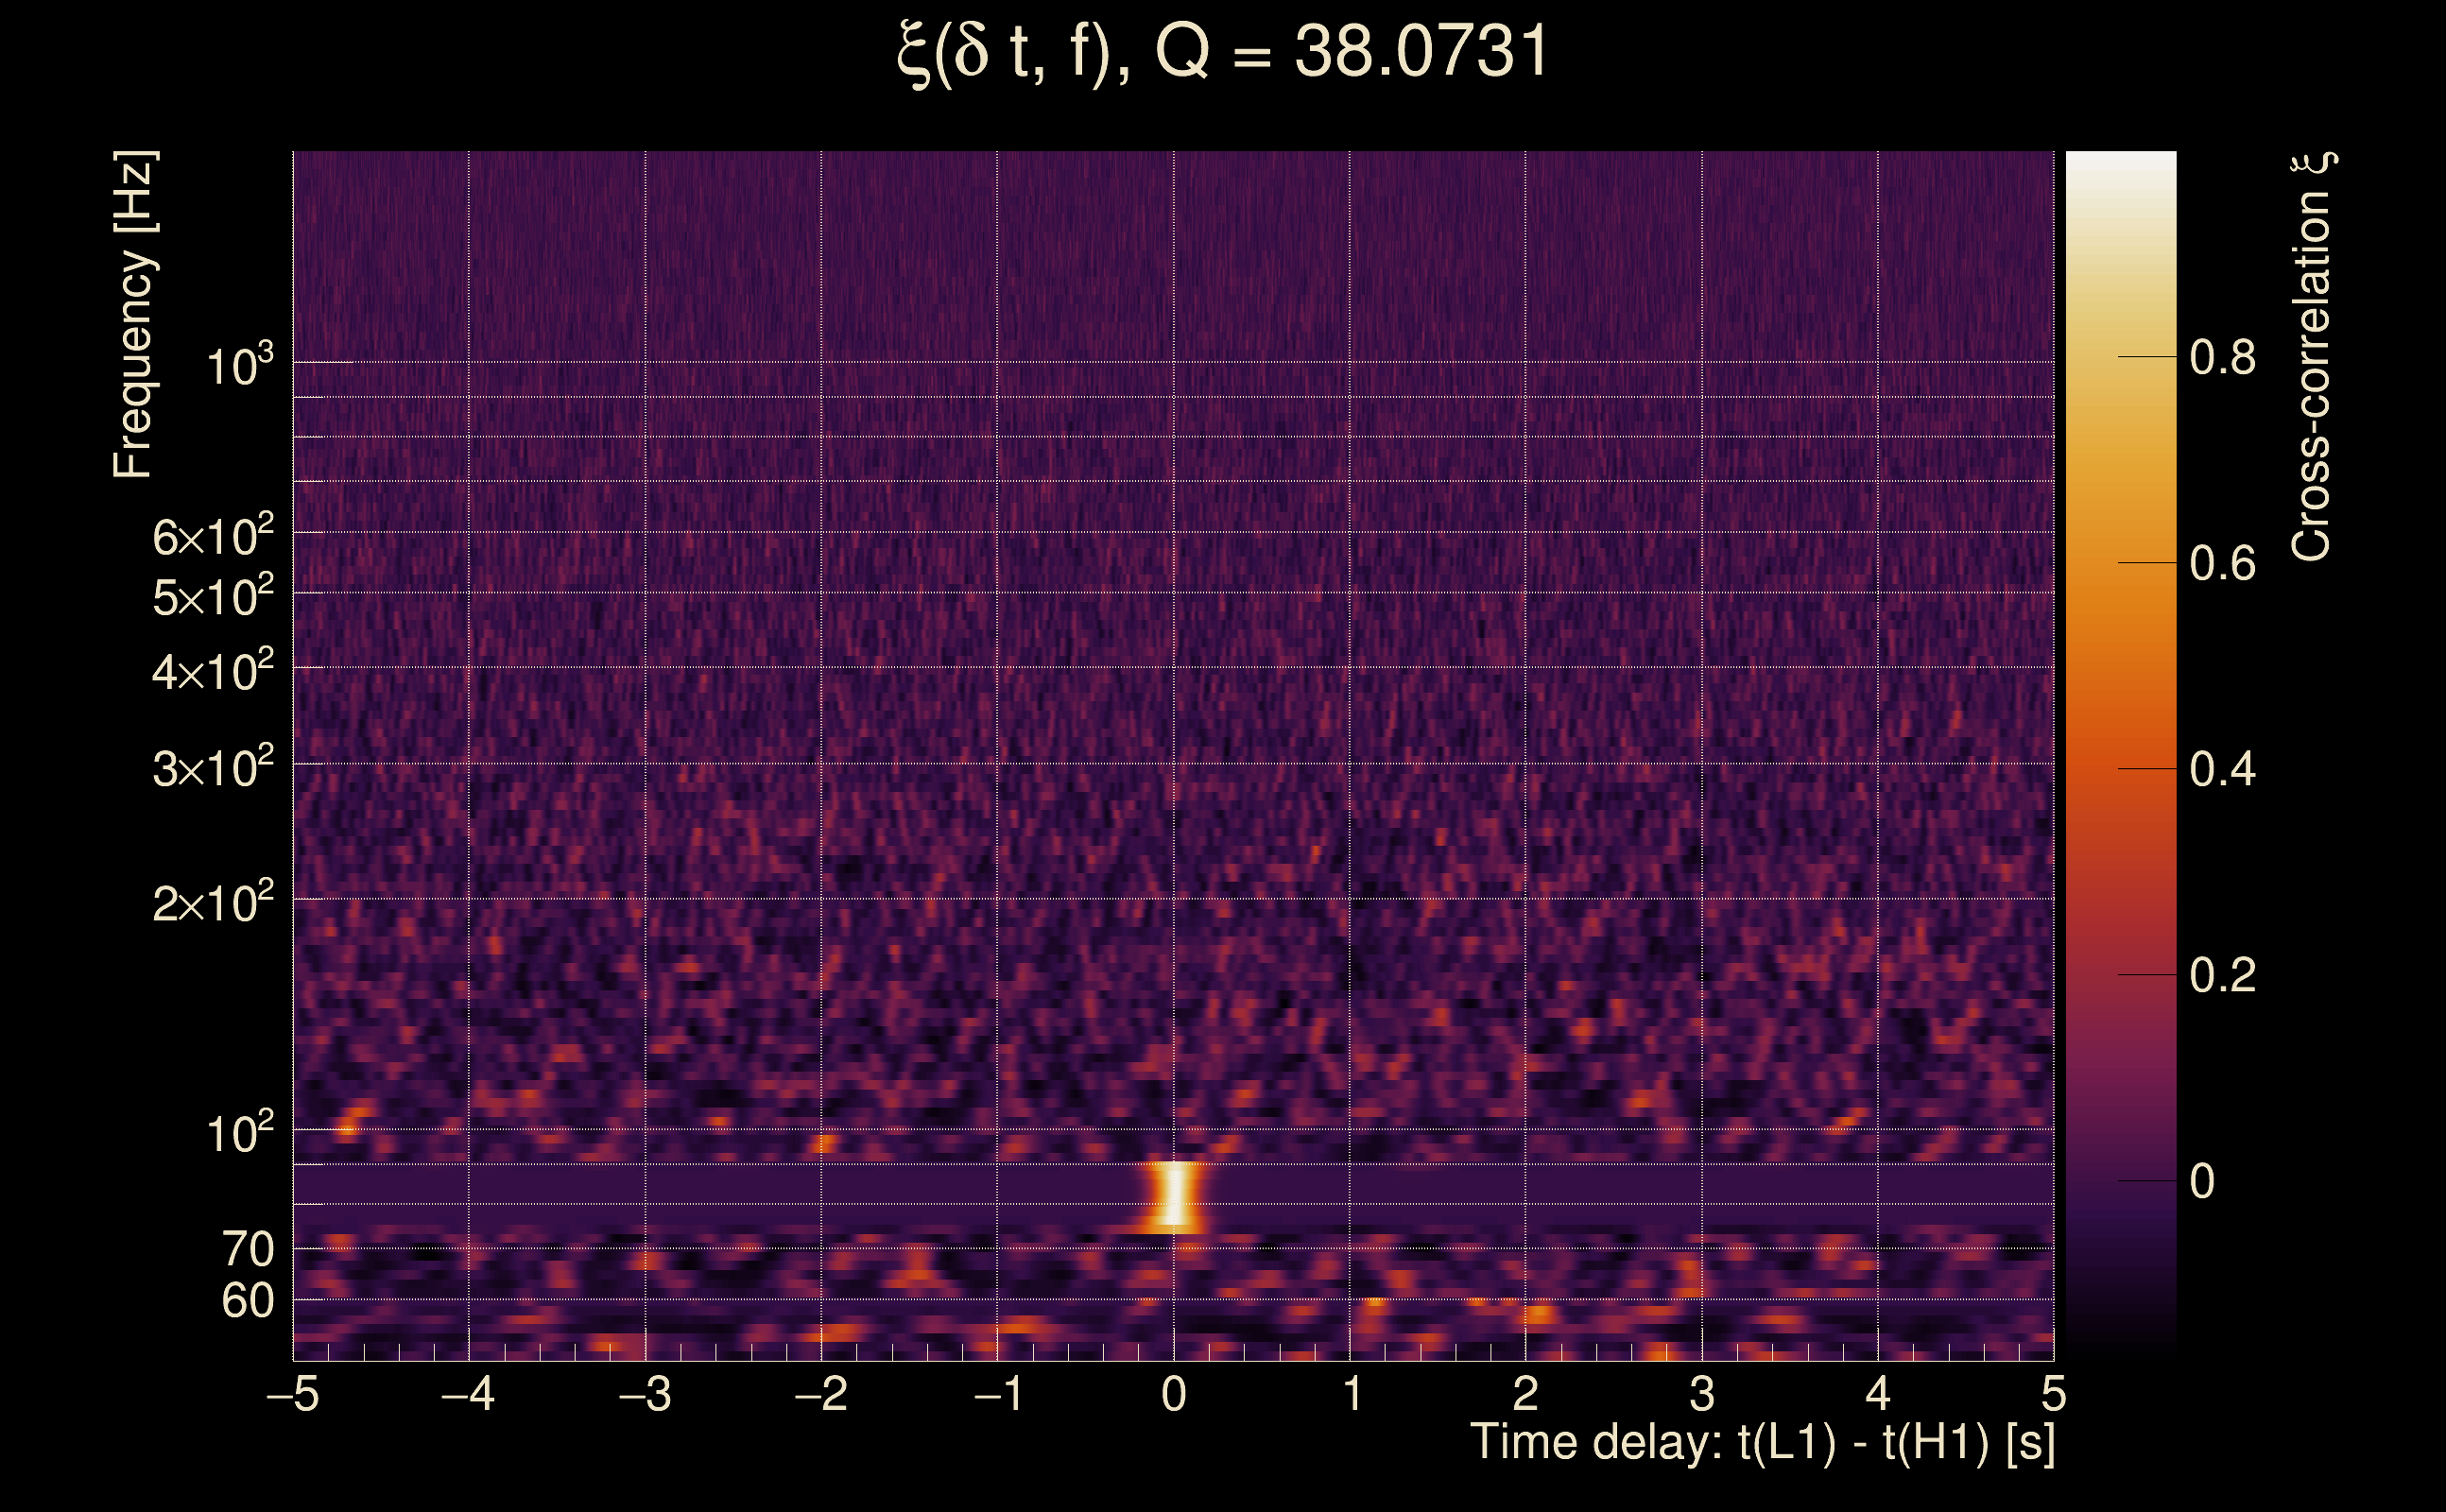
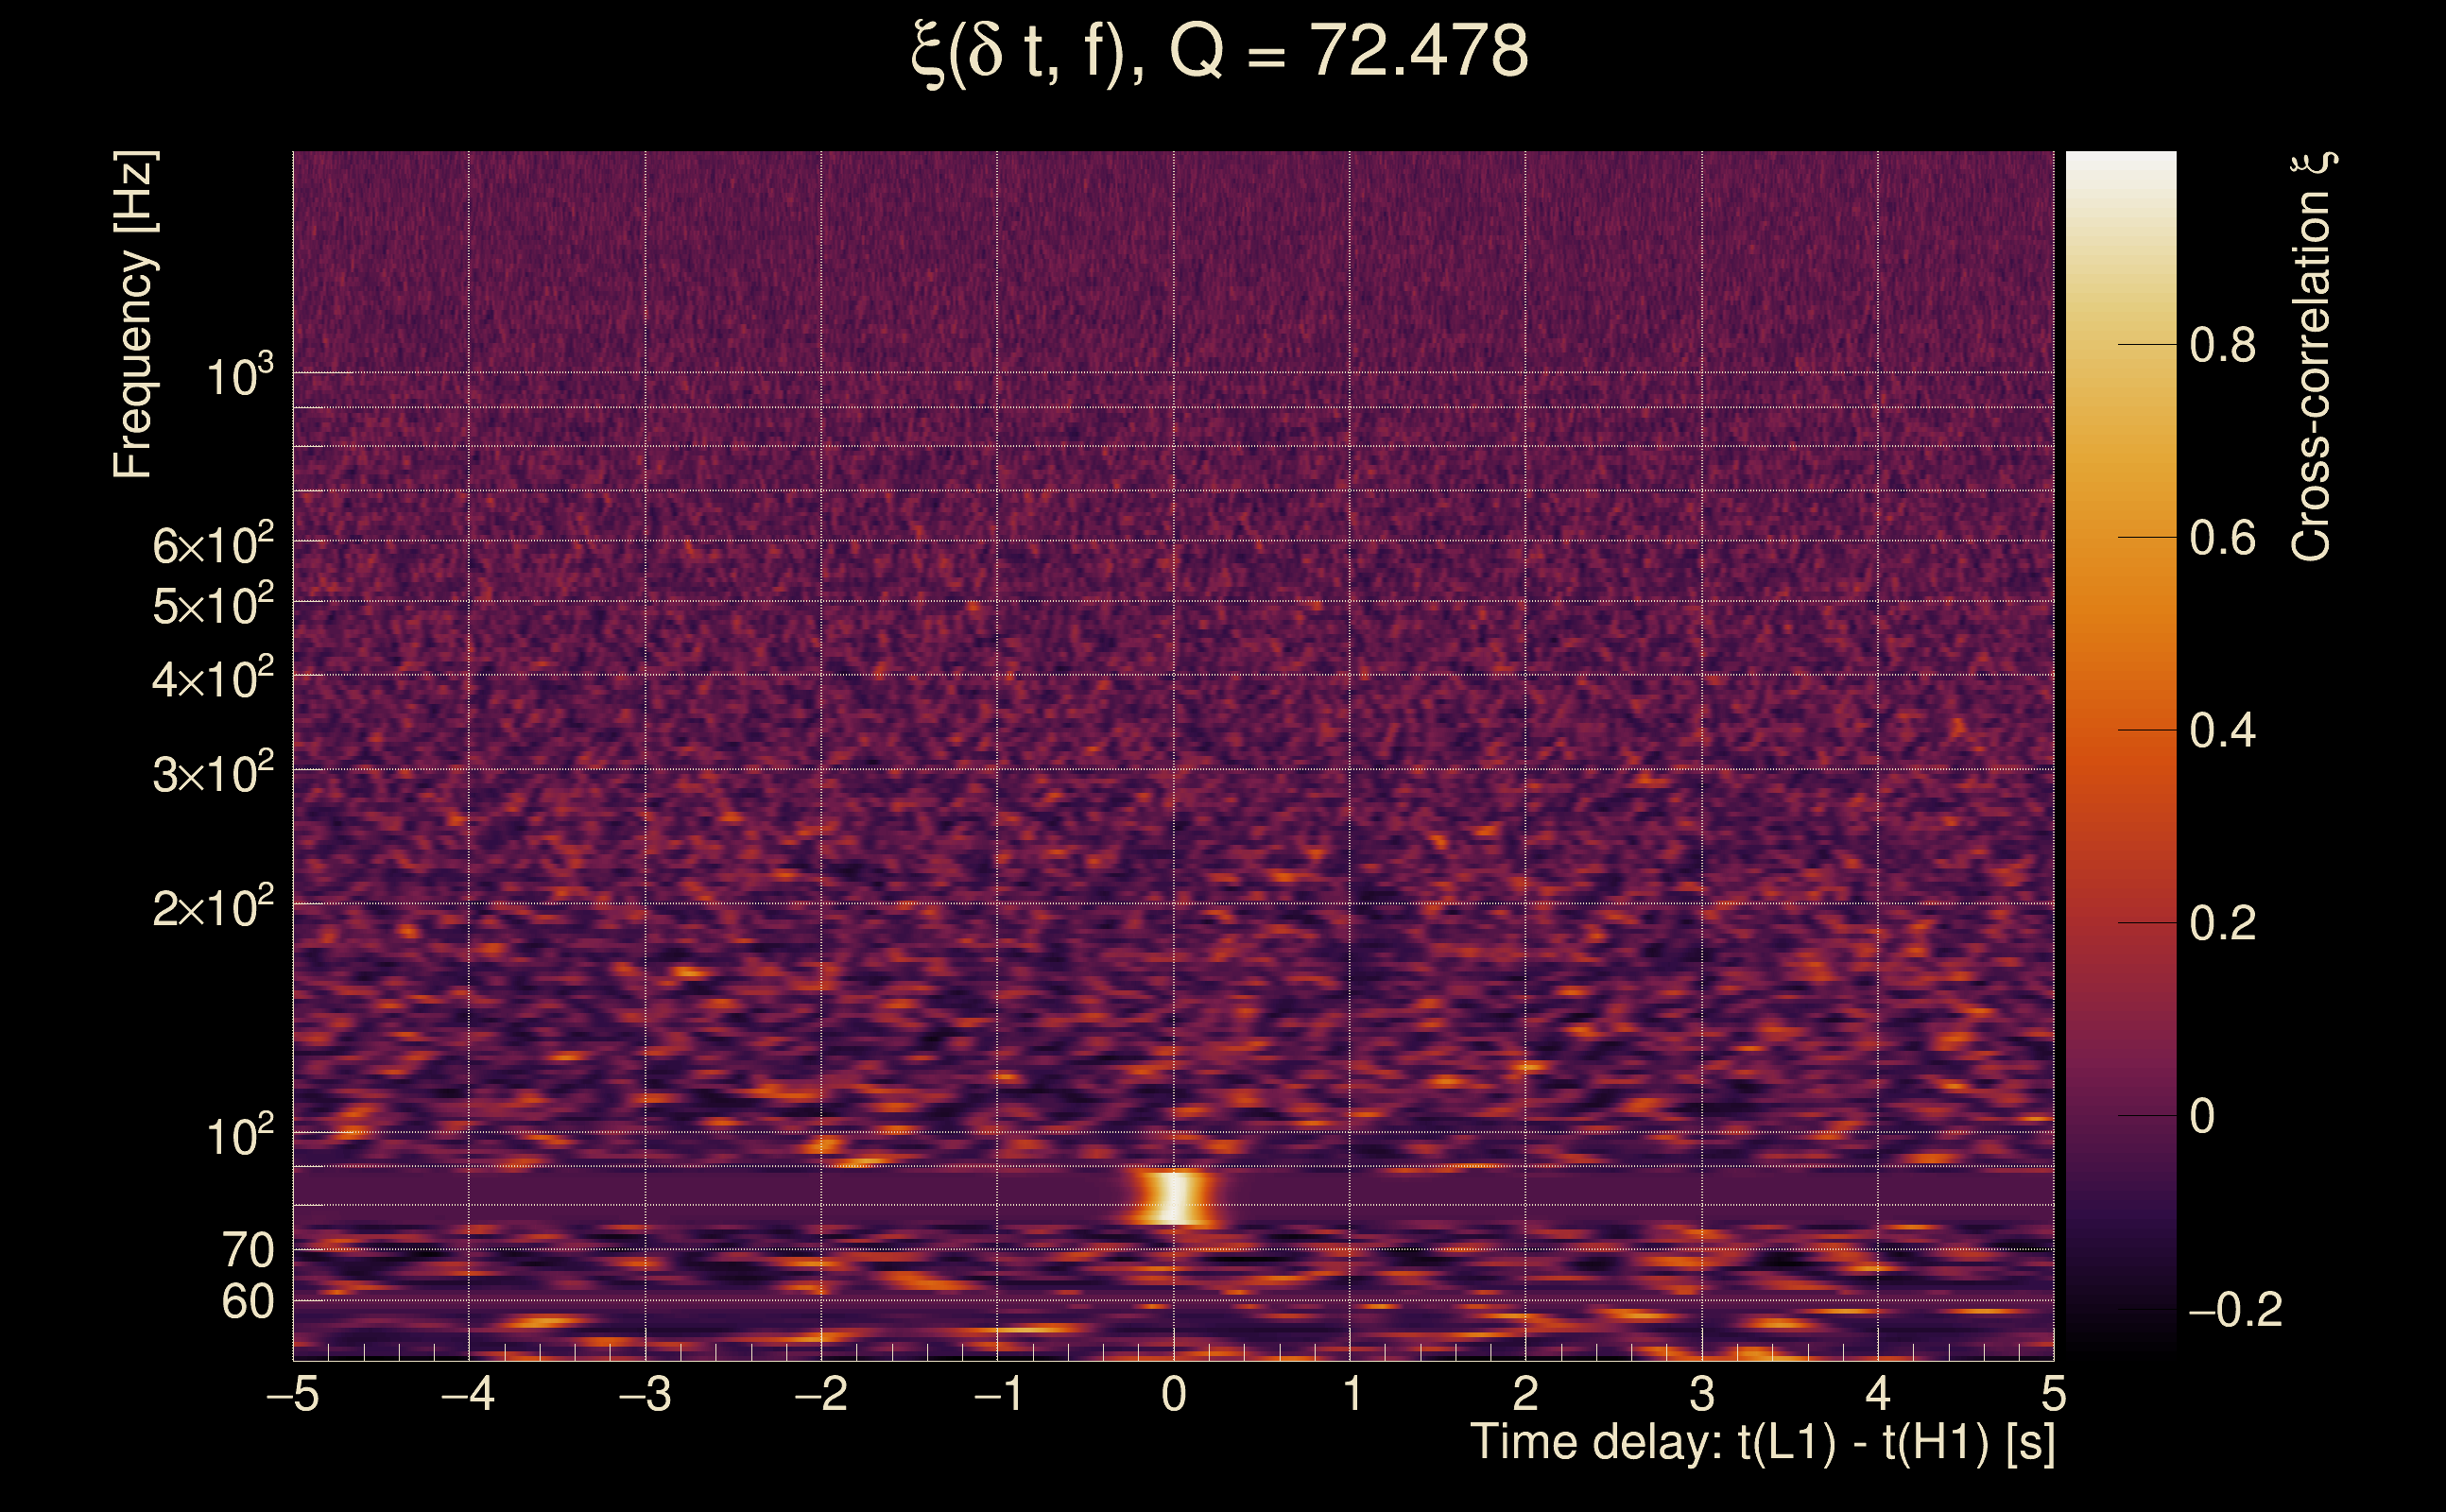
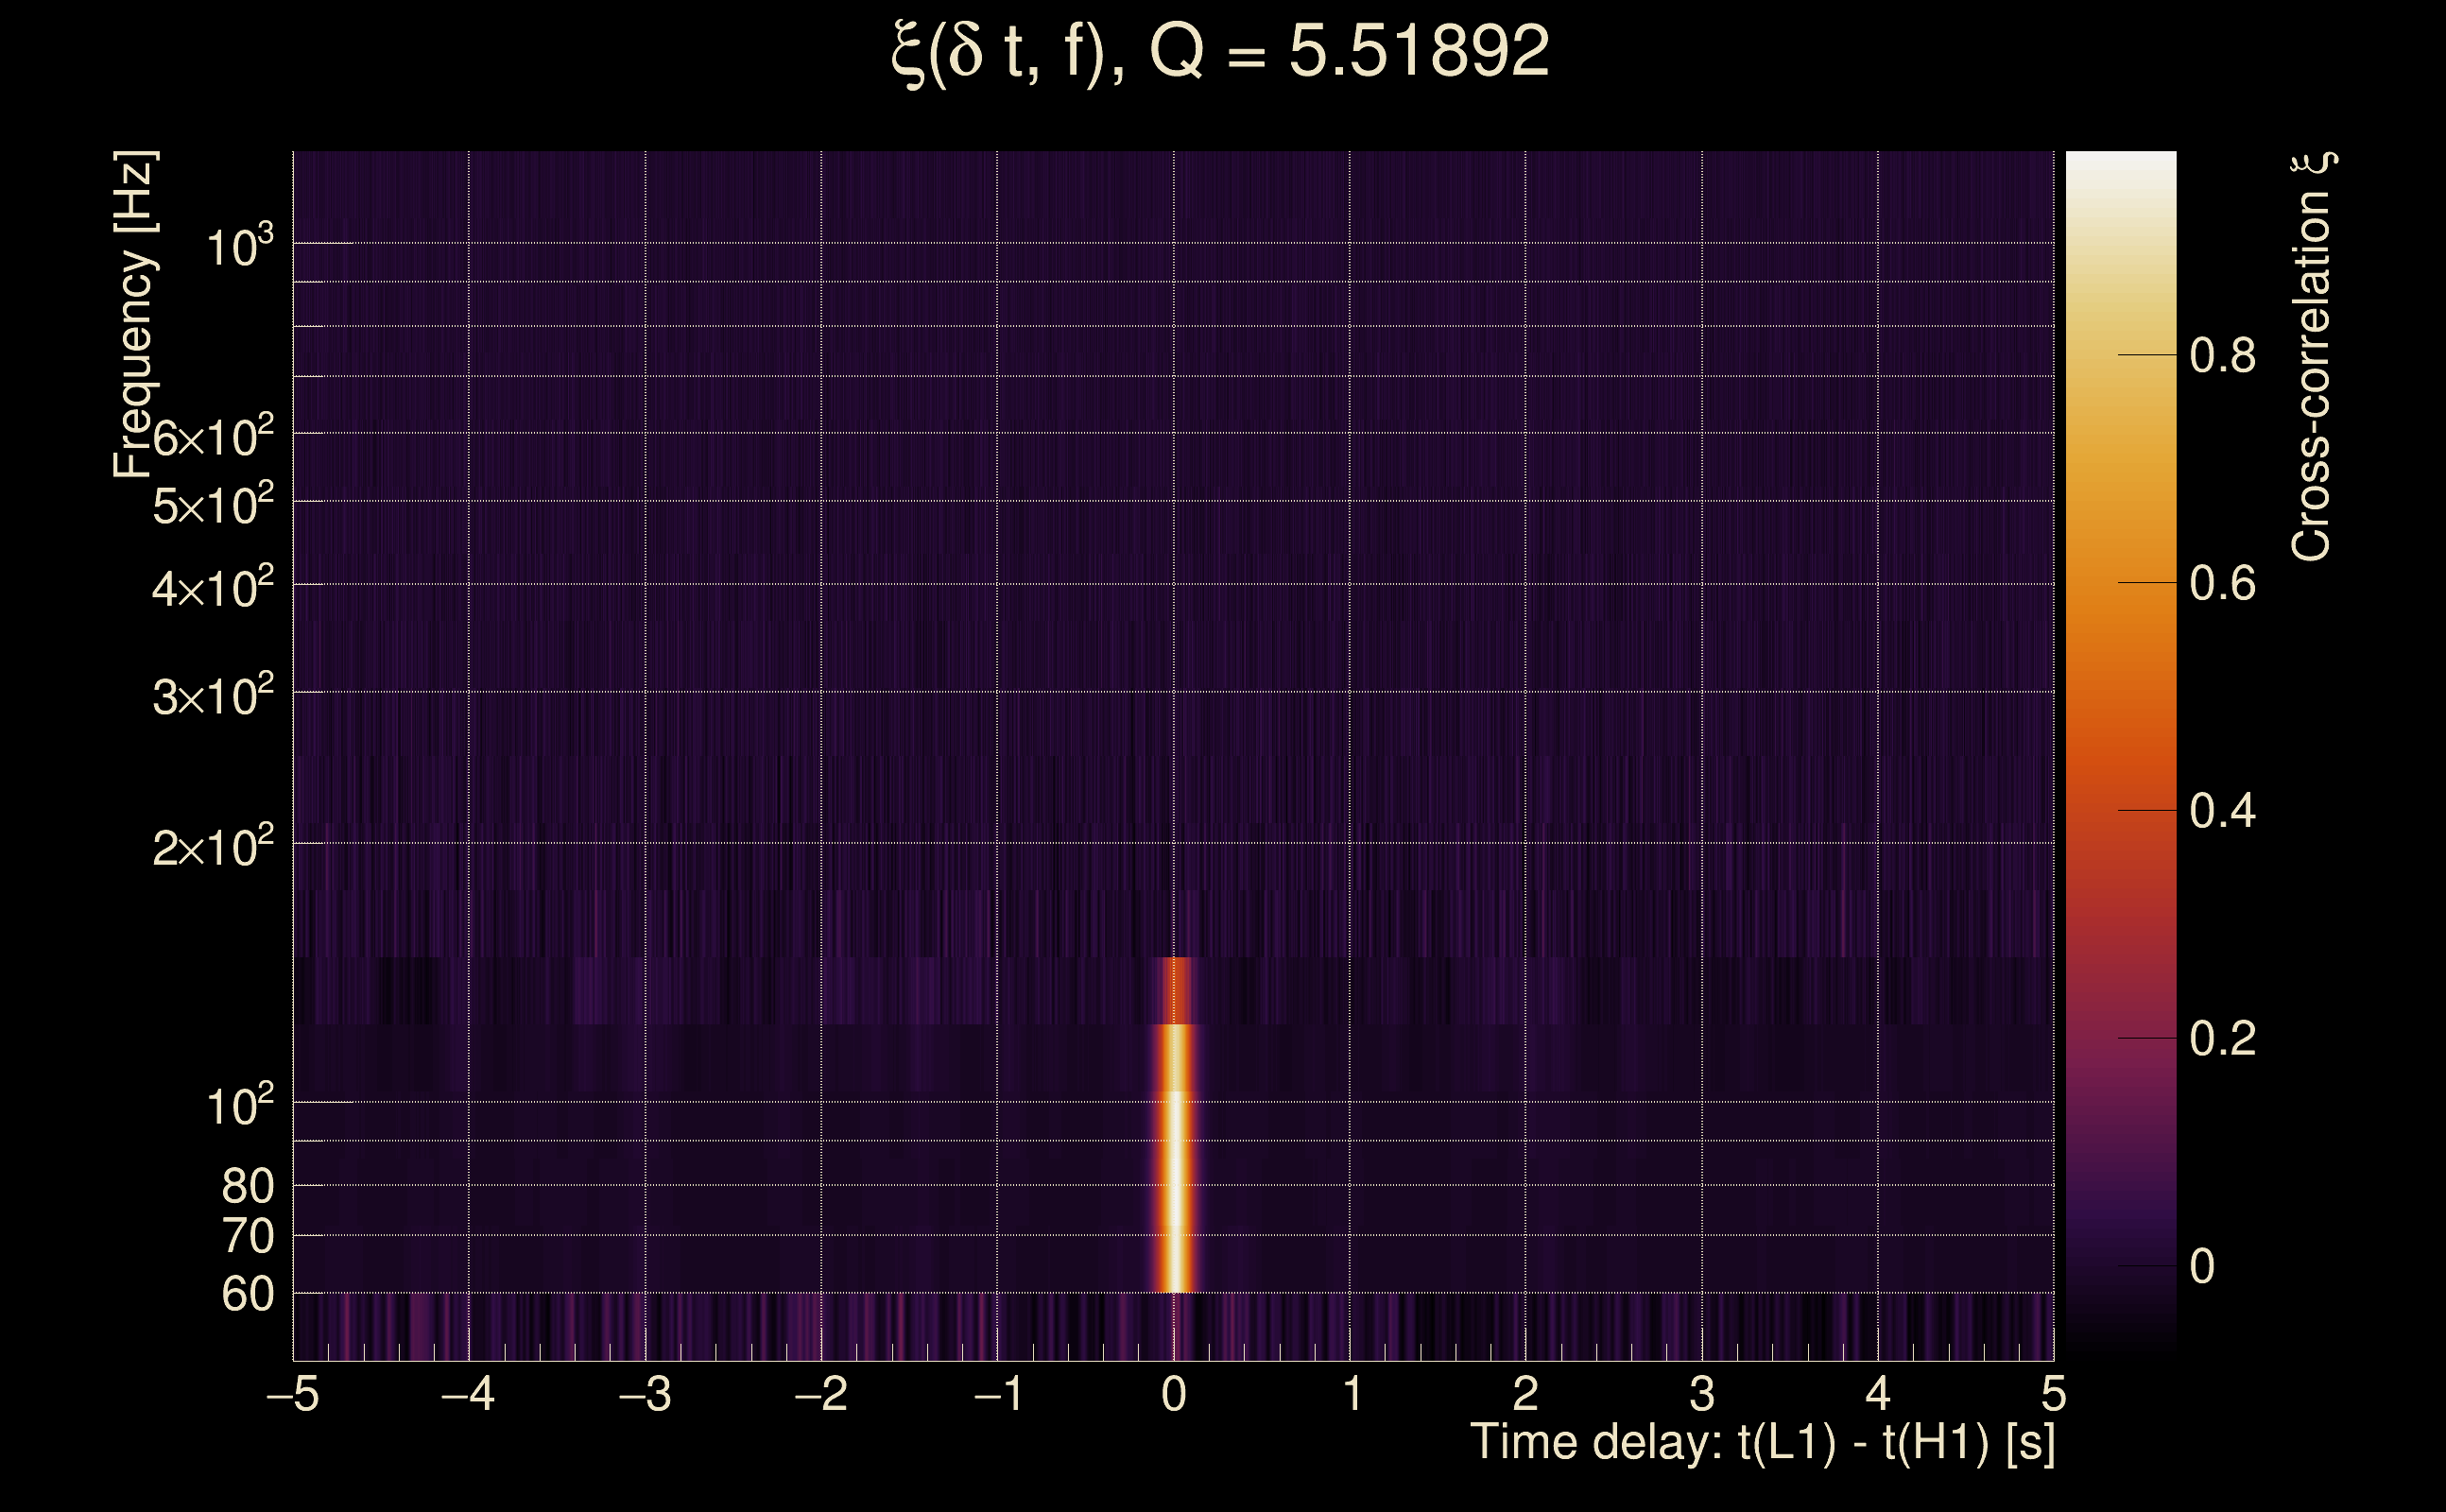
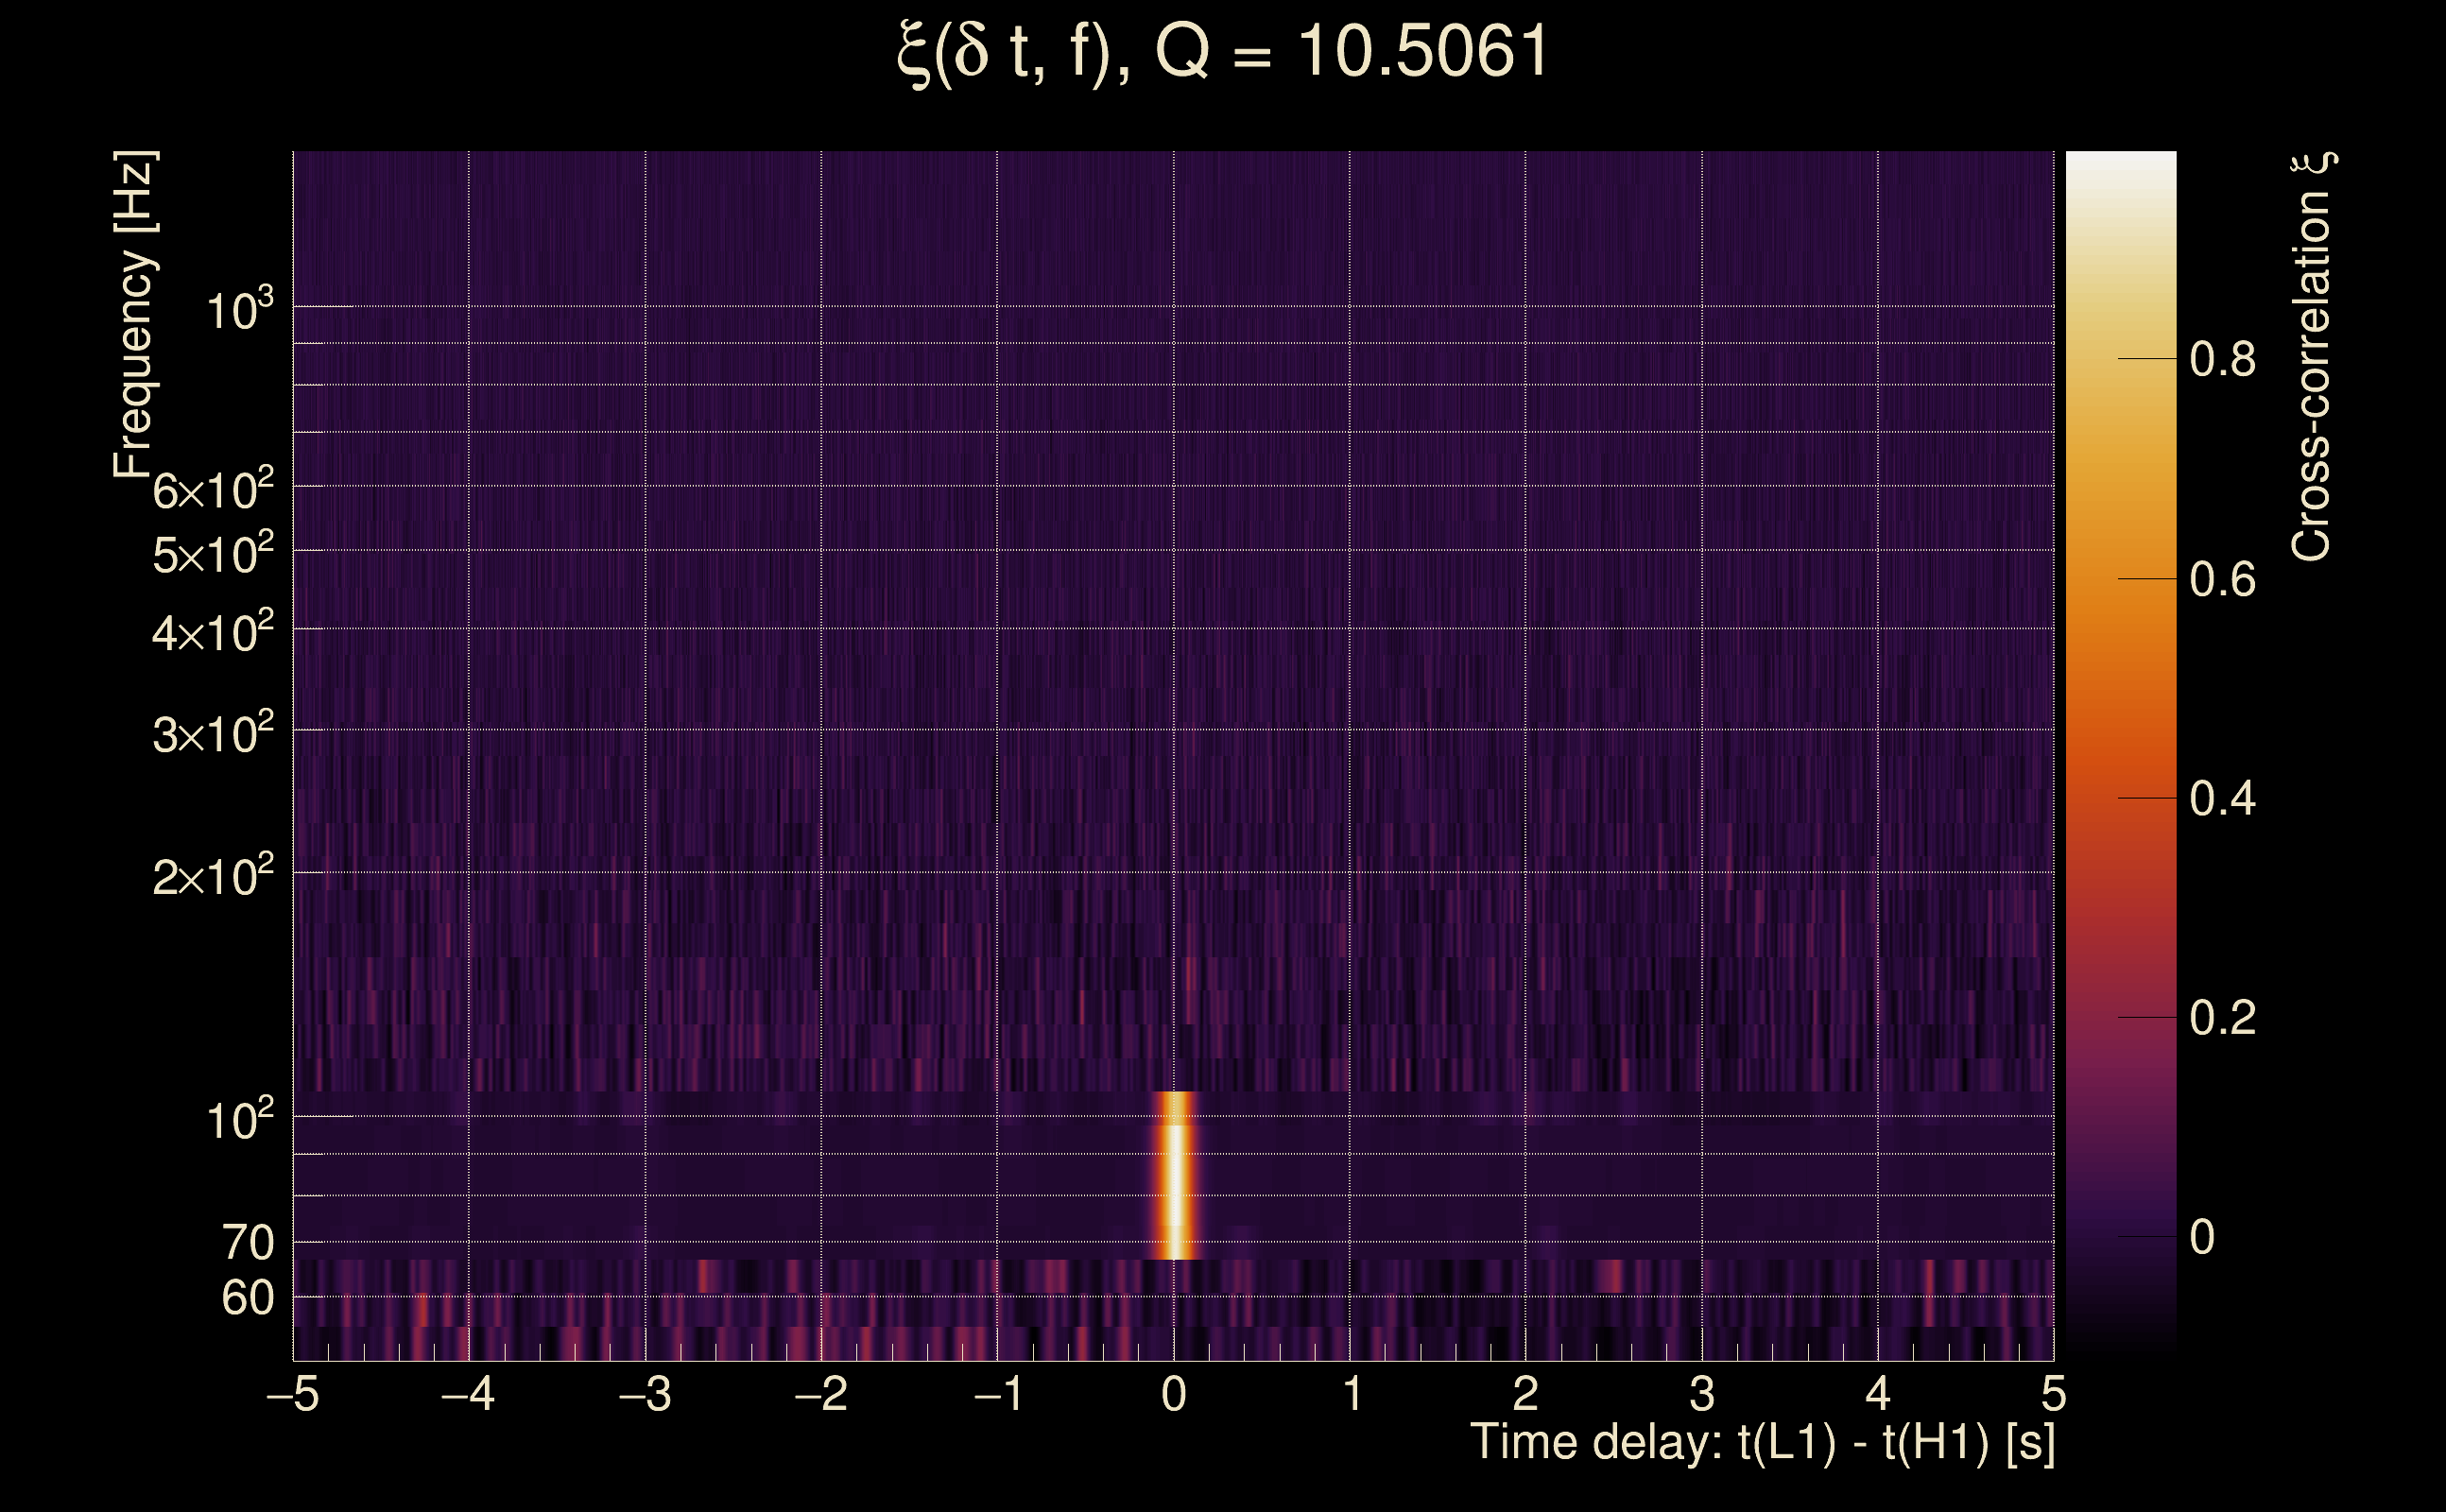
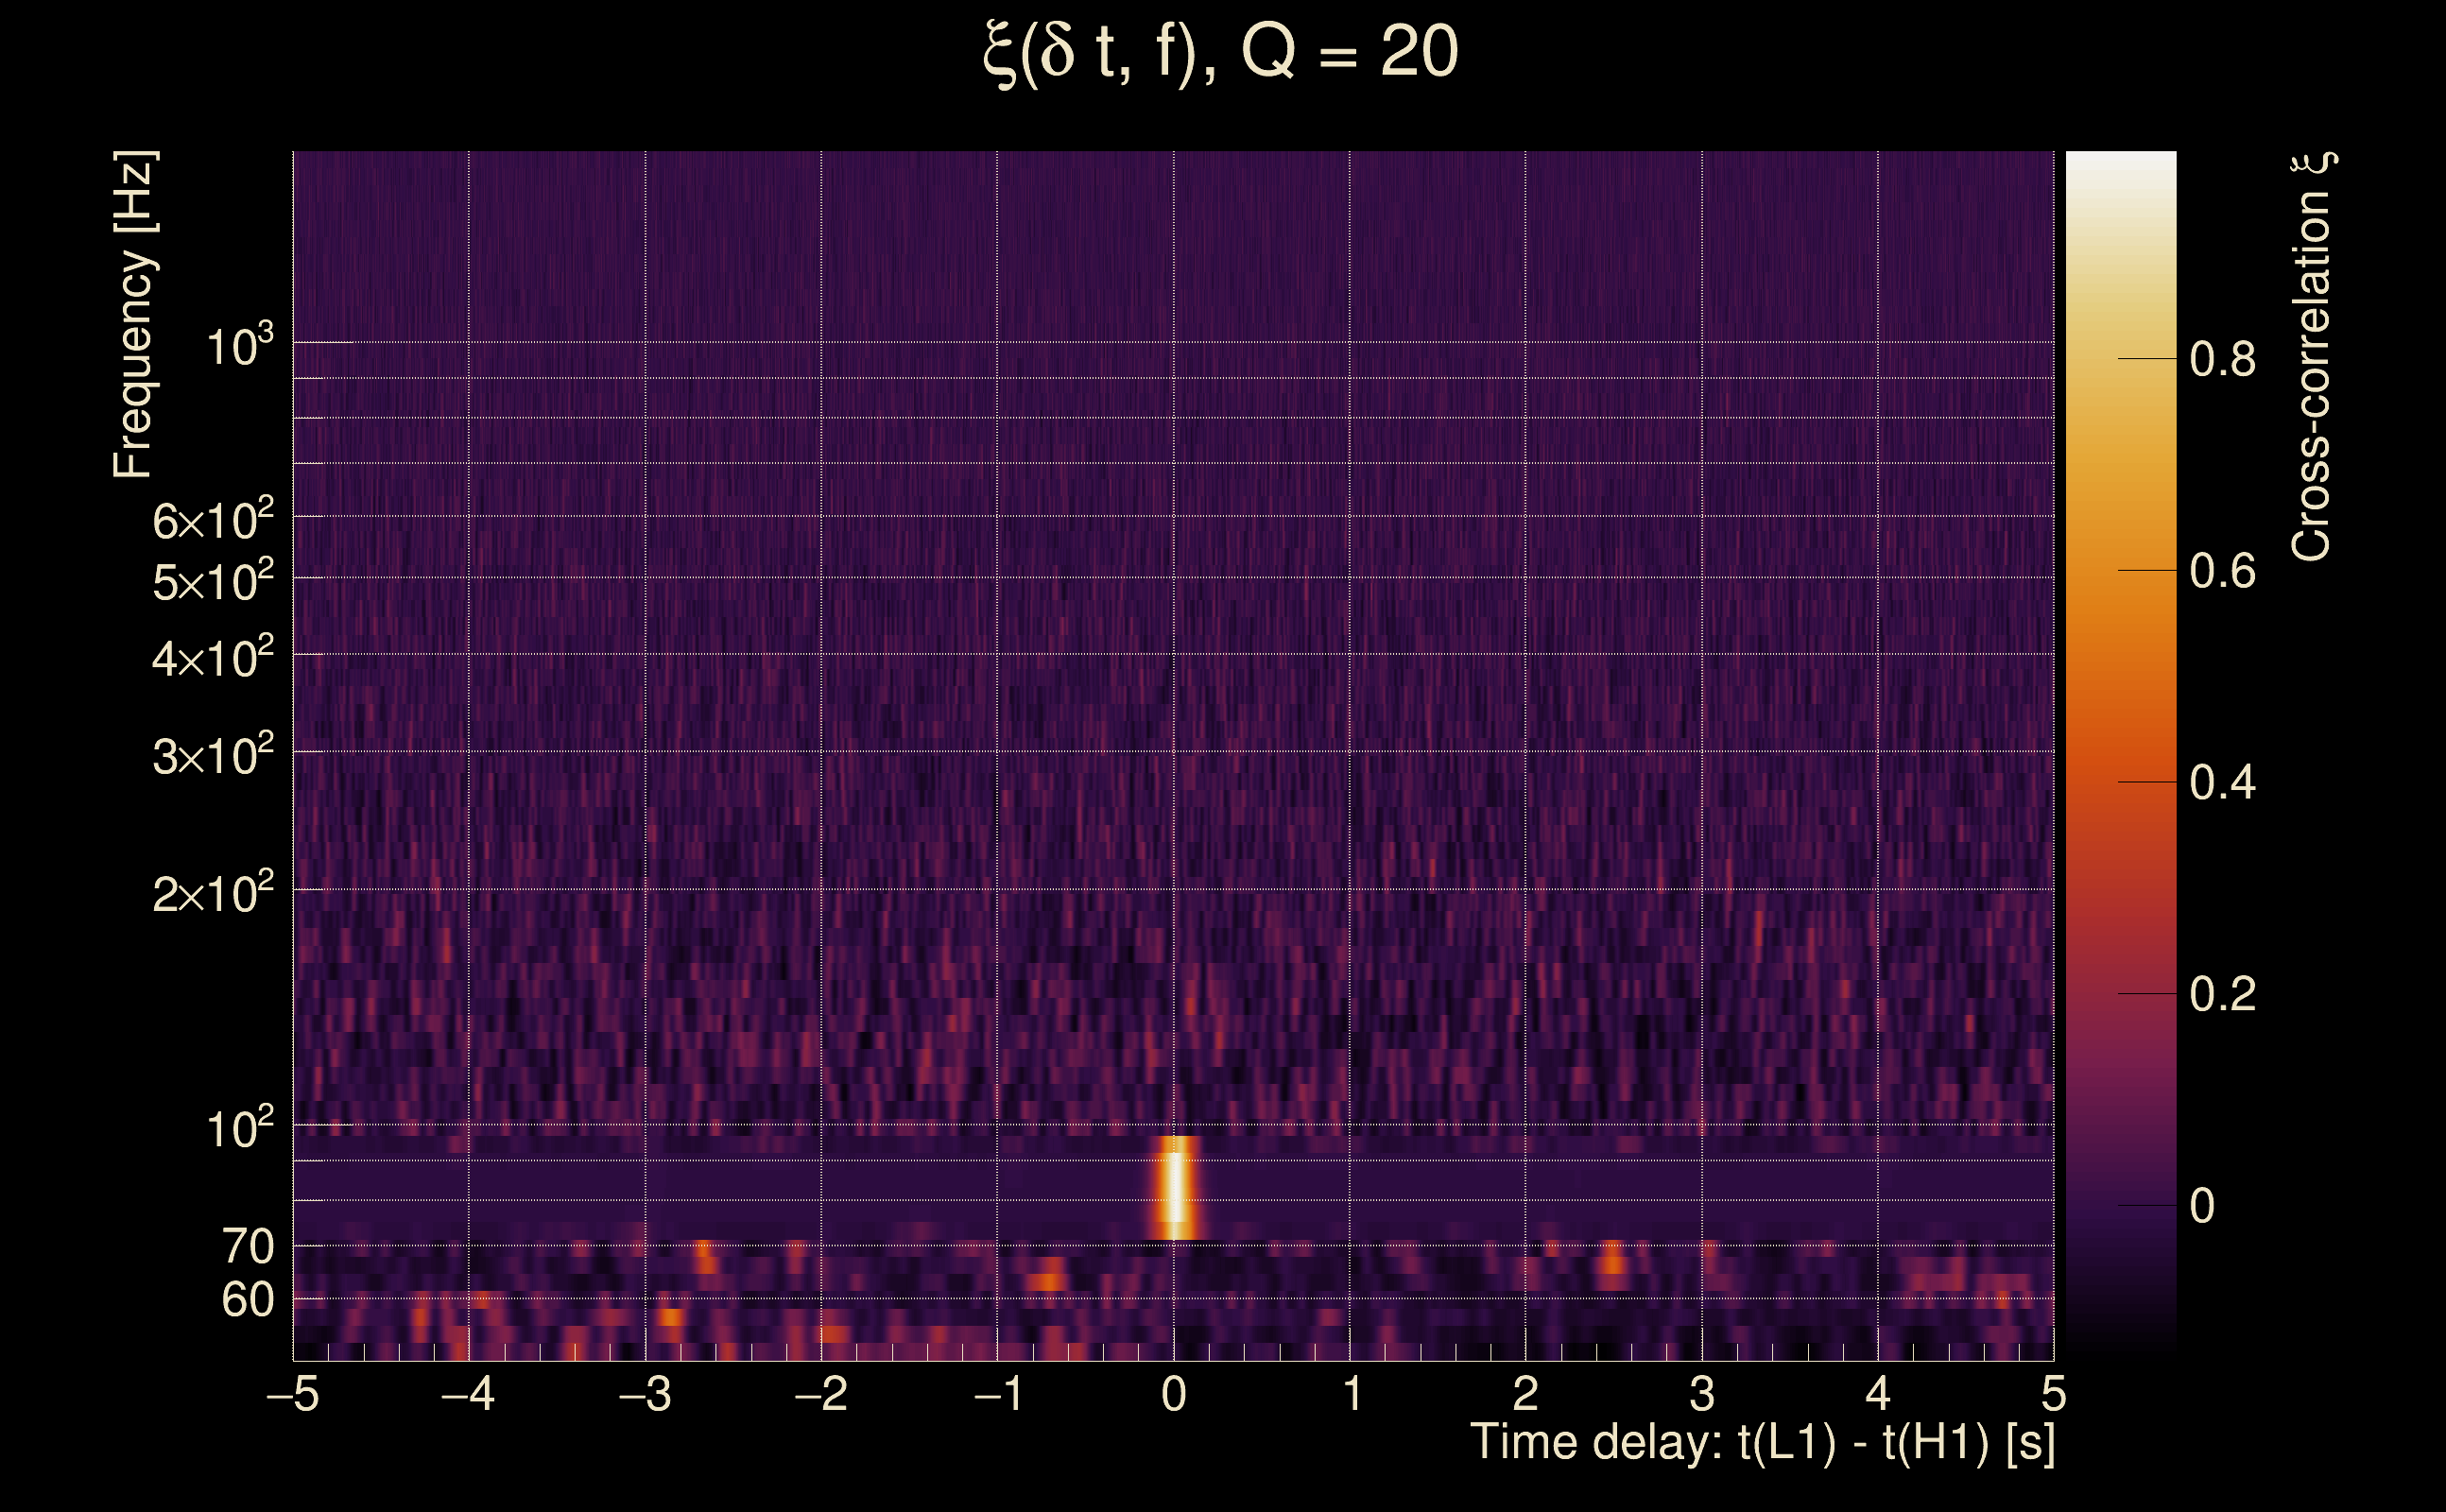
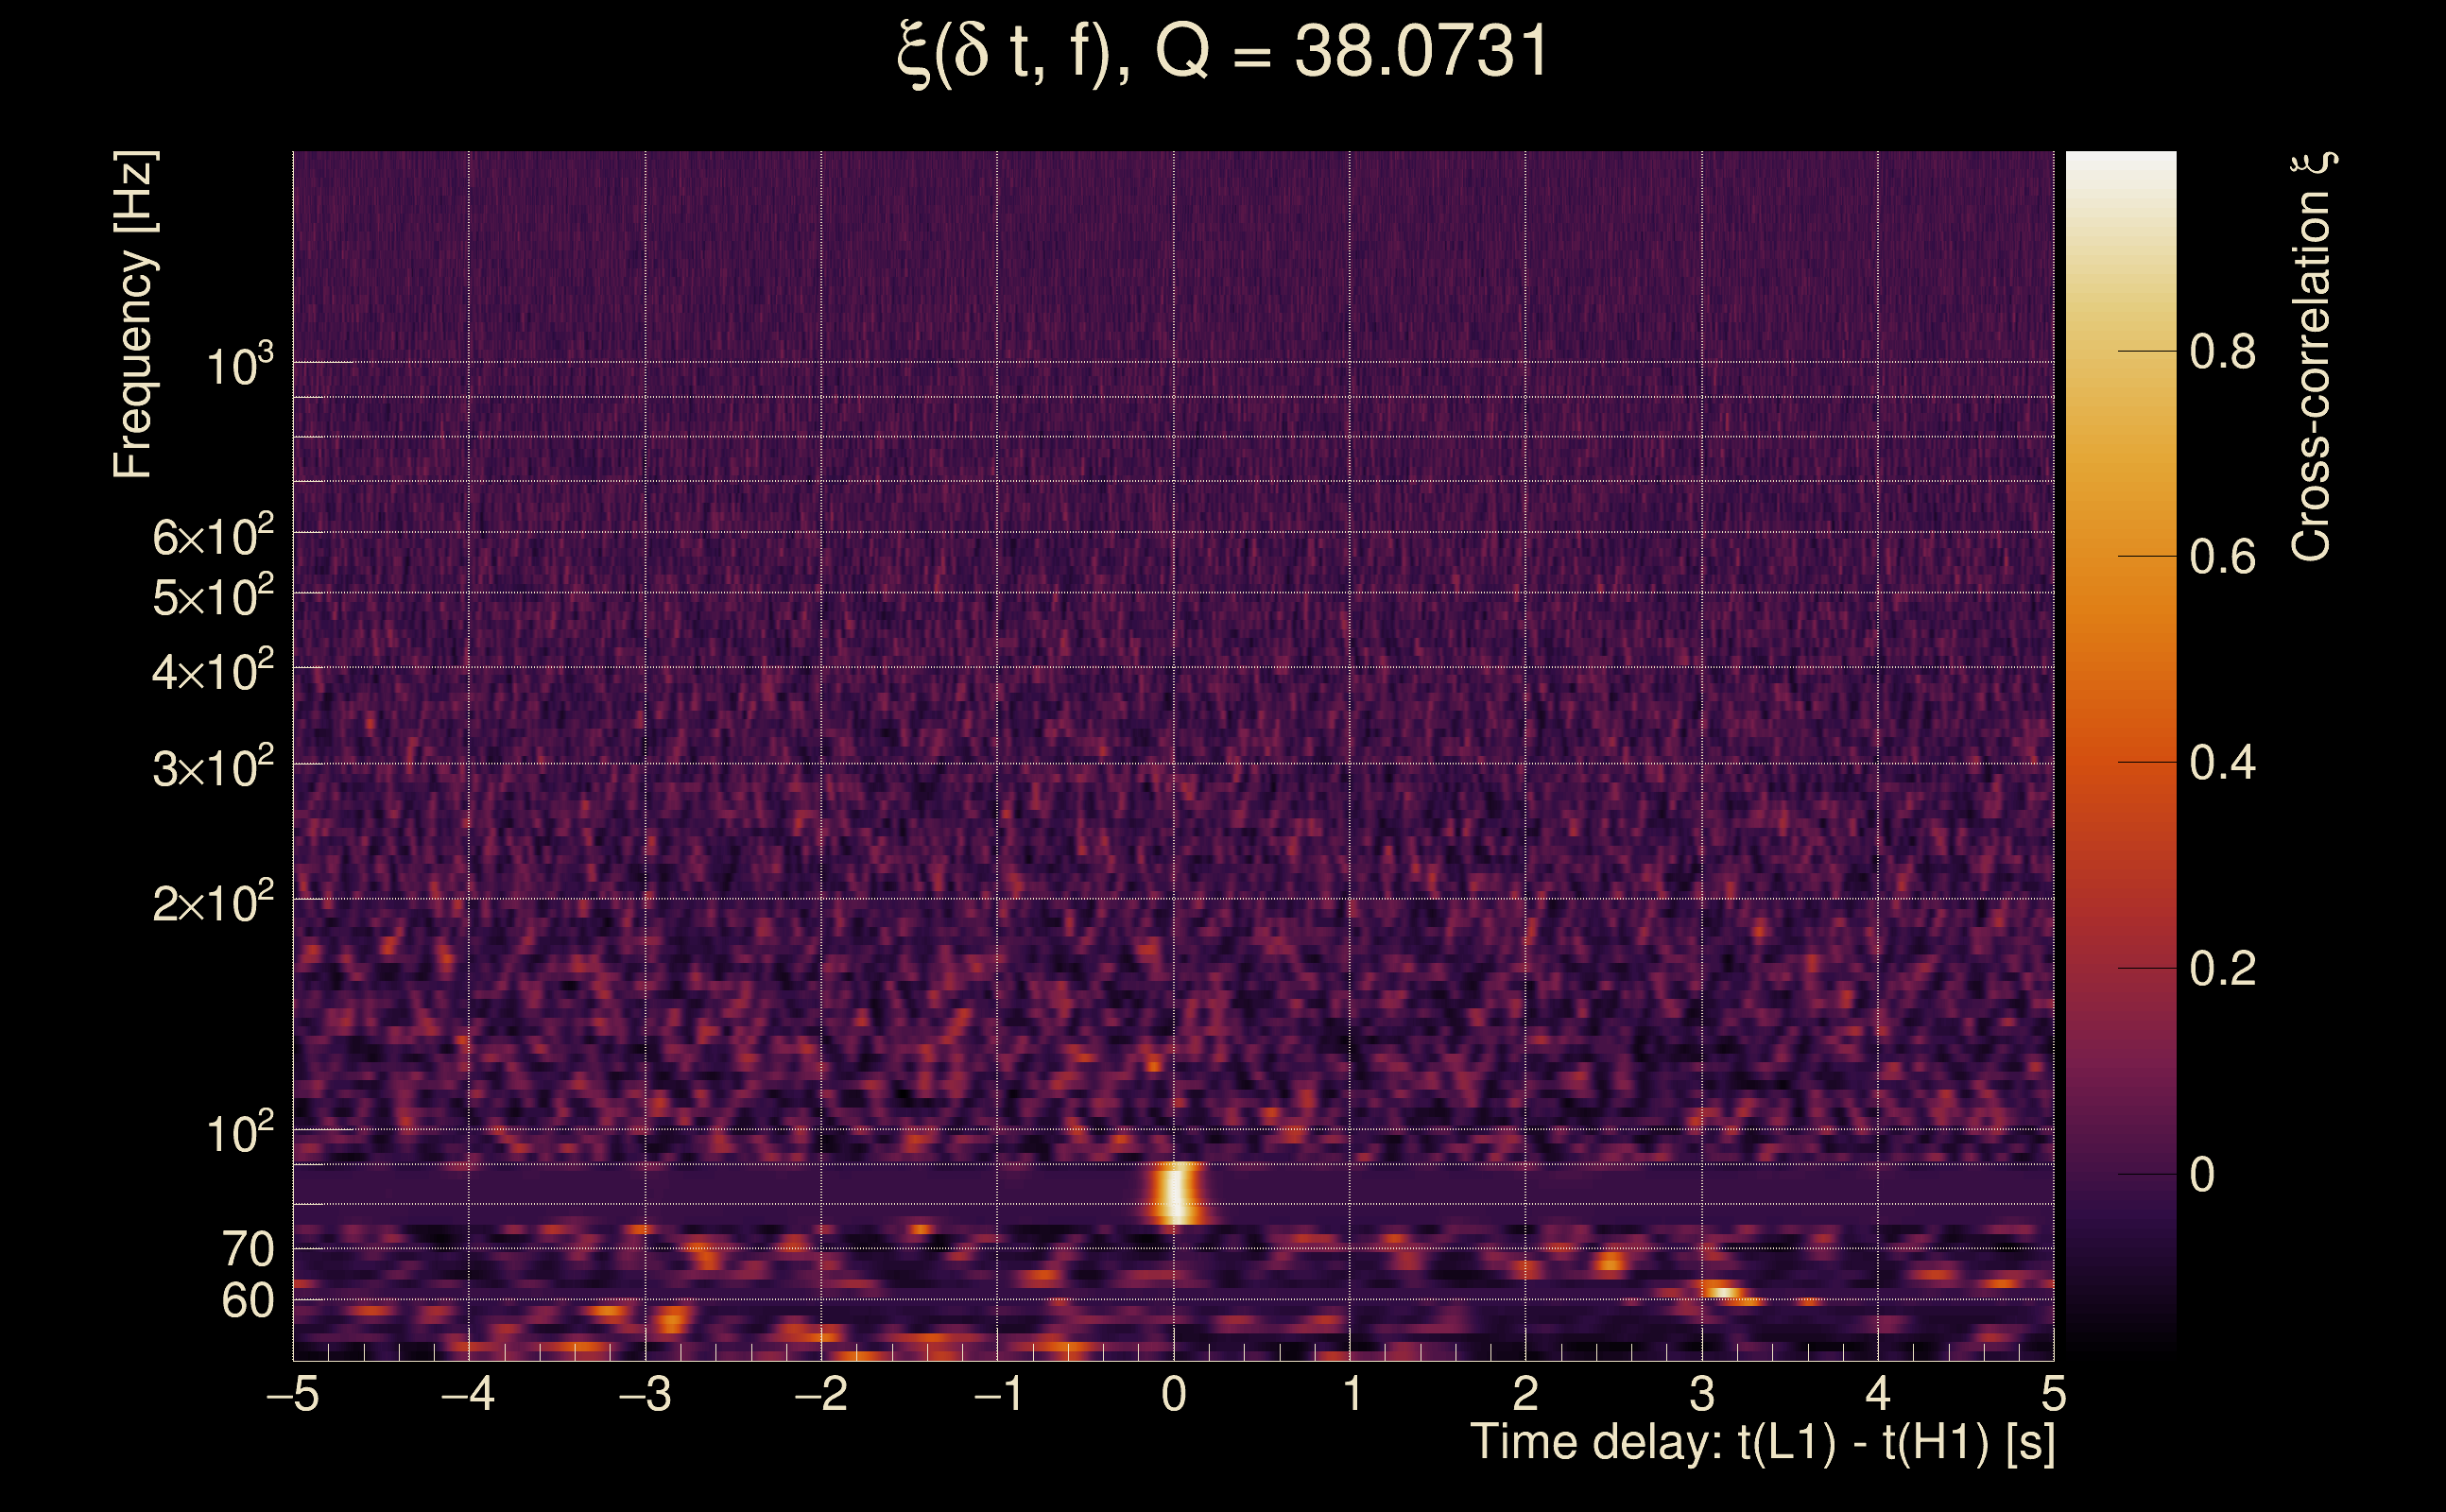
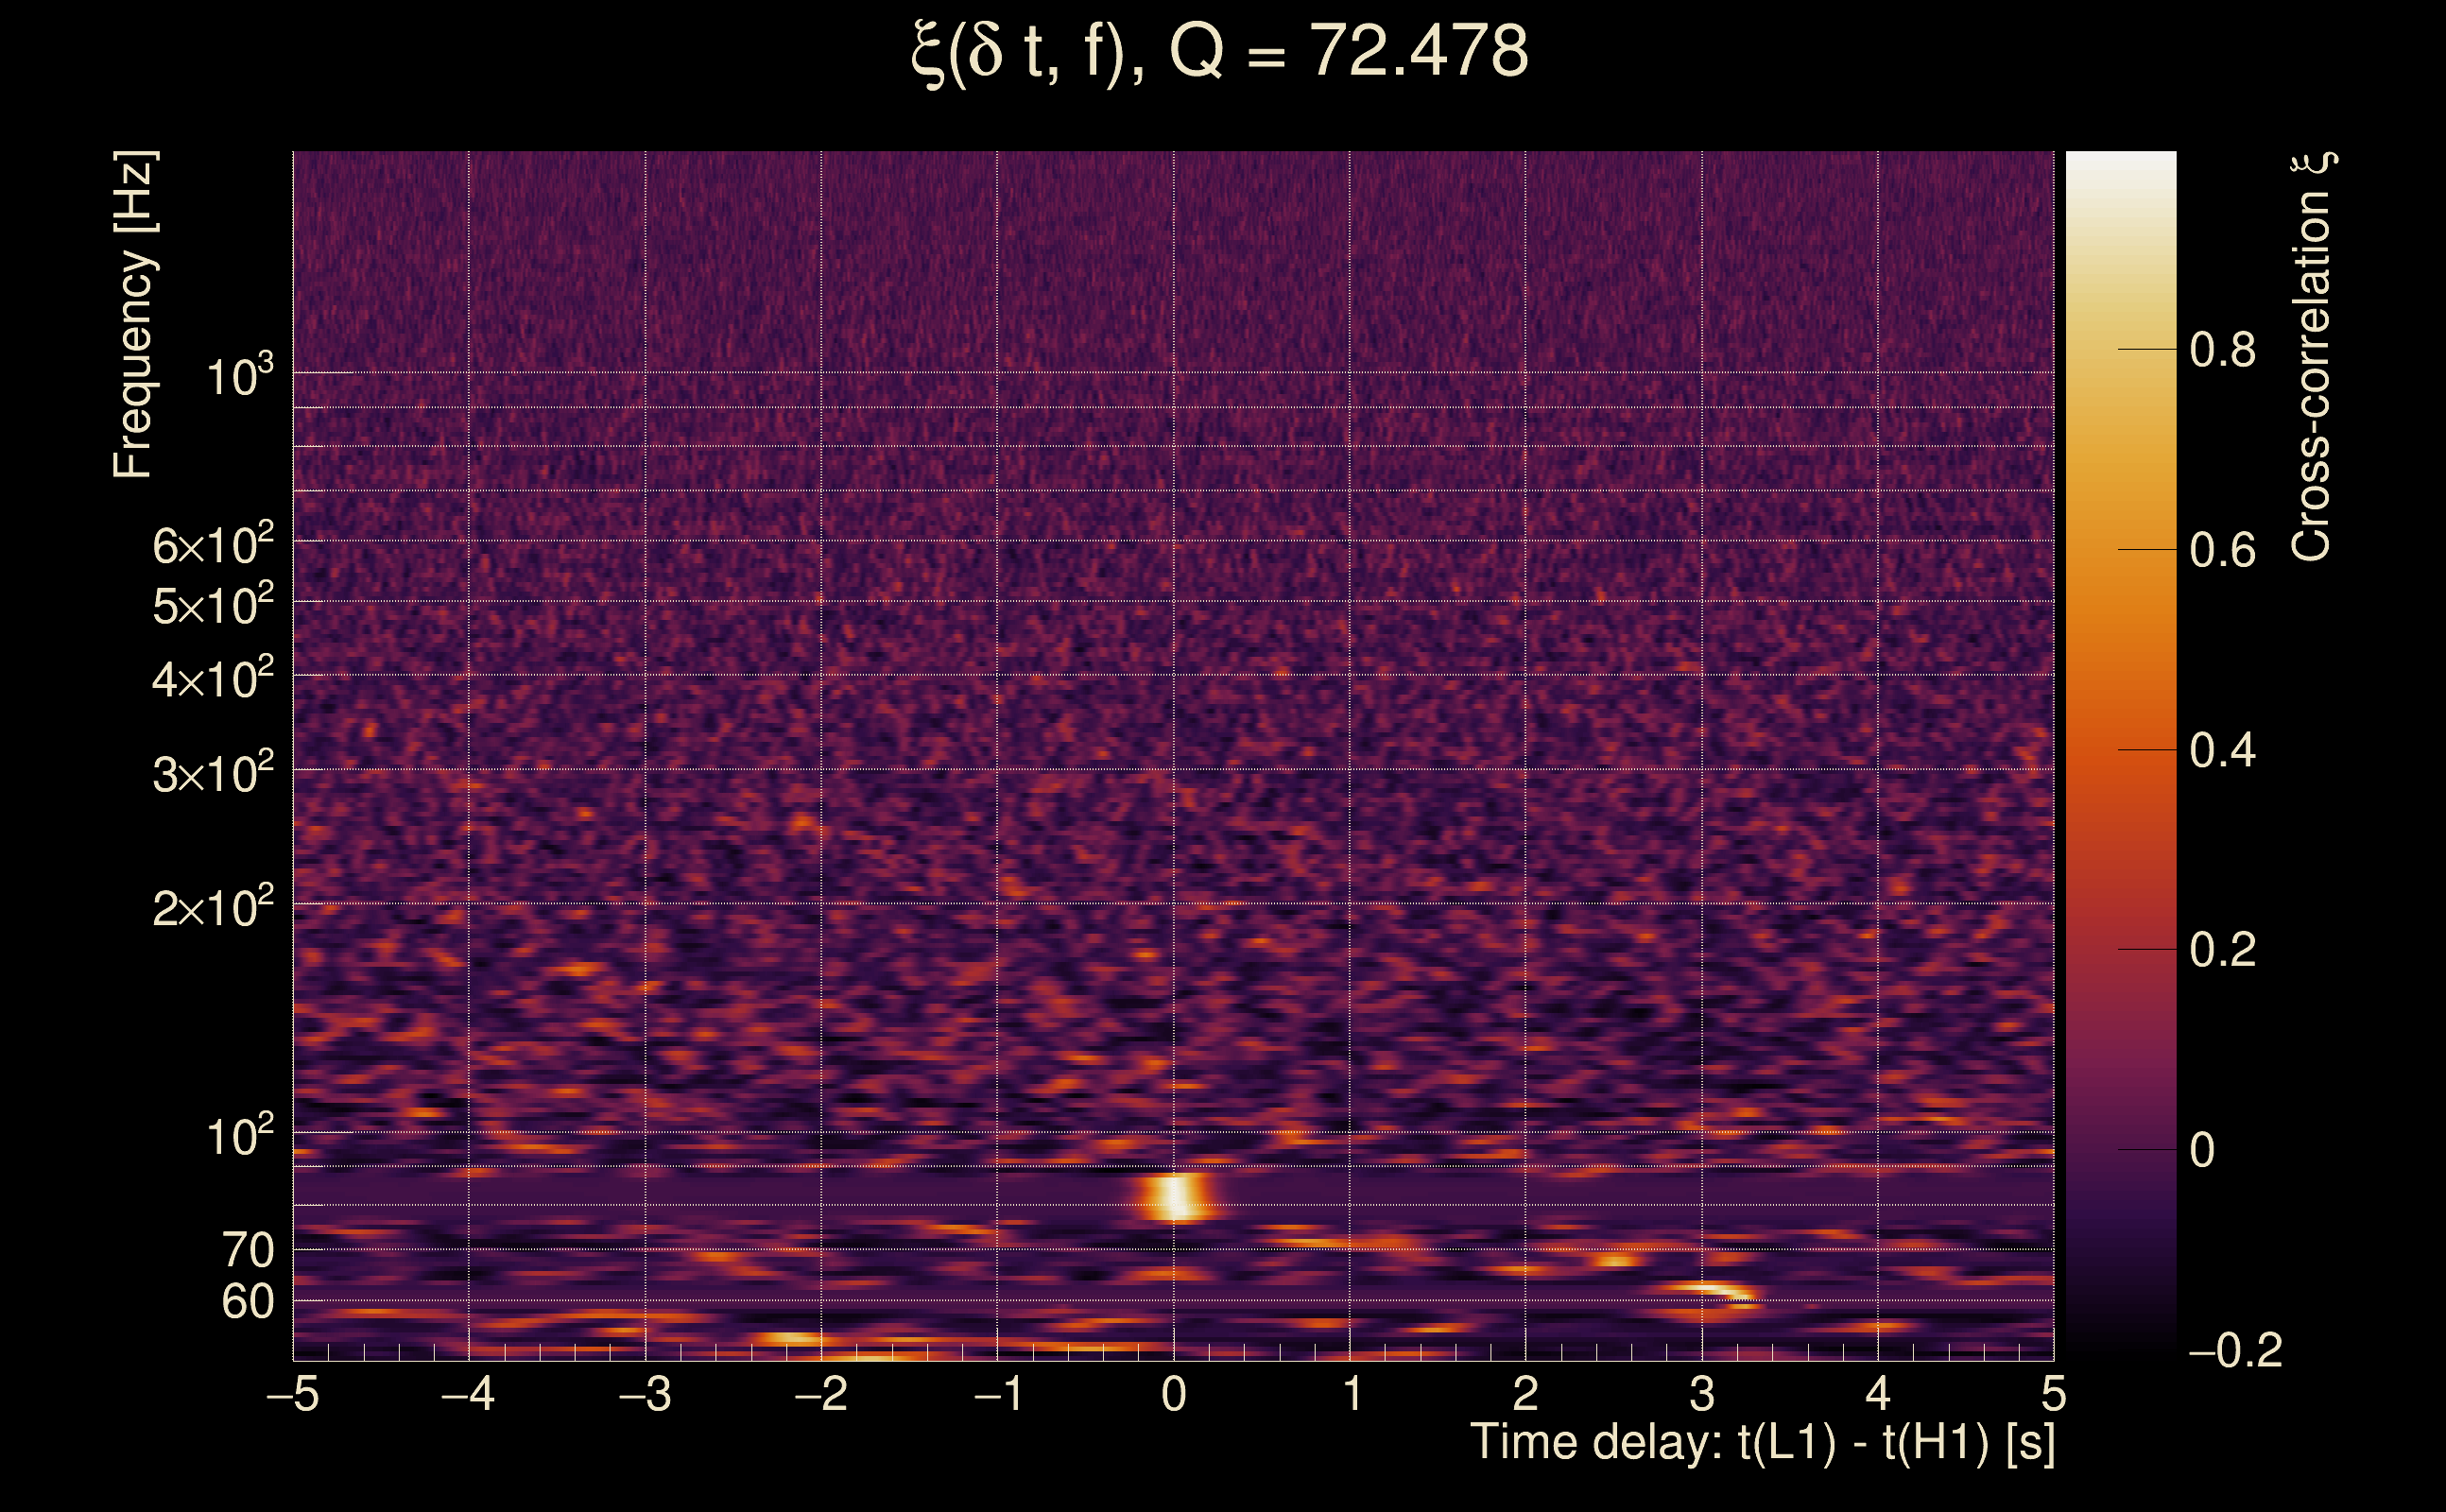
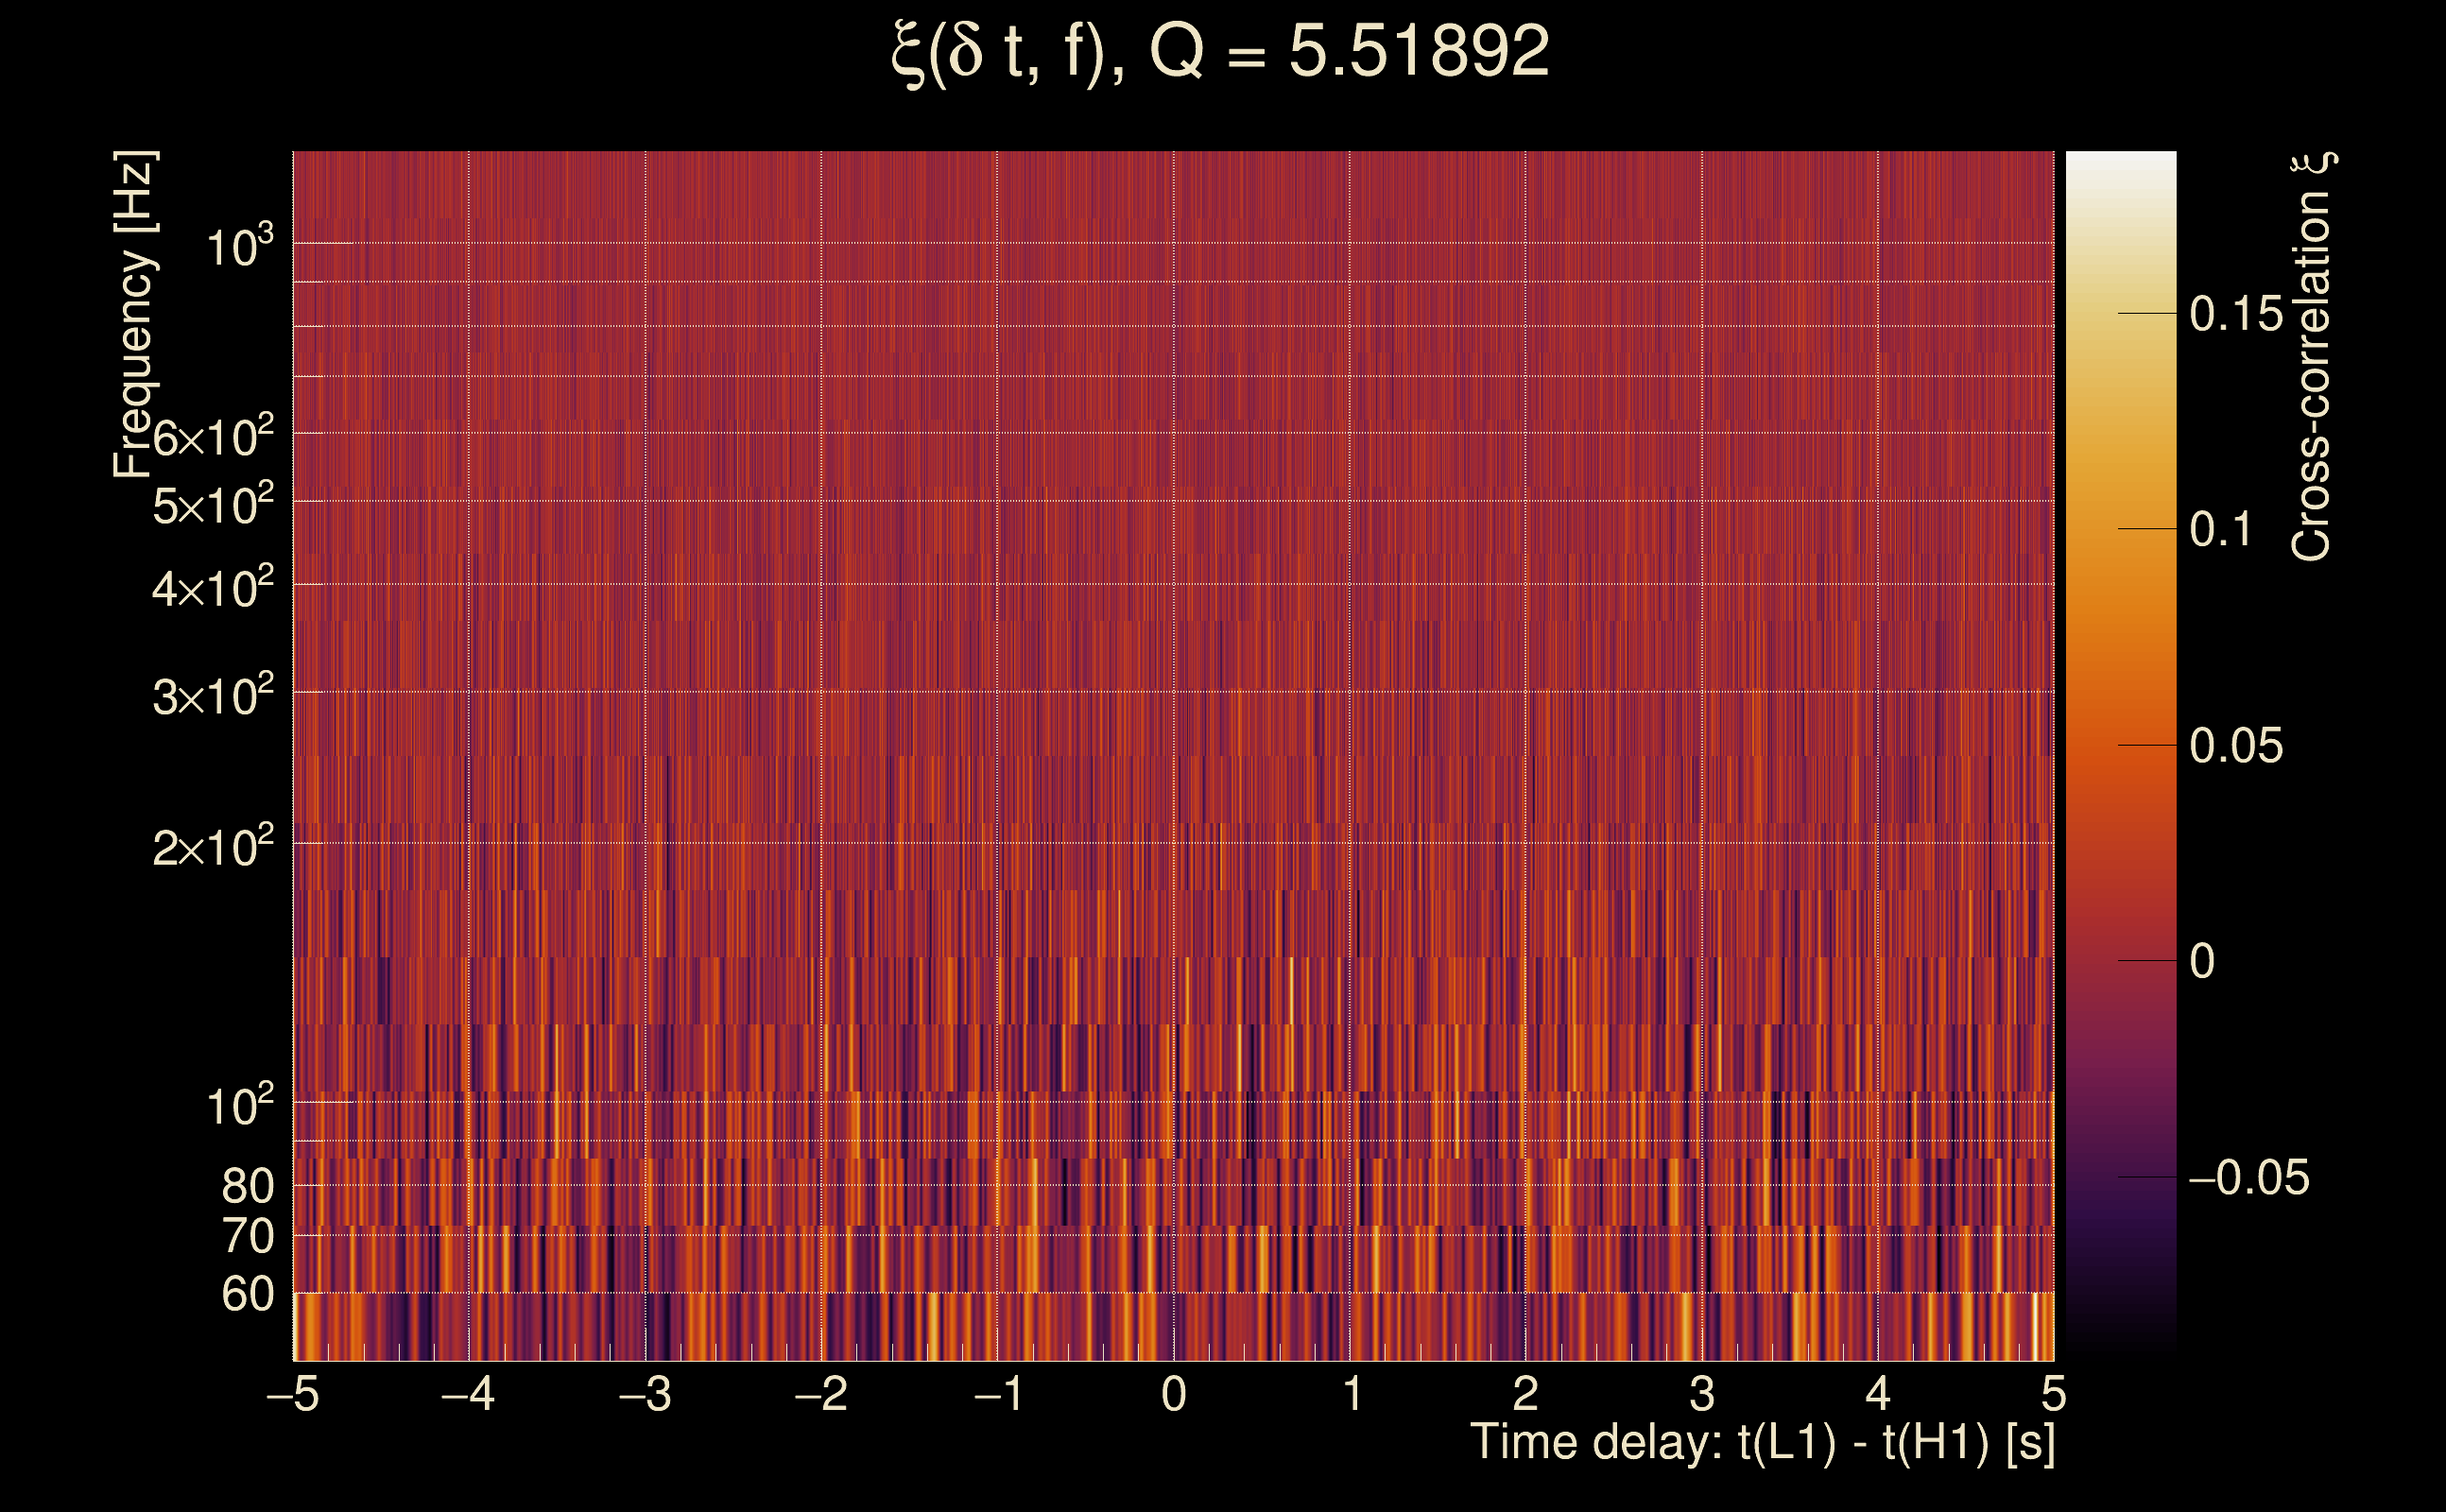
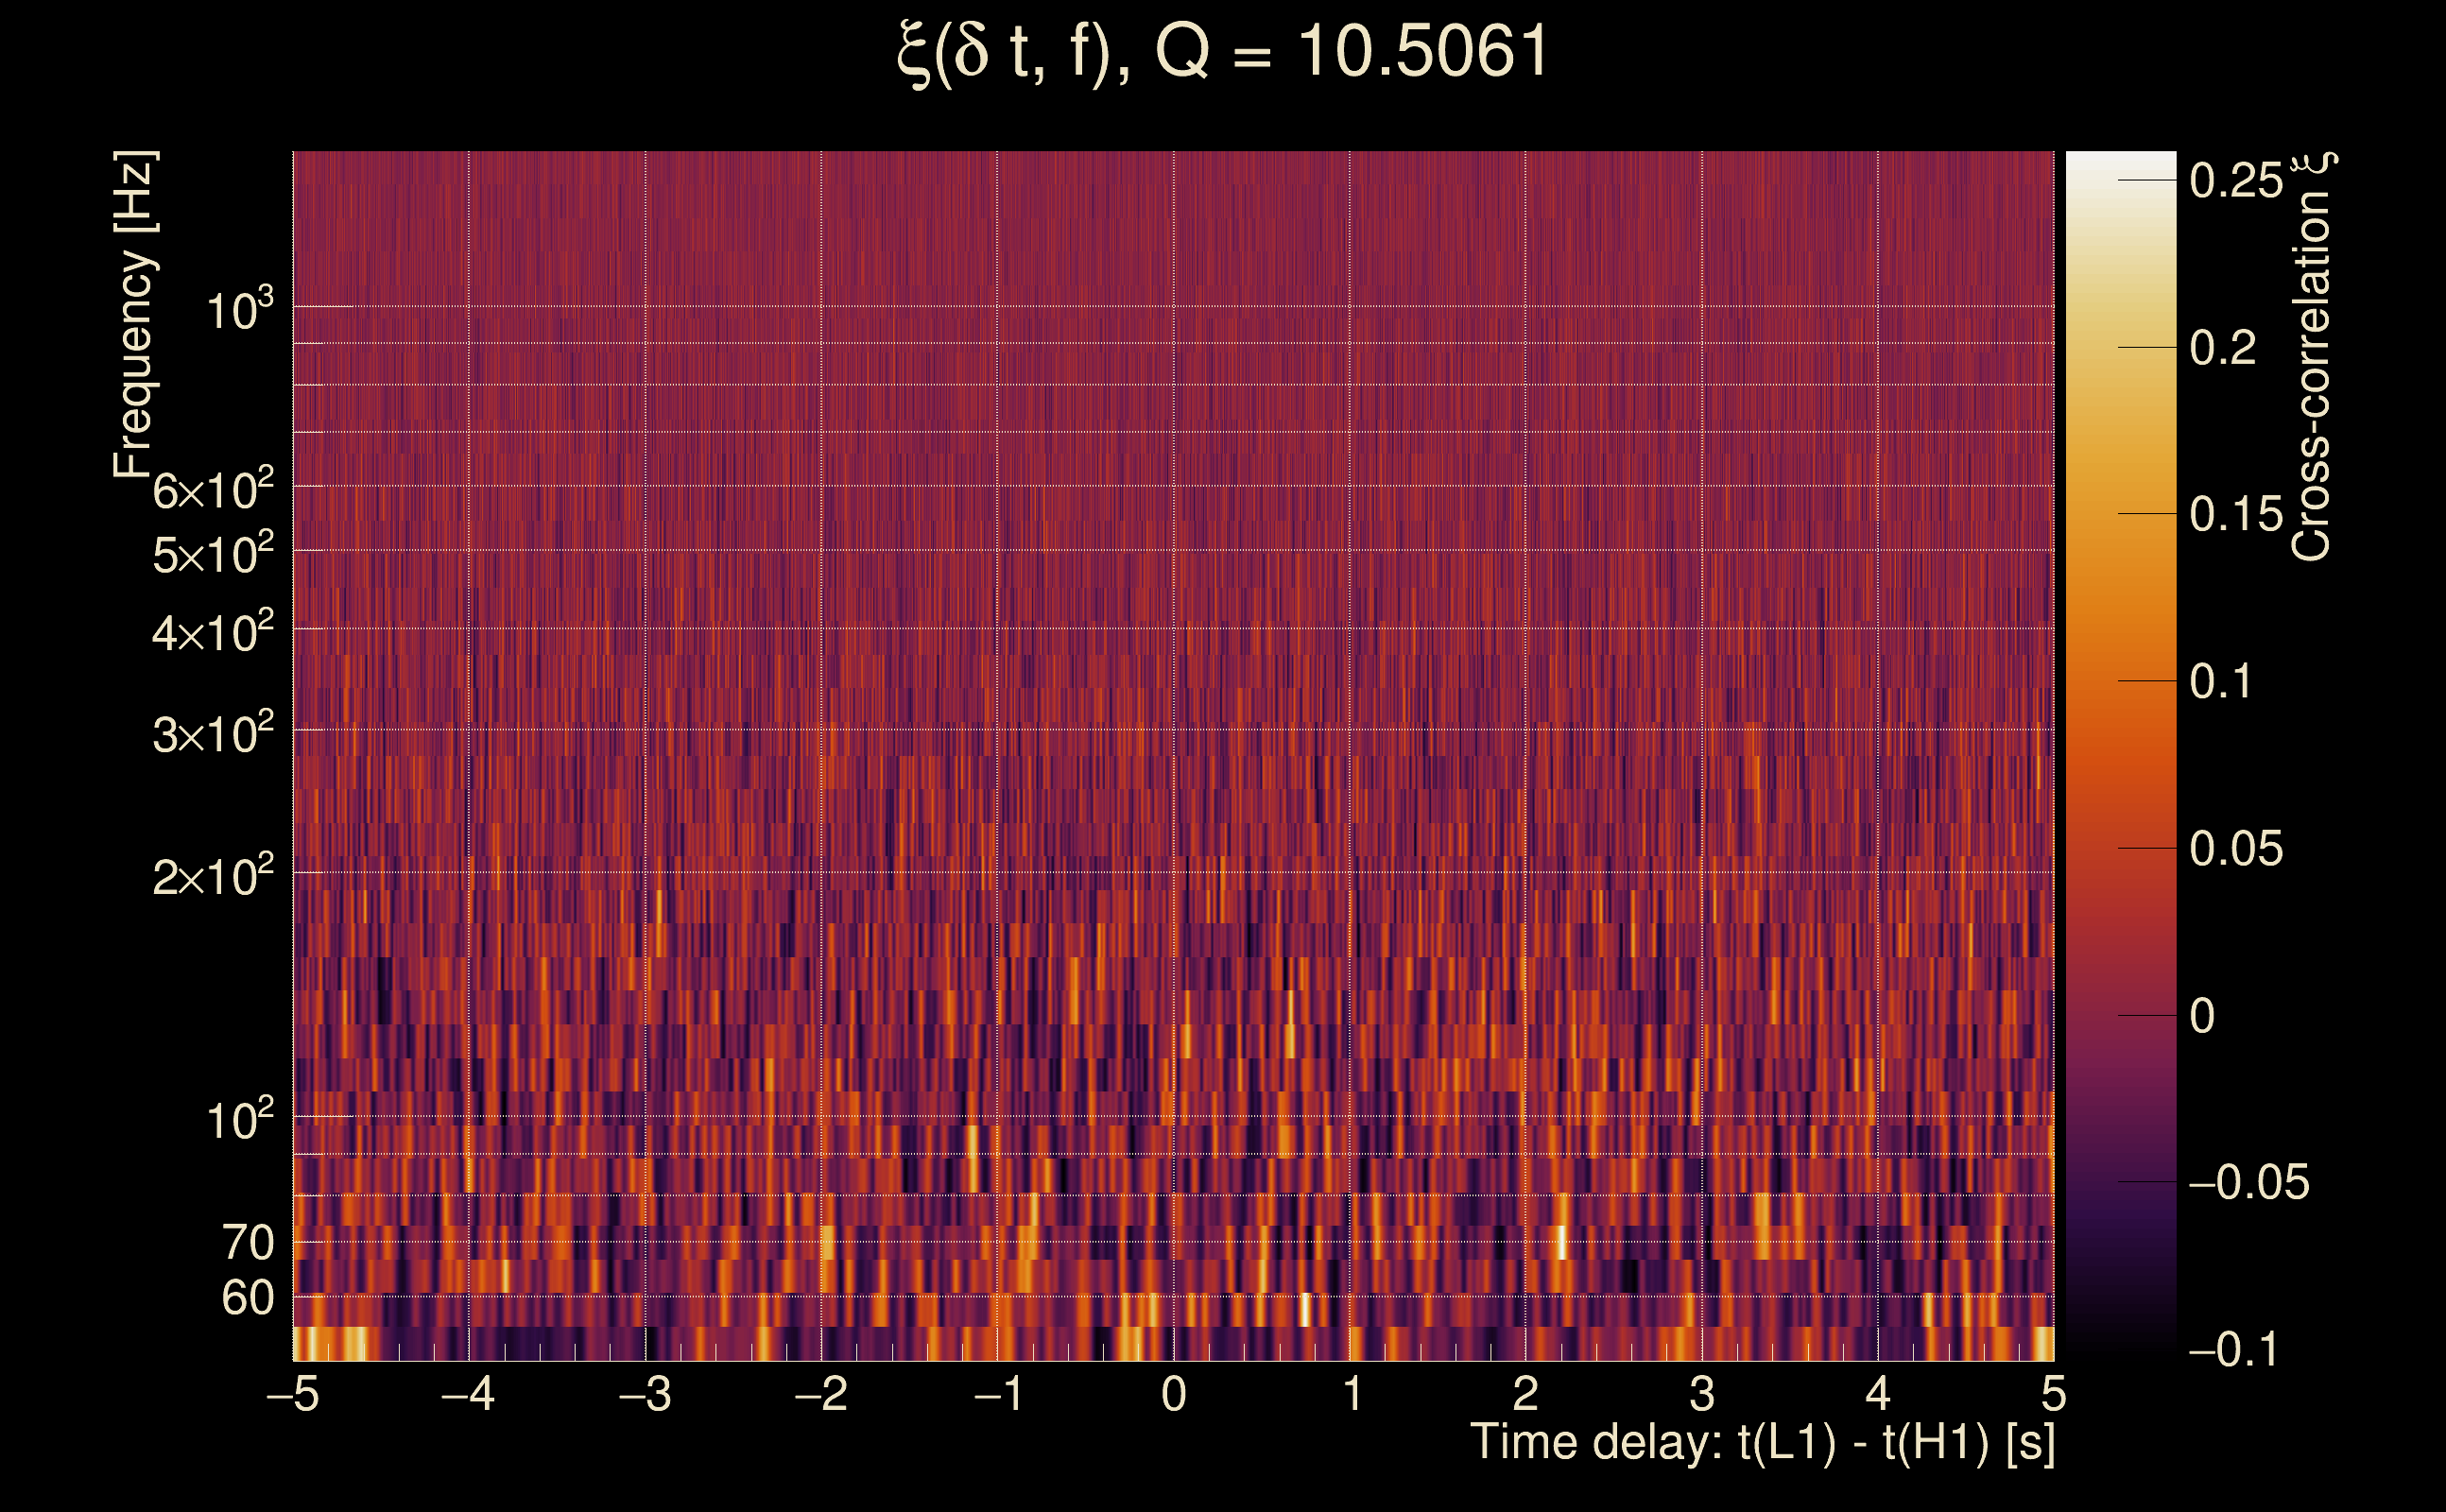
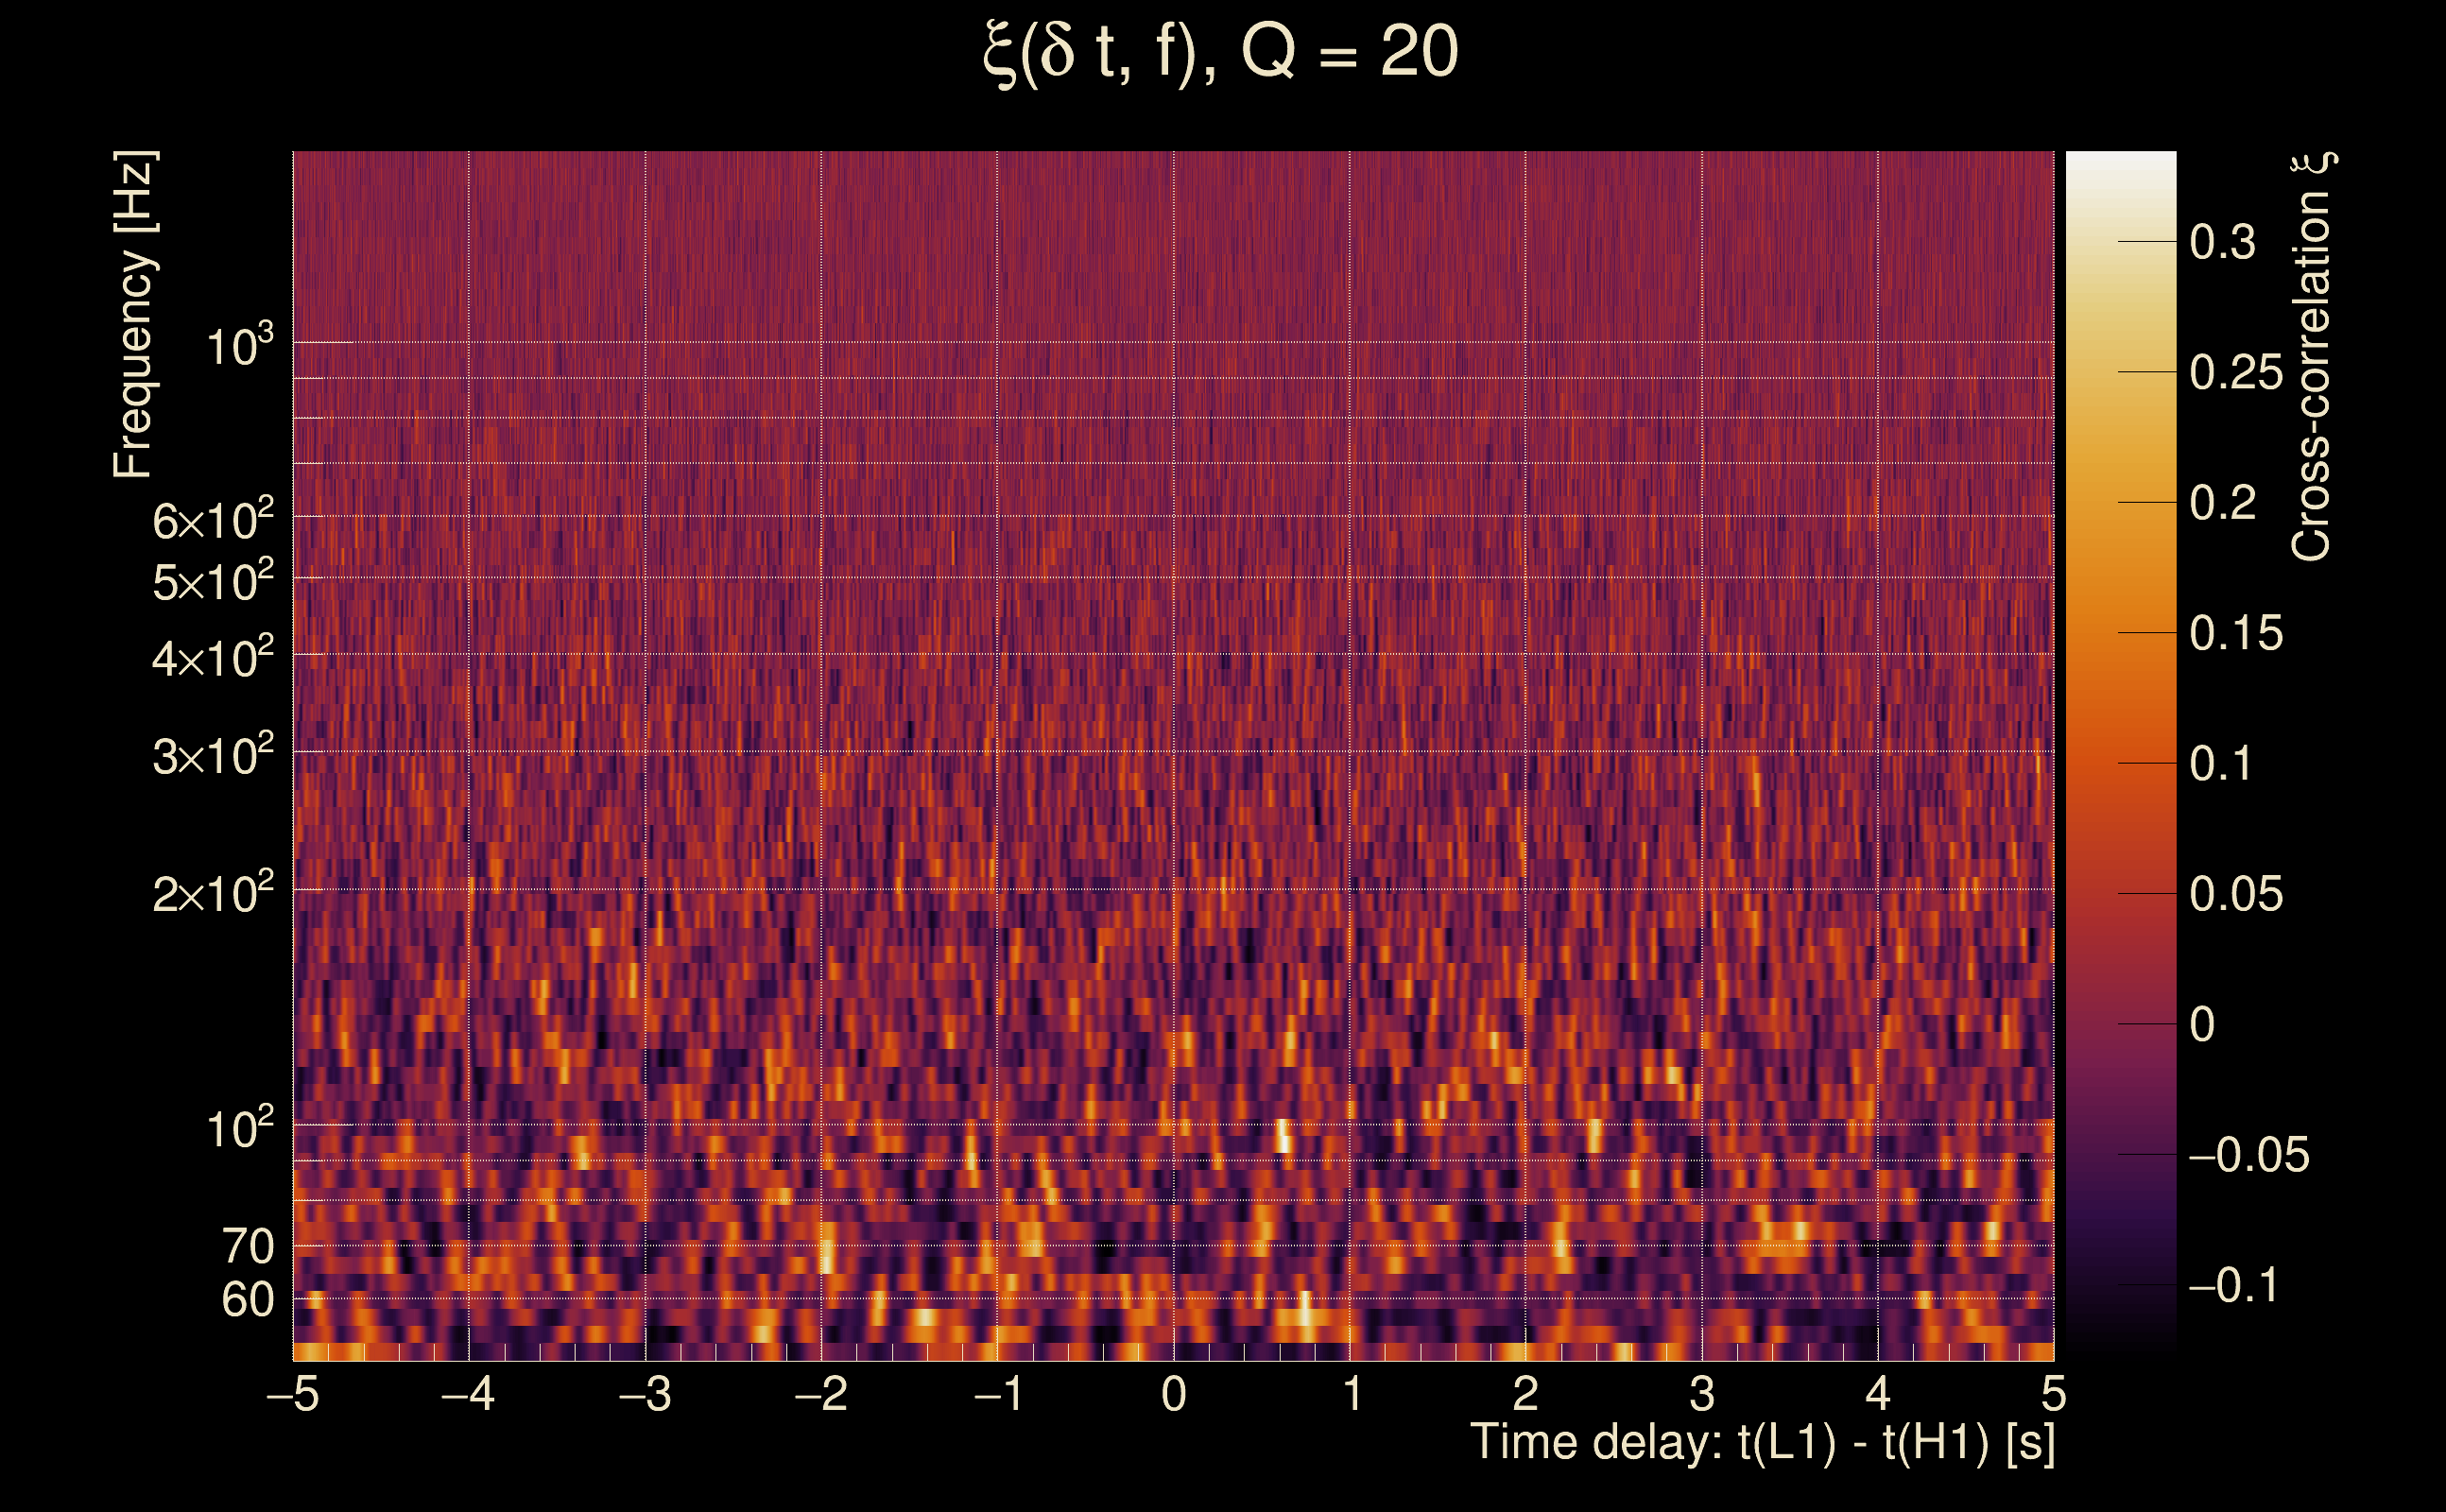
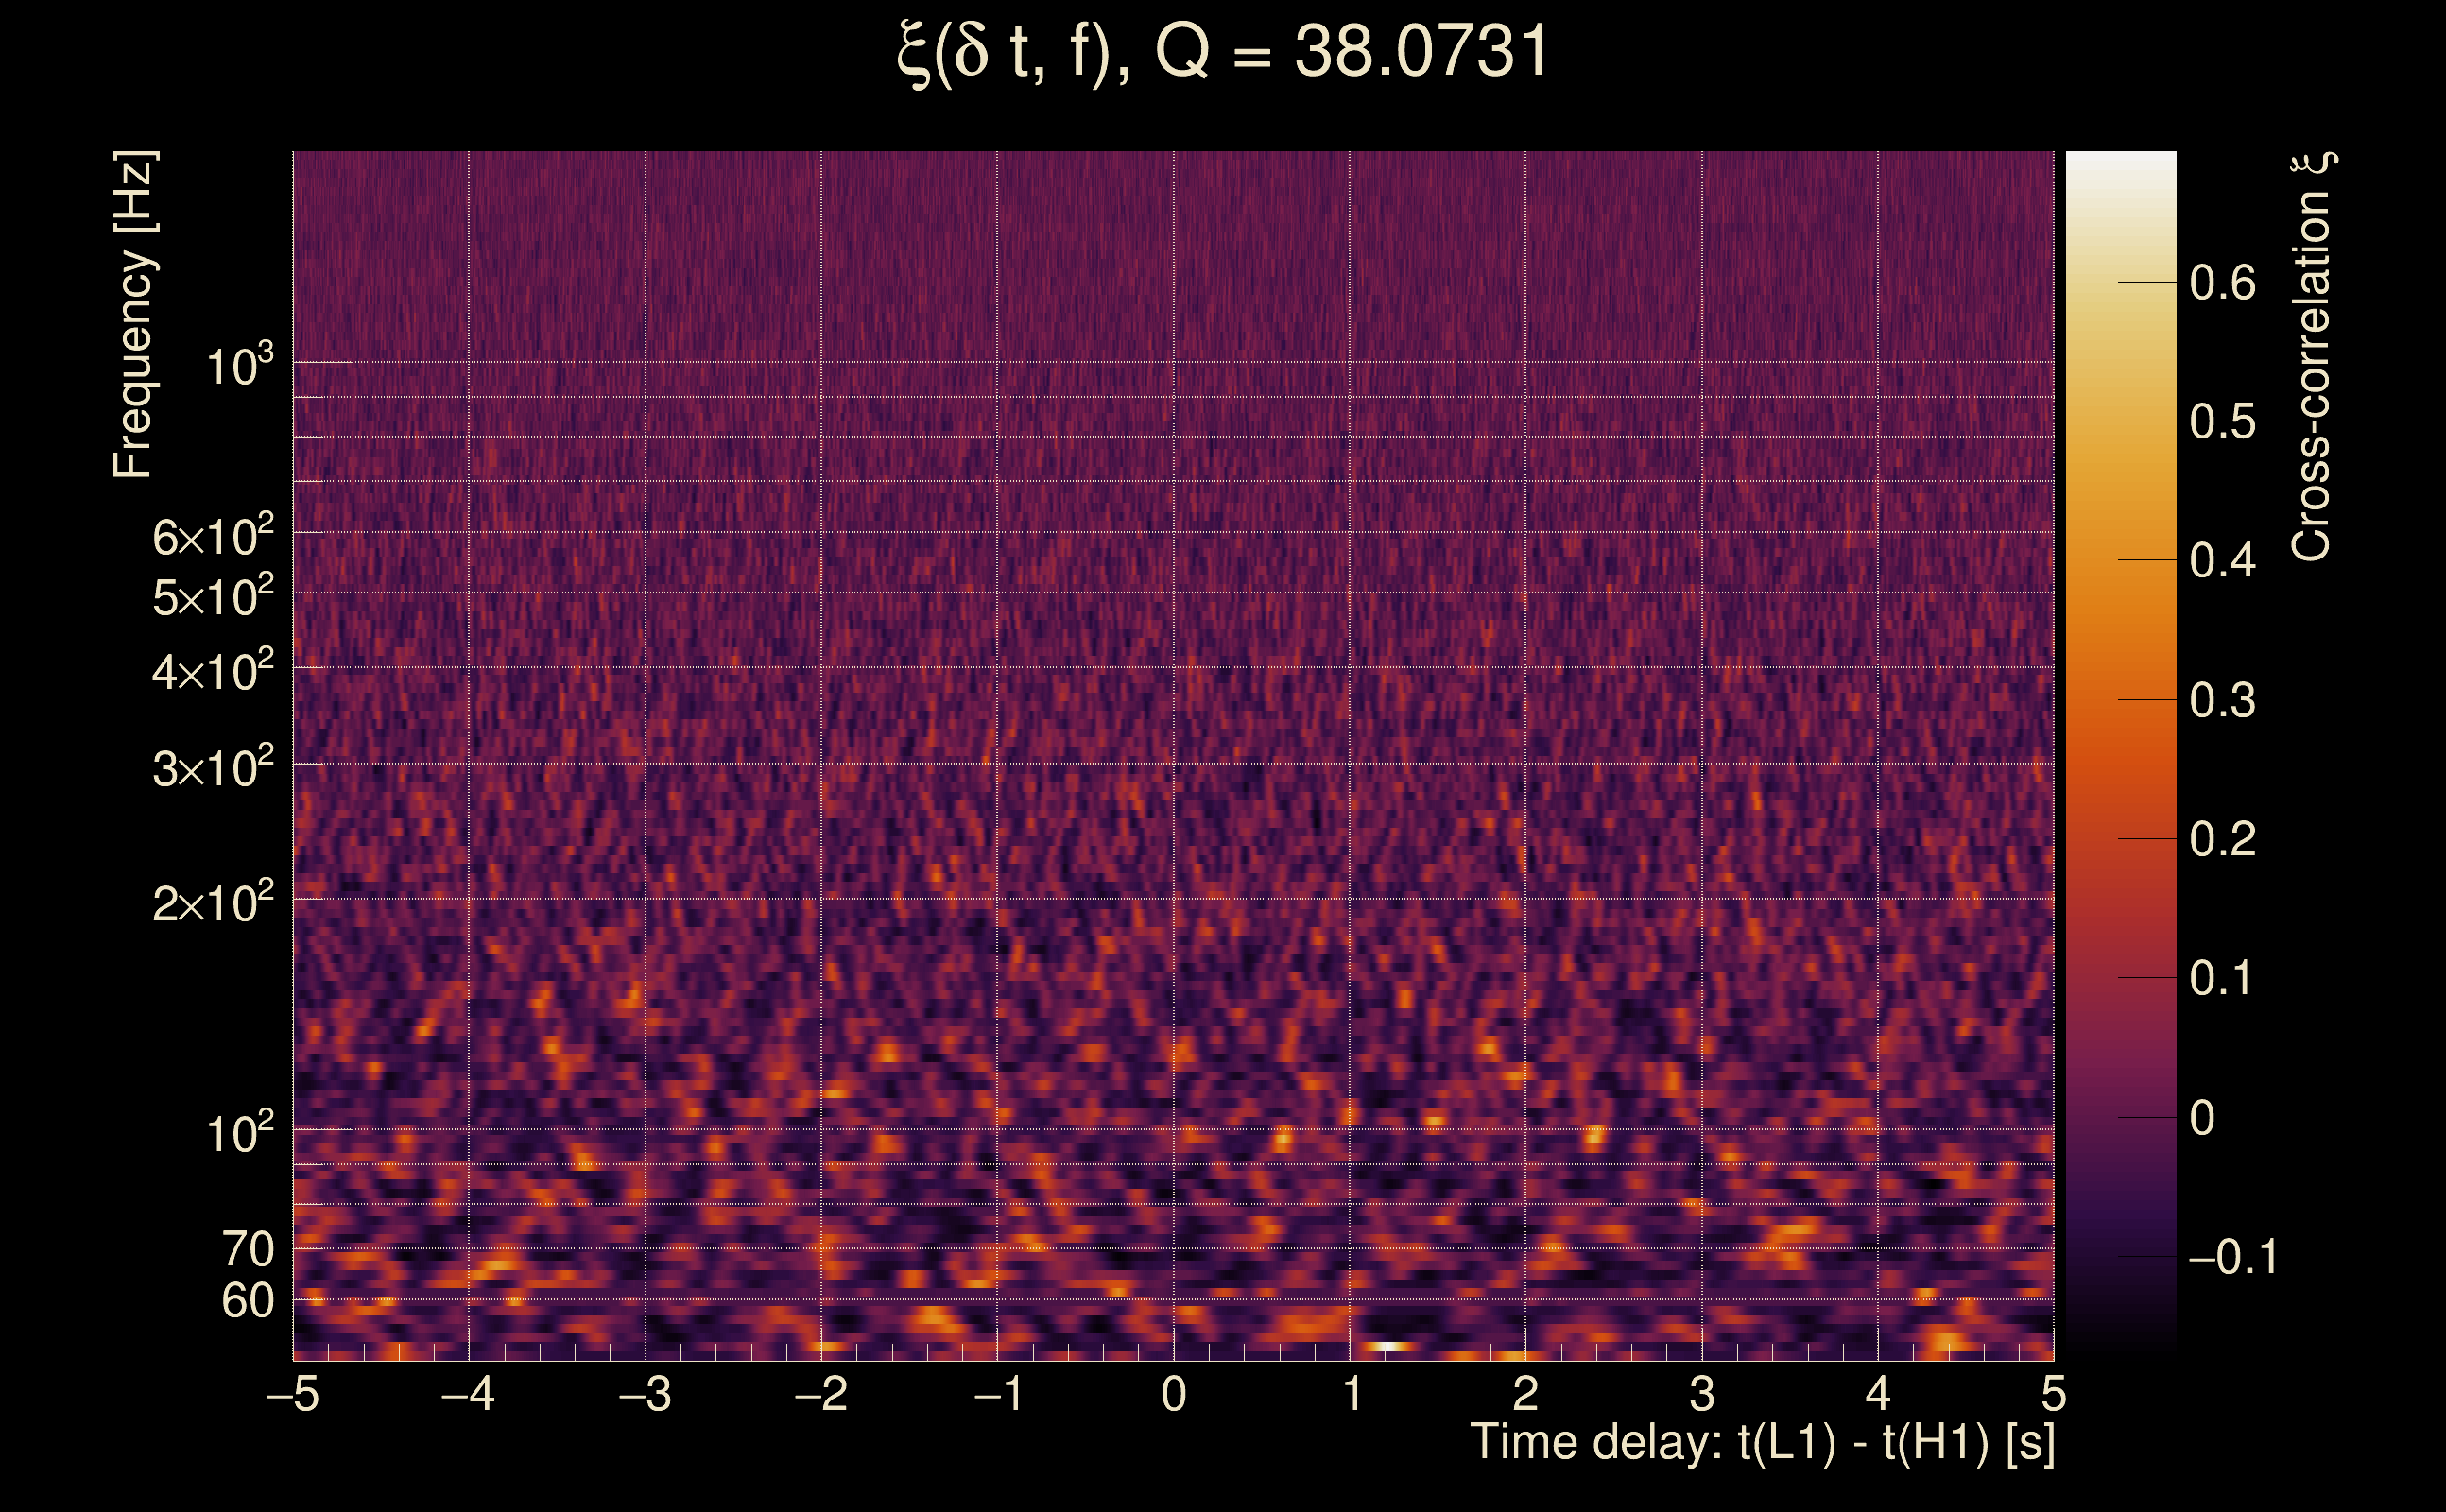
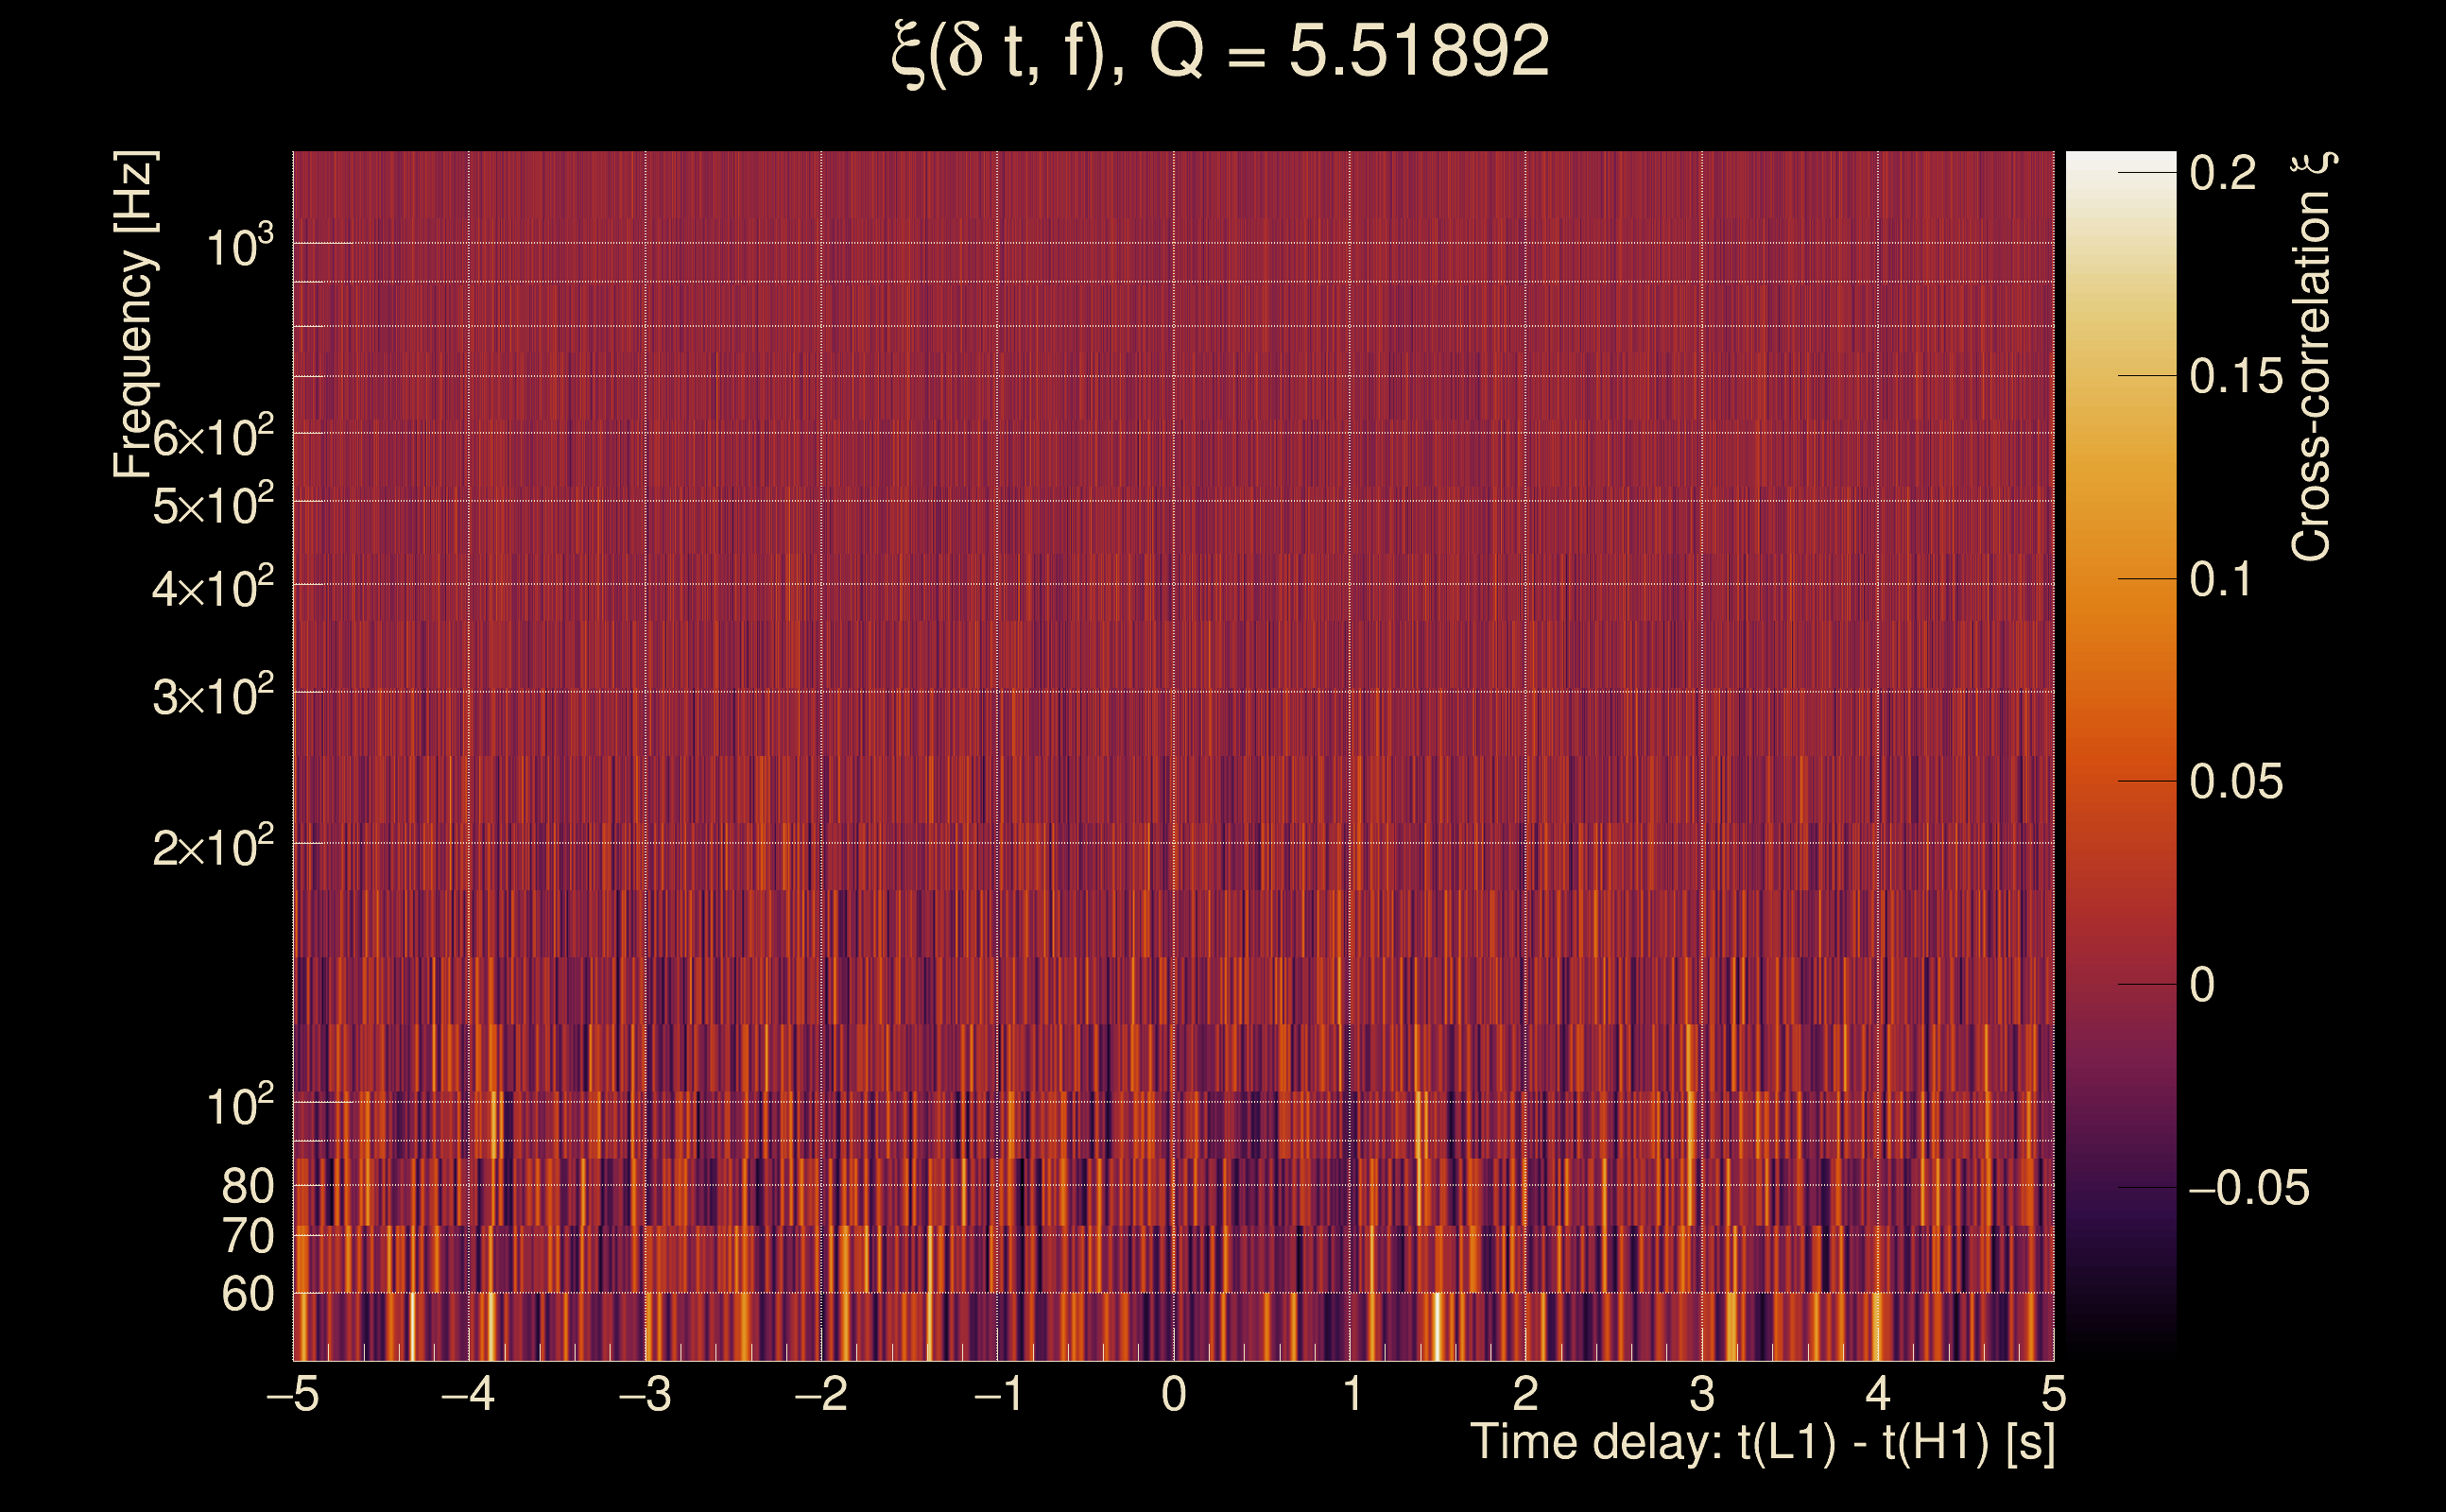
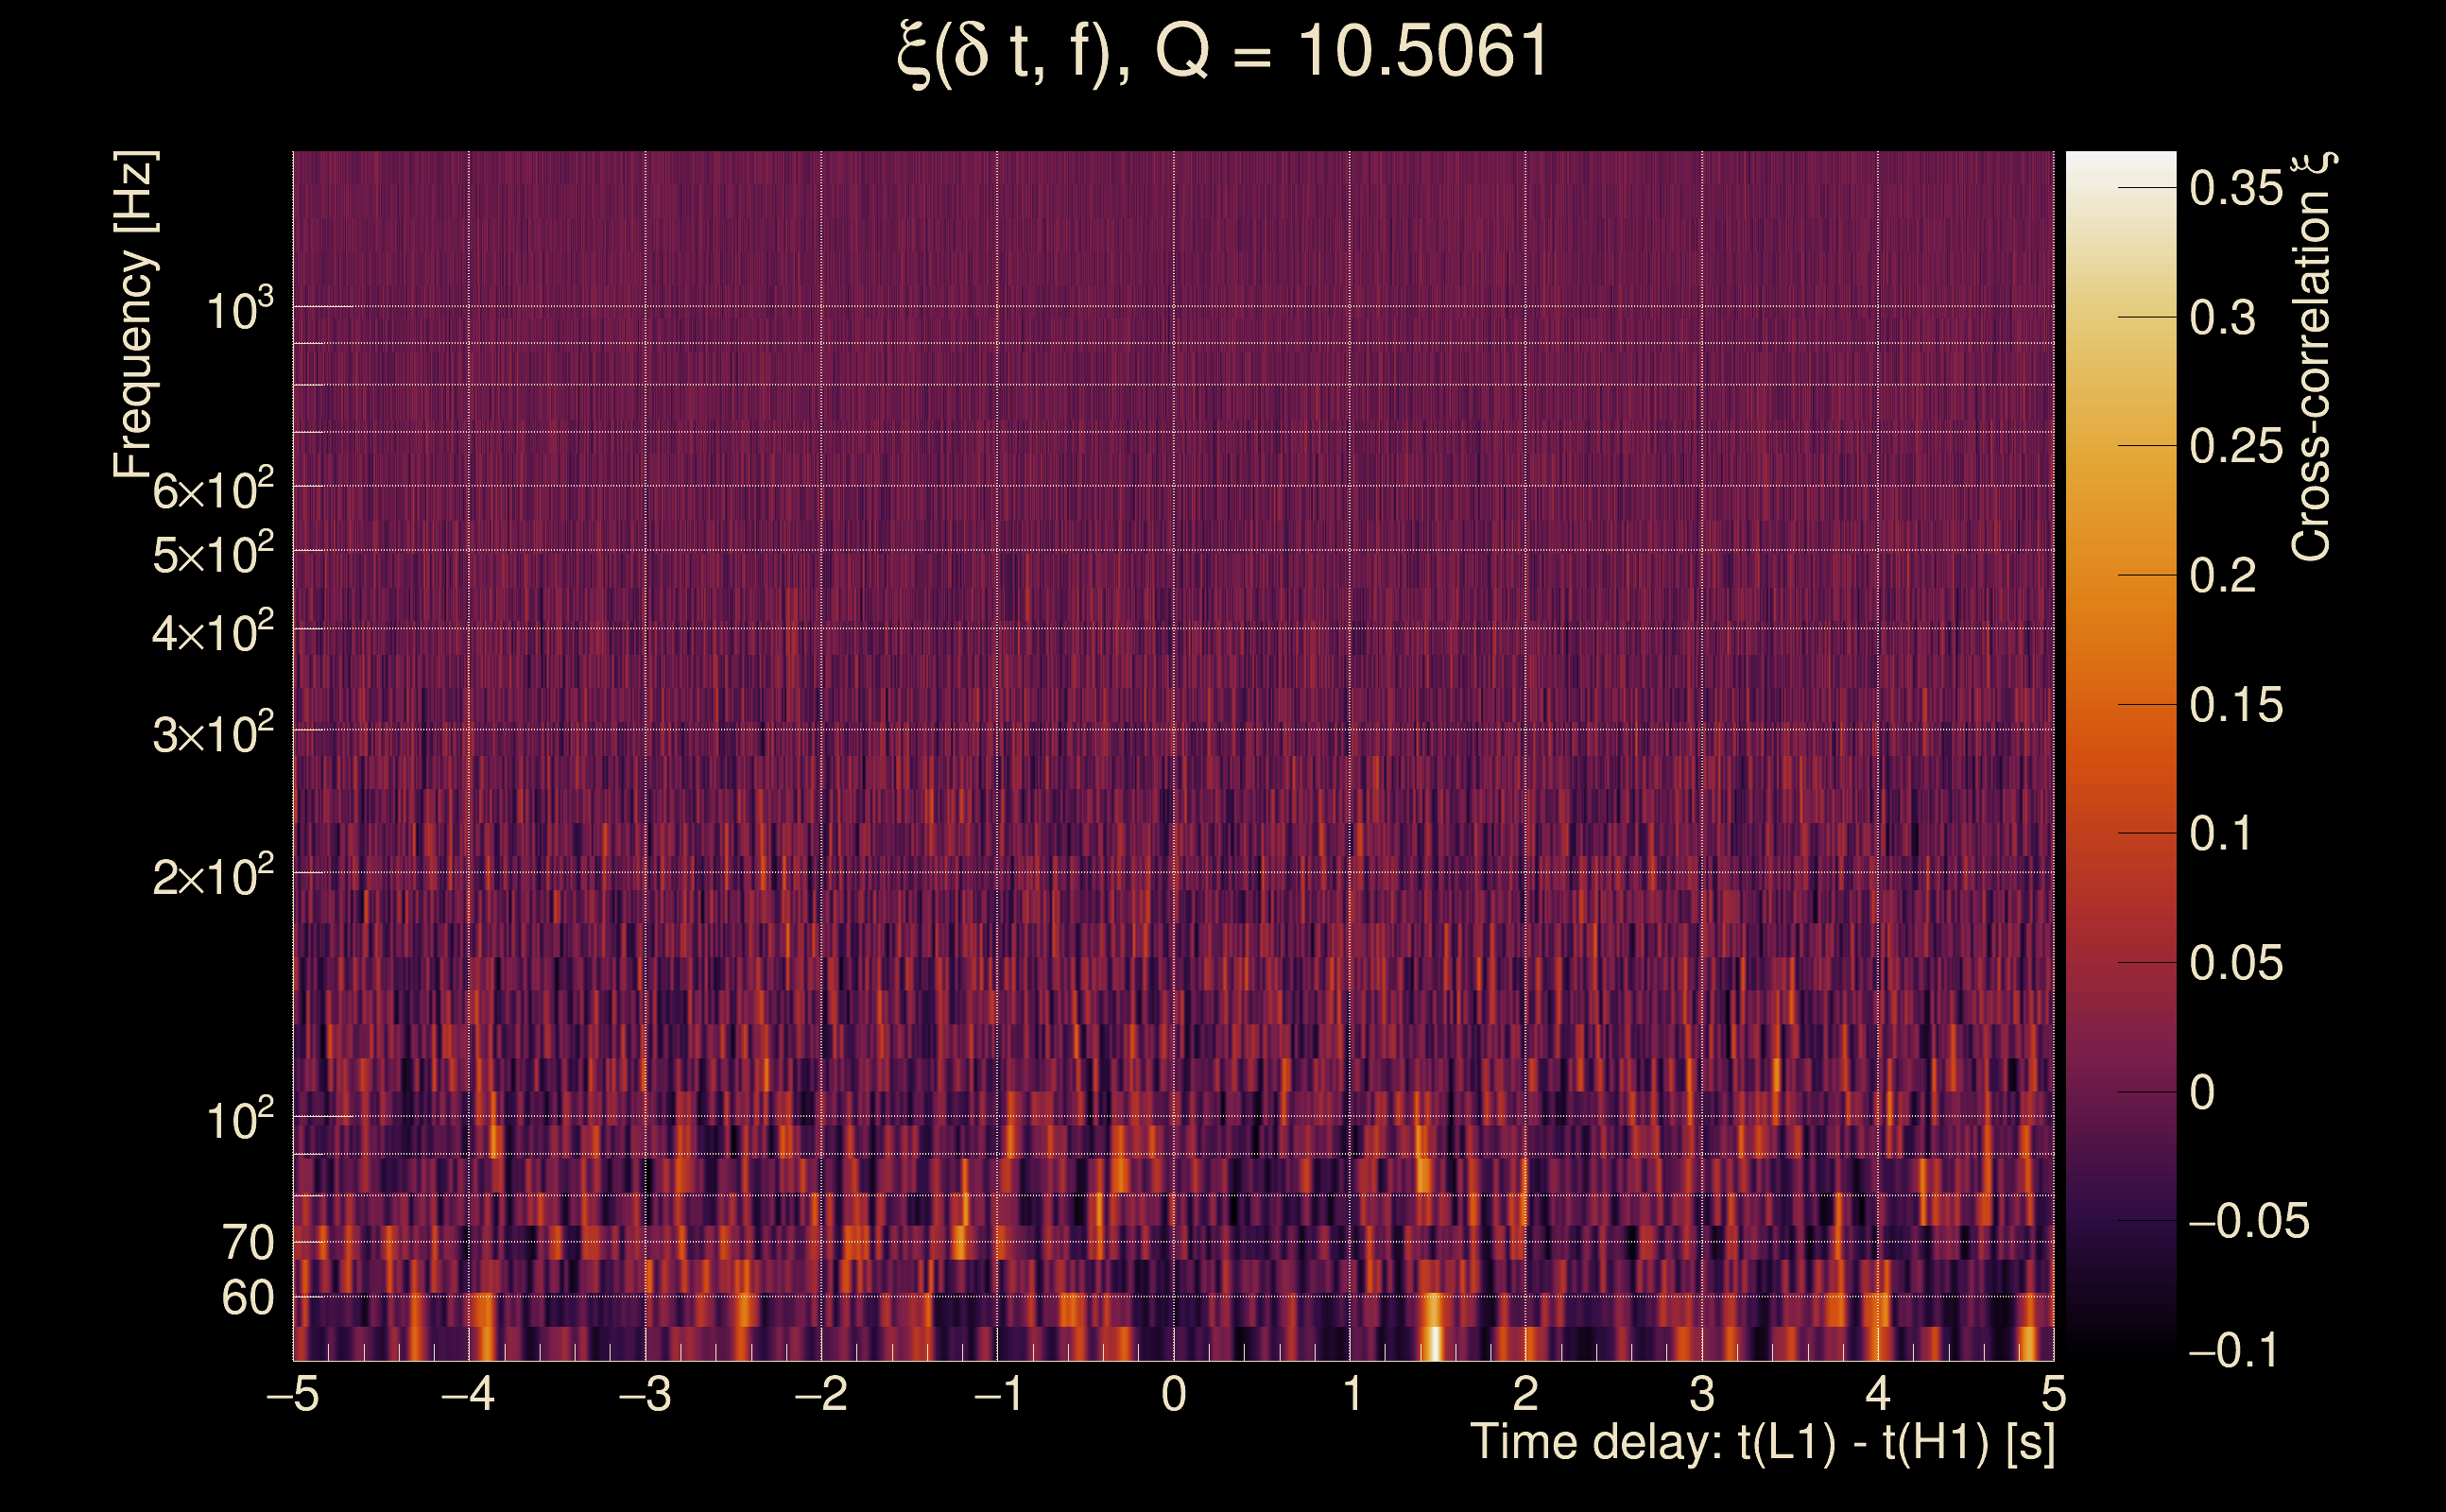
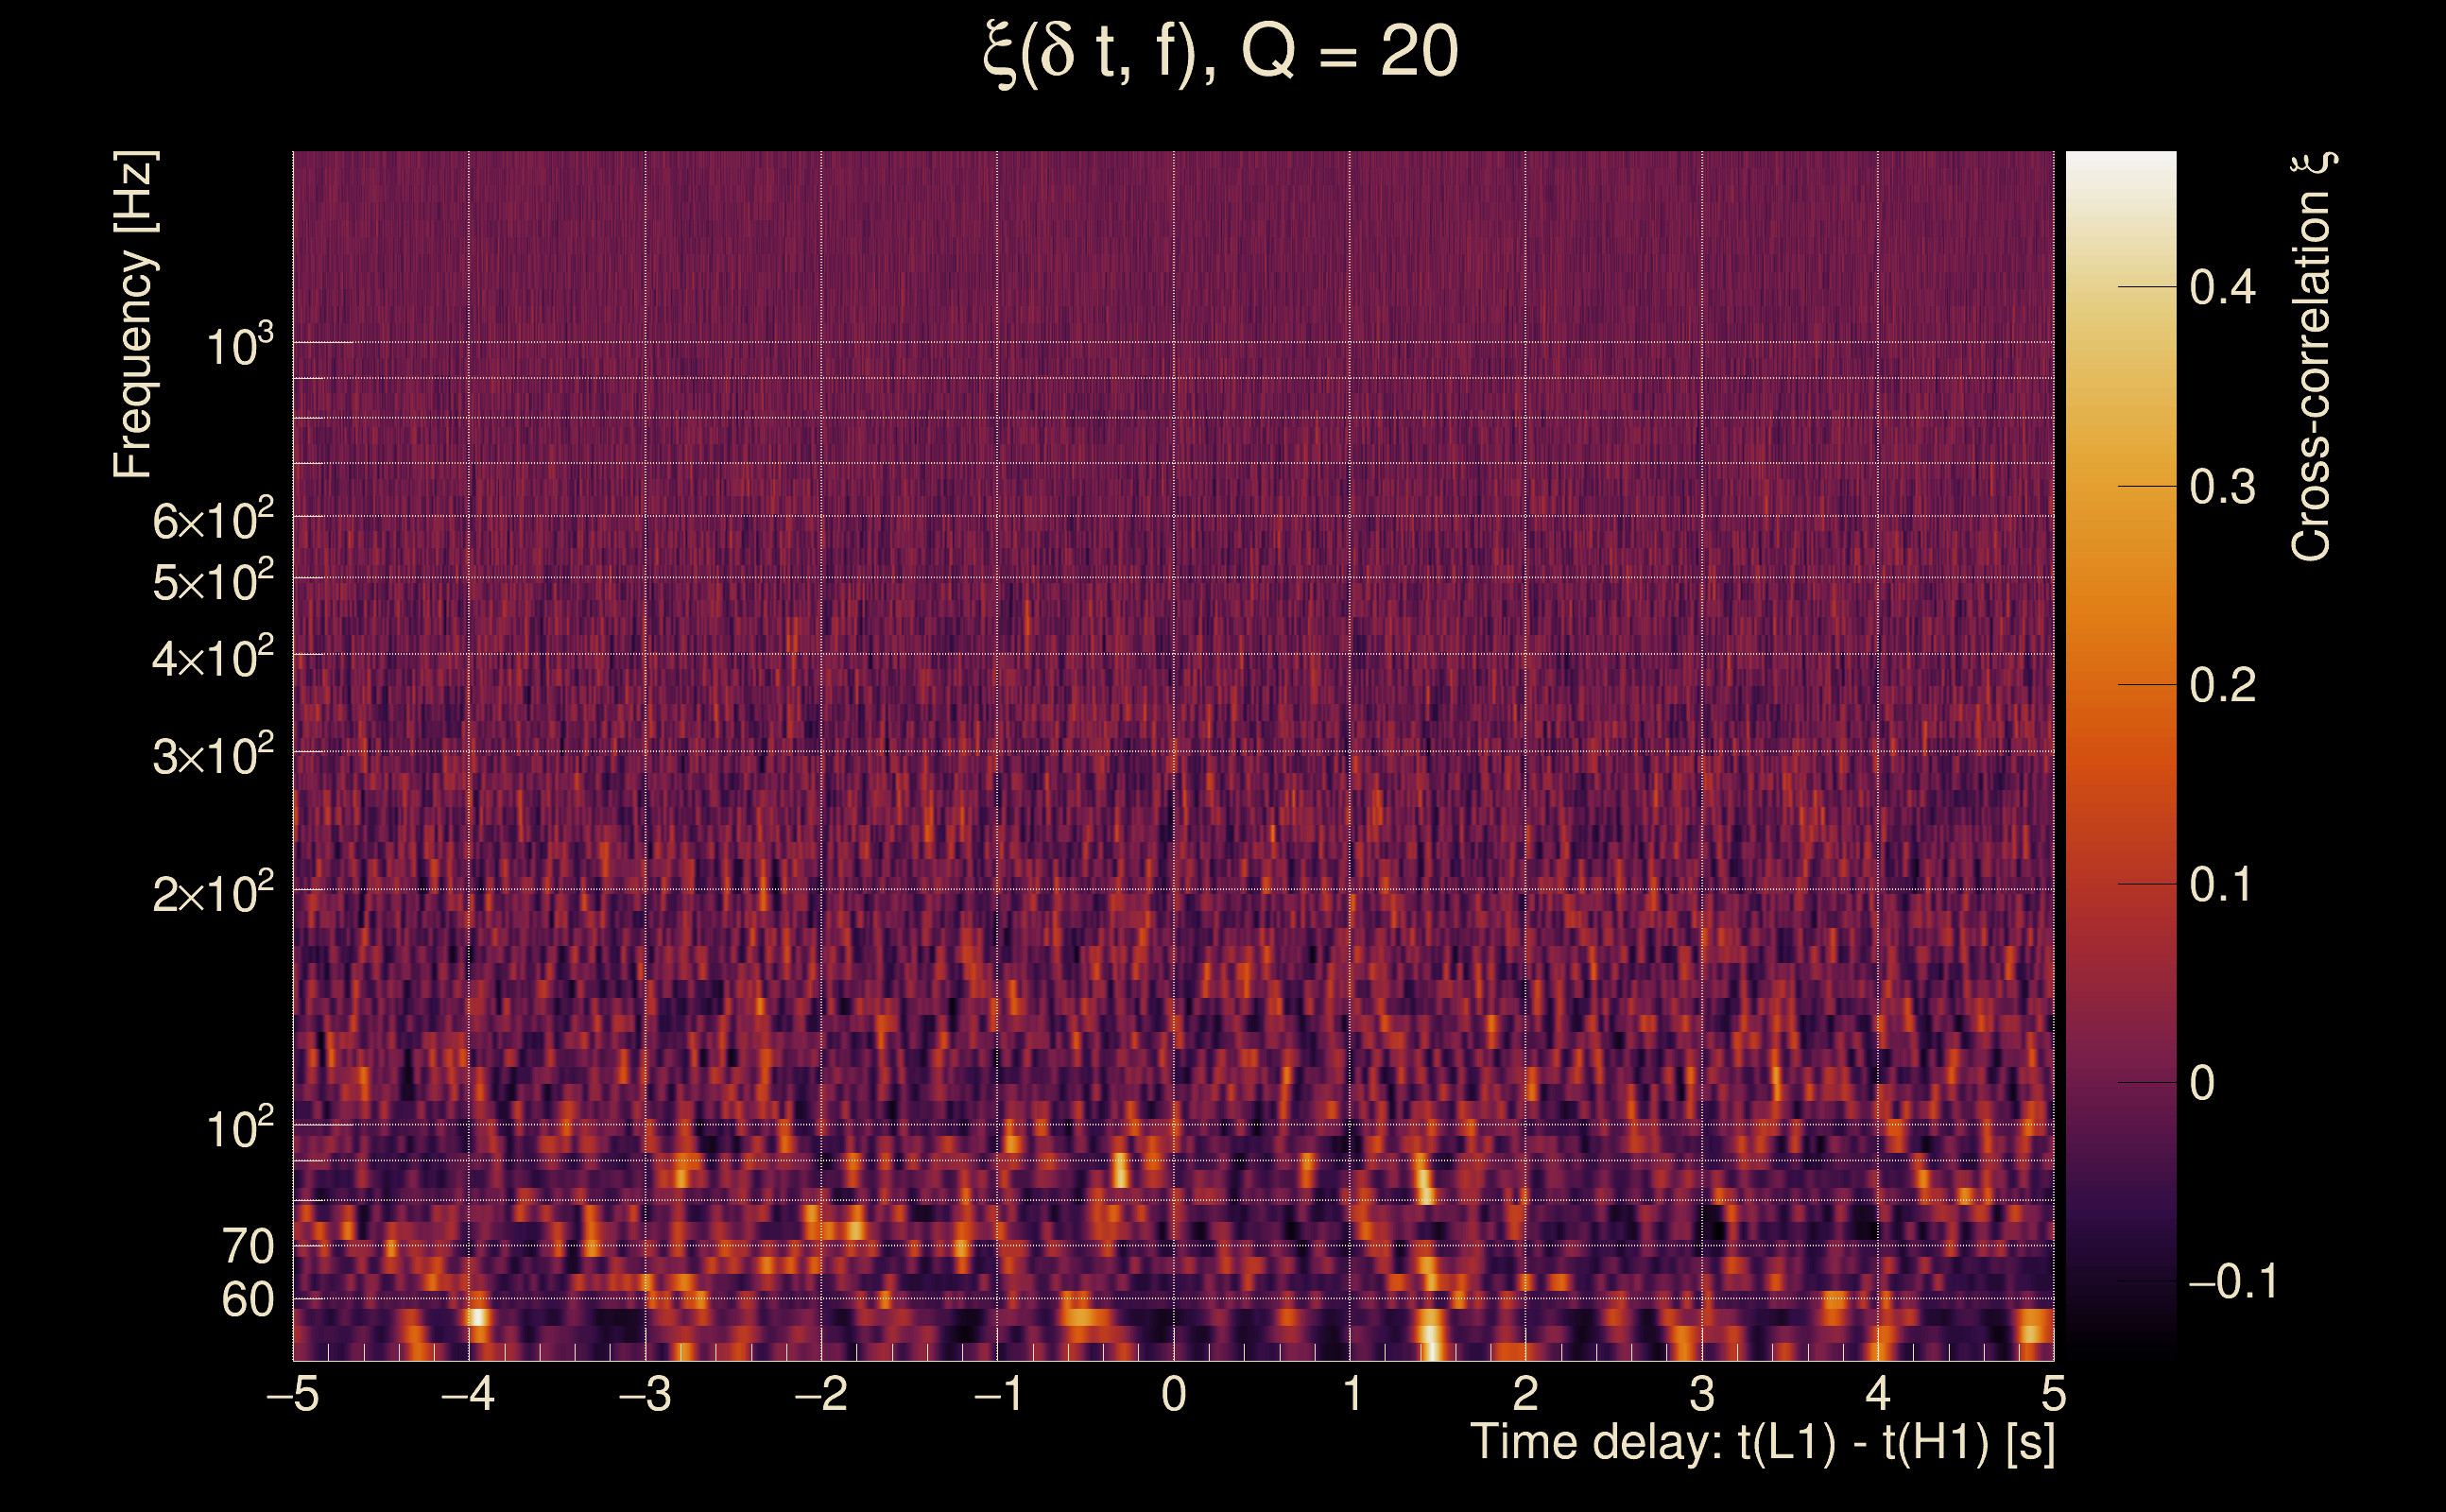
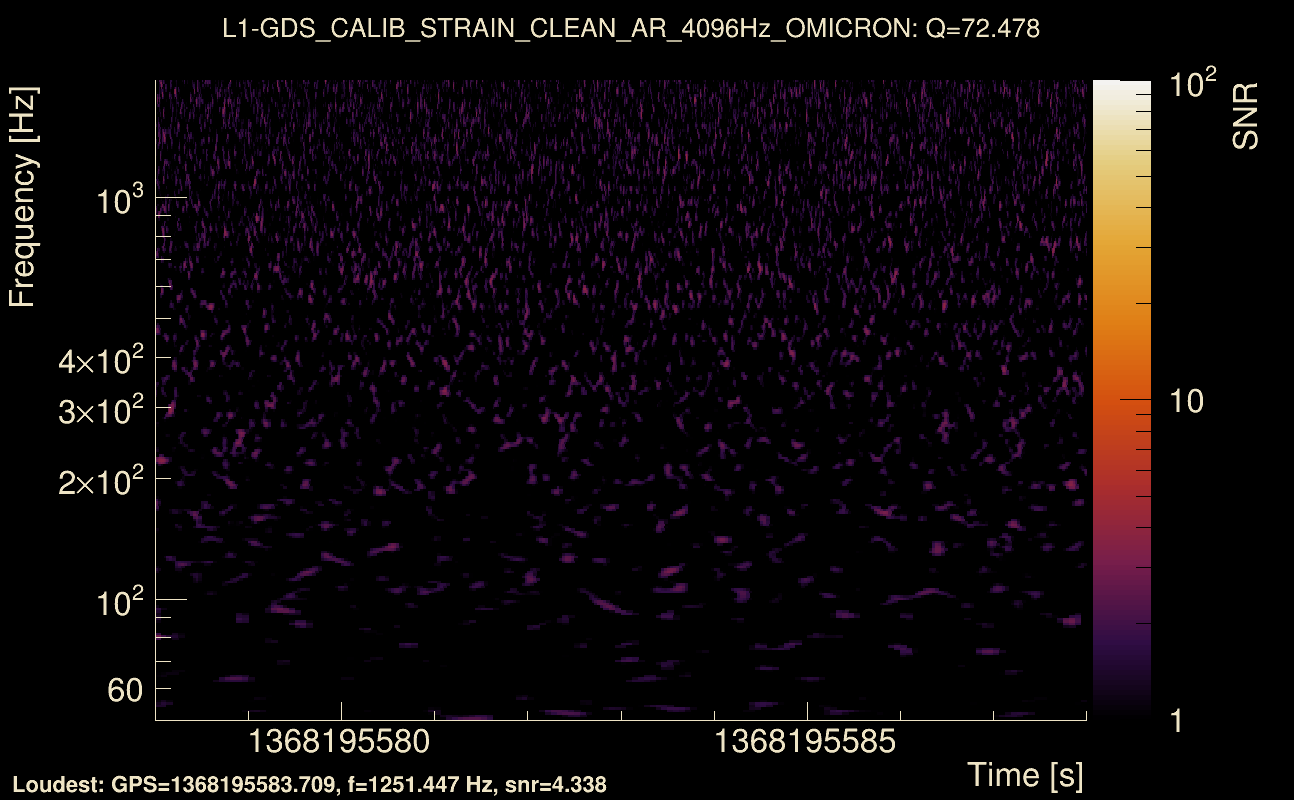
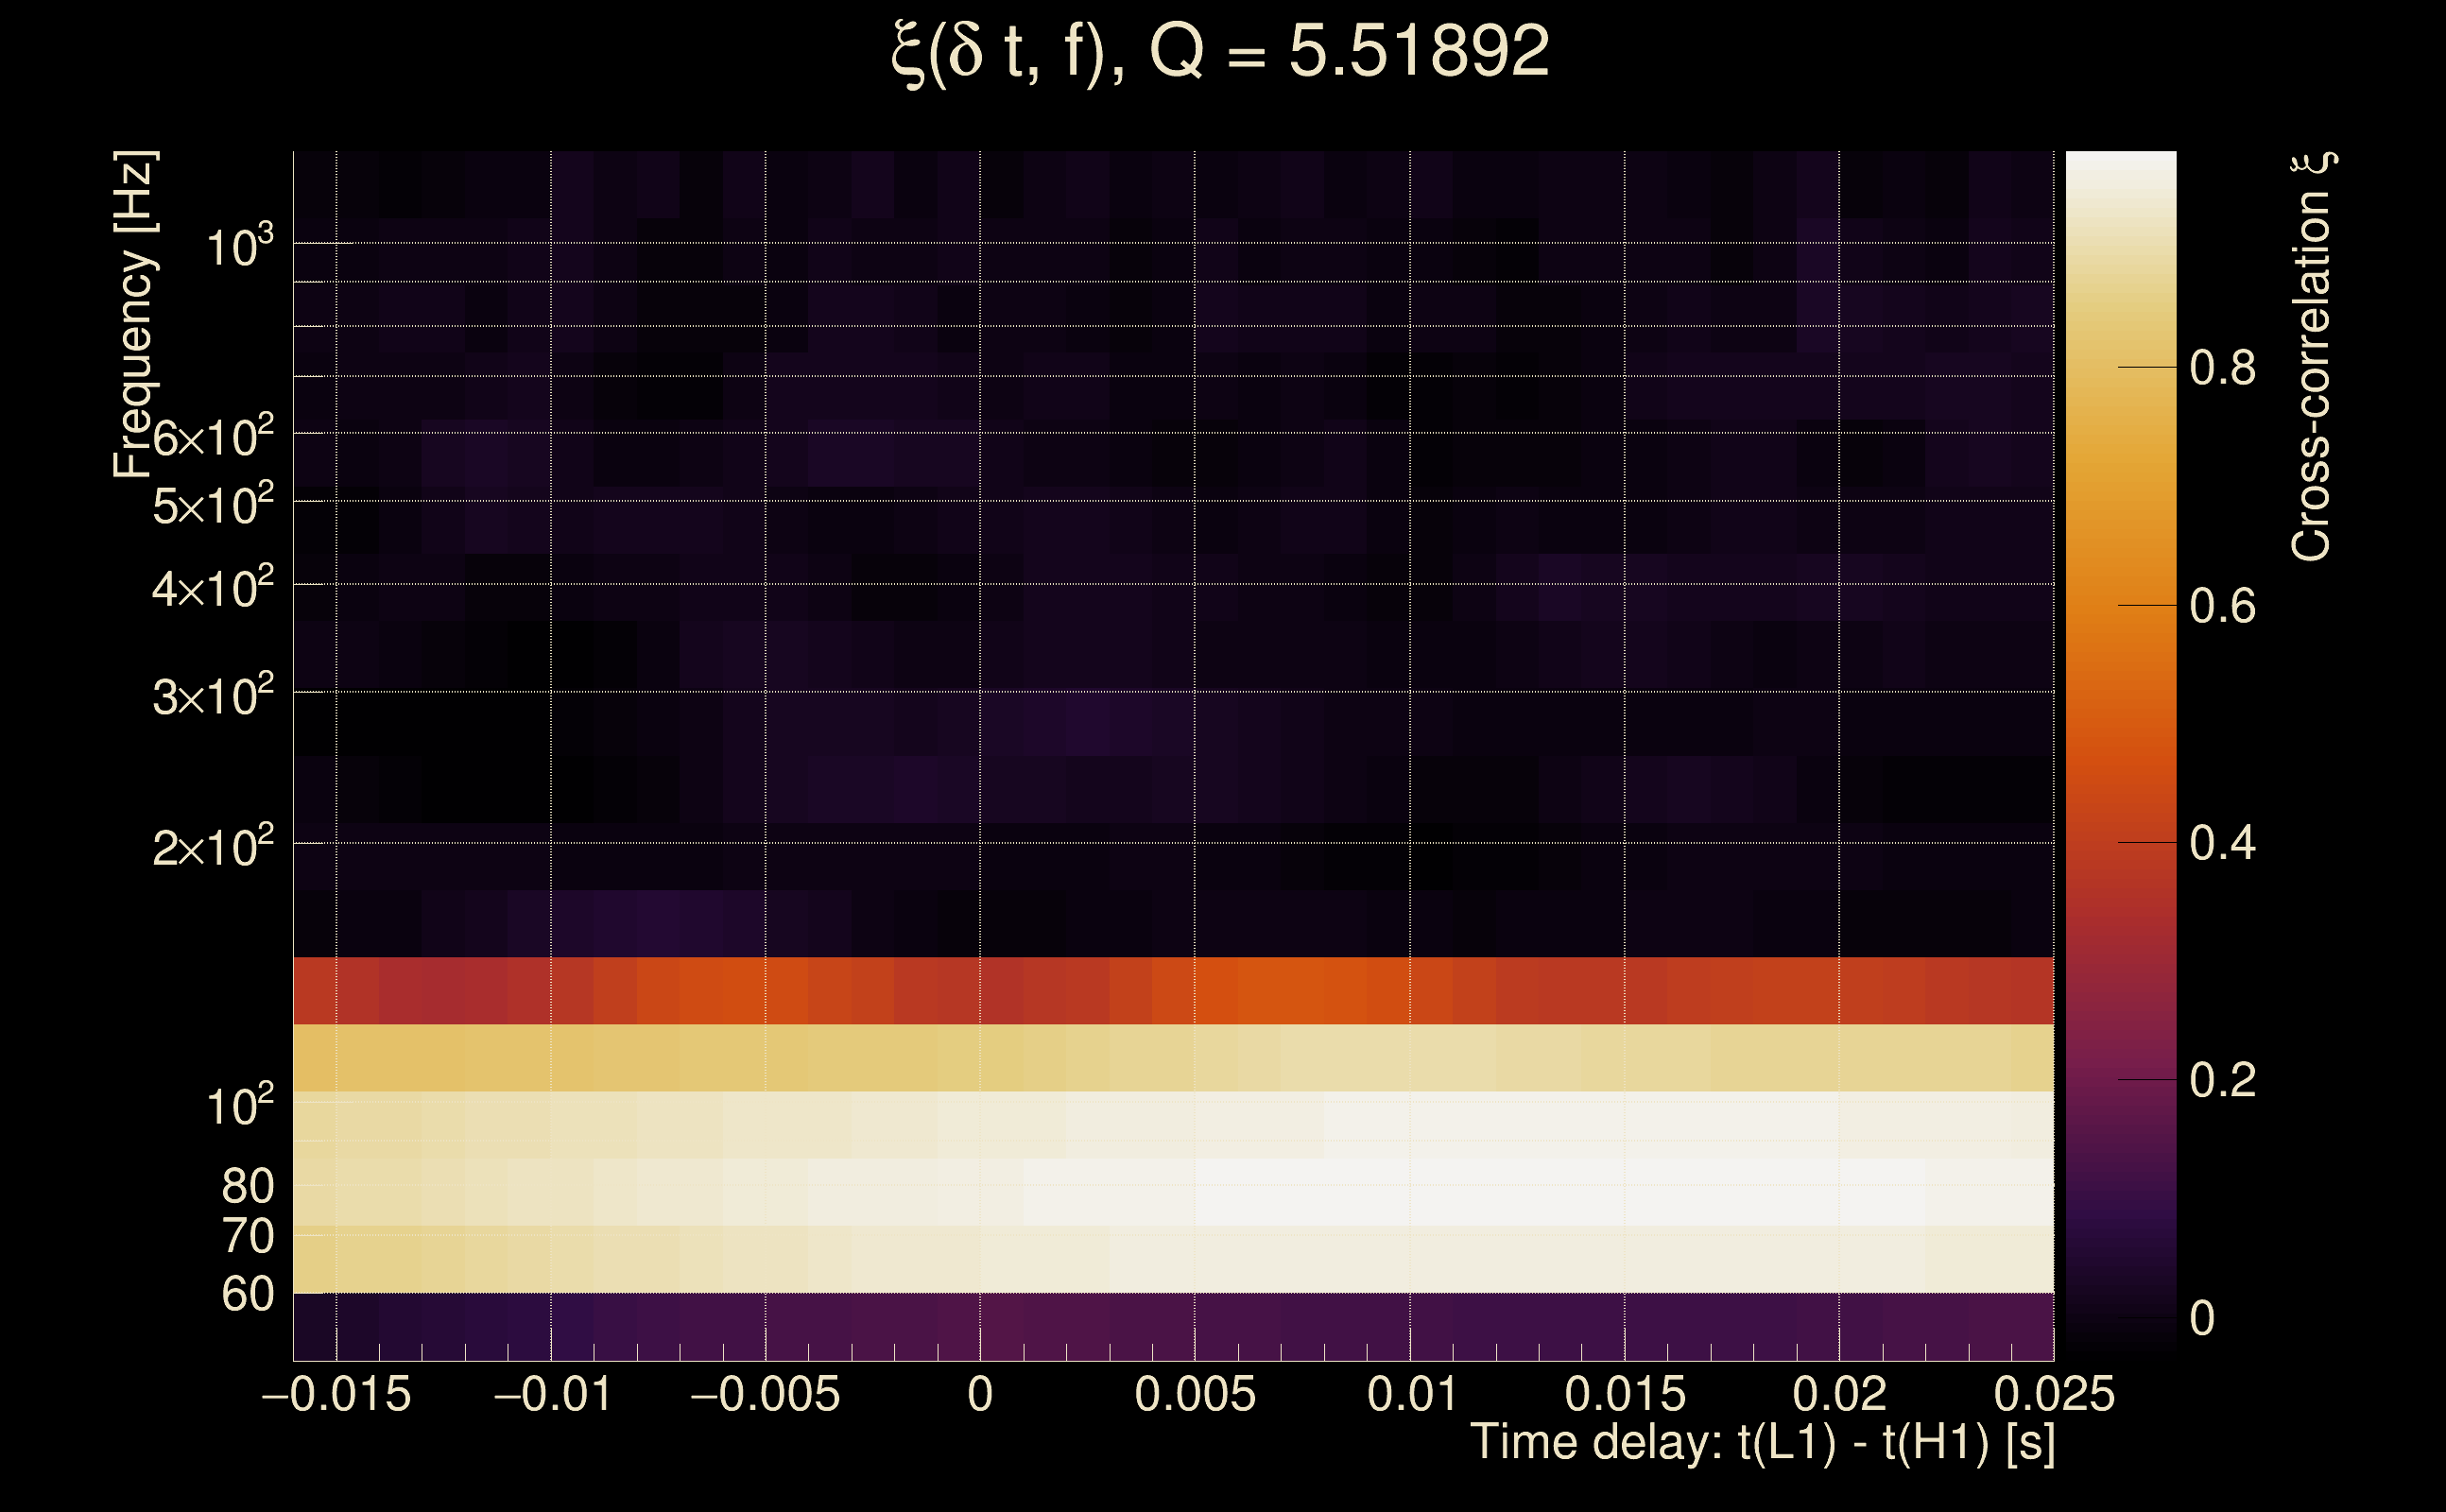
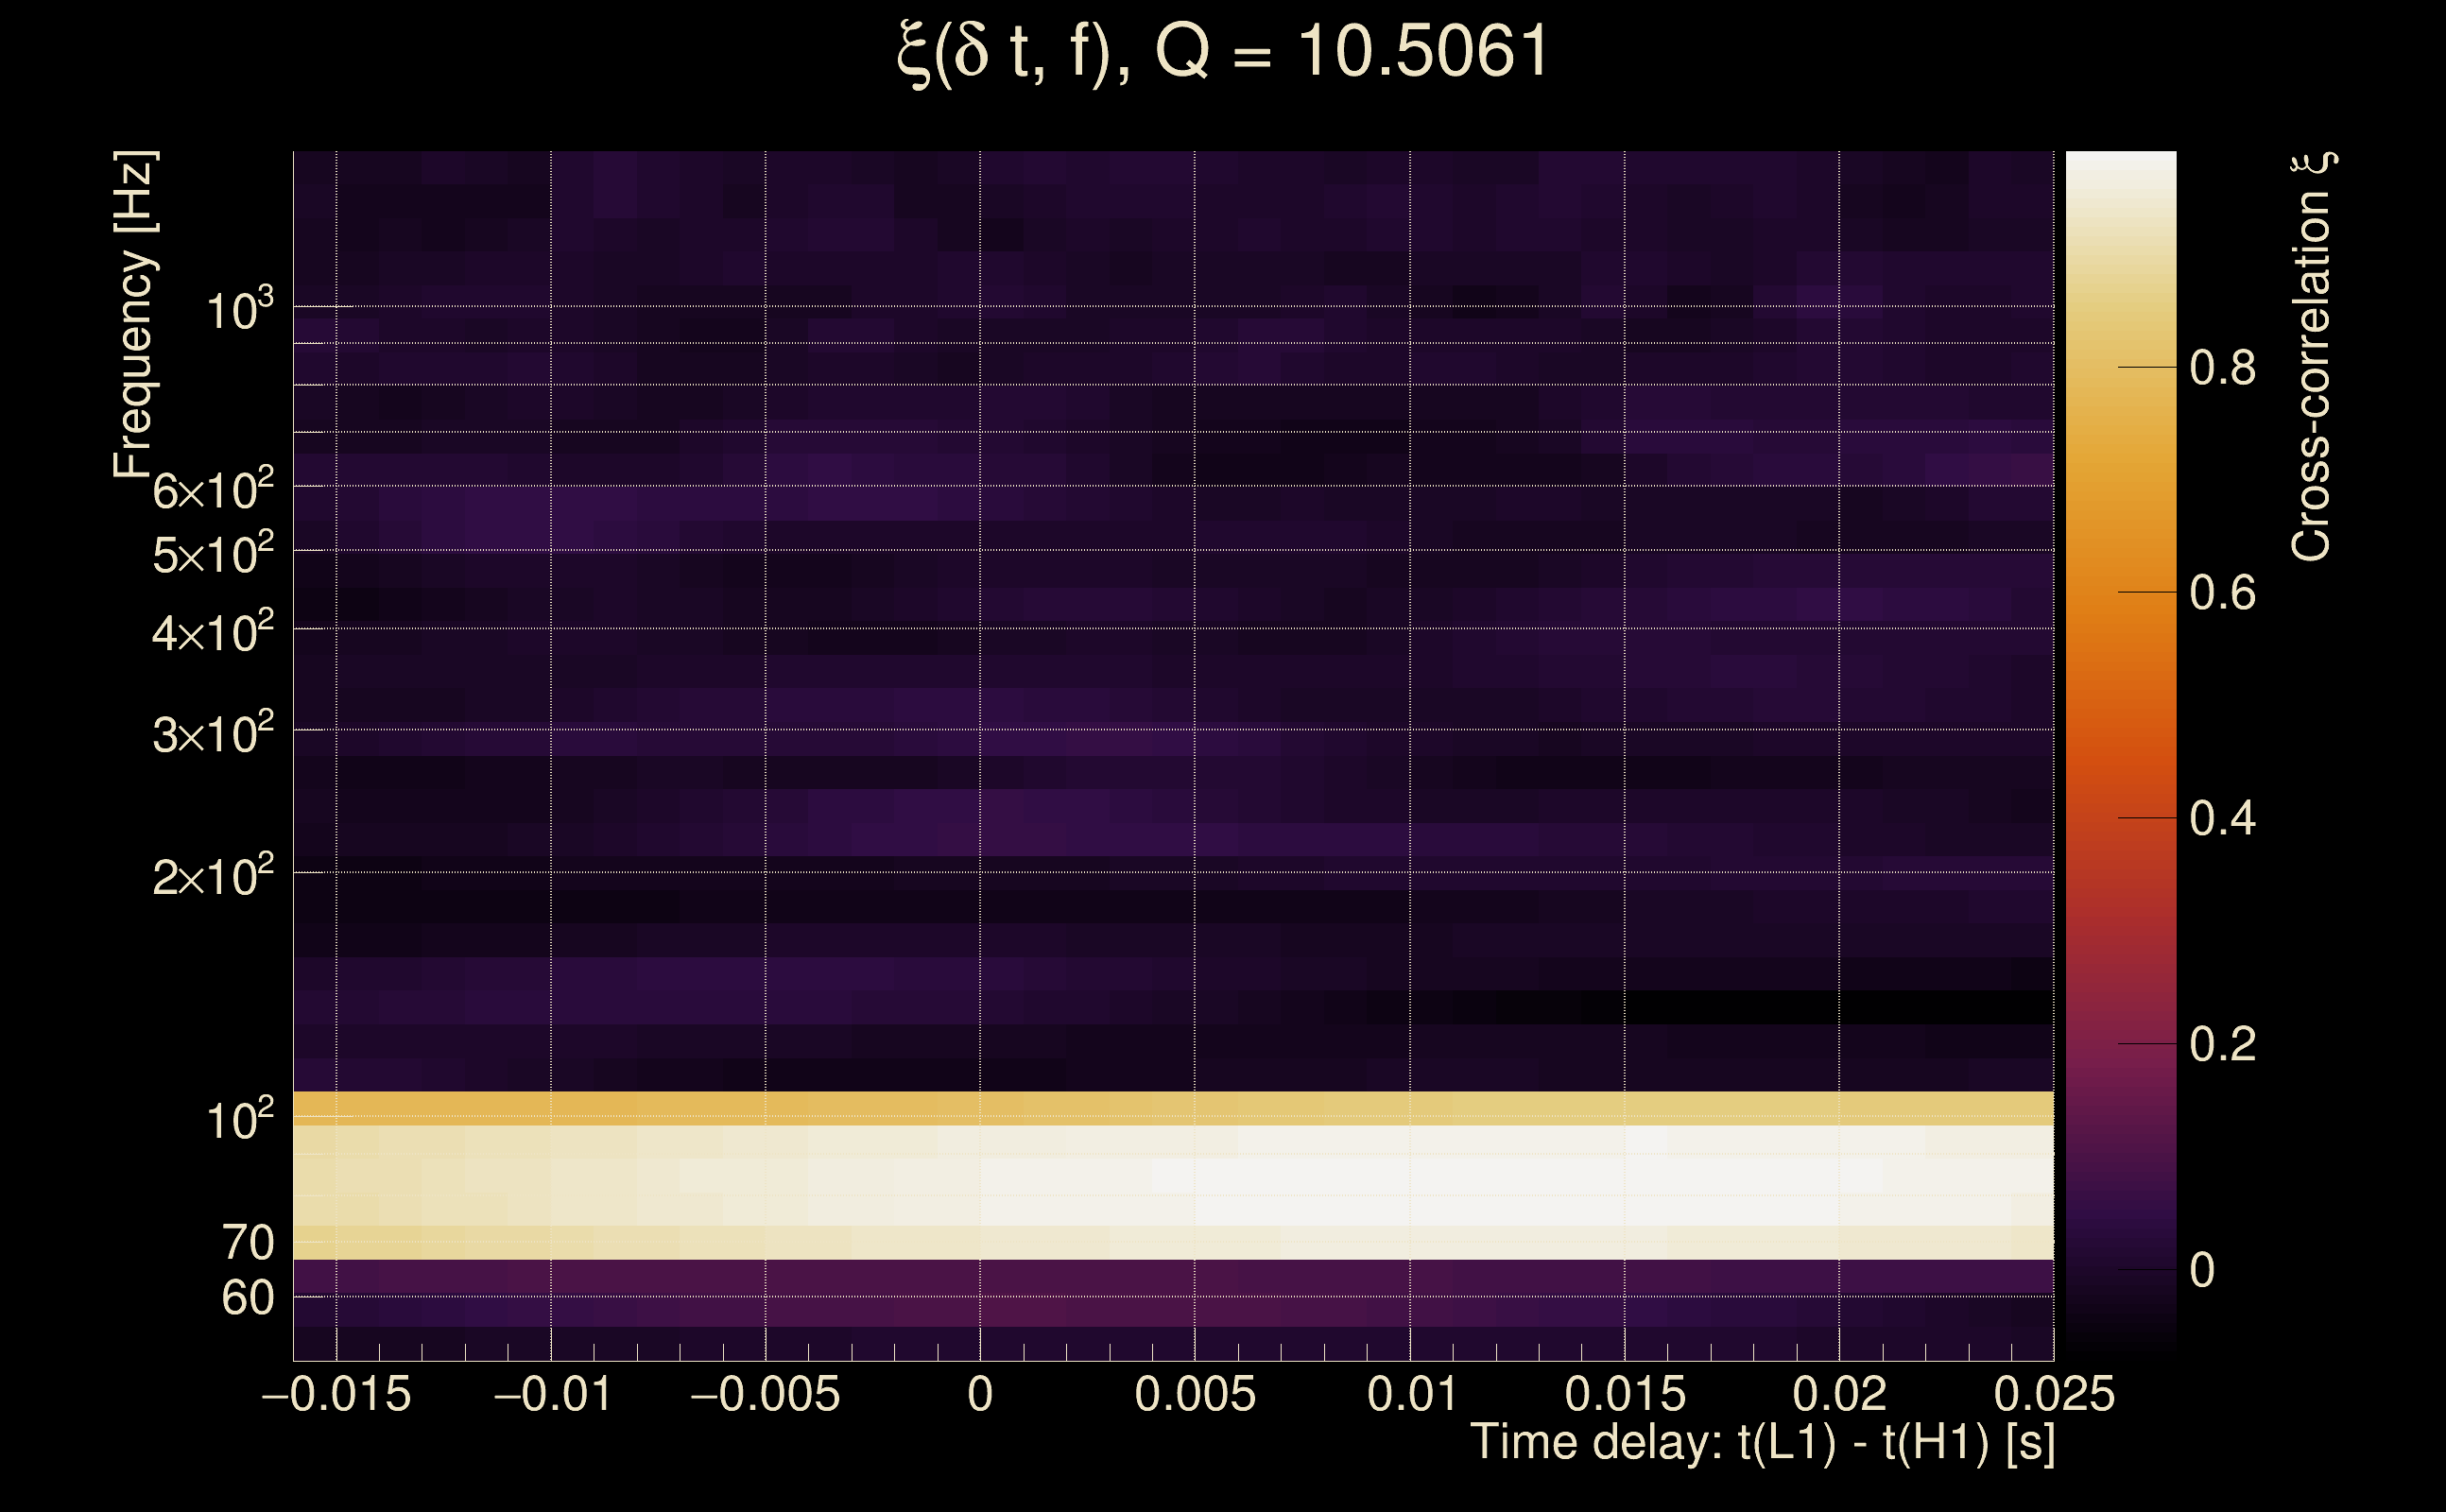
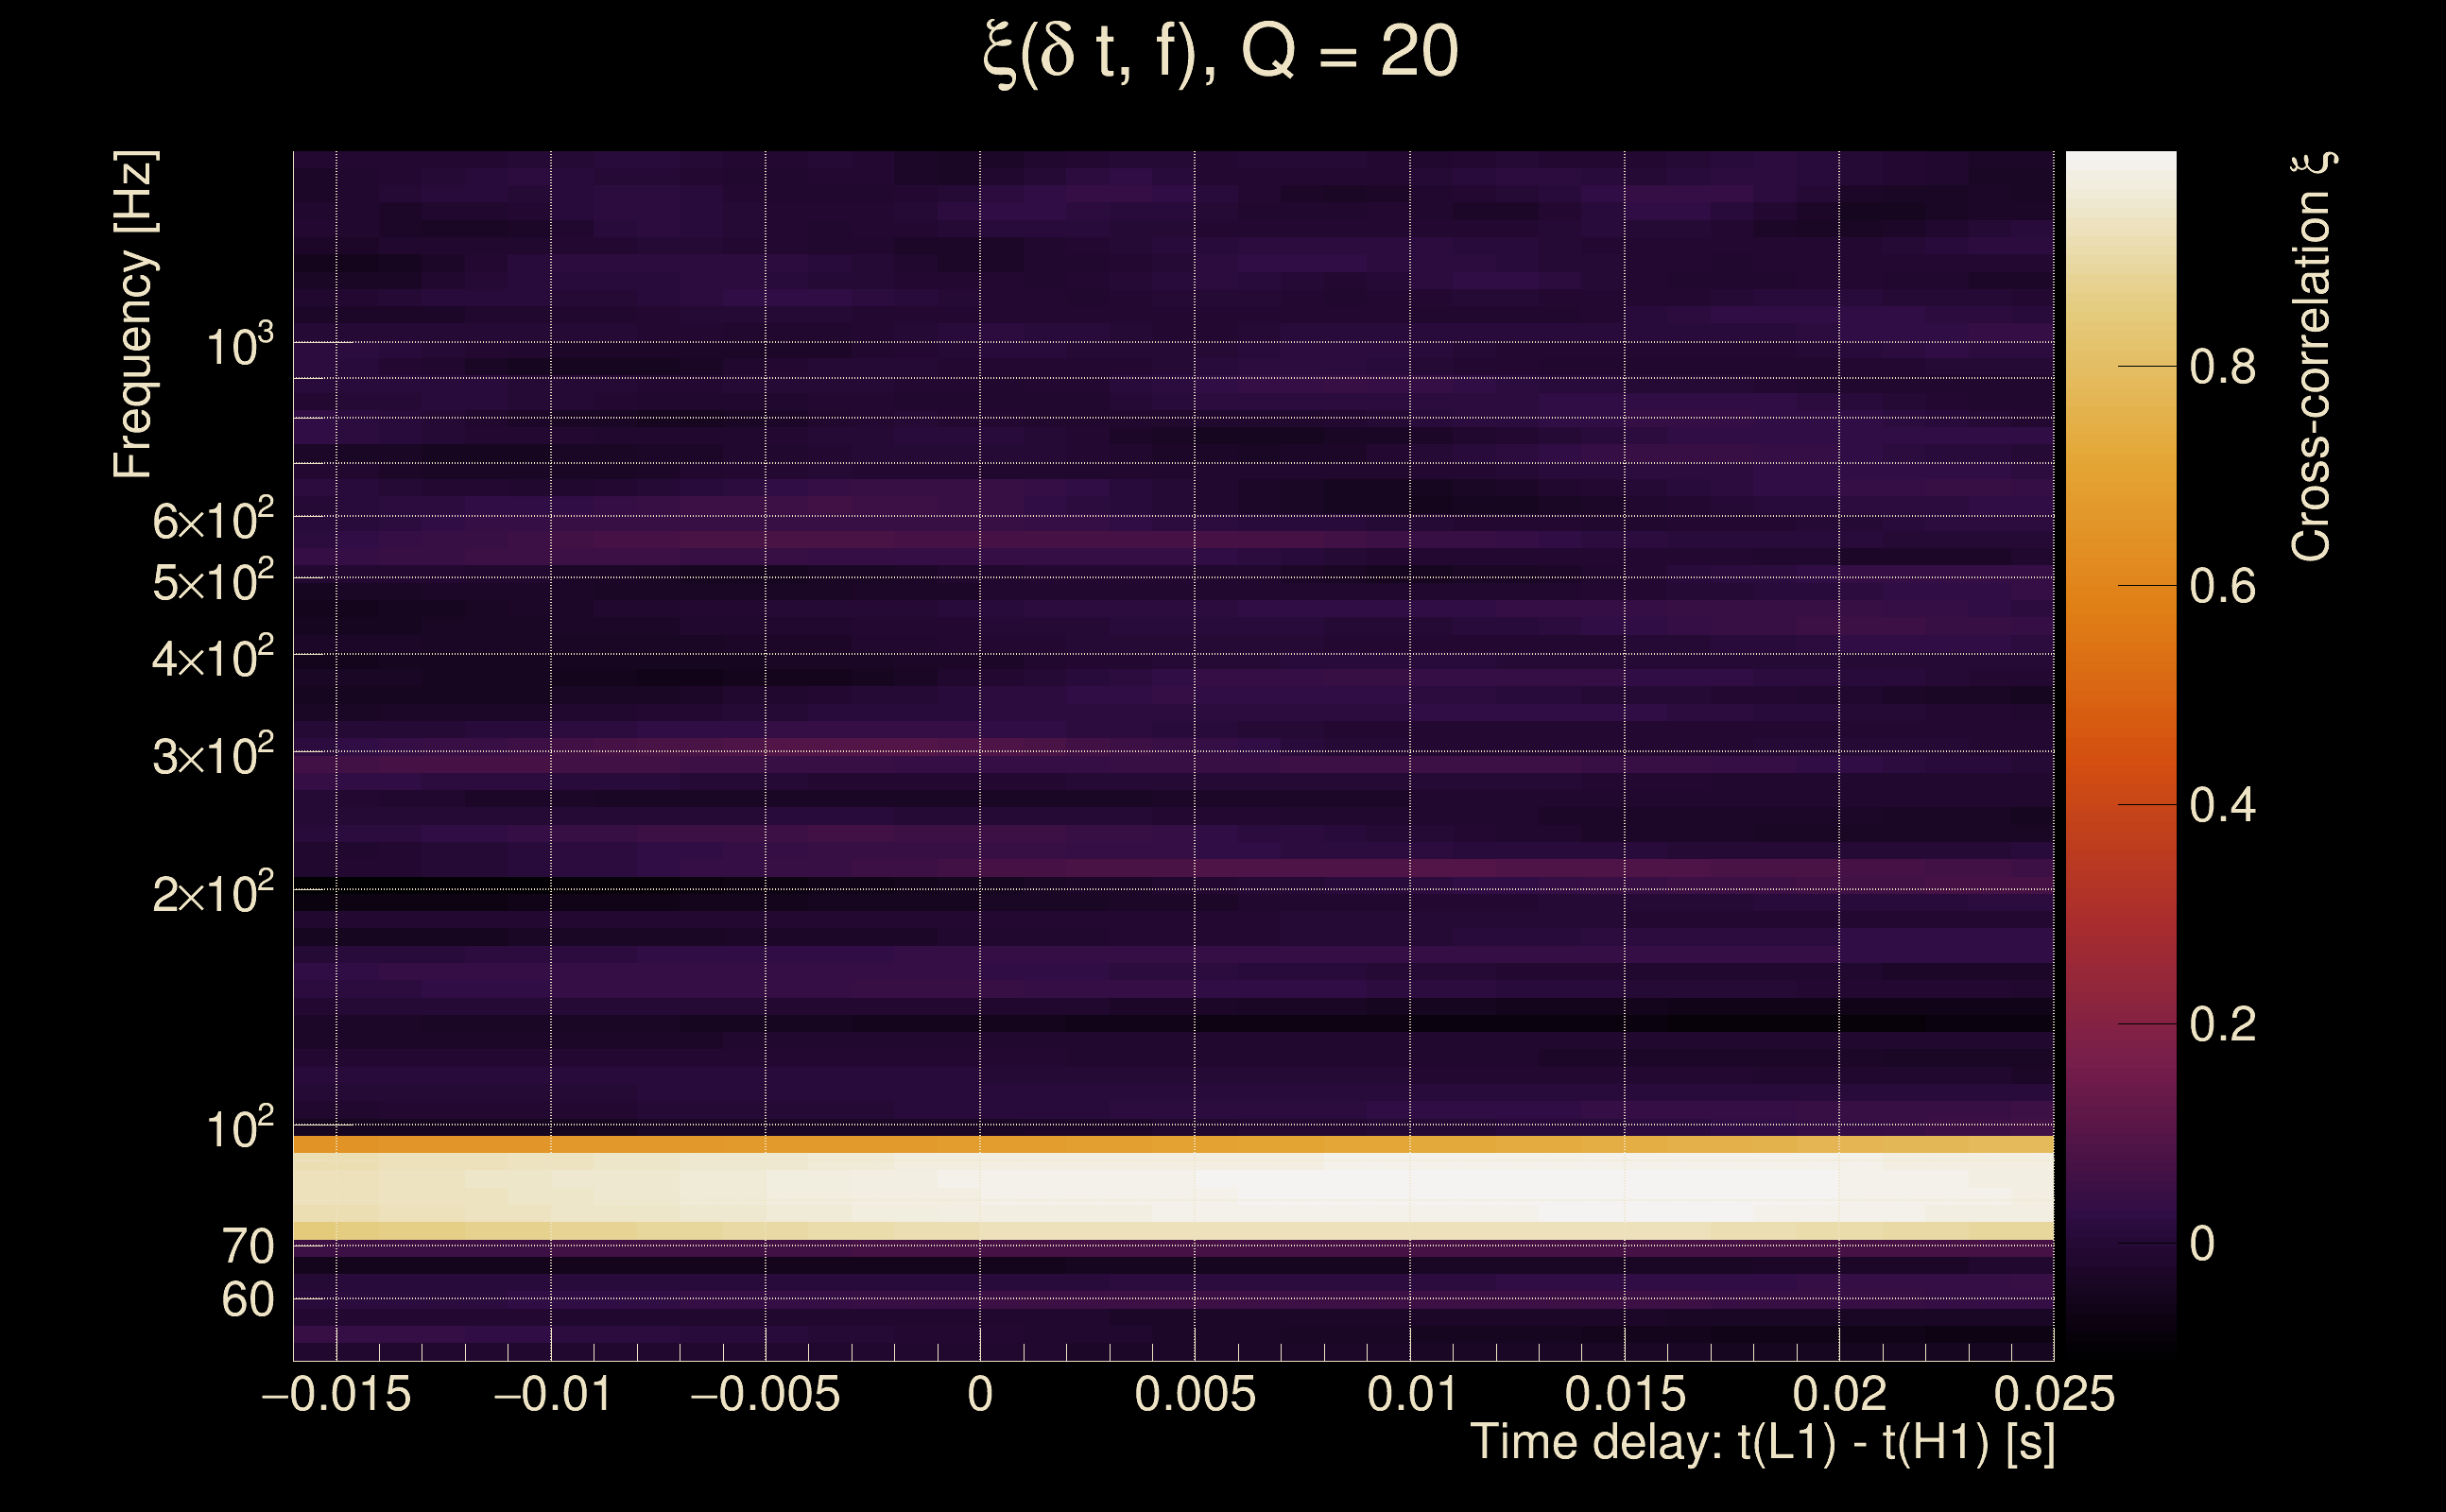
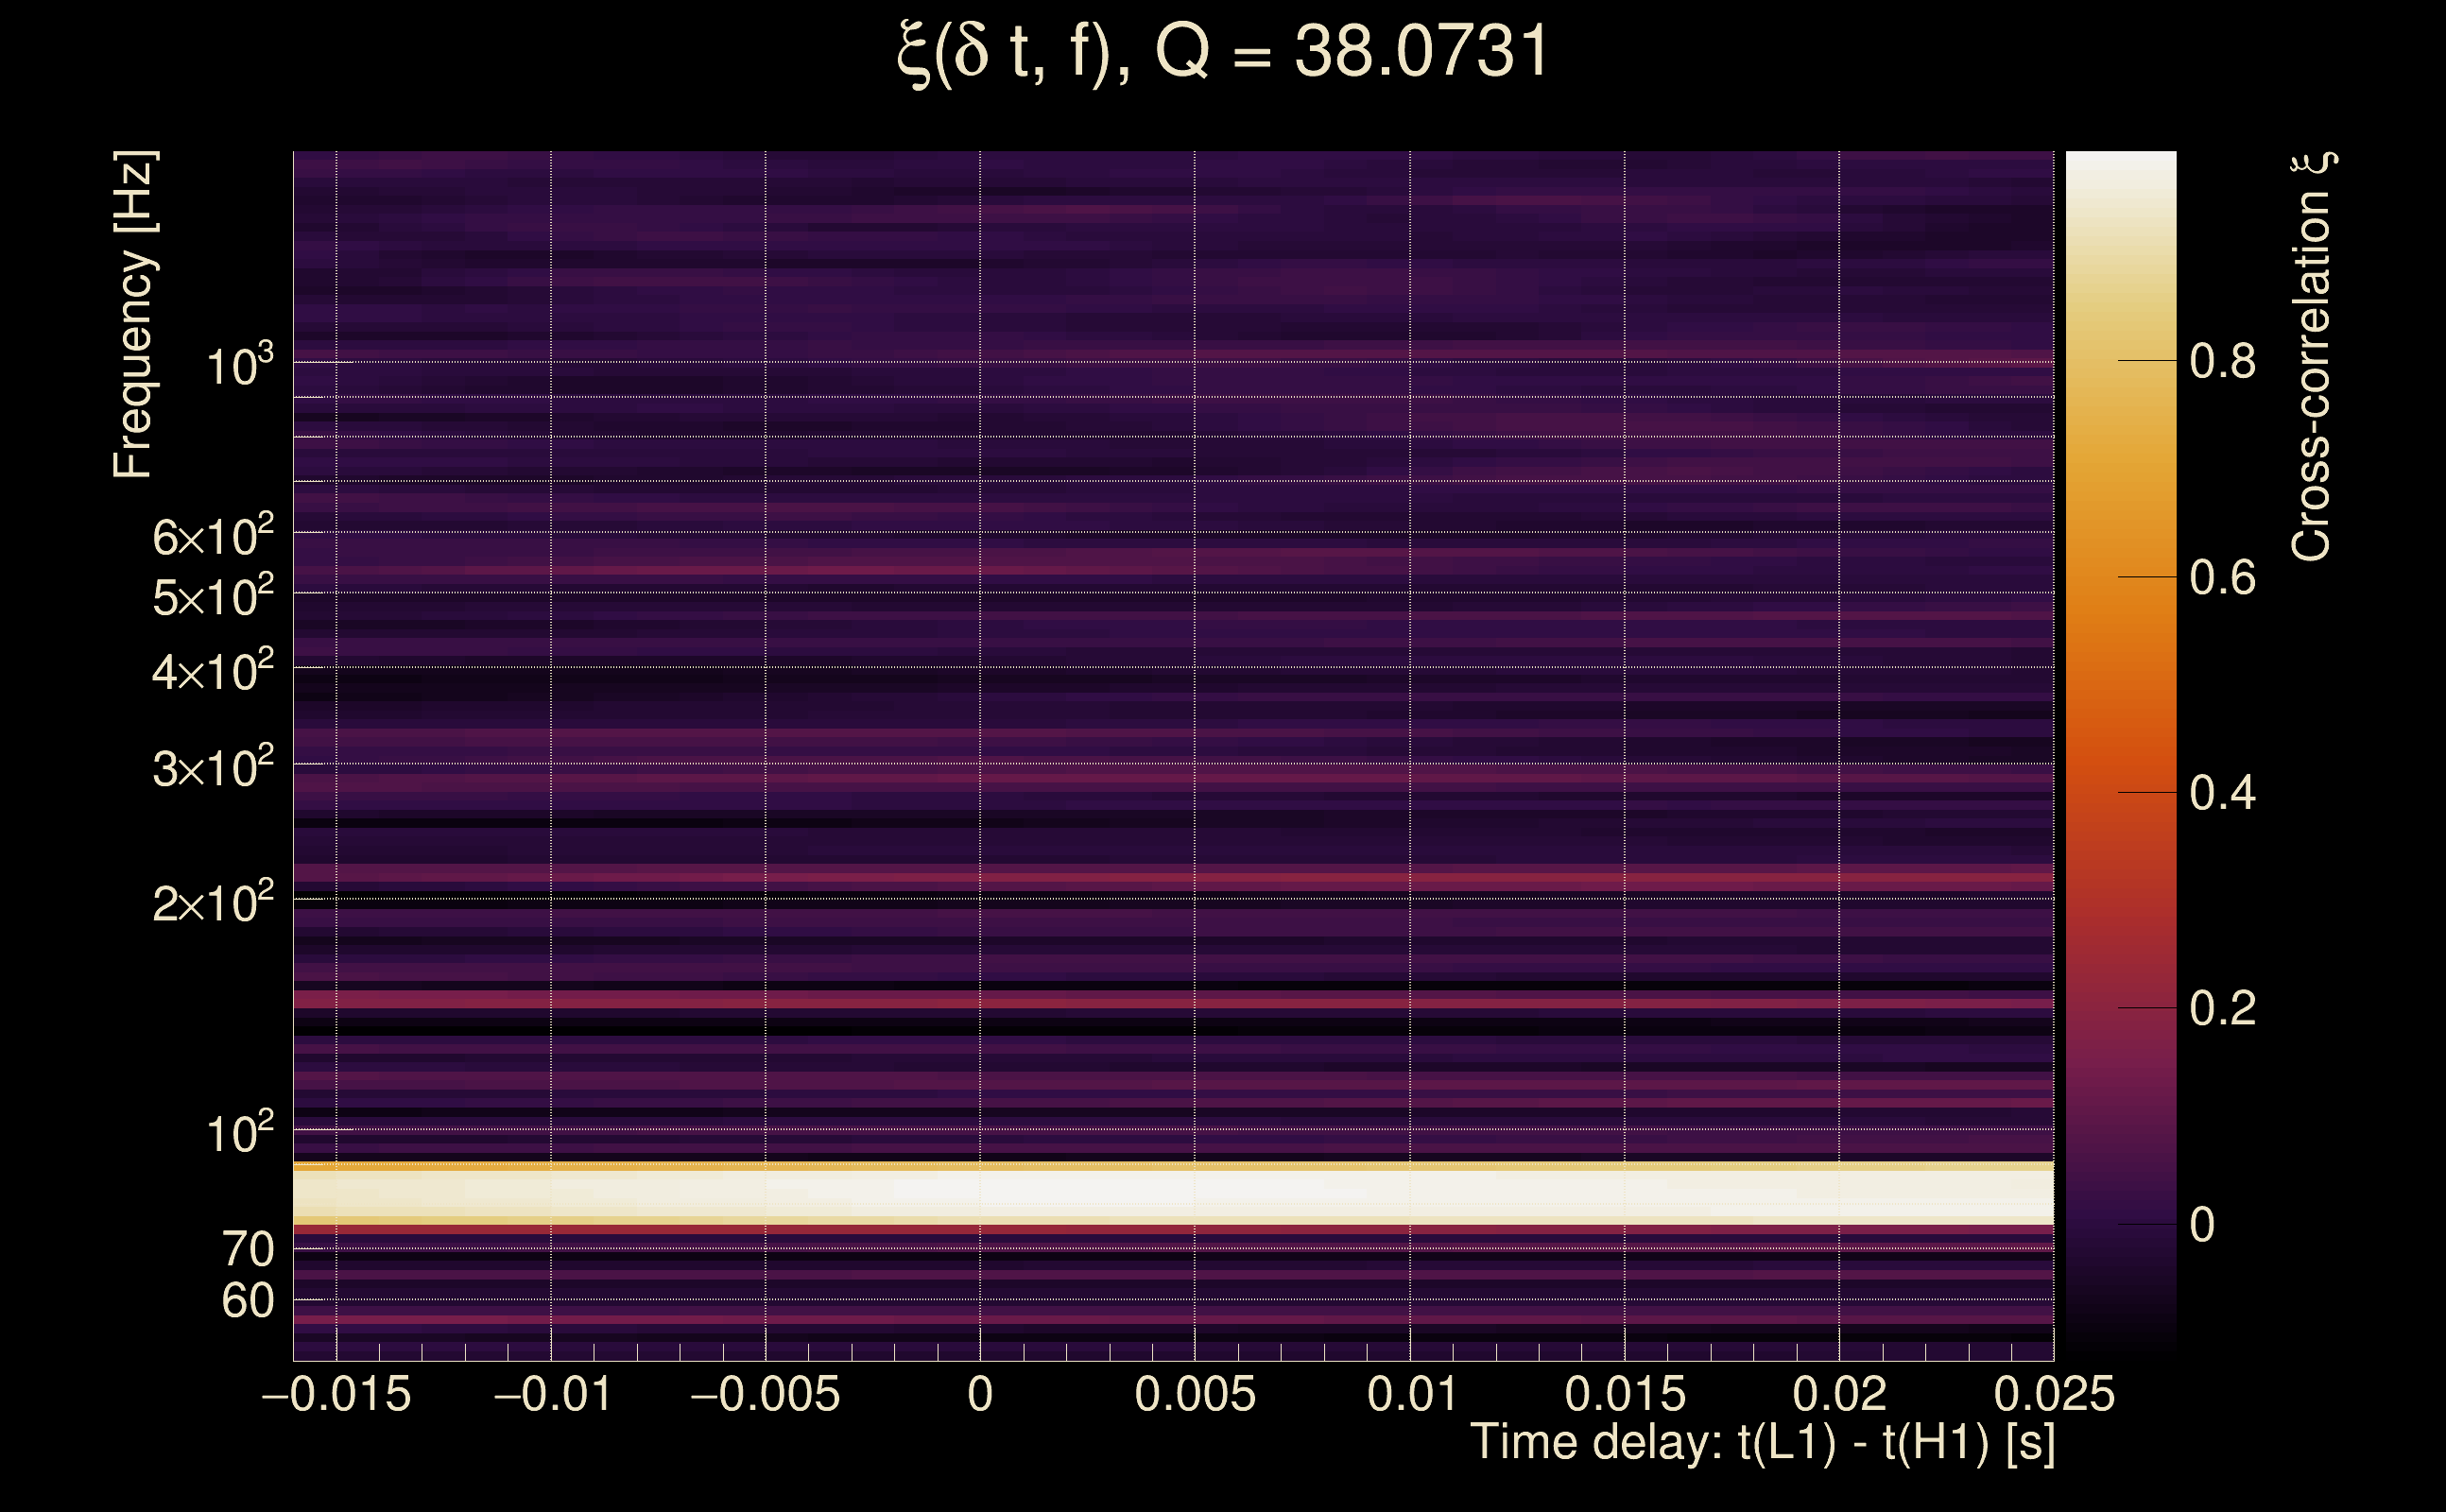
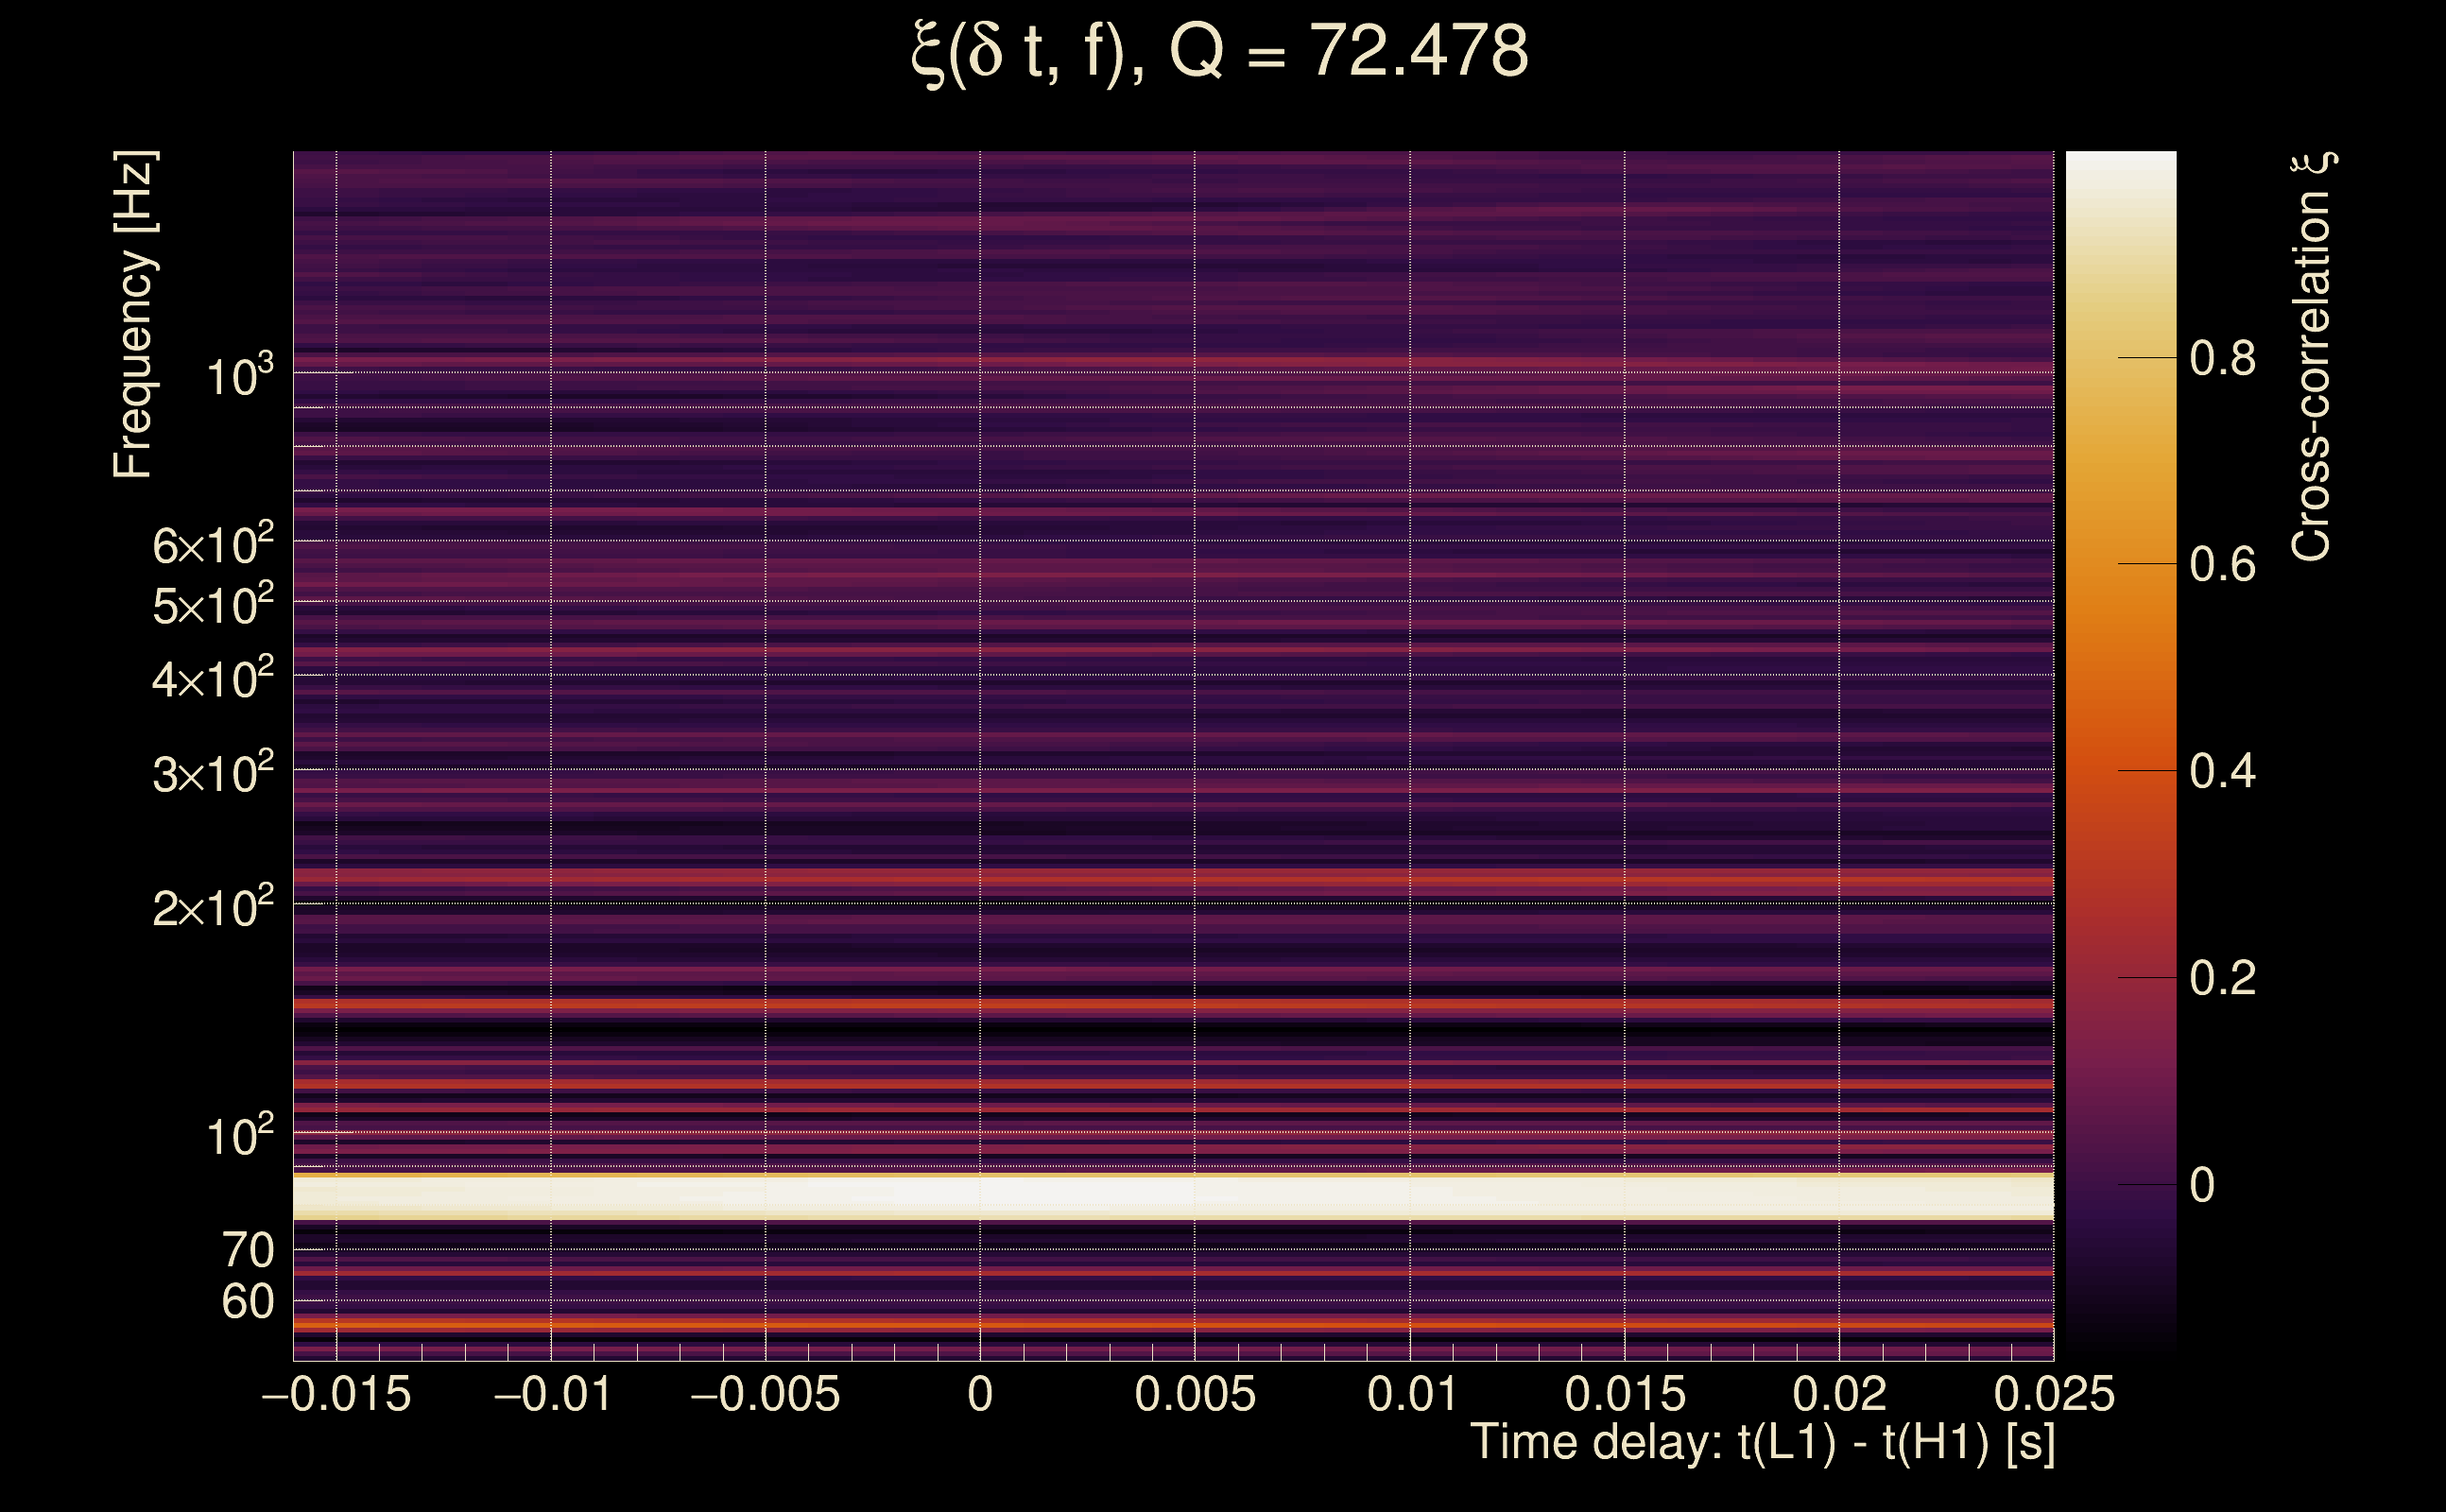
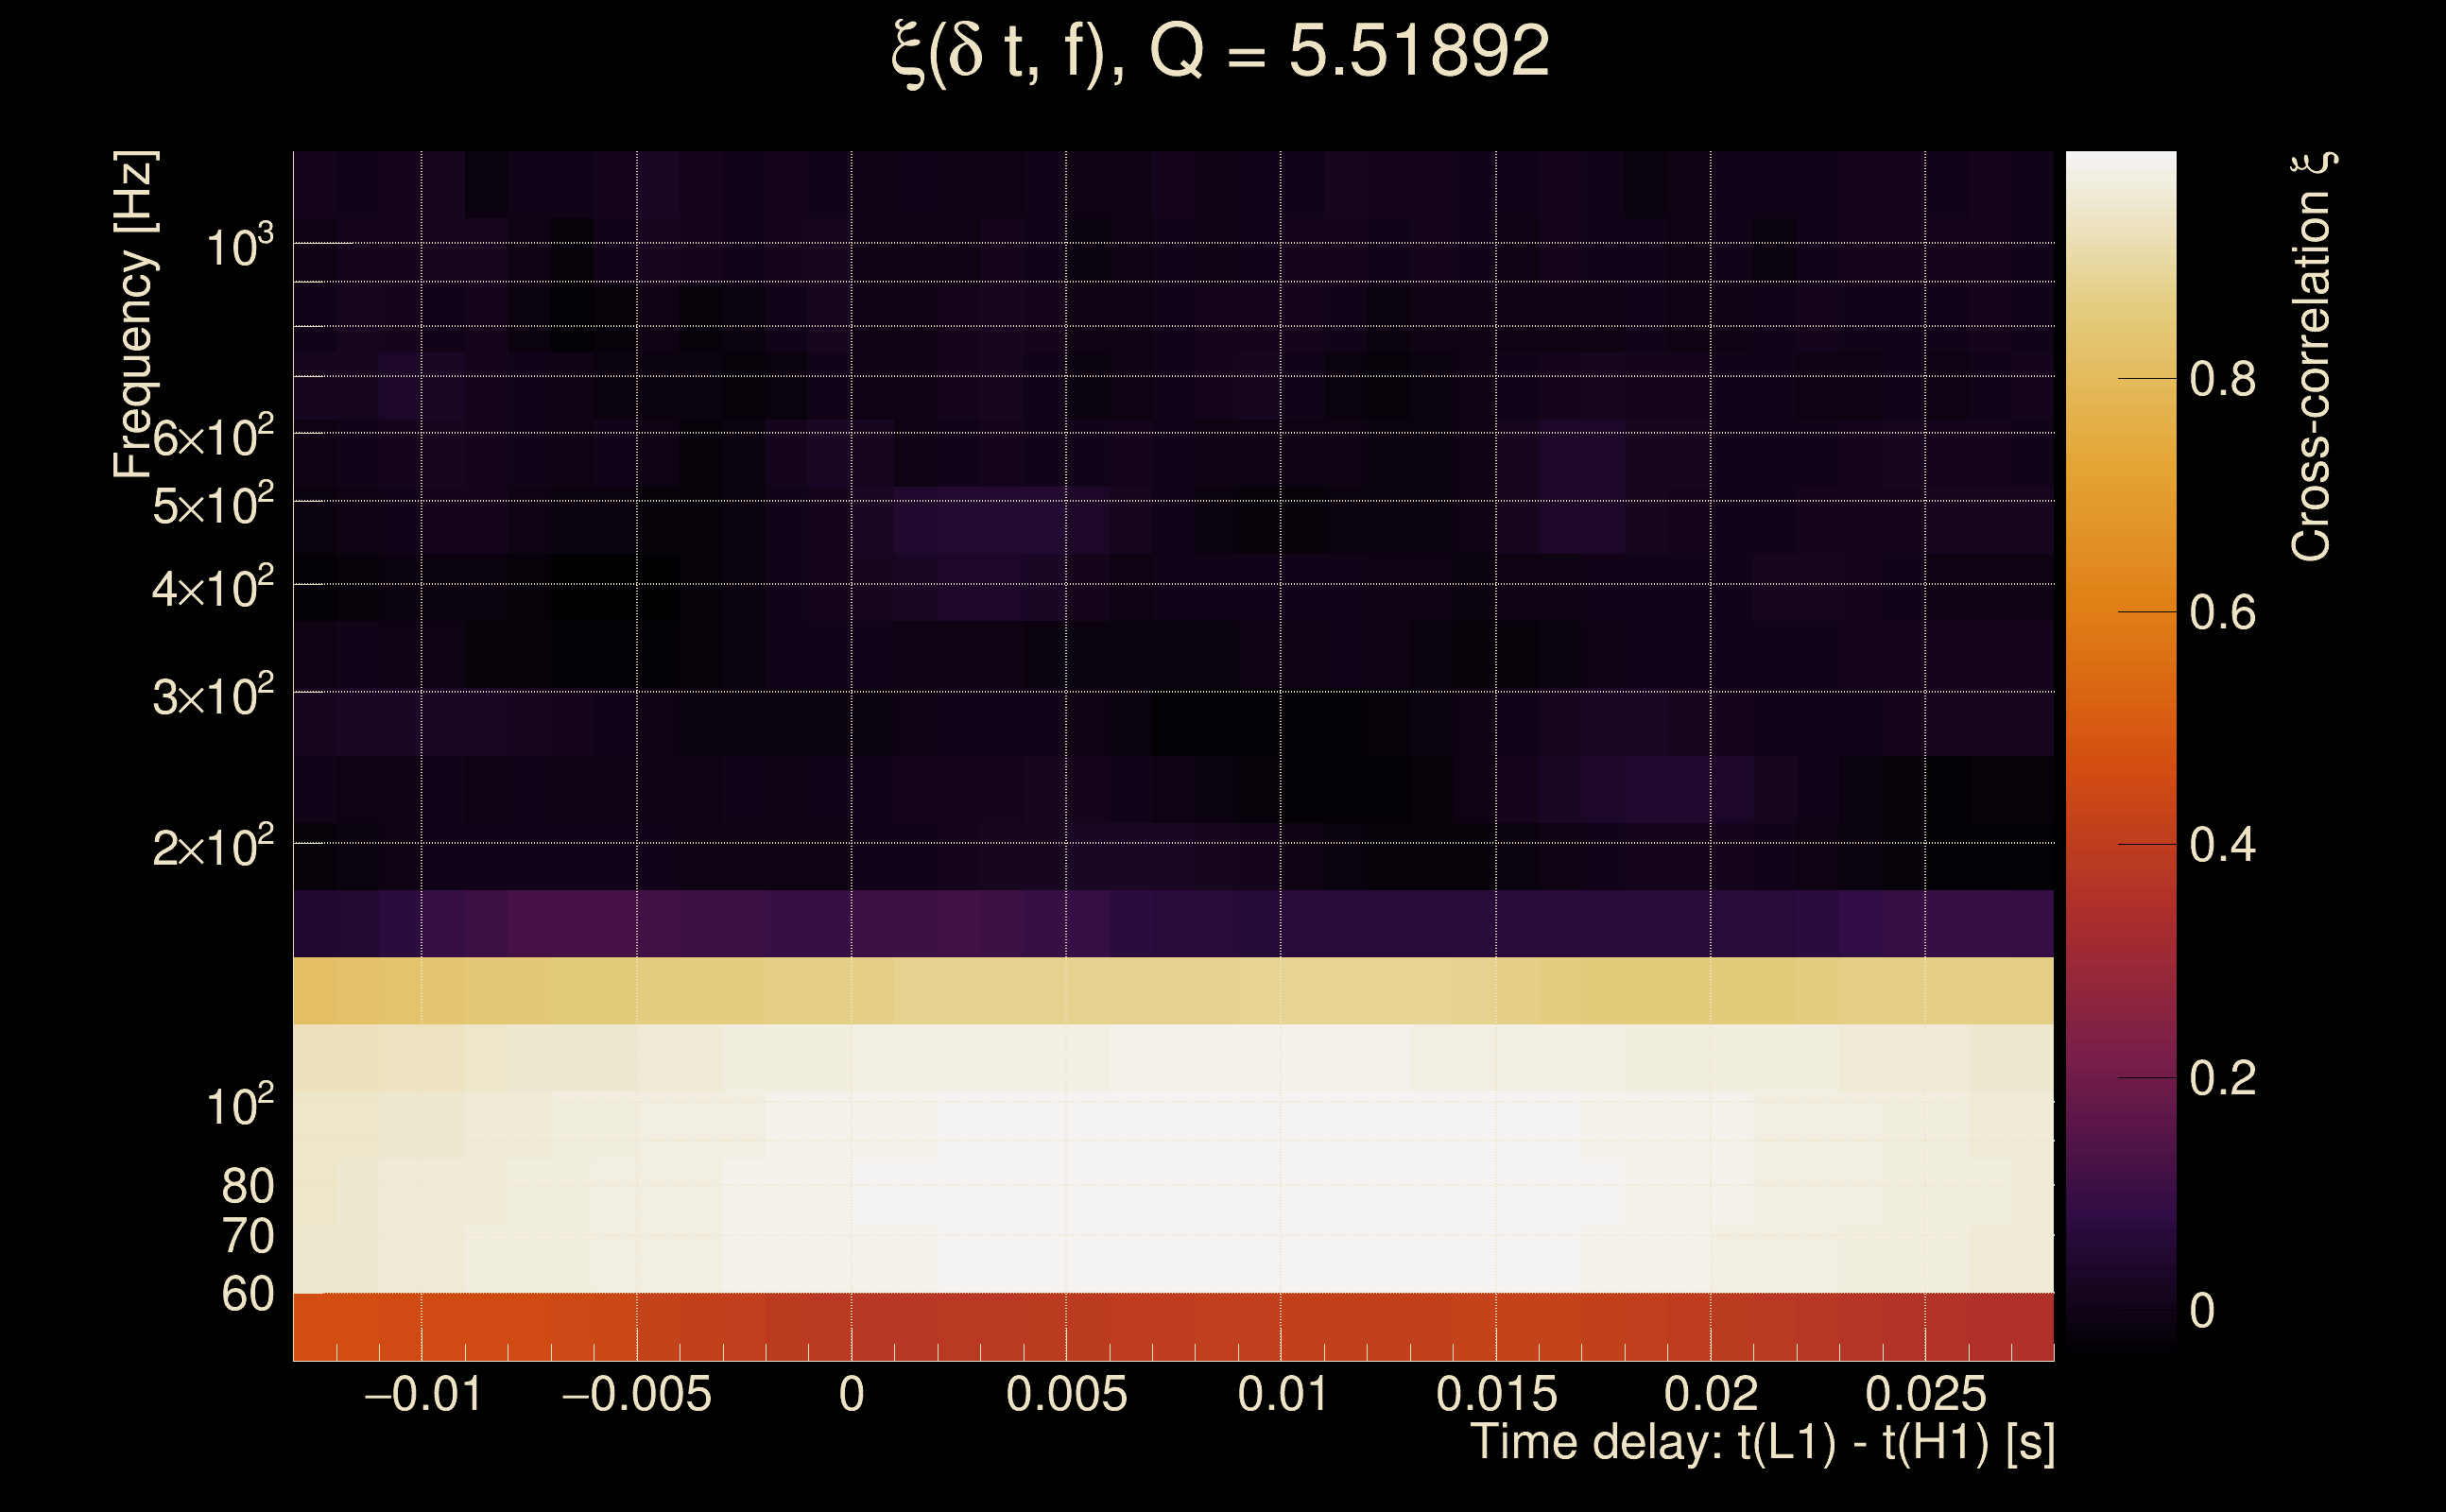
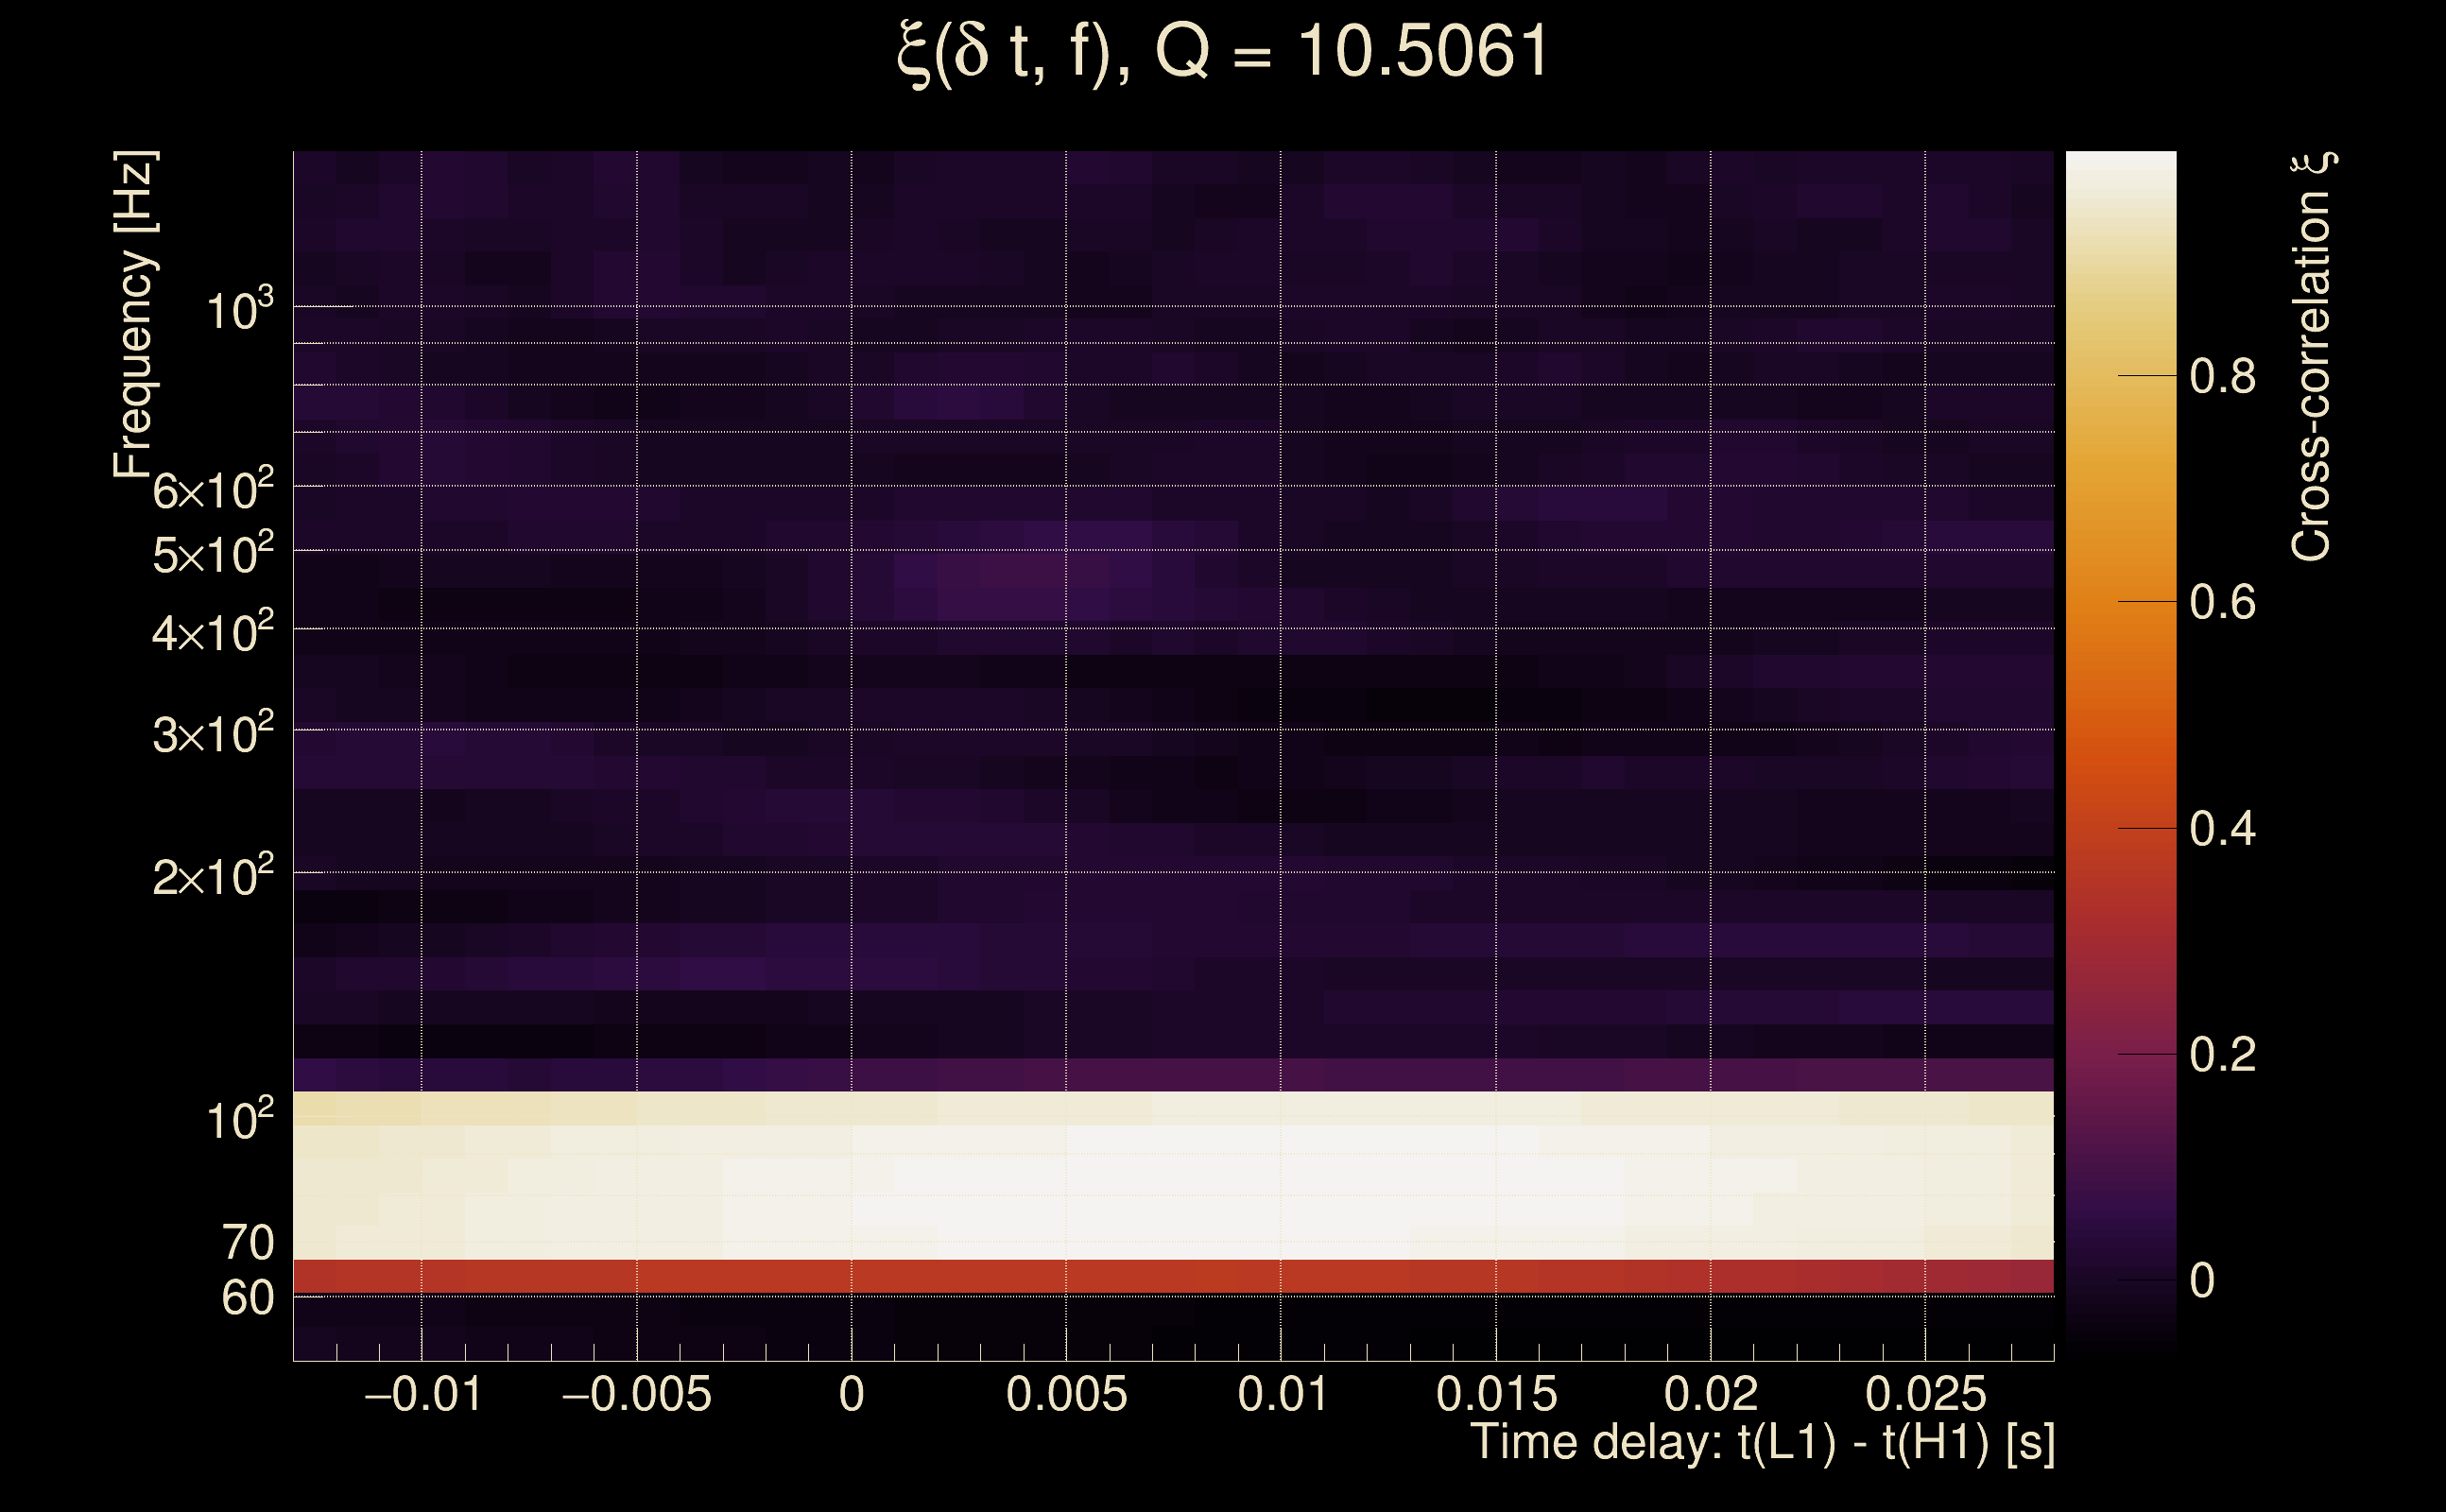
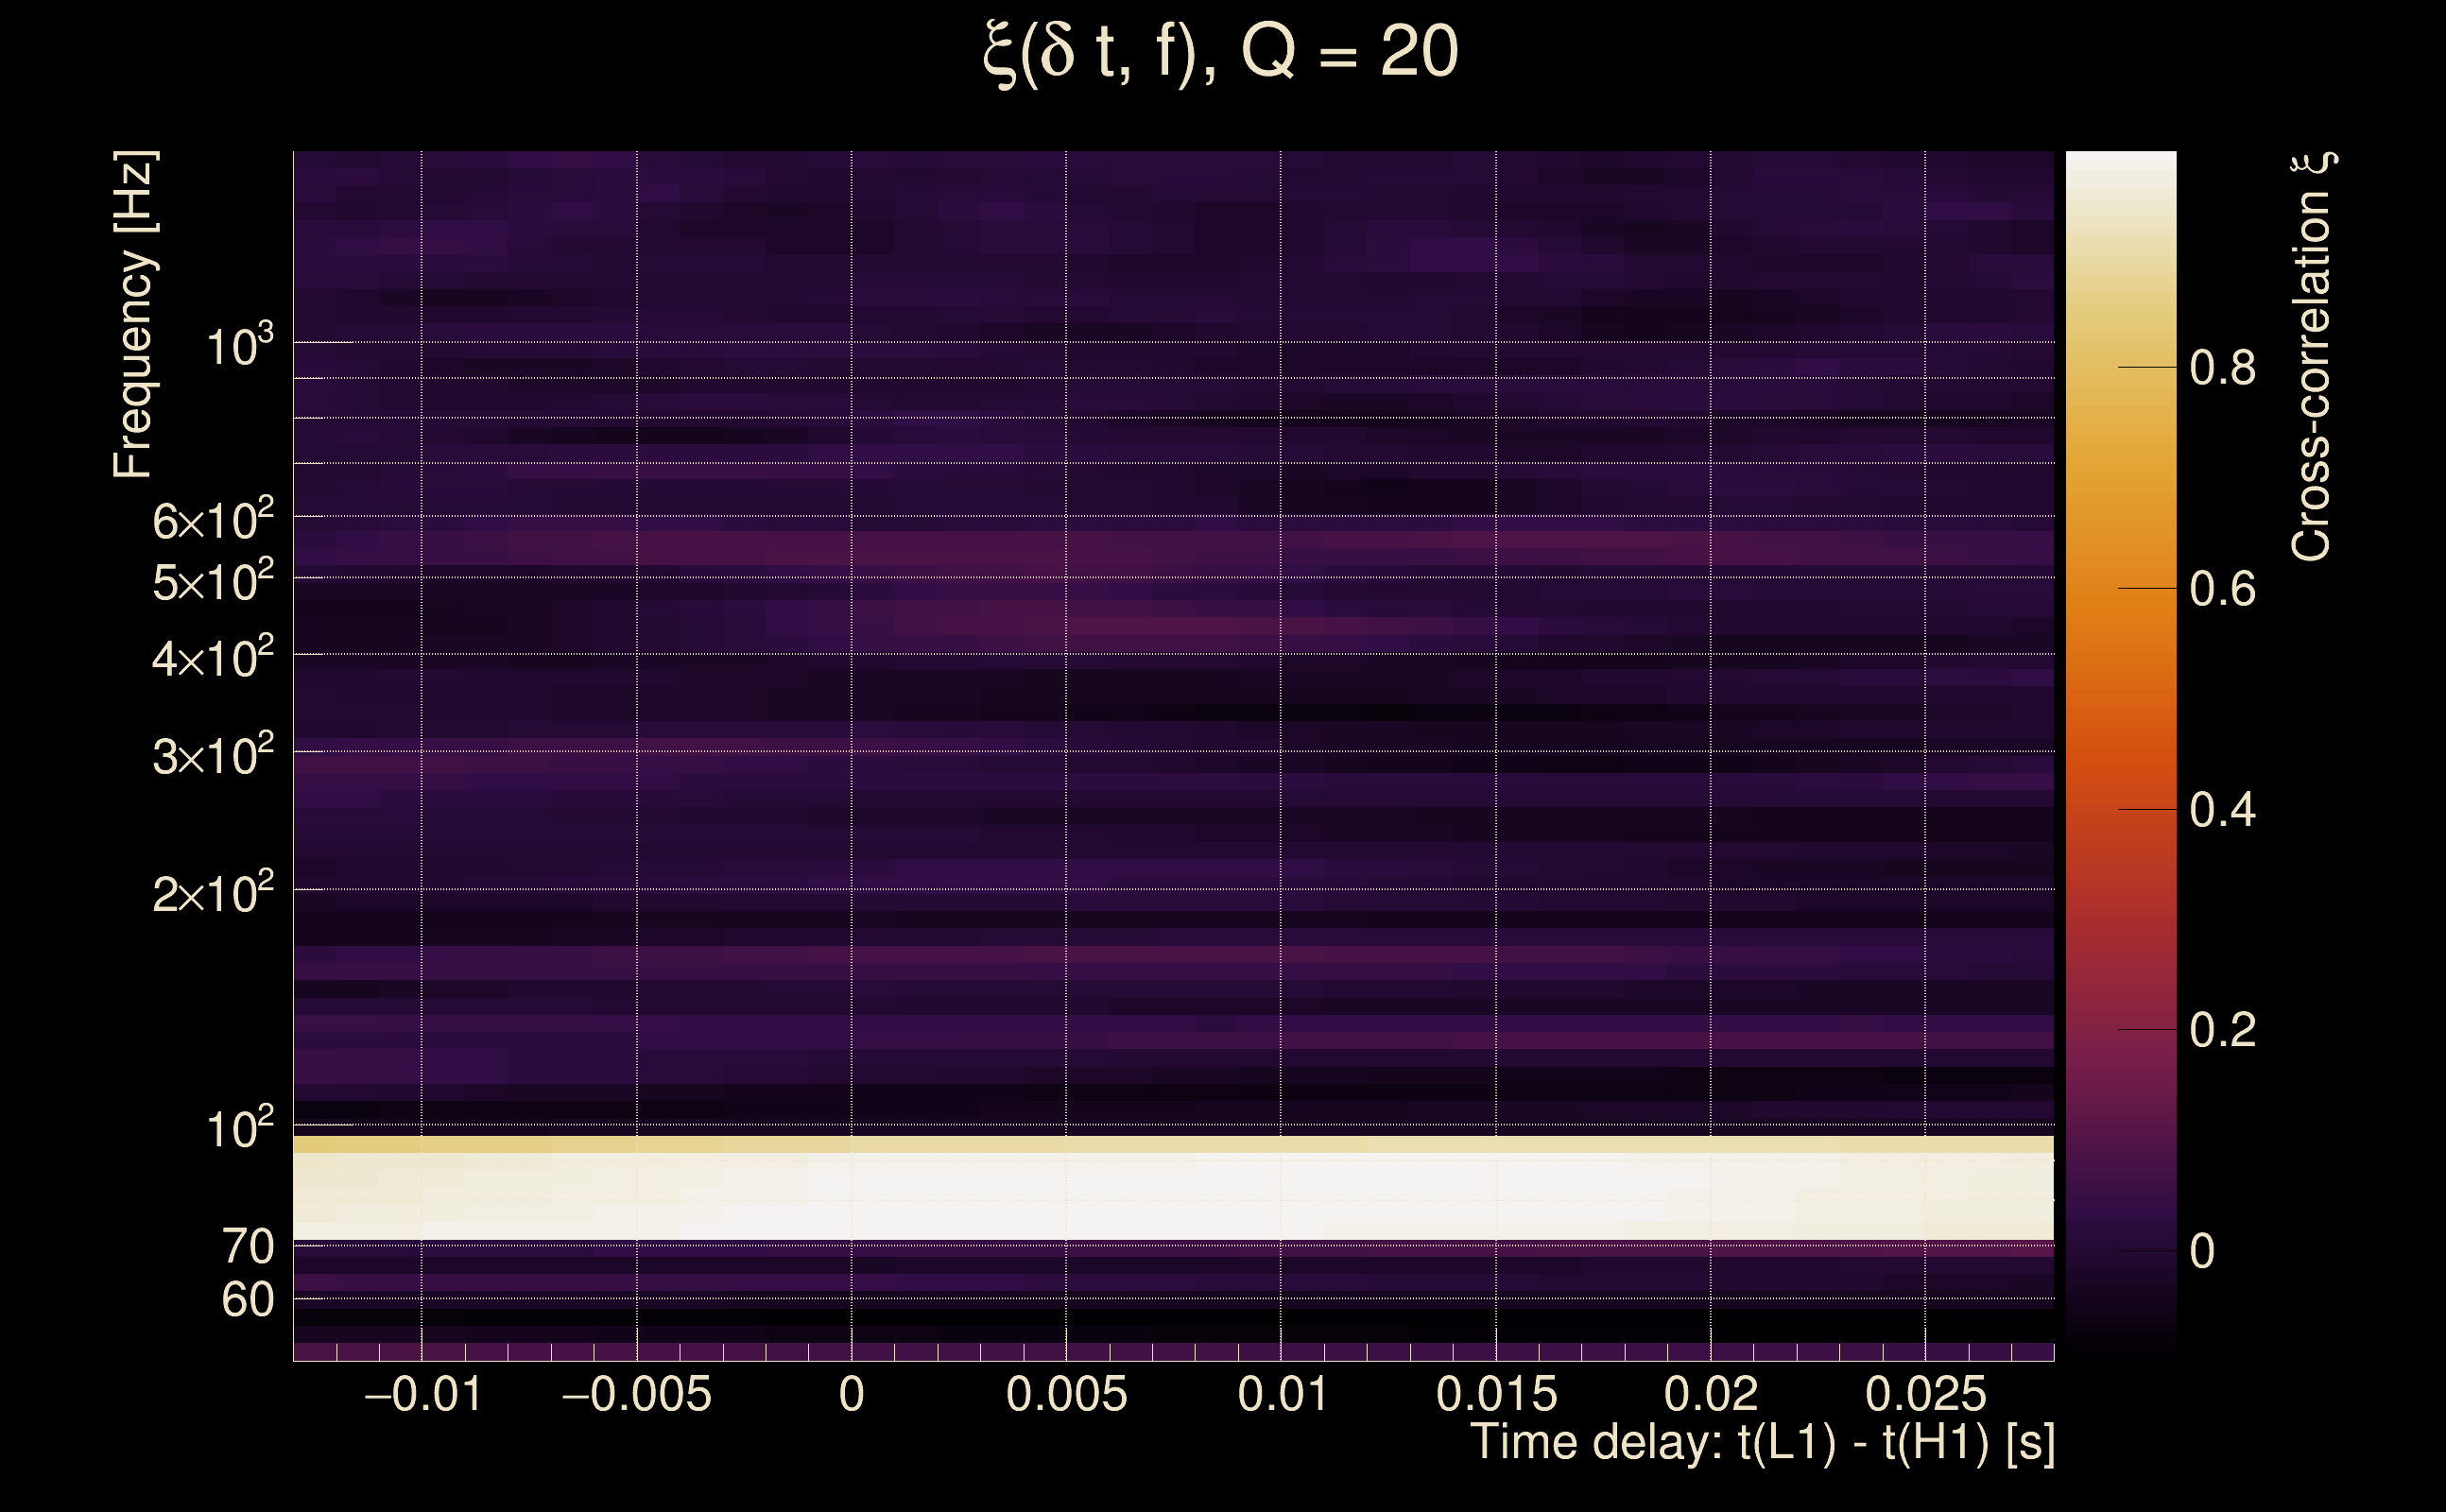
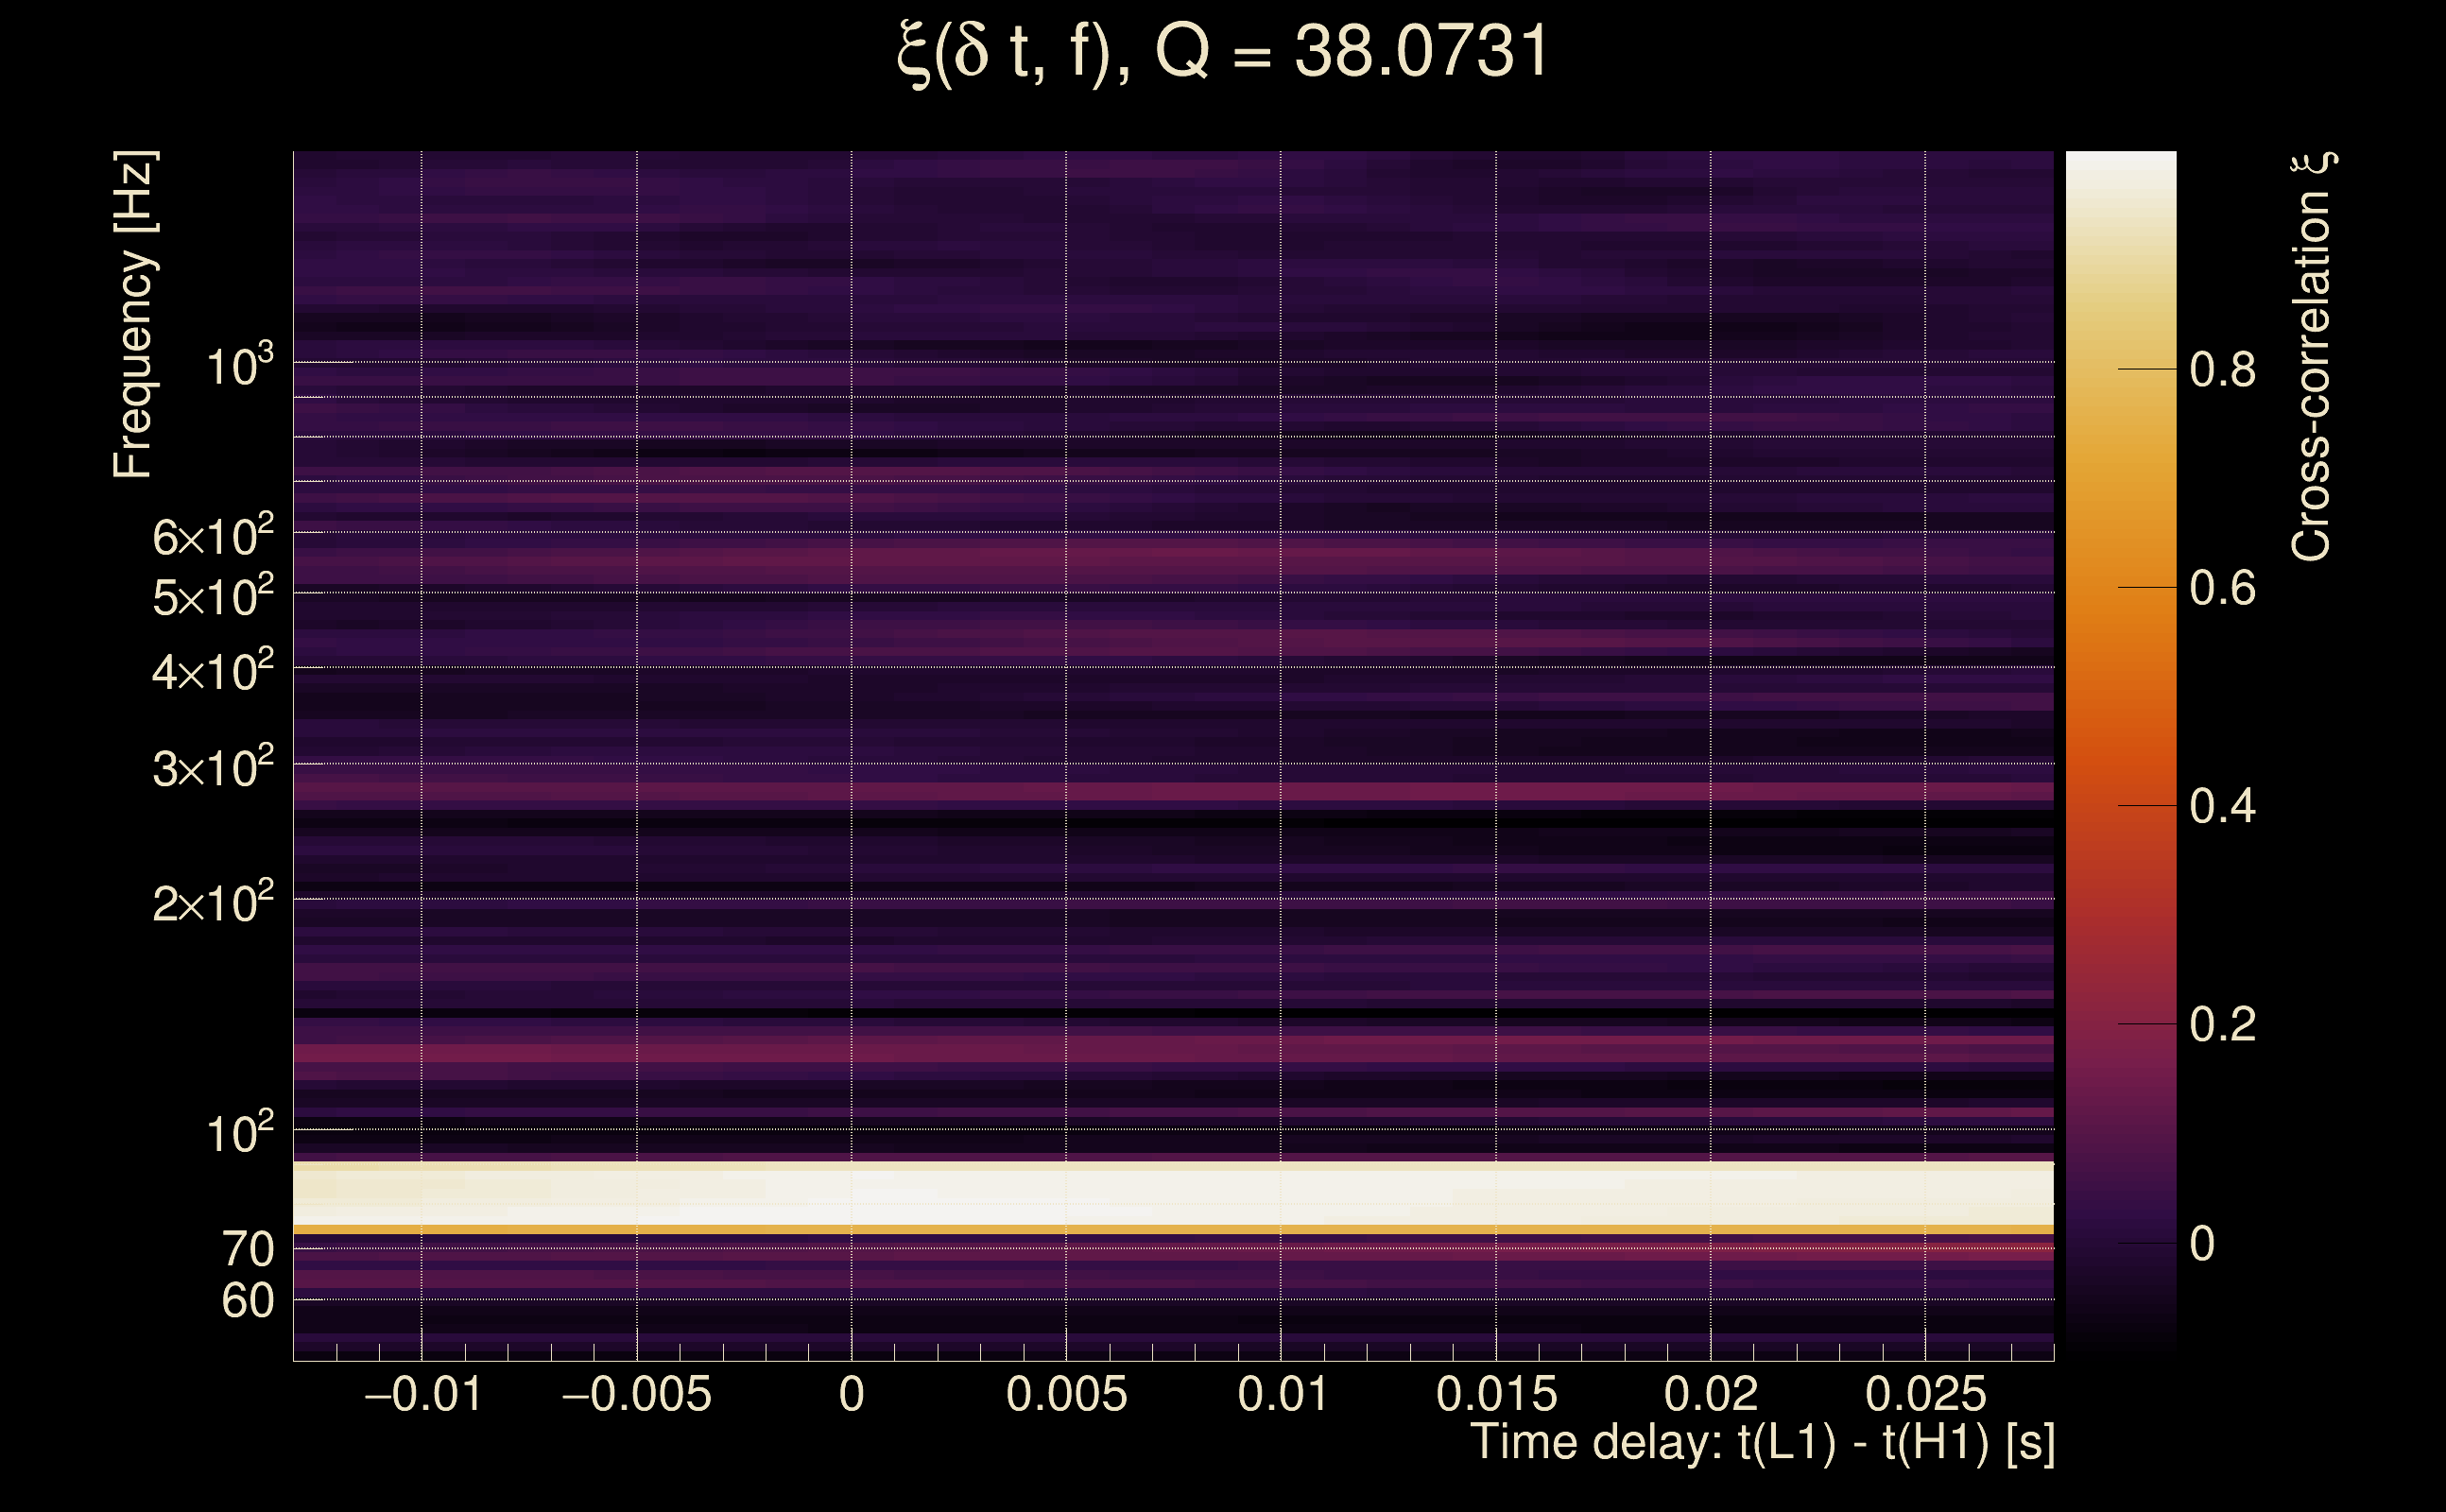
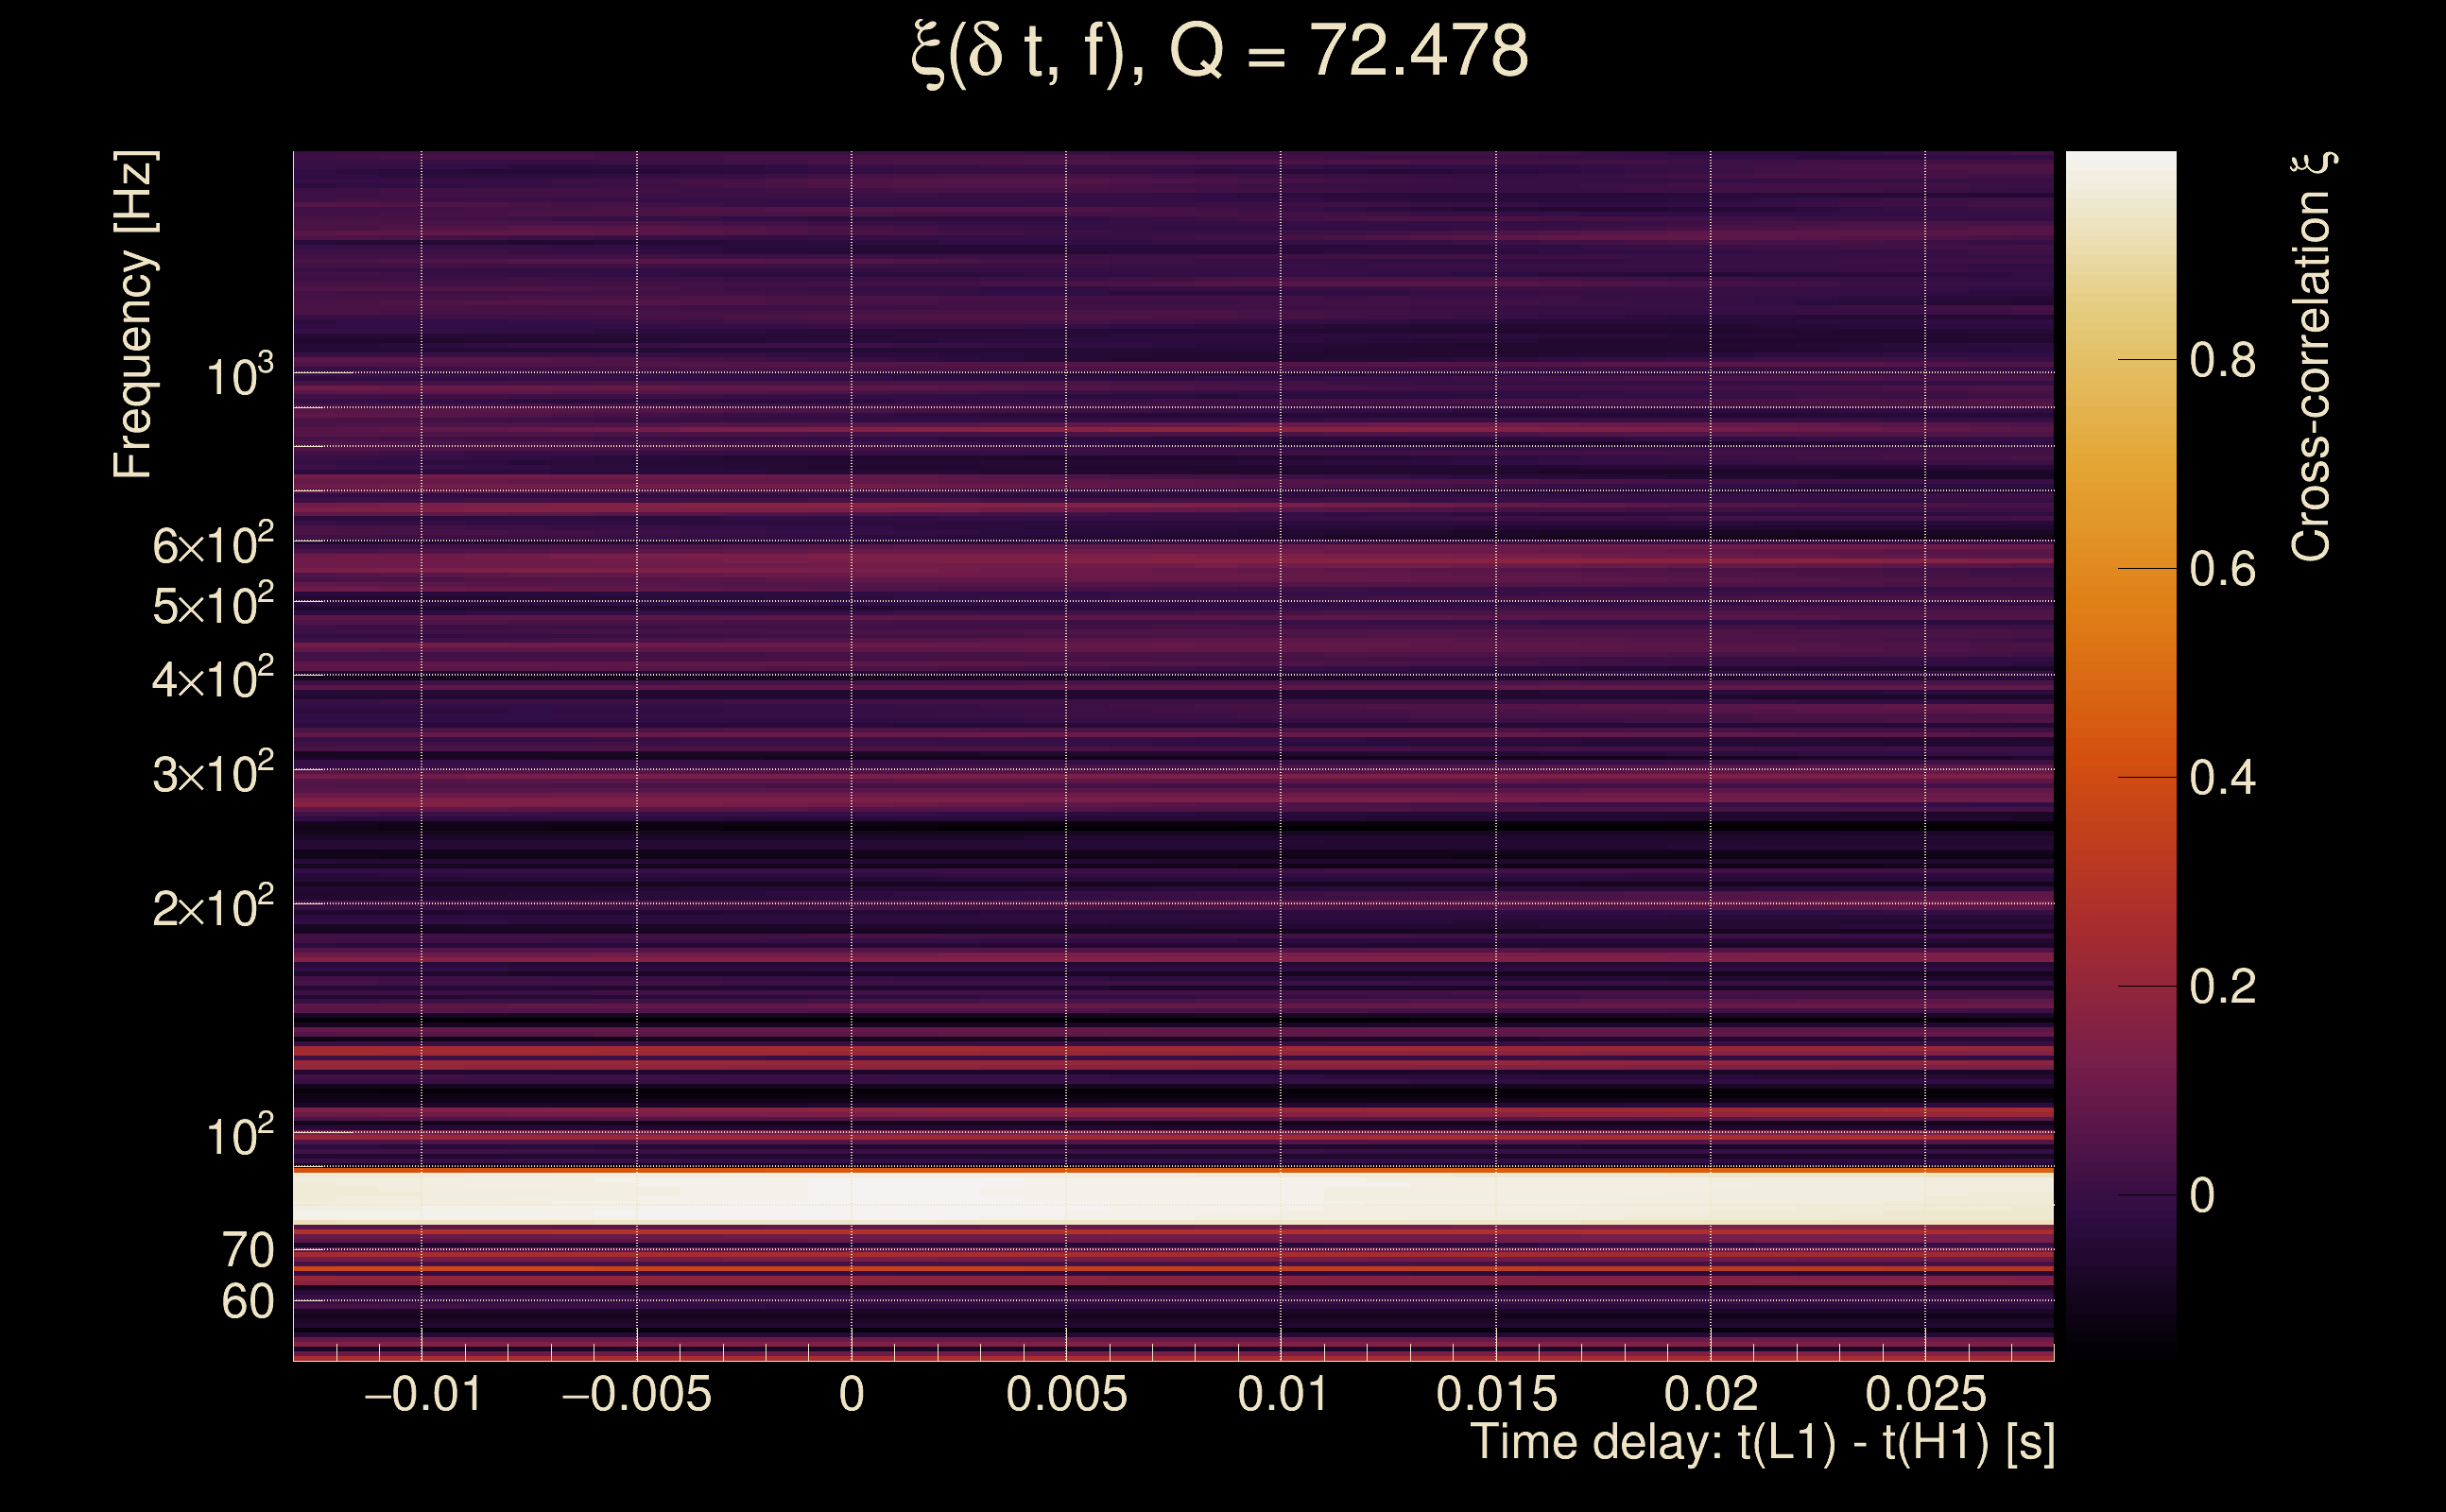
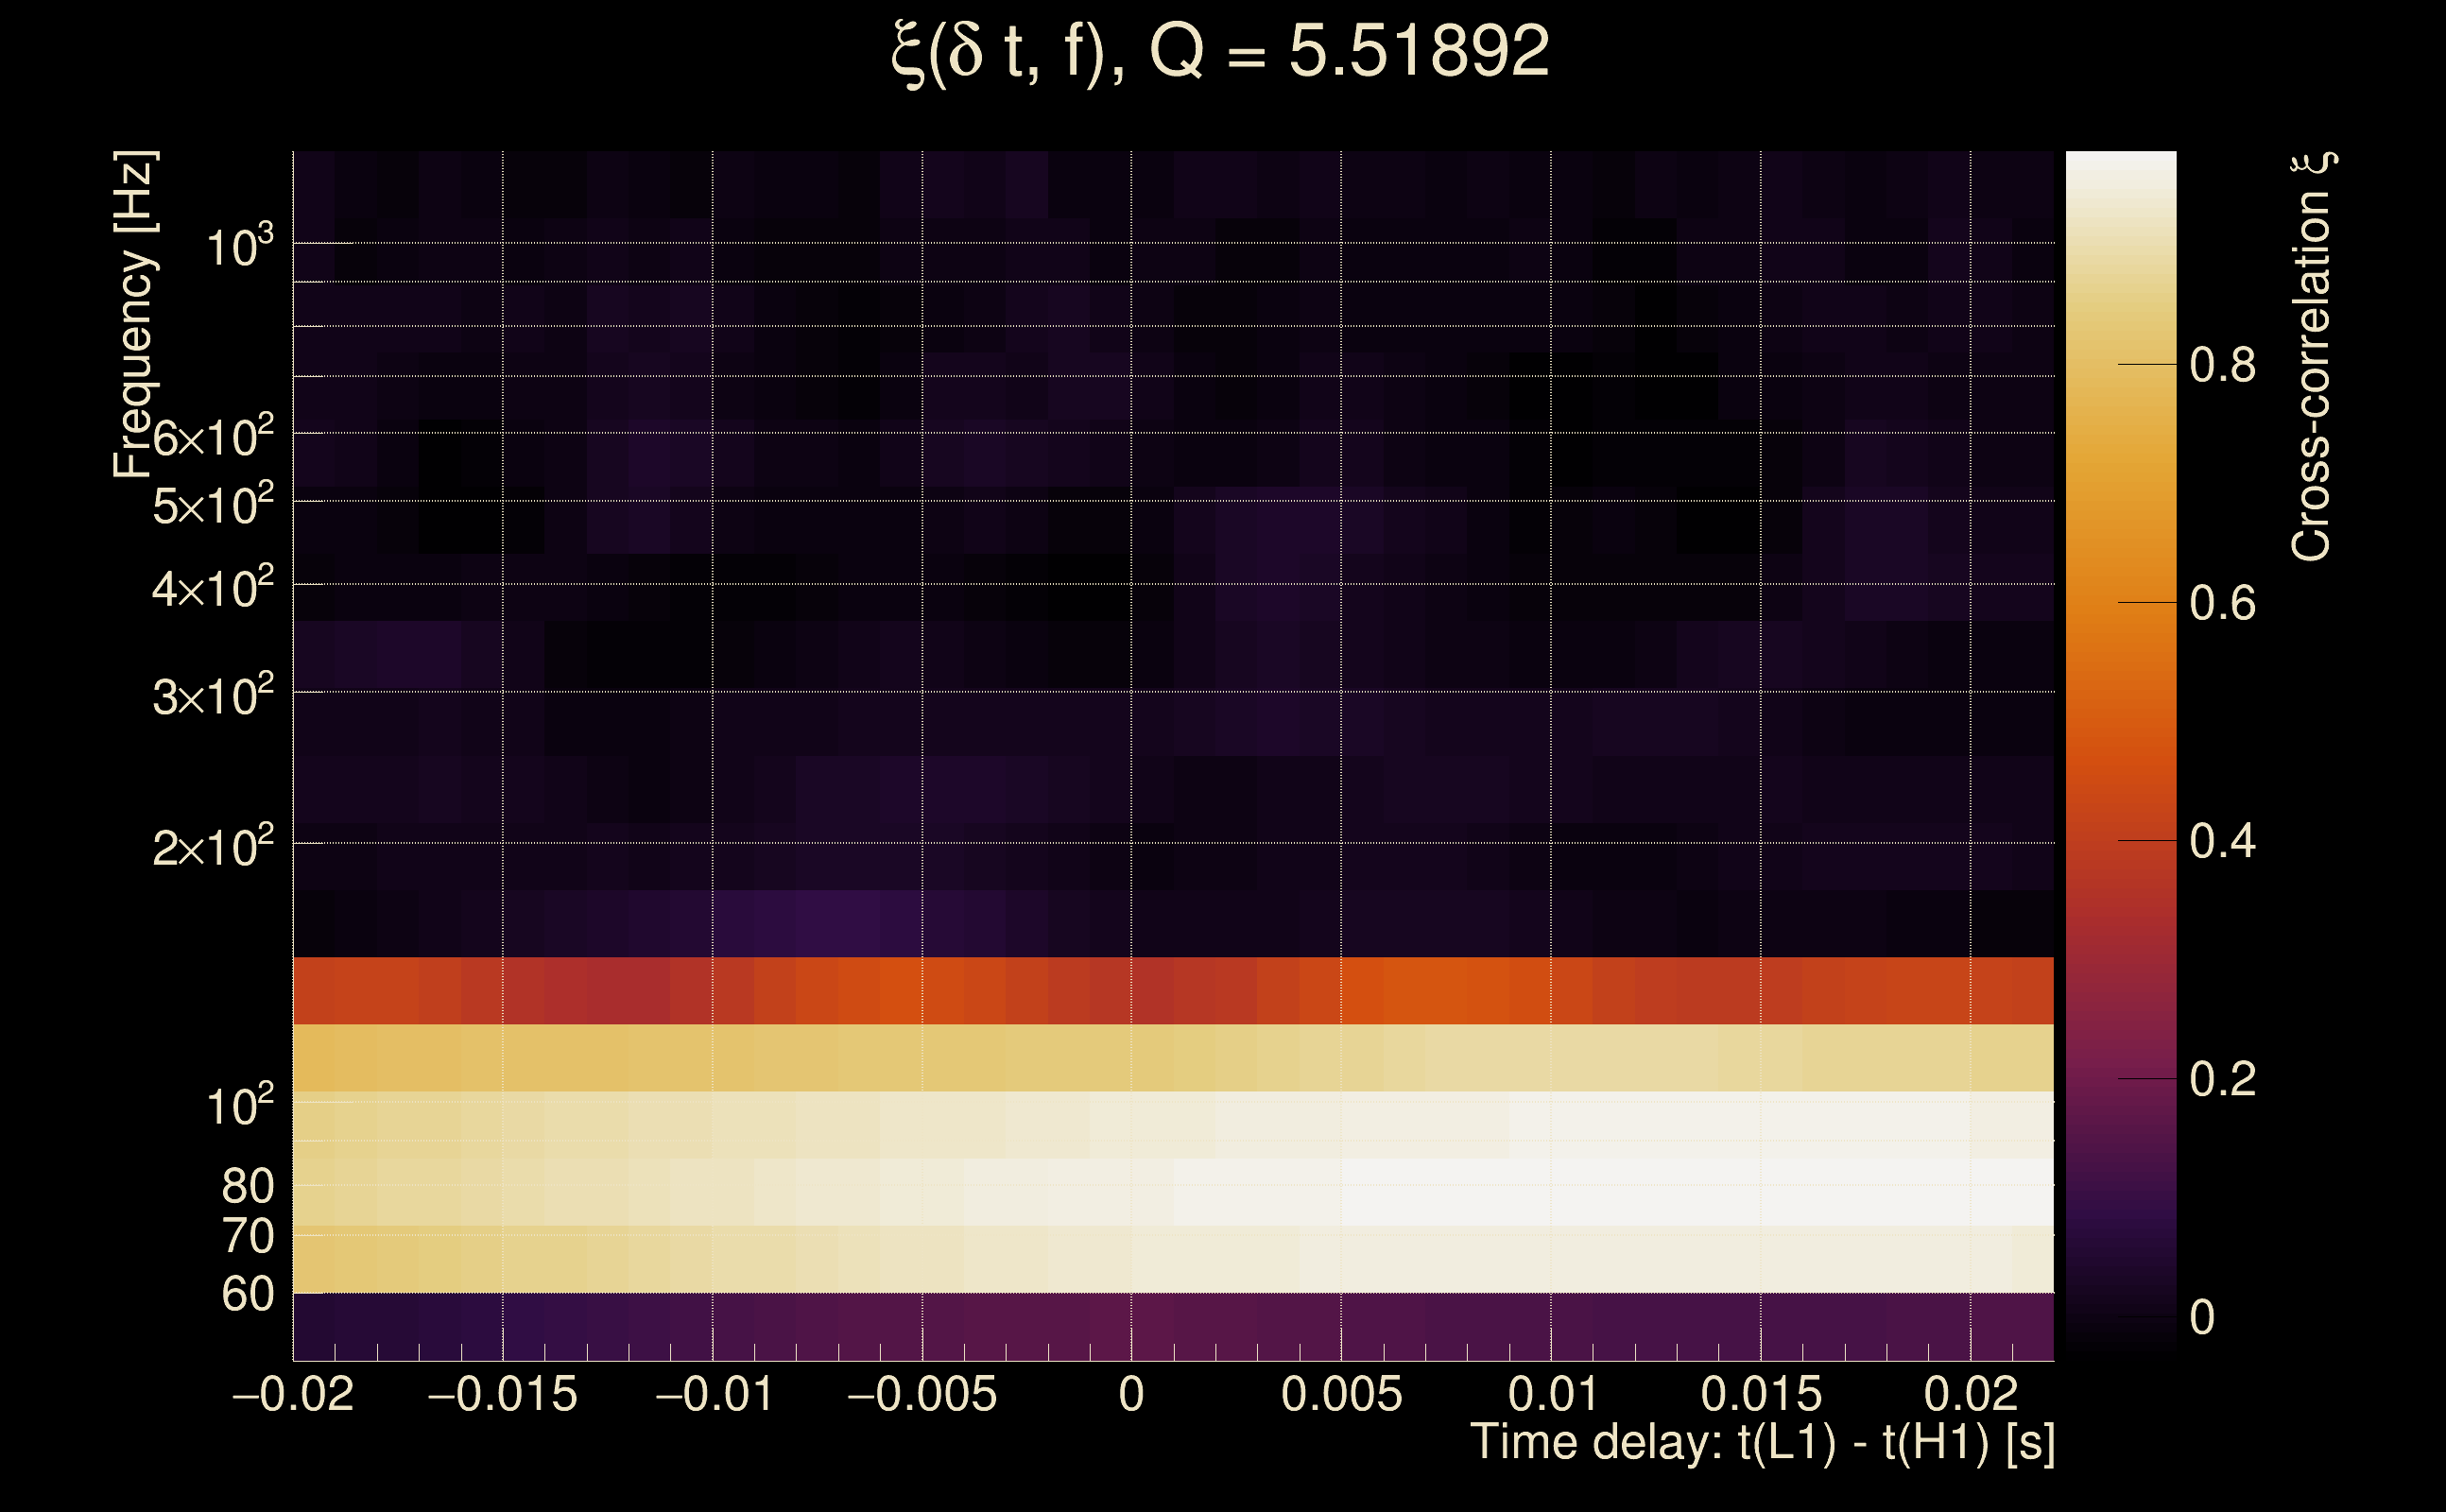
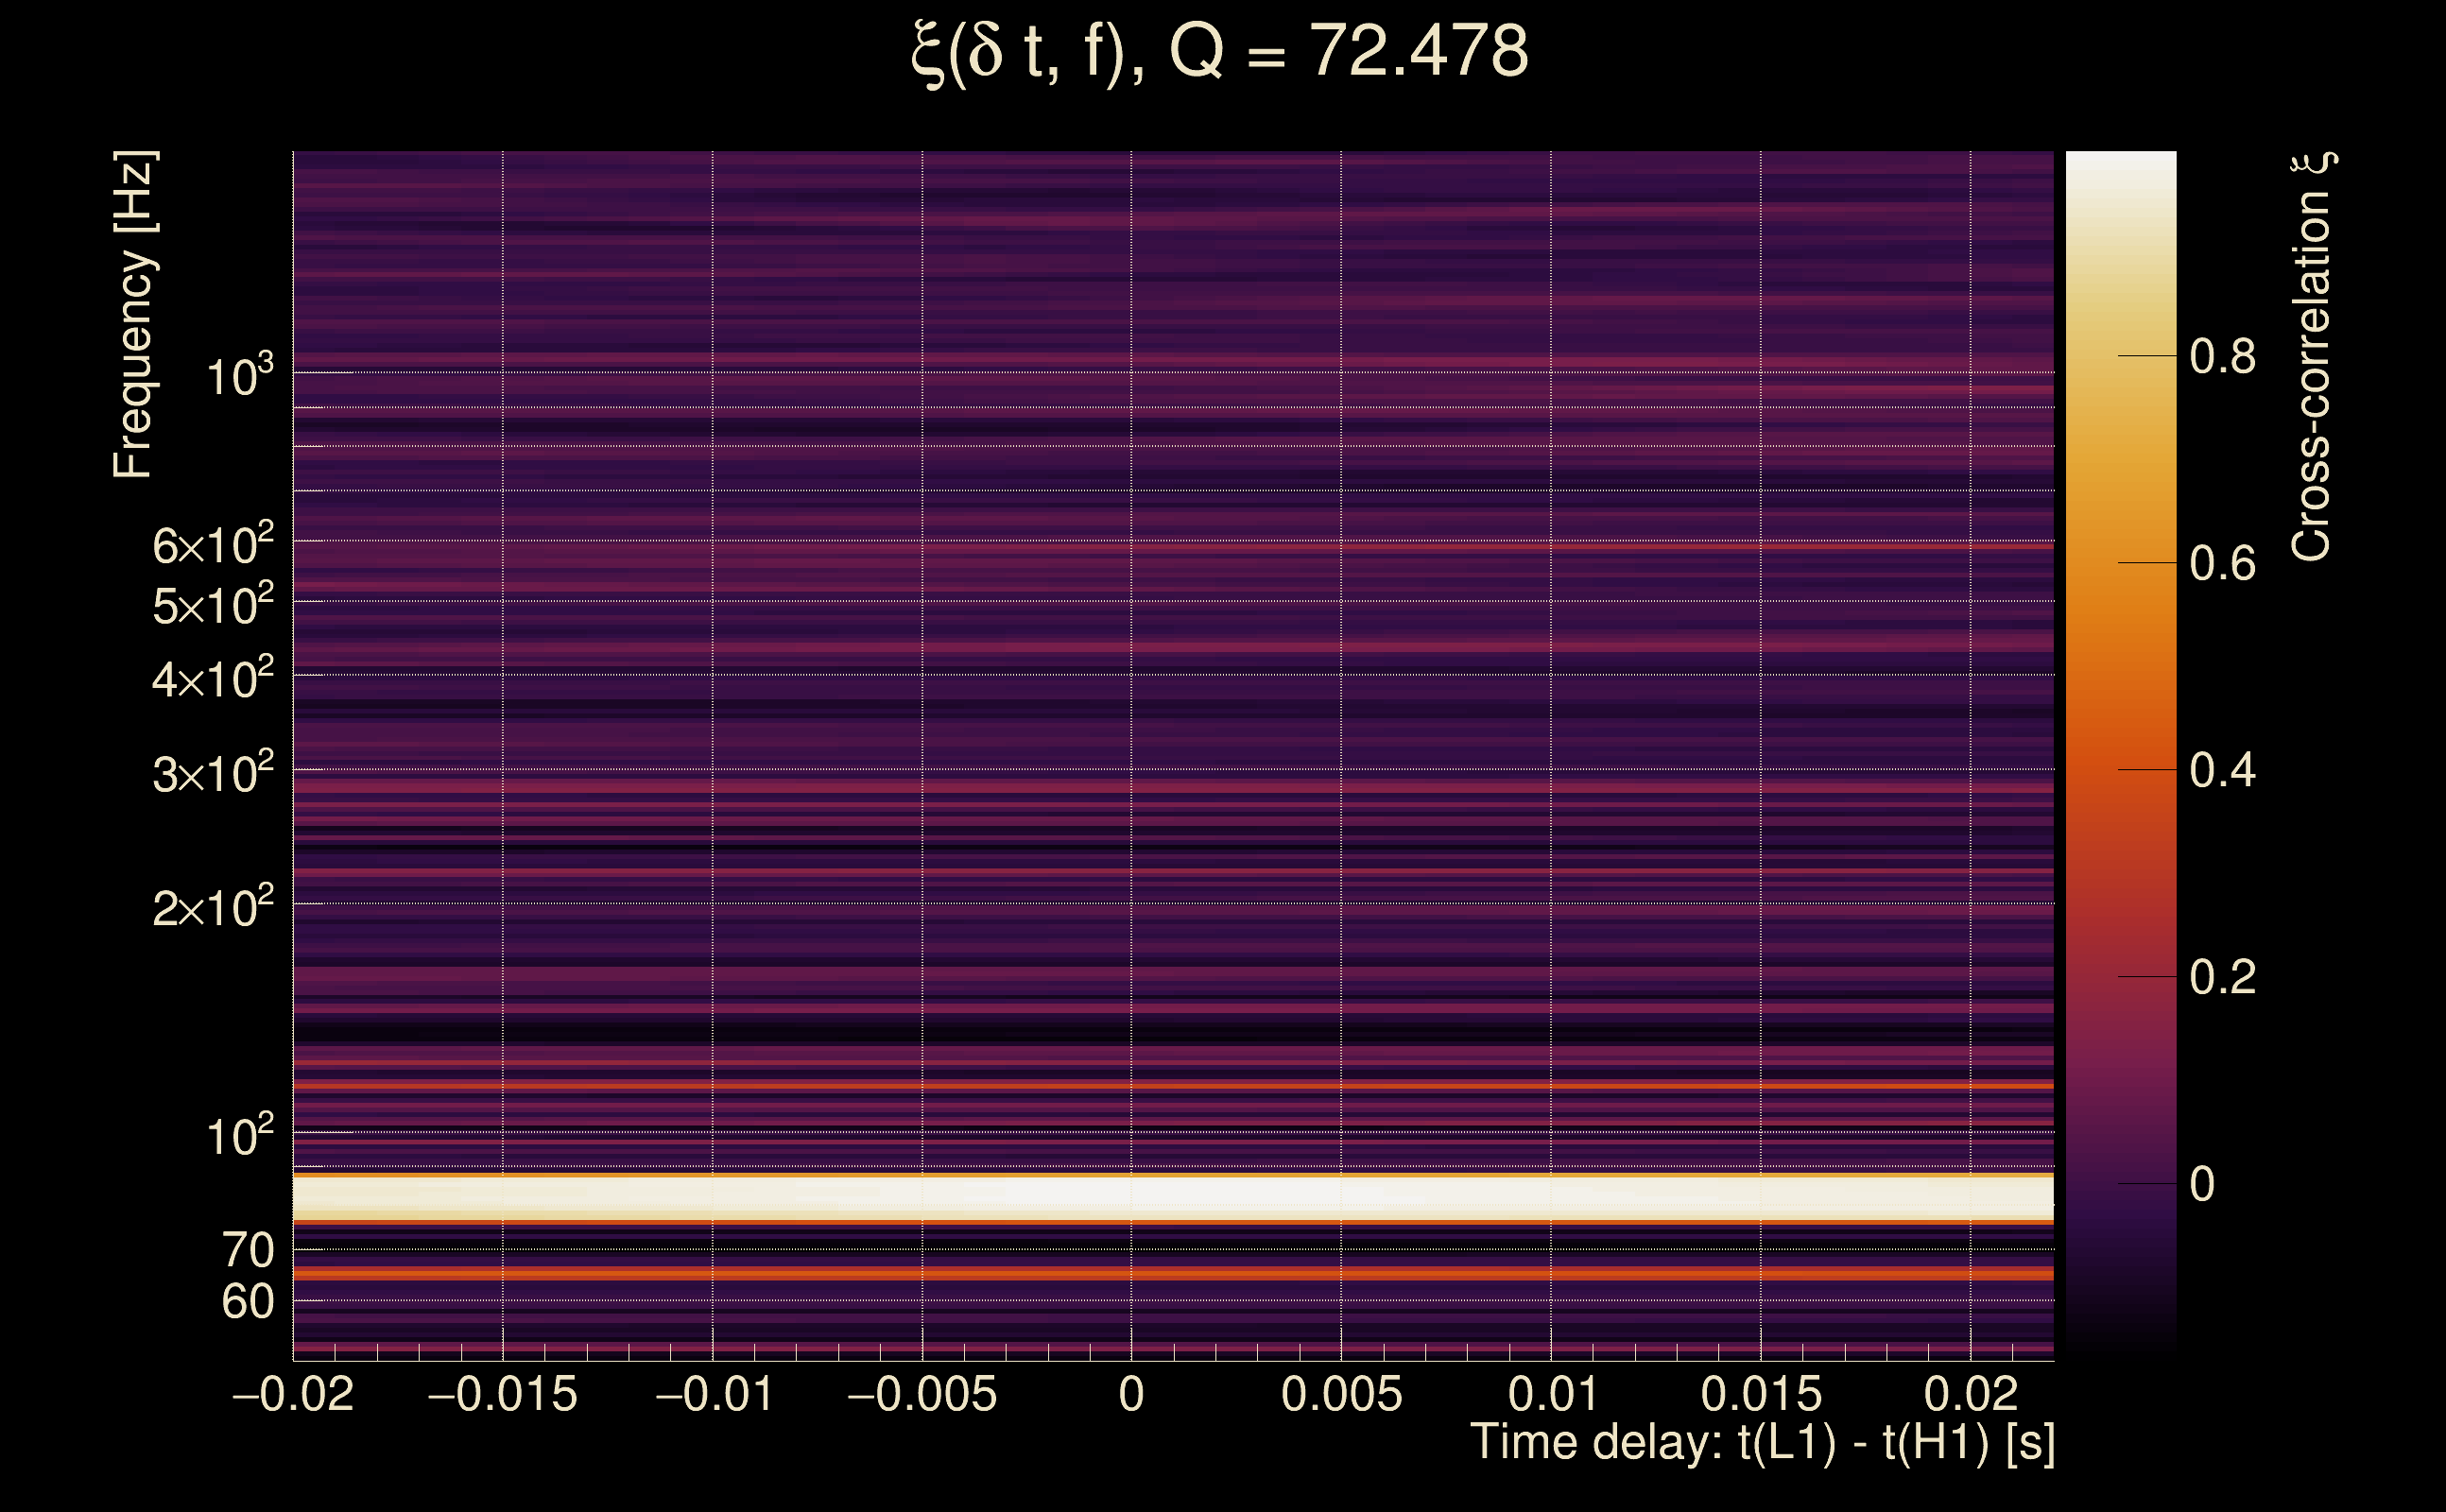
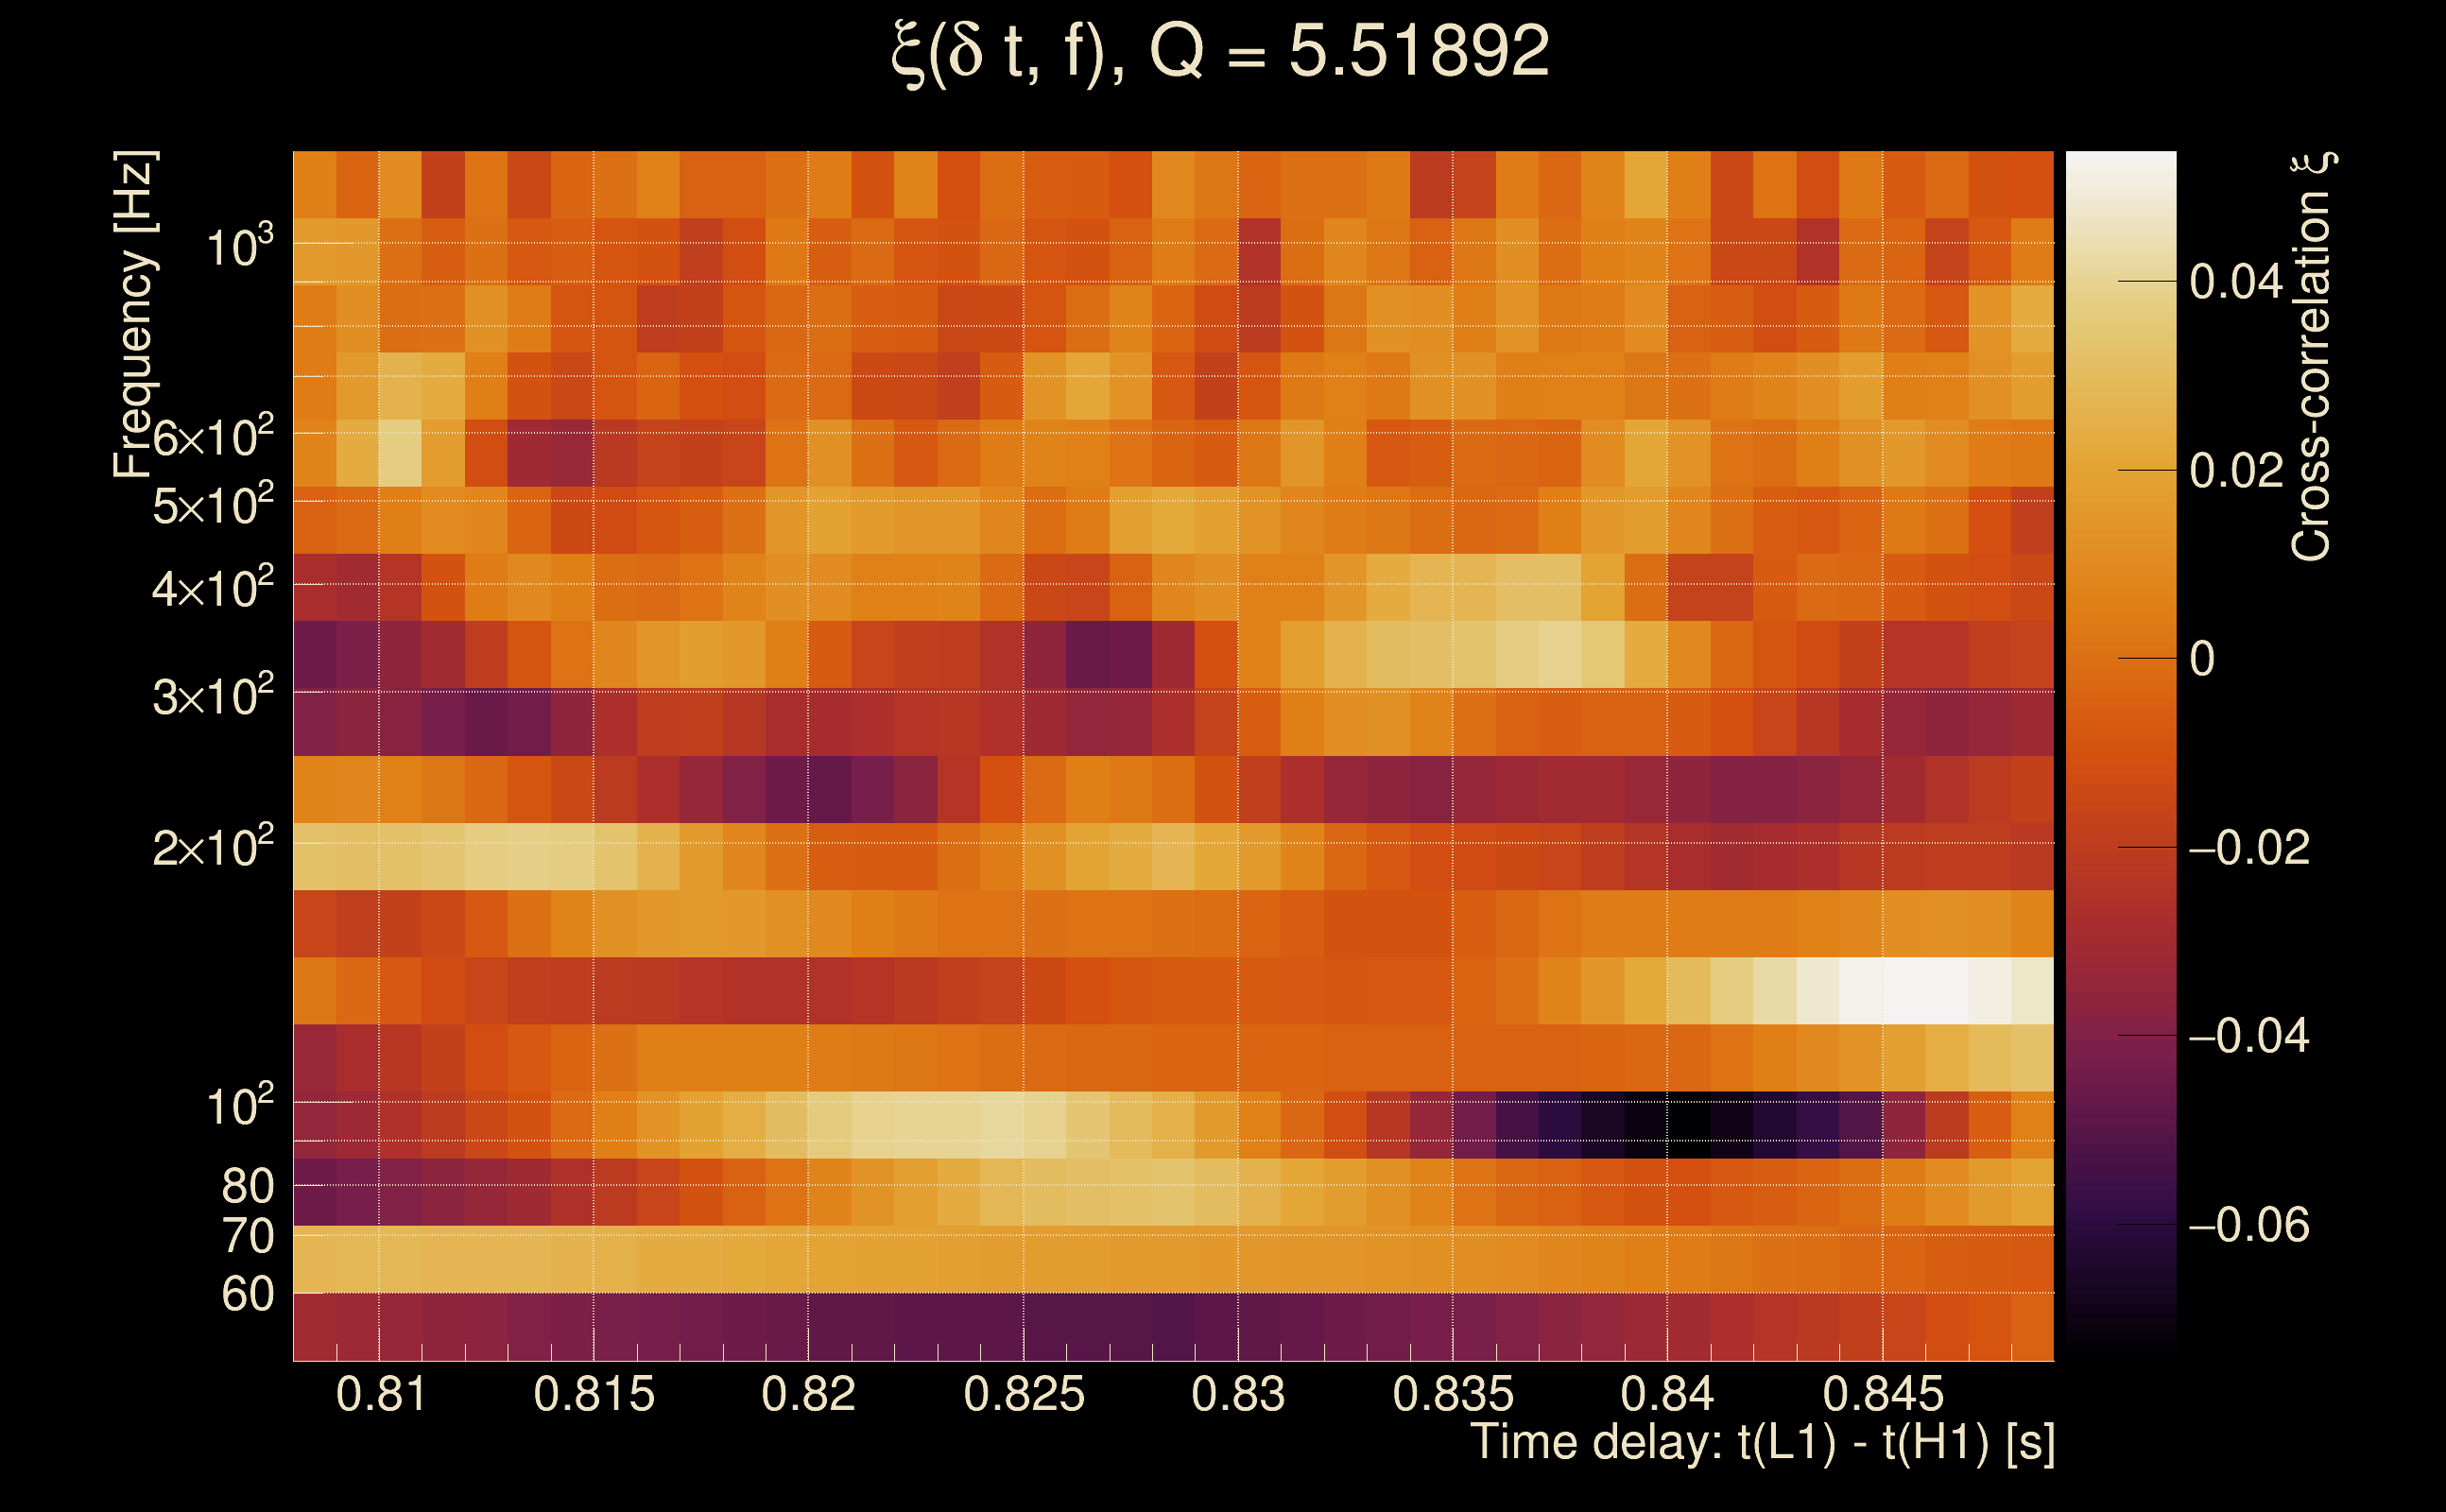
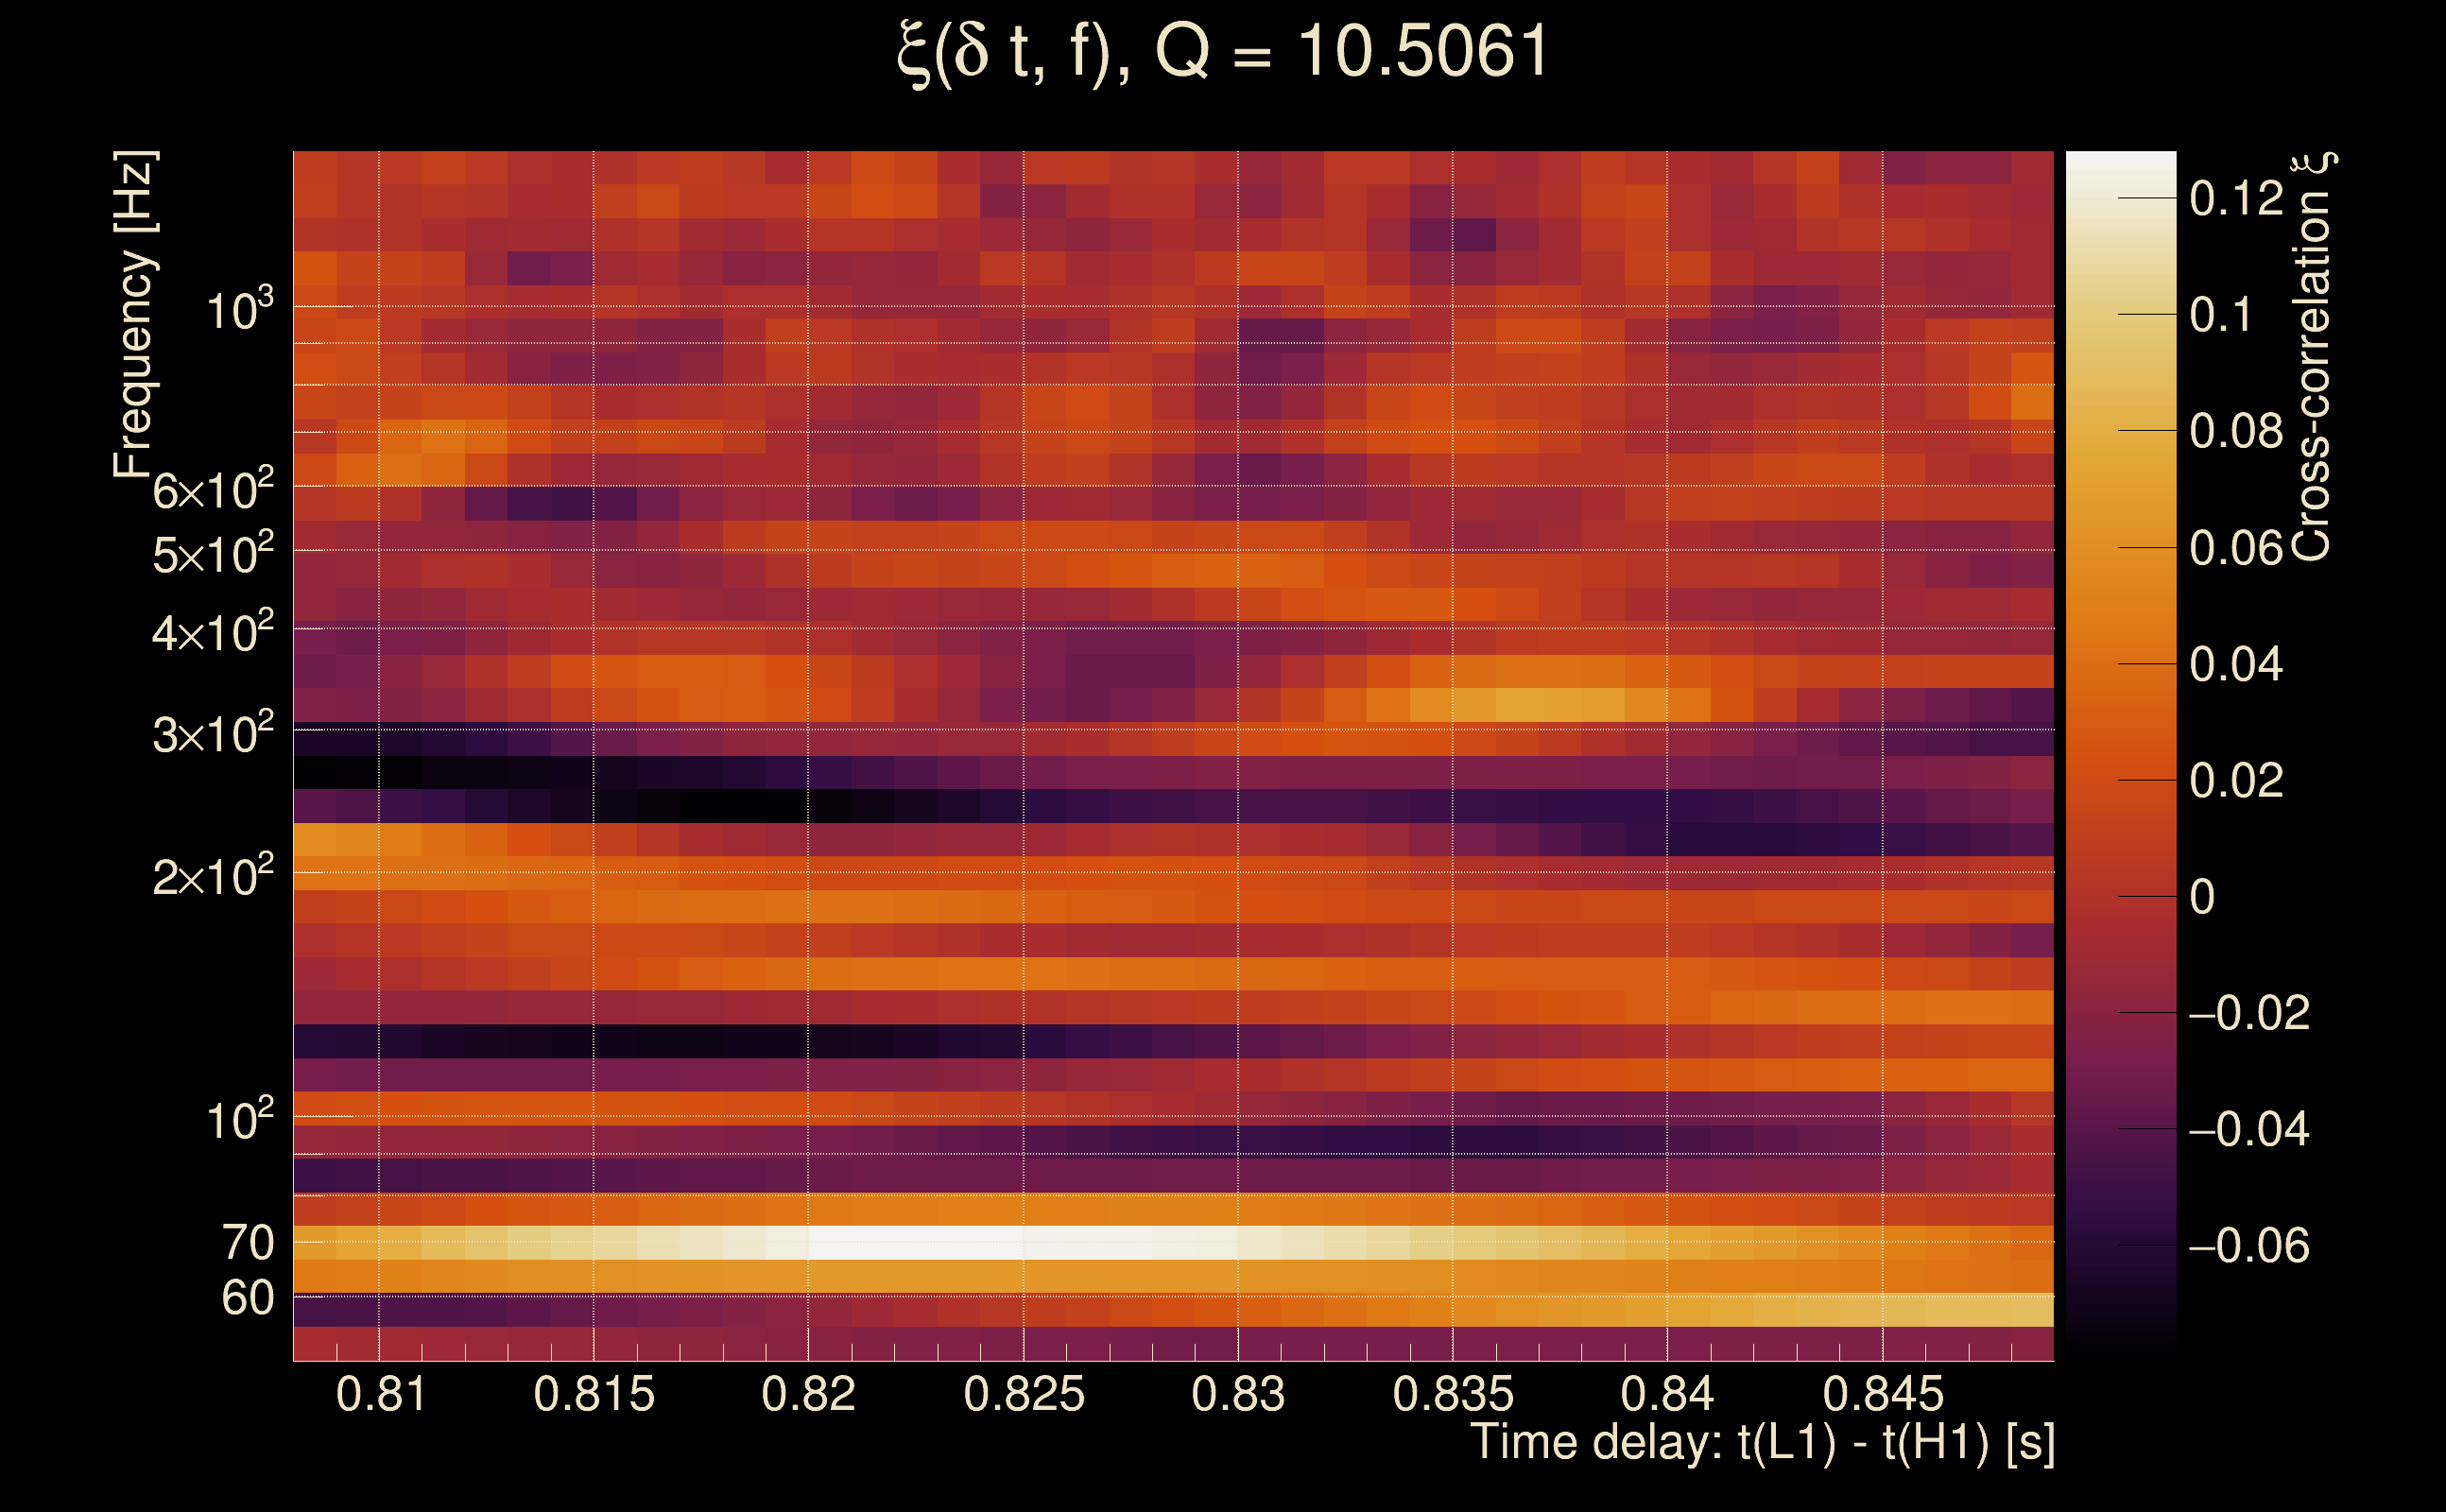
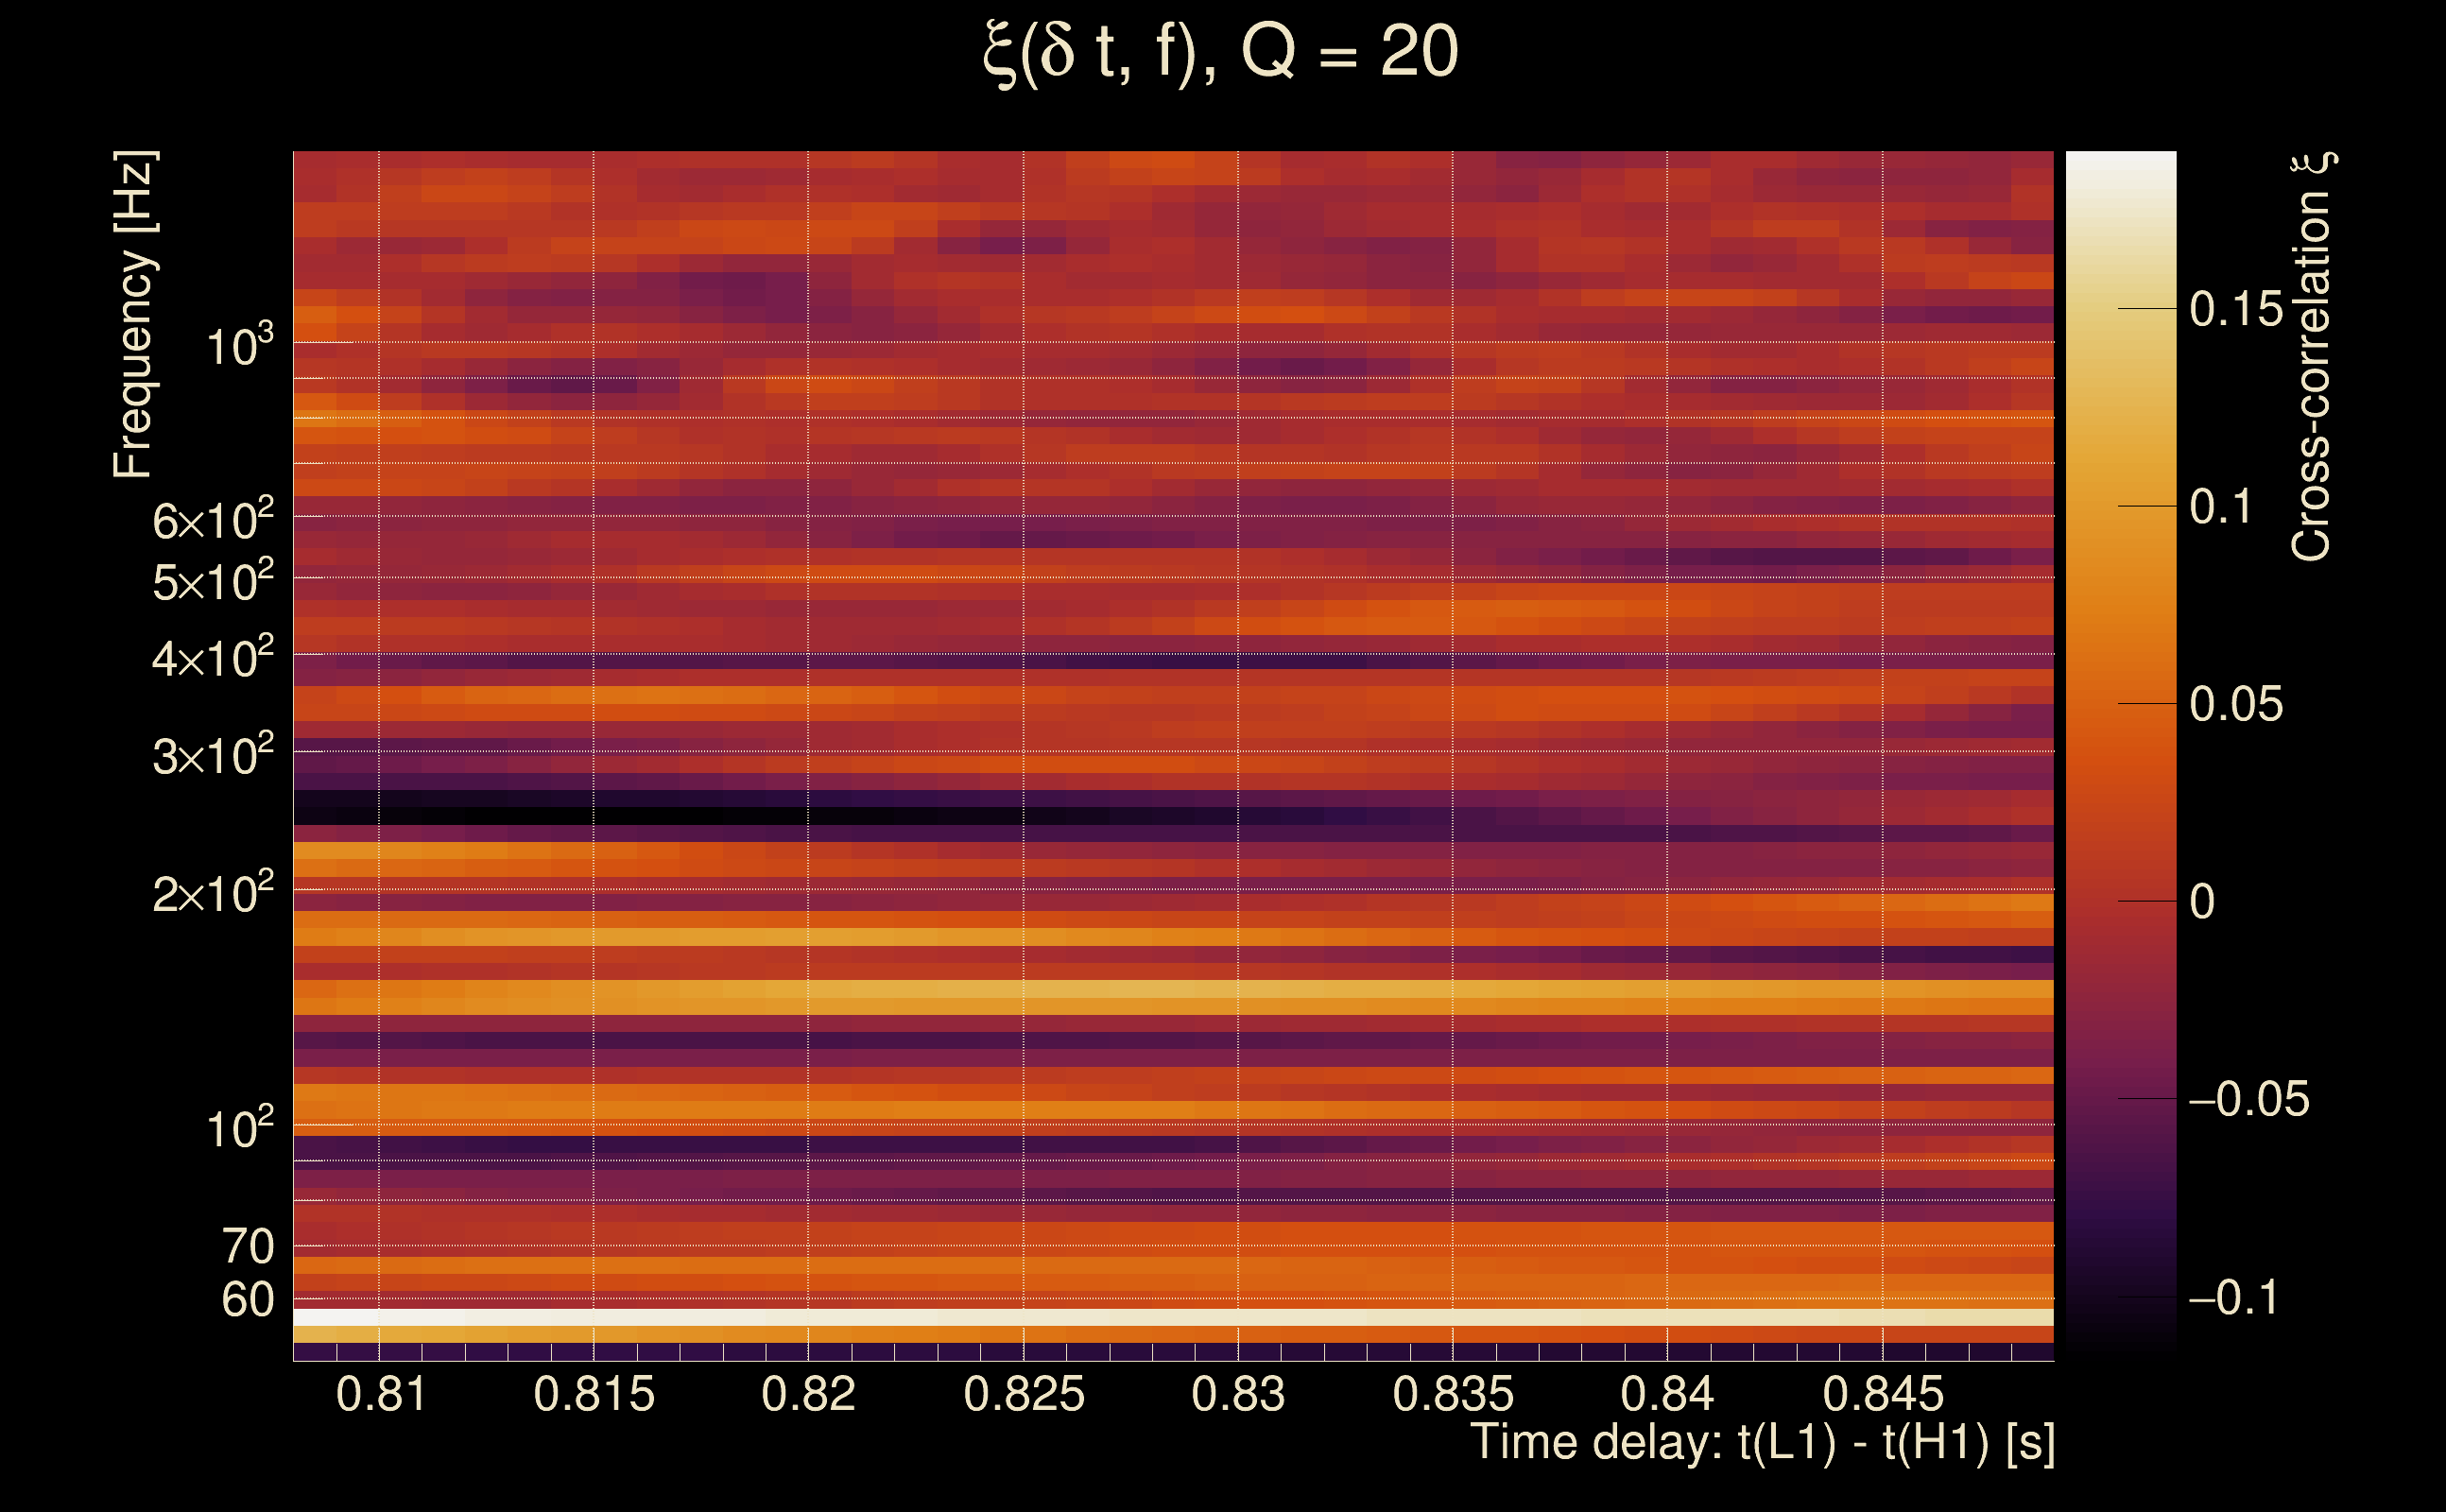
| Number of Q planes: | 5 (Q = 5.51892 → Q = 72.478) |
| Omicron frequency range: | 50 Hz → 1958.38 Hz |
| Light travel time between detectors: | 0.0100128 s |
| Slice extra-time (calibration uncertainty + slice veto): | 0.0129872 s |
| Number of time-delay bins in a cross-correlation map: | 10000 |
| Number of slices in a cross-correlation map: | 217 |
| Number of time-delay bins in a slice: | 46 |
| SNR gating: | < 100 (detector 0), < 100 (detector 1) |
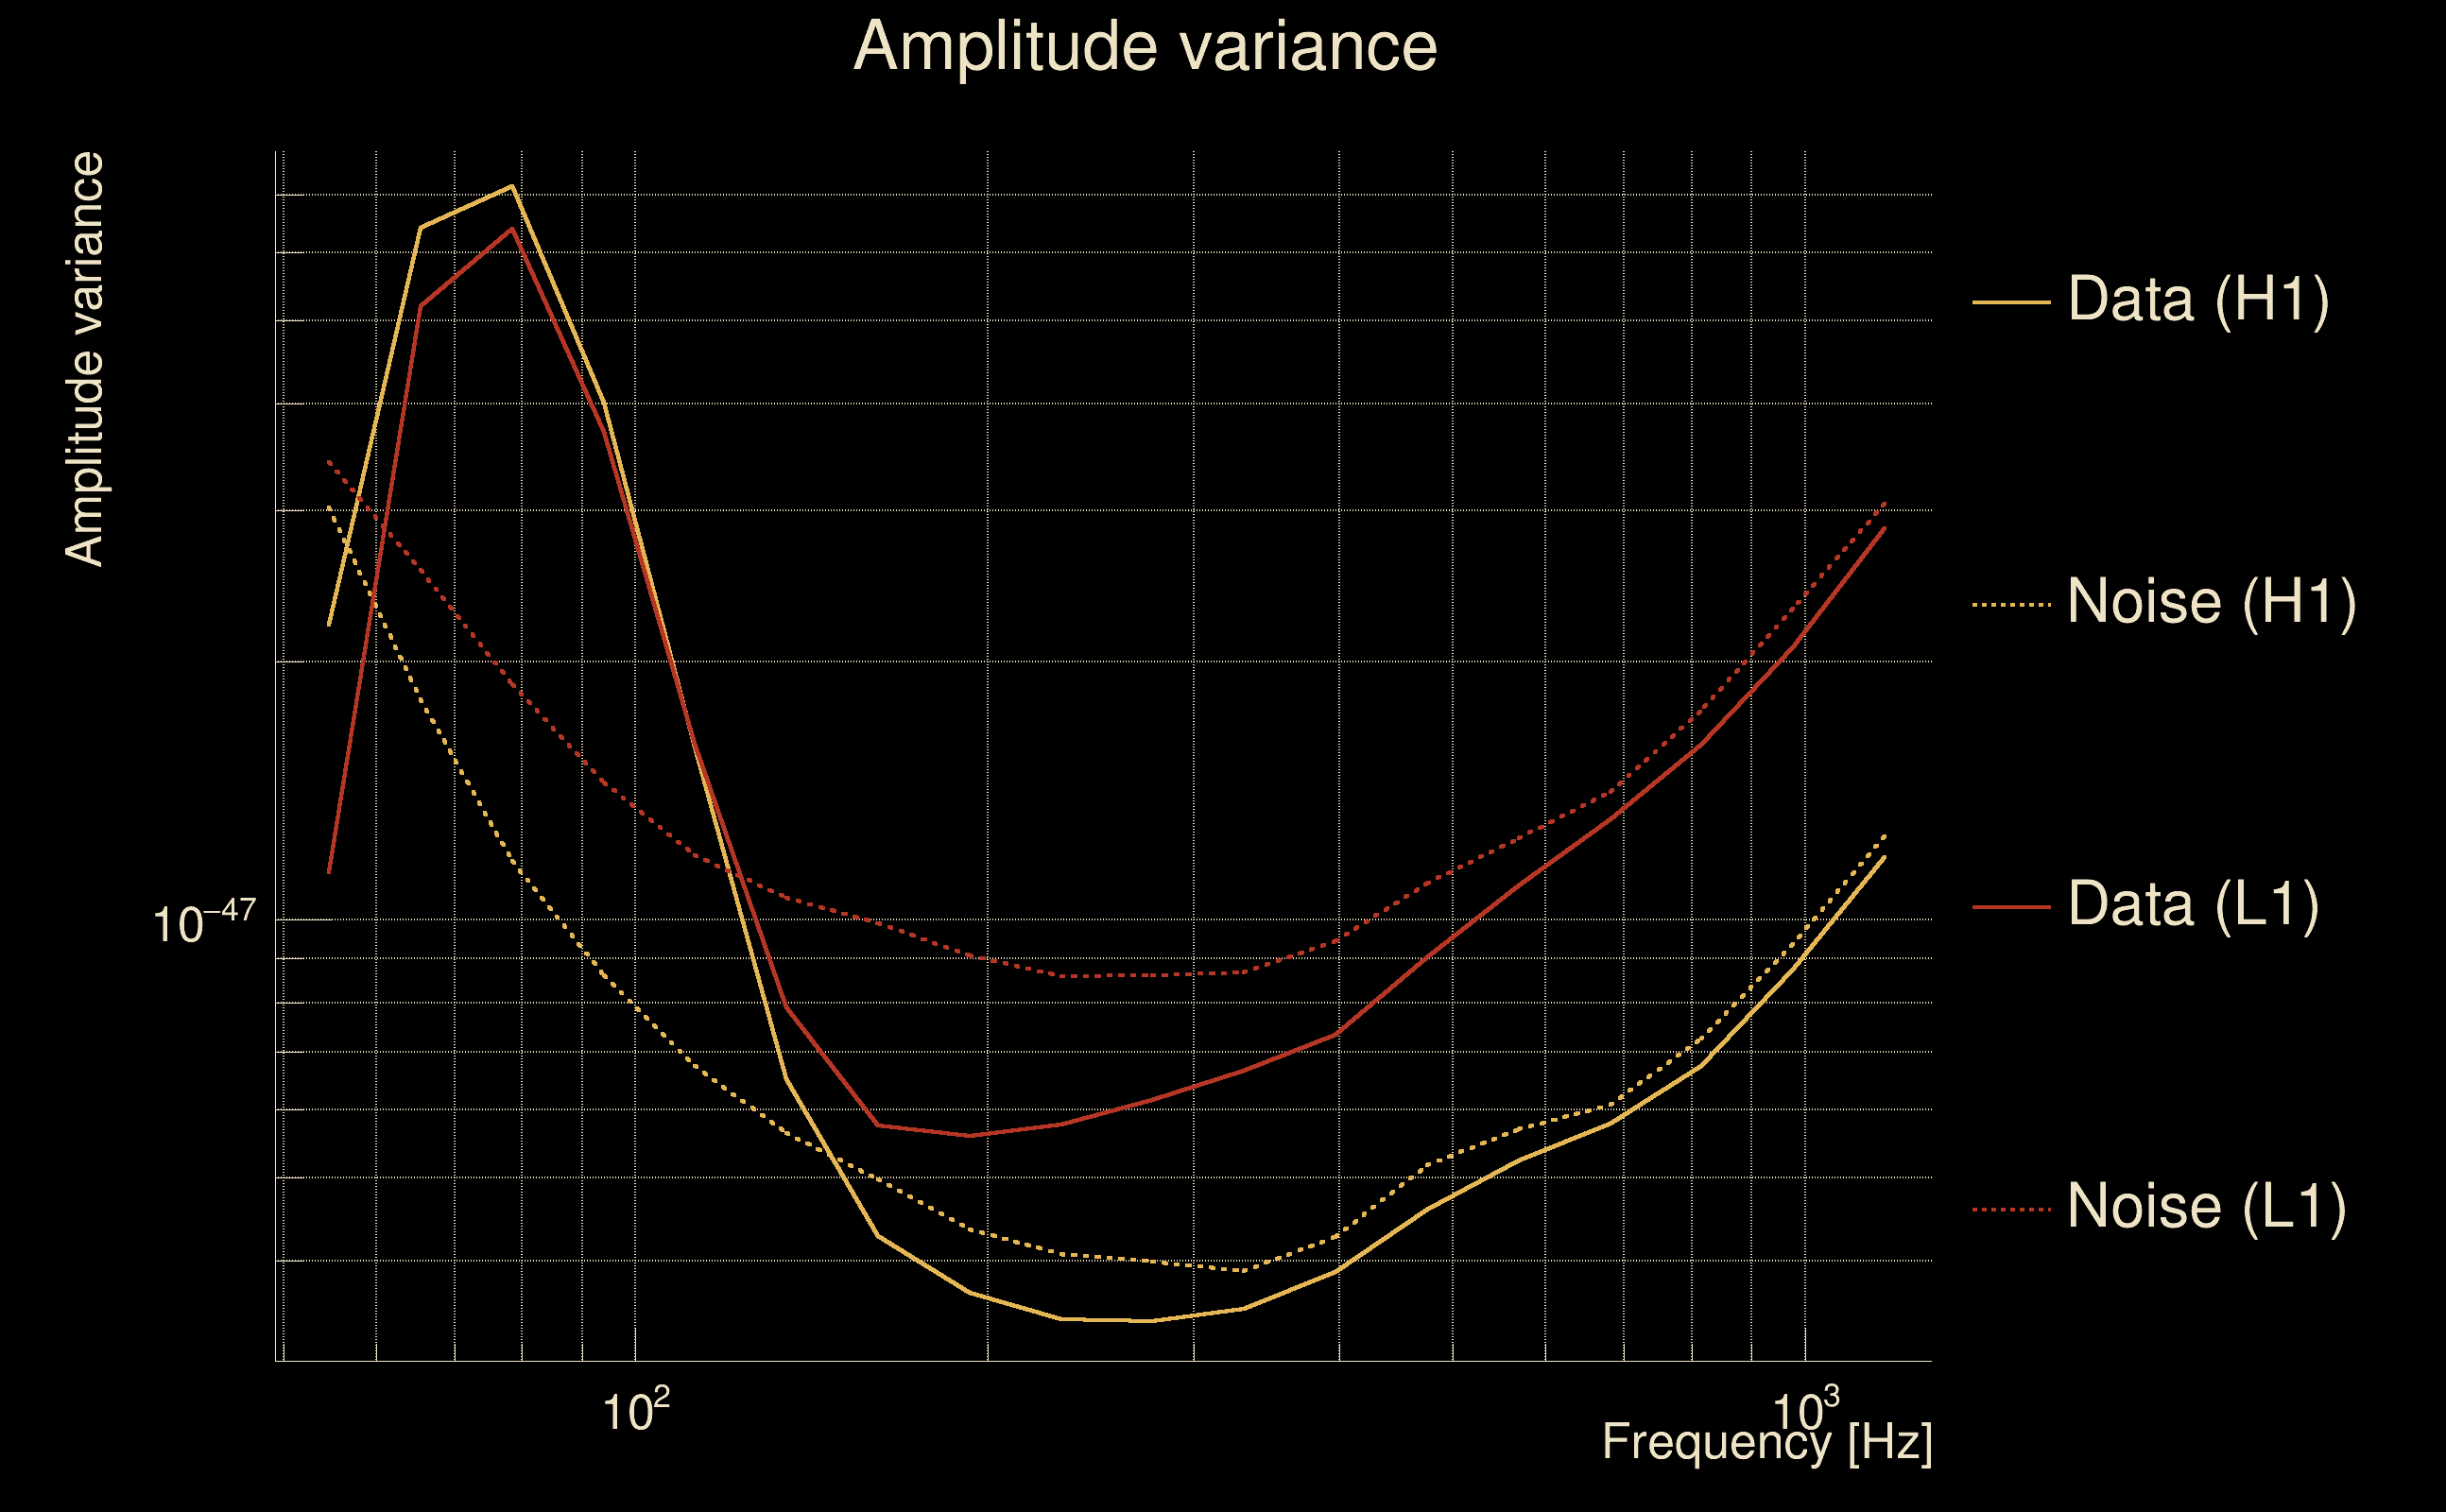
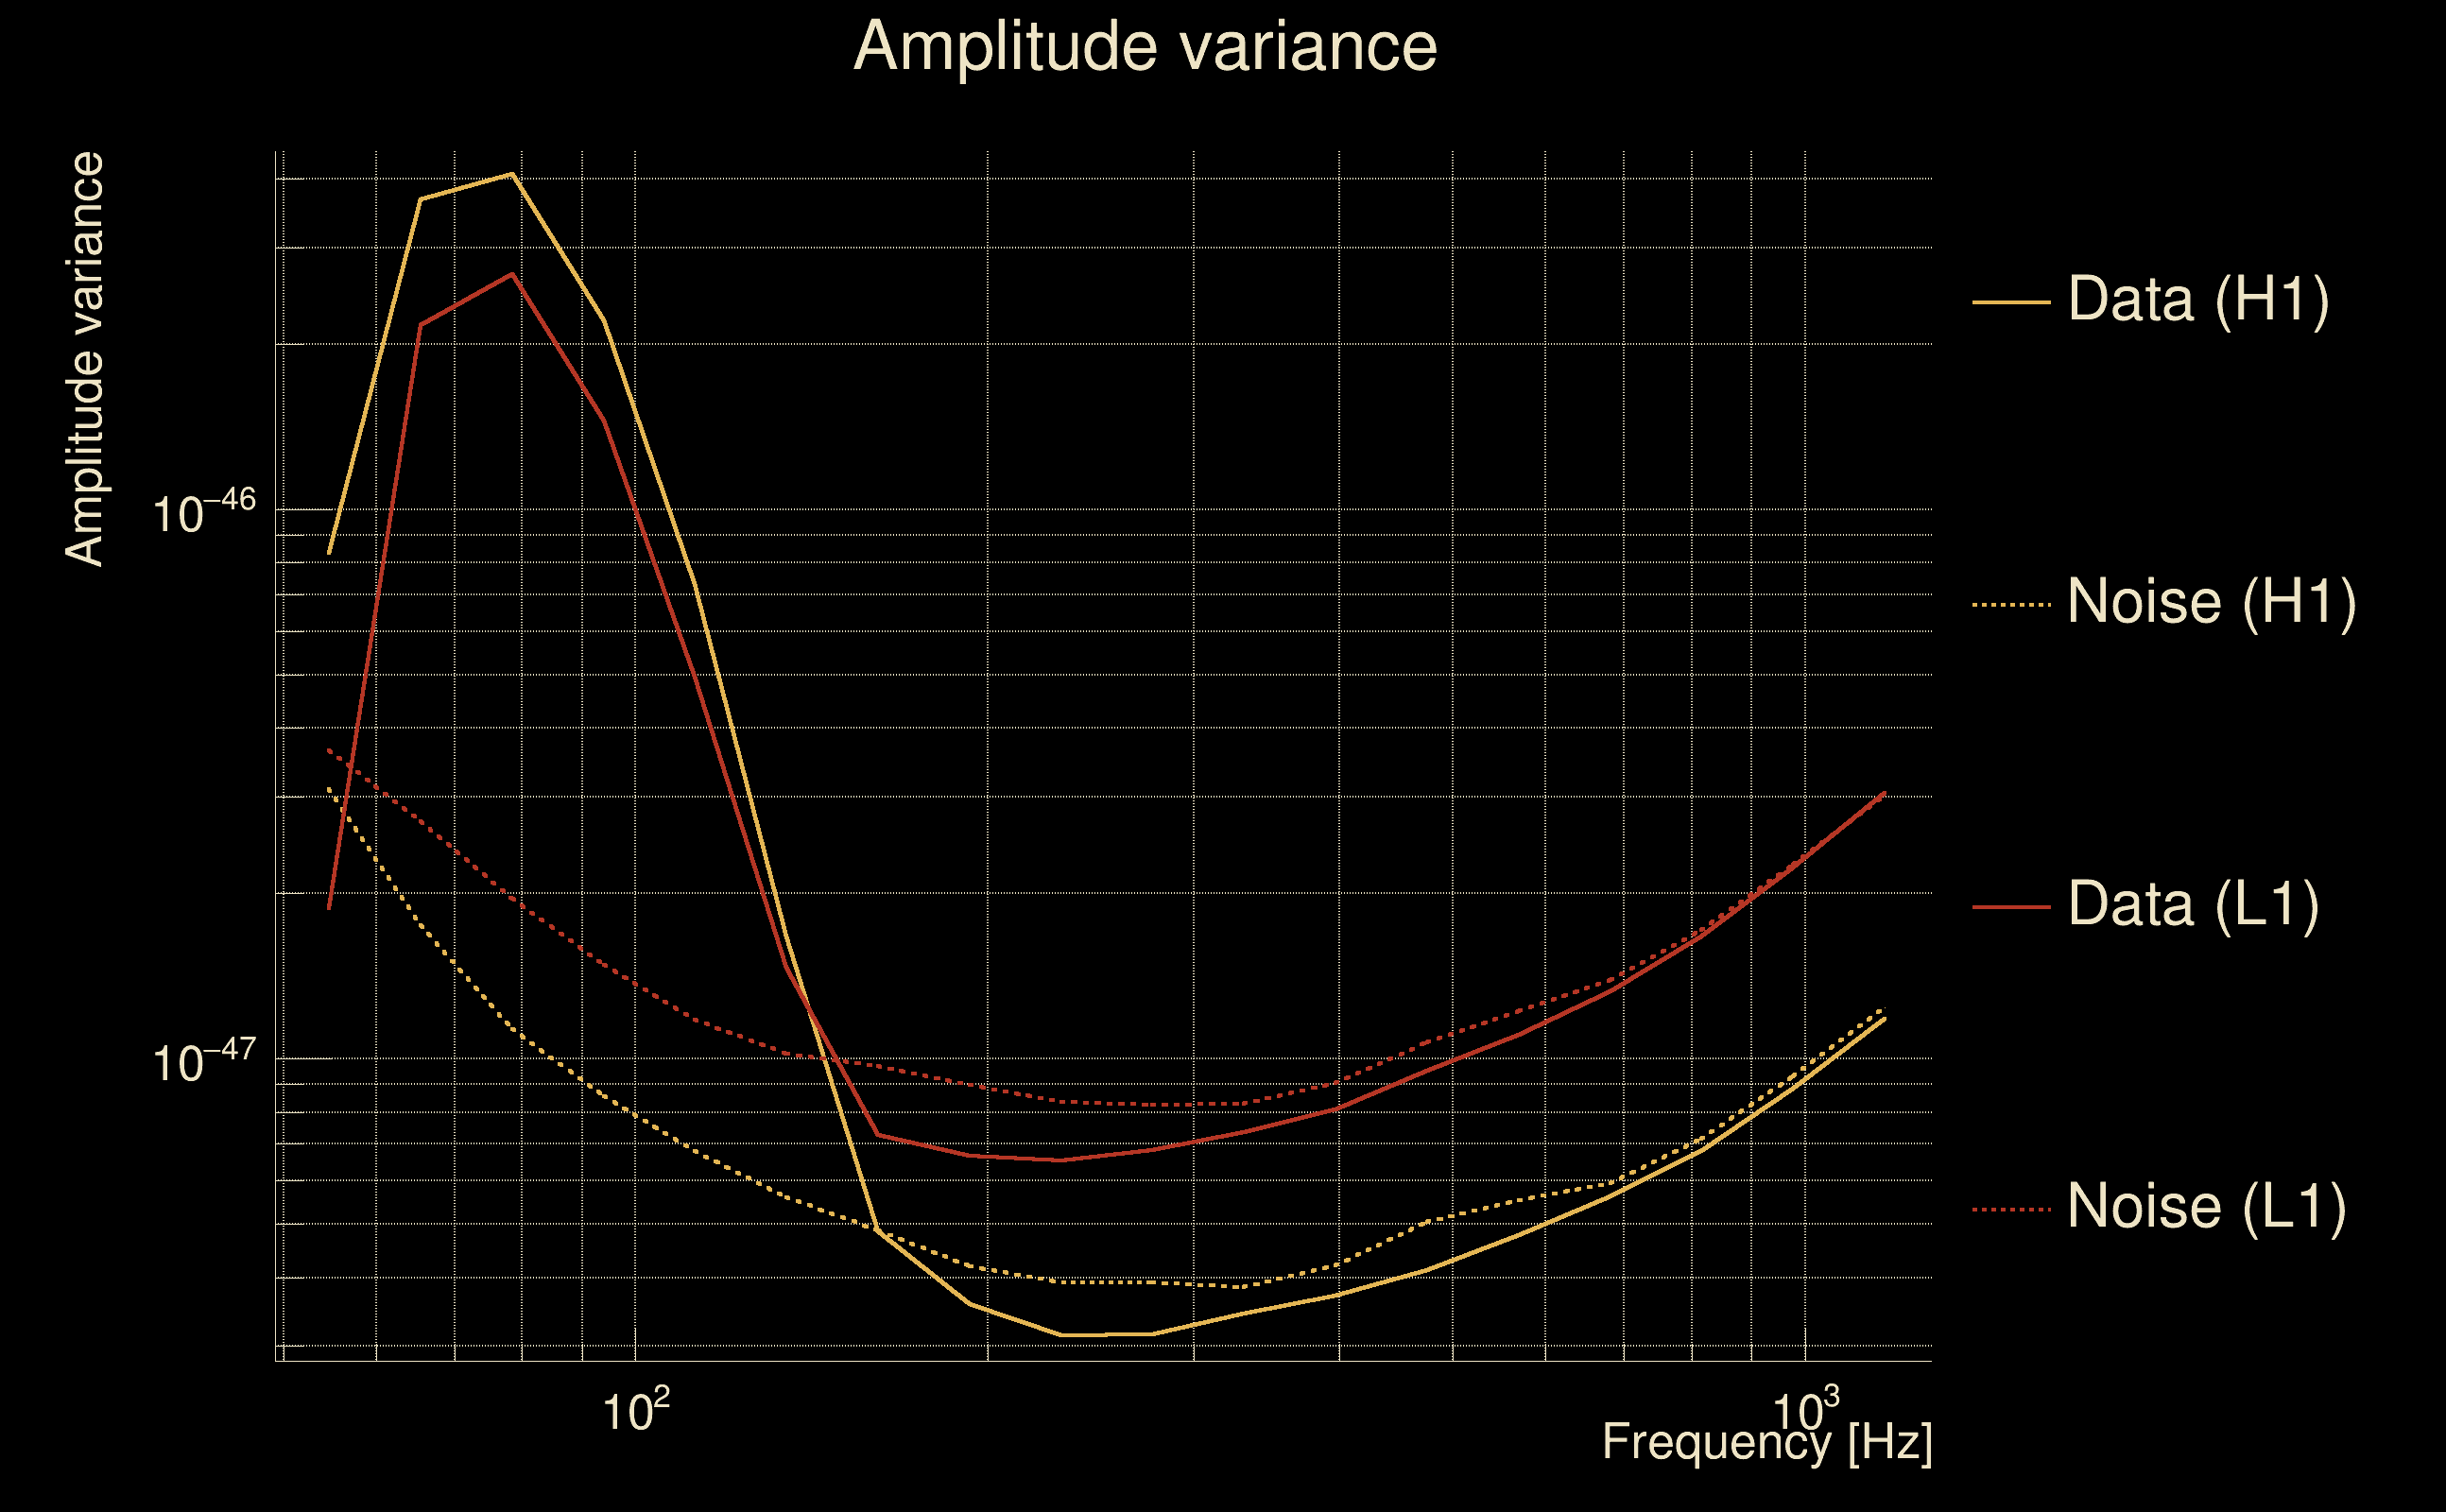
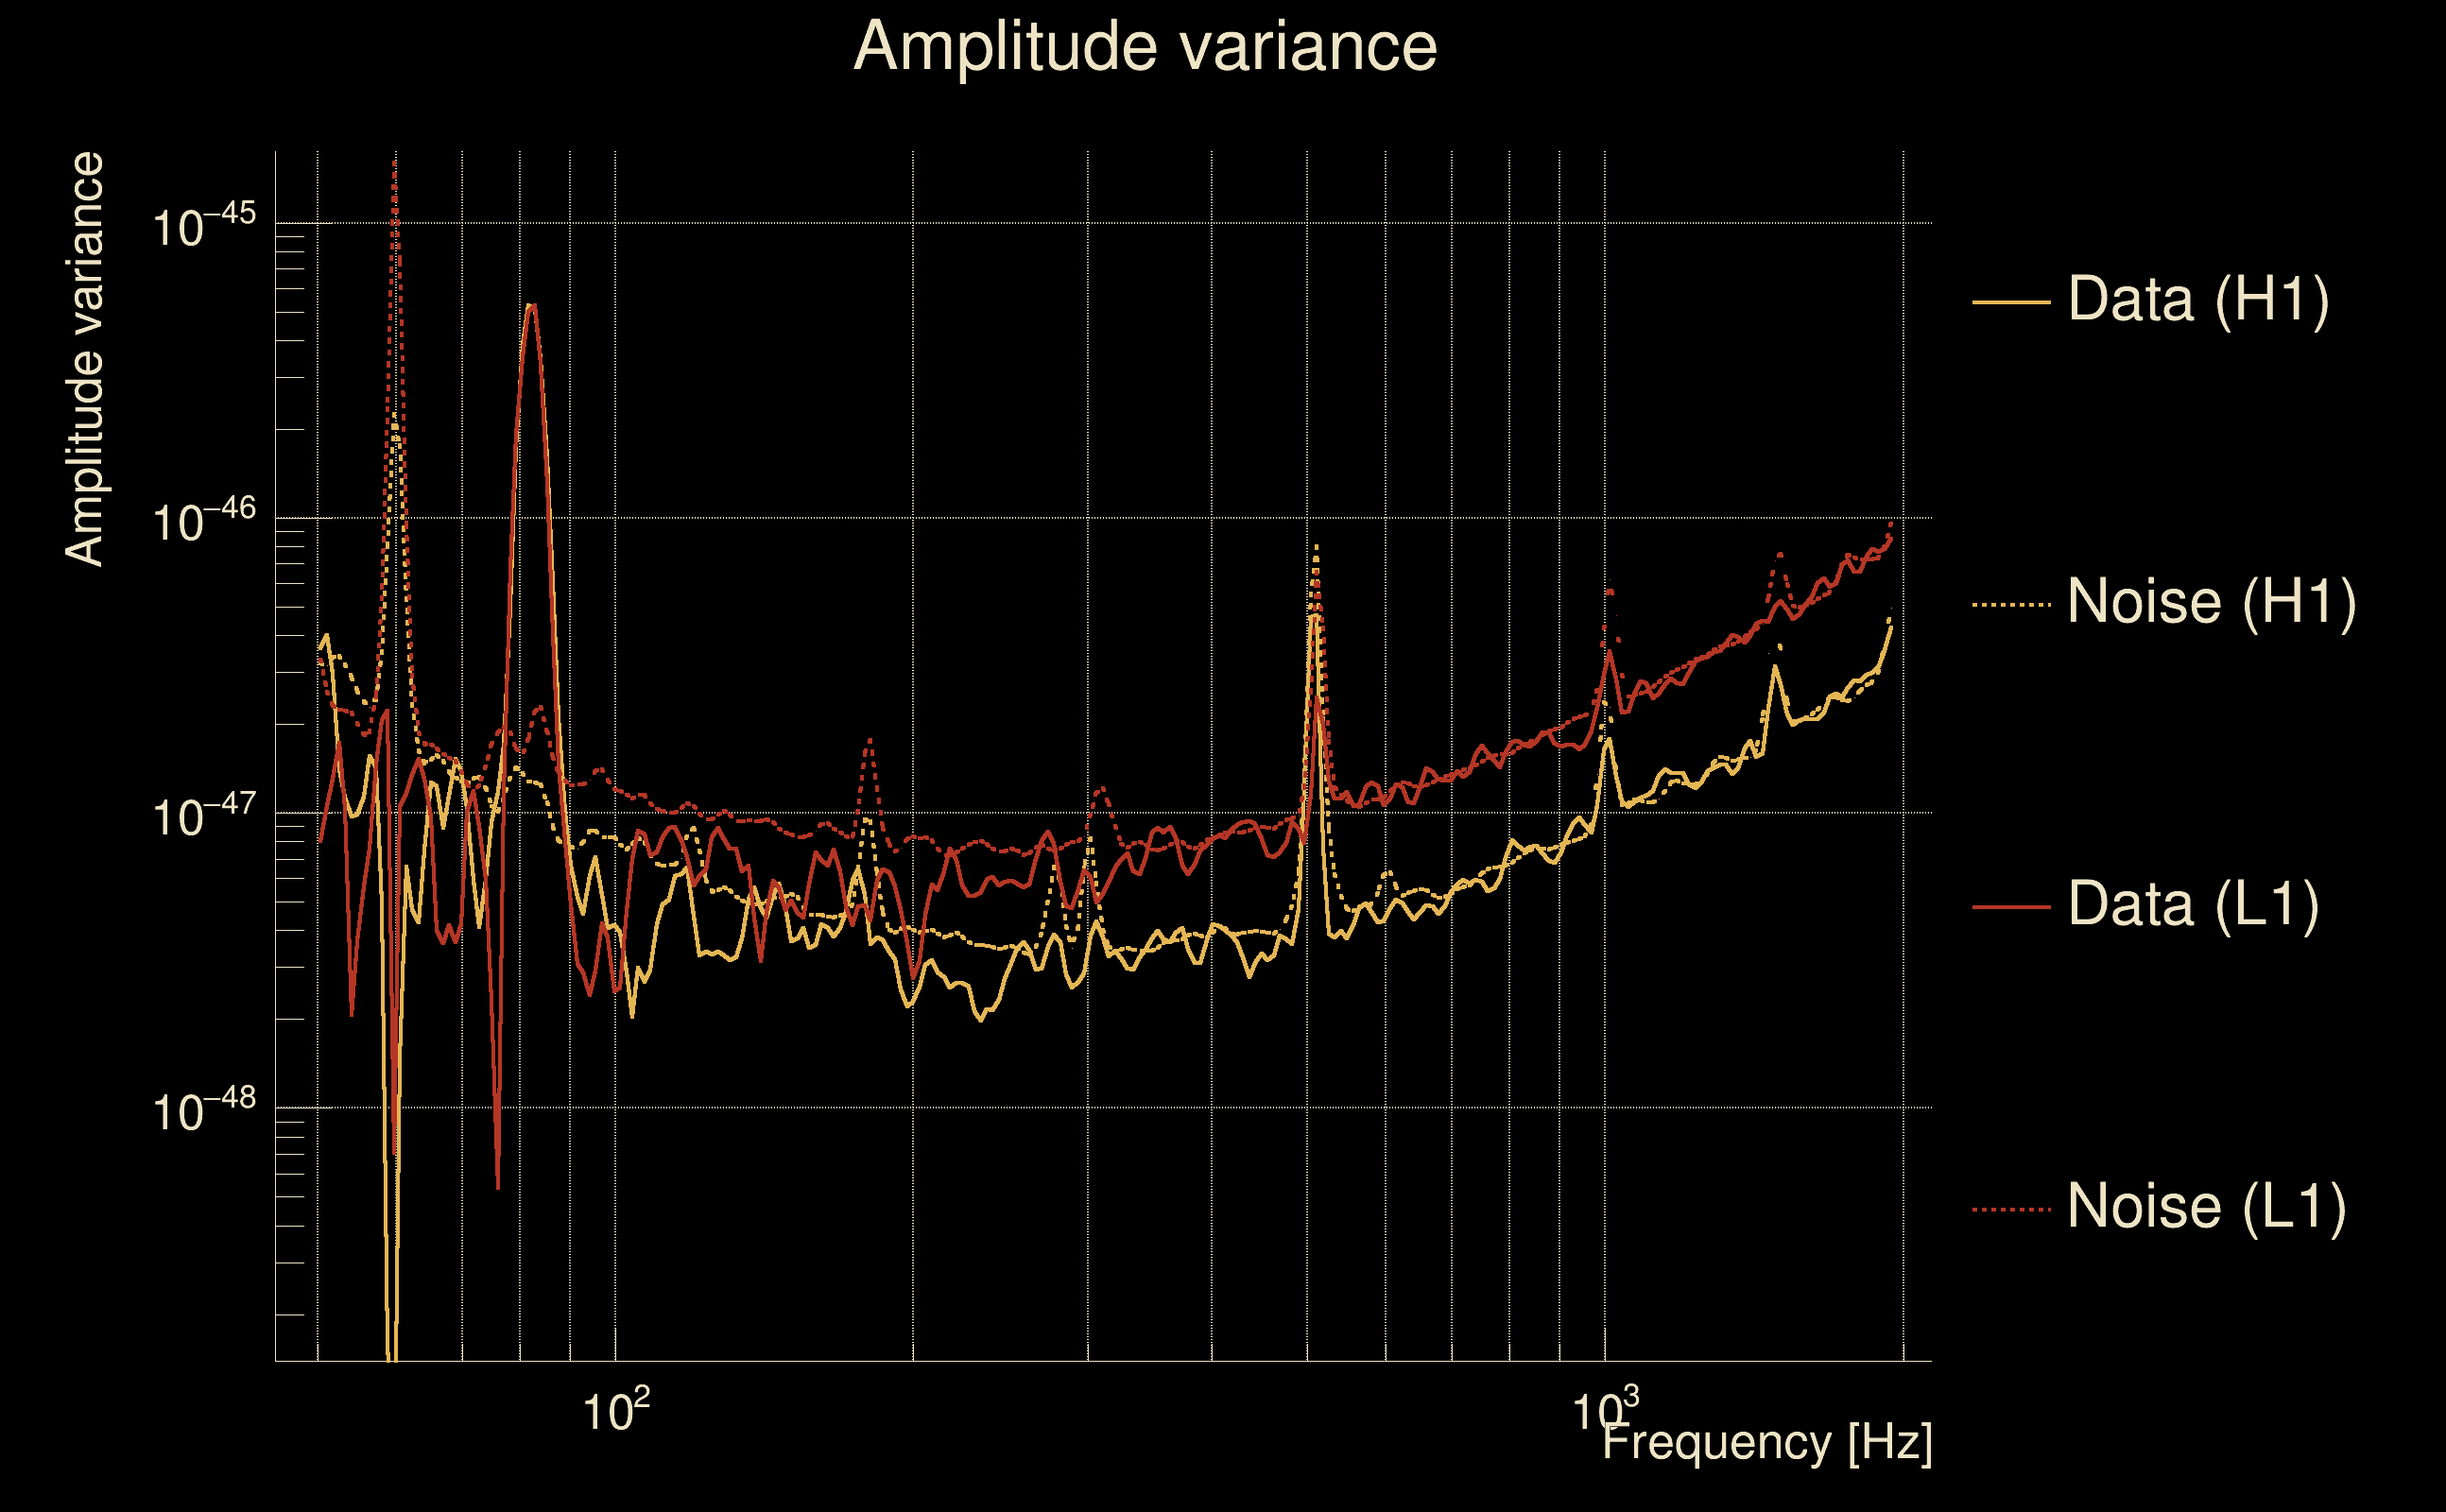
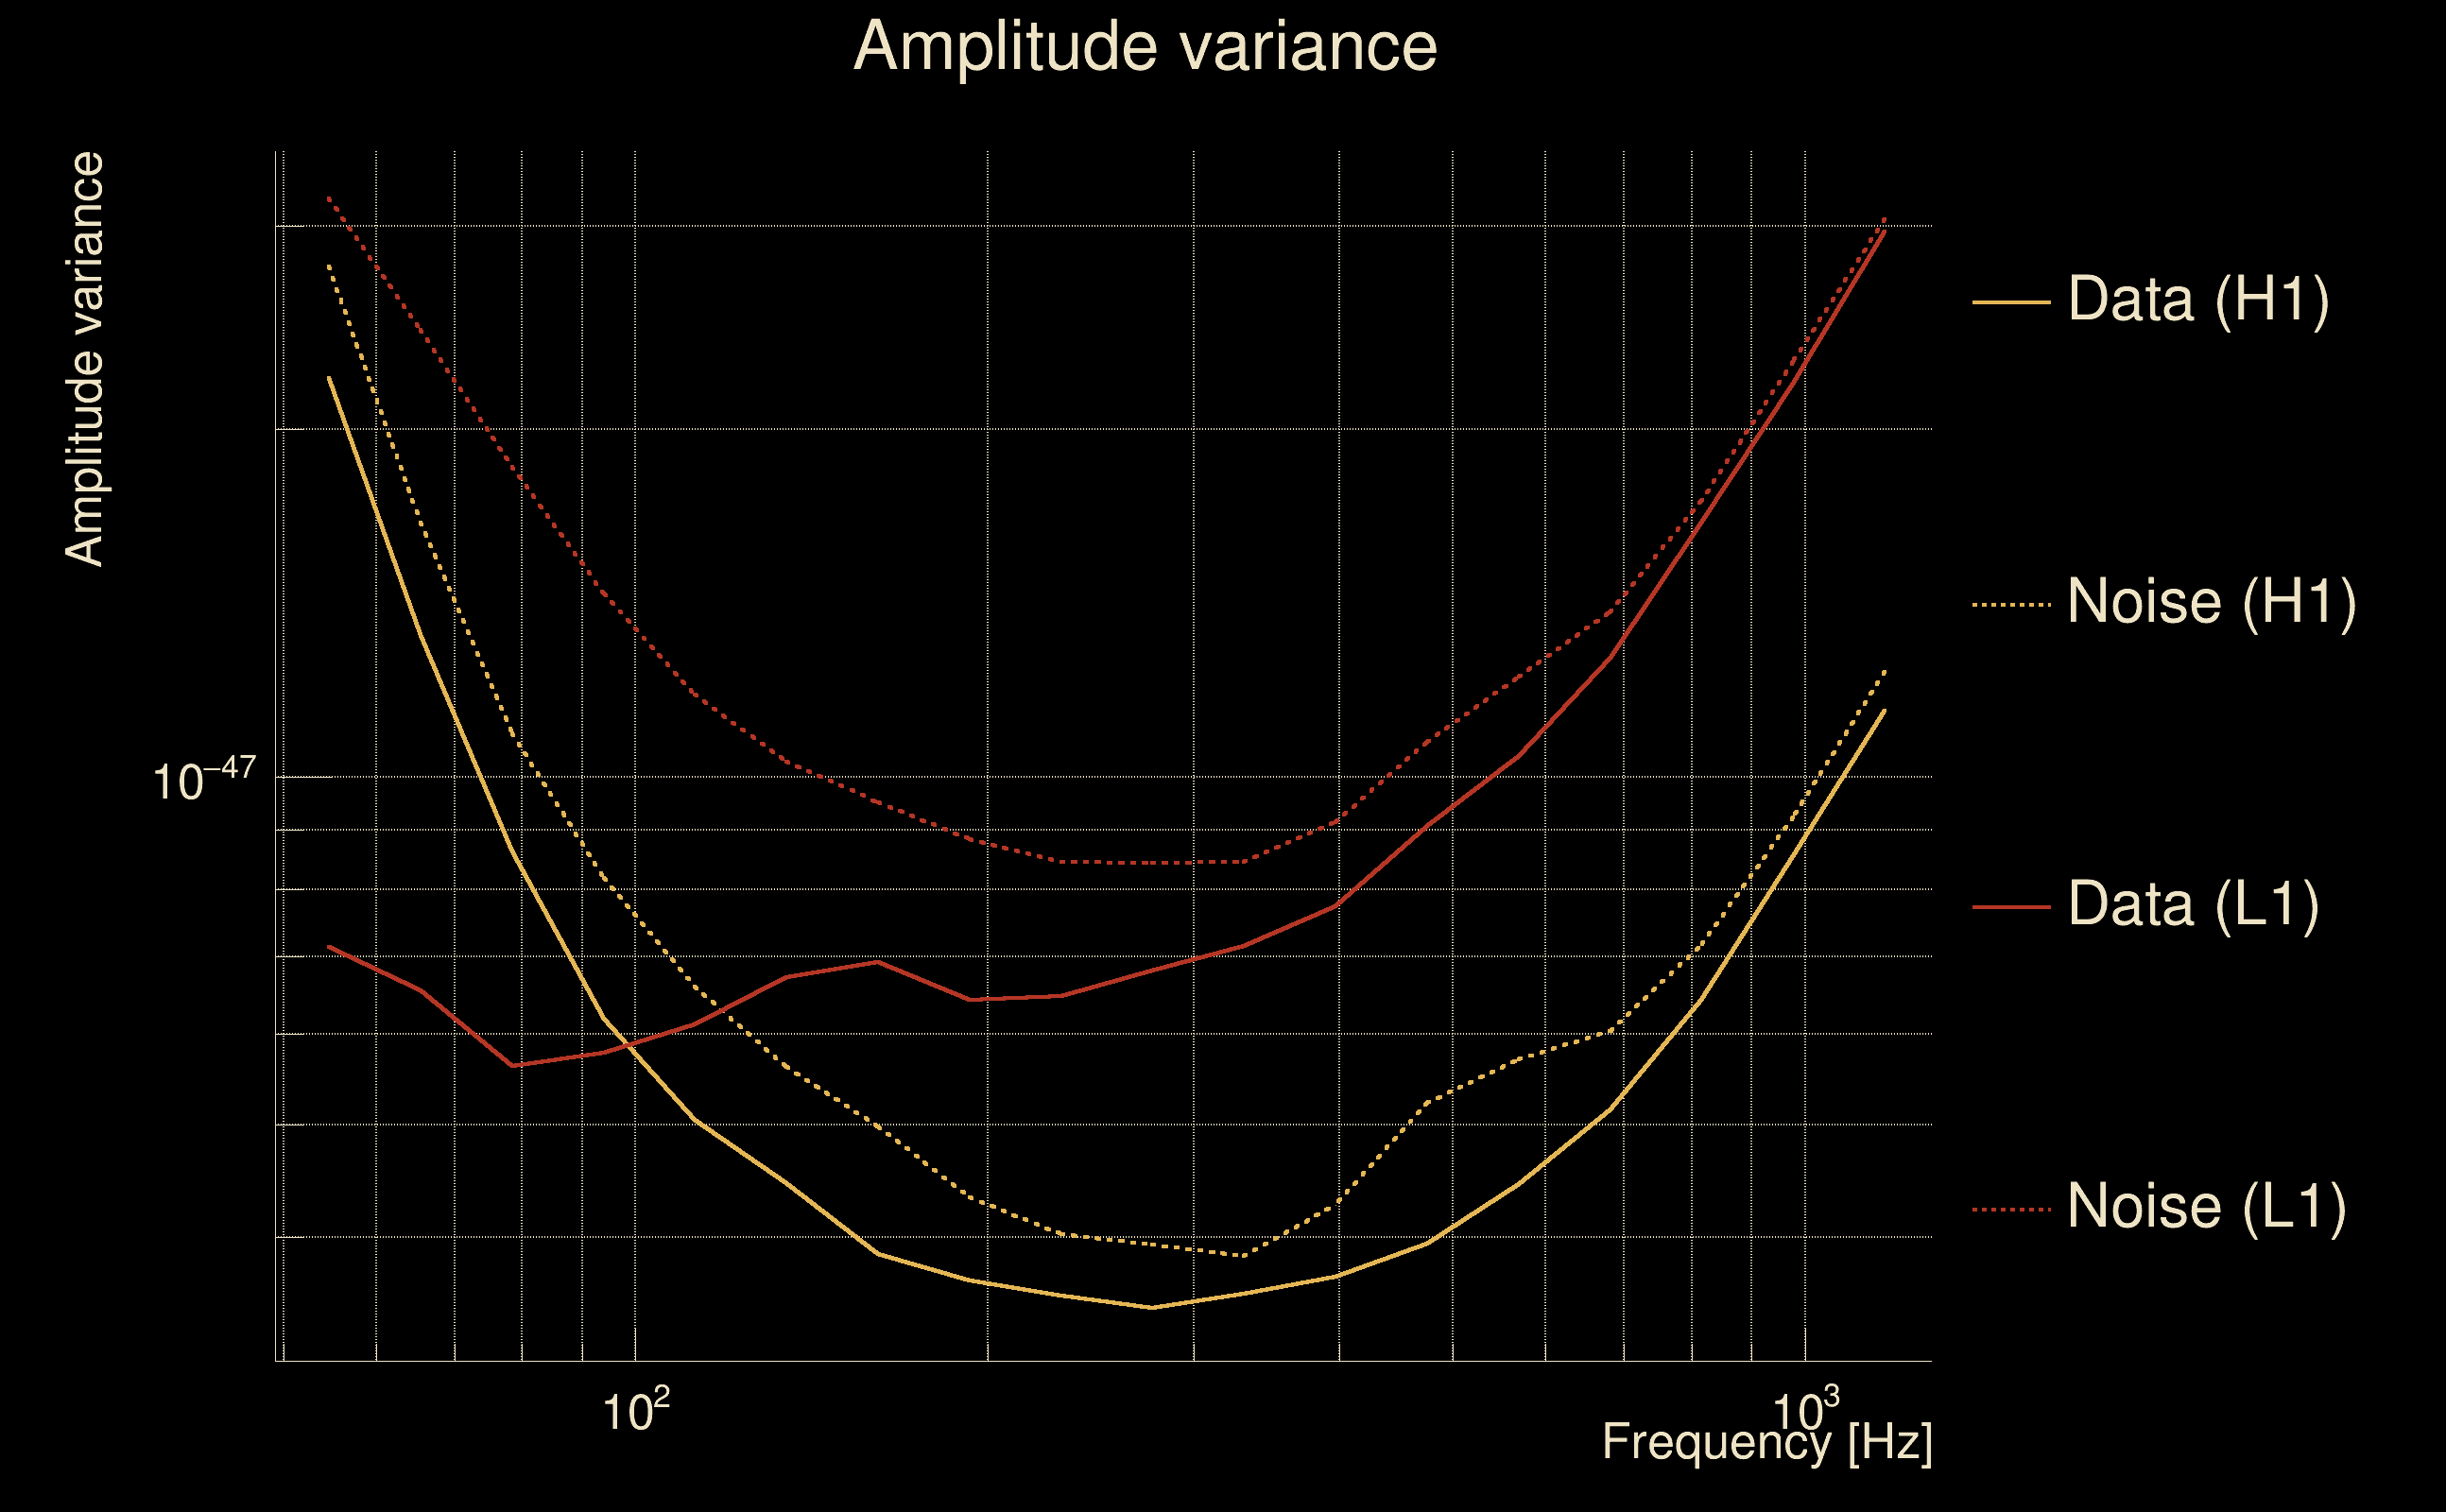
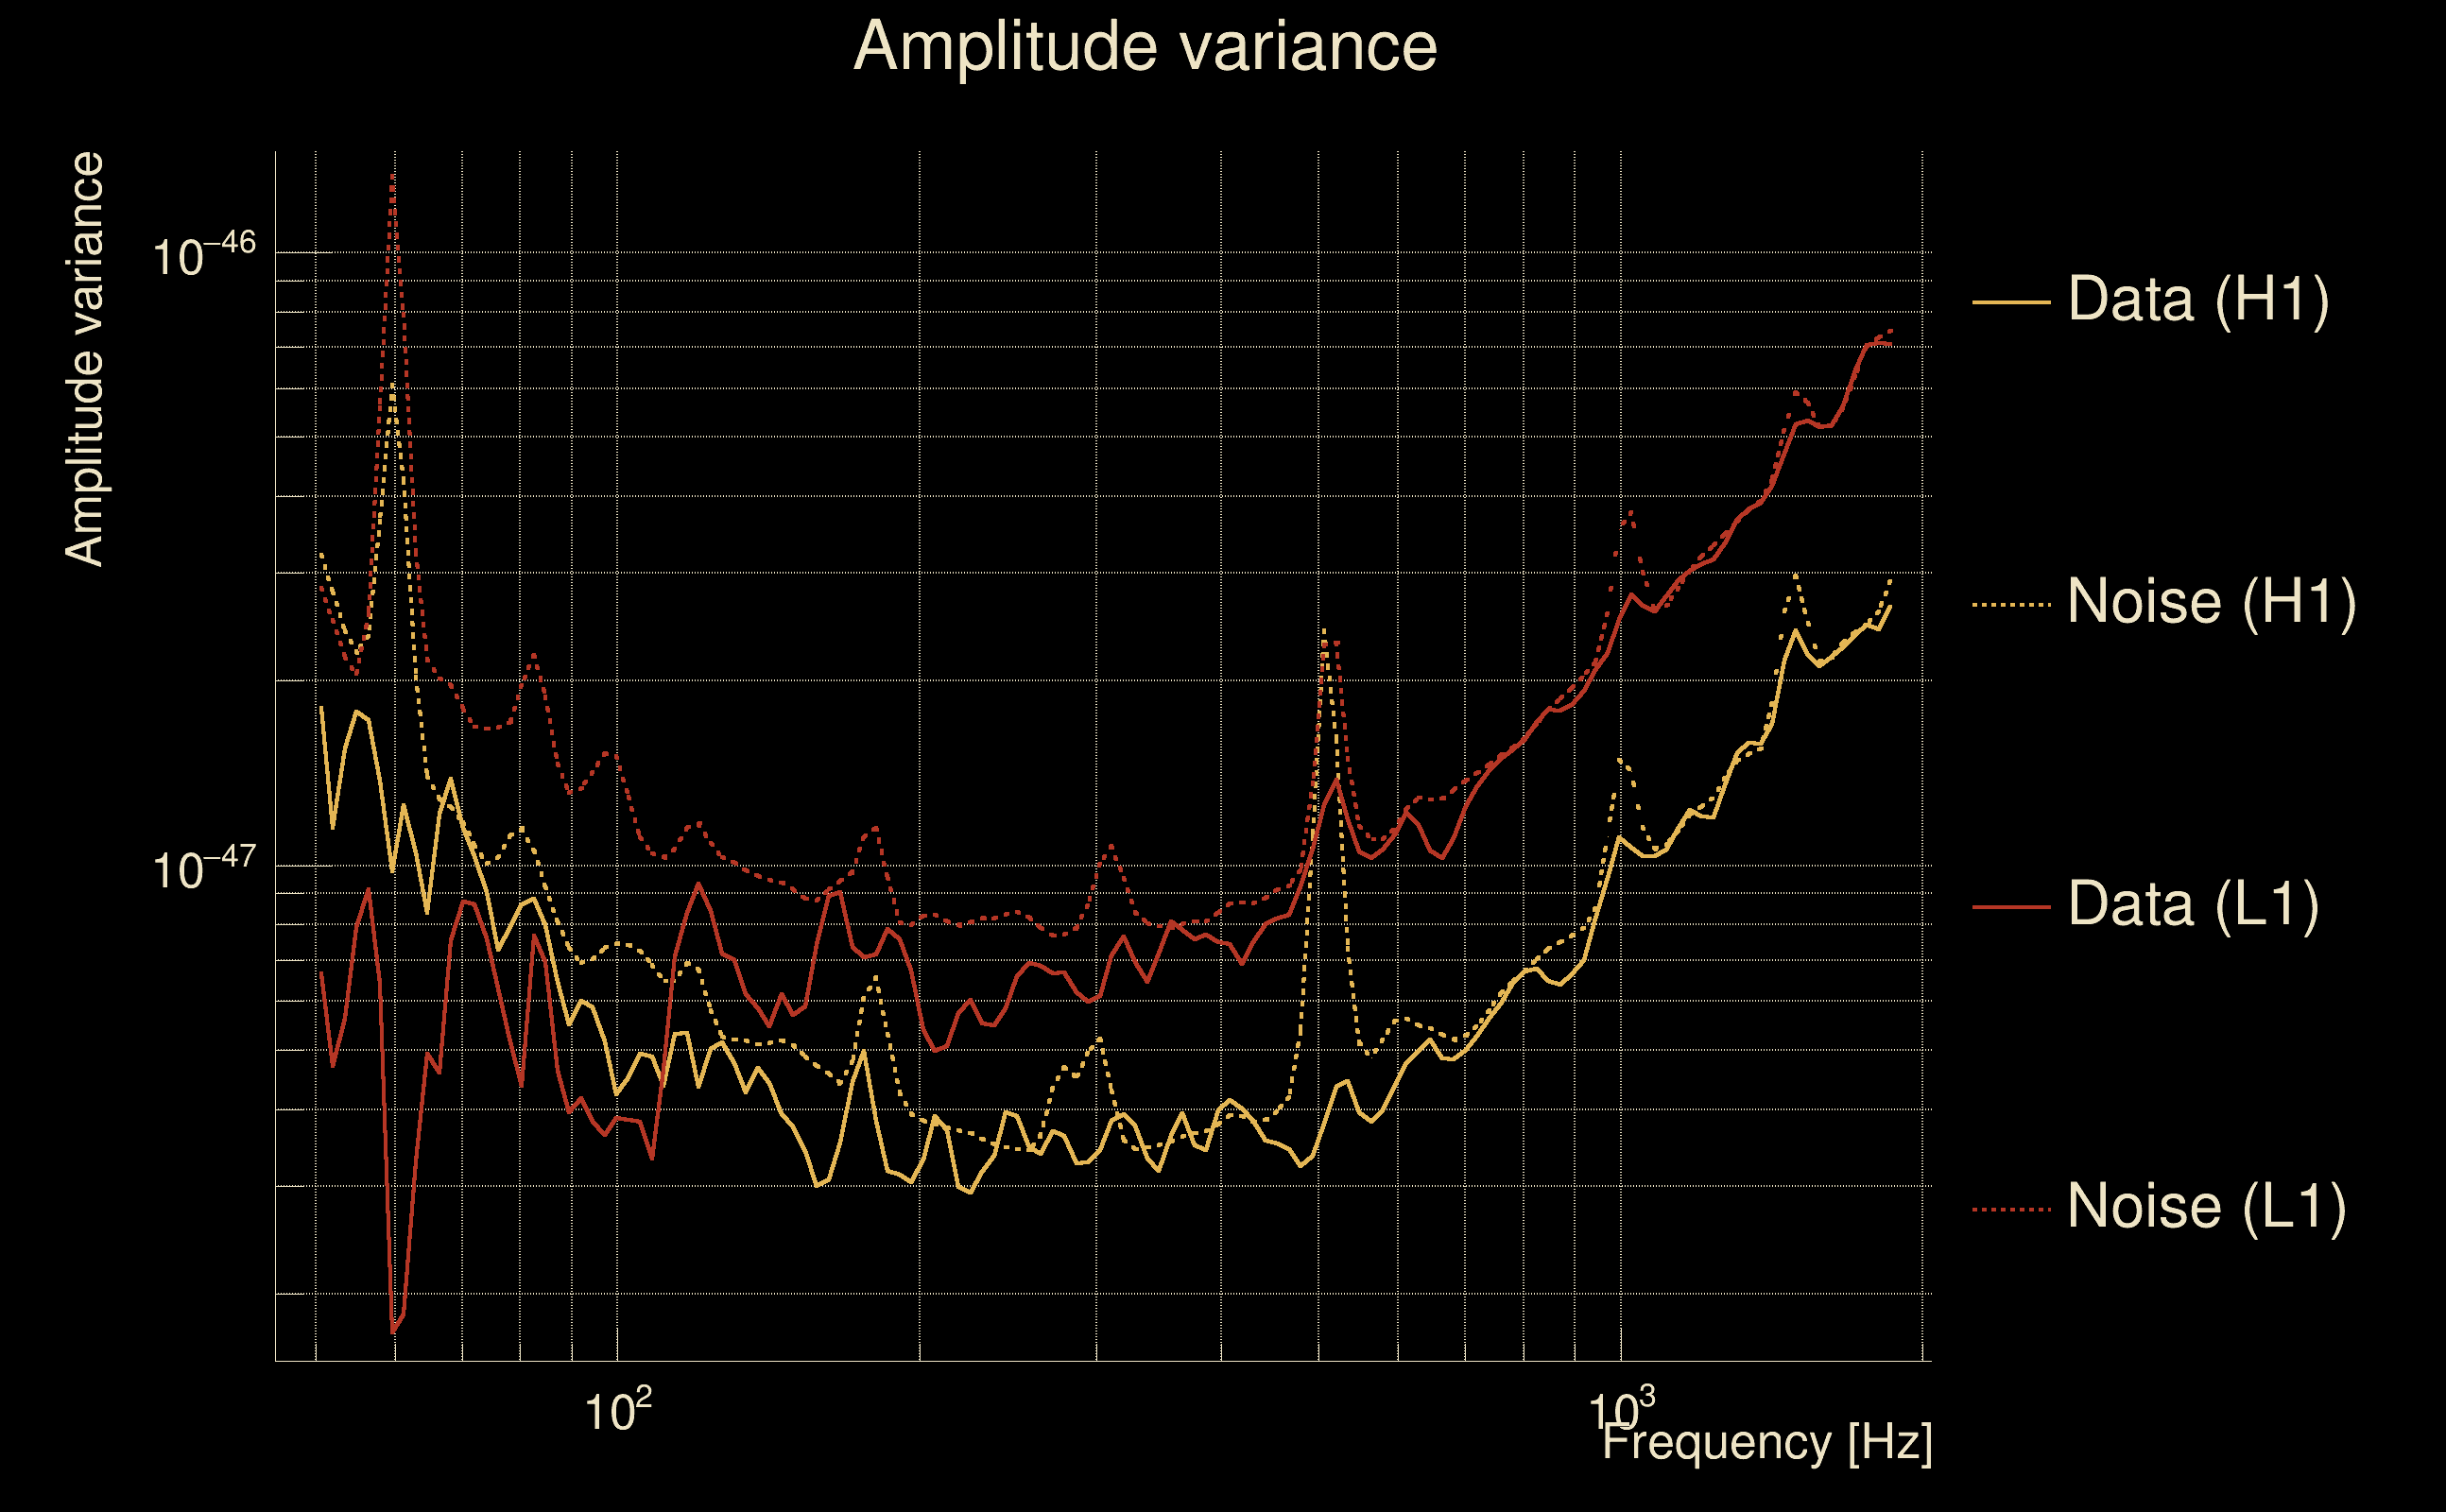
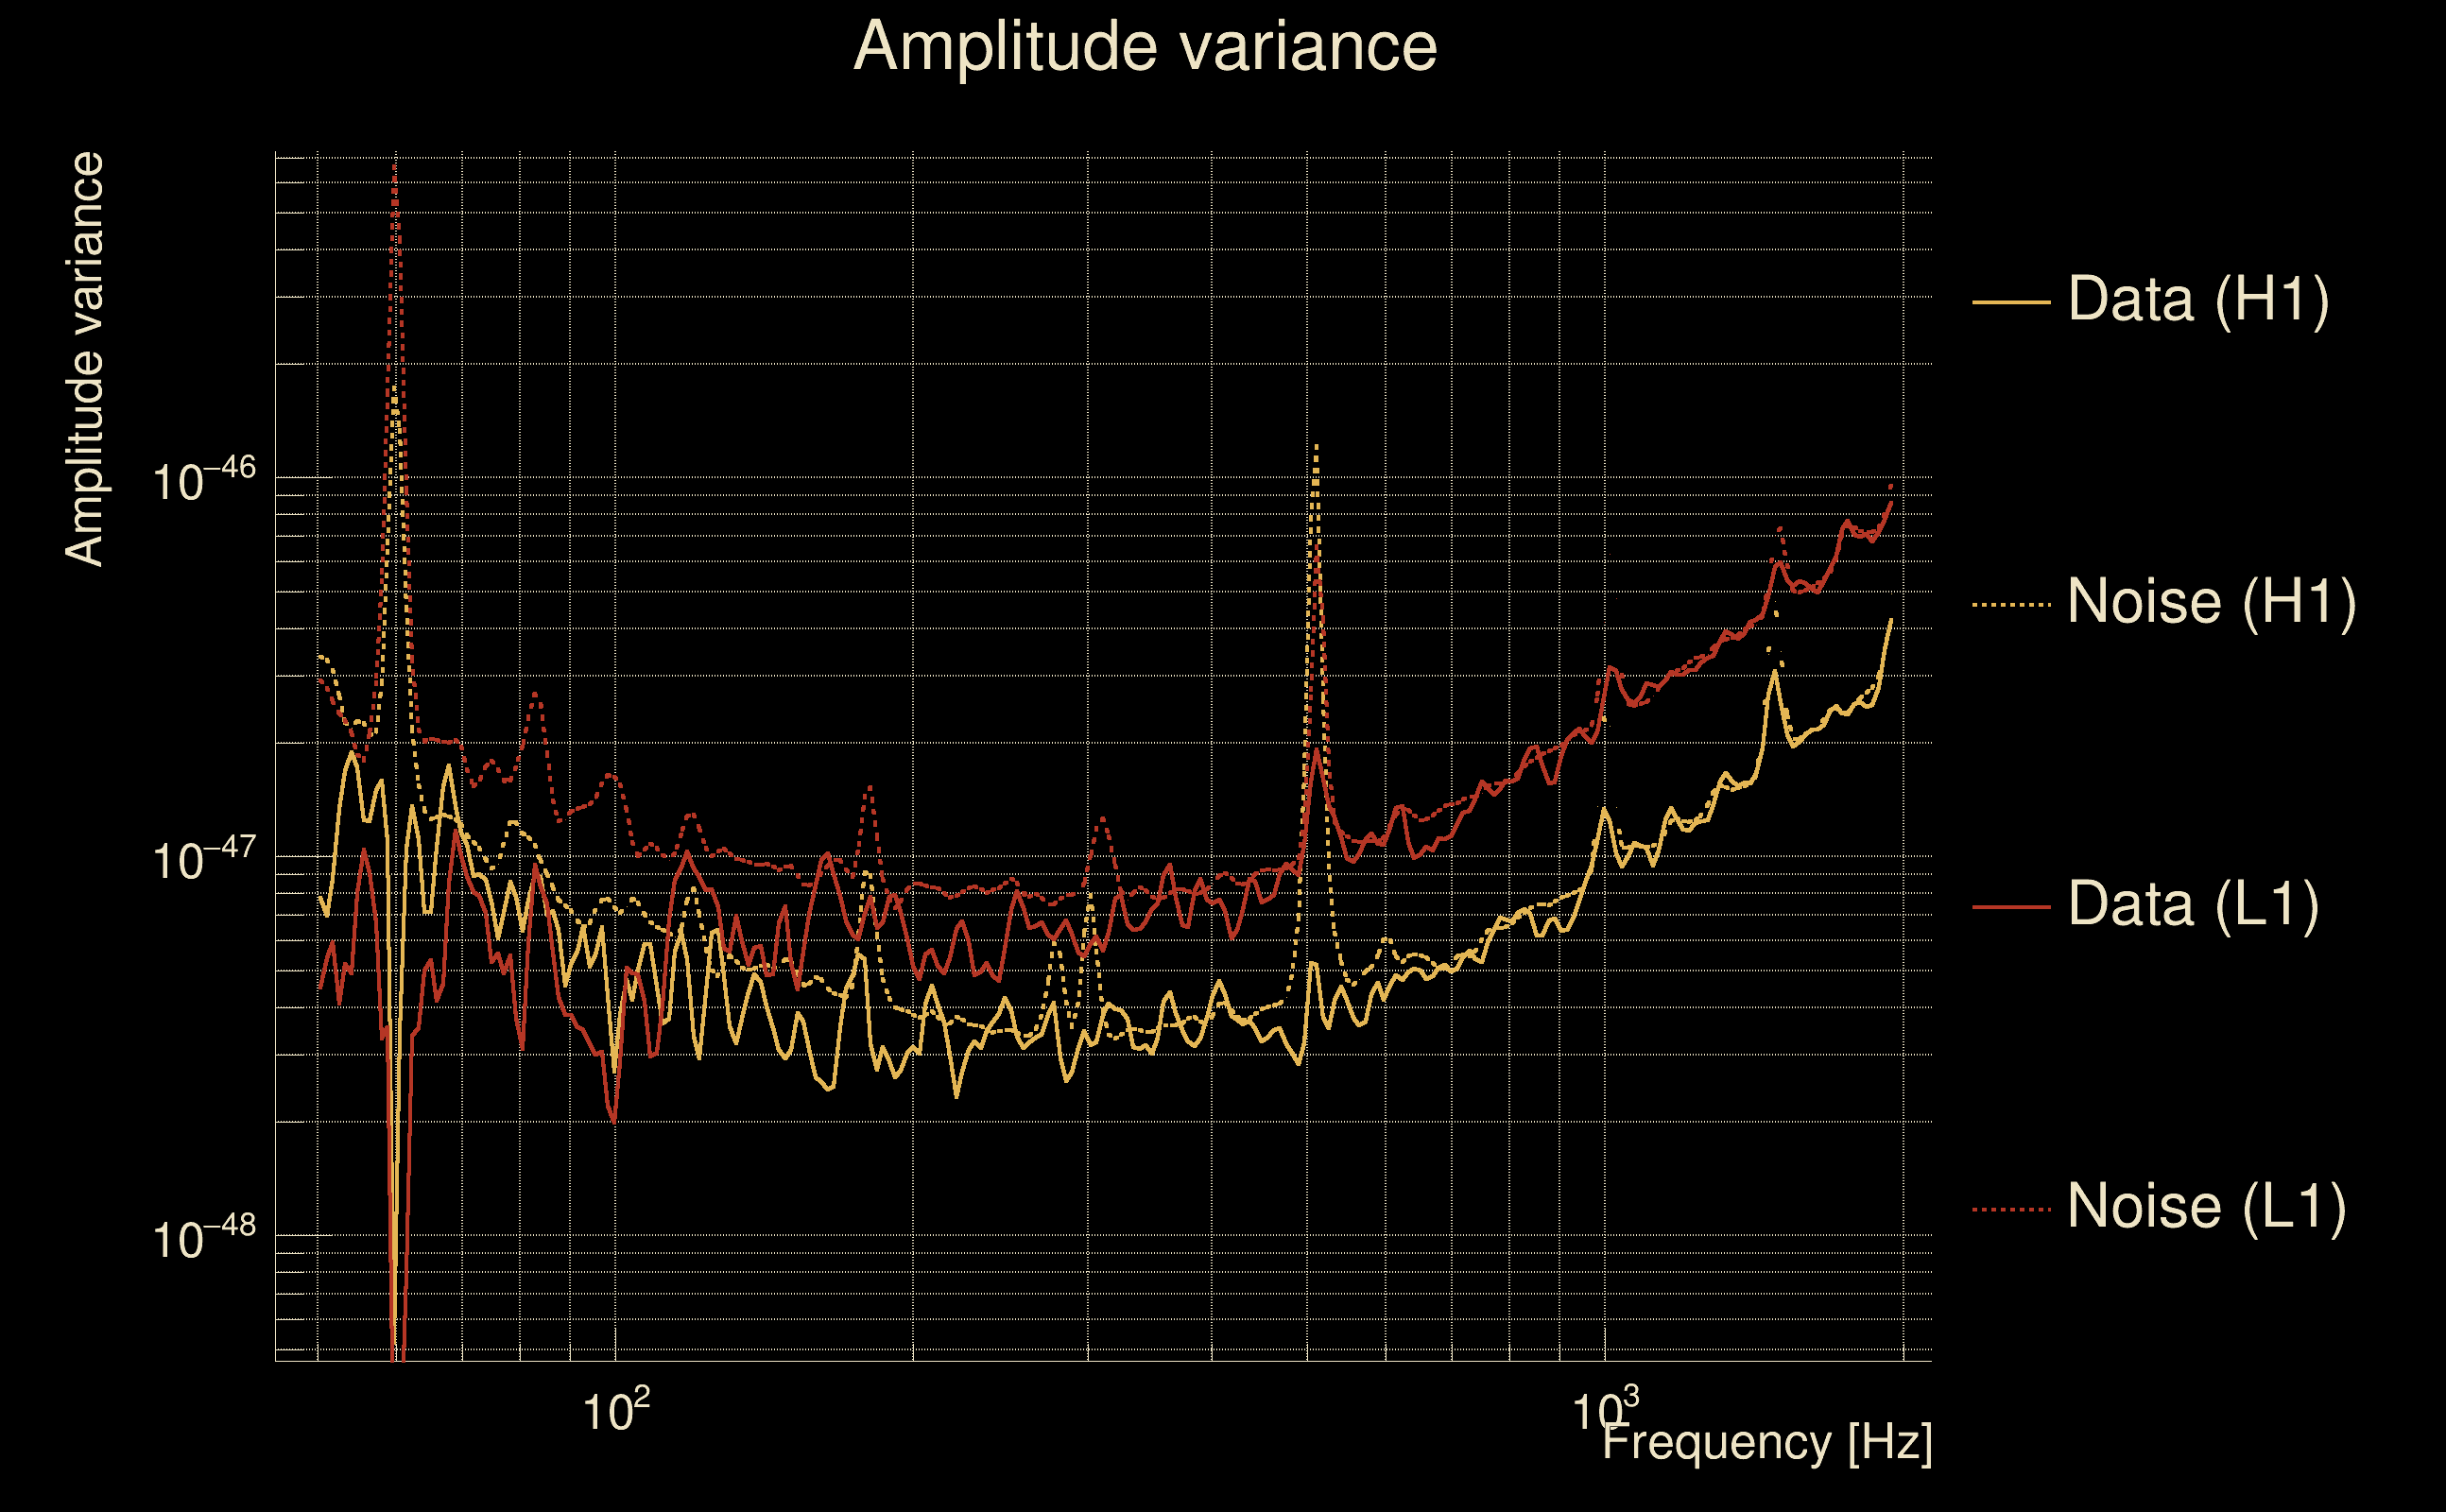
| Amplitude spectrograms: | normalization = 1e-22, power index = 2 |
| White noise SNR variance: | 0.523175 (after applying a correction factor = 1) |
| Amplitude ratio confidence level: | 3 sigma |
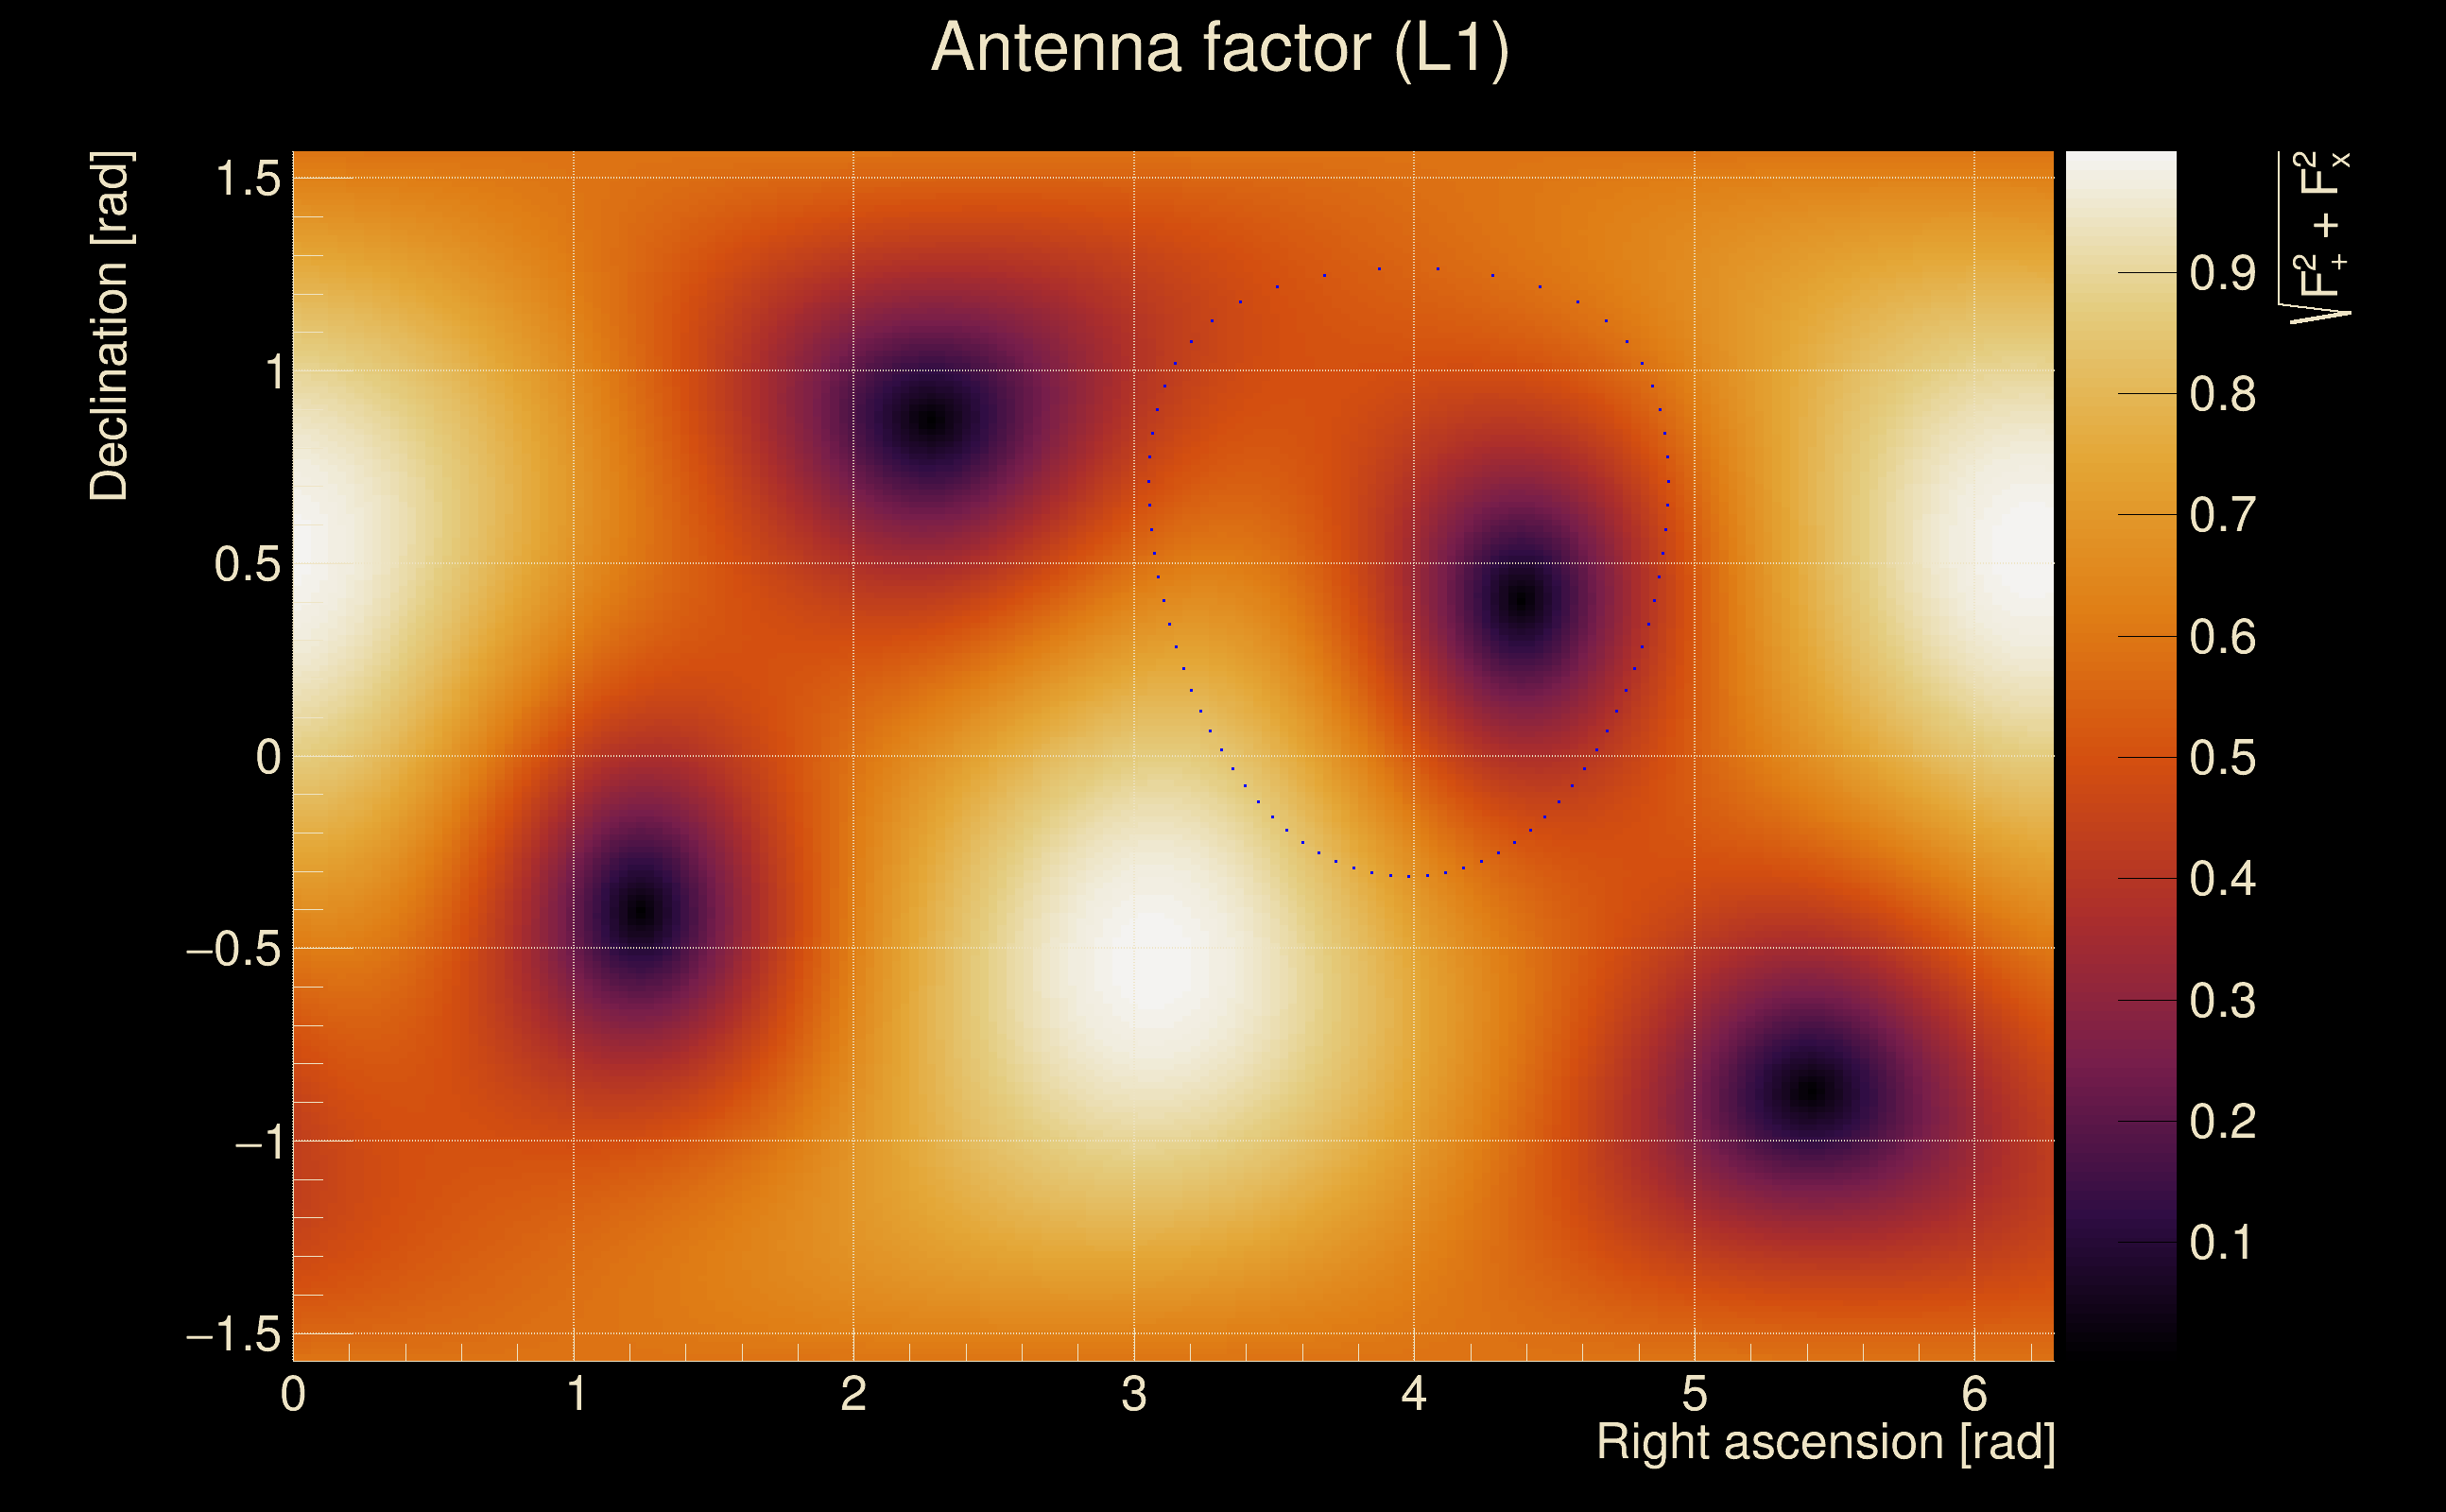
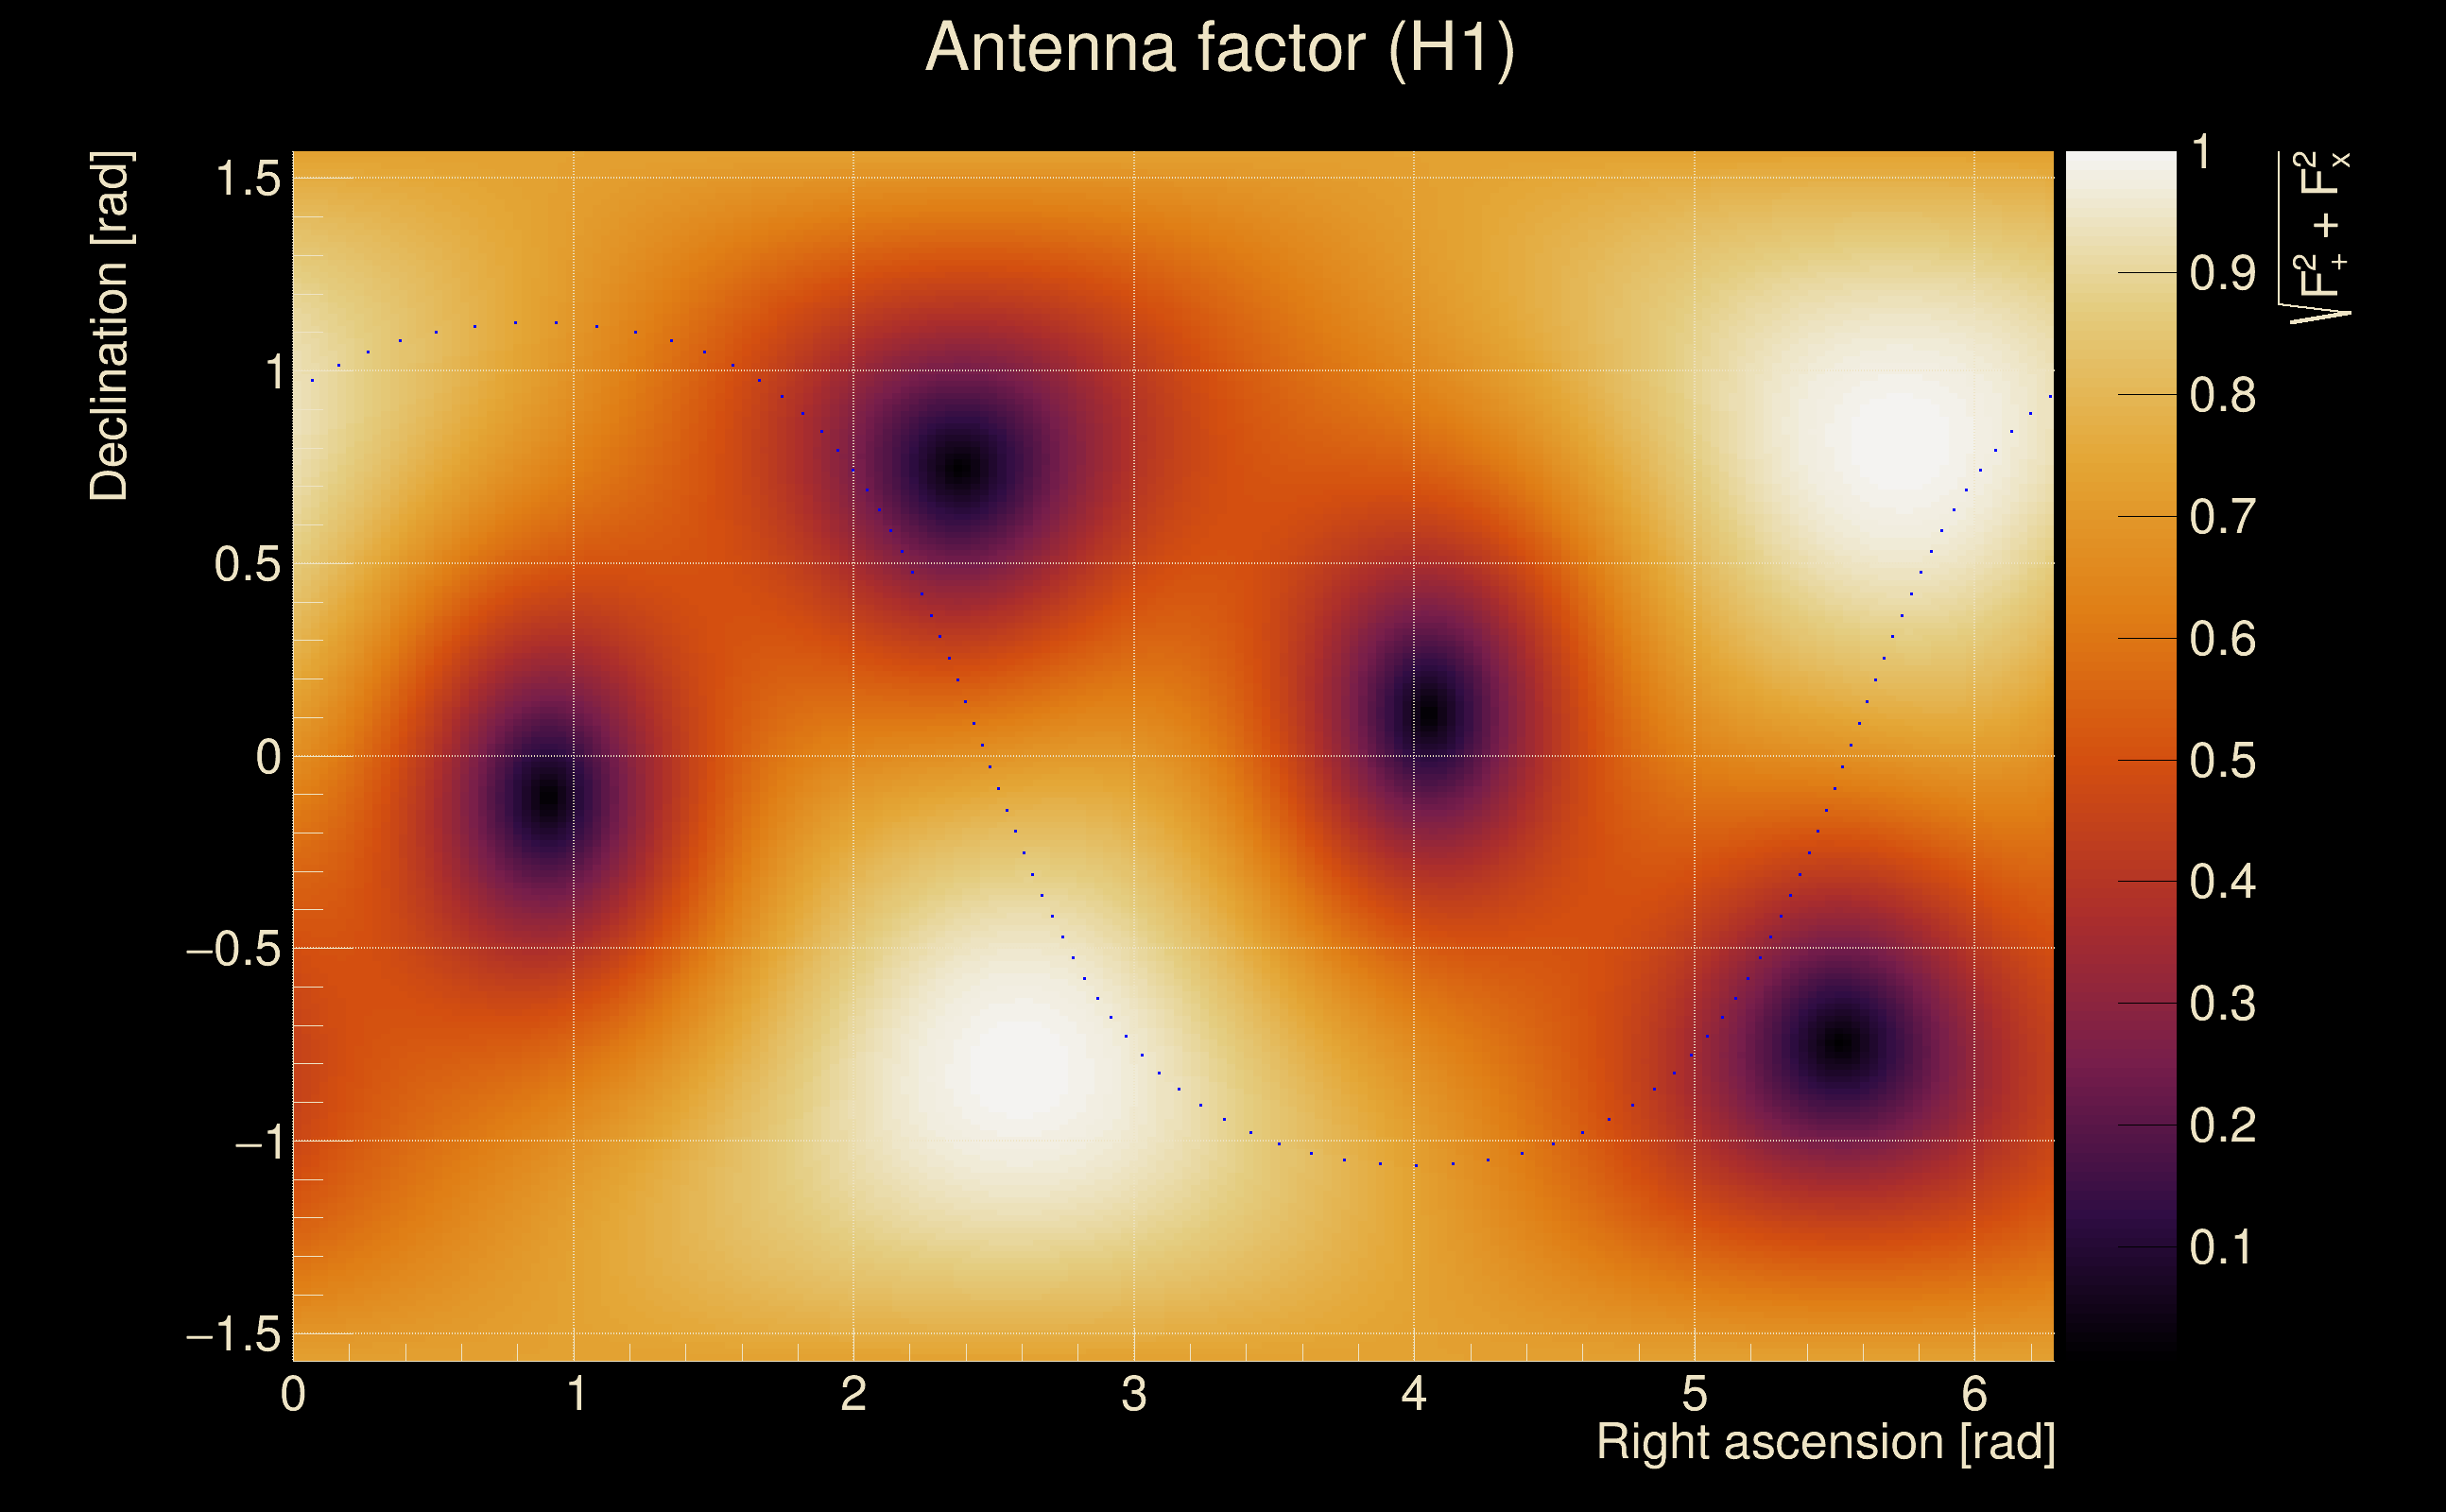
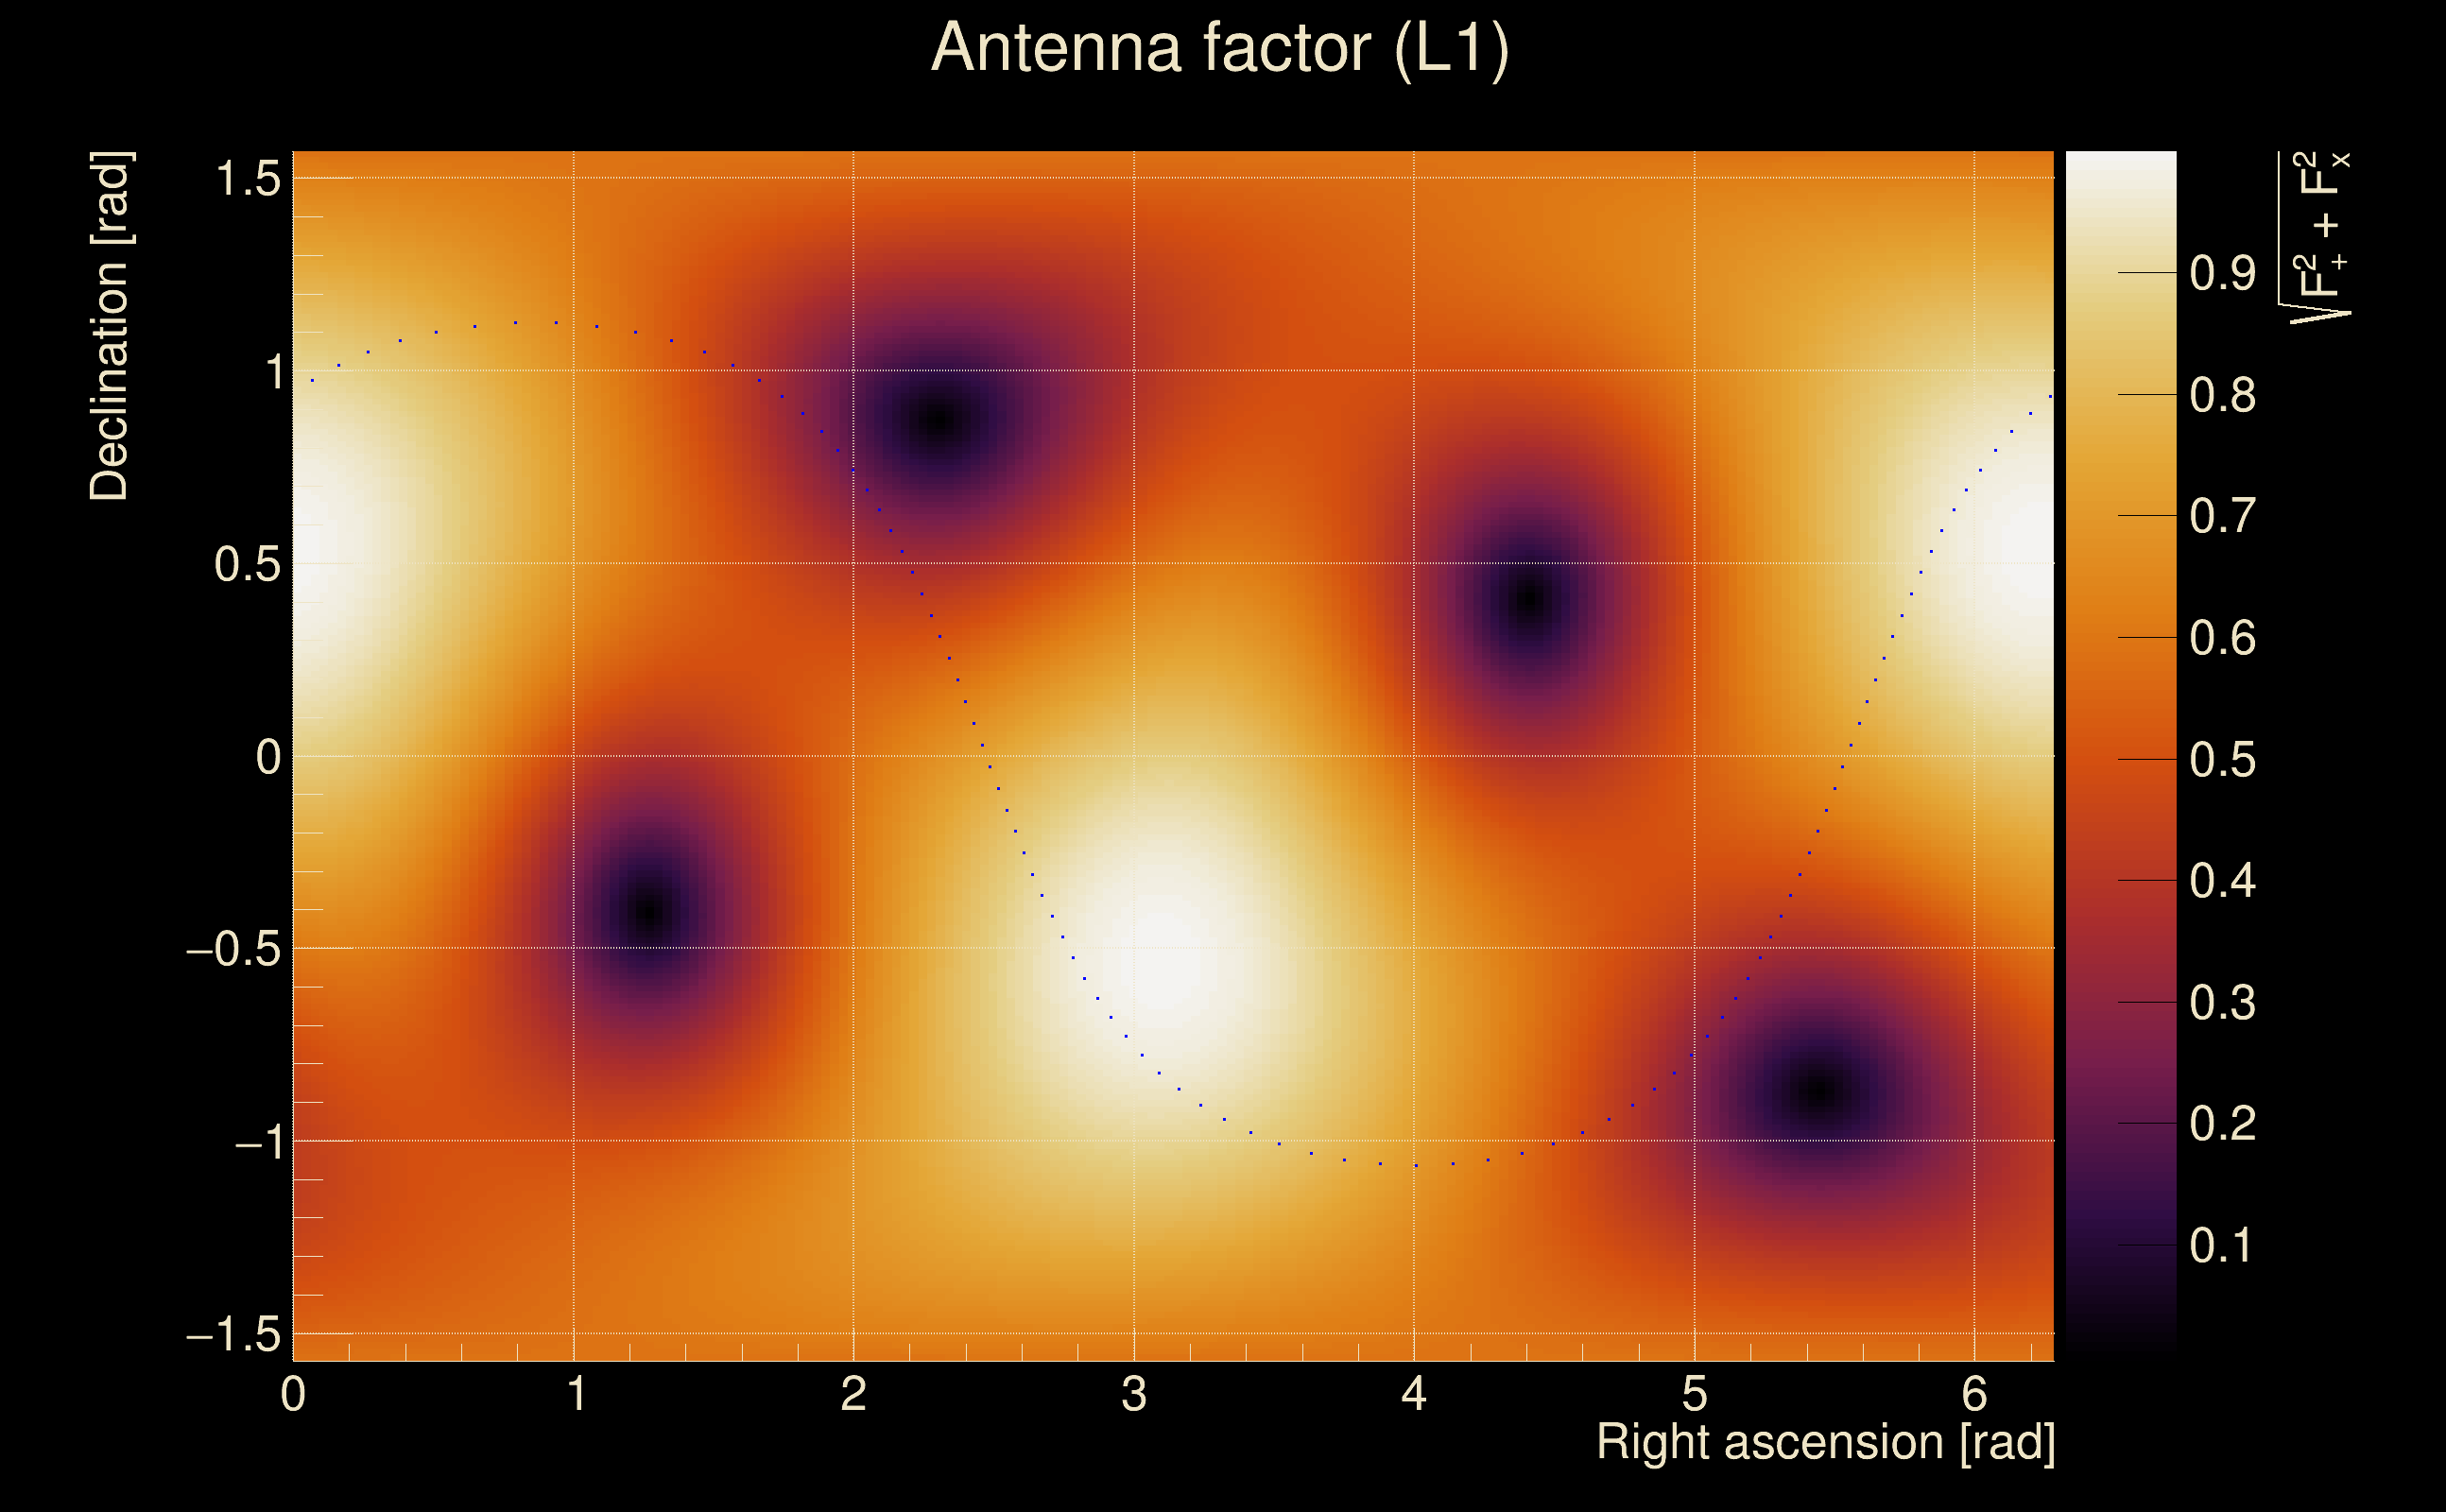
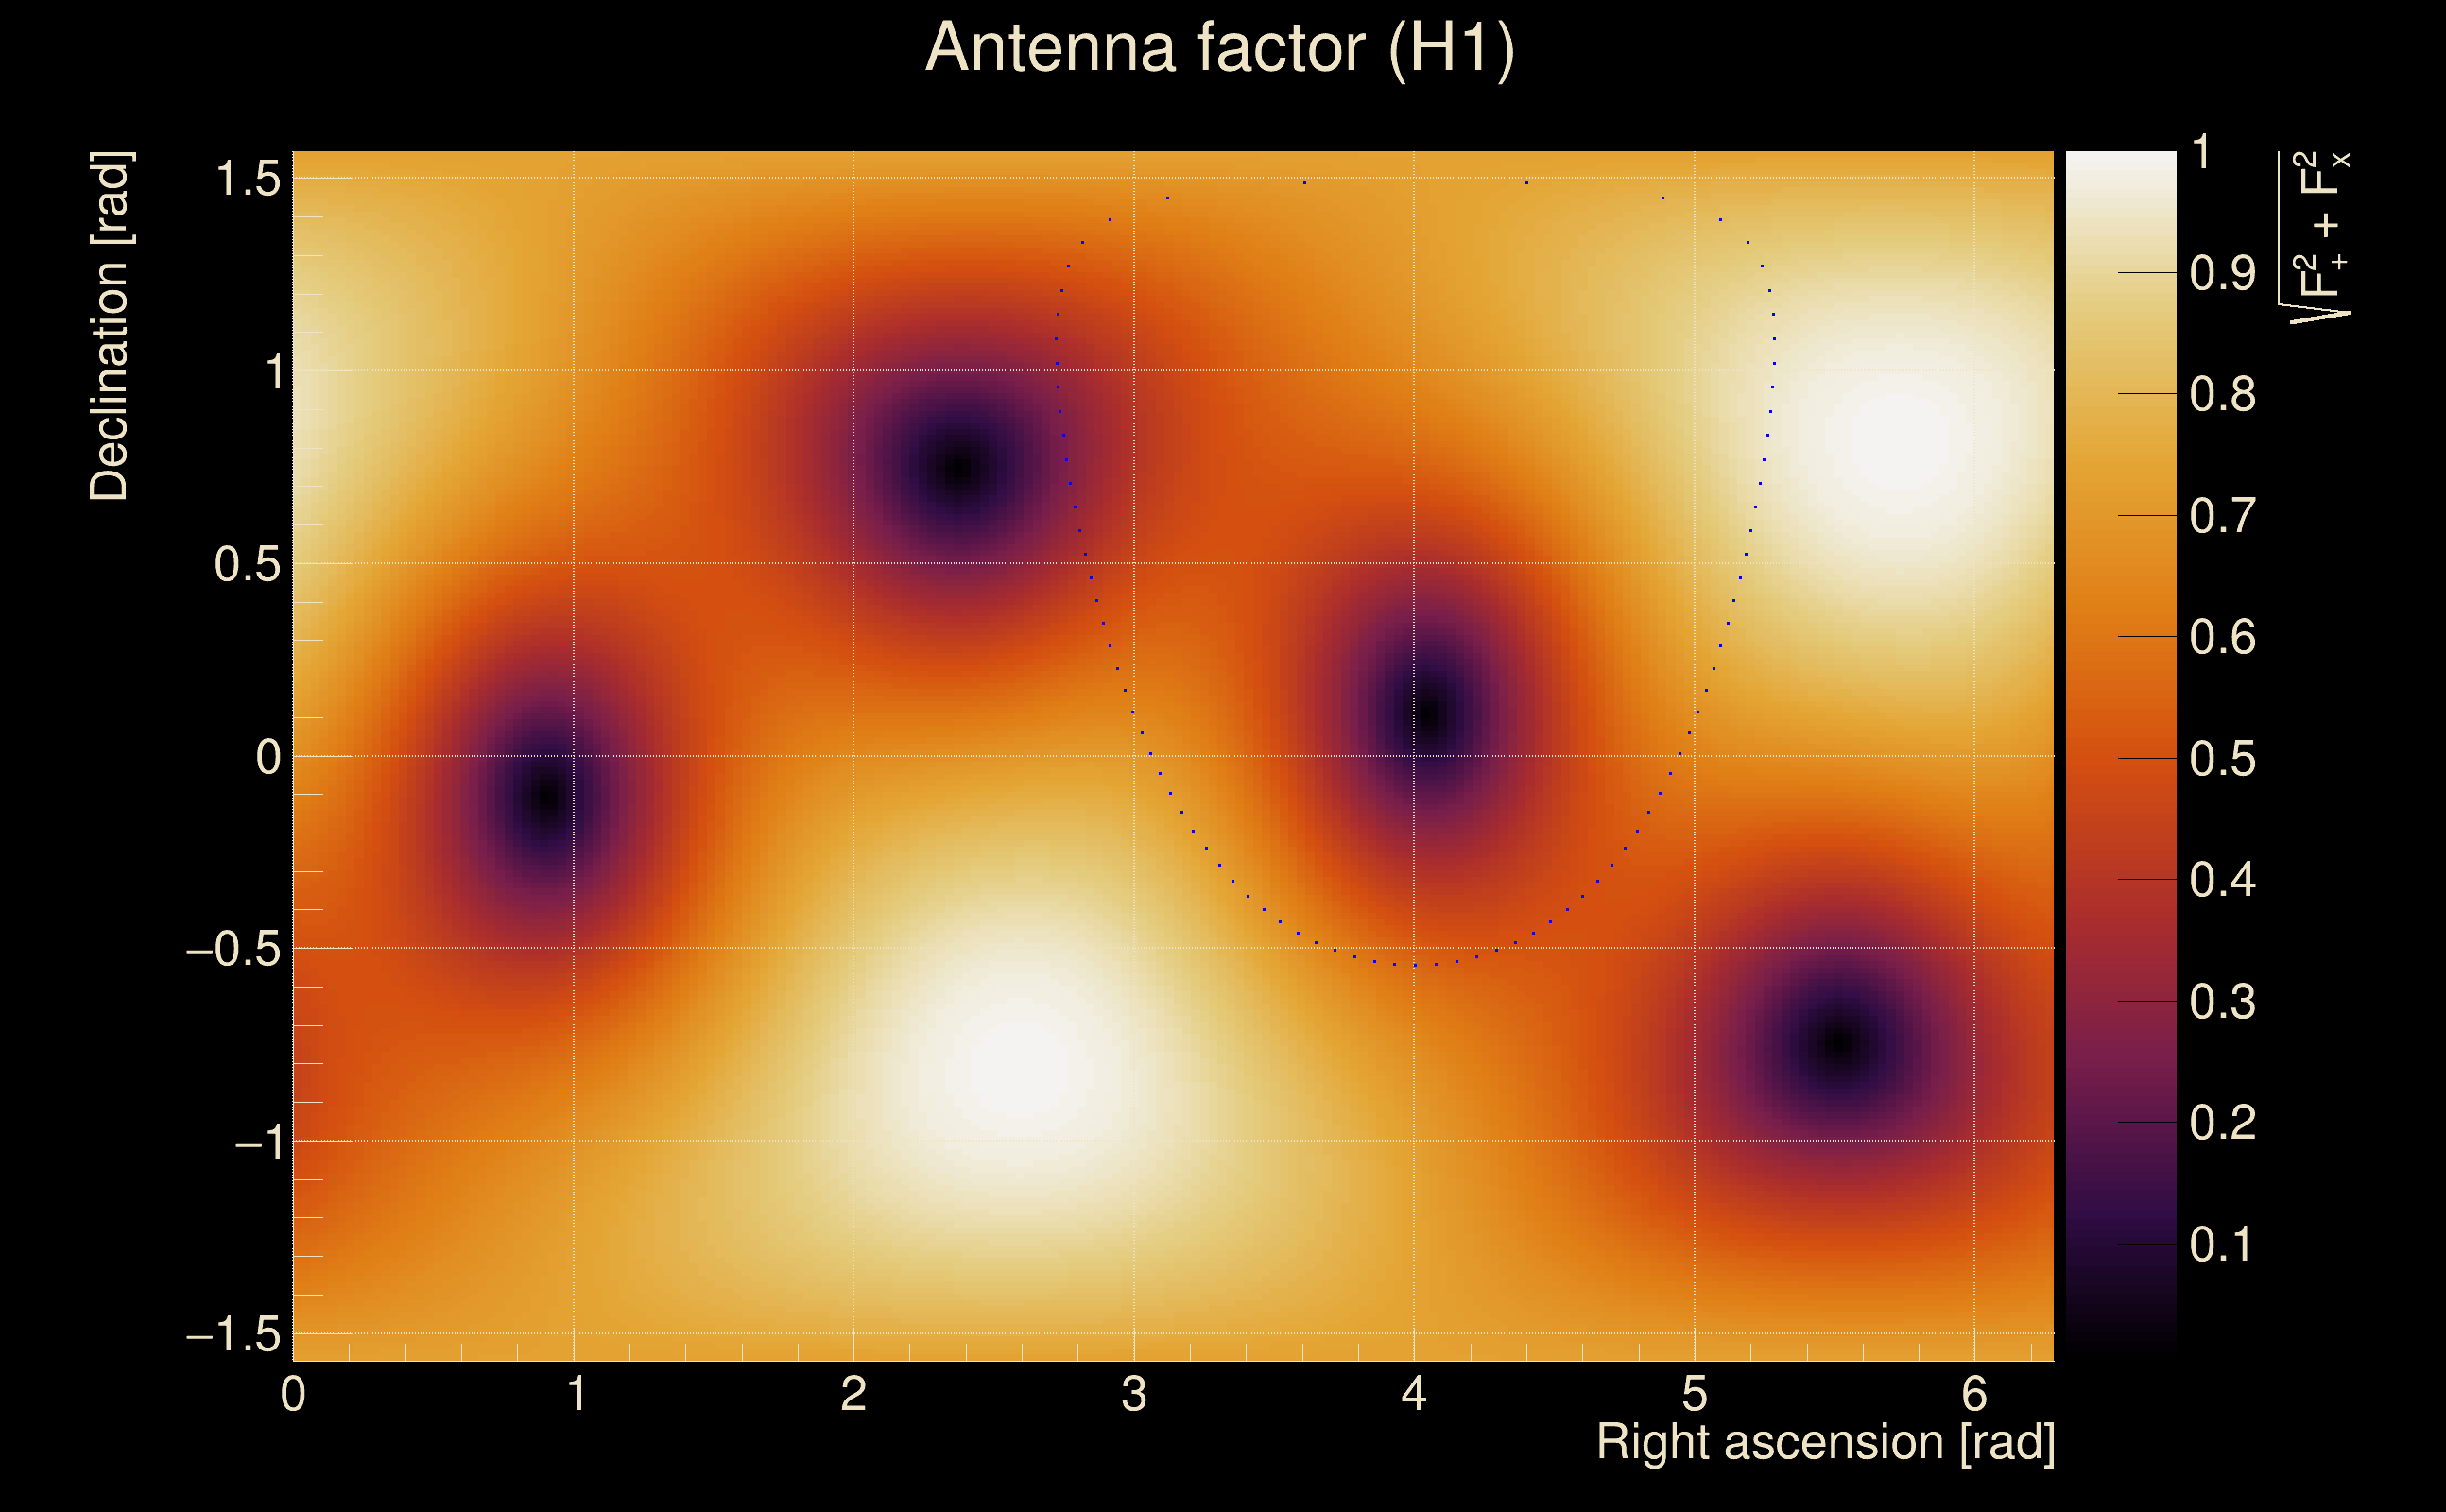
| Target sky positon: | Ra: 3.68109, Dec: 0.94792 [rad] |
| List of input Ox files: | TargIxf_feb2026_SG1_10min_file_list.txt (1 files) |
| Analysis result file: | TargIxf_feb2026_SG1_10min_results-0.root |
| Slice selected for the the fakeground: | slice index=90 (0.828 s), time lag = 0 s |
| Foreground | Fakeground | Background | ||
|---|---|---|---|---|
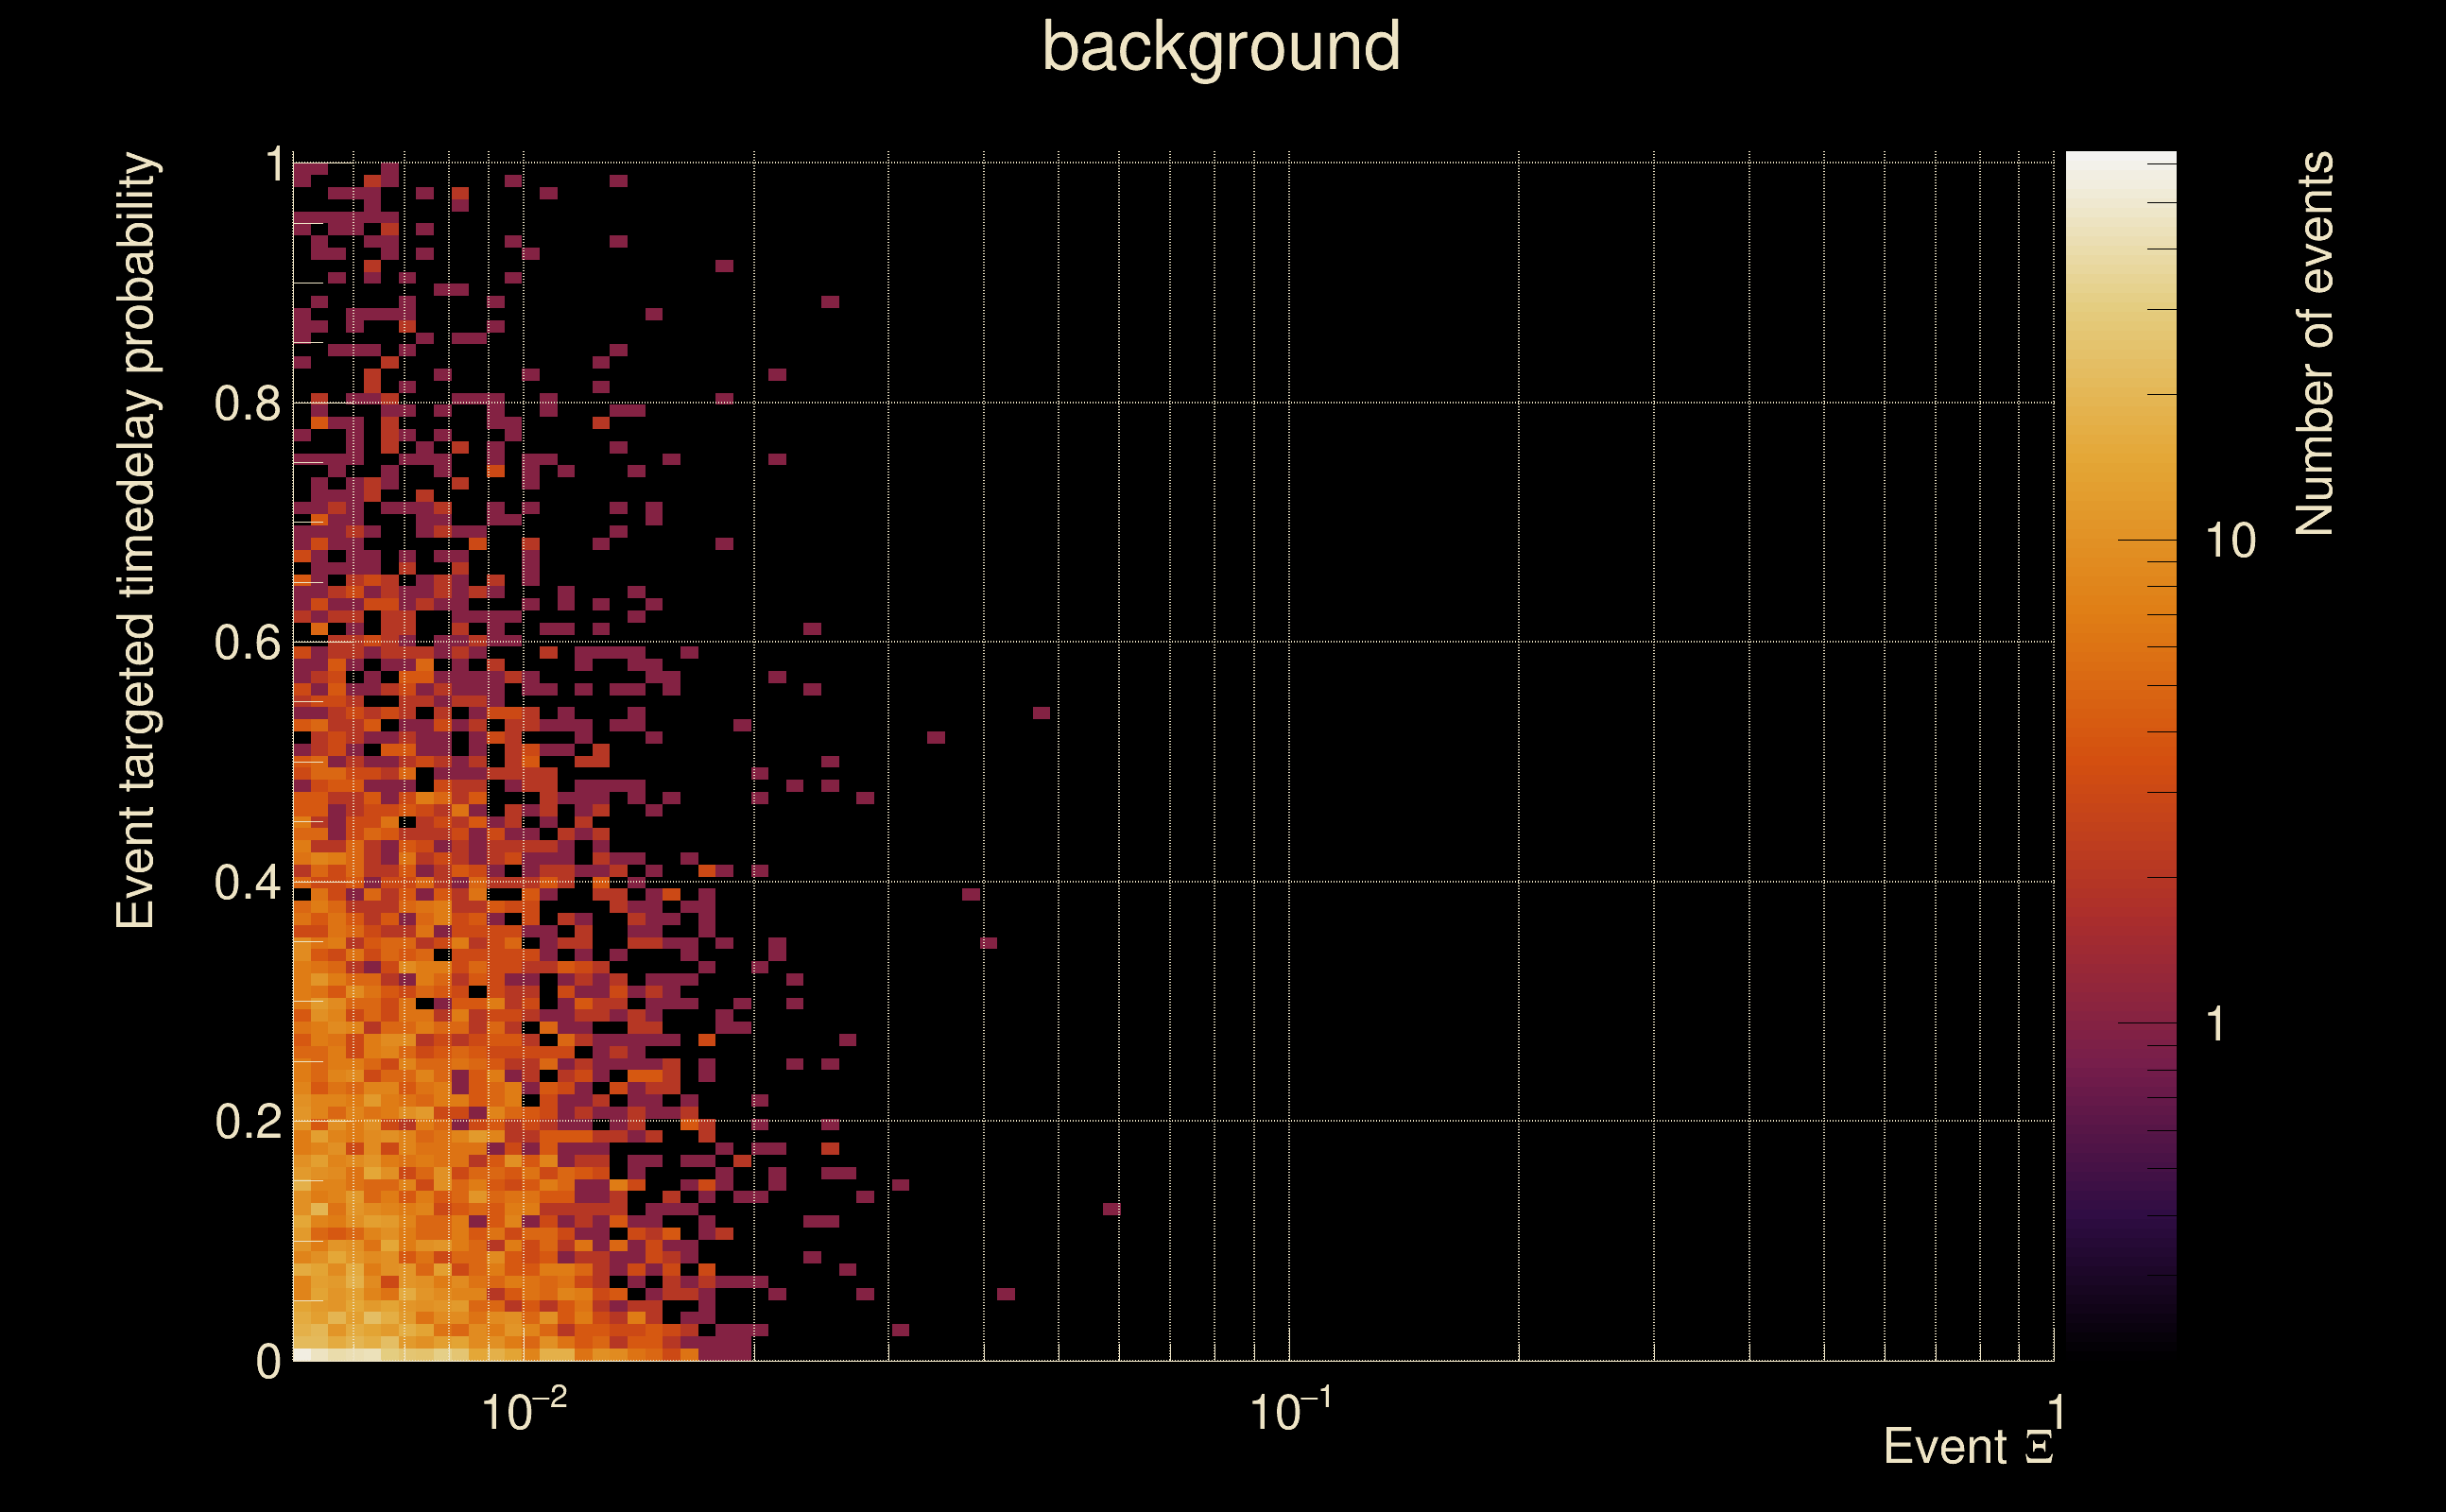
| Number of processed ox events | 117 | 117 | 25155 | |
| Start Date (detector 0) | Mon May 15 14:13:25 2023 UTC | Mon May 15 14:13:25 2023 UTC | Mon May 15 14:13:25 2023 UTC | |
| End Date (detector 0) | Mon May 15 14:23:15 2023 UTC | Mon May 15 14:23:15 2023 UTC | Mon May 15 14:23:15 2023 UTC | |
| Start GPS (detector 0) | 1368195223 | 1368195223 | 1368195223 | |
| End GPS (detector 0) | 1368195813 | 1368195813 | 1368195813 | |
| Used livetime (detector 0) | 590 s | 590 s | 590 s | |
| Start Date (detector 1) | Mon May 15 14:13:25 2023 UTC | Mon May 15 14:13:25 2023 UTC | Mon May 15 14:13:25 2023 UTC | |
| End Date (detector 1) | Mon May 15 14:23:15 2023 UTC | Mon May 15 14:23:15 2023 UTC | Mon May 15 14:23:15 2023 UTC | |
| Start GPS (detector 1) | 1368195223 | 1368195223 | 1368195223 | |
| End GPS (detector 1) | 1368195813 | 1368195813 | 1368195813 | |
| Used livetime (detector 1) | 590 s | 590 s | 590 s | |
| Cumulative livetime | 1170 s | 1170 s | 251550 s | |
| 0 years, 0 days, 0 hours, 19 min, 30 s | 0 years, 0 days, 0 hours, 19 min, 30 s | 0 years, 2 days, 21 hours, 52 min, 30 s |
|
|
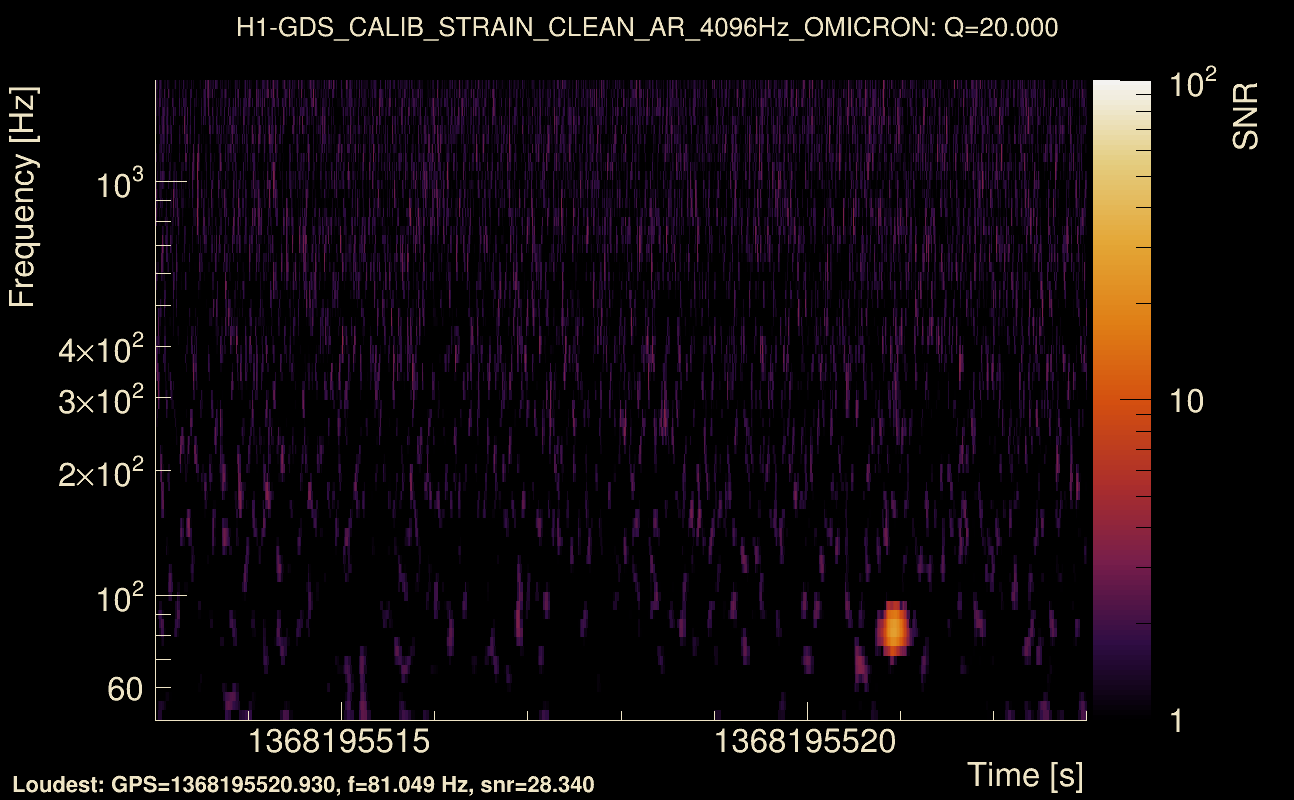
| Event time t(H1): | GPS = 1368195518 (Mon May 15 14:18:20 2023 ) → GPS = 1368195528 (Mon May 15 14:18:30 2023 ) |
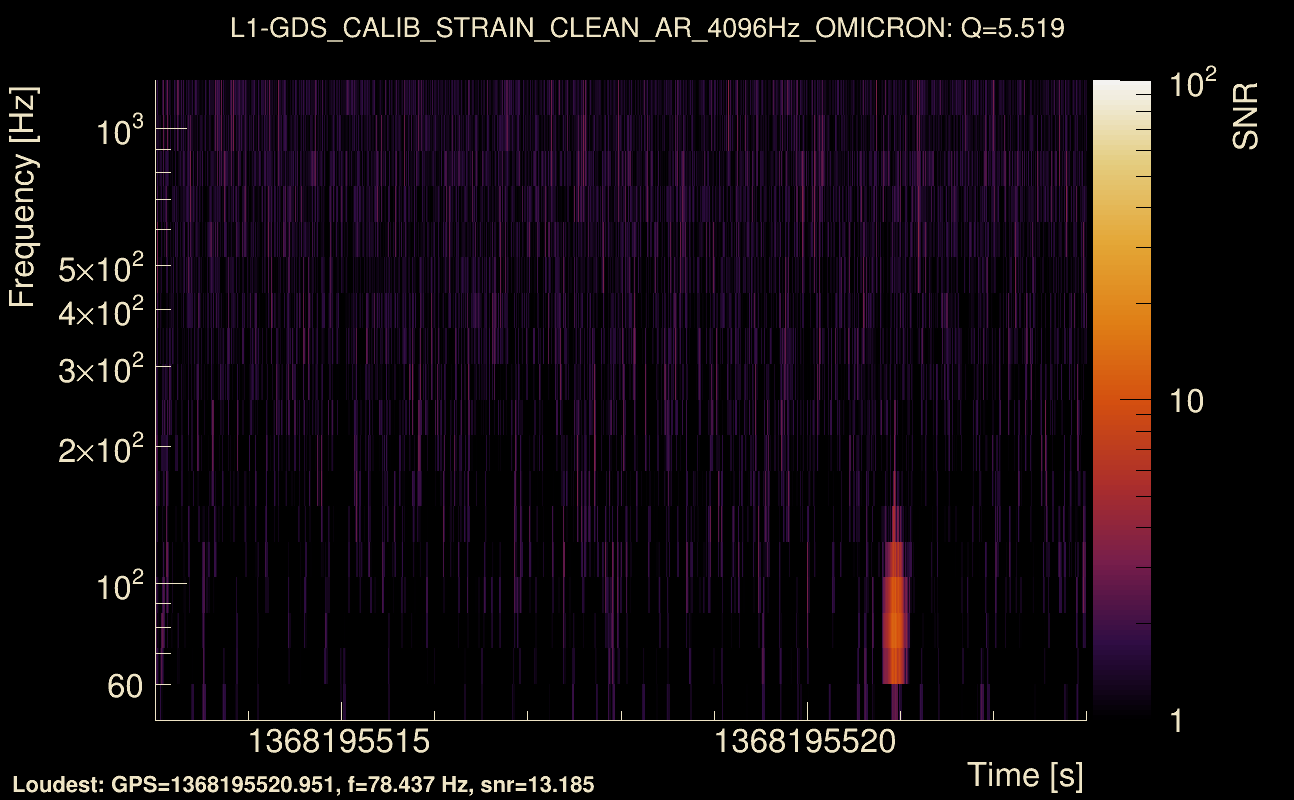
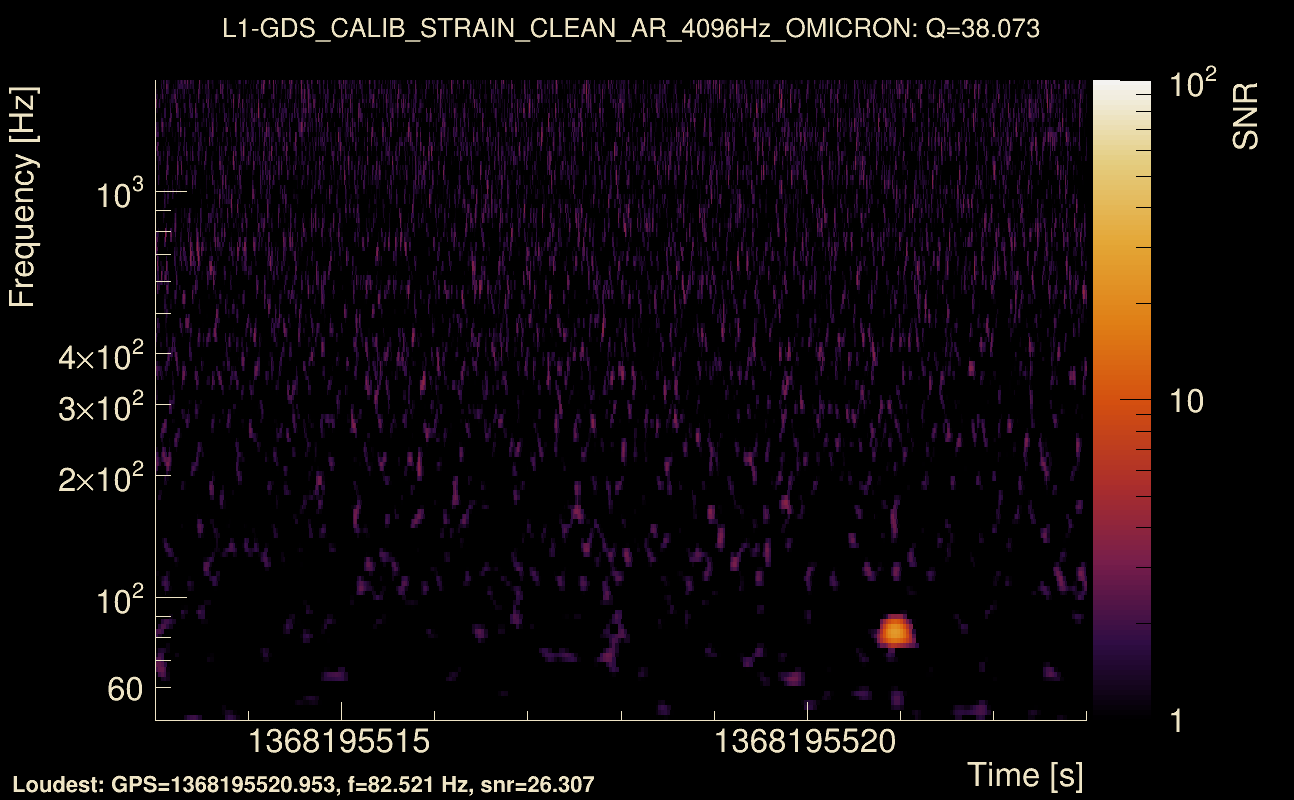
| Event time t(L1): | GPS = 1368195518 (Mon May 15 14:18:30 2023 ) → GPS = 1368195528 (Mon May 15 14:18:30 2023 ) |
| Omicron analysis time window (H1): | GPS = 1368195515 → GPS = 1368195531 |
| Omicron analysis time window (L1): | GPS = 1368195515 → GPS = 1368195531 |
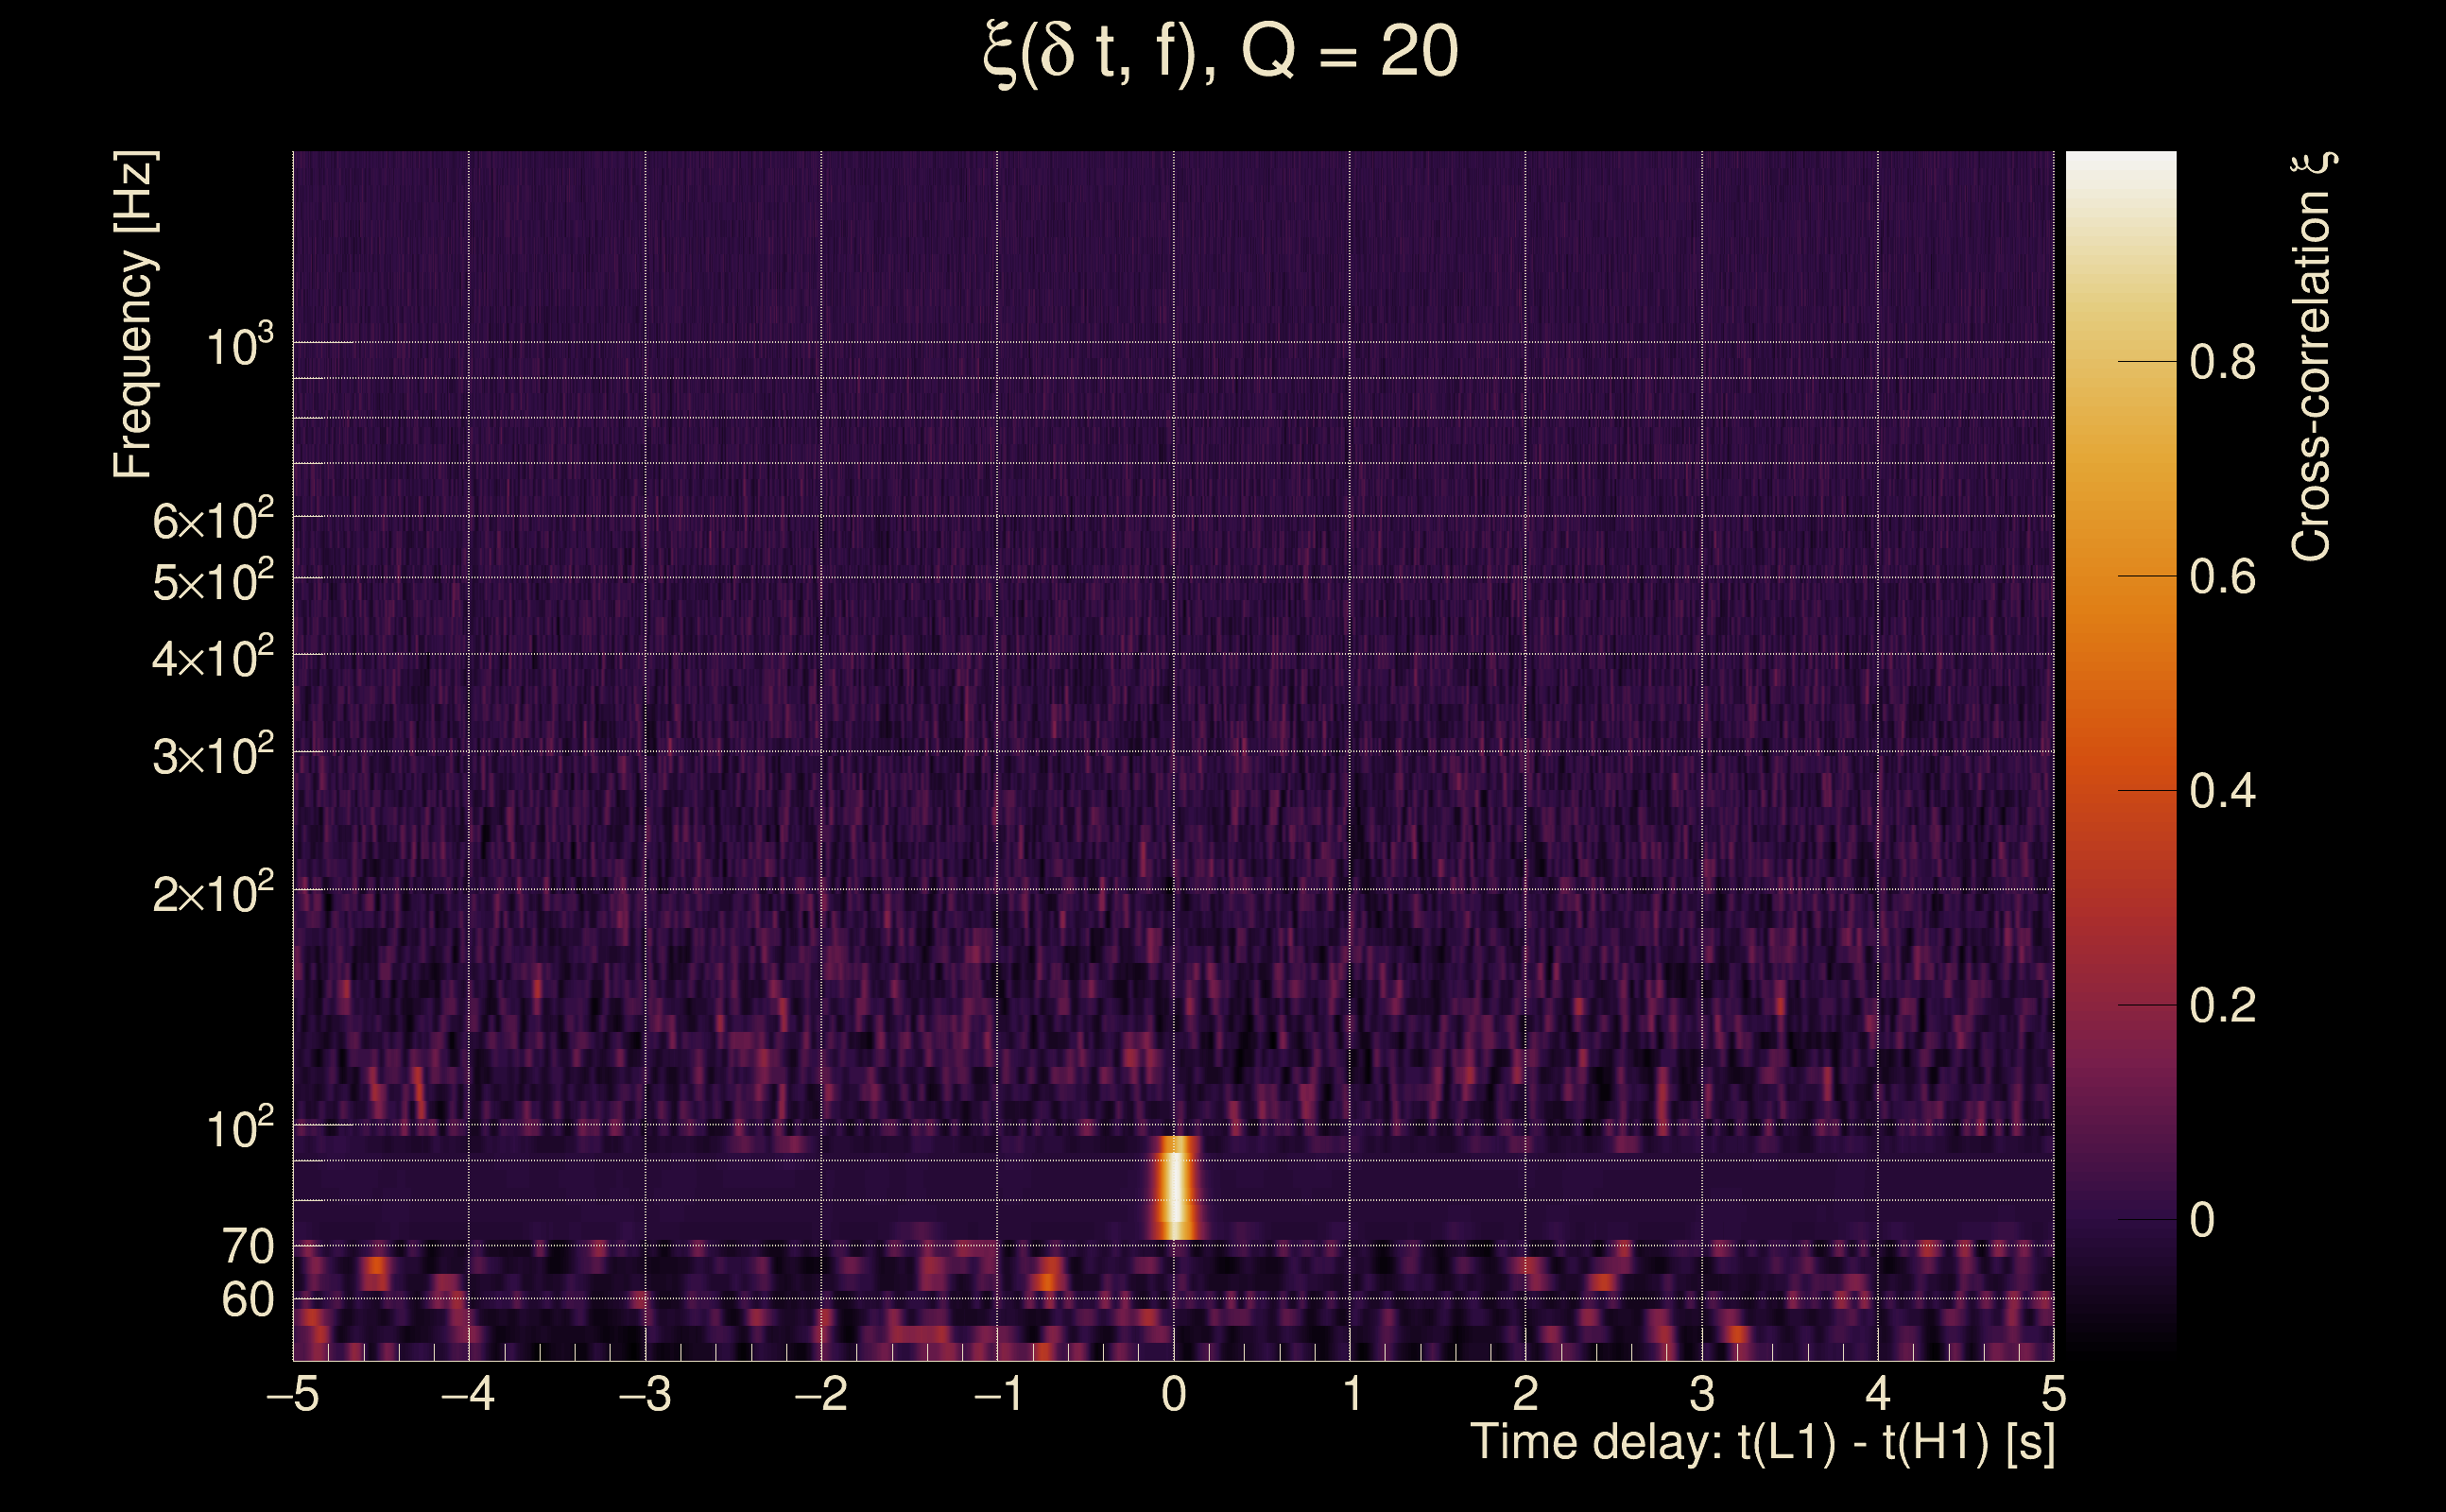
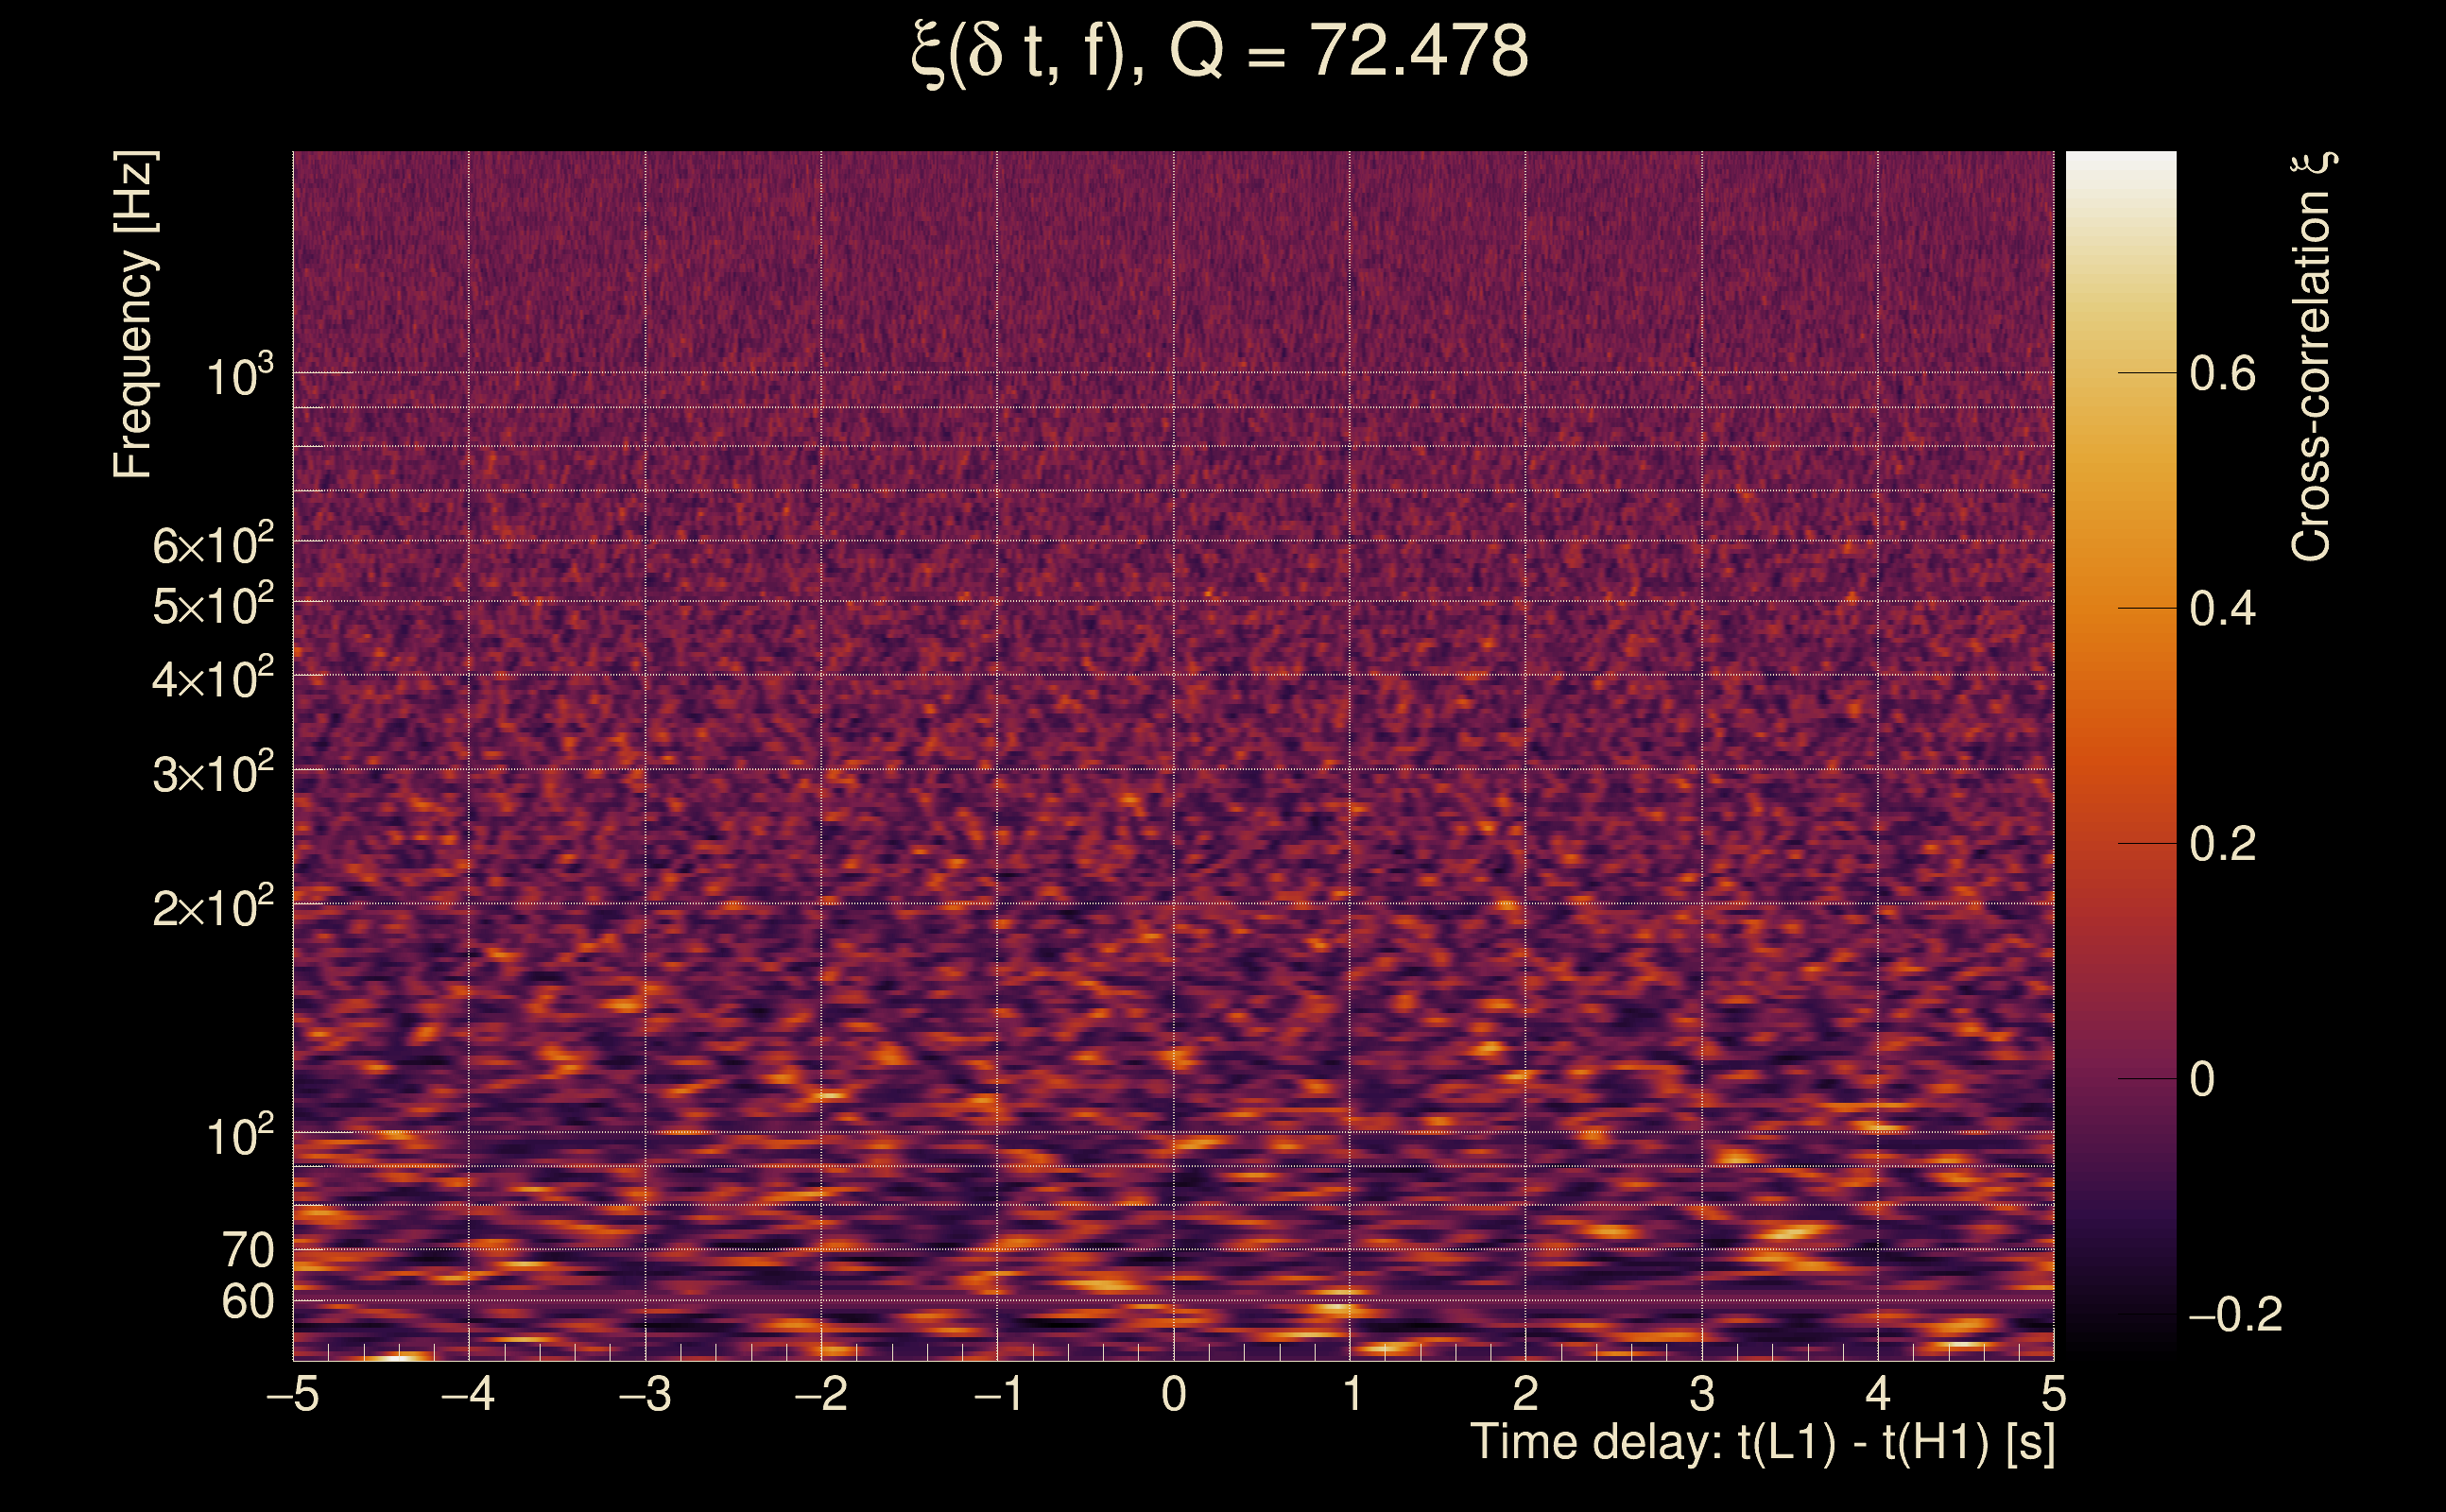
| Time delay between detectors t(L1) - t(H1): | 0.00480839 s (slice index = 108 / 217), δt_gw = 0.00480839 s |
| Time delay standard deviation: | 0.0821852 s |
| [targeted mode] Time delay probability: | 0.568509 (0.570248 sigmas), δt_target = 1.72247e+45 s |
| Frequency: | 92.8891 Hz |
| Ξ: | 0.294932 ± 0.0525793 (variance = 0.00276459): Q0: 0.853217, Q1: 0.814021, Q2: 0.729309, Q3: 0.837196, Q4: 0.885069 |
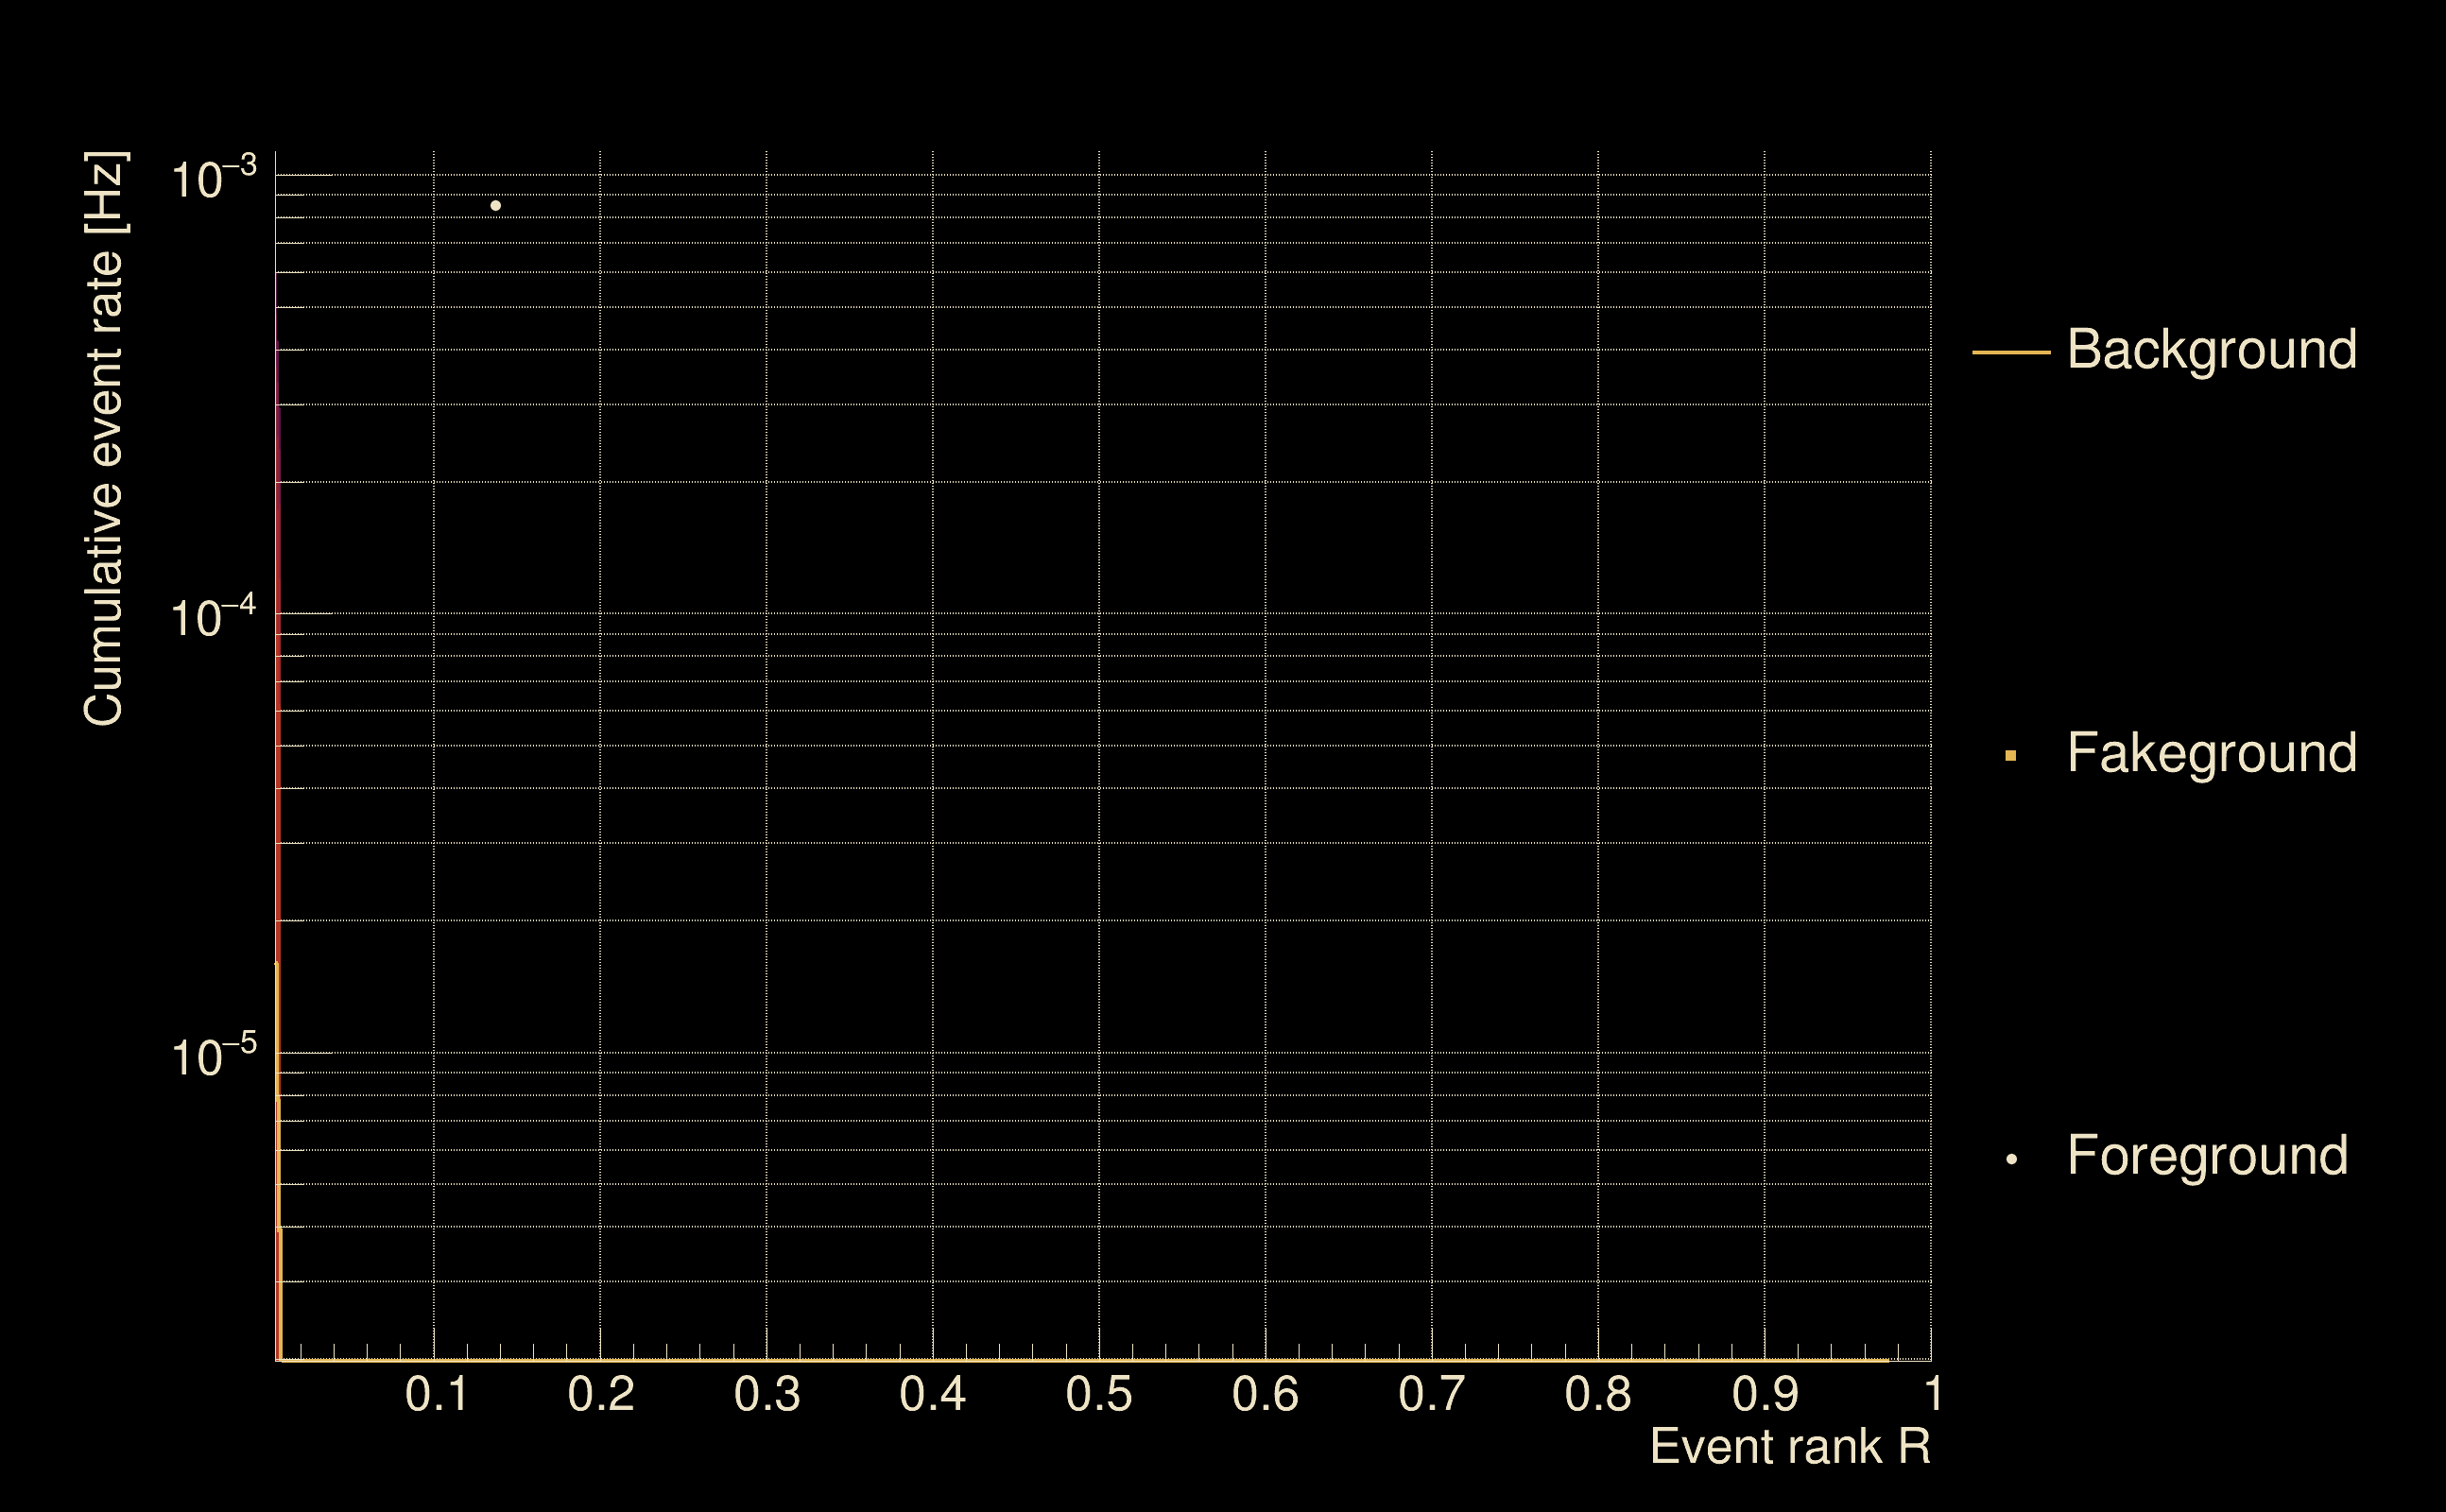
| Rank: | R_A = 0.136902 |
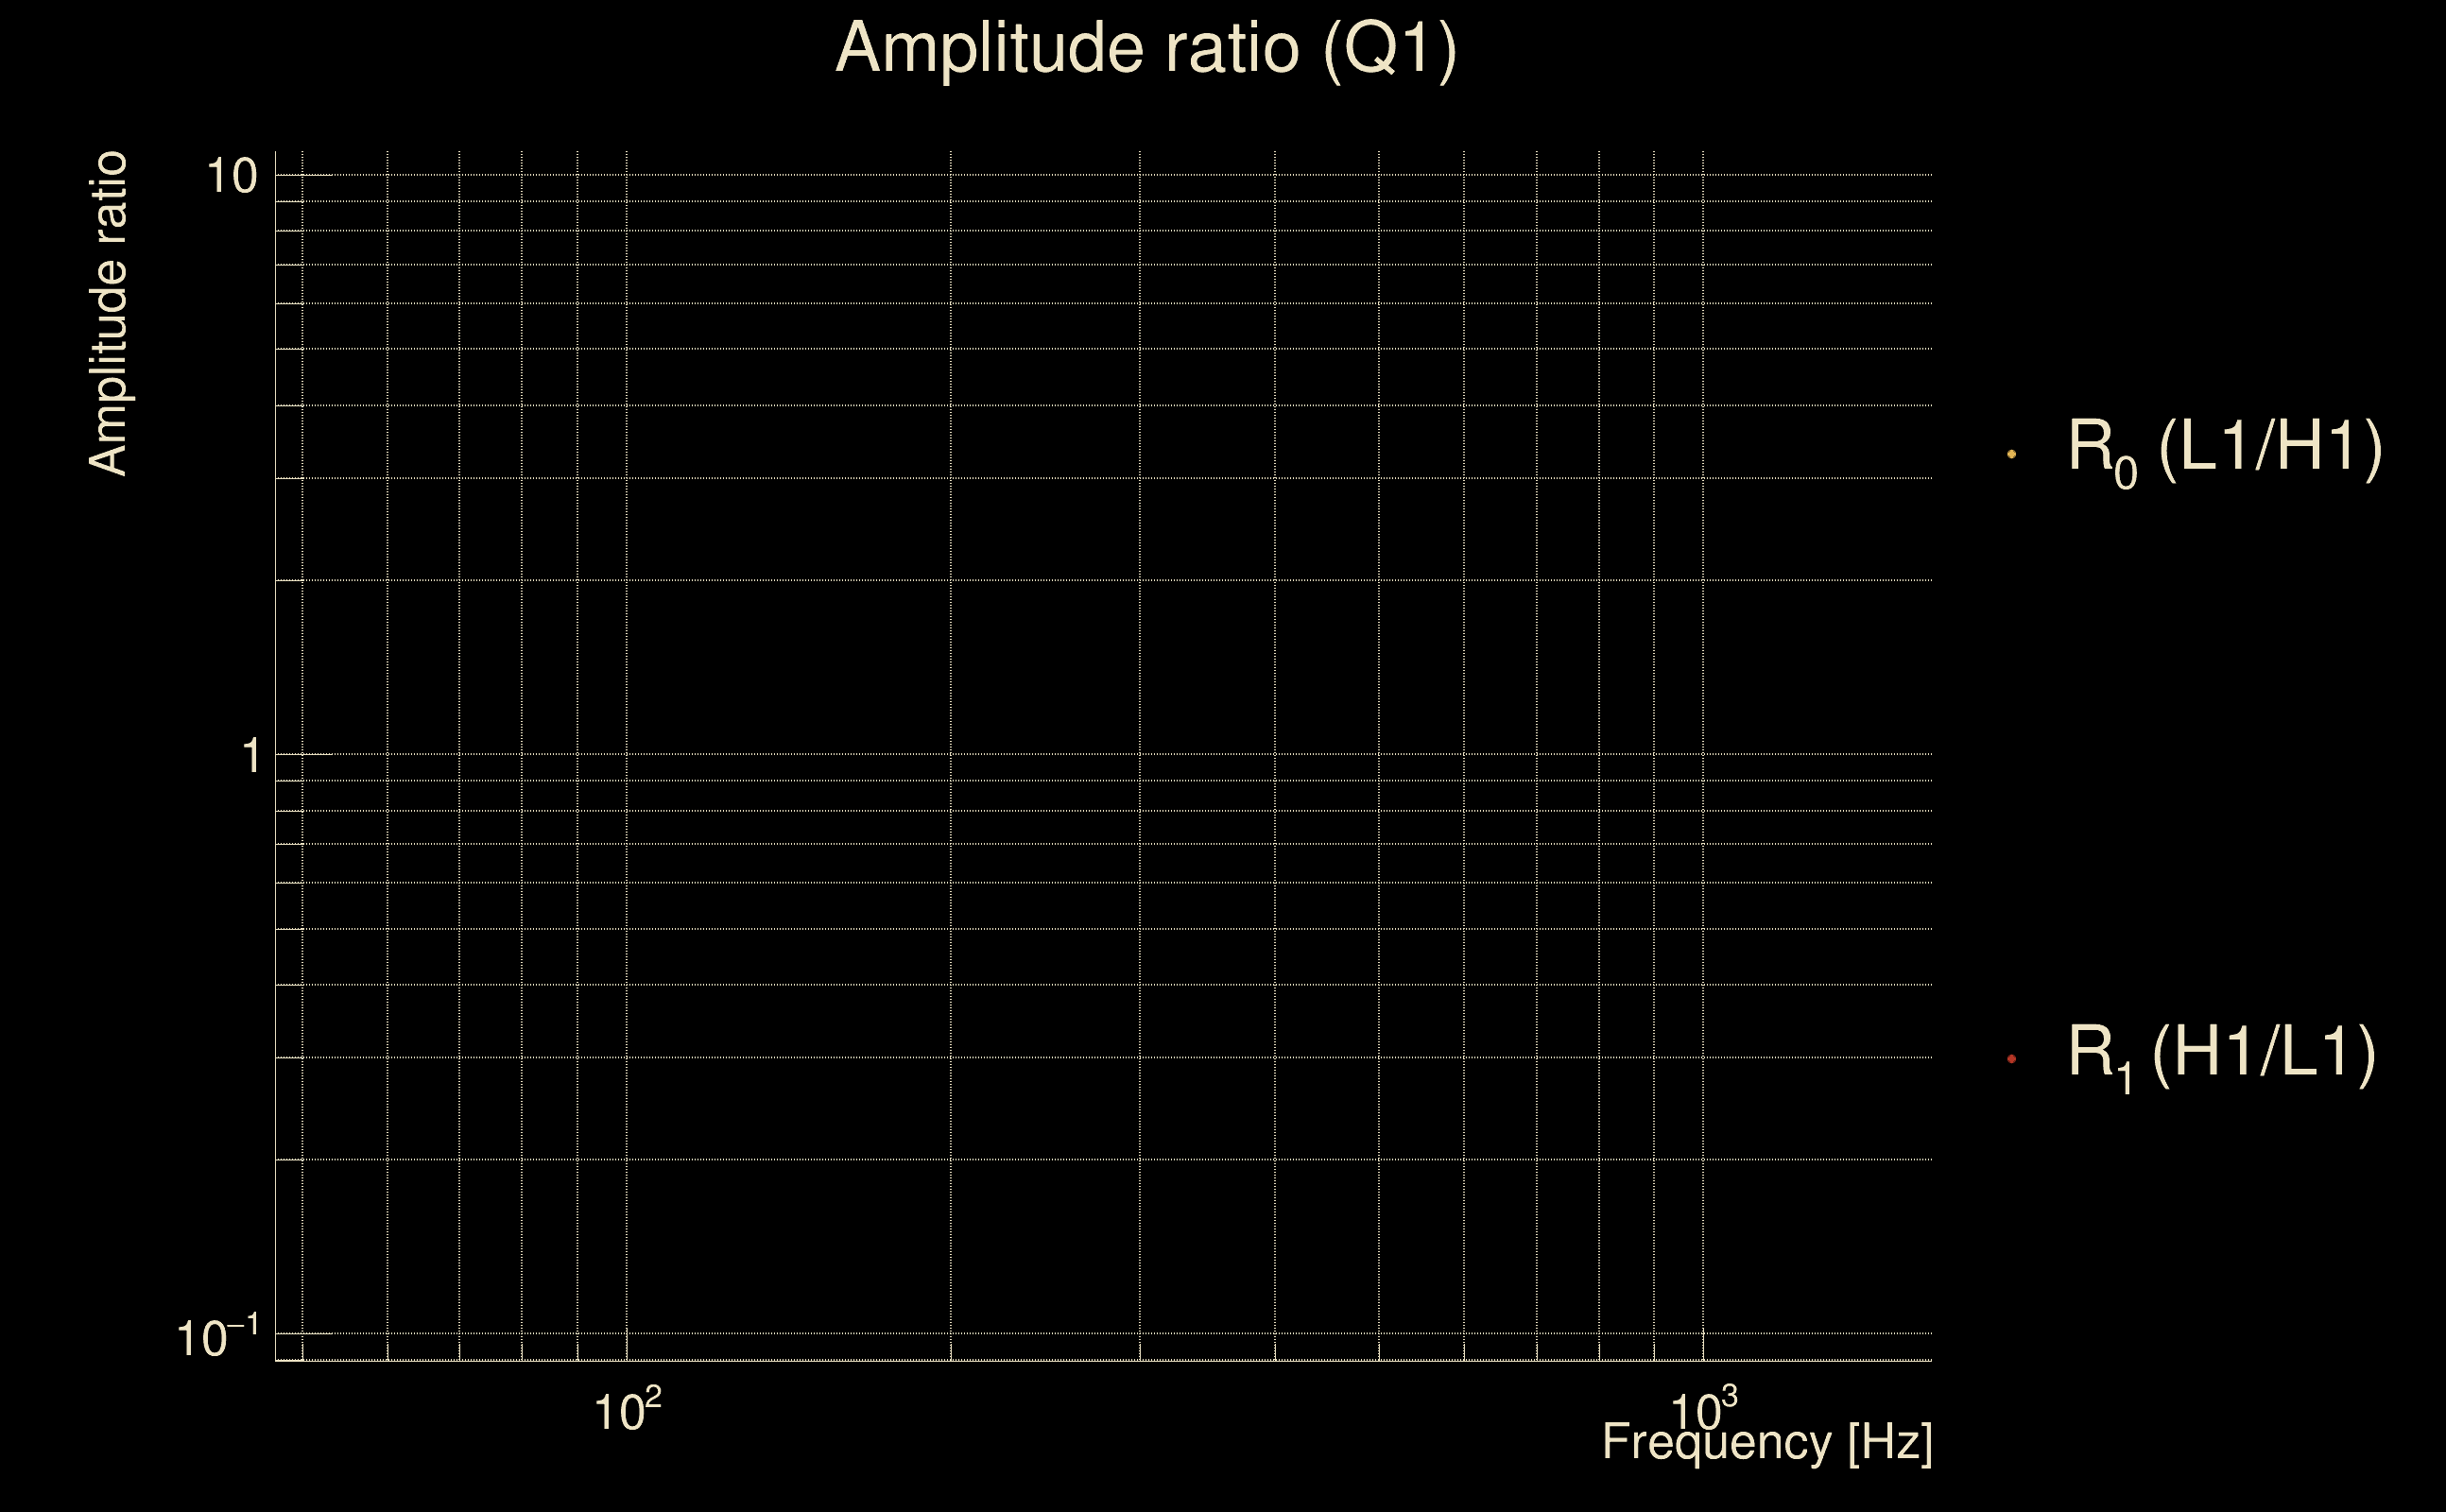
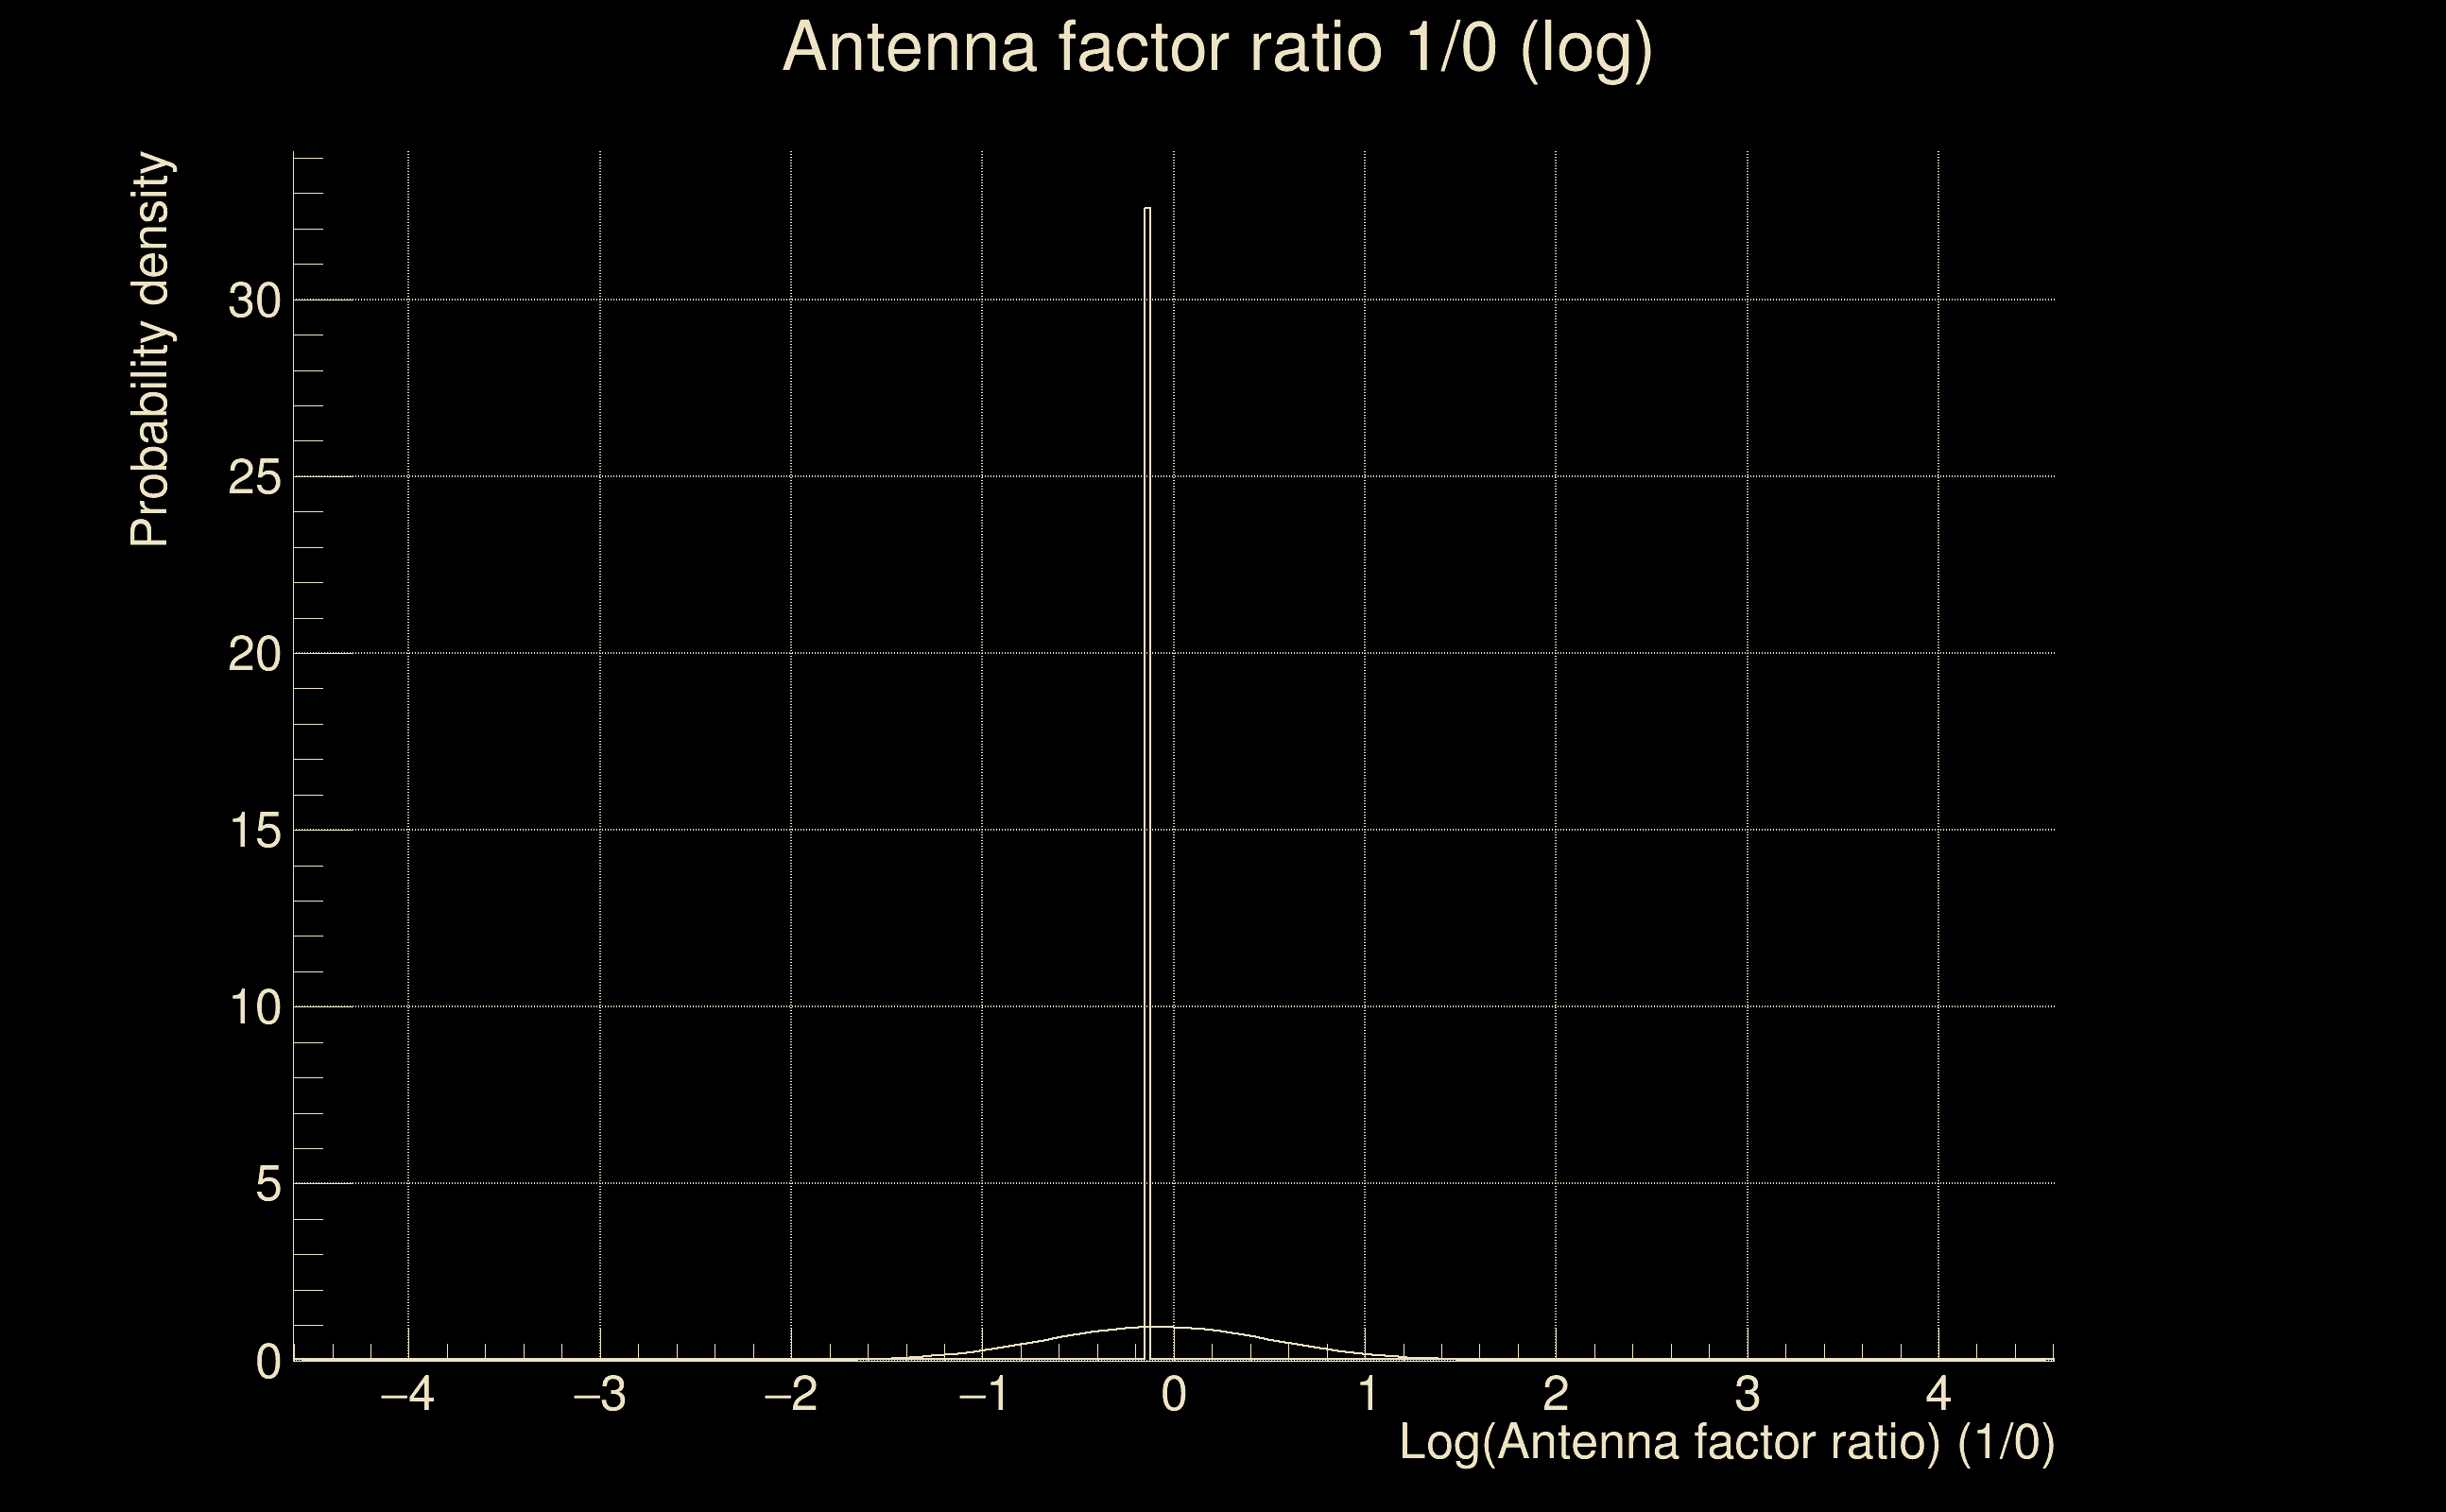
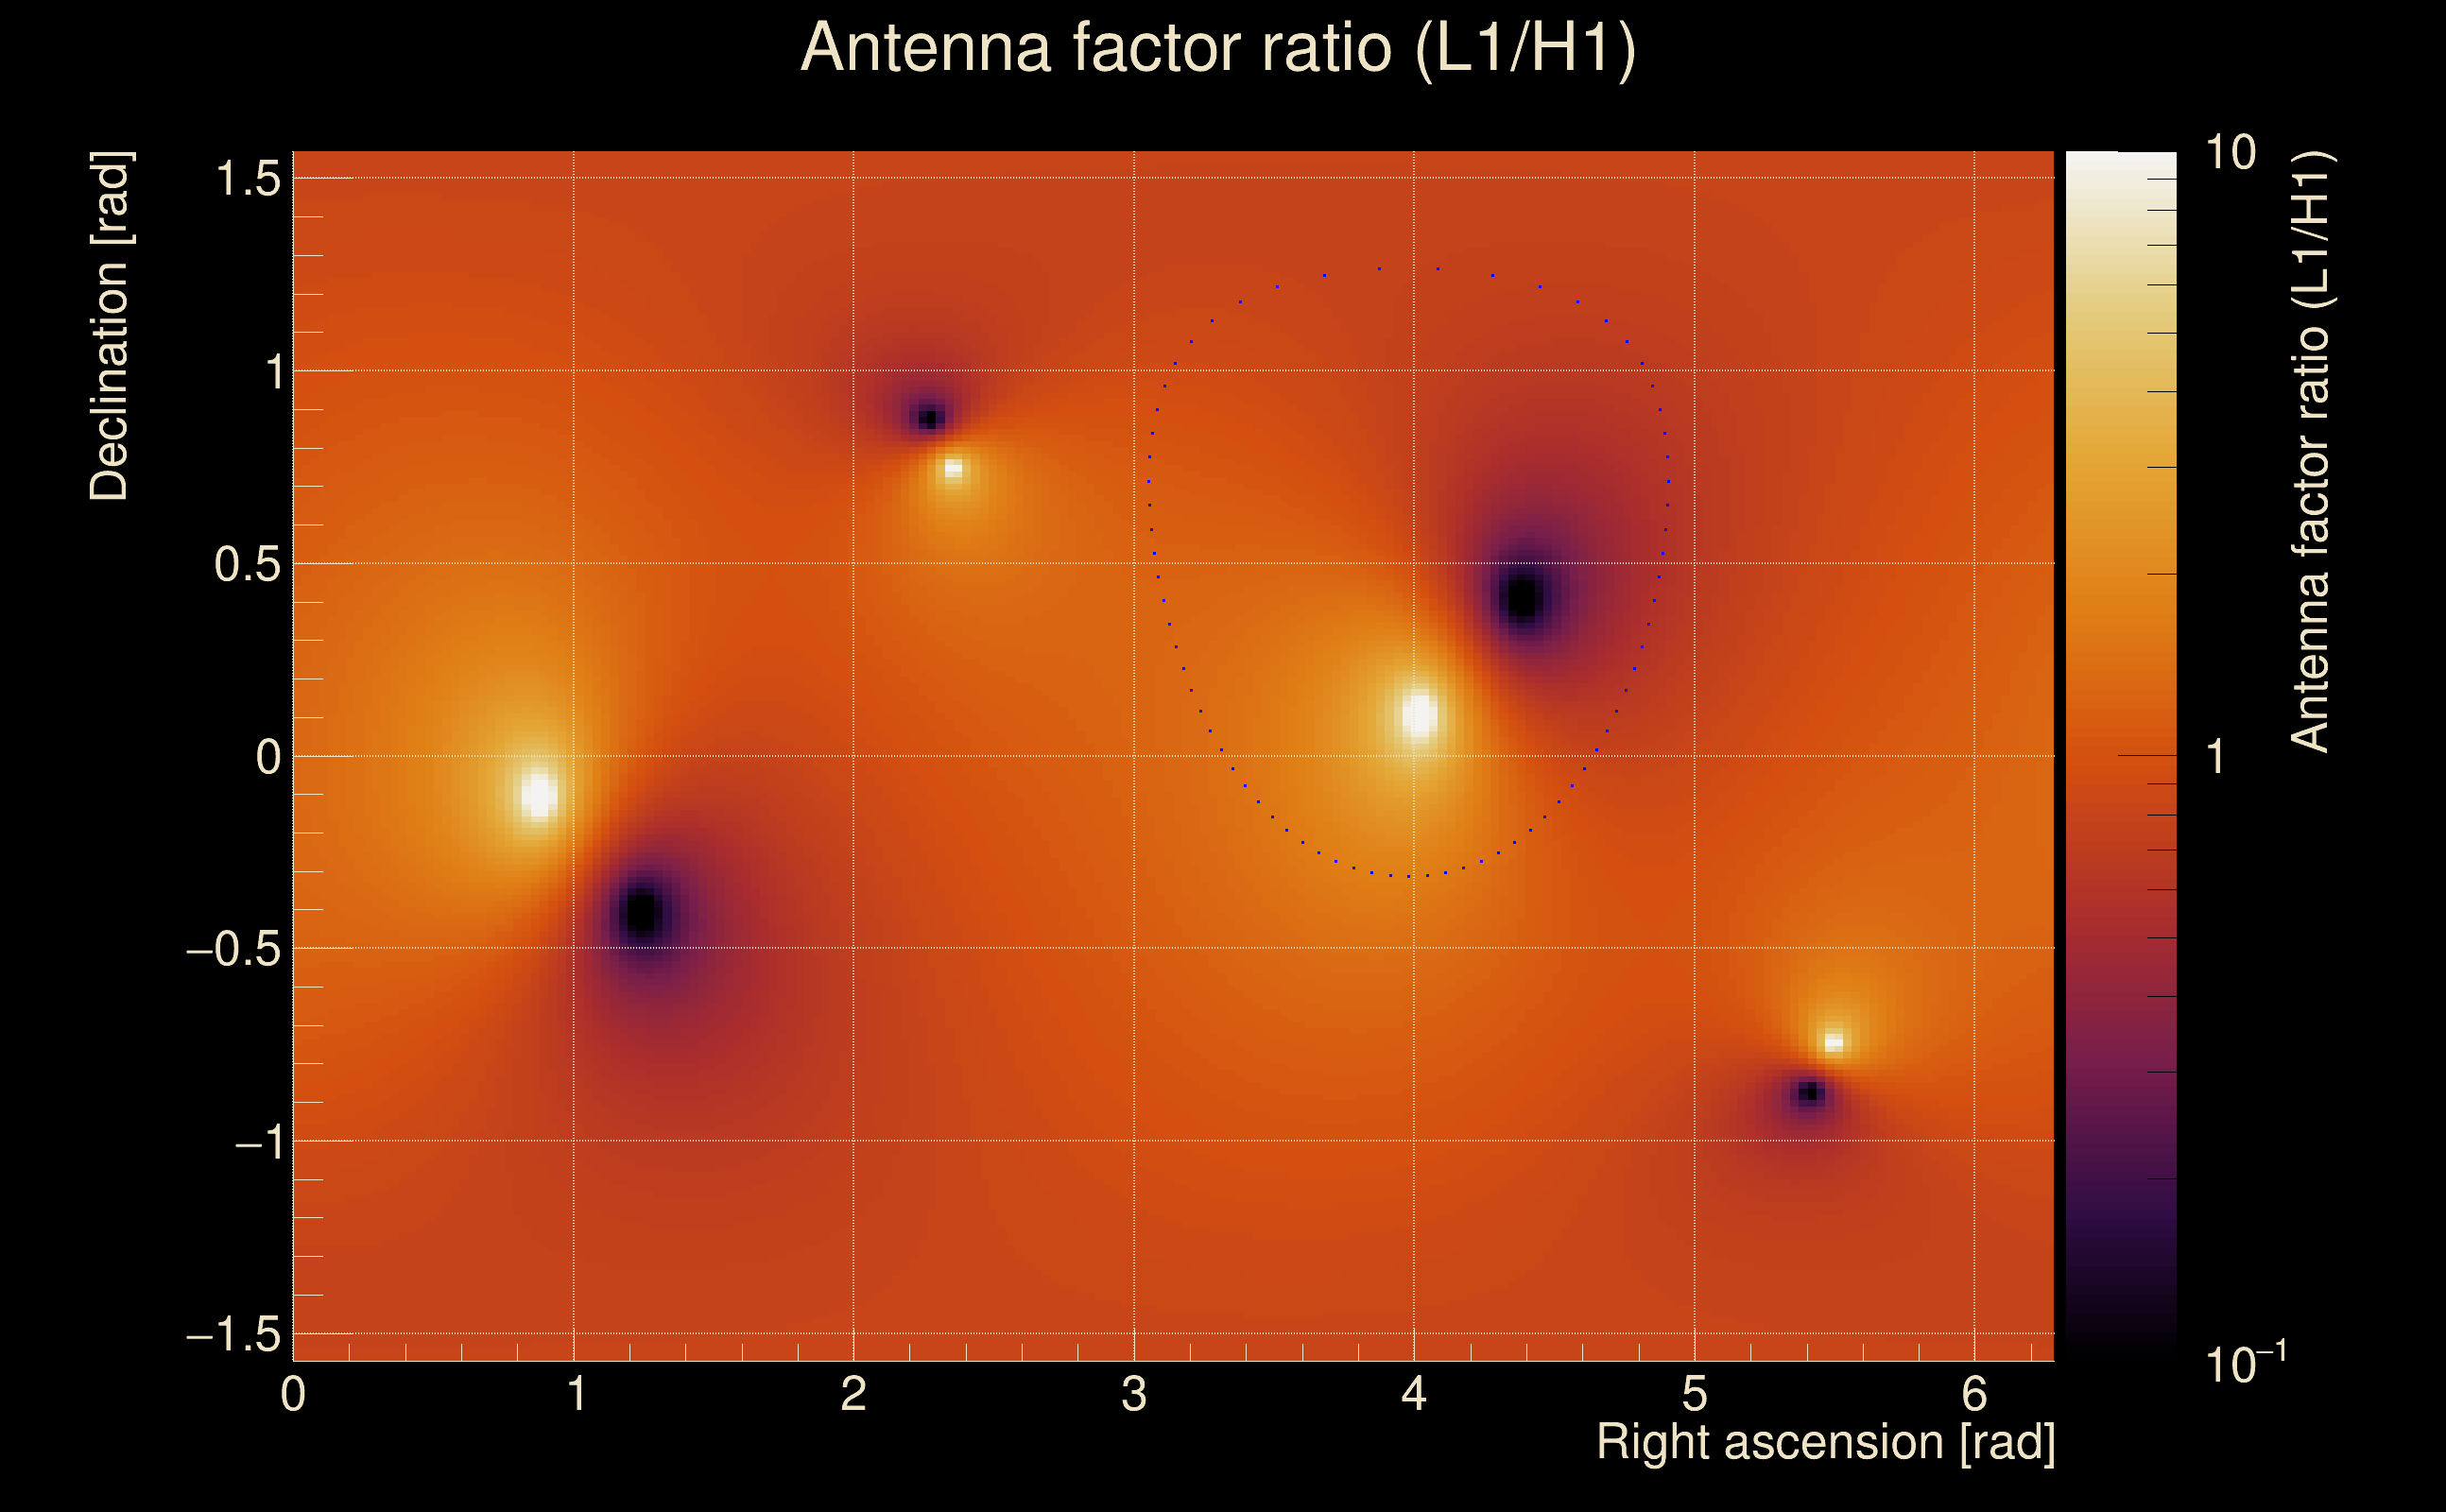
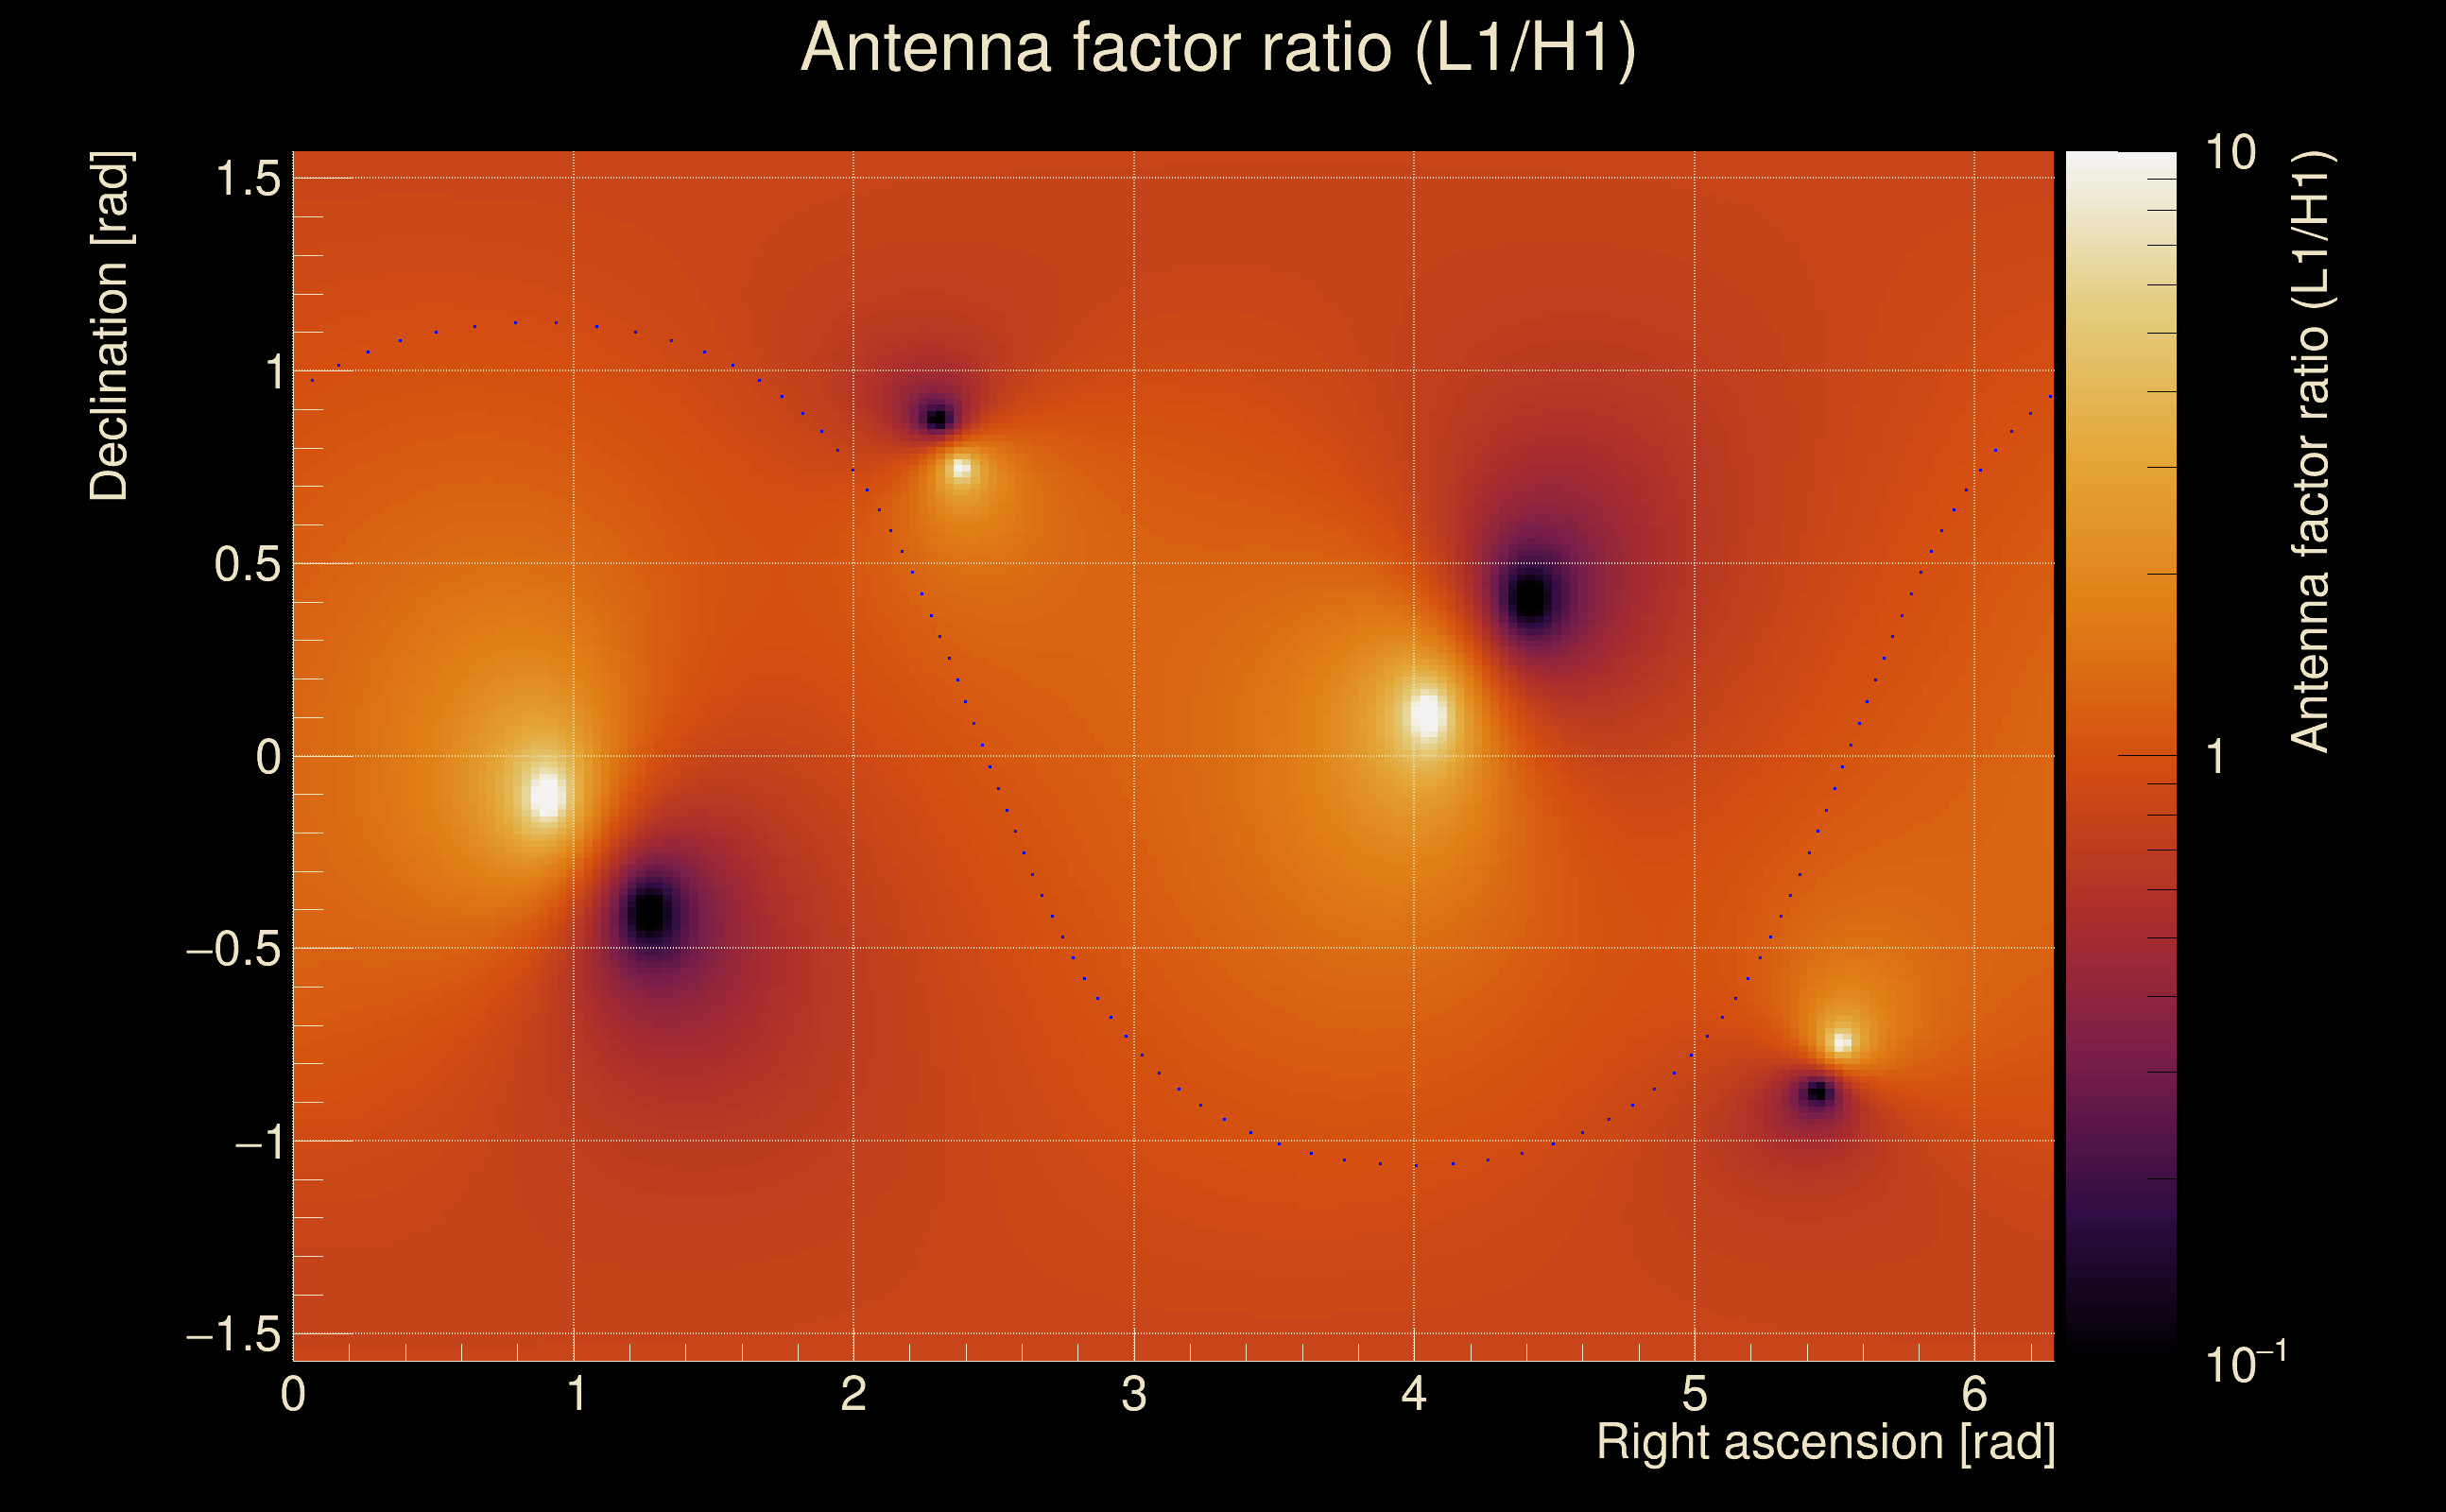
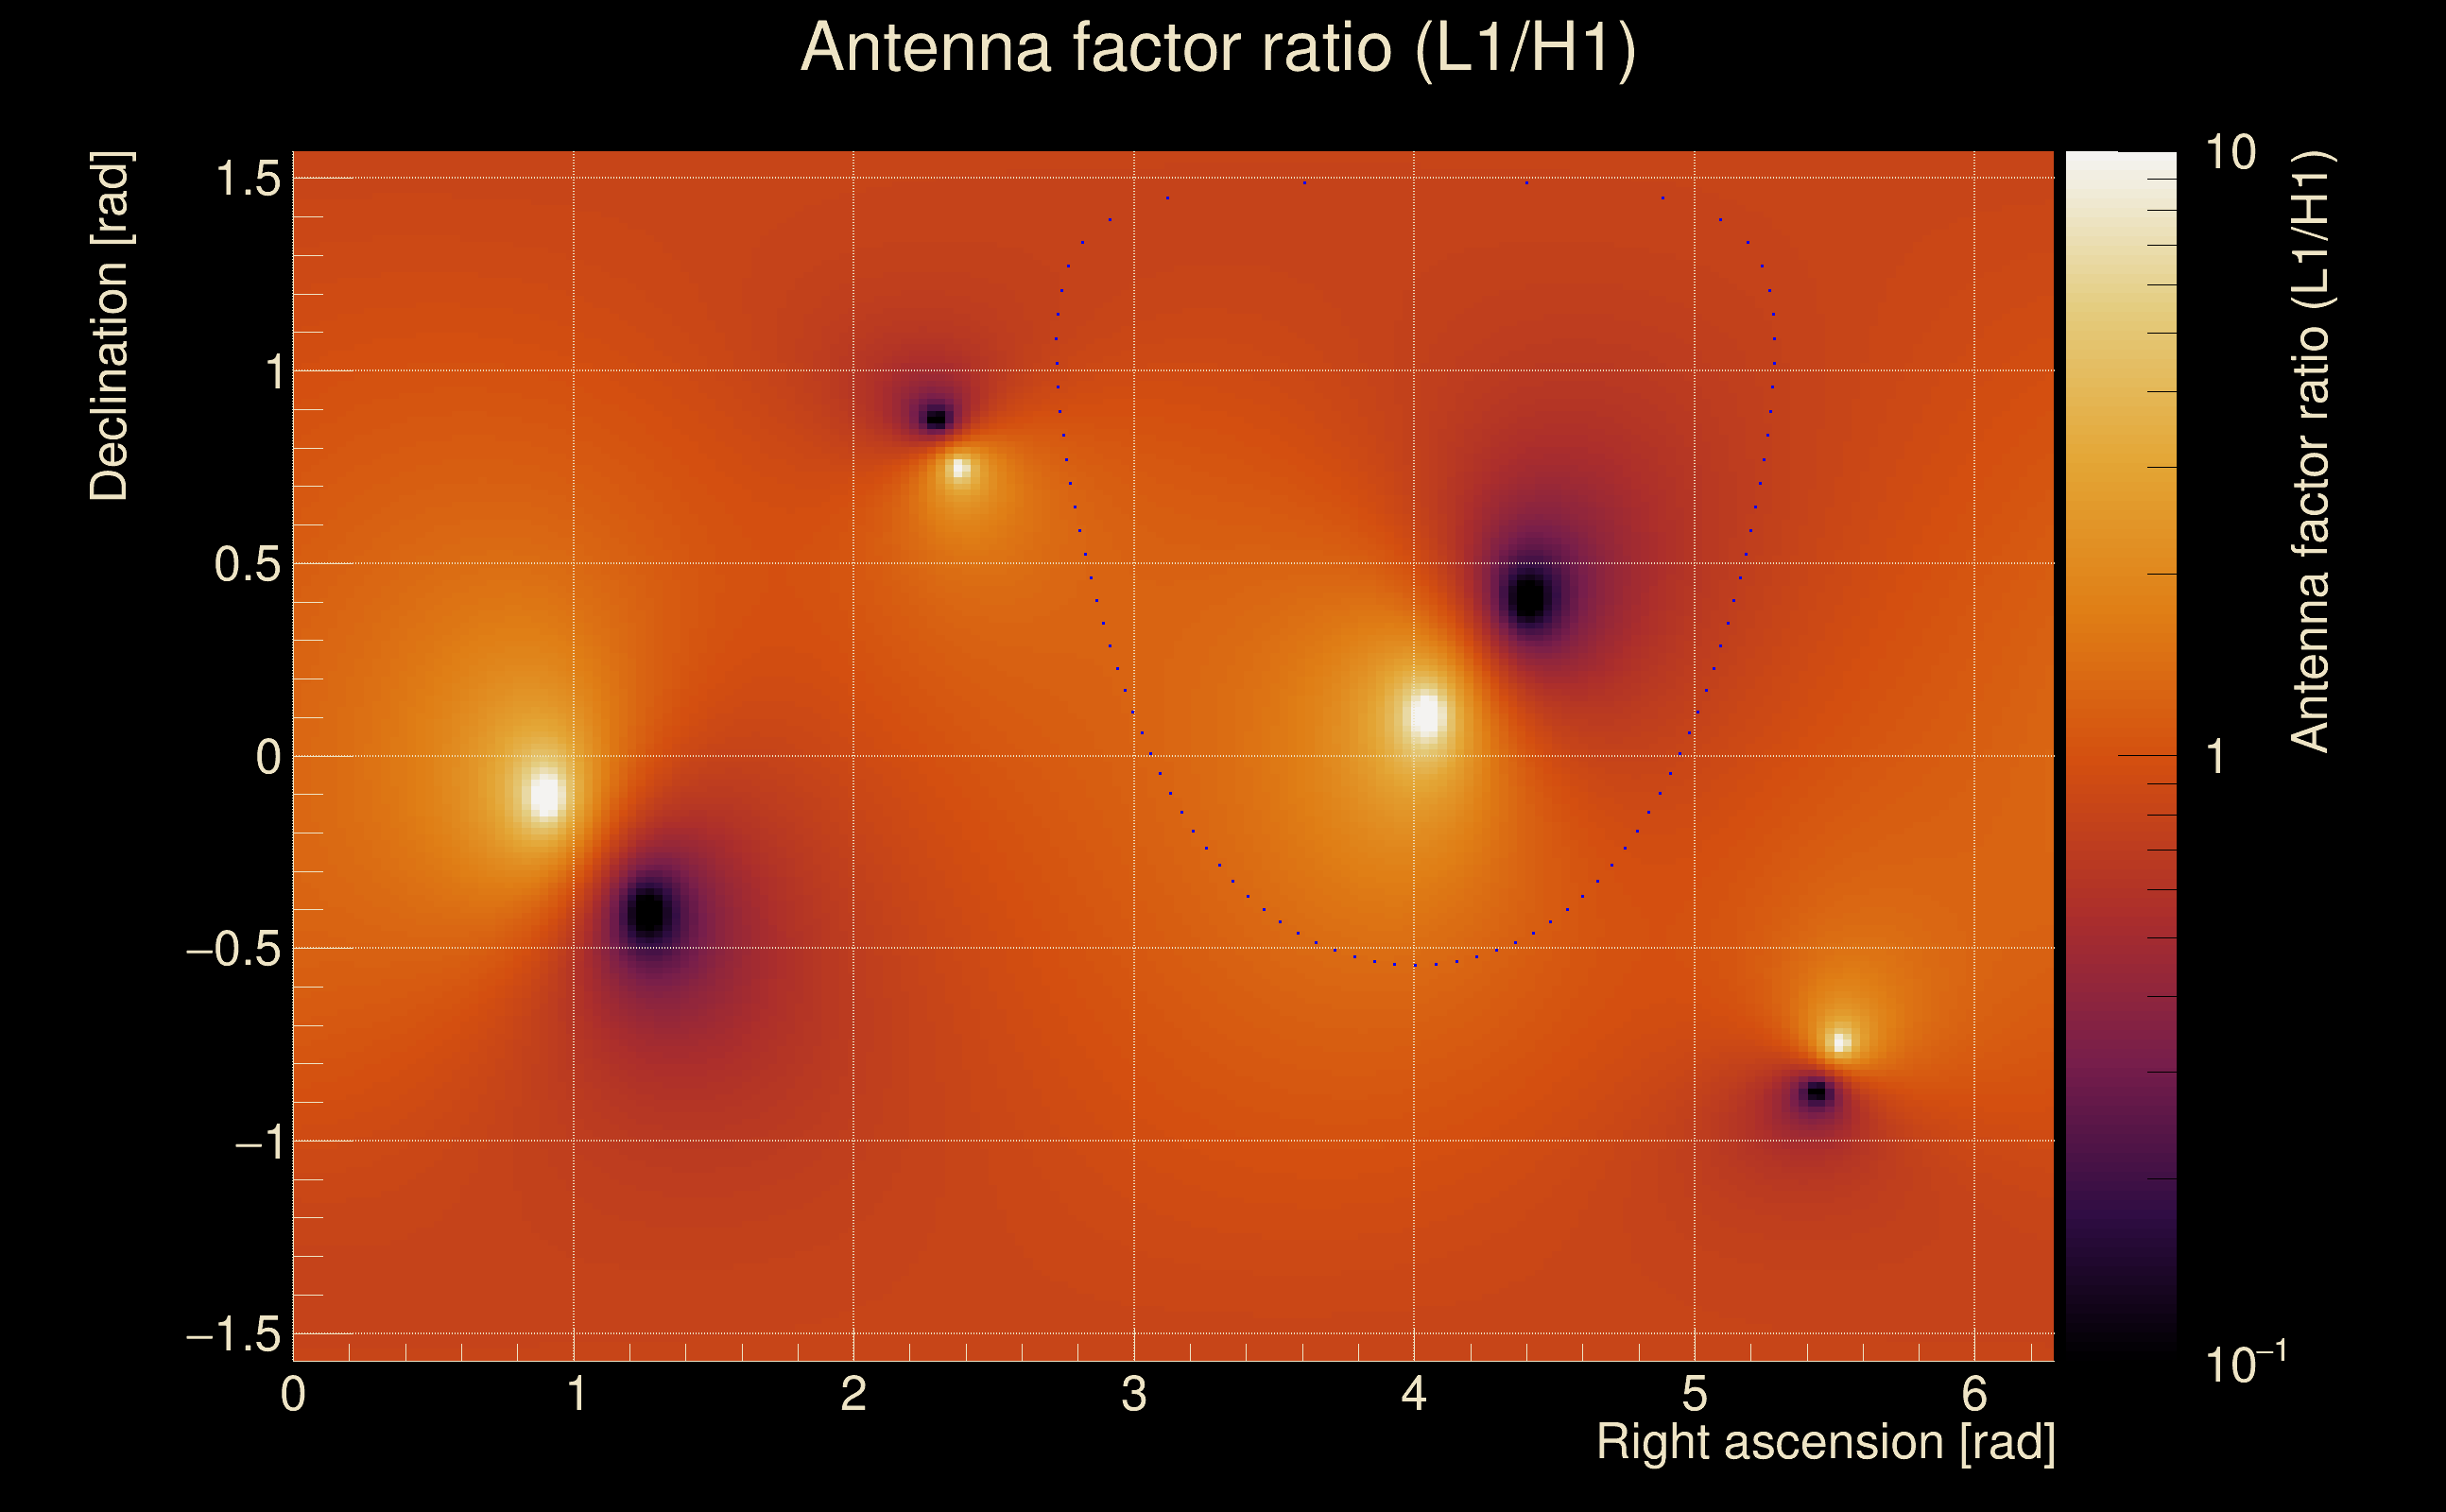
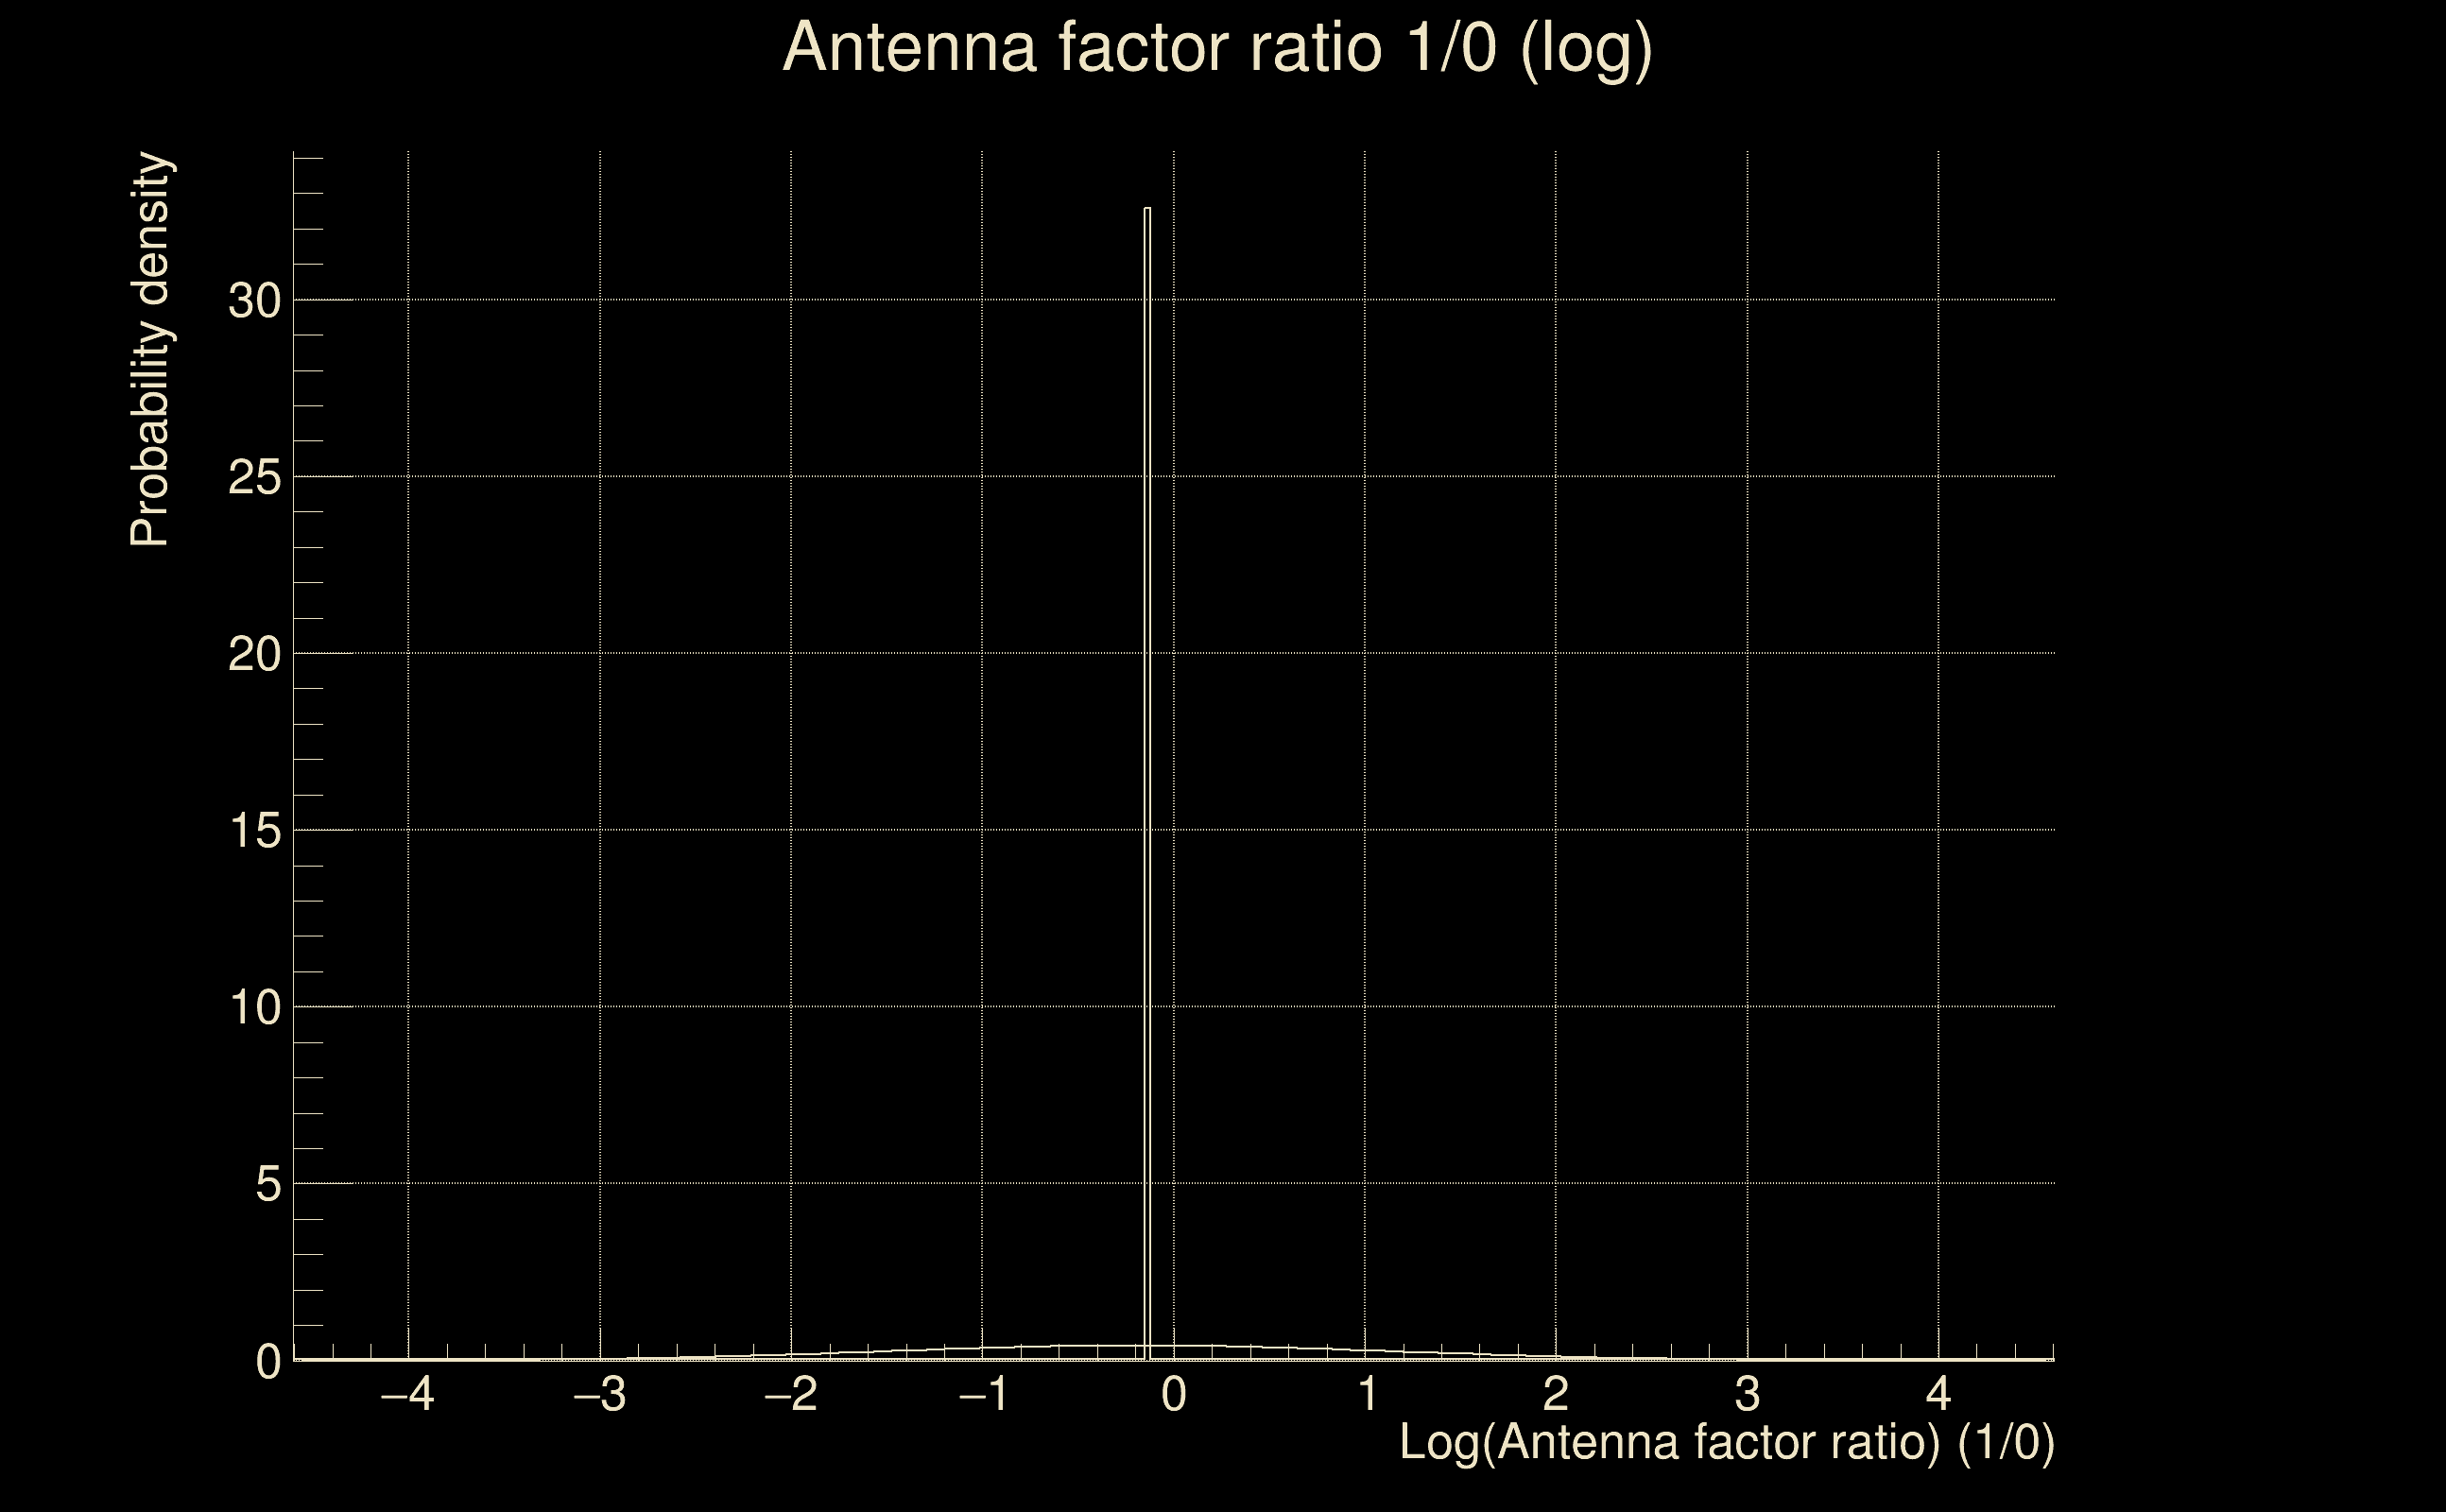
| Log of amplitude ratio (L1/H1): | -0.0762898, variance = 0.170409 (L1/H1: -0.0932248, variance = 0.318332, H1/L1: 0.0486027, variance = 0.332227) |
| Amplitude ratio (L1/H1): | 0.926548 ⋇ 1.51105 (L1/H1: 0.910989 ⋇ 1.75806, H1/L1: 1.0498 ⋇ 1.77961) |
| Amplitude ratio H1|L1 compatibility (probability): | 0.955881 |
| Antenna factor probability: | 0.854174 |
| Number of rejected frequency rows: | Q0: 9 / 18, Q1: 26 / 36, Q2: 63 / 70, Q3: 117 / 134, Q4: 234 / 258 |
| Maximum signal-to-noise ratio: | H1: 40.955, L1: 32.0302 |
| SNR variance: | H1: 1.1235, L1: 0.852926 |
| Click here for a zoomed plot | Click here for a zoomed plot | Click here for a zoomed plot | Click here for a zoomed plot | Click here for a zoomed plot |
 |
 |
 |
 |
 |
 |
 |
 |
 |
 |
 |
 |
 |
 |
 |
 |
 |
 |
 |
 |
 |
 |
 |
 |
 |
 |
 |
 |
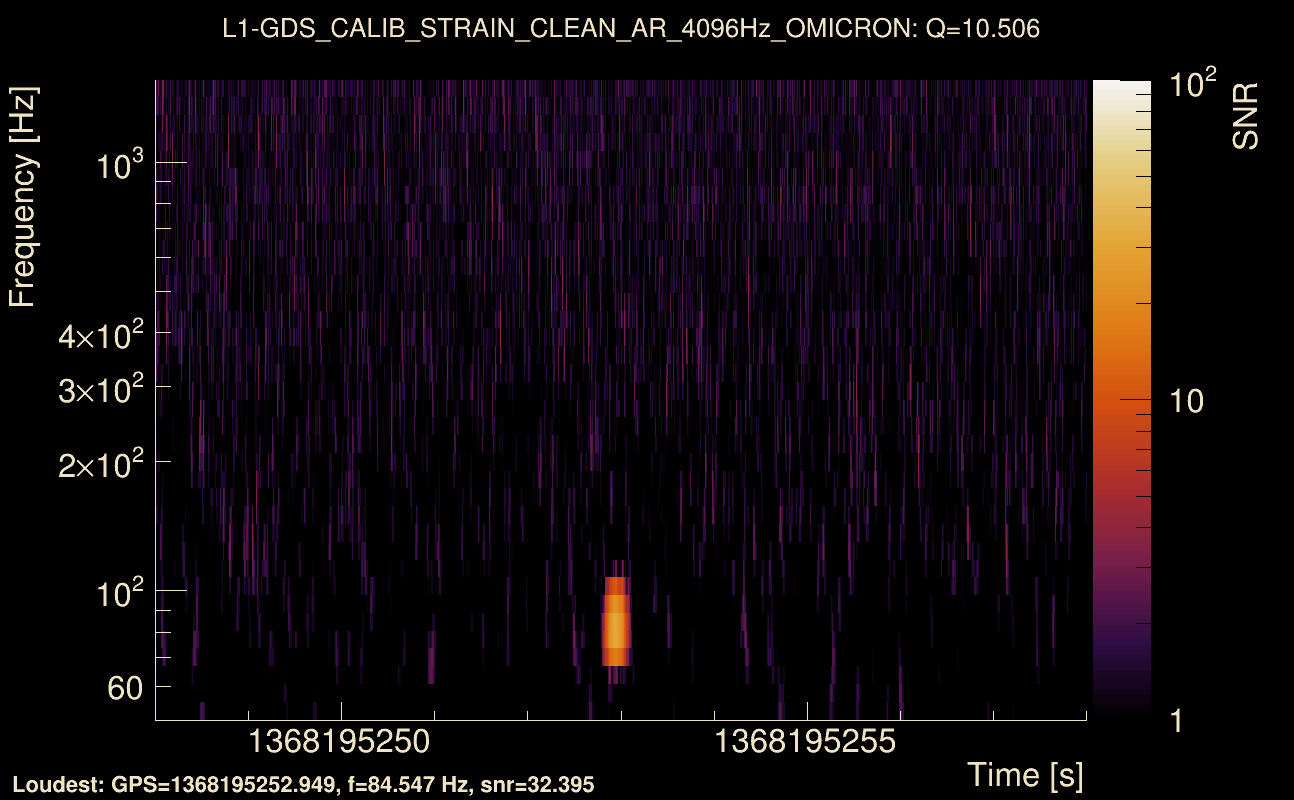
 |
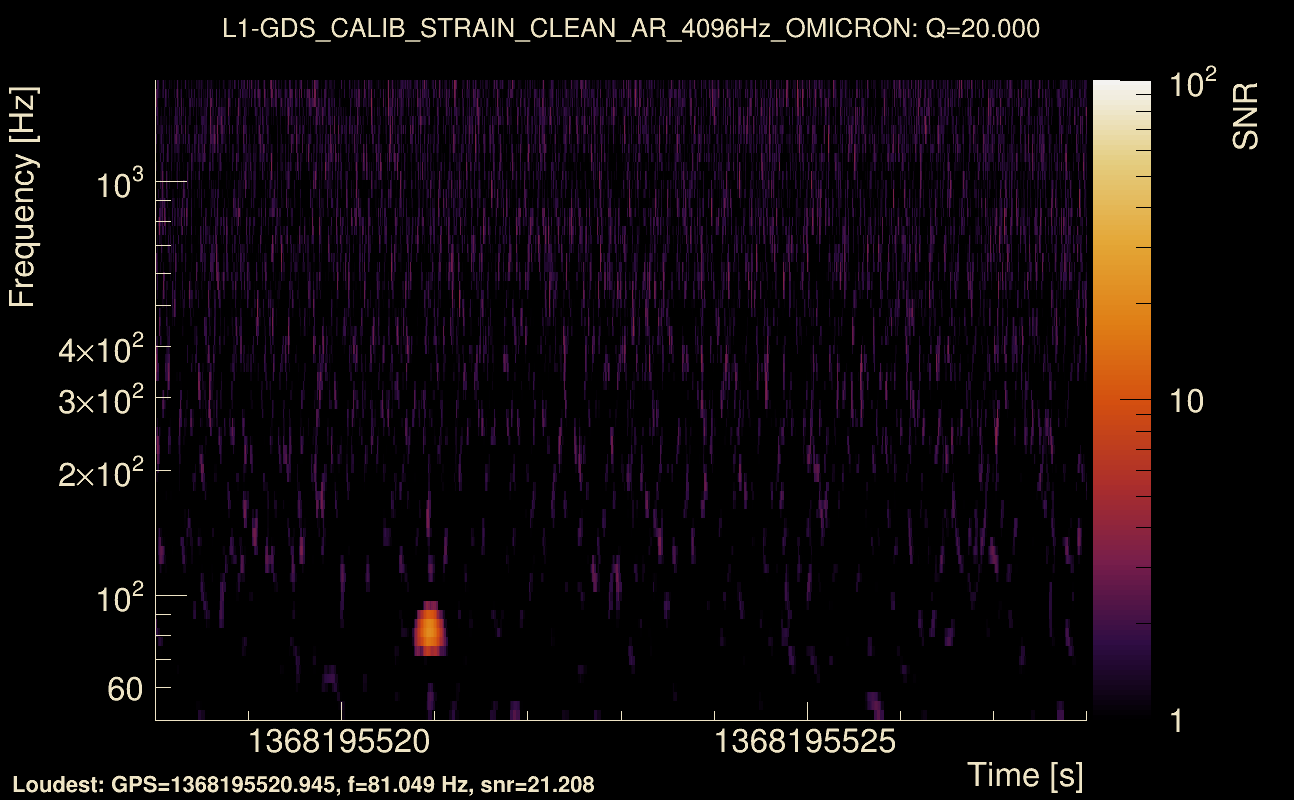
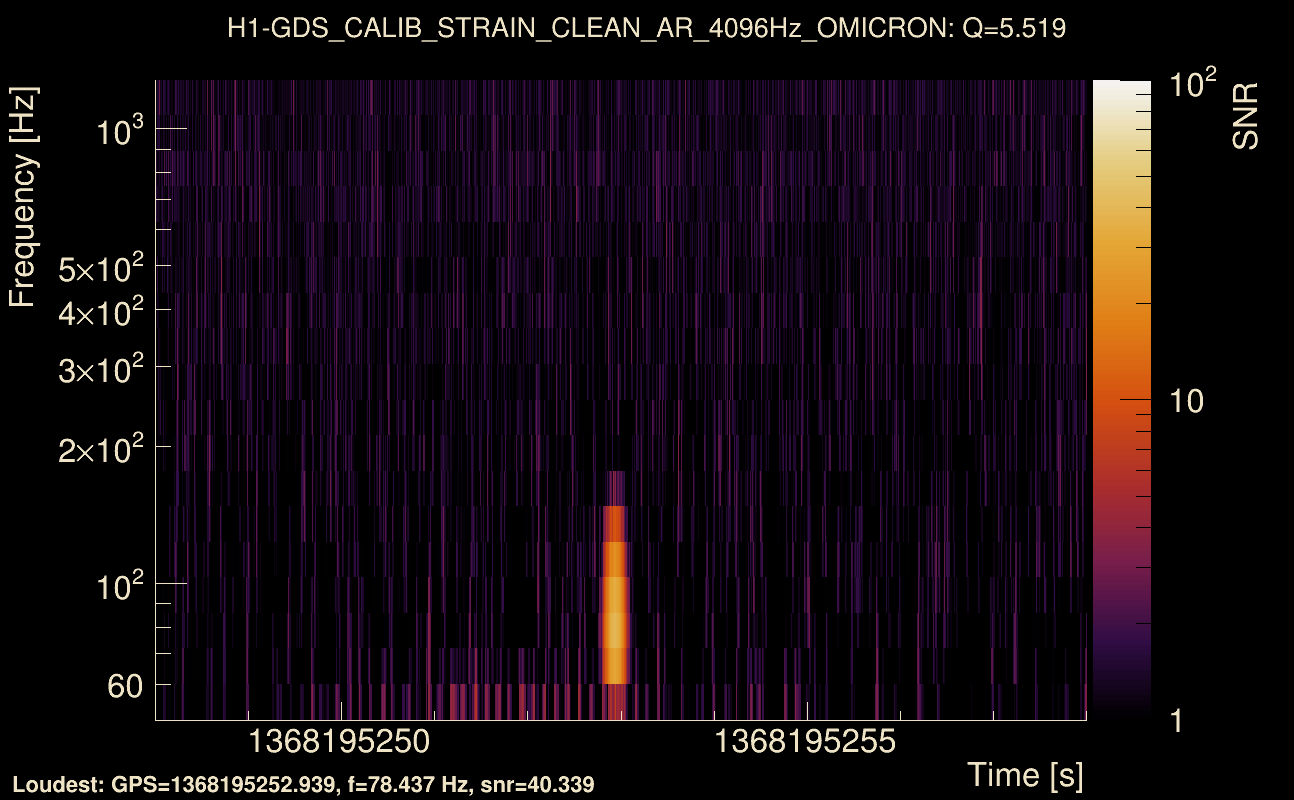
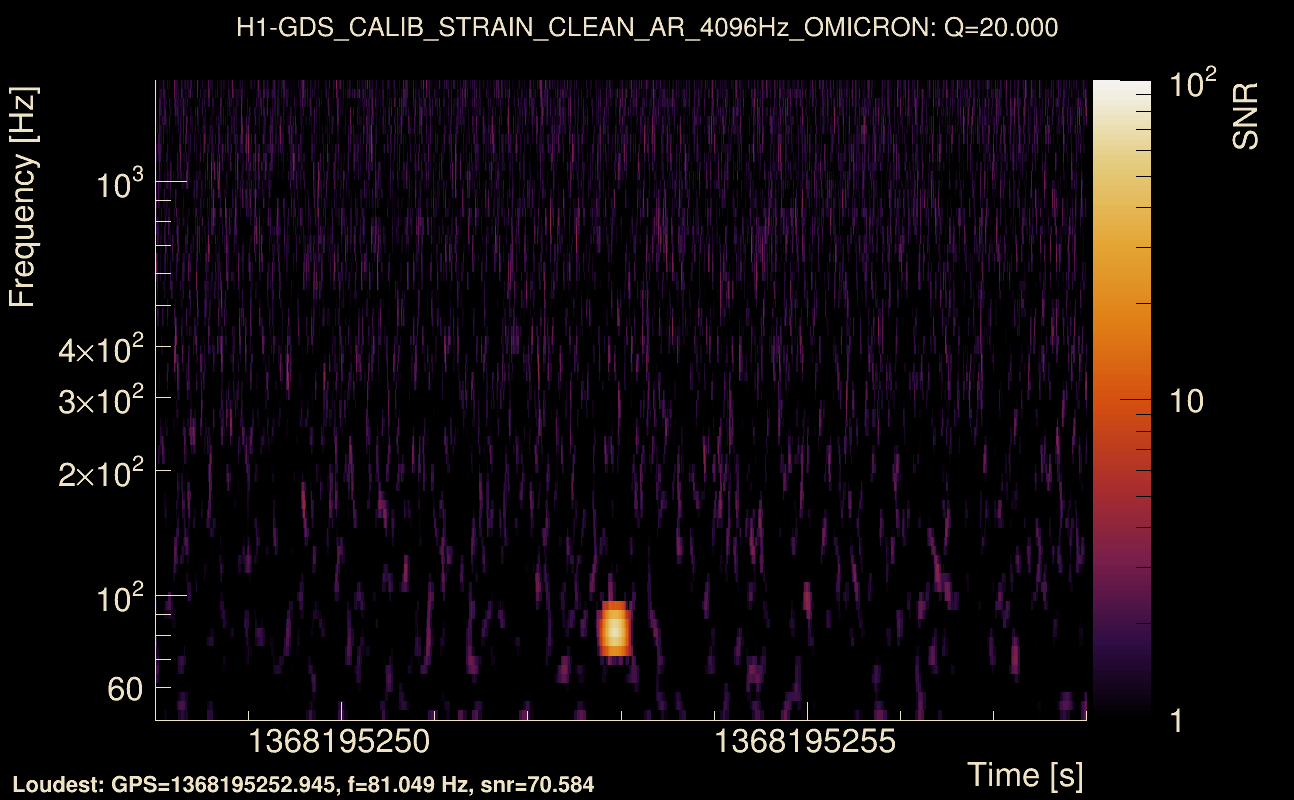
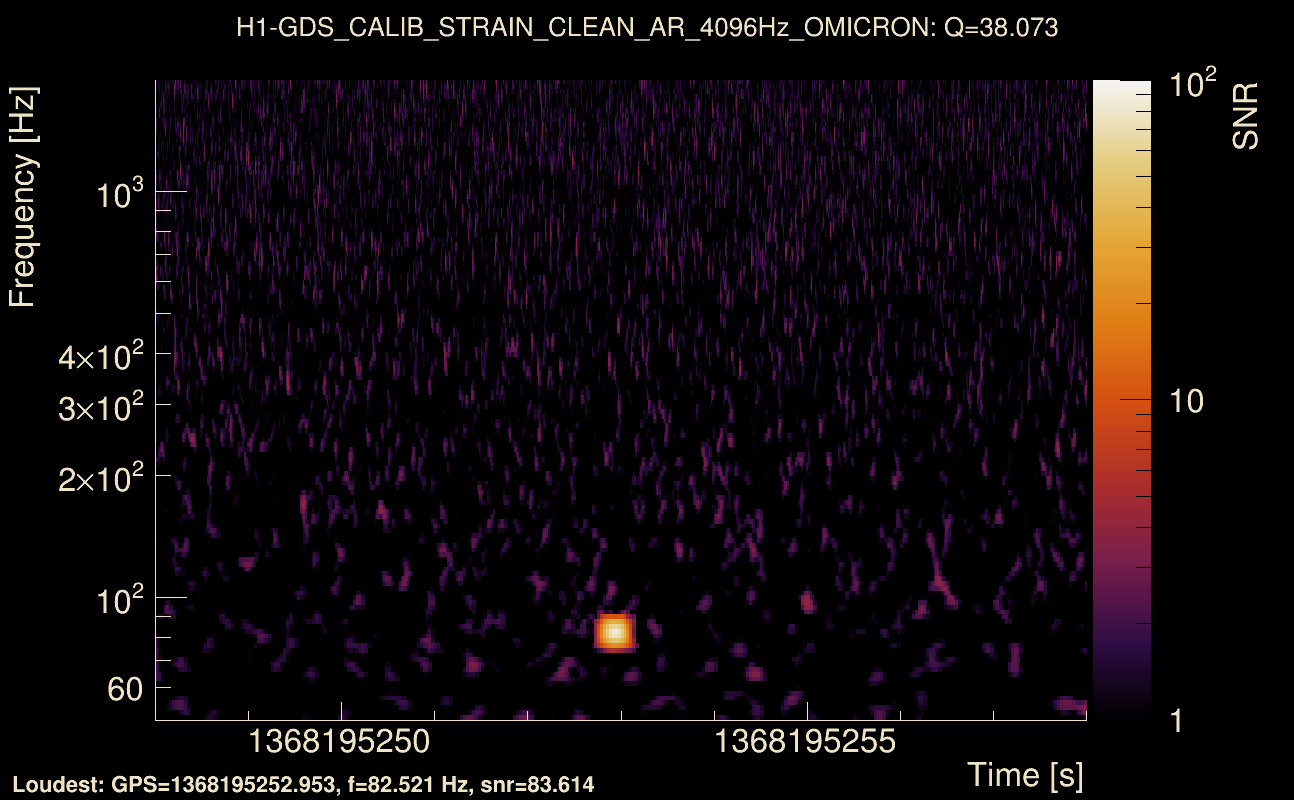
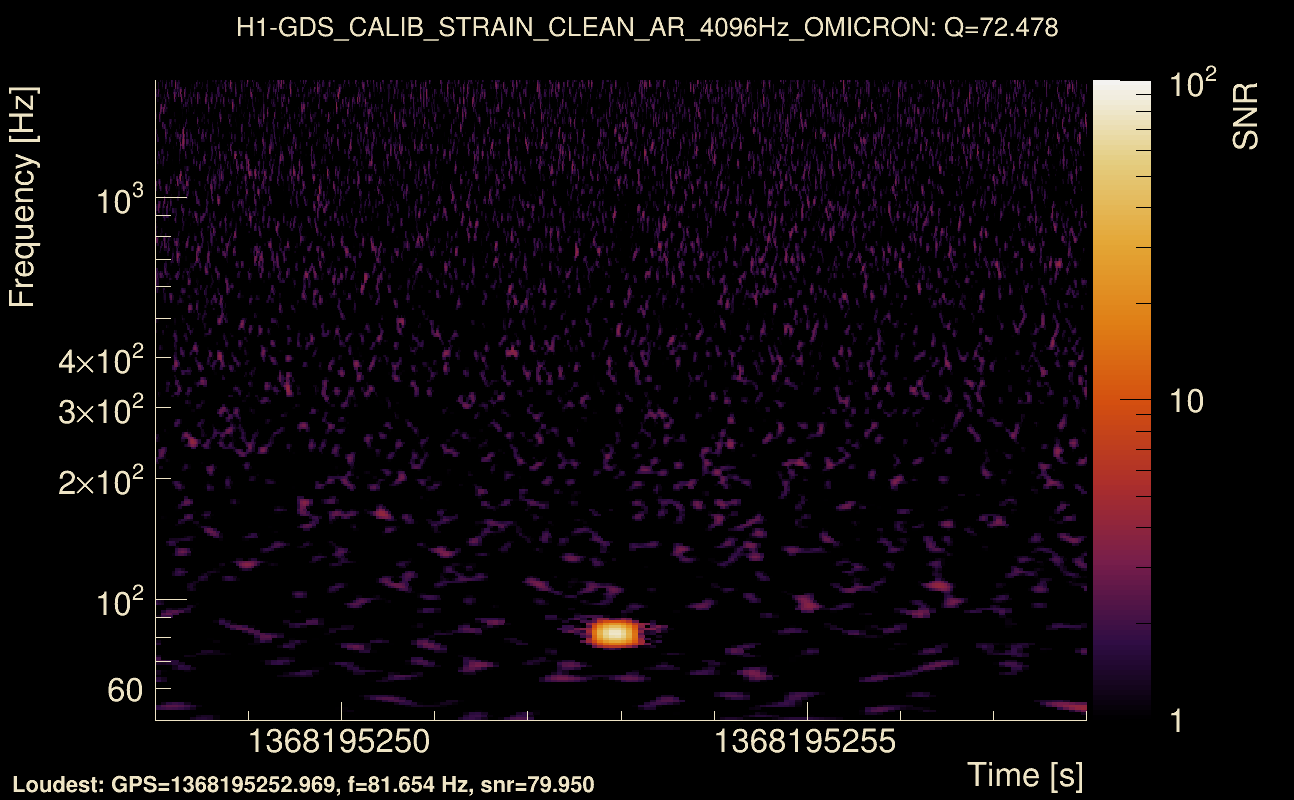
| Event time t(H1): | GPS = 1368195248 (Mon May 15 14:13:50 2023 ) → GPS = 1368195258 (Mon May 15 14:14:00 2023 ) |
| Event time t(L1): | GPS = 1368195248 (Mon May 15 14:14:00 2023 ) → GPS = 1368195258 (Mon May 15 14:14:00 2023 ) |
| Omicron analysis time window (H1): | GPS = 1368195245 → GPS = 1368195261 |
| Omicron analysis time window (L1): | GPS = 1368195245 → GPS = 1368195261 |
| Time delay between detectors t(L1) - t(H1): | 0.00705049 s (slice index = 108 / 217), δt_gw = 0.00705049 s |
| Time delay standard deviation: | 0.0716894 s |
| [targeted mode] Time delay probability: | 0.749595 (0.319173 sigmas), δt_target = 0.00866008 s |
| Frequency: | 89.9177 Hz |
| Ξ: | 0.196811 ± 0.0209102 (variance = 0.000437238): Q0: 0.974414, Q1: 0.980681, Q2: 0.923817, Q3: 0.977397, Q4: 0.961484 |
| Rank: | R_A = 0.131191 |
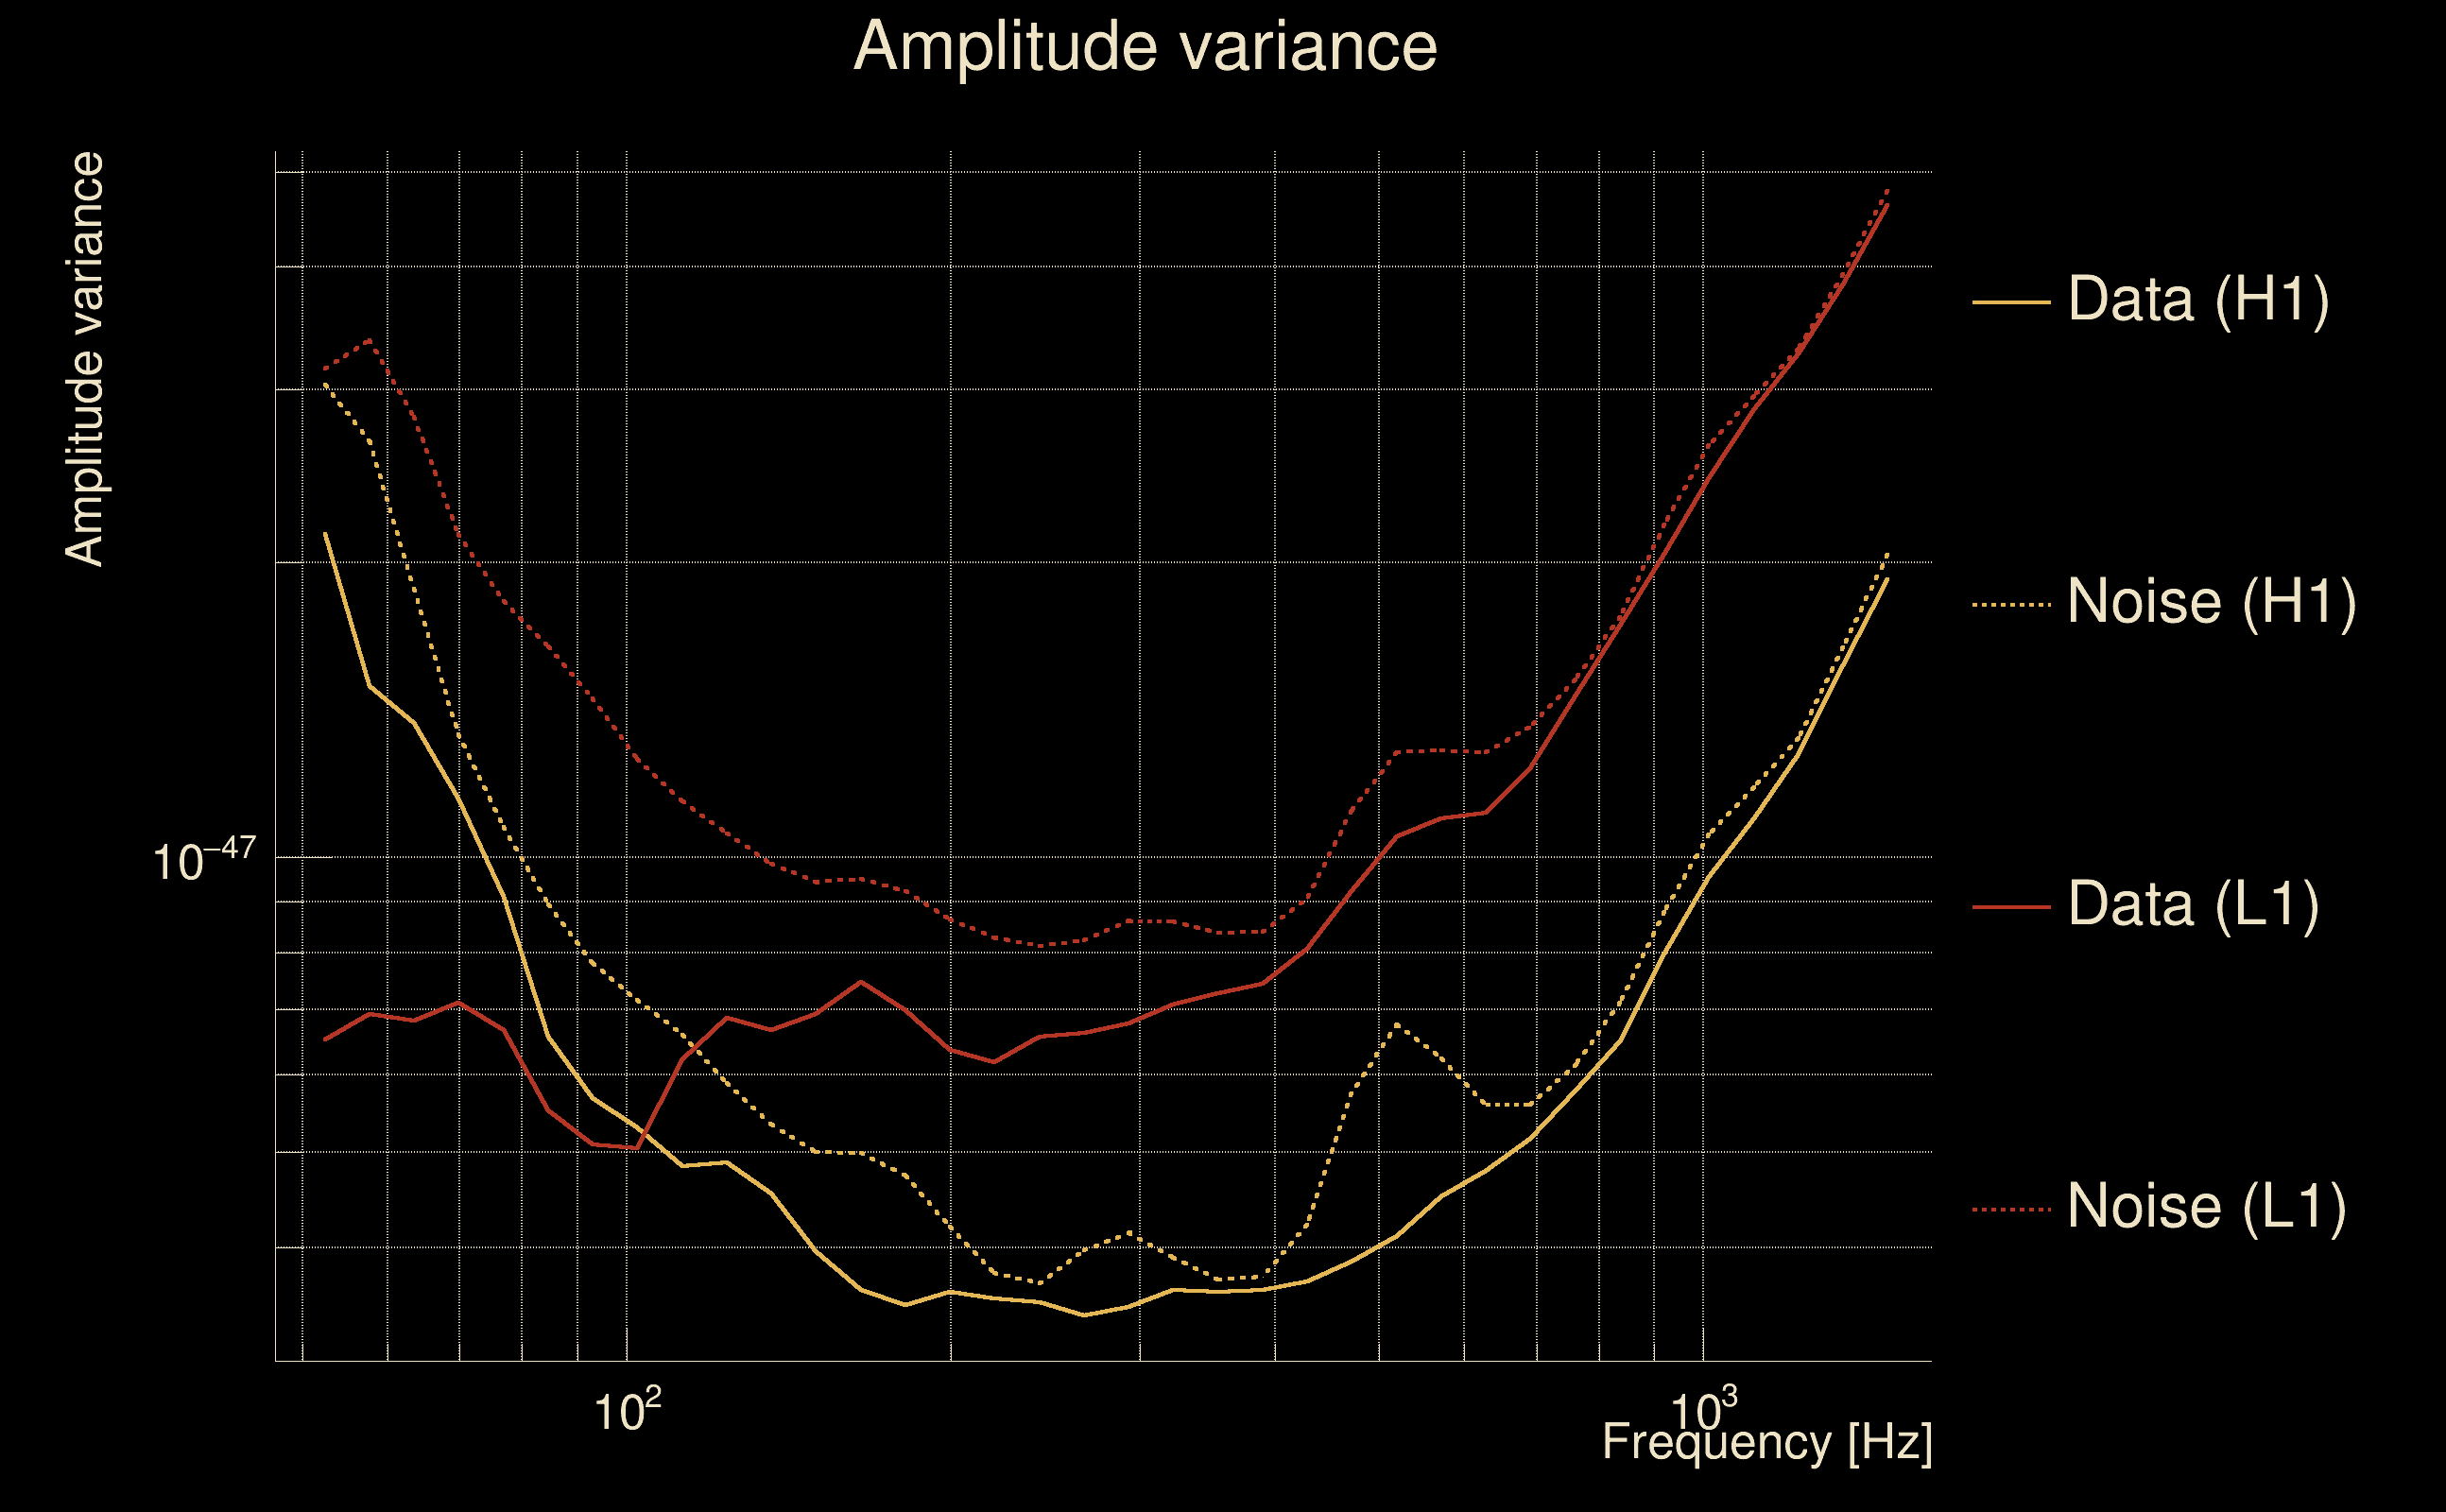
| Log of amplitude ratio (L1/H1): | -0.106829, variance = 0.16456 (L1/H1: -0.103339, variance = 0.302731, H1/L1: 0.113185, variance = 0.305637) |
| Amplitude ratio (L1/H1): | 0.898679 ⋇ 1.50029 (L1/H1: 0.901821 ⋇ 1.73362, H1/L1: 1.11984 ⋇ 1.73819) |
| Amplitude ratio H1|L1 compatibility (probability): | 0.989929 |
| Antenna factor probability: | 0.898303 |
| Number of rejected frequency rows: | Q0: 13 / 18, Q1: 30 / 36, Q2: 64 / 70, Q3: 125 / 134, Q4: 241 / 258 |
| Maximum signal-to-noise ratio: | H1: 81.5595, L1: 60.4327 |
| SNR variance: | H1: 2.44165, L1: 1.46982 |
| Click here for a zoomed plot | Click here for a zoomed plot | Click here for a zoomed plot | Click here for a zoomed plot | Click here for a zoomed plot |
 |
 |
 |
 |
 |
 |
 |
 |
 |
 |
 |
 |
 |
 |
 |
 |
 |
 |
 |
 |
 |
 |
 |
 |
 |
 |
 |
 |
 |
| Event time t(H1): | GPS = 1368195513 (Mon May 15 14:18:15 2023 ) → GPS = 1368195523 (Mon May 15 14:18:25 2023 ) |
| Event time t(L1): | GPS = 1368195513 (Mon May 15 14:18:25 2023 ) → GPS = 1368195523 (Mon May 15 14:18:25 2023 ) |
| Omicron analysis time window (H1): | GPS = 1368195510 → GPS = 1368195526 |
| Omicron analysis time window (L1): | GPS = 1368195510 → GPS = 1368195526 |
| Time delay between detectors t(L1) - t(H1): | 0.000997362 s (slice index = 108 / 217), δt_gw = 0.000997362 s |
| Time delay standard deviation: | 0.0940098 s |
| [targeted mode] Time delay probability: | 0.385893 (0.867089 sigmas), δt_target = 0.00869083 s |
| Frequency: | 92.0723 Hz |
| Ξ: | 0.283593 ± 0.0879791 (variance = 0.00774033): Q0: 0.845736, Q1: 0.849339, Q2: 0.696554, Q3: 0.913812, Q4: 0.955301 |
| Rank: | R_A = 0.0921681 |
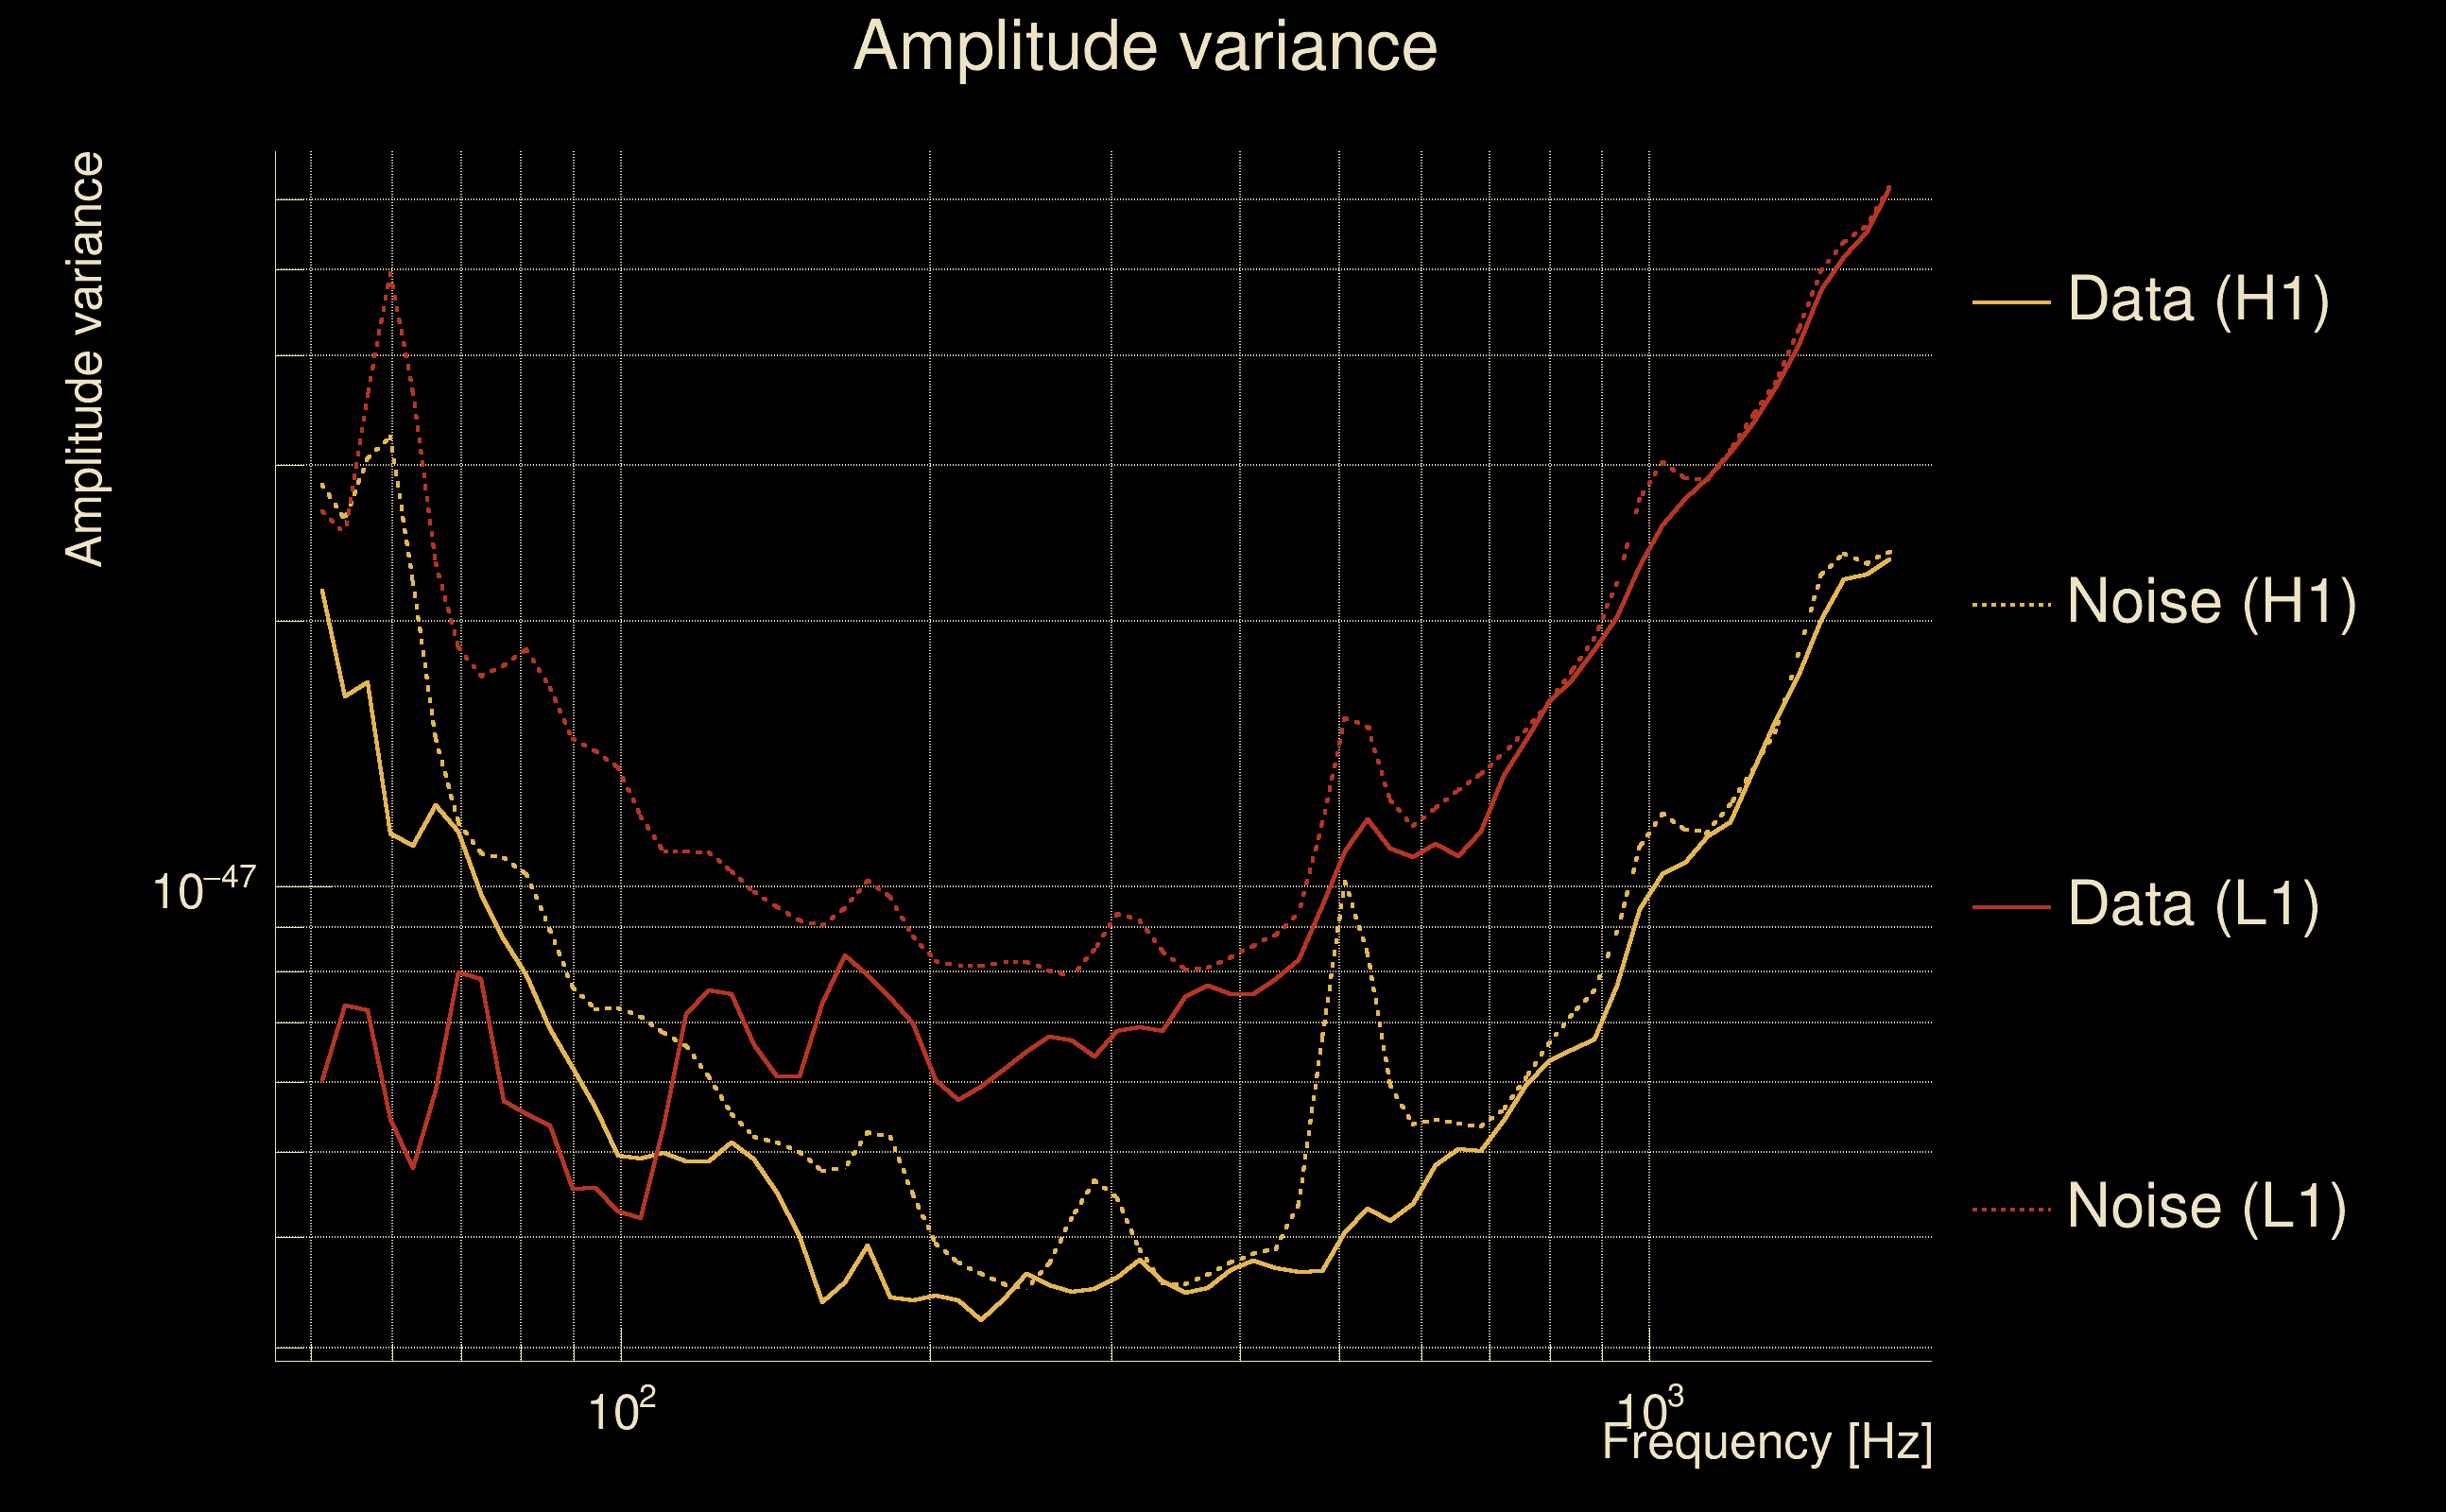
| Log of amplitude ratio (L1/H1): | -0.0859928, variance = 0.173299 (L1/H1: -0.0997269, variance = 0.320898, H1/L1: 0.0631795, variance = 0.341774) |
| Amplitude ratio (L1/H1): | 0.917601 ⋇ 1.51633 (L1/H1: 0.905085 ⋇ 1.76205, H1/L1: 1.06522 ⋇ 1.7943) |
| Amplitude ratio H1|L1 compatibility (probability): | 0.96419 |
| Antenna factor probability: | 0.873486 |
| Number of rejected frequency rows: | Q0: 9 / 18, Q1: 28 / 36, Q2: 61 / 70, Q3: 120 / 134, Q4: 246 / 258 |
| Maximum signal-to-noise ratio: | H1: 40.978, L1: 31.7949 |
| SNR variance: | H1: 0.527263, L1: 0.514634 |
| Click here for a zoomed plot | Click here for a zoomed plot | Click here for a zoomed plot | Click here for a zoomed plot | Click here for a zoomed plot |
 |
 |
 |
 |
 |
 |
 |
 |
 |
 |
 |
 |
 |
 |
 |
 |
 |
 |
 |
 |
 |
 |
 |
 |
 |
 |
 |
 |
 |
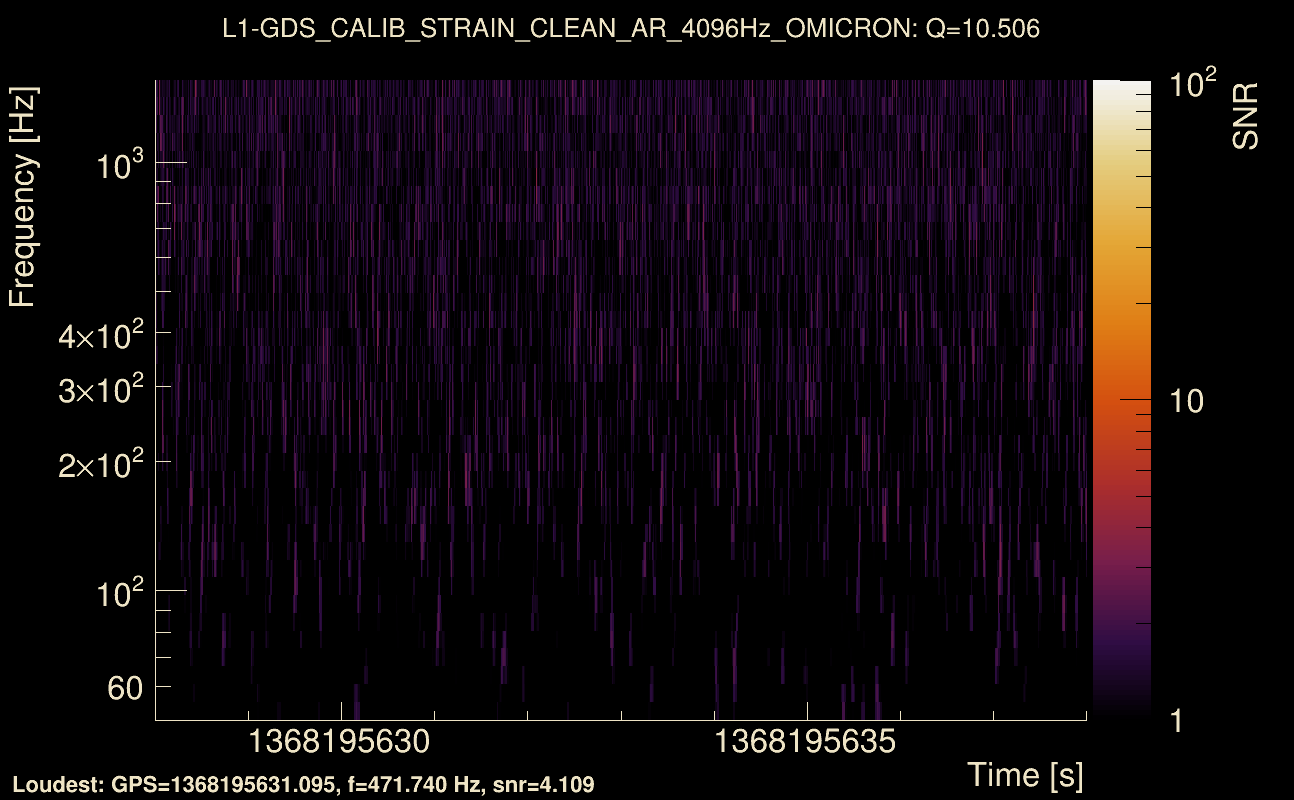
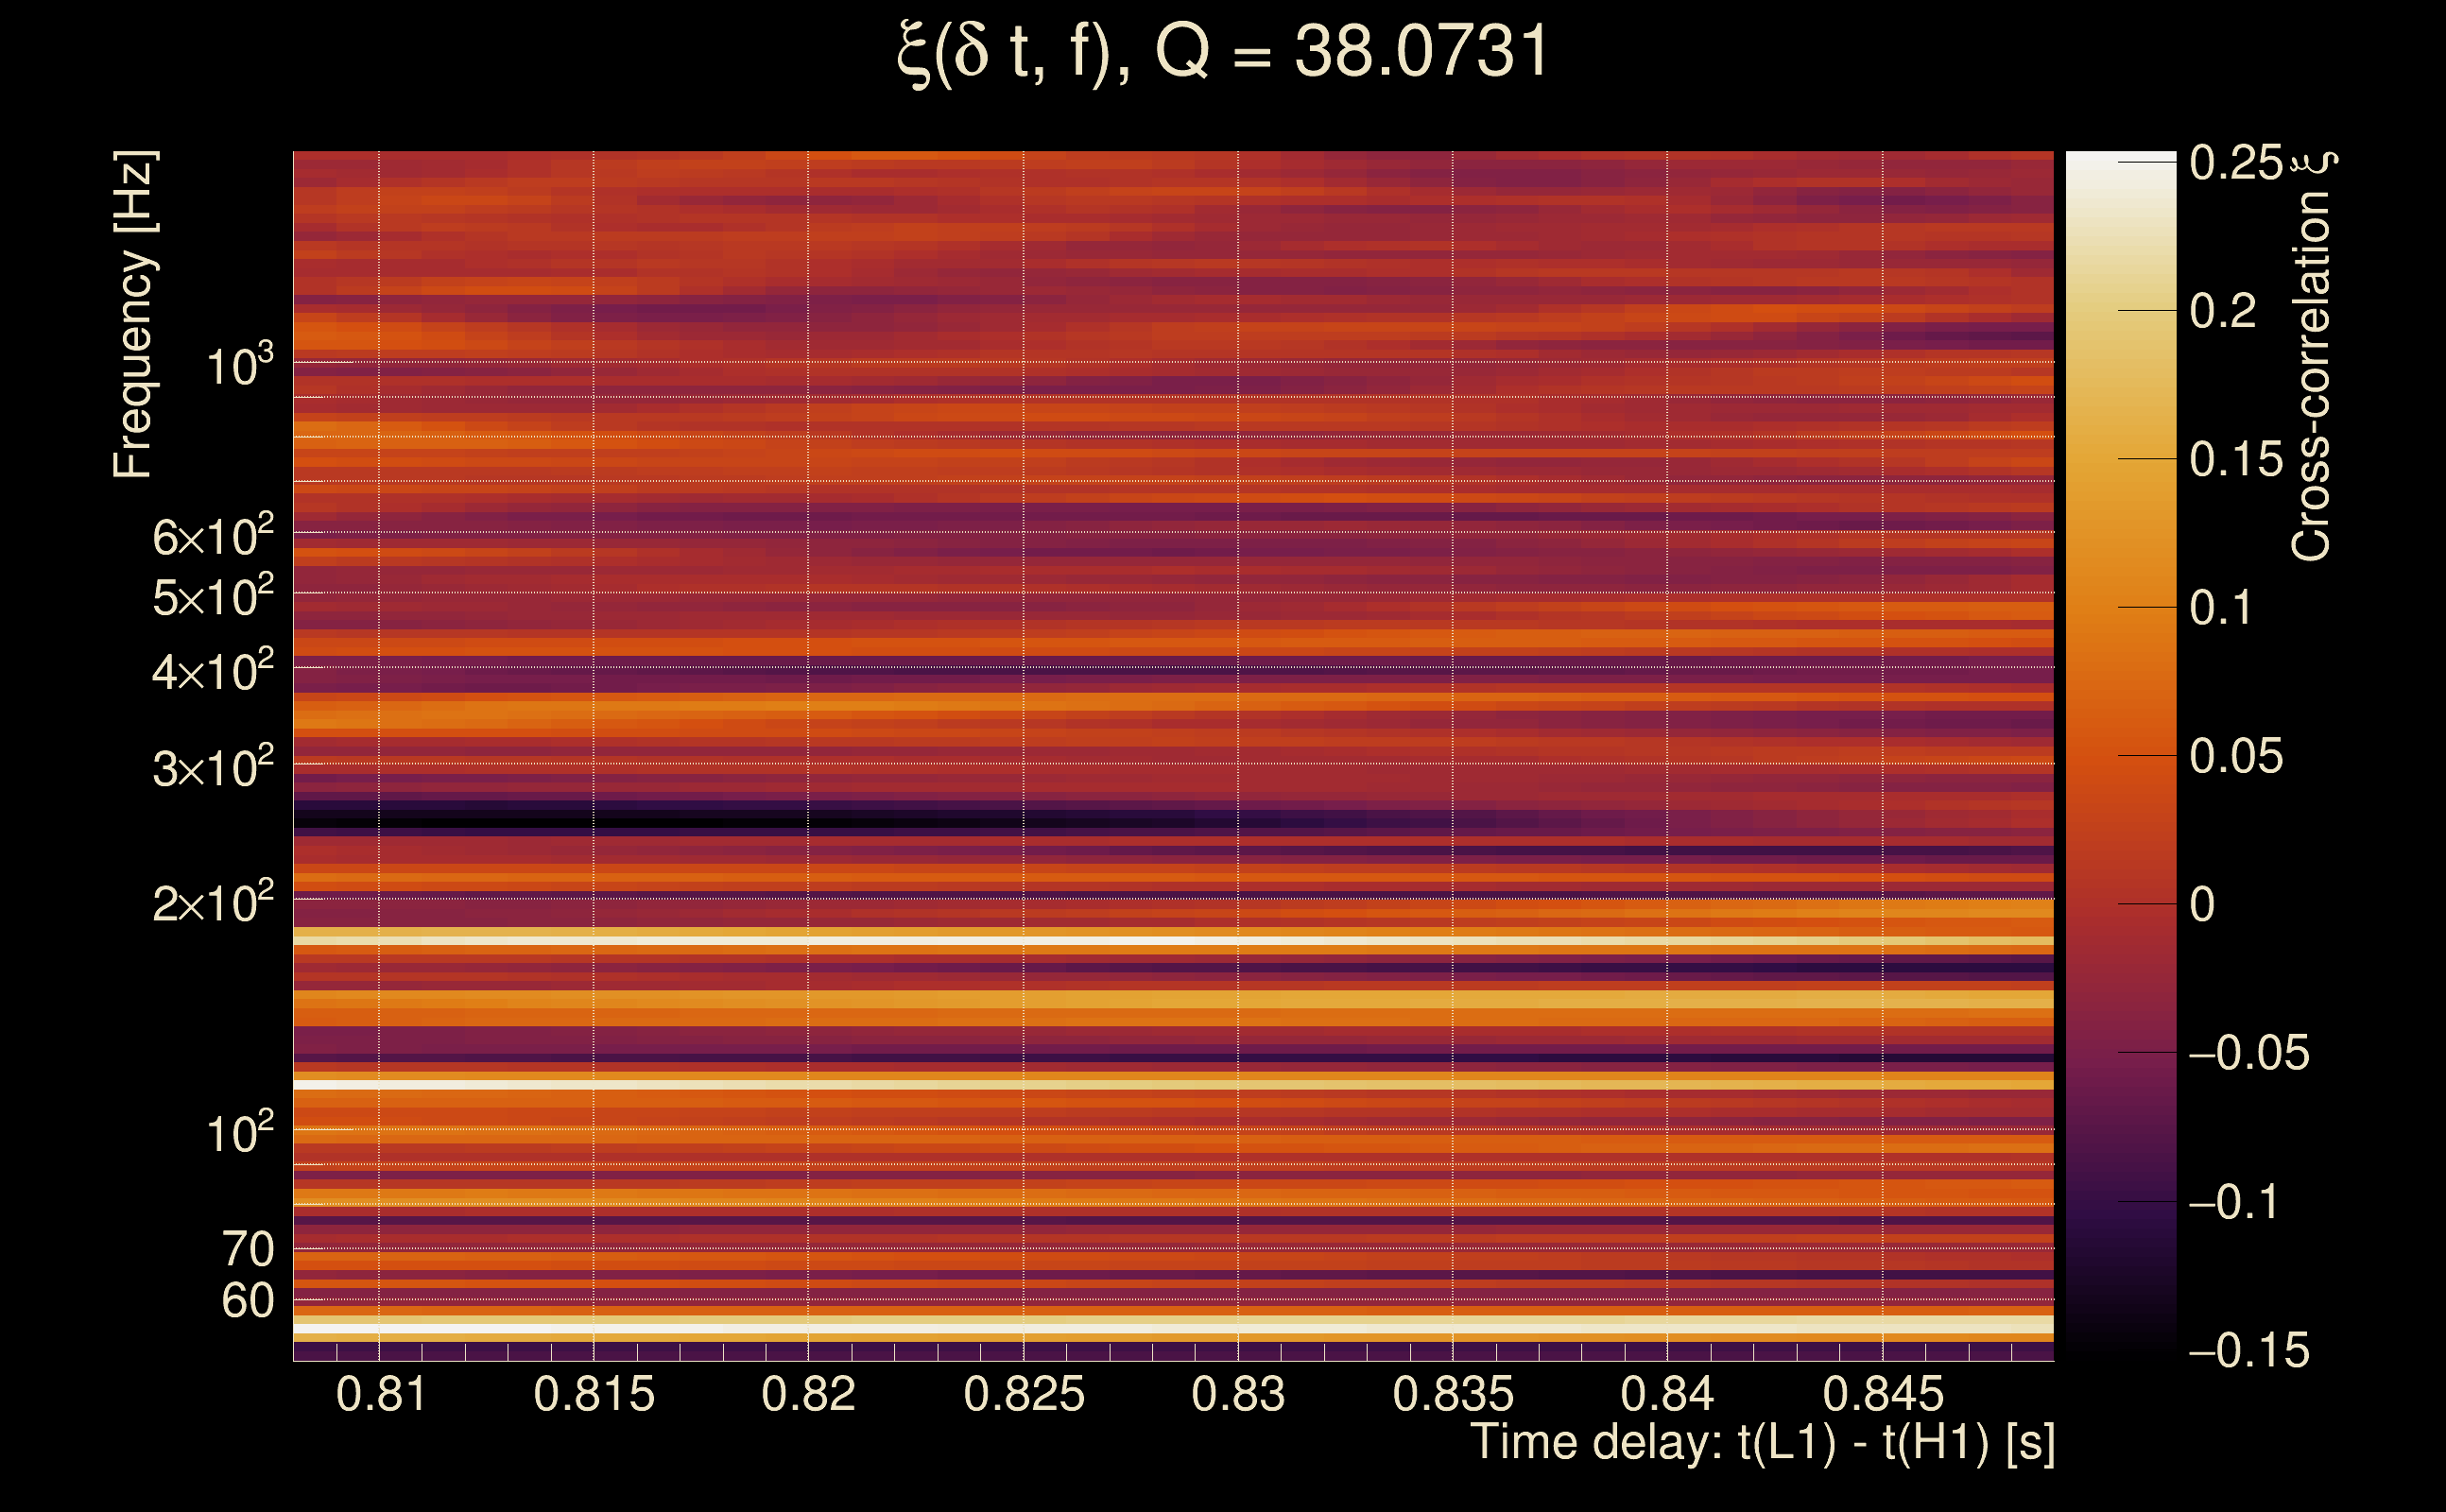
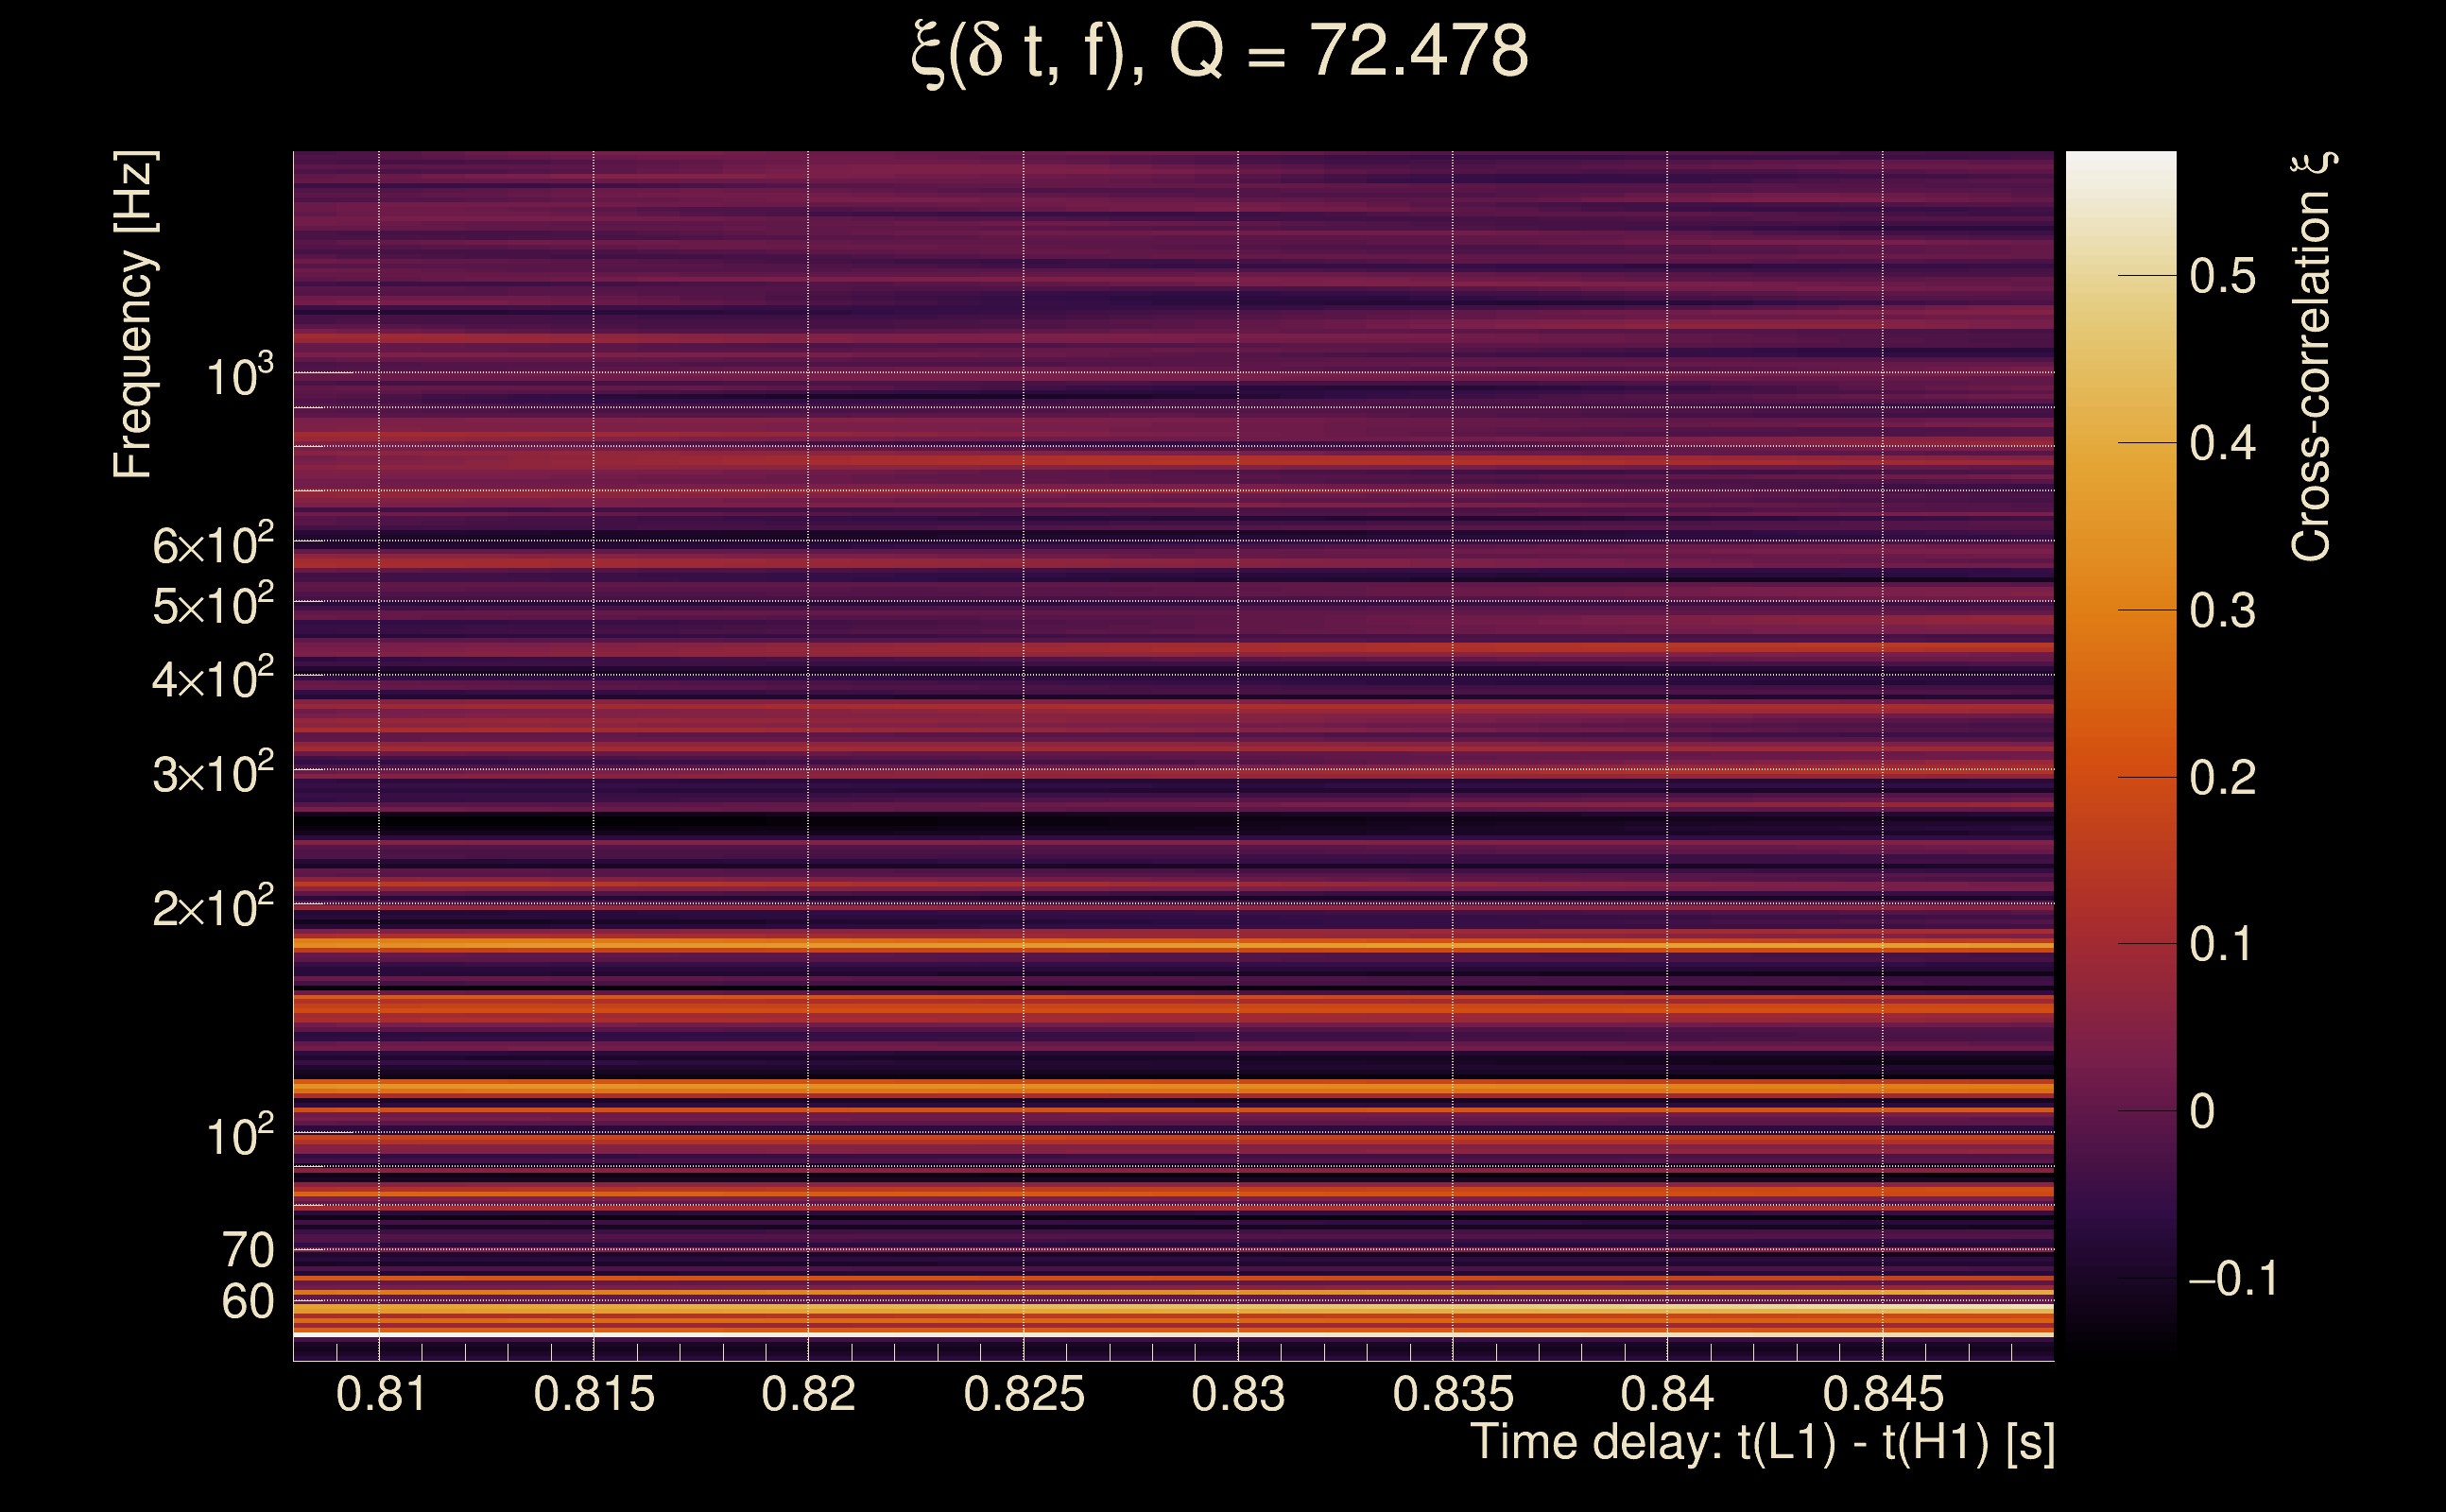
| Event time t(H1): | GPS = 1368195628 (Mon May 15 14:20:10 2023 ) → GPS = 1368195638 (Mon May 15 14:20:20 2023 ) |
| Event time t(L1): | GPS = 1368195628 (Mon May 15 14:20:20 2023 ) → GPS = 1368195638 (Mon May 15 14:20:20 2023 ) |
| Omicron analysis time window (H1): | GPS = 1368195625 → GPS = 1368195641 |
| Omicron analysis time window (L1): | GPS = 1368195625 → GPS = 1368195641 |
| Time delay between detectors t(L1) - t(H1): | 0.828321 s (slice index = 90 / 217), δt_gw = 0.00032084 s |
| Time delay standard deviation: | 0.0948838 s |
| [targeted mode] Time delay probability: | 0.355071 (0.924798 sigmas), δt_target = 0.00866055 s |
| Frequency: | 192.35 Hz |
| Ξ: | 0.00962228 ± 0.0246923 (variance = 0.000609708): Q0: 0.0339238, Q1: 0.0949521, Q2: 0.0680874, Q3: 0.0893216, Q4: 0.102339 |
| Rank: | R_A = 0.00106968 |
| Log of amplitude ratio (L1/H1): | 0.250236, variance = 0.692158 (L1/H1: -0.241299, variance = 1.31144, H1/L1: -0.888312, variance = 1.44561) |
| Amplitude ratio (L1/H1): | 1.28433 ⋇ 2.29782 (L1/H1: 0.785607 ⋇ 3.14301, H1/L1: 0.41135 ⋇ 3.32788) |
| Amplitude ratio H1|L1 compatibility (probability): | 0.496308 |
| Antenna factor probability: | 0.630824 |
| Number of rejected frequency rows: | Q0: 15 / 18, Q1: 28 / 36, Q2: 63 / 70, Q3: 125 / 134, Q4: 254 / 258 |
| Maximum signal-to-noise ratio: | H1: 5.33482, L1: 4.68232 |
| SNR variance: | H1: 0.530245, L1: 0.514531 |
| Click here for a zoomed plot | Click here for a zoomed plot | Click here for a zoomed plot | Click here for a zoomed plot | Click here for a zoomed plot |
 |
 |
 |
 |
 |
 |
 |
 |
 |
 |
 |
 |
 |
 |
 |
 |
 |
 |
 |
 |
 |
 |
 |
 |
 |
 |
 |
 |
 |
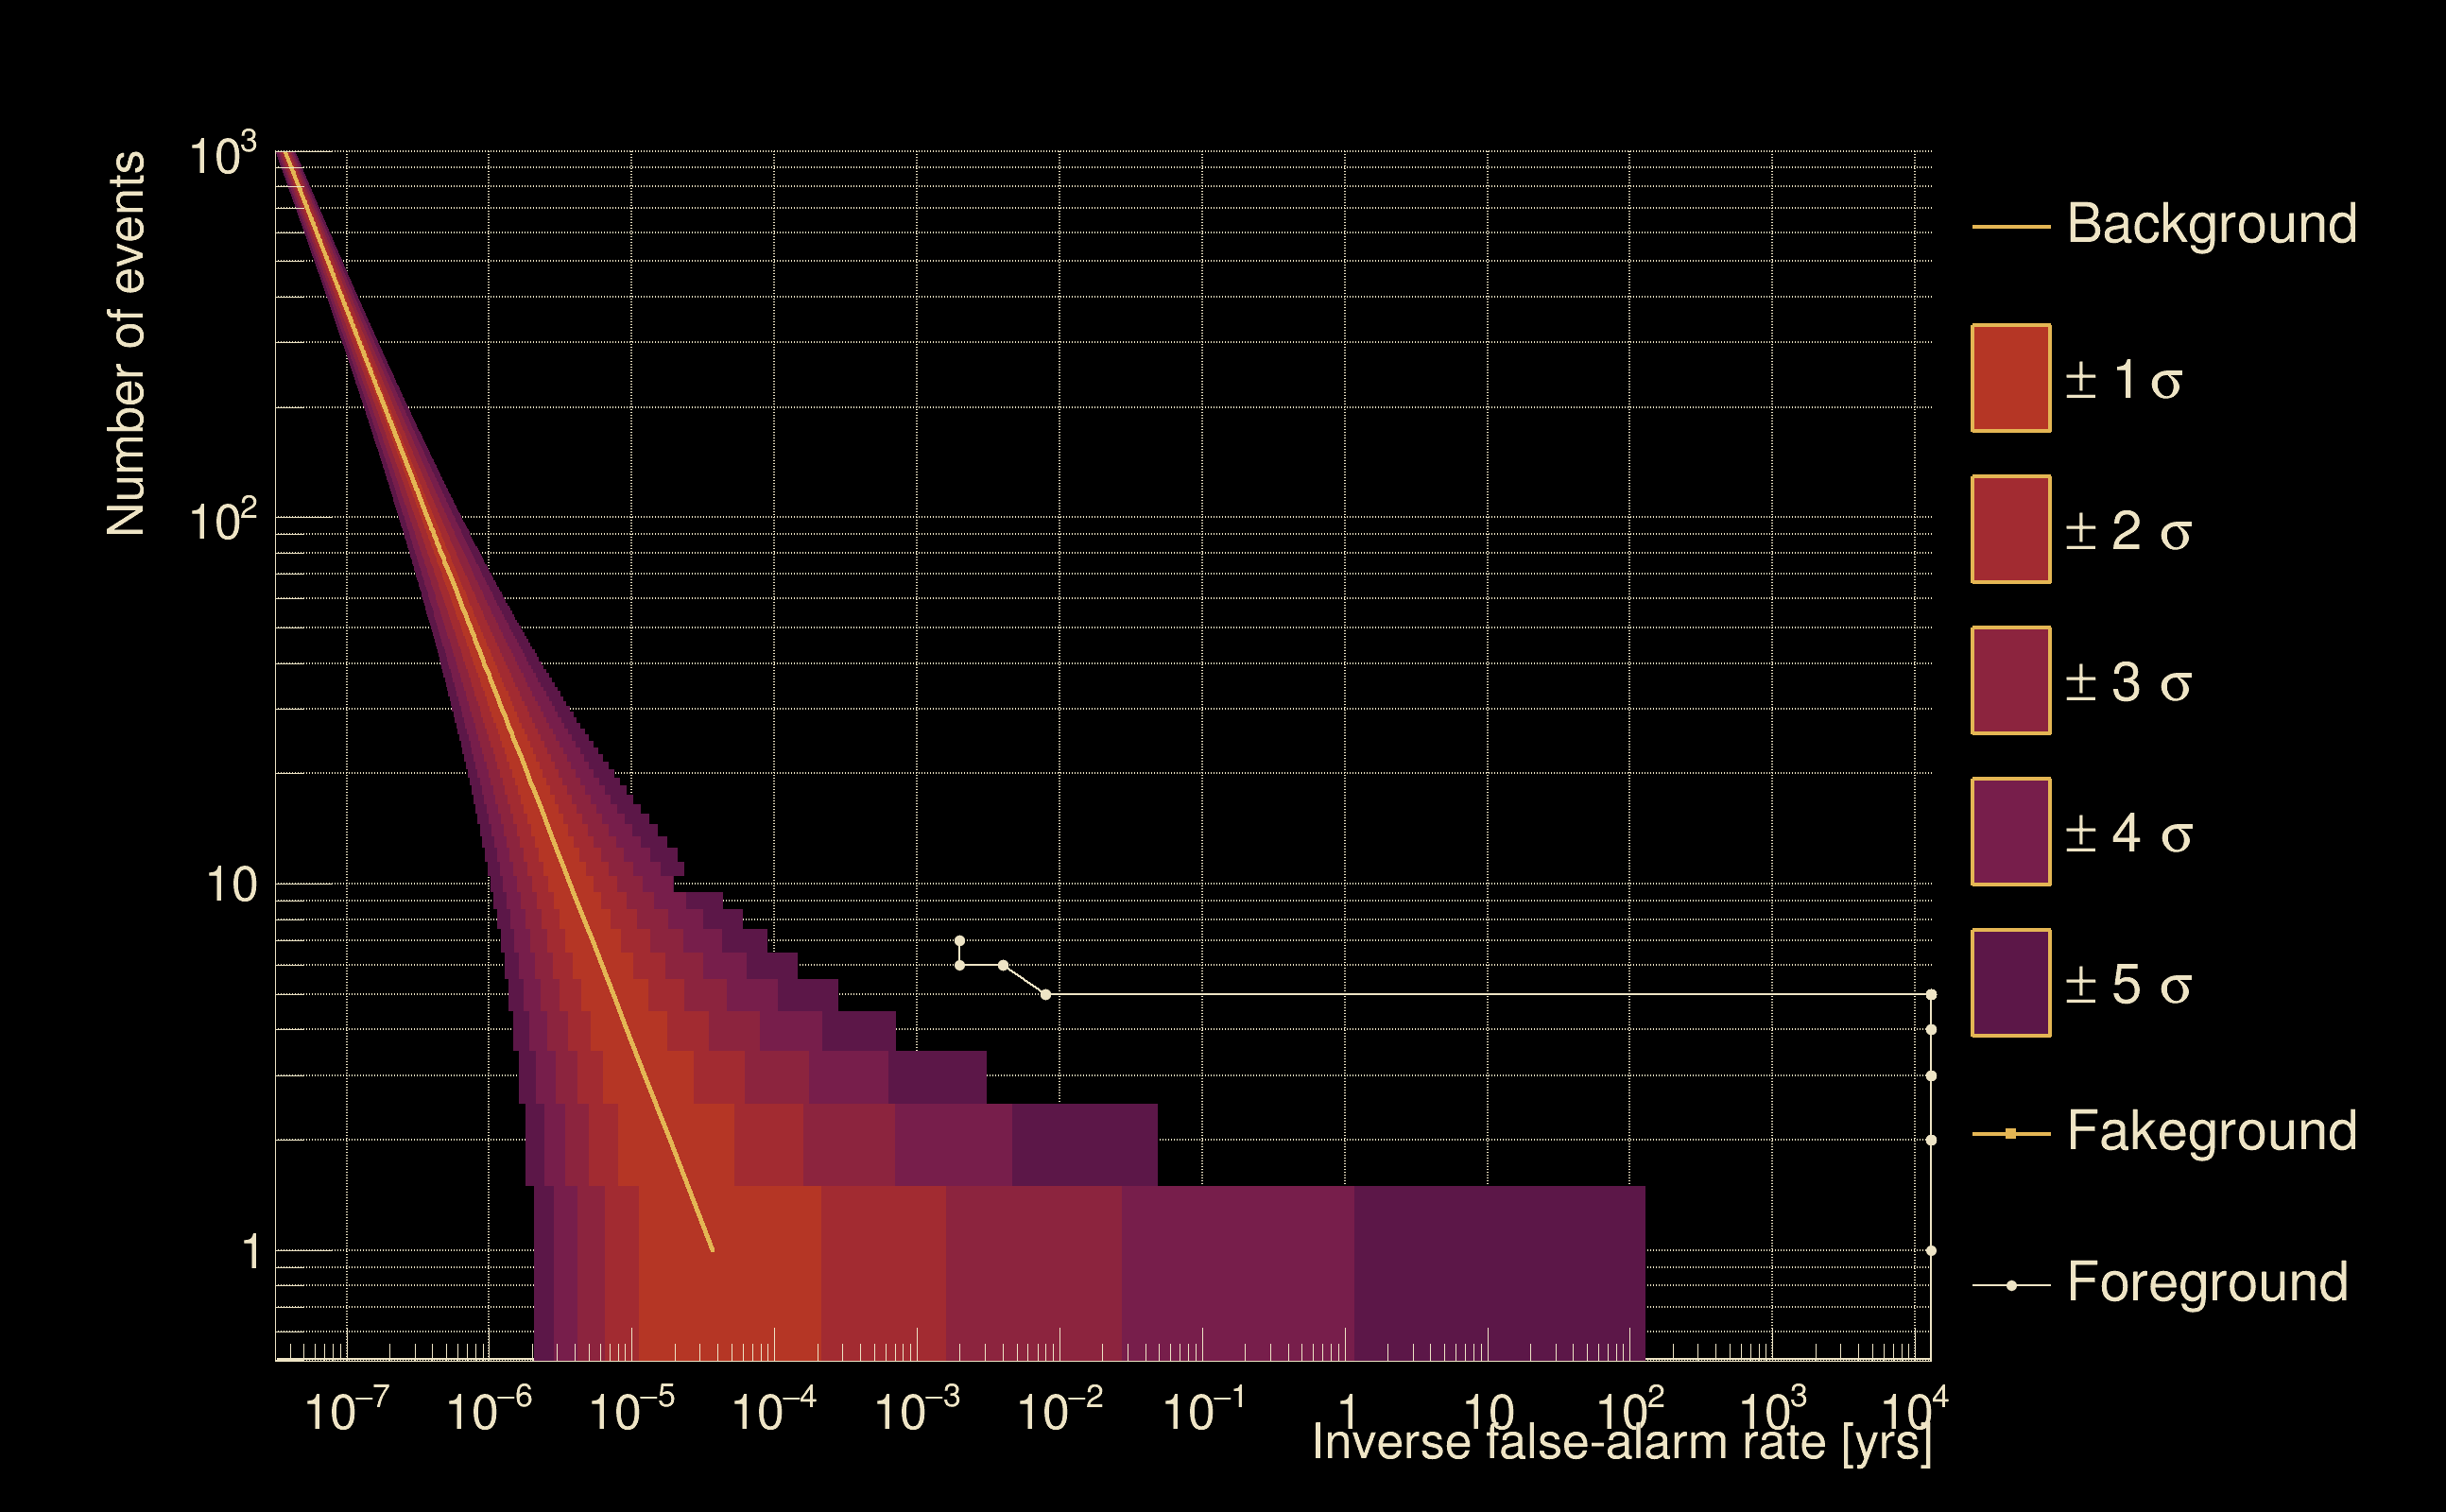
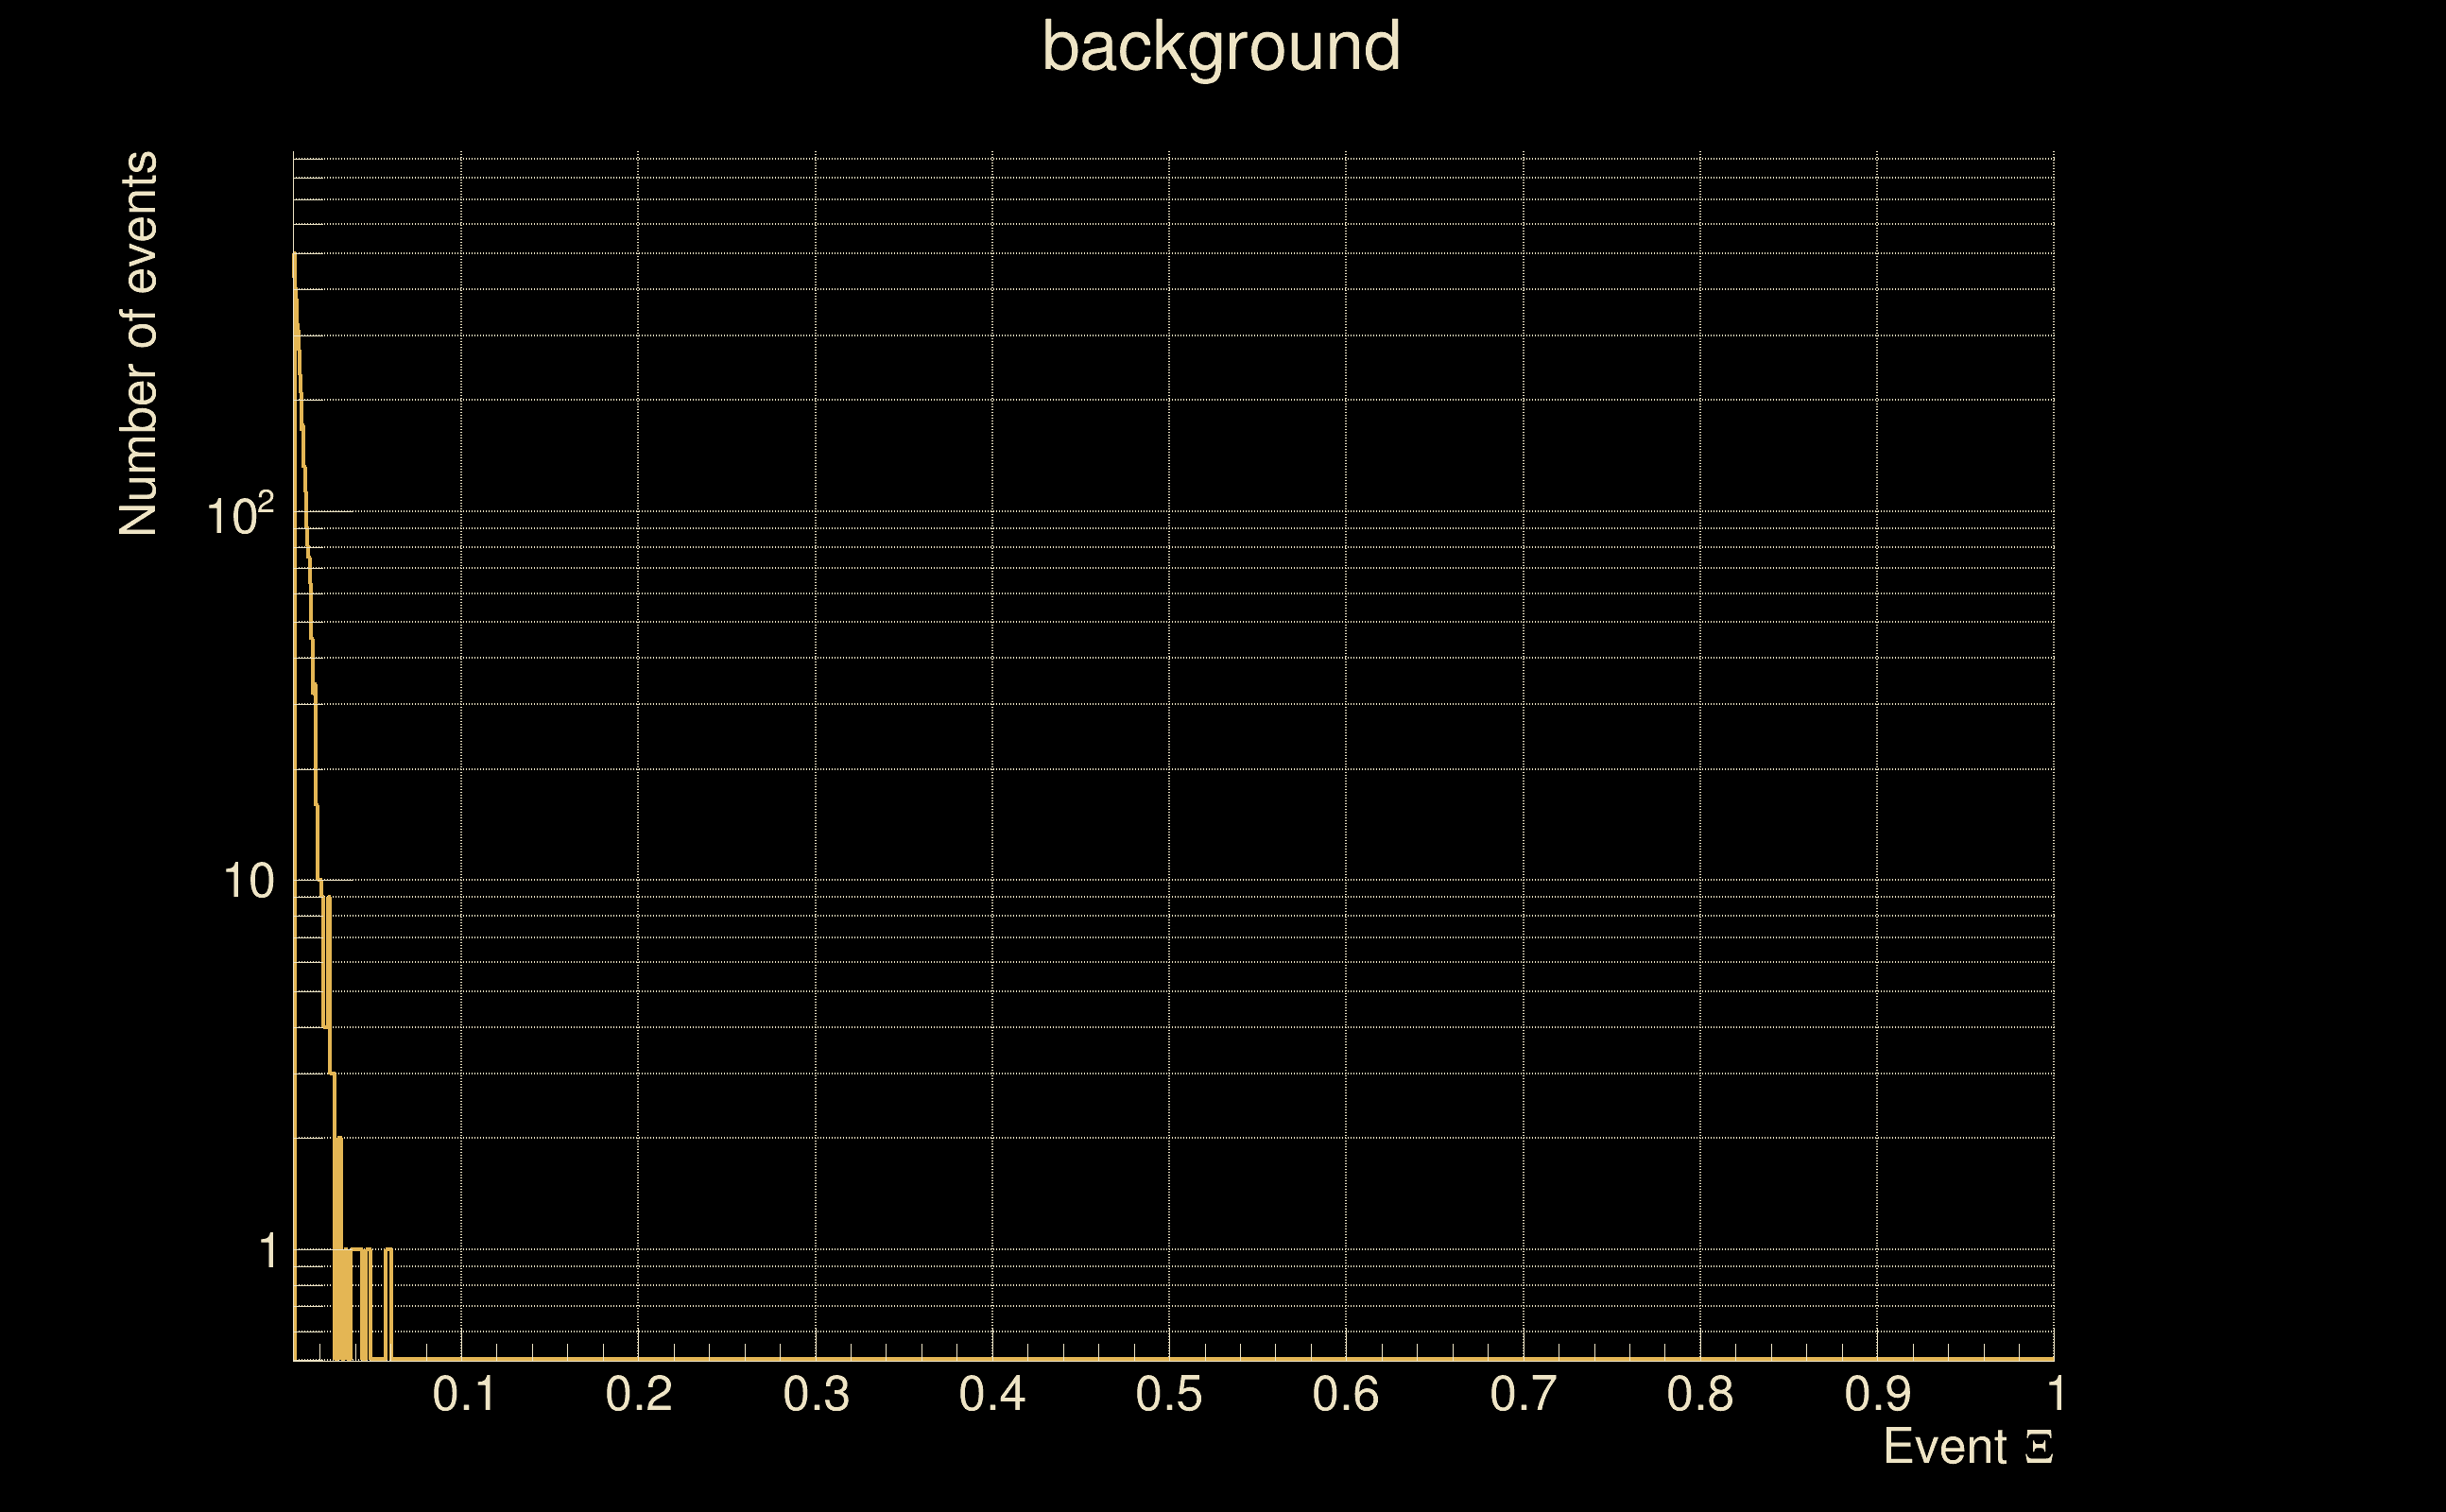
| Detection threshold: | R > 0.00784711 |
| False-alarm rate above that detection threshold: | 1.98768e-06 |
| Alternative threshold at 1/1000 yrs: | R > 0.00784711 |
| Alternative threshold at 1/100 yrs: | R > 0.00784711 |
| Alternative threshold at 1/10 yrs: | R > 0.00784711 |
| Alternative threshold at 1/1 yr: | R > 0.00784711 |
| Alternative threshold at 1/1 d: | R > 0.00585254 |
 |
|
 |
 |
 |
 |
 |
 |
 |
 |
 |
 |
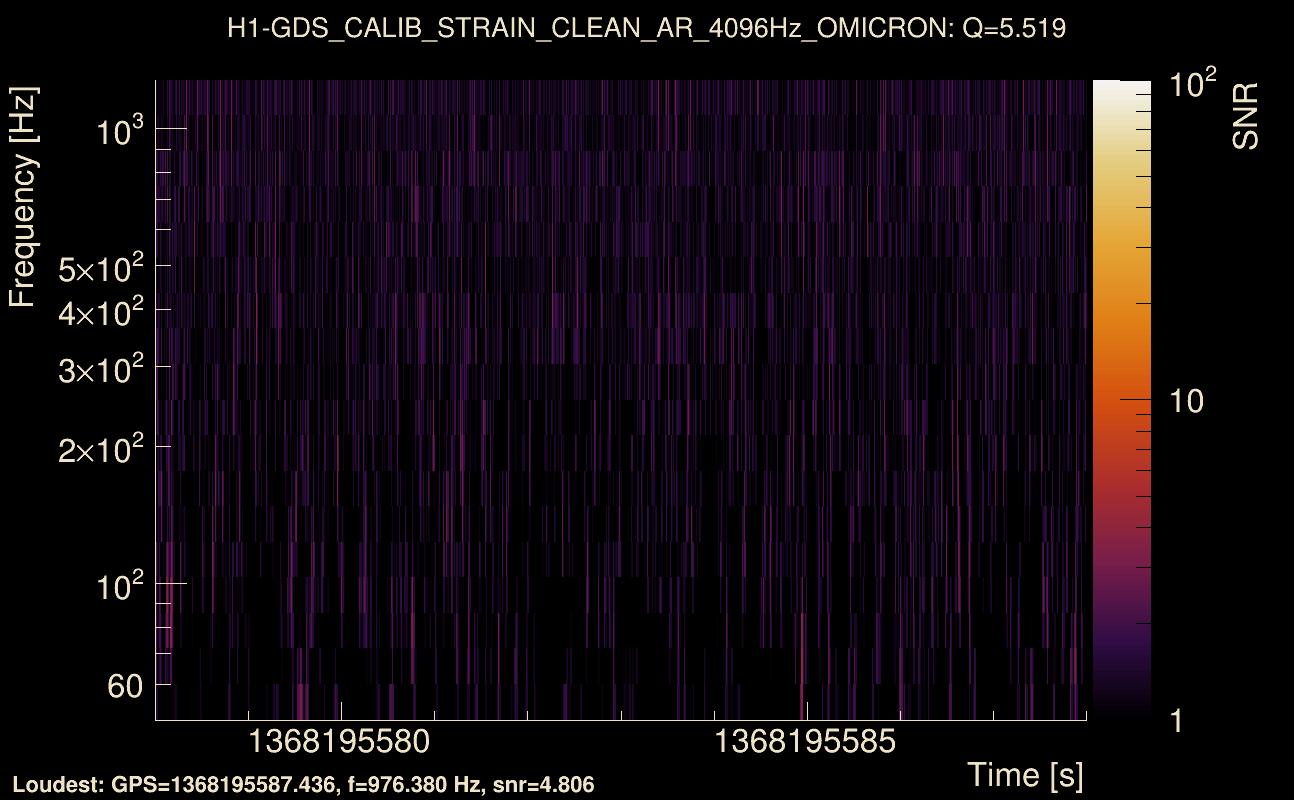
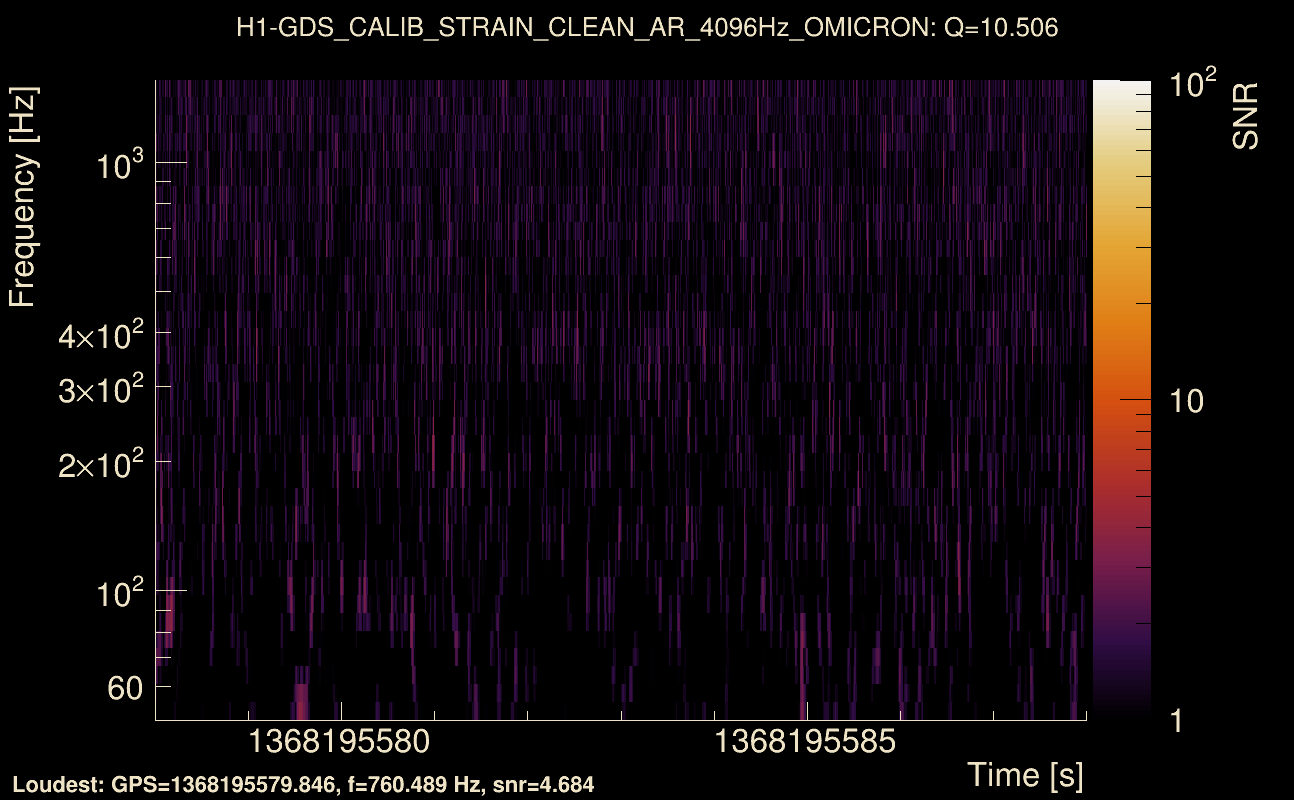
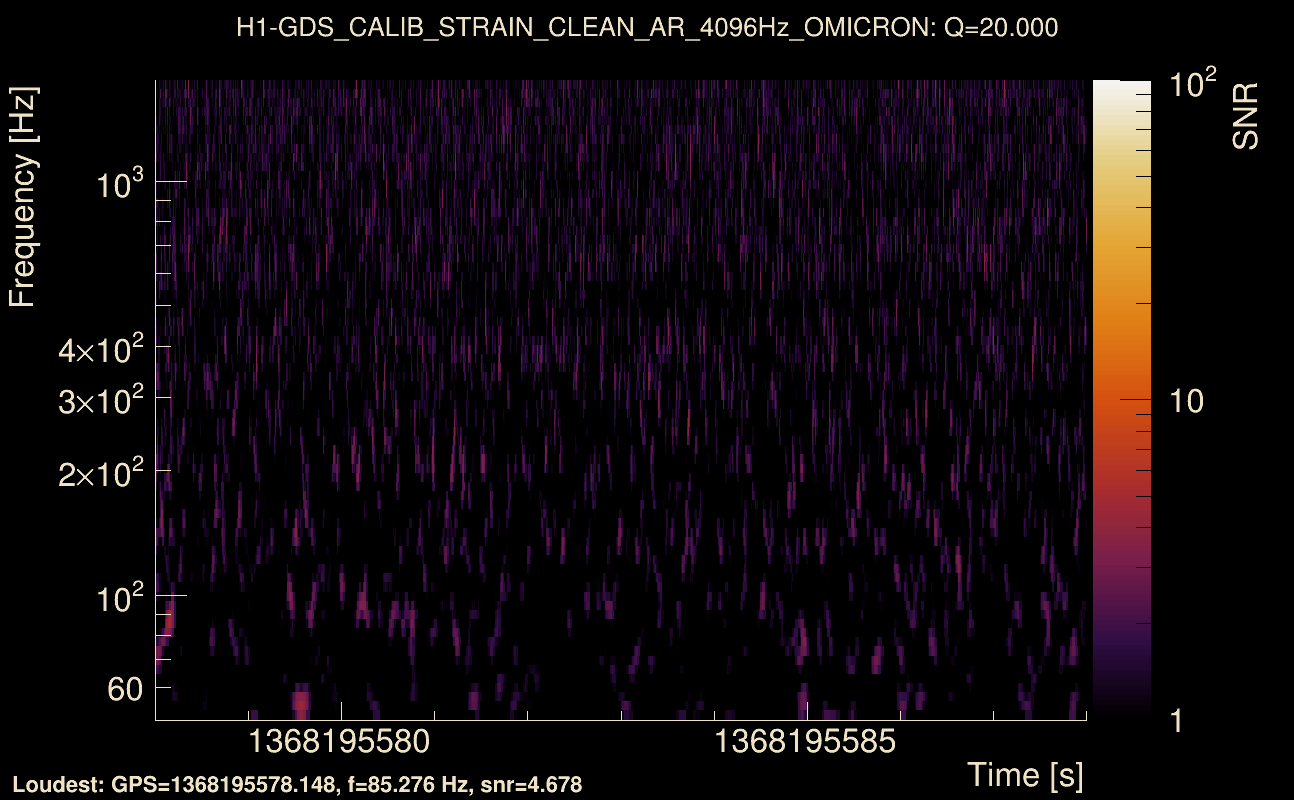
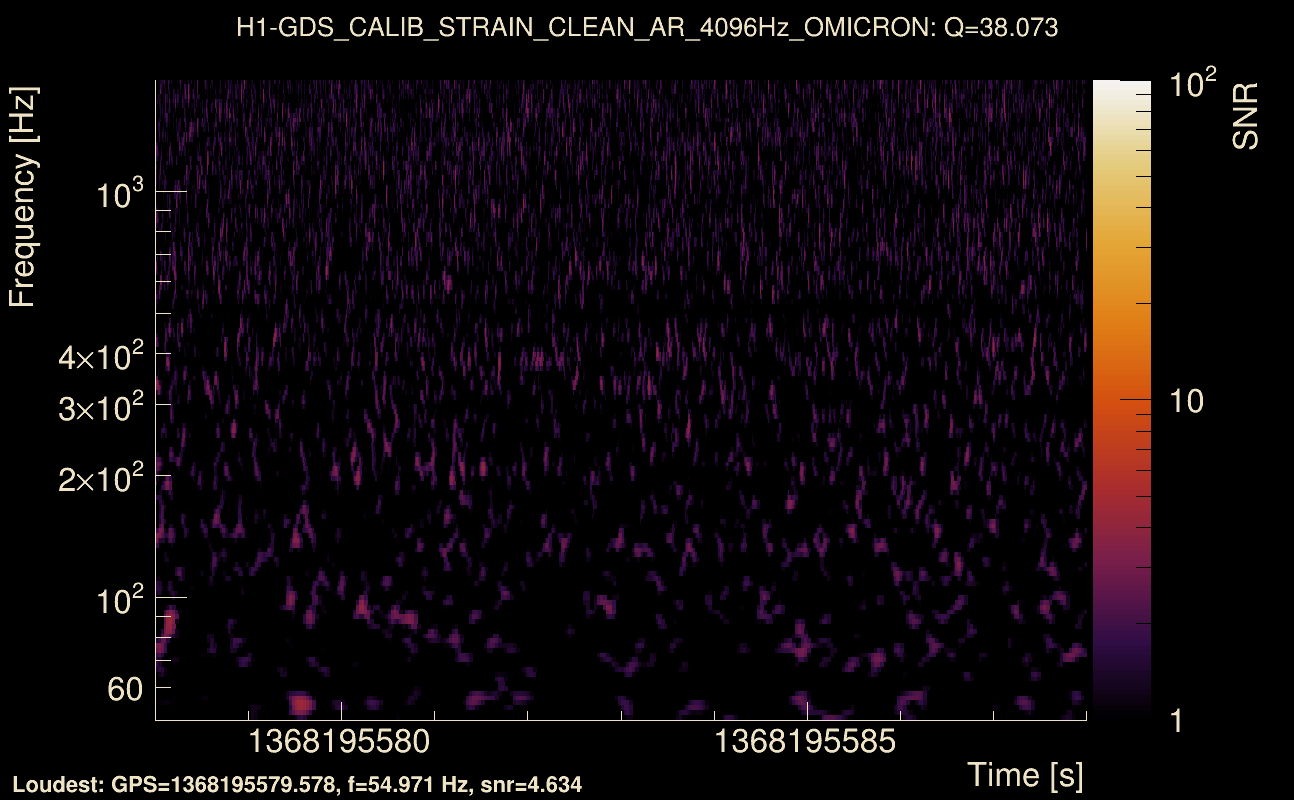
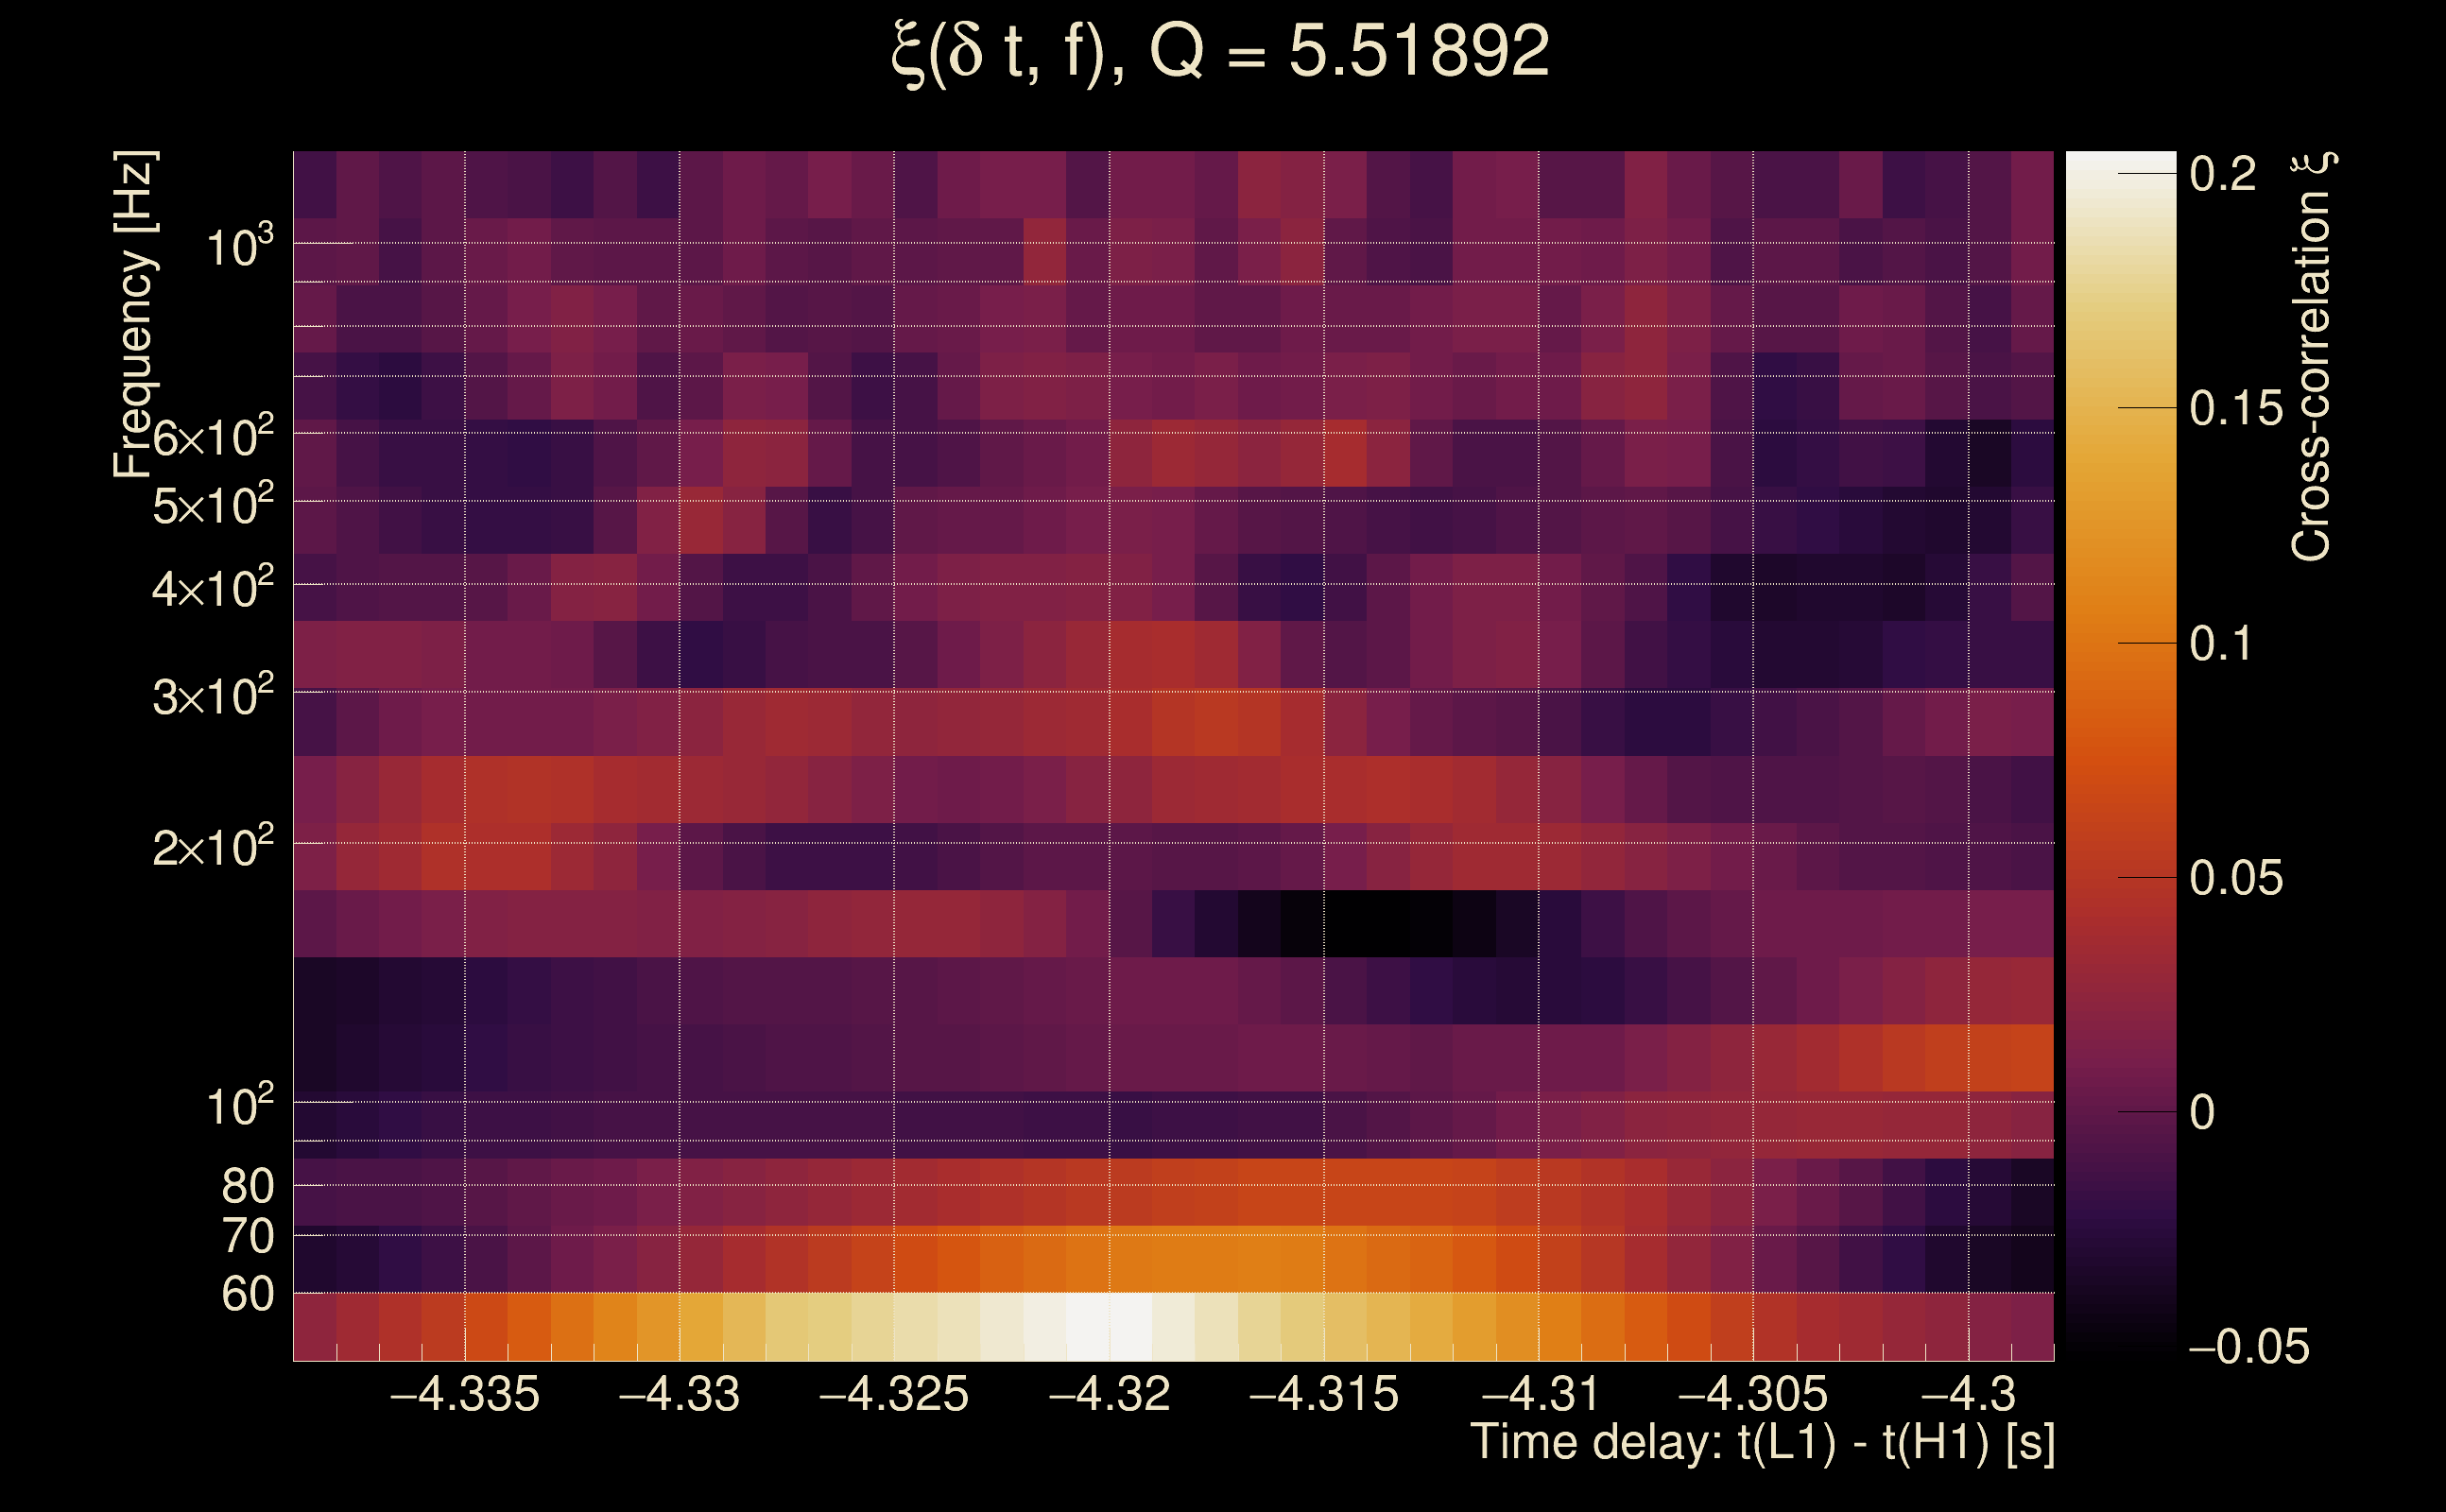
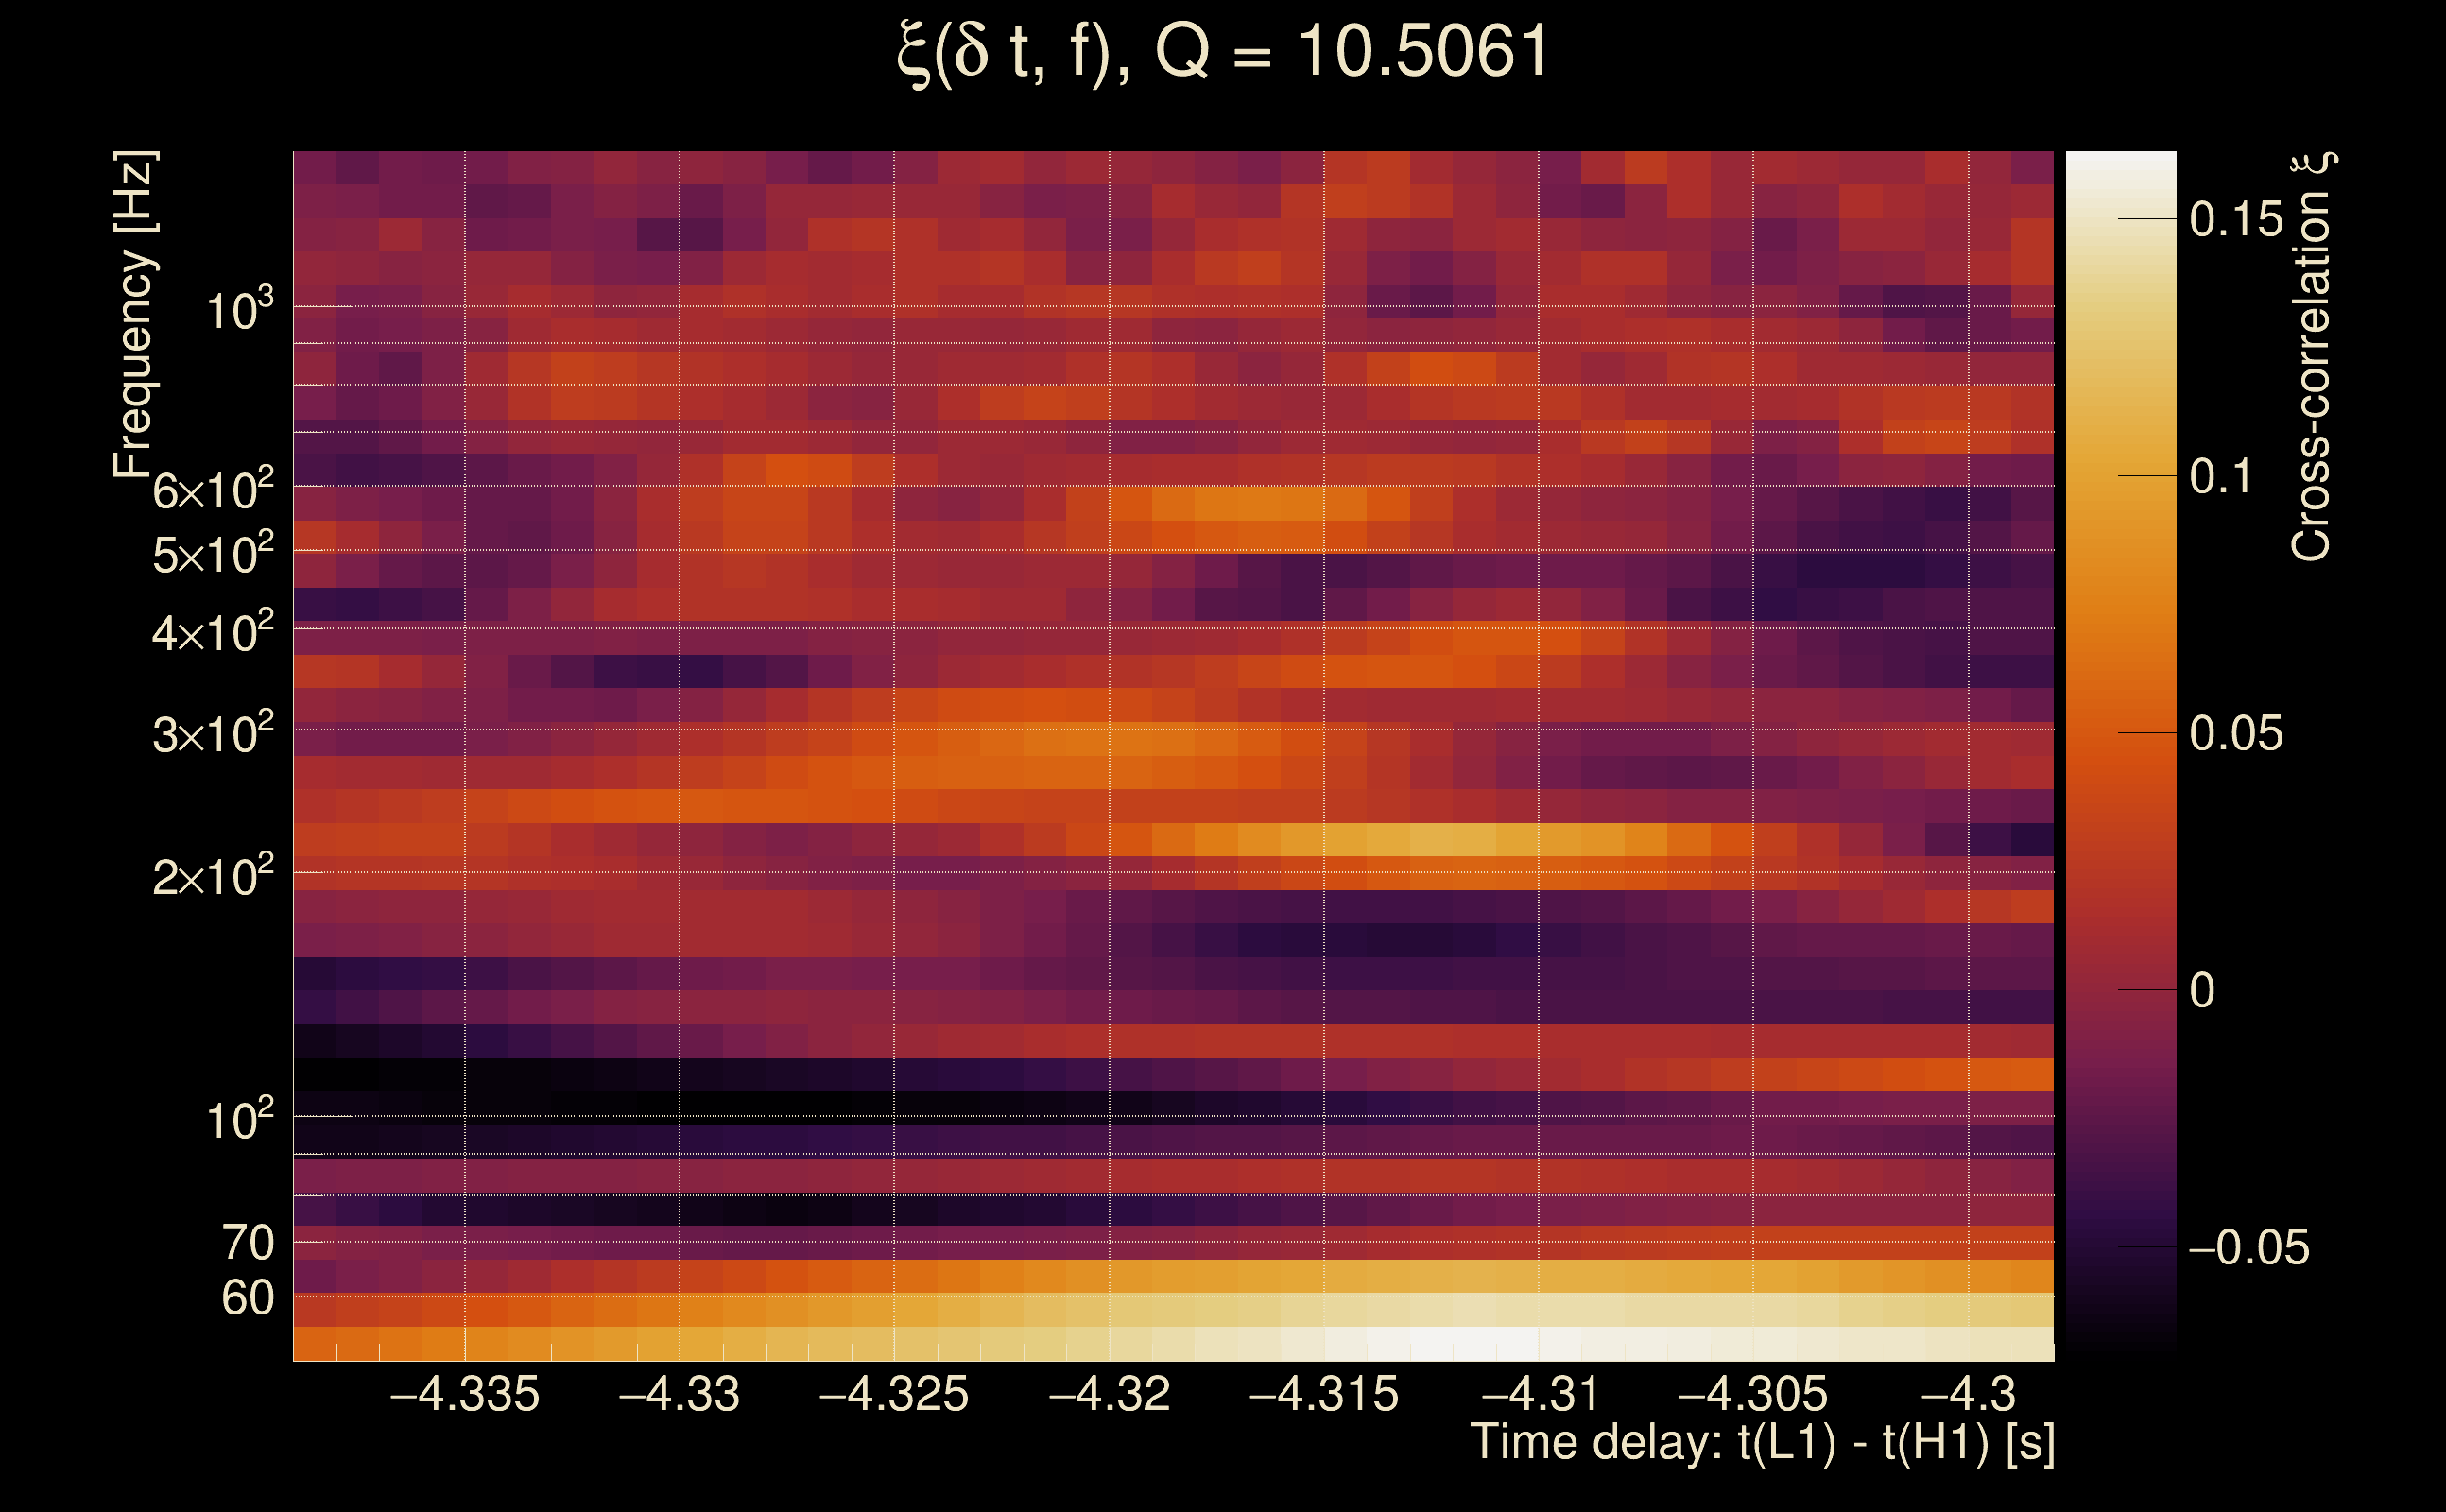
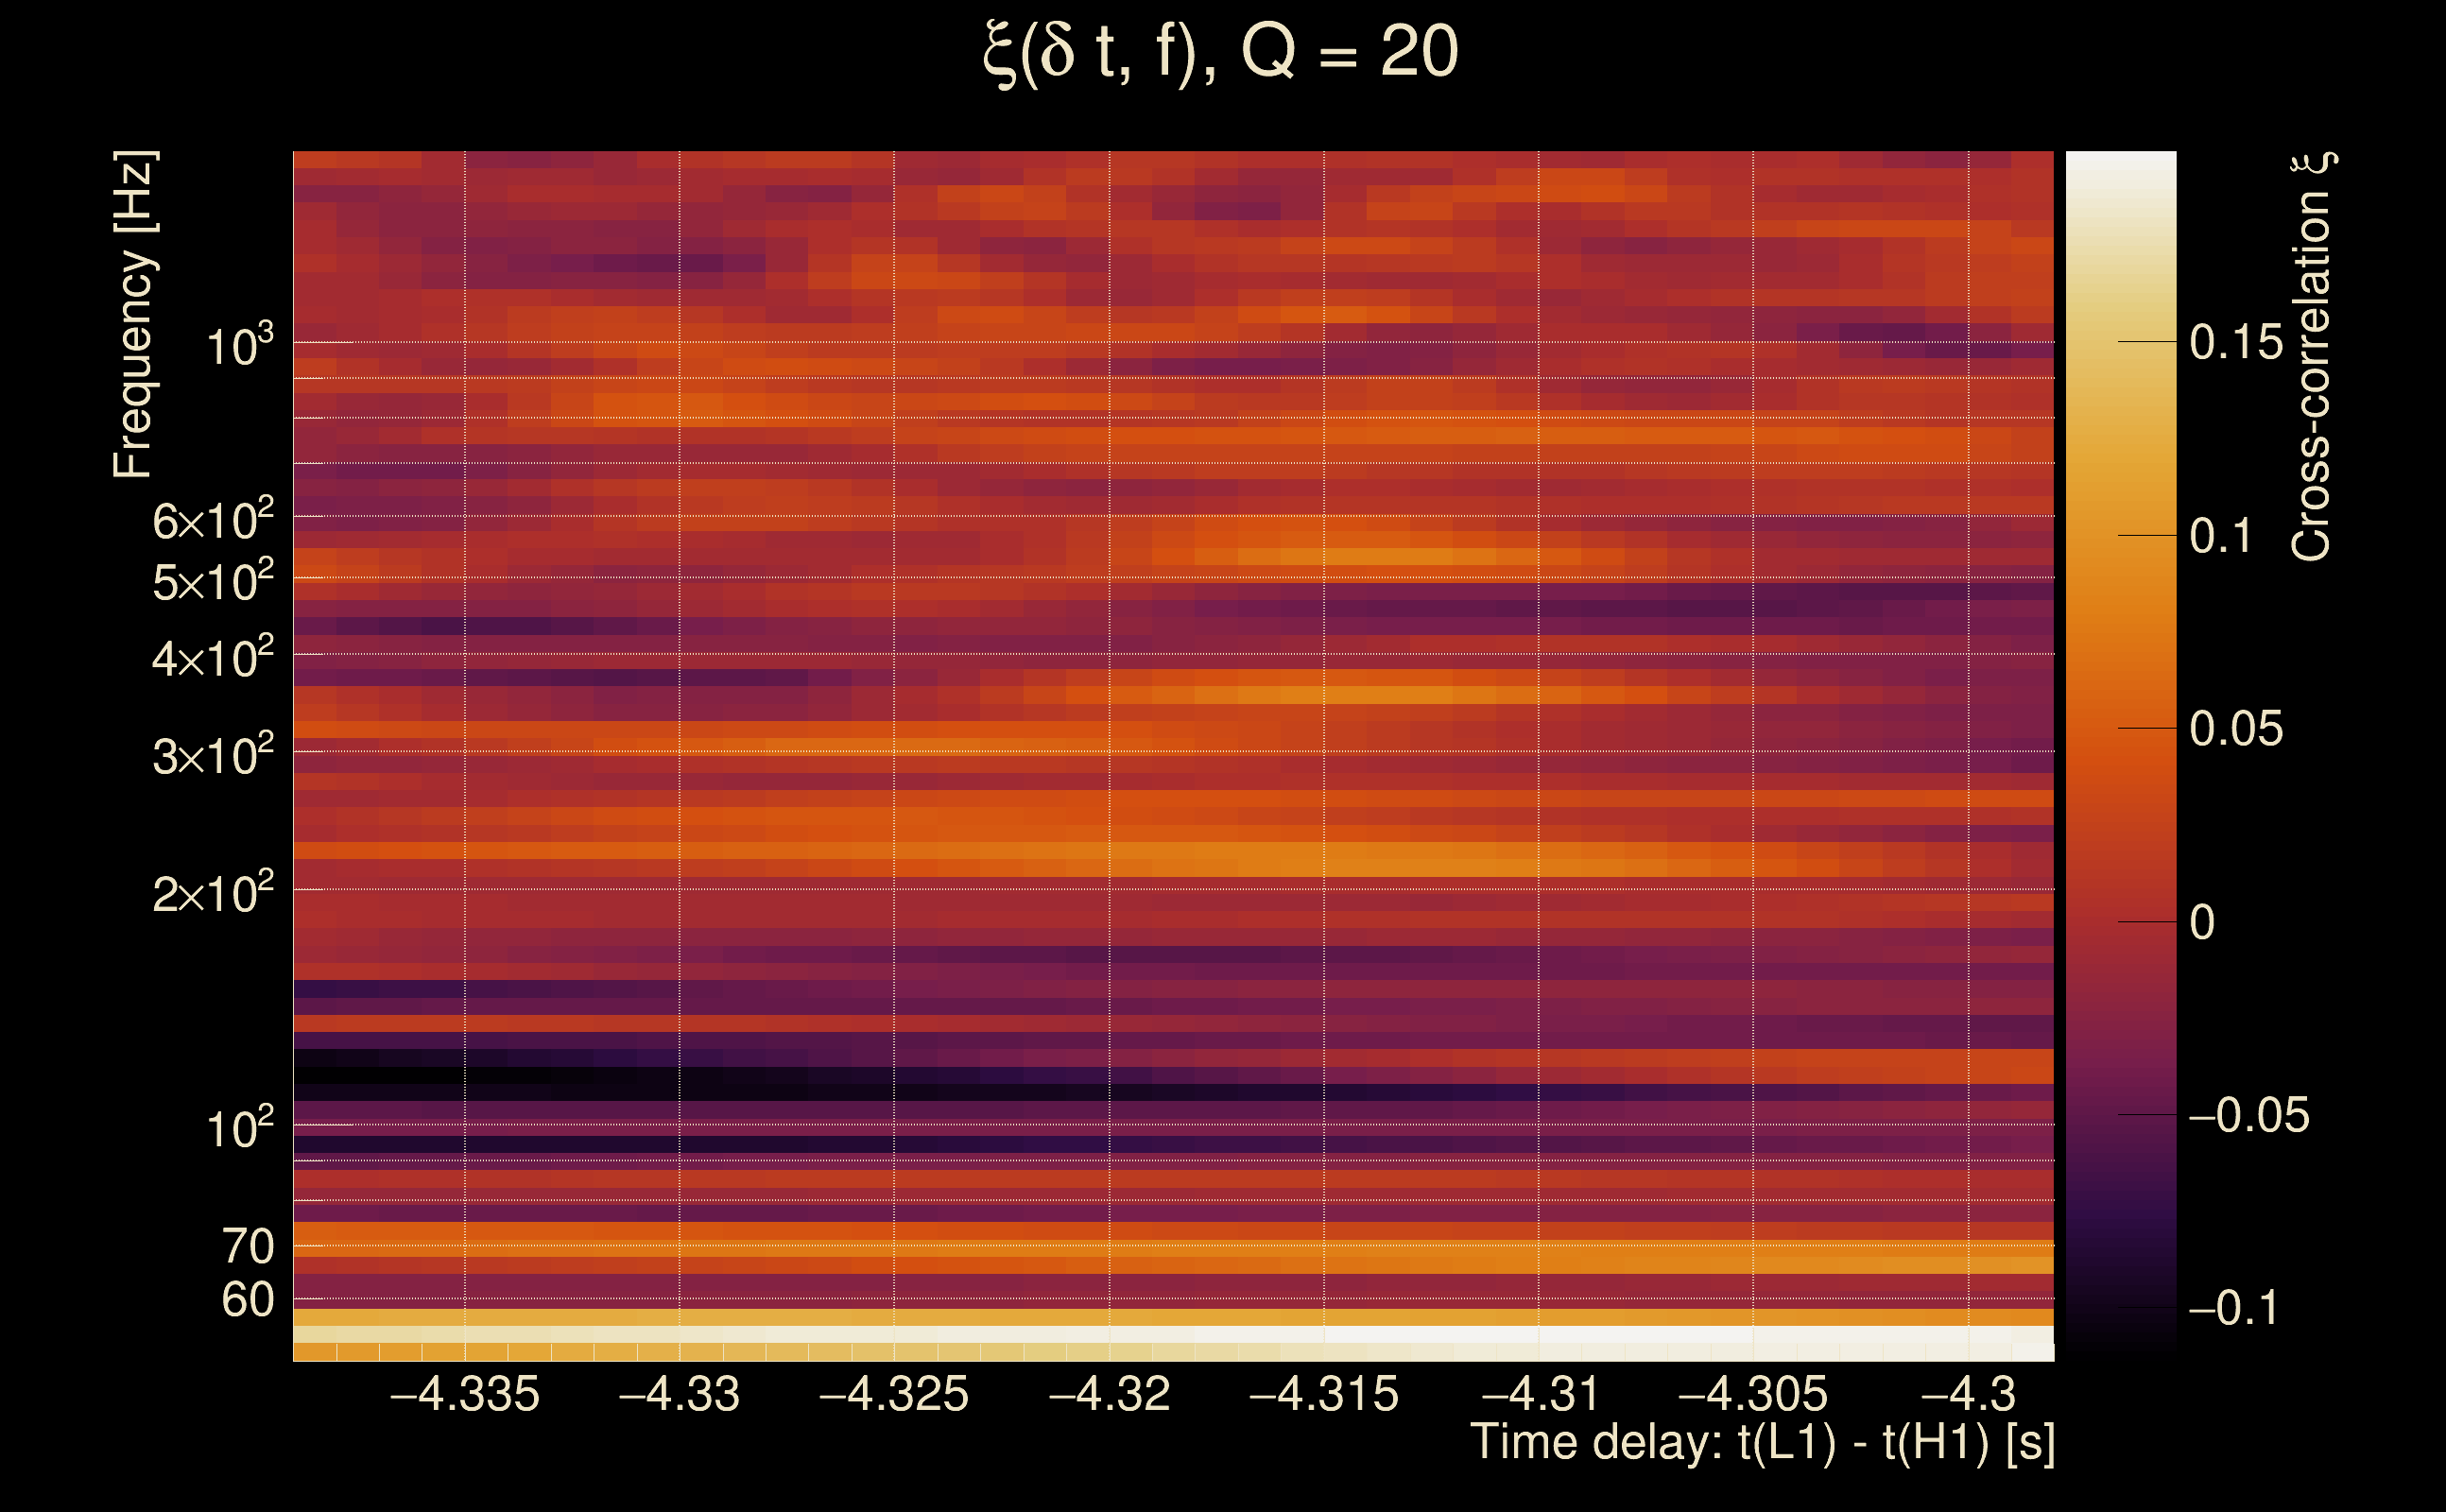
| Event time t(H1): | GPS = 1368195578 (Mon May 15 14:19:20 2023 ) → GPS = 1368195588 (Mon May 15 14:19:30 2023 ) |
| Event time t(L1): | GPS = 1368195578 (Mon May 15 14:19:30 2023 ) → GPS = 1368195588 (Mon May 15 14:19:30 2023 ) |
| Omicron analysis time window (H1): | GPS = 1368195575 → GPS = 1368195591 |
| Omicron analysis time window (L1): | GPS = 1368195575 → GPS = 1368195591 |
| Time delay between detectors t(L1) - t(H1): | -4.31875 s (slice index = 202 / 217), δt_gw = 0.00525054 s |
| Time delay standard deviation: | 0.0707756 s |
| [targeted mode] Time delay probability: | 0.497024 (0.67918 sigmas), δt_target = 0.00864673 s |
| Frequency: | 112.262 Hz |
| Ξ: | 0.0249367 ± 0.0426562 (variance = 0.00181956): Q0: 0.156848, Q1: 0.146433, Q2: 0.152491, Q3: 0.0519846, Q4: 0.082892 |
| Rank: | R_A = 0.00780787 |
| Log of amplitude ratio (L1/H1): | -0.194316, variance = 0.872745 (L1/H1: -0.59177, variance = 1.47112, H1/L1: -0.251841, variance = 2.07812) |
| Amplitude ratio (L1/H1): | 0.823397 ⋇ 2.5452 (L1/H1: 0.553347 ⋇ 3.36322, H1/L1: 0.777369 ⋇ 4.22731) |
| Amplitude ratio H1|L1 compatibility (probability): | 0.654305 |
| Antenna factor probability: | 0.962802 |
| Number of rejected frequency rows: | Q0: 14 / 18, Q1: 31 / 36, Q2: 64 / 70, Q3: 127 / 134, Q4: 251 / 258 |
| Maximum signal-to-noise ratio: | H1: 5.03867, L1: 4.7557 |
| SNR variance: | H1: 12.6674, L1: 9.40803 |
| Click here for a zoomed plot | Click here for a zoomed plot | Click here for a zoomed plot | Click here for a zoomed plot | Click here for a zoomed plot |
 |
 |
 |
 |
 |
 |
 |
 |
 |
 |
 |
 |
 |
 |
 |
 |
 |
 |
 |
 |
 |
 |
 |
 |
 |
 |
 |
 |
 |
| Number of injections (total/valid/detected): | 1 / 1 / 0 |
| List of missed injections: | ./SG-82Hz-0p1s_inc0p06346651825433926_missed.txt |
| Injection amplitude at 90% detection efficiency: | -1 |
| Injection amplitude at 50% detection efficiency: | -1 |
| Injection amplitude at 10% detection efficiency: | -1 |
 |
 |
 |
 |
 |
 |
 |
|
 |
 |
|
 |
 |
|
 |
 |
|
 |
 |
|
 |
 |
|
 |
 |
|
 |
 |
|
 |
 |
 |
 |
 |
 |
 |
 |
 |
 |
 |
 |
 |
 |
 |
| Number of injections (total/valid/detected): | 1 / 1 / 0 |
| List of missed injections: | ./SG-82Hz-0p1s_inc1p0154642920694281_missed.txt |
| Injection amplitude at 90% detection efficiency: | -1 |
| Injection amplitude at 50% detection efficiency: | -1 |
| Injection amplitude at 10% detection efficiency: | -1 |
 |
 |
 |
 |
 |
 |
 |
|
 |
 |
|
 |
 |
|
 |
 |
|
 |
 |
|
 |
 |
|
 |
 |
|
 |
 |
|
 |
 |
 |
 |
 |
 |
 |
 |
 |
 |
 |
 |
 |
 |
 |
| Number of injections (total/valid/detected): | 1 / 1 / 0 |
| List of missed injections: | ./SG-82Hz-0p1s_inc1p269330365086785_missed.txt |
| Injection amplitude at 90% detection efficiency: | -1 |
| Injection amplitude at 50% detection efficiency: | -1 |
| Injection amplitude at 10% detection efficiency: | -1 |
 |
 |
 |
 |
 |
 |
 |
|
 |
 |
|
 |
 |
|
 |
 |
|
 |
 |
|
 |
 |
|
 |
 |
|
 |
 |
|
 |
 |
 |
 |
 |
 |
 |
 |
 |
 |
 |
 |
 |
 |
 |
| Number of injections (total/valid/detected): | 1 / 1 / 0 |
| List of missed injections: | ./SG-82Hz-0p1s_inc1p3327968833411243_missed.txt |
| Injection amplitude at 90% detection efficiency: | -1 |
| Injection amplitude at 50% detection efficiency: | -1 |
| Injection amplitude at 10% detection efficiency: | -1 |
 |
 |
 |
 |
 |
 |
 |
|
 |
 |
|
 |
 |
|
 |
 |
|
 |
 |
|
 |
 |
|
 |
 |
|
 |
 |
|
 |
 |
 |
 |
 |
 |
 |
 |
 |
 |
 |
 |
 |
 |
 |
| Number of injections (total/valid/detected): | 1 / 1 / 0 |
| List of missed injections: | ./SG-82Hz-0p1s_inc1p9039955476301778_missed.txt |
| Injection amplitude at 90% detection efficiency: | -1 |
| Injection amplitude at 50% detection efficiency: | -1 |
| Injection amplitude at 10% detection efficiency: | -1 |
 |
 |
 |
 |
 |
 |
 |
|
 |
 |
|
 |
 |
|
 |
 |
|
 |
 |
|
 |
 |
|
 |
 |
|
 |
 |
|
 |
 |
 |
 |
 |
 |
 |
 |
 |
 |
 |
 |
 |
 |
 |
| Number of injections (total/valid/detected): | 1 / 1 / 0 |
| List of missed injections: | ./SG-82Hz-0p1s_inc1p967462065884517_missed.txt |
| Injection amplitude at 90% detection efficiency: | -1 |
| Injection amplitude at 50% detection efficiency: | -1 |
| Injection amplitude at 10% detection efficiency: | -1 |
 |
 |
 |
 |
 |
 |
 |
|
 |
 |
|
 |
 |
|
 |
 |
|
 |
 |
|
 |
 |
|
 |
 |
|
 |
 |
|
 |
 |
 |
 |
 |
 |
 |
 |
 |
 |
 |
 |
 |
 |
 |
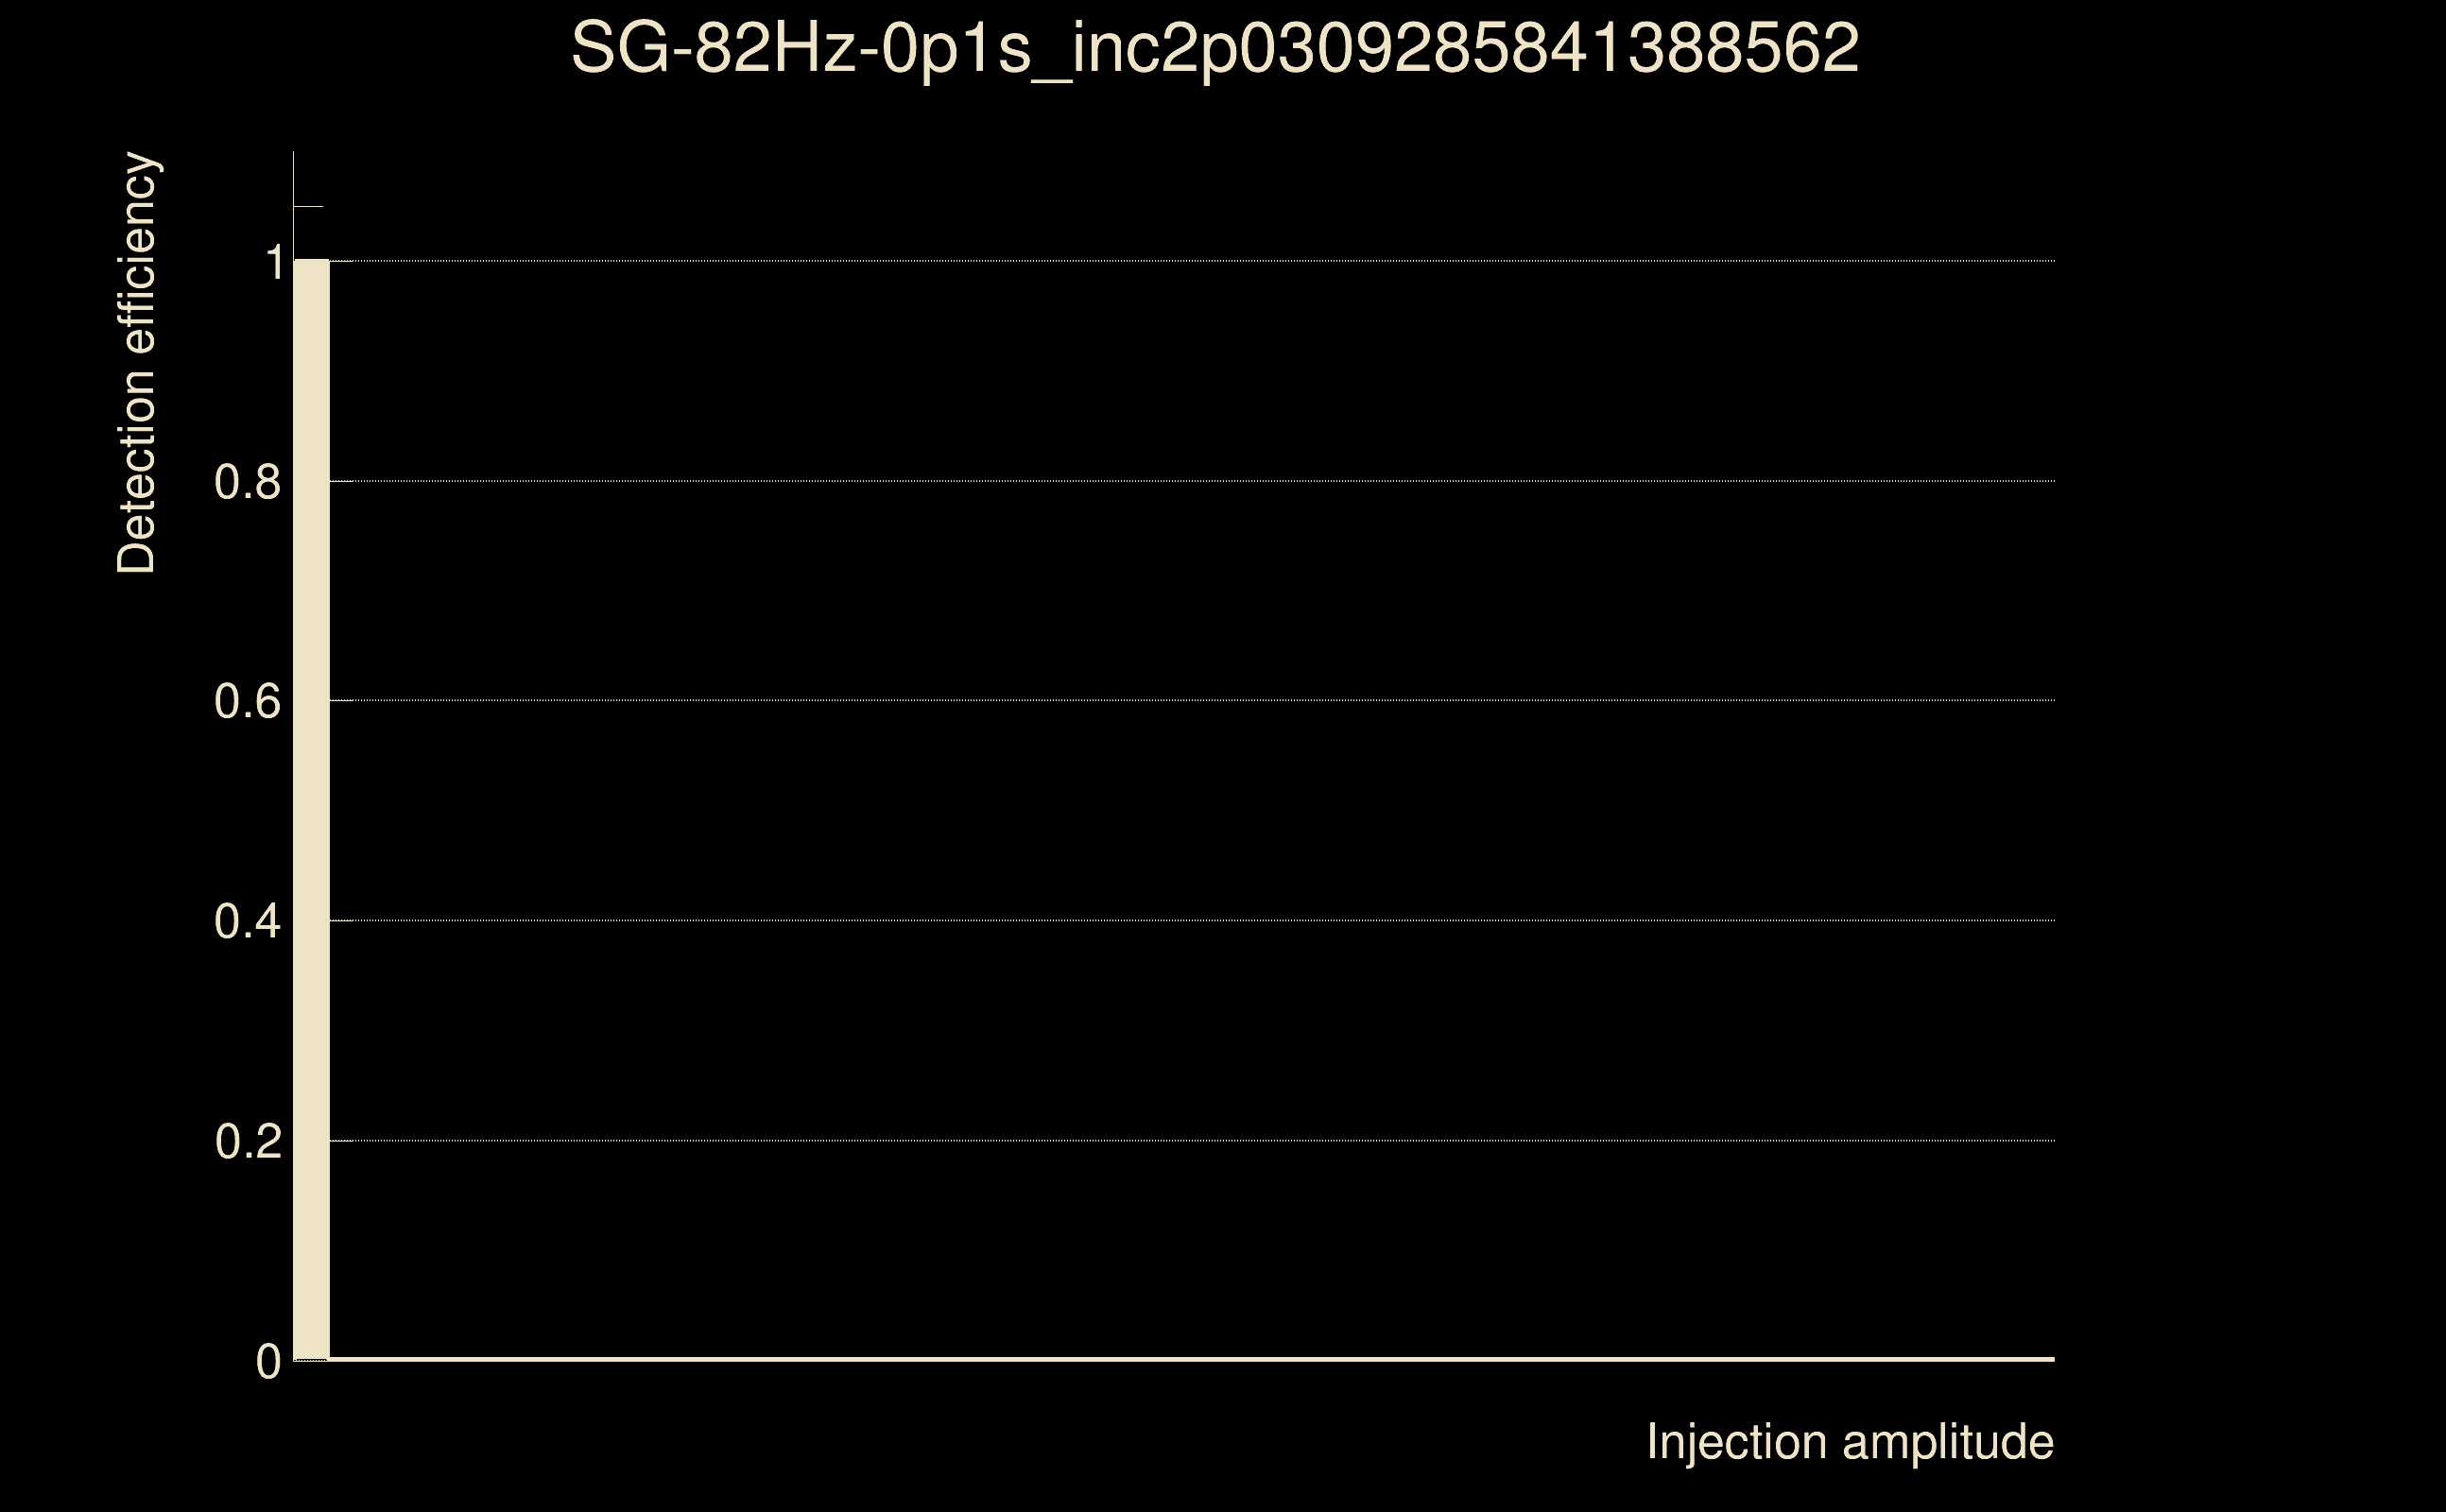
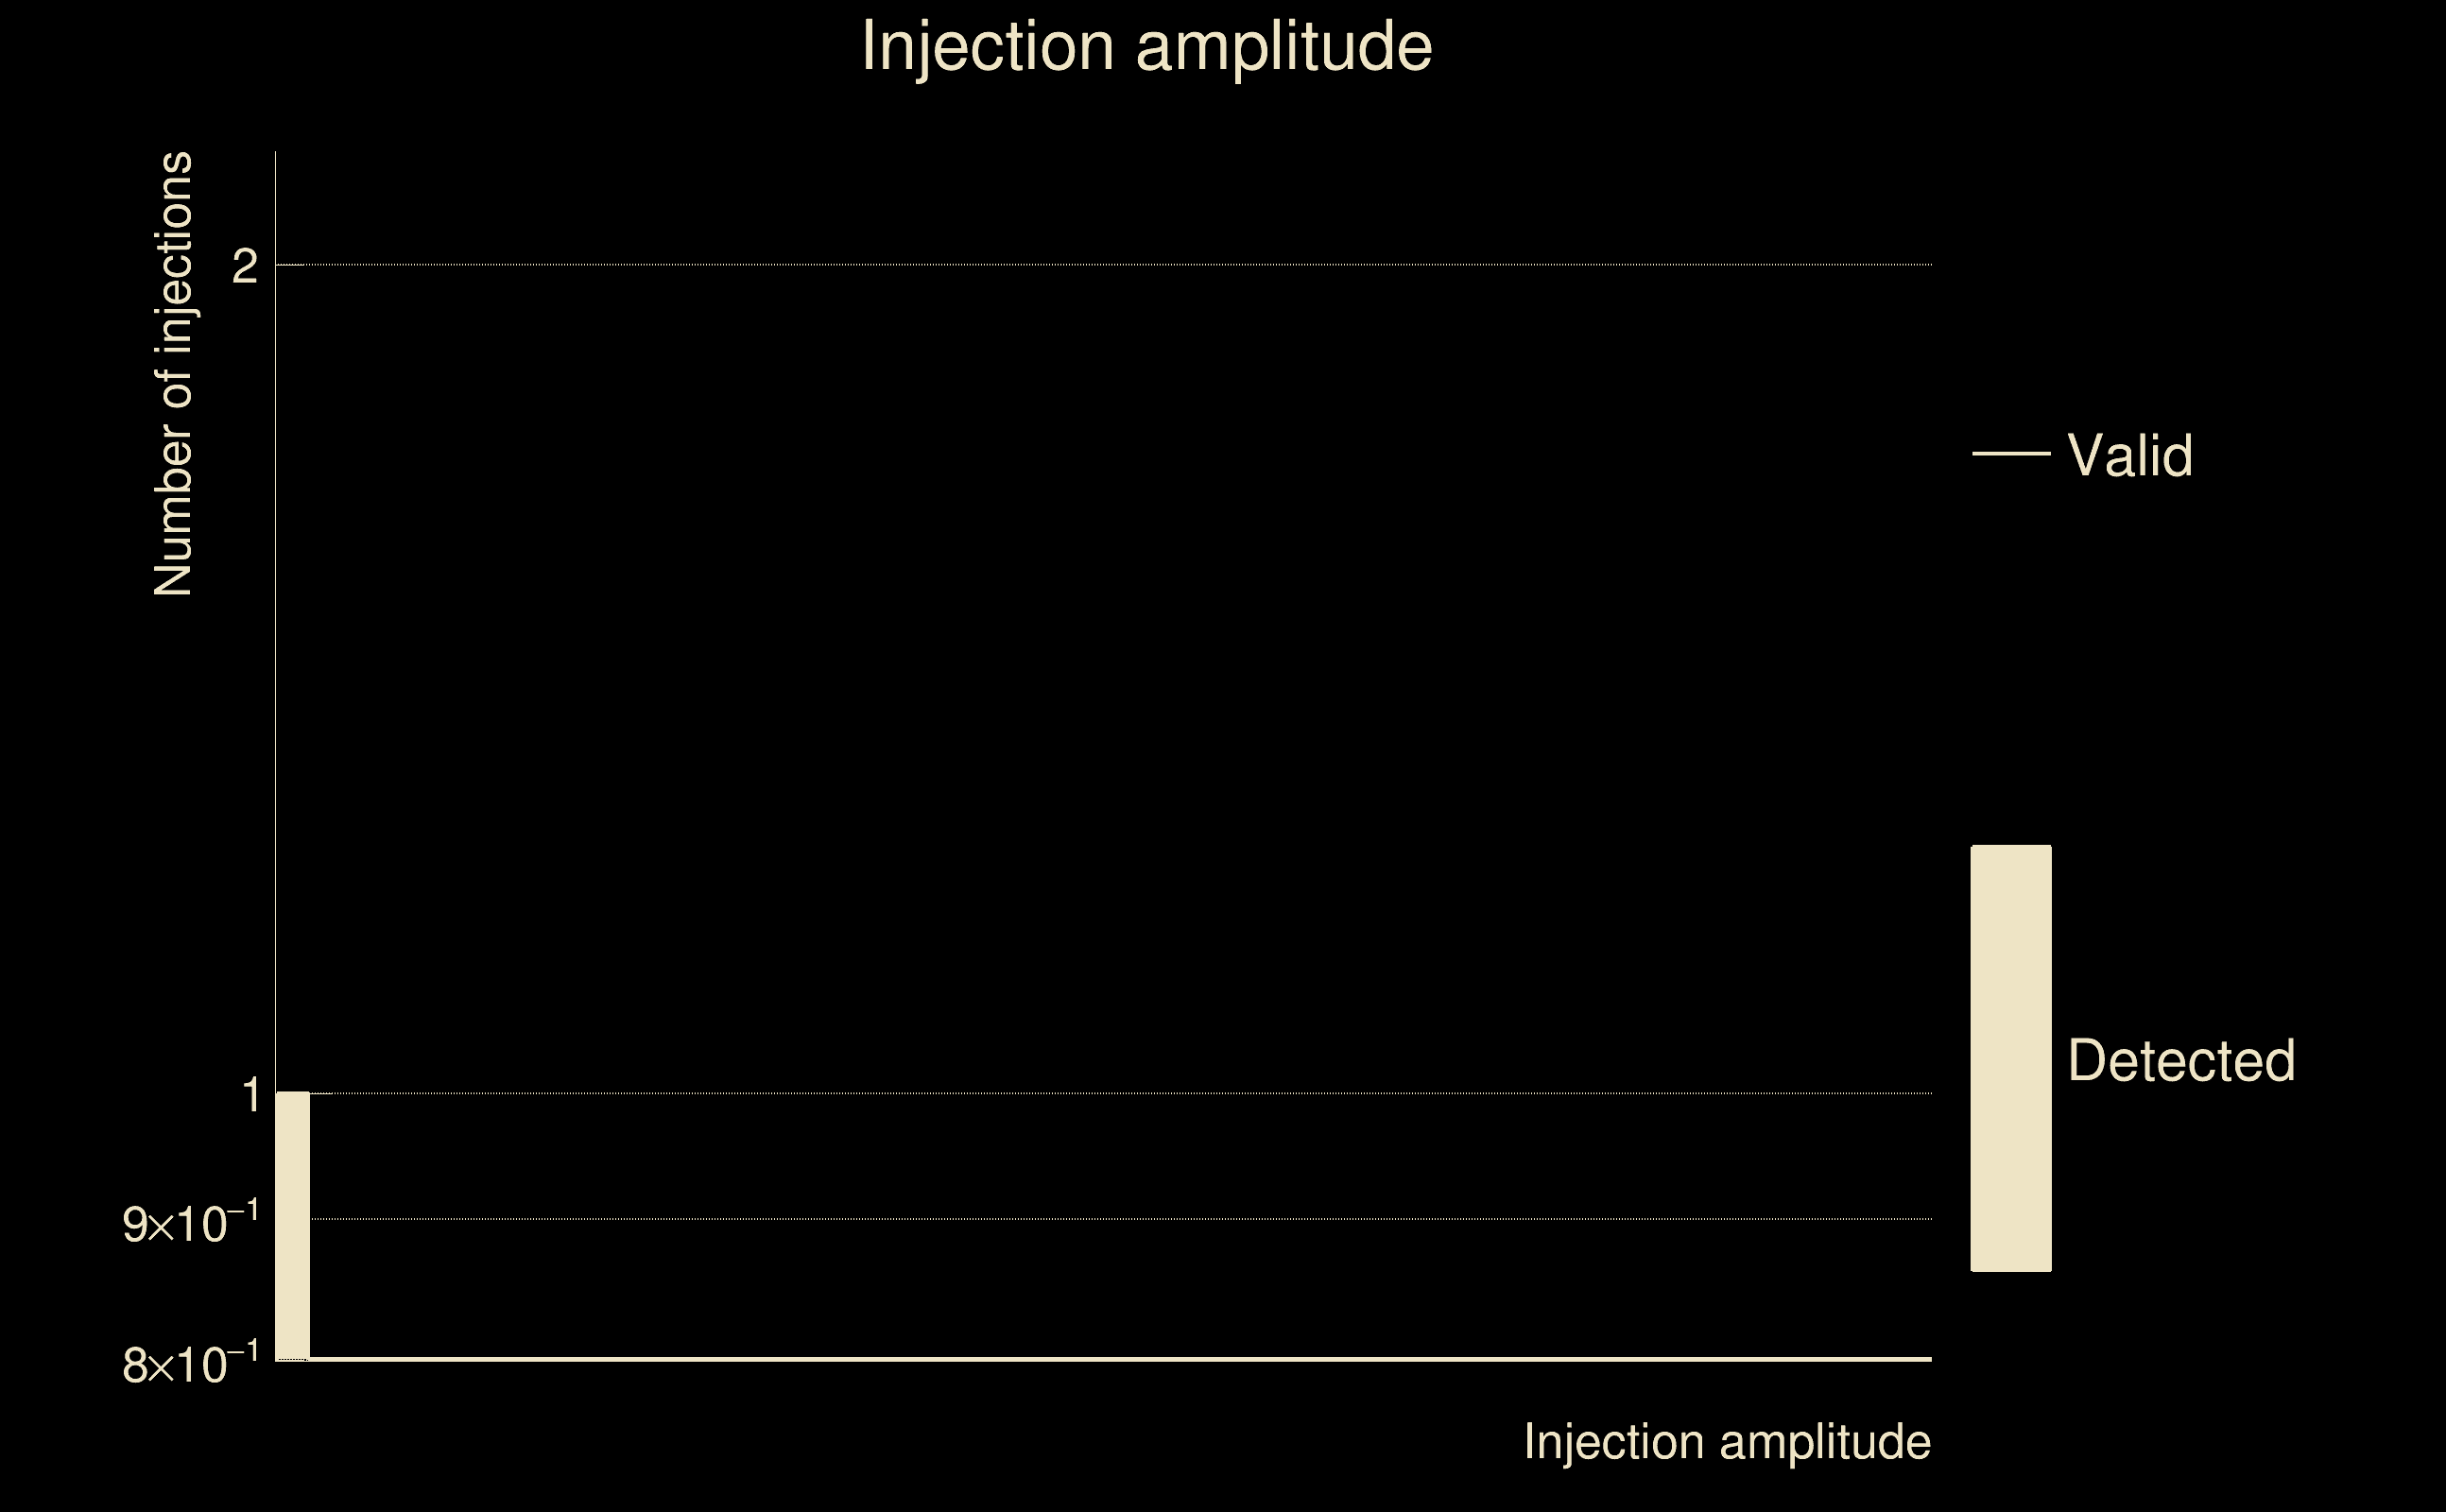
| Number of injections (total/valid/detected): | 1 / 1 / 1 |
| List of missed injections: | ./SG-82Hz-0p1s_inc2p0309285841388562_missed.txt |
| Injection amplitude at 90% detection efficiency: | -1 |
| Injection amplitude at 50% detection efficiency: | -1 |
| Injection amplitude at 10% detection efficiency: | -1 |
 |
 |
 |
 |
 |
 |
 |
|
 |
 |
|
 |
 |
|
 |
 |
|
 |
 |
|
 |
 |
|
 |
 |
|
 |
 |
|
 |
 |
 |
 |
 |
 |
 |
 |
 |
 |
 |
 |
 |
 |
 |
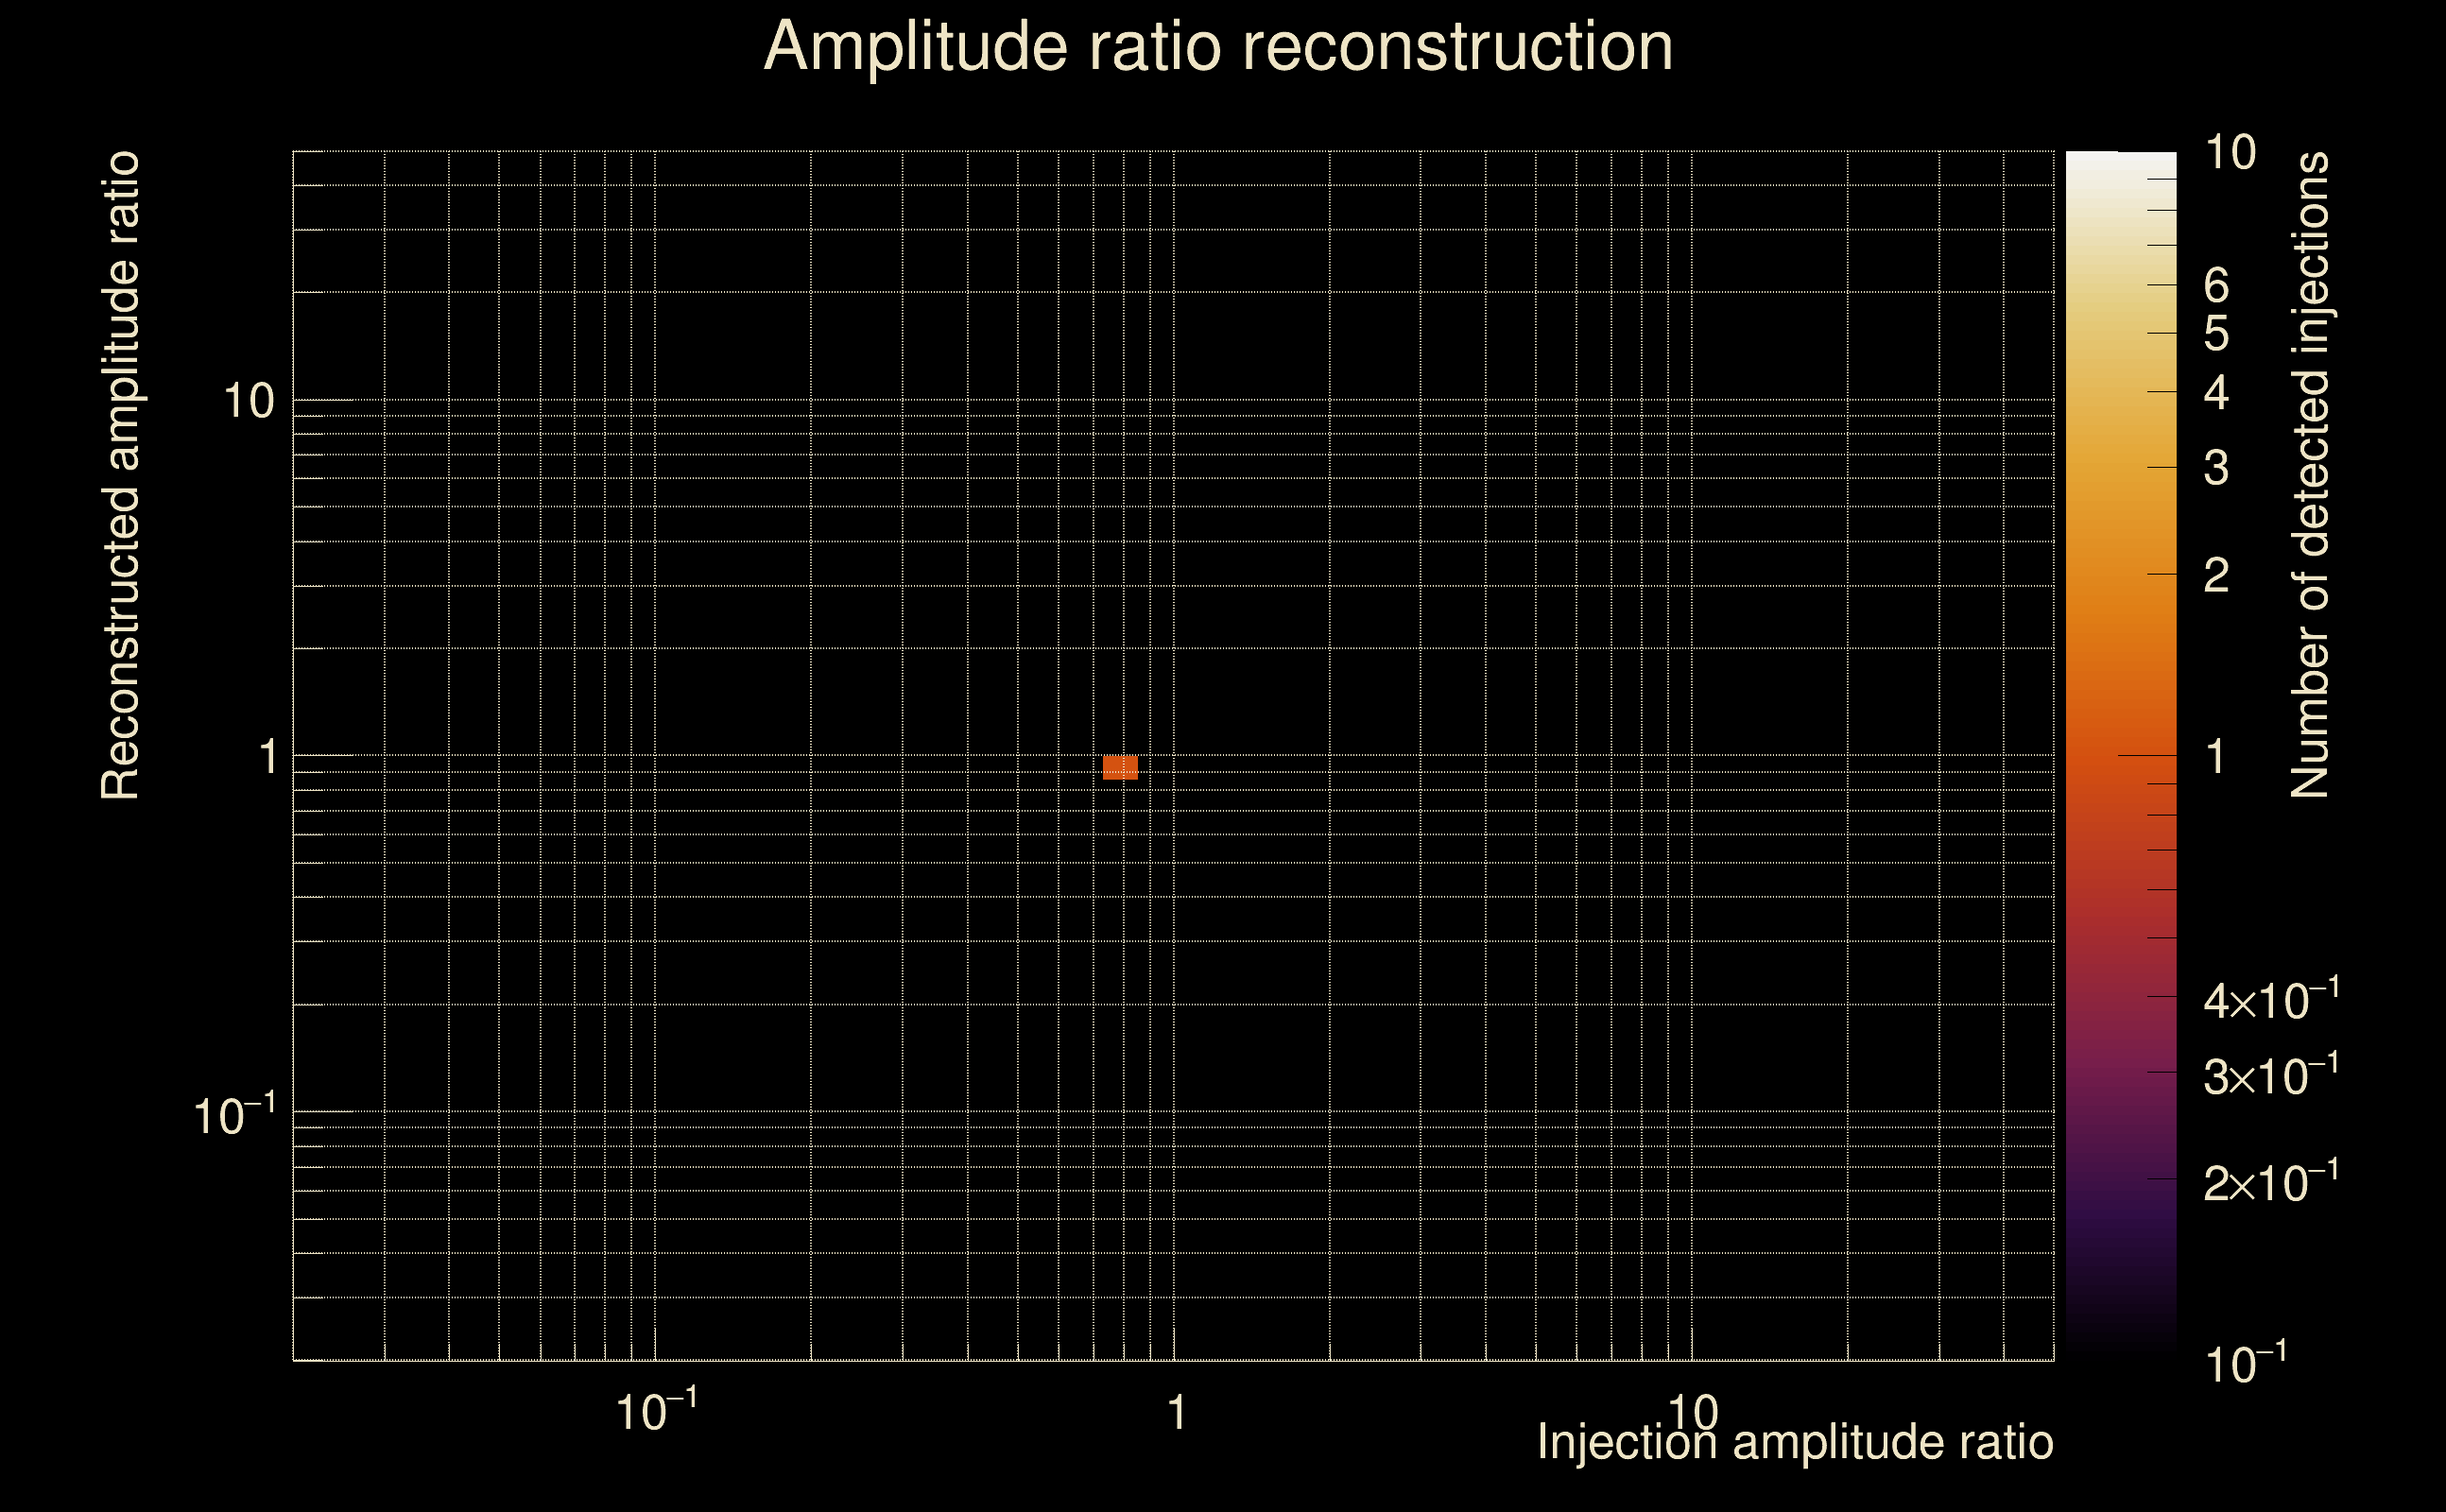
| Number of injections (total/valid/detected): | 1 / 1 / 0 |
| List of missed injections: | ./SG-82Hz-0p1s_inc2p284794657156213_missed.txt |
| Injection amplitude at 90% detection efficiency: | -1 |
| Injection amplitude at 50% detection efficiency: | -1 |
| Injection amplitude at 10% detection efficiency: | -1 |
 |
 |
 |
 |
 |
 |
 |
|
 |
 |
|
 |
 |
|
 |
 |
|
 |
 |
|
 |
 |
|
 |
 |
|
 |
 |
|
 |
 |
 |
 |
 |
 |
 |
 |
 |
 |
 |
 |
 |
 |
 |
| Number of injections (total/valid/detected): | 1 / 1 / 0 |
| List of missed injections: | ./SG-82Hz-0p1s_inc2p982926357953945_missed.txt |
| Injection amplitude at 90% detection efficiency: | -1 |
| Injection amplitude at 50% detection efficiency: | -1 |
| Injection amplitude at 10% detection efficiency: | -1 |
 |
 |
 |
 |
 |
 |
 |
|
 |
 |
|
 |
 |
|
 |
 |
|
 |
 |
|
 |
 |
|
 |
 |
|
 |
 |
|
 |
 |
 |
 |
 |
 |
 |
 |
 |
 |
 |
 |
 |
 |
 |
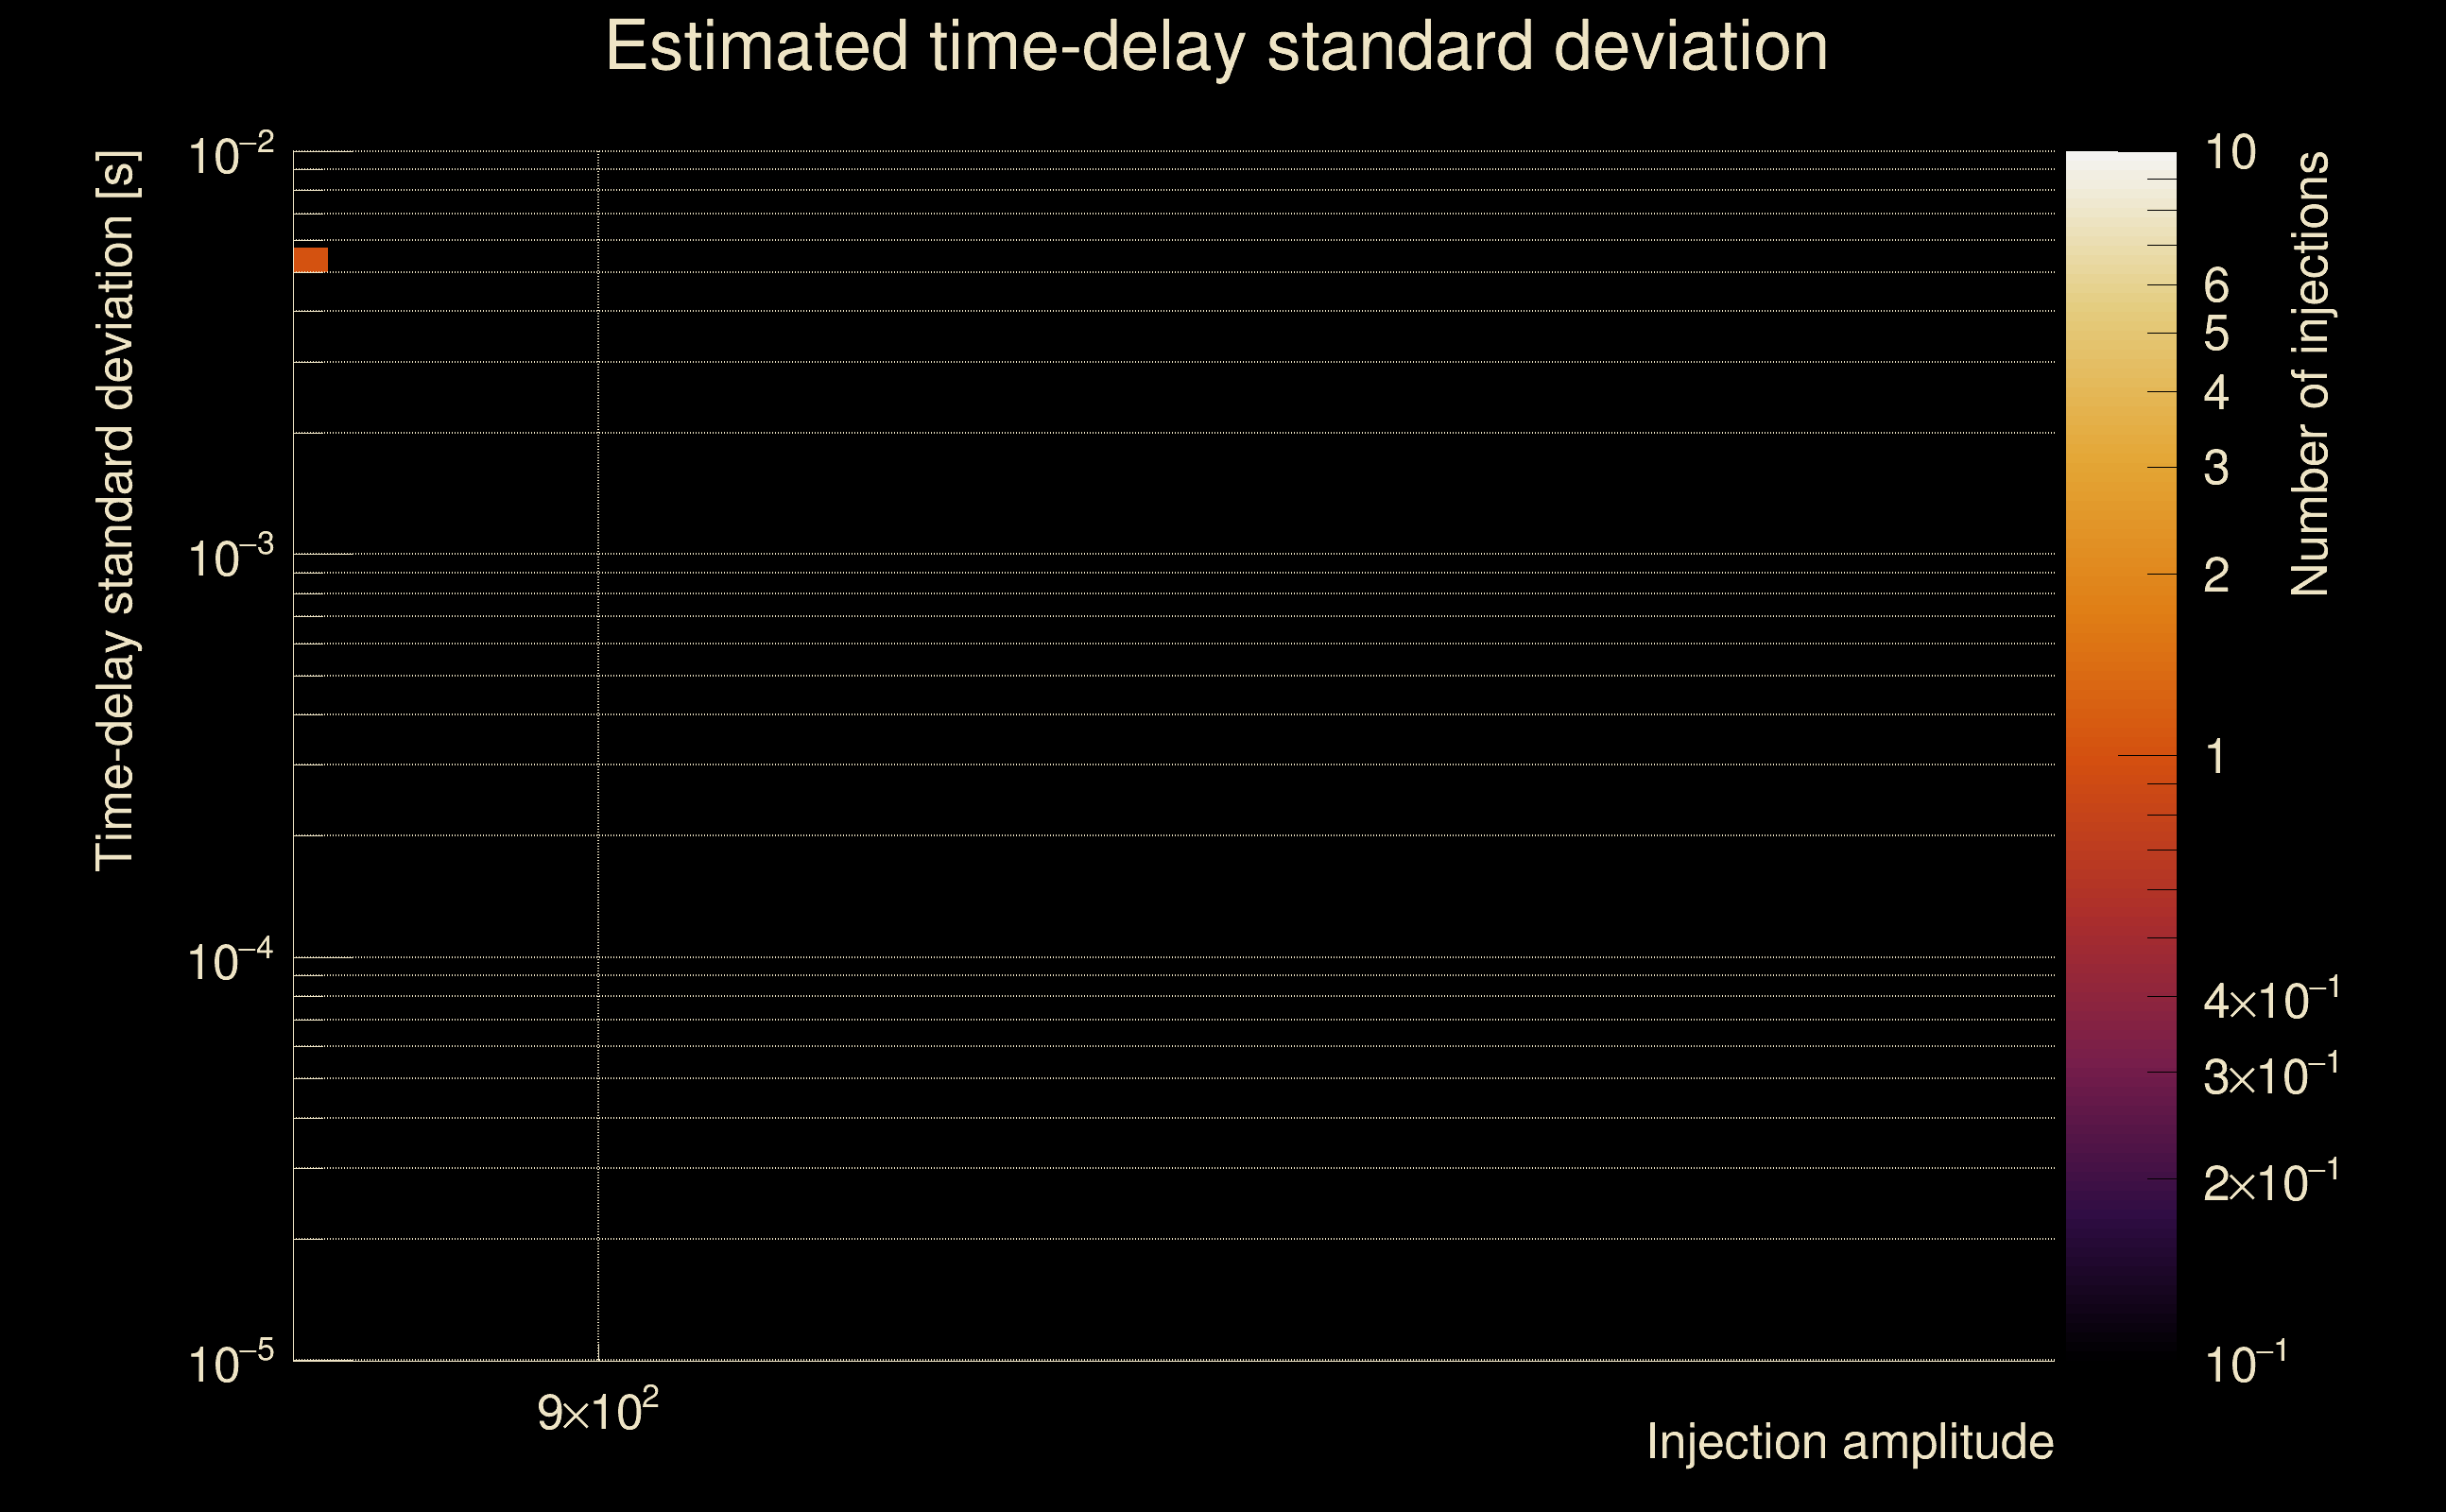
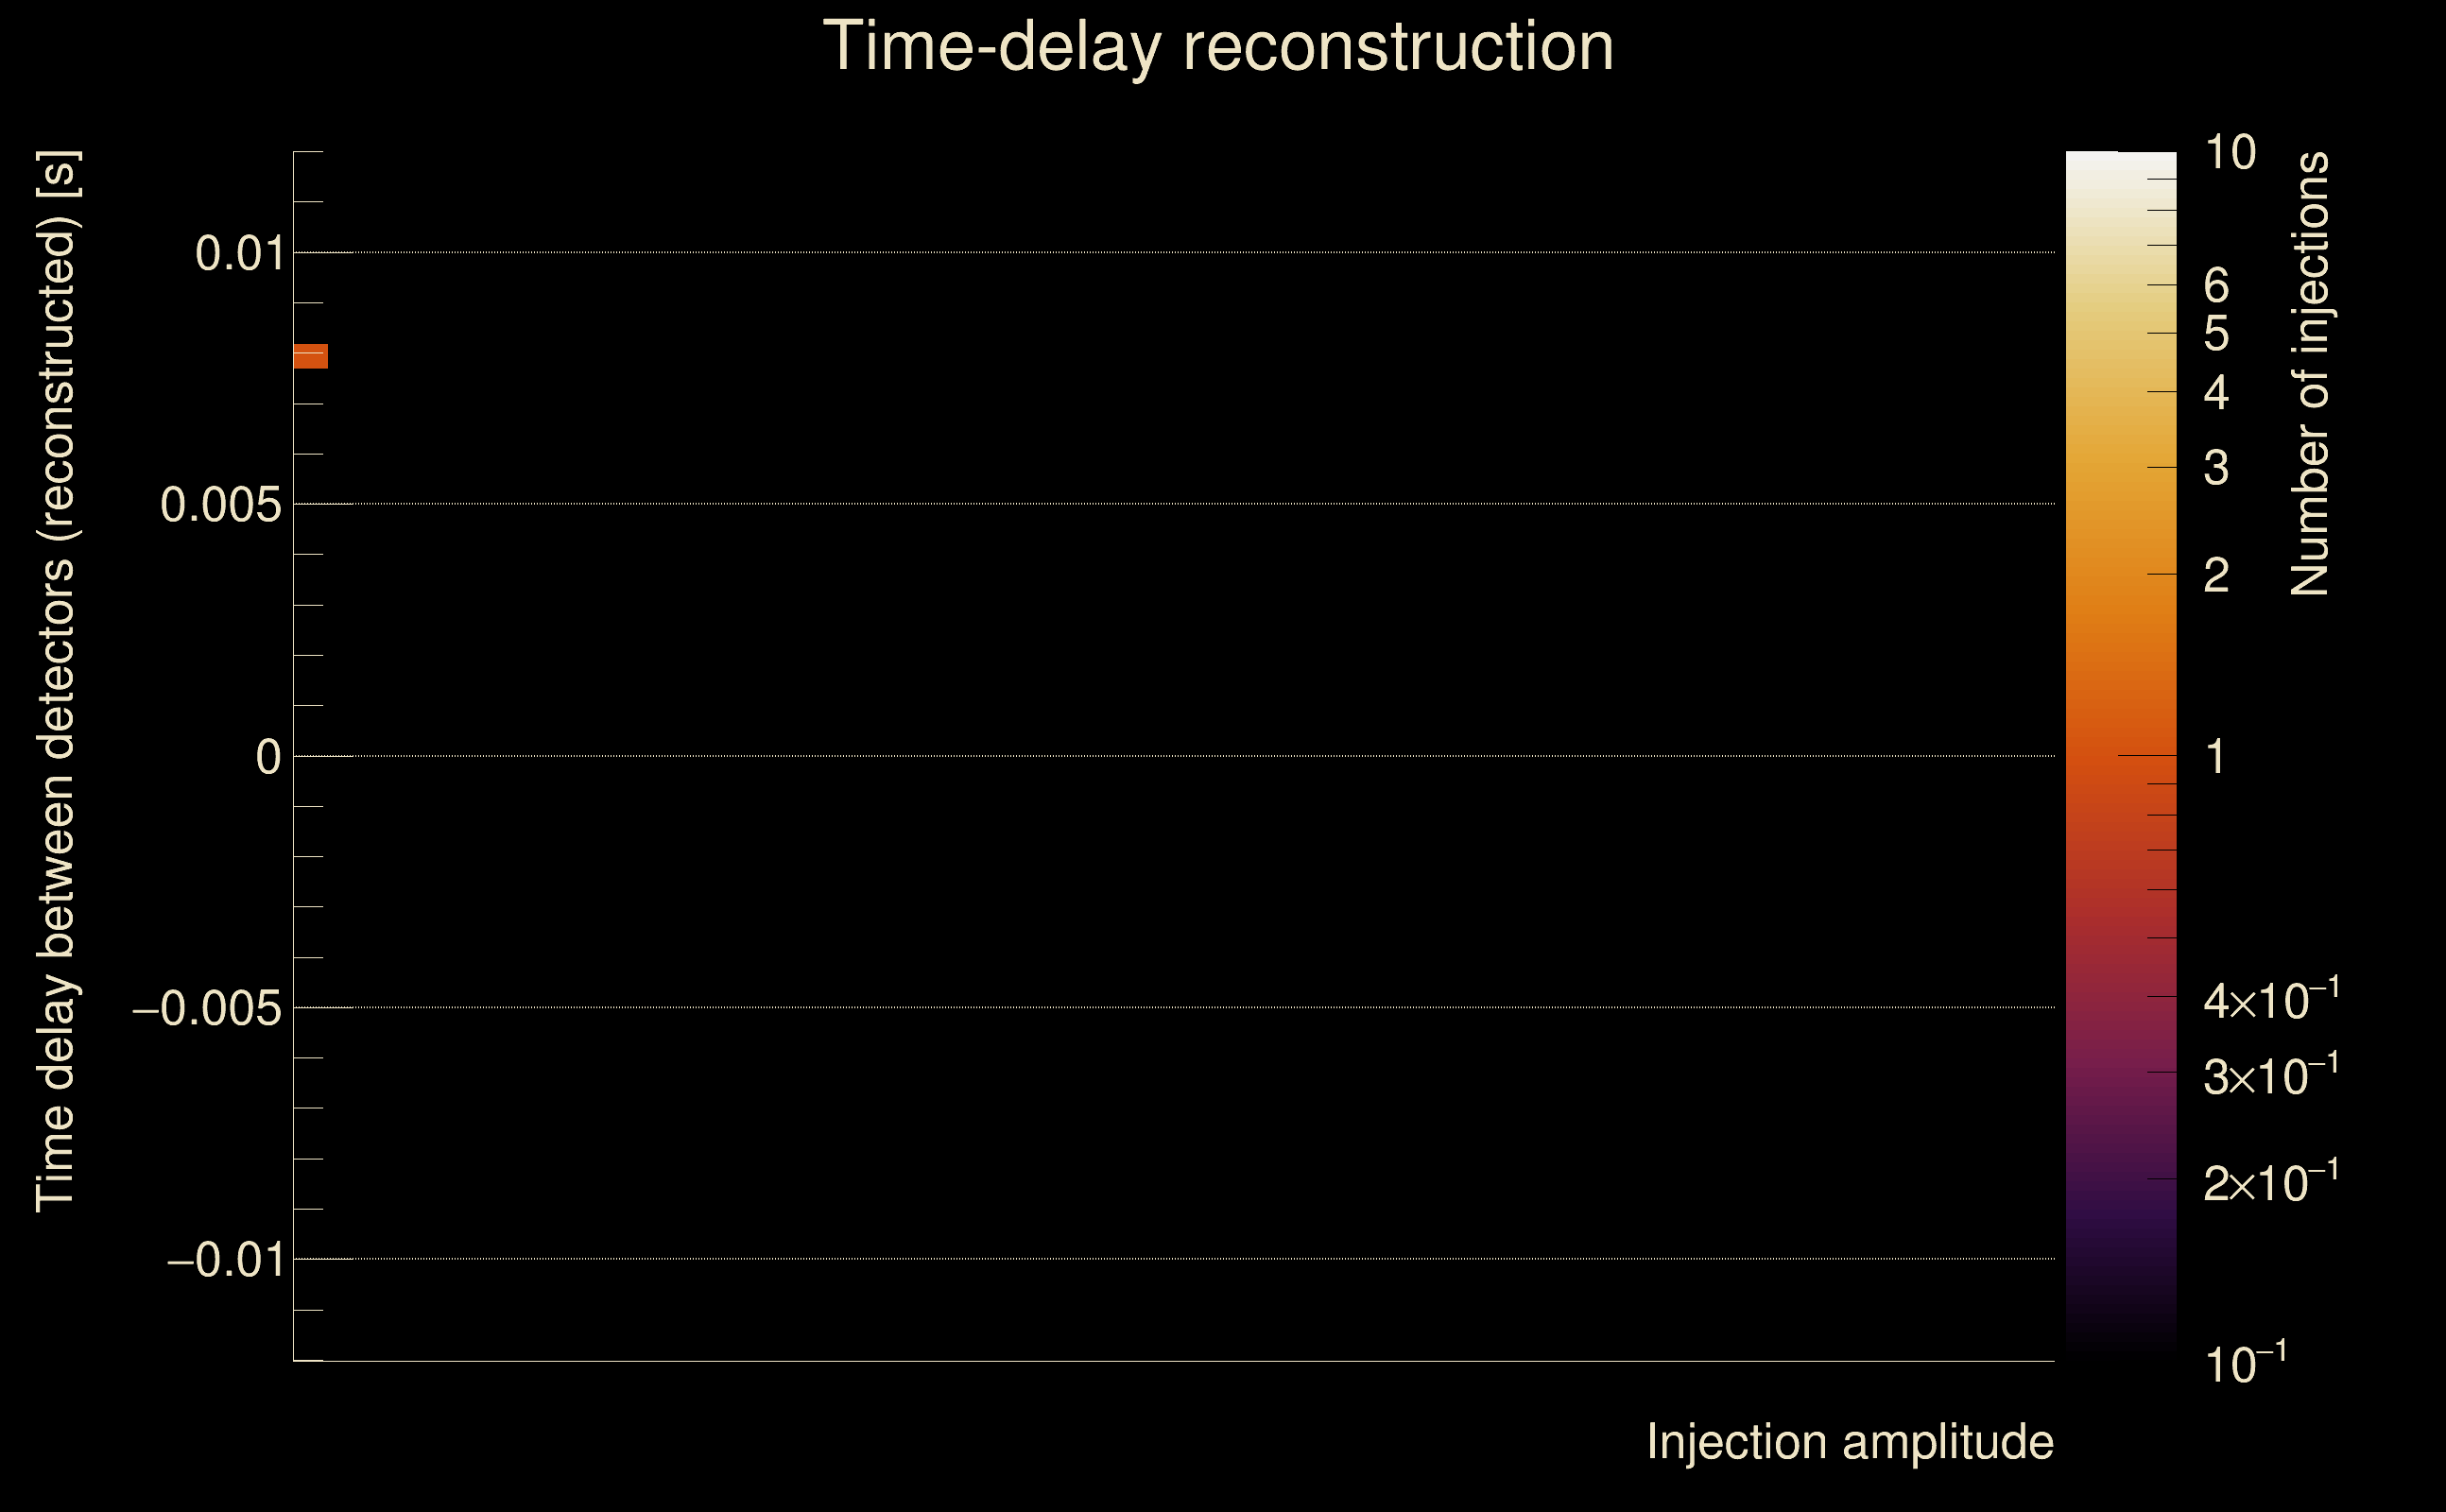
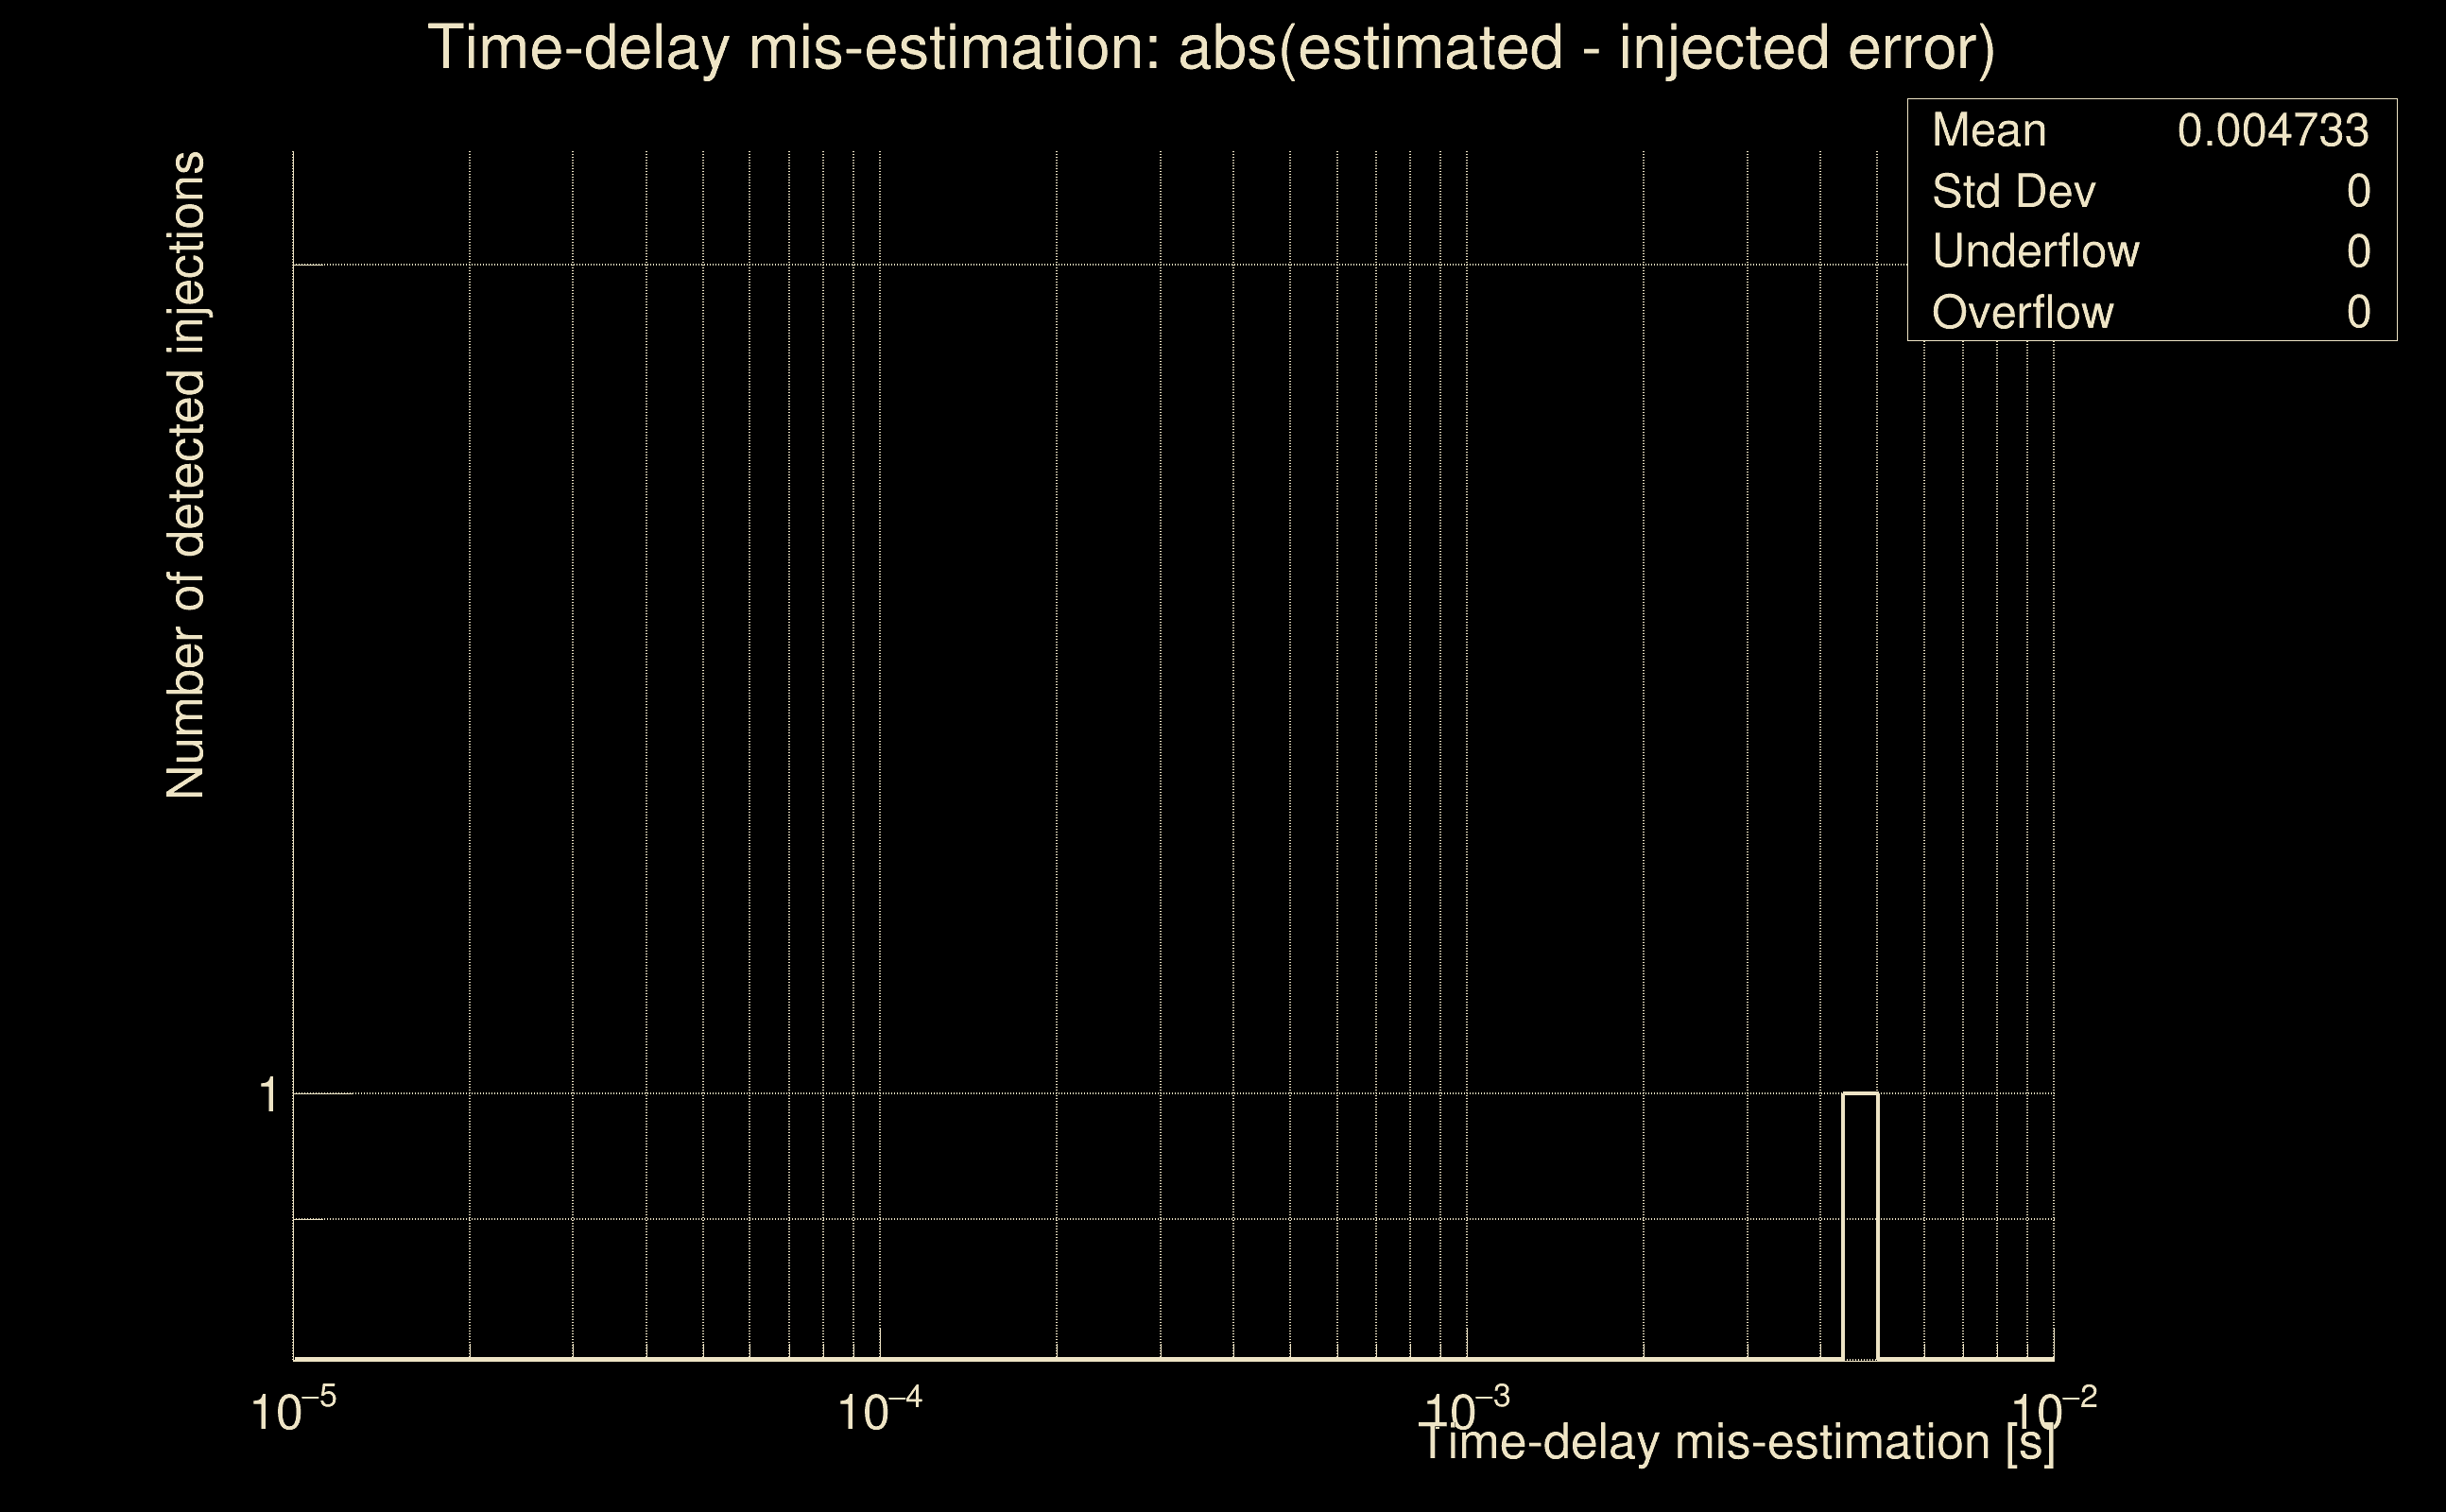
| Number of injections (total/valid/detected): | 1 / 1 / 0 |
| List of missed injections: | ./SG-82Hz-0p1s_inc3p8714576135146945_missed.txt |
| Injection amplitude at 90% detection efficiency: | -1 |
| Injection amplitude at 50% detection efficiency: | -1 |
| Injection amplitude at 10% detection efficiency: | -1 |
 |
 |
 |
 |
 |
 |
 |
|
 |
 |
|
 |
 |
|
 |
 |
|
 |
 |
|
 |
 |
|
 |
 |
|
 |
 |
|
 |
 |
 |
 |
 |
 |
 |
 |
 |
 |
 |
 |
 |
 |
 |
| Number of injections (total/valid/detected): | 1 / 1 / 0 |
| List of missed injections: | ./SG-82Hz-0p1s_inc4p25225672304073_missed.txt |
| Injection amplitude at 90% detection efficiency: | -1 |
| Injection amplitude at 50% detection efficiency: | -1 |
| Injection amplitude at 10% detection efficiency: | -1 |
 |
 |
 |
 |
 |
 |
 |
|
 |
 |
|
 |
 |
|
 |
 |
|
 |
 |
|
 |
 |
|
 |
 |
|
 |
 |
|
 |
 |
 |
 |
 |
 |
 |
 |
 |
 |
 |
 |
 |
 |
 |
| Number of injections (total/valid/detected): | 2 / 2 / 0 |
| List of missed injections: | ./SG-82Hz-0p1s_inc4p6330558325667655_missed.txt |
| Injection amplitude at 90% detection efficiency: | -1 |
| Injection amplitude at 50% detection efficiency: | -1 |
| Injection amplitude at 10% detection efficiency: | -1 |
 |
 |
 |
 |
 |
 |
 |
|
 |
 |
|
 |
 |
|
 |
 |
|
 |
 |
|
 |
 |
|
 |
 |
|
 |
 |
|
 |
 |
 |
 |
 |
 |
 |
 |
 |
 |
 |
 |
 |
 |
 |
| Number of injections (total/valid/detected): | 2 / 2 / 0 |
| List of missed injections: | ./SG-82Hz-0p1s_inc4p950388423838462_missed.txt |
| Injection amplitude at 90% detection efficiency: | -1 |
| Injection amplitude at 50% detection efficiency: | -1 |
| Injection amplitude at 10% detection efficiency: | -1 |
 |
 |
 |
 |
 |
 |
 |
|
 |
 |
|
 |
 |
|
 |
 |
|
 |
 |
|
 |
 |
|
 |
 |
|
 |
 |
|
 |
 |
 |
 |
 |
 |
 |
 |
 |
 |
 |
 |
 |
 |
 |
| Number of injections (total/valid/detected): | 1 / 1 / 1 |
| List of missed injections: | ./SG-82Hz-0p1s_inc5p267721015110158_missed.txt |
| Injection amplitude at 90% detection efficiency: | -1 |
| Injection amplitude at 50% detection efficiency: | -1 |
| Injection amplitude at 10% detection efficiency: | -1 |
 |
 |
 |
 |
 |
 |
 |
|
 |
 |
|
 |
 |
|
 |
 |
|
 |
 |
|
 |
 |
|
 |
 |
|
 |
 |
|
 |
 |
 |
 |
 |
 |
 |
 |
 |
 |
 |
 |
 |
 |
 |
| Number of injections (total/valid/detected): | 1 / 1 / 1 |
| List of missed injections: | ./SG-82Hz-0p1s_inc5p331187533364497_missed.txt |
| Injection amplitude at 90% detection efficiency: | -1 |
| Injection amplitude at 50% detection efficiency: | -1 |
| Injection amplitude at 10% detection efficiency: | -1 |
 |
 |
 |
 |
 |
 |
 |
|
 |
 |
|
 |
 |
|
 |
 |
|
 |
 |
|
 |
 |
|
 |
 |
|
 |
 |
|
 |
 |
 |
 |
 |
 |
 |
 |
 |
 |
 |
 |
 |
 |
 |
| Number of injections (total/valid/detected): | 1 / 1 / 0 |
| List of missed injections: | ./SG-82Hz-0p1s_inc5p521587088127515_missed.txt |
| Injection amplitude at 90% detection efficiency: | -1 |
| Injection amplitude at 50% detection efficiency: | -1 |
| Injection amplitude at 10% detection efficiency: | -1 |
 |
 |
 |
 |
 |
 |
 |
|
 |
 |
|
 |
 |
|
 |
 |
|
 |
 |
|
 |
 |
|
 |
 |
|
 |
 |
|
 |
 |
 |
 |
 |
 |
 |
 |
 |
 |
 |
 |
 |
 |
 |
| Number of injections (total/valid/detected): | 1 / 1 / 0 |
| List of missed injections: | ./SG-82Hz-0p1s_inc5p585053606381854_missed.txt |
| Injection amplitude at 90% detection efficiency: | -1 |
| Injection amplitude at 50% detection efficiency: | -1 |
| Injection amplitude at 10% detection efficiency: | -1 |
 |
 |
 |
 |
 |
 |
 |
|
 |
 |
|
 |
 |
|
 |
 |
|
 |
 |
|
 |
 |
|
 |
 |
|
 |
 |
|
 |
 |
 |
 |
 |
 |
 |
 |
 |
 |
 |
 |
 |
 |
 |
| Number of injections (total/valid/detected): | 1 / 0 / 0 |
| List of missed injections: | ./SG-82Hz-0p1s_inc5p838919679399211_missed.txt |
| Injection amplitude at 90% detection efficiency: | -1 |
| Injection amplitude at 50% detection efficiency: | -1 |
| Injection amplitude at 10% detection efficiency: | -1 |
 |
 |
 |
 |
 |
 |
 |
|
 |
 |
|
 |
 |
|
 |
 |
|
 |
 |
|
 |
 |
|
 |
 |
|
 |
 |
|
 |
 |
 |
 |
 |
 |
 |
 |
 |
 |
 |
 |
 |
 |
 |
| florent.robinet@ijclab.in2p3.fr |