
| Omicron version: | 4.2.0: documentation gitlab repository |
| Omicron run by: | unknown |
| Report produced on: | Wed Mar 11 10:43:05 2026 UTC |
| Ox option file: | TargIxf_feb2026_BG_CAT1_options.txt |
| Omicron option files: | detector 0, detector 1 |
| Detector channel names: | H1:GDS-CALIB_STRAIN_CLEAN_AR_4096Hz, L1:GDS-CALIB_STRAIN_CLEAN_AR_4096Hz |
| Omicron analysis time window and overlap: | 16 s, 6 s |
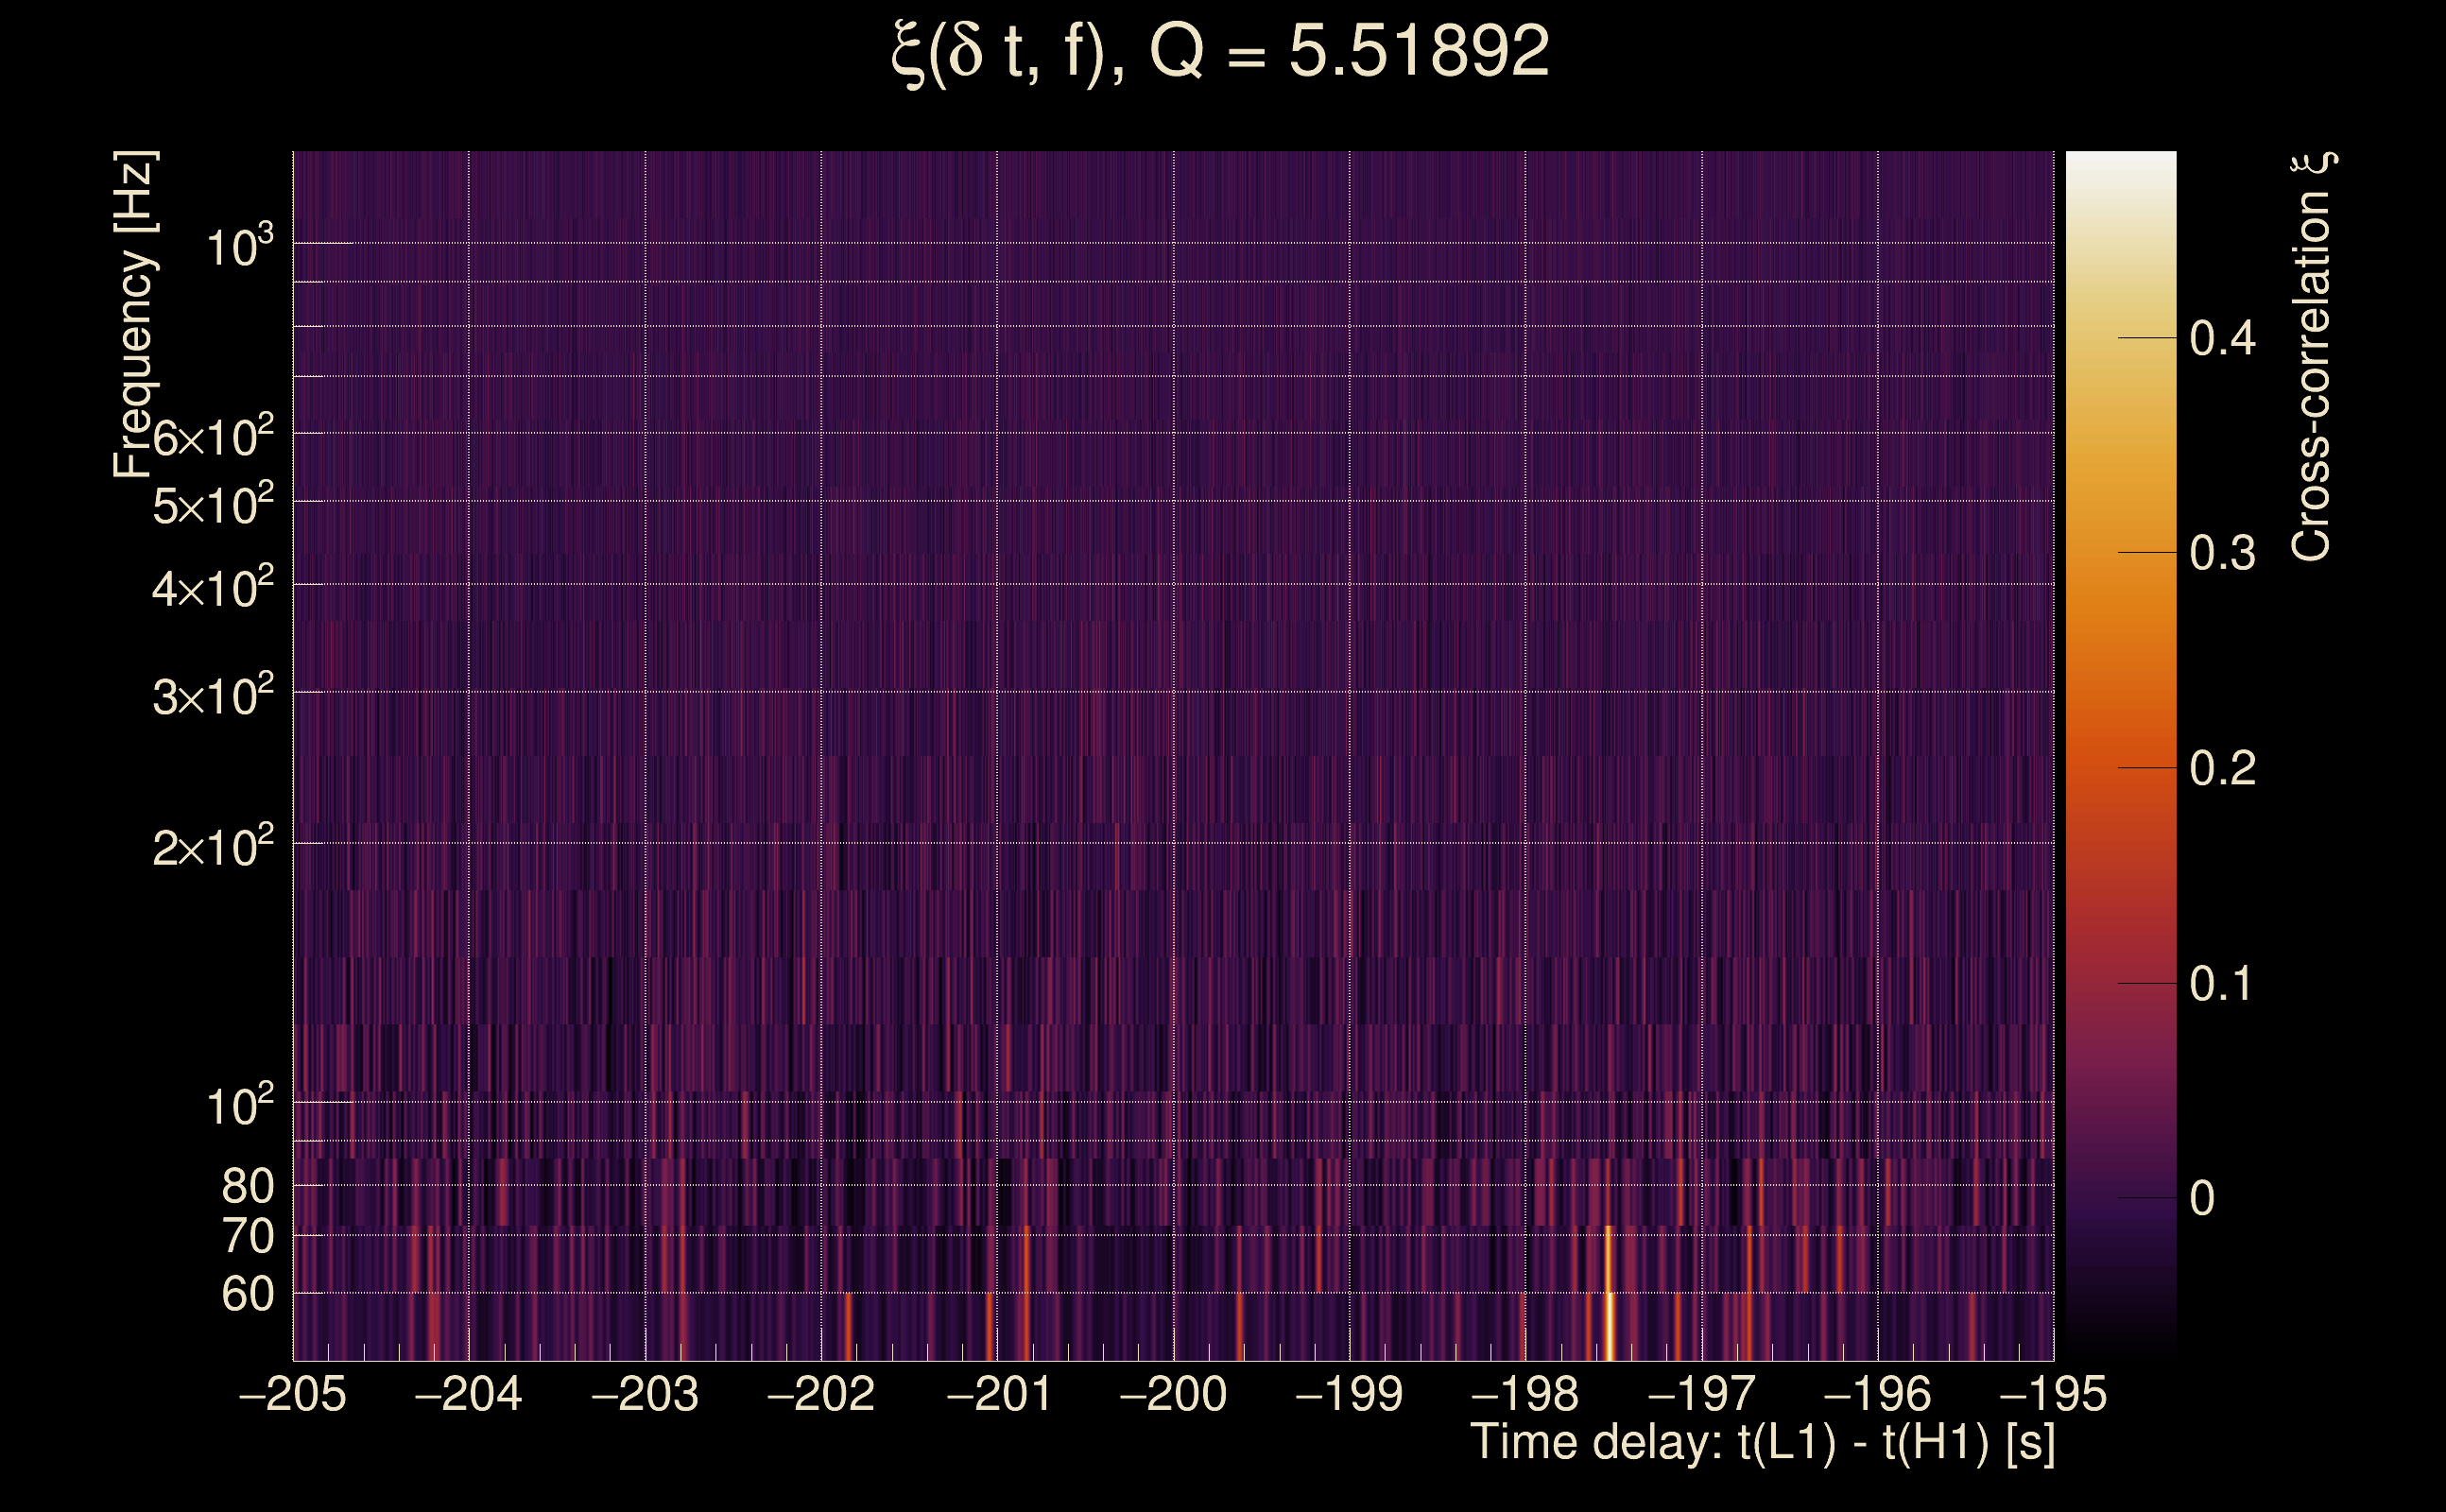
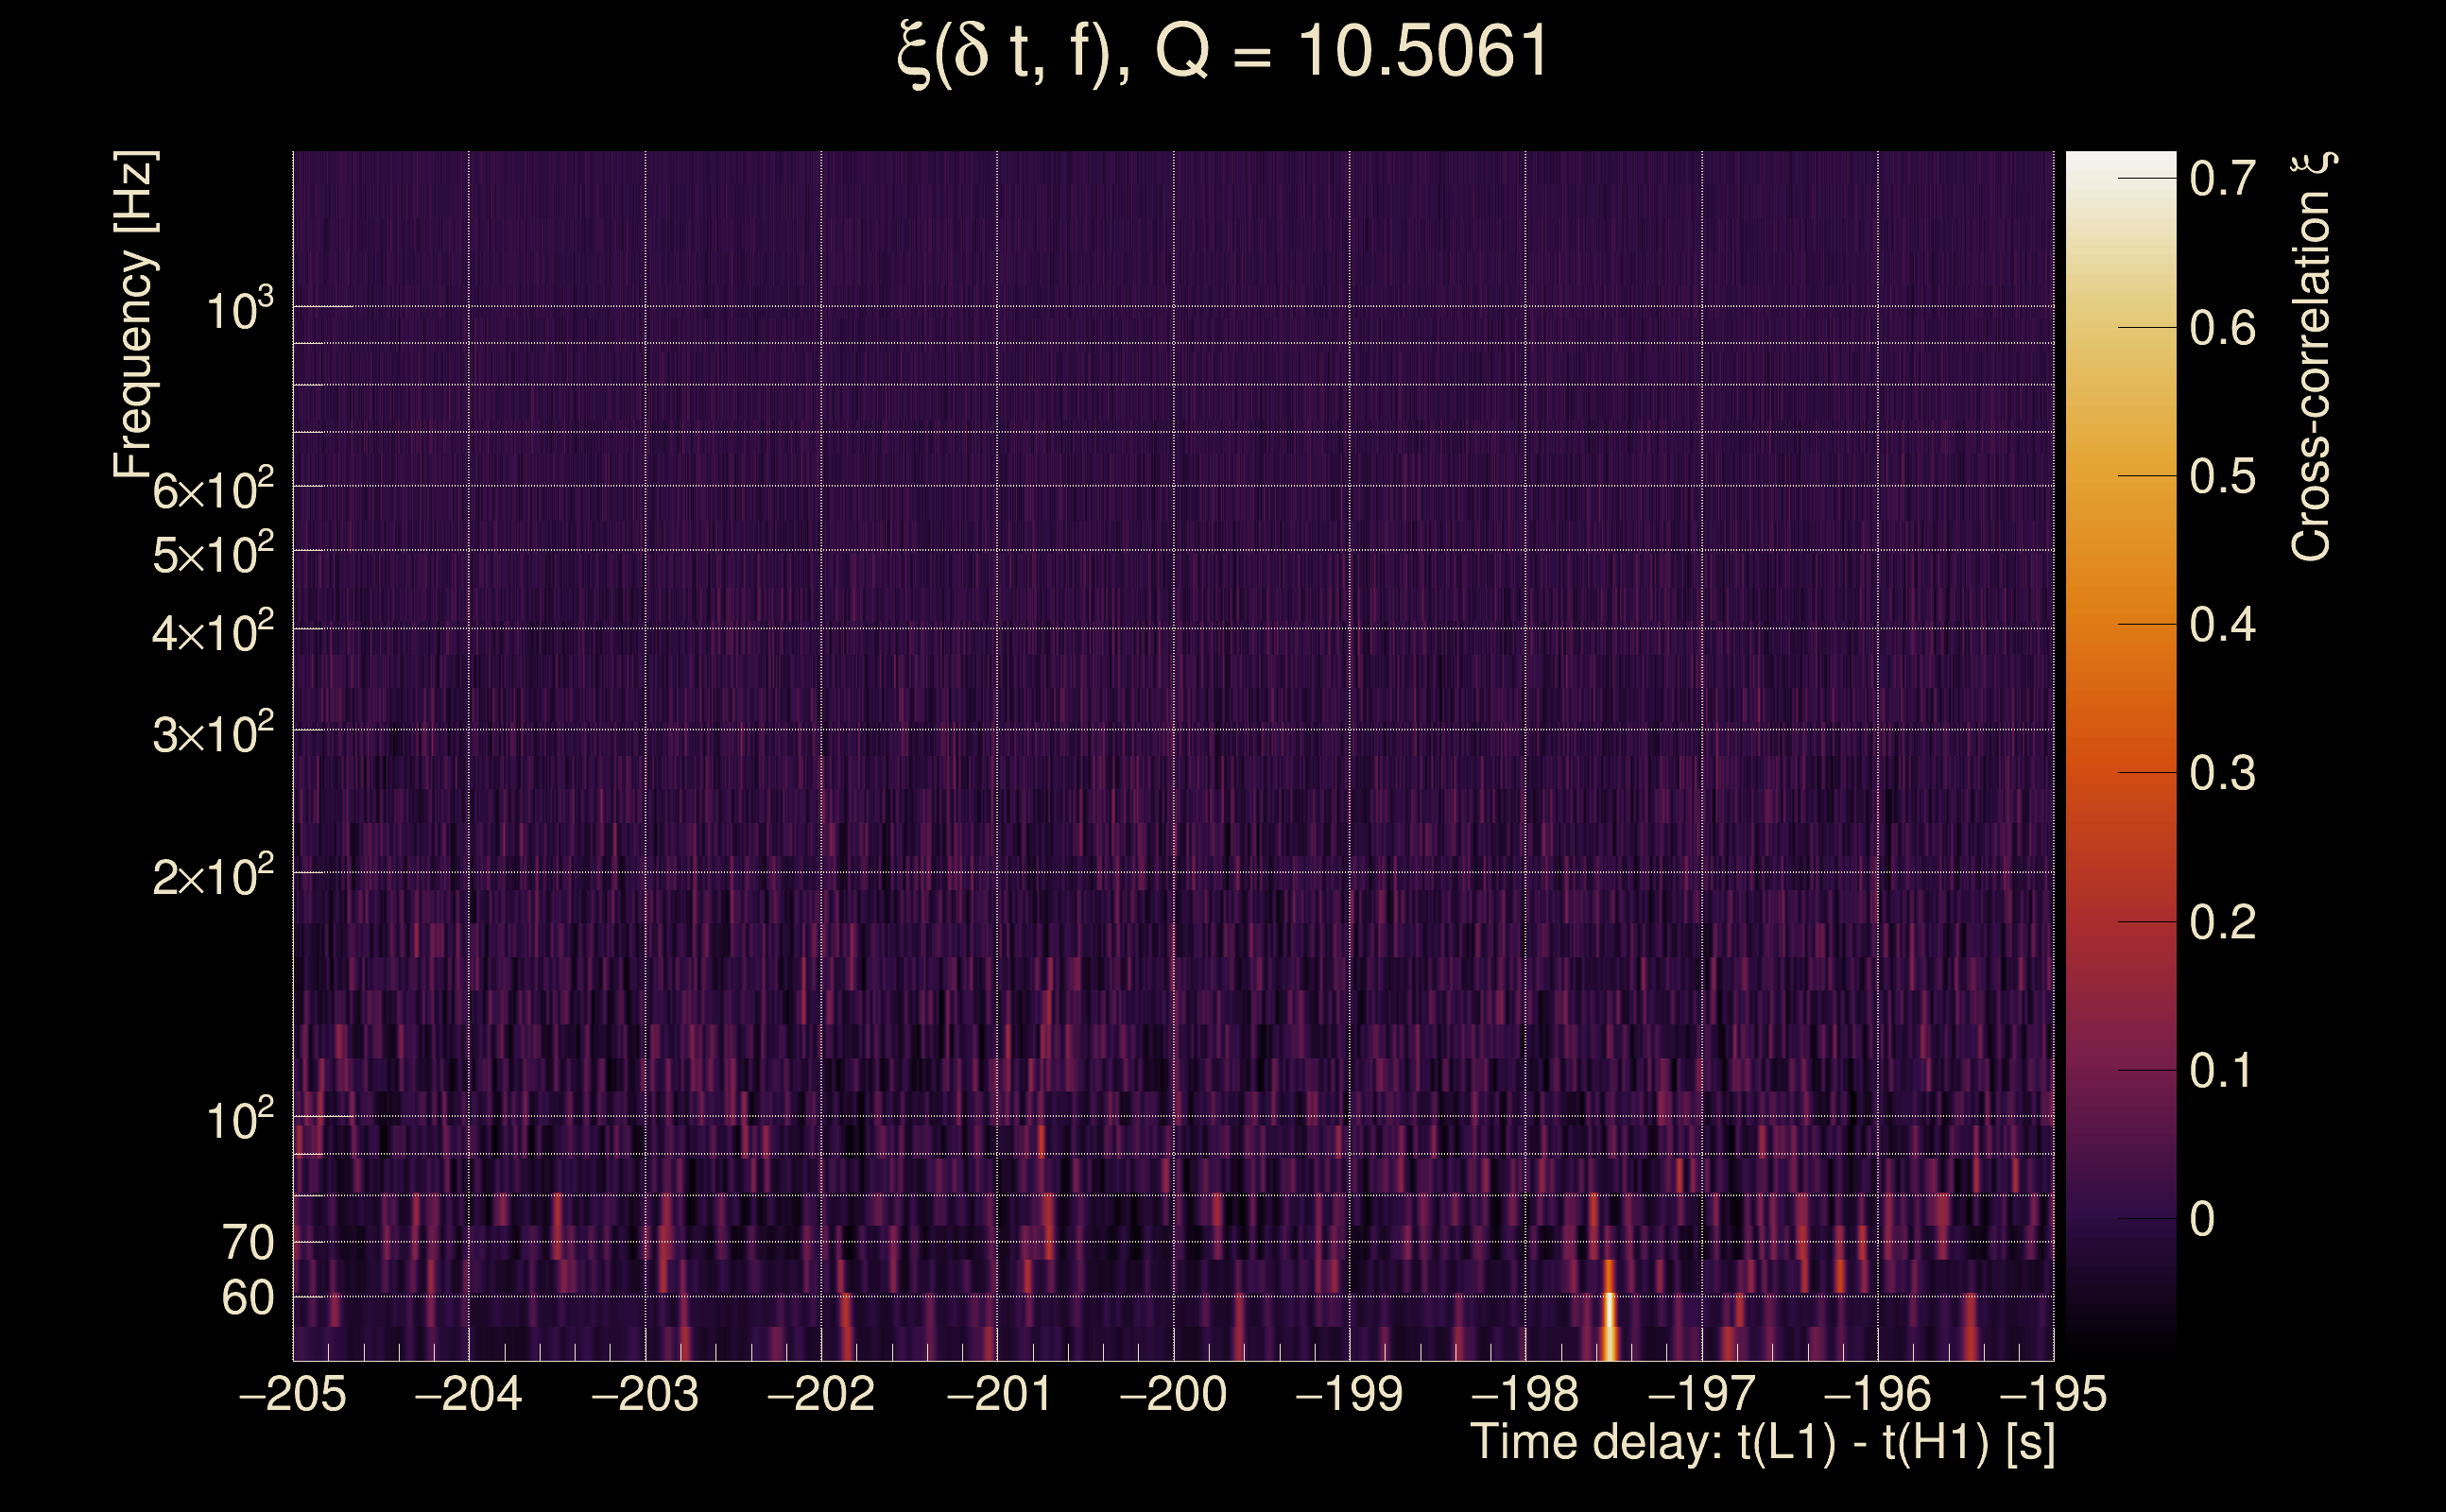
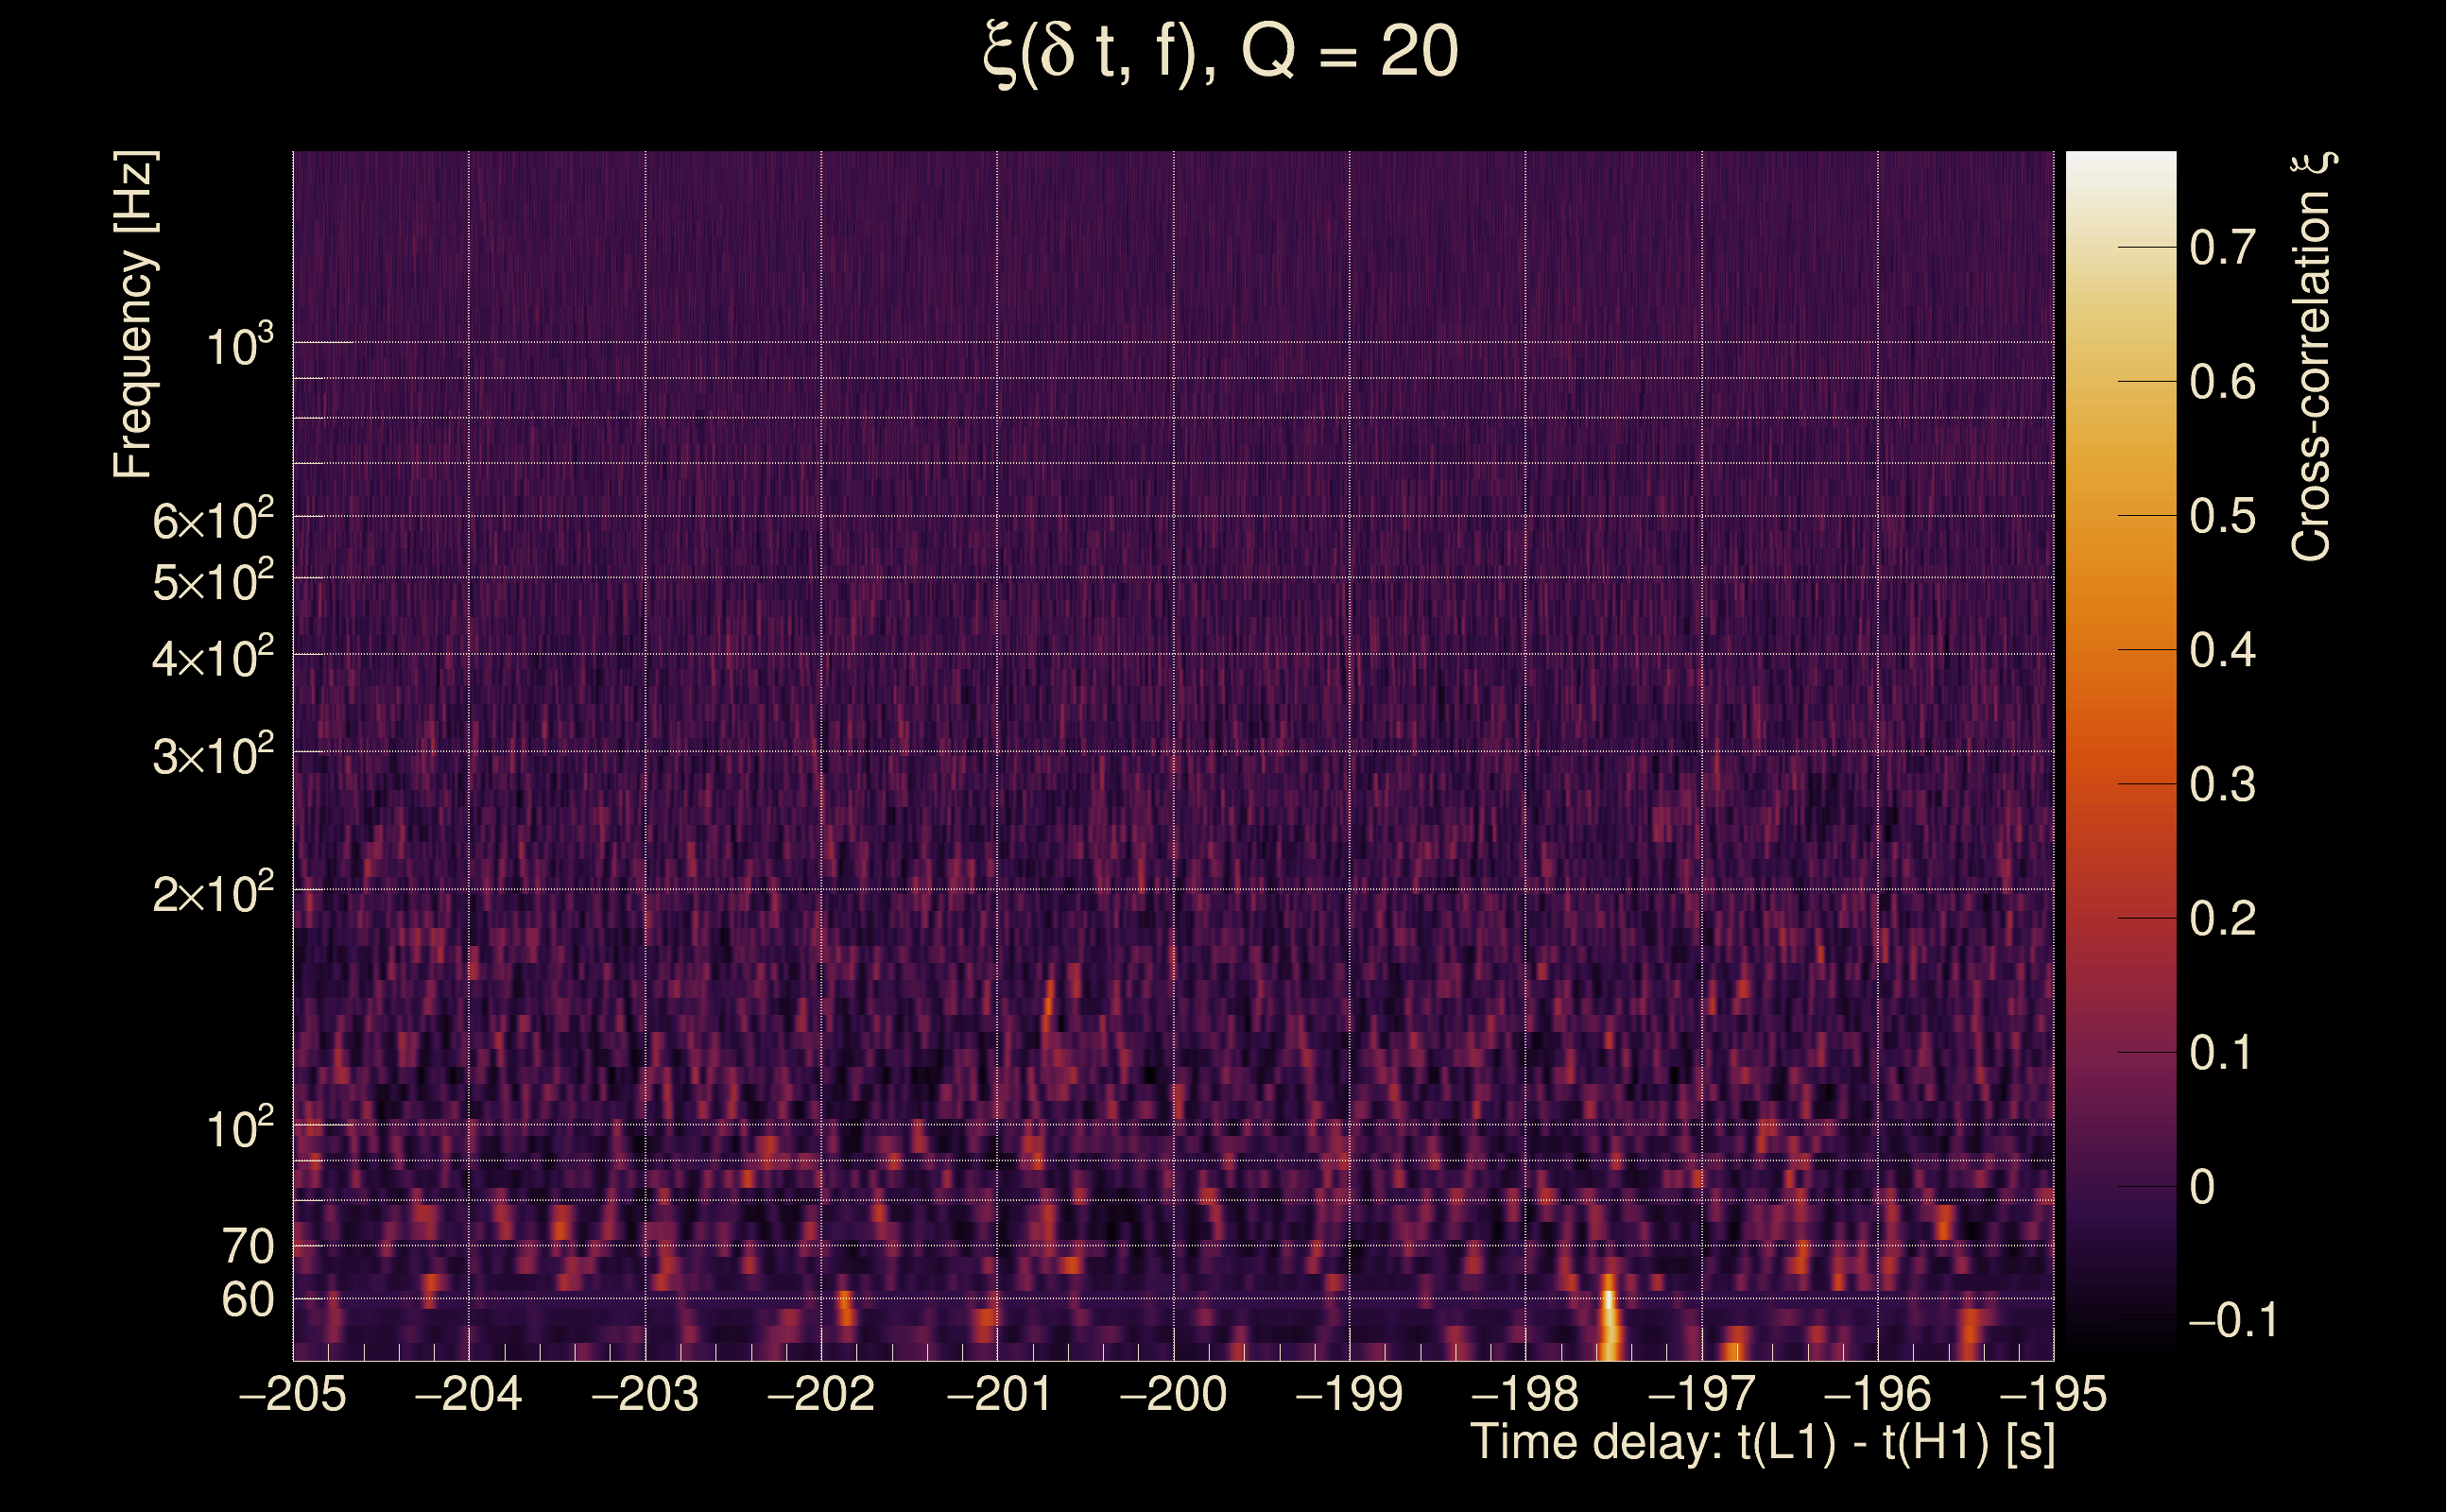
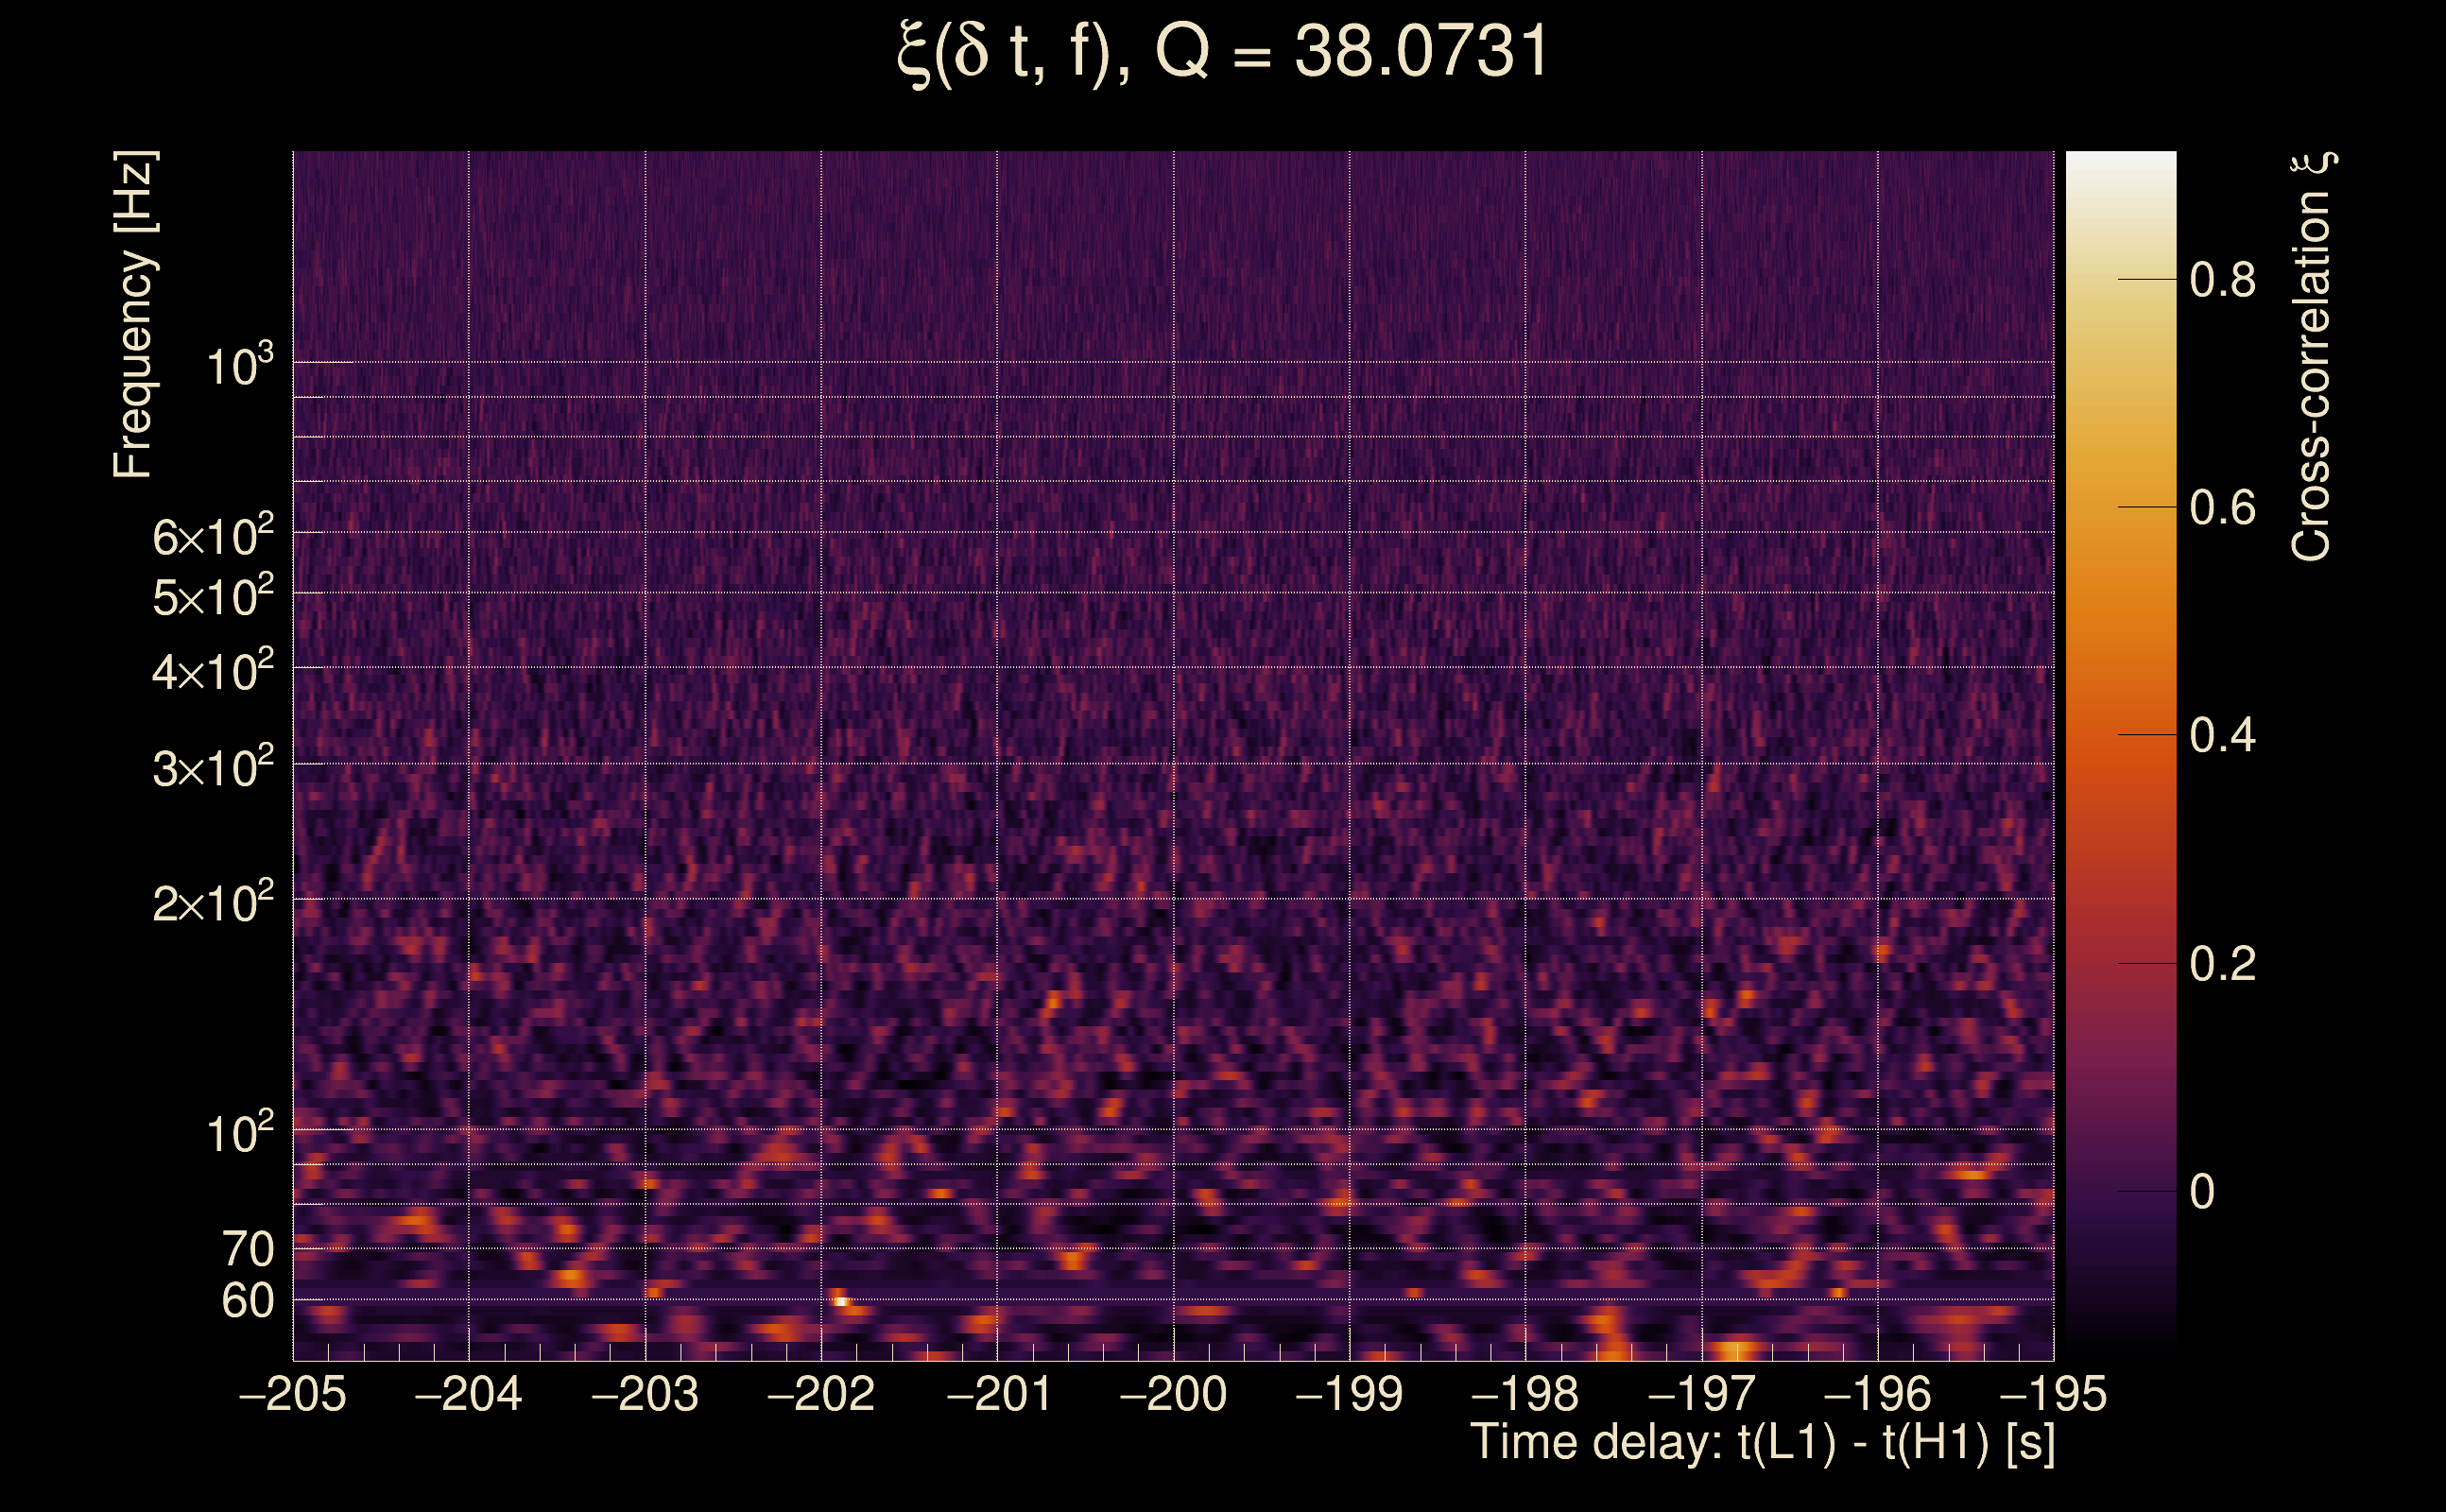
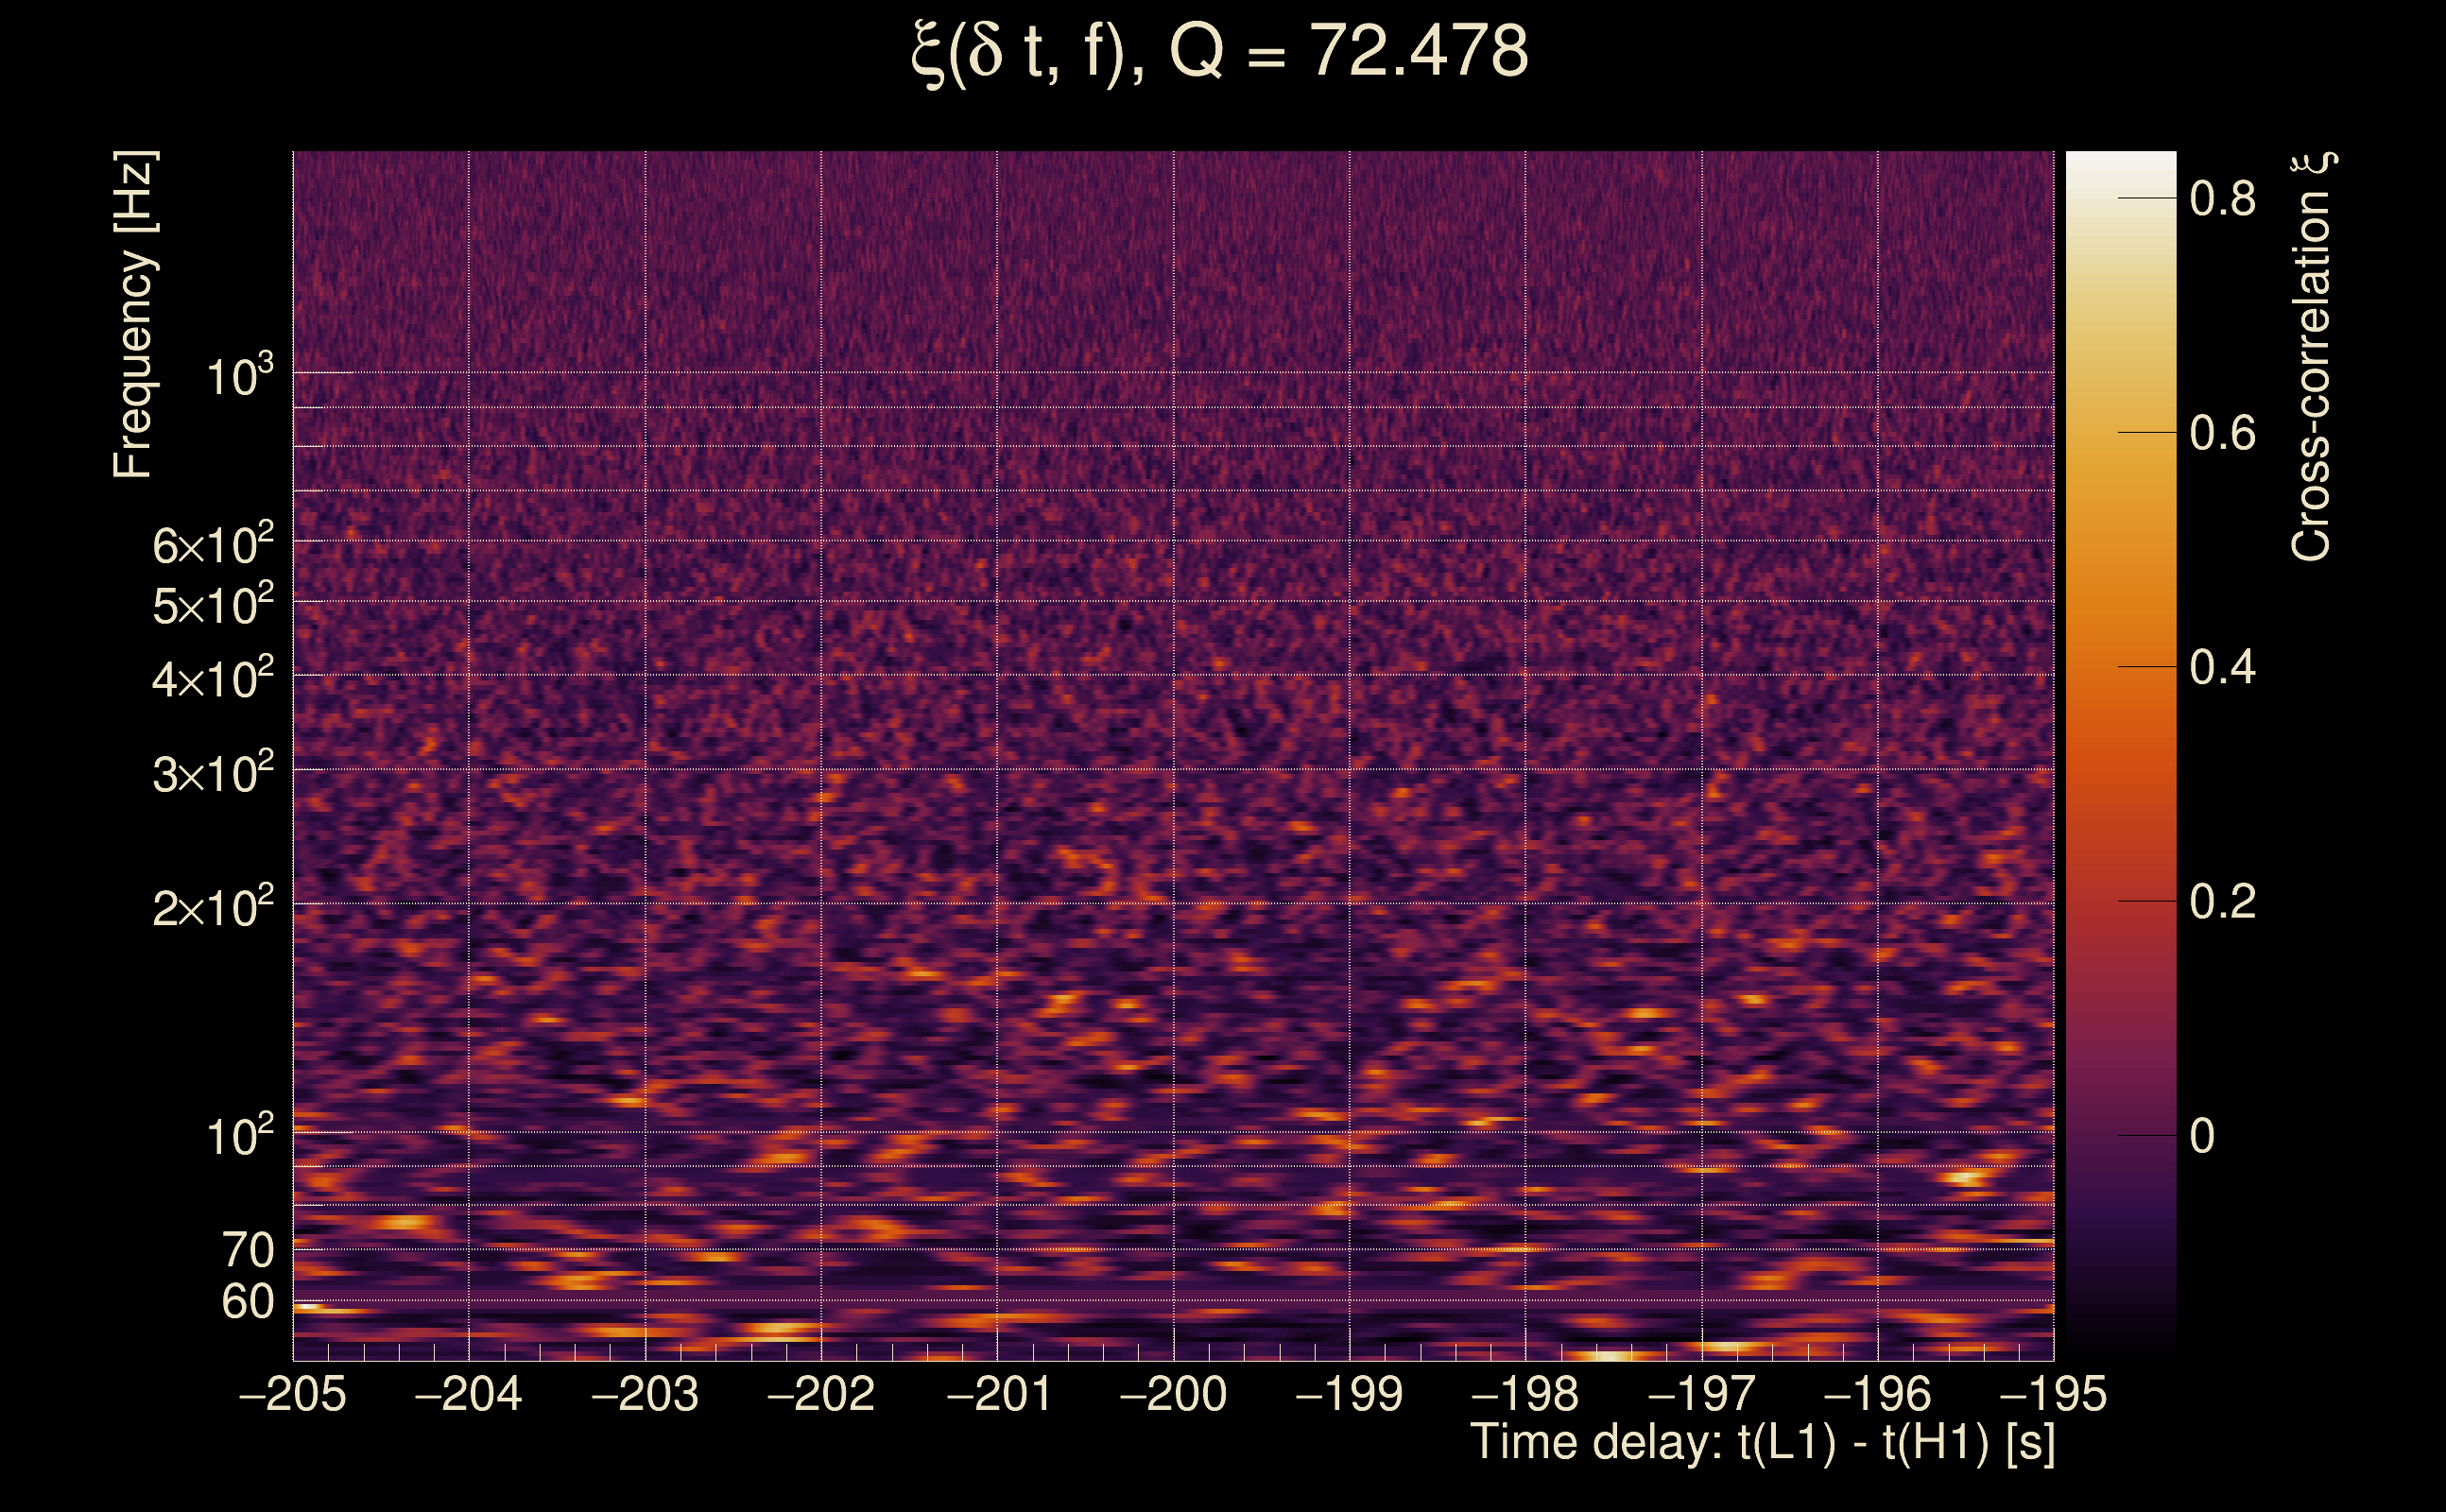
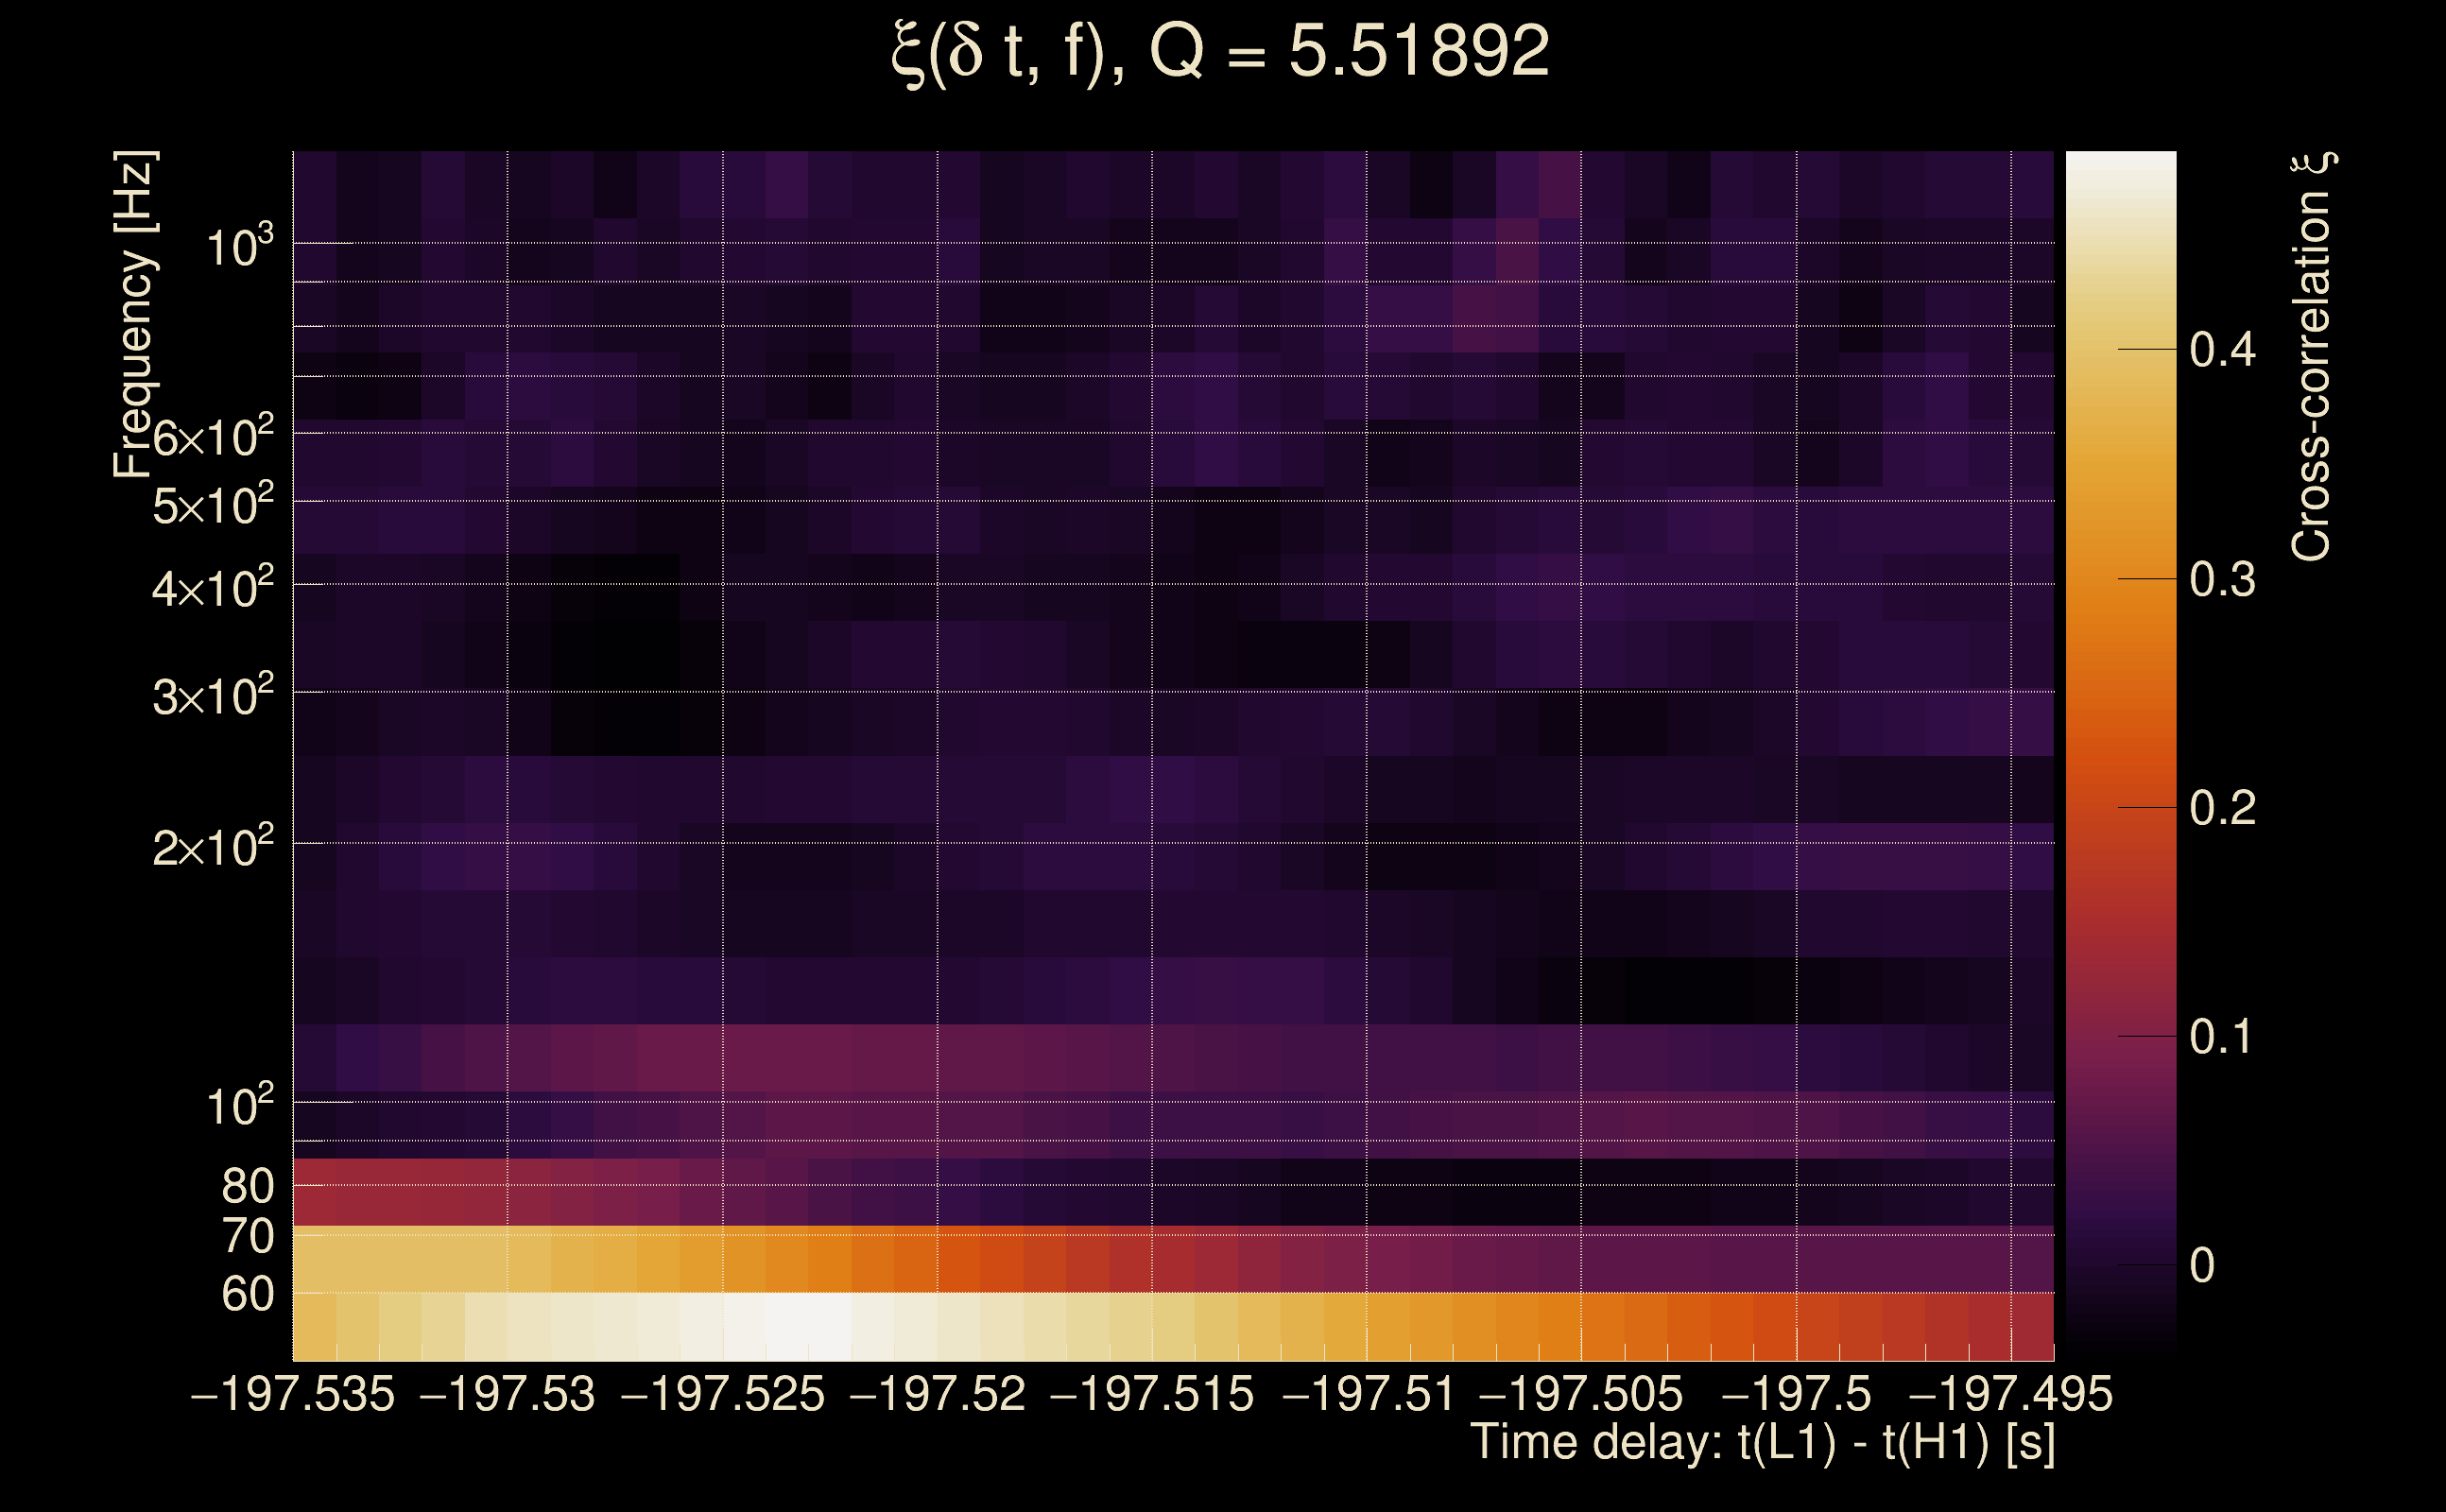
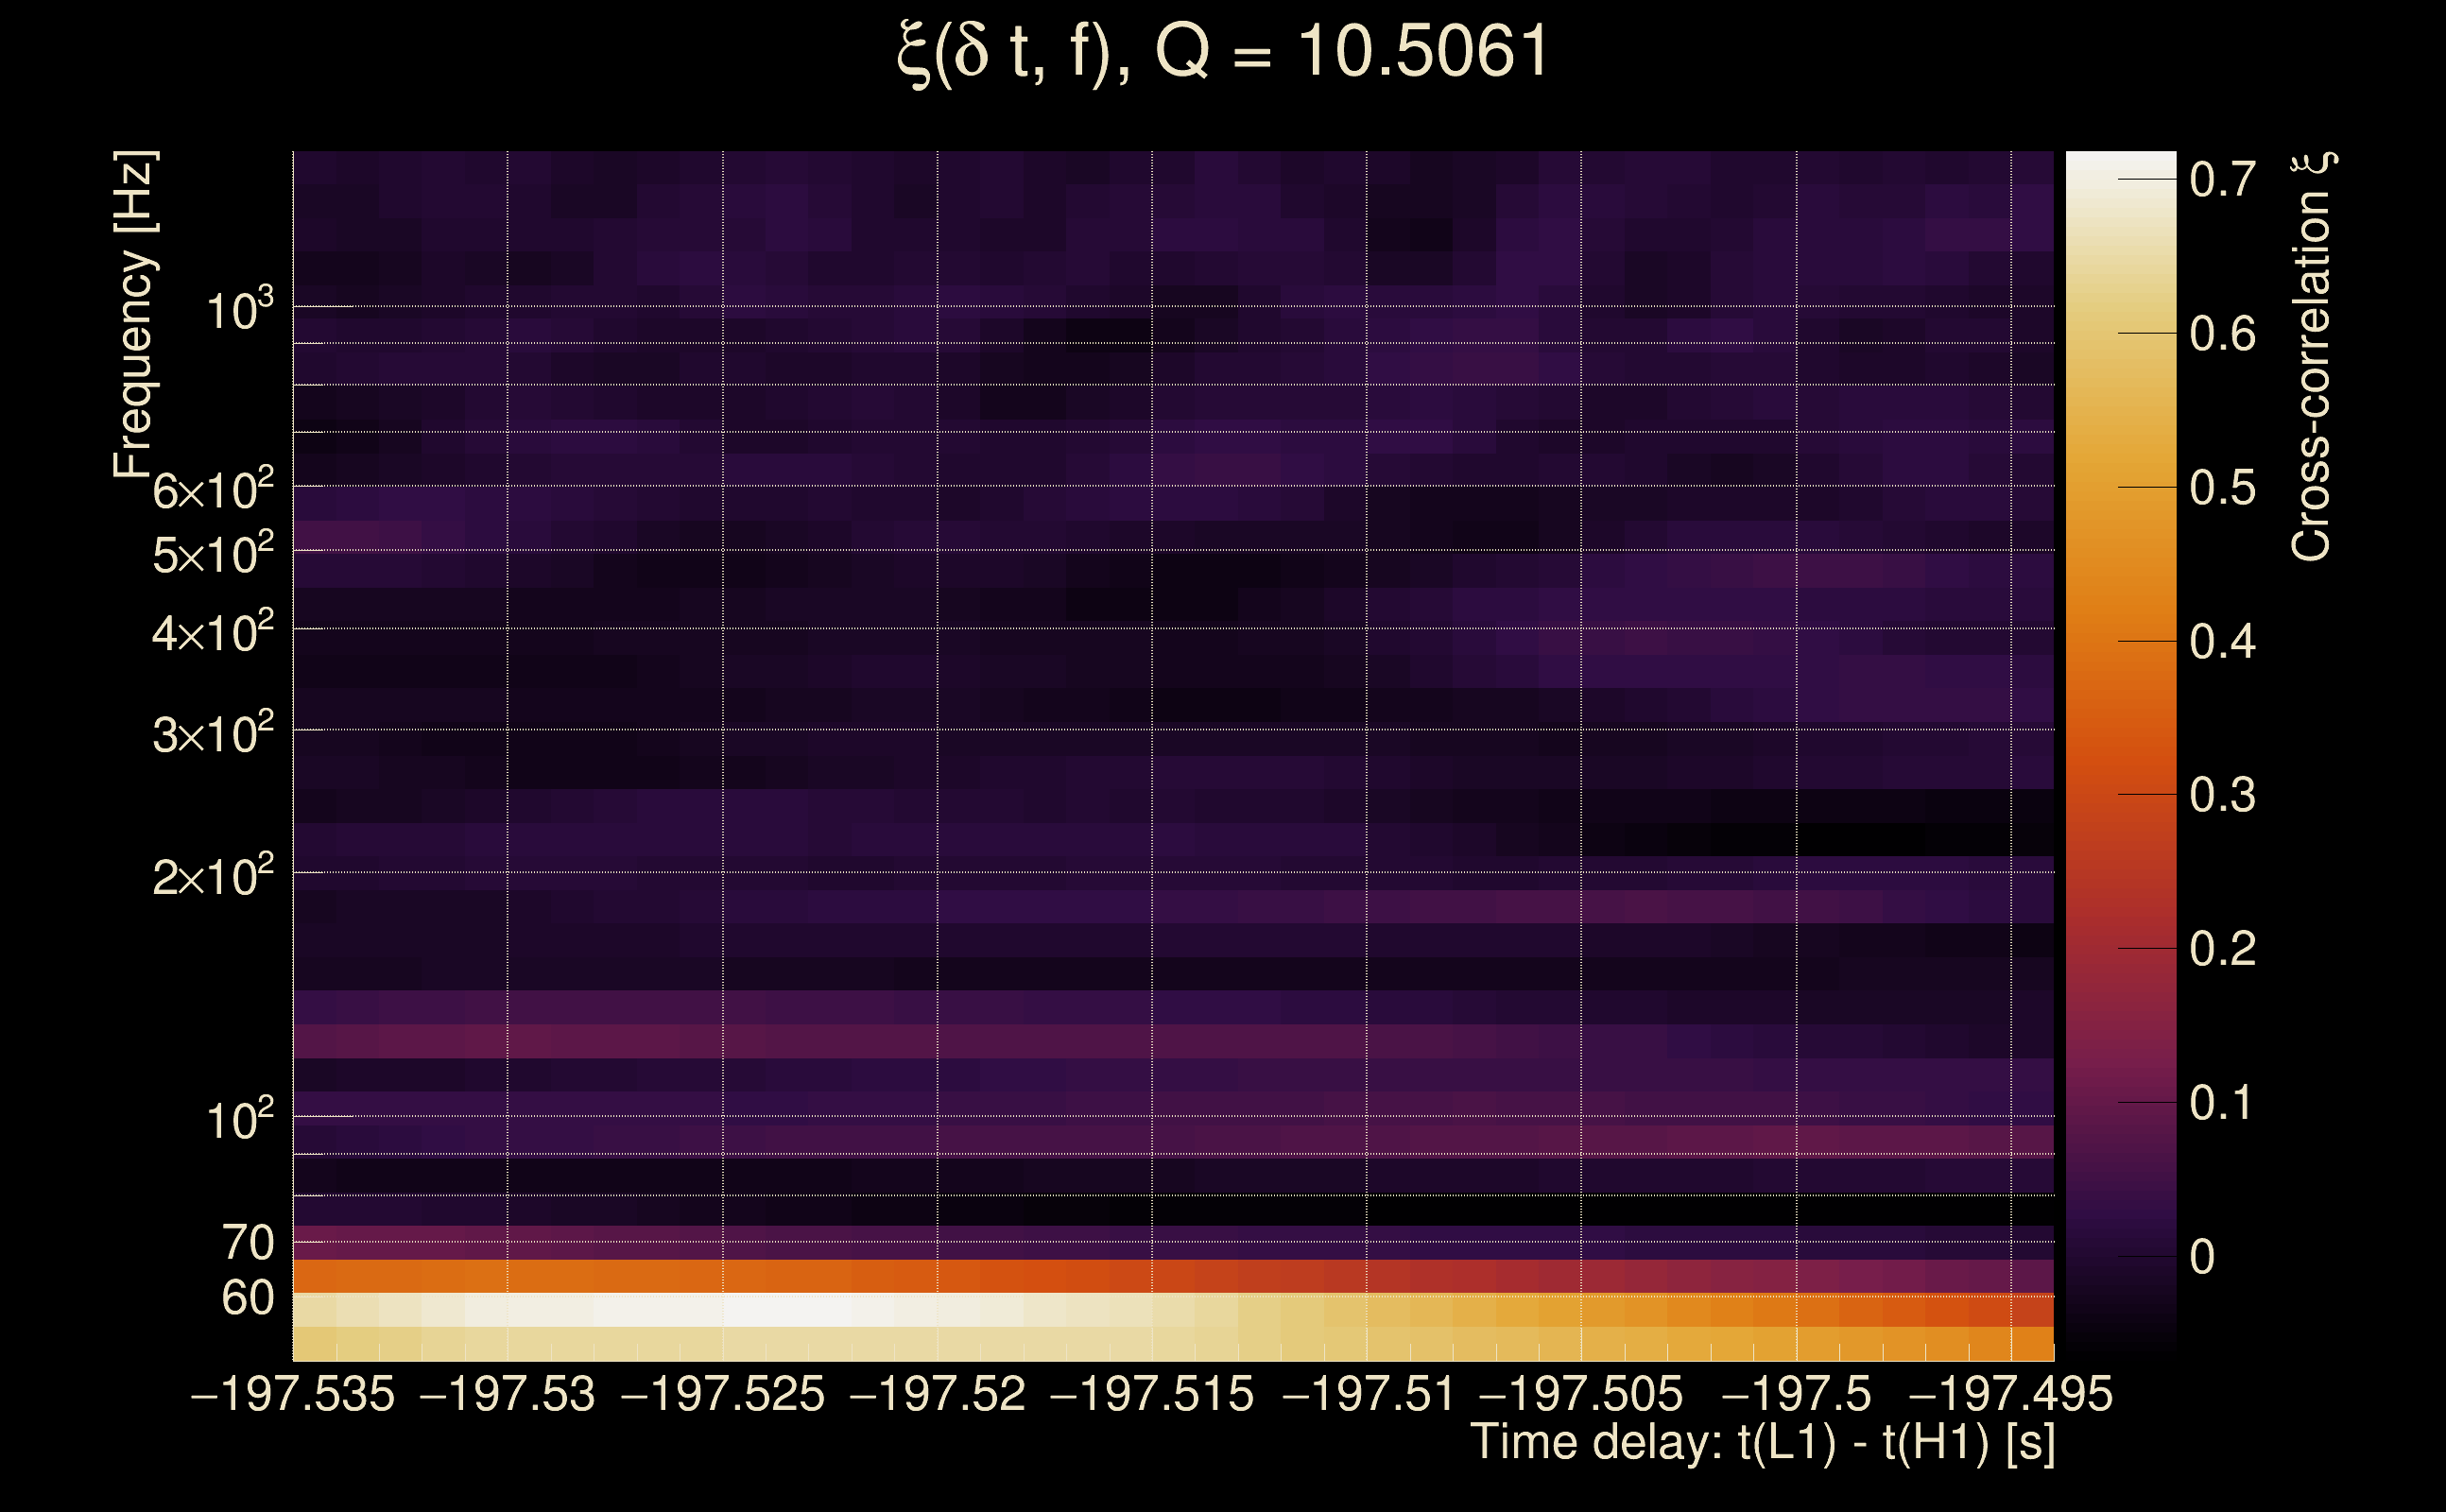
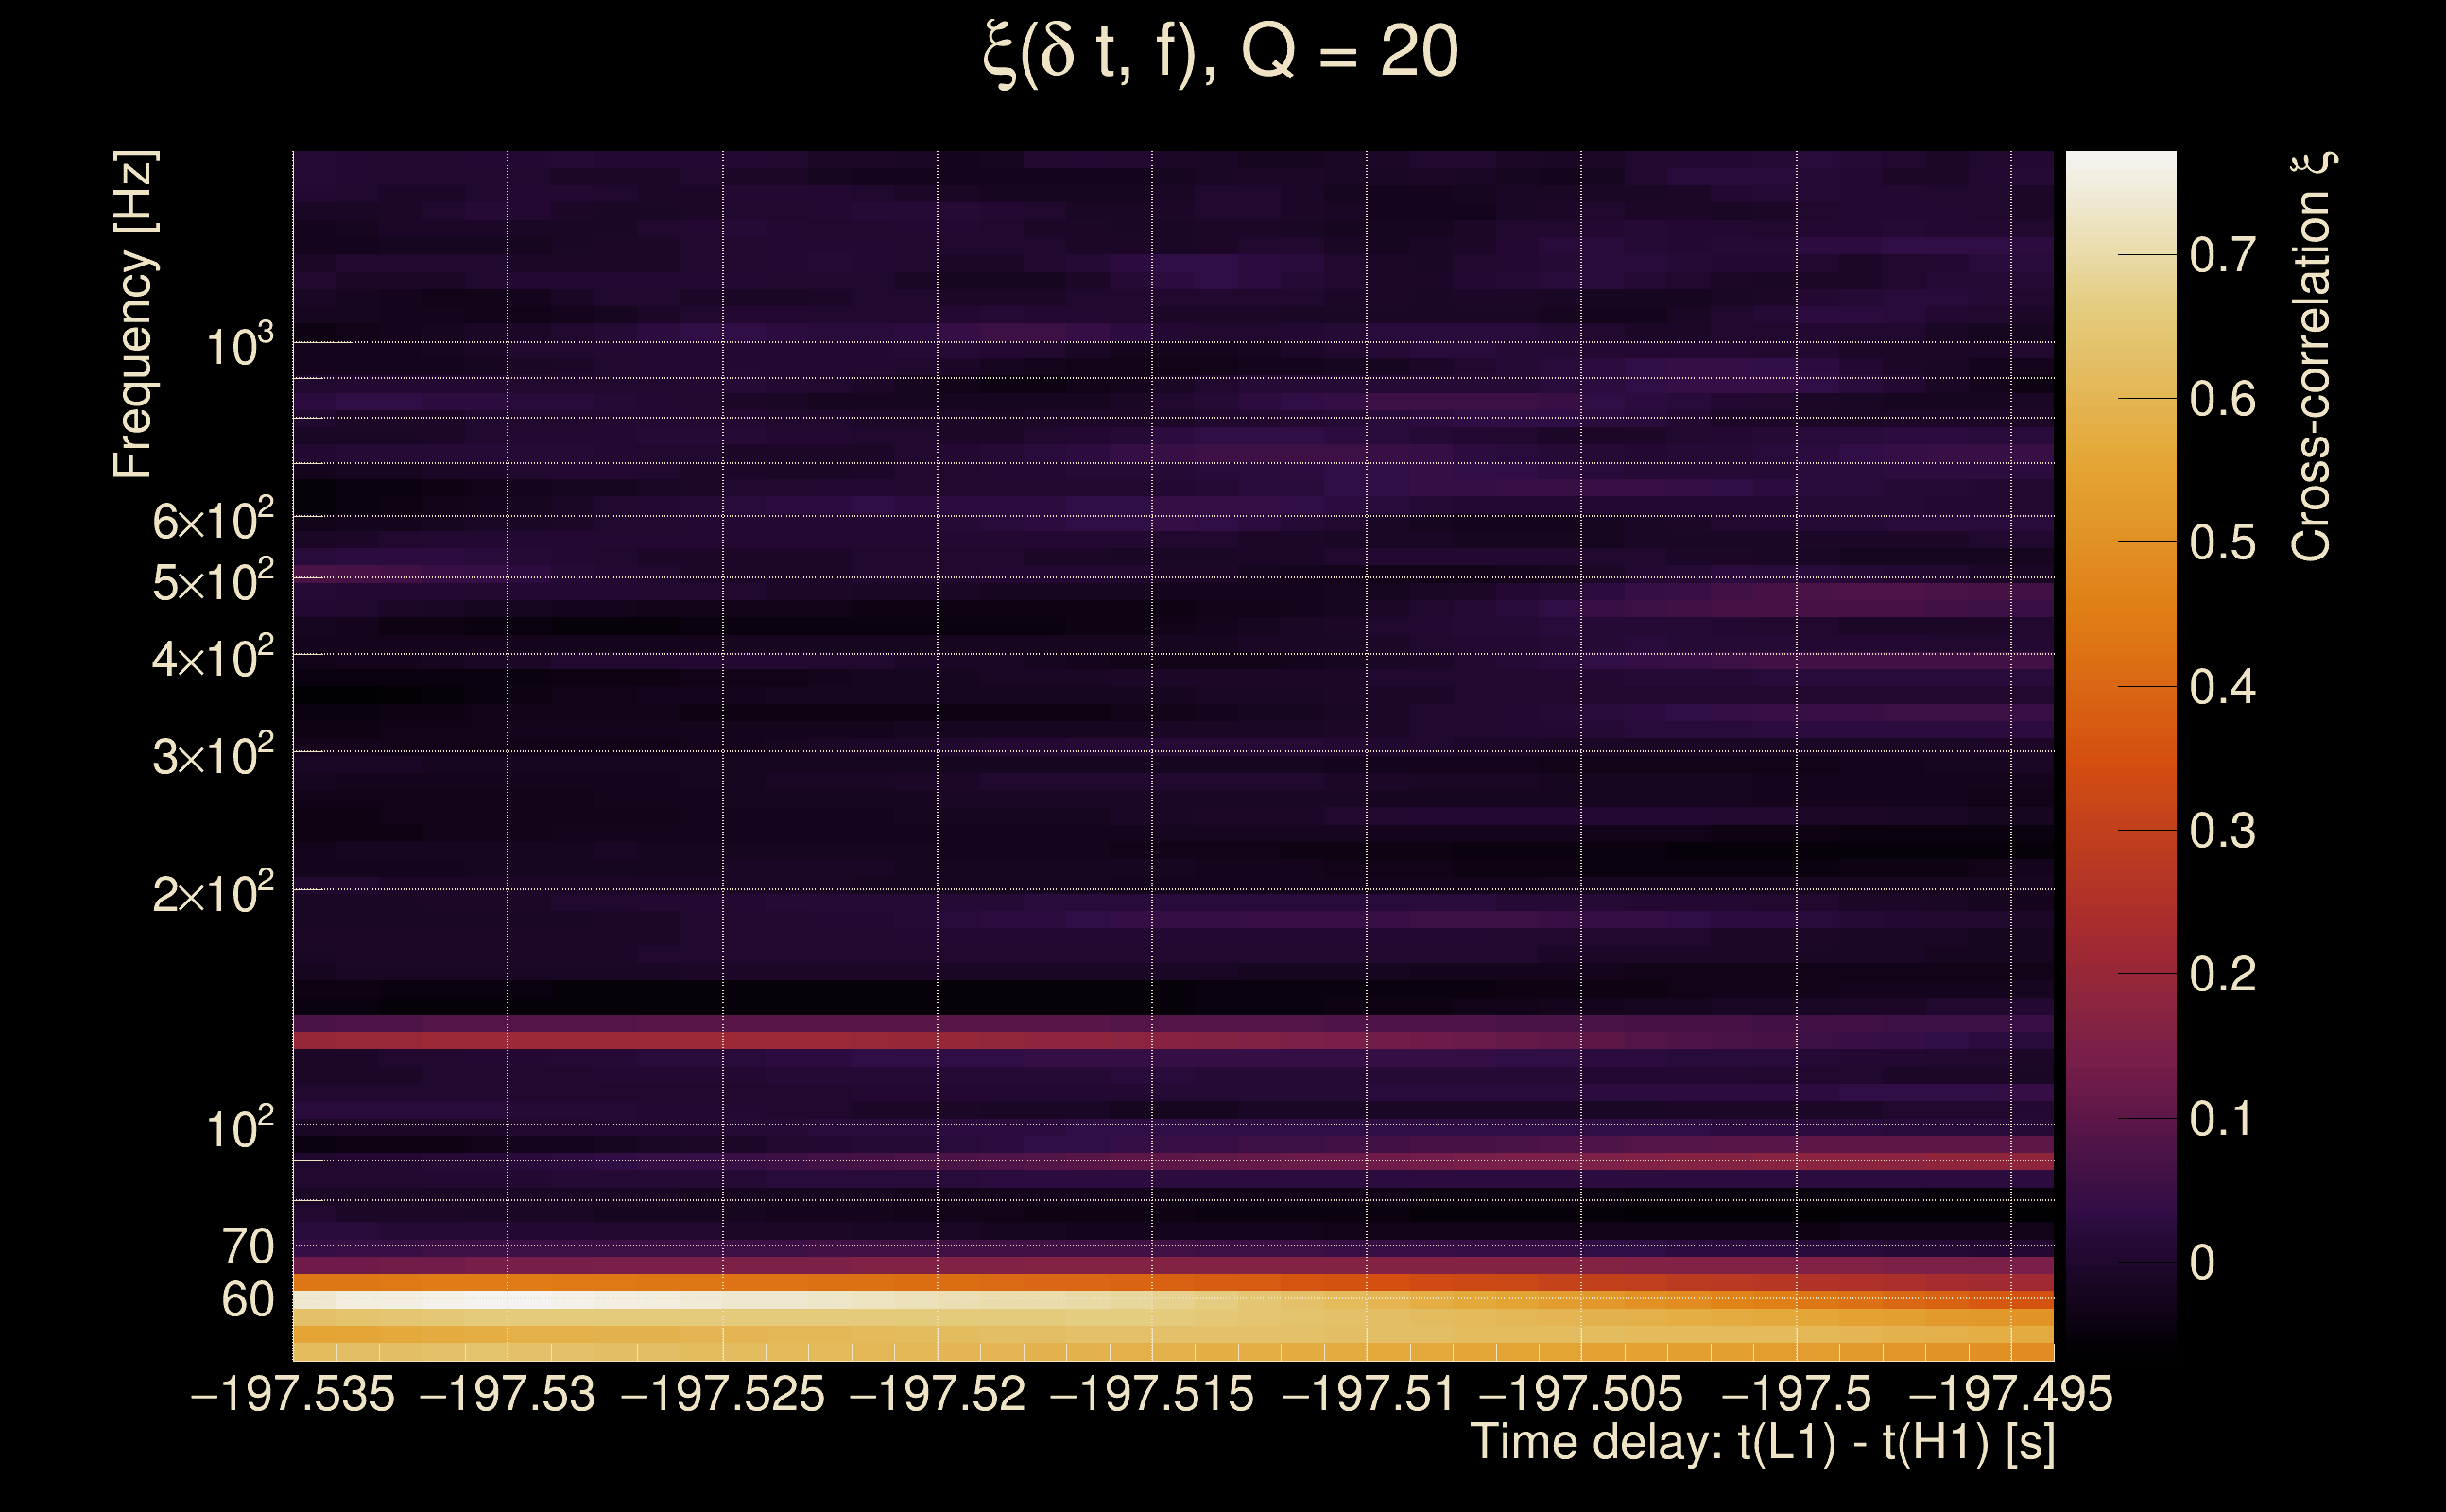
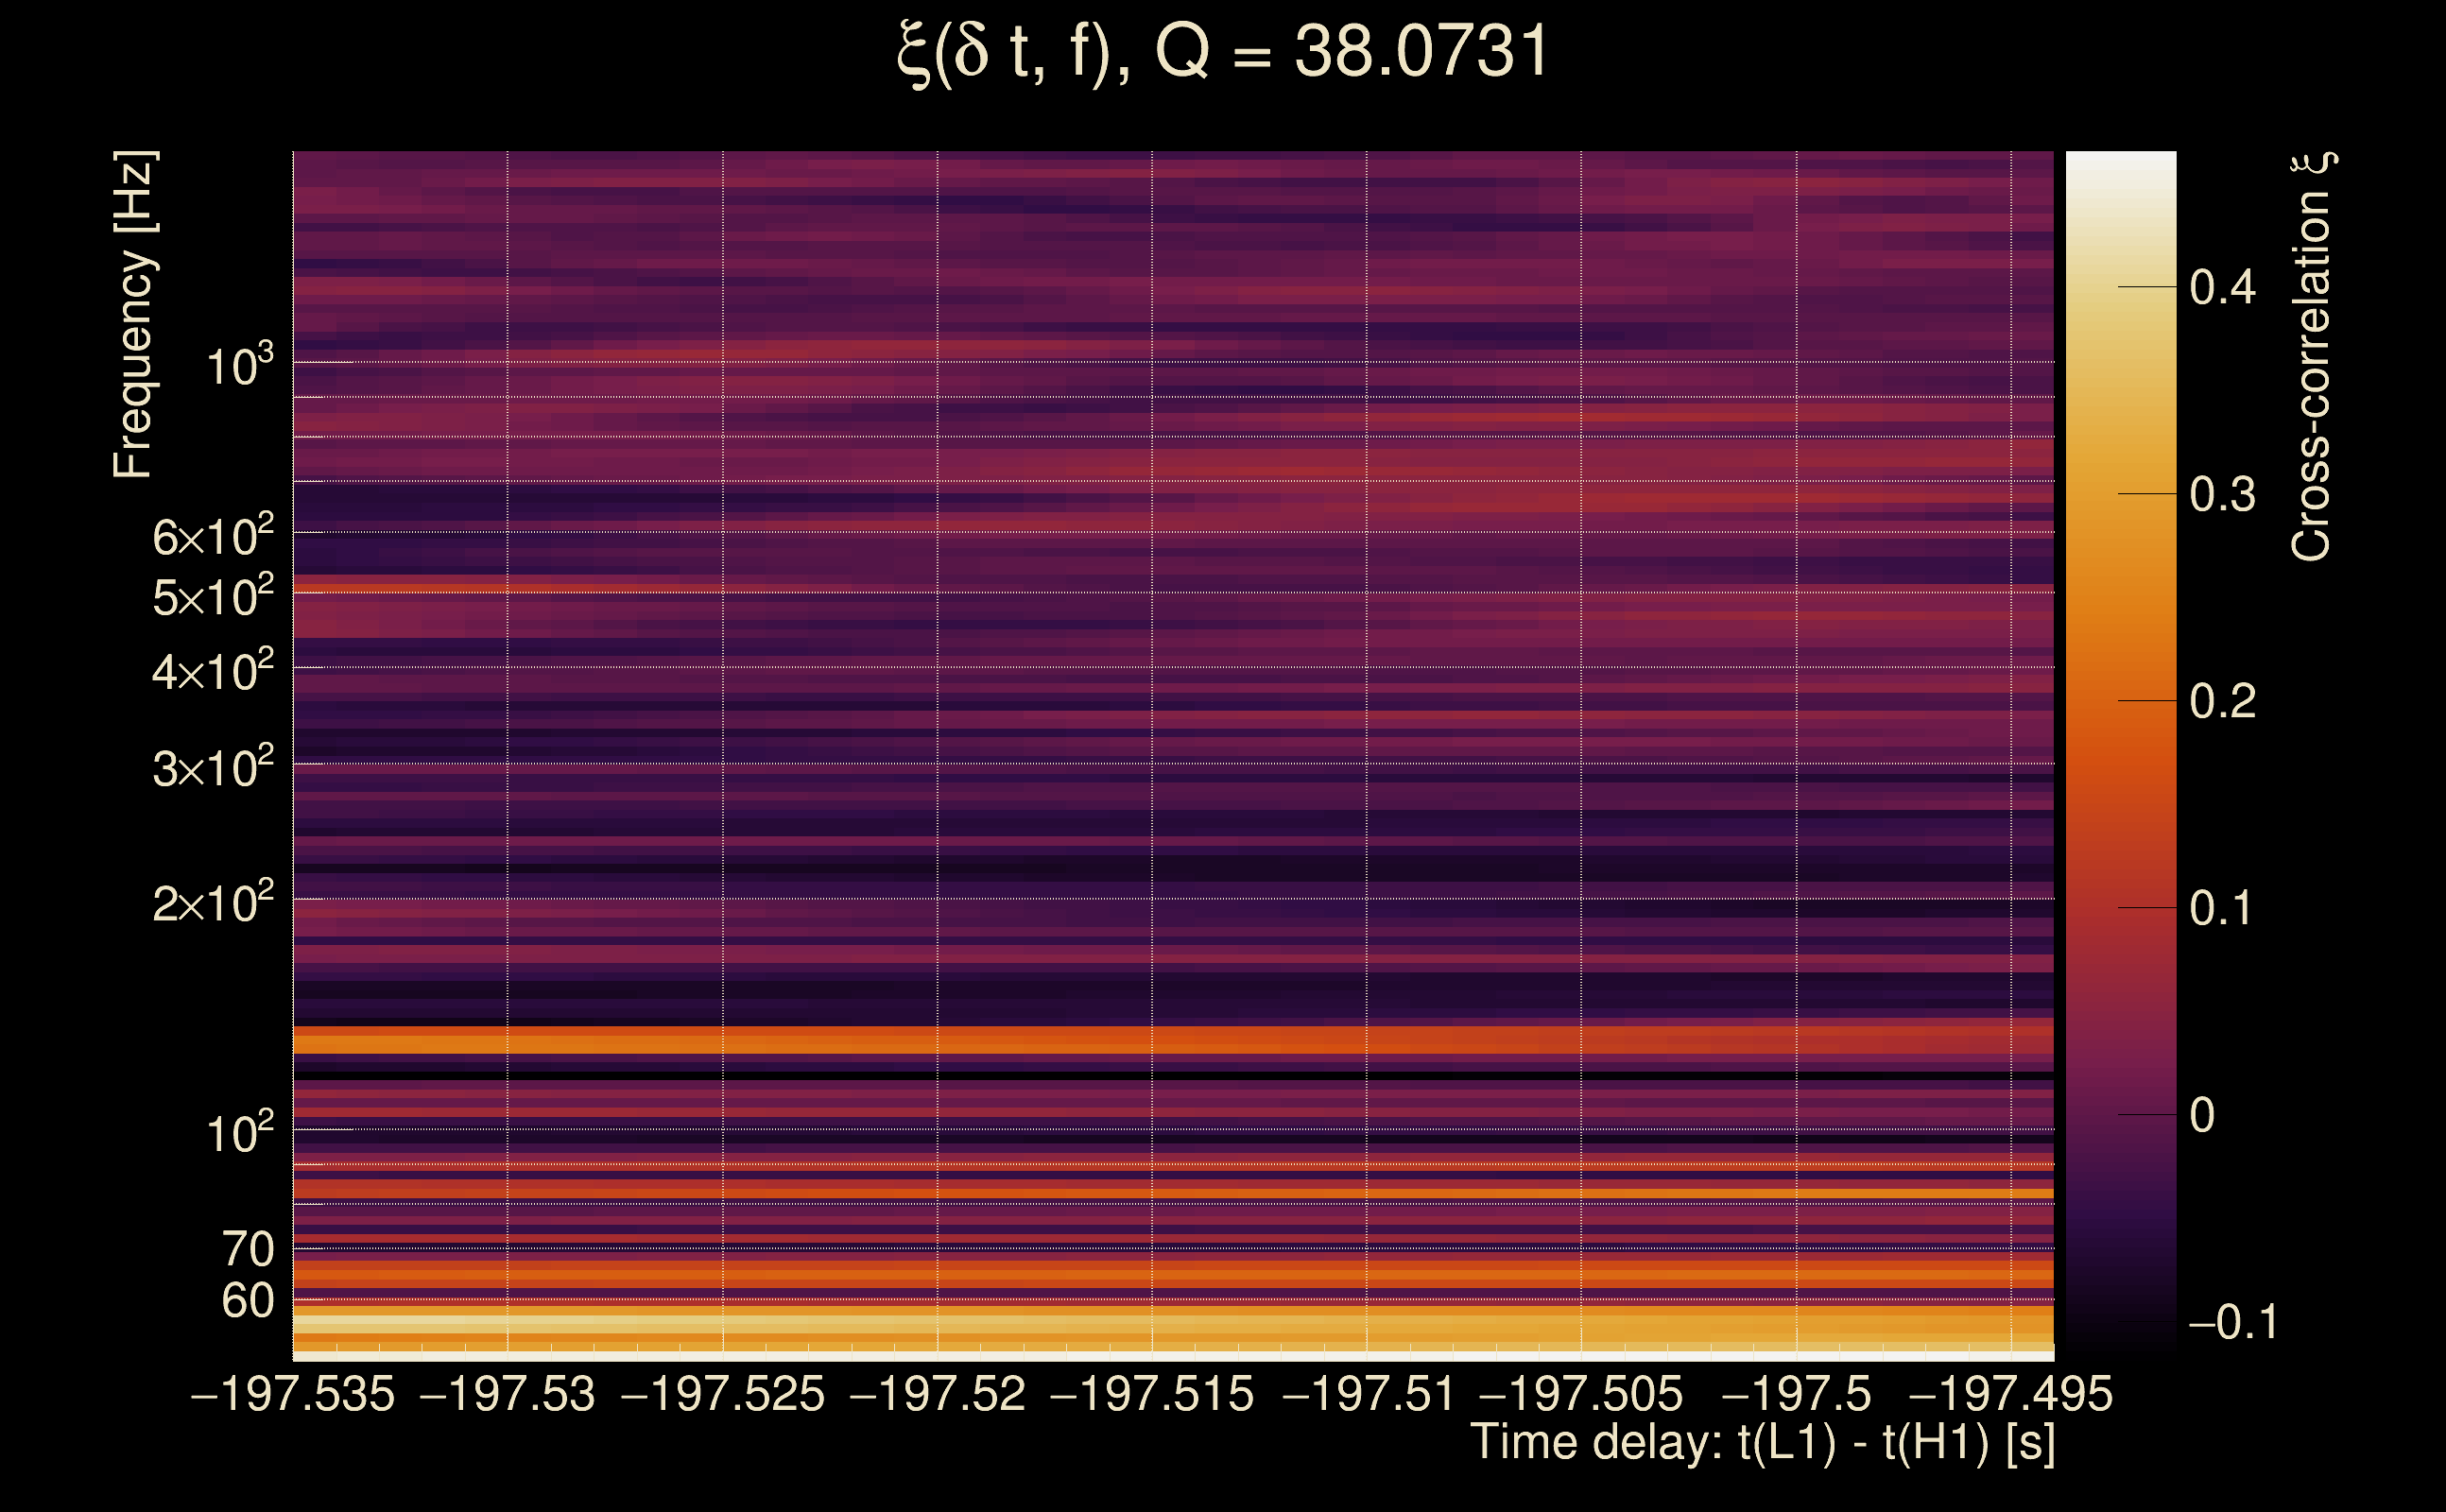
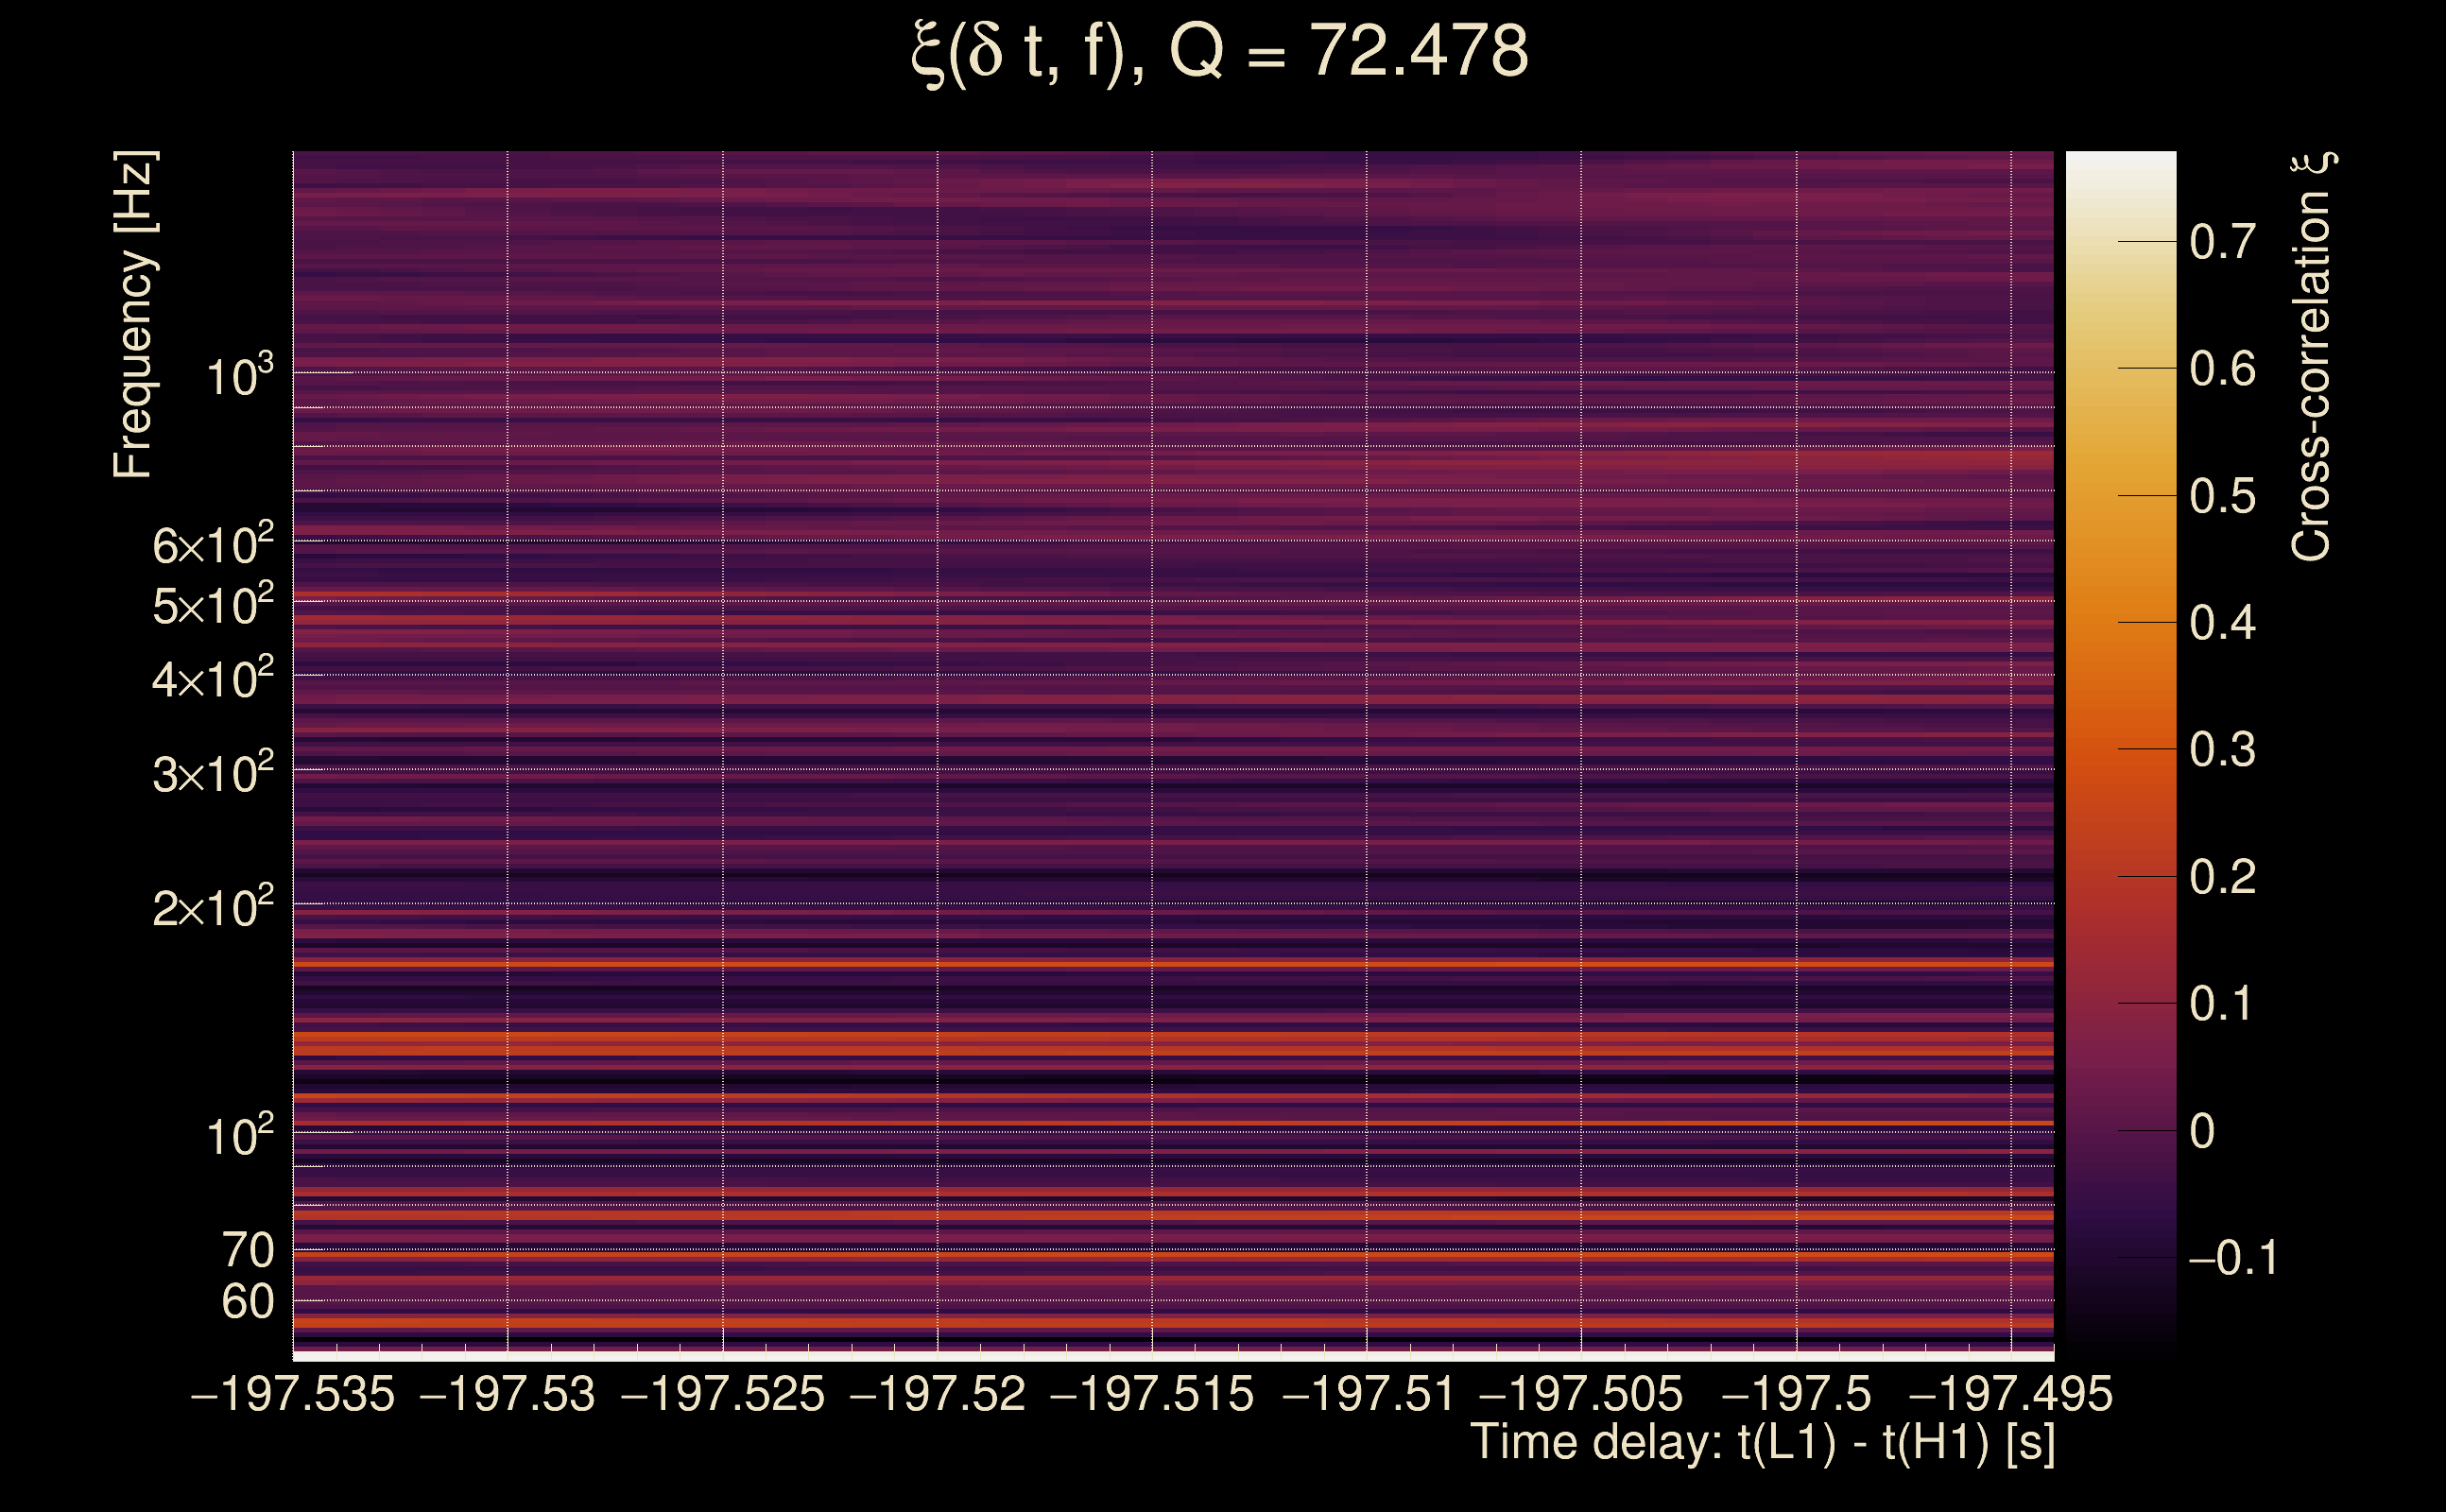
| Number of Q planes: | 5 (Q = 5.51892 → Q = 72.478) |
| Omicron frequency range: | 50 Hz → 1958.38 Hz |
| Light travel time between detectors: | 0.0100128 s |
| Slice extra-time (calibration uncertainty + slice veto): | 0.0129872 s |
| Number of time-delay bins in a cross-correlation map: | 10000 |
| Number of slices in a cross-correlation map: | 217 |
| Number of time-delay bins in a slice: | 46 |
| SNR gating: | < 100000 (detector 0), < 100000 (detector 1) |
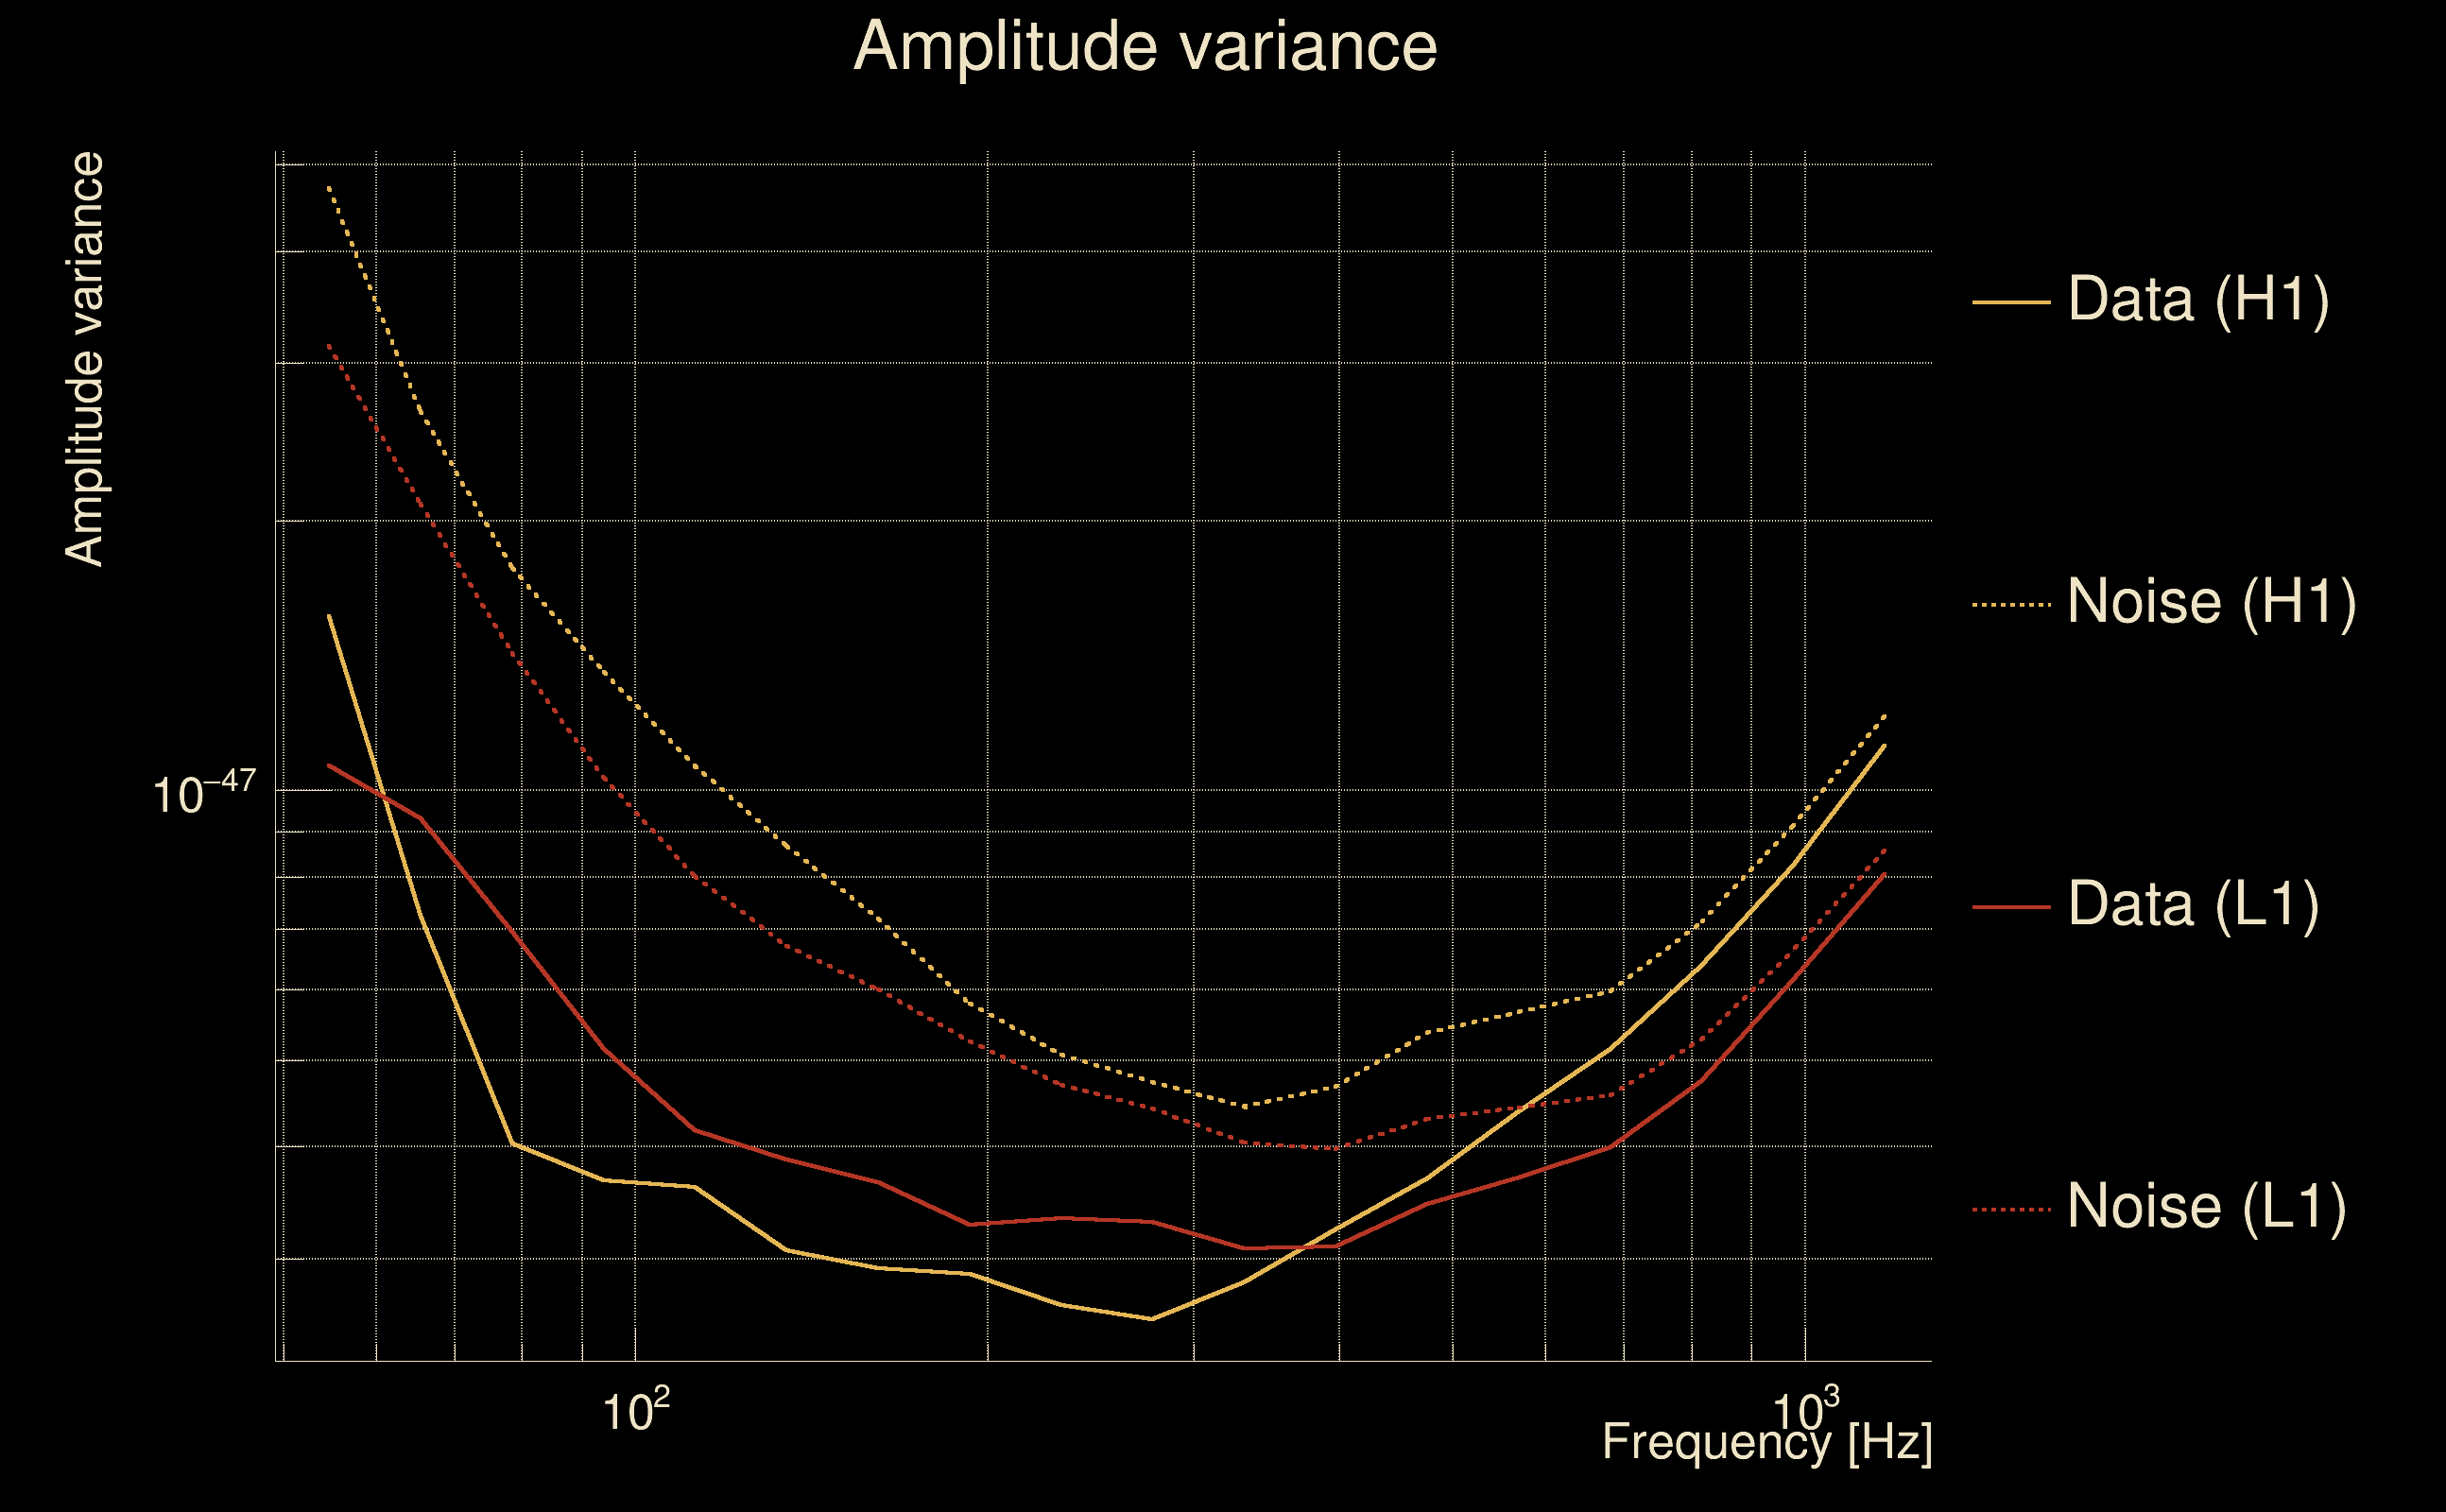
| Amplitude spectrograms: | normalization = 1e-22, power index = 2 |
| White noise SNR variance: | 0.523175 (after applying a correction factor = 1) |
| Amplitude ratio confidence level: | 3 sigma |
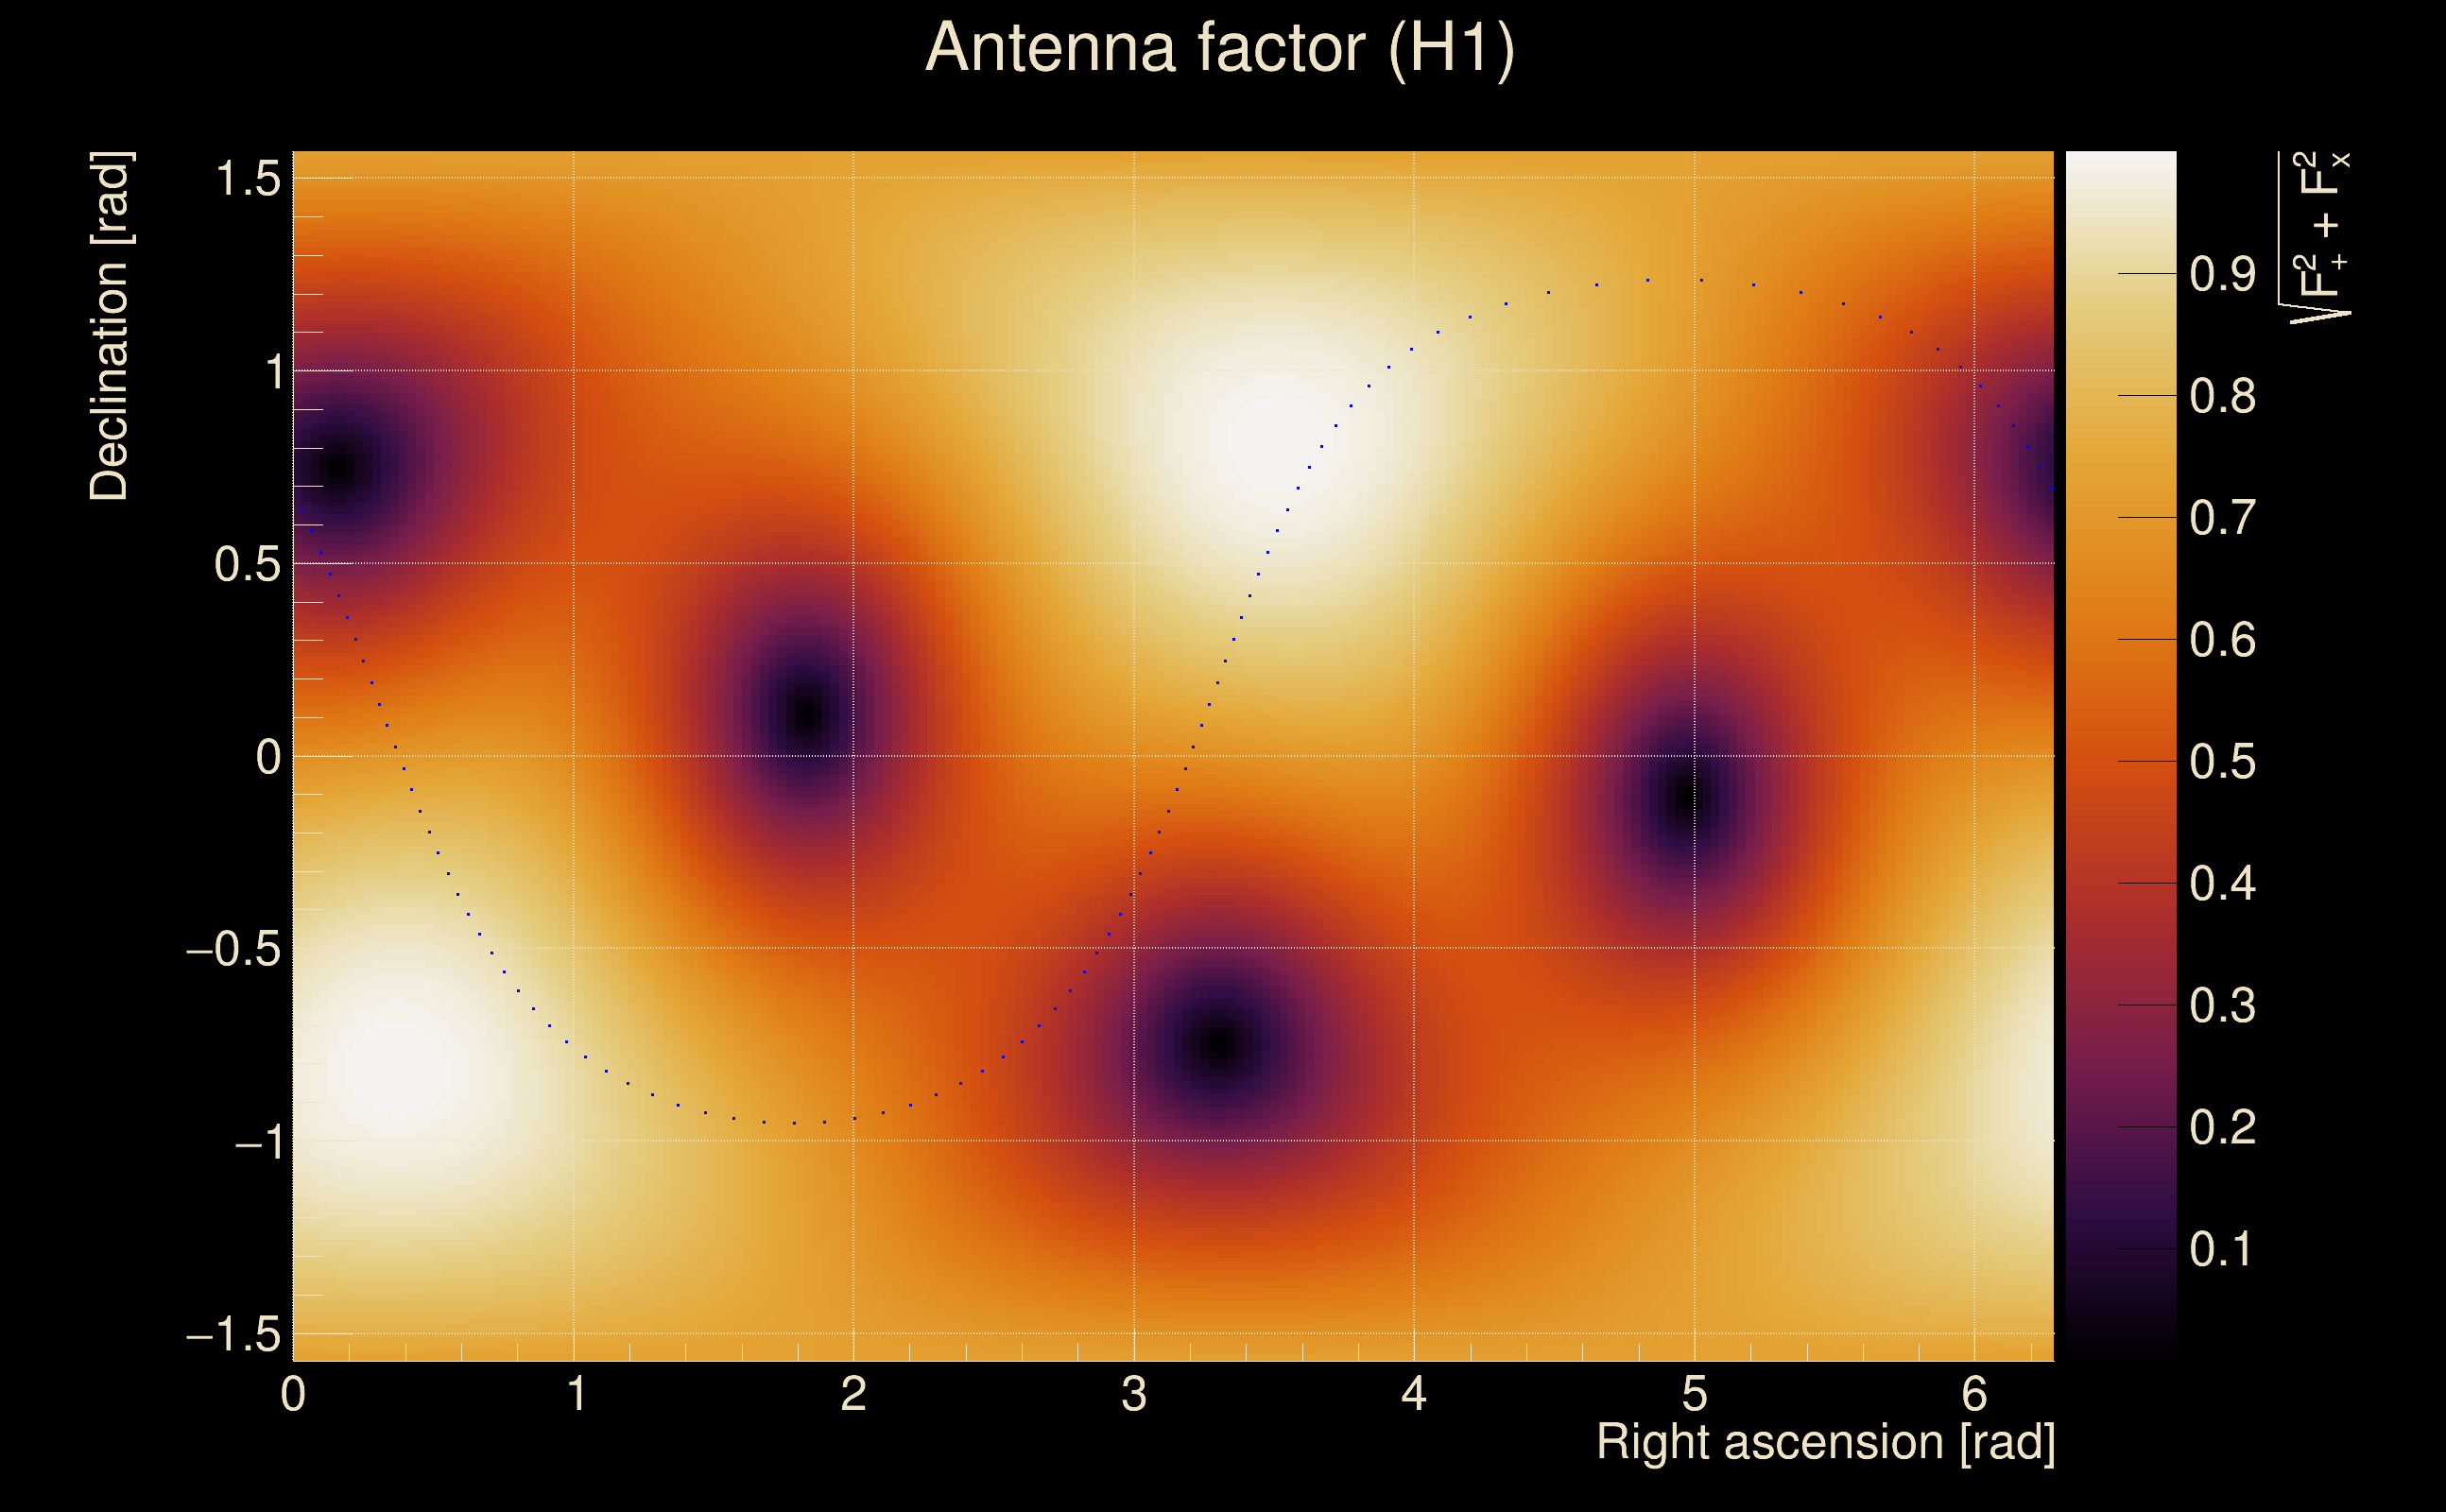
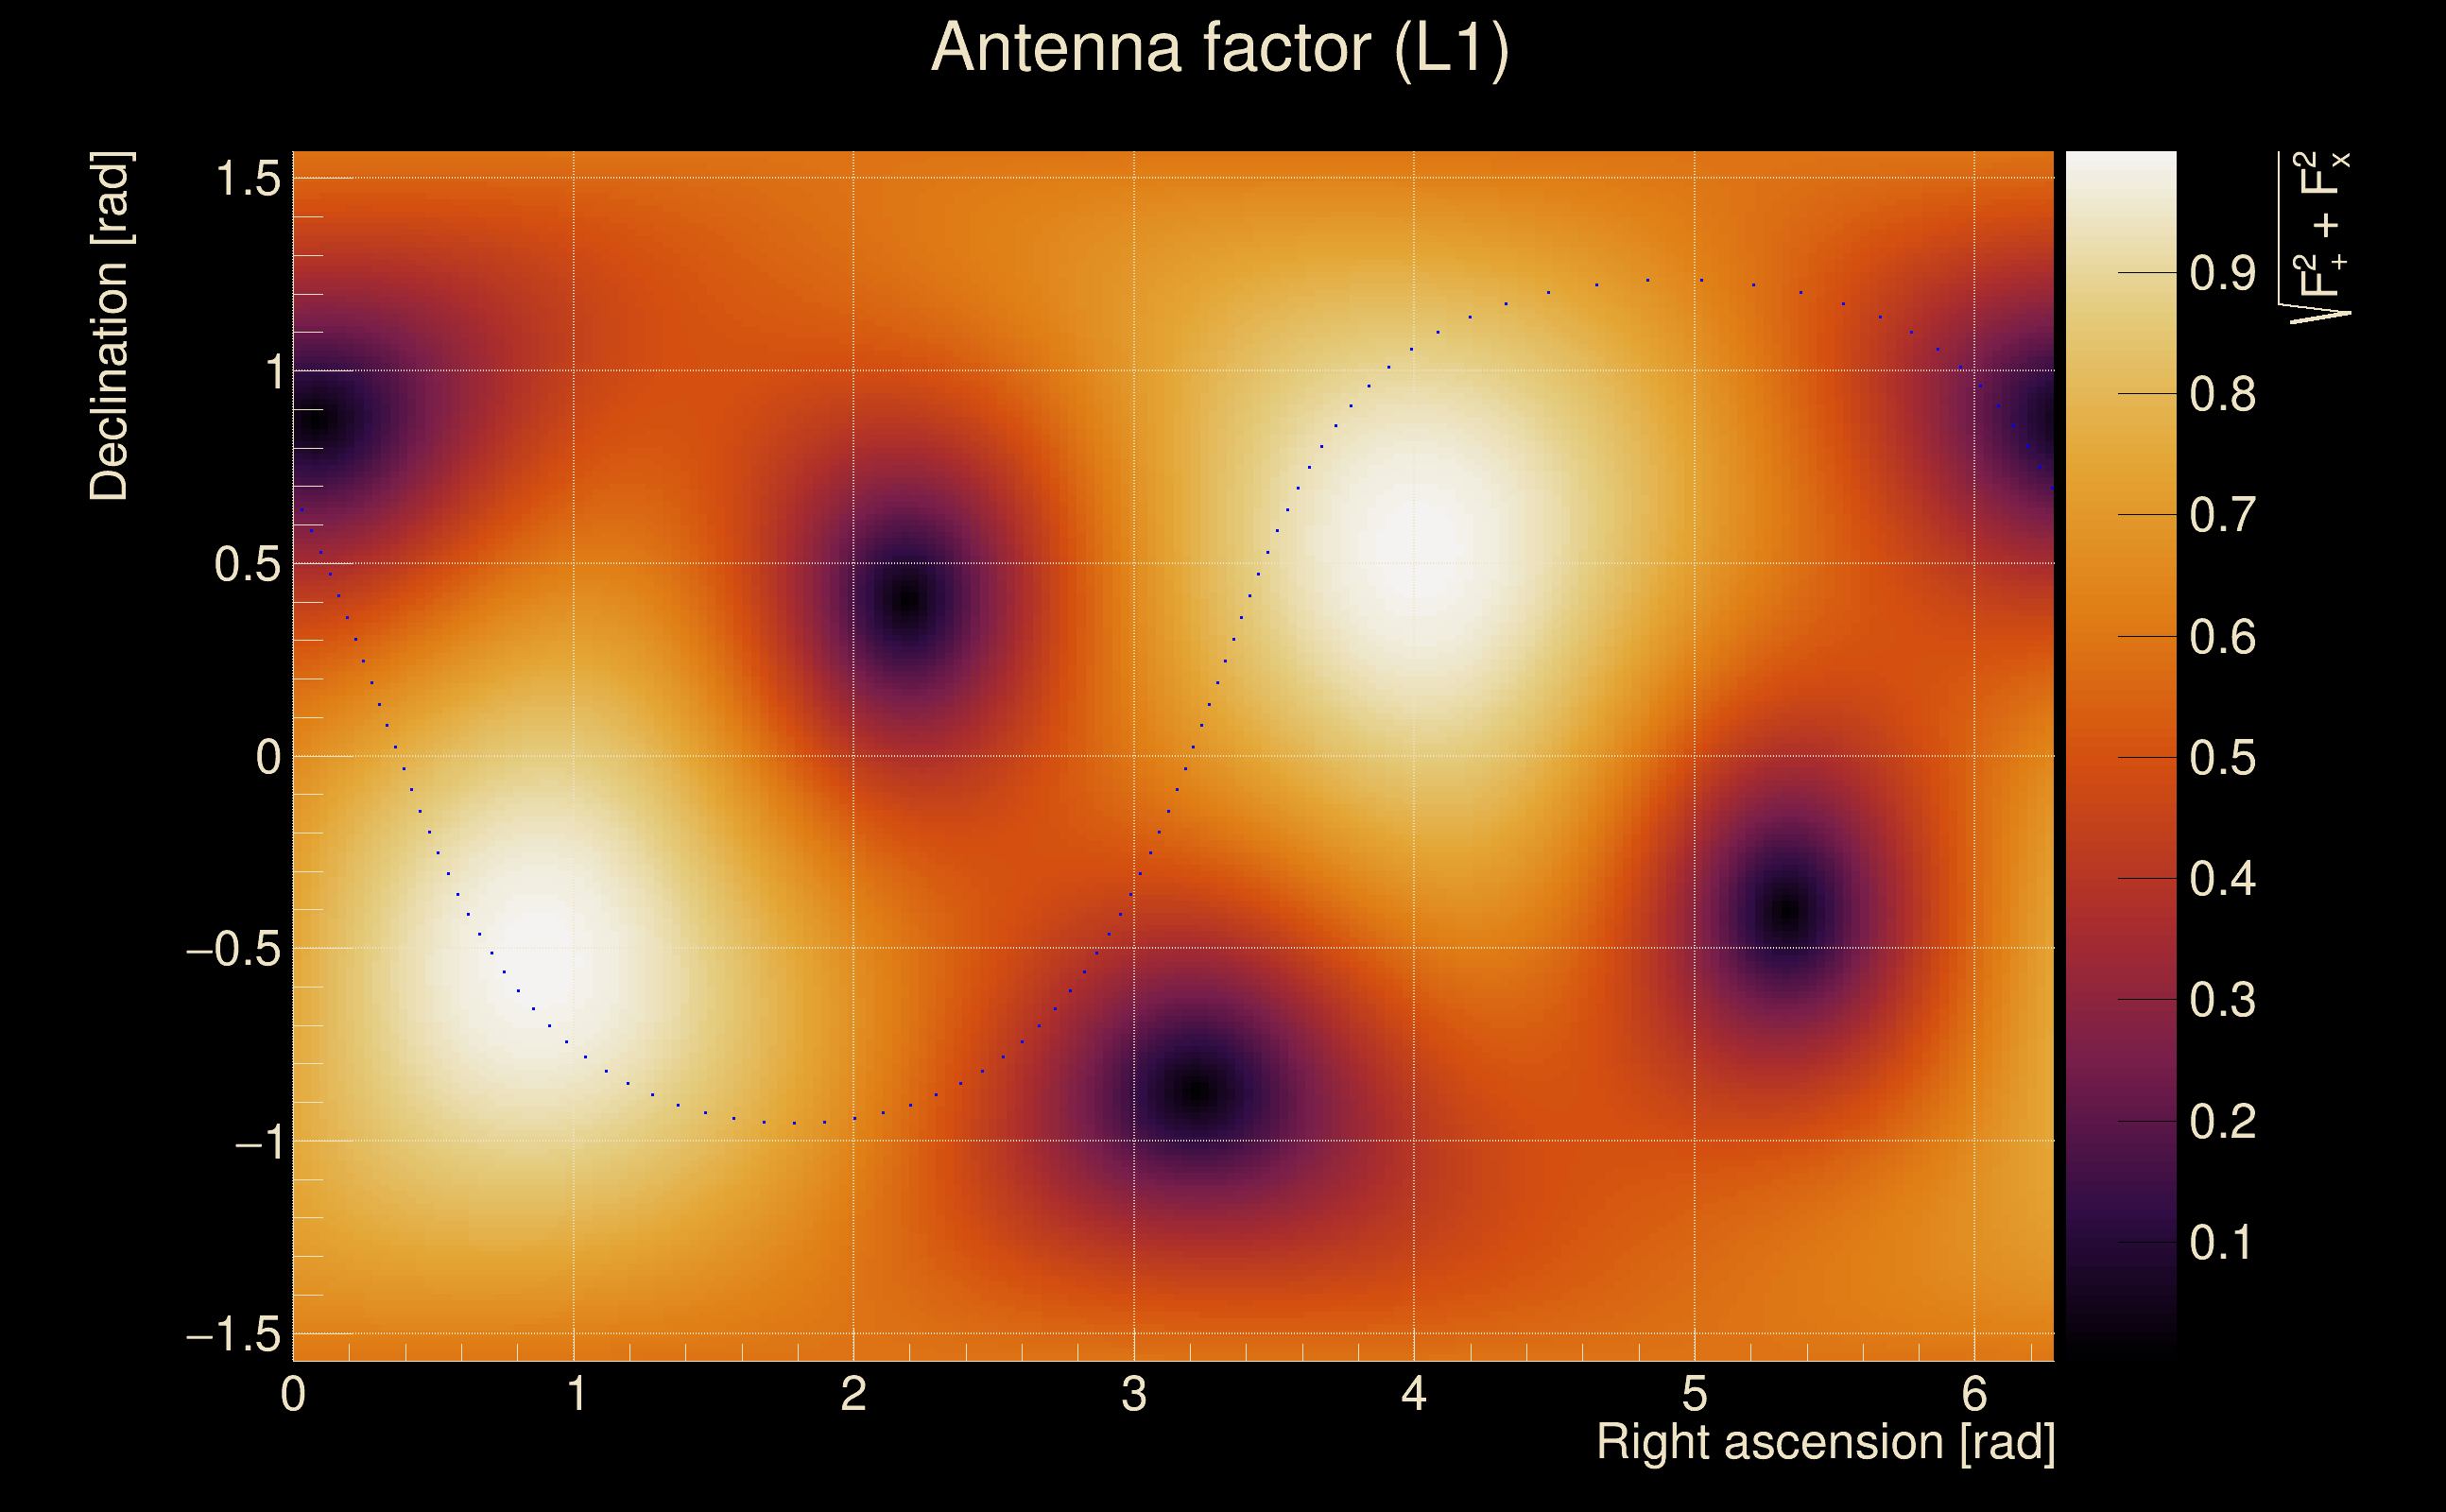
| Target sky positon: | Ra: 3.68109, Dec: 0.94792 [rad] |
| List of input Ox files: | TargIxf_feb2026_BG_CAT1_file_list.txt (6354 files) |
| Analysis result file: | TargIxf_feb2026_BG_CAT1_results-0.root |
| Slice selected for the the fakeground: | slice index=203 (-234.37 s), time lag = -560 s |
| Foreground | Fakeground | Background | ||
|---|---|---|---|---|
| Number of processed ox events | 0 | 11605 | 255056488 | |
| Start Date (detector 0) | - | Mon May 15 14:13:35 2023 UTC | Mon May 15 14:22:45 2023 UTC | |
| End Date (detector 0) | - | Thu May 18 15:54:40 2023 UTC | Thu May 18 15:54:40 2023 UTC | |
| Start GPS (detector 0) | - | 1368195233 | 1368195783 | |
| End GPS (detector 0) | - | 1368460498 | 1368460498 | |
| Used livetime (detector 0) | 0 s | 58340 s | 60845 s | |
| Start Date (detector 1) | - | Mon May 15 14:13:25 2023 UTC | Mon May 15 14:13:25 2023 UTC | |
| End Date (detector 1) | - | Thu May 18 15:54:30 2023 UTC | Thu May 18 15:45:20 2023 UTC | |
| Start GPS (detector 1) | - | 1368195223 | 1368195223 | |
| End GPS (detector 1) | - | 1368460488 | 1368459938 | |
| Used livetime (detector 1) | 0 s | 58340 s | 64550 s | |
| Cumulative livetime | 0 s | 116050 s | 2550564880 s | |
| 0 years, 0 days, 0 hours, 0 min, 0 s | 0 years, 1 days, 8 hours, 14 min, 10 s | 80 years, 300 days, 10 hours, 14 min, 40 s |
|
|
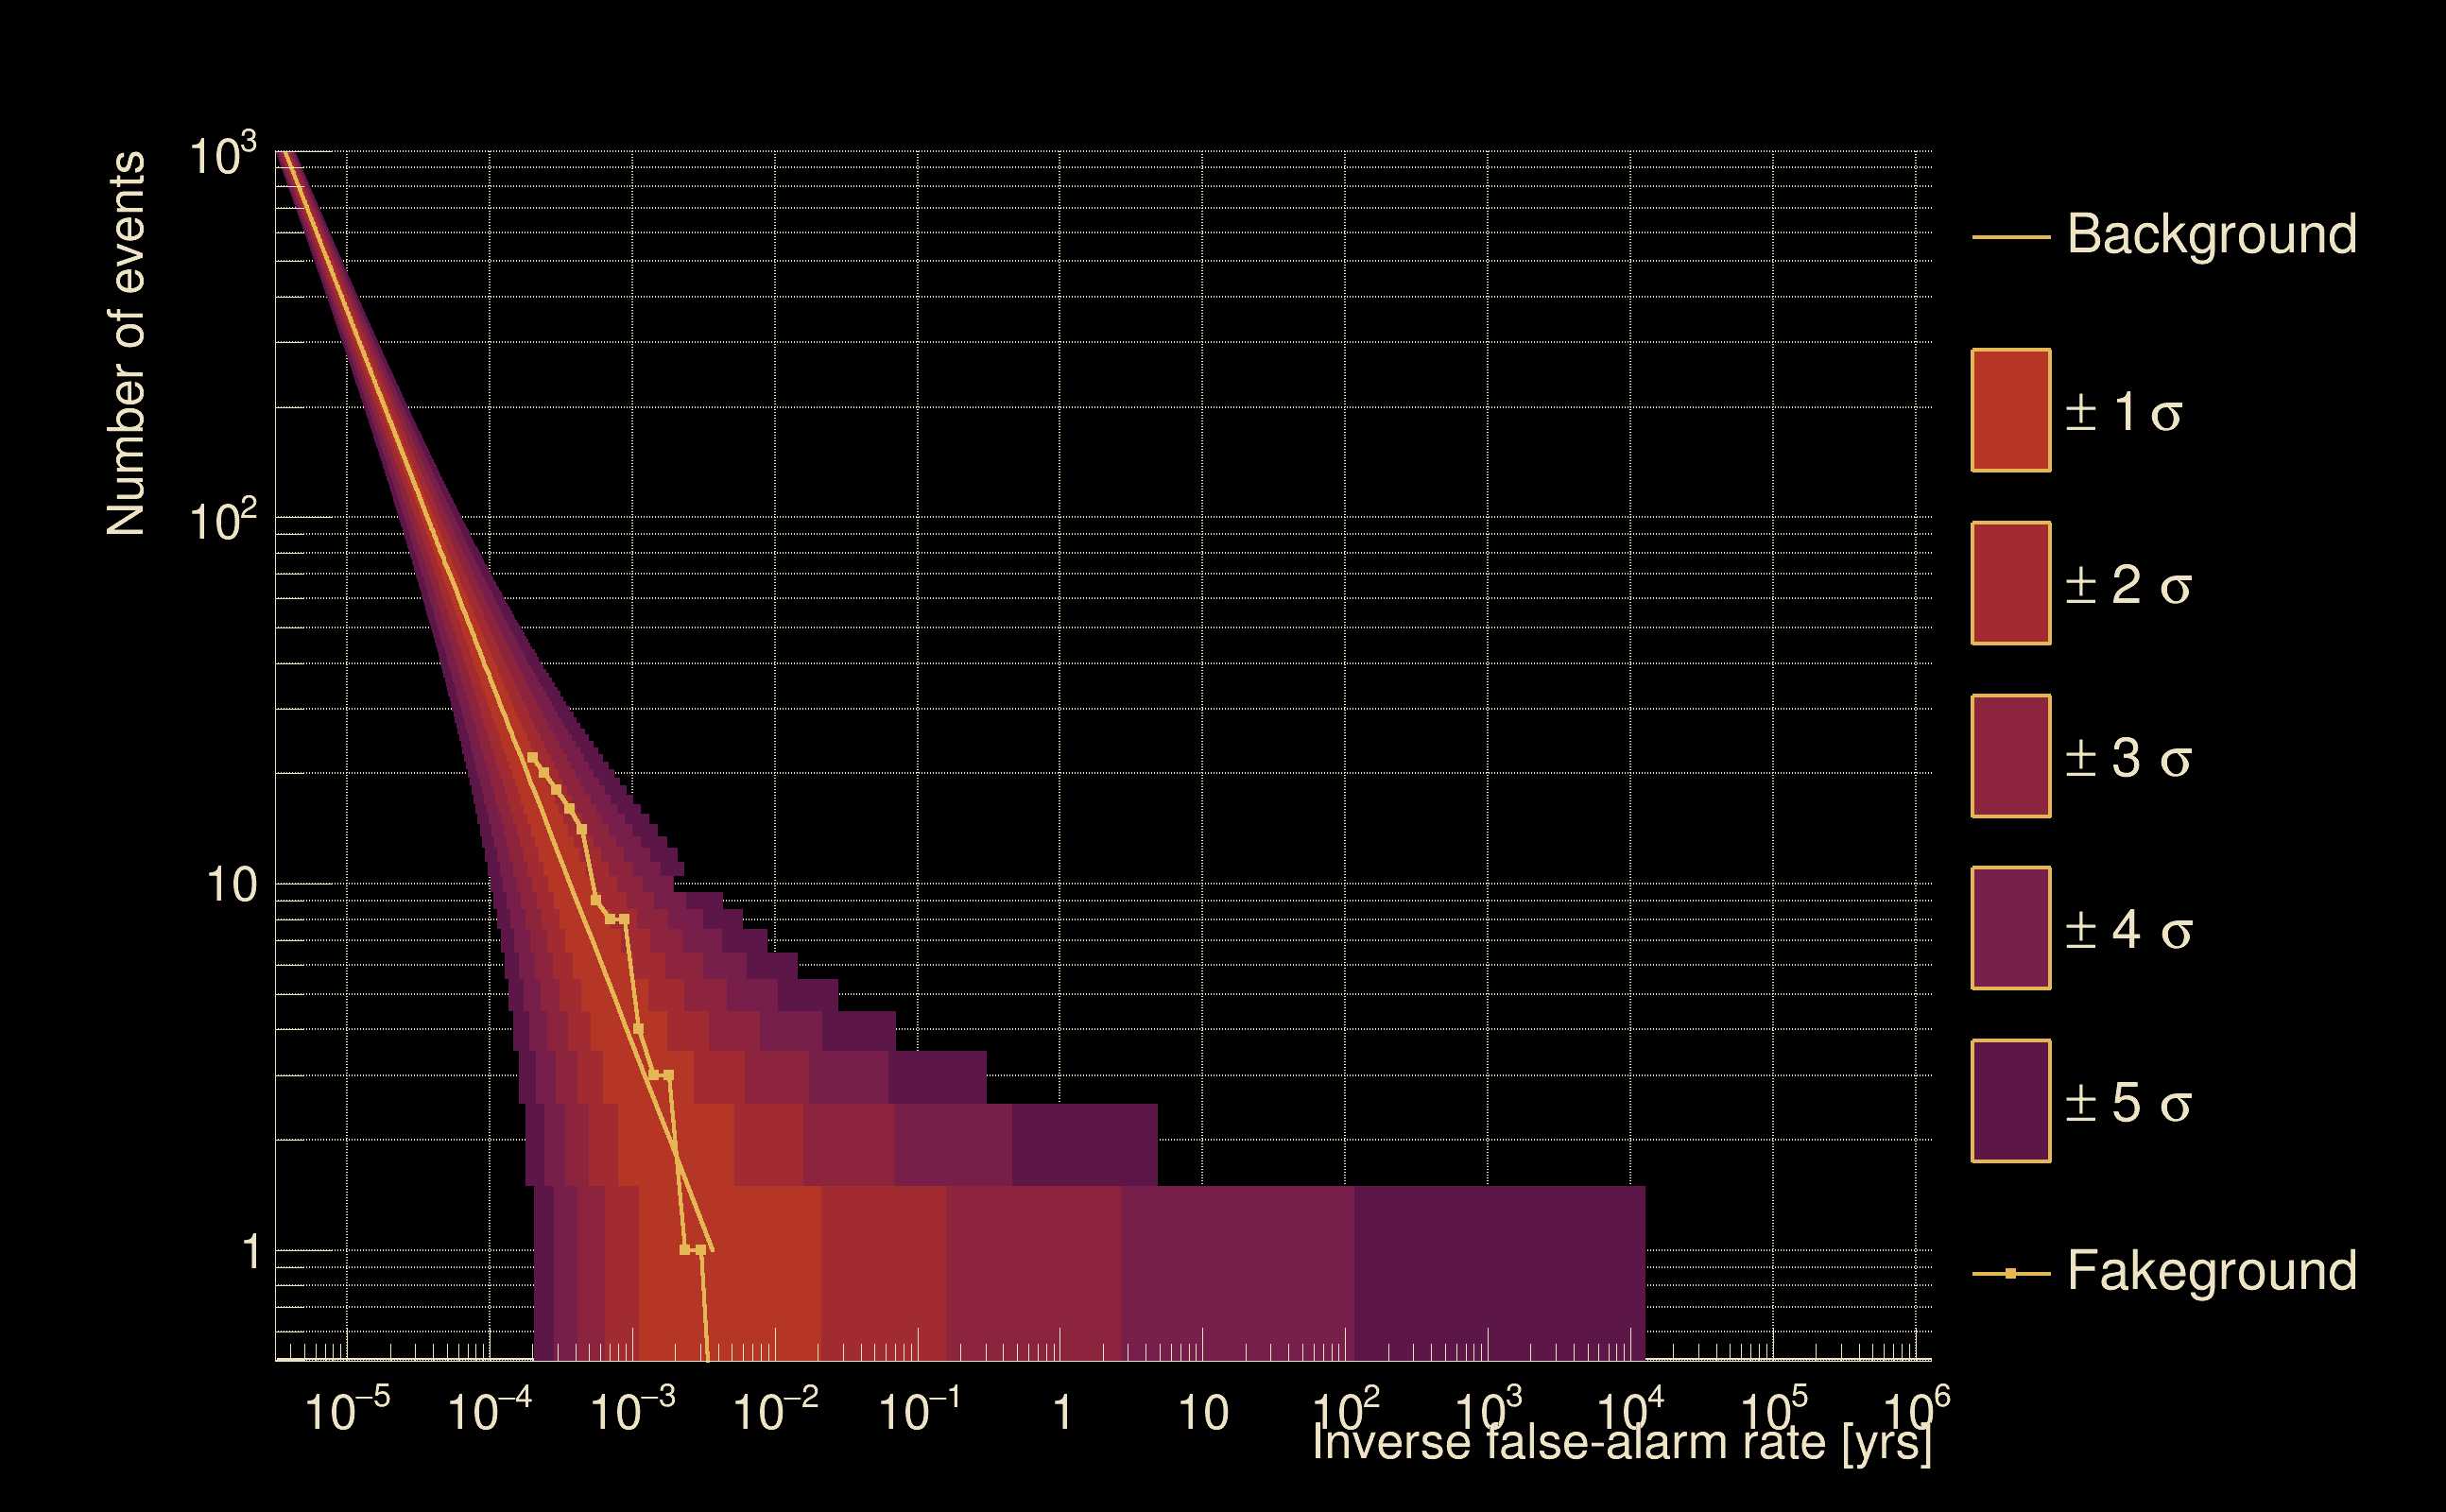
| Detection threshold: | R > 0.0316403 |
| False-alarm rate above that detection threshold: | 3.13581e-09 |
| Alternative threshold at 1/1000 yrs: | R > 0.0450868 |
| Alternative threshold at 1/100 yrs: | R > 0.0450868 |
| Alternative threshold at 1/10 yrs: | R > 0.0316406 |
| Alternative threshold at 1/1 yr: | R > 0.0239628 |
| Alternative threshold at 1/1 d: | R > 0.00920769 |
 |
|
 |
 |
 |
 |
 |
 |
 |
 |
 |
 |
| Event time t(H1): | GPS = 1368423679 (Thu May 18 05:41:01 2023 ) → GPS = 1368423689 (Thu May 18 05:41:11 2023 ) |
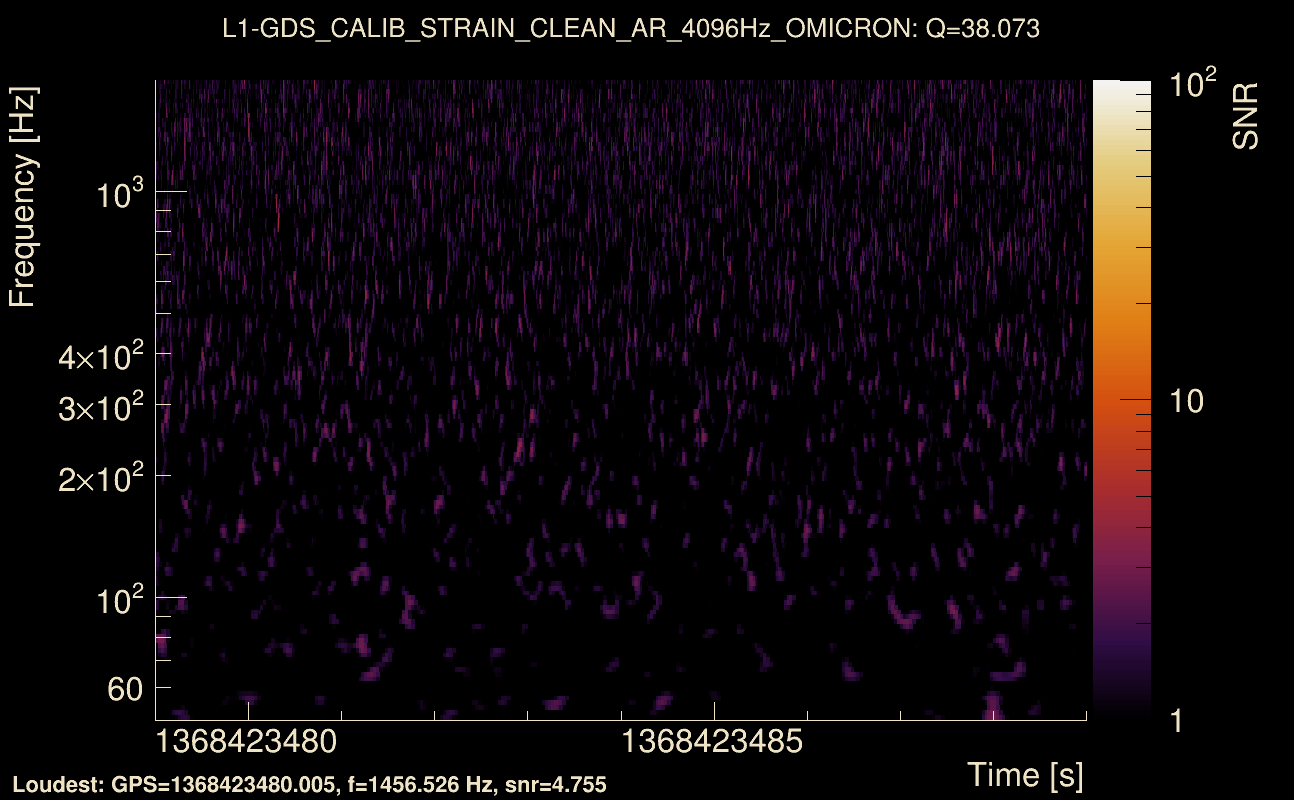
| Event time t(L1): | GPS = 1368423479 (Thu May 18 05:41:11 2023 ) → GPS = 1368423489 (Thu May 18 05:37:51 2023 ) |
| Omicron analysis time window (H1): | GPS = 1368423676 → GPS = 1368423692 |
| Omicron analysis time window (L1): | GPS = 1368423476 → GPS = 1368423492 |
| Time delay between detectors t(L1) - t(H1): | -197.515 s (slice index = 54 / 217), δt_gw = 0.00140647 s |
| Time delay standard deviation: | 0.0840724 s |
| [targeted mode] Time delay probability: | 0.924329 (0.0949817 sigmas), δt_target = 1.72247e+45 s |
| Frequency: | 73.1757 Hz |
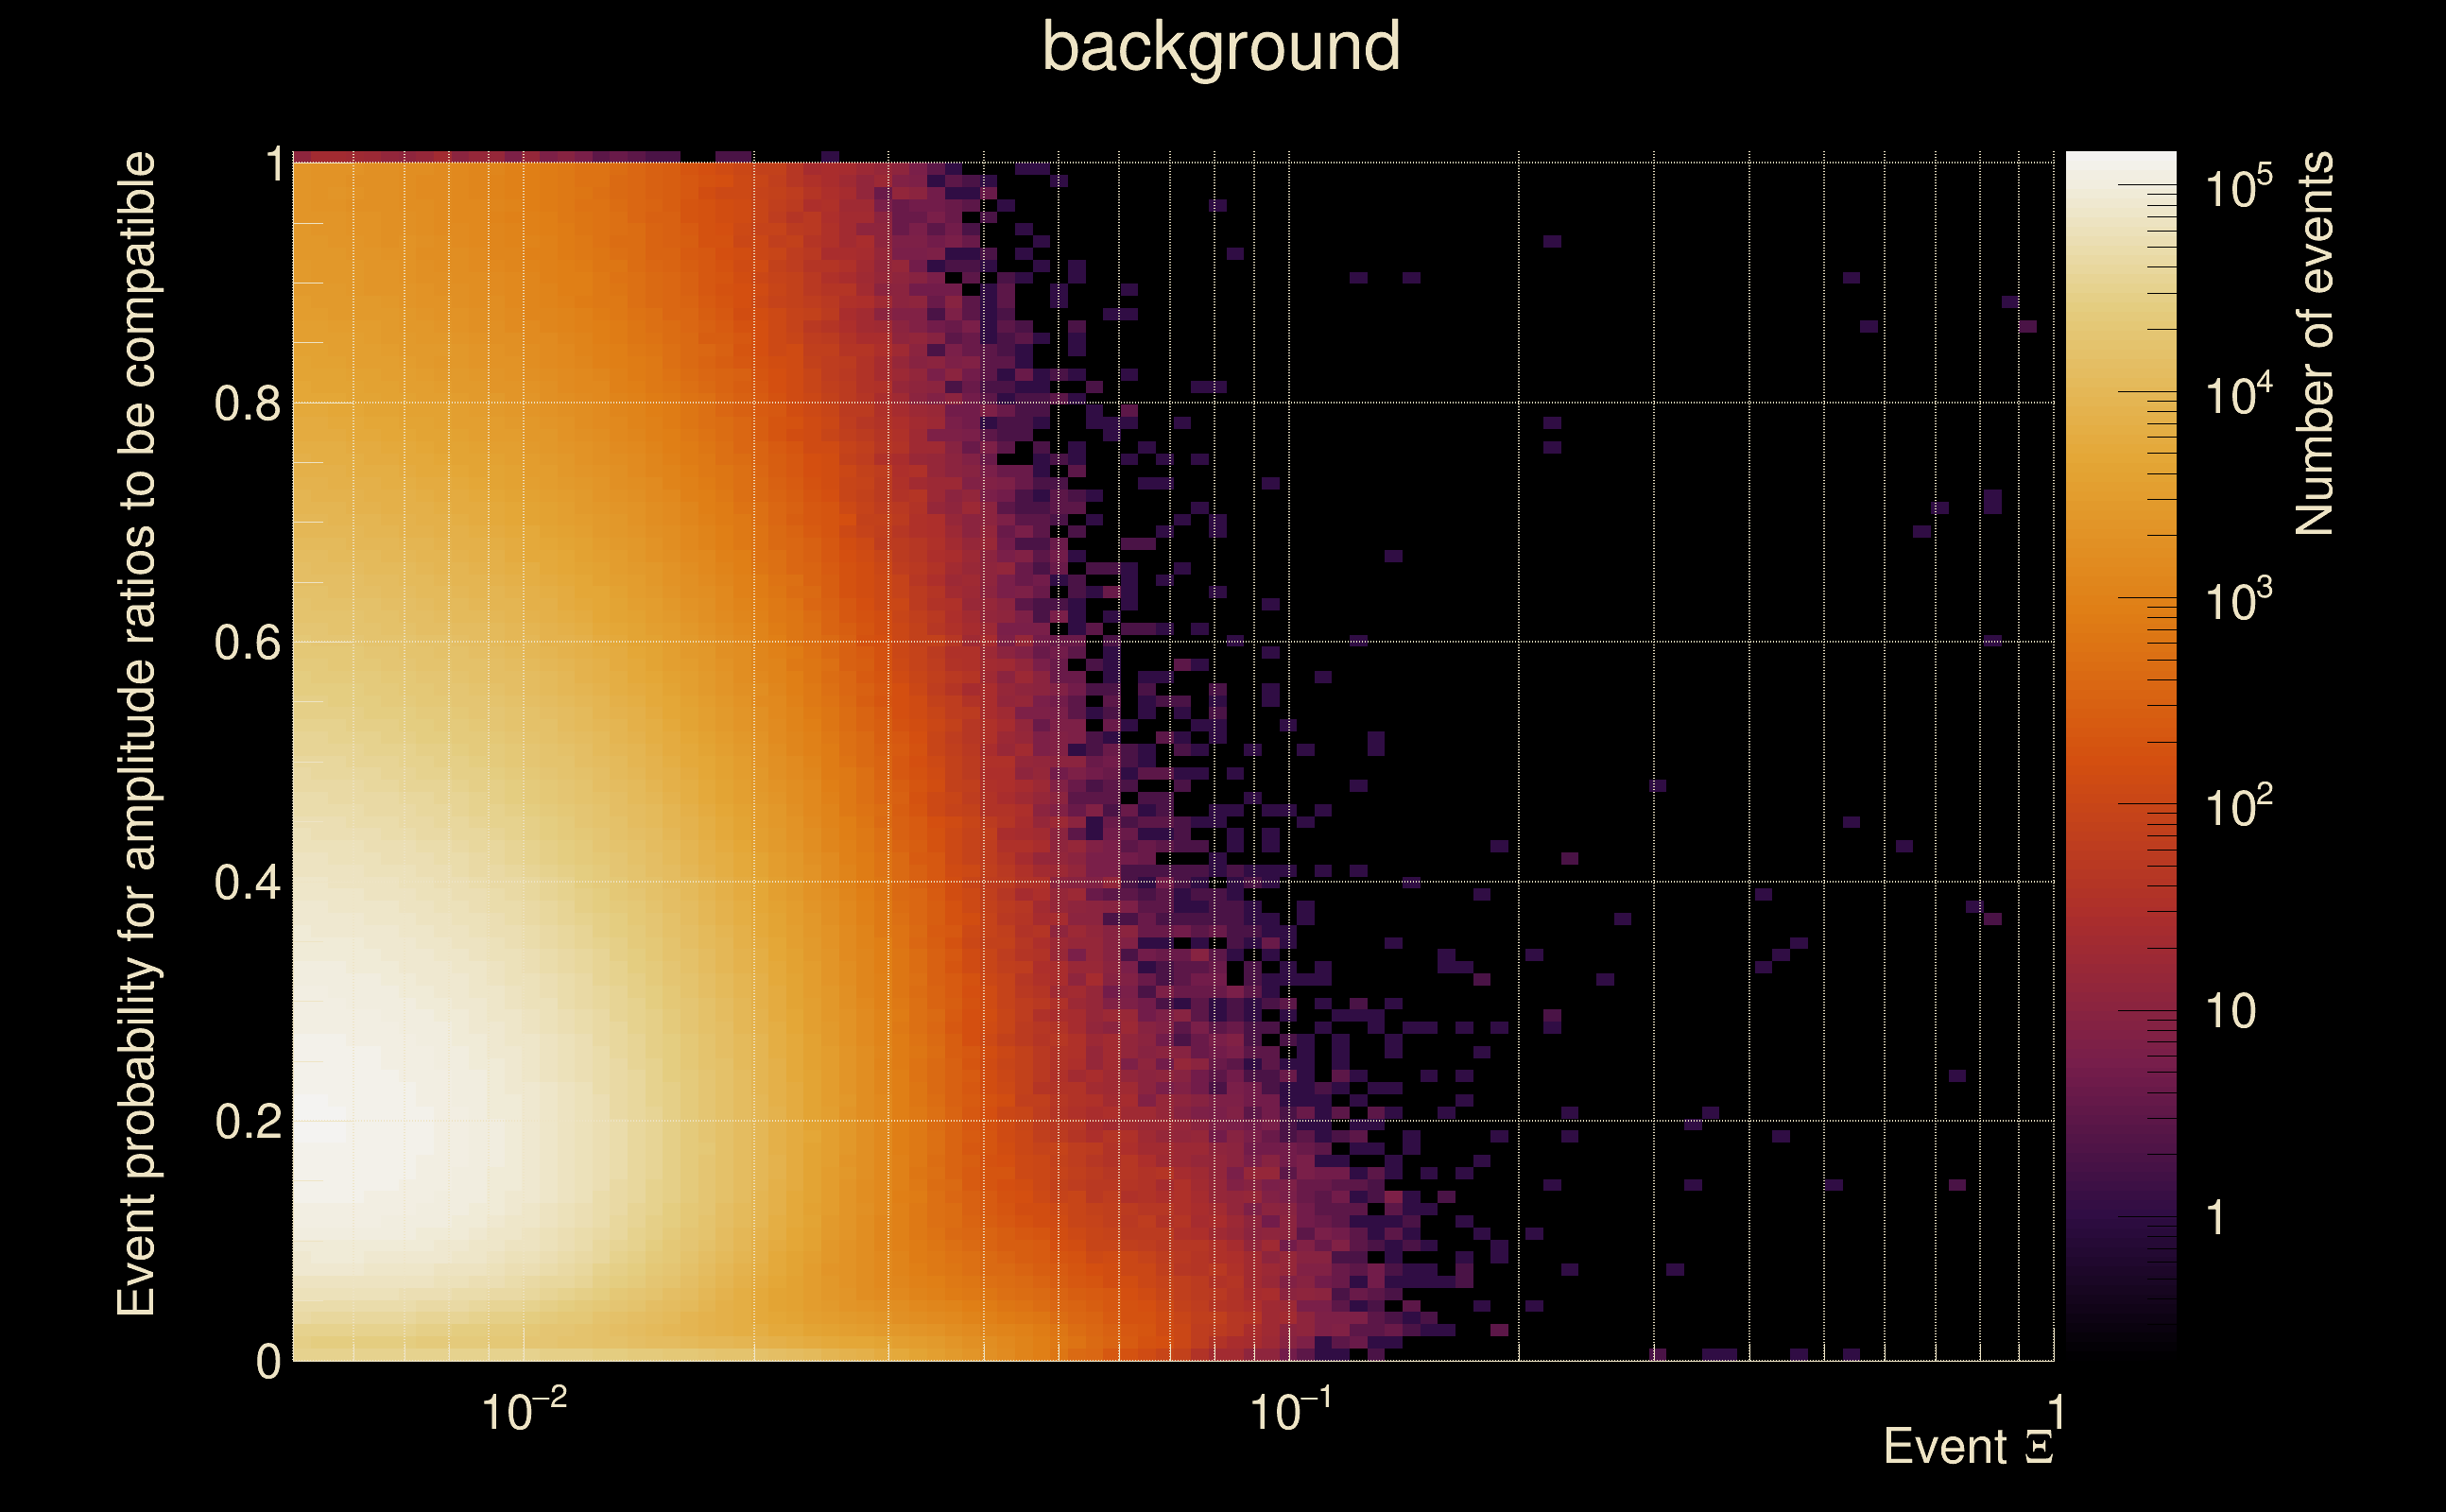
| Ξ: | 0.0688802 ± 0.18437 (variance = 0.0339923): Q0: 0.299357, Q1: 0.473286, Q2: 0.465747, Q3: 0.0611187, Q4: 0.0559154 |
| Rank: | R_A = 0.0460312 |
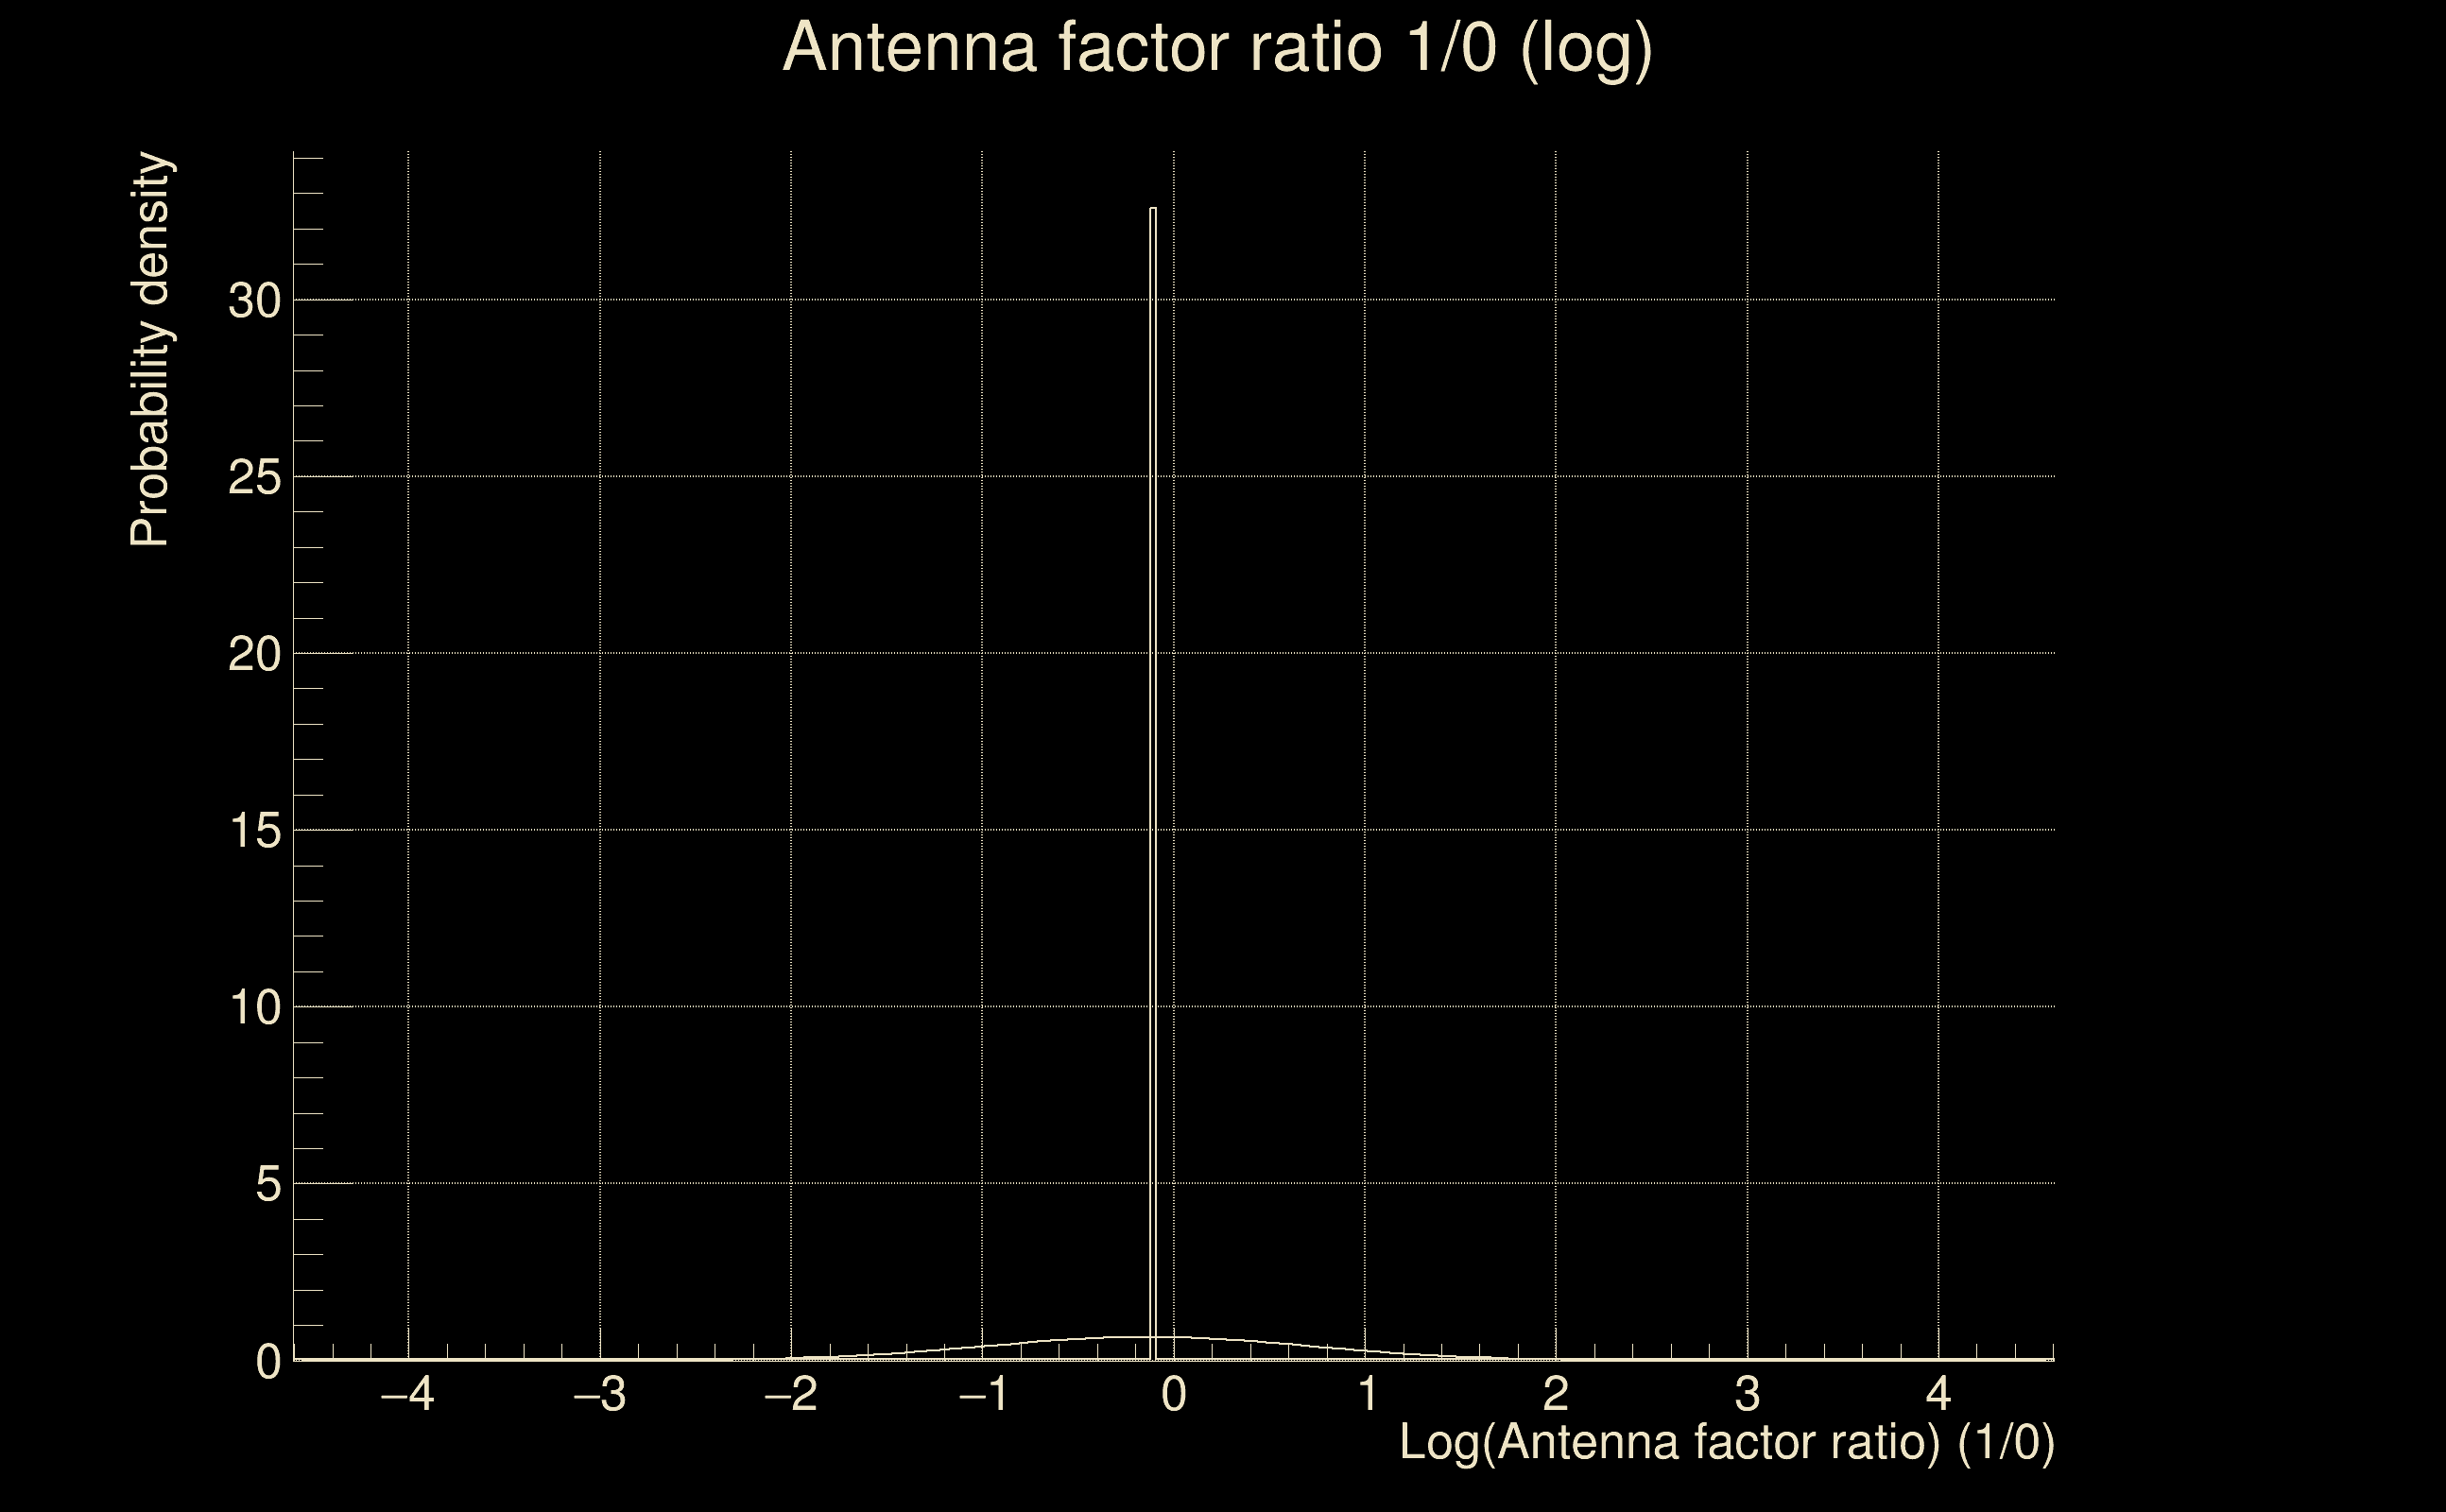
| Log of amplitude ratio (L1/H1): | -0.0844399, variance = 0.351924 (L1/H1: -0.341175, variance = 0.885688, H1/L1: -0.0659877, variance = 0.58108) |
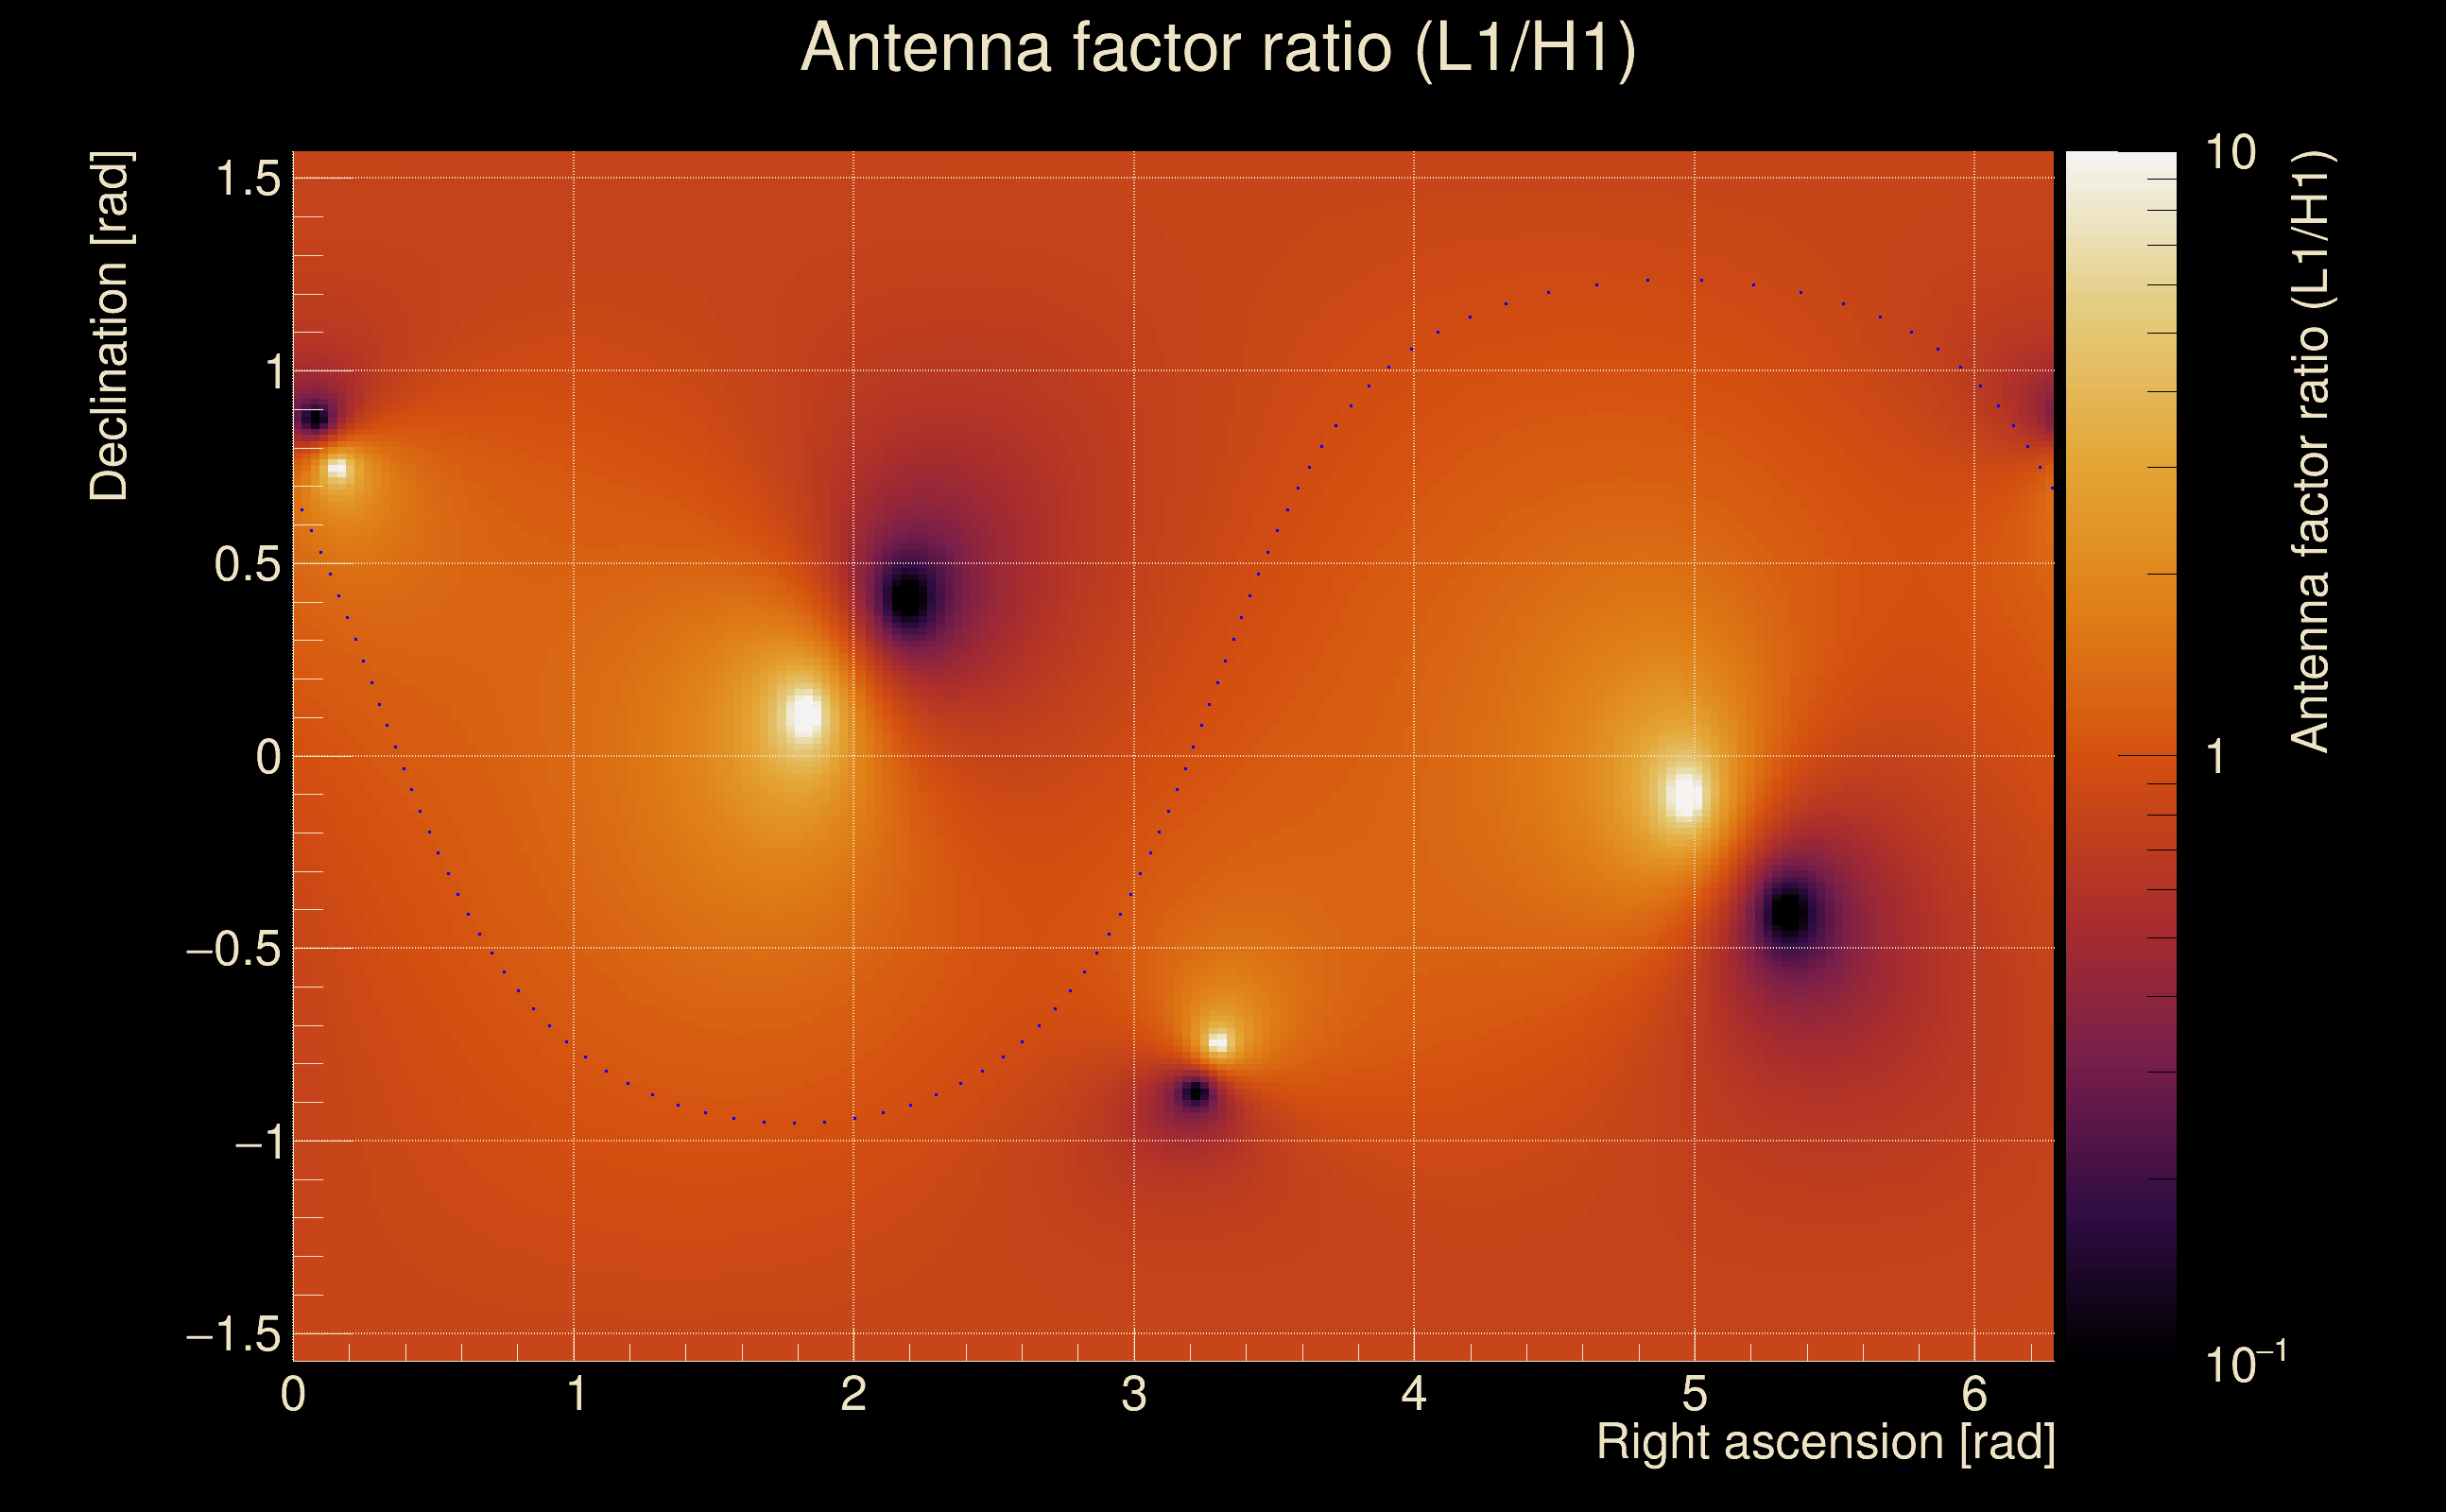
| Amplitude ratio (L1/H1): | 0.919027 ⋇ 1.80983 (L1/H1: 0.710934 ⋇ 2.56282, H1/L1: 0.936142 ⋇ 2.14317) |
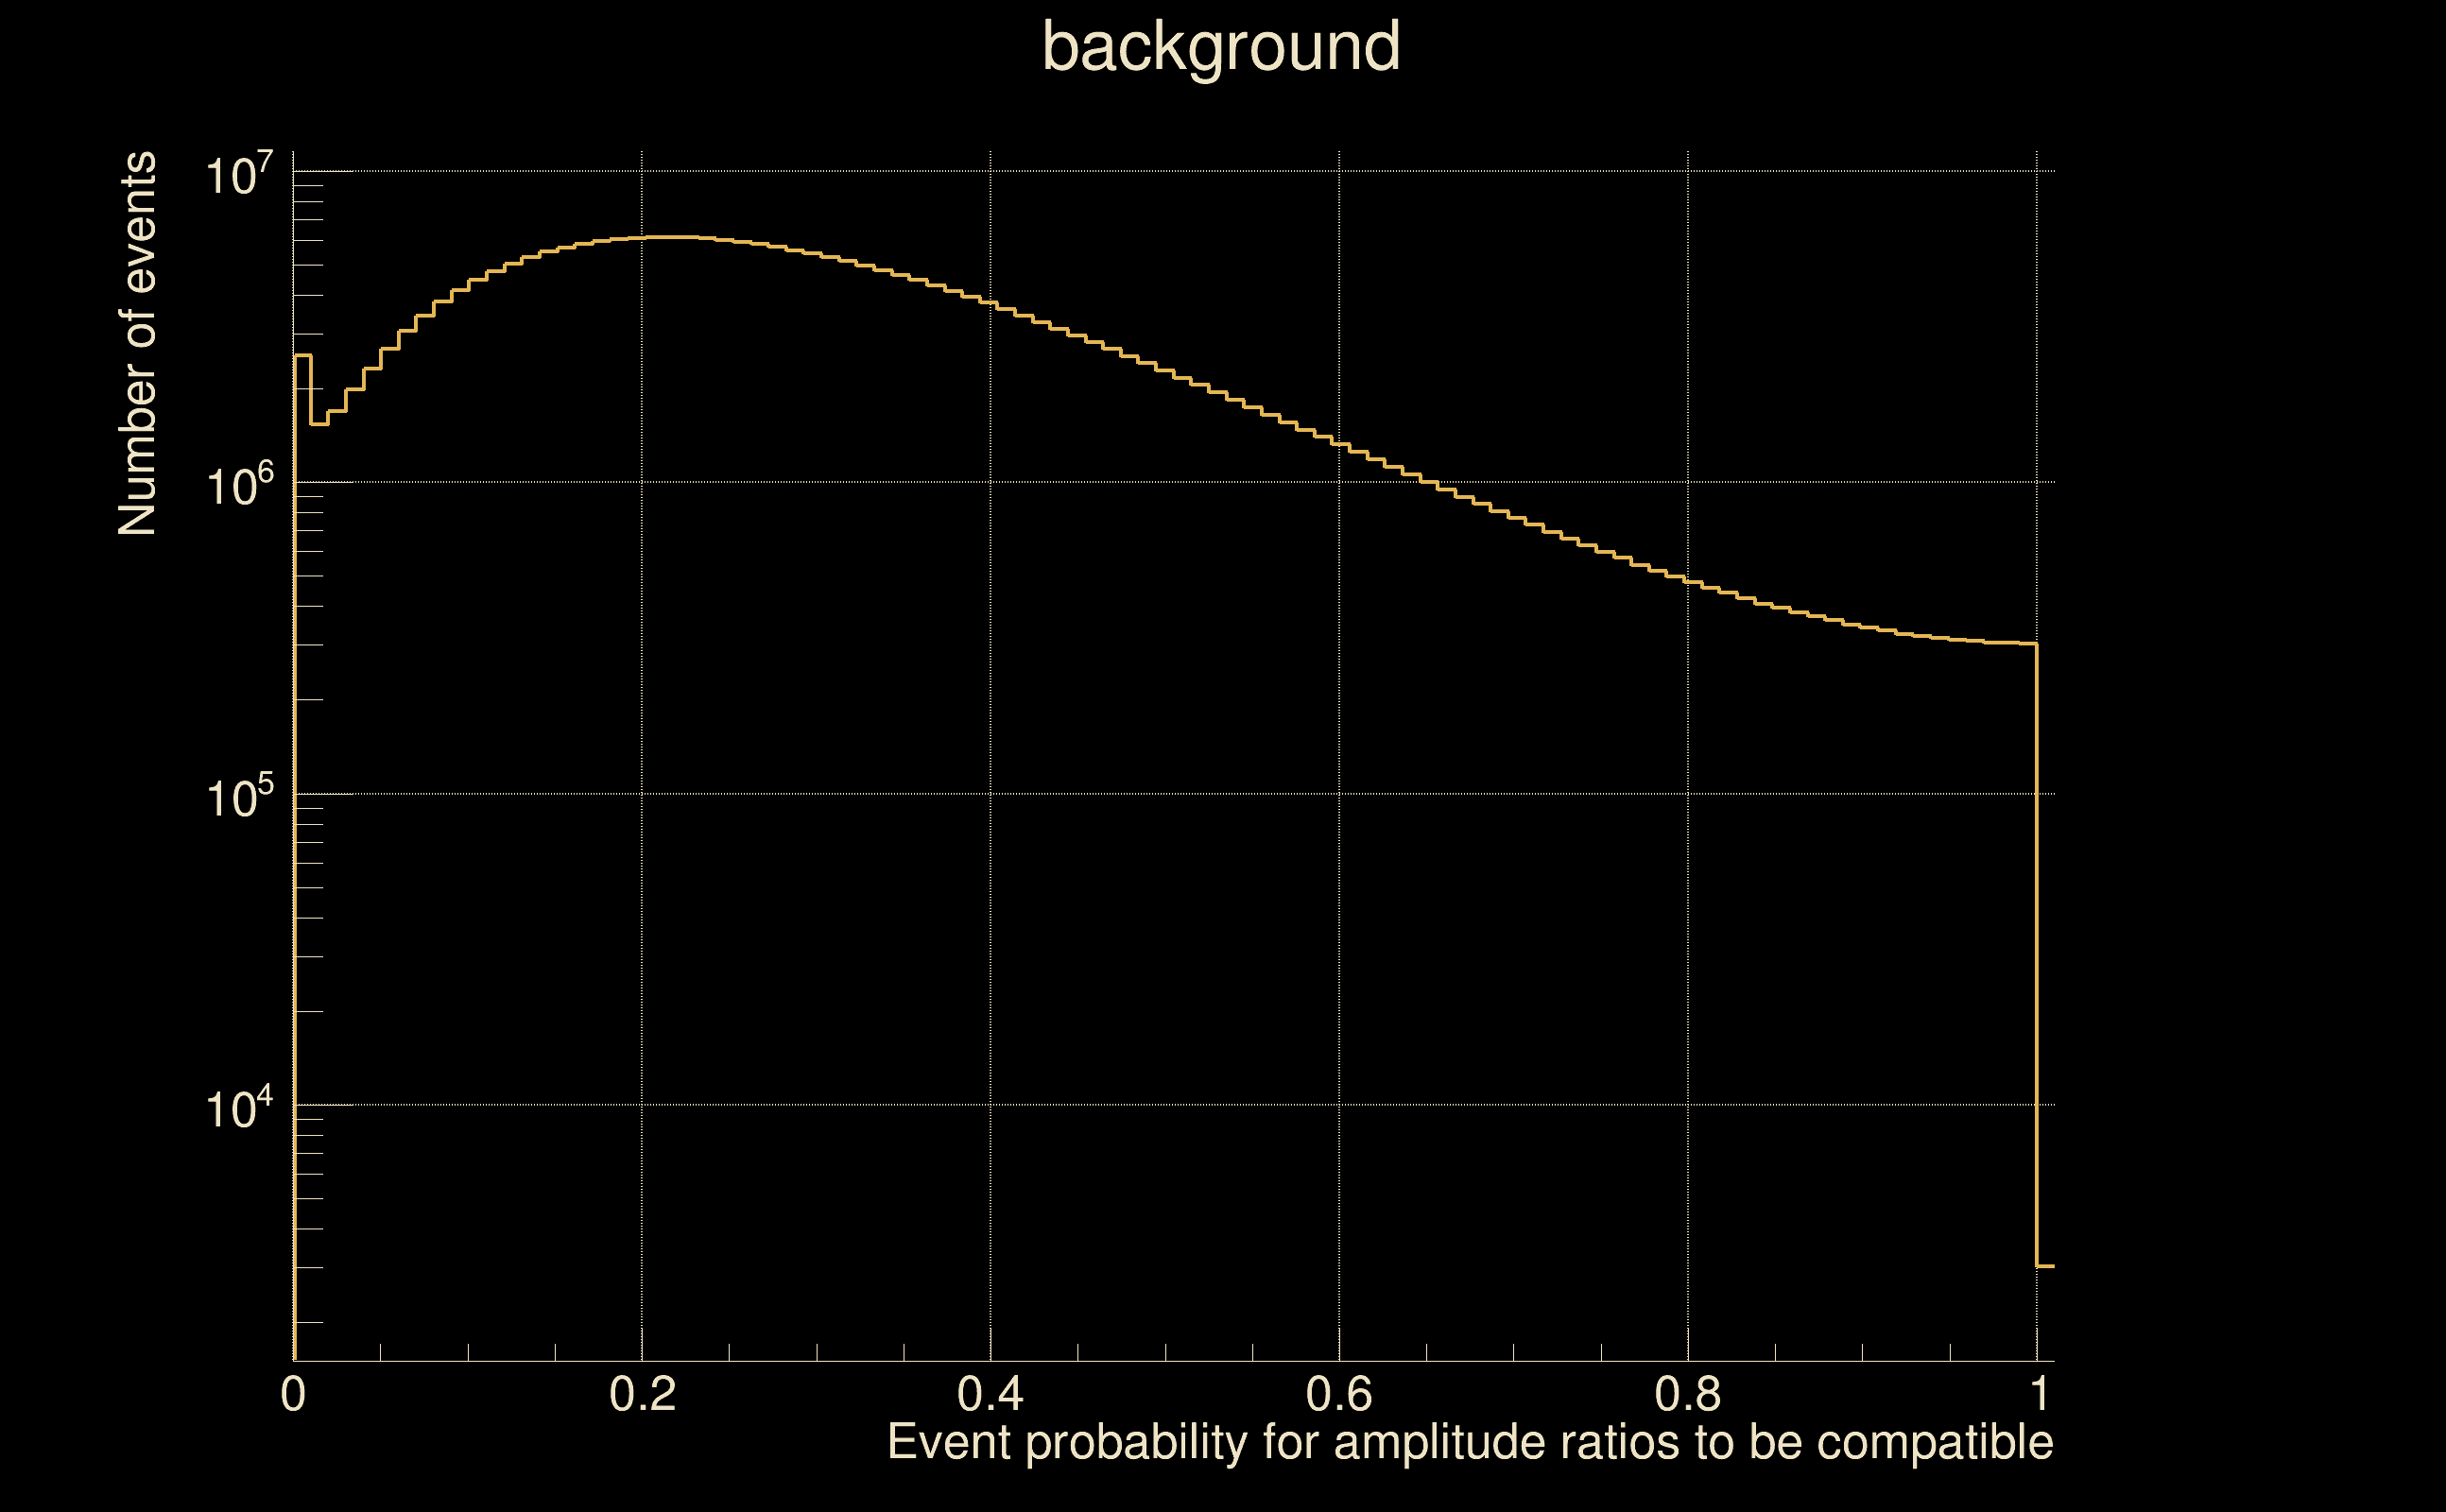
| Amplitude ratio H1|L1 compatibility (probability): | 0.736726 |
| Antenna factor probability: | 0.981352 |
| Number of rejected frequency rows: | Q0: 13 / 18, Q1: 30 / 36, Q2: 63 / 70, Q3: 128 / 134, Q4: 248 / 258 |
| Maximum signal-to-noise ratio: | H1: 5.17806, L1: 6.76466 |
| SNR variance: | H1: 0.52966, L1: 0.525918 |
| Click here for a zoomed plot | Click here for a zoomed plot | Click here for a zoomed plot | Click here for a zoomed plot | Click here for a zoomed plot |
 |
 |
 |
 |
 |
 |
 |
 |
 |
 |
 |
 |
 |
 |
 |
 |
 |
 |
 |
 |
 |
 |
 |
 |
 |
 |
 |
 |
 |
| Event time t(H1): | GPS = 1368332943 (Wed May 17 04:28:45 2023 ) → GPS = 1368332953 (Wed May 17 04:28:55 2023 ) |
| Event time t(L1): | GPS = 1368332313 (Wed May 17 04:28:55 2023 ) → GPS = 1368332323 (Wed May 17 04:18:25 2023 ) |
| Omicron analysis time window (H1): | GPS = 1368332940 → GPS = 1368332956 |
| Omicron analysis time window (L1): | GPS = 1368332310 → GPS = 1368332326 |
| Time delay between detectors t(L1) - t(H1): | -630.596 s (slice index = 121 / 217), δt_gw = 0.0017298 s |
| Time delay standard deviation: | 0.075754 s |
| [targeted mode] Time delay probability: | 0.838221 (0.20417 sigmas), δt_target = 0.00207782 s |
| Frequency: | 101.248 Hz |
| Ξ: | 0.068224 ± 0.0698673 (variance = 0.00488143): Q0: 0.282245, Q1: 0.221534, Q2: 0.203778, Q3: 0.158038, Q4: 0.072873 |
| Rank: | R_A = 0.0411015 |
| Log of amplitude ratio (L1/H1): | 0.0100015, variance = 0.453647 (L1/H1: -0.293609, variance = 1.41058, H1/L1: -0.160808, variance = 0.668214) |
| Amplitude ratio (L1/H1): | 1.01005 ⋇ 1.96115 (L1/H1: 0.745568 ⋇ 3.27946, H1/L1: 0.851456 ⋇ 2.2647) |
| Amplitude ratio H1|L1 compatibility (probability): | 0.75263 |
| Antenna factor probability: | 0.954948 |
| Number of rejected frequency rows: | Q0: 11 / 18, Q1: 31 / 36, Q2: 61 / 70, Q3: 123 / 134, Q4: 249 / 258 |
| Maximum signal-to-noise ratio: | H1: 5.09267, L1: 7.22594 |
| SNR variance: | H1: 0.516751, L1: 0.513553 |
| Event time t(H1): | GPS = 1368430389 (Thu May 18 07:32:51 2023 ) → GPS = 1368430399 (Thu May 18 07:33:01 2023 ) |
| Event time t(L1): | GPS = 1368429569 (Thu May 18 07:33:01 2023 ) → GPS = 1368429579 (Thu May 18 07:19:21 2023 ) |
| Omicron analysis time window (H1): | GPS = 1368430386 → GPS = 1368430402 |
| Omicron analysis time window (L1): | GPS = 1368429566 → GPS = 1368429582 |
| Time delay between detectors t(L1) - t(H1): | -816.959 s (slice index = 42 / 217), δt_gw = 0.00516981 s |
| Time delay standard deviation: | 0.0715094 s |
| [targeted mode] Time delay probability: | 0.908954 (0.114358 sigmas), δt_target = 0.00207782 s |
| Frequency: | 118.855 Hz |
| Ξ: | 0.04716 ± 0.111996 (variance = 0.0125431): Q0: 0.134698, Q1: 0.26426, Q2: 0.399804, Q3: 0.183862, Q4: 0.0780341 |
| Rank: | R_A = 0.0338919 |
| Log of amplitude ratio (L1/H1): | -0.265329, variance = 0.386269 (L1/H1: -0.391645, variance = 0.699984, H1/L1: 0.11515, variance = 0.861309) |
| Amplitude ratio (L1/H1): | 0.766954 ⋇ 1.86173 (L1/H1: 0.675944 ⋇ 2.30862, H1/L1: 1.12204 ⋇ 2.52962) |
| Amplitude ratio H1|L1 compatibility (probability): | 0.824873 |
| Antenna factor probability: | 0.958501 |
| Number of rejected frequency rows: | Q0: 12 / 18, Q1: 28 / 36, Q2: 59 / 70, Q3: 124 / 134, Q4: 247 / 258 |
| Maximum signal-to-noise ratio: | H1: 5.14633, L1: 4.7198 |
| SNR variance: | H1: 0.51686, L1: 0.547073 |
| Event time t(H1): | GPS = 1368268403 (Tue May 16 10:33:05 2023 ) → GPS = 1368268413 (Tue May 16 10:33:15 2023 ) |
| Event time t(L1): | GPS = 1368268273 (Tue May 16 10:33:15 2023 ) → GPS = 1368268283 (Tue May 16 10:31:05 2023 ) |
| Omicron analysis time window (H1): | GPS = 1368268400 → GPS = 1368268416 |
| Omicron analysis time window (L1): | GPS = 1368268270 → GPS = 1368268286 |
| Time delay between detectors t(L1) - t(H1): | -125.622 s (slice index = 13 / 217), δt_gw = 0.00799007 s |
| Time delay standard deviation: | 0.0769573 s |
| [targeted mode] Time delay probability: | 0.982245 (0.0222541 sigmas), δt_target = 0.00207782 s |
| Frequency: | 79.1826 Hz |
| Ξ: | 0.0588067 ± 0.0774965 (variance = 0.00600571): Q0: 0.247444, Q1: 0.323858, Q2: 0.369338, Q3: 0.436788, Q4: 0.461876 |
| Rank: | R_A = 0.0338204 |
| Log of amplitude ratio (L1/H1): | -0.122493, variance = 1.07743 (L1/H1: -0.515537, variance = 1.18103, H1/L1: 0.0613167, variance = 1.41033) |
| Amplitude ratio (L1/H1): | 0.884712 ⋇ 2.82355 (L1/H1: 0.59718 ⋇ 2.96463, H1/L1: 1.06324 ⋇ 3.27911) |
| Amplitude ratio H1|L1 compatibility (probability): | 0.777817 |
| Antenna factor probability: | 0.752756 |
| Number of rejected frequency rows: | Q0: 14 / 18, Q1: 27 / 36, Q2: 59 / 70, Q3: 125 / 134, Q4: 250 / 258 |
| Maximum signal-to-noise ratio: | H1: 4.66761, L1: 11.831 |
| SNR variance: | H1: 0.520491, L1: 0.558127 |
| Event time t(H1): | GPS = 1368331923 (Wed May 17 04:11:45 2023 ) → GPS = 1368331933 (Wed May 17 04:11:55 2023 ) |
| Event time t(L1): | GPS = 1368331693 (Wed May 17 04:11:55 2023 ) → GPS = 1368331703 (Wed May 17 04:08:05 2023 ) |
| Omicron analysis time window (H1): | GPS = 1368331920 → GPS = 1368331936 |
| Omicron analysis time window (L1): | GPS = 1368331690 → GPS = 1368331706 |
| Time delay between detectors t(L1) - t(H1): | -227.334 s (slice index = 50 / 217), δt_gw = -0.00156136 s |
| Time delay standard deviation: | 0.0937106 s |
| [targeted mode] Time delay probability: | 0.835557 (0.20758 sigmas), δt_target = 0.00207782 s |
| Frequency: | 84.0468 Hz |
| Ξ: | 0.0517921 ± 0.117658 (variance = 0.0138435): Q0: 0.278927, Q1: 0.354071, Q2: 0.385807, Q3: 0.295241, Q4: 0.0507618 |
| Rank: | R_A = 0.0337621 |
| Log of amplitude ratio (L1/H1): | 0.0944221, variance = 0.336739 (L1/H1: 0.0348043, variance = 0.58647, H1/L1: -0.155304, variance = 0.764061) |
| Amplitude ratio (L1/H1): | 1.09902 ⋇ 1.78656 (L1/H1: 1.03542 ⋇ 2.15074, H1/L1: 0.856155 ⋇ 2.39673) |
| Amplitude ratio H1|L1 compatibility (probability): | 0.917416 |
| Antenna factor probability: | 0.8504 |
| Number of rejected frequency rows: | Q0: 14 / 18, Q1: 30 / 36, Q2: 65 / 70, Q3: 124 / 134, Q4: 255 / 258 |
| Maximum signal-to-noise ratio: | H1: 5.22871, L1: 5.17415 |
| SNR variance: | H1: 0.527028, L1: 0.526815 |
| florent.robinet@ijclab.in2p3.fr |