

| Omicron version: | 4.2.0: documentation gitlab repository |
| Omicron run by: | unknown |
| Report produced on: | Wed Mar 11 10:43:05 2026 UTC |
| Ox option file: | TargIxf_feb2026_BG_CAT1_options.txt |
| Omicron option files: | detector 0, detector 1 |
| Detector channel names: | H1:GDS-CALIB_STRAIN_CLEAN_AR_4096Hz, L1:GDS-CALIB_STRAIN_CLEAN_AR_4096Hz |
| Omicron analysis time window and overlap: | 16 s, 6 s |
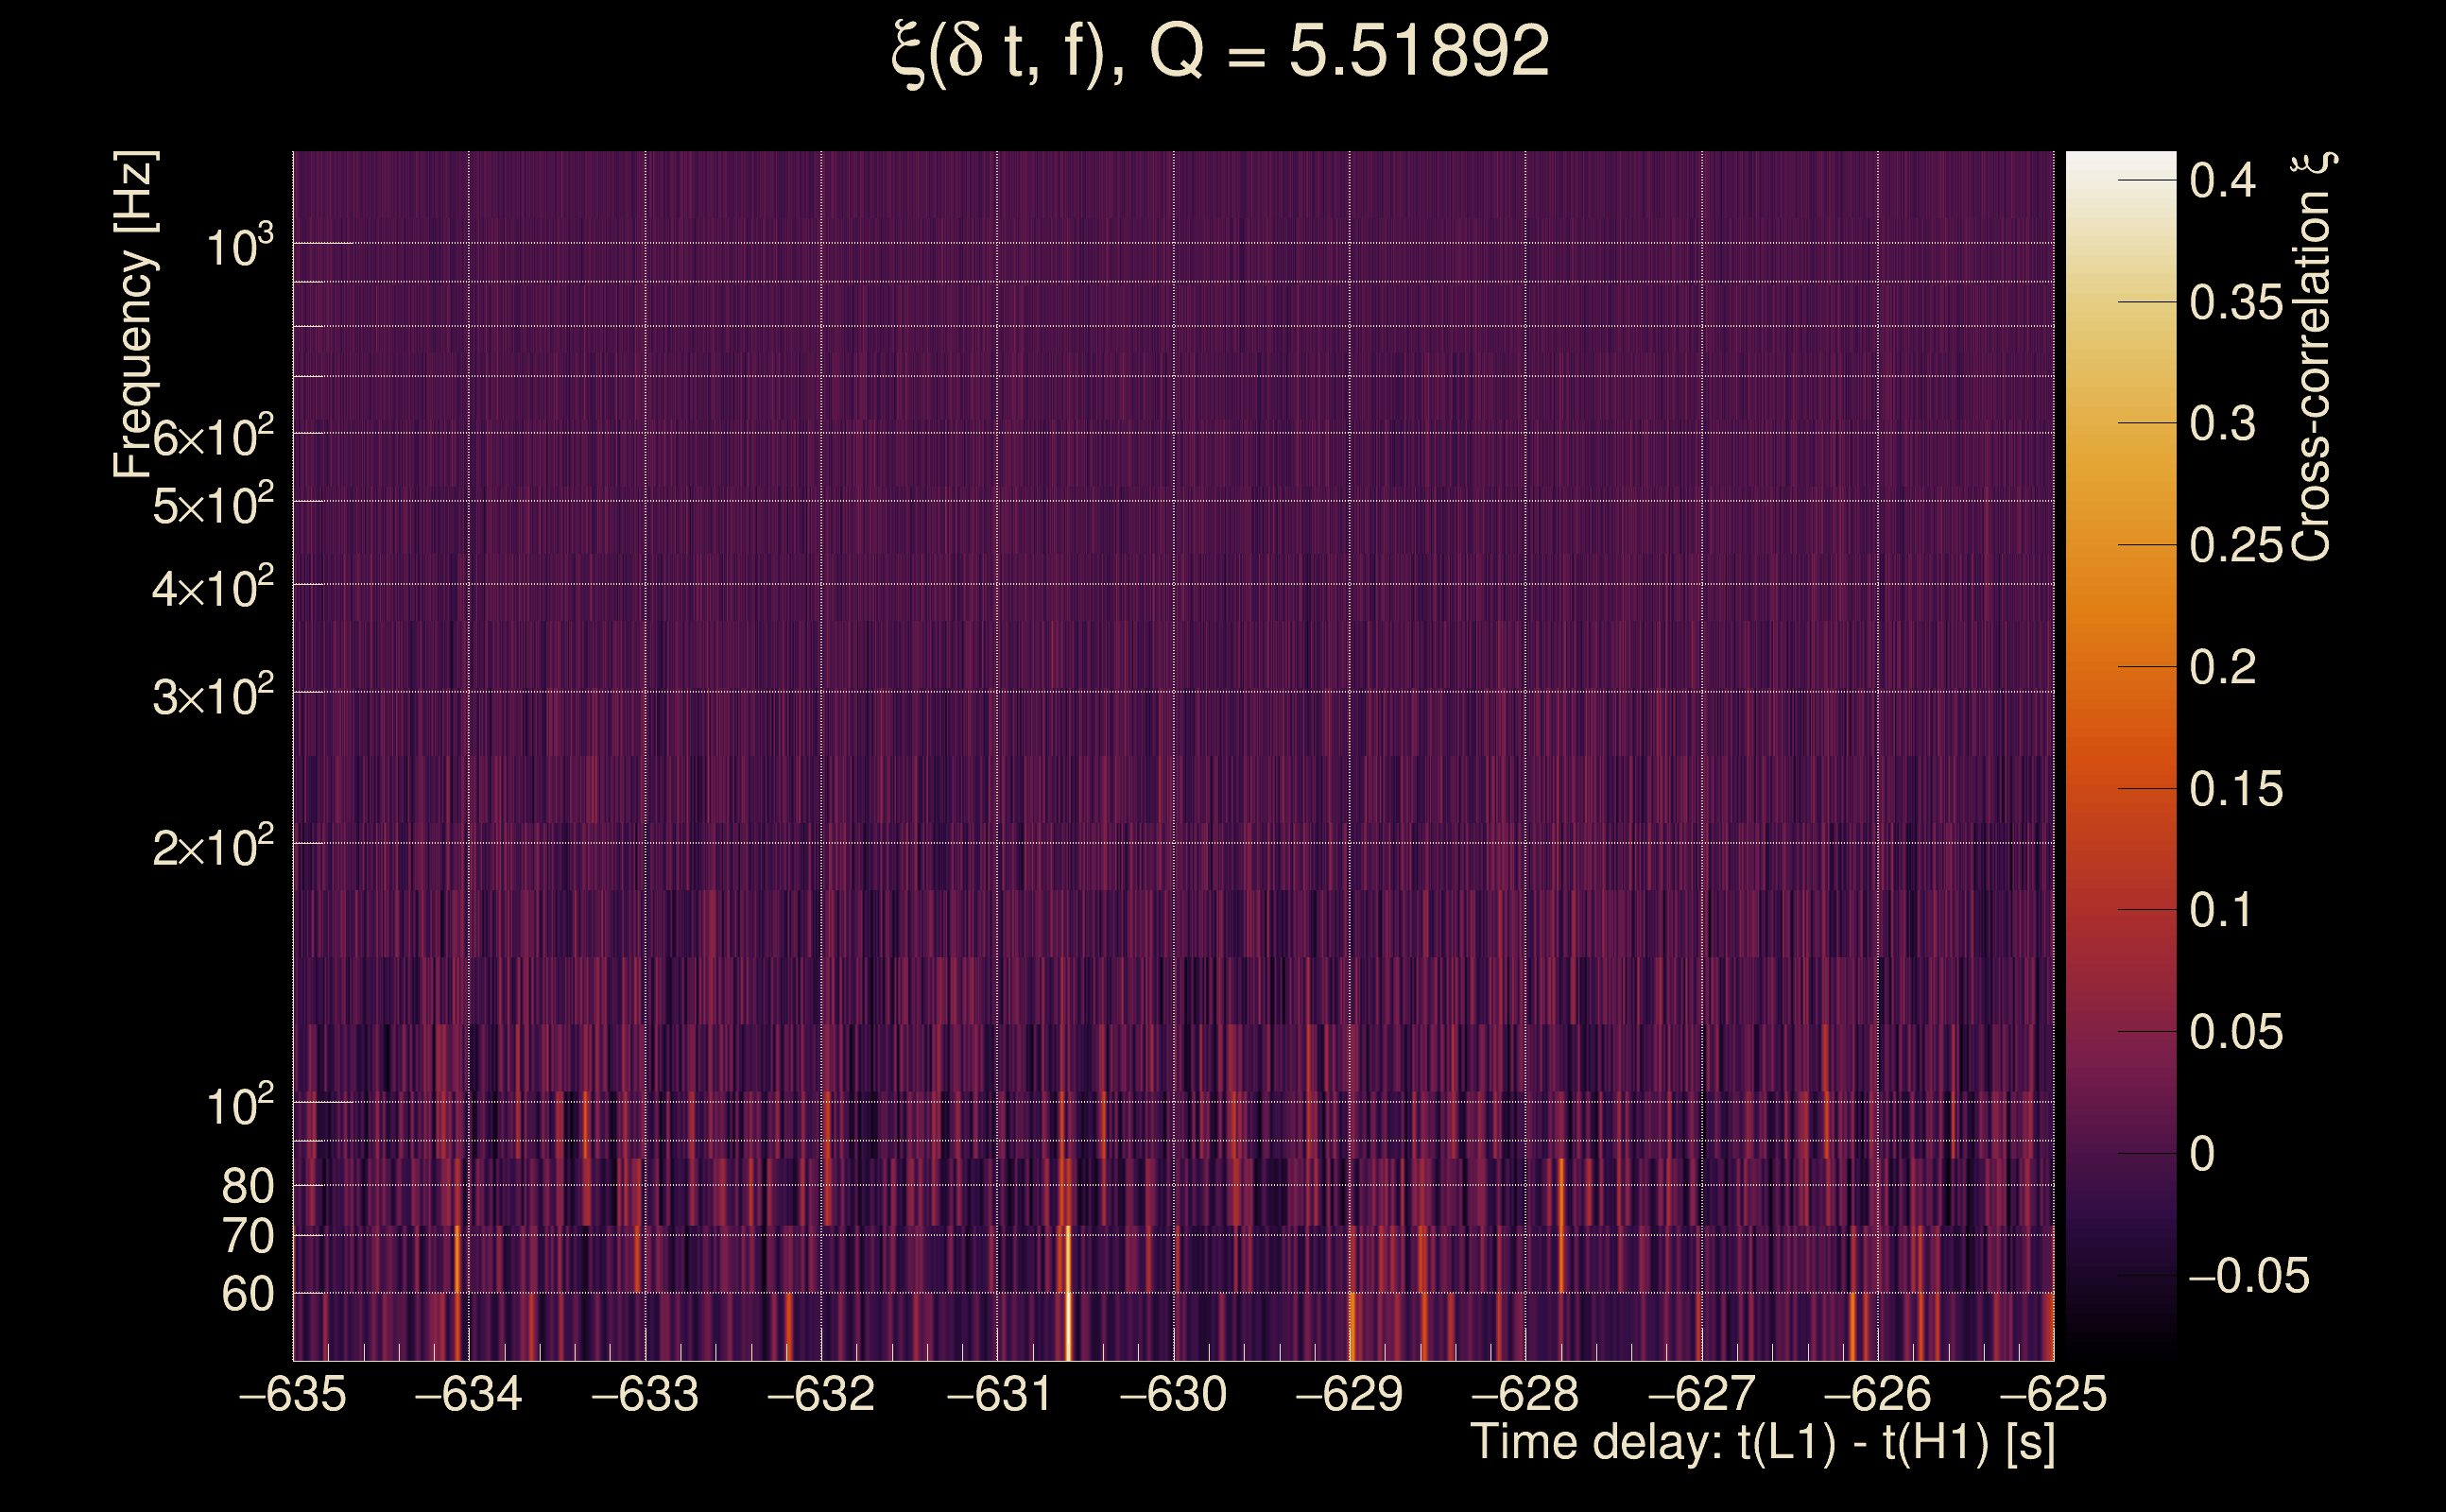
| Number of Q planes: | 5 (Q = 5.51892 → Q = 72.478) |
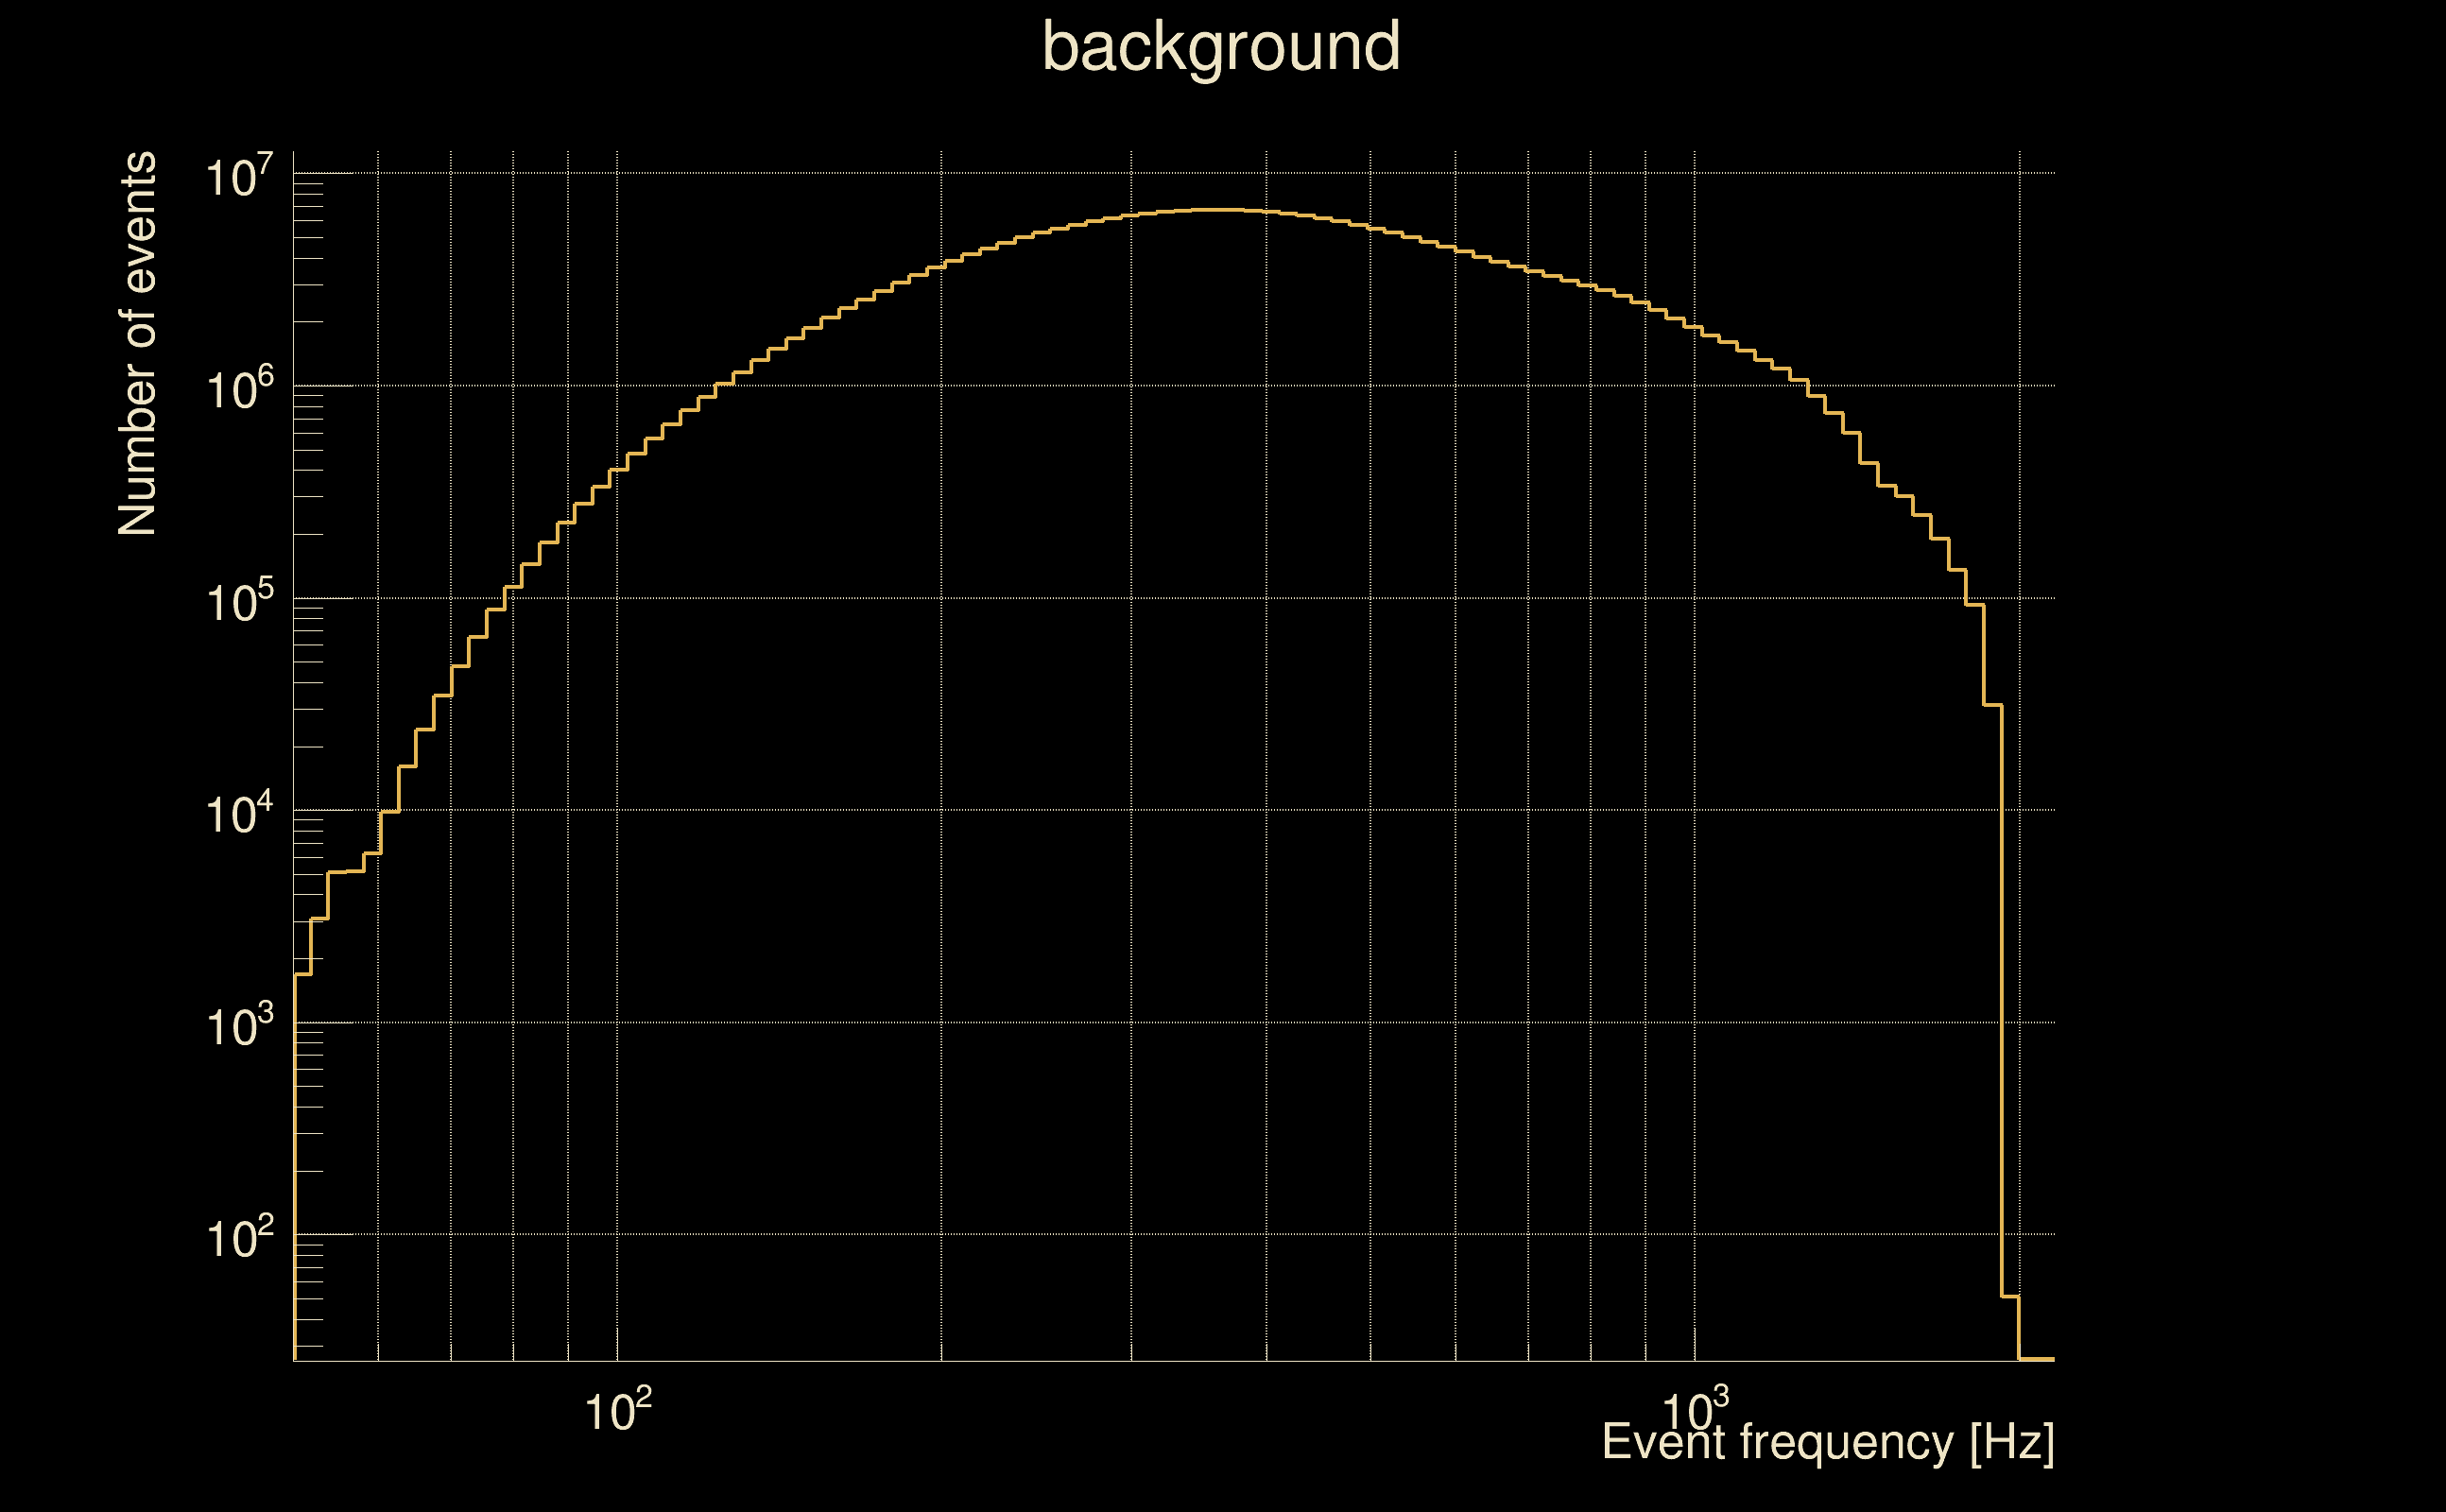
| Omicron frequency range: | 50 Hz → 1958.38 Hz |
| Light travel time between detectors: | 0.0100128 s |
| Slice extra-time (calibration uncertainty + slice veto): | 0.0129872 s |
| Number of time-delay bins in a cross-correlation map: | 10000 |
| Number of slices in a cross-correlation map: | 217 |
| Number of time-delay bins in a slice: | 46 |
| SNR gating: | < 100000 (detector 0), < 100000 (detector 1) |
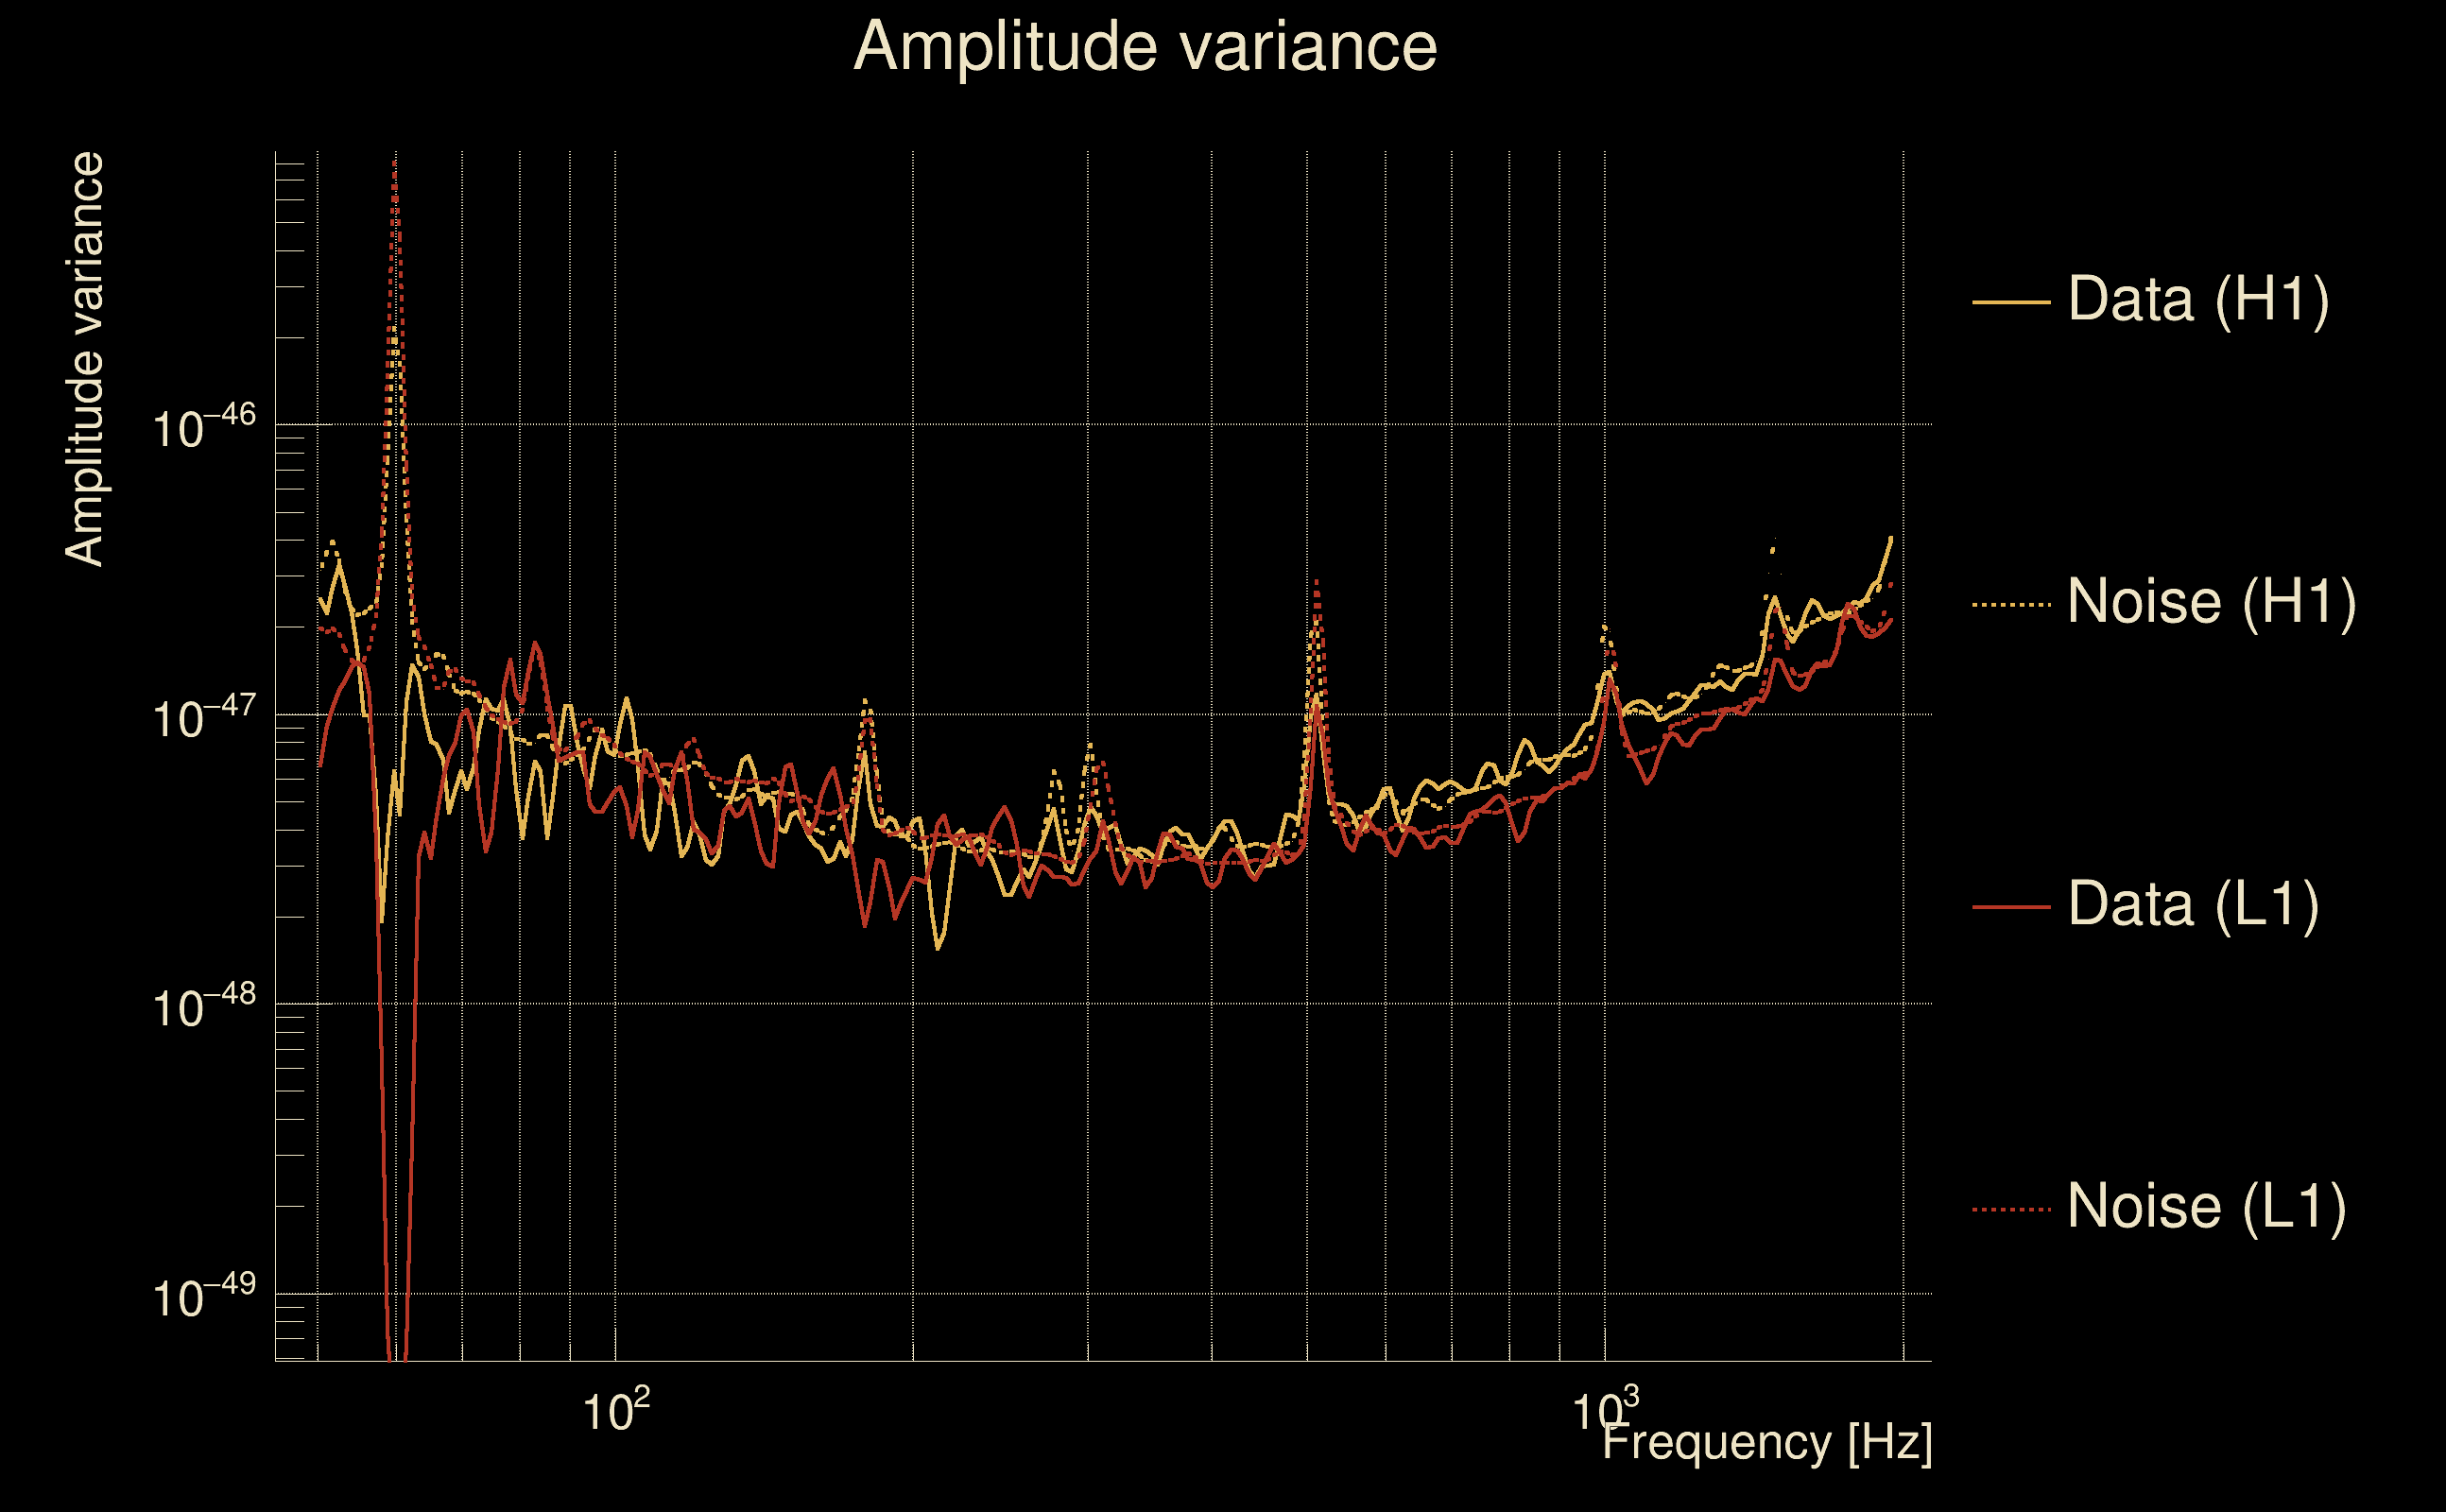
| Amplitude spectrograms: | normalization = 1e-22, power index = 2 |
| White noise SNR variance: | 0.523175 (after applying a correction factor = 1) |
| Amplitude ratio confidence level: | 3 sigma |
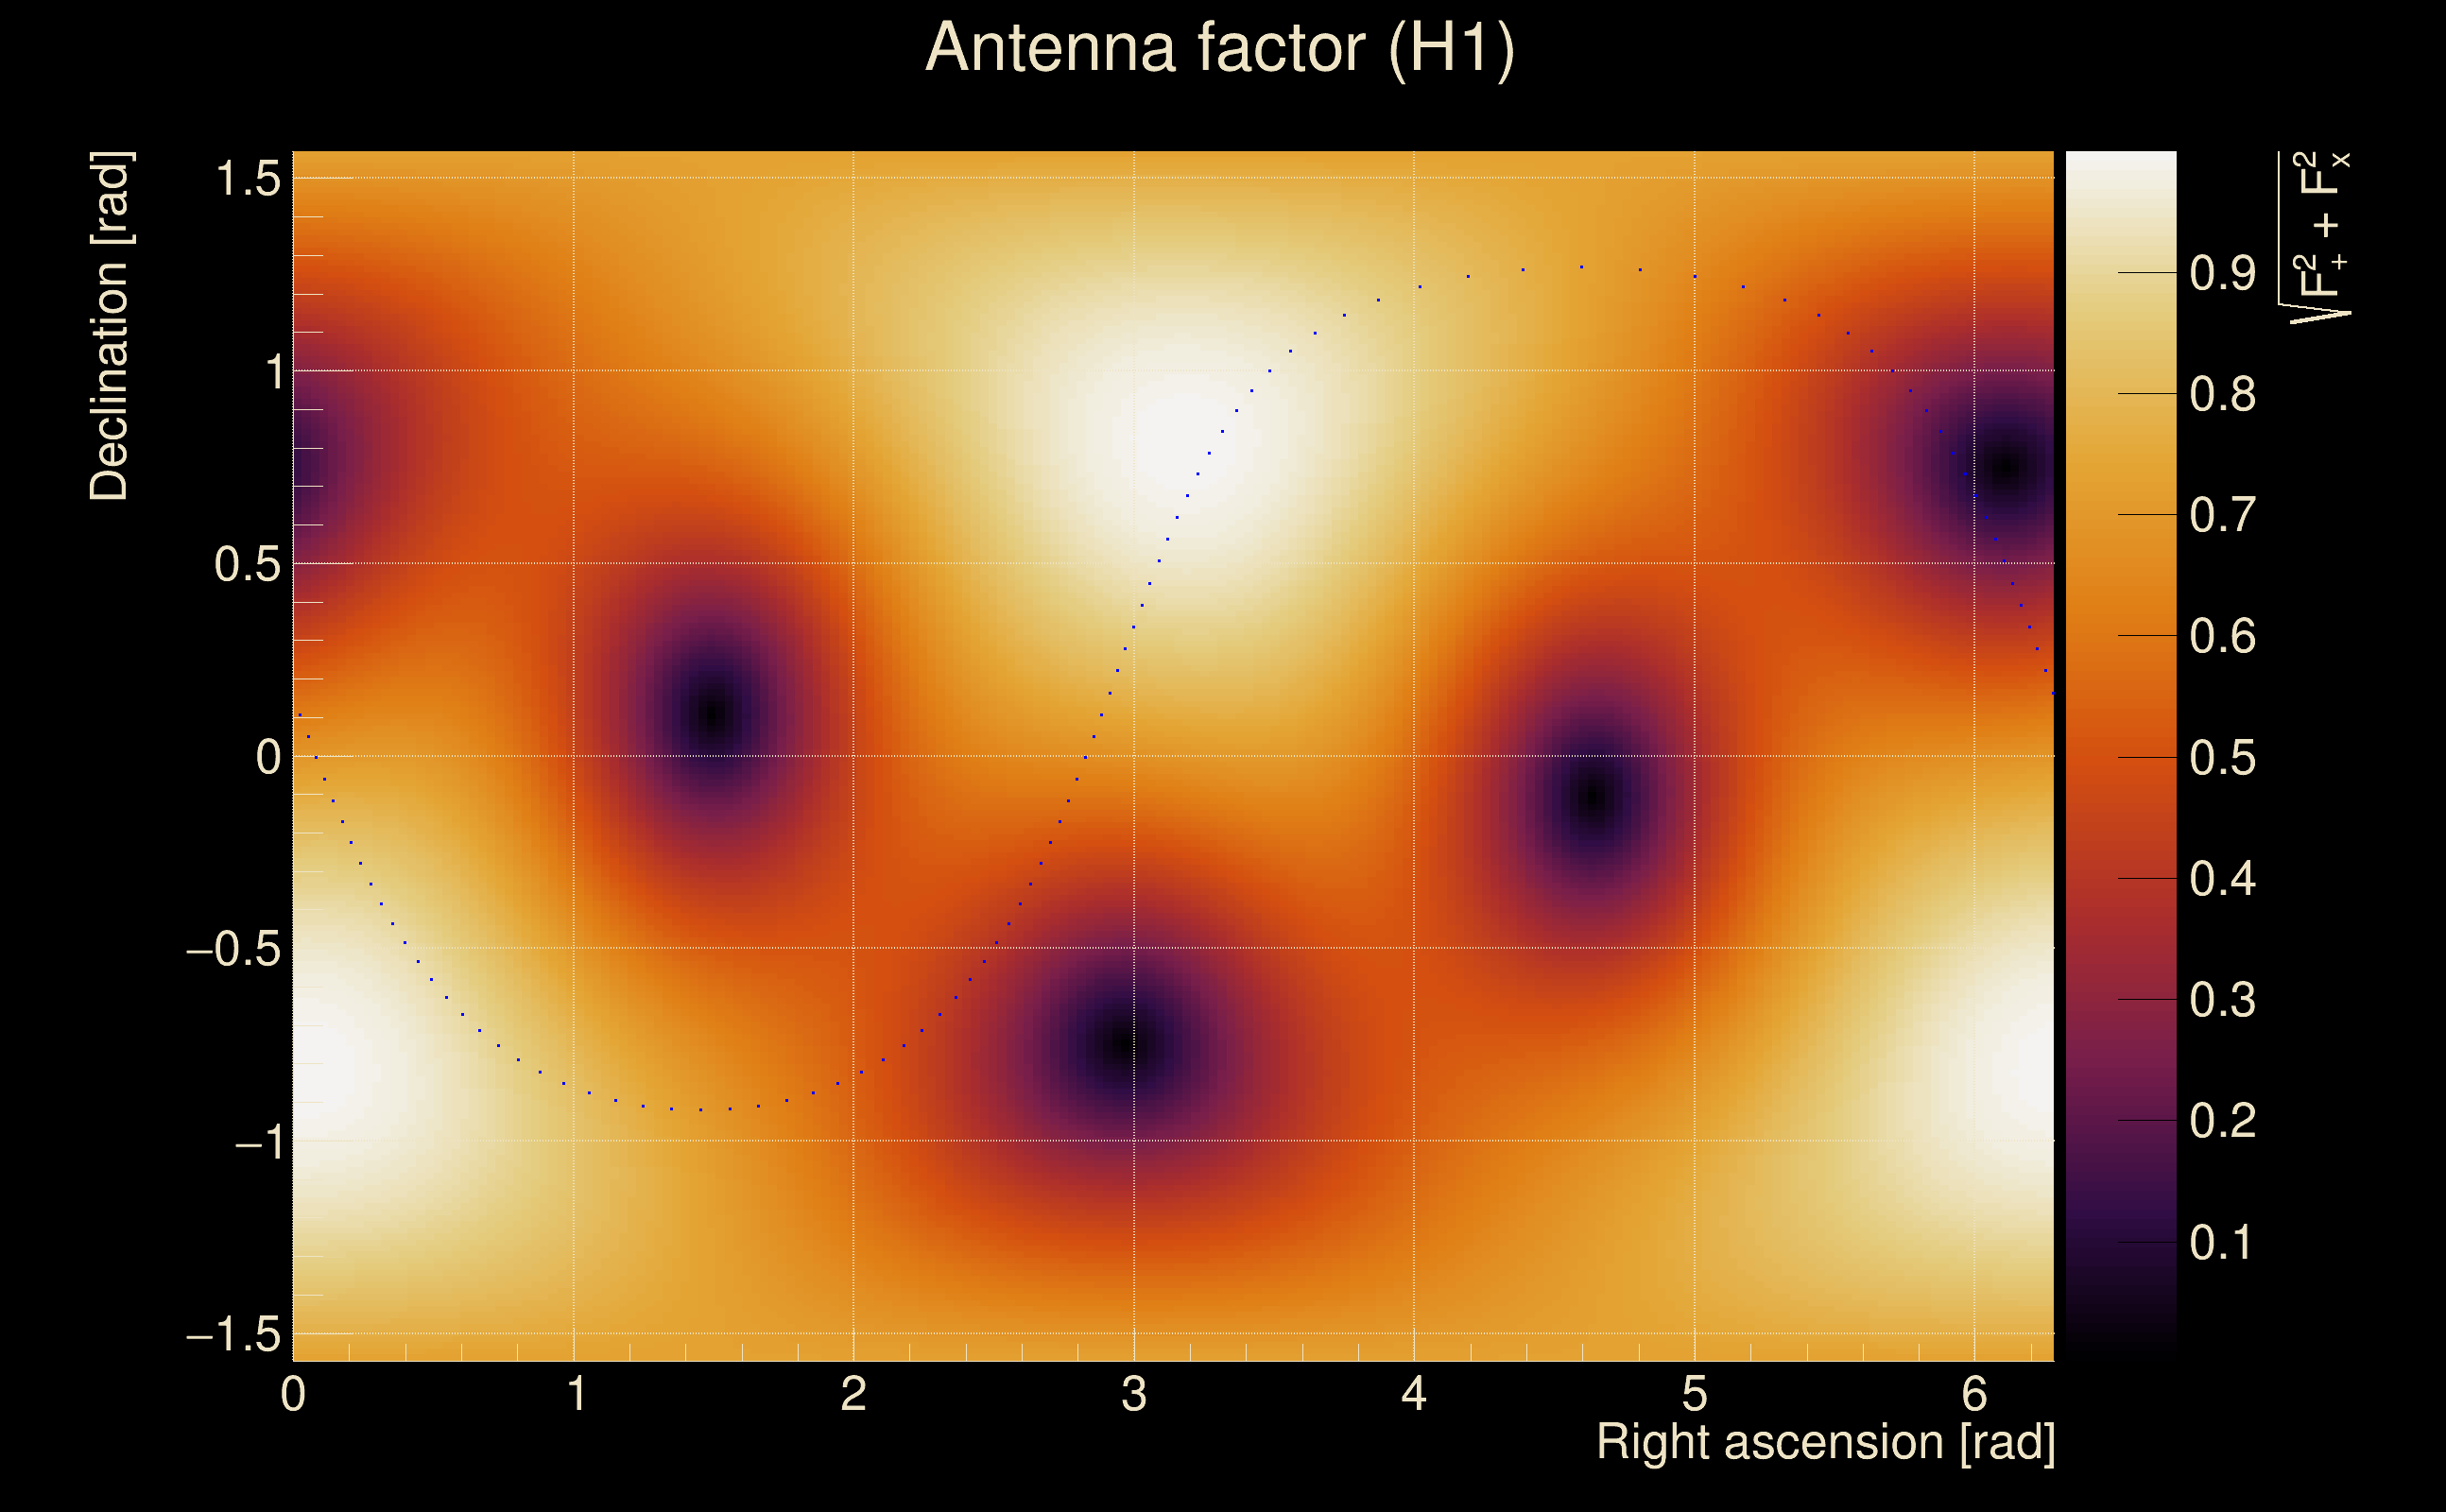
| Target sky positon: | Ra: 3.68109, Dec: 0.94792 [rad] |
| List of input Ox files: | TargIxf_feb2026_BG_CAT1_file_list.txt (6354 files) |
| Analysis result file: | TargIxf_feb2026_BG_CAT1_results-0.root |
| Slice selected for the the fakeground: | slice index=98 (-769.54 s), time lag = -860 s |
| Foreground | Fakeground | Background | ||
|---|---|---|---|---|
| Number of processed ox events | 0 | 11425 | 255056668 | |
| Start Date (detector 0) | - | Mon May 15 14:13:35 2023 UTC | Mon May 15 14:27:45 2023 UTC | |
| End Date (detector 0) | - | Thu May 18 15:54:40 2023 UTC | Thu May 18 15:54:40 2023 UTC | |
| Start GPS (detector 0) | - | 1368195233 | 1368196083 | |
| End GPS (detector 0) | - | 1368460498 | 1368460498 | |
| Used livetime (detector 0) | 0 s | 57440 s | 60845 s | |
| Start Date (detector 1) | - | Mon May 15 14:13:25 2023 UTC | Mon May 15 14:13:25 2023 UTC | |
| End Date (detector 1) | - | Thu May 18 15:54:30 2023 UTC | Thu May 18 15:40:20 2023 UTC | |
| Start GPS (detector 1) | - | 1368195223 | 1368195223 | |
| End GPS (detector 1) | - | 1368460488 | 1368459638 | |
| Used livetime (detector 1) | 0 s | 57440 s | 64550 s | |
| Cumulative livetime | 0 s | 114250 s | 2550566680 s | |
| 0 years, 0 days, 0 hours, 0 min, 0 s | 0 years, 1 days, 7 hours, 44 min, 10 s | 80 years, 300 days, 10 hours, 44 min, 40 s |
|
|
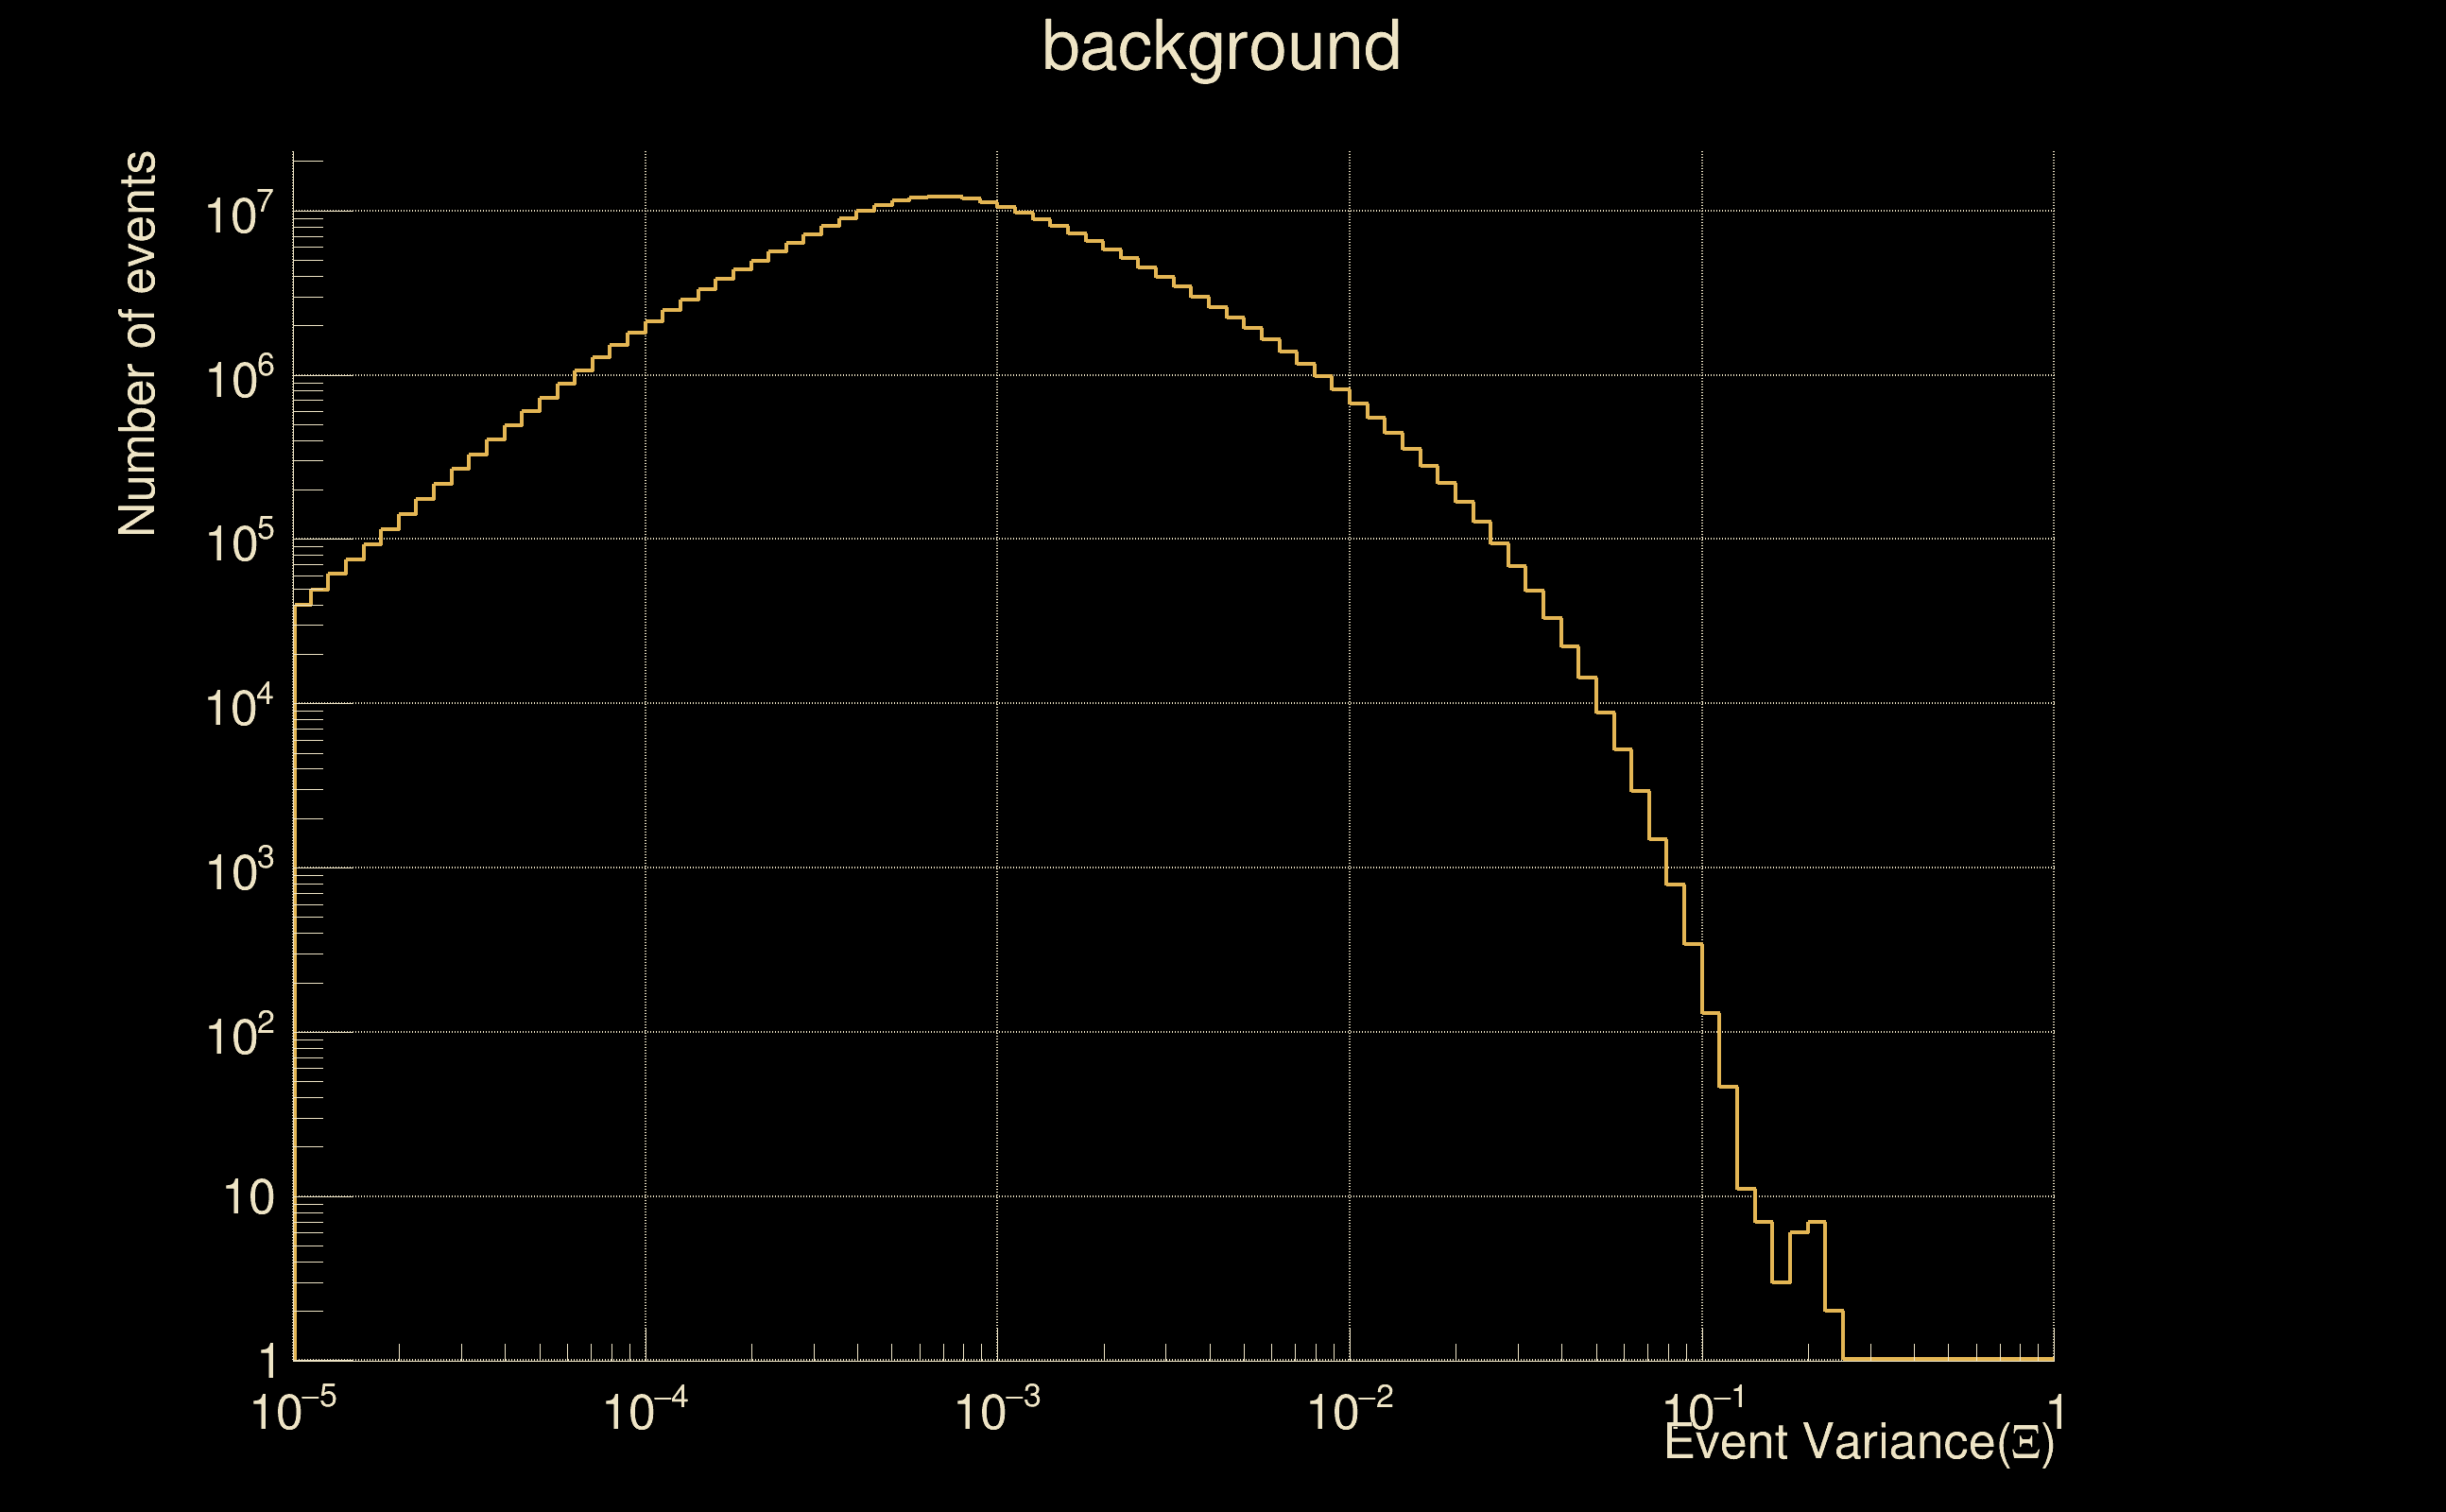
| Detection threshold: | R > 0.0330444 |
| False-alarm rate above that detection threshold: | 2.6746e-09 |
| Alternative threshold at 1/1000 yrs: | R > 0.0450868 |
| Alternative threshold at 1/100 yrs: | R > 0.0450868 |
| Alternative threshold at 1/10 yrs: | R > 0.0330448 |
| Alternative threshold at 1/1 yr: | R > 0.0252553 |
| Alternative threshold at 1/1 d: | R > 0.0102419 |
 |
|
 |
 |
 |
 |
 |
 |
 |
 |
 |
 |
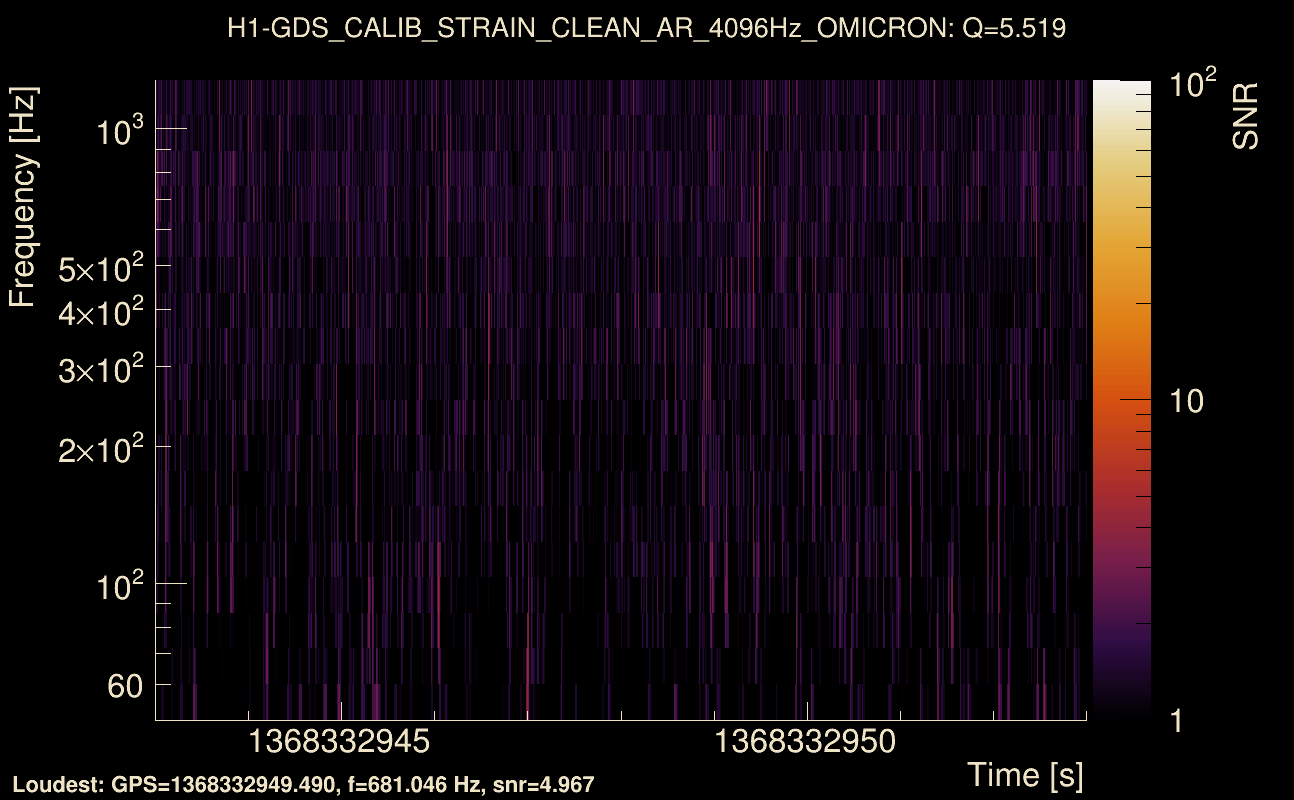
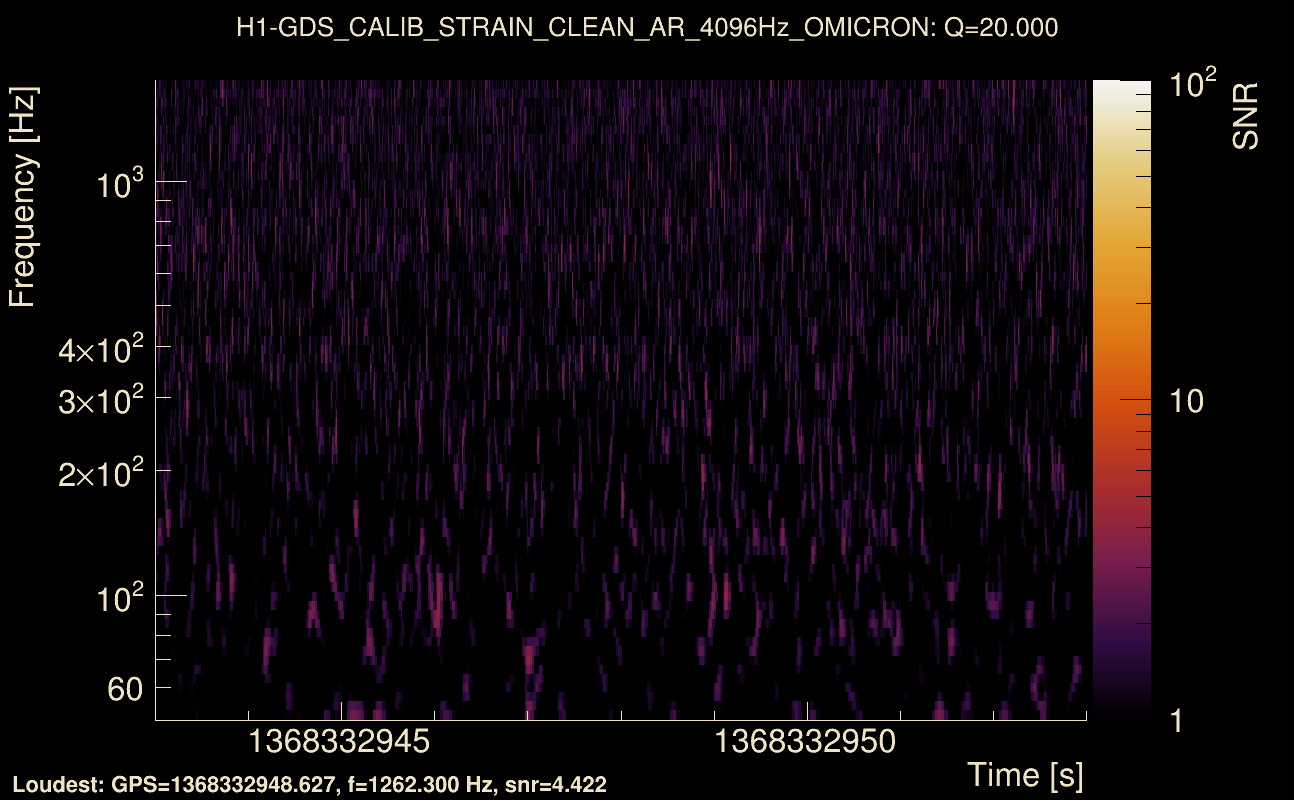
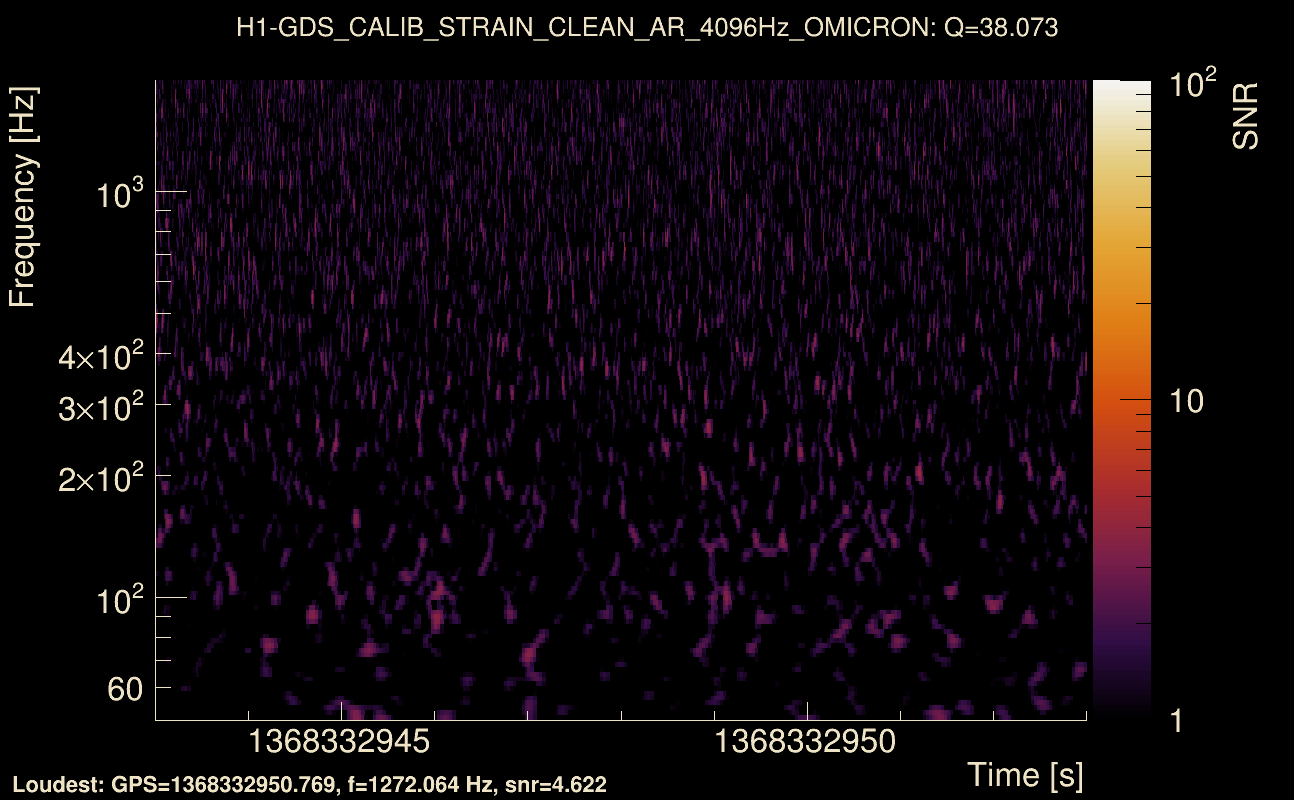
| Event time t(H1): | GPS = 1368332943 (Wed May 17 04:28:45 2023 ) → GPS = 1368332953 (Wed May 17 04:28:55 2023 ) |
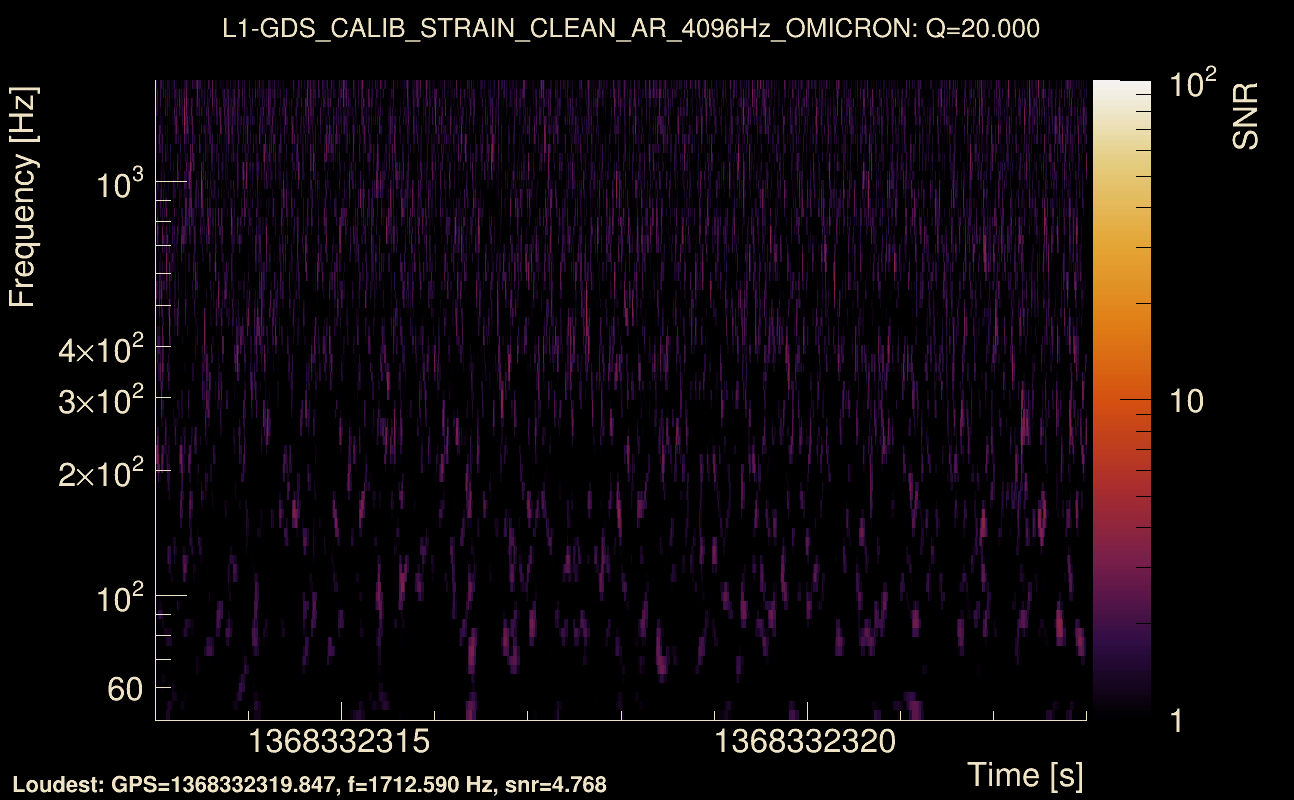
| Event time t(L1): | GPS = 1368332313 (Wed May 17 04:28:55 2023 ) → GPS = 1368332323 (Wed May 17 04:18:25 2023 ) |
| Omicron analysis time window (H1): | GPS = 1368332940 → GPS = 1368332956 |
| Omicron analysis time window (L1): | GPS = 1368332310 → GPS = 1368332326 |
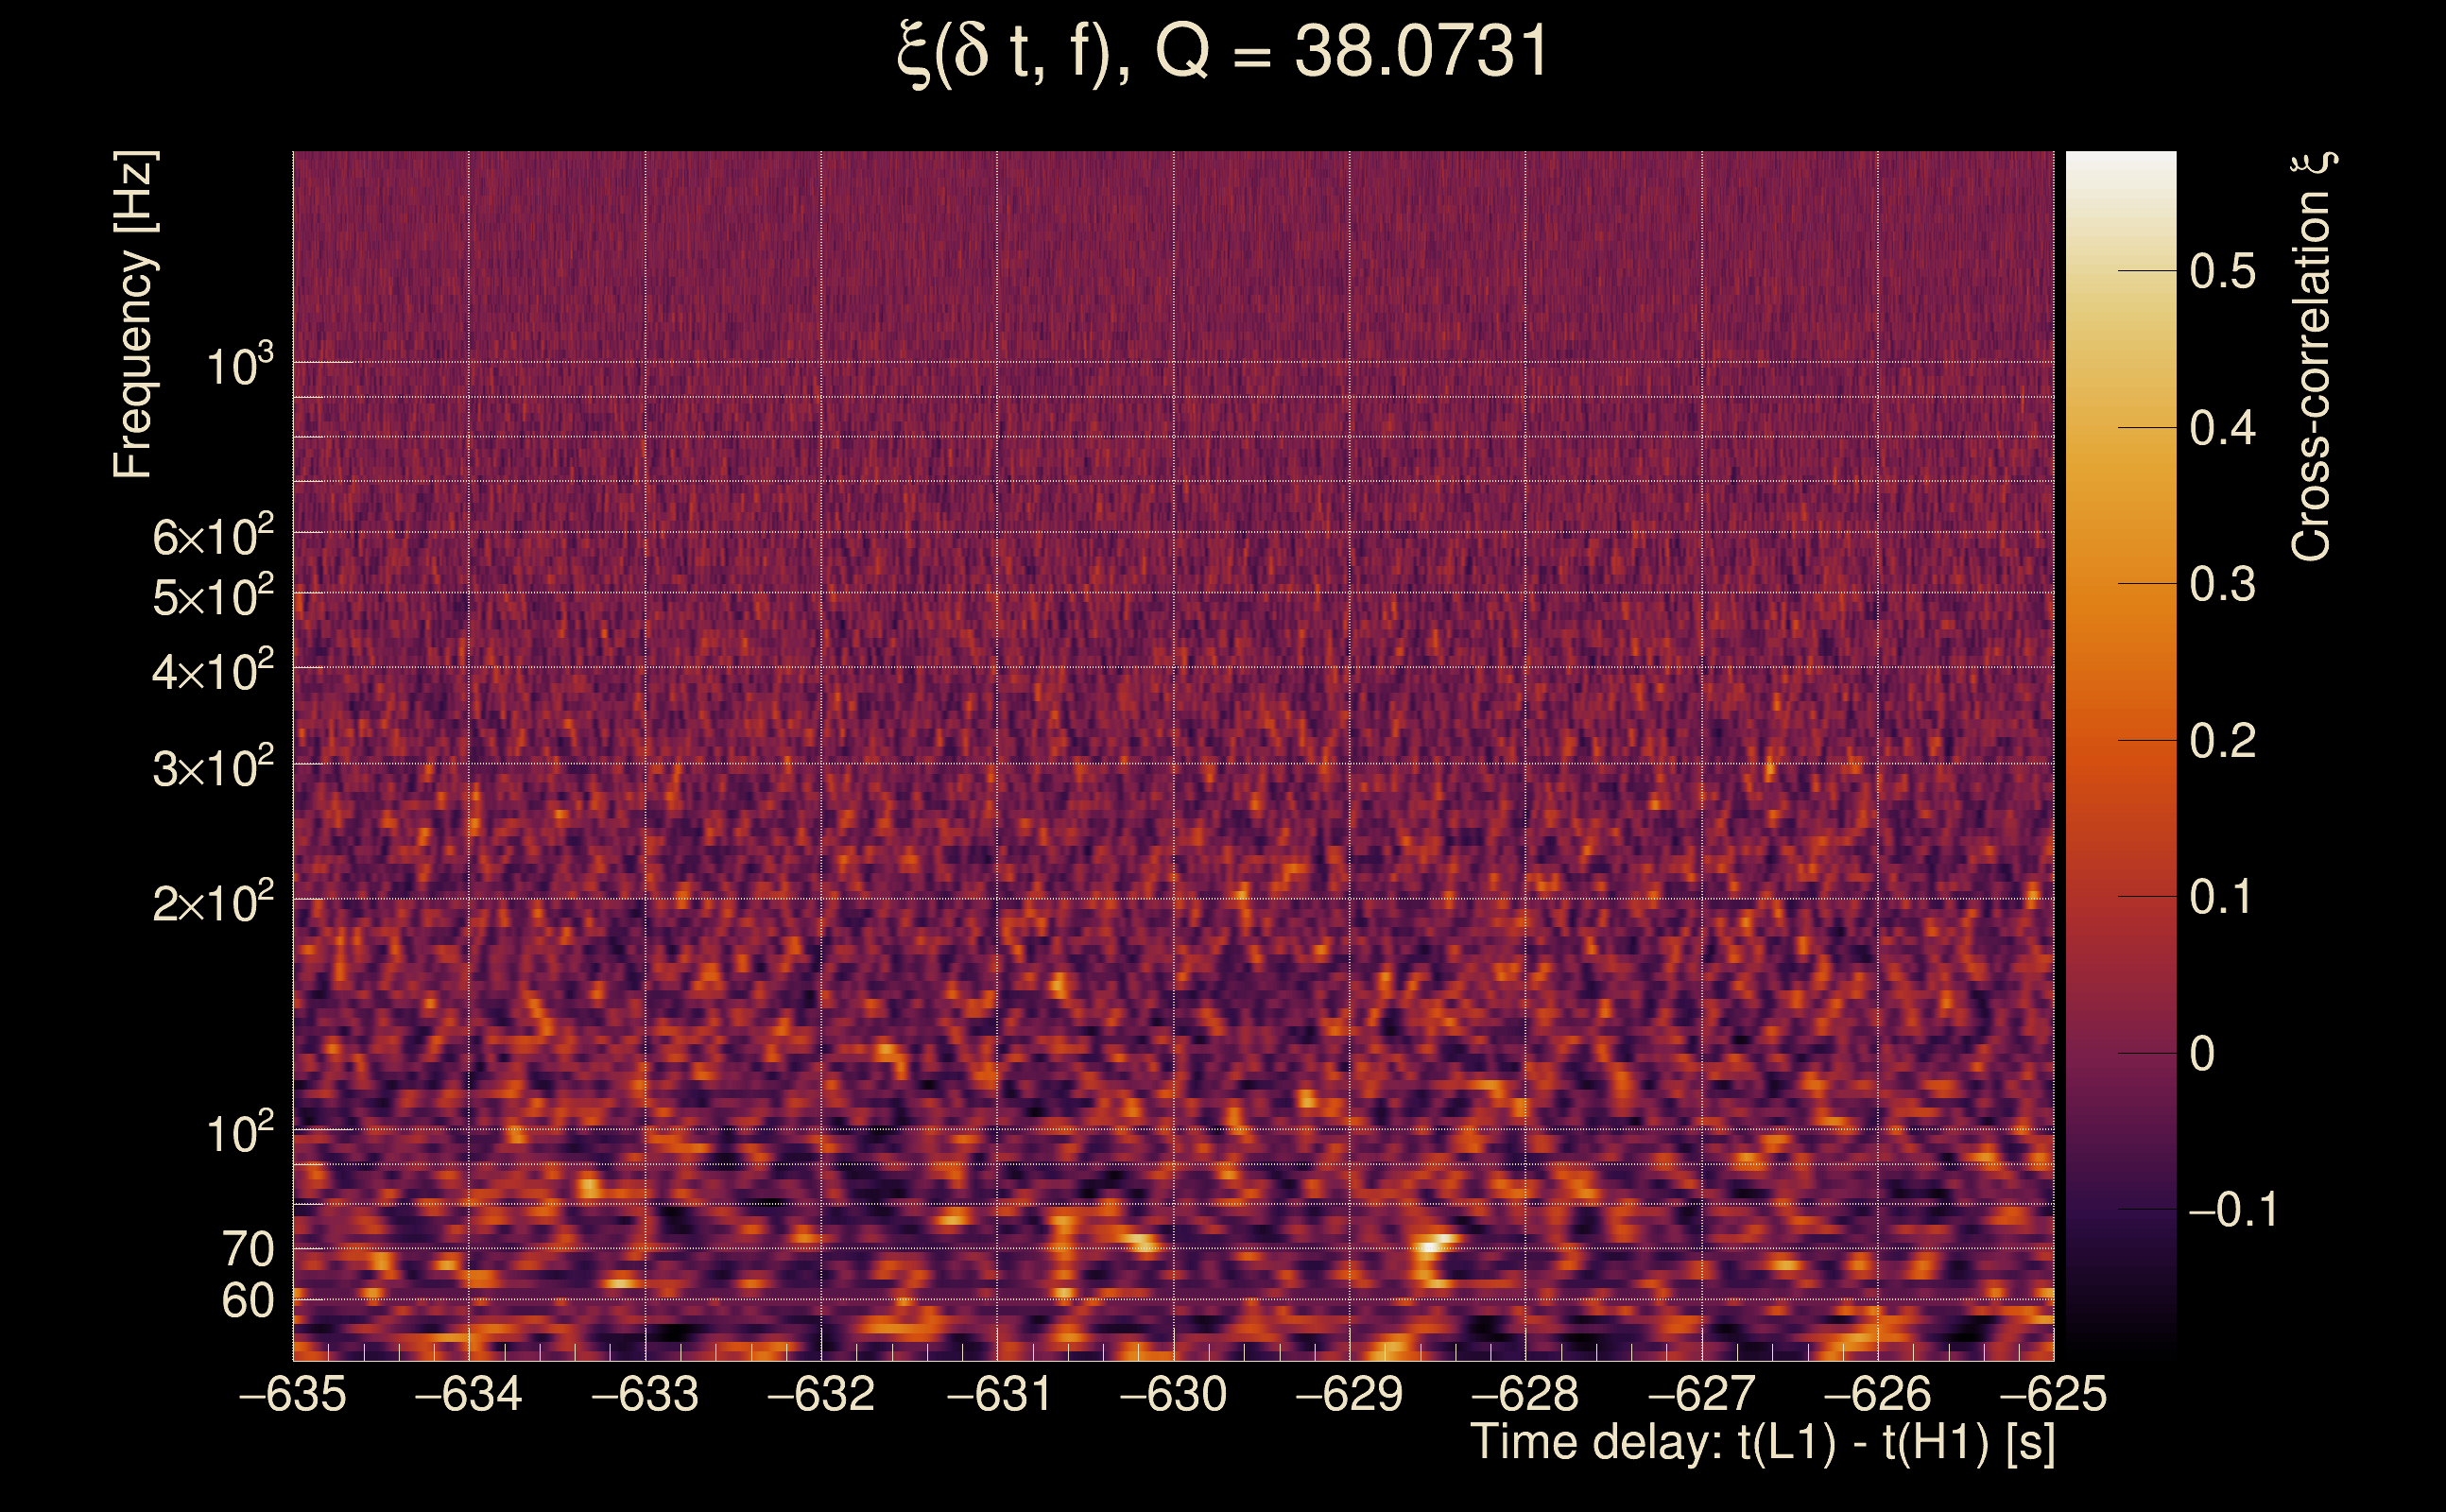
| Time delay between detectors t(L1) - t(H1): | -630.596 s (slice index = 121 / 217), δt_gw = 0.0017298 s |
| Time delay standard deviation: | 0.075754 s |
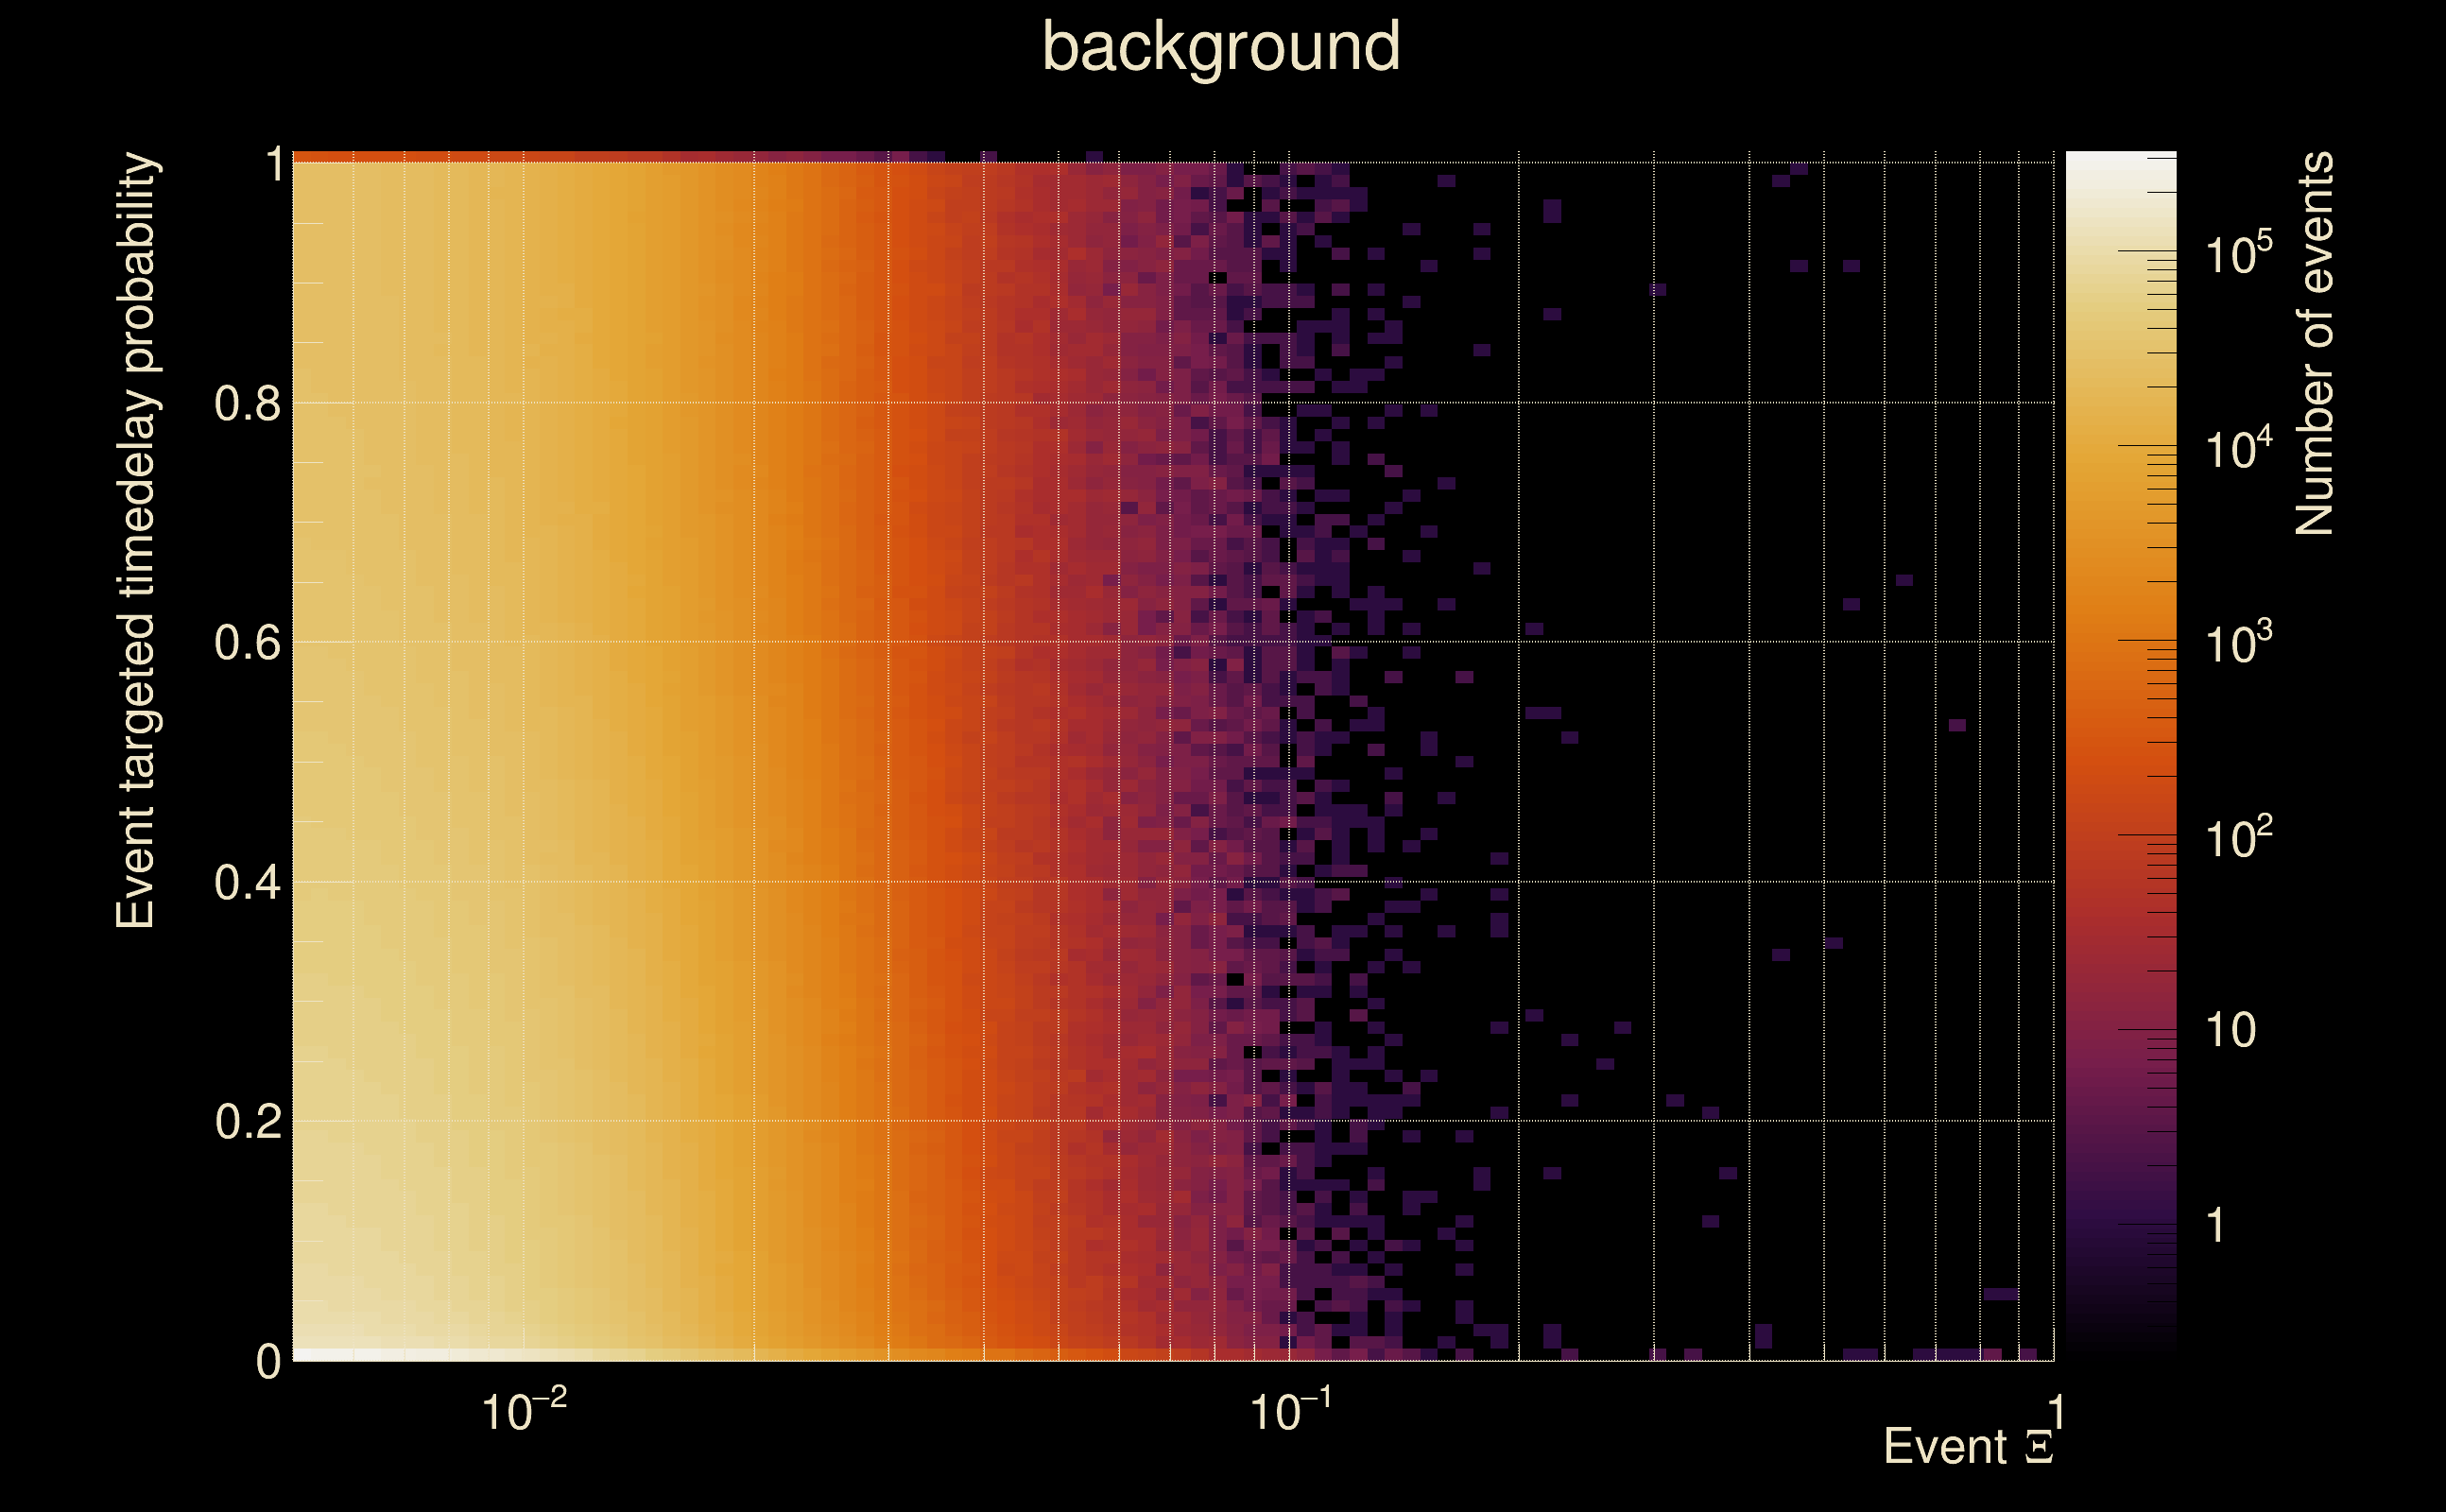
| [targeted mode] Time delay probability: | 0.838221 (0.20417 sigmas), δt_target = 1.72247e+45 s |
| Frequency: | 101.248 Hz |
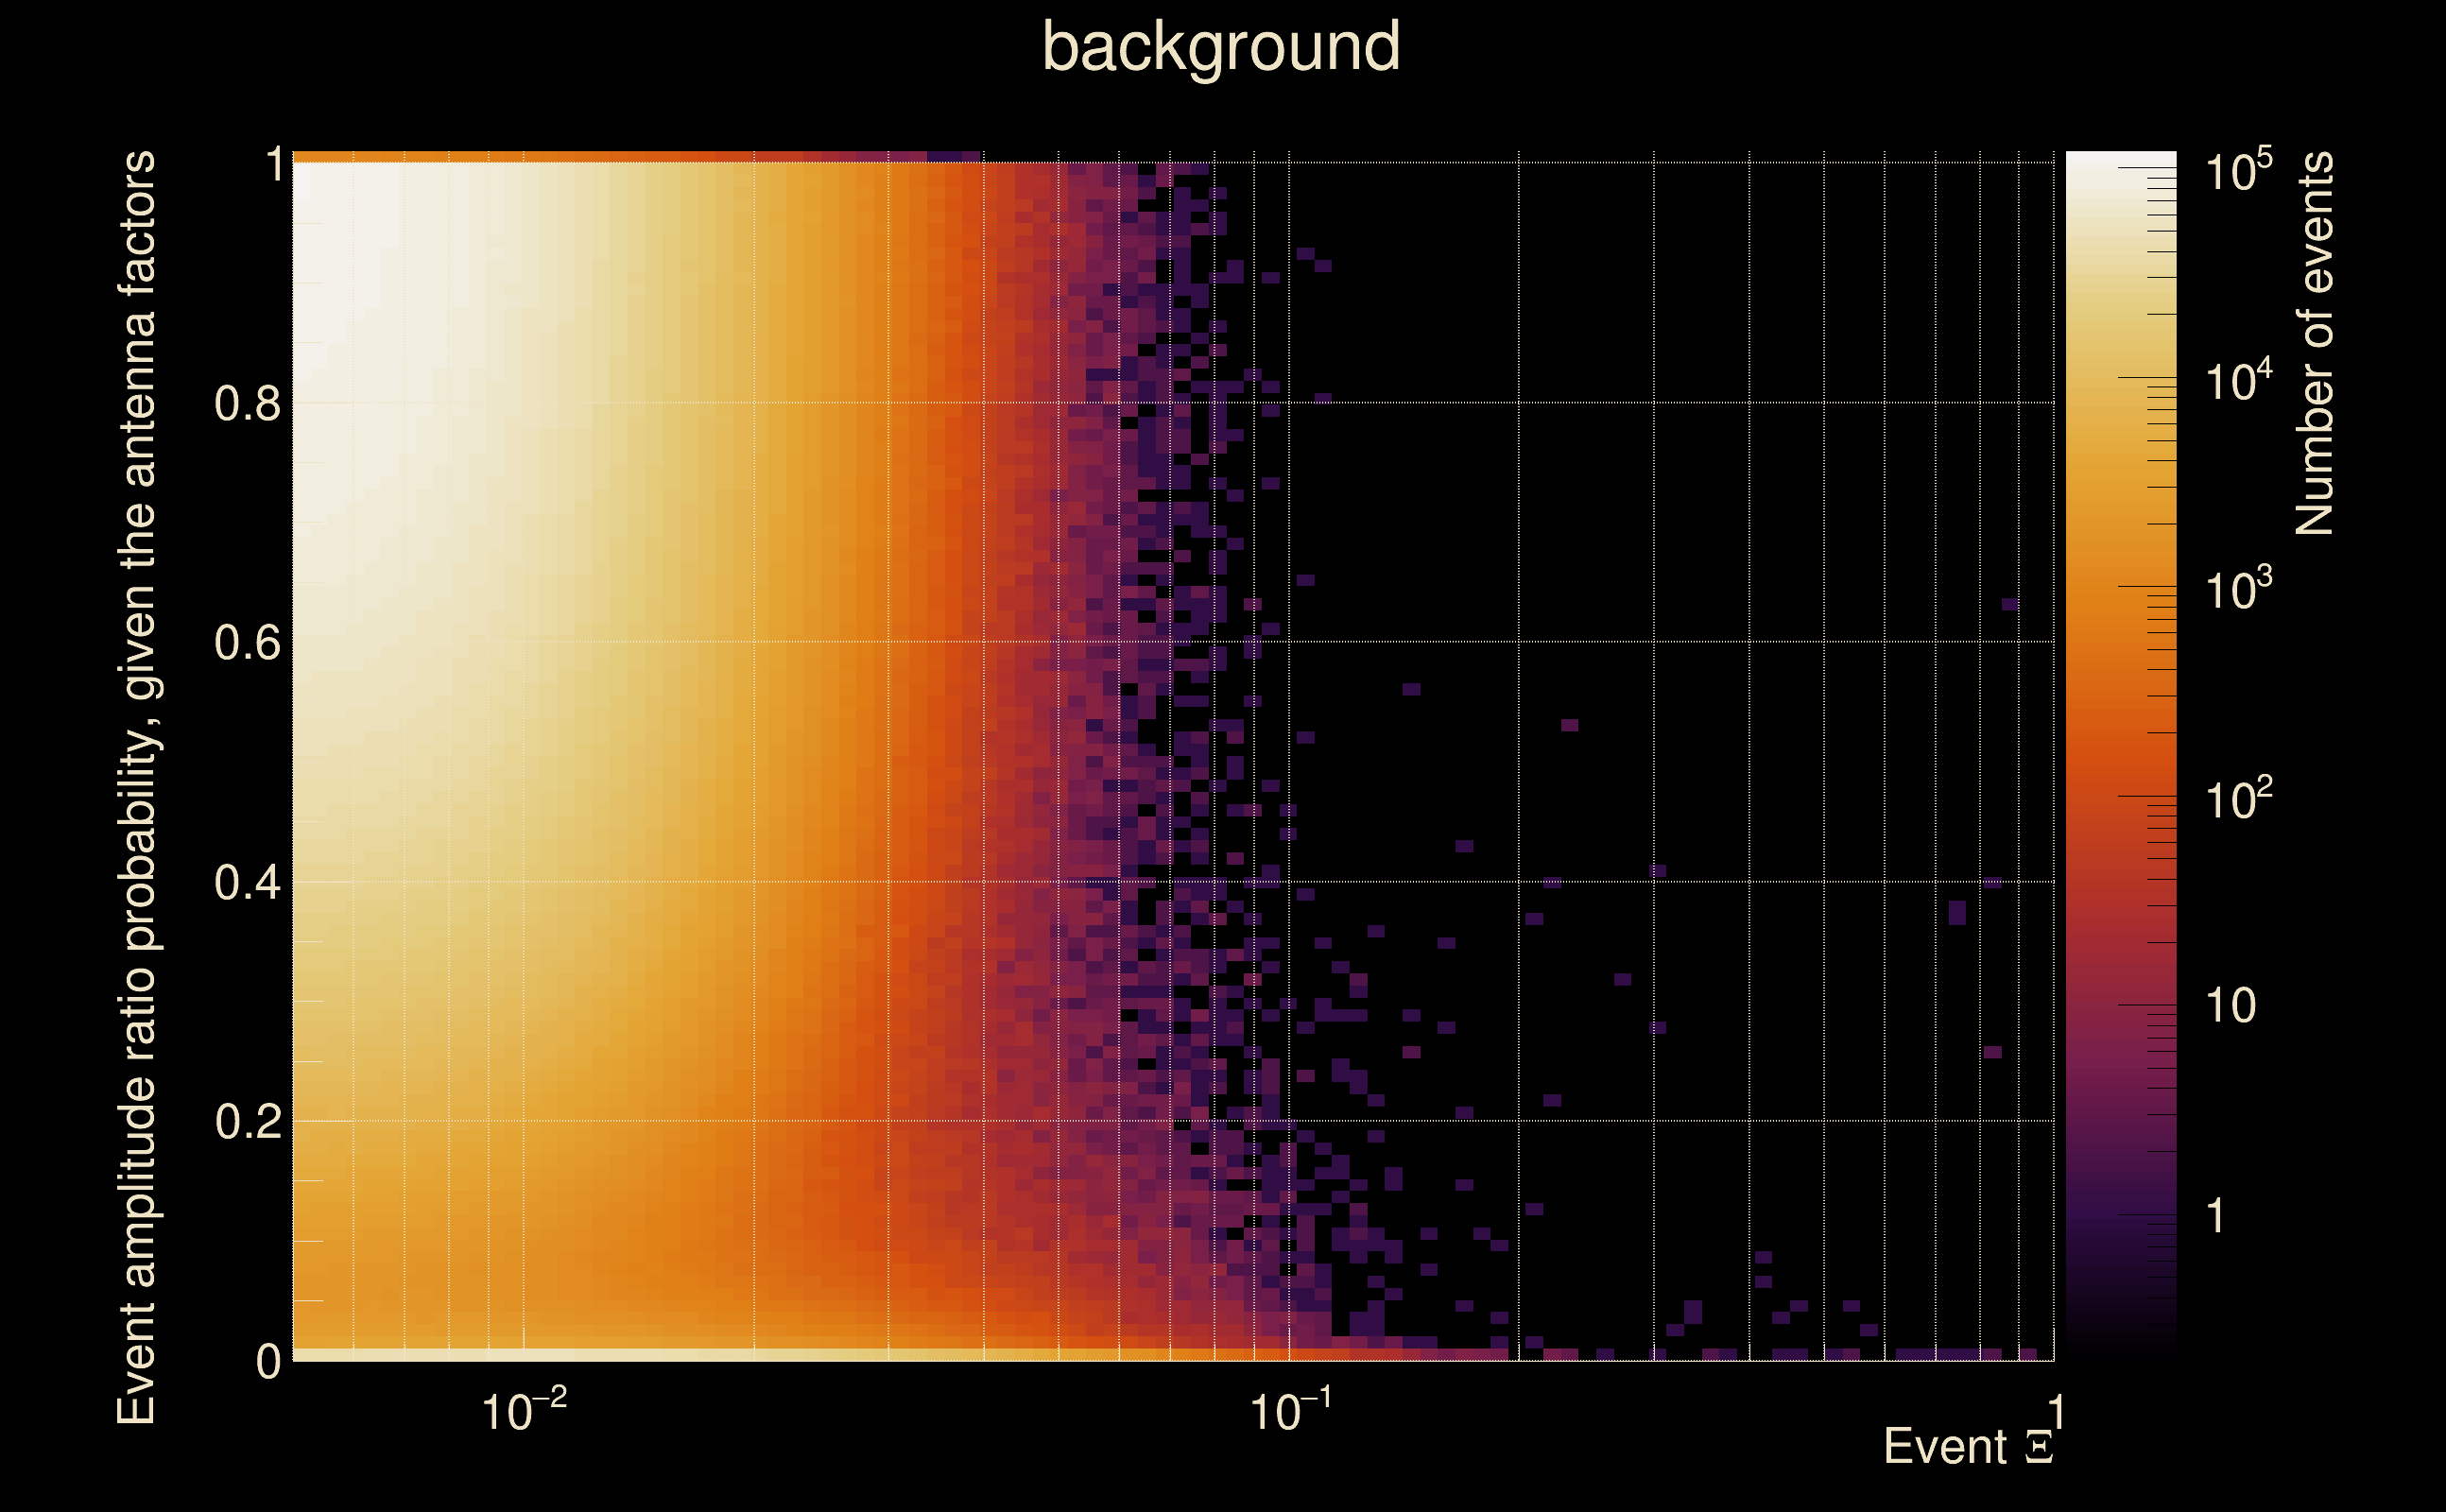
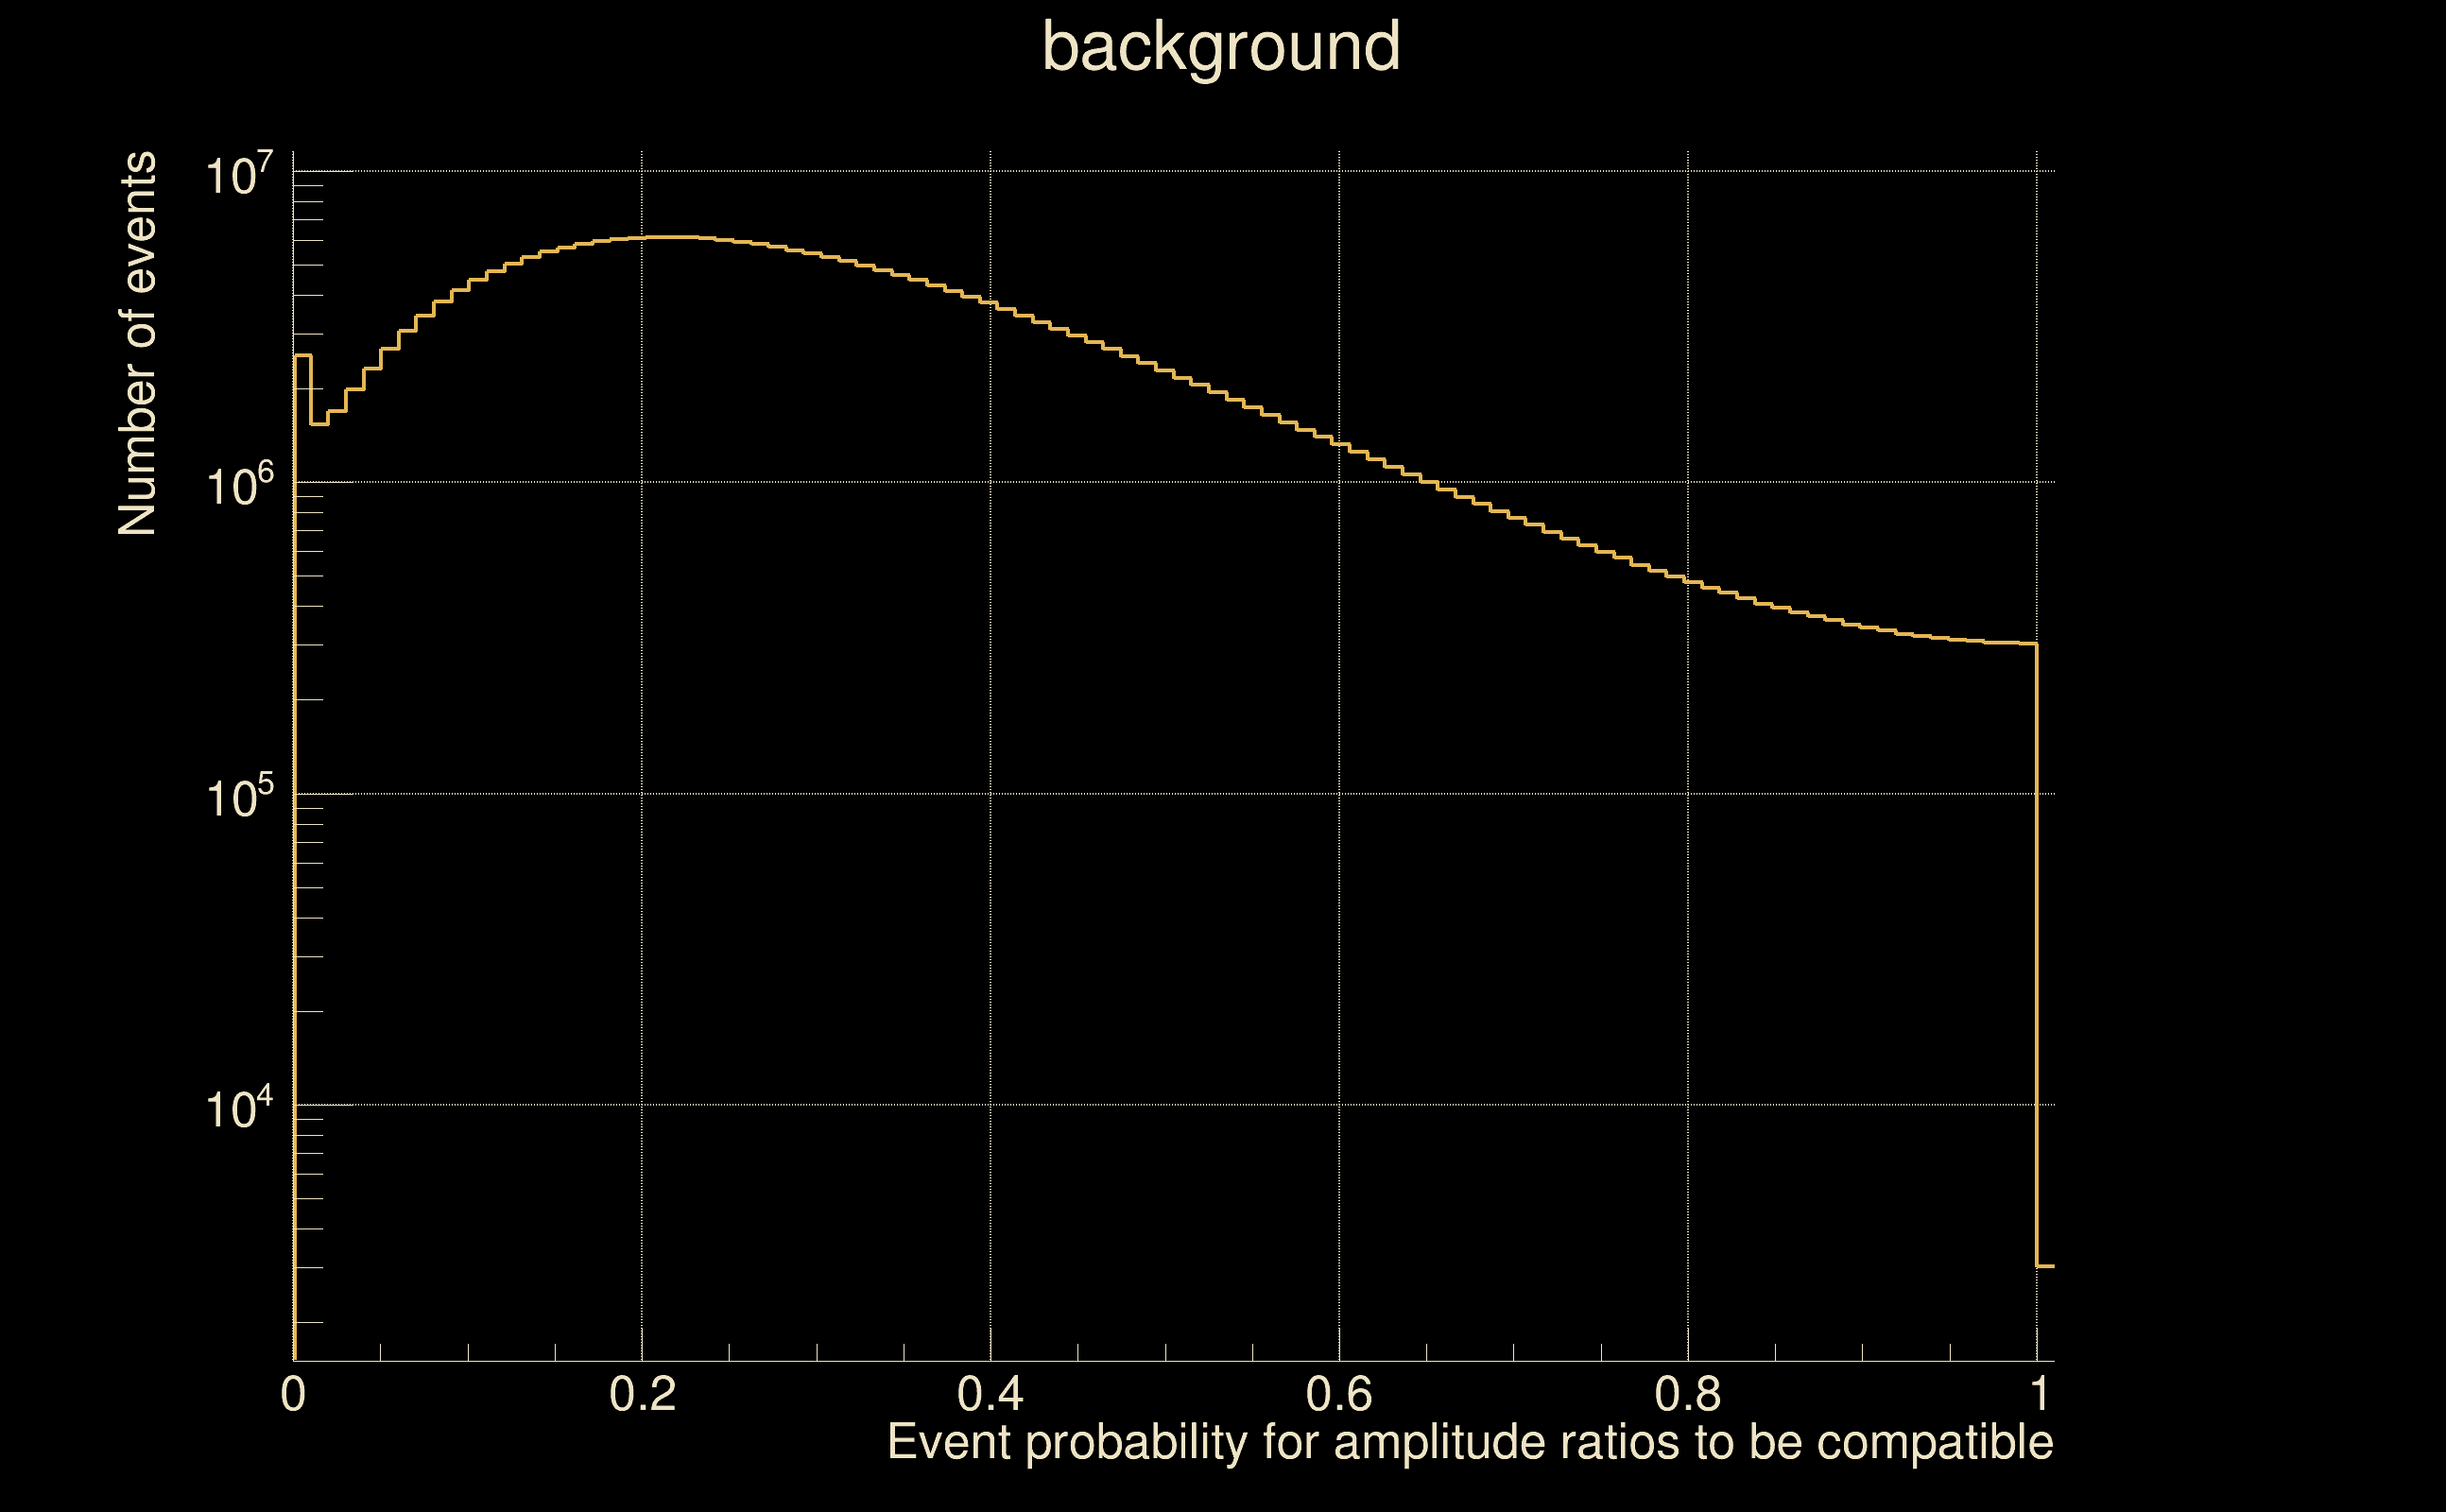
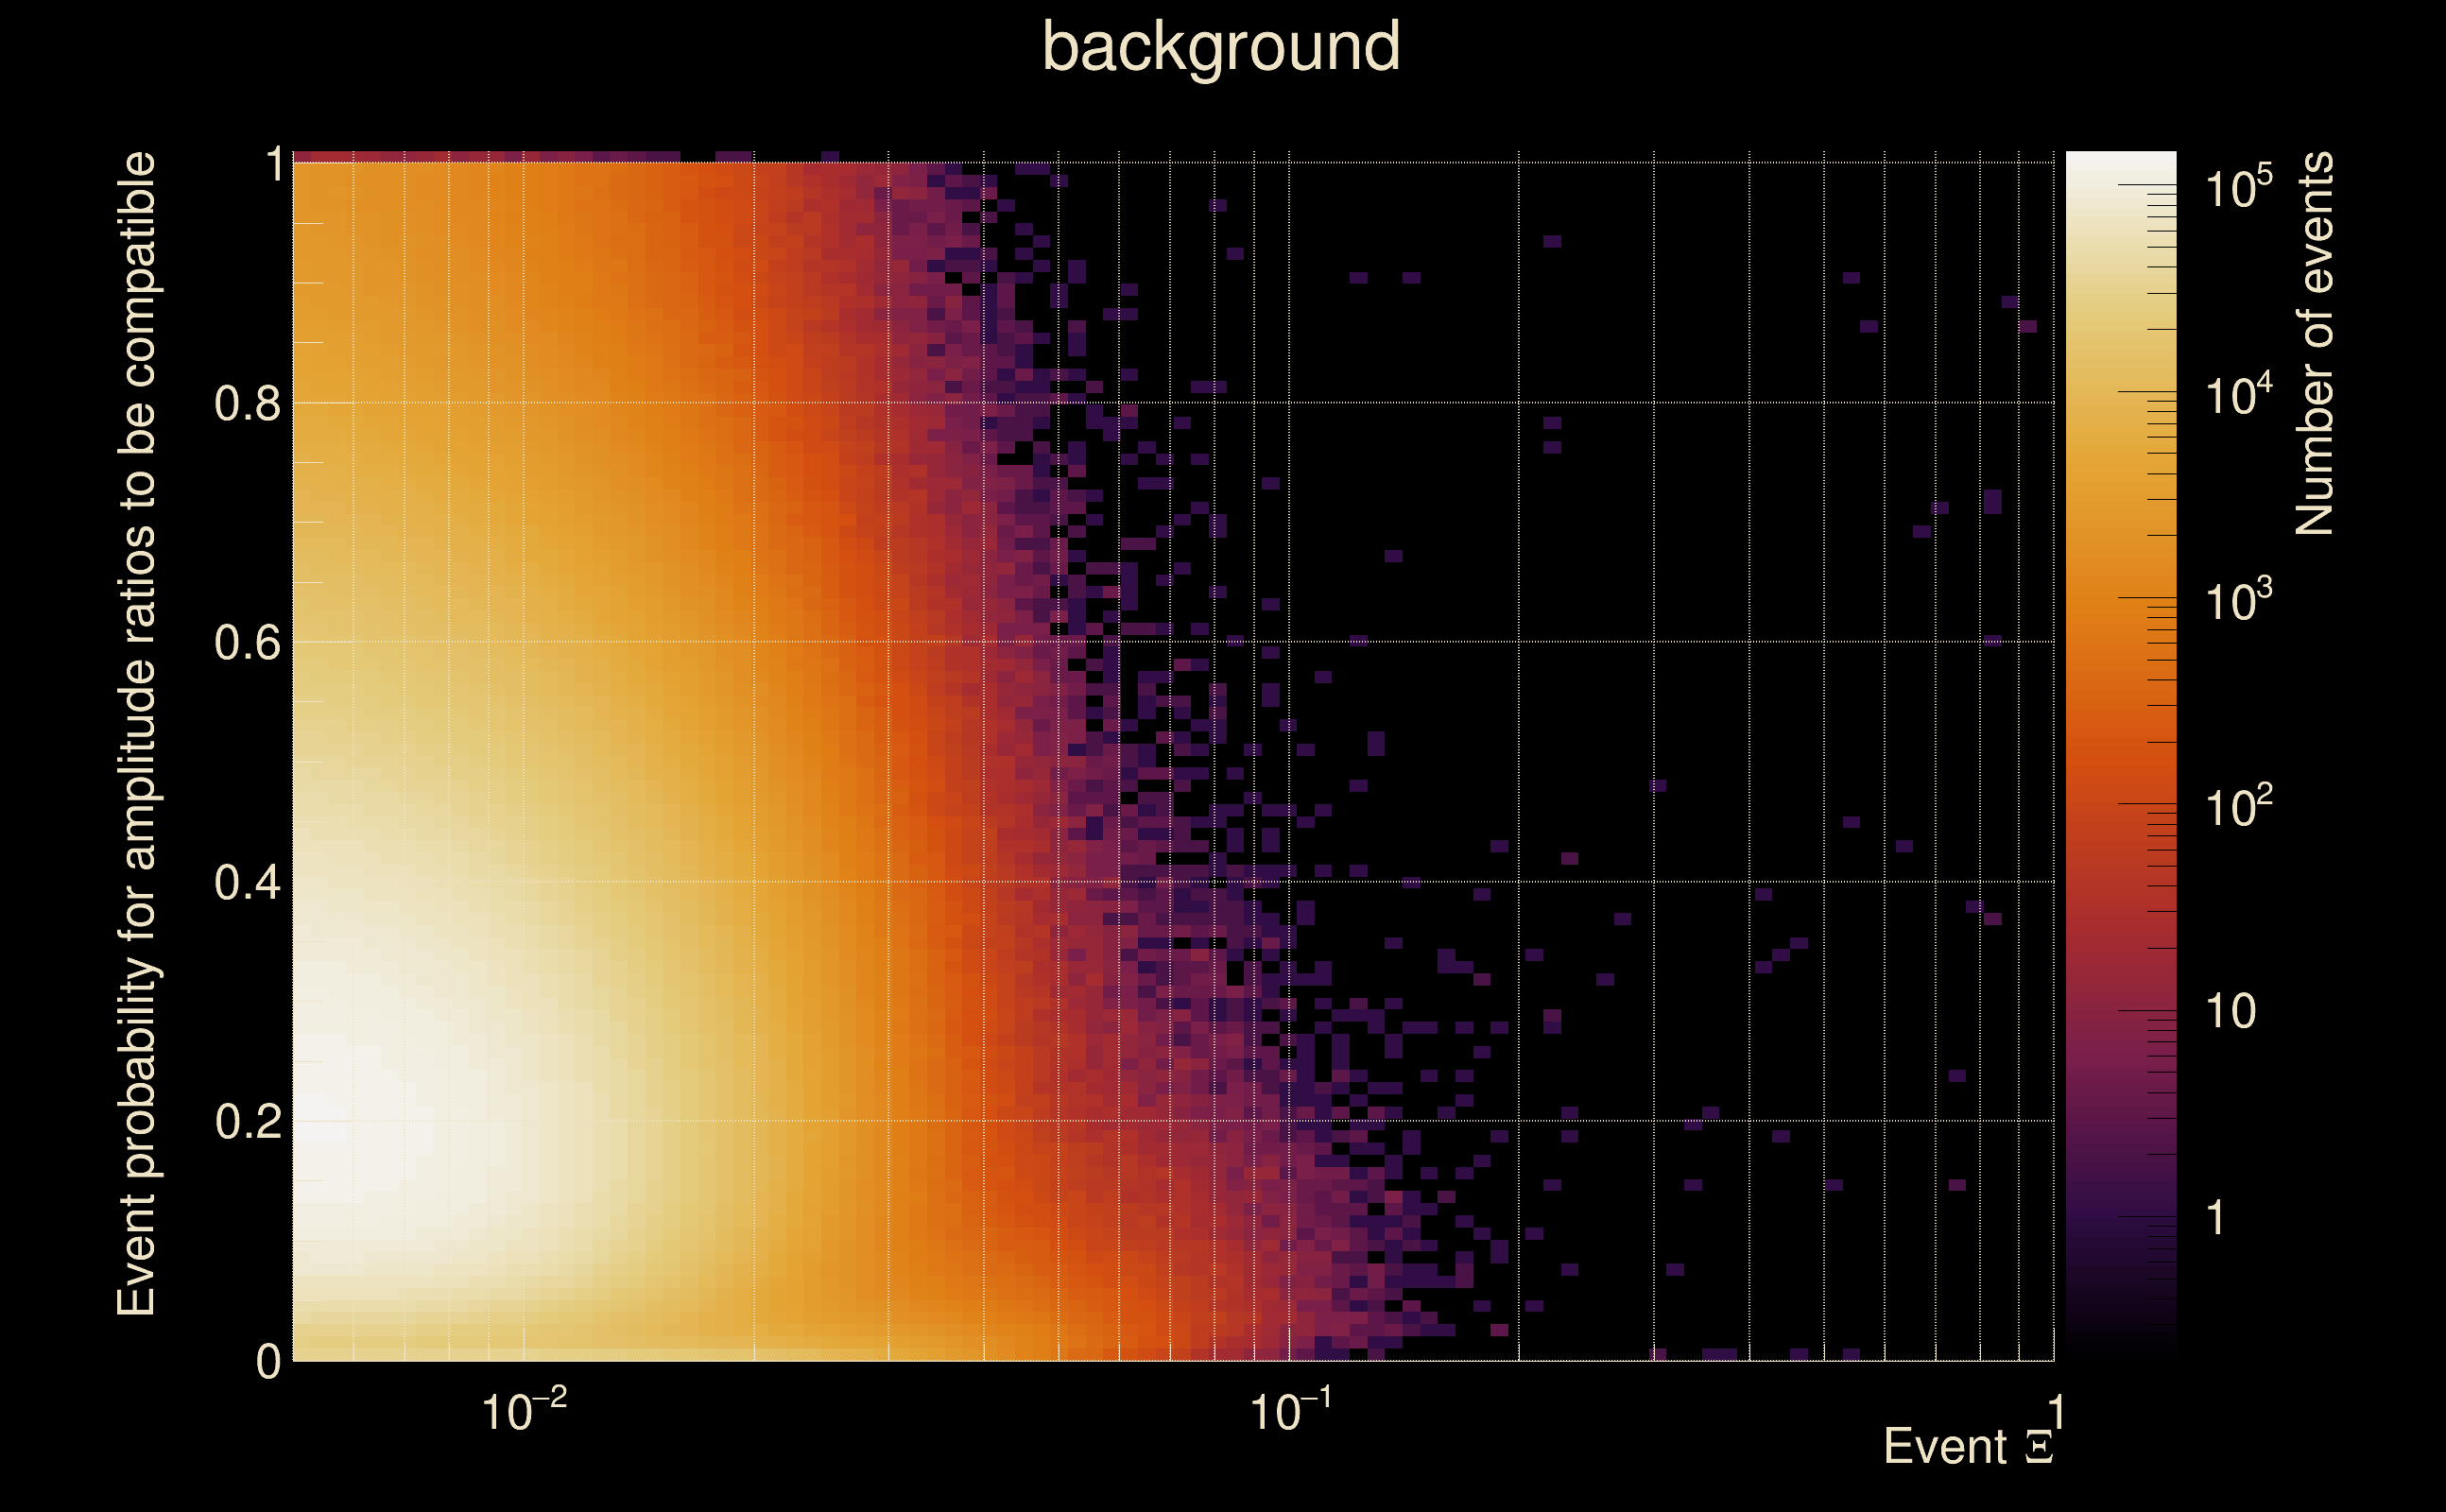
| Ξ: | 0.068224 ± 0.0698673 (variance = 0.00488143): Q0: 0.282245, Q1: 0.221534, Q2: 0.203778, Q3: 0.158038, Q4: 0.072873 |
| Rank: | R_A = 0.0441278 |
| Log of amplitude ratio (L1/H1): | 0.0100015, variance = 0.453647 (L1/H1: -0.293609, variance = 1.41058, H1/L1: -0.160808, variance = 0.668214) |
| Amplitude ratio (L1/H1): | 1.01005 ⋇ 1.96115 (L1/H1: 0.745568 ⋇ 3.27946, H1/L1: 0.851456 ⋇ 2.2647) |
| Amplitude ratio H1|L1 compatibility (probability): | 0.75263 |
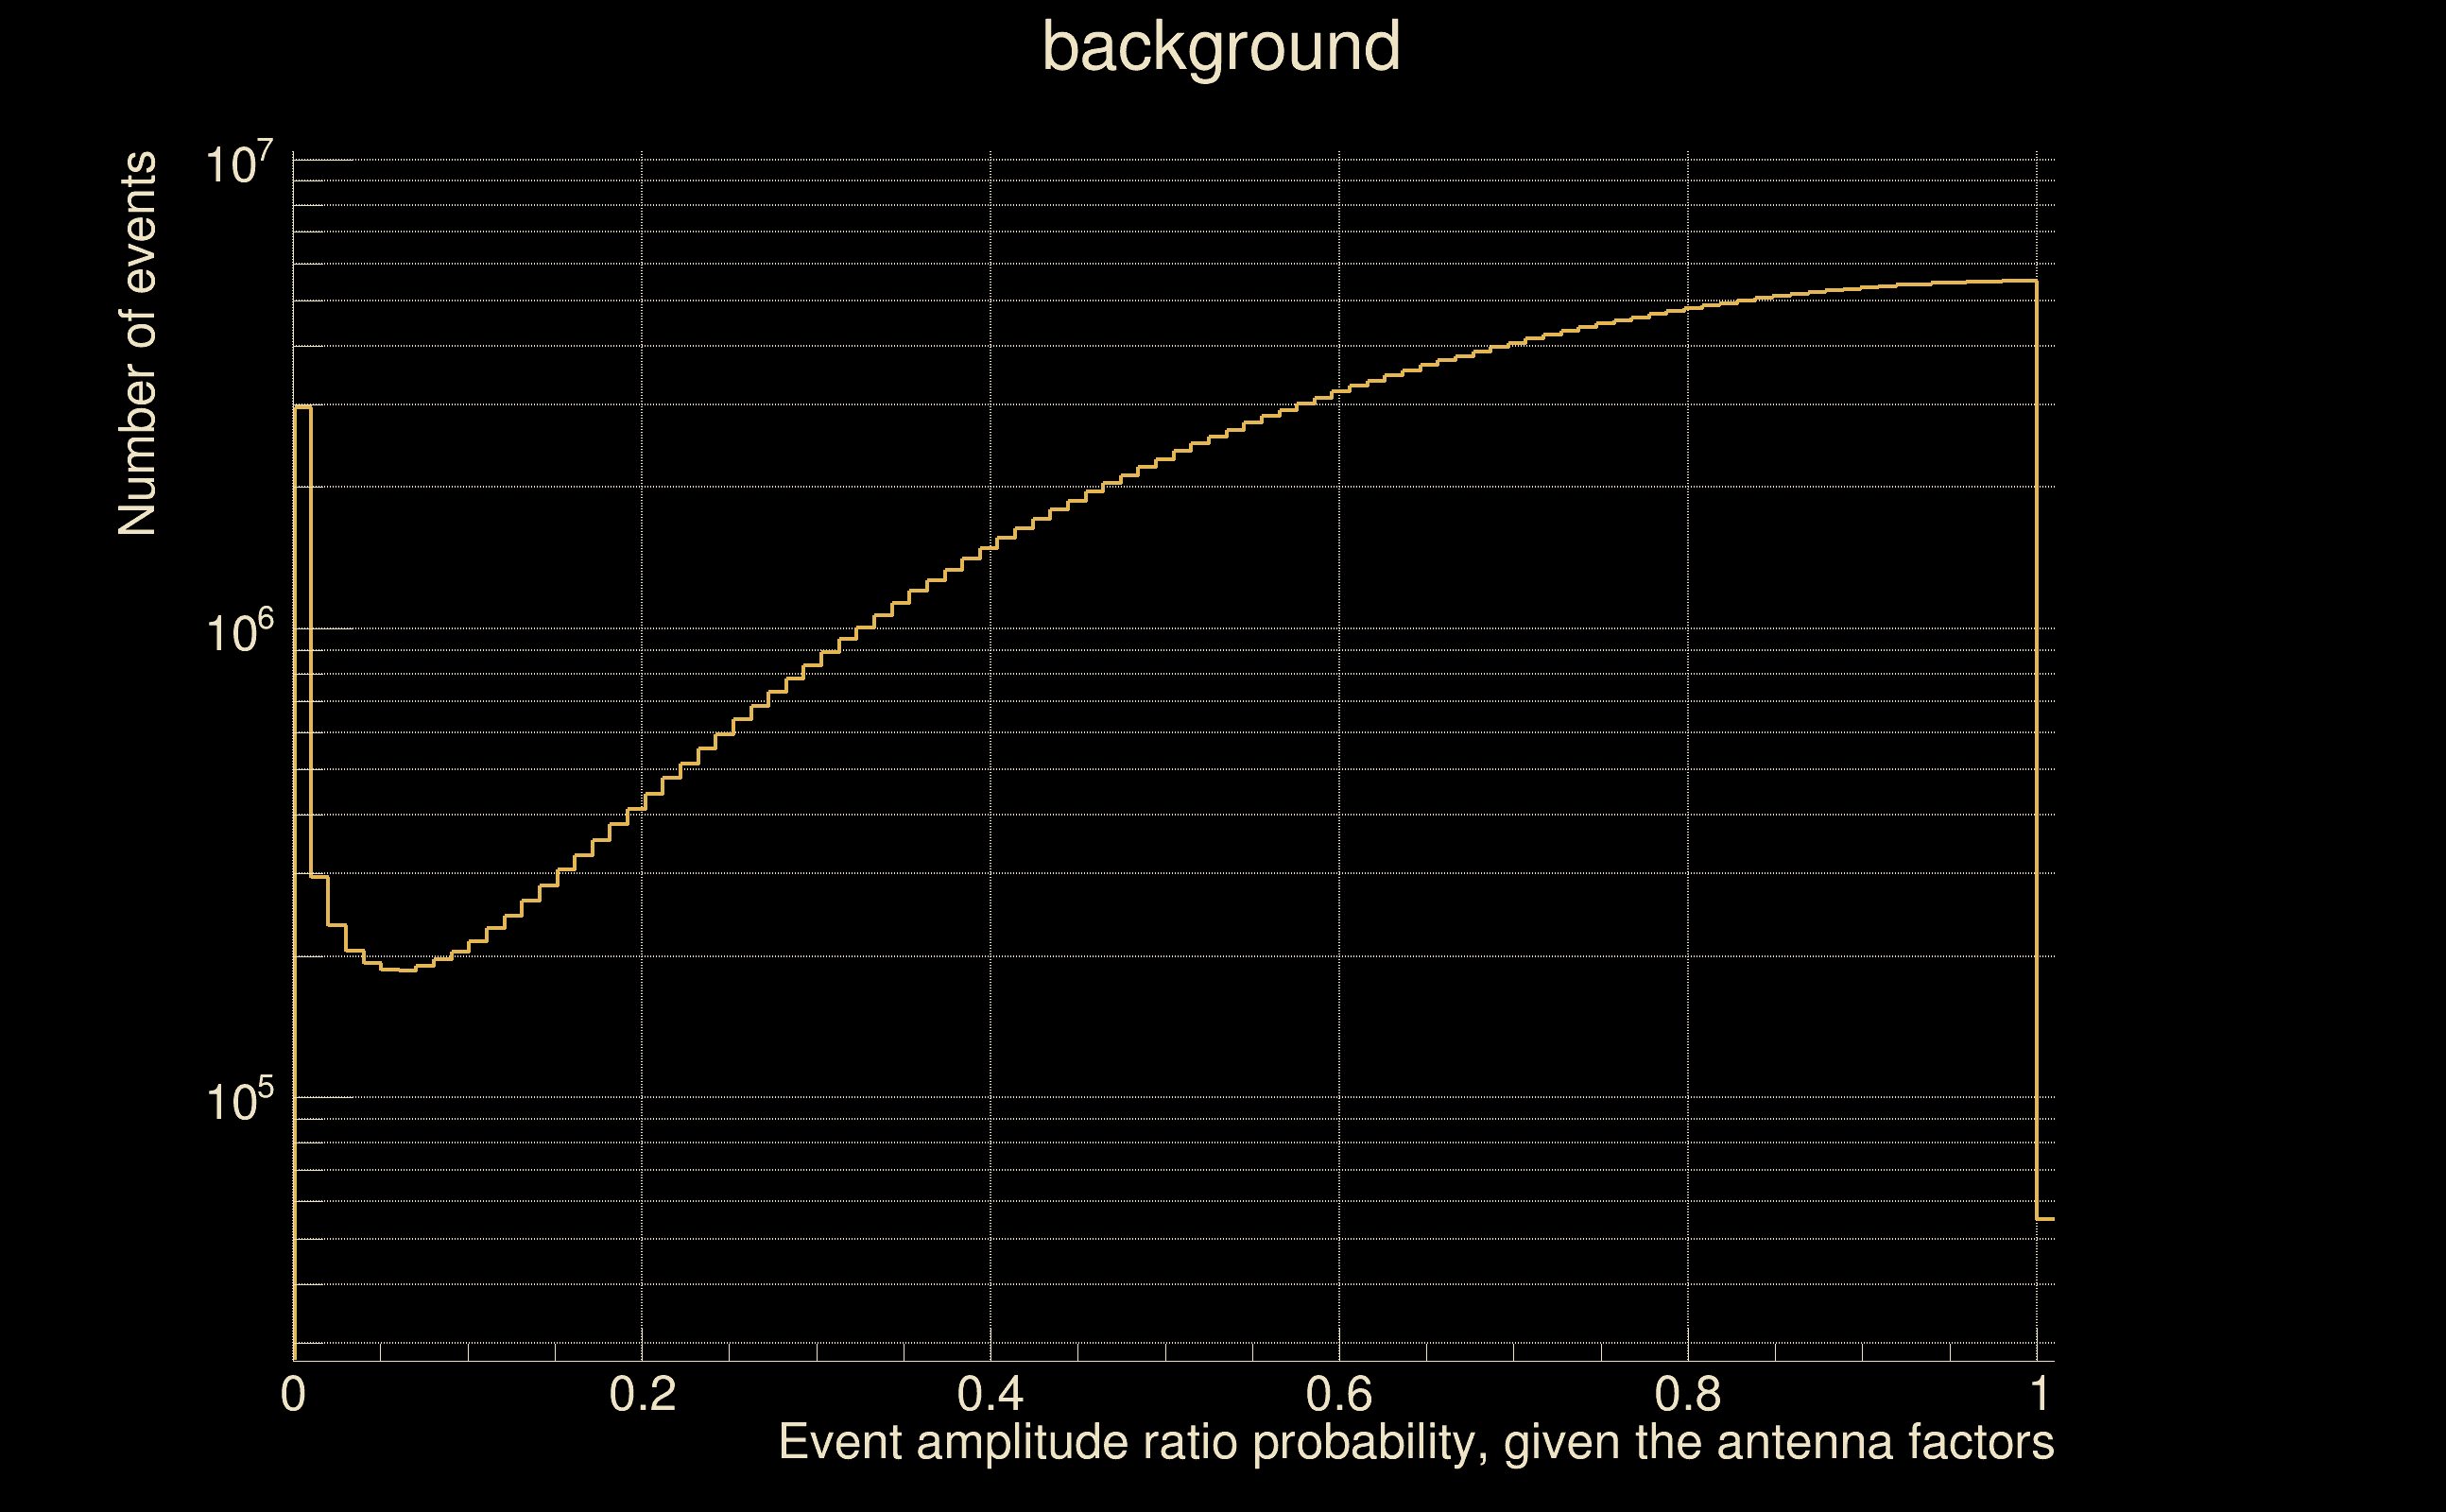
| Antenna factor probability: | 0.954948 |
| Number of rejected frequency rows: | Q0: 11 / 18, Q1: 31 / 36, Q2: 61 / 70, Q3: 123 / 134, Q4: 249 / 258 |
| Maximum signal-to-noise ratio: | H1: 5.09267, L1: 7.22594 |
| SNR variance: | H1: 0.516751, L1: 0.513553 |
| Click here for a zoomed plot | Click here for a zoomed plot | Click here for a zoomed plot | Click here for a zoomed plot | Click here for a zoomed plot |
 |
 |
 |
 |
 |
 |
 |
 |
 |
 |
 |
 |
 |
 |
 |
 |
 |
 |
 |
 |
 |
 |
 |
 |
 |
 |
 |
 |
 |
| Event time t(H1): | GPS = 1368421519 (Thu May 18 05:05:01 2023 ) → GPS = 1368421529 (Thu May 18 05:05:11 2023 ) |
| Event time t(L1): | GPS = 1368421439 (Thu May 18 05:05:11 2023 ) → GPS = 1368421449 (Thu May 18 05:03:51 2023 ) |
| Omicron analysis time window (H1): | GPS = 1368421516 → GPS = 1368421532 |
| Omicron analysis time window (L1): | GPS = 1368421436 → GPS = 1368421452 |
| Time delay between detectors t(L1) - t(H1): | -75.9065 s (slice index = 19 / 217), δt_gw = -0.00048116 s |
| Time delay standard deviation: | 0.0897565 s |
| [targeted mode] Time delay probability: | 0.822479 (0.224358 sigmas), δt_target = 0.000558138 s |
| Frequency: | 98.8539 Hz |
| Ξ: | 0.0709147 ± 0.0864535 (variance = 0.00747421): Q0: 0.302193, Q1: 0.222838, Q2: 0.30771, Q3: 0.181807, Q4: 0.0734244 |
| Rank: | R_A = 0.0372233 |
| Log of amplitude ratio (L1/H1): | -0.104691, variance = 0.604513 (L1/H1: -0.800101, variance = 1.73133, H1/L1: -0.0826874, variance = 0.848475) |
| Amplitude ratio (L1/H1): | 0.900602 ⋇ 2.17603 (L1/H1: 0.449283 ⋇ 3.72773, H1/L1: 0.920639 ⋇ 2.51212) |
| Amplitude ratio H1|L1 compatibility (probability): | 0.582579 |
| Antenna factor probability: | 0.957055 |
| Number of rejected frequency rows: | Q0: 12 / 18, Q1: 28 / 36, Q2: 60 / 70, Q3: 122 / 134, Q4: 253 / 258 |
| Maximum signal-to-noise ratio: | H1: 5.03847, L1: 9.70641 |
| SNR variance: | H1: 0.530409, L1: 0.522281 |
| Event time t(H1): | GPS = 1368268403 (Tue May 16 10:33:05 2023 ) → GPS = 1368268413 (Tue May 16 10:33:15 2023 ) |
| Event time t(L1): | GPS = 1368268273 (Tue May 16 10:33:15 2023 ) → GPS = 1368268283 (Tue May 16 10:31:05 2023 ) |
| Omicron analysis time window (H1): | GPS = 1368268400 → GPS = 1368268416 |
| Omicron analysis time window (L1): | GPS = 1368268270 → GPS = 1368268286 |
| Time delay between detectors t(L1) - t(H1): | -125.622 s (slice index = 13 / 217), δt_gw = 0.00799007 s |
| Time delay standard deviation: | 0.0769573 s |
| [targeted mode] Time delay probability: | 0.982245 (0.0222541 sigmas), δt_target = 0.000558138 s |
| Frequency: | 79.1826 Hz |
| Ξ: | 0.0588067 ± 0.0774965 (variance = 0.00600571): Q0: 0.247444, Q1: 0.323858, Q2: 0.369338, Q3: 0.436788, Q4: 0.461876 |
| Rank: | R_A = 0.036013 |
| Log of amplitude ratio (L1/H1): | -0.122493, variance = 1.07743 (L1/H1: -0.515537, variance = 1.18103, H1/L1: 0.0613167, variance = 1.41033) |
| Amplitude ratio (L1/H1): | 0.884712 ⋇ 2.82355 (L1/H1: 0.59718 ⋇ 2.96463, H1/L1: 1.06324 ⋇ 3.27911) |
| Amplitude ratio H1|L1 compatibility (probability): | 0.777817 |
| Antenna factor probability: | 0.752756 |
| Number of rejected frequency rows: | Q0: 14 / 18, Q1: 27 / 36, Q2: 59 / 70, Q3: 125 / 134, Q4: 250 / 258 |
| Maximum signal-to-noise ratio: | H1: 4.66761, L1: 11.831 |
| SNR variance: | H1: 0.520491, L1: 0.558127 |
| Event time t(H1): | GPS = 1368352701 (Wed May 17 09:58:03 2023 ) → GPS = 1368352711 (Wed May 17 09:58:13 2023 ) |
| Event time t(L1): | GPS = 1368351931 (Wed May 17 09:58:13 2023 ) → GPS = 1368351941 (Wed May 17 09:45:23 2023 ) |
| Omicron analysis time window (H1): | GPS = 1368352698 → GPS = 1368352714 |
| Omicron analysis time window (L1): | GPS = 1368351928 → GPS = 1368351944 |
| Time delay between detectors t(L1) - t(H1): | -768.982 s (slice index = 86 / 217), δt_gw = 0.00584919 s |
| Time delay standard deviation: | 0.0498527 s |
| [targeted mode] Time delay probability: | 0.534387 (0.621323 sigmas), δt_target = 0.000558138 s |
| Frequency: | 120.366 Hz |
| Ξ: | 0.730257 ± 0.0316014 (variance = 0.00099865): Q0: 0.758931, Q1: 0.763944, Q2: 0.745747, Q3: 0.699982, Q4: 0.686861 |
| Rank: | R_A = 0.0356398 |
| Log of amplitude ratio (L1/H1): | -0.997121, variance = 0.41748 (L1/H1: -1.70809, variance = 0.557405, H1/L1: -0.347186, variance = 1.49598) |
| Amplitude ratio (L1/H1): | 0.36894 ⋇ 1.90814 (L1/H1: 0.181212 ⋇ 2.10981, H1/L1: 0.706674 ⋇ 3.39771) |
| Amplitude ratio H1|L1 compatibility (probability): | 0.151492 |
| Antenna factor probability: | 0.376107 |
| Number of rejected frequency rows: | Q0: 0 / 18, Q1: 0 / 36, Q2: 1 / 70, Q3: 29 / 134, Q4: 104 / 258 |
| Maximum signal-to-noise ratio: | H1: 357.965, L1: 260.325 |
| SNR variance: | H1: 0.513603, L1: 0.522825 |
| Event time t(H1): | GPS = 1368352706 (Wed May 17 09:58:08 2023 ) → GPS = 1368352716 (Wed May 17 09:58:18 2023 ) |
| Event time t(L1): | GPS = 1368351936 (Wed May 17 09:58:18 2023 ) → GPS = 1368351946 (Wed May 17 09:45:28 2023 ) |
| Omicron analysis time window (H1): | GPS = 1368352703 → GPS = 1368352719 |
| Omicron analysis time window (L1): | GPS = 1368351933 → GPS = 1368351949 |
| Time delay between detectors t(L1) - t(H1): | -768.982 s (slice index = 86 / 217), δt_gw = 0.00585331 s |
| Time delay standard deviation: | 0.0497216 s |
| [targeted mode] Time delay probability: | 0.532945 (0.623517 sigmas), δt_target = 0.000558138 s |
| Frequency: | 120.399 Hz |
| Ξ: | 0.729842 ± 0.0323554 (variance = 0.00104687): Q0: 0.758718, Q1: 0.763969, Q2: 0.745811, Q3: 0.699988, Q4: 0.684105 |
| Rank: | R_A = 0.0349748 |
| Log of amplitude ratio (L1/H1): | -0.999368, variance = 0.415032 (L1/H1: -1.70972, variance = 0.55557, H1/L1: -0.344984, variance = 1.48259) |
| Amplitude ratio (L1/H1): | 0.368112 ⋇ 1.90452 (L1/H1: 0.180916 ⋇ 2.10721, H1/L1: 0.708232 ⋇ 3.37912) |
| Amplitude ratio H1|L1 compatibility (probability): | 0.150085 |
| Antenna factor probability: | 0.3729 |
| Number of rejected frequency rows: | Q0: 0 / 18, Q1: 0 / 36, Q2: 1 / 70, Q3: 30 / 134, Q4: 103 / 258 |
| Maximum signal-to-noise ratio: | H1: 354.695, L1: 257.831 |
| SNR variance: | H1: 66.7698, L1: 12.2509 |
| florent.robinet@ijclab.in2p3.fr |