| Omicron version: | 4.2.0: documentation gitlab repository |
| Omicron run by: | unknown |
| Report produced on: | Mon Feb 23 09:25:03 2026 UTC |
| Ox option file: | TargIxf_feb2026_SN7_30s_options.txt |
| Omicron option files: | detector 0, detector 1 |
| Detector channel names: | H1:GDS-CALIB_STRAIN_CLEAN_AR_4096Hz, L1:GDS-CALIB_STRAIN_CLEAN_AR_4096Hz |
| Omicron analysis time window and overlap: | 16 s, 6 s |
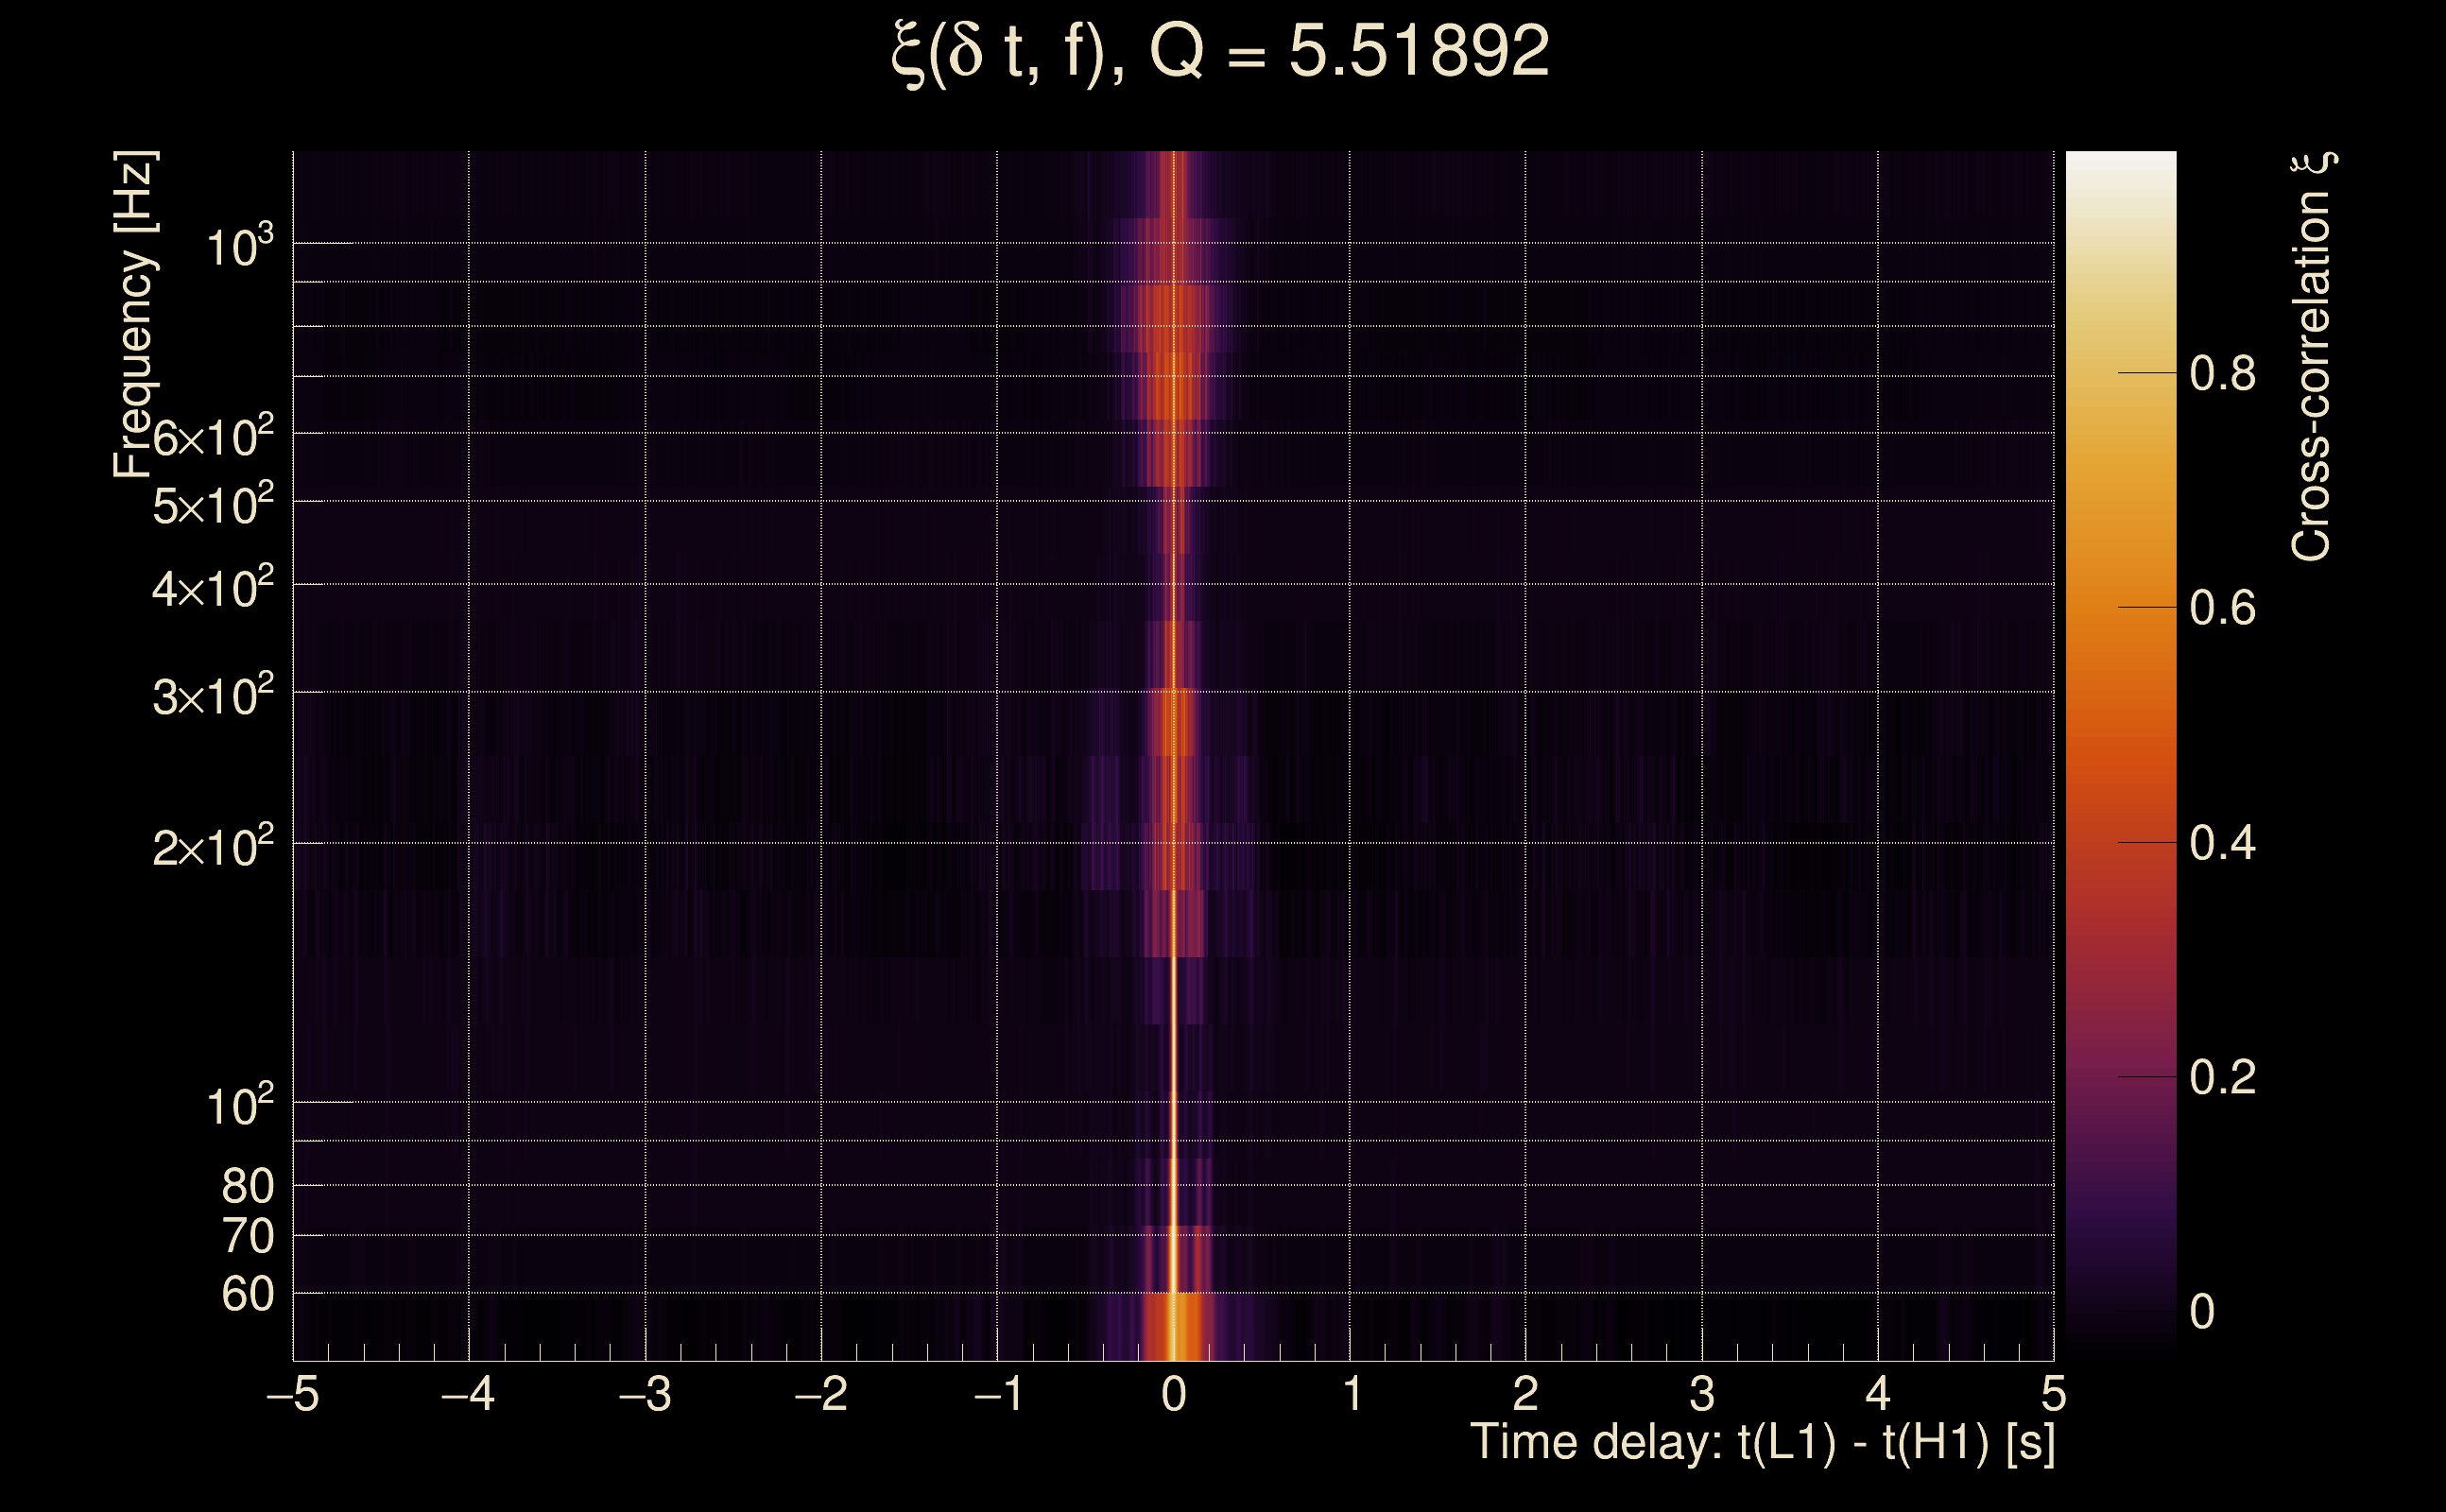
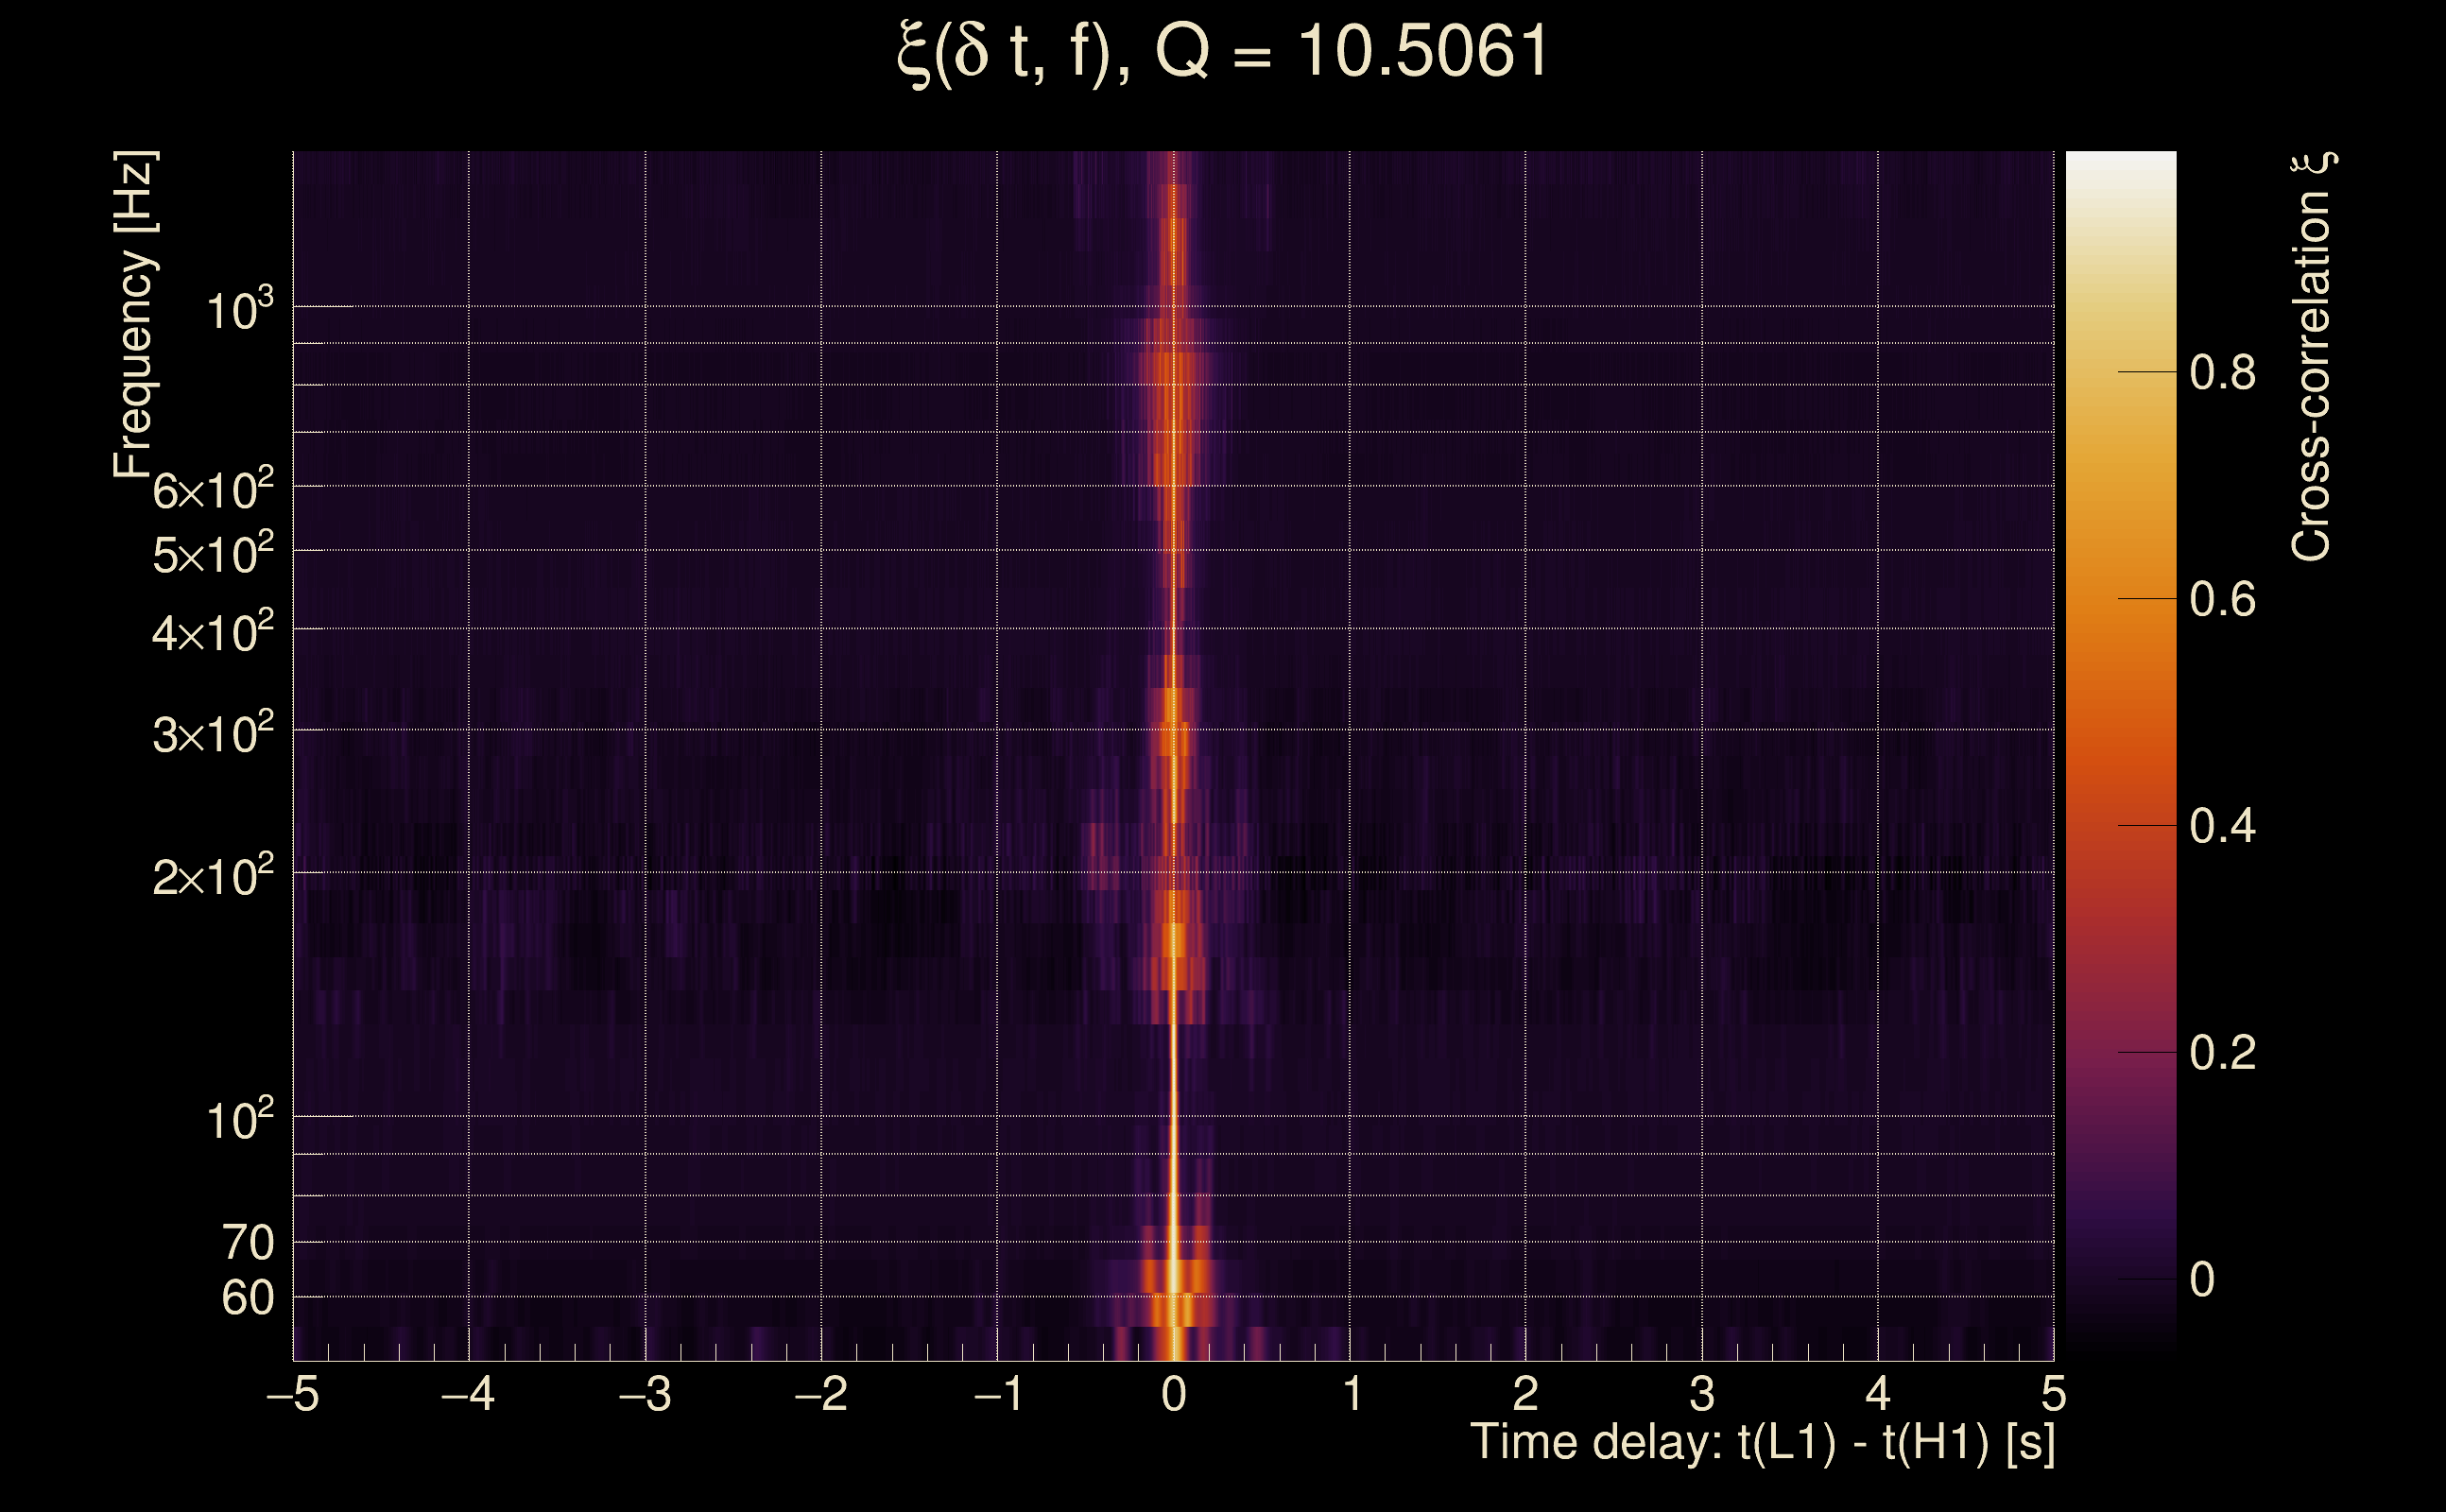
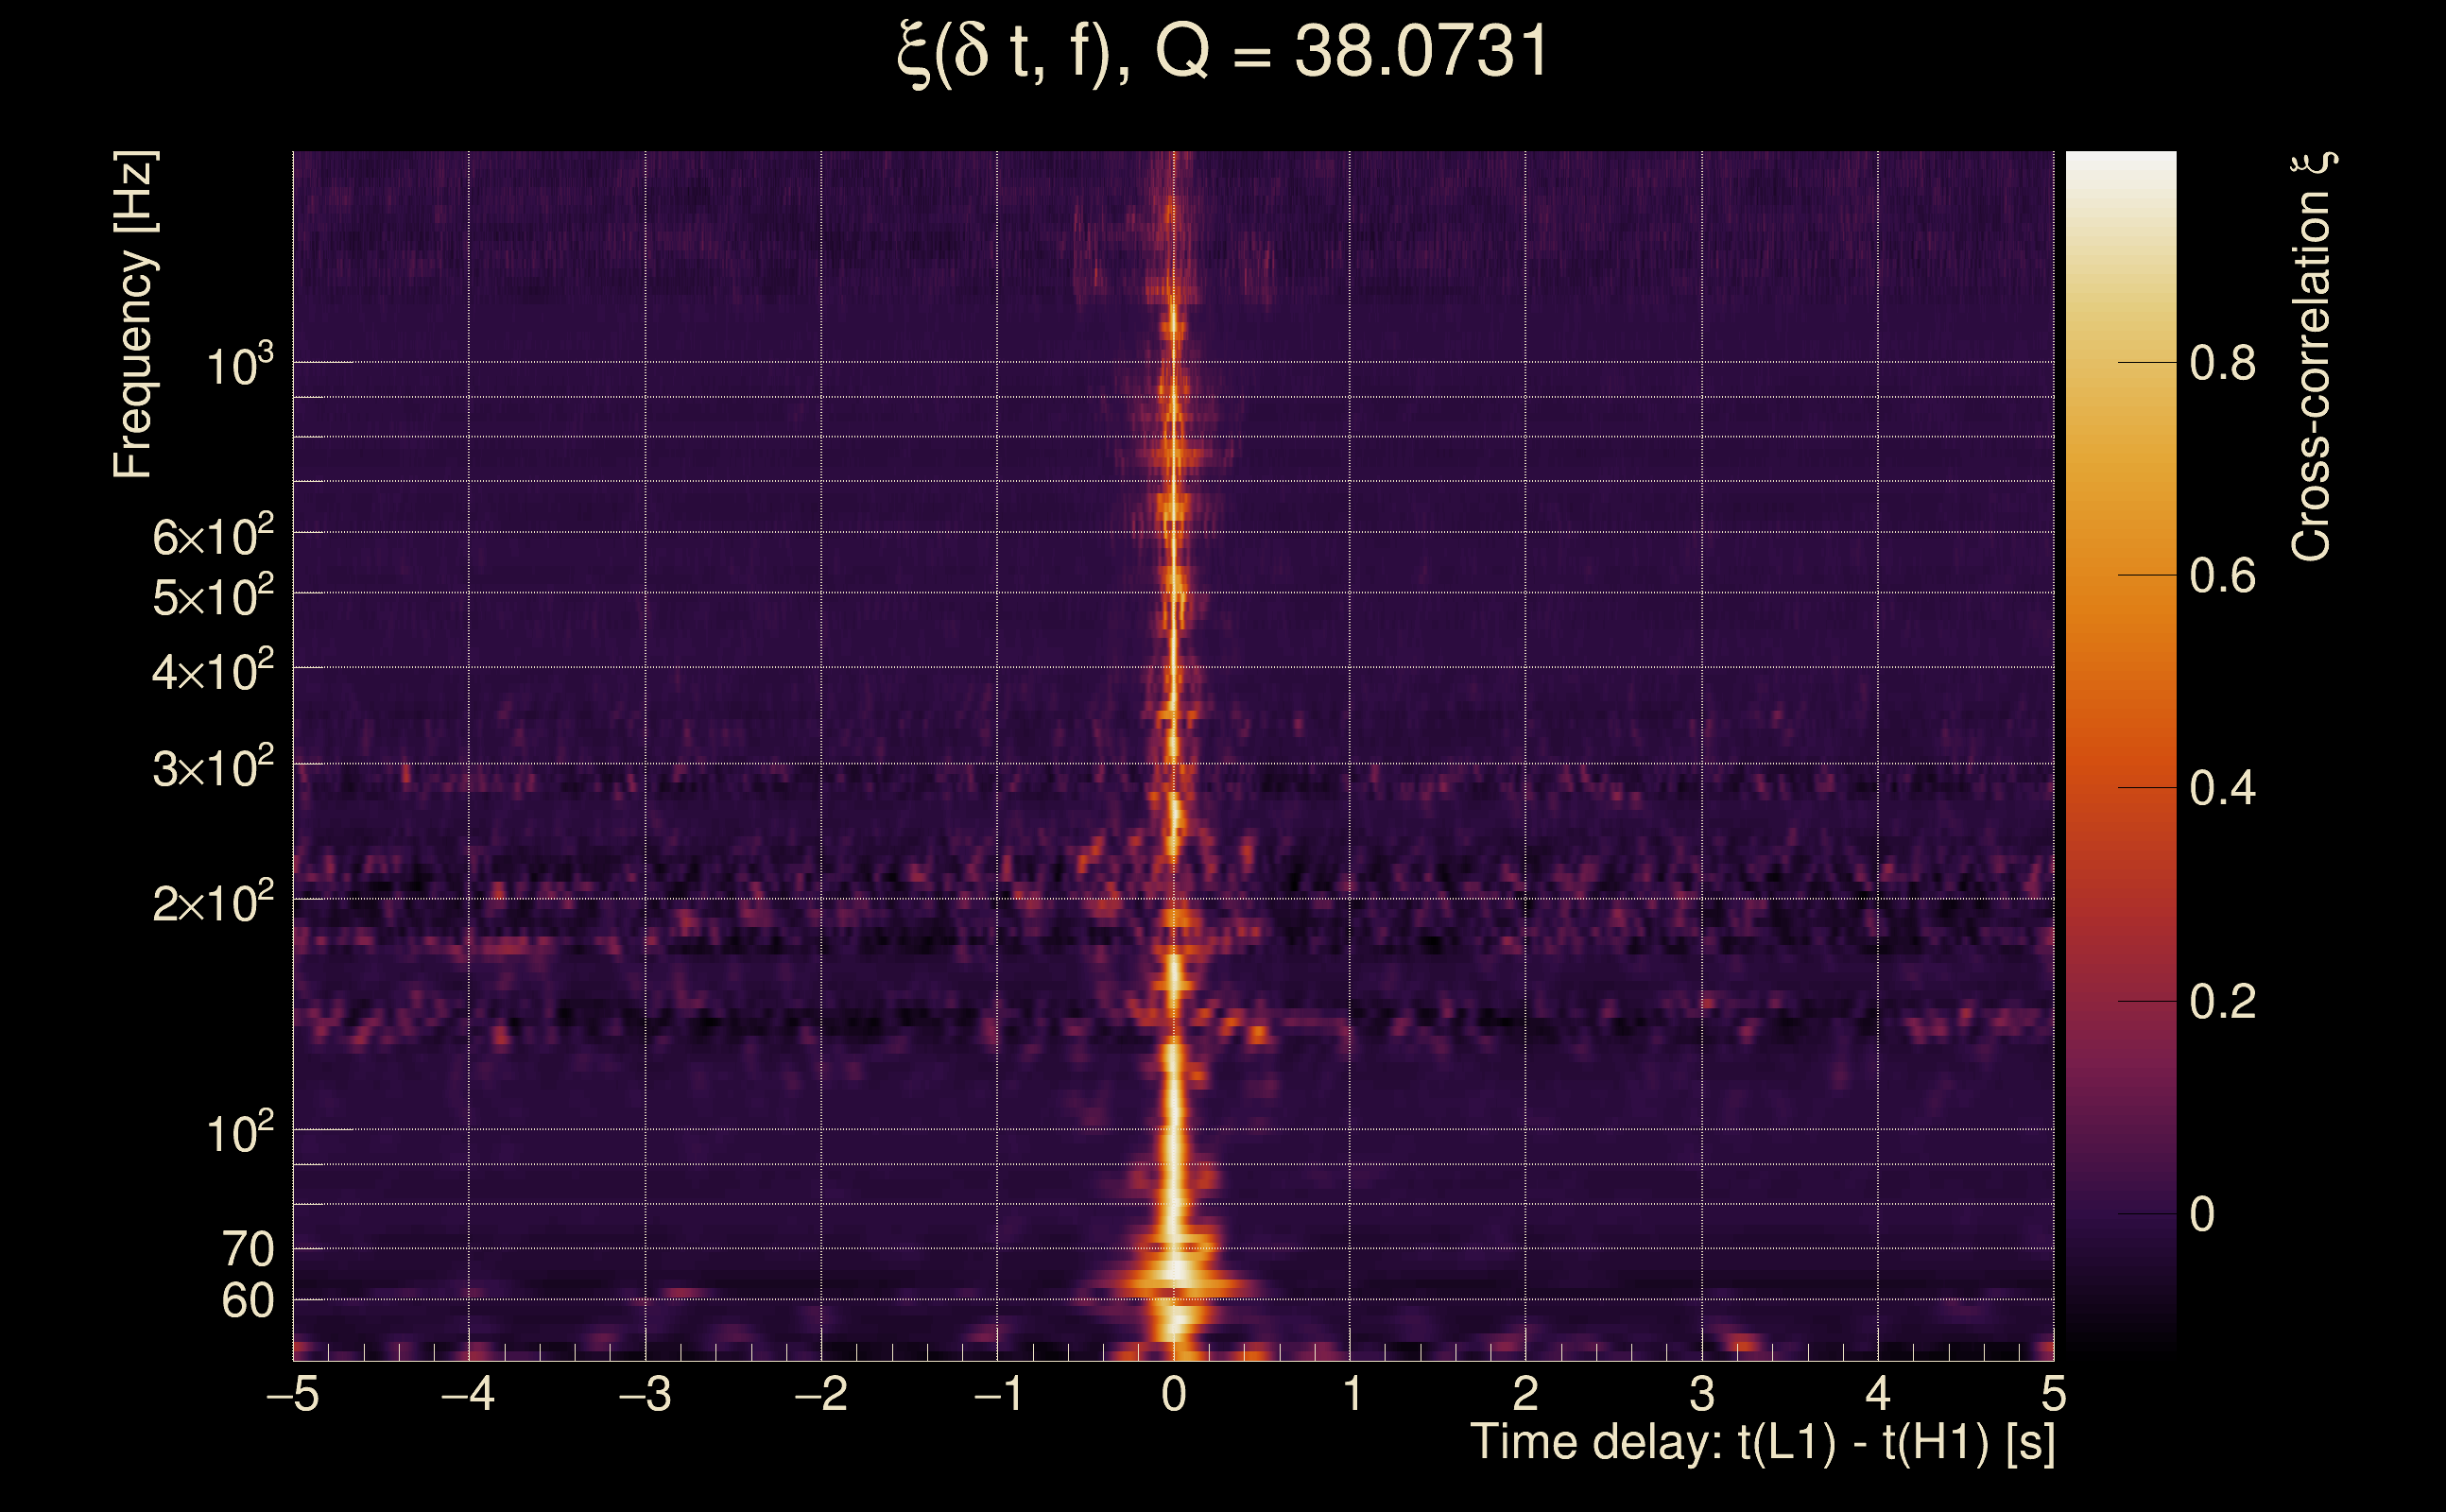
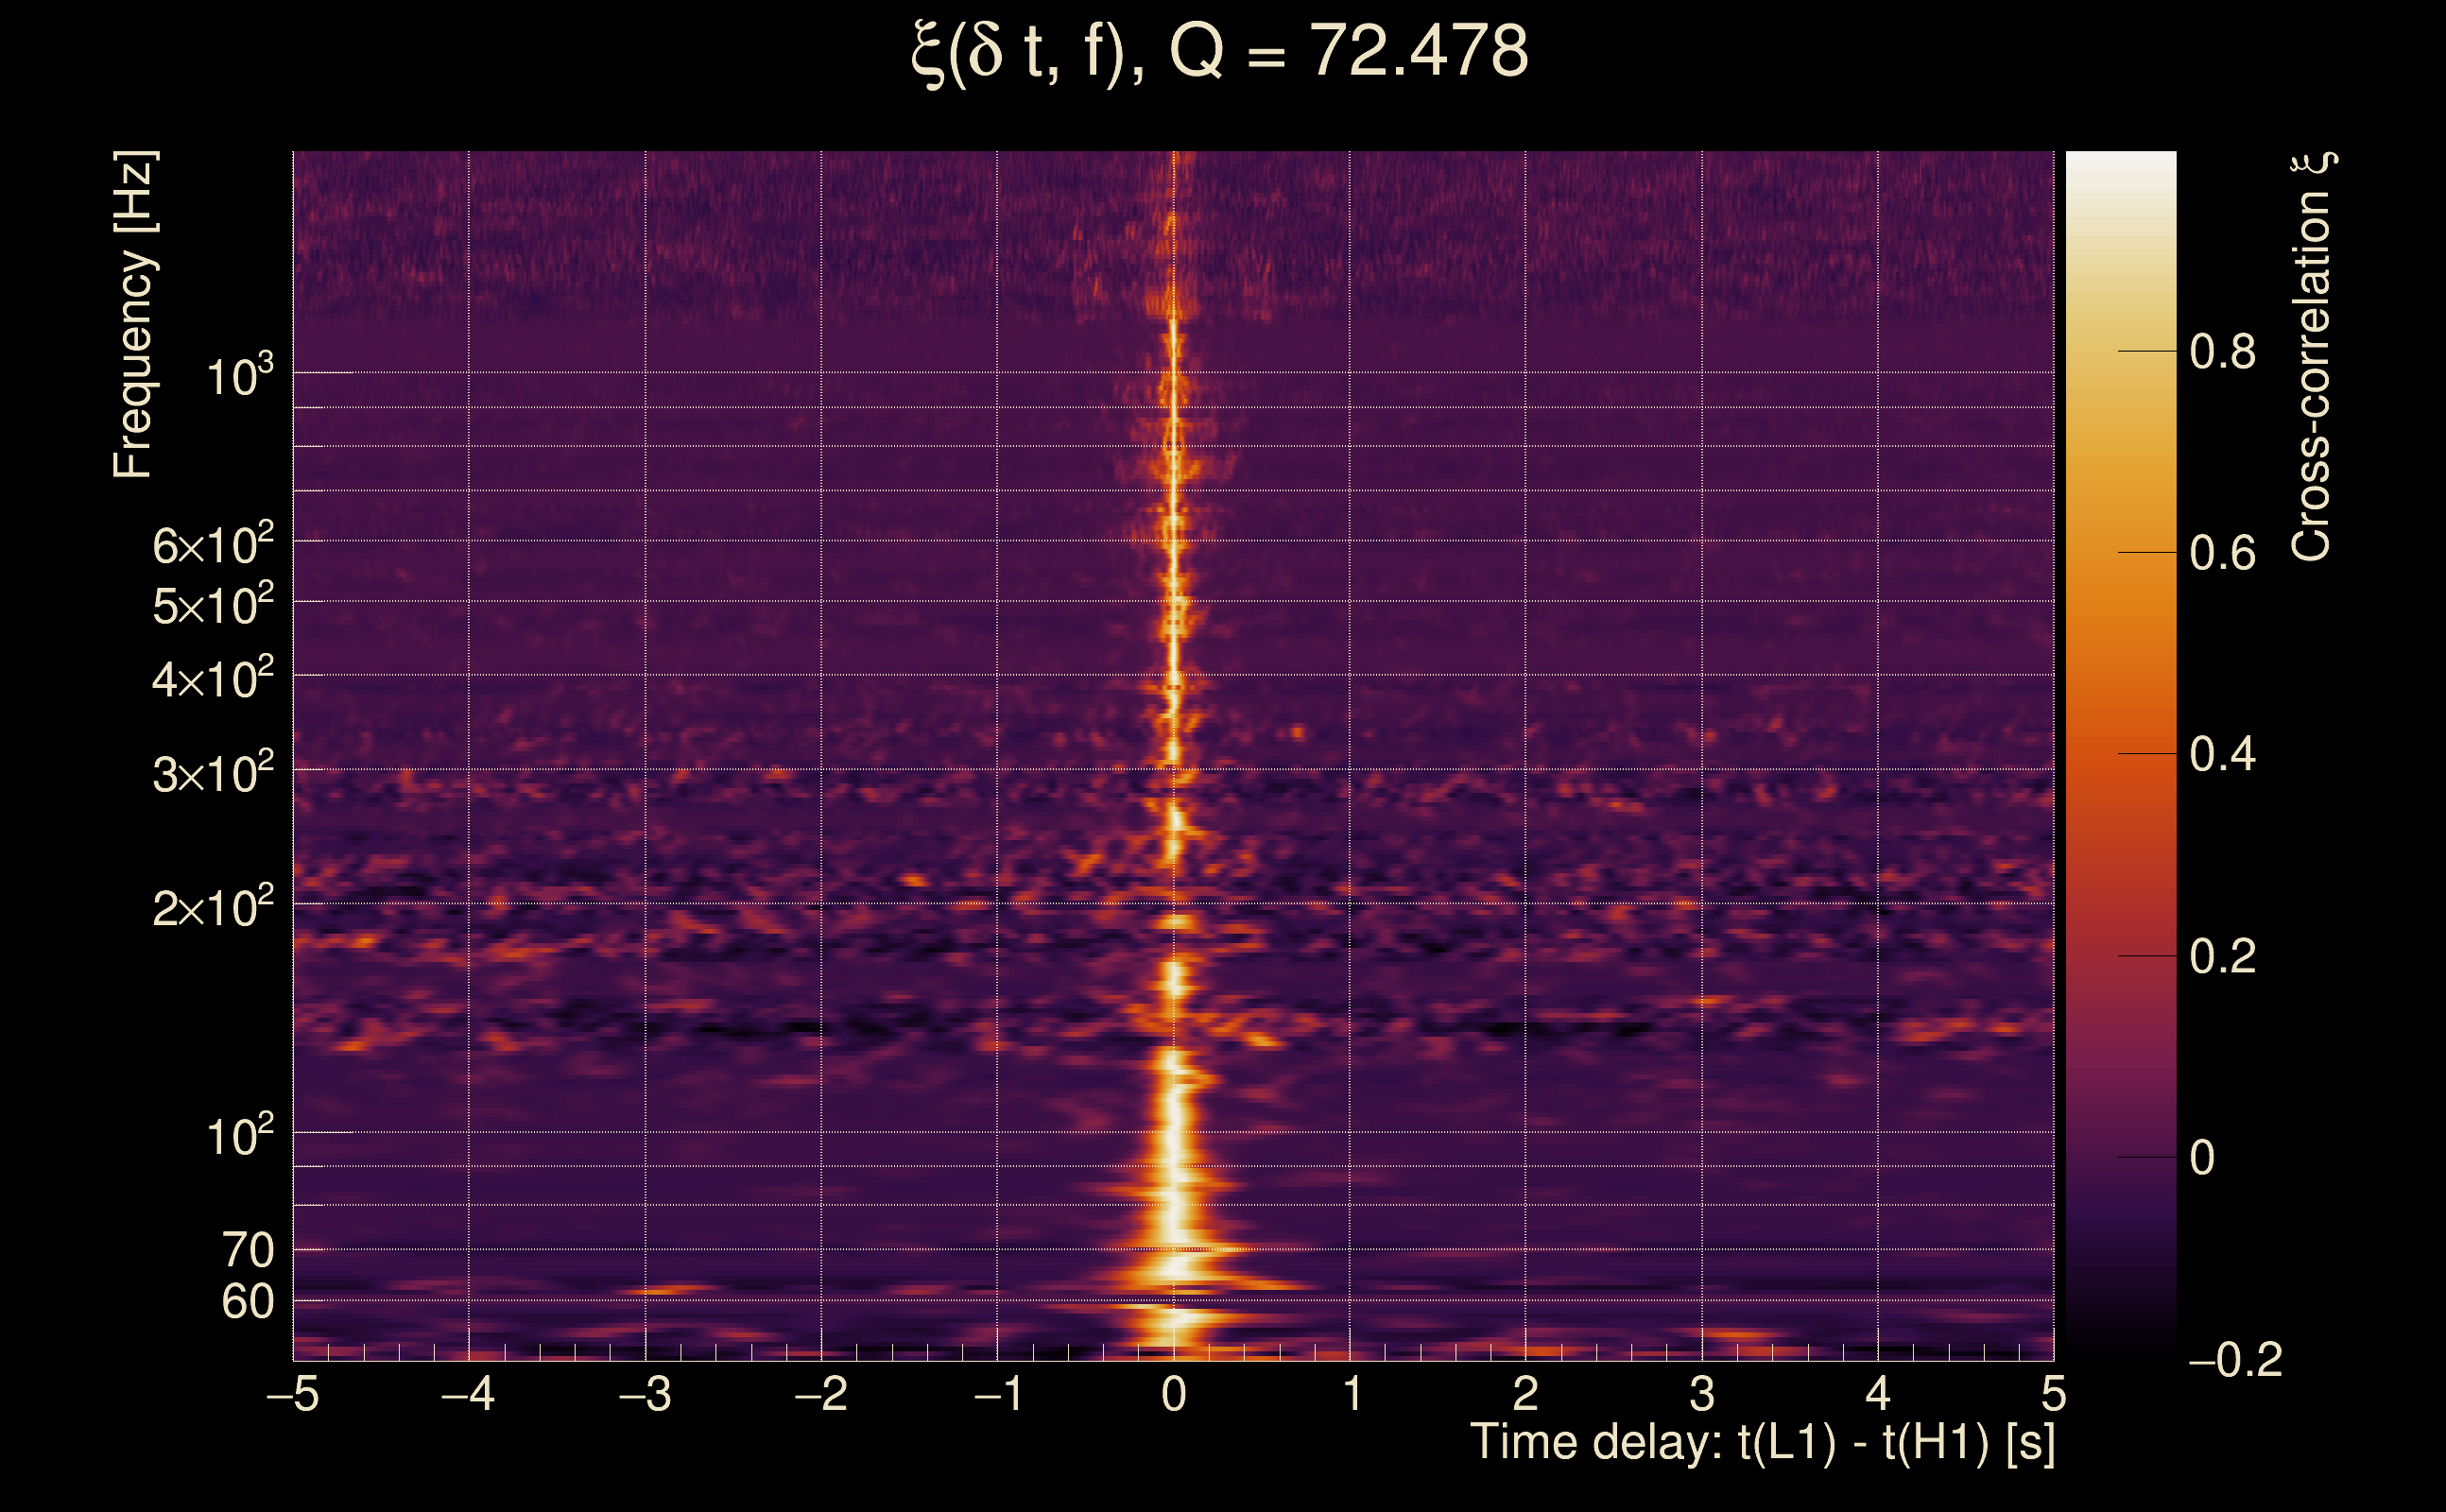
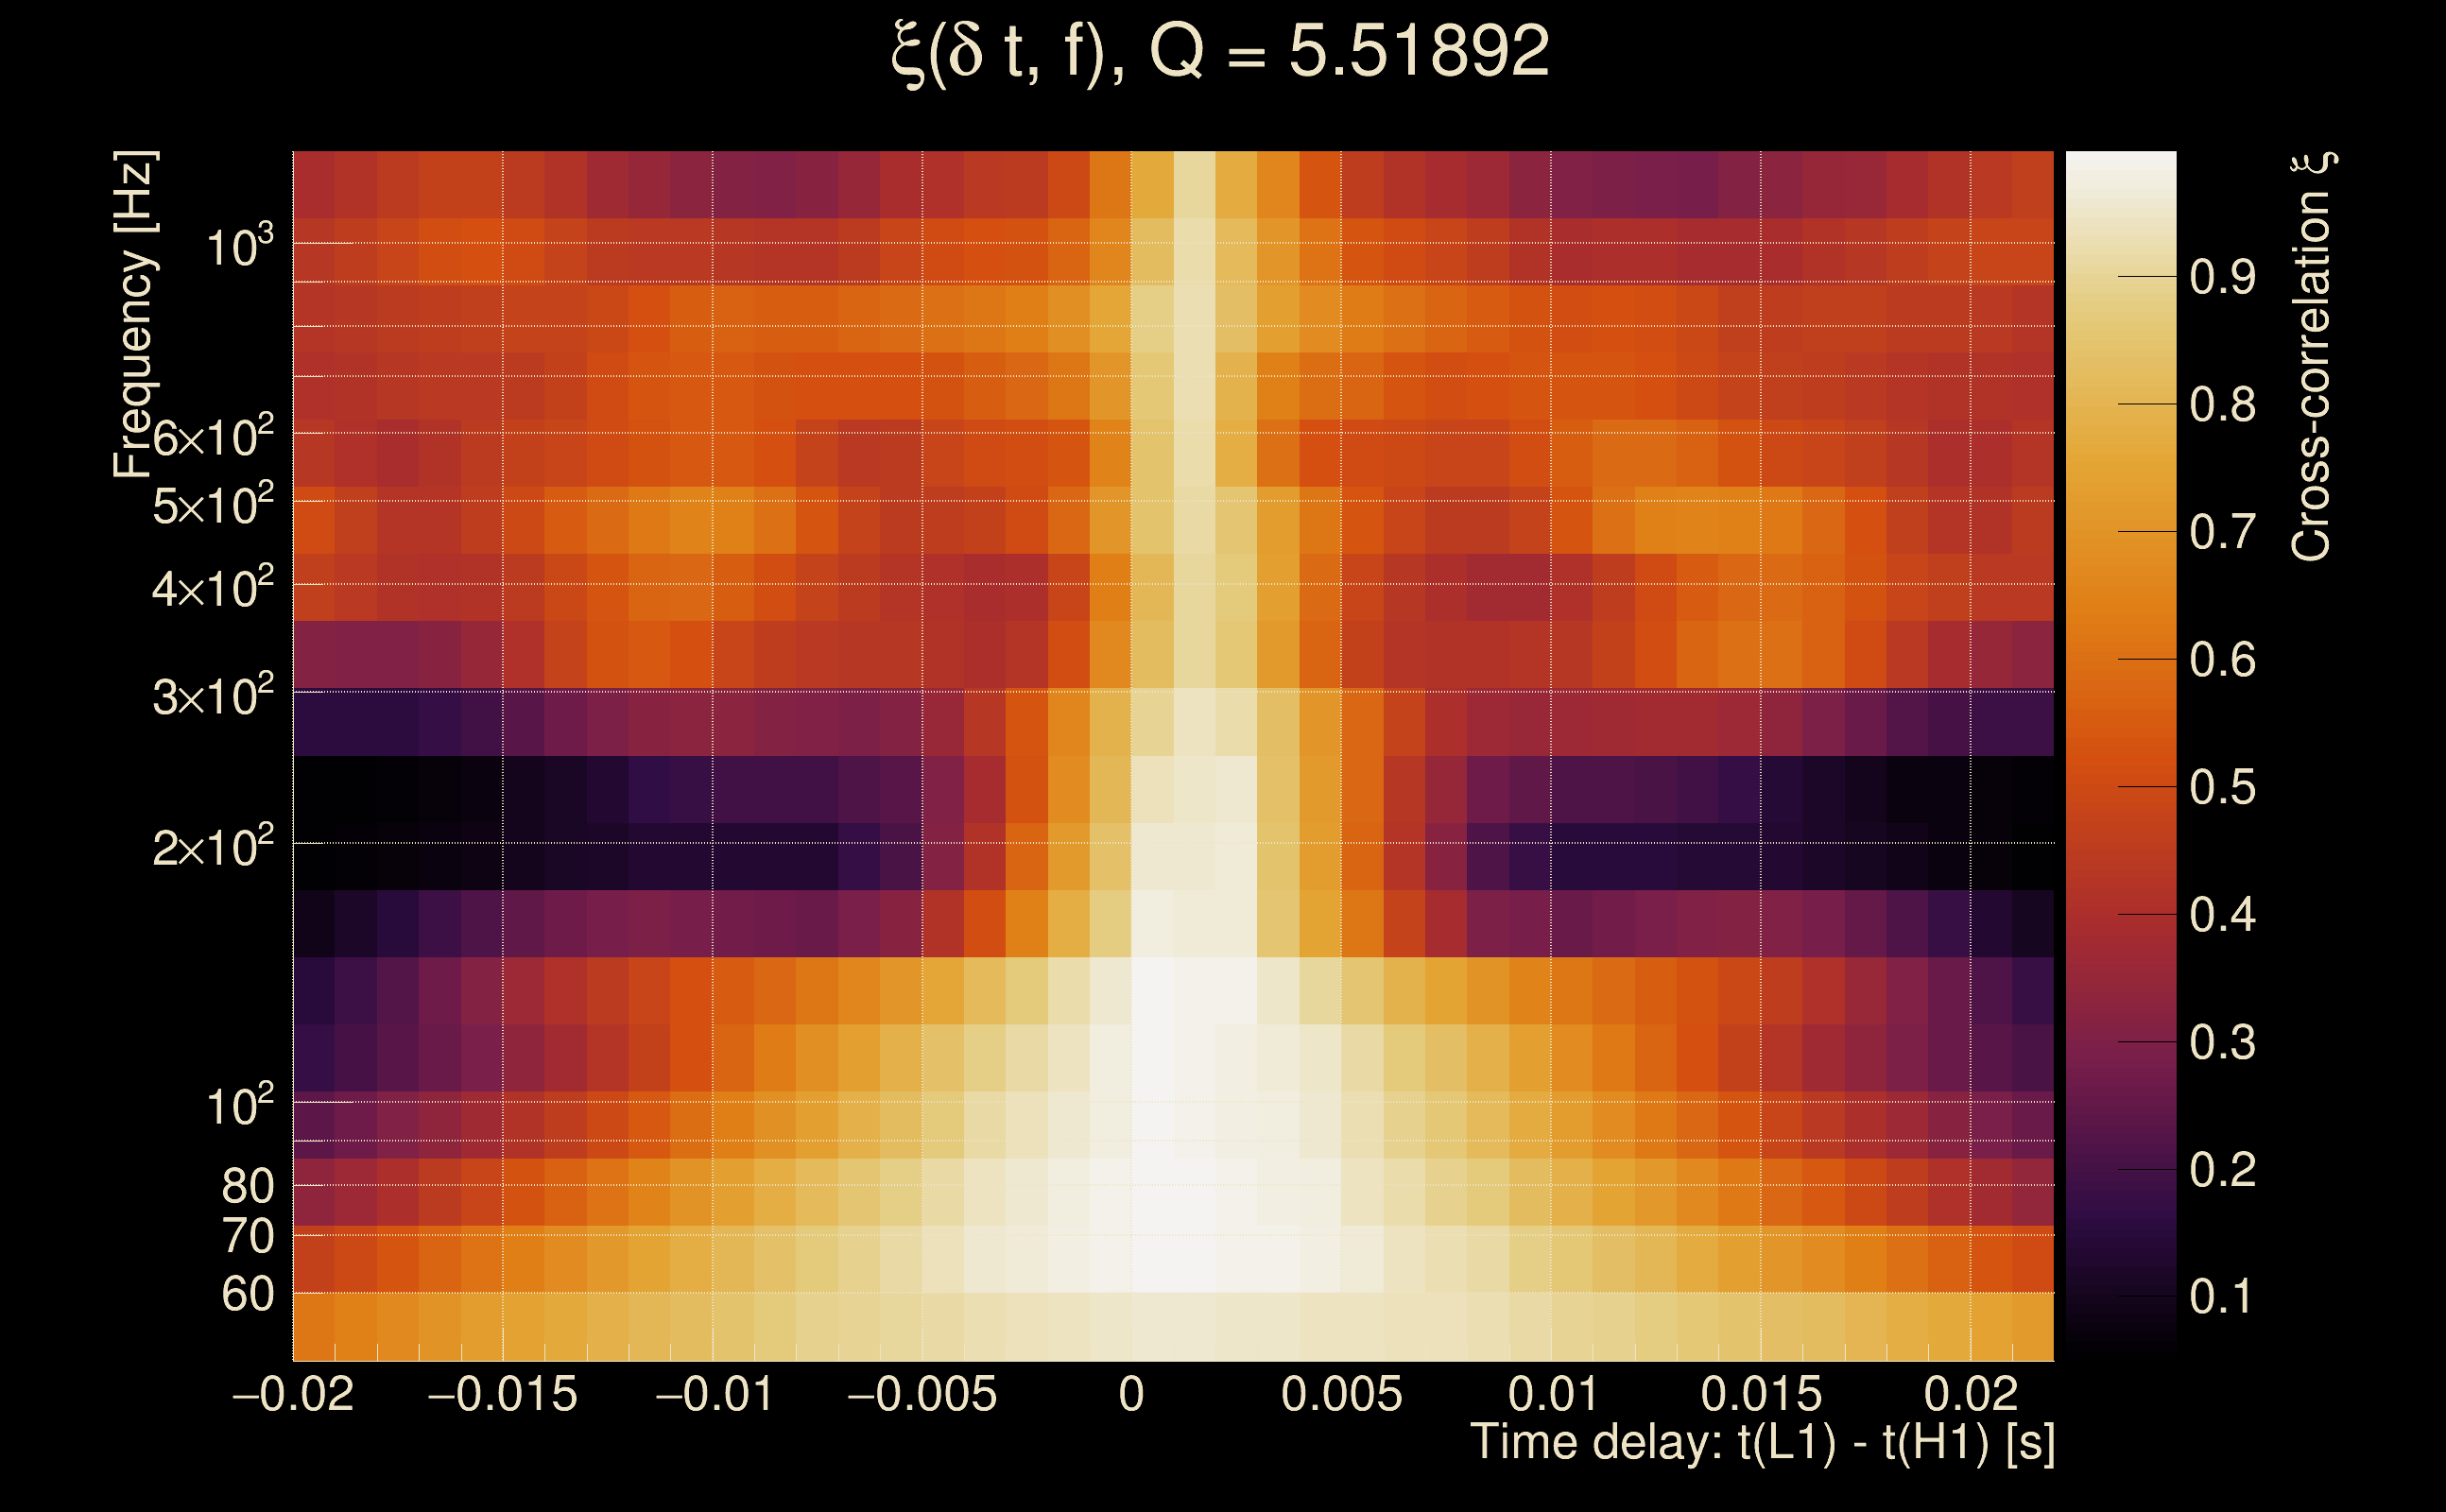
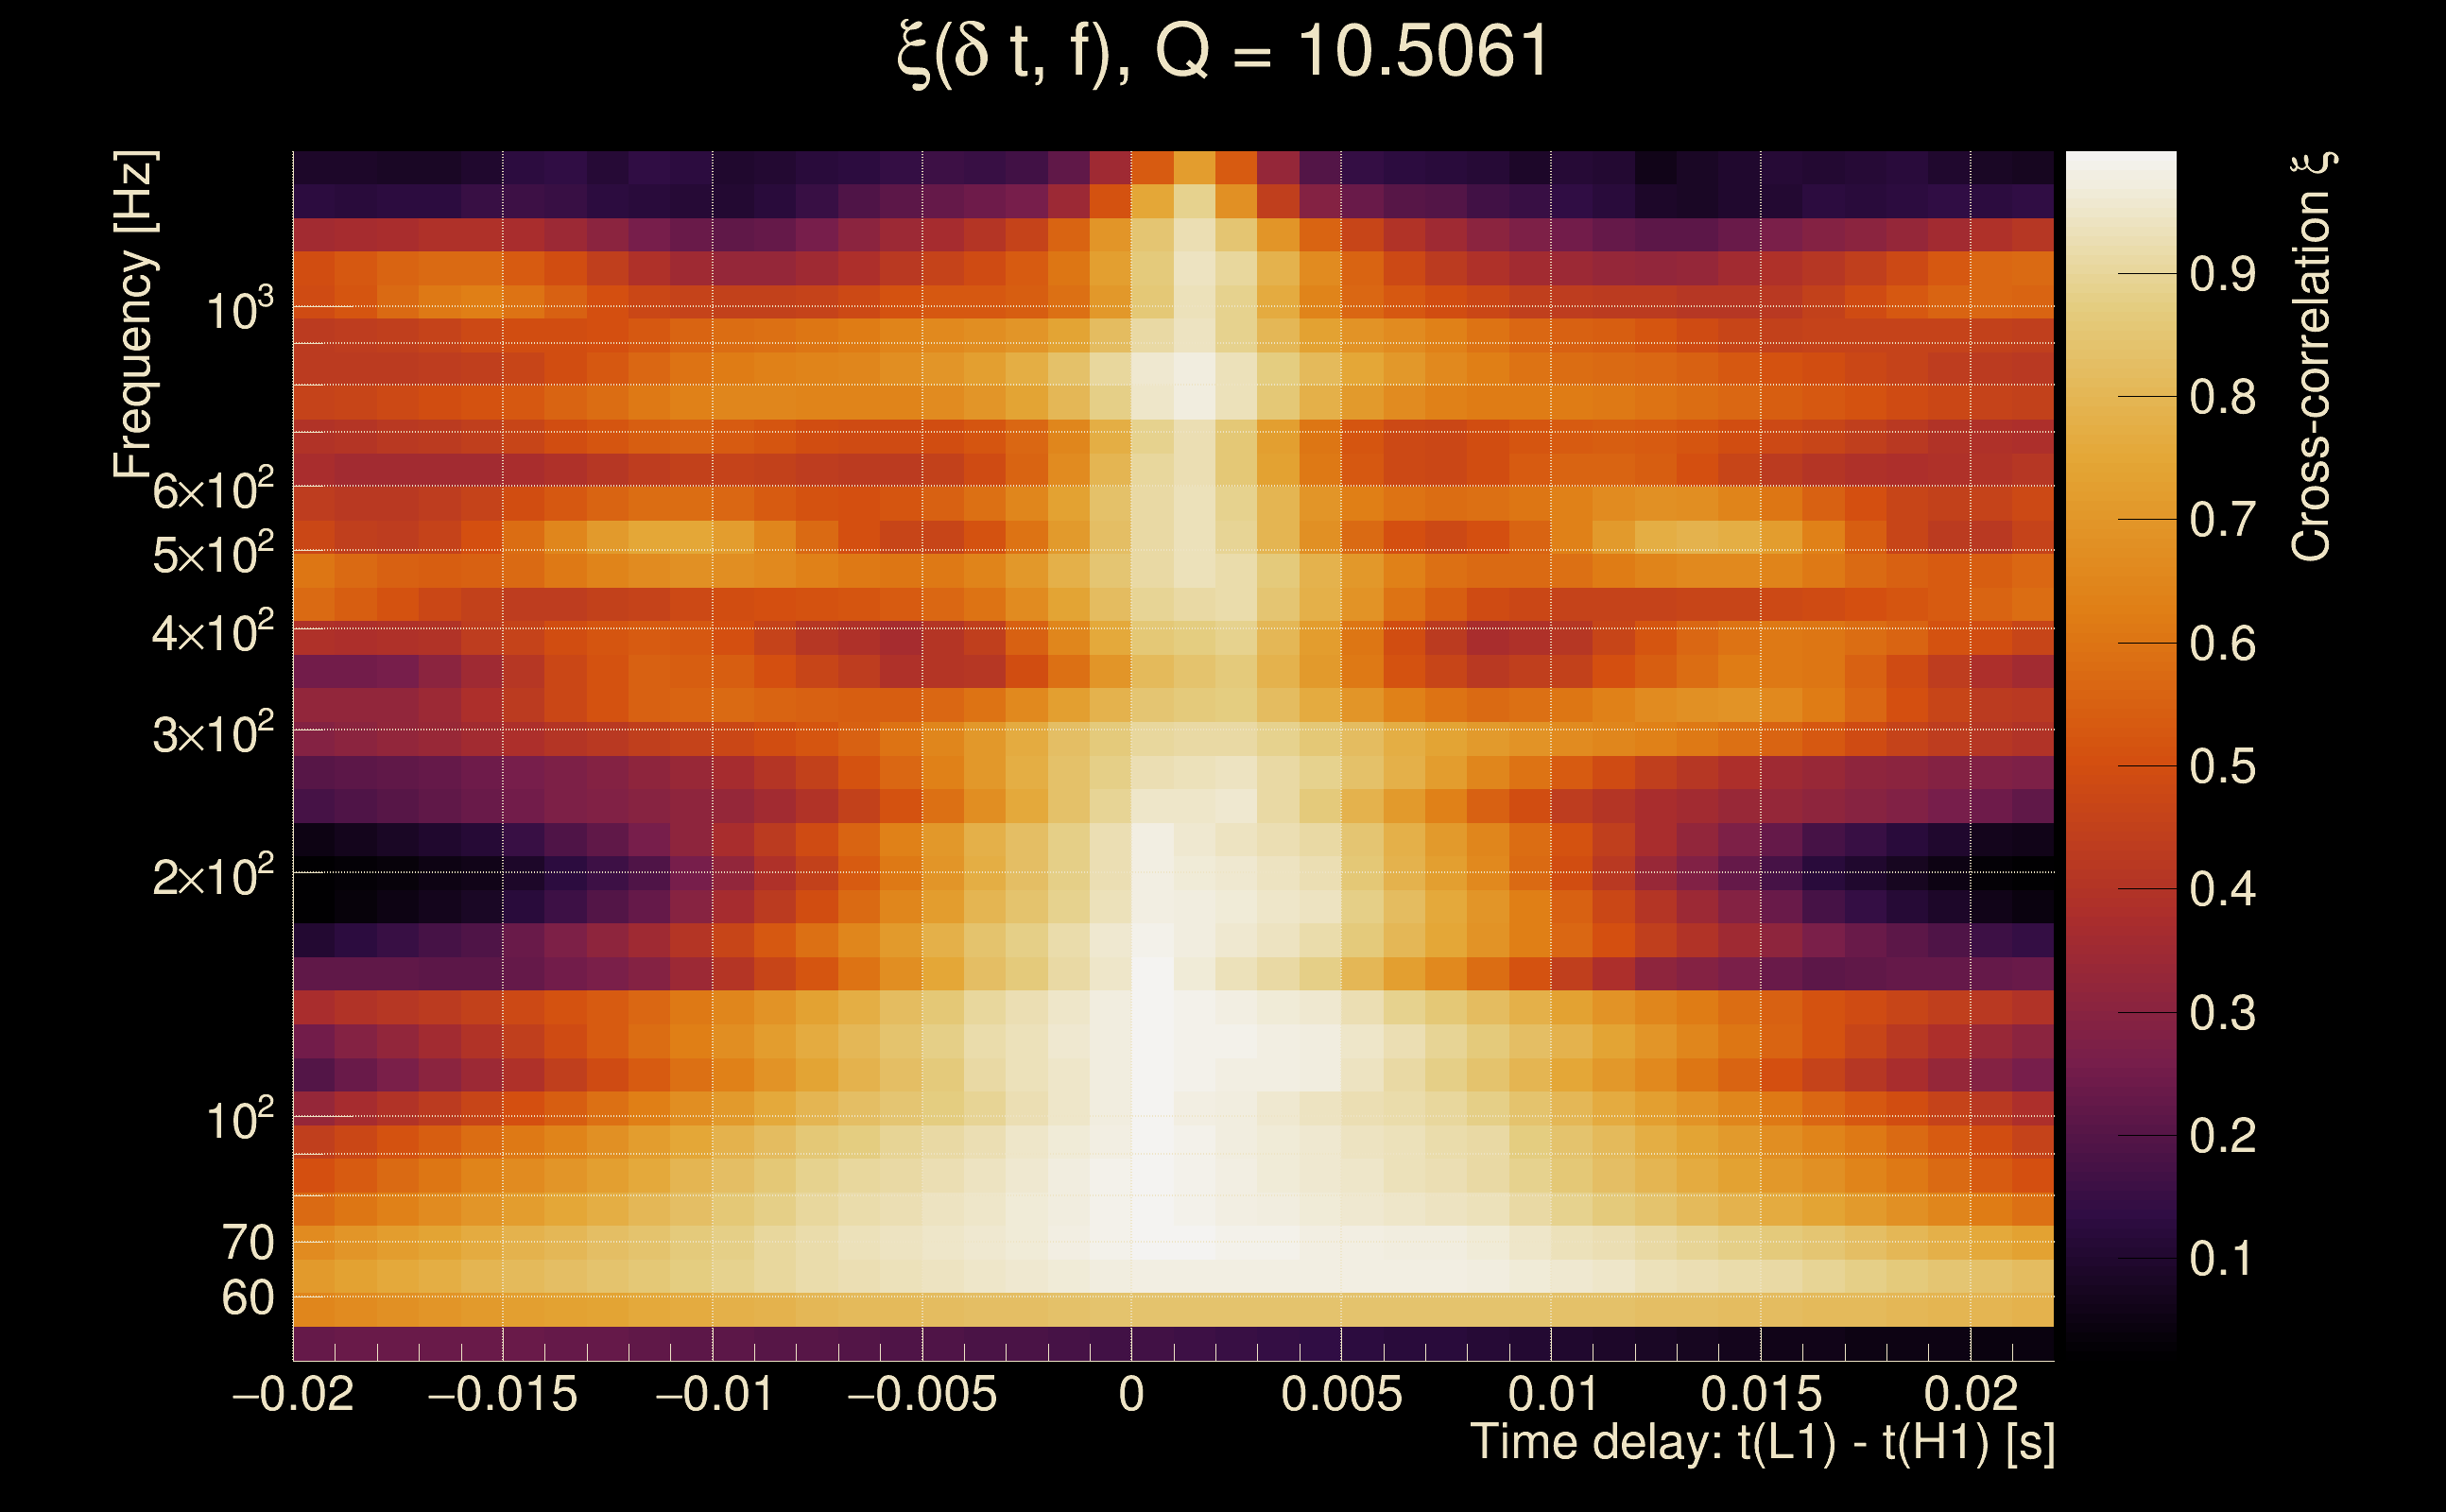
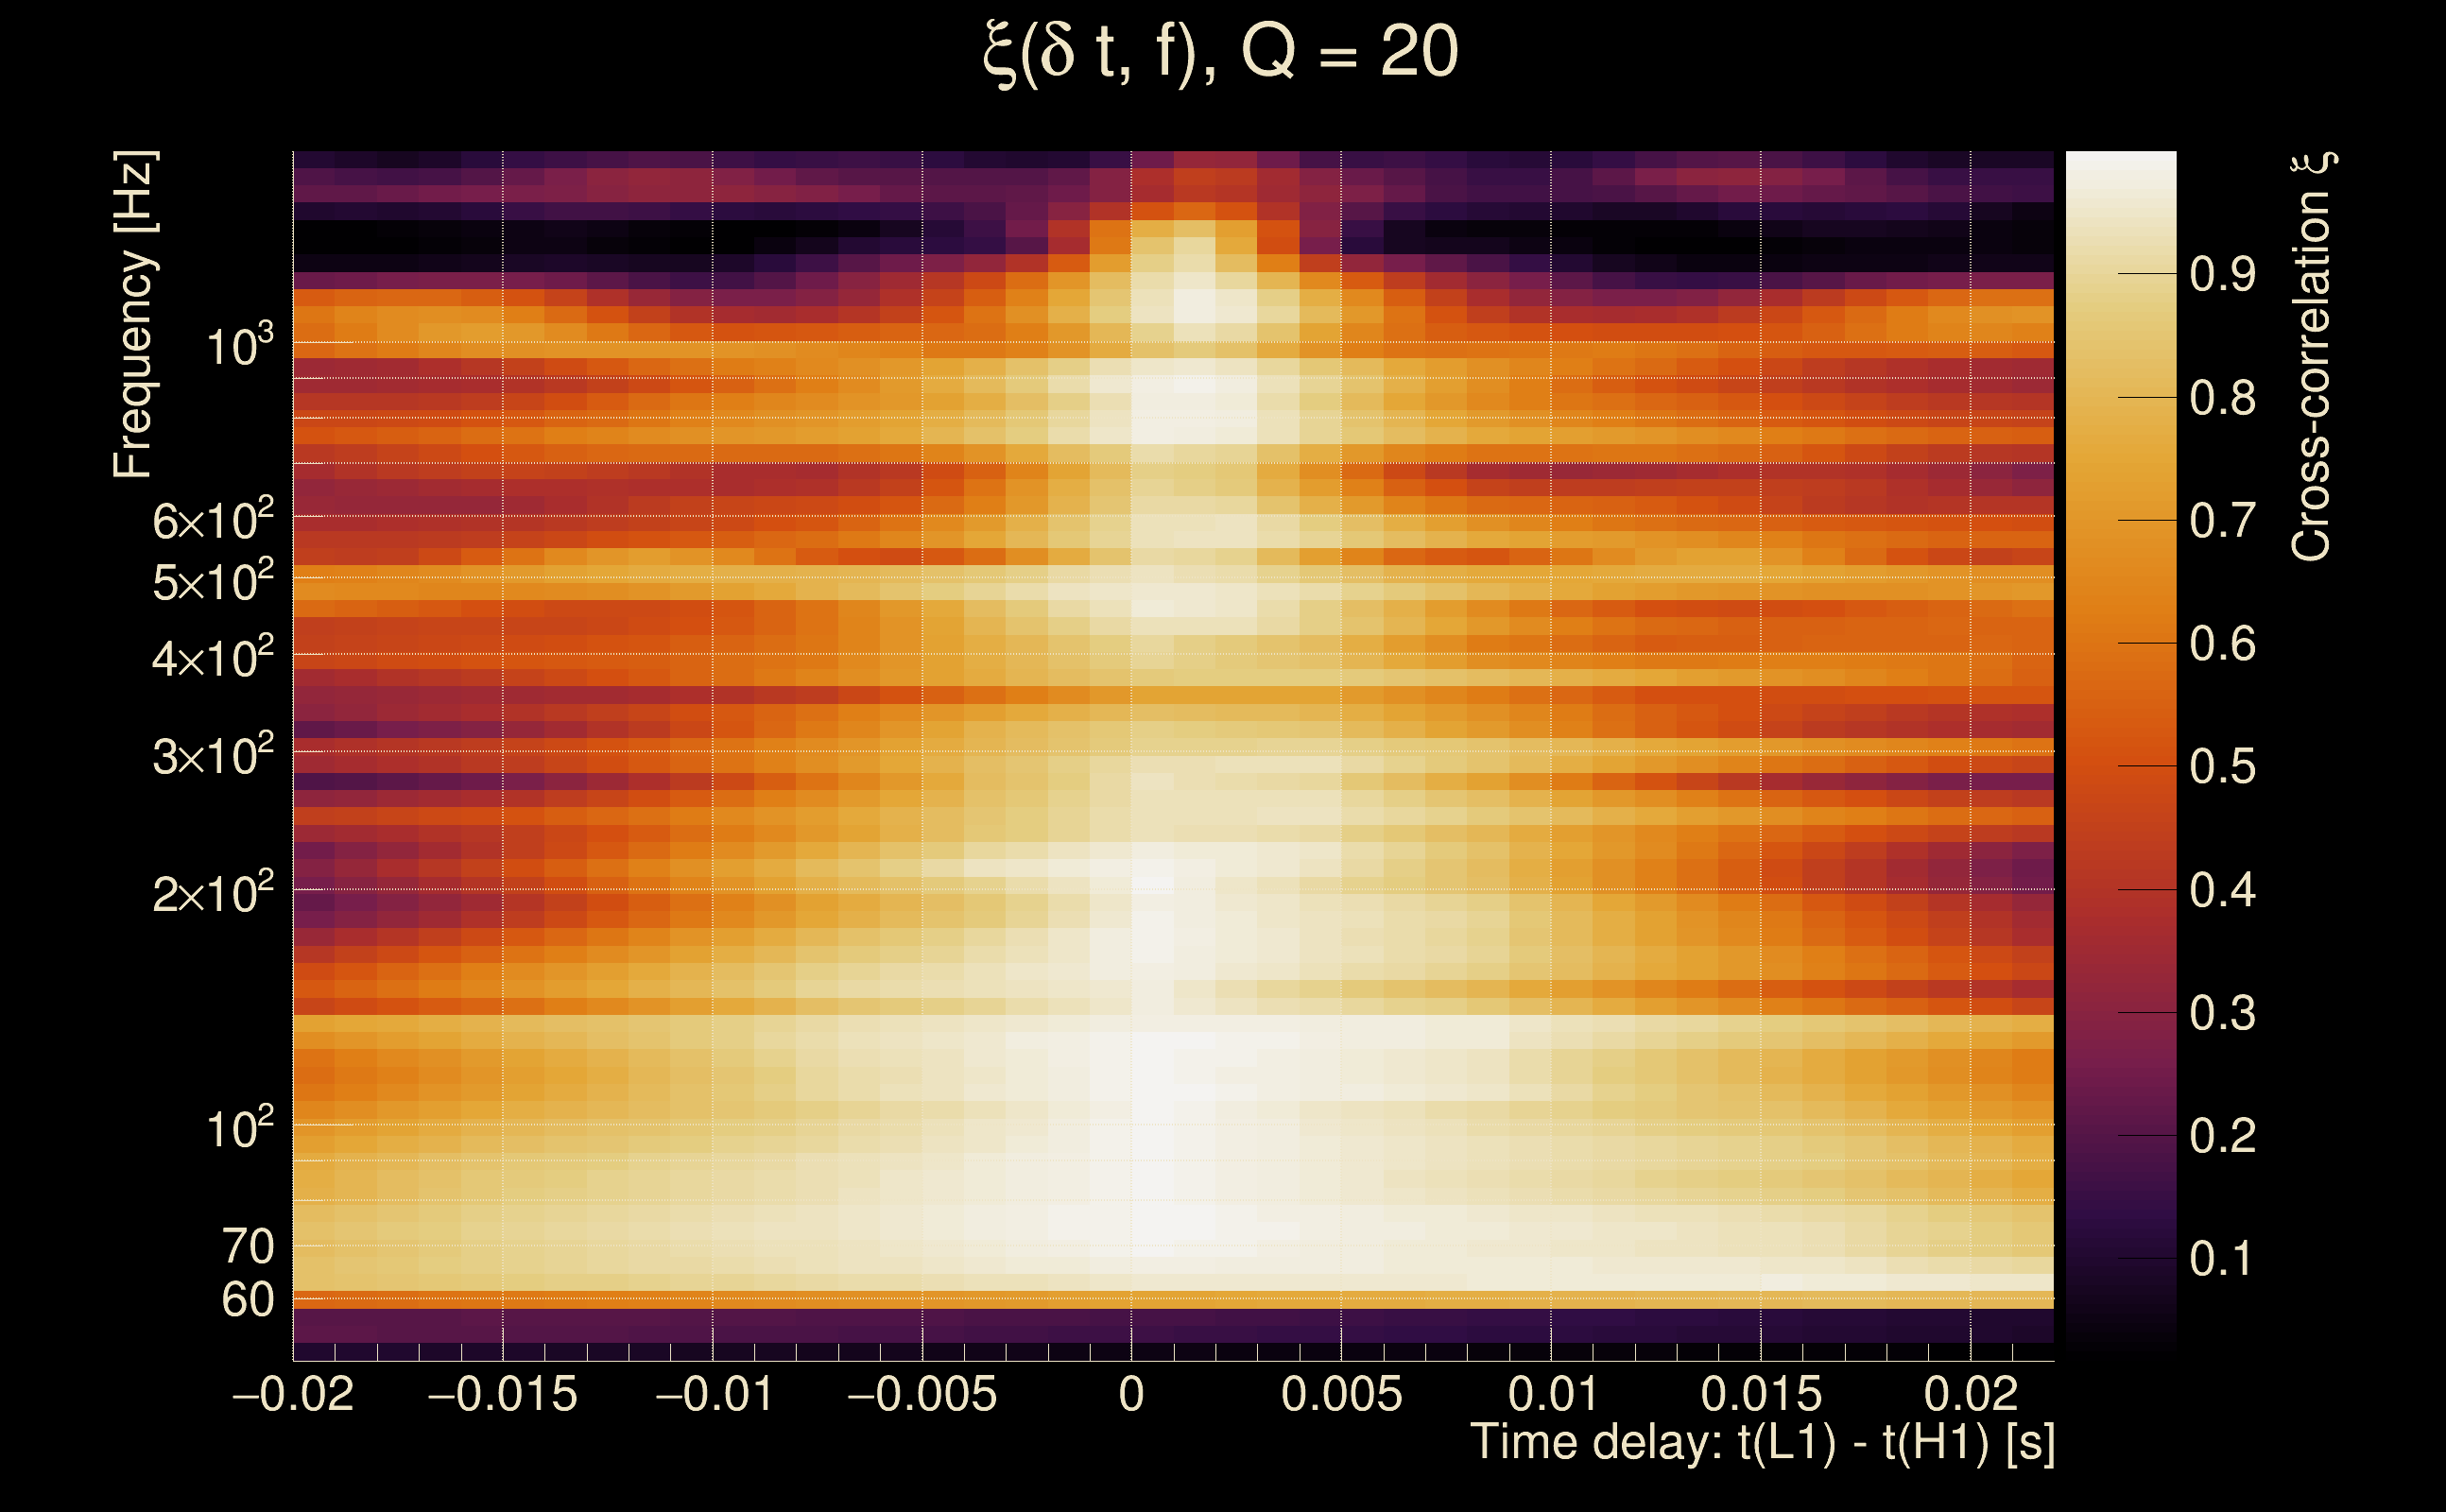
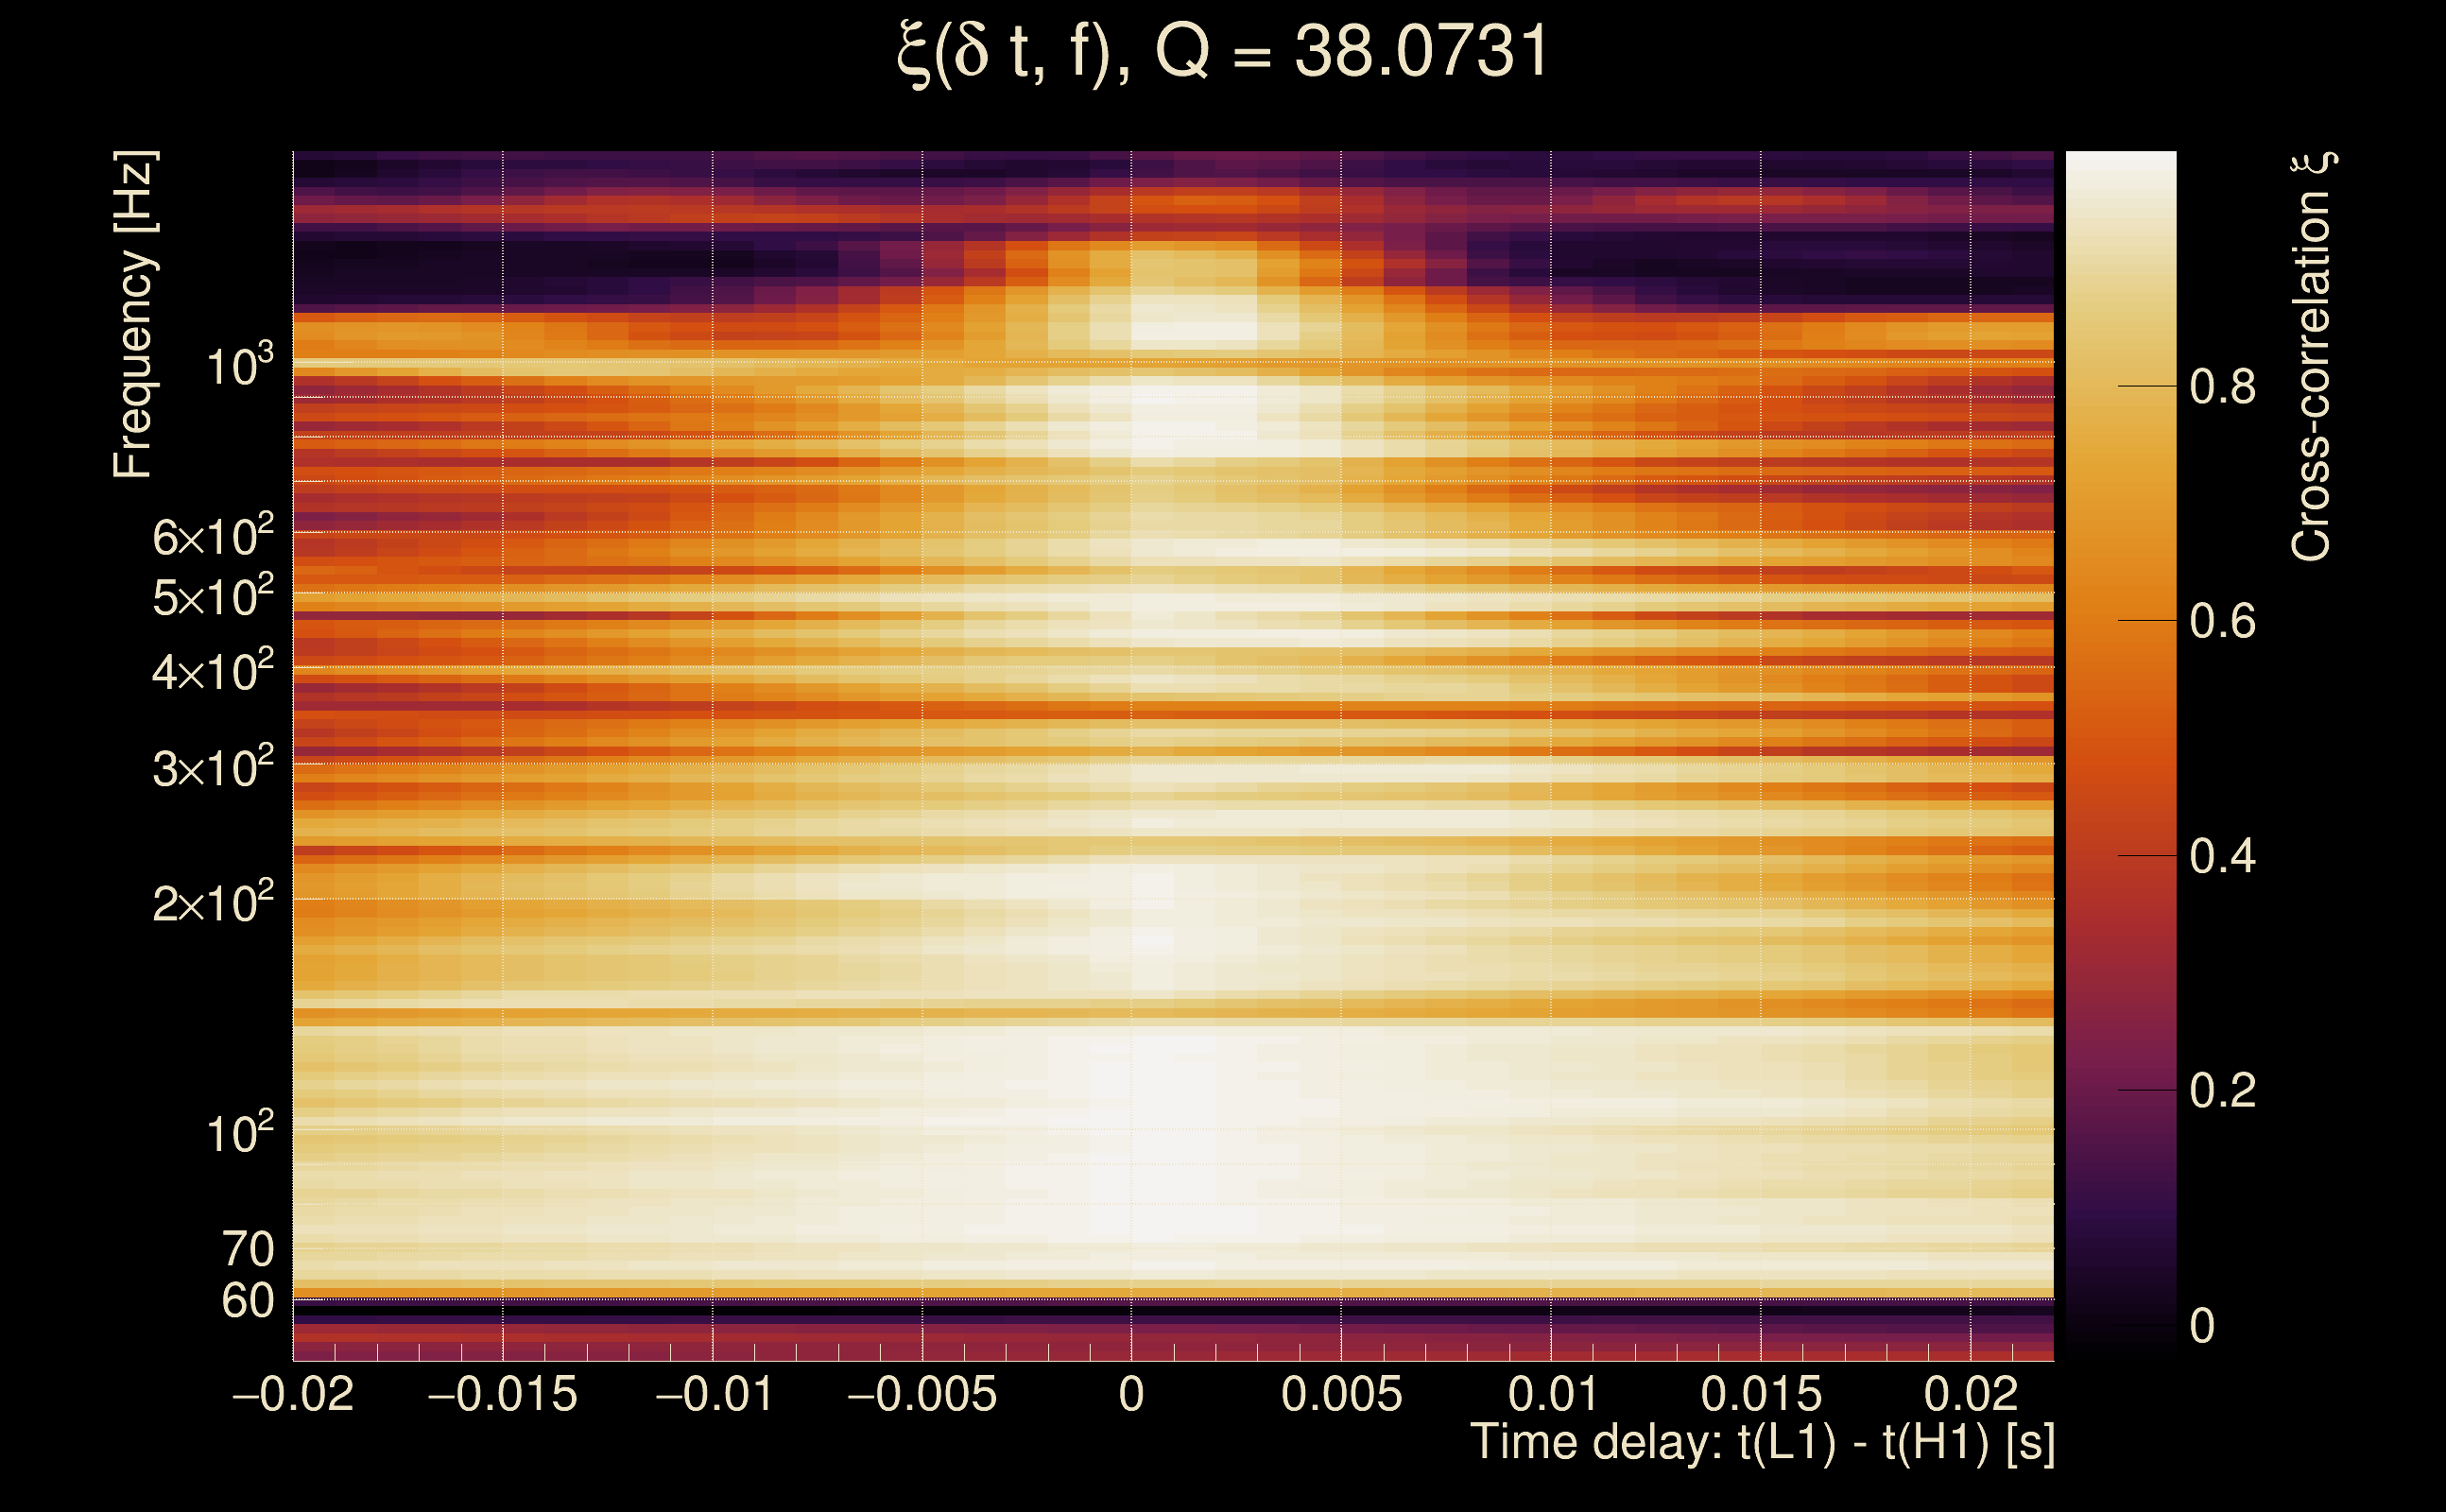
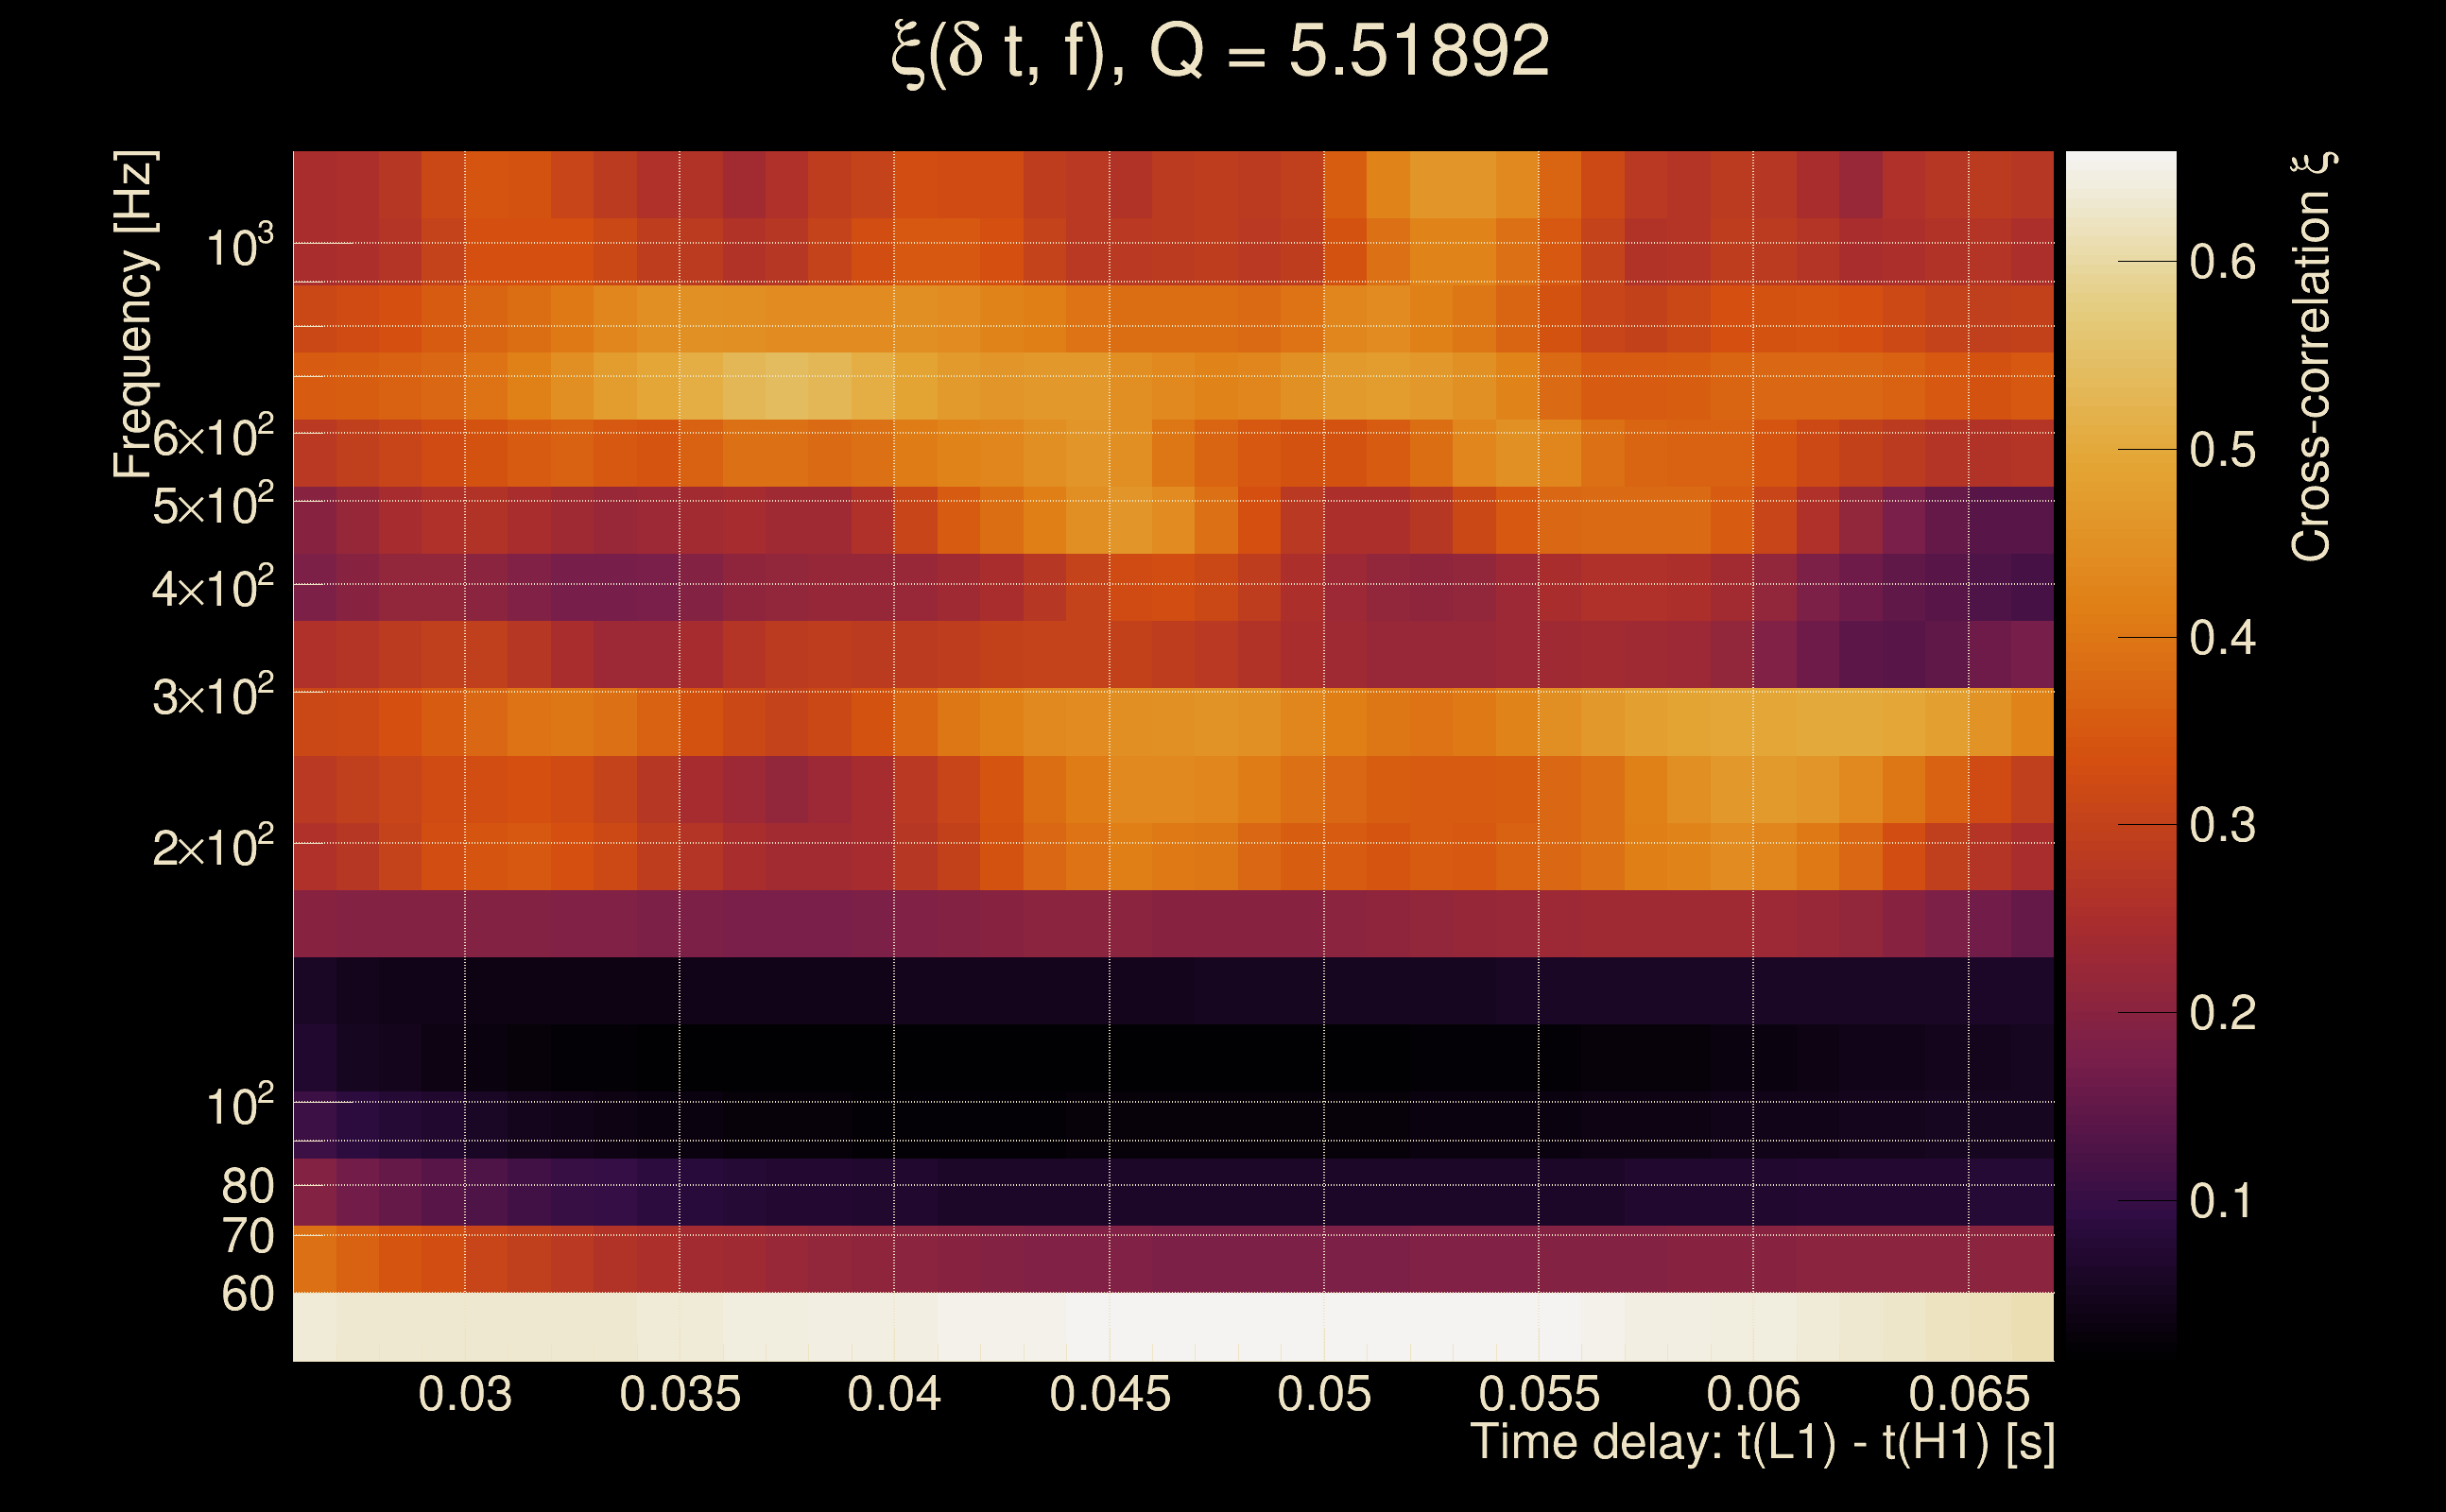
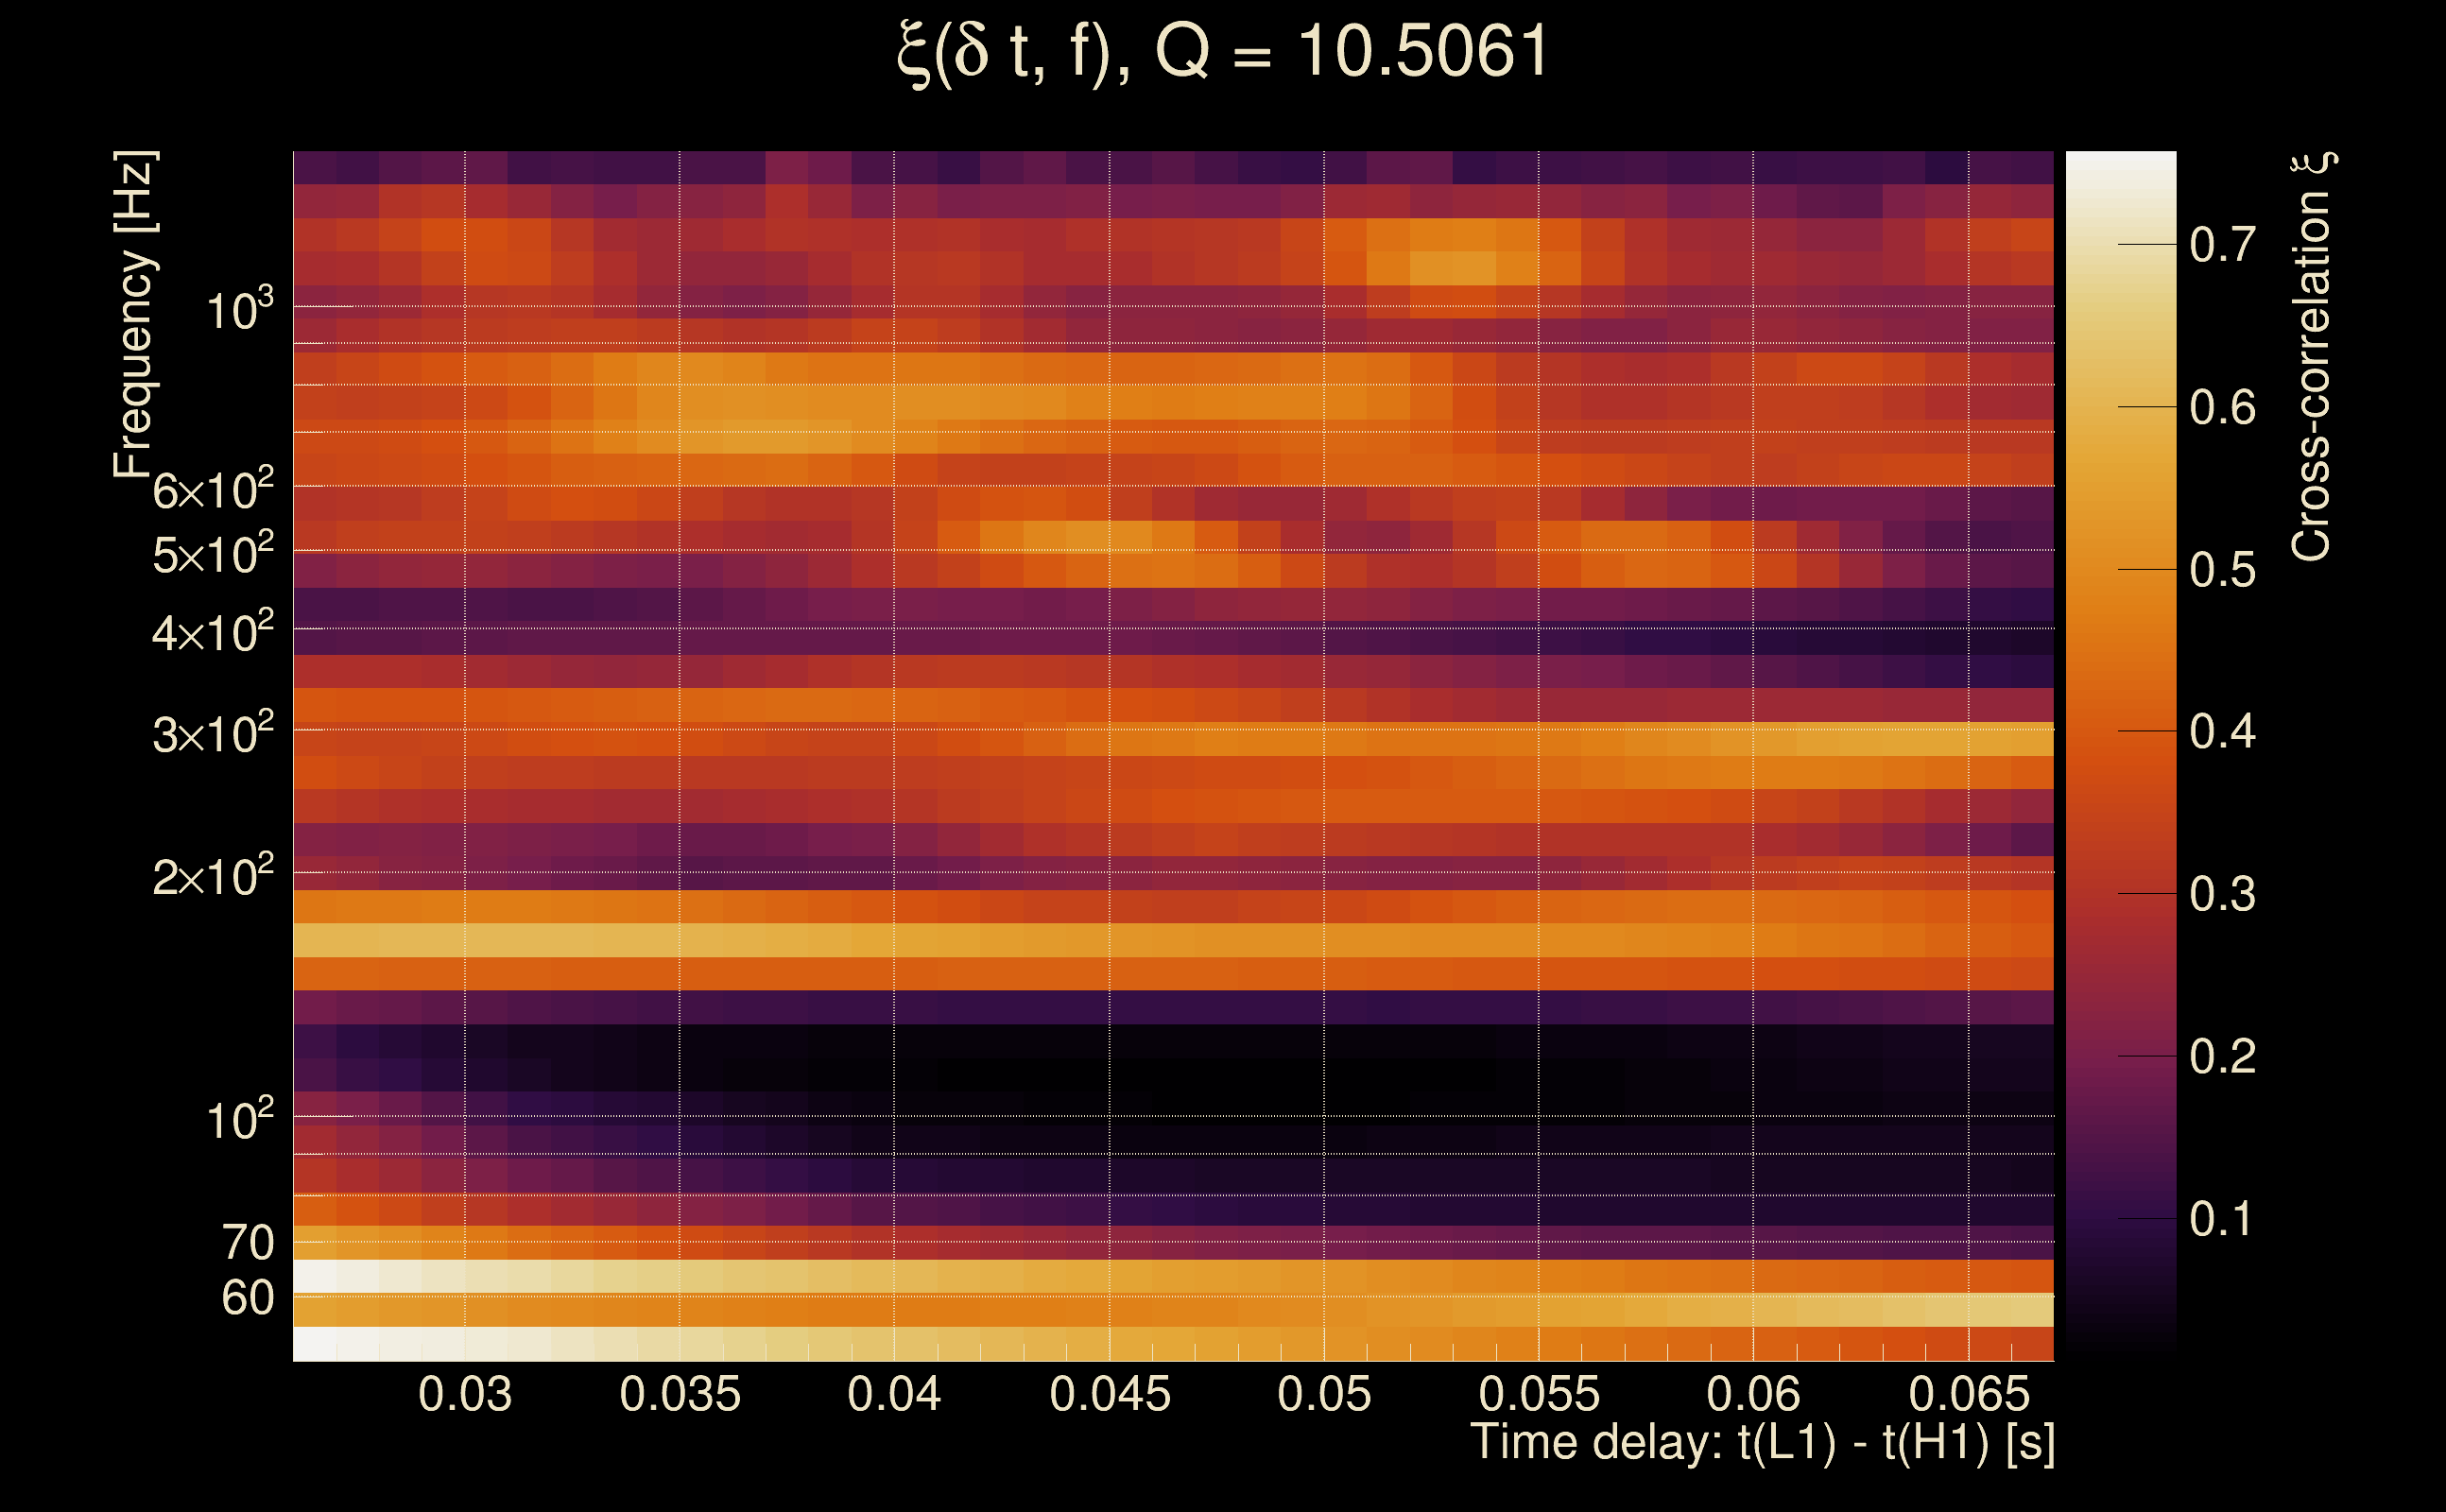
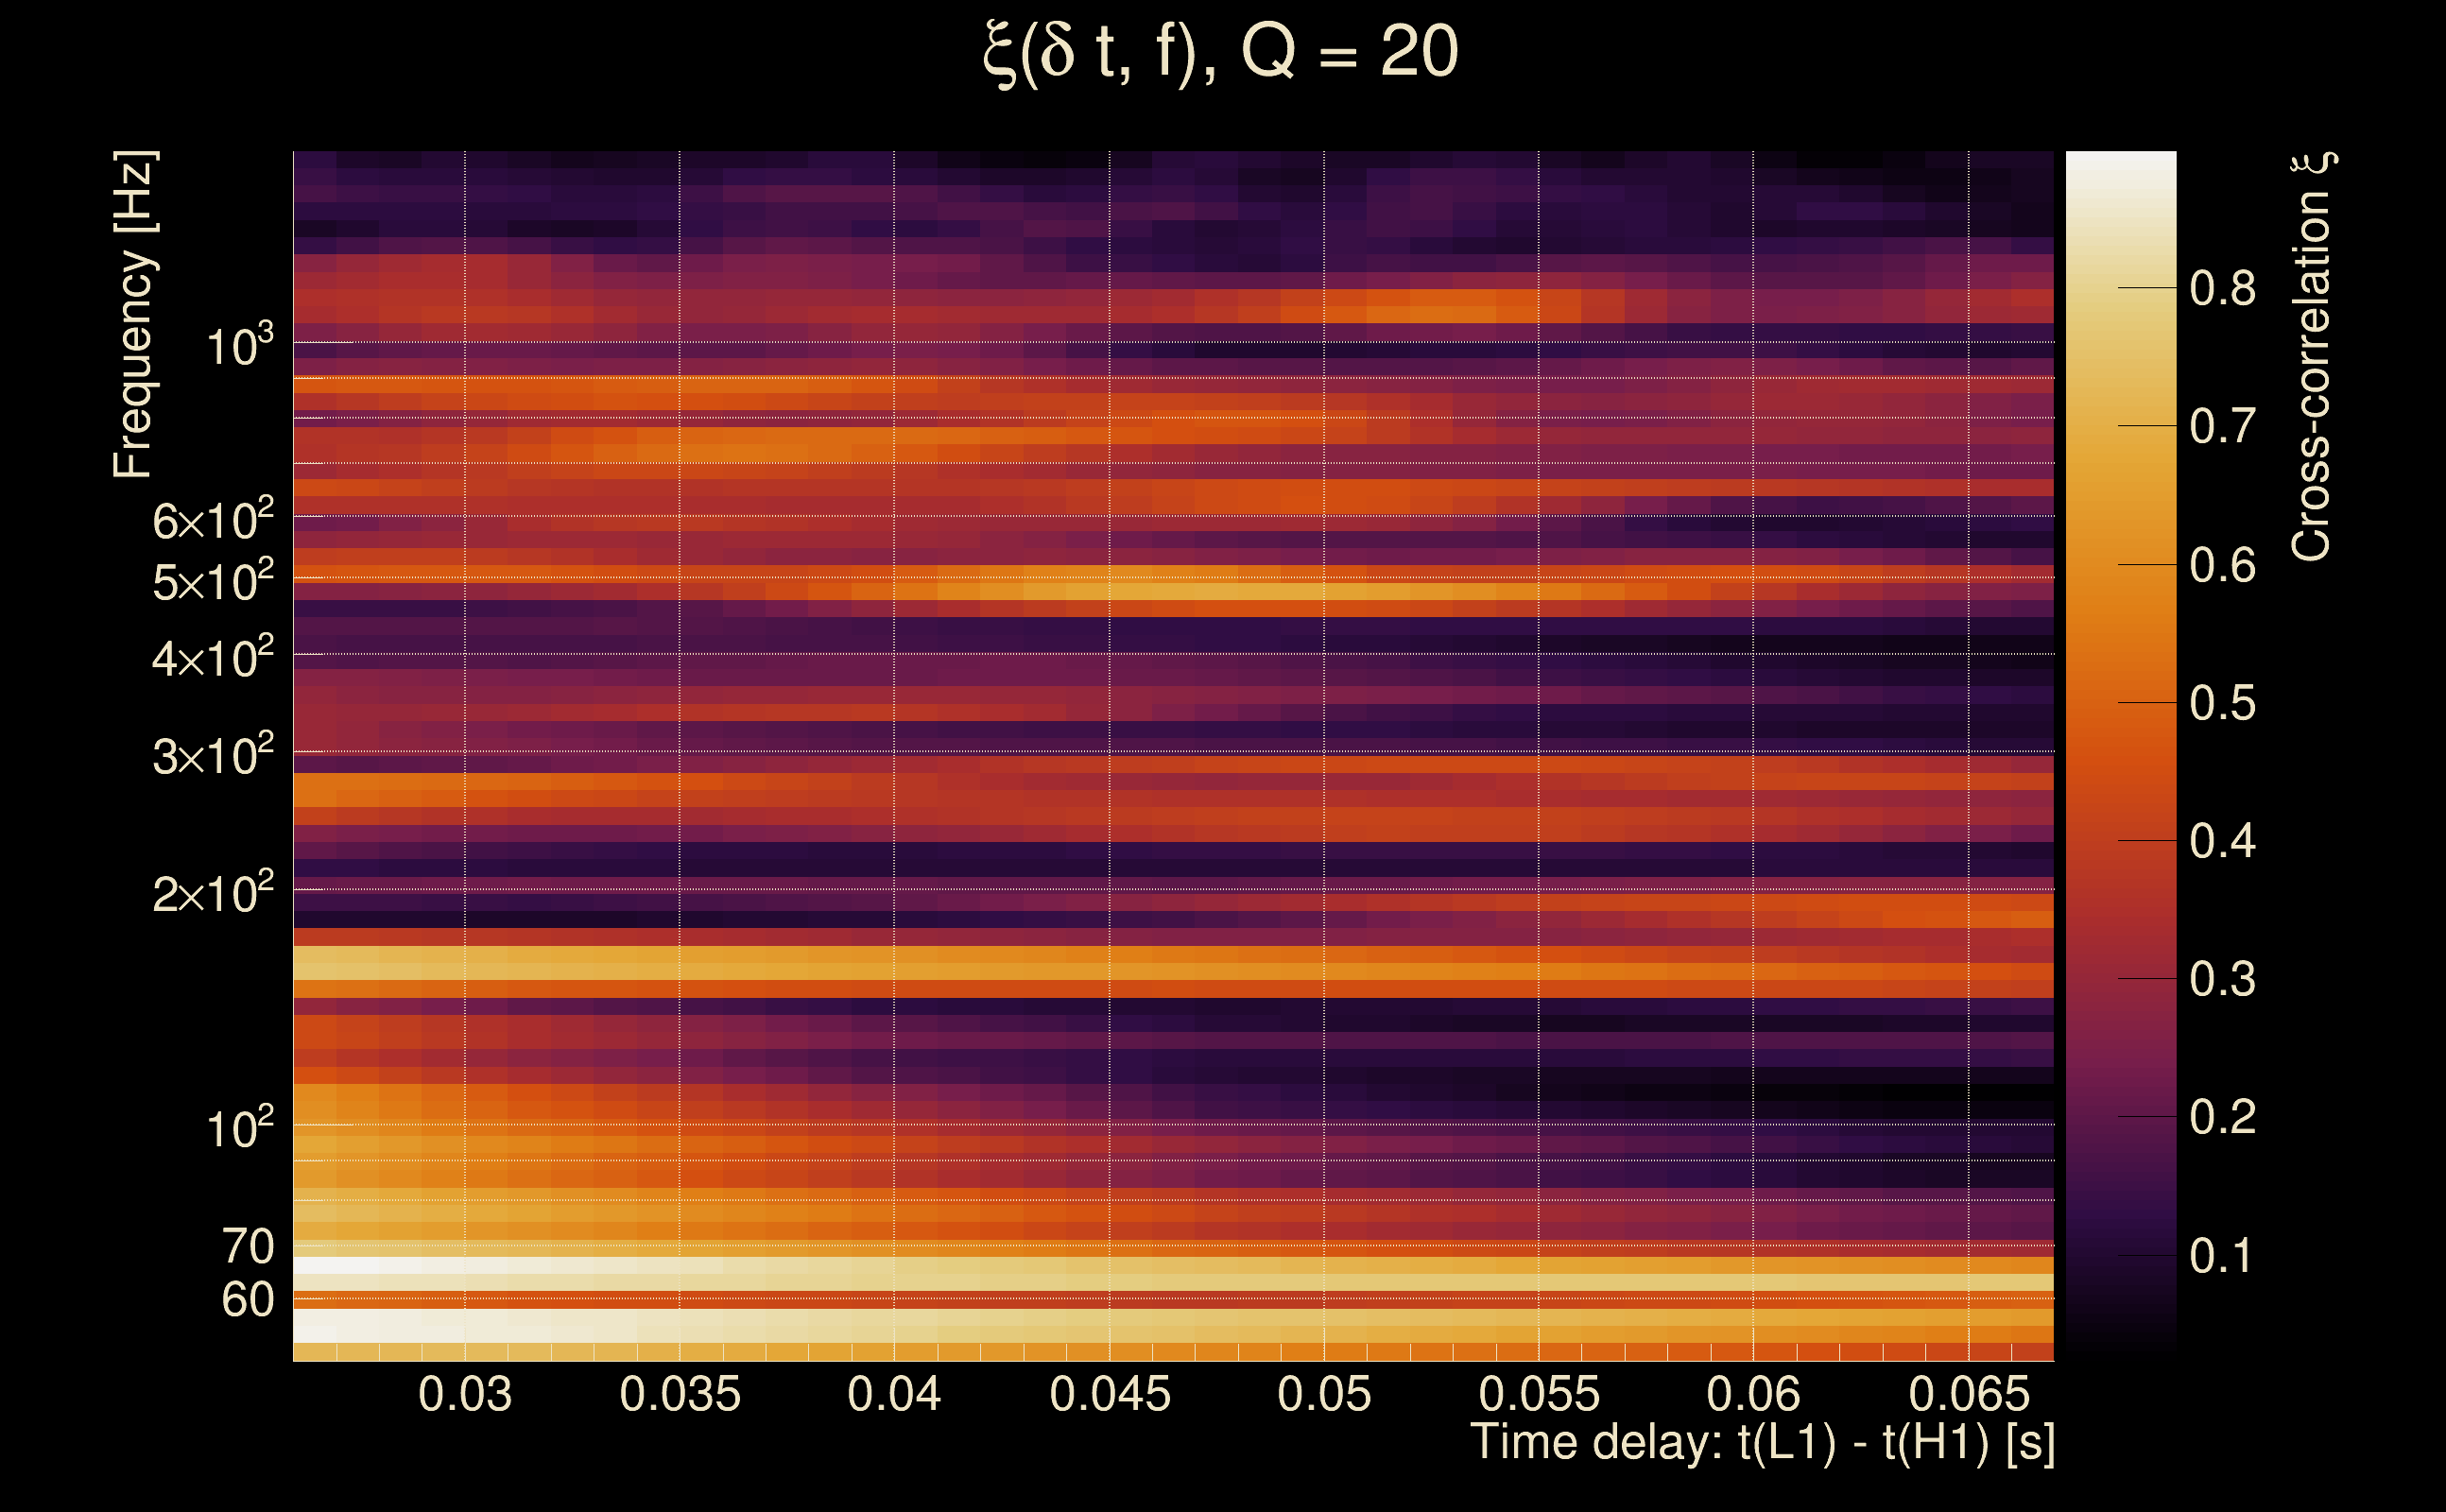
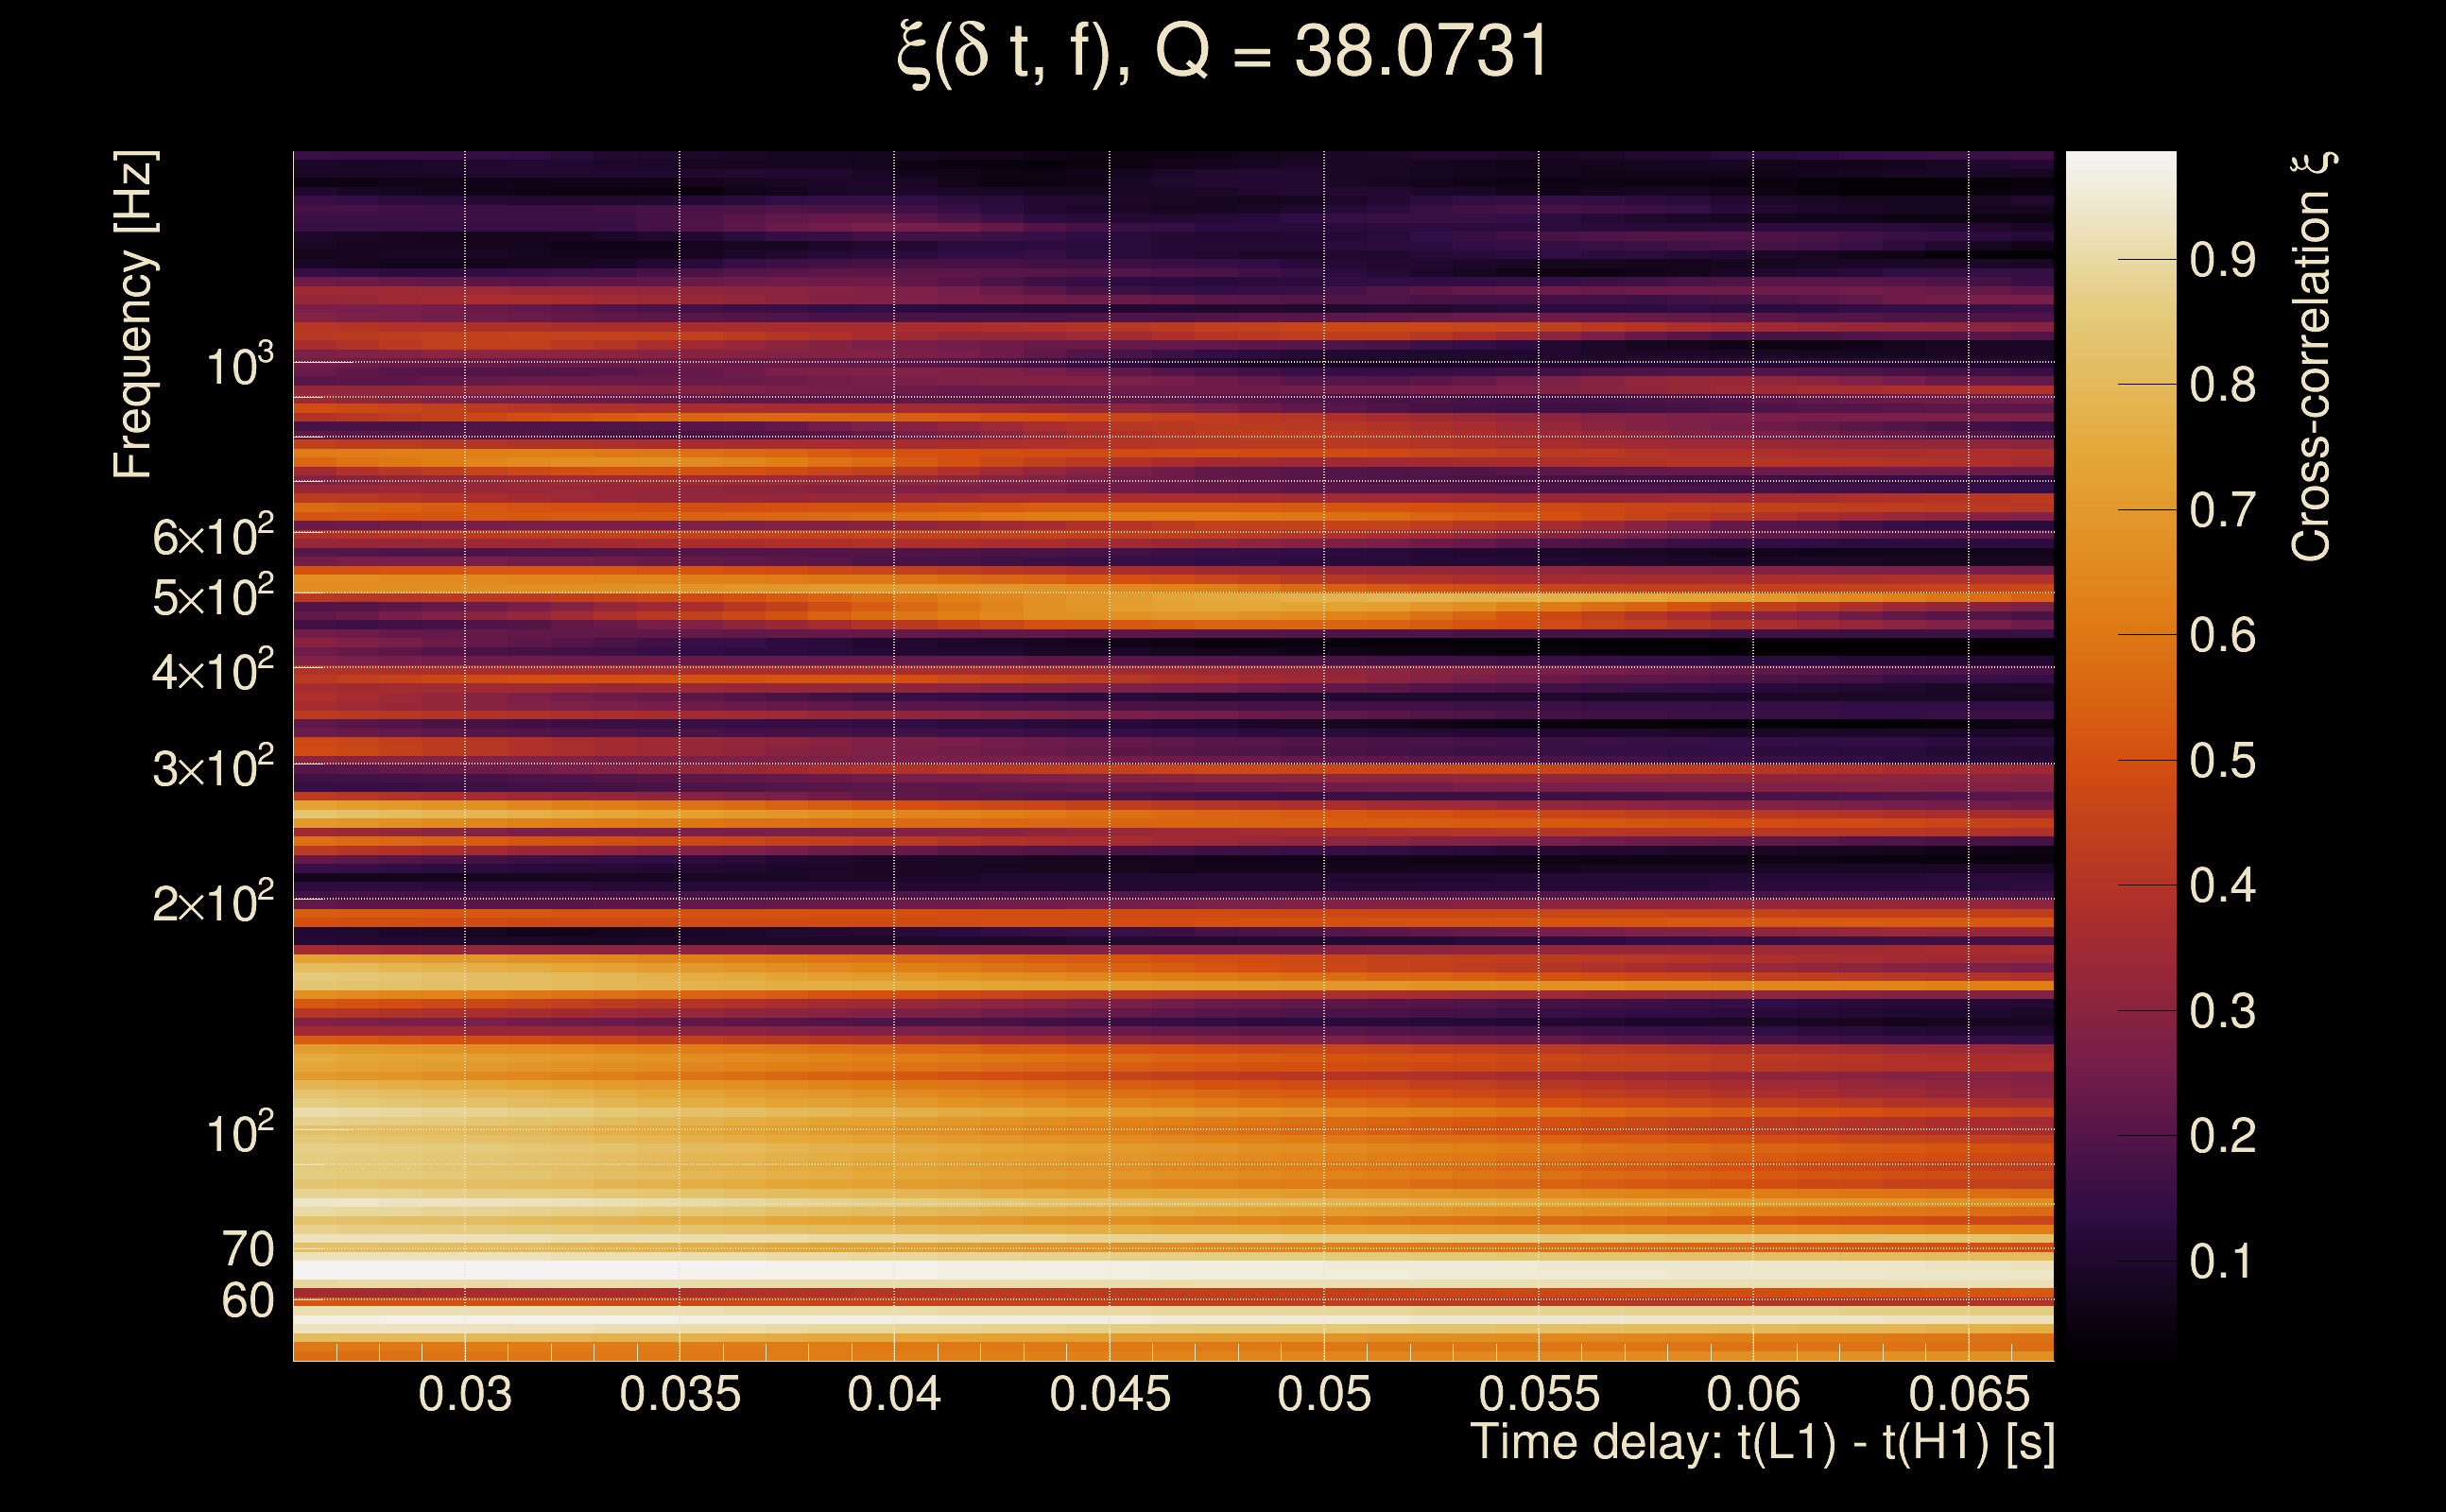
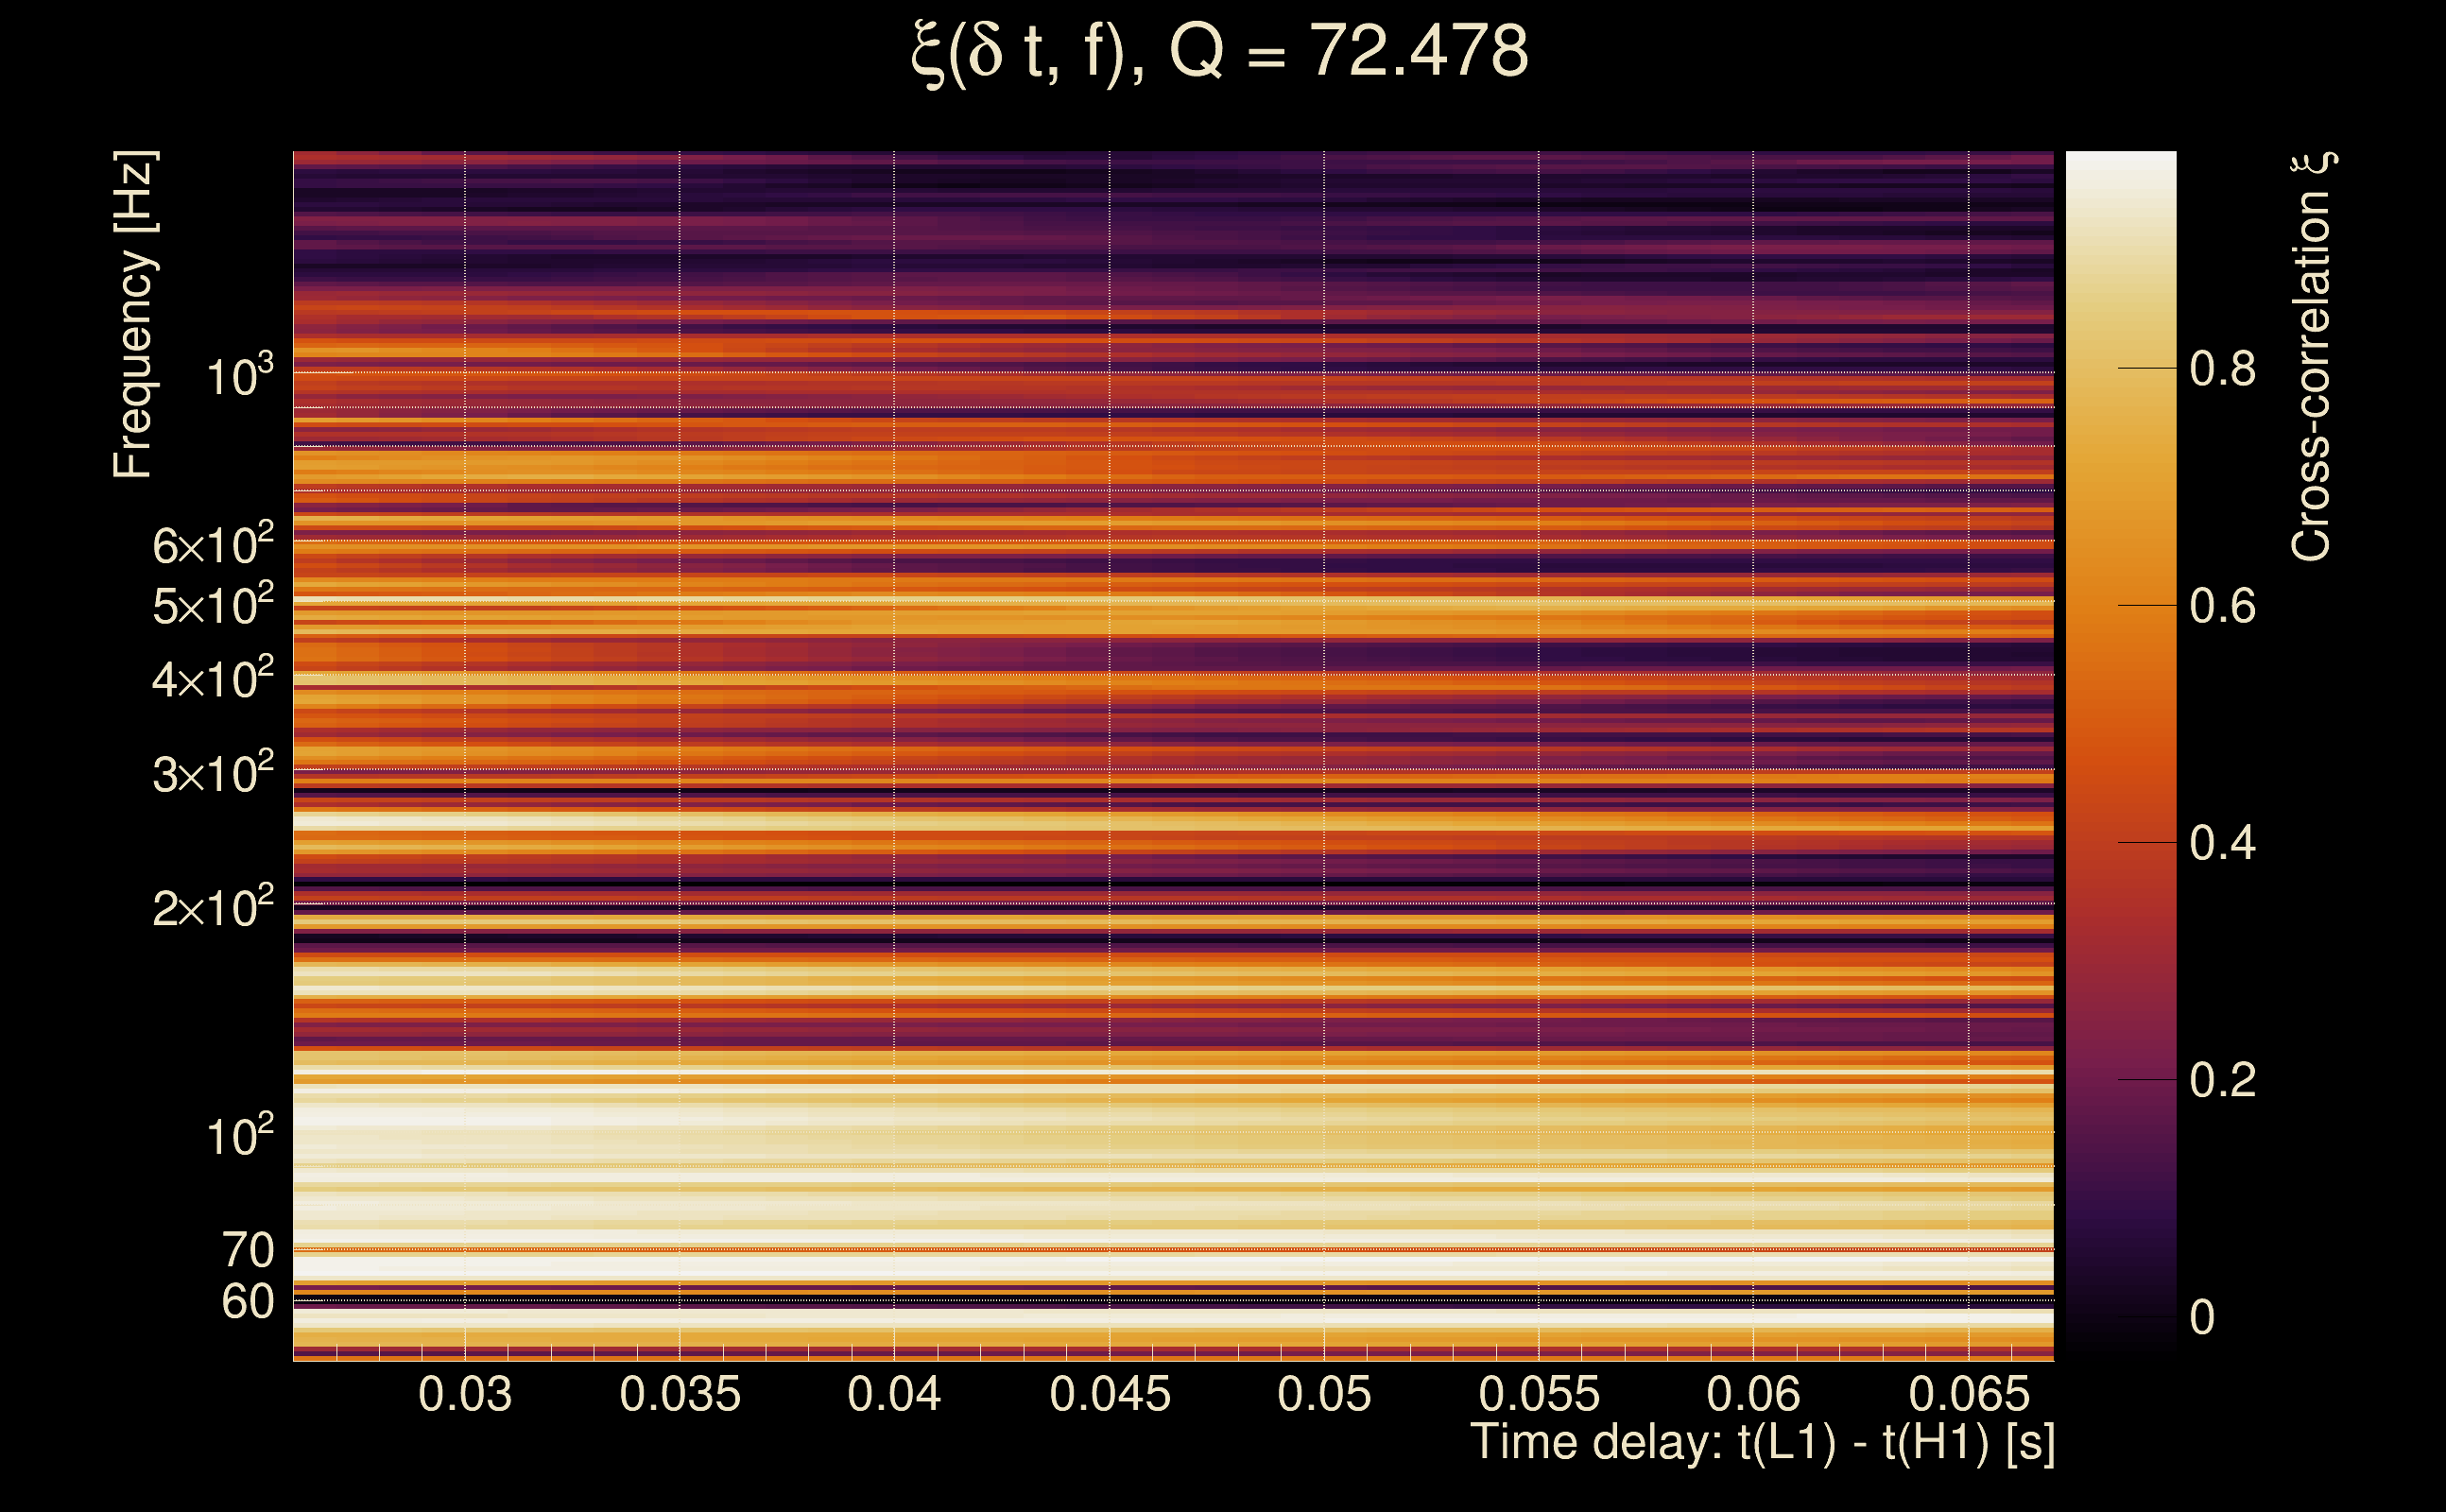
| Number of Q planes: | 5 (Q = 5.51892 → Q = 72.478) |
| Omicron frequency range: | 50 Hz → 1958.38 Hz |
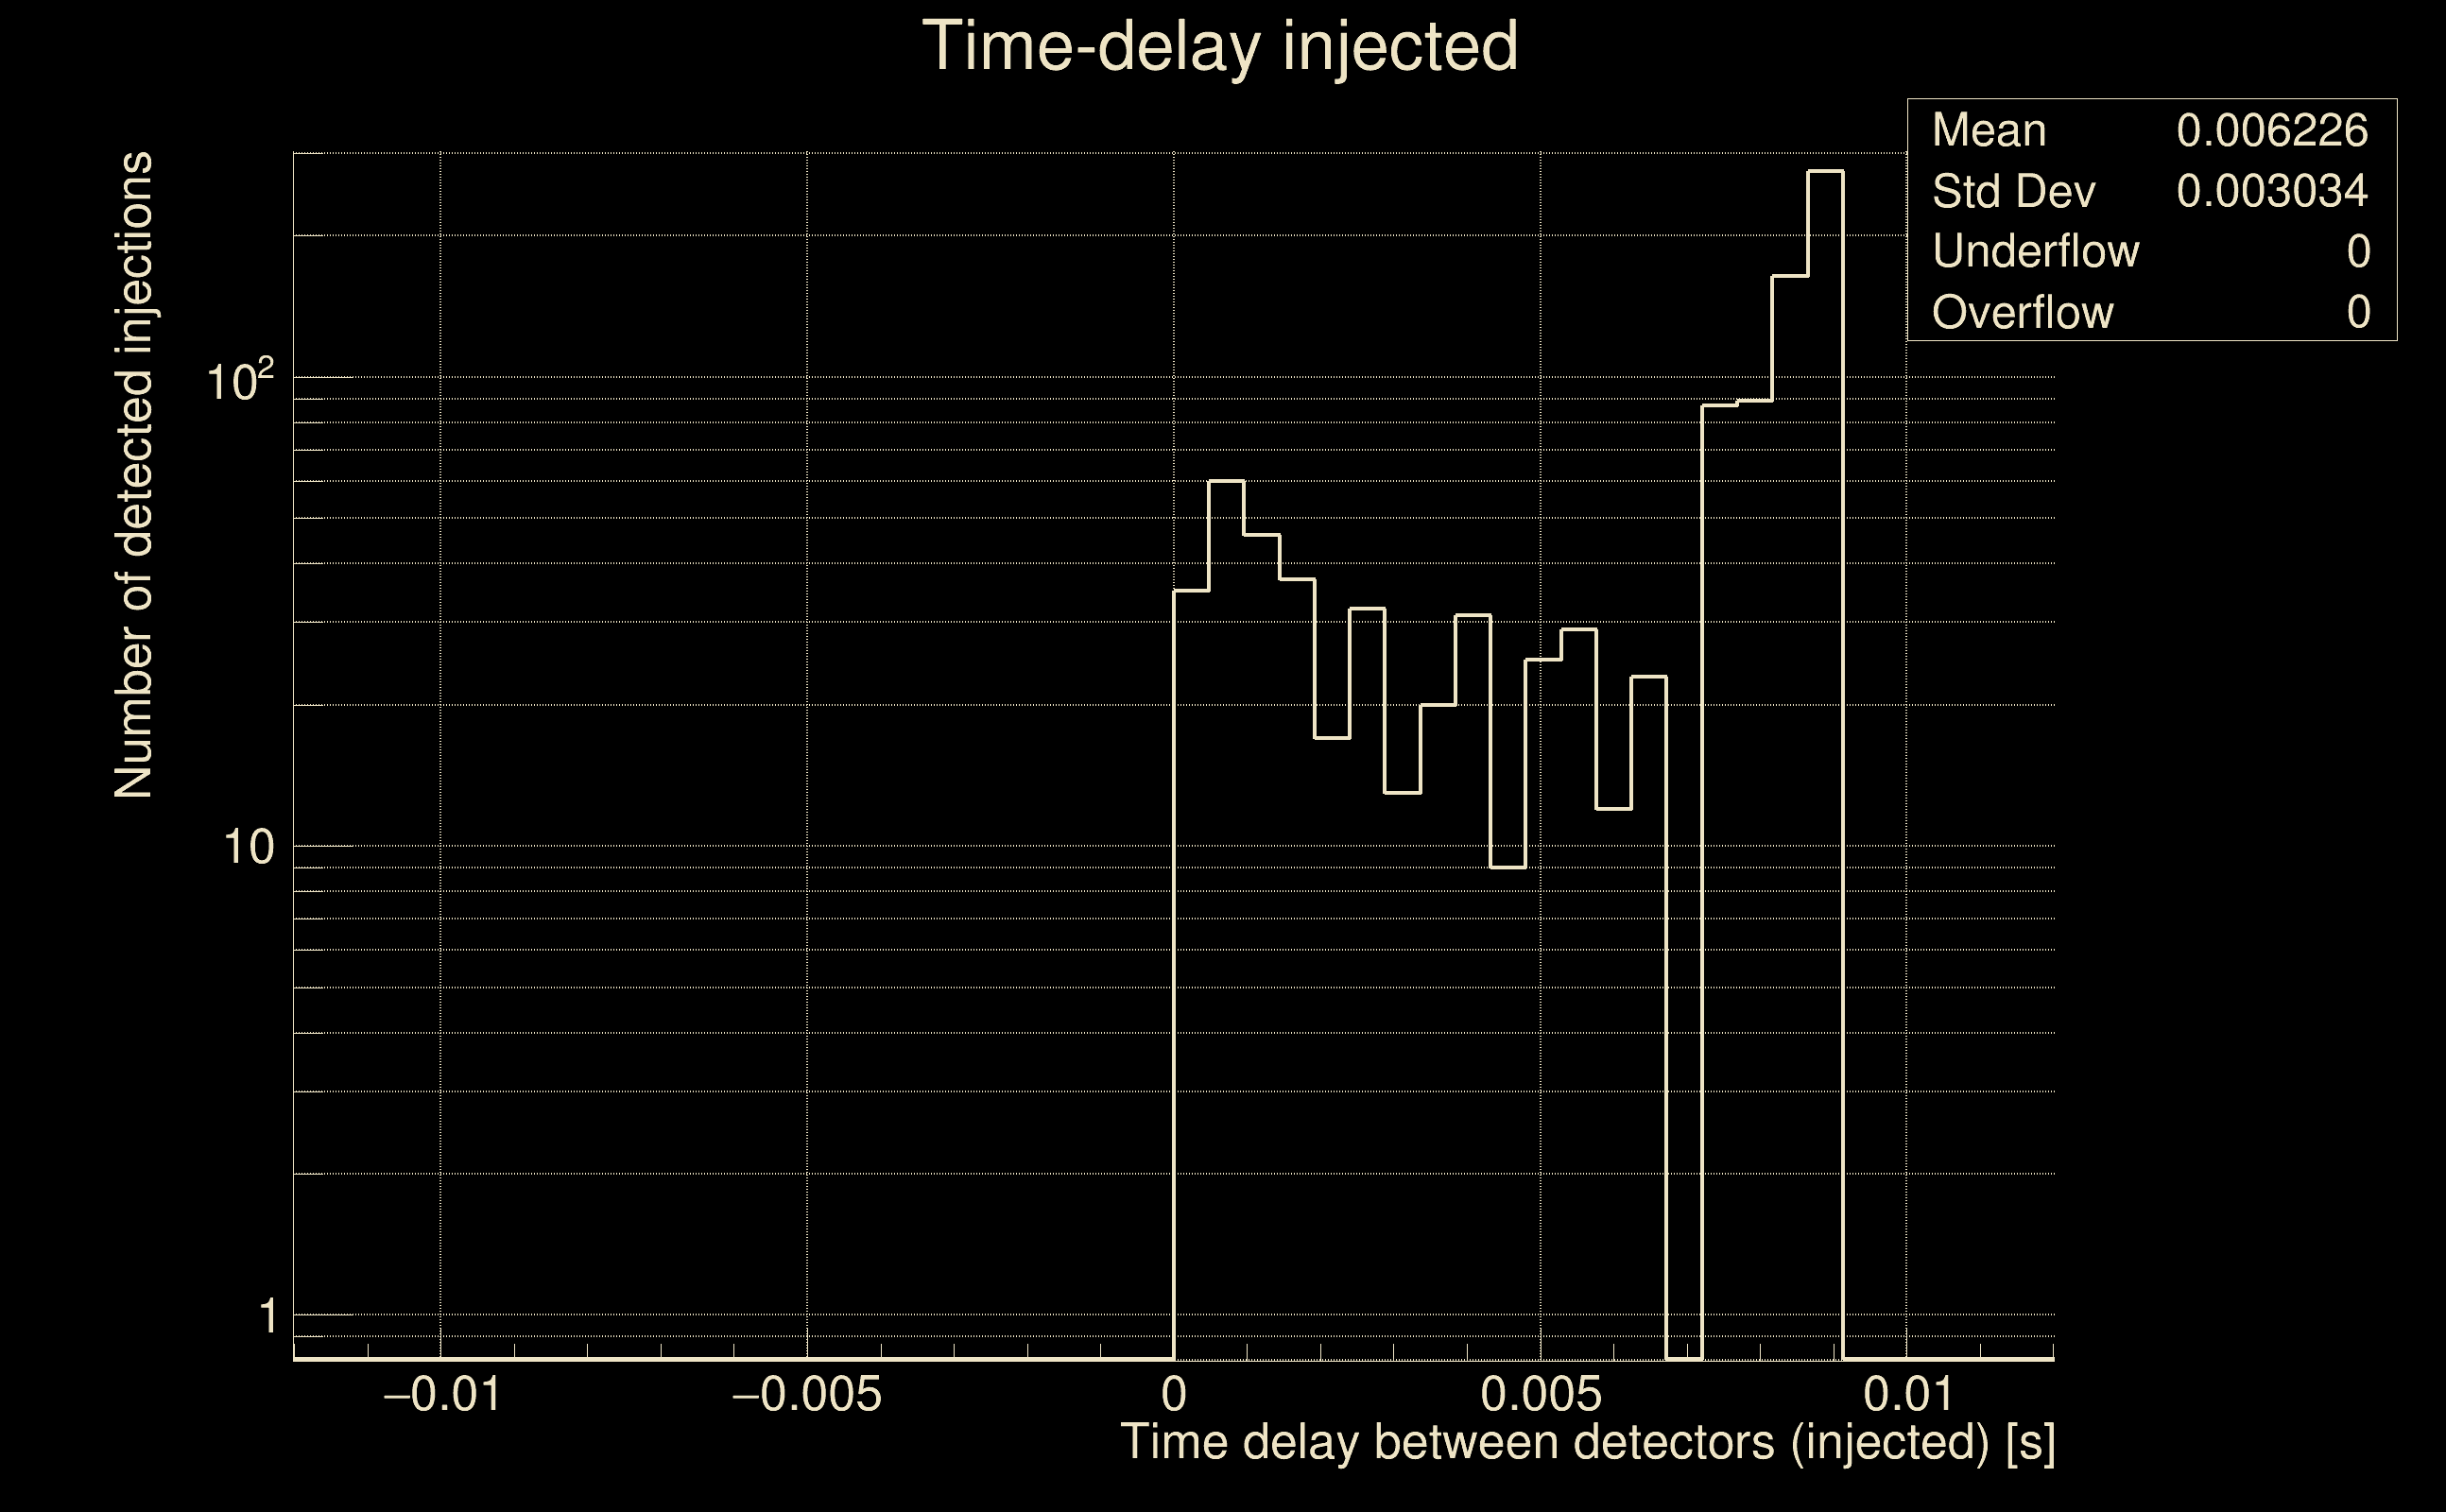
| Light travel time between detectors: | 0.0100128 s |
| Slice extra-time (calibration uncertainty + slice veto): | 0.0129872 s |
| Number of time-delay bins in a cross-correlation map: | 10000 |
| Number of slices in a cross-correlation map: | 217 |
| Number of time-delay bins in a slice: | 46 |
| SNR gating: | < 100 (detector 0), < 100 (detector 1) |
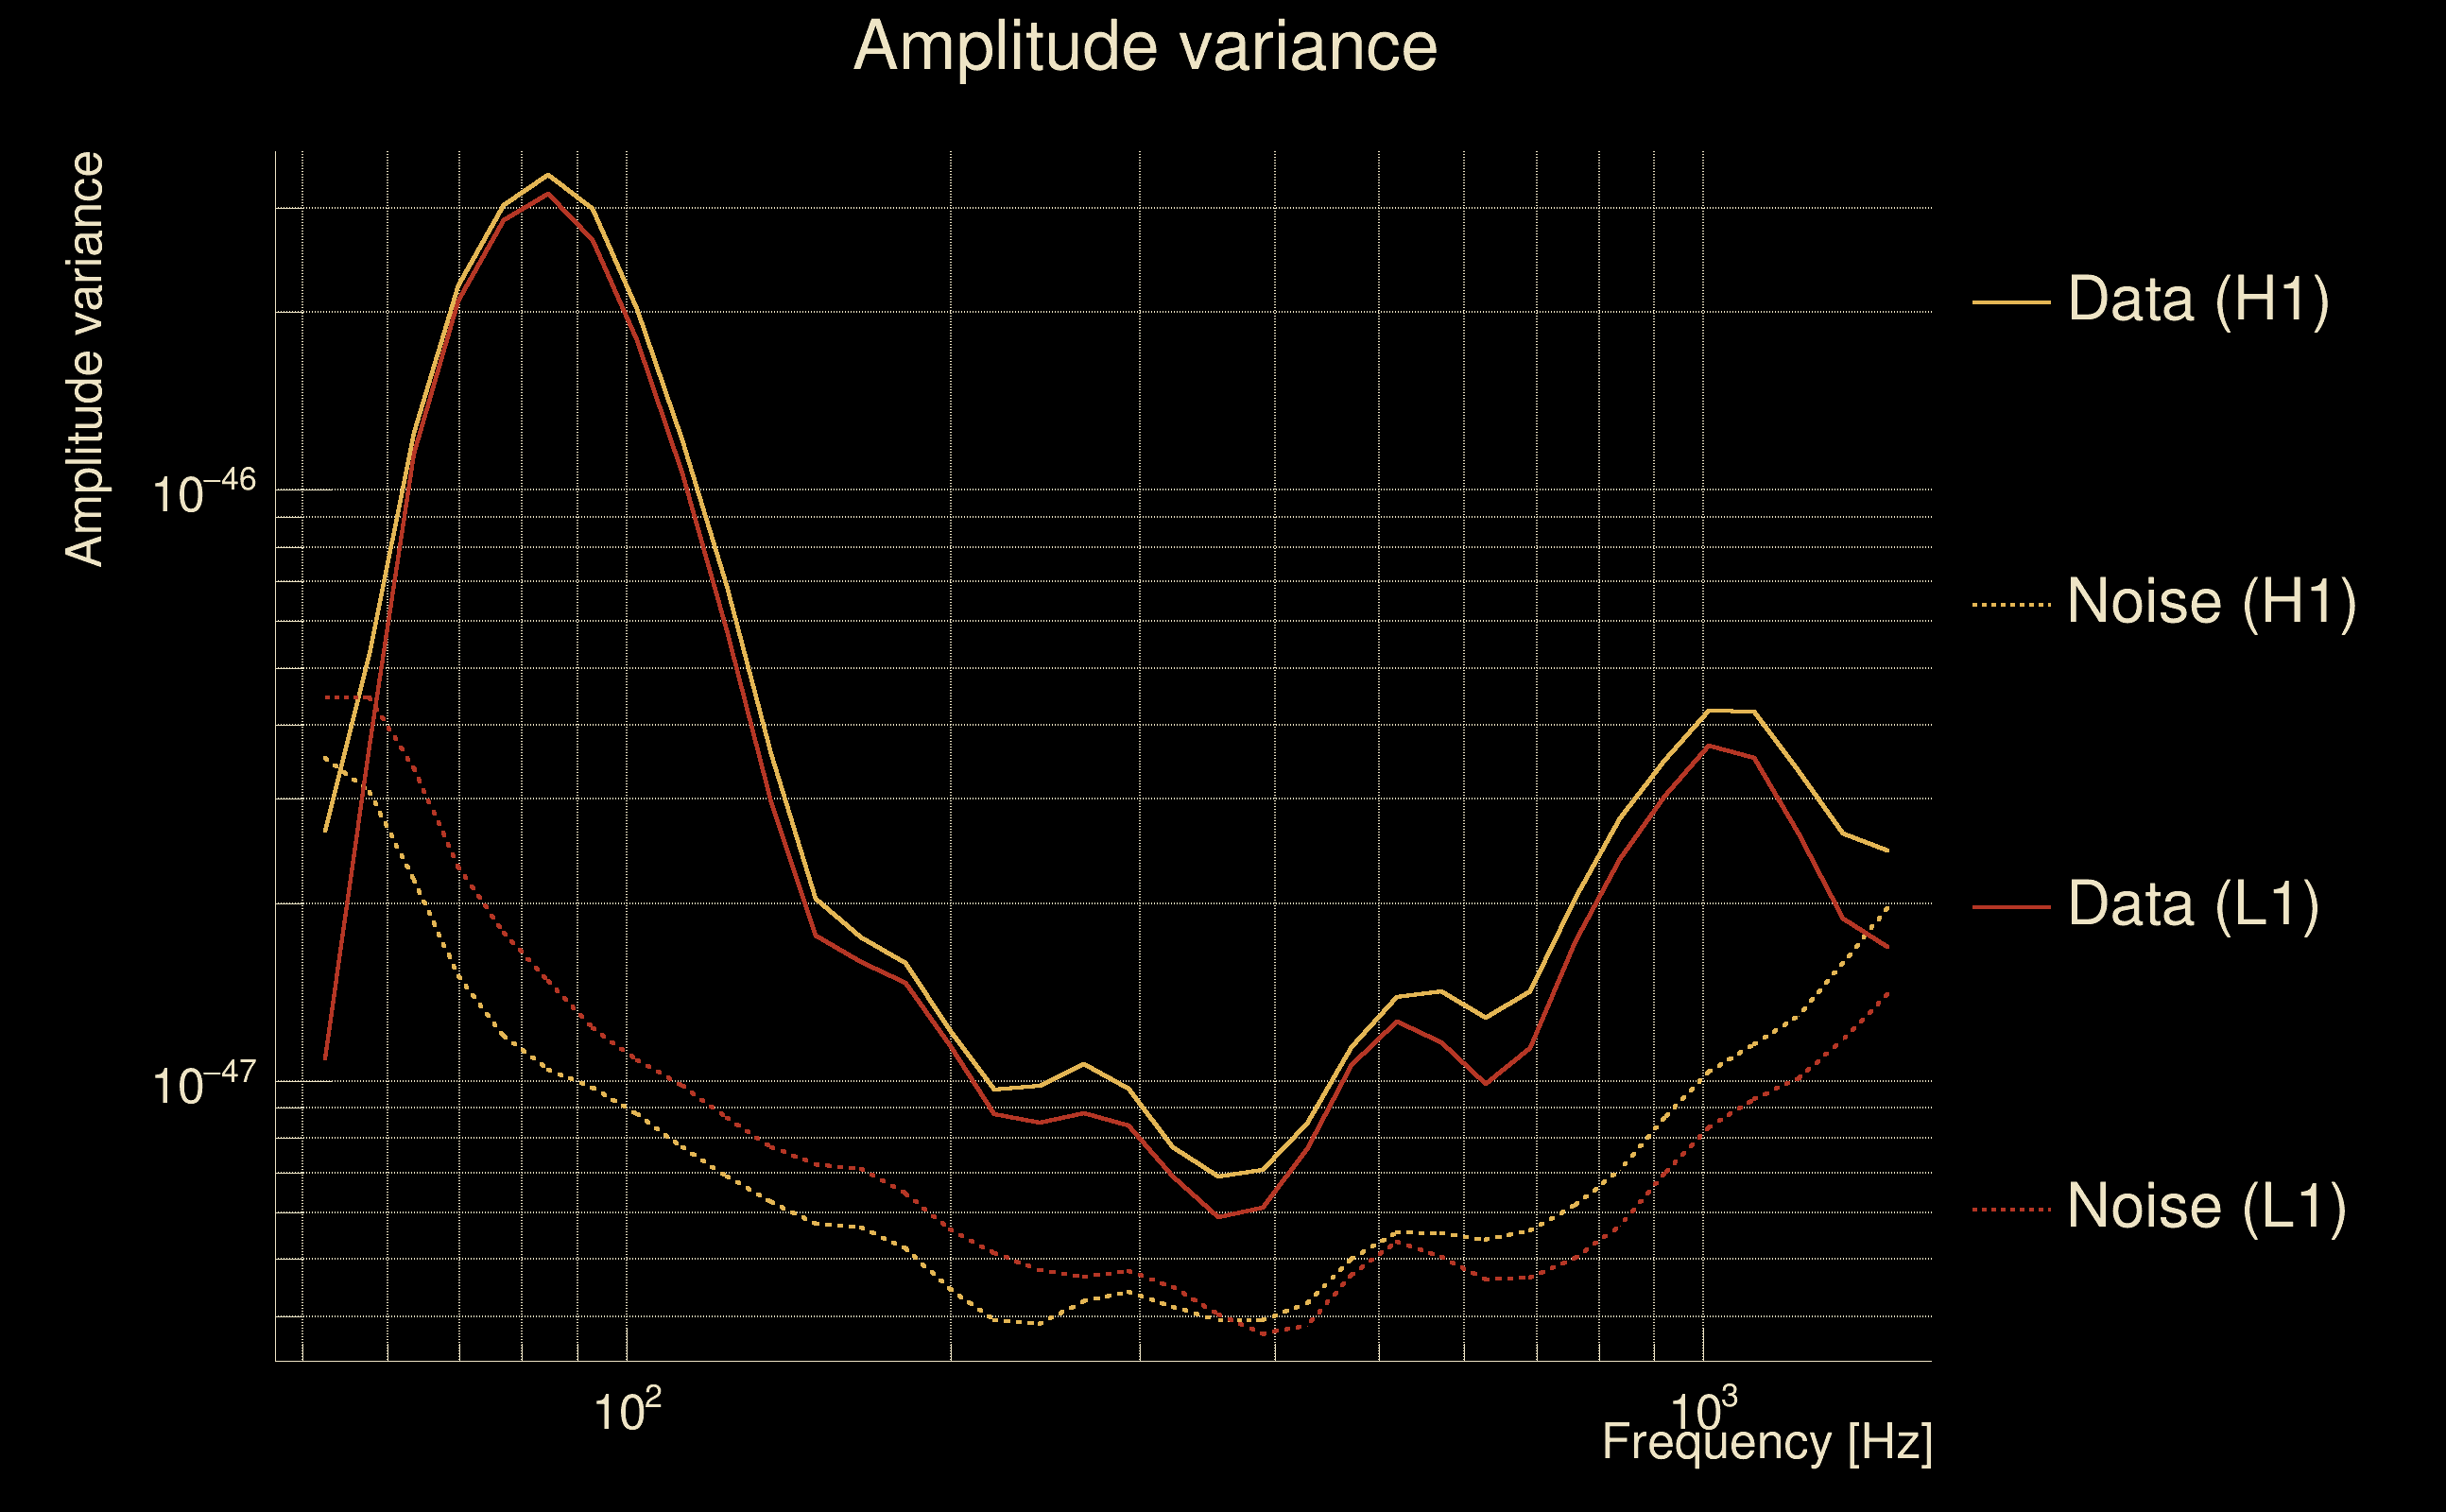
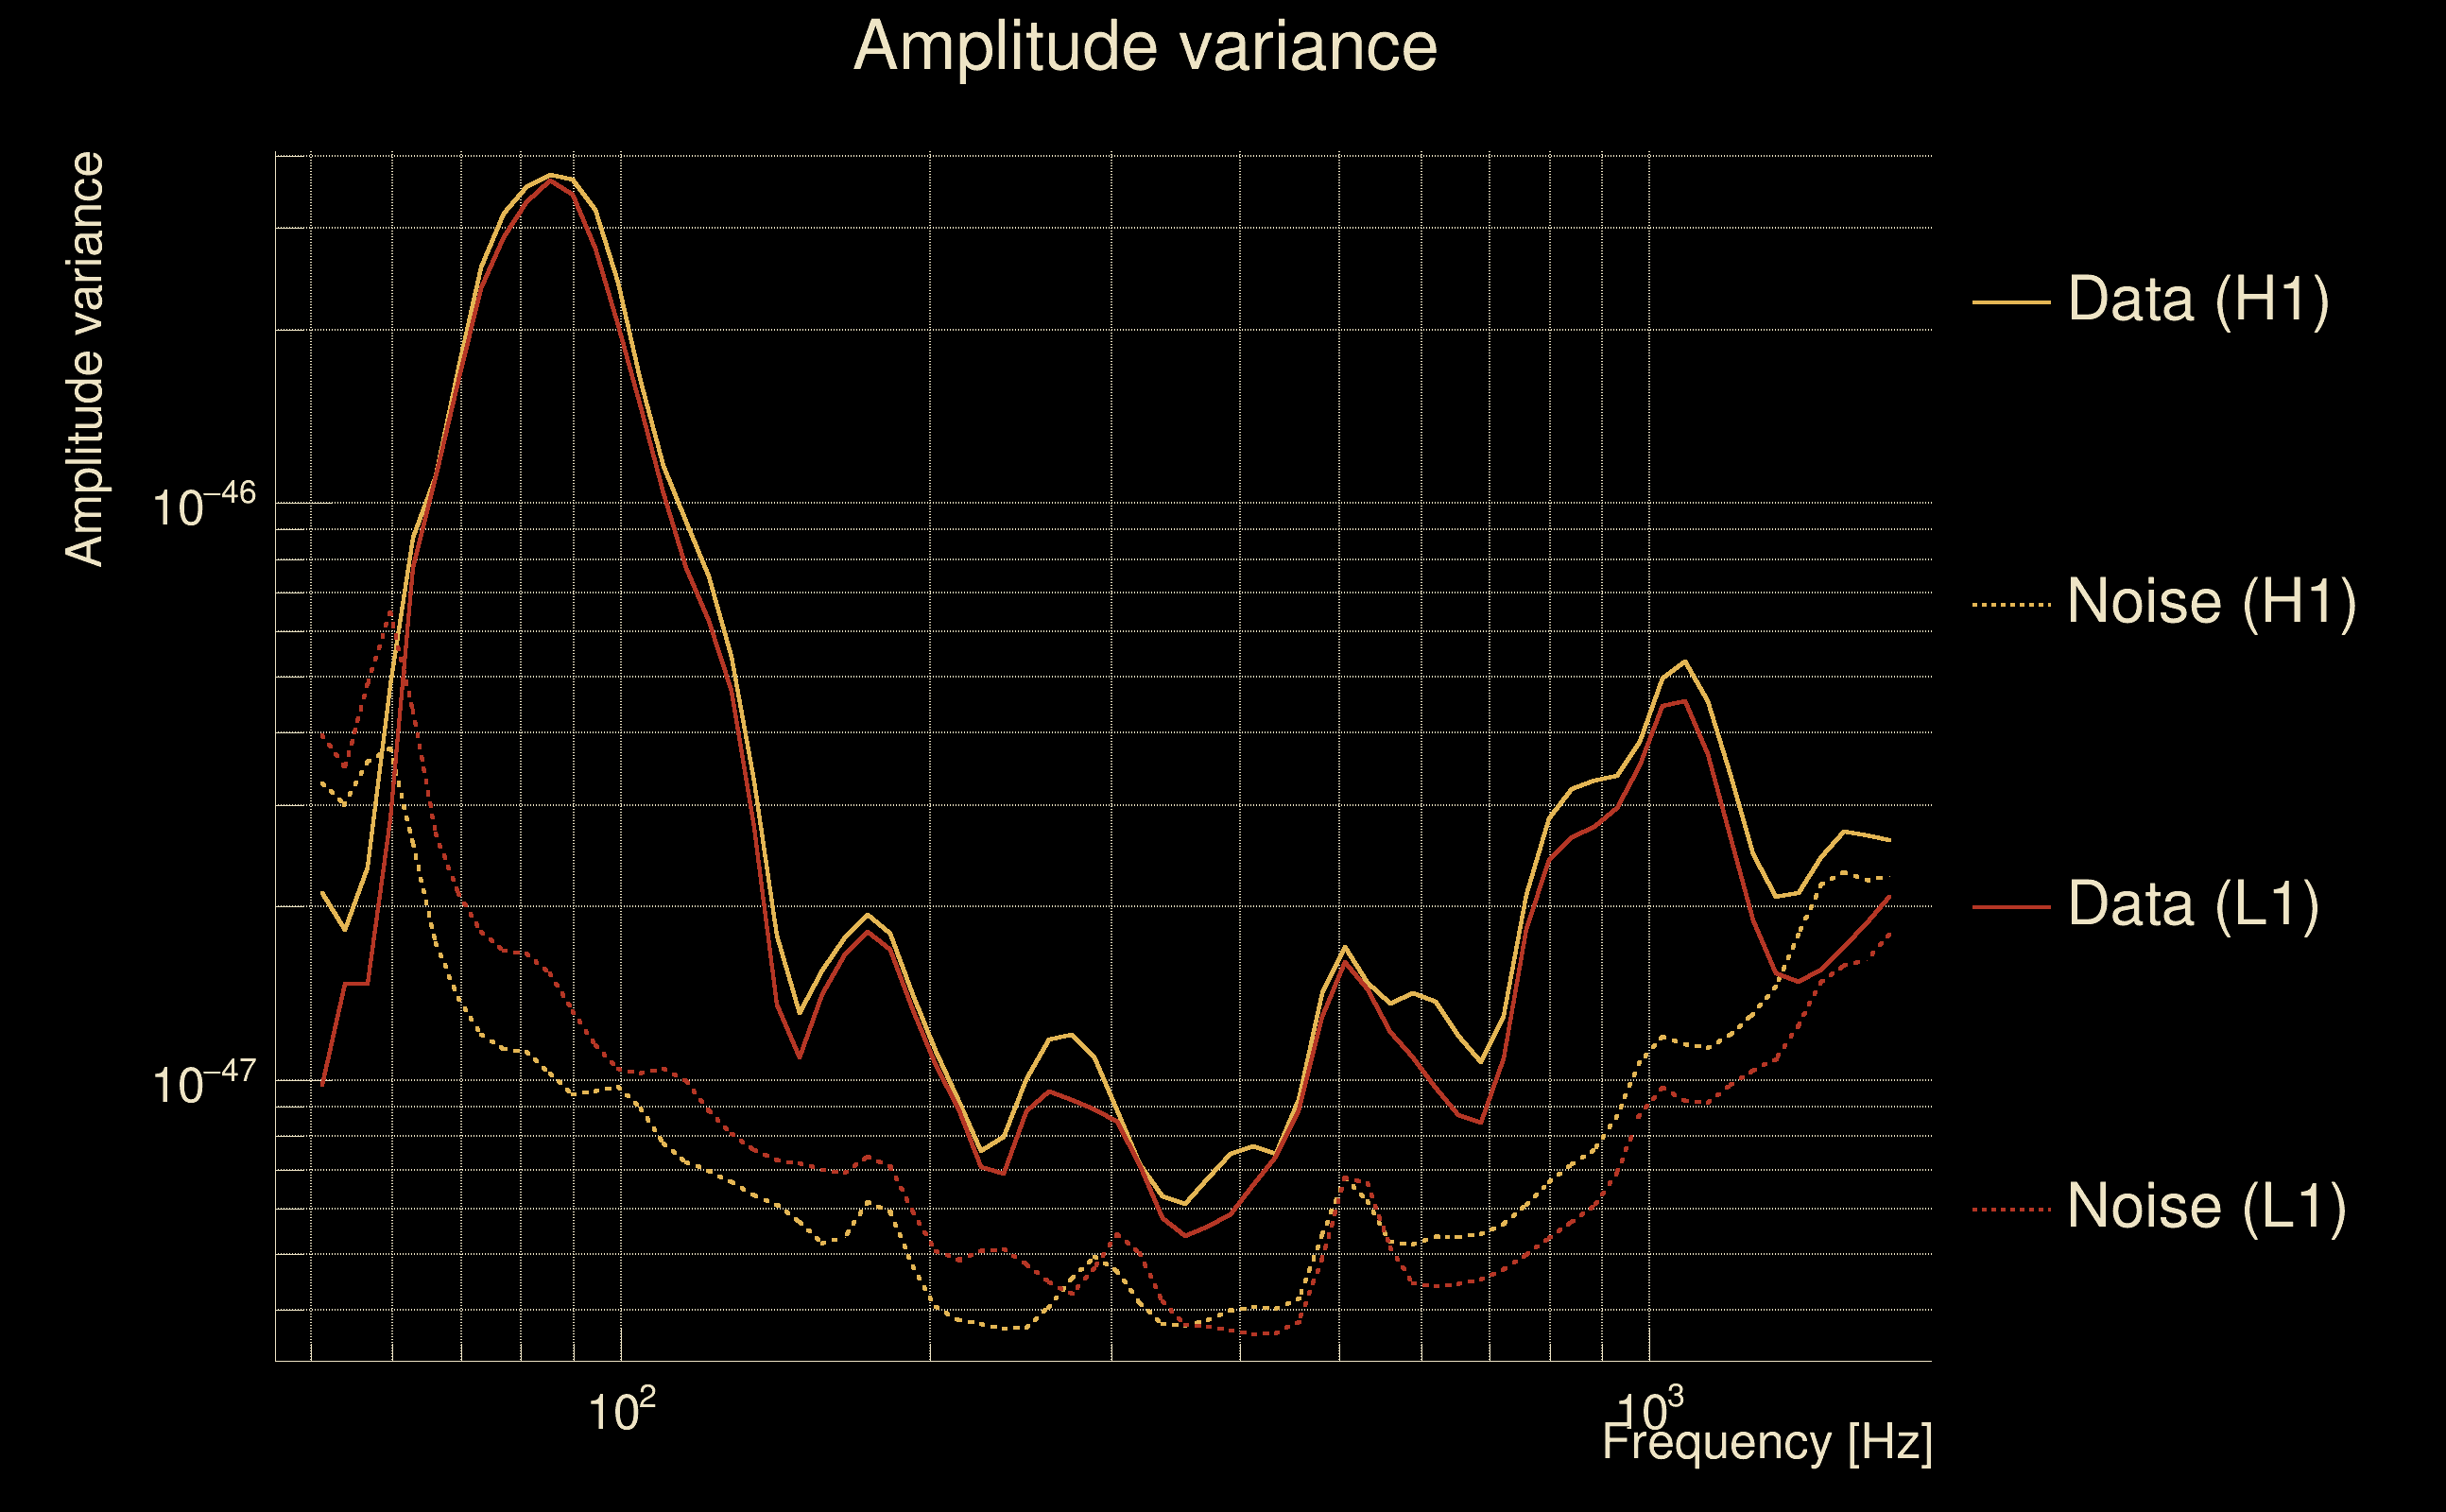
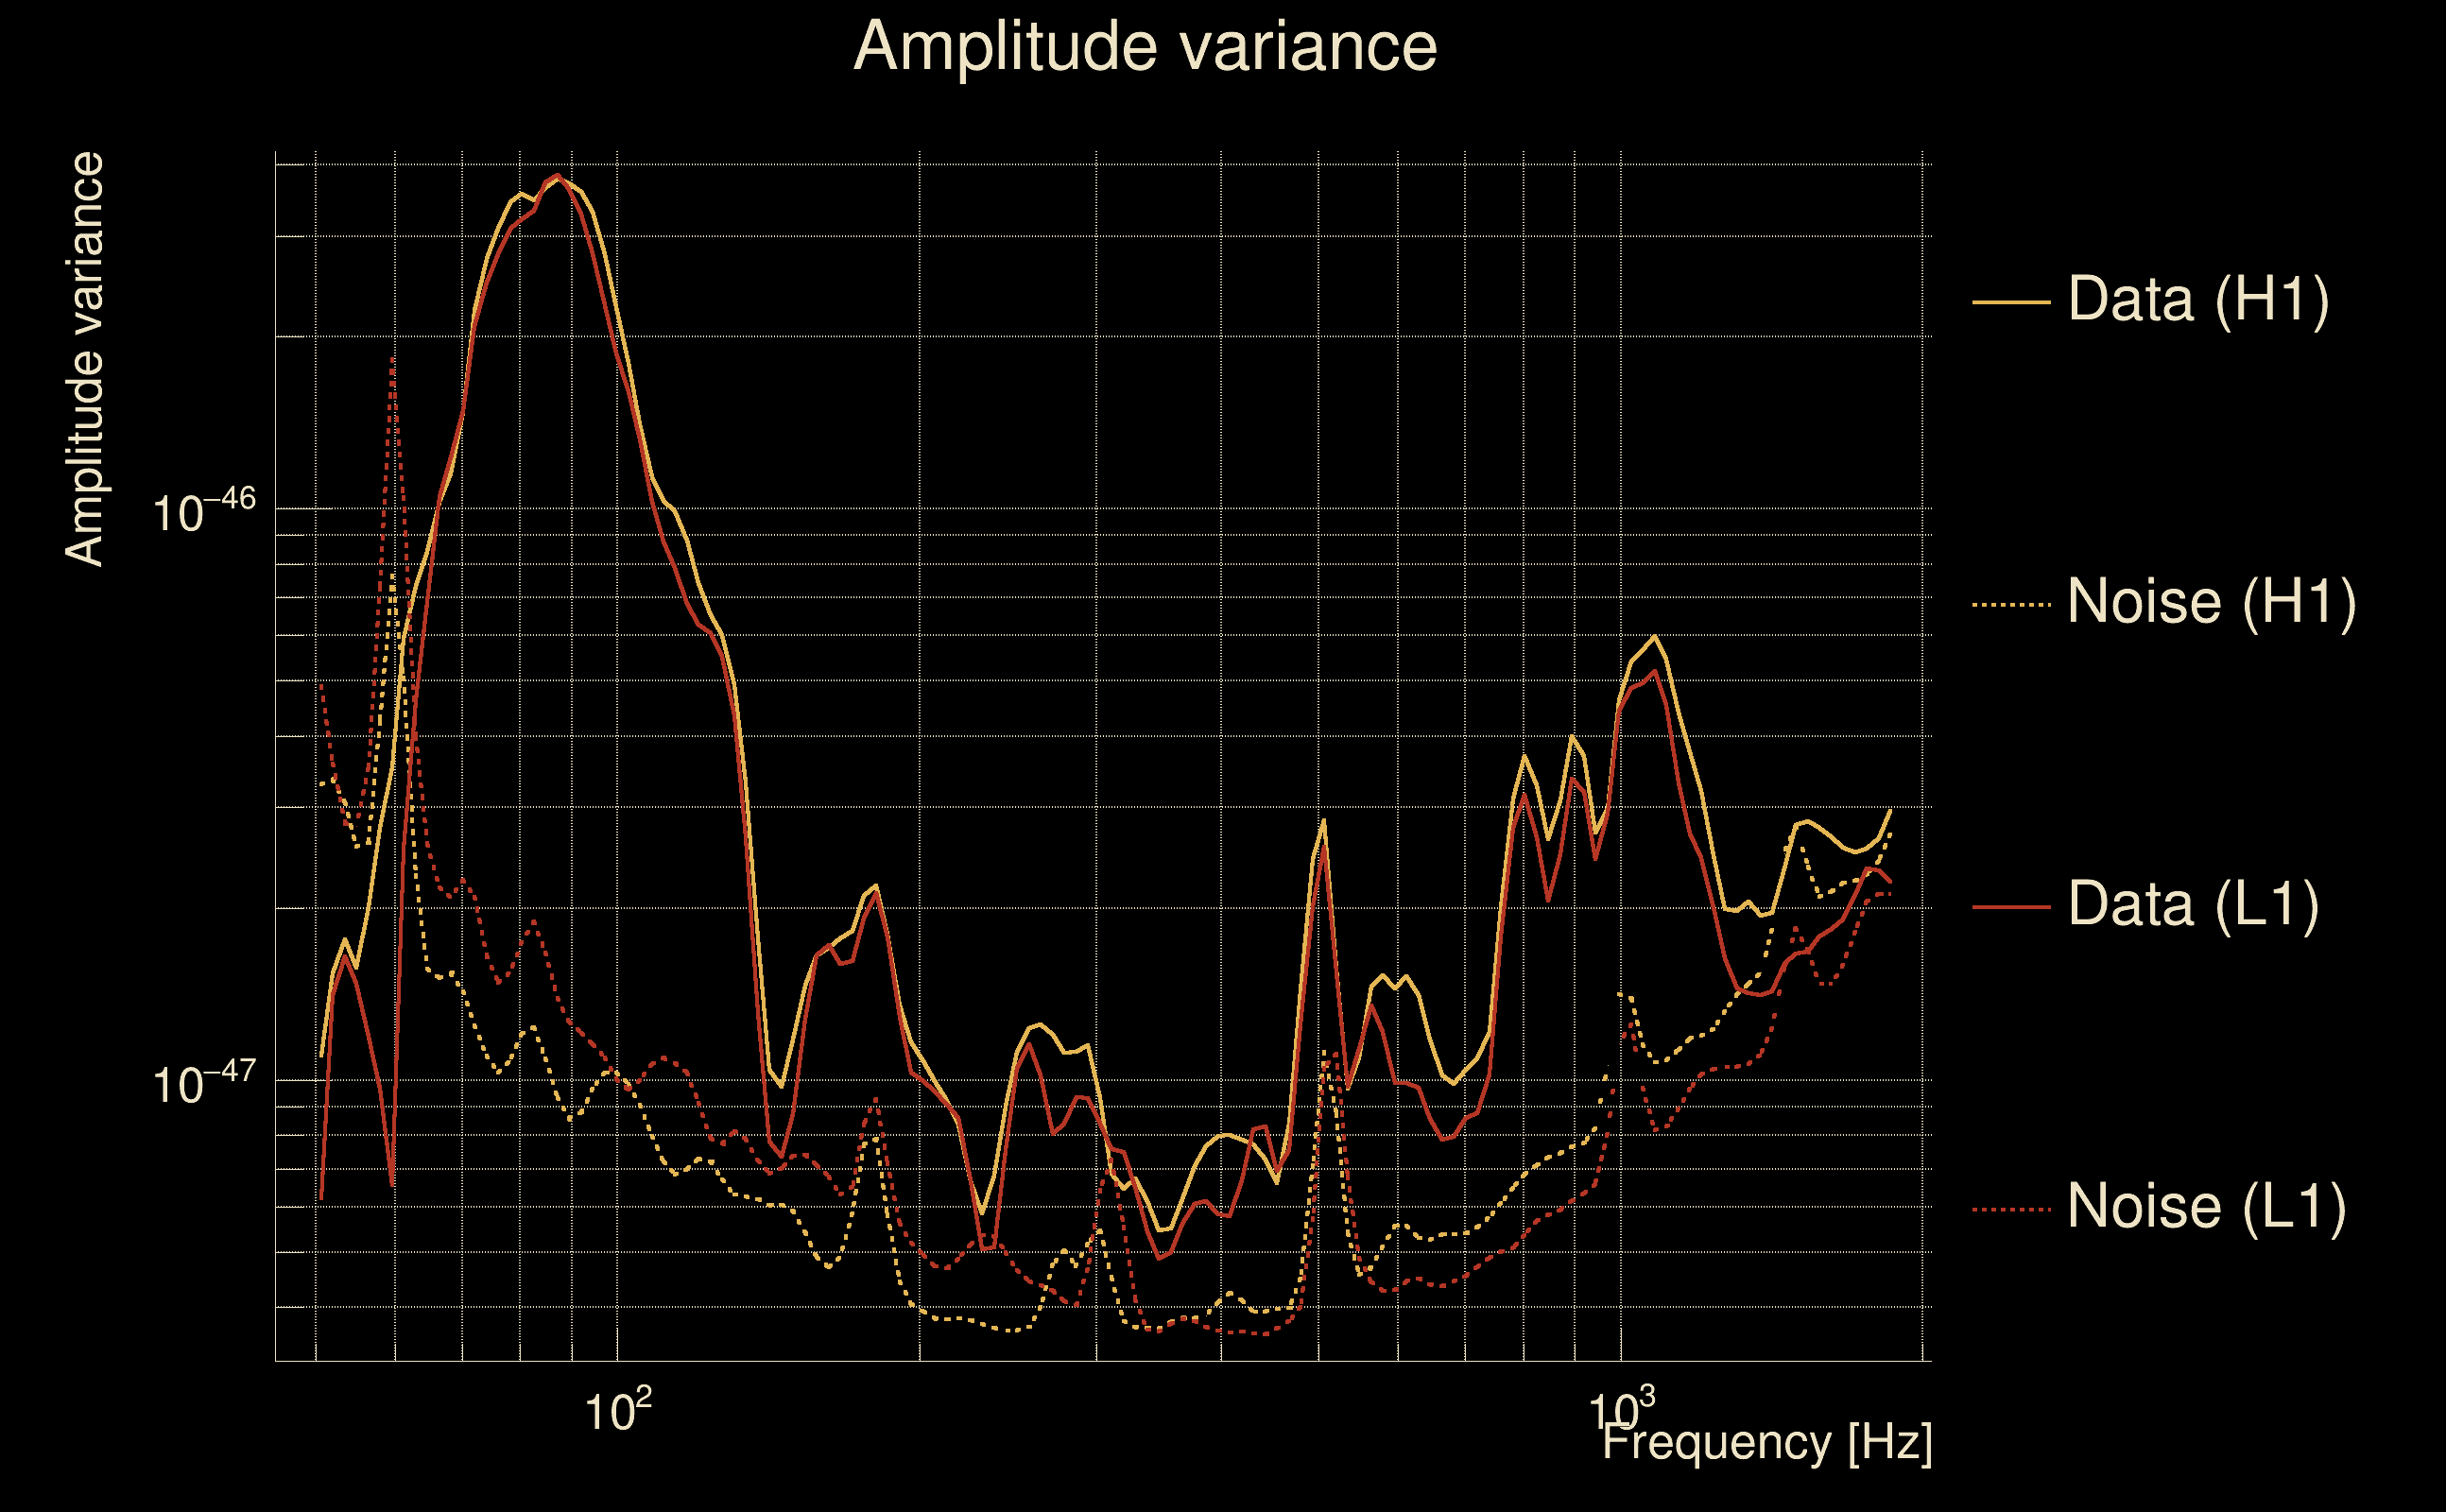
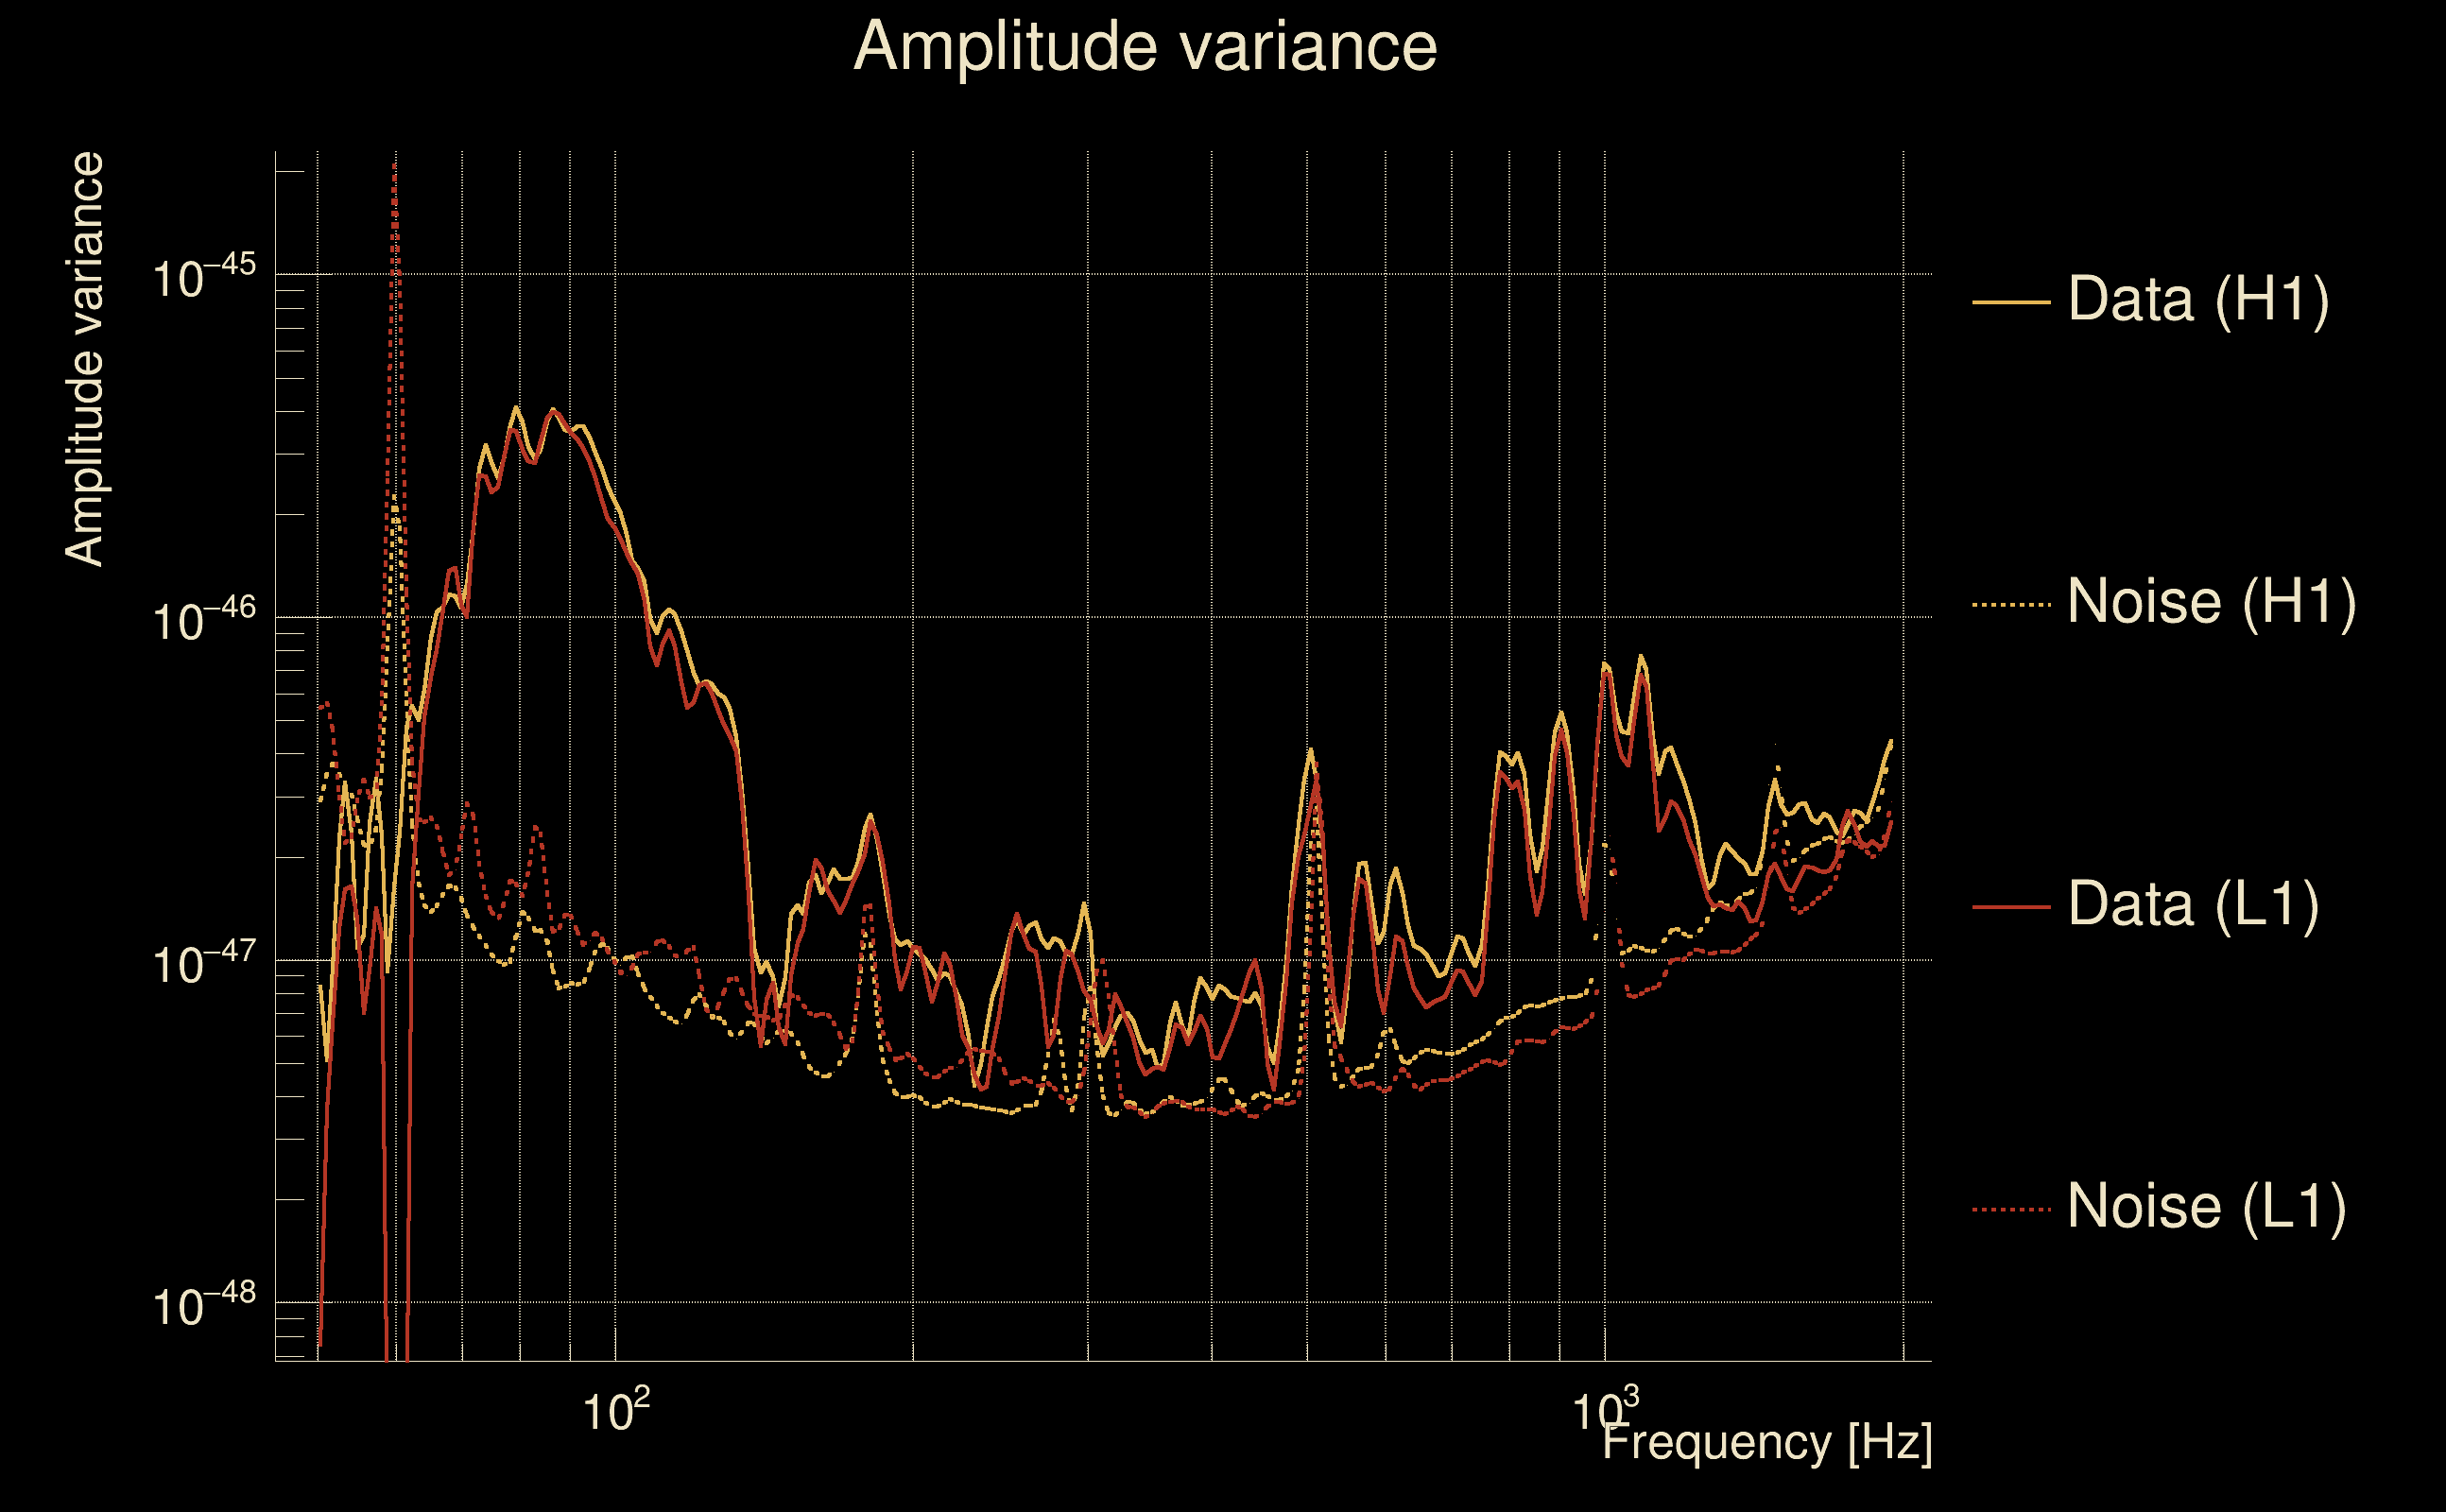
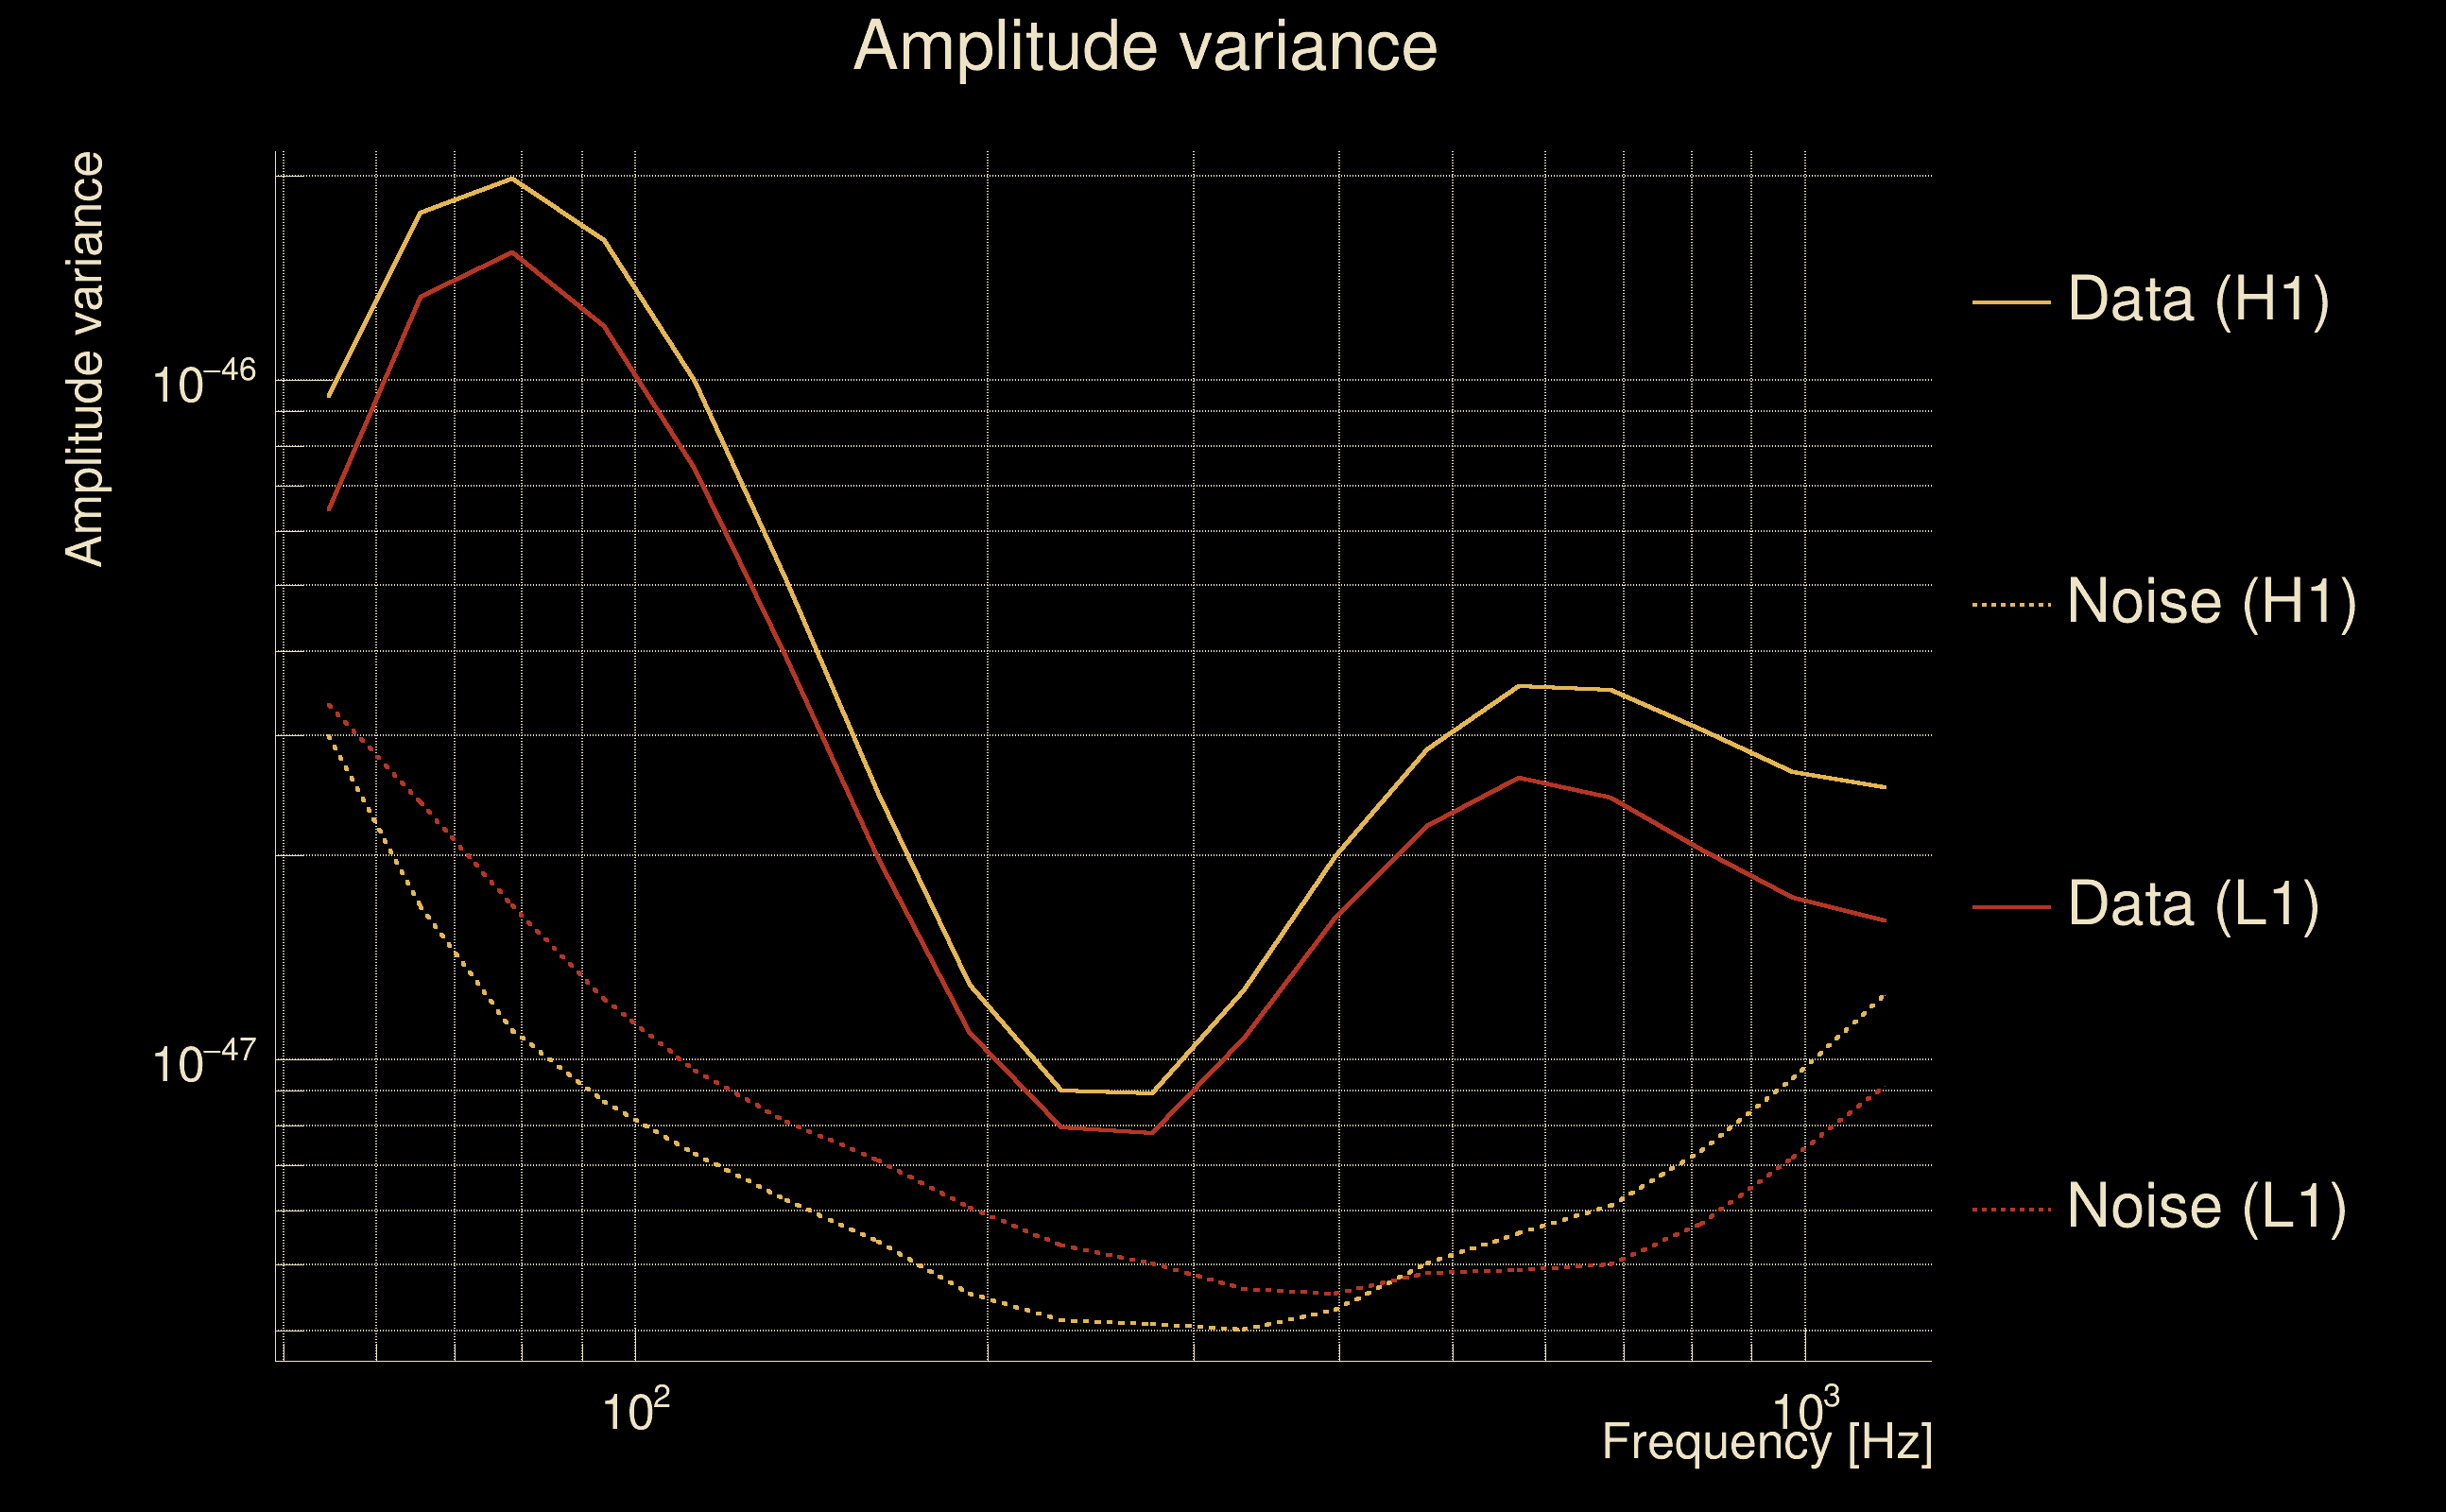
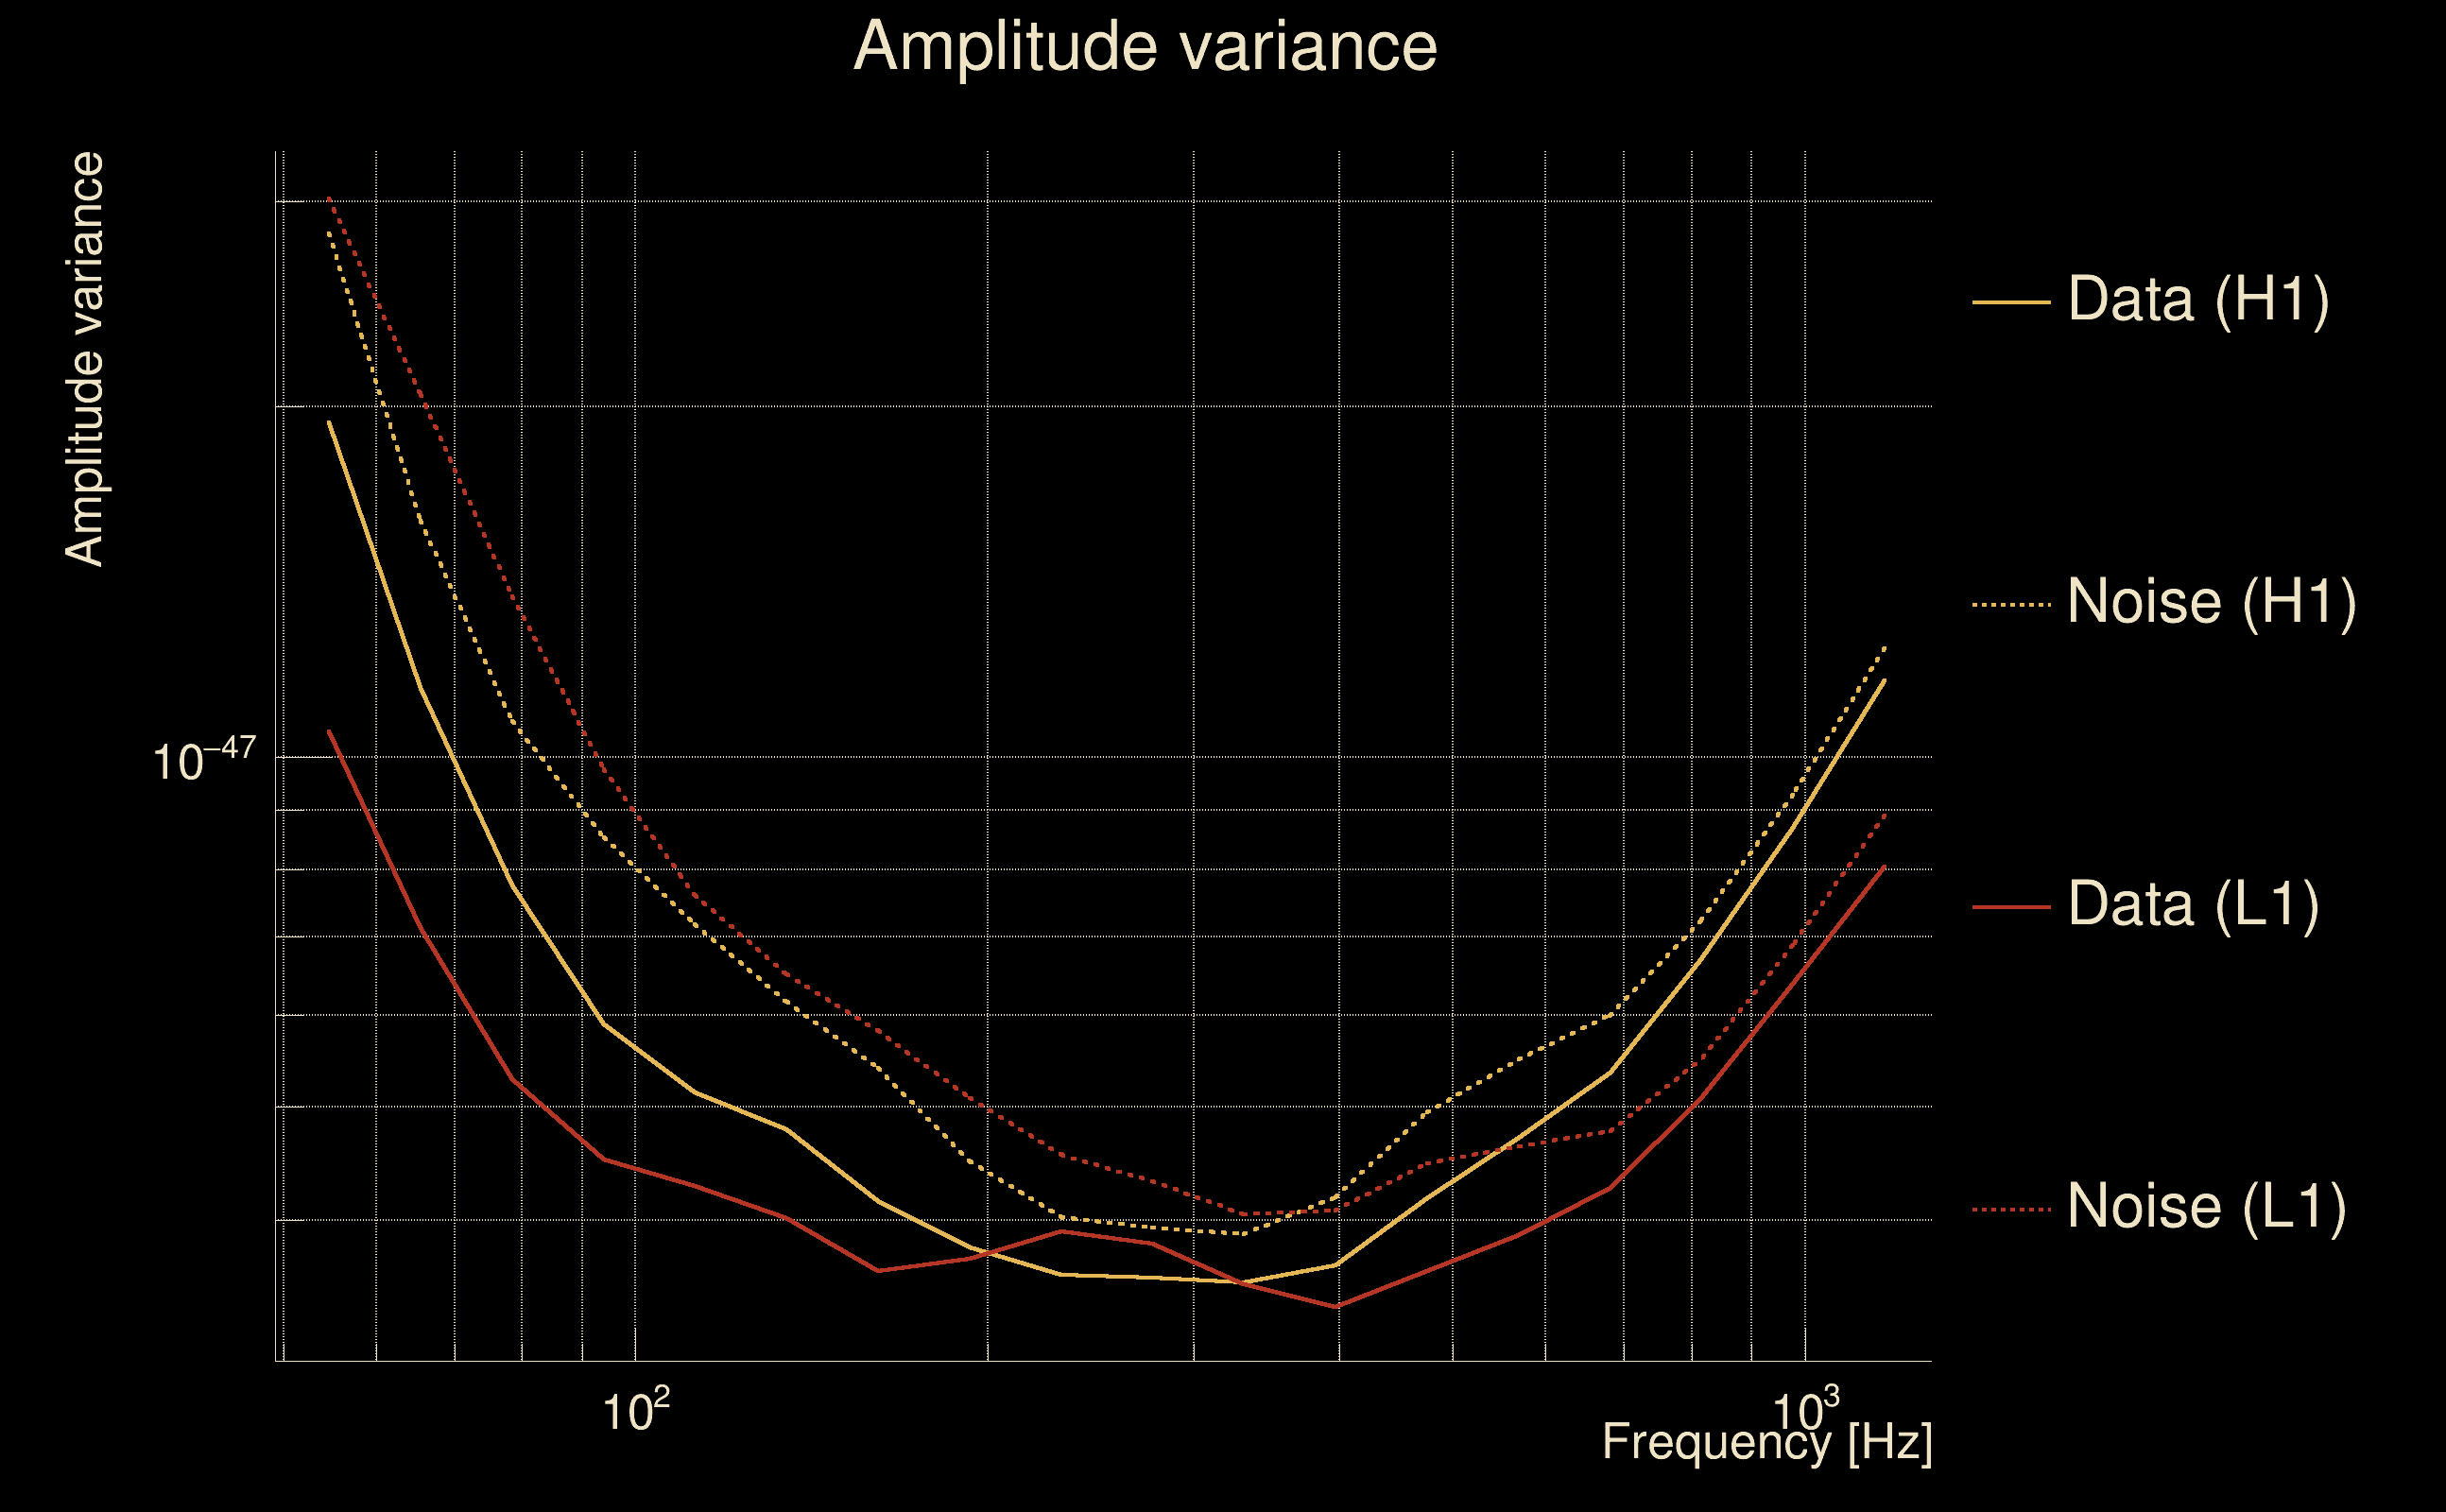
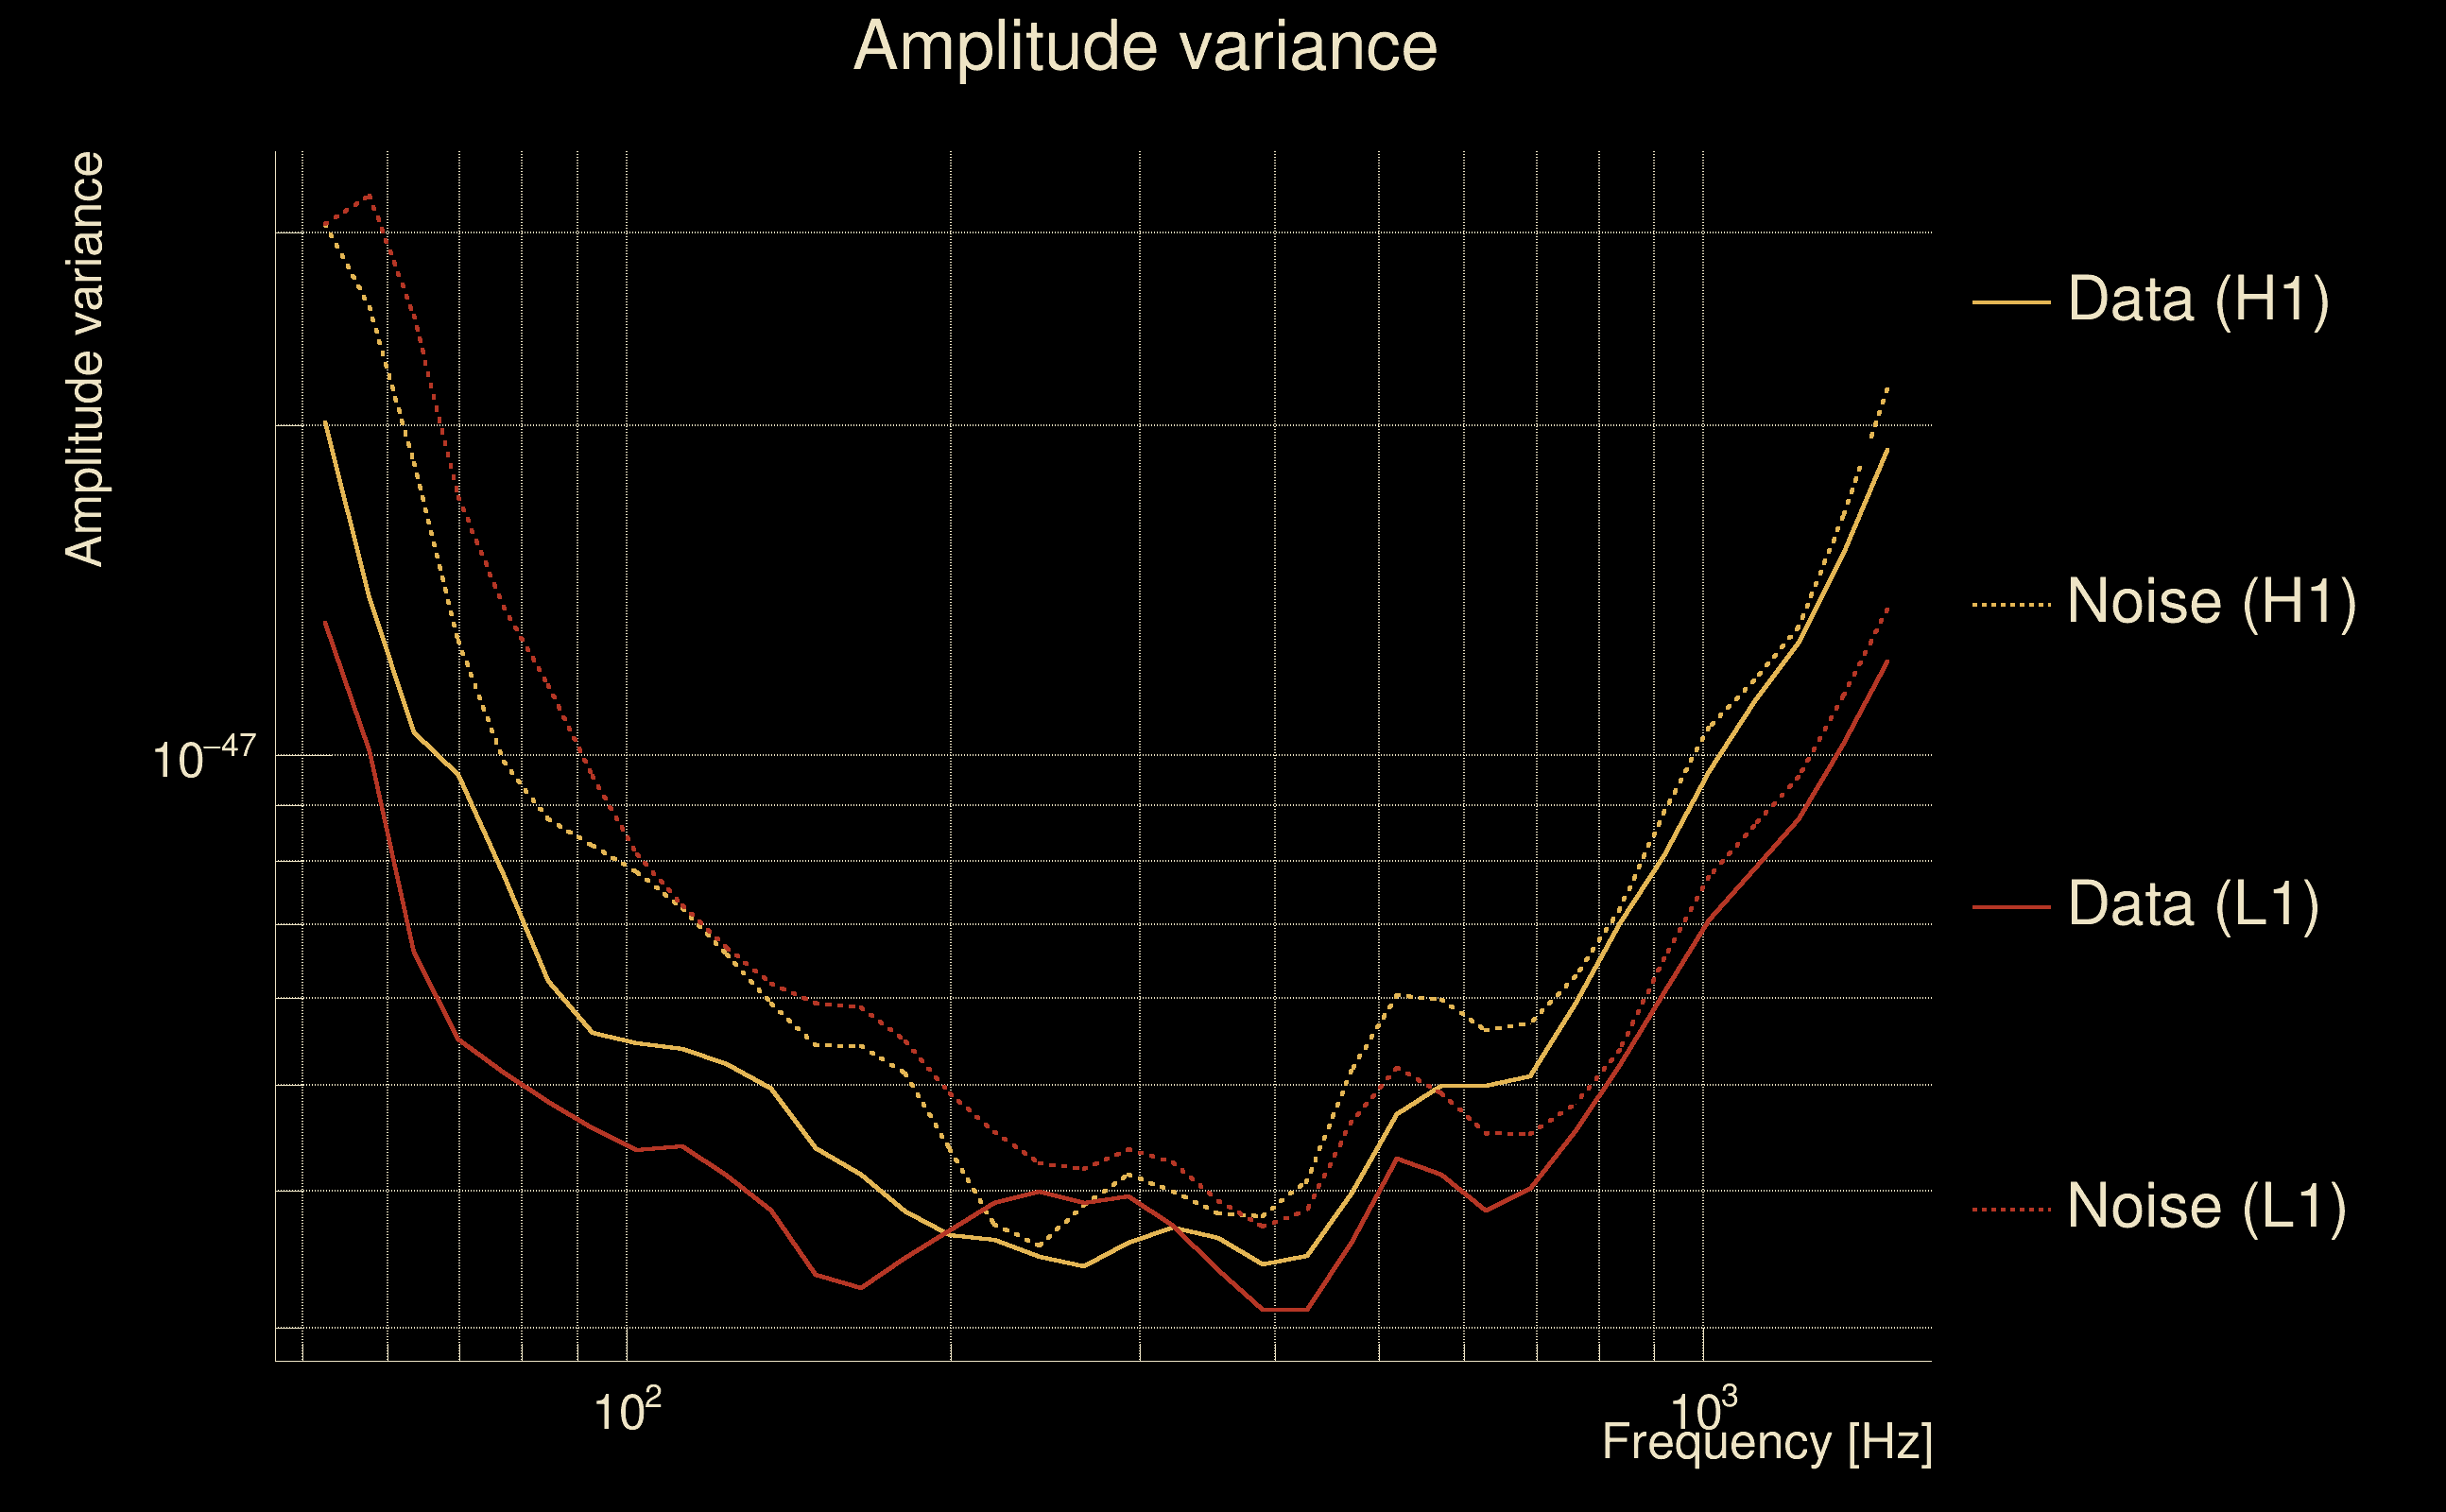
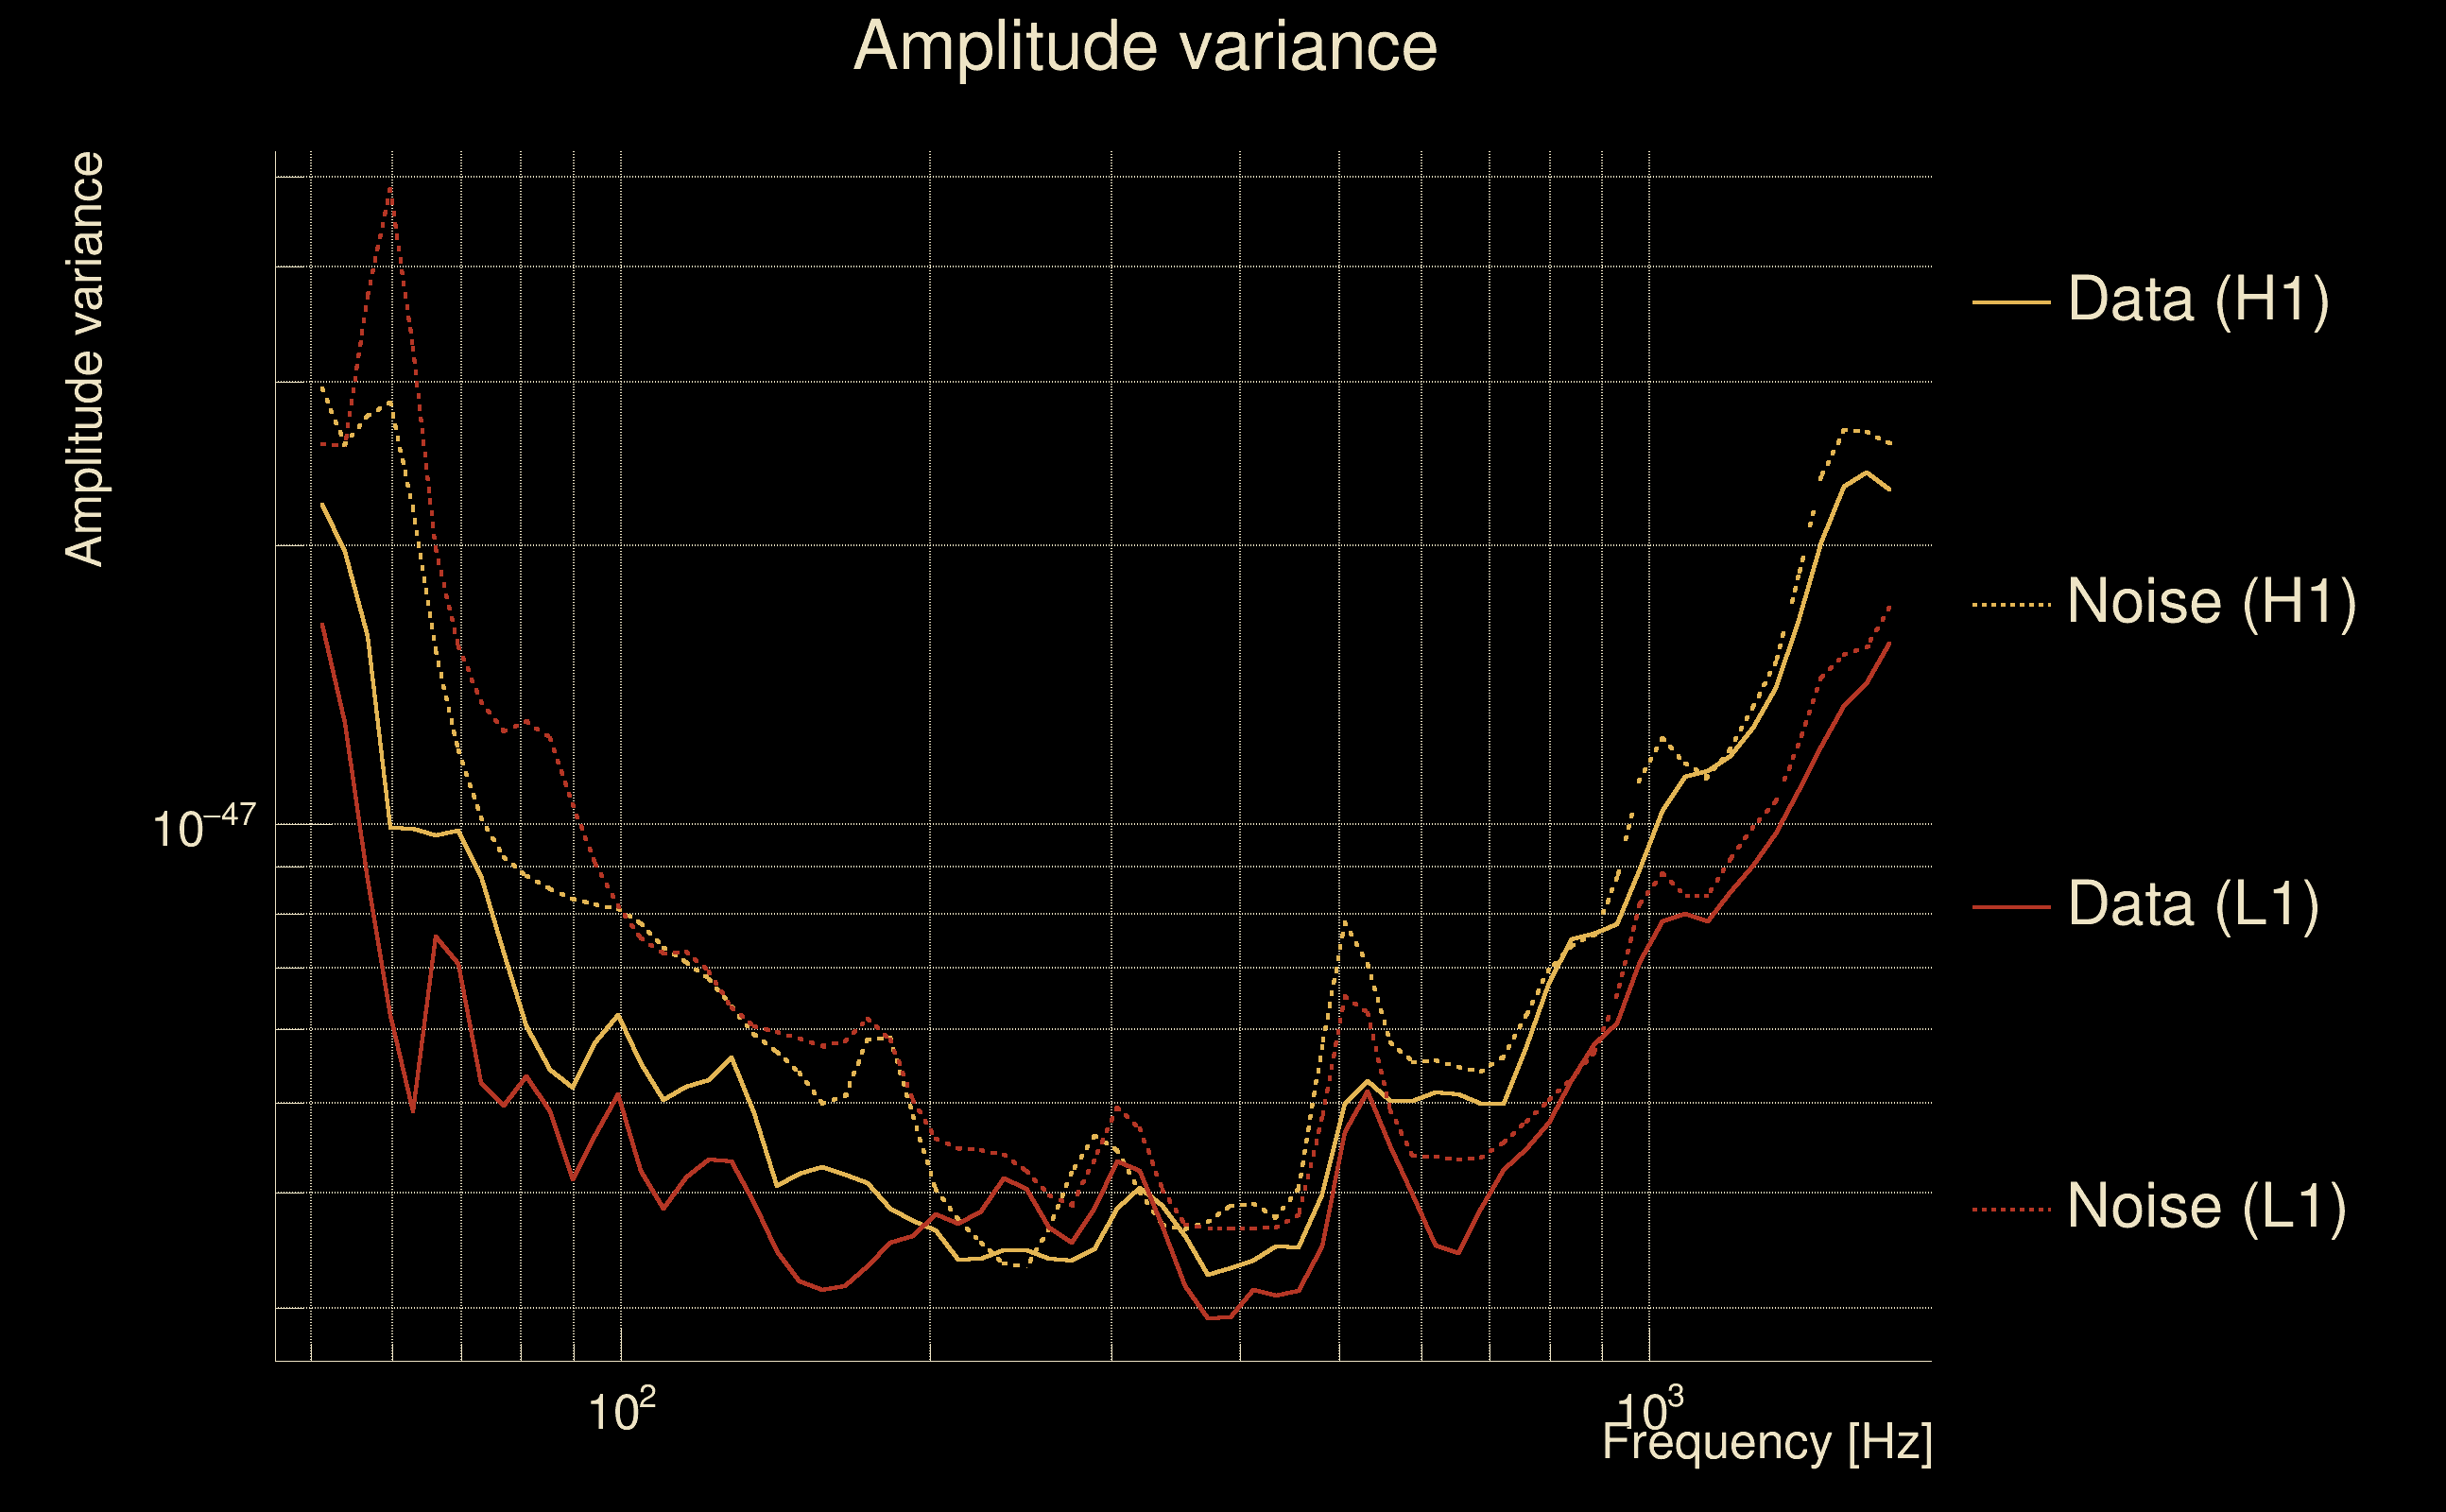
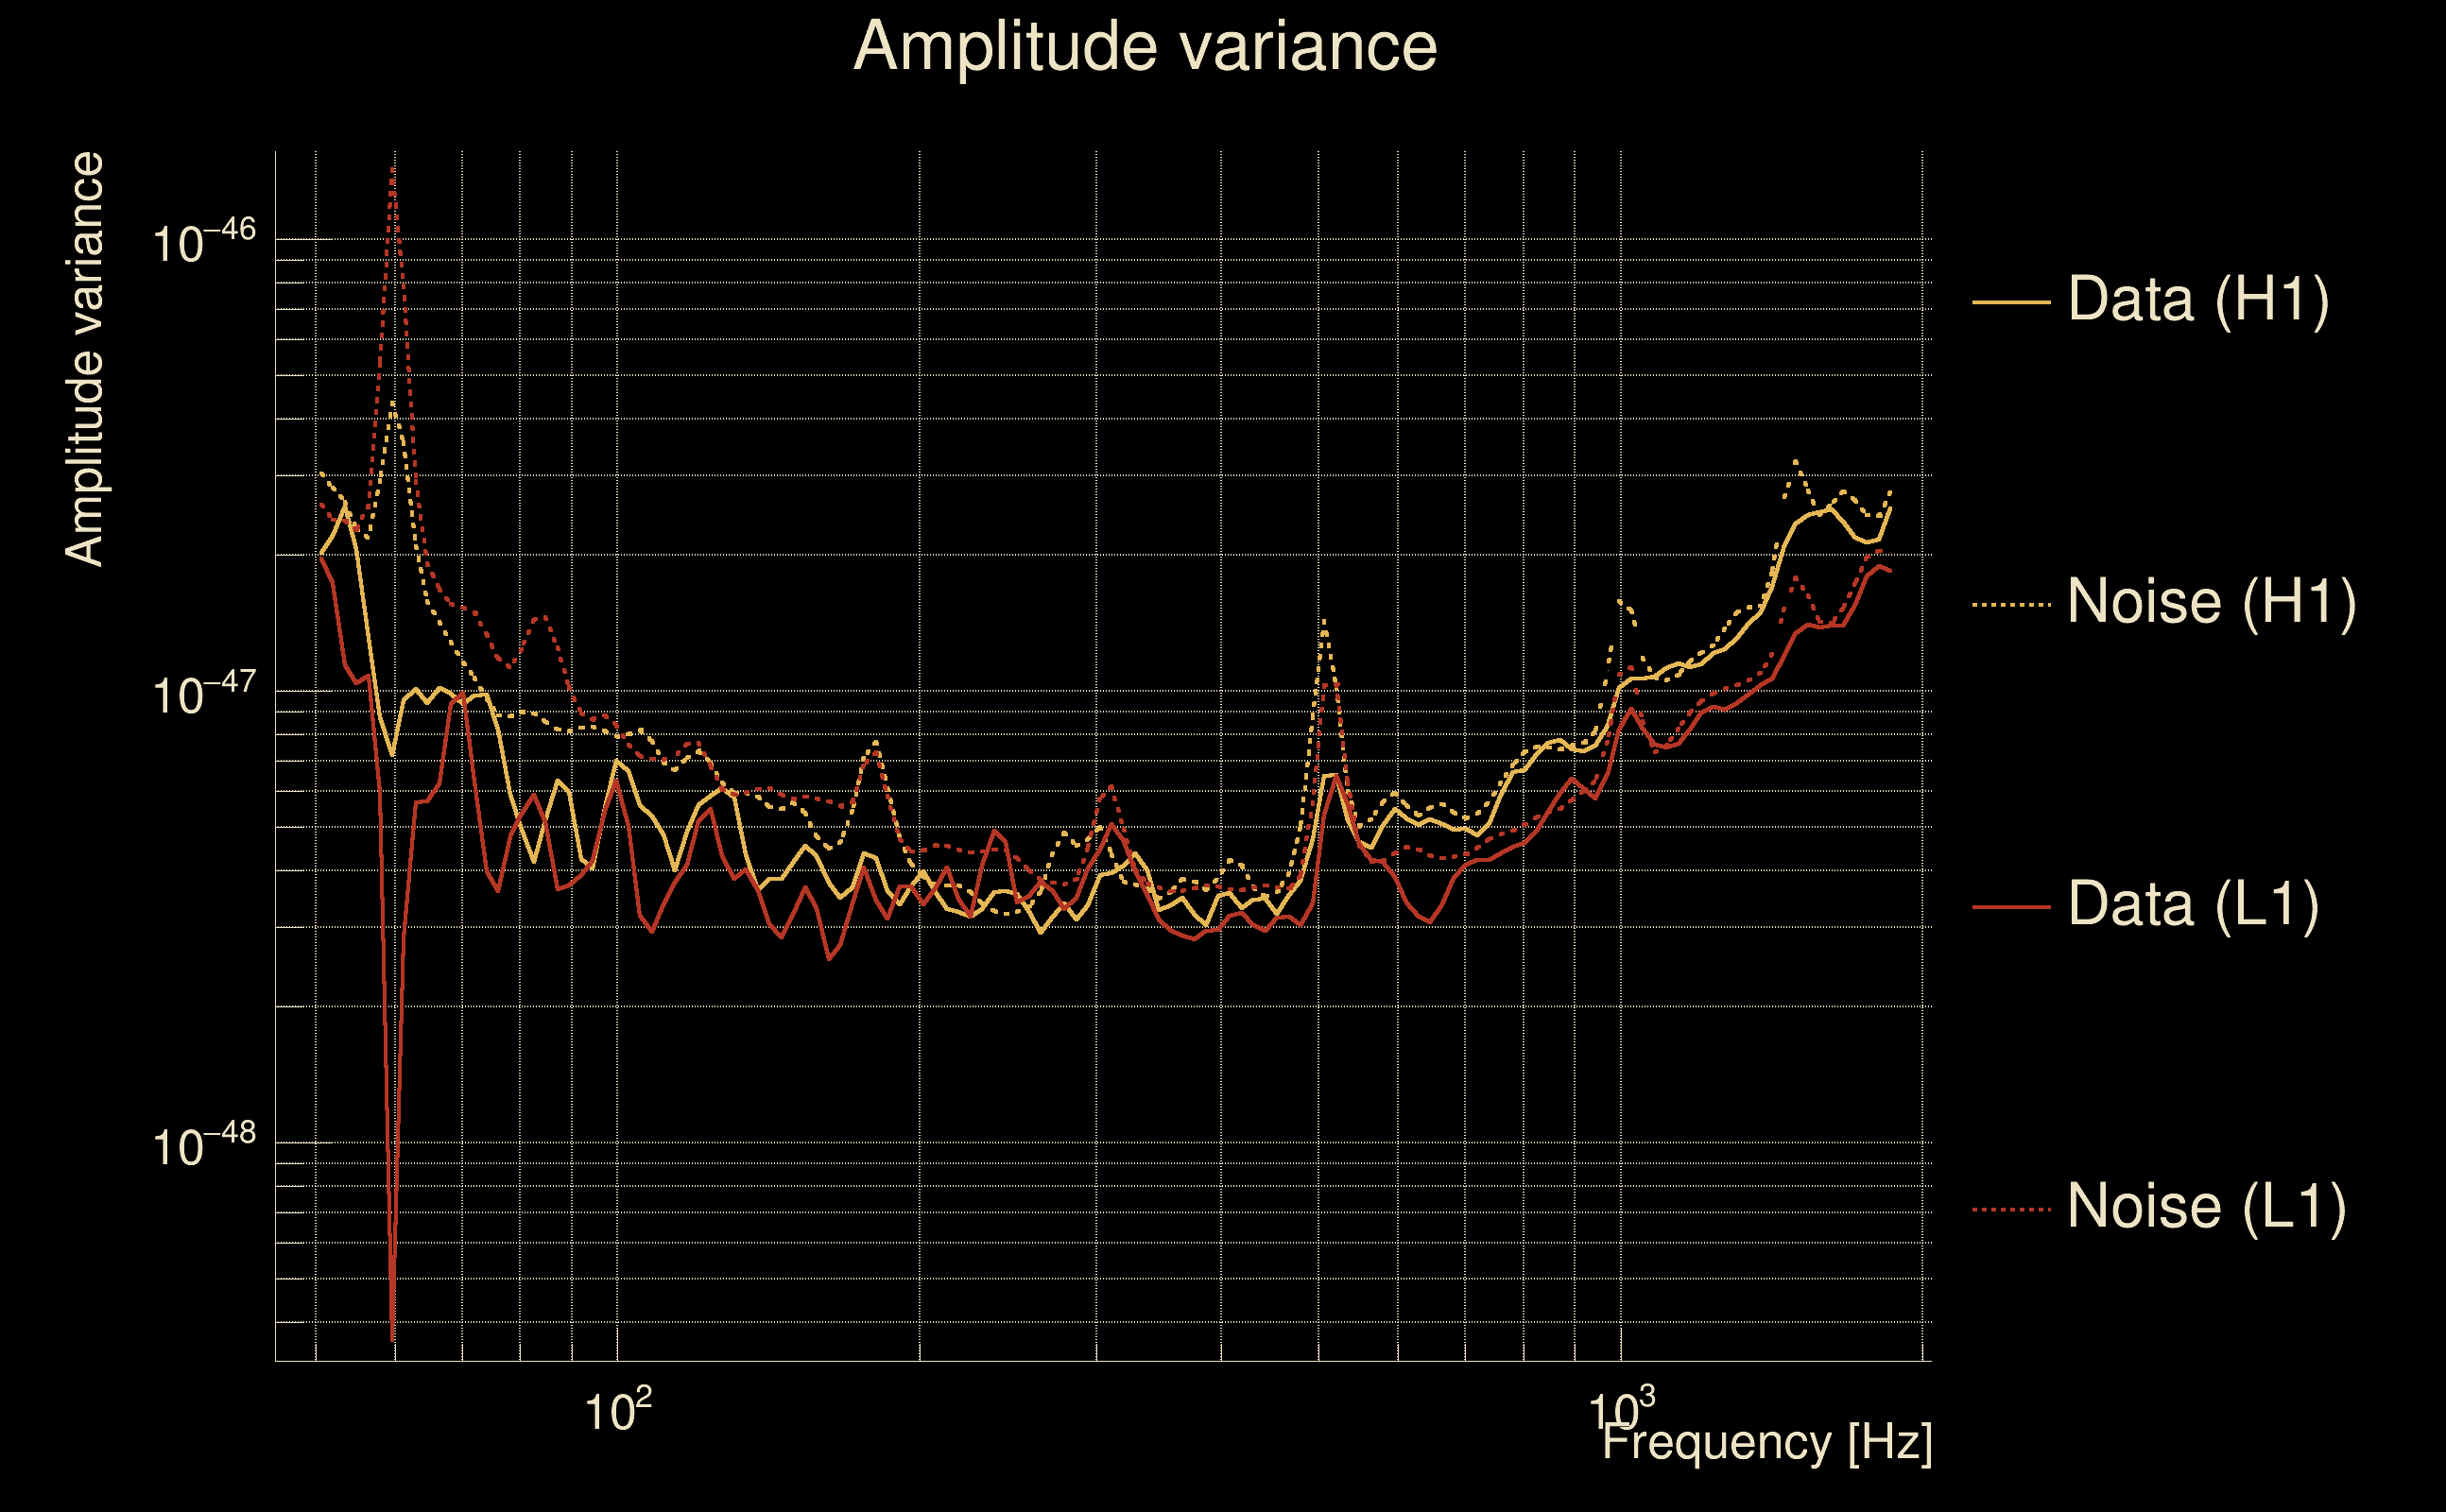
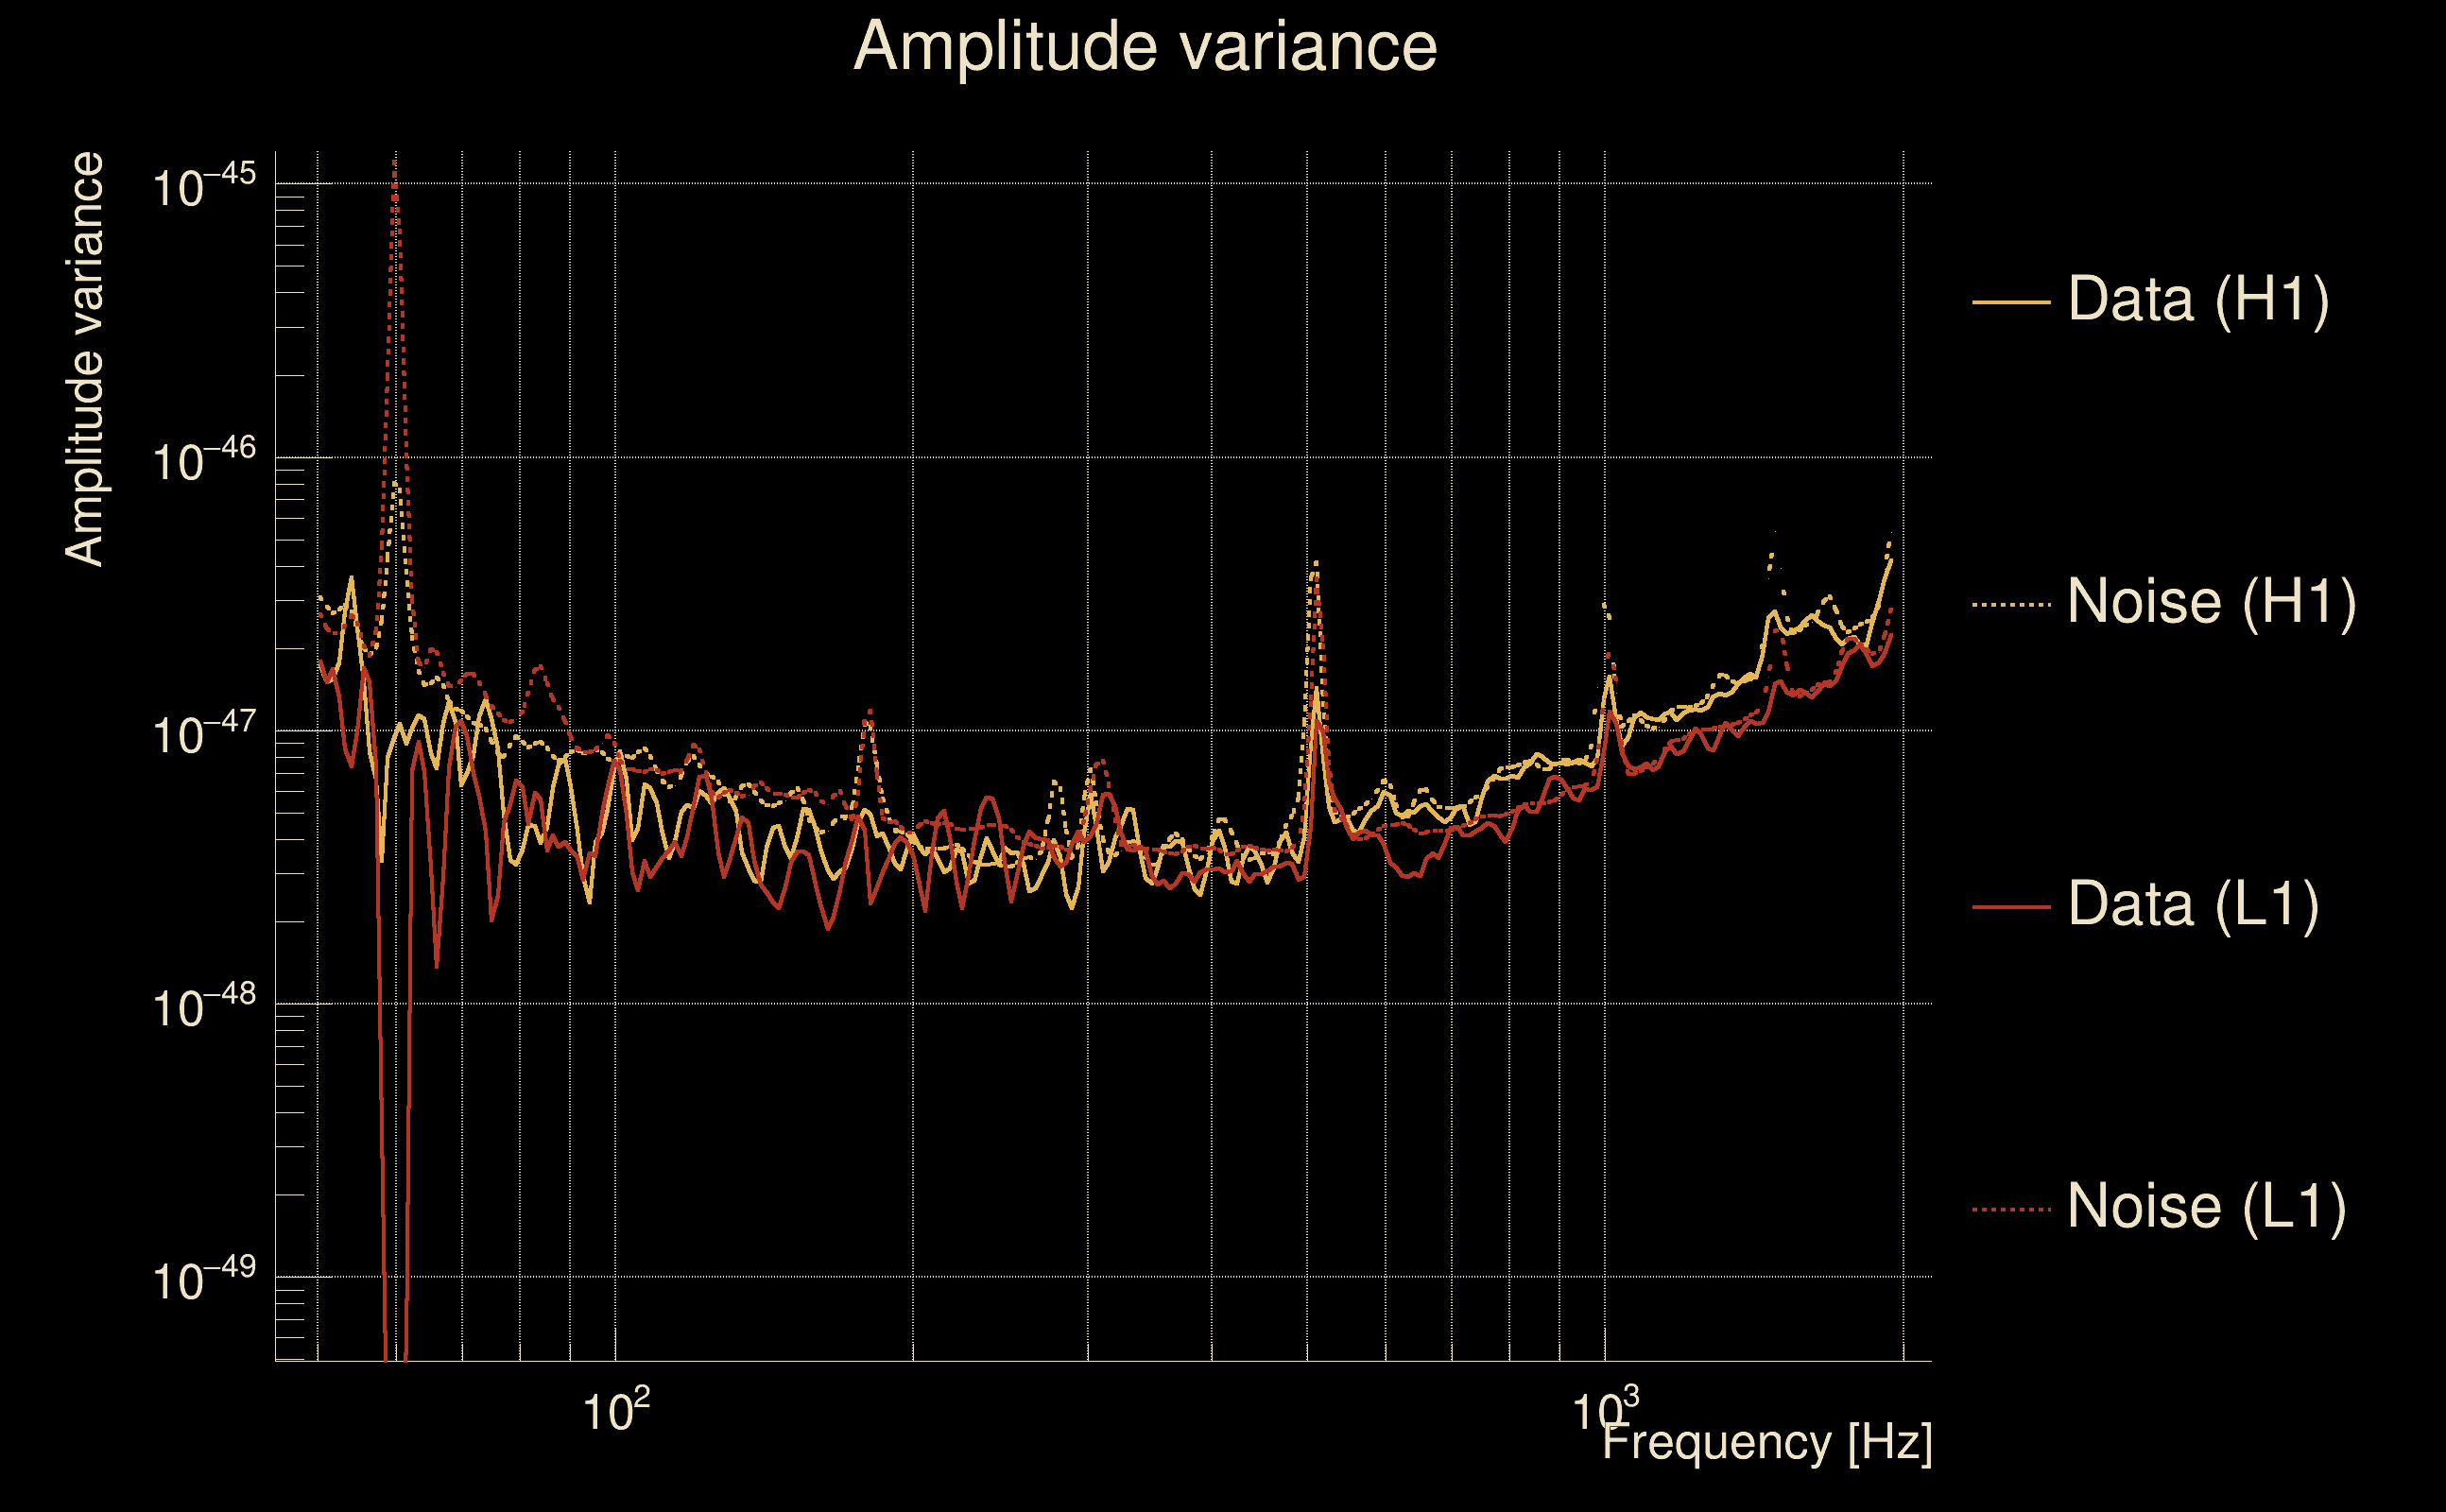
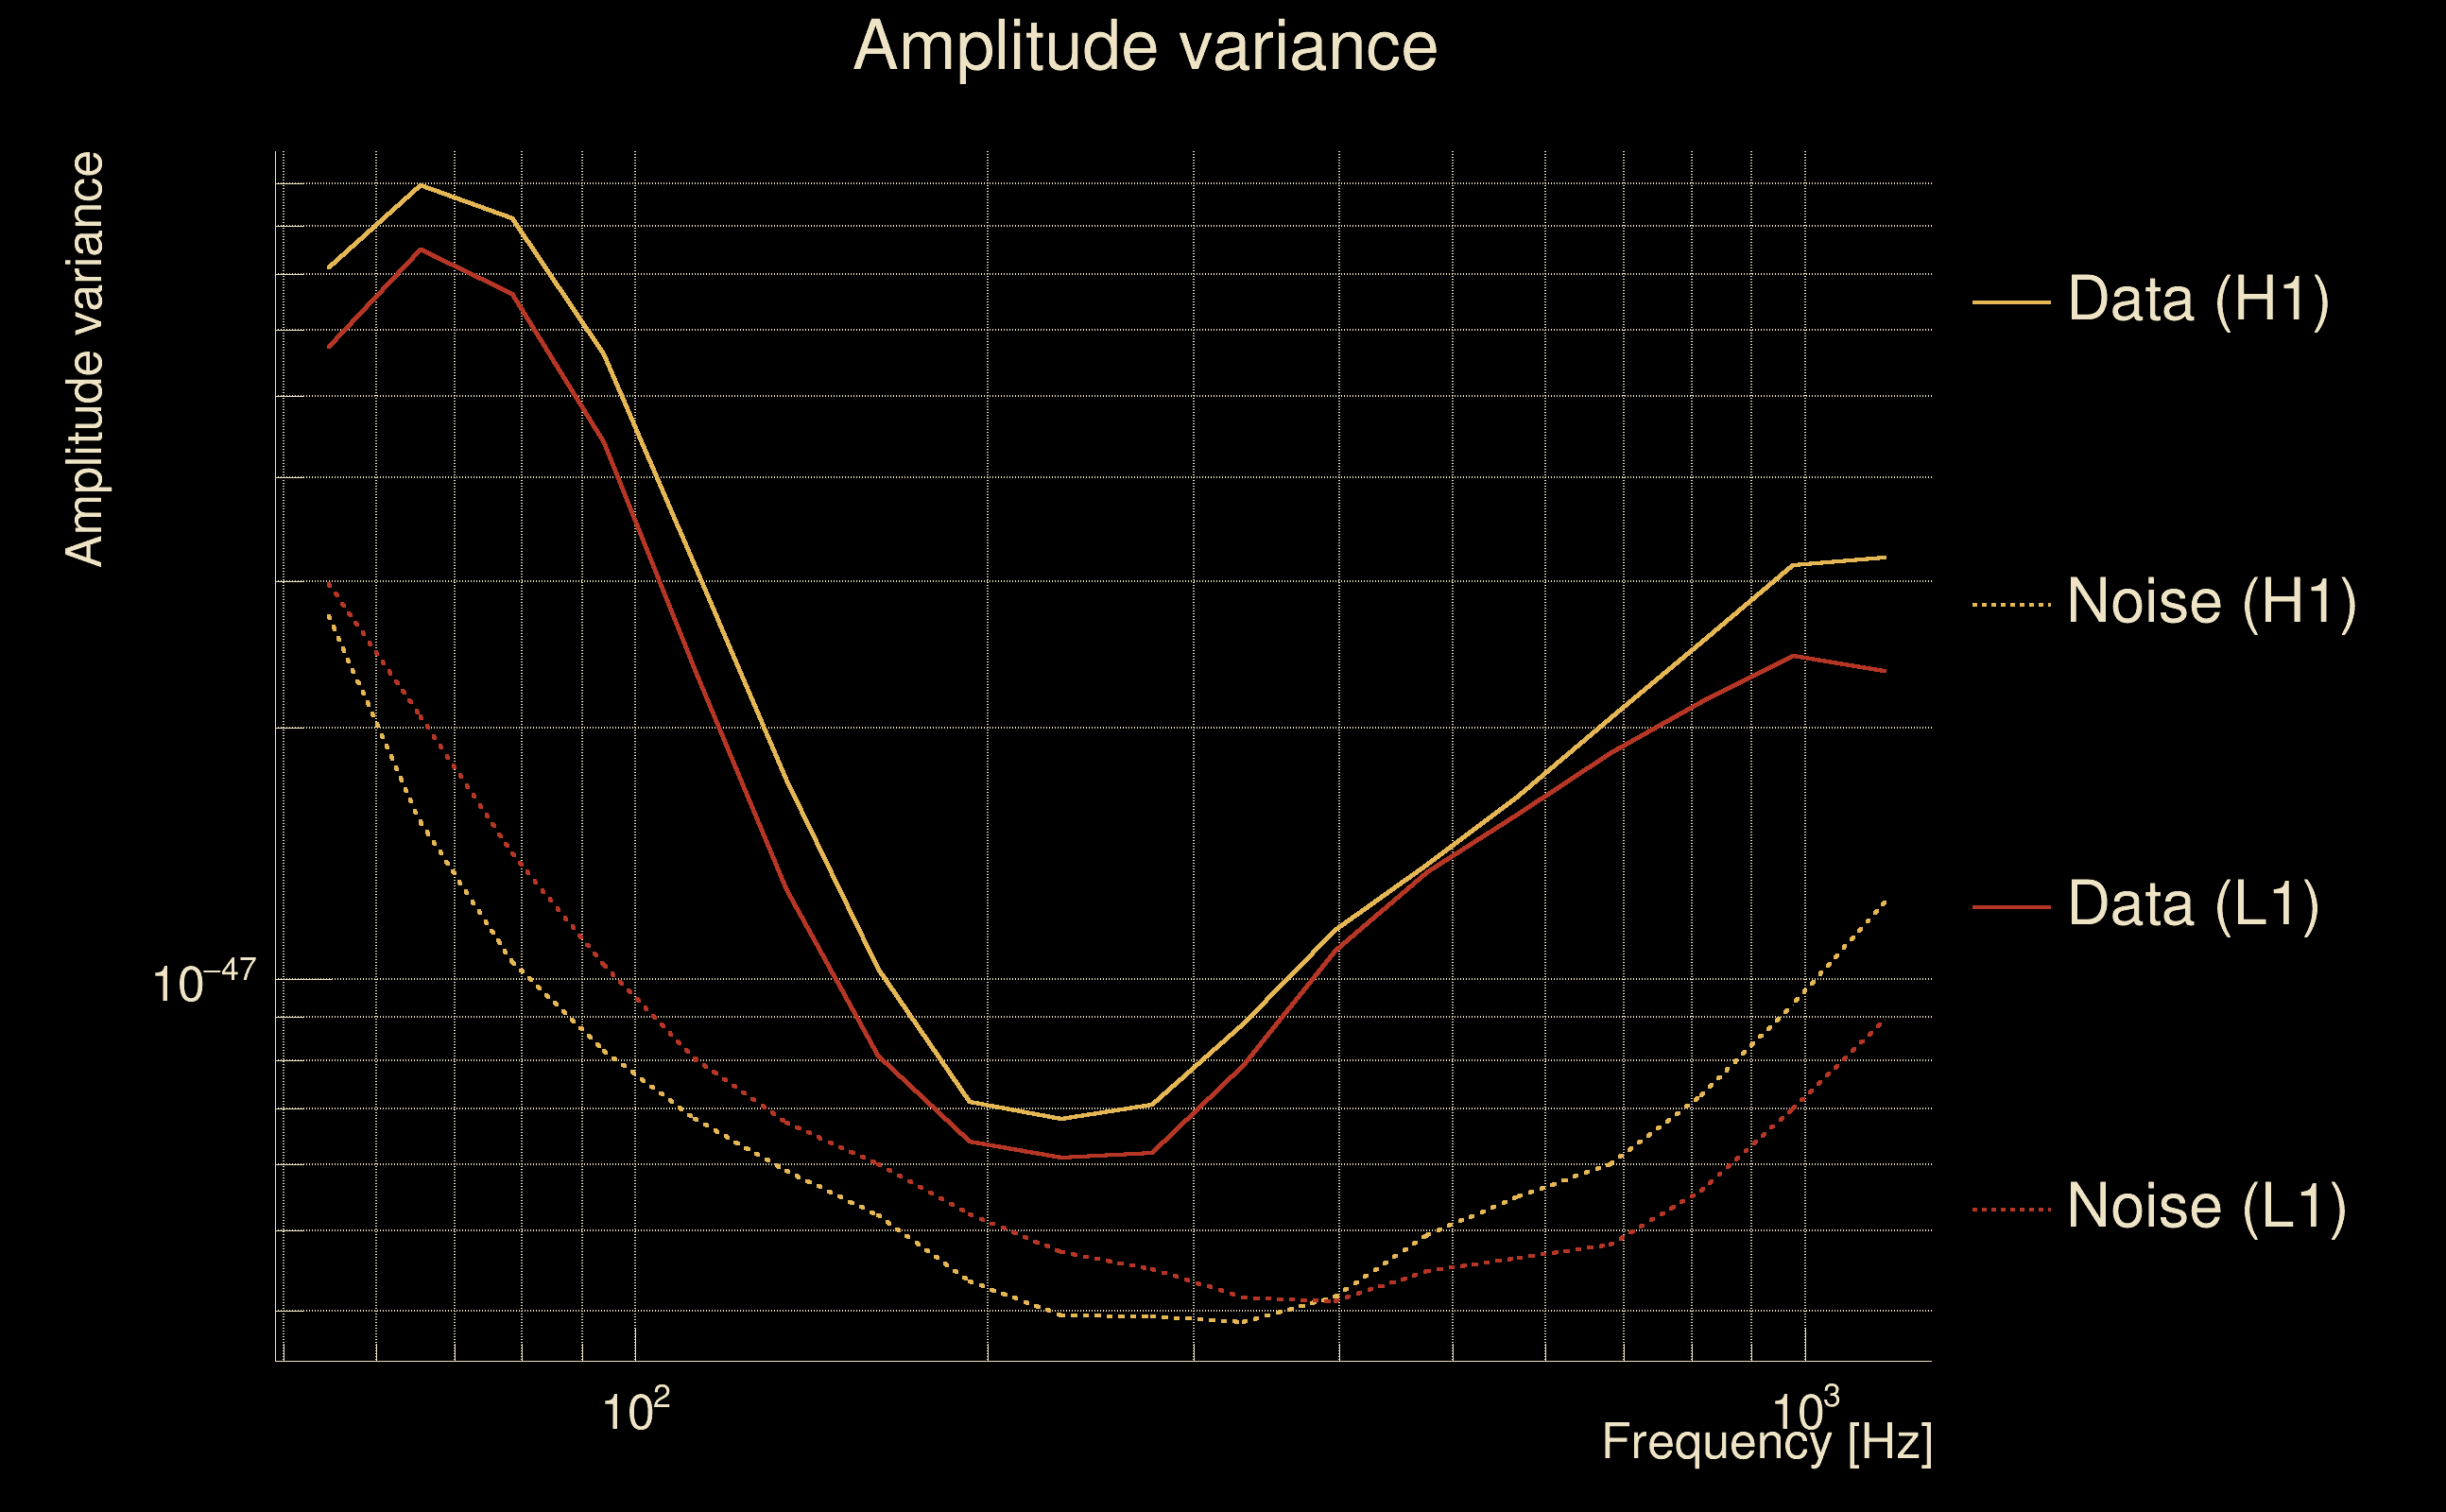
| Amplitude spectrograms: | normalization = 1e-22, power index = 2 |
| White noise SNR variance: | 0.523175 (after applying a correction factor = 1) |
| Amplitude ratio confidence level: | 3 sigma |
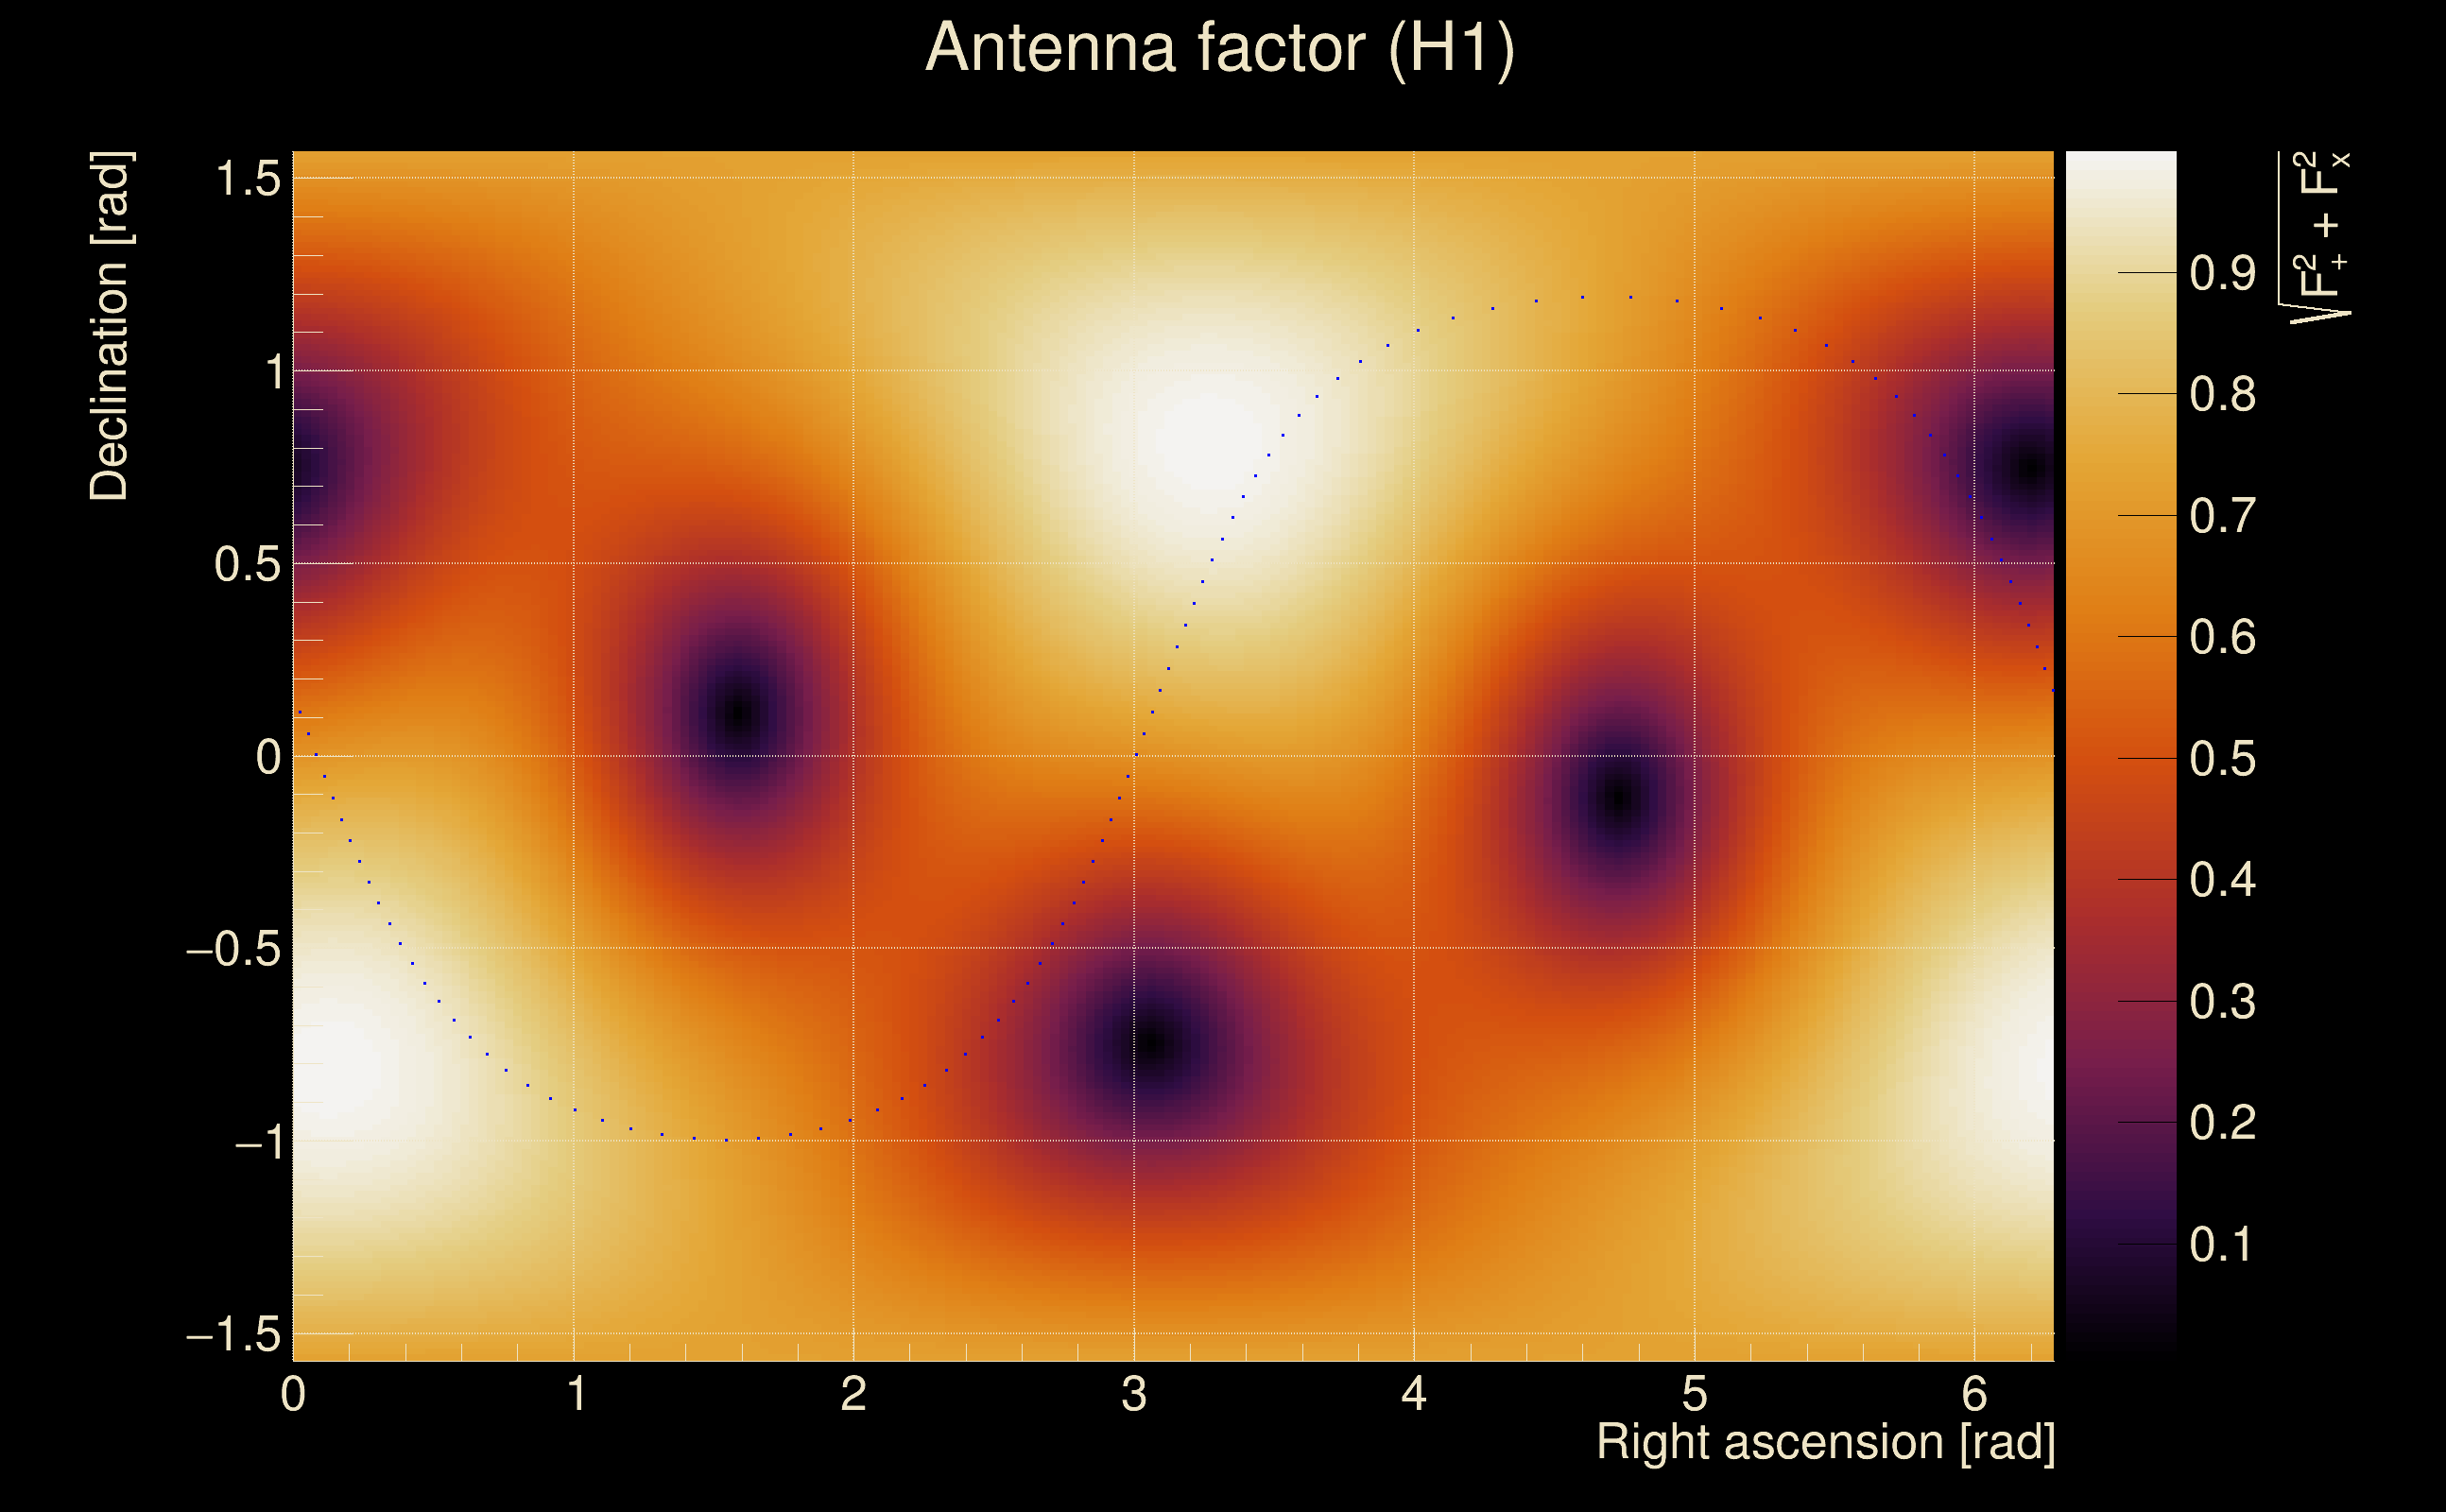
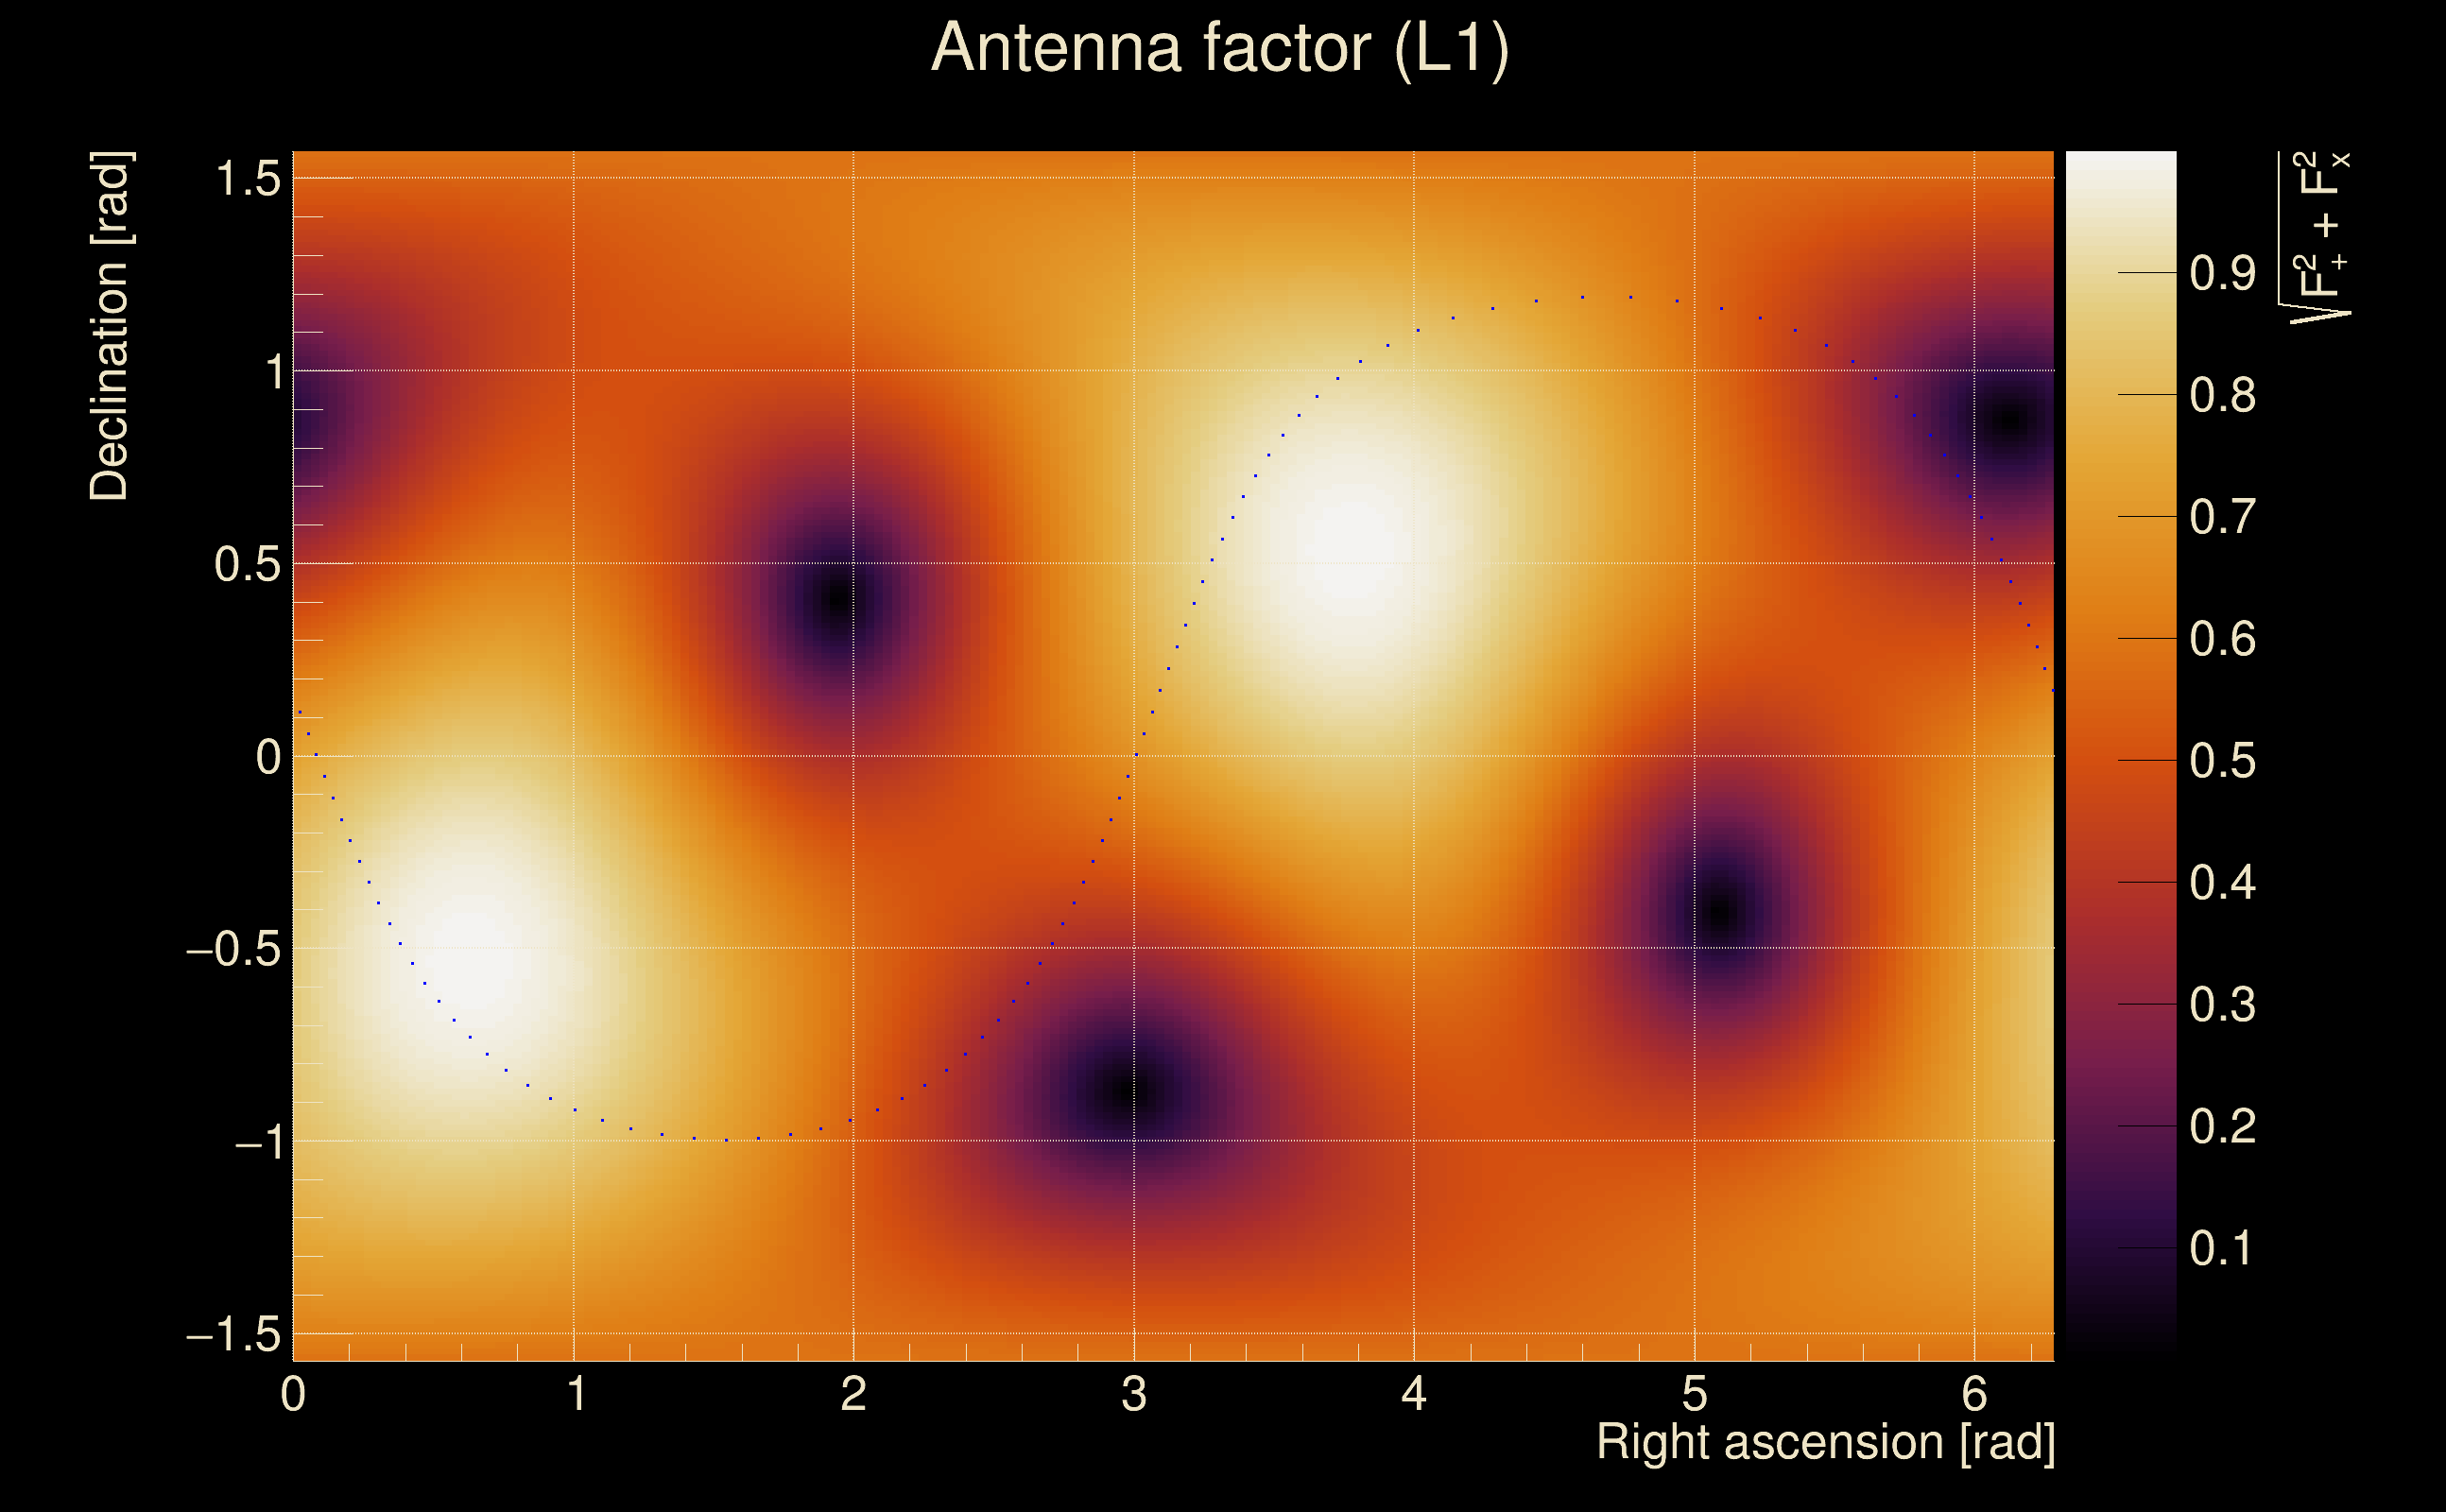
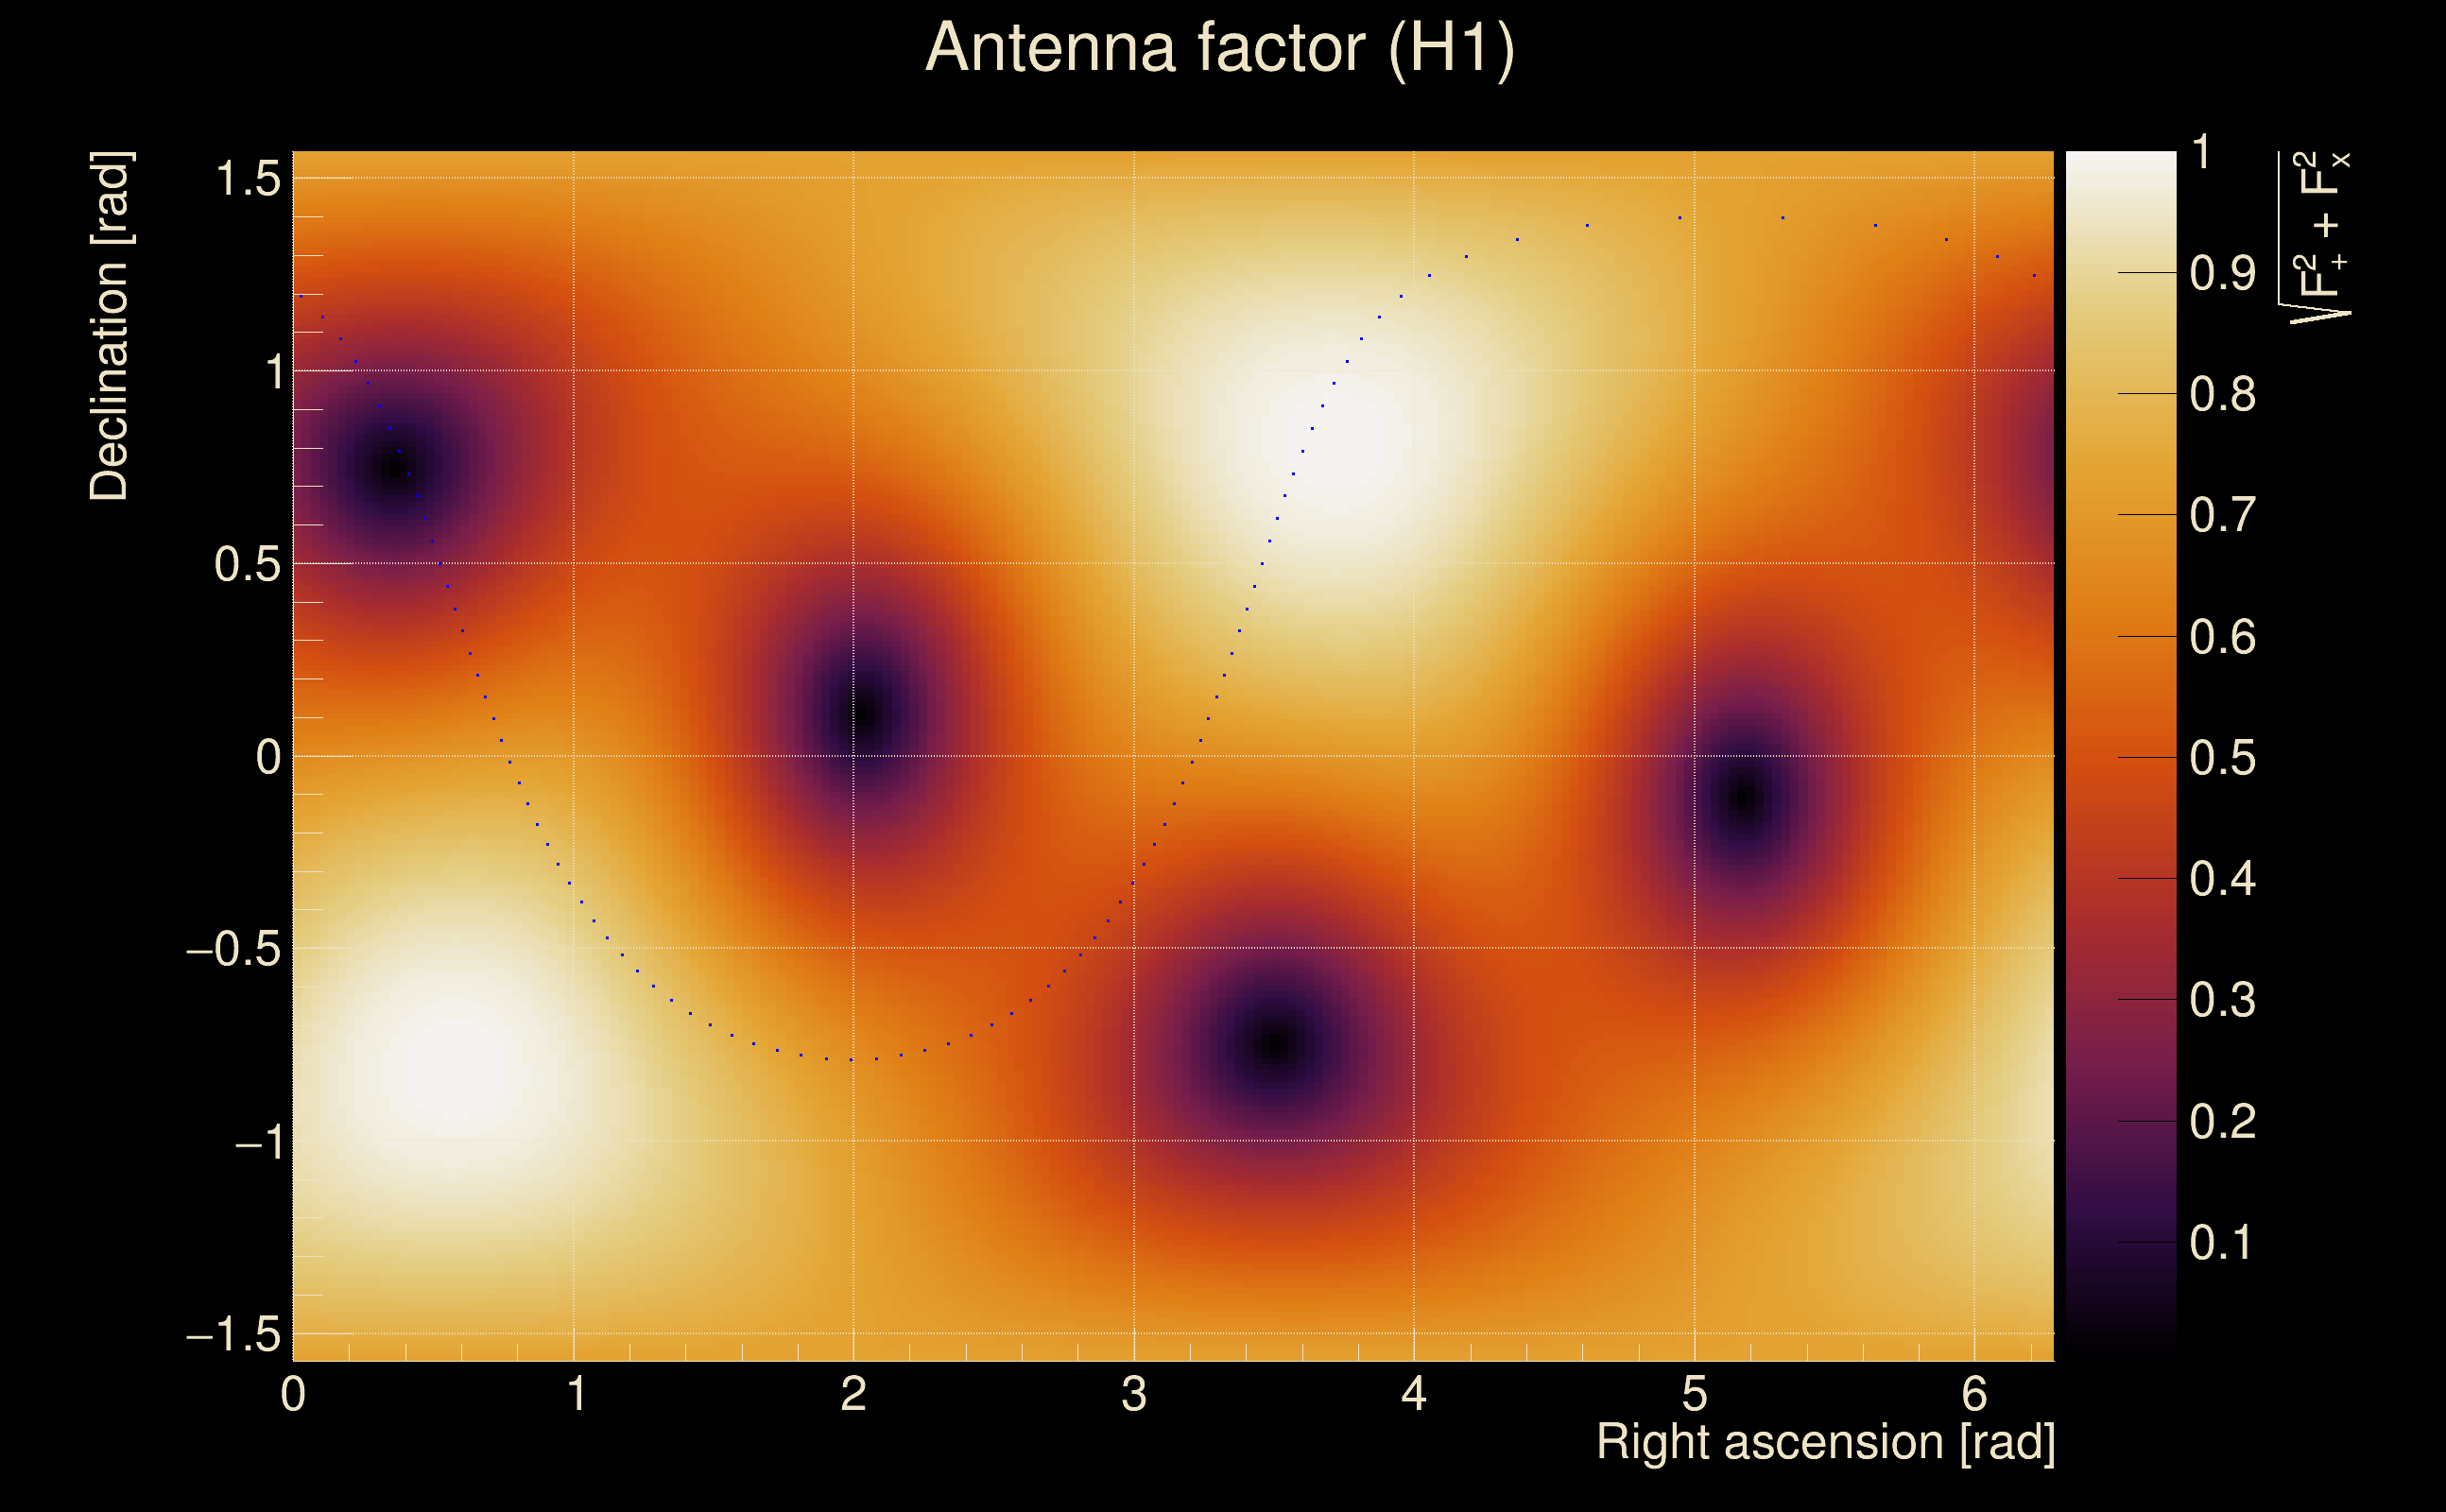
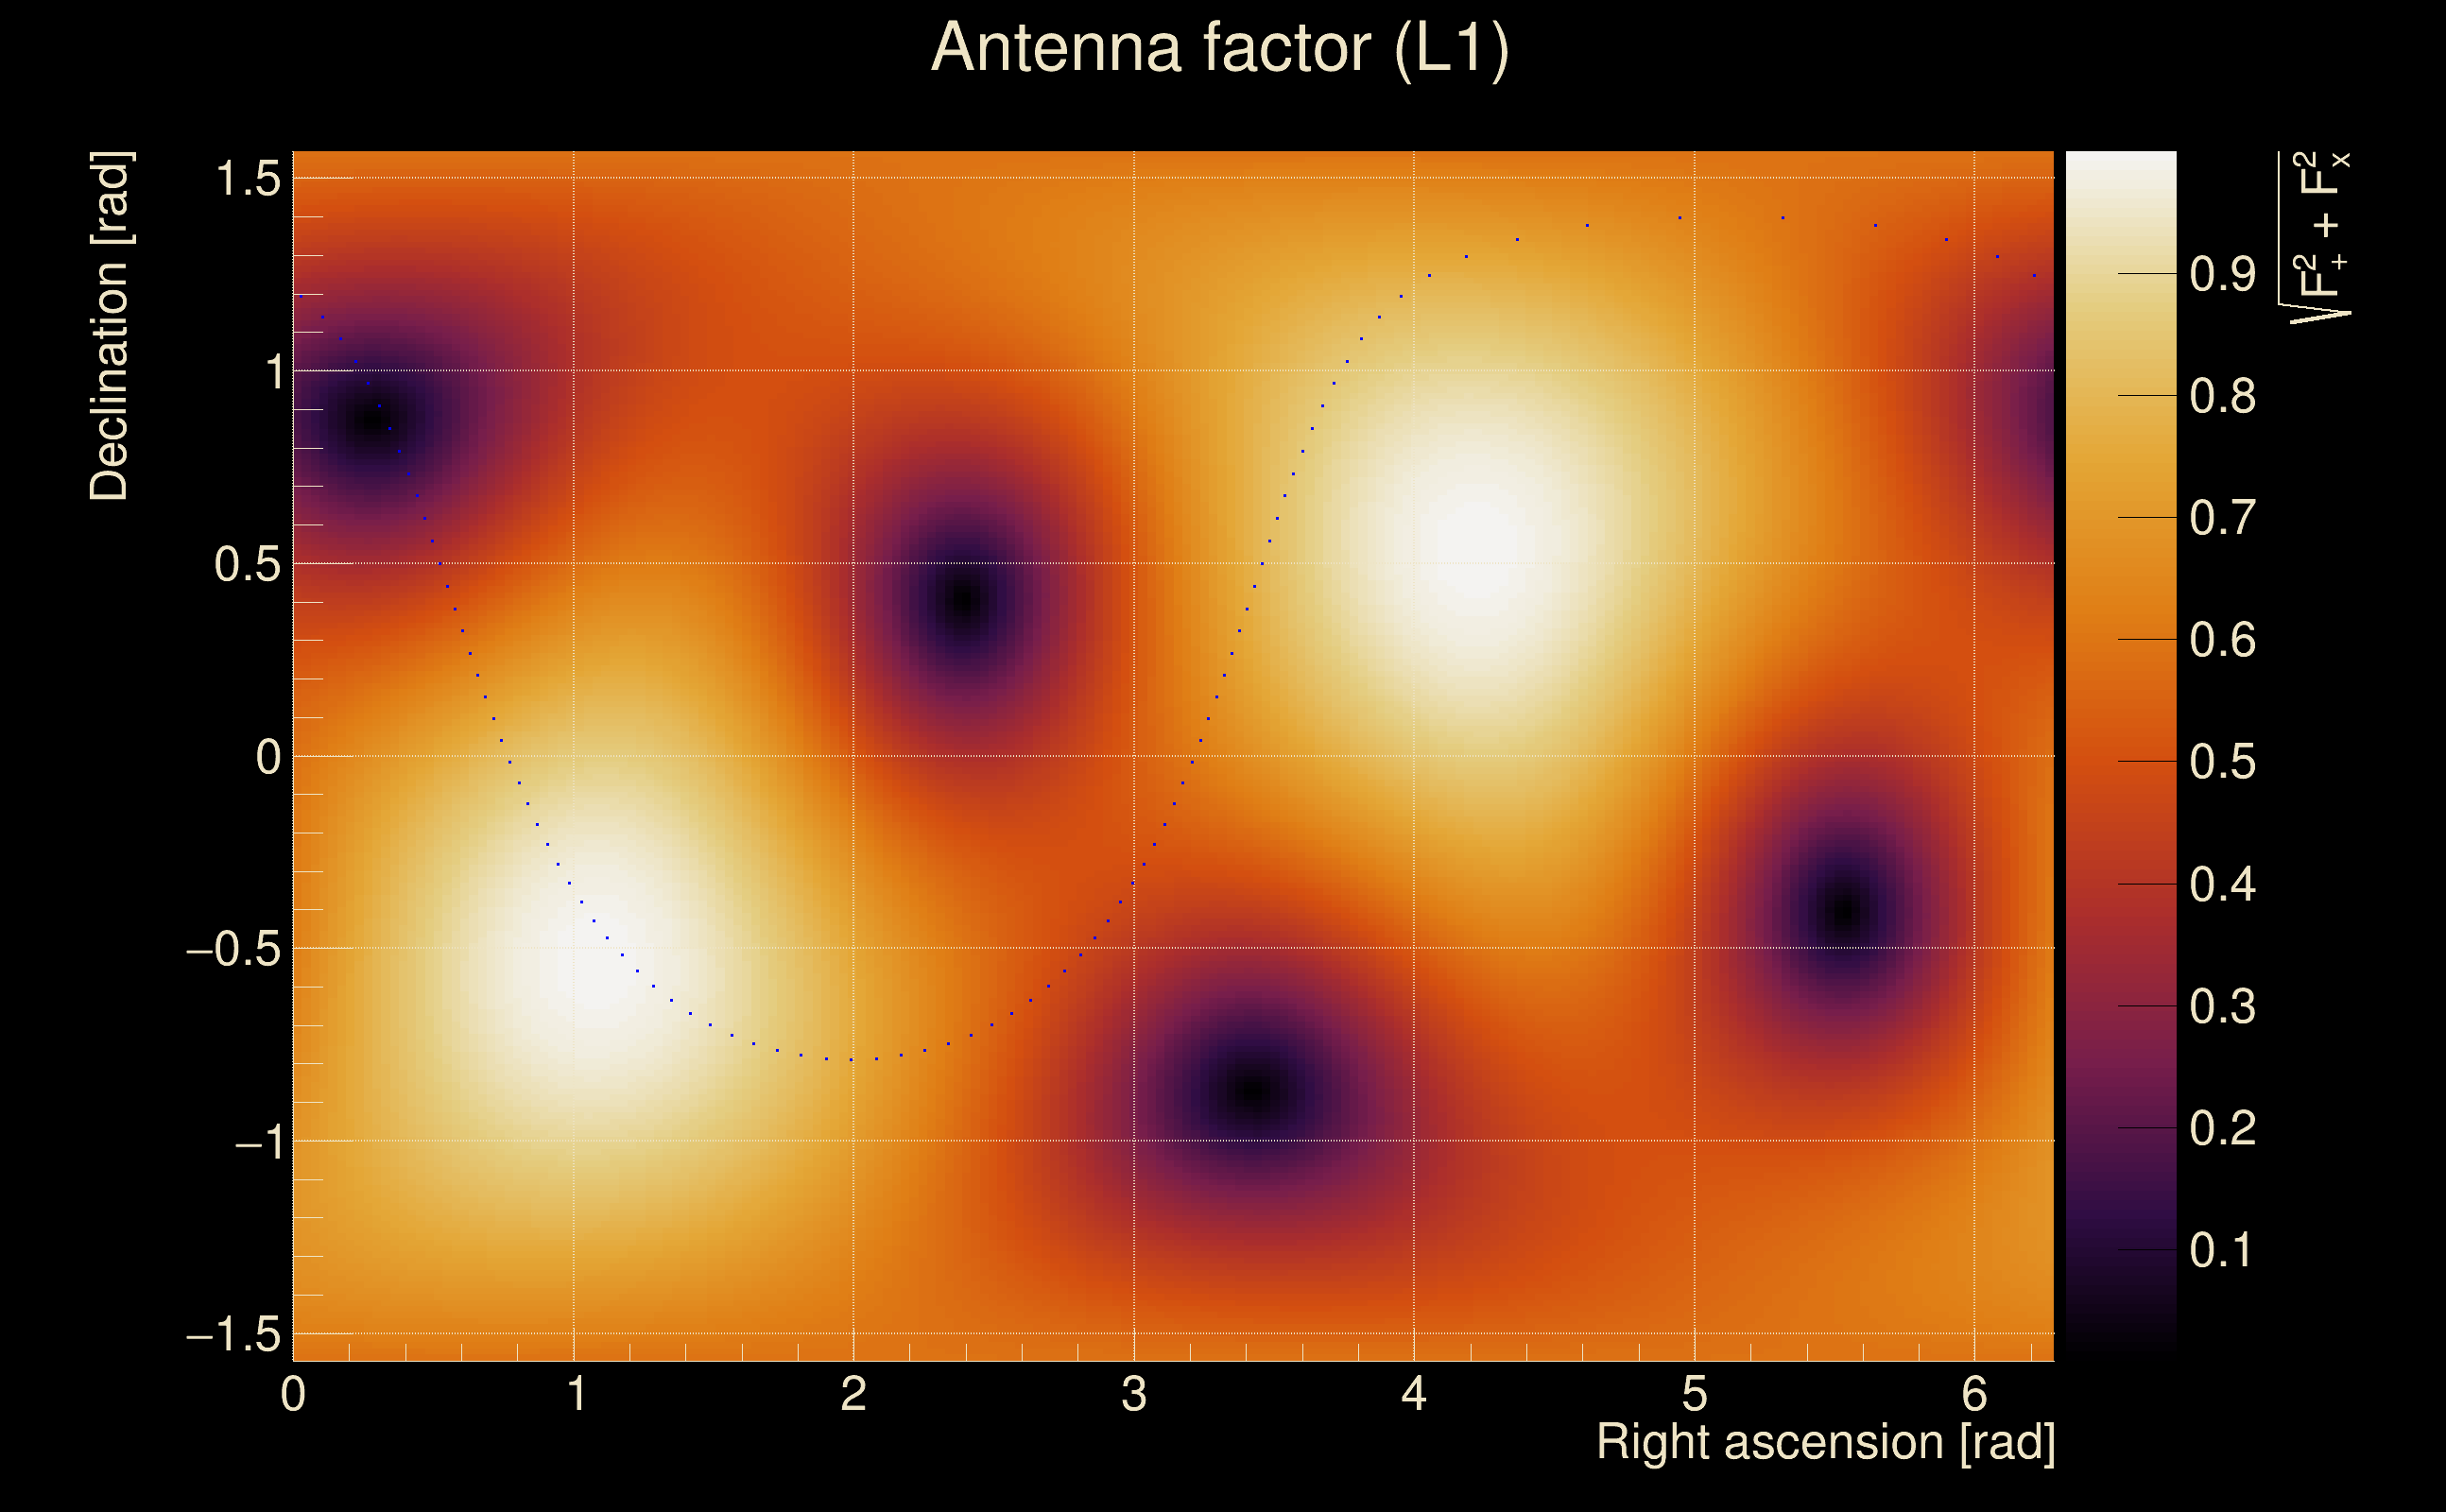
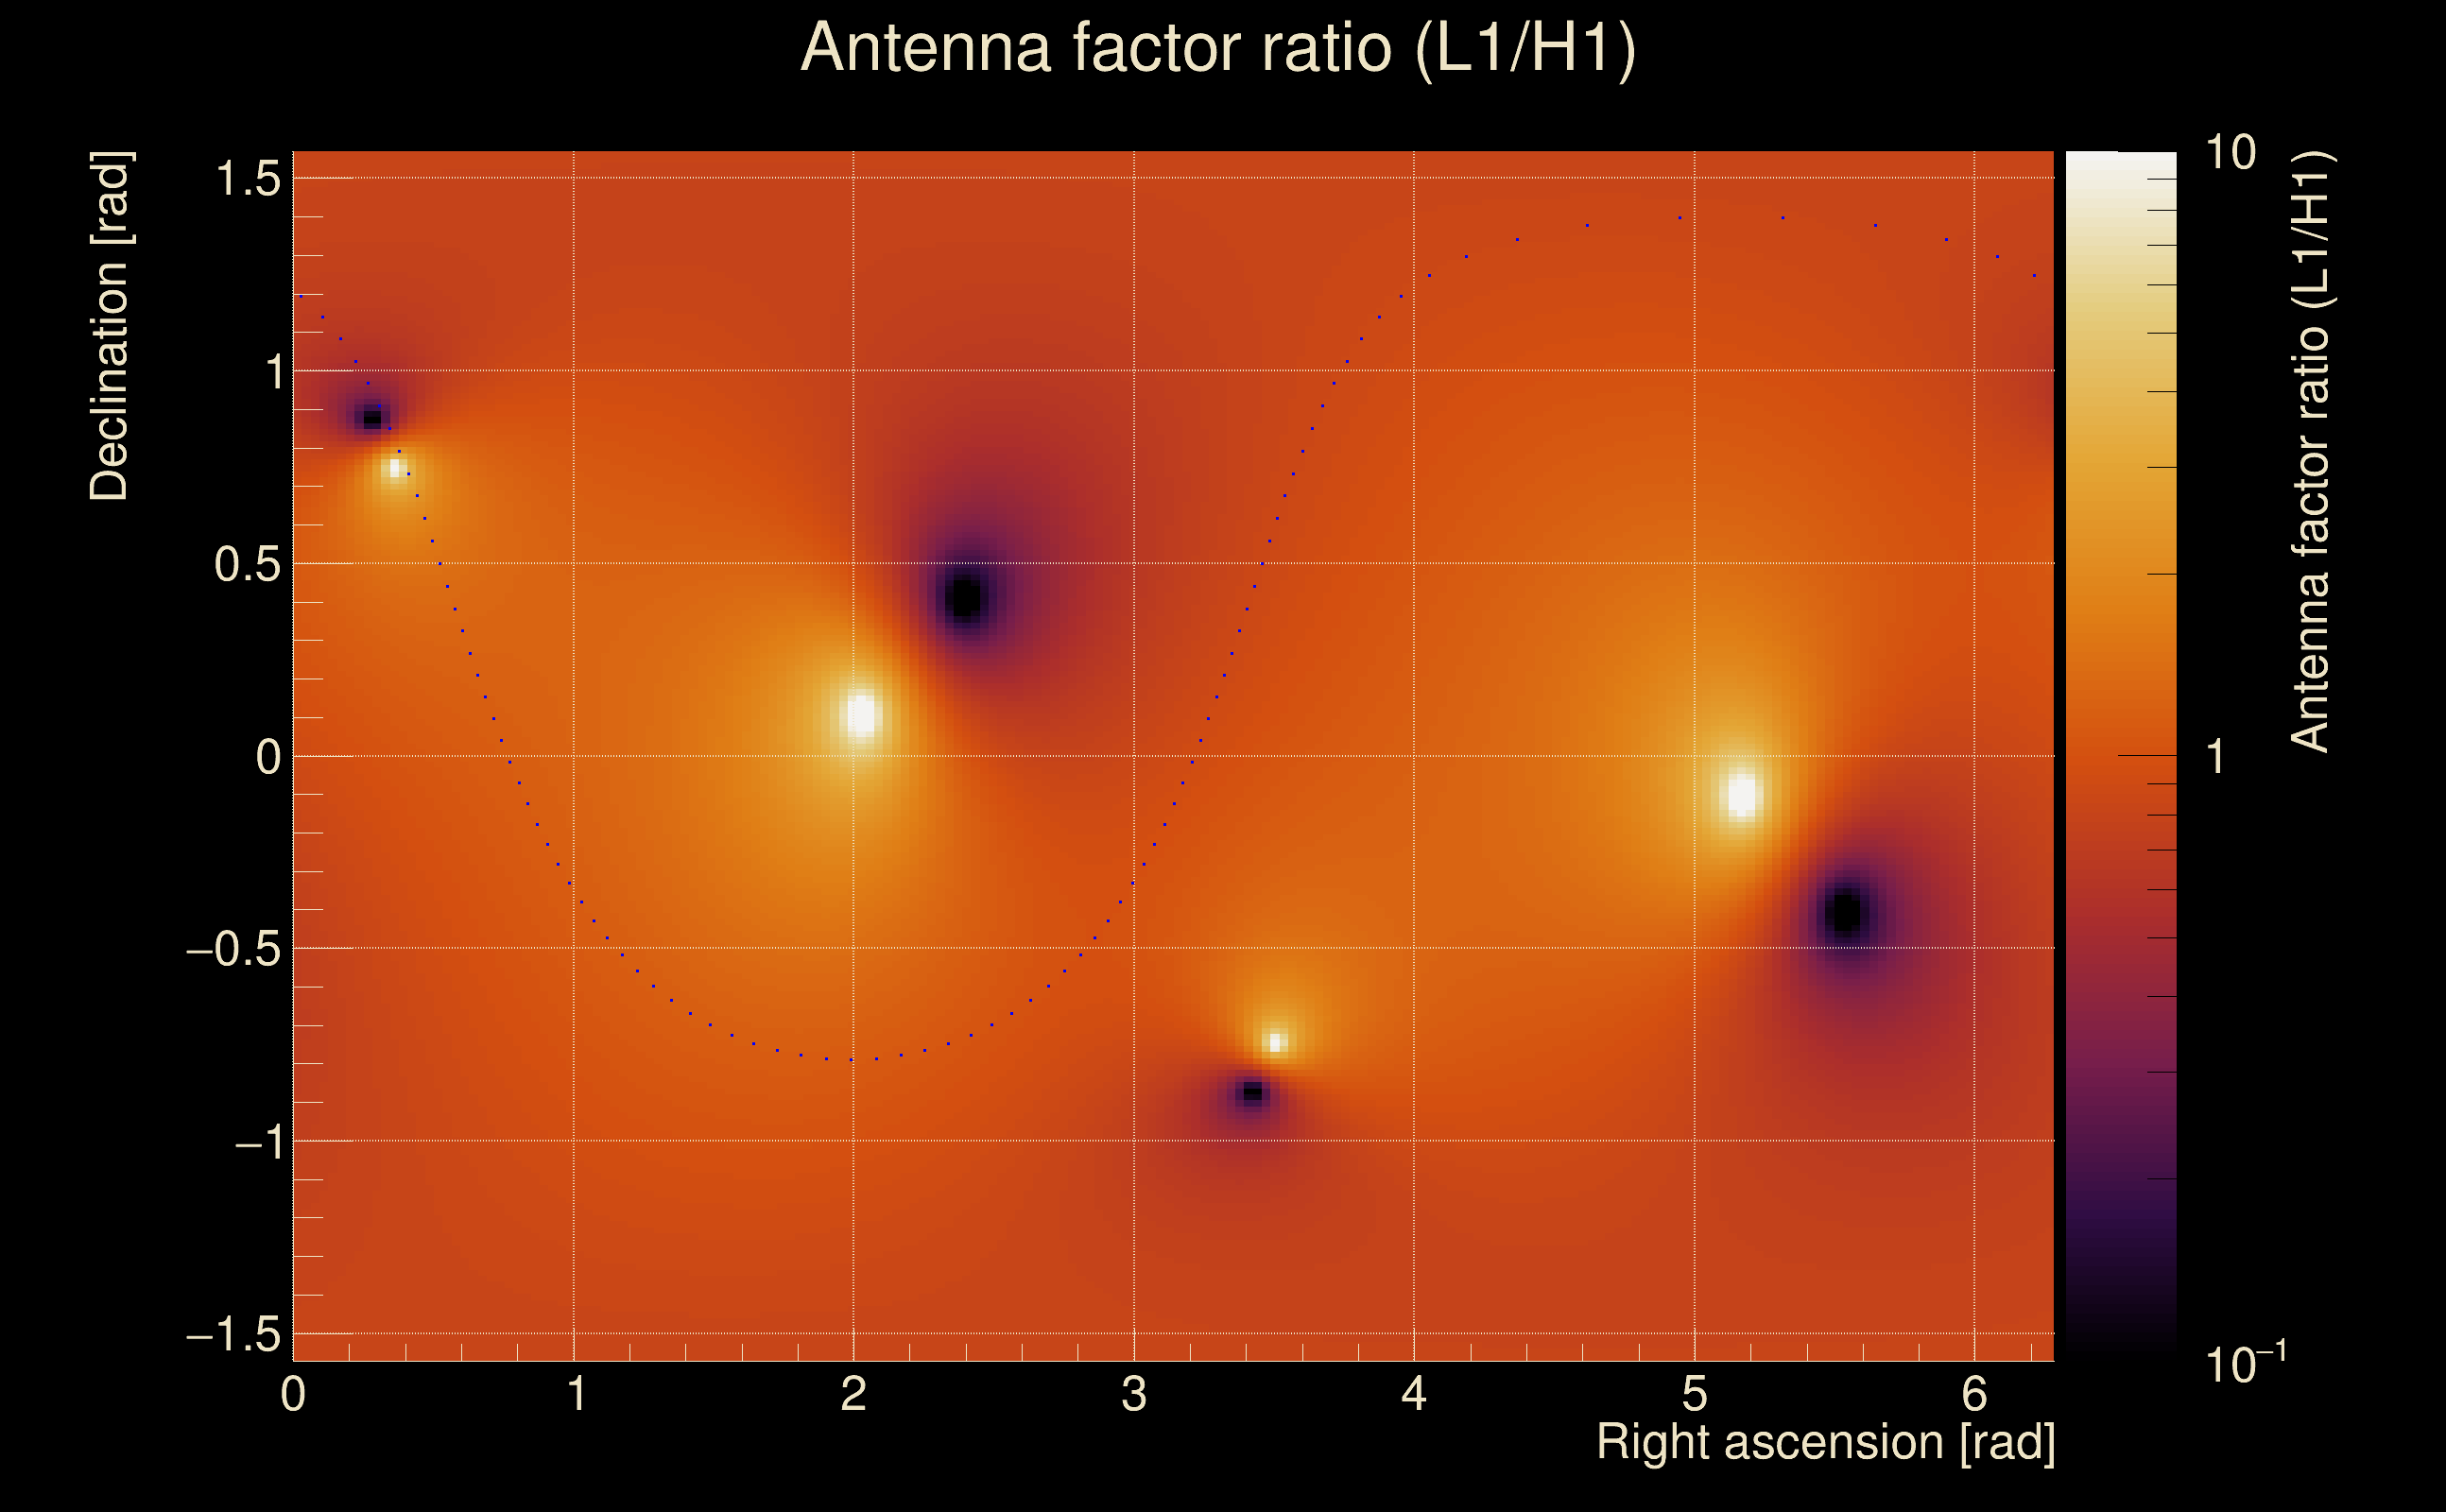
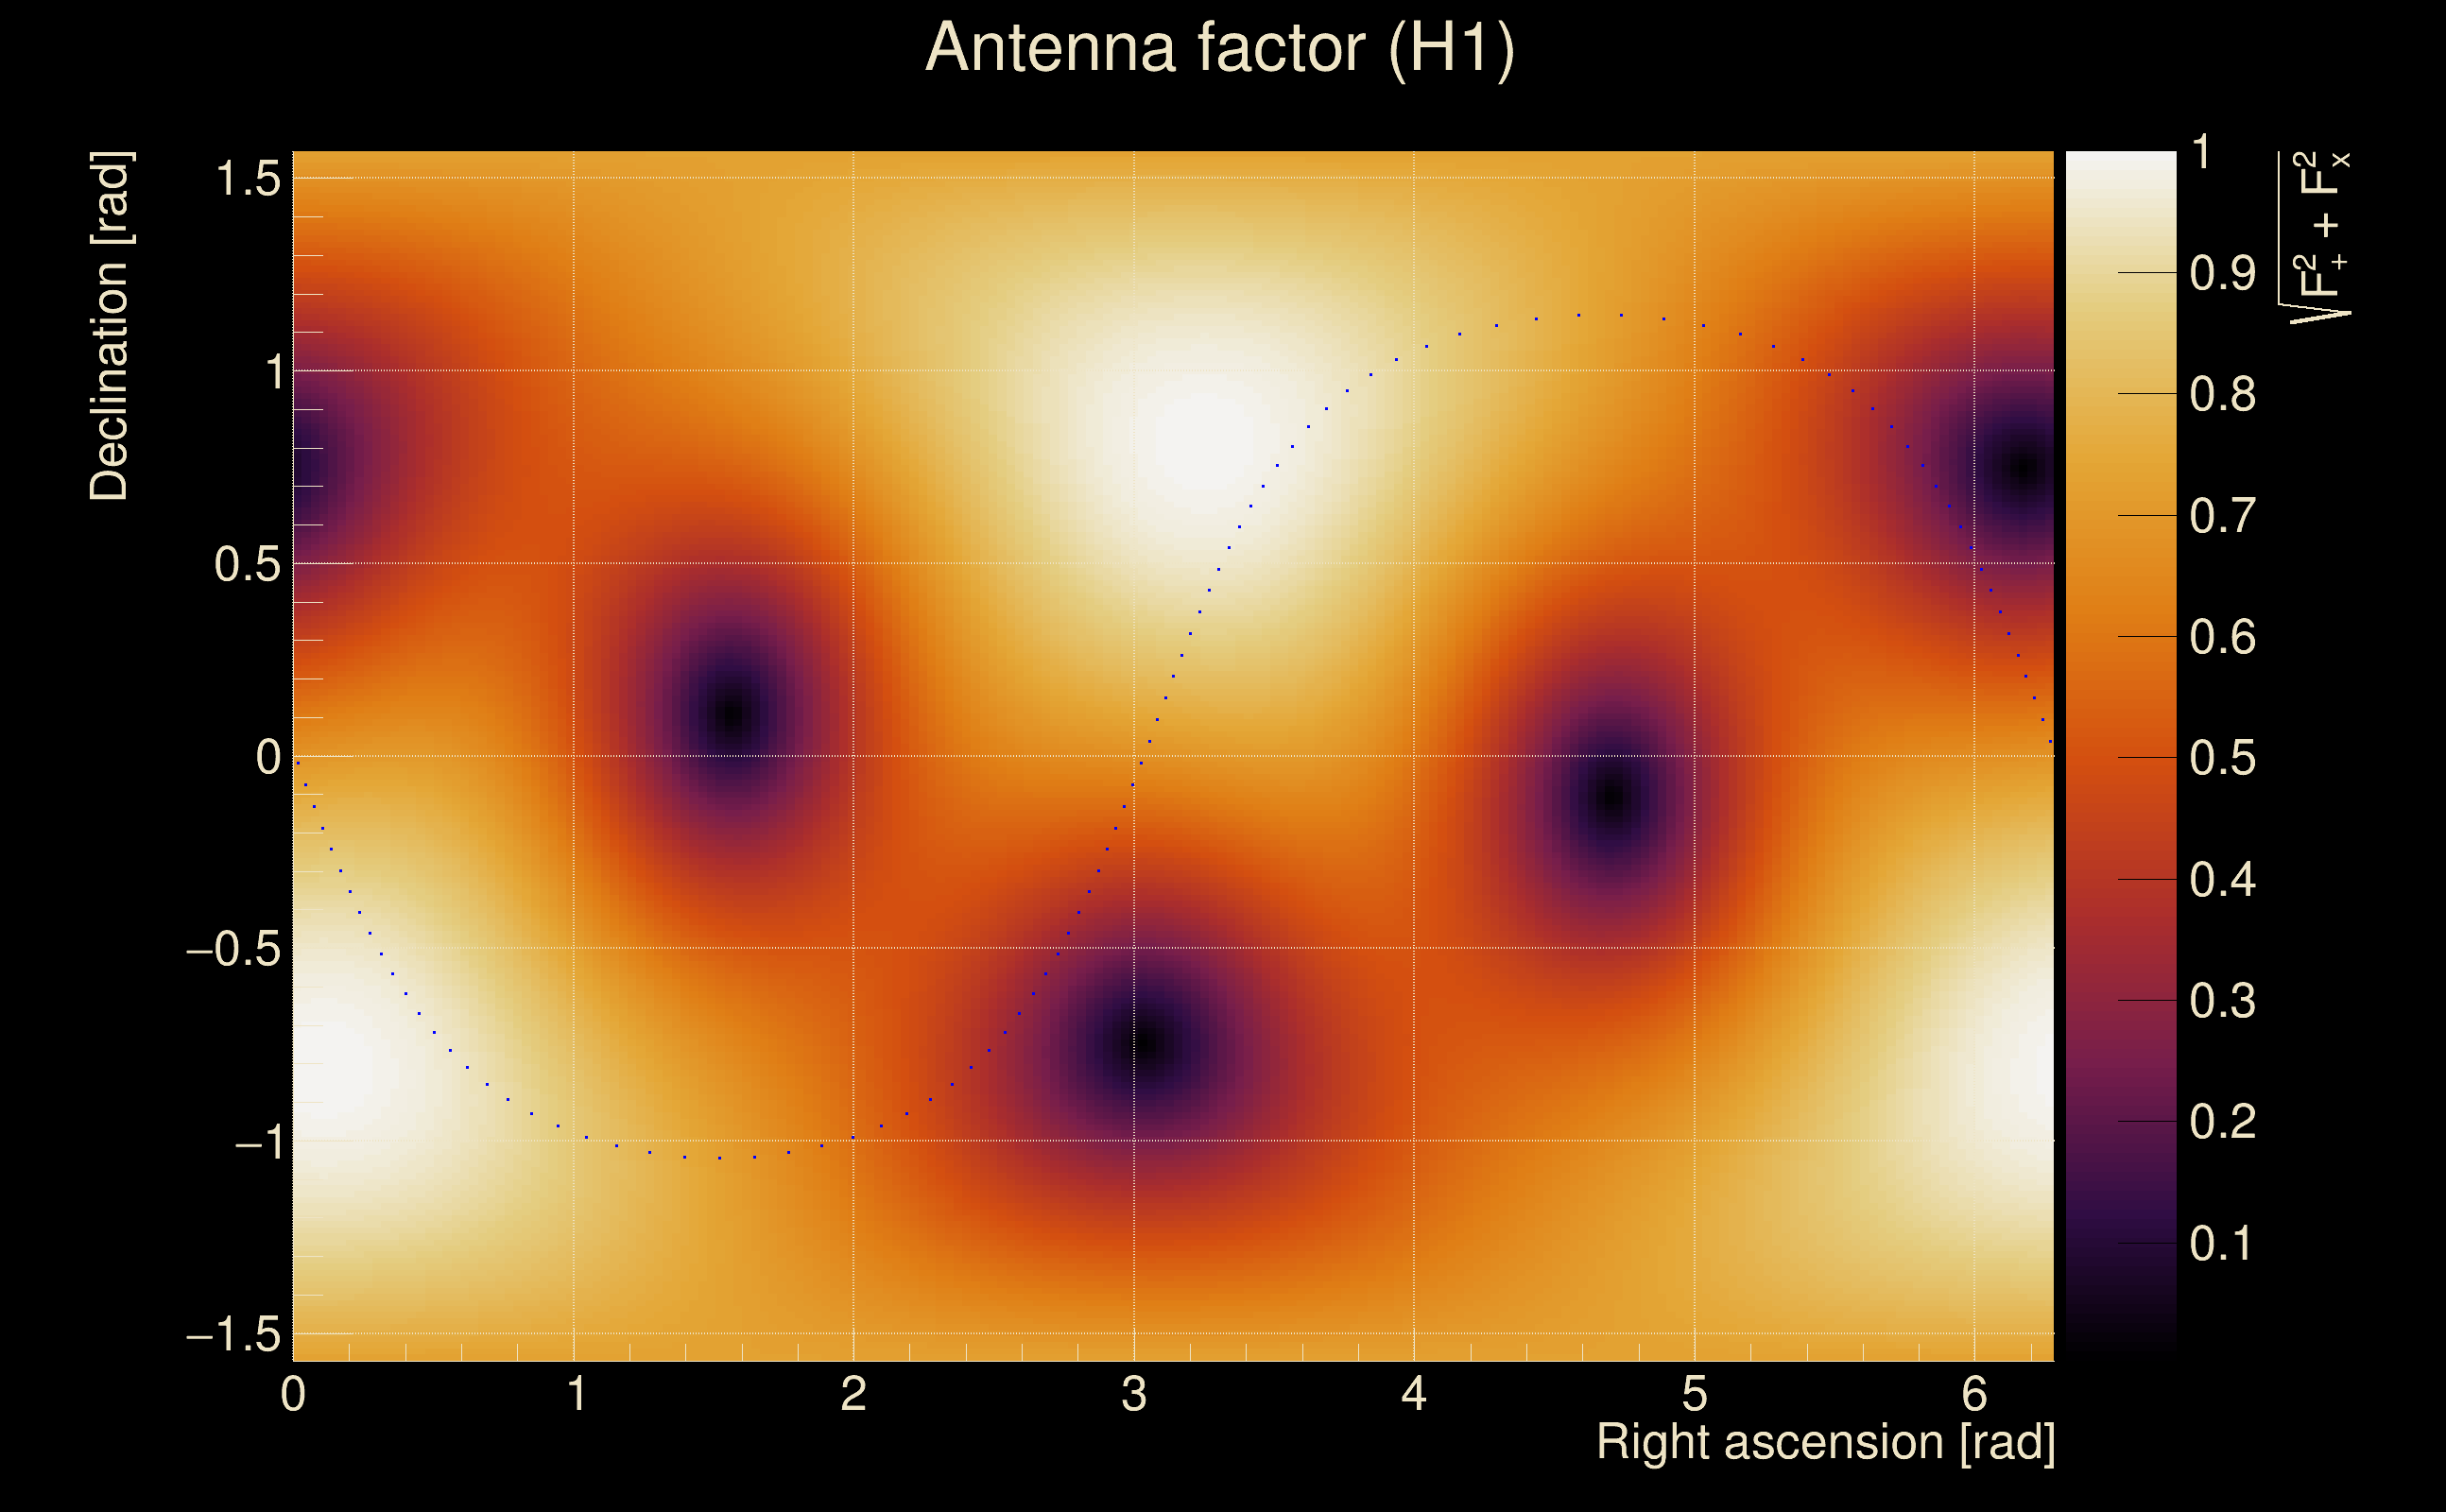
| Target sky positon: | Ra: 3.68109, Dec: 0.94792 [rad] |
| List of input Ox files: | TargIxf_feb2026_SN7_30s_file_list.txt (71 files) |
| Analysis result file: | TargIxf_feb2026_SN7_30s_results-0.root |
| Slice selected for the the fakeground: | slice index=193 (-3.91 s), time lag = 0 s |
| Foreground | Fakeground | Background | ||
|---|---|---|---|---|
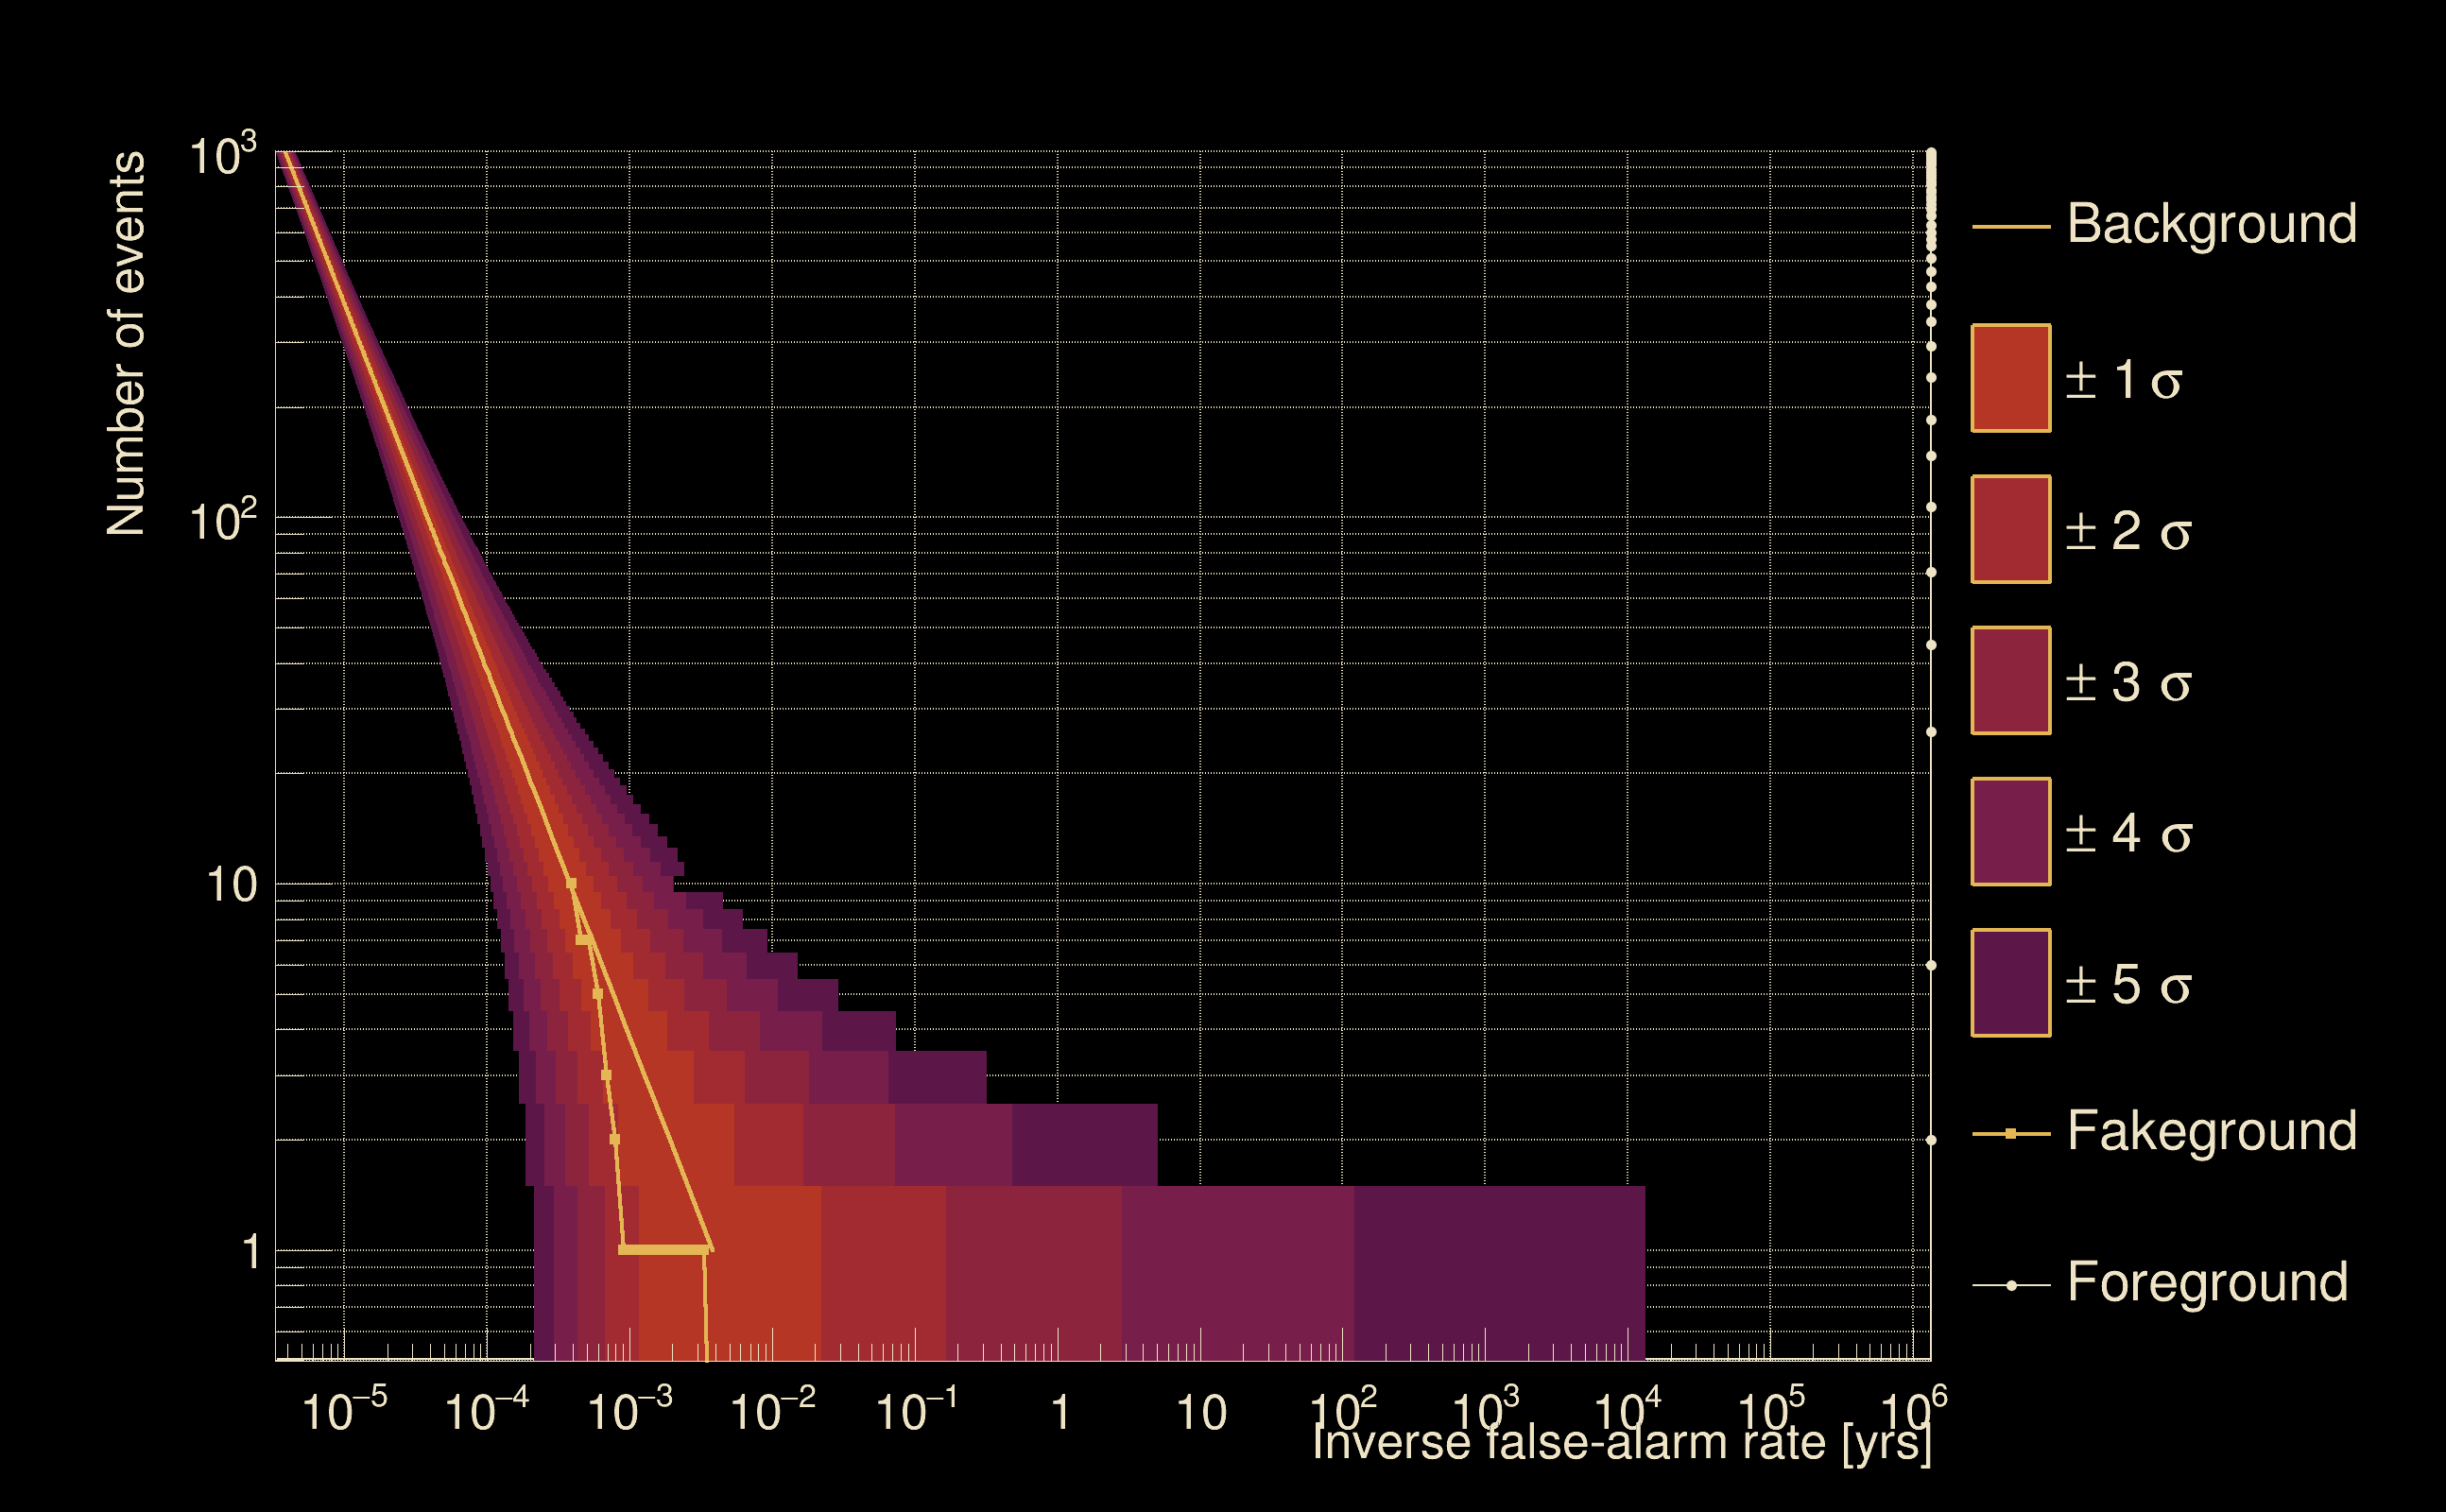
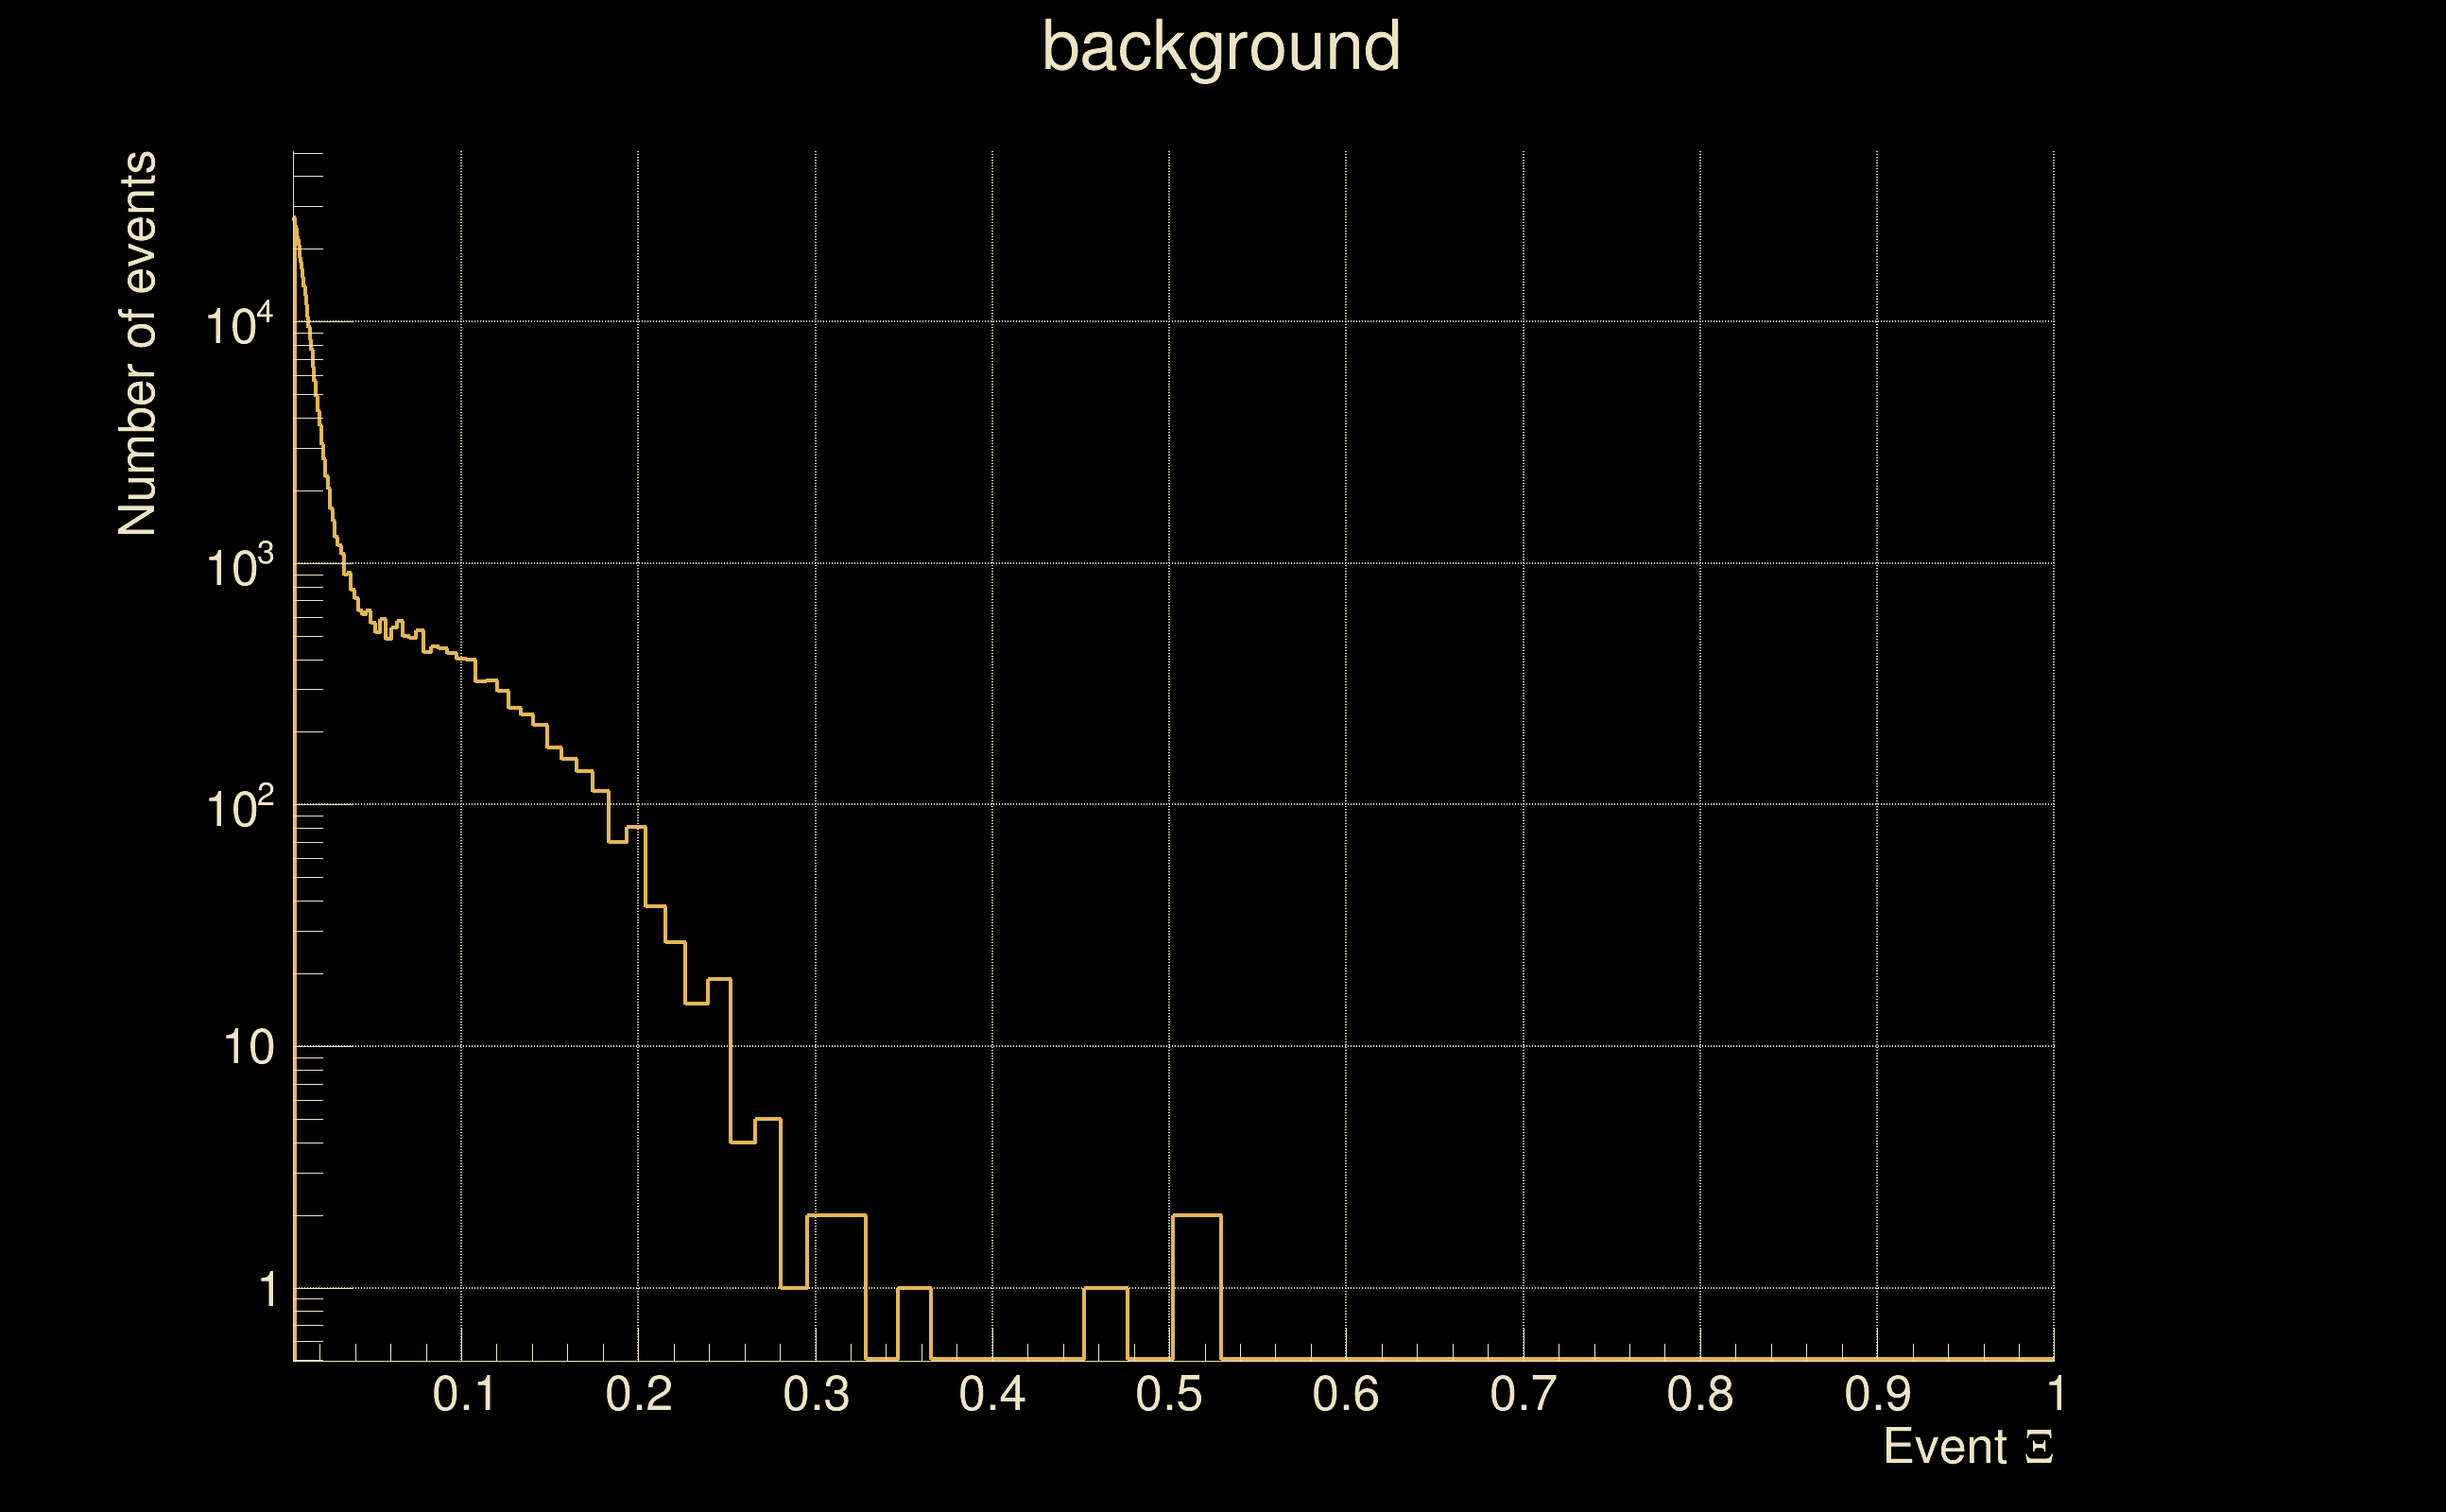
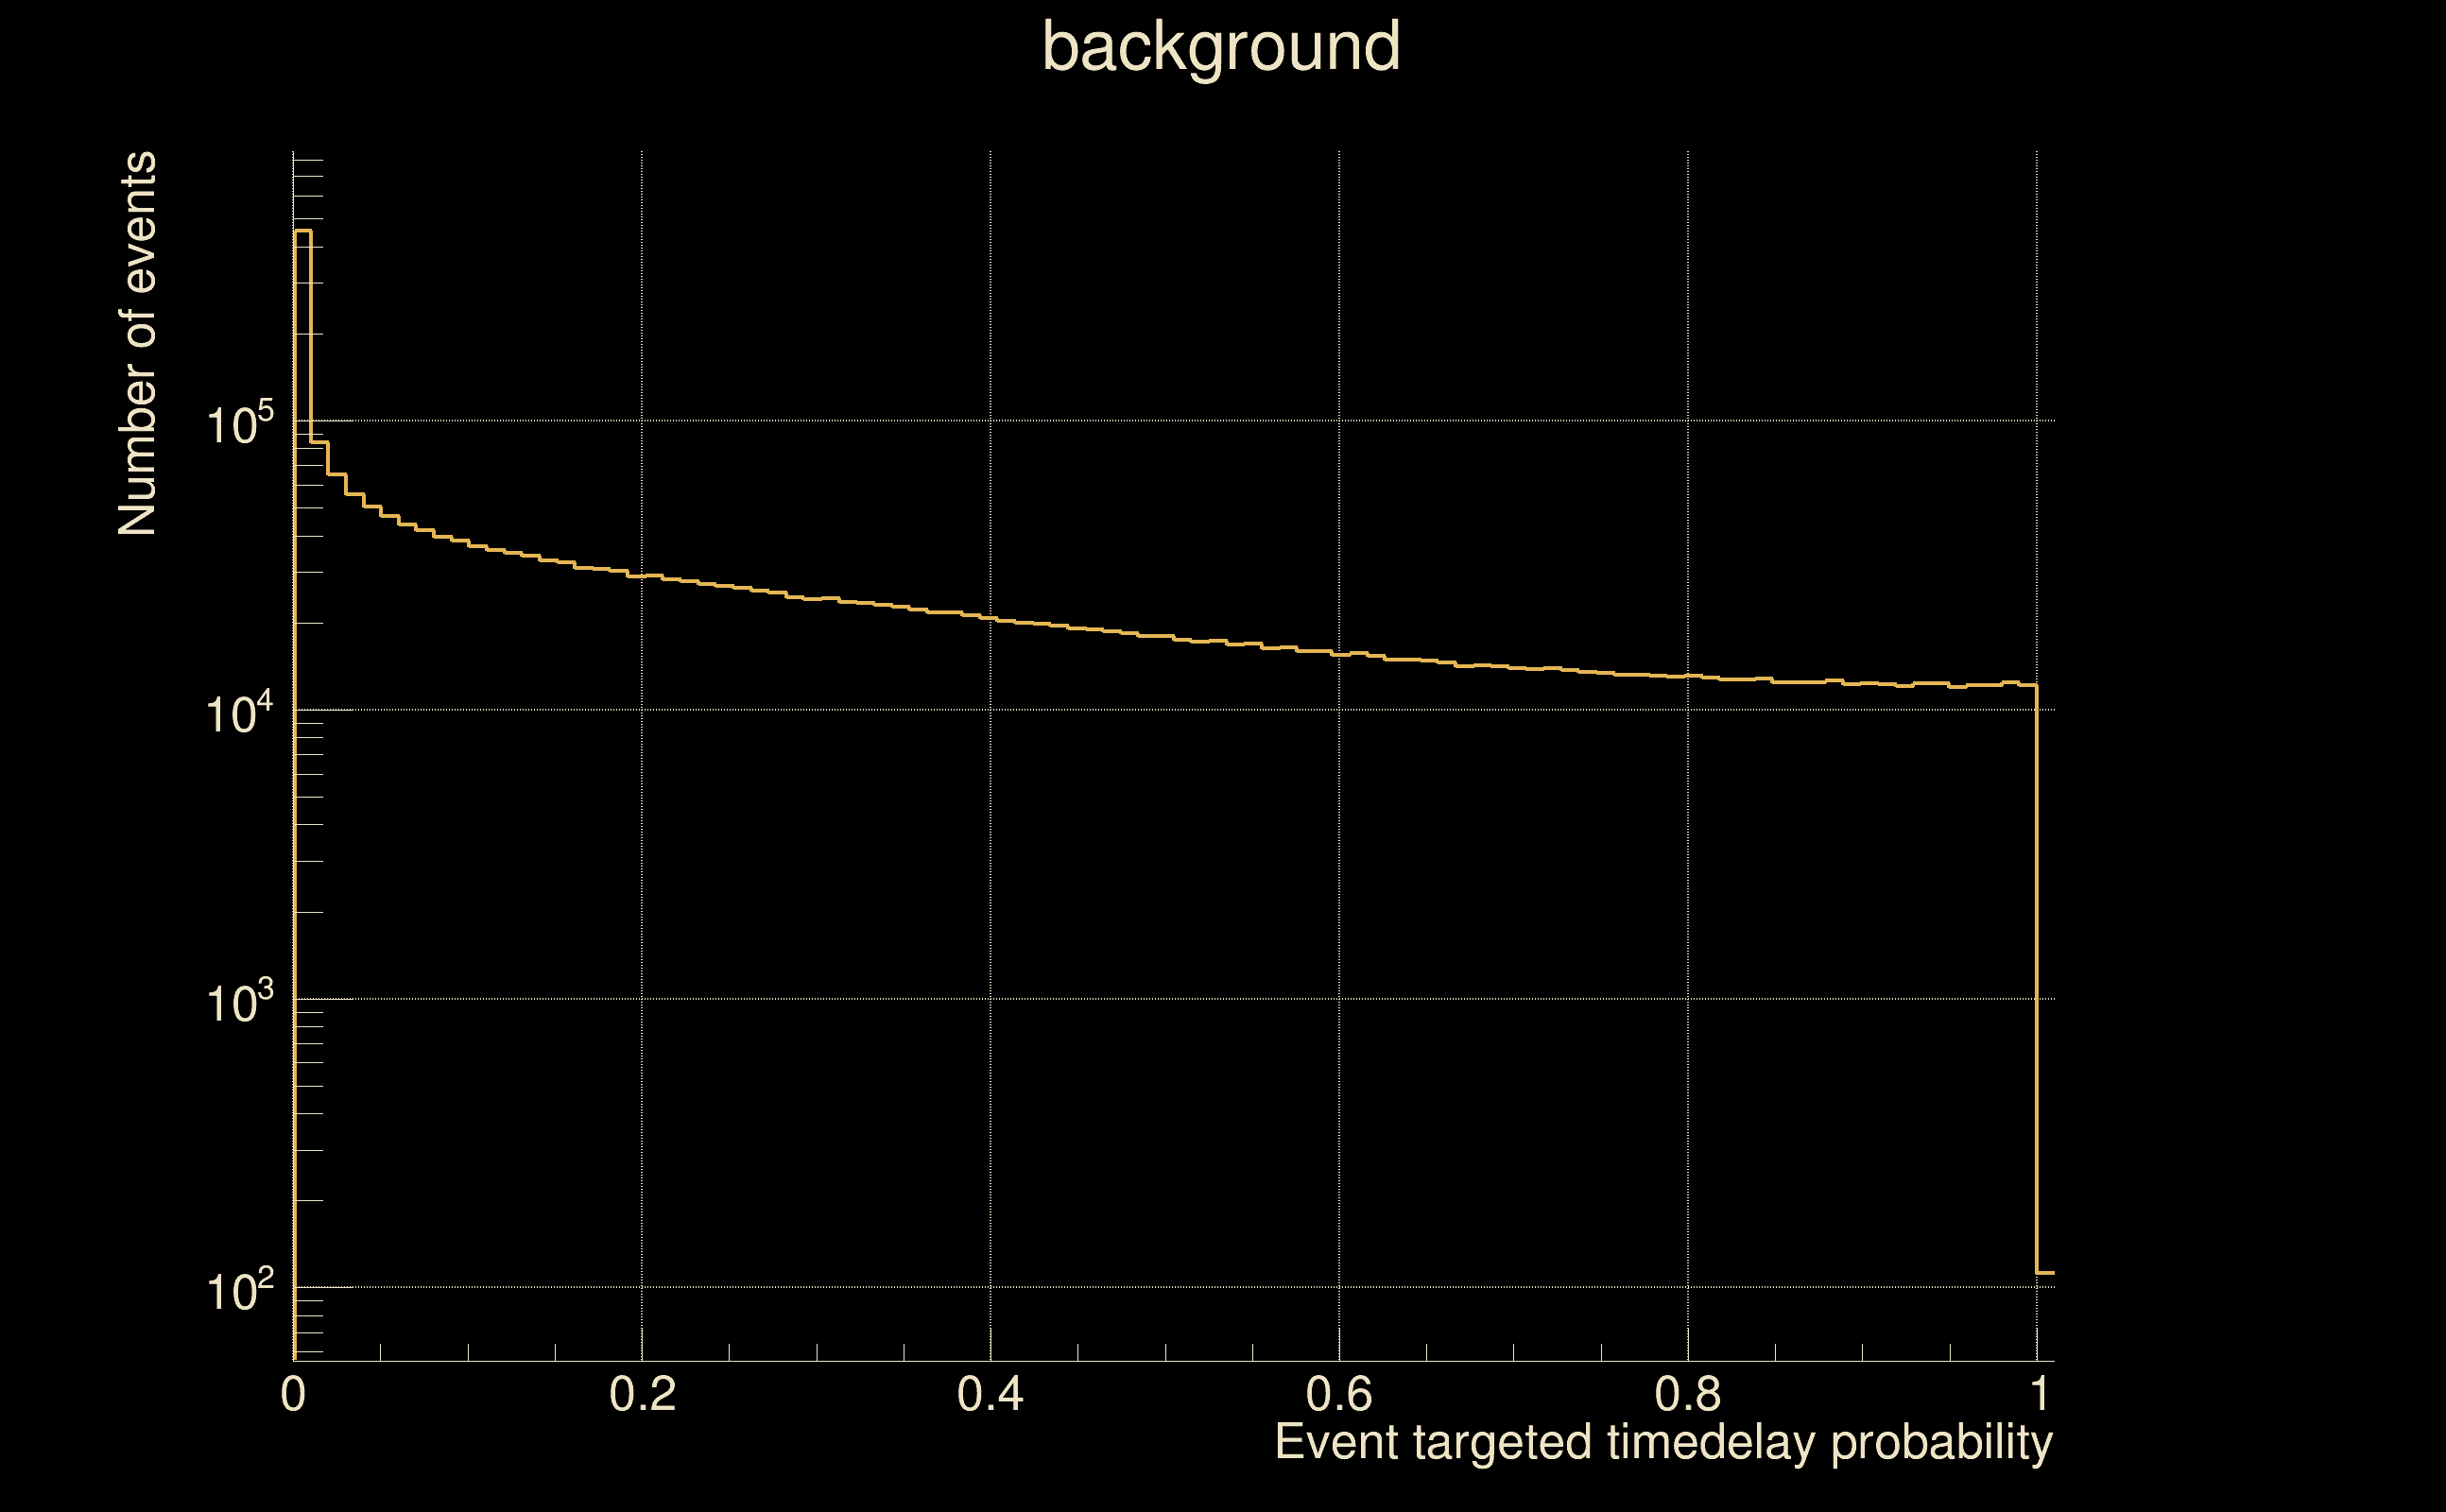
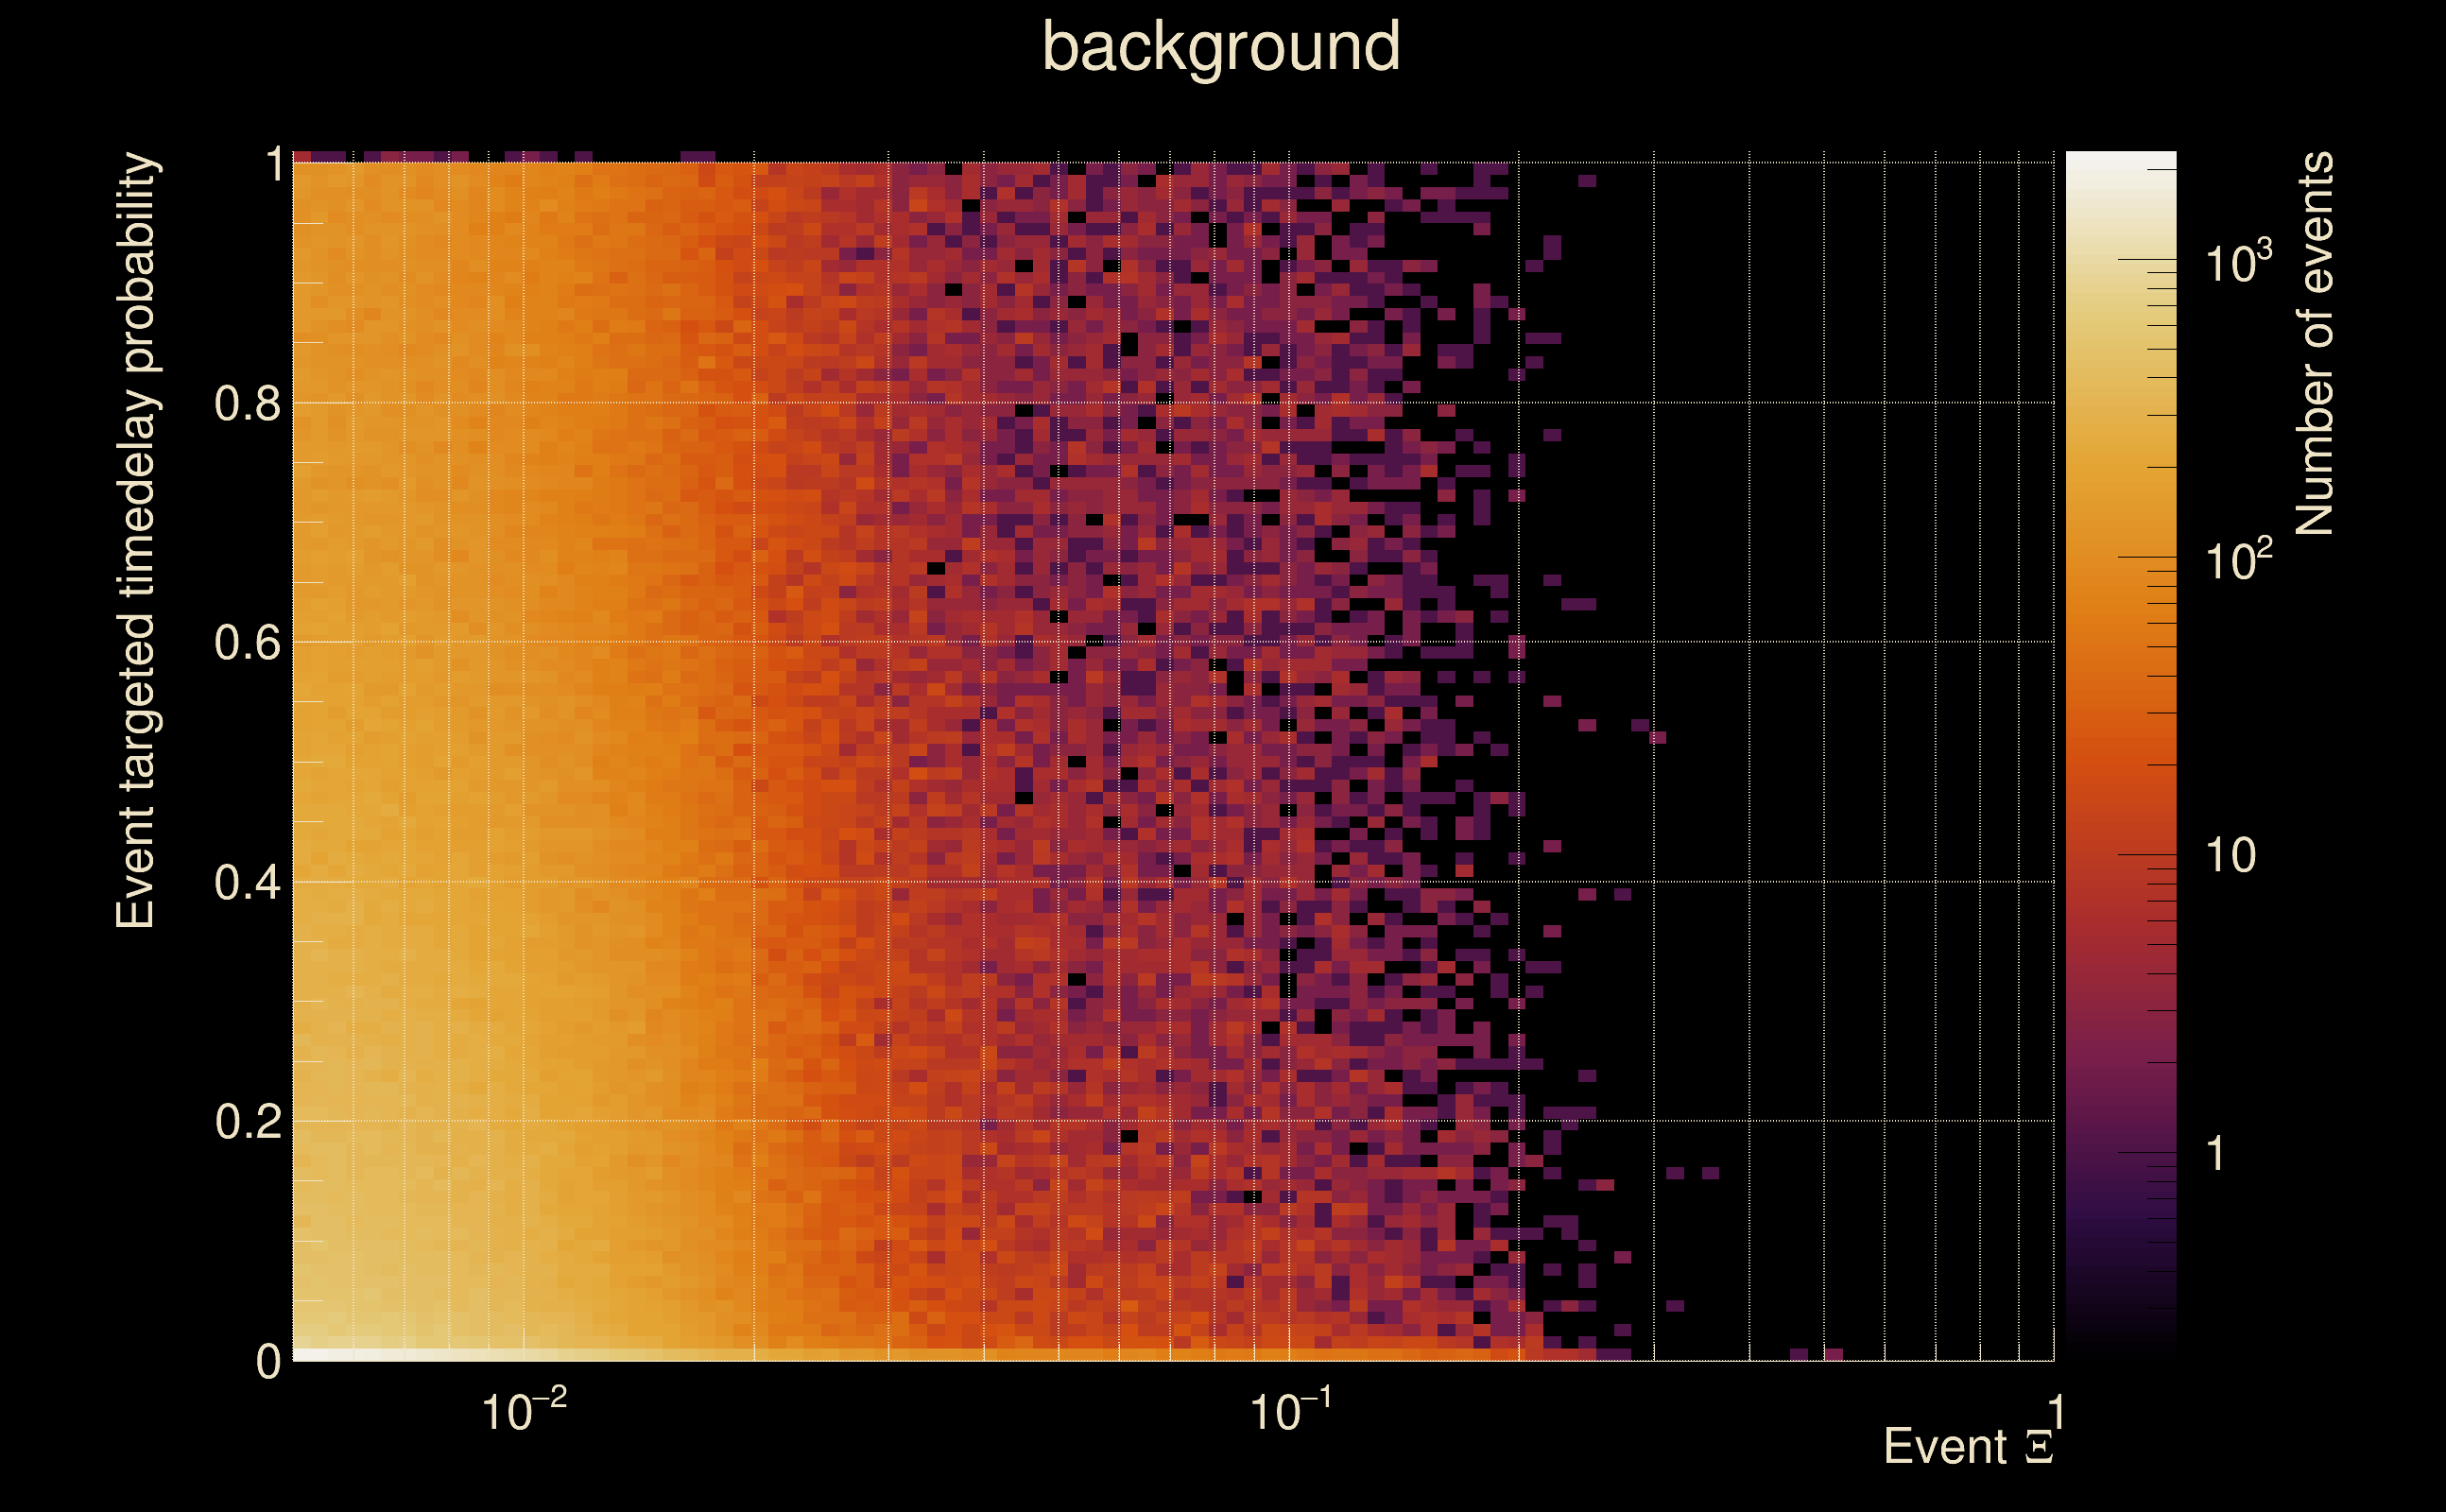
| Number of processed ox events | 12111 | 12111 | 2603865 | |
| Start Date (detector 0) | Mon May 15 14:13:25 2023 UTC | Mon May 15 14:13:25 2023 UTC | Mon May 15 14:13:25 2023 UTC | |
| End Date (detector 0) | Thu May 18 15:54:40 2023 UTC | Thu May 18 15:54:40 2023 UTC | Thu May 18 15:54:40 2023 UTC | |
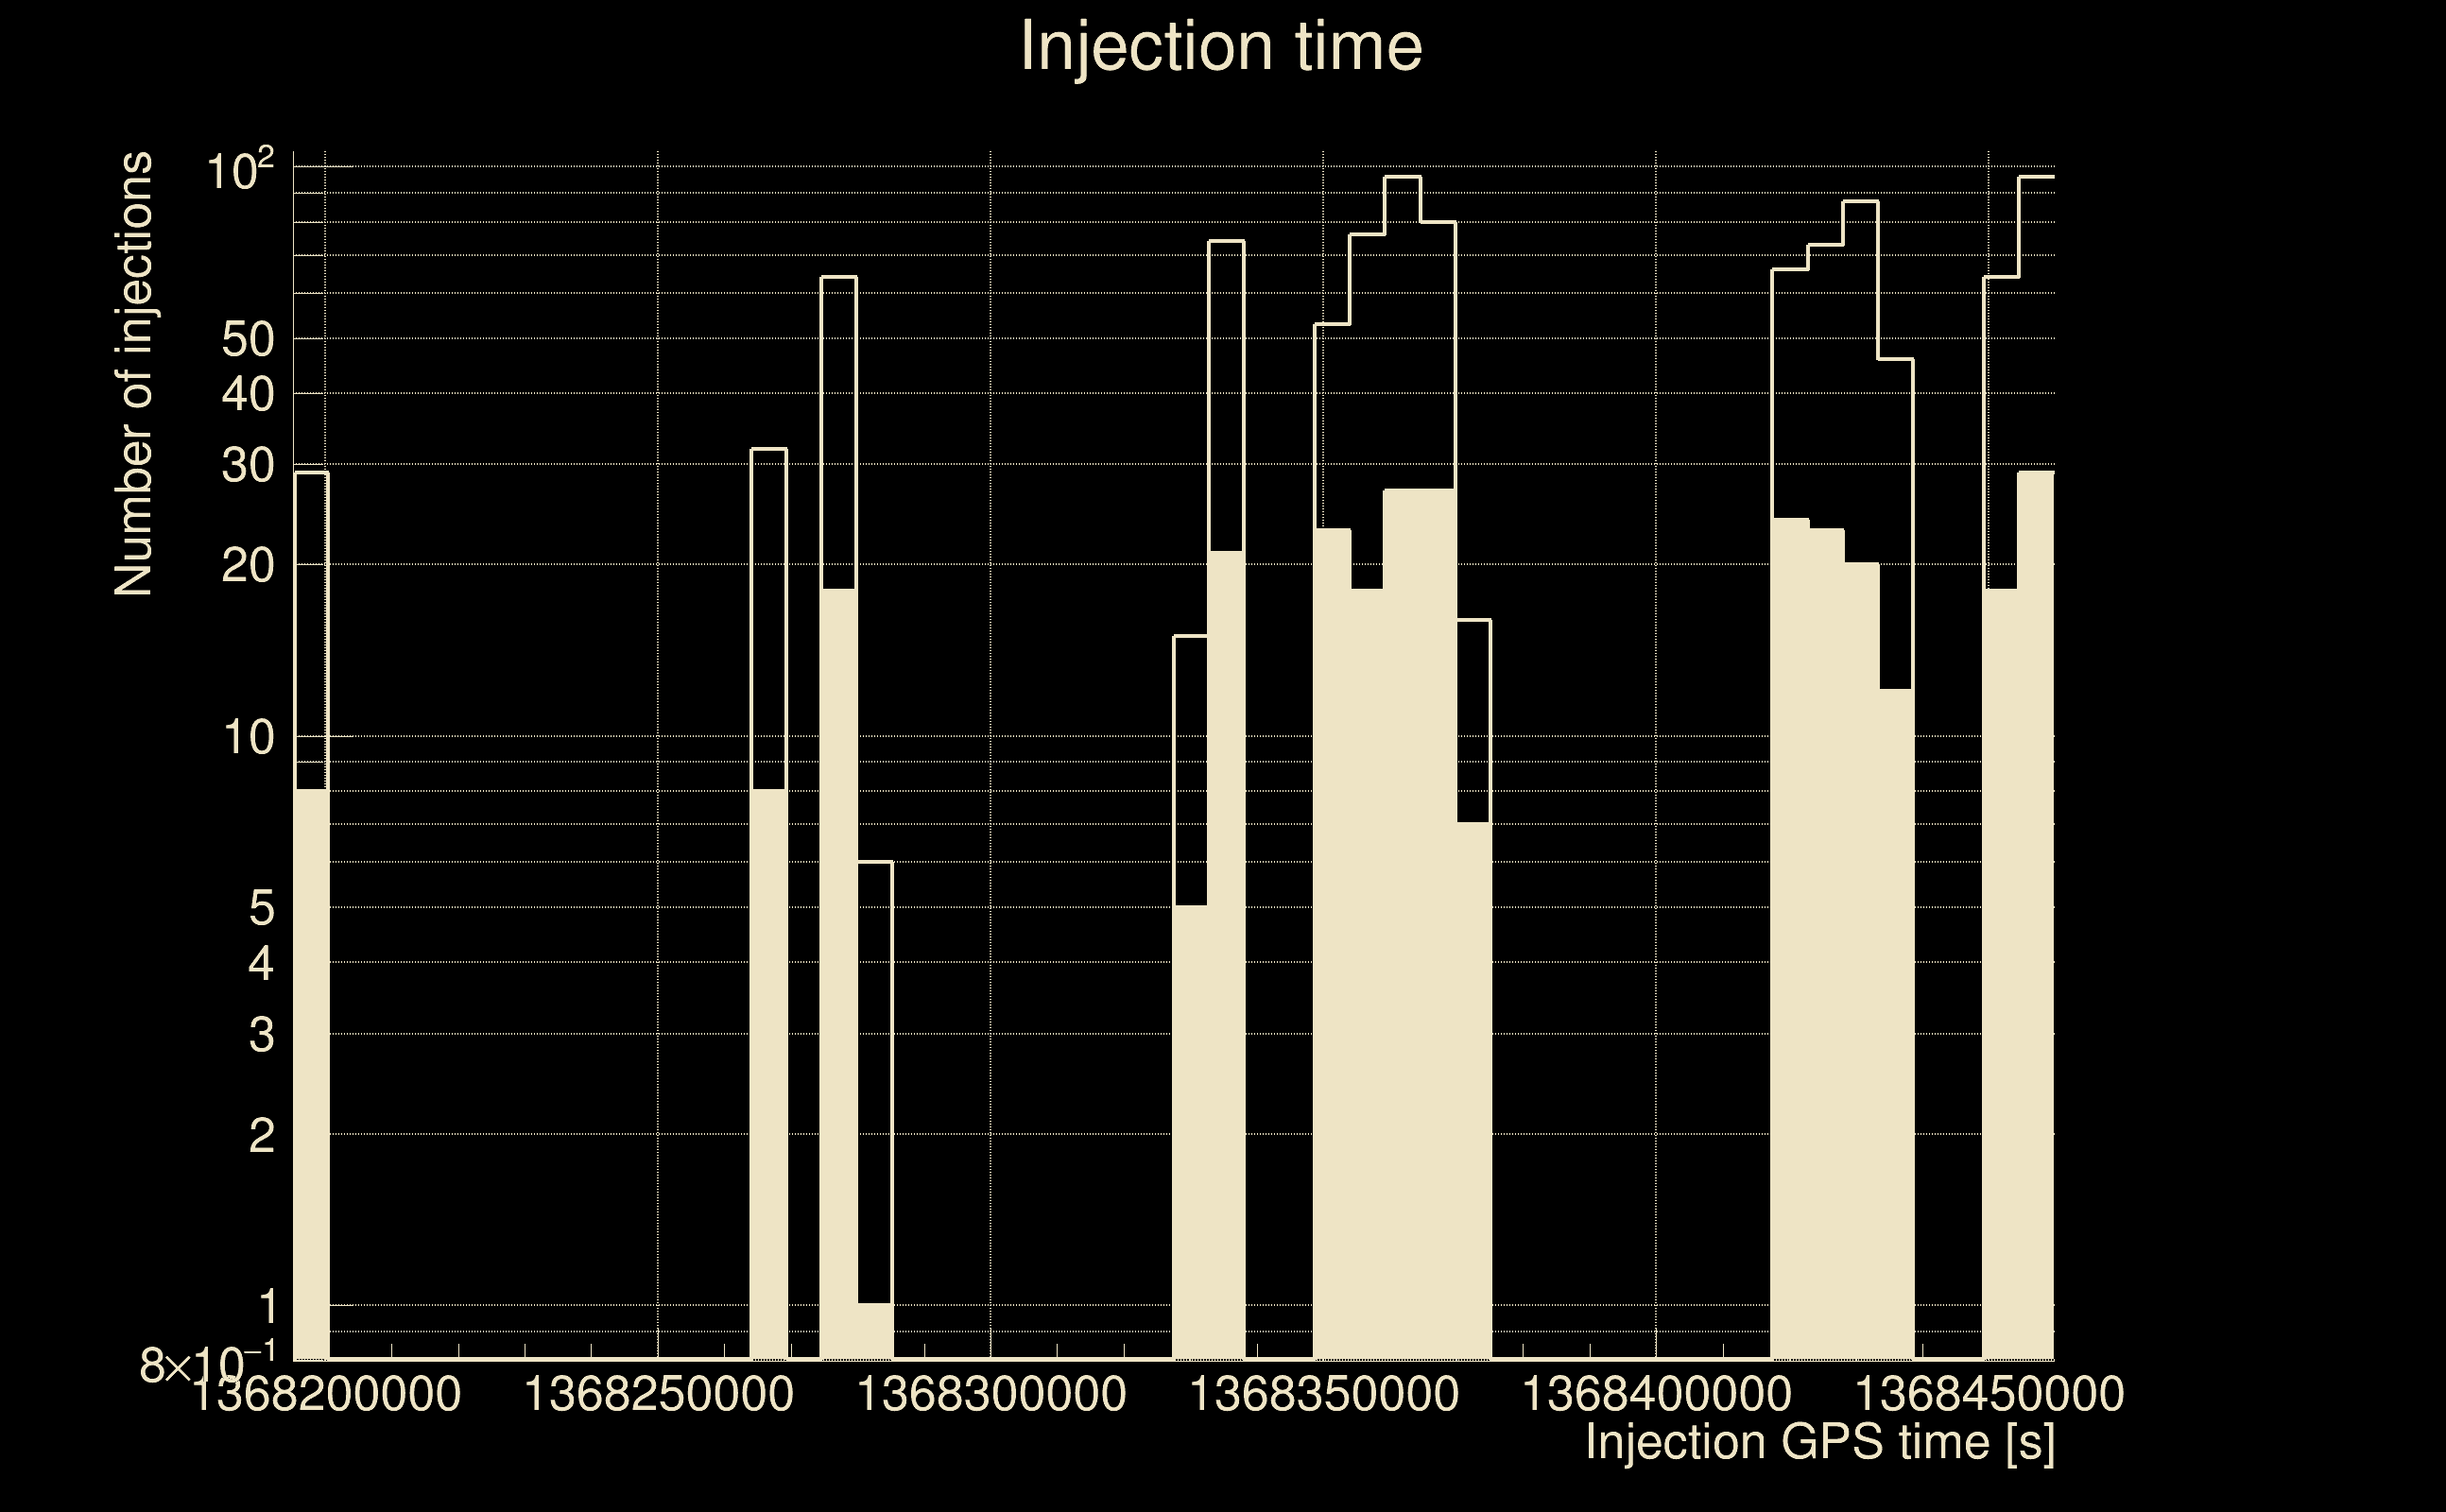
| Start GPS (detector 0) | 1368195223 | 1368195223 | 1368195223 | |
| End GPS (detector 0) | 1368460498 | 1368460498 | 1368460498 | |
| Used livetime (detector 0) | 60875 s | 60875 s | 60875 s | |
| Start Date (detector 1) | Mon May 15 14:13:25 2023 UTC | Mon May 15 14:13:25 2023 UTC | Mon May 15 14:13:25 2023 UTC | |
| End Date (detector 1) | Thu May 18 15:54:40 2023 UTC | Thu May 18 15:54:40 2023 UTC | Thu May 18 15:54:40 2023 UTC | |
| Start GPS (detector 1) | 1368195223 | 1368195223 | 1368195223 | |
| End GPS (detector 1) | 1368460498 | 1368460498 | 1368460498 | |
| Used livetime (detector 1) | 60875 s | 60875 s | 60875 s | |
| Cumulative livetime | 121110 s | 121110 s | 26038650 s | |
| 0 years, 1 days, 9 hours, 38 min, 30 s | 0 years, 1 days, 9 hours, 38 min, 30 s | 0 years, 301 days, 8 hours, 57 min, 30 s |
|
|
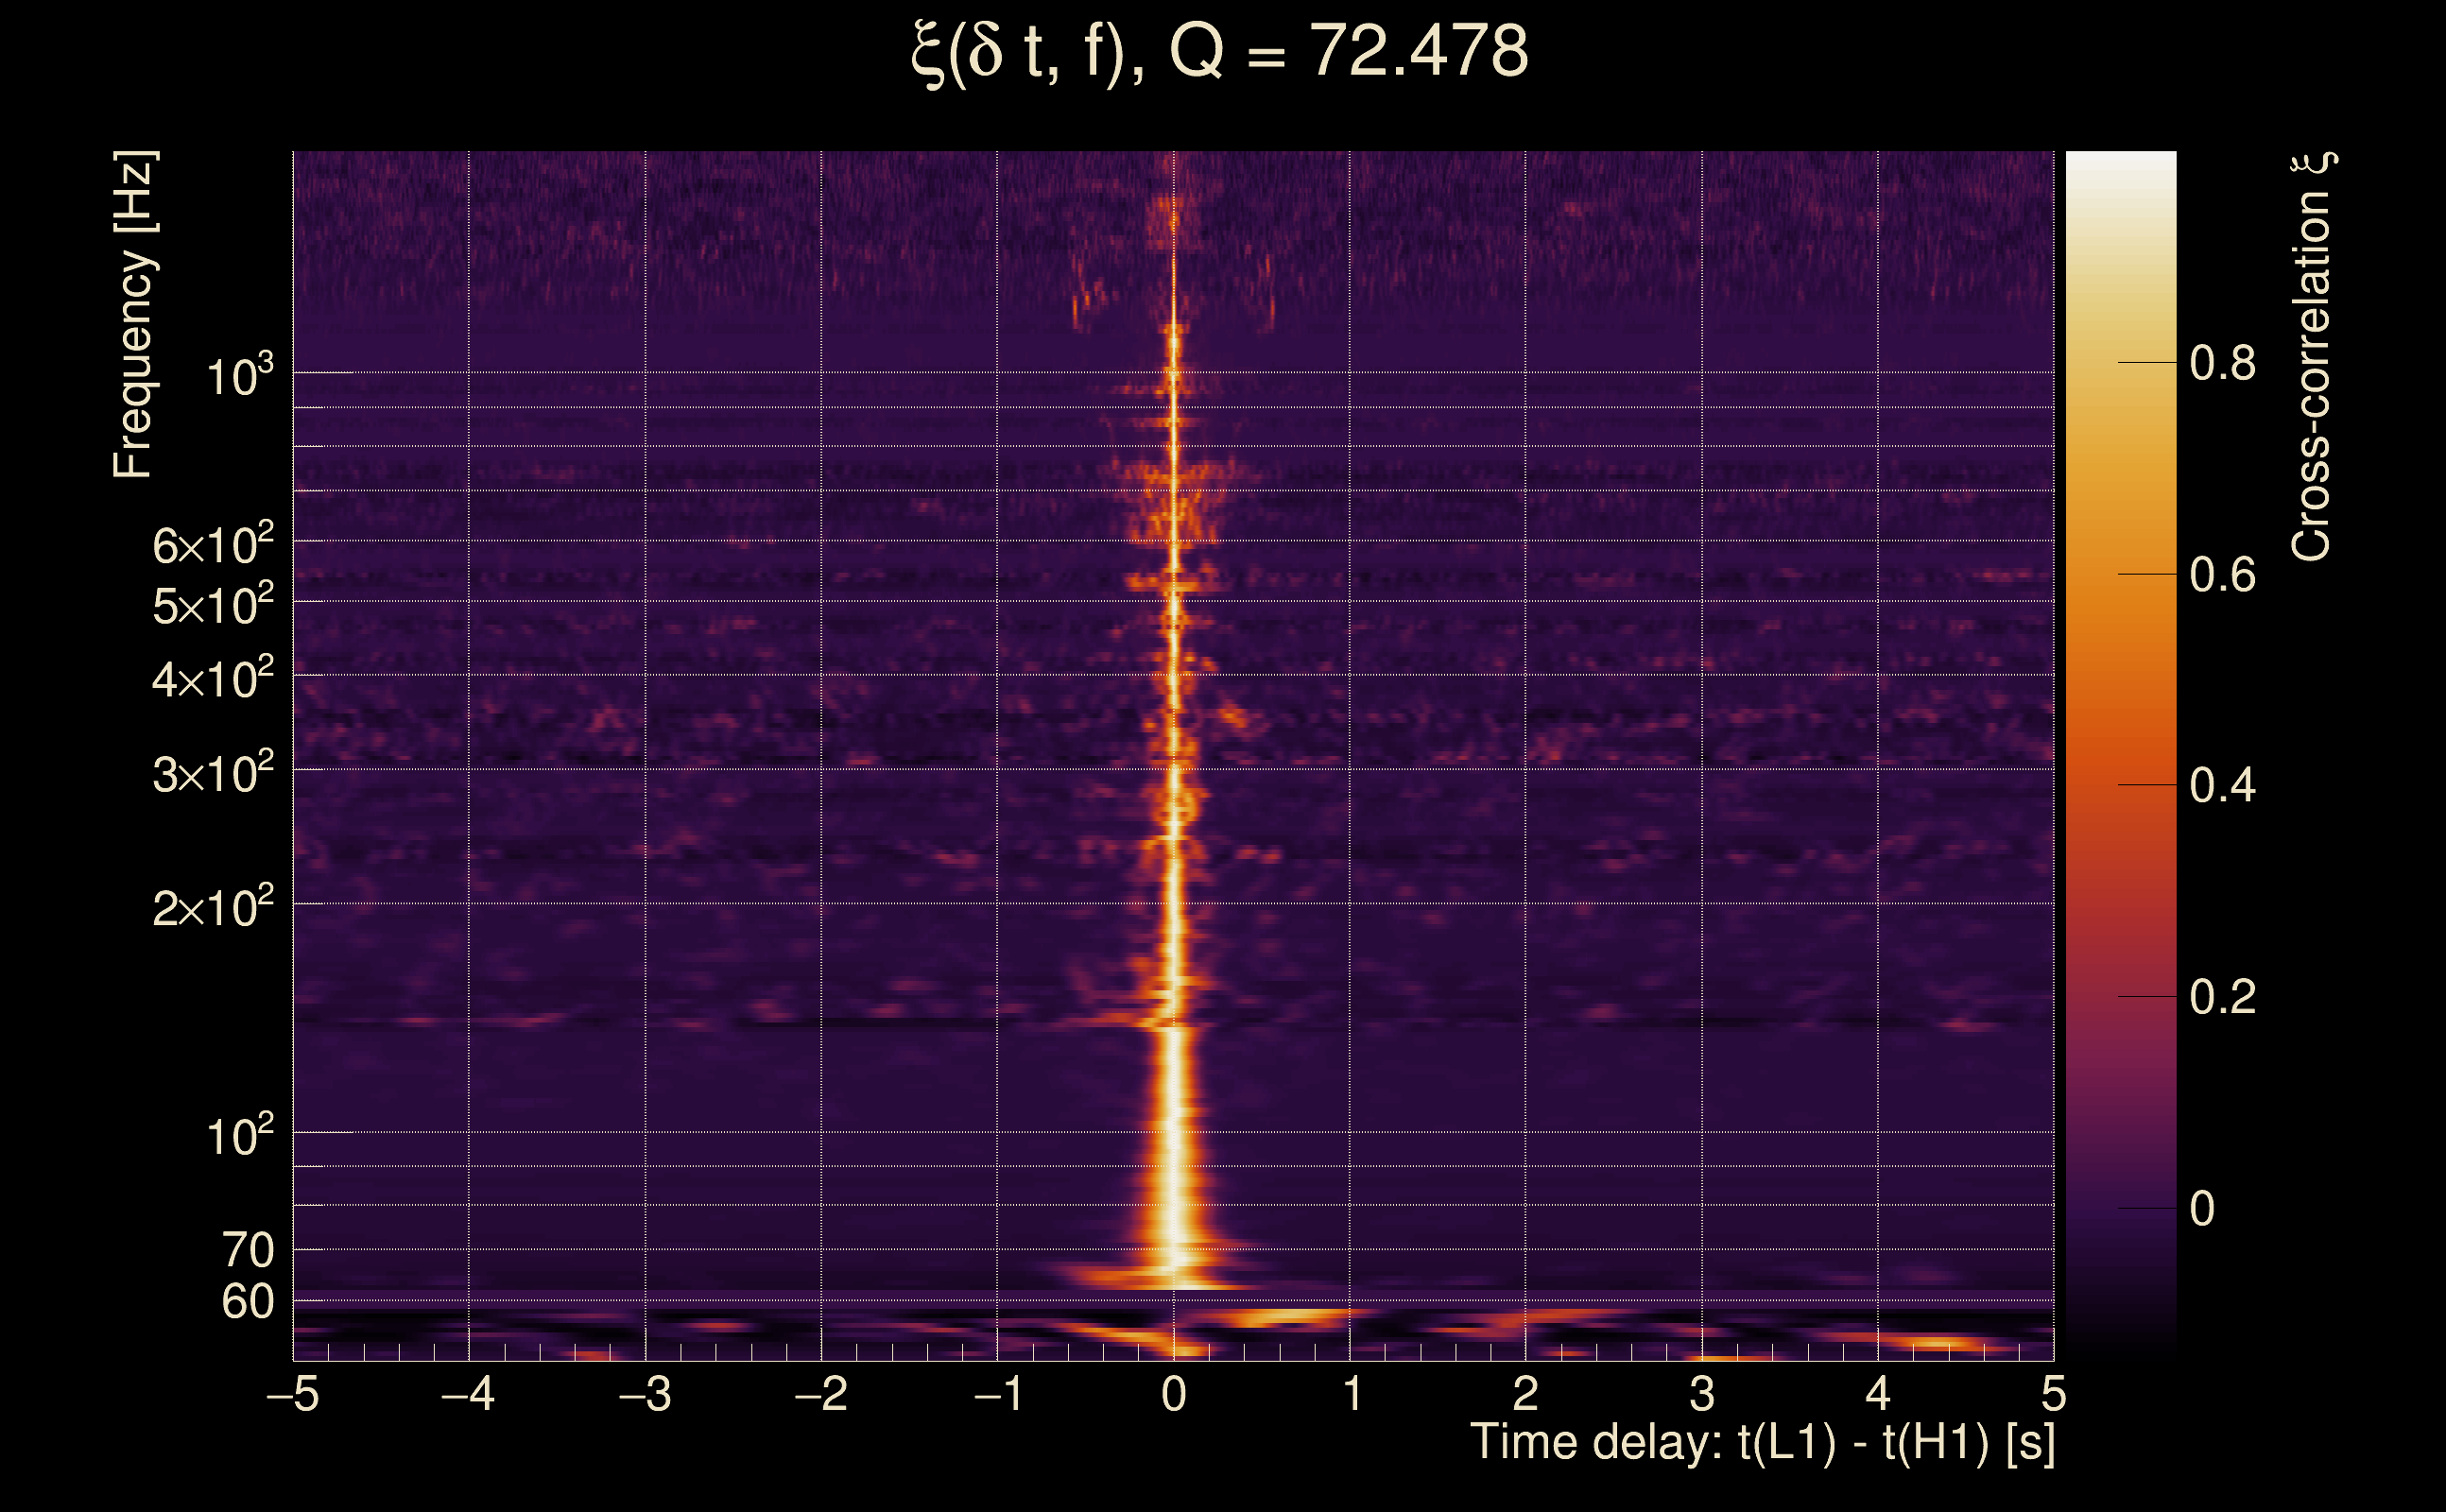
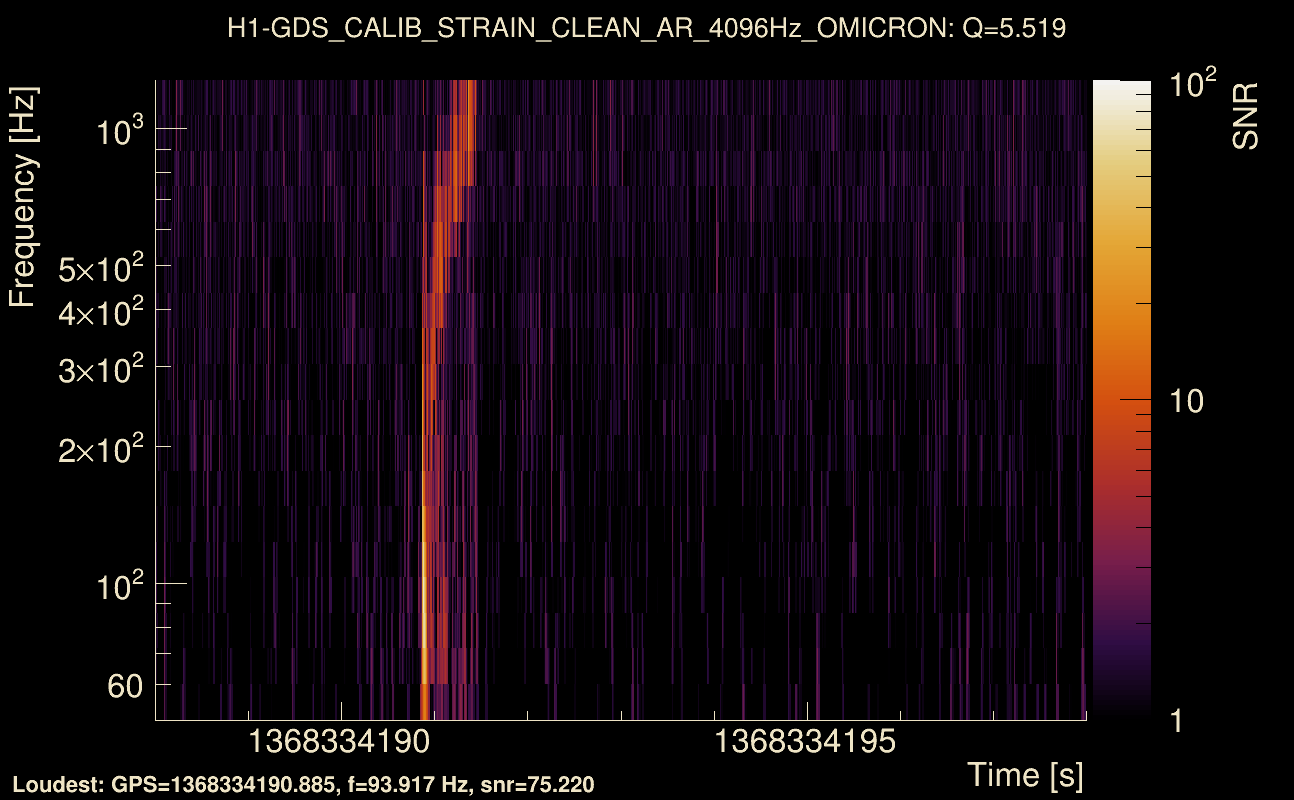
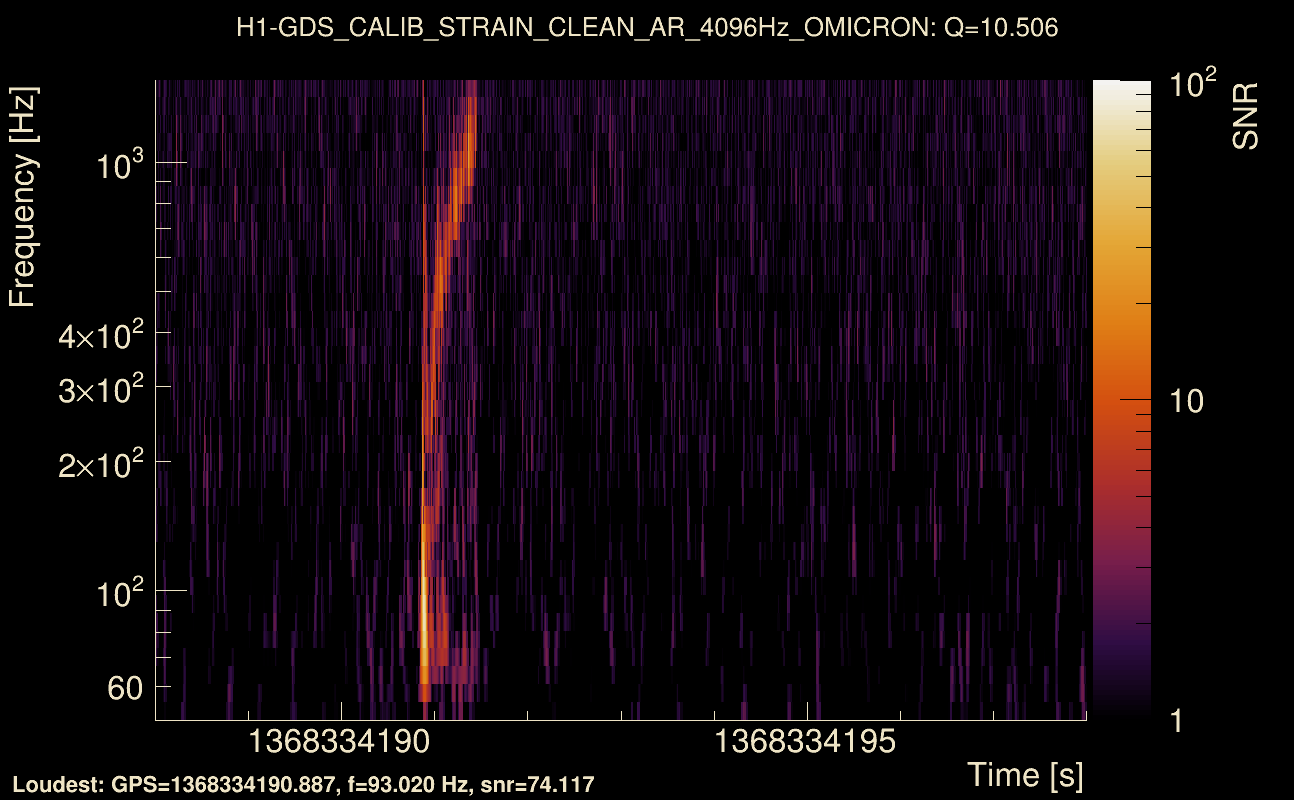
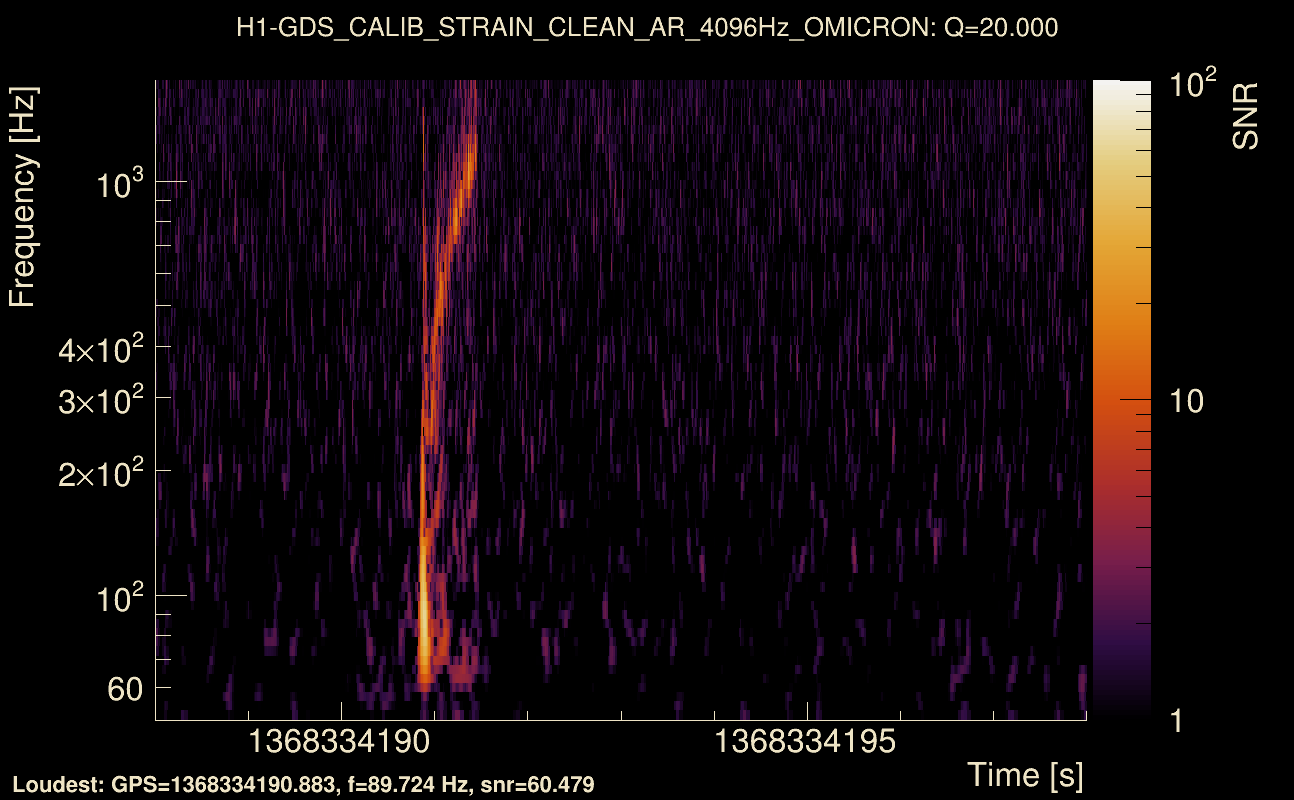
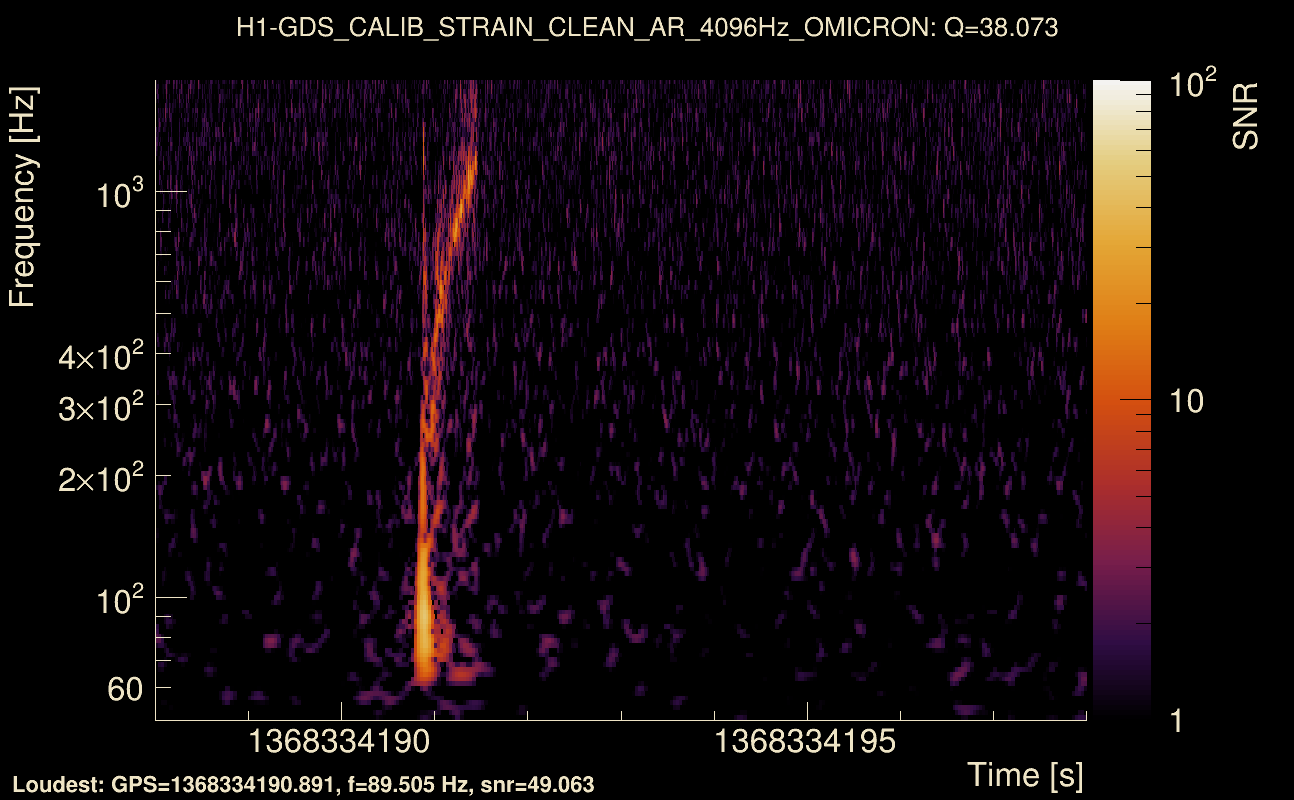
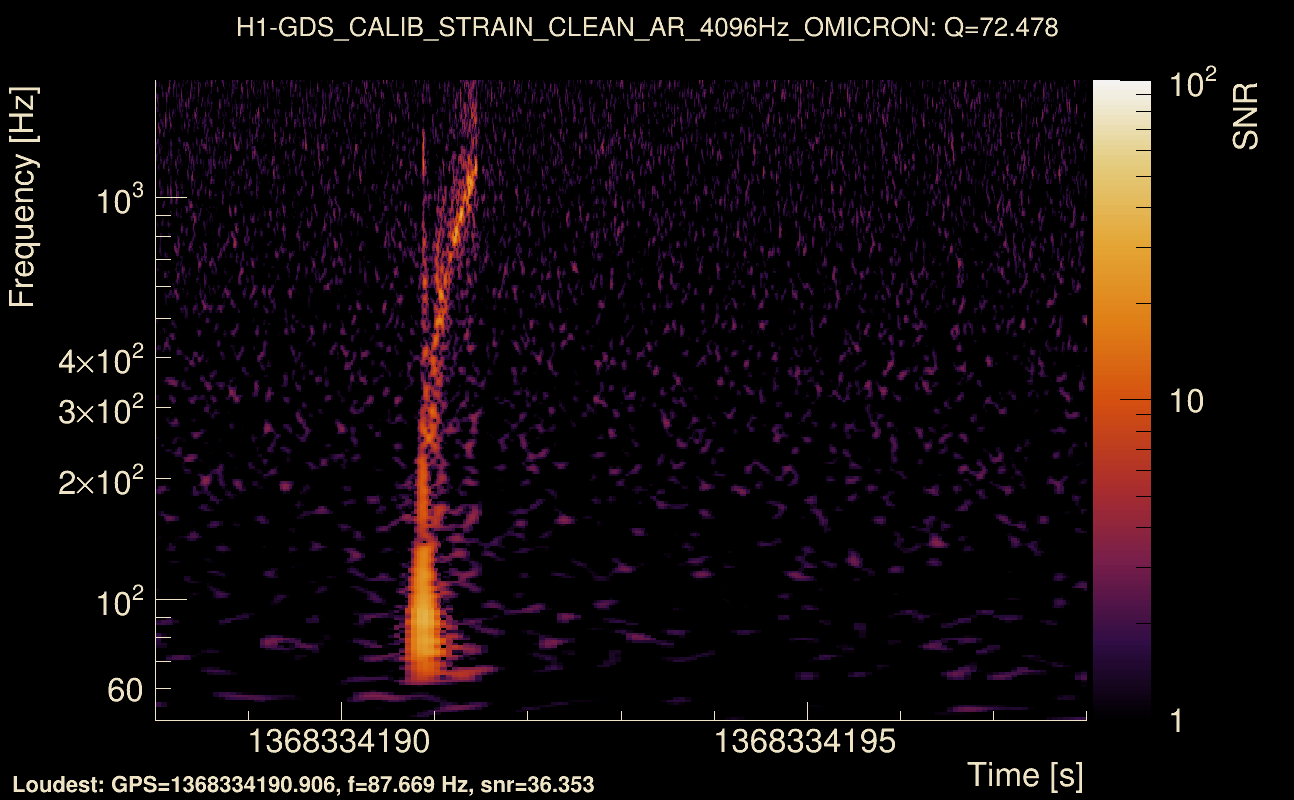
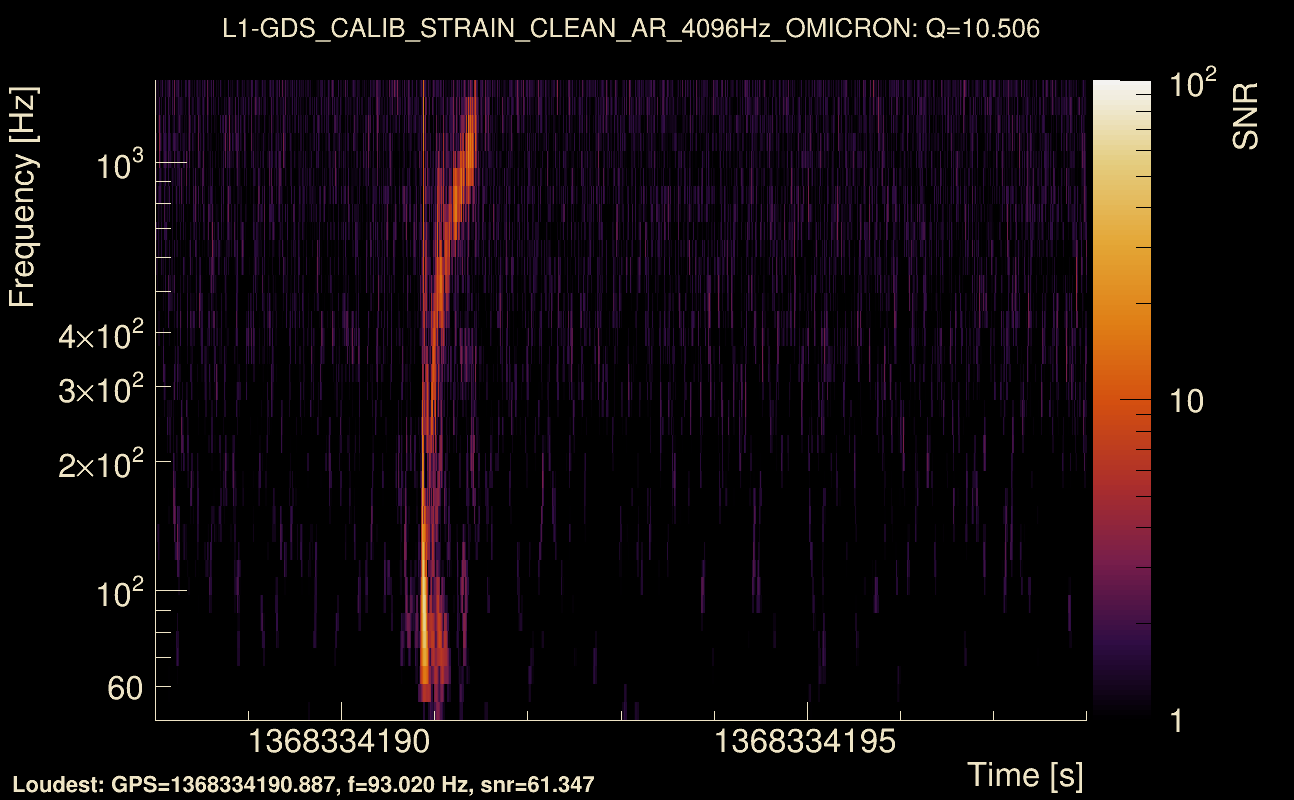
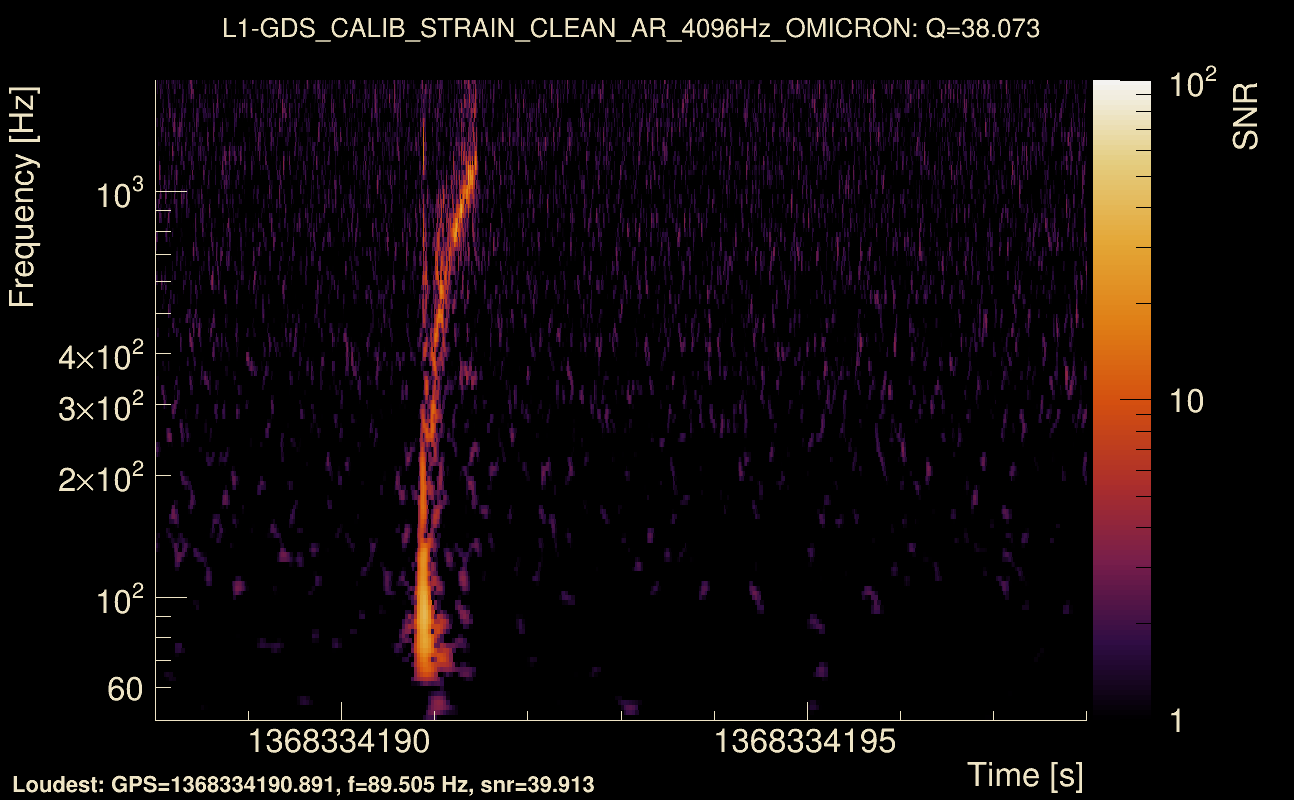
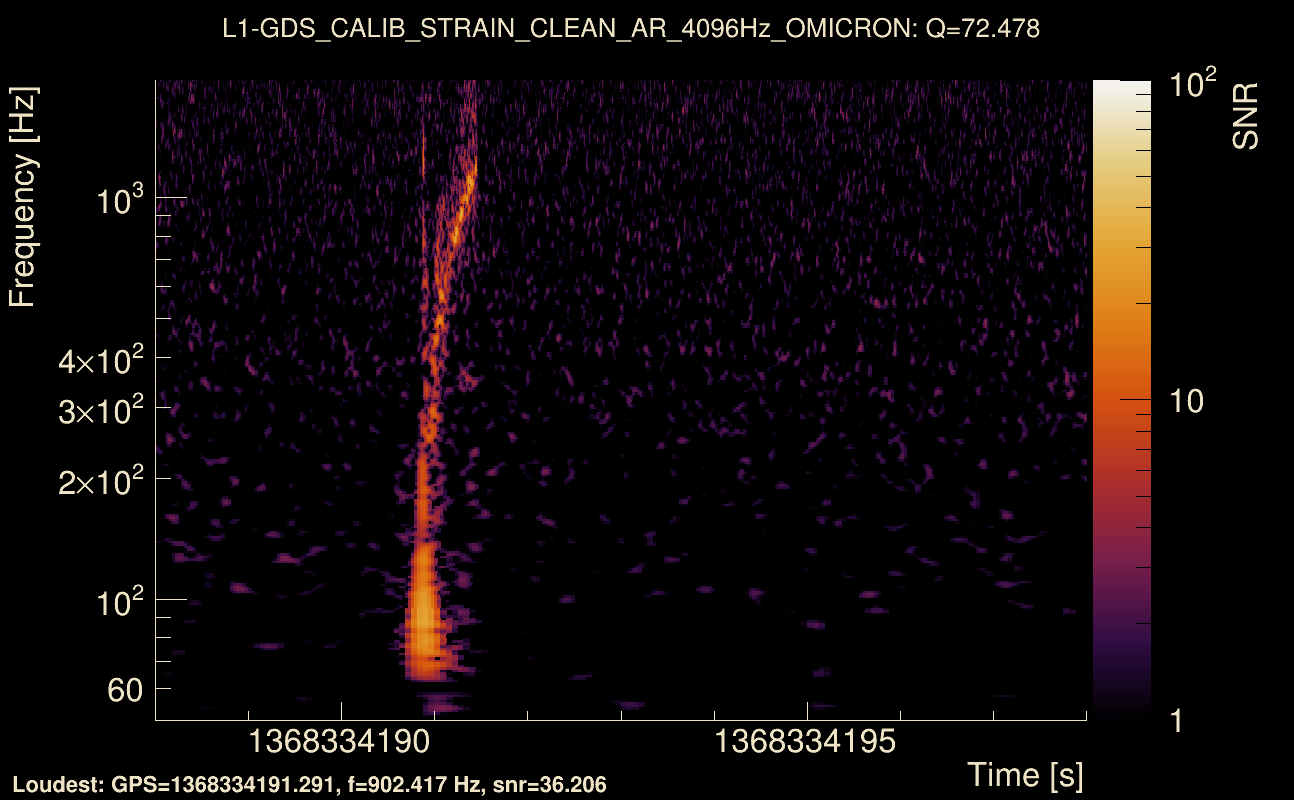
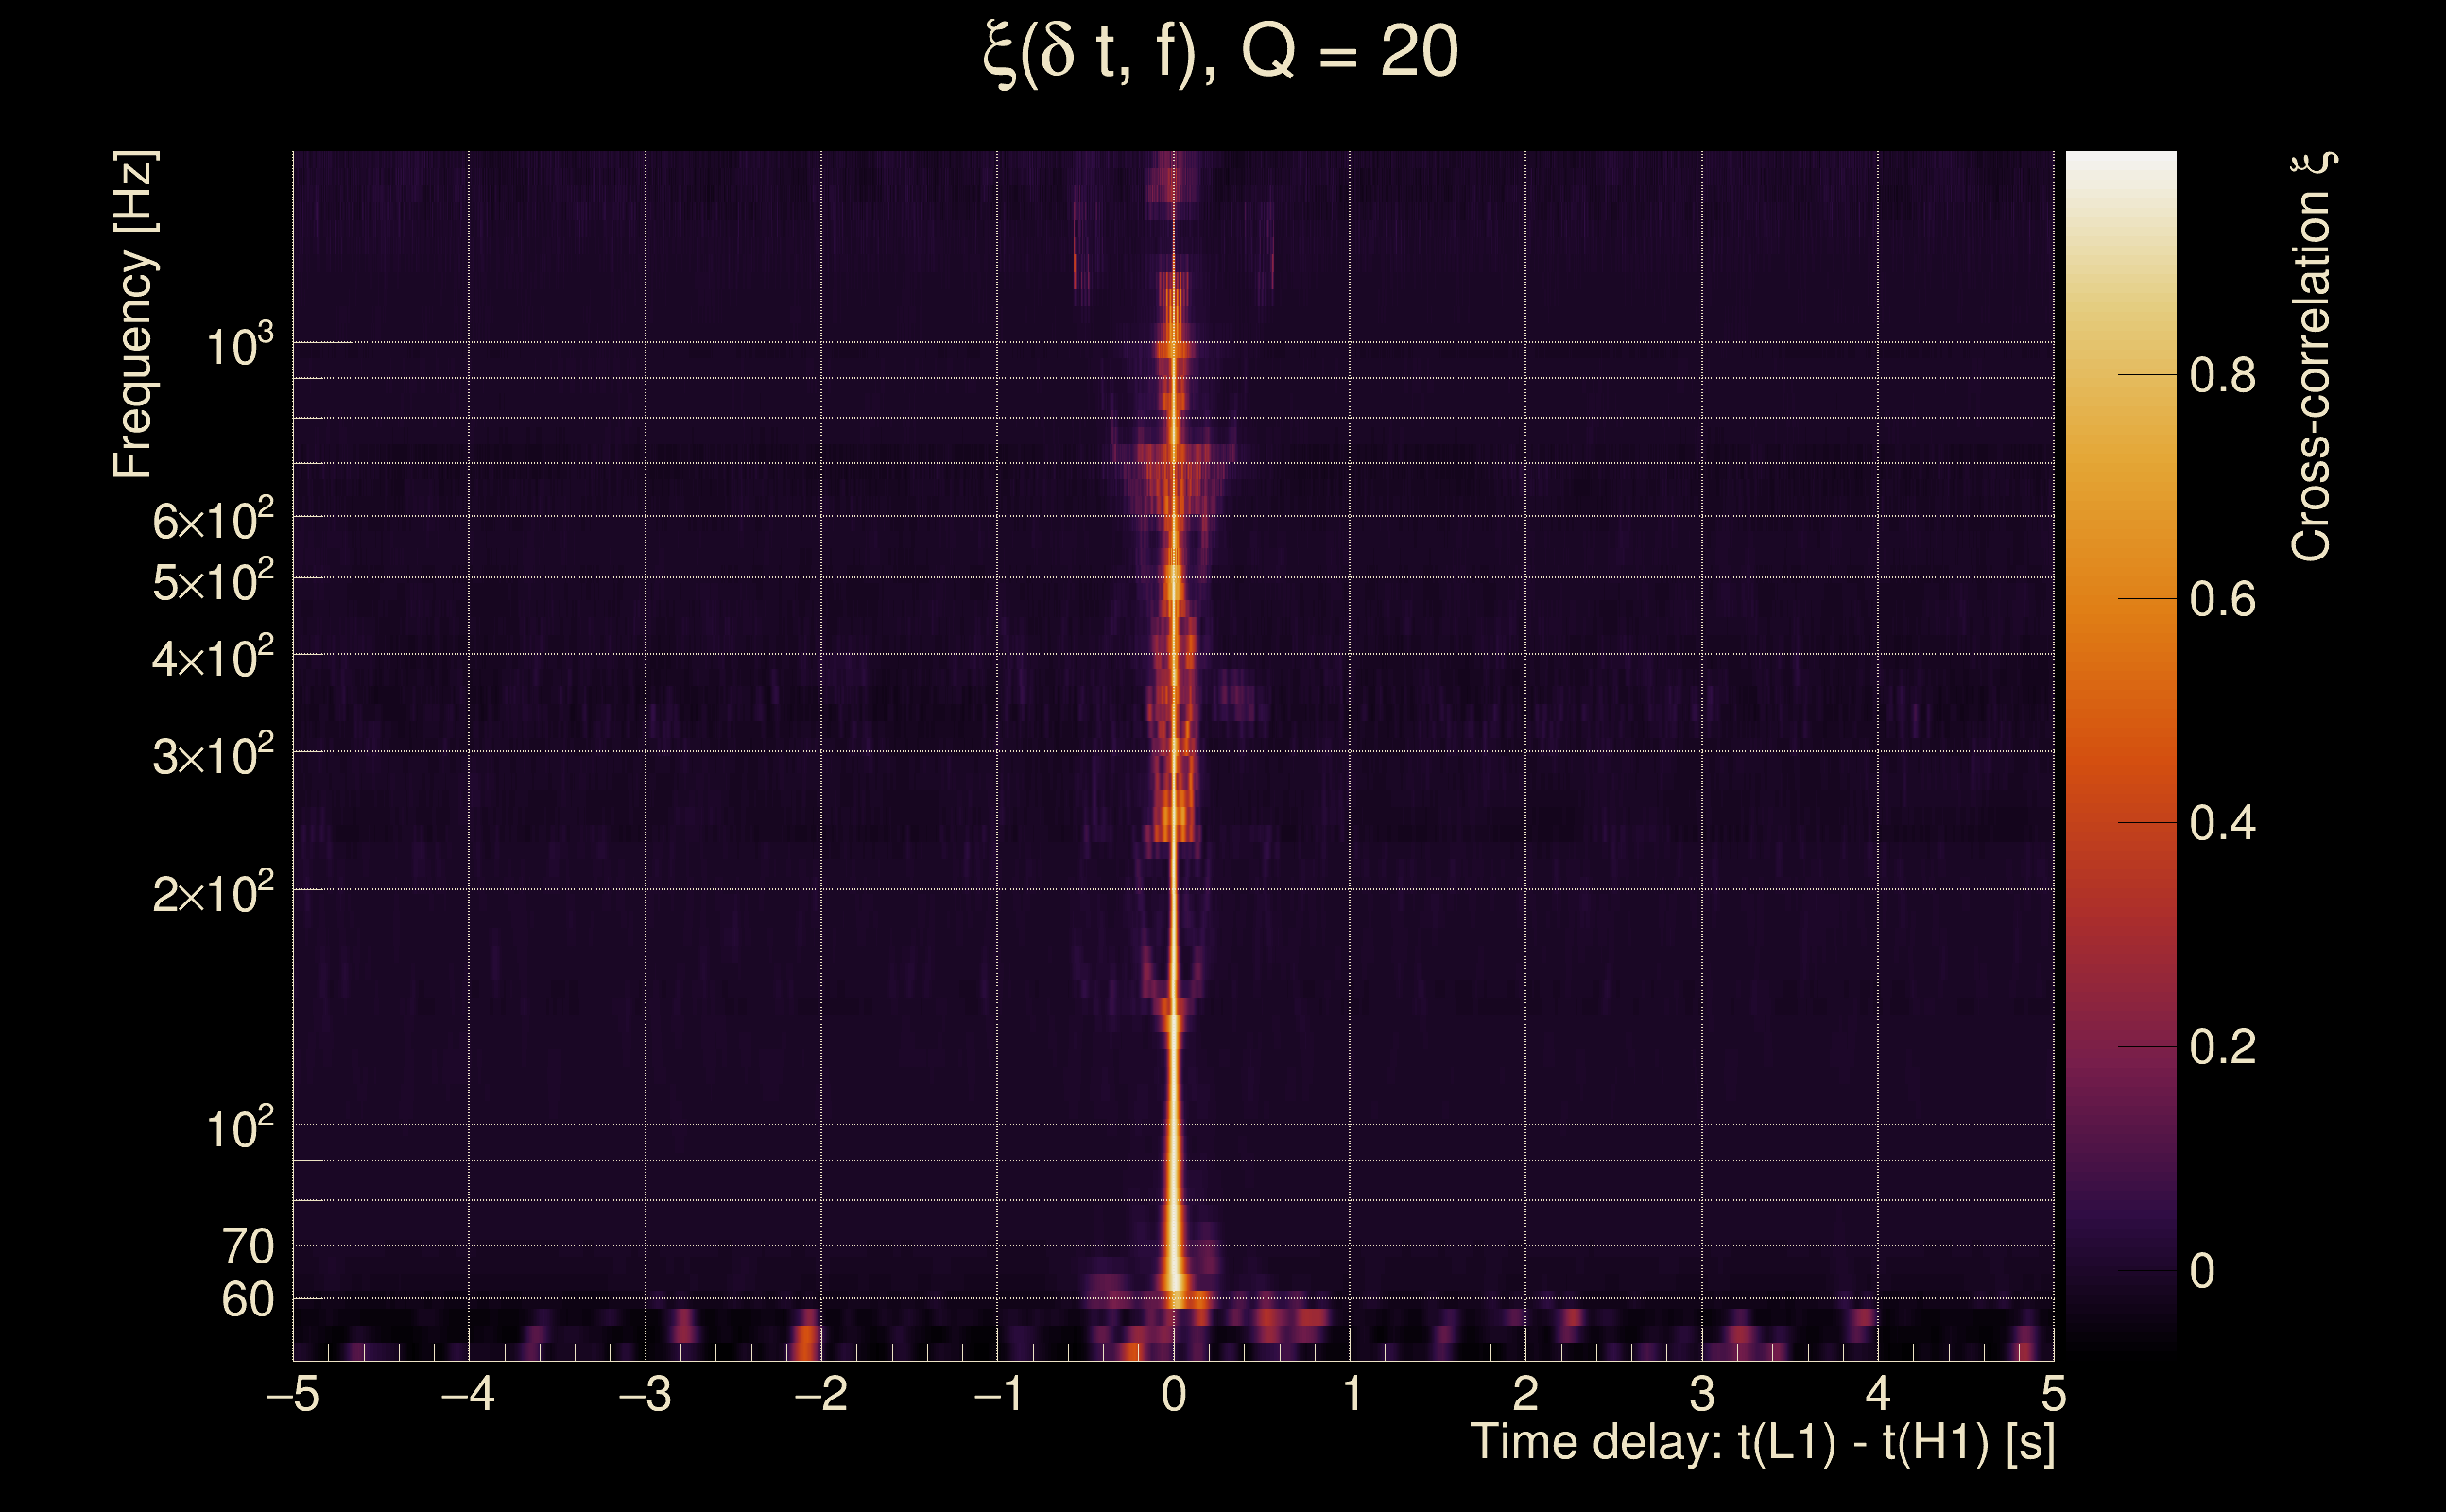
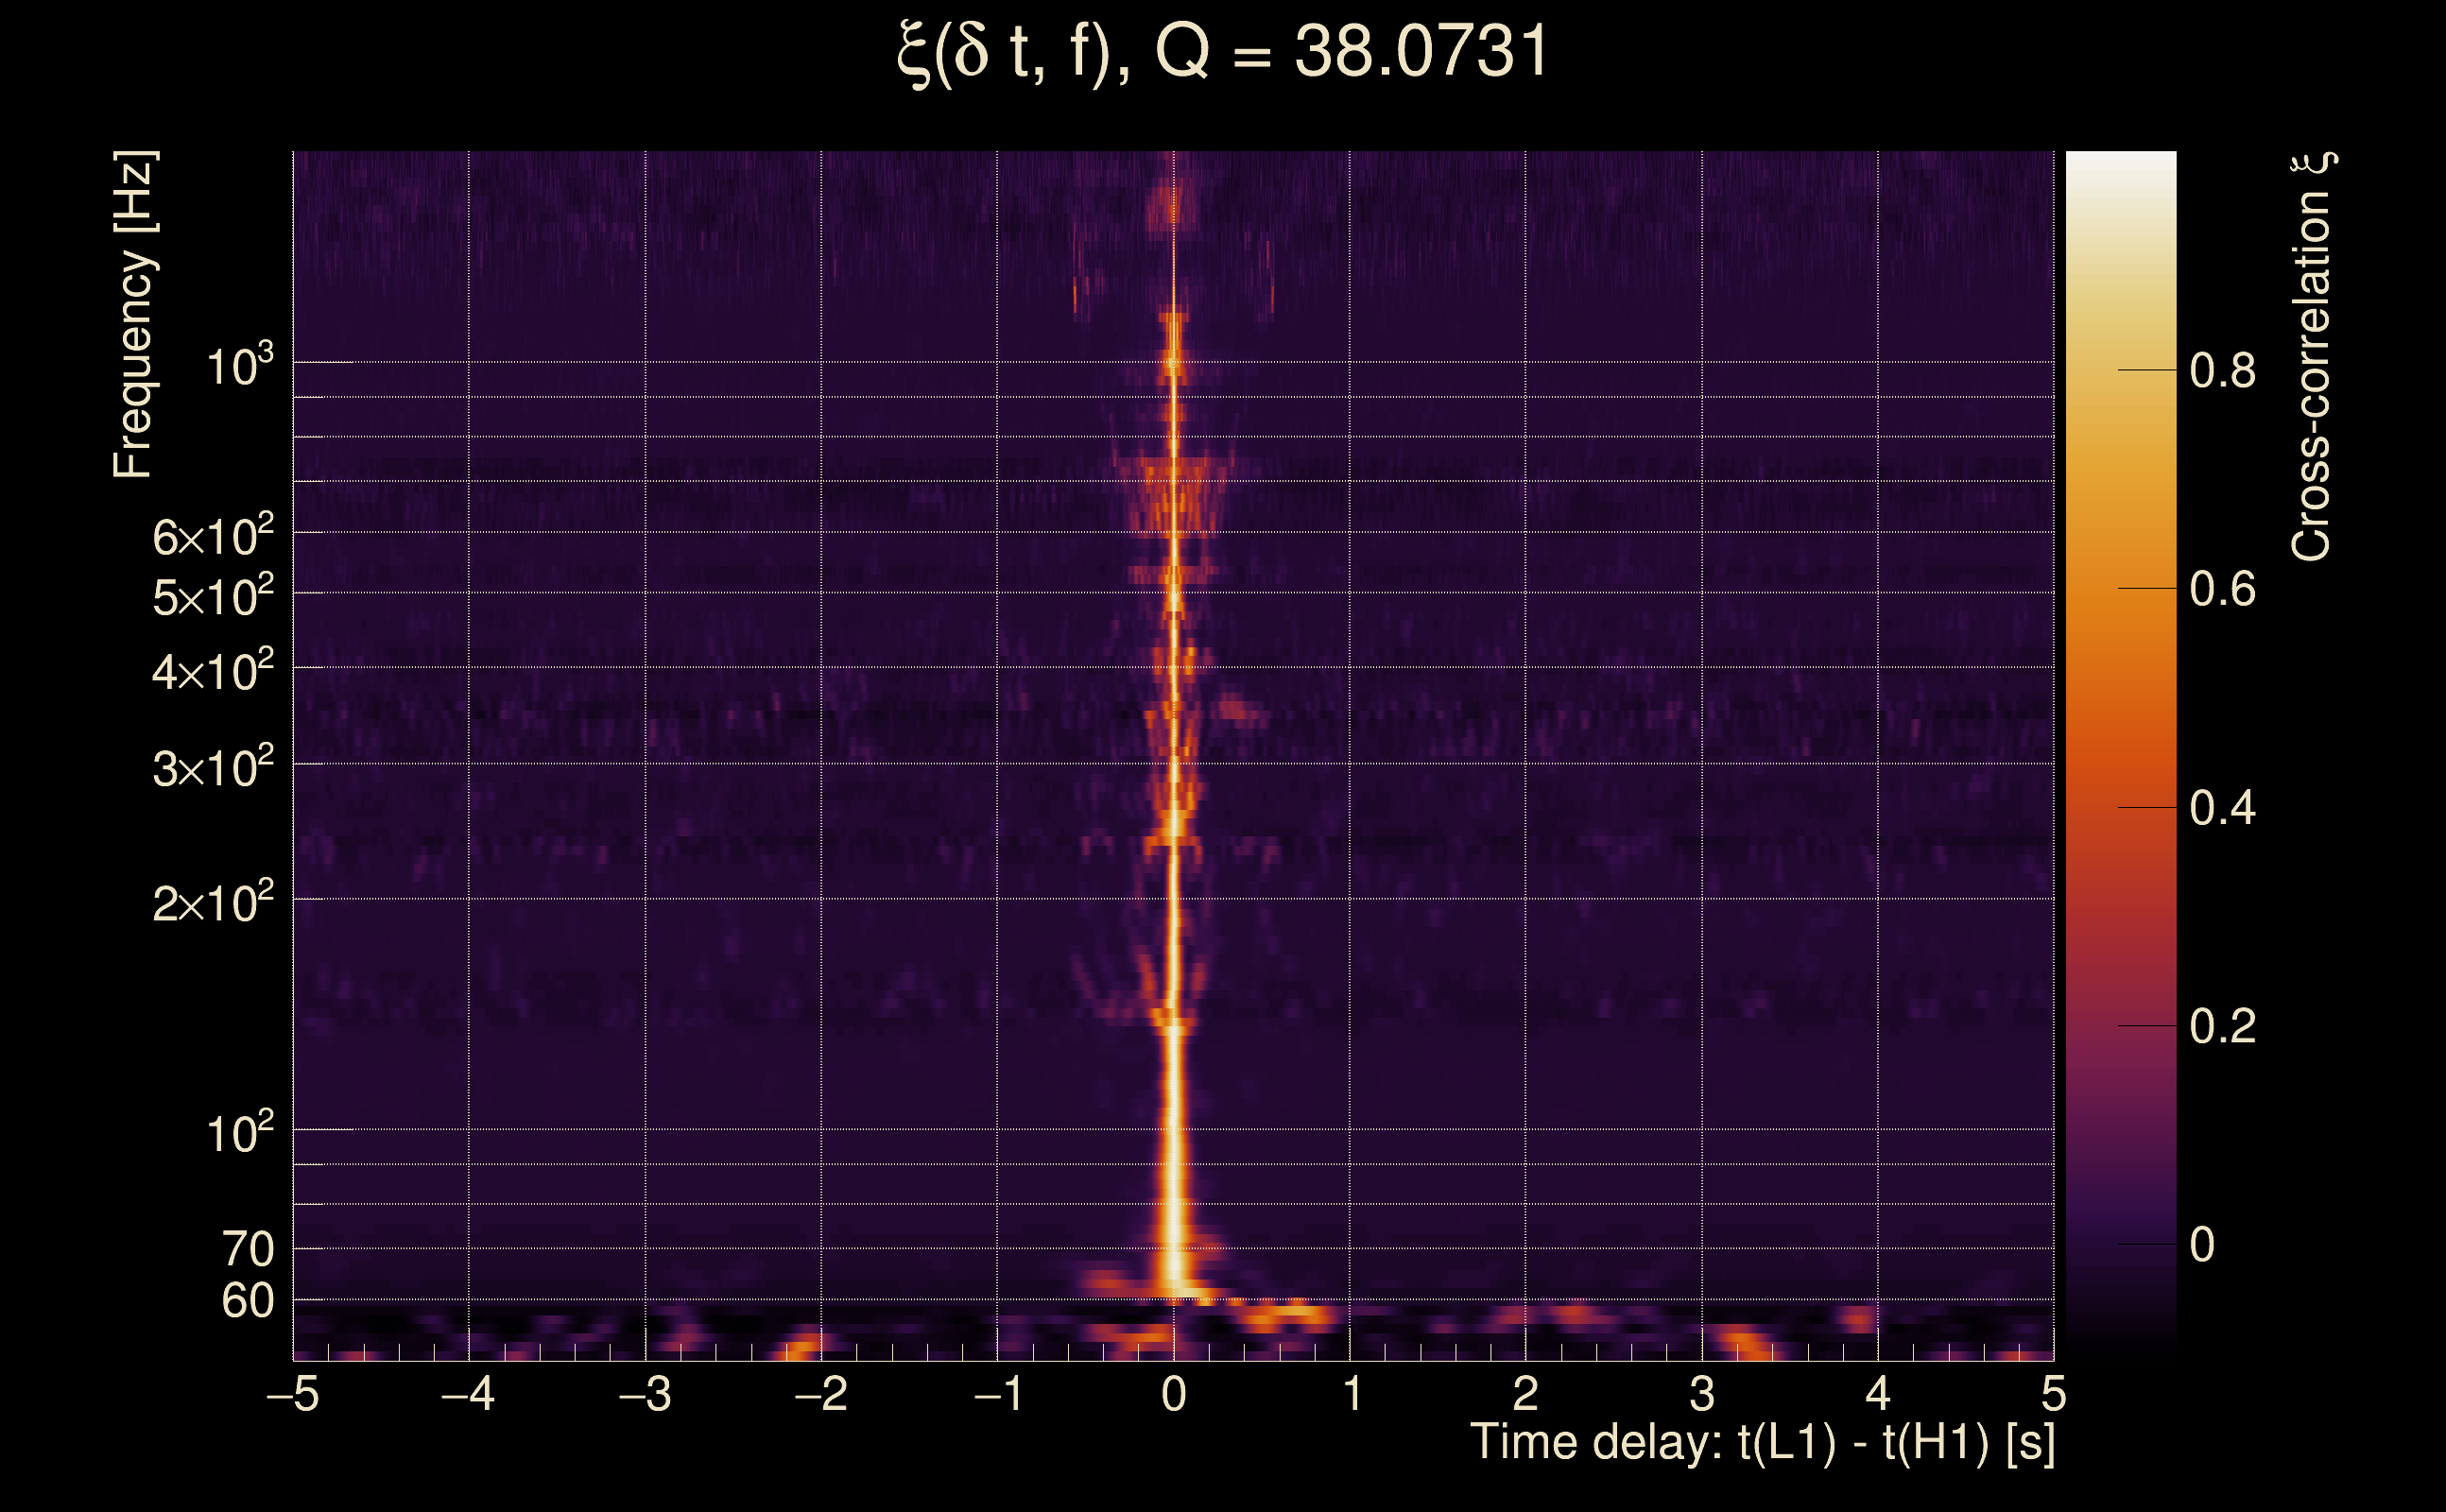
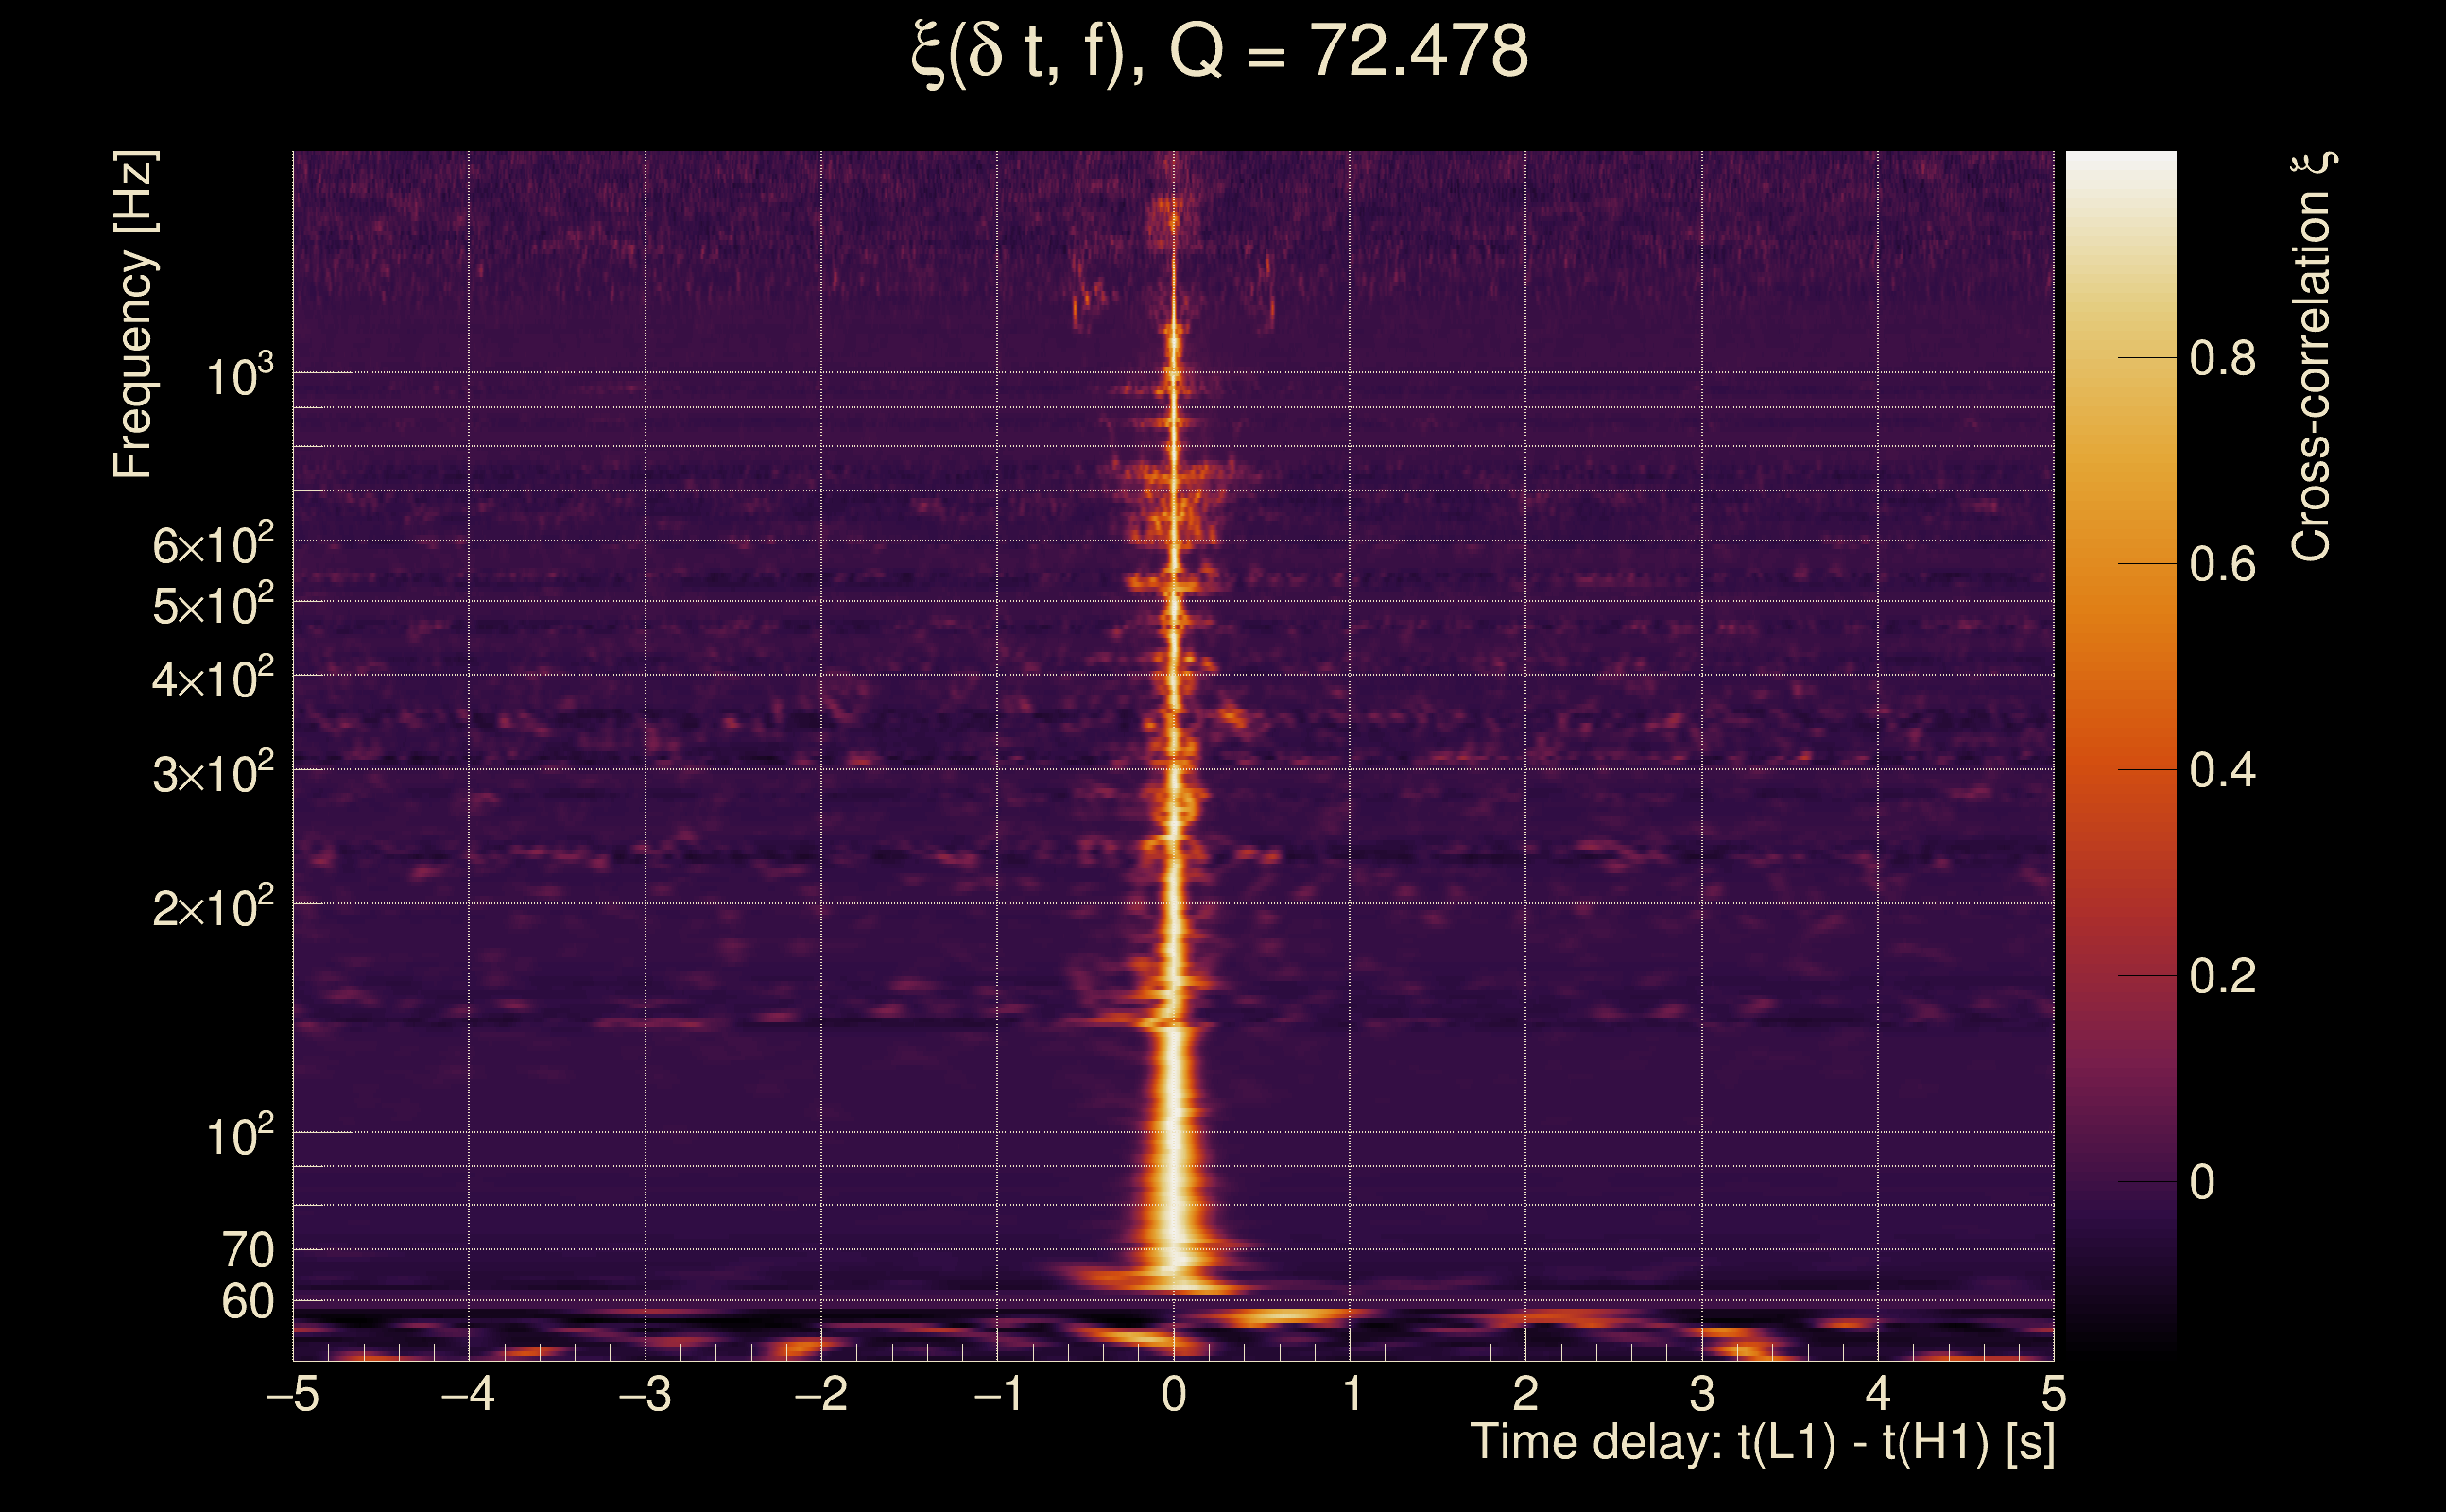
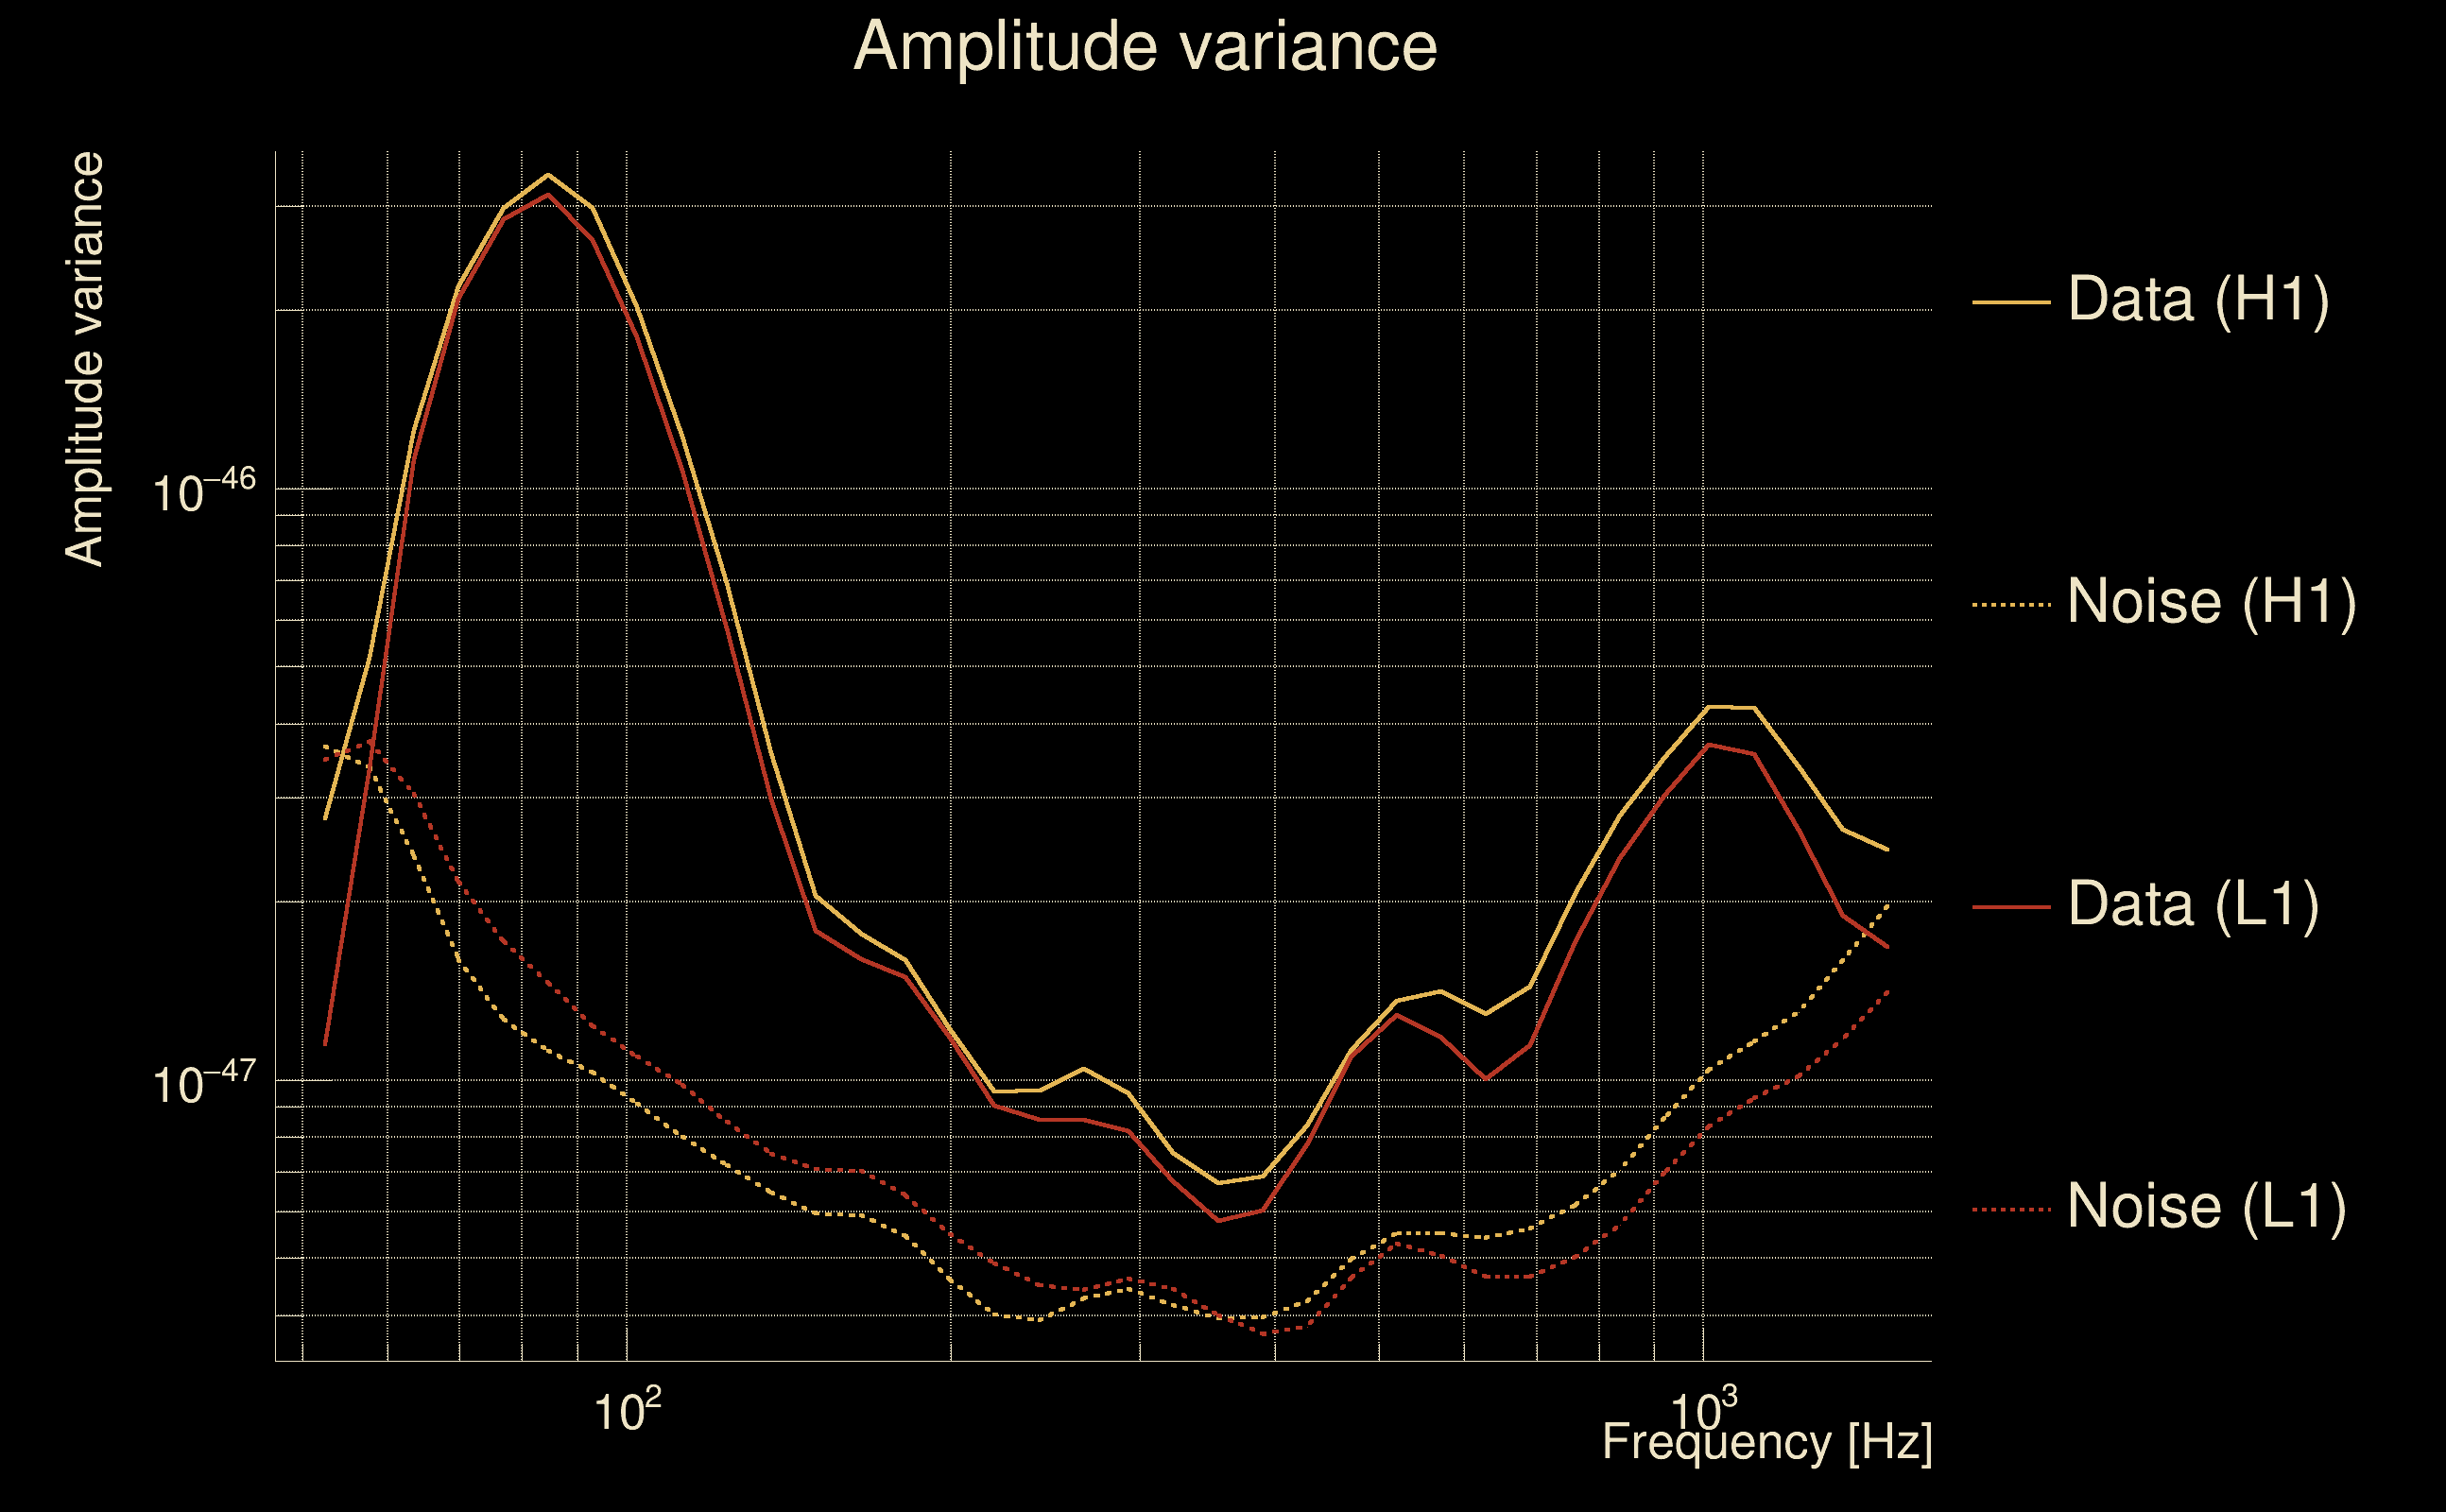
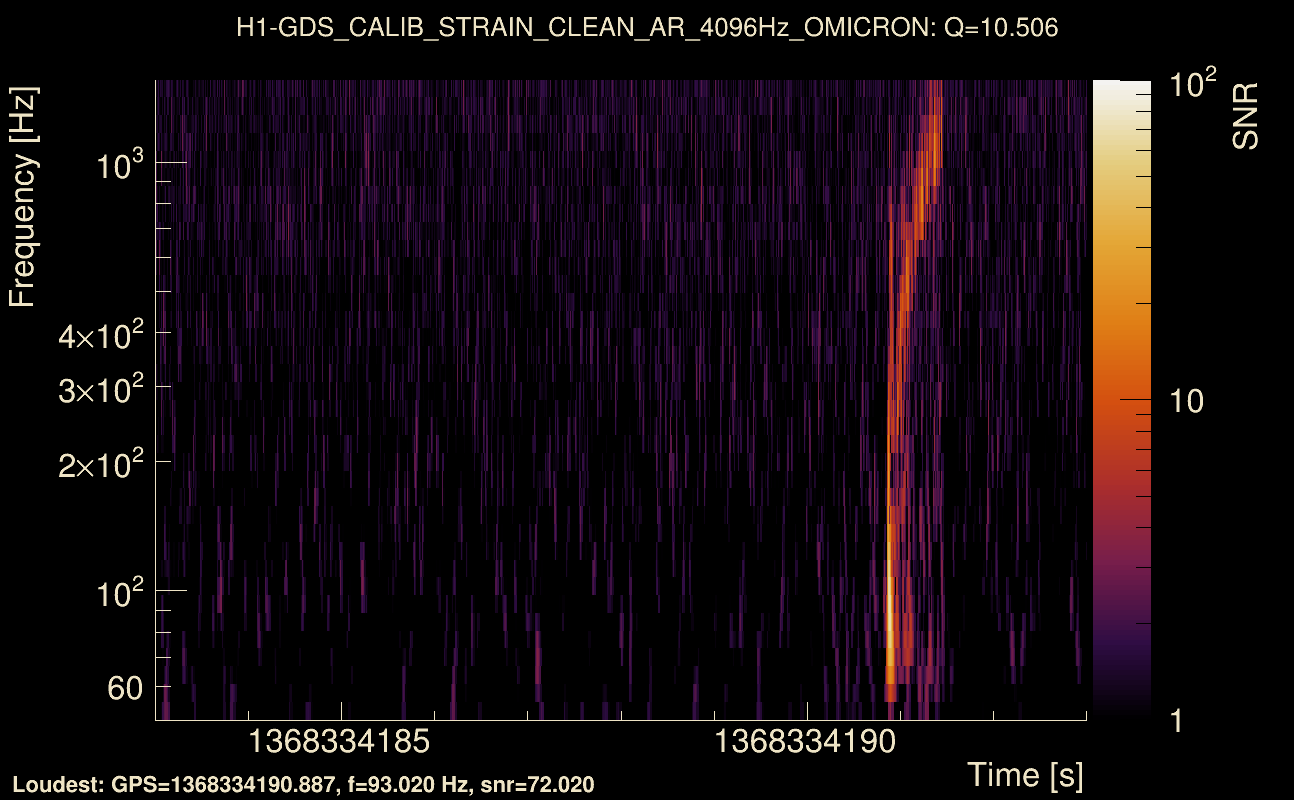
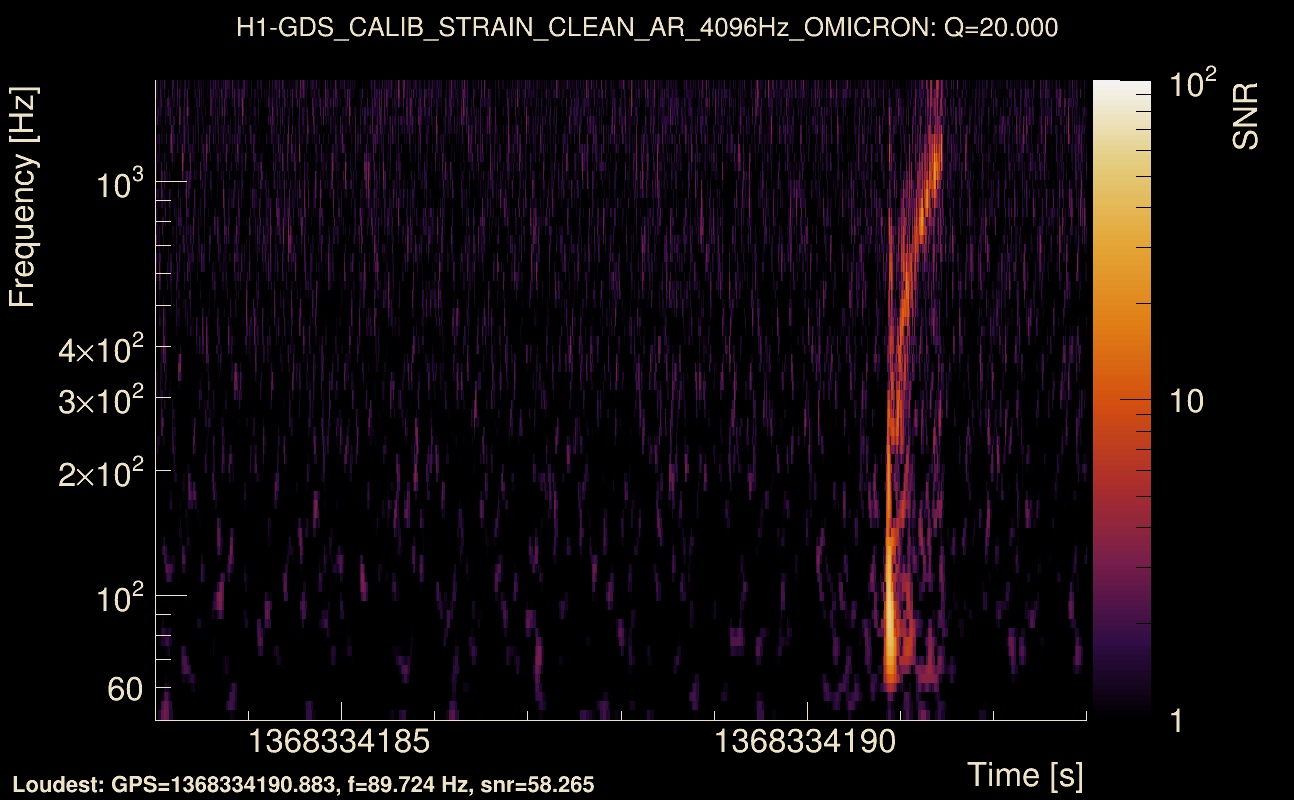
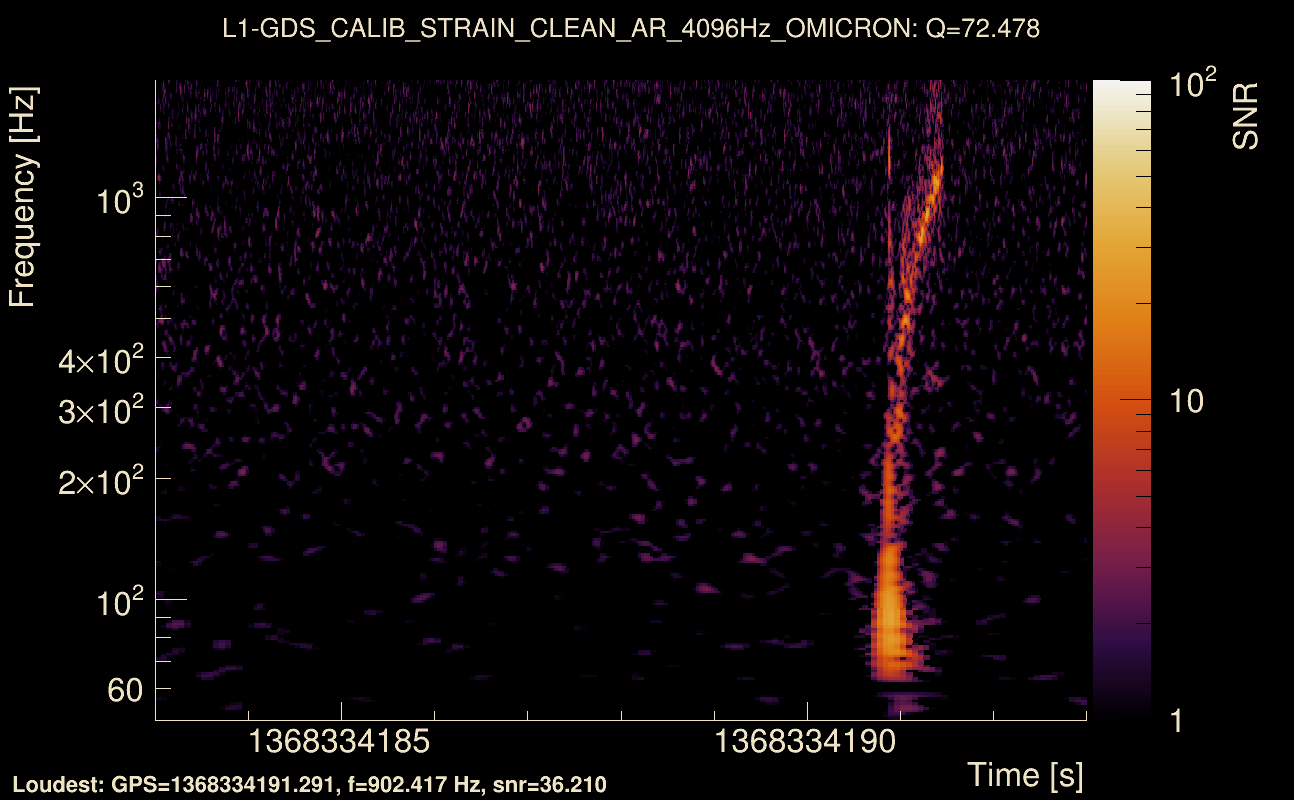
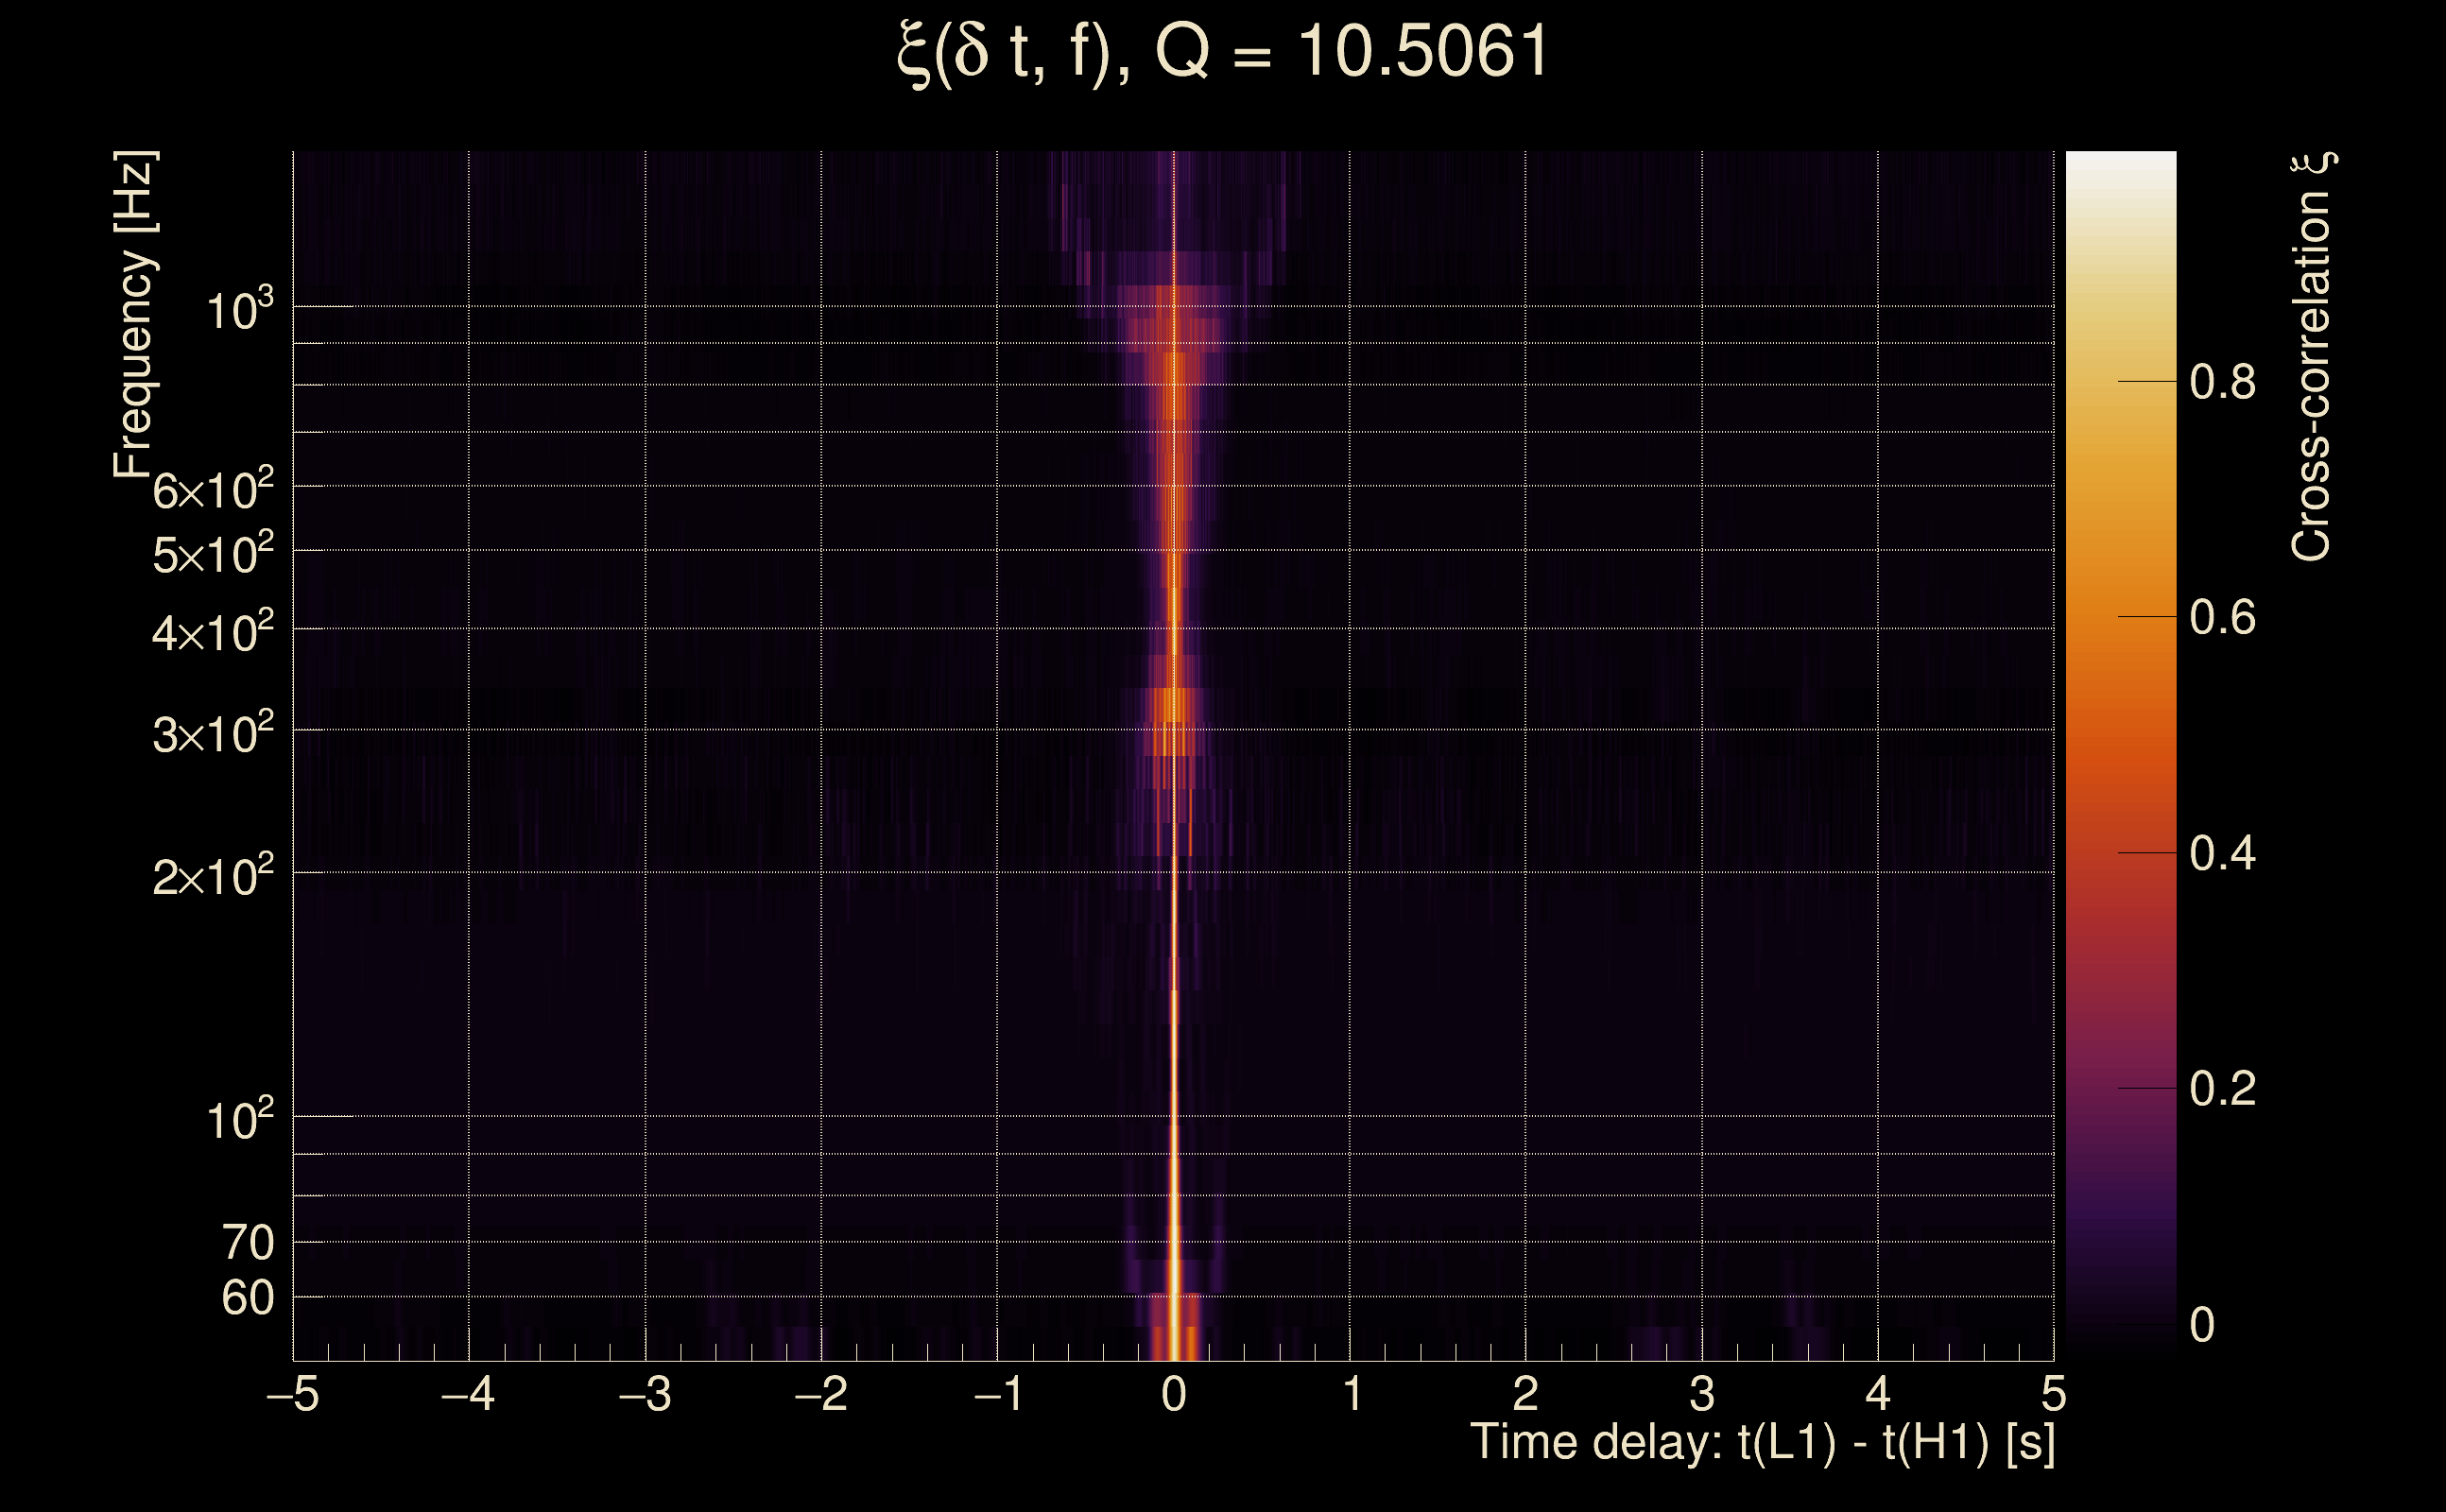
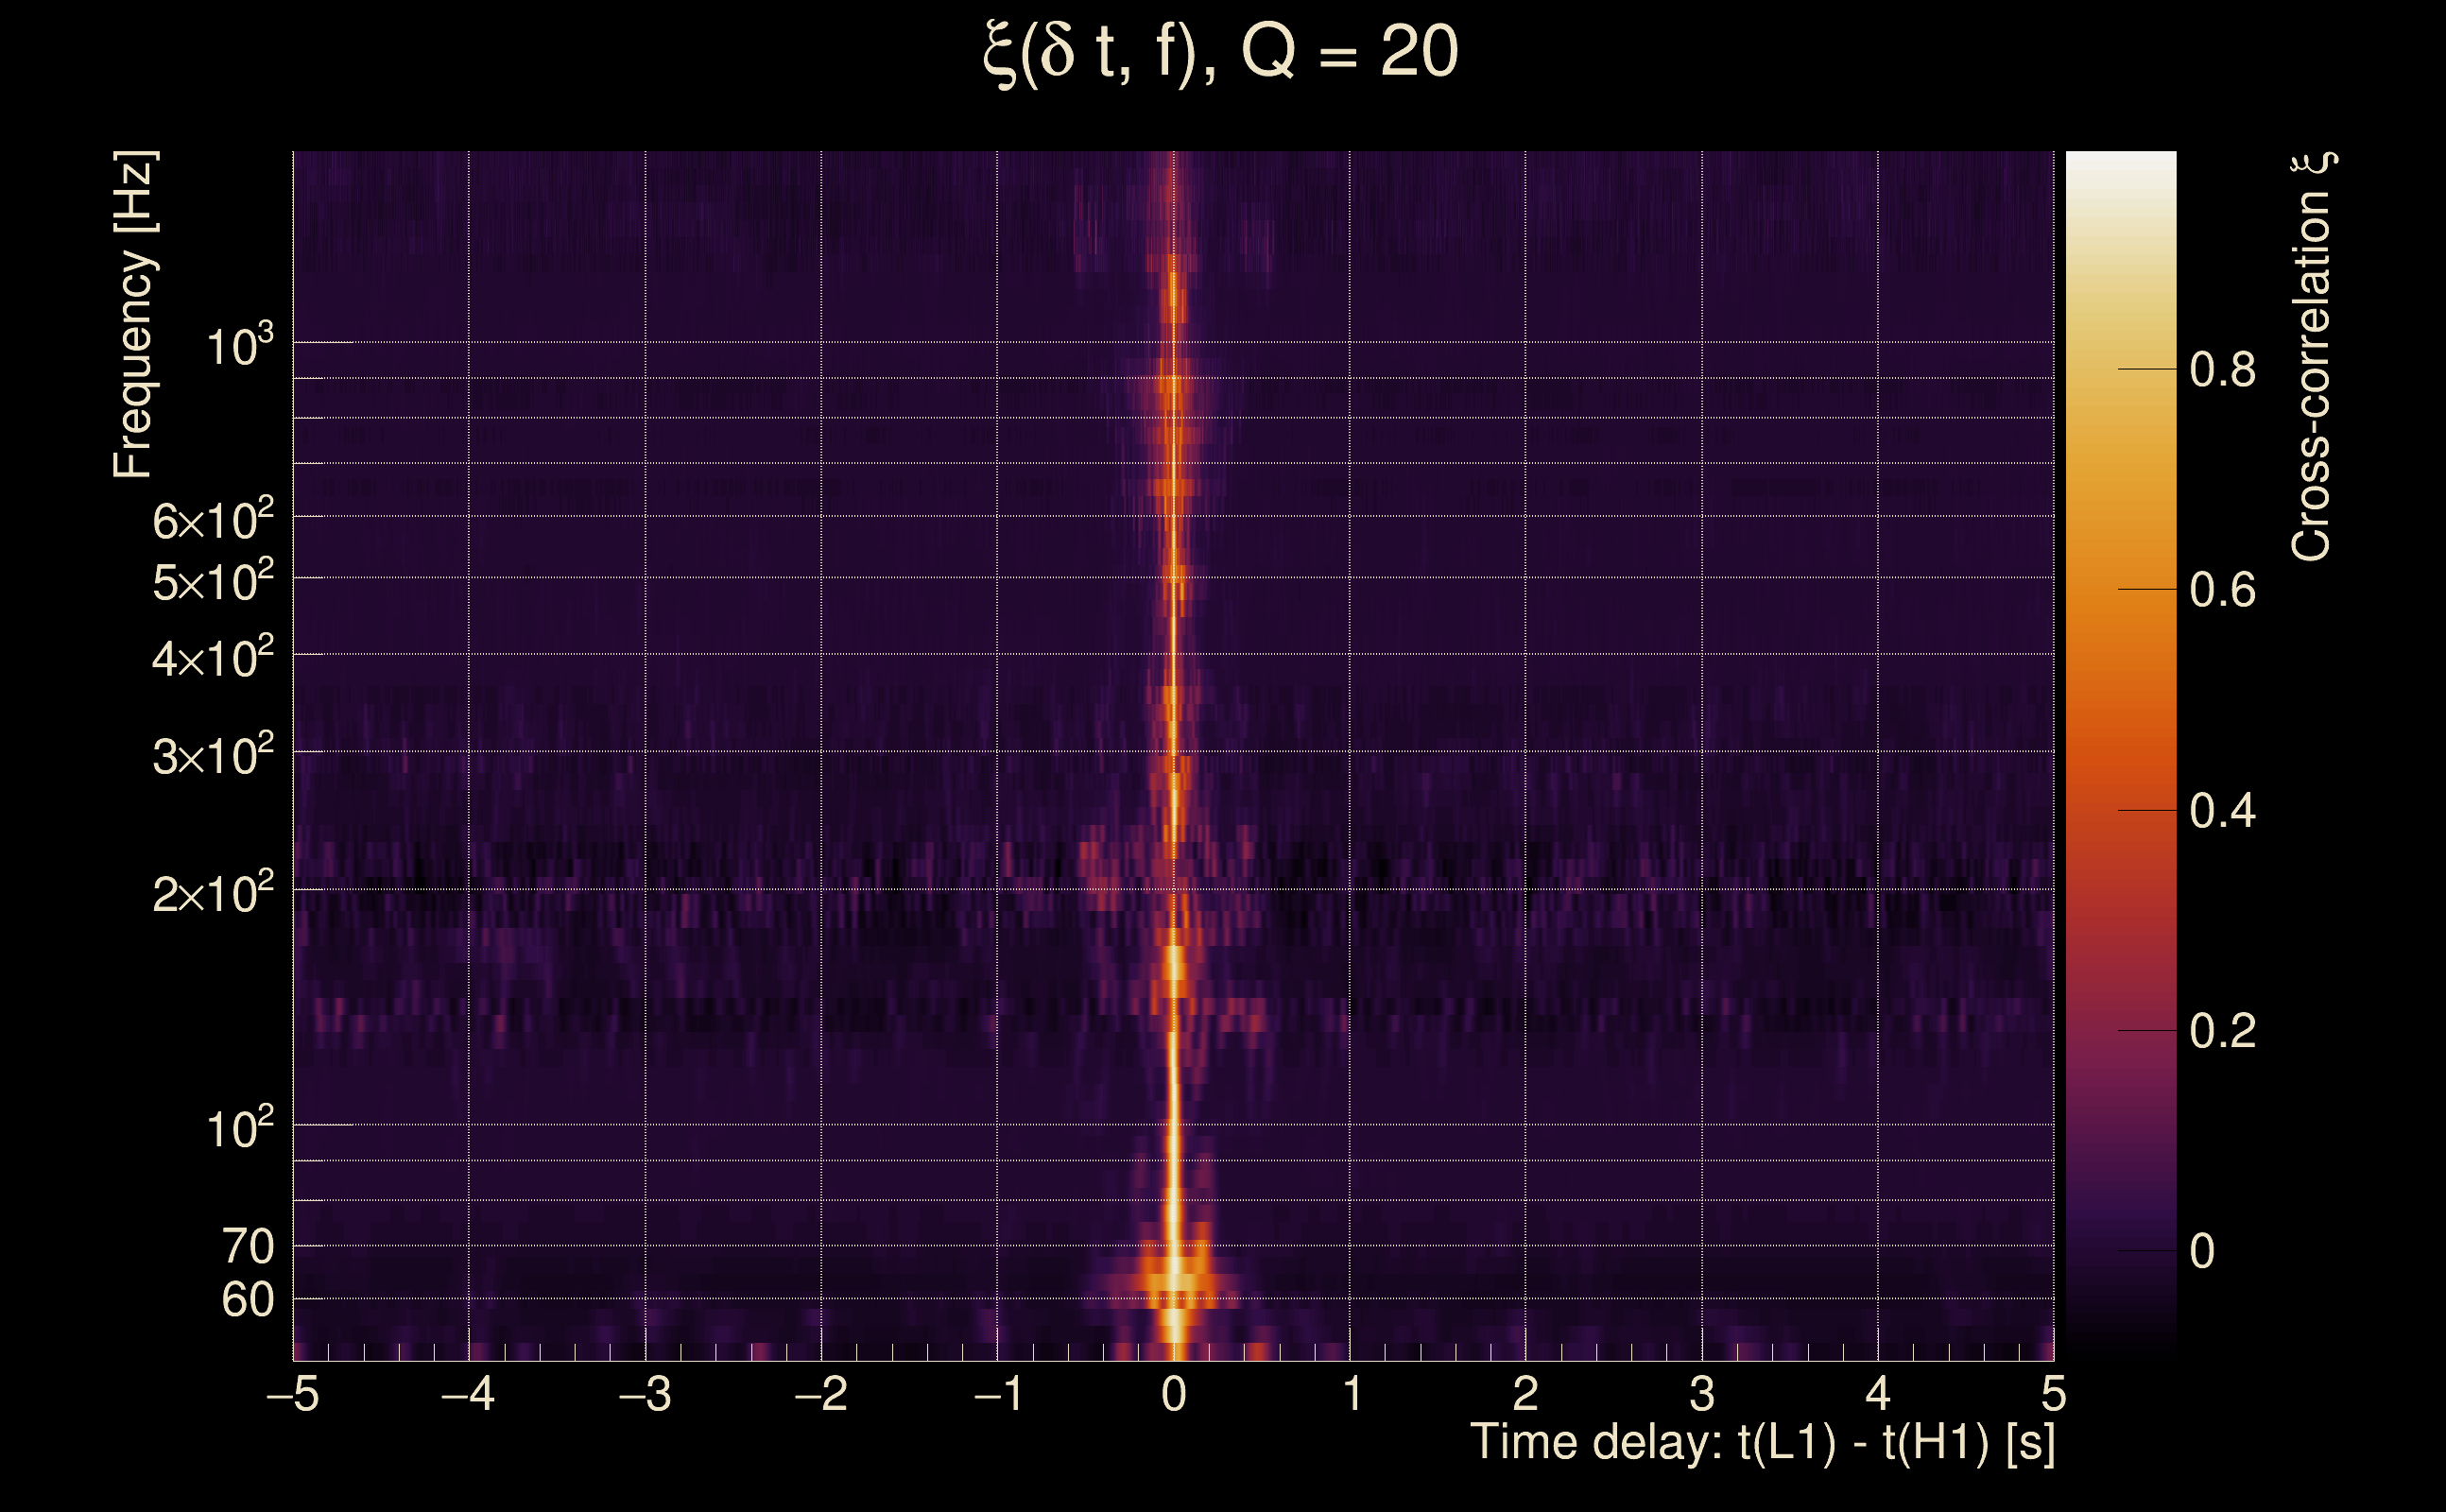
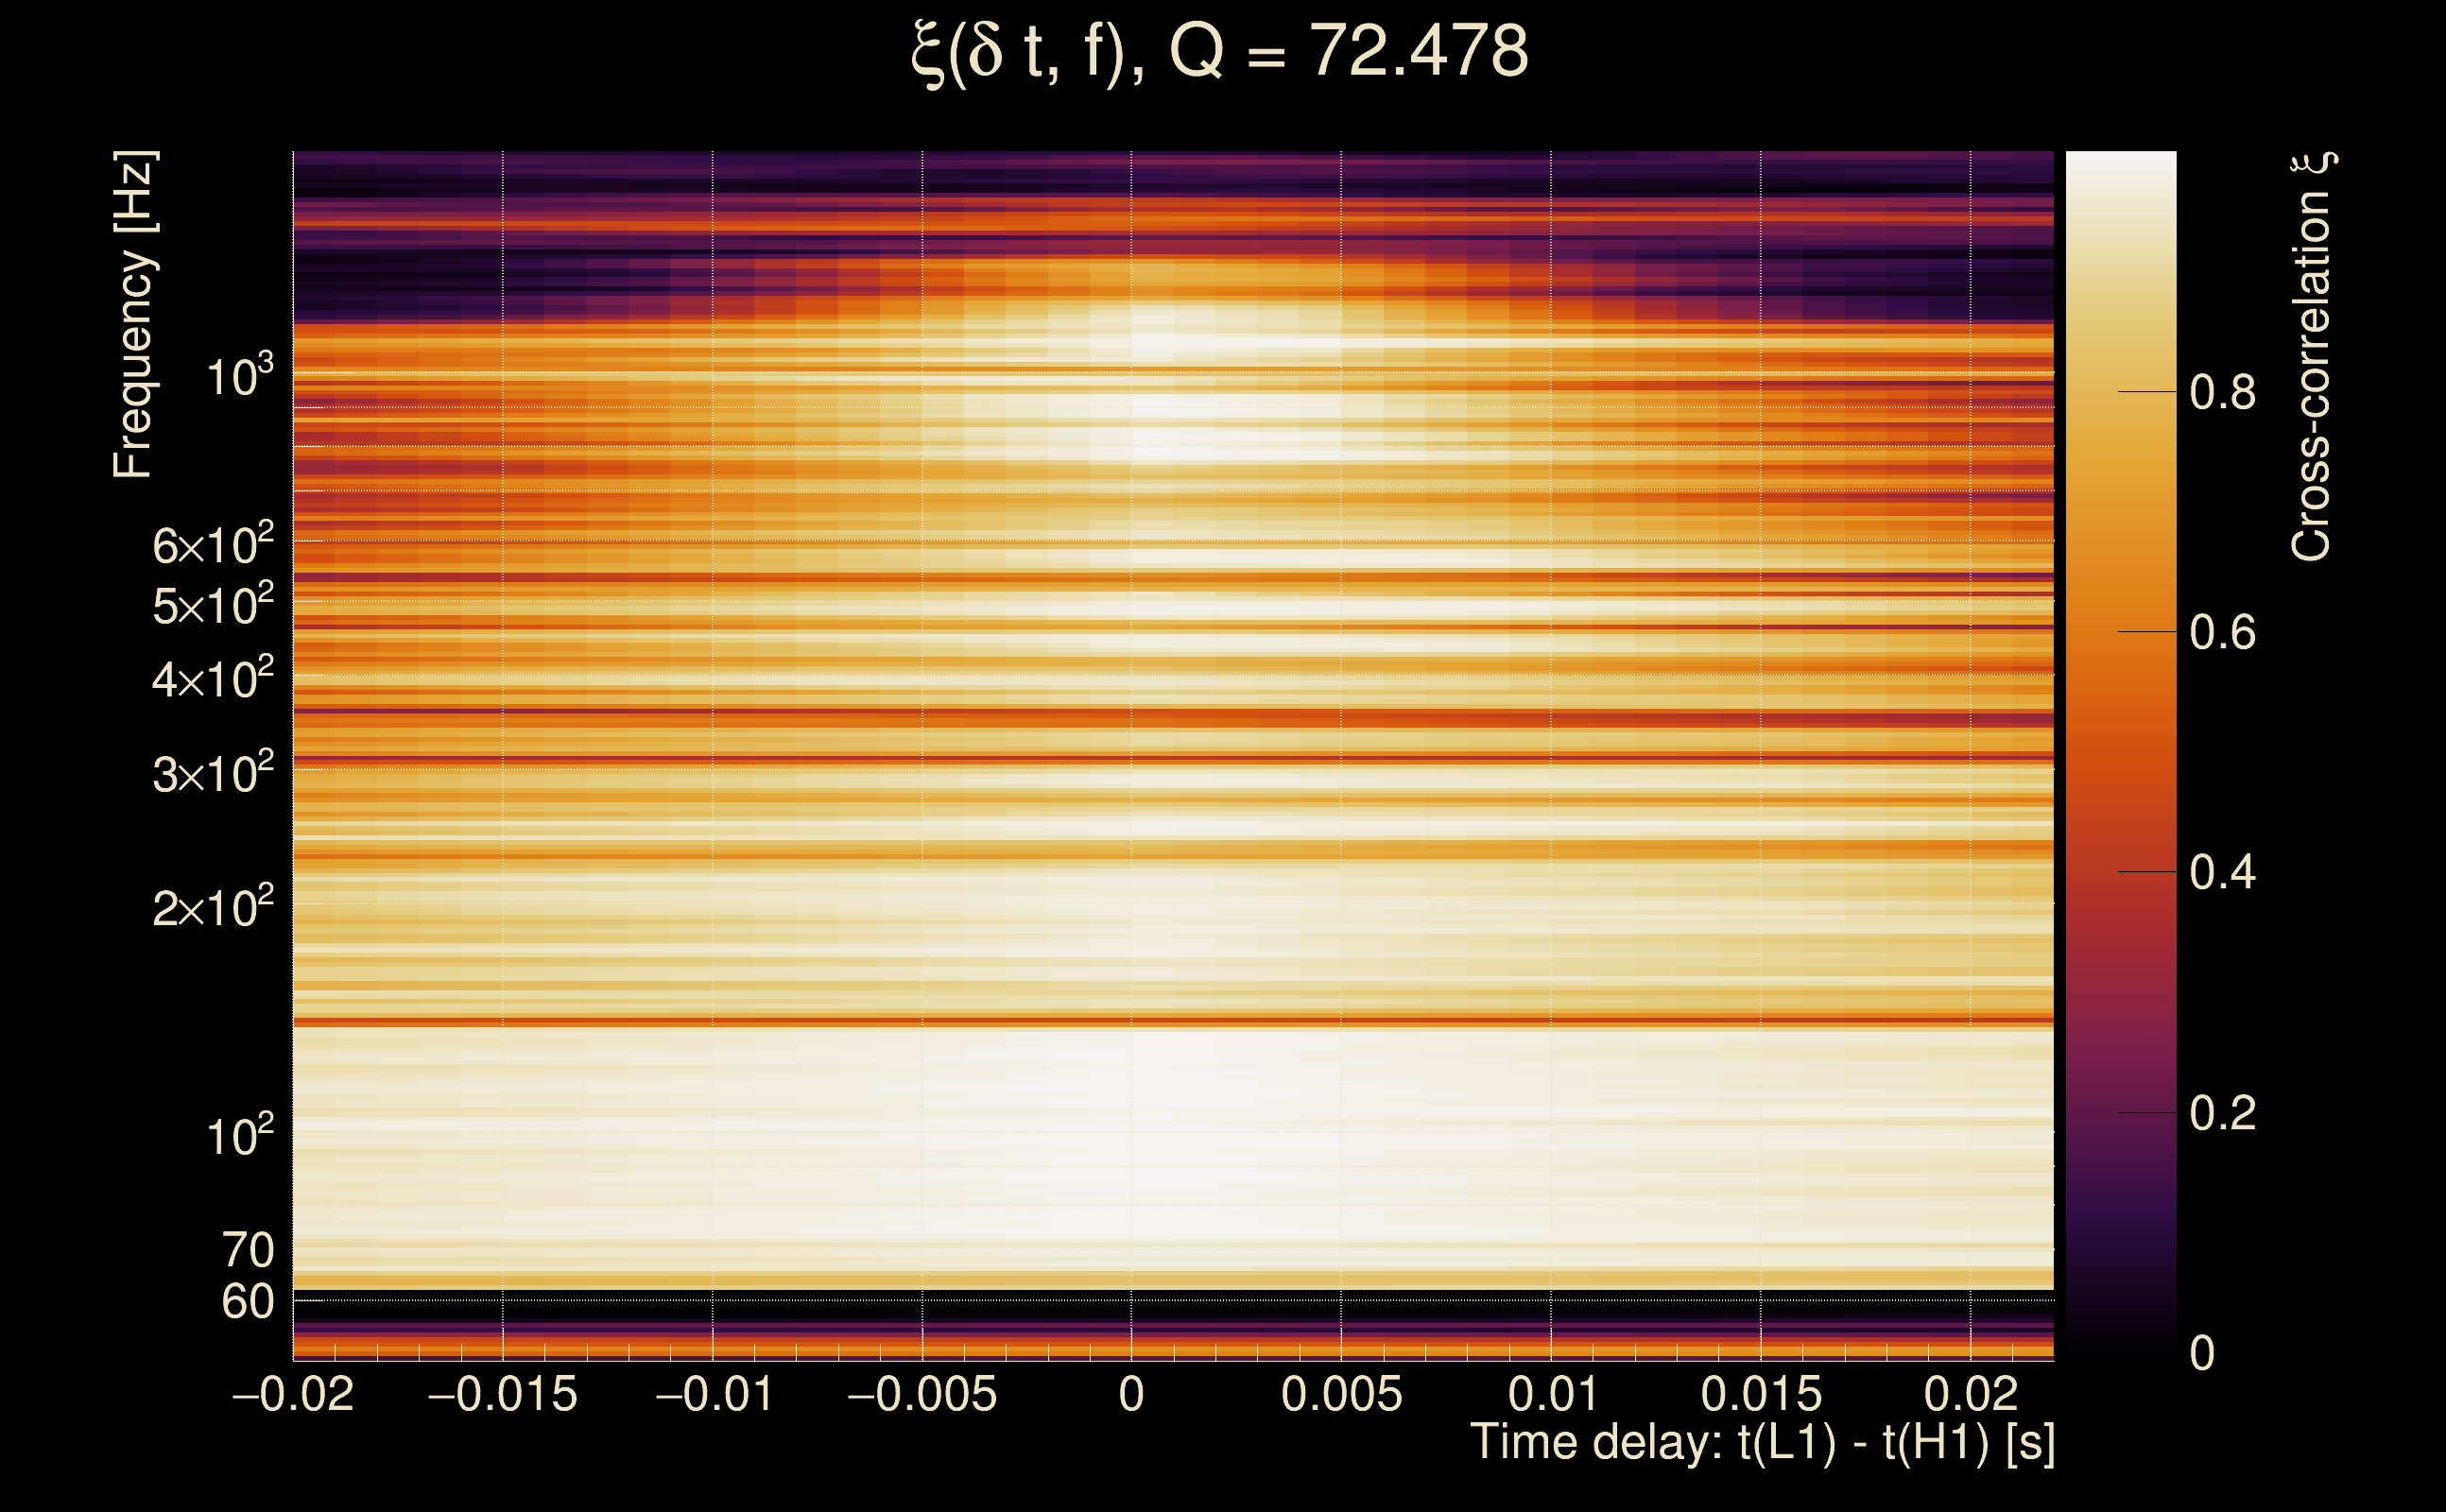
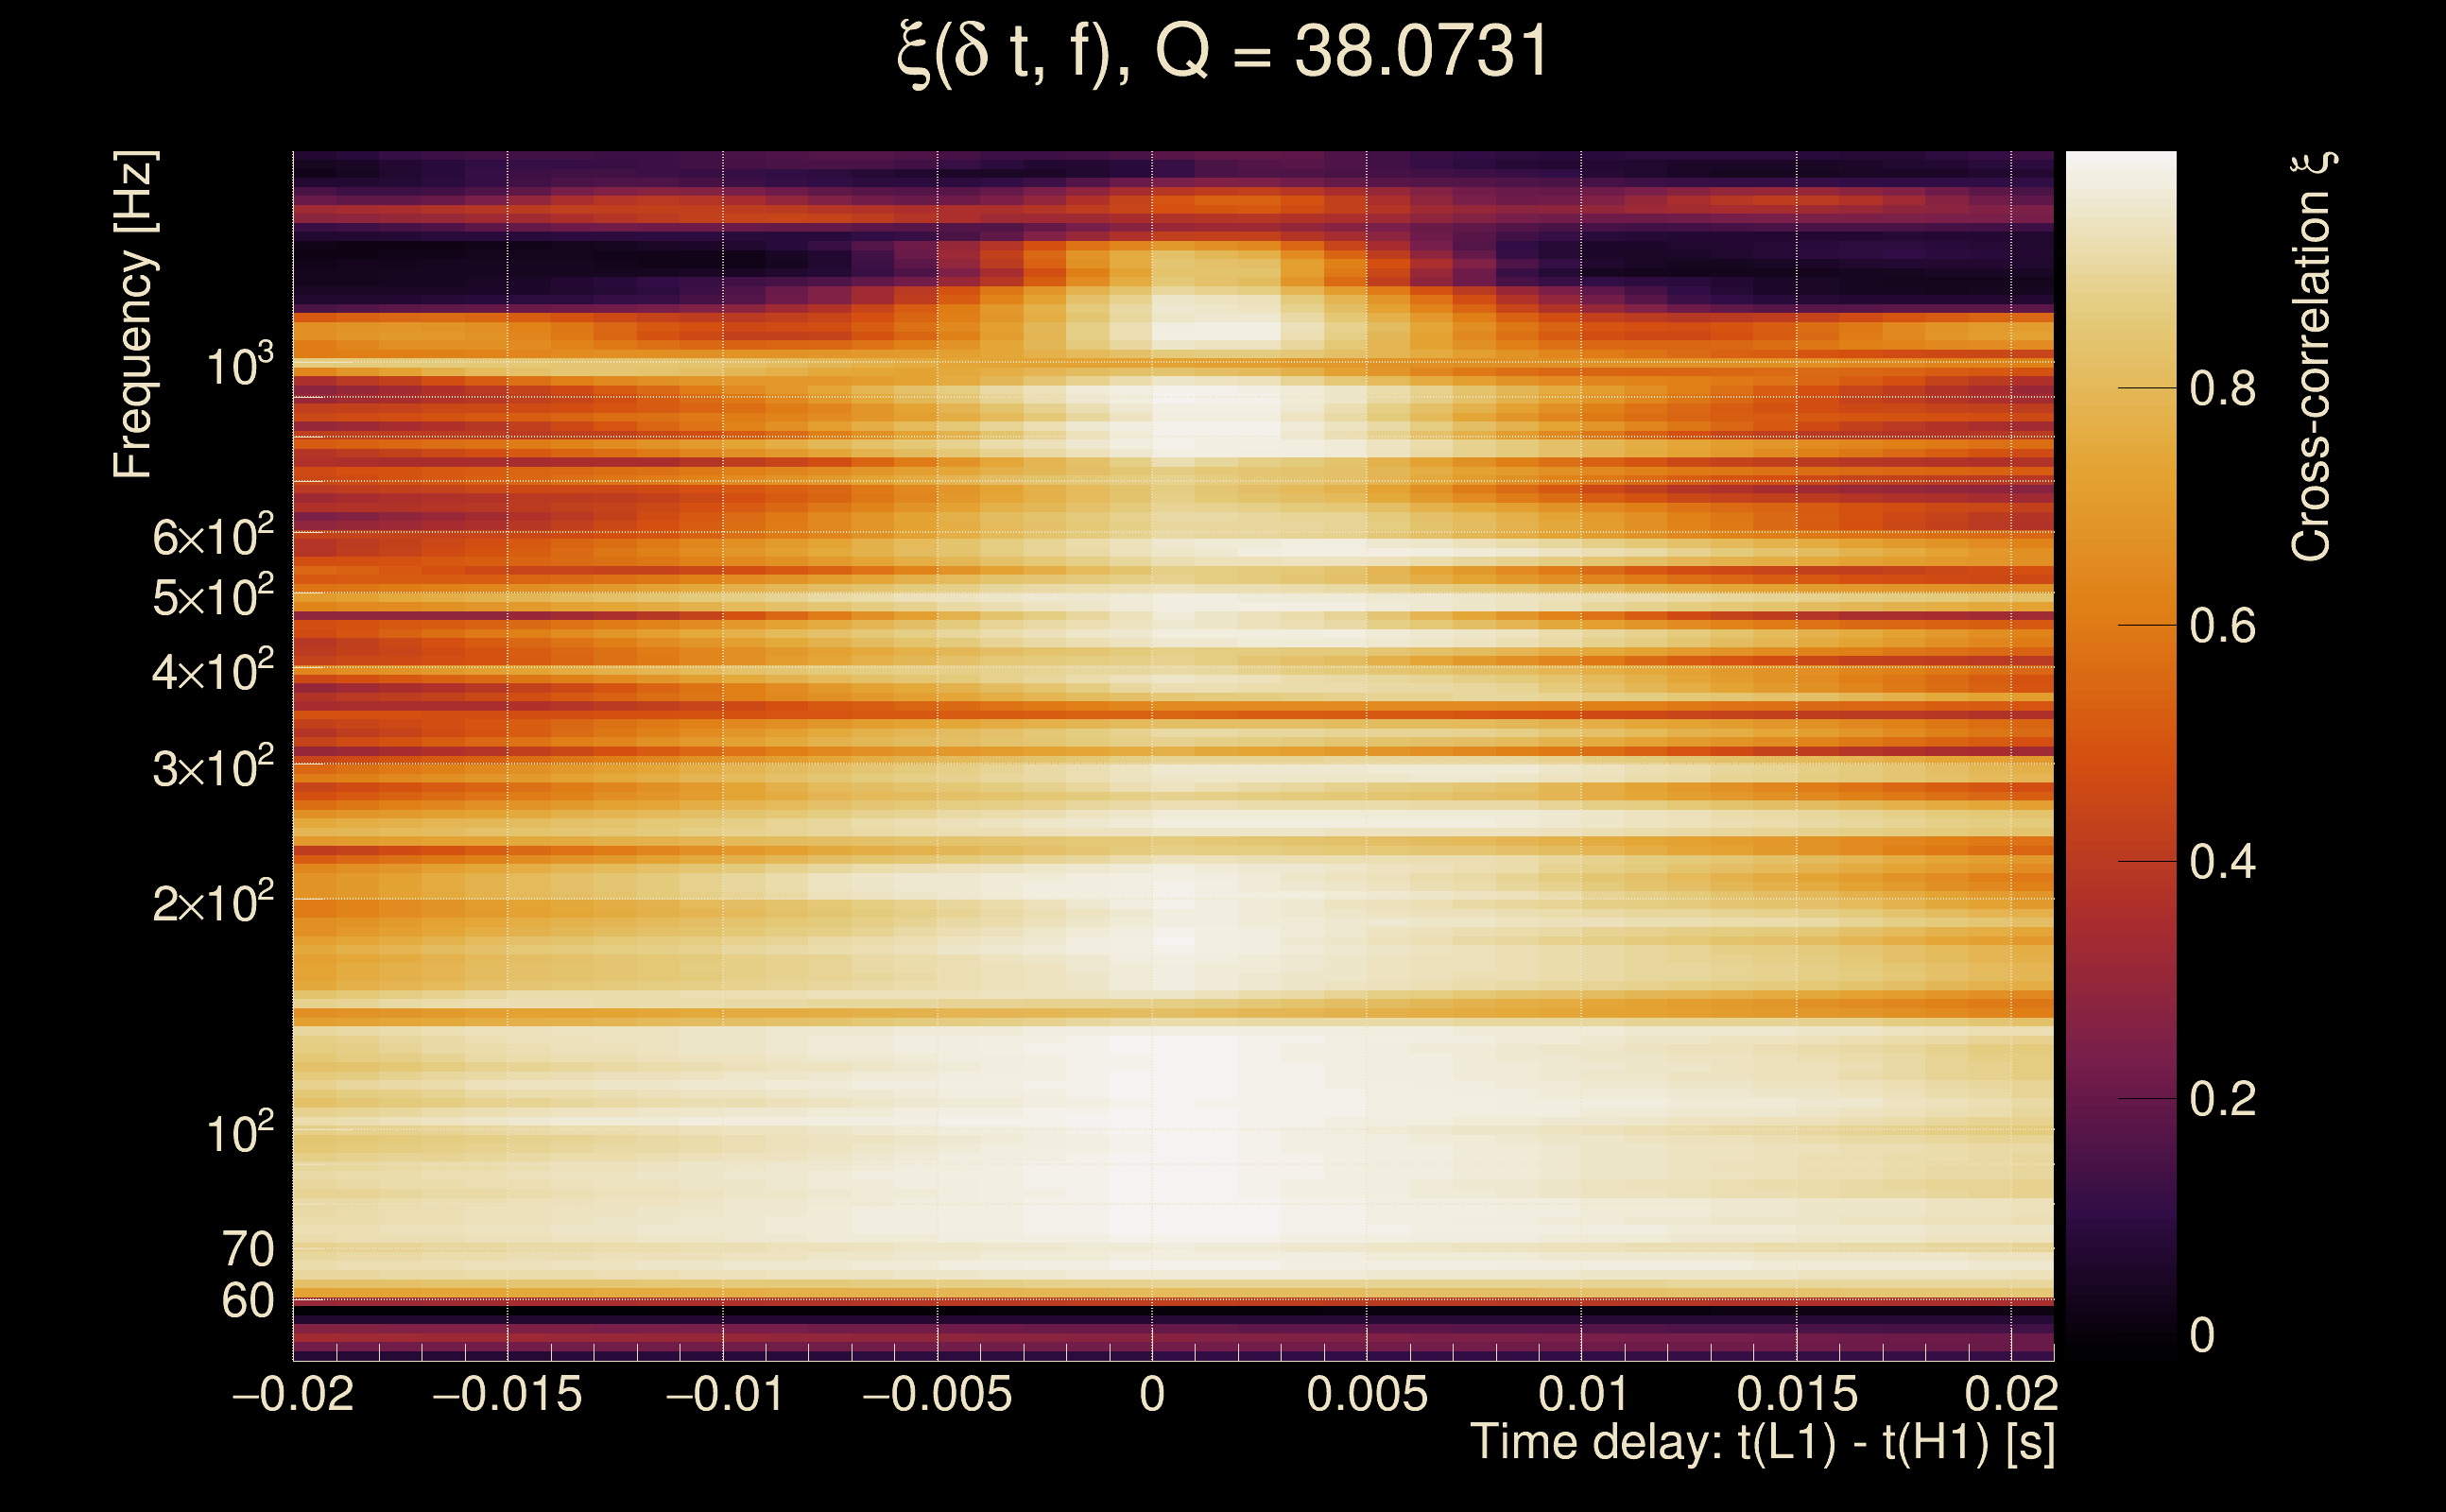
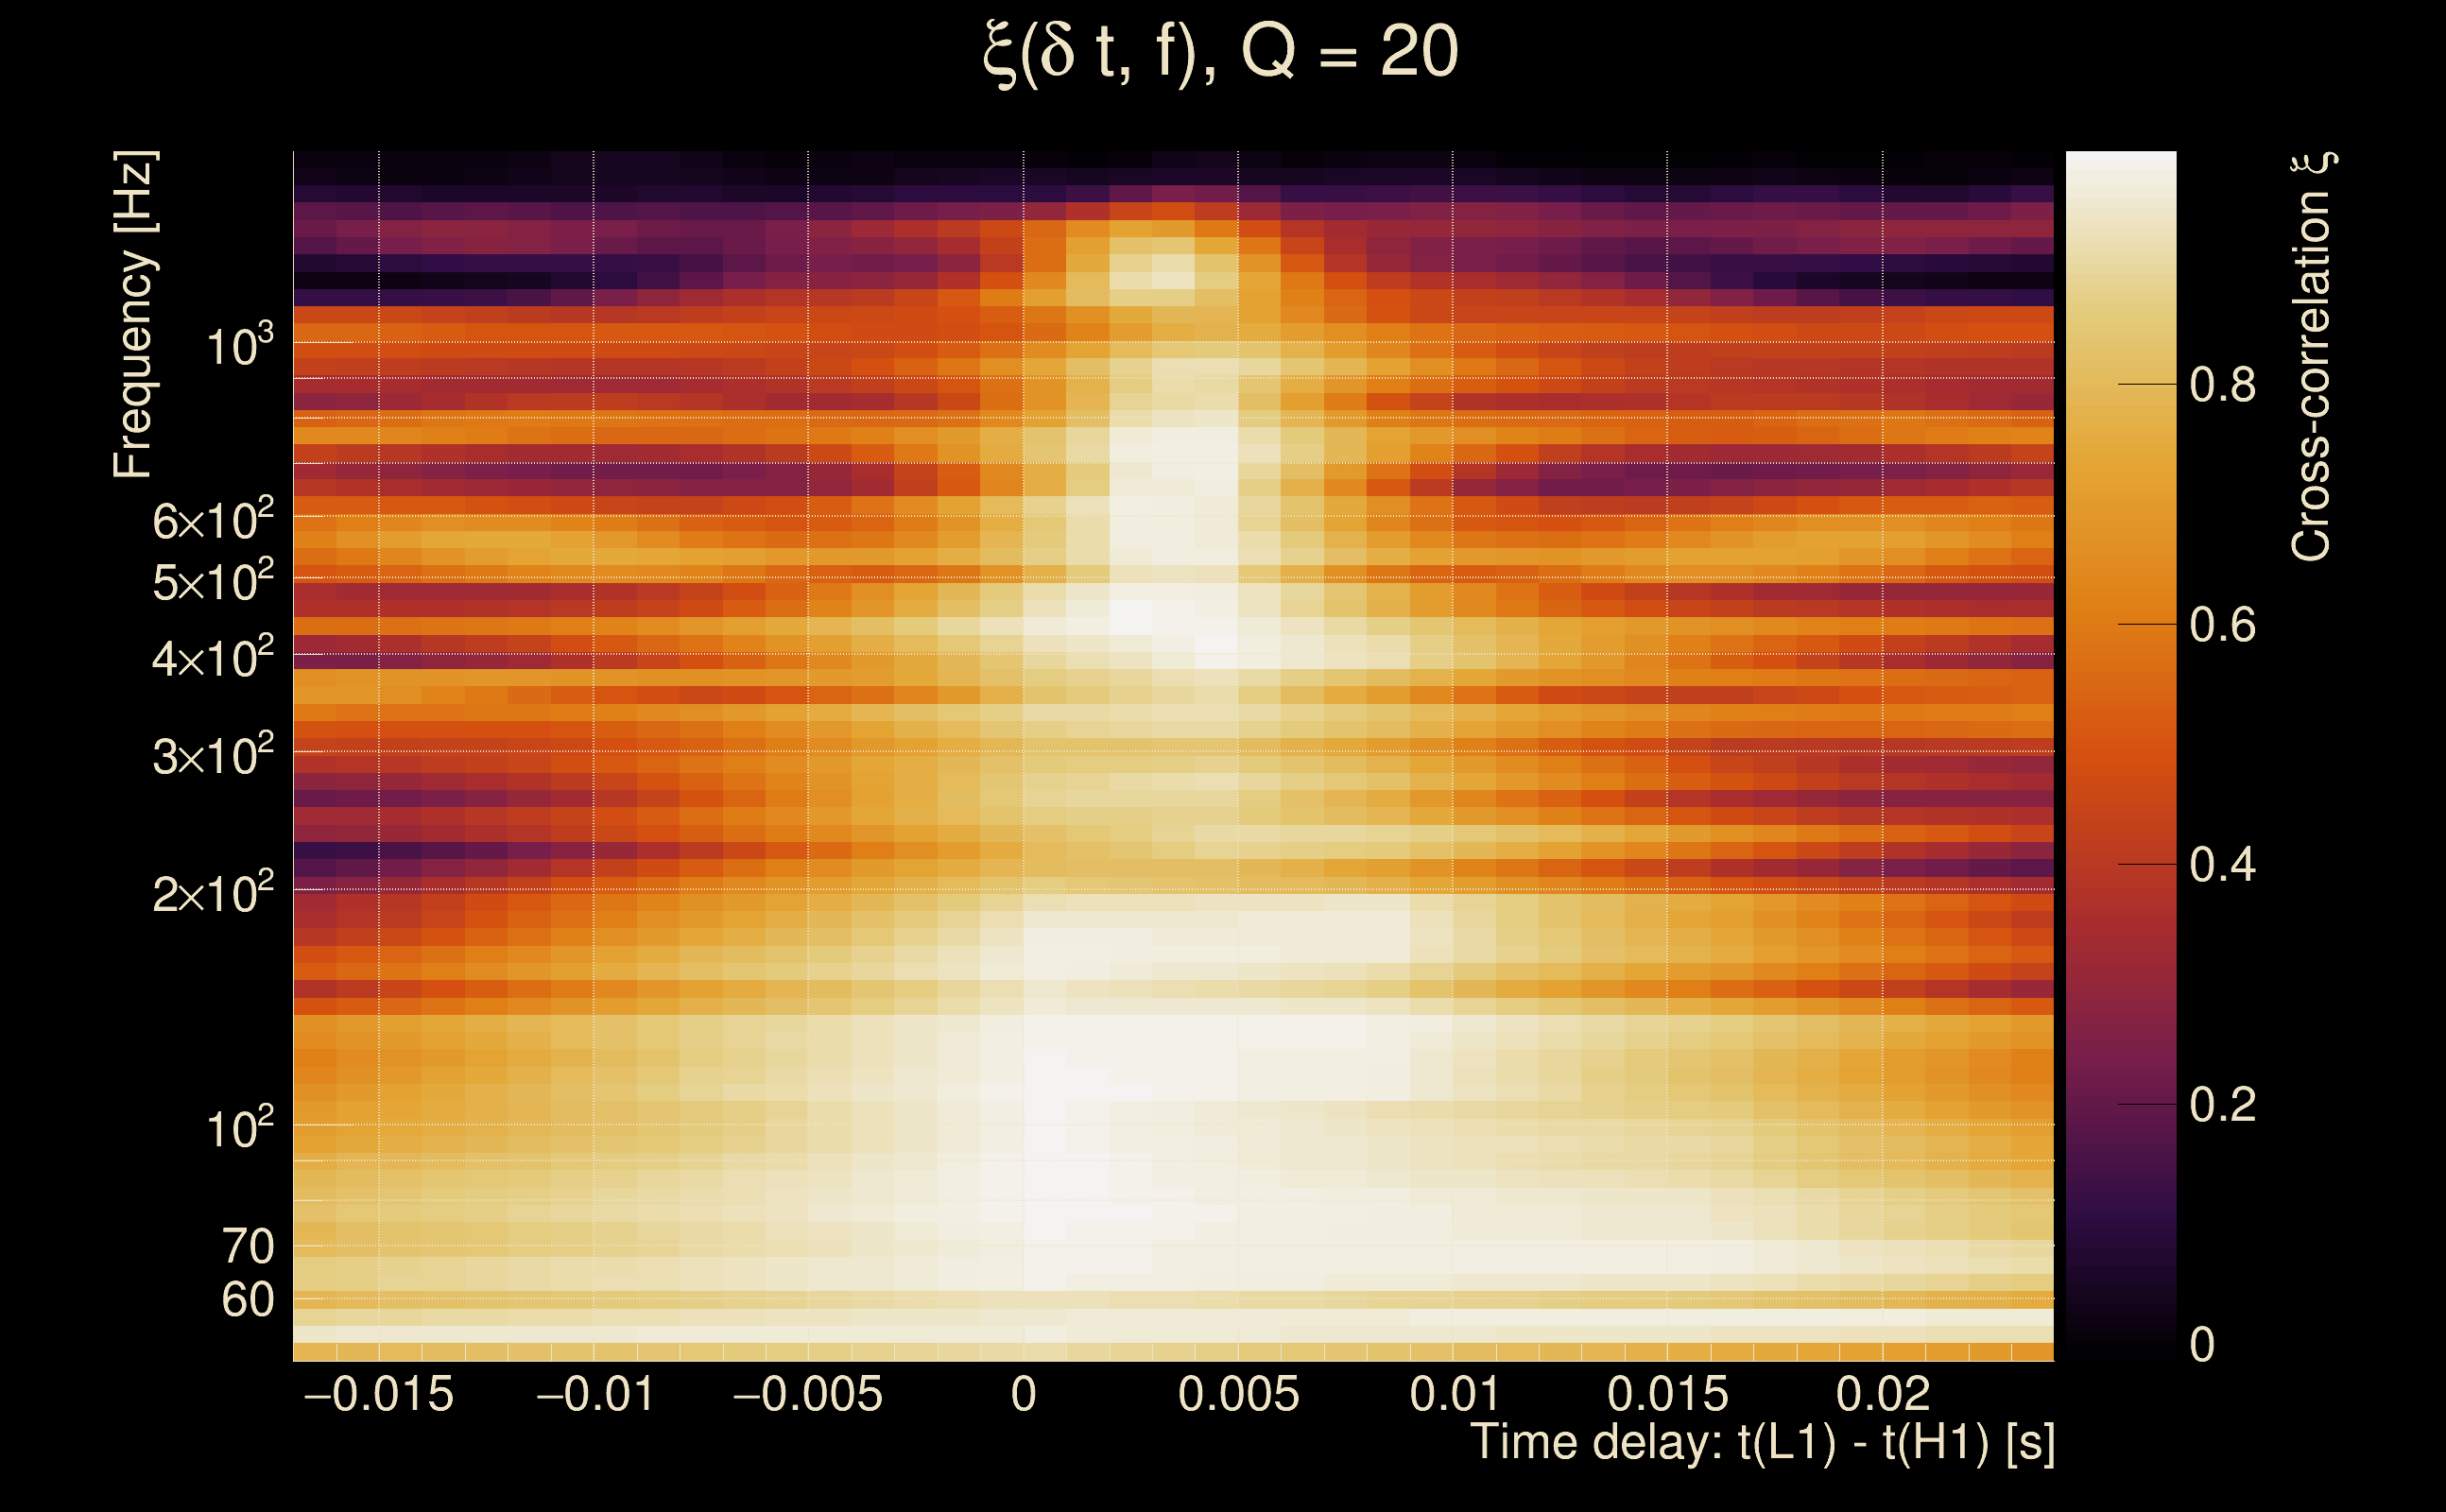
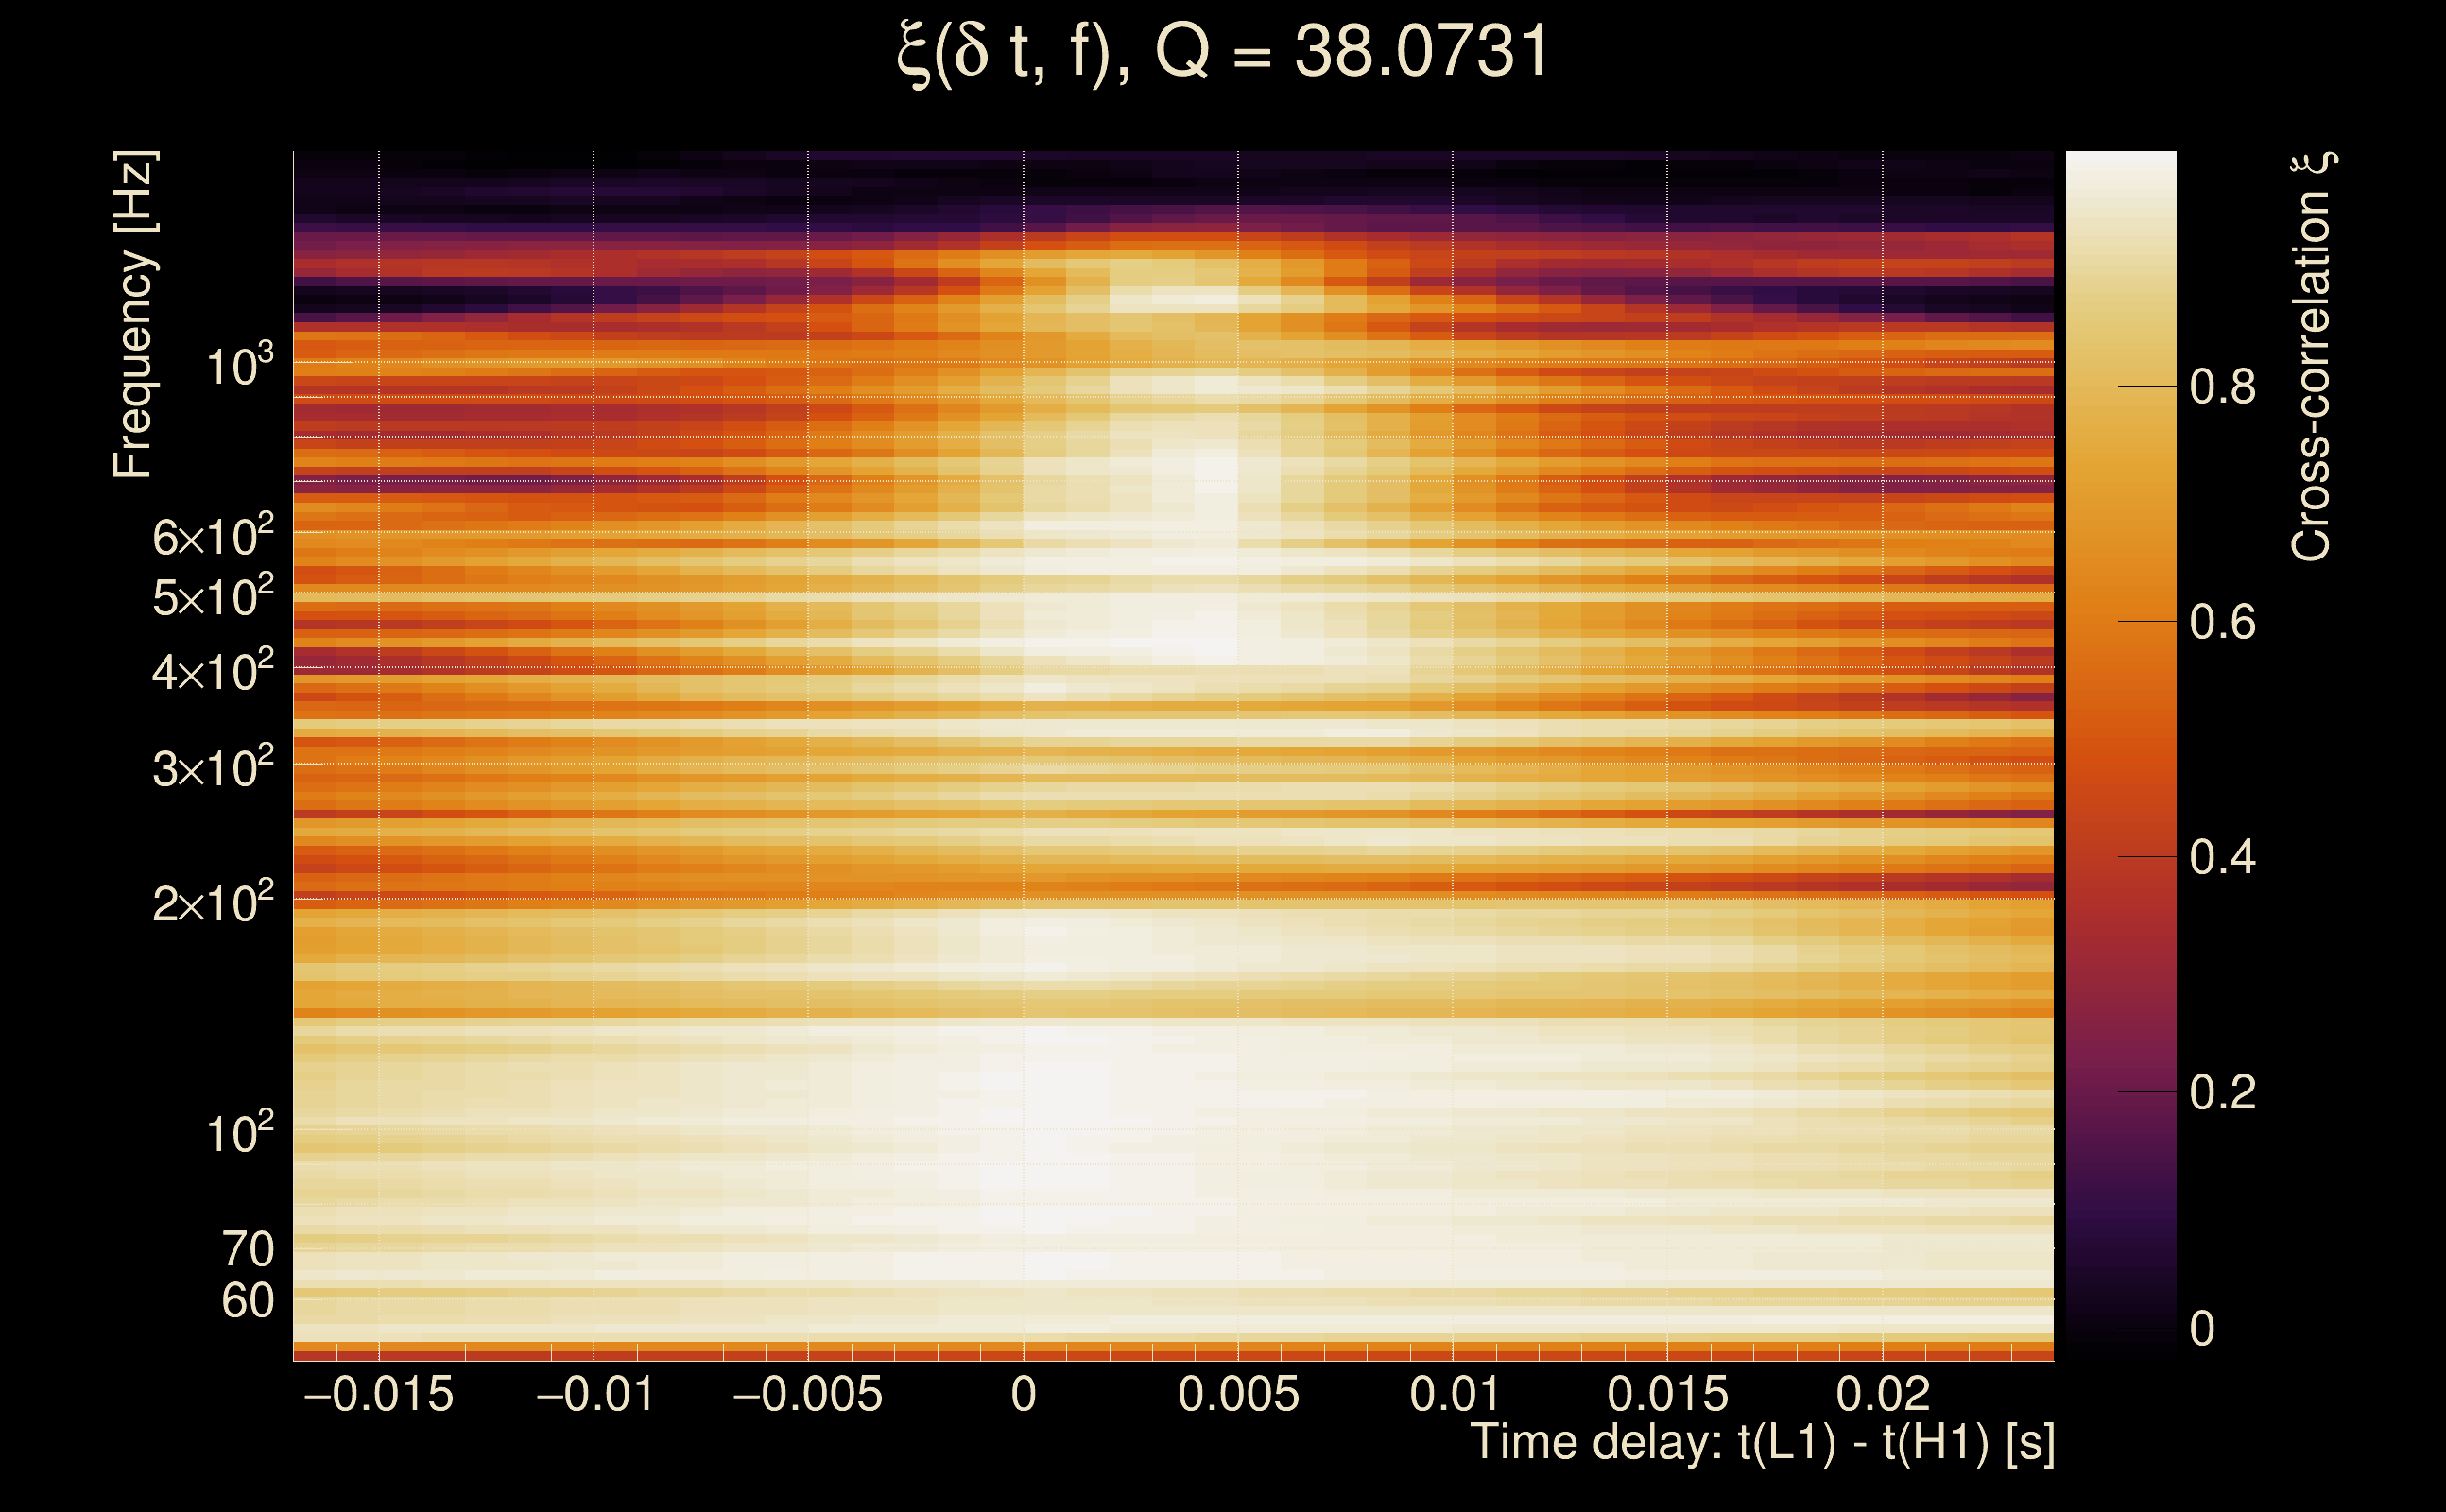
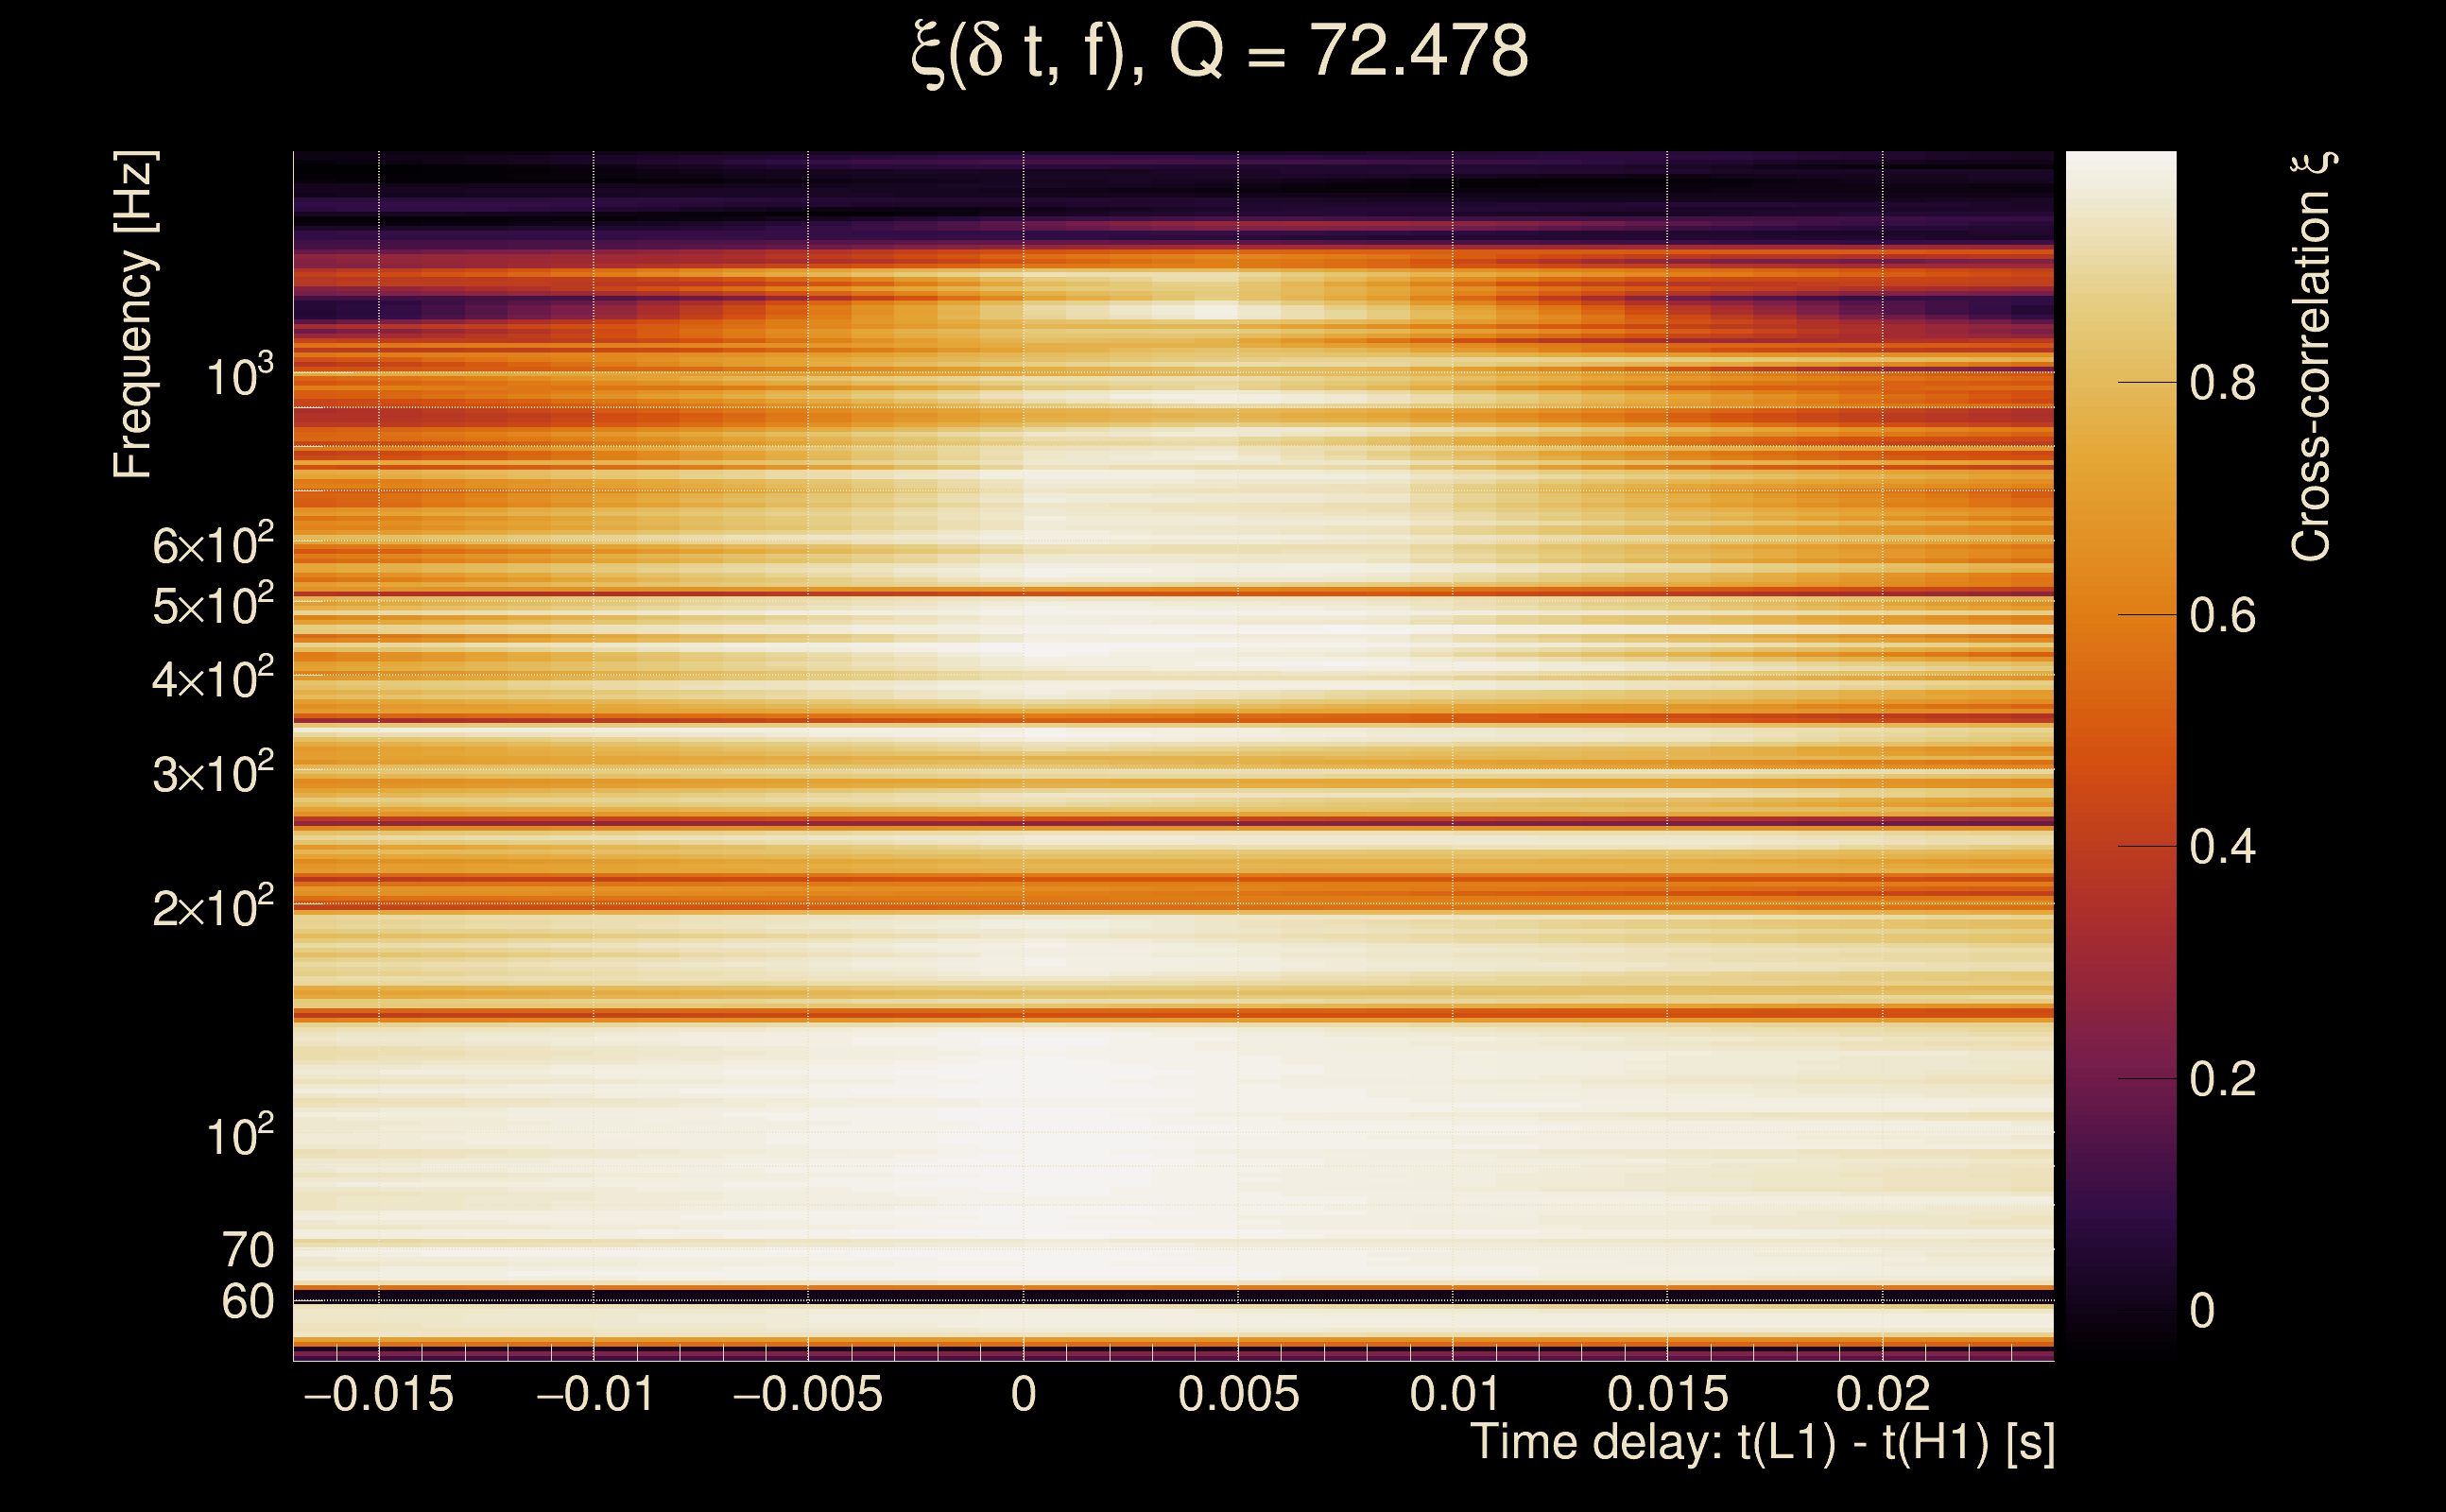
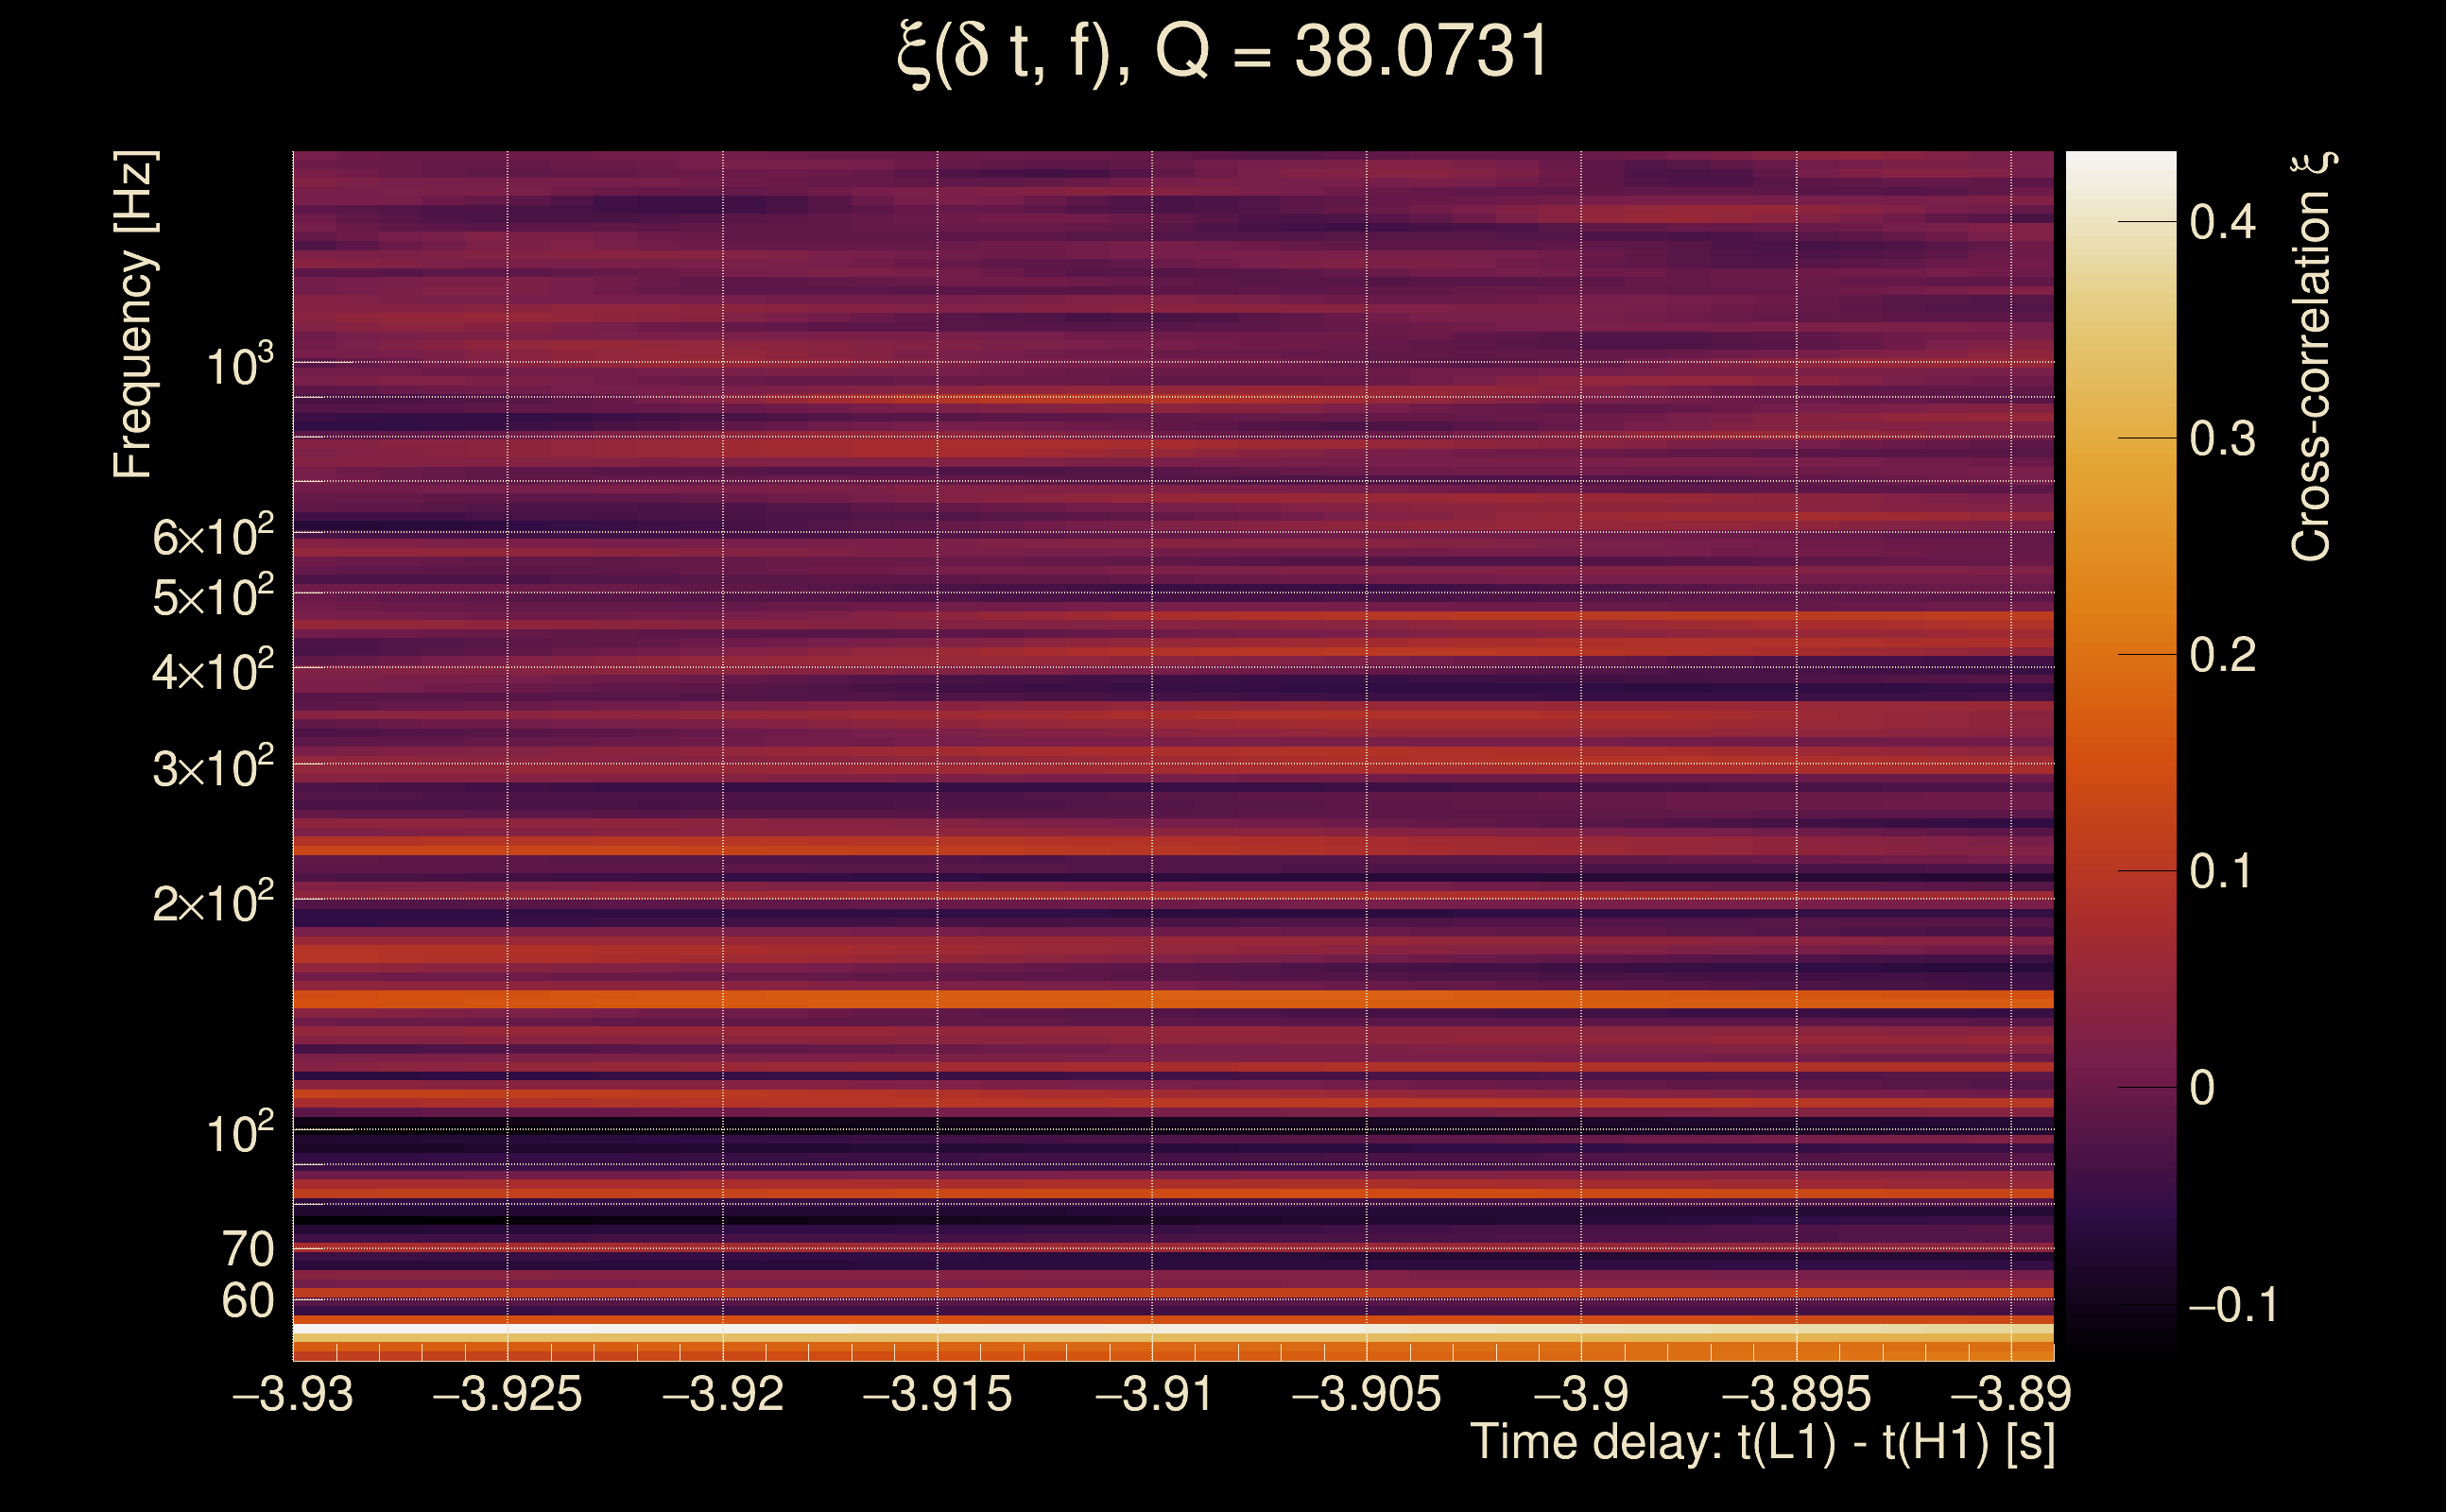
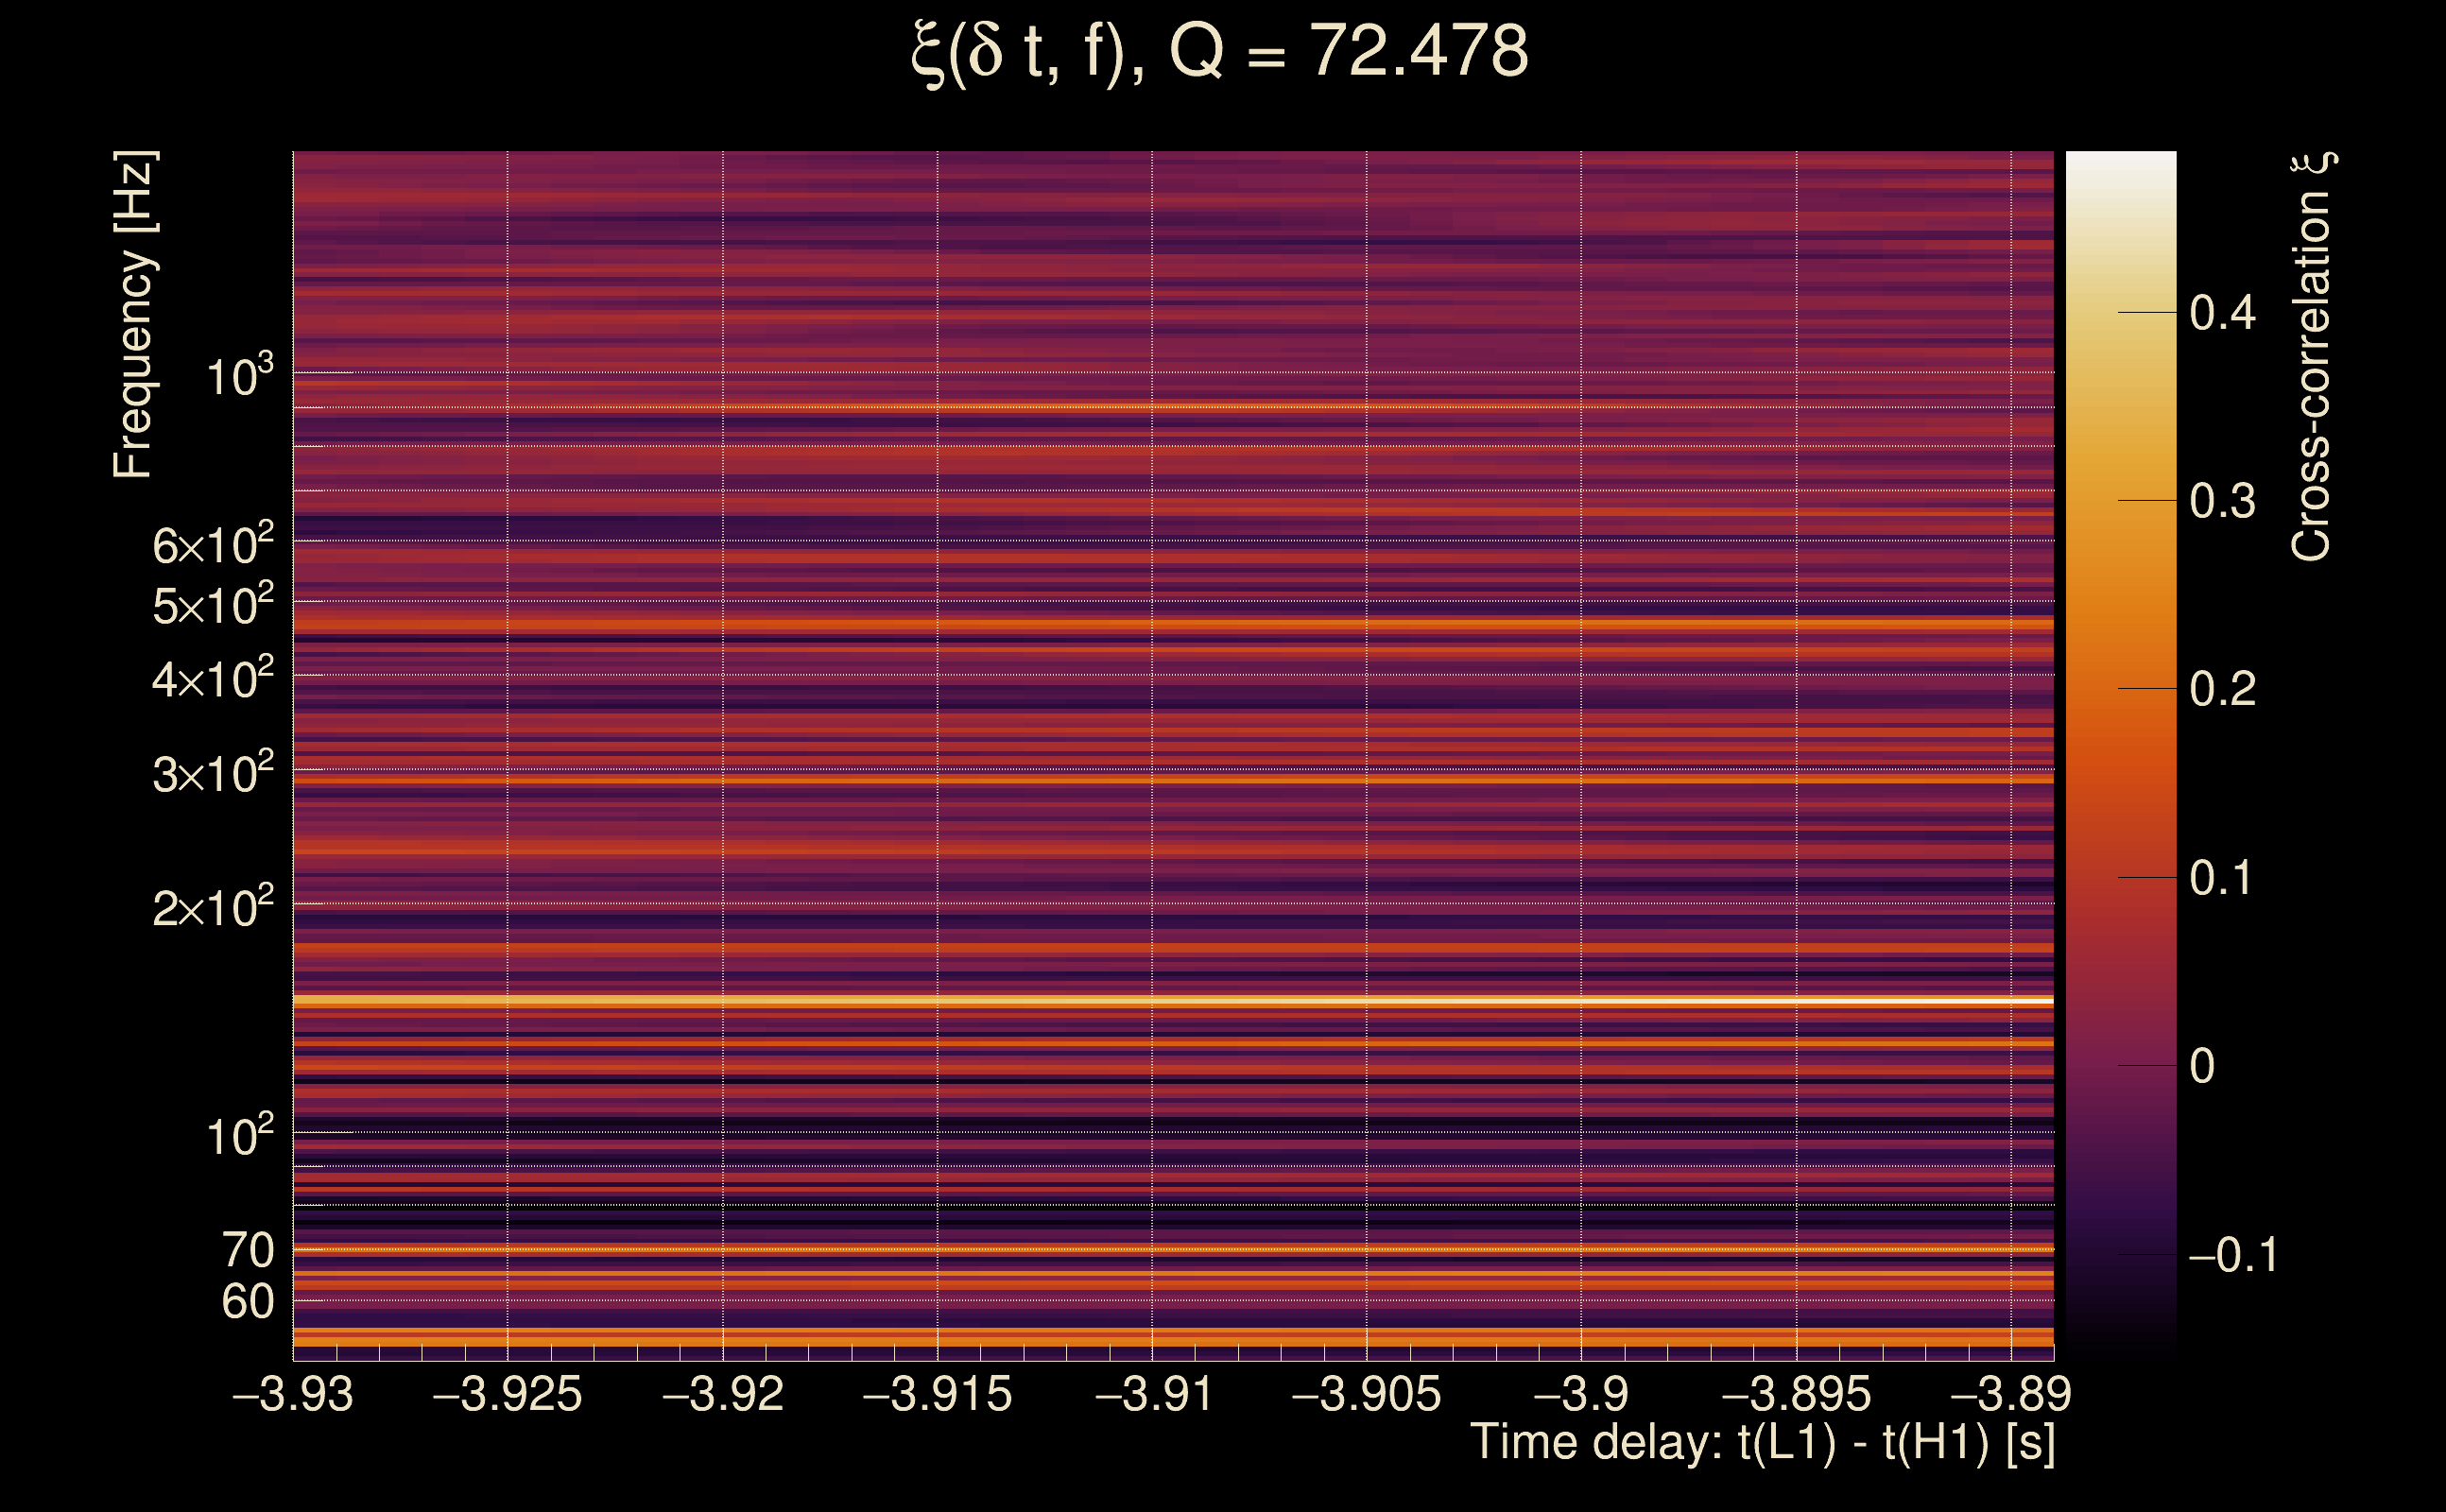
| Event time t(H1): | GPS = 1368334188 (Wed May 17 04:49:30 2023 ) → GPS = 1368334198 (Wed May 17 04:49:40 2023 ) |
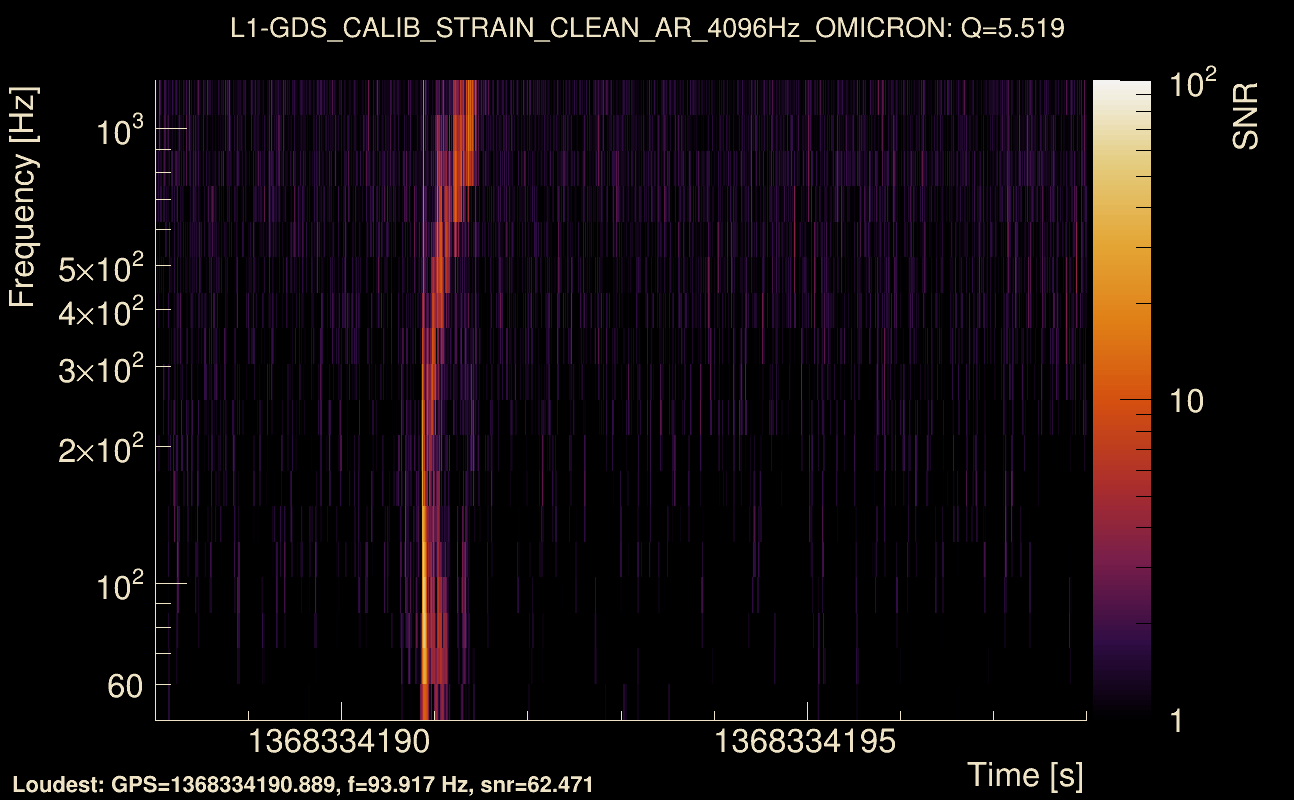
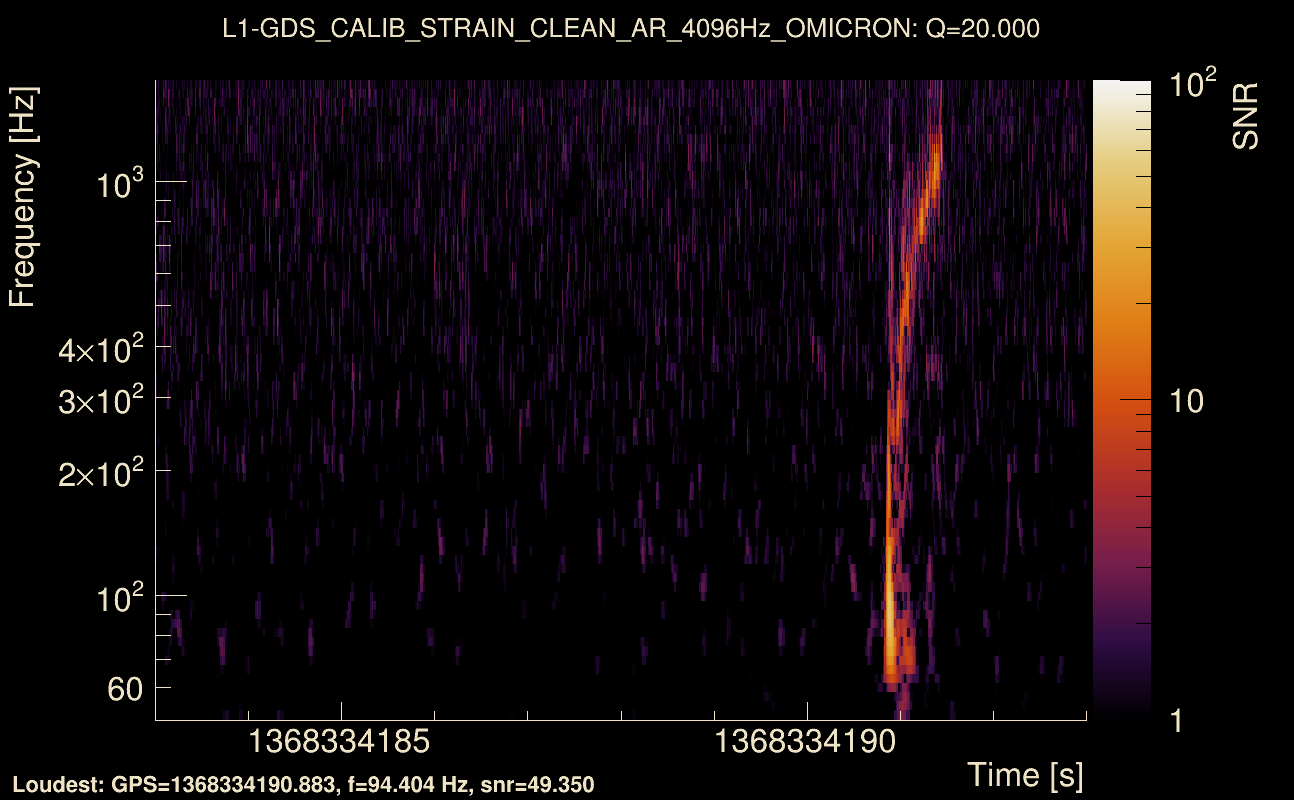
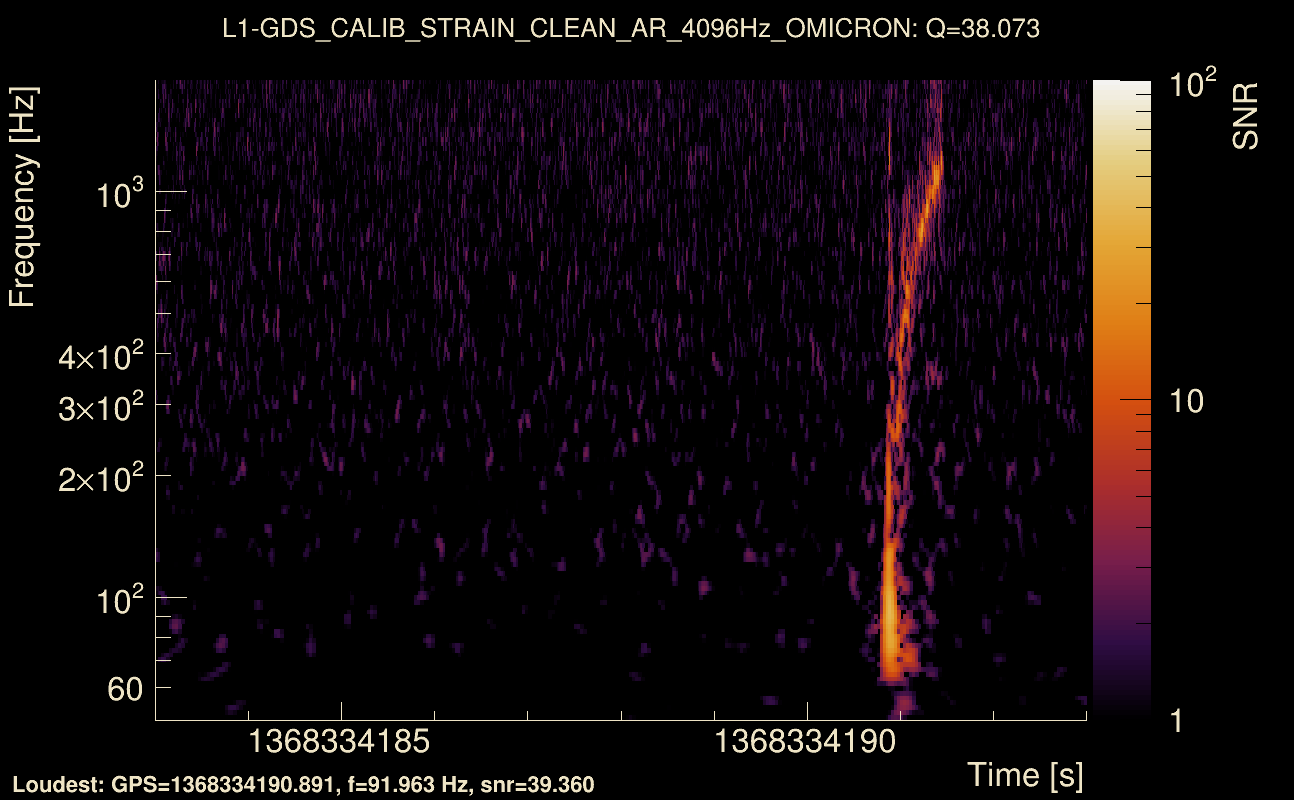
| Event time t(L1): | GPS = 1368334188 (Wed May 17 04:49:40 2023 ) → GPS = 1368334198 (Wed May 17 04:49:40 2023 ) |
| Omicron analysis time window (H1): | GPS = 1368334185 → GPS = 1368334201 |
| Omicron analysis time window (L1): | GPS = 1368334185 → GPS = 1368334201 |
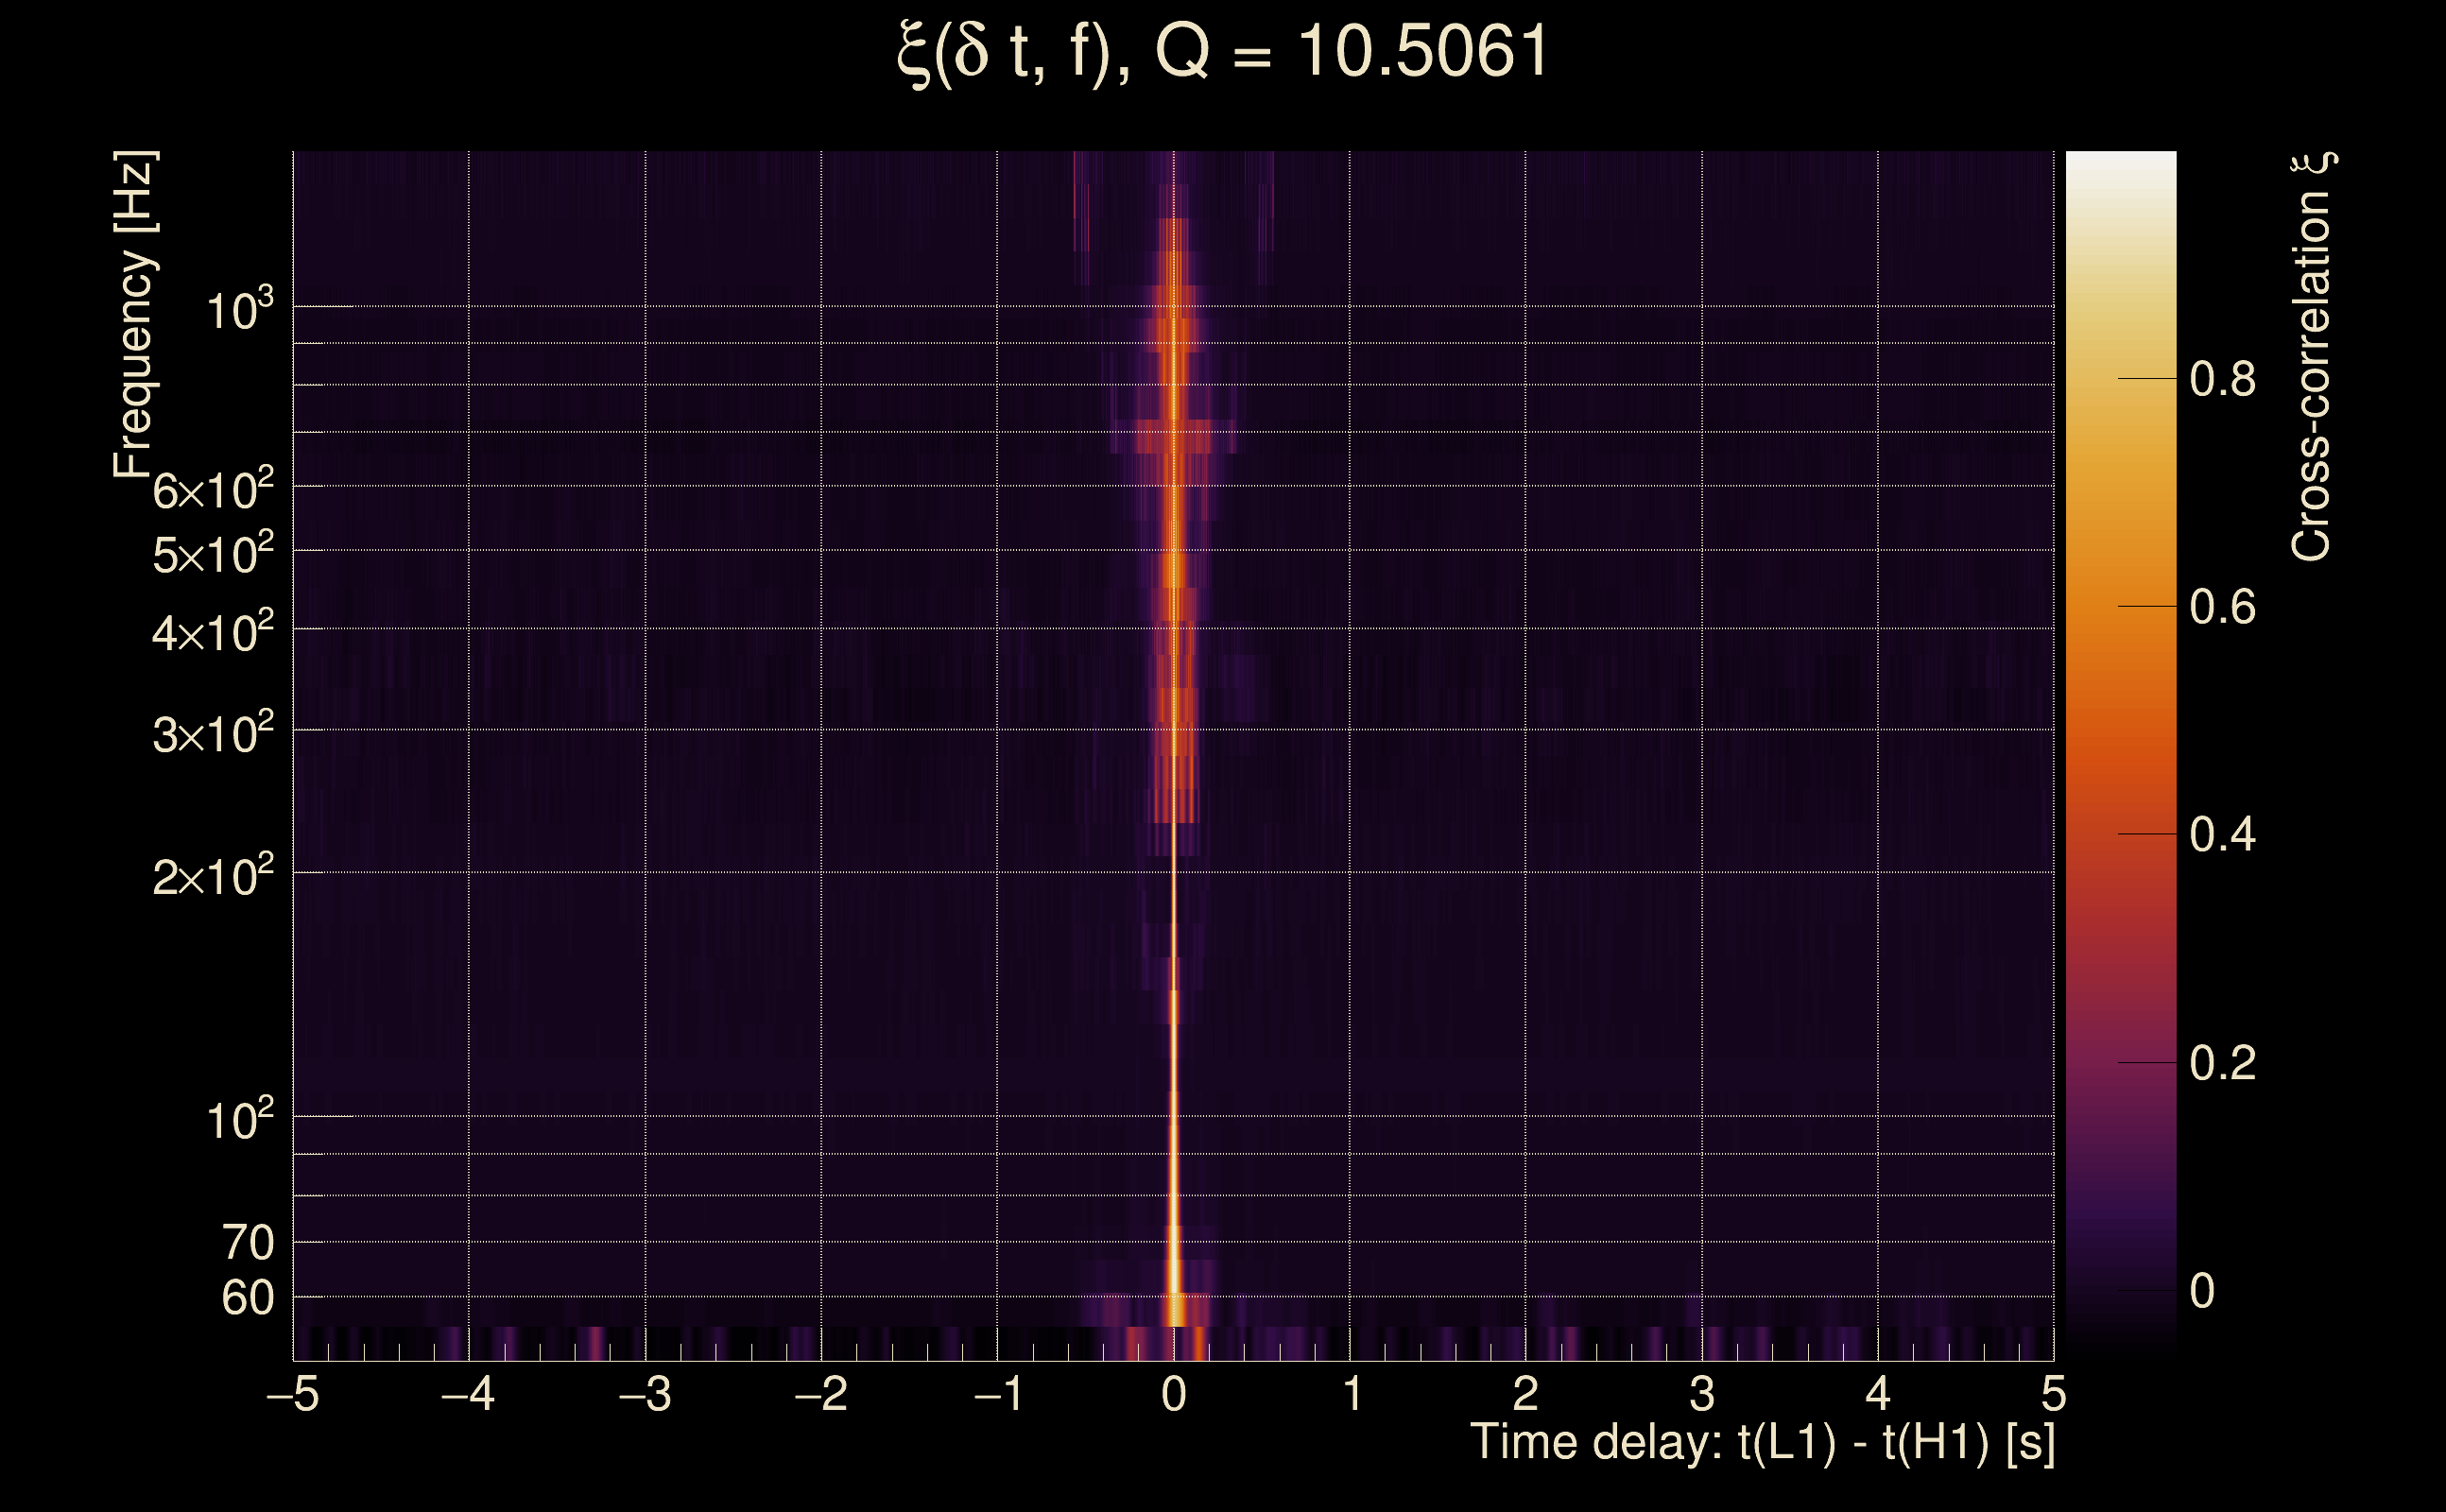
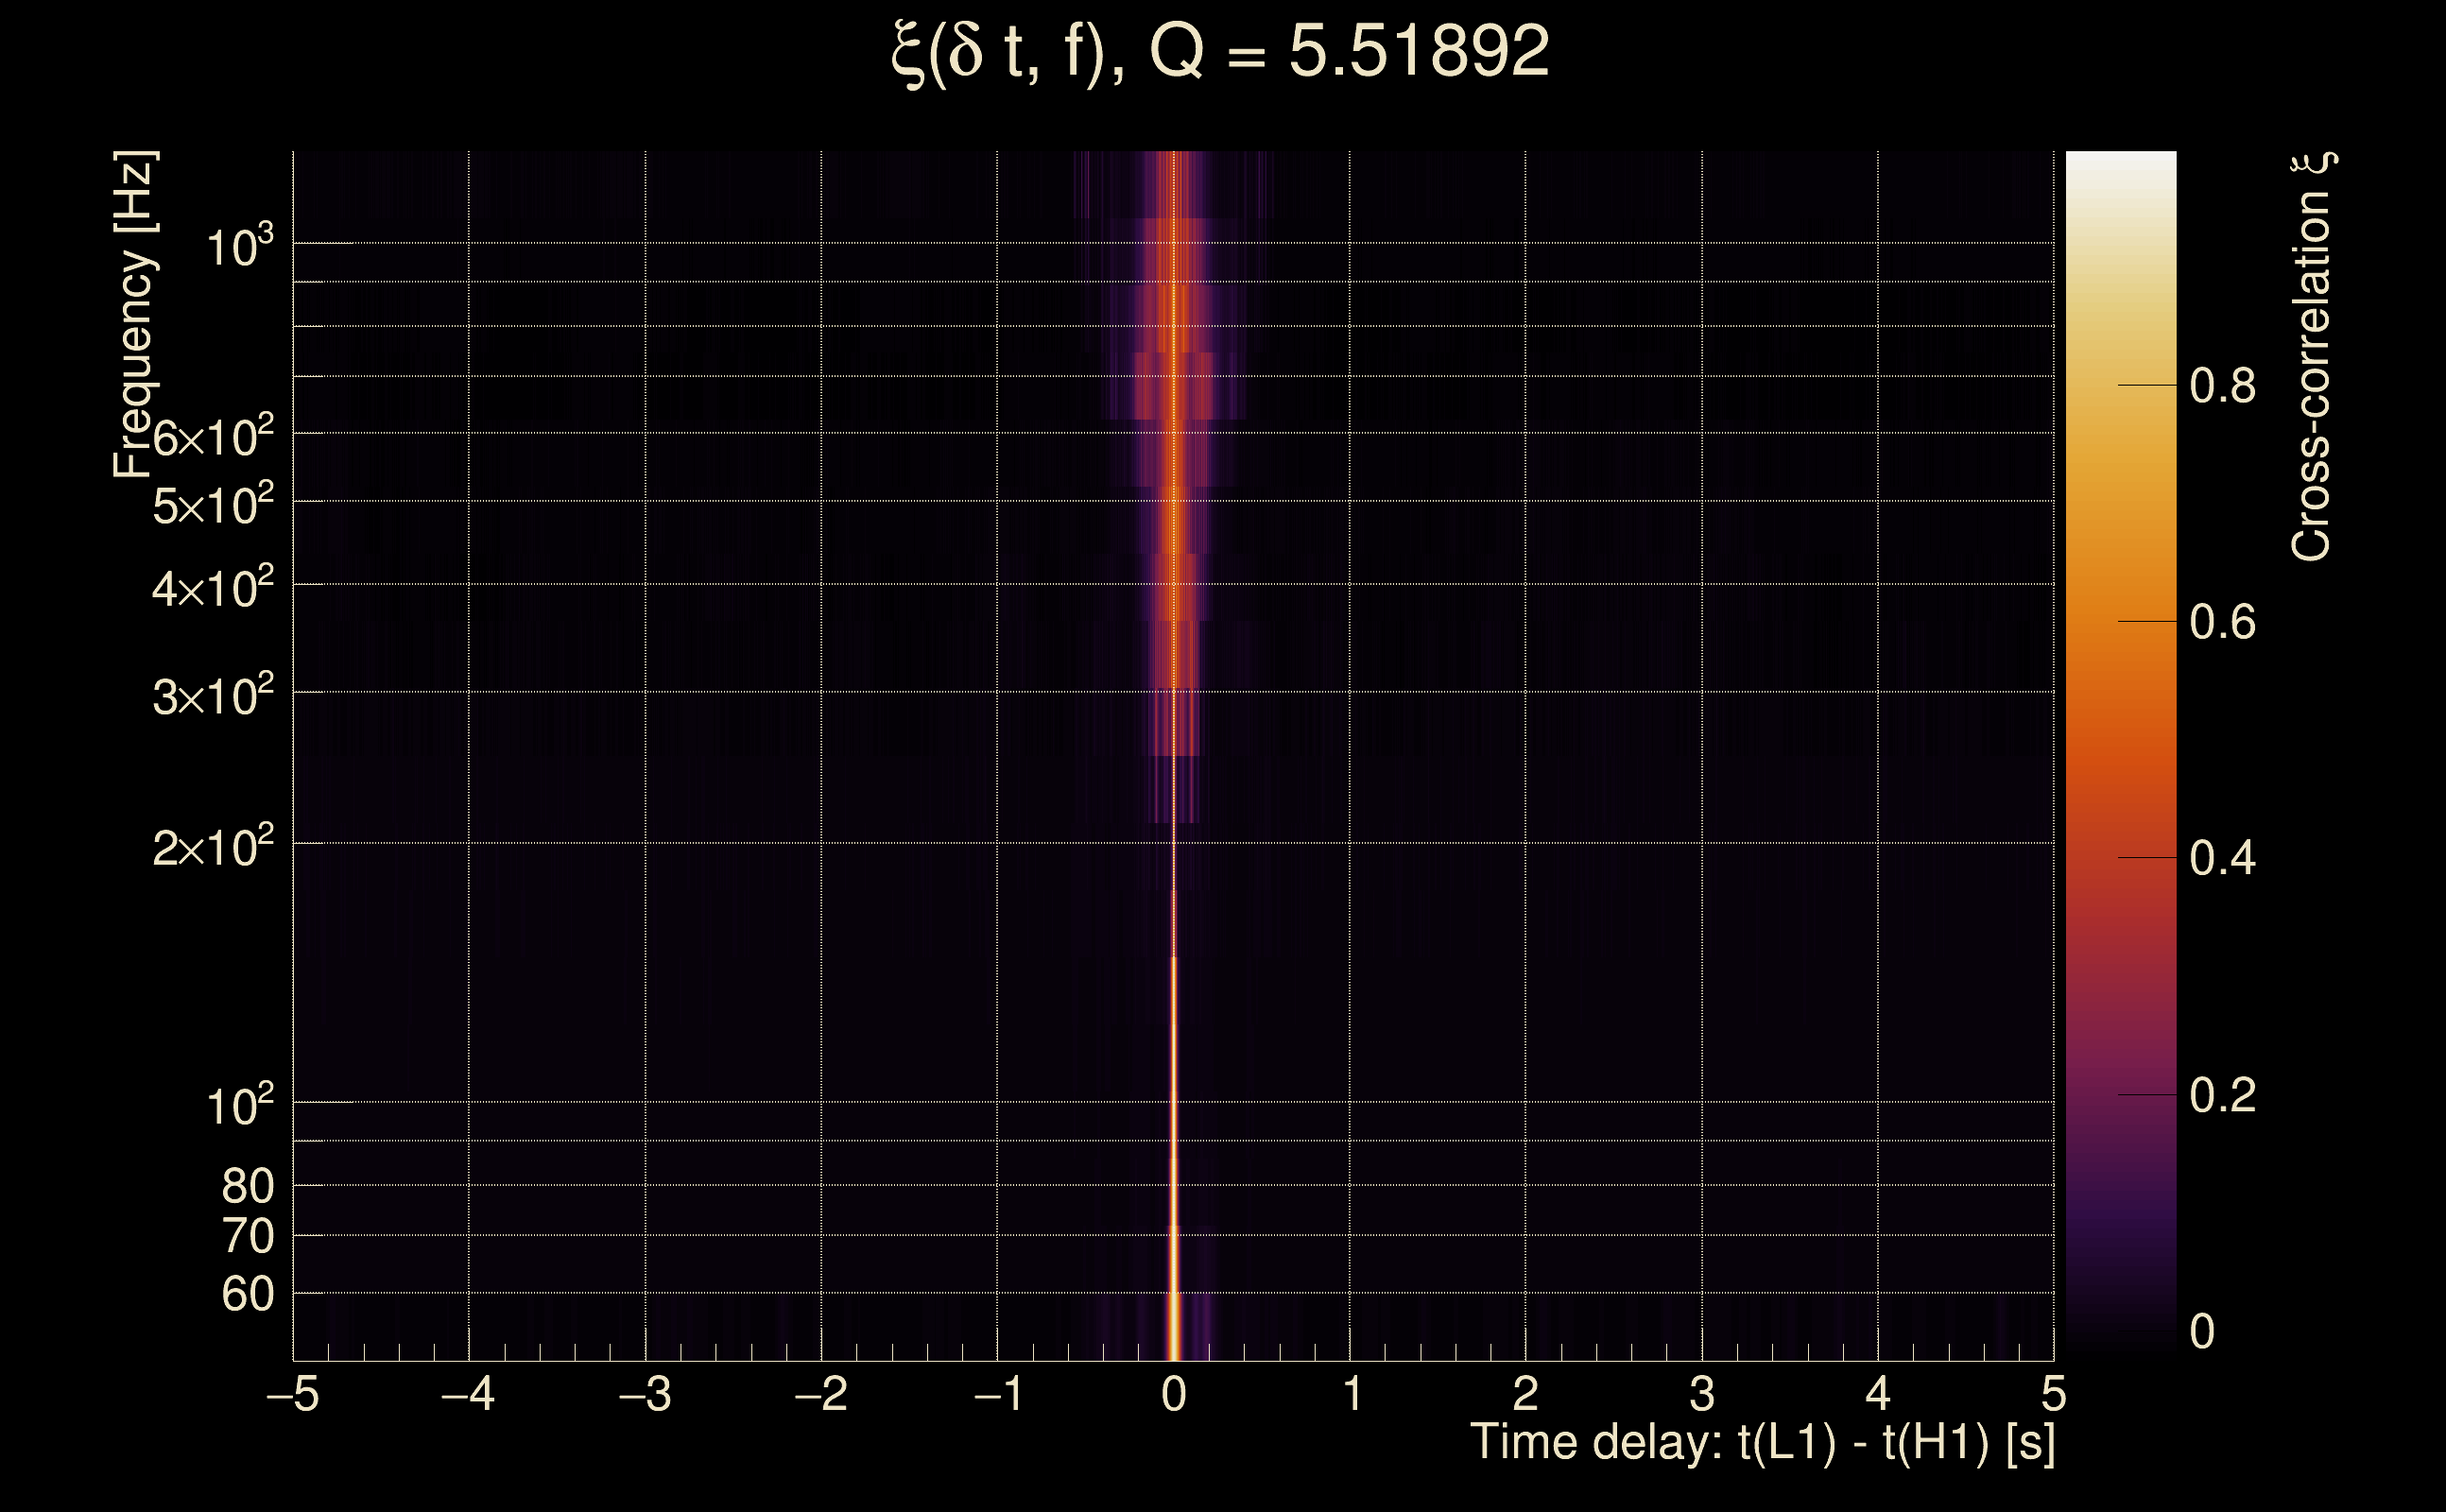
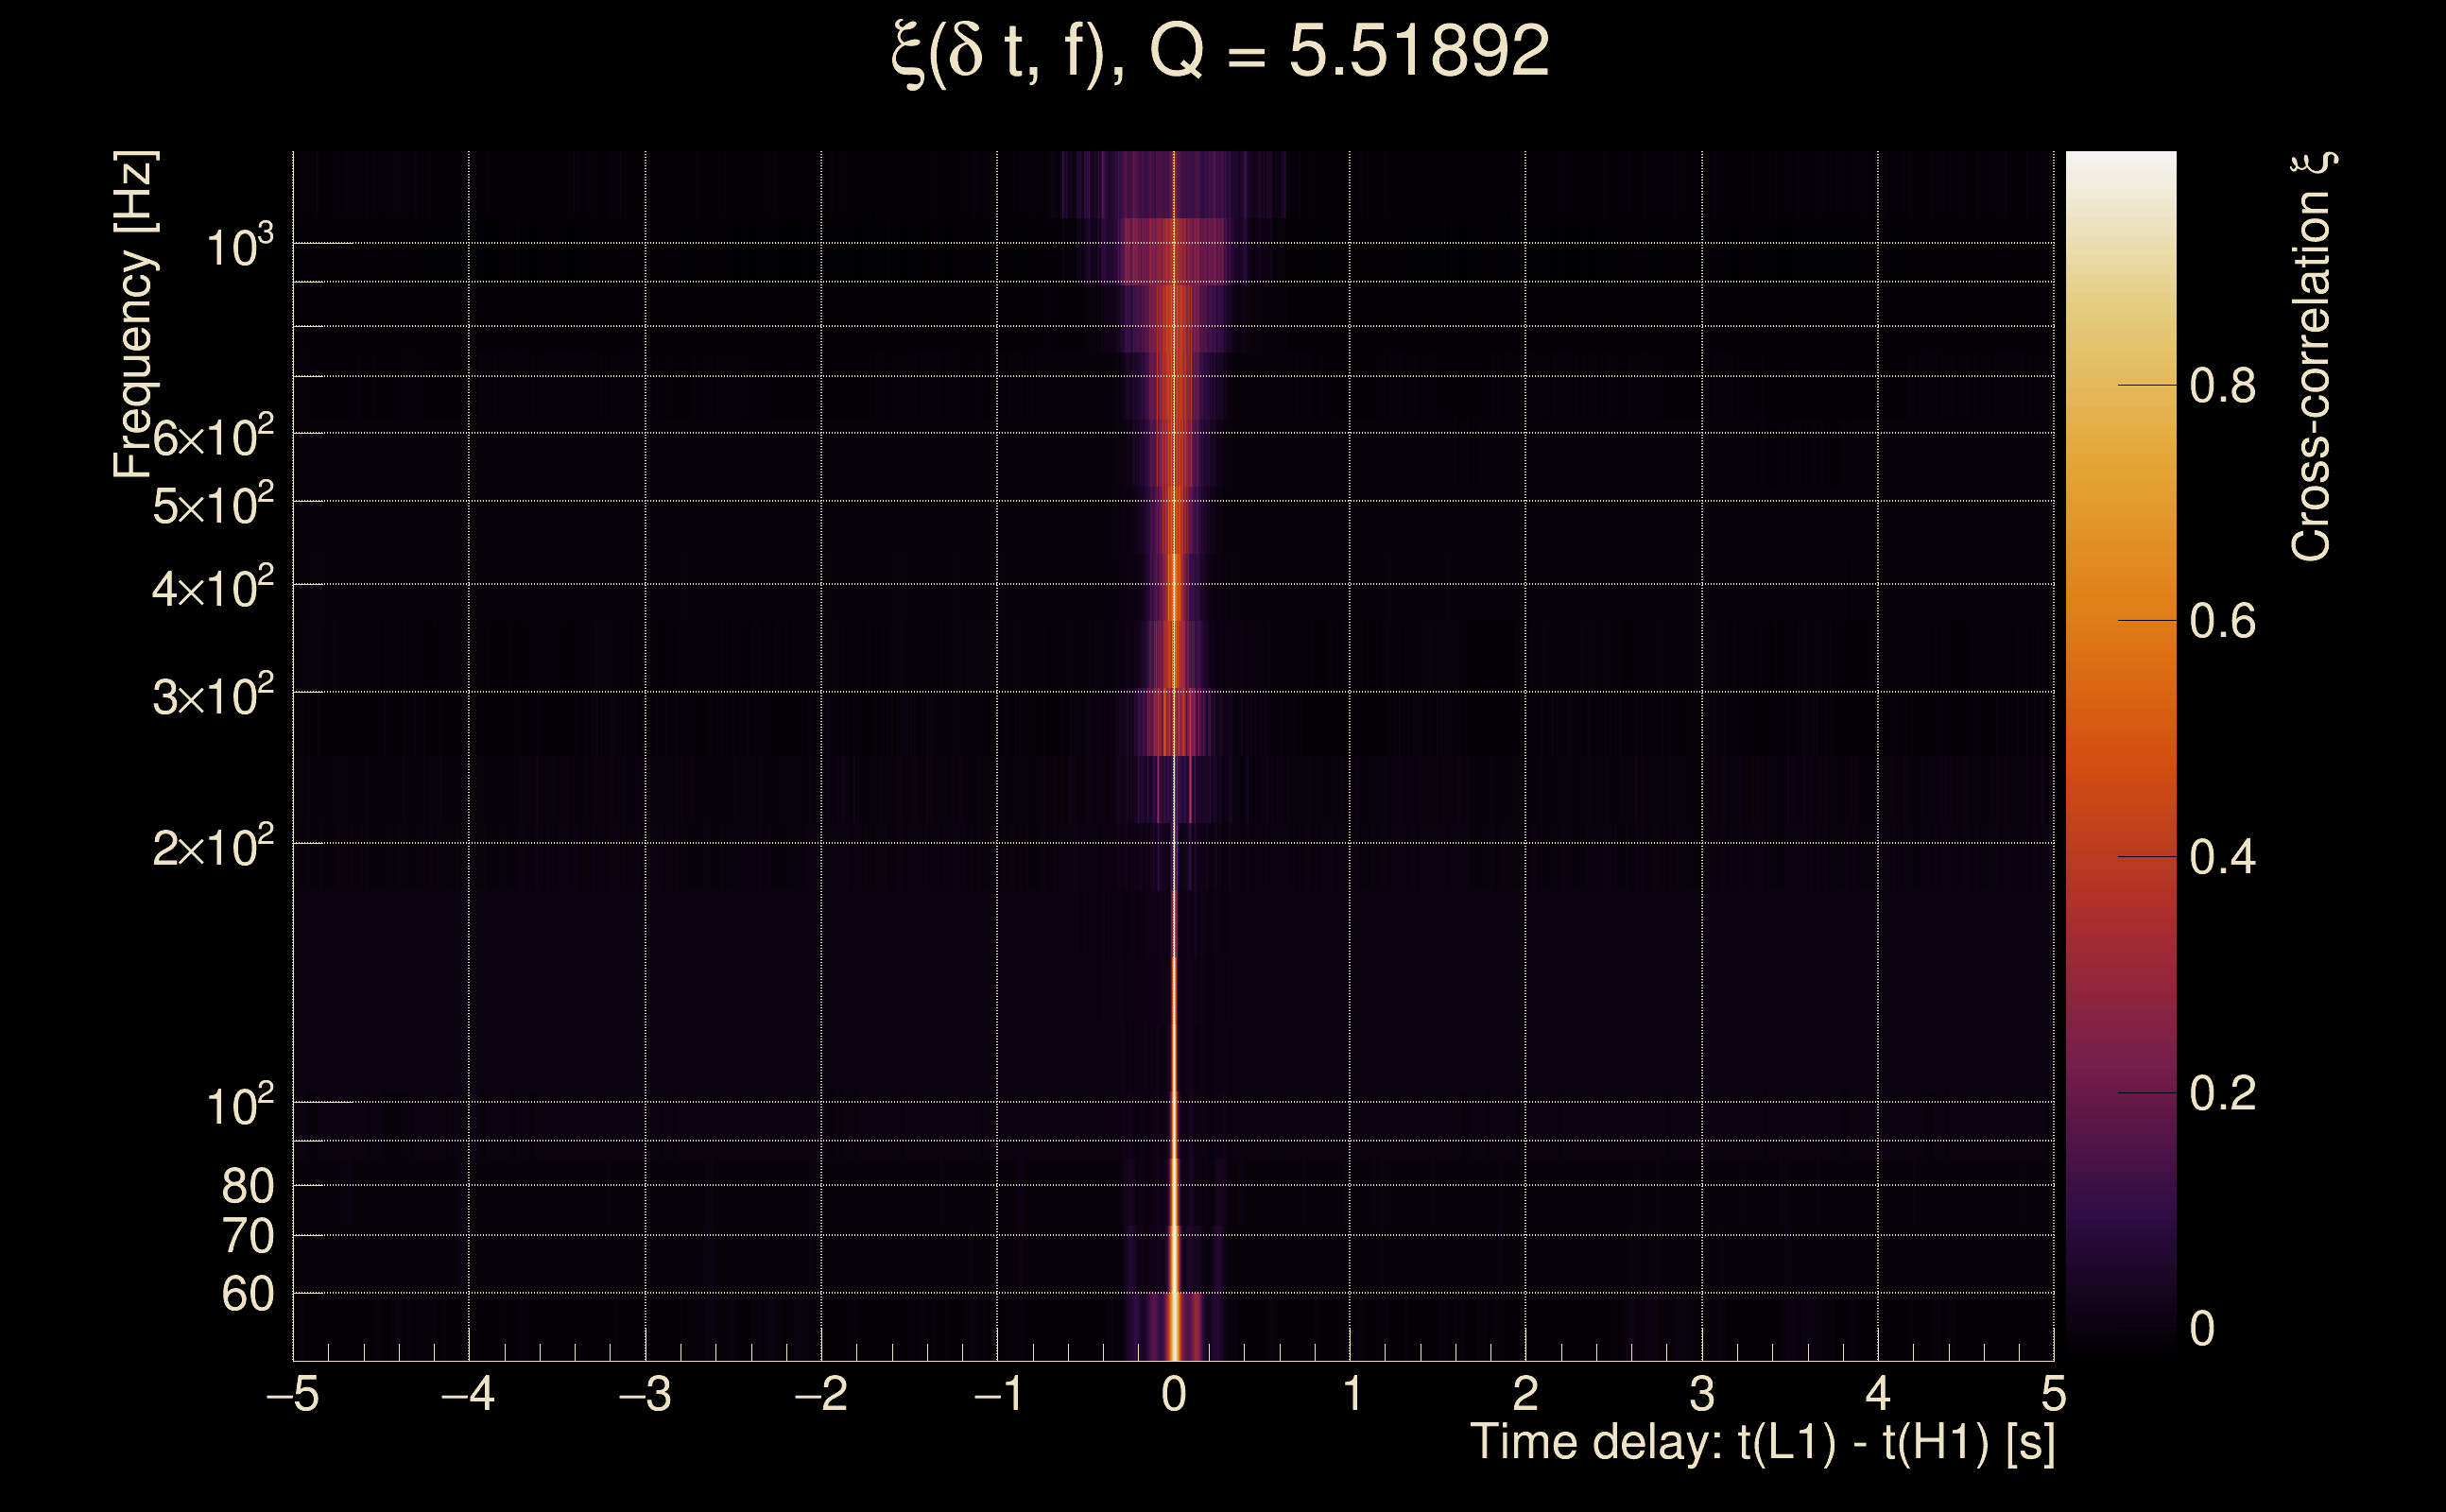
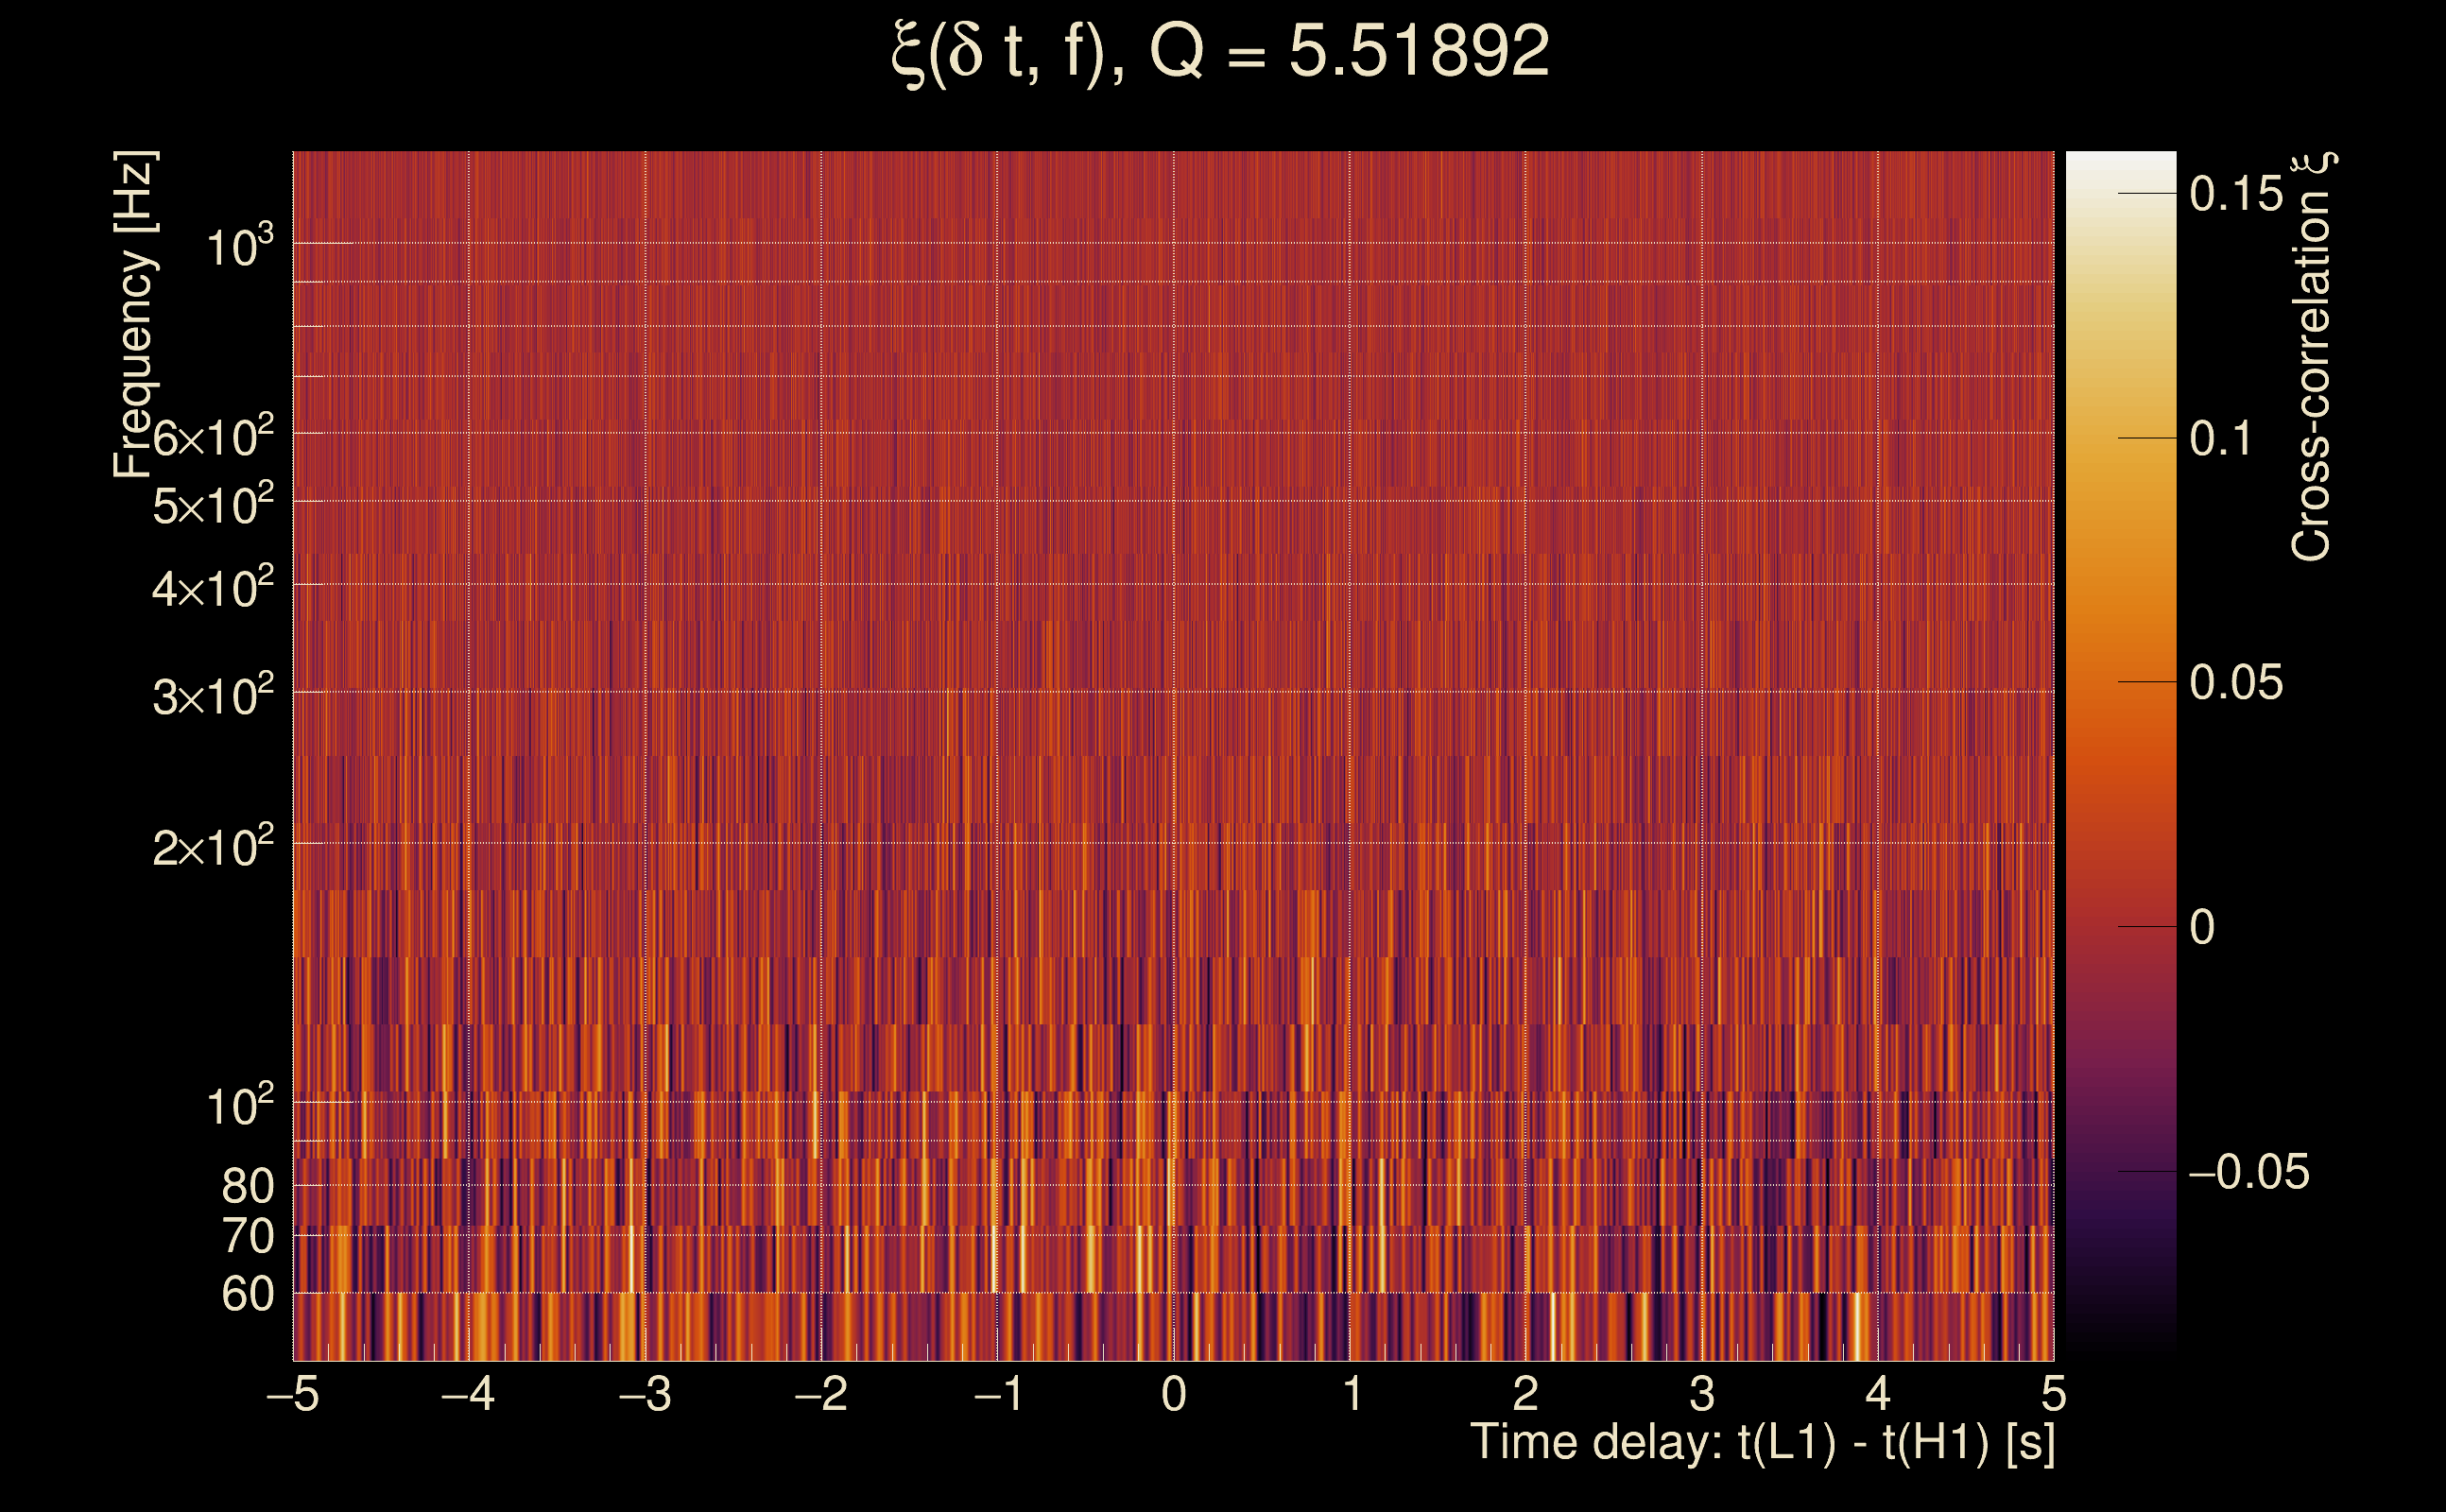
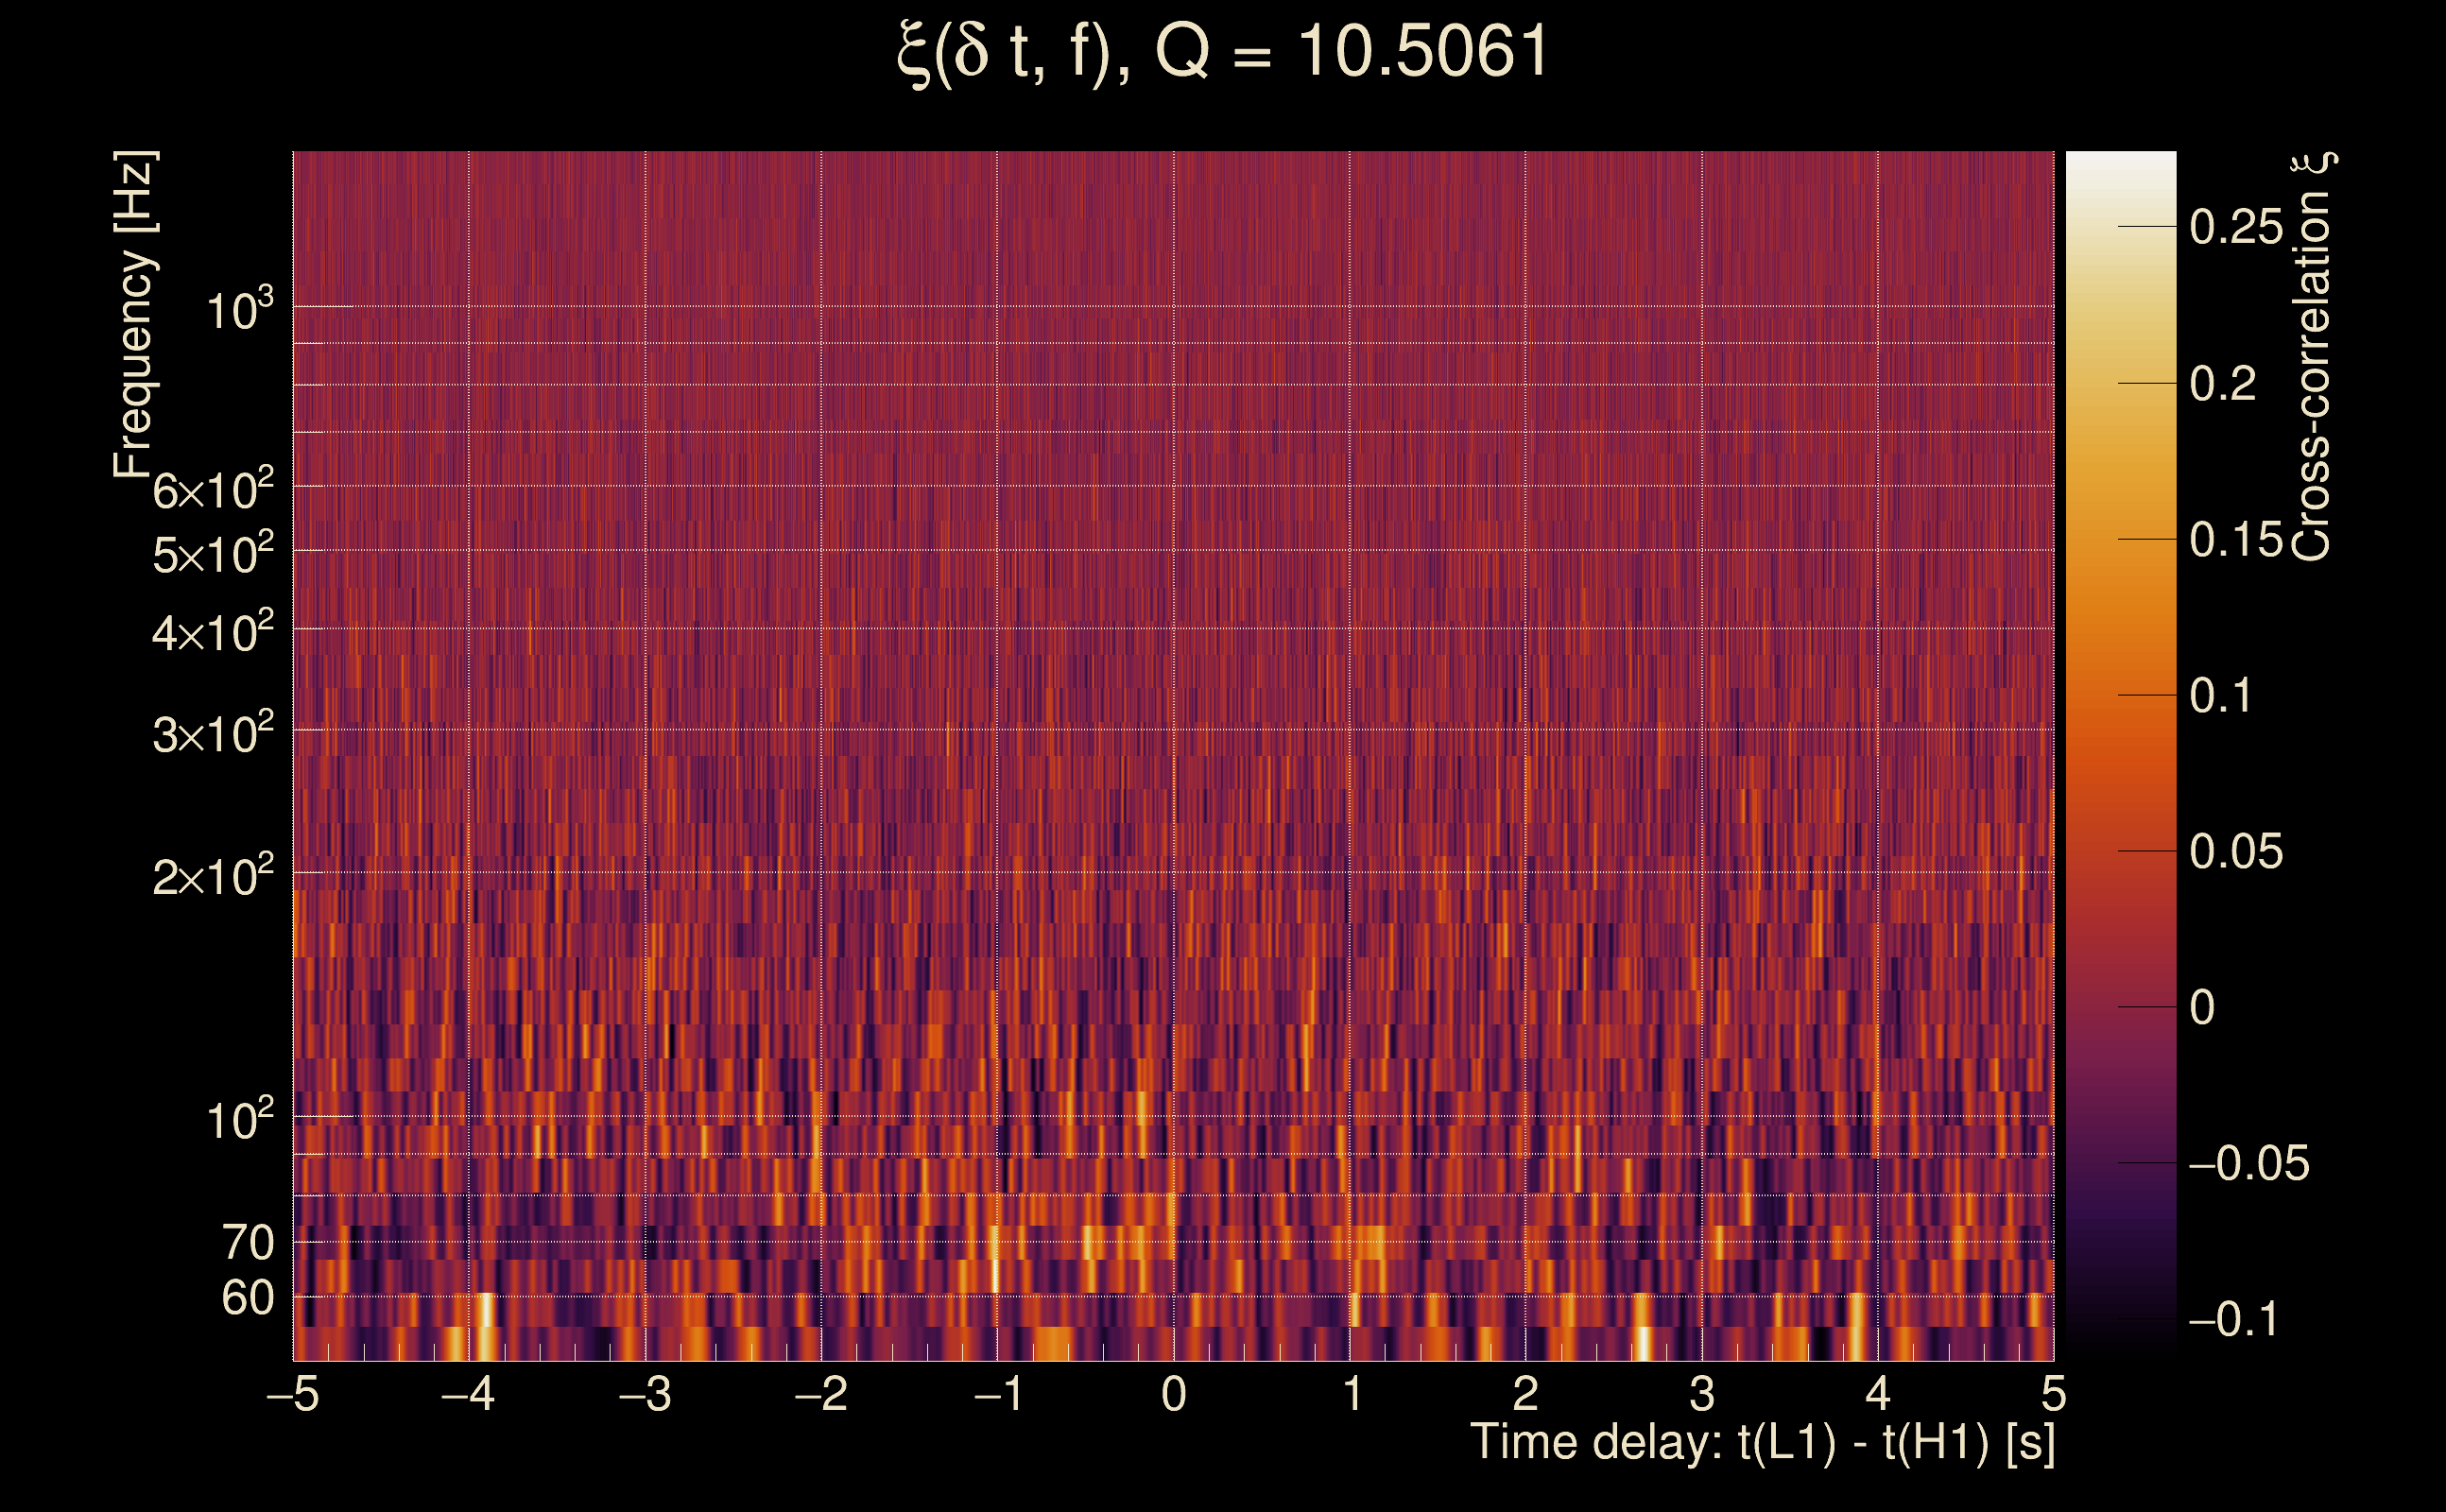
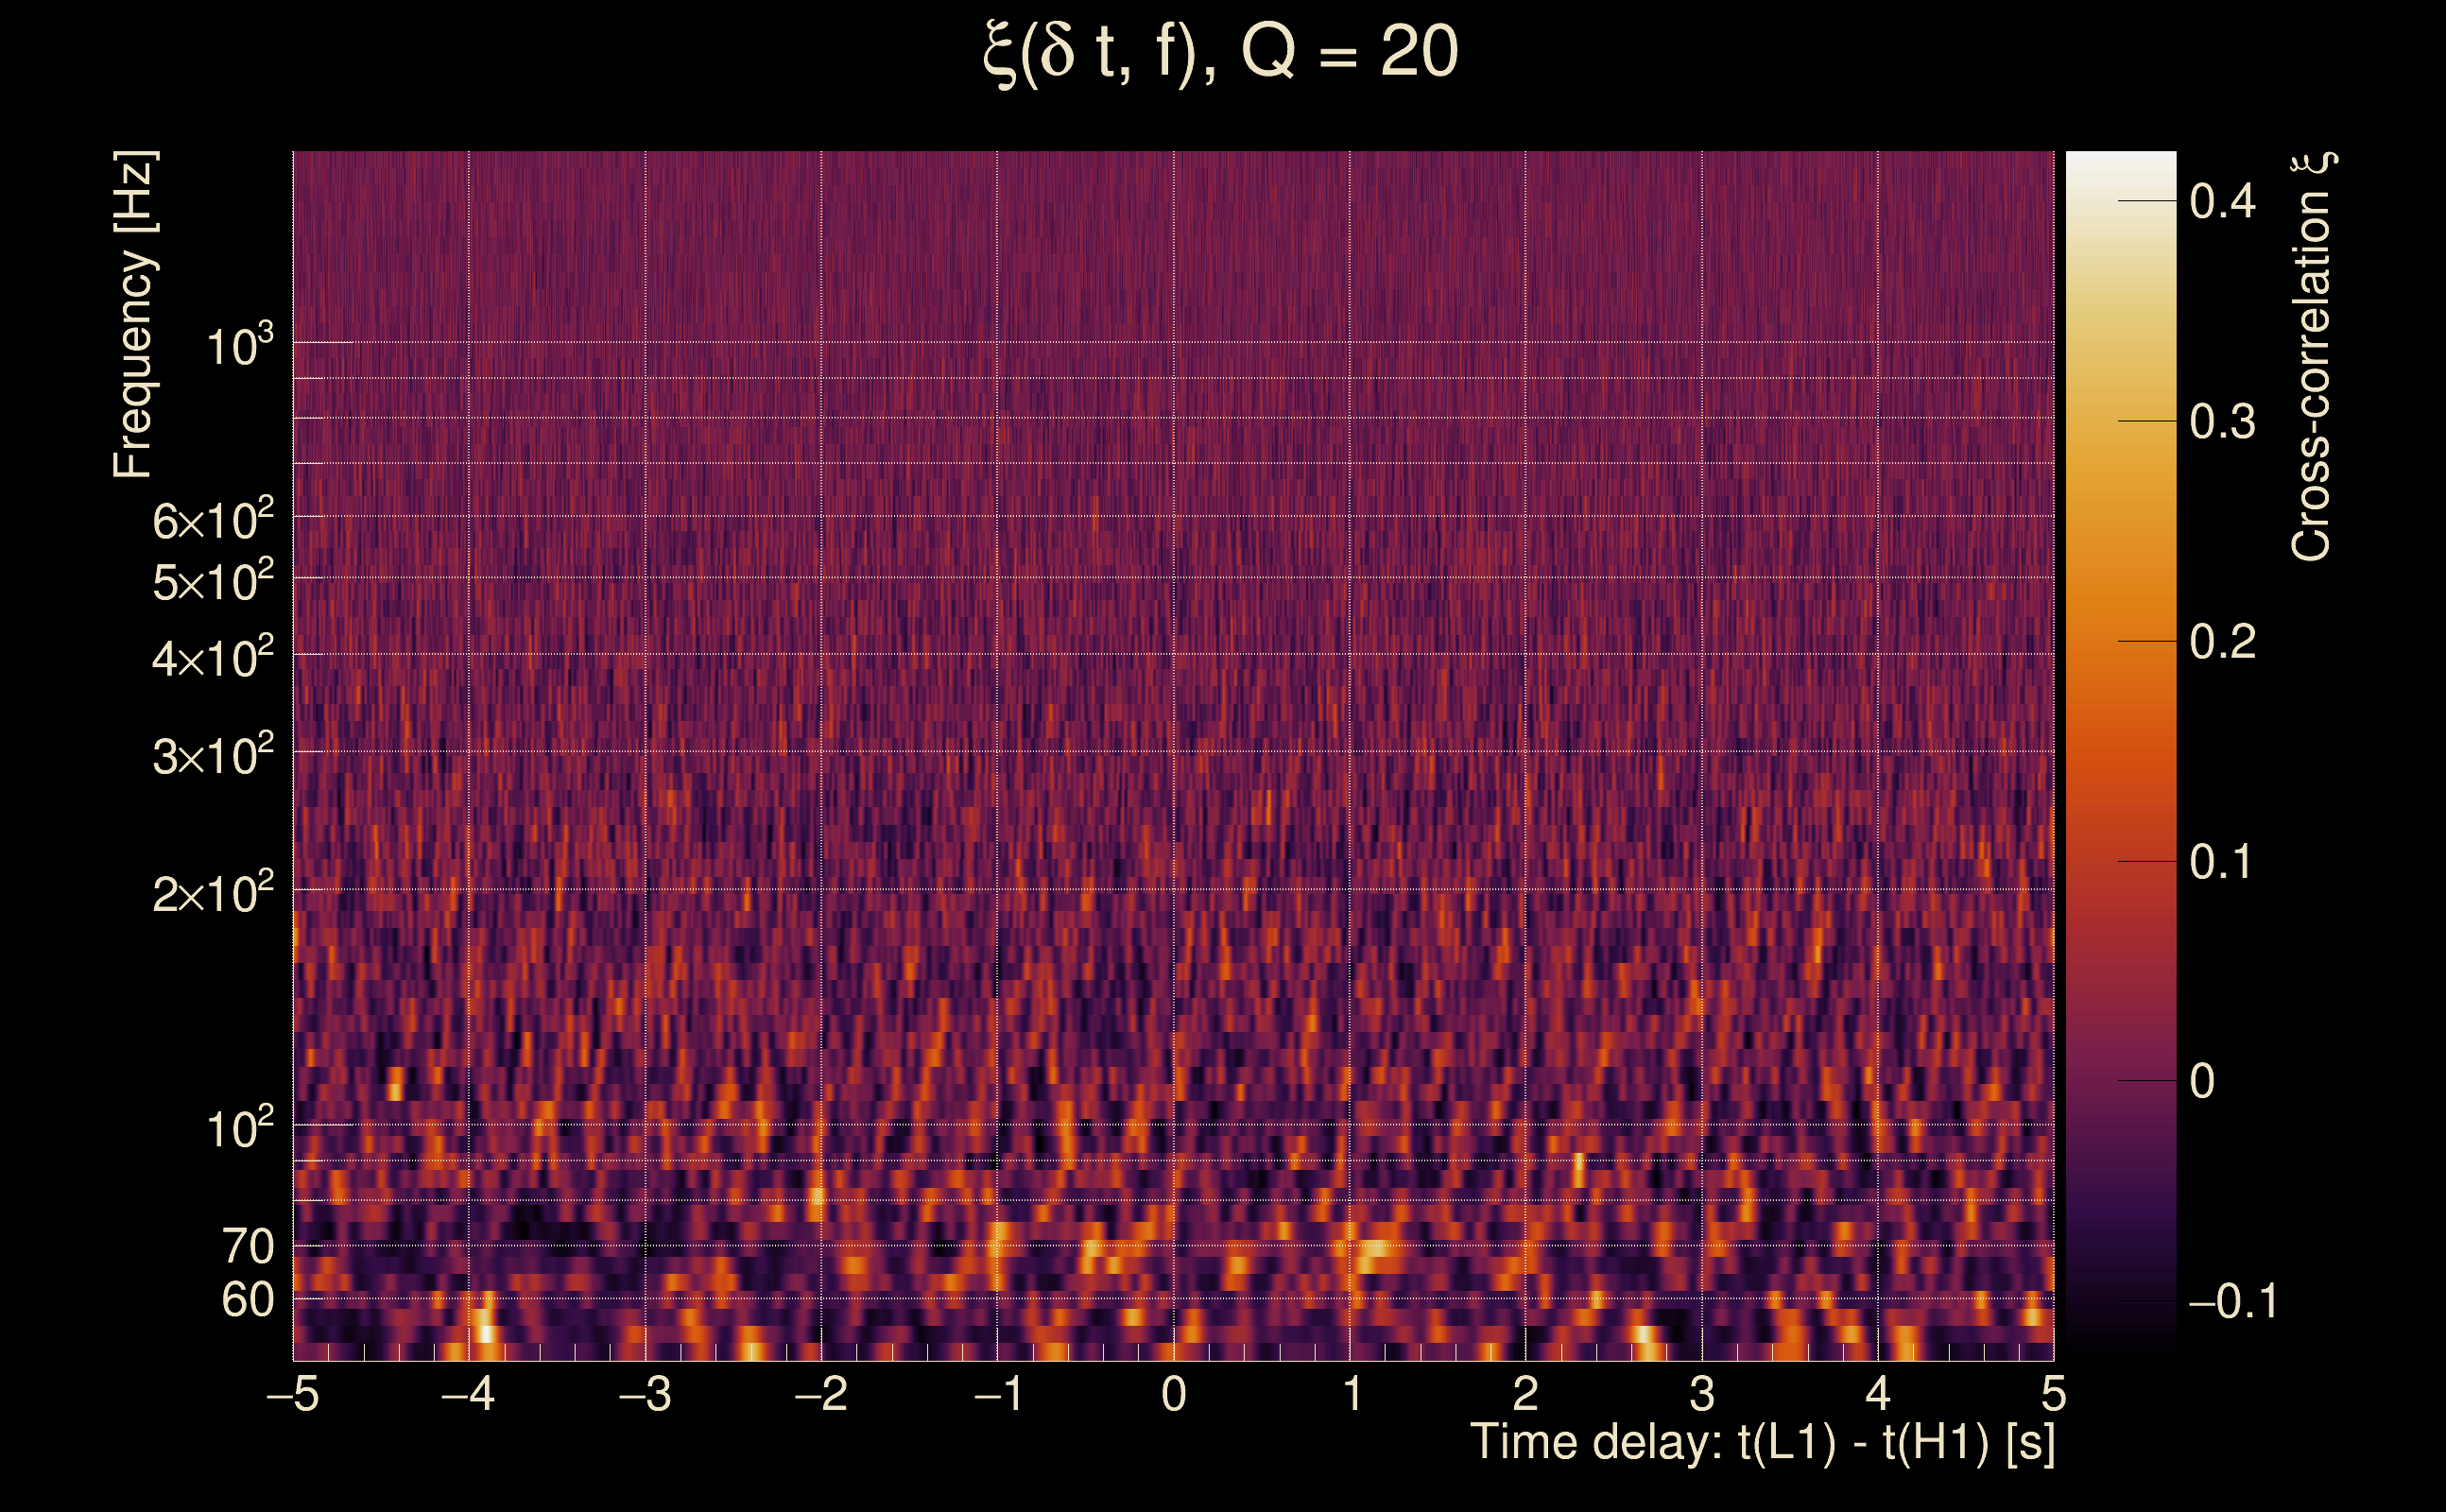
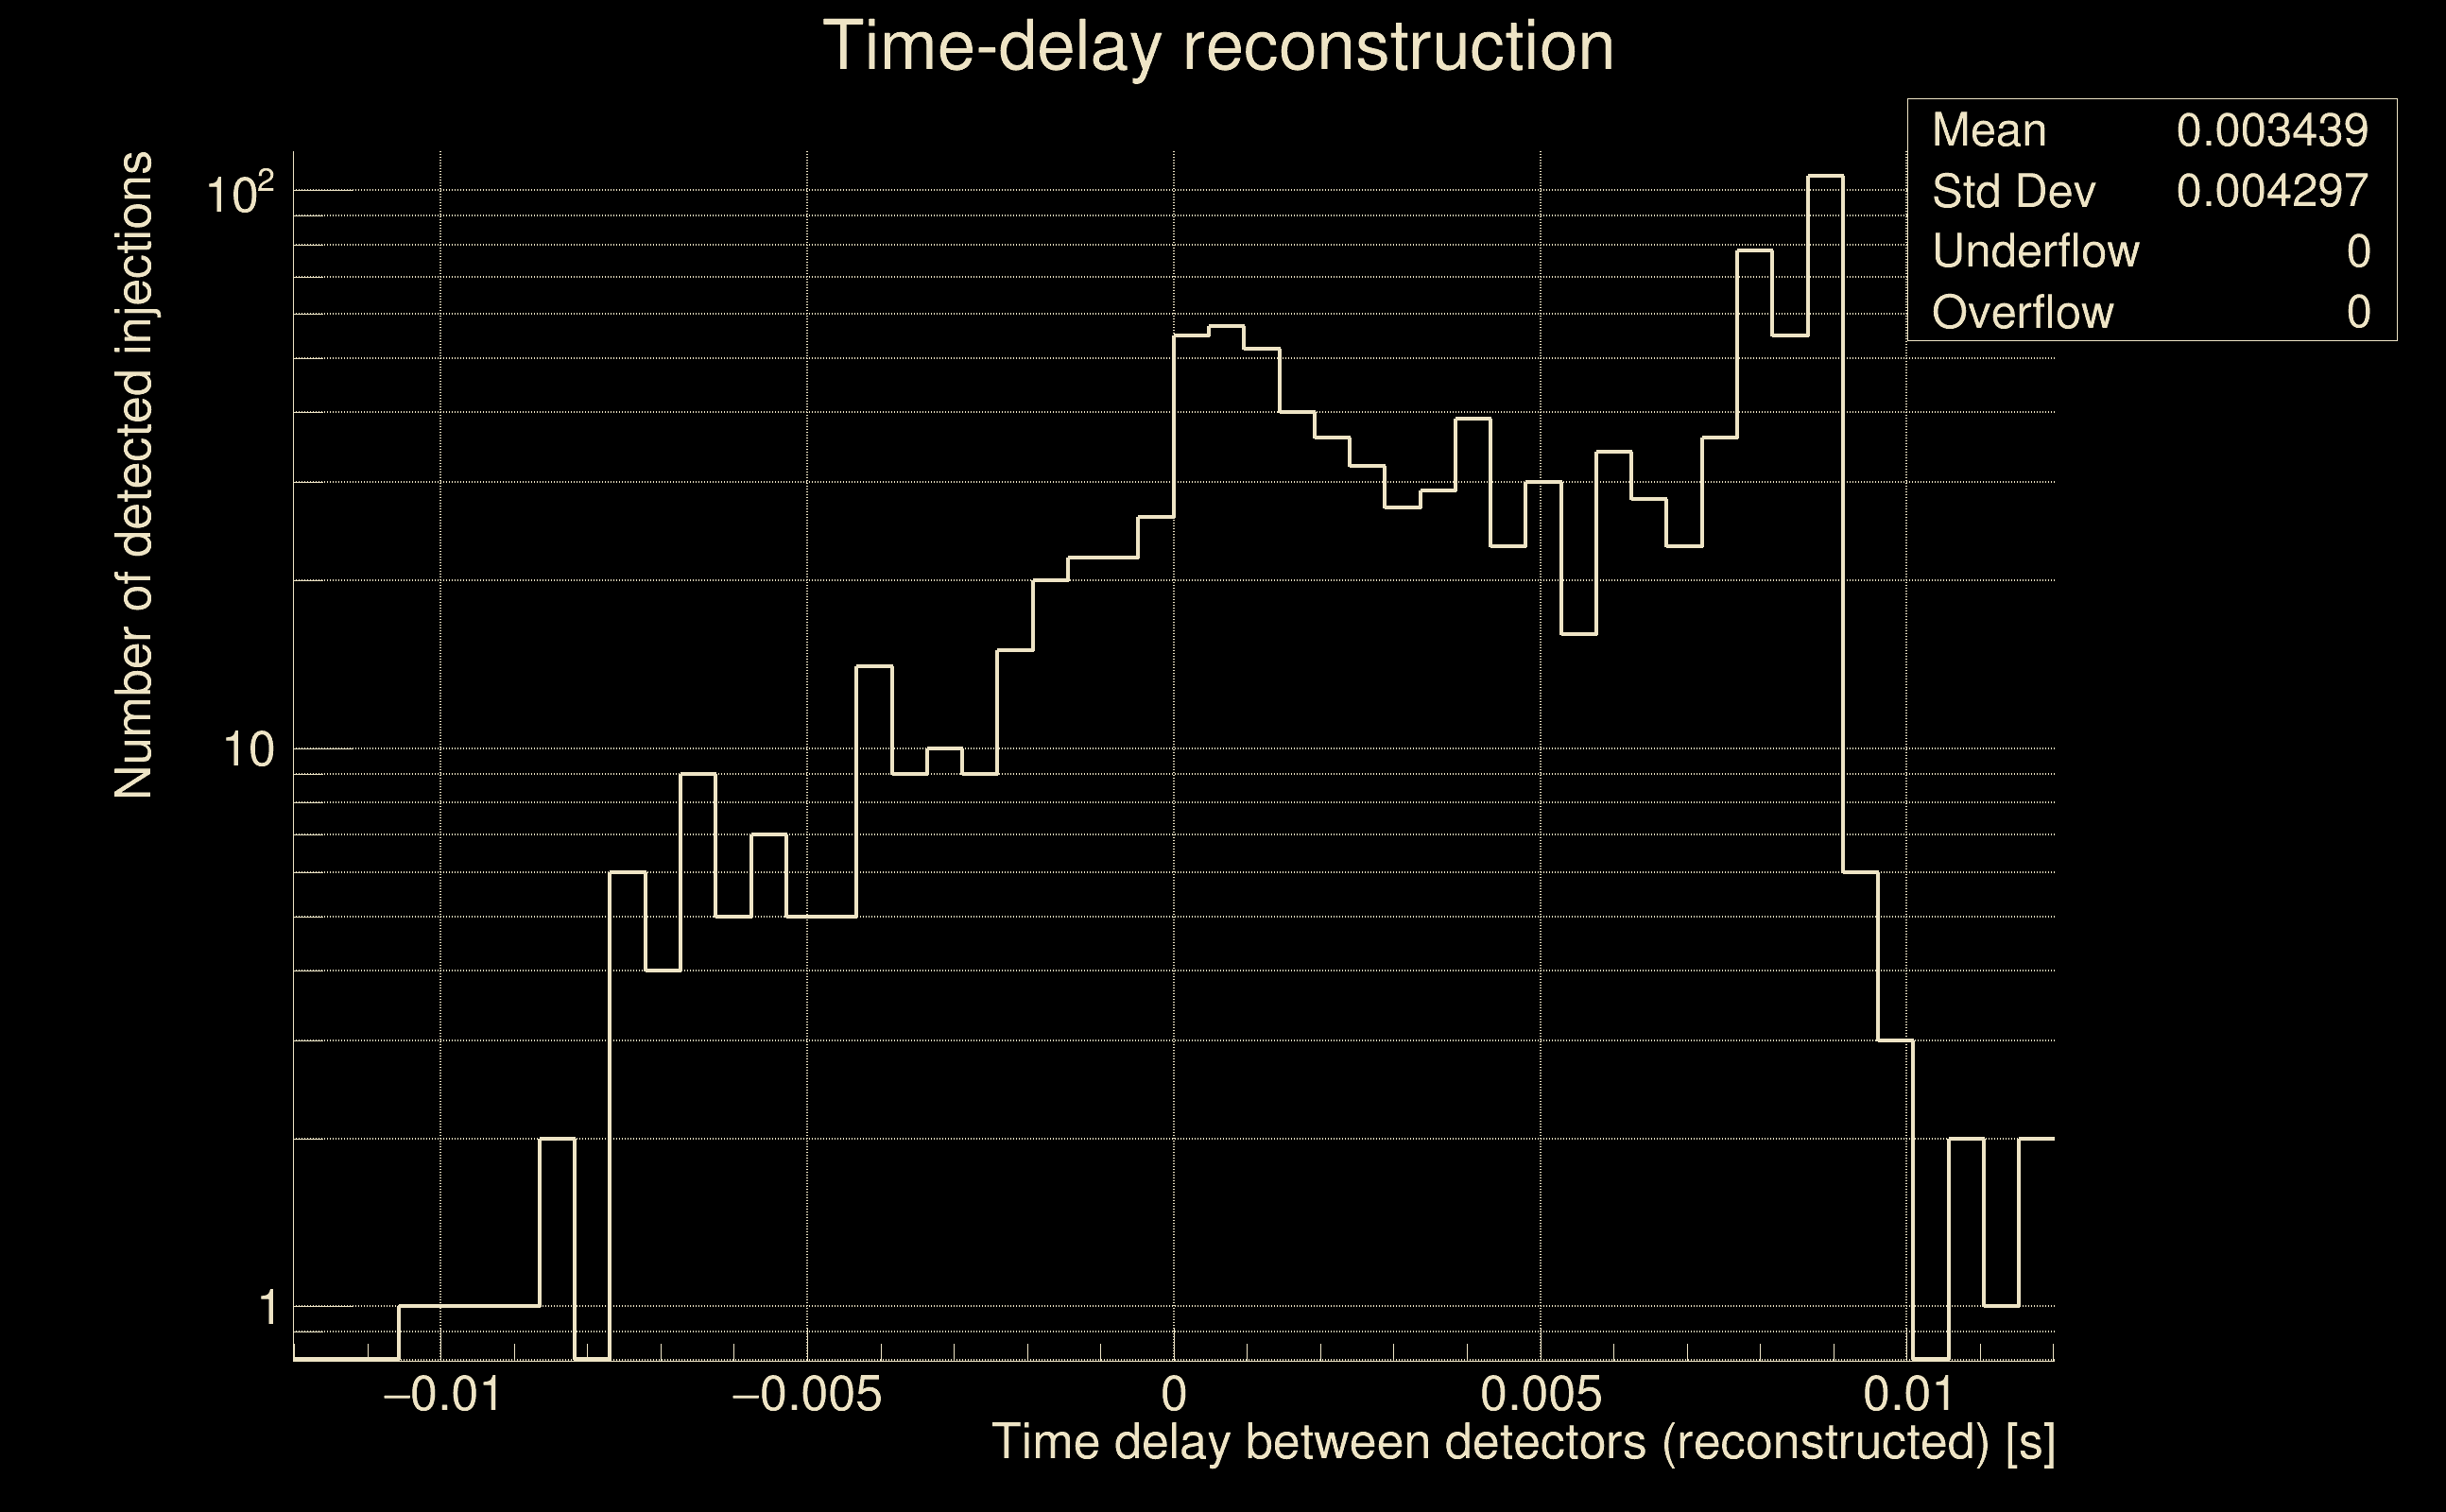
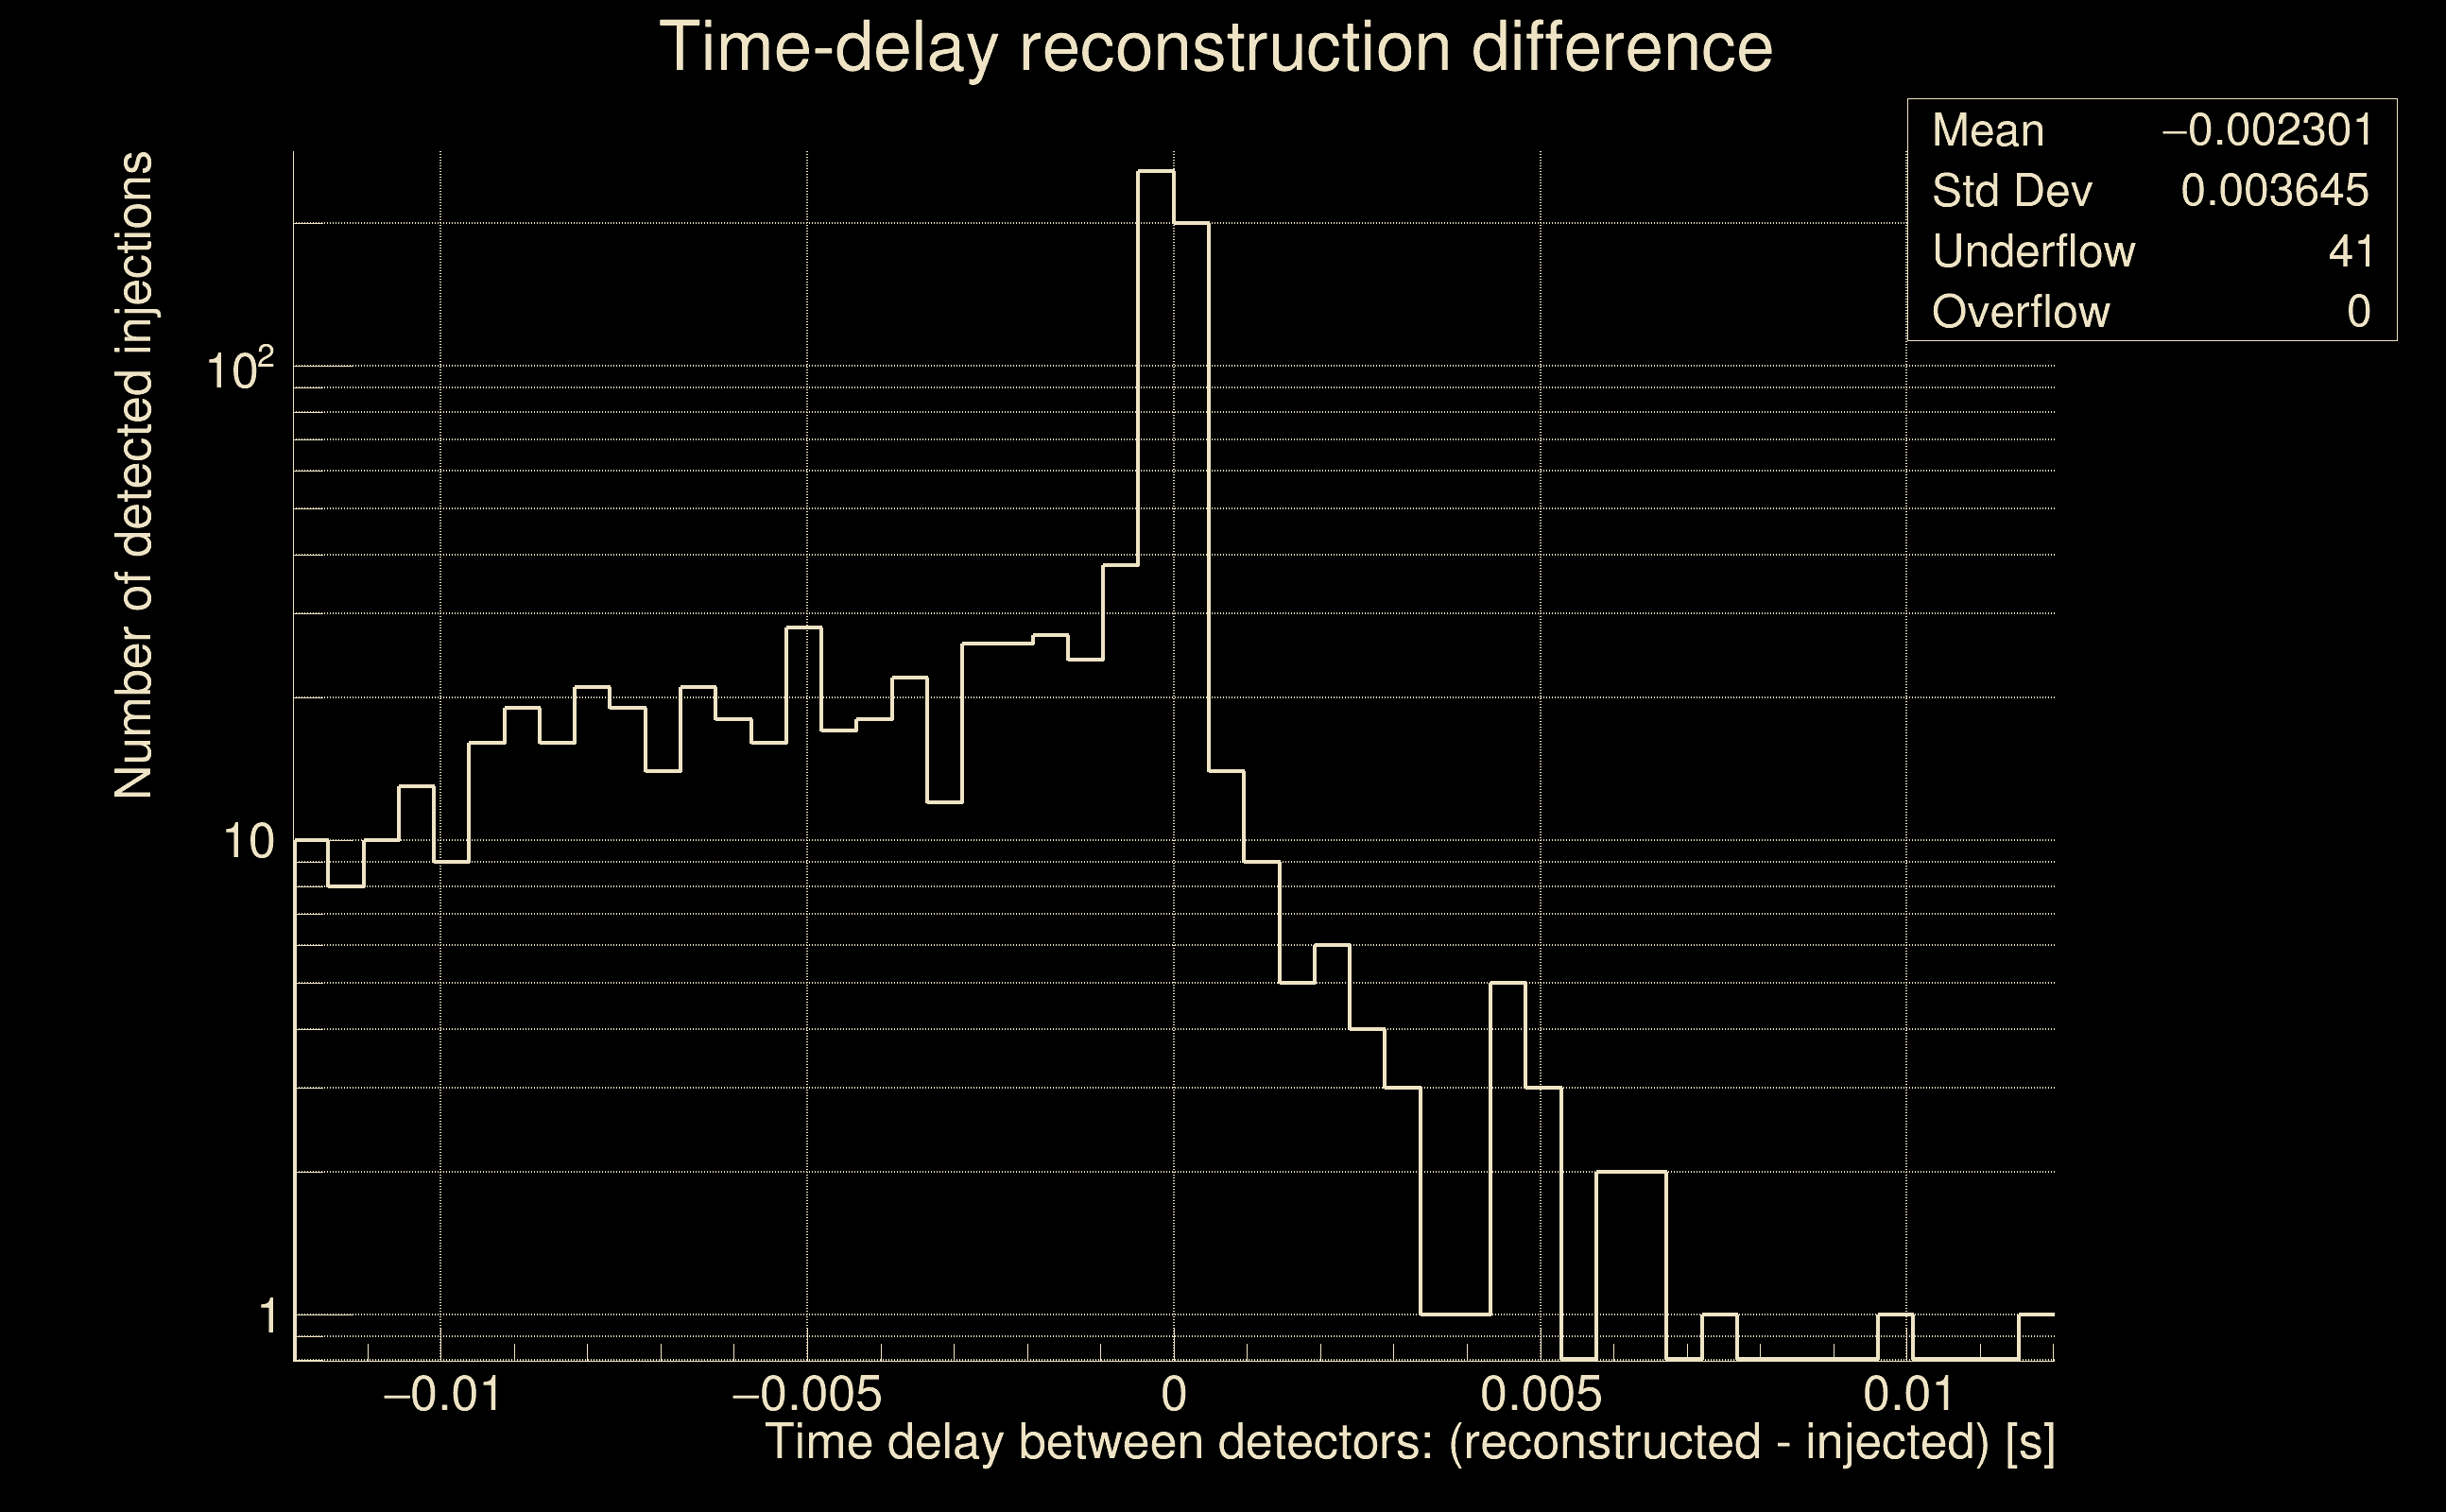
| Time delay between detectors t(L1) - t(H1): | 0.00097583 s (slice index = 108 / 217), δt_gw = 0.00097583 s |
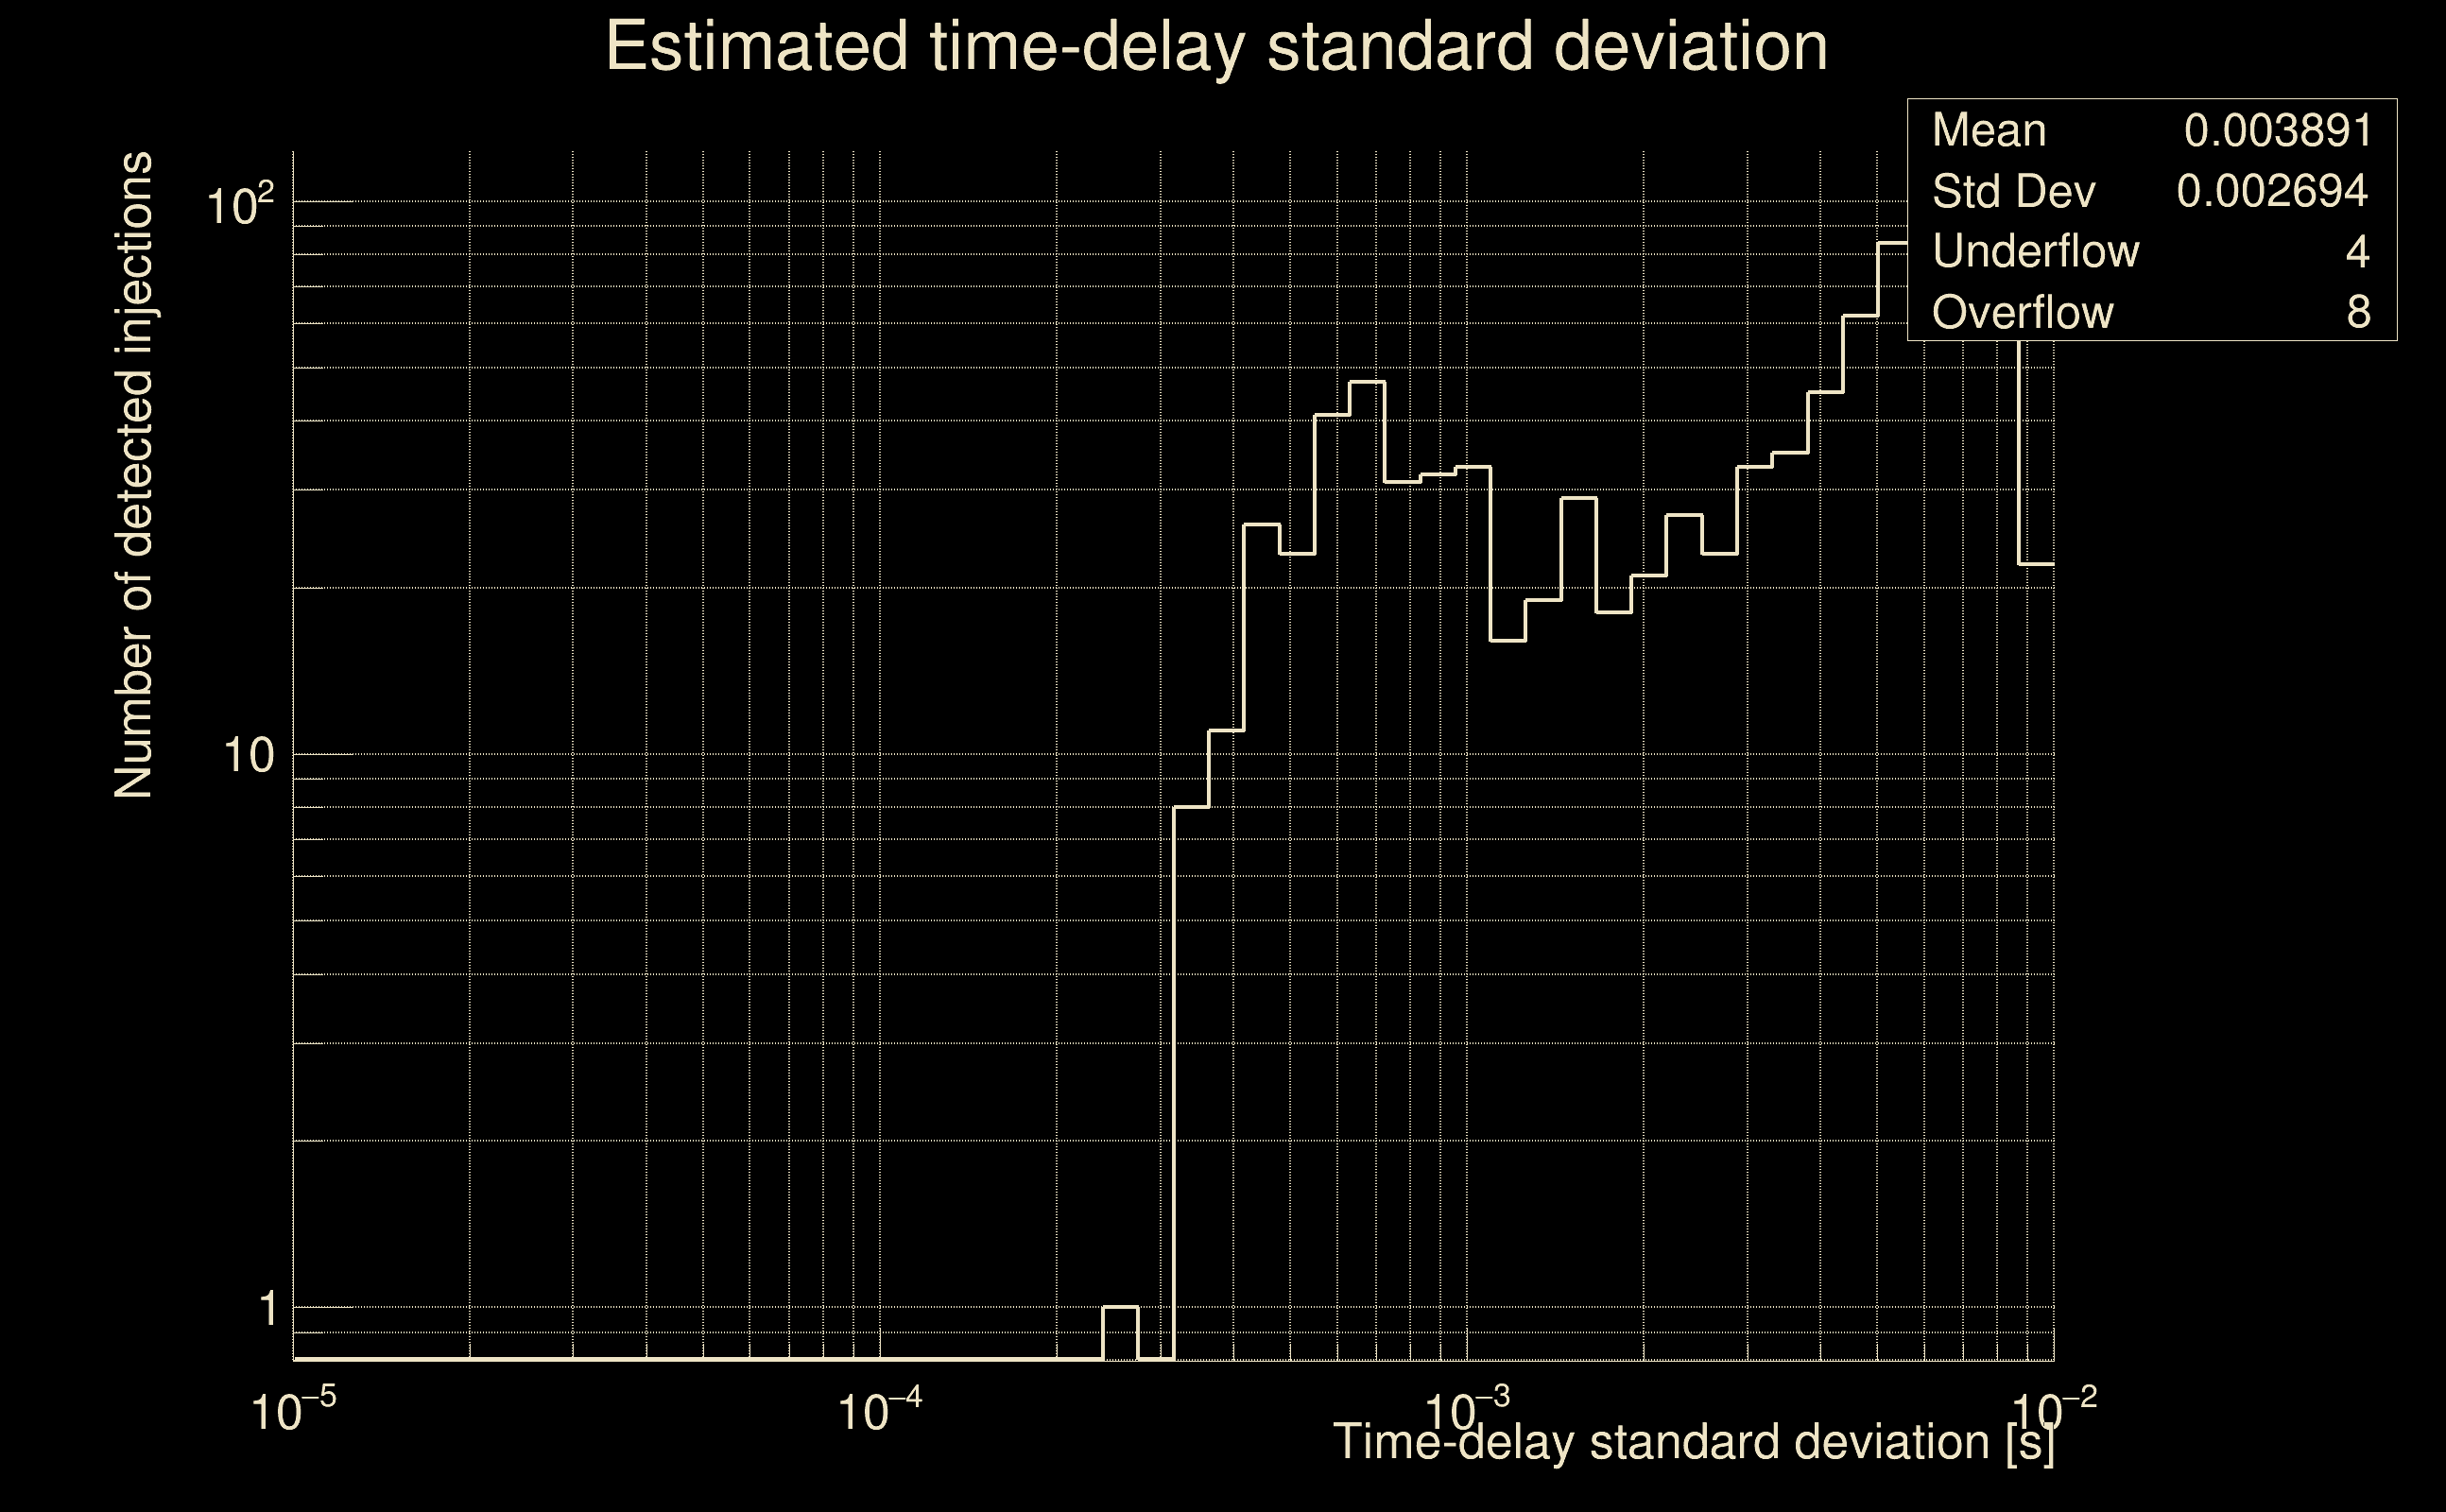
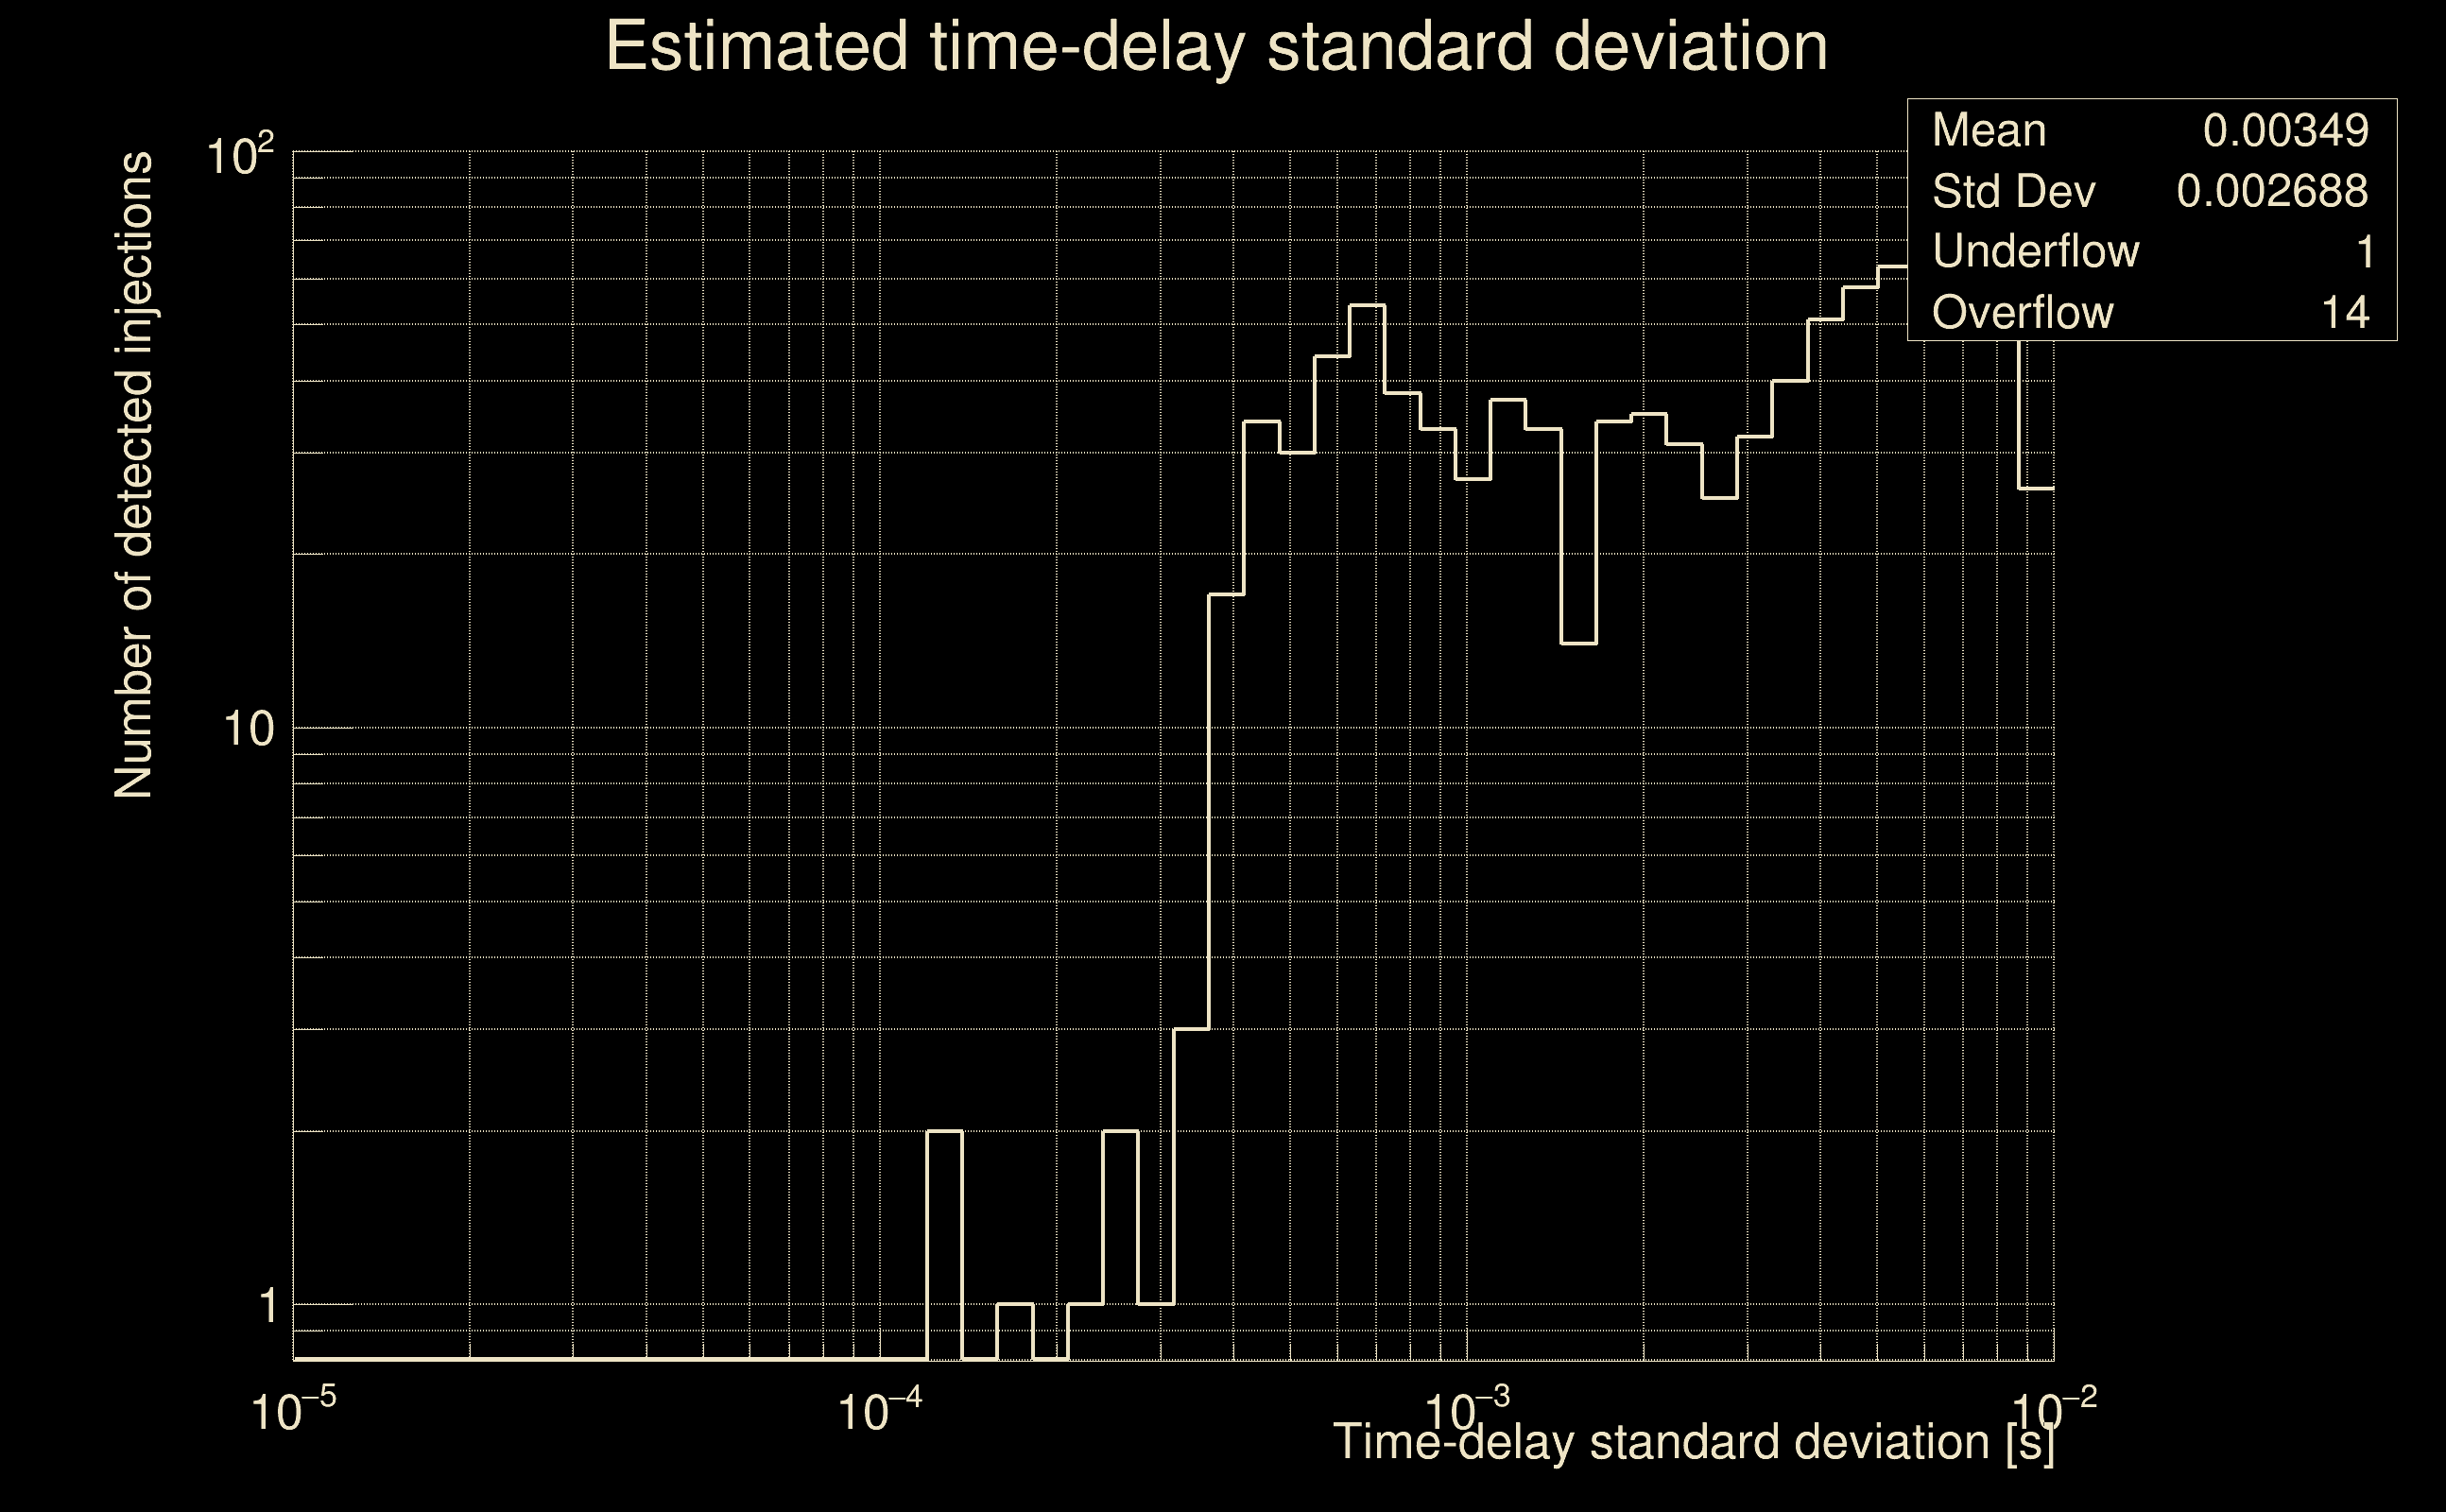
| Time delay standard deviation: | 0.0238503 s |
| [targeted mode] Time delay probability: | 0.955235 (0.0561341 sigmas), δt_target = 1.72247e+45 s |
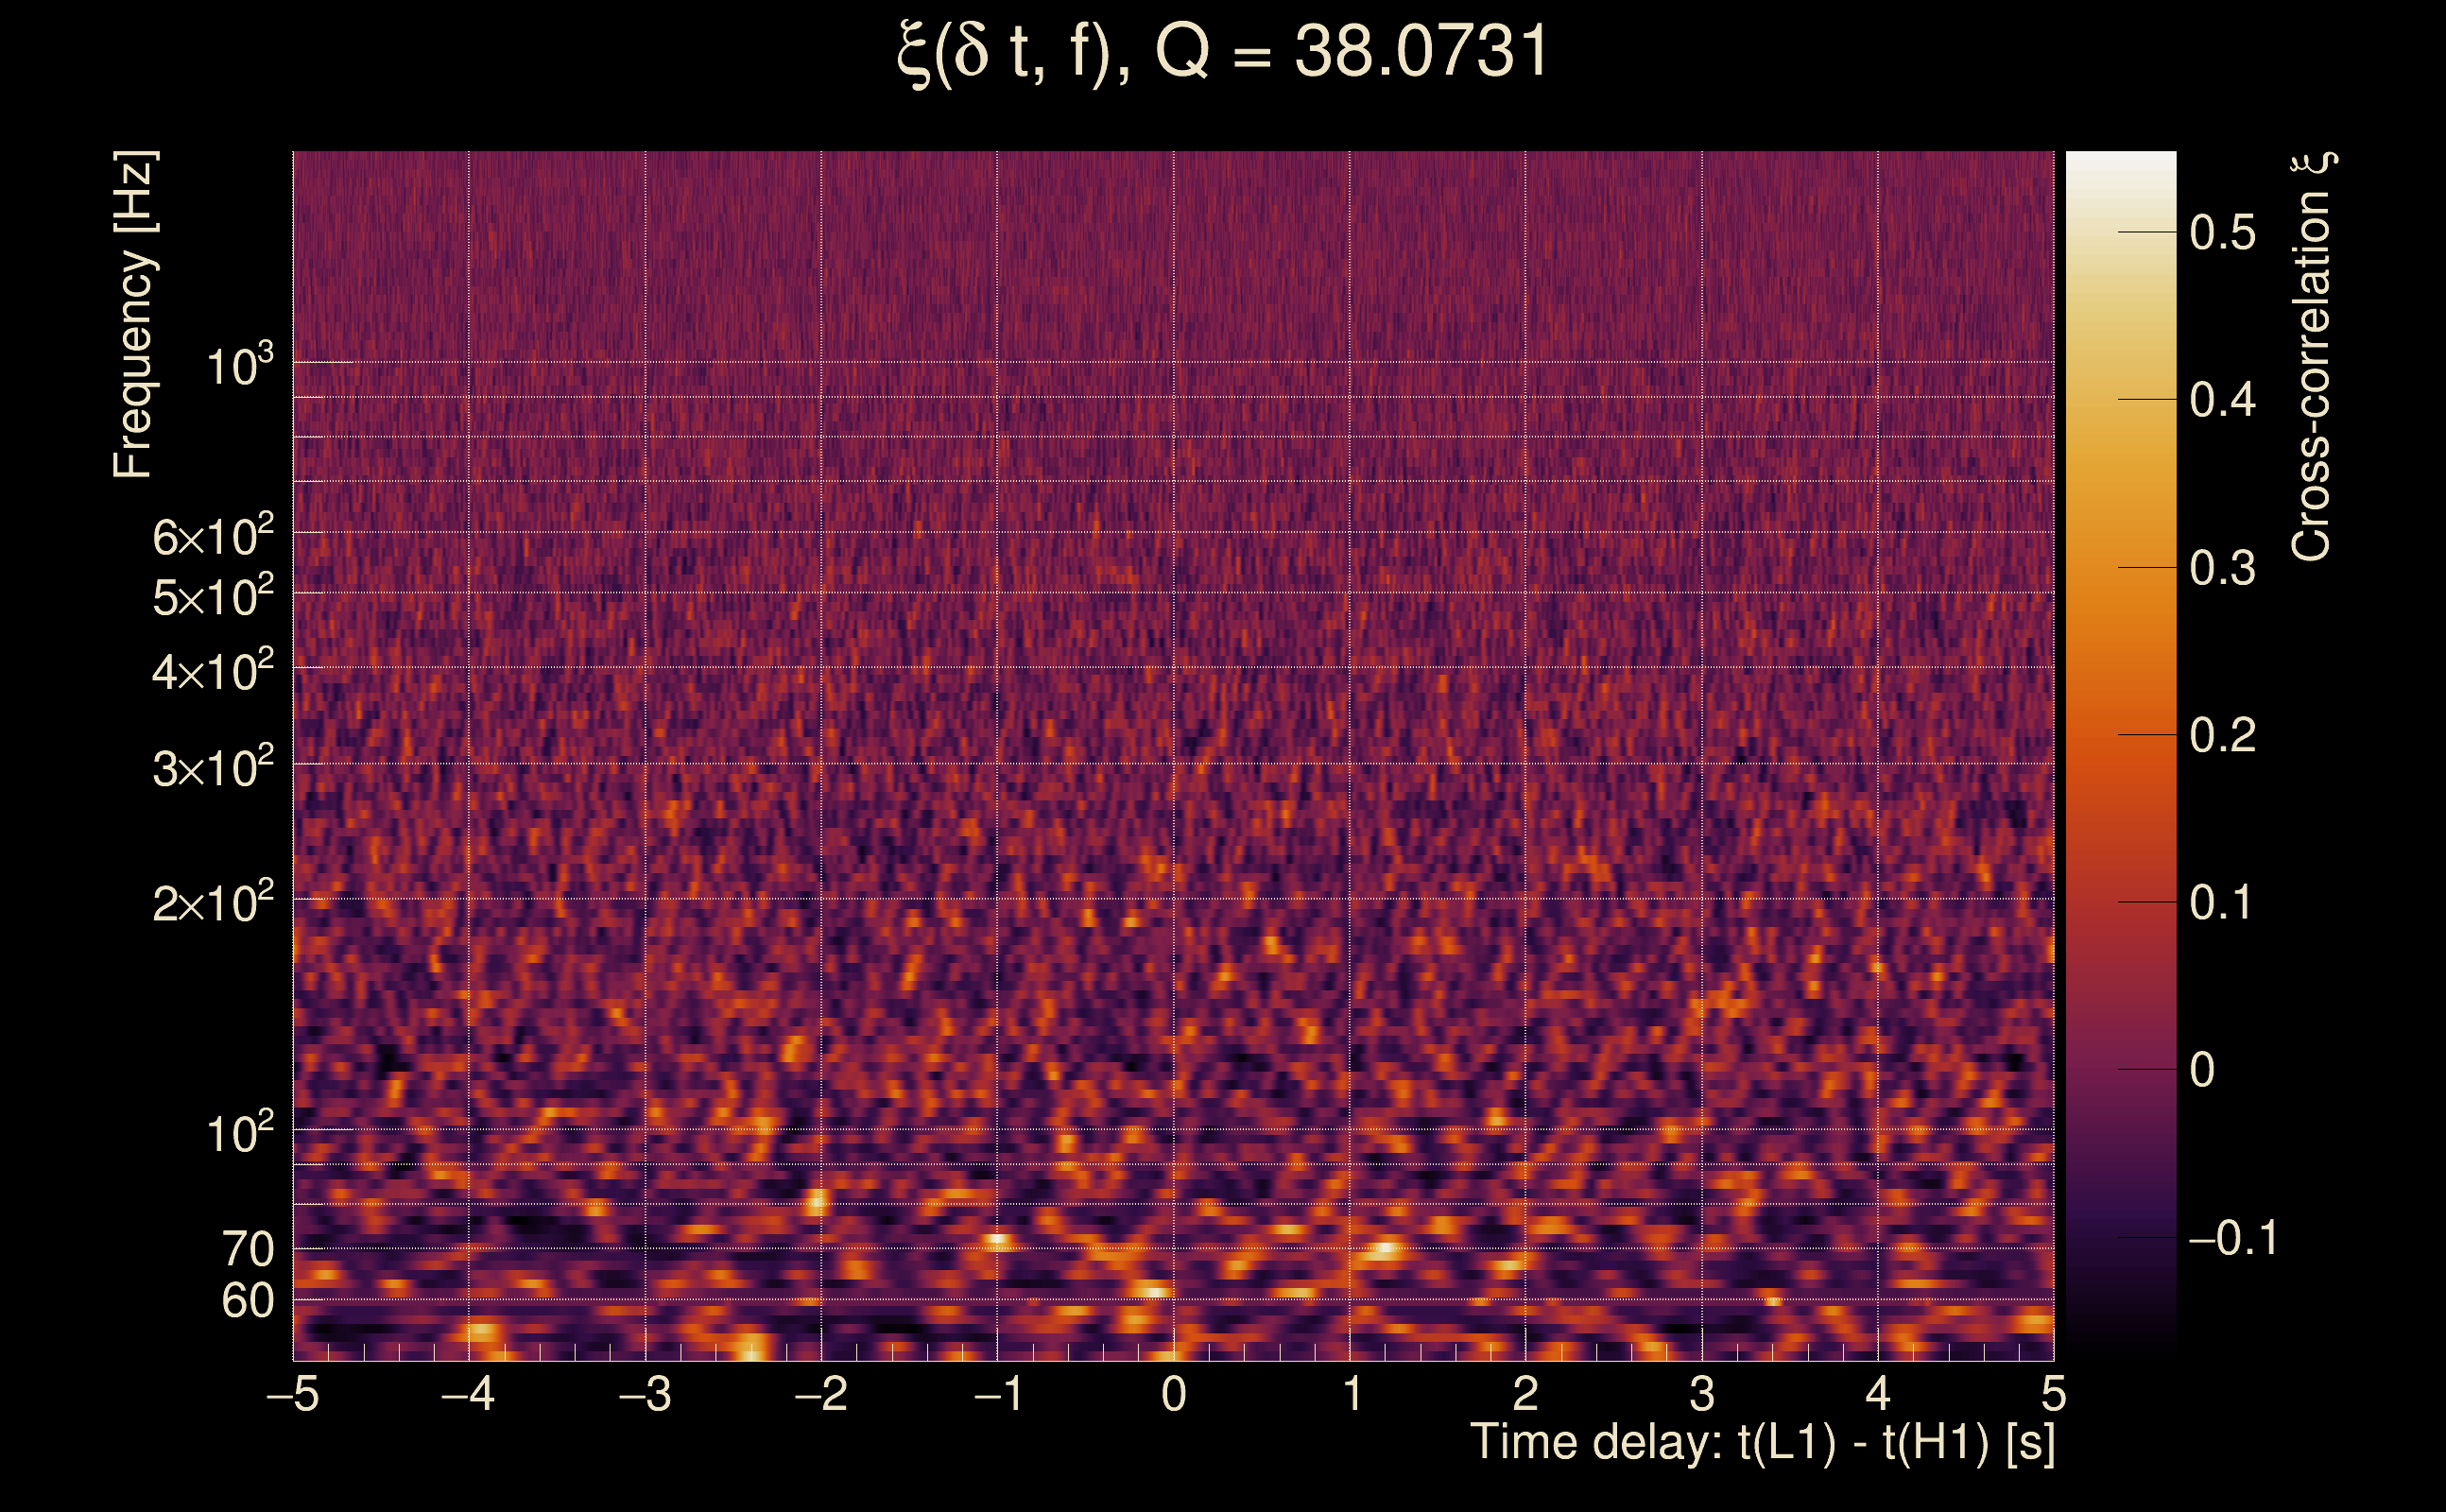
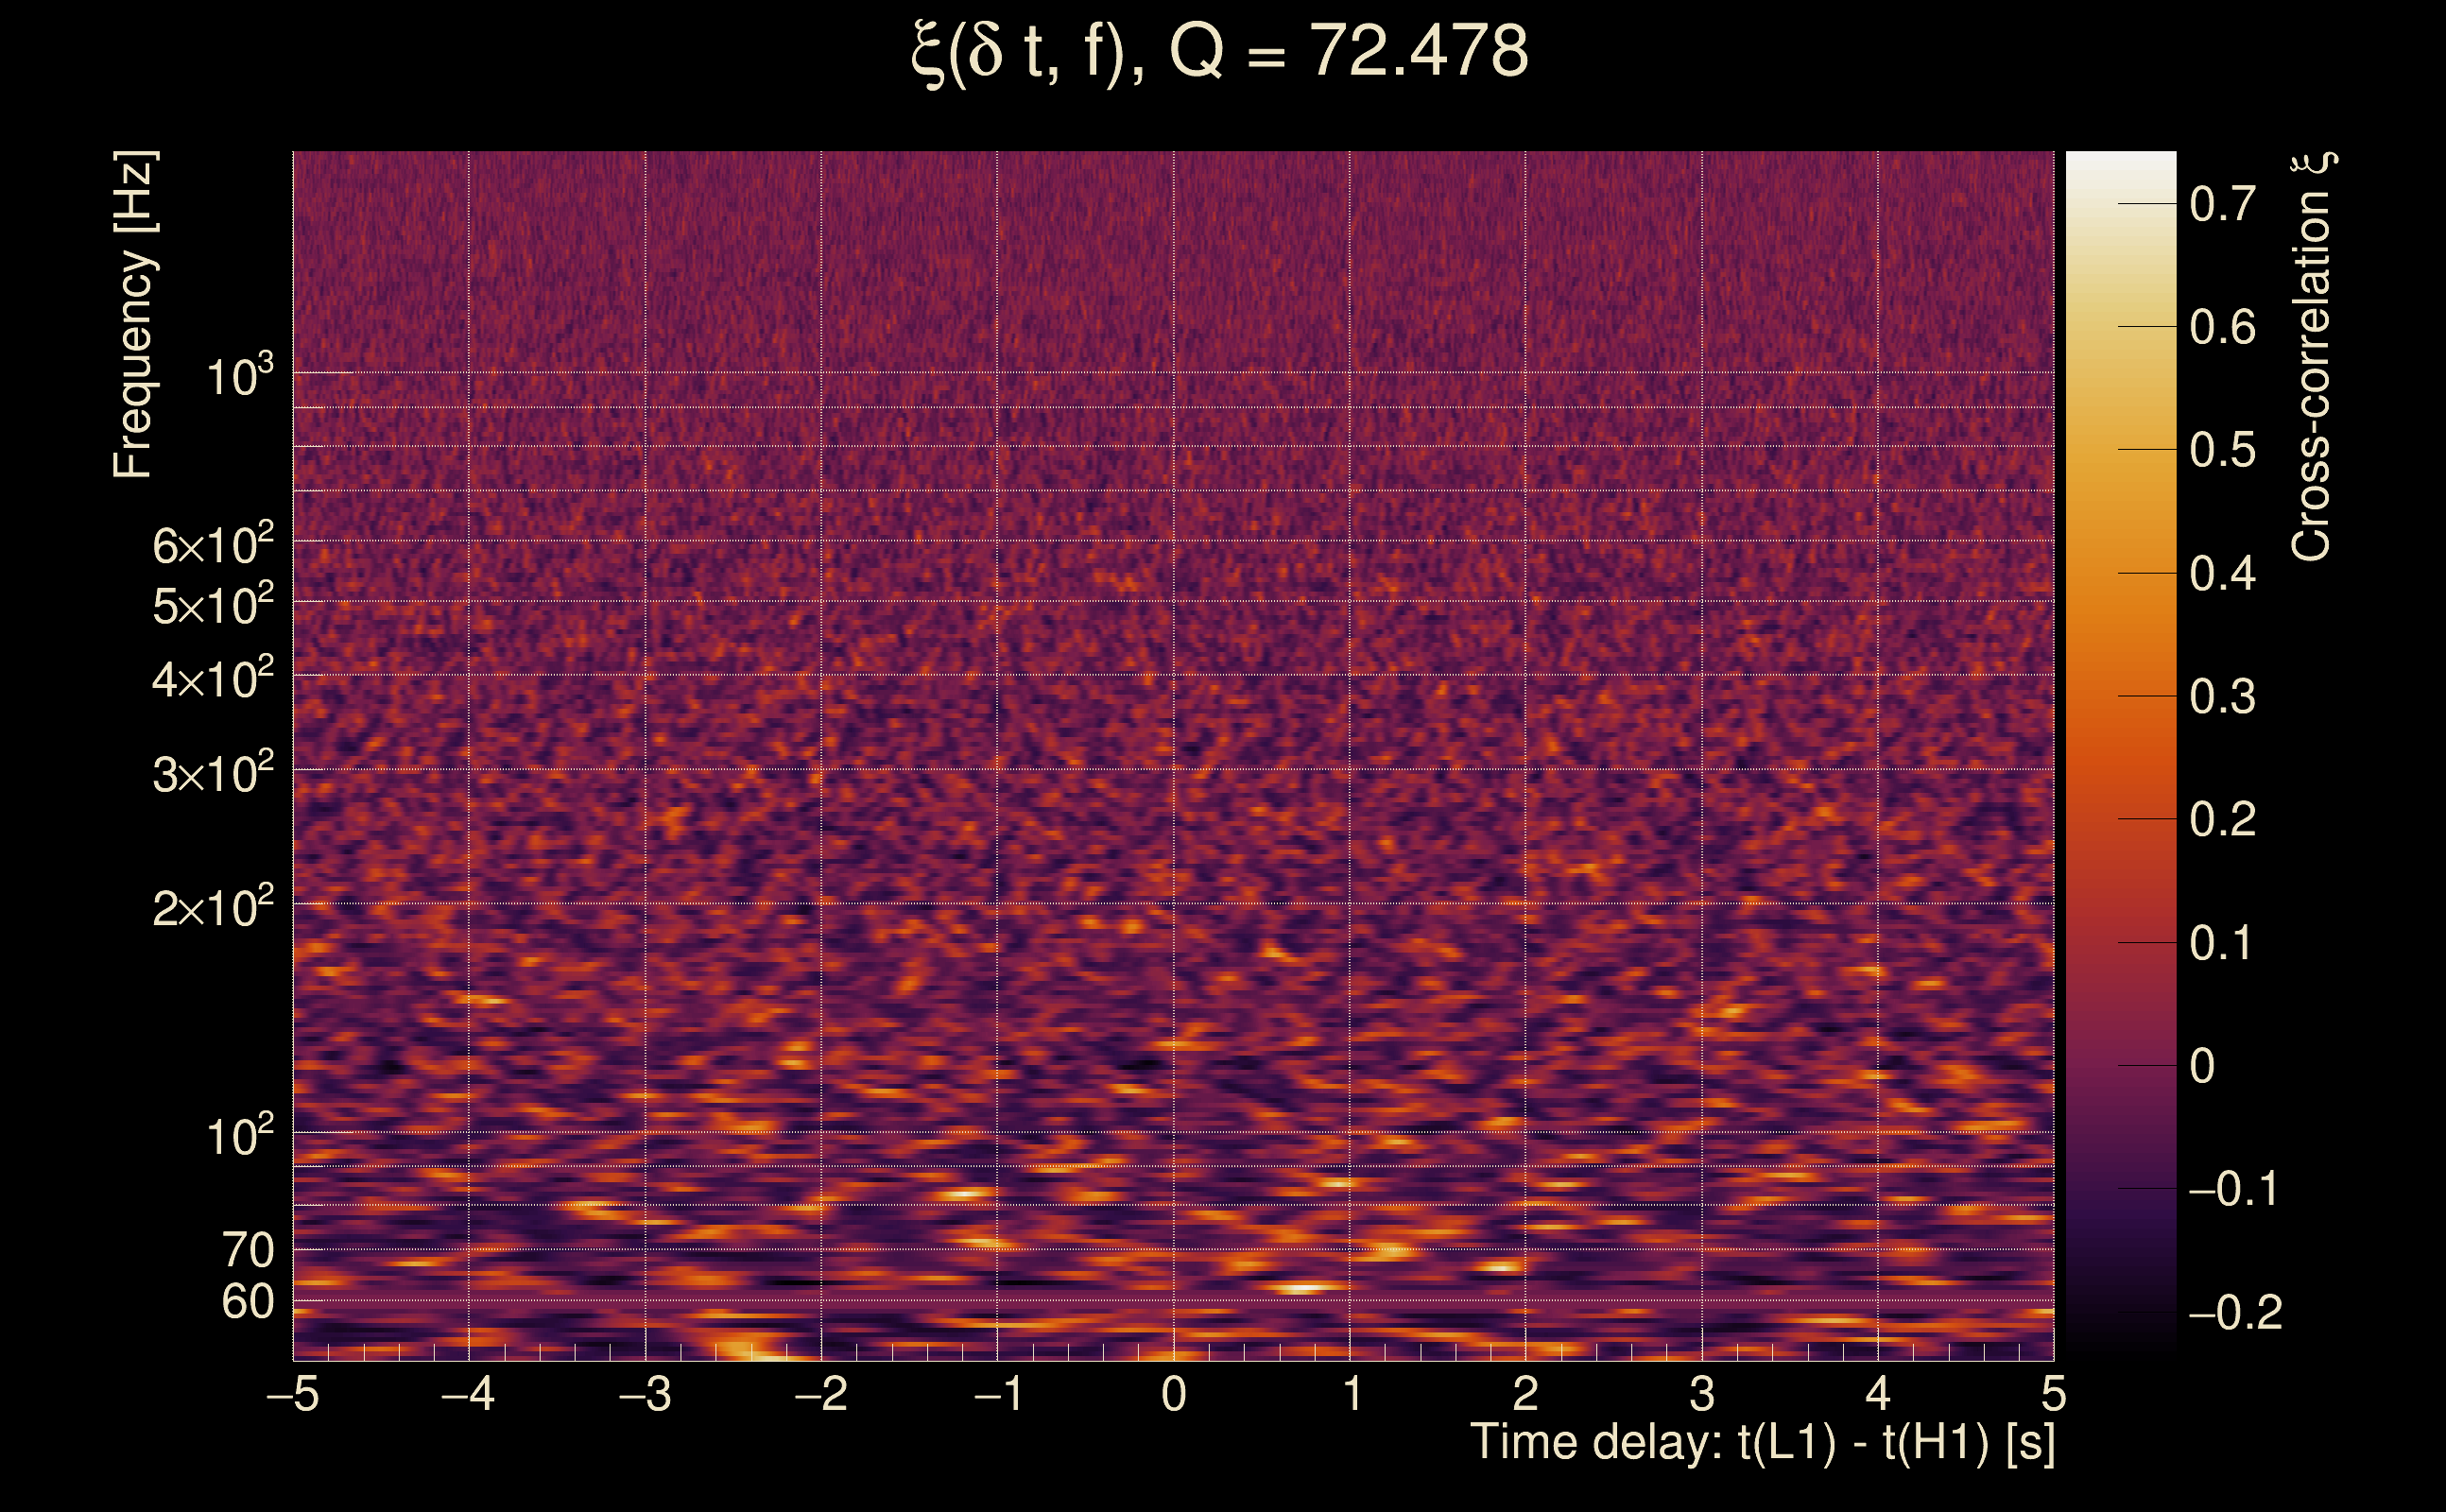
| Frequency: | 287.146 Hz |
| Ξ: | 0.920374 ± 0.0123874 (variance = 0.000153447): Q0: 0.951885, Q1: 0.946613, Q2: 0.93655, Q3: 0.926869, Q4: 0.918151 |
| Rank: | R_A = 0.859774 |
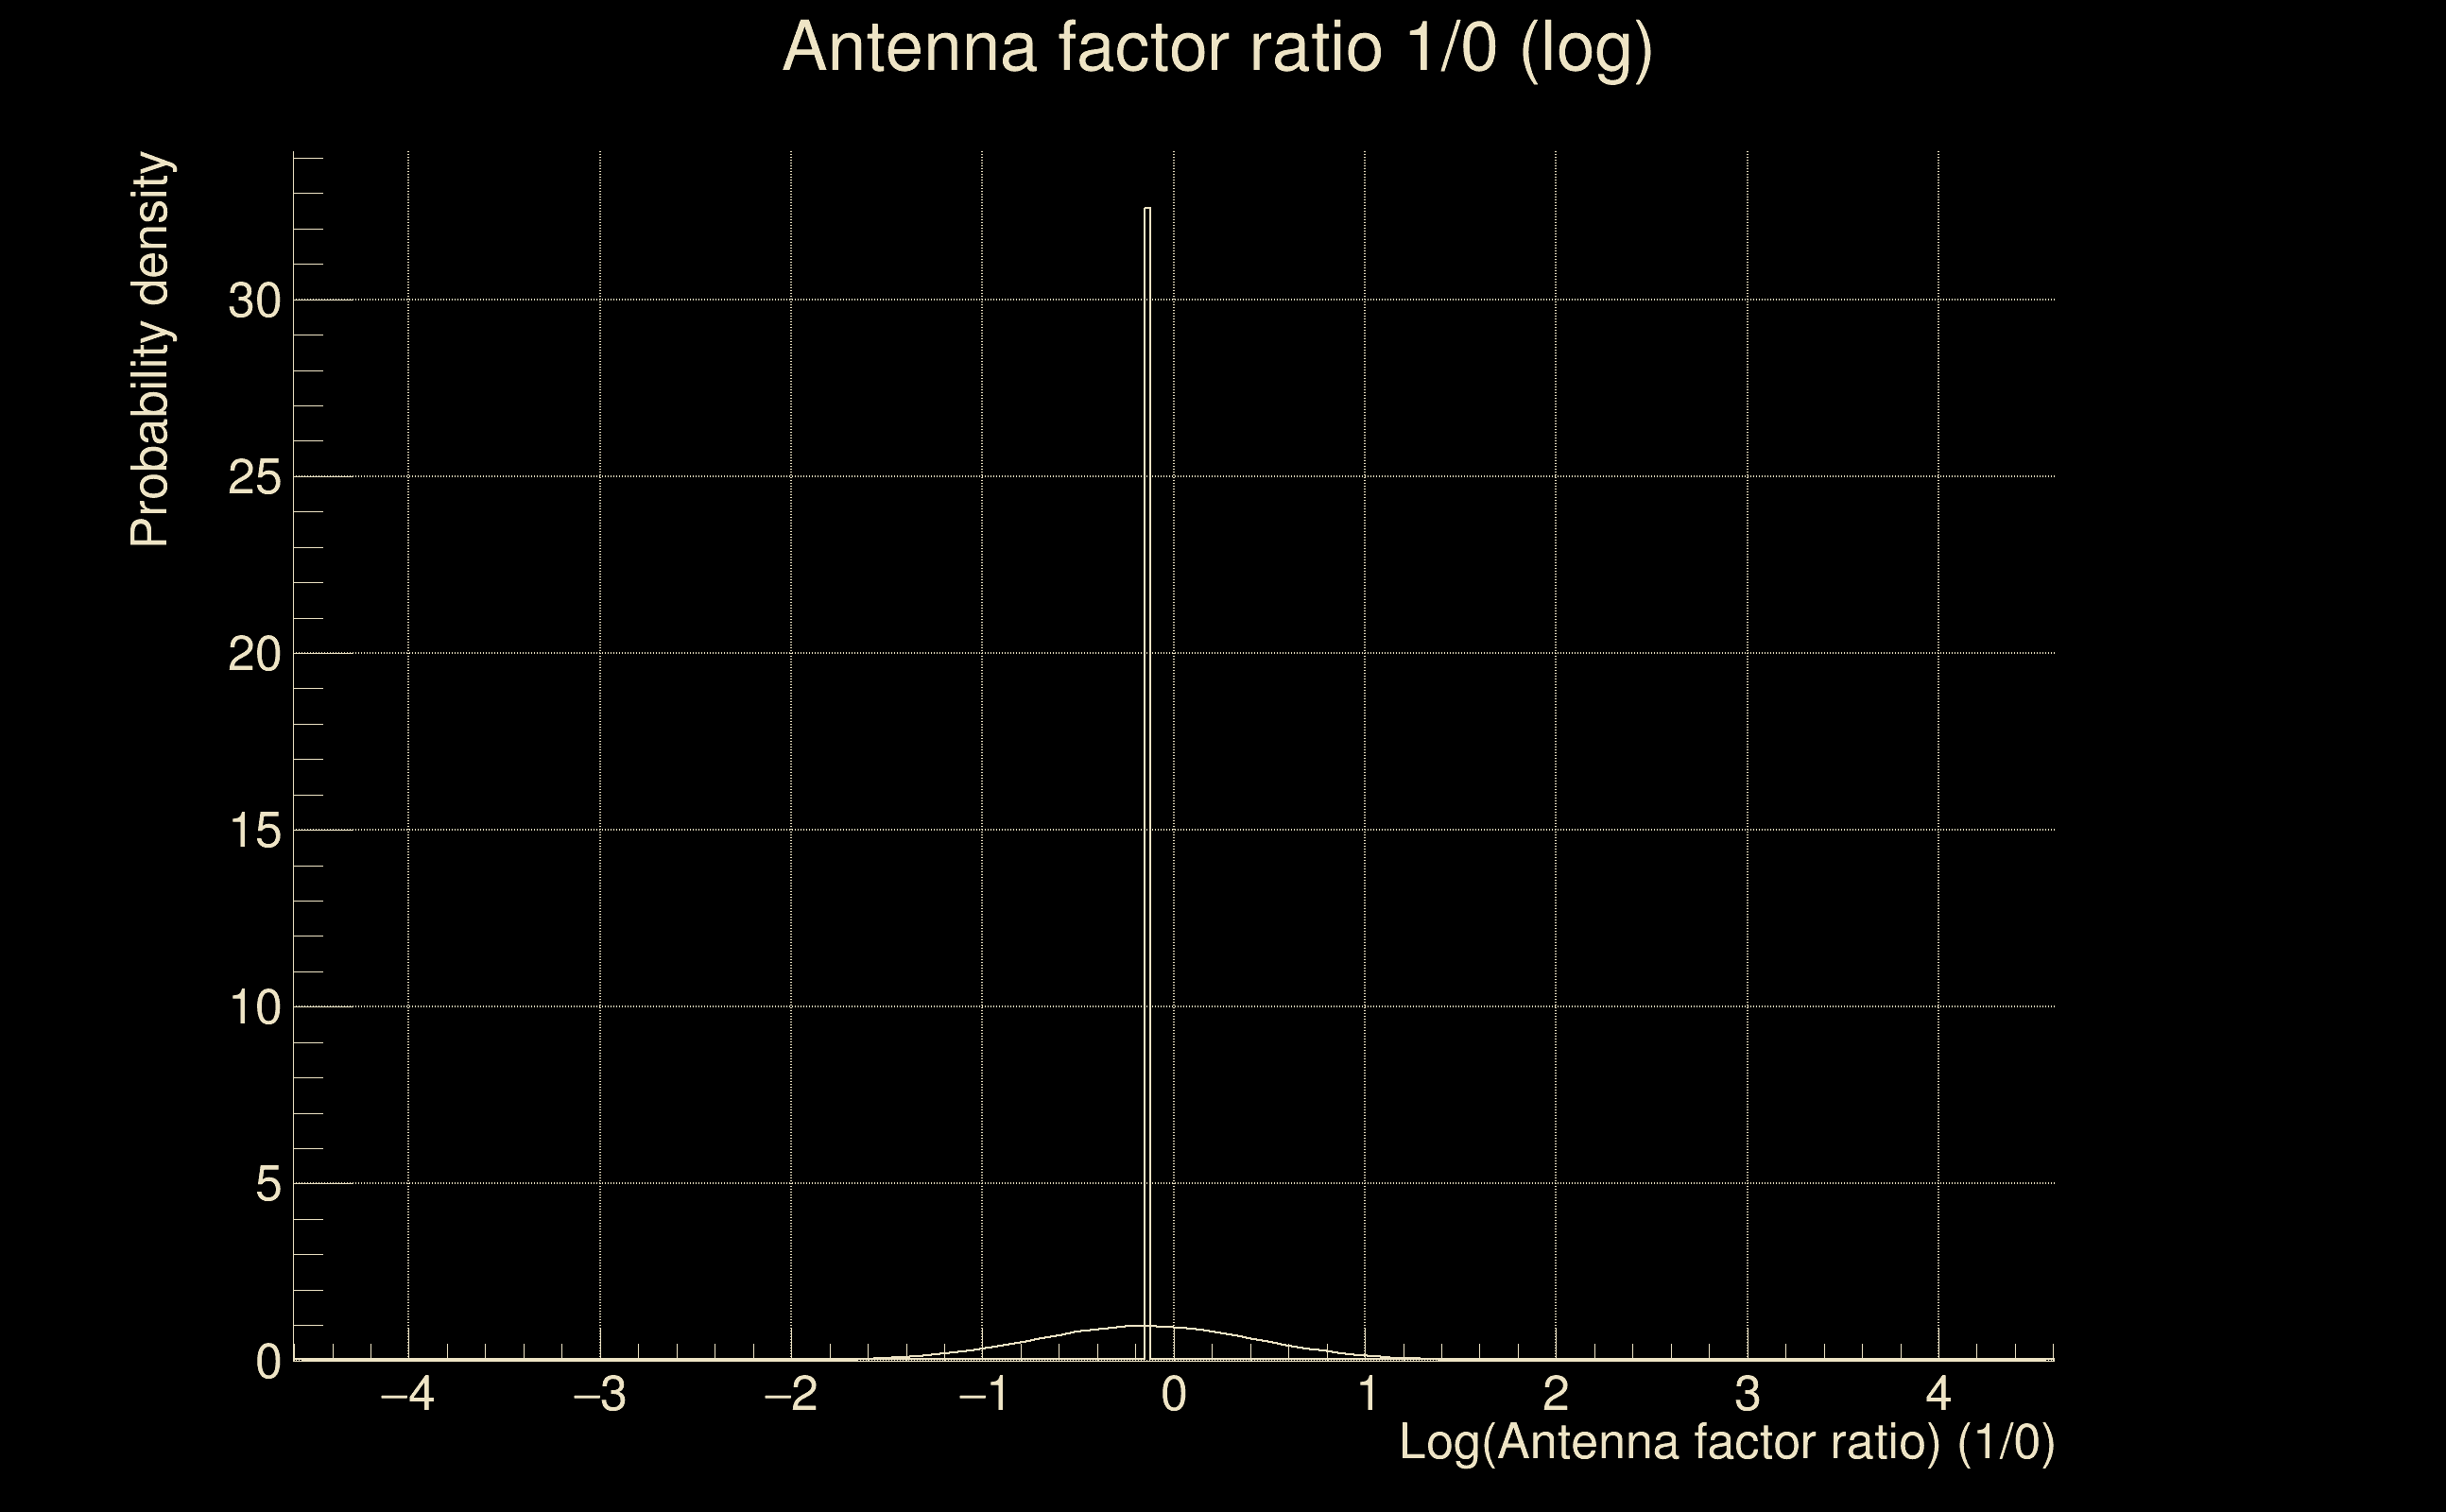
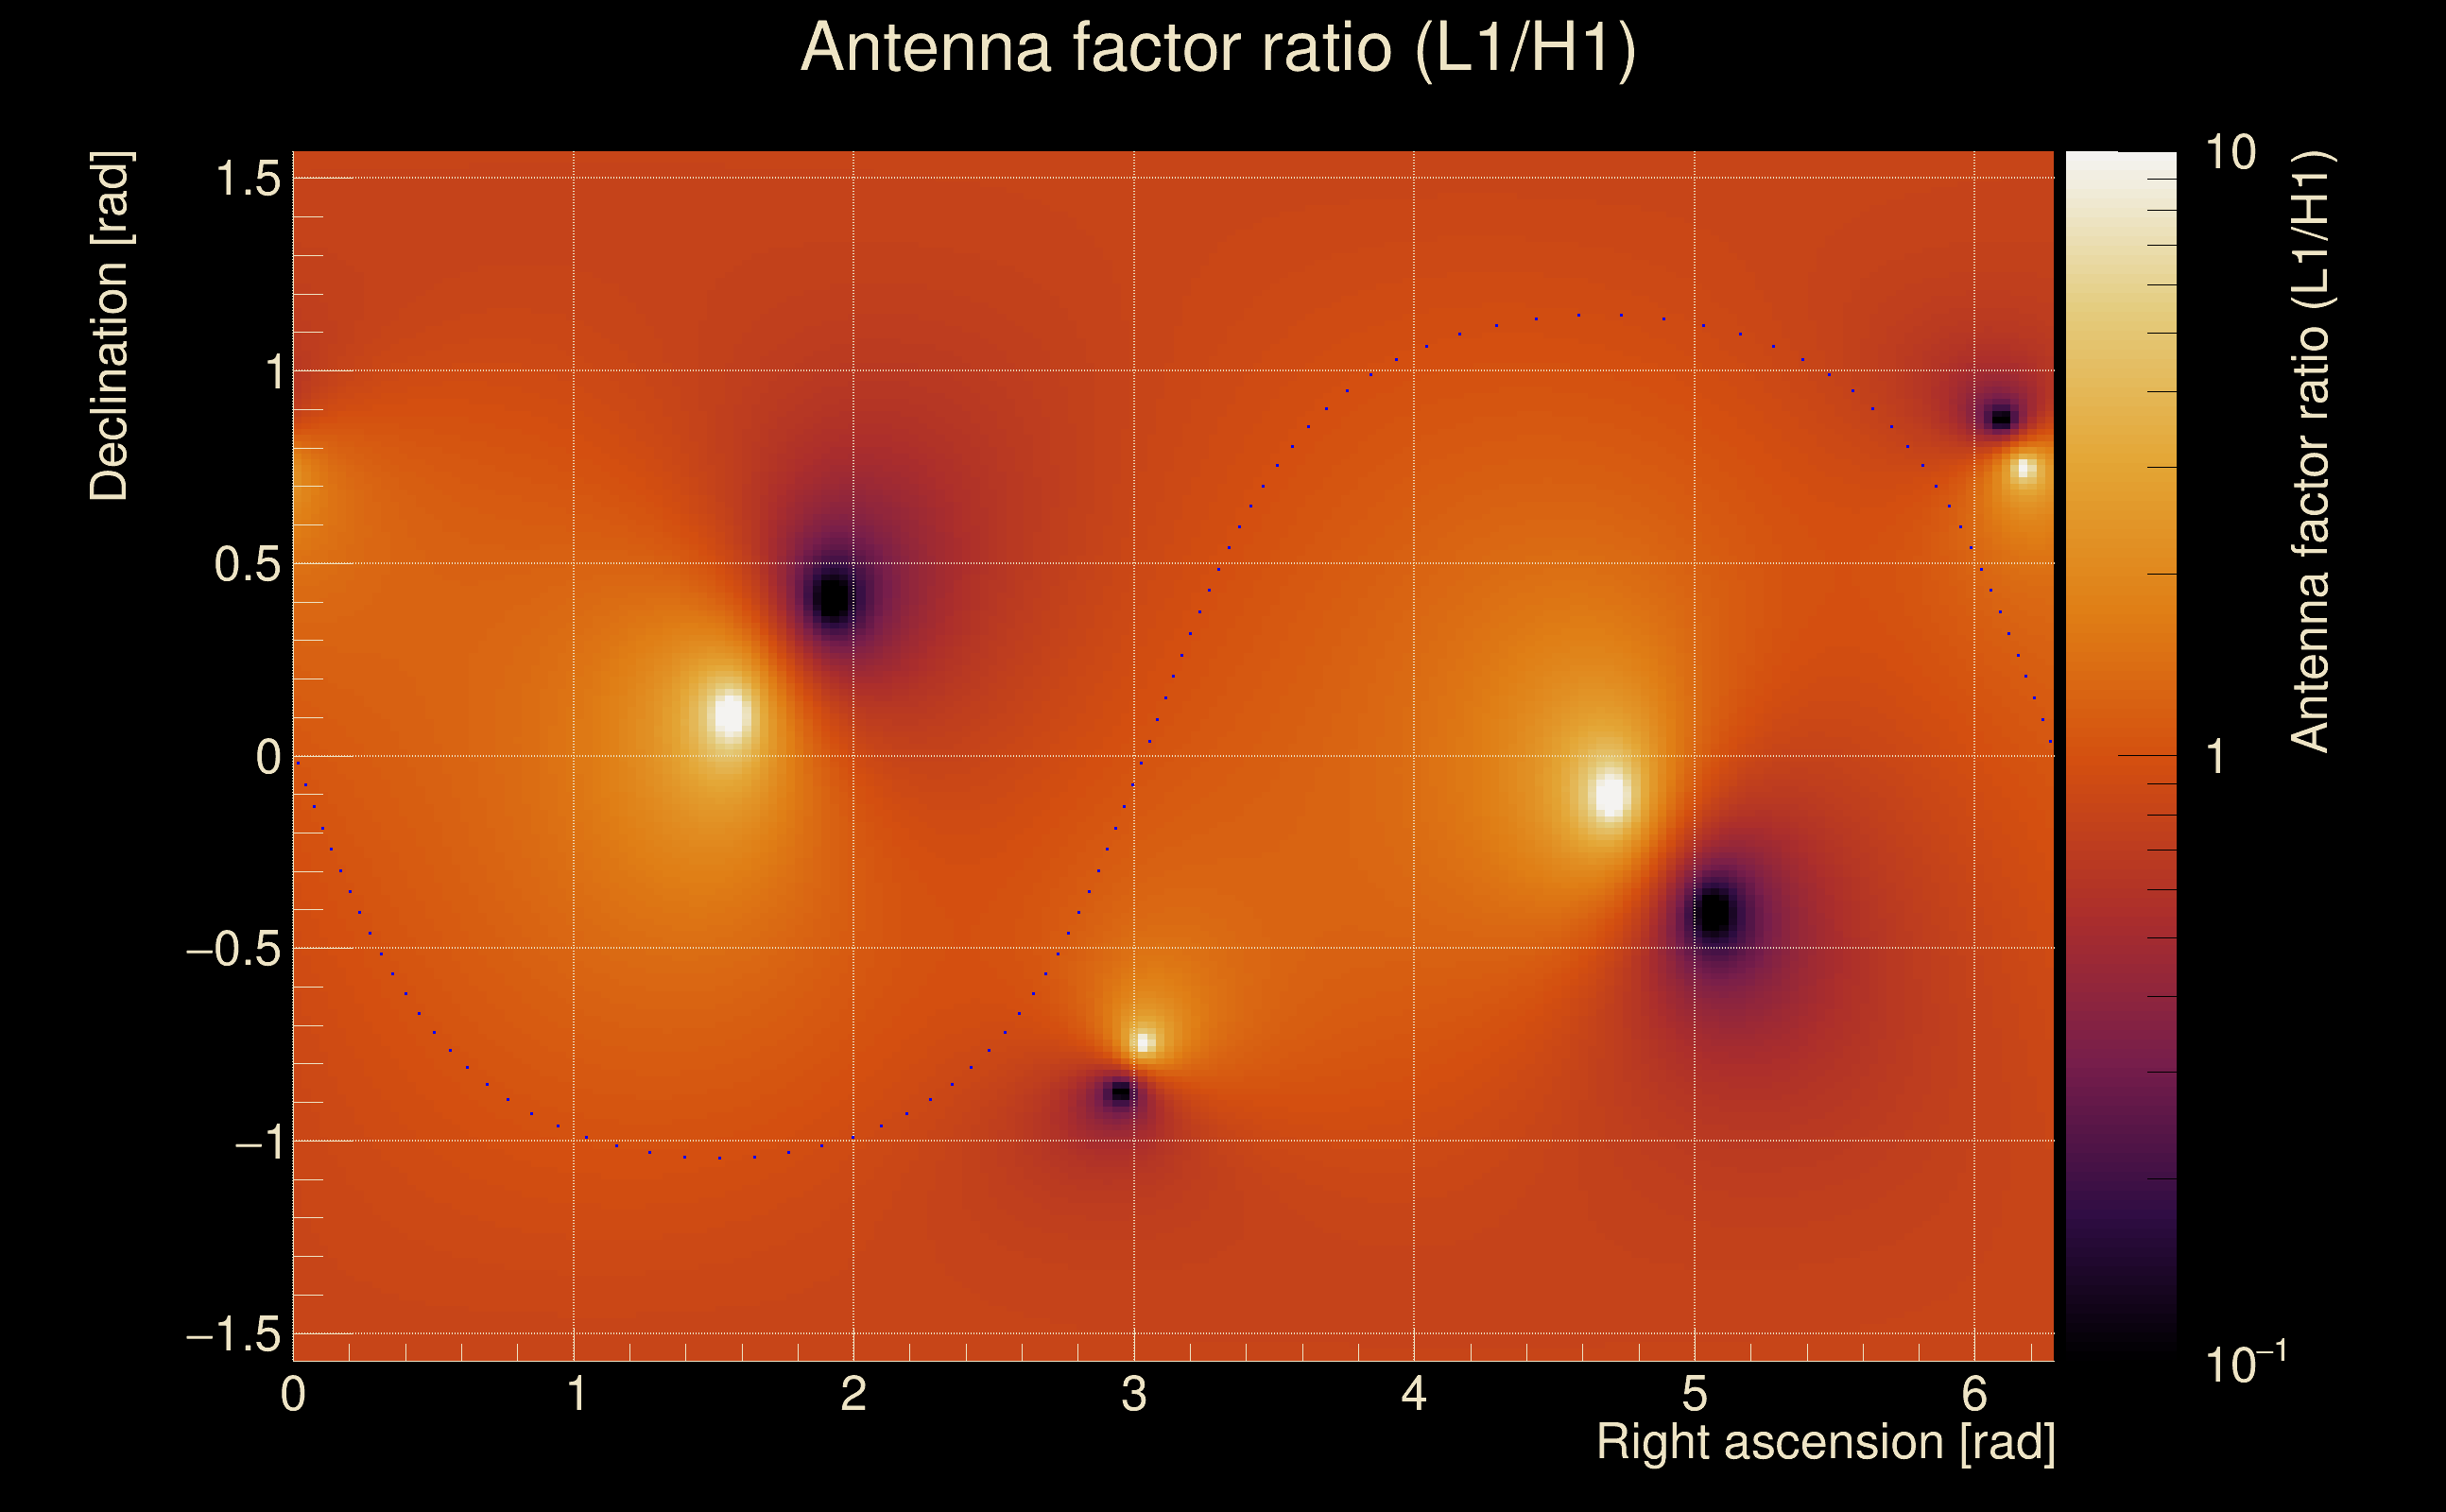
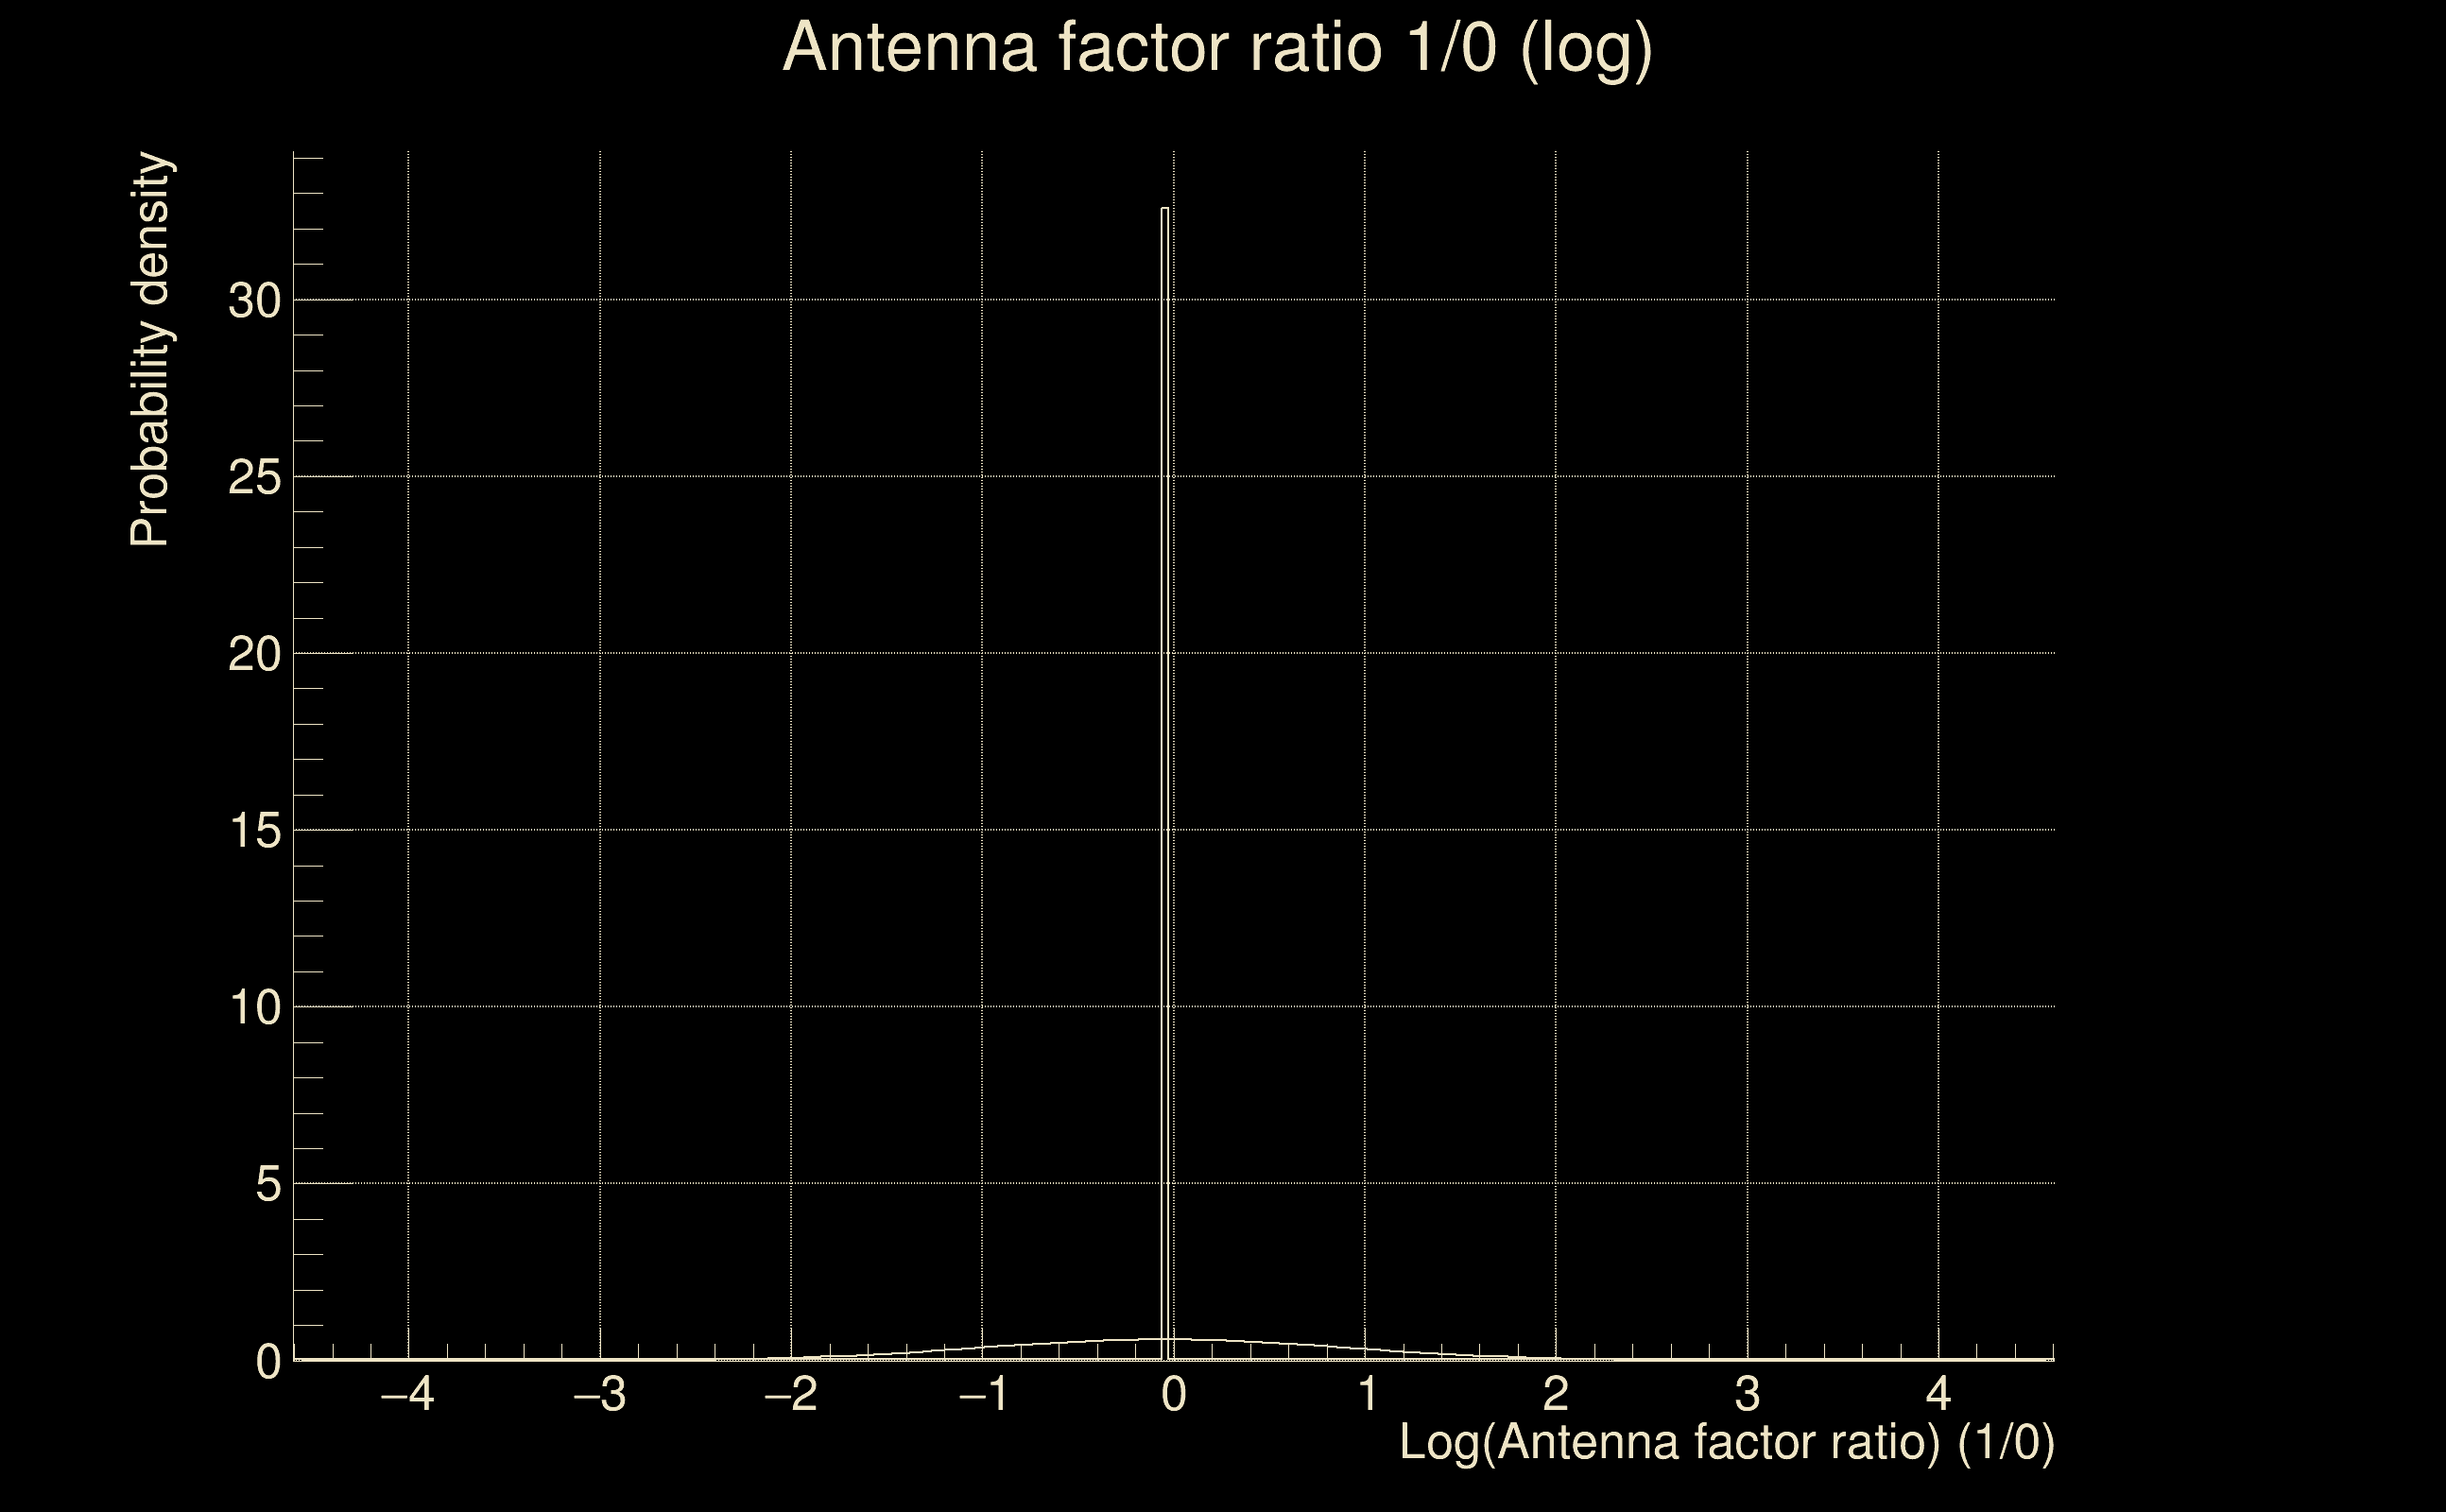
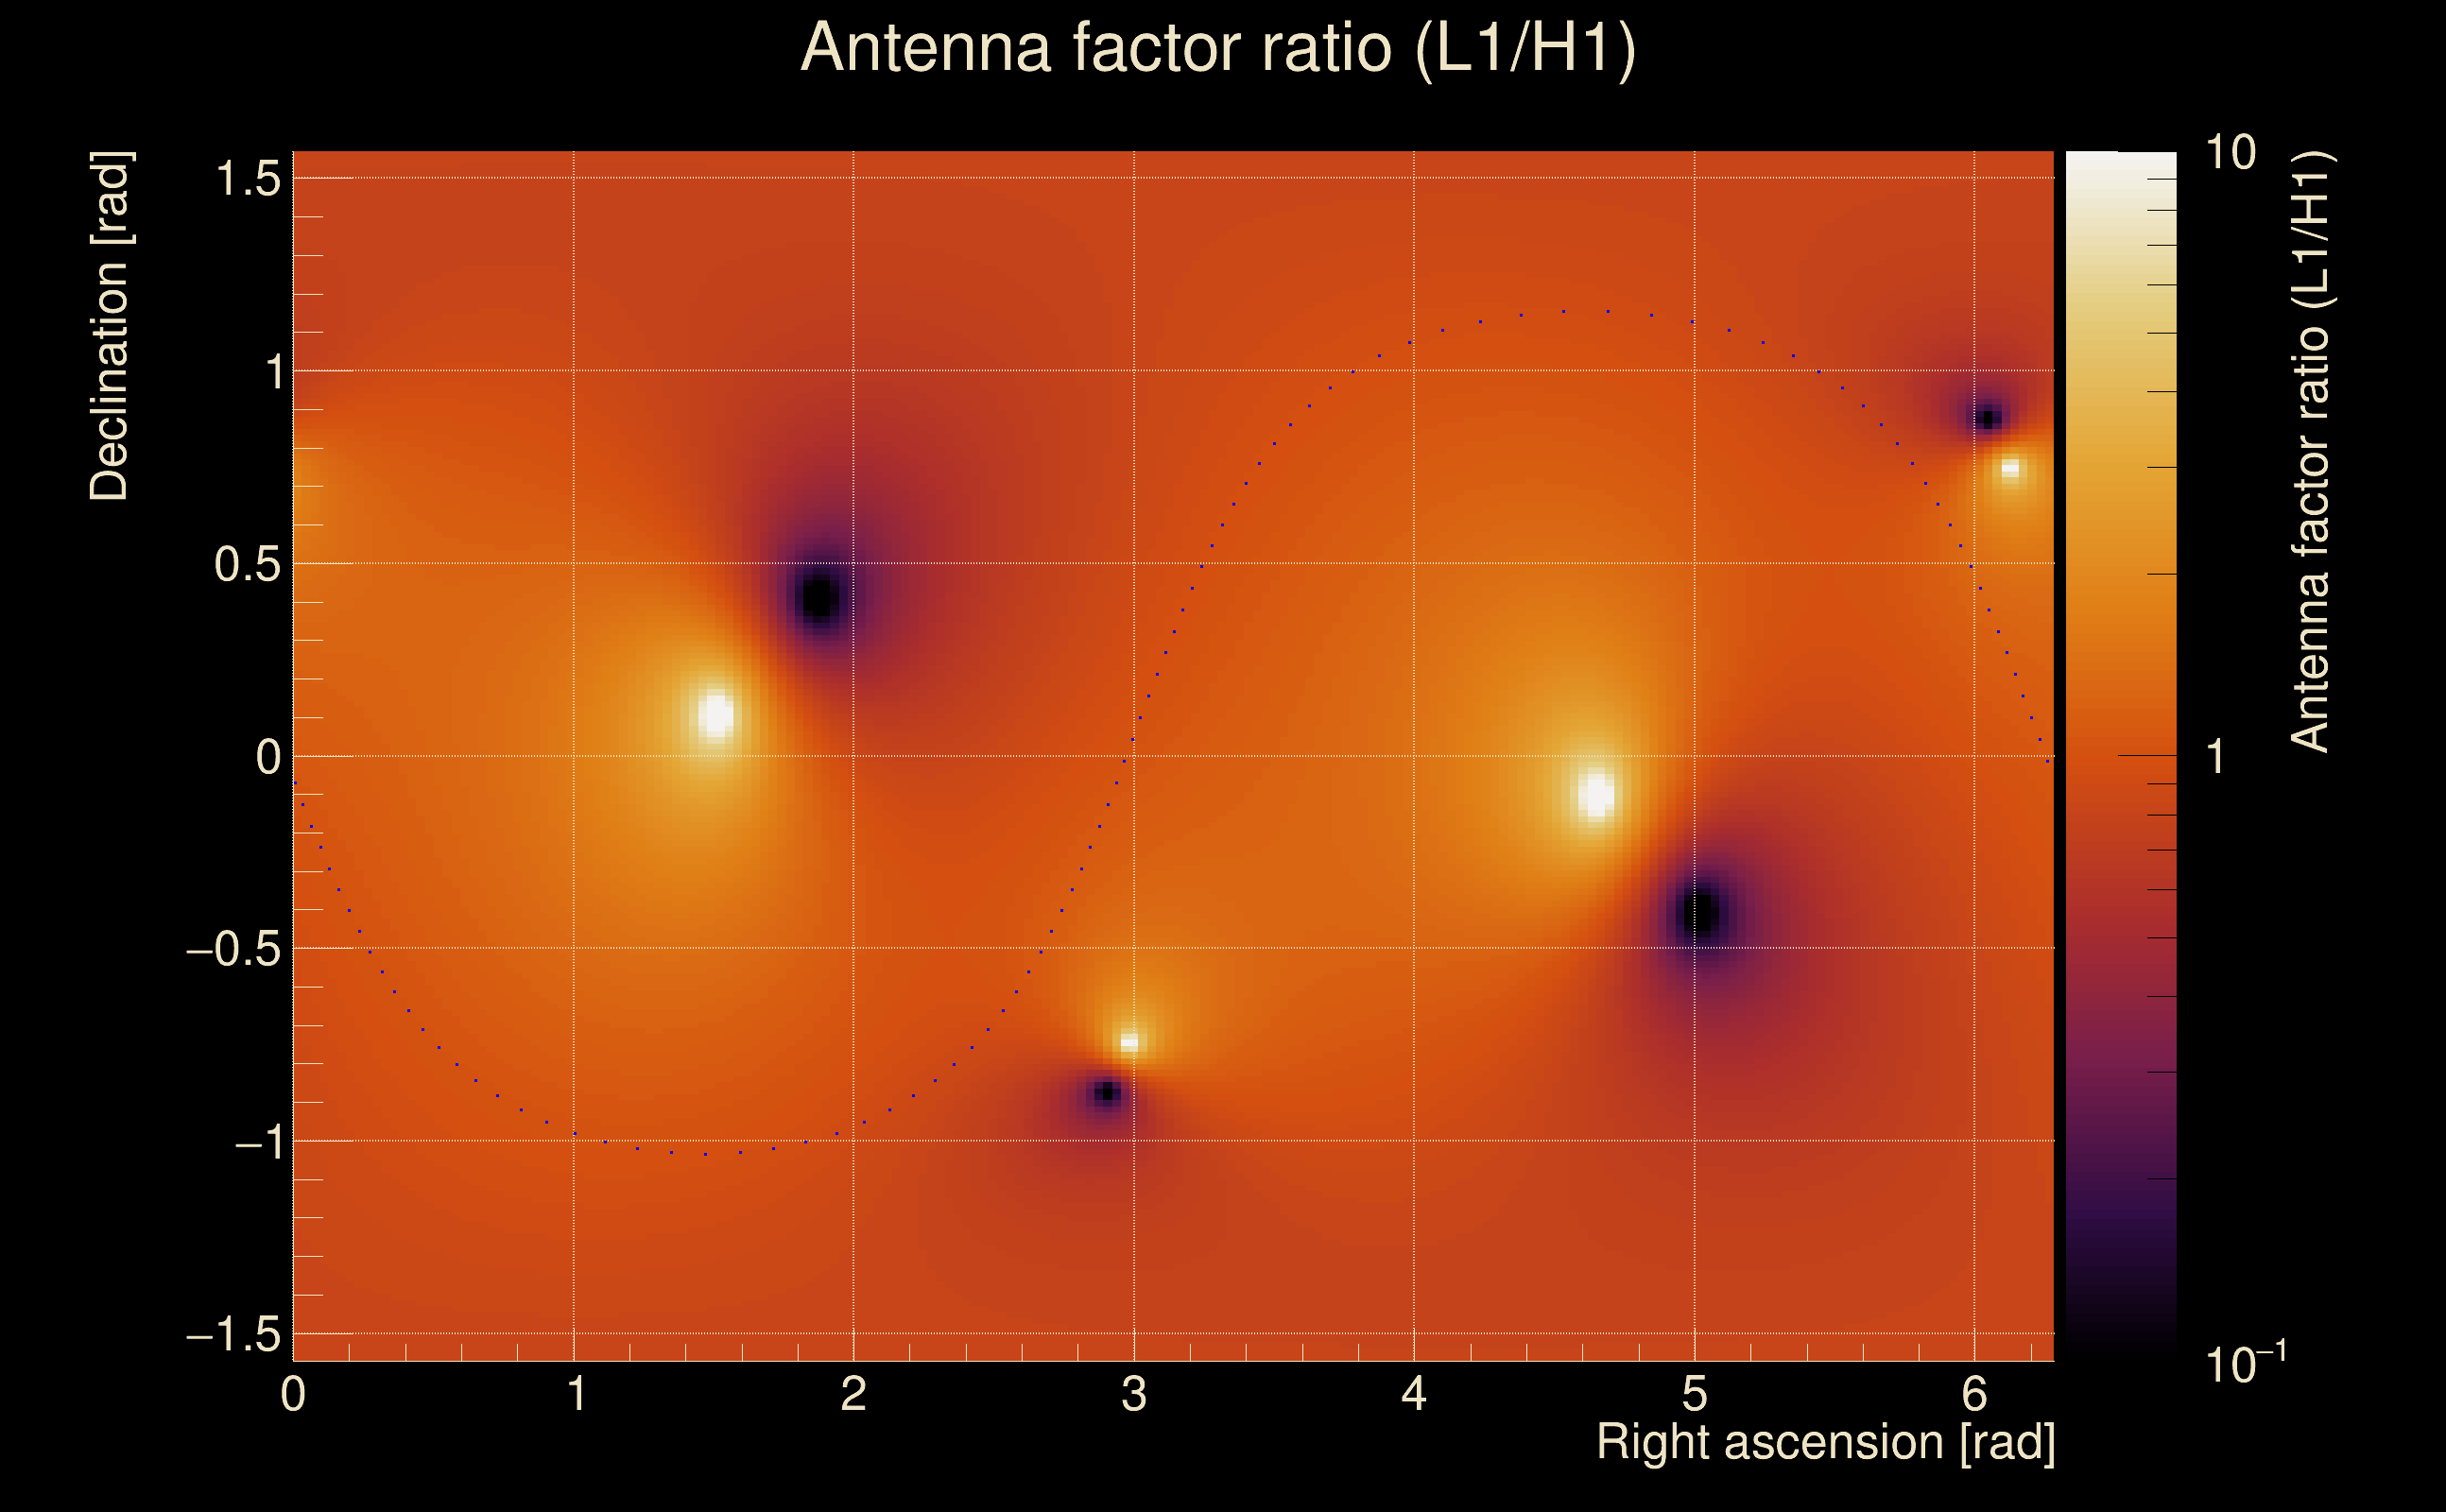
| Log of amplitude ratio (L1/H1): | -0.0494286, variance = 0.151449 (L1/H1: -0.0563282, variance = 0.302755, H1/L1: 0.0428882, variance = 0.302615) |
| Amplitude ratio (L1/H1): | 0.951773 ⋇ 1.47575 (L1/H1: 0.945229 ⋇ 1.73365, H1/L1: 1.04382 ⋇ 1.73343) |
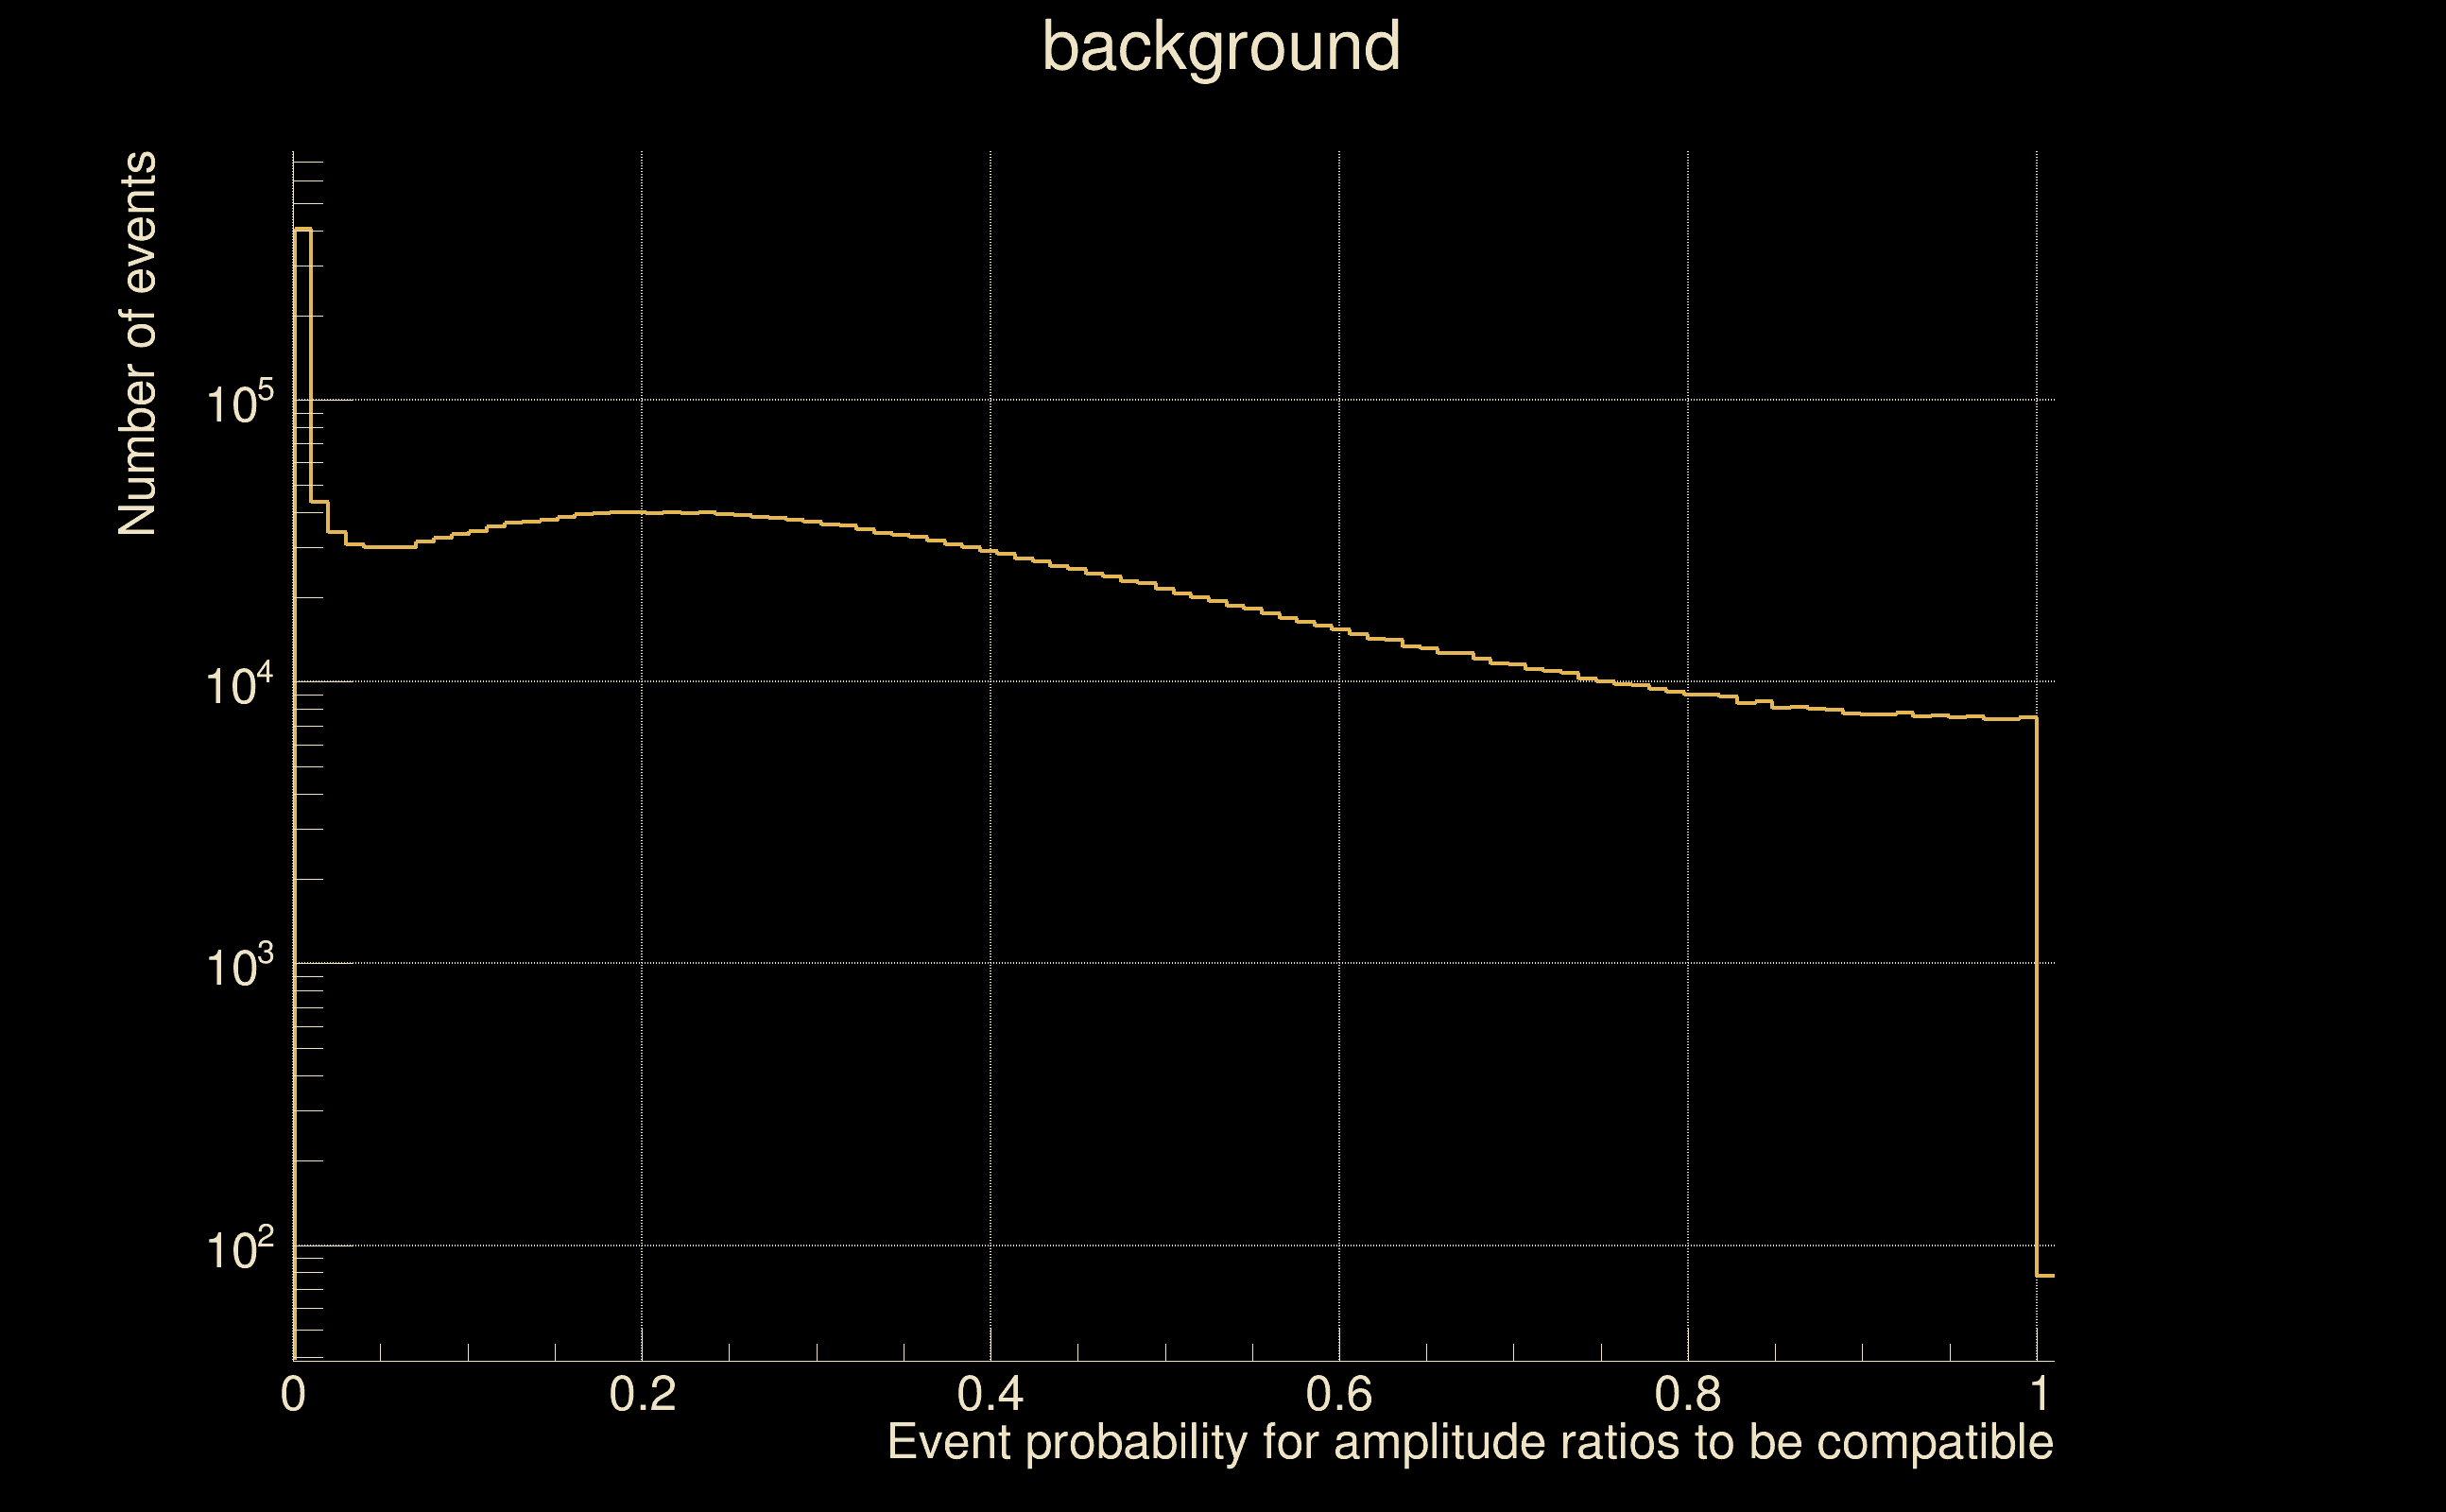
| Amplitude ratio H1|L1 compatibility (probability): | 0.986218 |
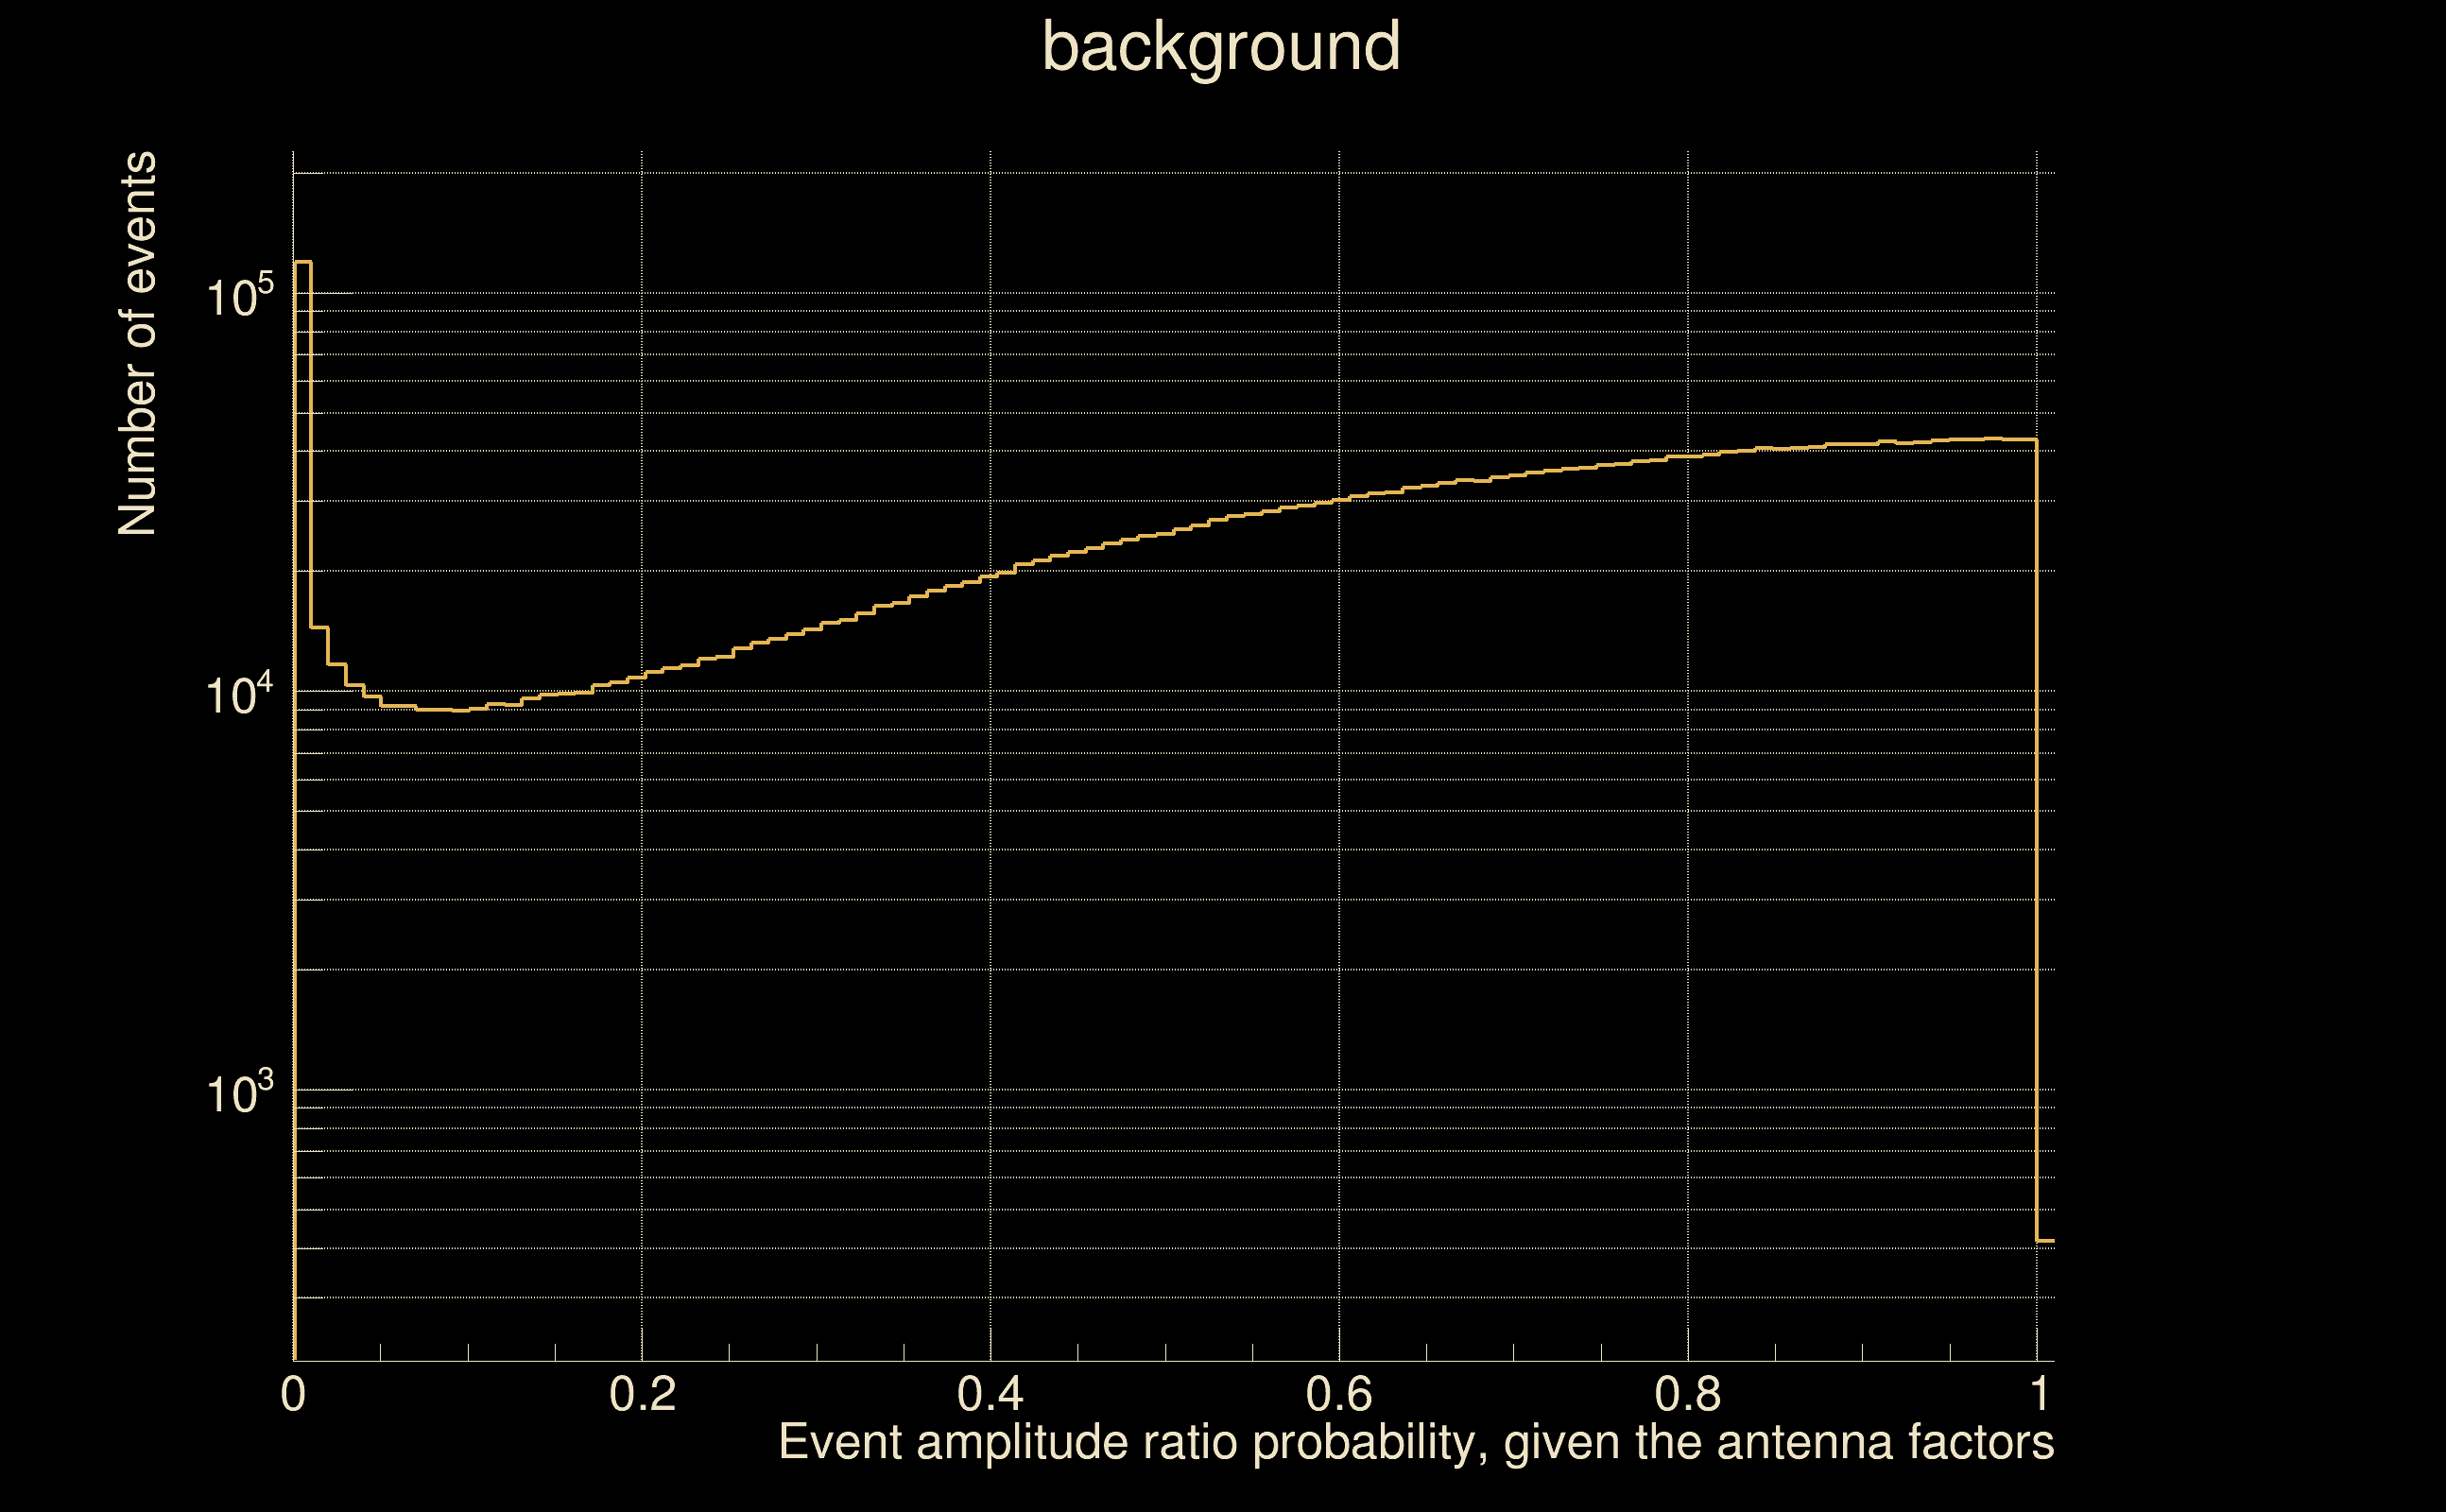
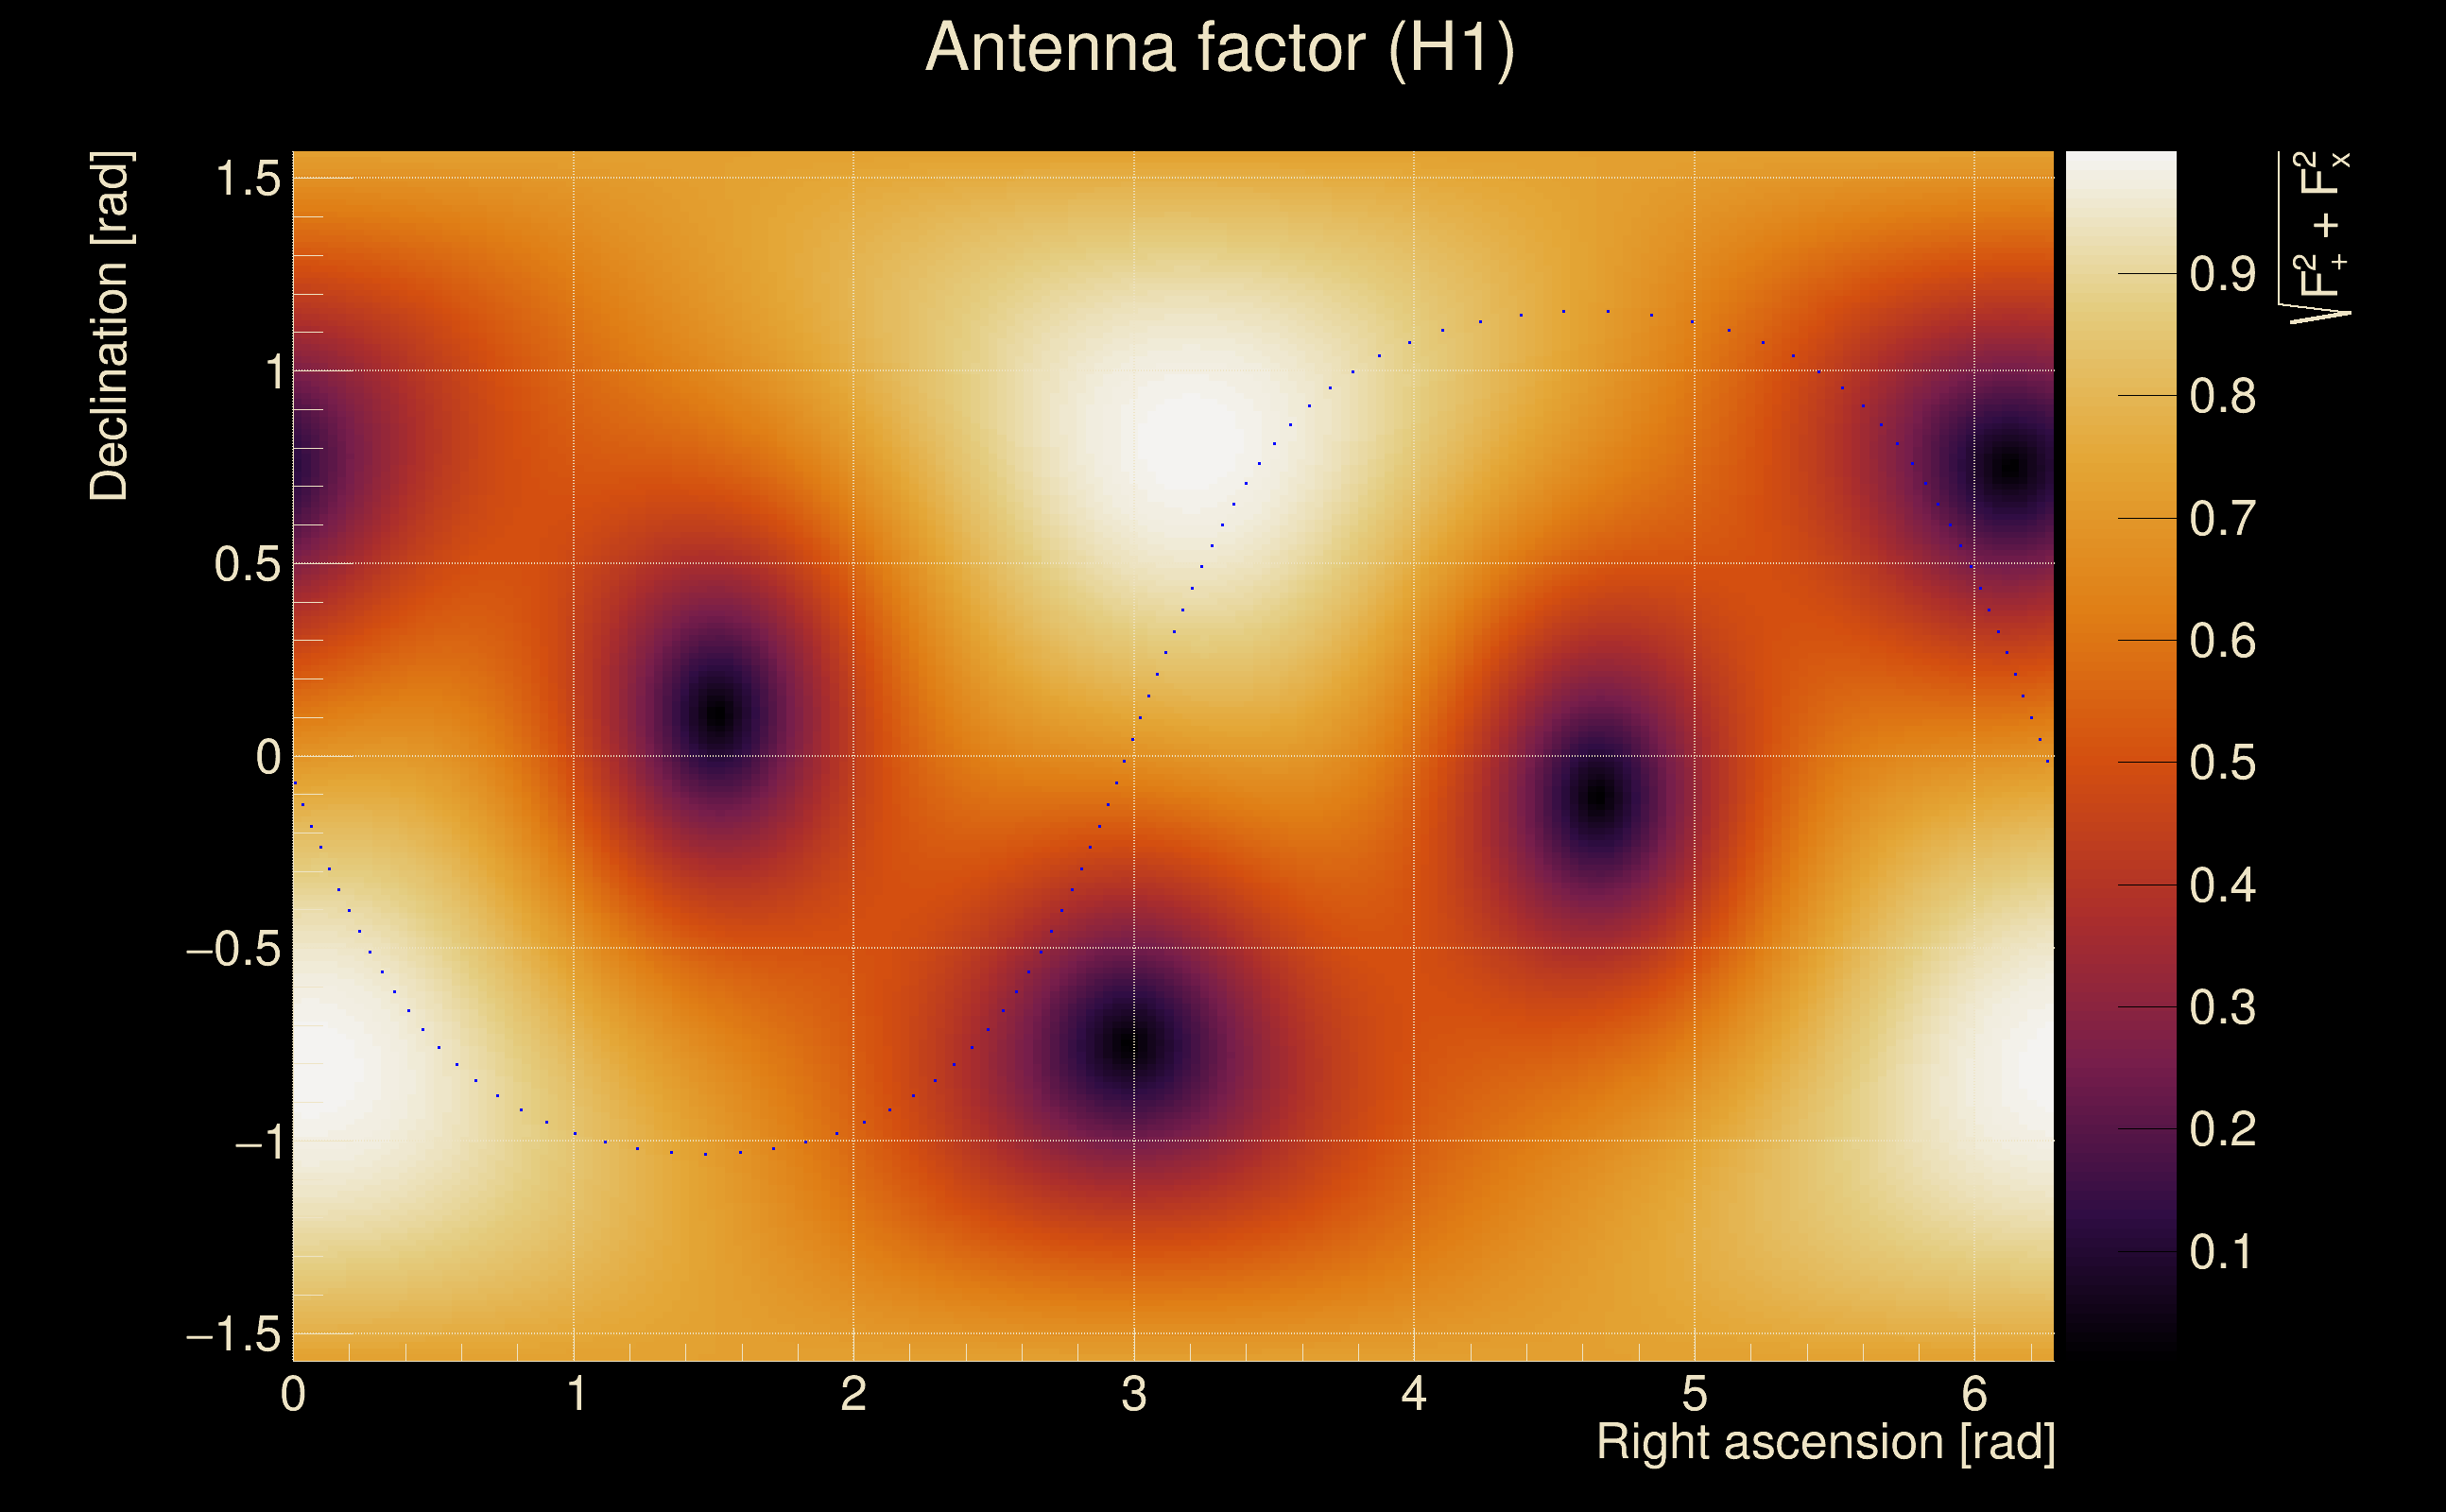
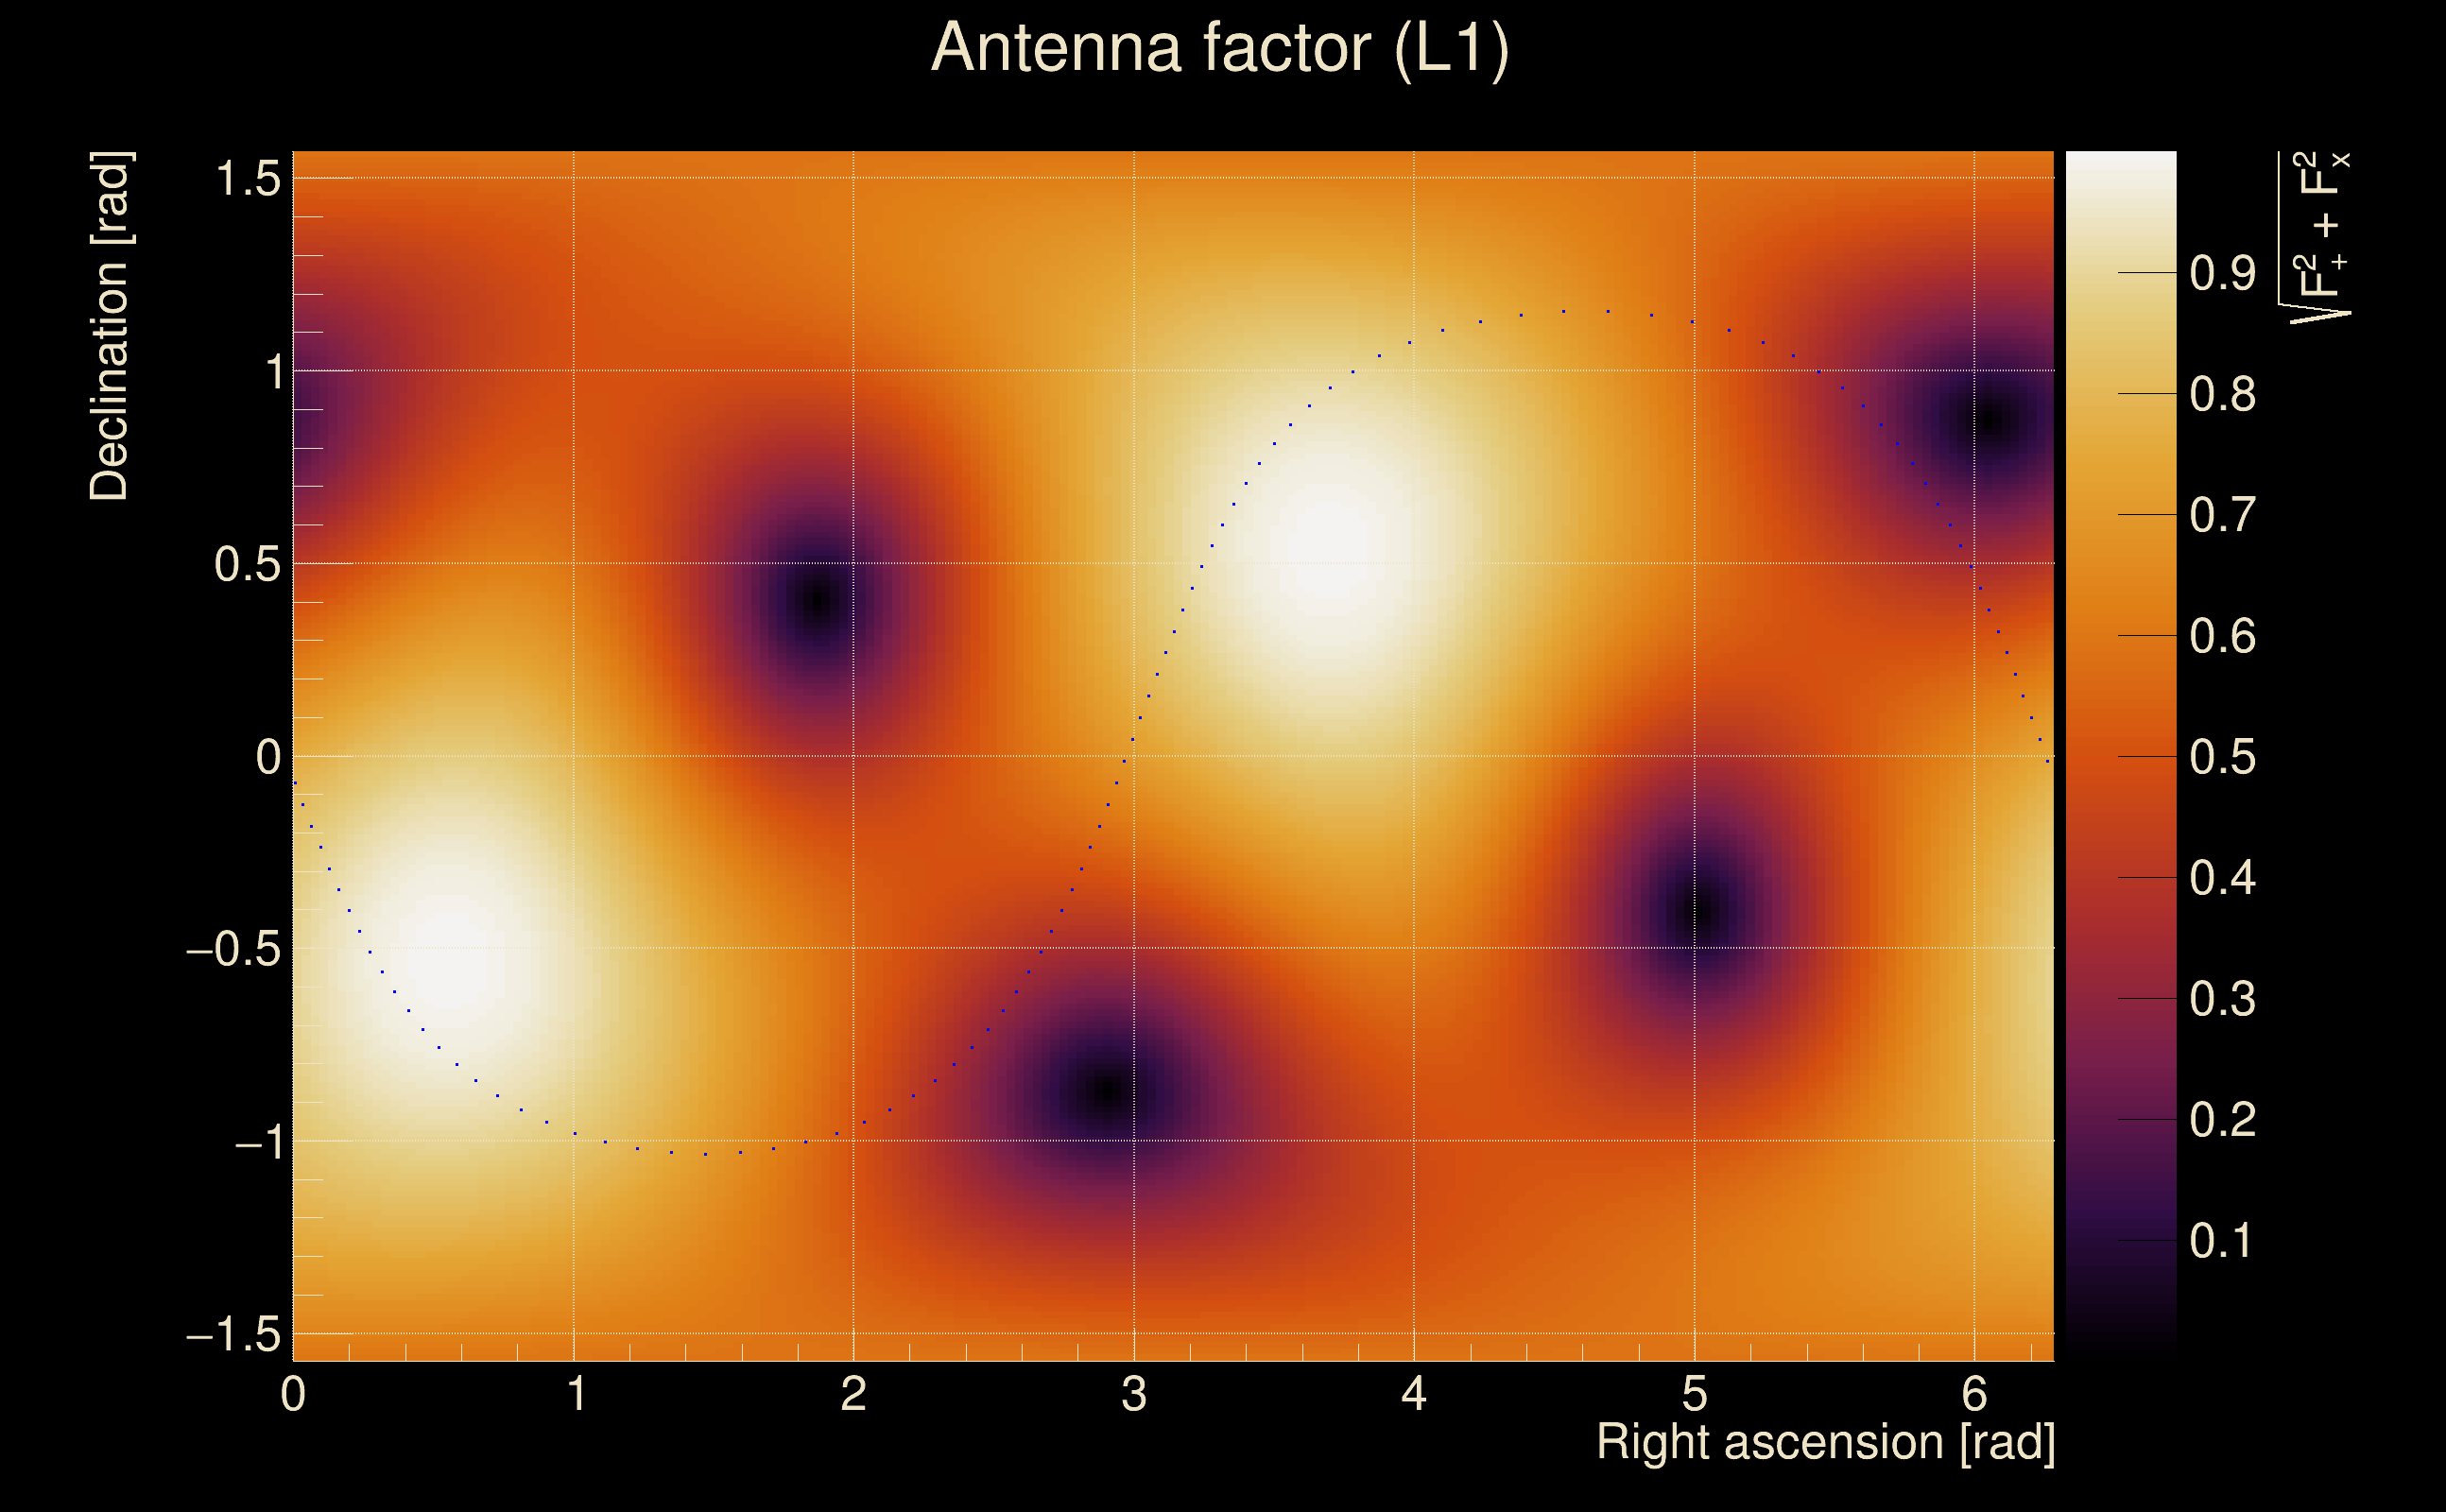
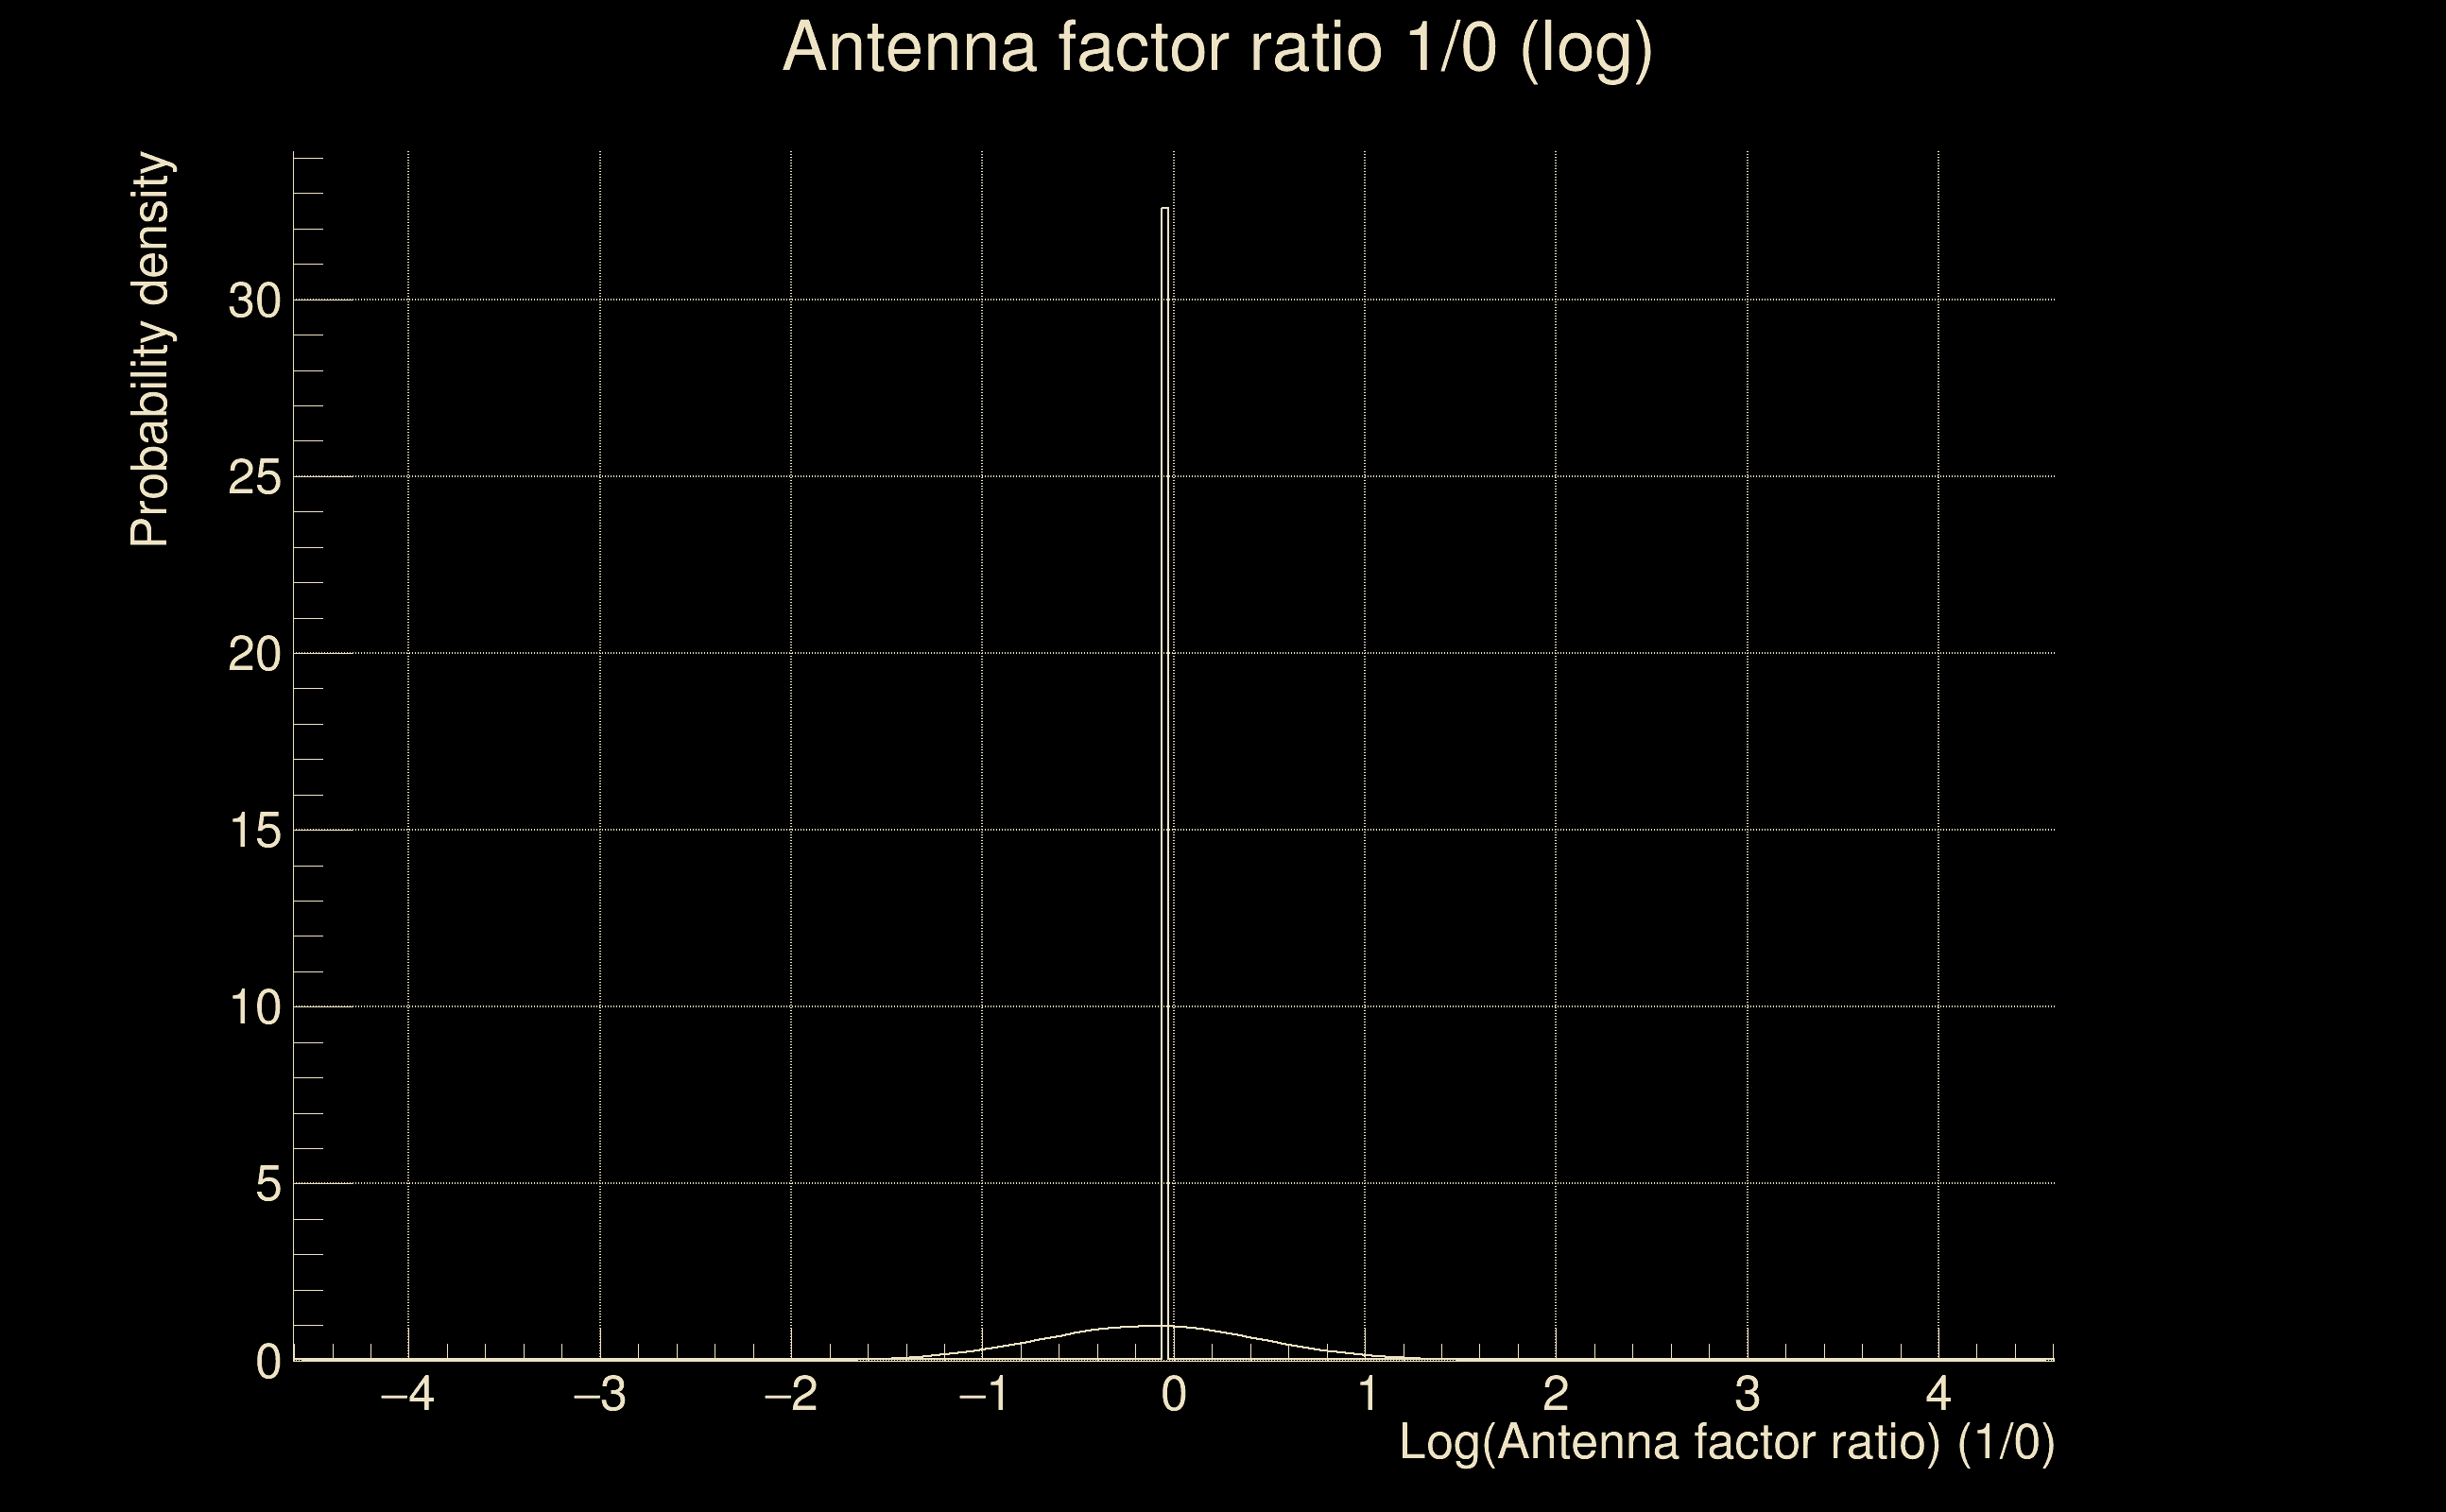
| Antenna factor probability: | 0.991601 |
| Number of rejected frequency rows: | Q0: 0 / 18, Q1: 1 / 36, Q2: 5 / 70, Q3: 11 / 134, Q4: 36 / 258 |
| Maximum signal-to-noise ratio: | H1: 83.0241, L1: 85.2742 |
| SNR variance: | H1: 3.79081, L1: 3.98412 |
| Click here for a zoomed plot | Click here for a zoomed plot | Click here for a zoomed plot | Click here for a zoomed plot | Click here for a zoomed plot |
 |
 |
 |
 |
 |
 |
 |
 |
 |
 |
 |
 |
 |
 |
 |
 |
 |
 |
 |
 |
 |
 |
 |
 |
 |
 |
 |
 |
 |
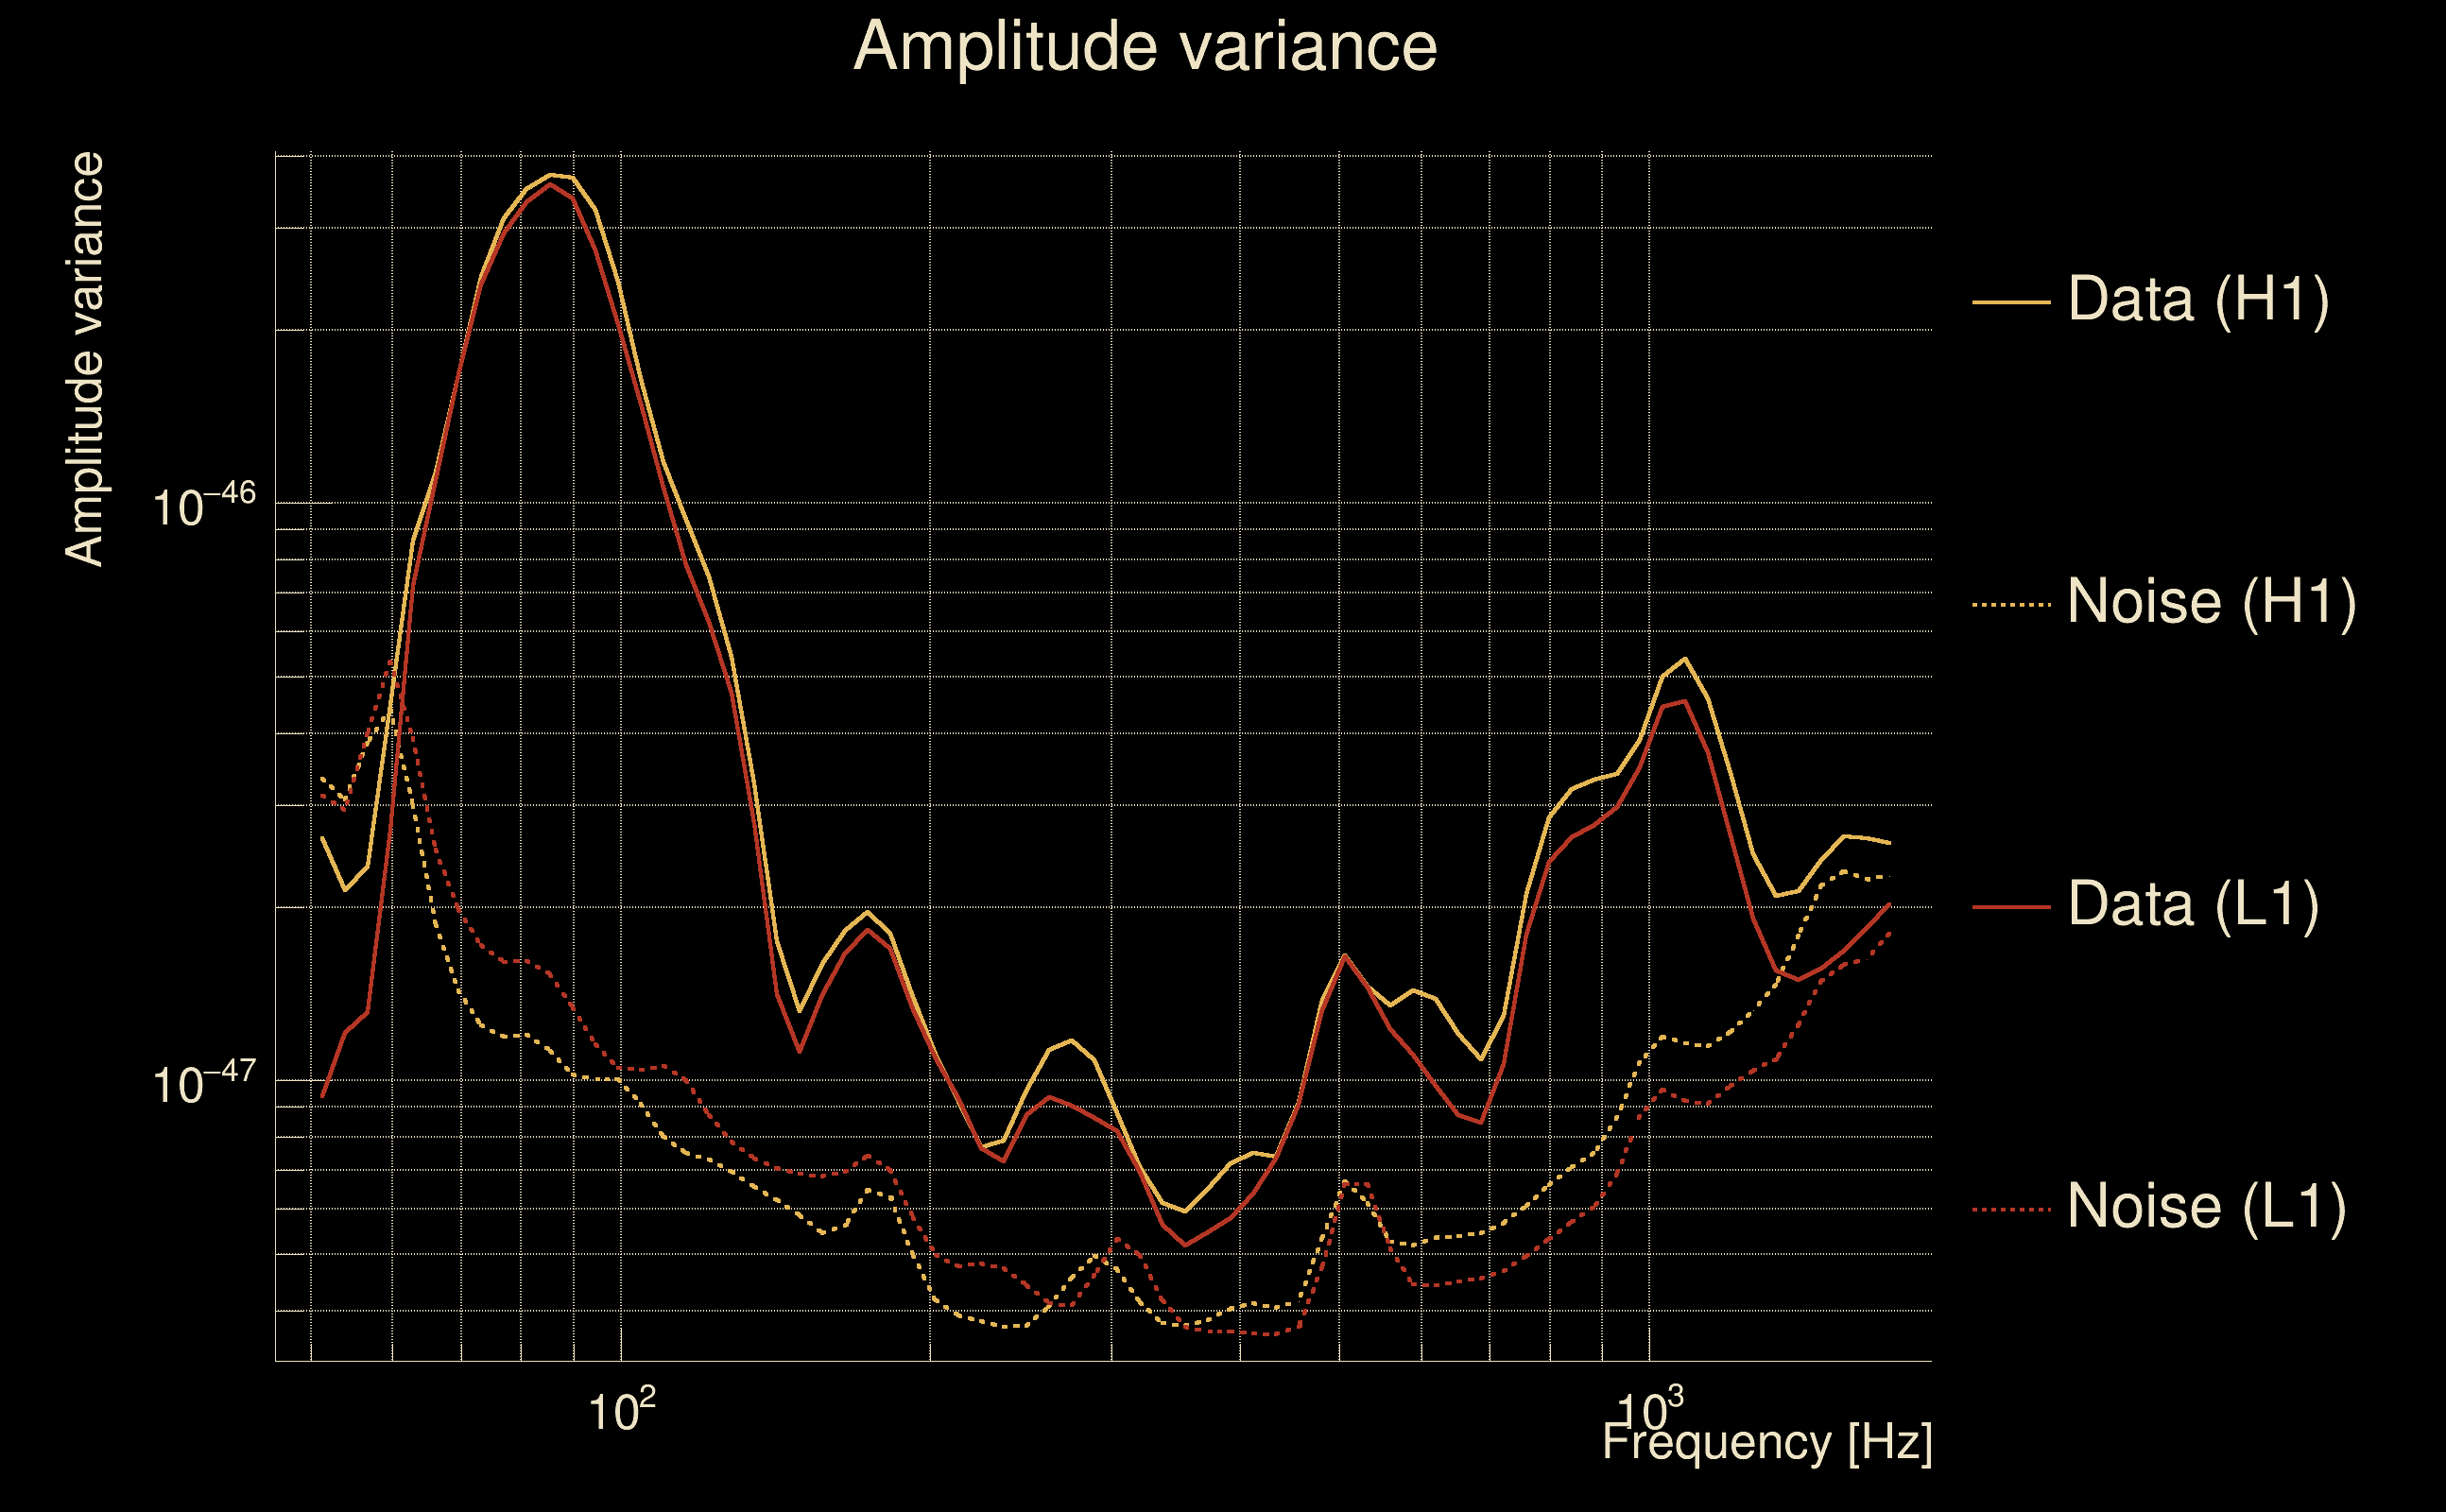
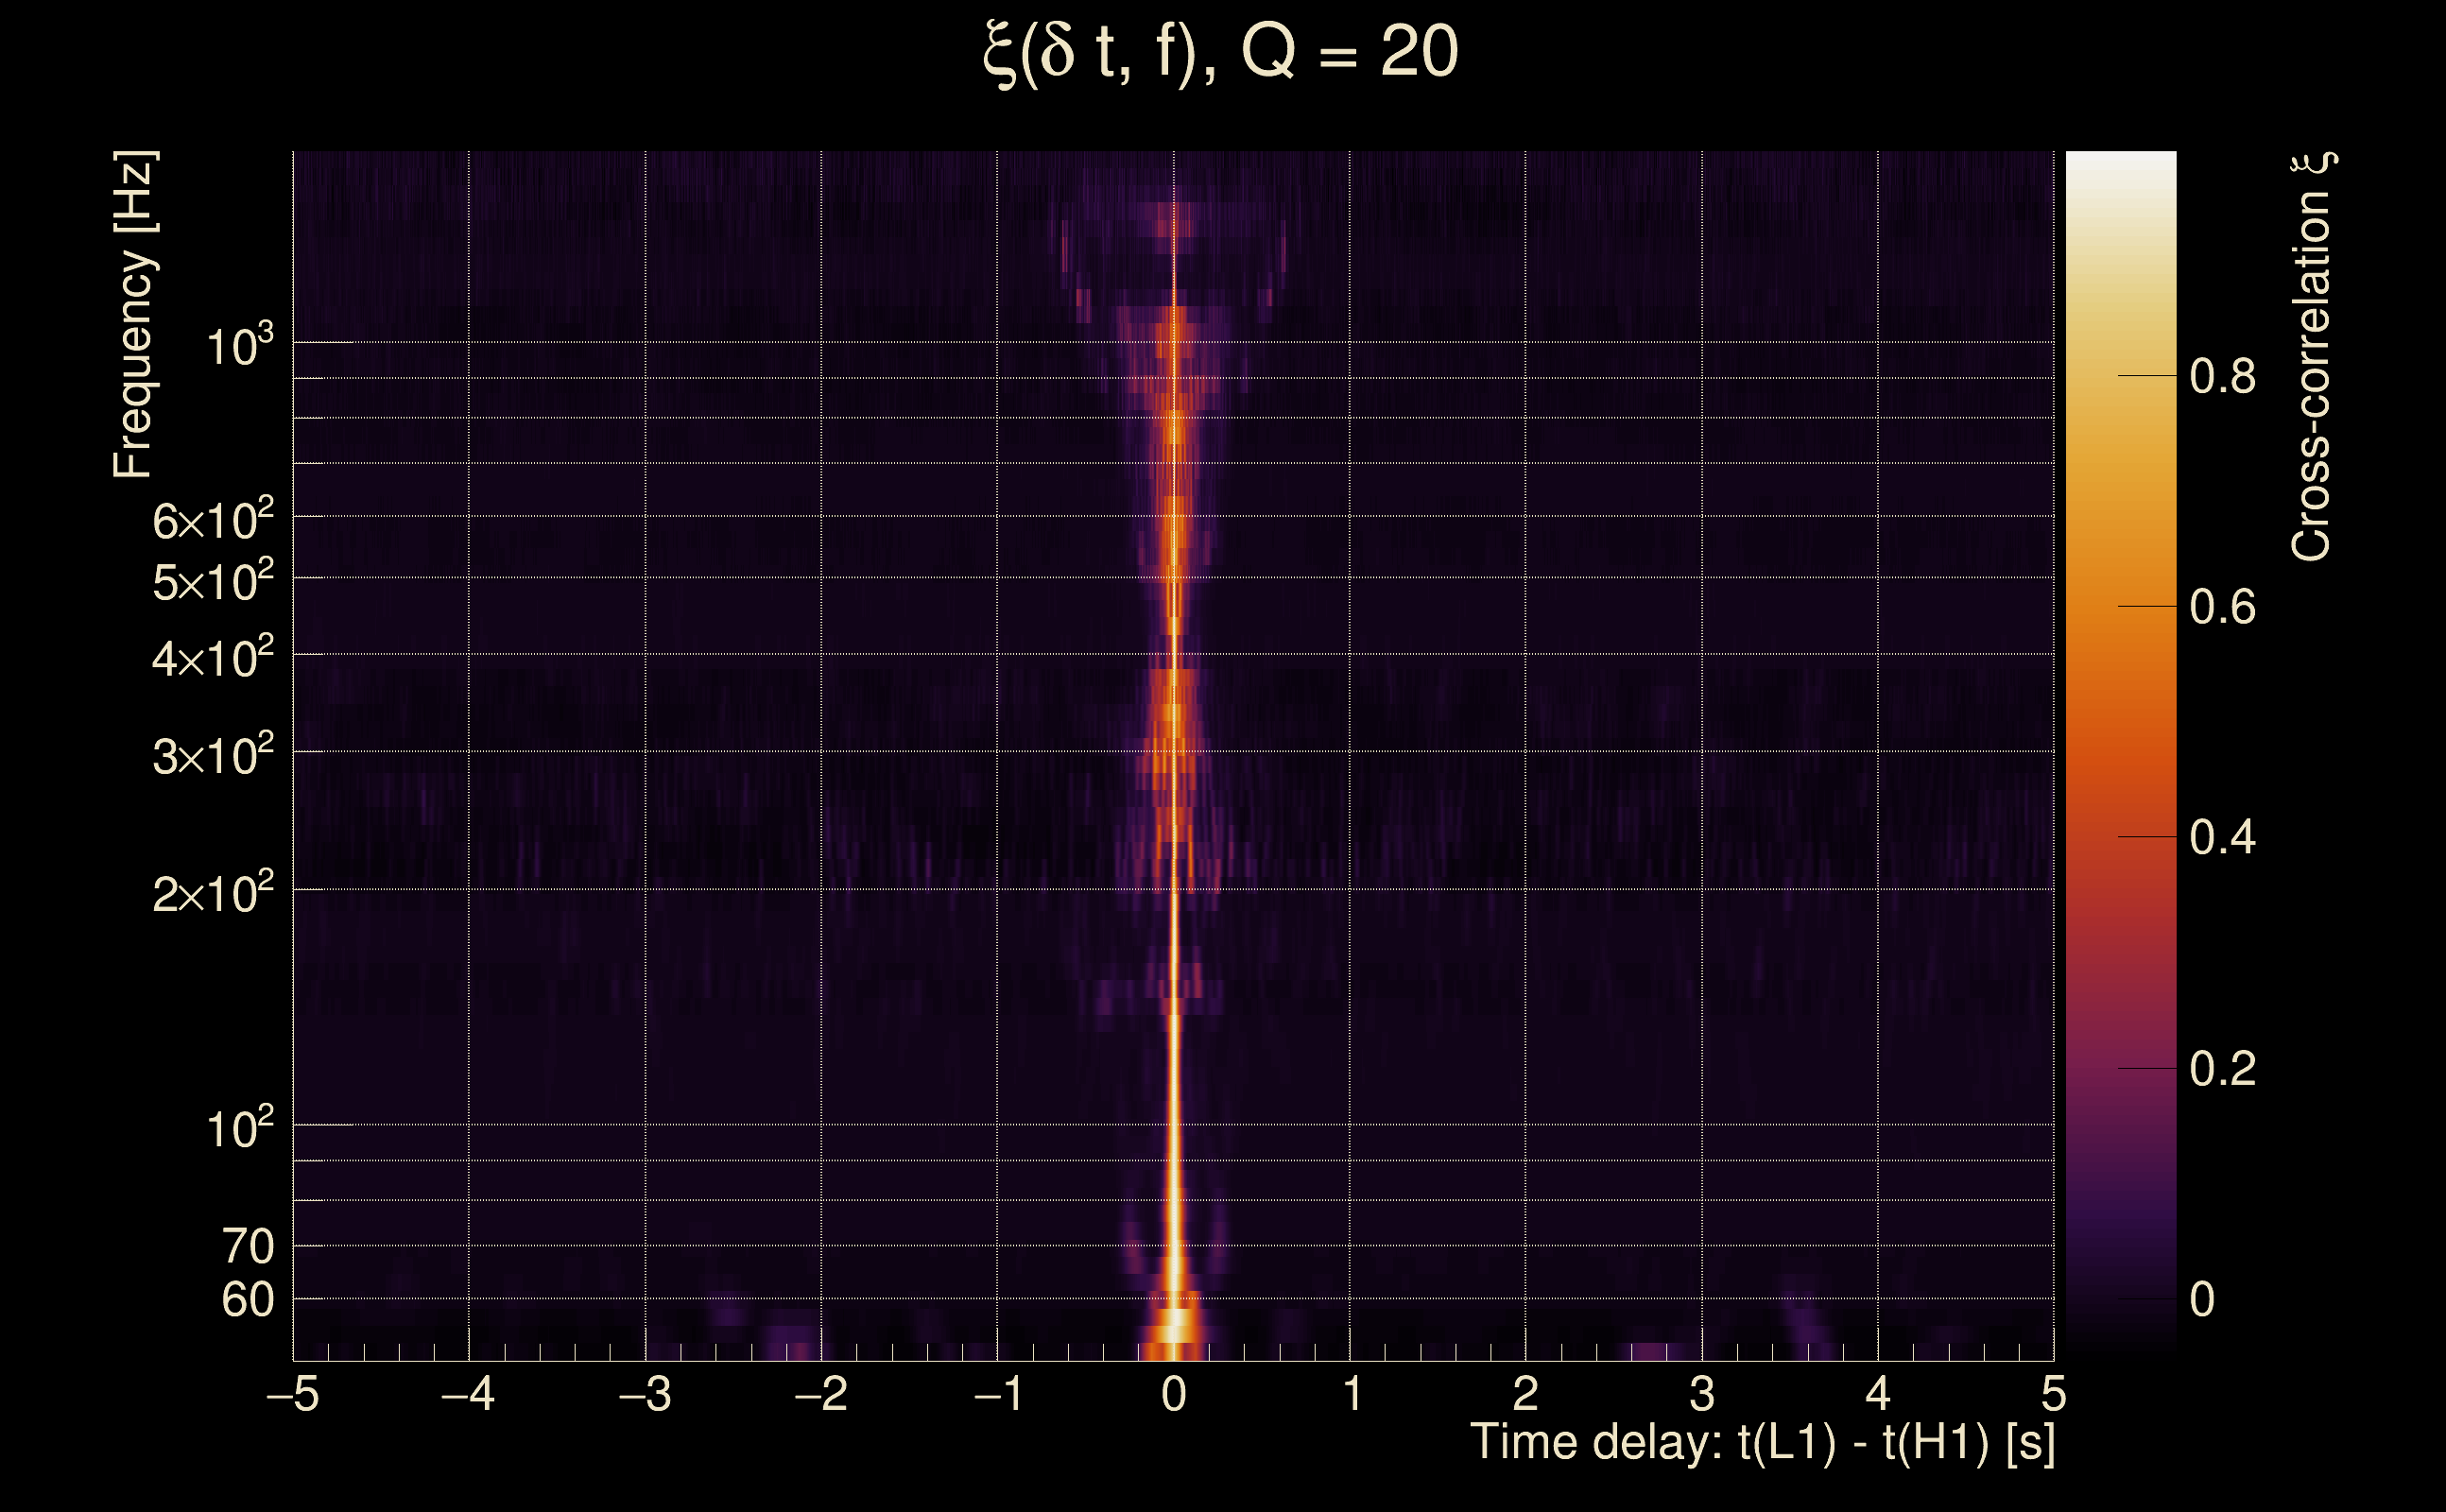
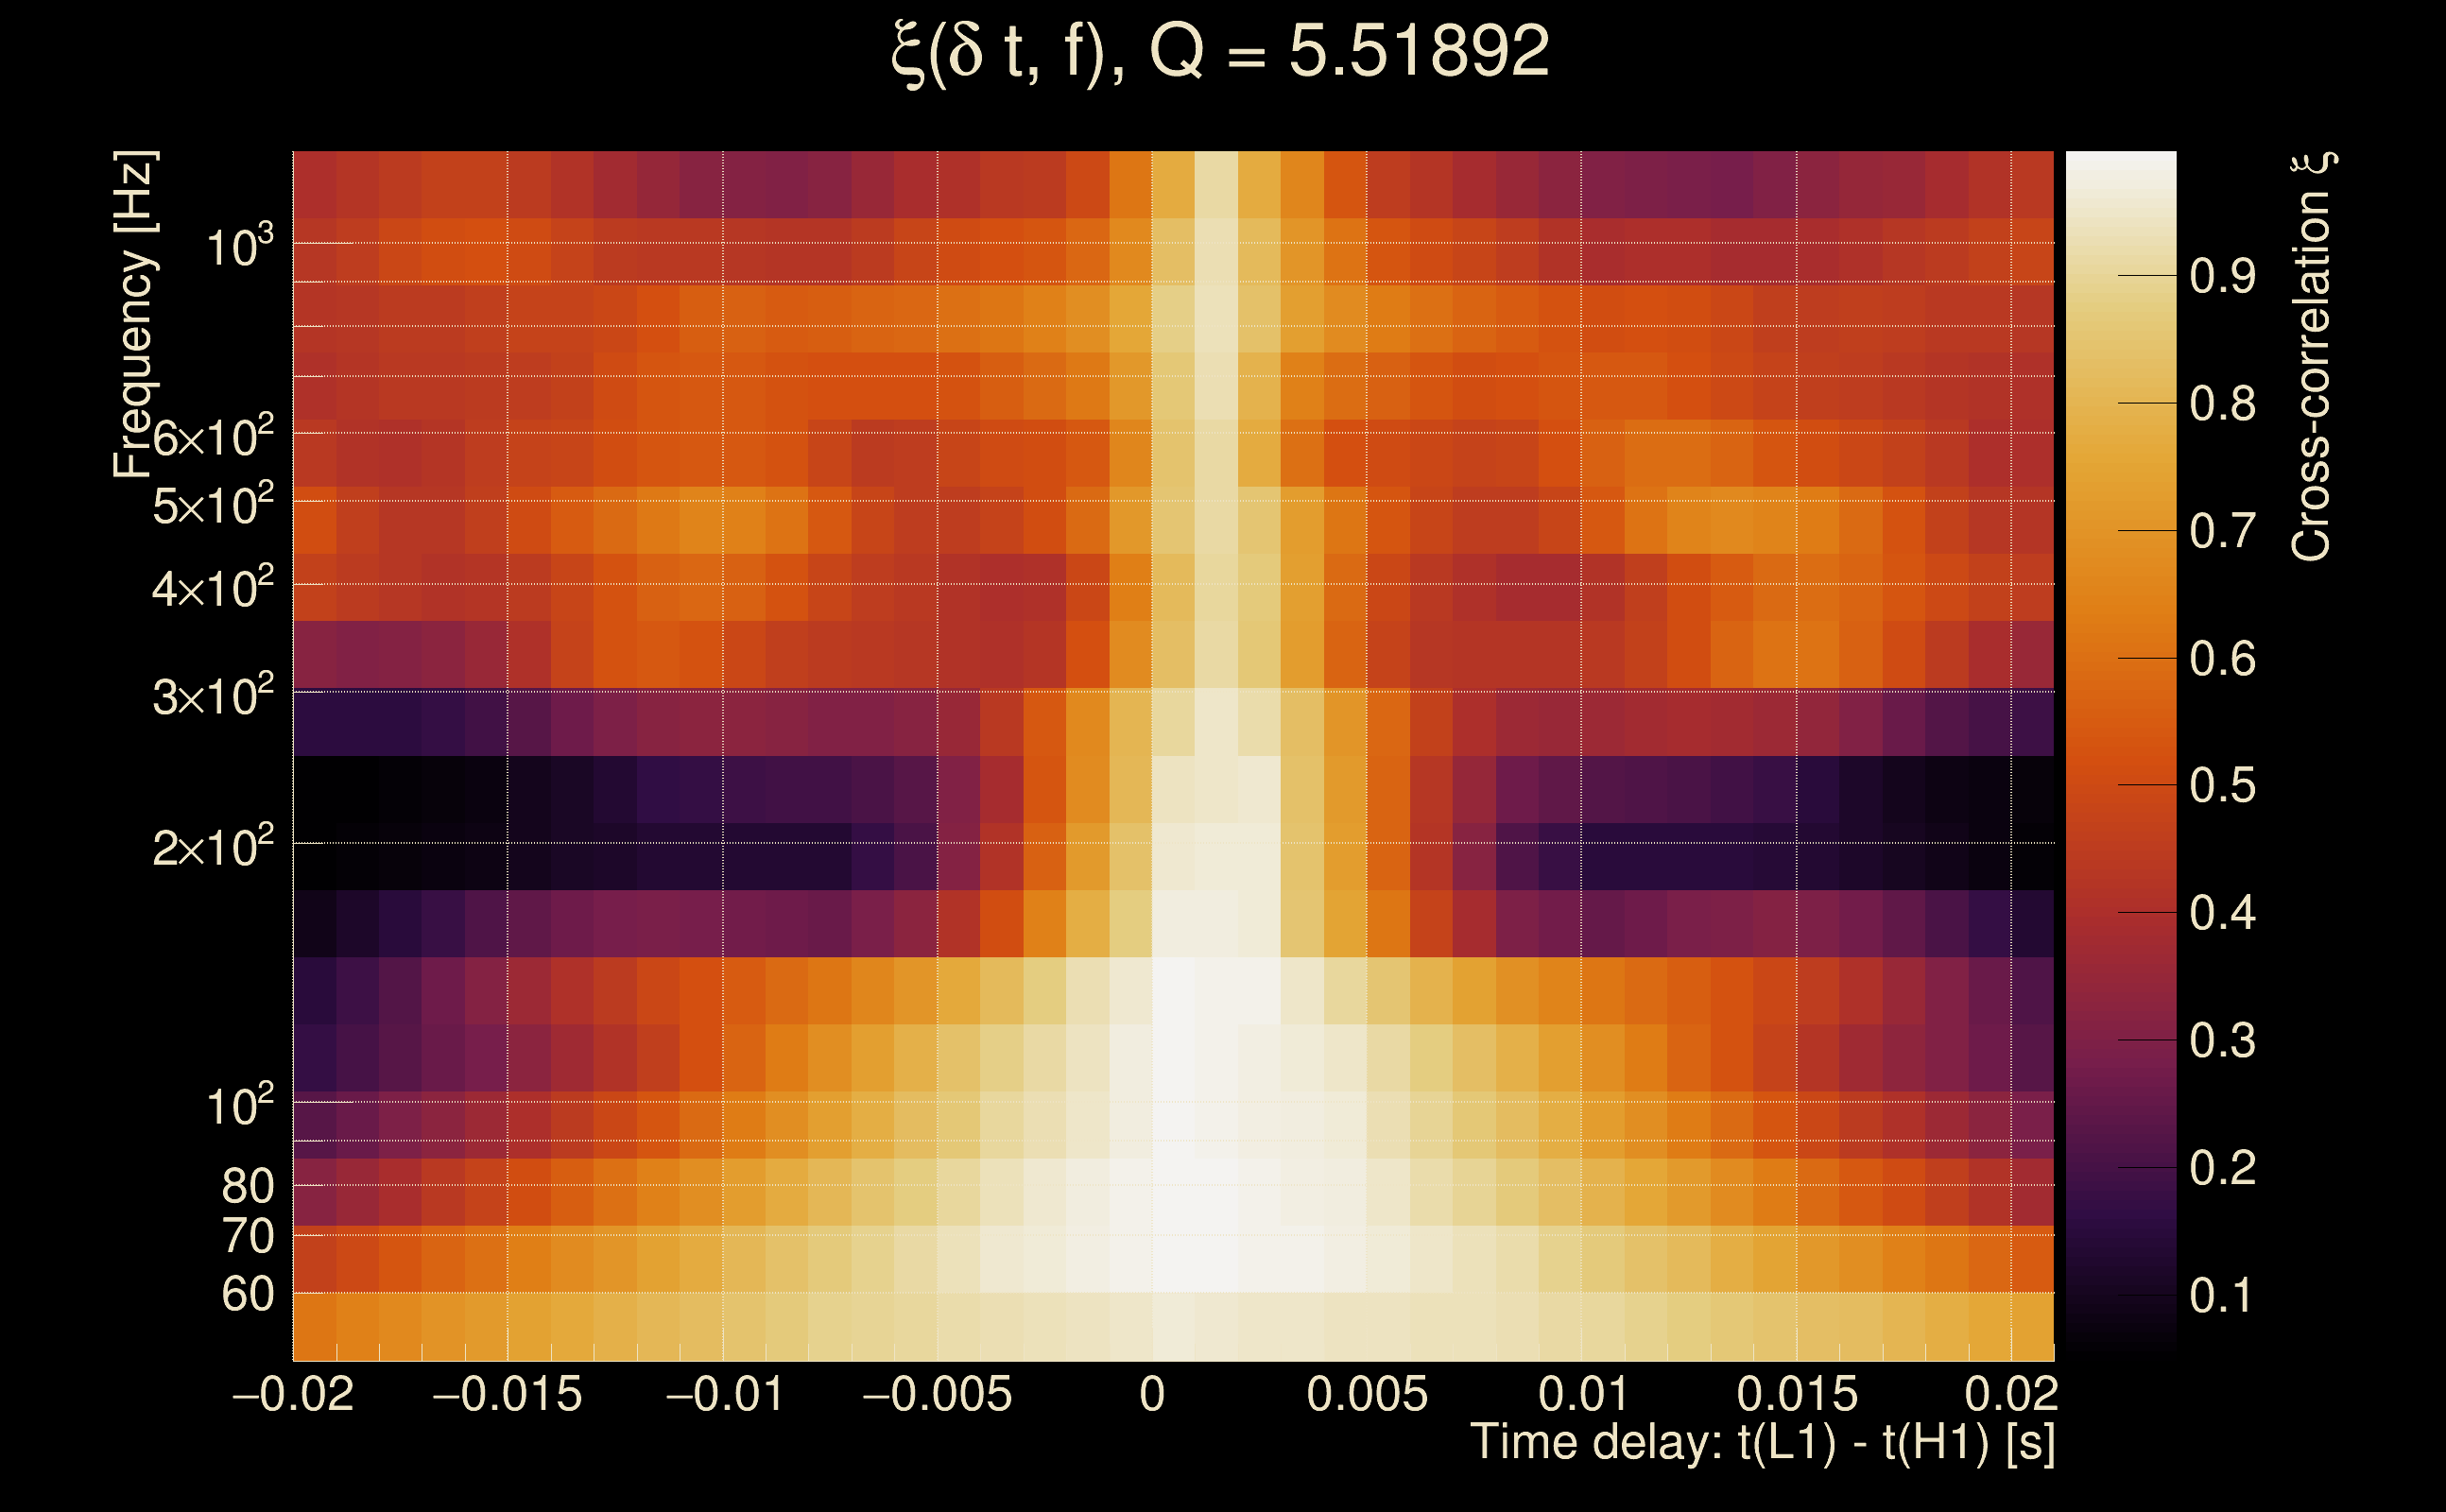
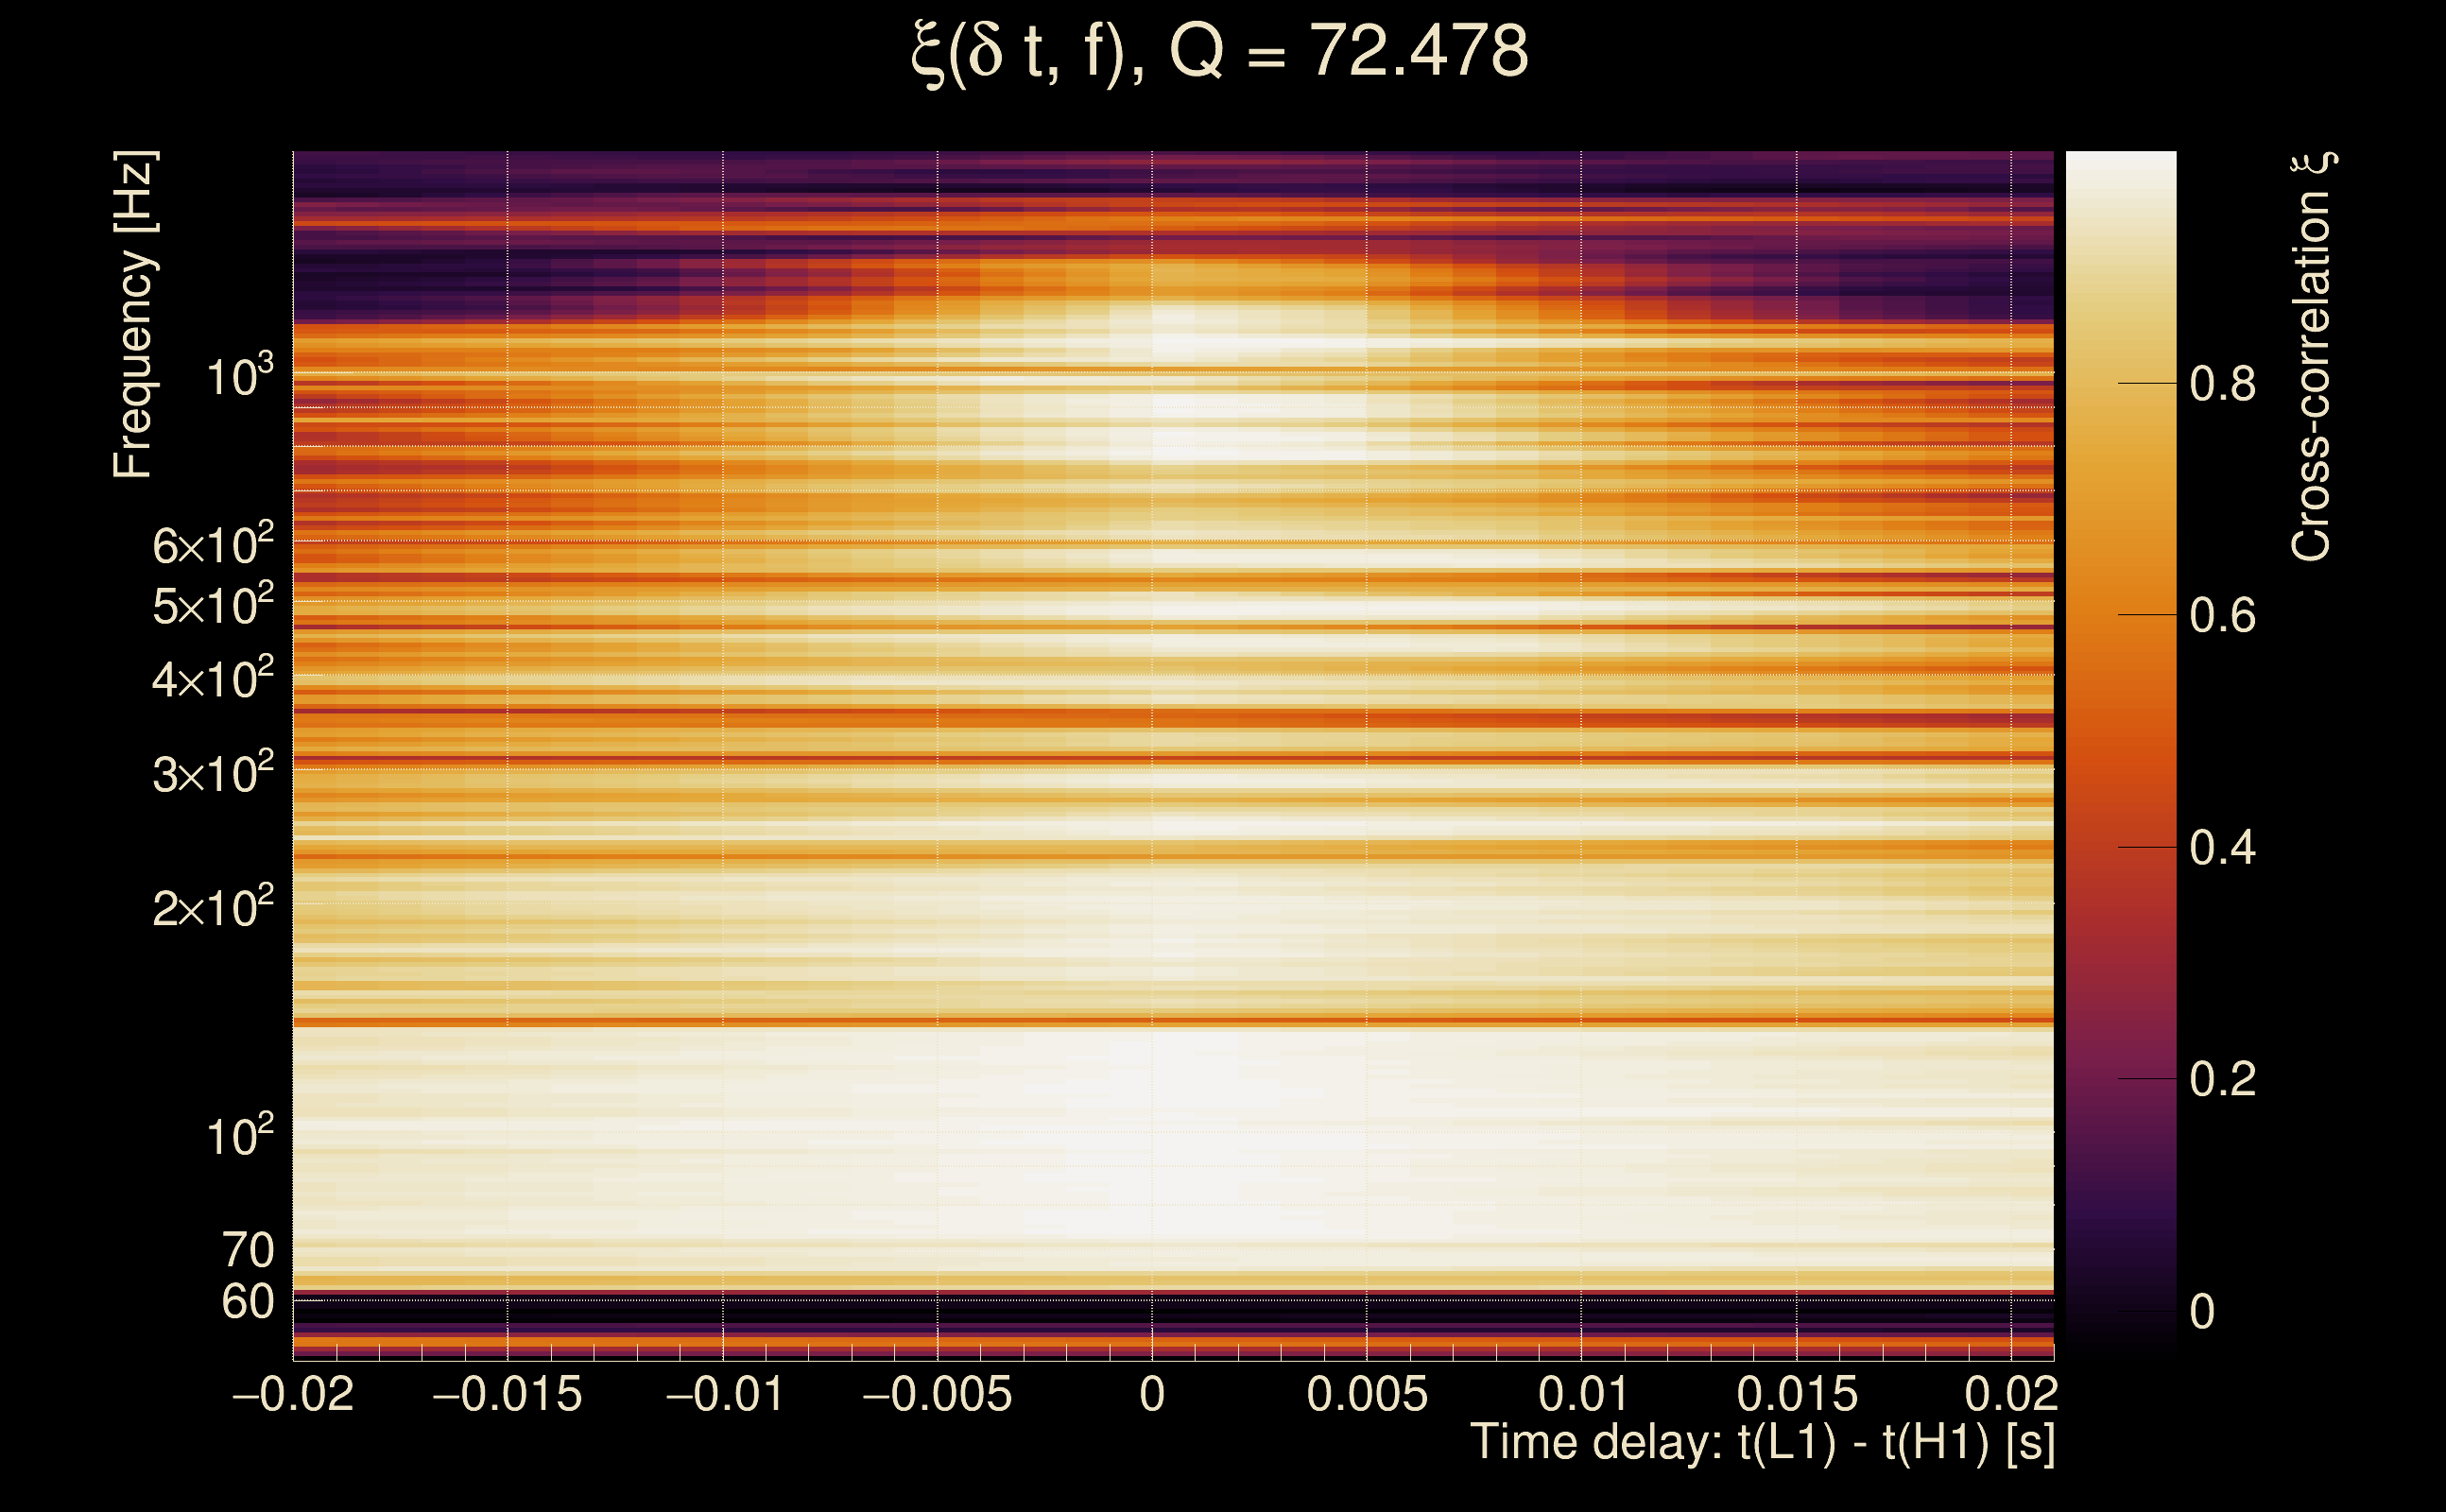
| Event time t(H1): | GPS = 1368334183 (Wed May 17 04:49:25 2023 ) → GPS = 1368334193 (Wed May 17 04:49:35 2023 ) |
| Event time t(L1): | GPS = 1368334183 (Wed May 17 04:49:35 2023 ) → GPS = 1368334193 (Wed May 17 04:49:35 2023 ) |
| Omicron analysis time window (H1): | GPS = 1368334180 → GPS = 1368334196 |
| Omicron analysis time window (L1): | GPS = 1368334180 → GPS = 1368334196 |
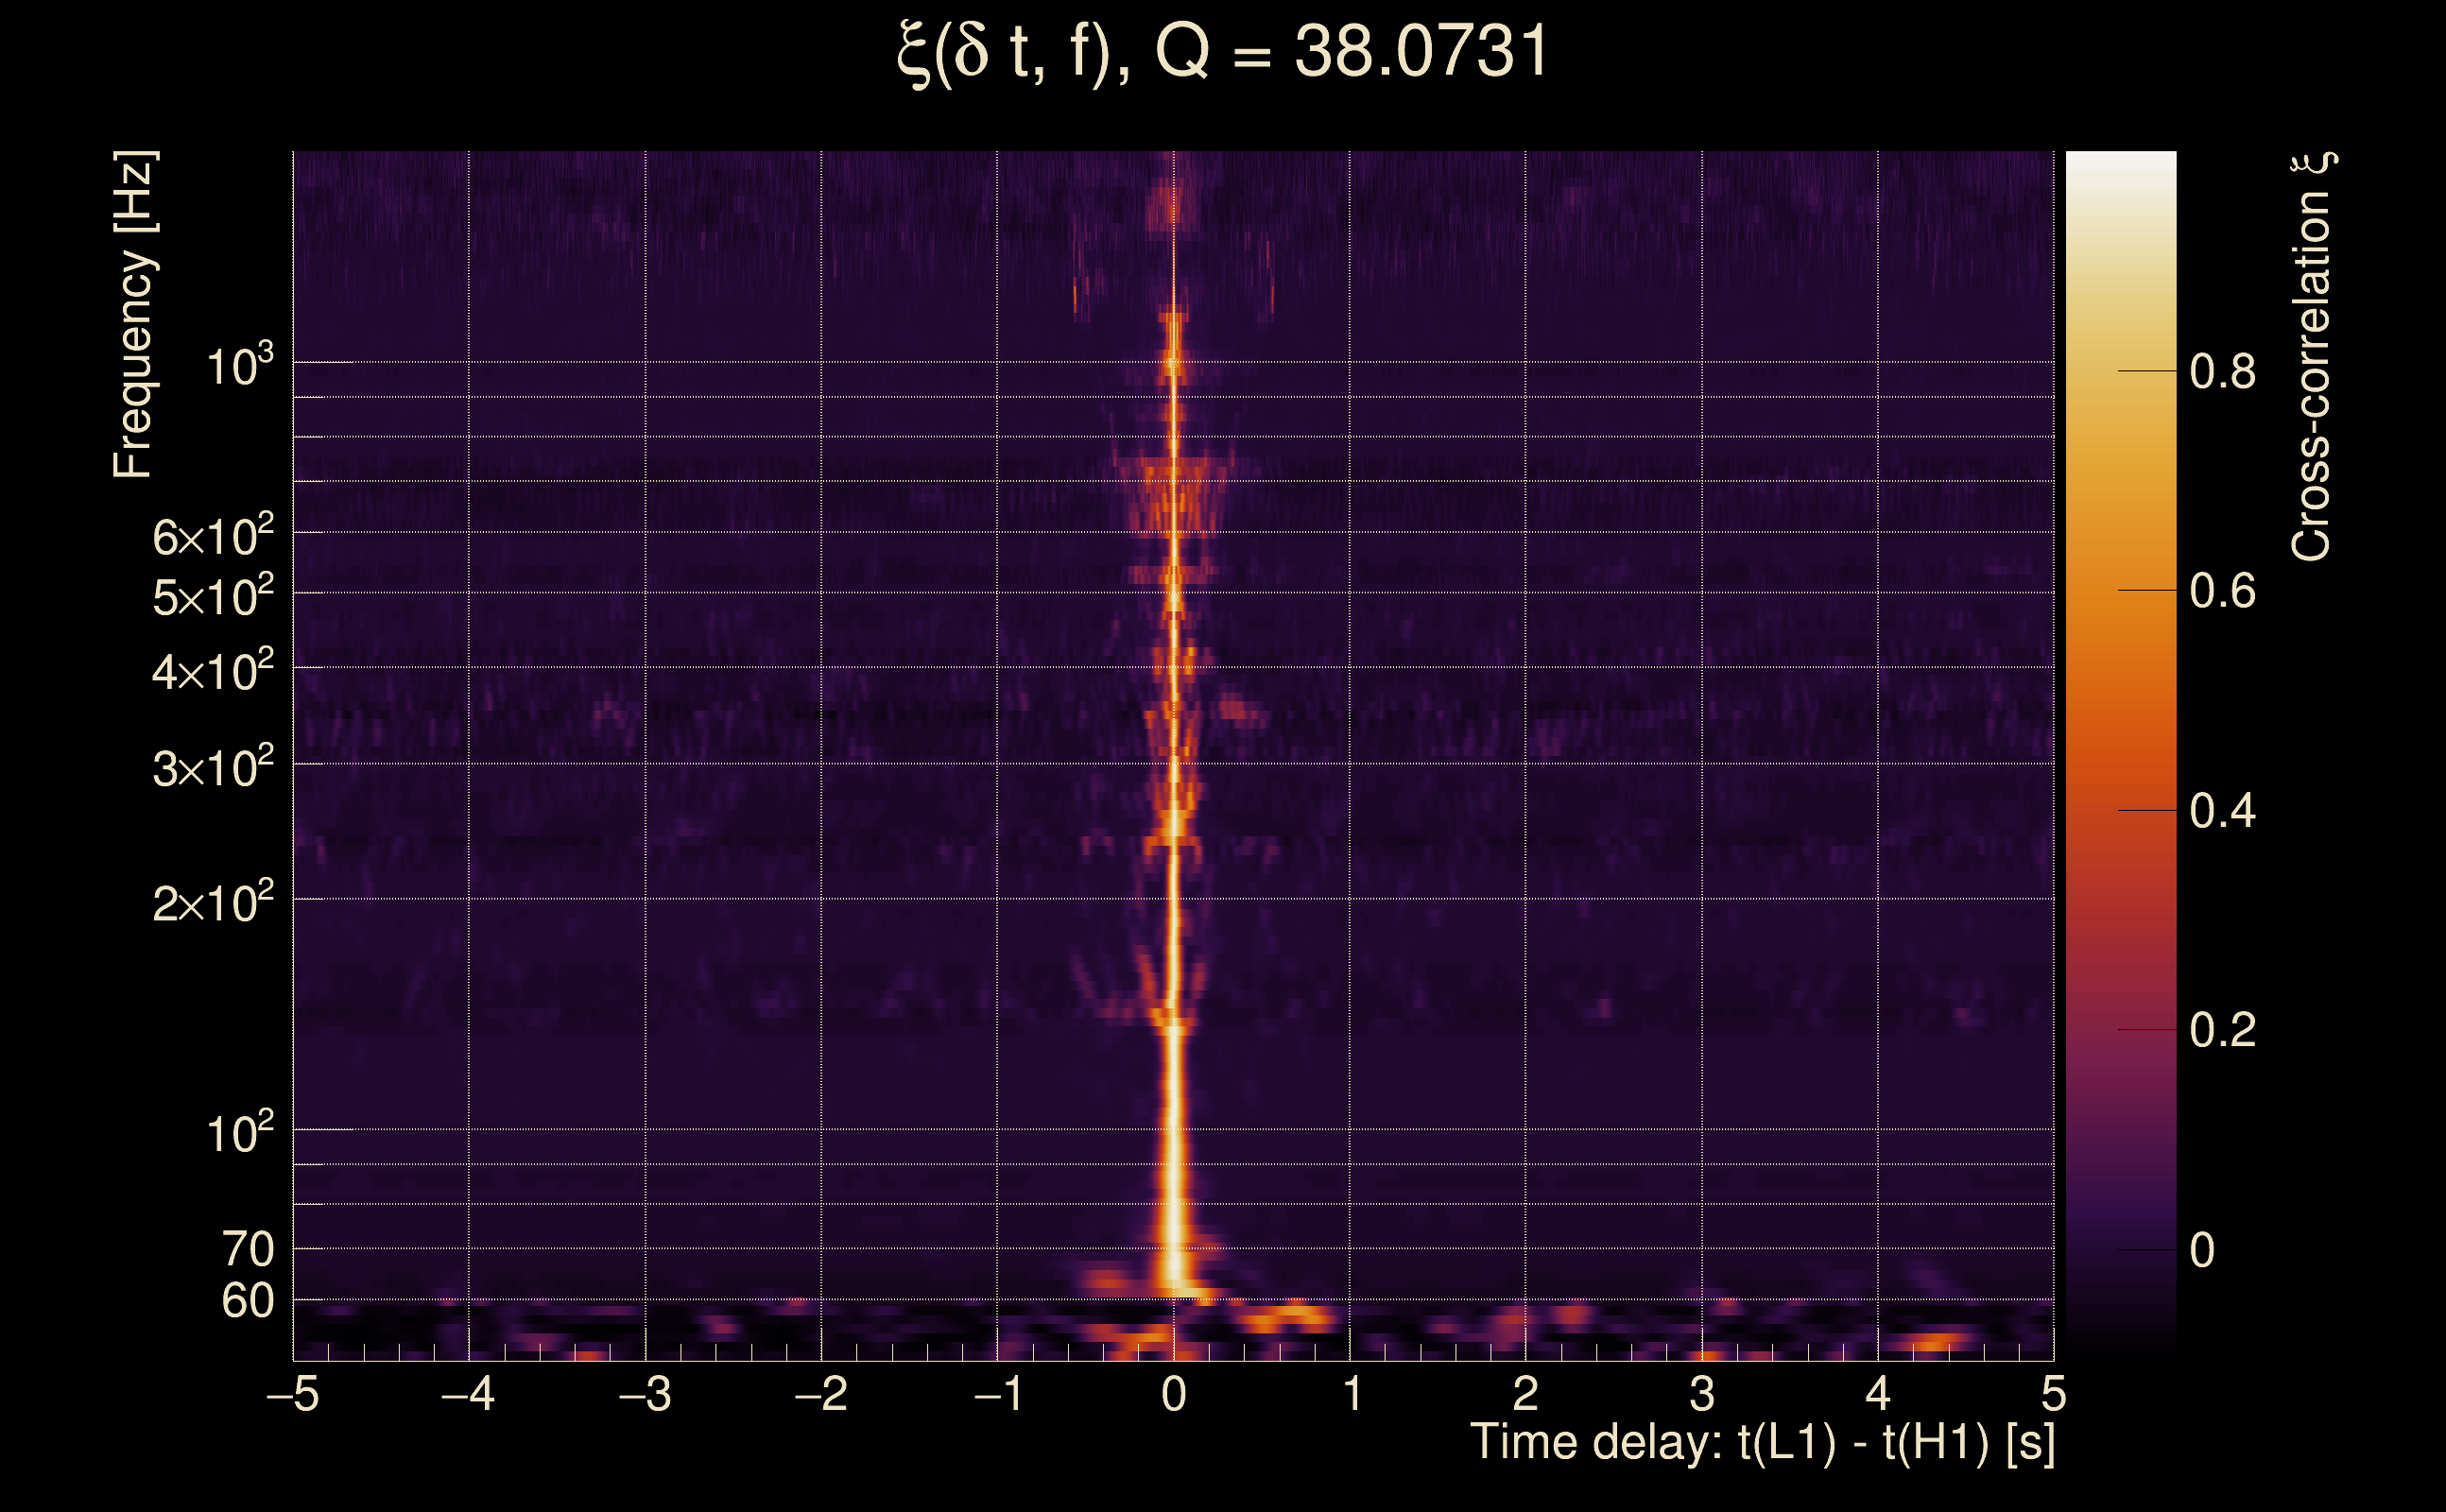
| Time delay between detectors t(L1) - t(H1): | 0.000971403 s (slice index = 108 / 217), δt_gw = 0.000971403 s |
| Time delay standard deviation: | 0.0238529 s |
| [targeted mode] Time delay probability: | 0.959442 (0.0508538 sigmas), δt_target = 0.000943899 s |
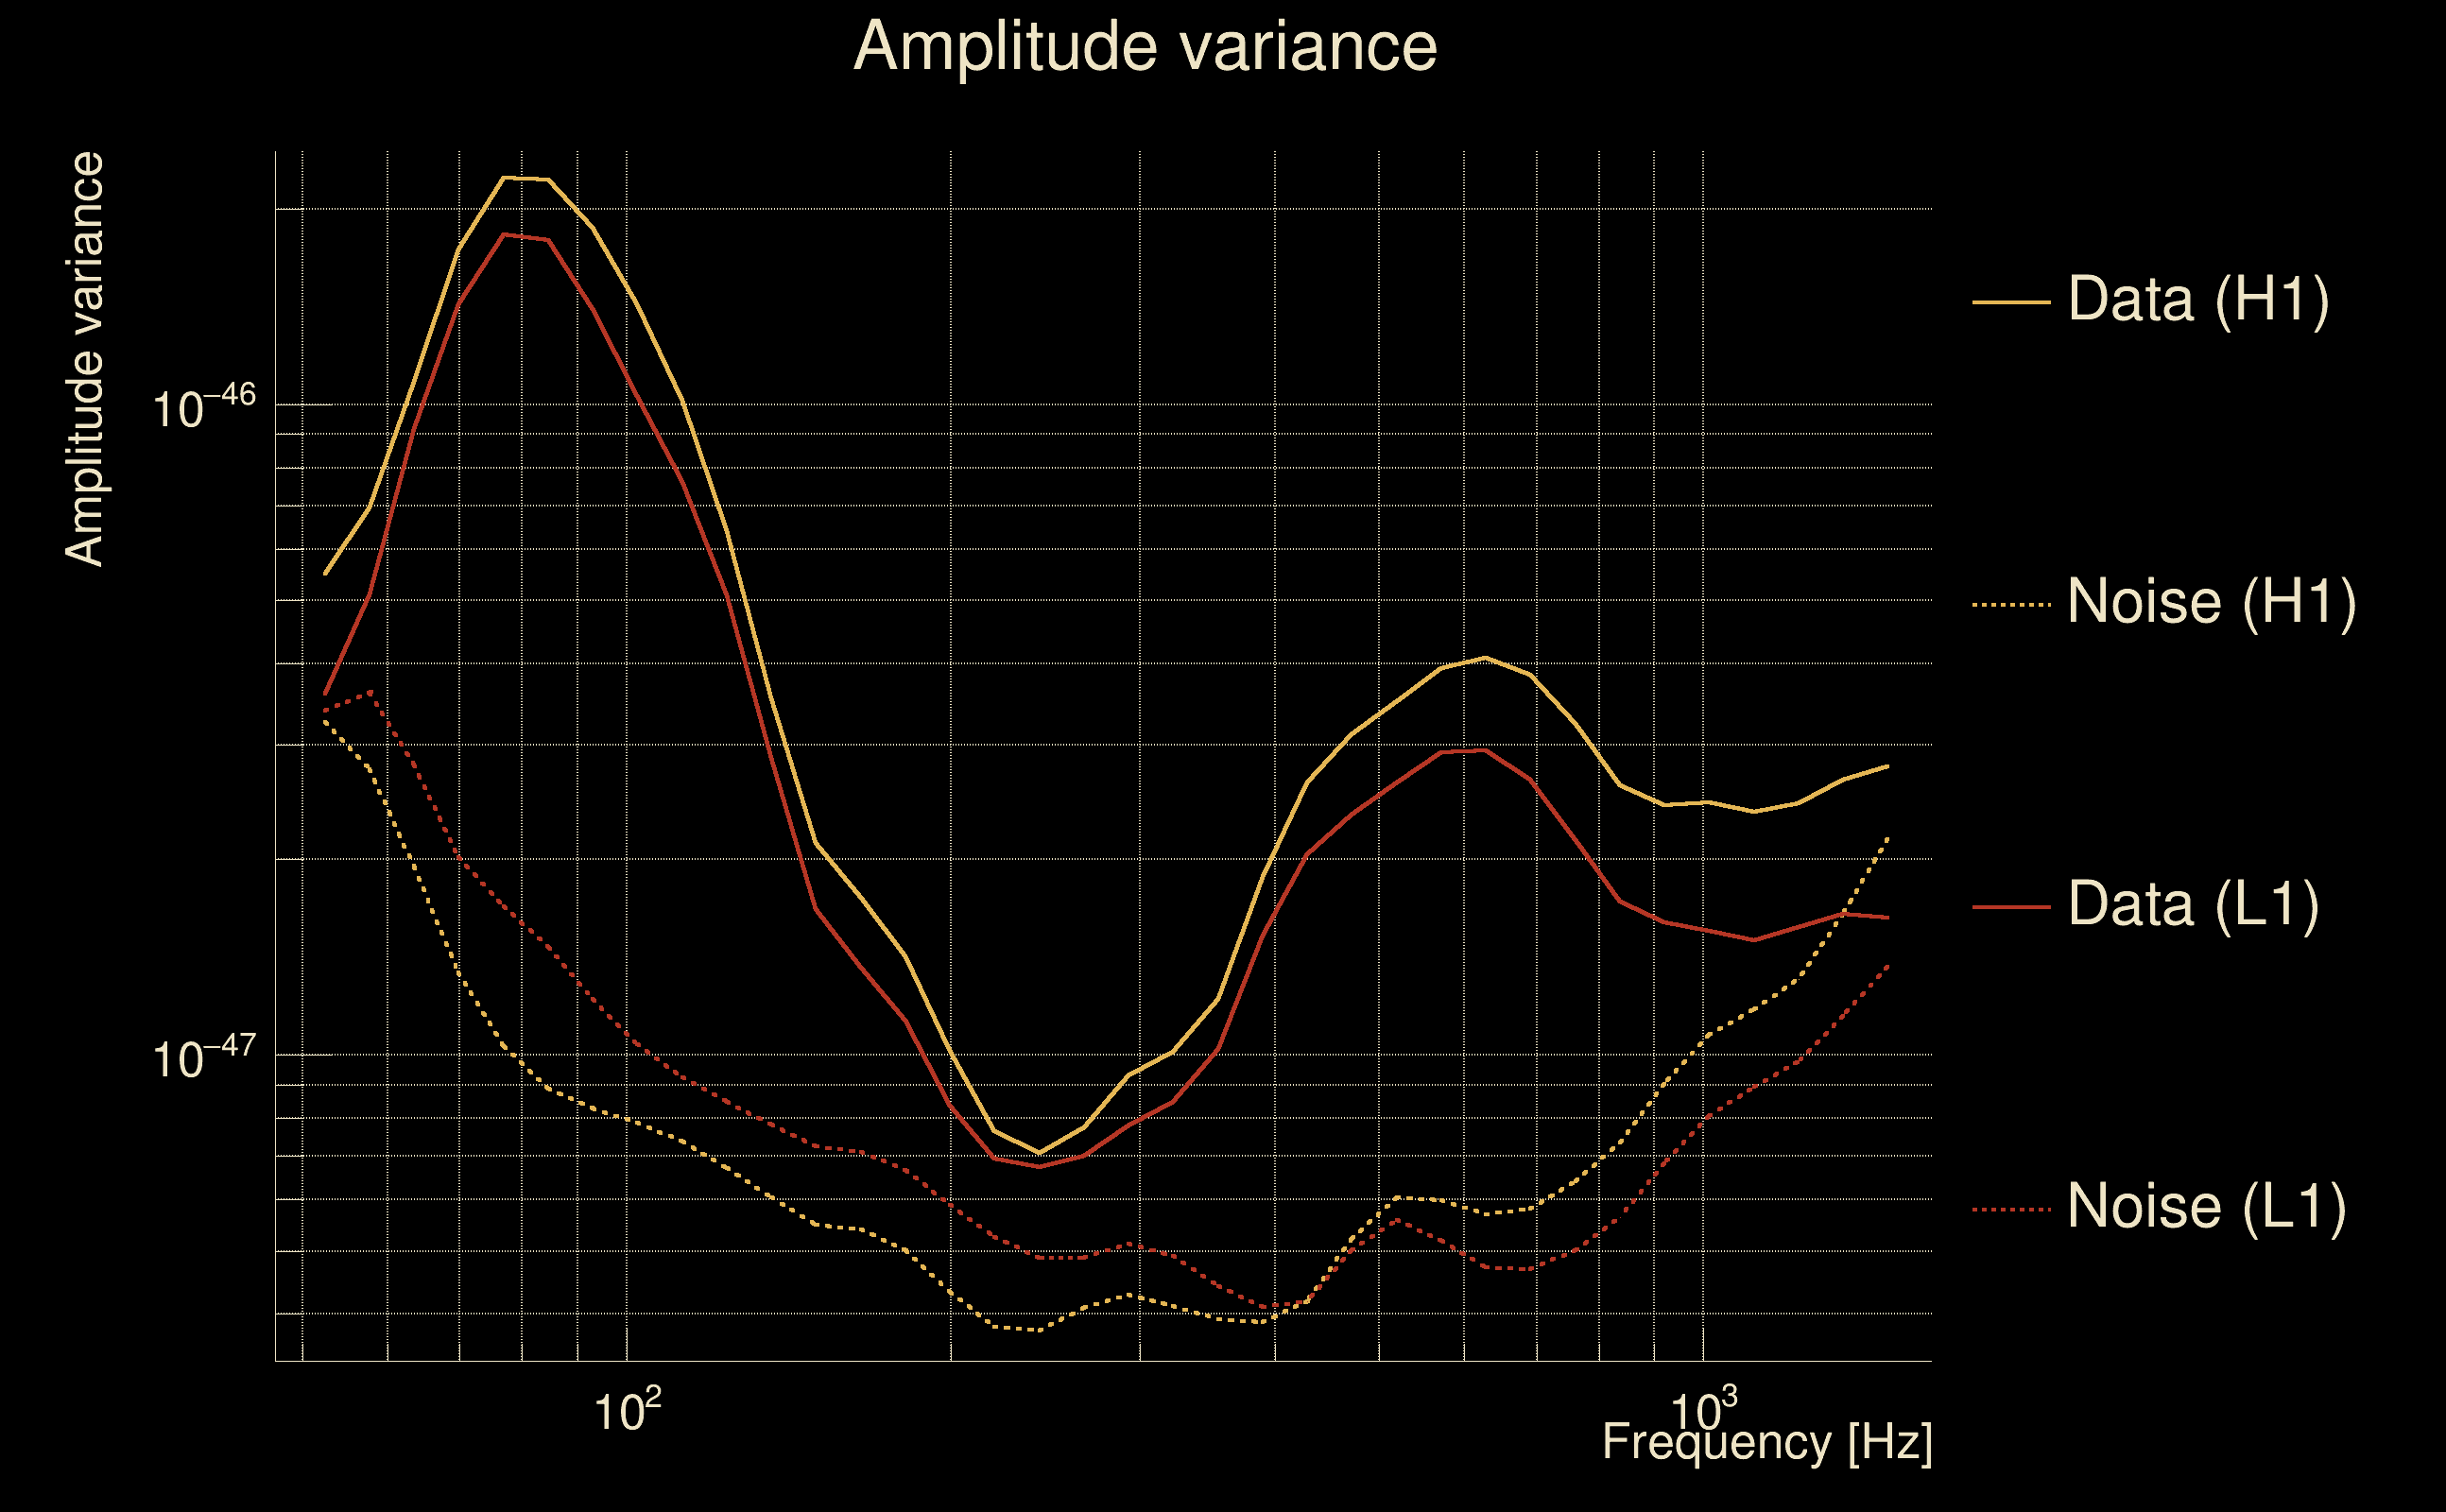
| Frequency: | 286.681 Hz |
| Ξ: | 0.920911 ± 0.012435 (variance = 0.000154629): Q0: 0.95221, Q1: 0.947485, Q2: 0.937294, Q3: 0.927802, Q4: 0.918349 |
| Rank: | R_A = 0.855651 |
| Log of amplitude ratio (L1/H1): | -0.0502616, variance = 0.151283 (L1/H1: -0.0610408, variance = 0.302393, H1/L1: 0.0400367, variance = 0.302323) |
| Amplitude ratio (L1/H1): | 0.950981 ⋇ 1.47543 (L1/H1: 0.940785 ⋇ 1.73308, H1/L1: 1.04085 ⋇ 1.73297) |
| Amplitude ratio H1|L1 compatibility (probability): | 0.978452 |
| Antenna factor probability: | 0.989739 |
| Number of rejected frequency rows: | Q0: 0 / 18, Q1: 1 / 36, Q2: 5 / 70, Q3: 11 / 134, Q4: 36 / 258 |
| Maximum signal-to-noise ratio: | H1: 83.4979, L1: 85.7312 |
| SNR variance: | H1: 0.464532, L1: 0.488895 |
| Click here for a zoomed plot | Click here for a zoomed plot | Click here for a zoomed plot | Click here for a zoomed plot | Click here for a zoomed plot |
 |
 |
 |
 |
 |
 |
 |
 |
 |
 |
 |
 |
 |
 |
 |
 |
 |
 |
 |
 |
 |
 |
 |
 |
 |
 |
 |
 |
 |
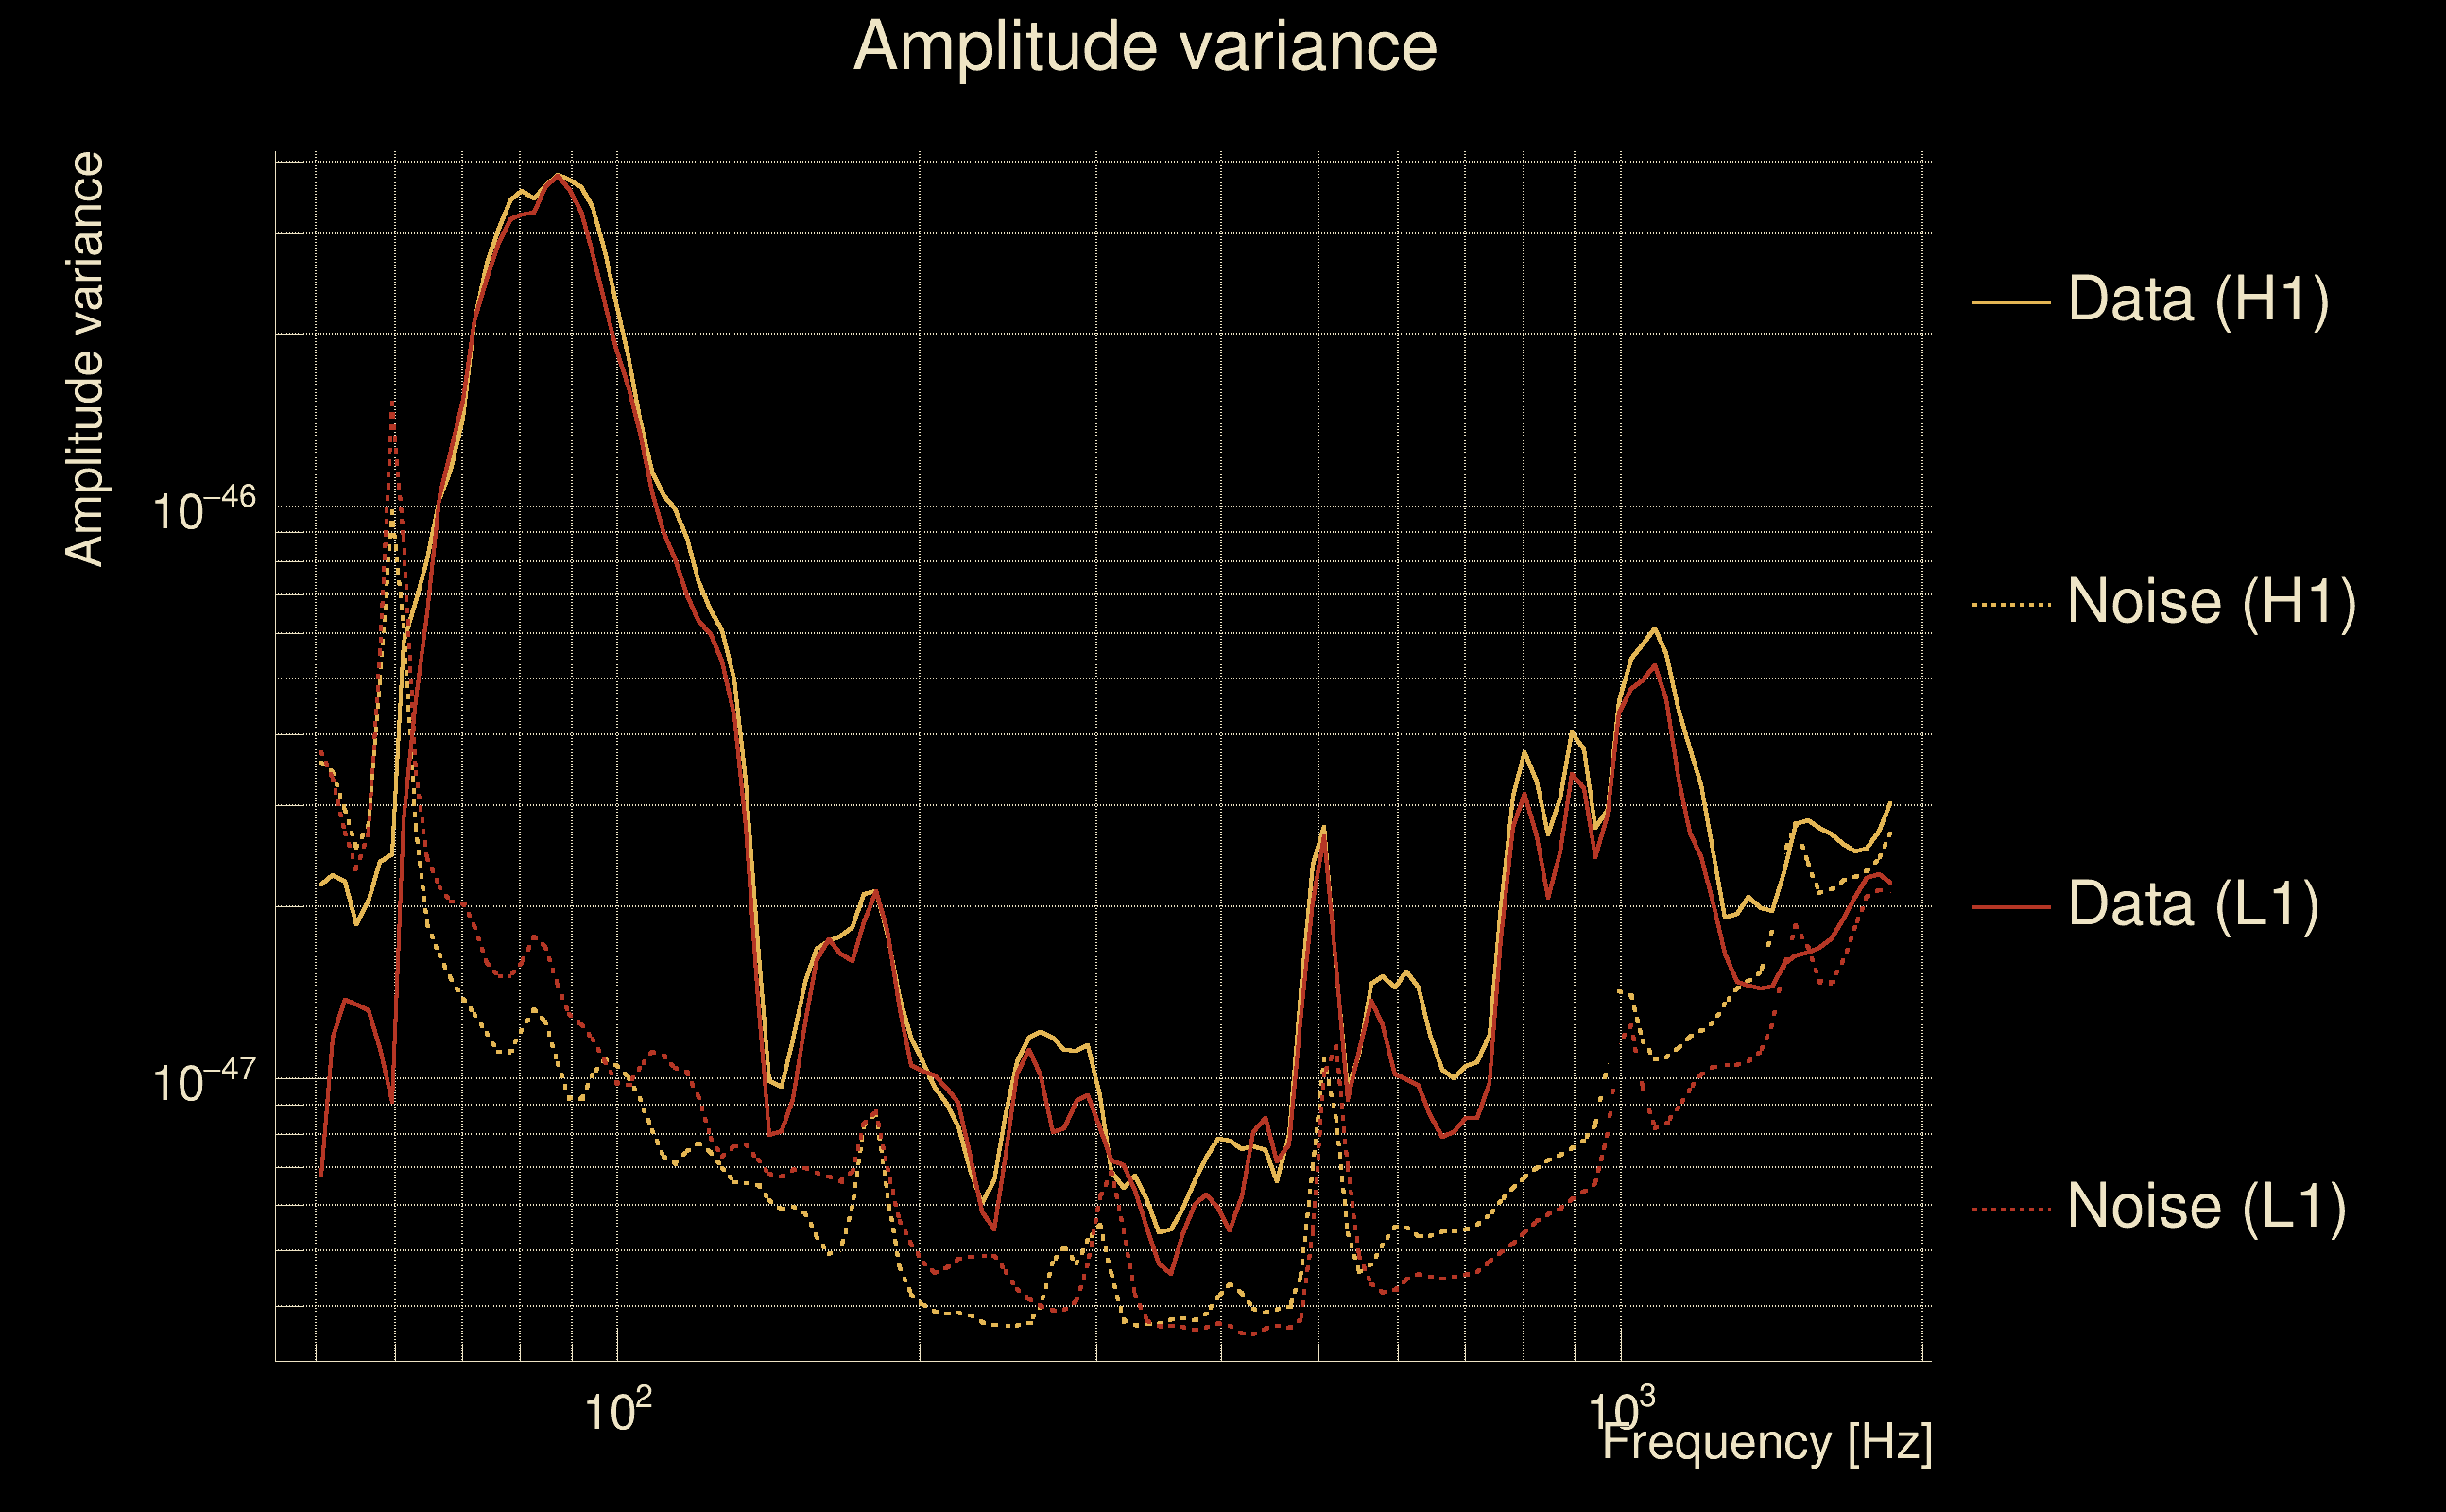
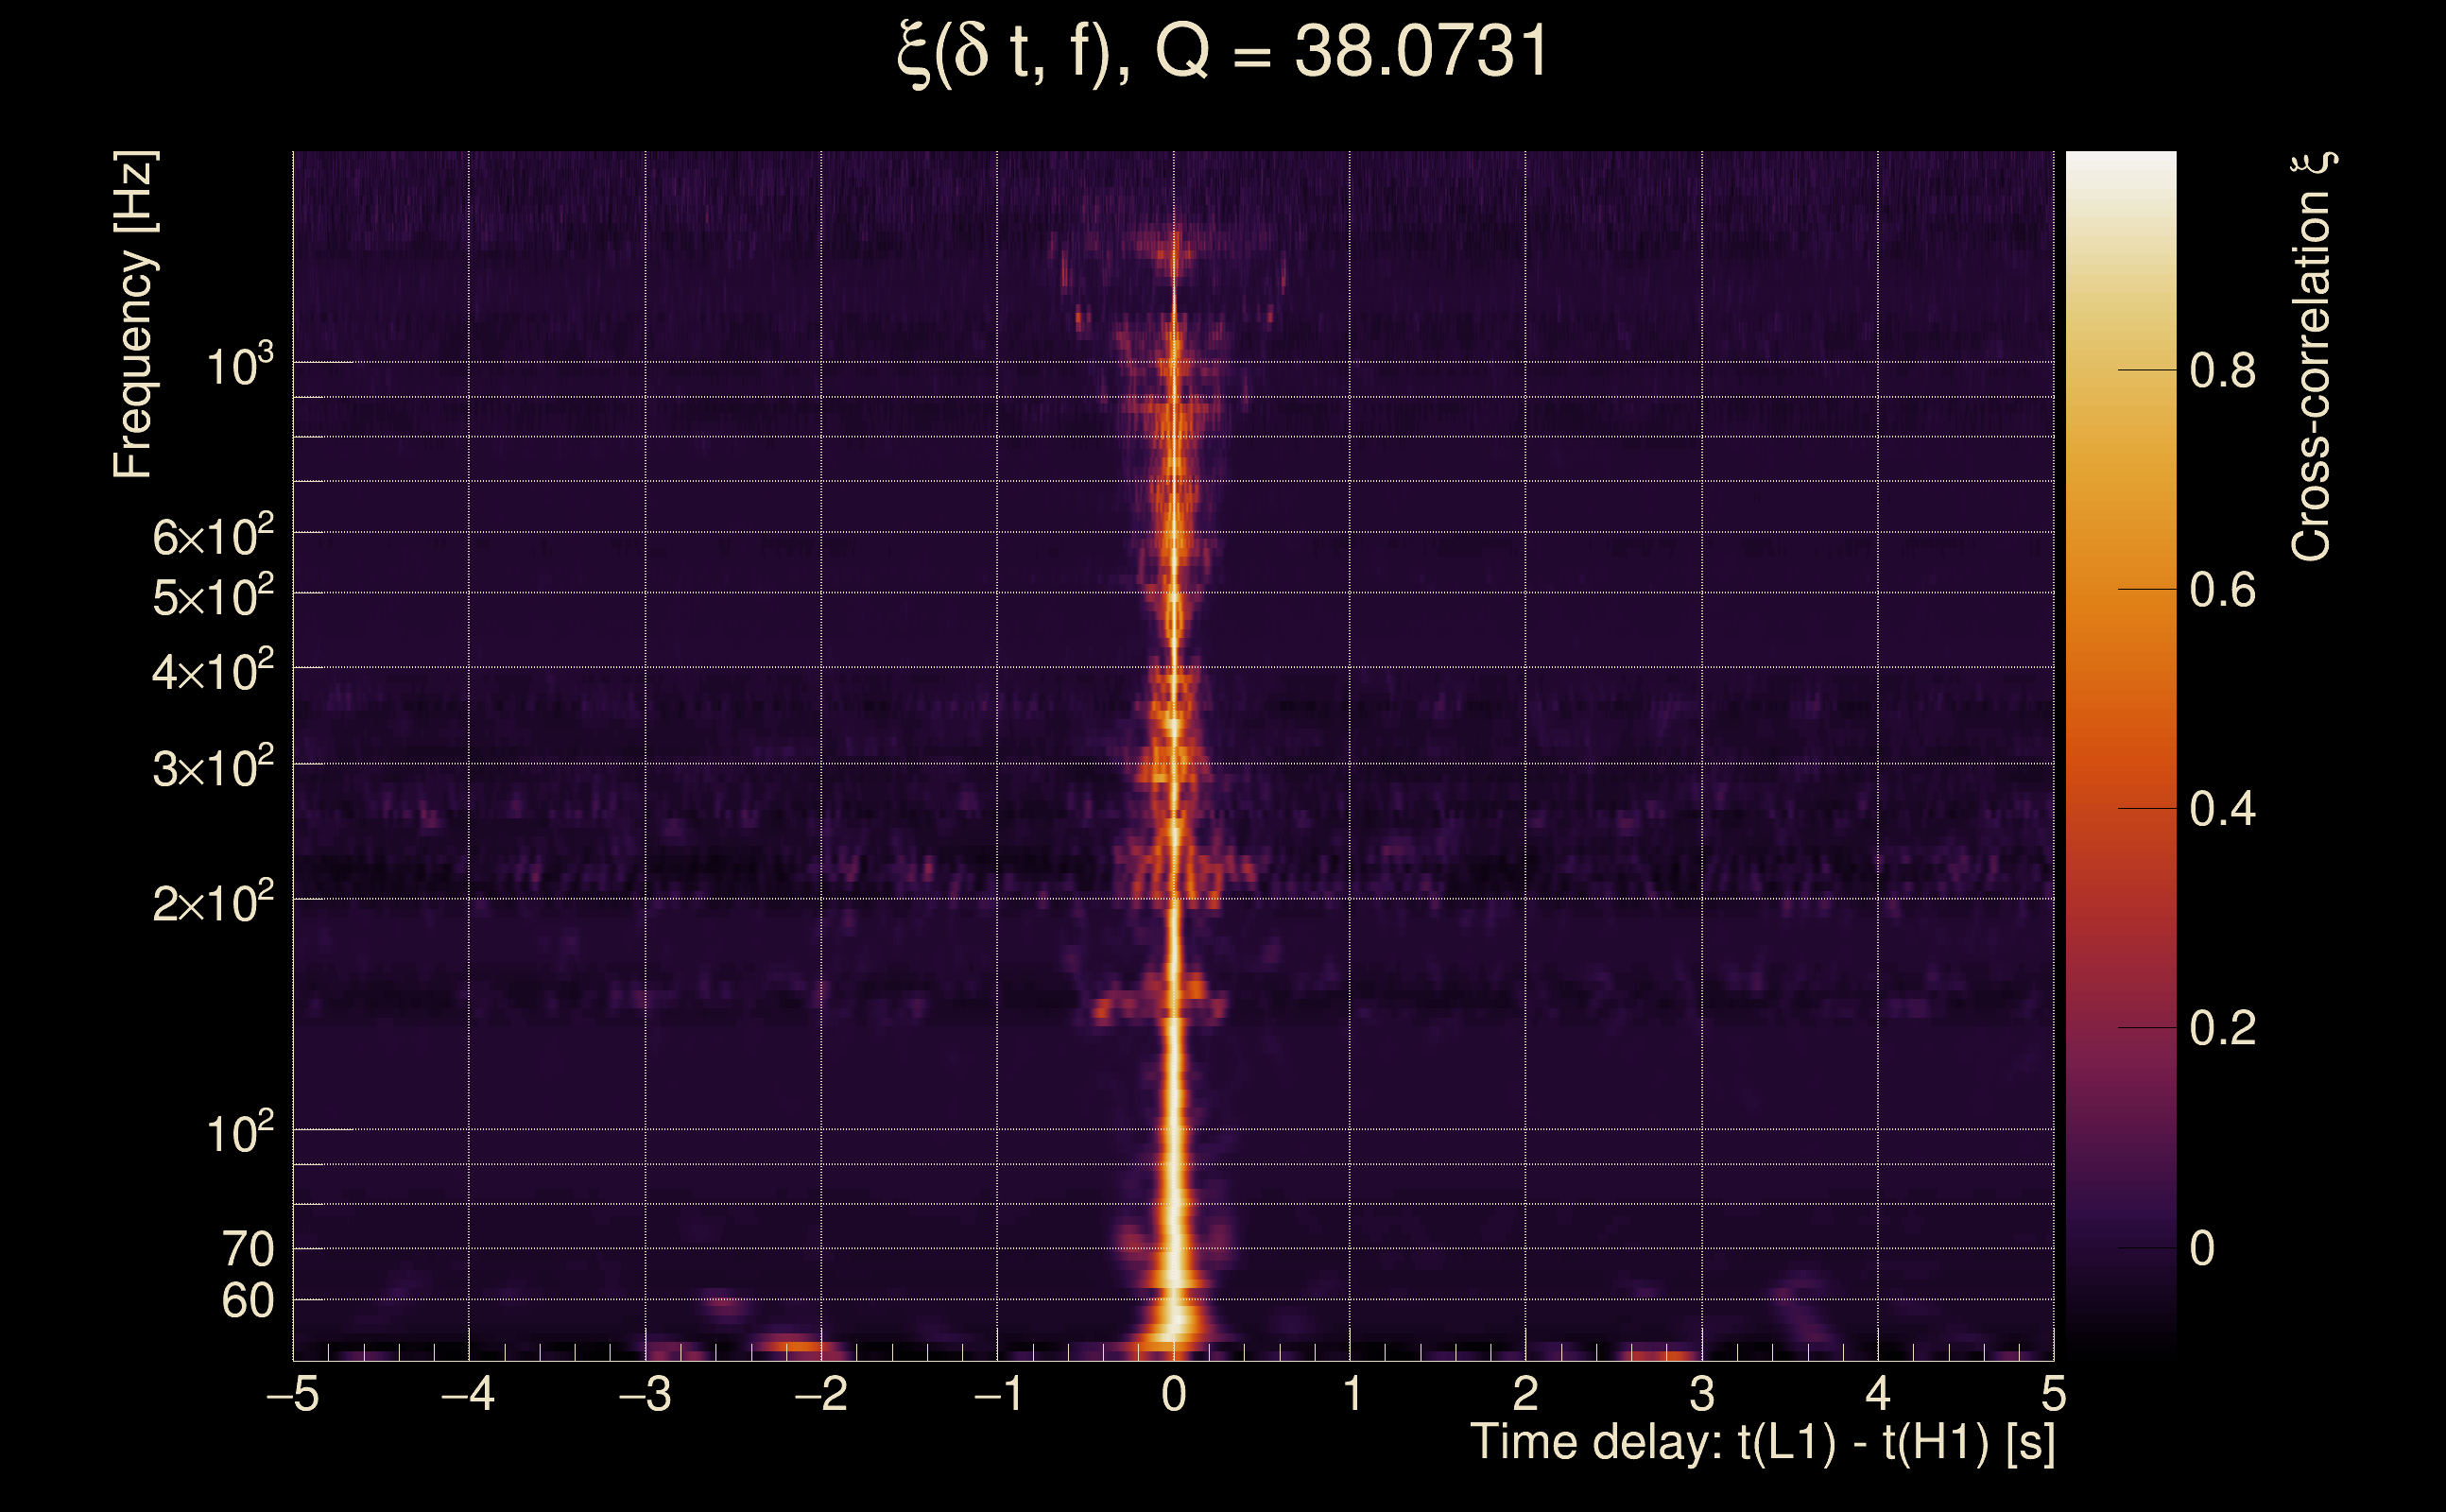
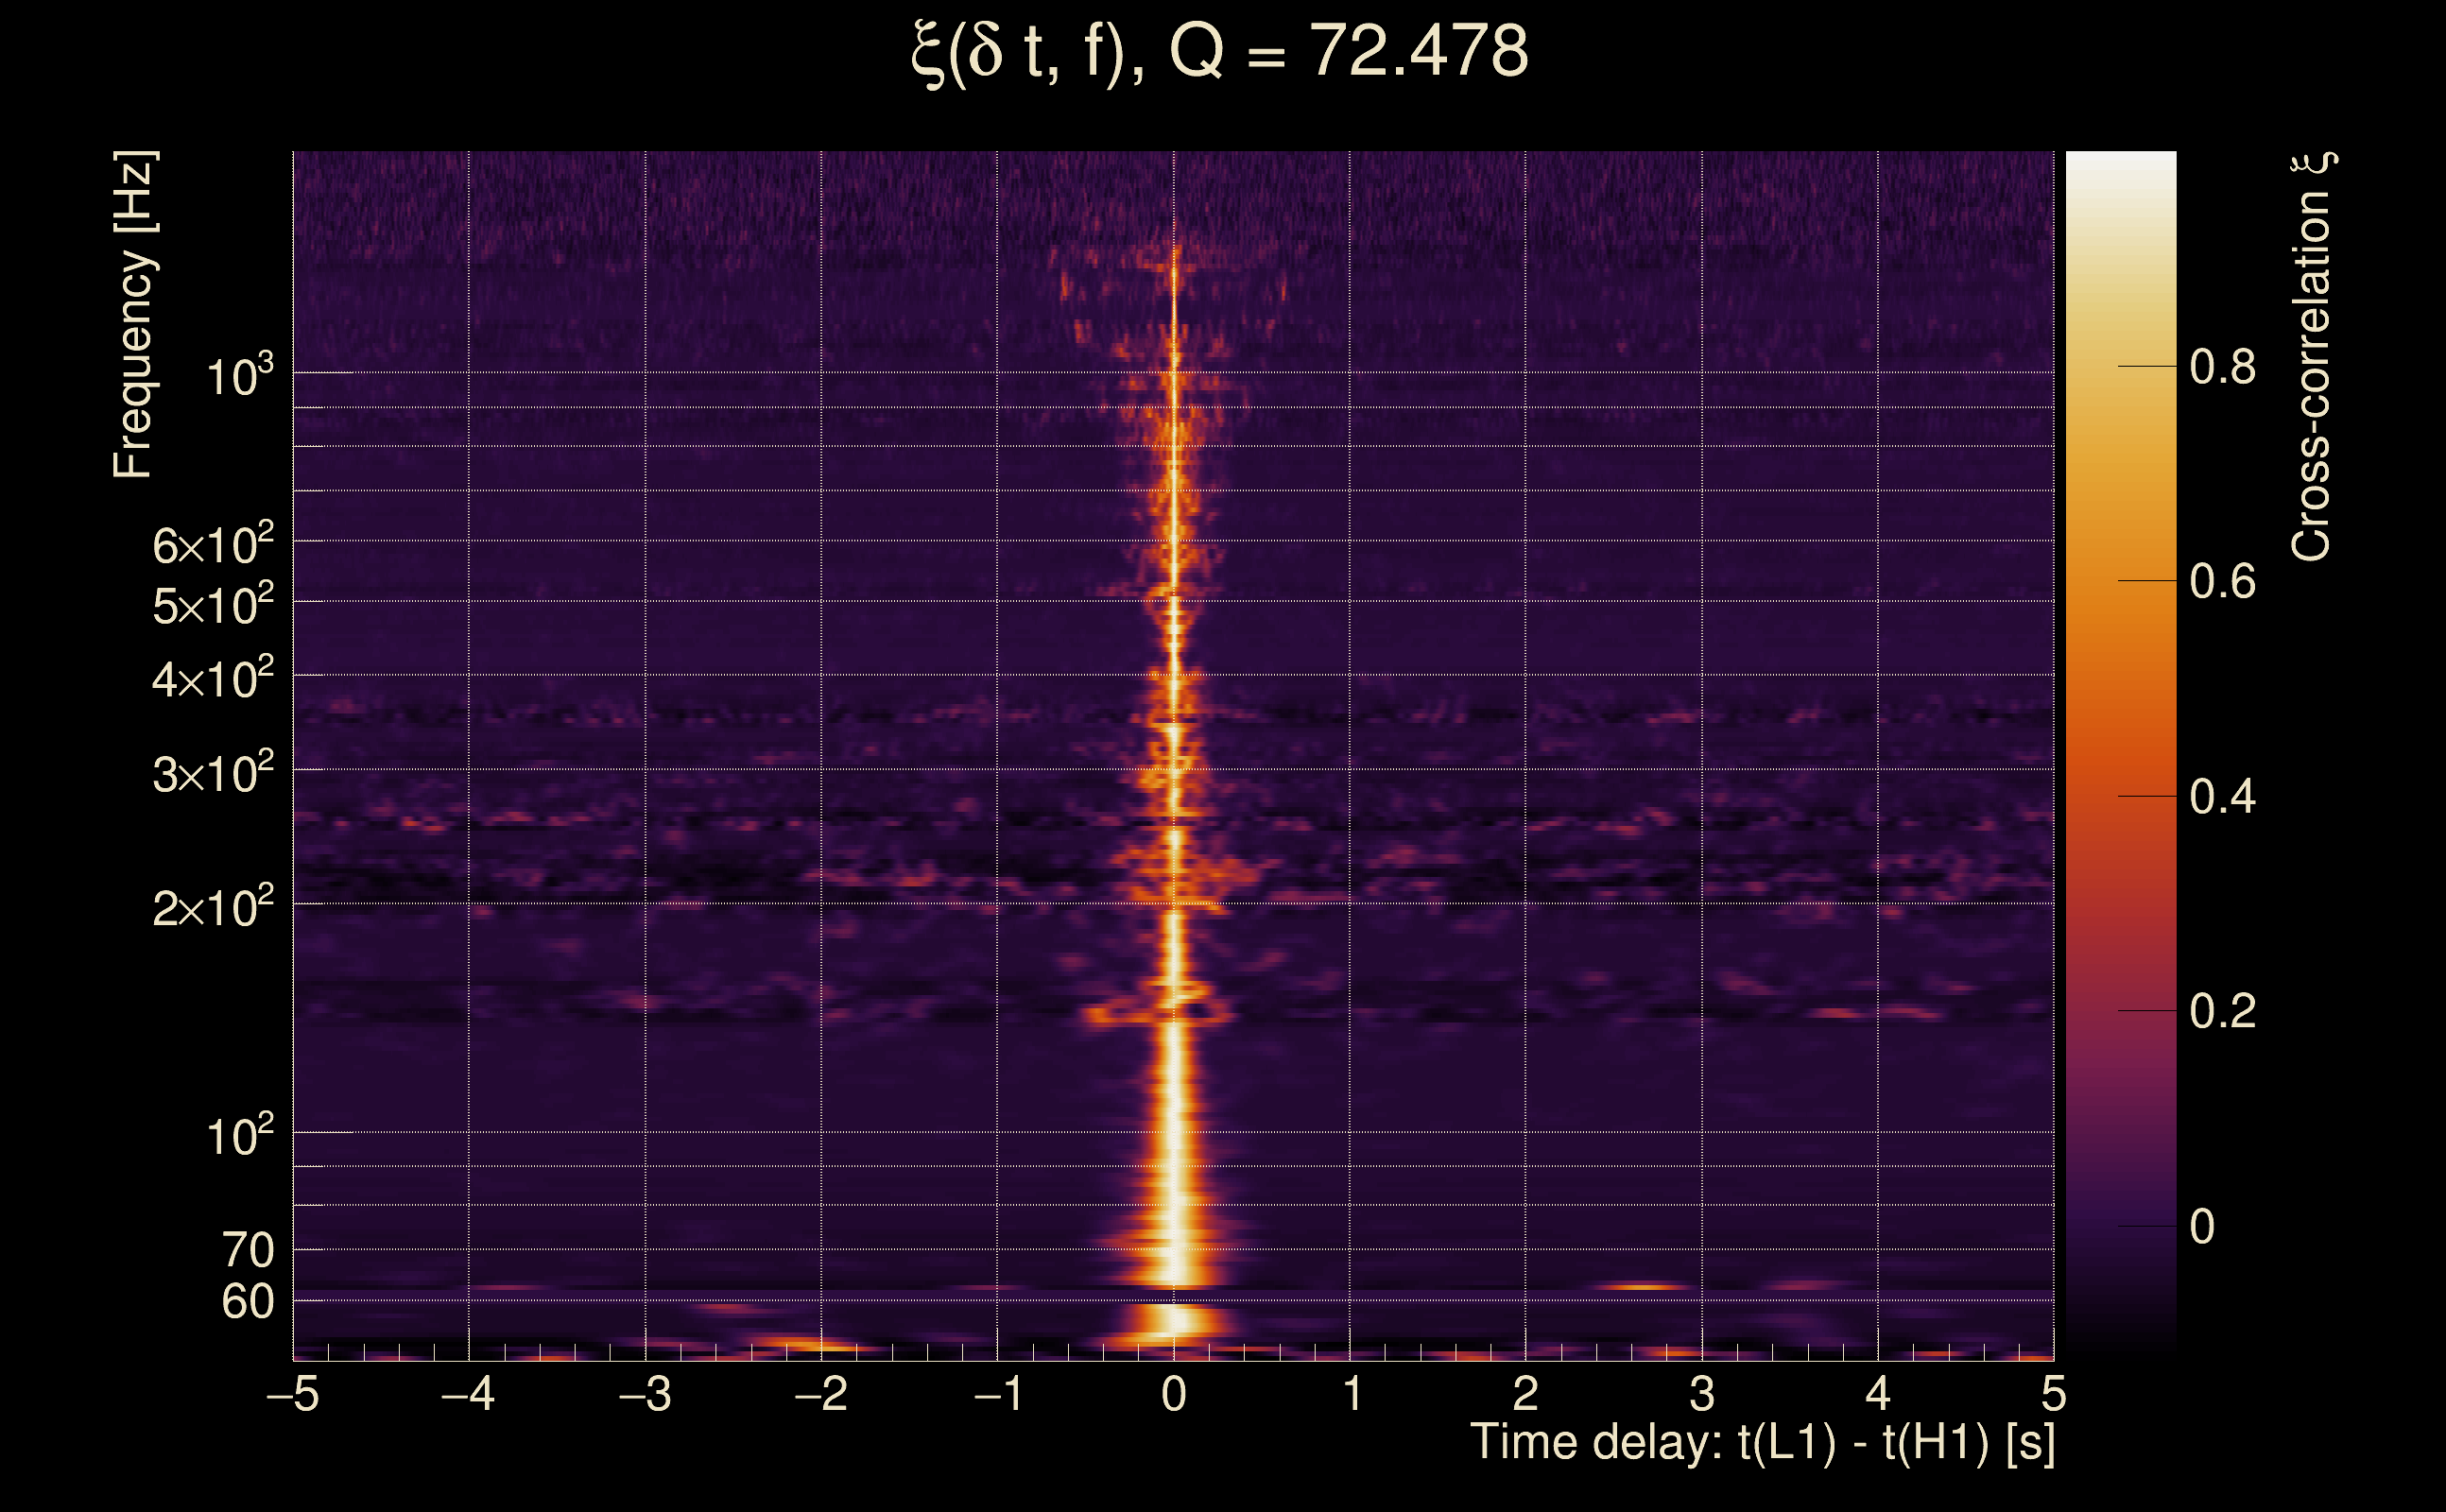
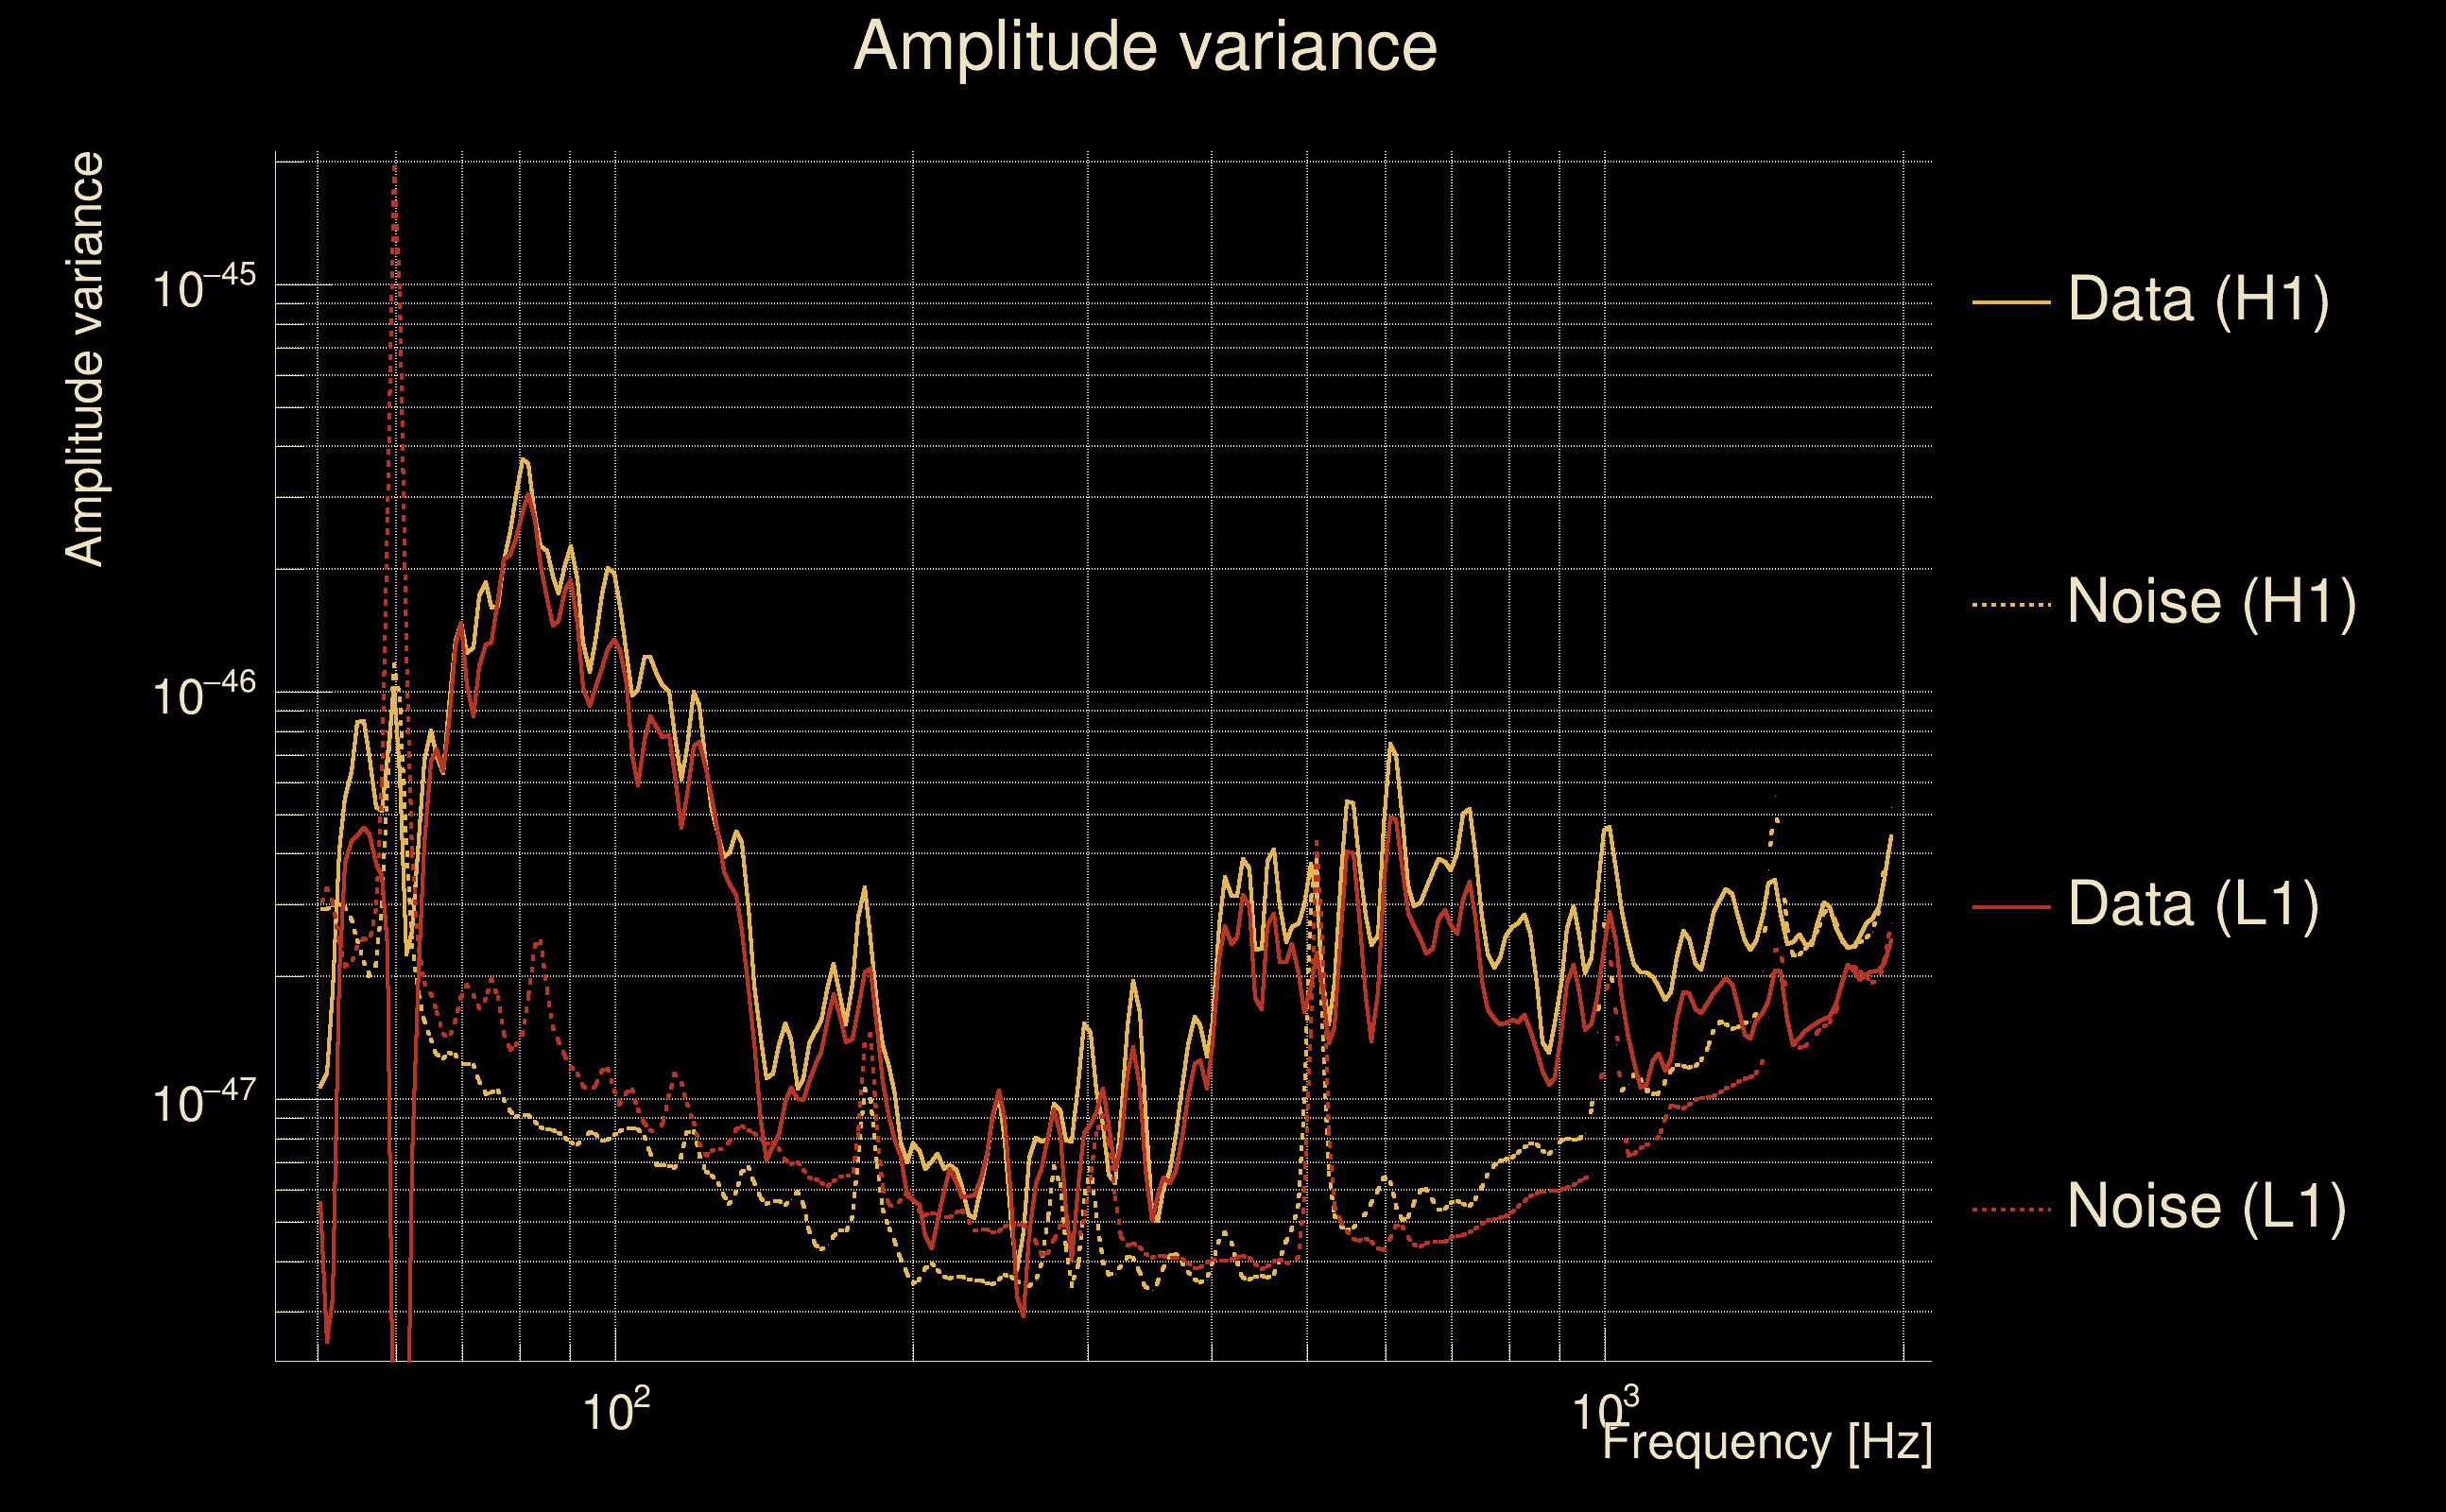
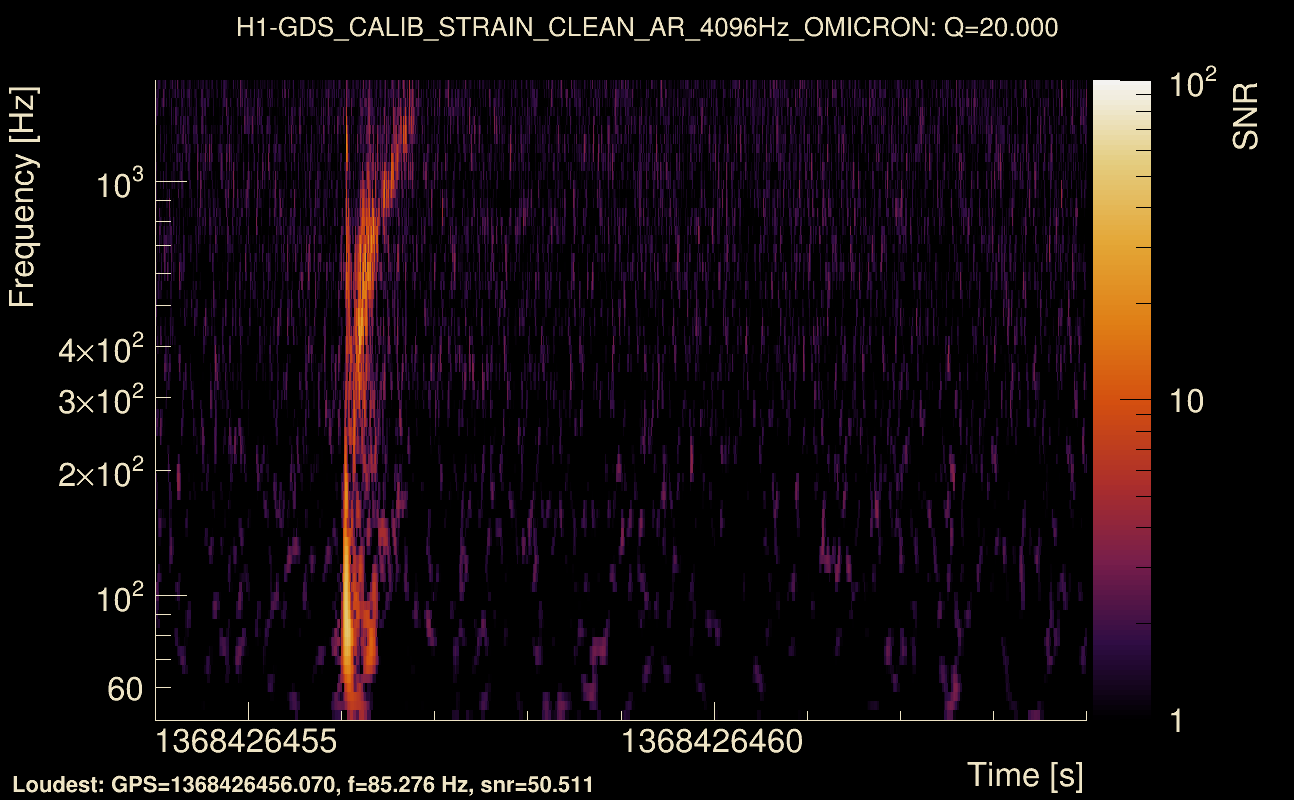
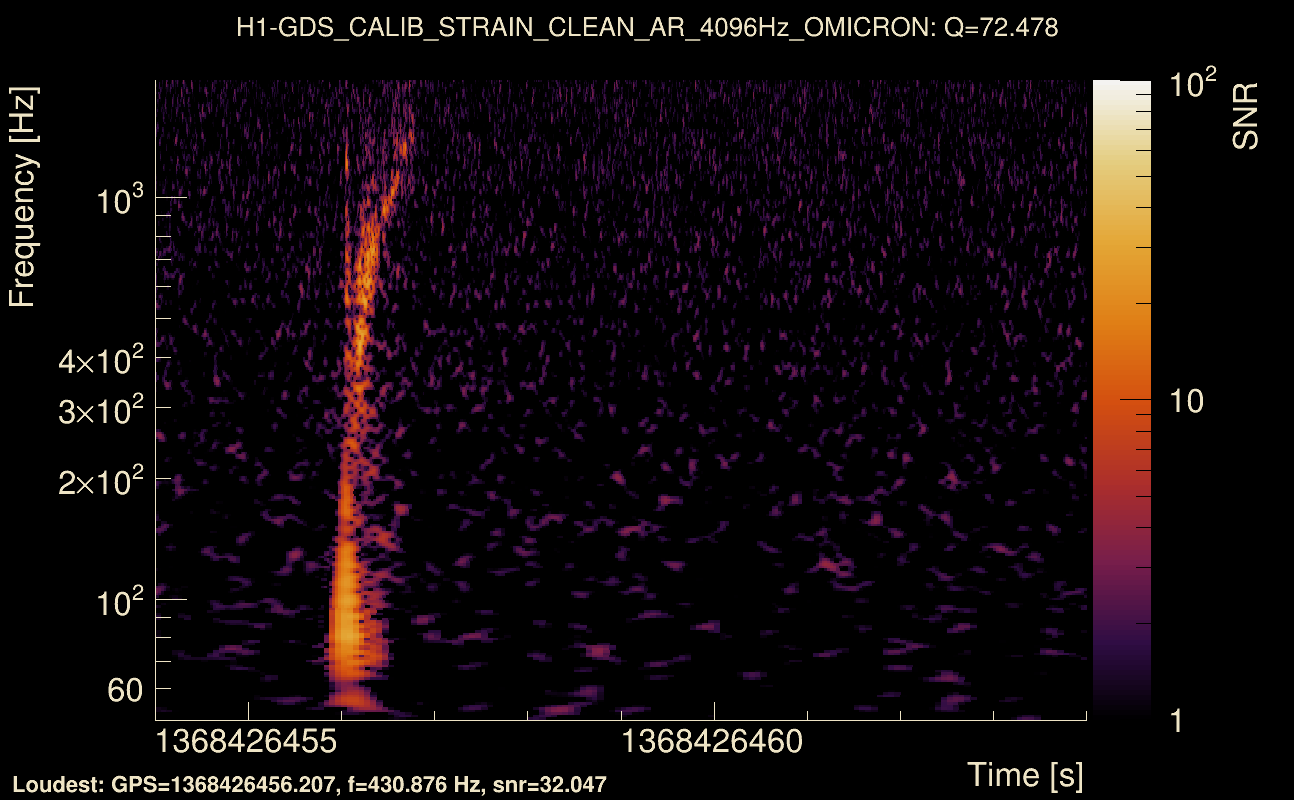
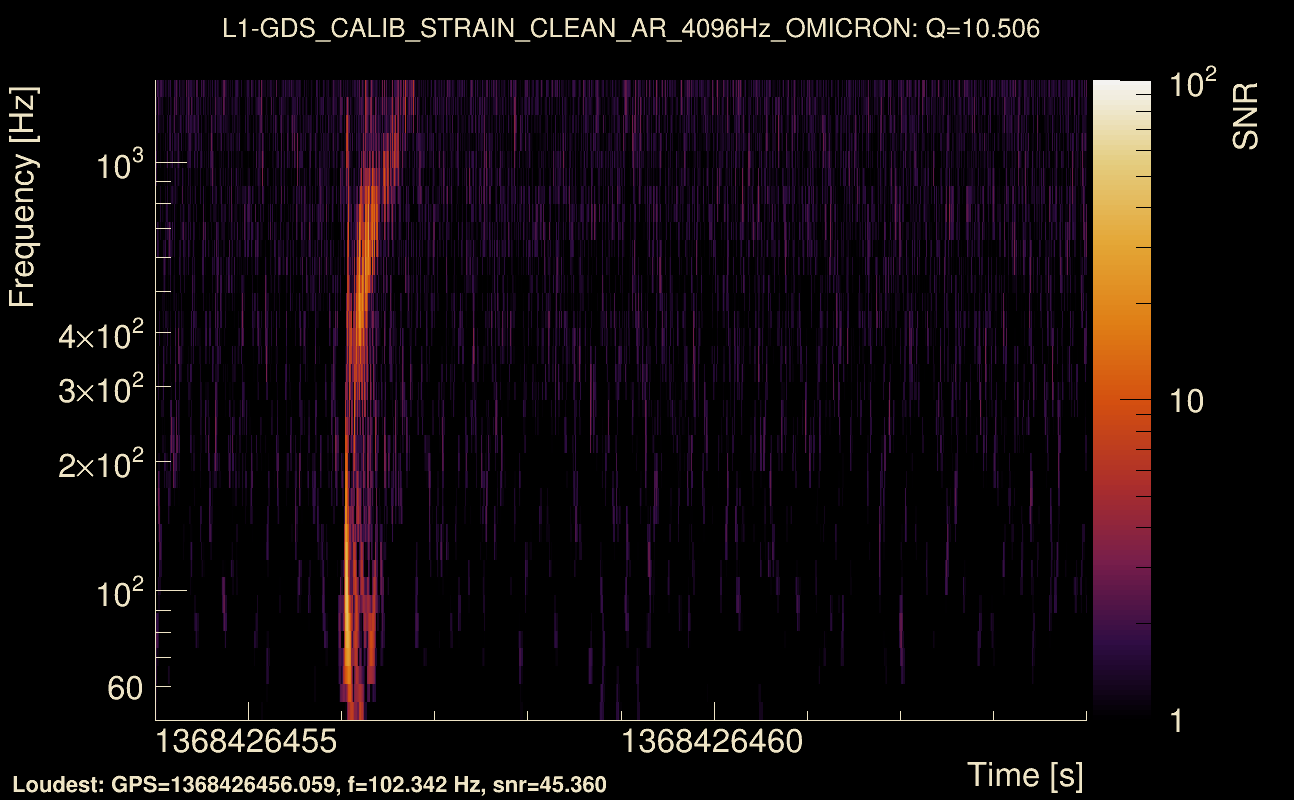
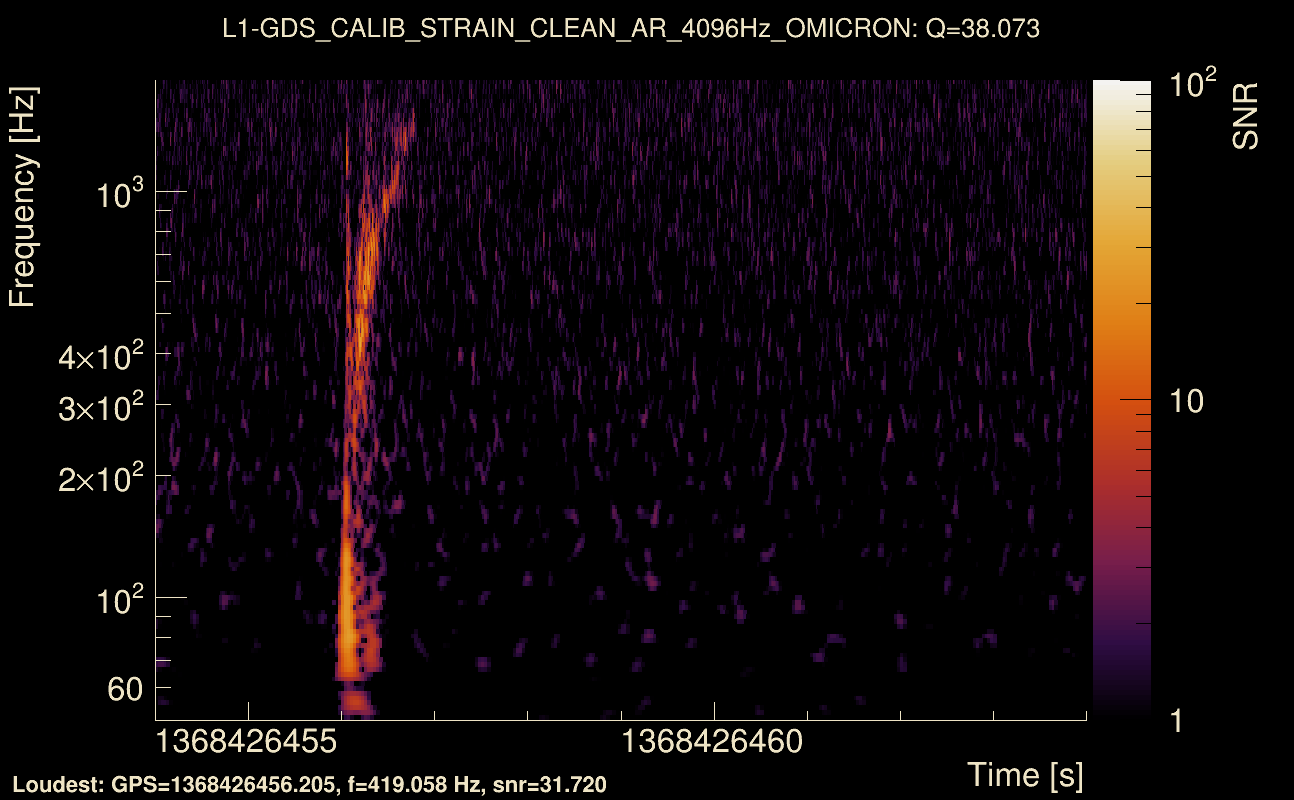
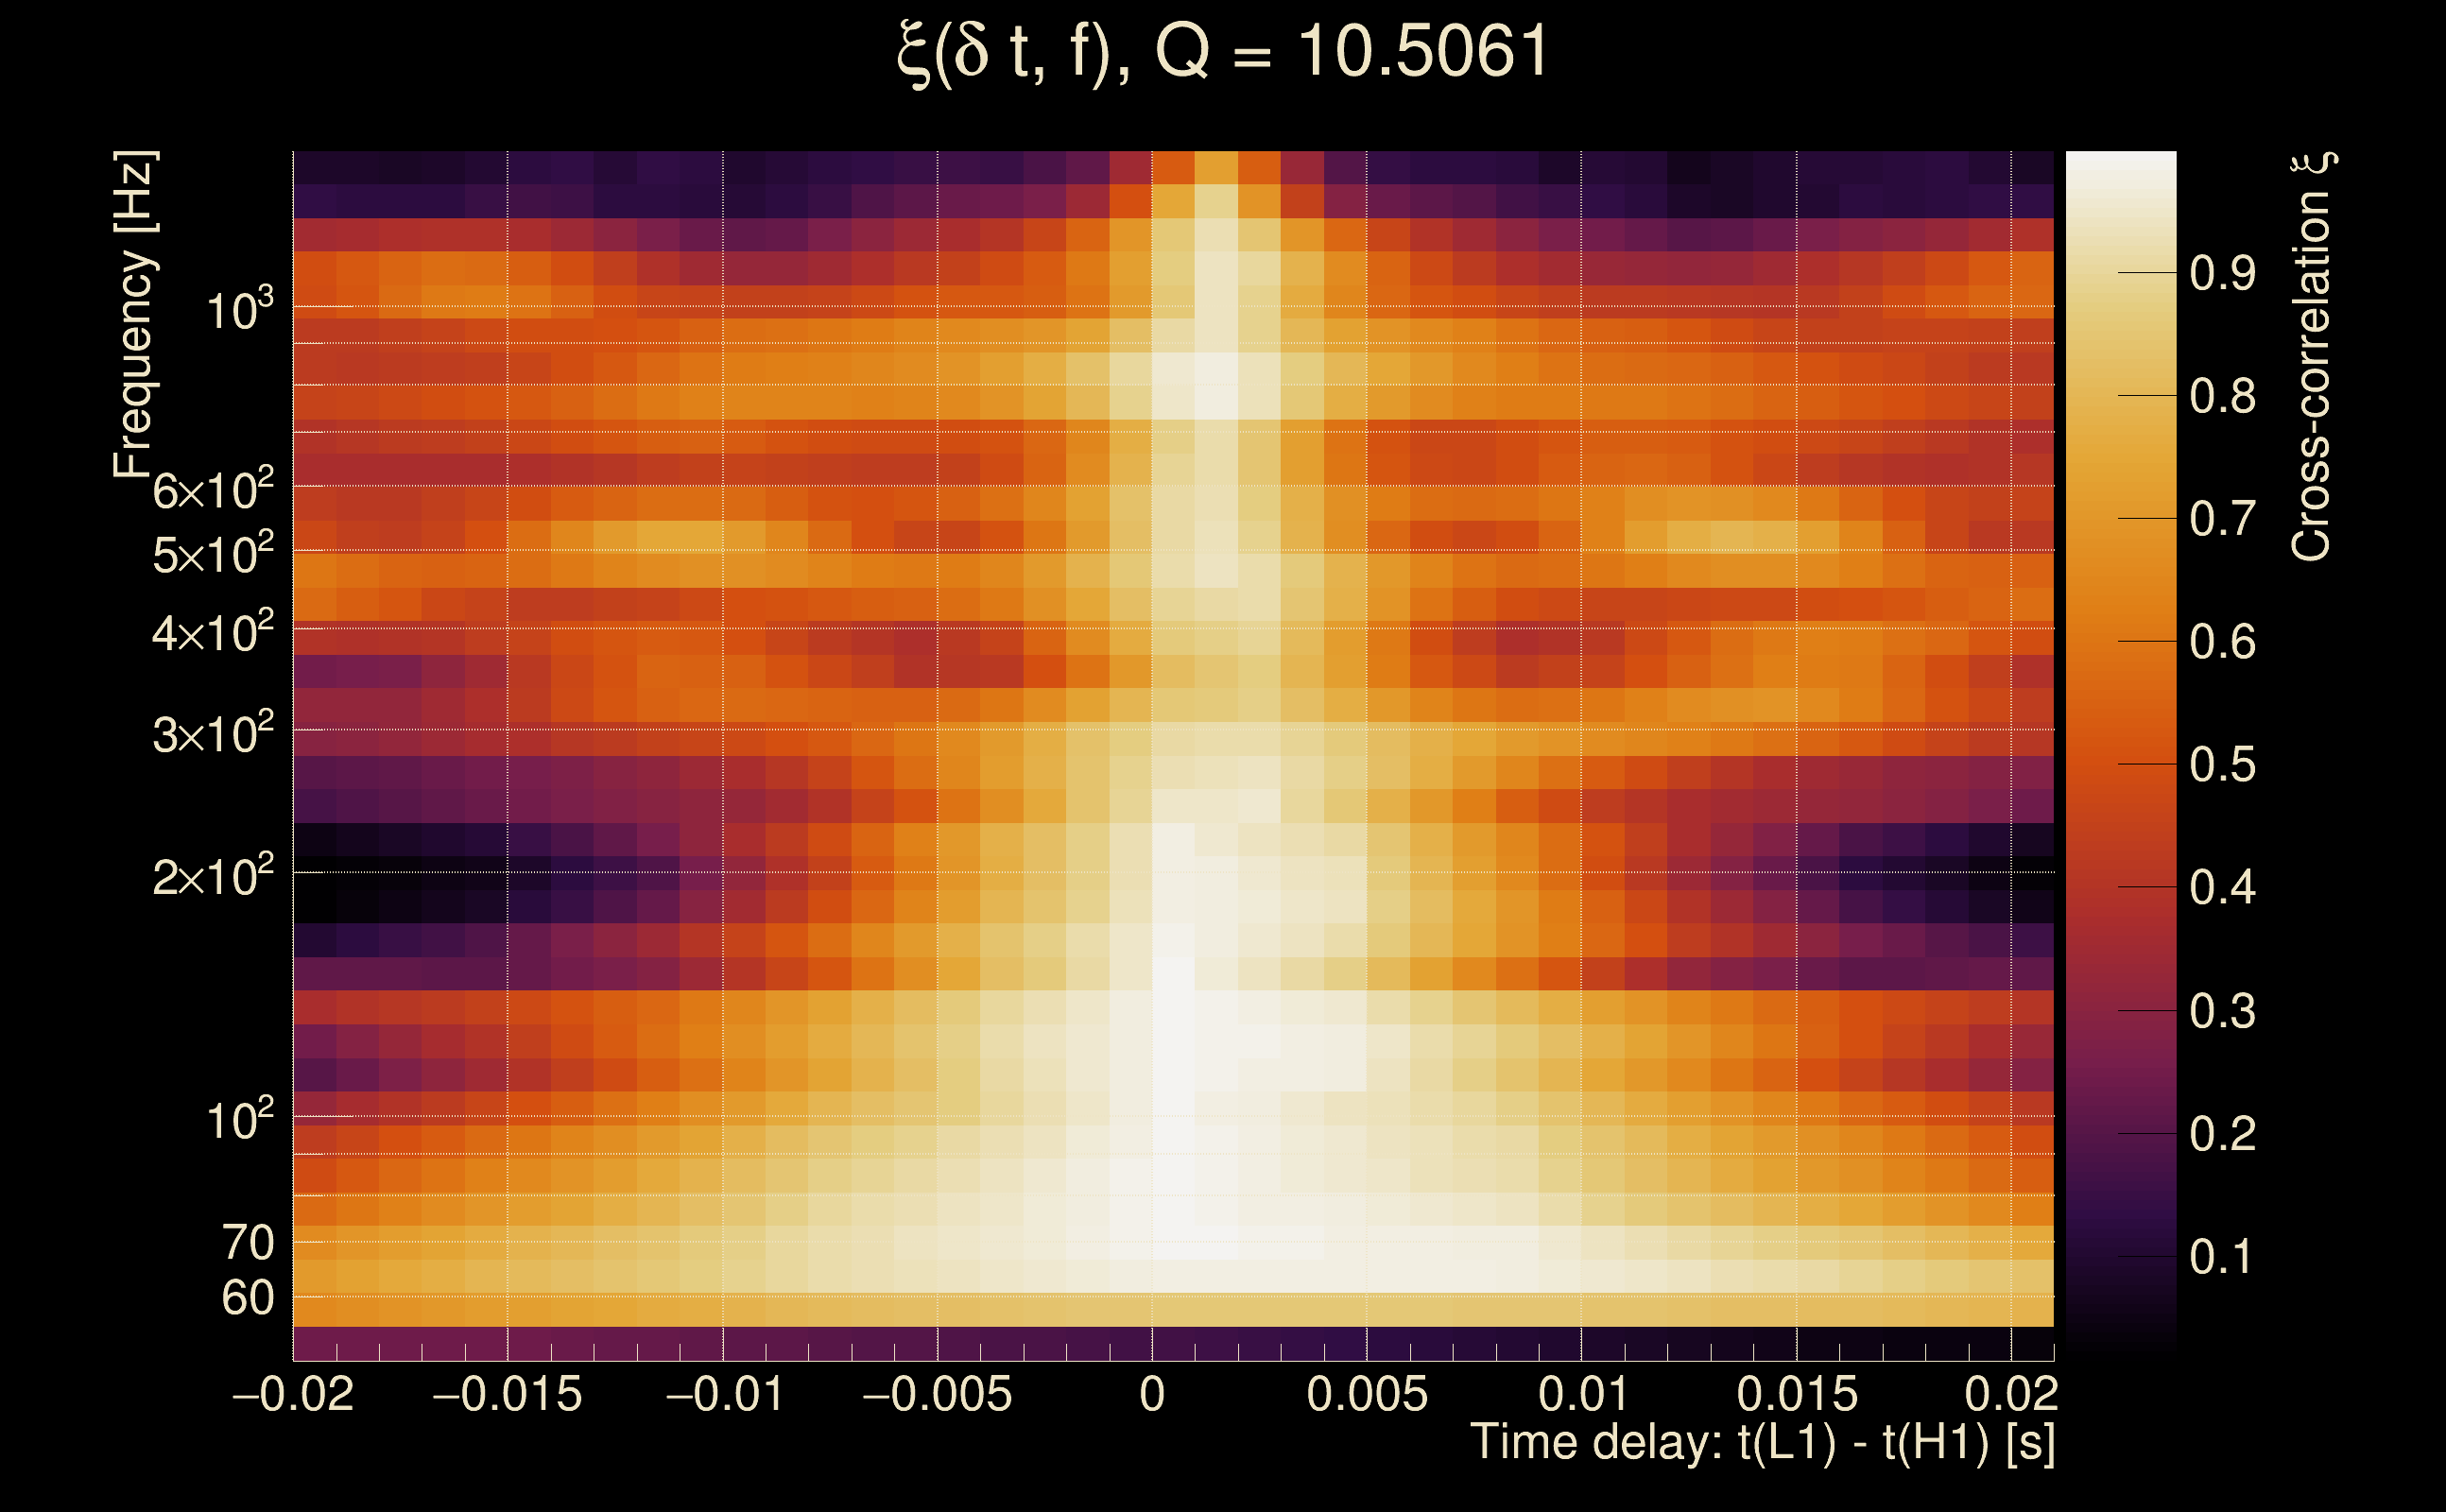
| Event time t(H1): | GPS = 1368426454 (Thu May 18 06:27:16 2023 ) → GPS = 1368426464 (Thu May 18 06:27:26 2023 ) |
| Event time t(L1): | GPS = 1368426454 (Thu May 18 06:27:26 2023 ) → GPS = 1368426464 (Thu May 18 06:27:26 2023 ) |
| Omicron analysis time window (H1): | GPS = 1368426451 → GPS = 1368426467 |
| Omicron analysis time window (L1): | GPS = 1368426451 → GPS = 1368426467 |
| Time delay between detectors t(L1) - t(H1): | 0.00302632 s (slice index = 108 / 217), δt_gw = 0.00302632 s |
| Time delay standard deviation: | 0.0305673 s |
| [targeted mode] Time delay probability: | 0.936409 (0.0797845 sigmas), δt_target = 0.000942469 s |
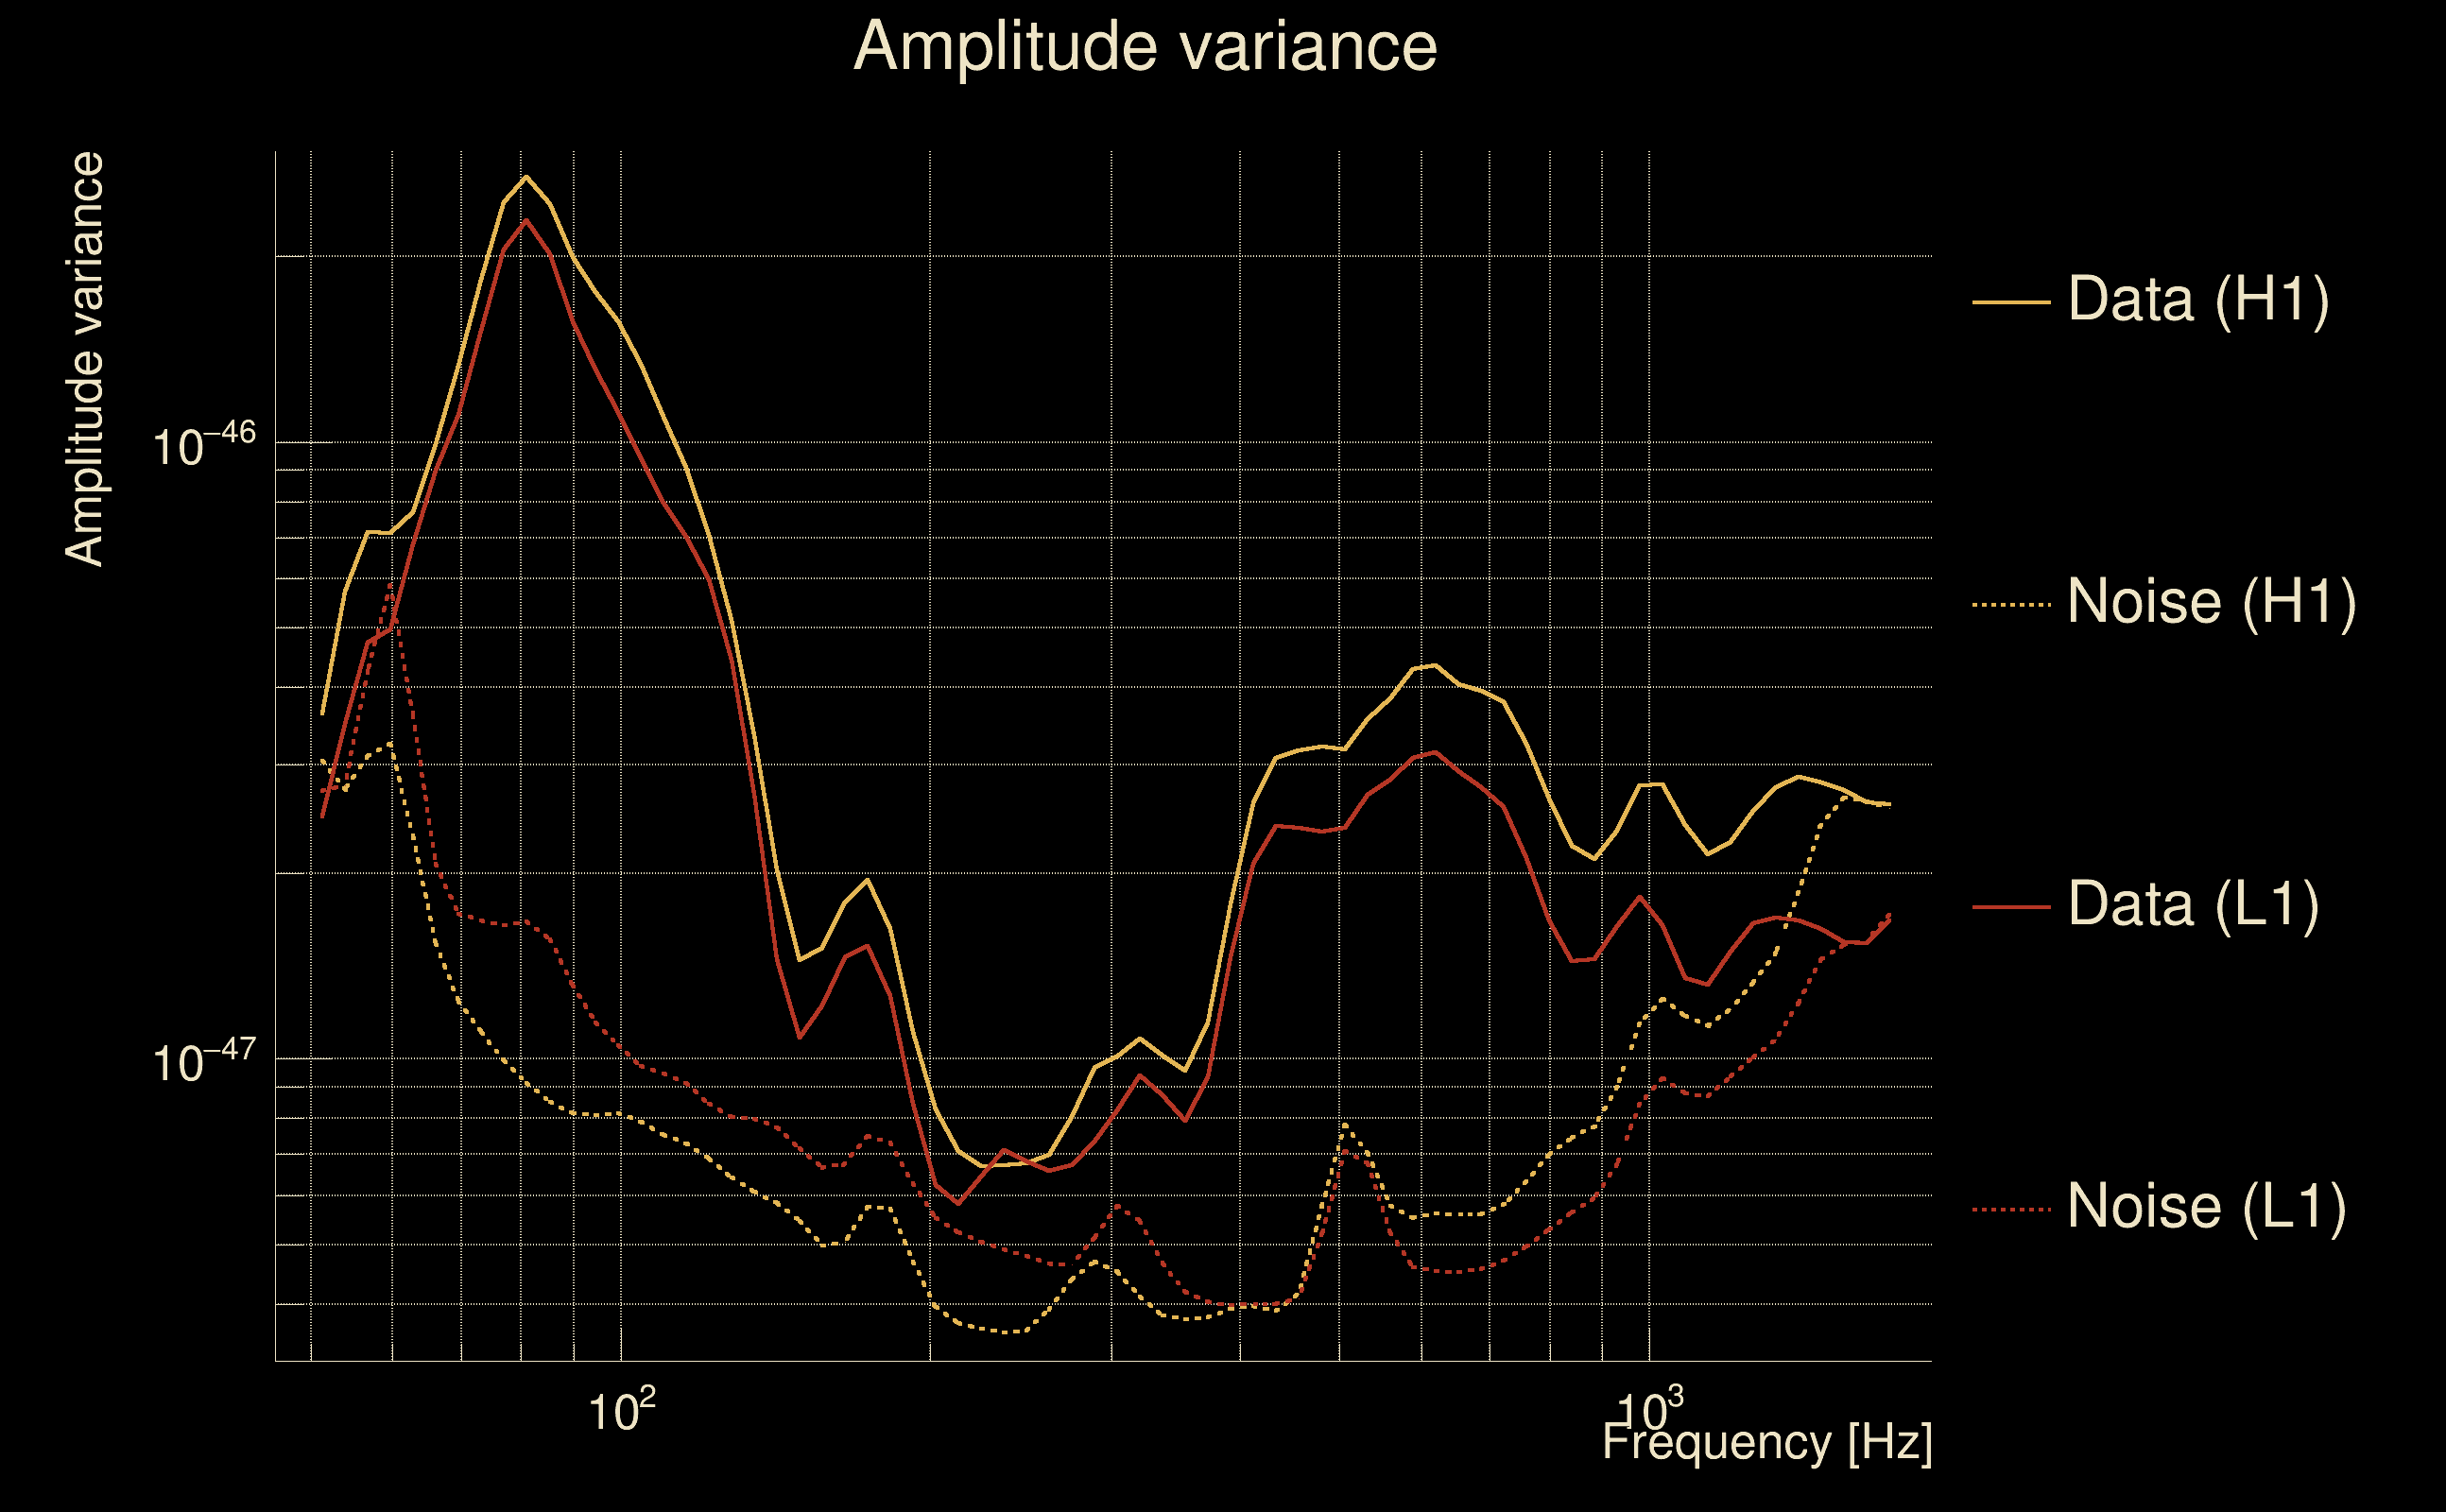
| Frequency: | 267.619 Hz |
| Ξ: | 0.93957 ± 0.0108985 (variance = 0.000118778): Q0: 0.956286, Q1: 0.941651, Q2: 0.932414, Q3: 0.930176, Q4: 0.925472 |
| Rank: | R_A = 0.845116 |
| Log of amplitude ratio (L1/H1): | -0.143628, variance = 0.15506 (L1/H1: -0.155264, variance = 0.304021, H1/L1: 0.128187, variance = 0.304291) |
| Amplitude ratio (L1/H1): | 0.86621 ⋇ 1.48257 (L1/H1: 0.856189 ⋇ 1.73565, H1/L1: 1.13677 ⋇ 1.73607) |
| Amplitude ratio H1|L1 compatibility (probability): | 0.972305 |
| Antenna factor probability: | 0.987915 |
| Number of rejected frequency rows: | Q0: 0 / 18, Q1: 0 / 36, Q2: 0 / 70, Q3: 5 / 134, Q4: 36 / 258 |
| Maximum signal-to-noise ratio: | H1: 75.4244, L1: 65.4781 |
| SNR variance: | H1: 3.69911, L1: 3.04717 |
| Click here for a zoomed plot | Click here for a zoomed plot | Click here for a zoomed plot | Click here for a zoomed plot | Click here for a zoomed plot |
 |
 |
 |
 |
 |
 |
 |
 |
 |
 |
 |
 |
 |
 |
 |
 |
 |
 |
 |
 |
 |
 |
 |
 |
 |
 |
 |
 |
 |
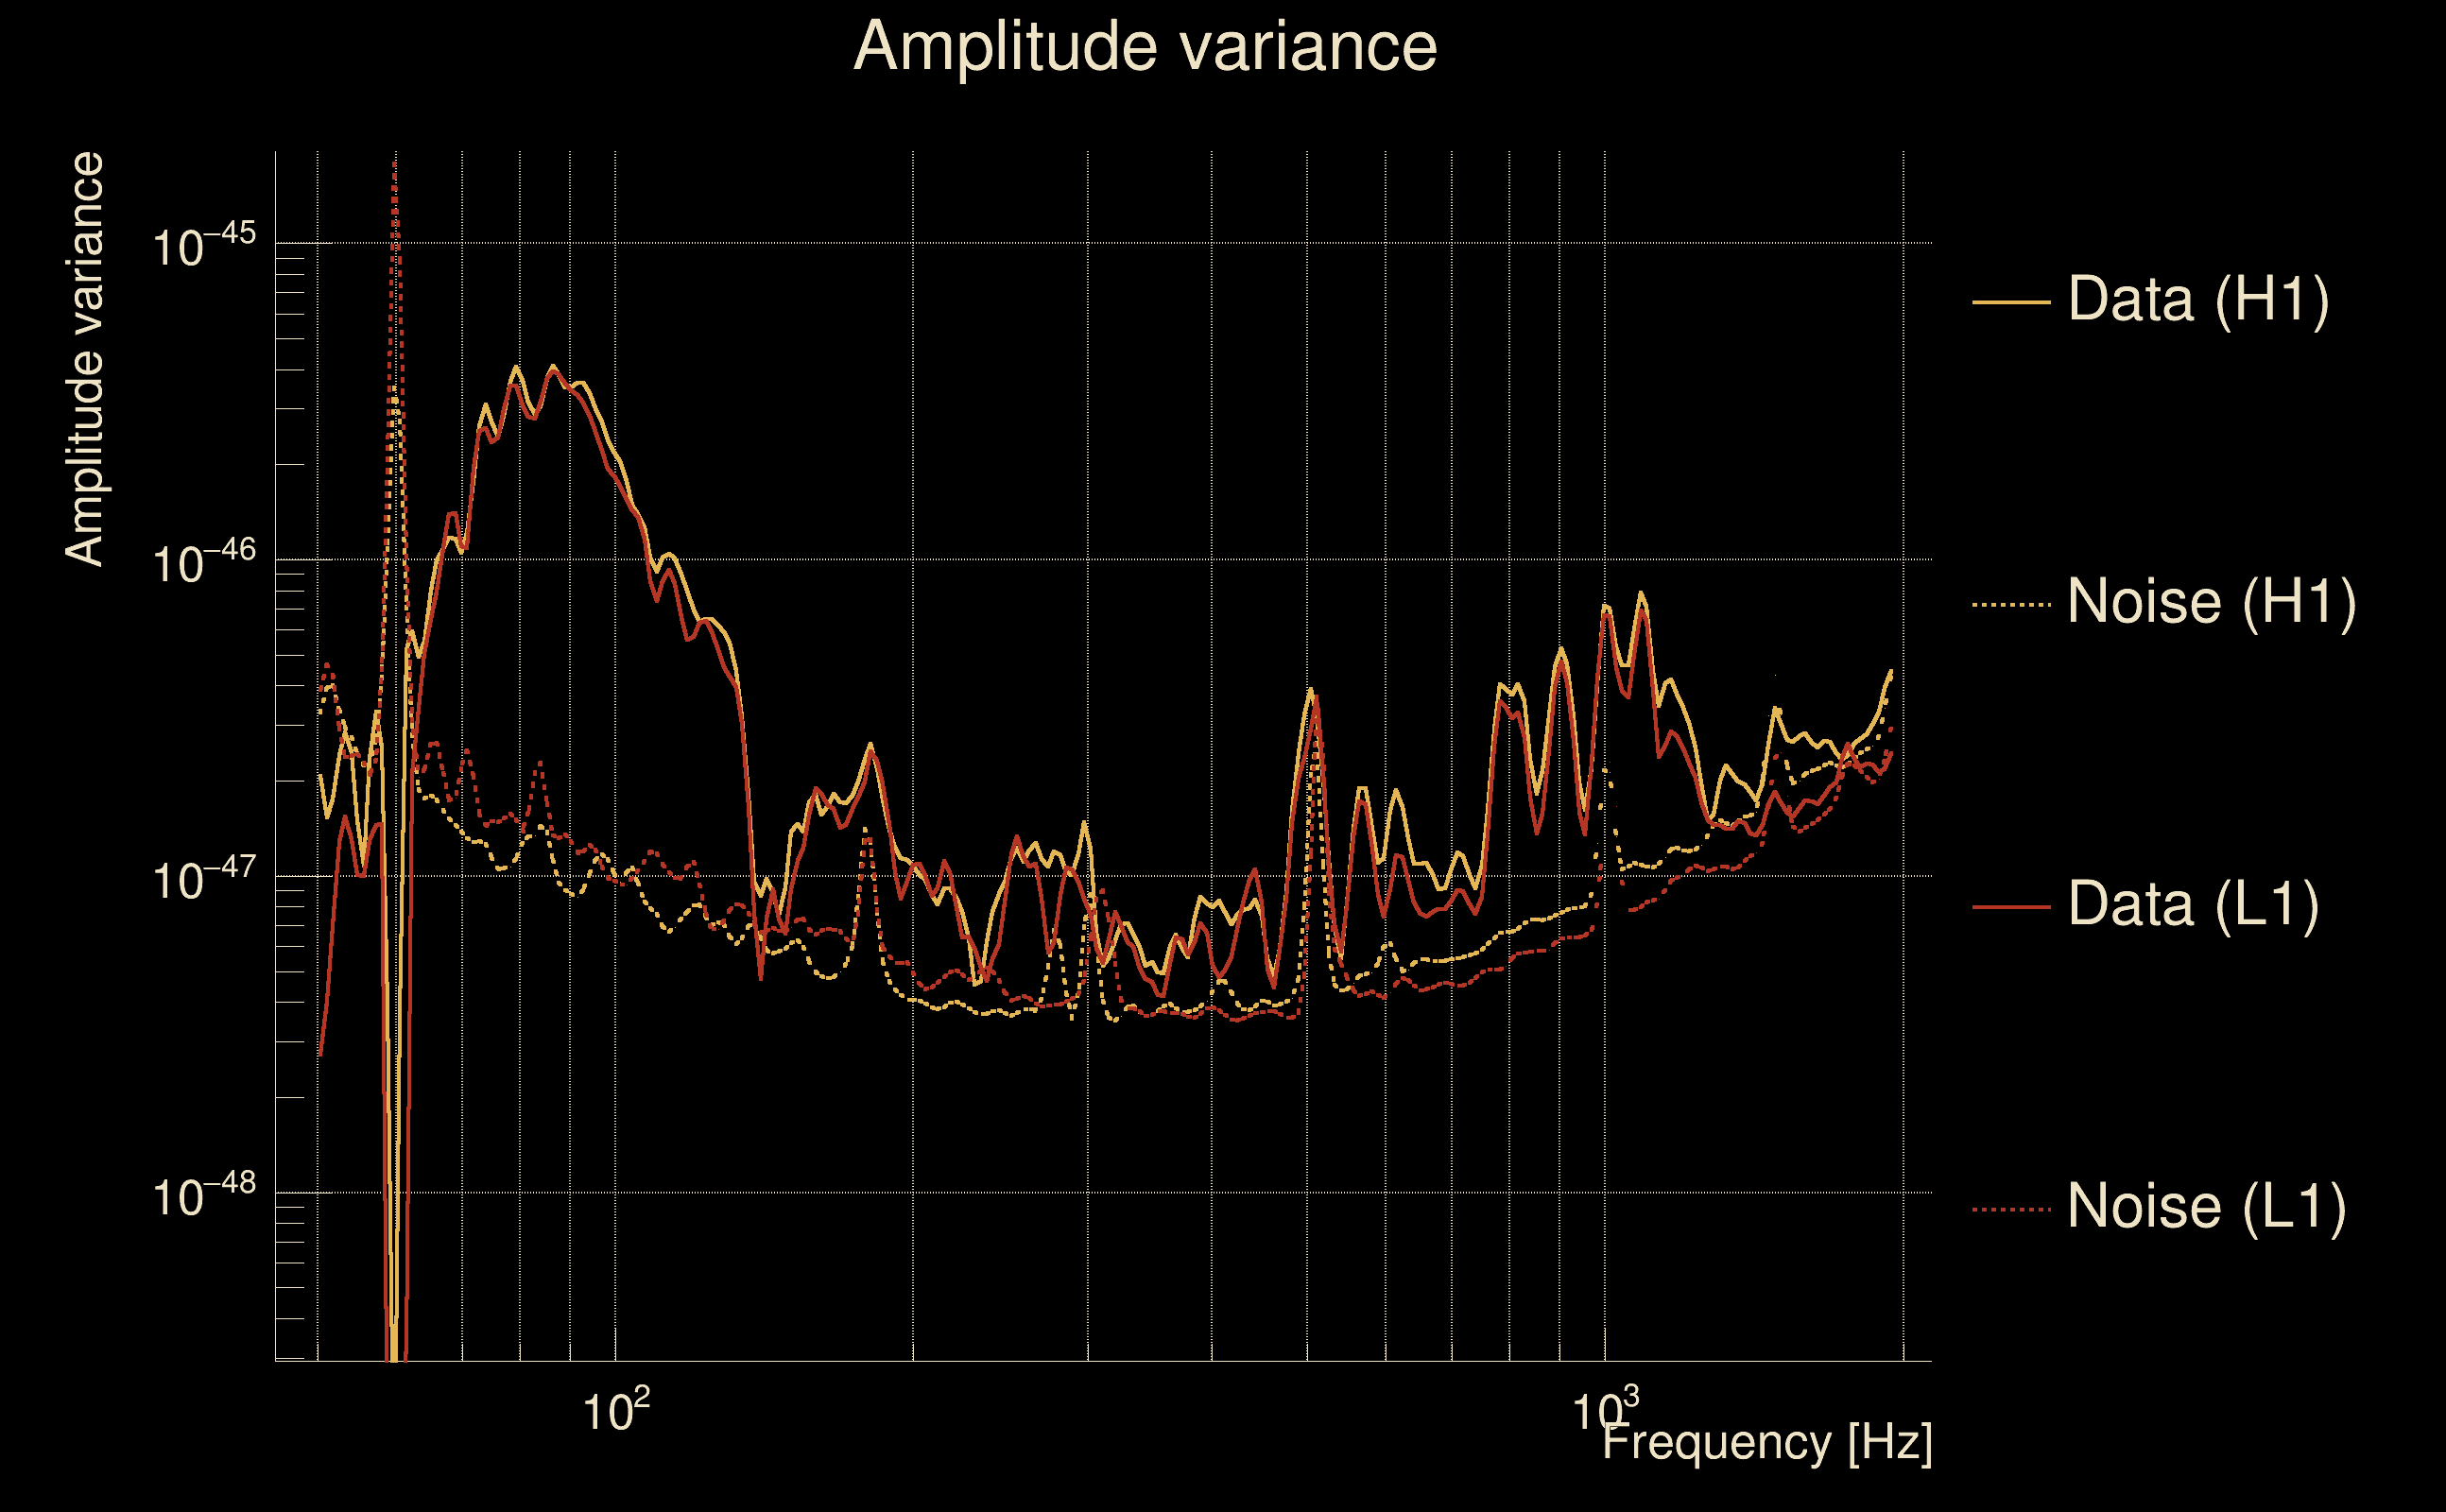
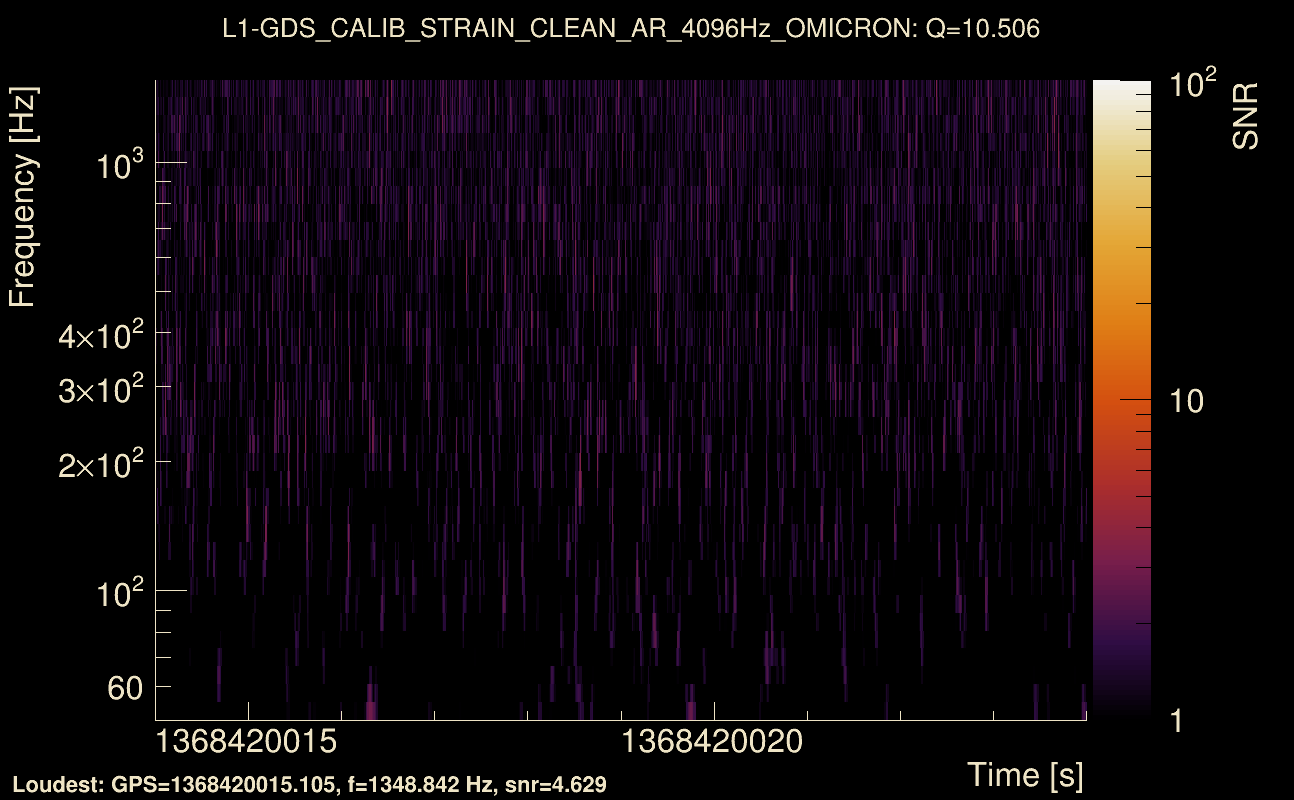
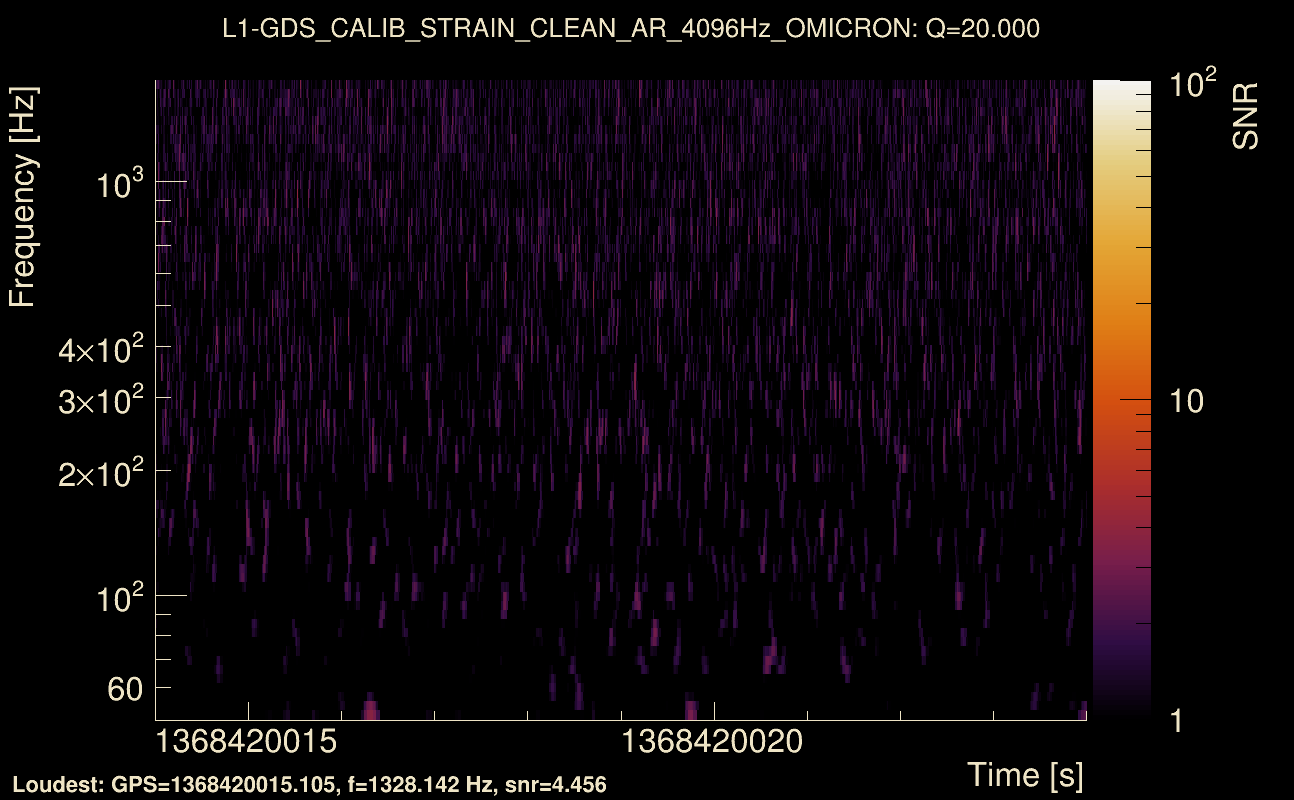
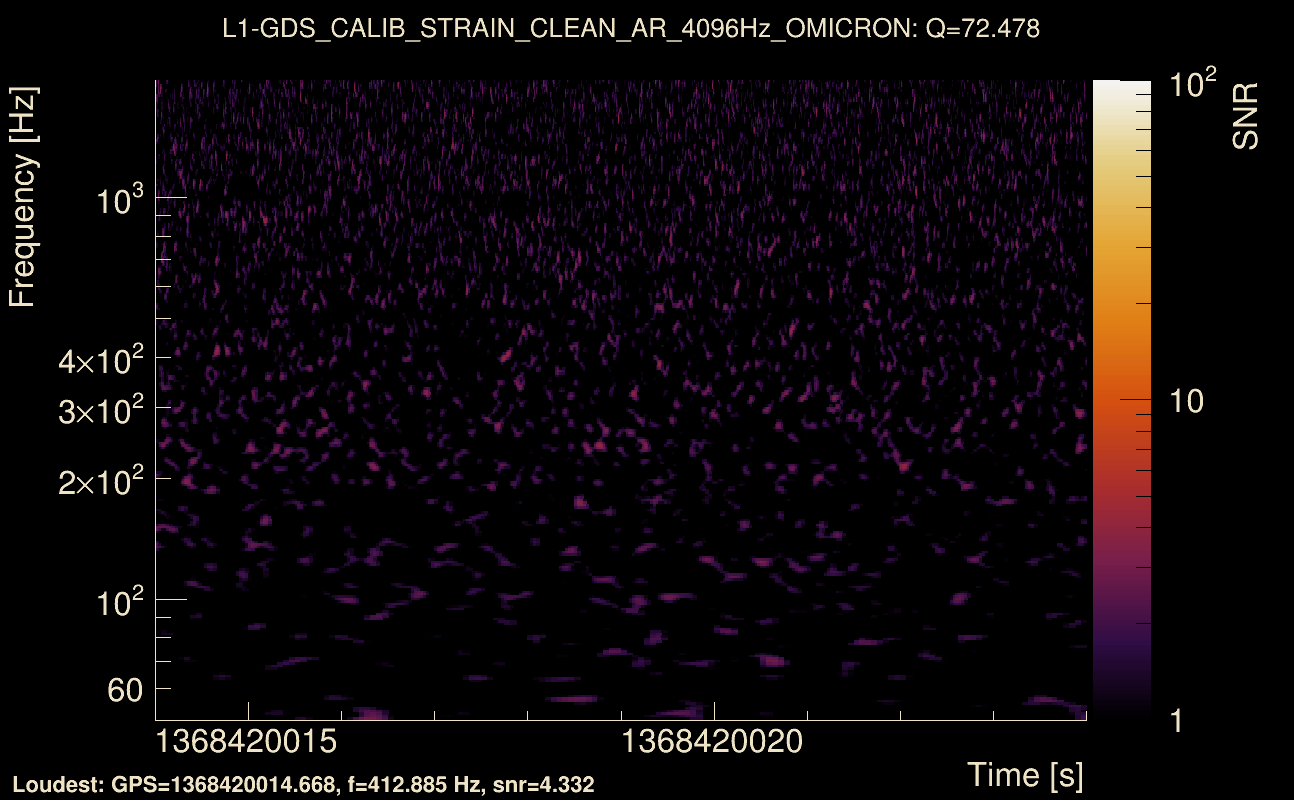
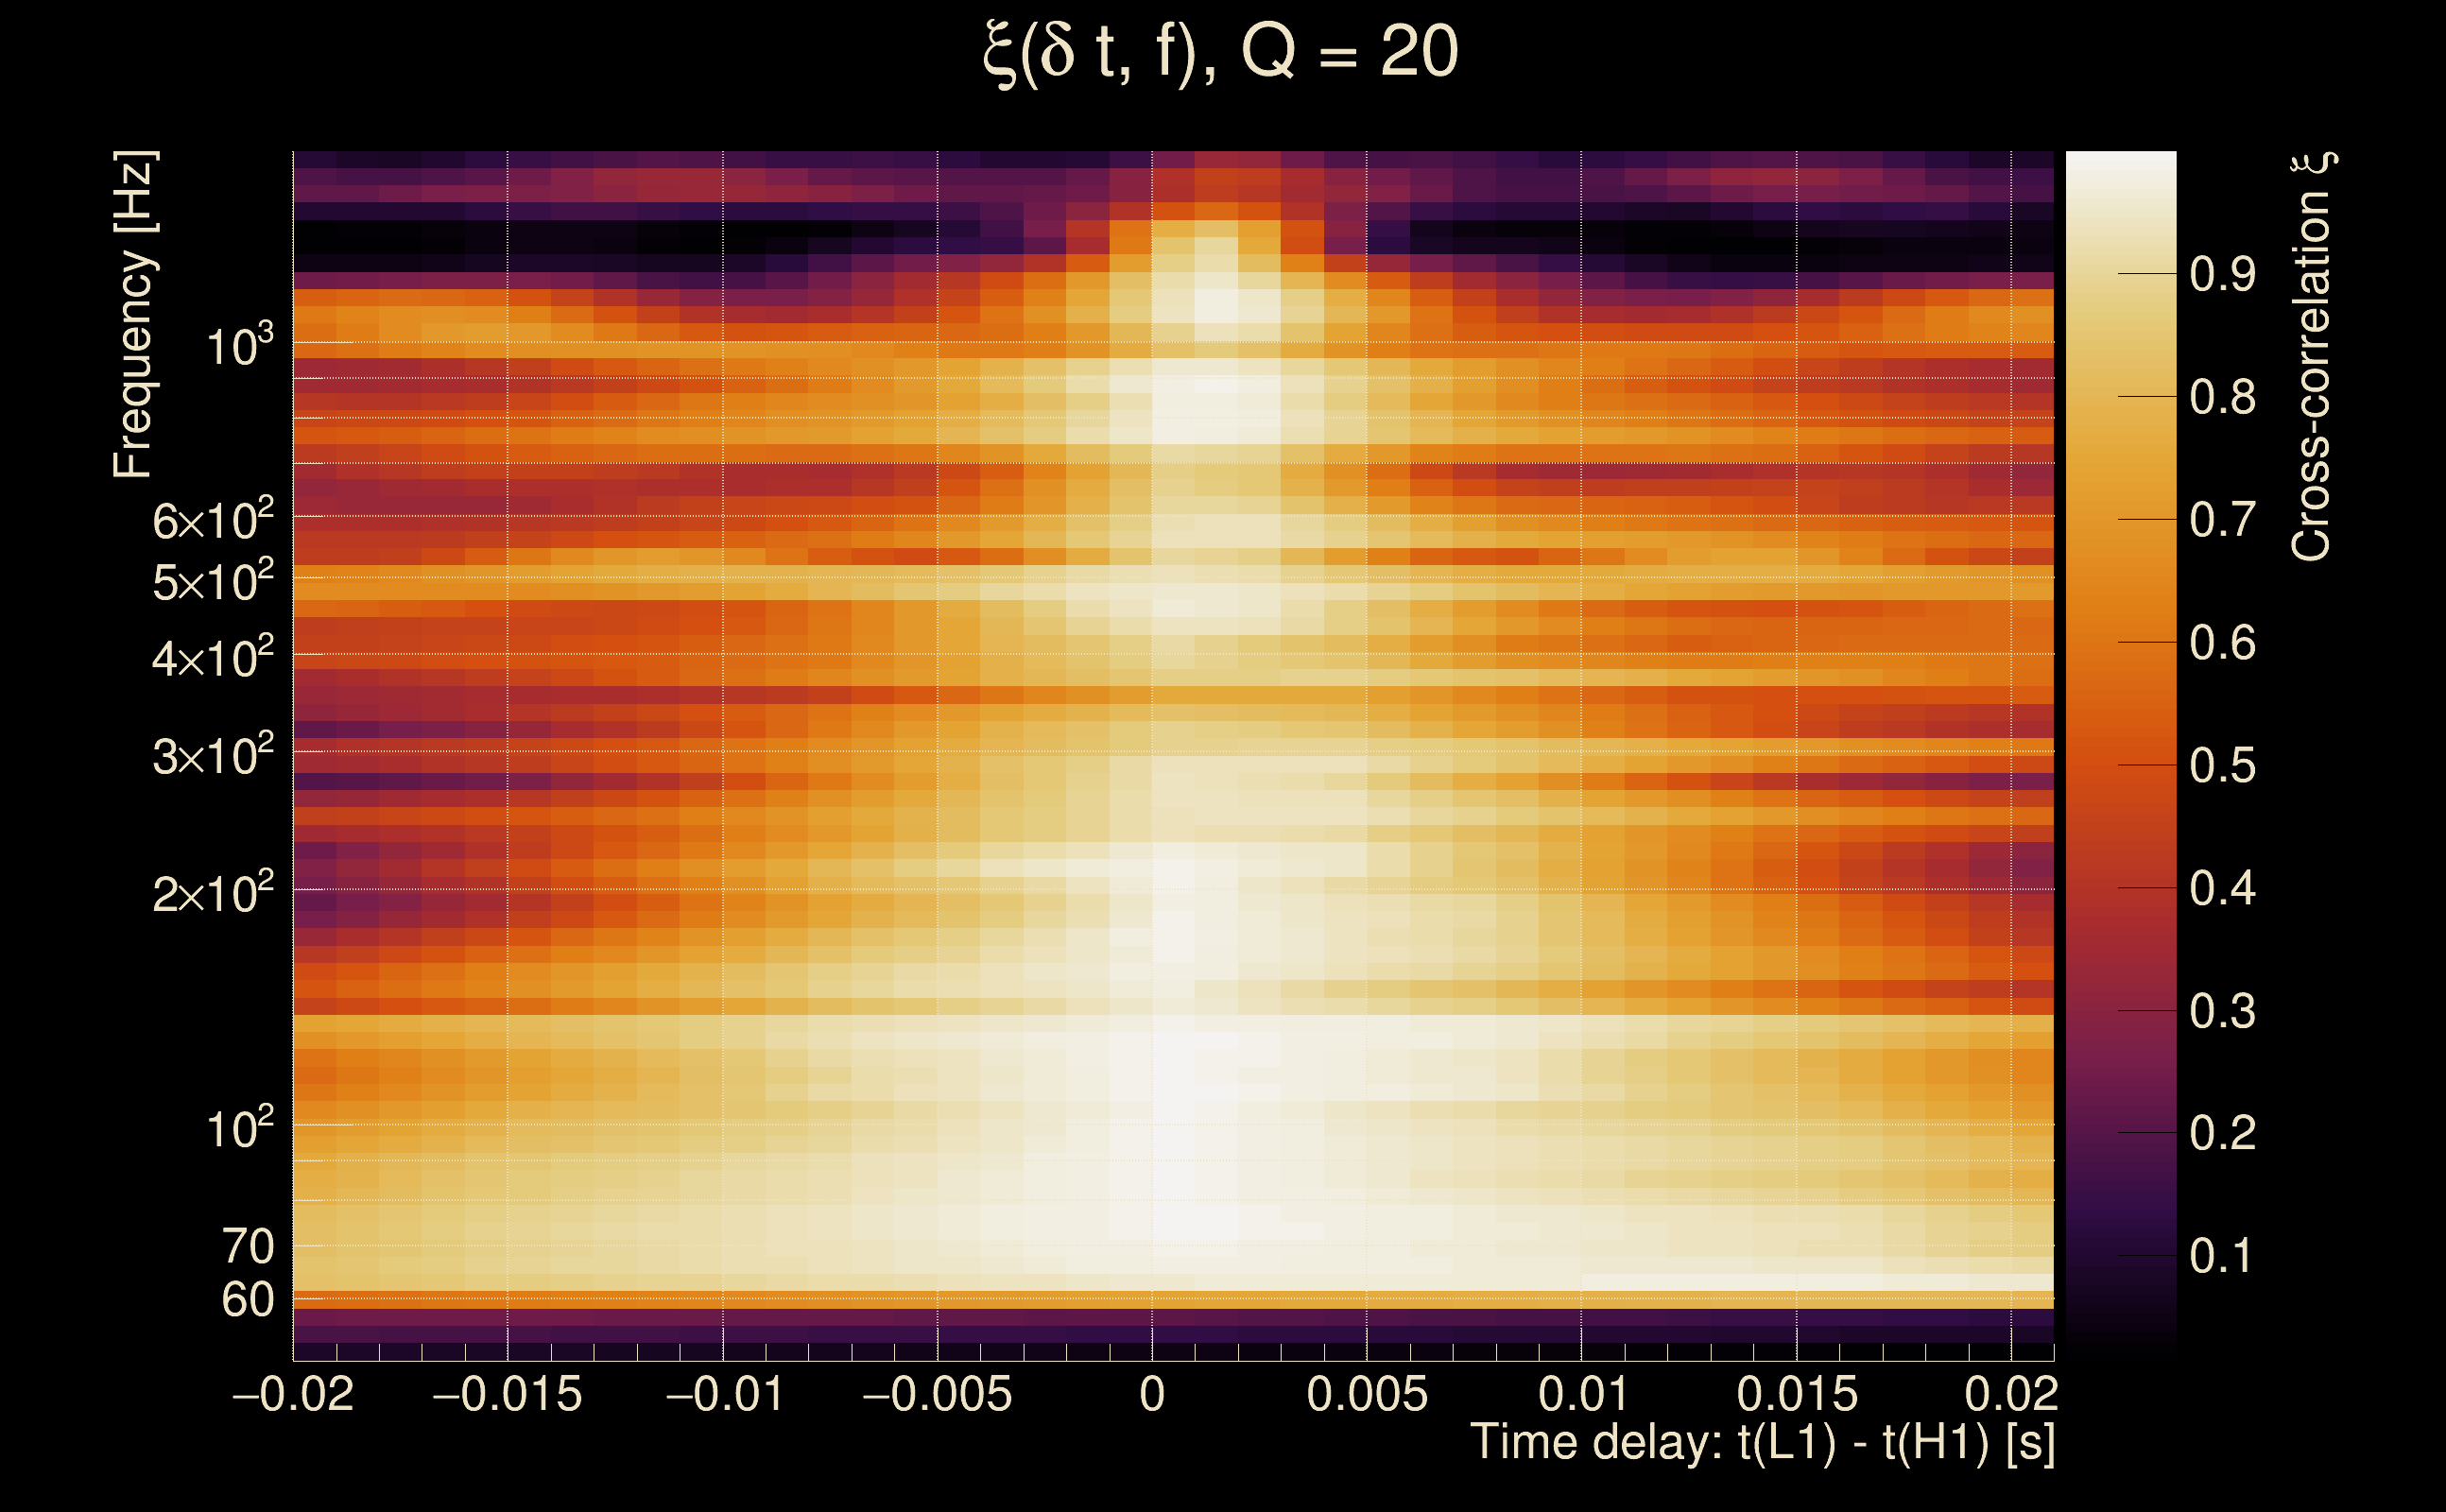
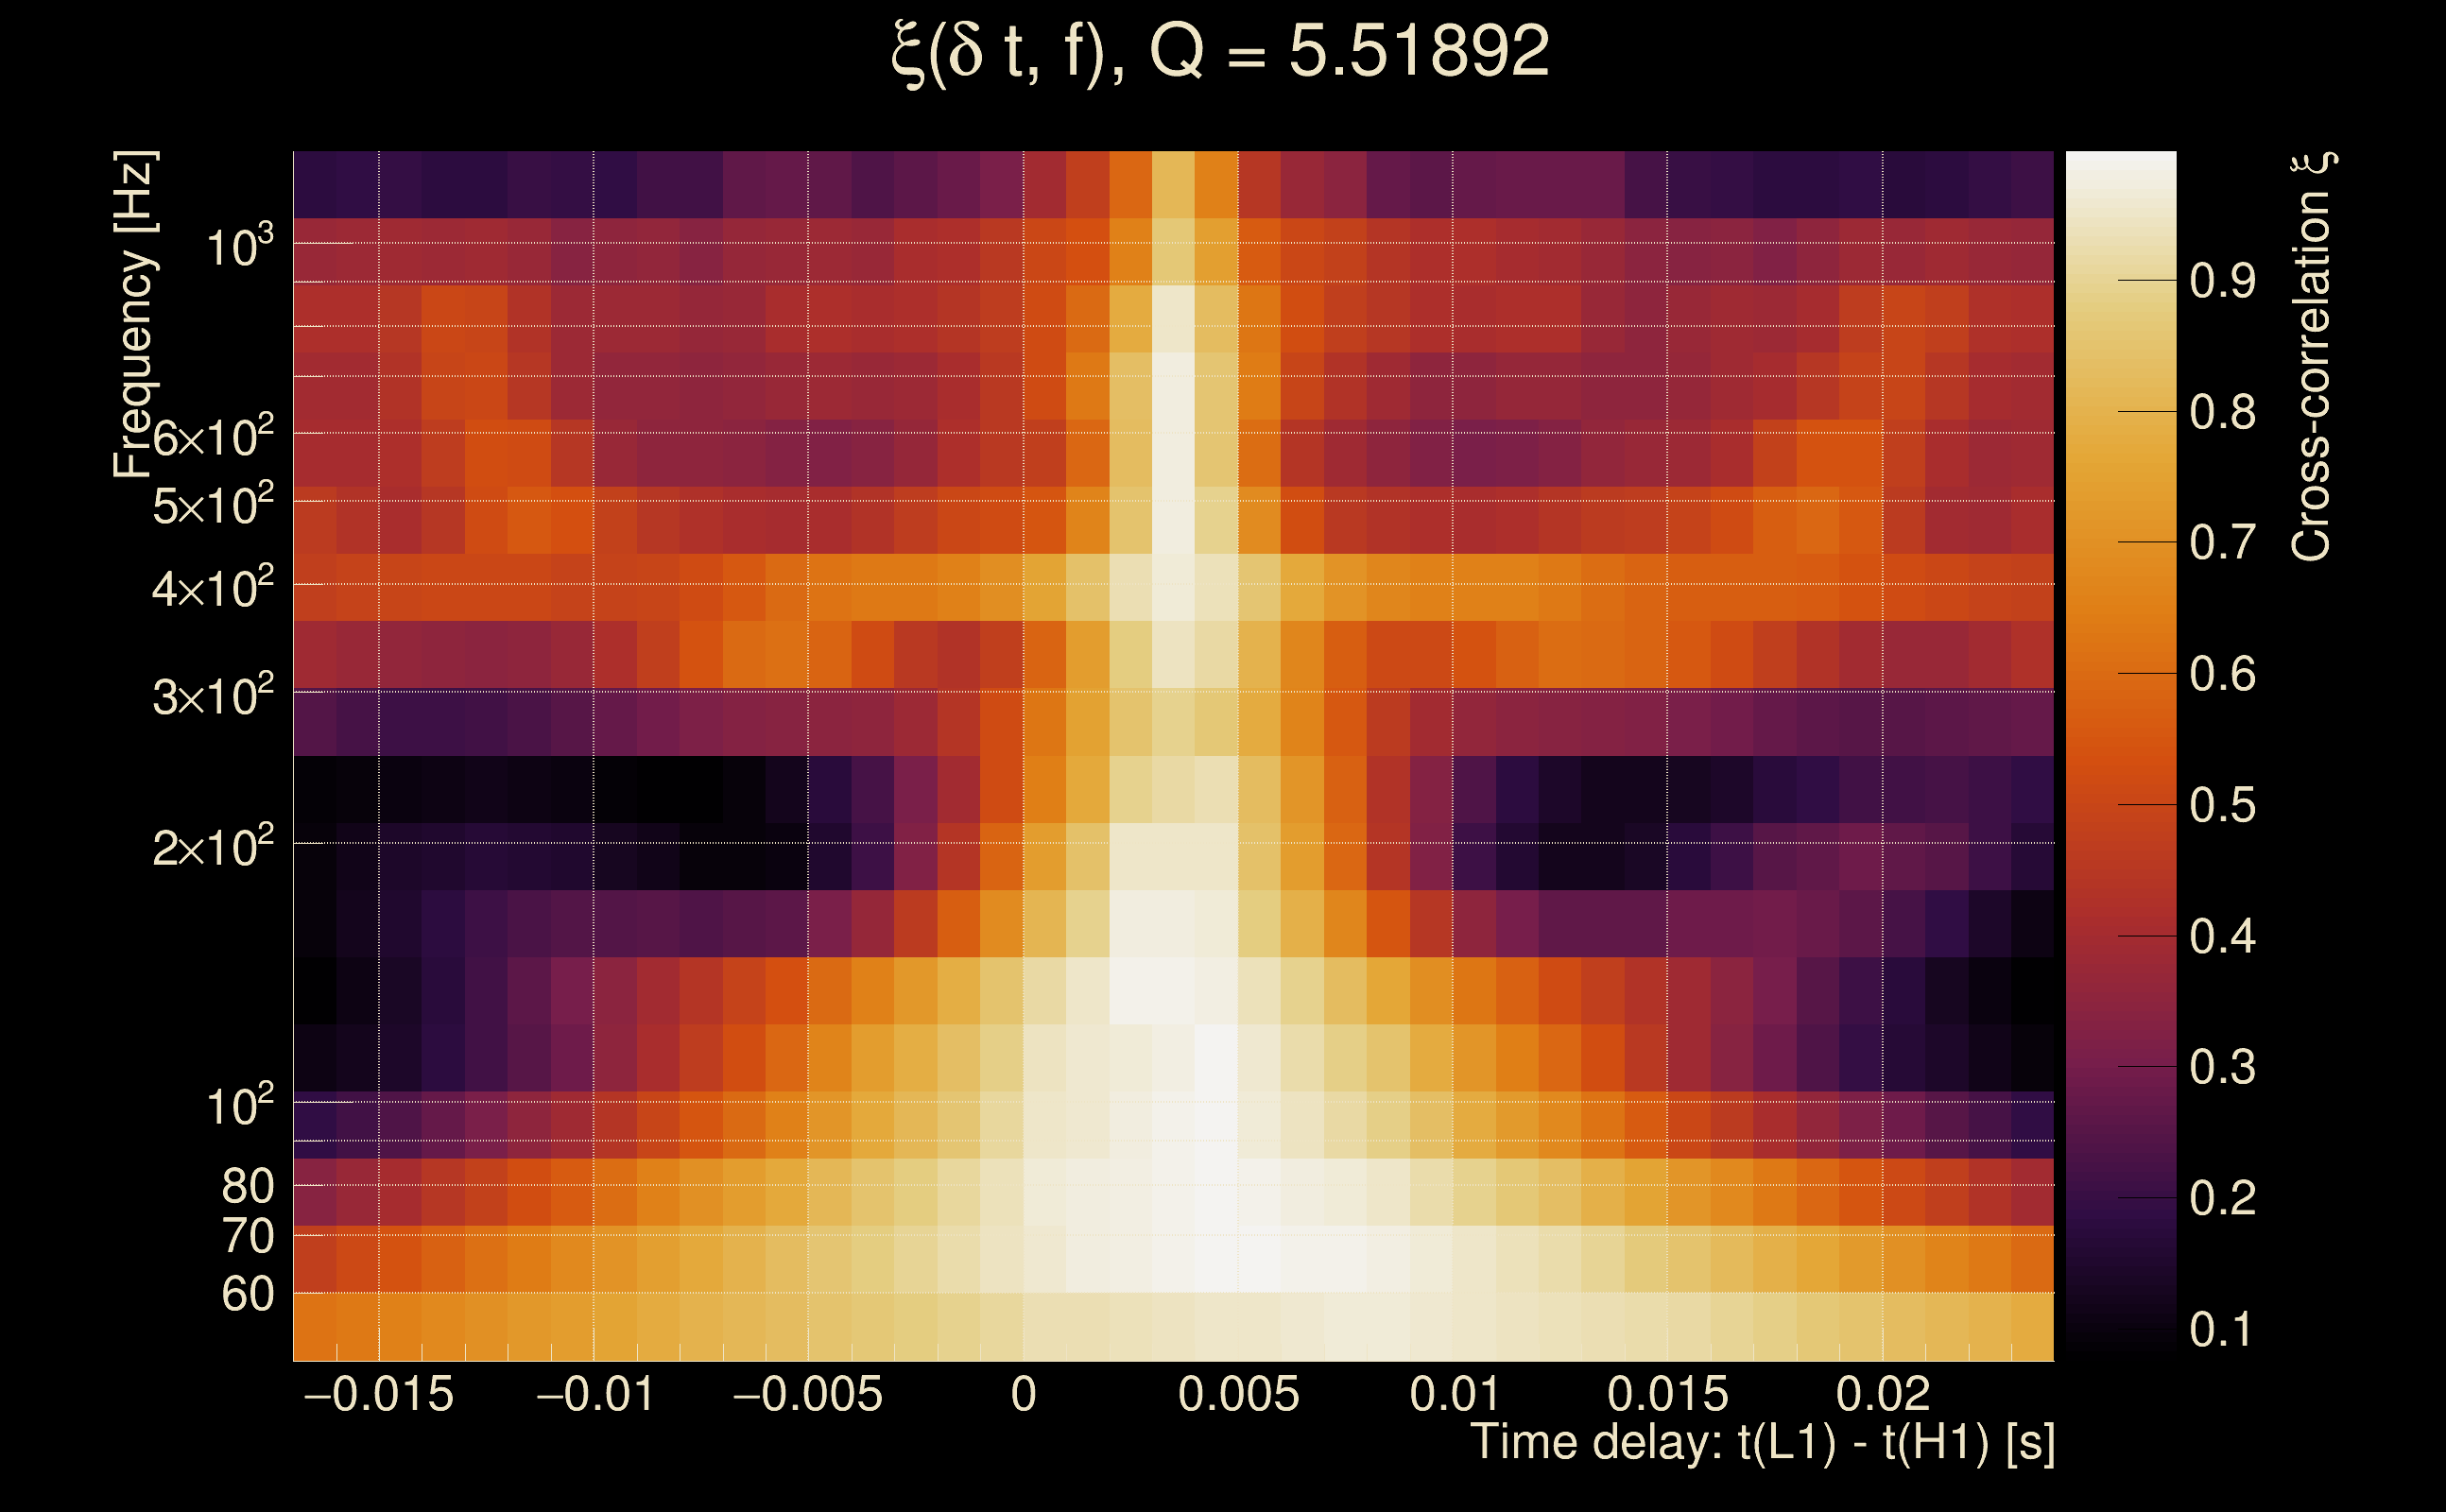
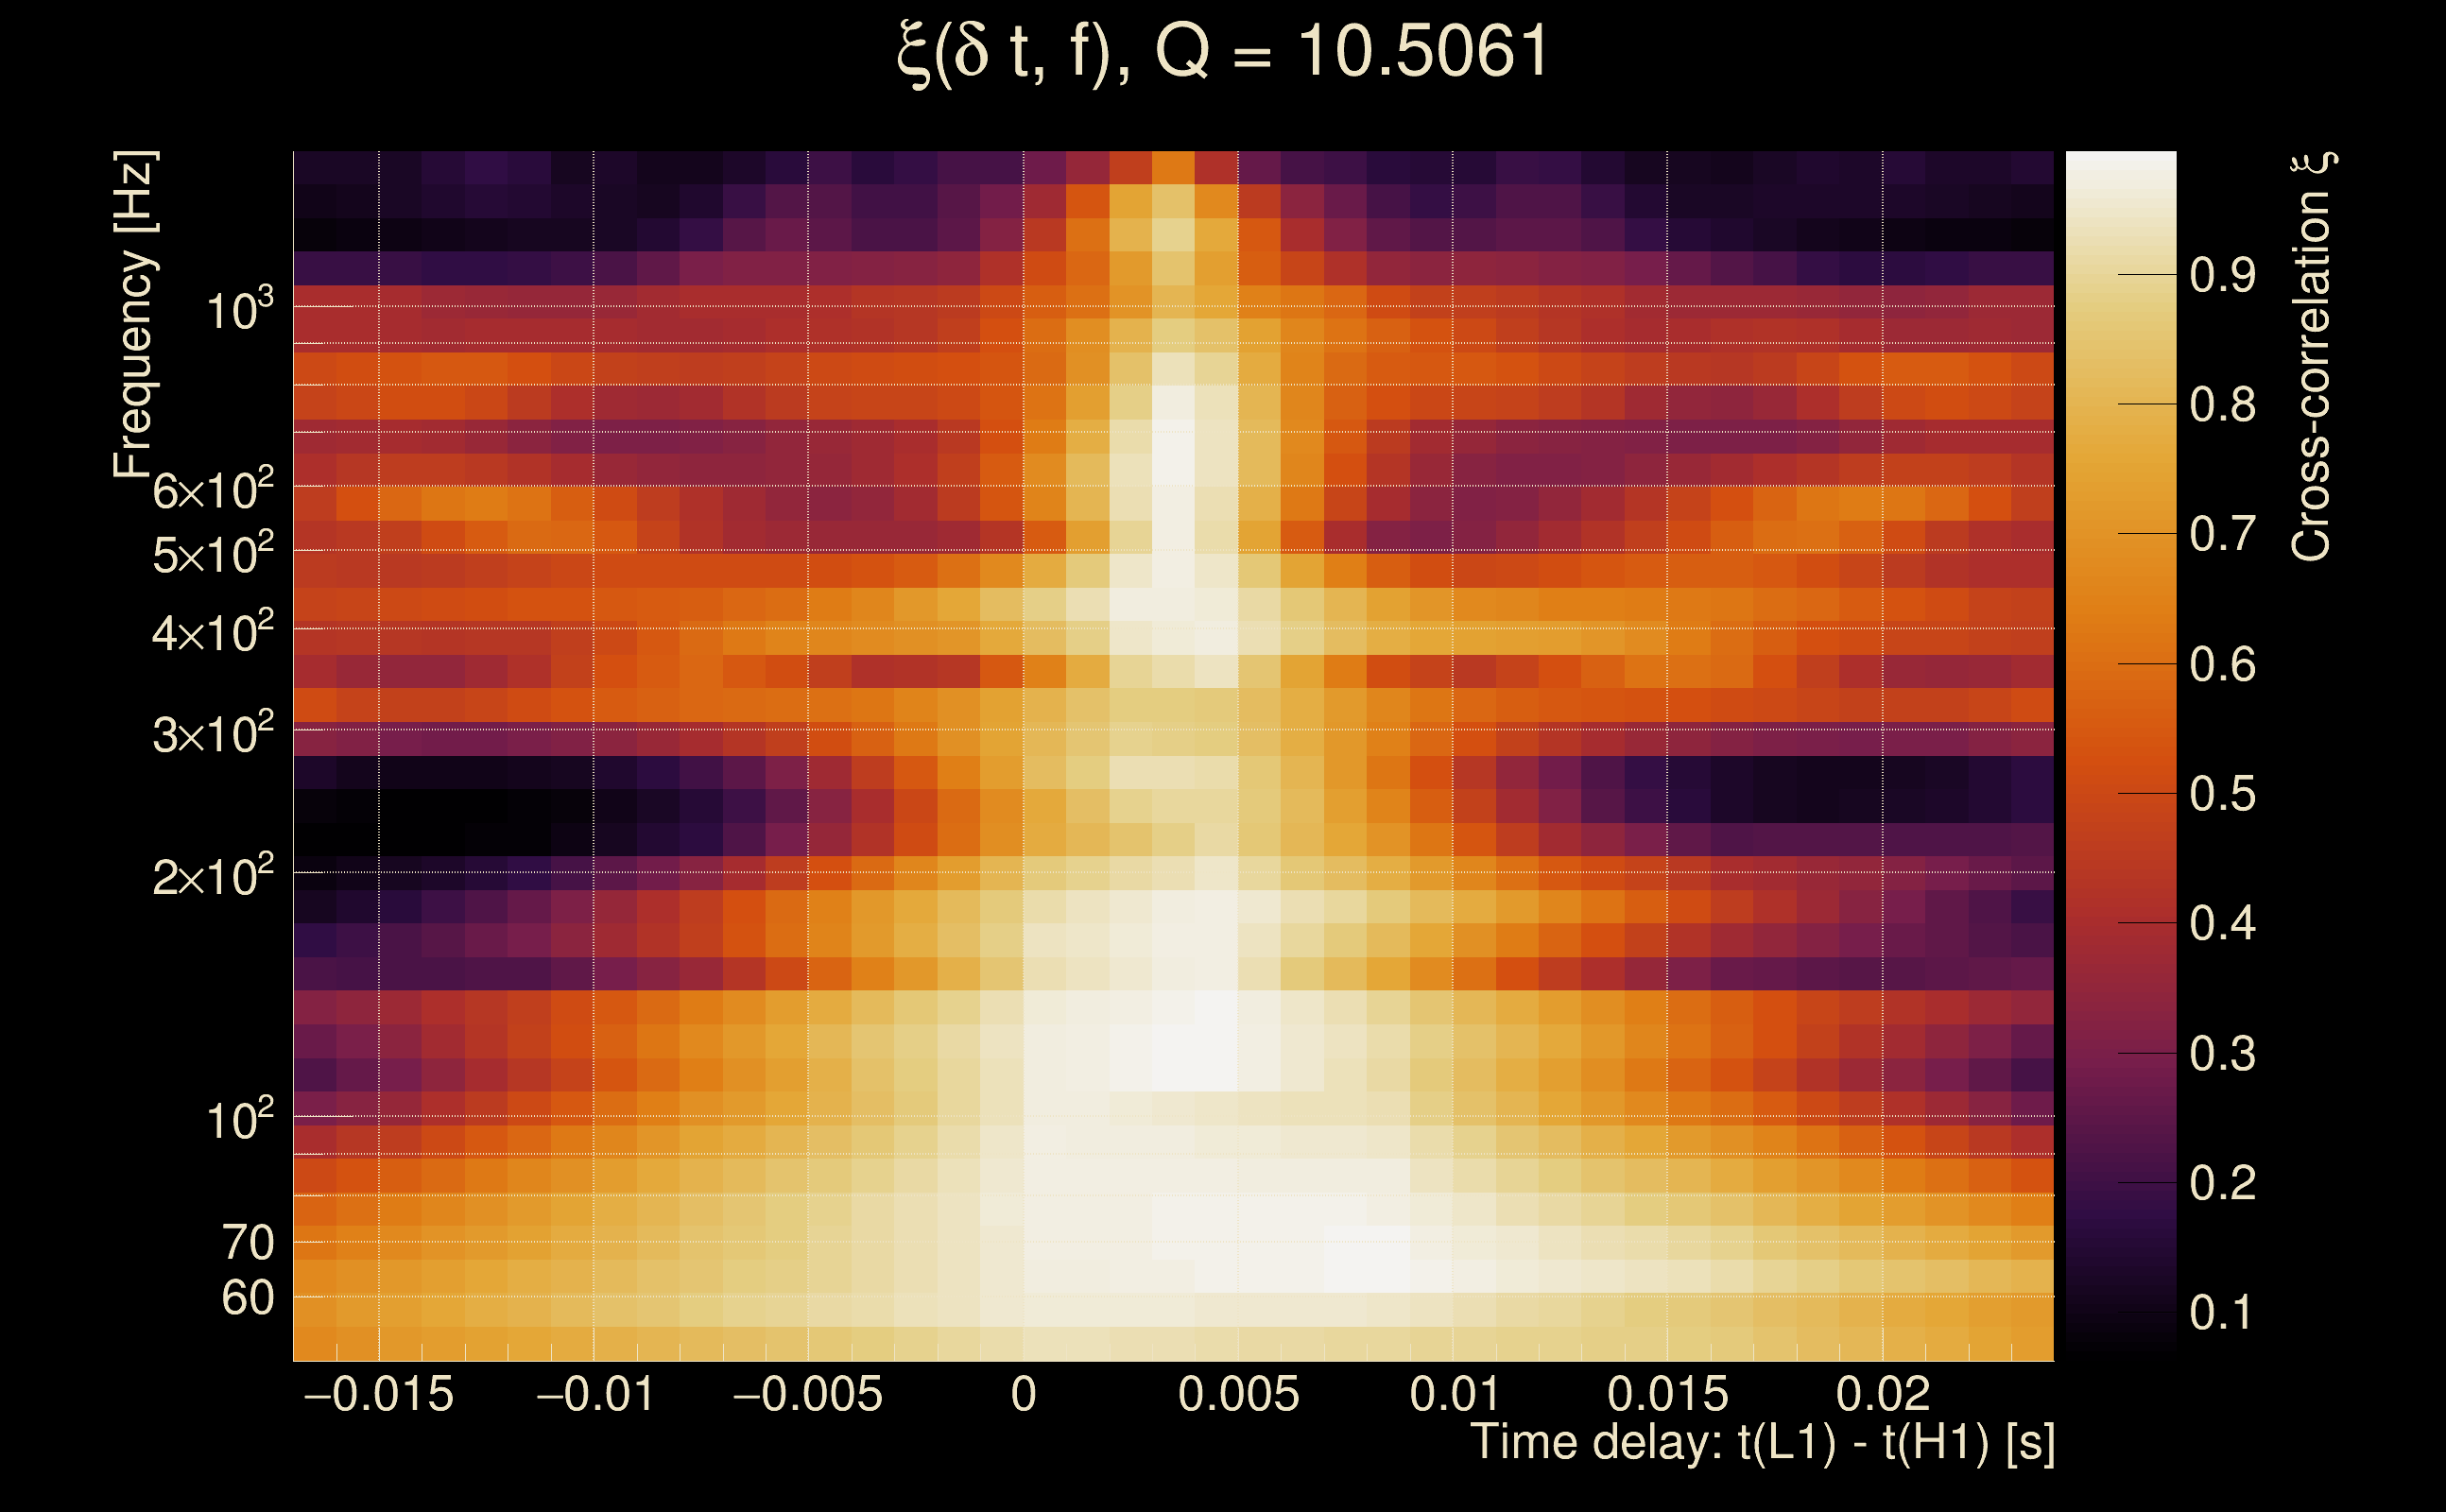
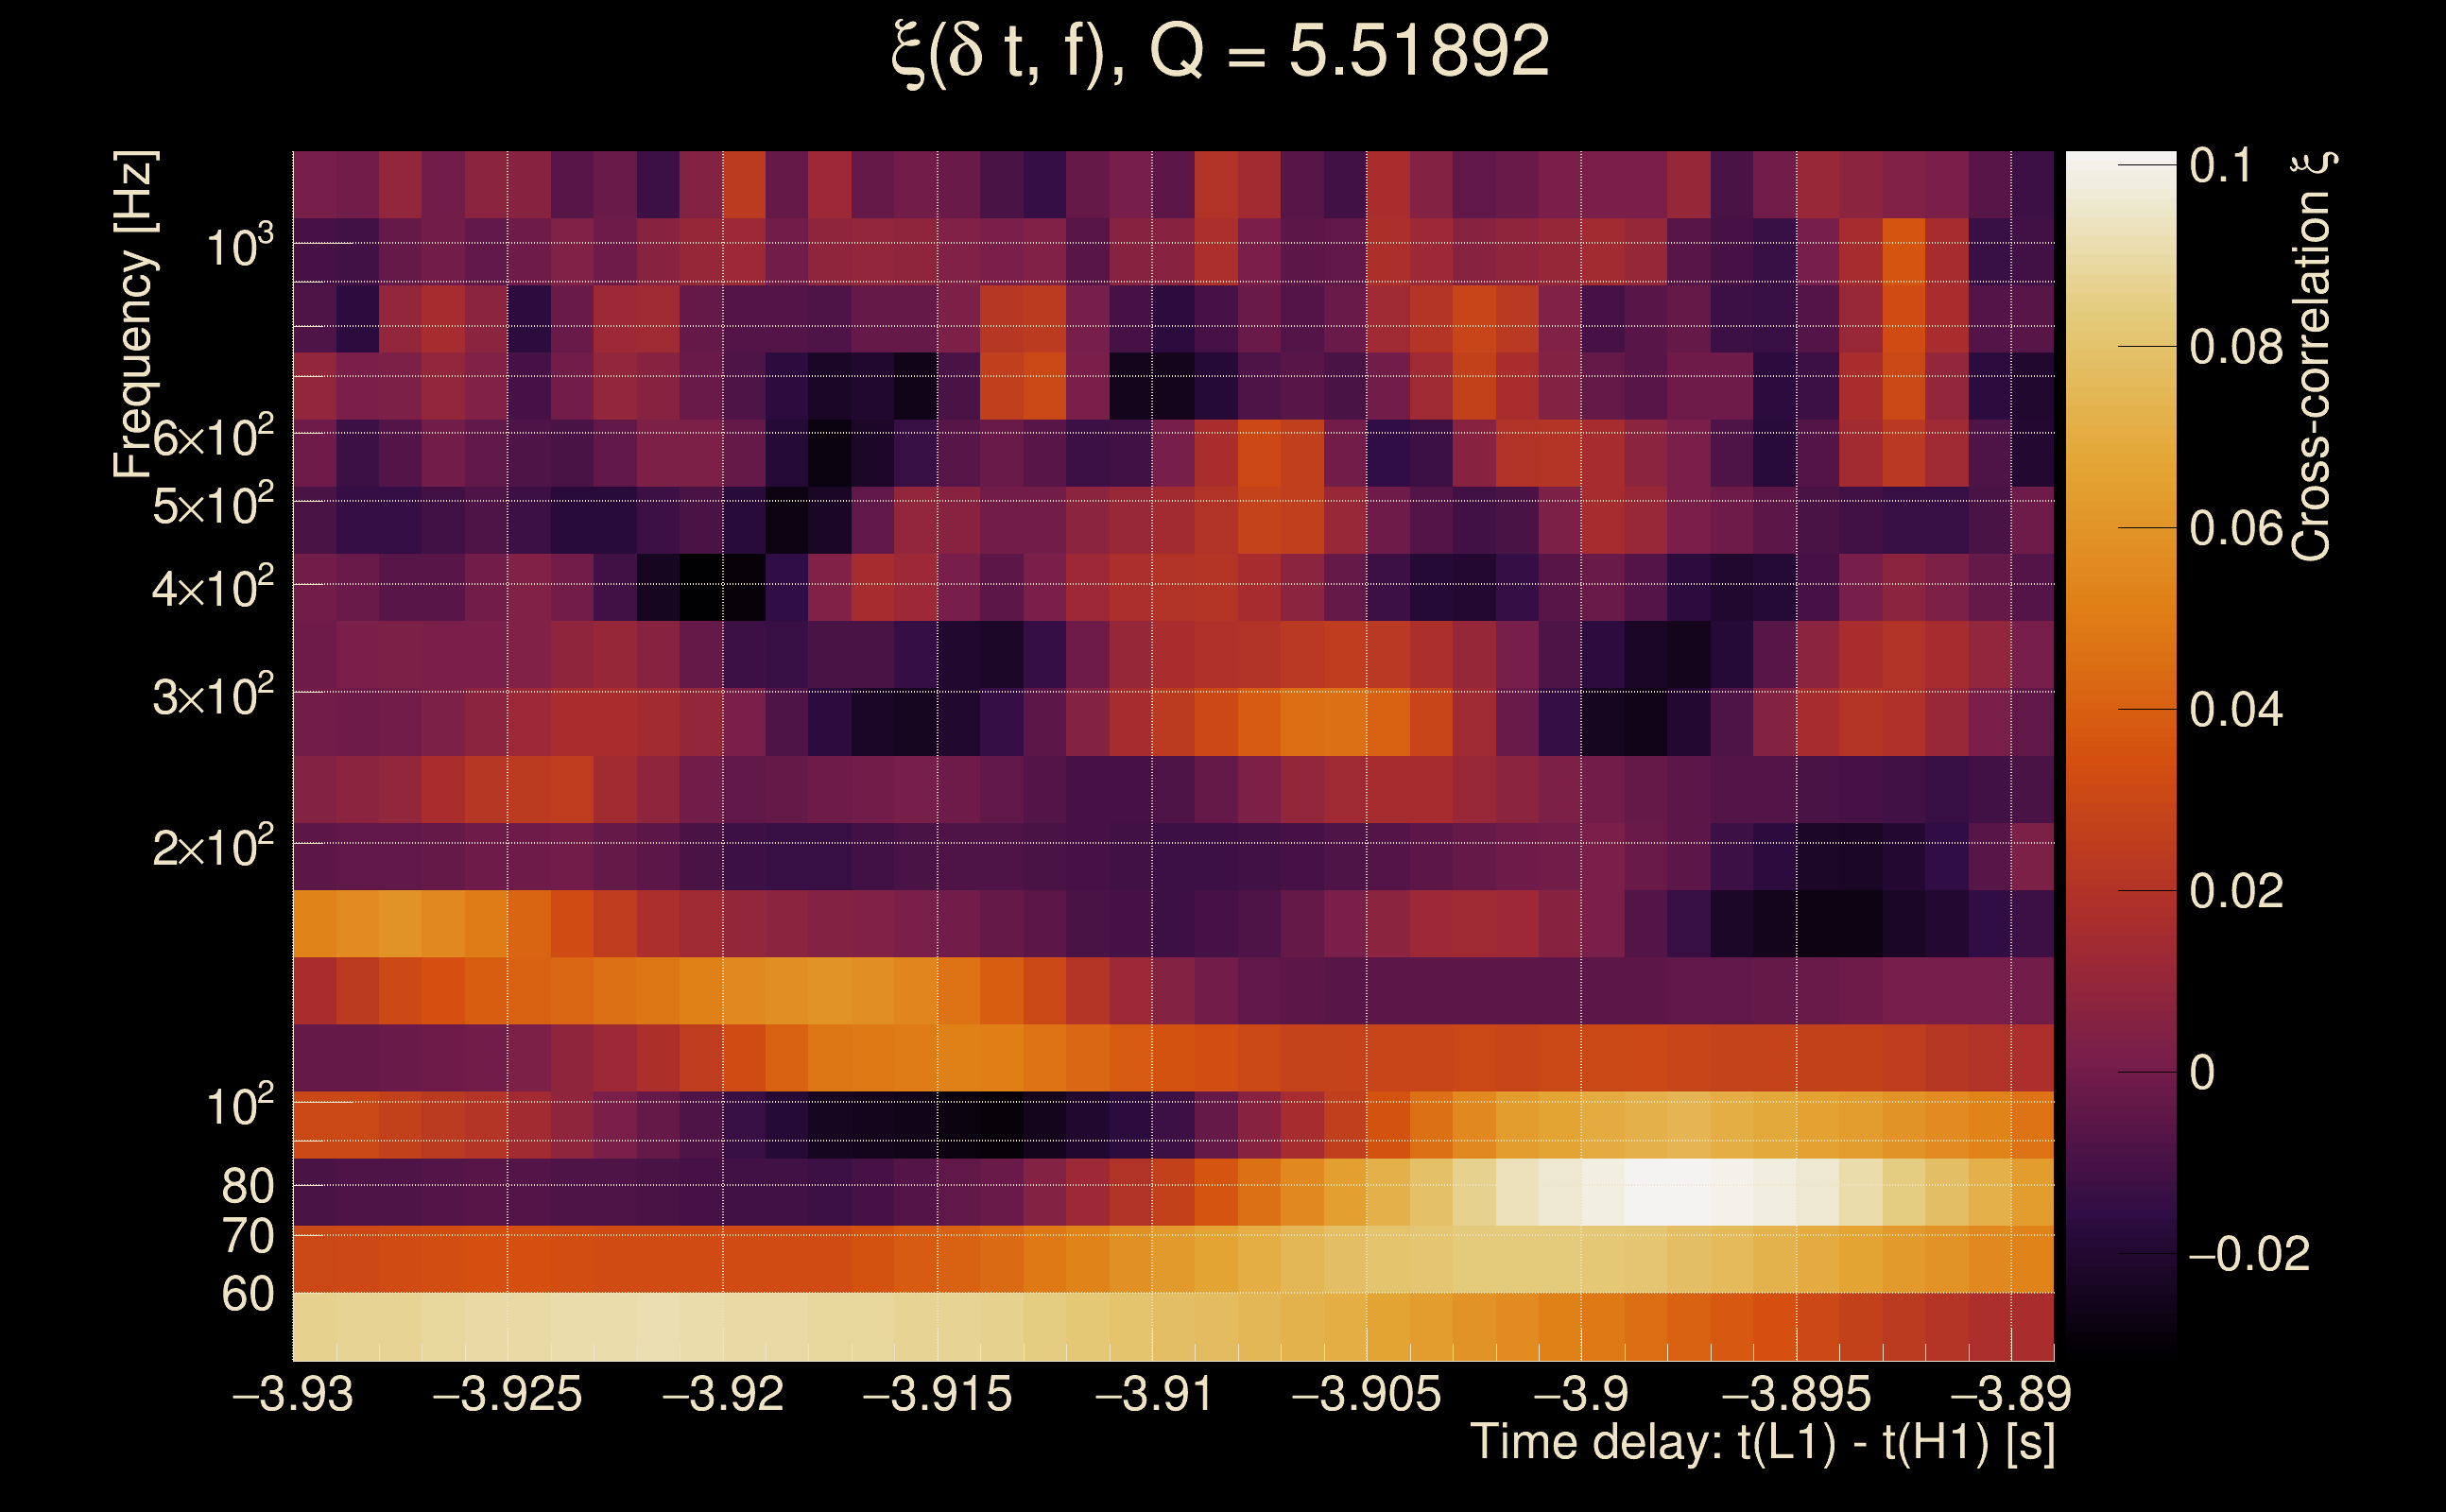
| Event time t(H1): | GPS = 1368420014 (Thu May 18 04:39:56 2023 ) → GPS = 1368420024 (Thu May 18 04:40:06 2023 ) |
| Event time t(L1): | GPS = 1368420014 (Thu May 18 04:40:06 2023 ) → GPS = 1368420024 (Thu May 18 04:40:06 2023 ) |
| Omicron analysis time window (H1): | GPS = 1368420011 → GPS = 1368420027 |
| Omicron analysis time window (L1): | GPS = 1368420011 → GPS = 1368420027 |
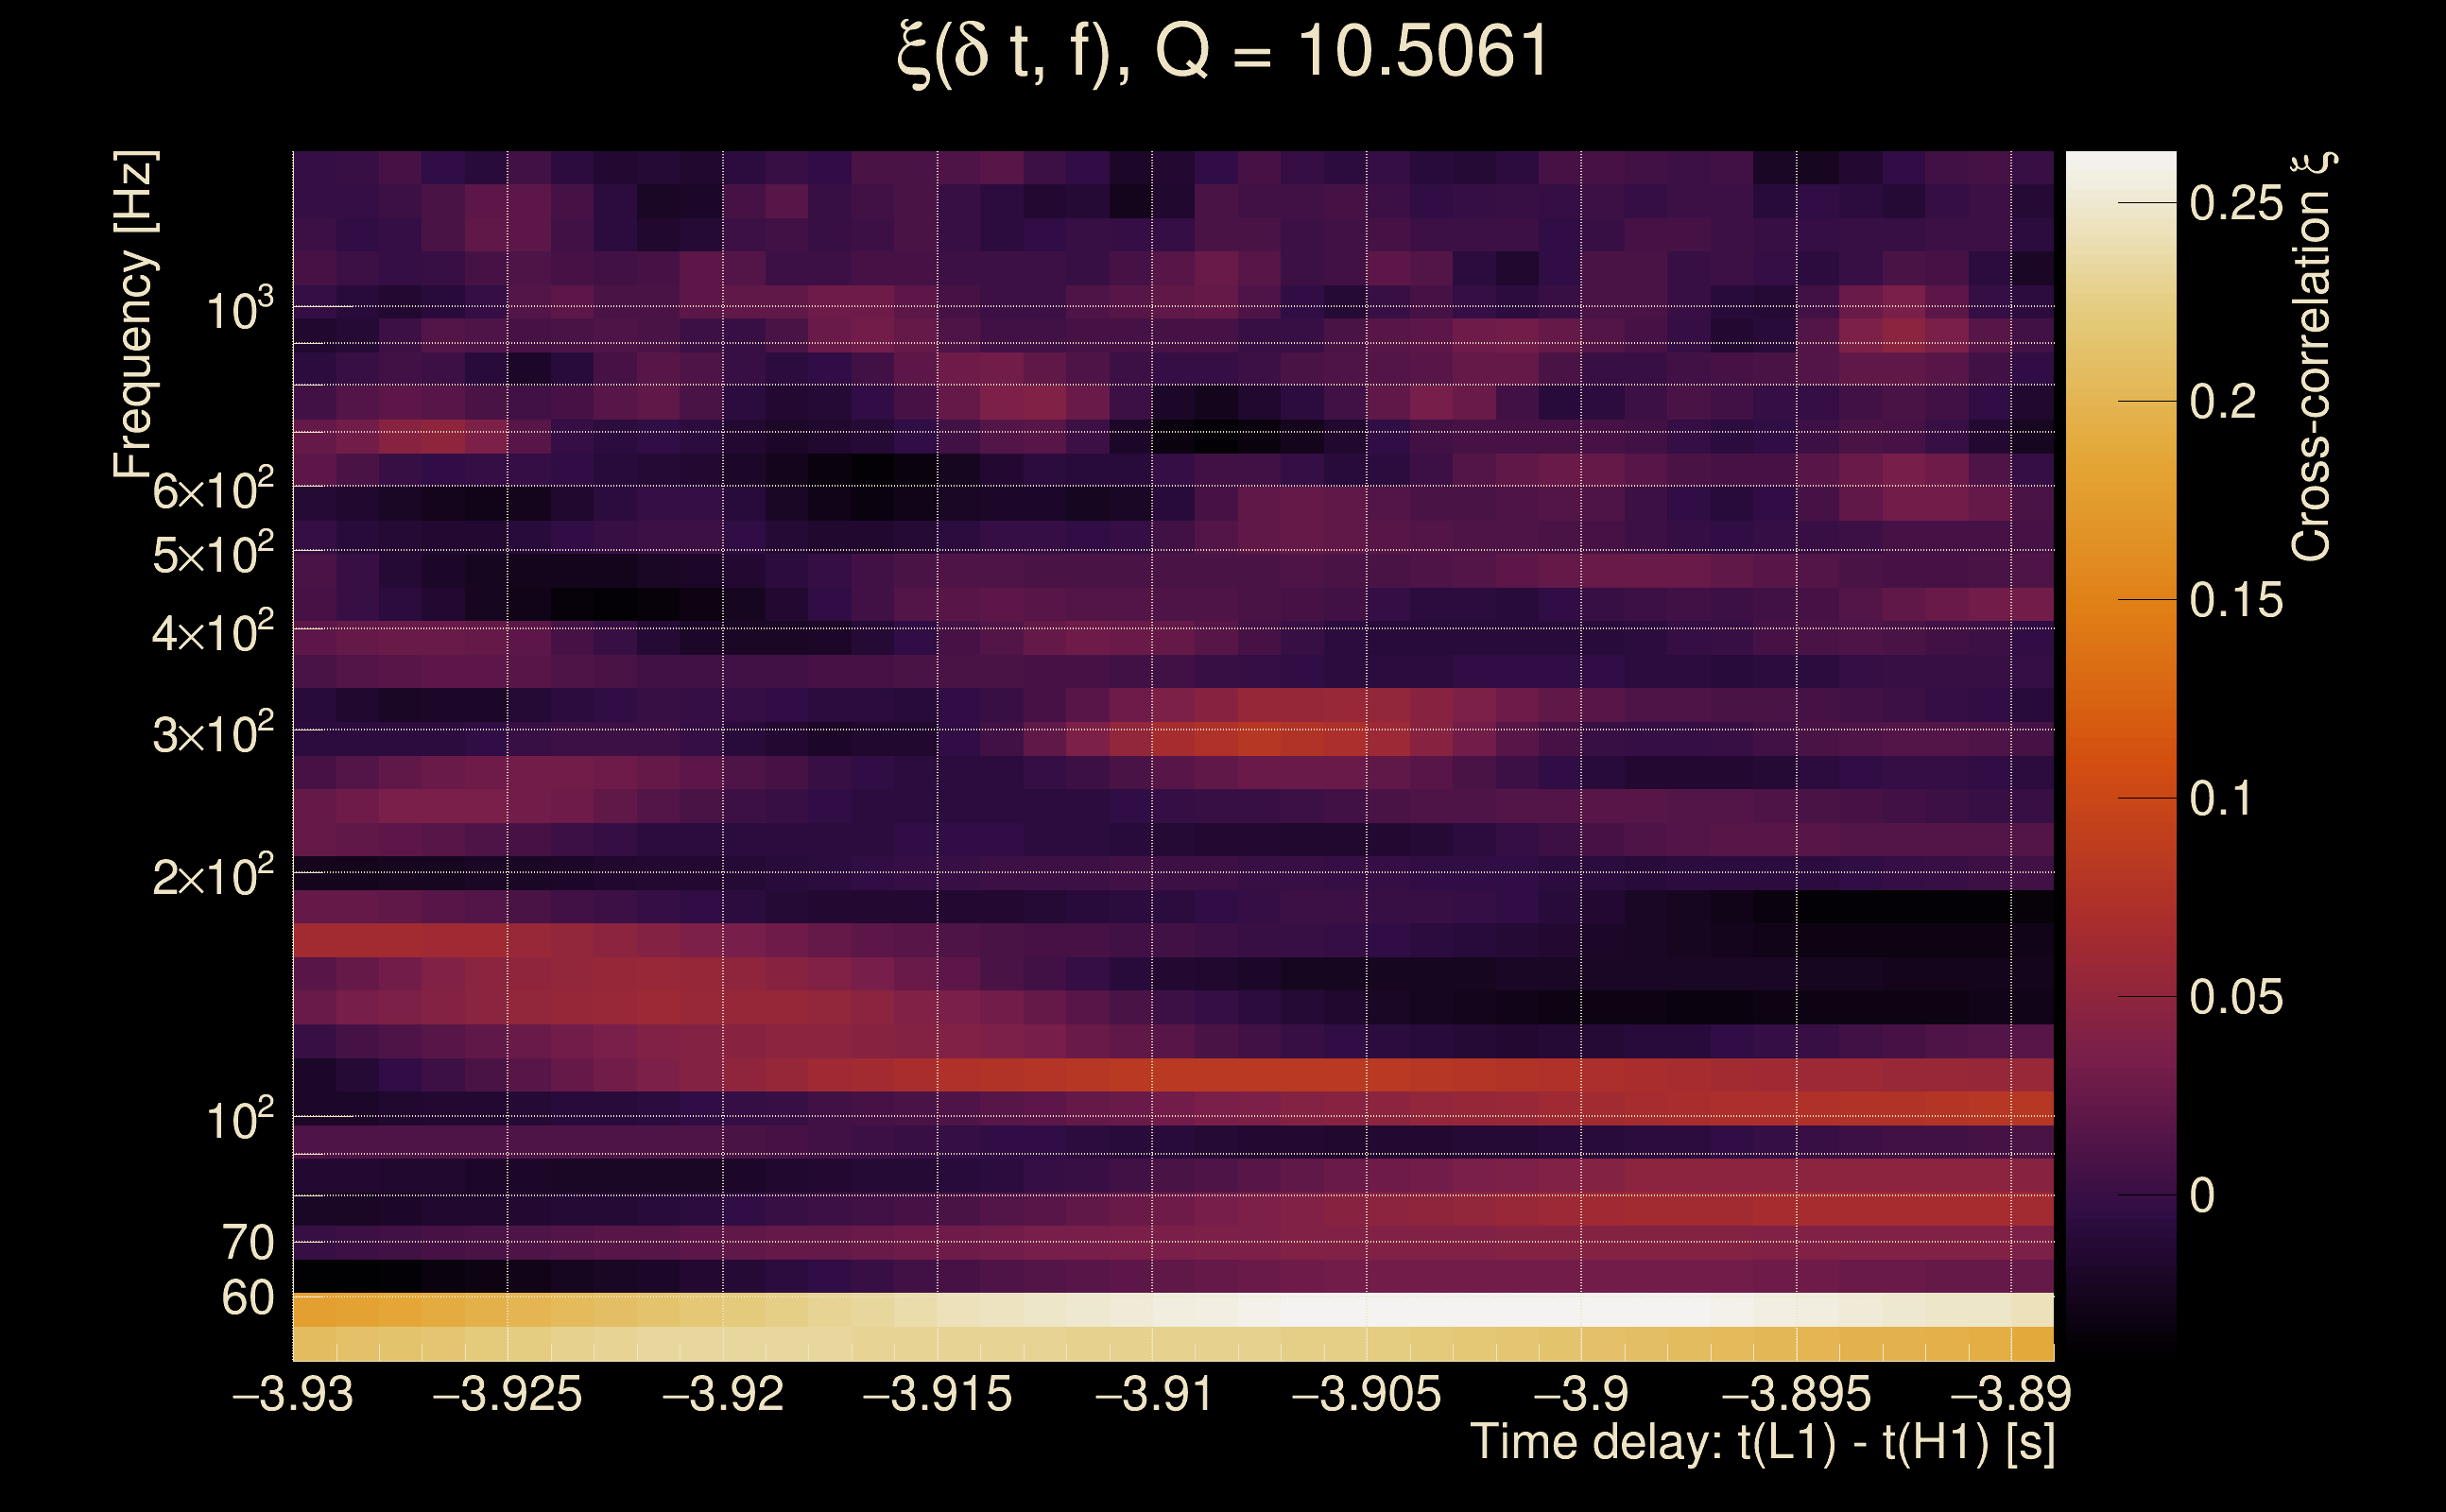
| Time delay between detectors t(L1) - t(H1): | -3.9095 s (slice index = 193 / 217), δt_gw = 0.000497811 s |
| Time delay standard deviation: | 0.0654836 s |
| [targeted mode] Time delay probability: | 0.937025 (0.0790092 sigmas), δt_target = 0.00310087 s |
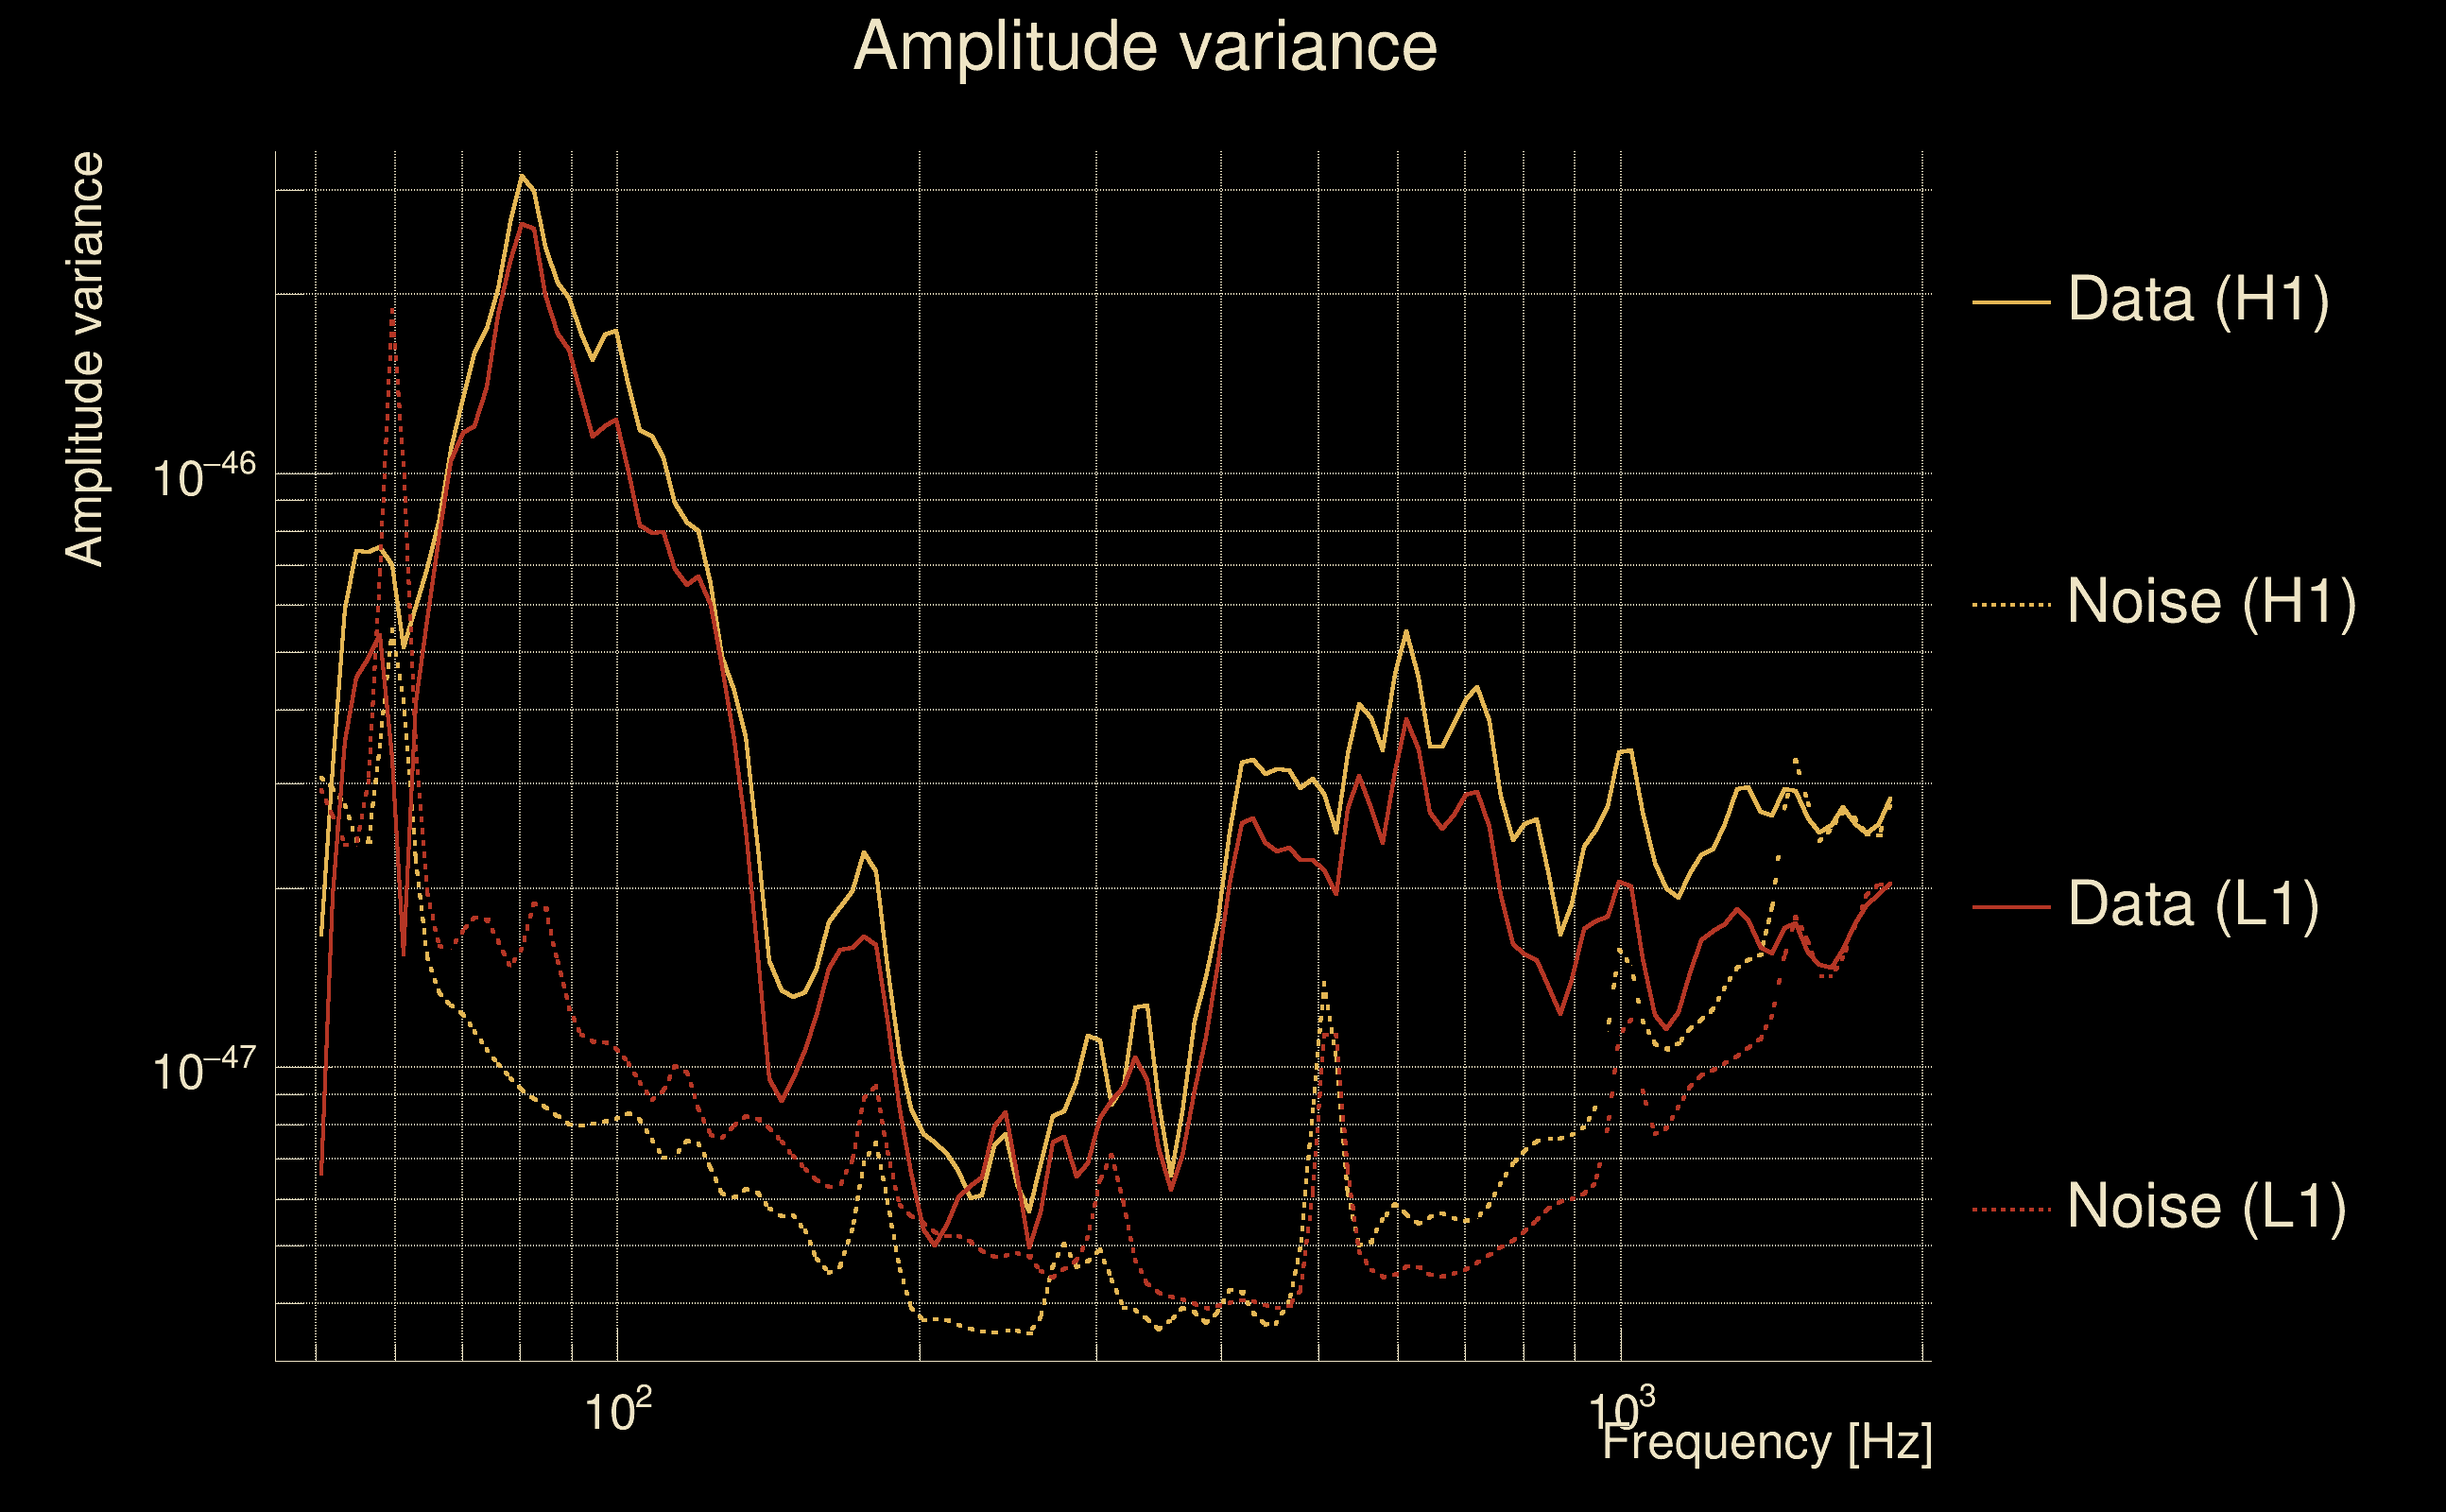
| Frequency: | 164.189 Hz |
| Ξ: | 0.0277989 ± 0.0541787 (variance = 0.00293534): Q0: 0.088755, Q1: 0.17761, Q2: 0.213801, Q3: 0.0763886, Q4: 0.101287 |
| Rank: | R_A = 0.0123548 |
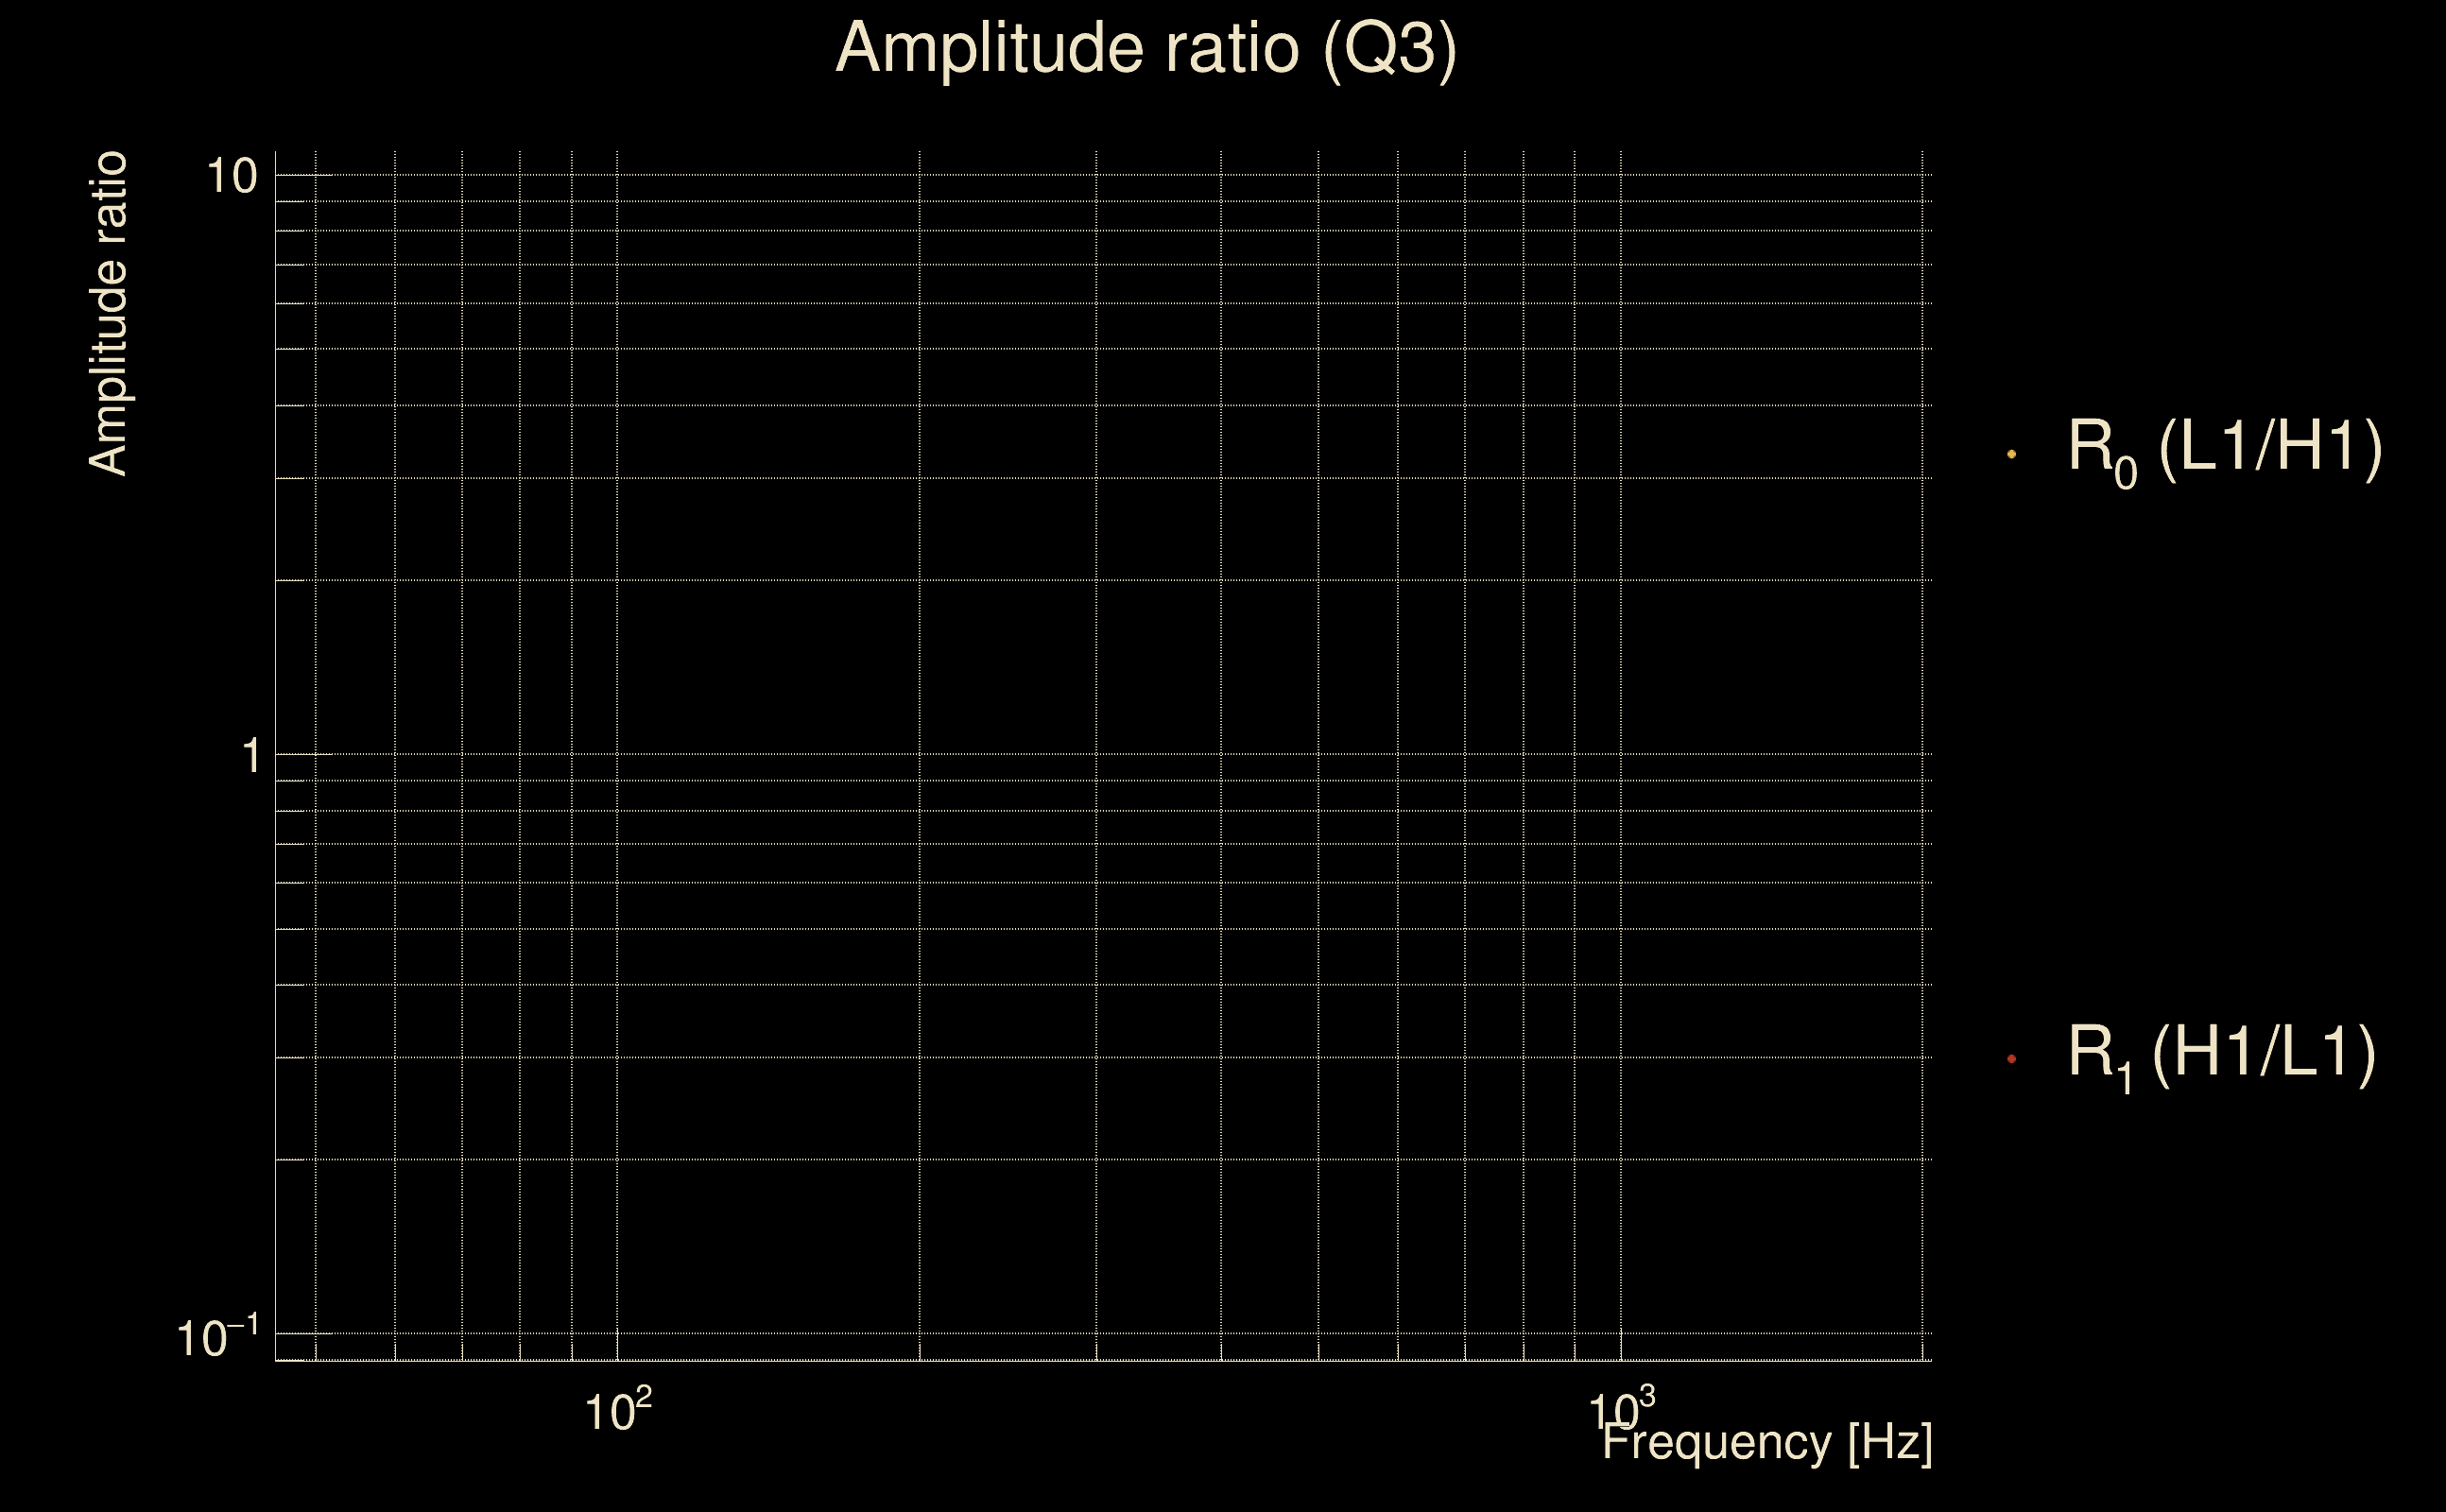
| Log of amplitude ratio (L1/H1): | -0.0318802, variance = 0.446447 (L1/H1: -0.514294, variance = 1.004, H1/L1: -0.433136, variance = 0.789075) |
| Amplitude ratio (L1/H1): | 0.968623 ⋇ 1.95066 (L1/H1: 0.597923 ⋇ 2.72372, H1/L1: 0.648472 ⋇ 2.43099) |
| Amplitude ratio H1|L1 compatibility (probability): | 0.479235 |
| Antenna factor probability: | 0.989714 |
| Number of rejected frequency rows: | Q0: 13 / 18, Q1: 29 / 36, Q2: 56 / 70, Q3: 117 / 134, Q4: 247 / 258 |
| Maximum signal-to-noise ratio: | H1: 4.94595, L1: 5.03762 |
| SNR variance: | H1: 0.52606, L1: 0.566467 |
| Click here for a zoomed plot | Click here for a zoomed plot | Click here for a zoomed plot | Click here for a zoomed plot | Click here for a zoomed plot |
 |
 |
 |
 |
 |
 |
 |
 |
 |
 |
 |
 |
 |
 |
 |
 |
 |
 |
 |
 |
 |
 |
 |
 |
 |
 |
 |
 |
 |
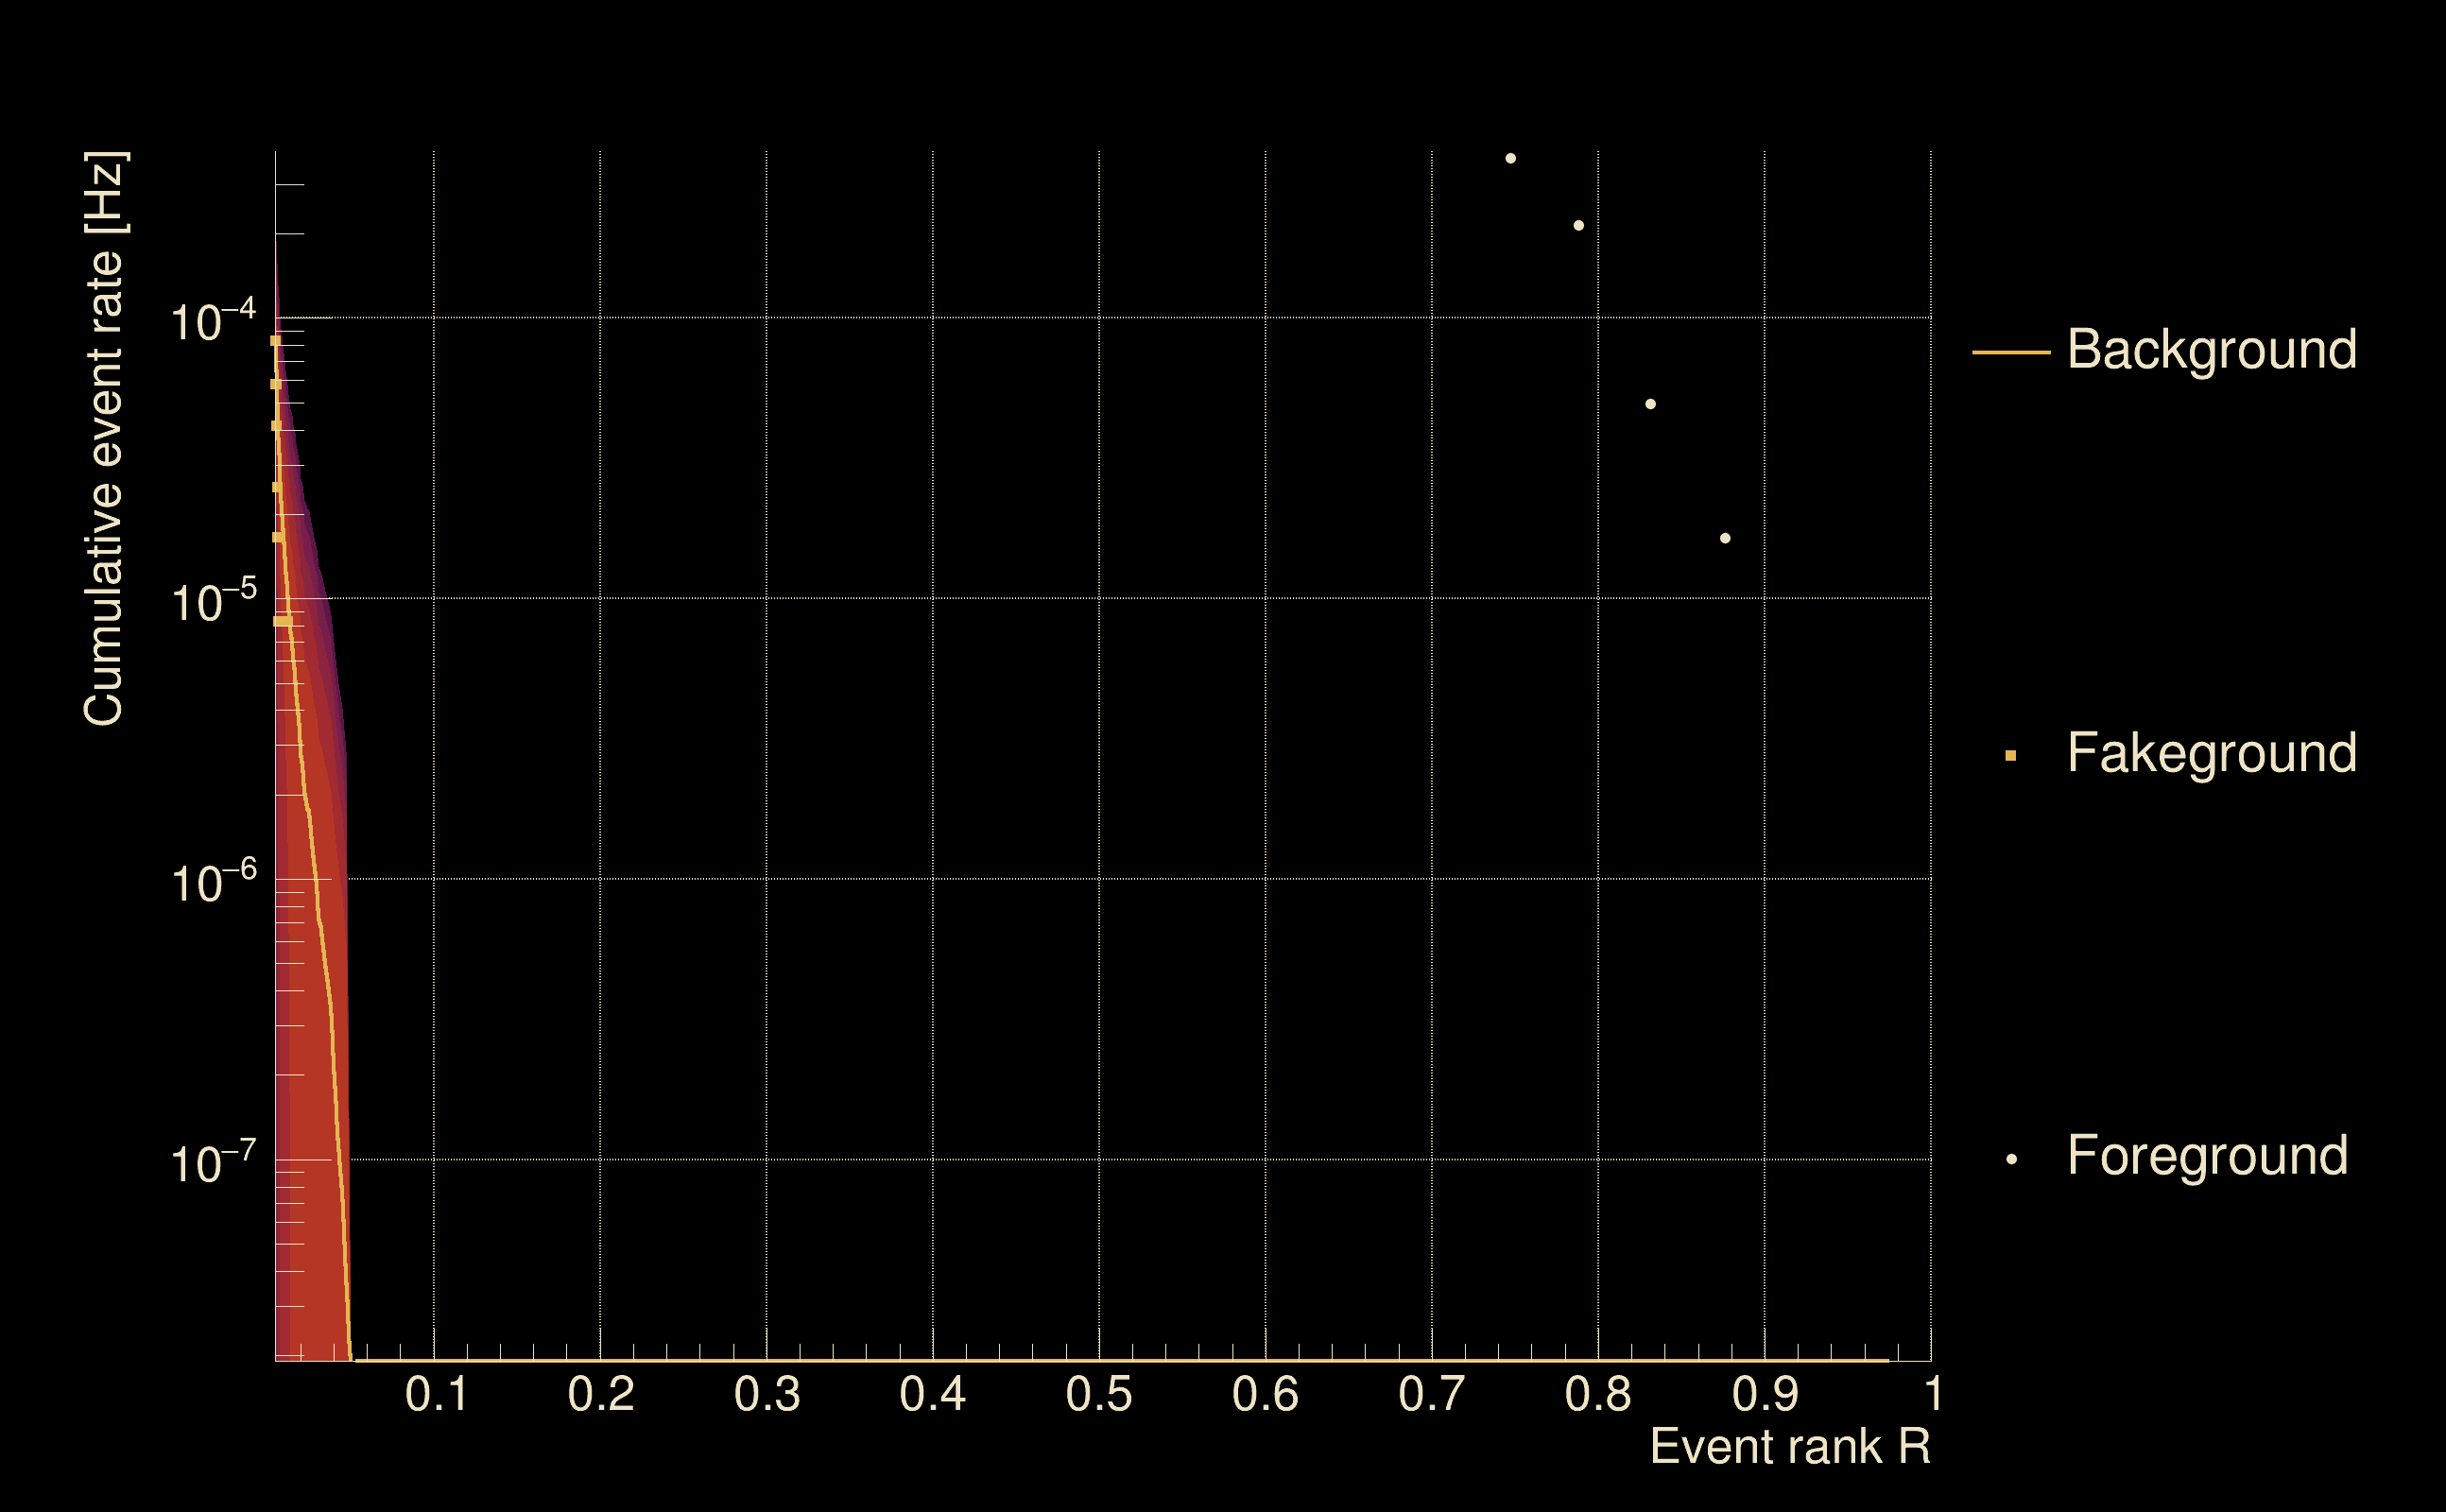
| Detection threshold: | R > 0.0314201 |
| False-alarm rate above that detection threshold: | 6.77088e-07 |
| Alternative threshold at 1/1000 yrs: | R > 0.0475401 |
| Alternative threshold at 1/100 yrs: | R > 0.0475401 |
| Alternative threshold at 1/10 yrs: | R > 0.0475401 |
| Alternative threshold at 1/1 yr: | R > 0.0475401 |
| Alternative threshold at 1/1 d: | R > 0.0113783 |
 |
|
 |
 |
 |
 |
 |
 |
 |
 |
 |
 |
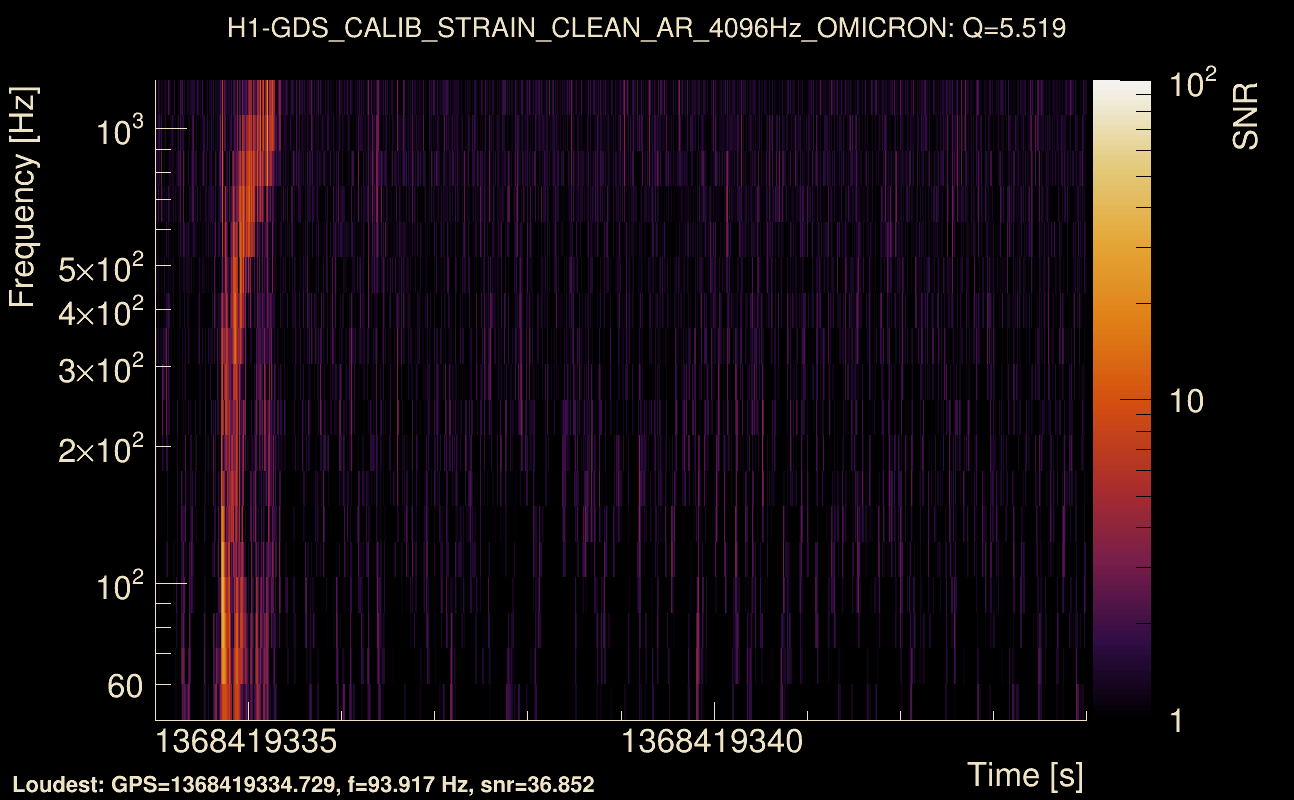
| Event time t(H1): | GPS = 1368419334 (Thu May 18 04:28:36 2023 ) → GPS = 1368419344 (Thu May 18 04:28:46 2023 ) |
| Event time t(L1): | GPS = 1368419334 (Thu May 18 04:28:46 2023 ) → GPS = 1368419344 (Thu May 18 04:28:46 2023 ) |
| Omicron analysis time window (H1): | GPS = 1368419331 → GPS = 1368419347 |
| Omicron analysis time window (L1): | GPS = 1368419331 → GPS = 1368419347 |
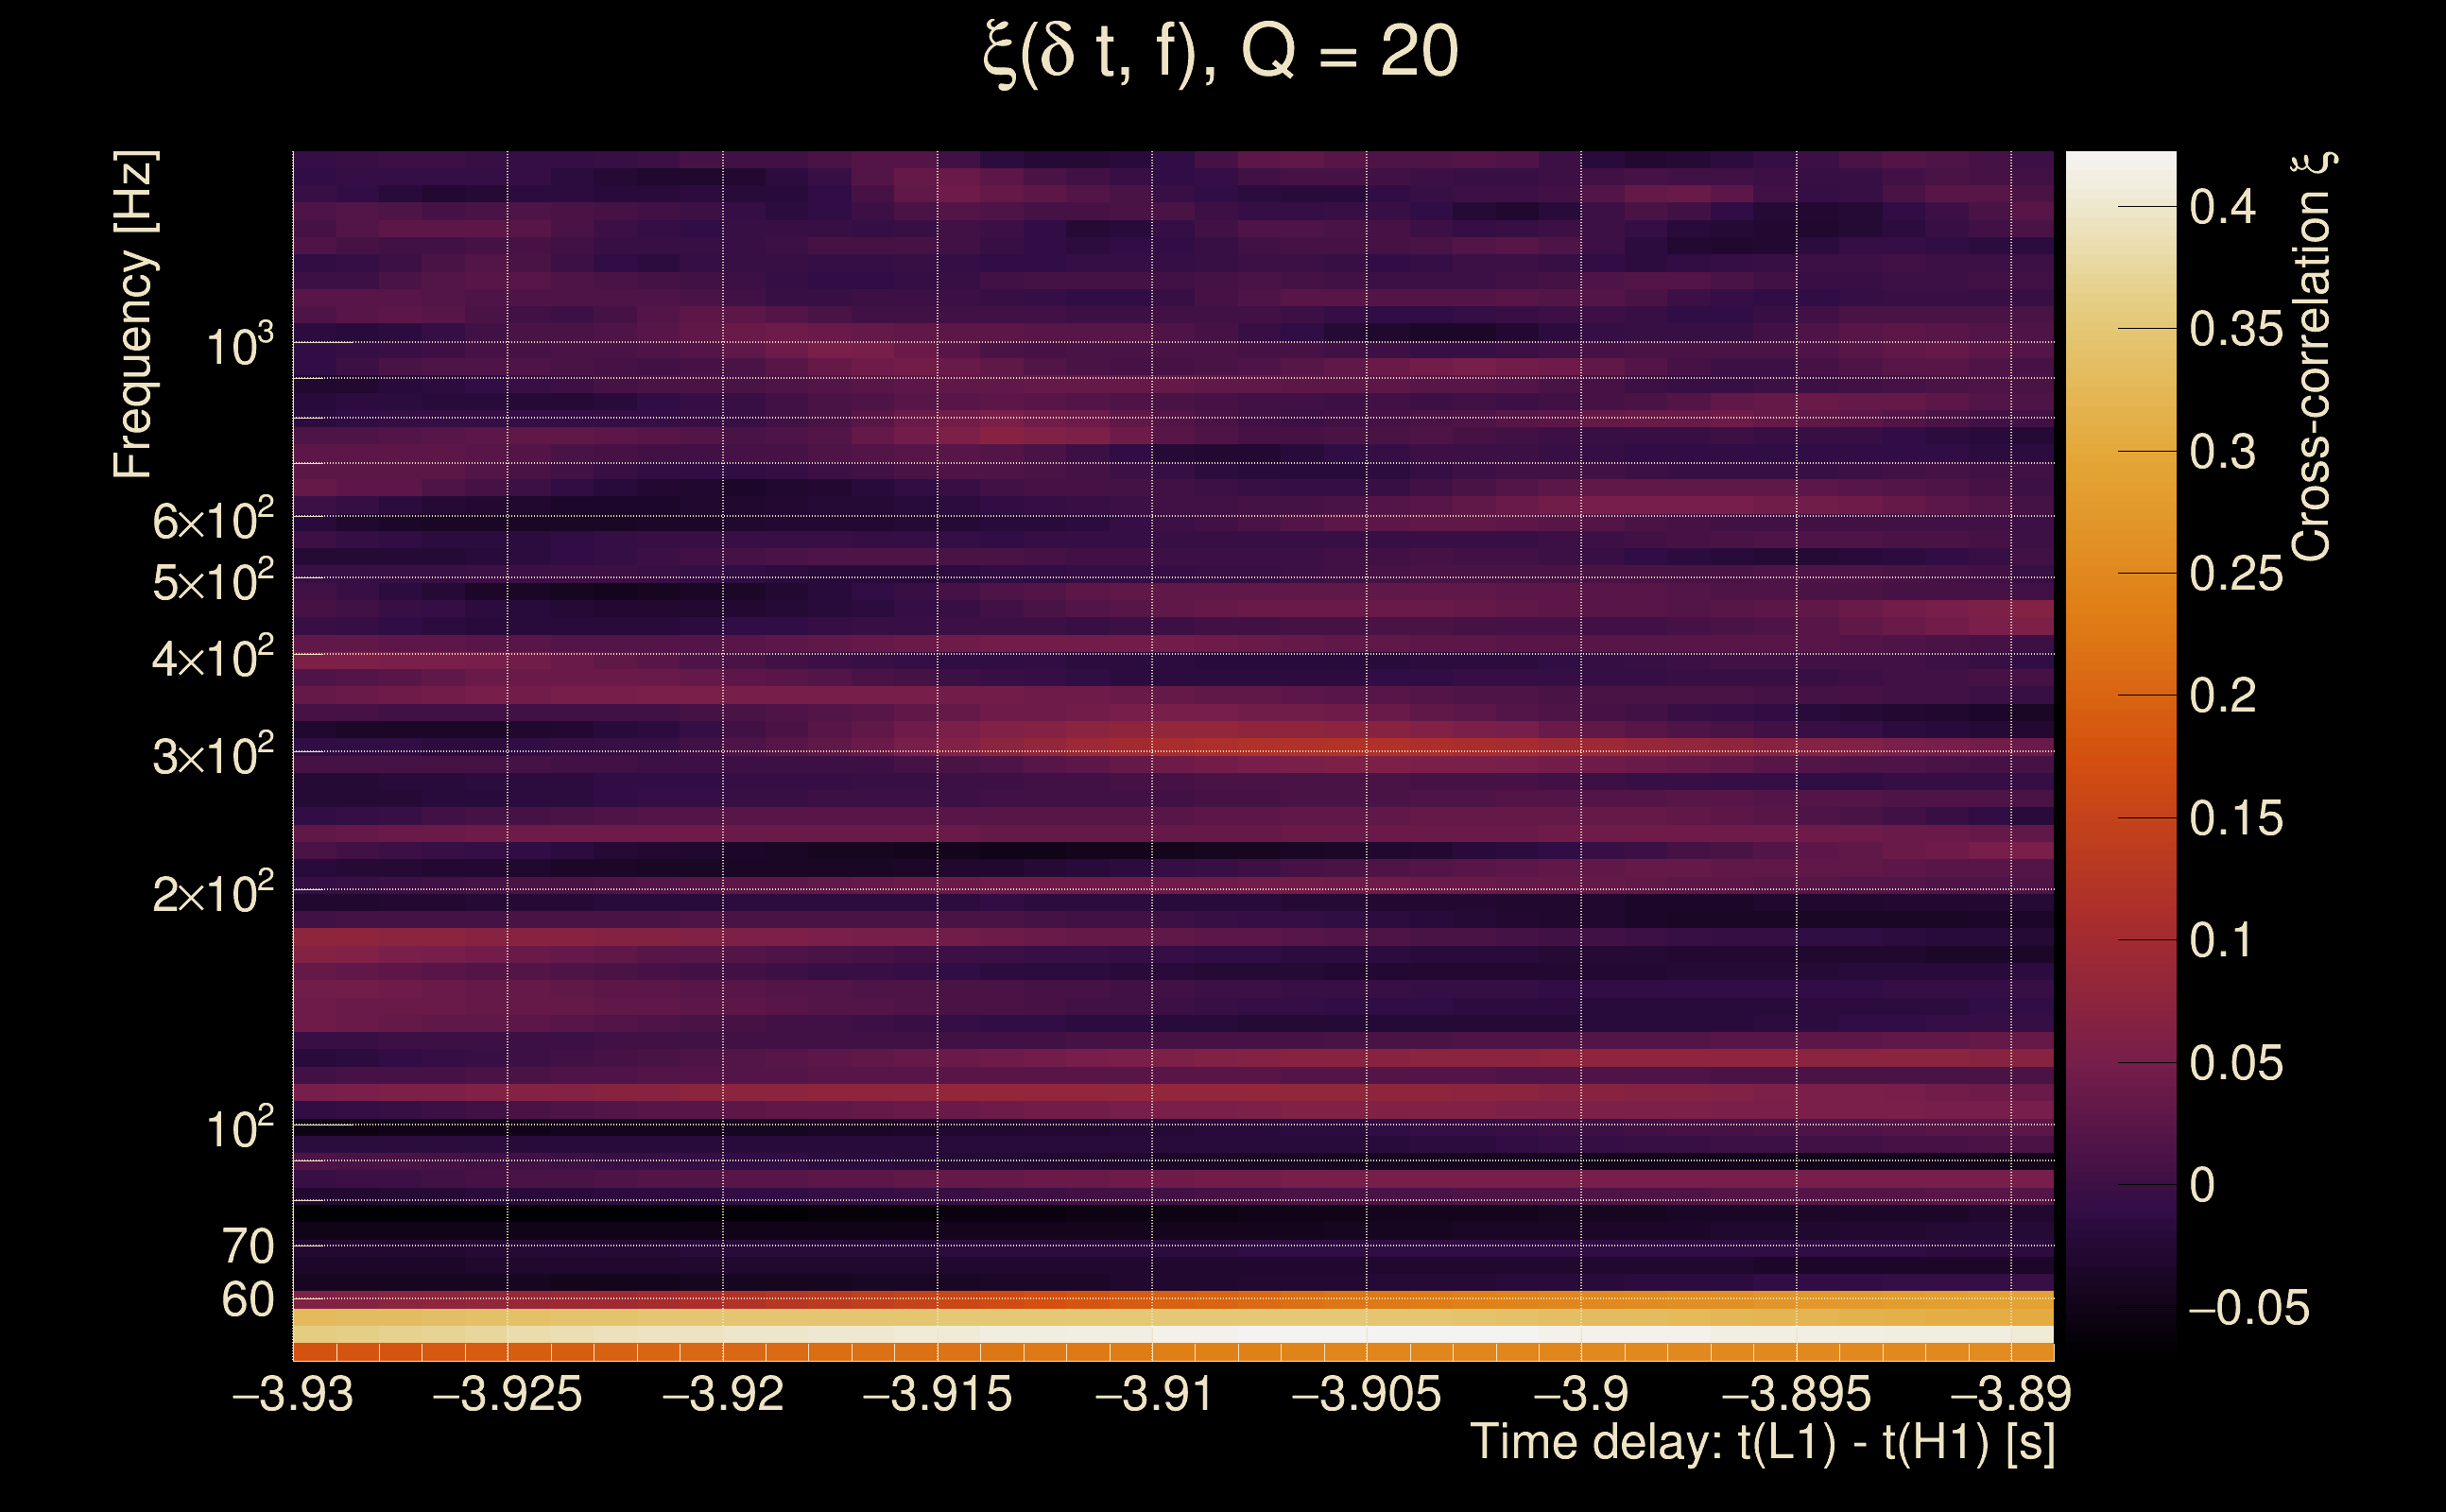
| Time delay between detectors t(L1) - t(H1): | 0.0466147 s (slice index = 107 / 217), δt_gw = 0.000614658 s |
| Time delay standard deviation: | 0.0813691 s |
| [targeted mode] Time delay probability: | 0.998565 (0.00179824 sigmas), δt_target = 0.000836611 s |
| Frequency: | 622.054 Hz |
| Ξ: | 0.193442 ± 0.0329442 (variance = 0.00108532): Q0: 0.429902, Q1: 0.429131, Q2: 0.456176, Q3: 0.487321, Q4: 0.51346 |
| Rank: | R_A = 0.0463179 |
| Log of amplitude ratio (L1/H1): | -0.111052, variance = 0.165355 (L1/H1: -0.485592, variance = 0.332283, H1/L1: -0.375158, variance = 0.313362) |
| Amplitude ratio (L1/H1): | 0.894893 ⋇ 1.50176 (L1/H1: 0.615333 ⋇ 1.77969, H1/L1: 0.687181 ⋇ 1.7503) |
| Amplitude ratio H1|L1 compatibility (probability): | 0.284069 |
| Antenna factor probability: | 0.844107 |
| Number of rejected frequency rows: | Q0: 9 / 18, Q1: 18 / 36, Q2: 47 / 70, Q3: 105 / 134, Q4: 226 / 258 |
| Maximum signal-to-noise ratio: | H1: 38.8023, L1: 34.0561 |
| SNR variance: | H1: 1.89401, L1: 1.77823 |
| Click here for a zoomed plot | Click here for a zoomed plot | Click here for a zoomed plot | Click here for a zoomed plot | Click here for a zoomed plot |
 |
 |
 |
 |
 |
 |
 |
 |
 |
 |
 |
 |
 |
 |
 |
 |
 |
 |
 |
 |
 |
 |
 |
 |
 |
 |
 |
 |
 |
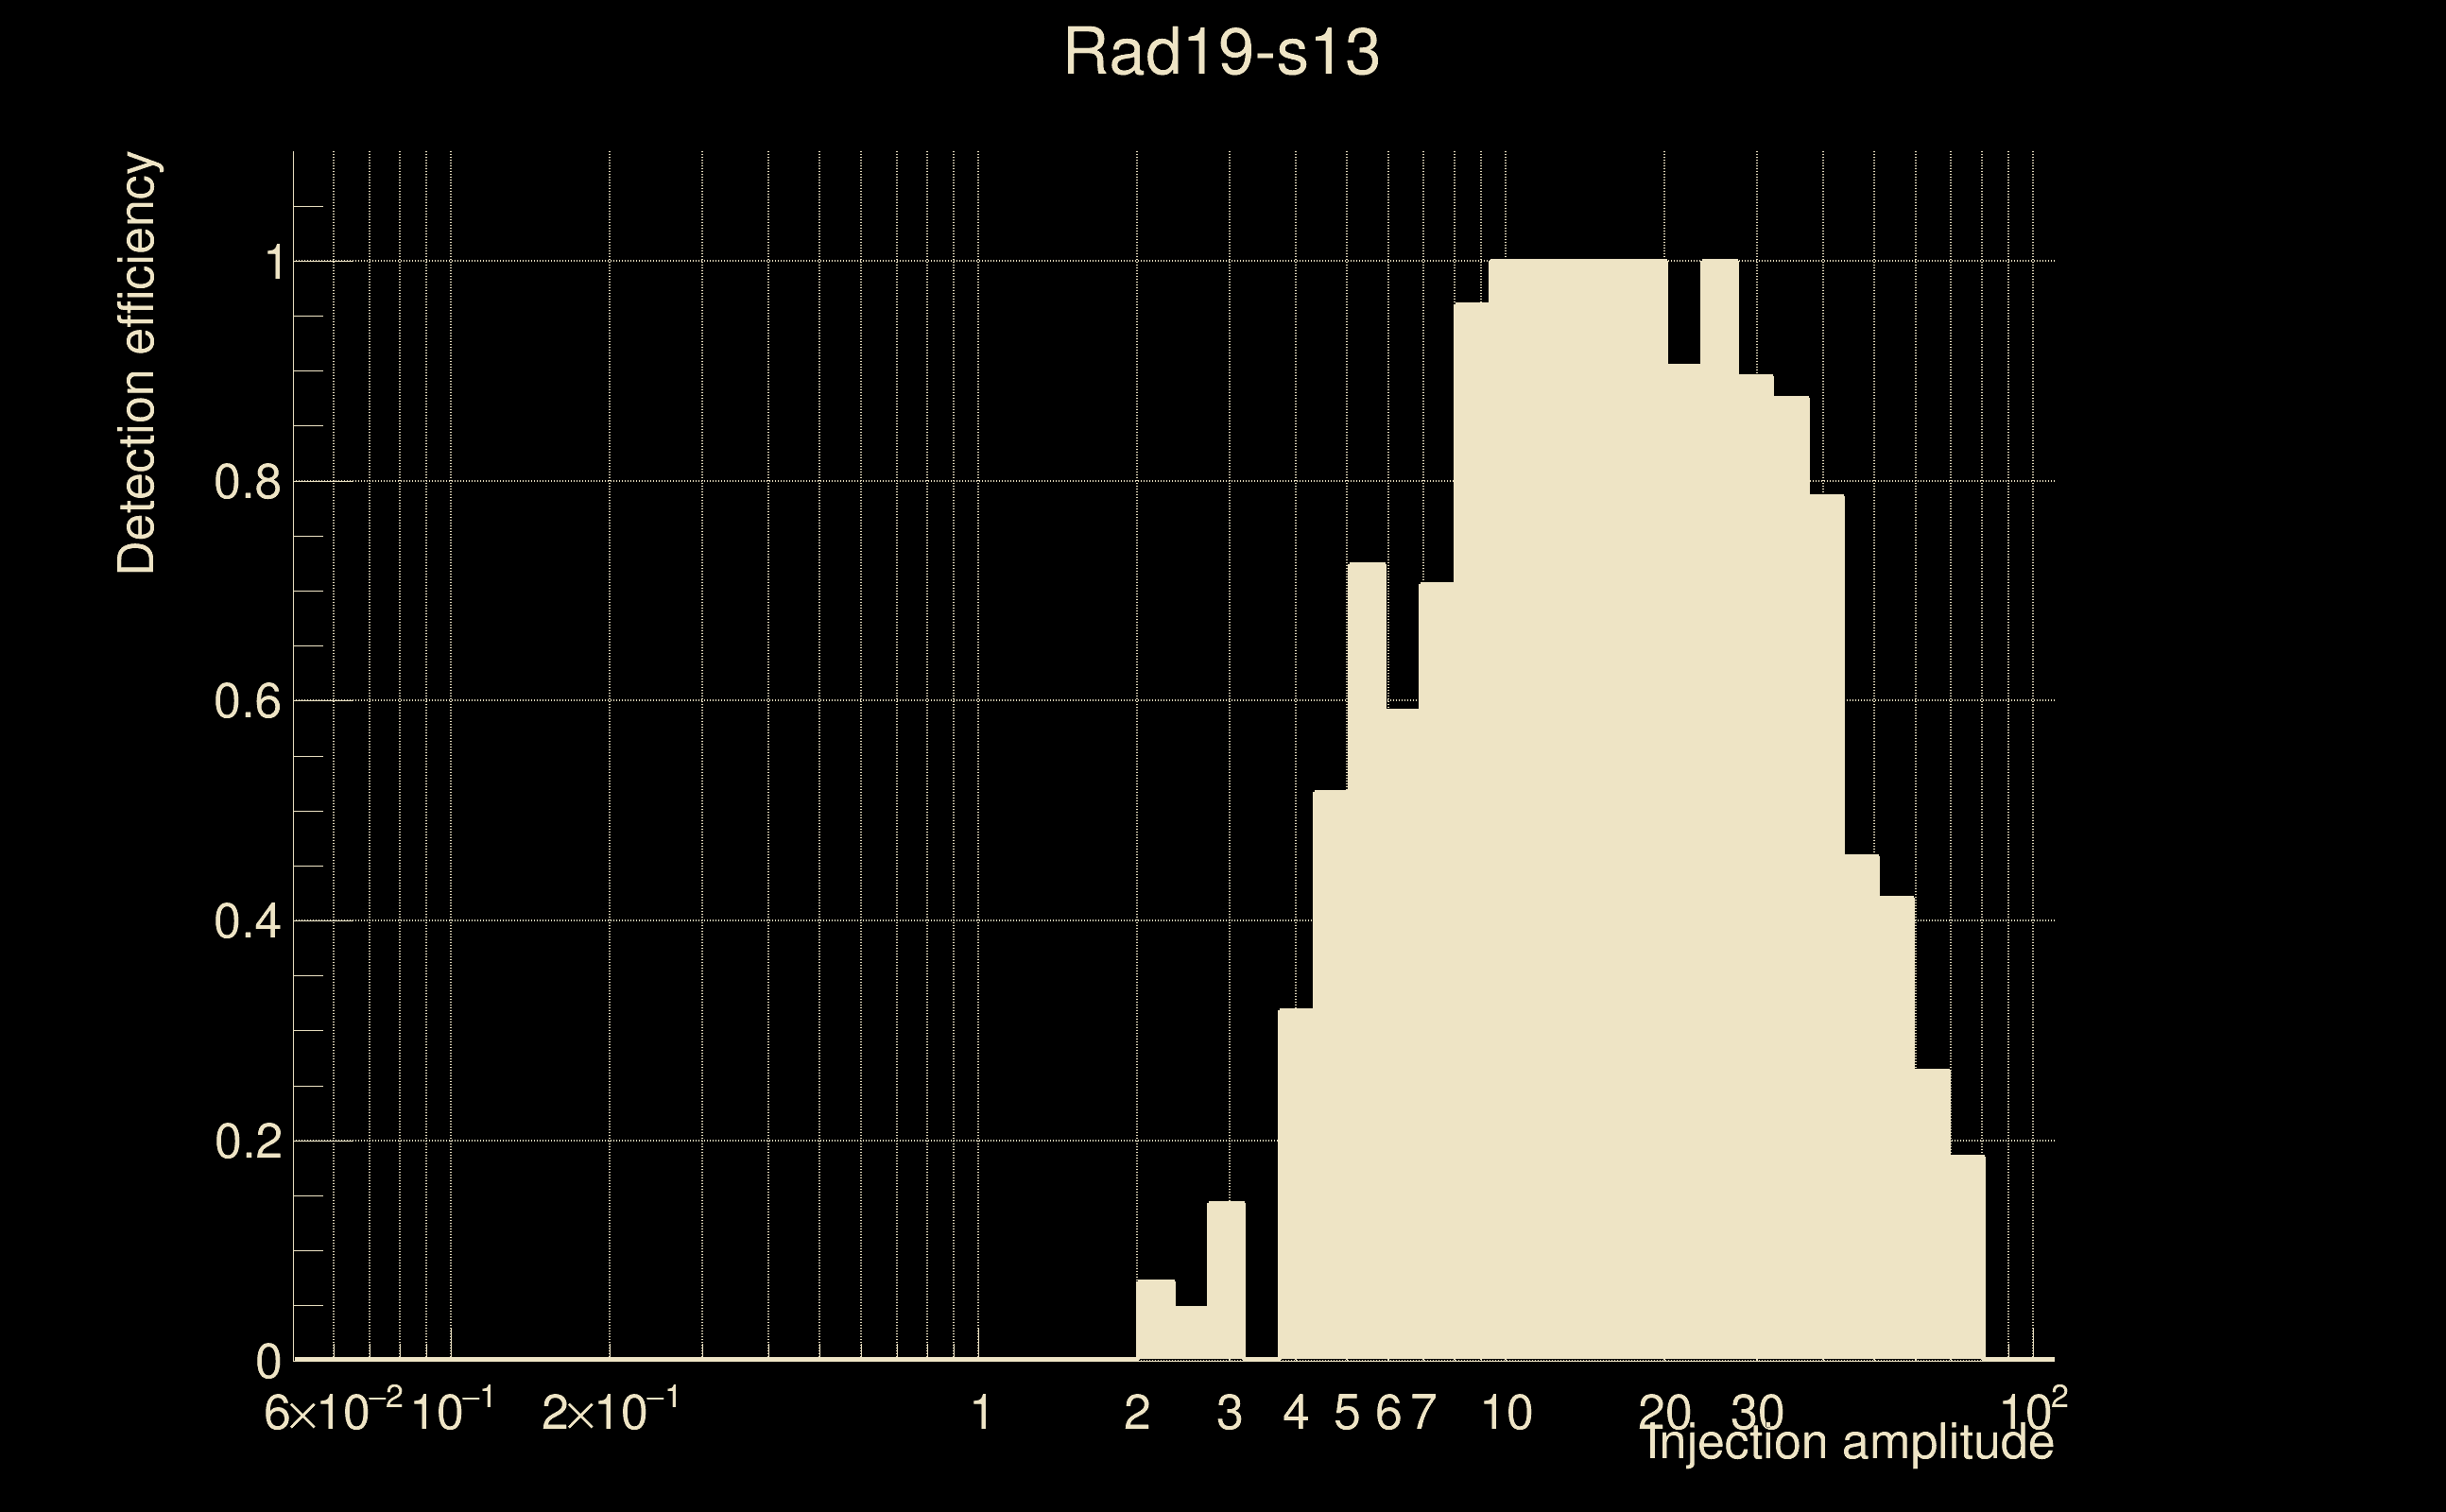
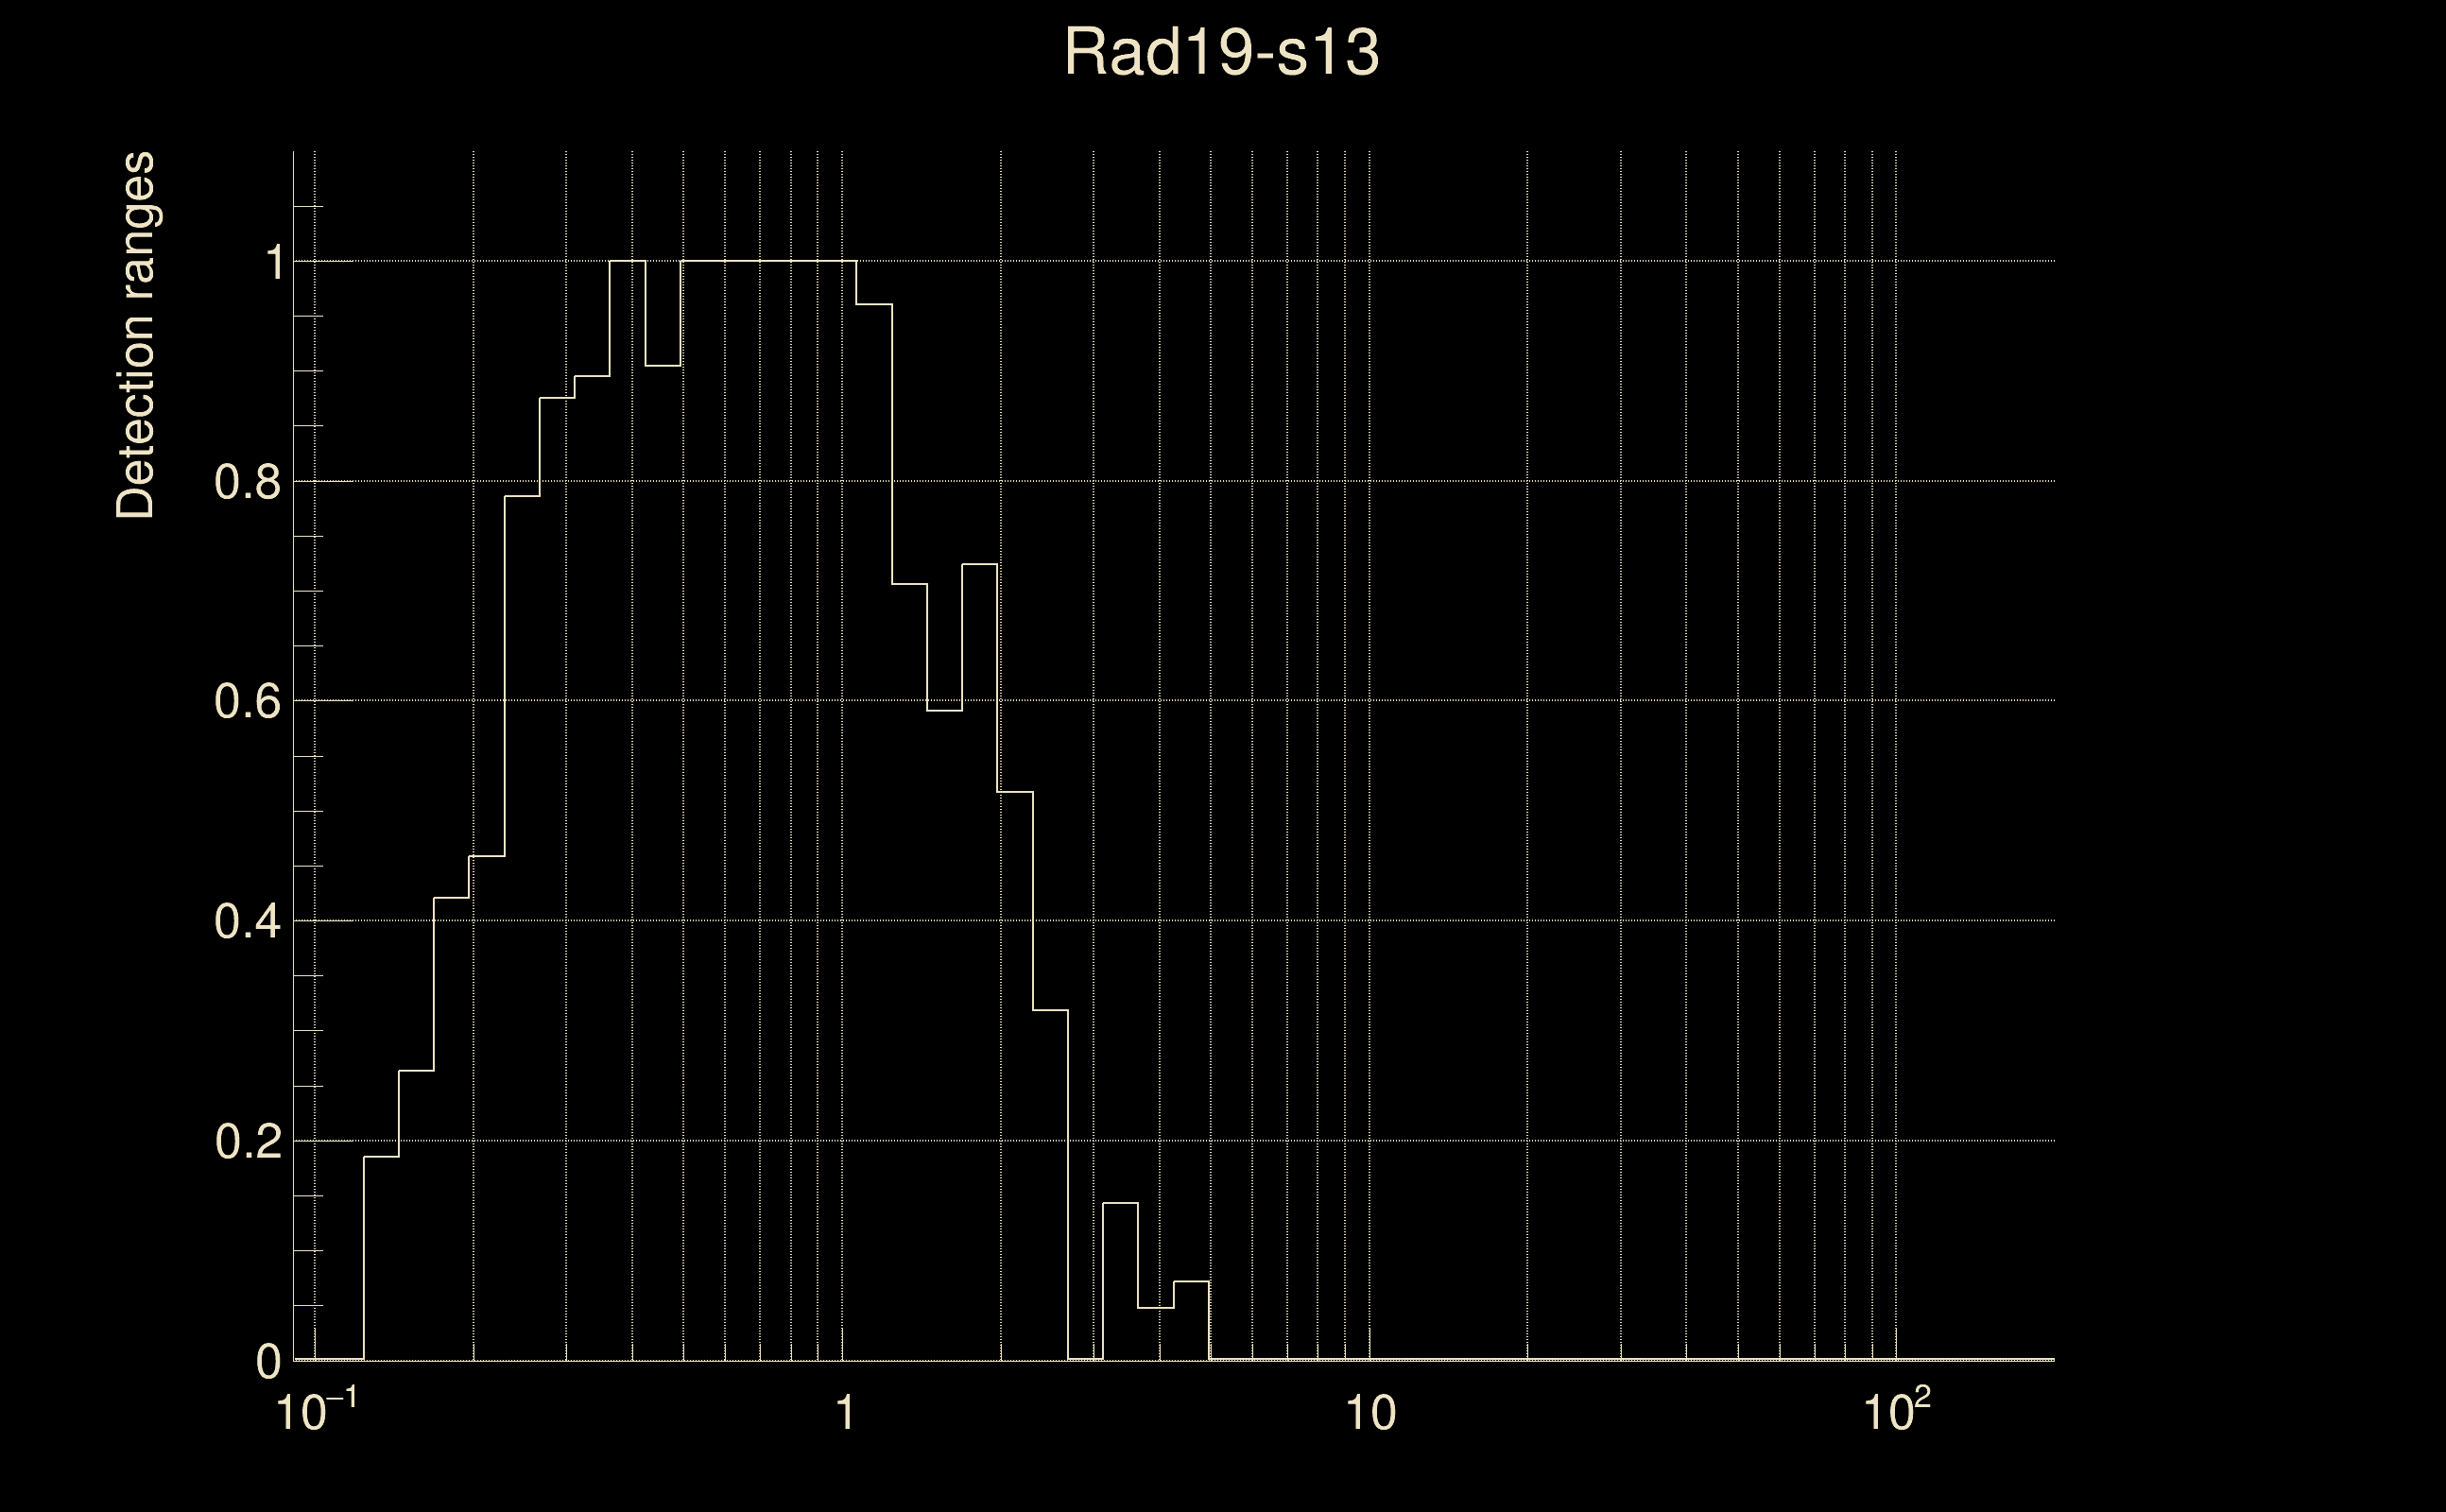
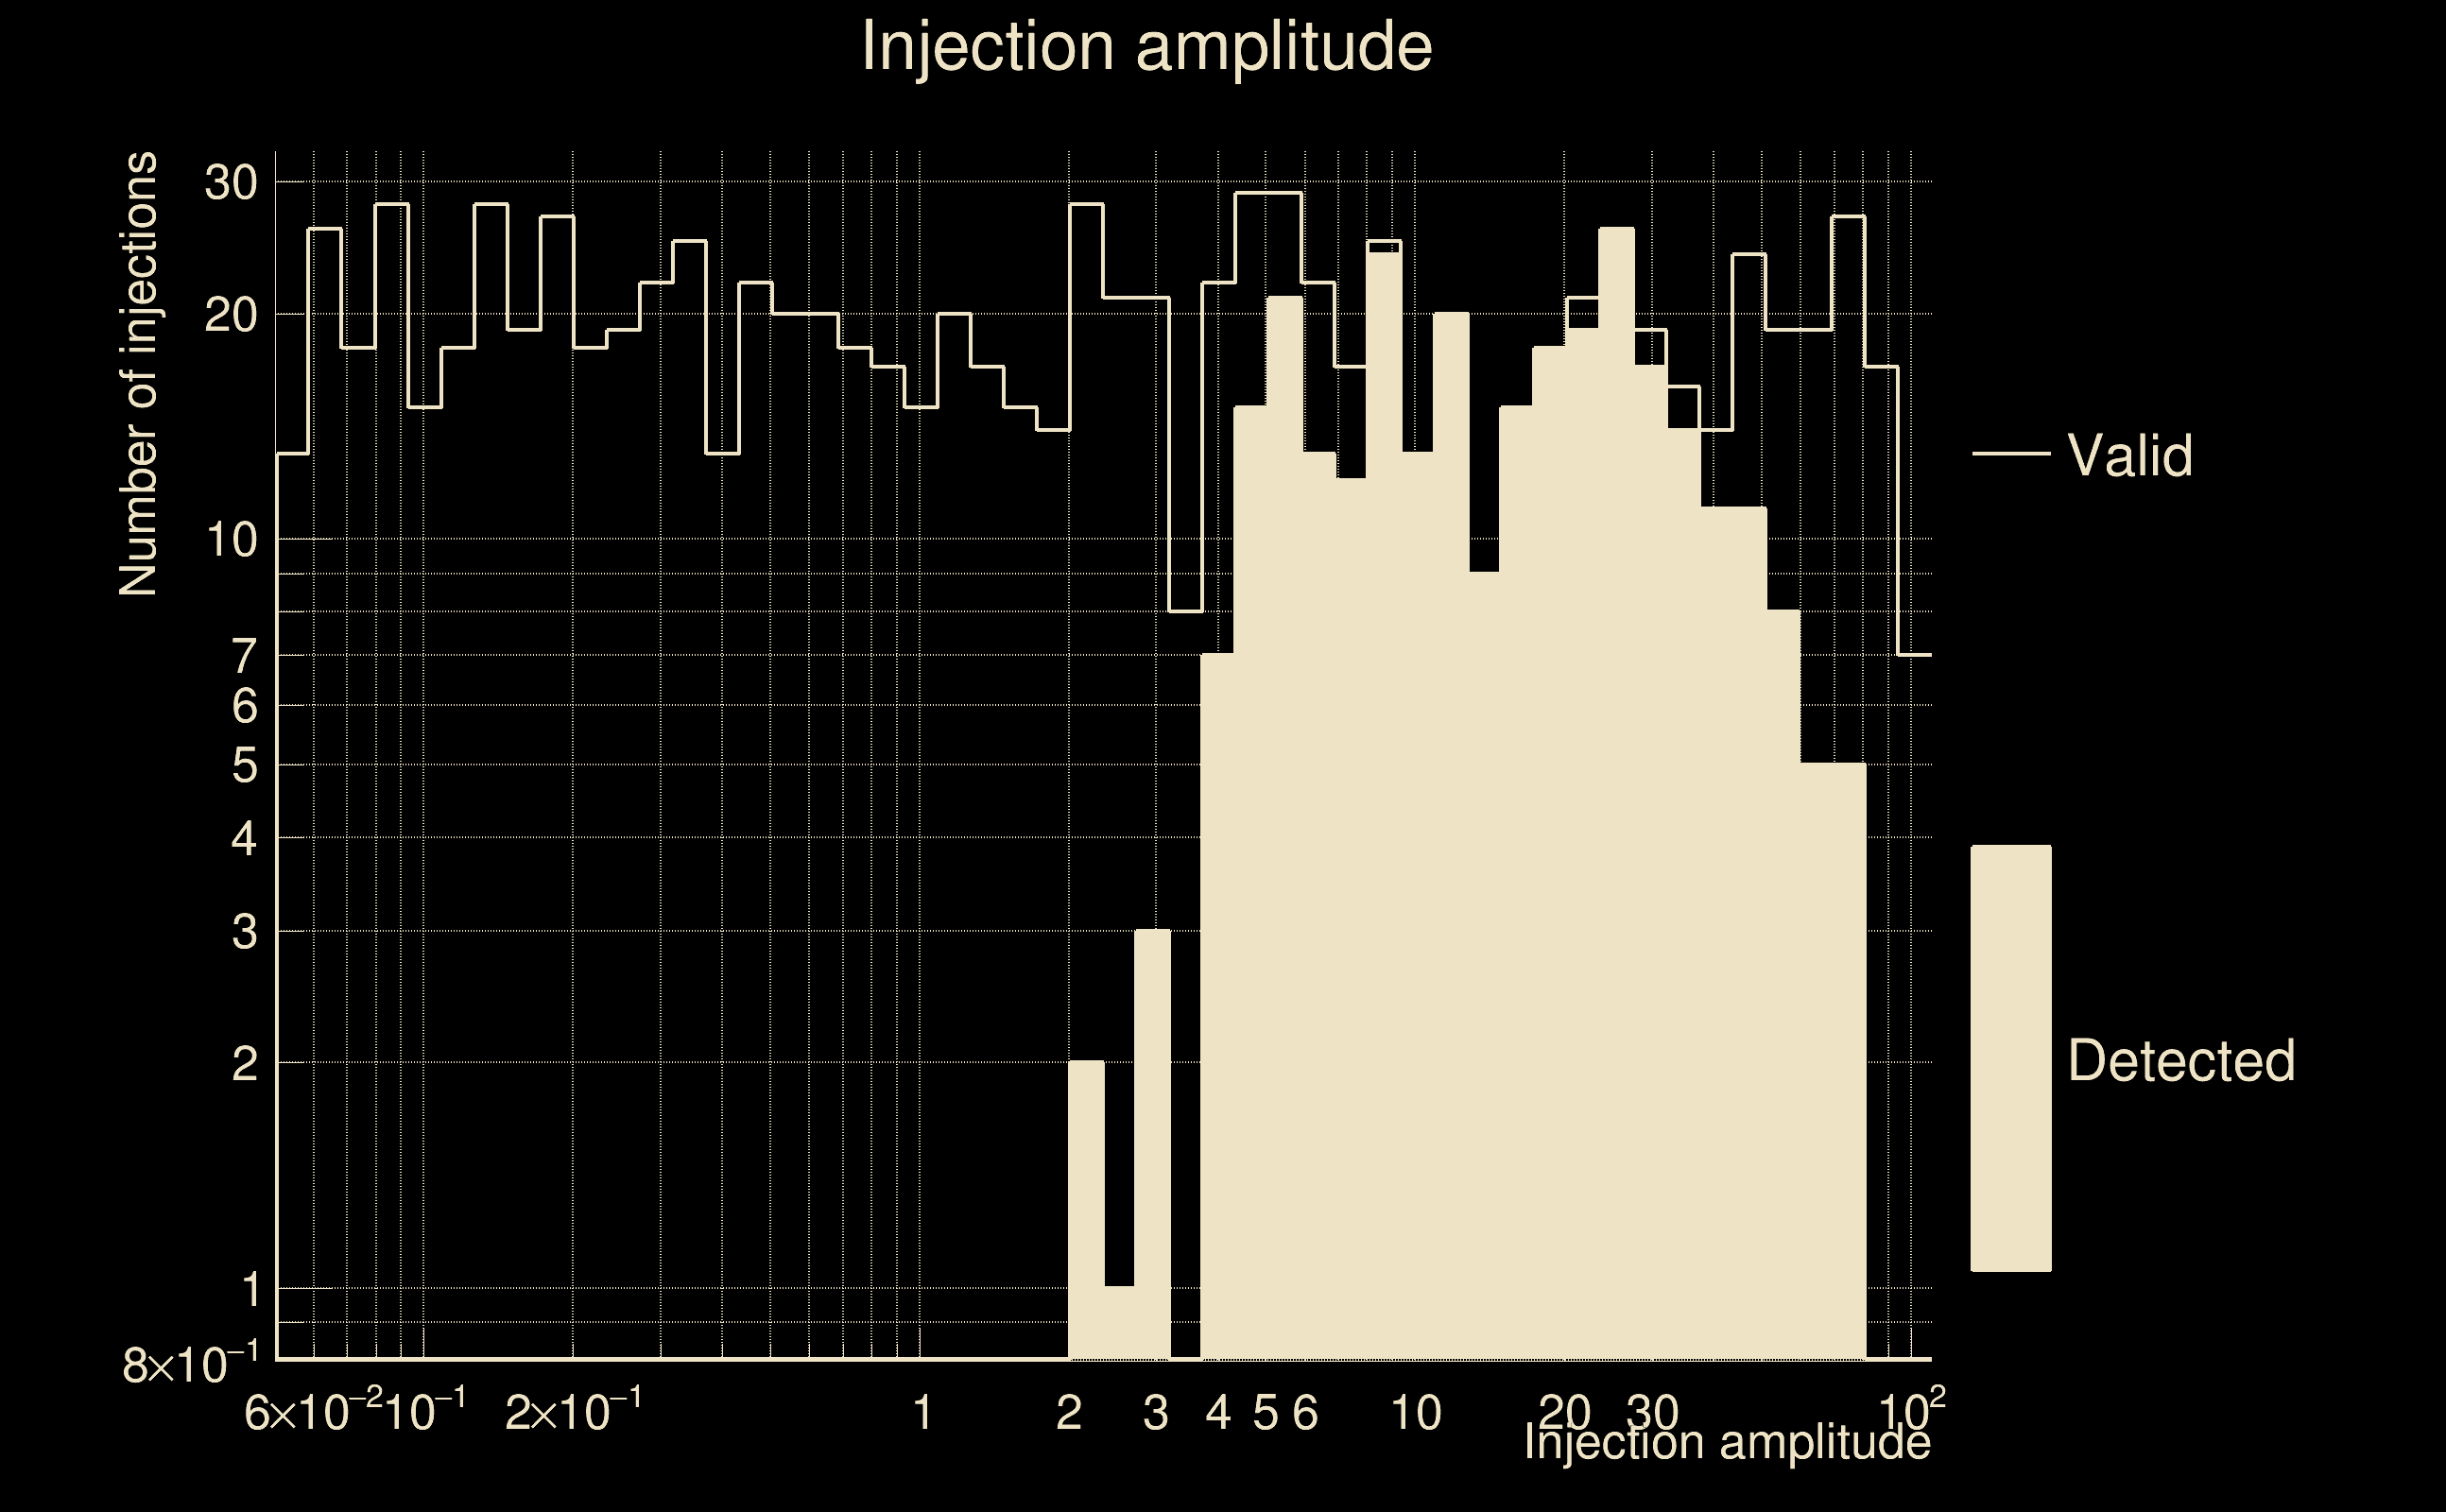
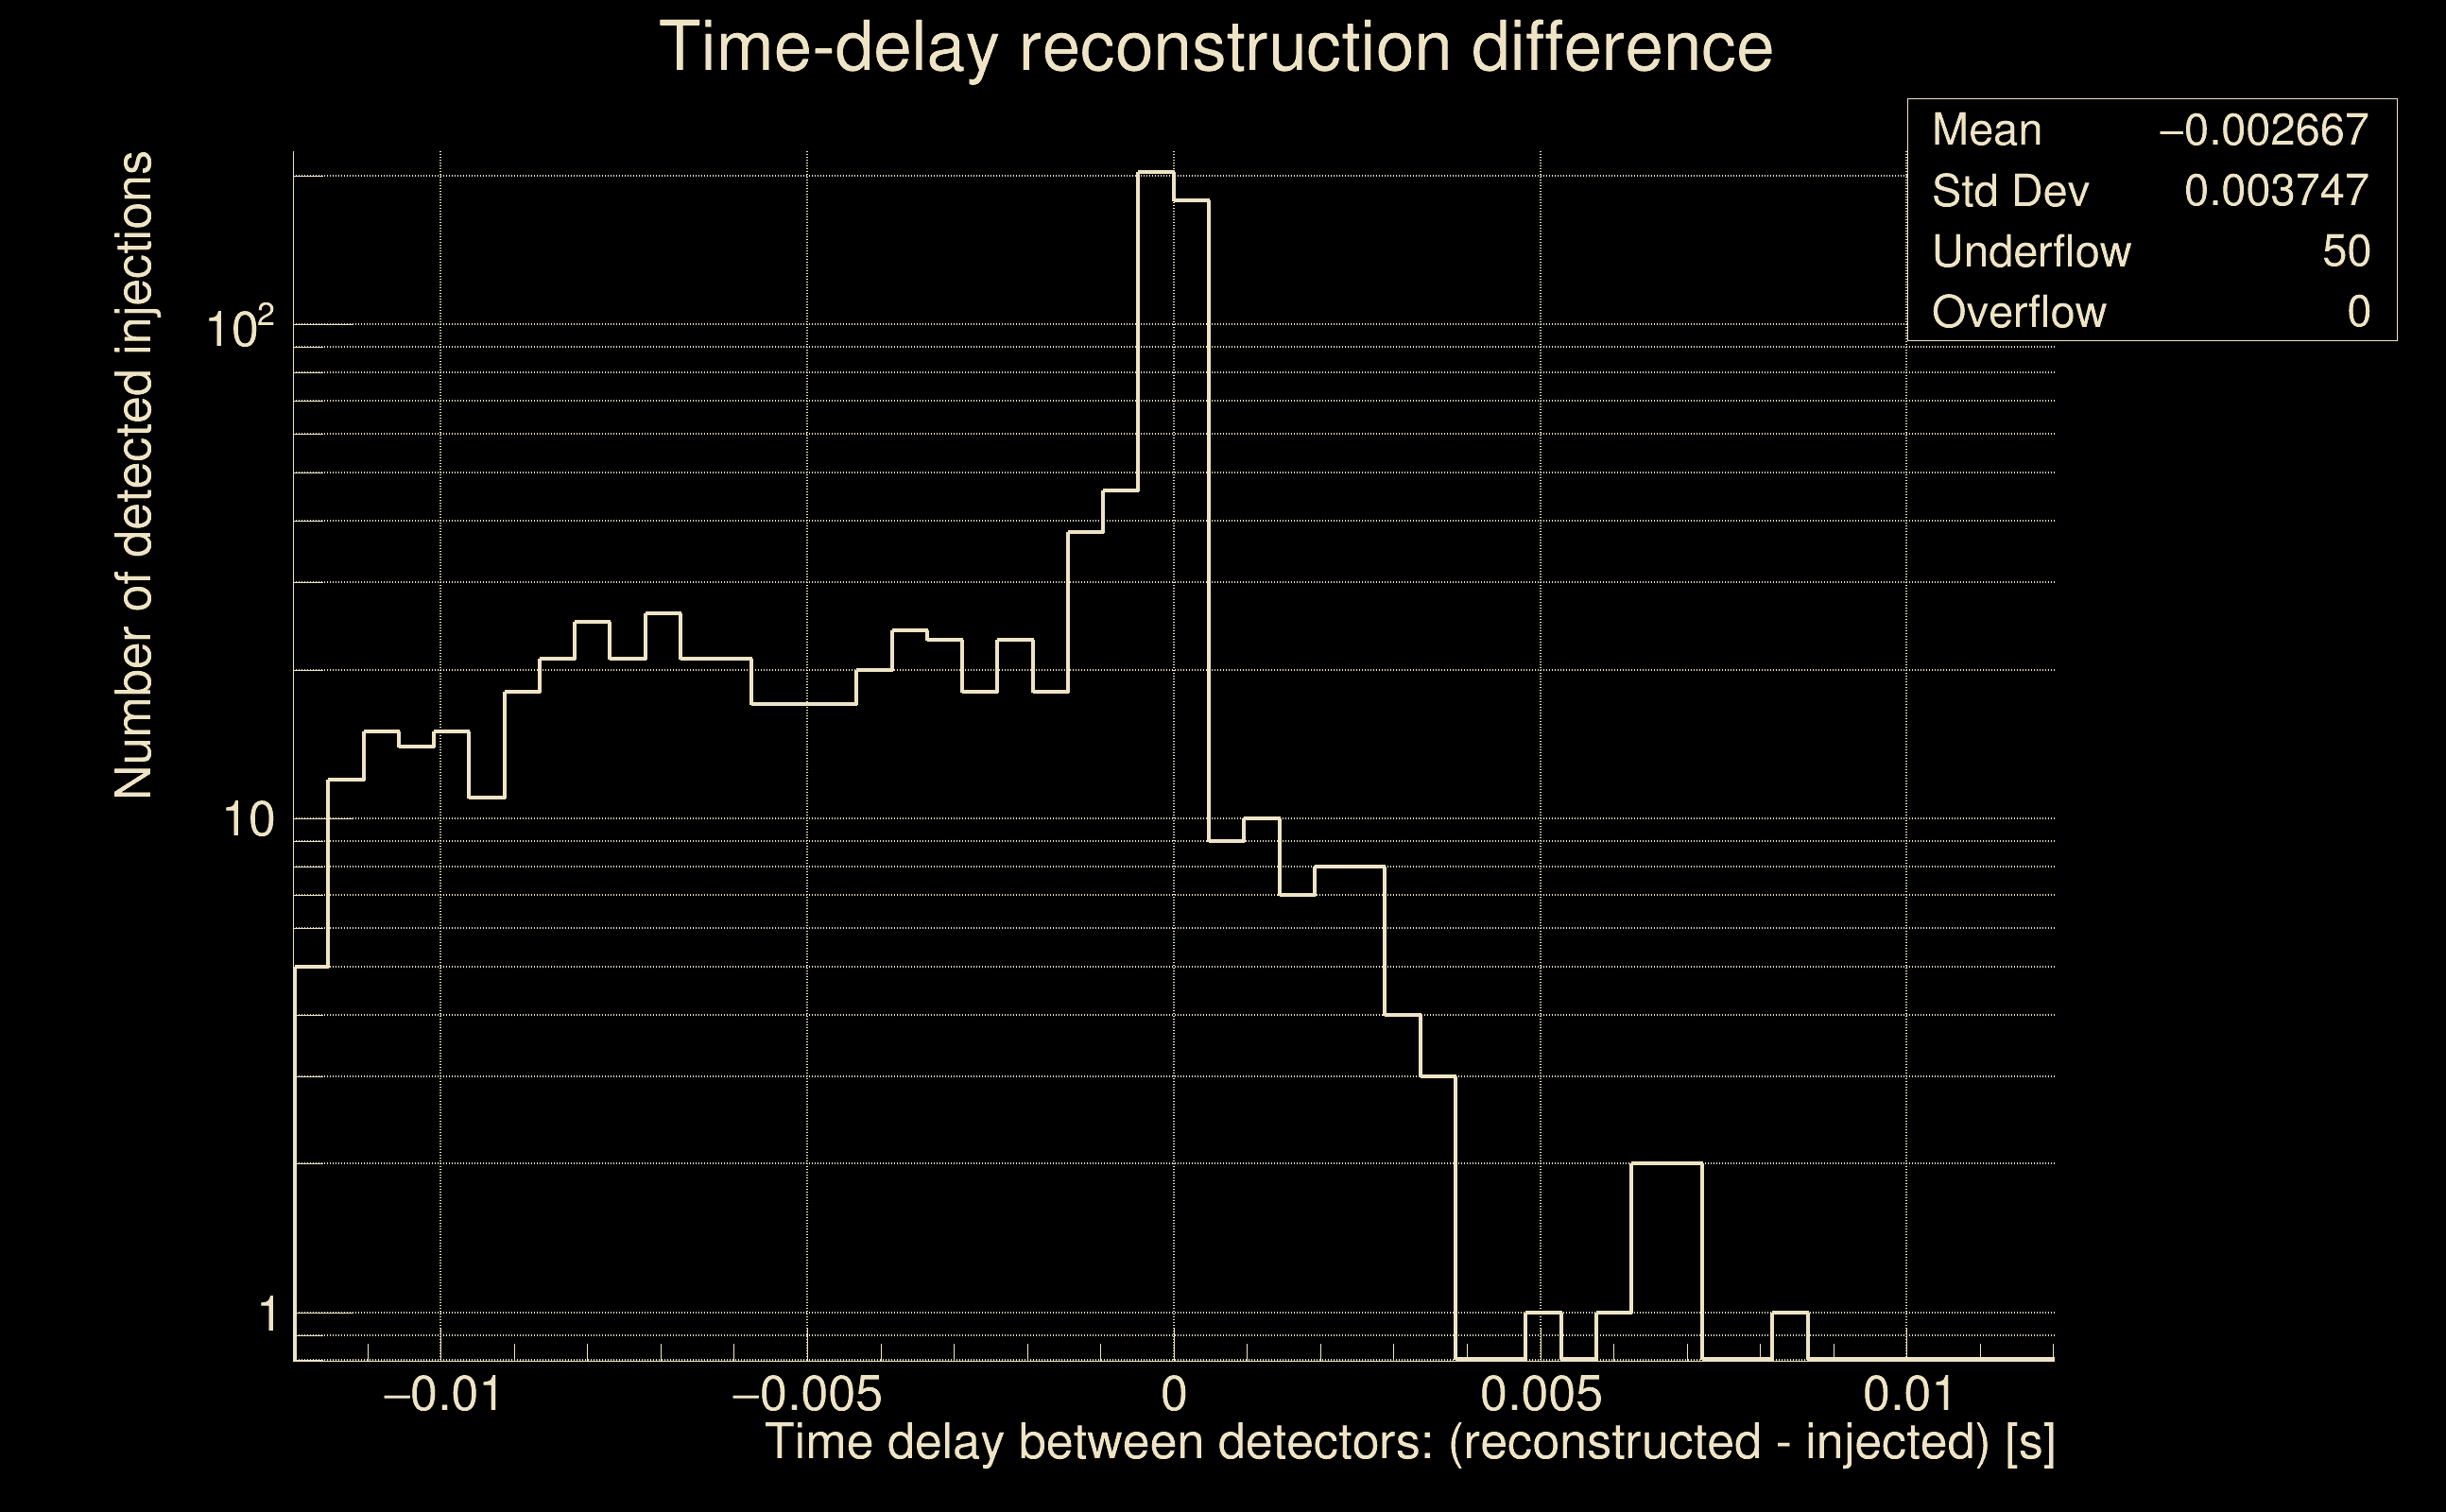
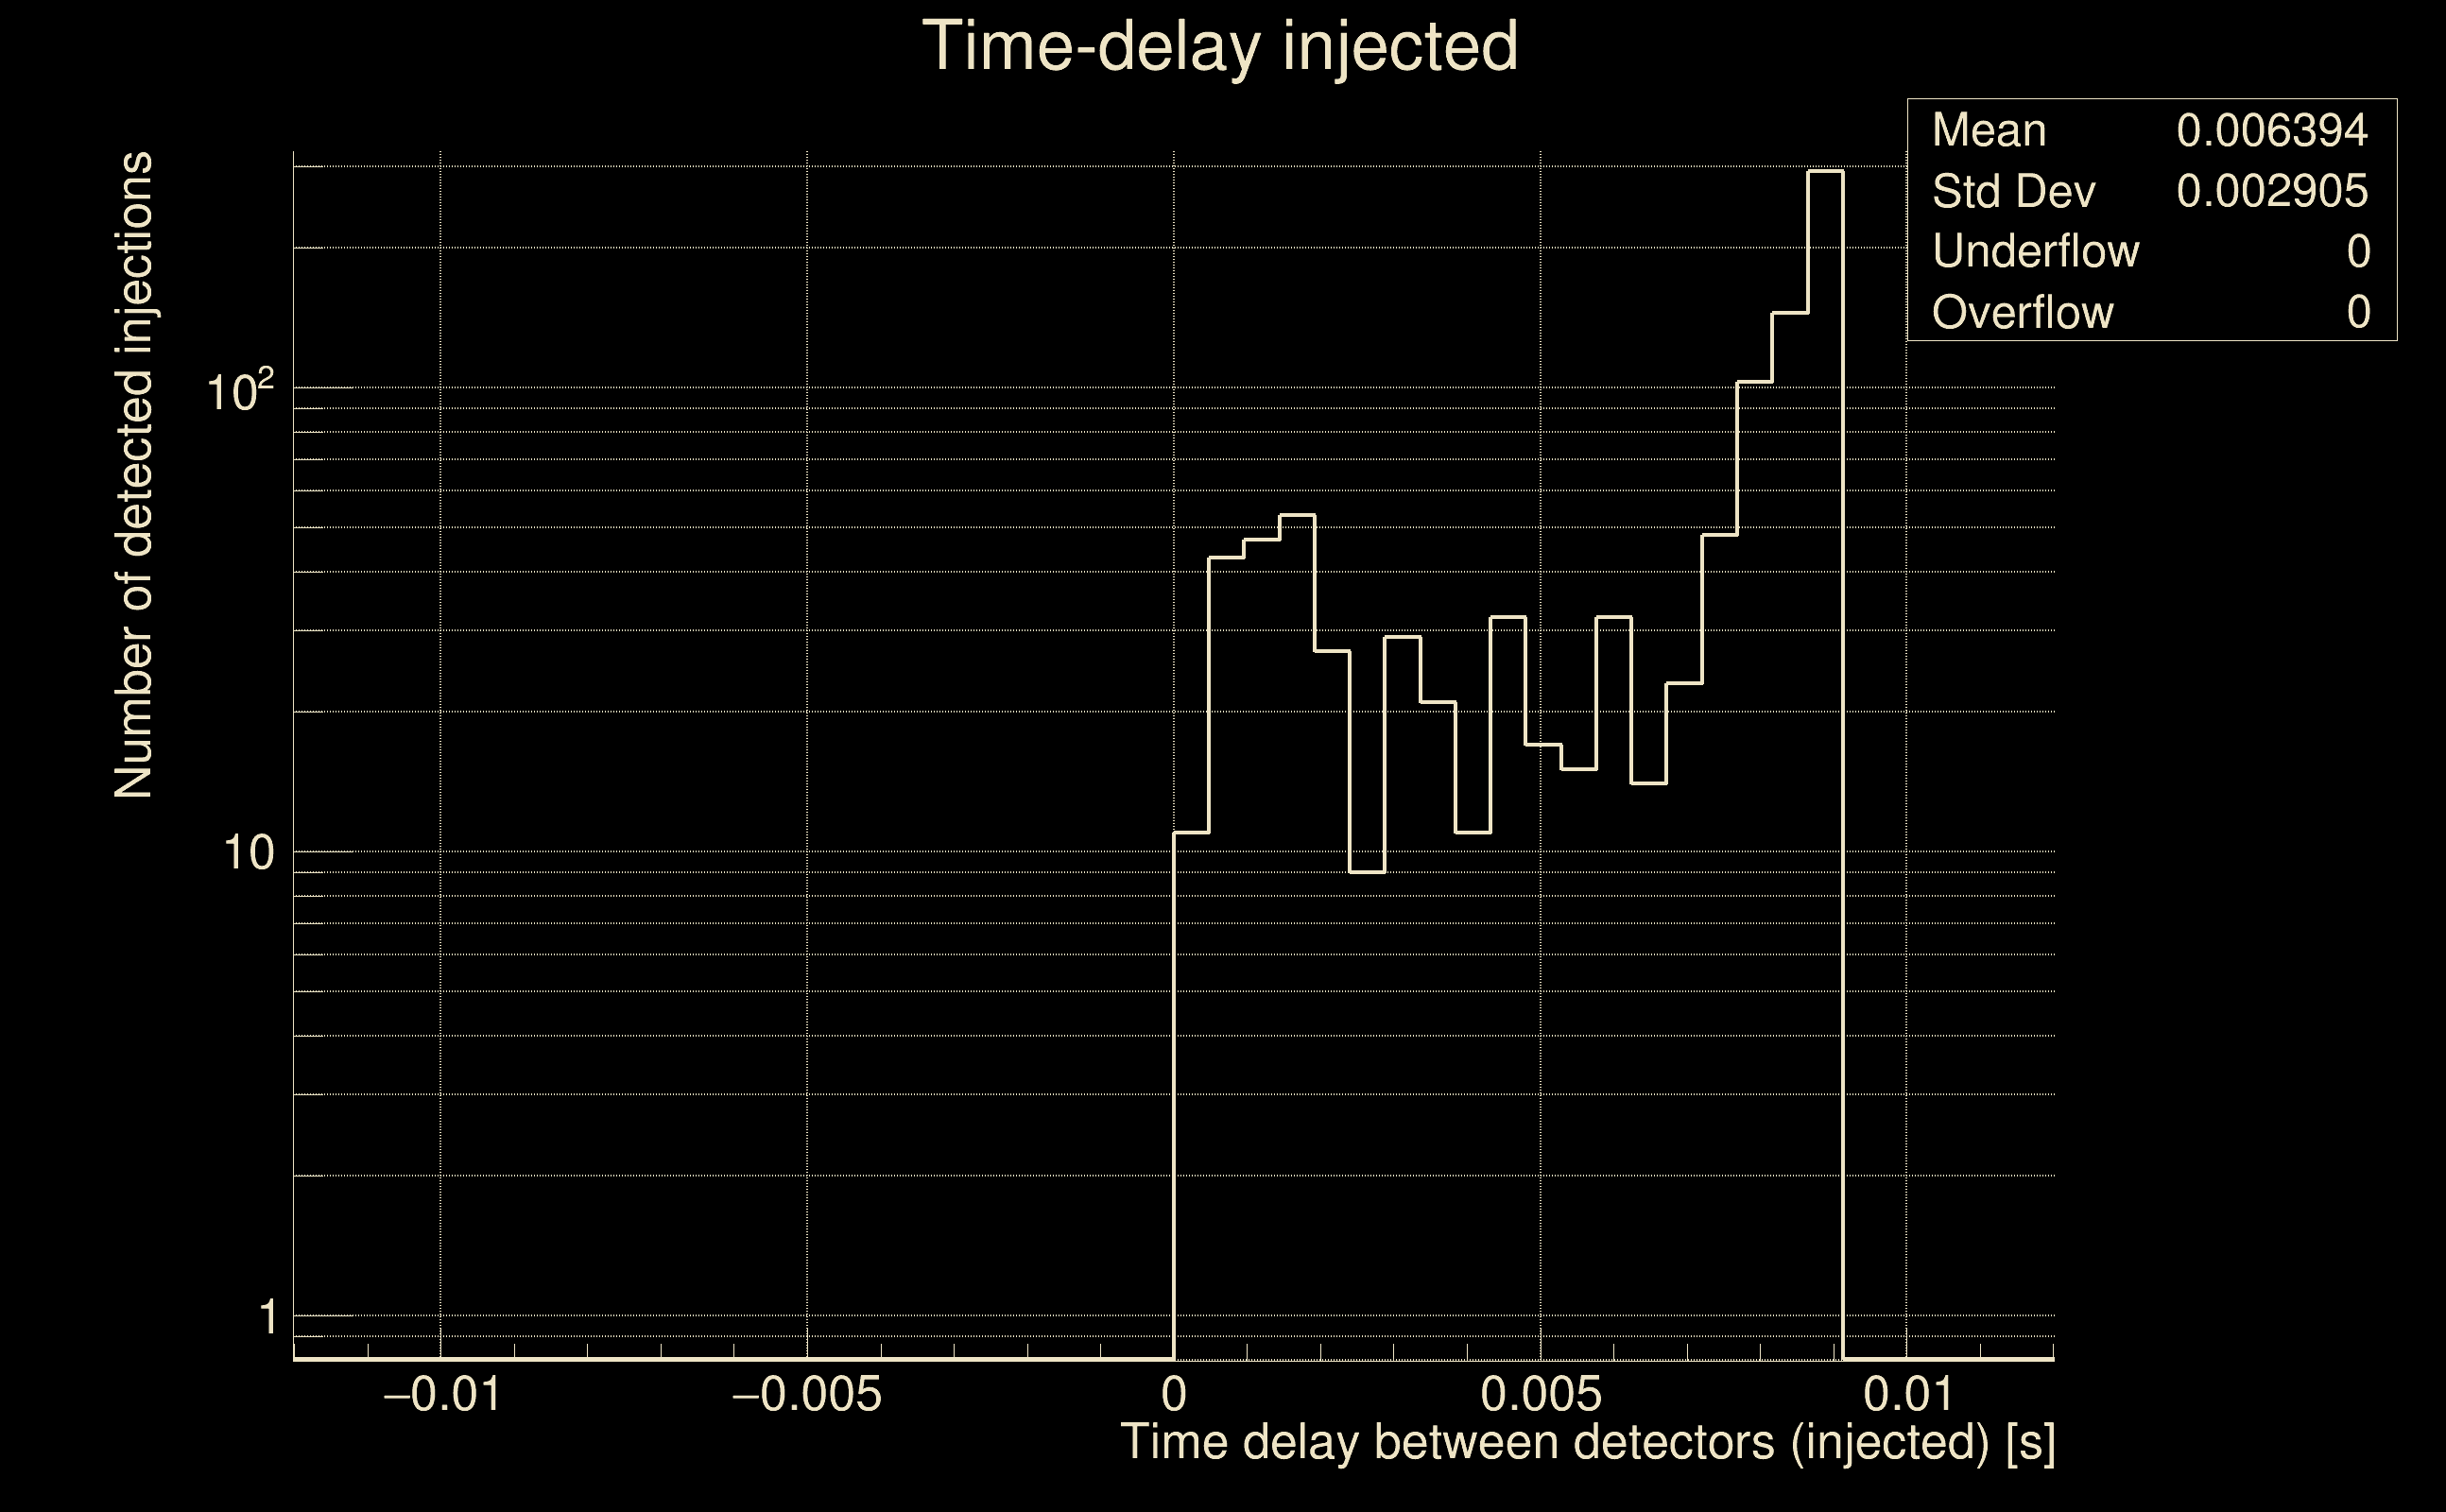
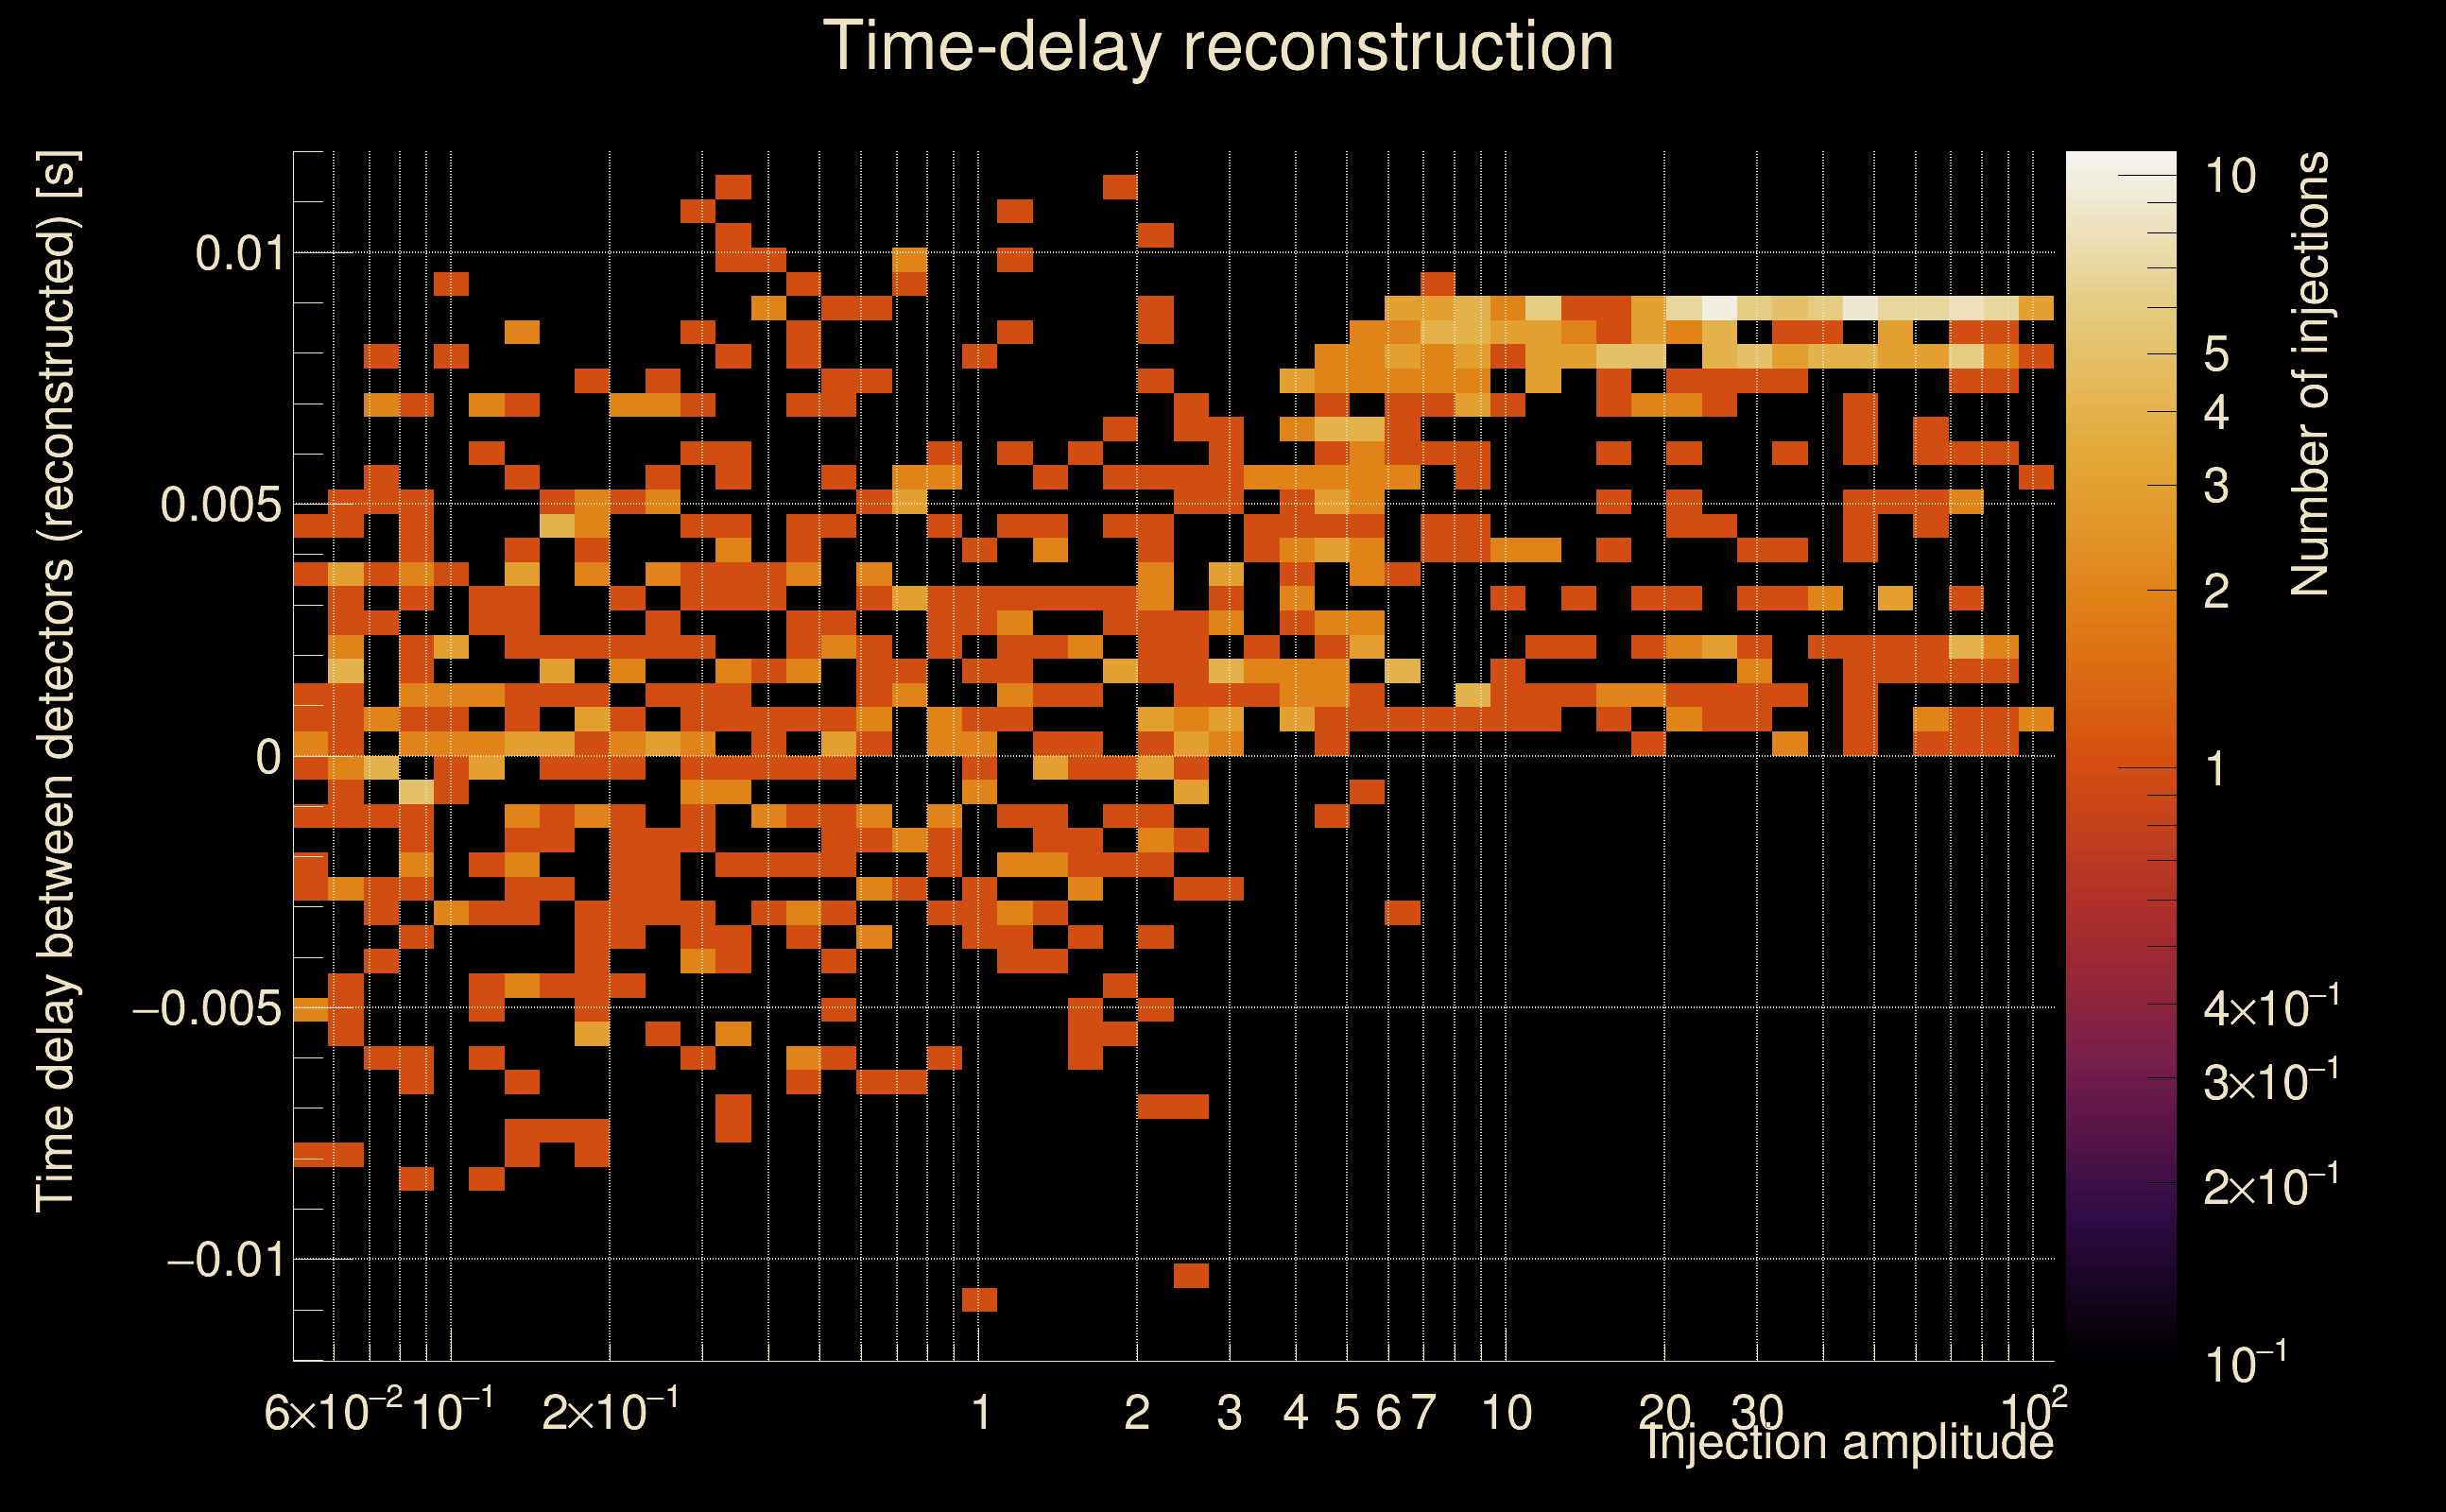
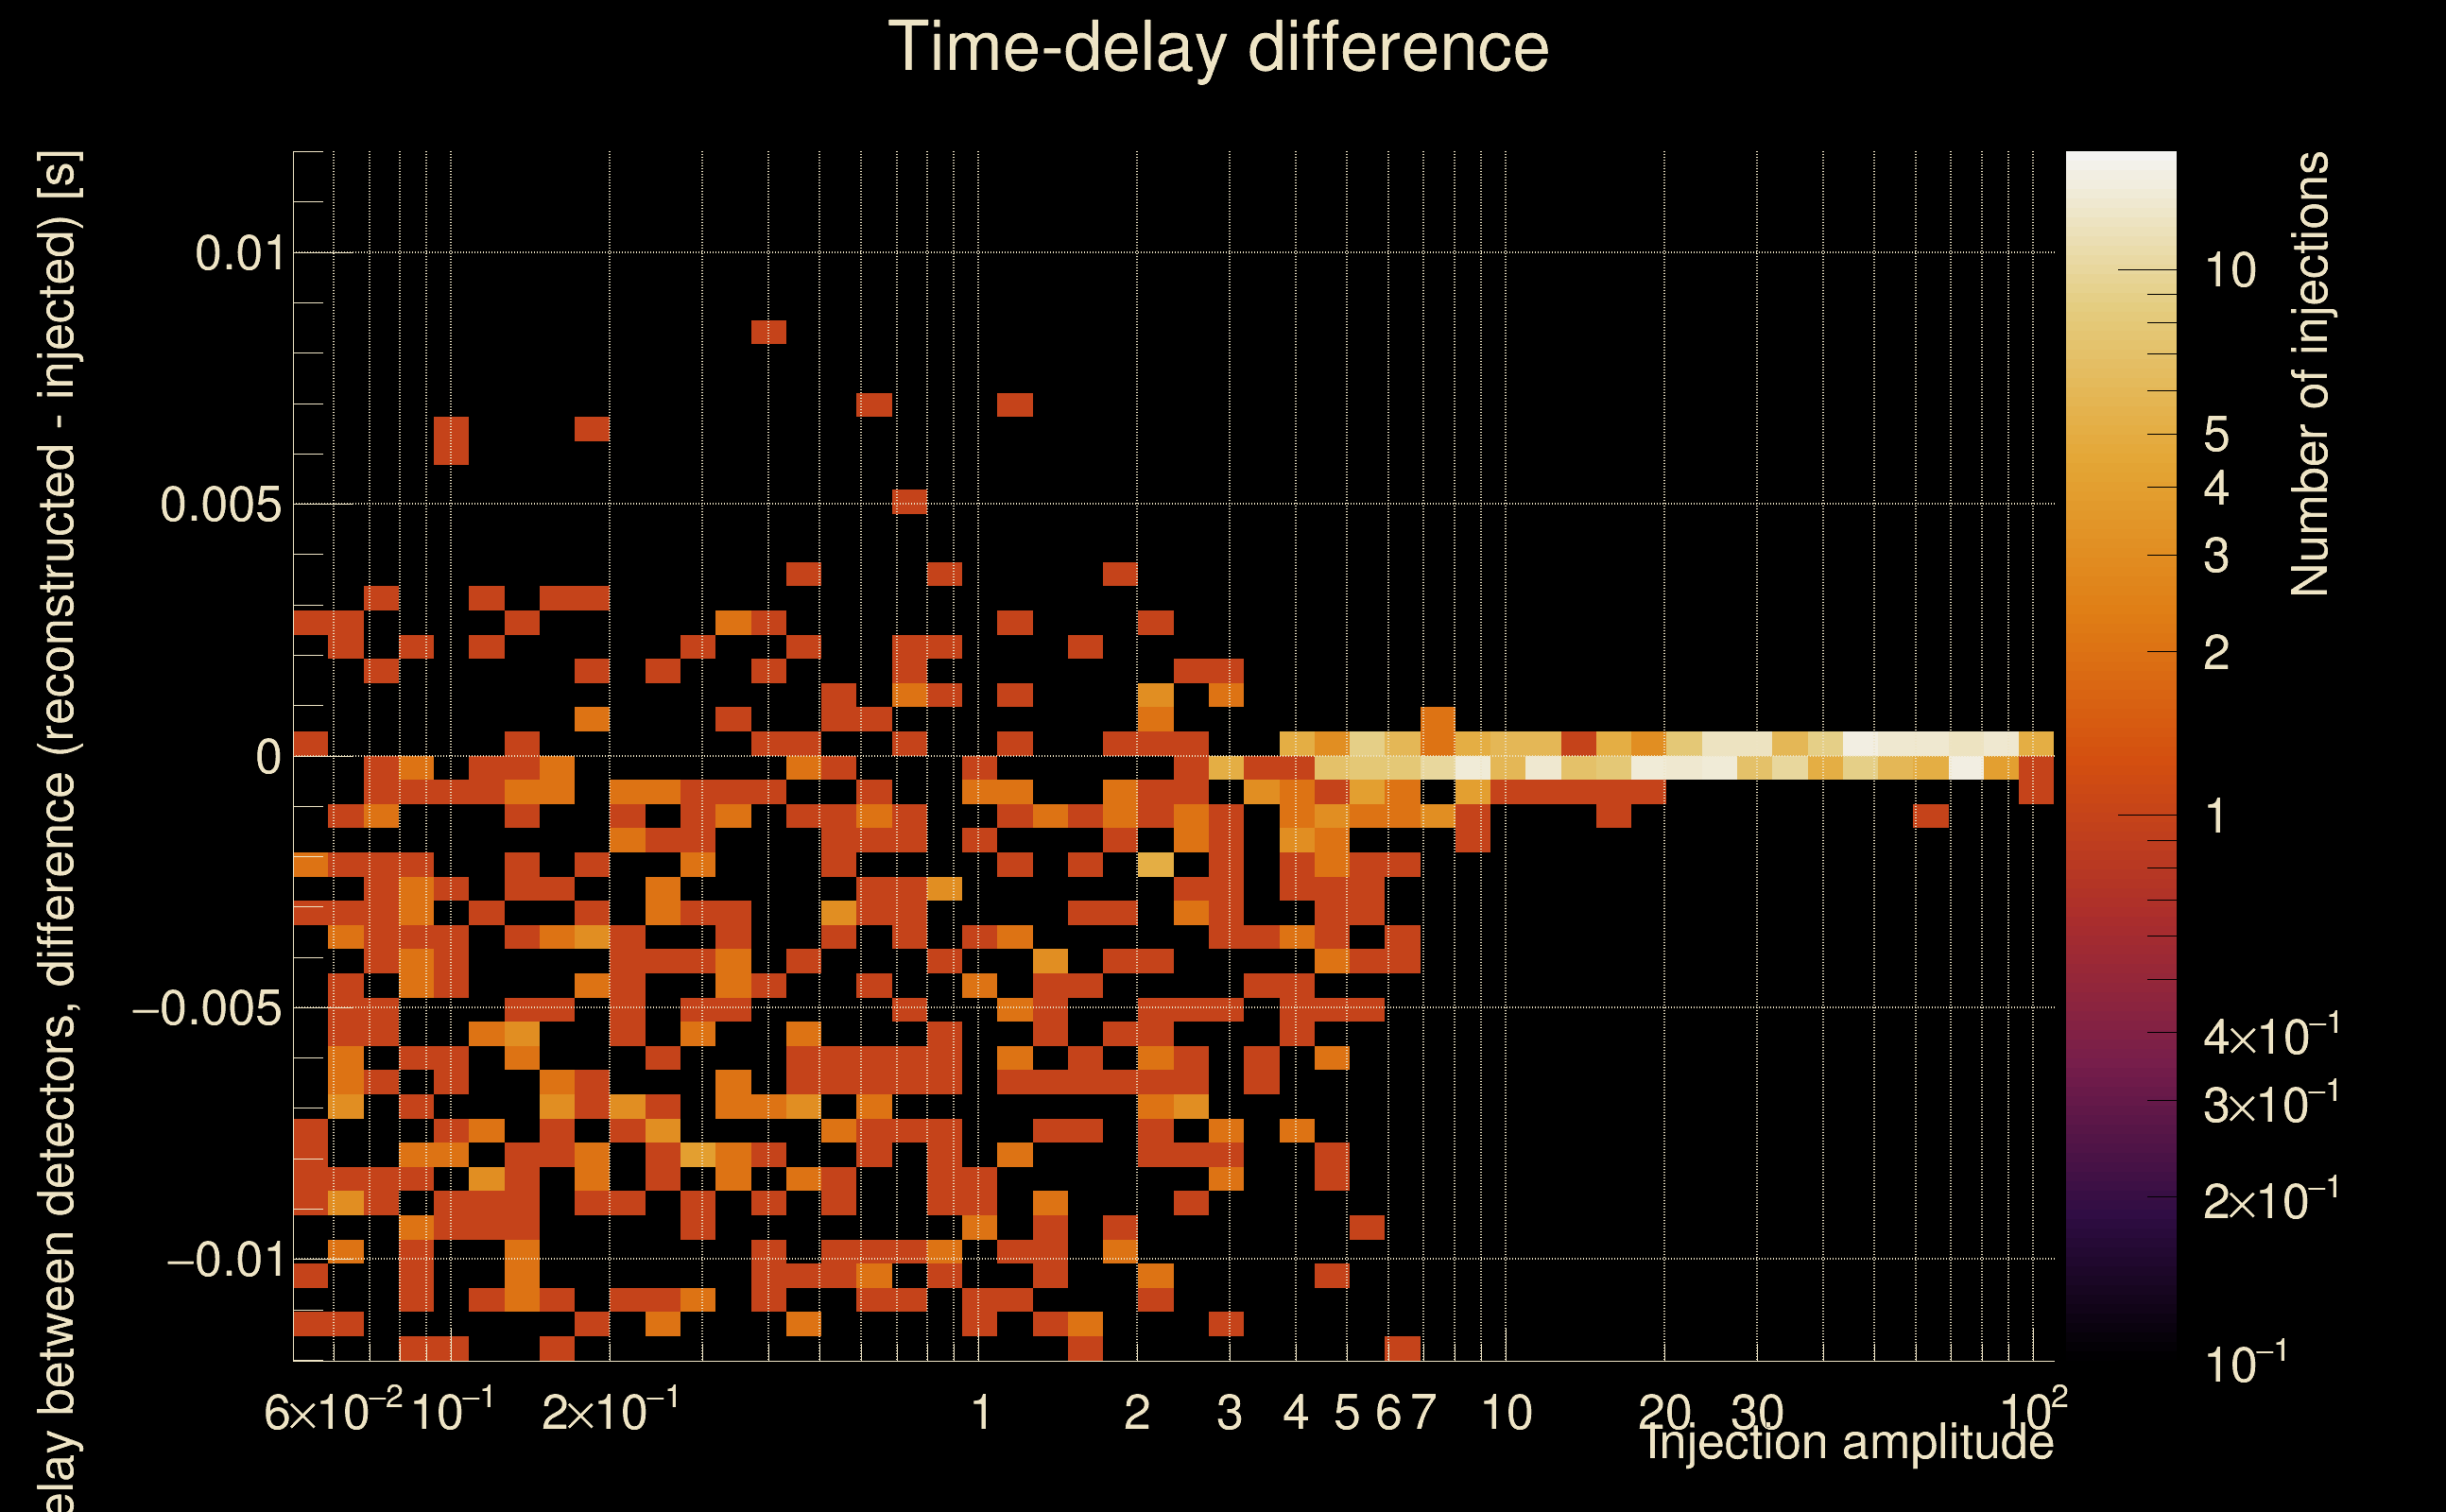
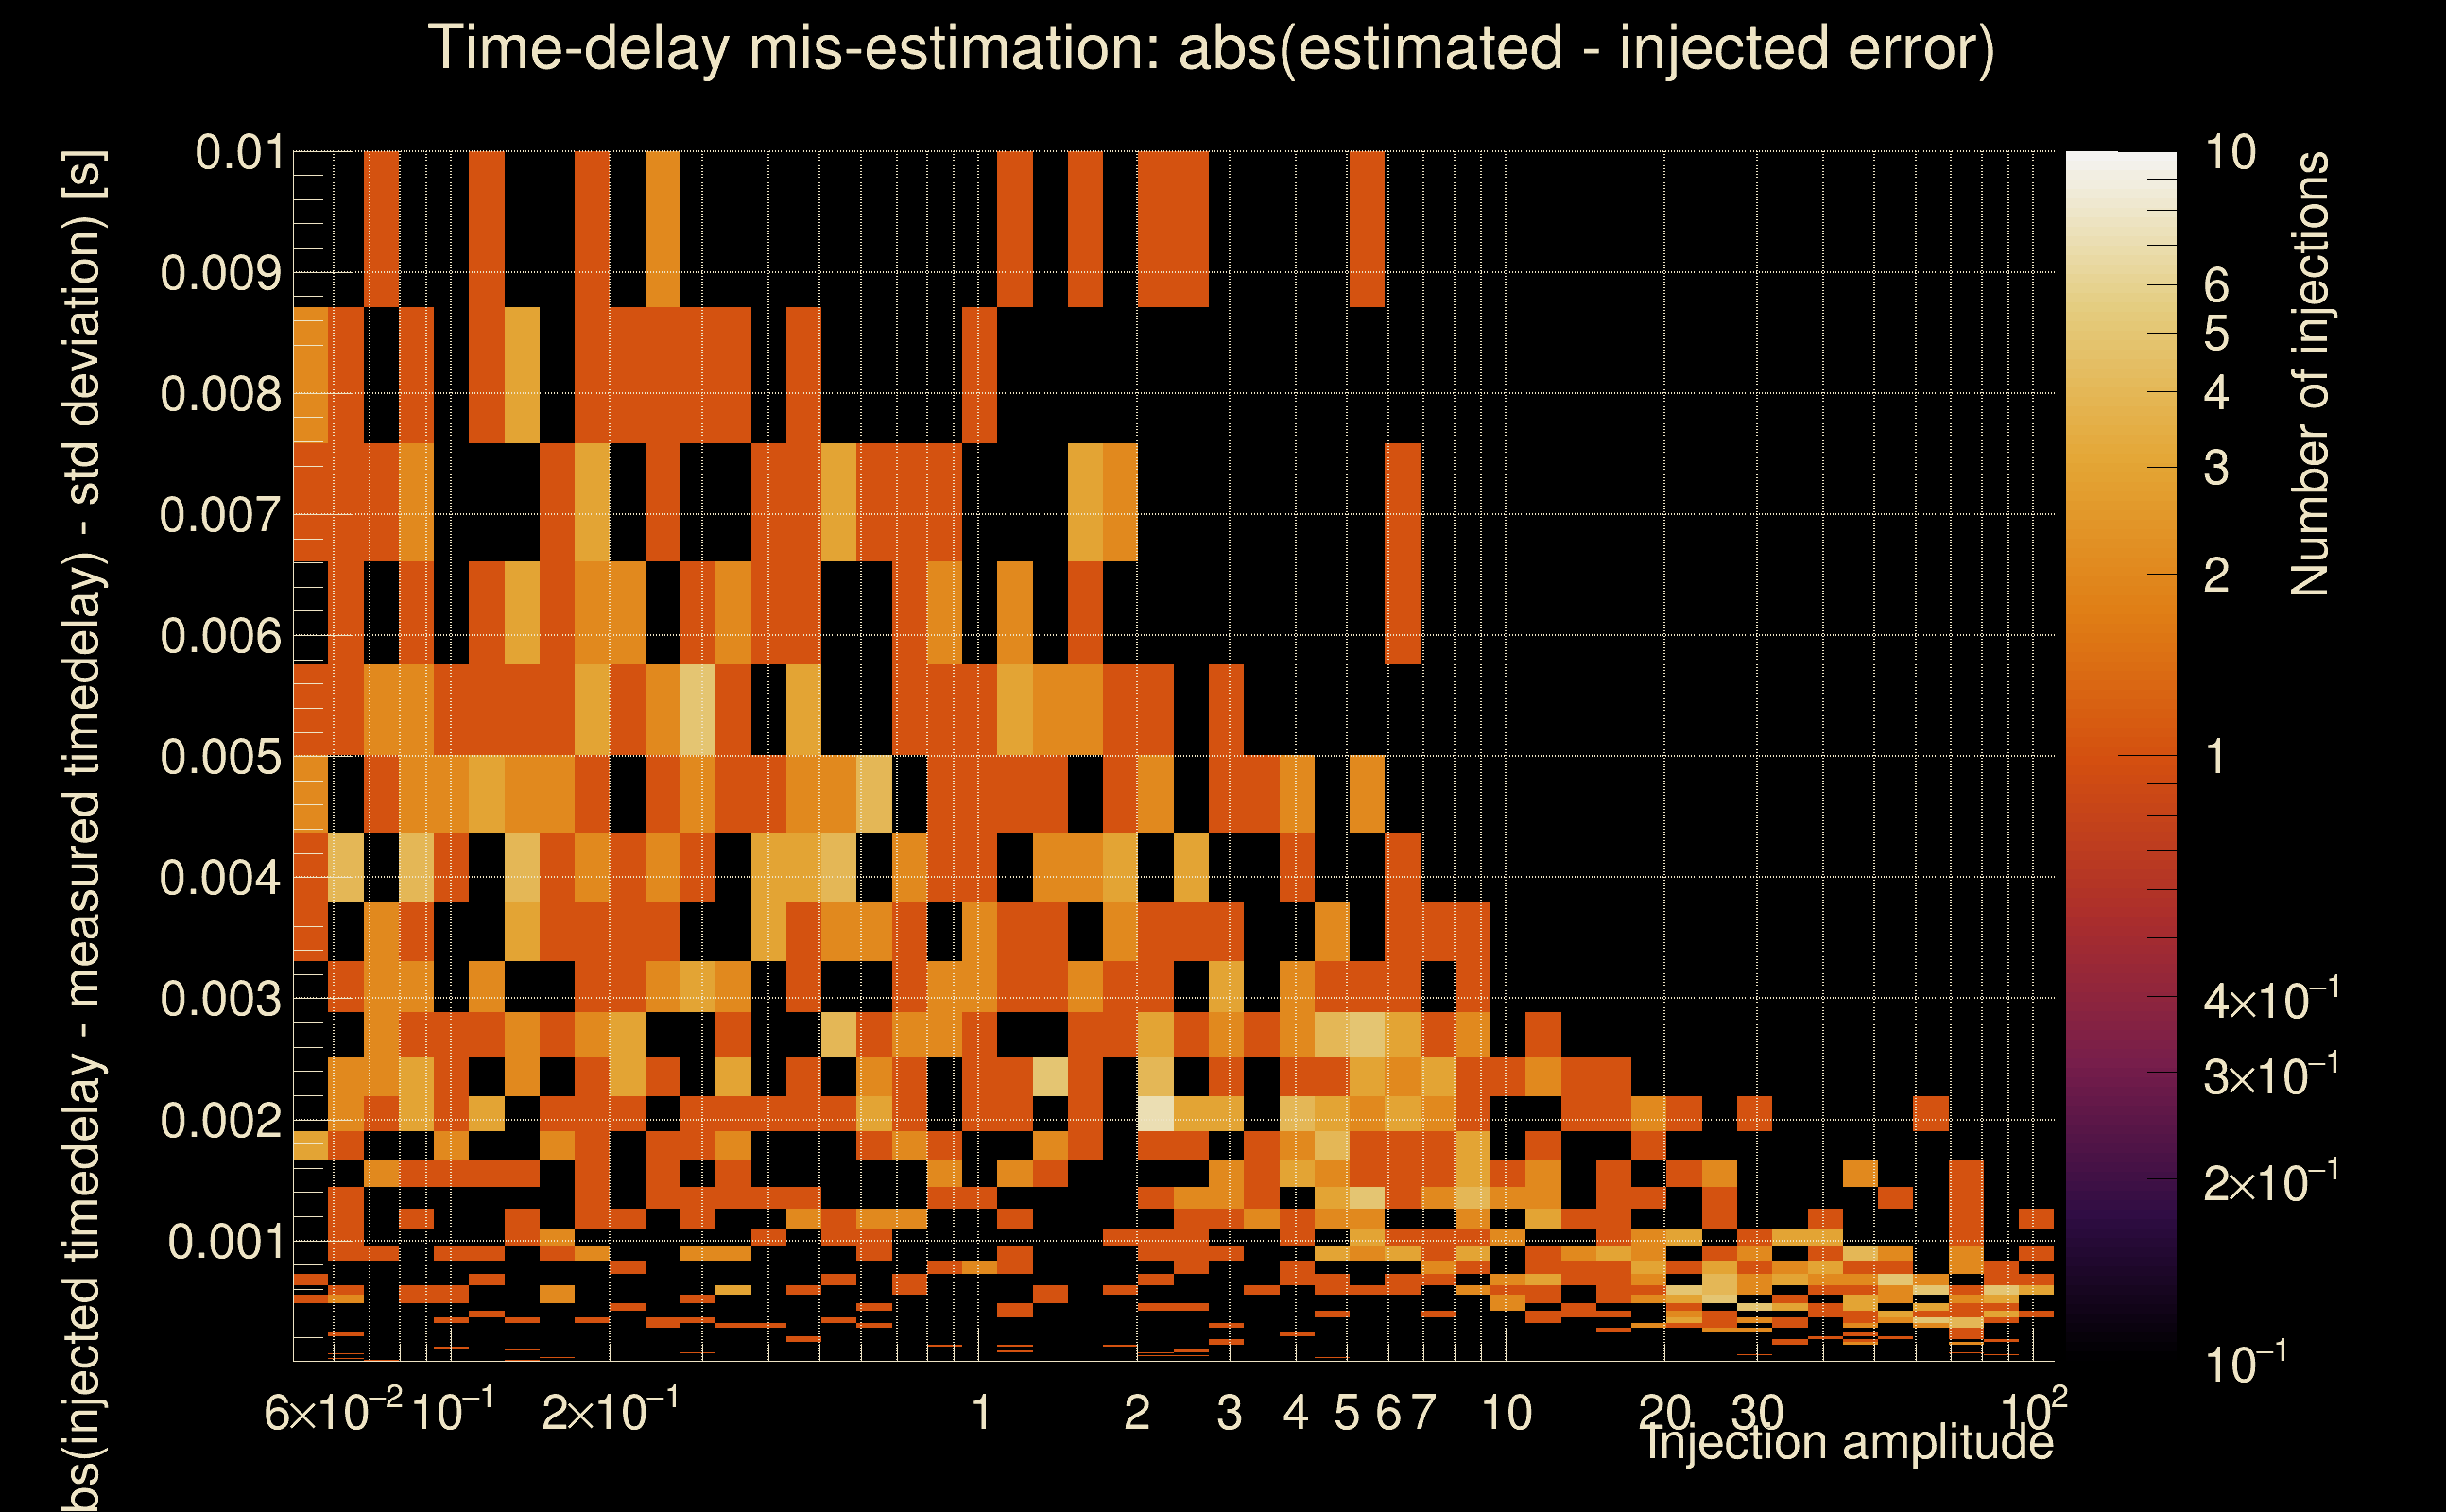
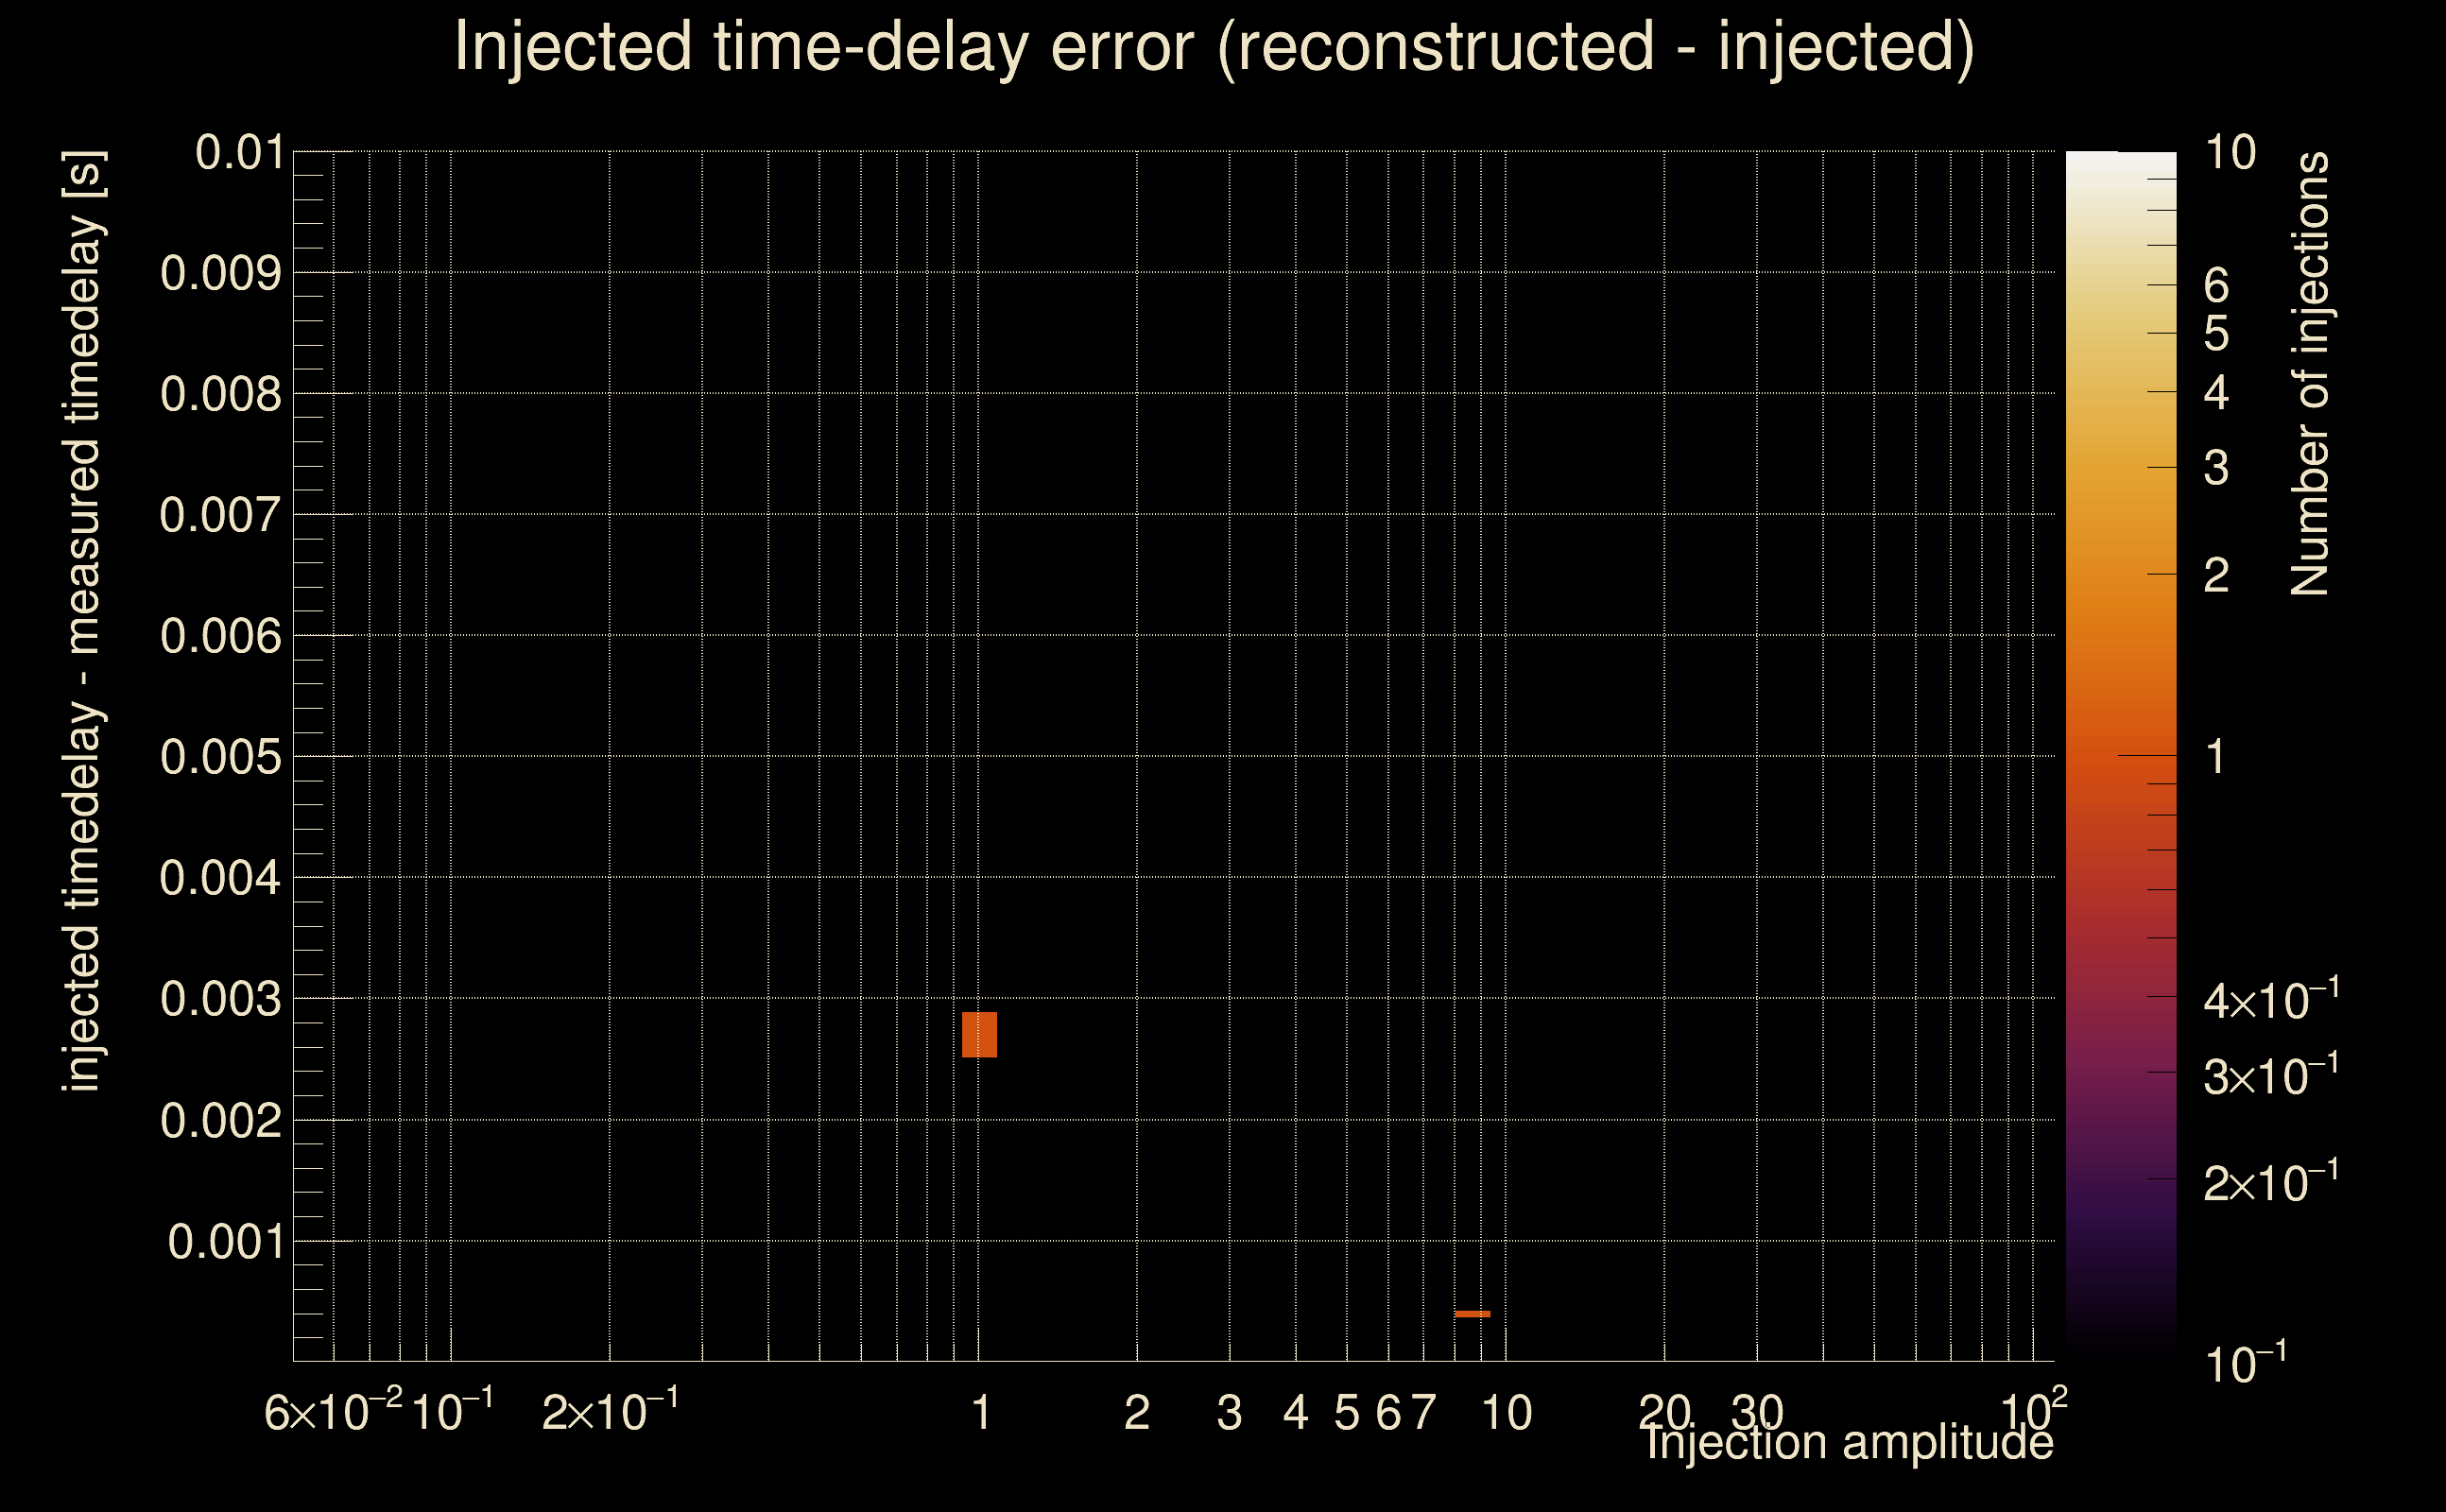
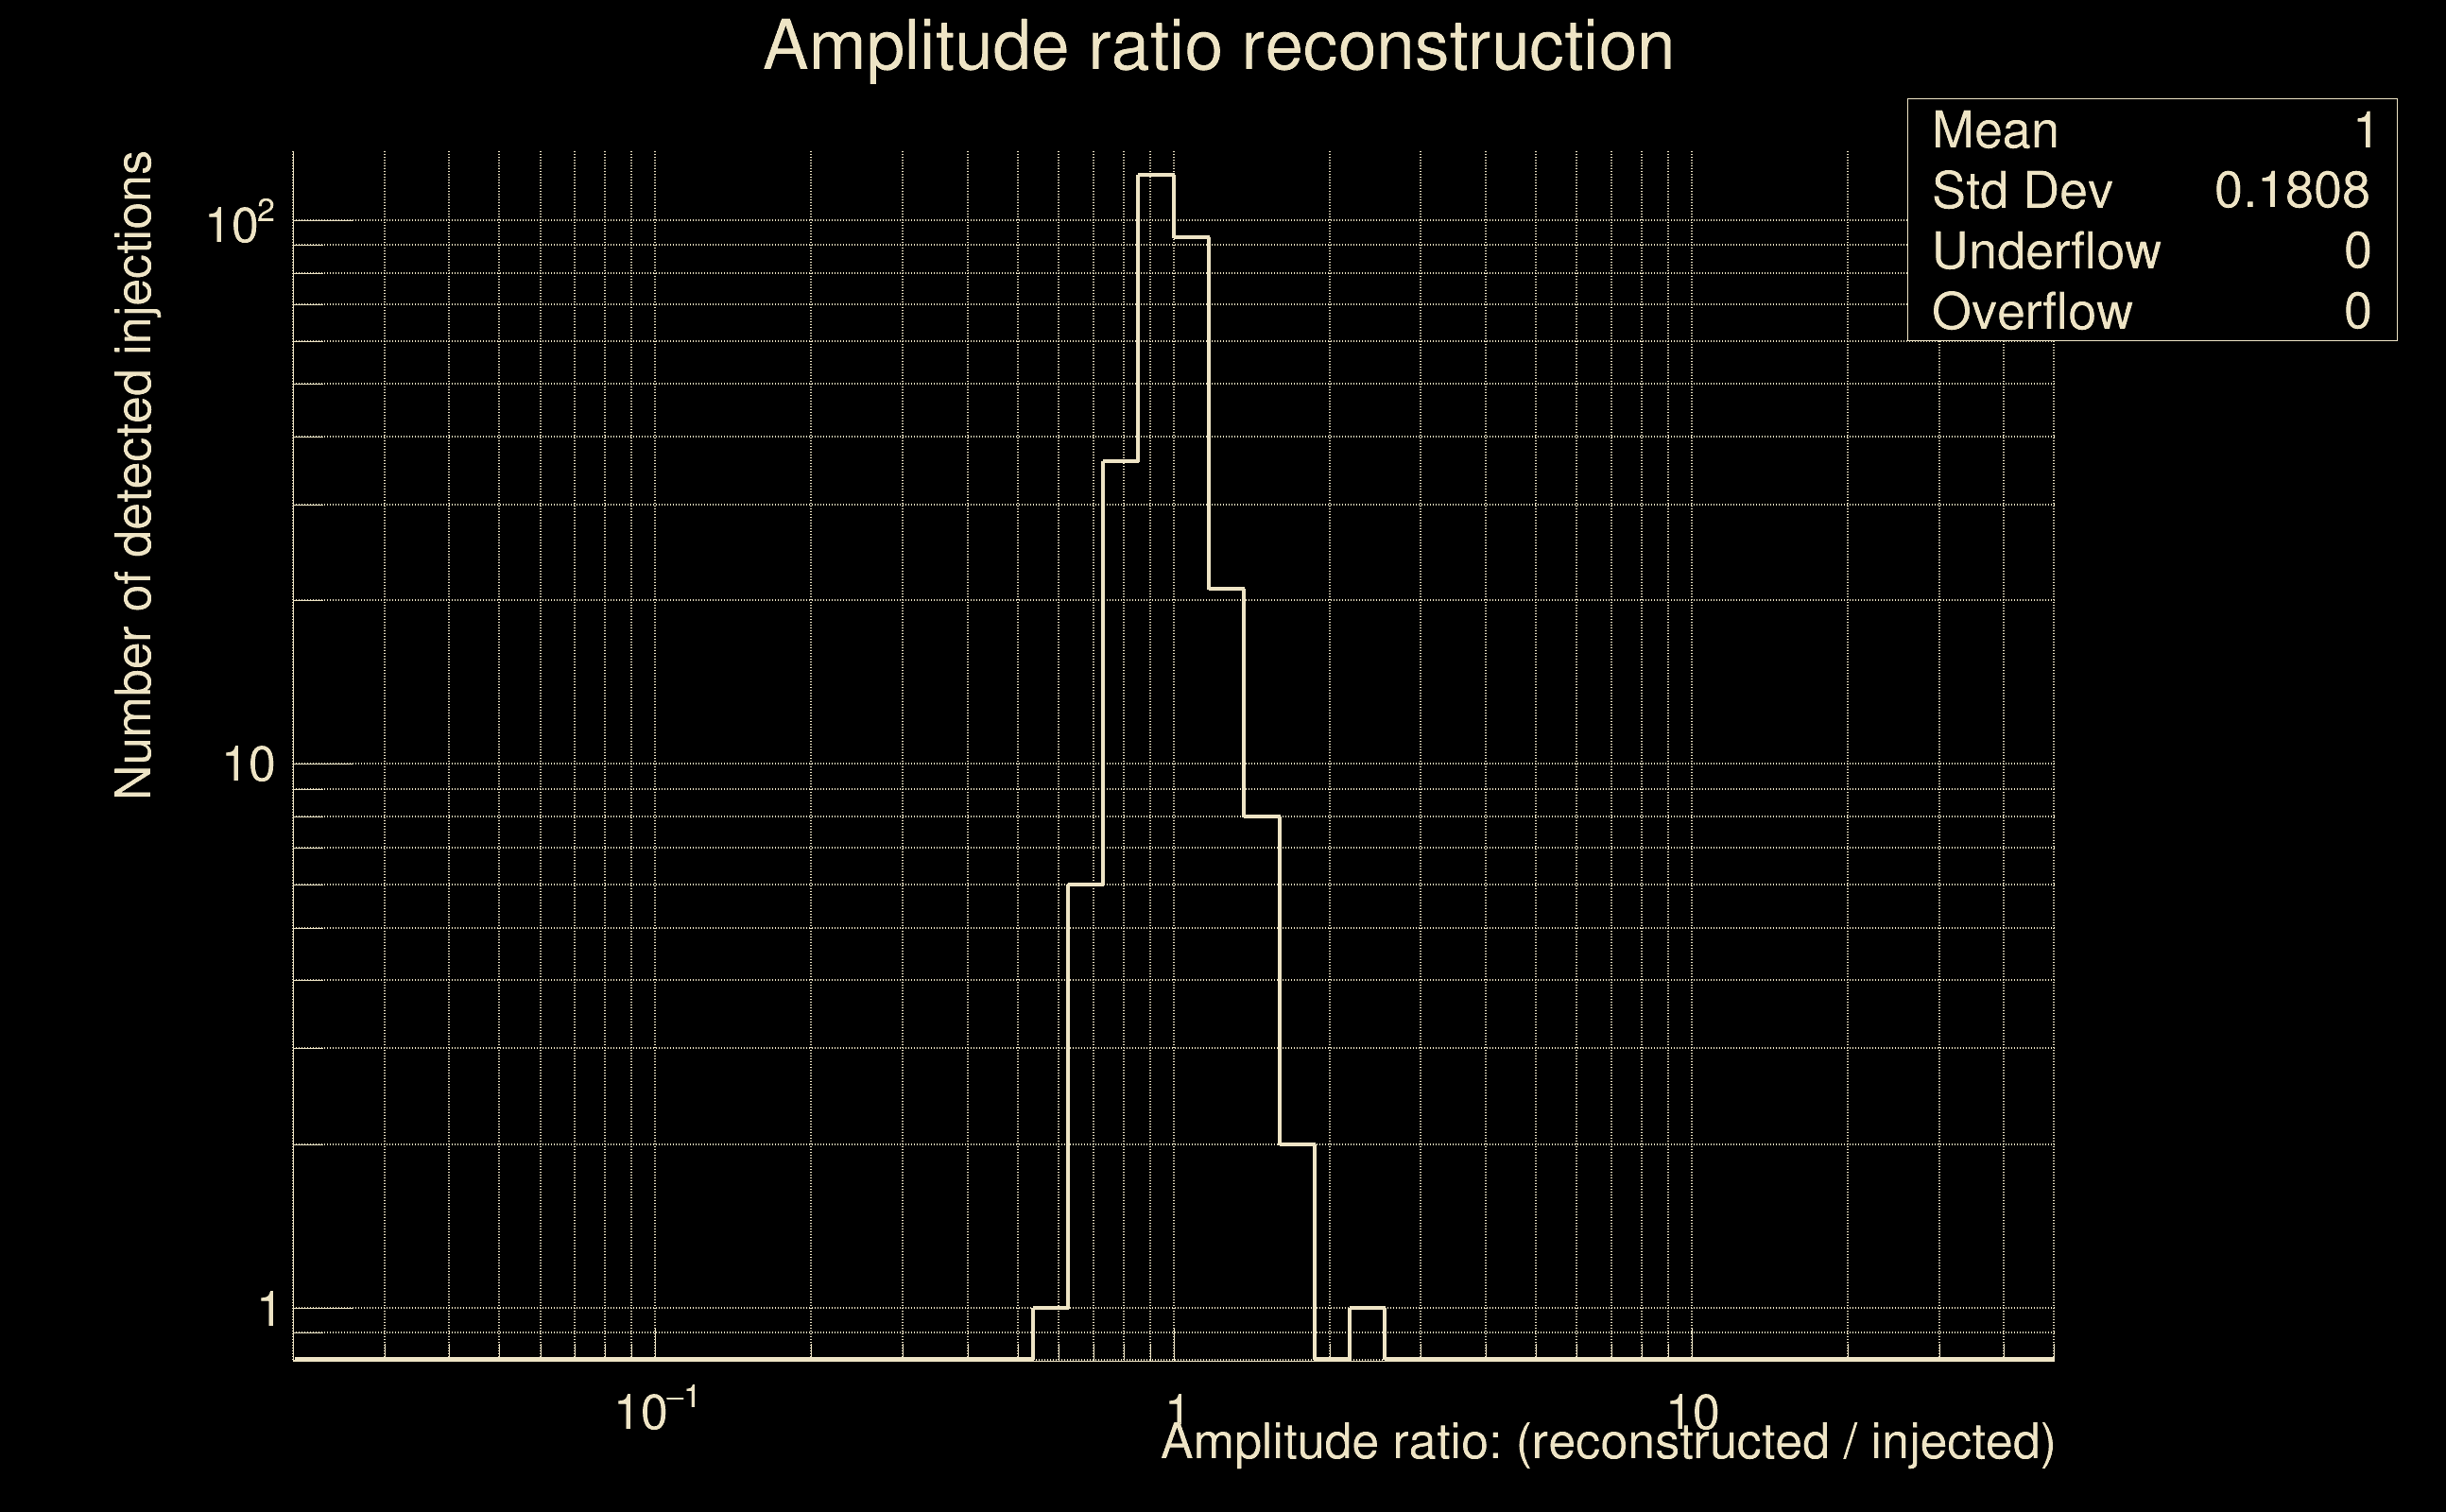
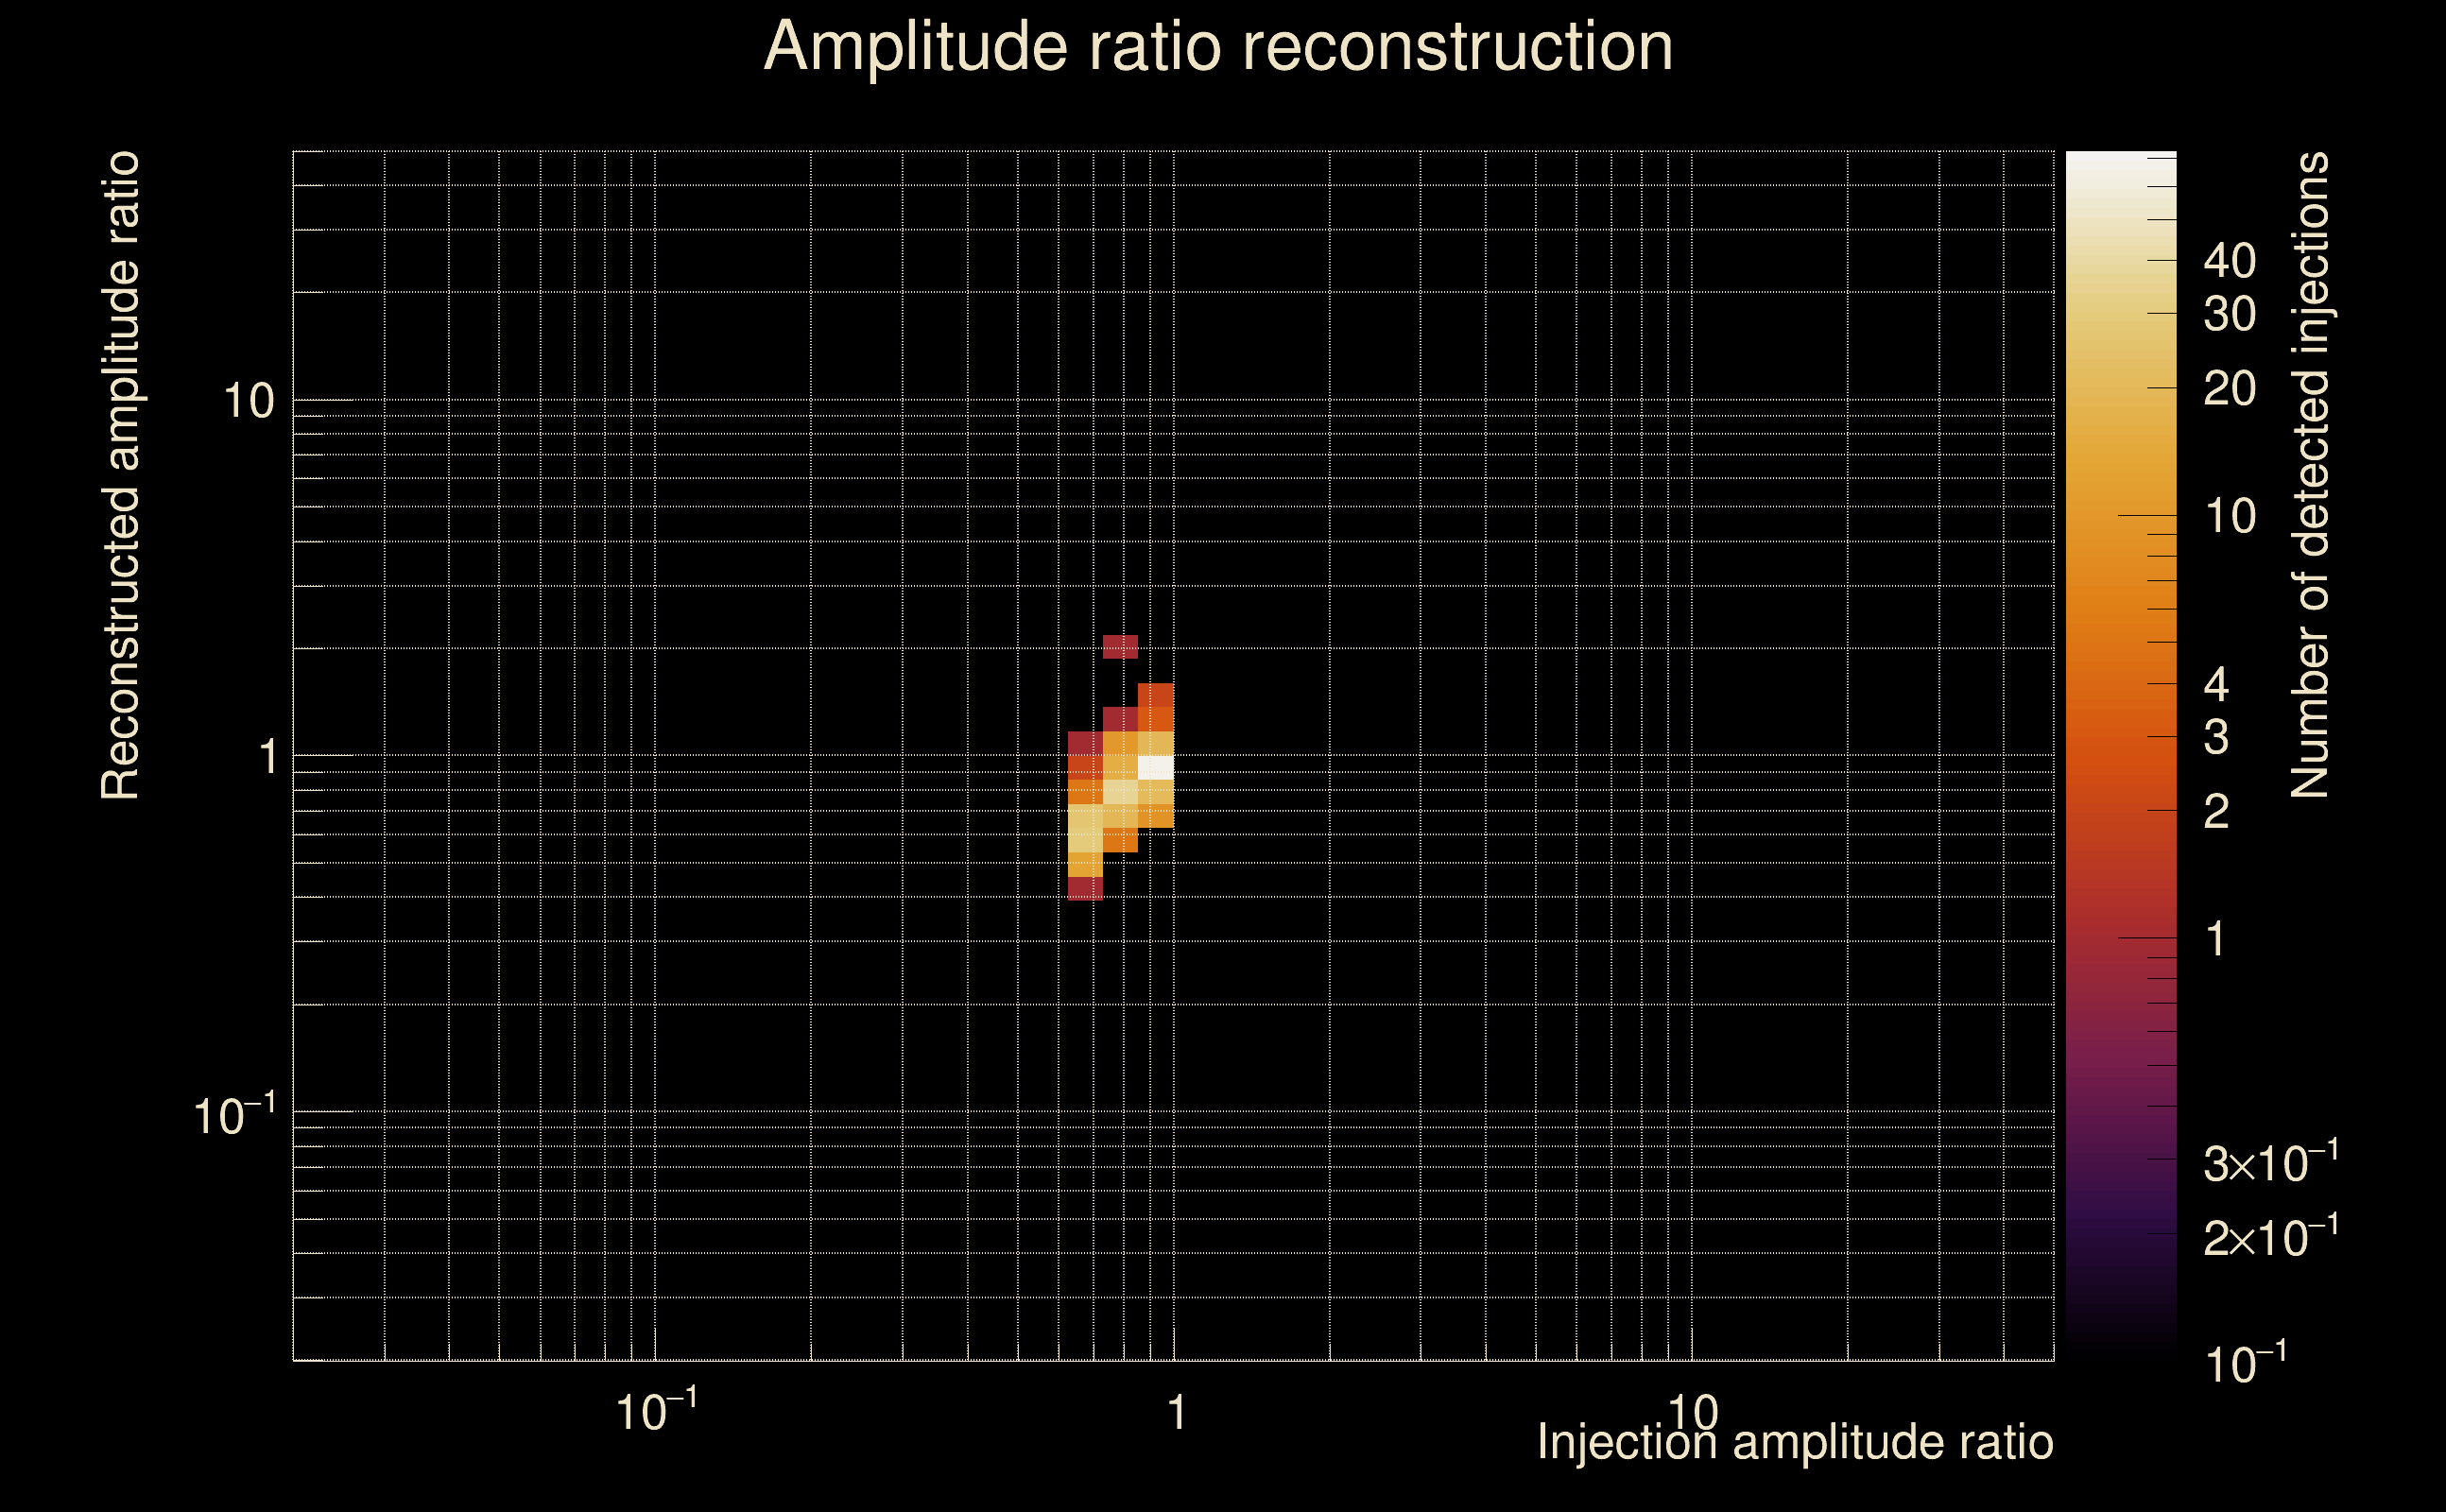
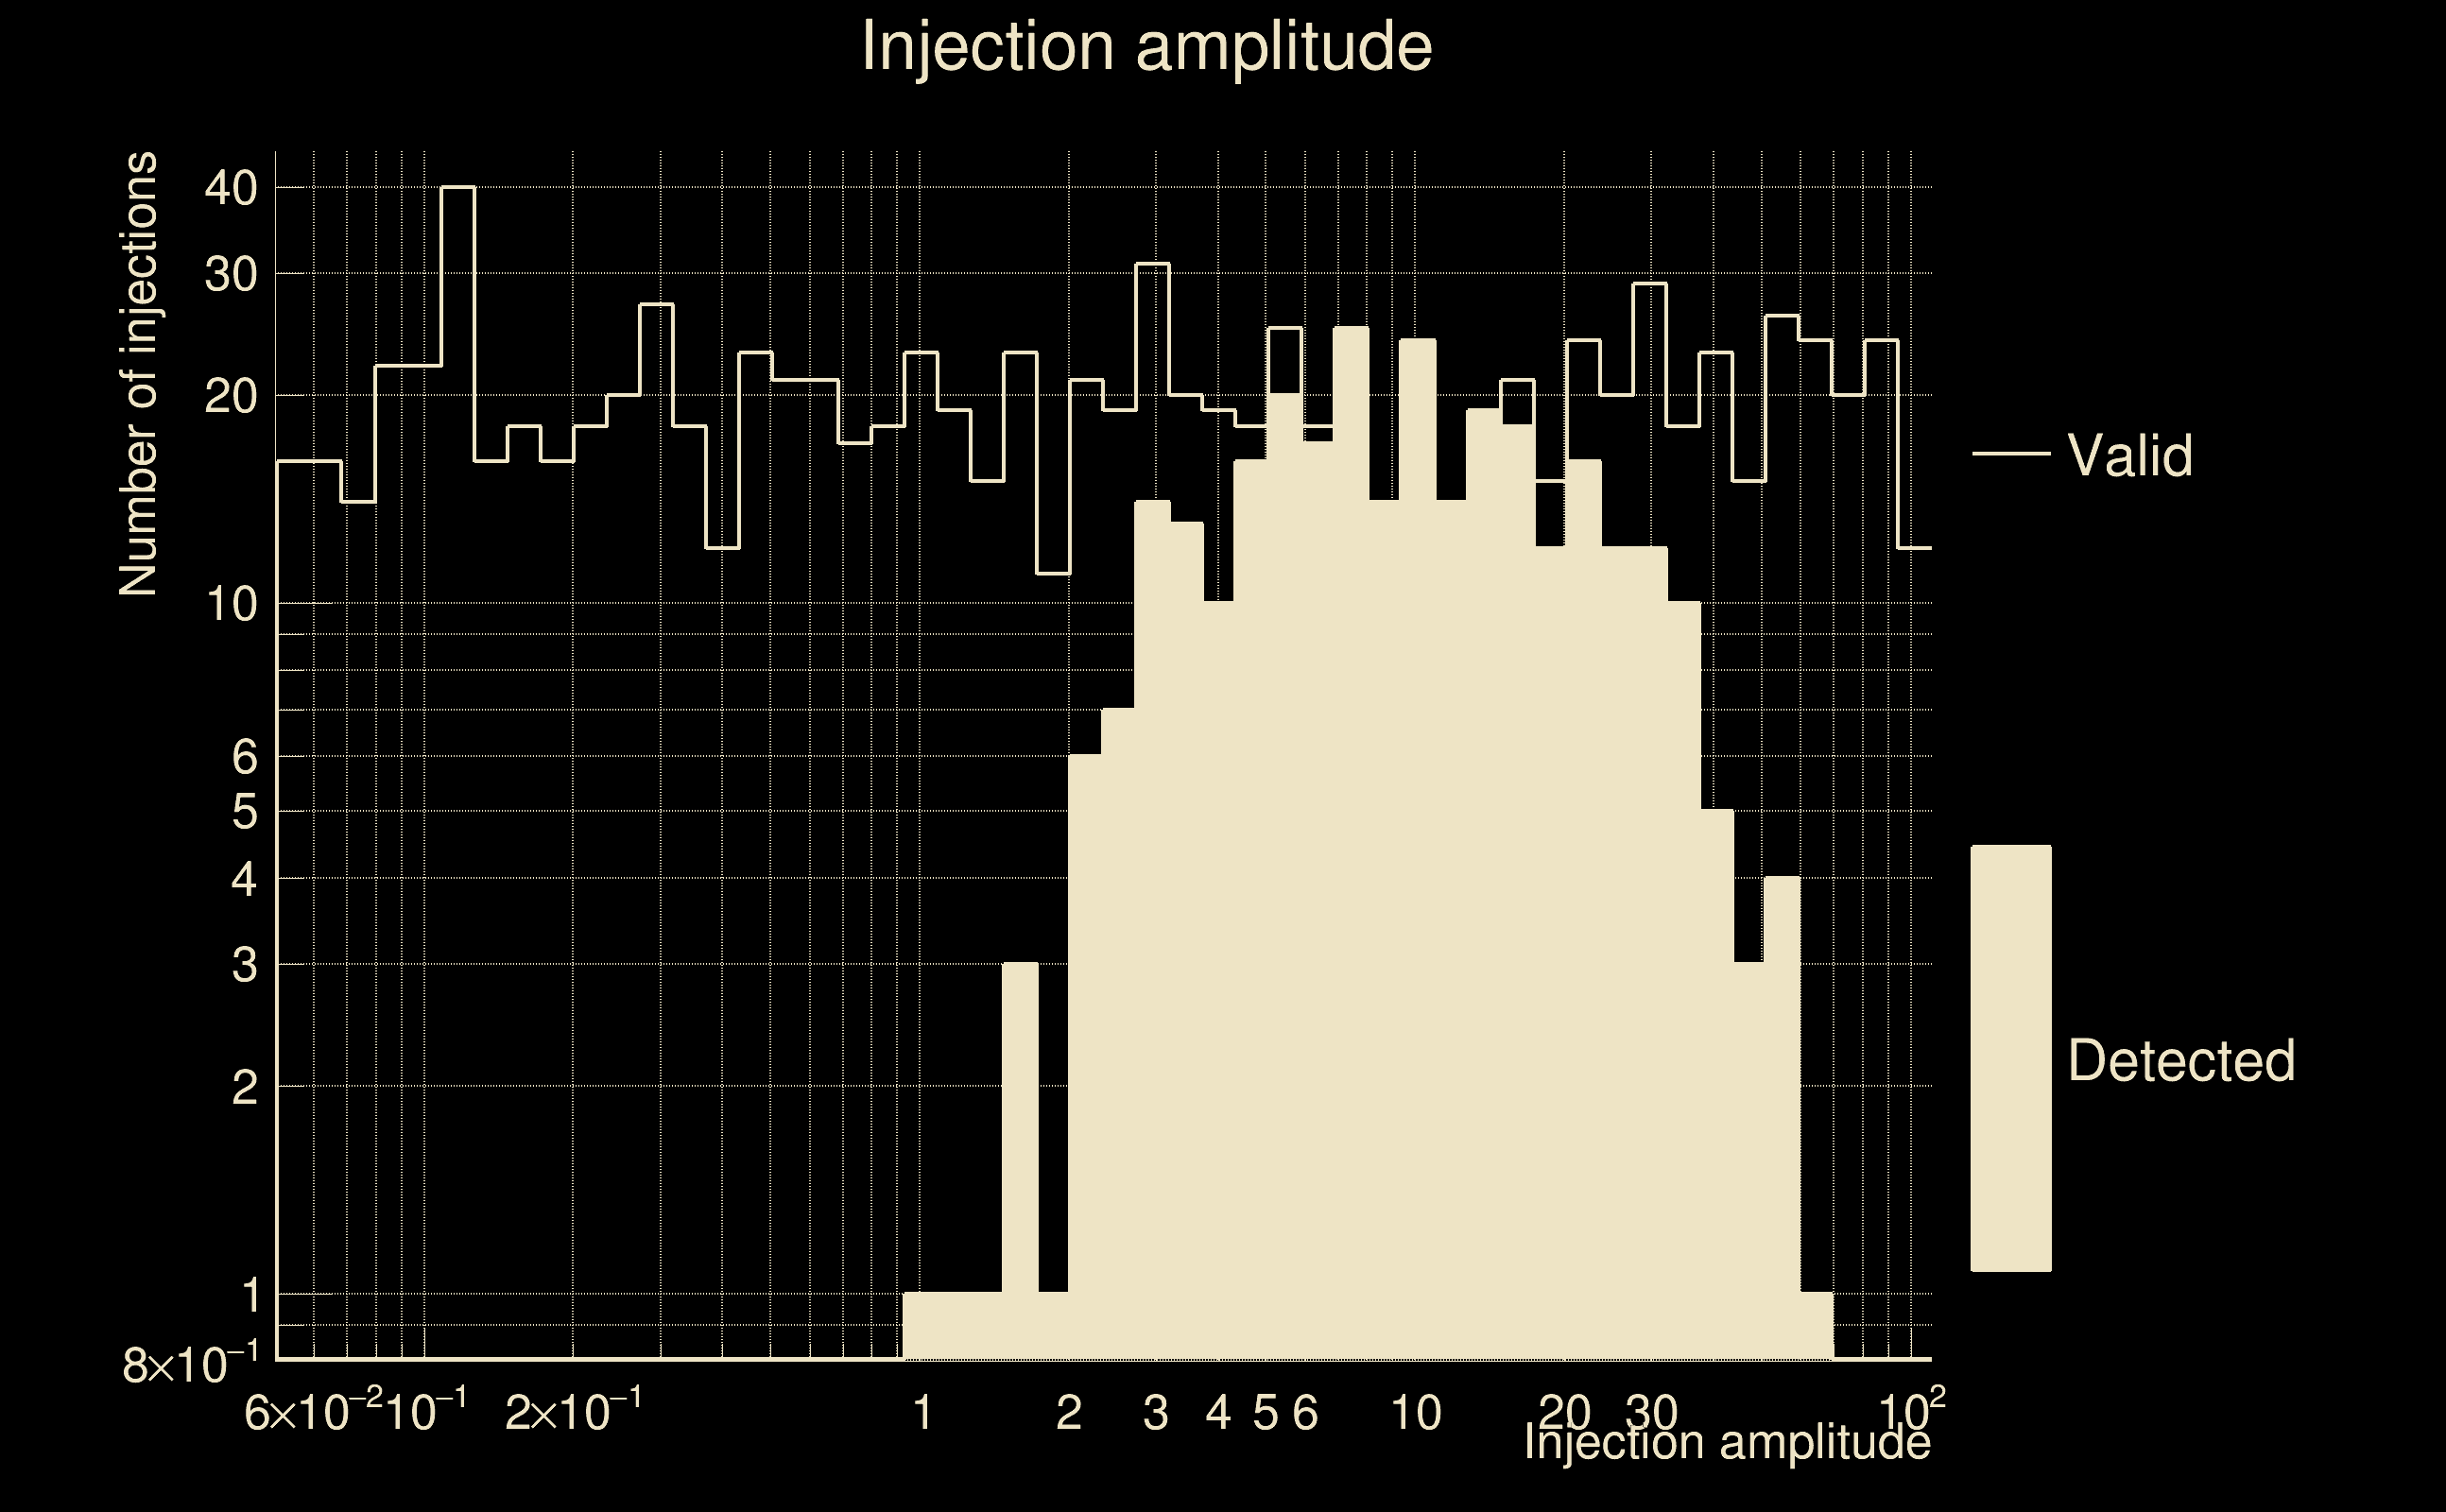
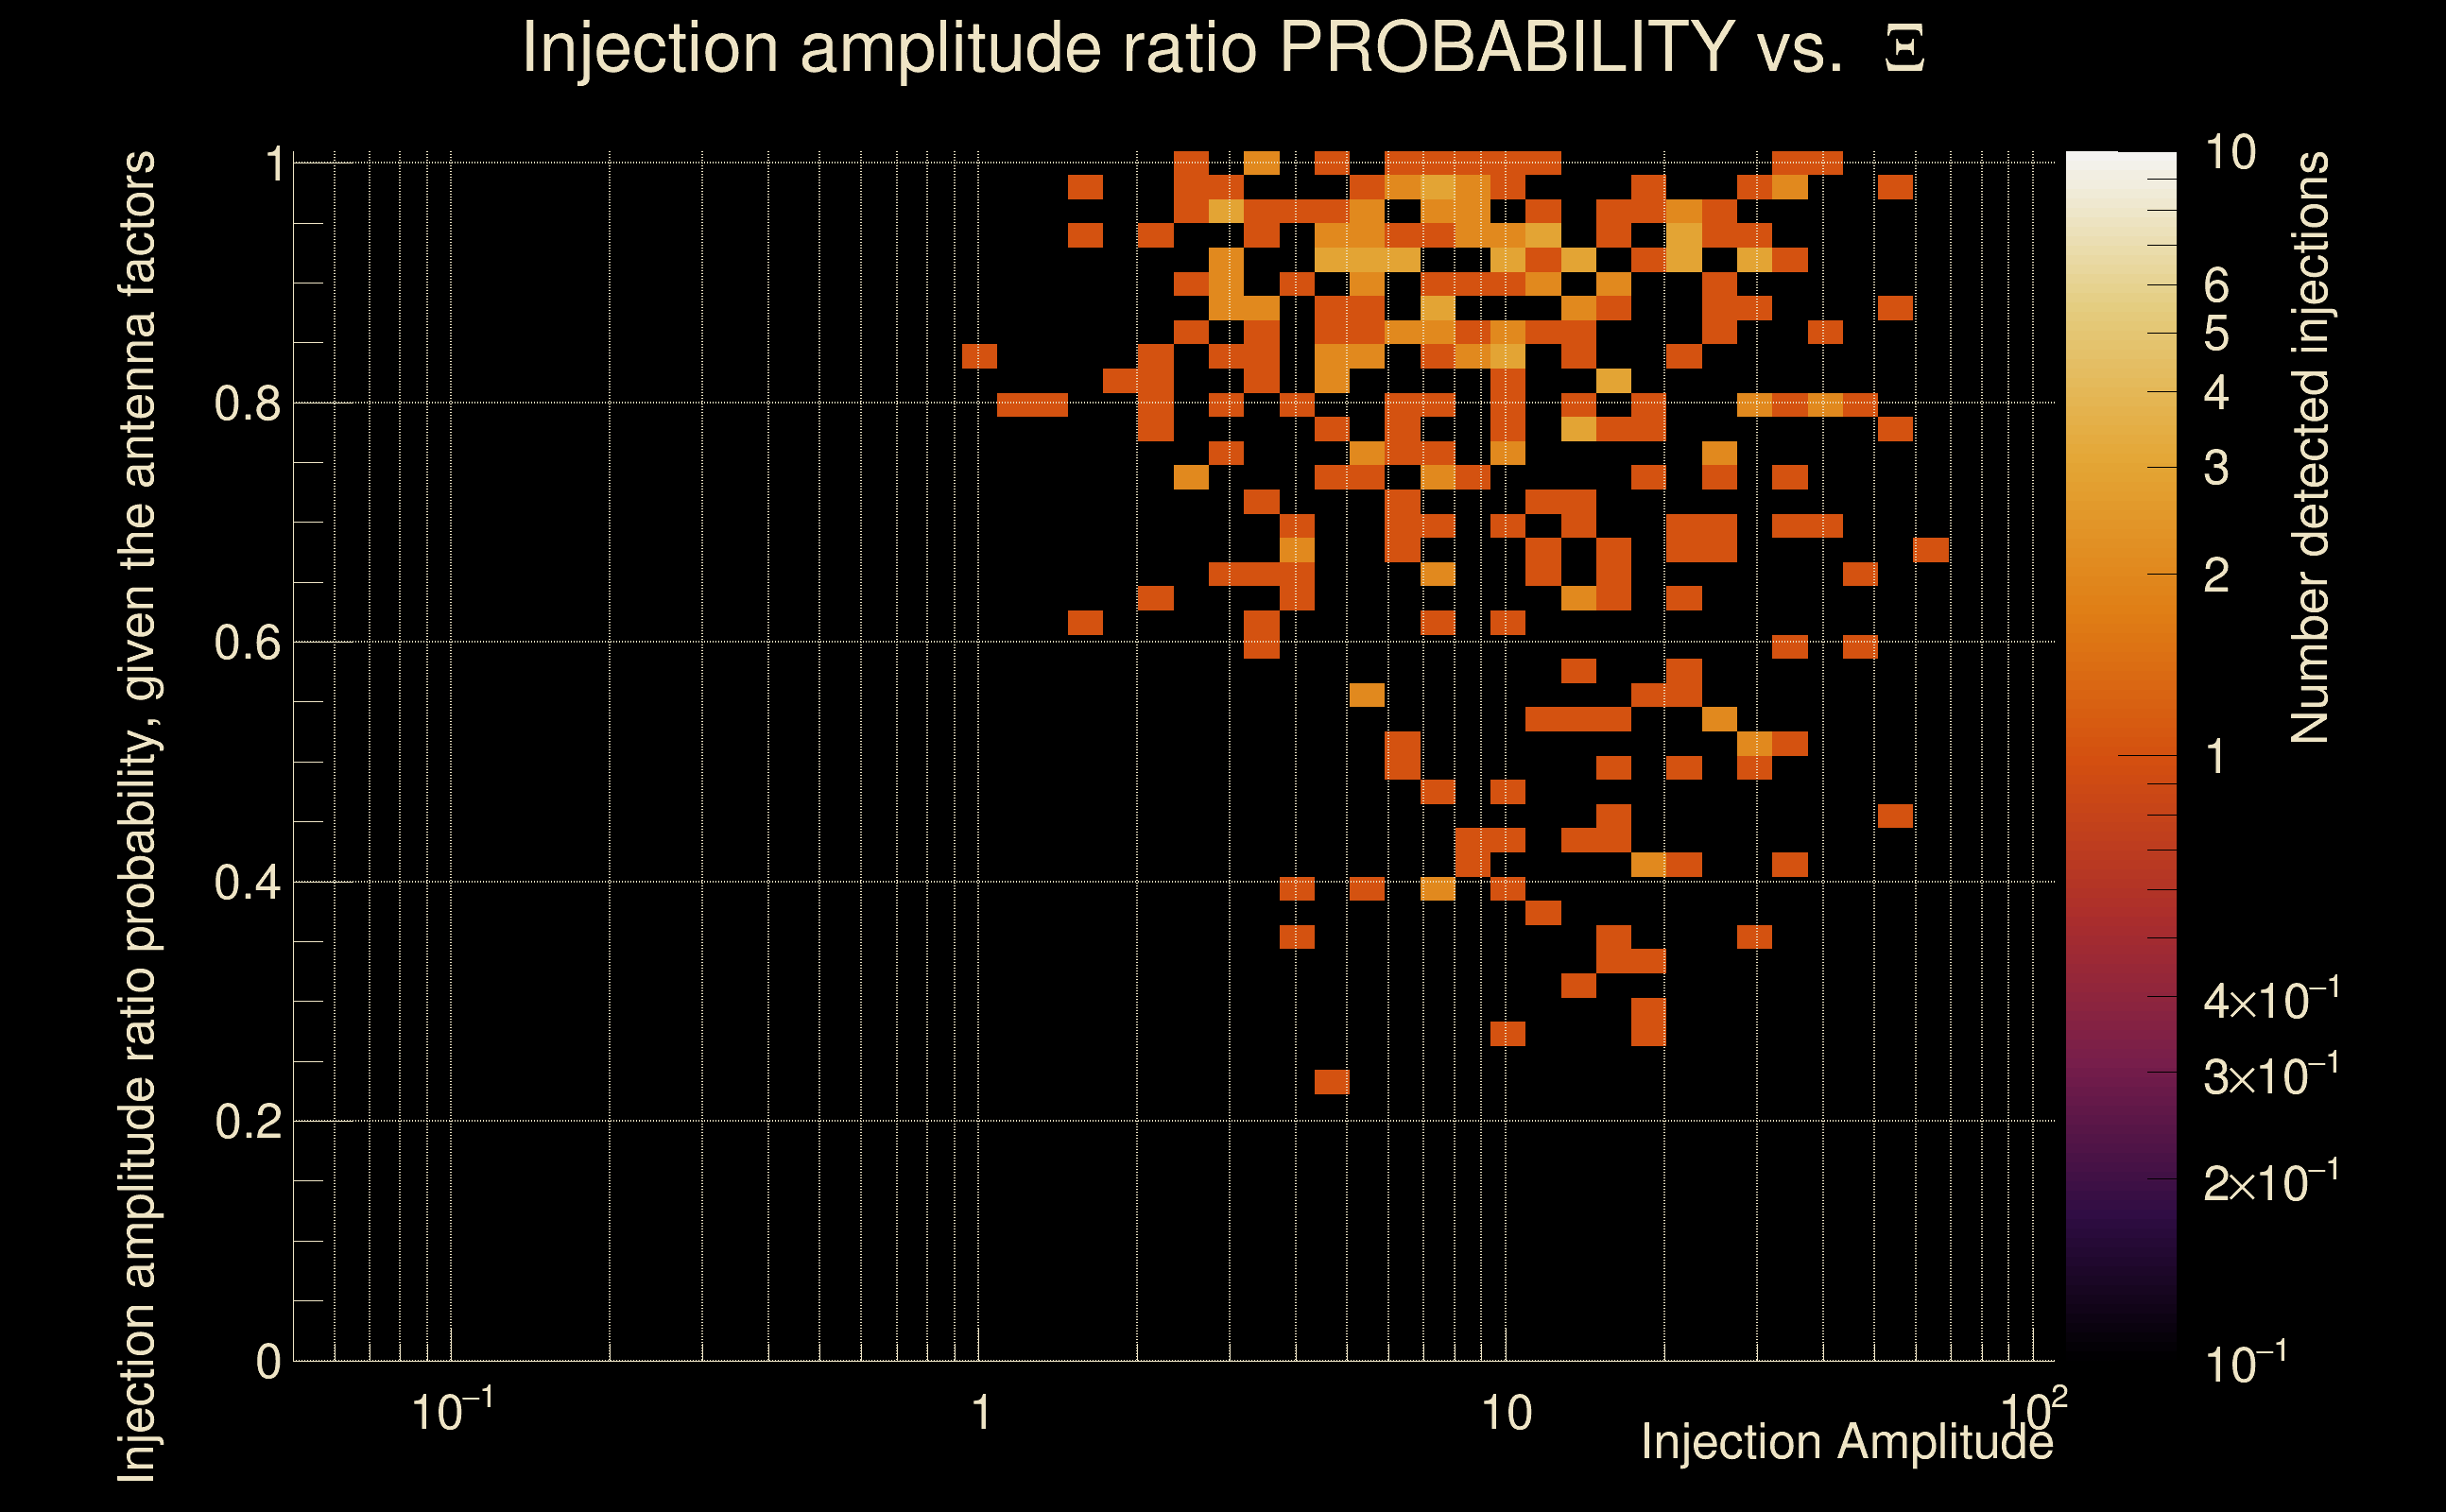
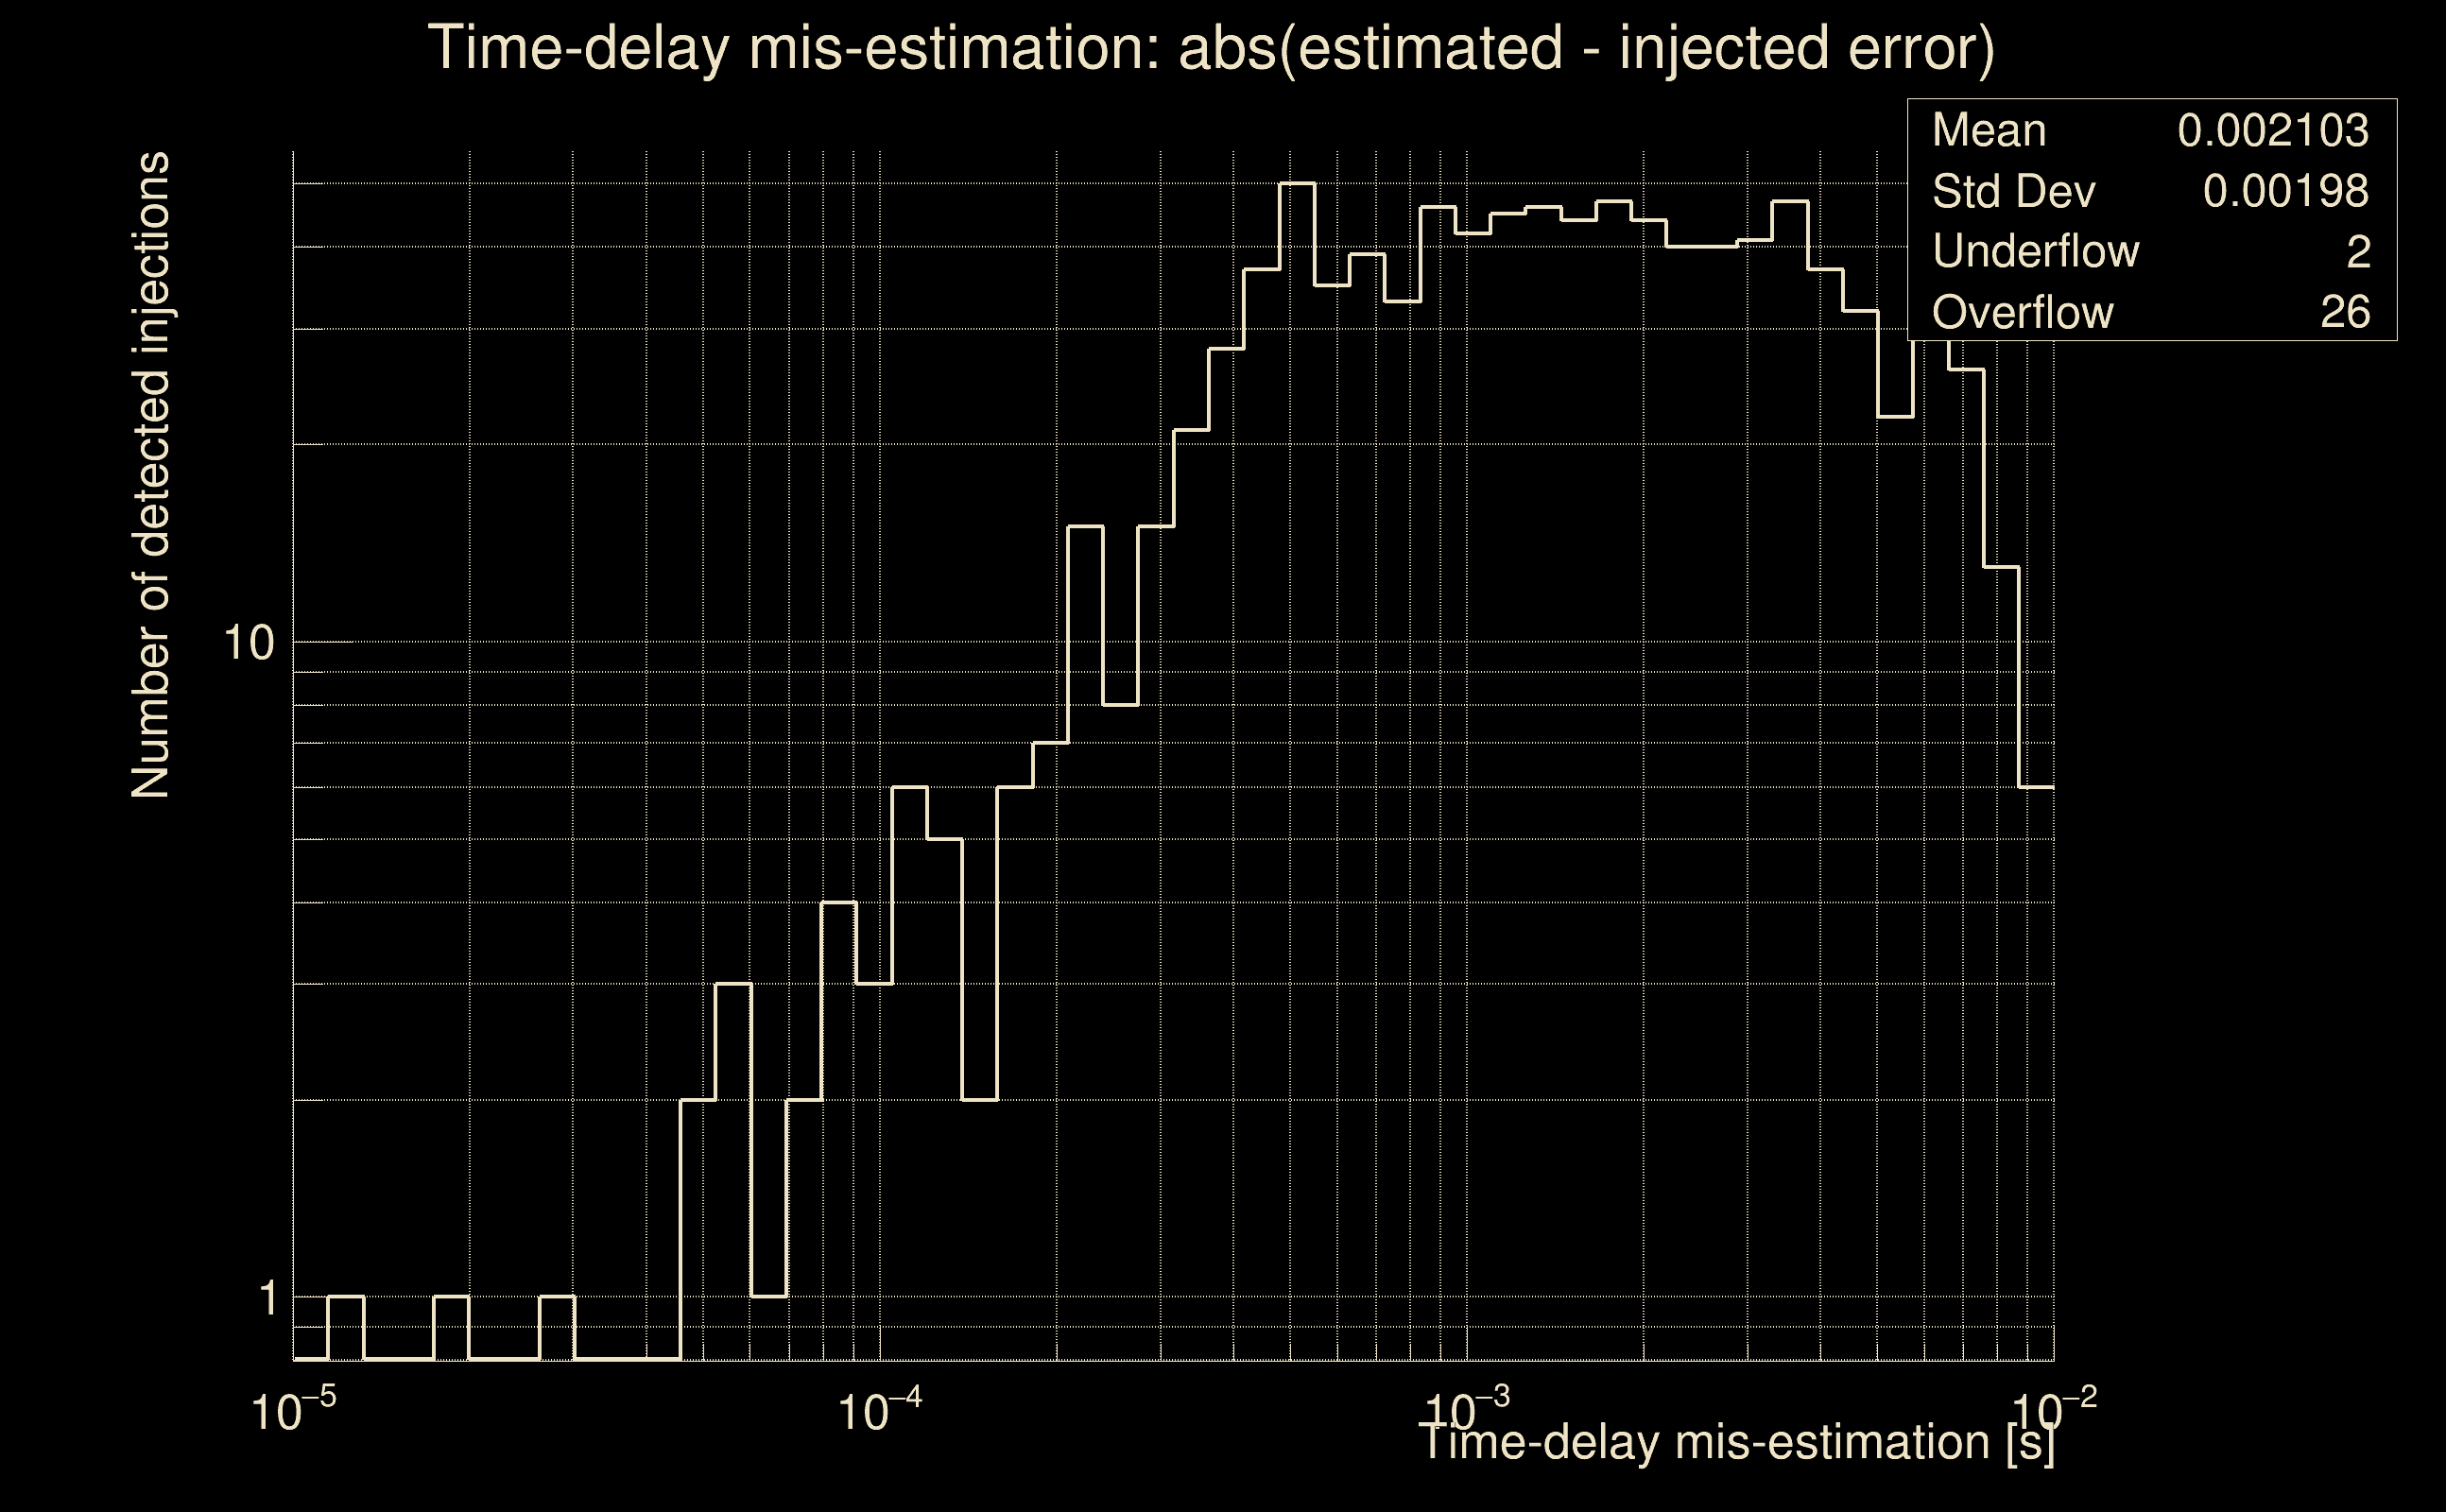
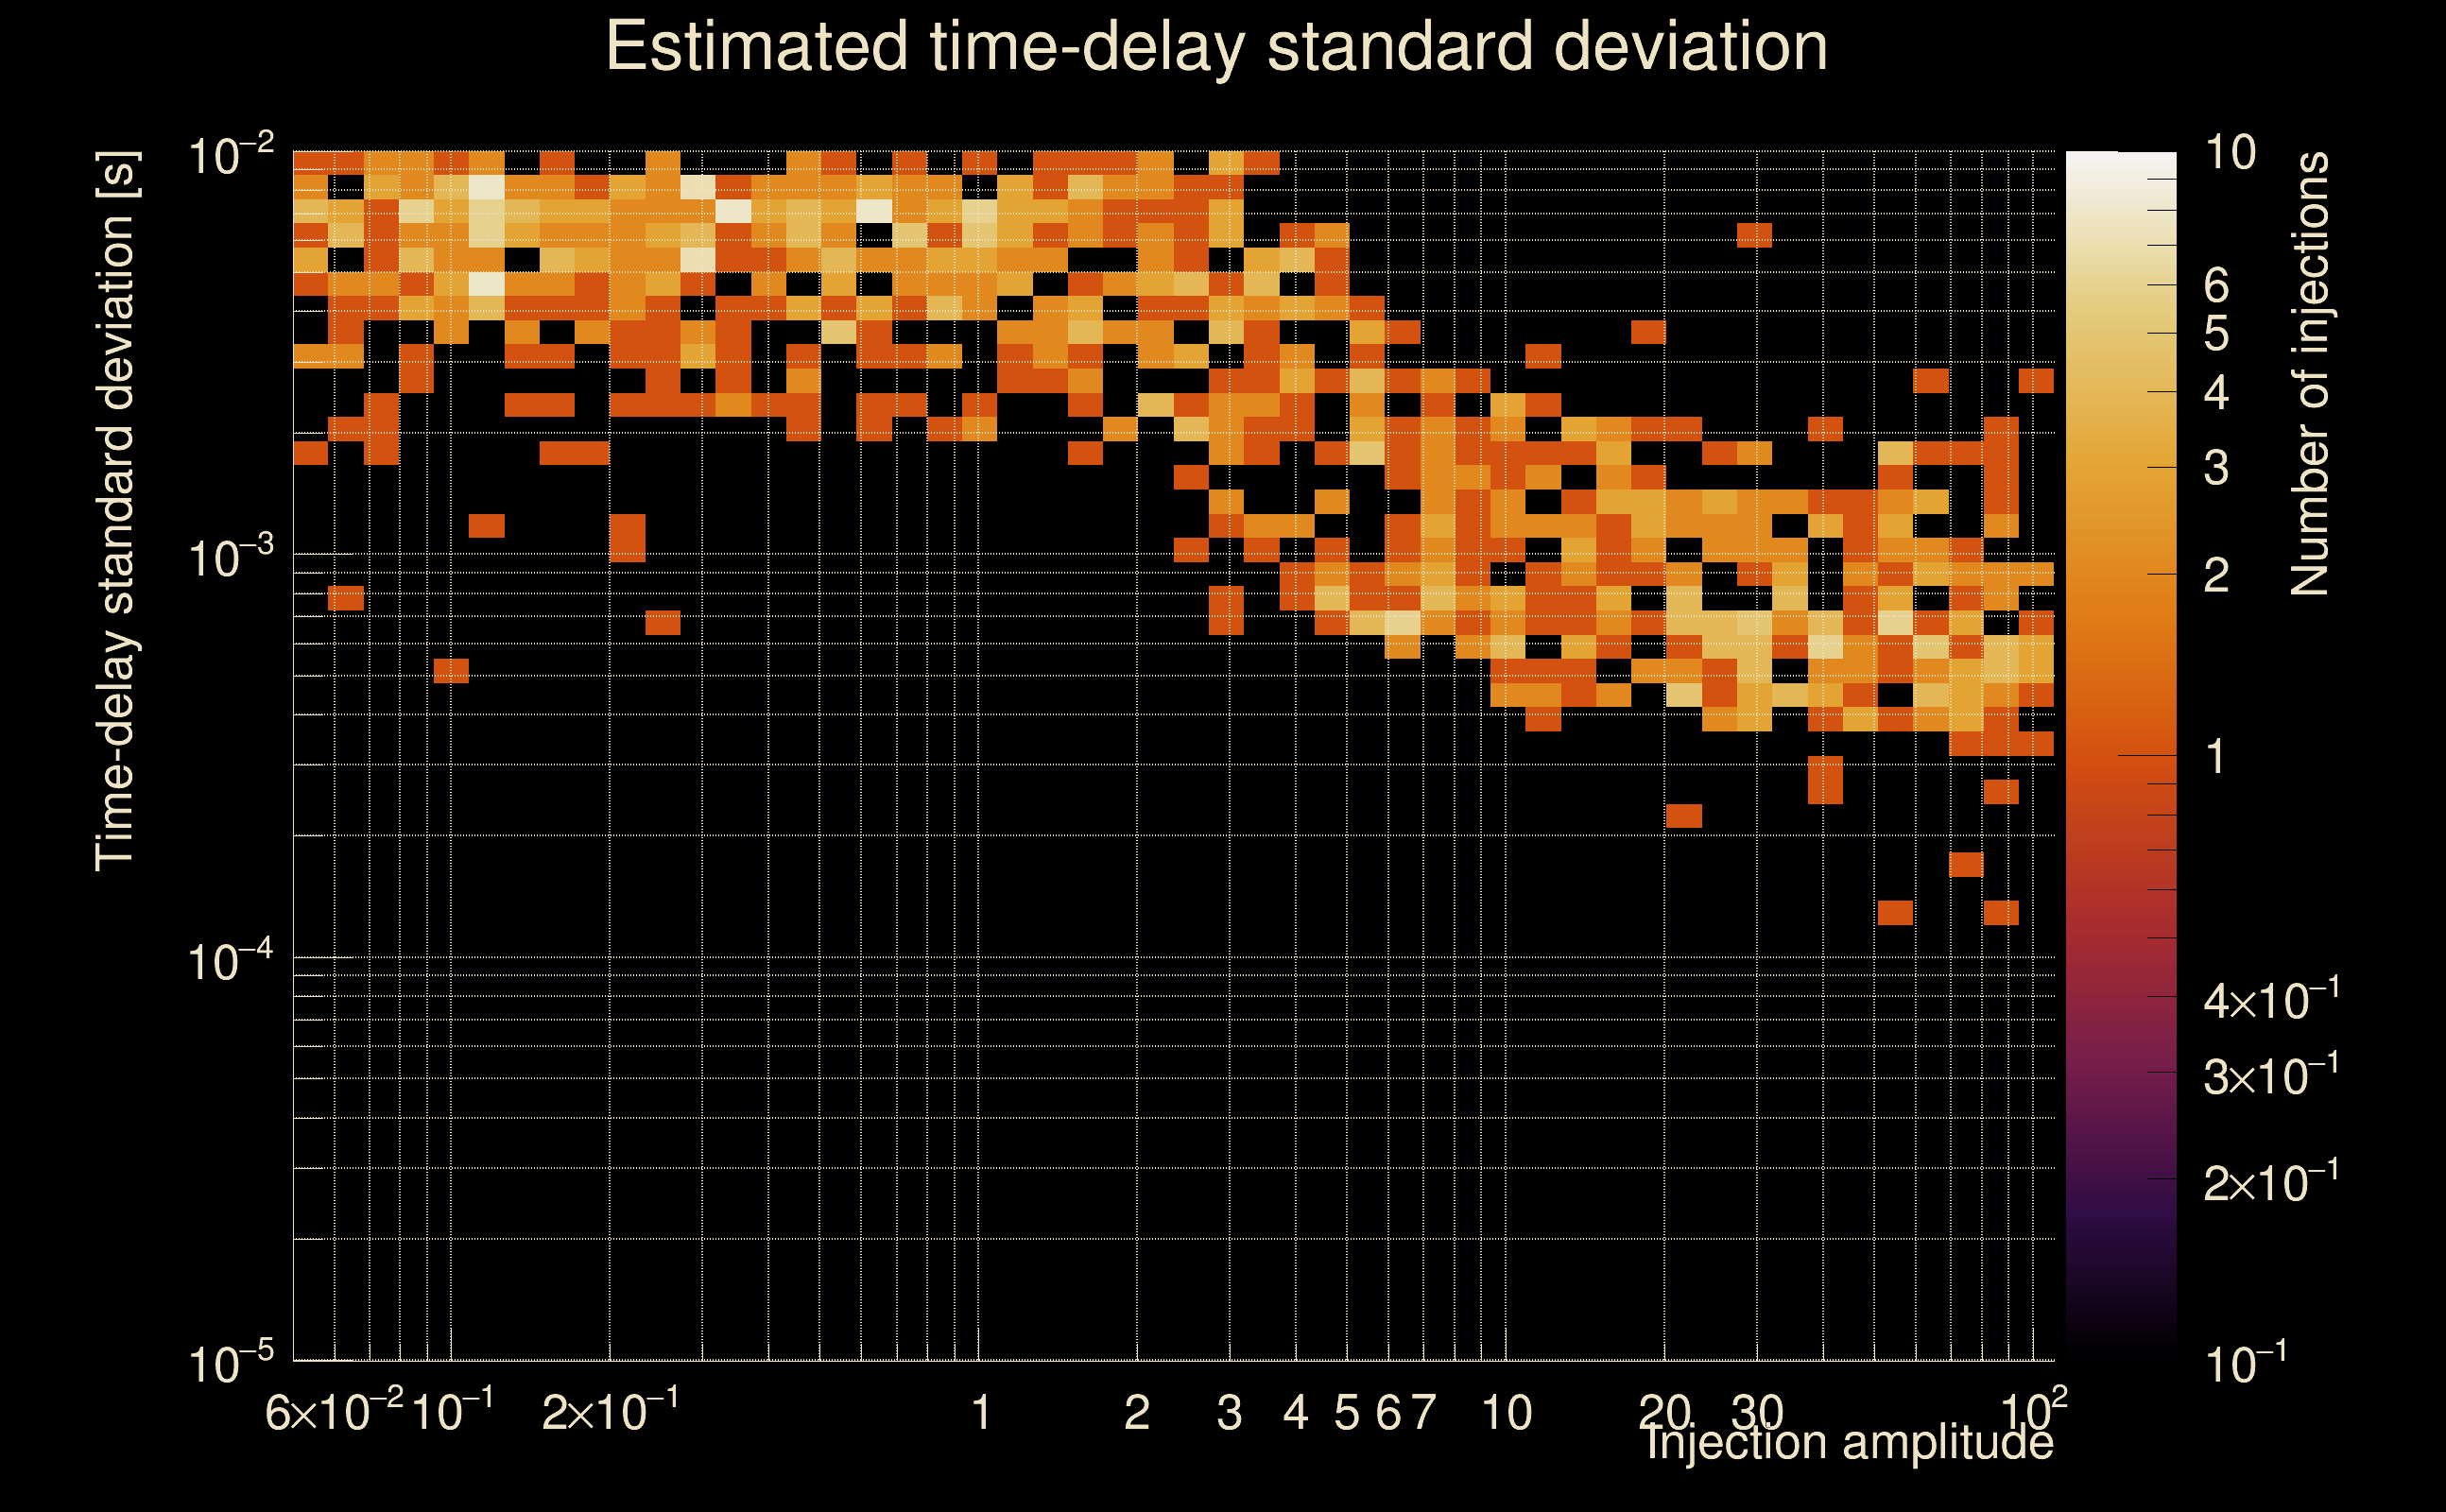
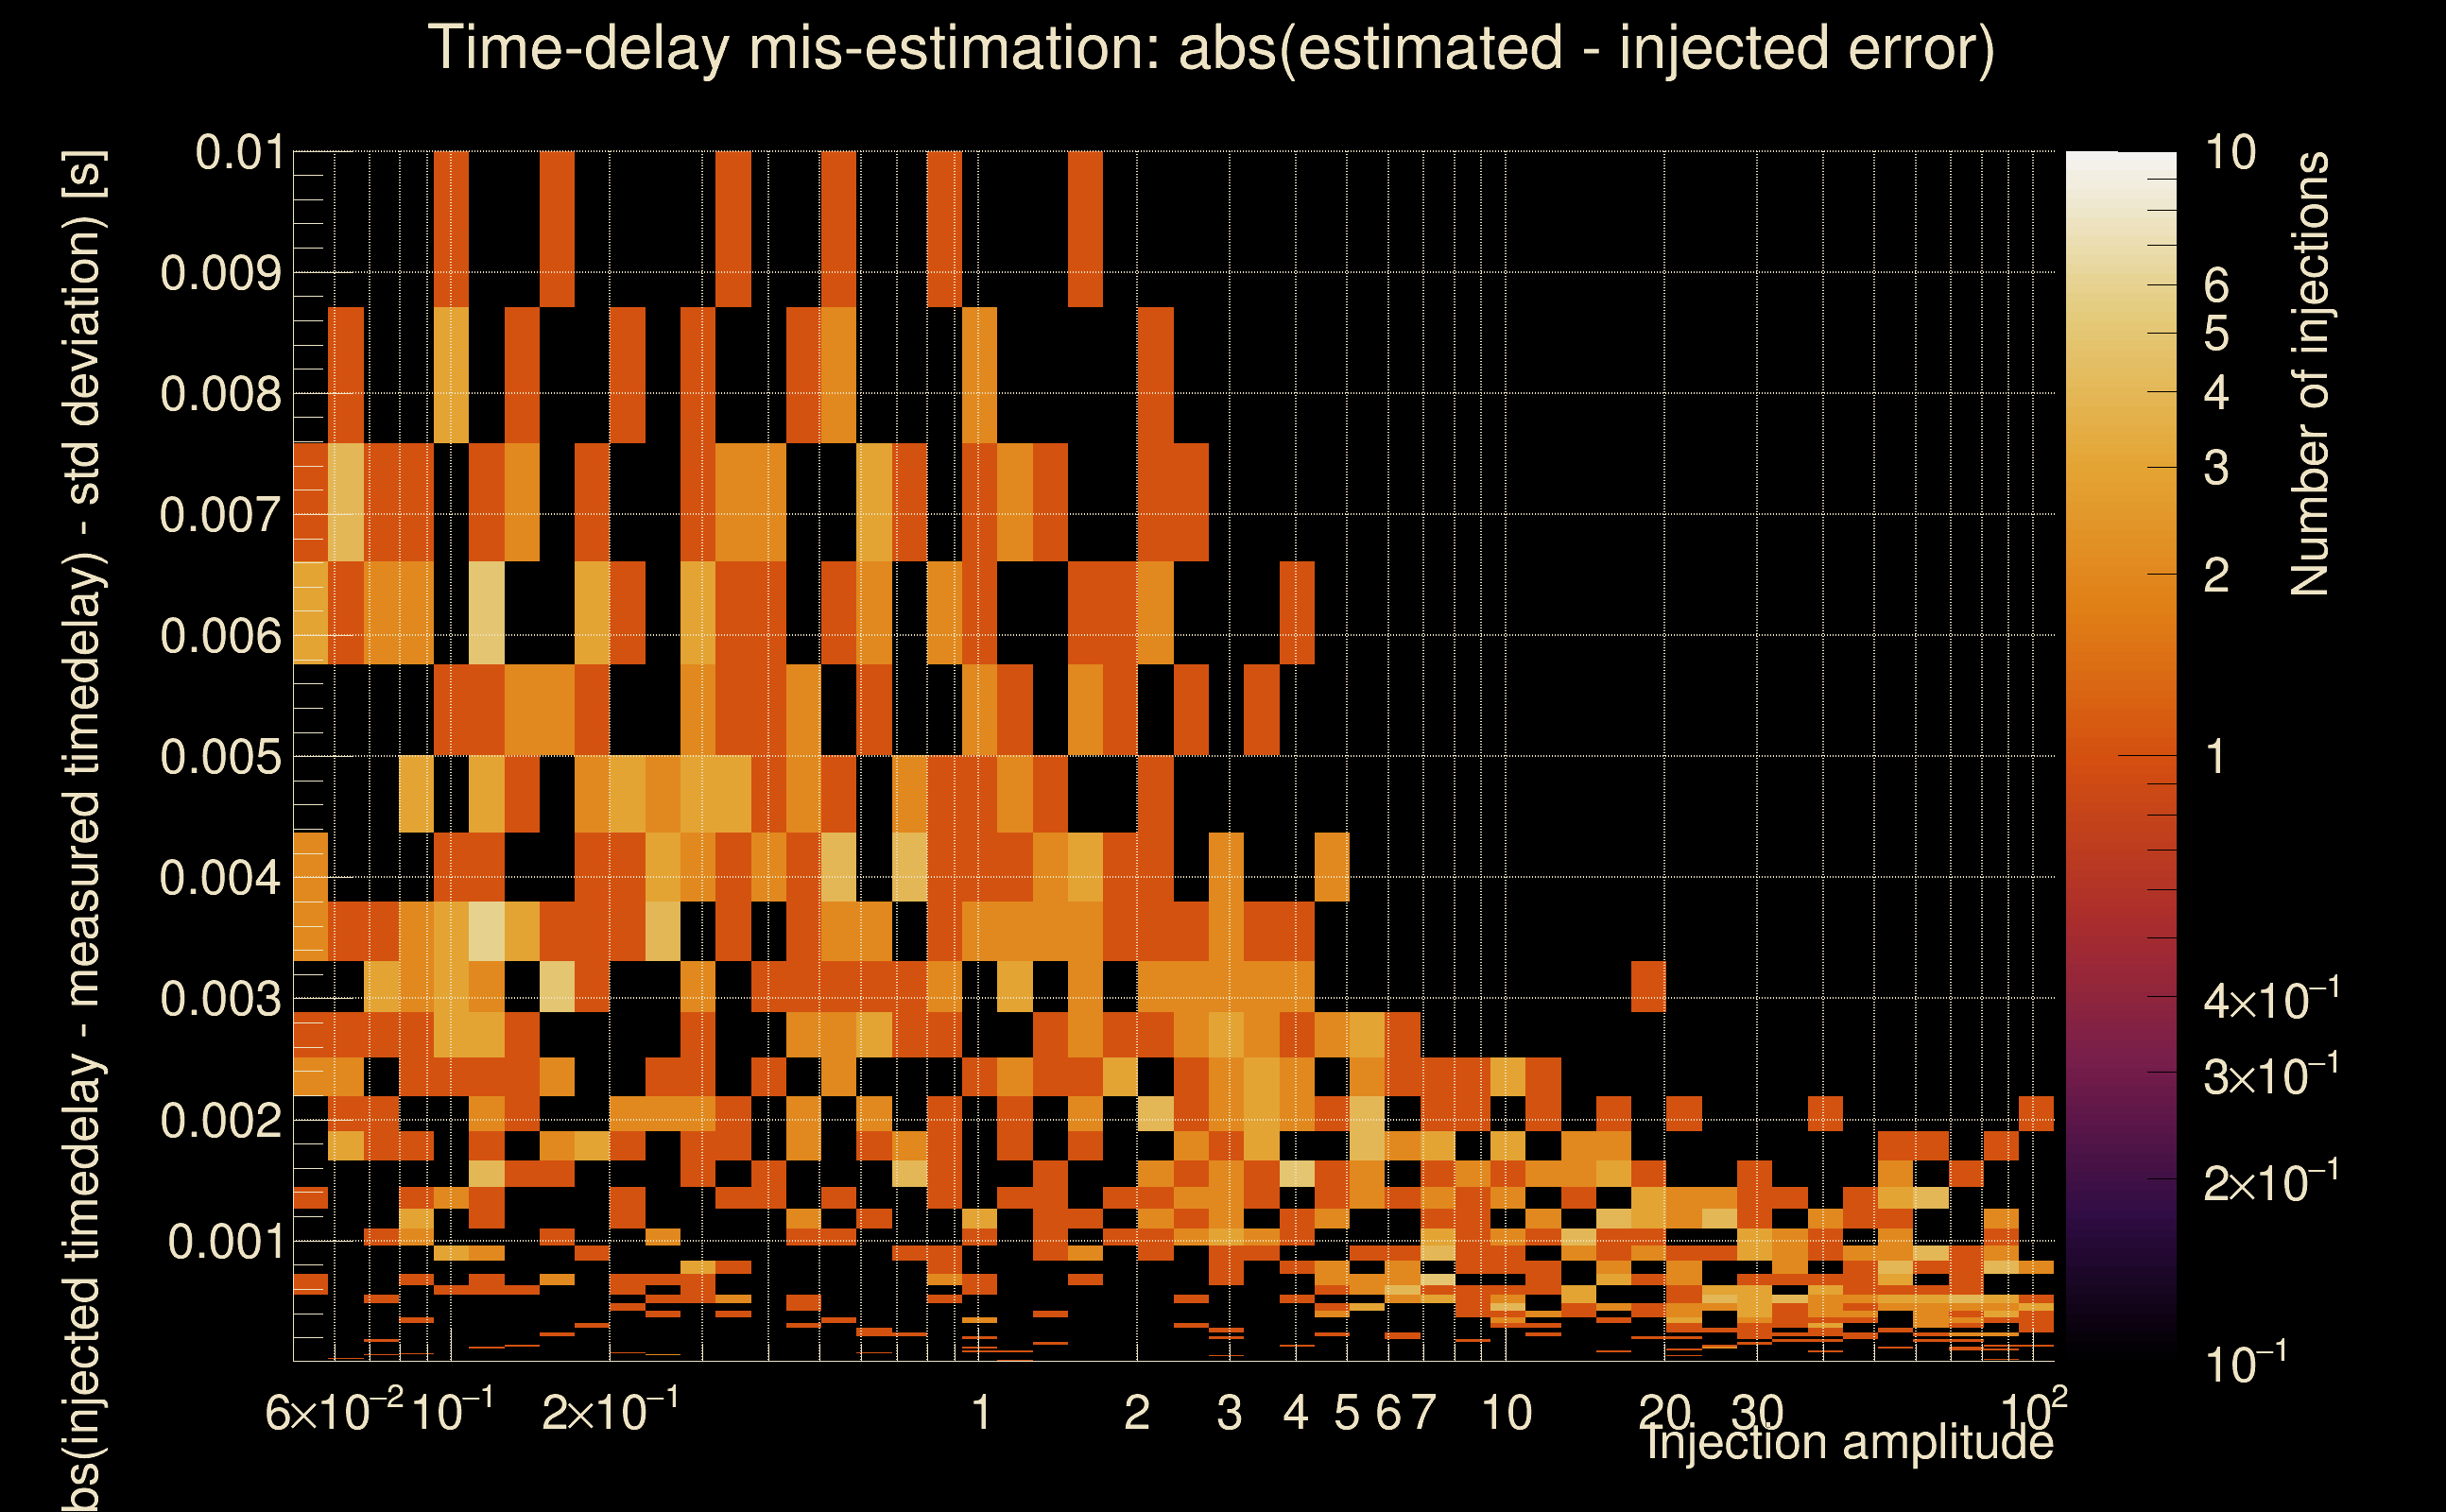
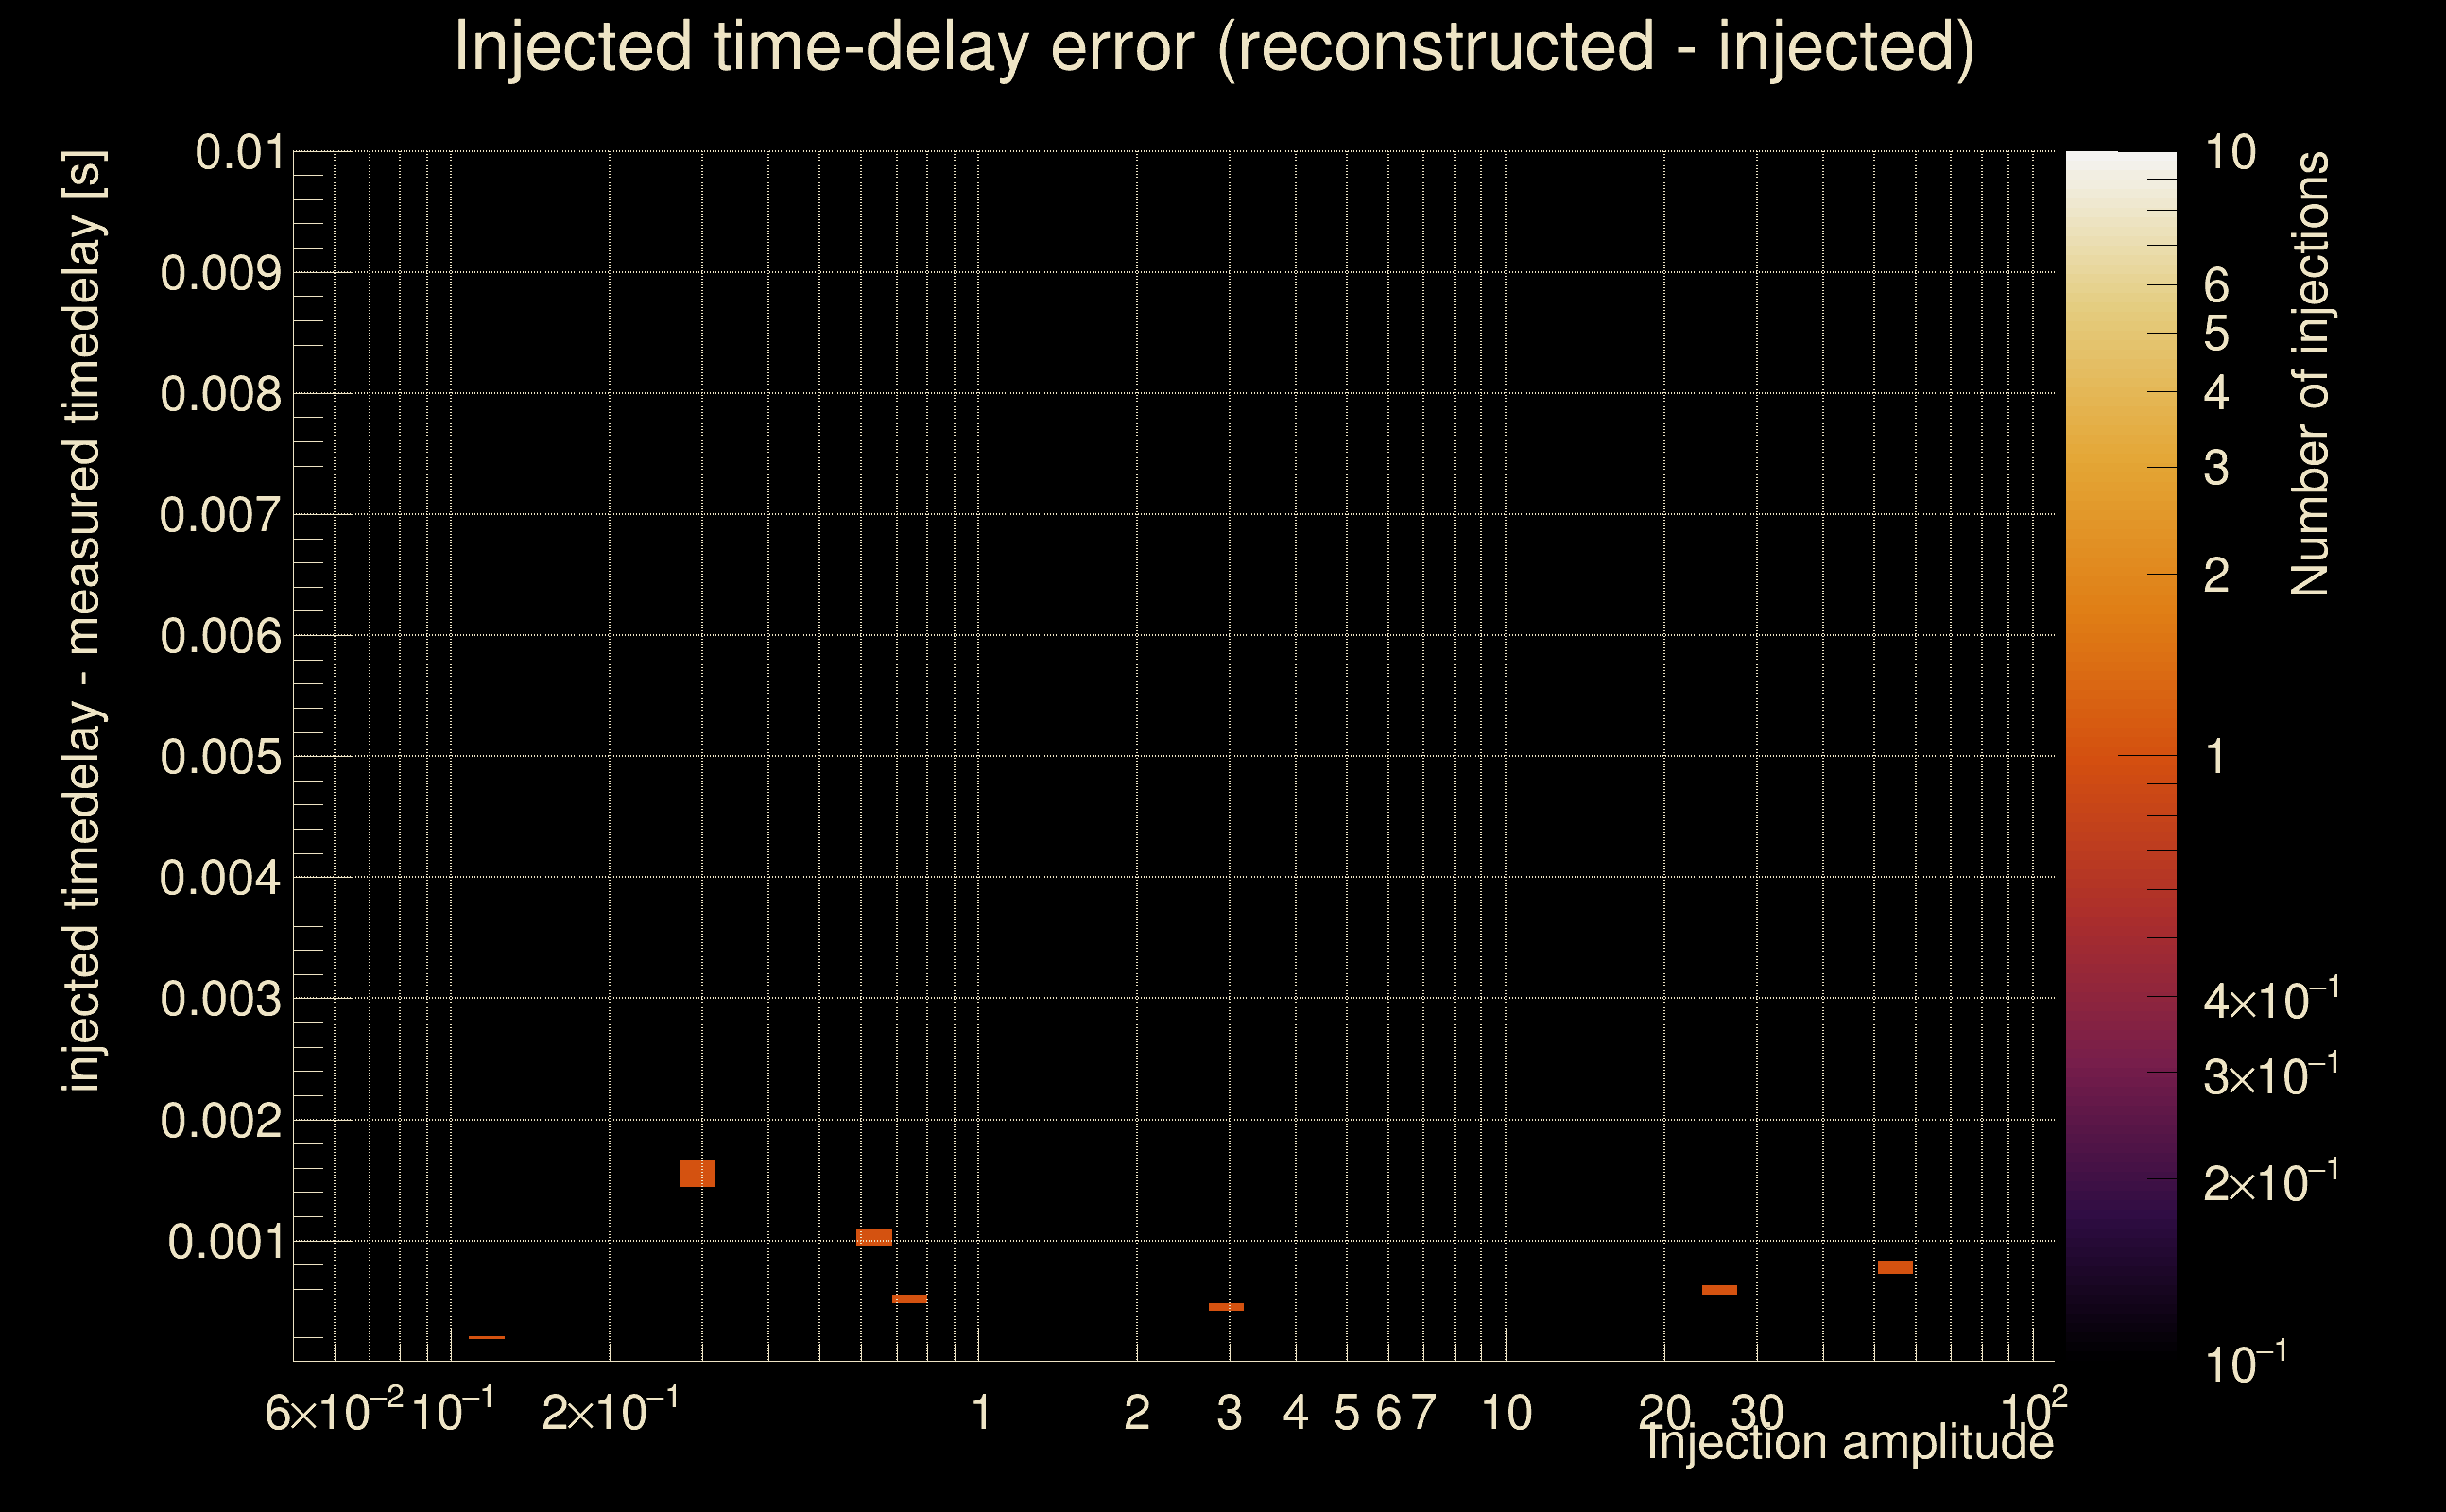
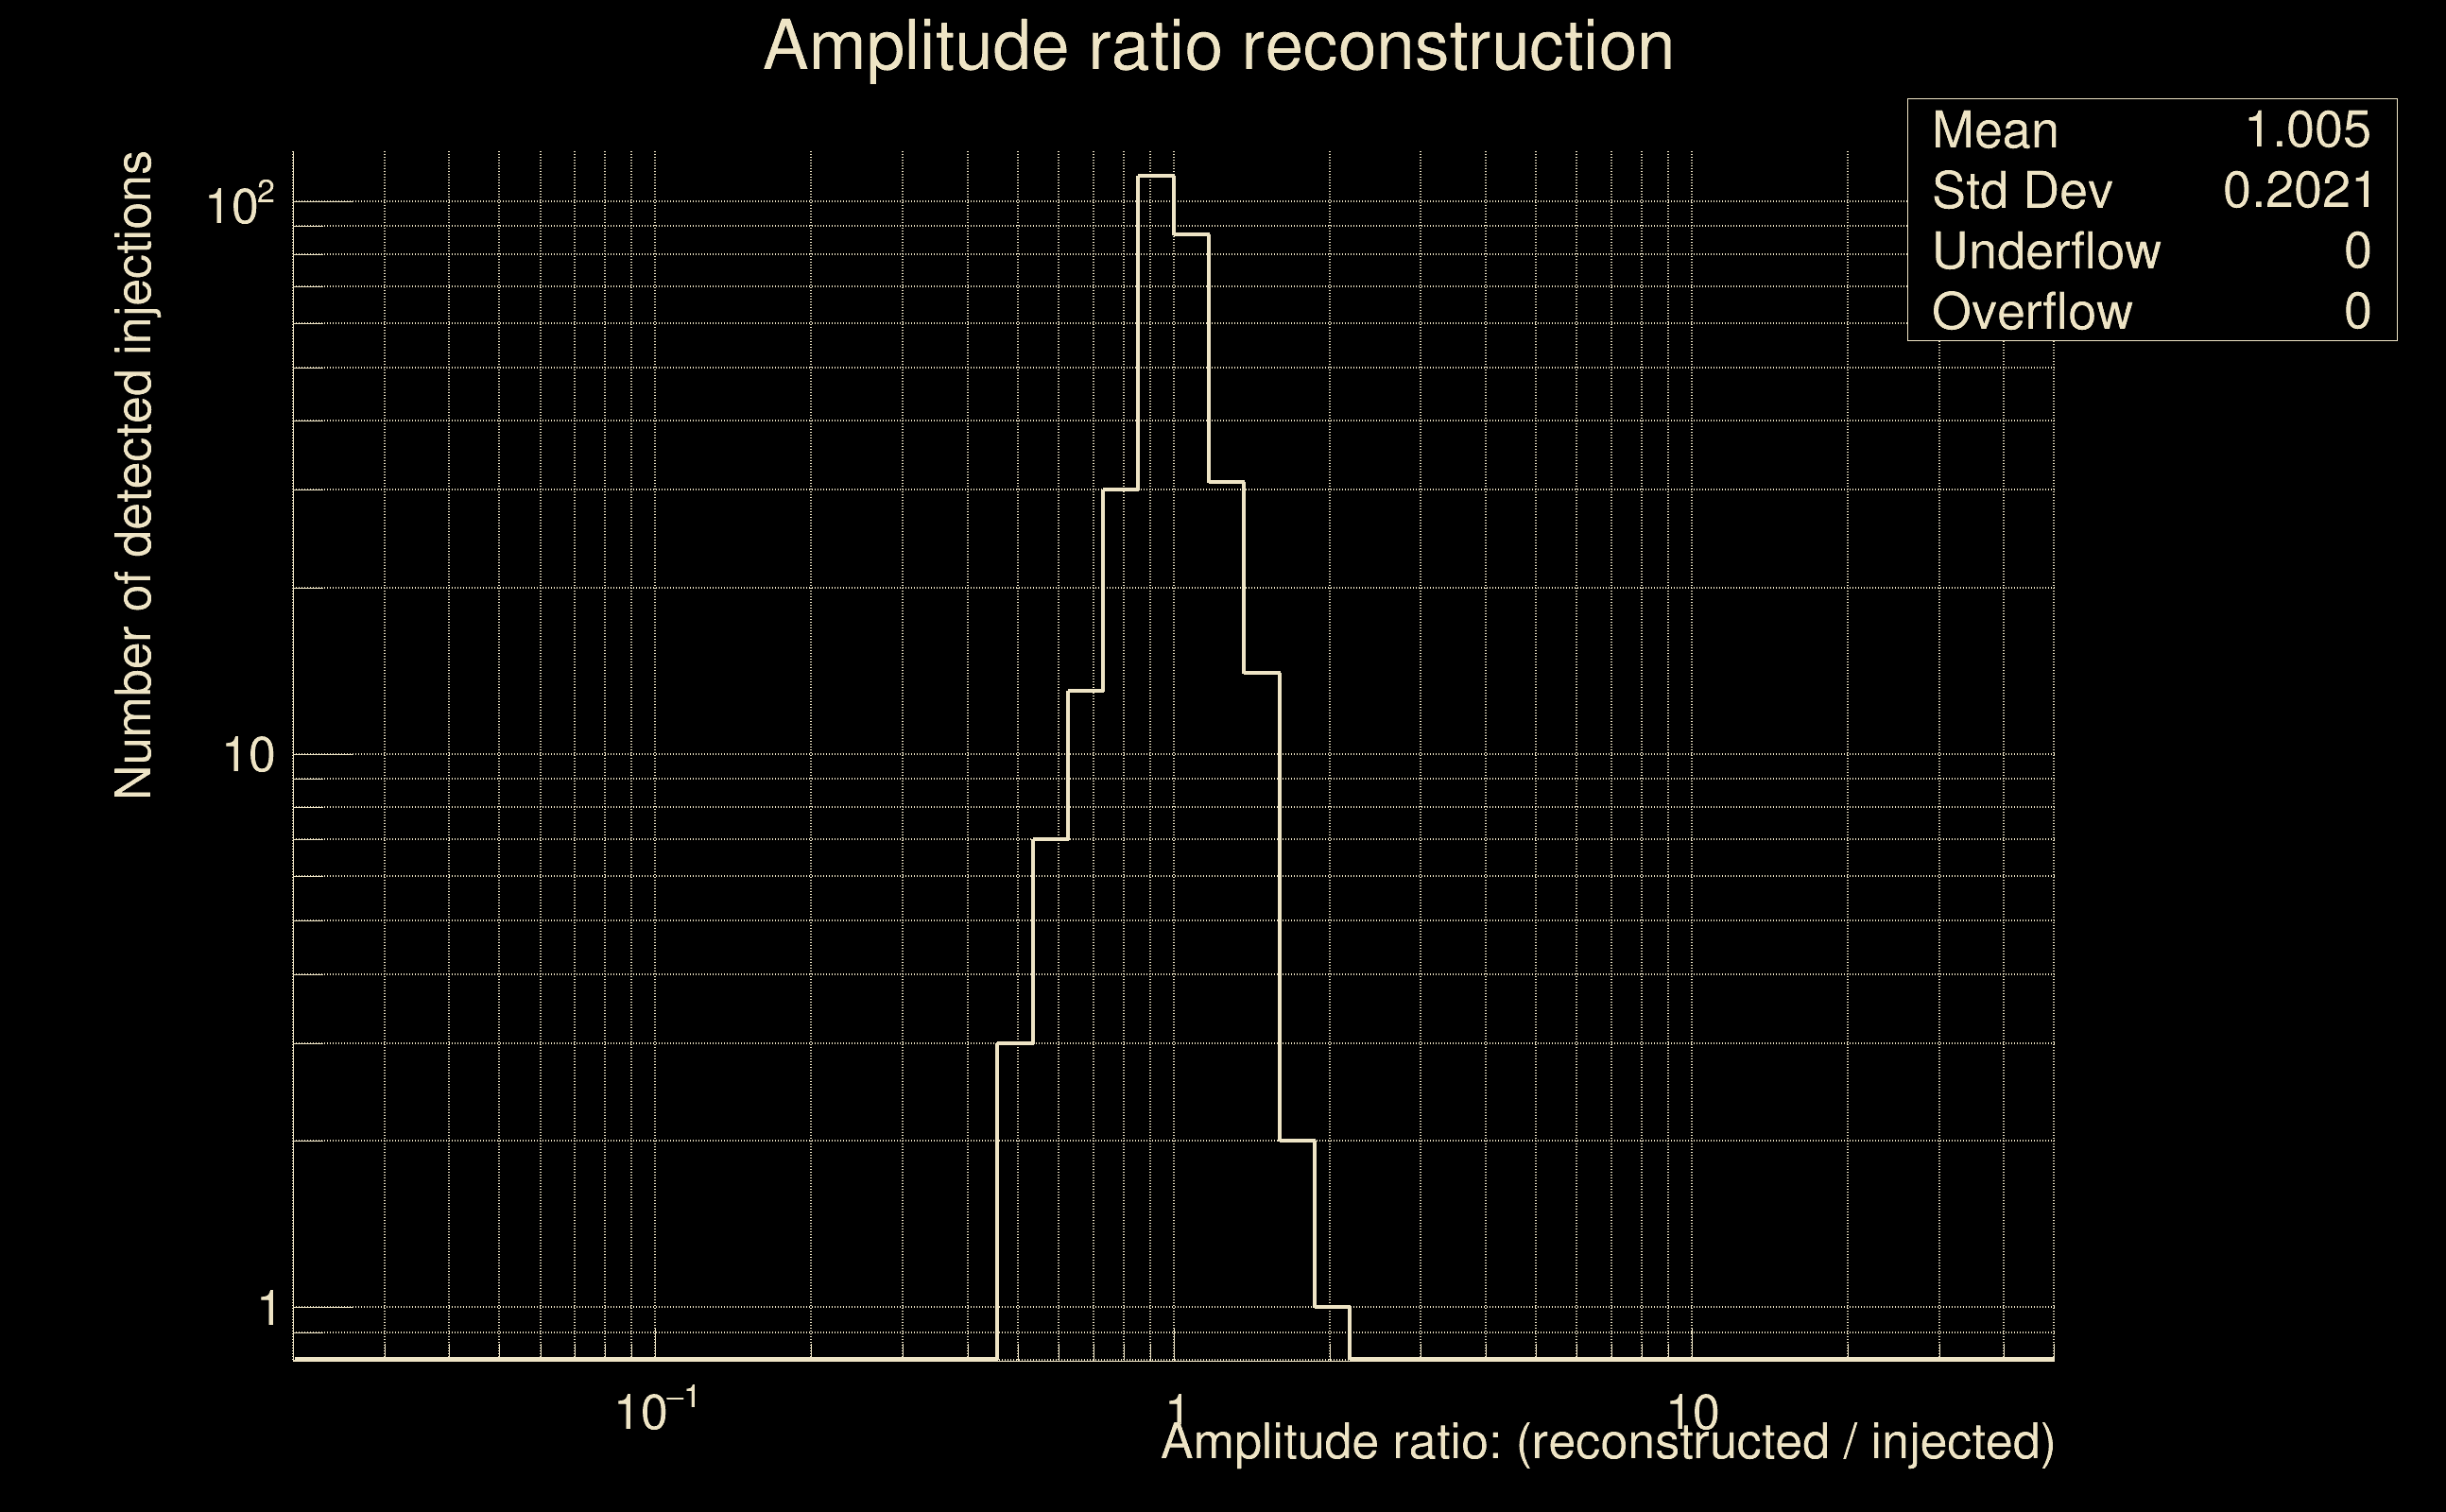
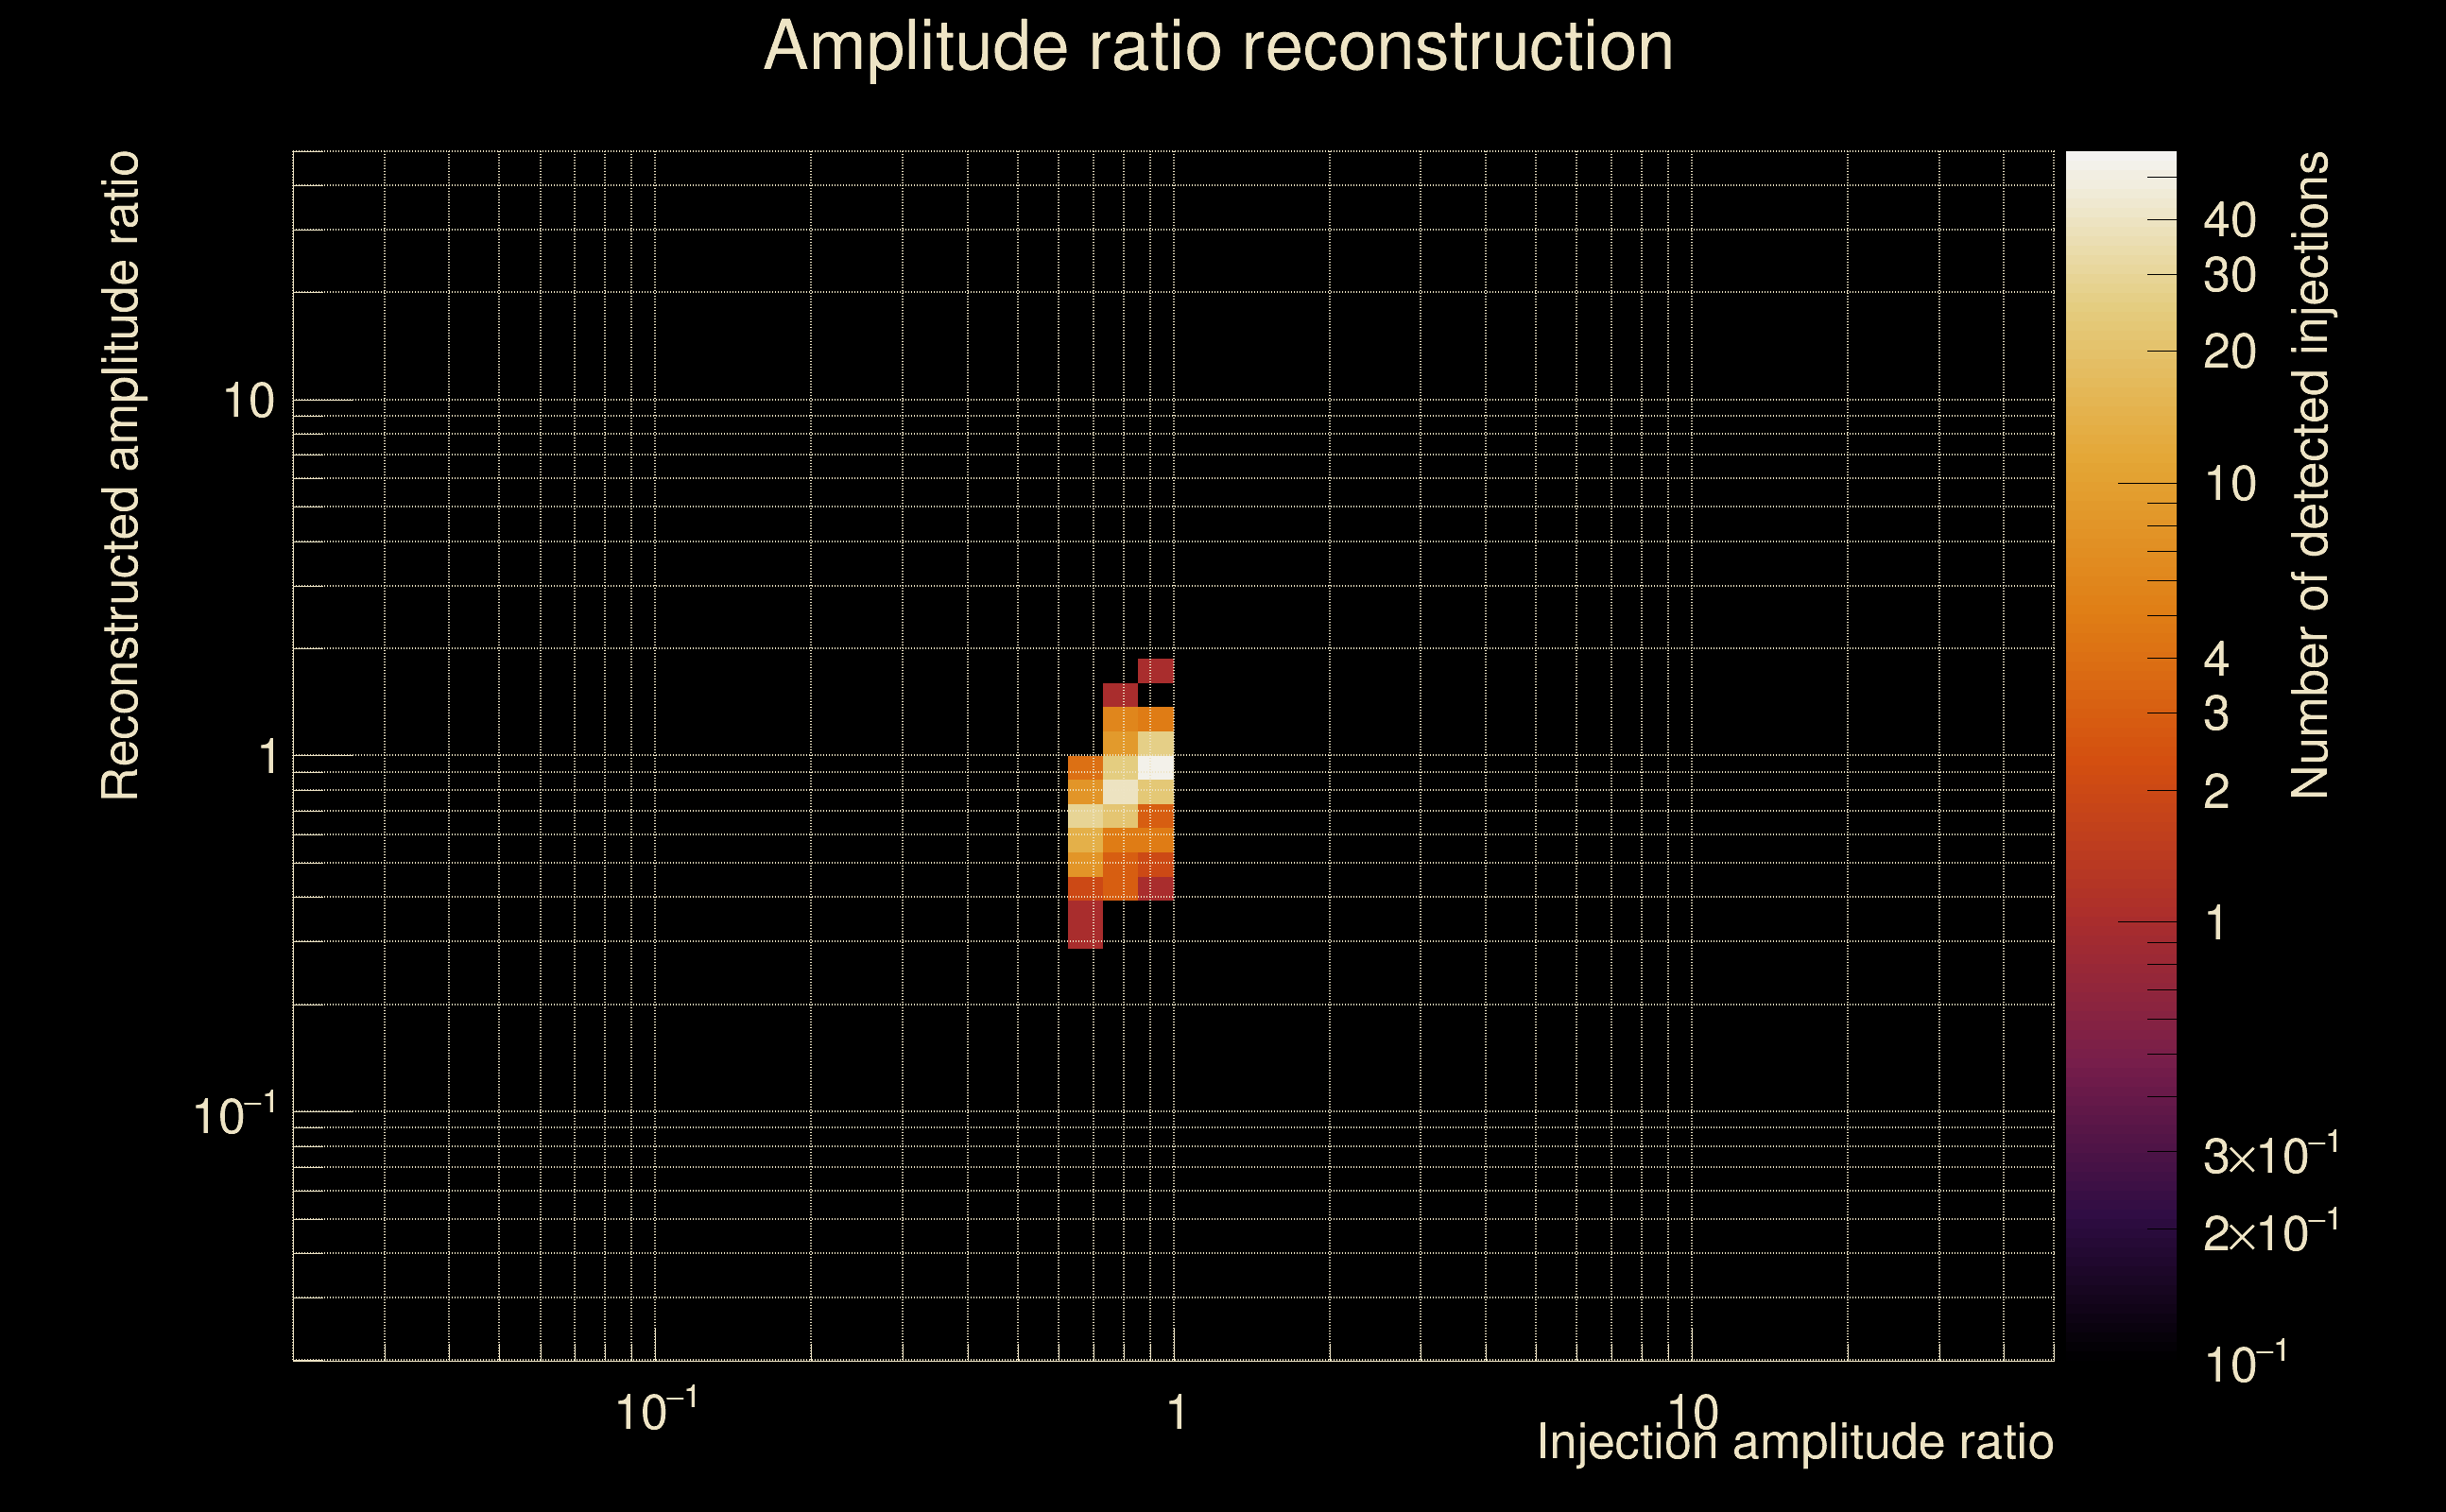
| Number of injections (total/valid/detected): | 1116 / 973 / 289 |
| List of missed injections: | ./Rad19-s13_missed.txt |
| Injection amplitude at 90% detection efficiency: | 8.38525 |
| Injection amplitude at 50% detection efficiency: | 4.63244 |
| Injection amplitude at 10% detection efficiency: | 3.62857 |
 |
 |
 |
 |
 |
 |
 |
|
 |
 |
|
 |
 |
|
 |
 |
|
 |
 |
|
 |
 |
|
 |
 |
|
 |
 |
|
 |
 |
 |
 |
 |
 |
 |
 |
 |
 |
 |
 |
 |
 |
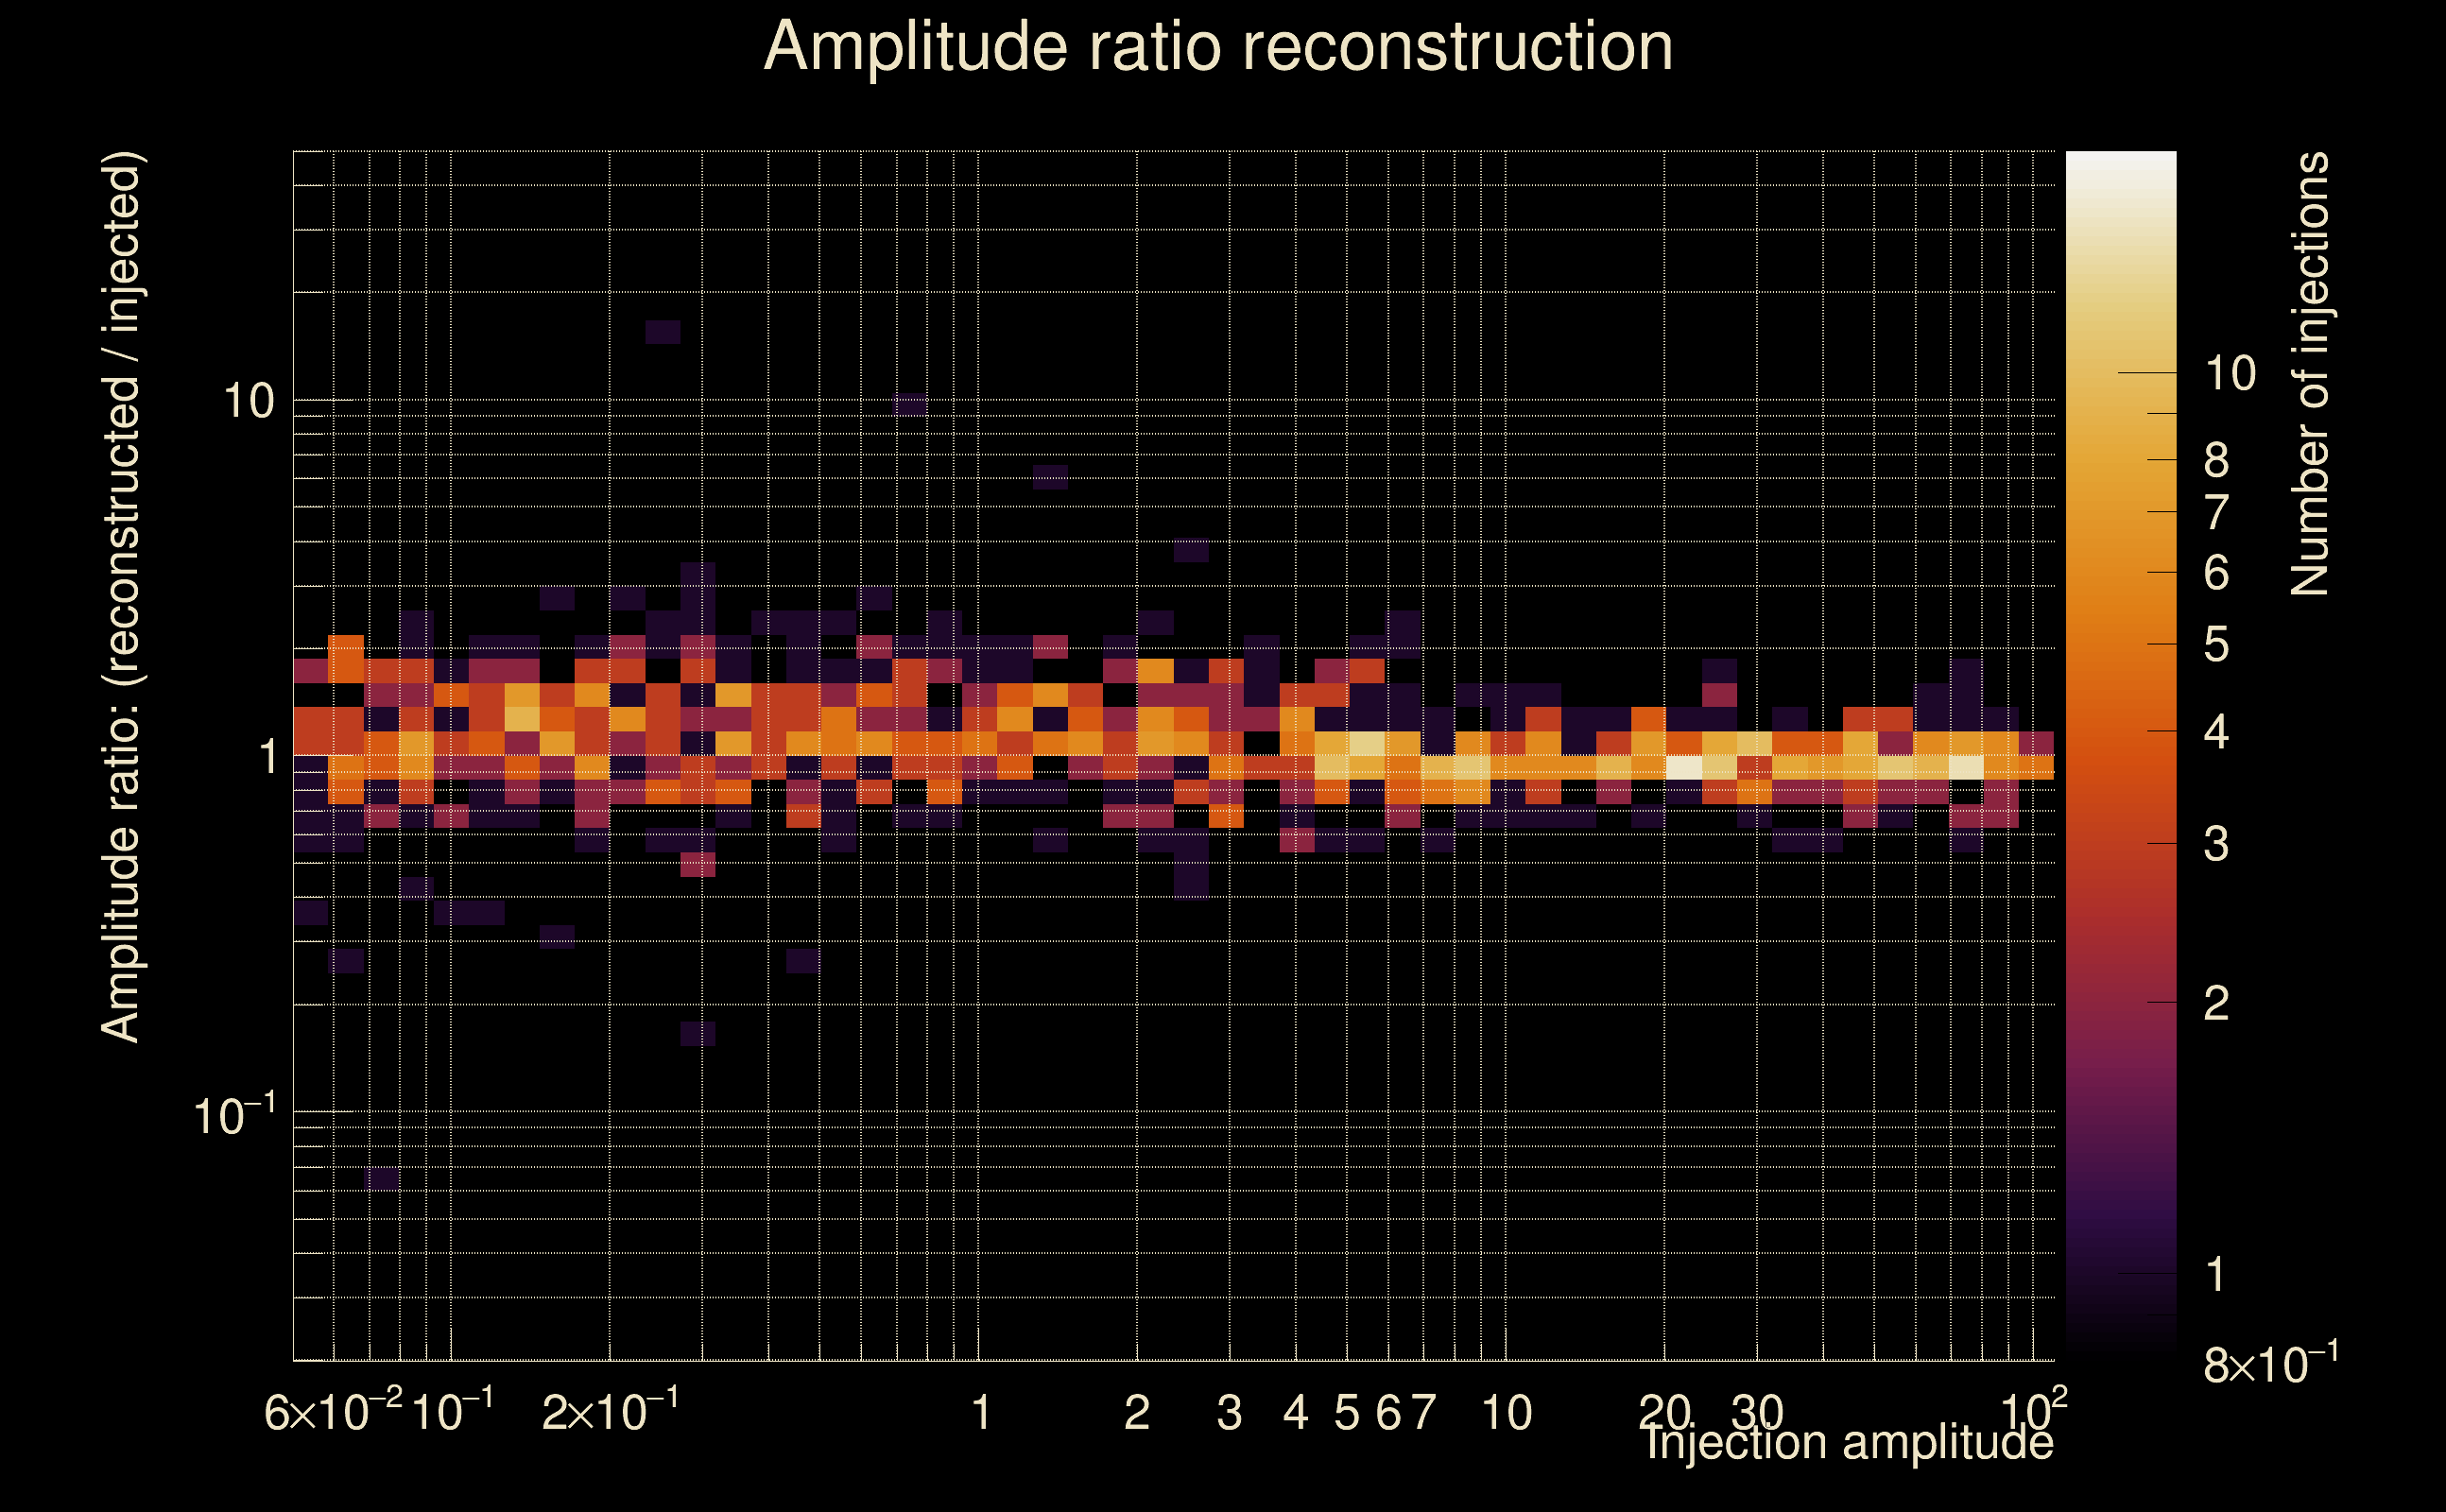 |
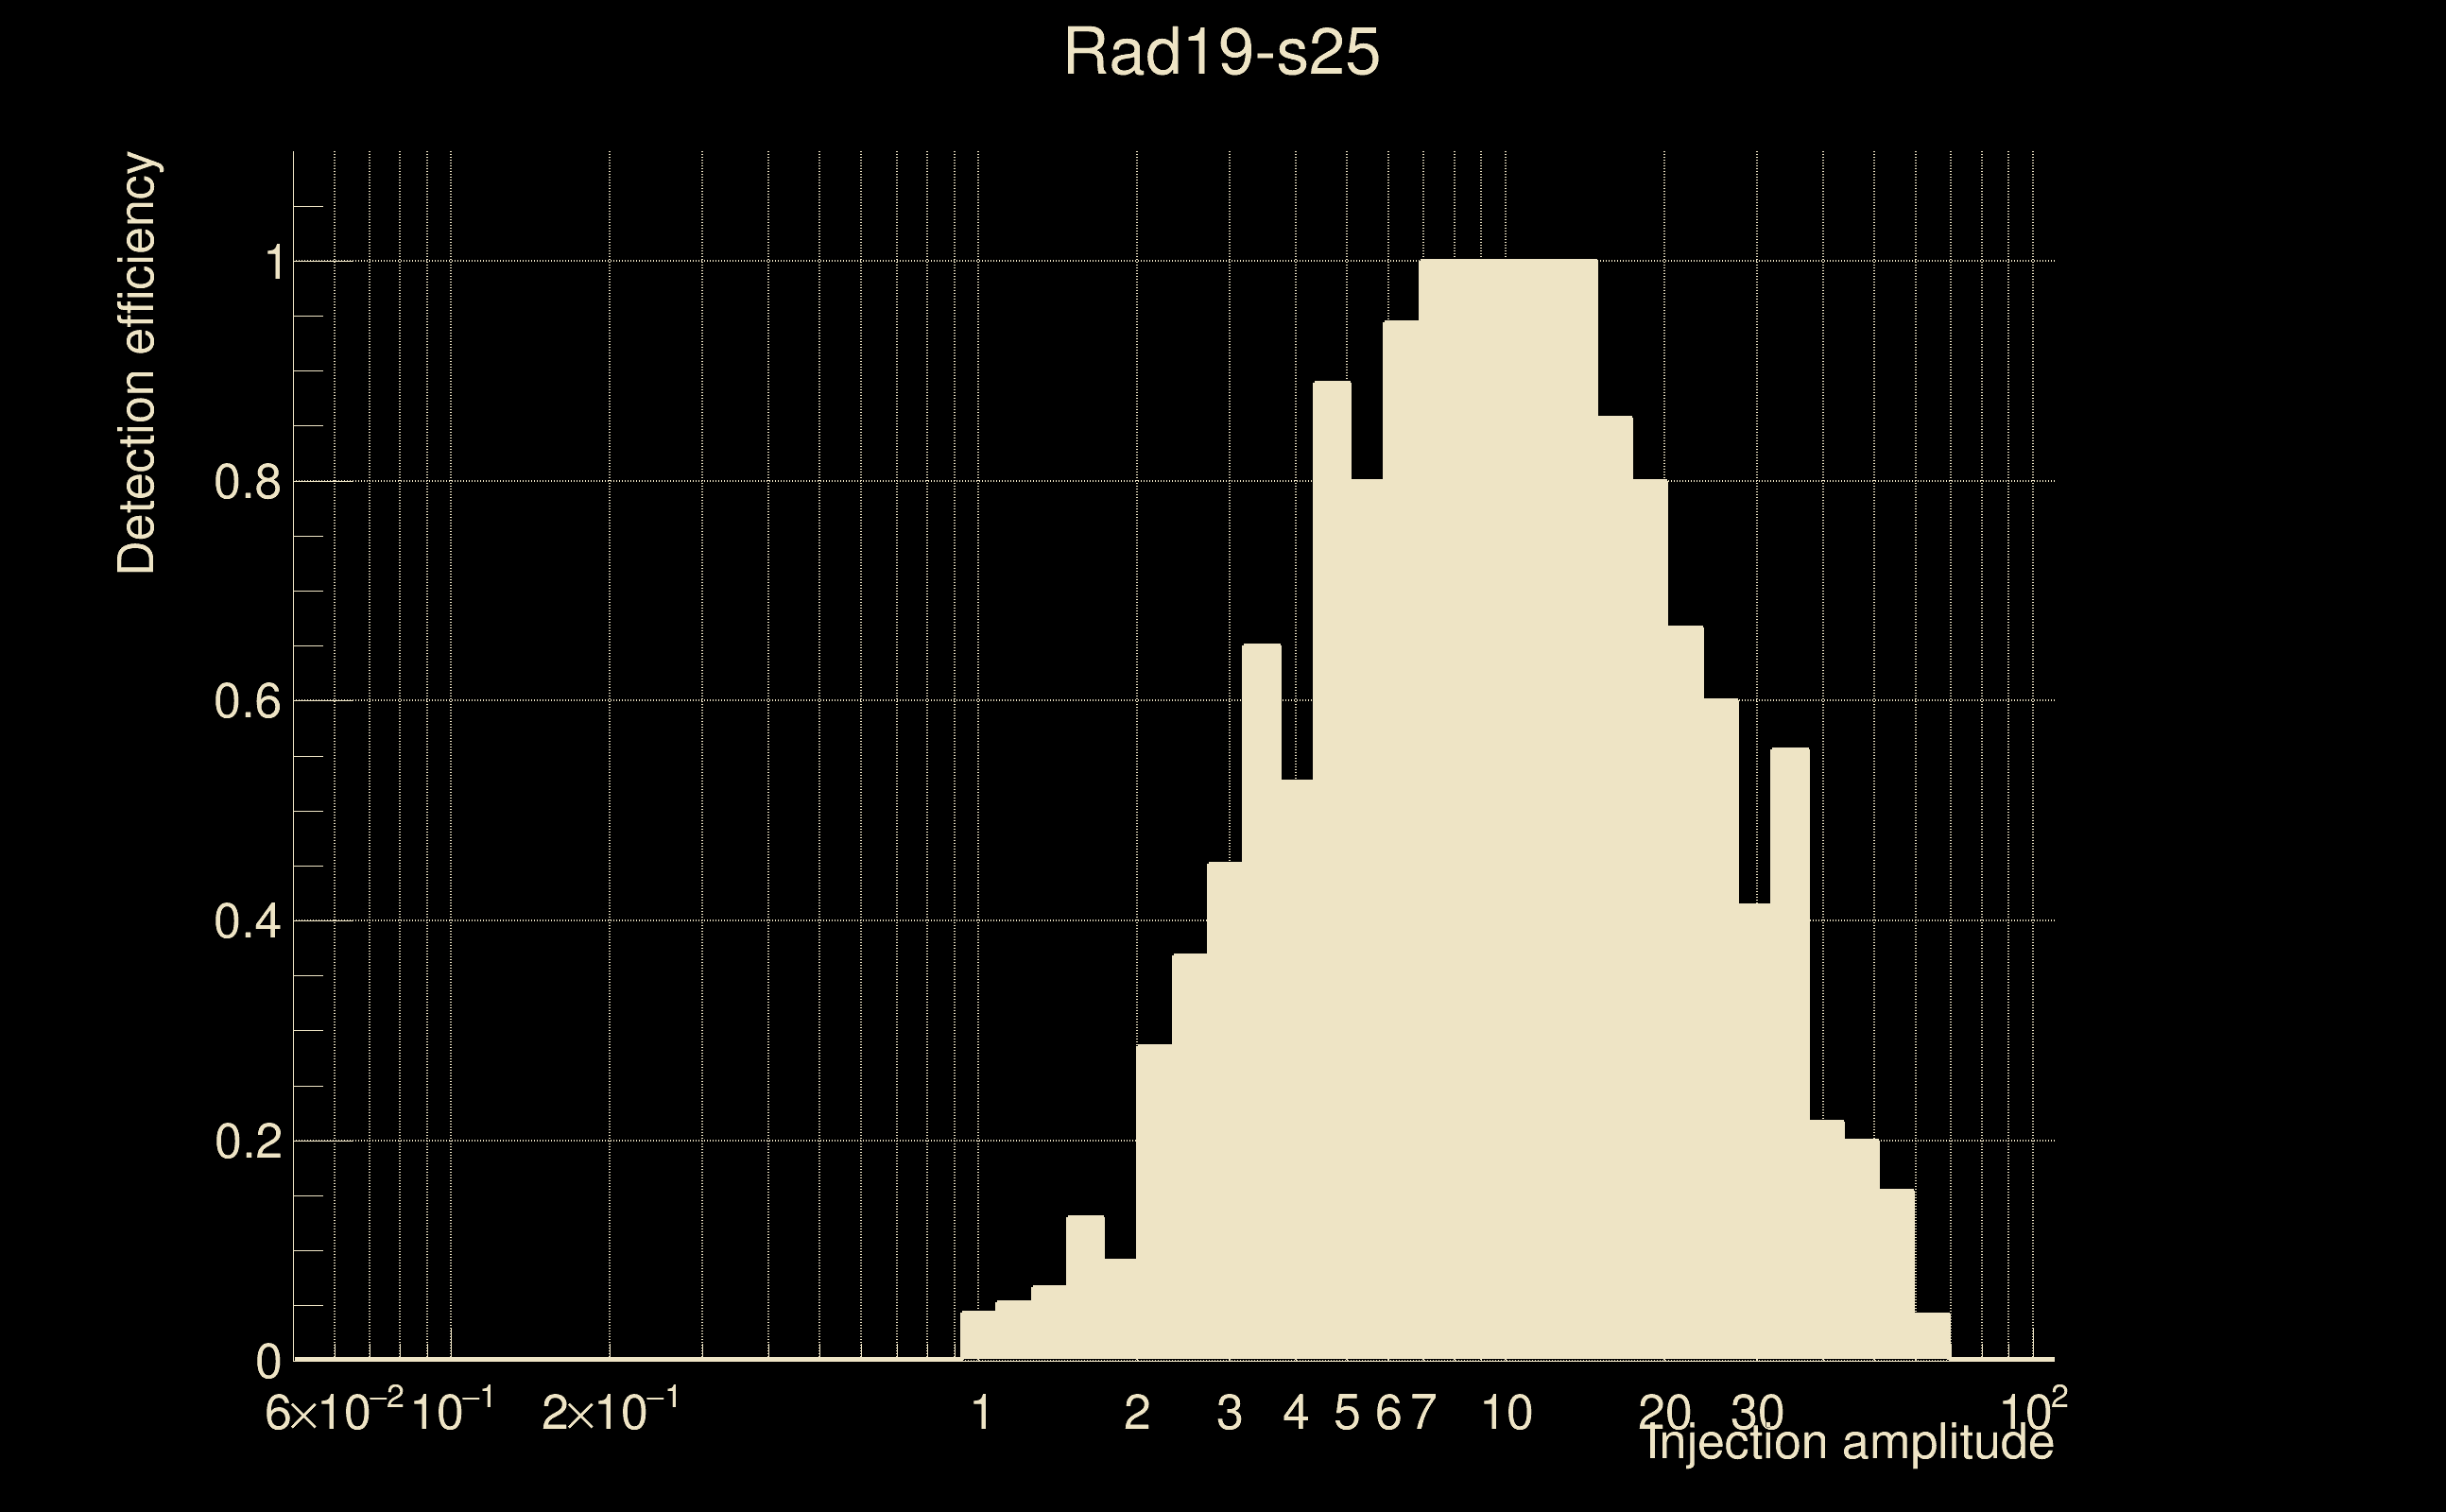
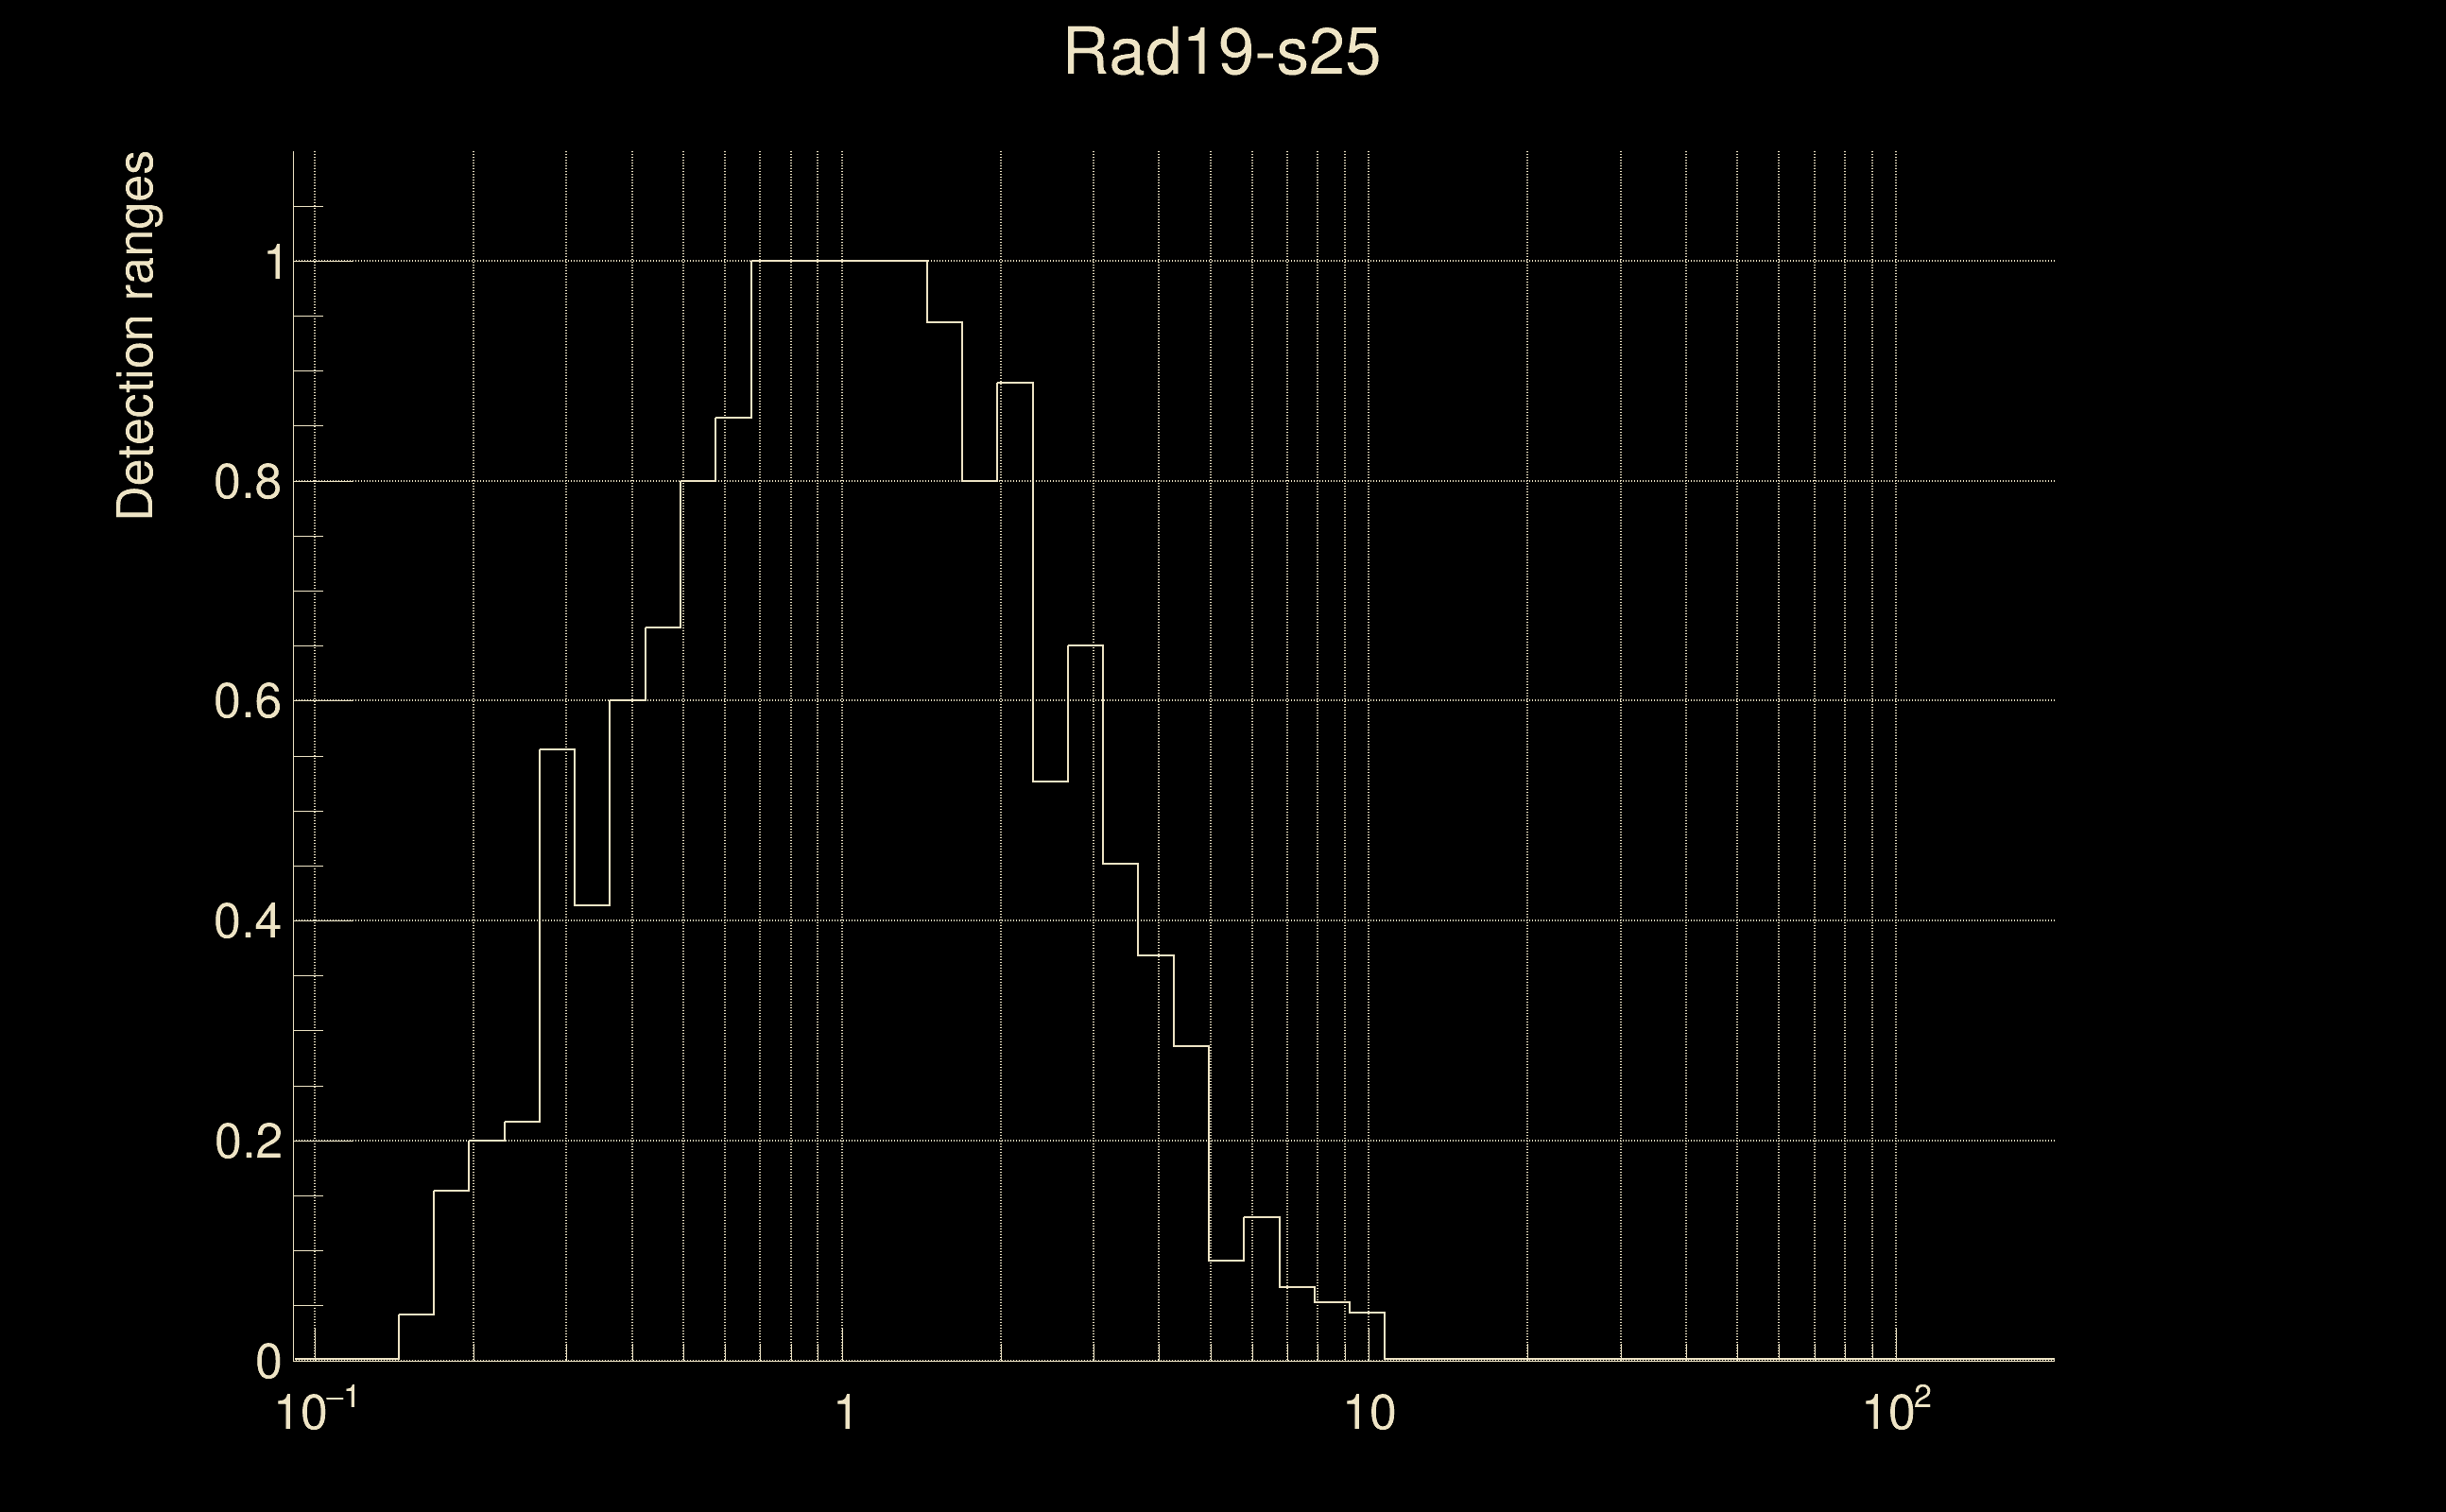
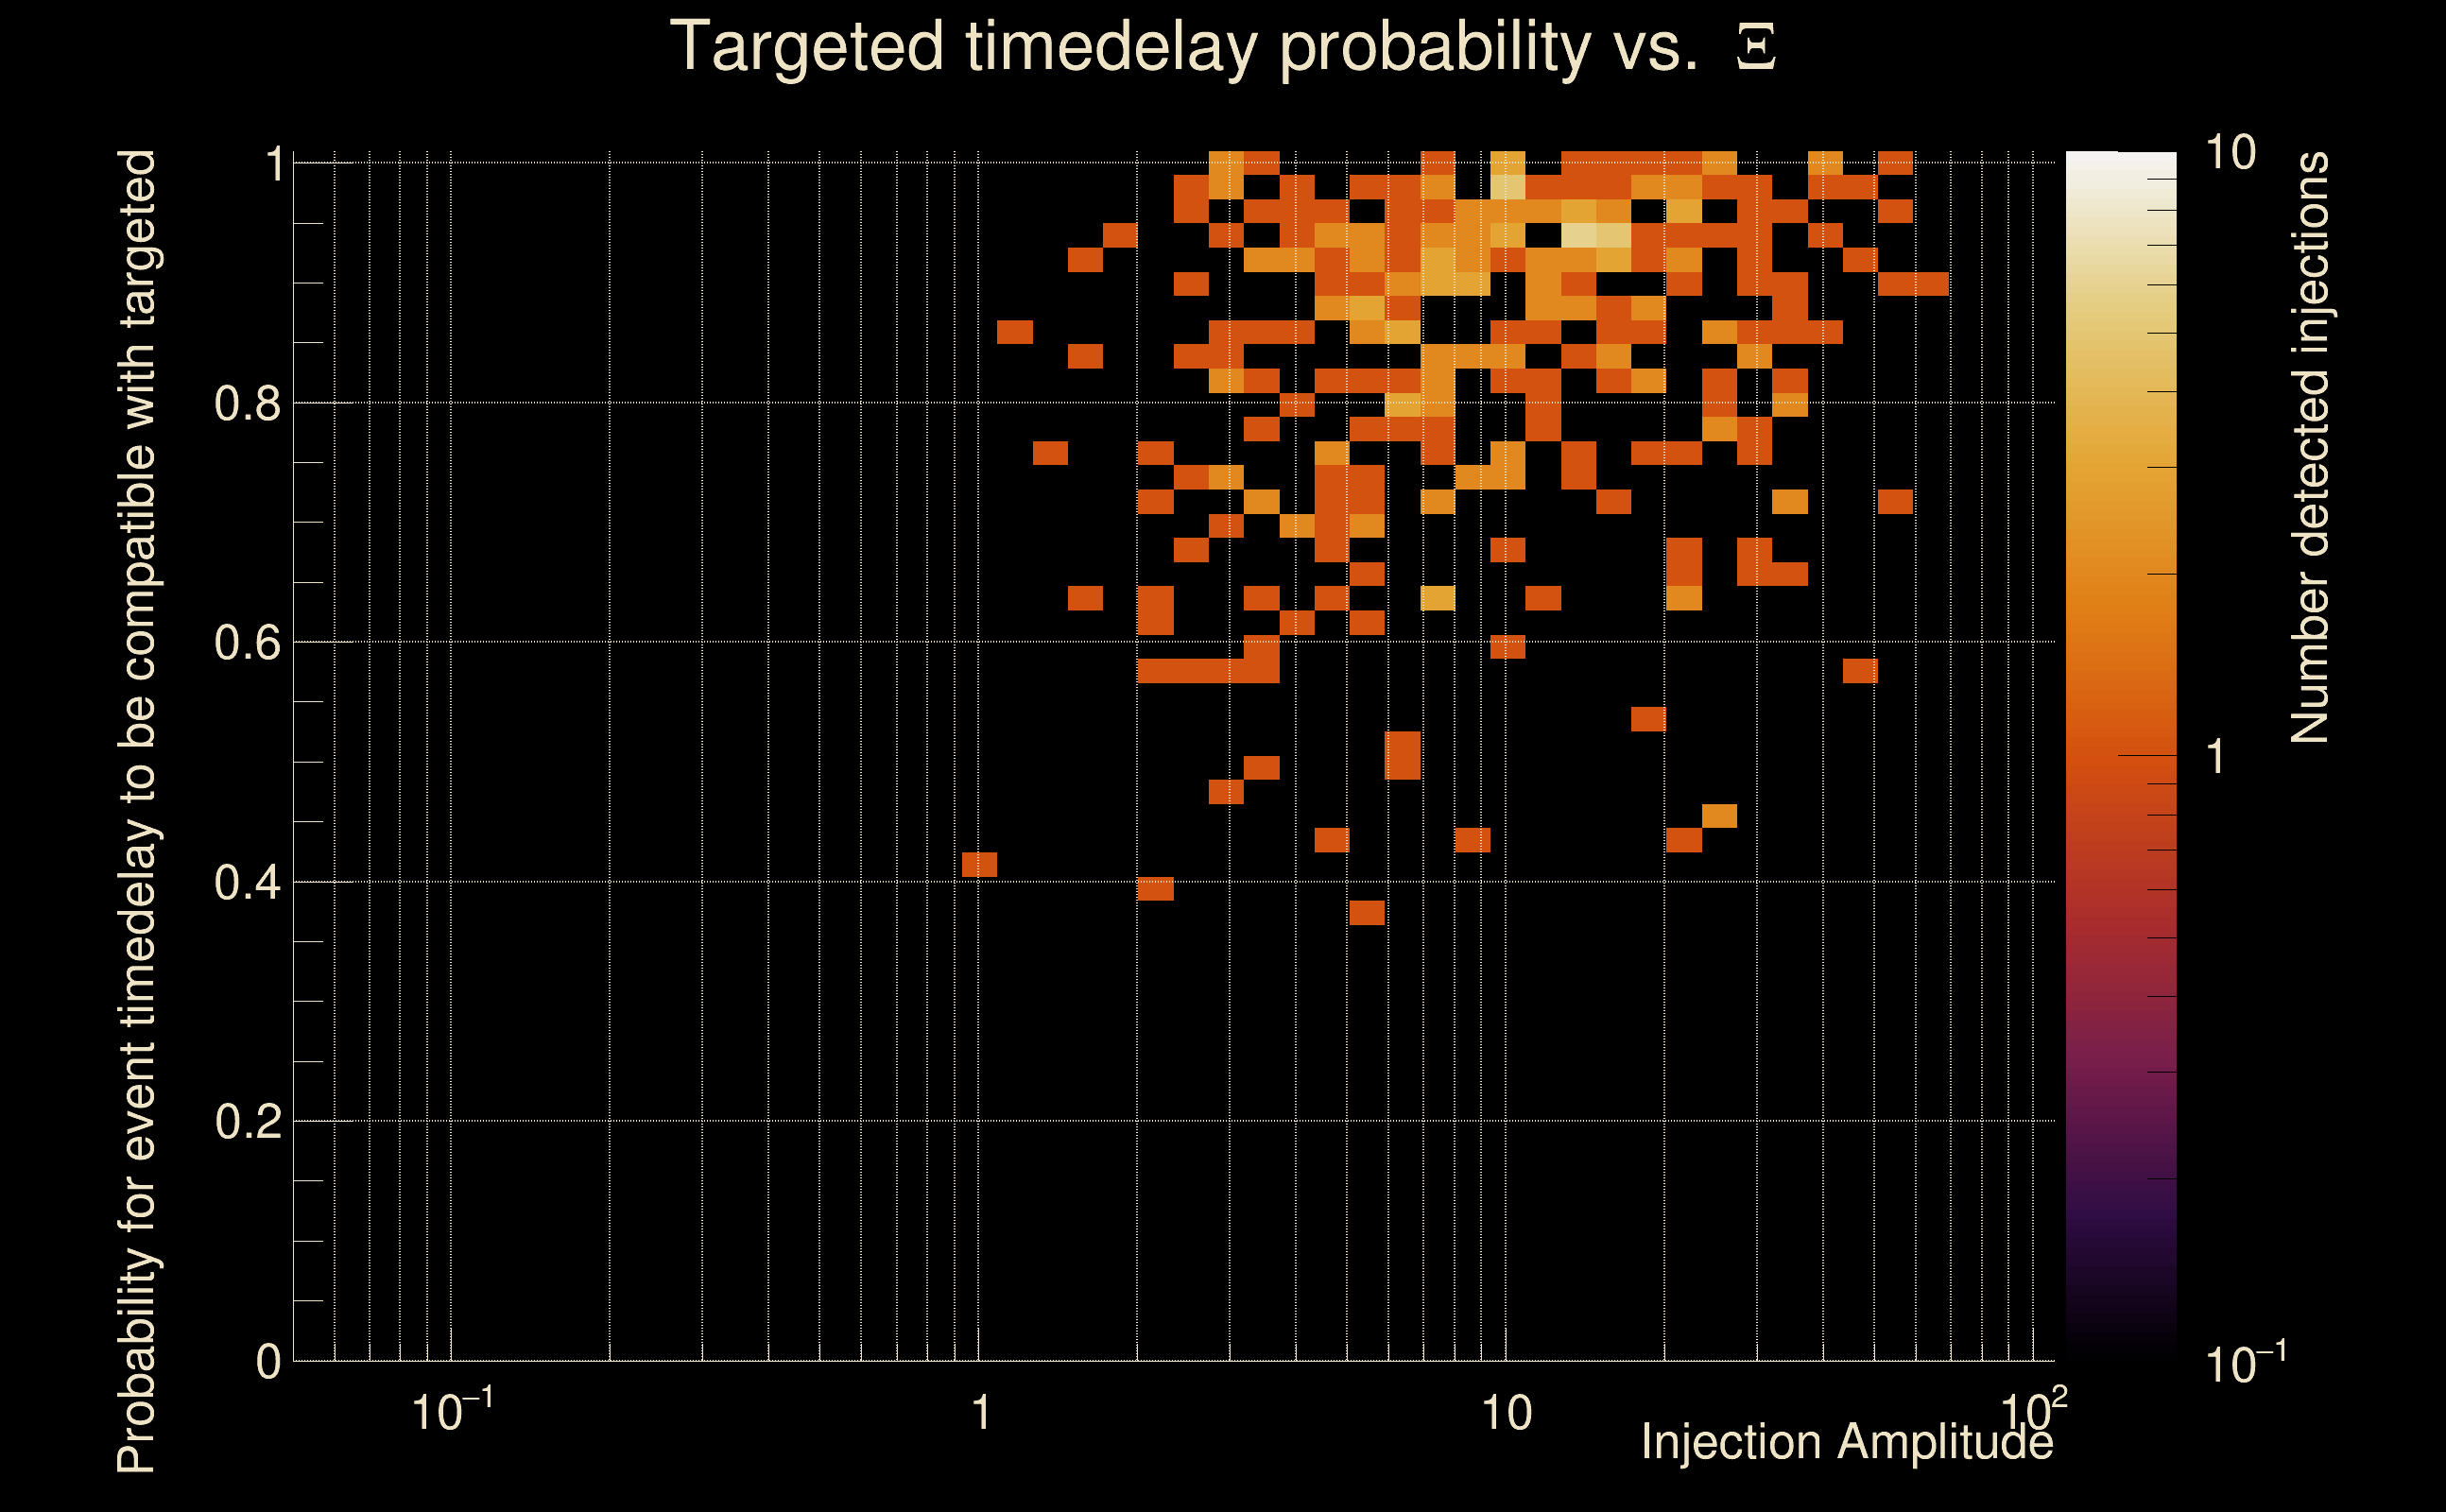
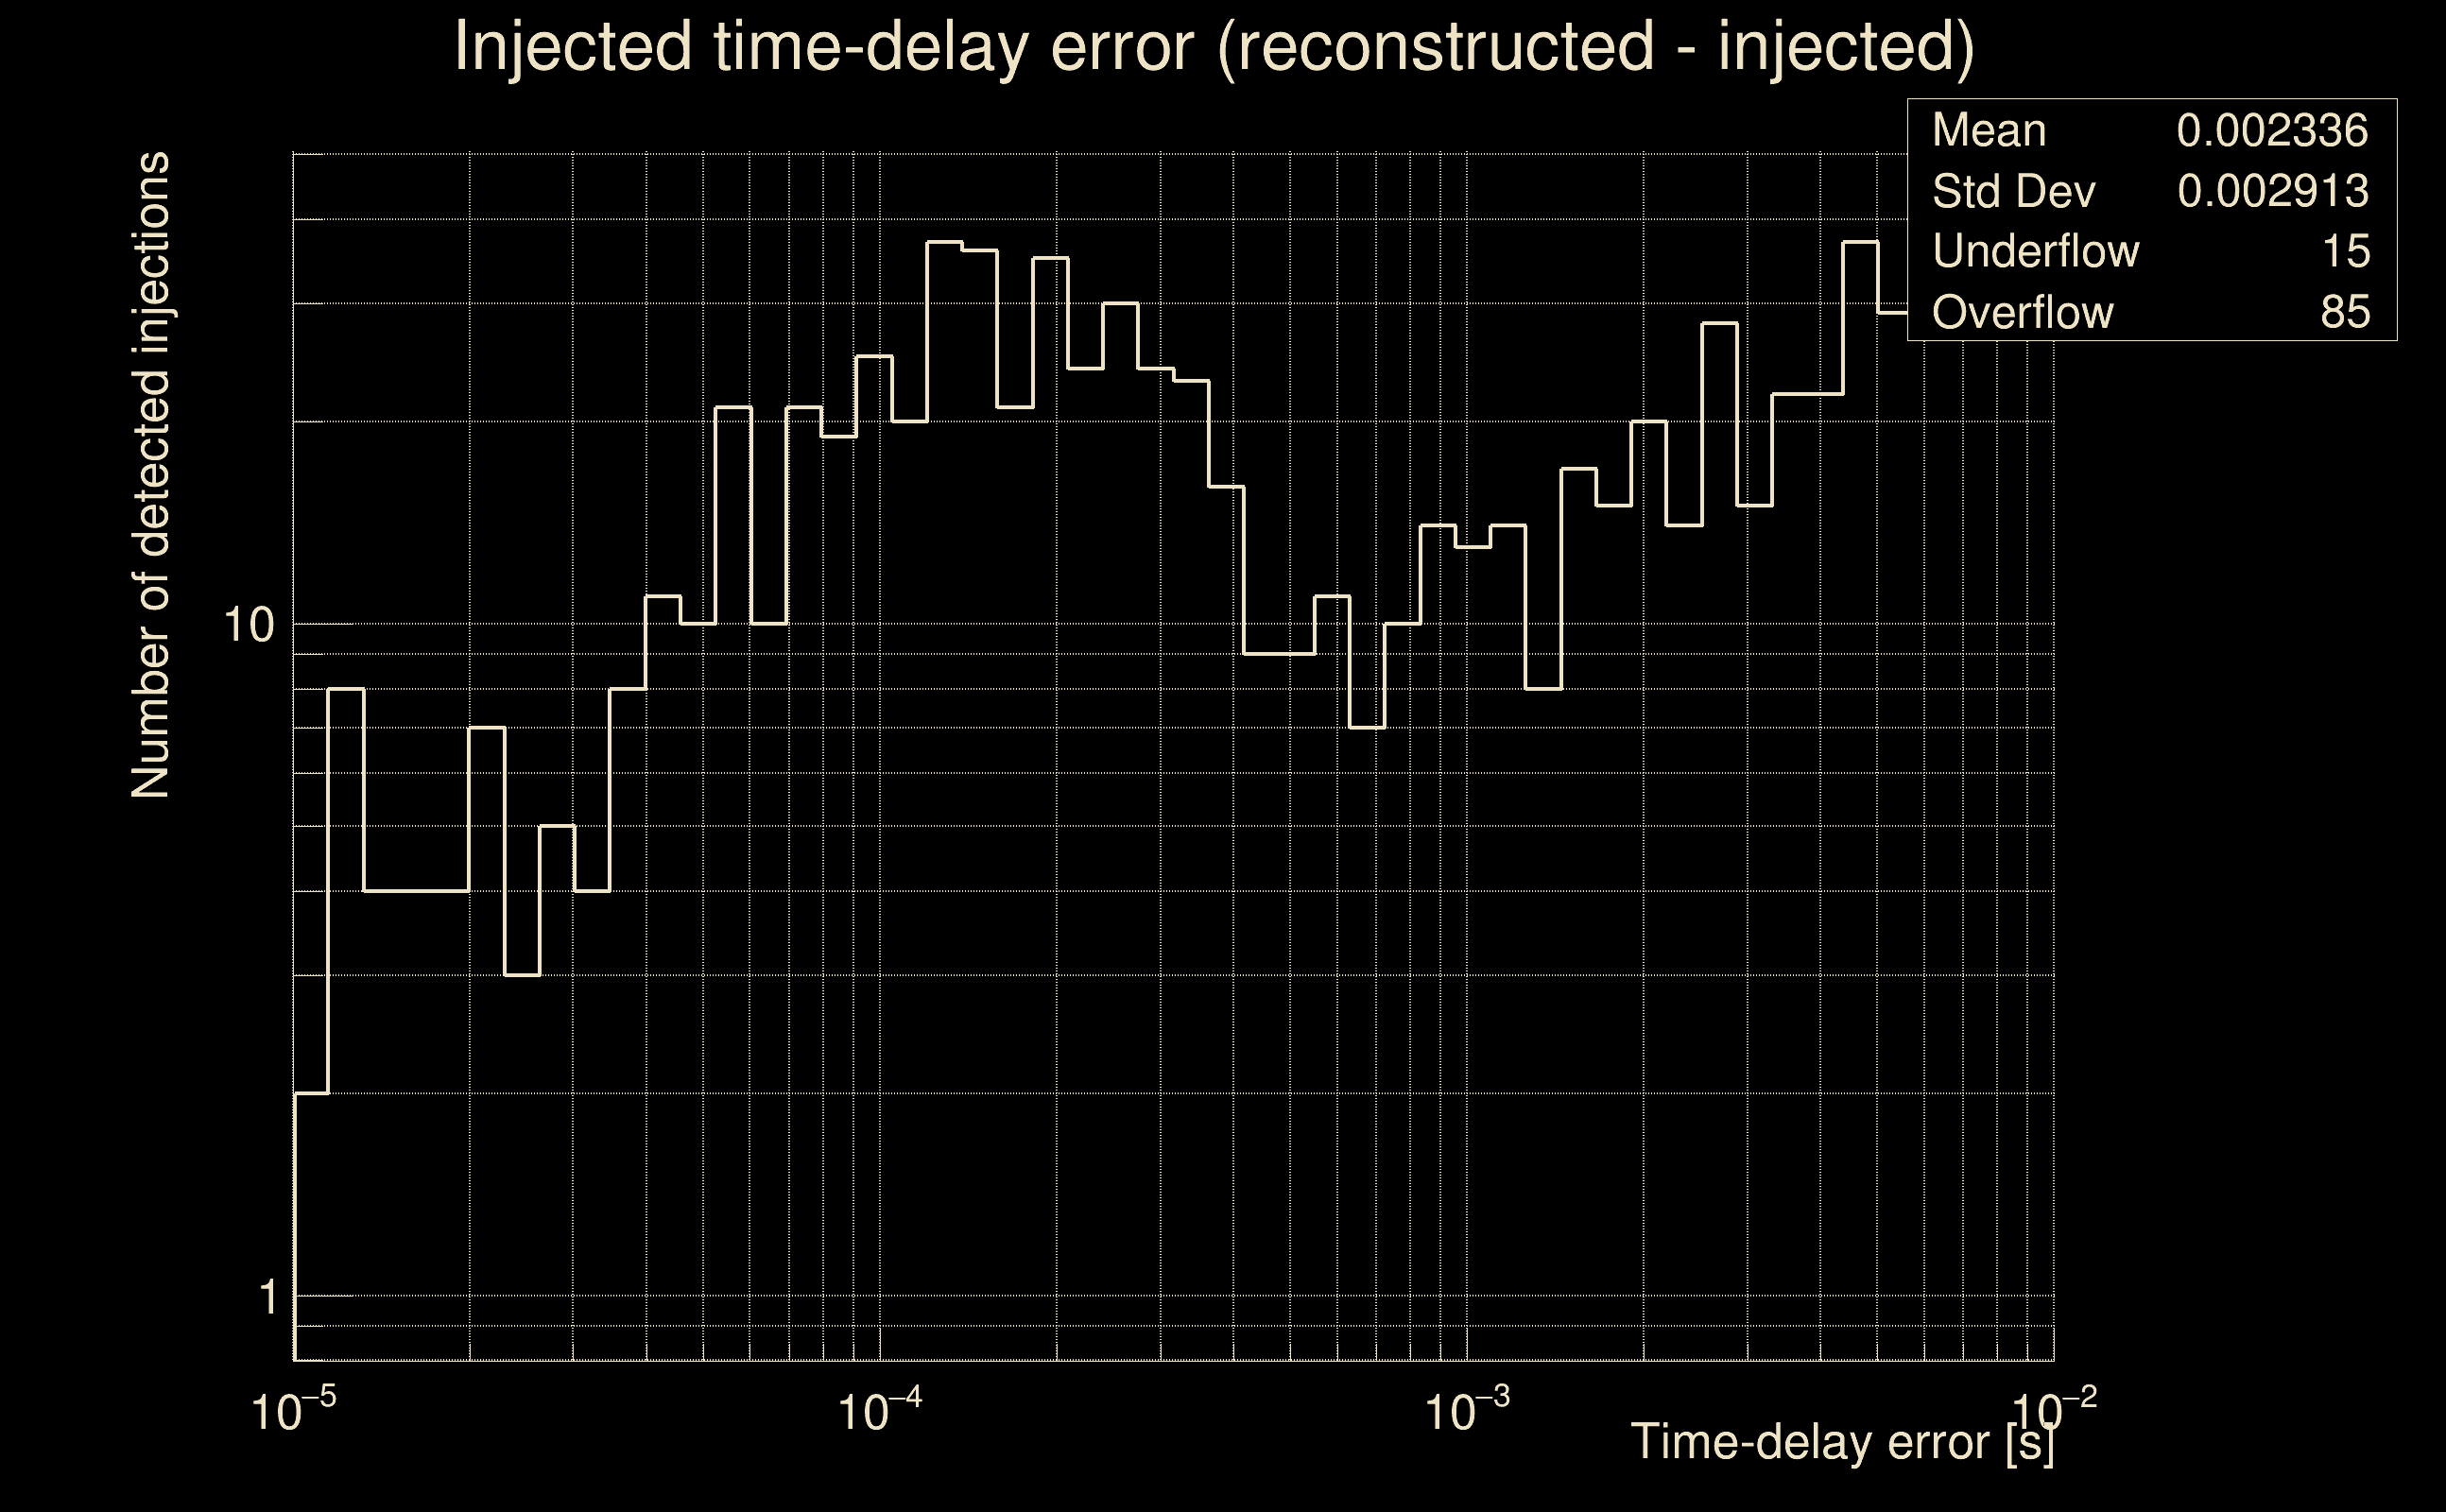
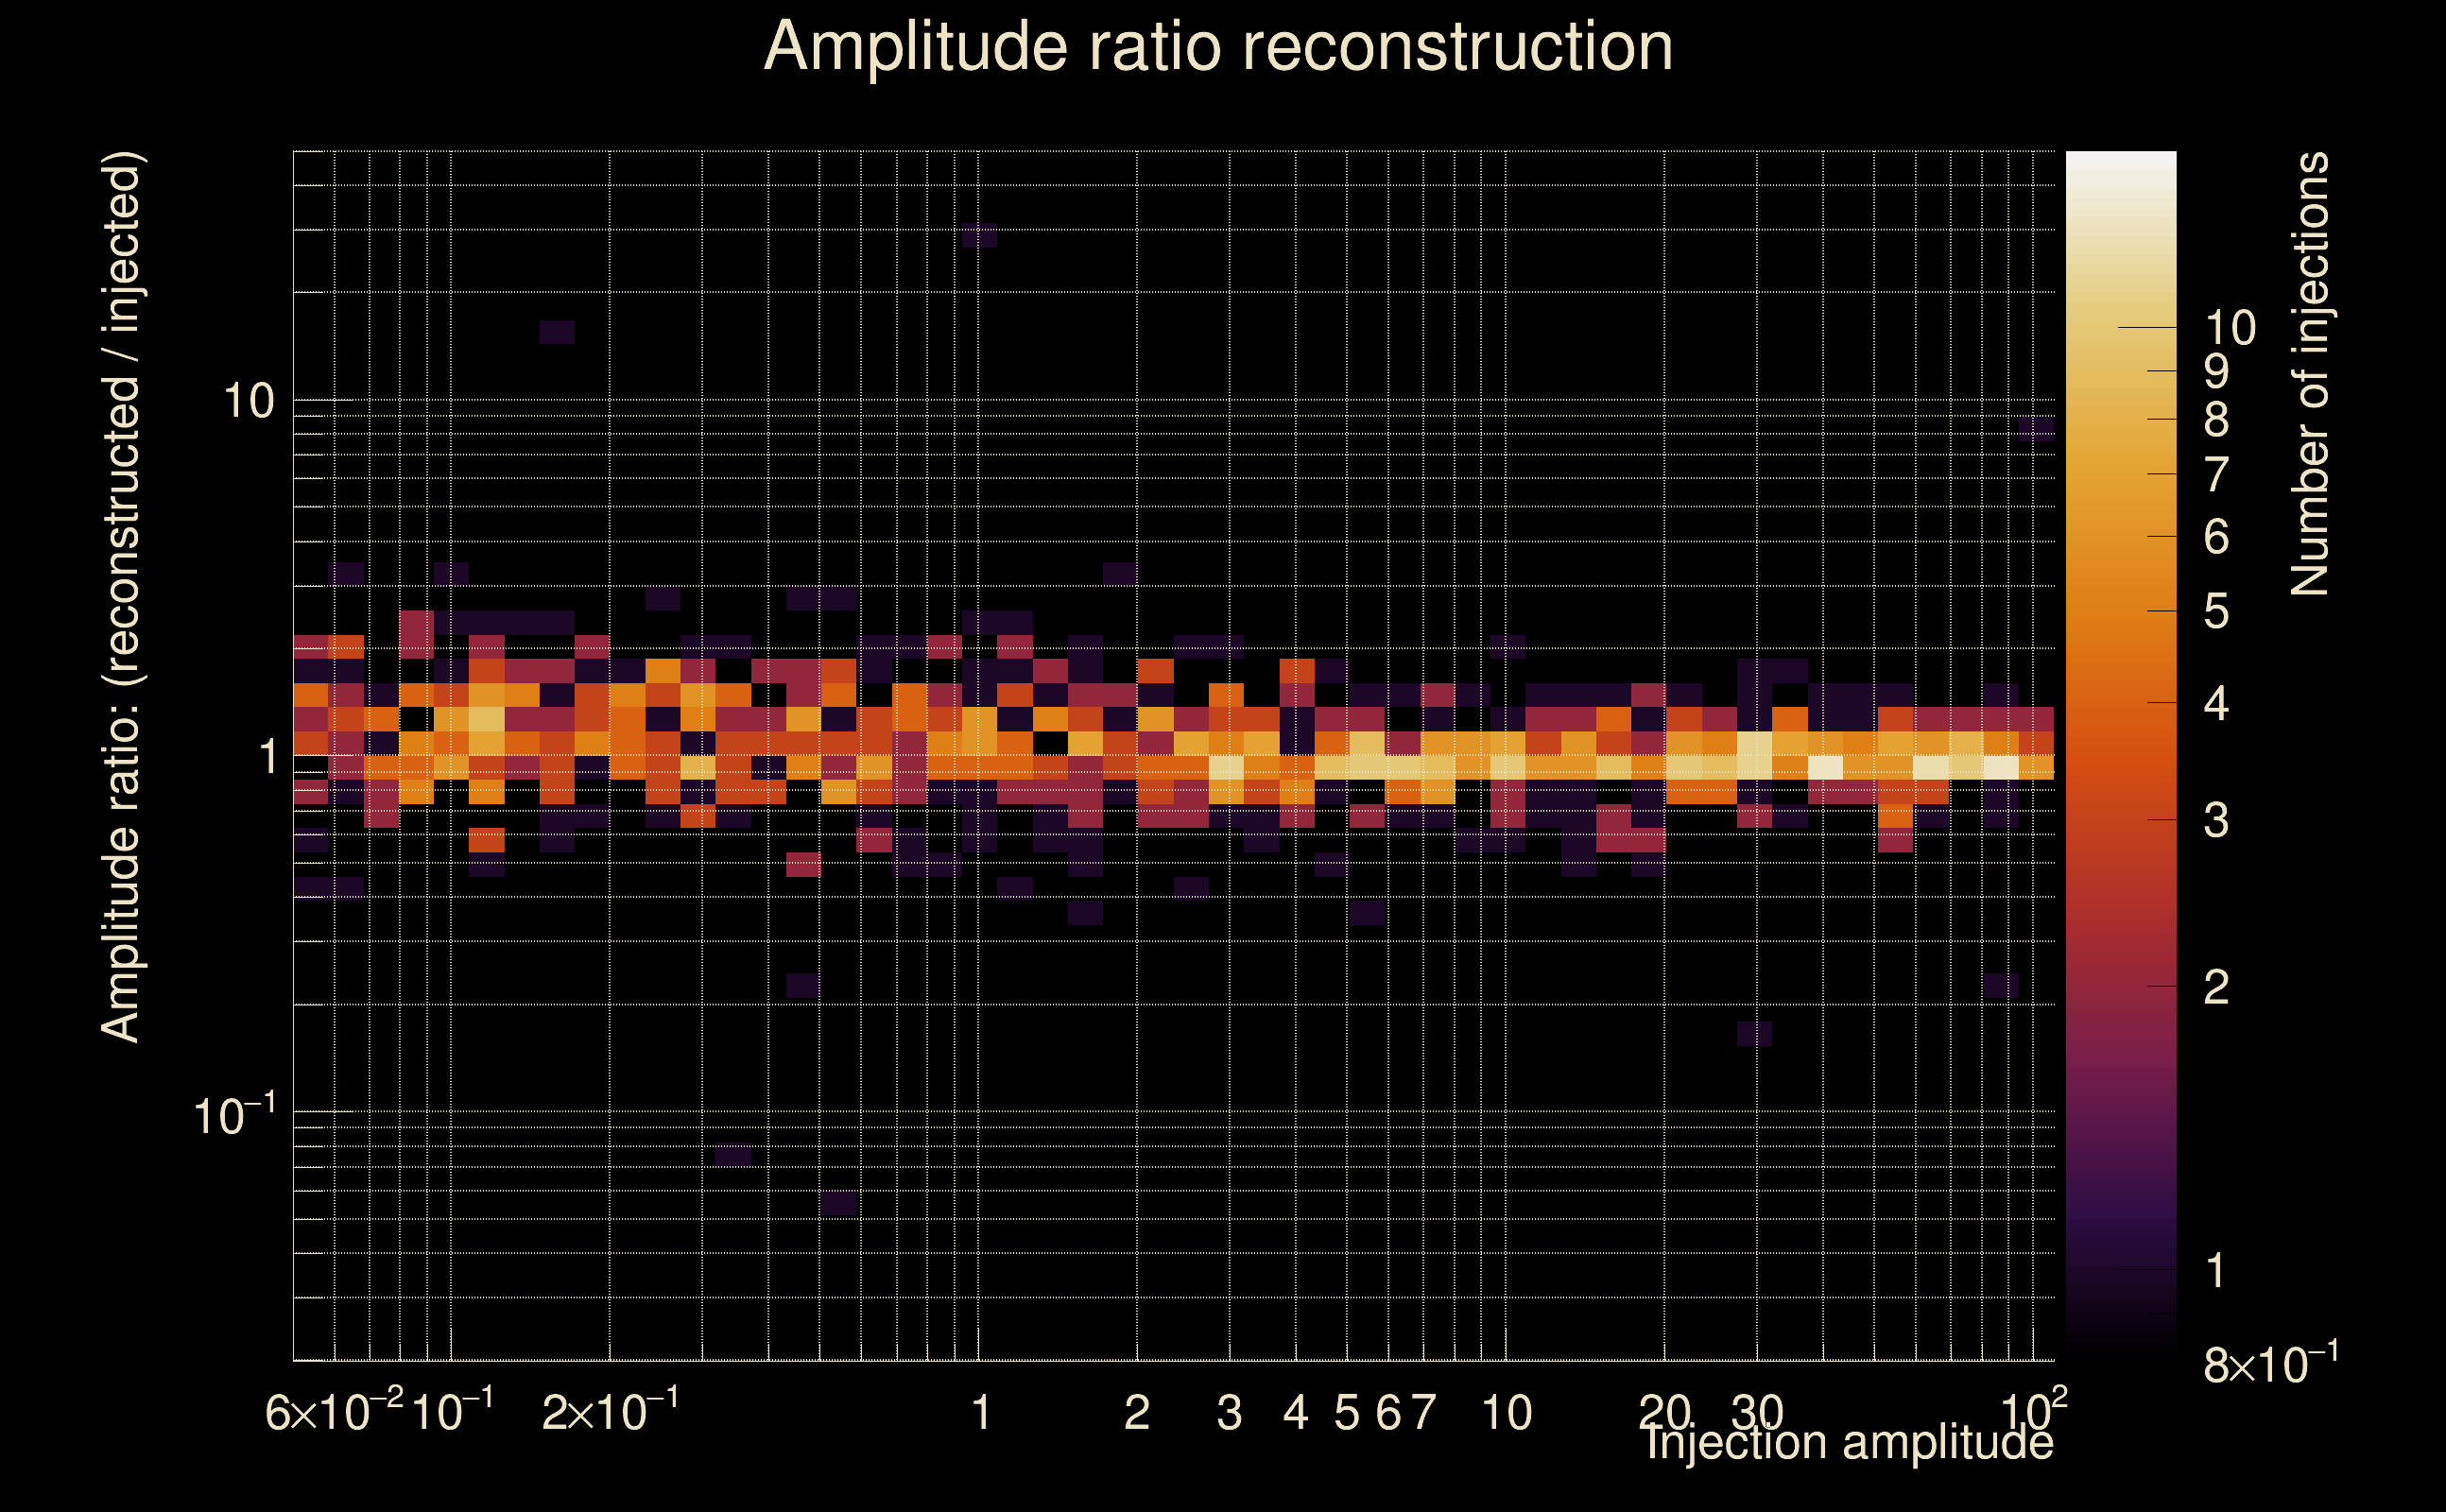
| Number of injections (total/valid/detected): | 1162 / 1004 / 299 |
| List of missed injections: | ./Rad19-s25_missed.txt |
| Injection amplitude at 90% detection efficiency: | 6.10023 |
| Injection amplitude at 50% detection efficiency: | 3.07636 |
| Injection amplitude at 10% detection efficiency: | 1.87797 |
 |
 |
 |
 |
 |
 |
 |
|
 |
 |
|
 |
 |
|
 |
 |
|
 |
 |
|
 |
 |
|
 |
 |
|
 |
 |
|
 |
 |
 |
 |
 |
 |
 |
 |
 |
 |
 |
 |
 |
 |
 |
| florent.robinet@ijclab.in2p3.fr |