| Omicron version: | 4.2.0: documentation gitlab repository |
| Omicron run by: | unknown |
| Report produced on: | Mon Feb 23 09:24:27 2026 UTC |
| Ox option file: | TargIxf_feb2026_SN6_30s_options.txt |
| Omicron option files: | detector 0, detector 1 |
| Detector channel names: | H1:GDS-CALIB_STRAIN_CLEAN_AR_4096Hz, L1:GDS-CALIB_STRAIN_CLEAN_AR_4096Hz |
| Omicron analysis time window and overlap: | 16 s, 6 s |
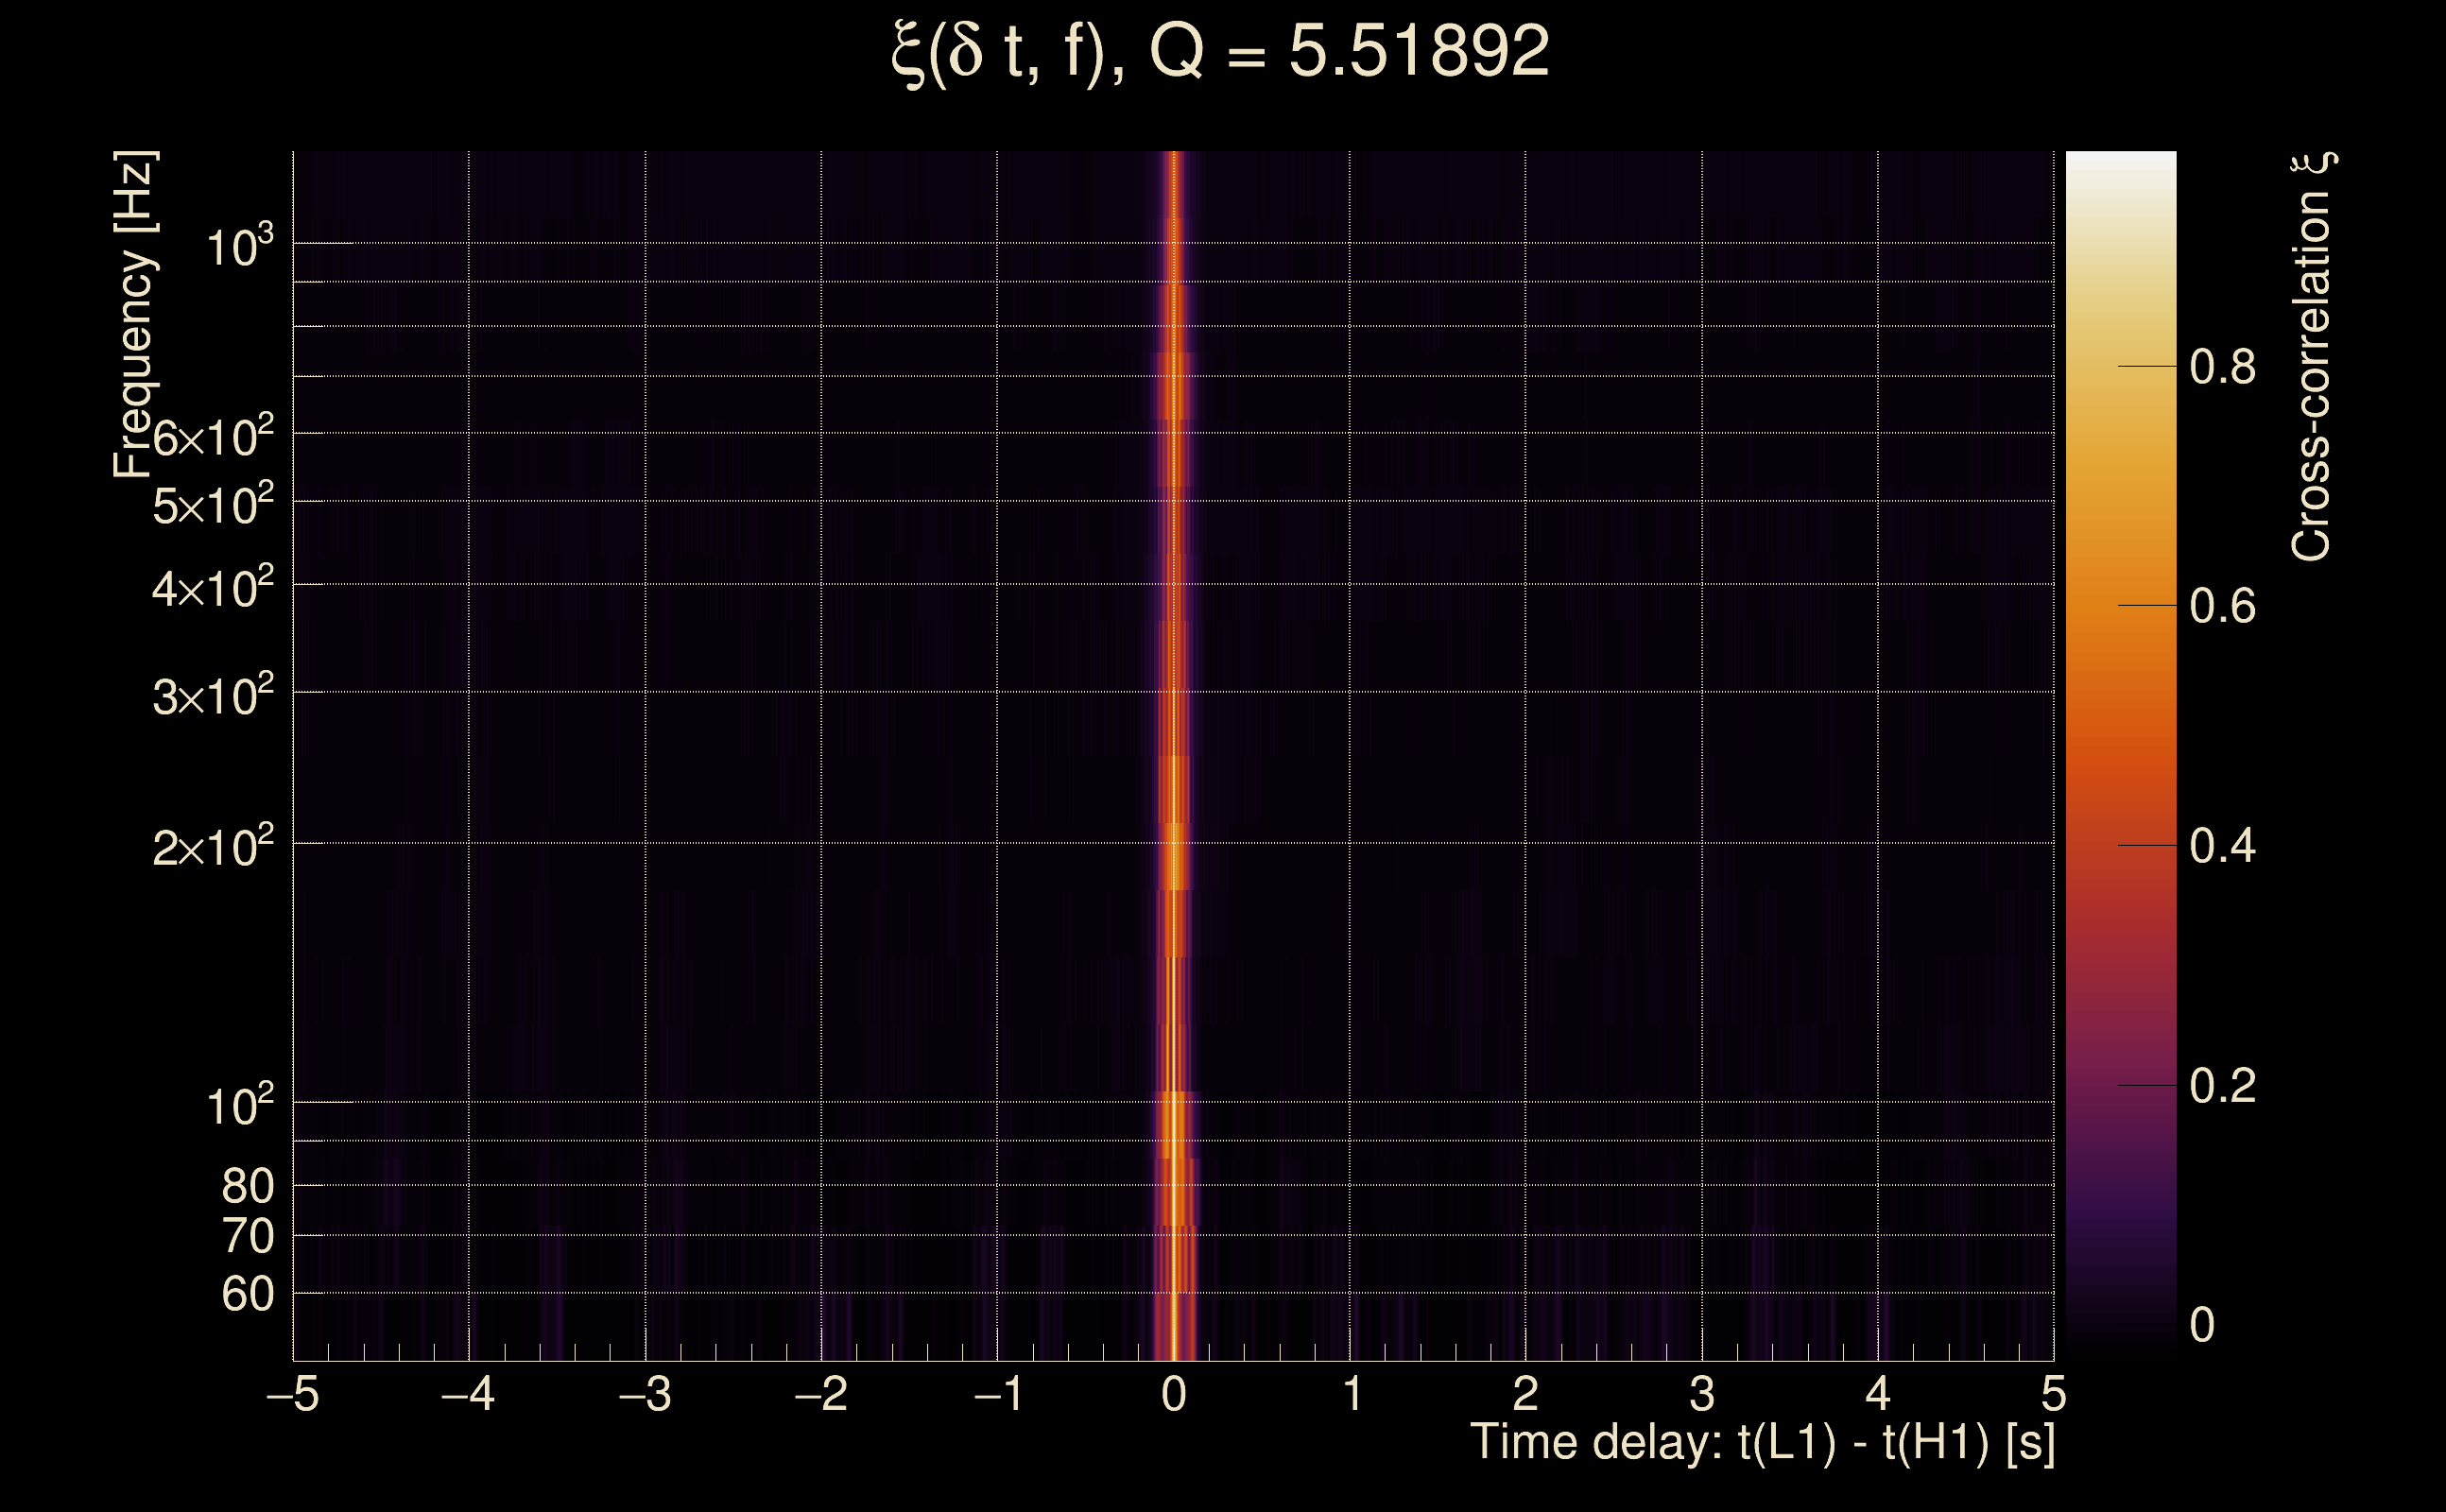
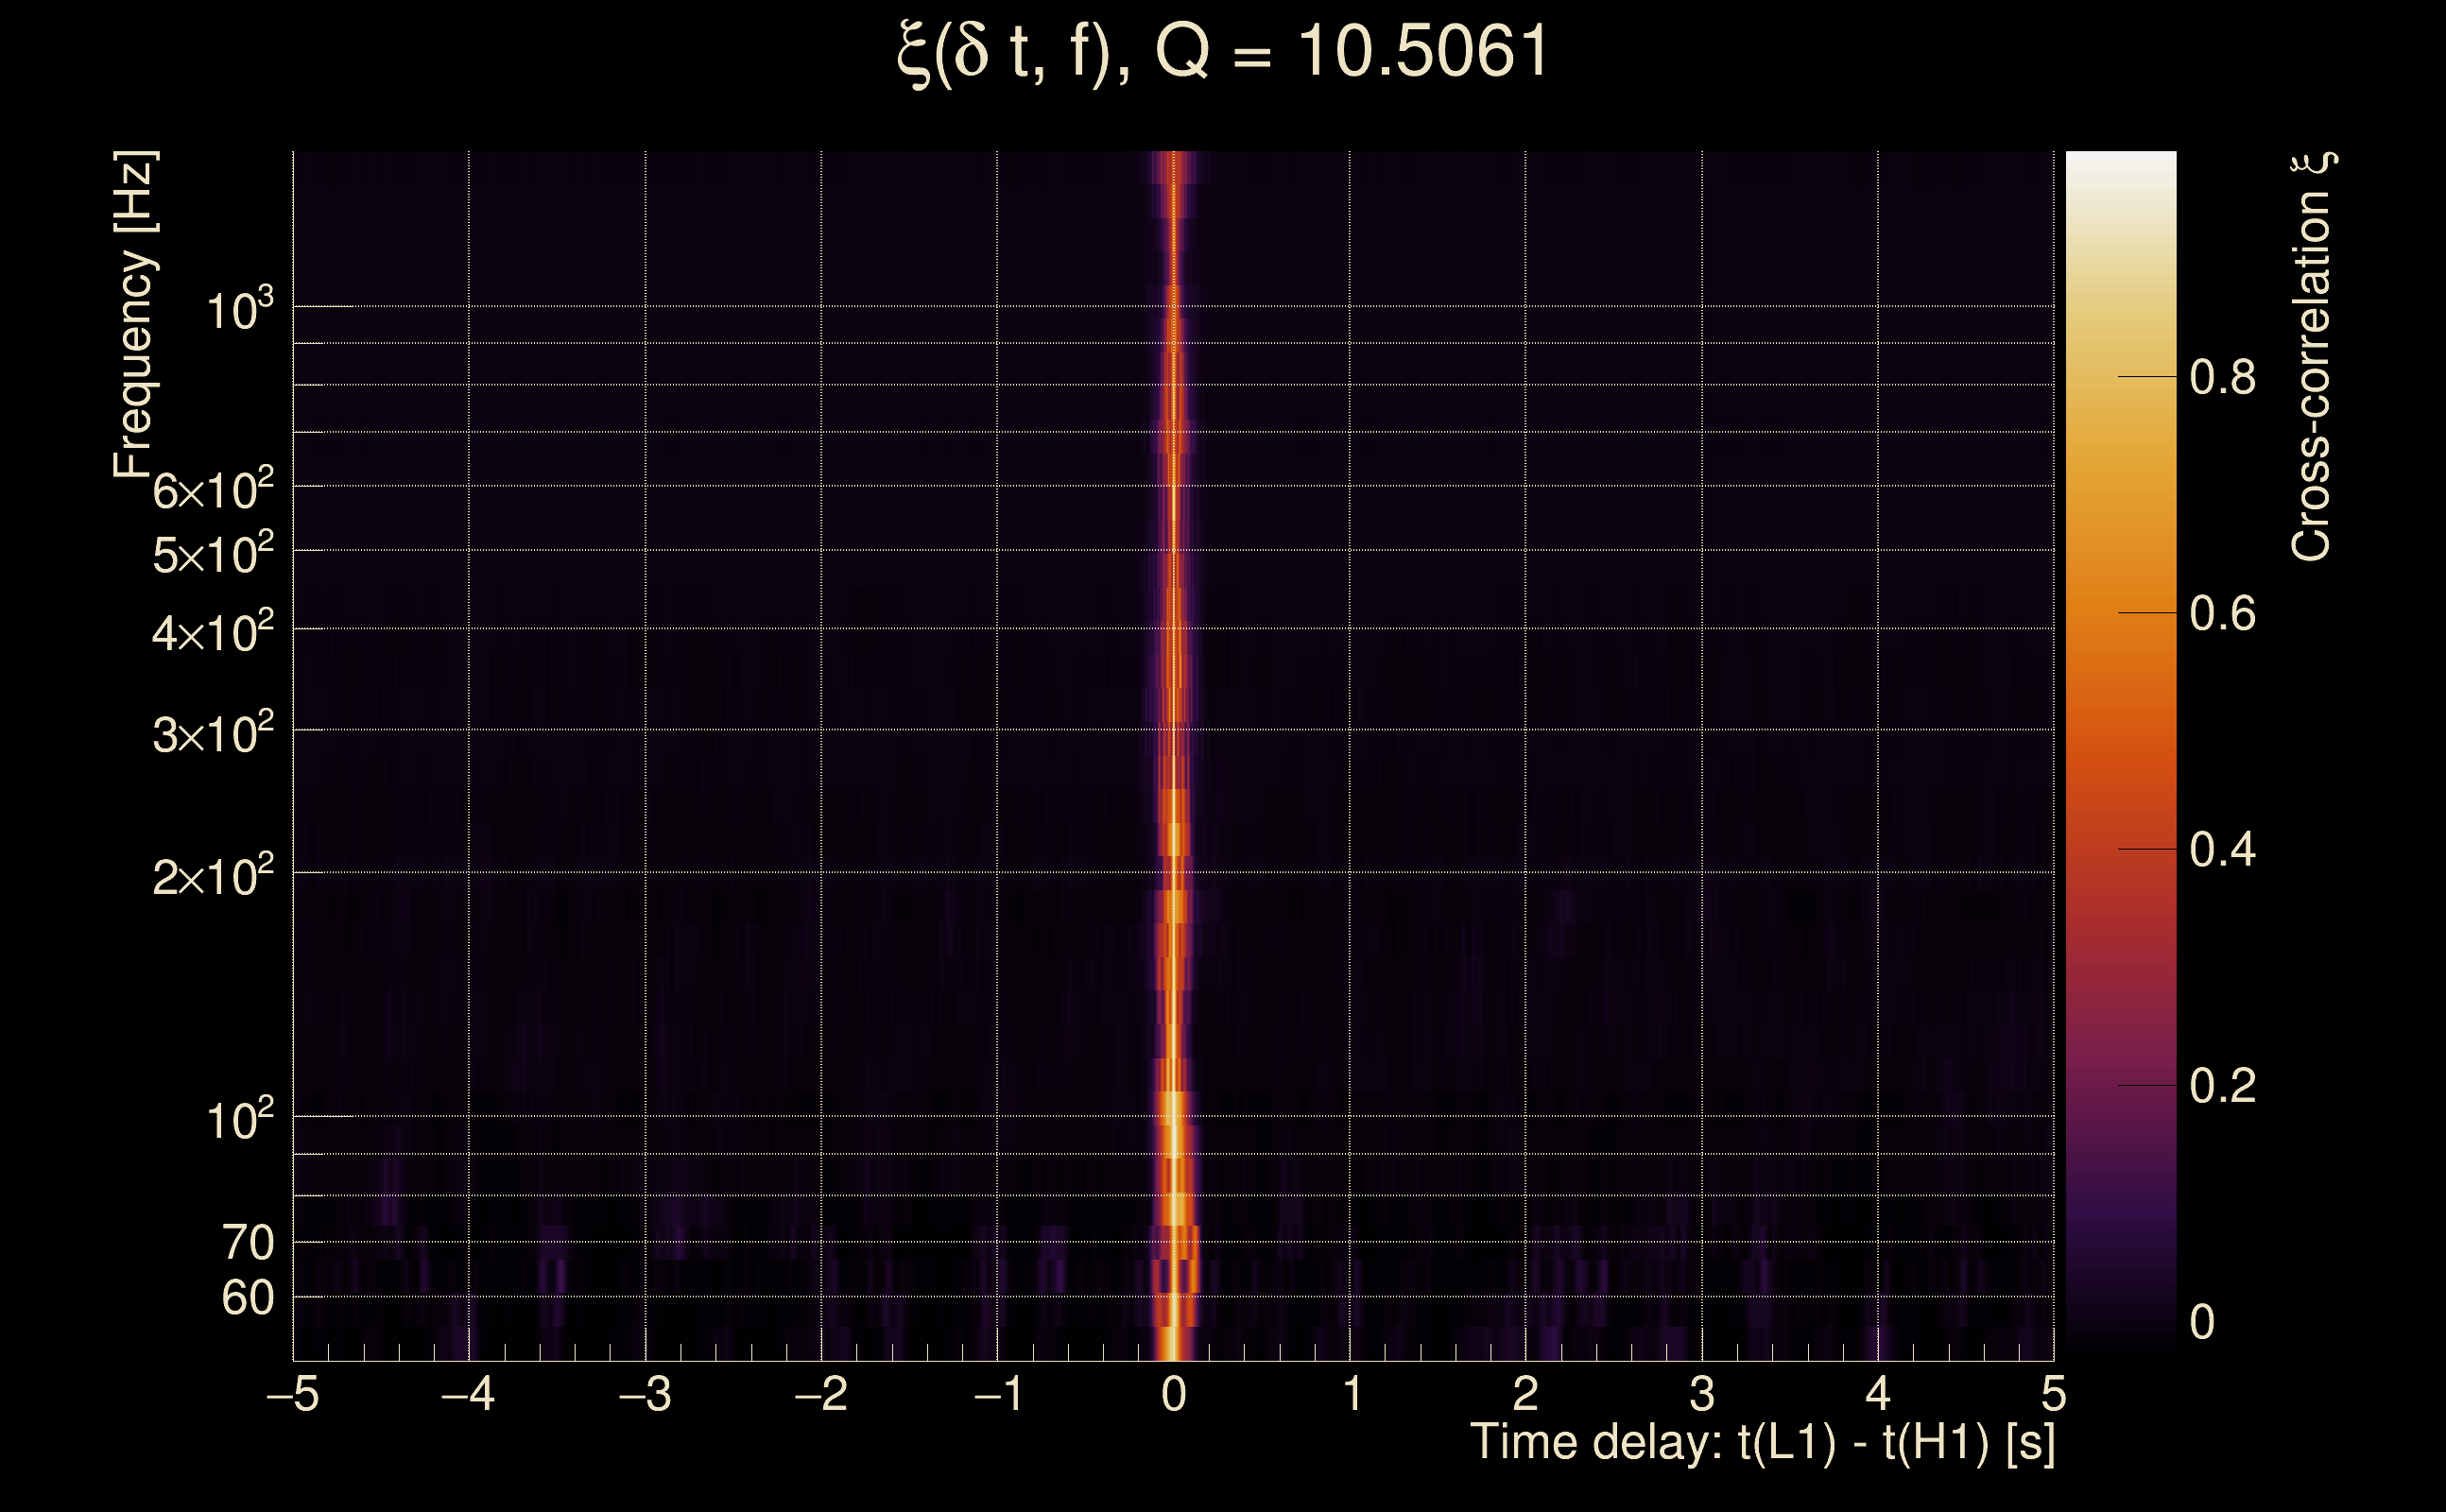
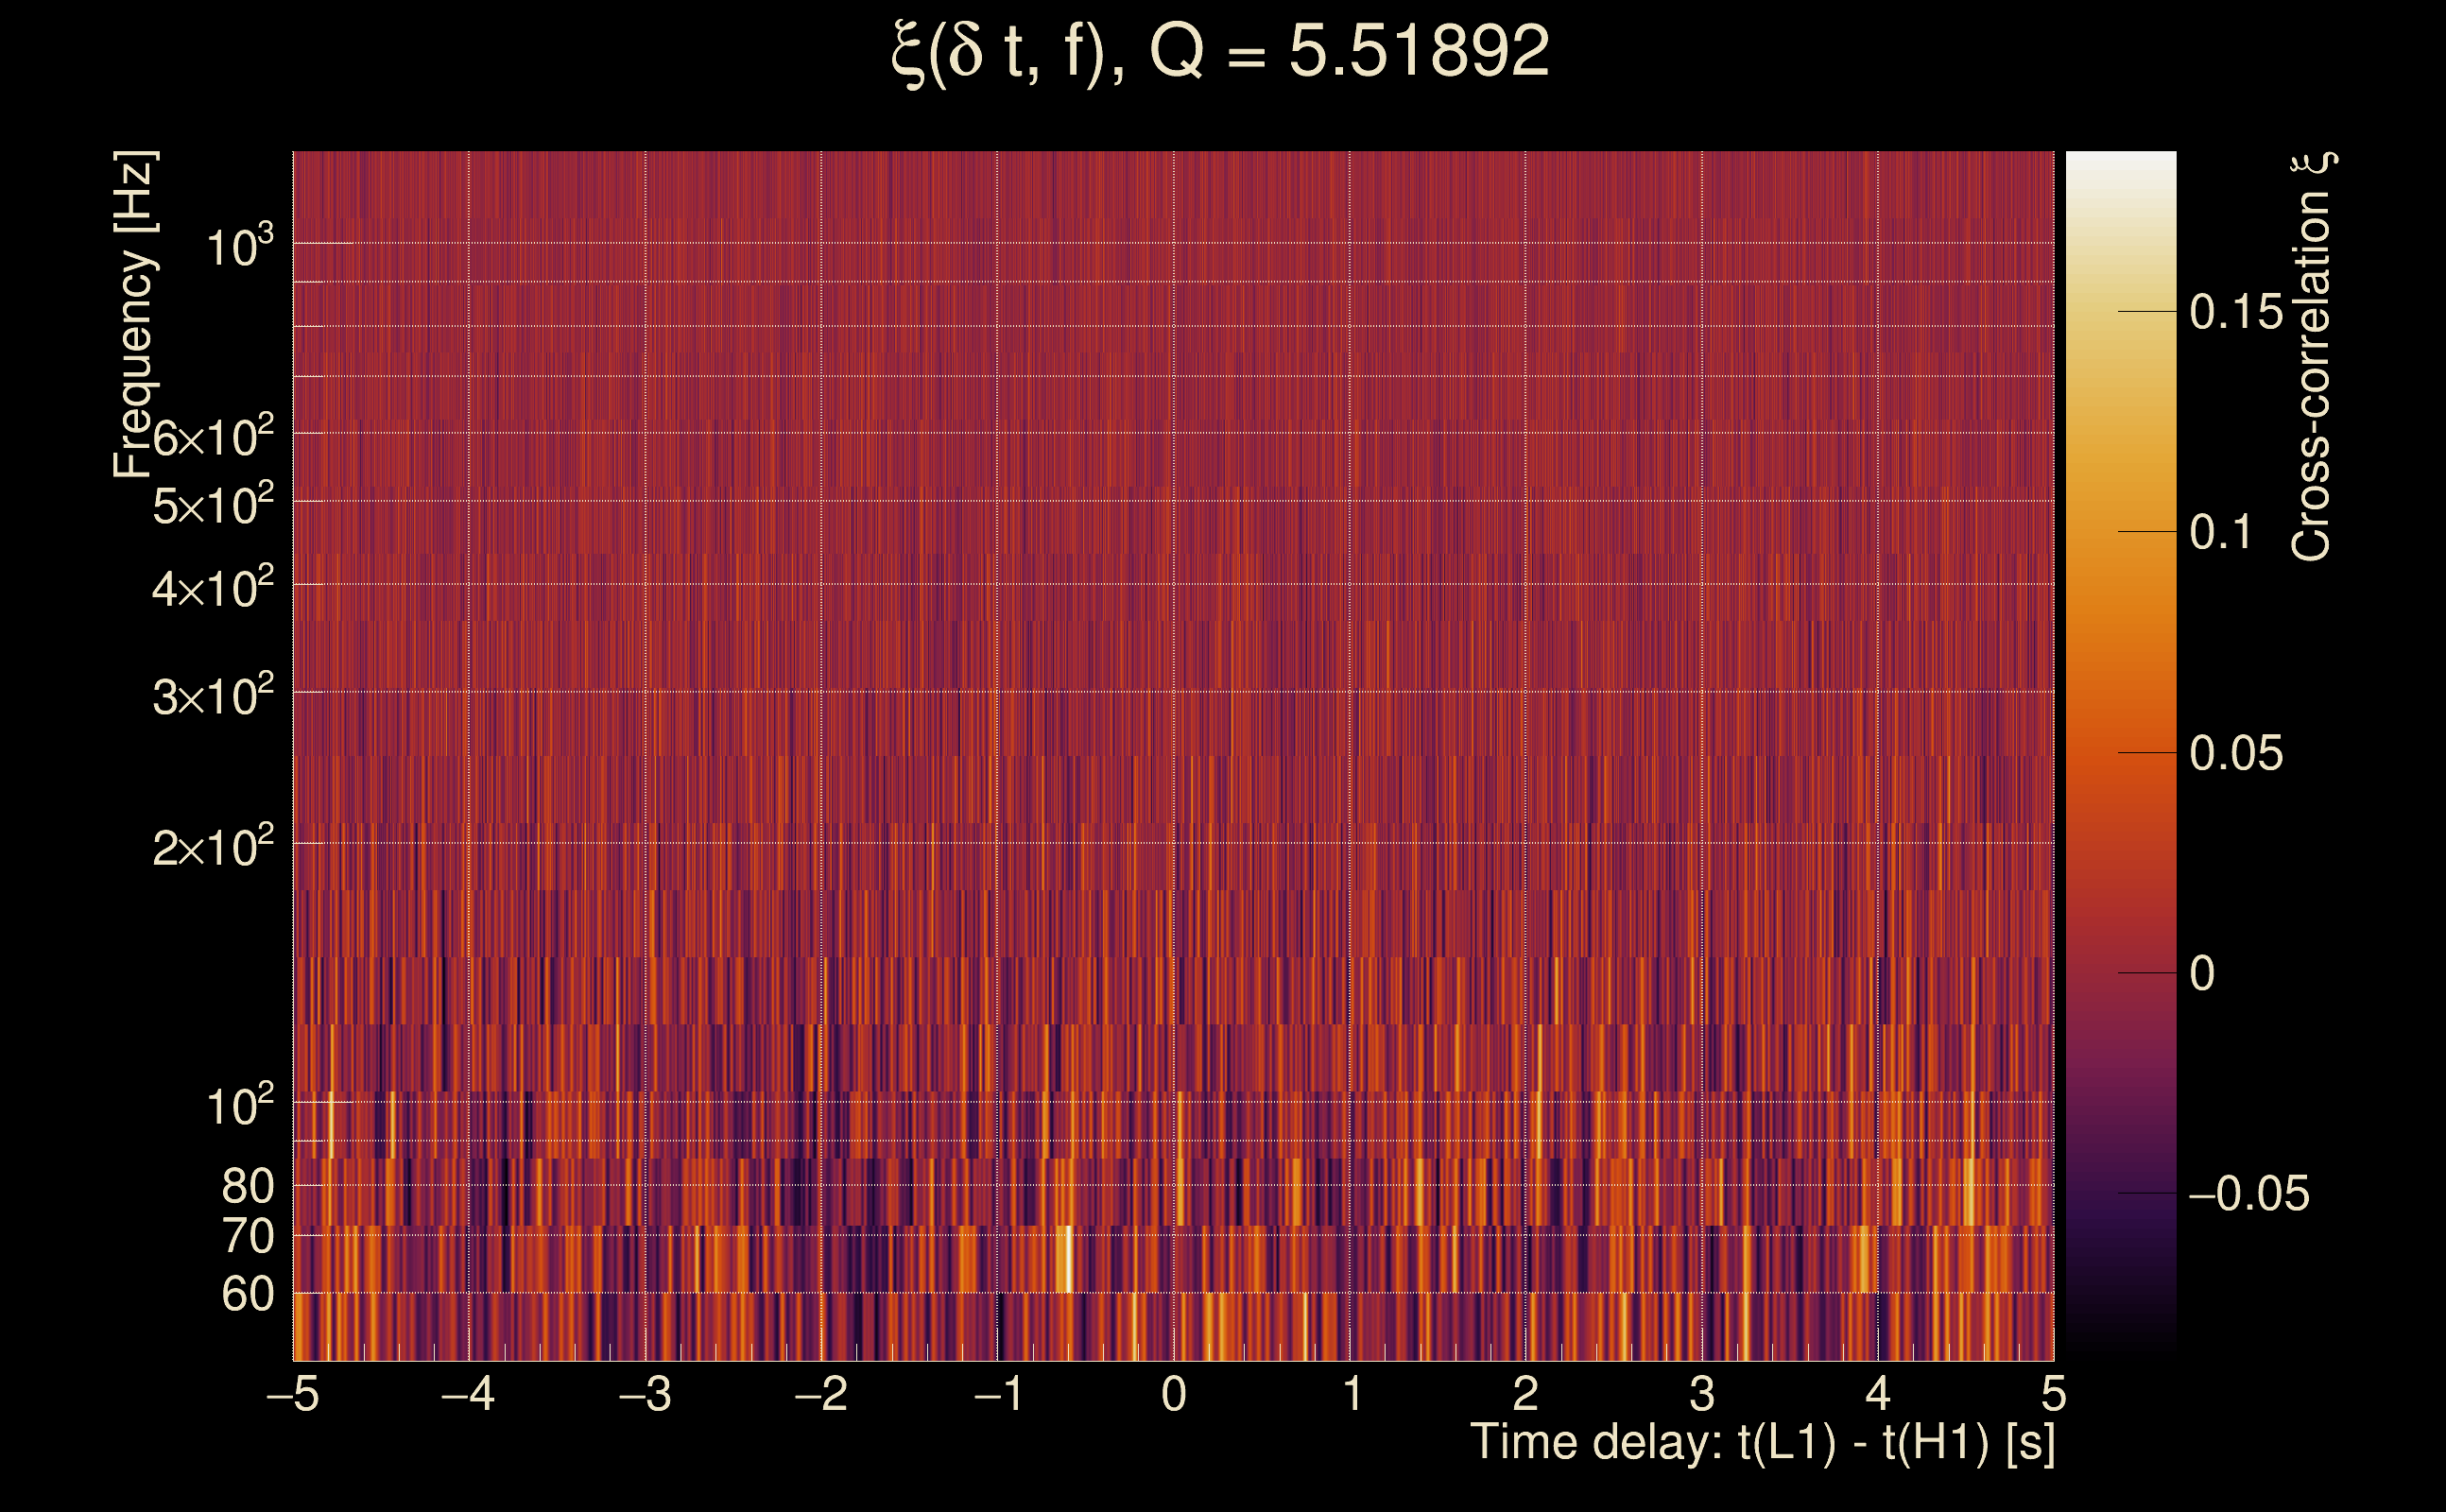
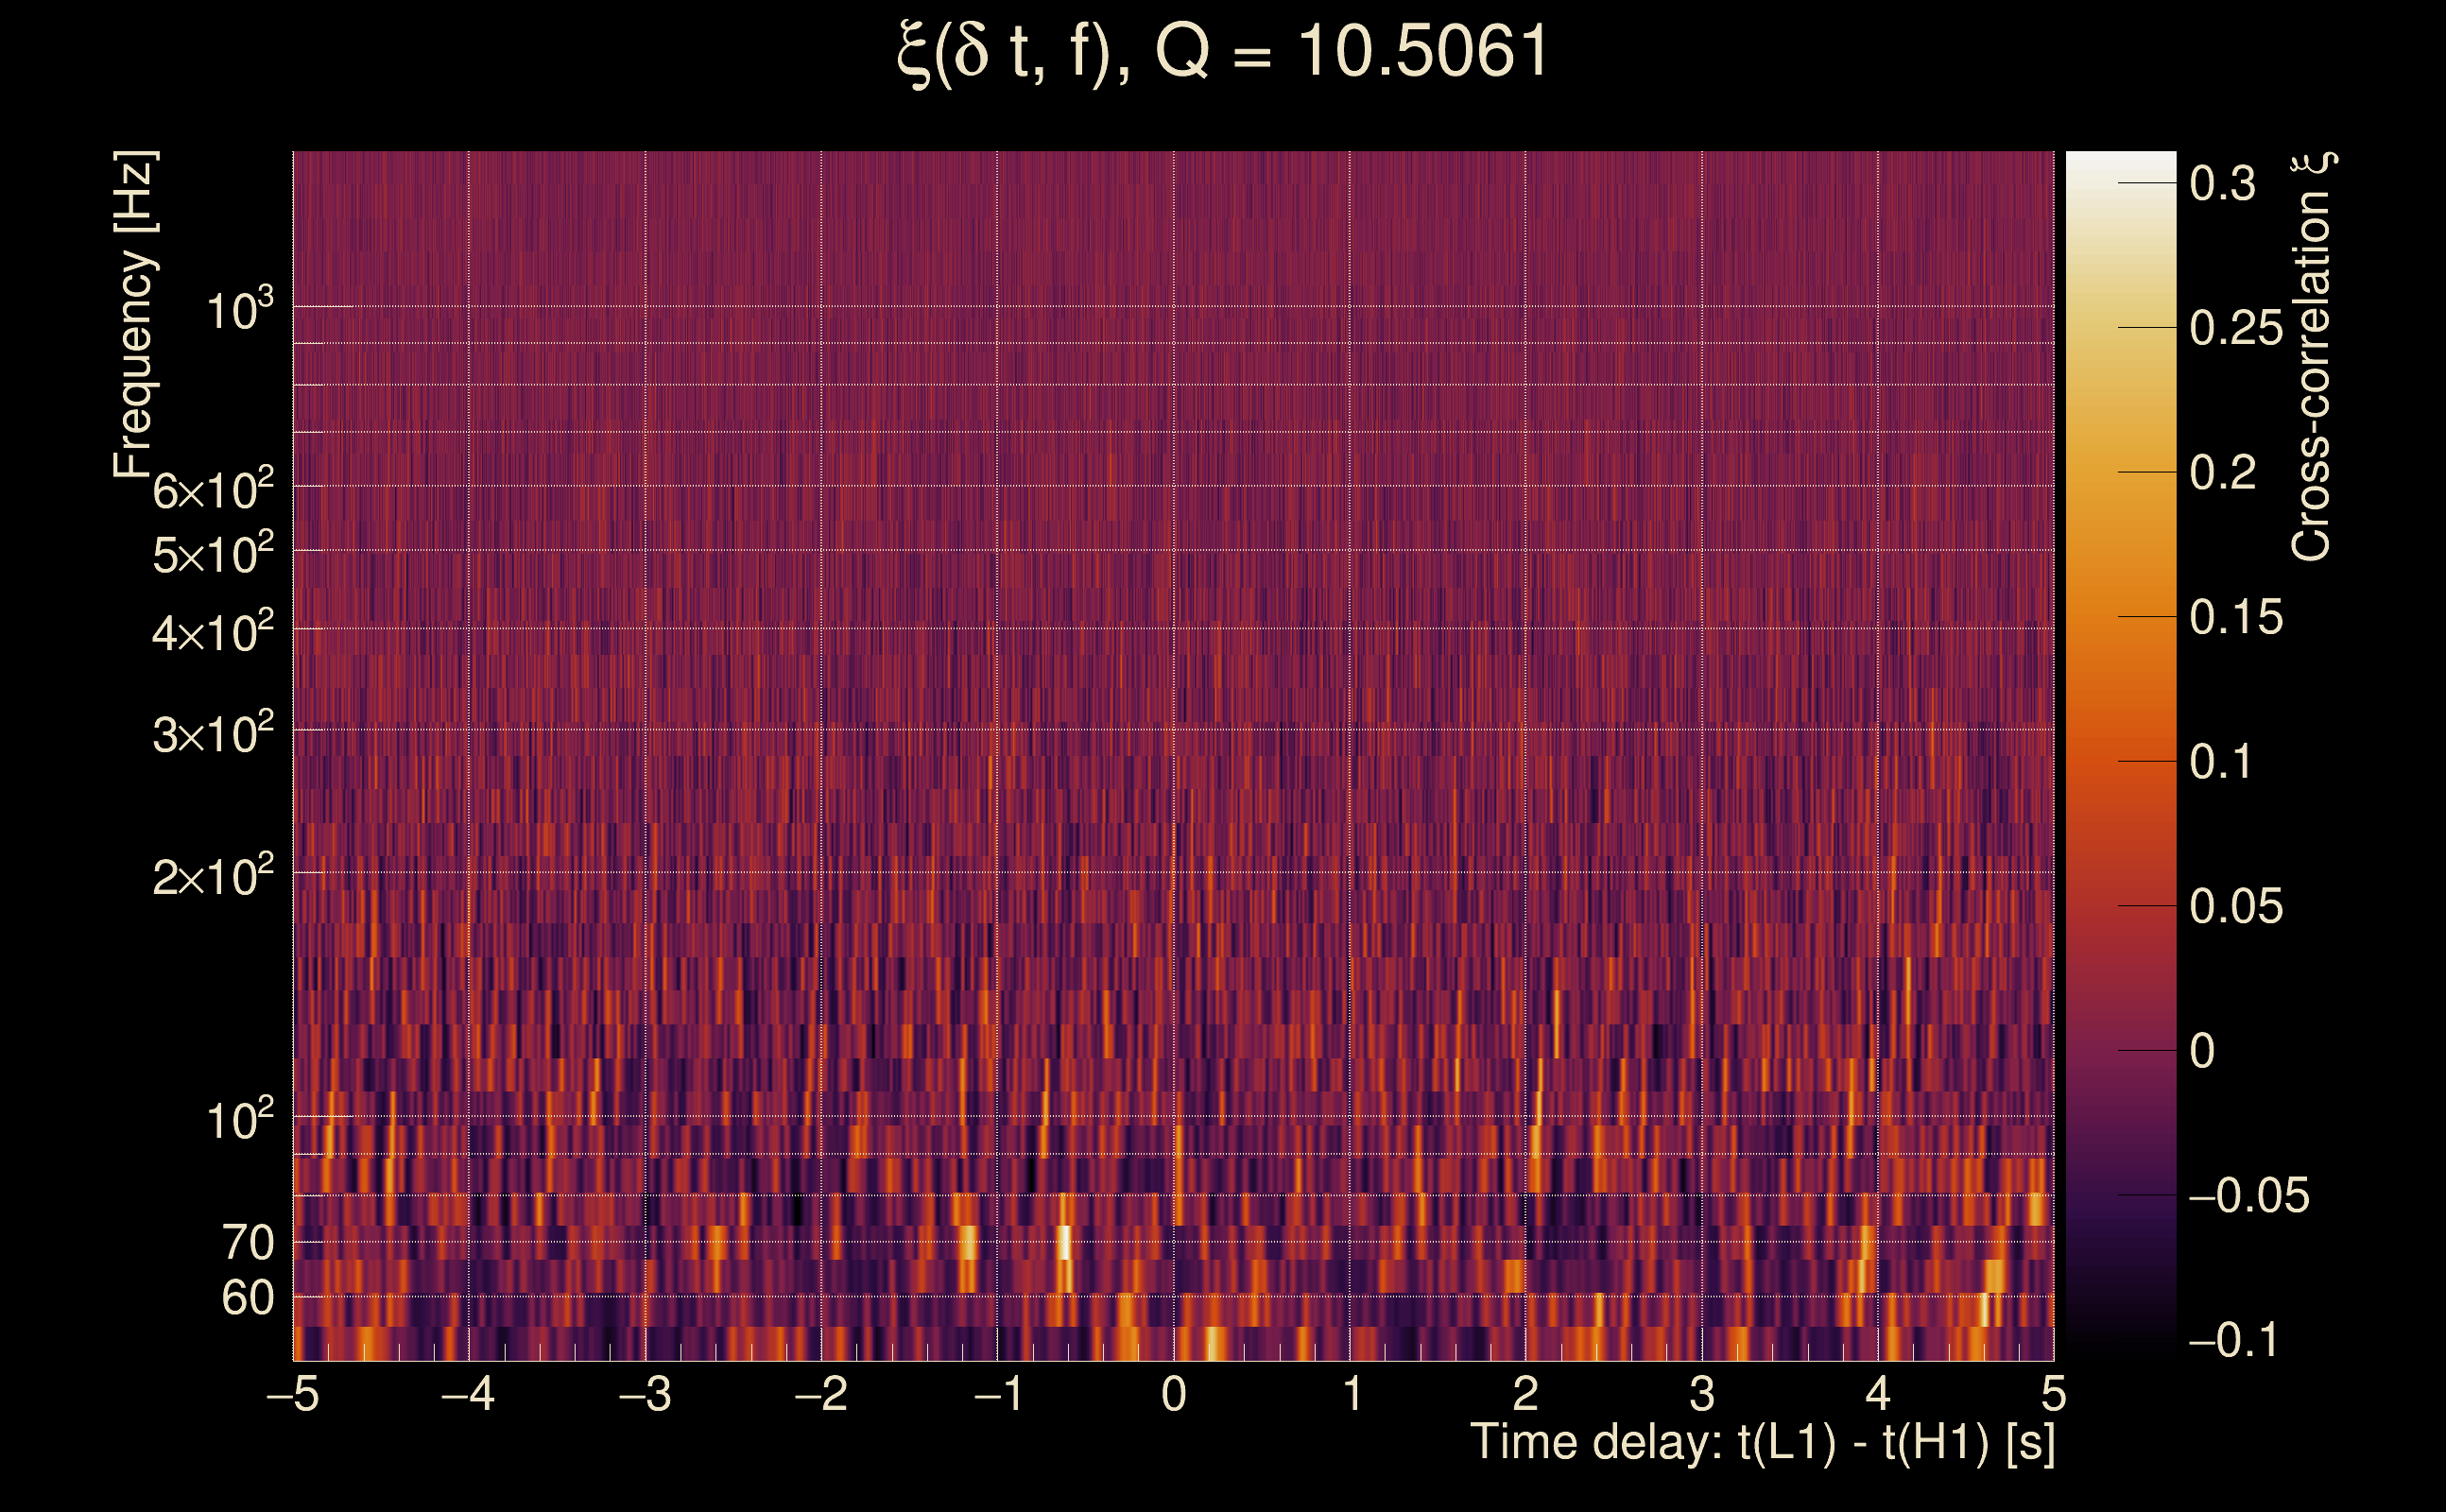
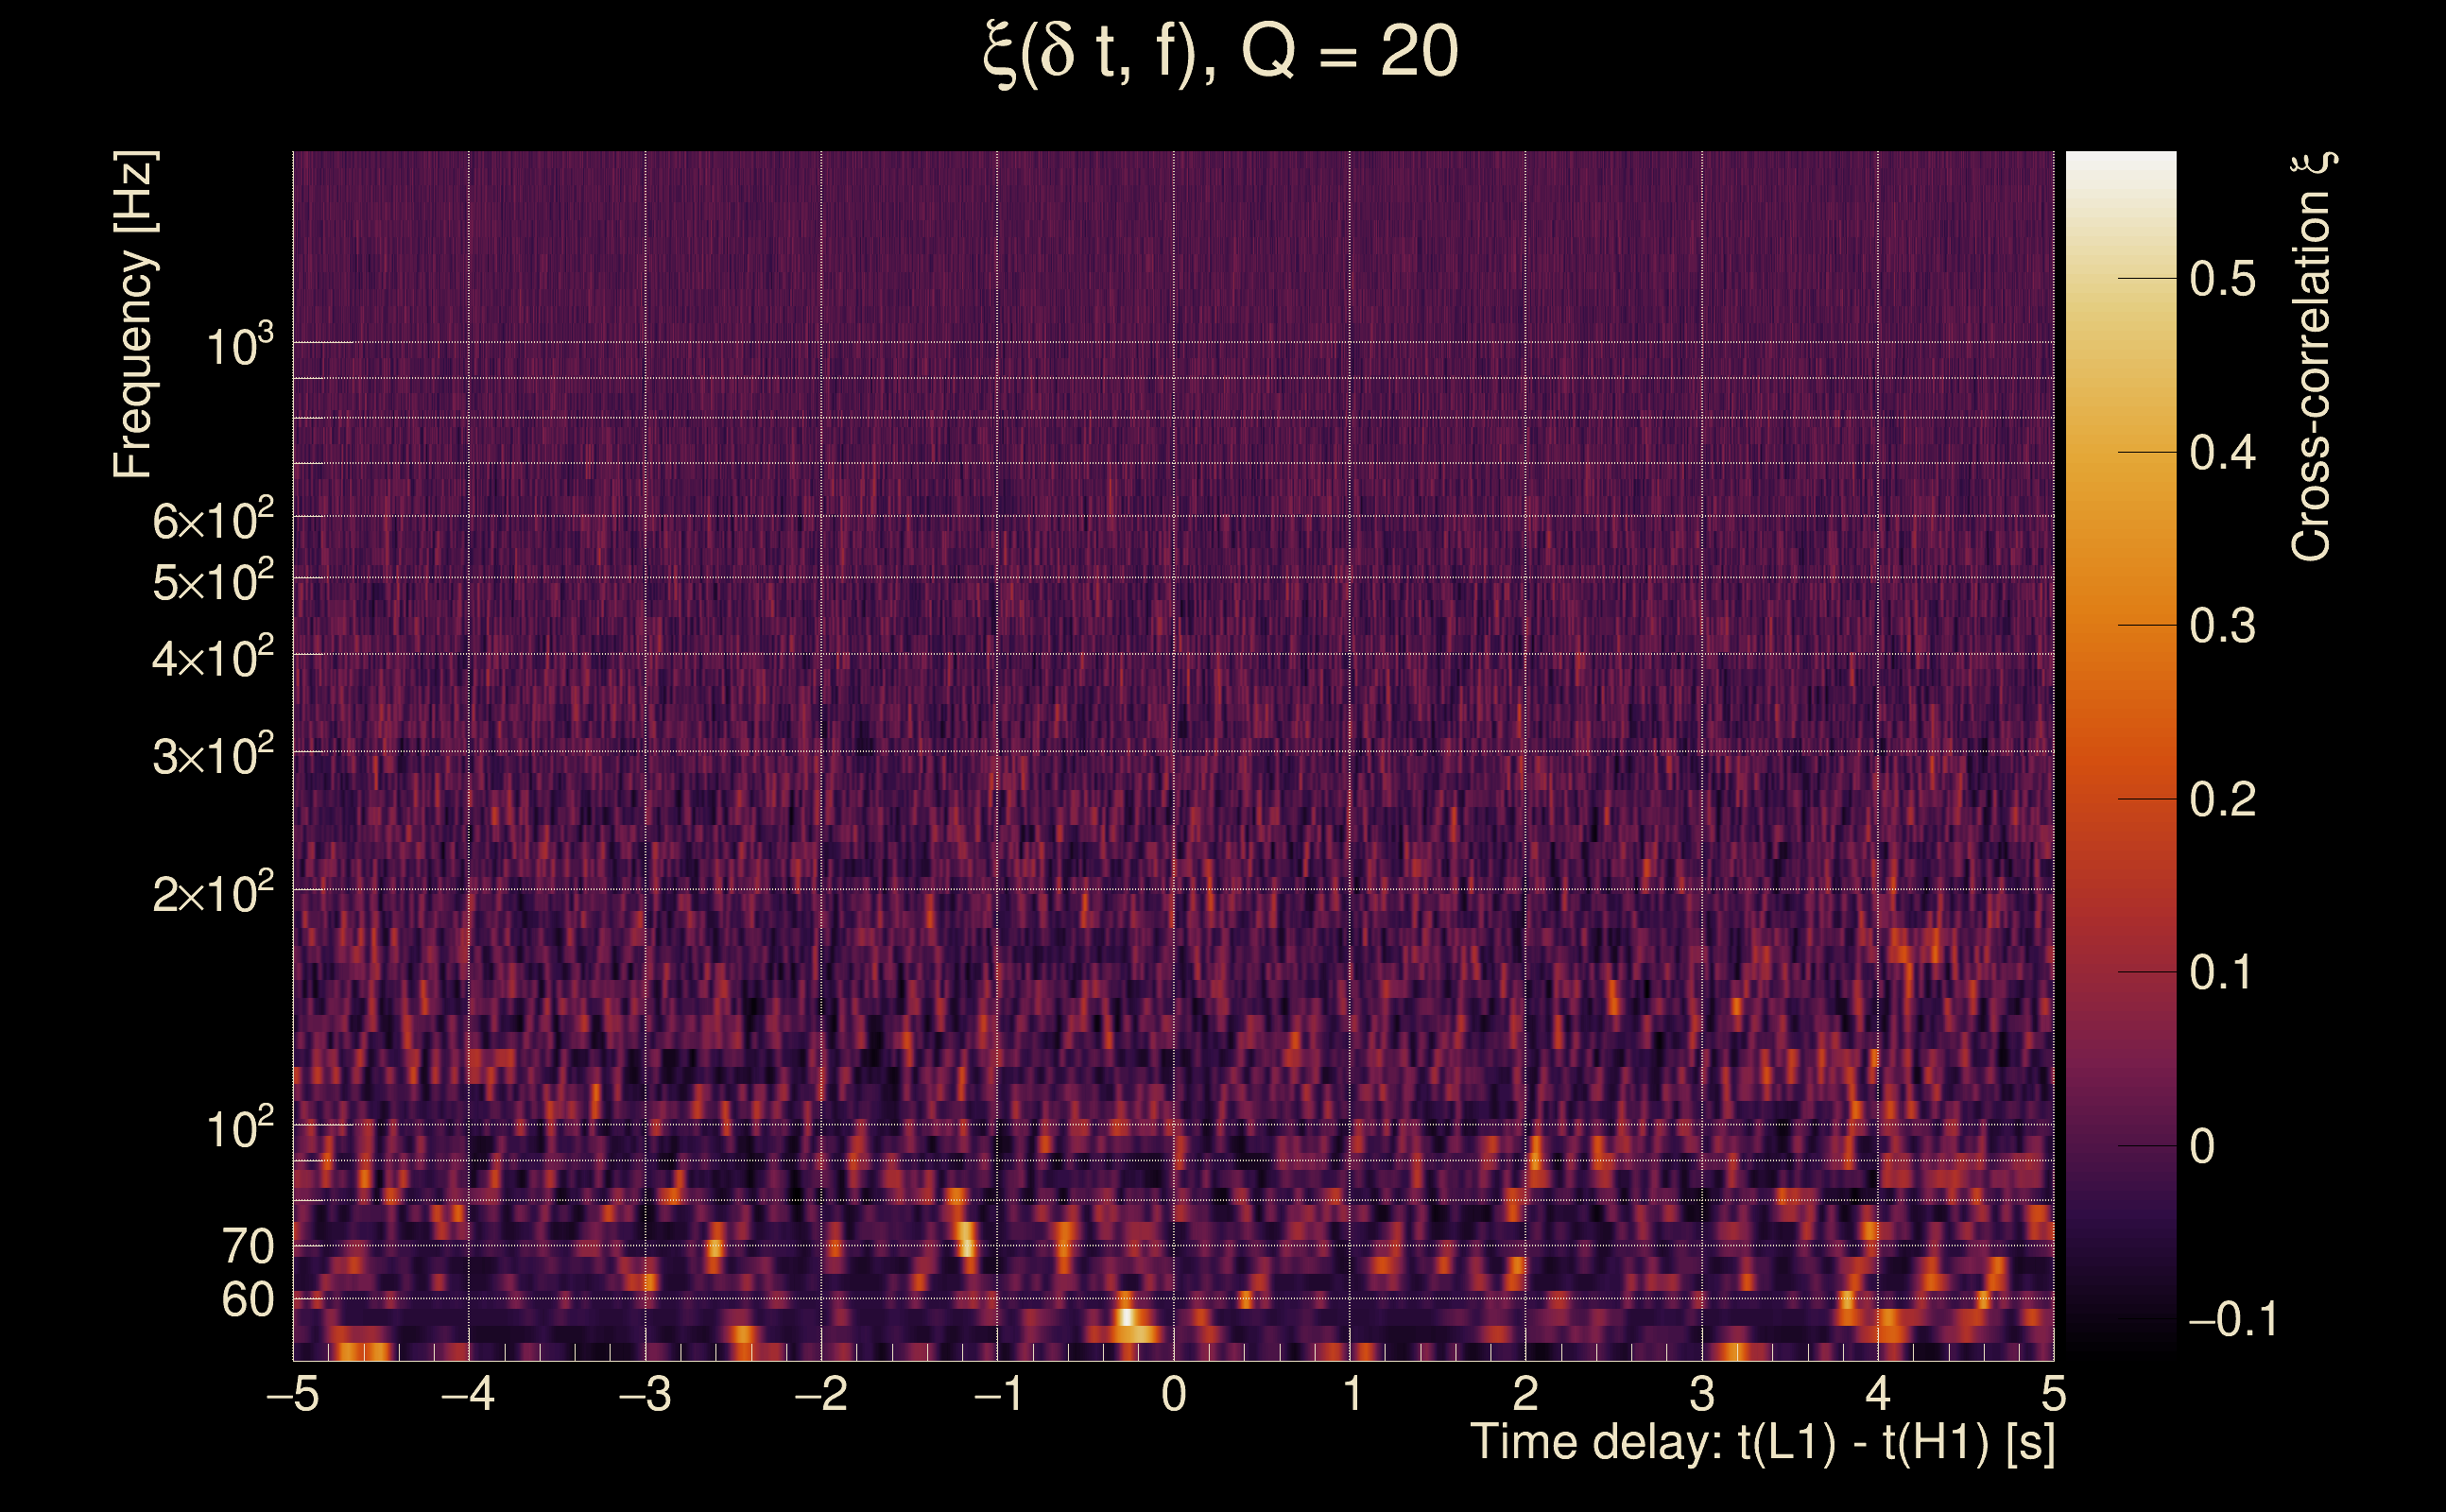
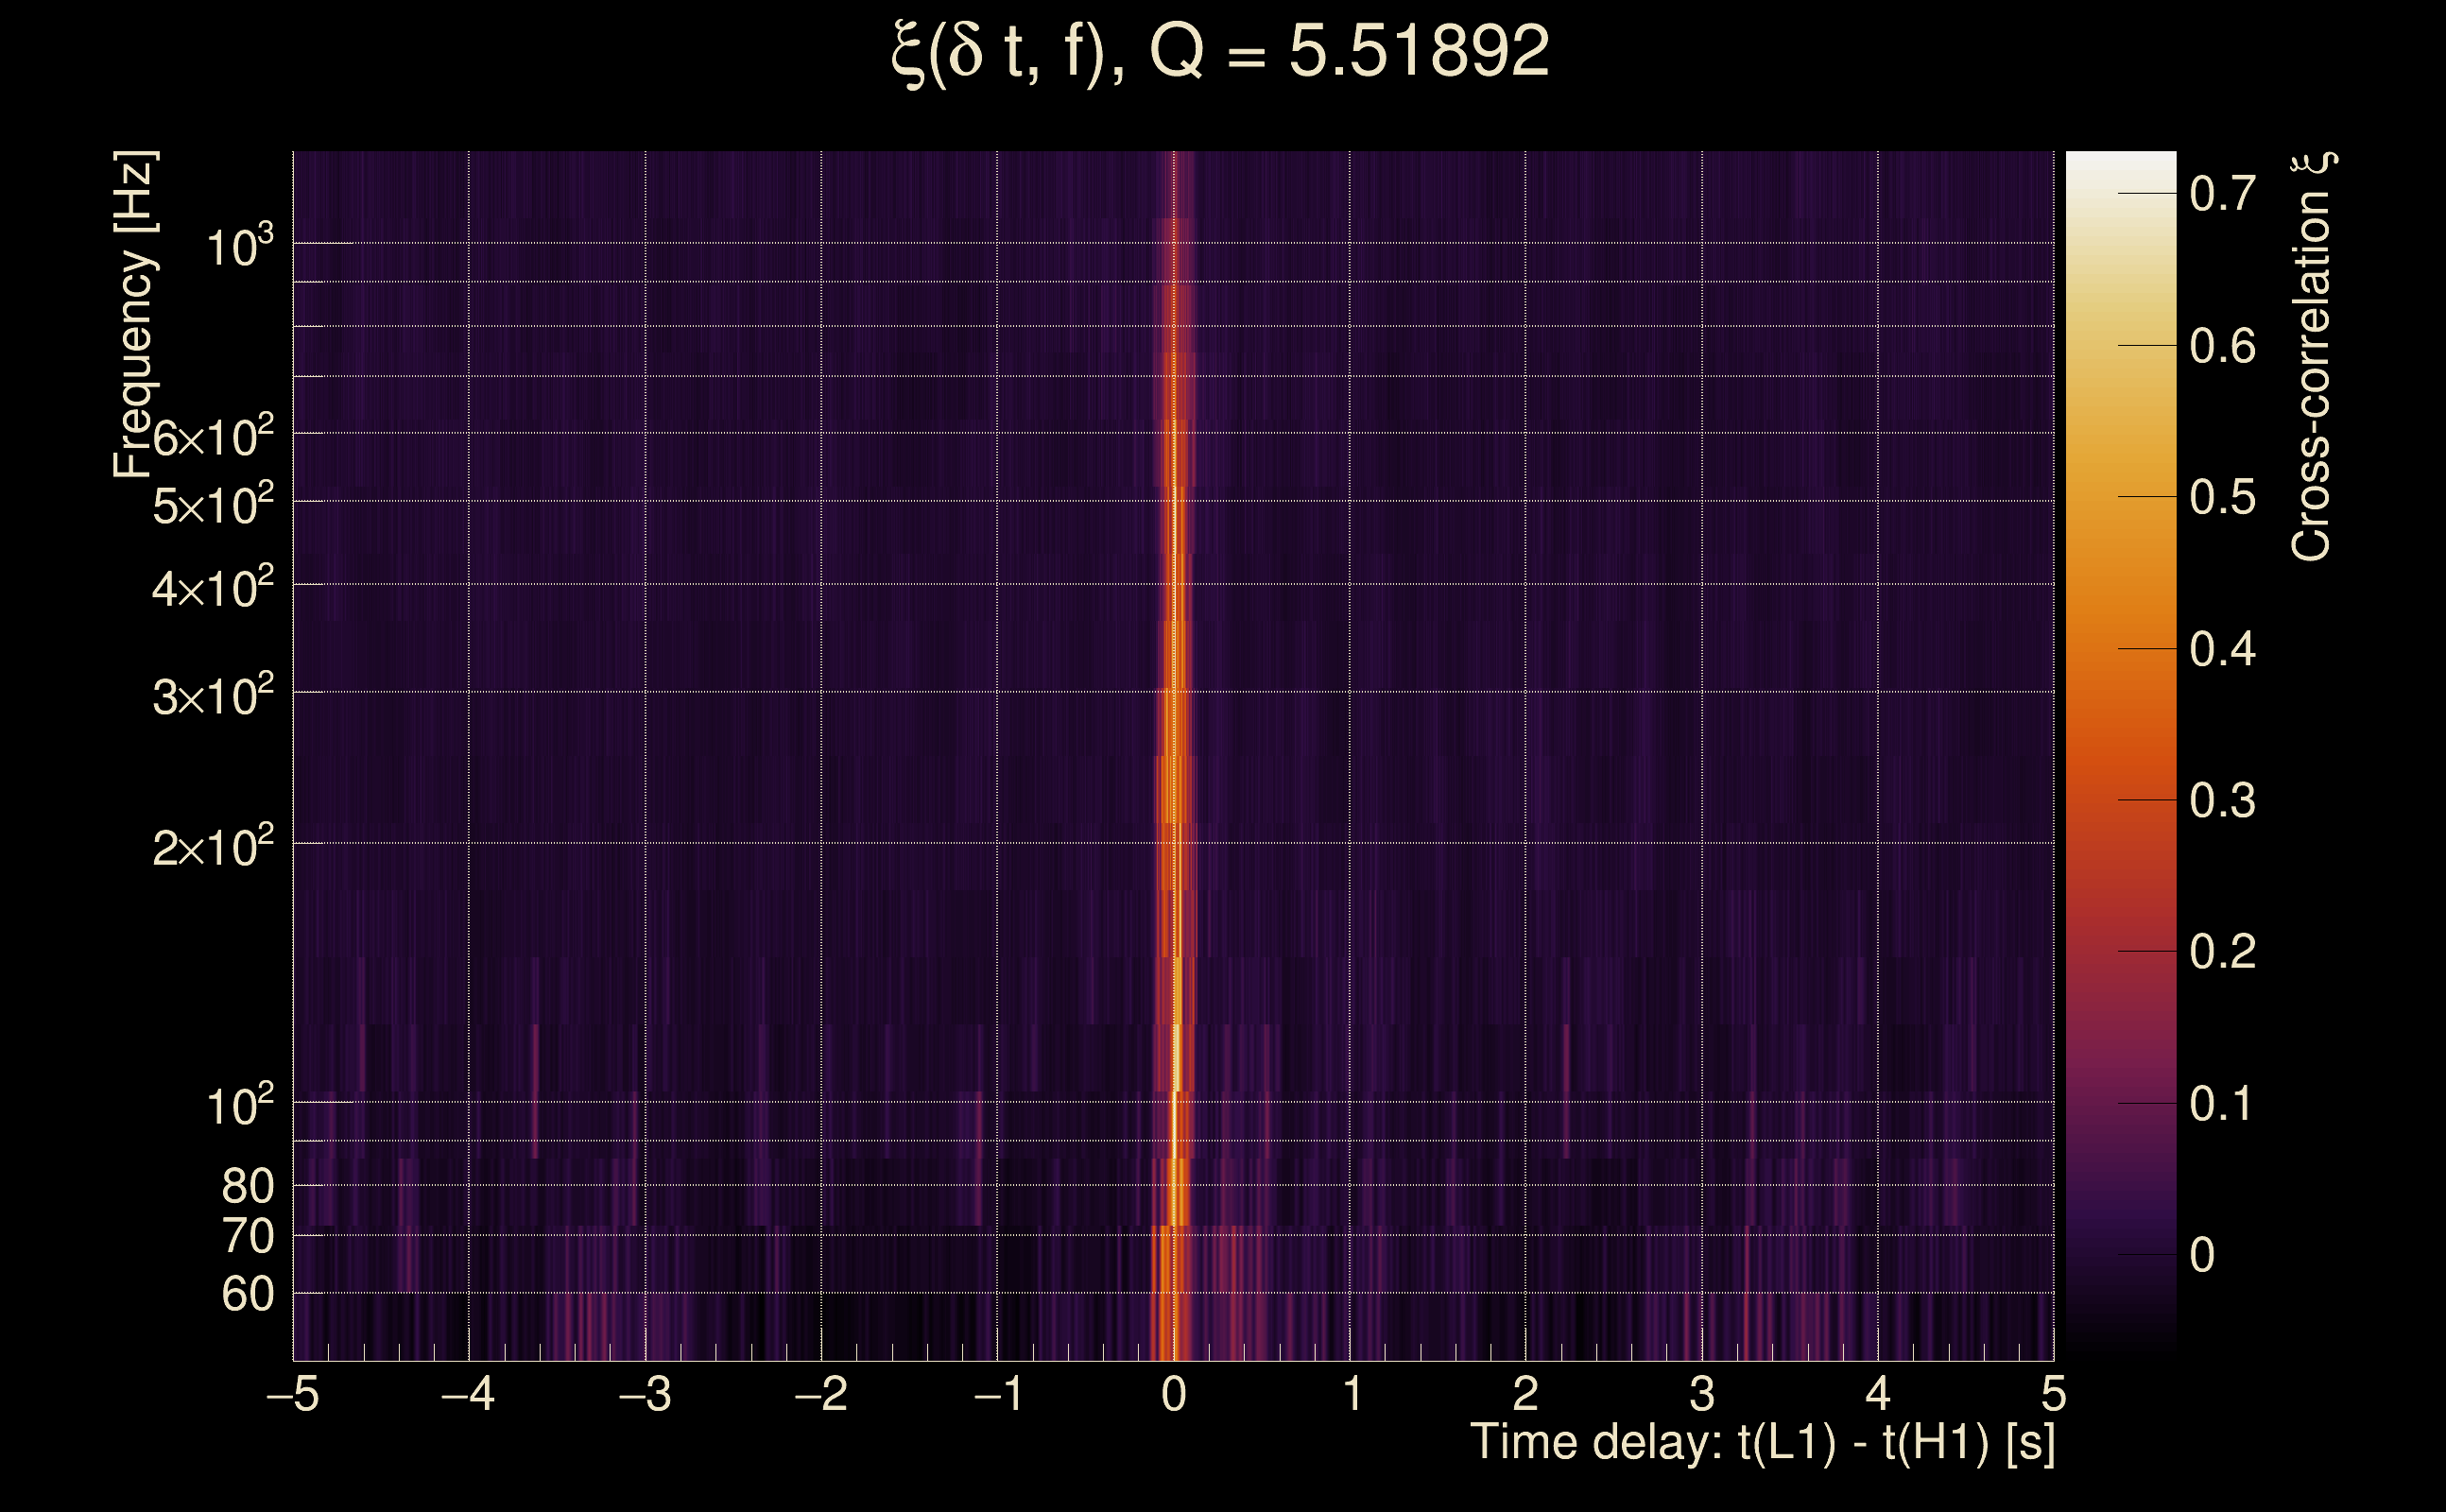
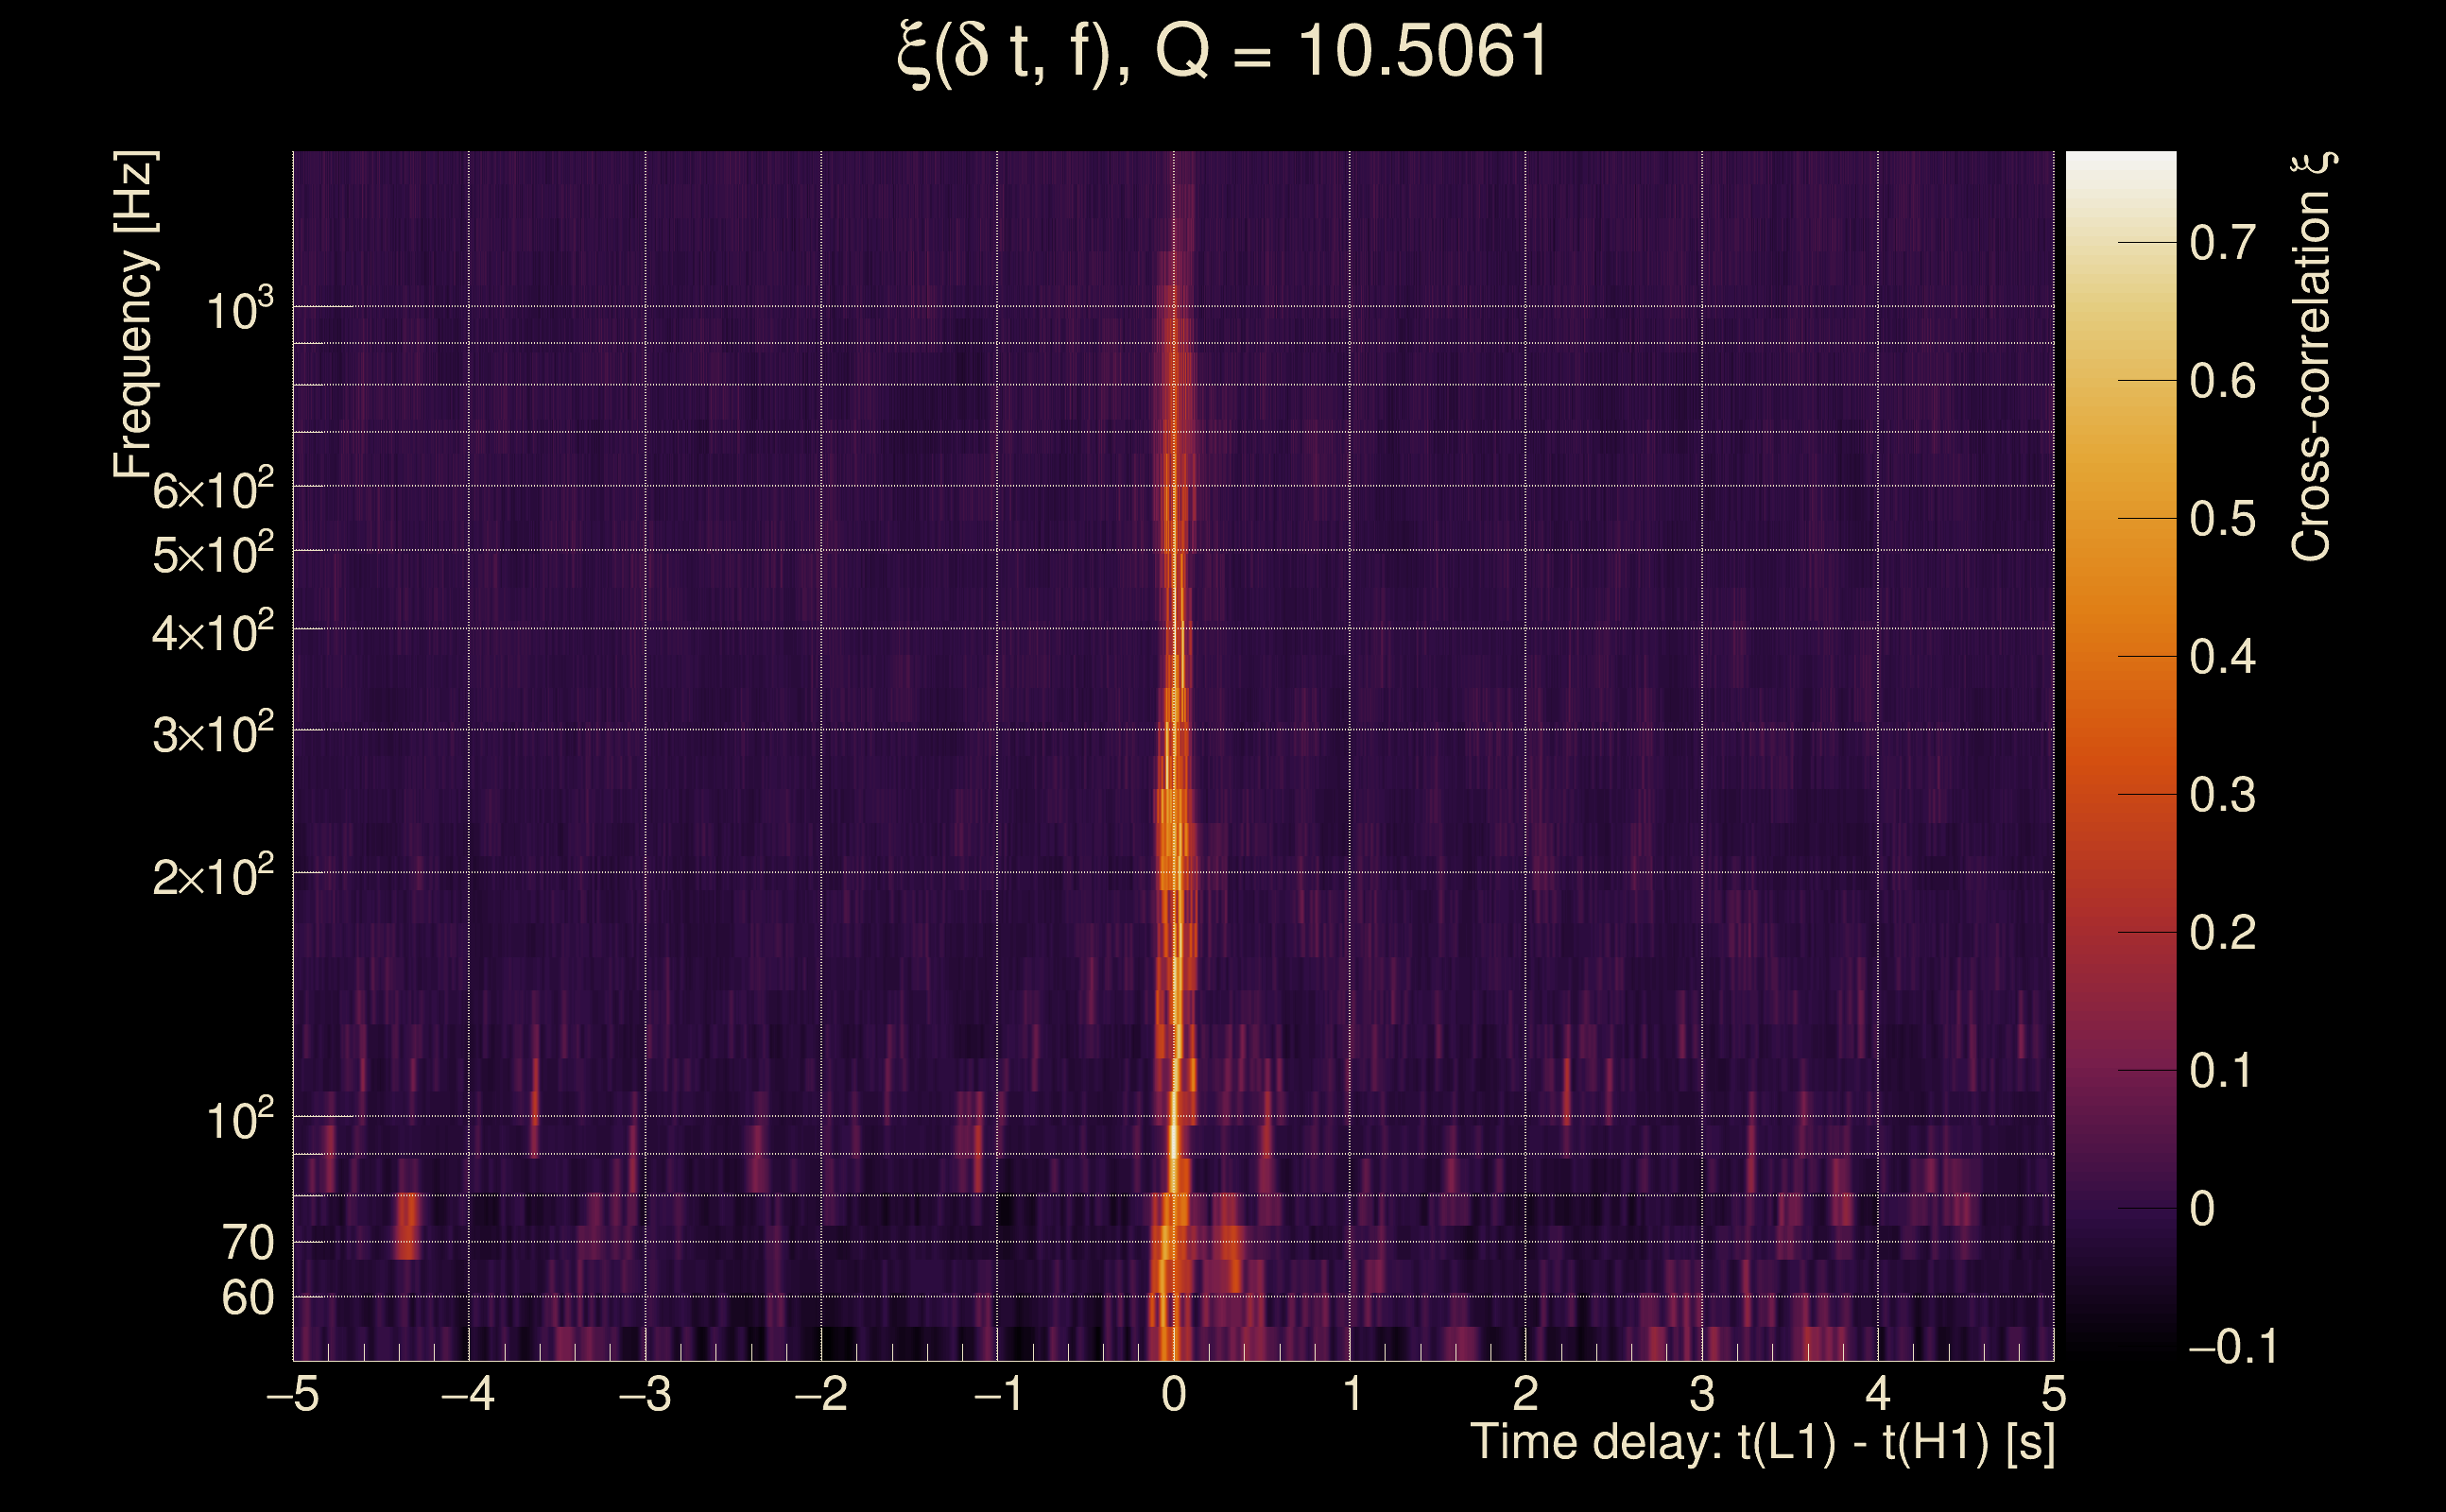
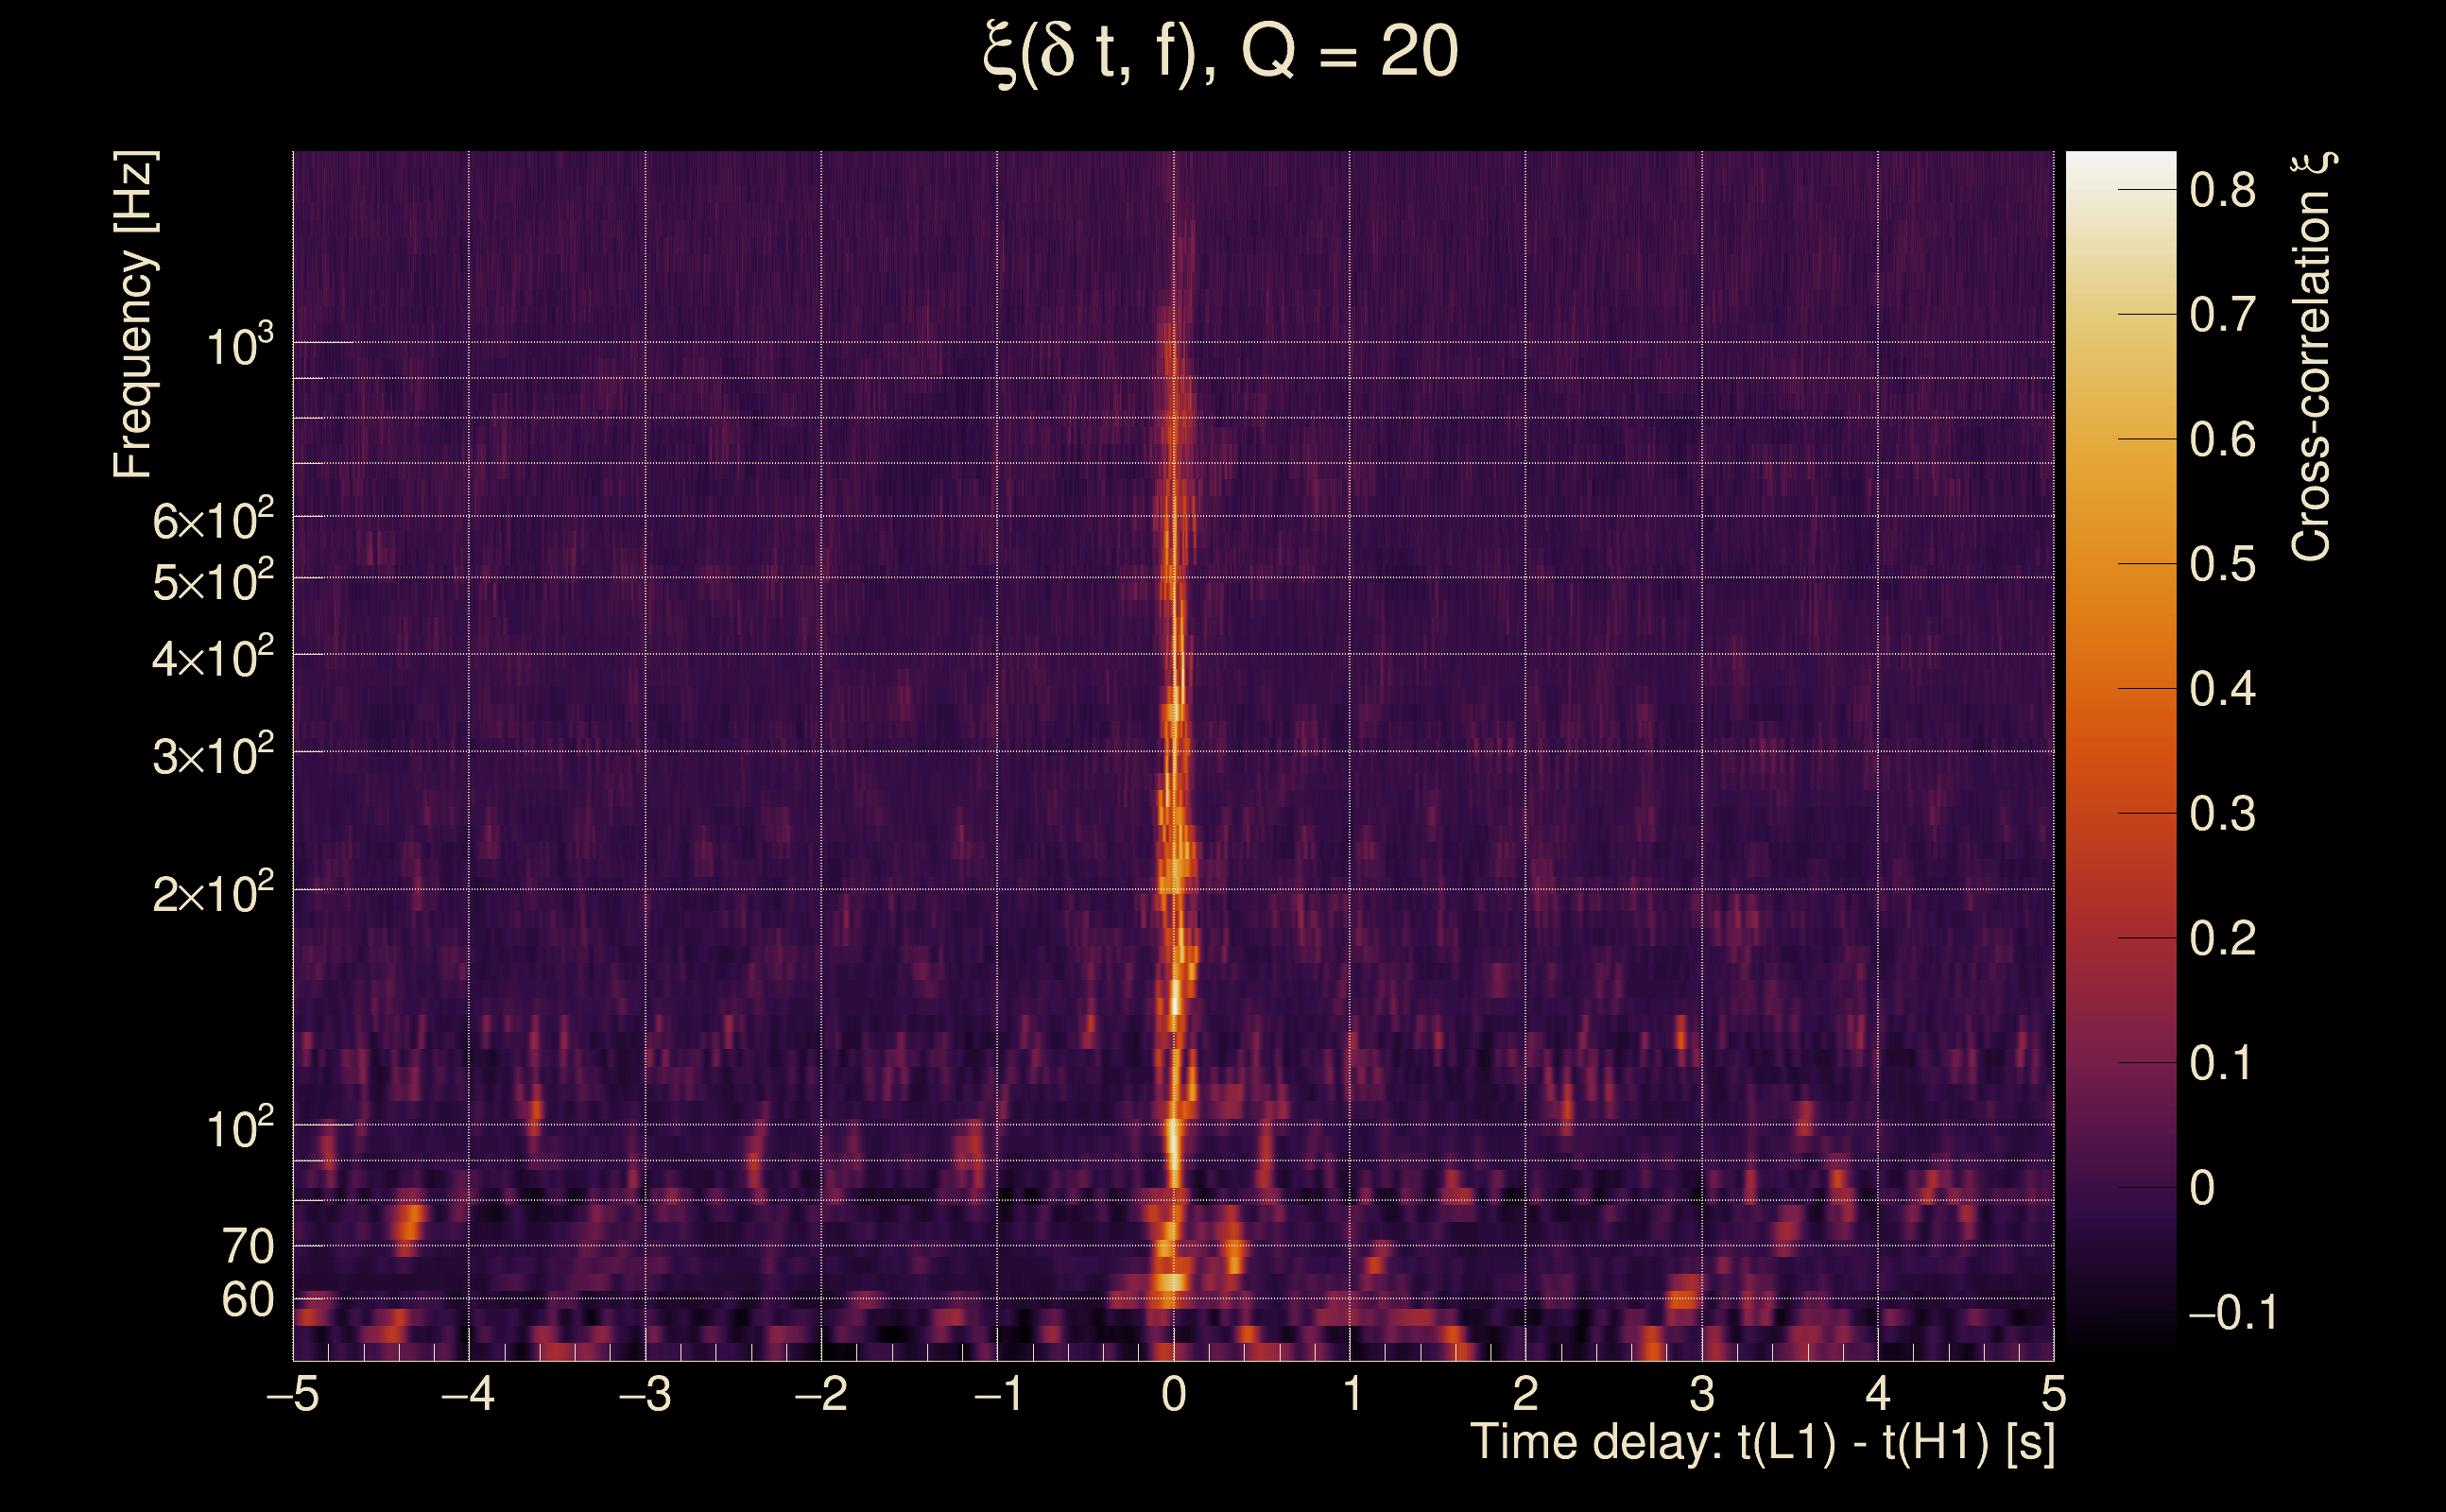
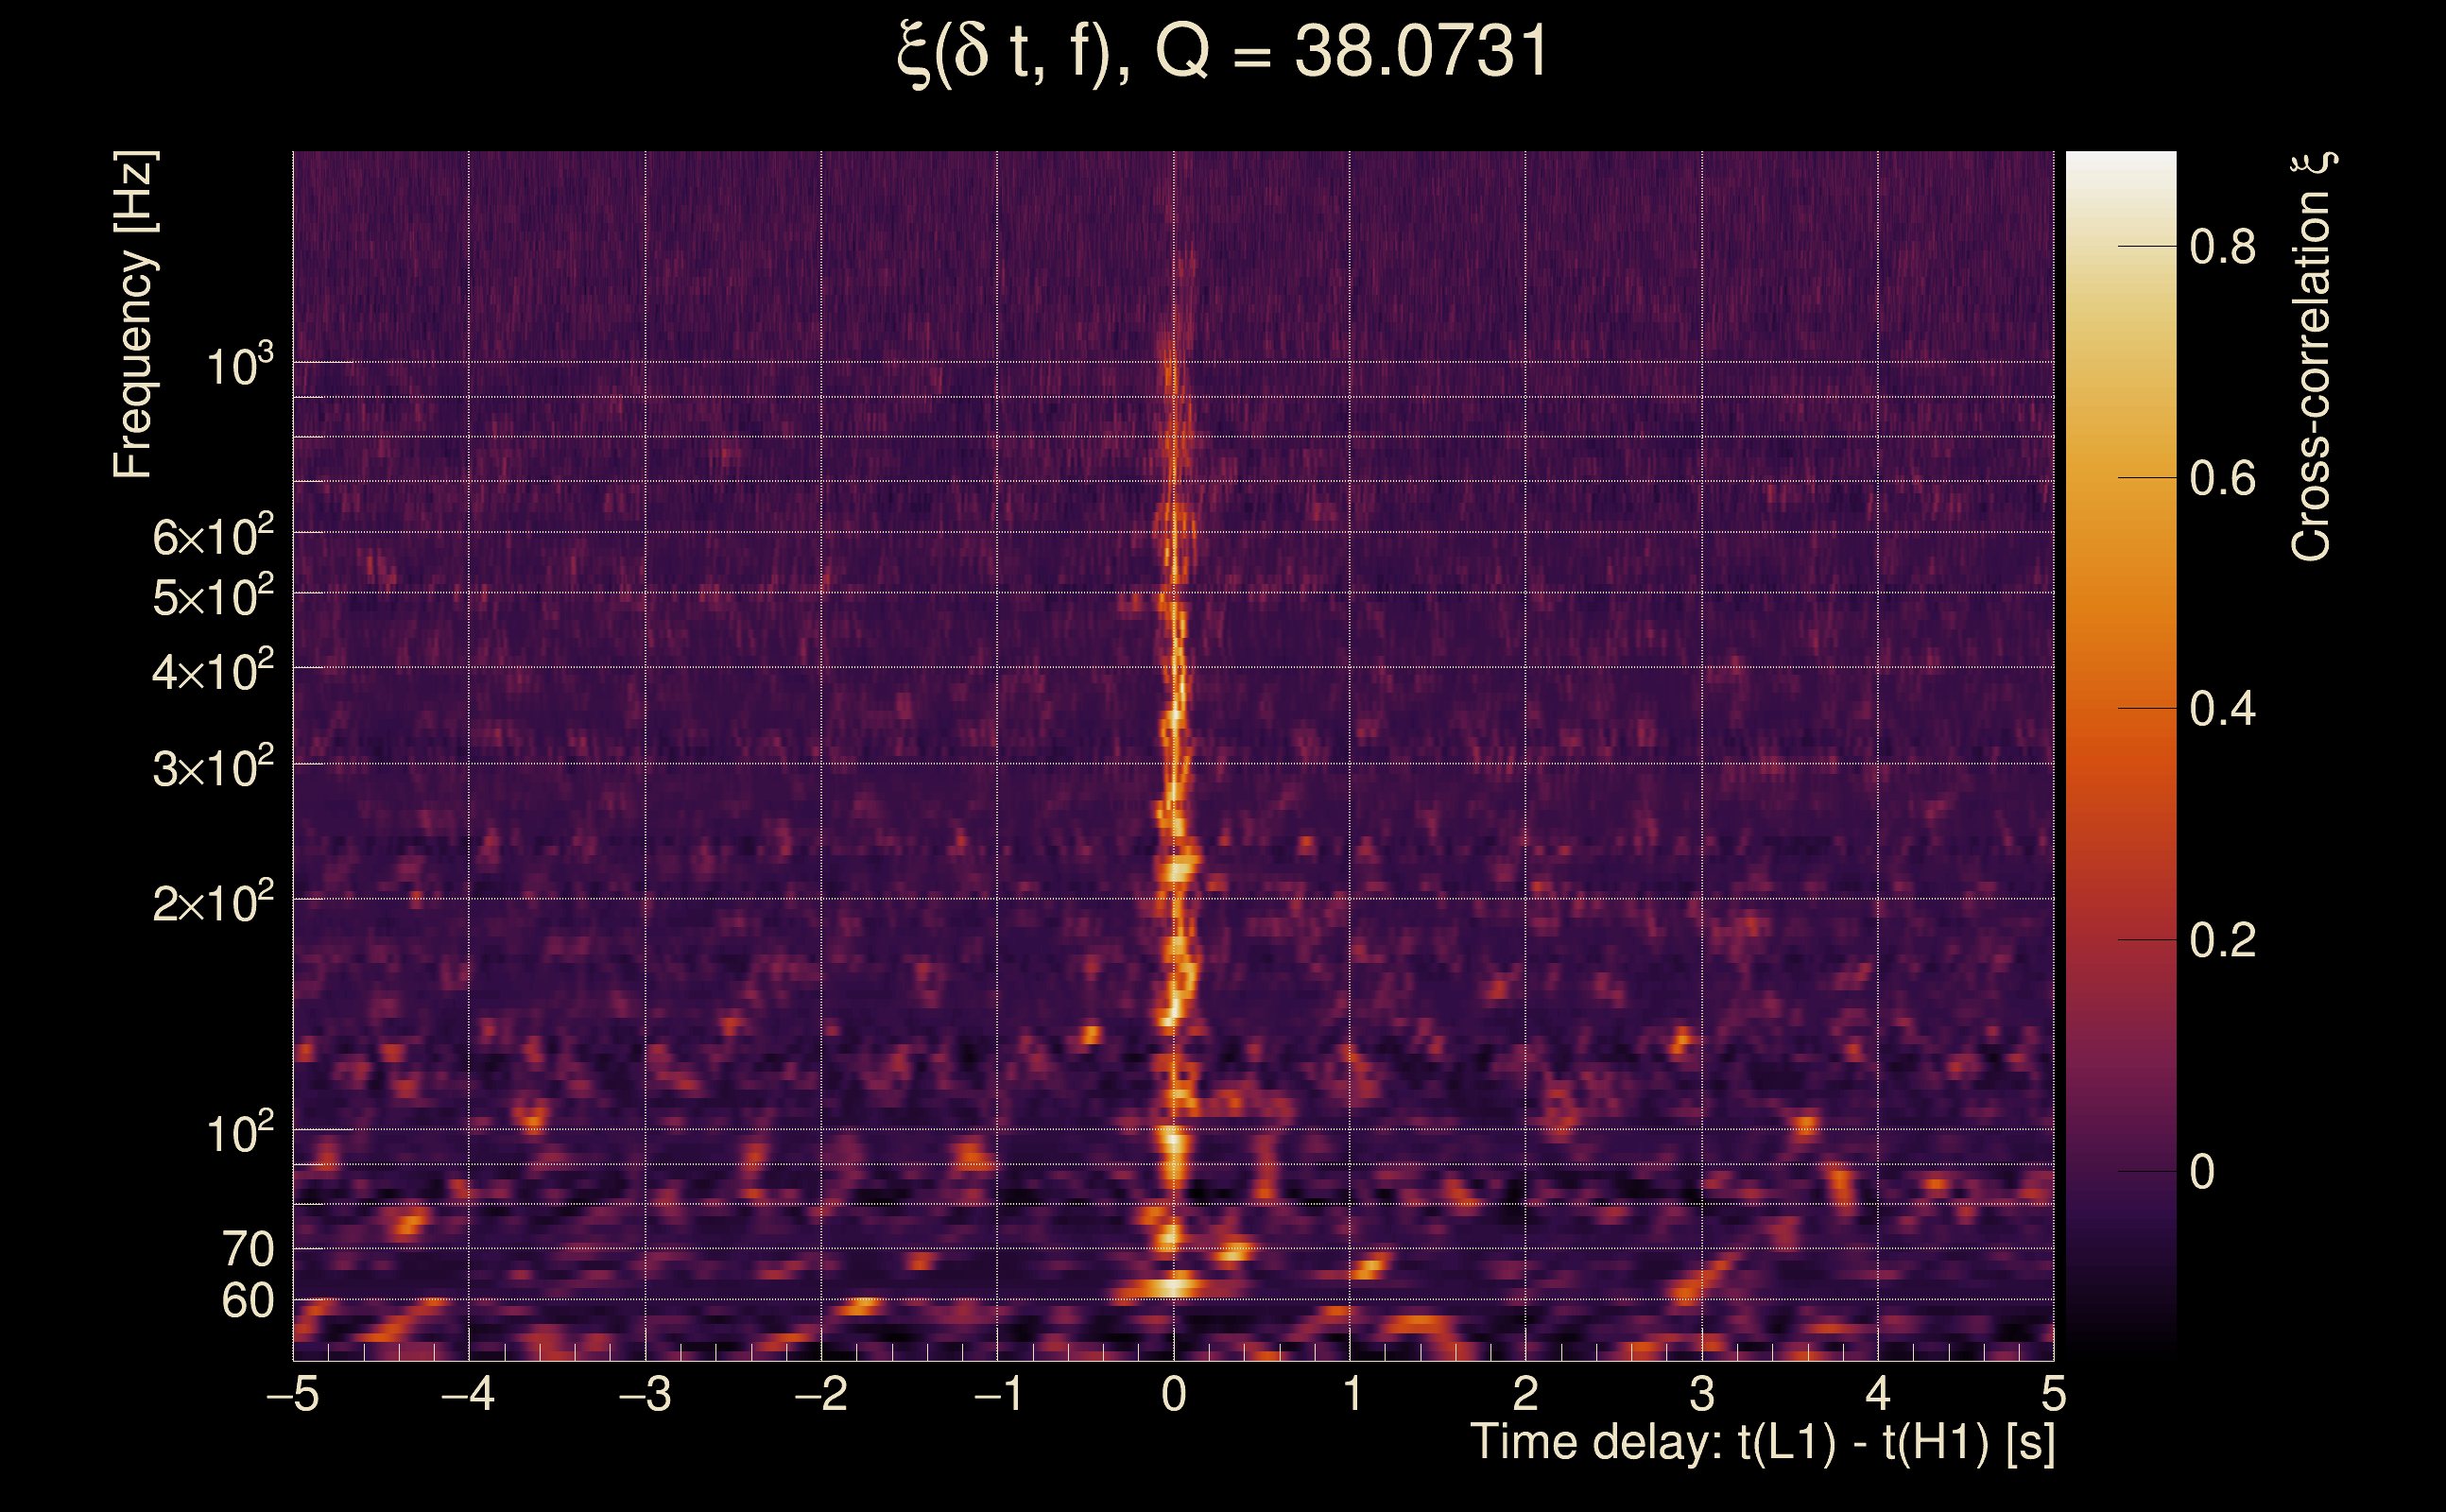
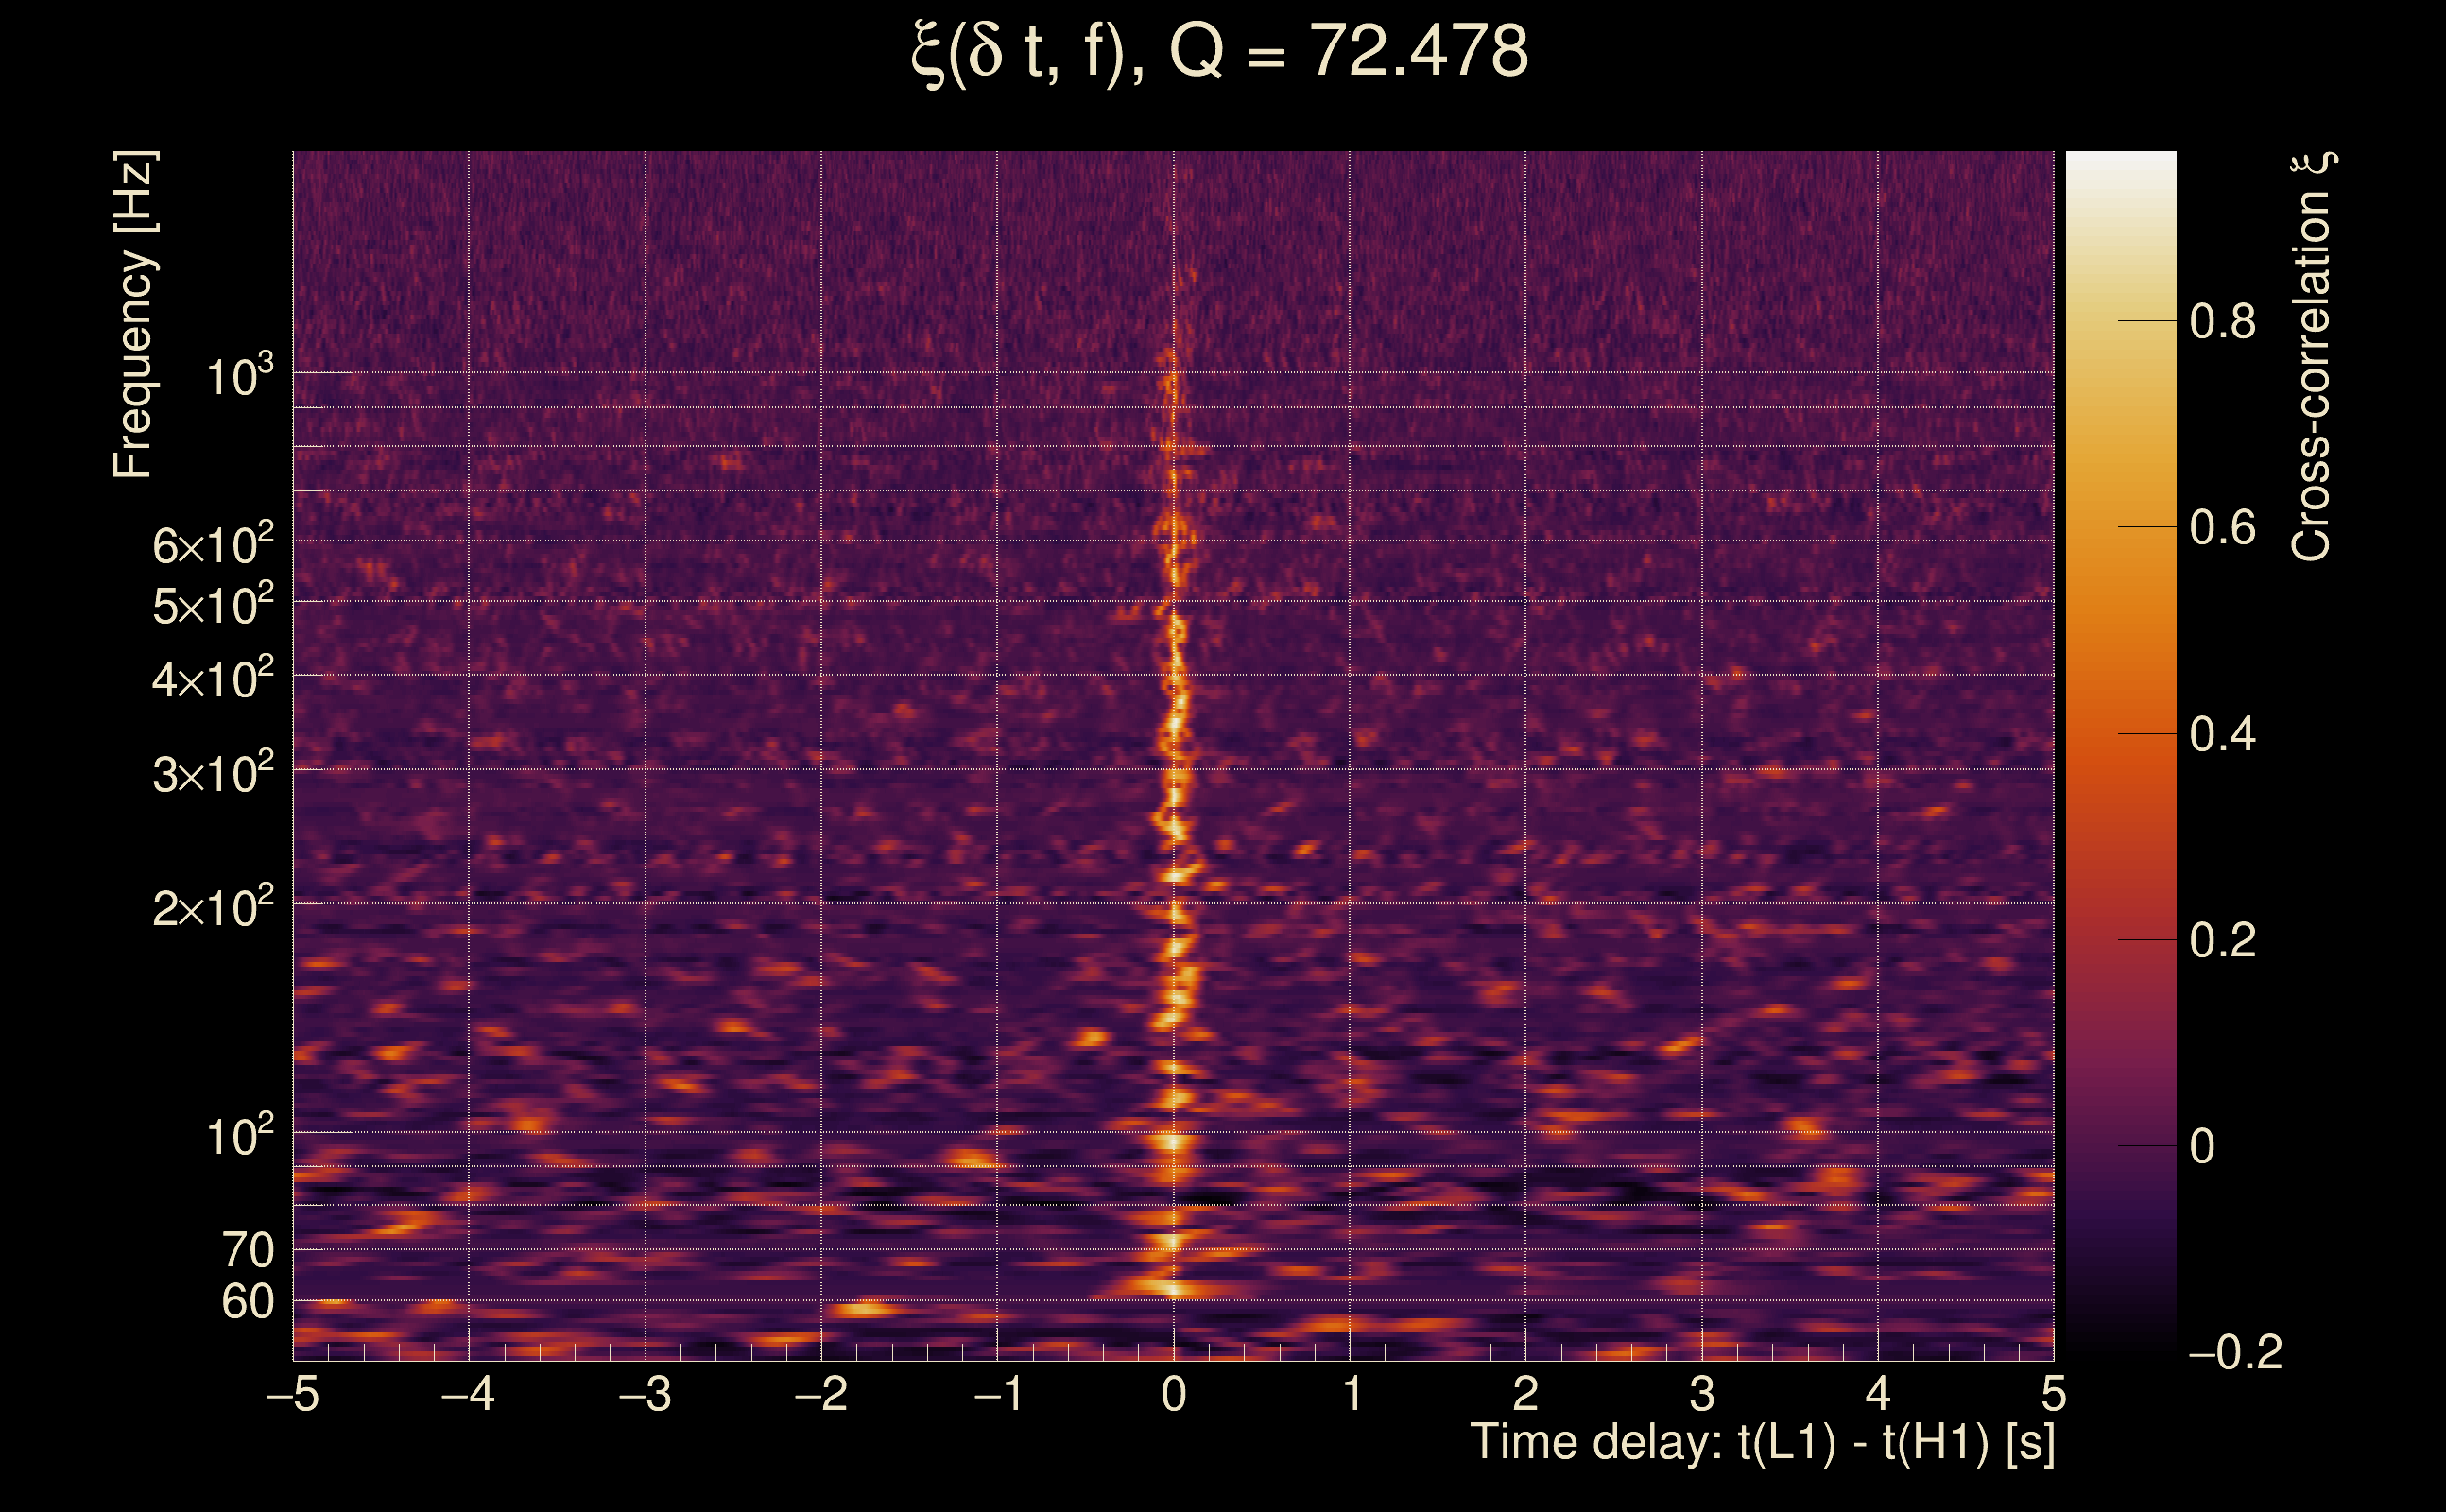
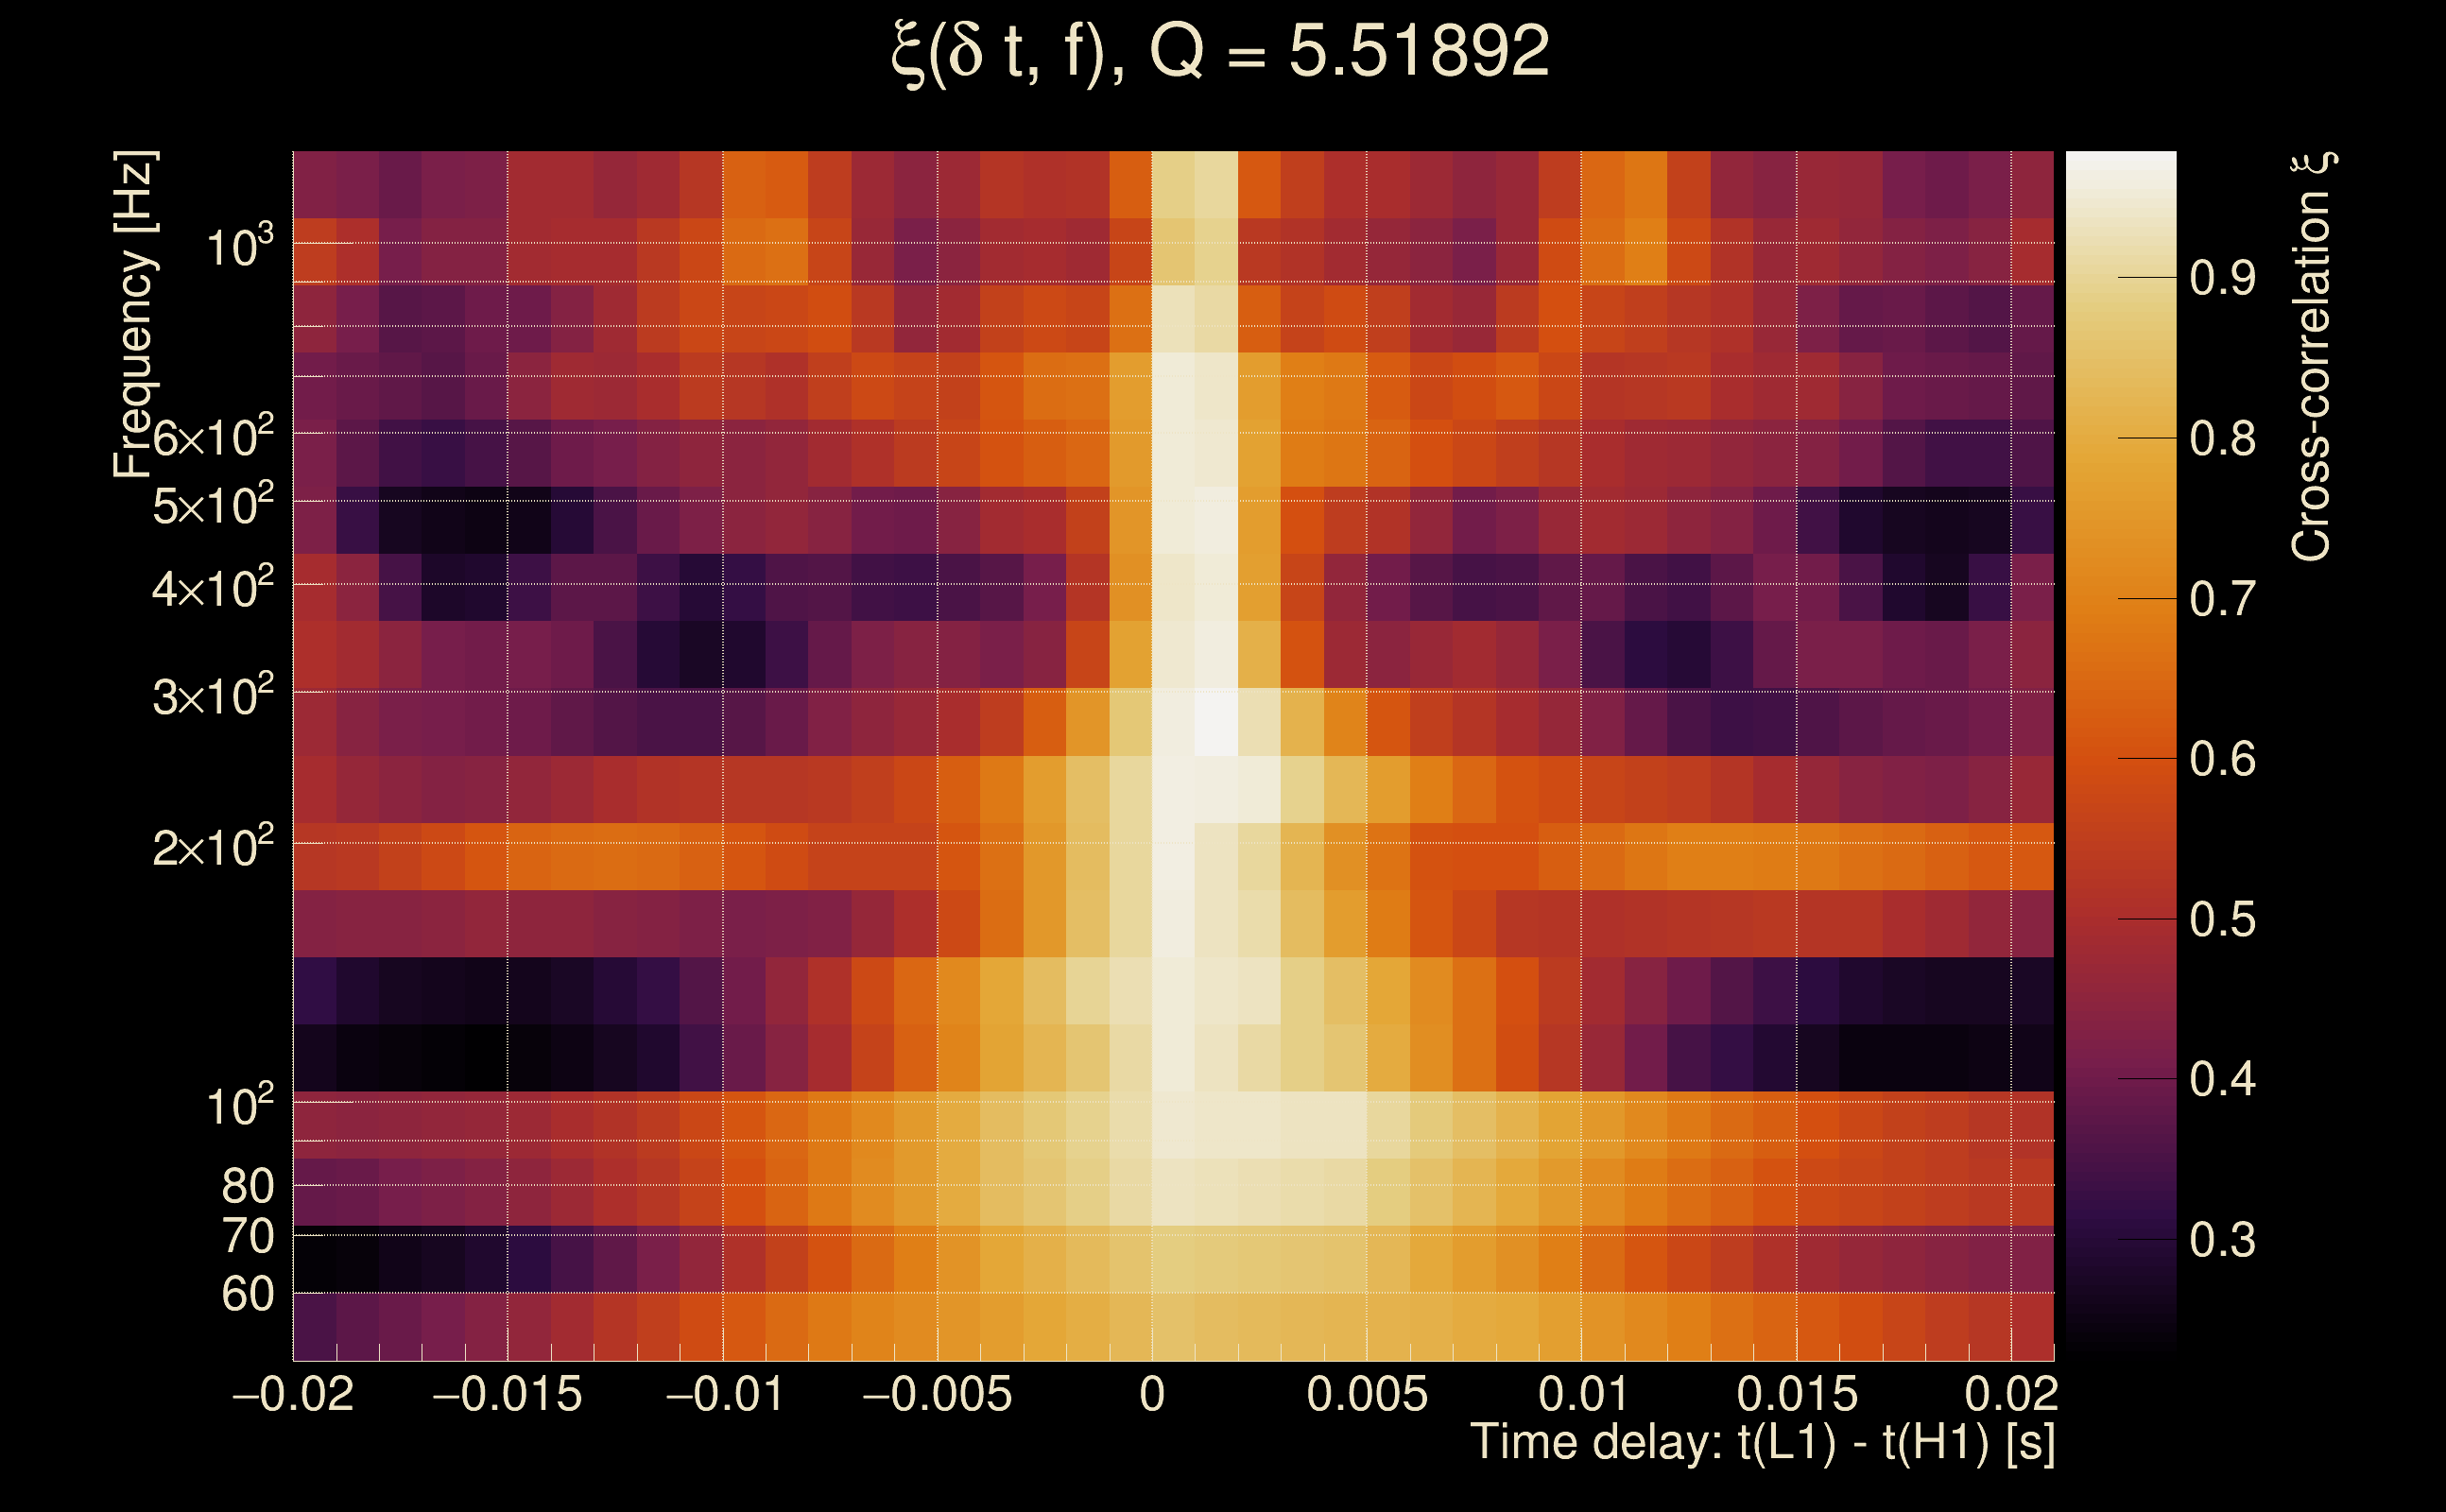
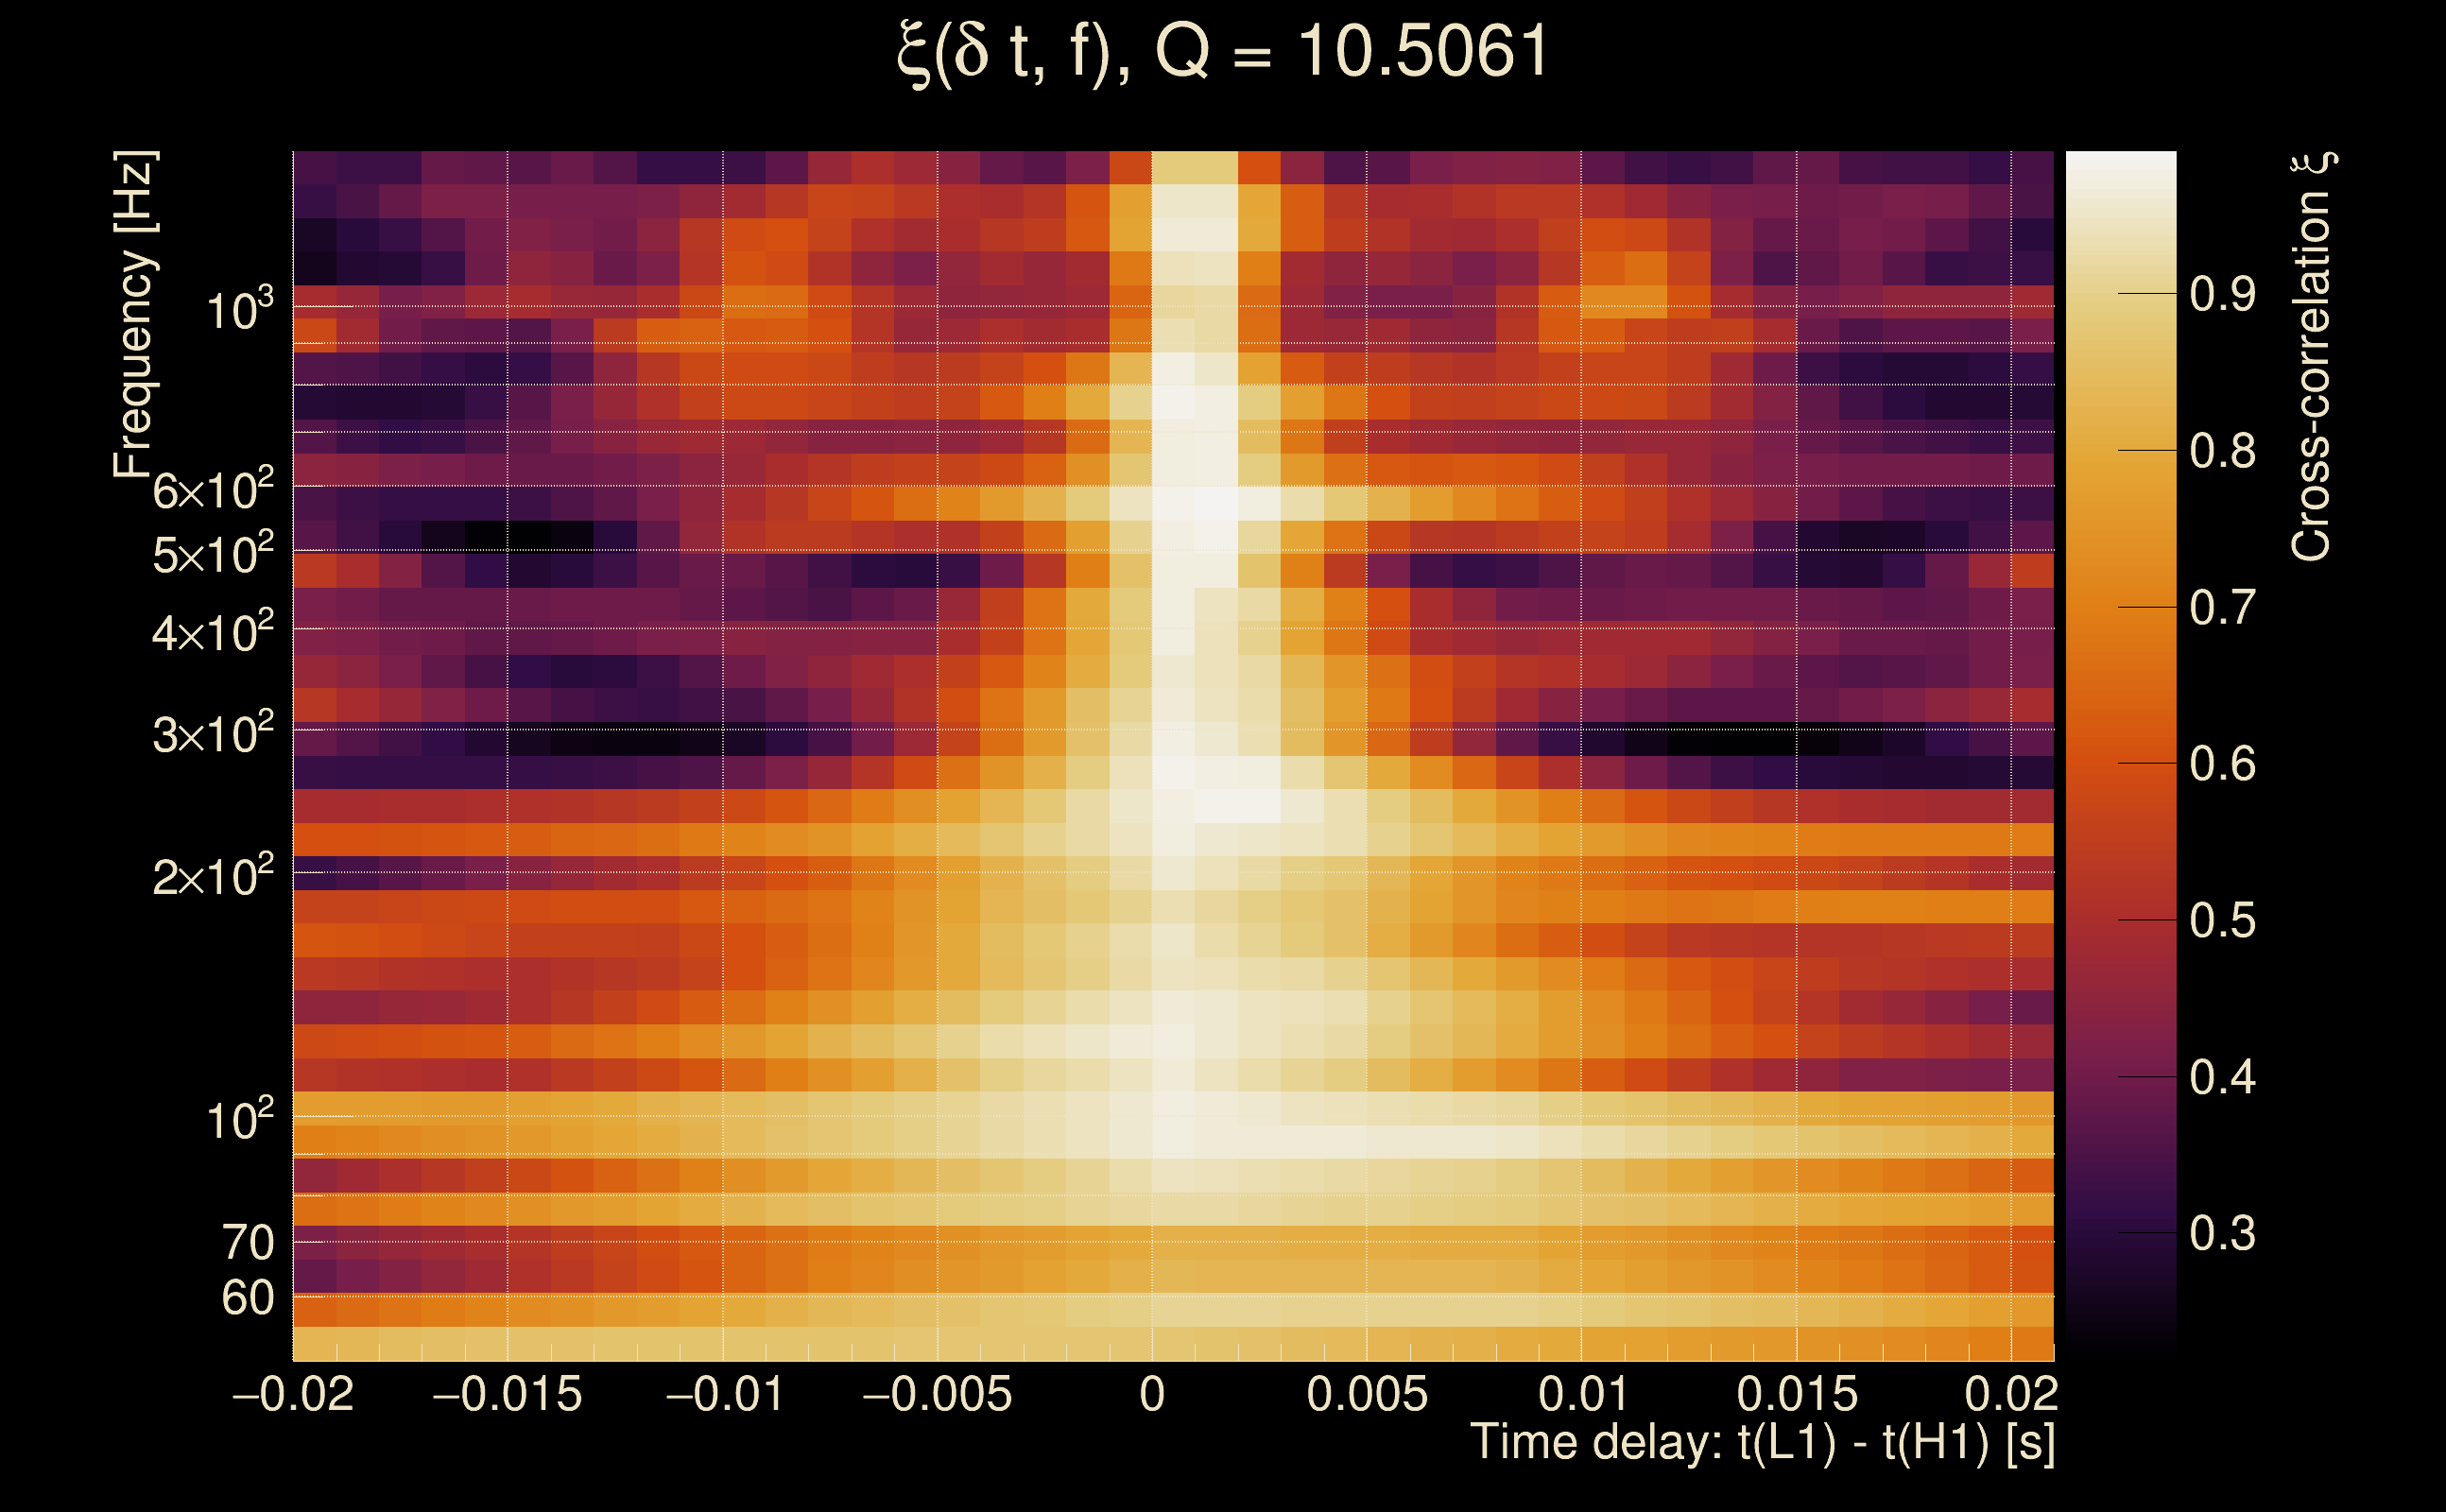
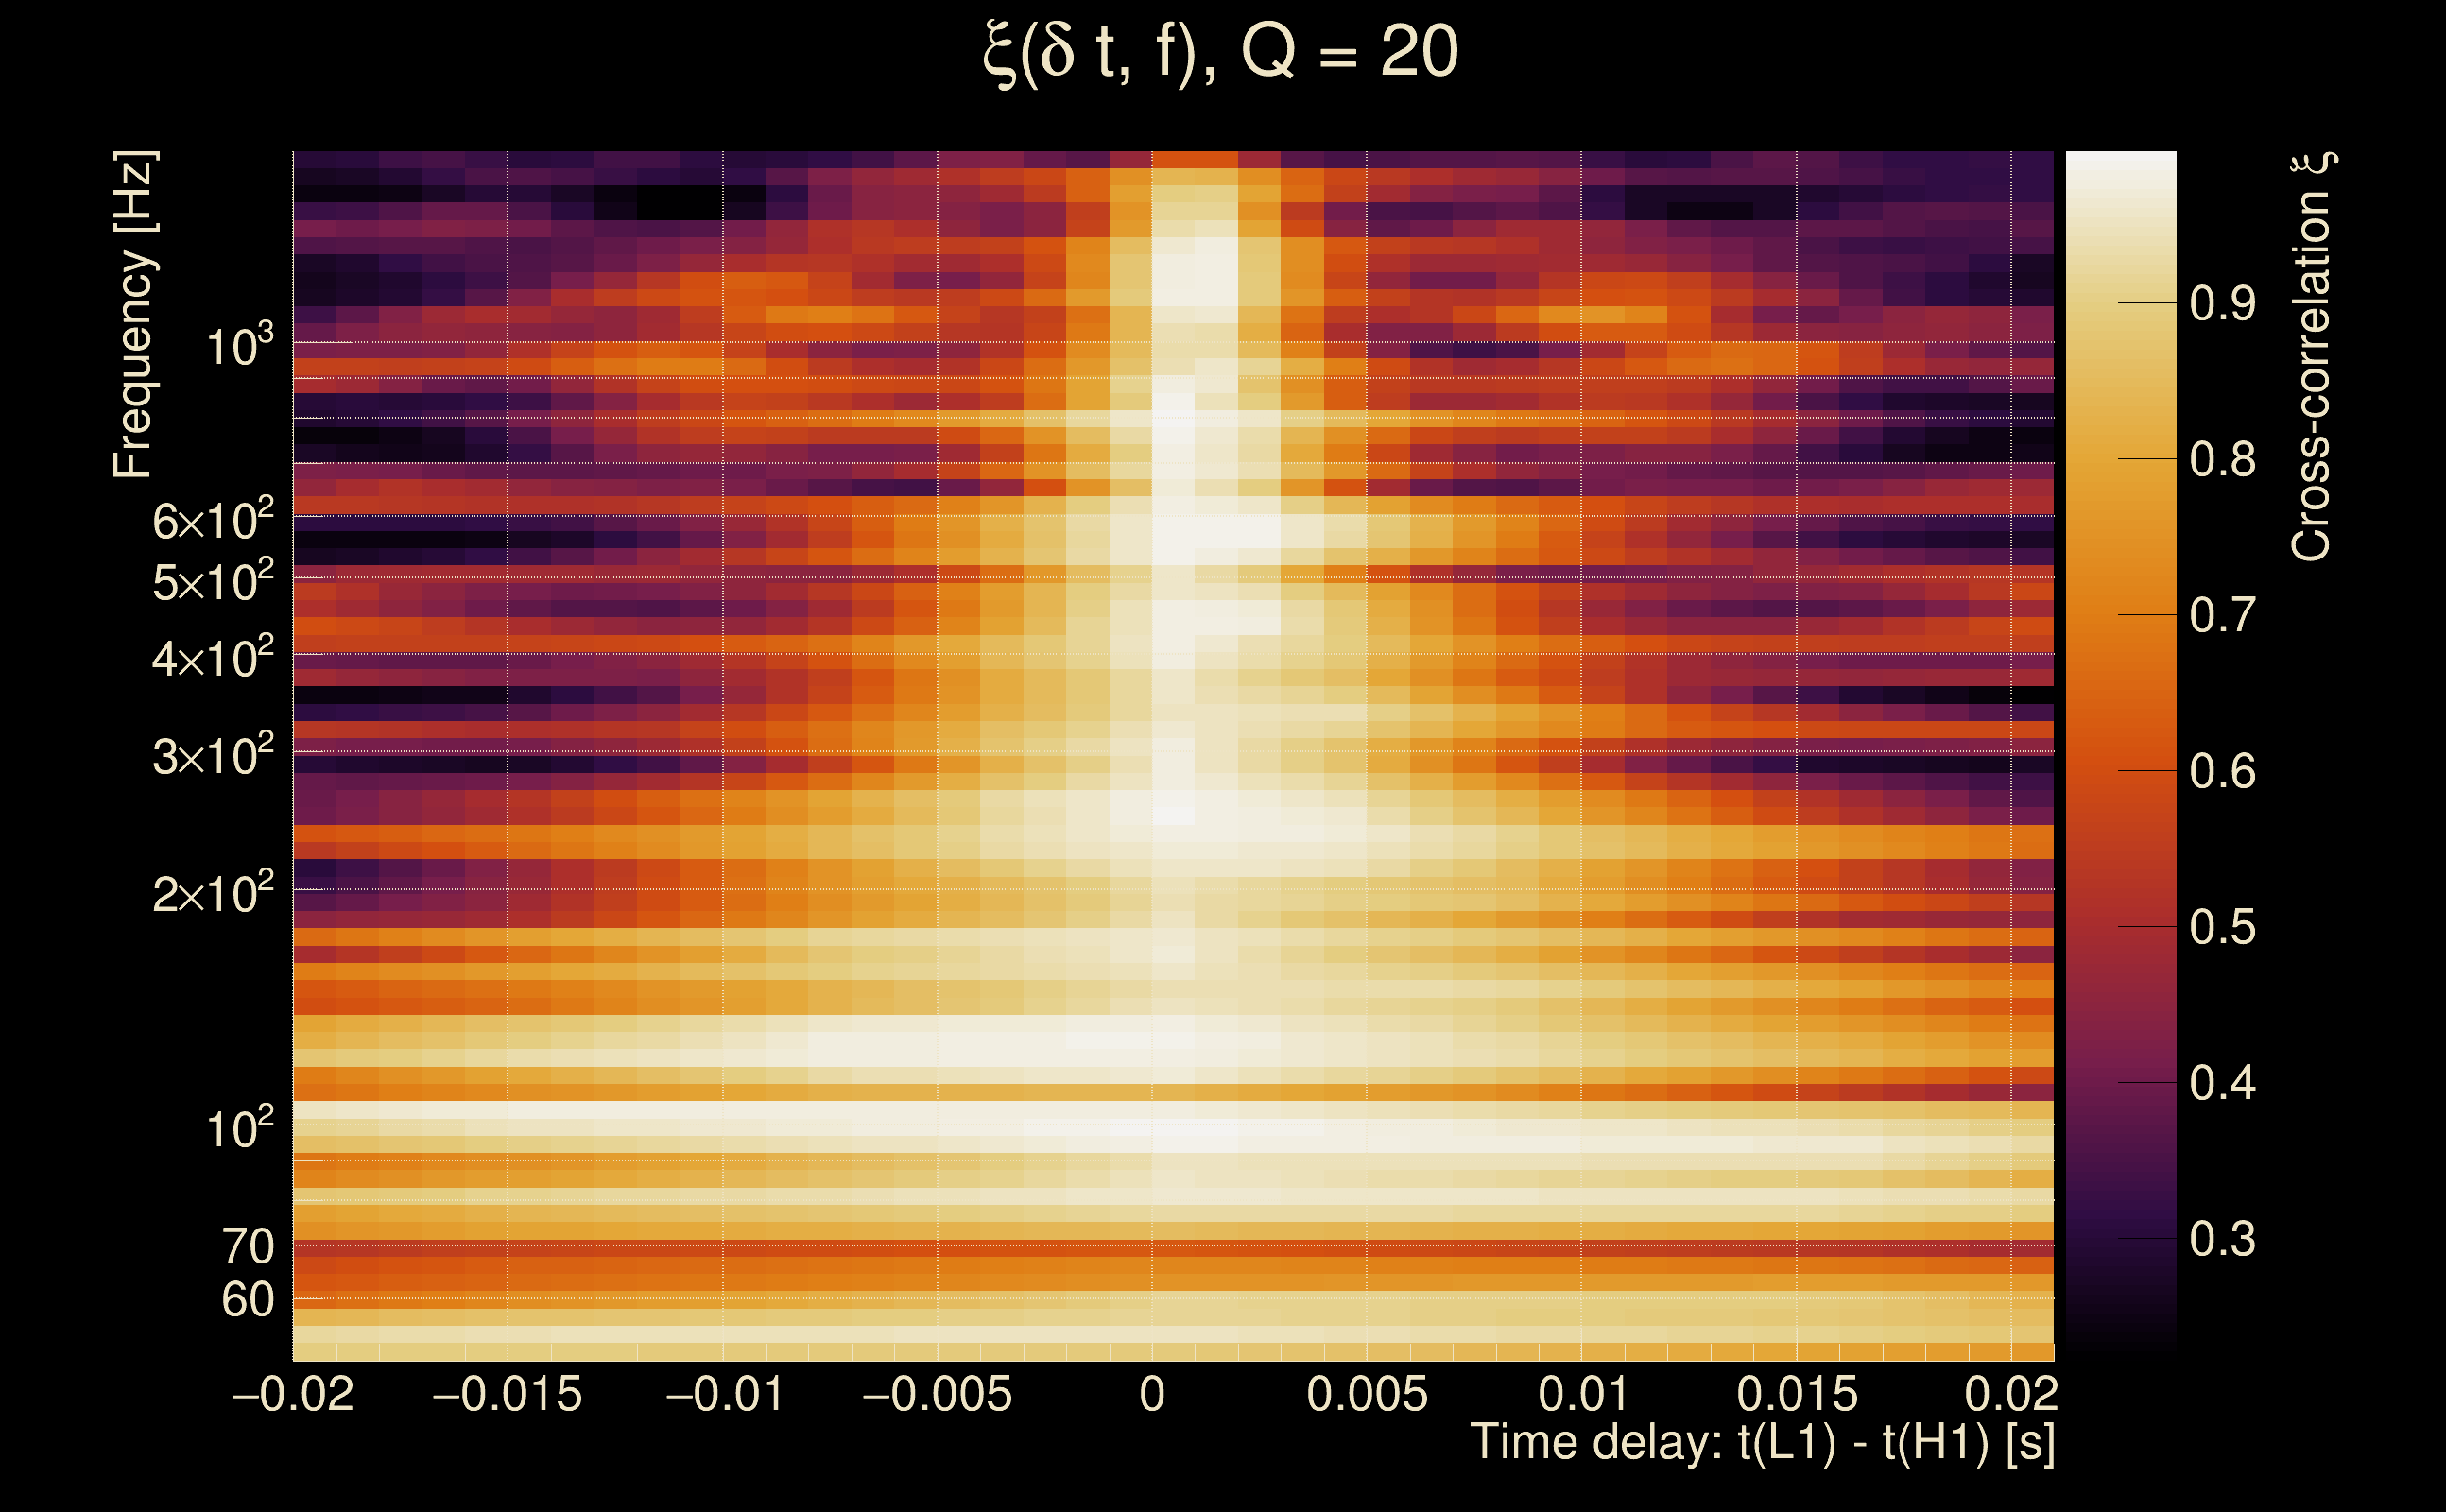
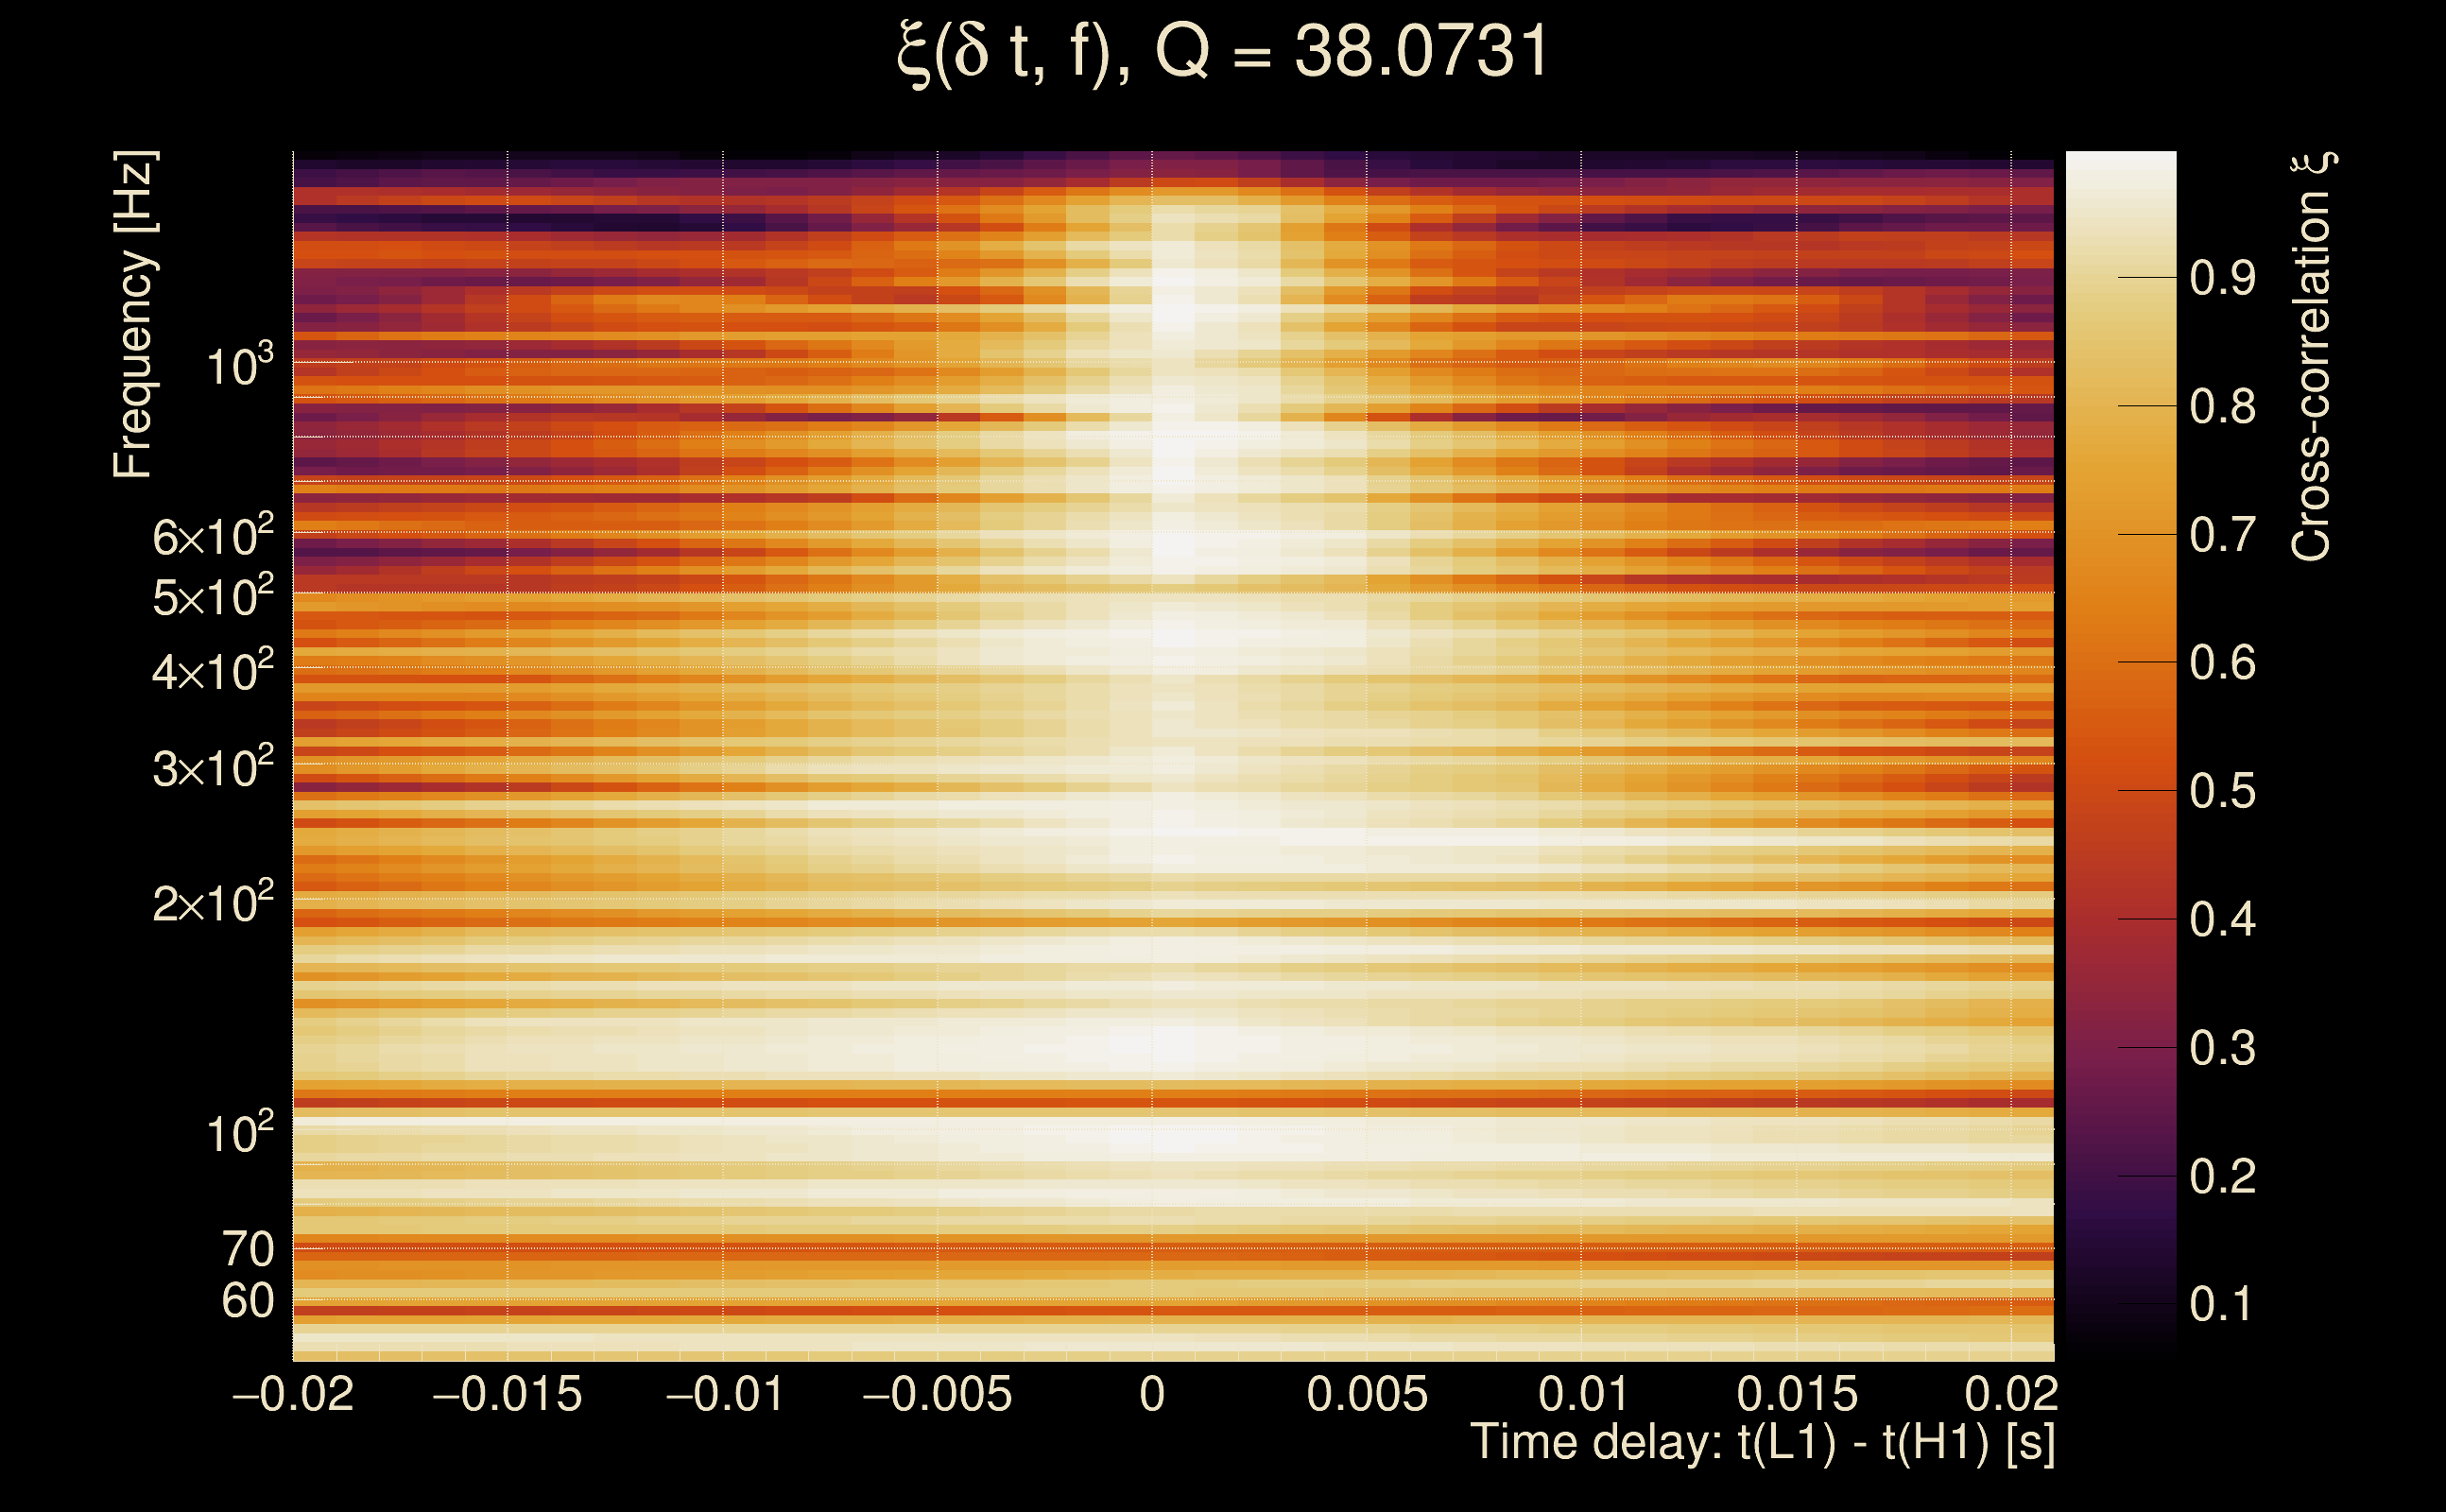
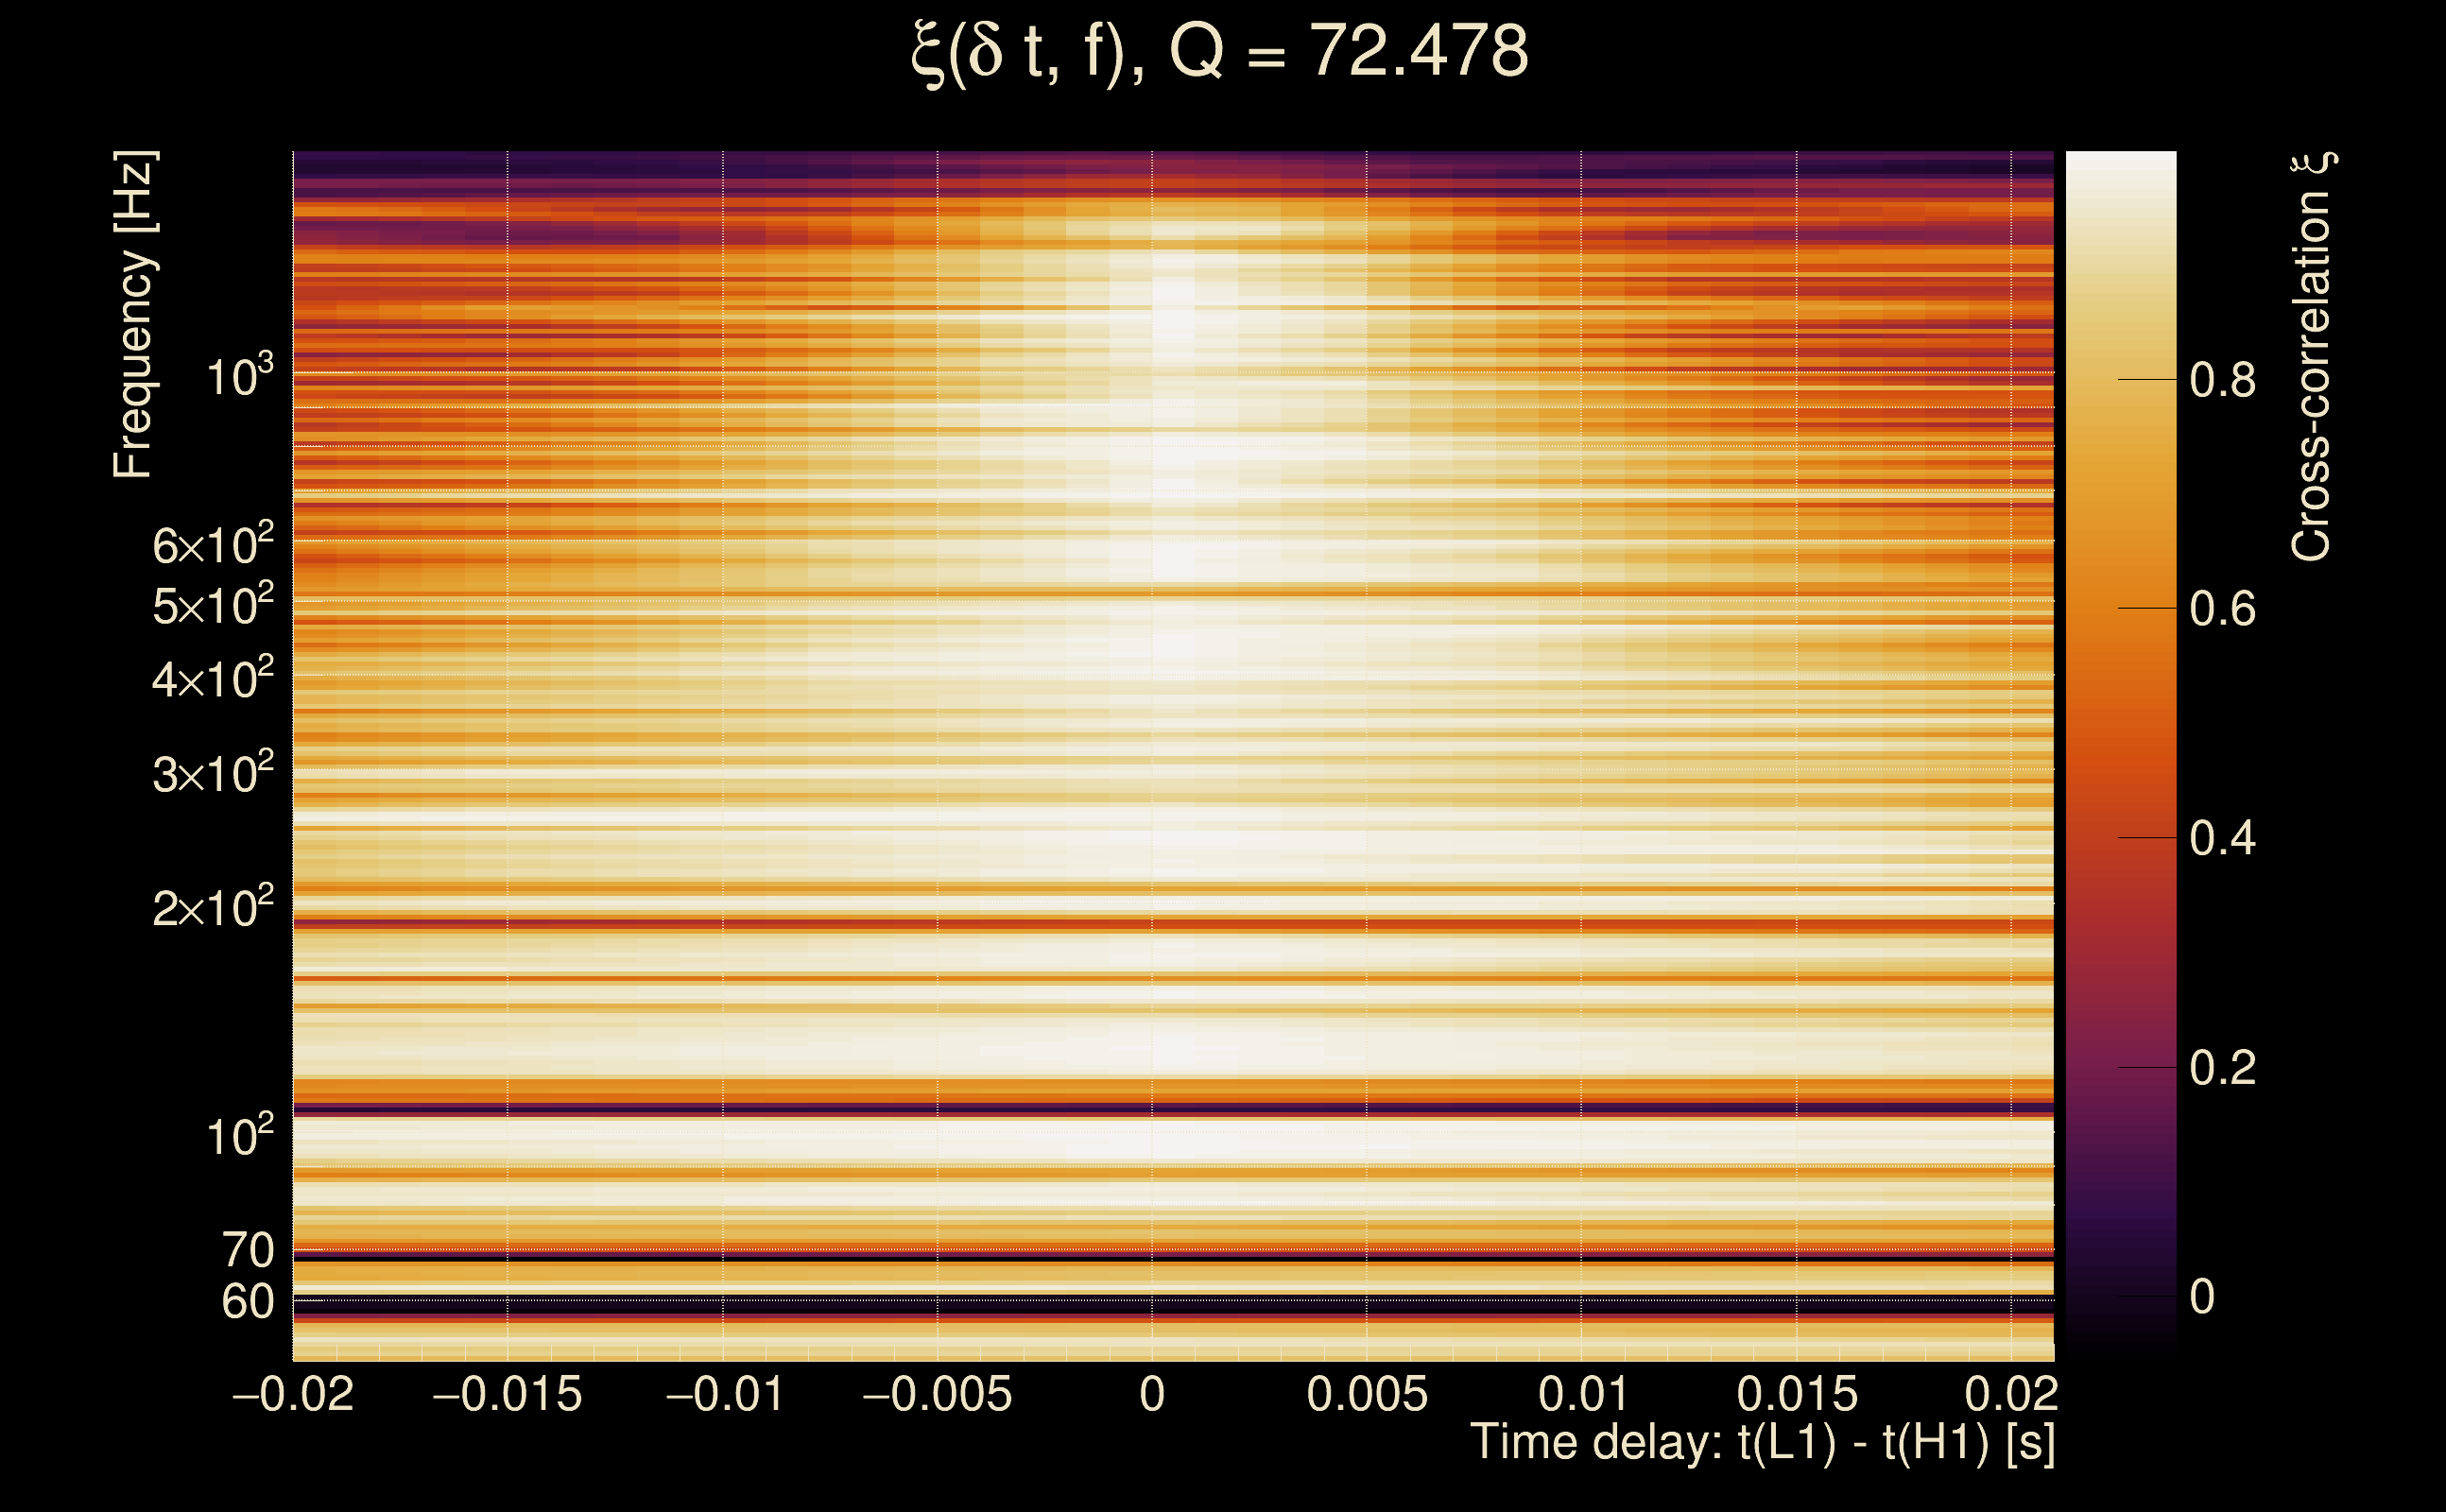
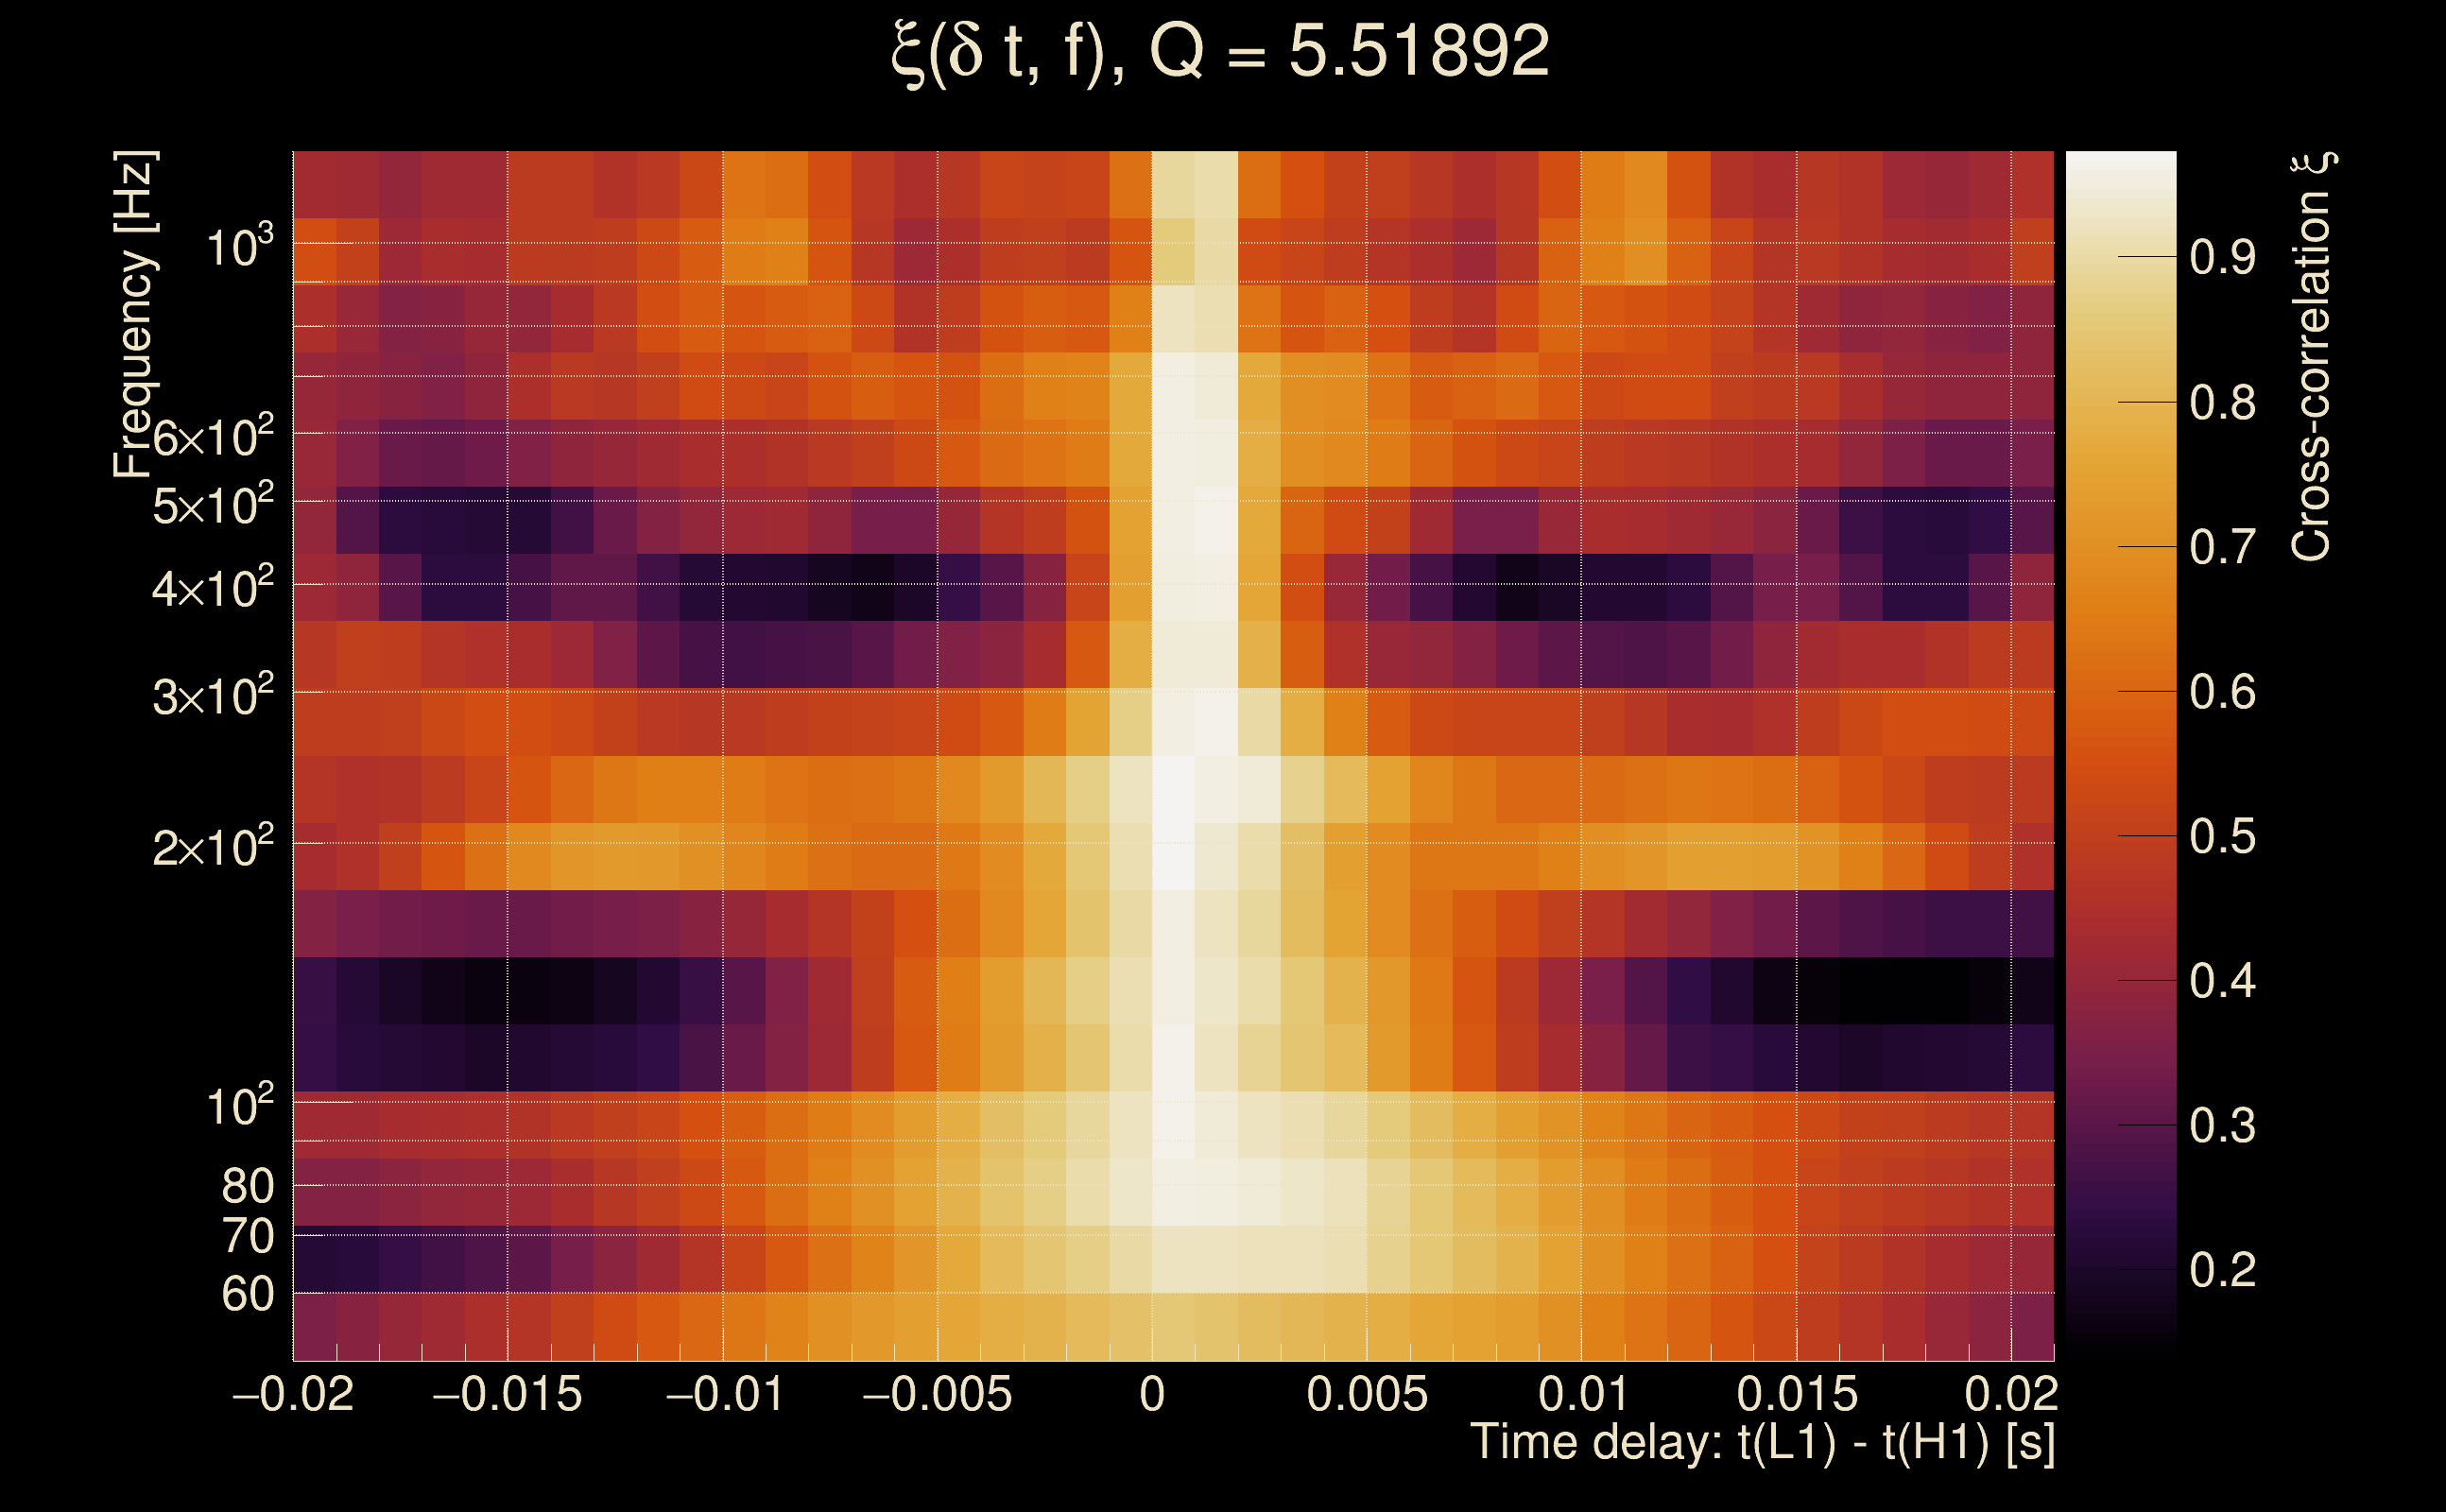
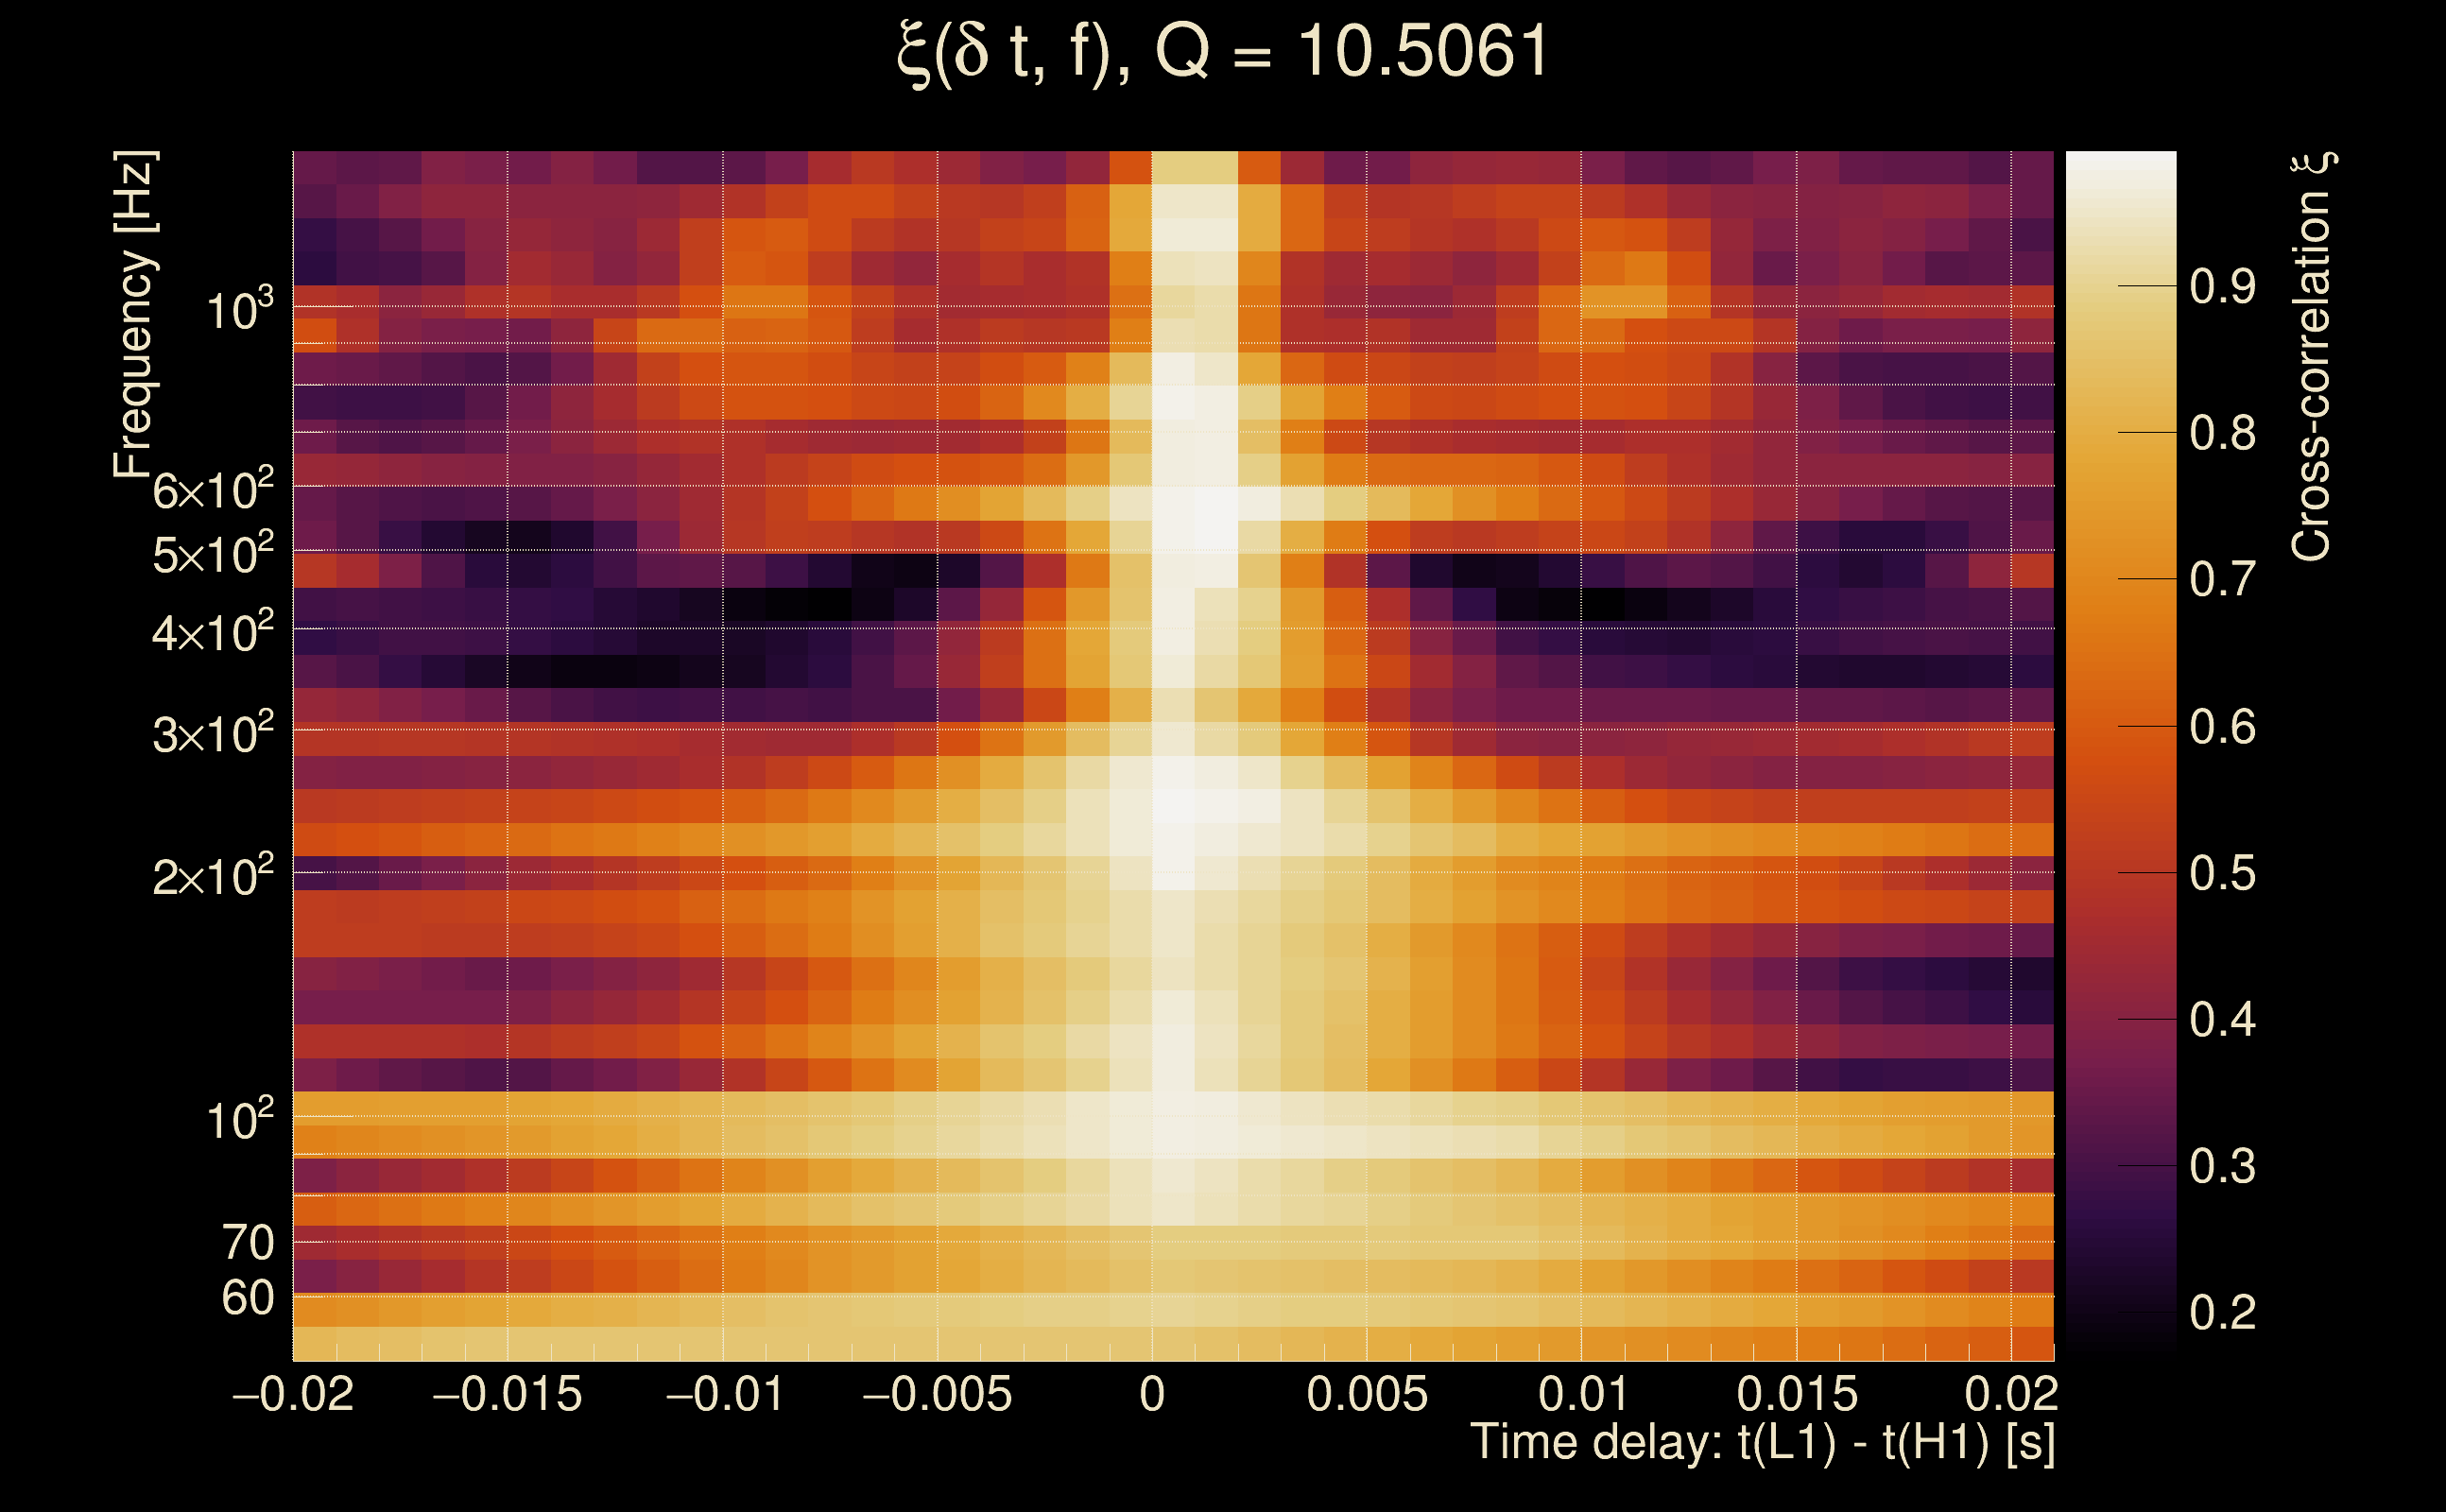
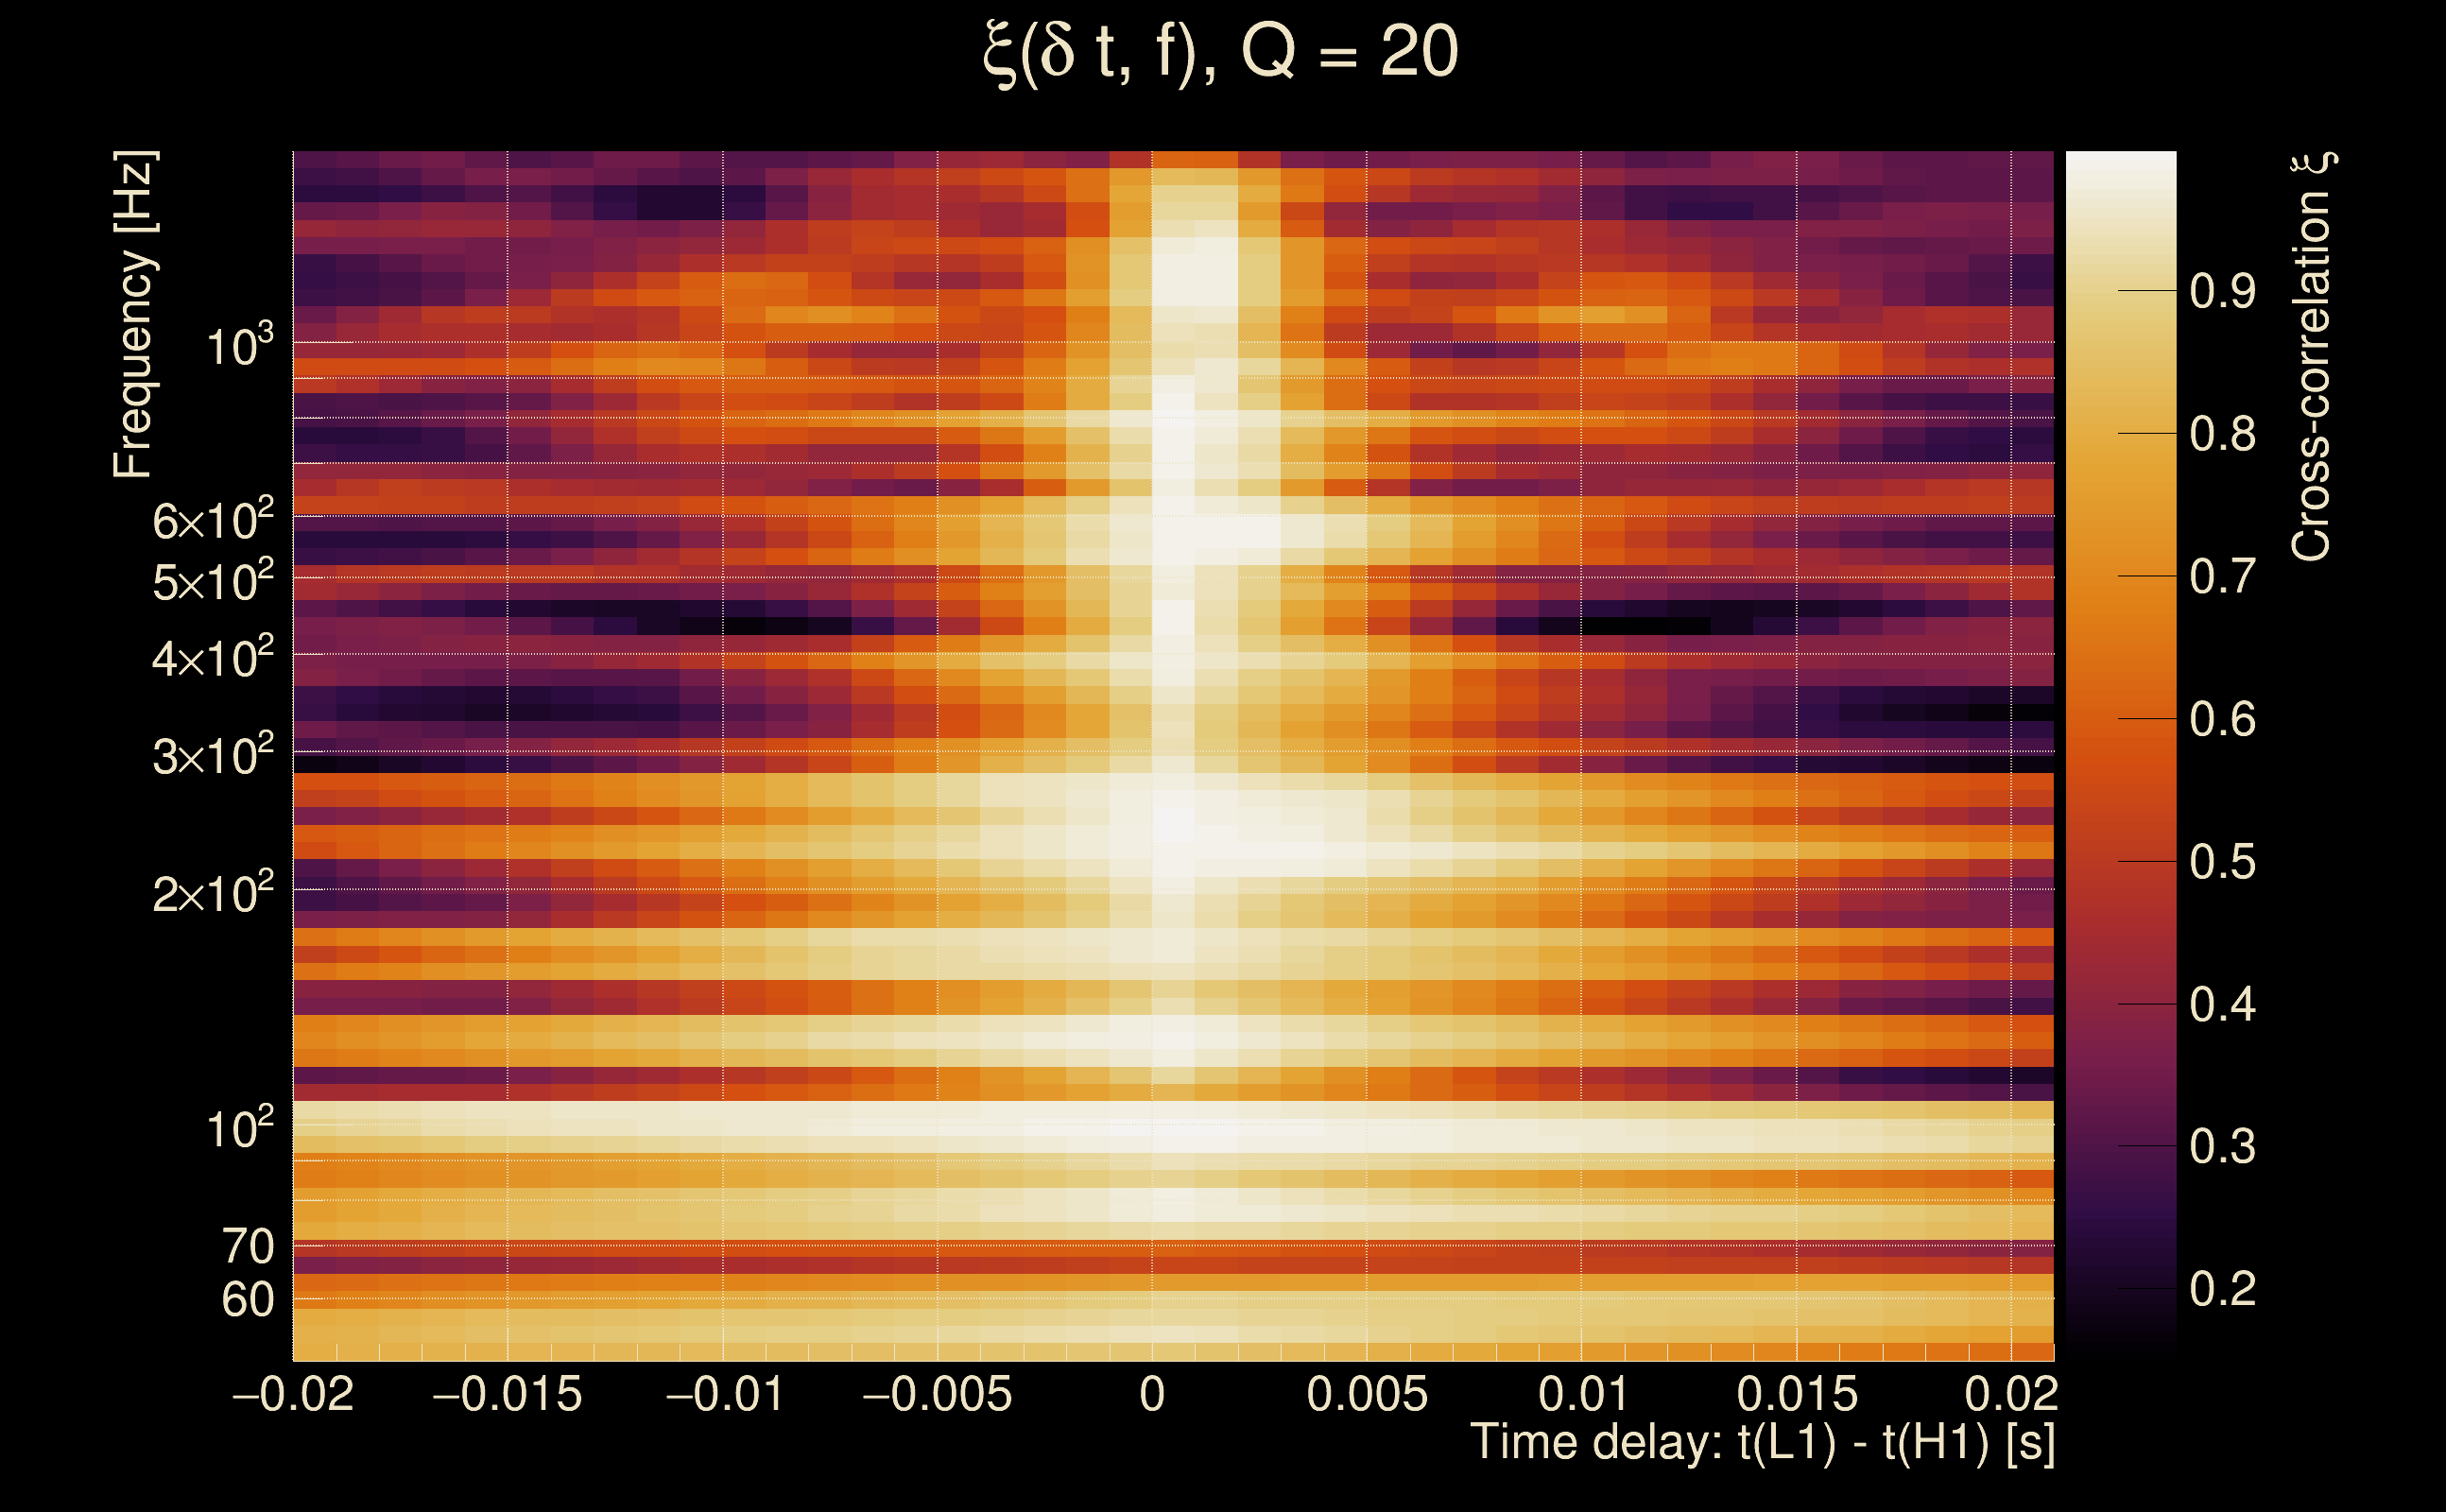
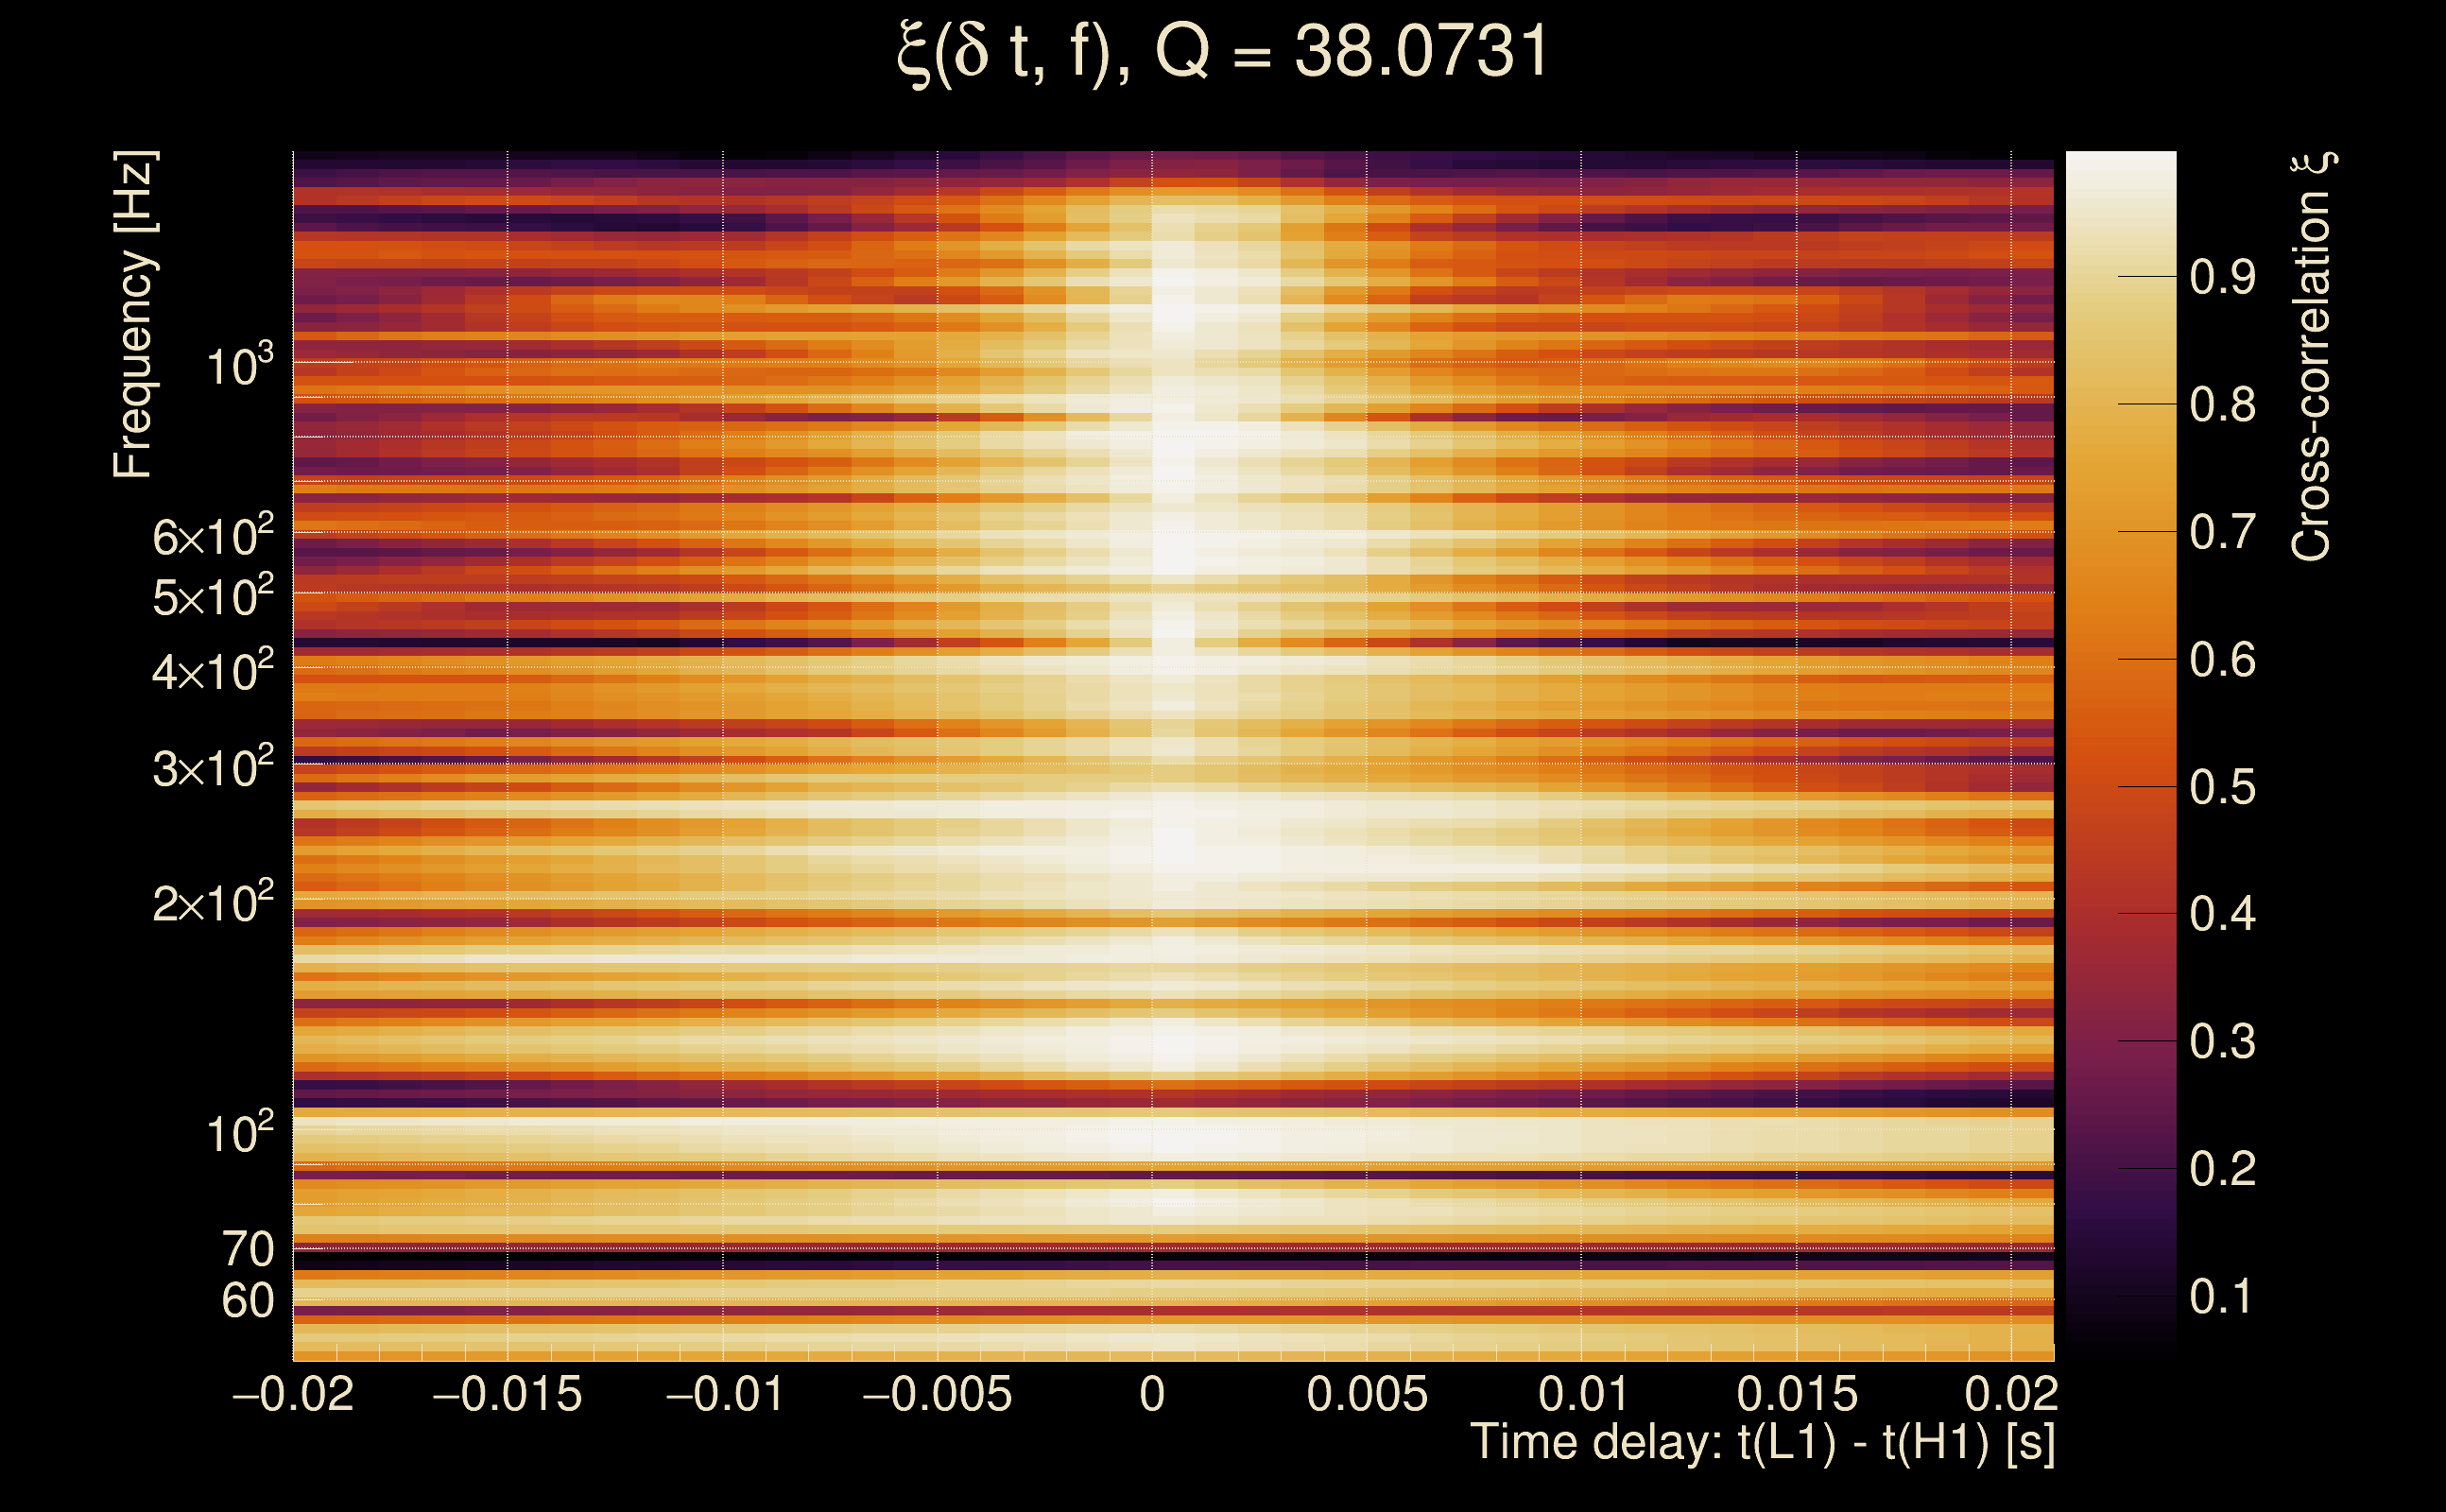
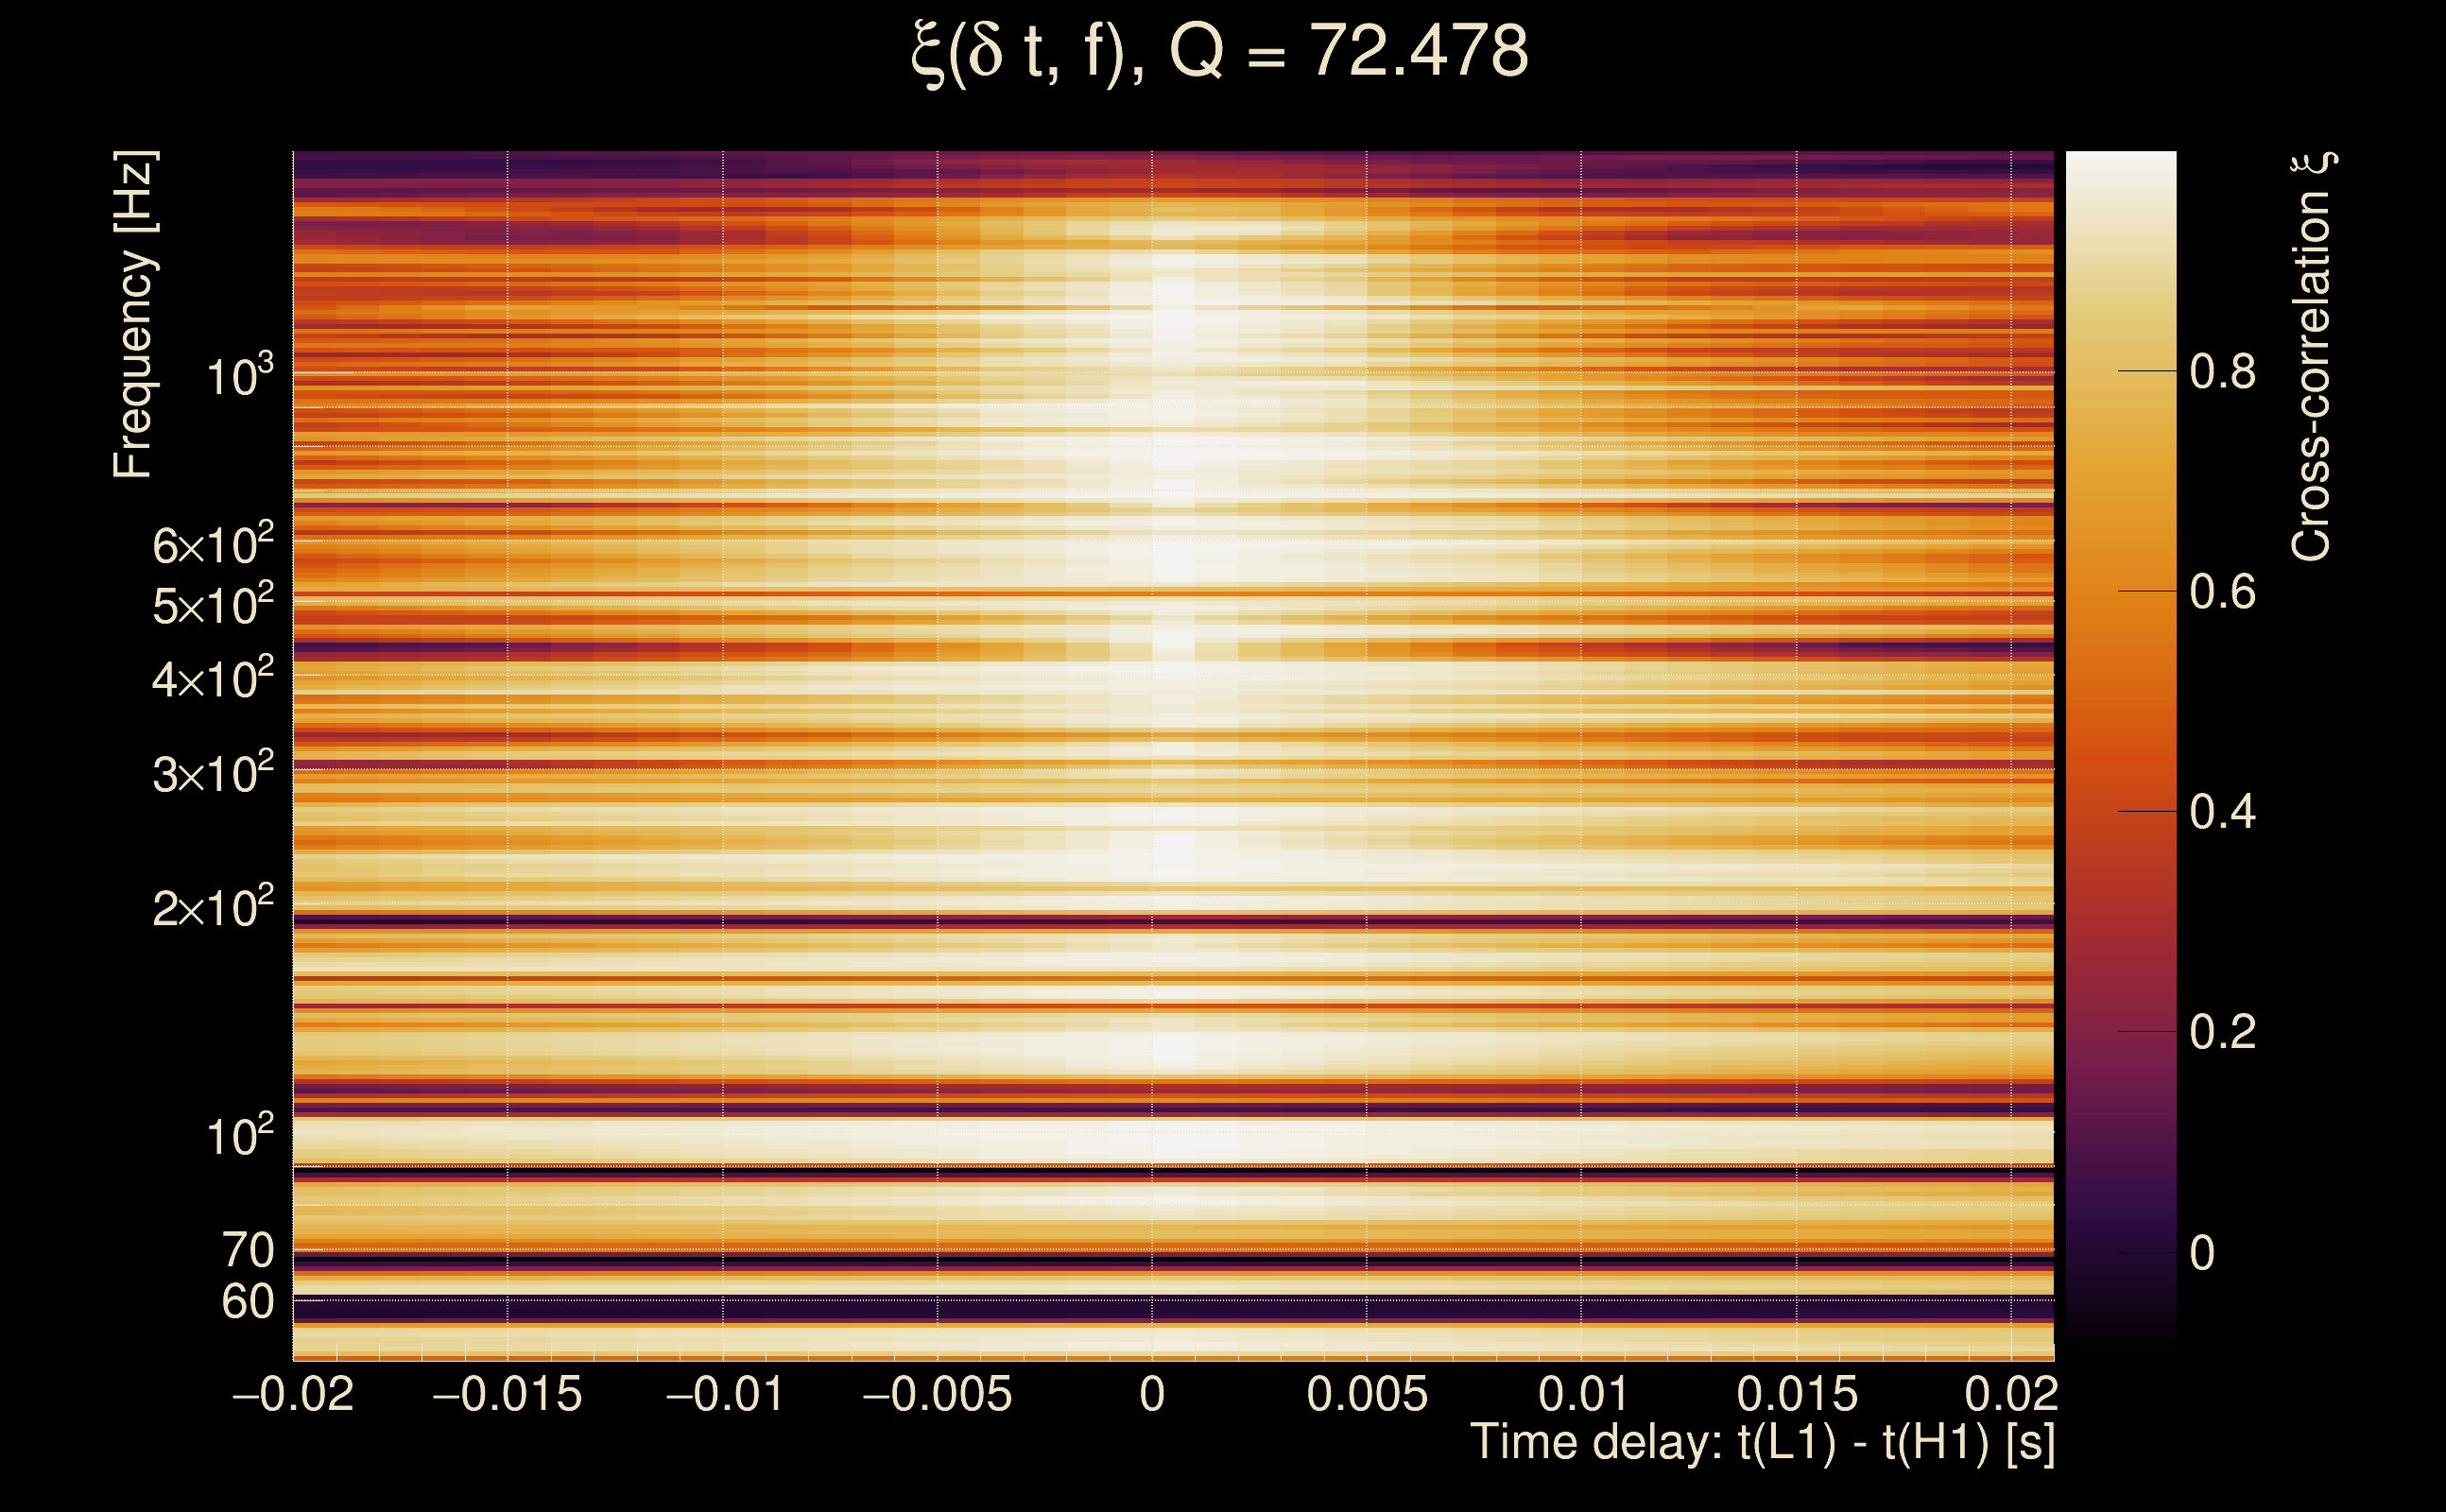
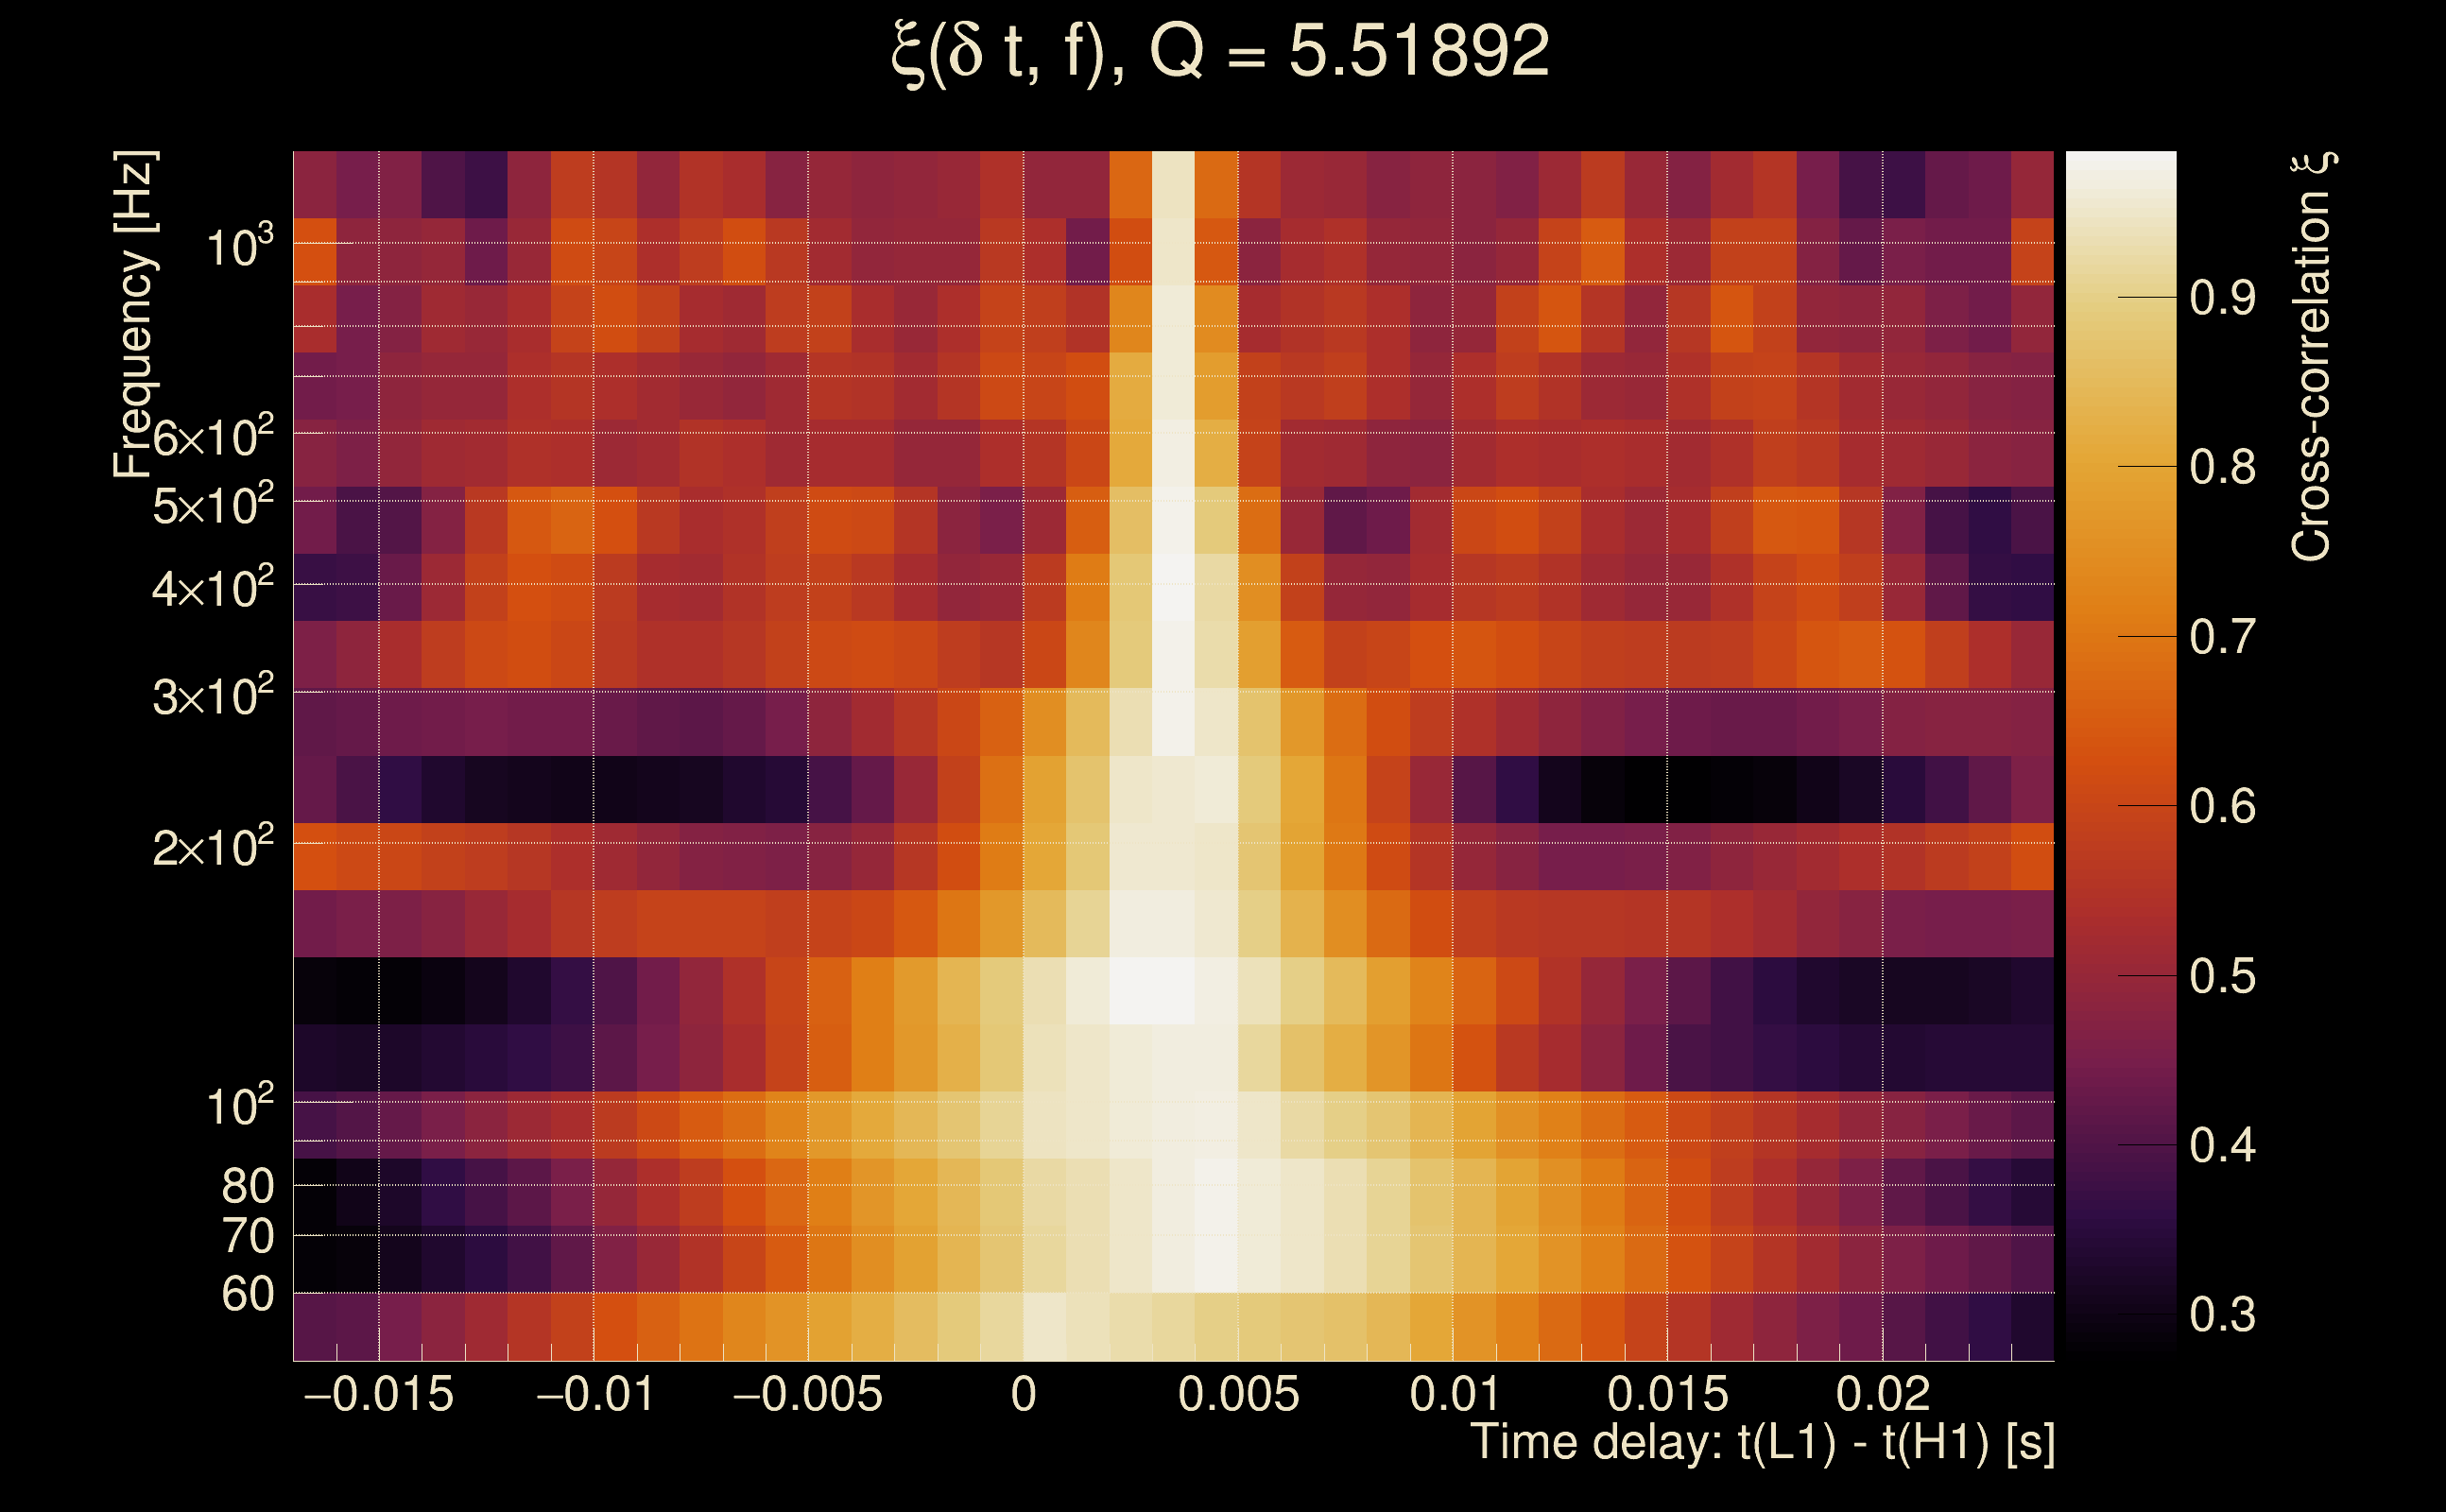
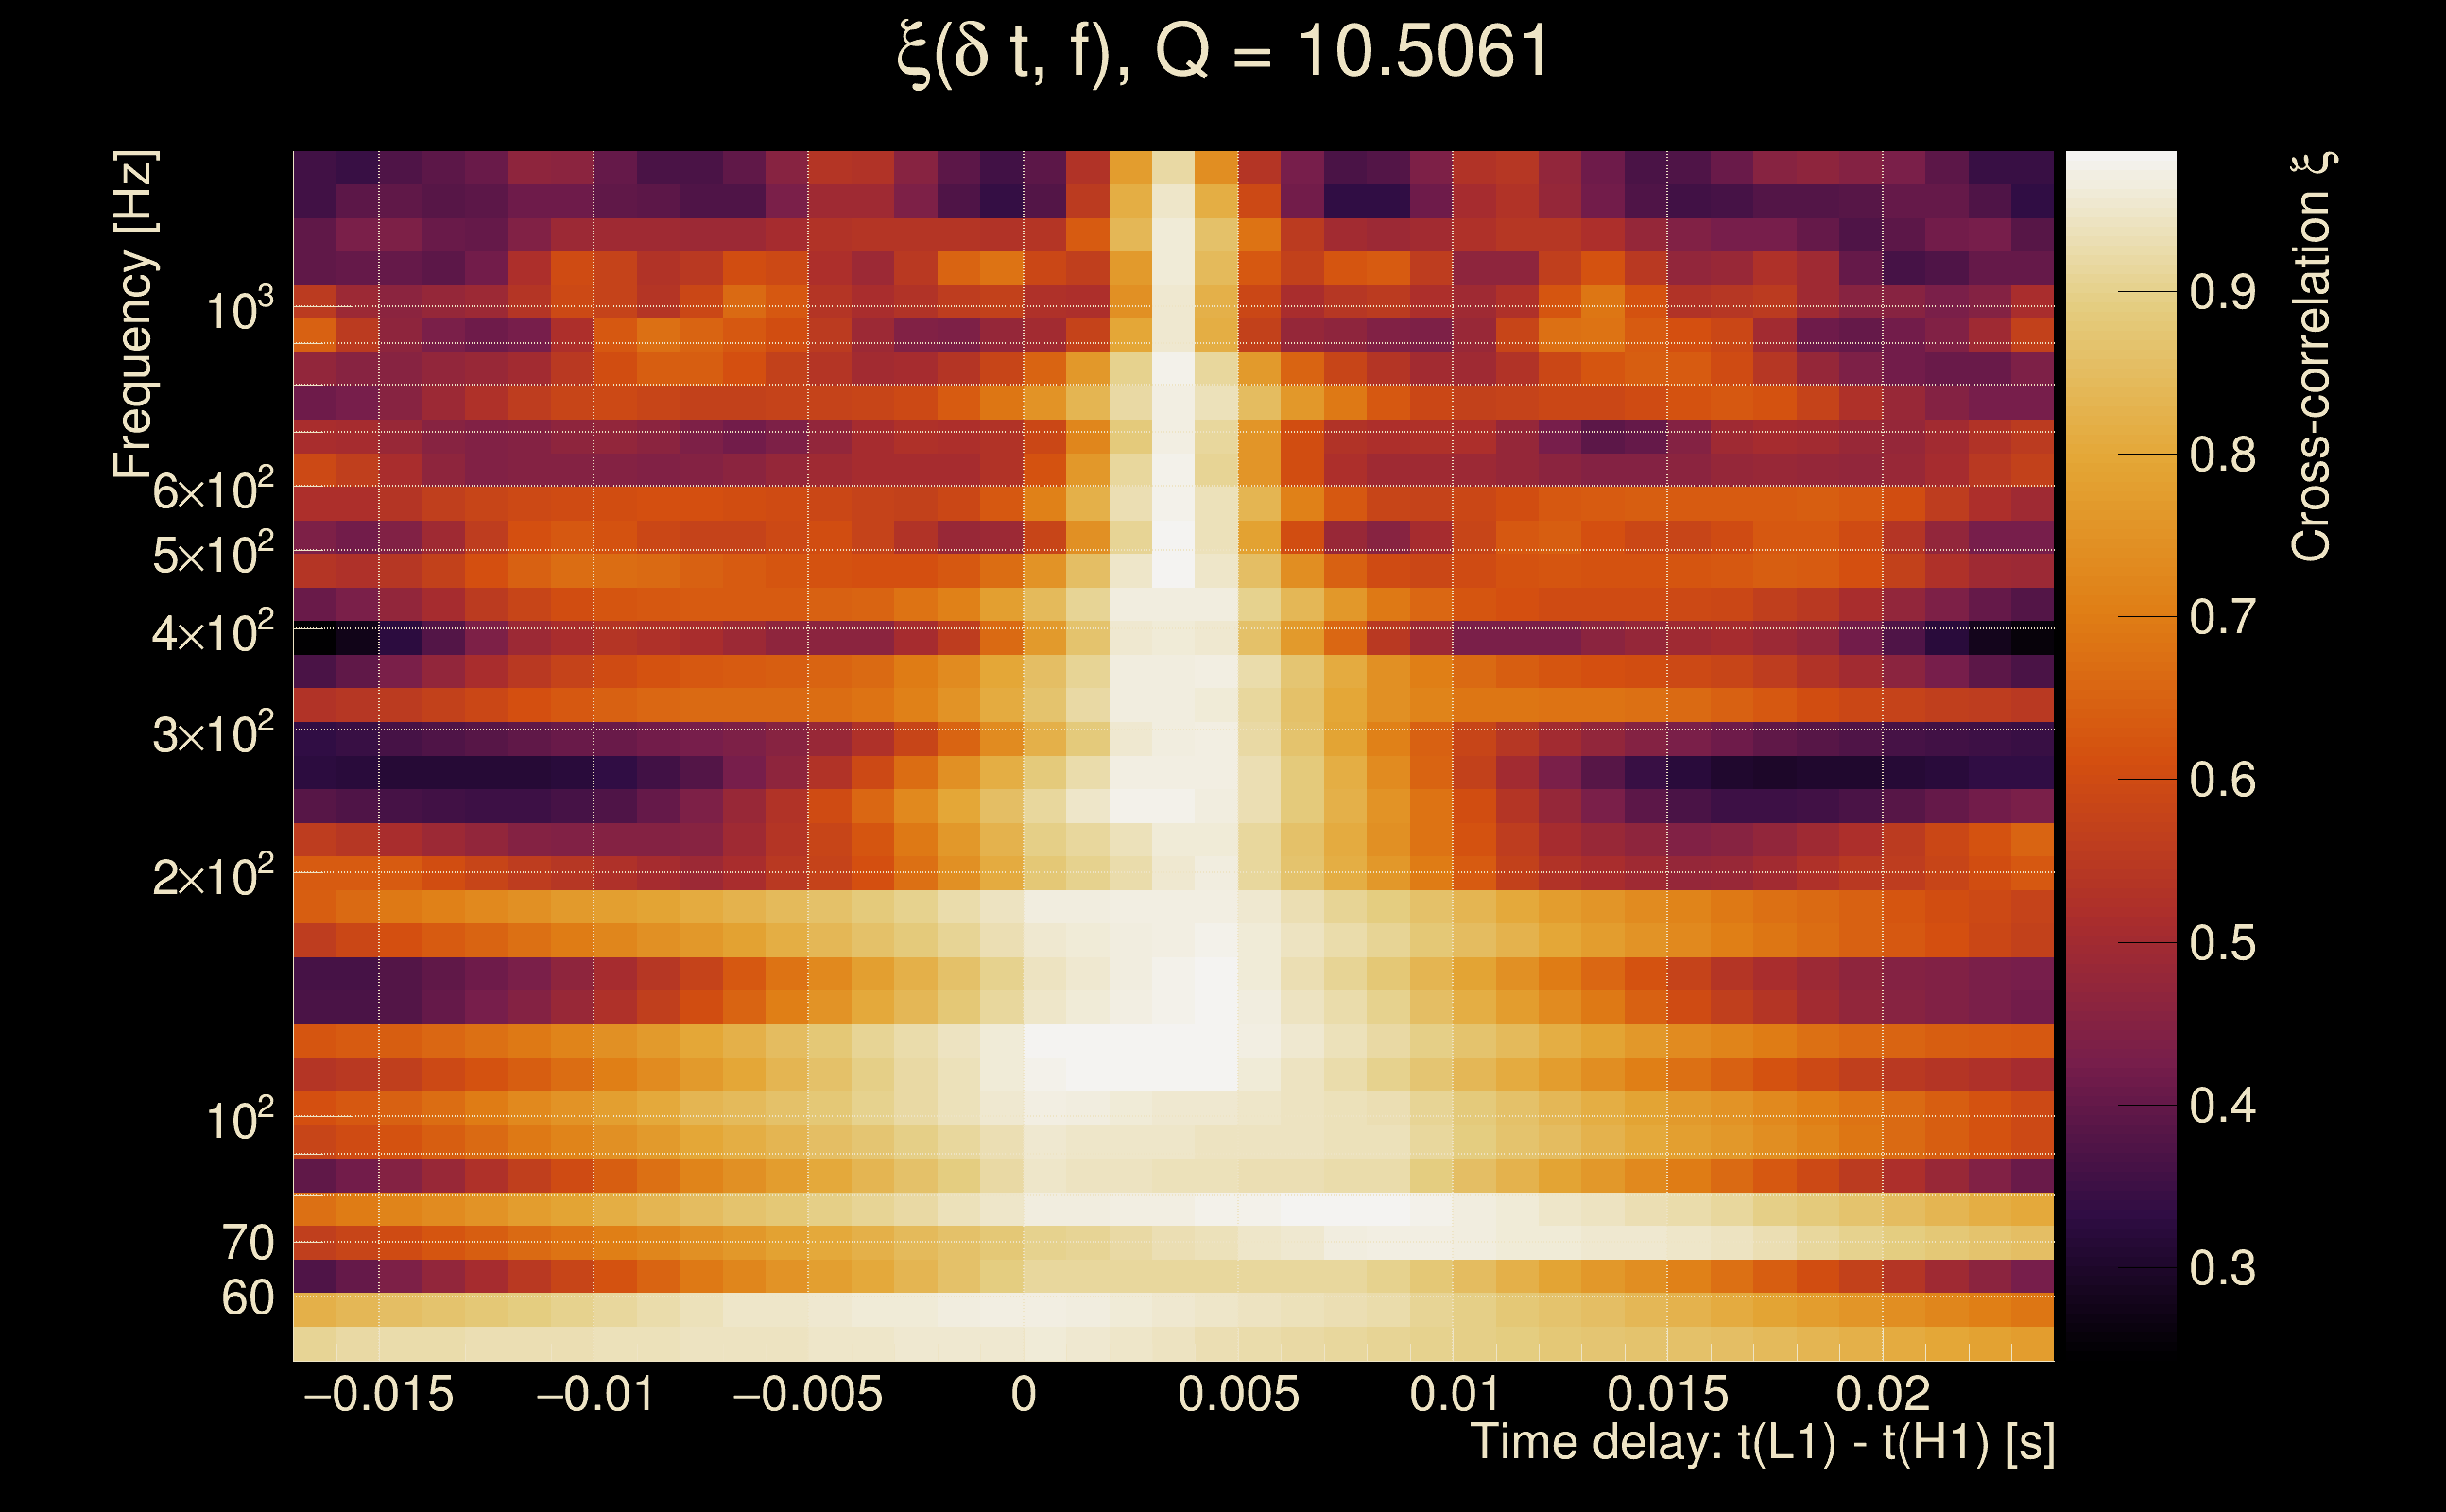
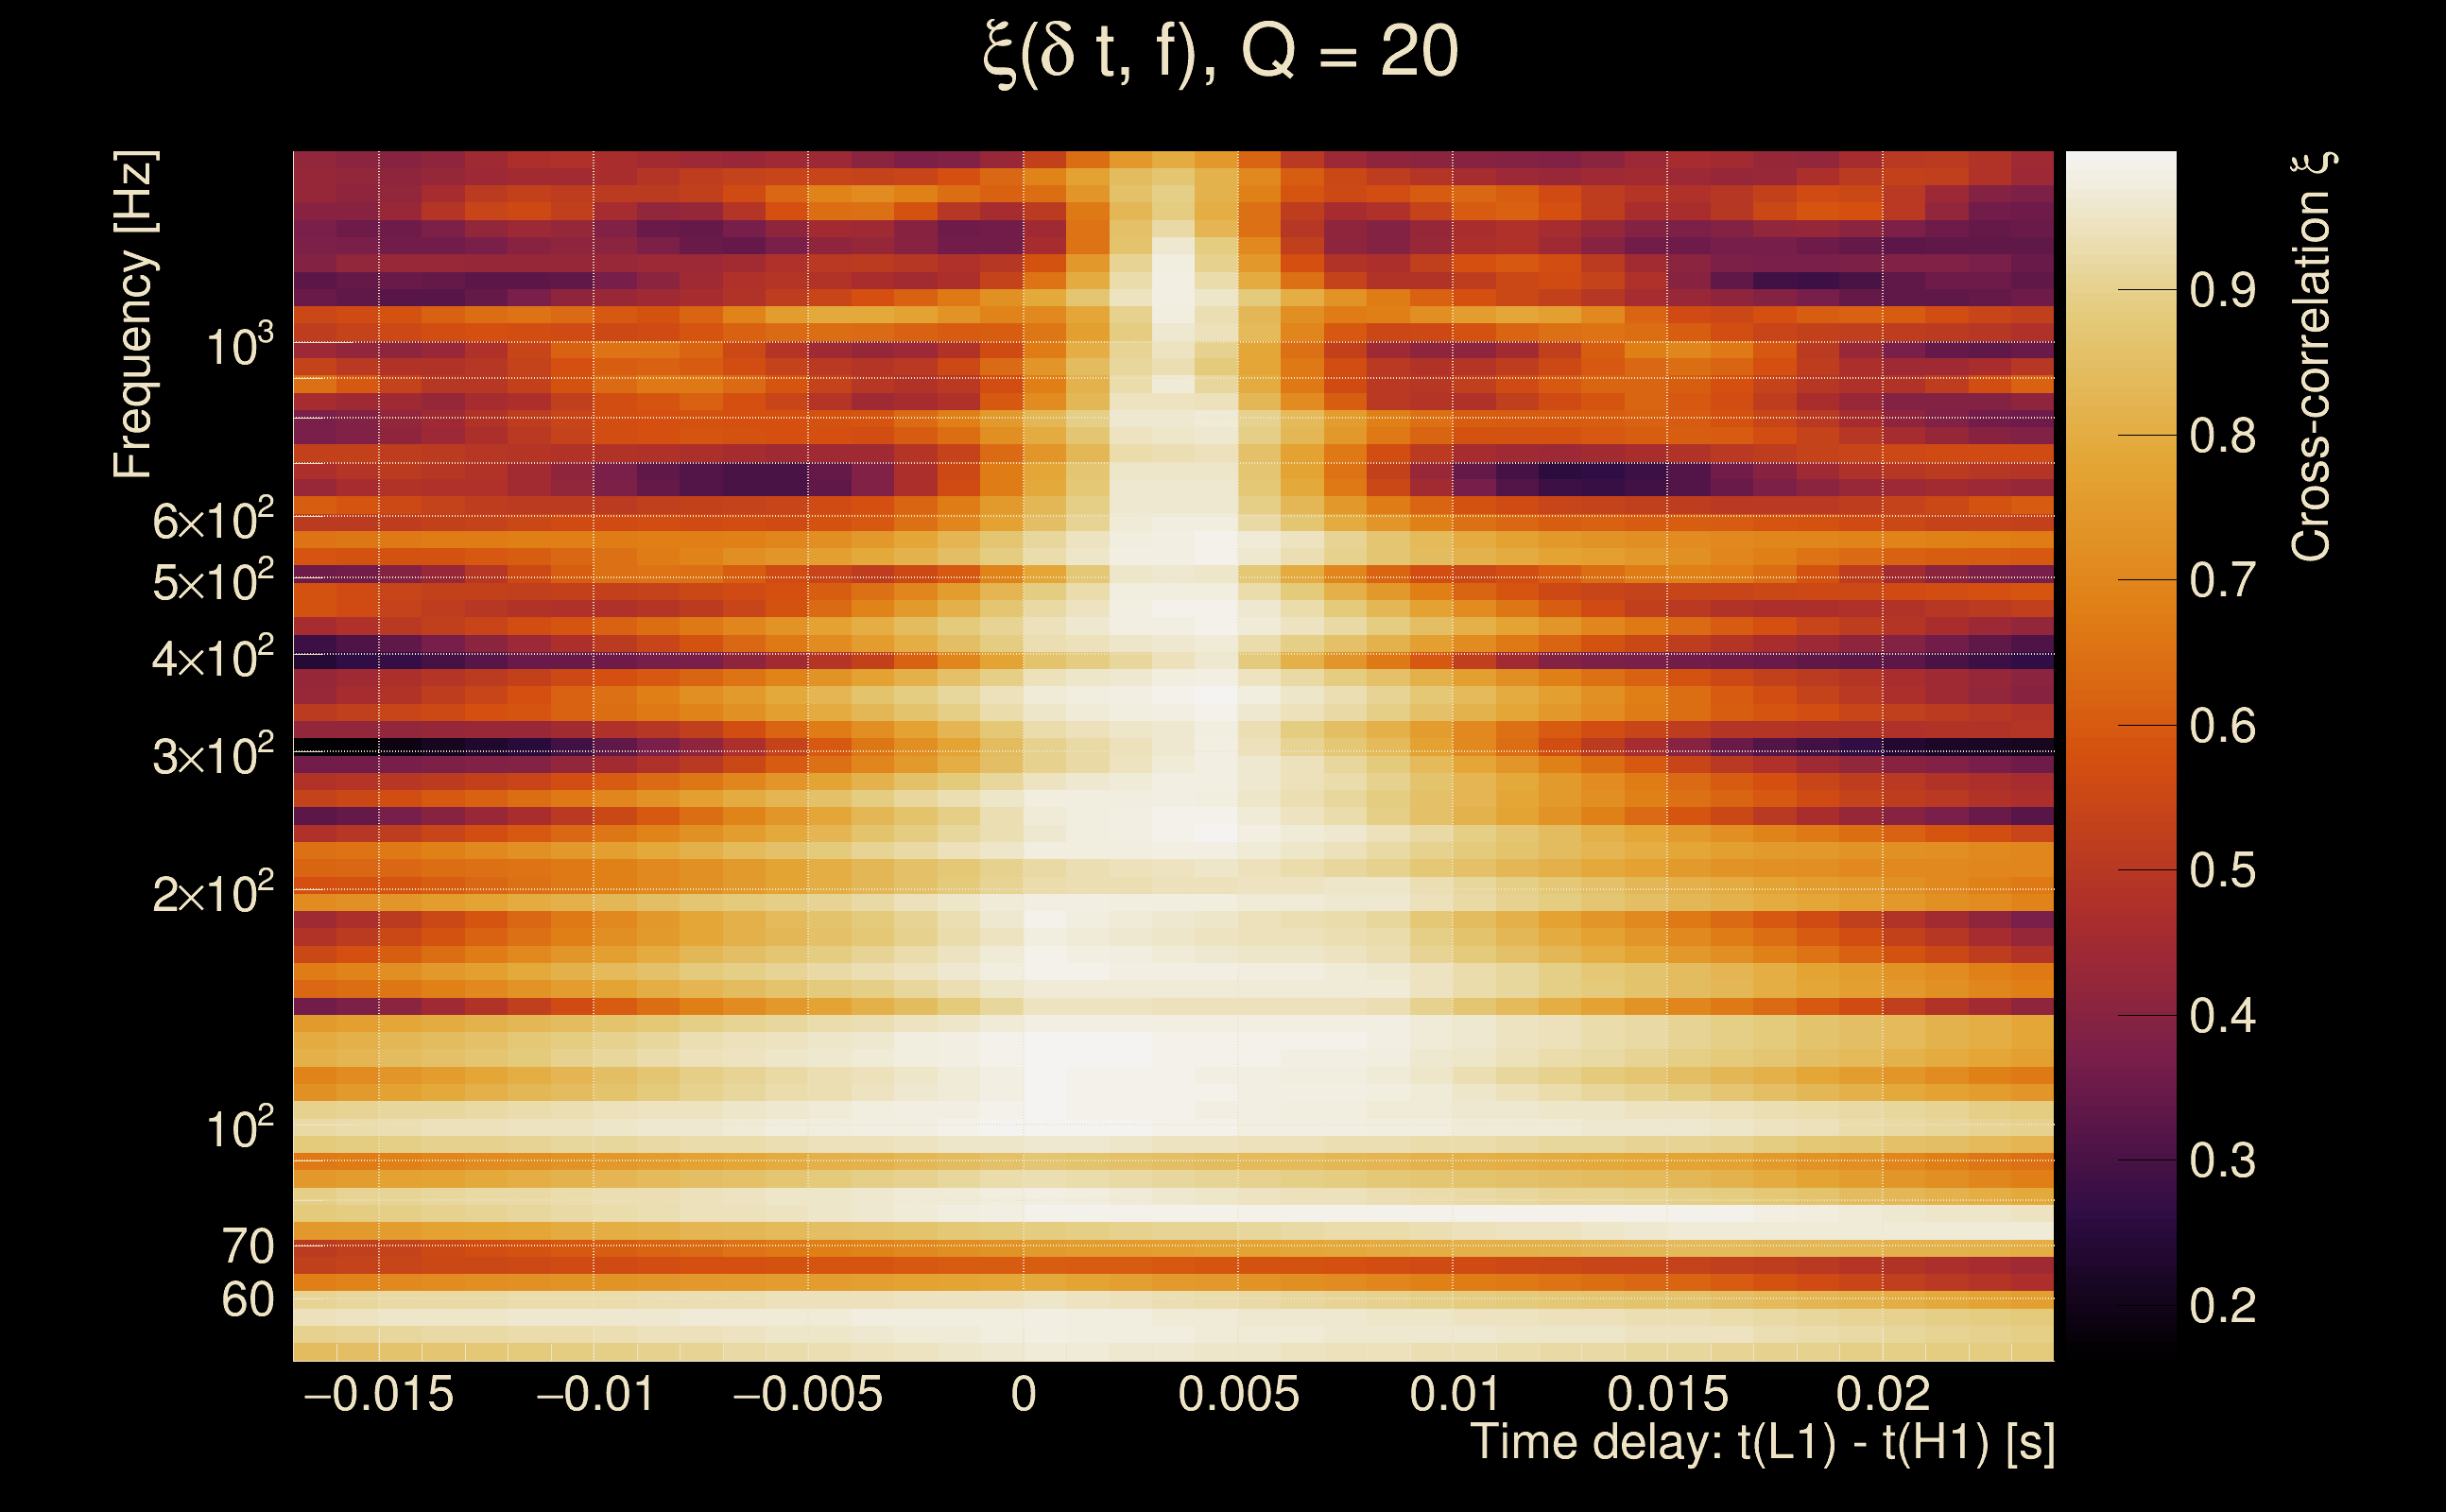
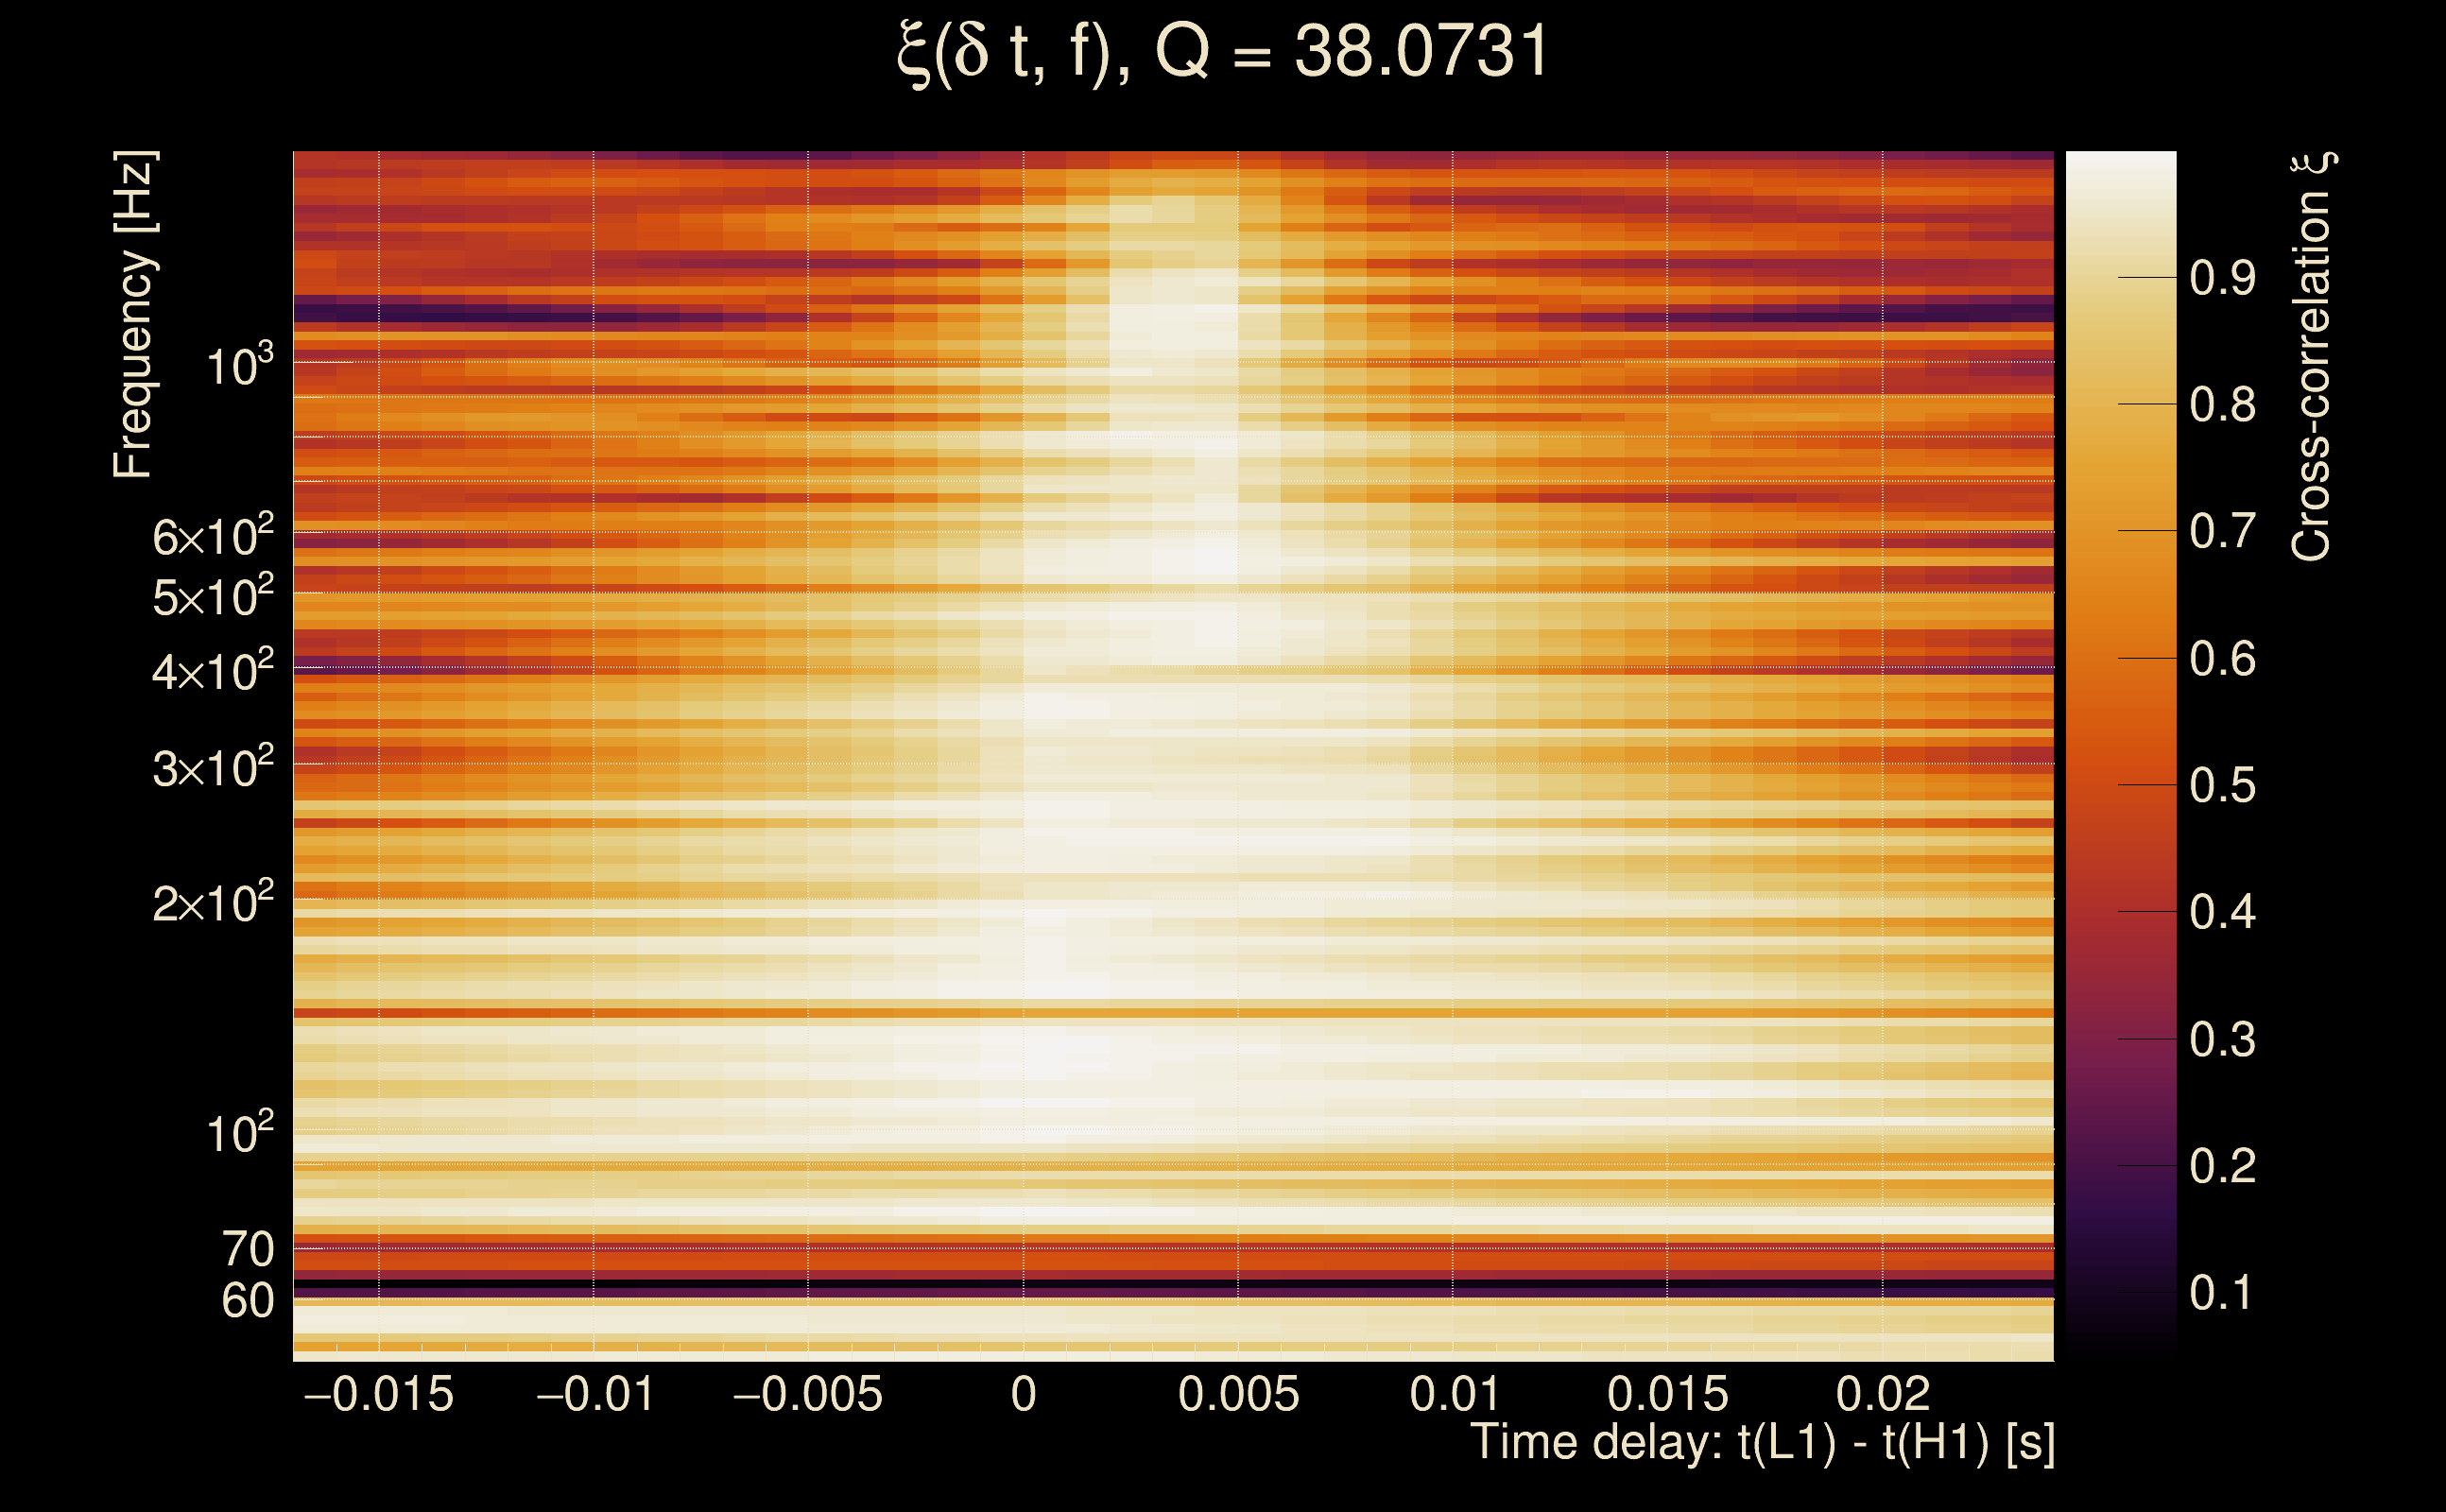
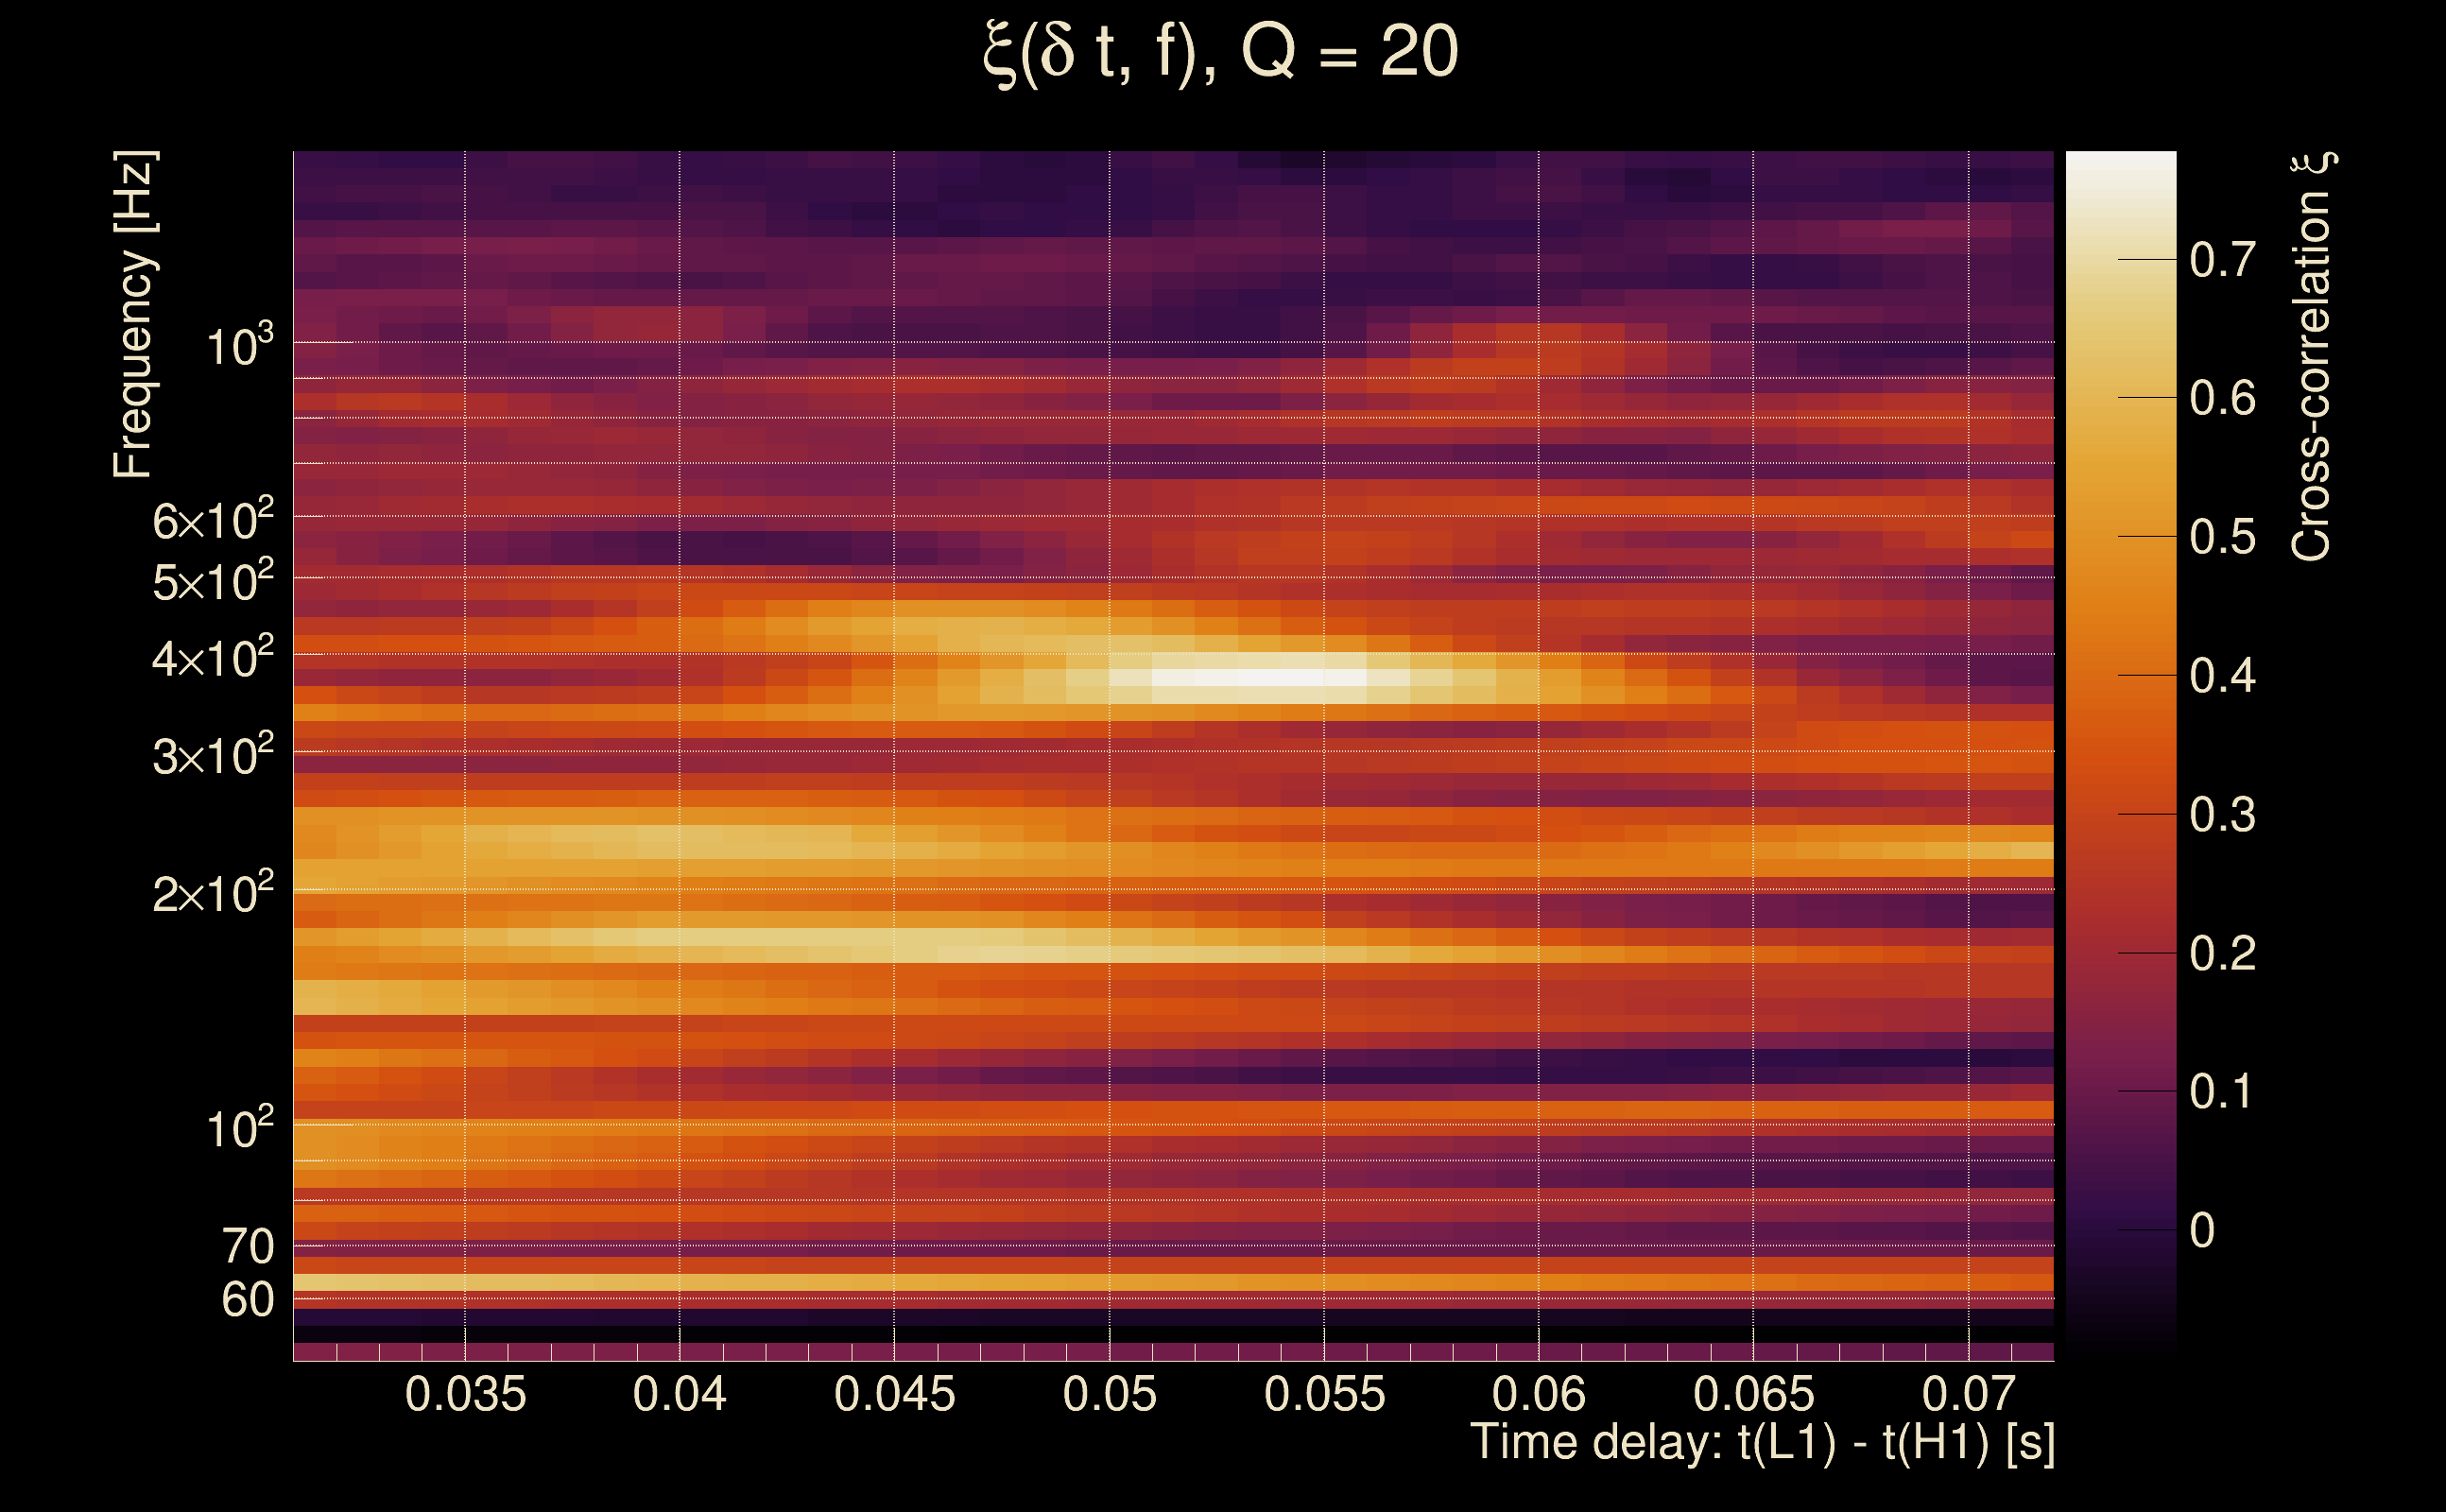
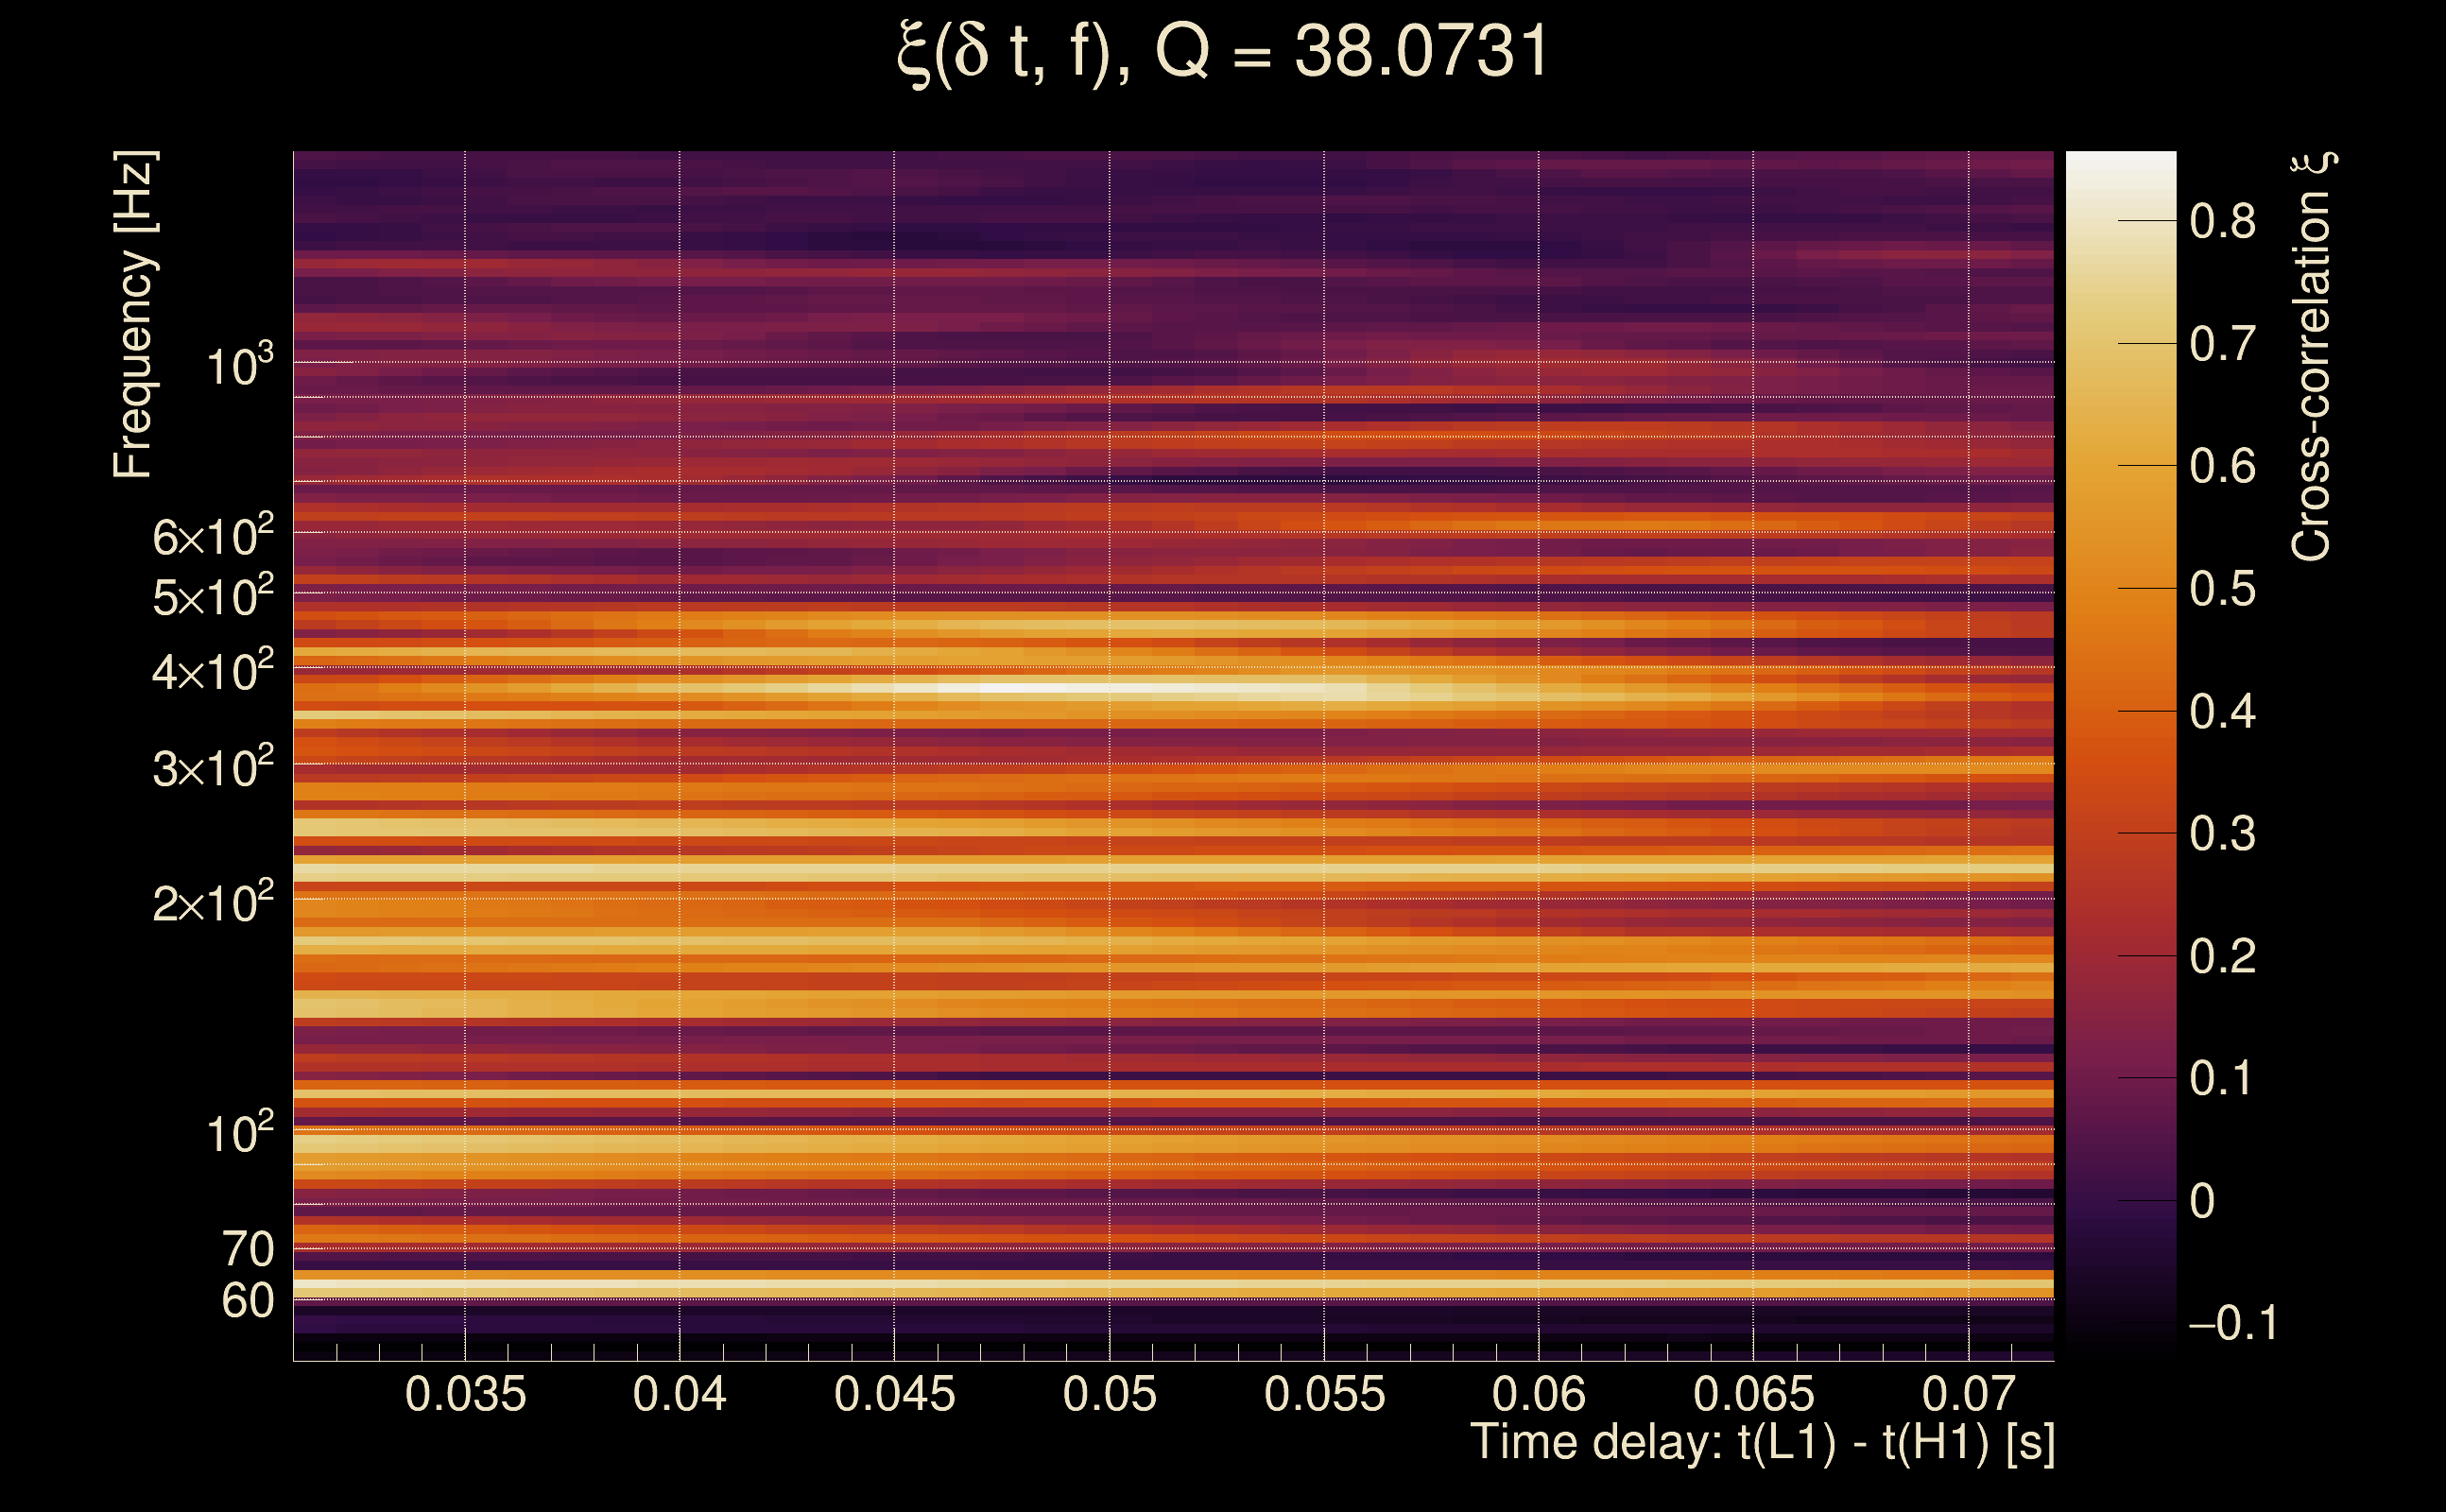
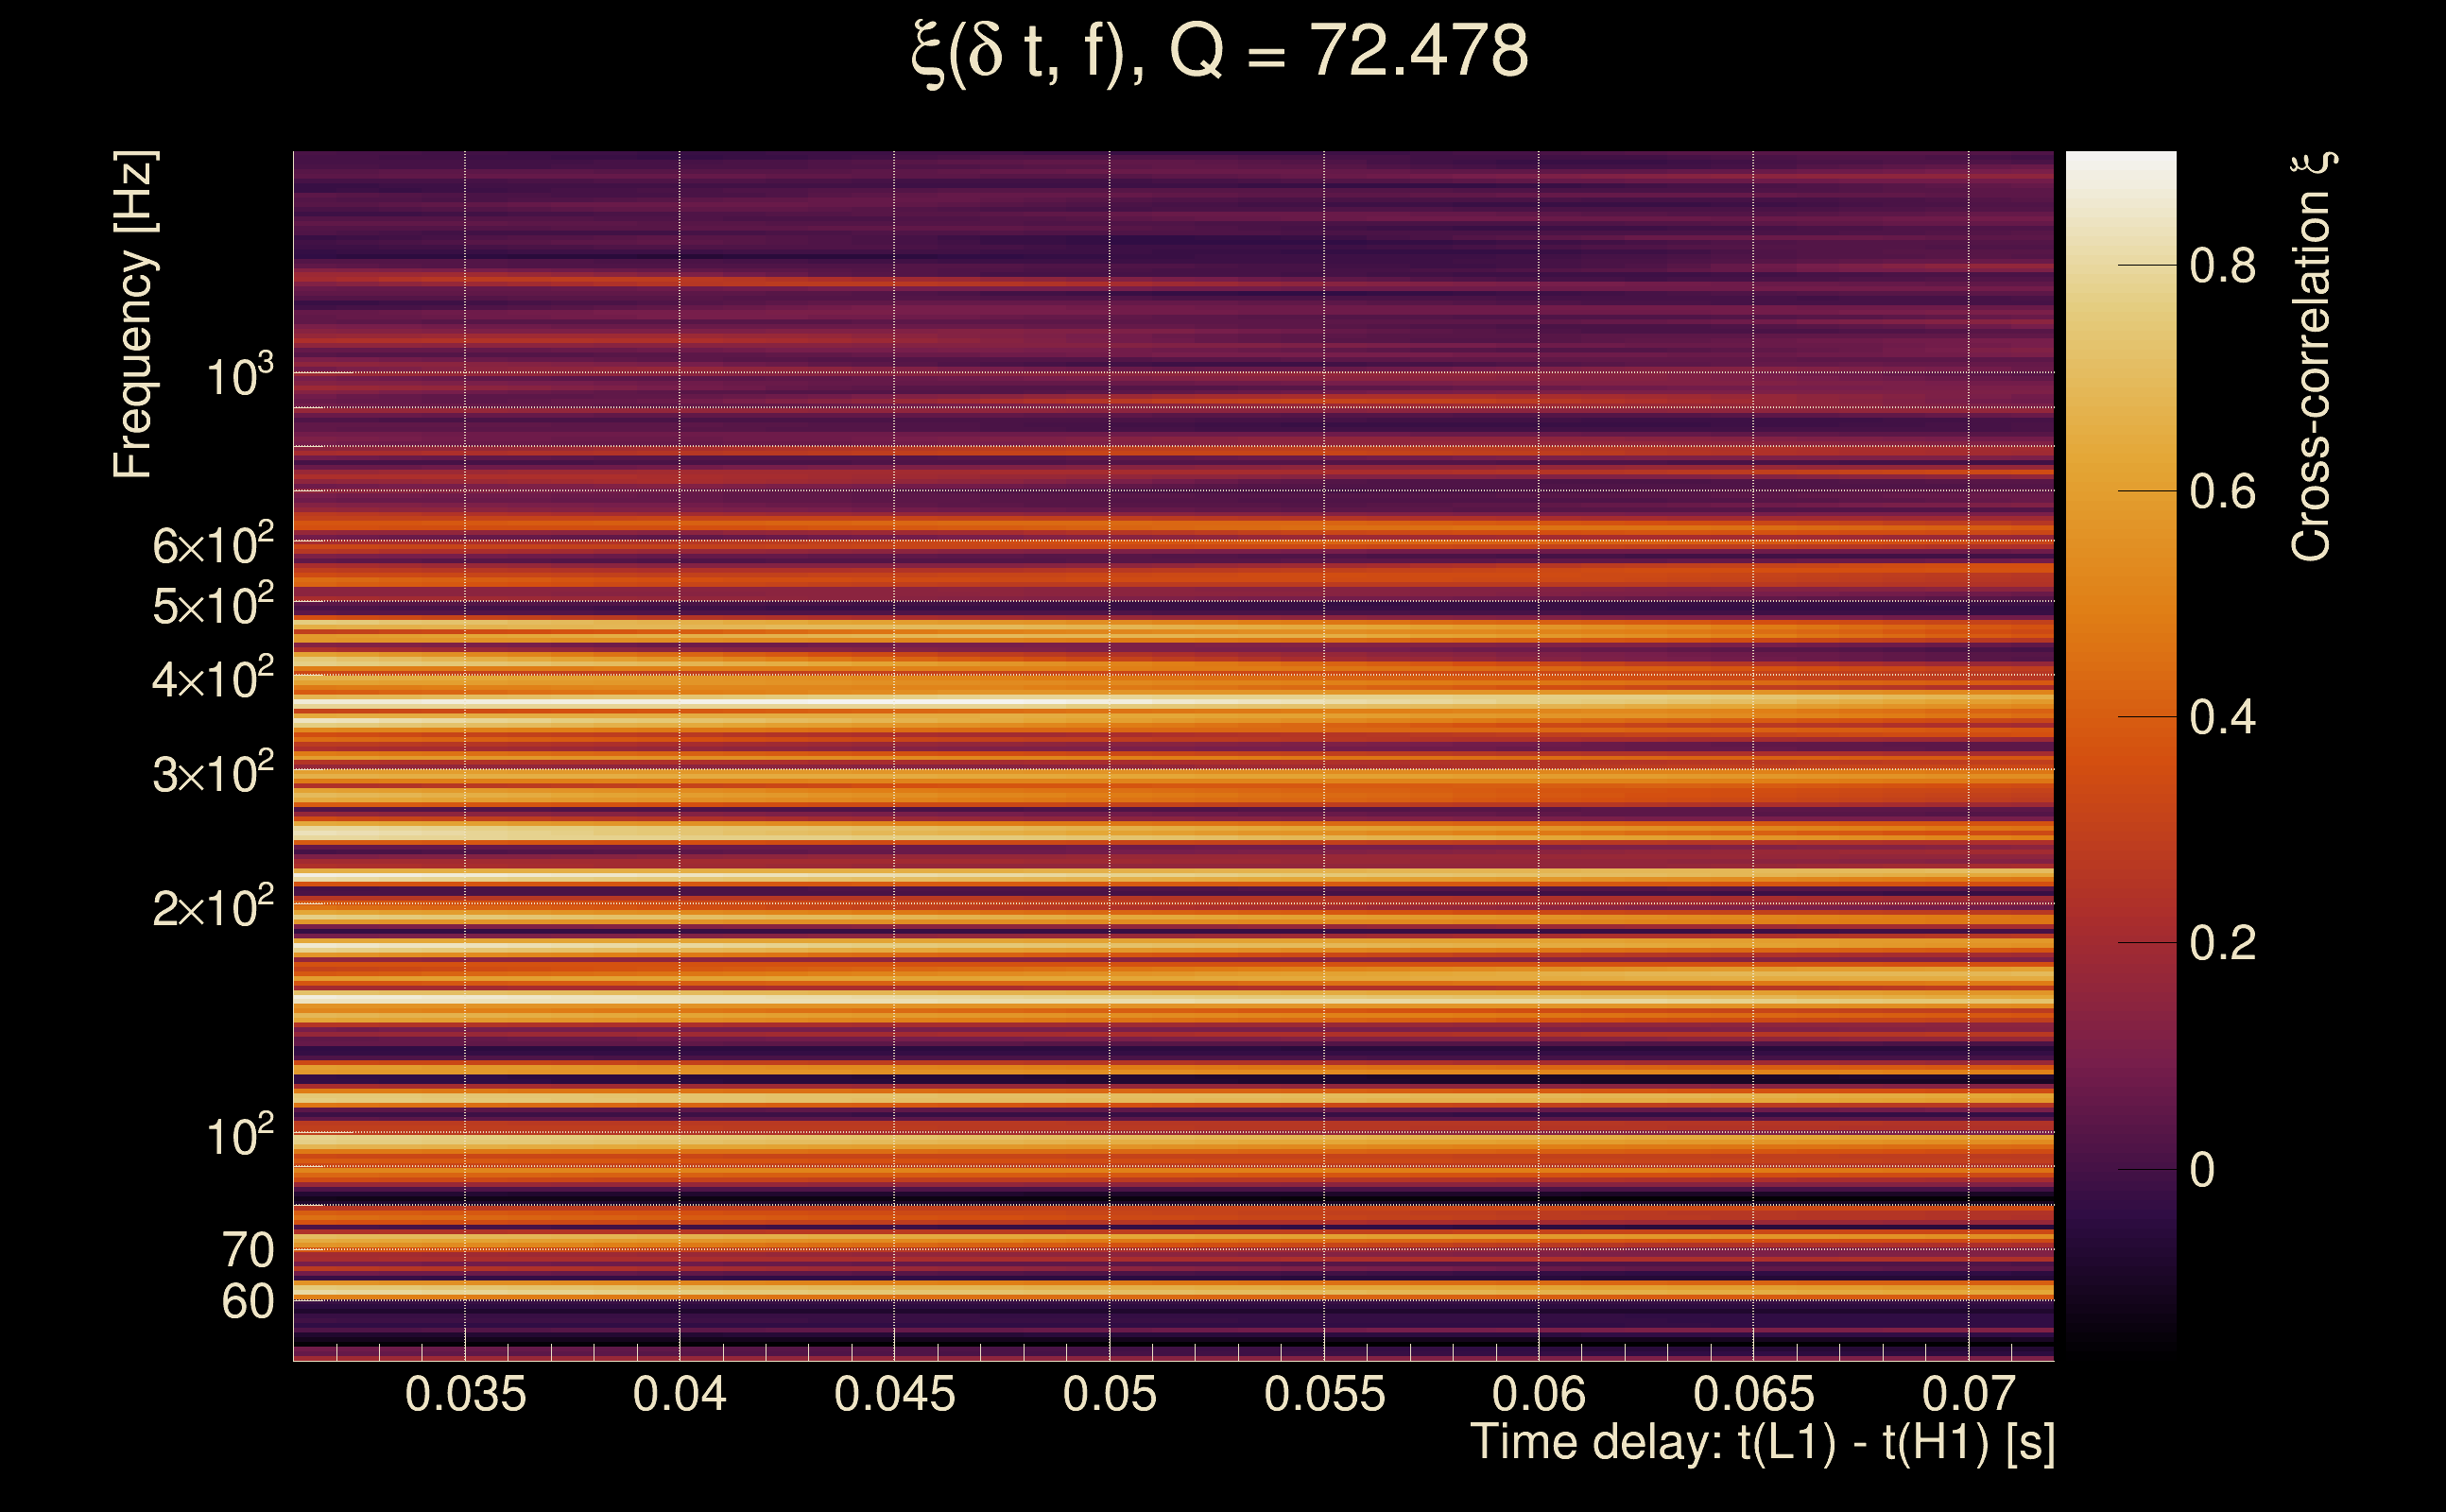
| Number of Q planes: | 5 (Q = 5.51892 → Q = 72.478) |
| Omicron frequency range: | 50 Hz → 1958.38 Hz |
| Light travel time between detectors: | 0.0100128 s |
| Slice extra-time (calibration uncertainty + slice veto): | 0.0129872 s |
| Number of time-delay bins in a cross-correlation map: | 10000 |
| Number of slices in a cross-correlation map: | 217 |
| Number of time-delay bins in a slice: | 46 |
| SNR gating: | < 100 (detector 0), < 100 (detector 1) |
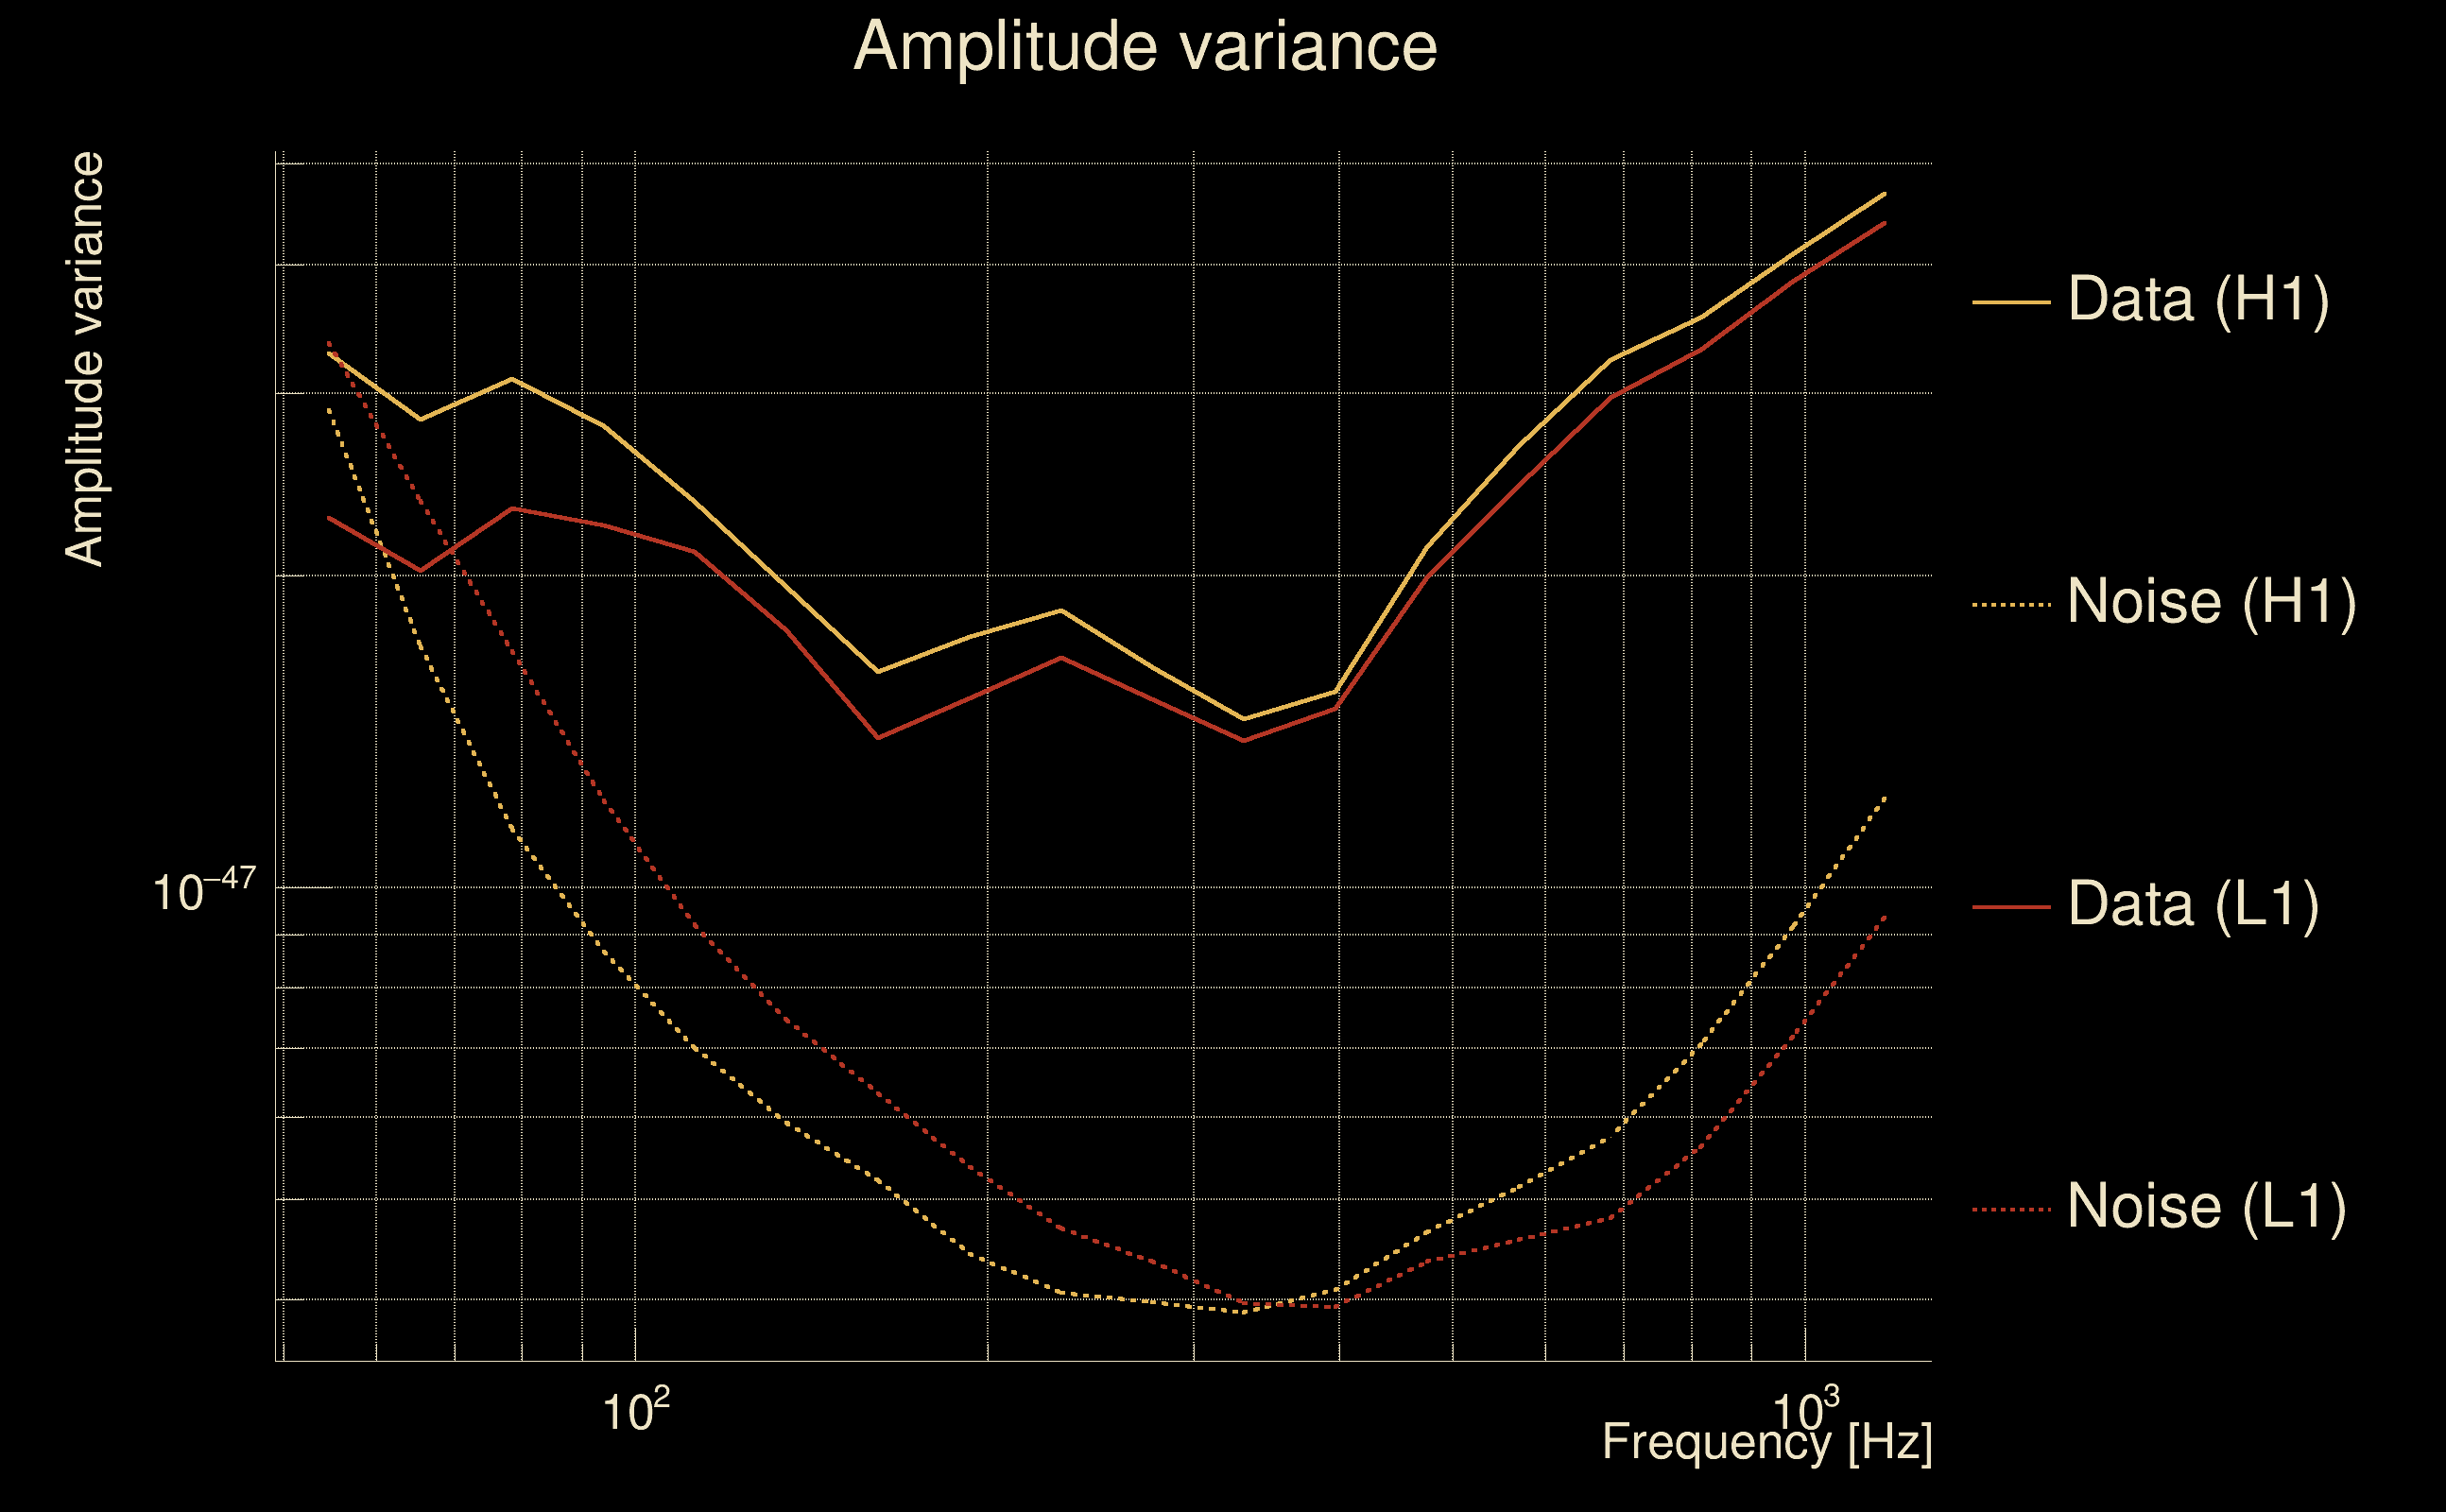
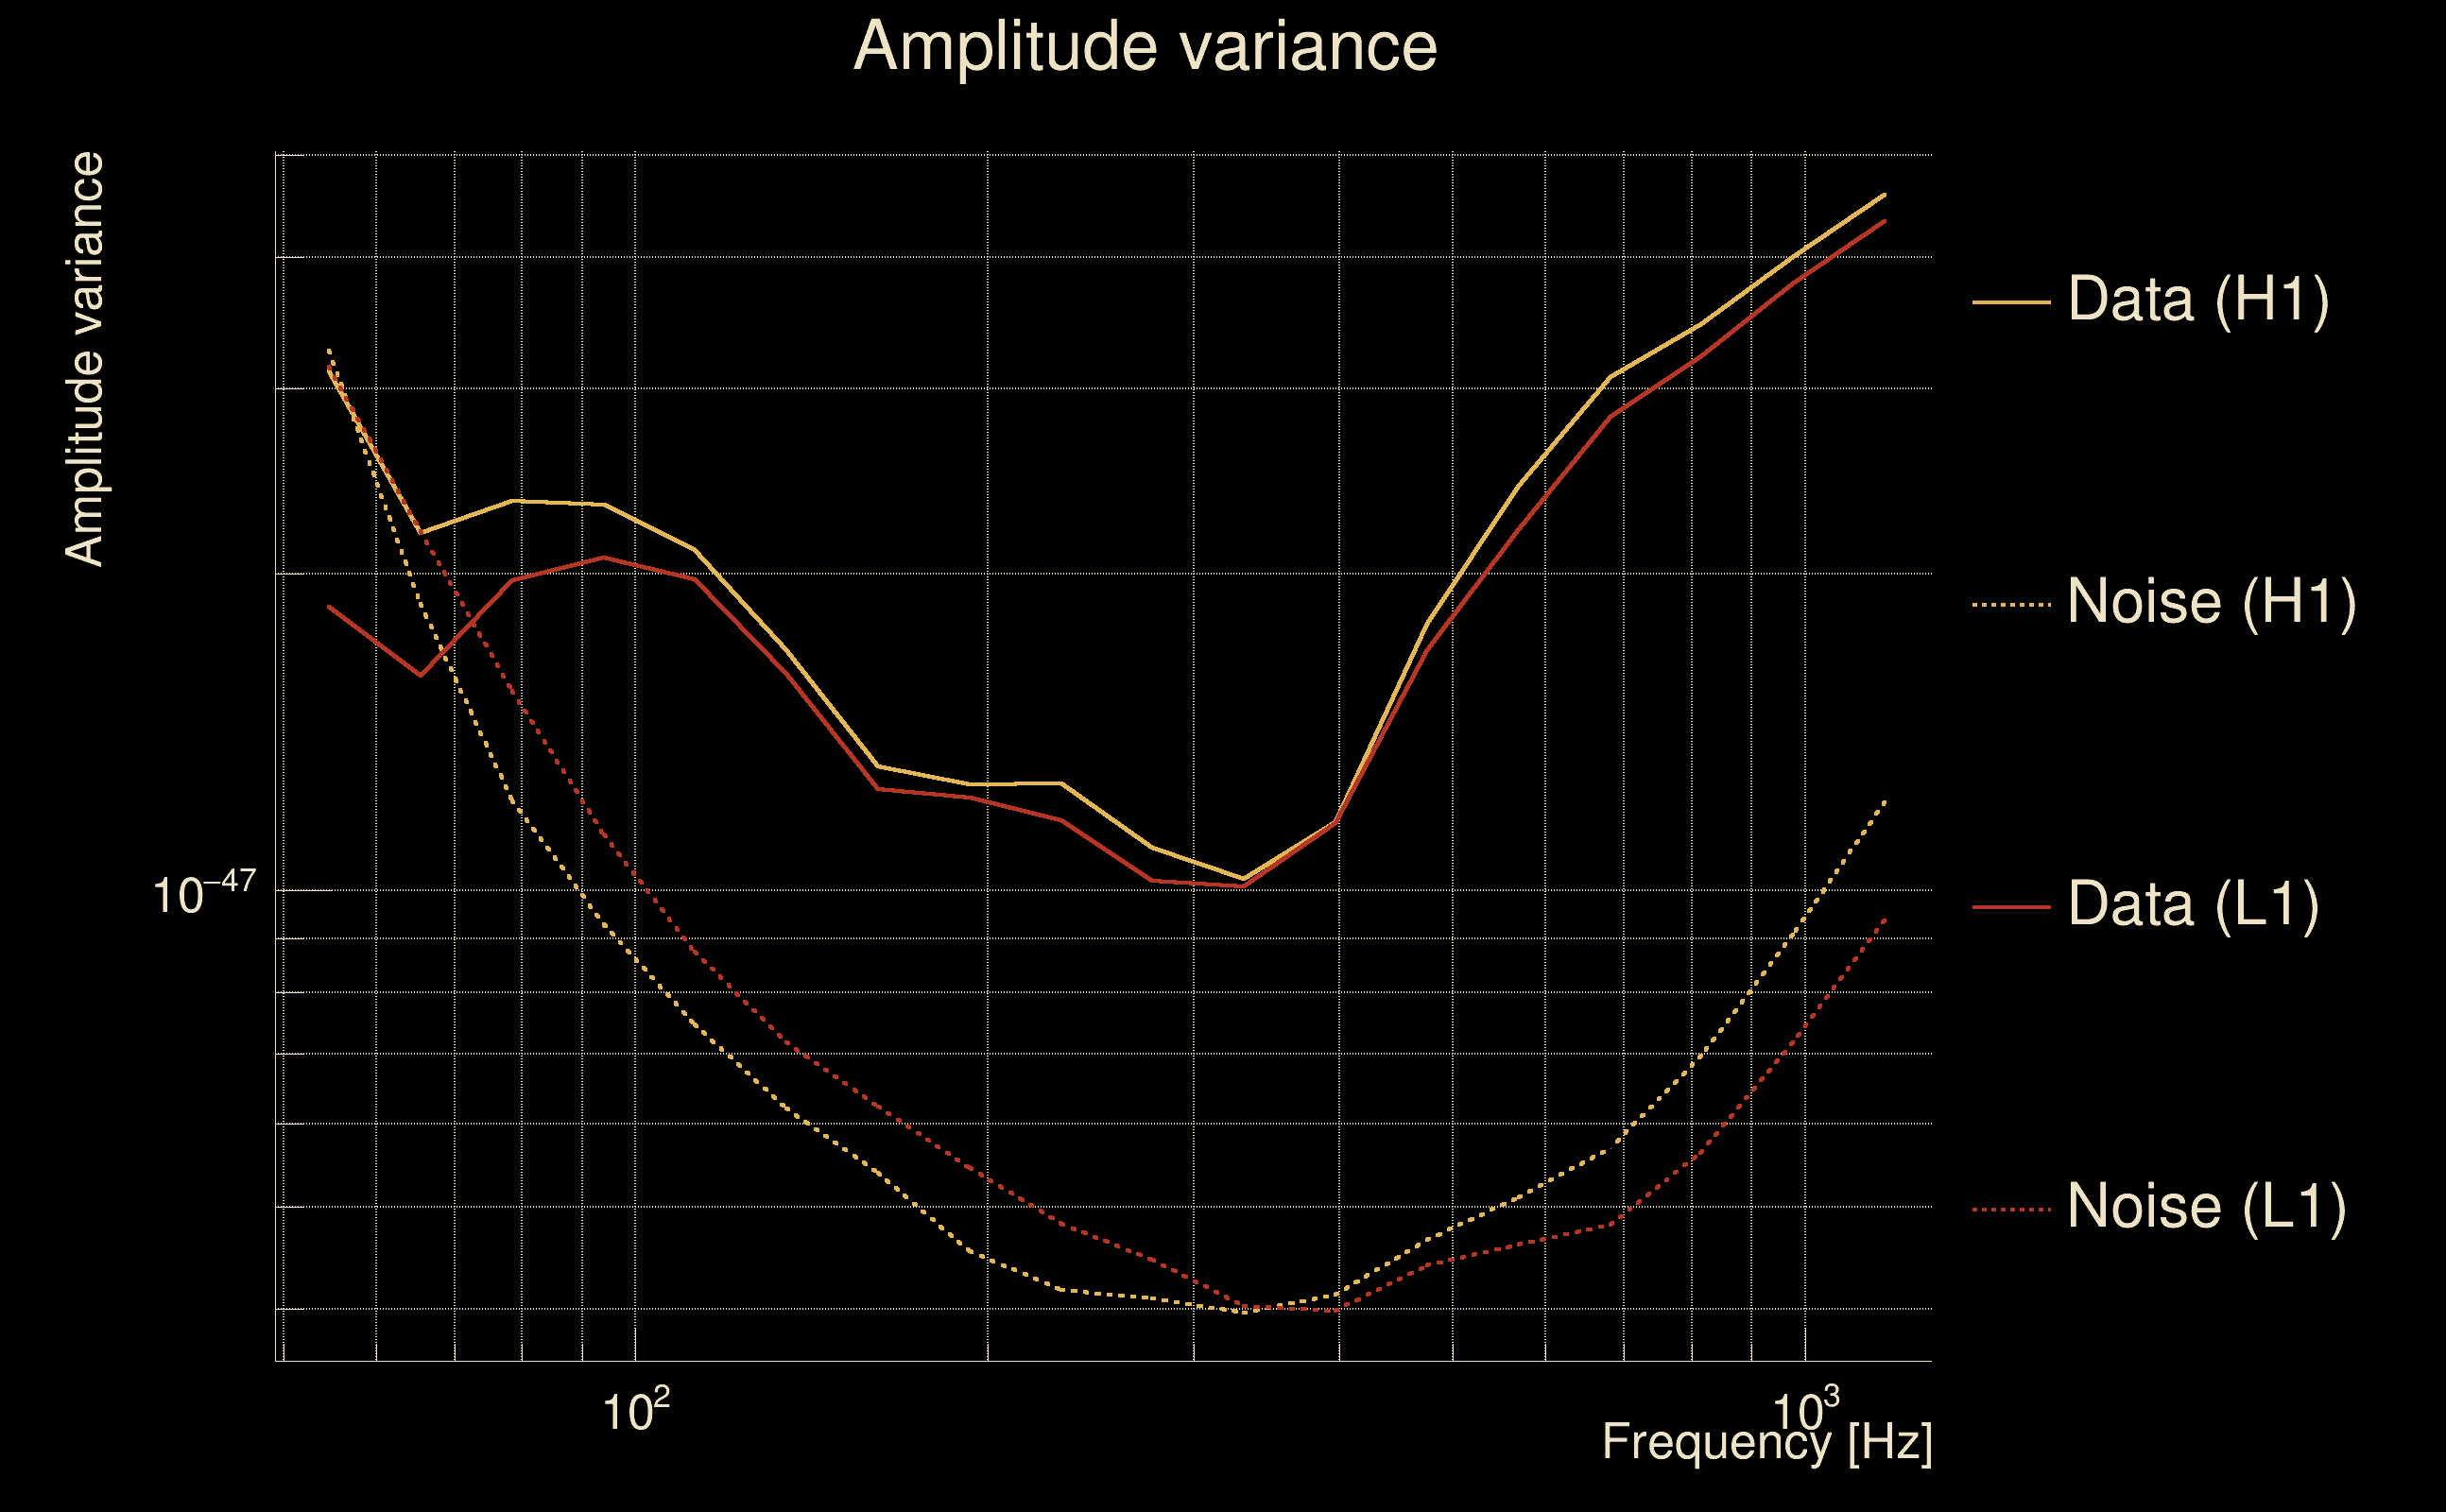
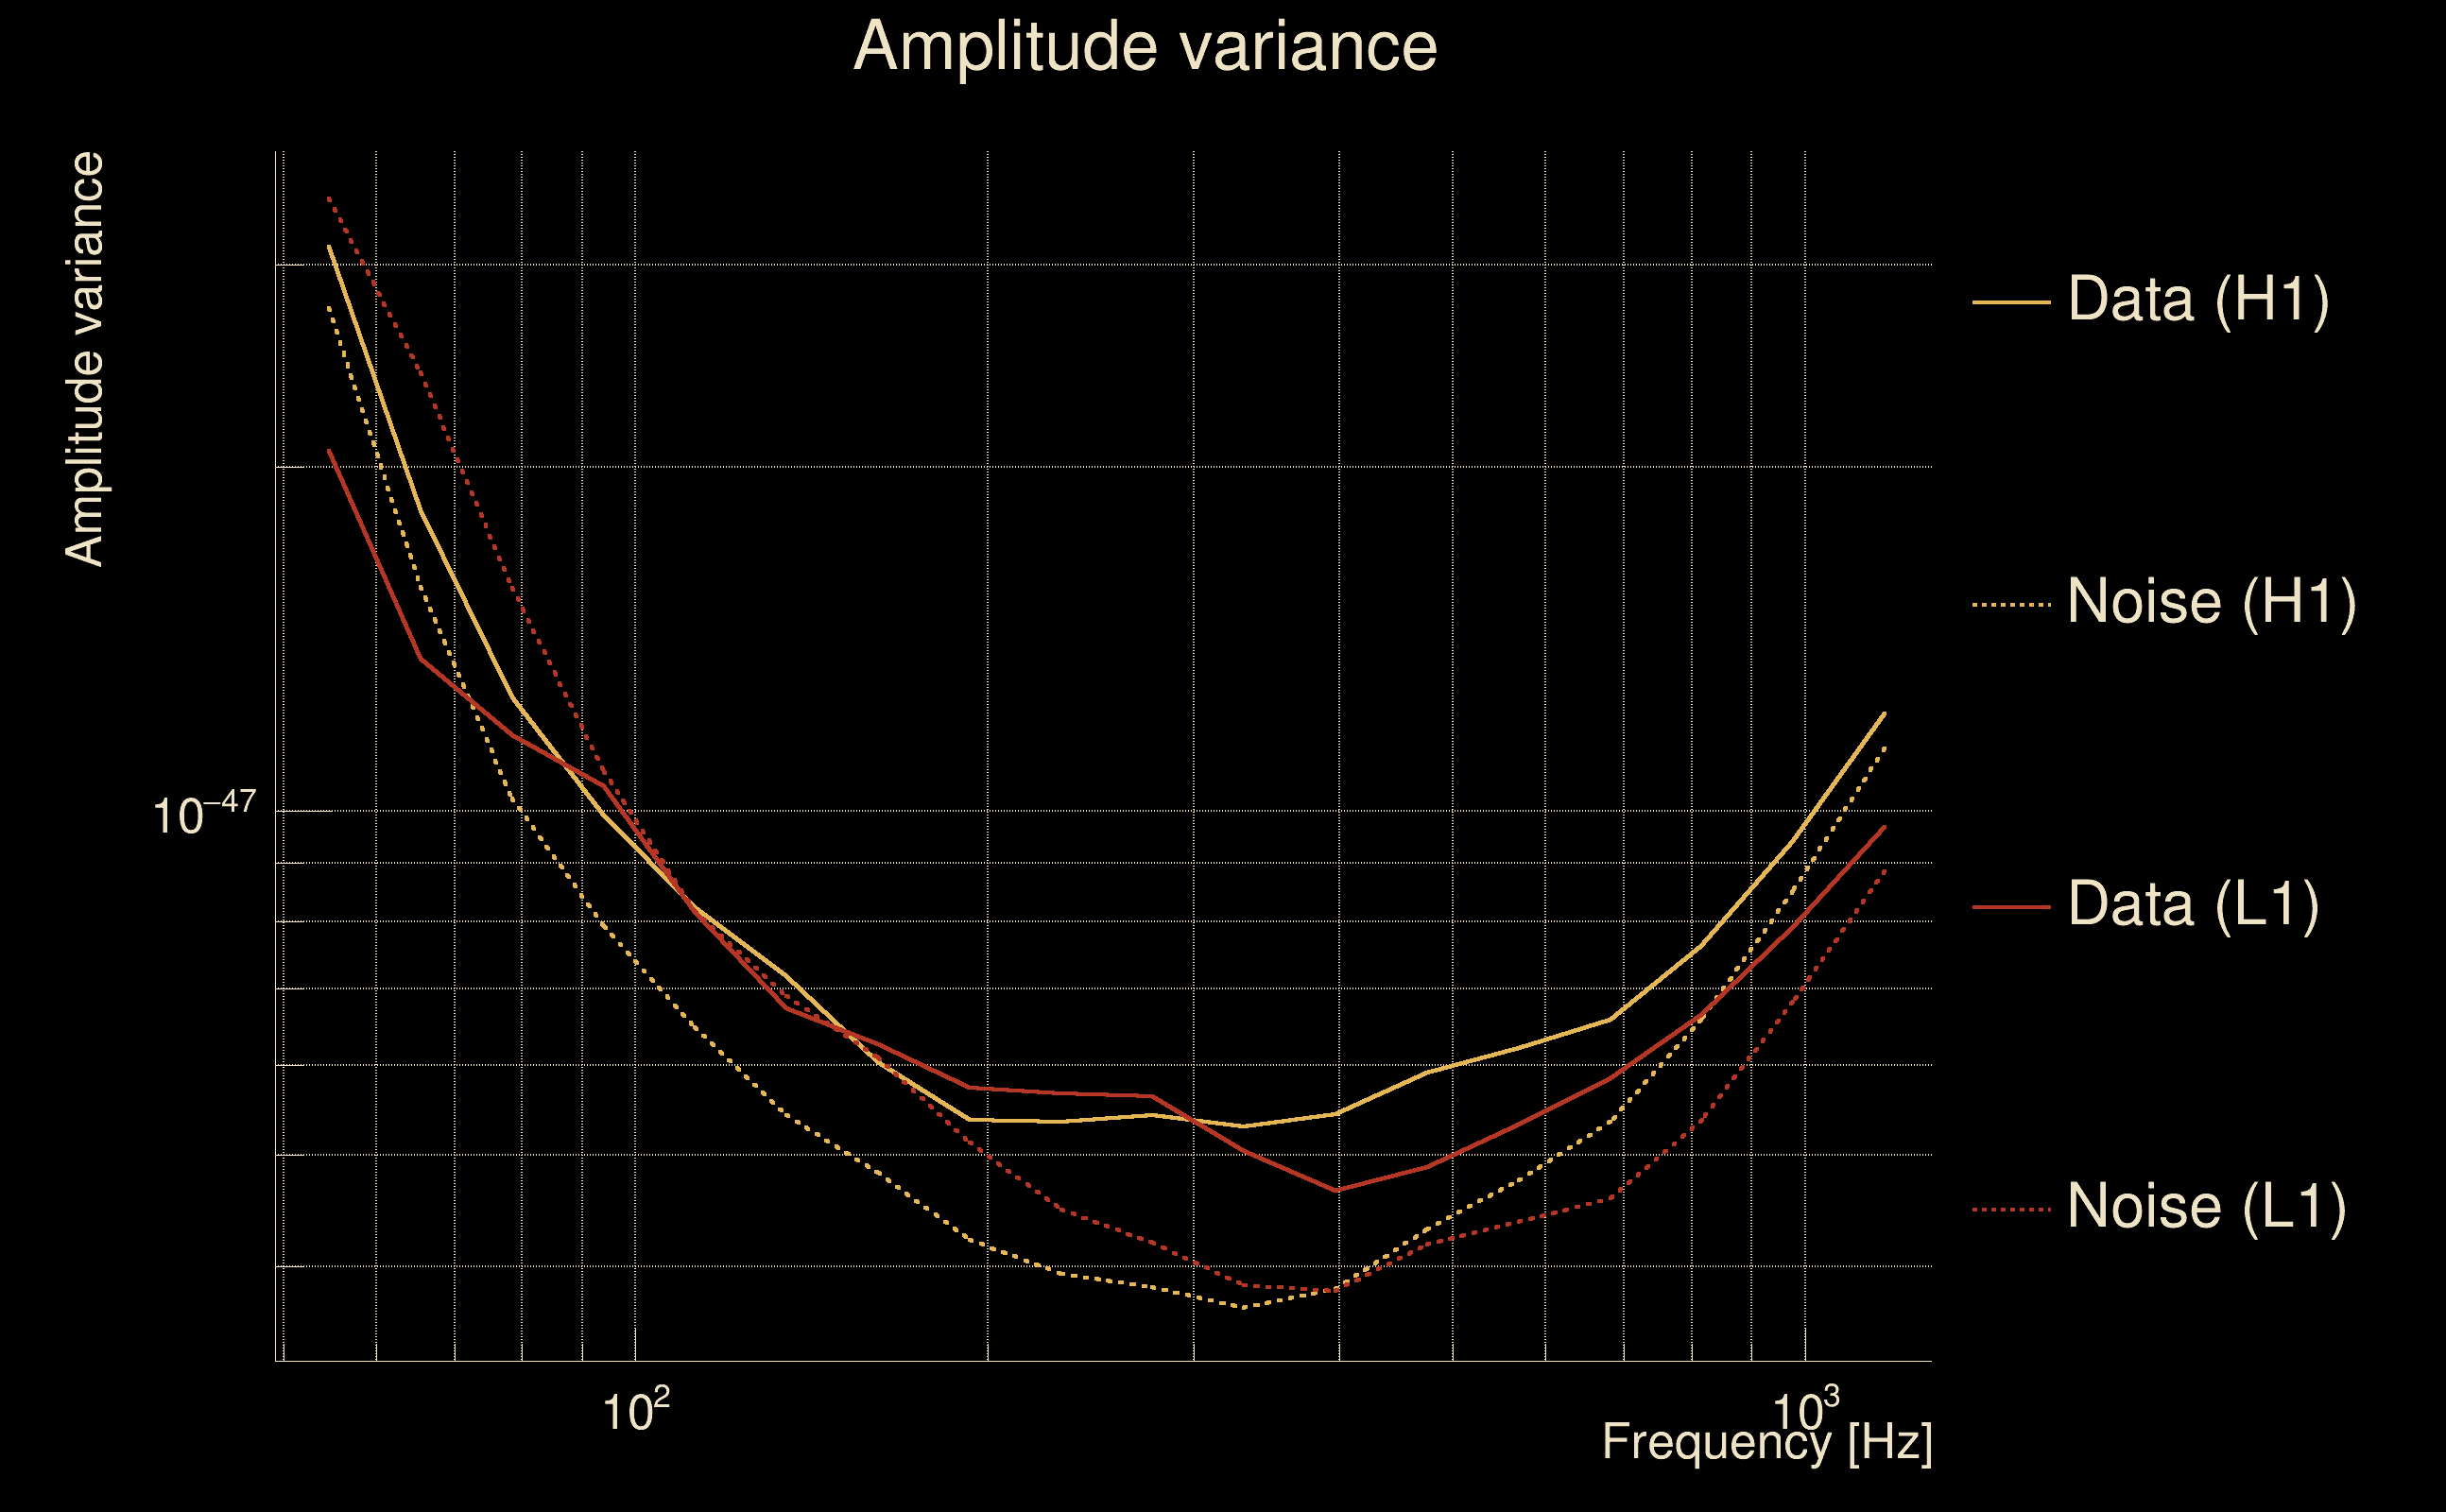
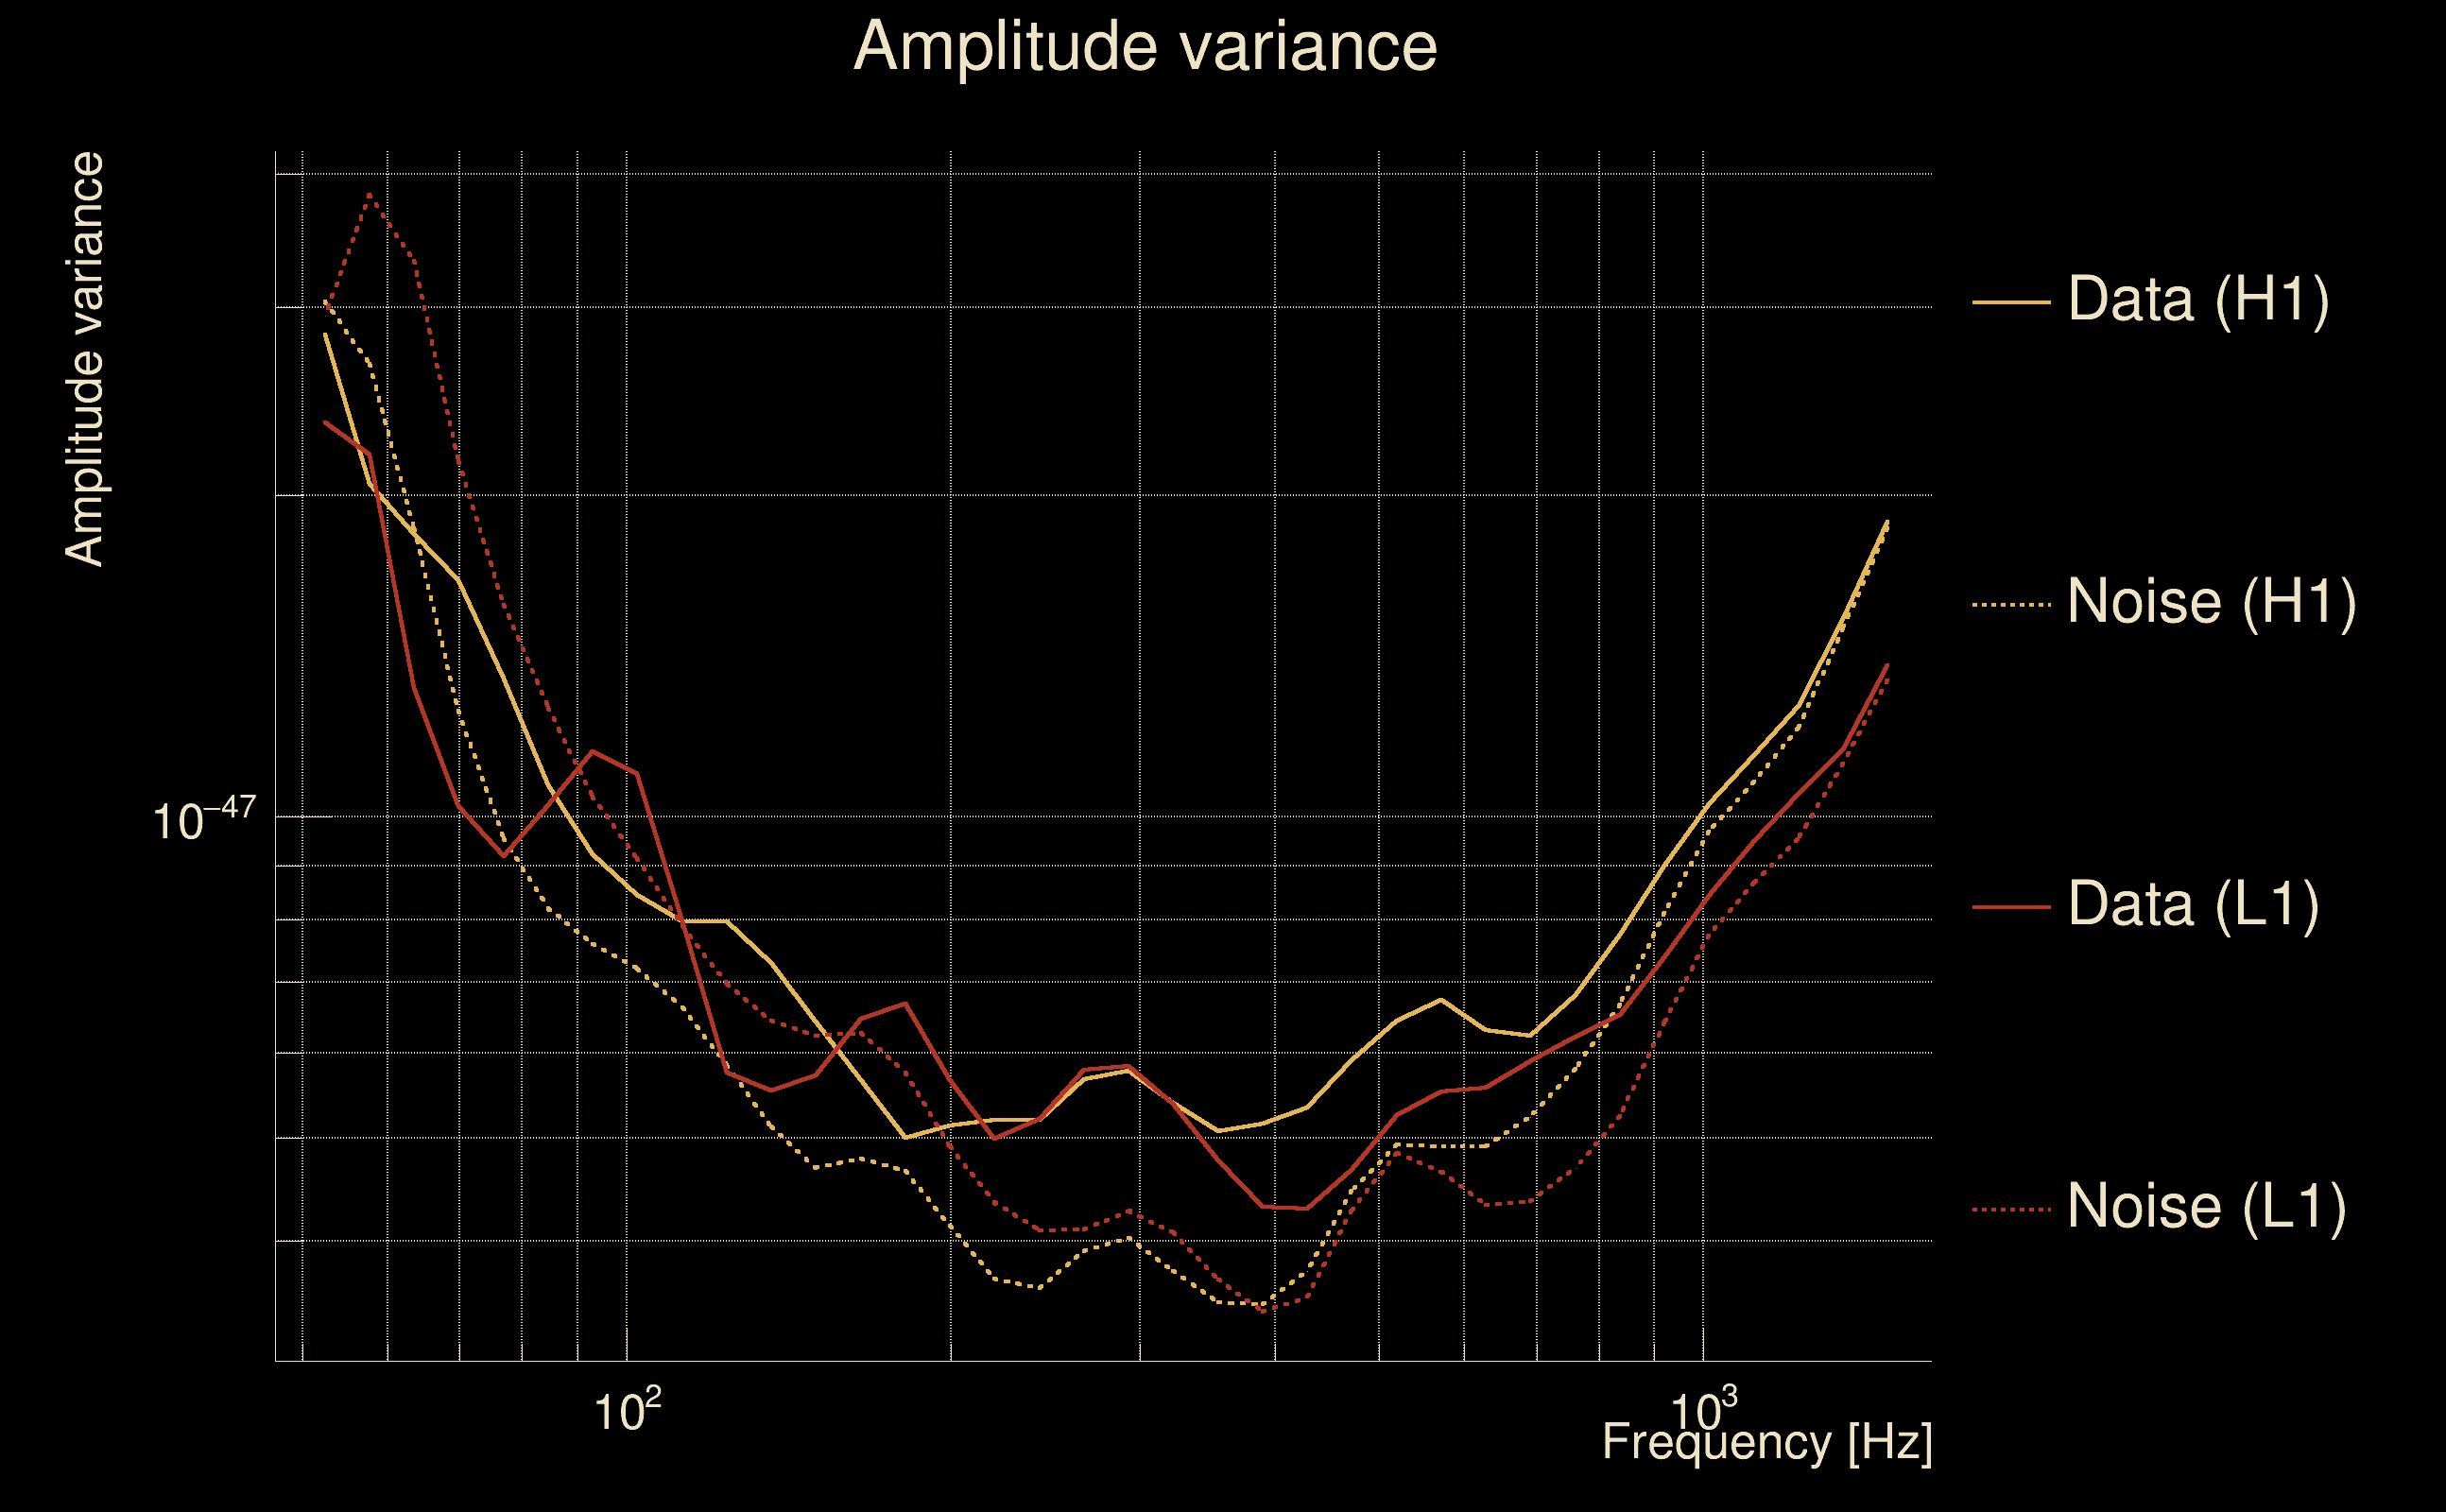
| Amplitude spectrograms: | normalization = 1e-22, power index = 2 |
| White noise SNR variance: | 0.523175 (after applying a correction factor = 1) |
| Amplitude ratio confidence level: | 3 sigma |
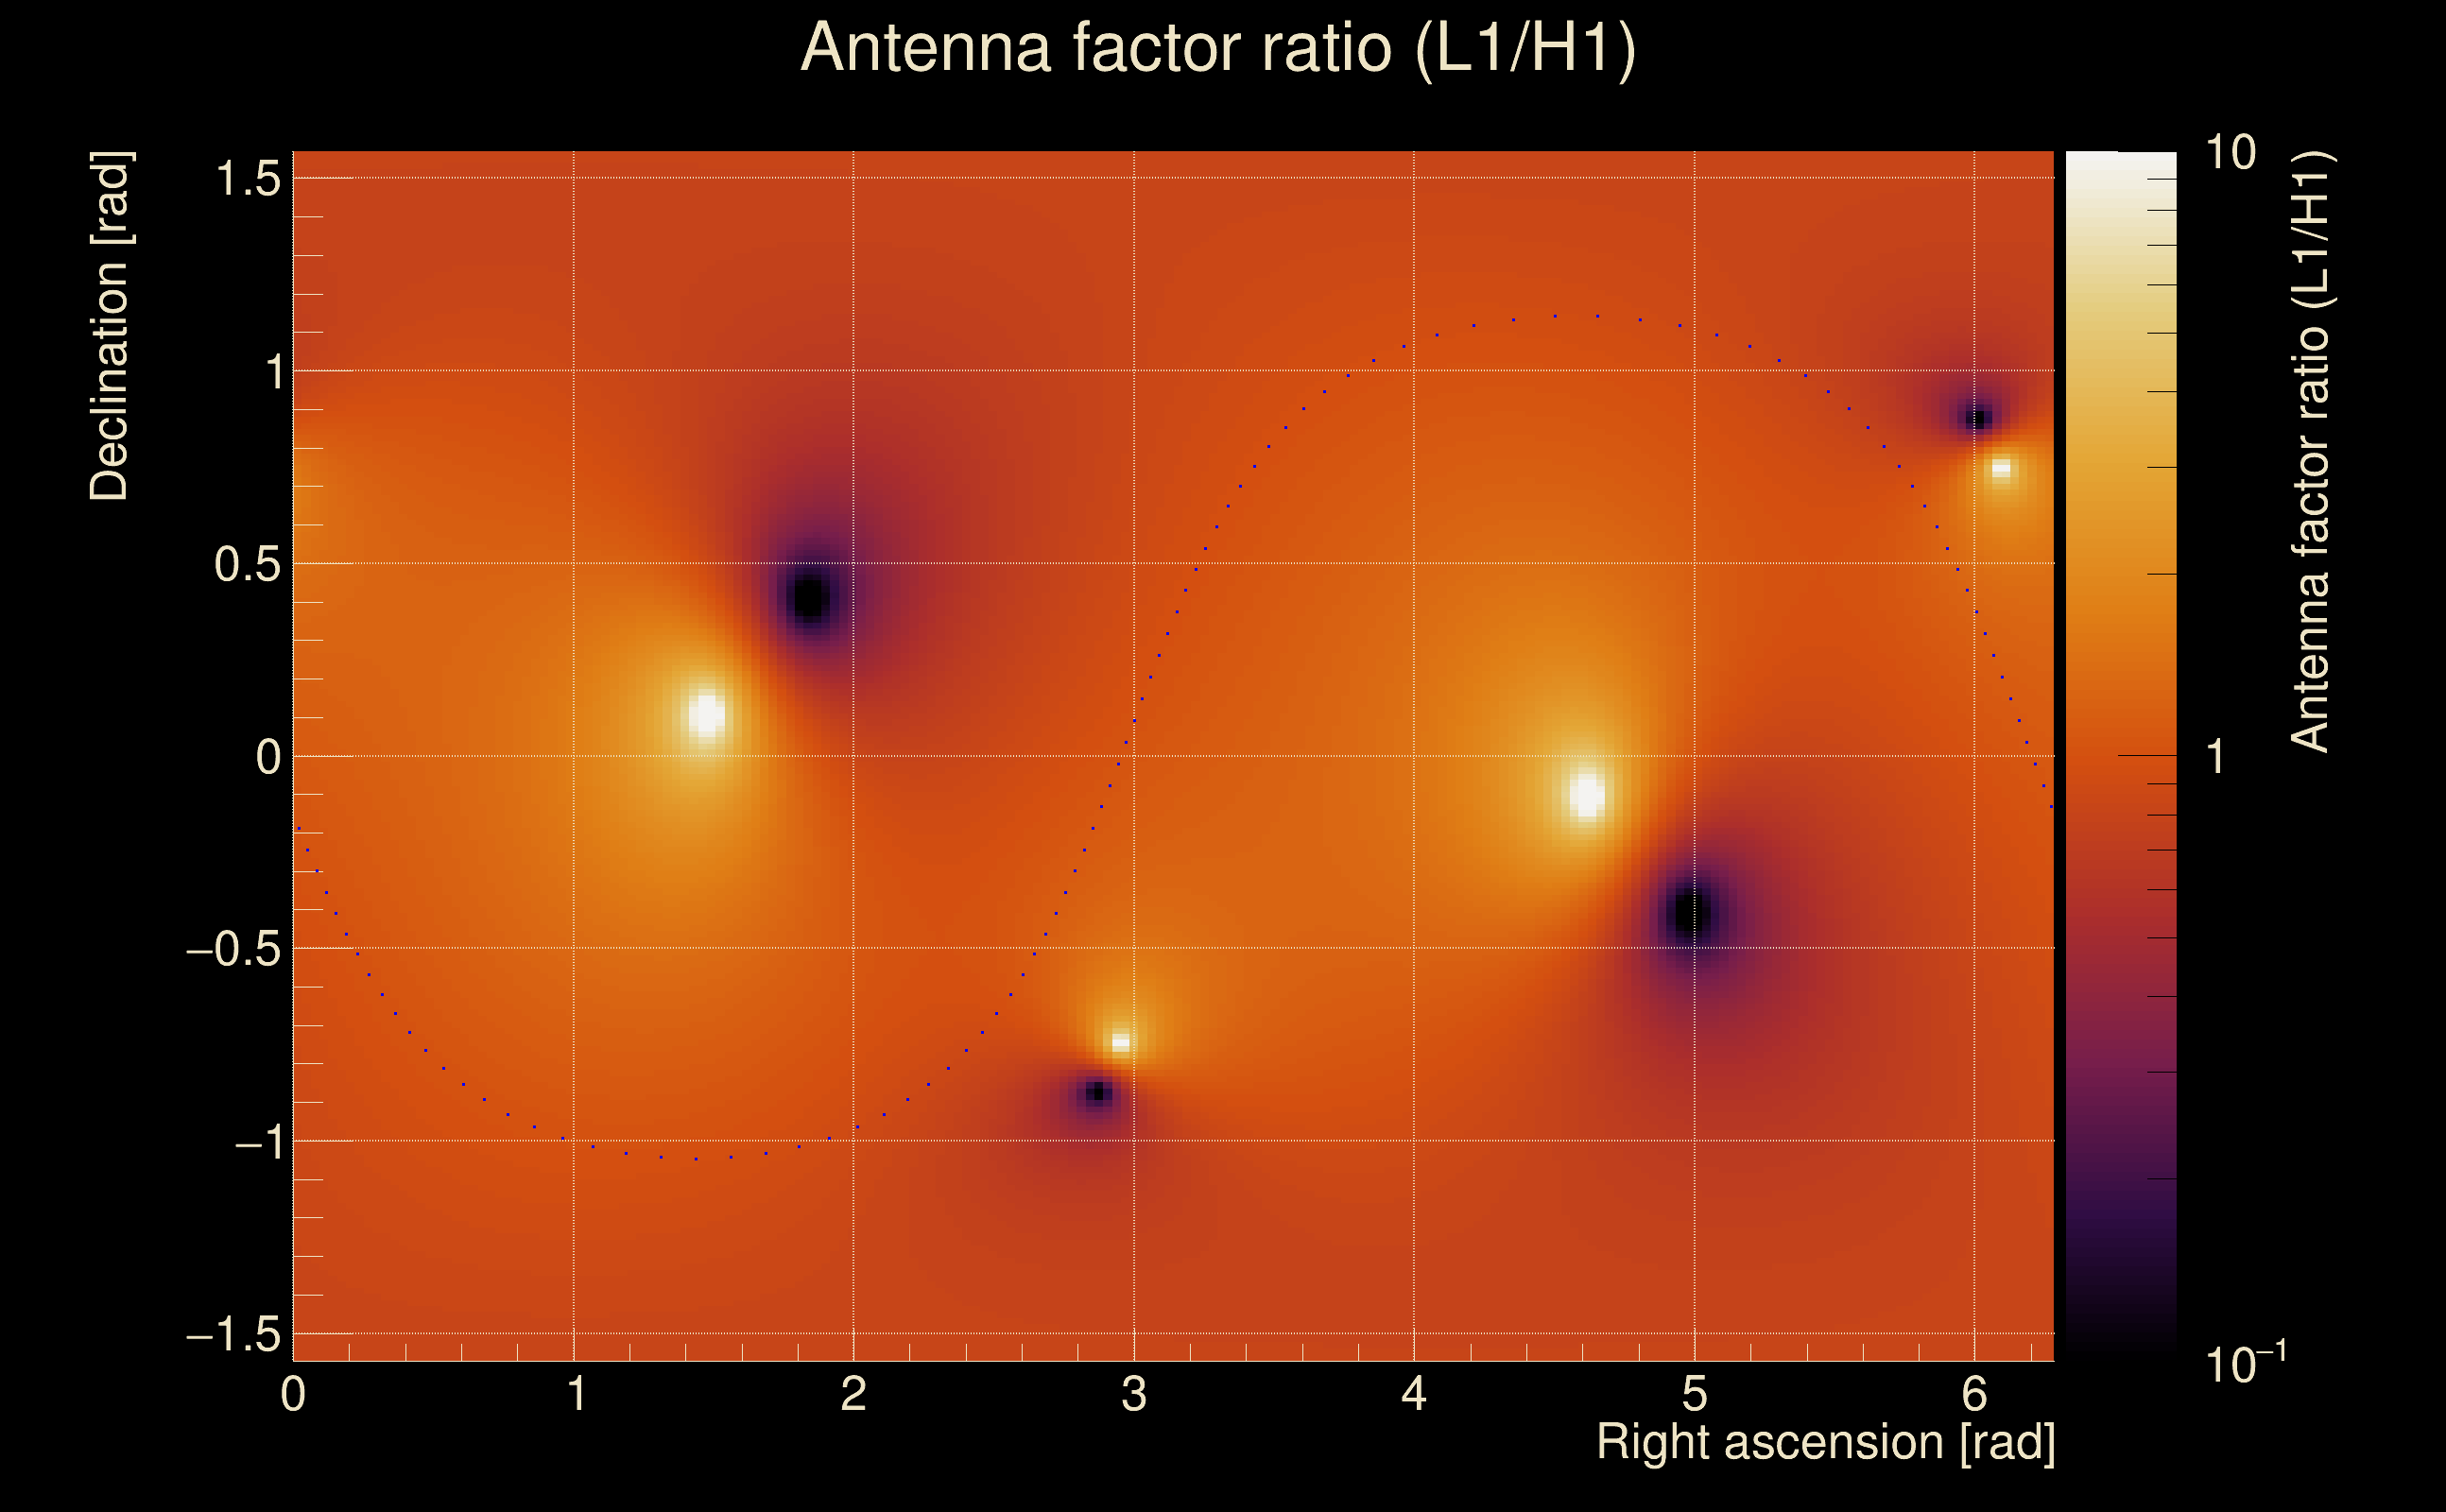
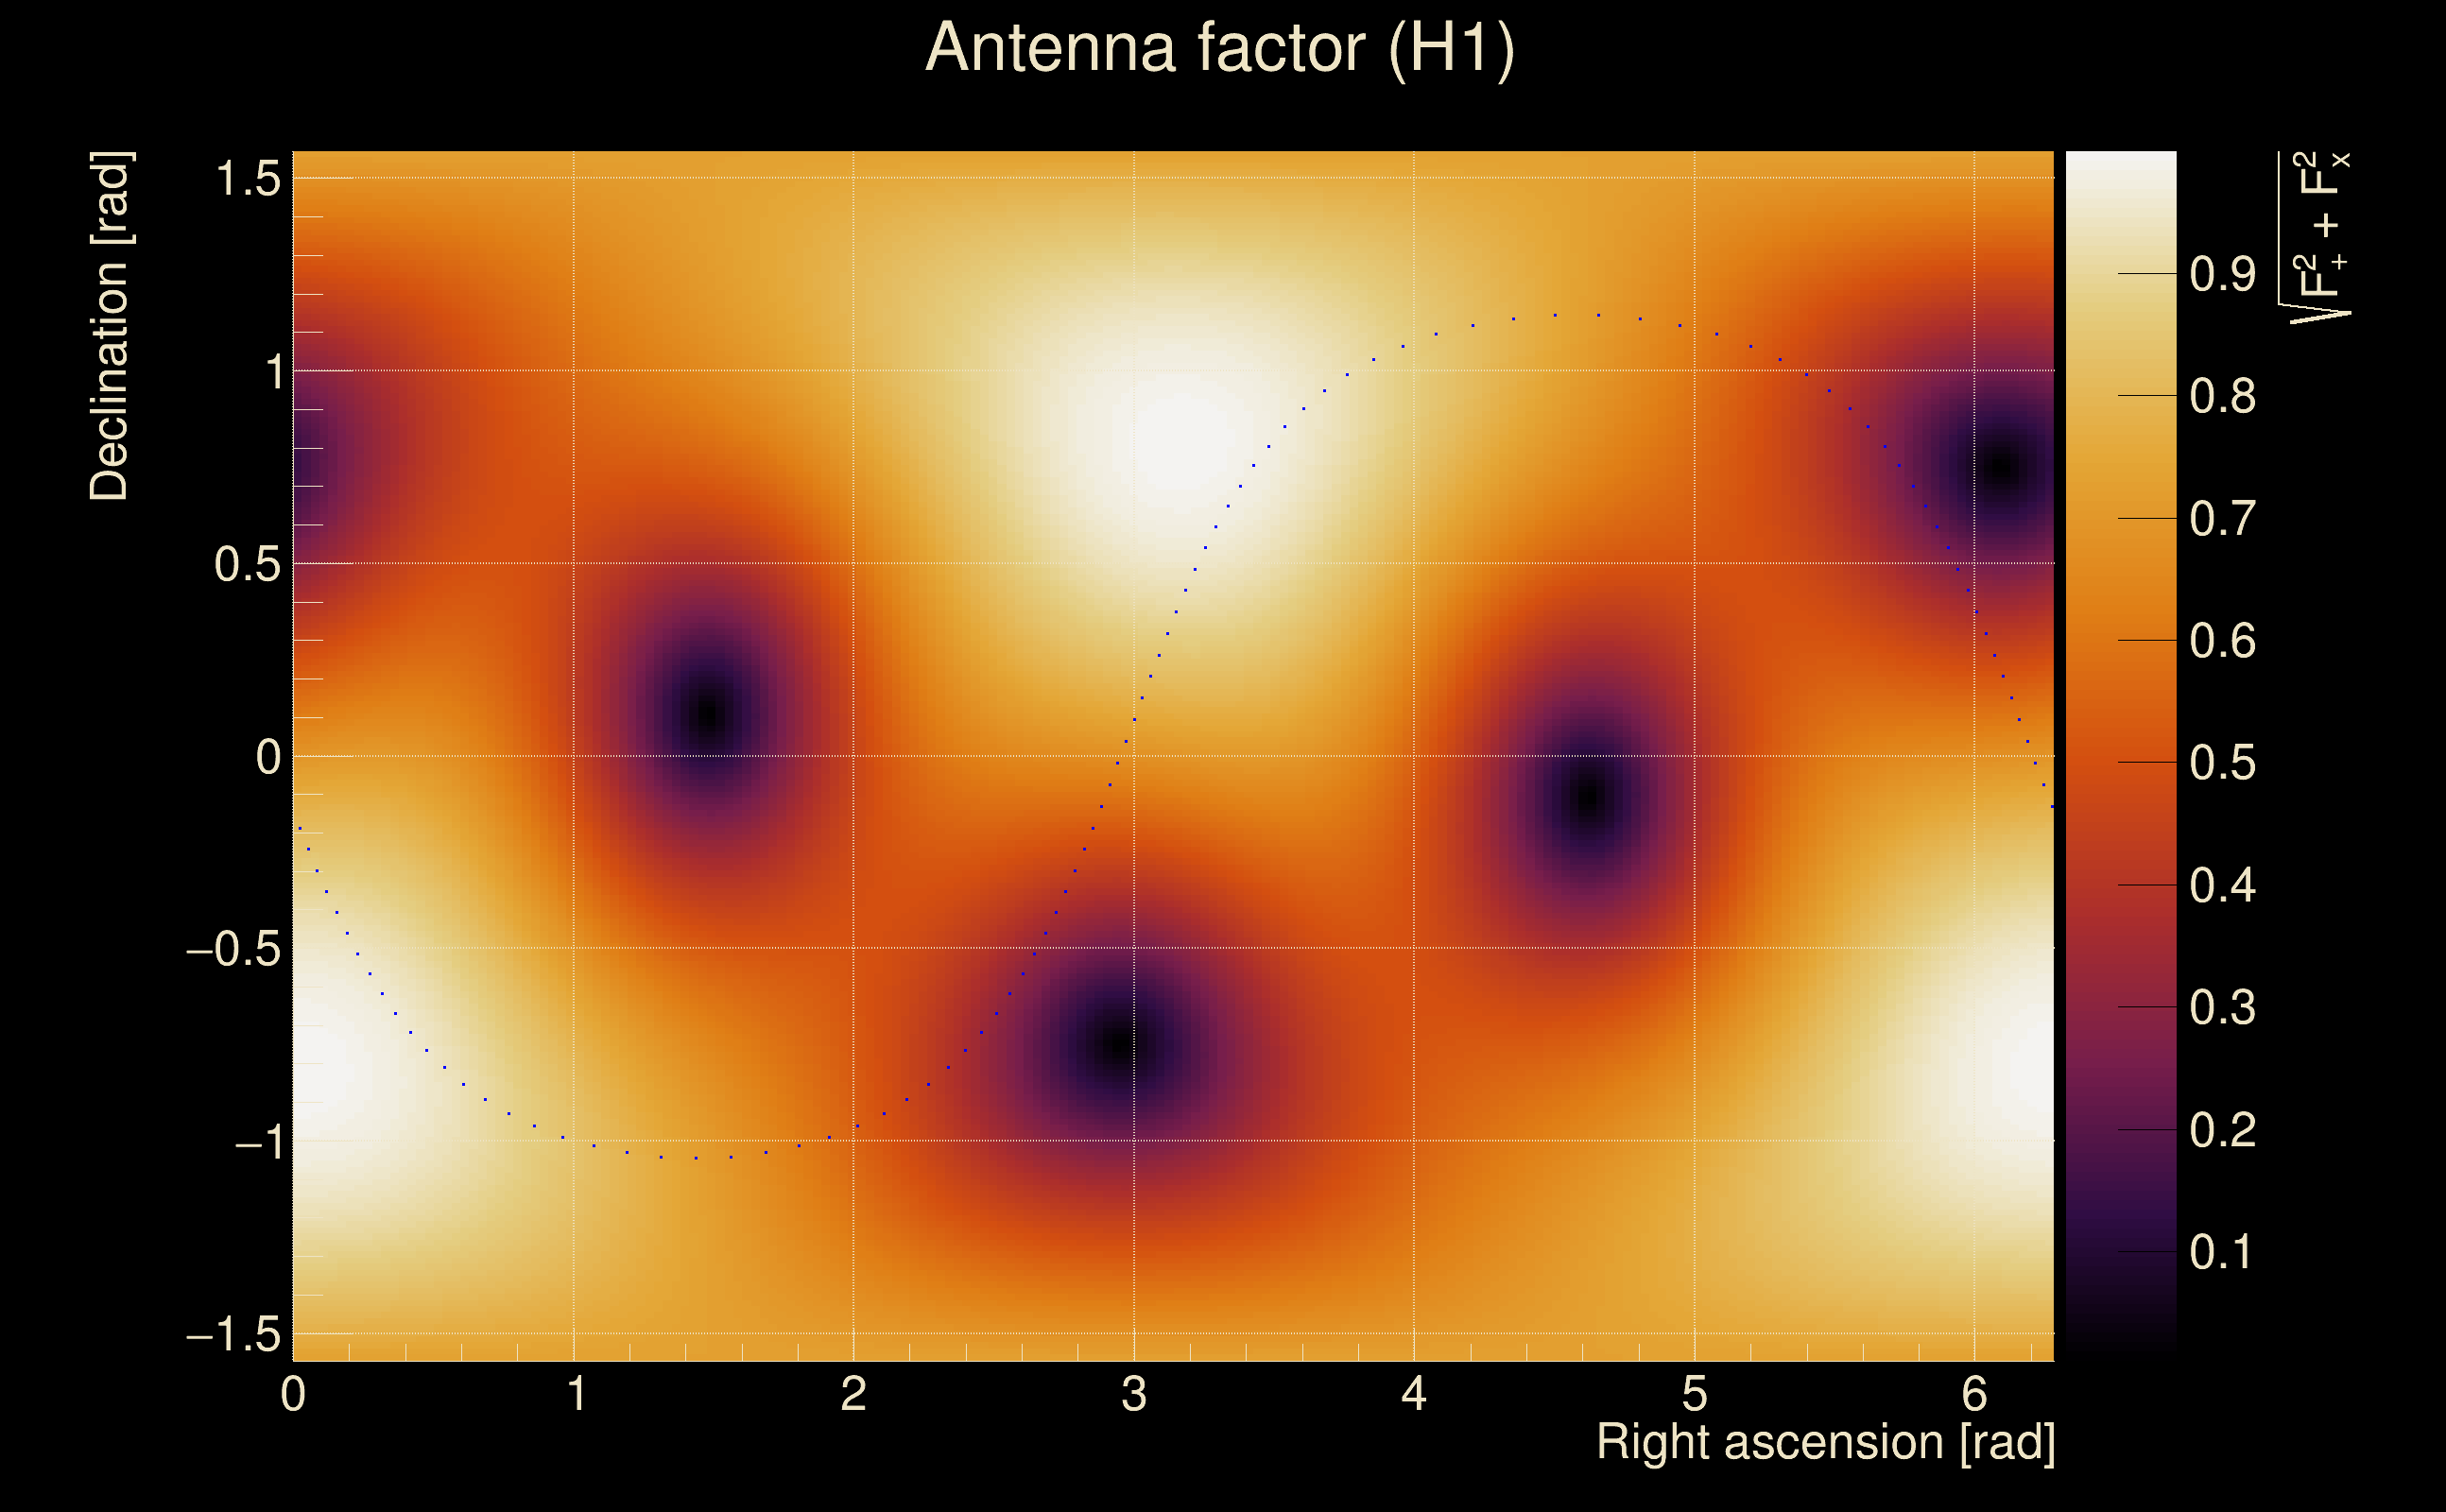
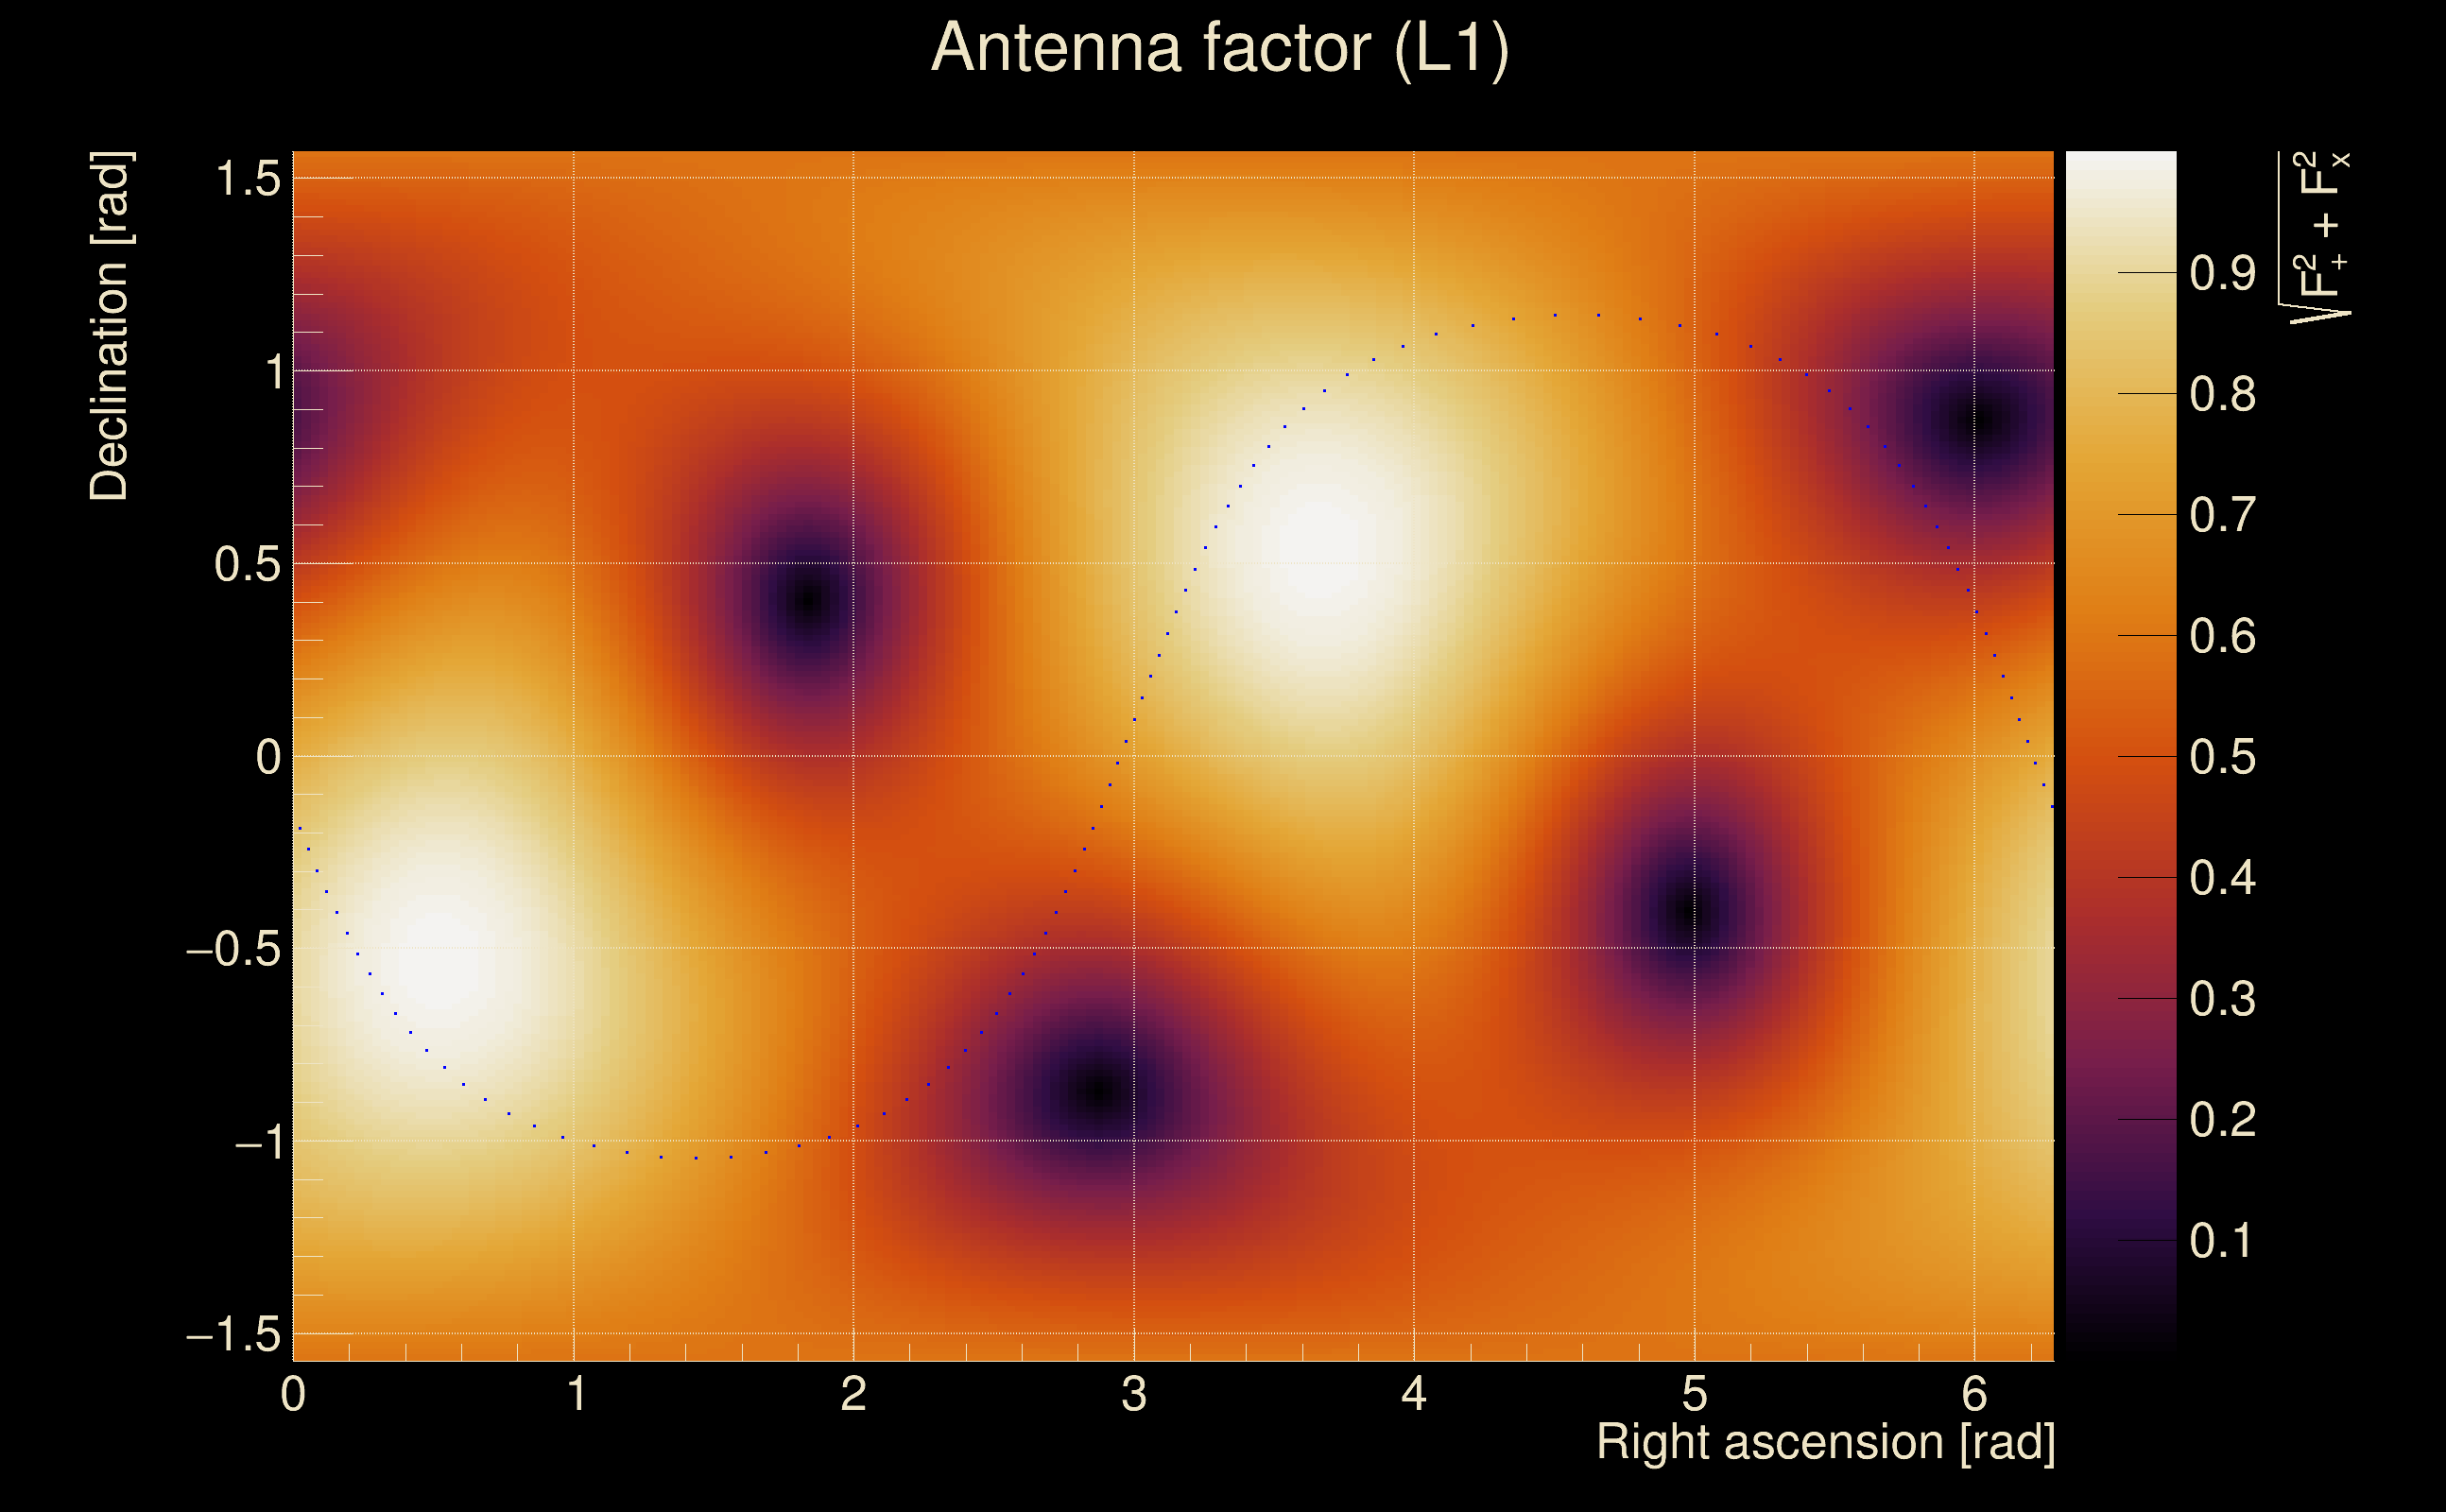
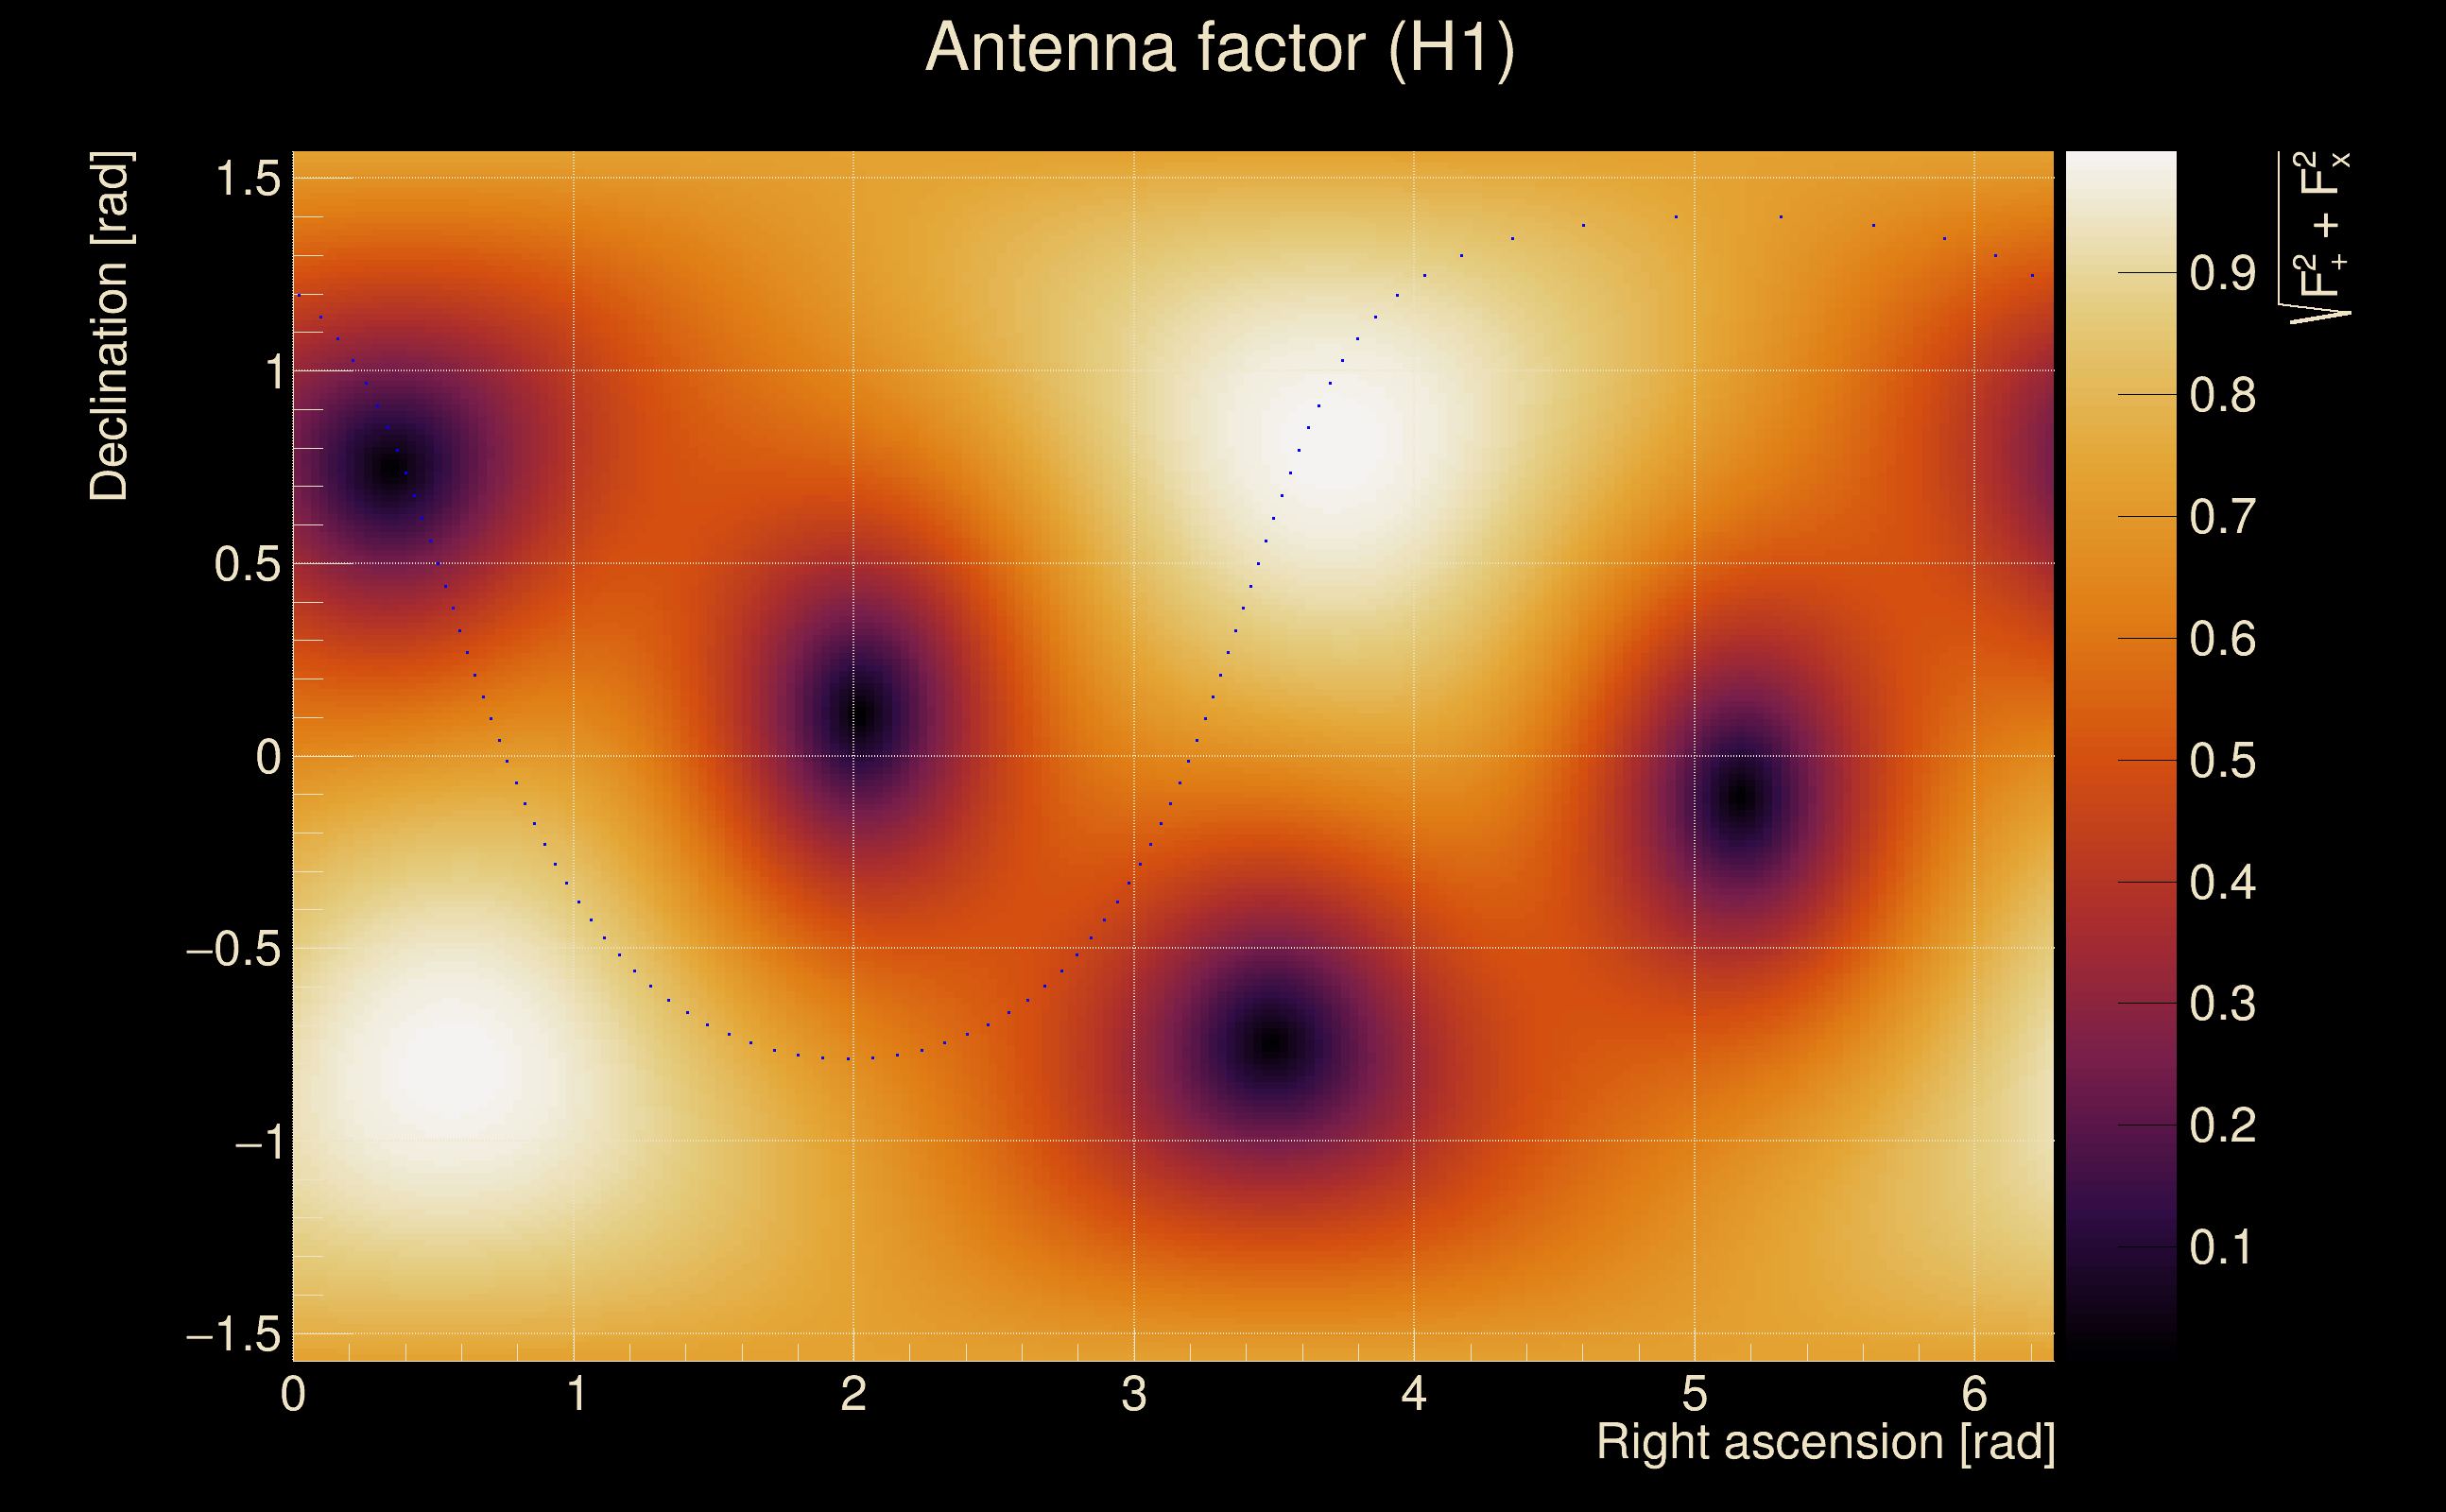
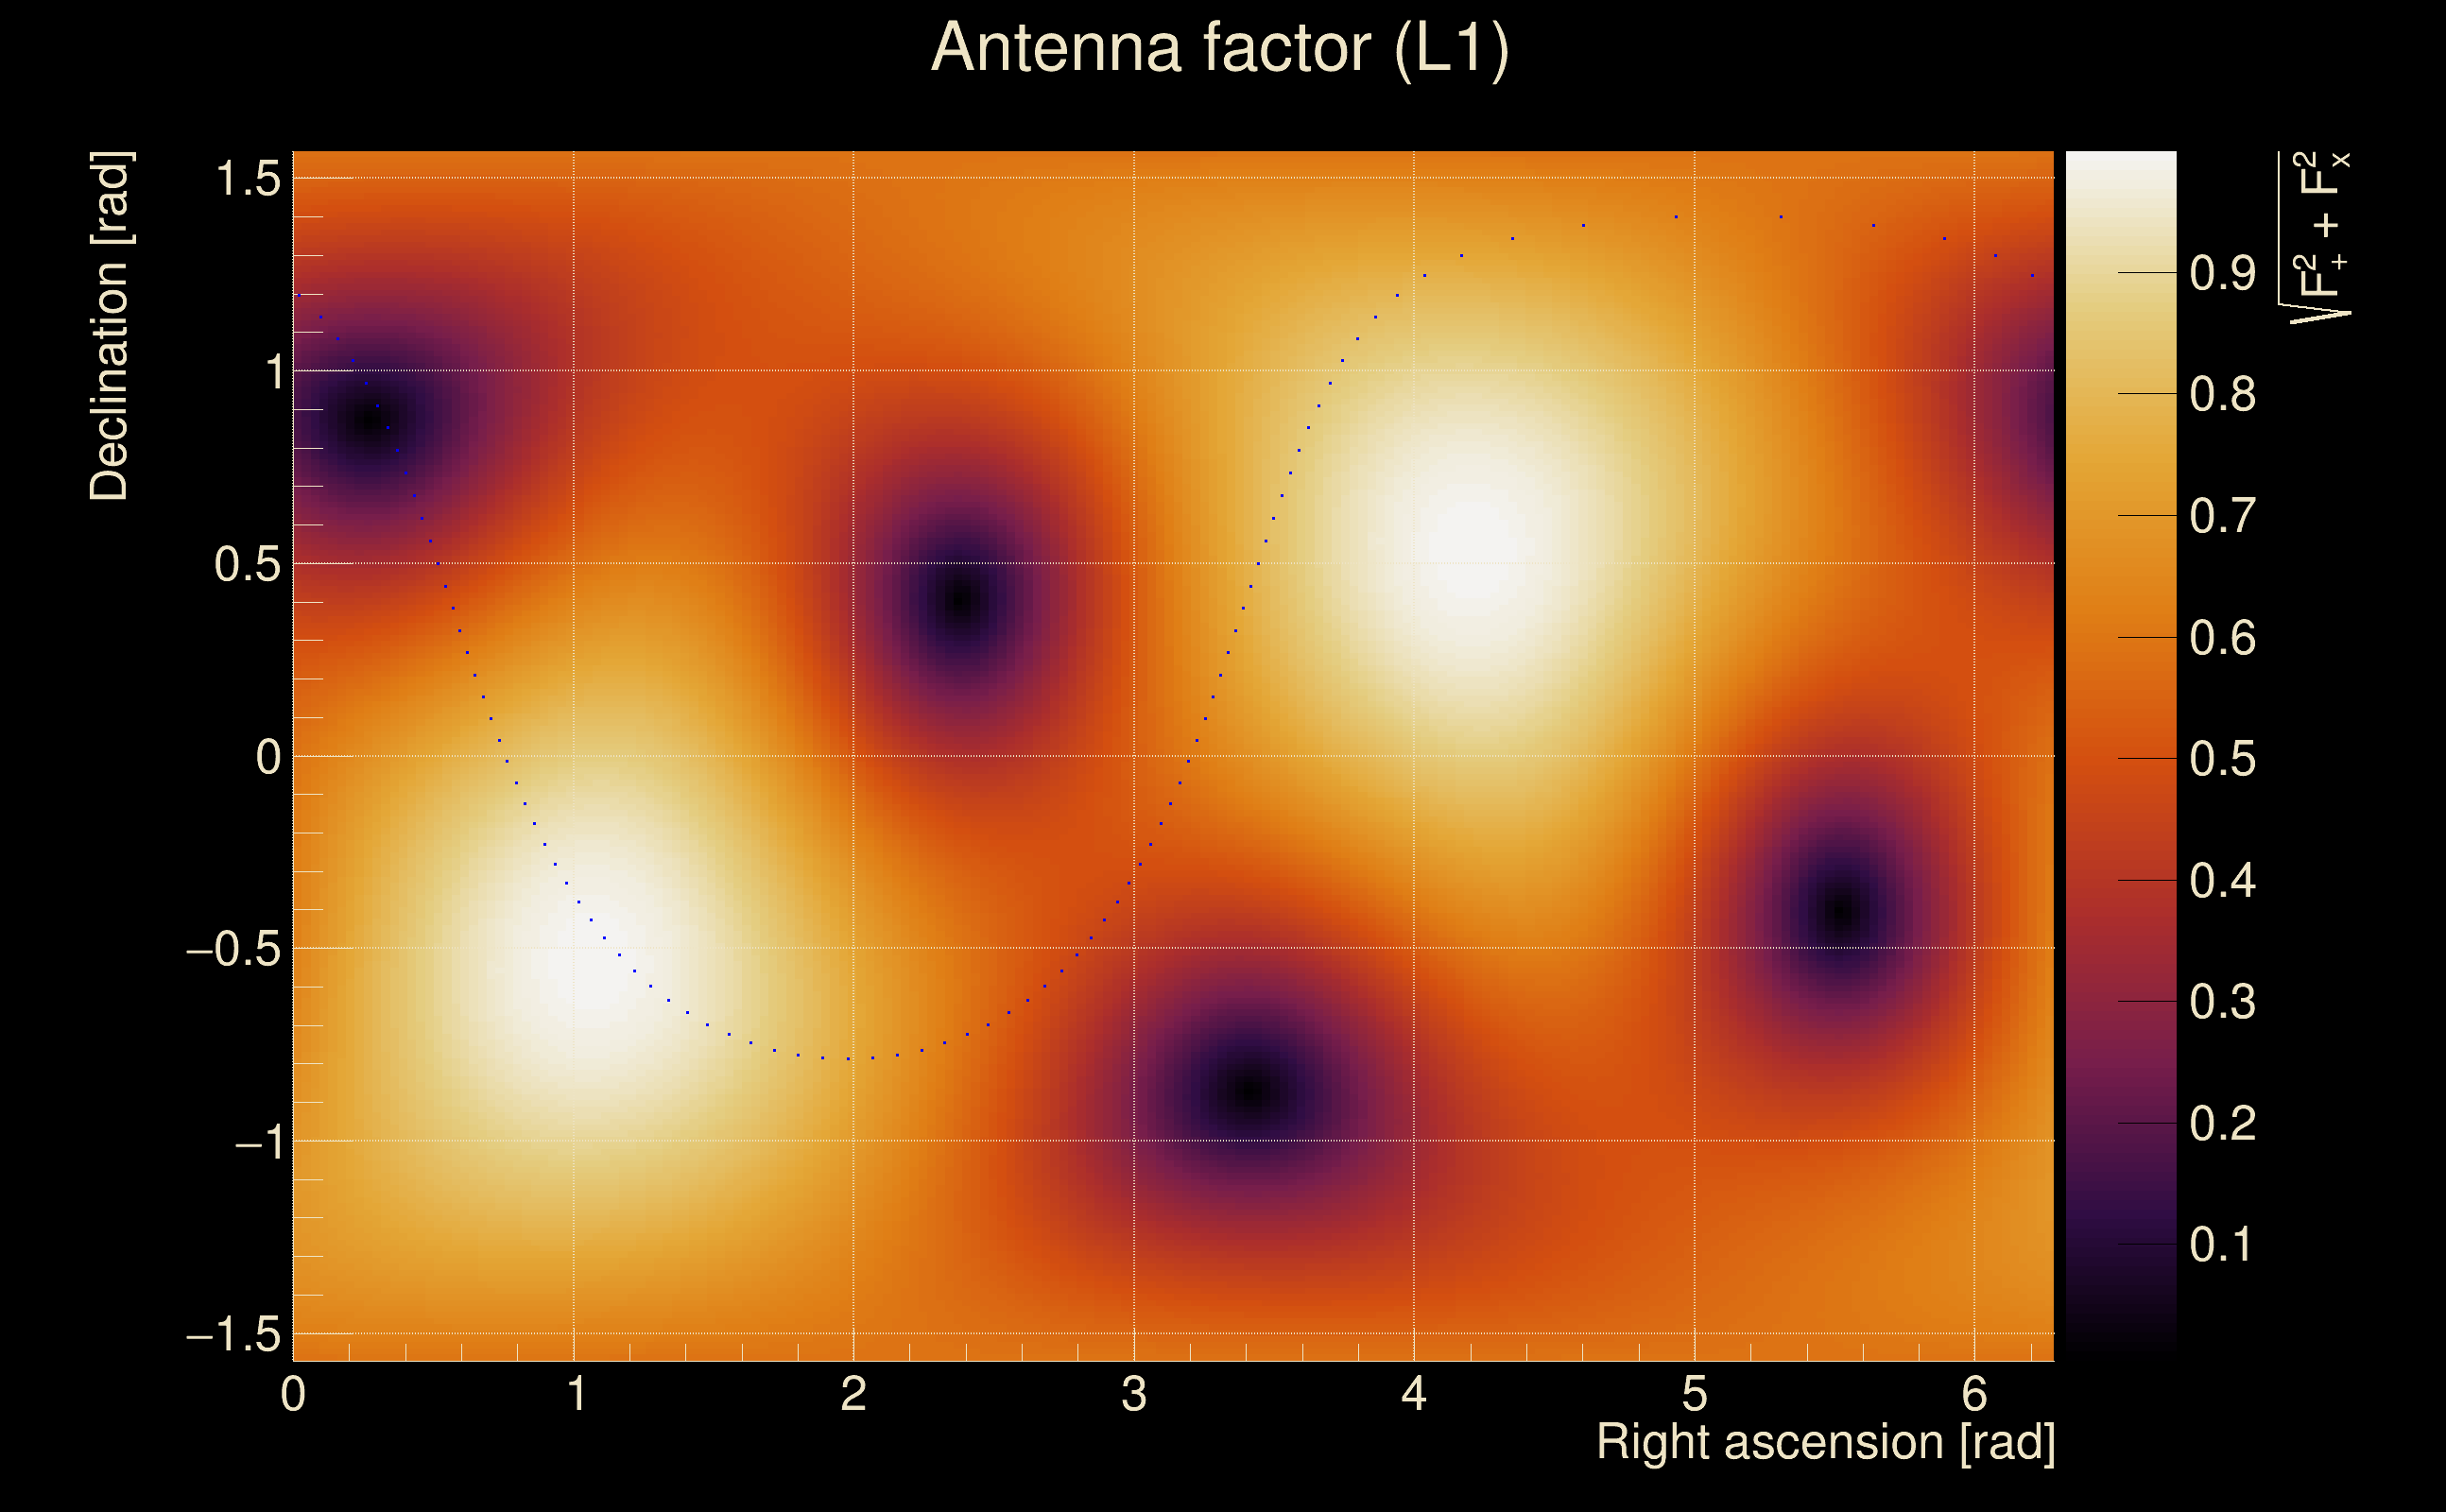
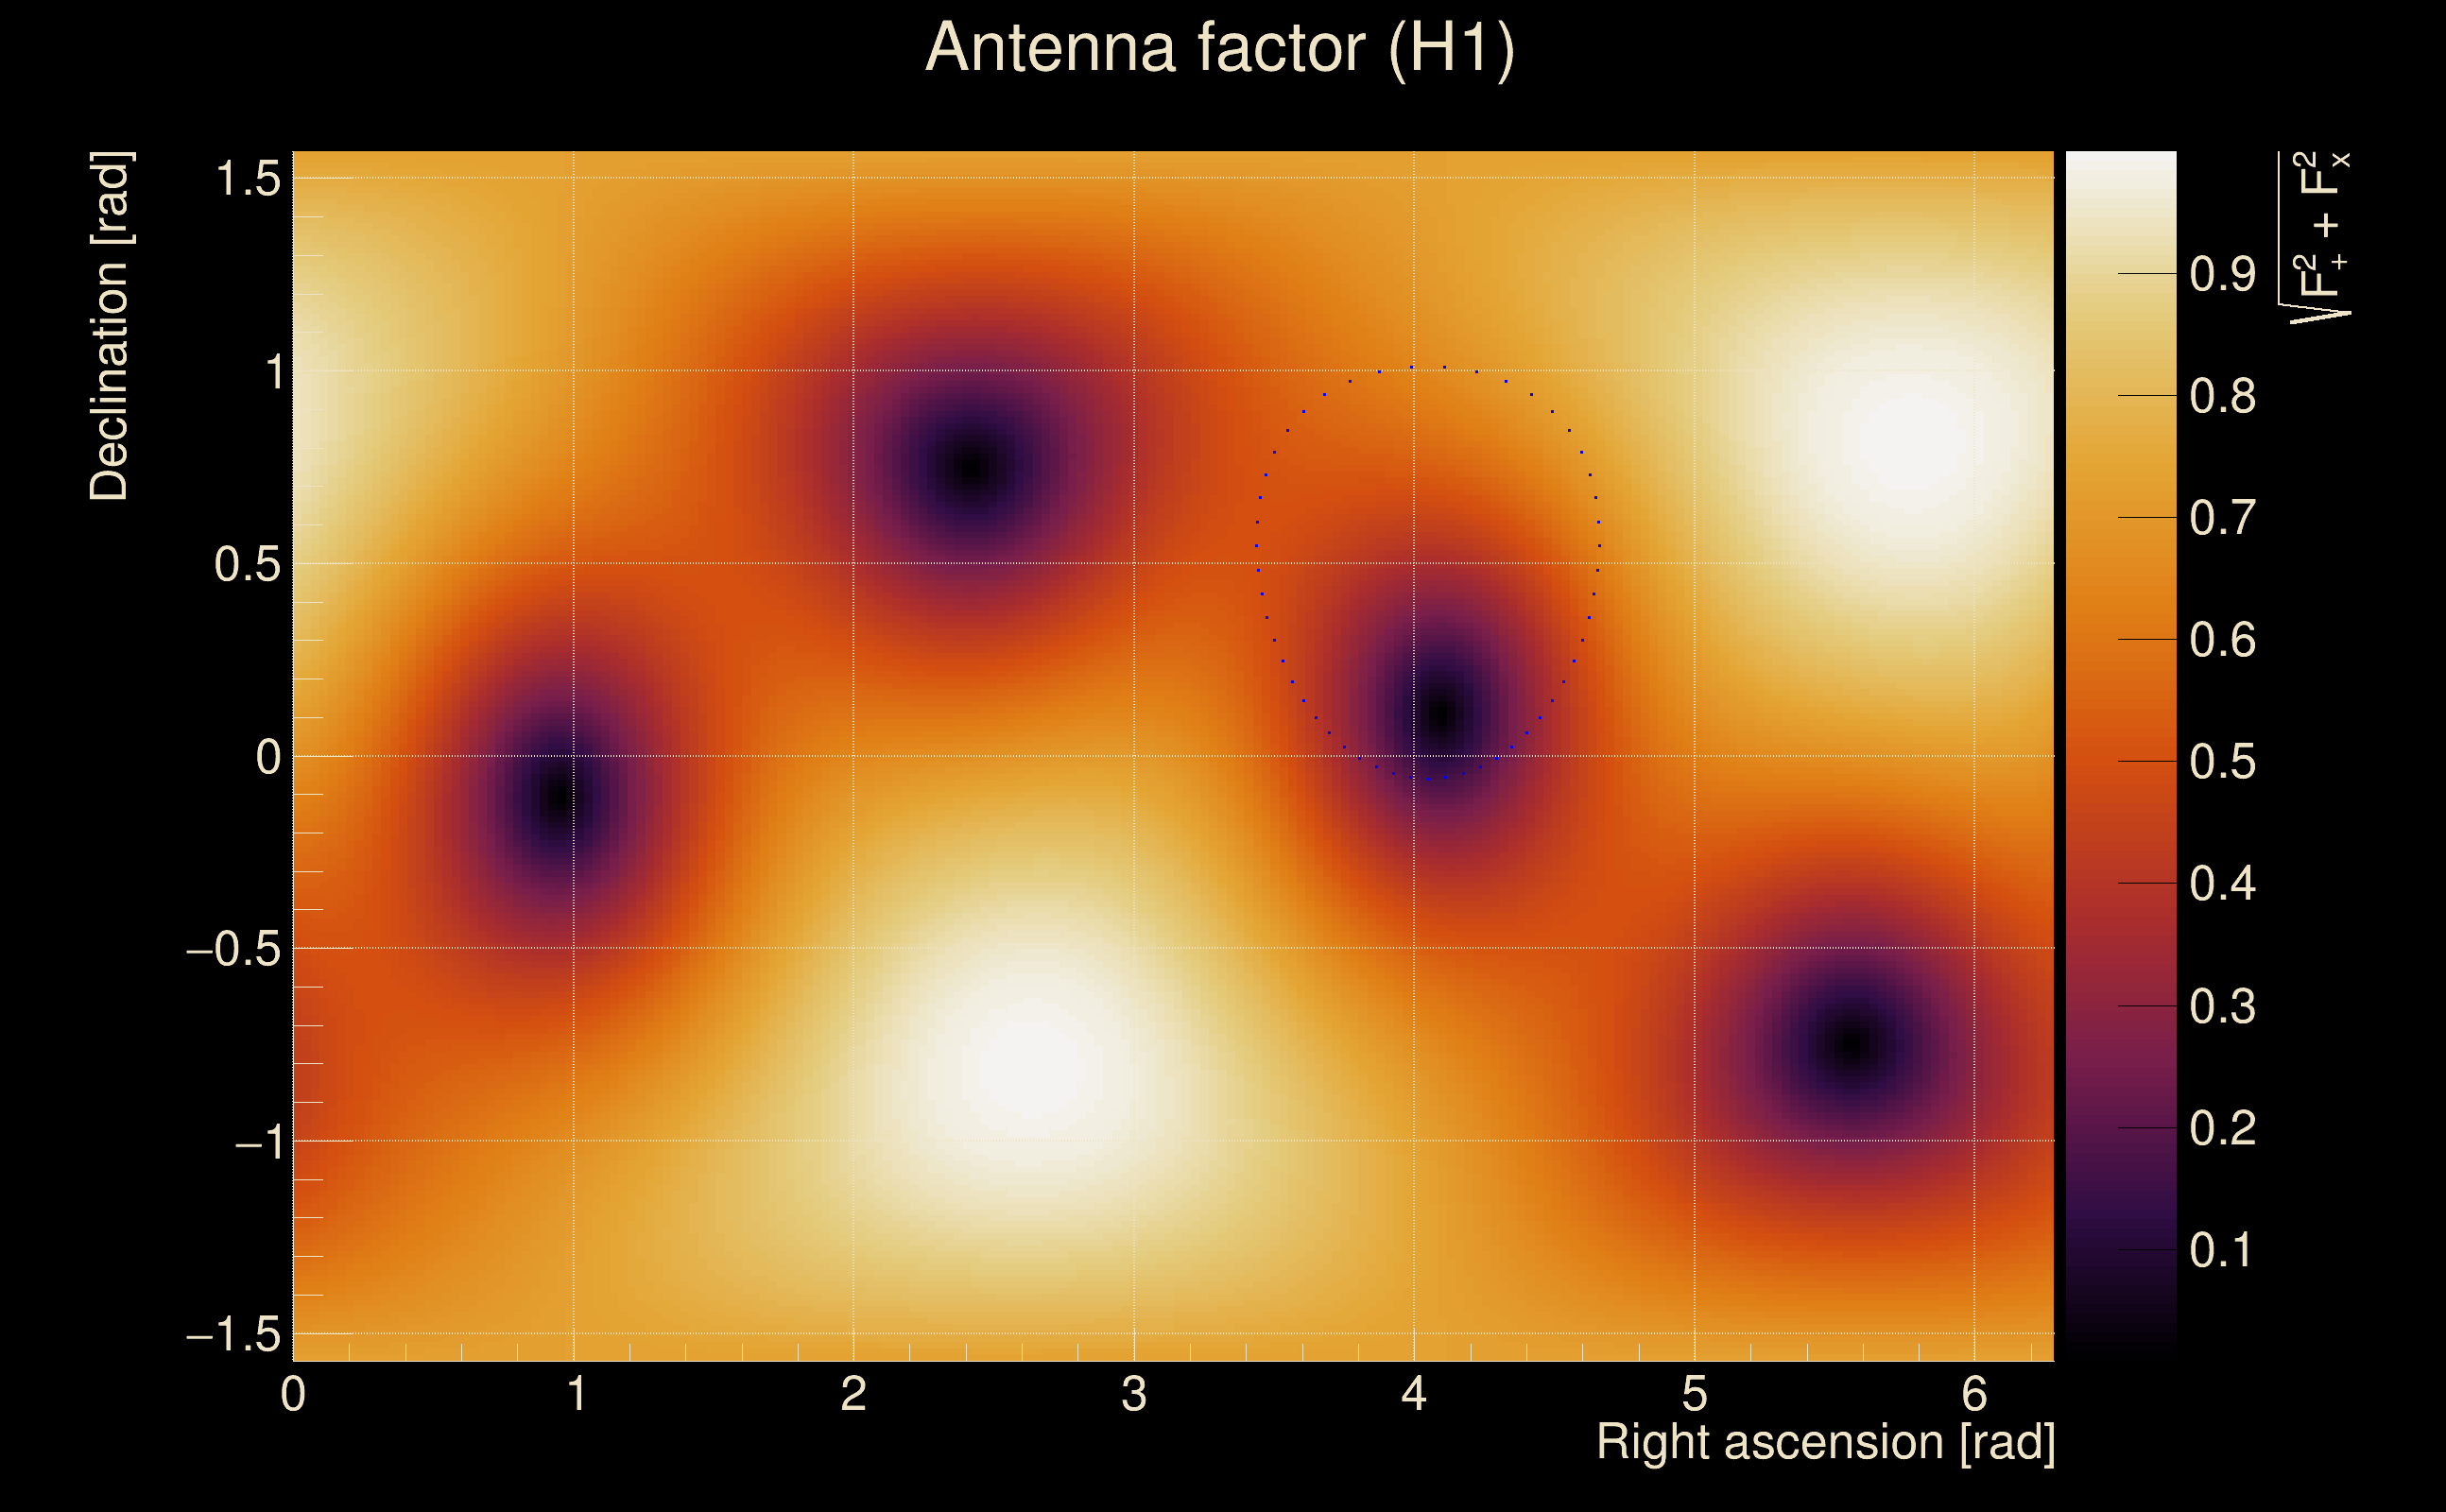
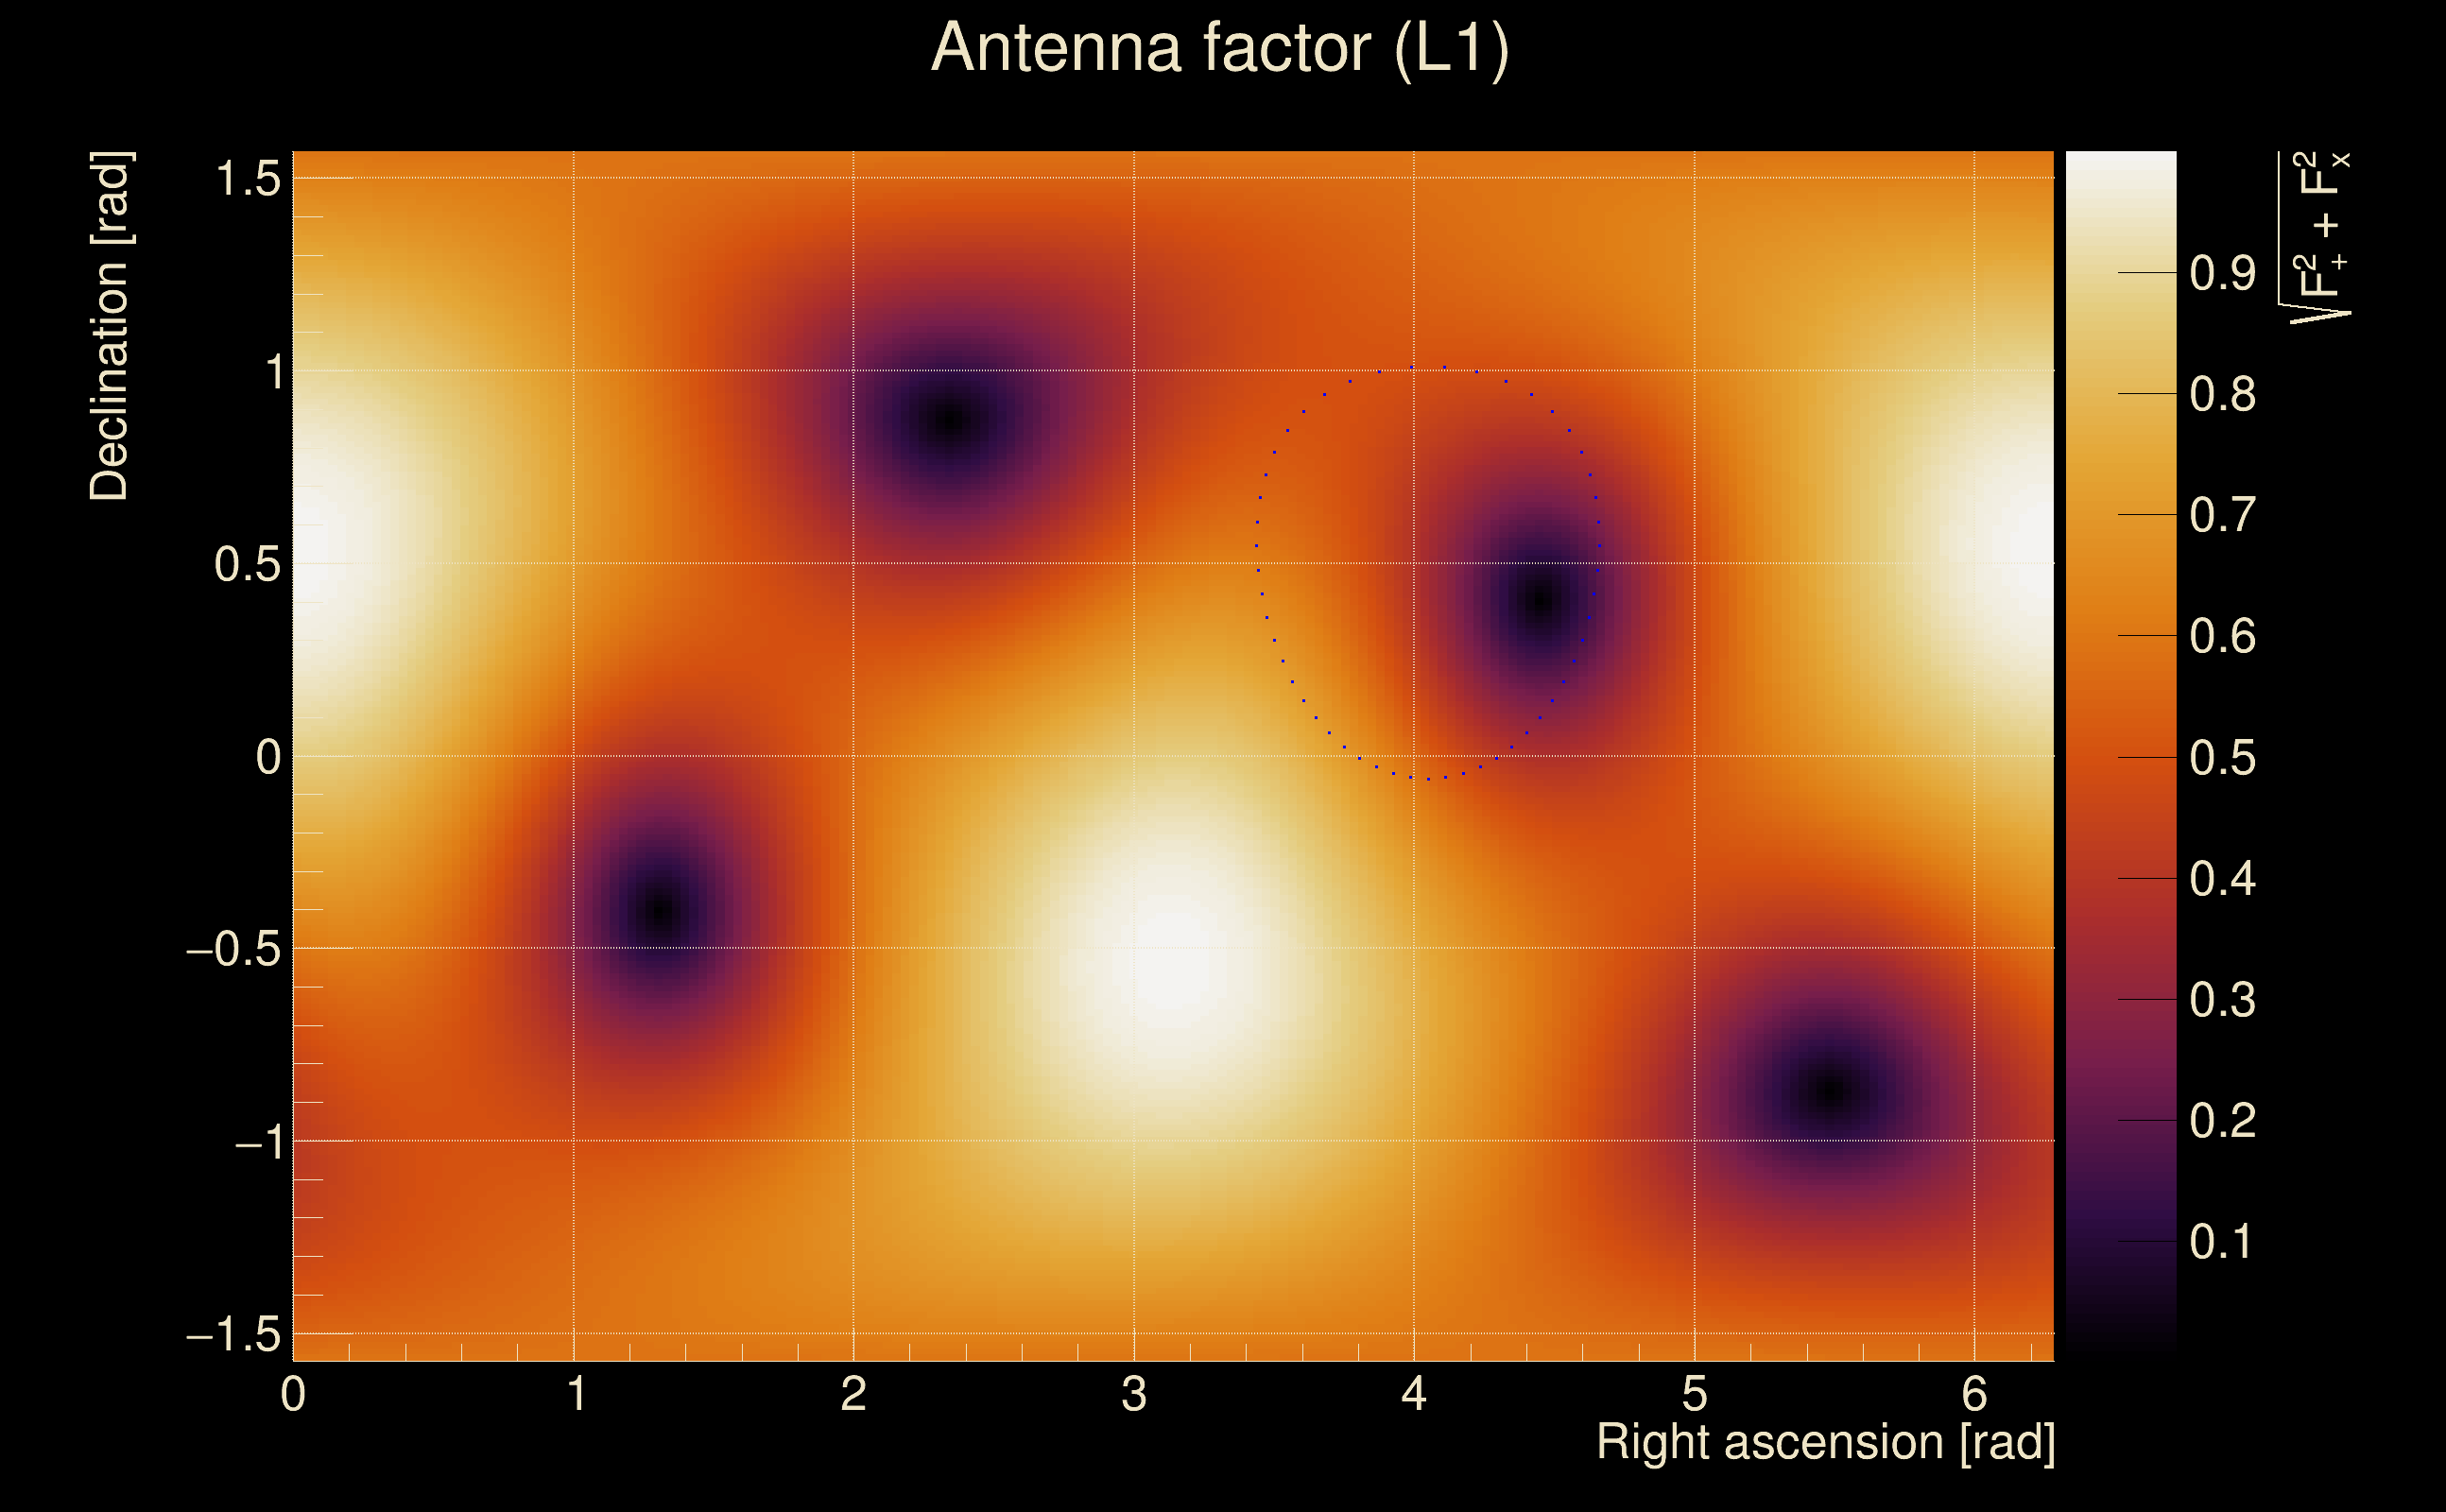
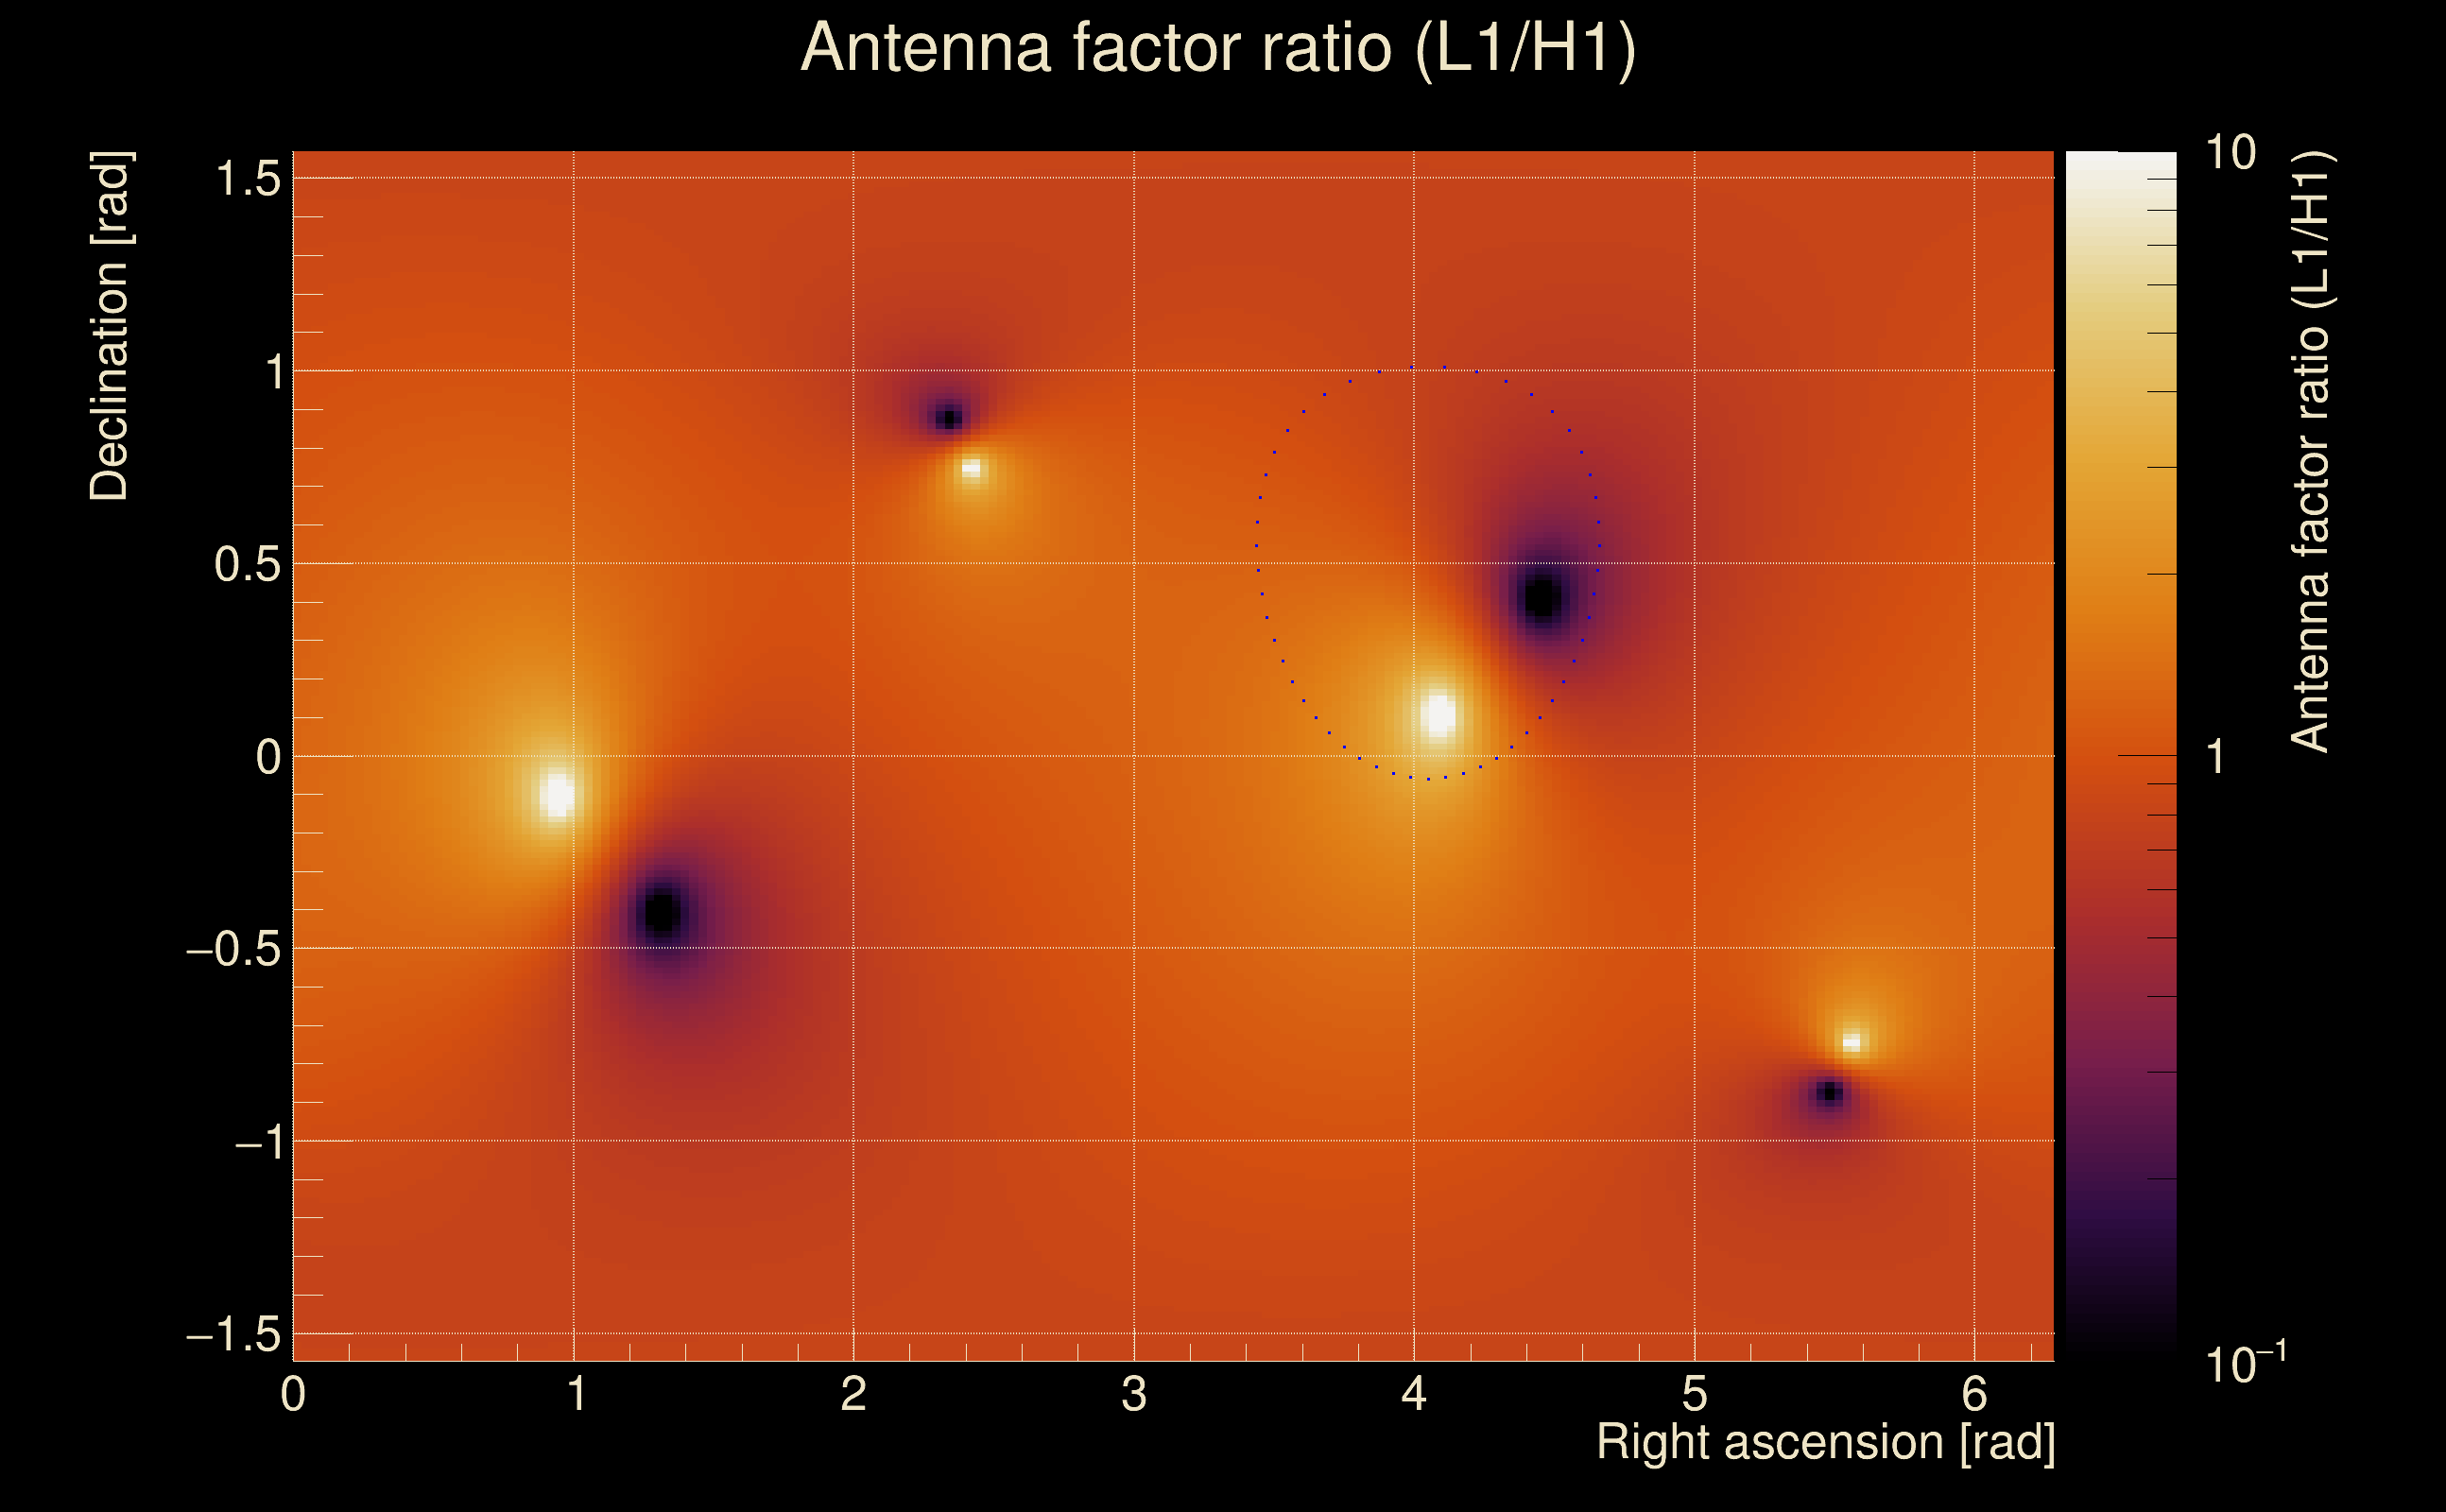
| Target sky positon: | Ra: 3.68109, Dec: 0.94792 [rad] |
| List of input Ox files: | TargIxf_feb2026_SN6_30s_file_list.txt (71 files) |
| Analysis result file: | TargIxf_feb2026_SN6_30s_results-0.root |
| Slice selected for the the fakeground: | slice index=121 (-0.598 s), time lag = 0 s |
| Foreground | Fakeground | Background | ||
|---|---|---|---|---|
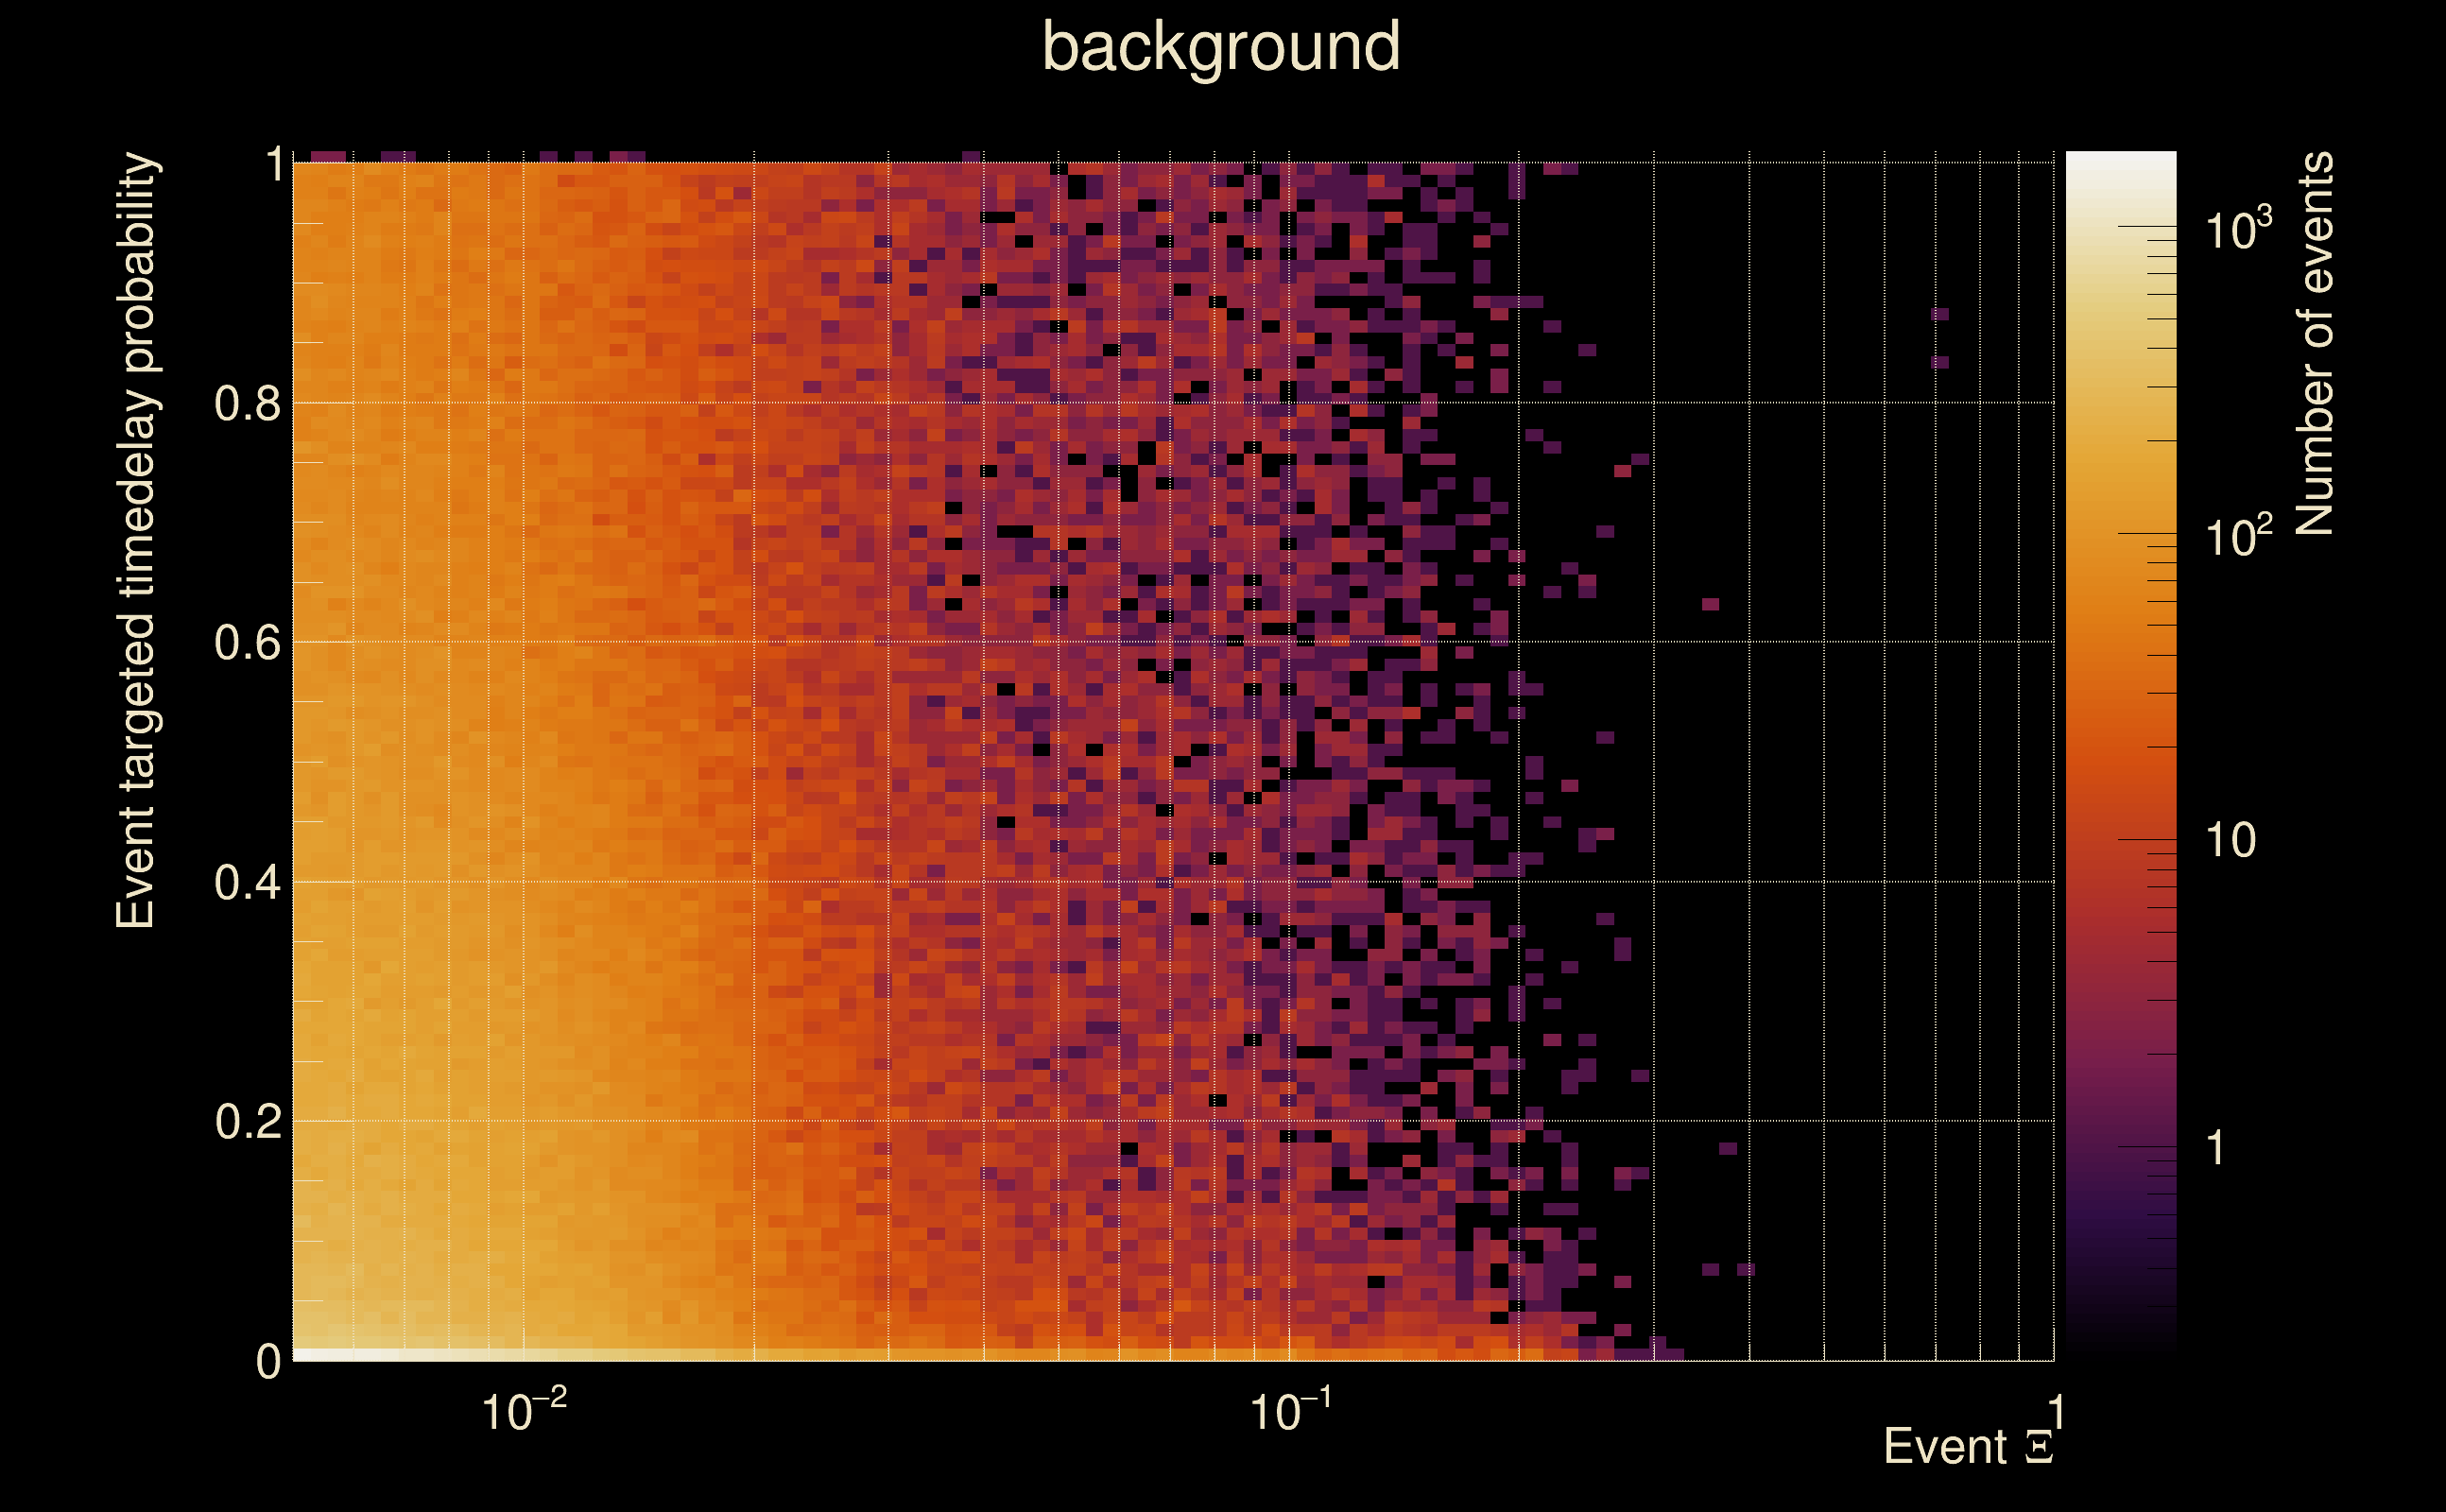
| Number of processed ox events | 12111 | 12111 | 2603865 | |
| Start Date (detector 0) | Mon May 15 14:13:25 2023 UTC | Mon May 15 14:13:25 2023 UTC | Mon May 15 14:13:25 2023 UTC | |
| End Date (detector 0) | Thu May 18 15:54:40 2023 UTC | Thu May 18 15:54:40 2023 UTC | Thu May 18 15:54:40 2023 UTC | |
| Start GPS (detector 0) | 1368195223 | 1368195223 | 1368195223 | |
| End GPS (detector 0) | 1368460498 | 1368460498 | 1368460498 | |
| Used livetime (detector 0) | 60875 s | 60875 s | 60875 s | |
| Start Date (detector 1) | Mon May 15 14:13:25 2023 UTC | Mon May 15 14:13:25 2023 UTC | Mon May 15 14:13:25 2023 UTC | |
| End Date (detector 1) | Thu May 18 15:54:40 2023 UTC | Thu May 18 15:54:40 2023 UTC | Thu May 18 15:54:40 2023 UTC | |
| Start GPS (detector 1) | 1368195223 | 1368195223 | 1368195223 | |
| End GPS (detector 1) | 1368460498 | 1368460498 | 1368460498 | |
| Used livetime (detector 1) | 60875 s | 60875 s | 60875 s | |
| Cumulative livetime | 121110 s | 121110 s | 26038650 s | |
| 0 years, 1 days, 9 hours, 38 min, 30 s | 0 years, 1 days, 9 hours, 38 min, 30 s | 0 years, 301 days, 8 hours, 57 min, 30 s |
|
|
| Event time t(H1): | GPS = 1368332708 (Wed May 17 04:24:50 2023 ) → GPS = 1368332718 (Wed May 17 04:25:00 2023 ) |
| Event time t(L1): | GPS = 1368332708 (Wed May 17 04:25:00 2023 ) → GPS = 1368332718 (Wed May 17 04:25:00 2023 ) |
| Omicron analysis time window (H1): | GPS = 1368332705 → GPS = 1368332721 |
| Omicron analysis time window (L1): | GPS = 1368332705 → GPS = 1368332721 |
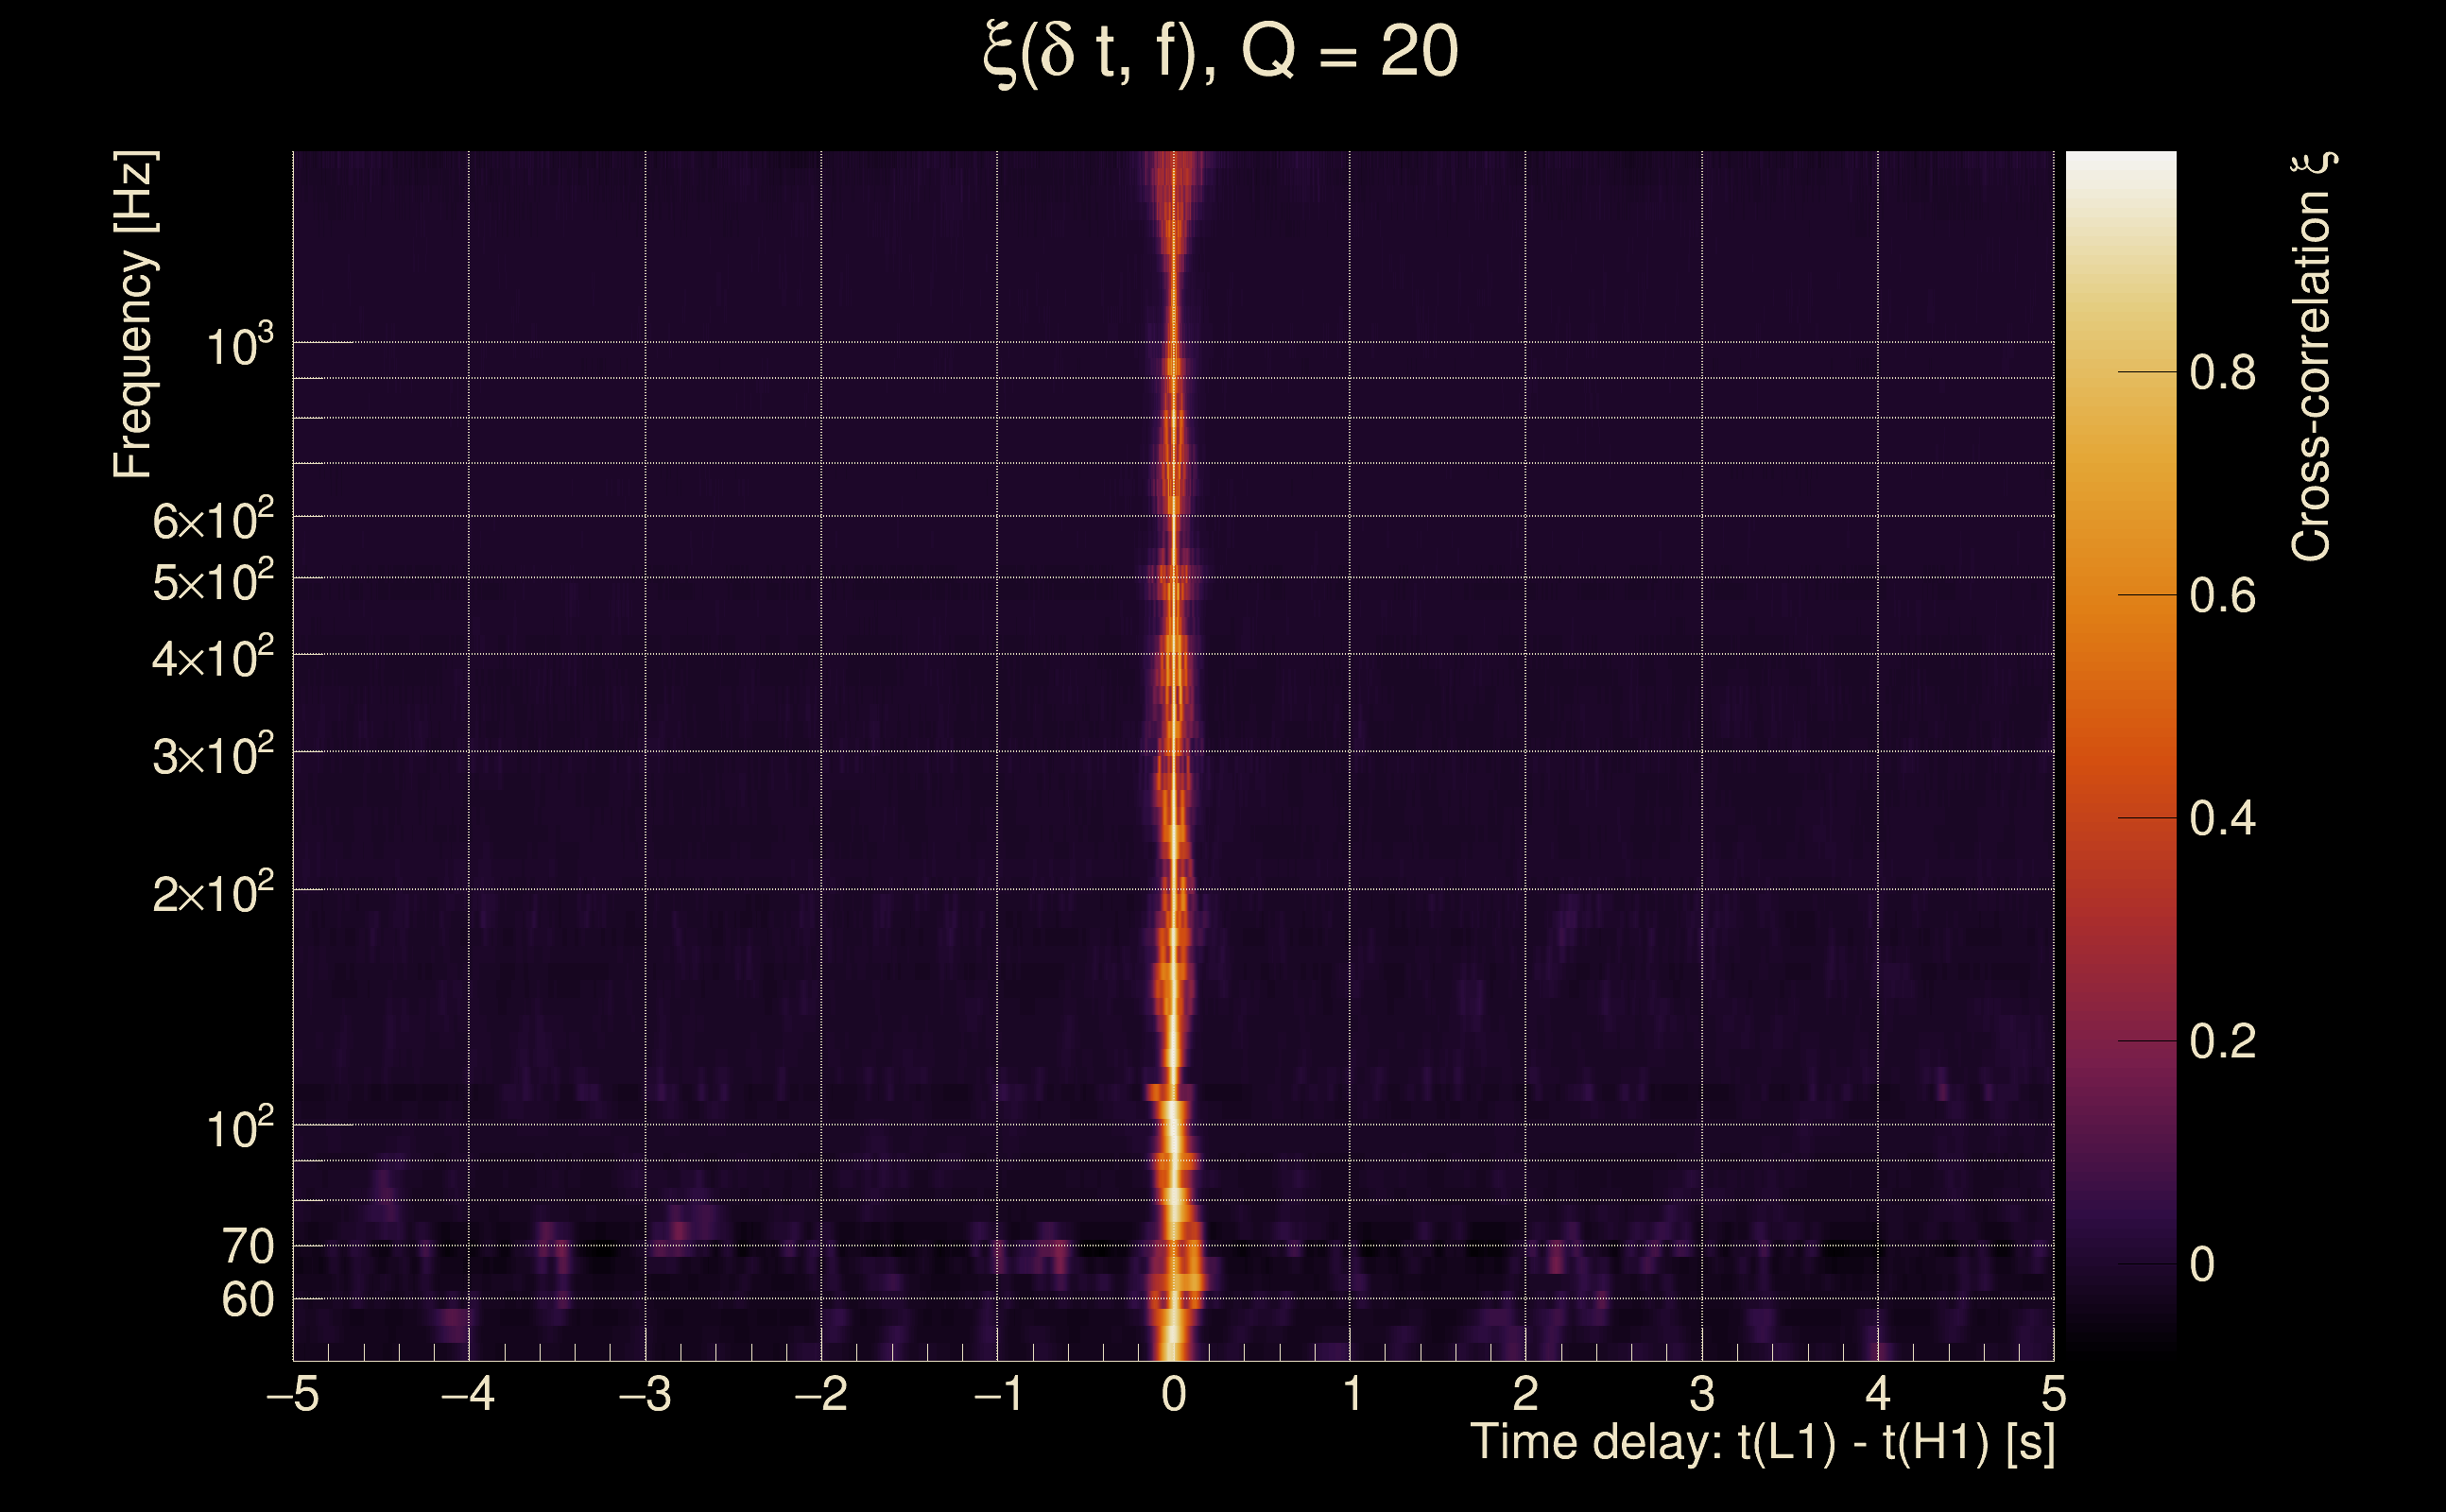
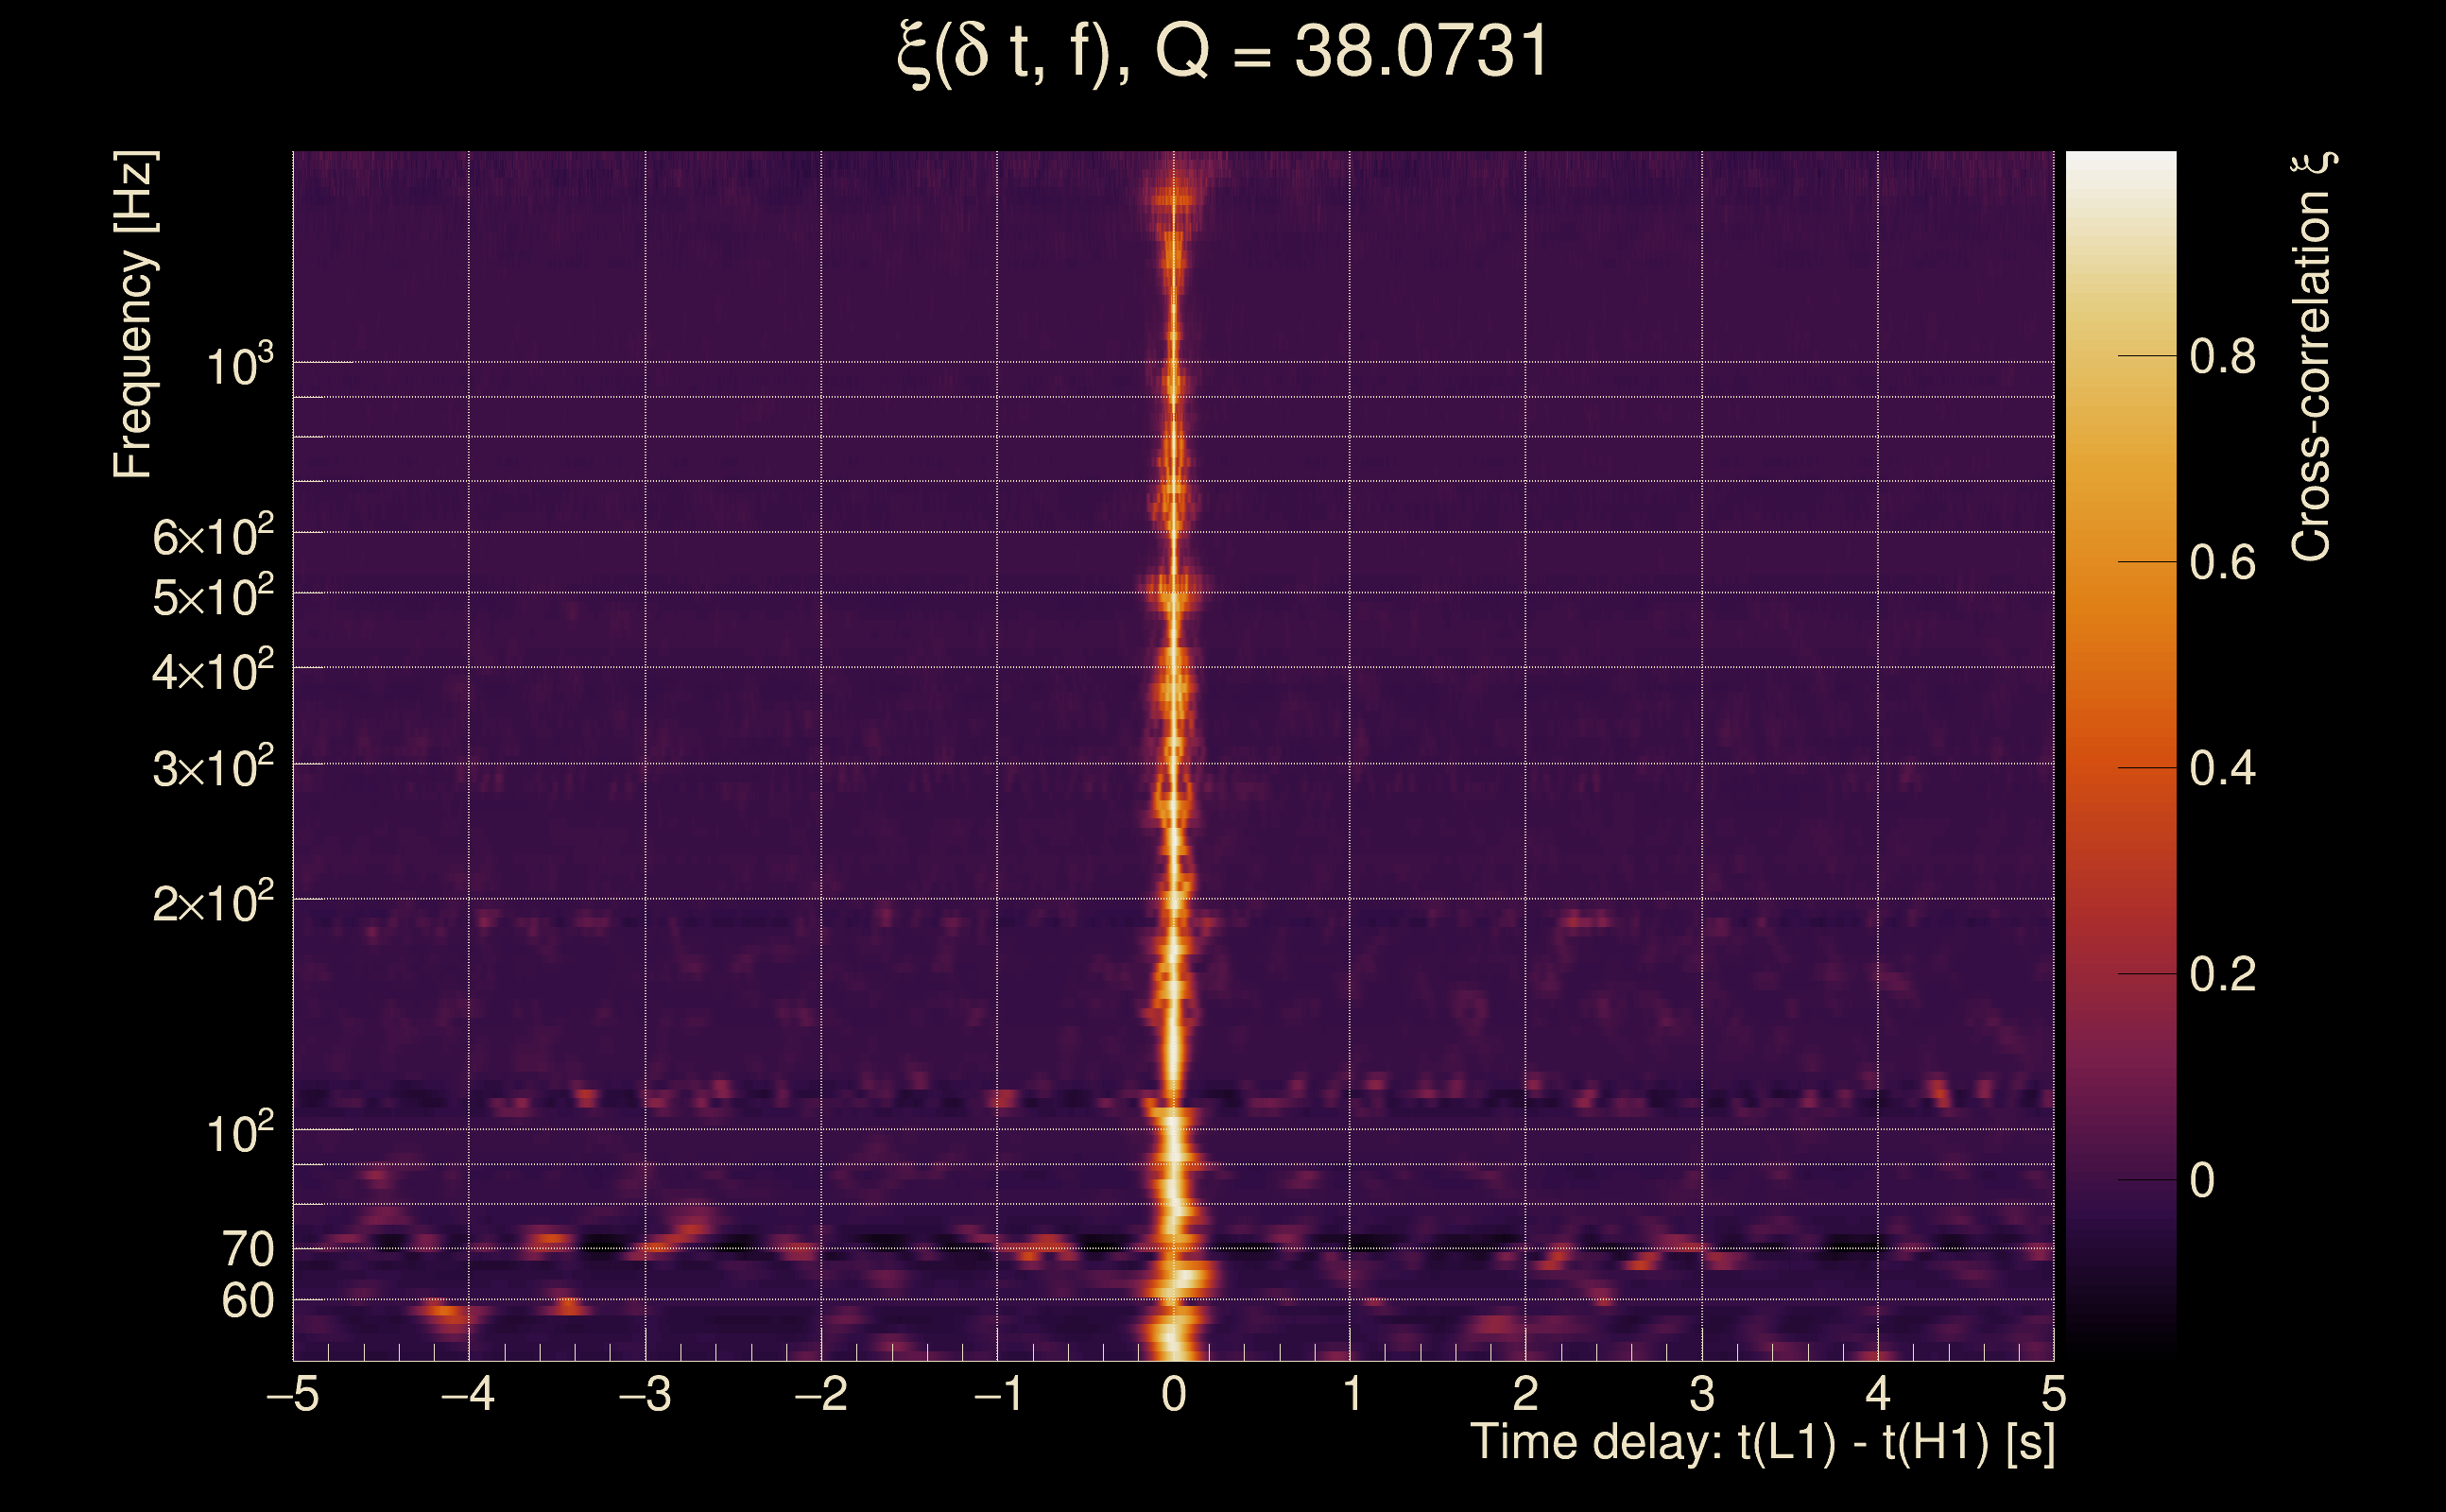
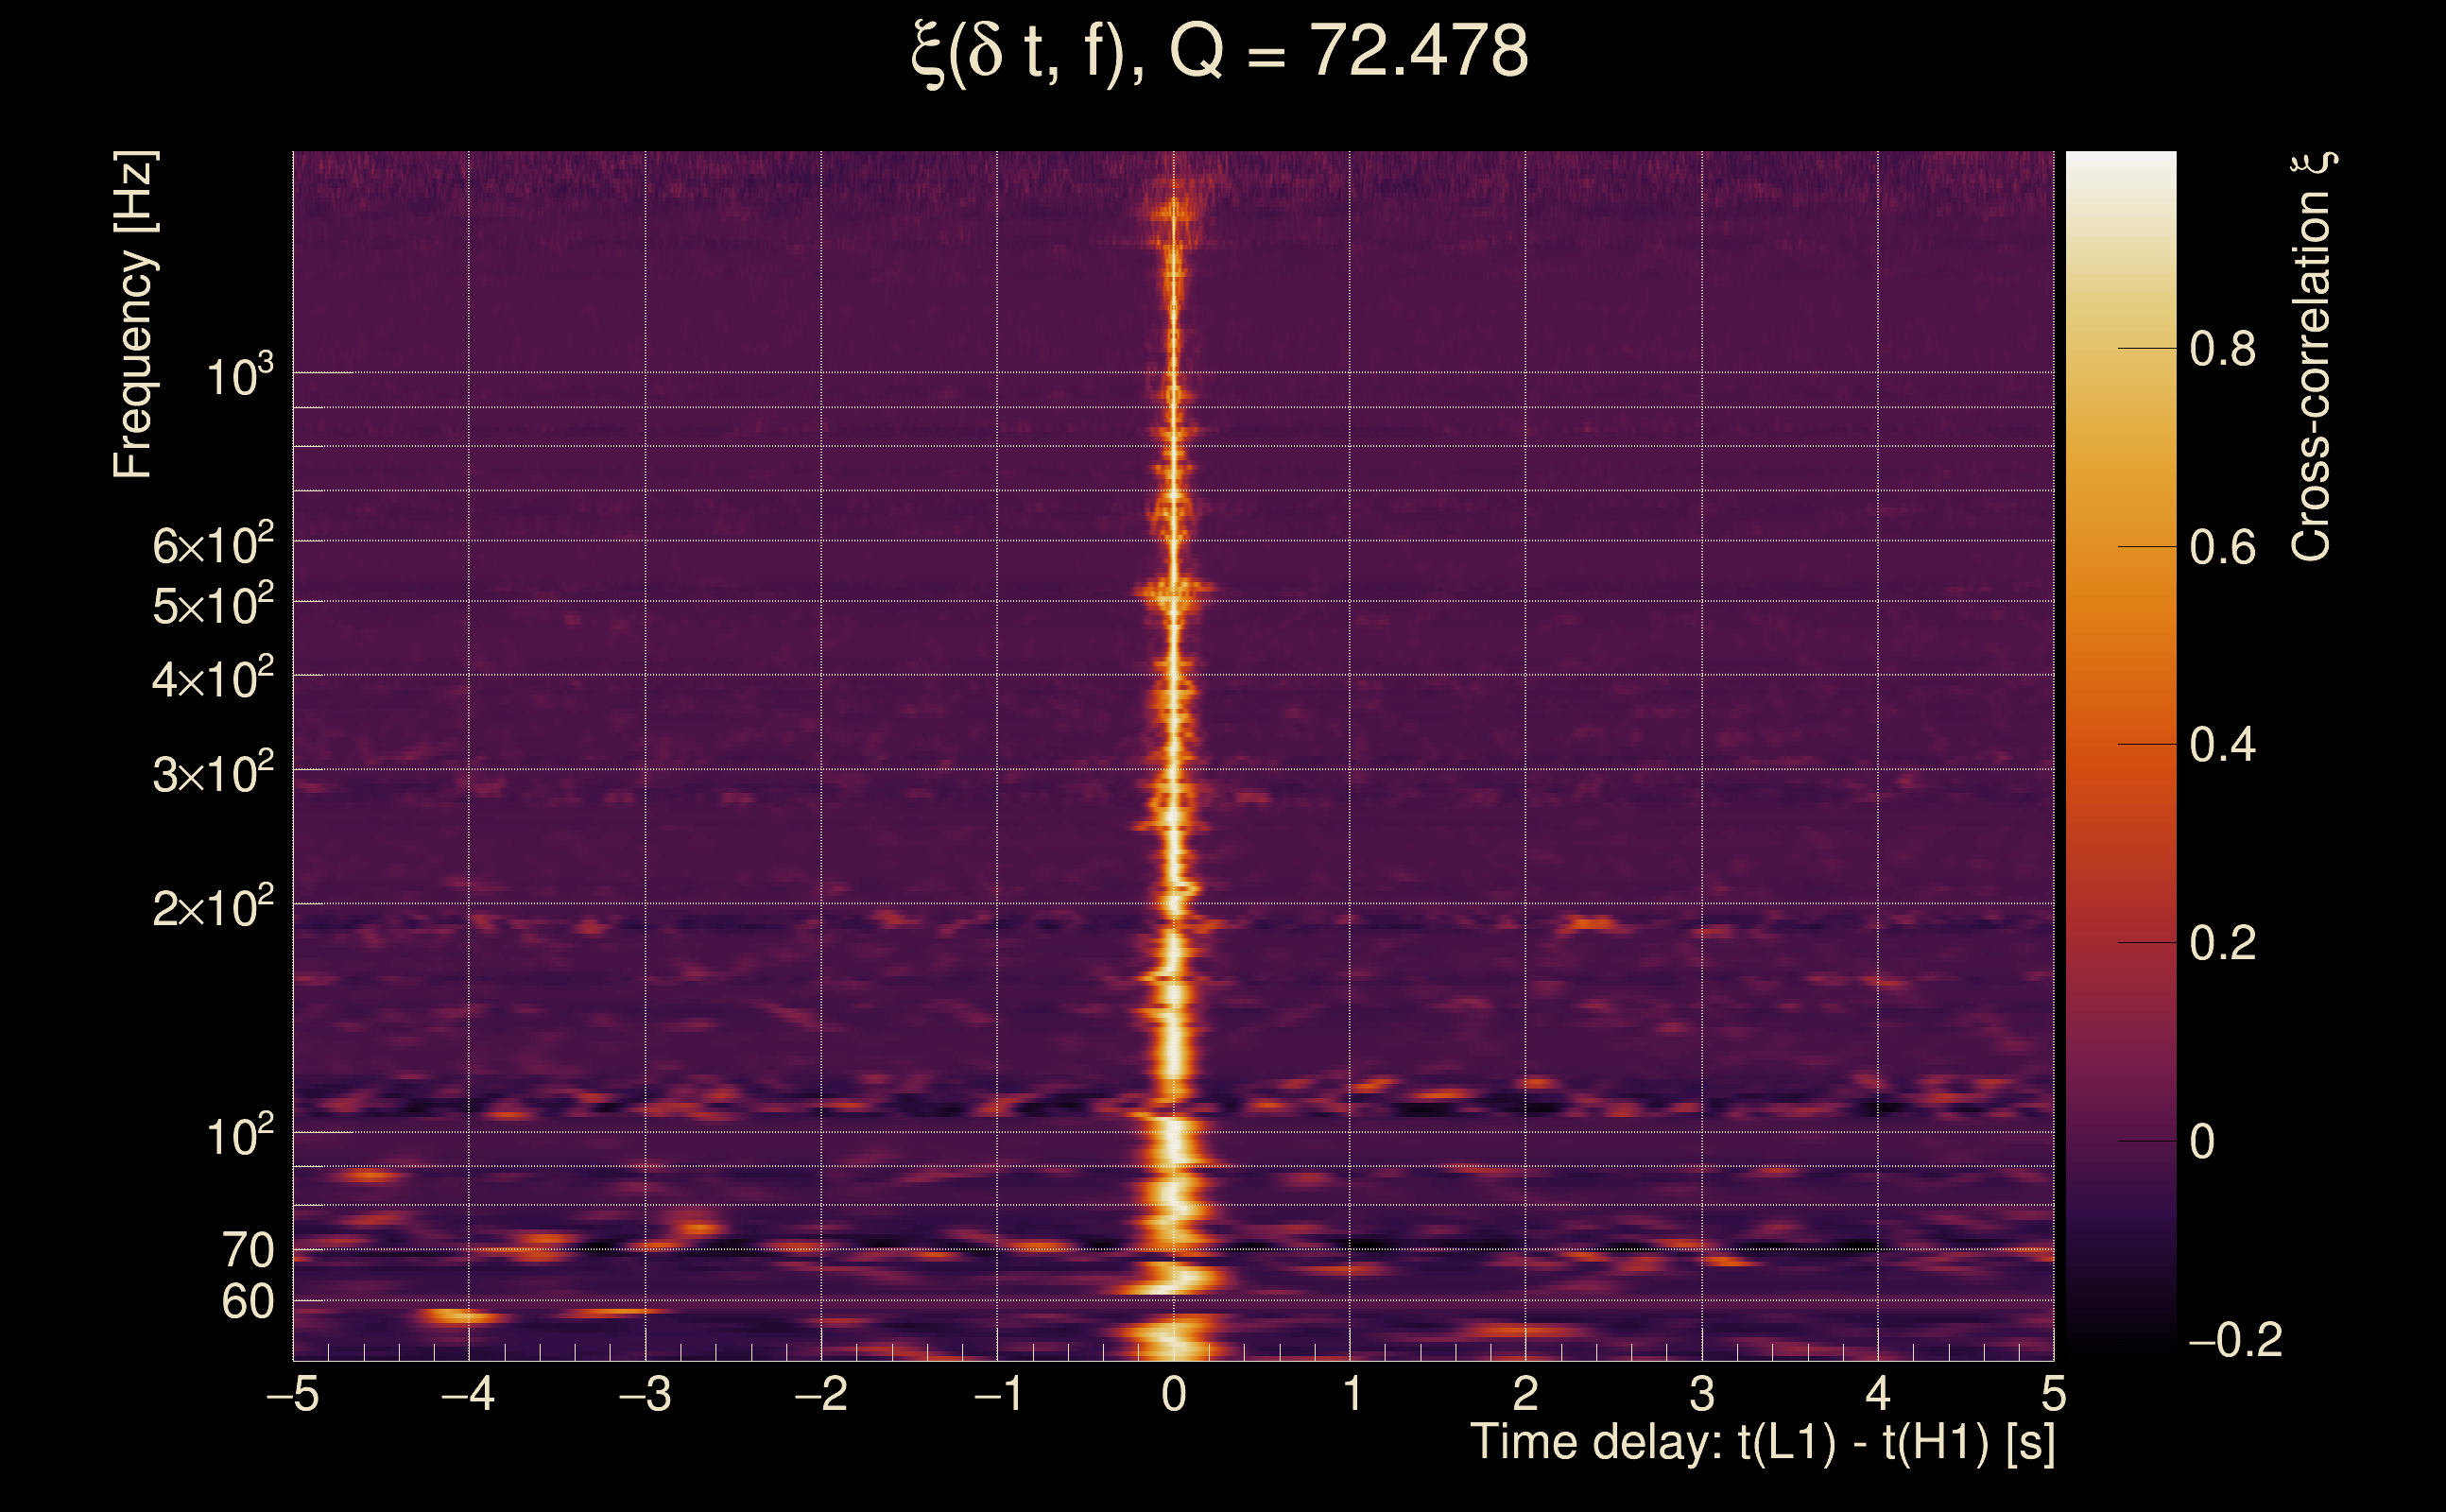
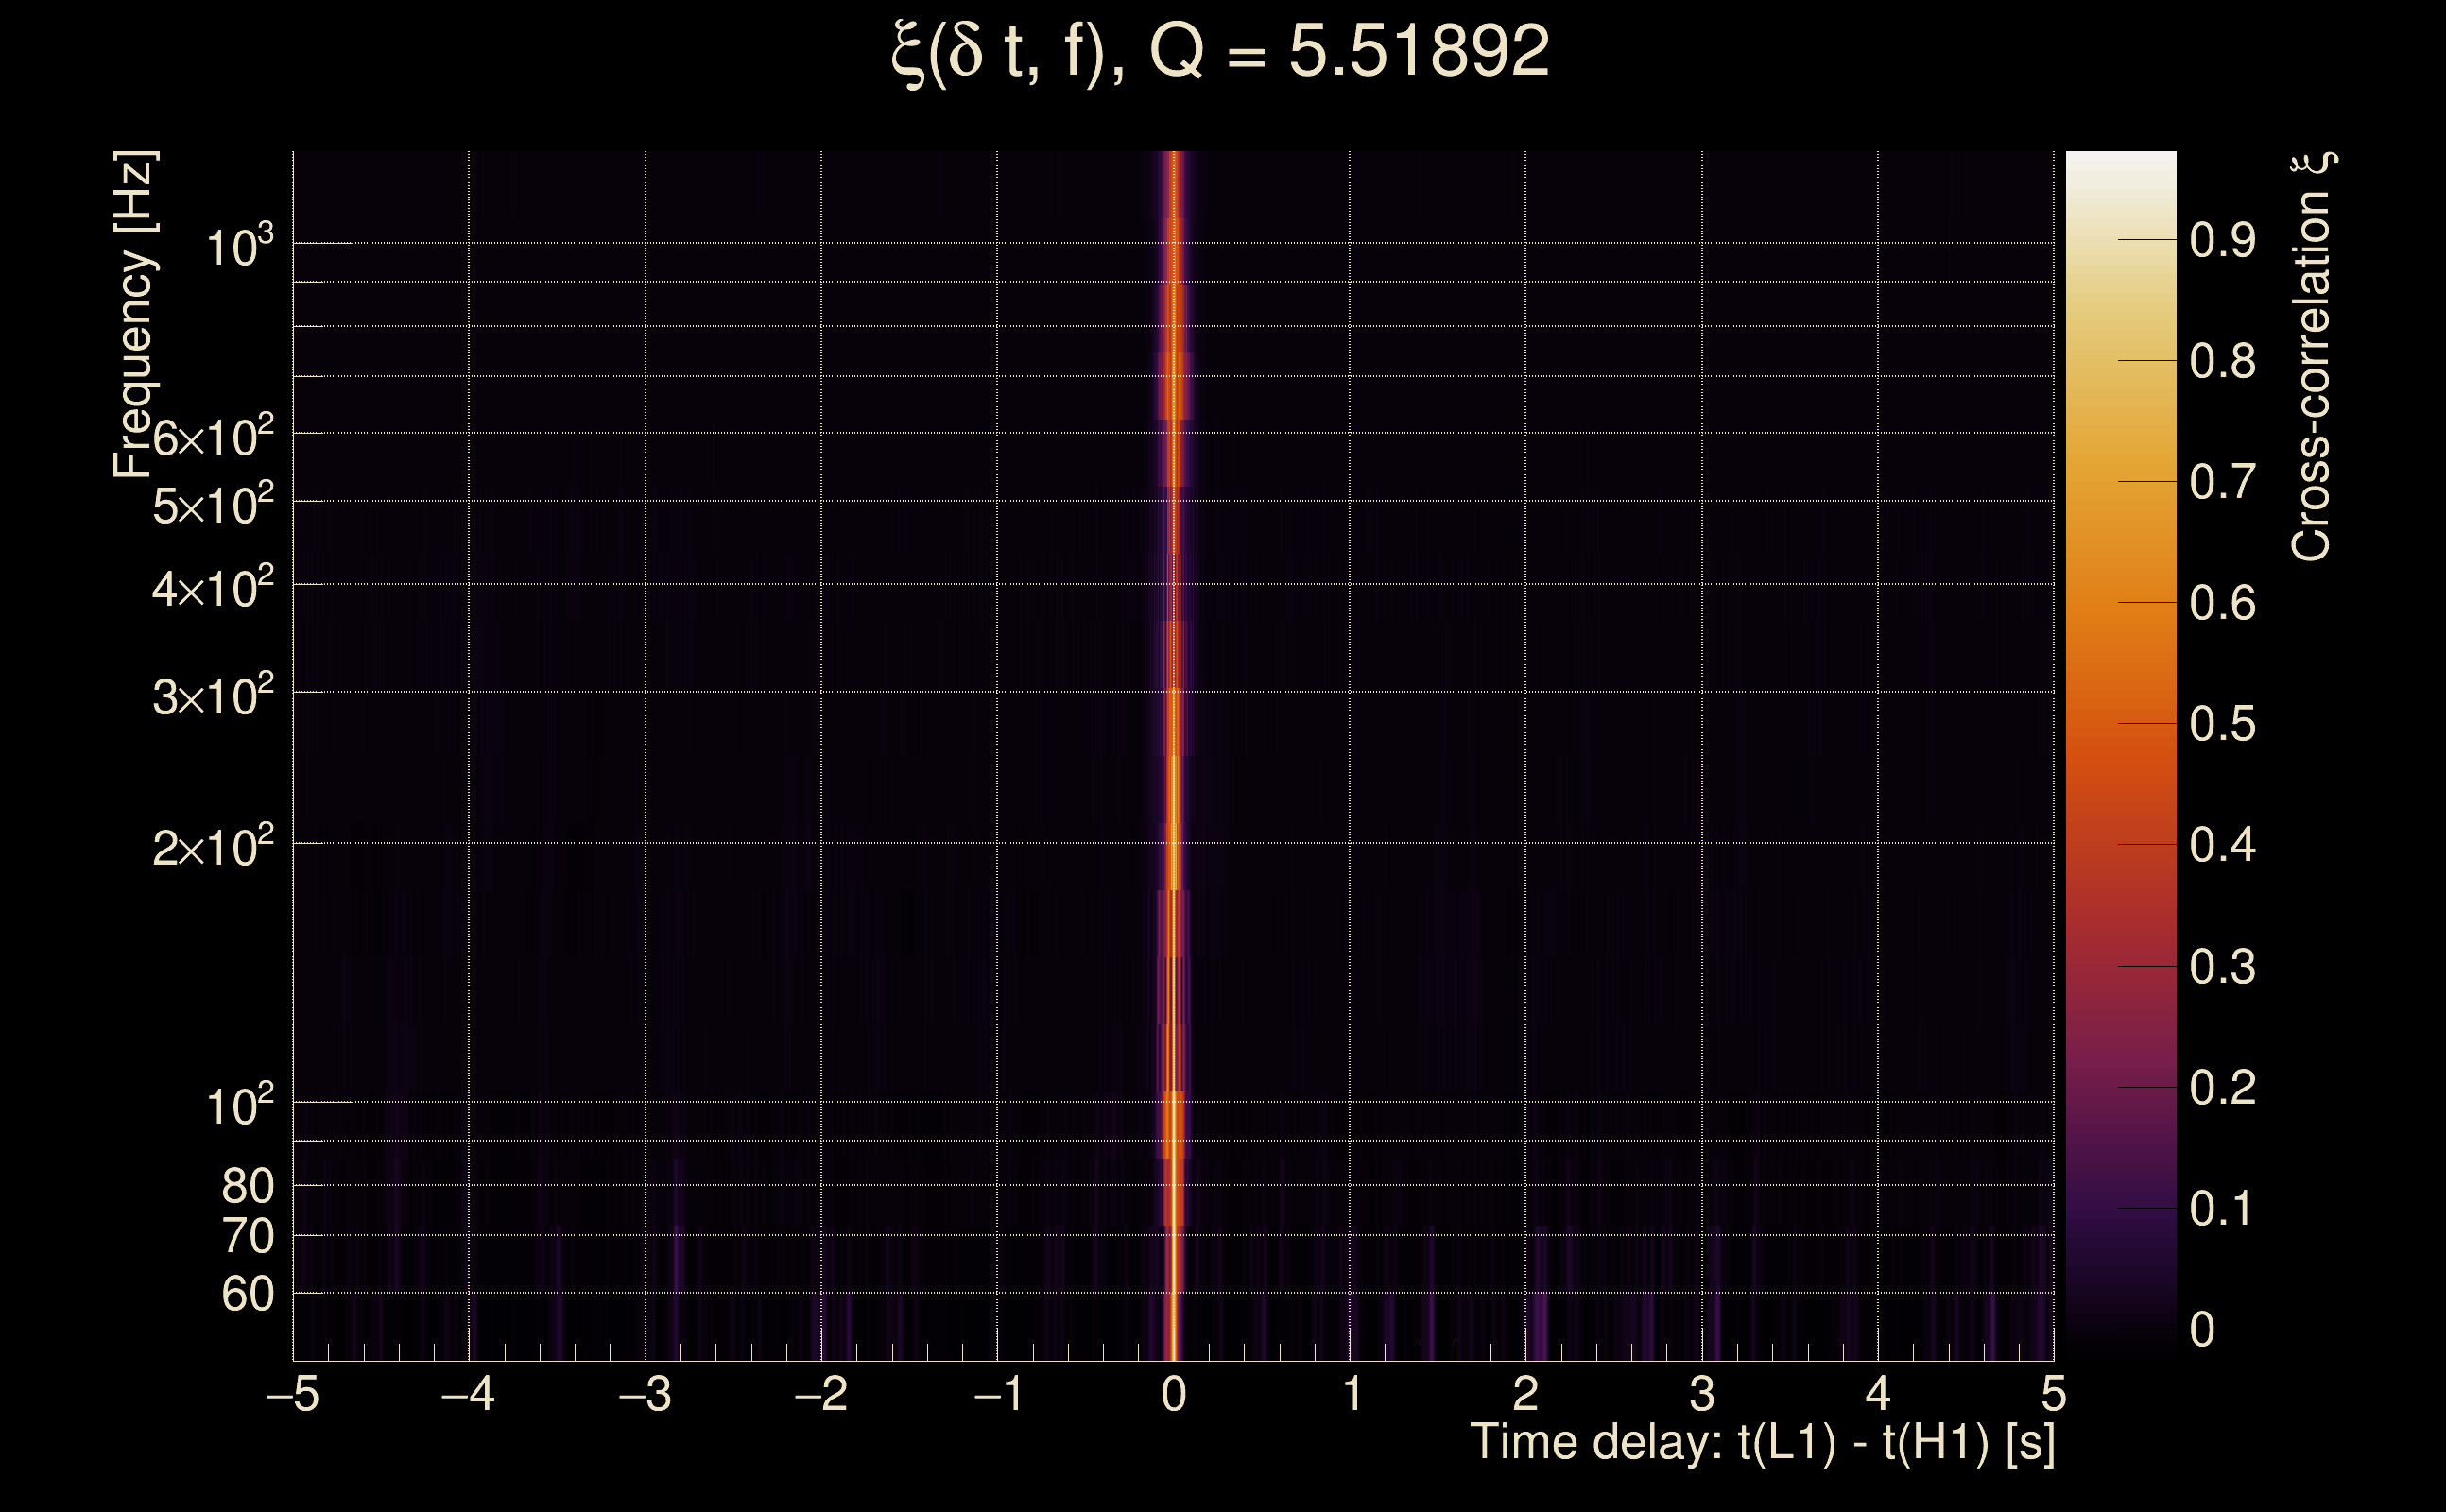
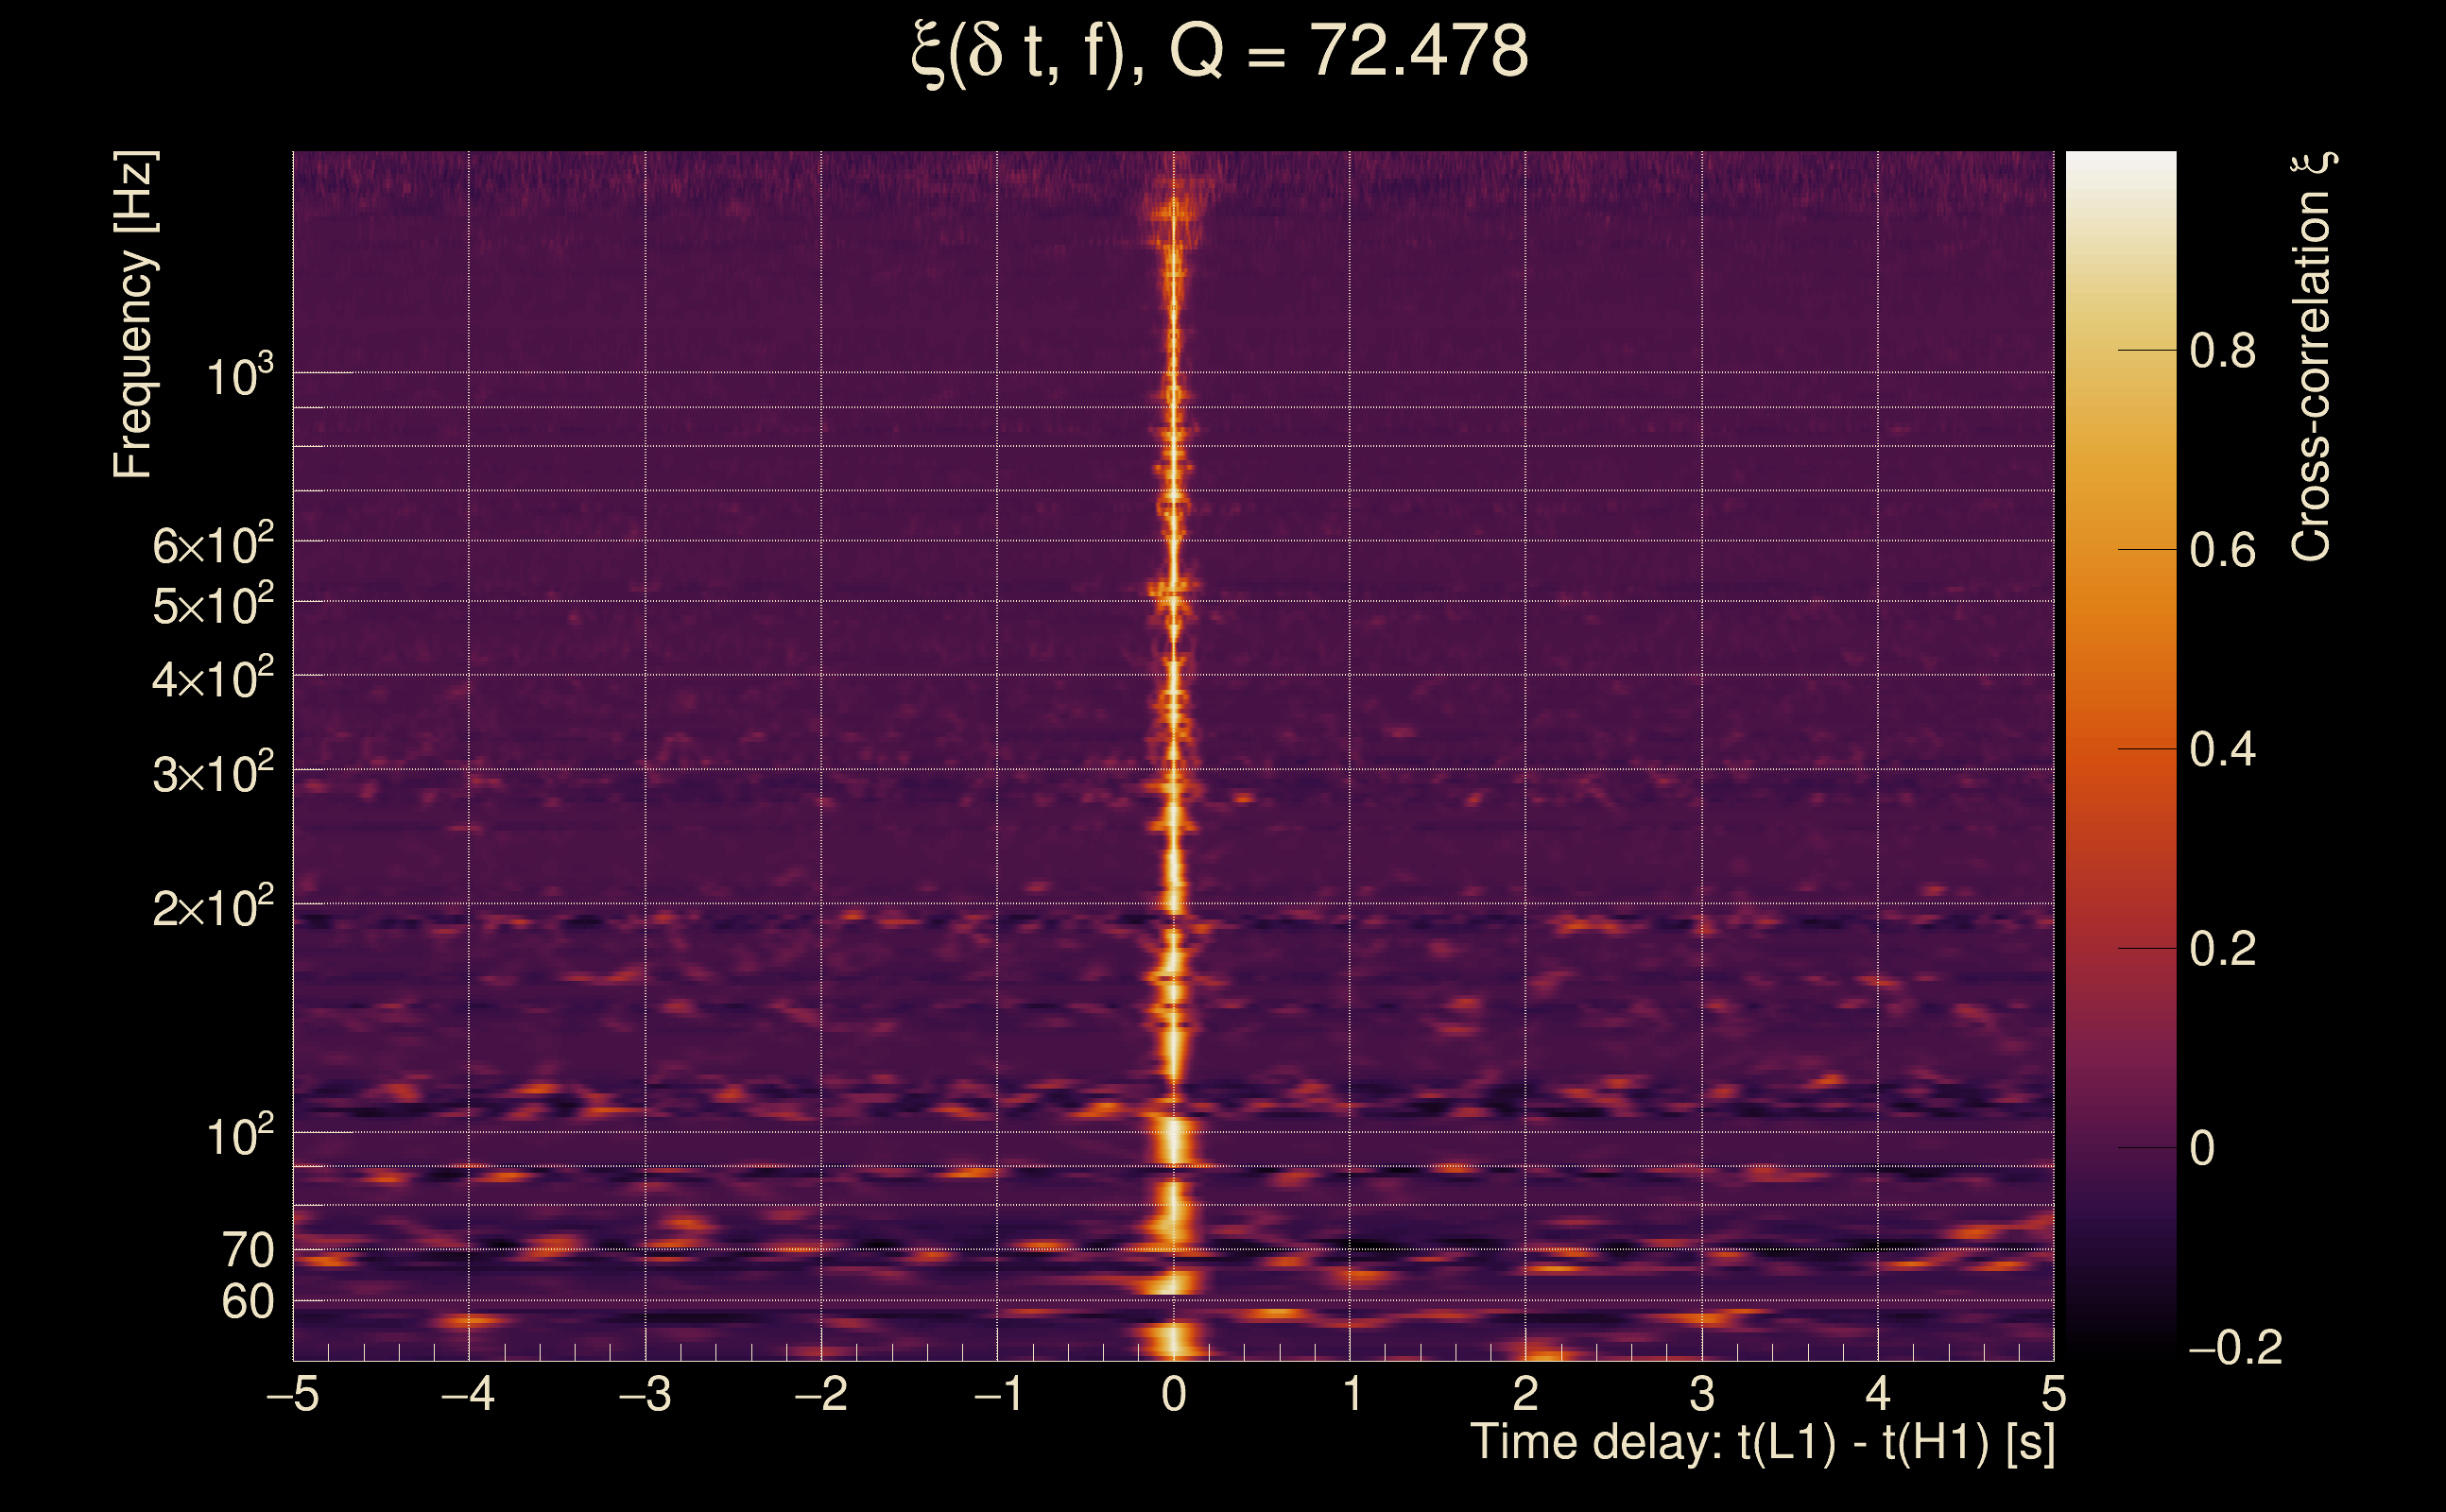
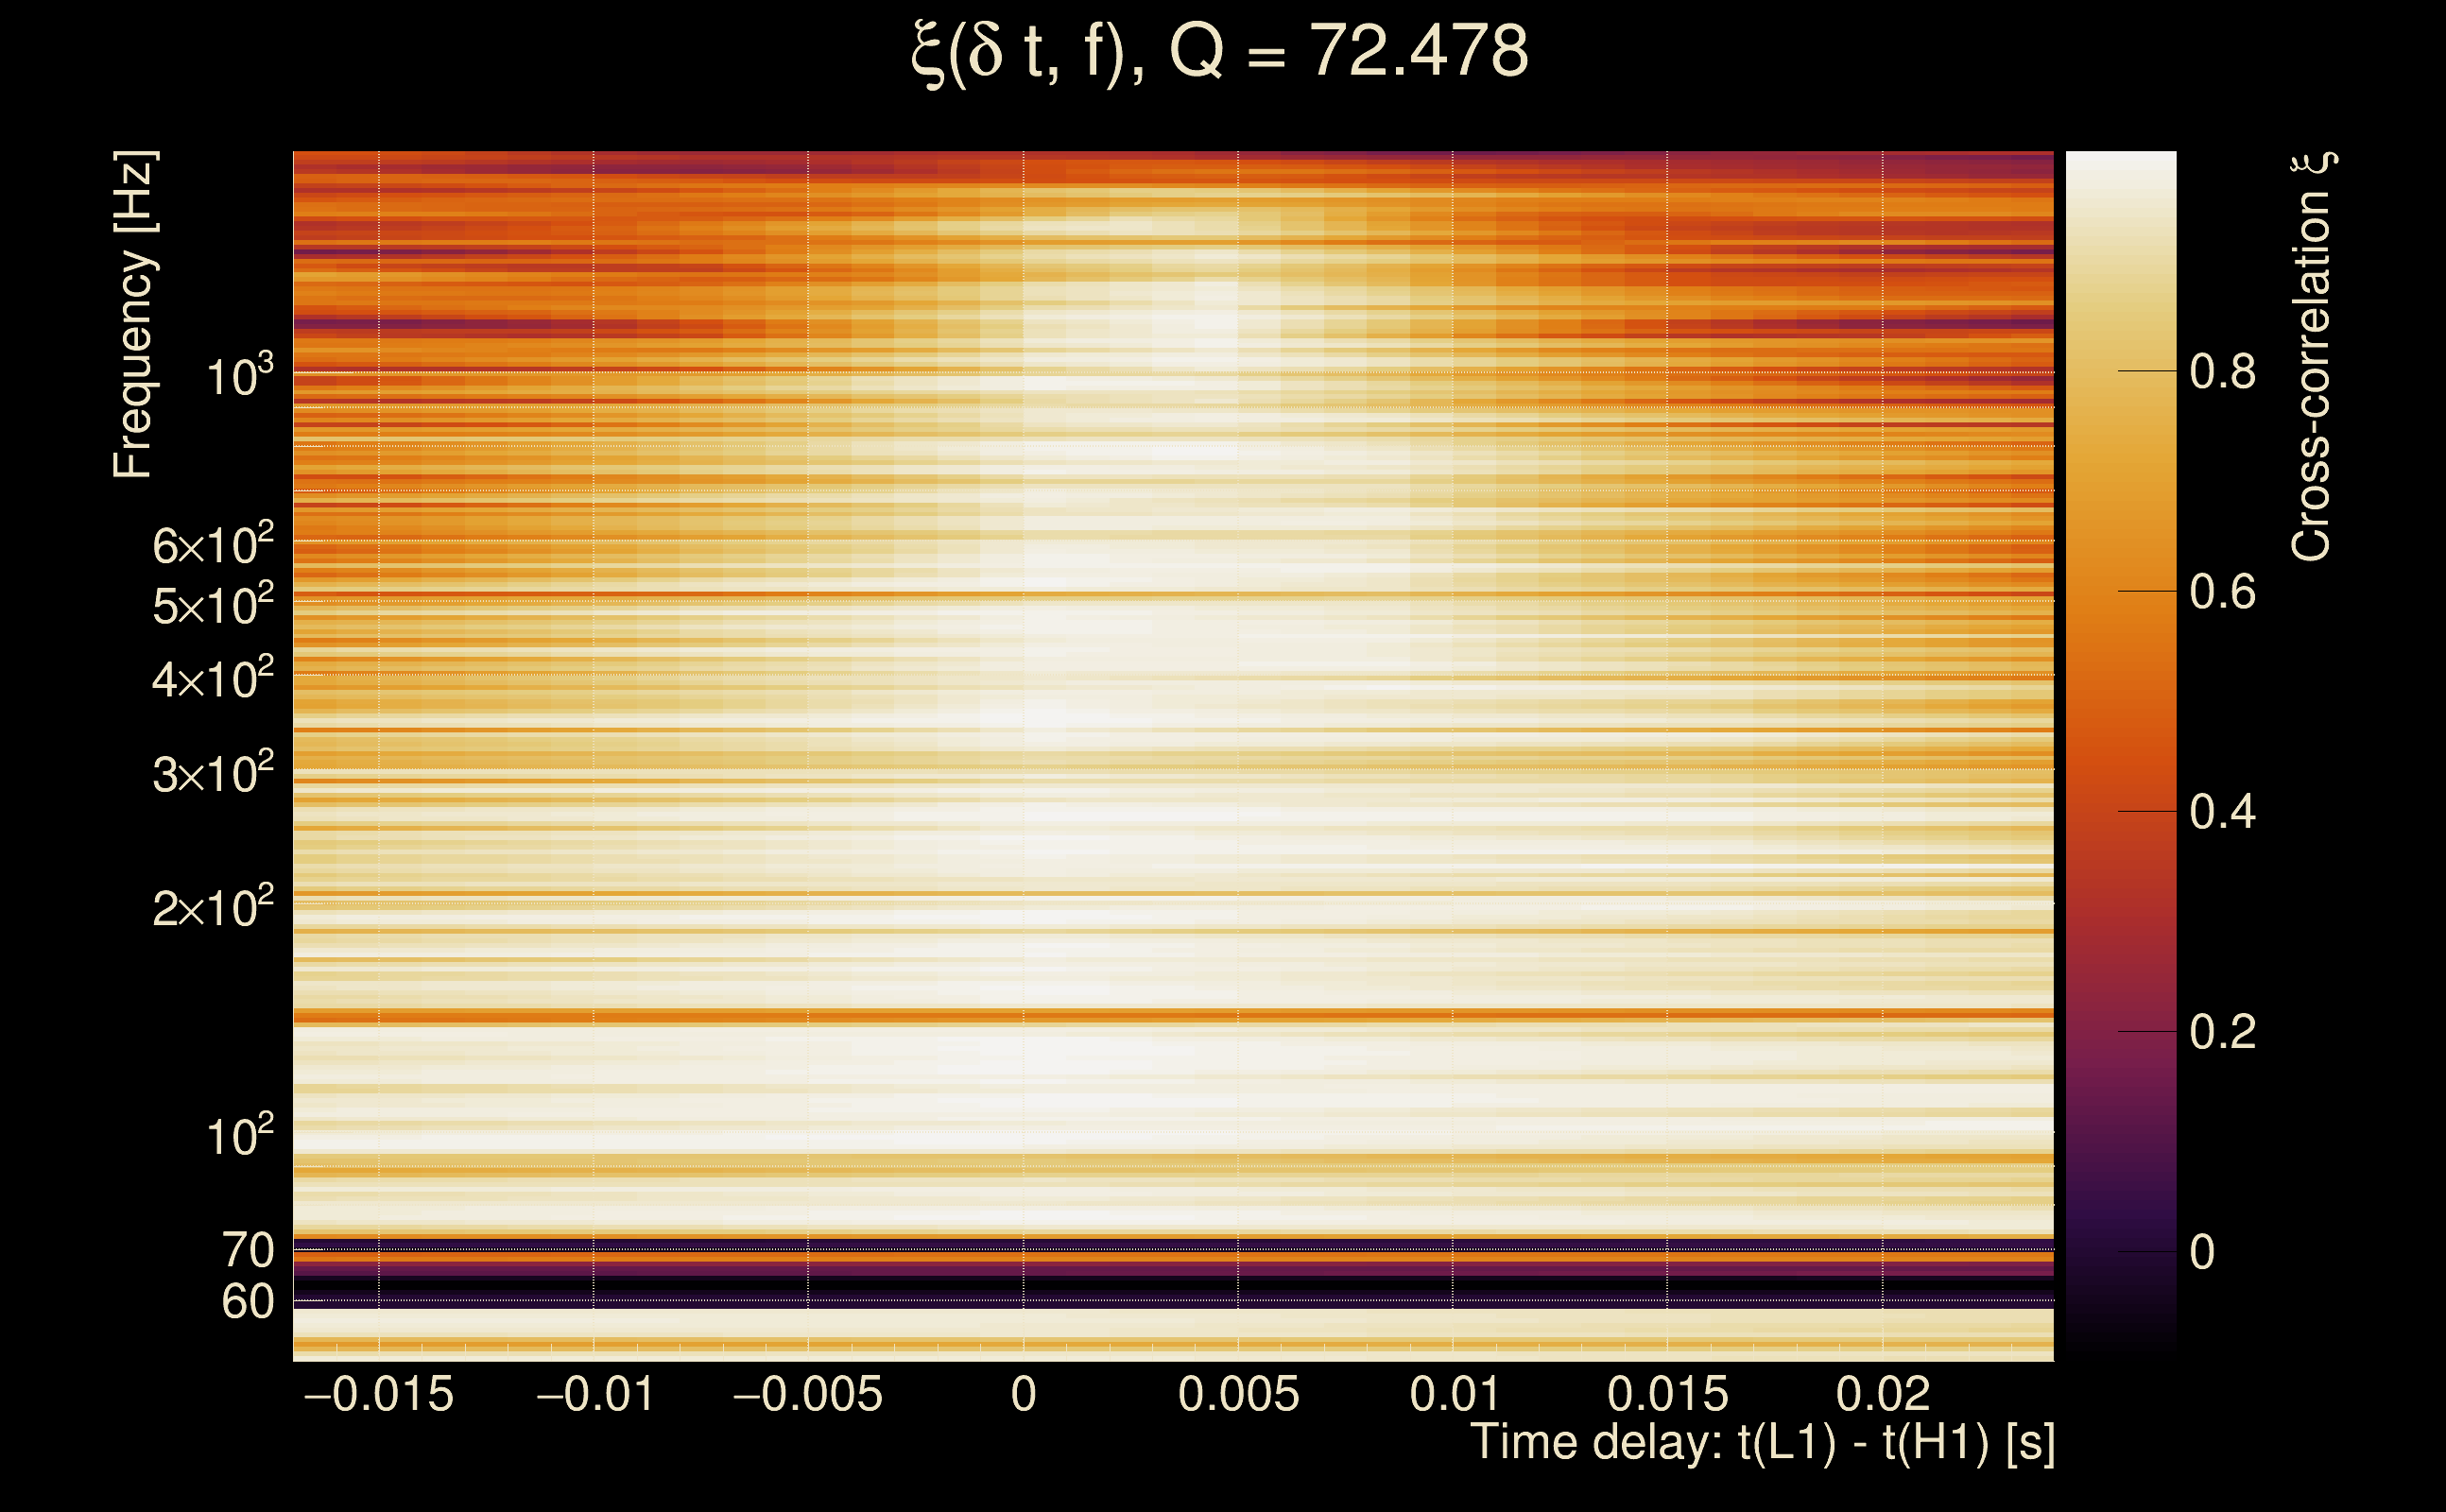
| Time delay between detectors t(L1) - t(H1): | 0.00048111 s (slice index = 108 / 217), δt_gw = 0.00048111 s |
| Time delay standard deviation: | 0.0226952 s |
| [targeted mode] Time delay probability: | 0.98926 (0.0134606 sigmas), δt_target = 1.72247e+45 s |
| Frequency: | 311.339 Hz |
| Ξ: | 0.92748 ± 0.00478053 (variance = 2.28535e-05): Q0: 0.94092, Q1: 0.950049, Q2: 0.954015, Q3: 0.950935, Q4: 0.944107 |
| Rank: | R_A = 0.8887 |
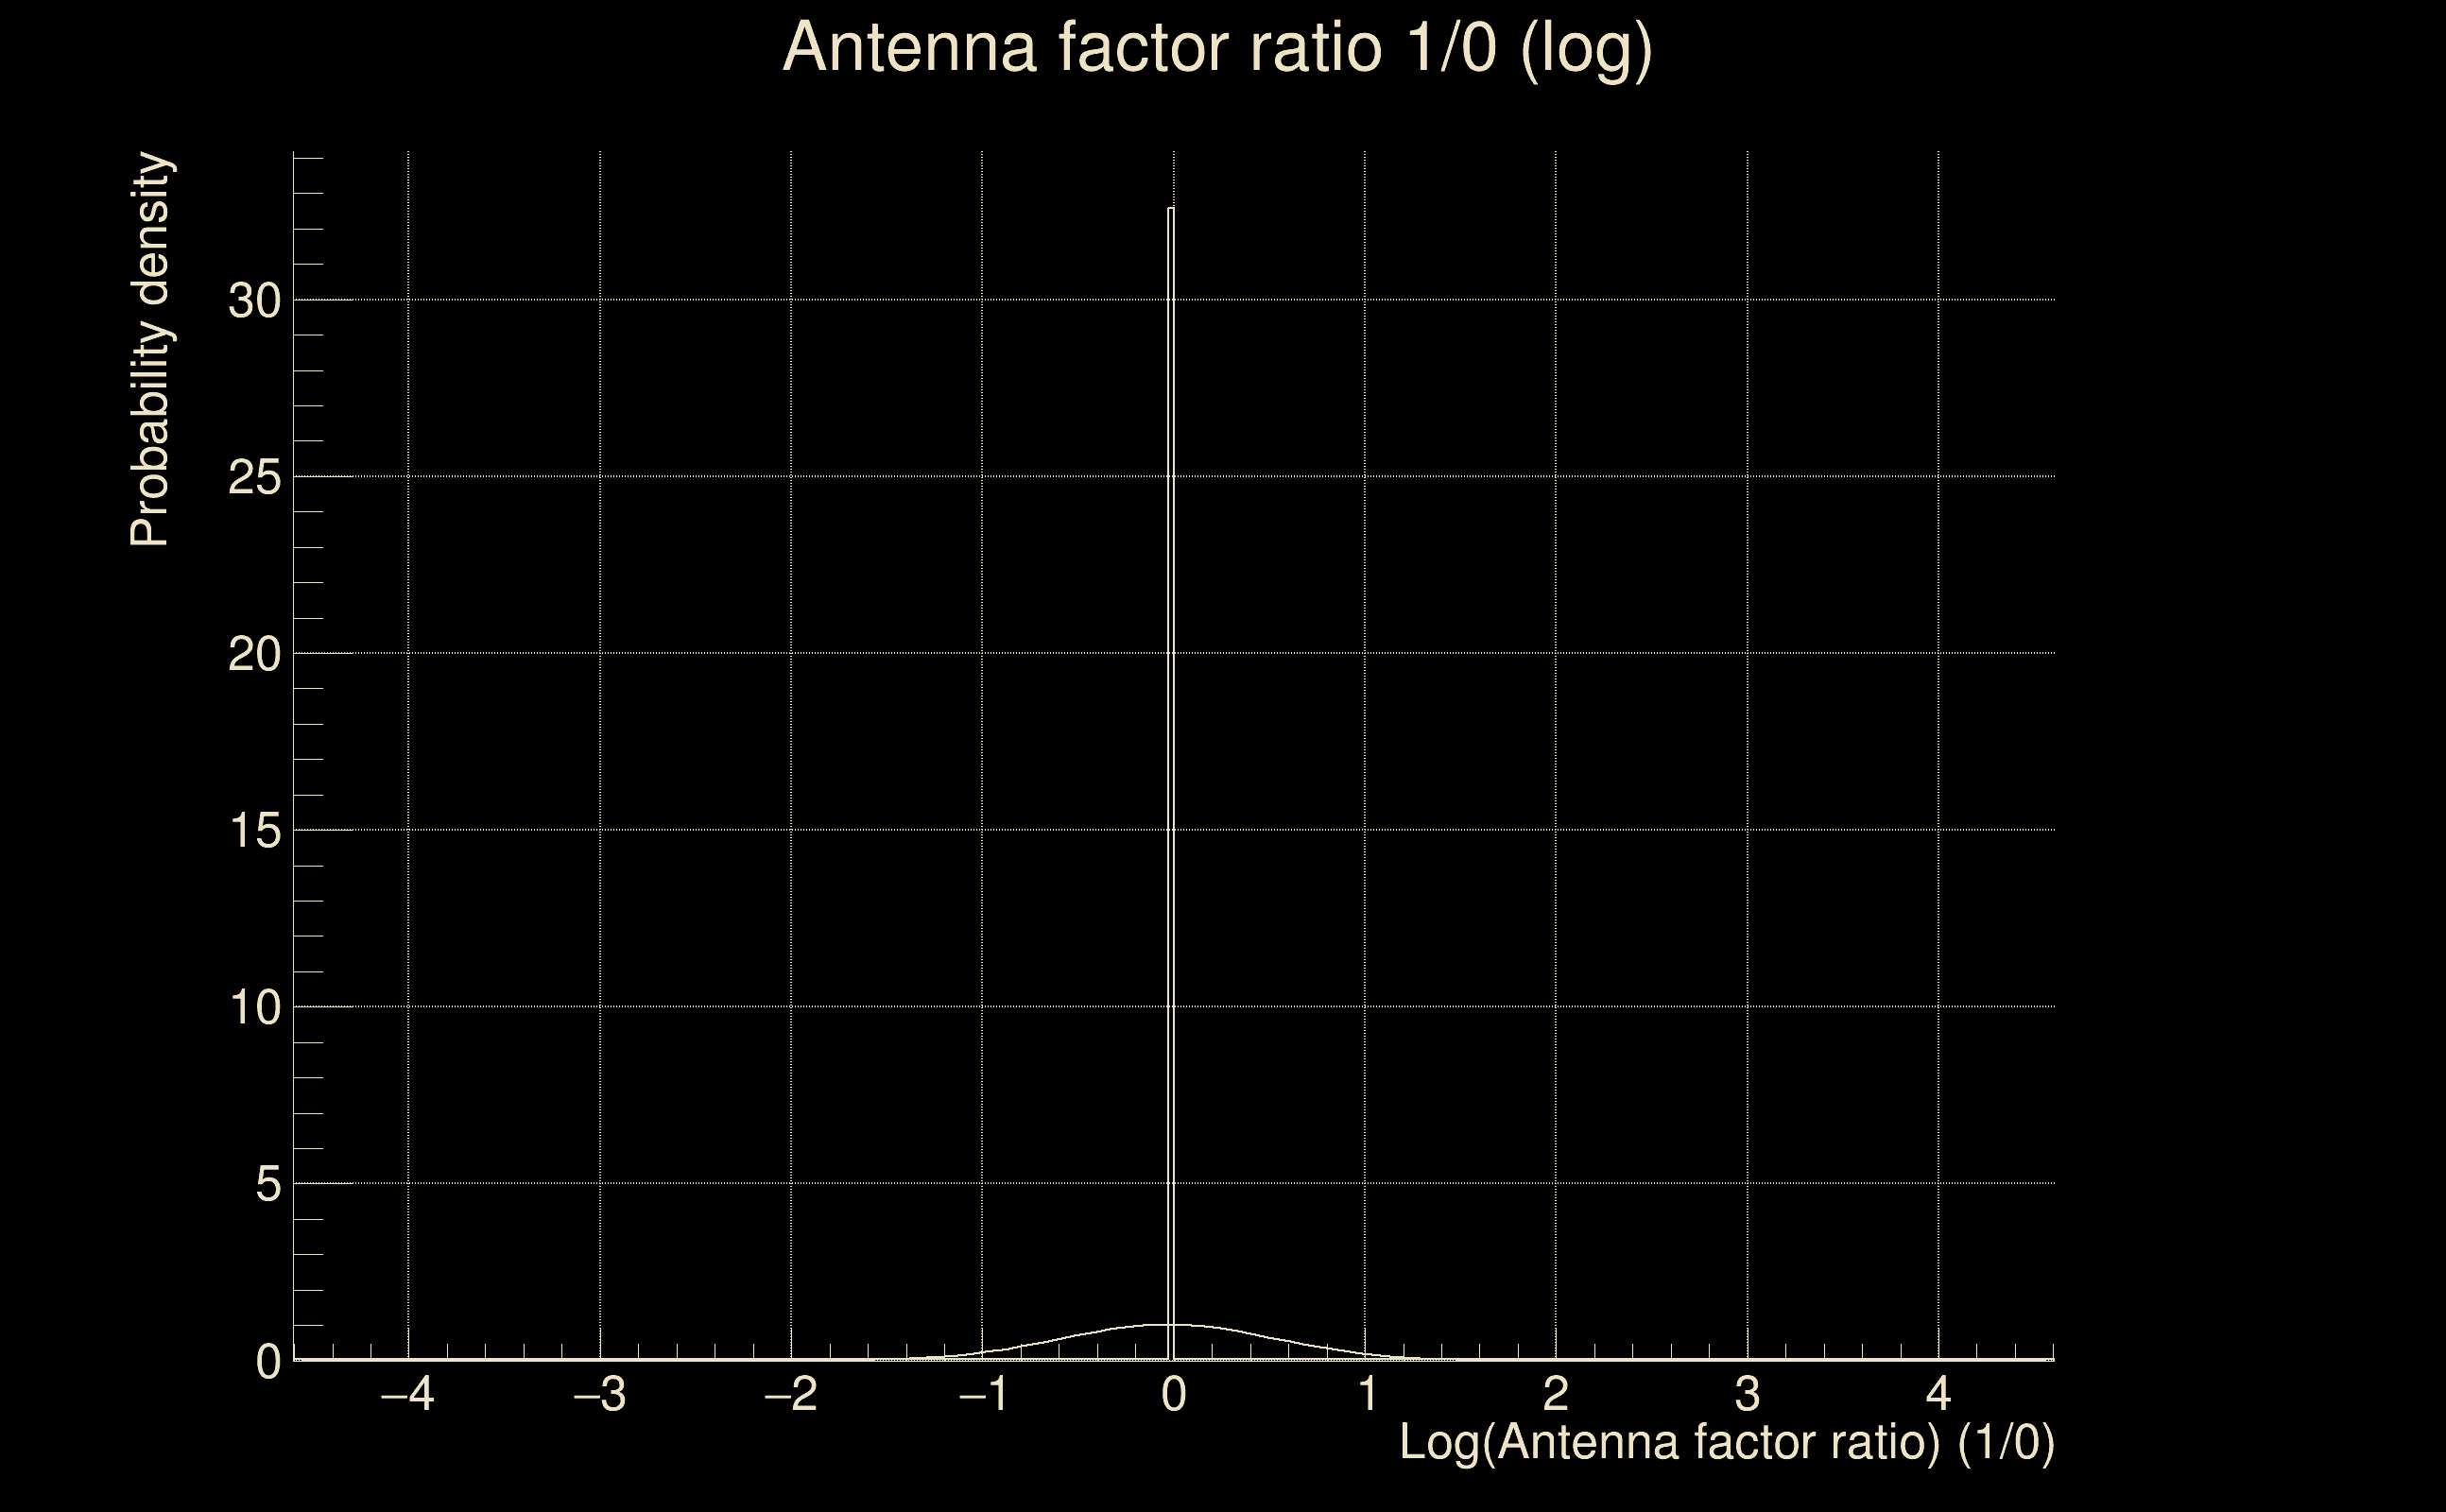
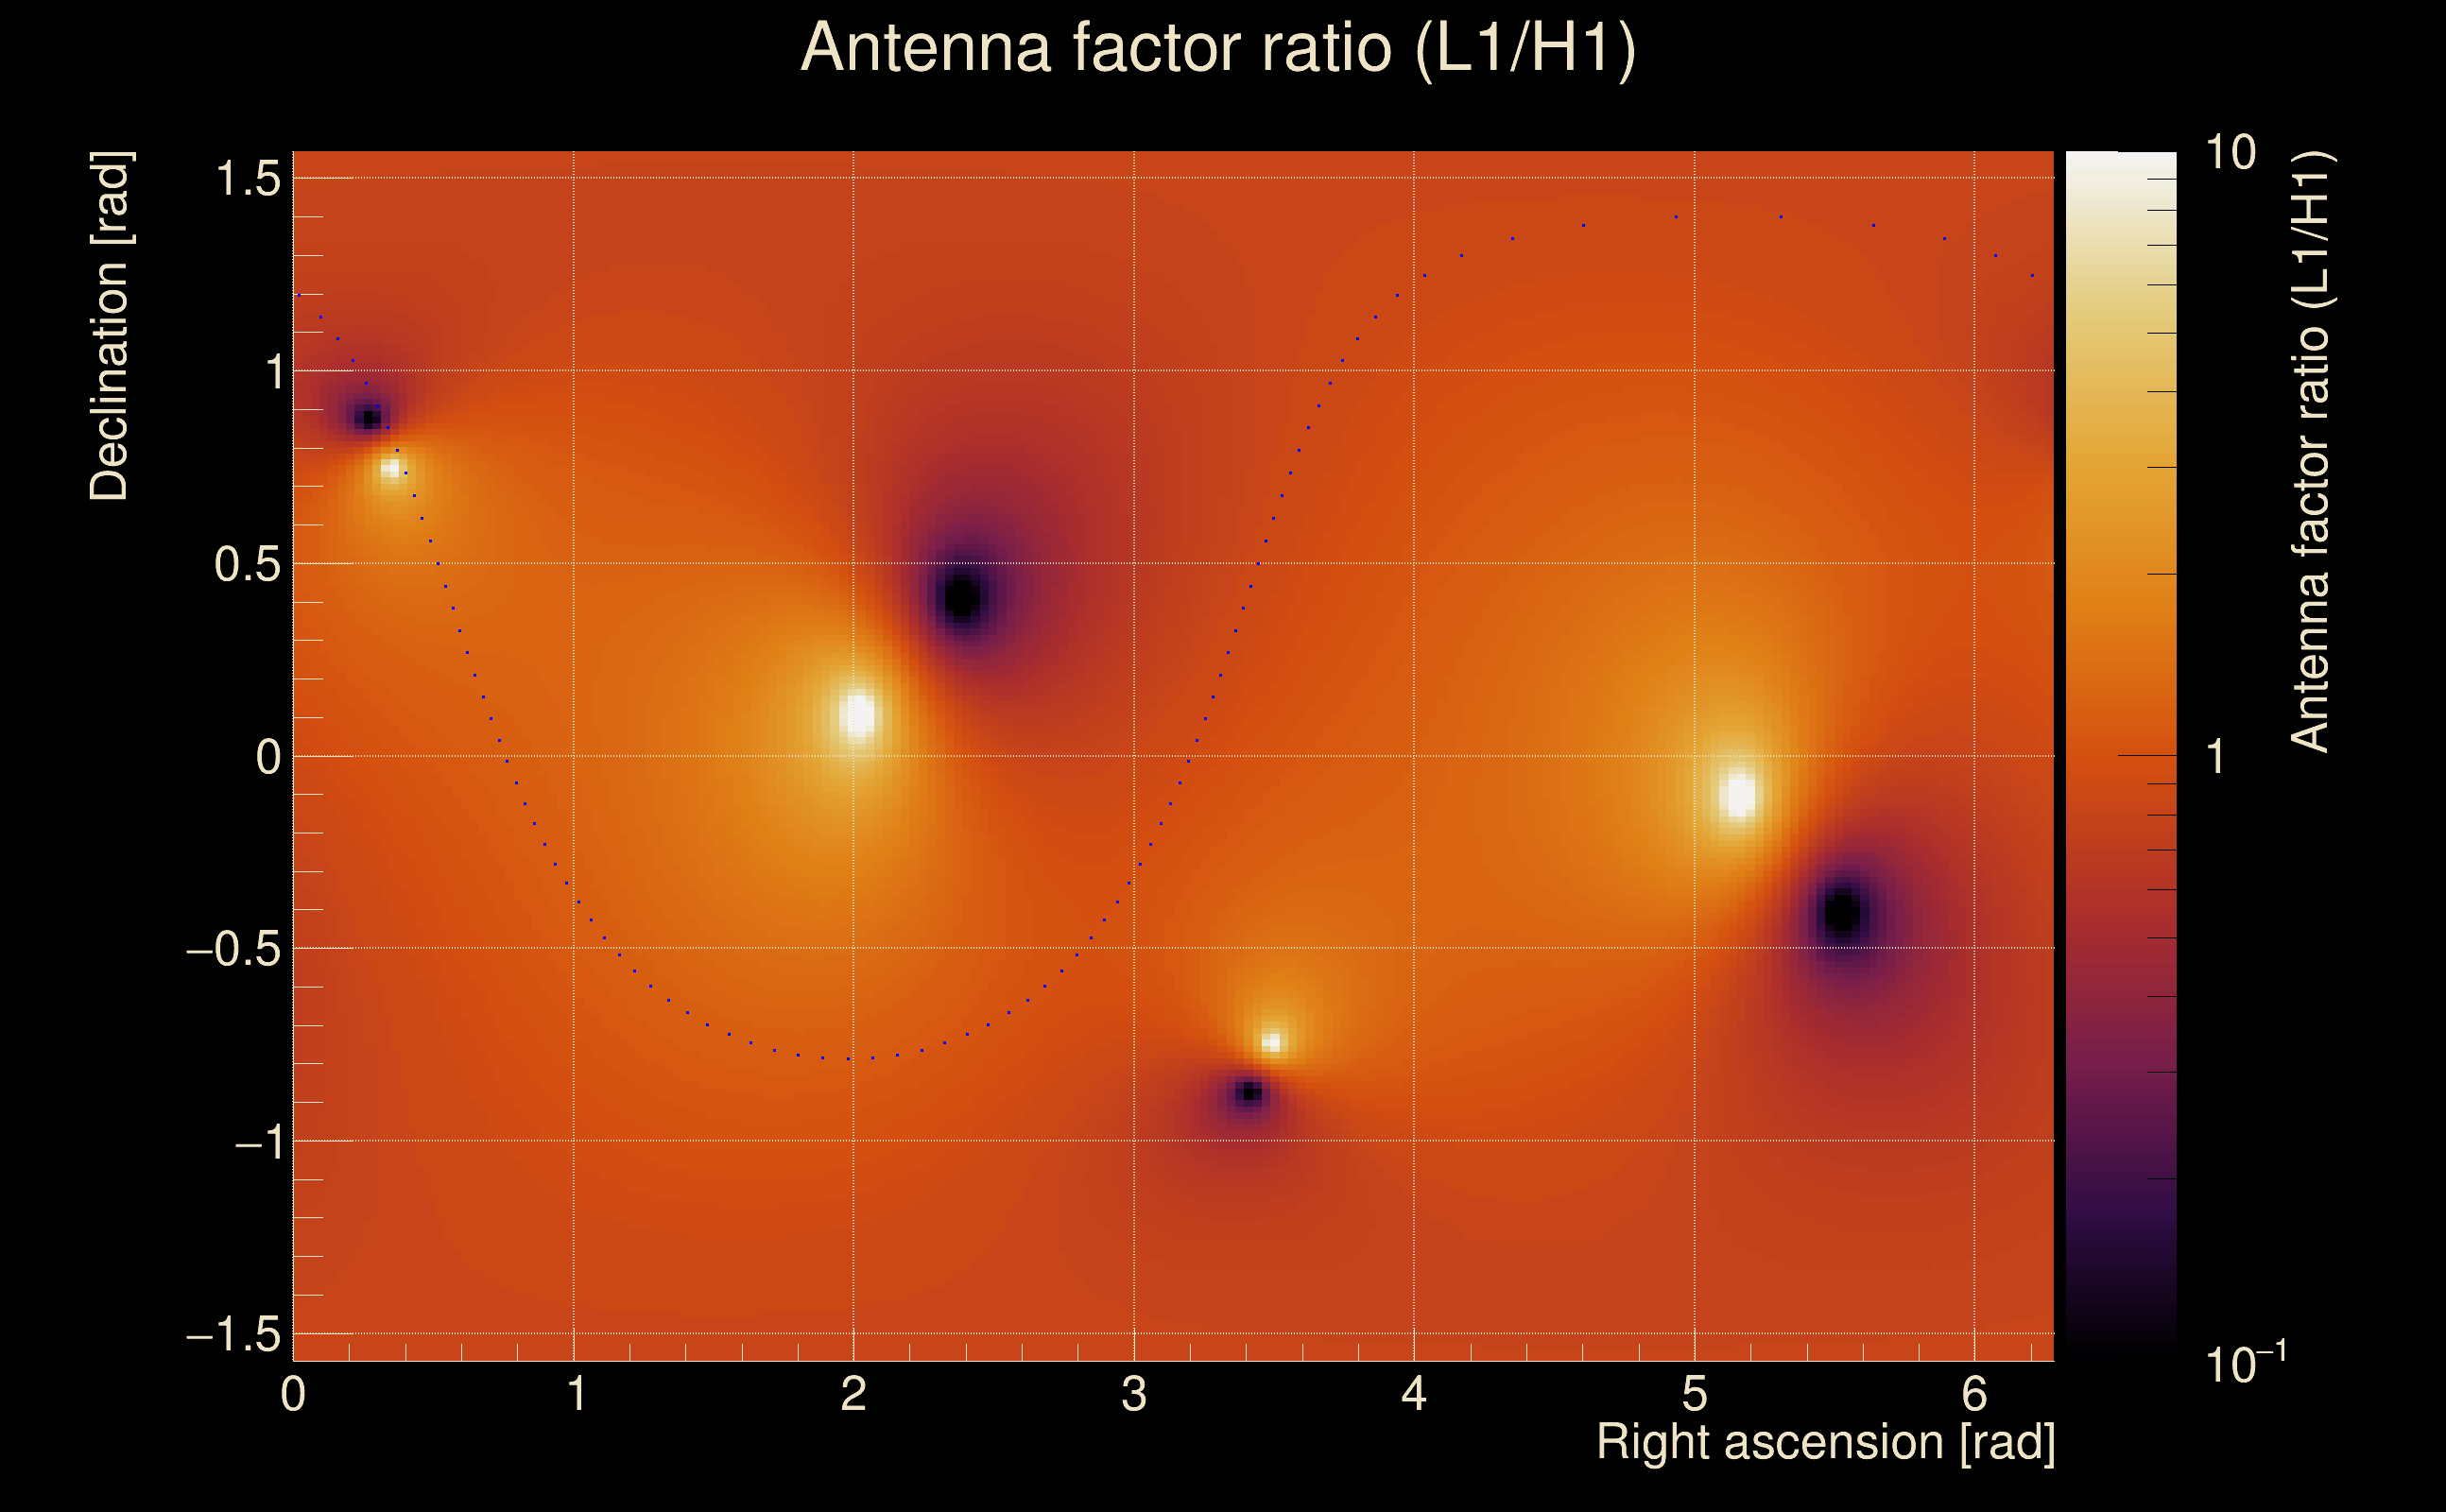
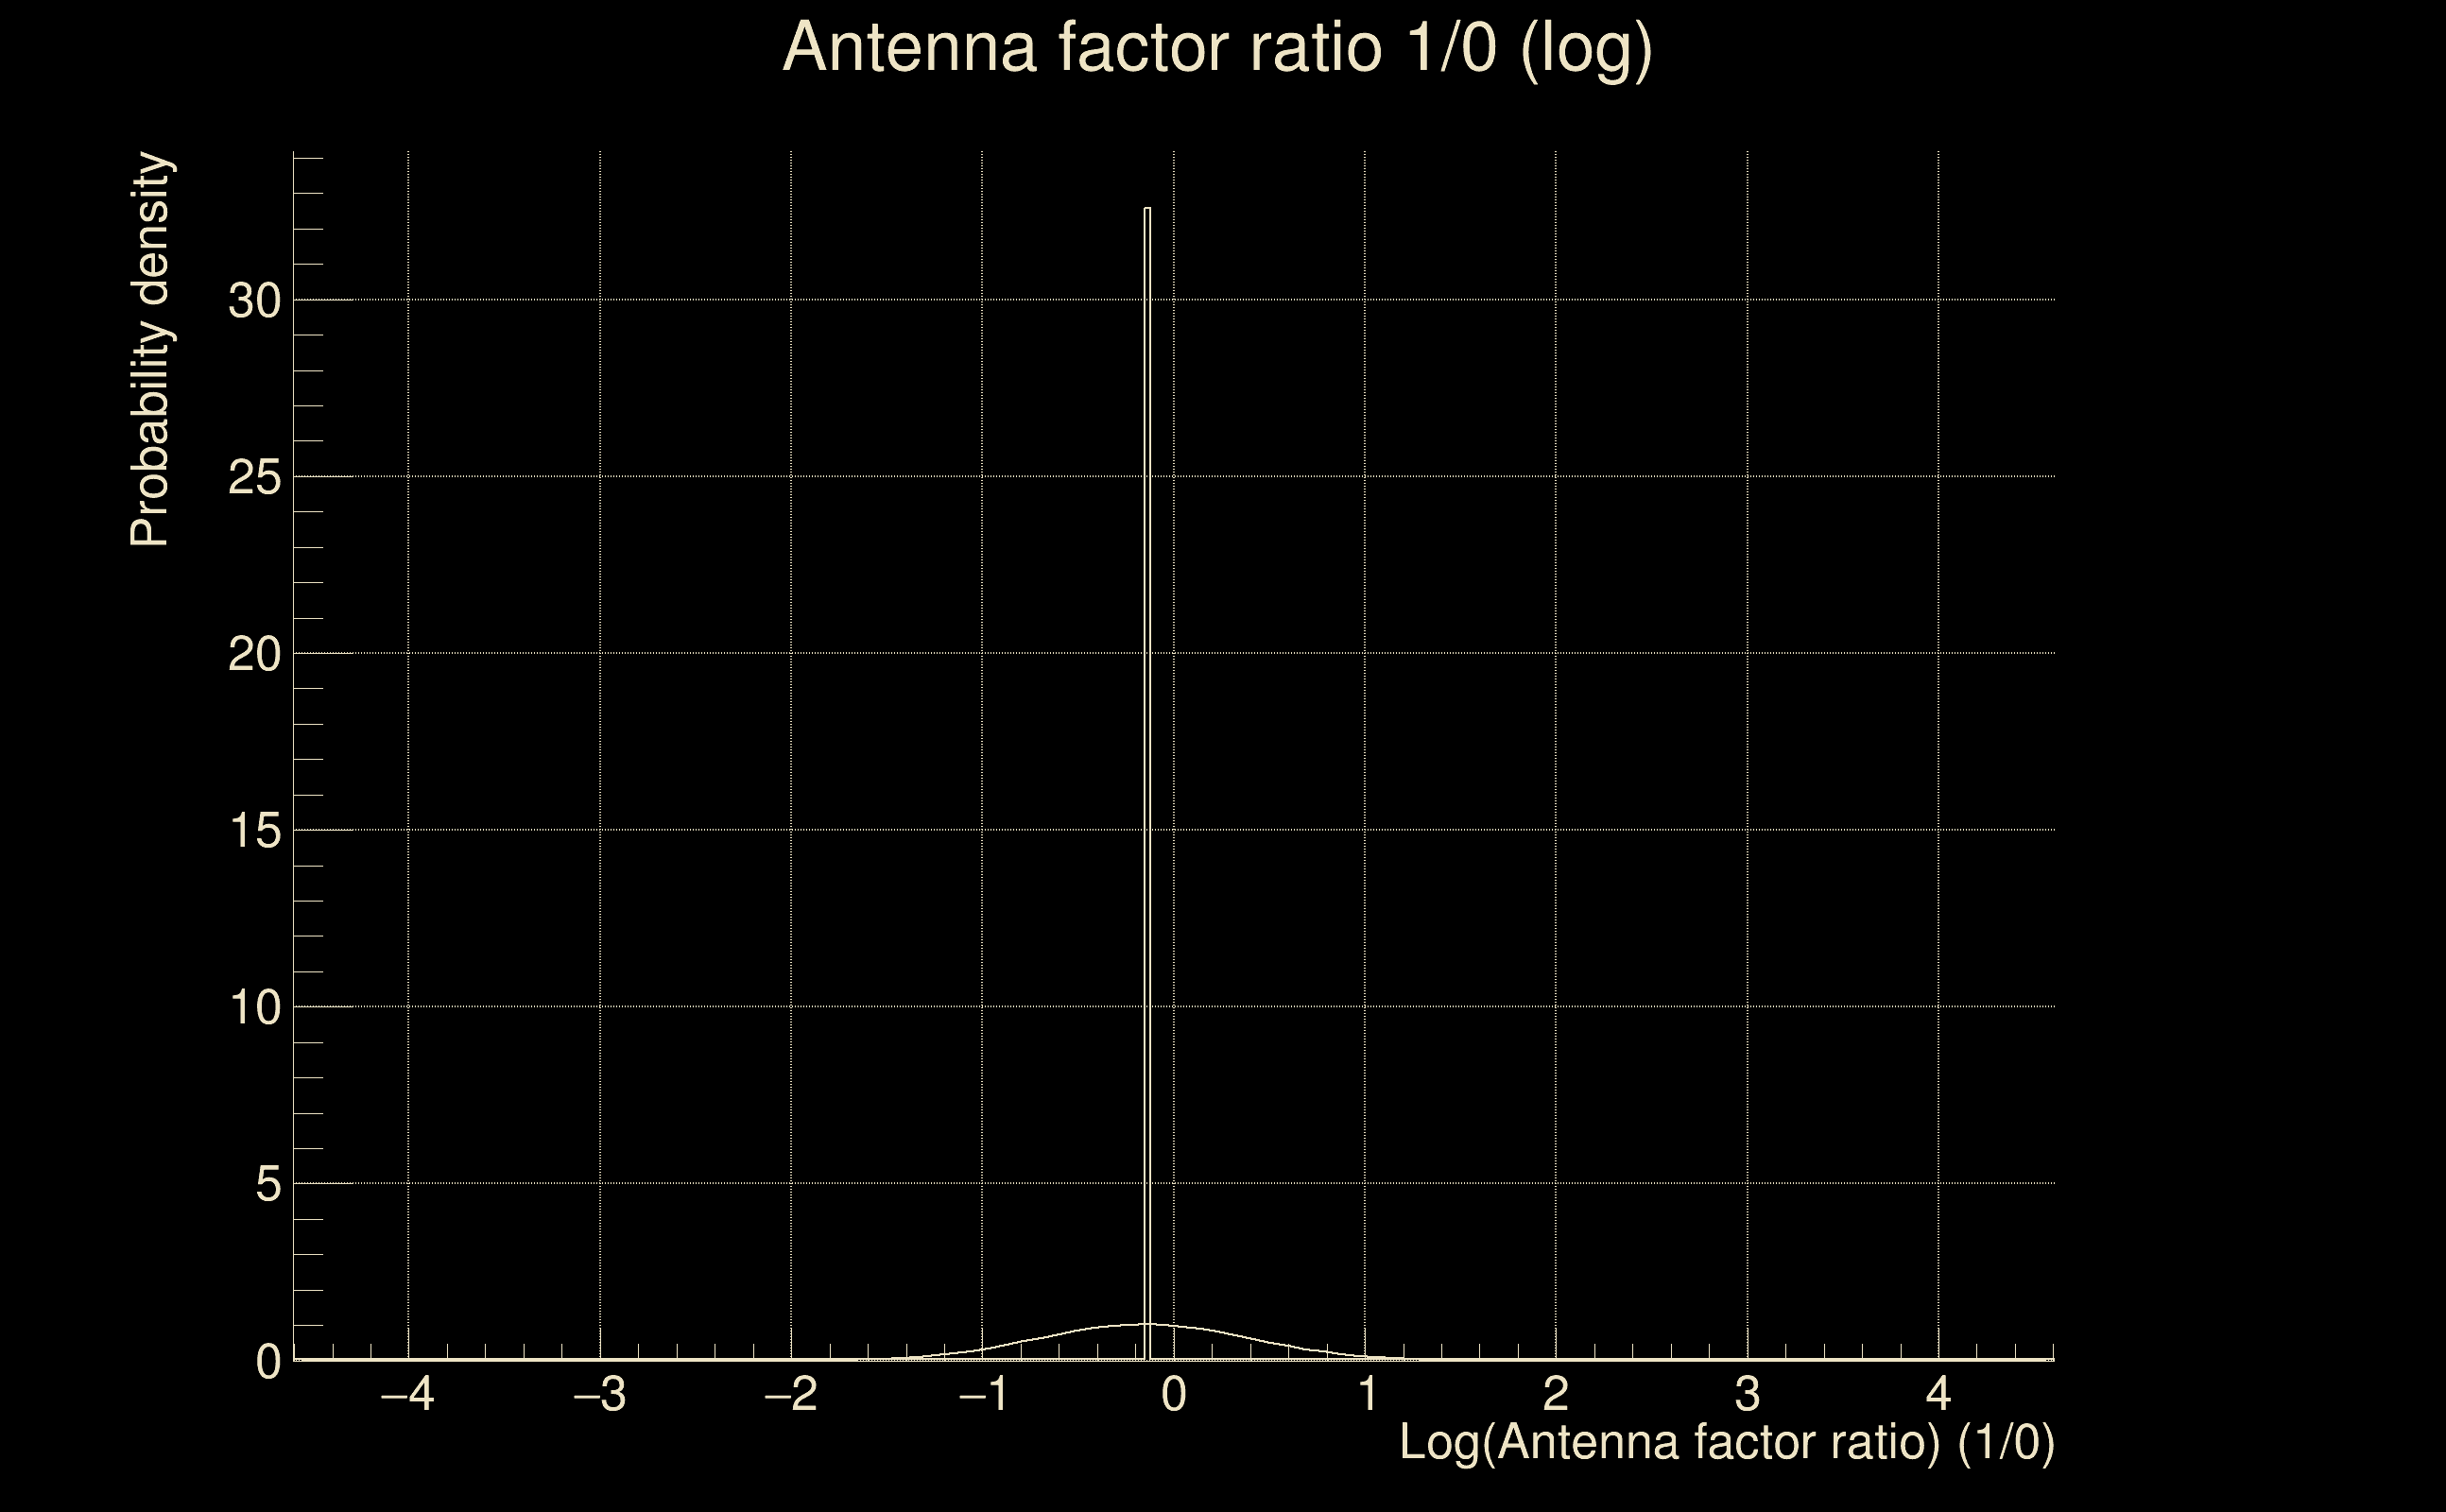
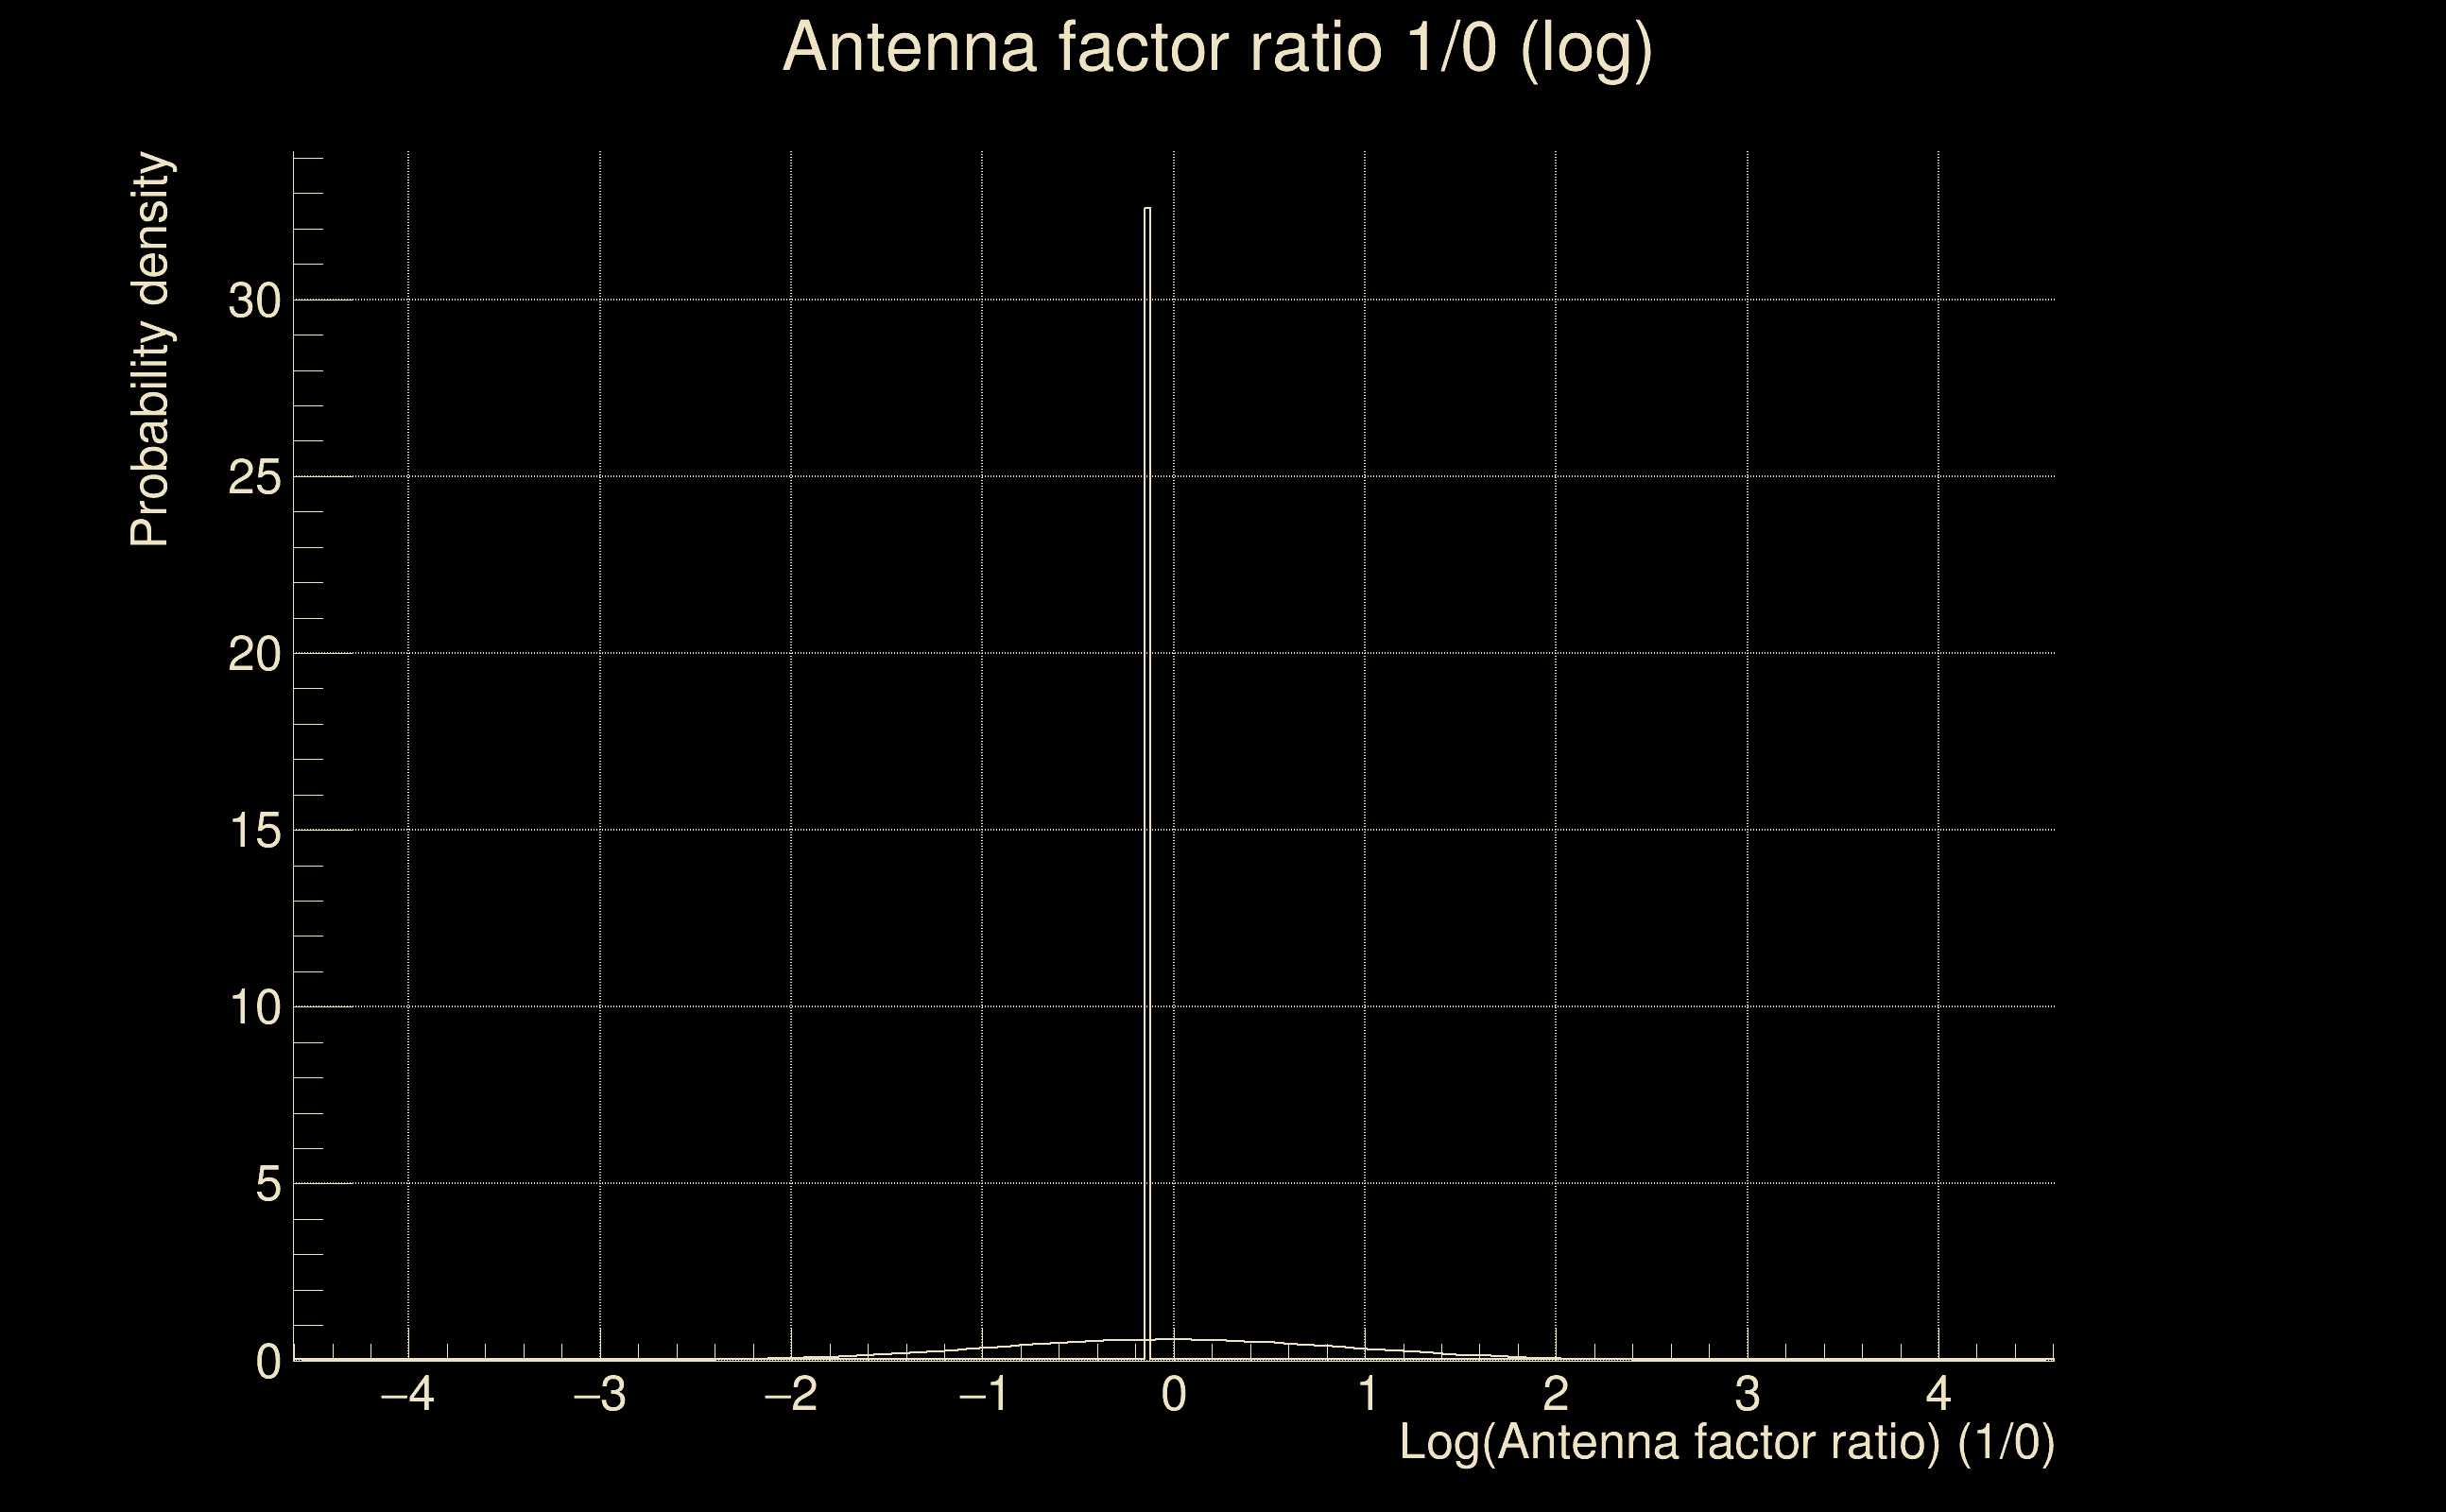
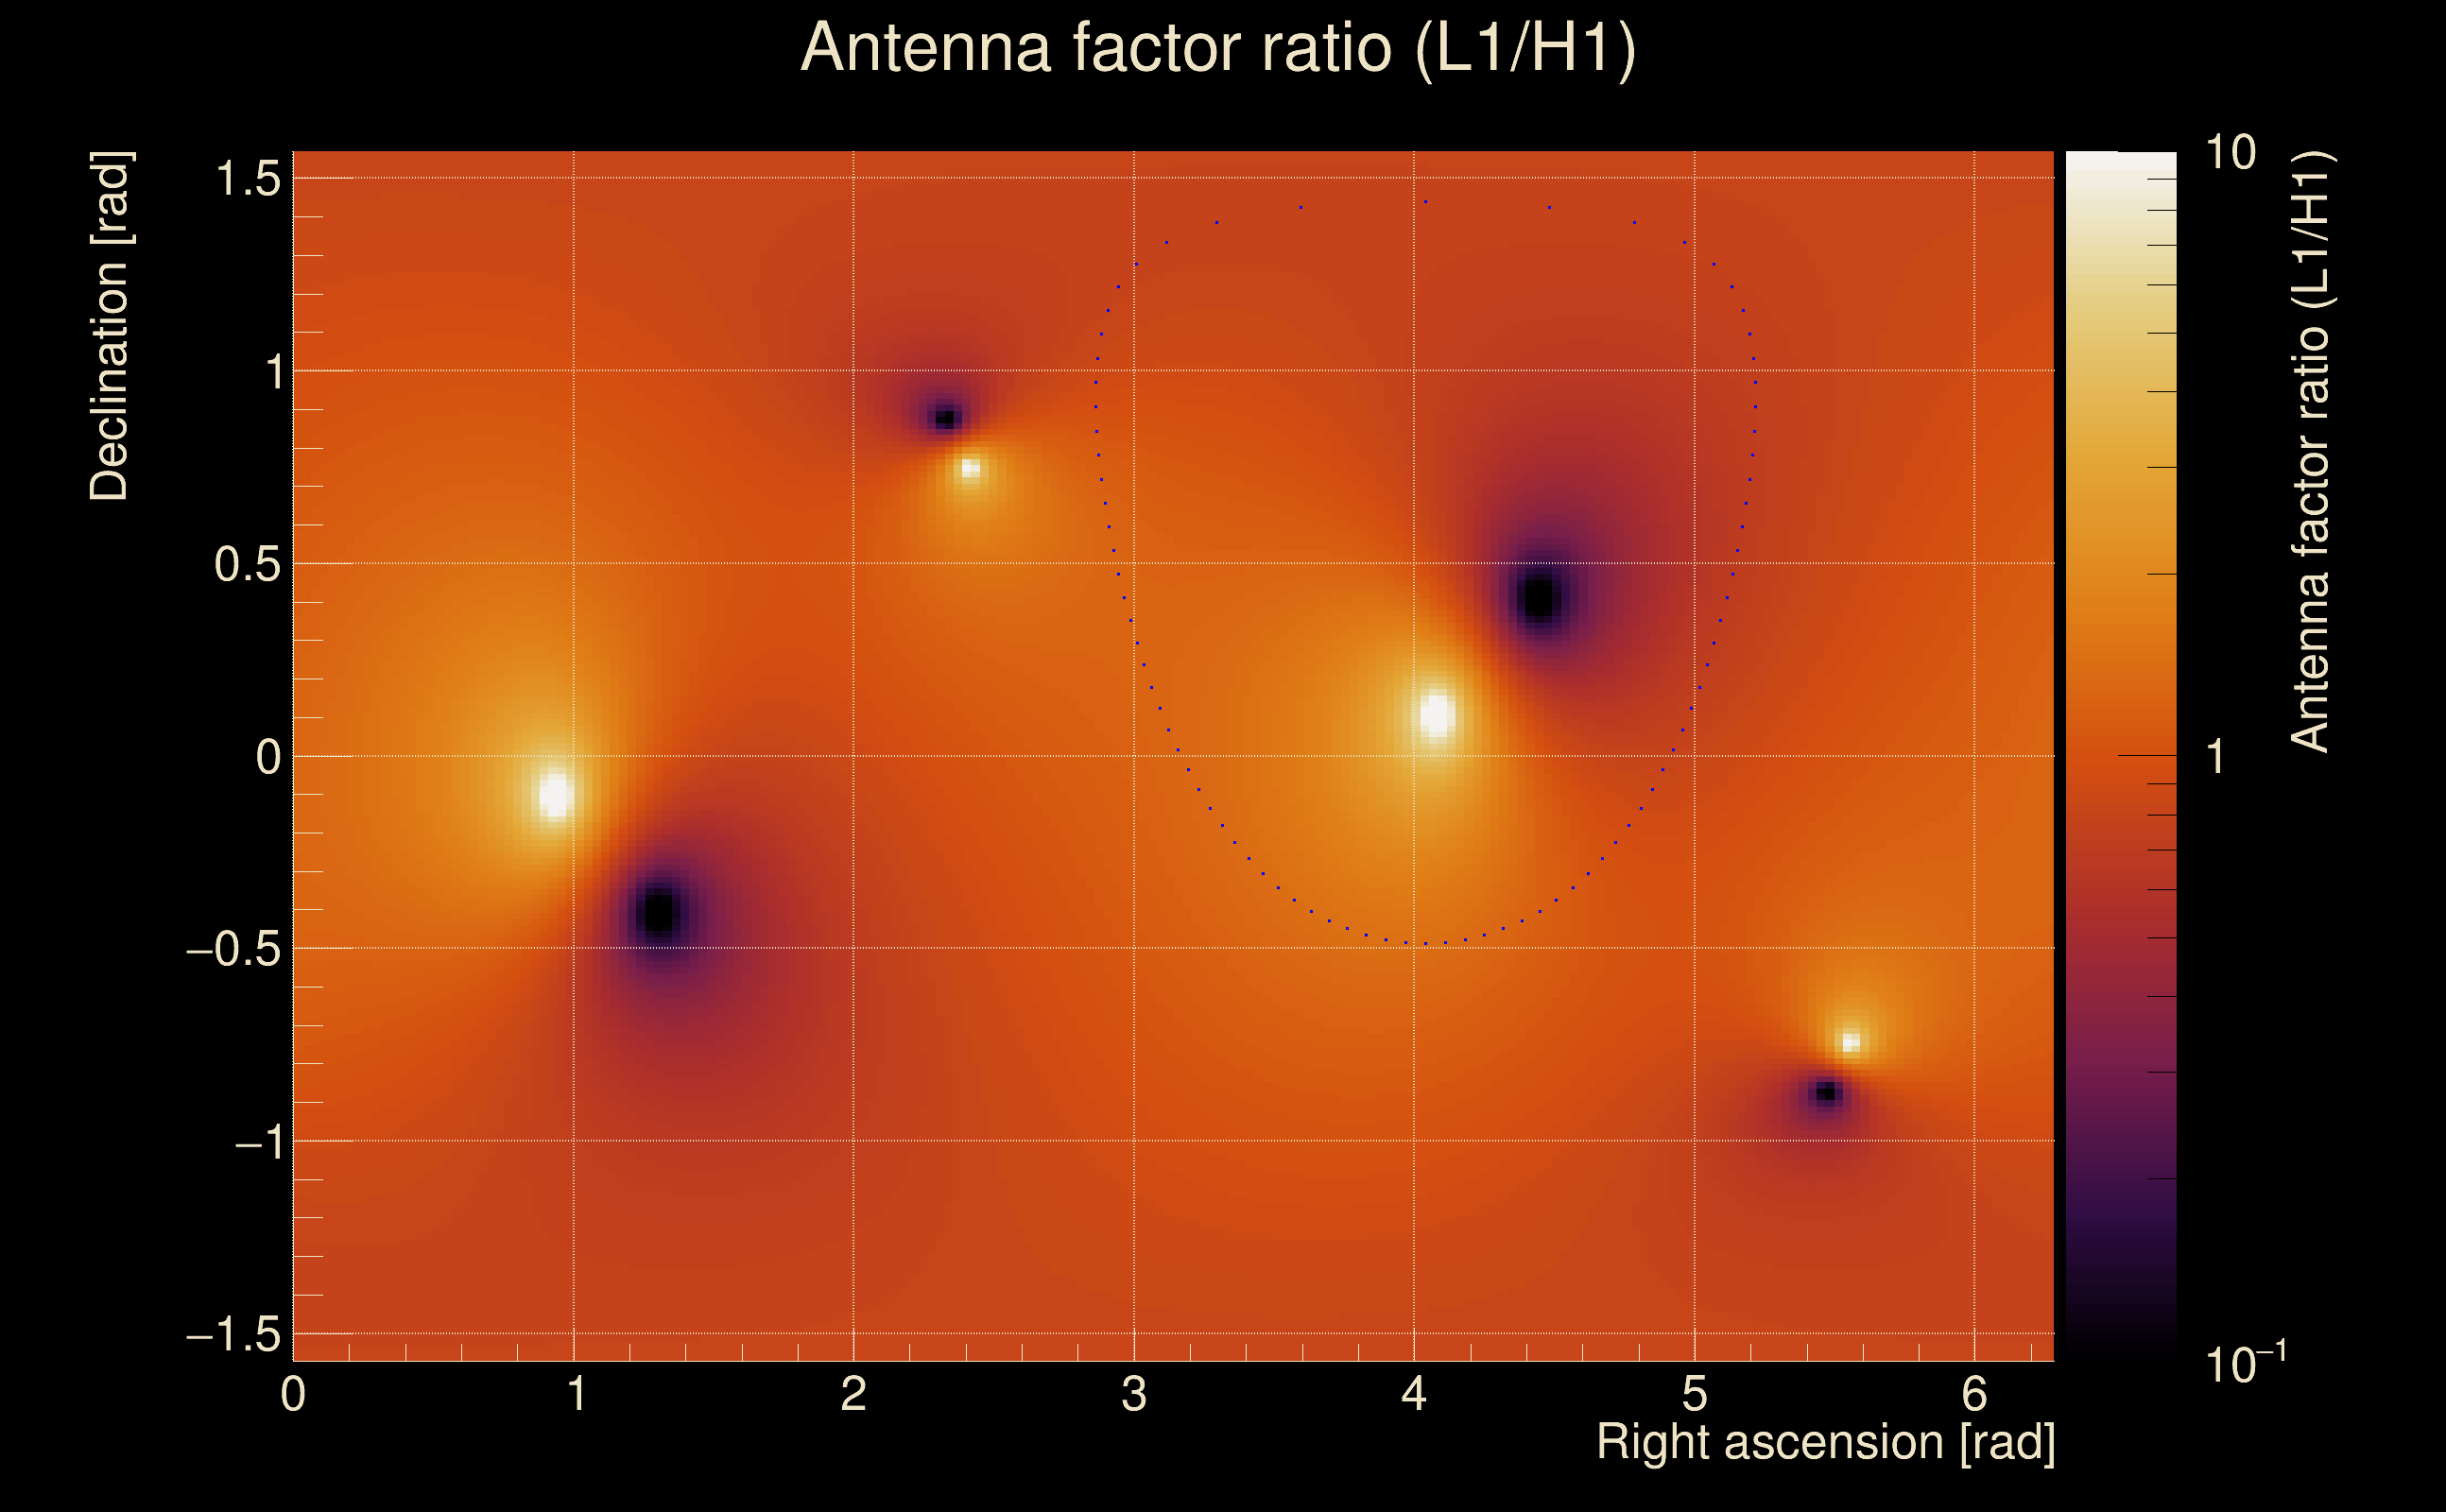
| Log of amplitude ratio (L1/H1): | -0.0283655, variance = 0.155036 (L1/H1: -0.0151747, variance = 0.307505, H1/L1: 0.0394326, variance = 0.307861) |
| Amplitude ratio (L1/H1): | 0.972033 ⋇ 1.48252 (L1/H1: 0.98494 ⋇ 1.74113, H1/L1: 1.04022 ⋇ 1.74168) |
| Amplitude ratio H1|L1 compatibility (probability): | 0.975331 |
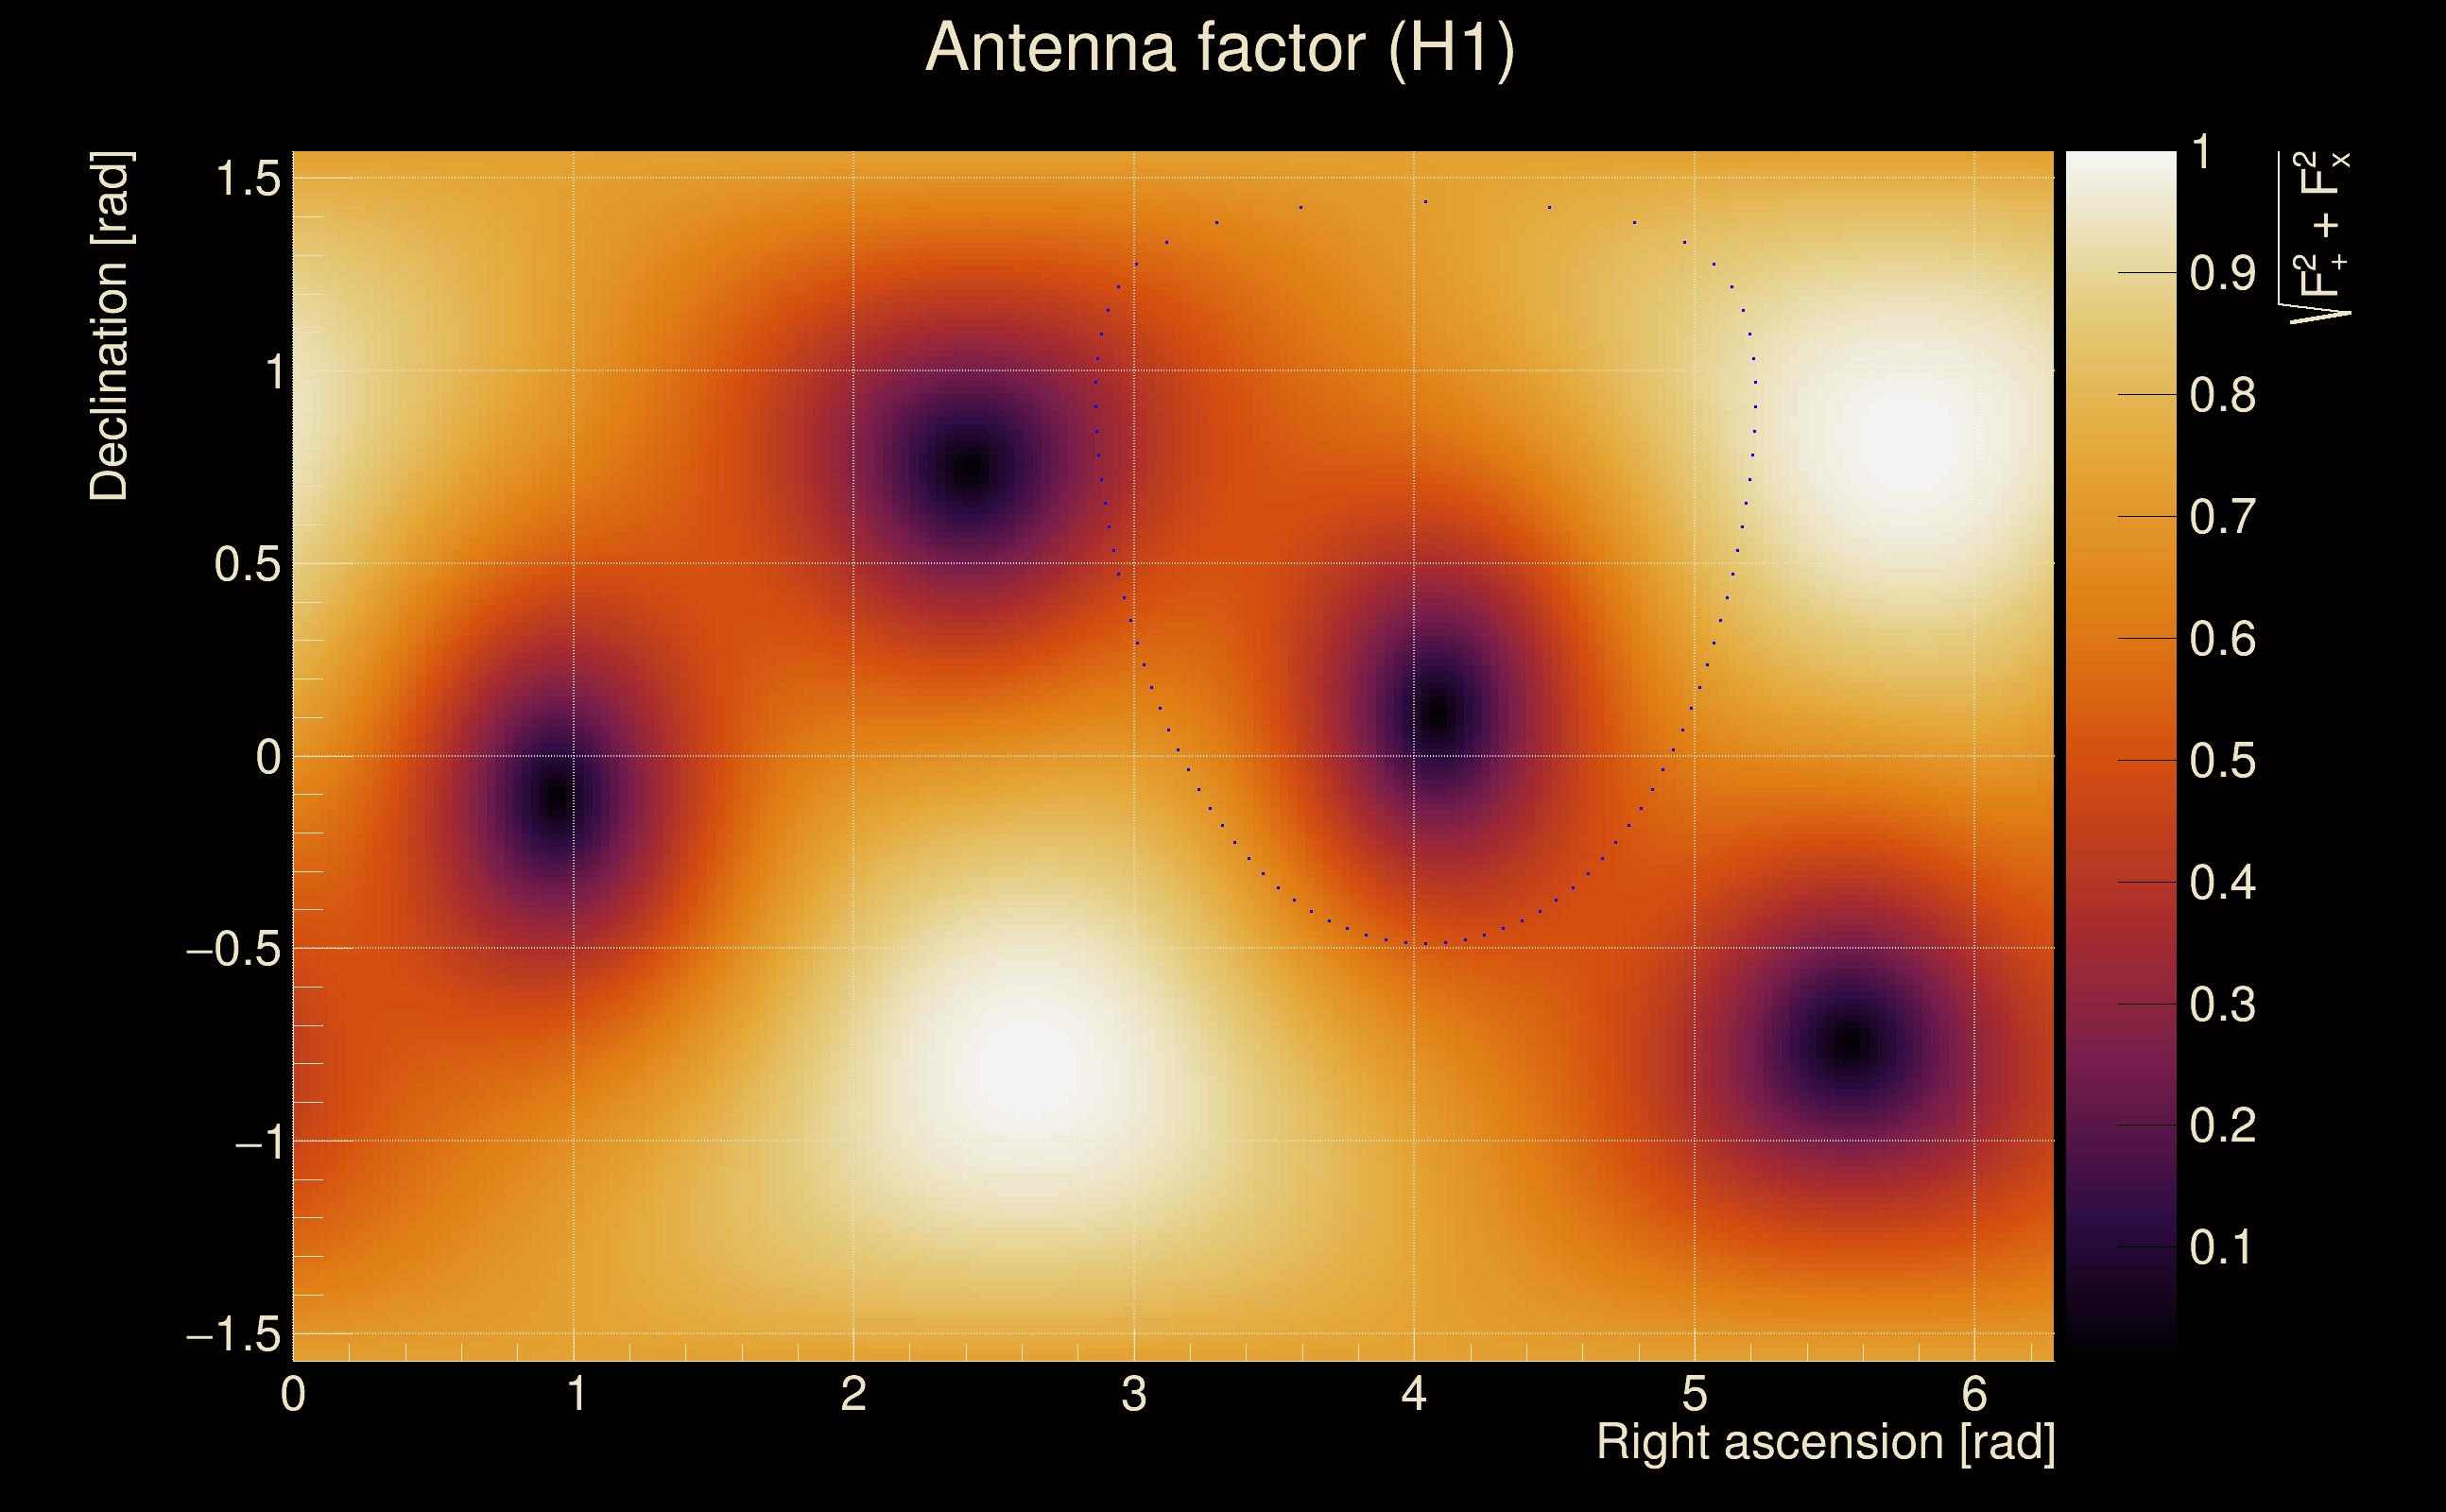
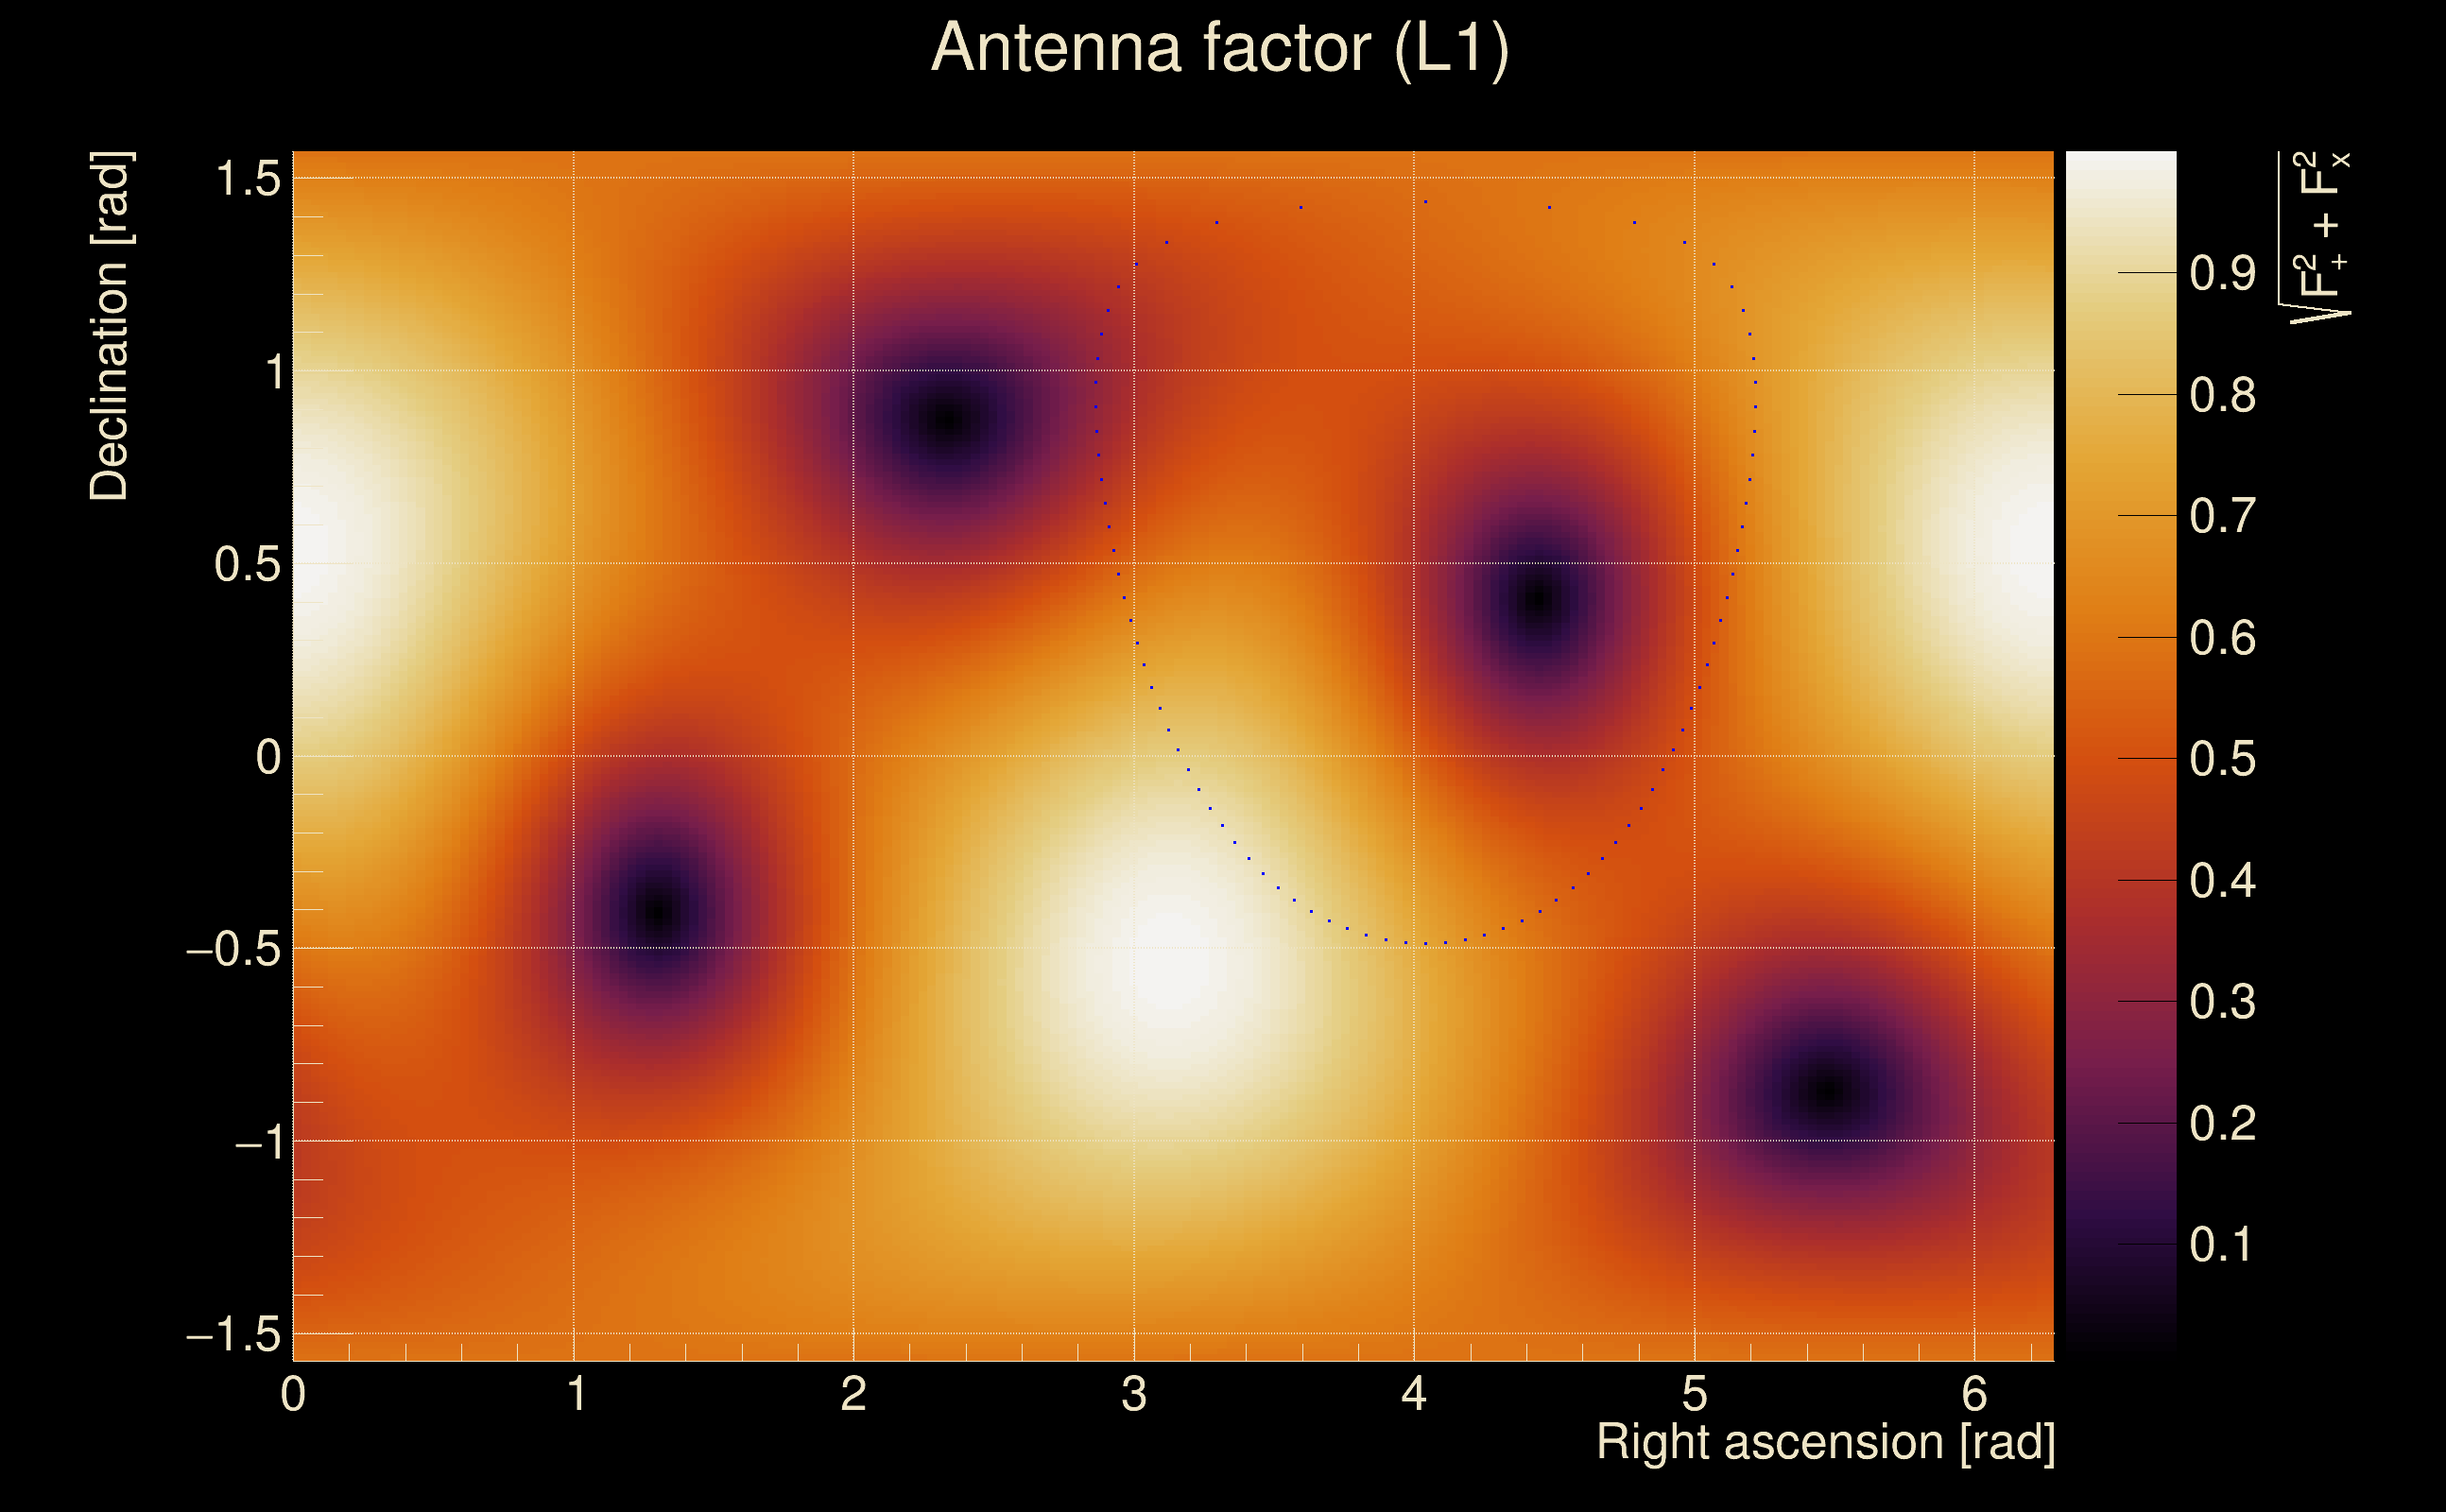
| Antenna factor probability: | 0.993089 |
| Number of rejected frequency rows: | Q0: 0 / 18, Q1: 0 / 36, Q2: 3 / 70, Q3: 14 / 134, Q4: 47 / 258 |
| Maximum signal-to-noise ratio: | H1: 44.4139, L1: 48.4884 |
| SNR variance: | H1: 0.77002, L1: 0.786188 |
| Click here for a zoomed plot | Click here for a zoomed plot | Click here for a zoomed plot | Click here for a zoomed plot | Click here for a zoomed plot |
 |
 |
 |
 |
 |
 |
 |
 |
 |
 |
 |
 |
 |
 |
 |
 |
 |
 |
 |
 |
 |
 |
 |
 |
 |
 |
 |
 |
 |
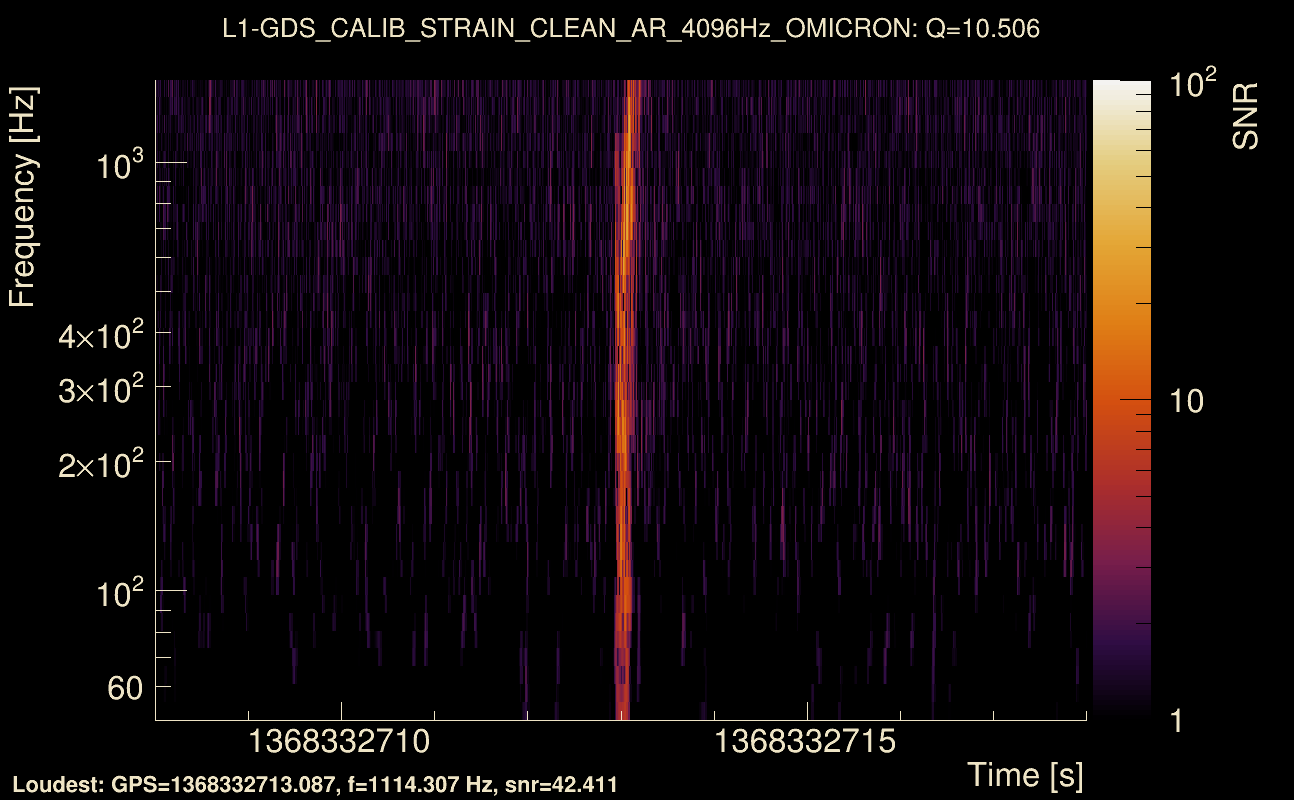
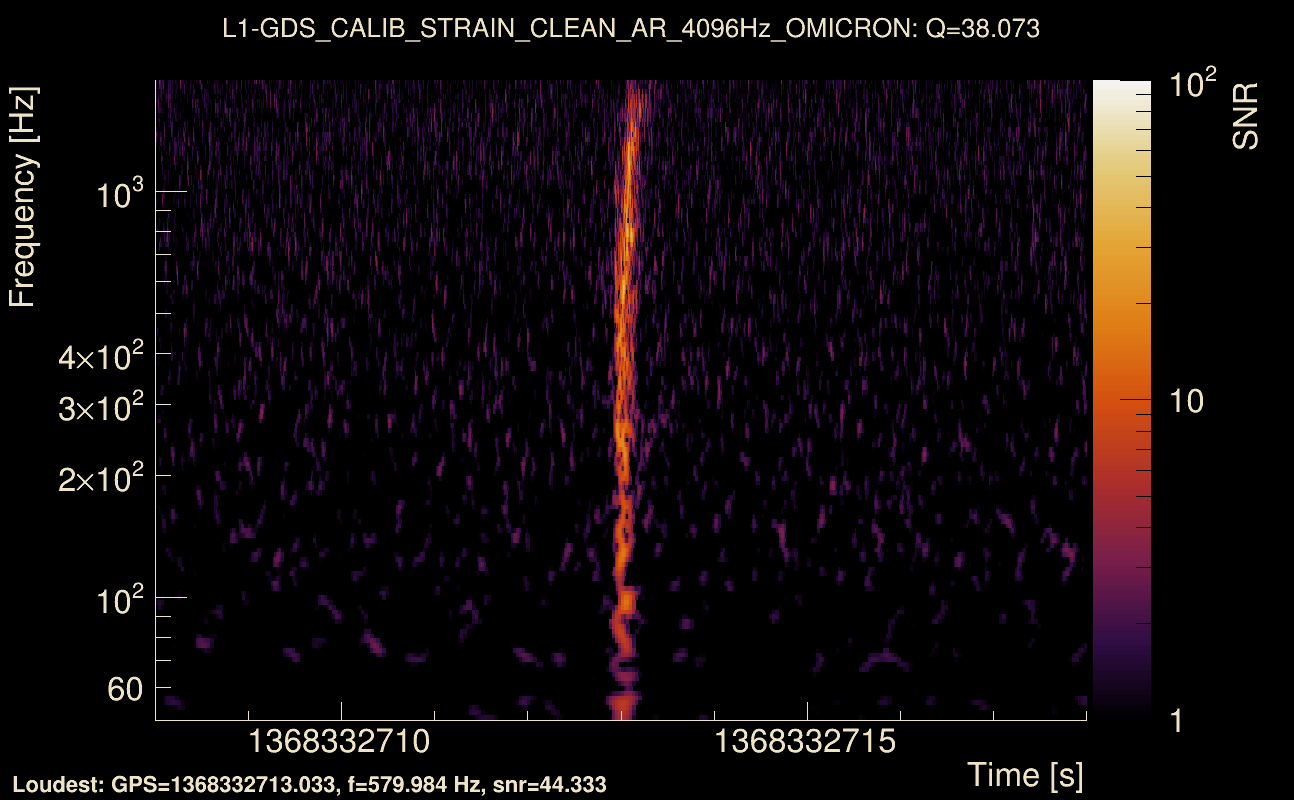
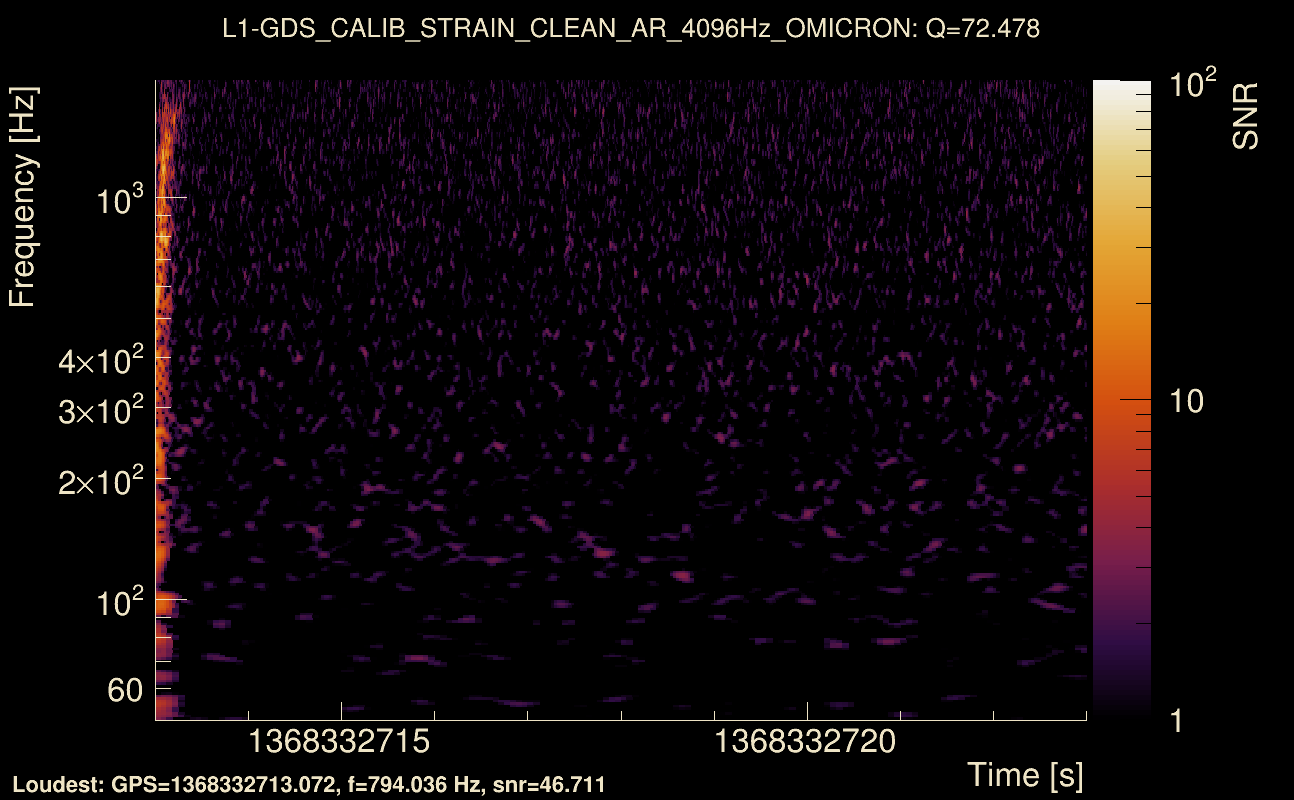
| Event time t(H1): | GPS = 1368332713 (Wed May 17 04:24:55 2023 ) → GPS = 1368332723 (Wed May 17 04:25:05 2023 ) |
| Event time t(L1): | GPS = 1368332713 (Wed May 17 04:25:05 2023 ) → GPS = 1368332723 (Wed May 17 04:25:05 2023 ) |
| Omicron analysis time window (H1): | GPS = 1368332710 → GPS = 1368332726 |
| Omicron analysis time window (L1): | GPS = 1368332710 → GPS = 1368332726 |
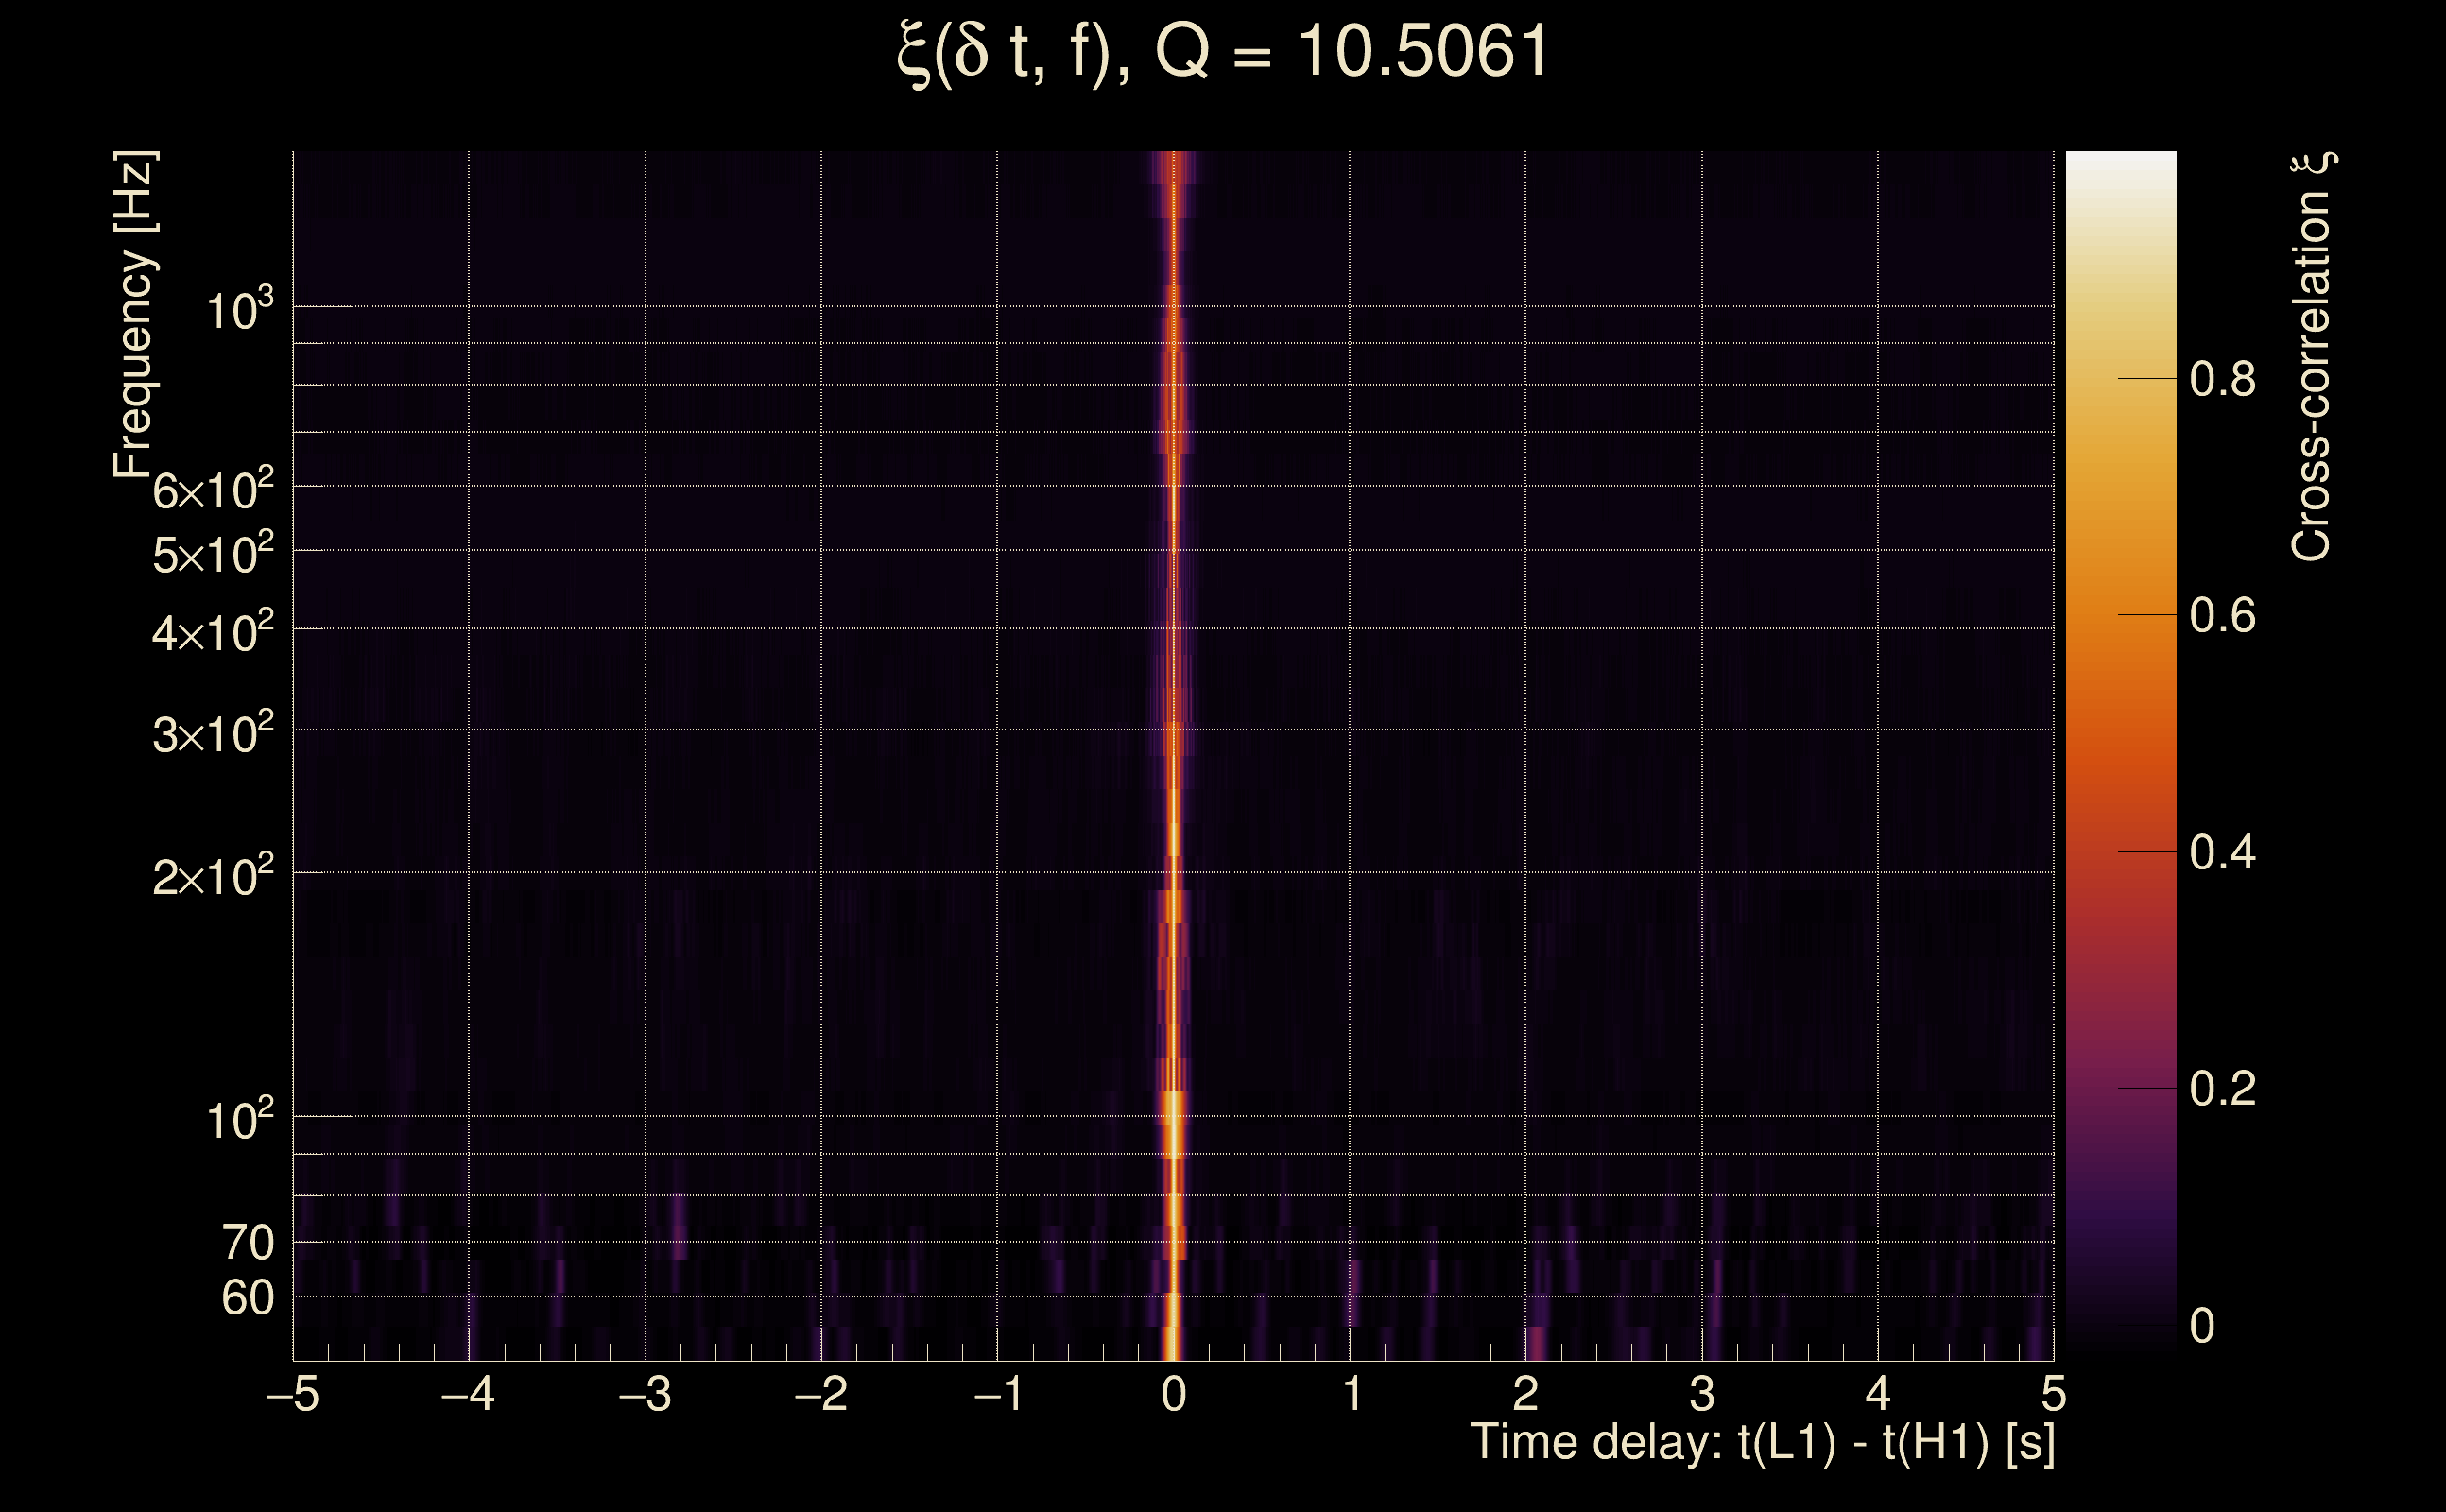
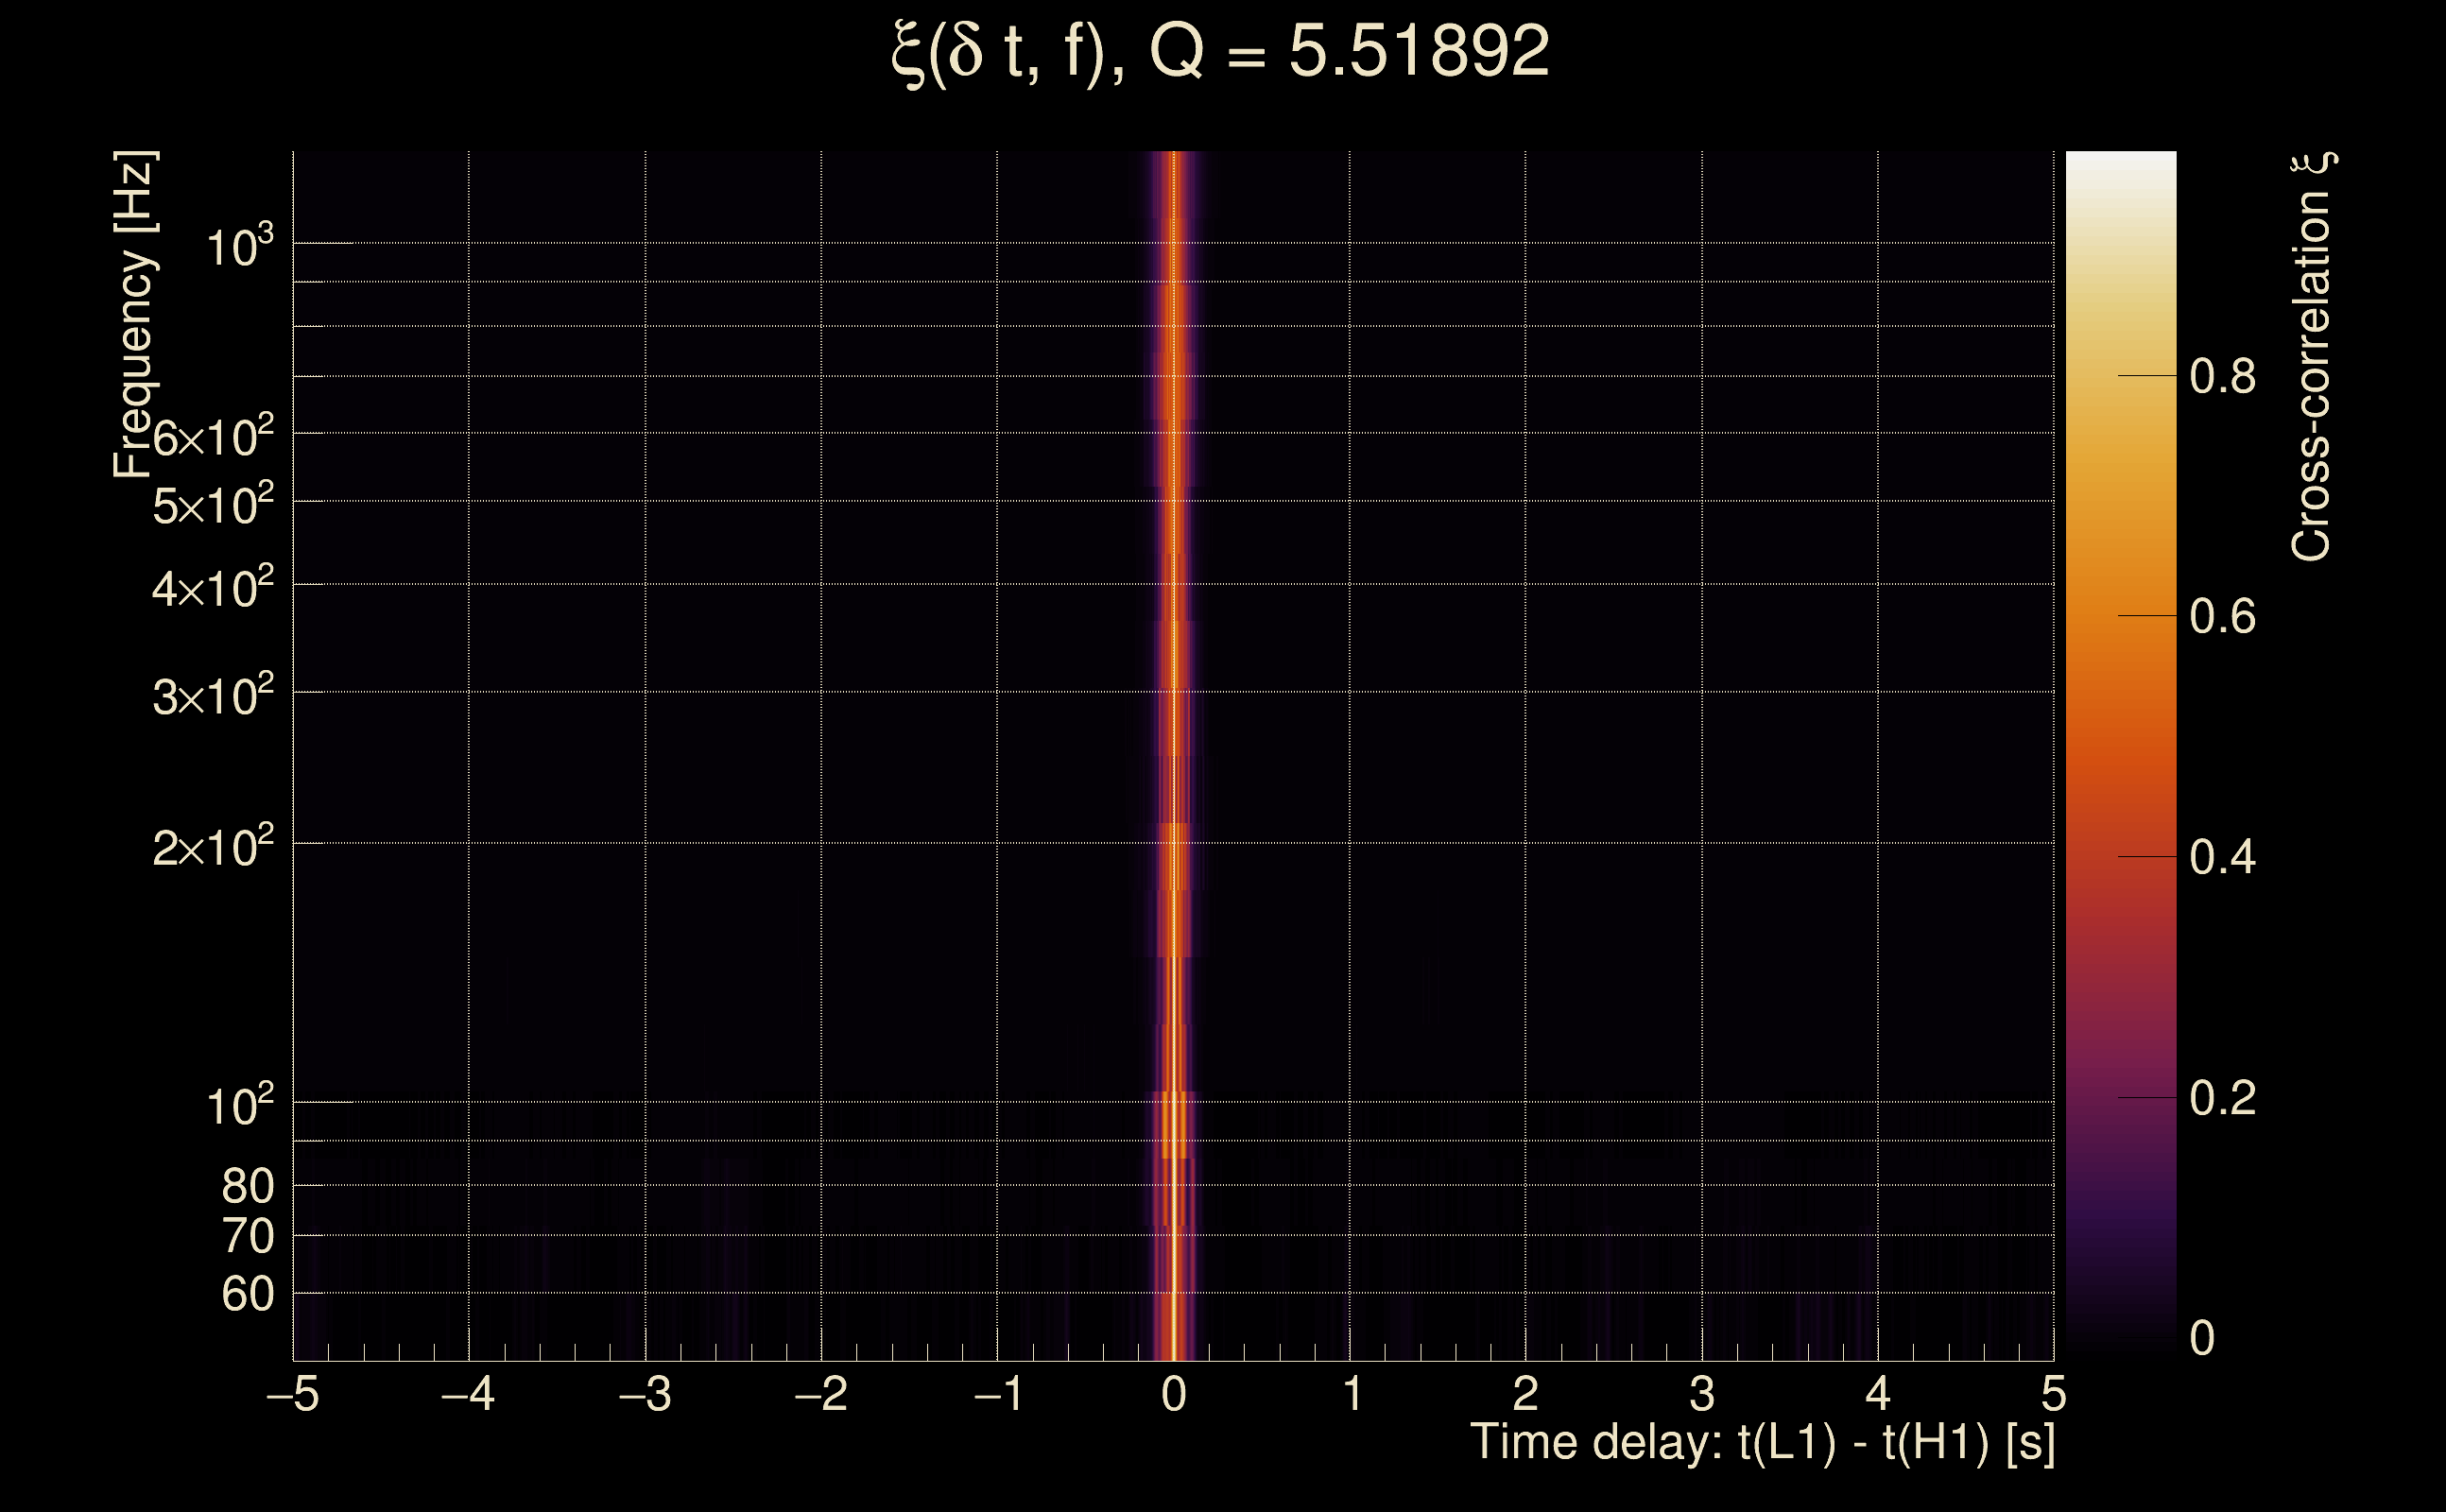
| Time delay between detectors t(L1) - t(H1): | 0.000496671 s (slice index = 108 / 217), δt_gw = 0.000496671 s |
| Time delay standard deviation: | 0.0225336 s |
| [targeted mode] Time delay probability: | 0.98869 (0.014175 sigmas), δt_target = 0.000488043 s |
| Frequency: | 306.894 Hz |
| Ξ: | 0.927778 ± 0.00732568 (variance = 5.36657e-05): Q0: 0.941677, Q1: 0.955224, Q2: 0.951361, Q3: 0.940161, Q4: 0.935561 |
| Rank: | R_A = 0.866537 |
| Log of amplitude ratio (L1/H1): | -0.0149271, variance = 0.156818 (L1/H1: 0.0042866, variance = 0.310614, H1/L1: 0.0310382, variance = 0.311674) |
| Amplitude ratio (L1/H1): | 0.985184 ⋇ 1.48587 (L1/H1: 1.0043 ⋇ 1.746, H1/L1: 1.03152 ⋇ 1.74766) |
| Amplitude ratio H1|L1 compatibility (probability): | 0.964283 |
| Antenna factor probability: | 0.979666 |
| Number of rejected frequency rows: | Q0: 0 / 18, Q1: 1 / 36, Q2: 2 / 70, Q3: 8 / 134, Q4: 32 / 258 |
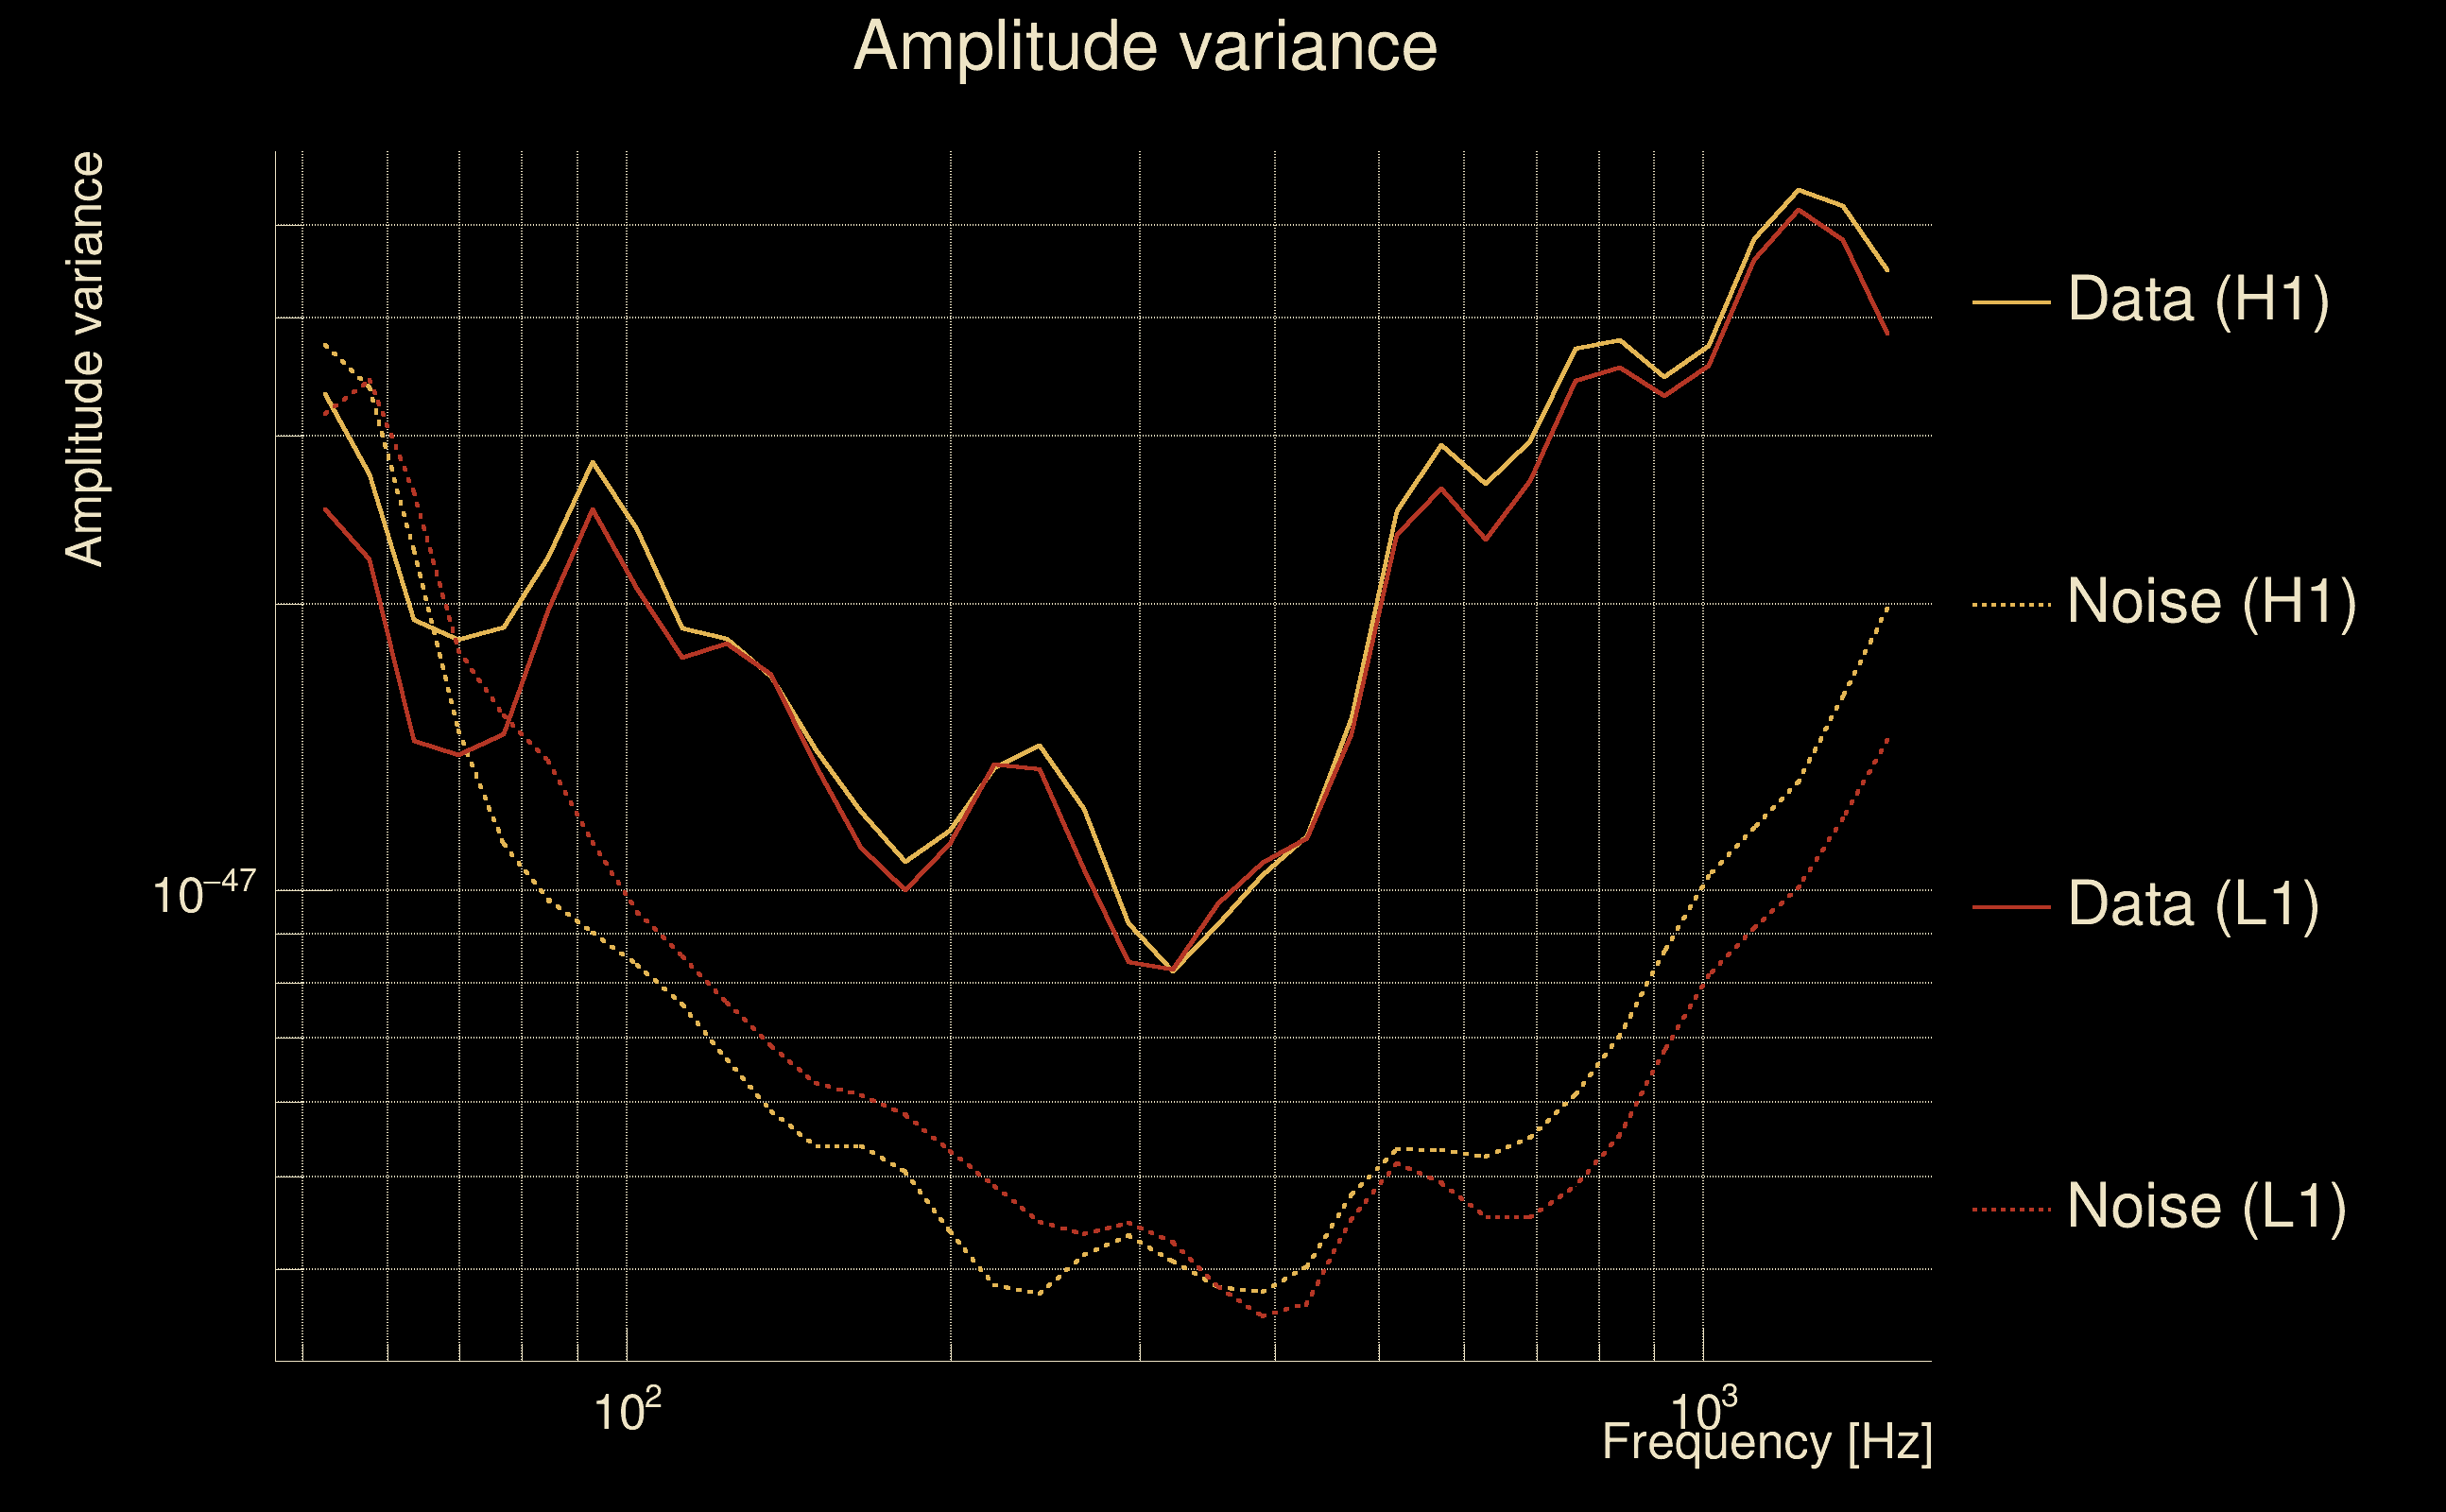
| Maximum signal-to-noise ratio: | H1: 44.4511, L1: 48.543 |
| SNR variance: | H1: 1.92351, L1: 2.07172 |
| Click here for a zoomed plot | Click here for a zoomed plot | Click here for a zoomed plot | Click here for a zoomed plot | Click here for a zoomed plot |
 |
 |
 |
 |
 |
 |
 |
 |
 |
 |
 |
 |
 |
 |
 |
 |
 |
 |
 |
 |
 |
 |
 |
 |
 |
 |
 |
 |
 |
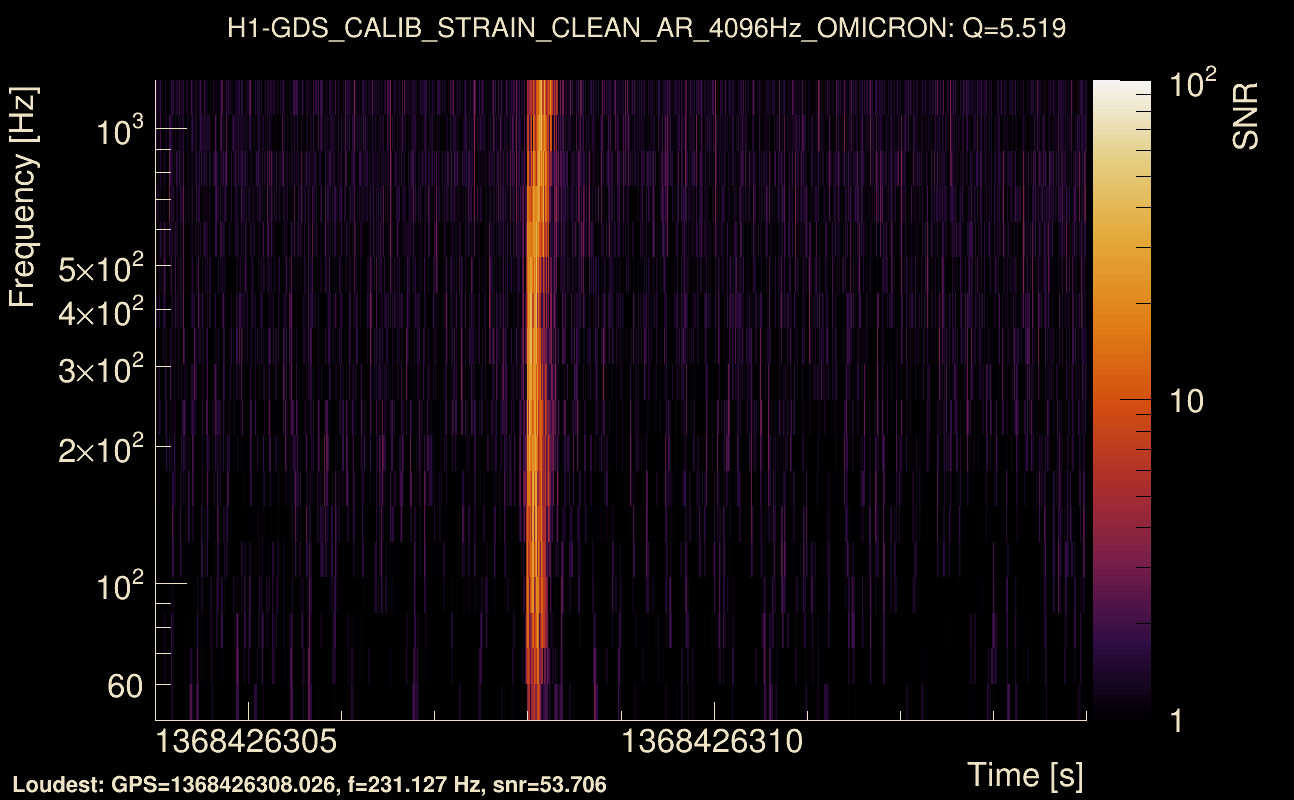
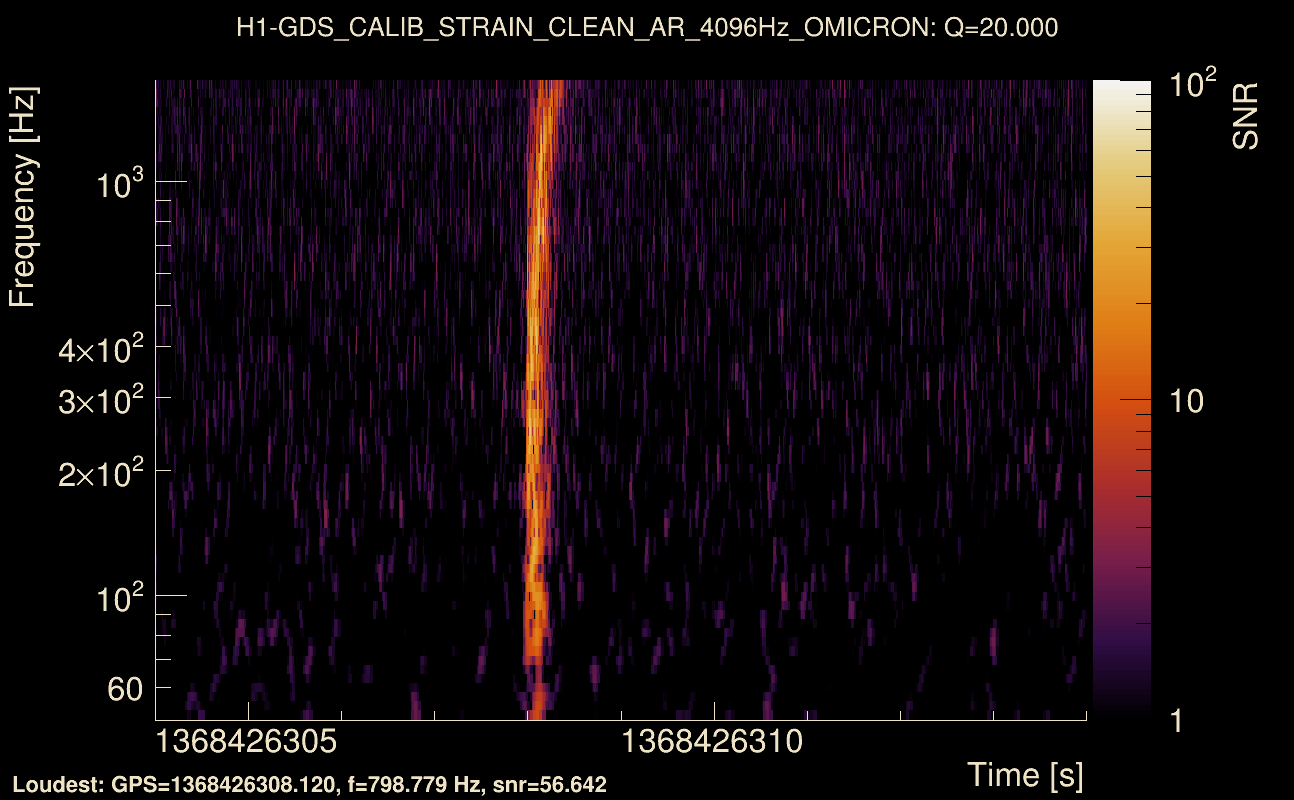
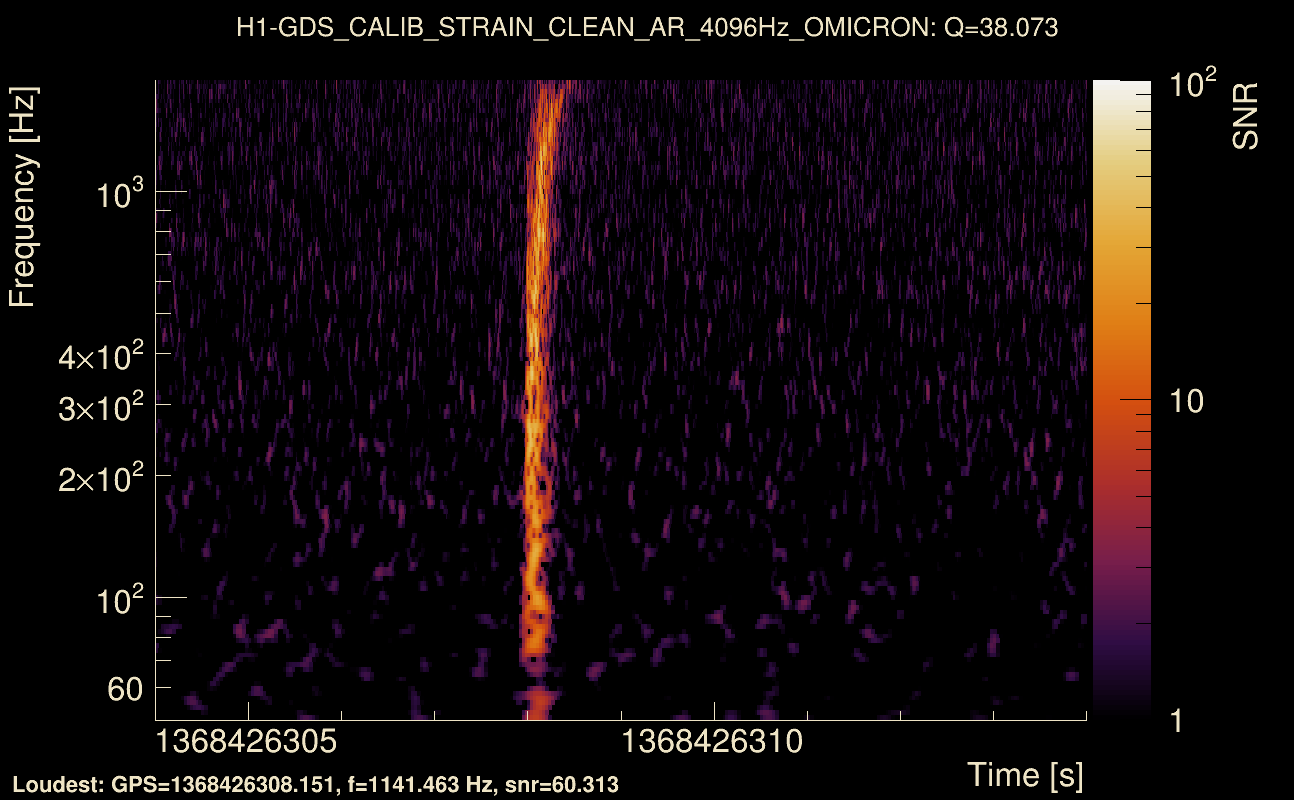
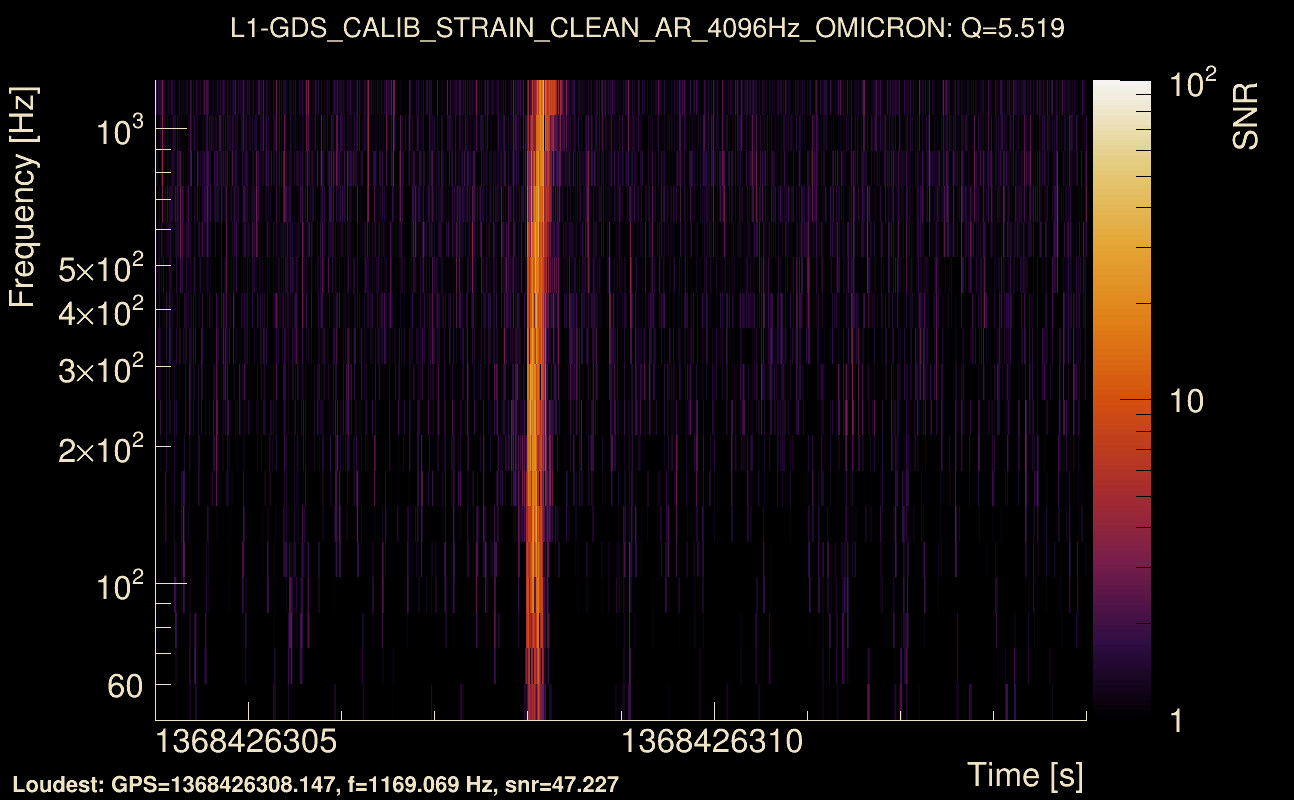
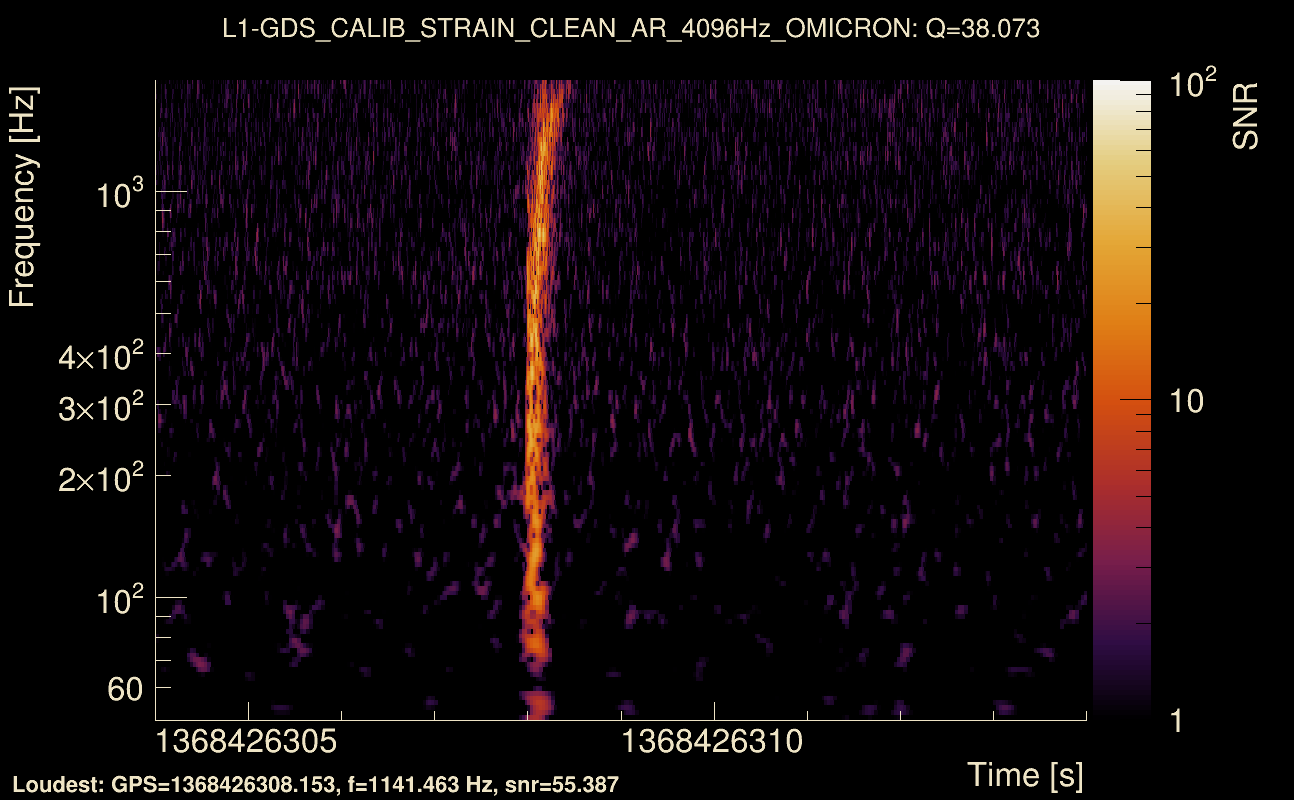
| Event time t(H1): | GPS = 1368426304 (Thu May 18 06:24:46 2023 ) → GPS = 1368426314 (Thu May 18 06:24:56 2023 ) |
| Event time t(L1): | GPS = 1368426304 (Thu May 18 06:24:56 2023 ) → GPS = 1368426314 (Thu May 18 06:24:56 2023 ) |
| Omicron analysis time window (H1): | GPS = 1368426301 → GPS = 1368426317 |
| Omicron analysis time window (L1): | GPS = 1368426301 → GPS = 1368426317 |
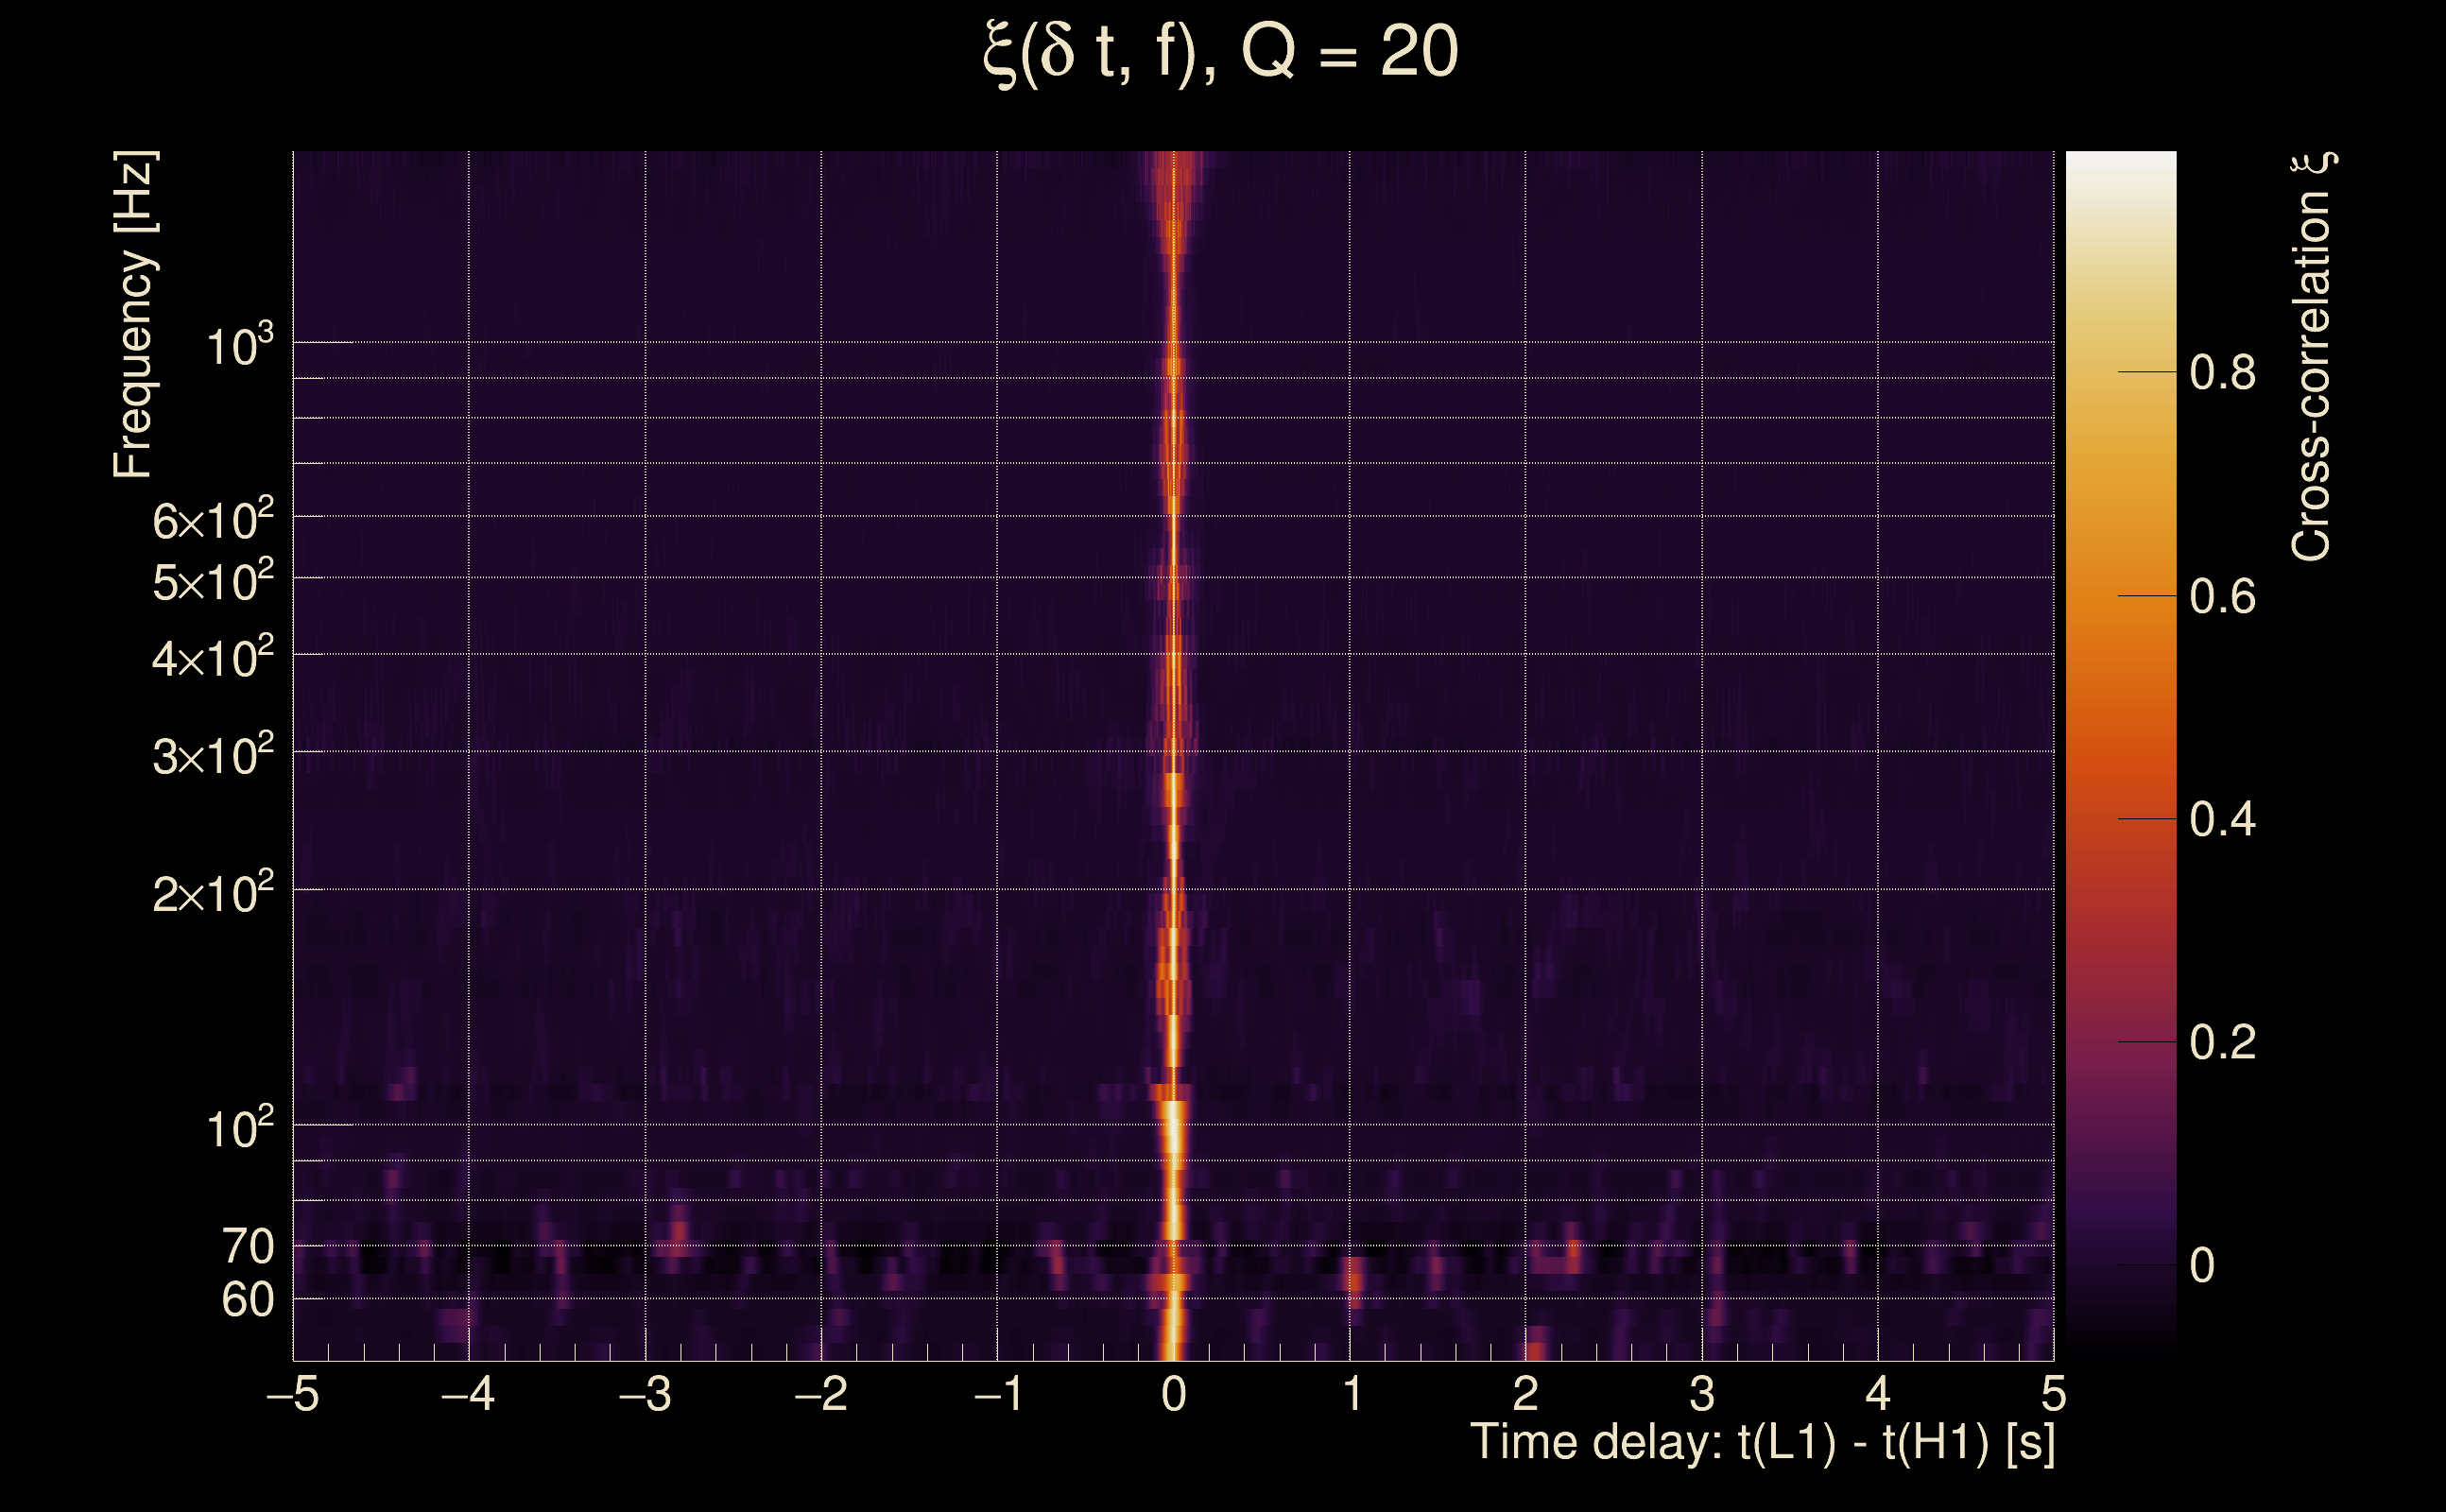
| Time delay between detectors t(L1) - t(H1): | 0.00303879 s (slice index = 108 / 217), δt_gw = 0.00303879 s |
| Time delay standard deviation: | 0.0209224 s |
| [targeted mode] Time delay probability: | 0.989842 (0.012731 sigmas), δt_target = 0.000489473 s |
| Frequency: | 315.331 Hz |
| Ξ: | 0.941495 ± 0.00522896 (variance = 2.7342e-05): Q0: 0.966502, Q1: 0.964739, Q2: 0.958466, Q3: 0.952522, Q4: 0.956235 |
| Rank: | R_A = 0.862747 |
| Log of amplitude ratio (L1/H1): | -0.155365, variance = 0.152163 (L1/H1: -0.183037, variance = 0.303864, H1/L1: 0.126819, variance = 0.304664) |
| Amplitude ratio (L1/H1): | 0.856103 ⋇ 1.4771 (L1/H1: 0.832737 ⋇ 1.7354, H1/L1: 1.13521 ⋇ 1.73666) |
| Amplitude ratio H1|L1 compatibility (probability): | 0.942548 |
| Antenna factor probability: | 0.982191 |
| Number of rejected frequency rows: | Q0: 0 / 18, Q1: 0 / 36, Q2: 4 / 70, Q3: 17 / 134, Q4: 51 / 258 |
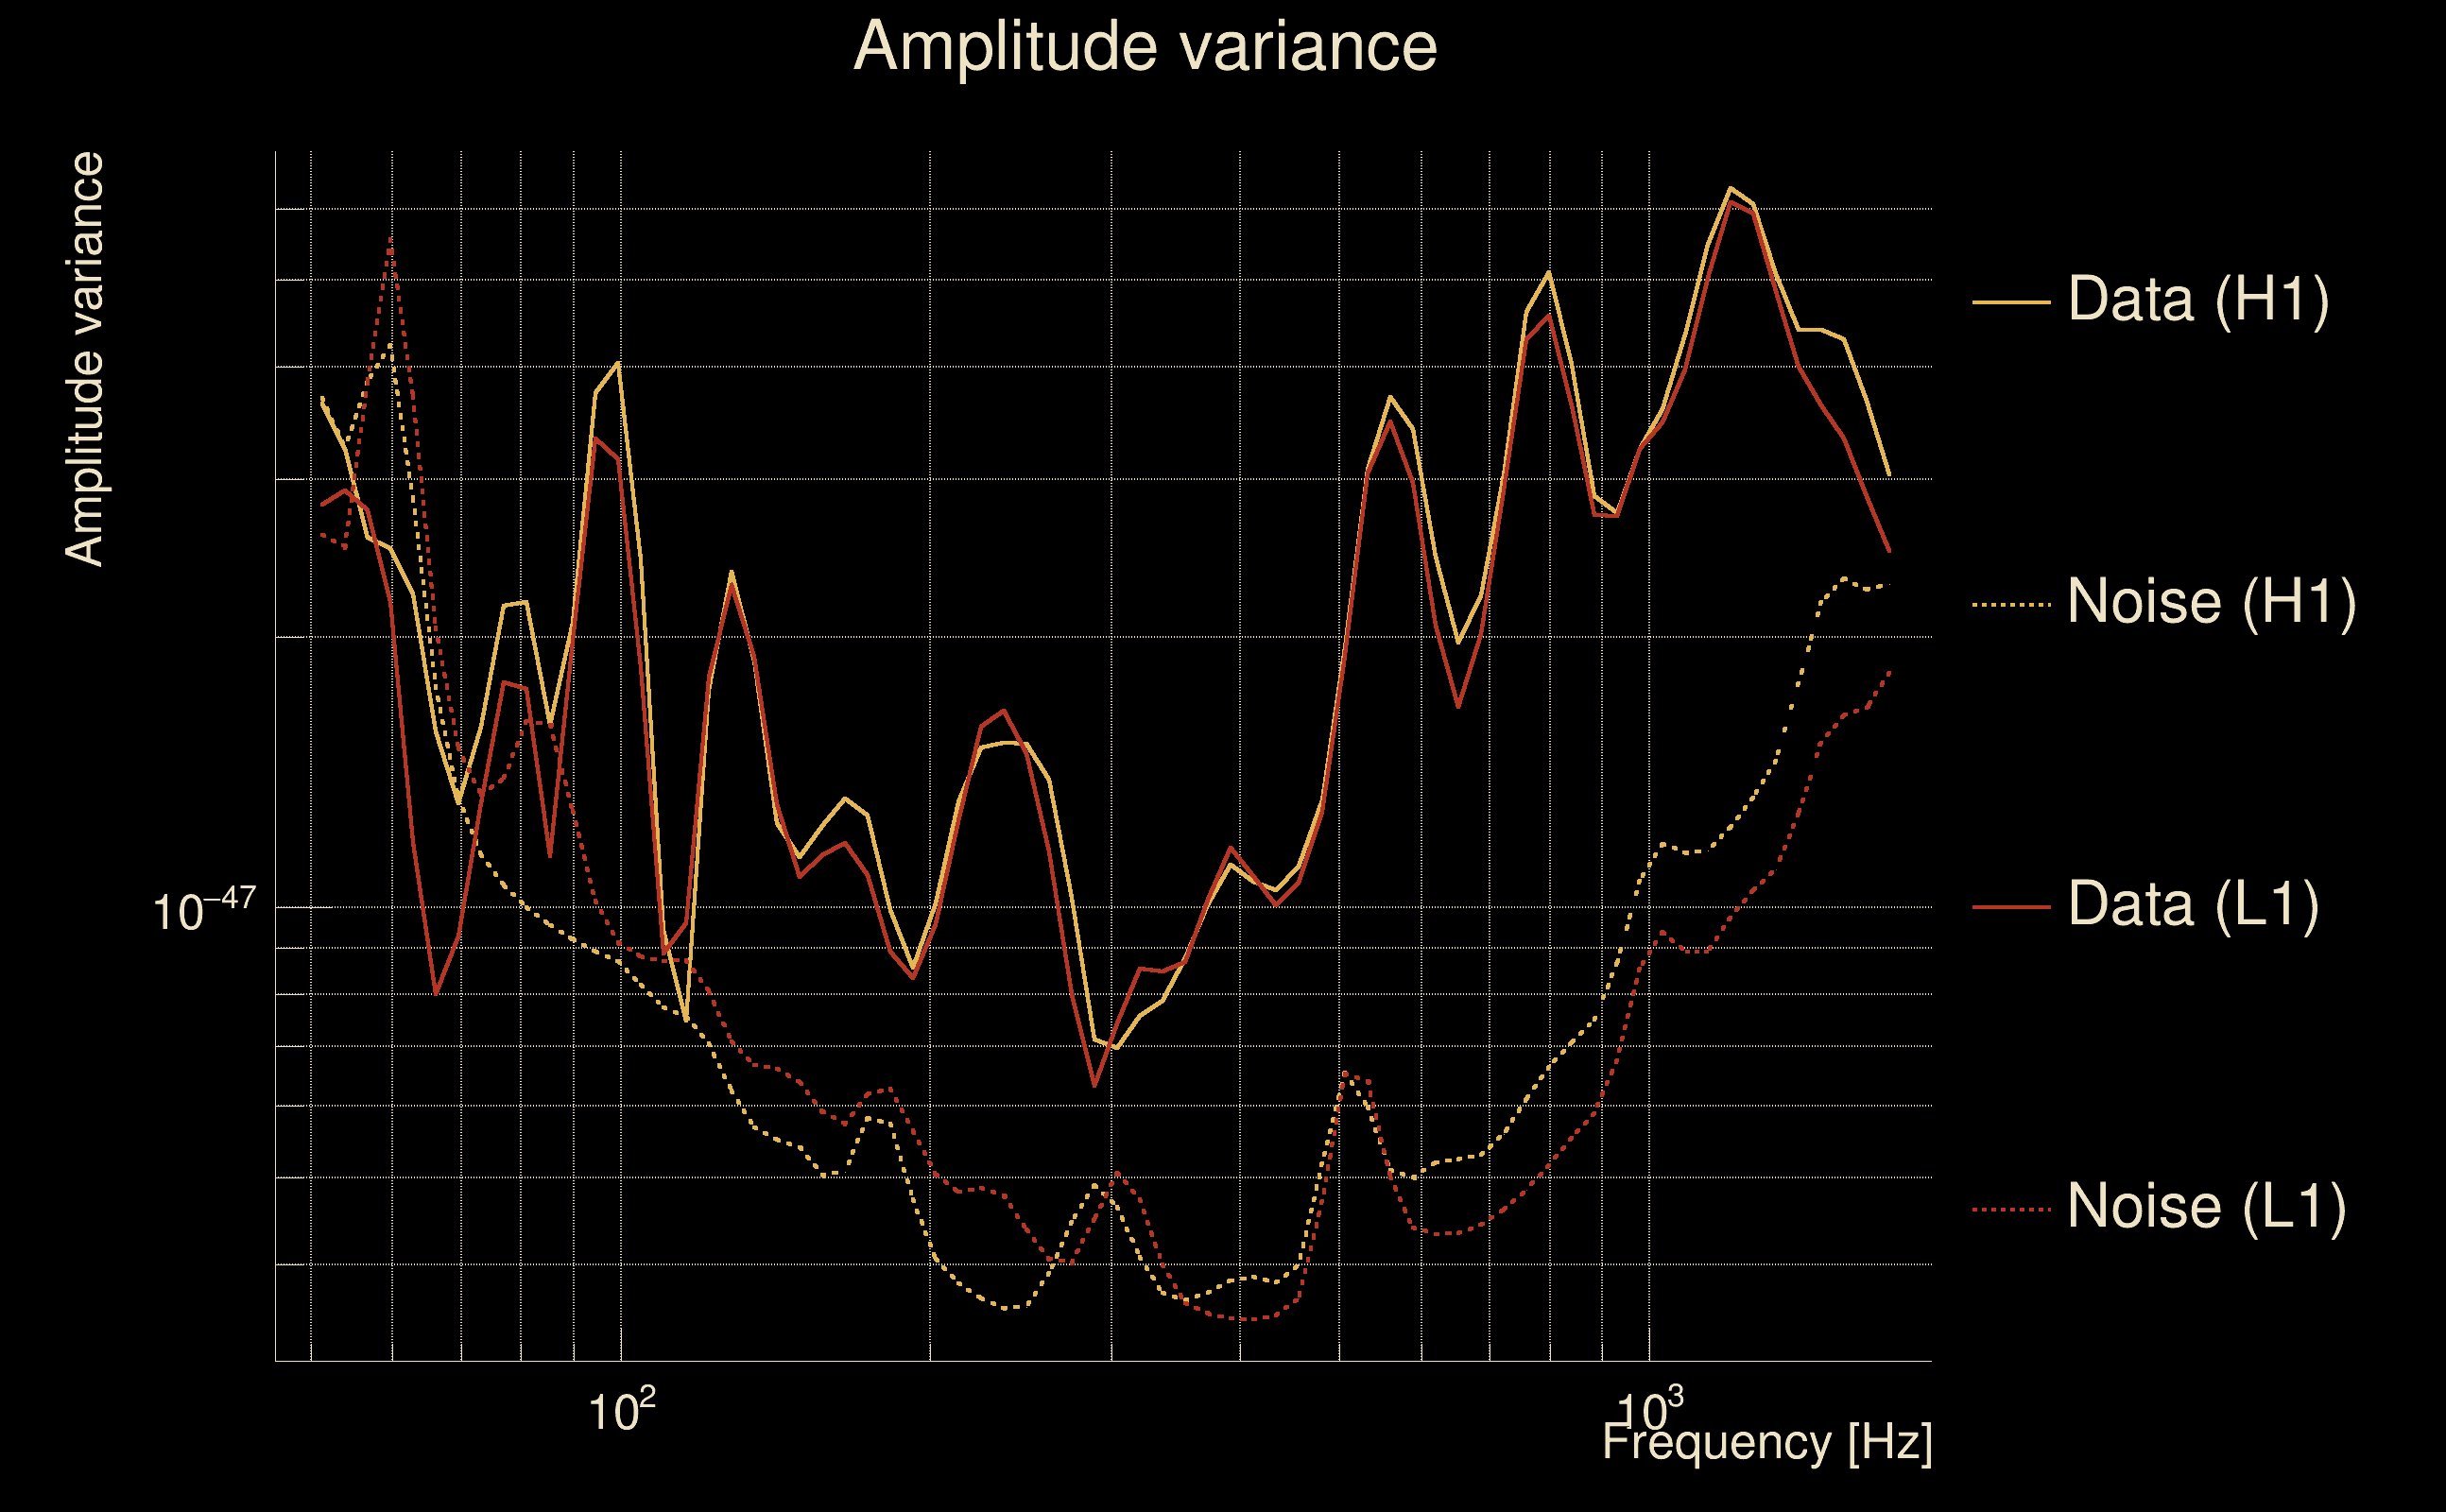
| Maximum signal-to-noise ratio: | H1: 67.3719, L1: 66.3328 |
| SNR variance: | H1: 5.86983, L1: 4.81777 |
| Click here for a zoomed plot | Click here for a zoomed plot | Click here for a zoomed plot | Click here for a zoomed plot | Click here for a zoomed plot |
 |
 |
 |
 |
 |
 |
 |
 |
 |
 |
 |
 |
 |
 |
 |
 |
 |
 |
 |
 |
 |
 |
 |
 |
 |
 |
 |
 |
 |
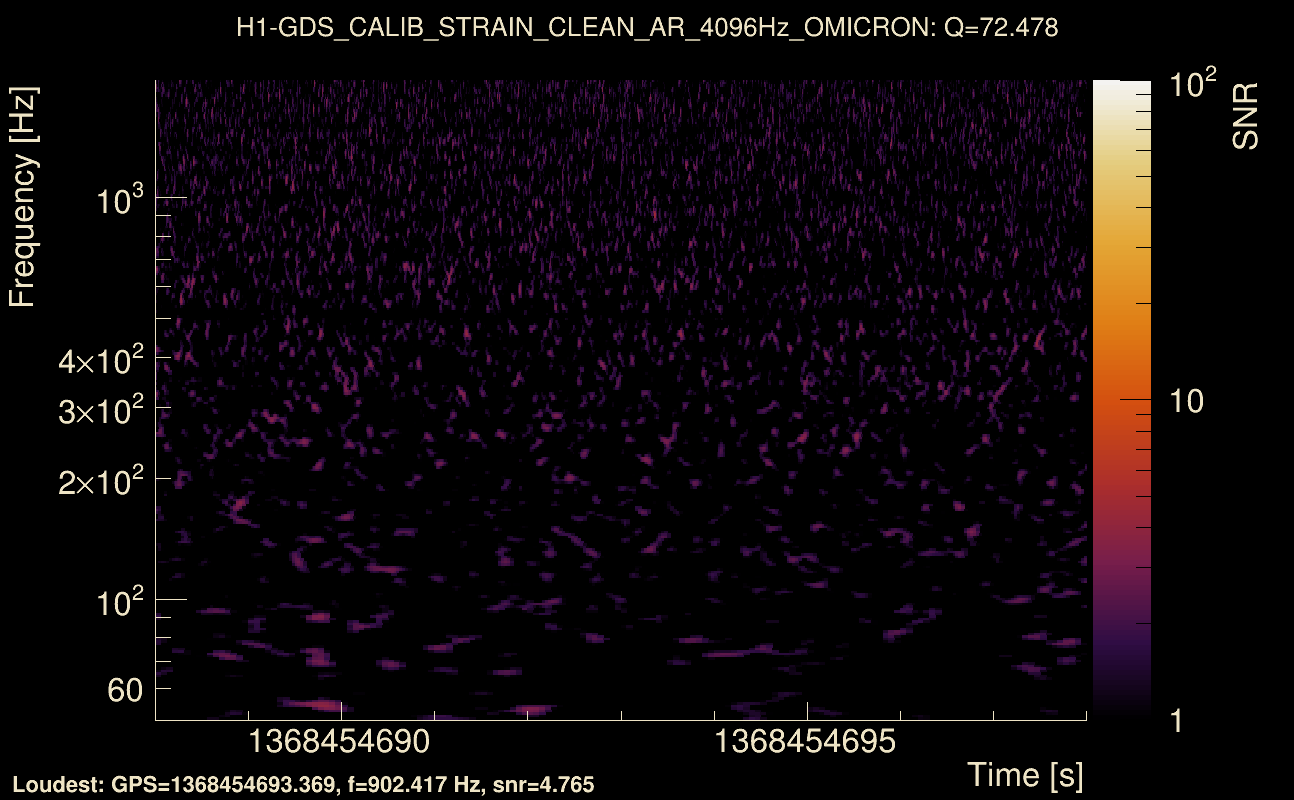
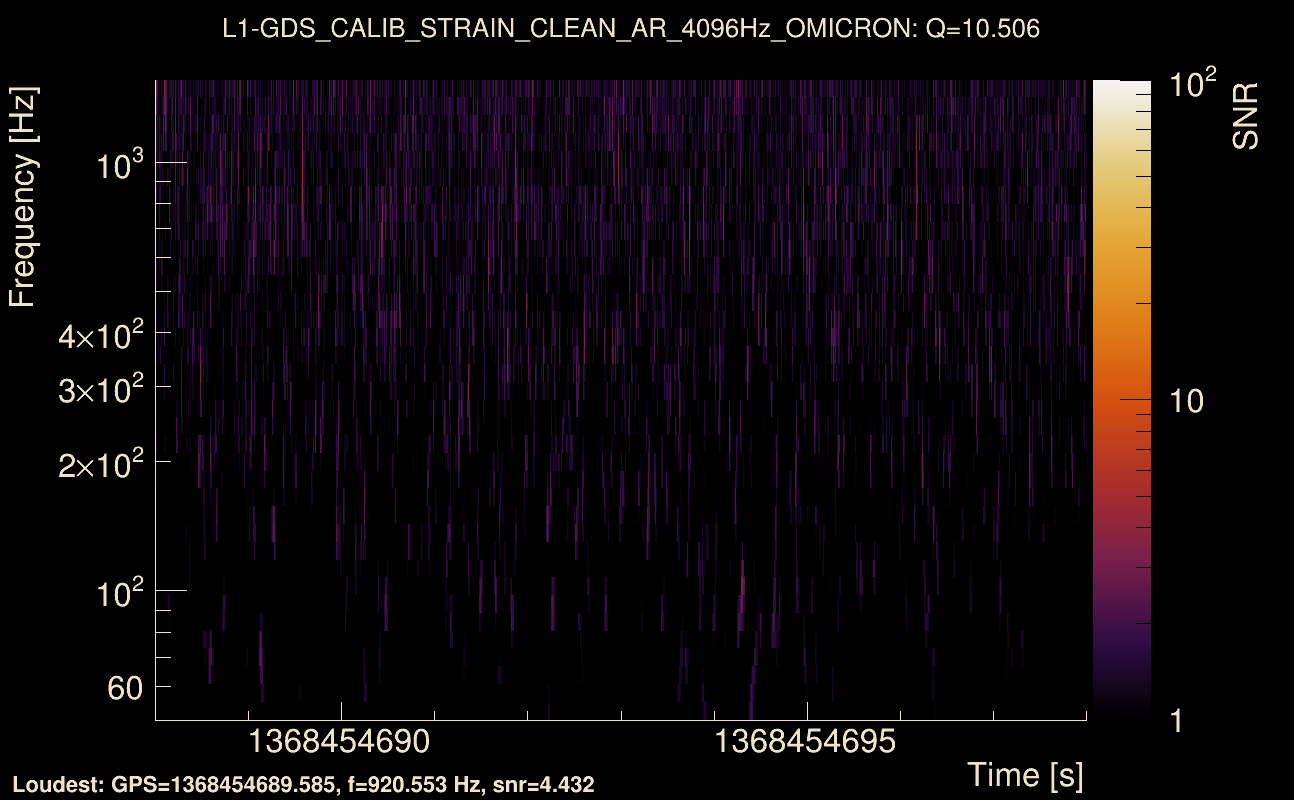
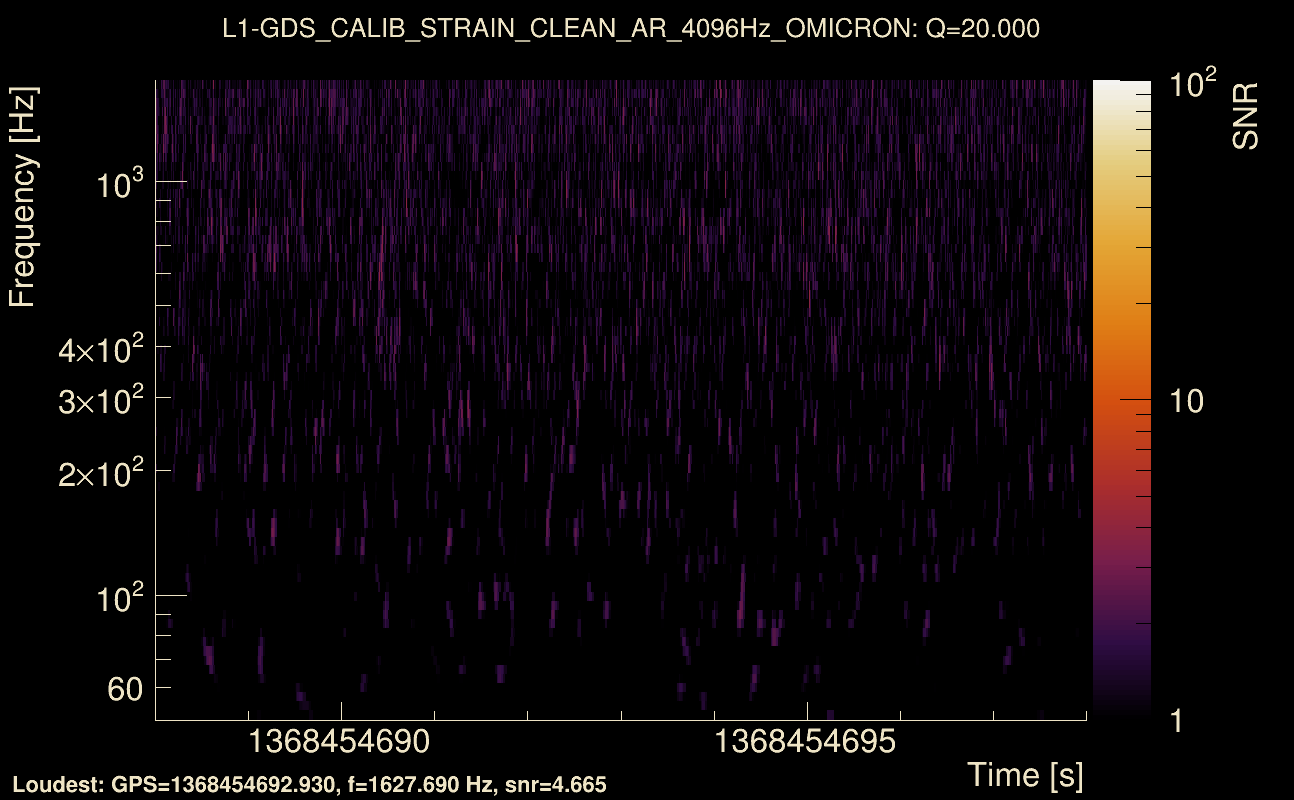
| Event time t(H1): | GPS = 1368454688 (Thu May 18 14:17:50 2023 ) → GPS = 1368454698 (Thu May 18 14:18:00 2023 ) |
| Event time t(L1): | GPS = 1368454688 (Thu May 18 14:18:00 2023 ) → GPS = 1368454698 (Thu May 18 14:18:00 2023 ) |
| Omicron analysis time window (H1): | GPS = 1368454685 → GPS = 1368454701 |
| Omicron analysis time window (L1): | GPS = 1368454685 → GPS = 1368454701 |
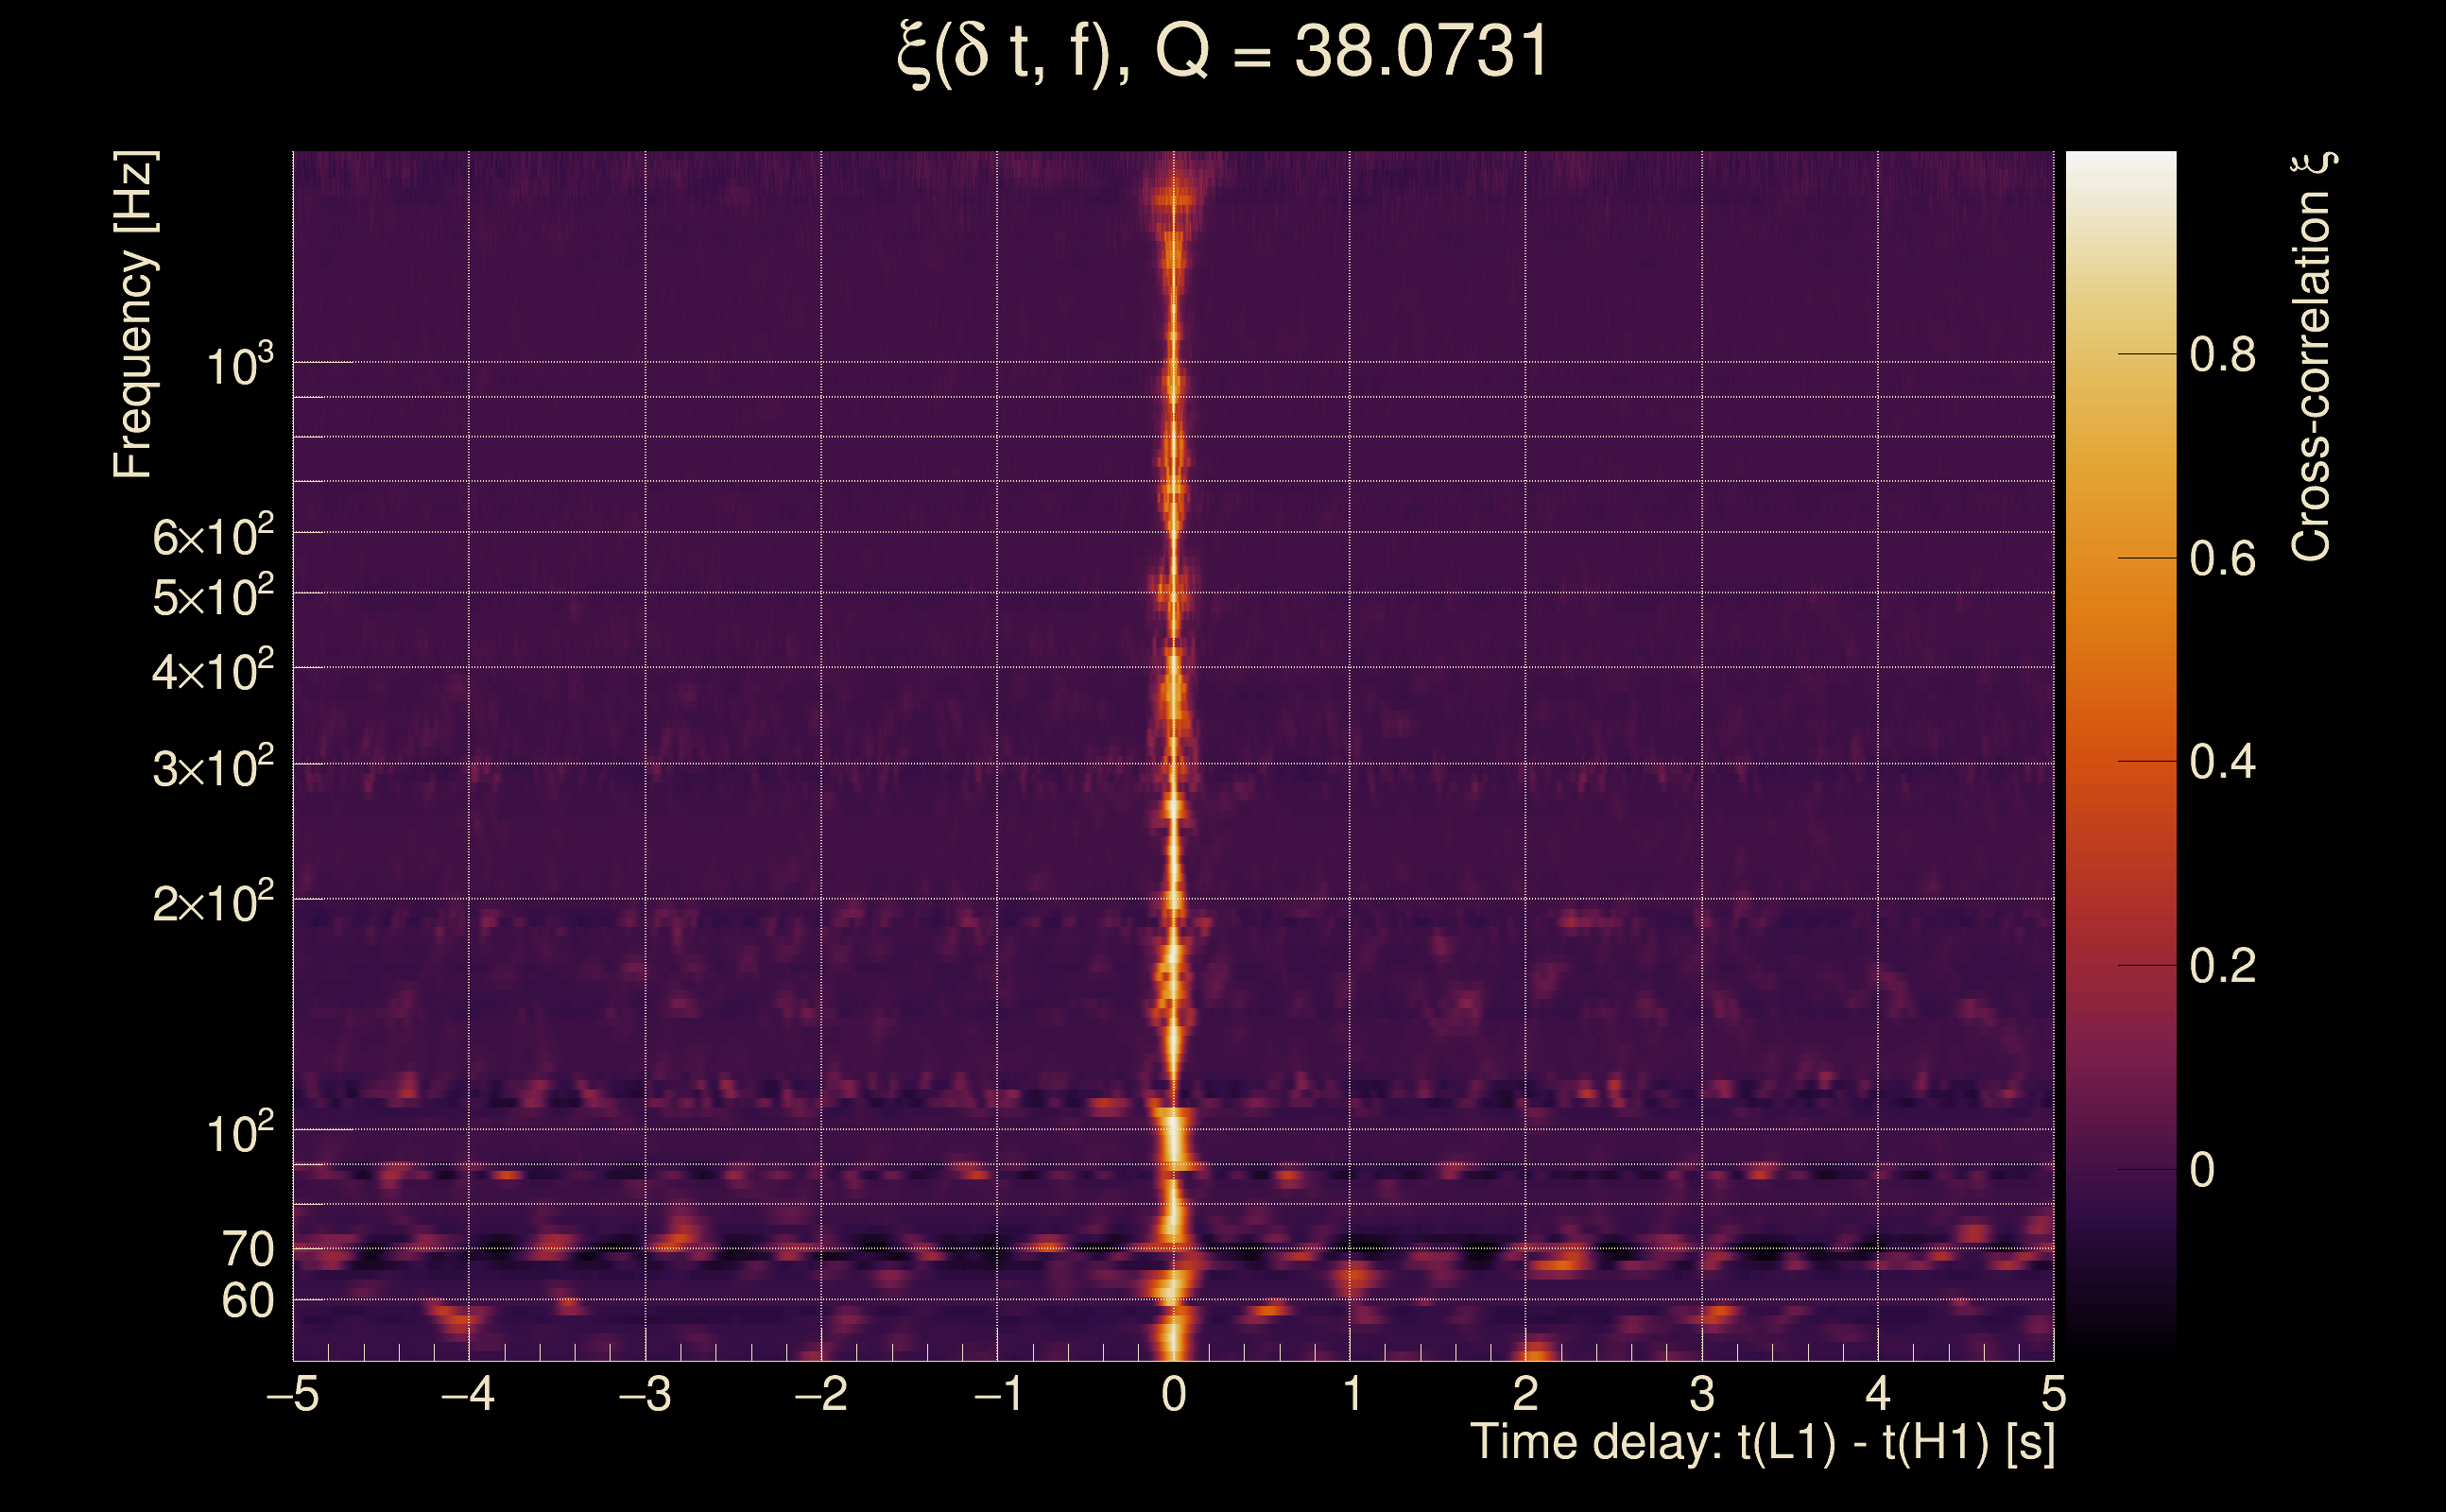
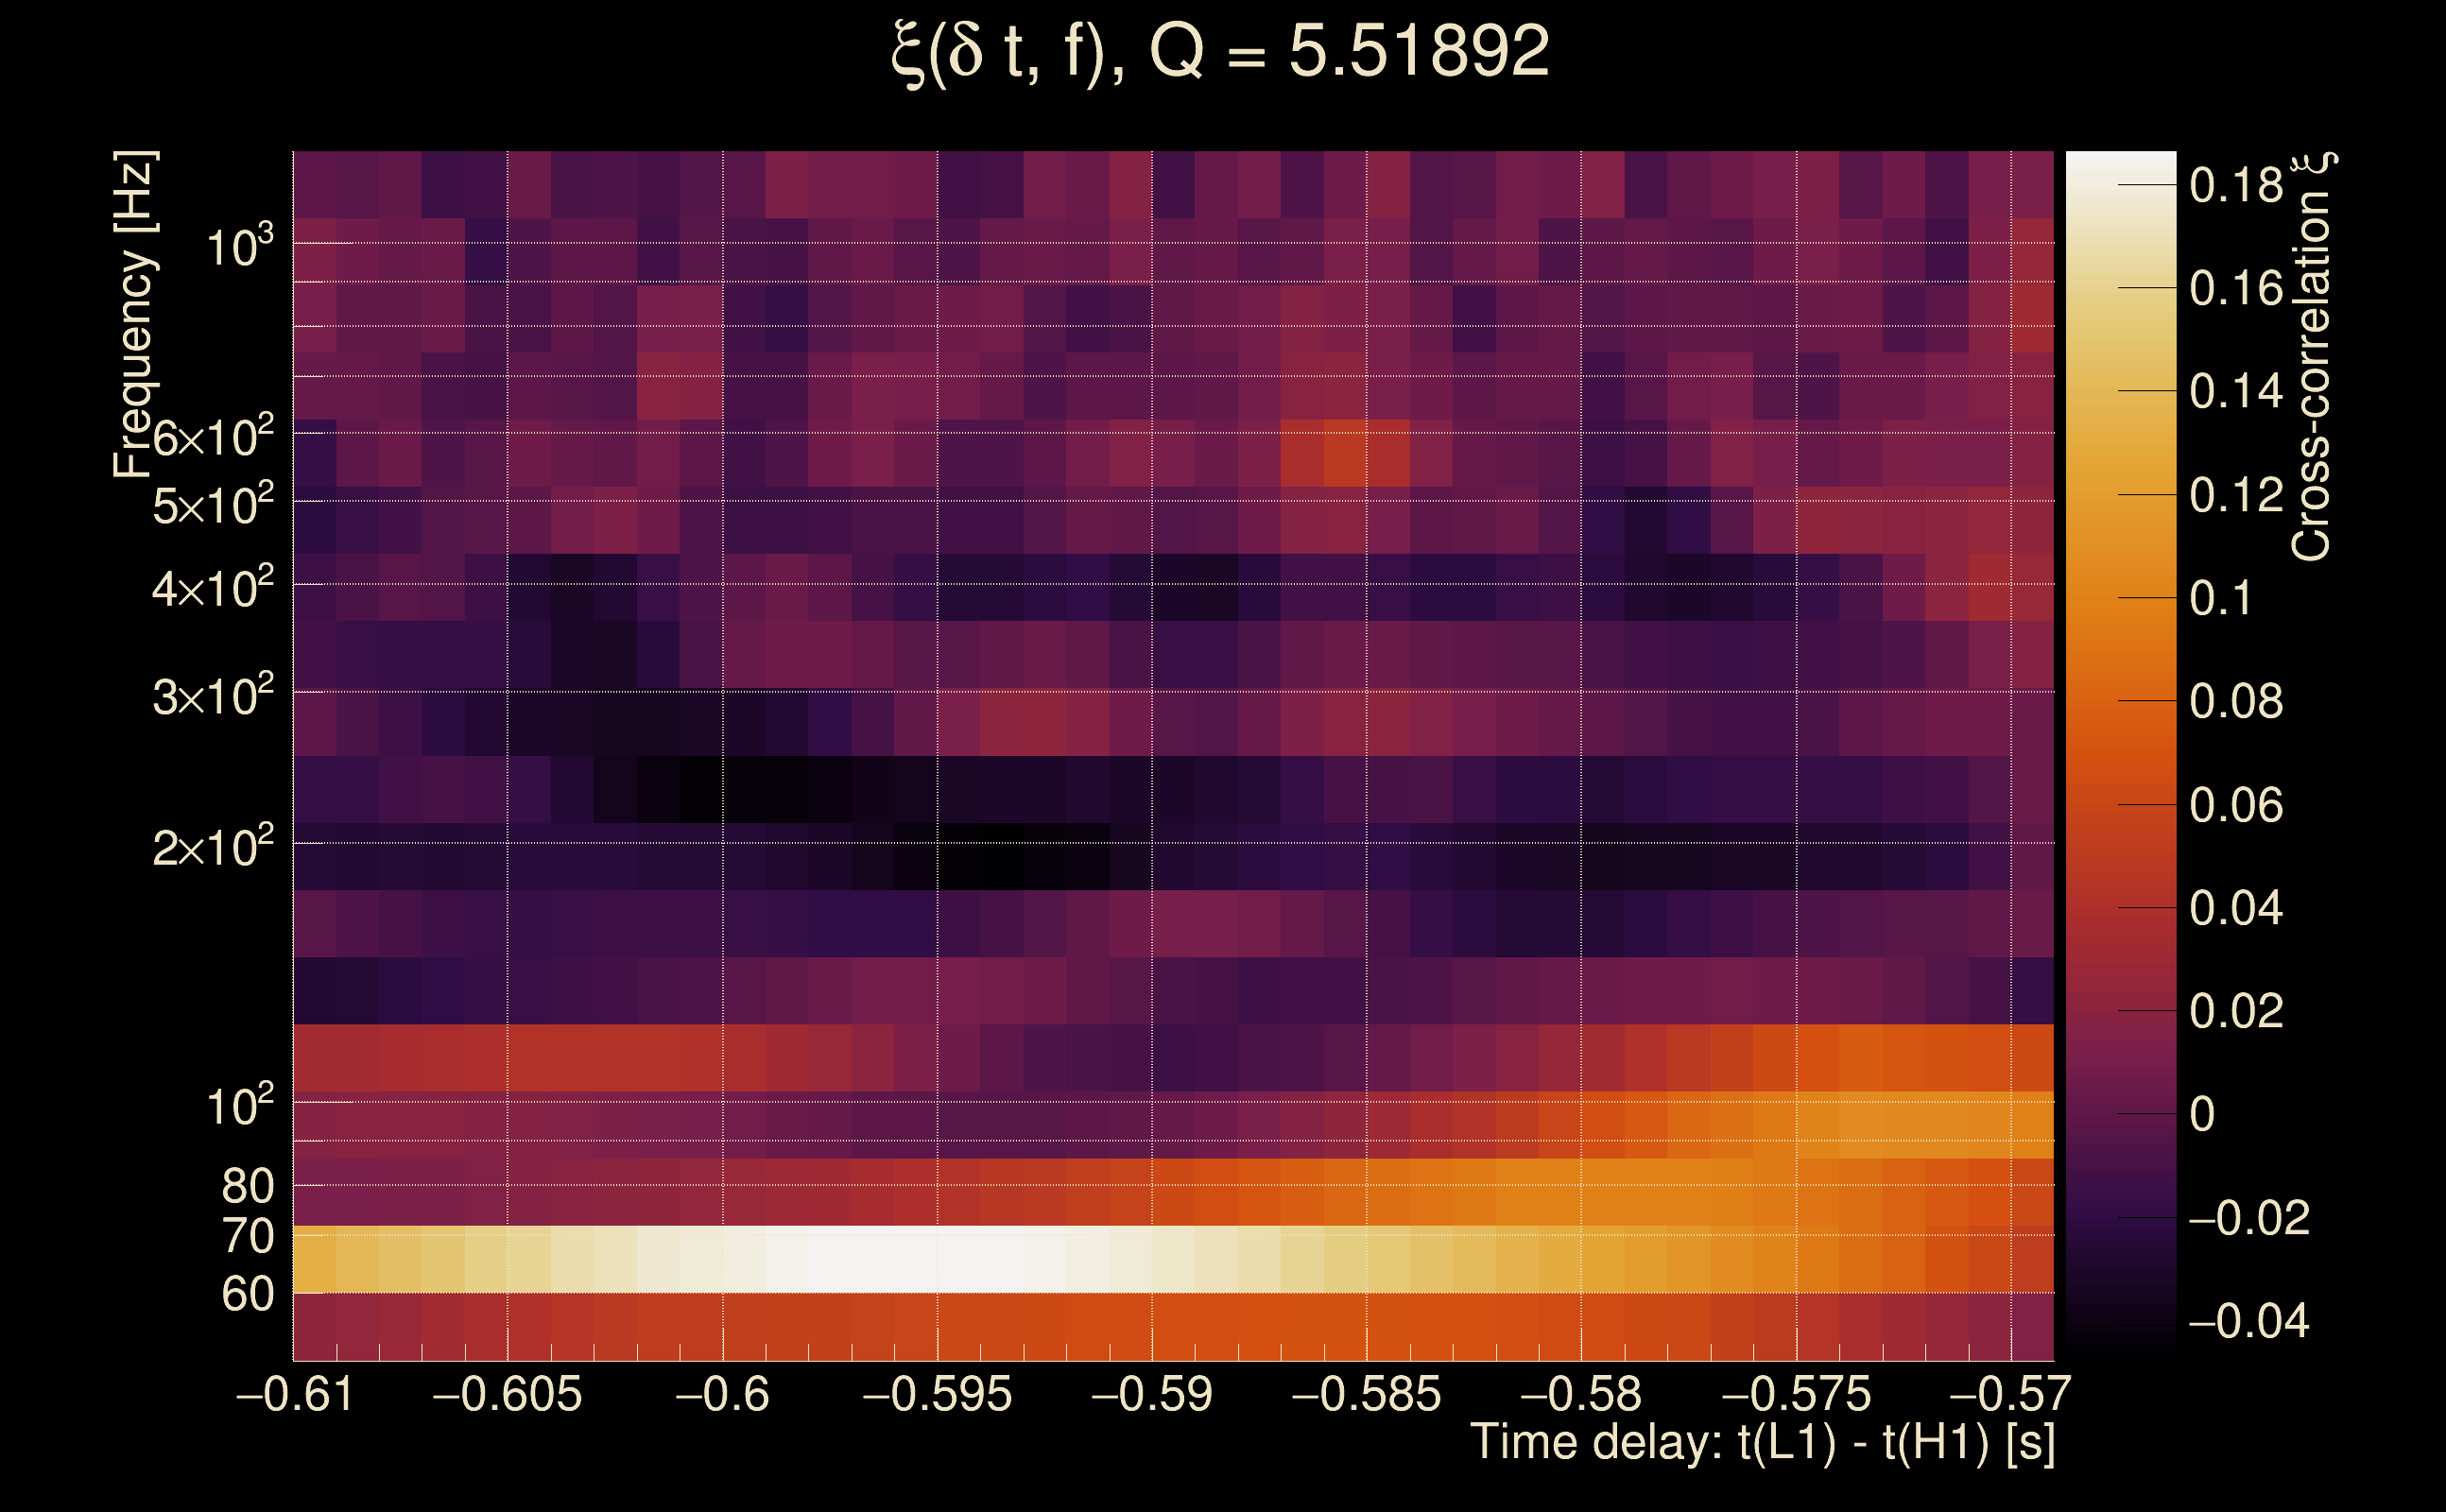
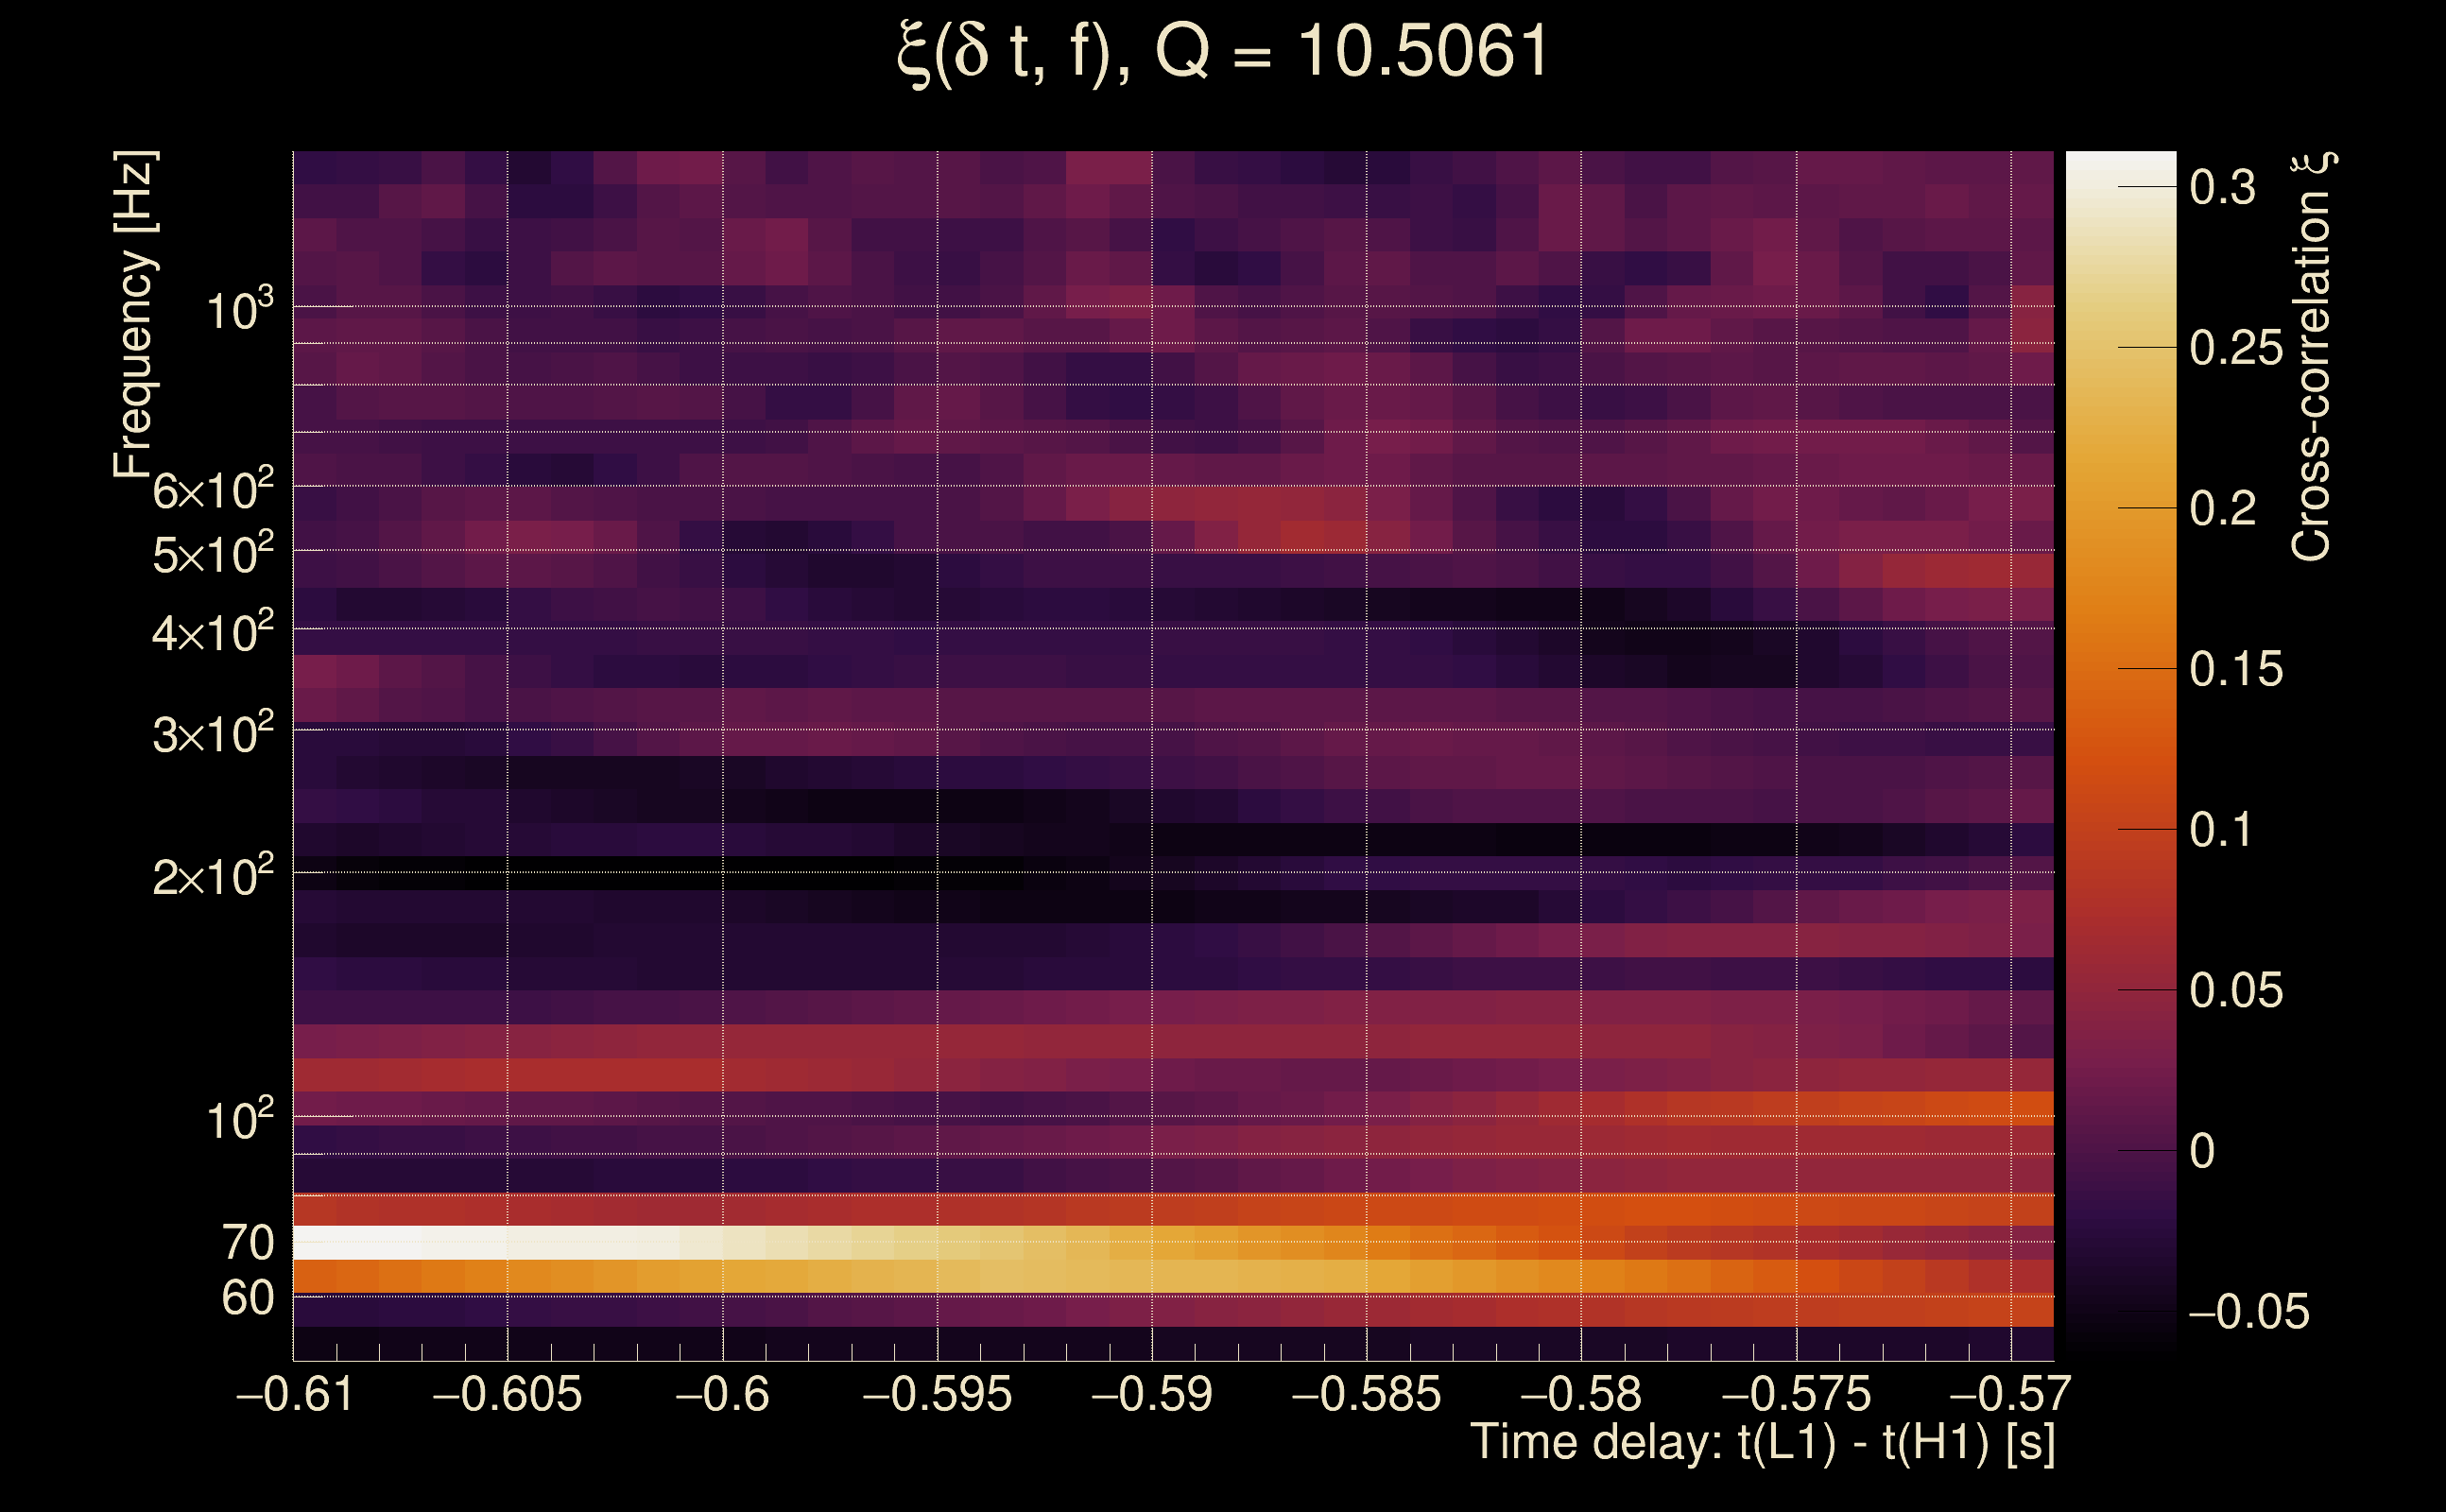
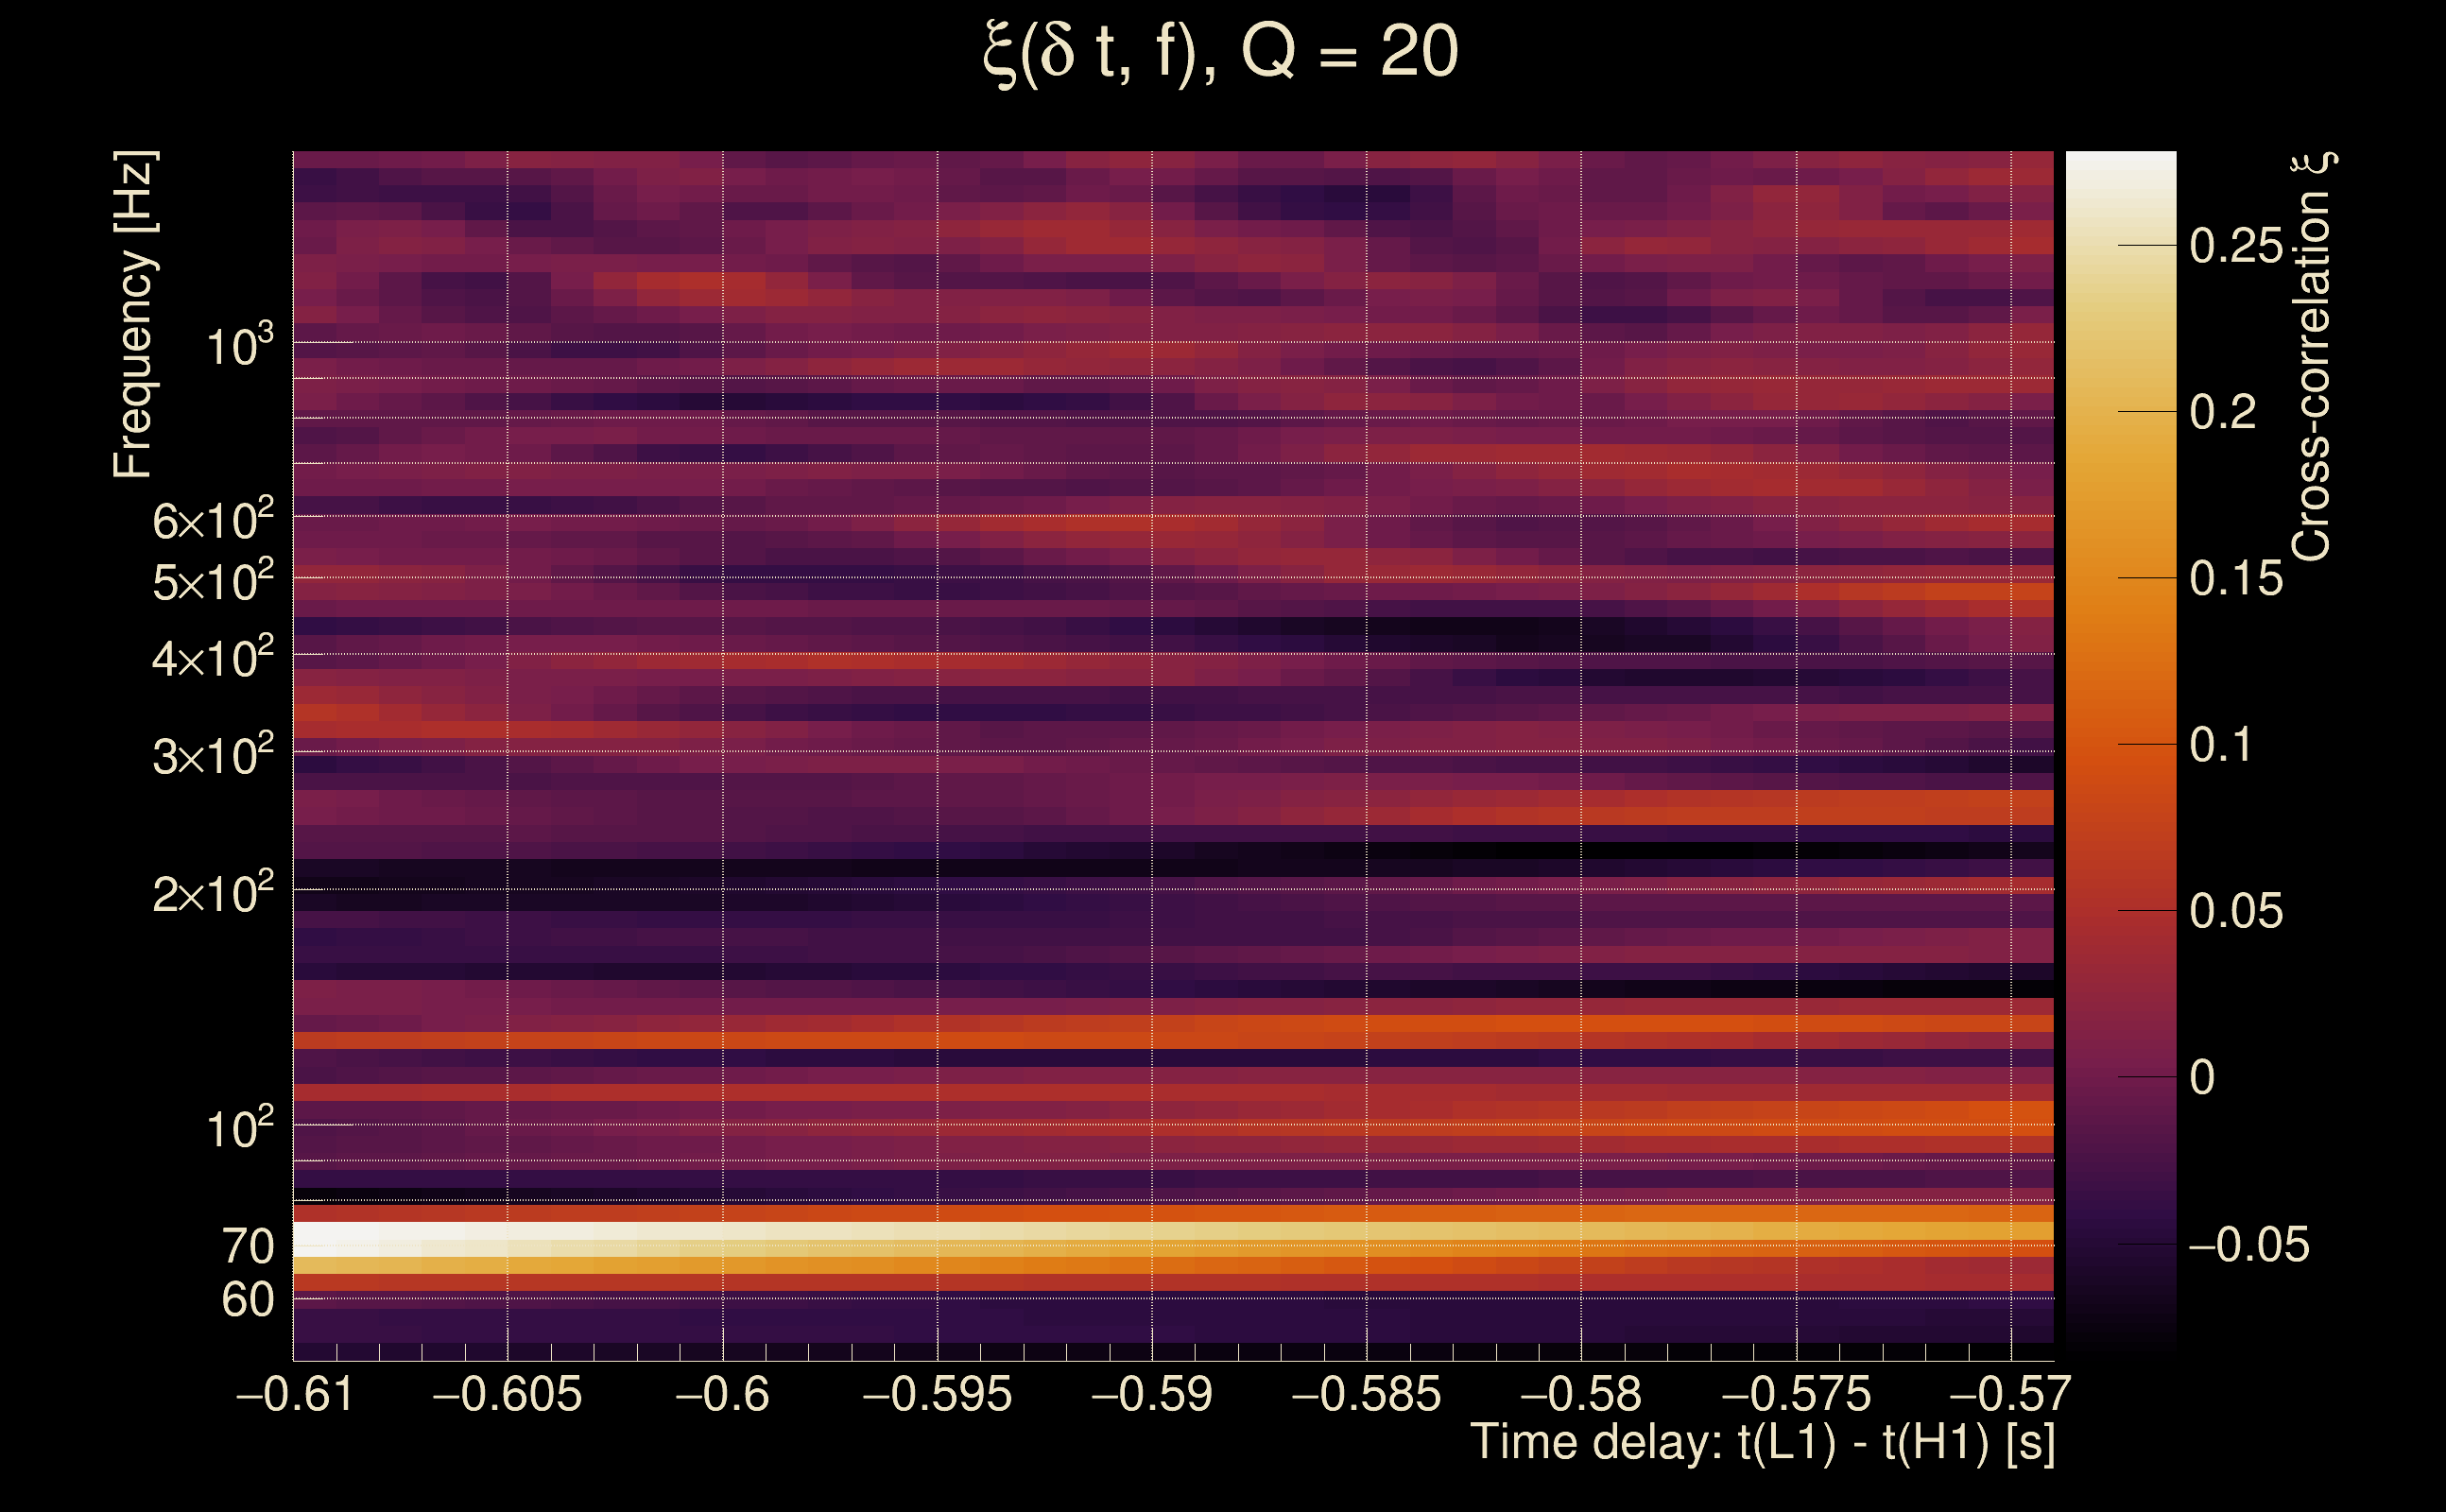
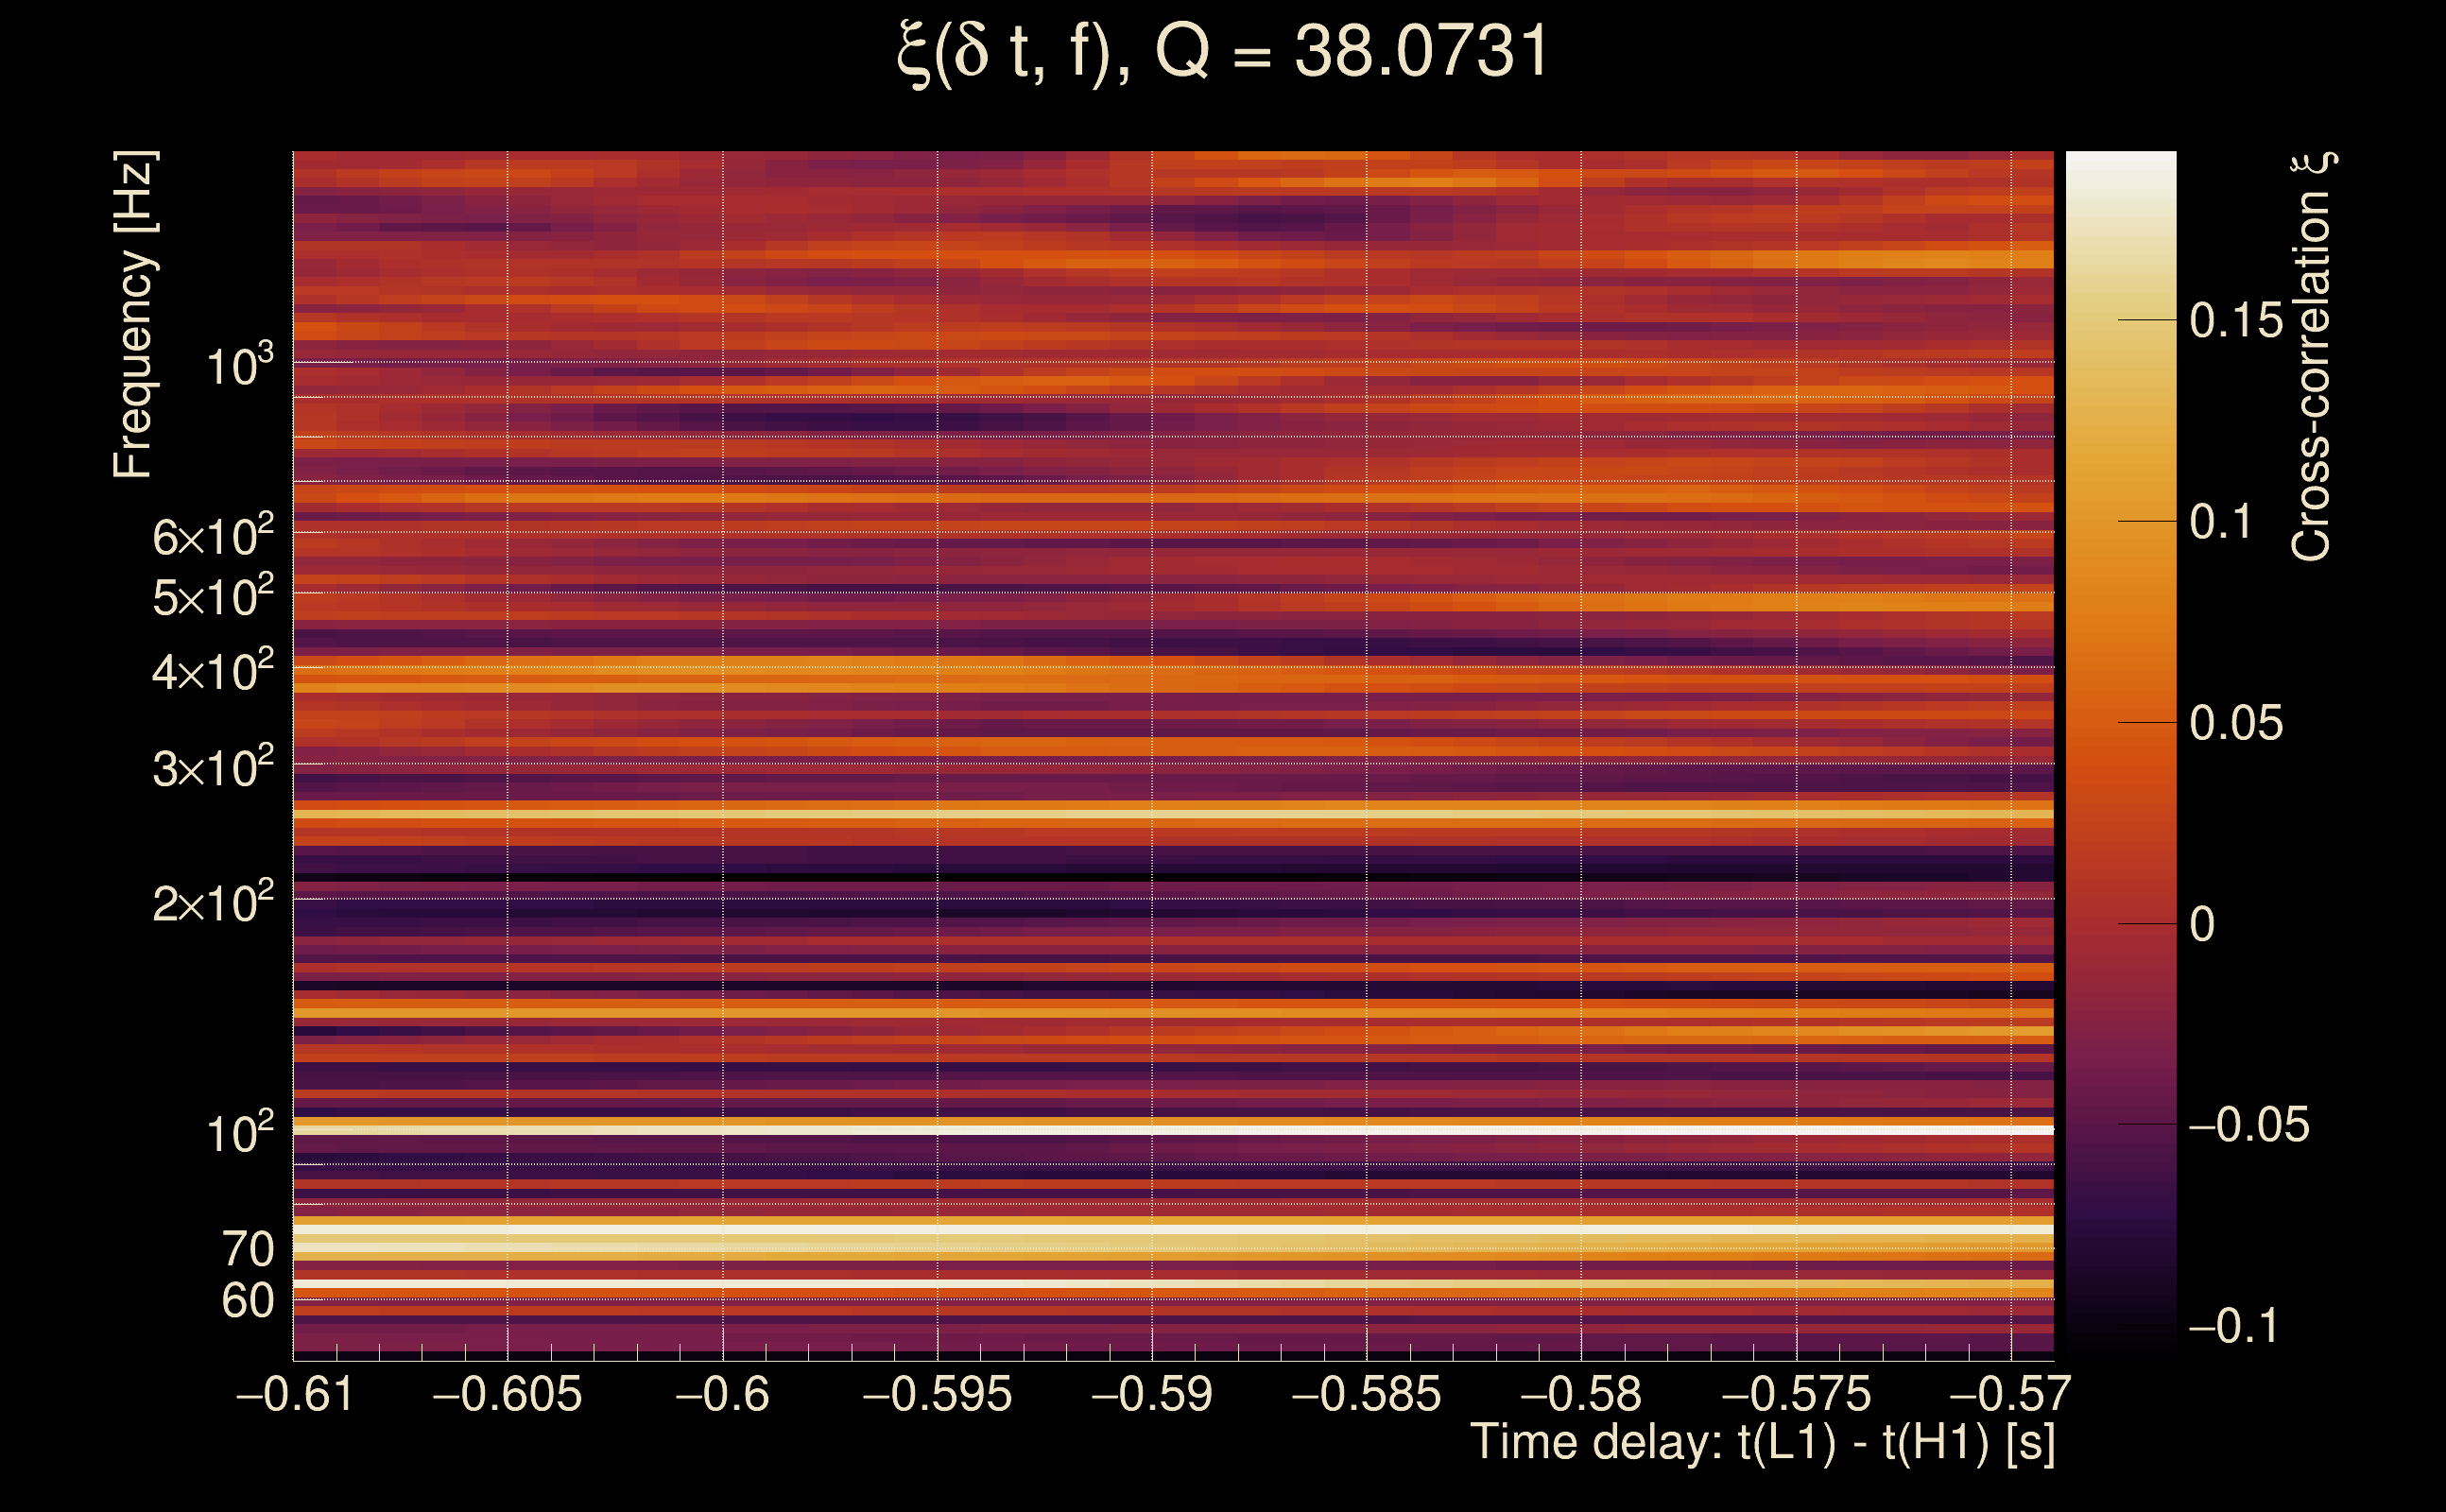
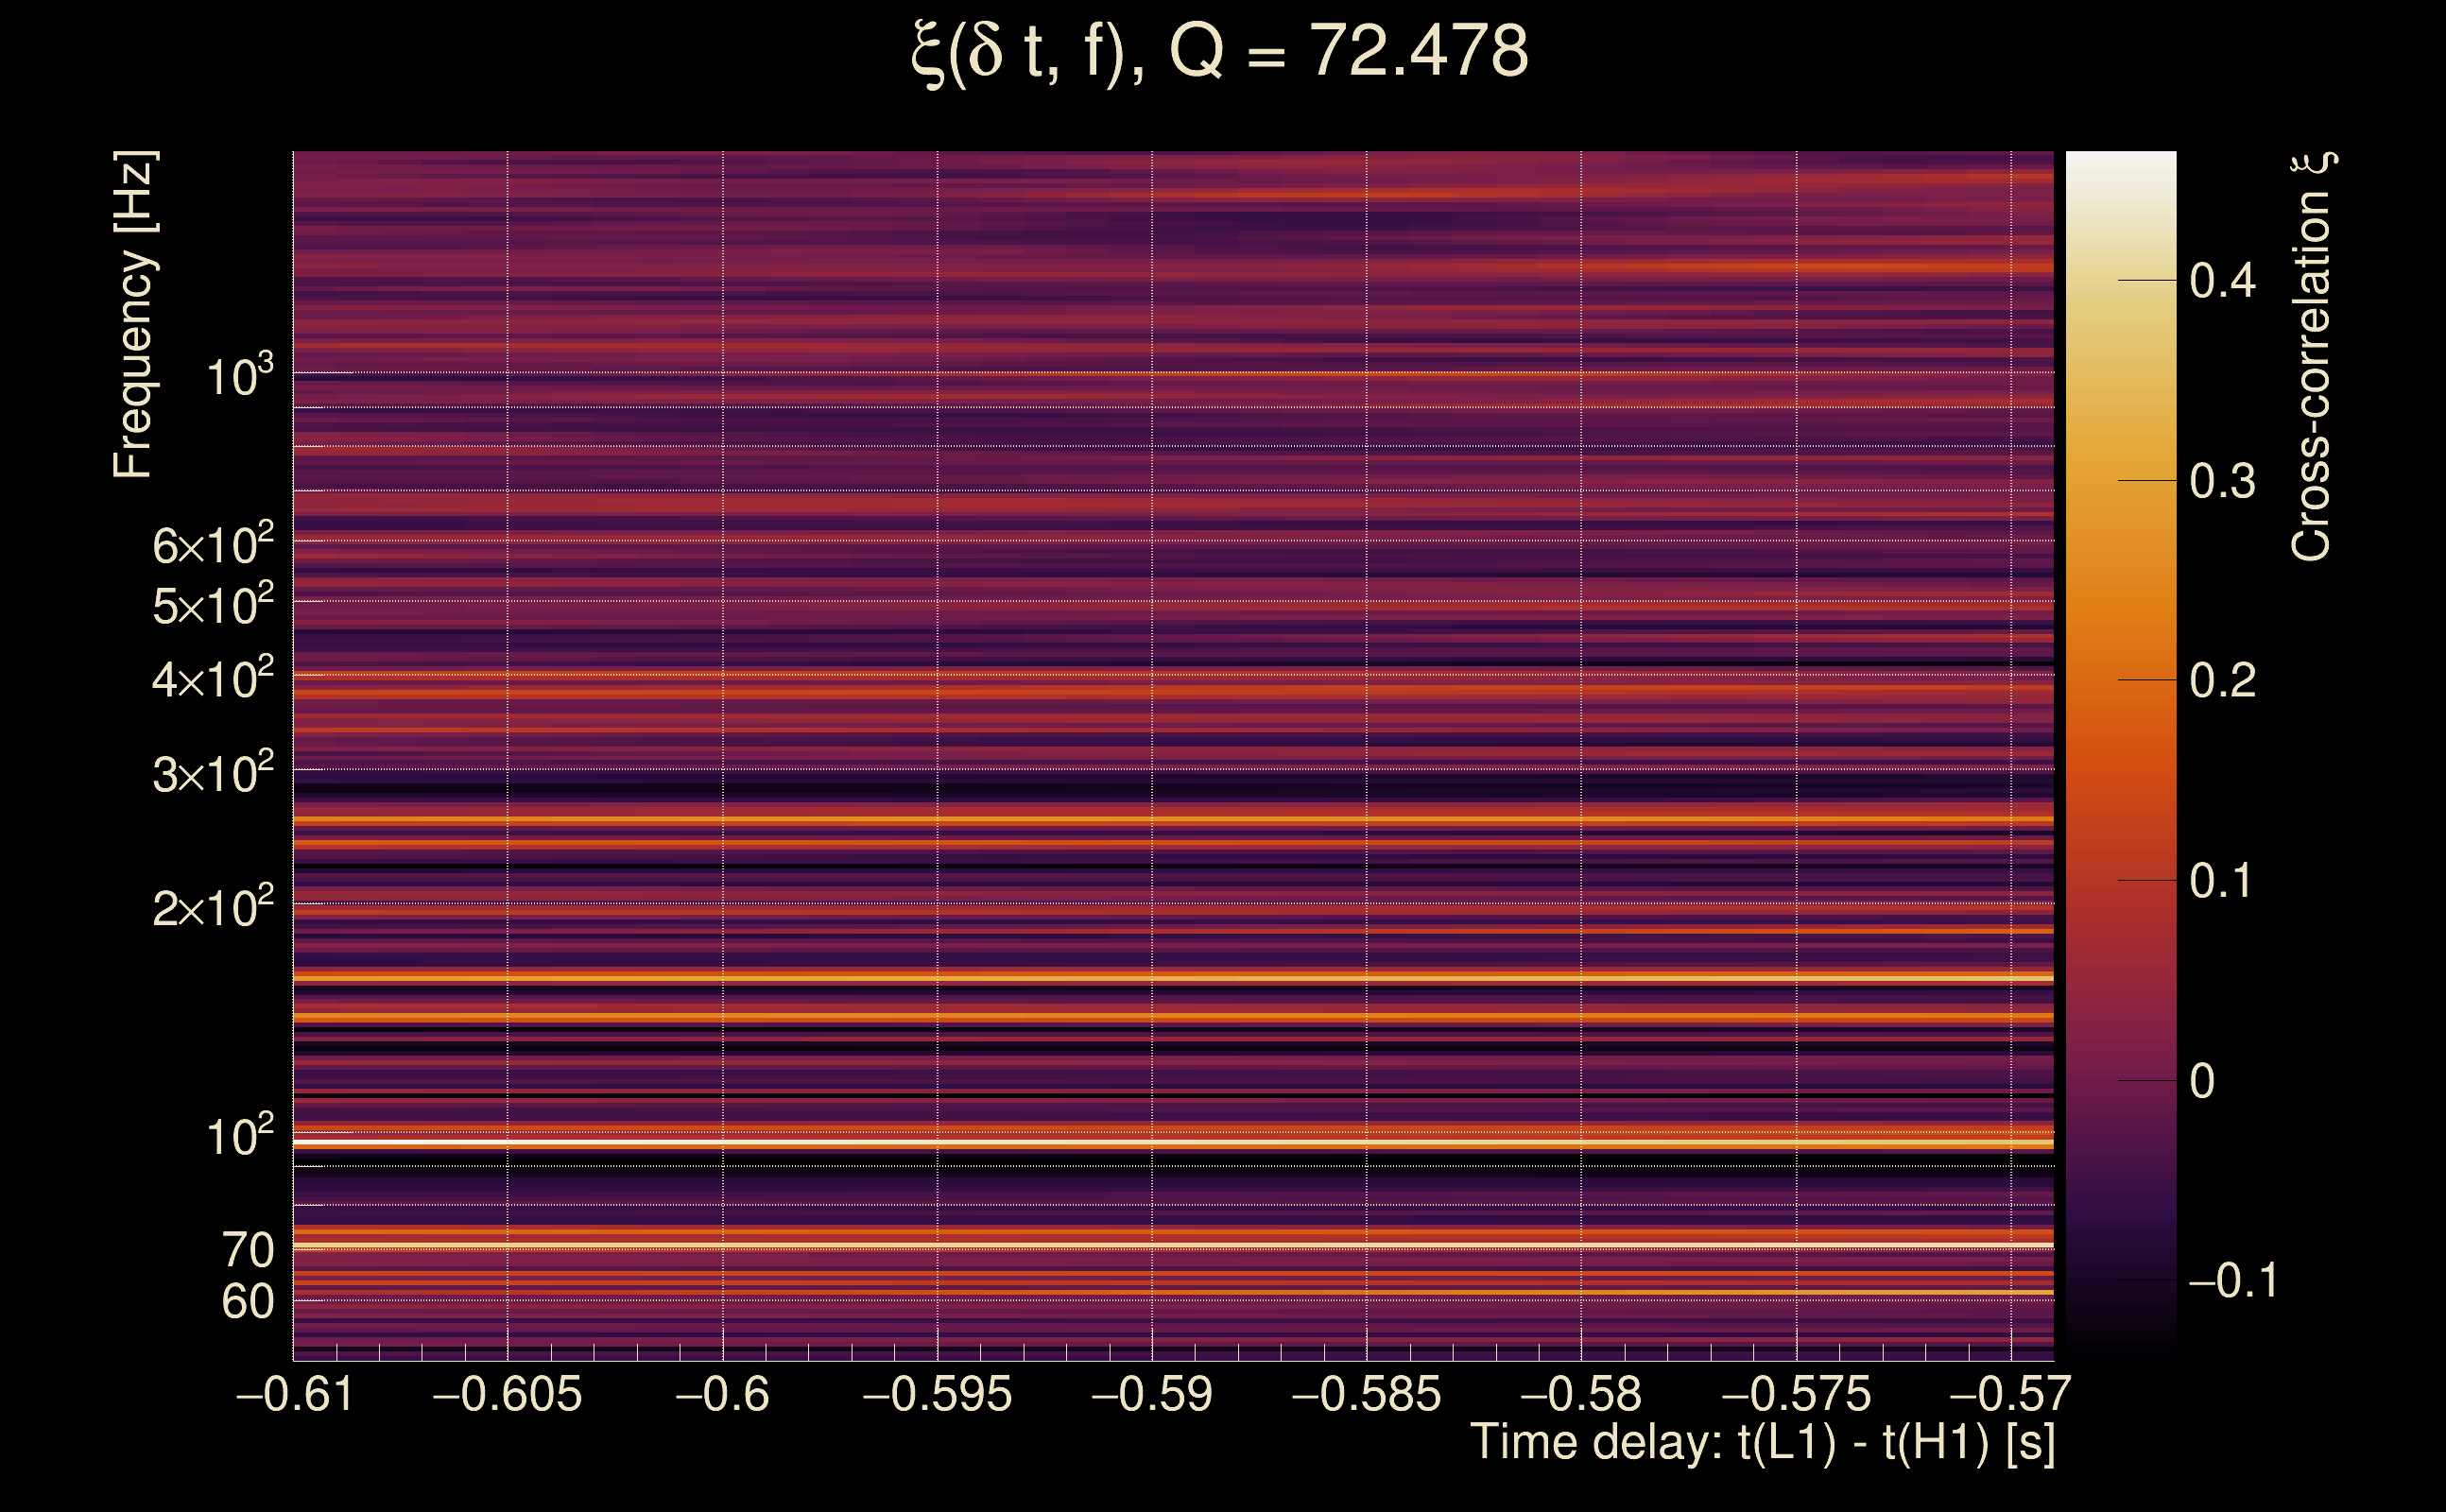
| Time delay between detectors t(L1) - t(H1): | -0.589392 s (slice index = 121 / 217), δt_gw = 0.00860775 s |
| Time delay standard deviation: | 0.0762622 s |
| [targeted mode] Time delay probability: | 0.995371 (0.005802 sigmas), δt_target = 0.00304437 s |
| Frequency: | 107.552 Hz |
| Ξ: | 0.0227694 ± 0.0393357 (variance = 0.0015473): Q0: 0.133555, Q1: 0.249401, Q2: 0.192866, Q3: 0.155051, Q4: 0.18505 |
| Rank: | R_A = 0.0116011 |
| Log of amplitude ratio (L1/H1): | -0.0449341, variance = 0.452466 (L1/H1: -0.430064, variance = 0.921502, H1/L1: -0.325738, variance = 0.888944) |
| Amplitude ratio (L1/H1): | 0.95606 ⋇ 1.95943 (L1/H1: 0.650468 ⋇ 2.61156, H1/L1: 0.721994 ⋇ 2.56726) |
| Amplitude ratio H1|L1 compatibility (probability): | 0.574311 |
| Antenna factor probability: | 0.89128 |
| Number of rejected frequency rows: | Q0: 14 / 18, Q1: 33 / 36, Q2: 67 / 70, Q3: 123 / 134, Q4: 243 / 258 |
| Maximum signal-to-noise ratio: | H1: 5.0539, L1: 5.15152 |
| SNR variance: | H1: 0.54095, L1: 0.516953 |
| Click here for a zoomed plot | Click here for a zoomed plot | Click here for a zoomed plot | Click here for a zoomed plot | Click here for a zoomed plot |
 |
 |
 |
 |
 |
 |
 |
 |
 |
 |
 |
 |
 |
 |
 |
 |
 |
 |
 |
 |
 |
 |
 |
 |
 |
 |
 |
 |
 |
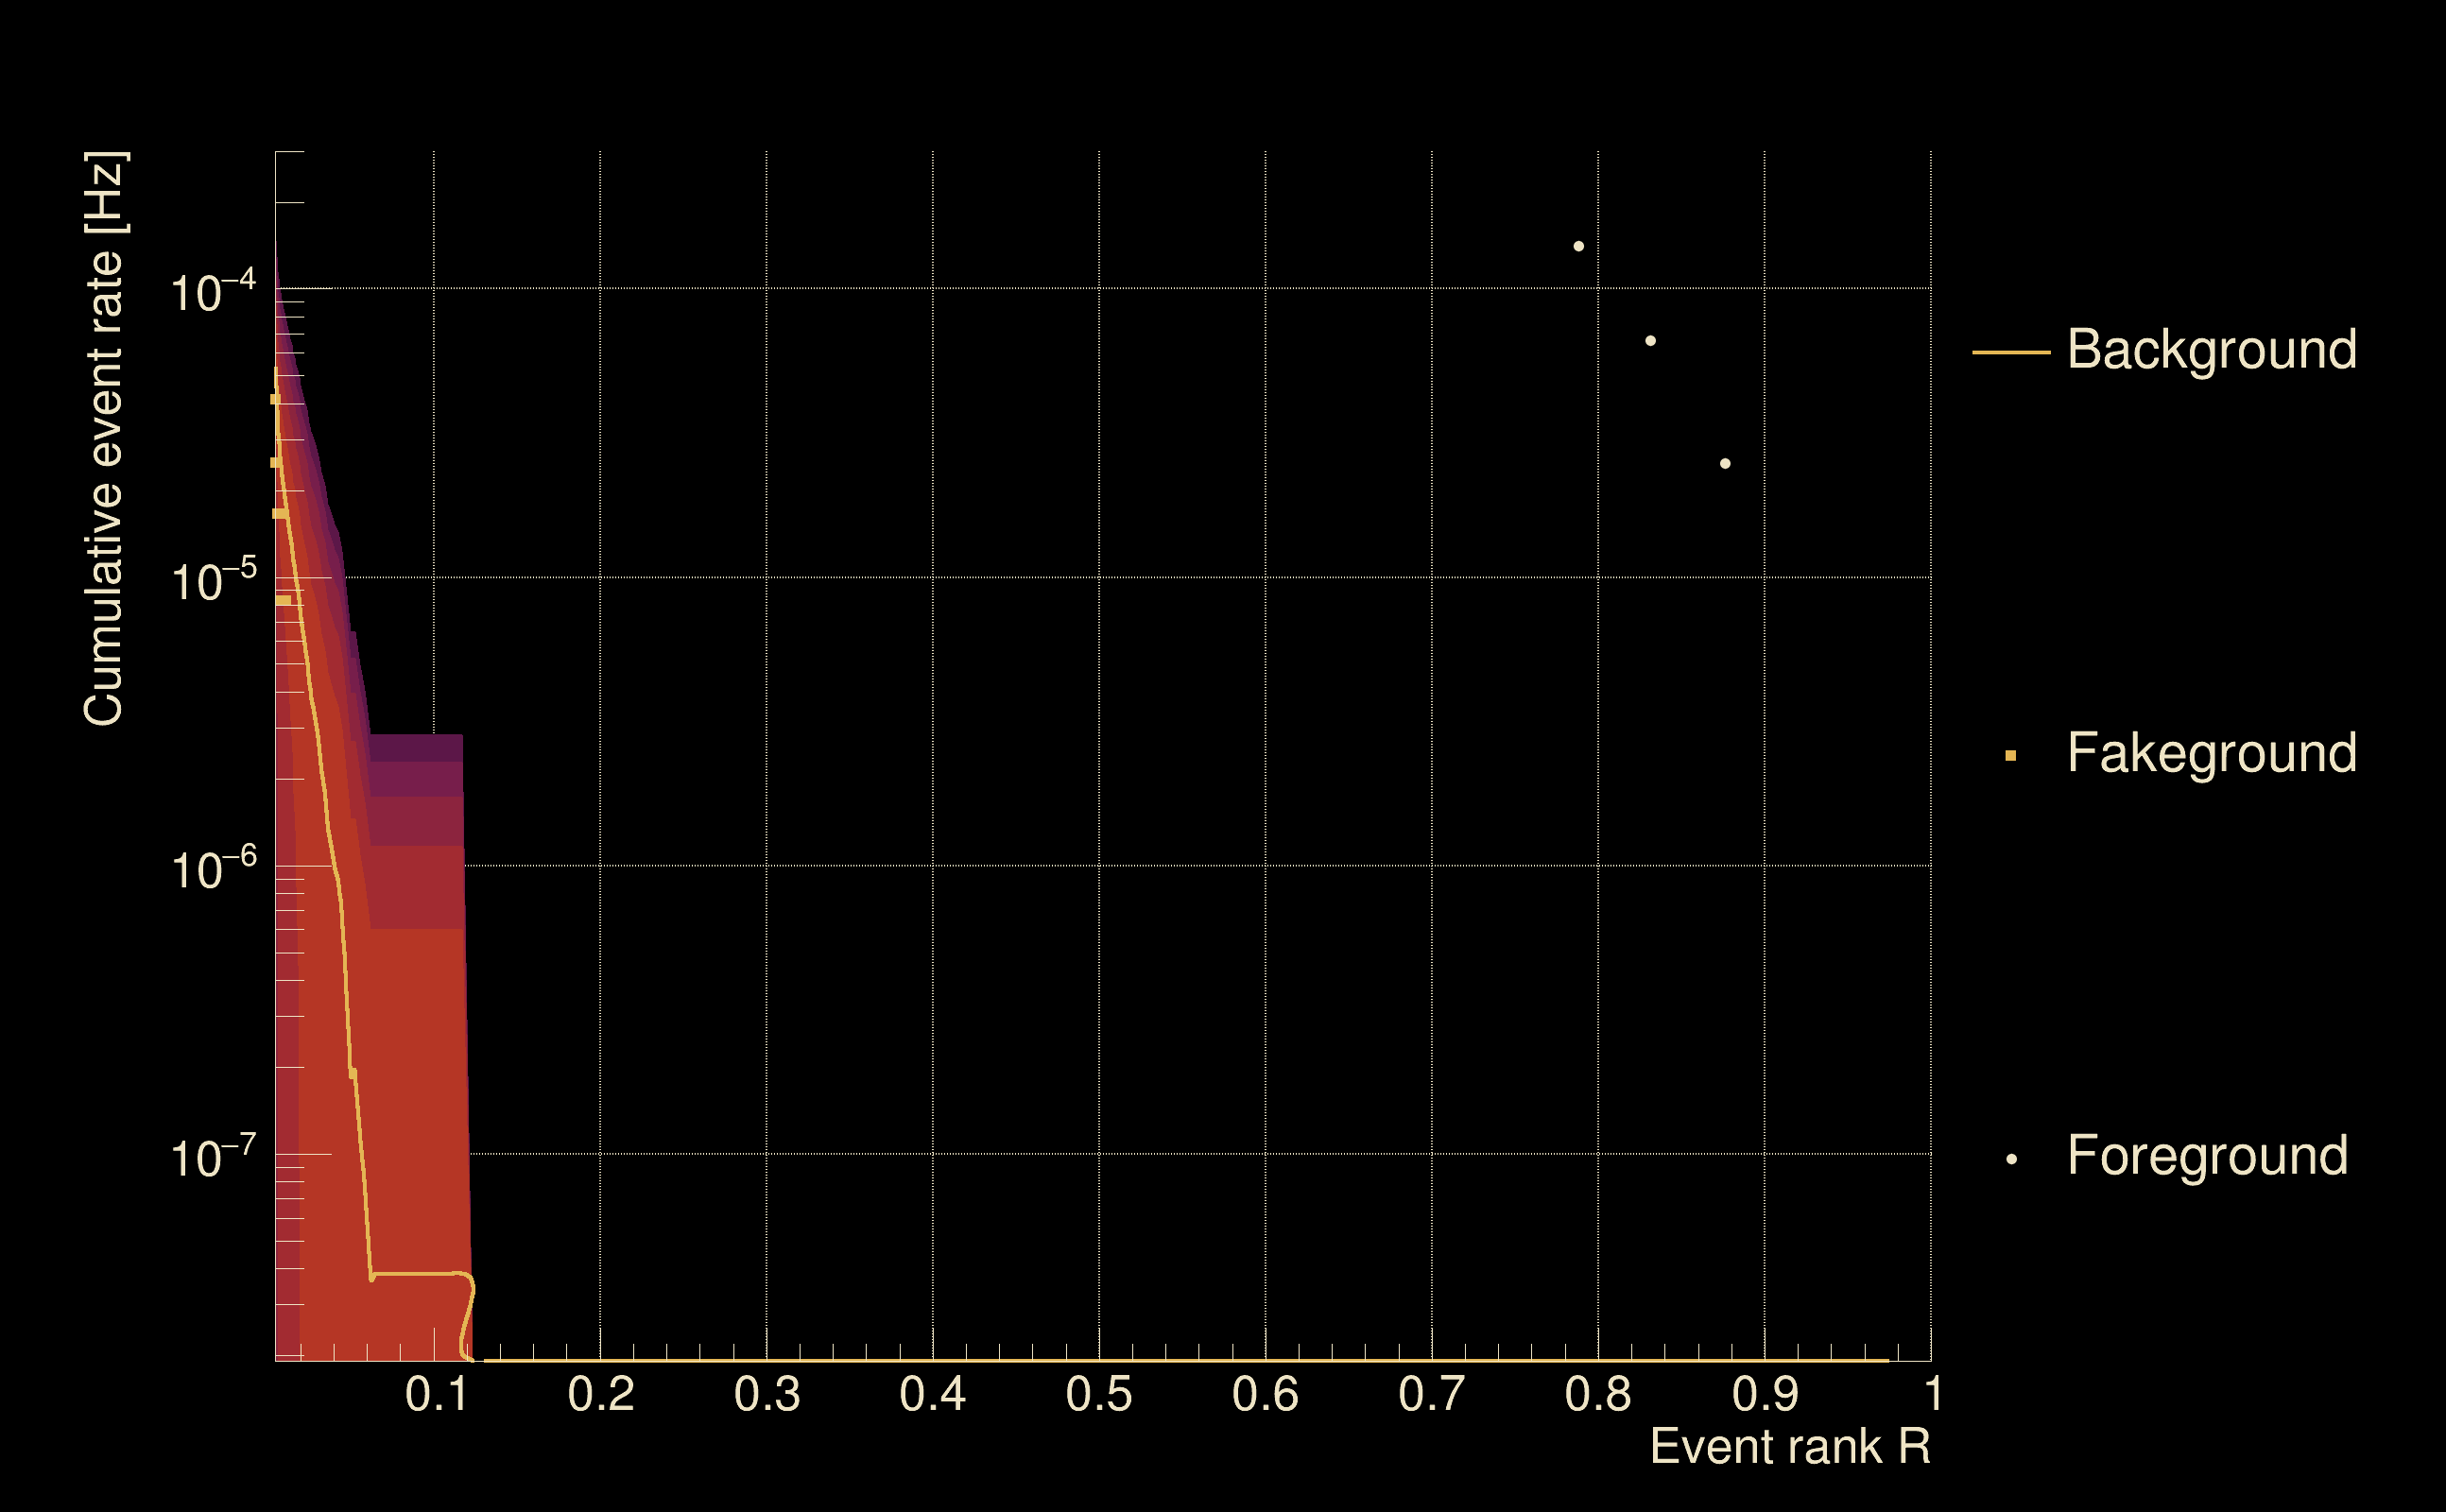
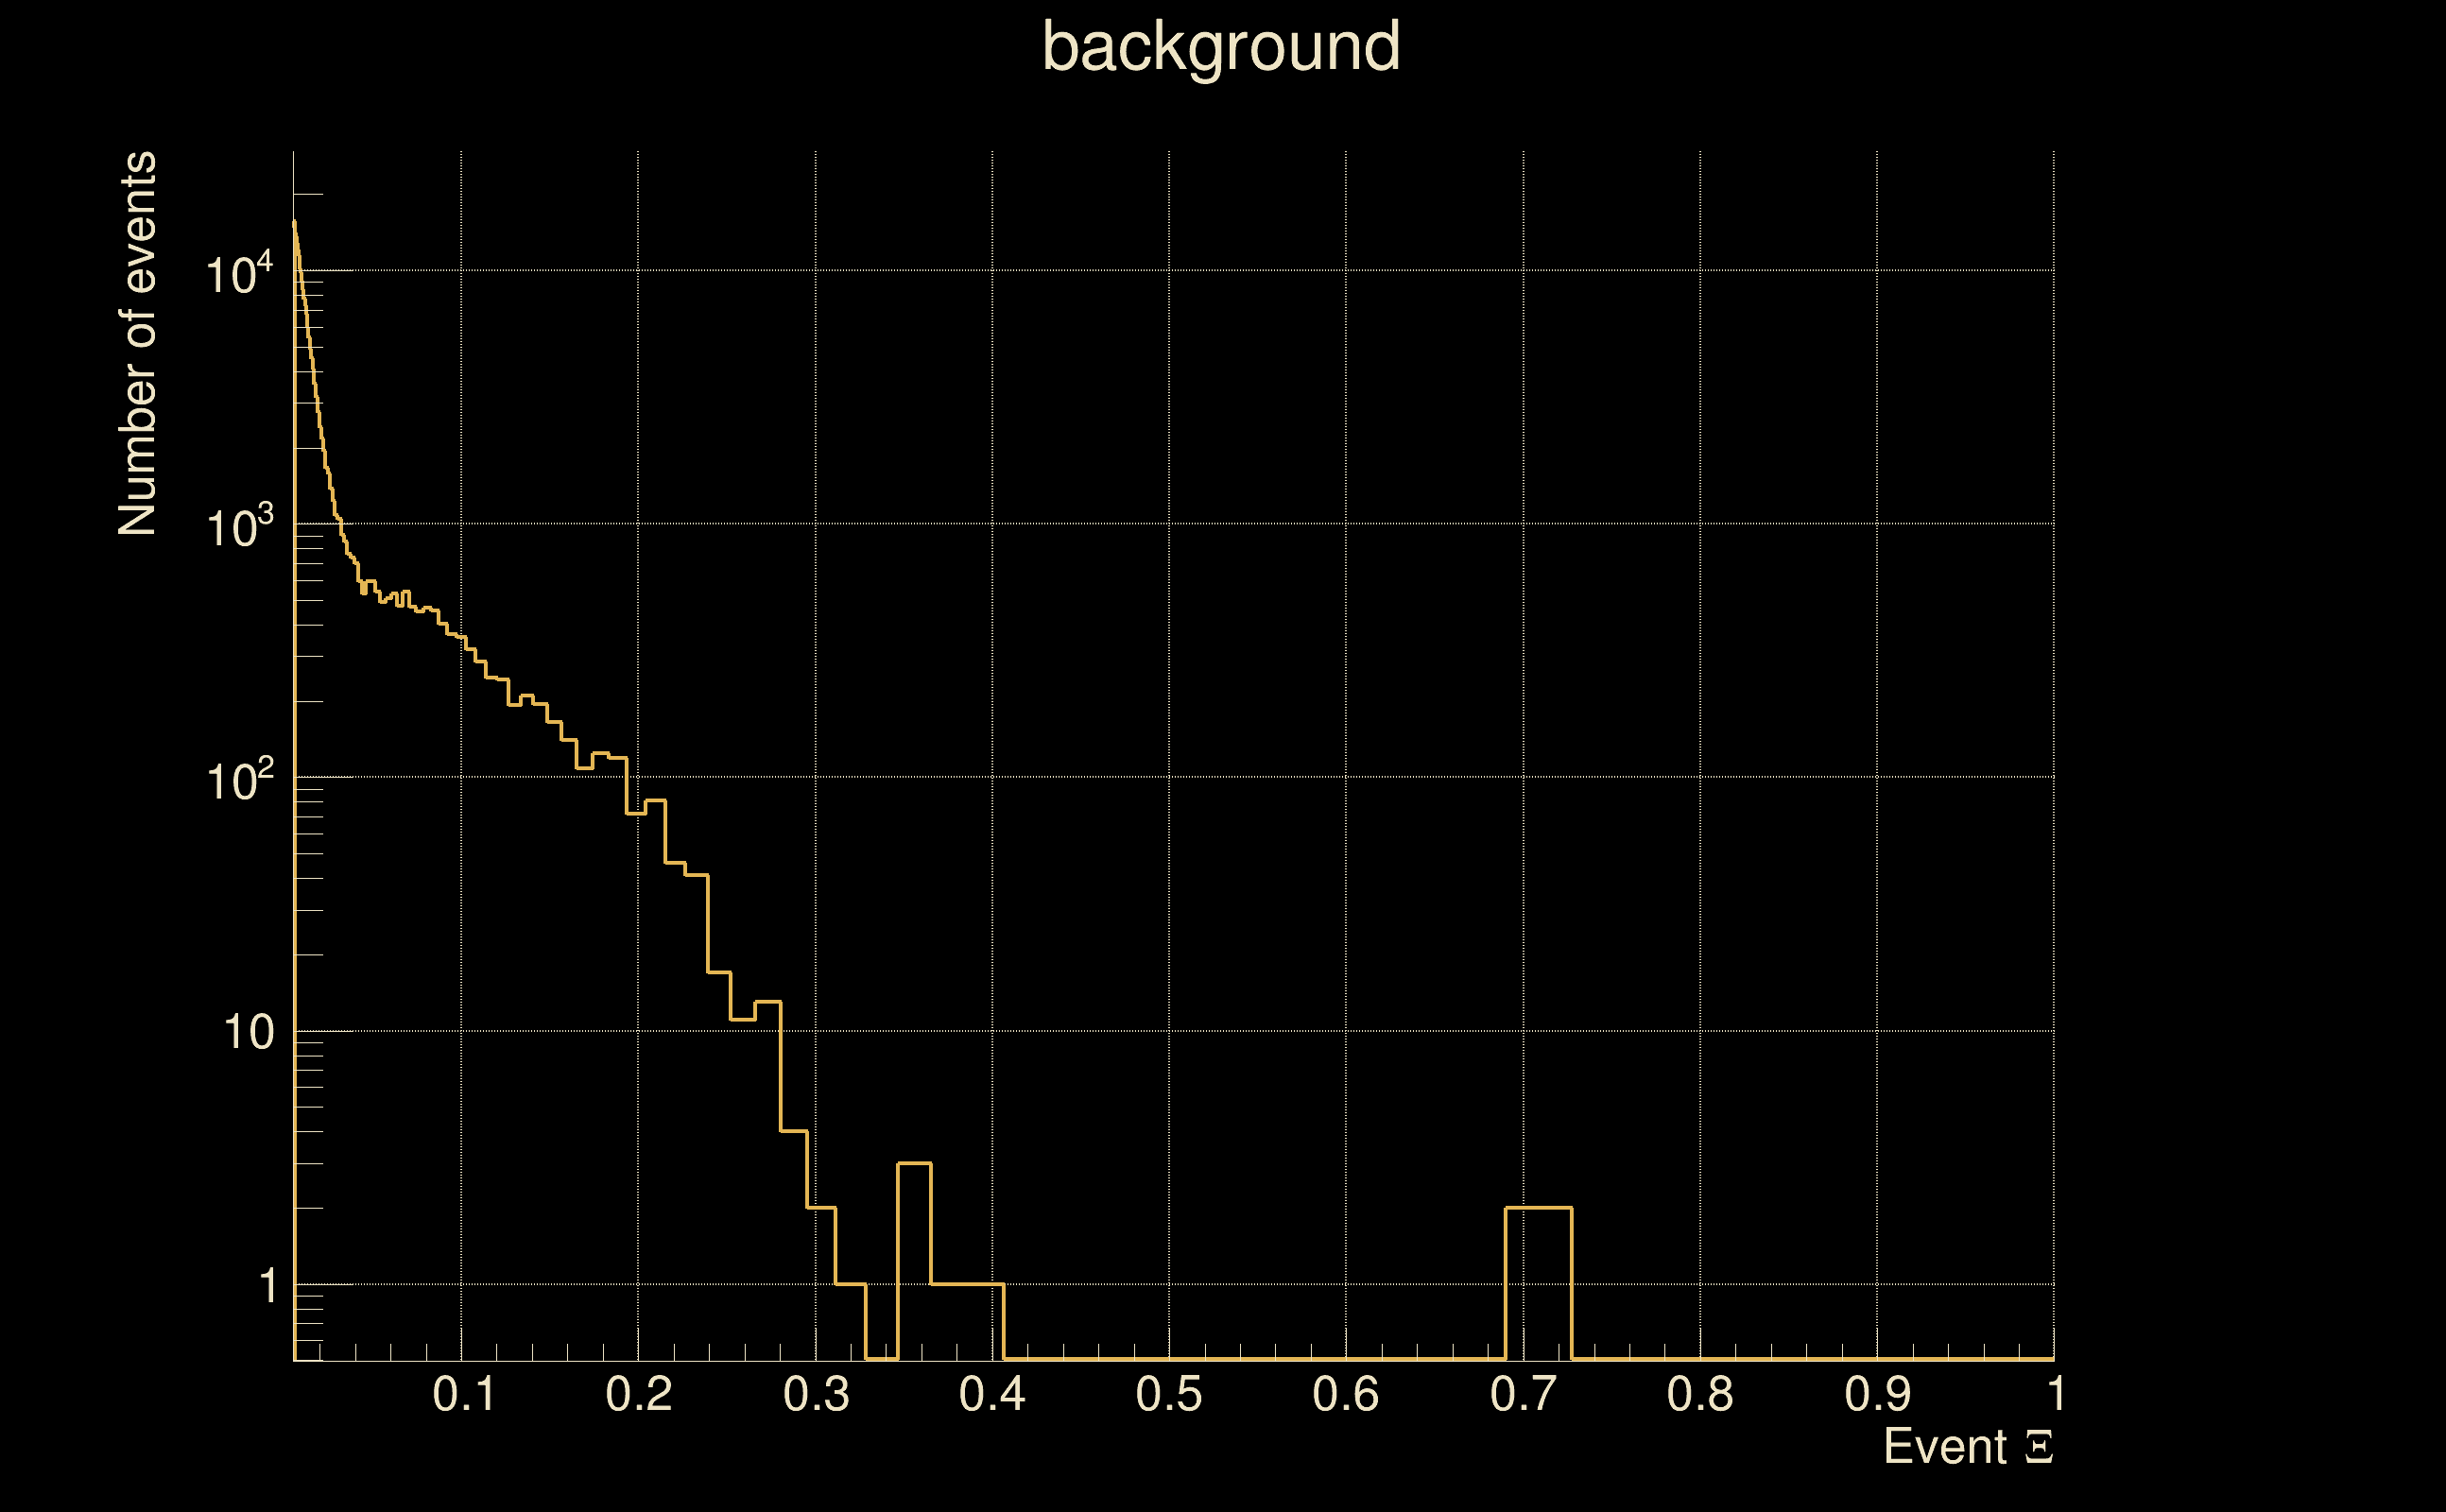
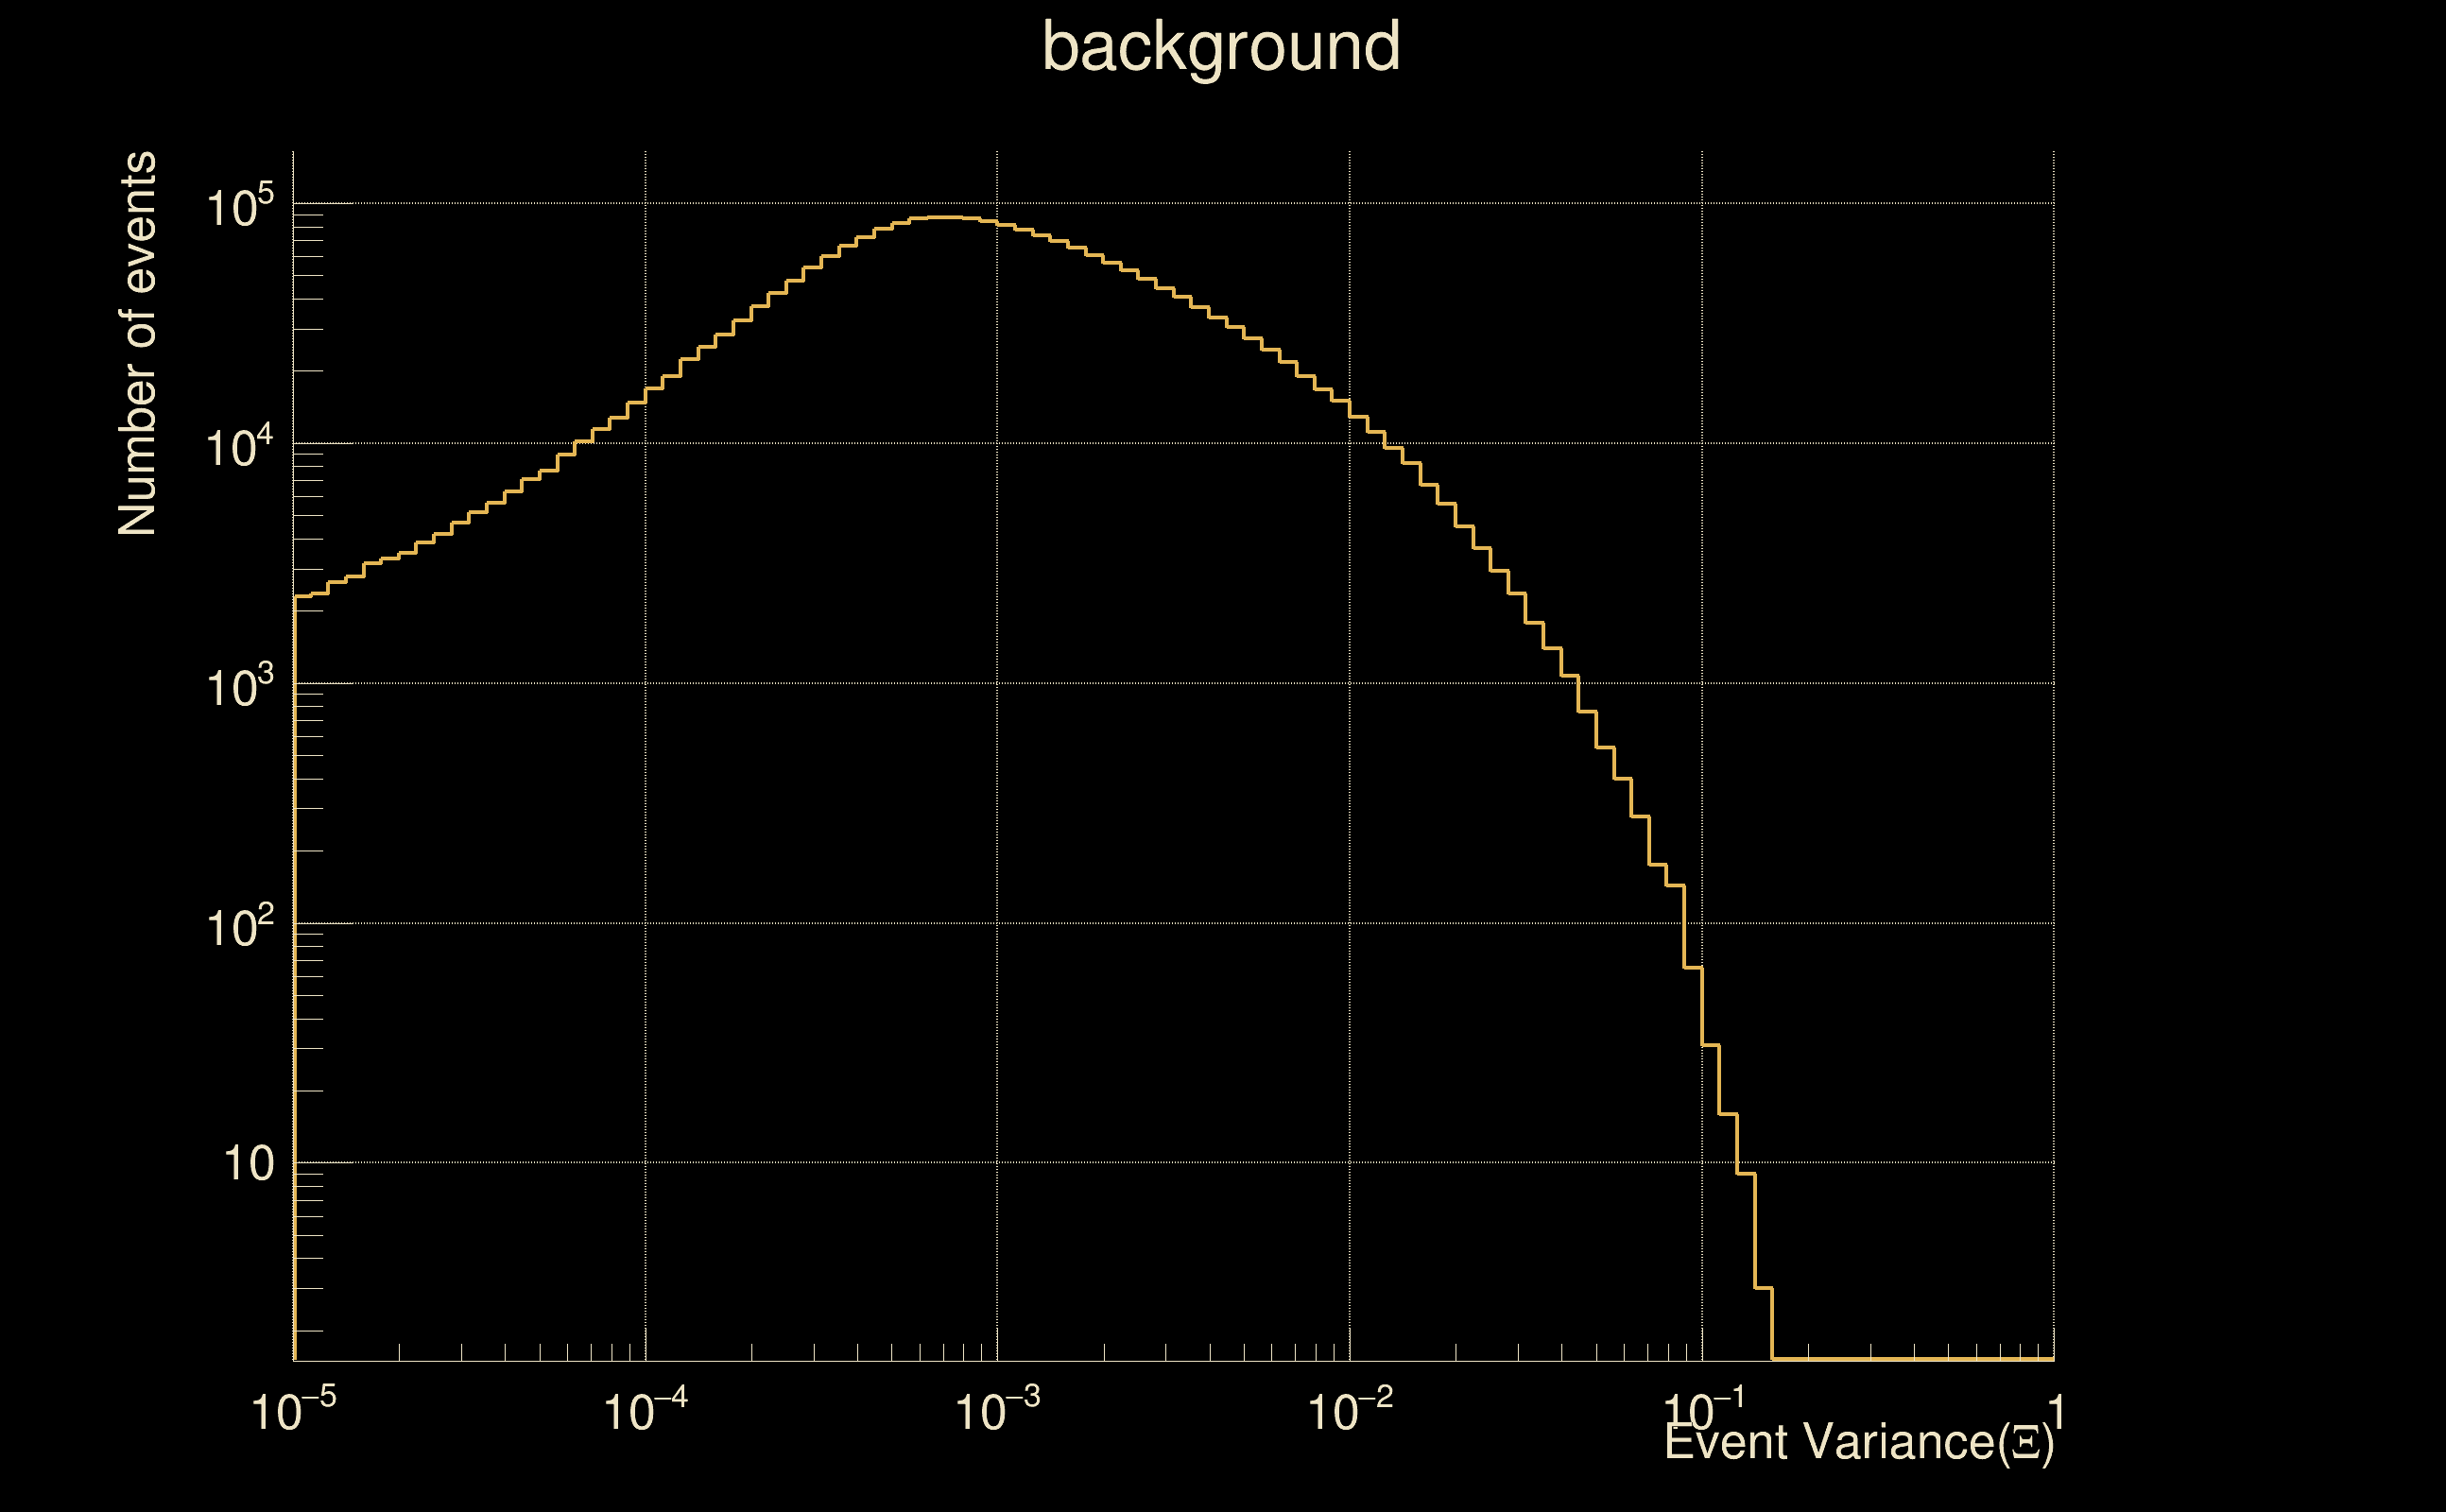
| Detection threshold: | R > 0.0314201 |
| False-alarm rate above that detection threshold: | 2.33225e-06 |
| Alternative threshold at 1/1000 yrs: | R > 0.117013 |
| Alternative threshold at 1/100 yrs: | R > 0.117013 |
| Alternative threshold at 1/10 yrs: | R > 0.117013 |
| Alternative threshold at 1/1 yr: | R > 0.117013 |
| Alternative threshold at 1/1 d: | R > 0.0148422 |
 |
|
 |
 |
 |
 |
 |
 |
 |
 |
 |
 |
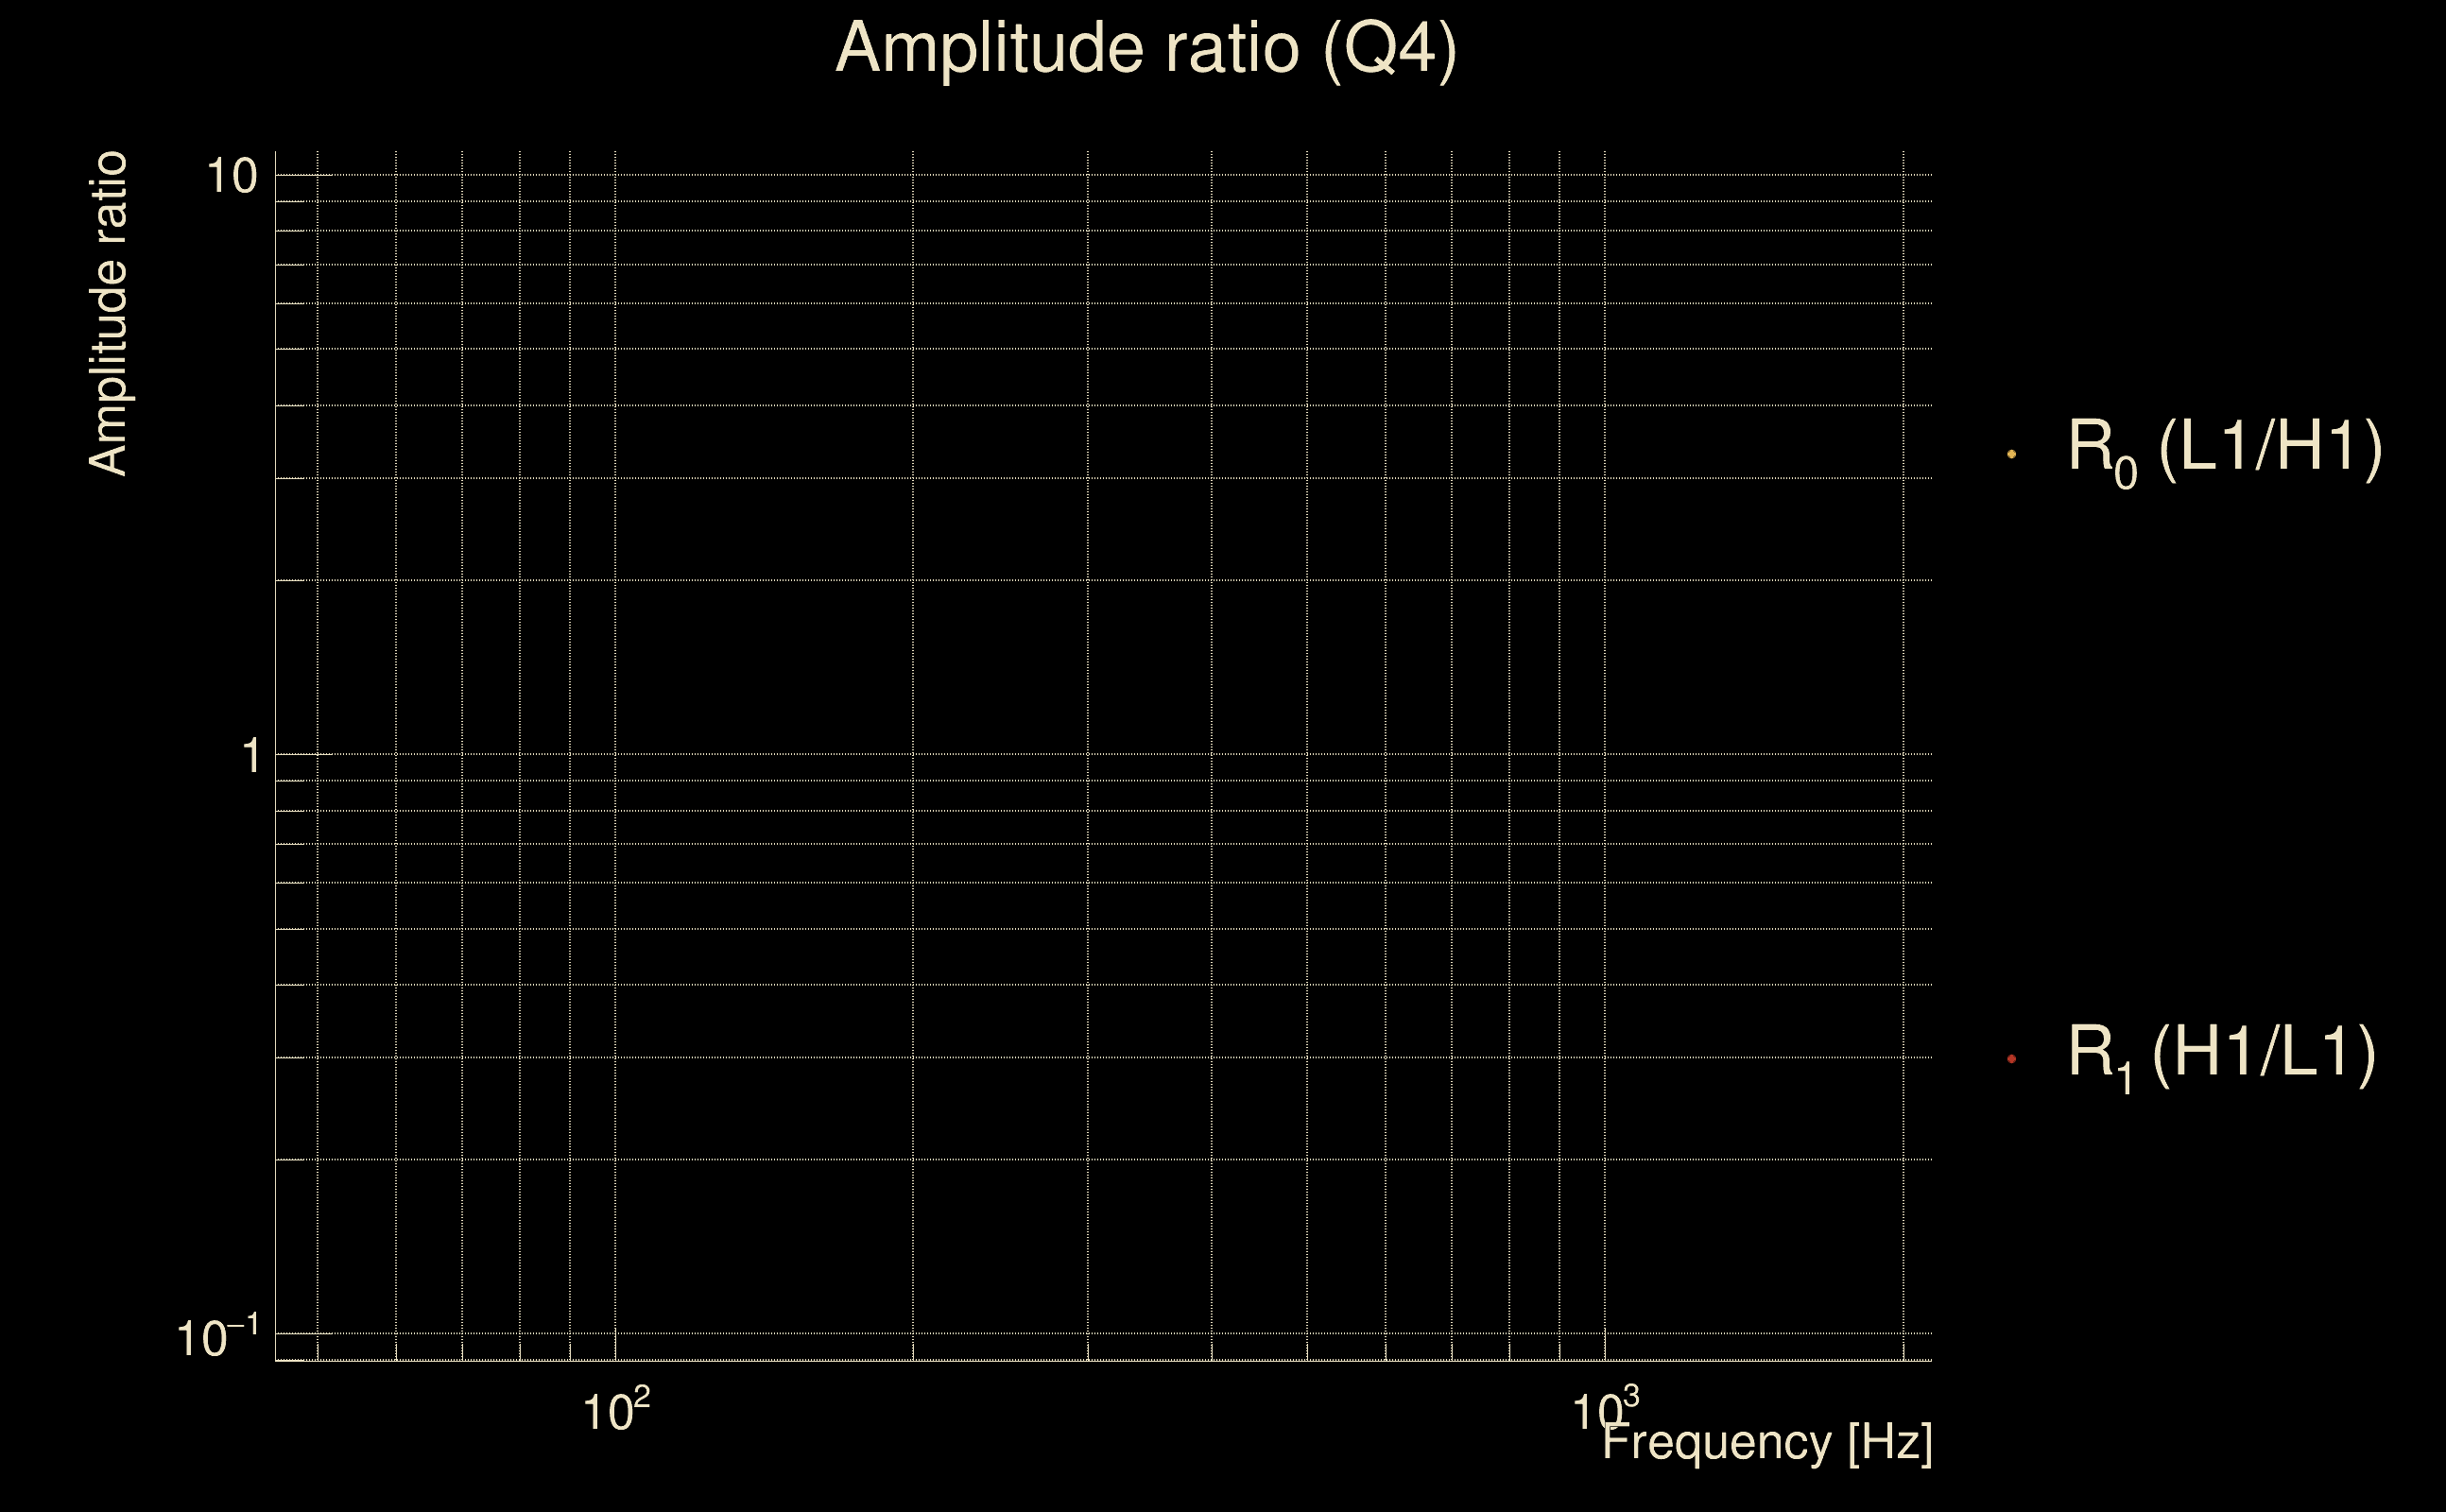
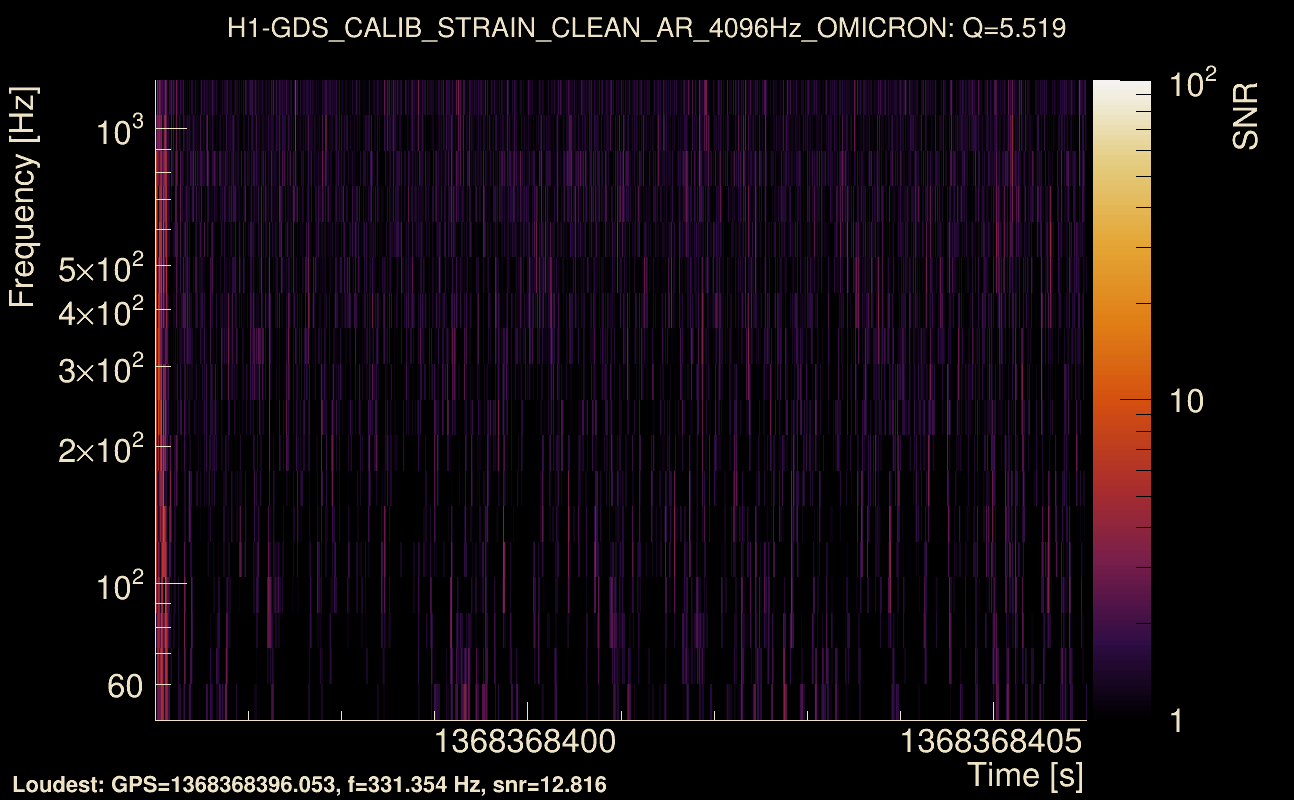
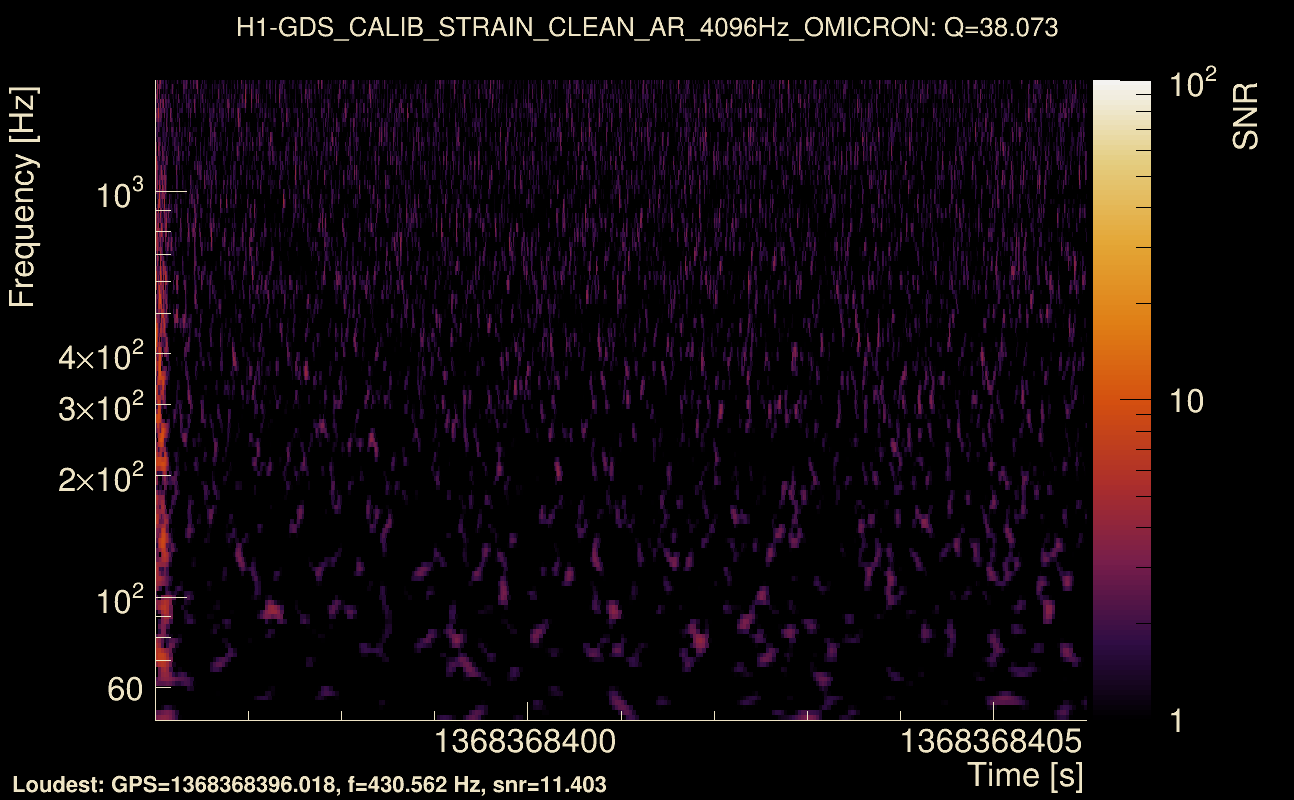
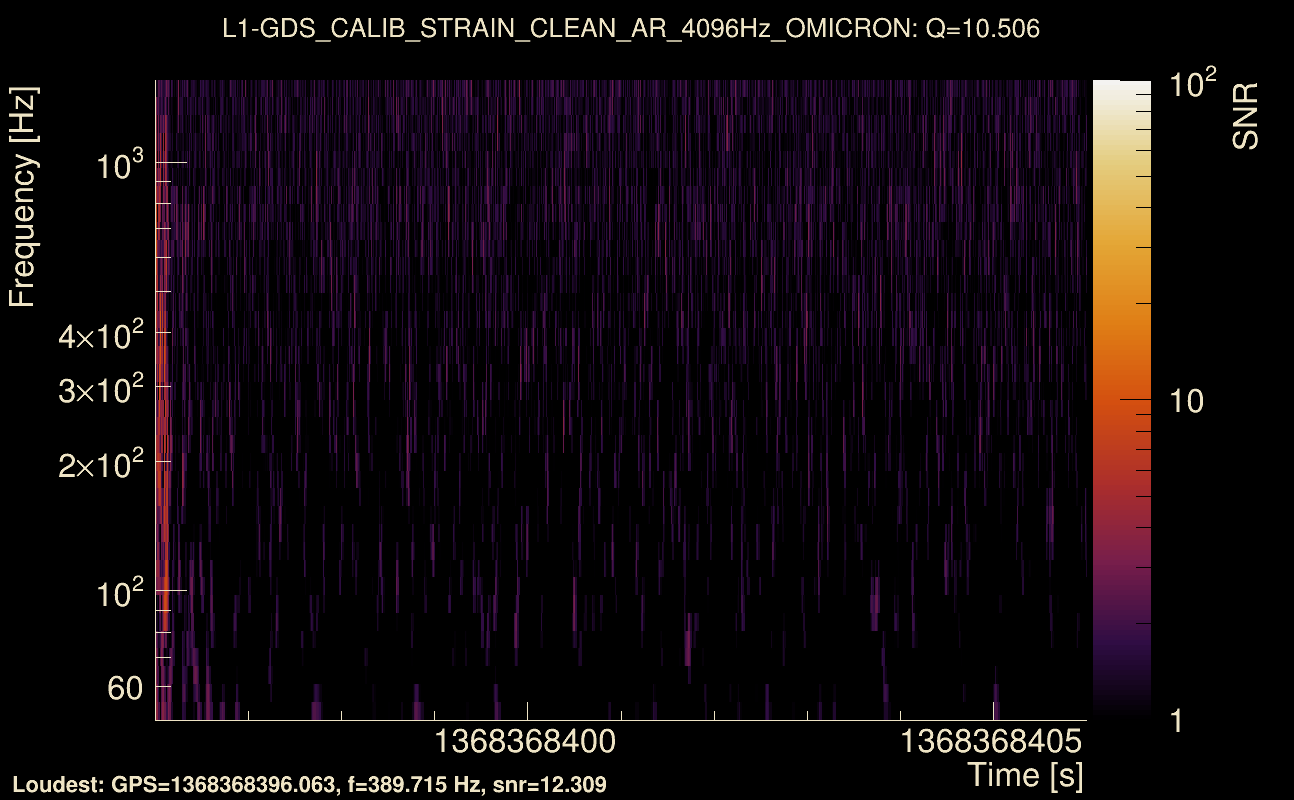
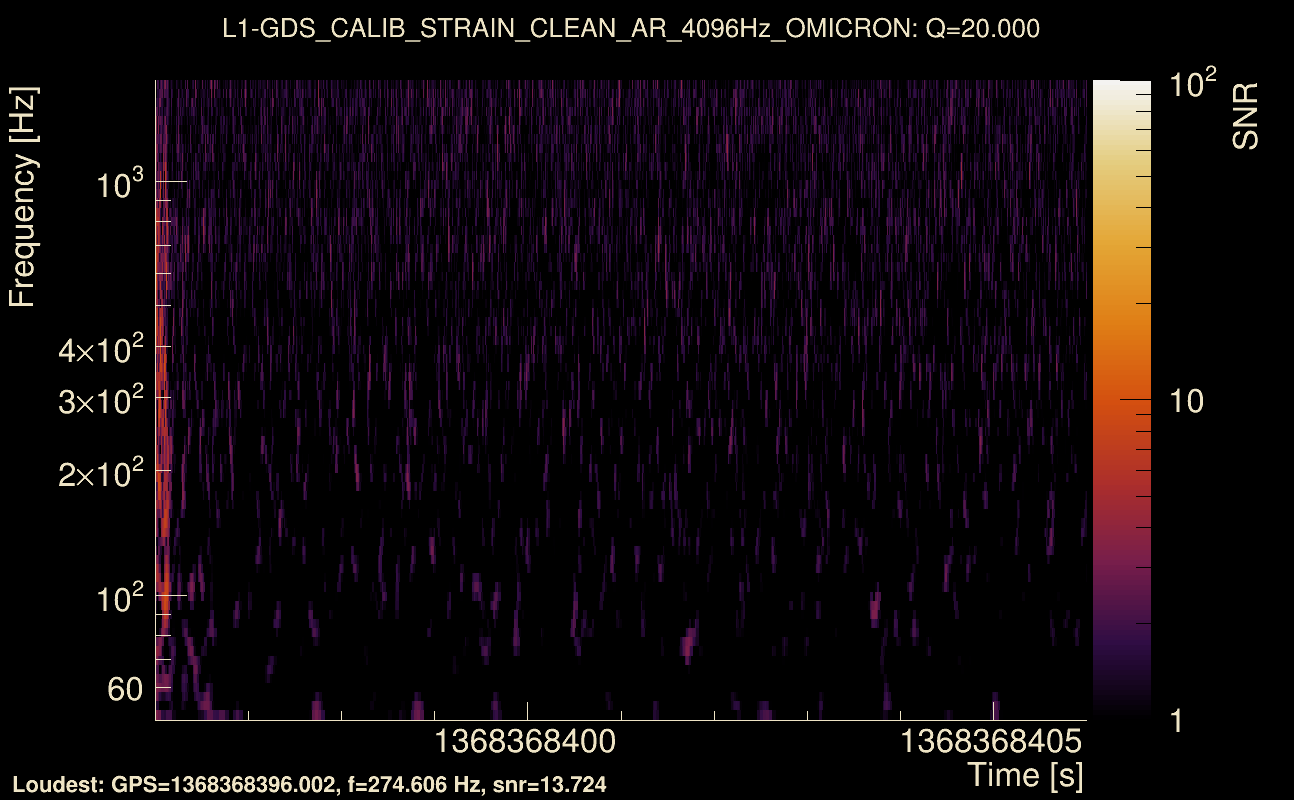
| Event time t(H1): | GPS = 1368368396 (Wed May 17 14:19:38 2023 ) → GPS = 1368368406 (Wed May 17 14:19:48 2023 ) |
| Event time t(L1): | GPS = 1368368396 (Wed May 17 14:19:48 2023 ) → GPS = 1368368406 (Wed May 17 14:19:48 2023 ) |
| Omicron analysis time window (H1): | GPS = 1368368393 → GPS = 1368368409 |
| Omicron analysis time window (L1): | GPS = 1368368393 → GPS = 1368368409 |
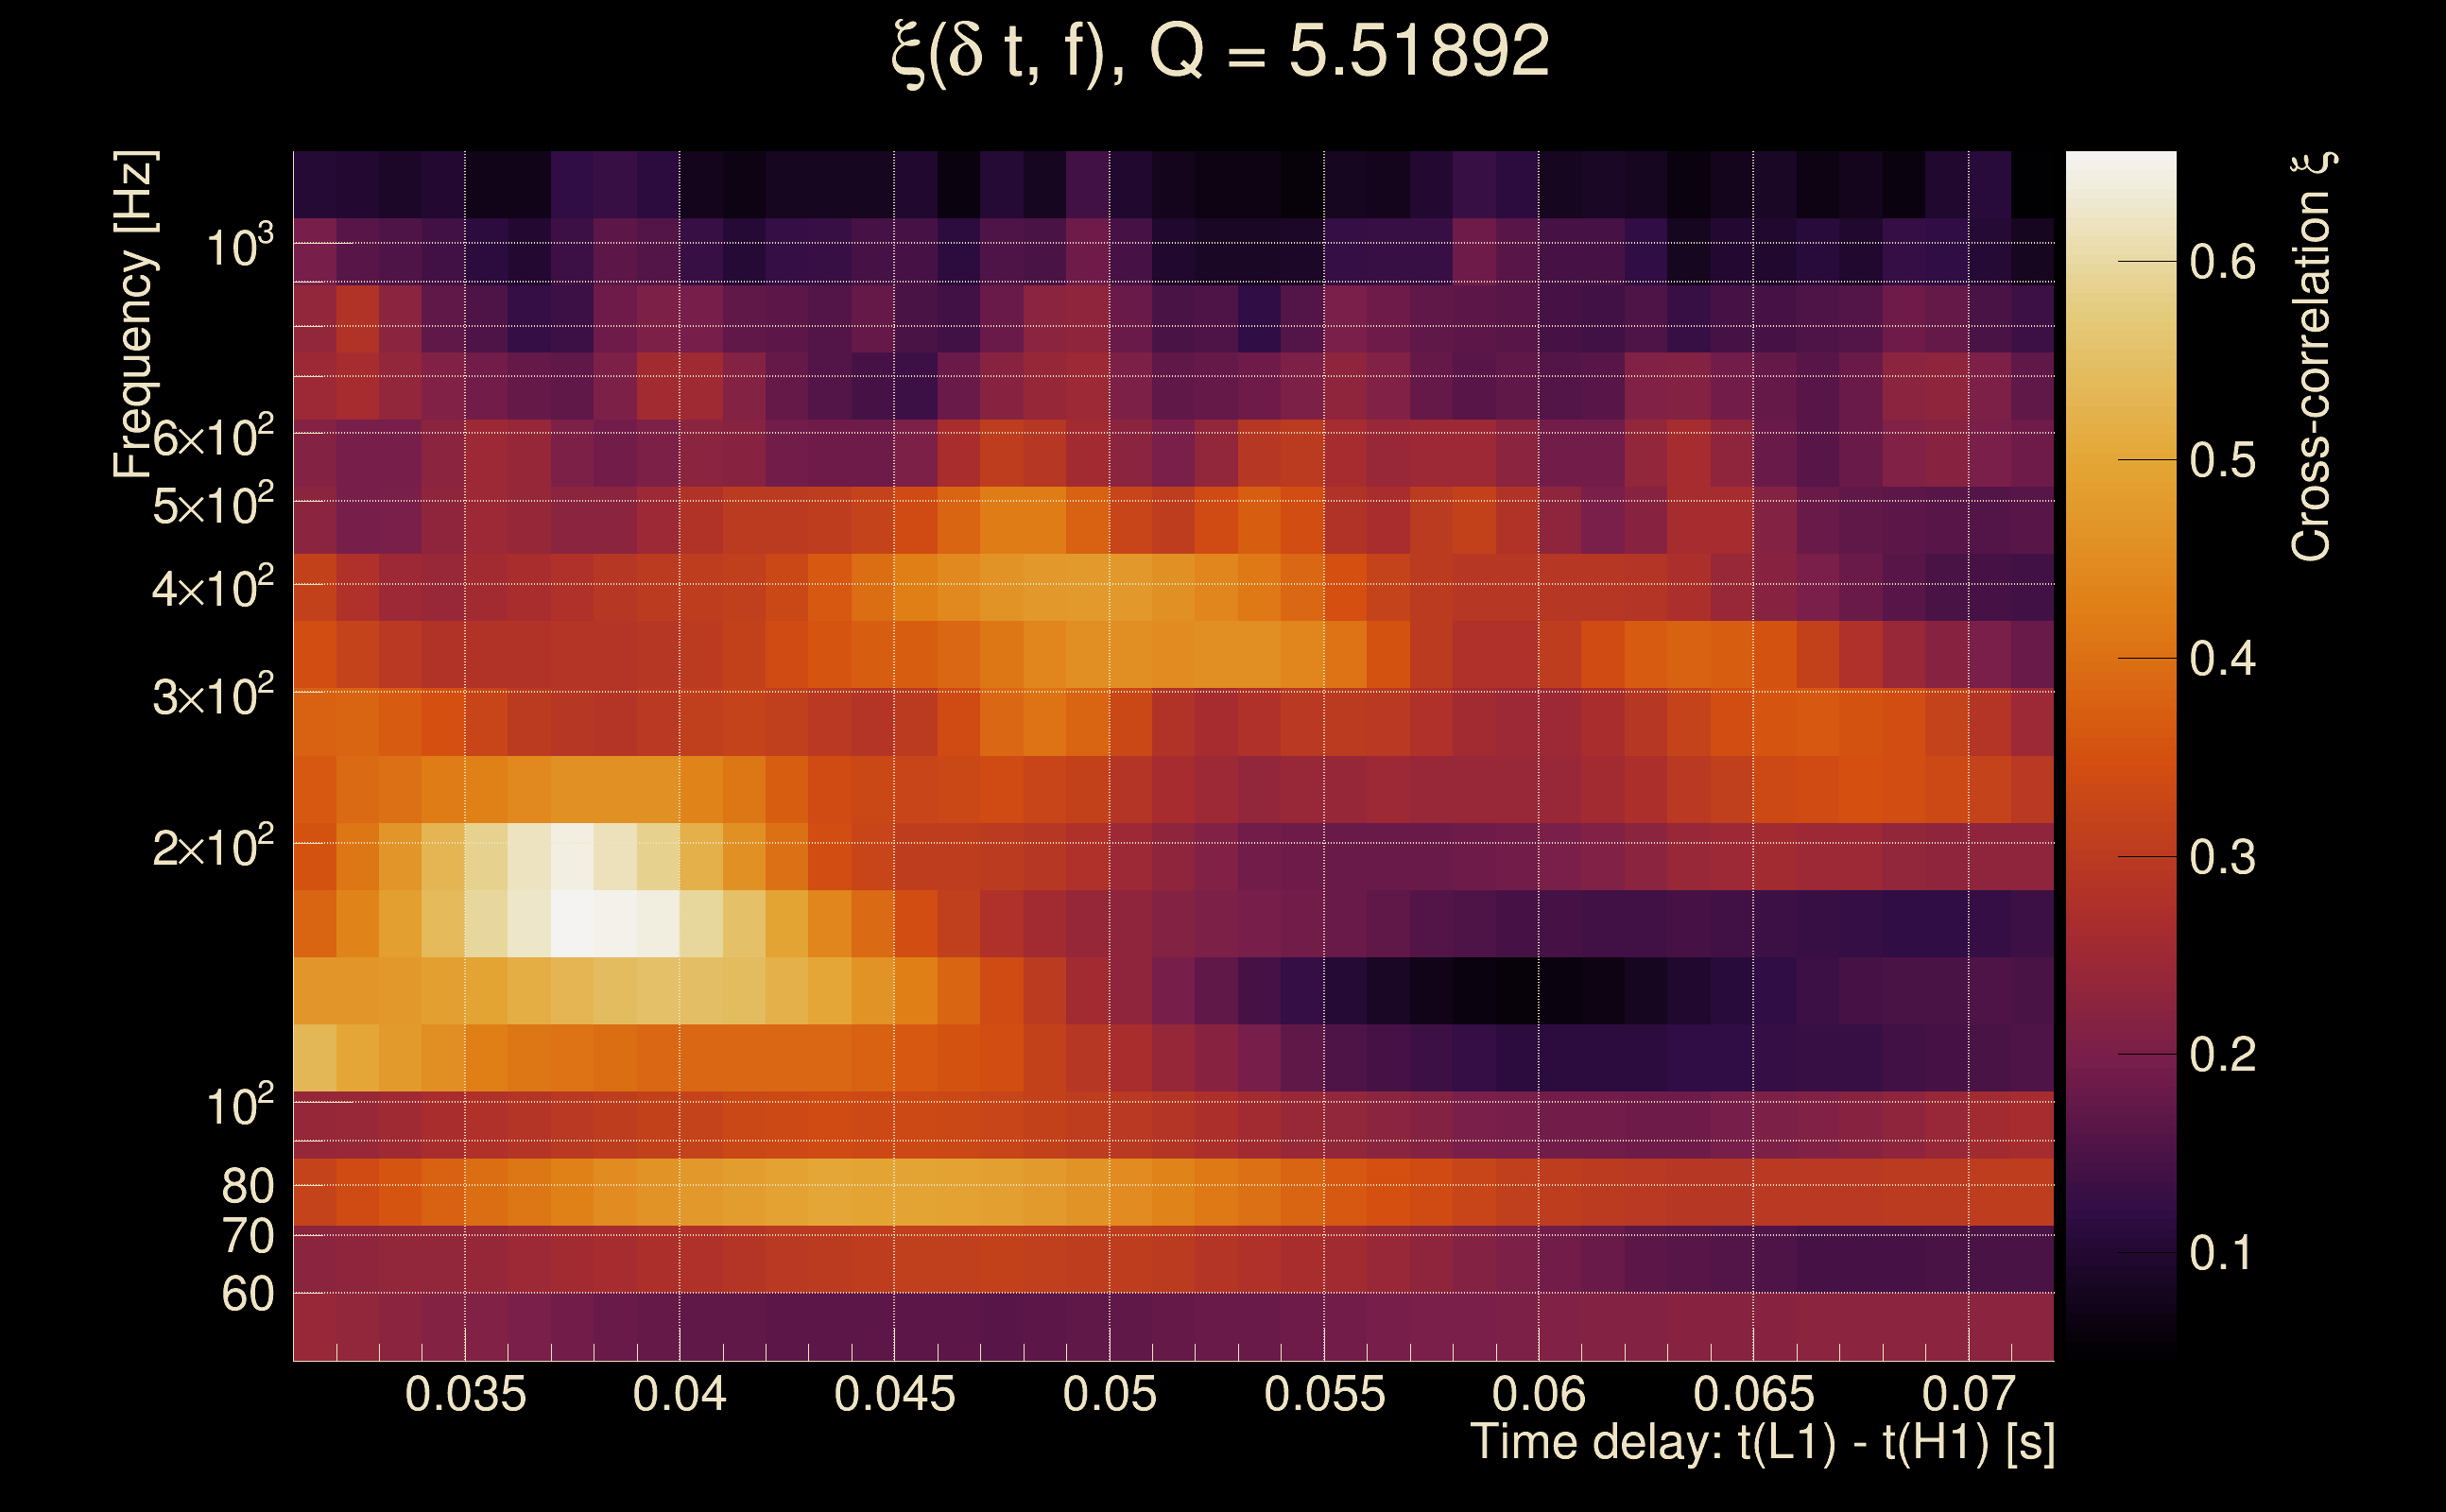
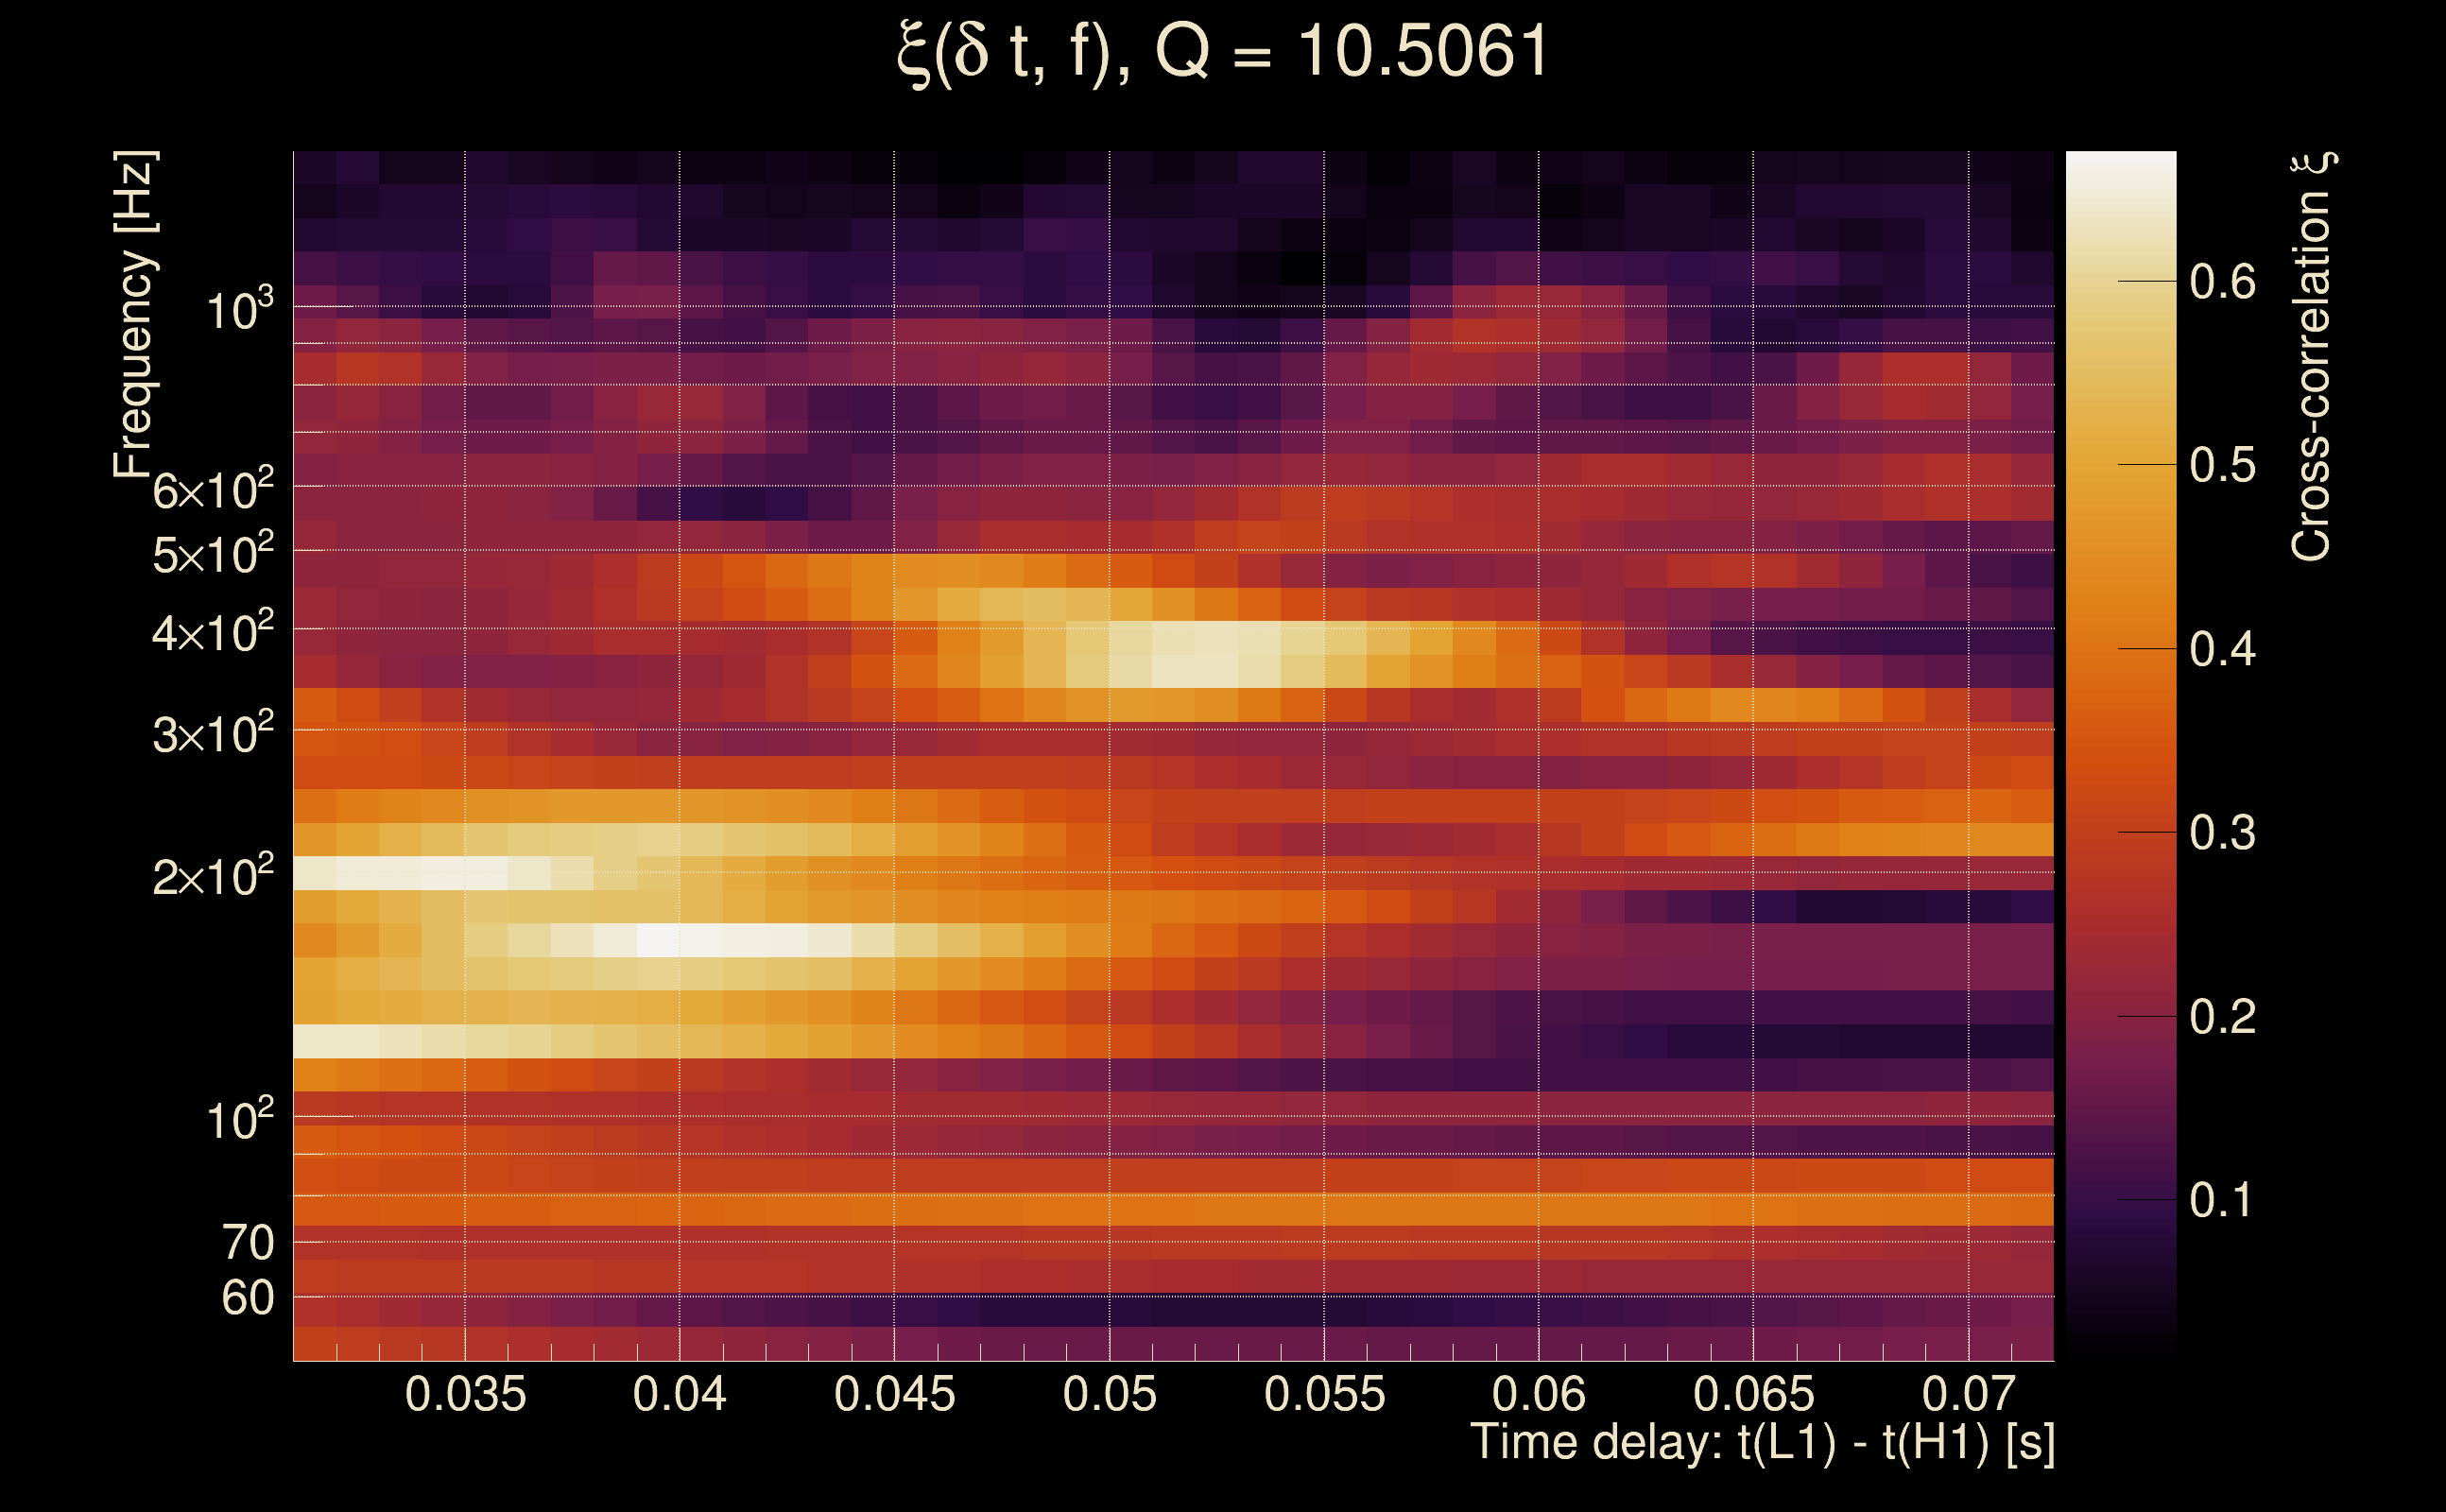
| Time delay between detectors t(L1) - t(H1): | 0.051717 s (slice index = 107 / 217), δt_gw = 0.00571698 s |
| Time delay standard deviation: | 0.0852261 s |
| [targeted mode] Time delay probability: | 0.692347 (0.395672 sigmas), δt_target = 0.00857401 s |
| Frequency: | 307.266 Hz |
| Ξ: | 0.256714 ± 0.0256798 (variance = 0.000659451): Q0: 0.485851, Q1: 0.525514, Q2: 0.515625, Q3: 0.559846, Q4: 0.546847 |
| Rank: | R_A = 0.114254 |
| Log of amplitude ratio (L1/H1): | -0.0483903, variance = 0.23626 (L1/H1: -0.205785, variance = 0.451878, H1/L1: -0.0964159, variance = 0.48848) |
| Amplitude ratio (L1/H1): | 0.952762 ⋇ 1.62591 (L1/H1: 0.814008 ⋇ 1.95858, H1/L1: 0.908086 ⋇ 2.01157) |
| Amplitude ratio H1|L1 compatibility (probability): | 0.755317 |
| Antenna factor probability: | 0.85108 |
| Number of rejected frequency rows: | Q0: 6 / 18, Q1: 20 / 36, Q2: 48 / 70, Q3: 104 / 134, Q4: 229 / 258 |
| Maximum signal-to-noise ratio: | H1: 13.8704, L1: 14.4607 |
| SNR variance: | H1: 98.72, L1: 410.248 |
| Click here for a zoomed plot | Click here for a zoomed plot | Click here for a zoomed plot | Click here for a zoomed plot | Click here for a zoomed plot |
 |
 |
 |
 |
 |
 |
 |
 |
 |
 |
 |
 |
 |
 |
 |
 |
 |
 |
 |
 |
 |
 |
 |
 |
 |
 |
 |
 |
 |
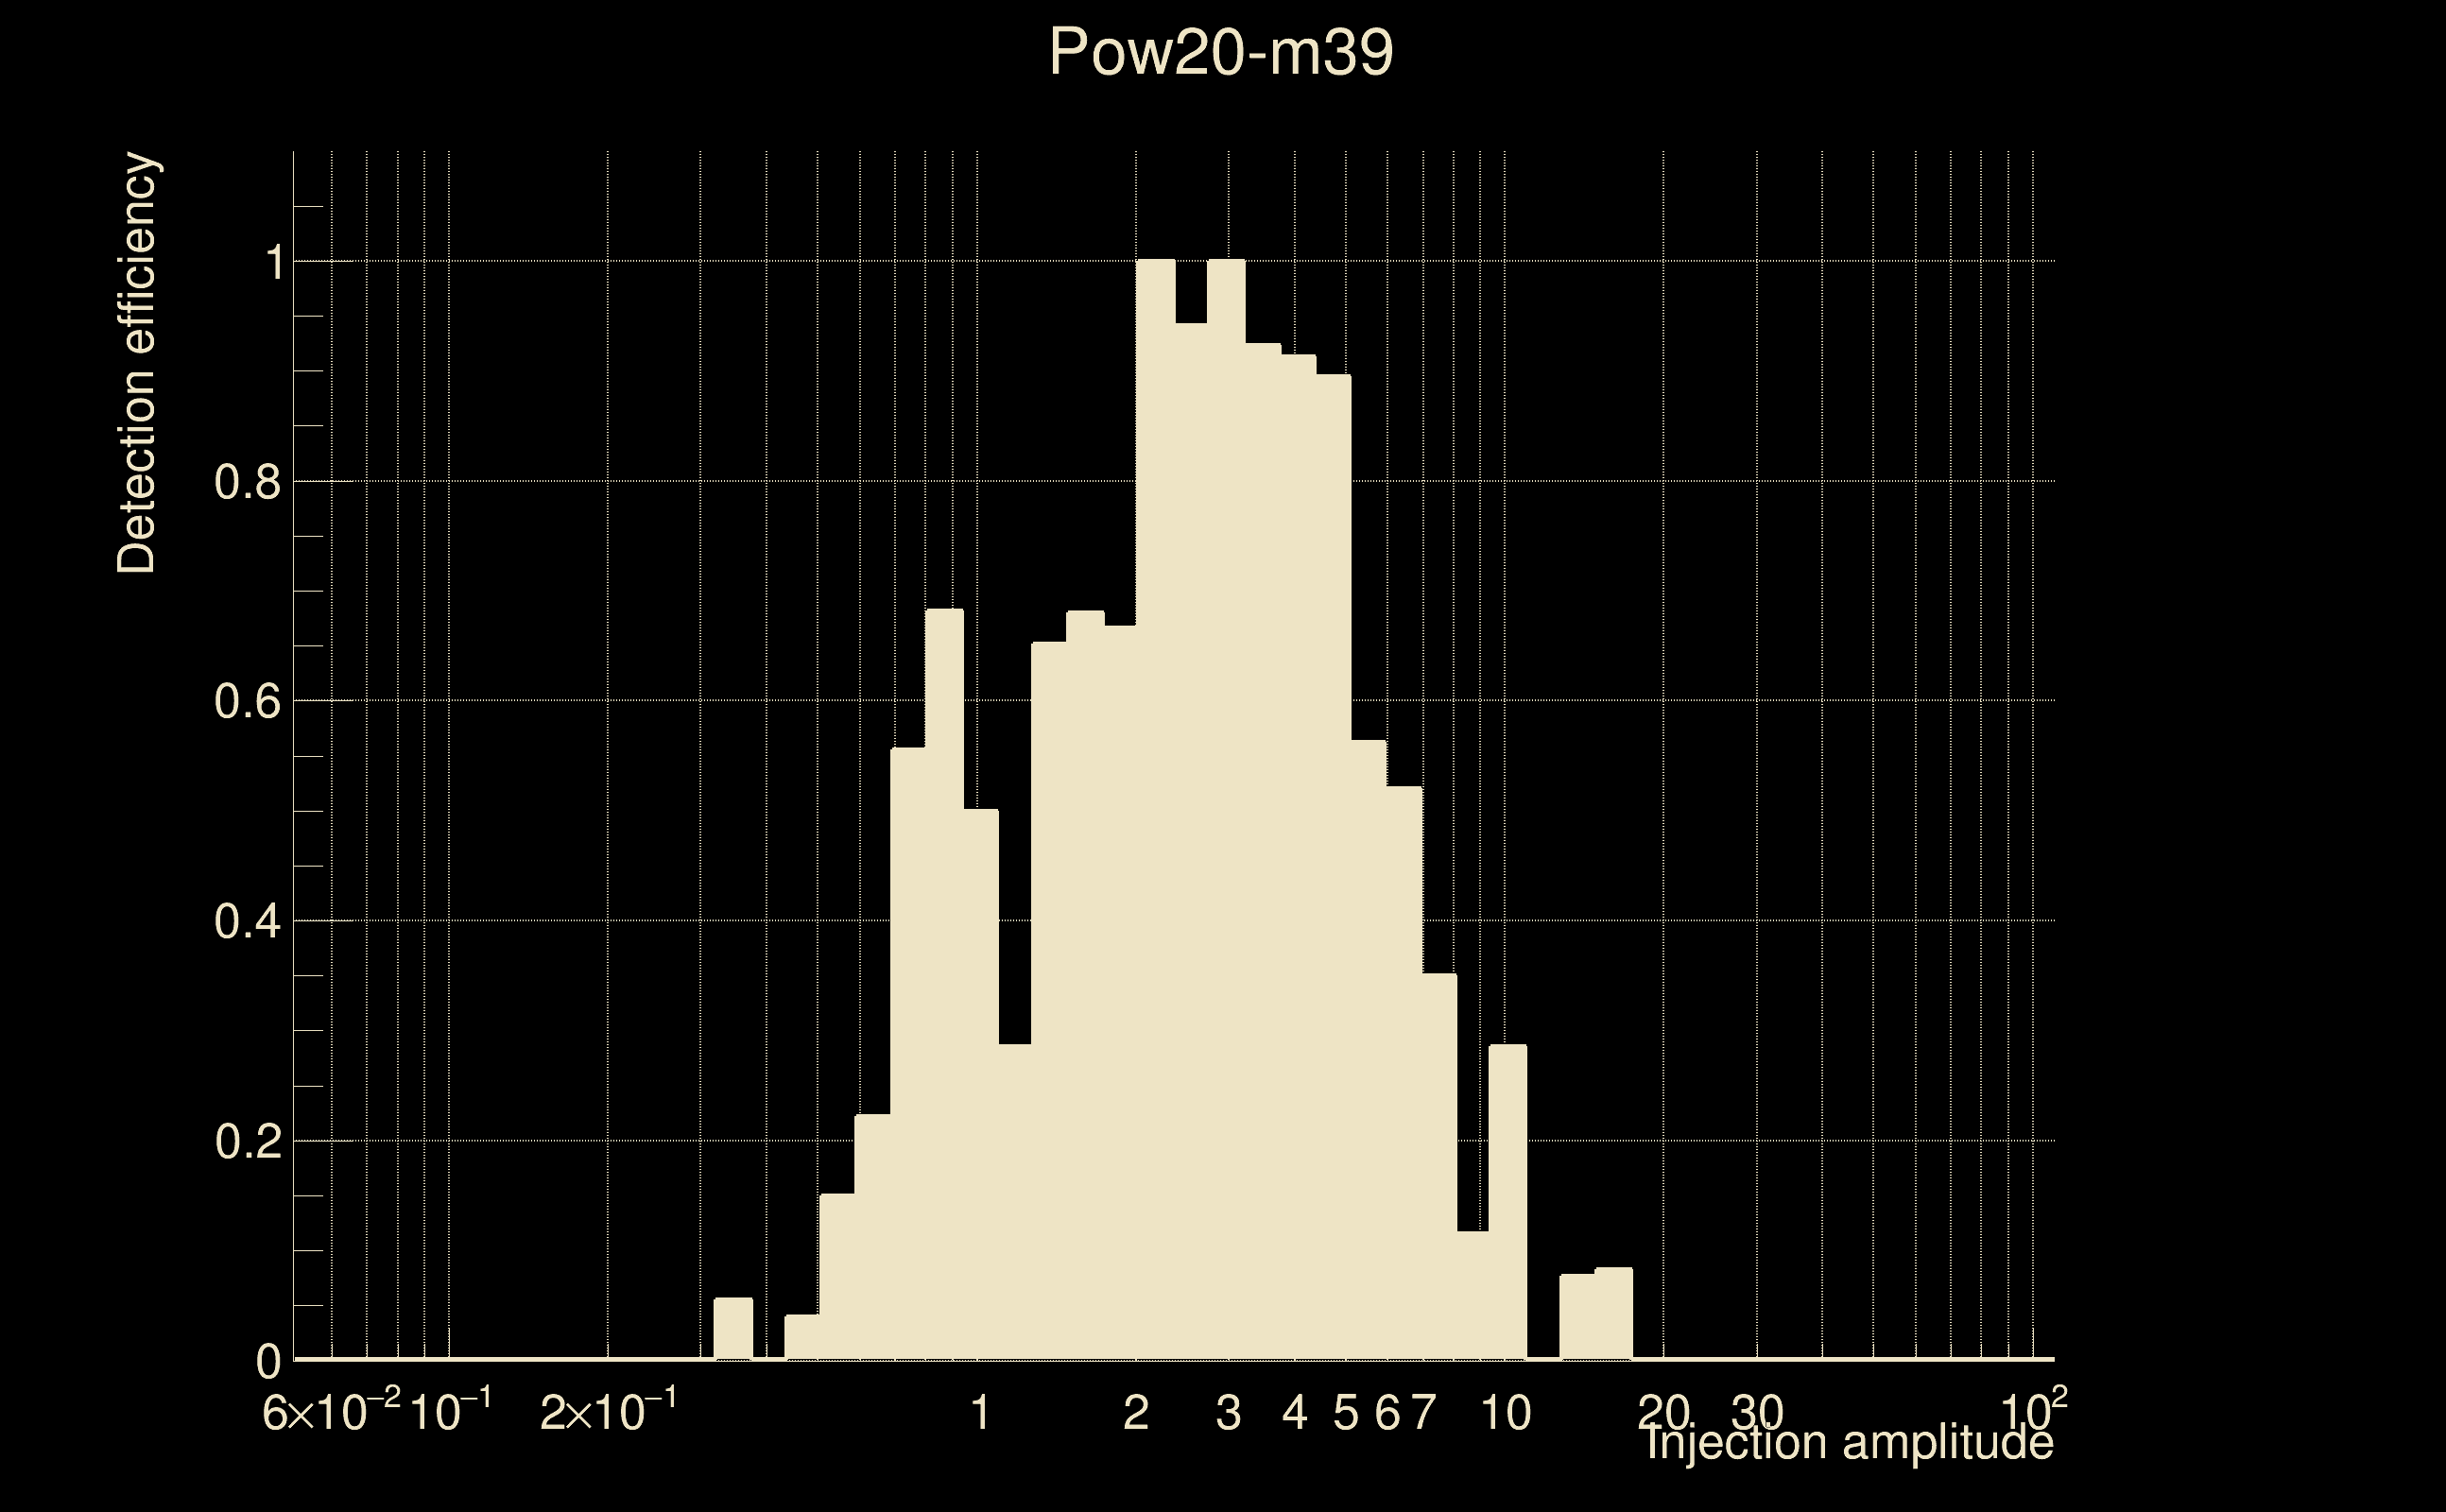
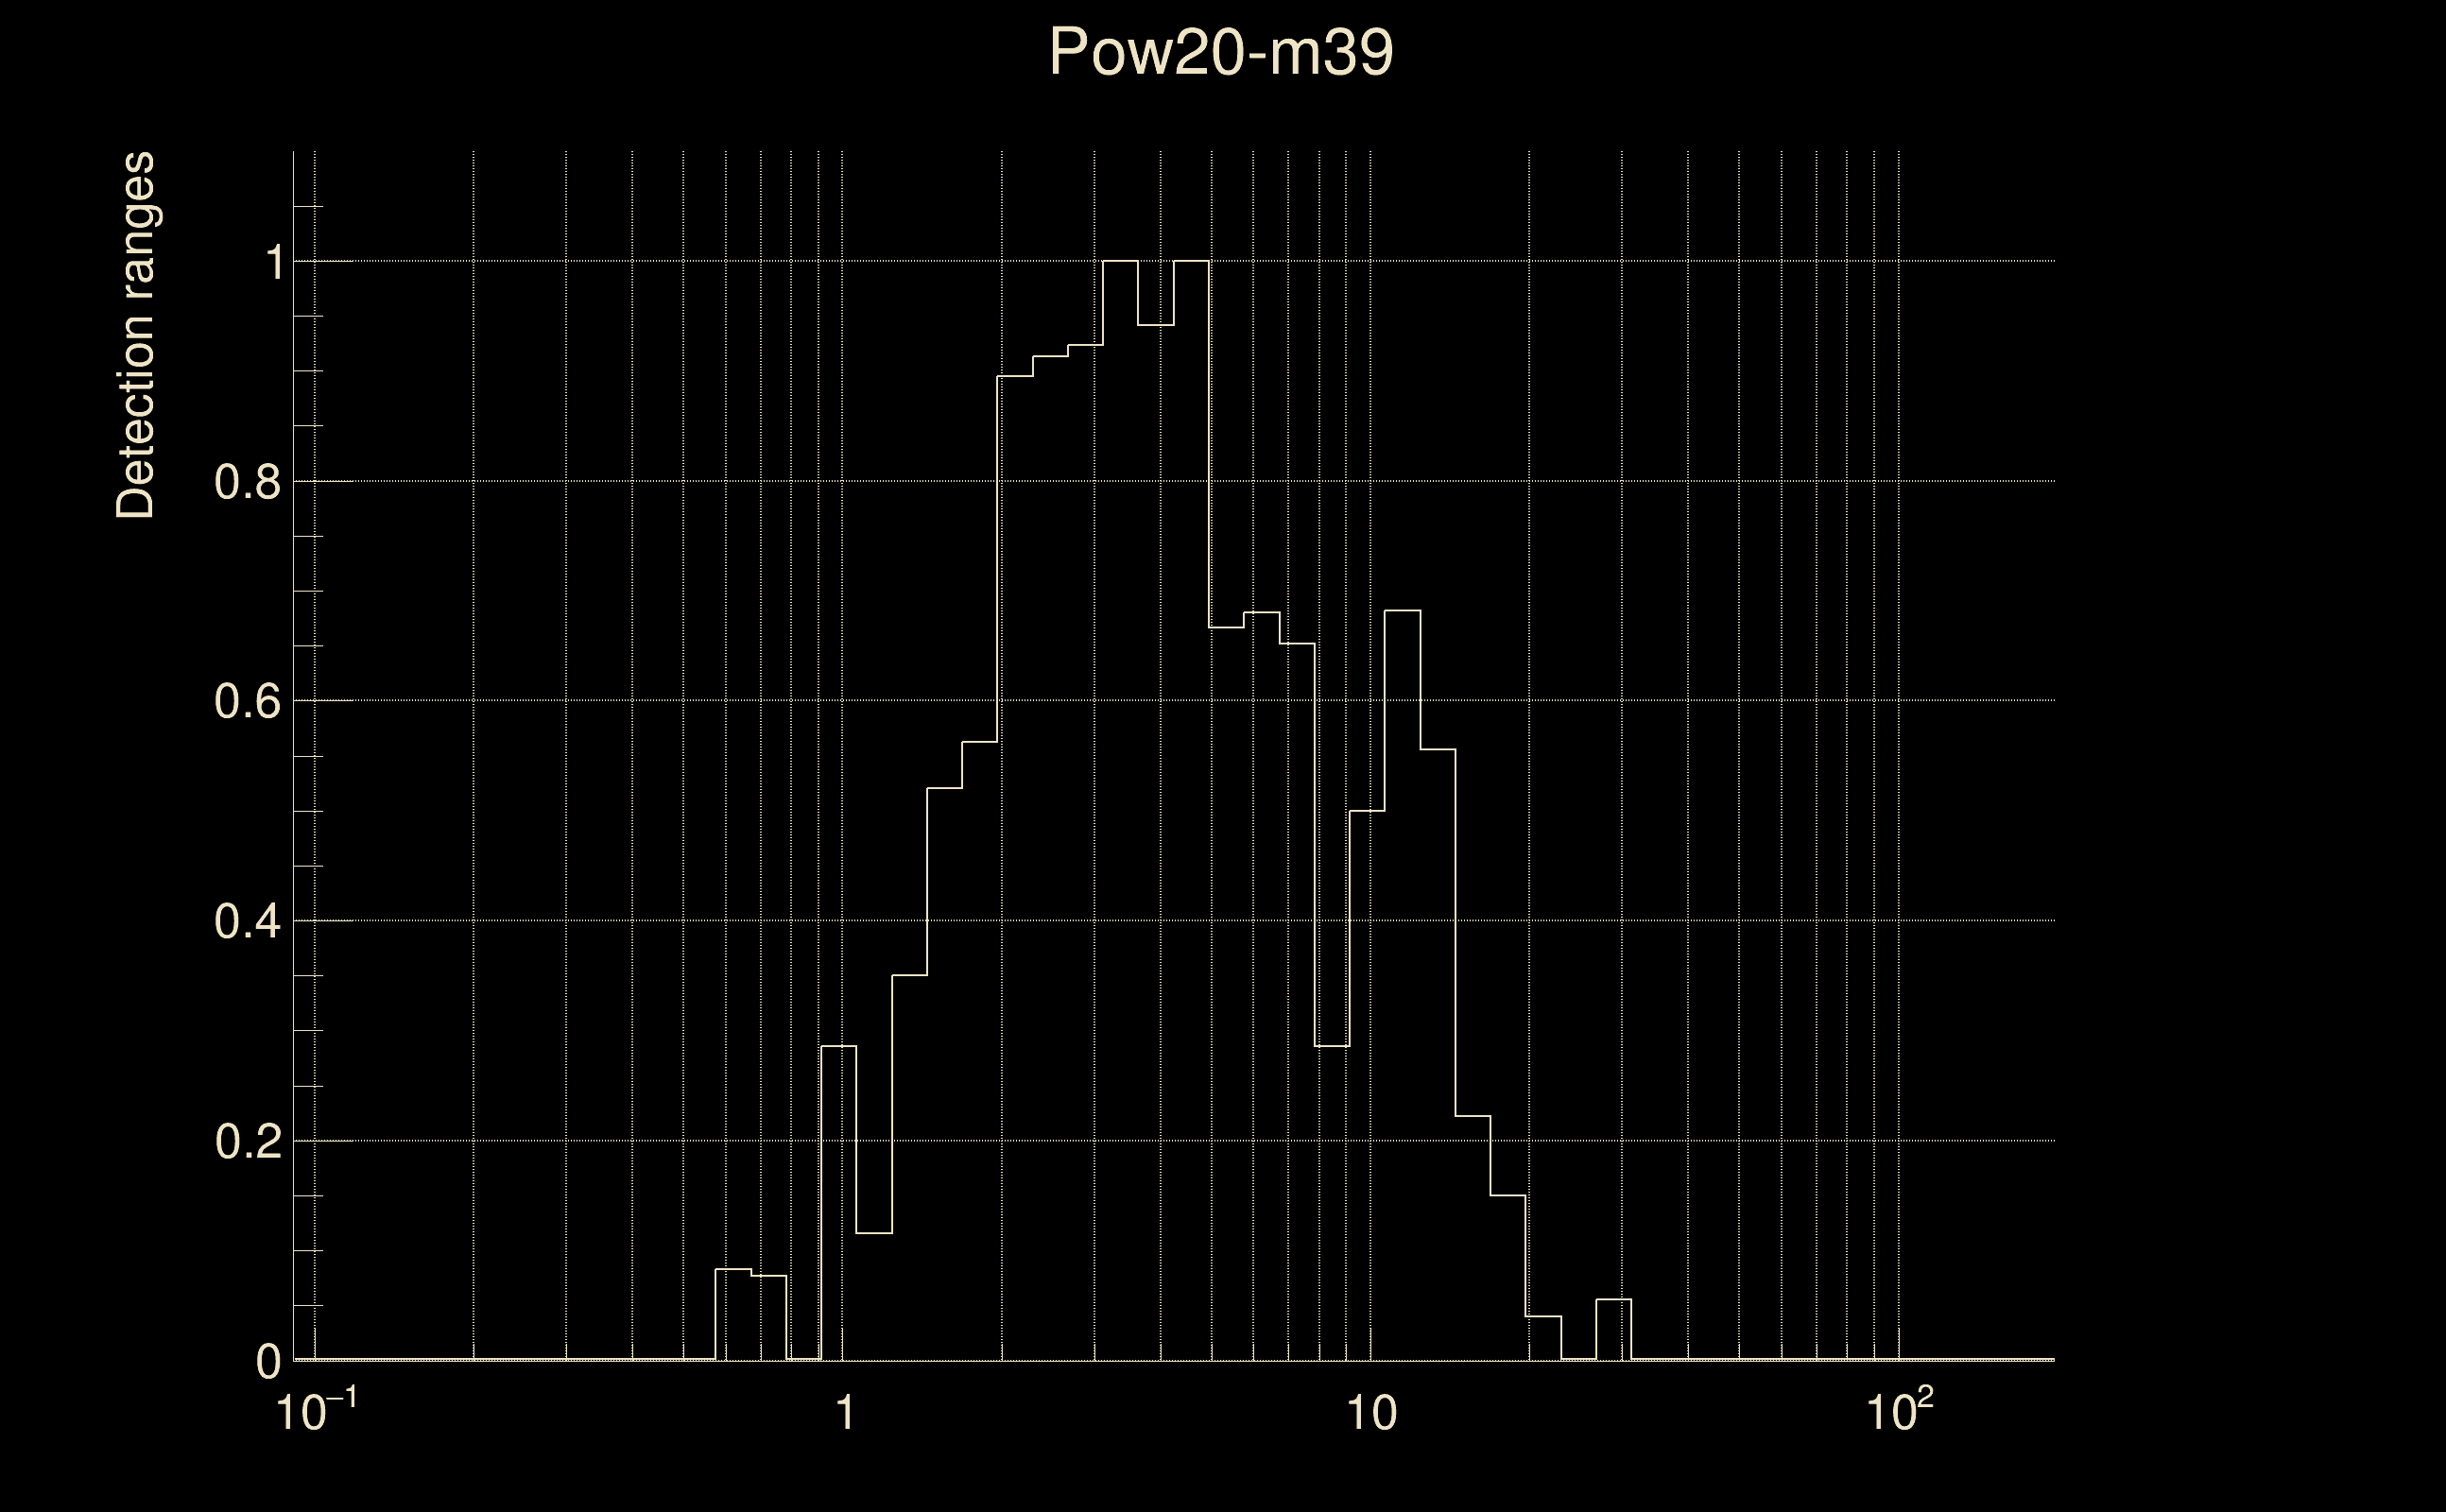
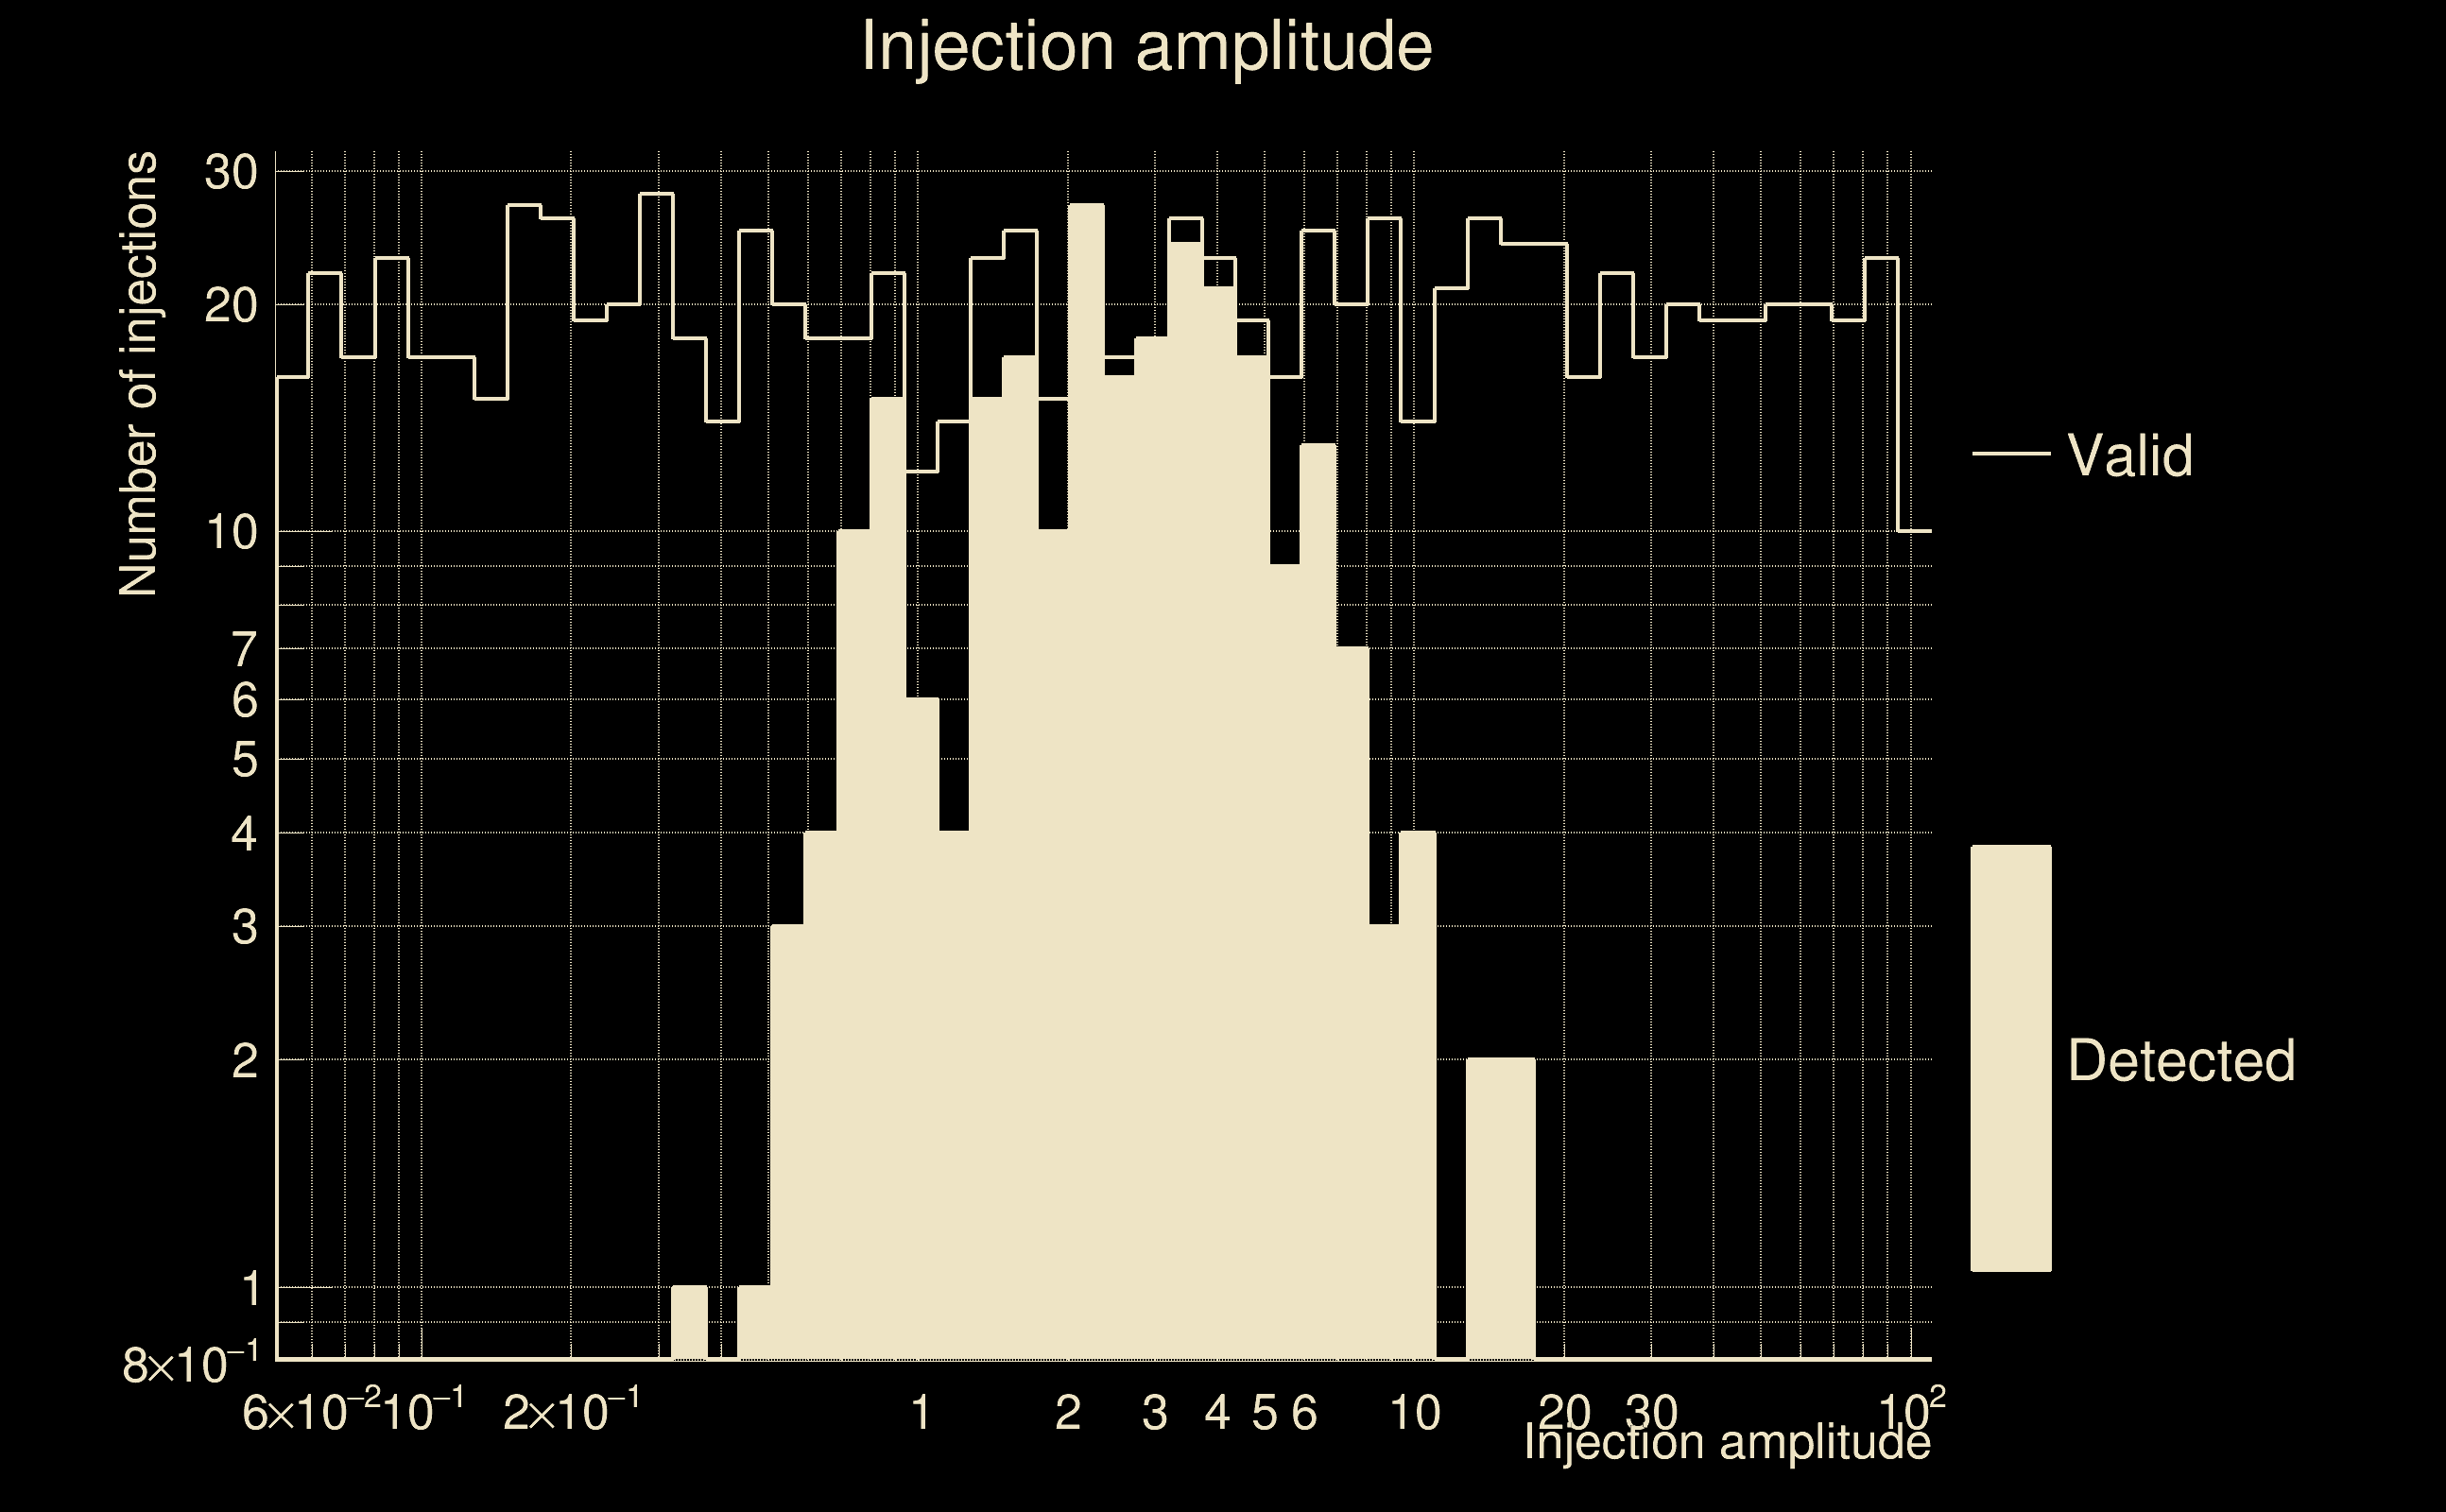
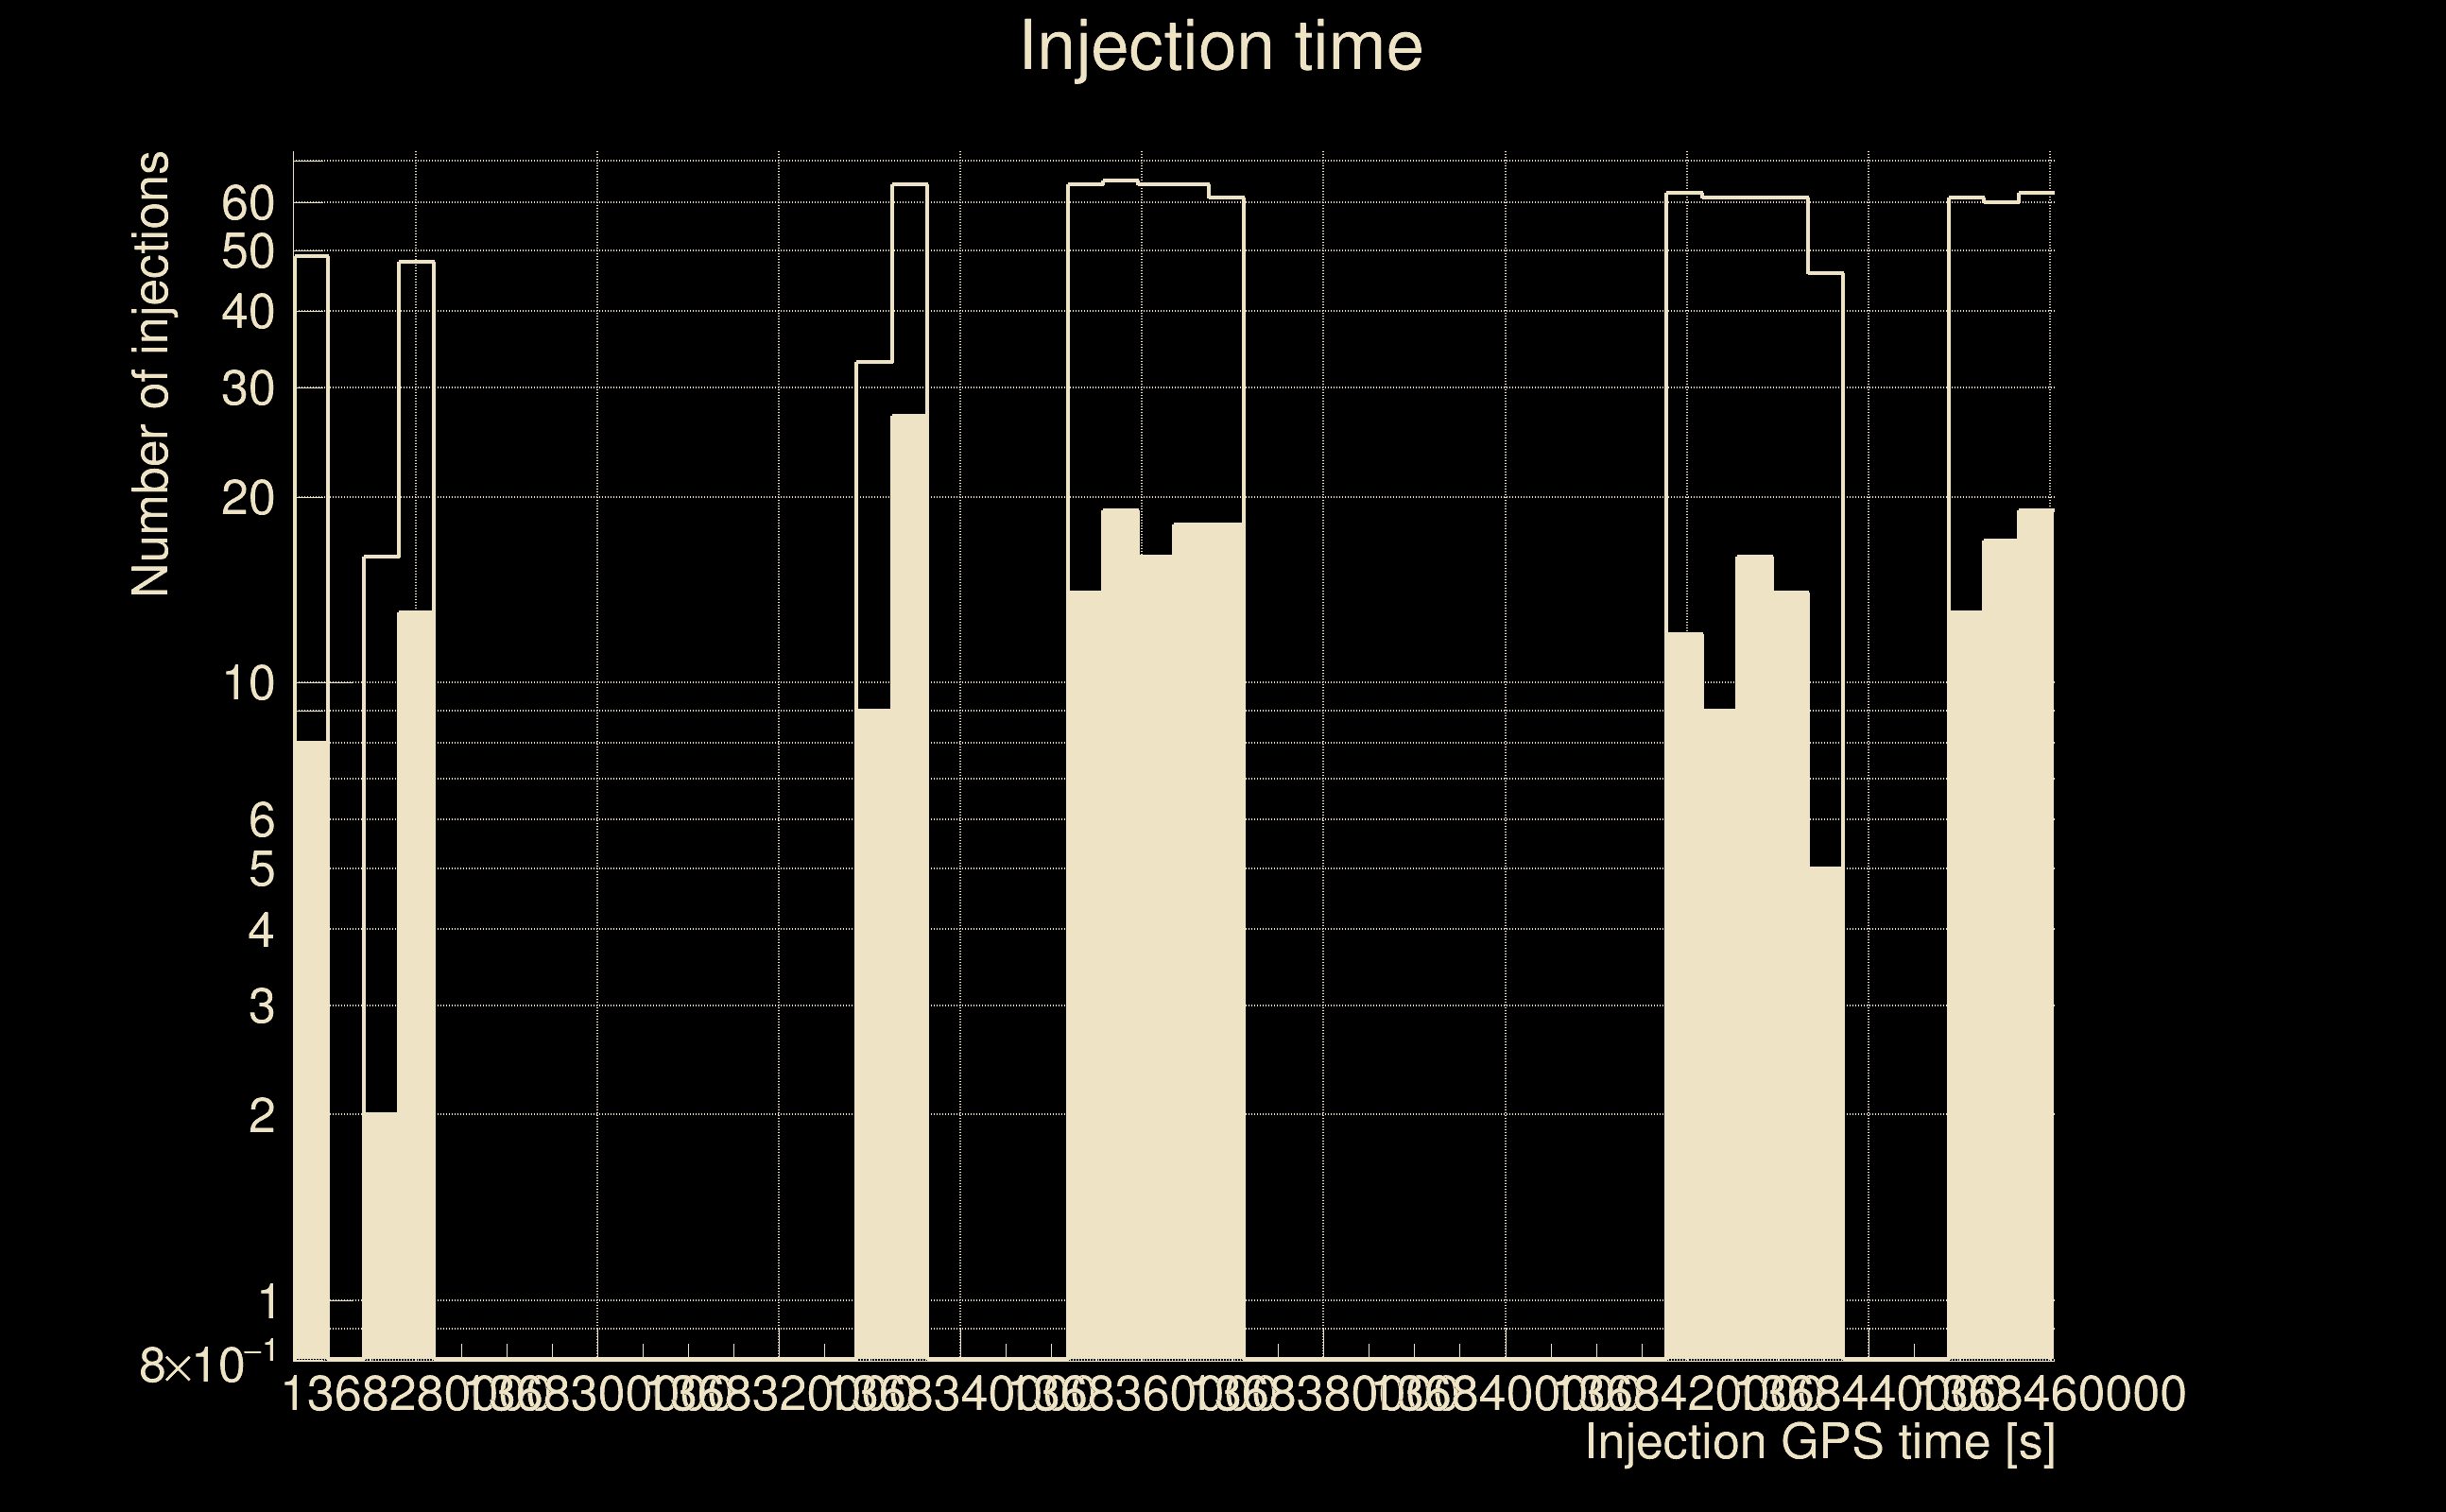
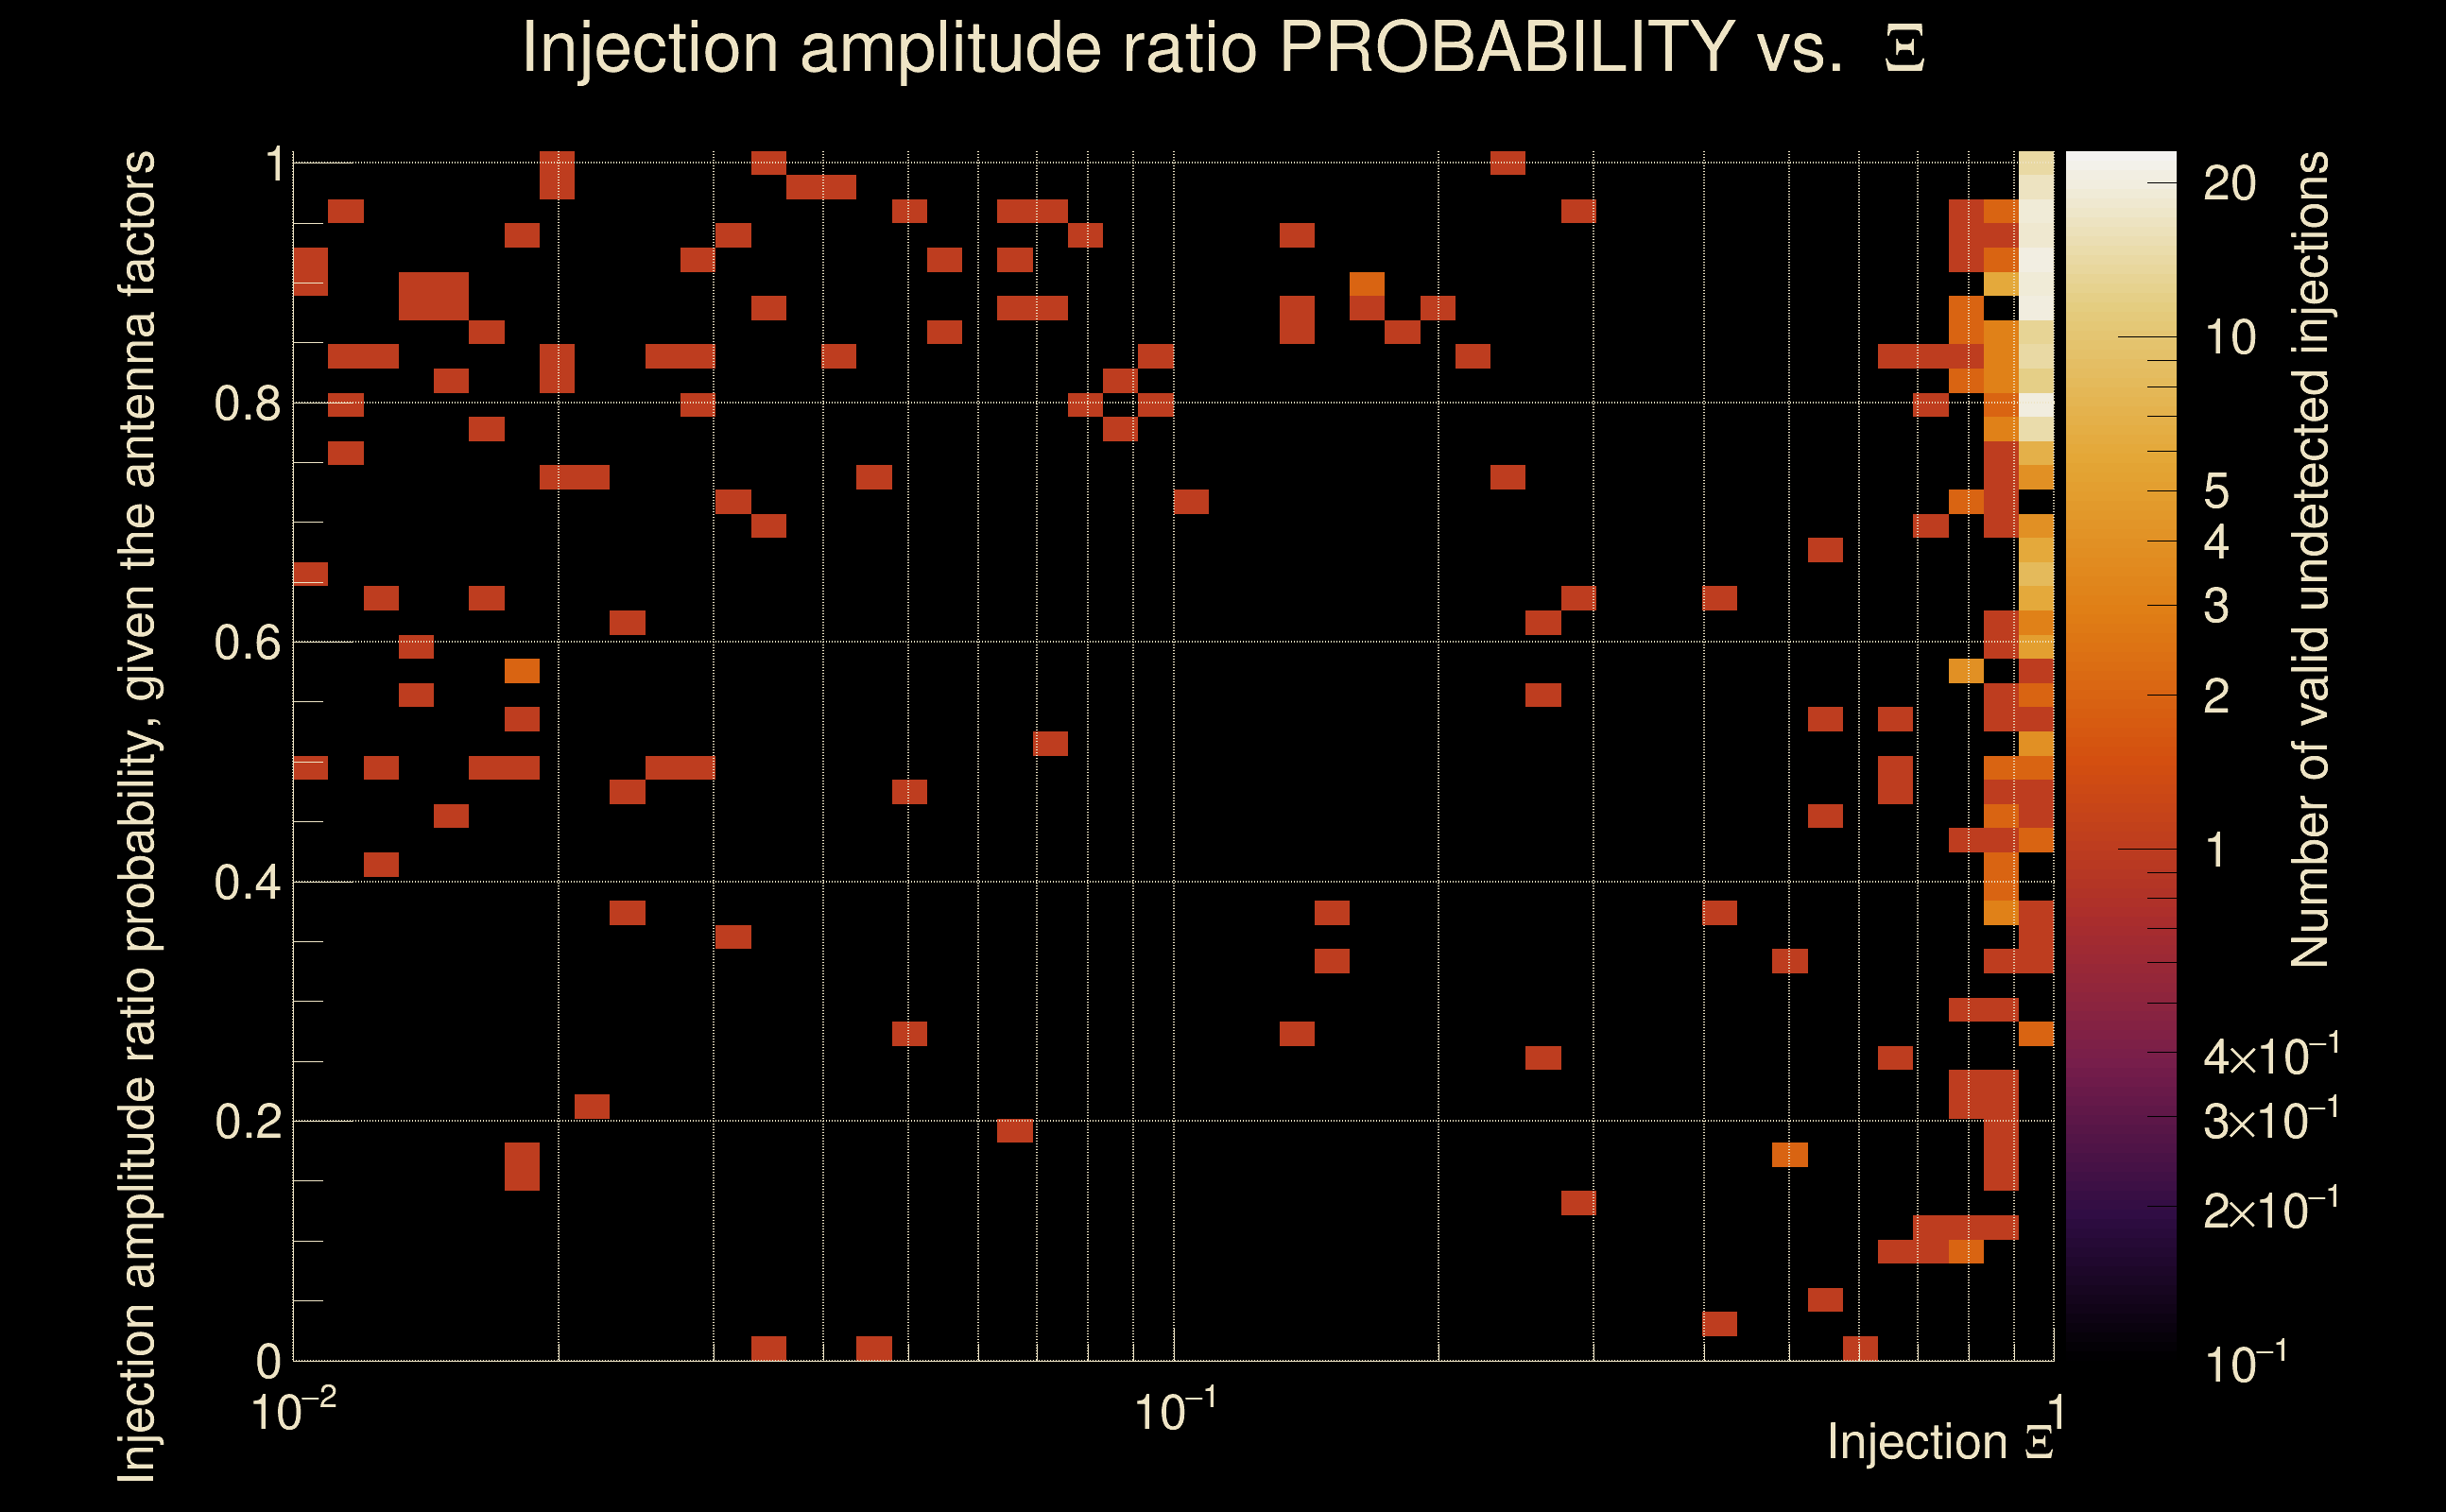
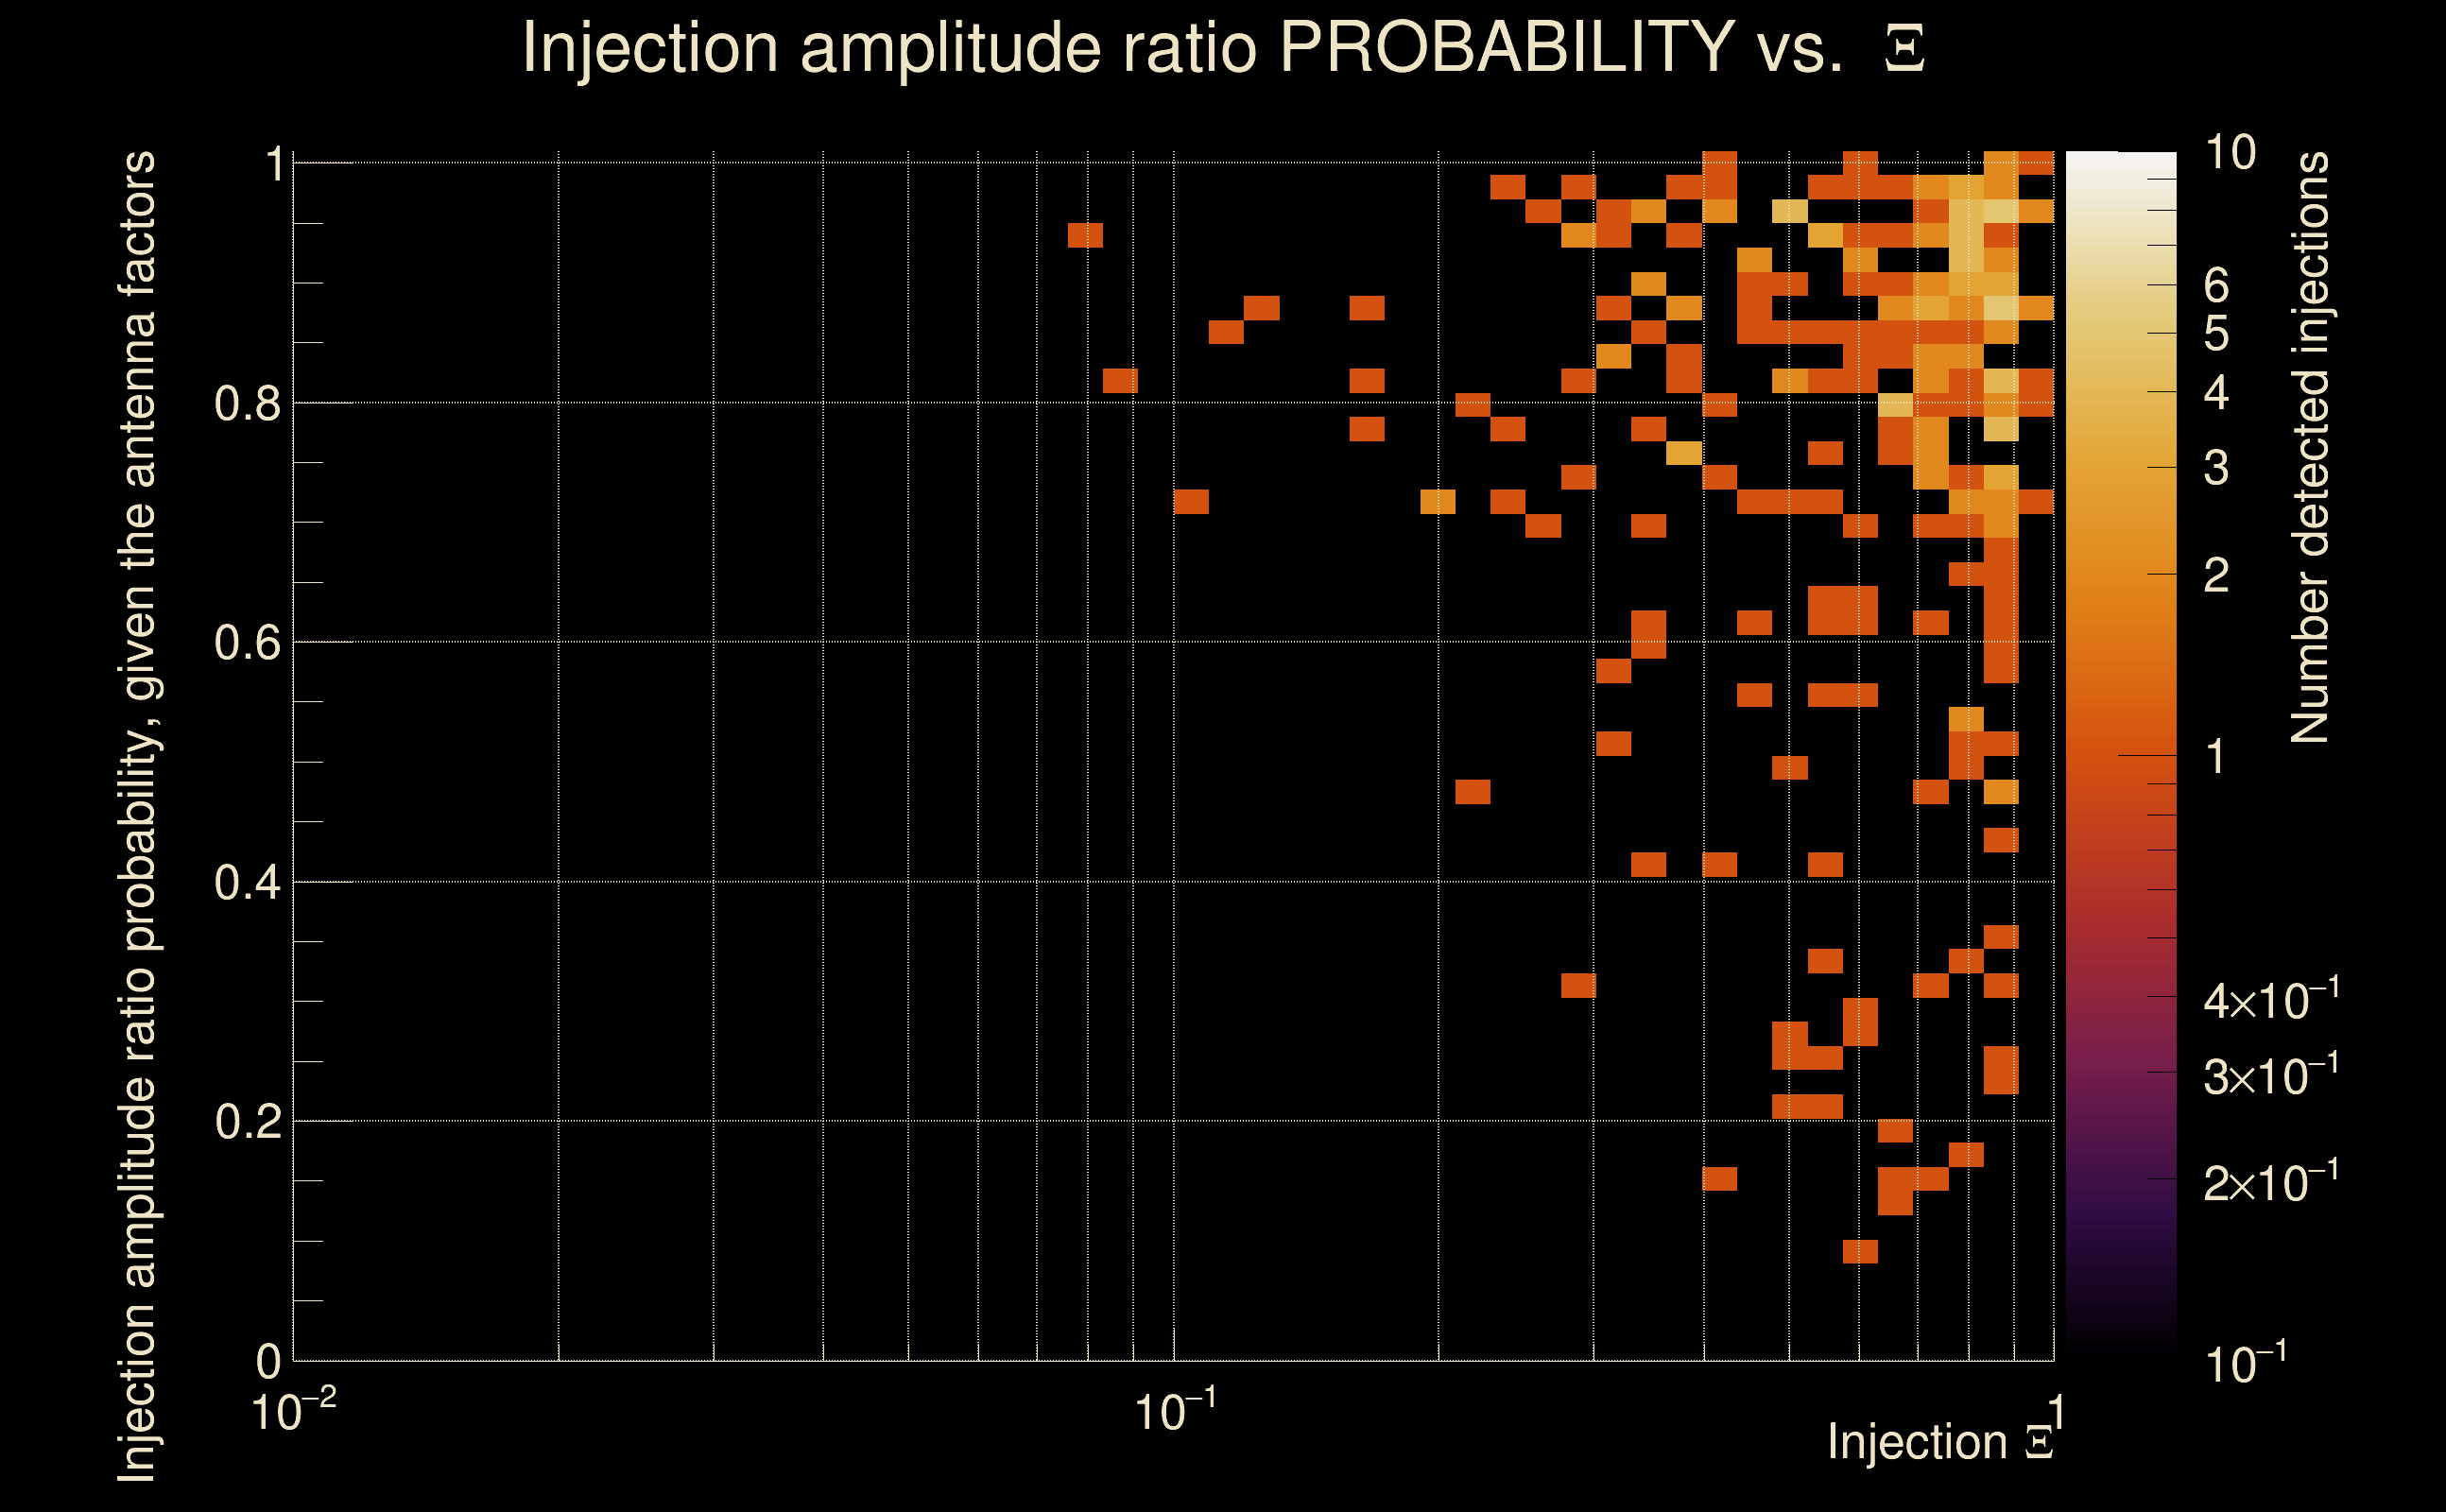
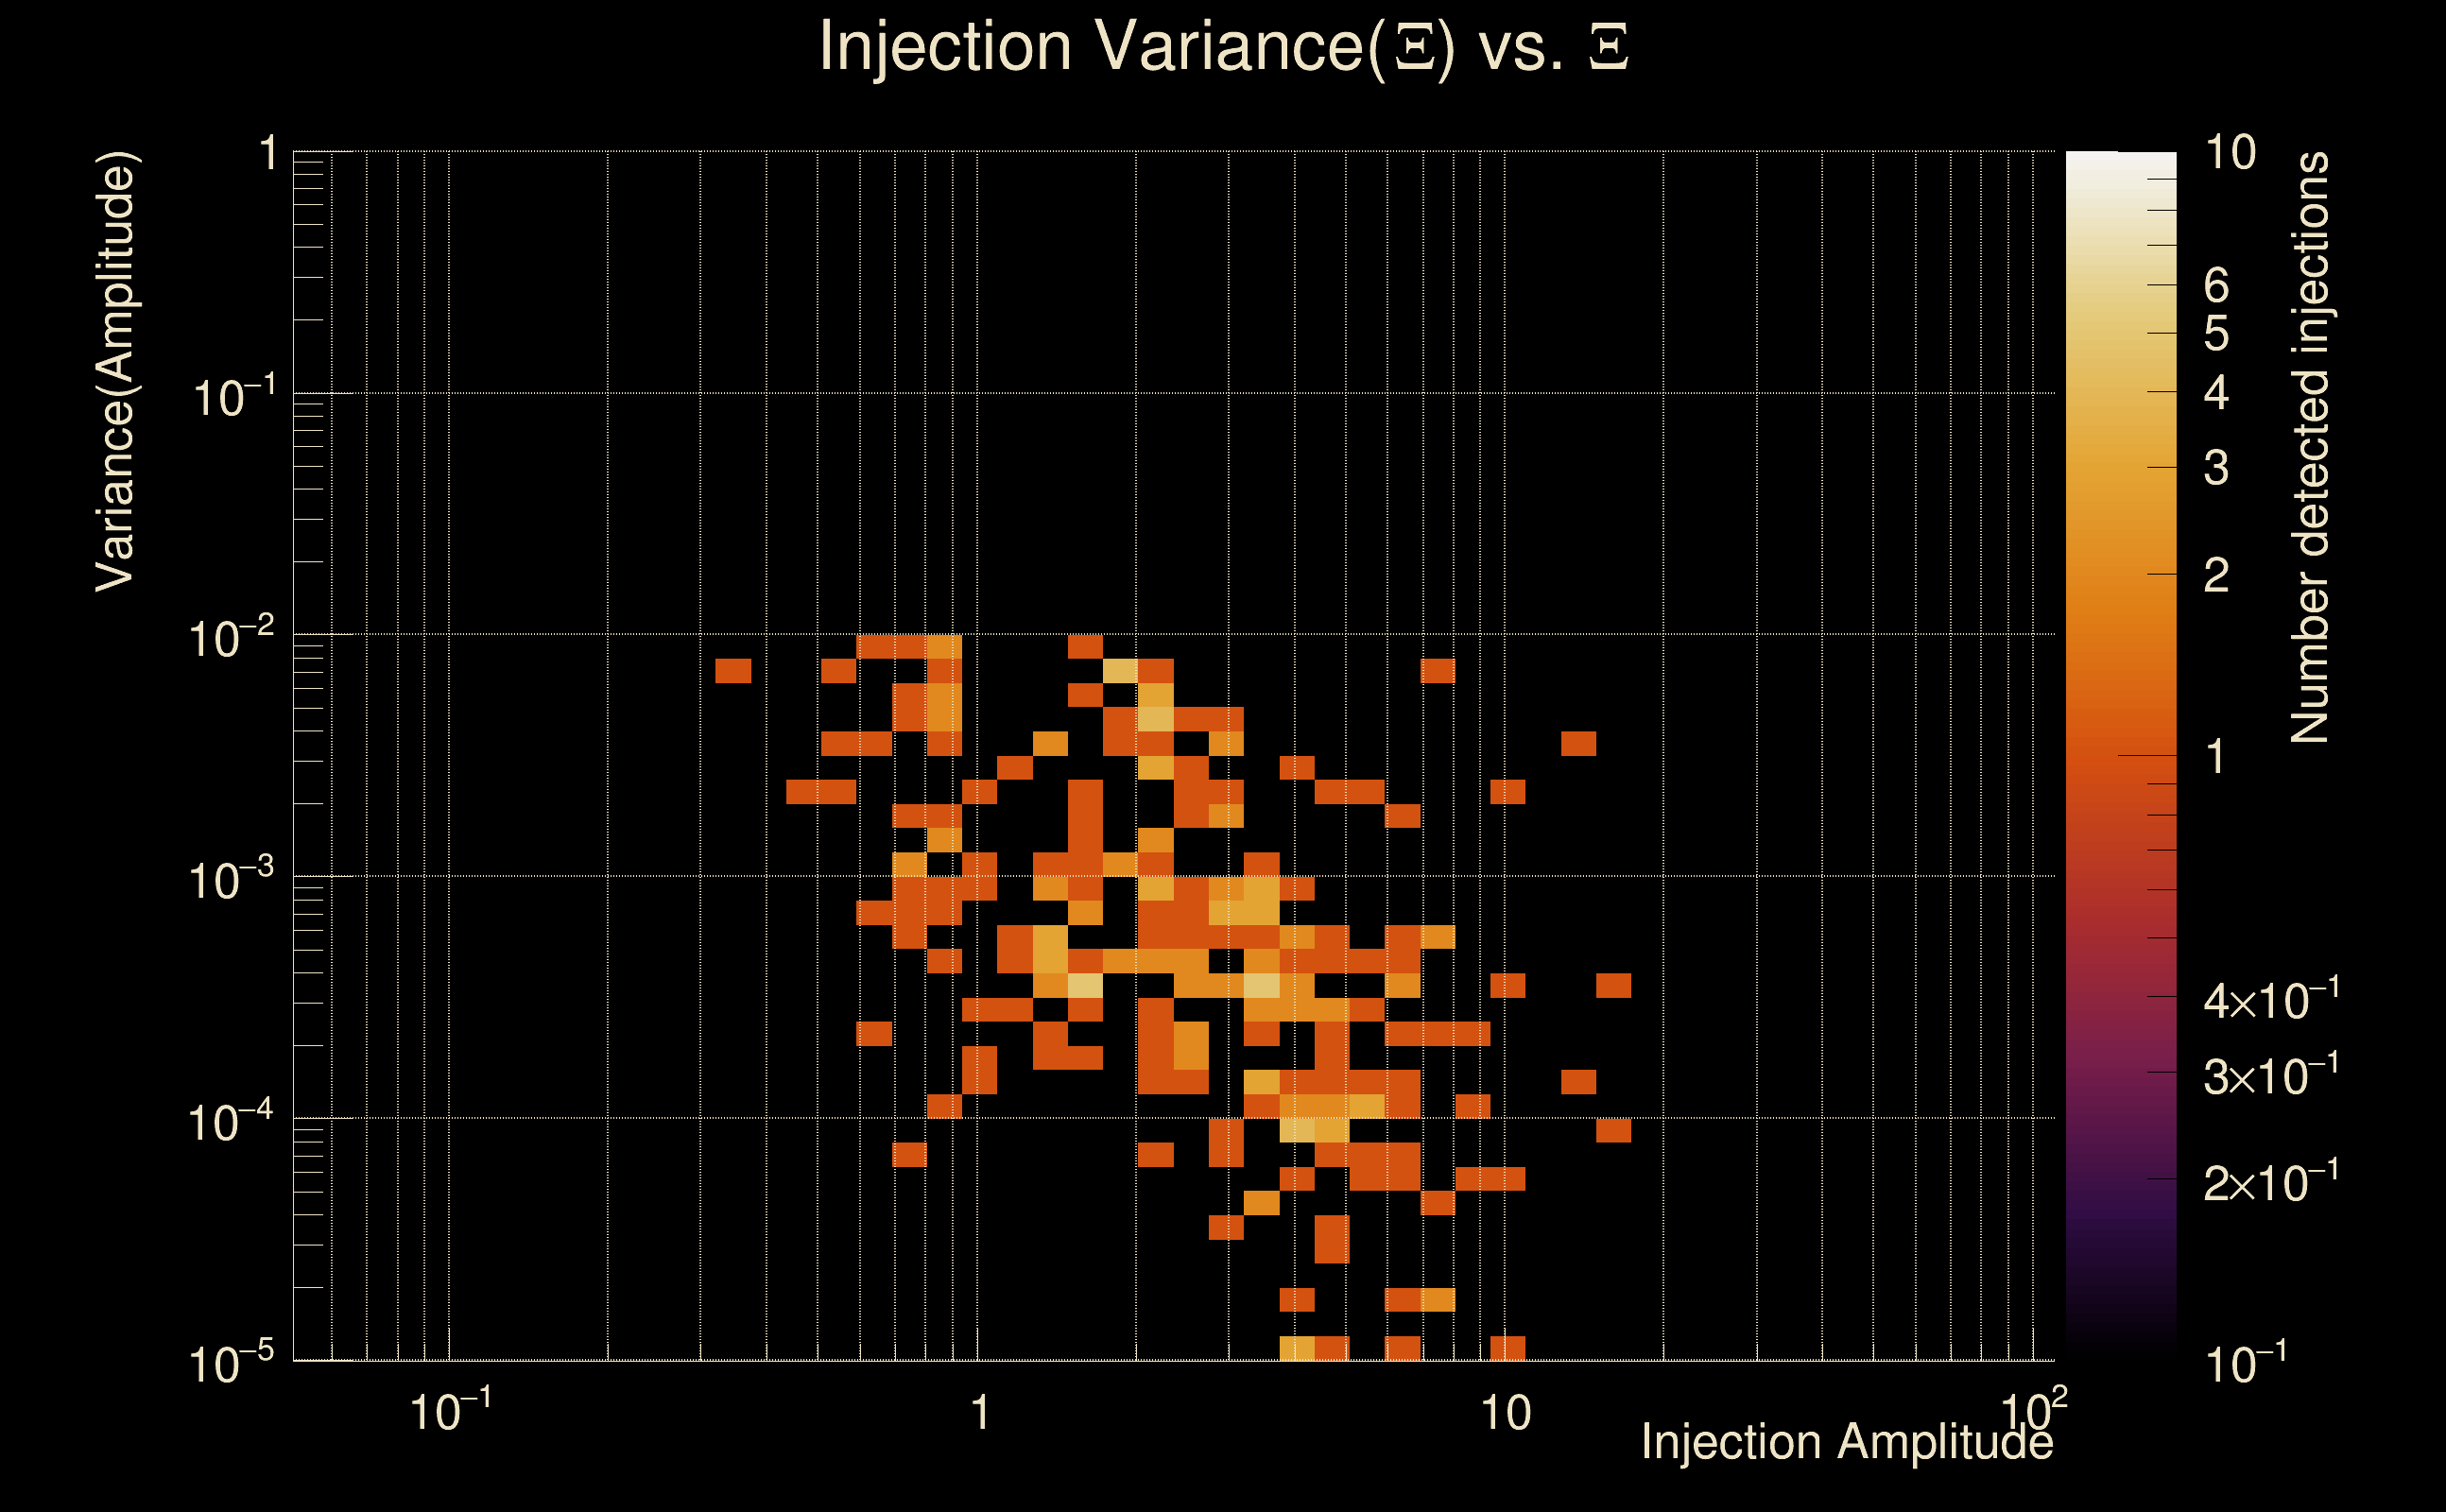
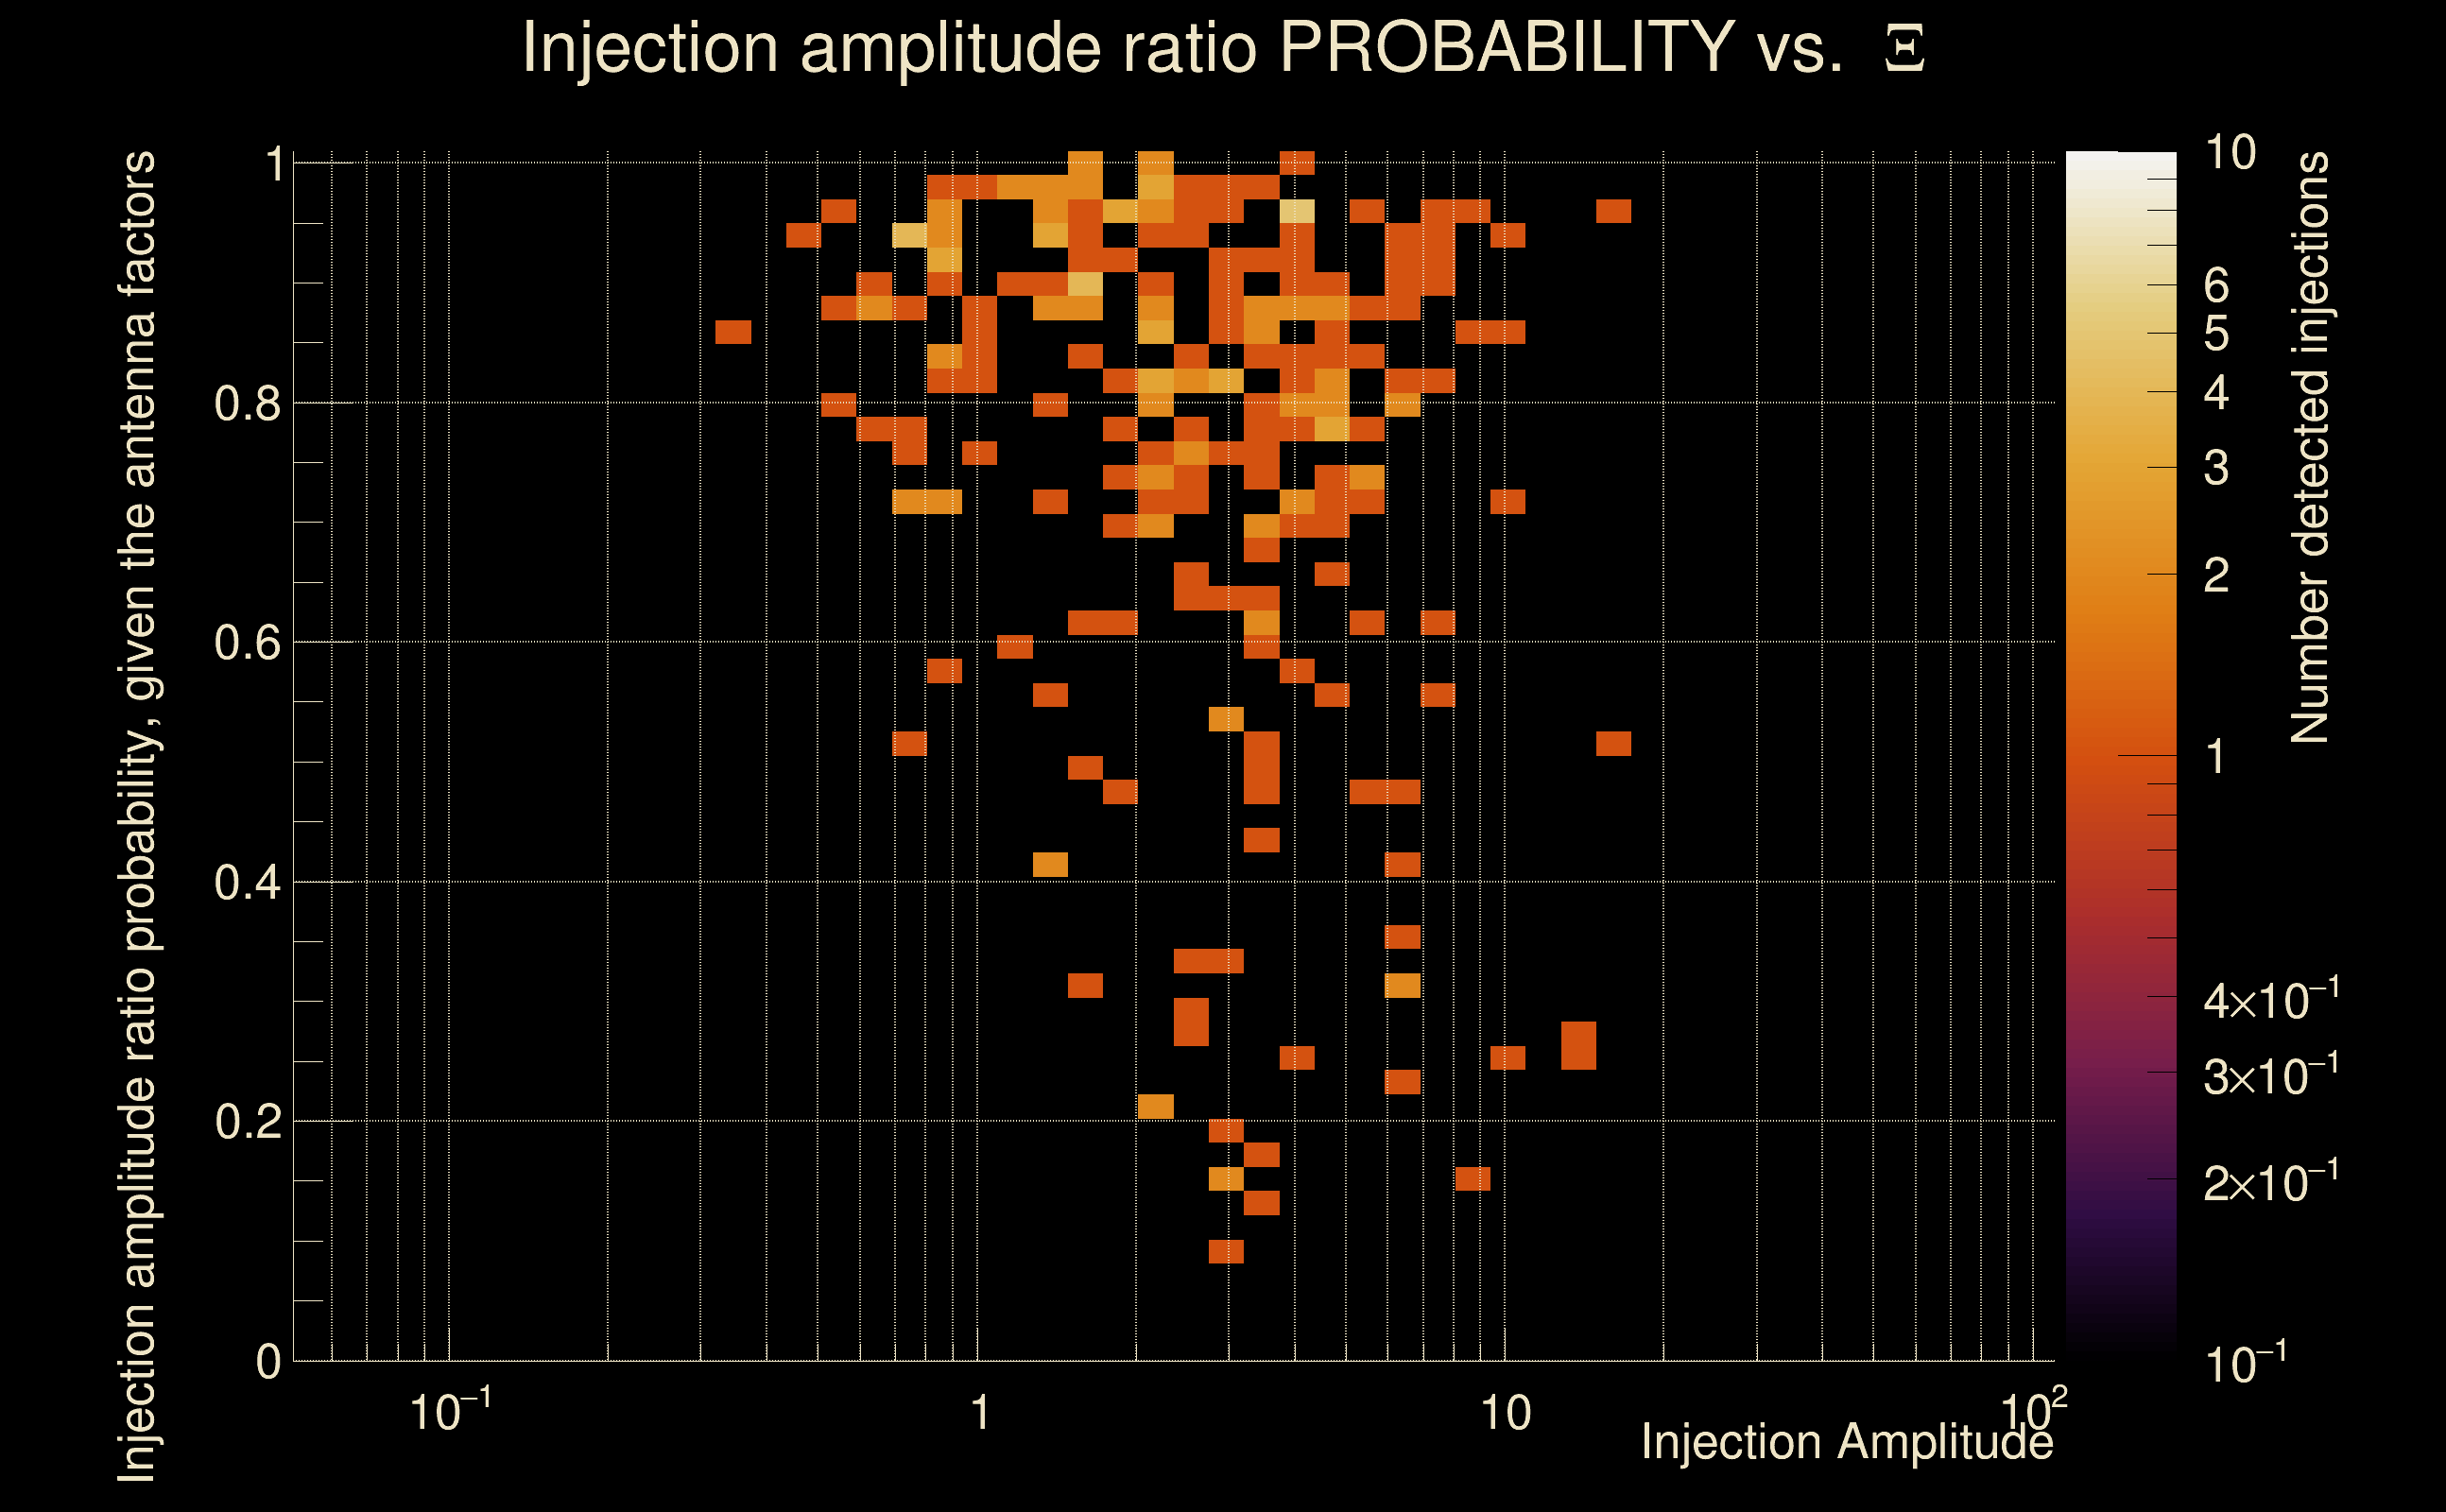
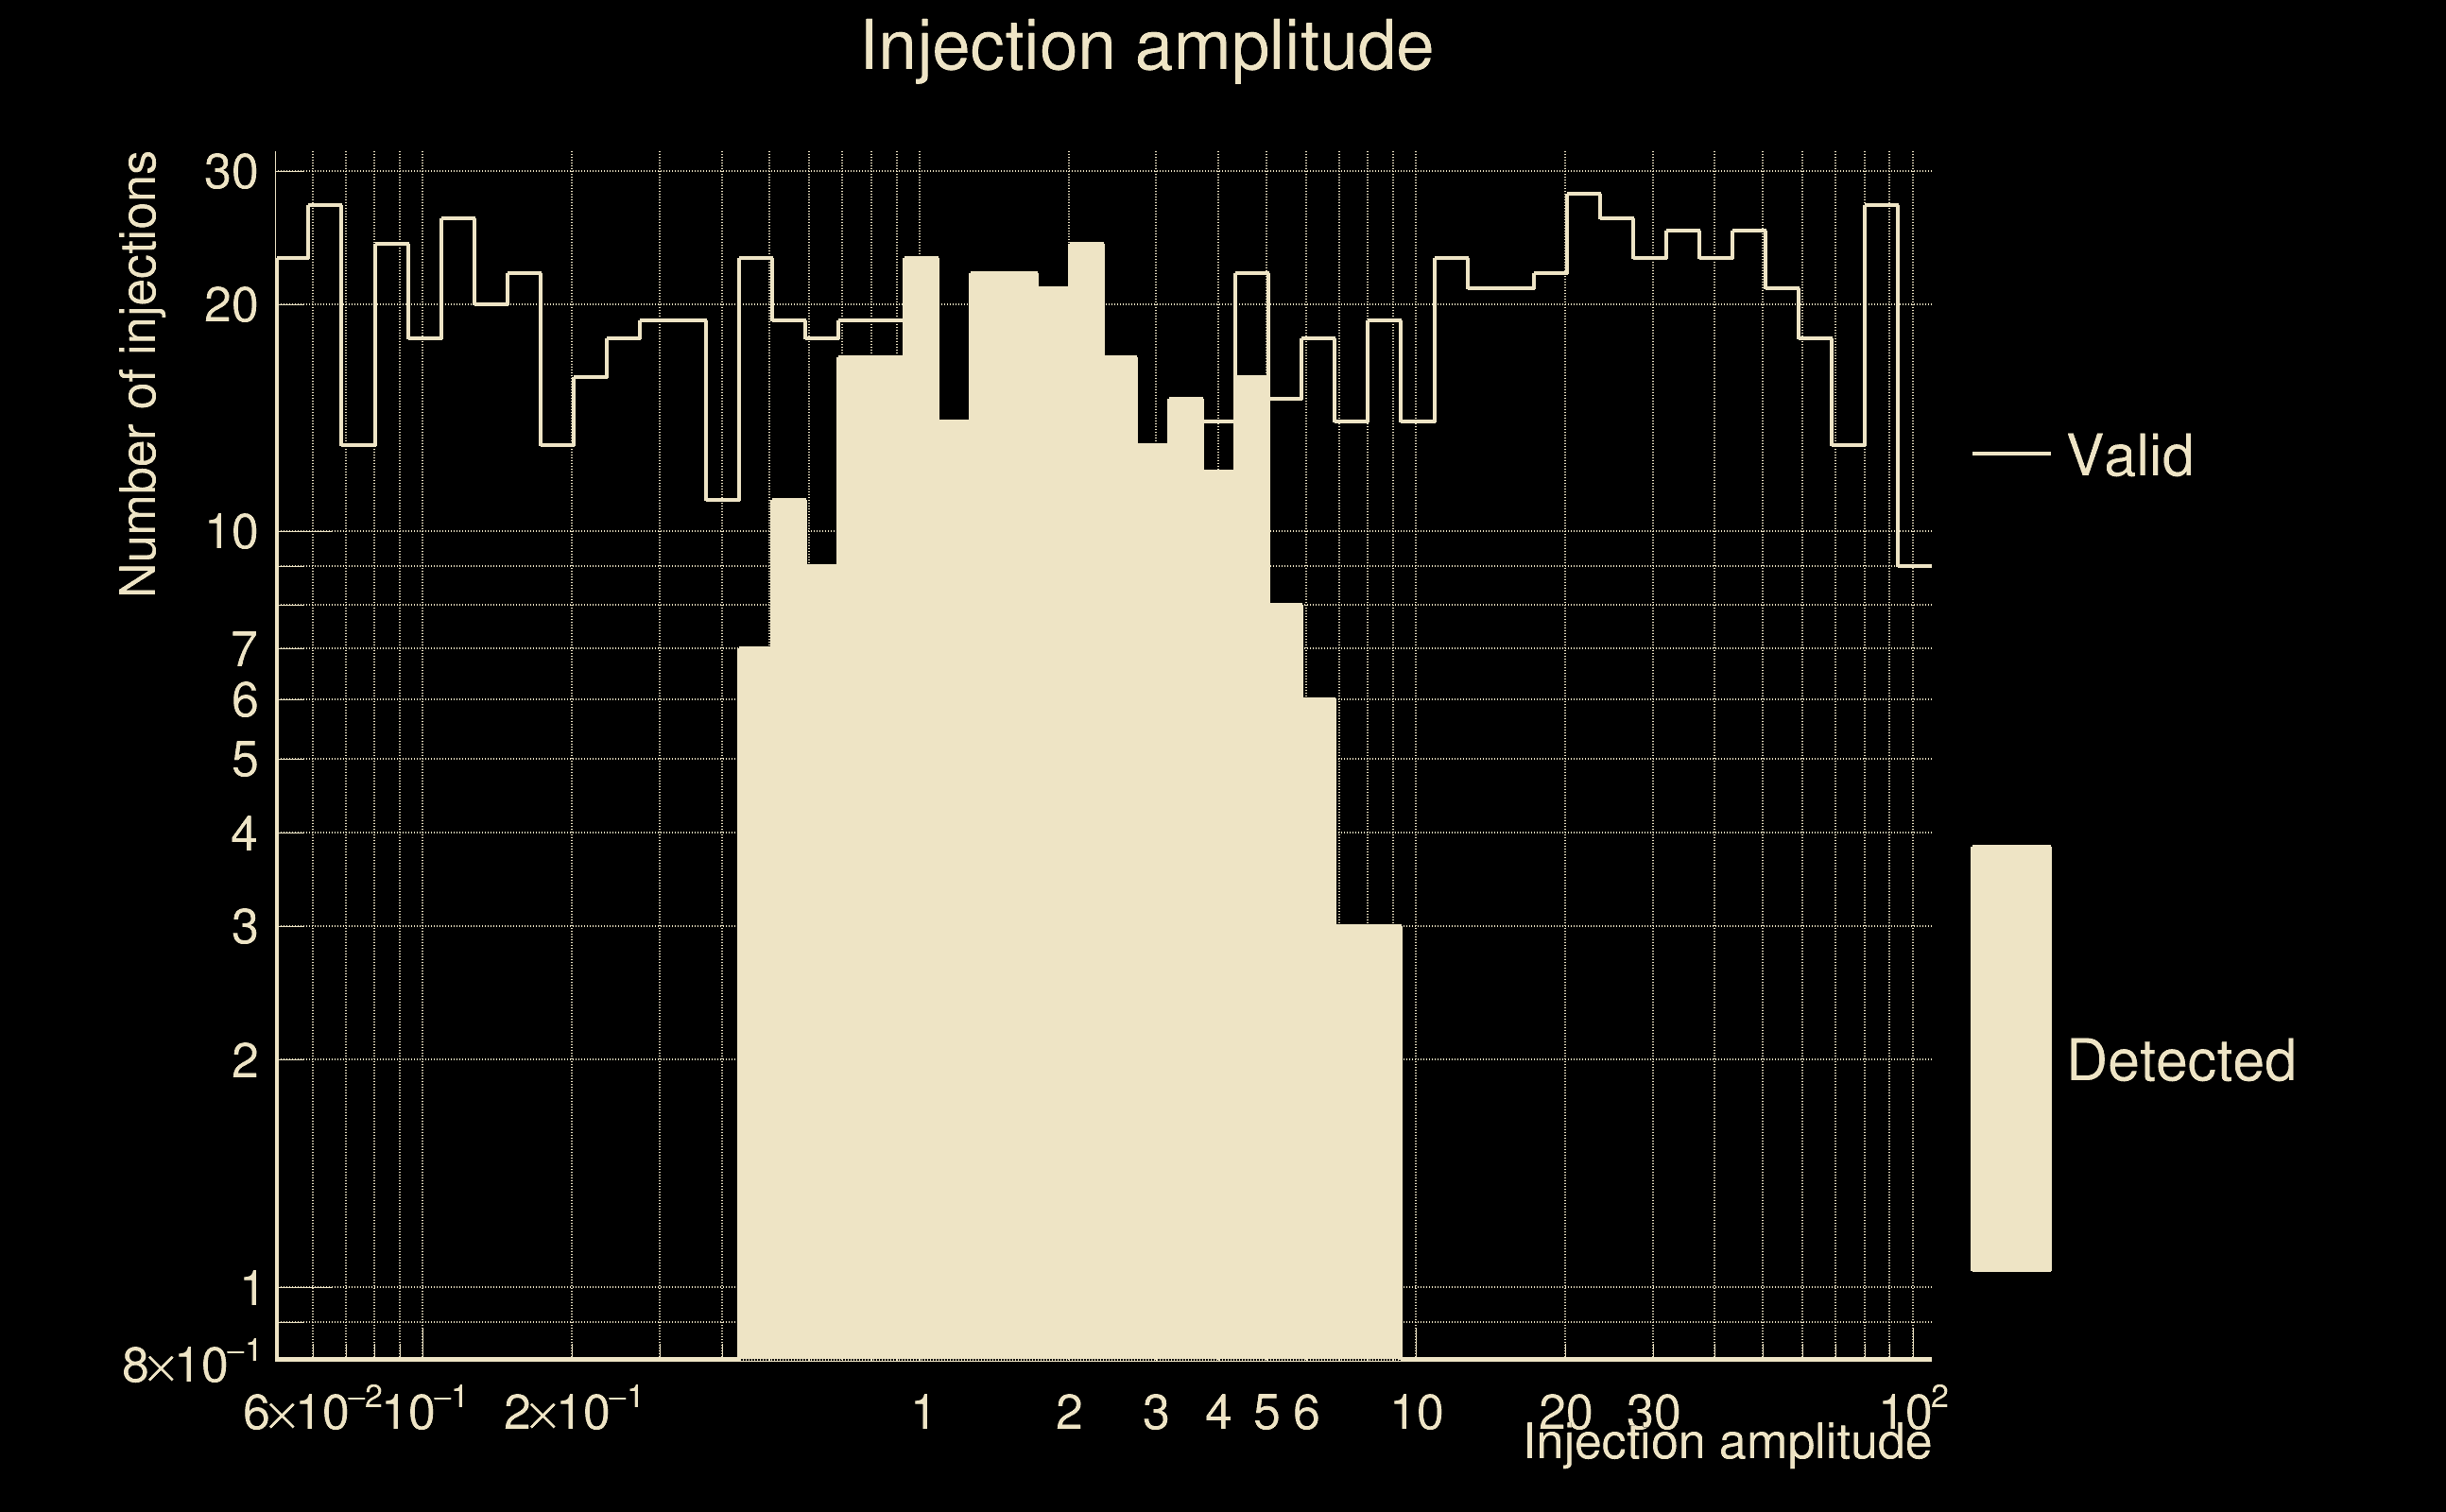
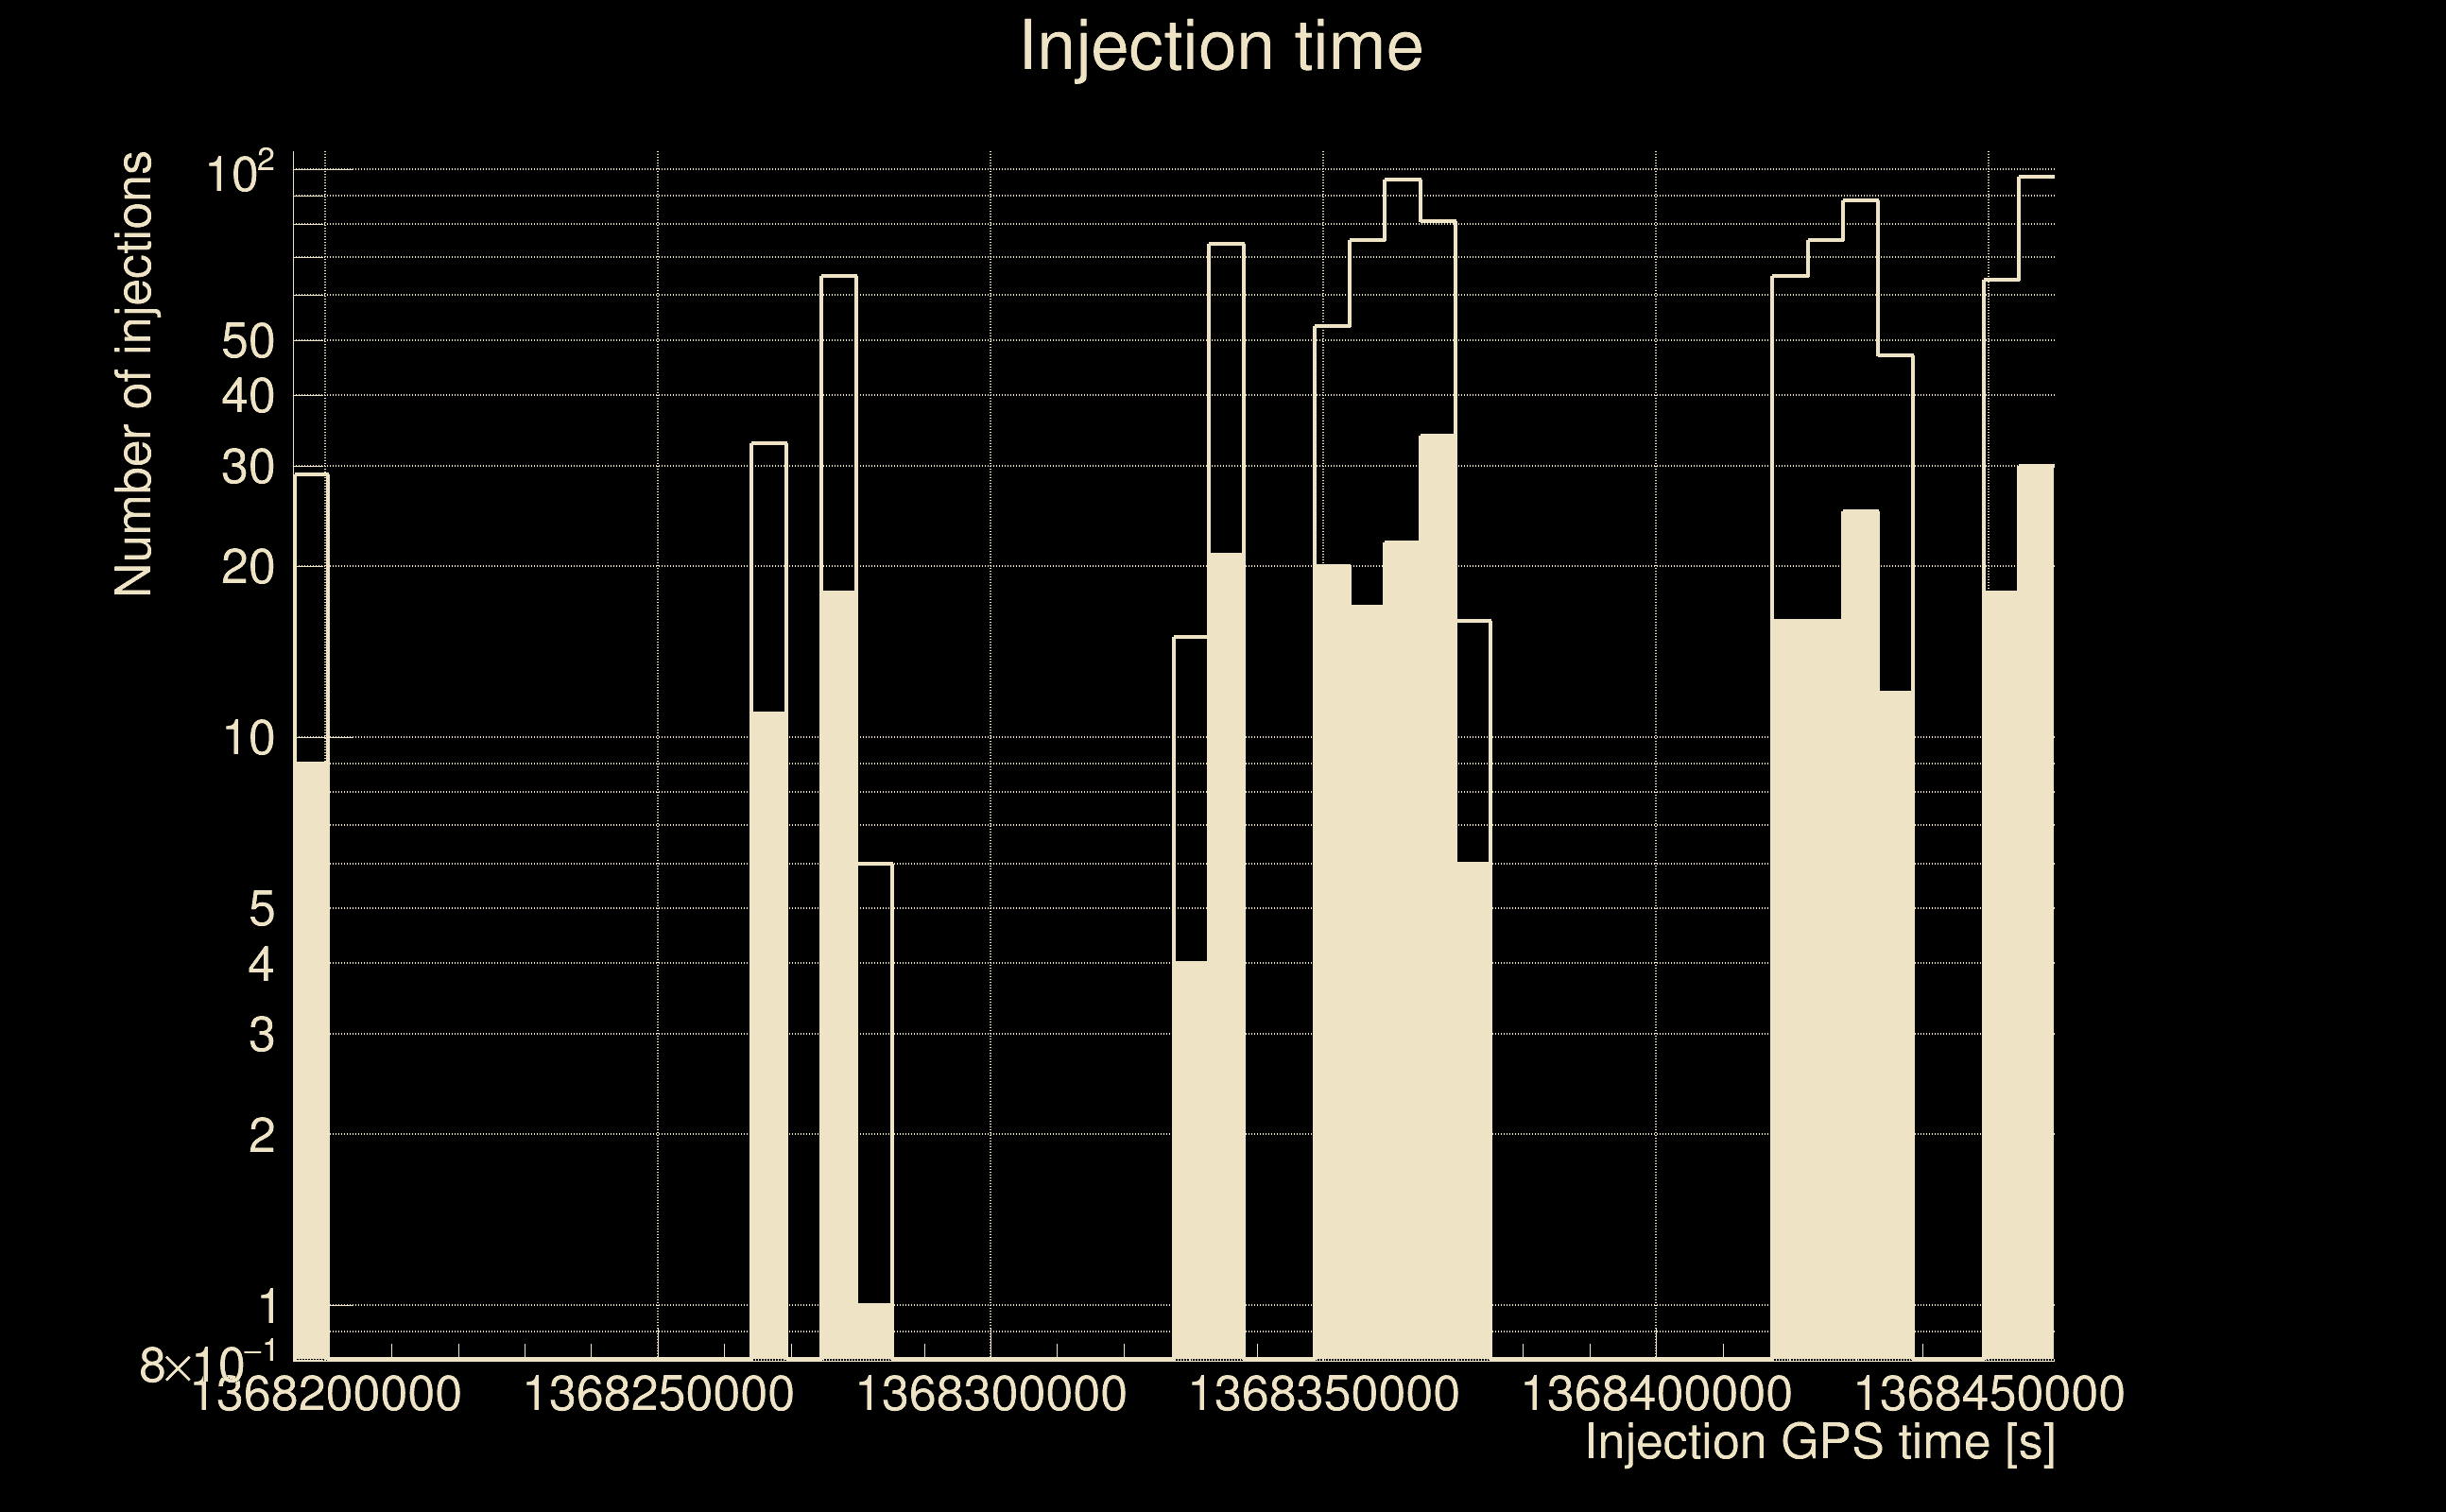
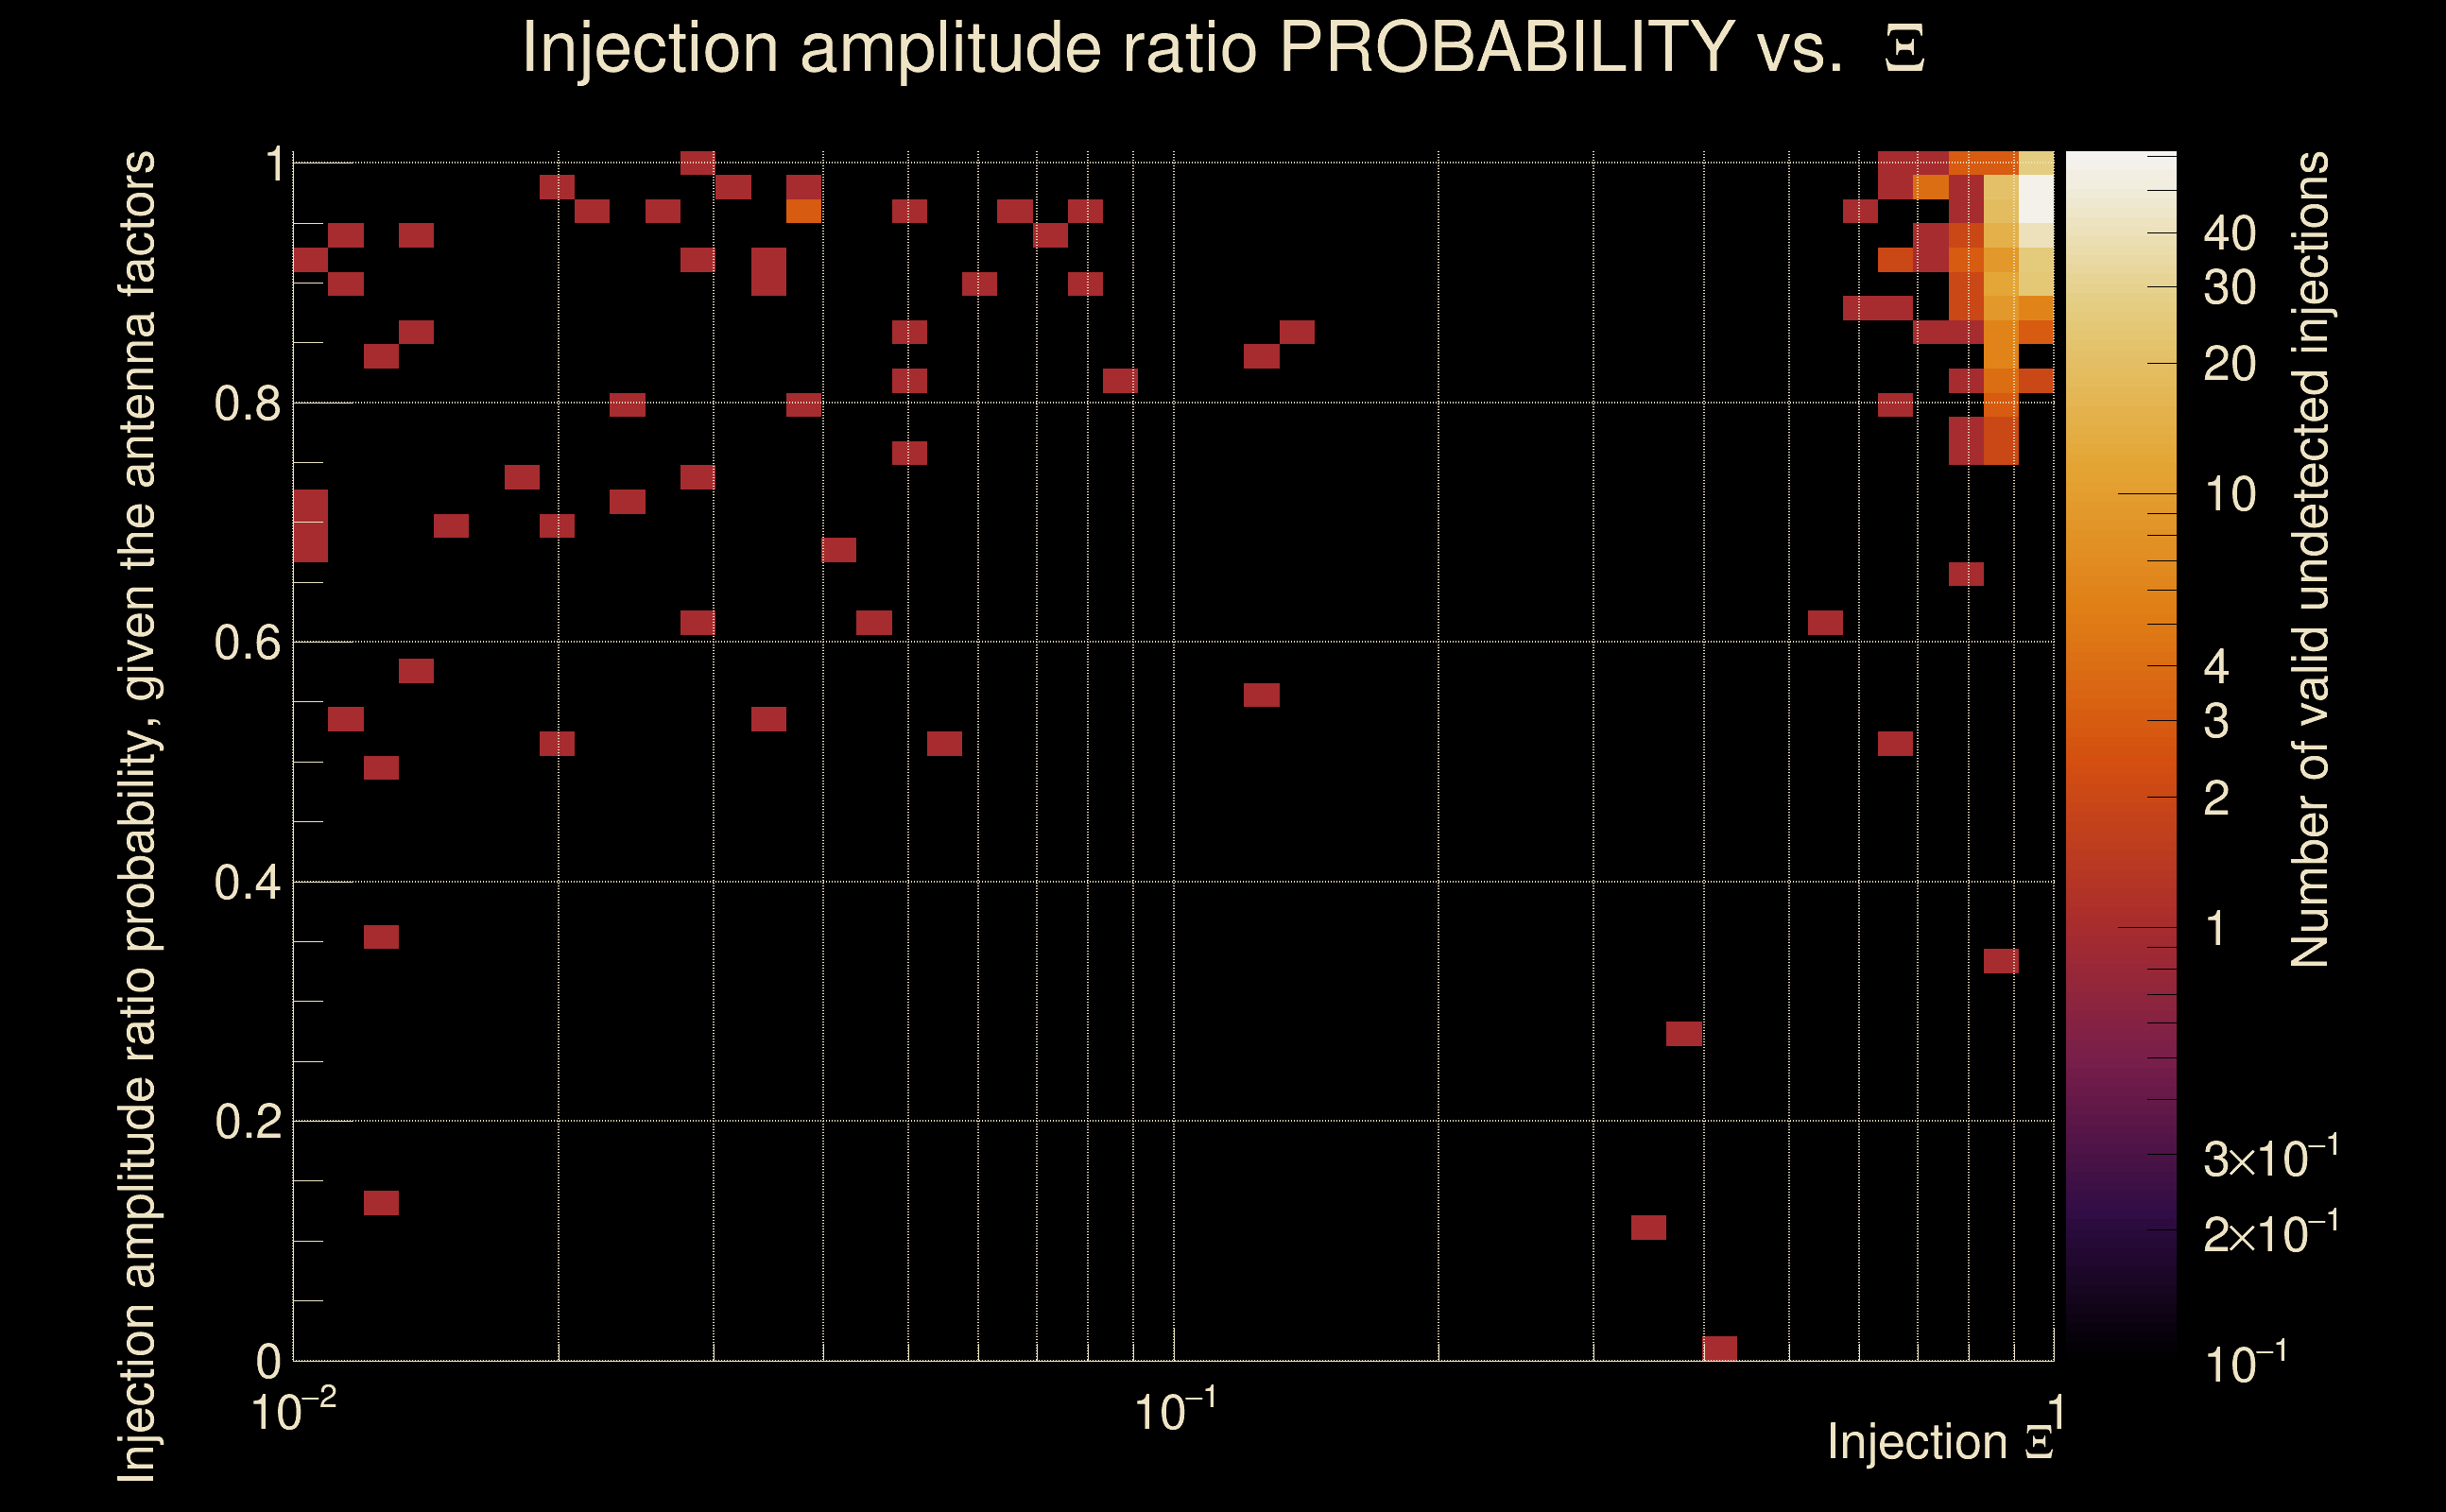
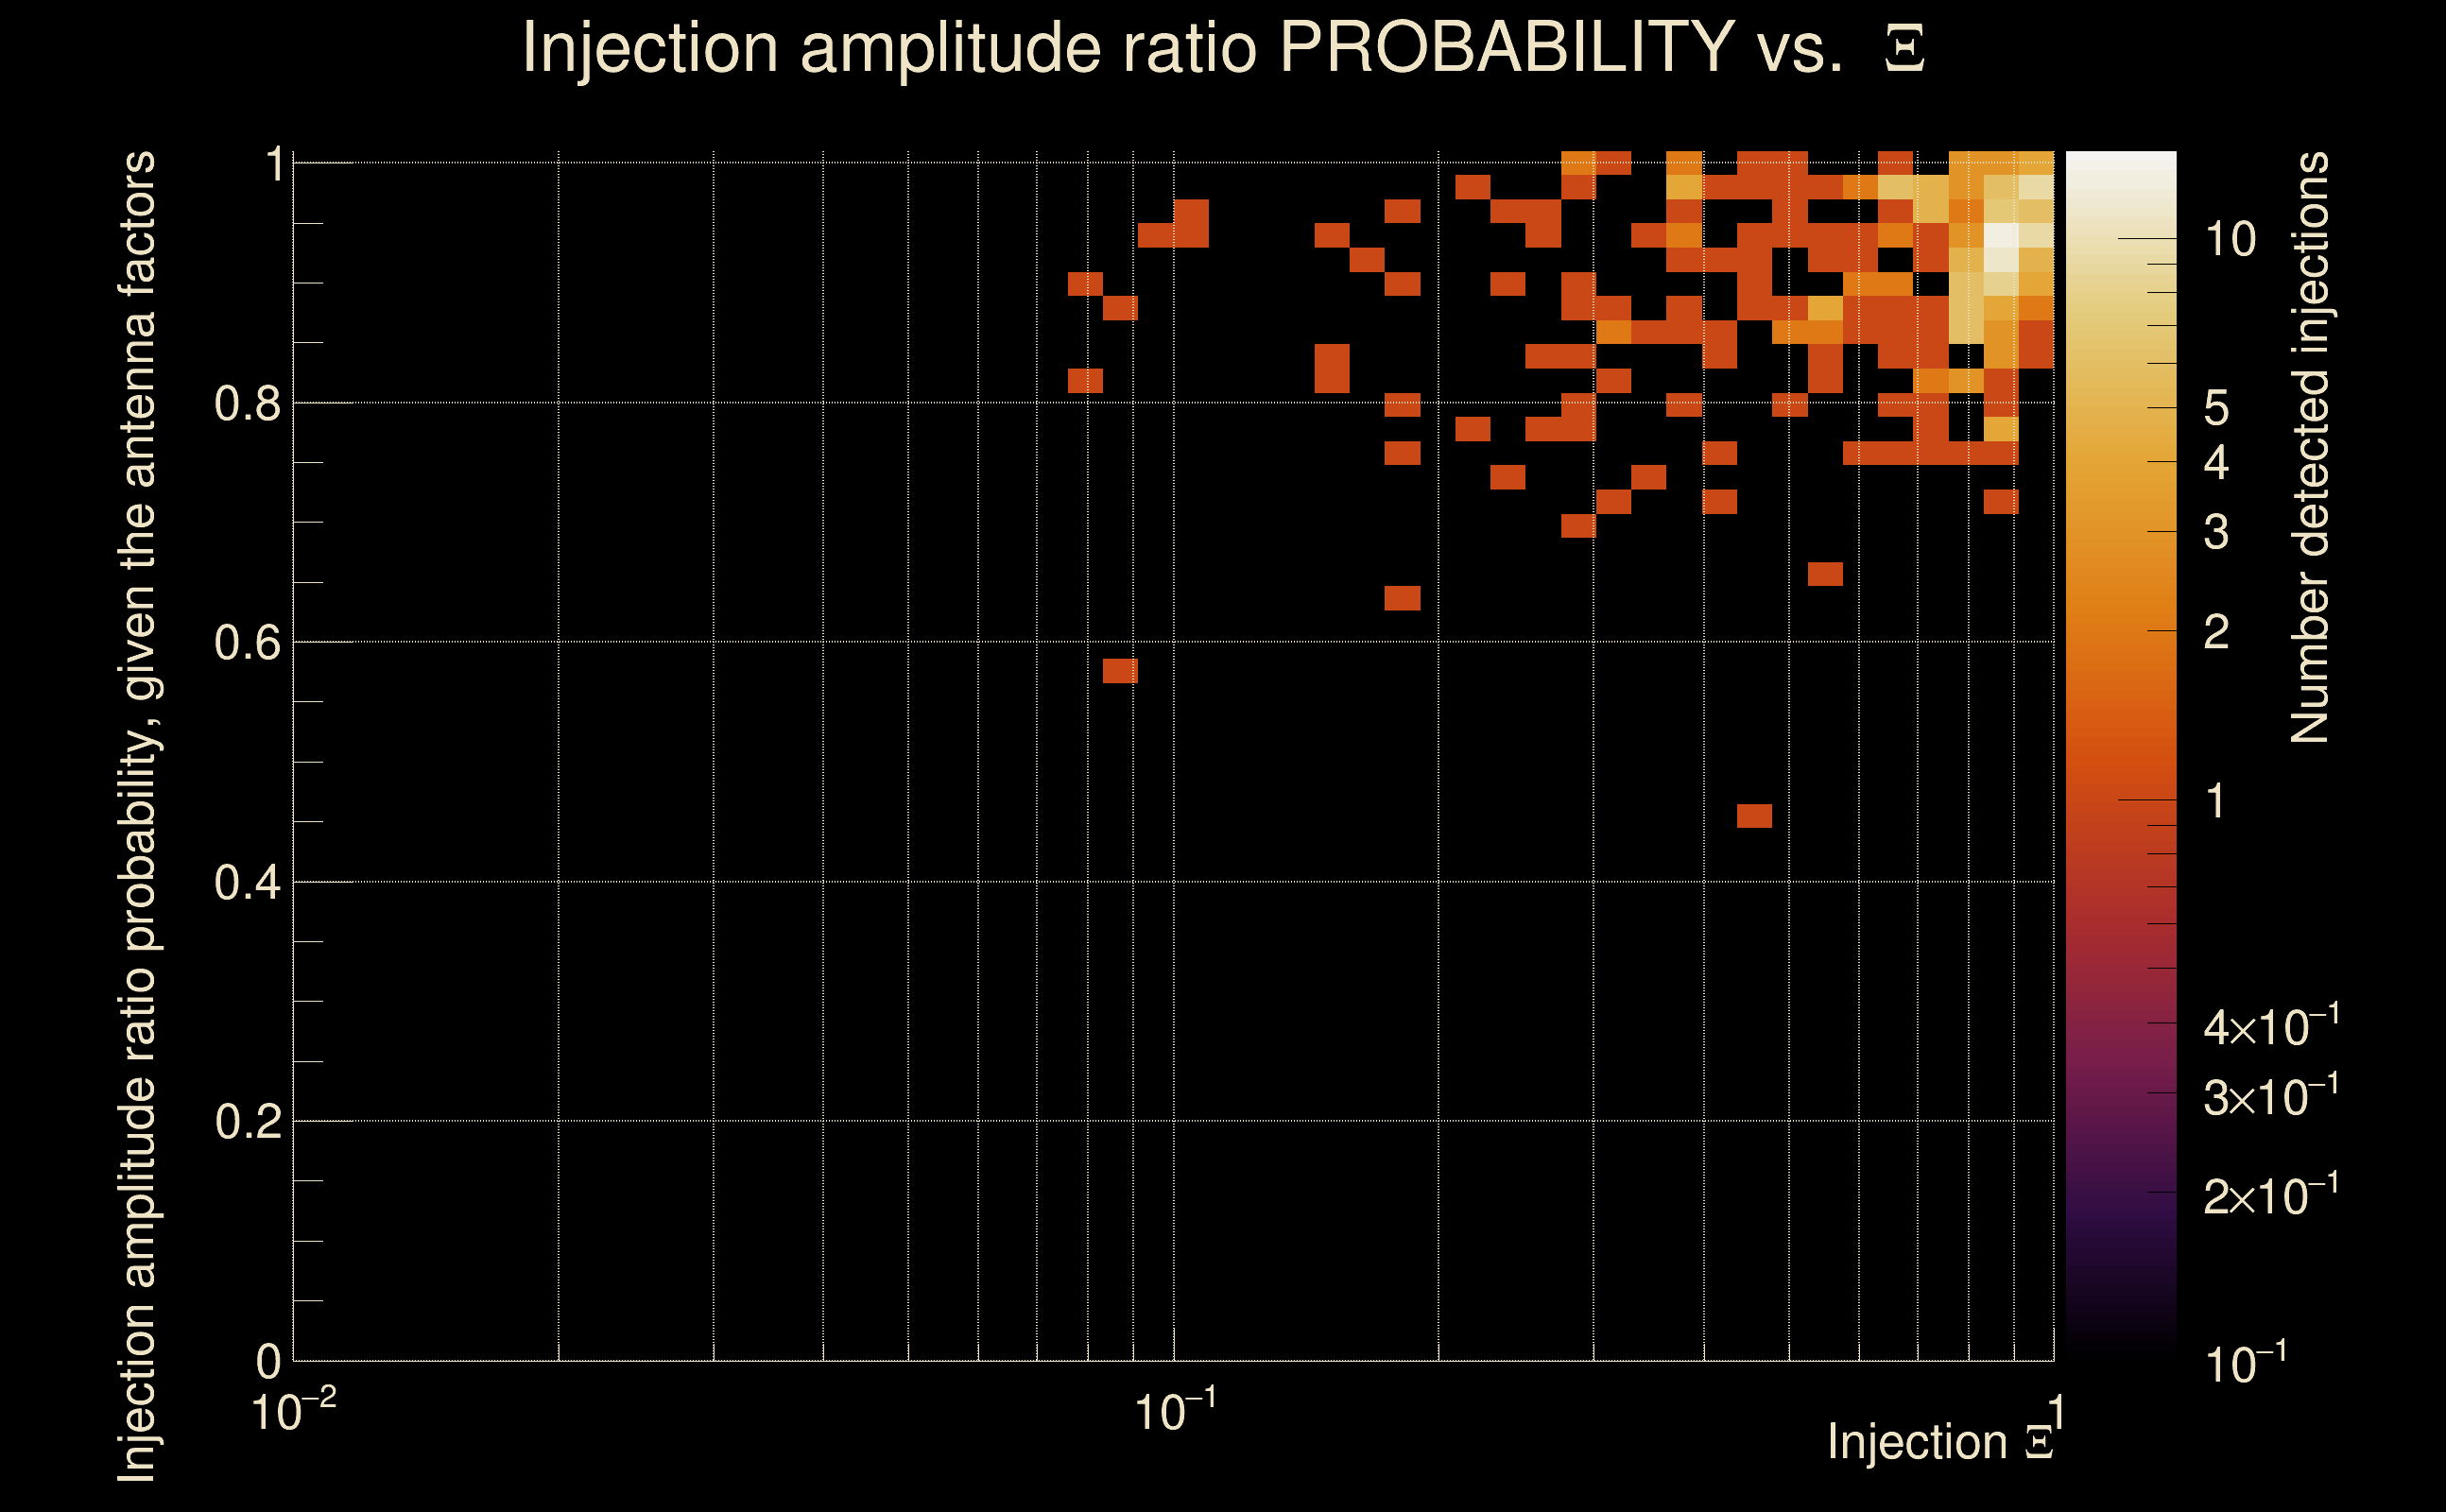
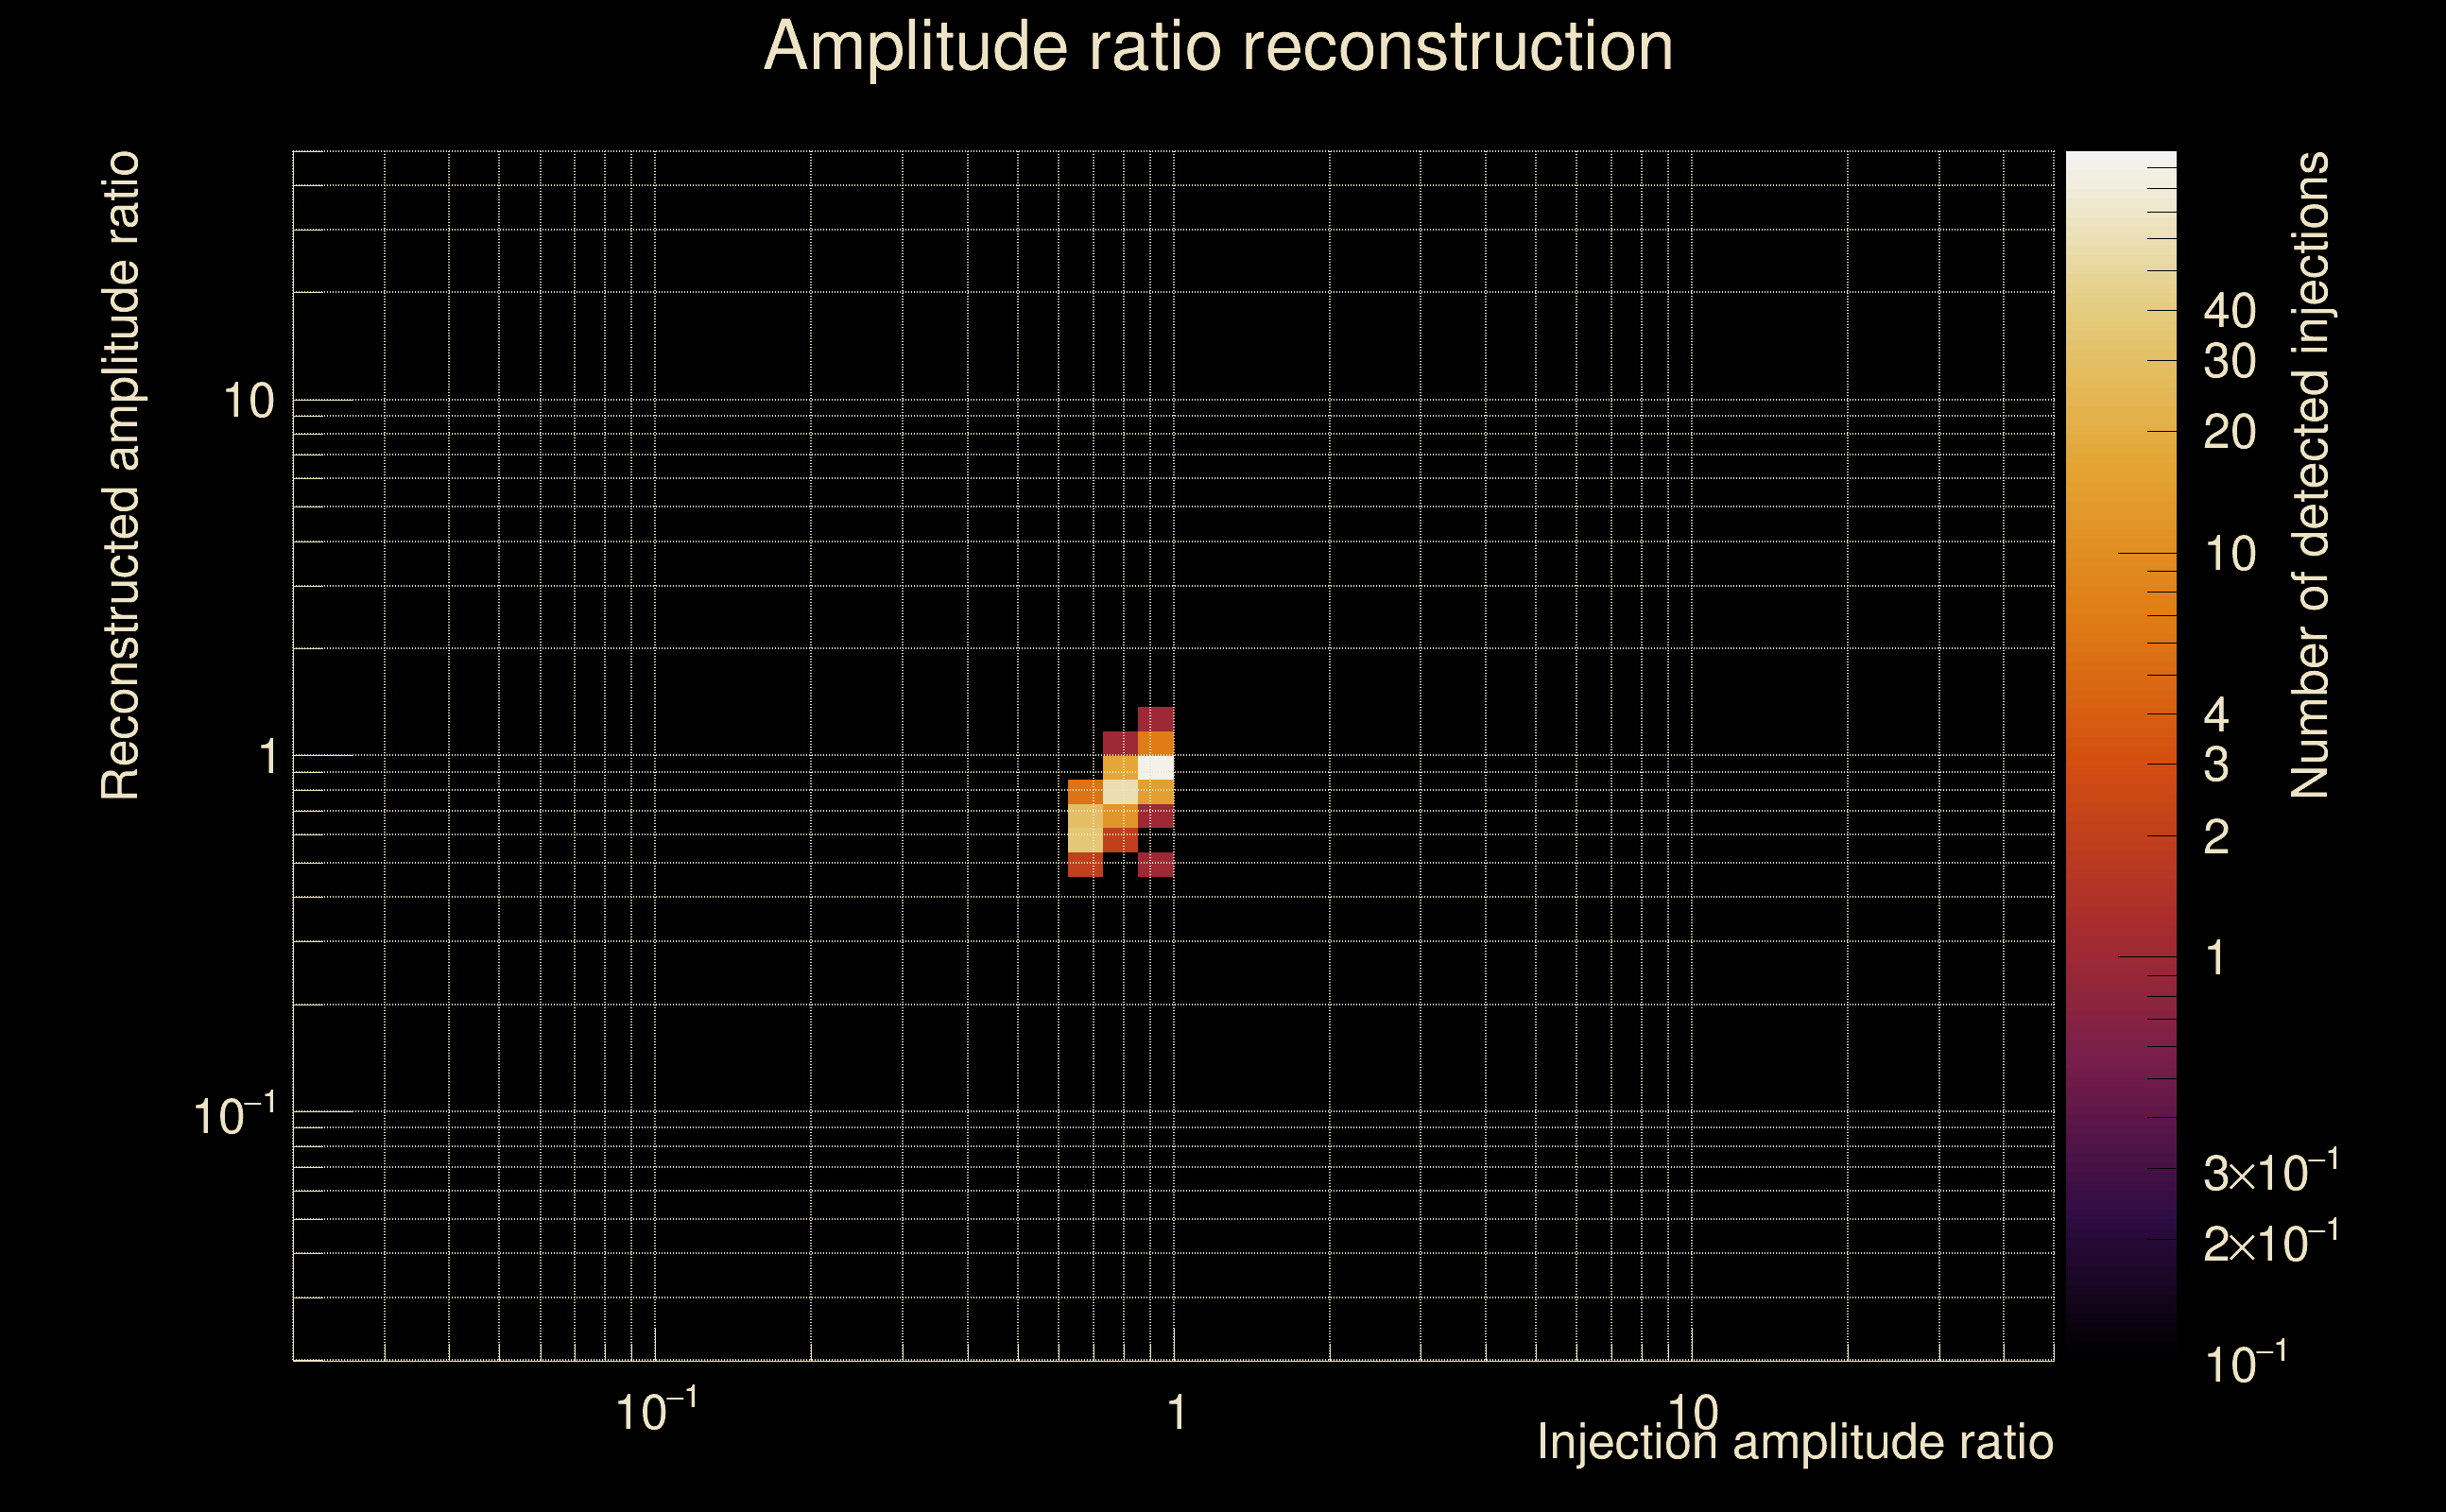
| Number of injections (total/valid/detected): | 1162 / 1002 / 249 |
| List of missed injections: | ./Pow20-m39_missed.txt |
| Injection amplitude at 90% detection efficiency: | 2.09171 |
| Injection amplitude at 50% detection efficiency: | 1.29665 |
| Injection amplitude at 10% detection efficiency: | 0.512737 |
 |
 |
 |
 |
 |
 |
 |
|
 |
 |
|
 |
 |
|
 |
 |
|
 |
 |
|
 |
 |
|
 |
 |
|
 |
 |
|
 |
 |
 |
 |
 |
 |
 |
 |
 |
 |
 |
 |
 |
 |
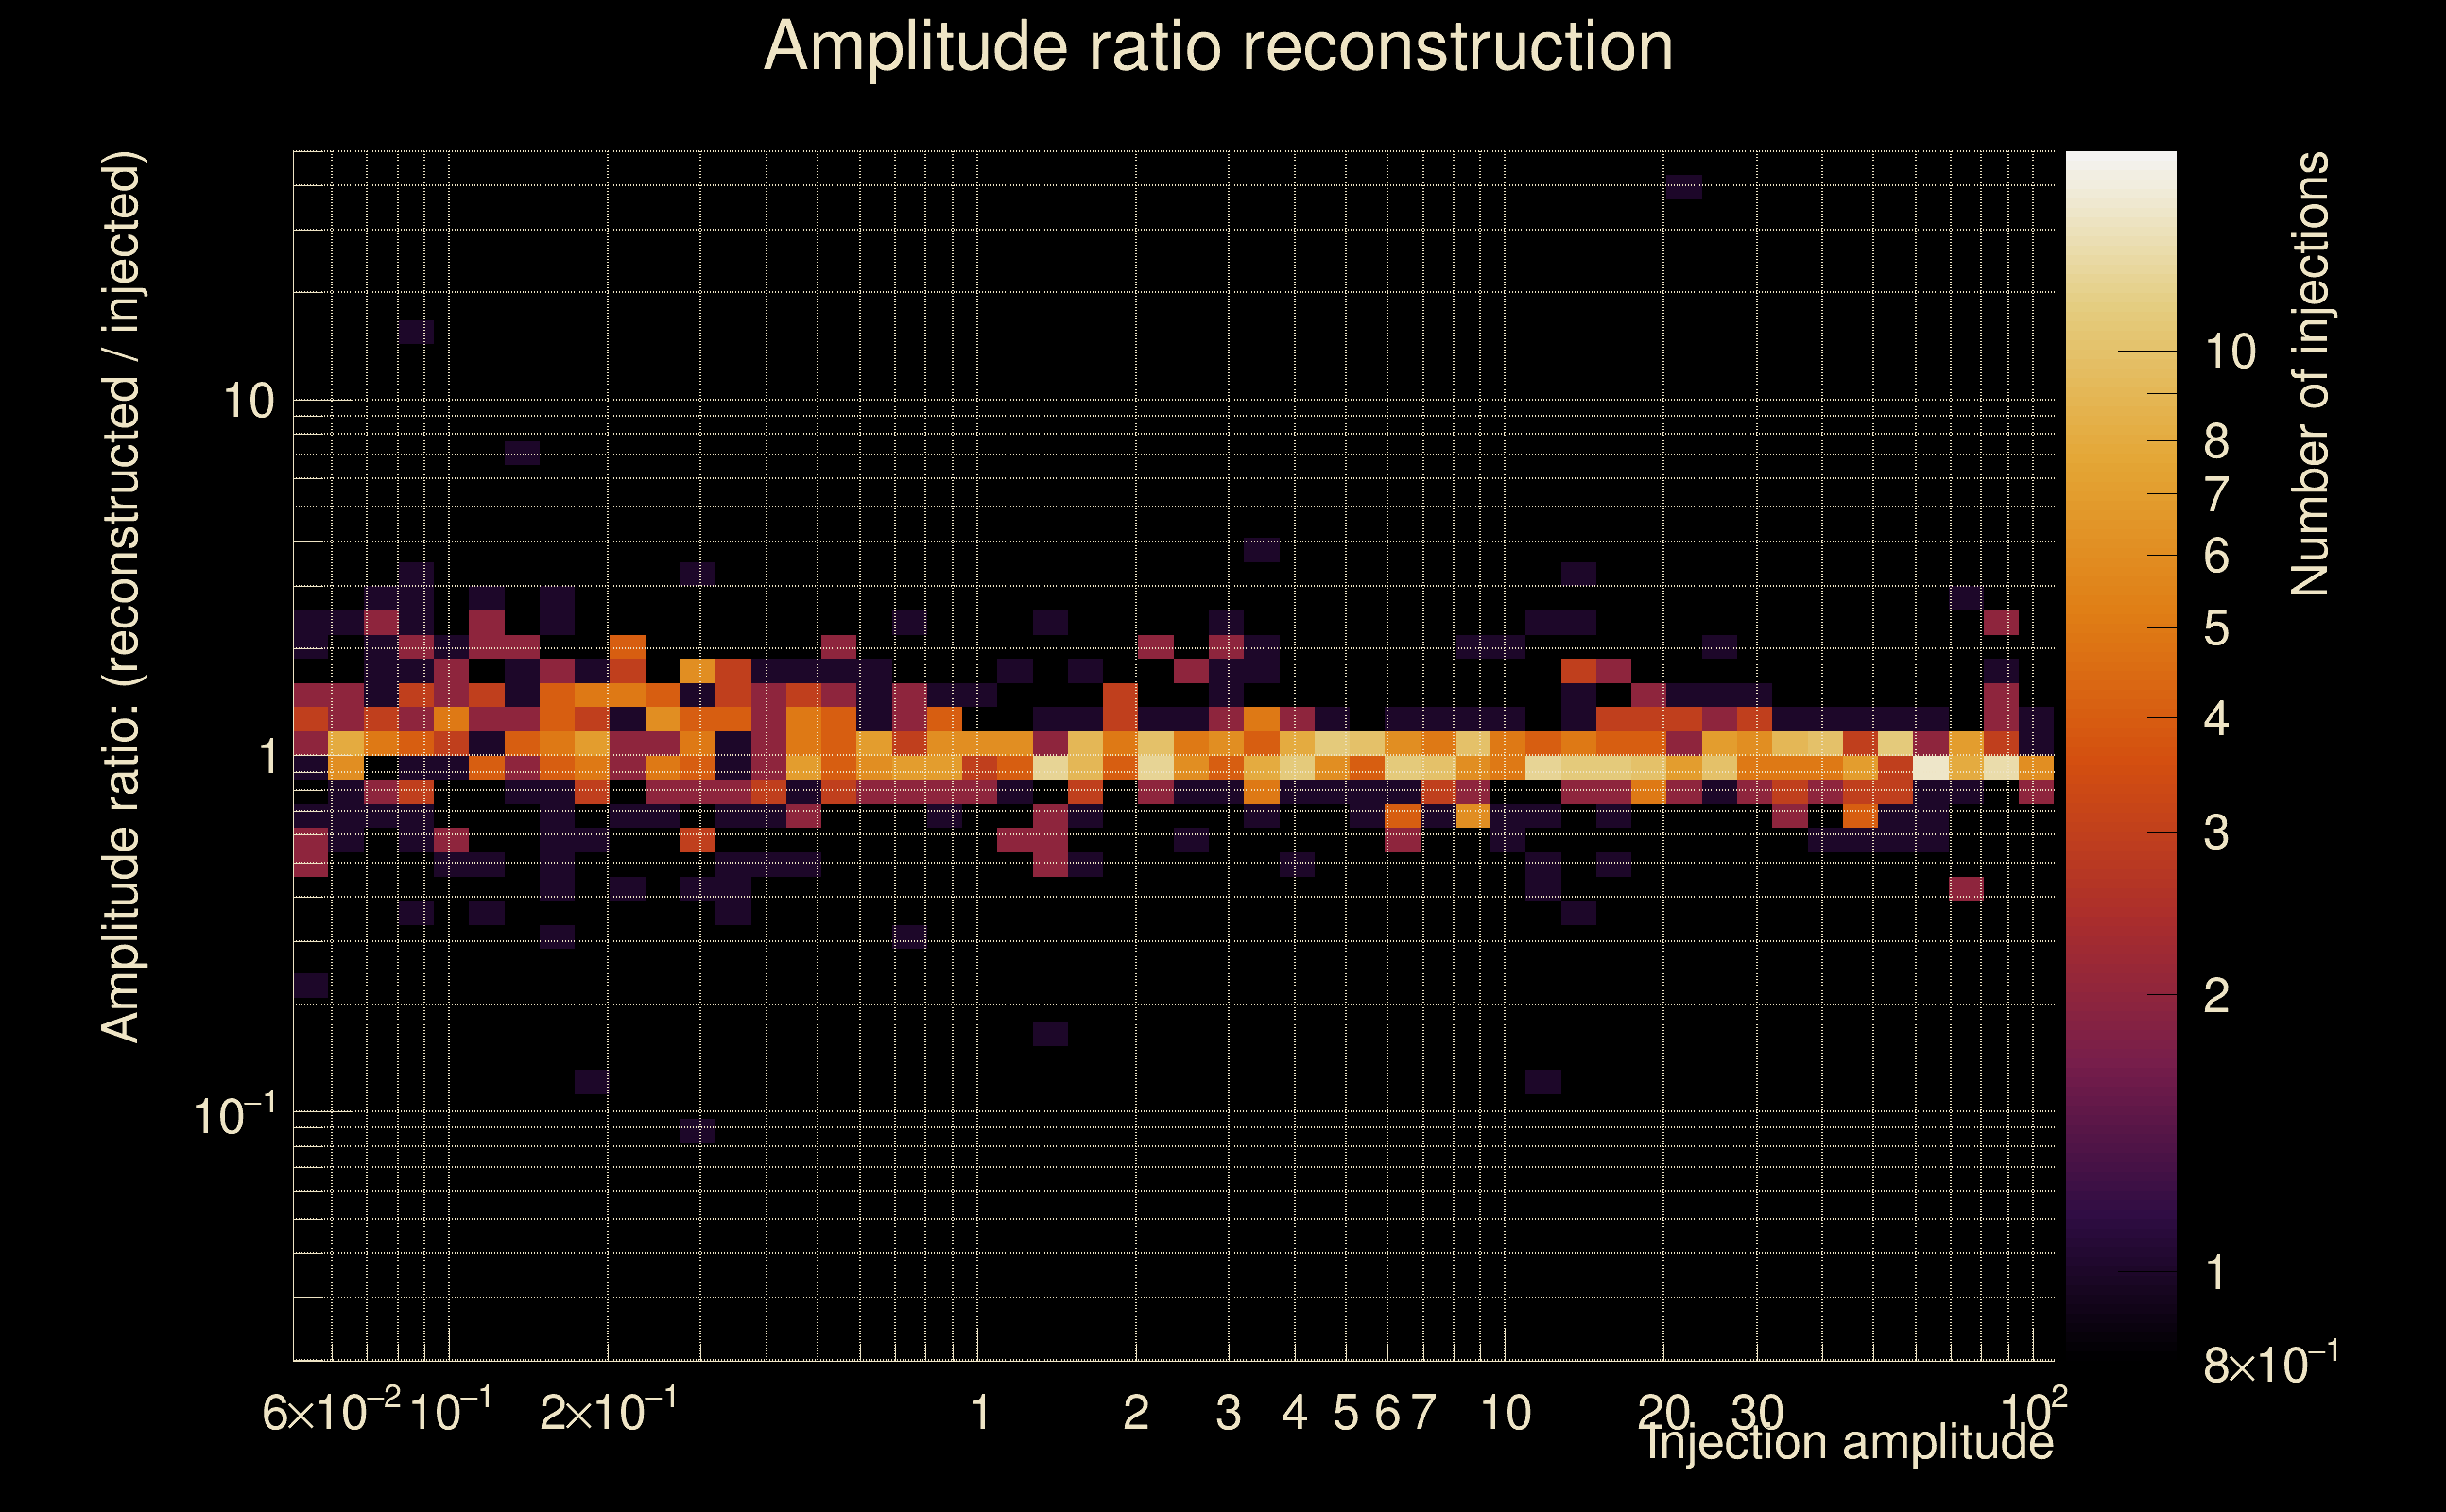 |
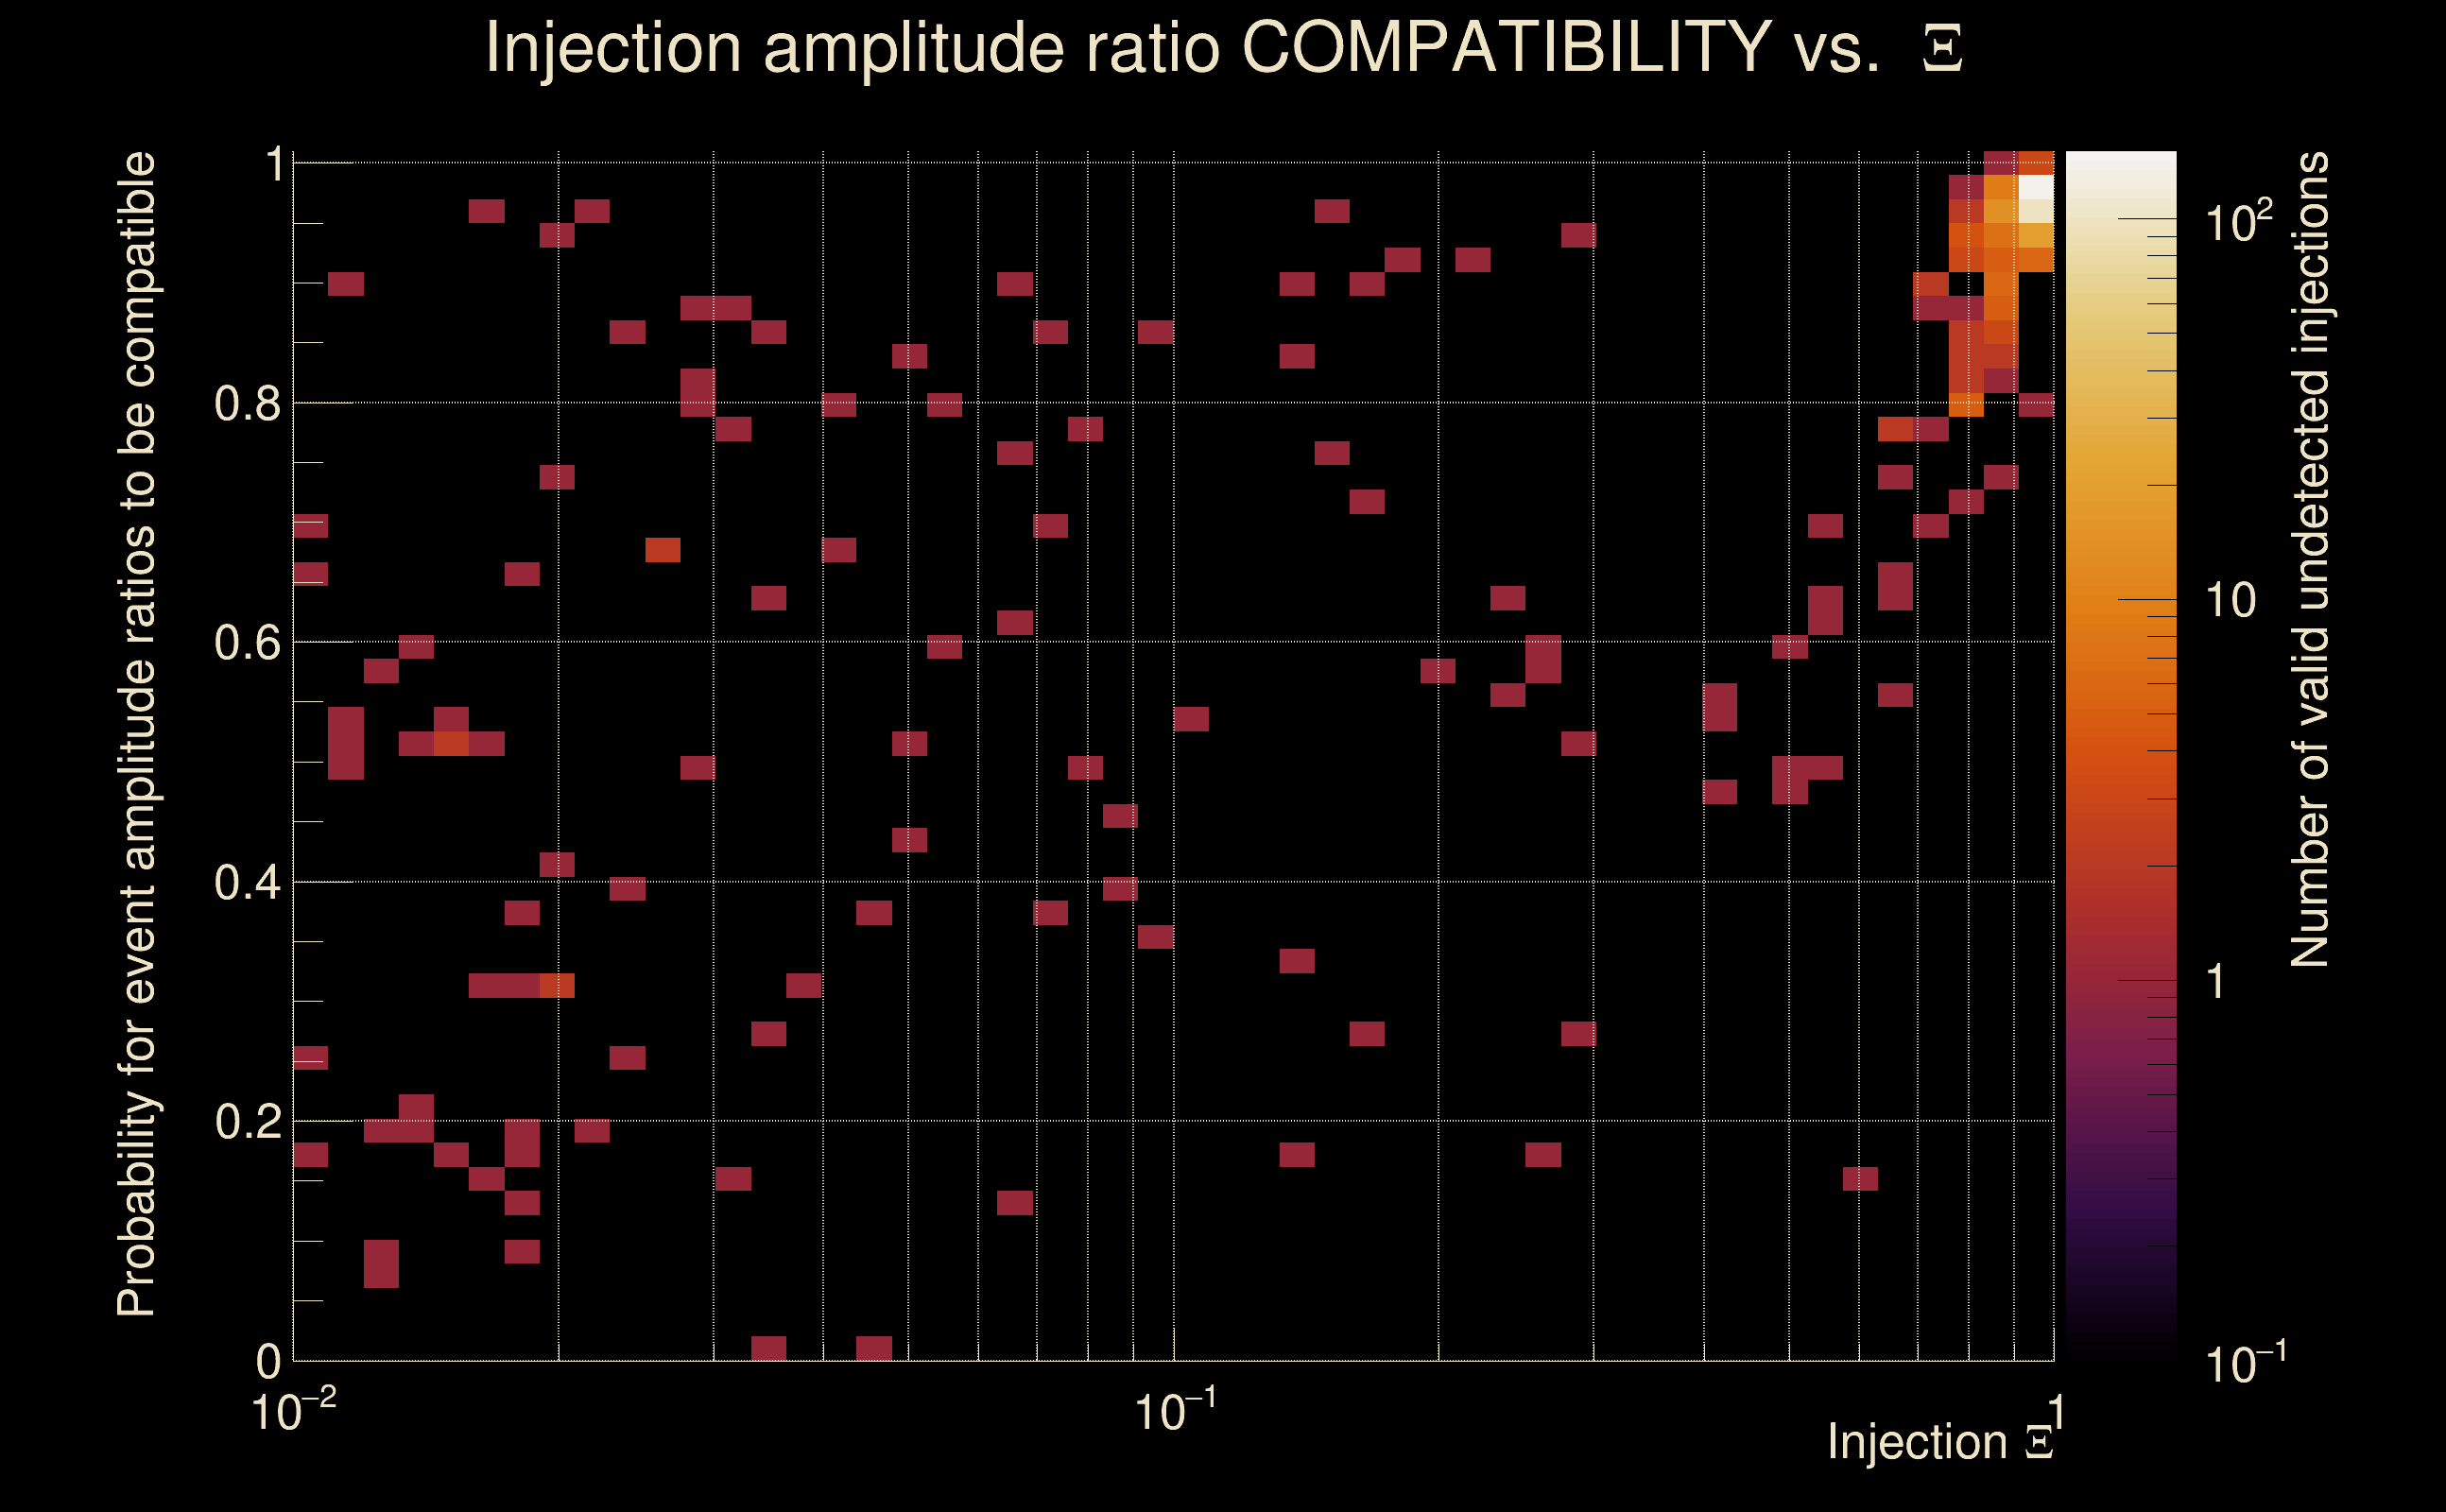
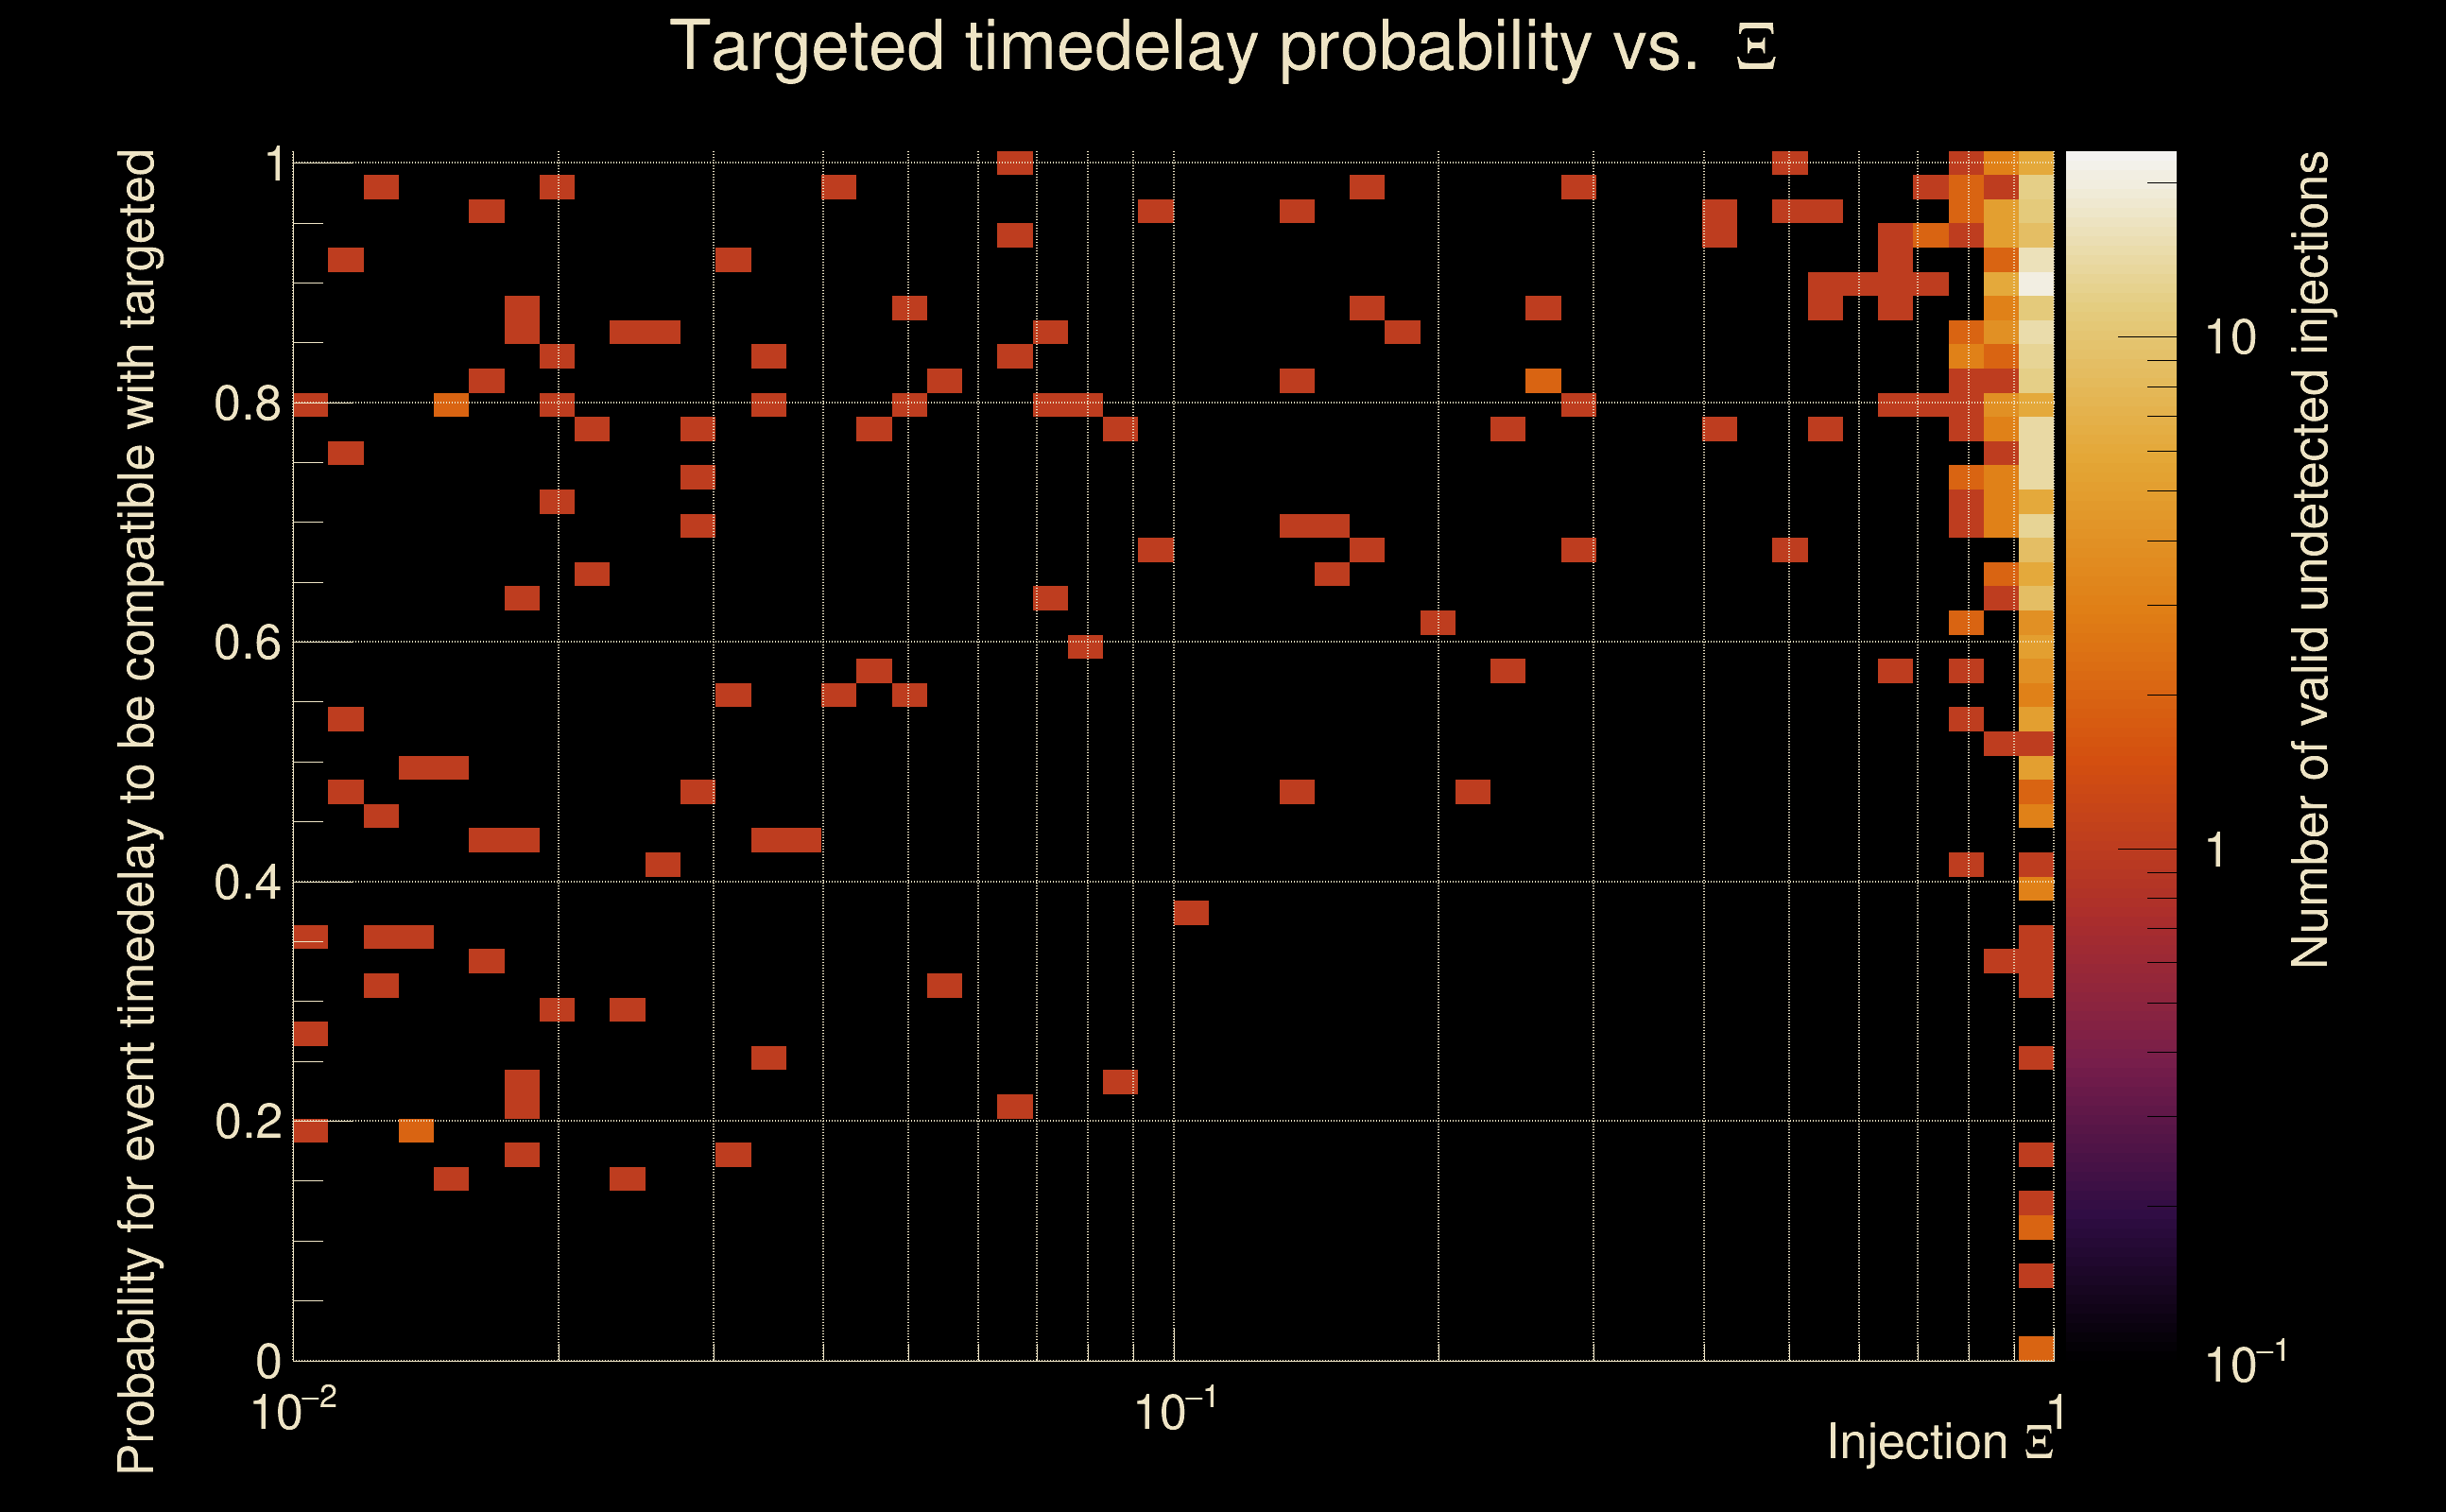
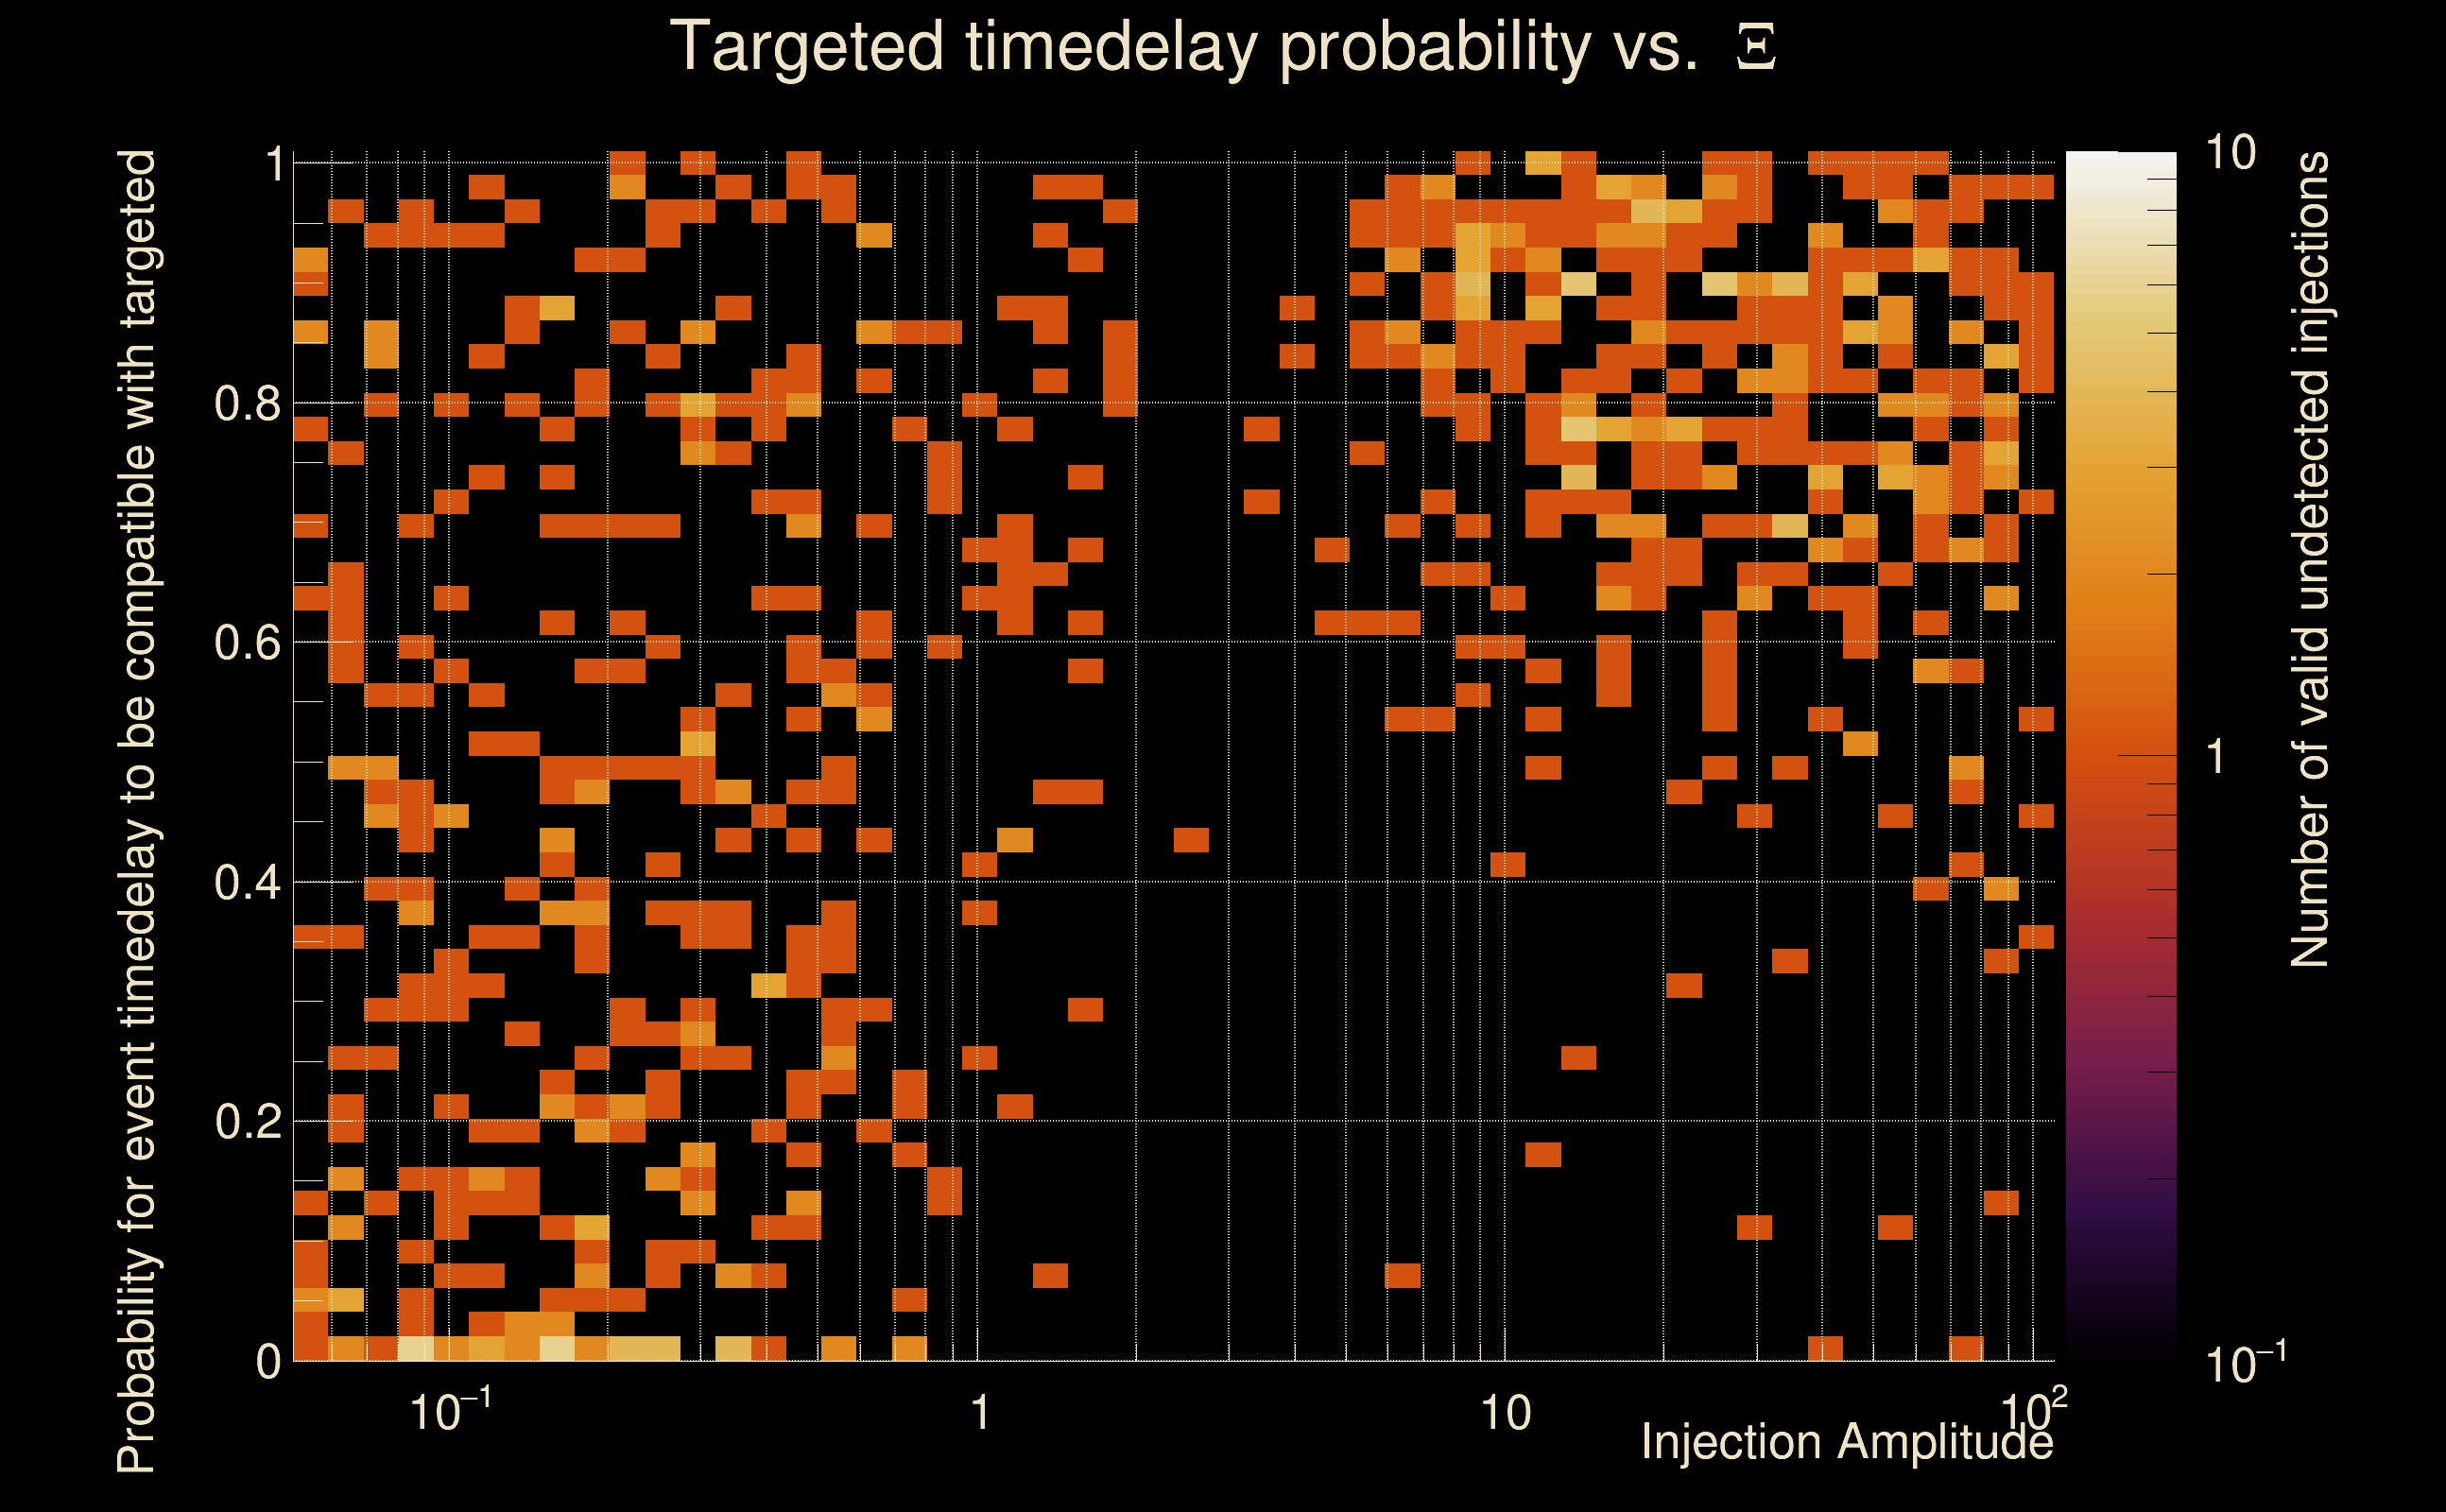
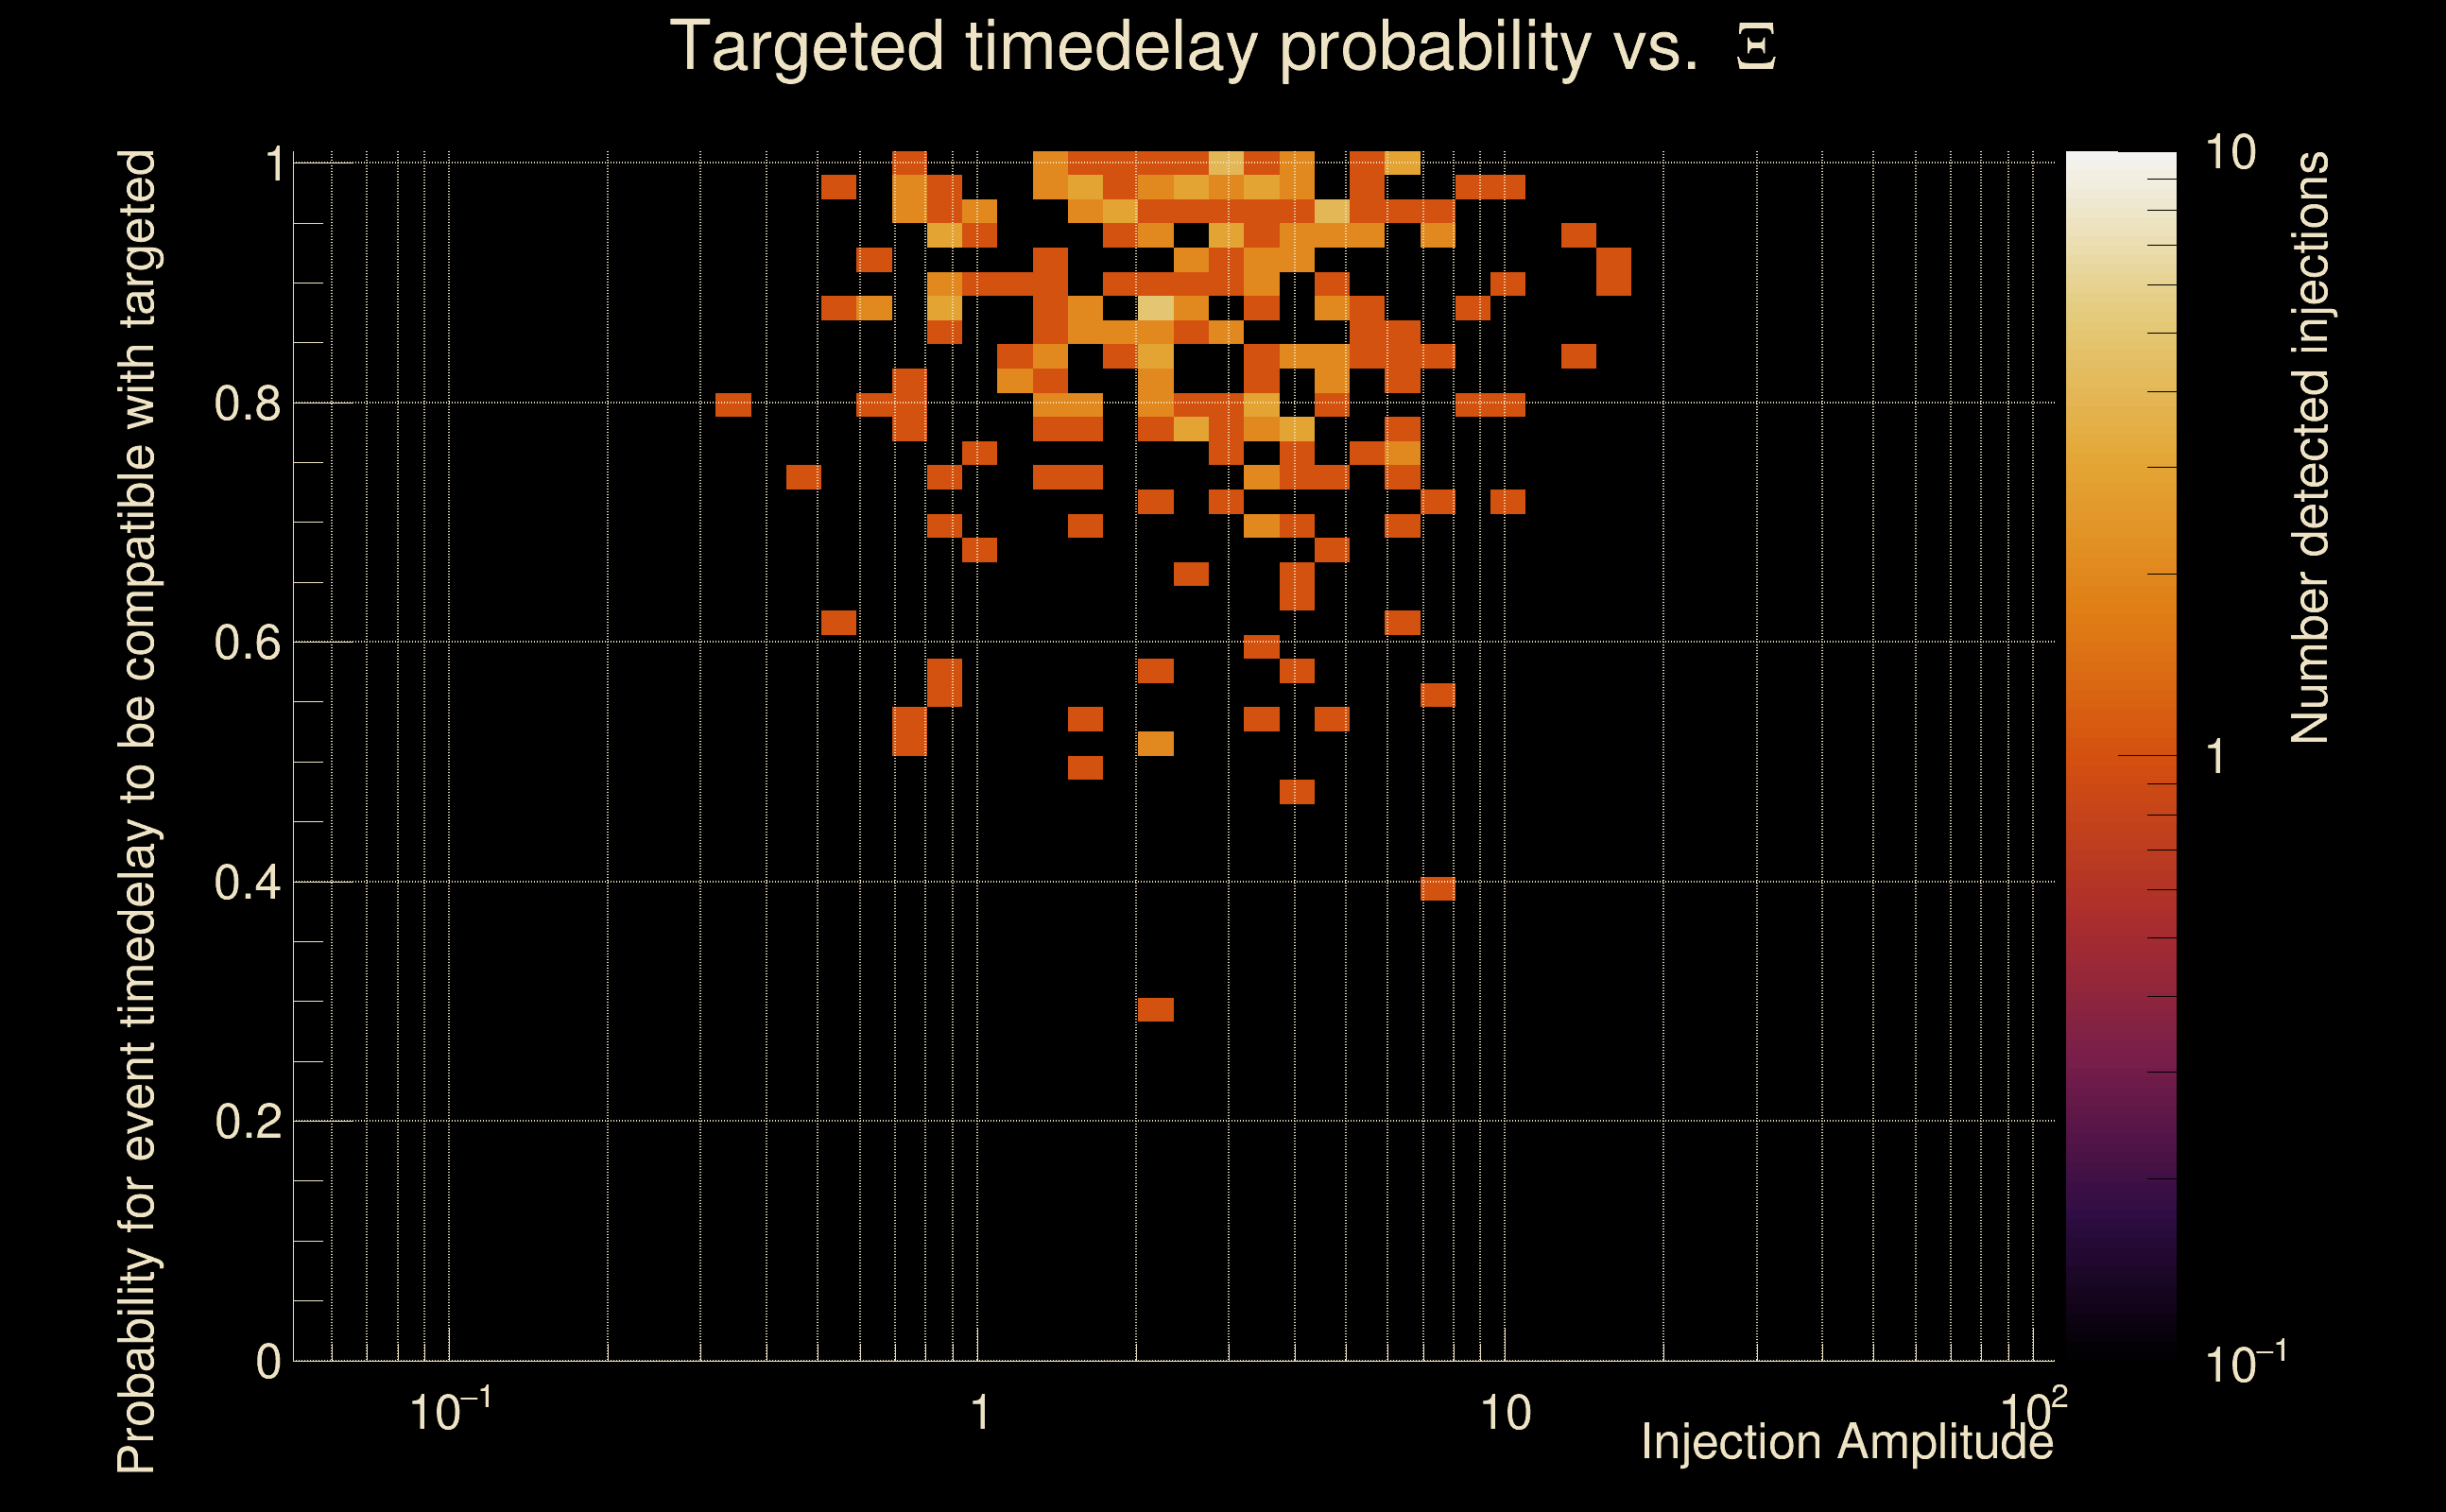
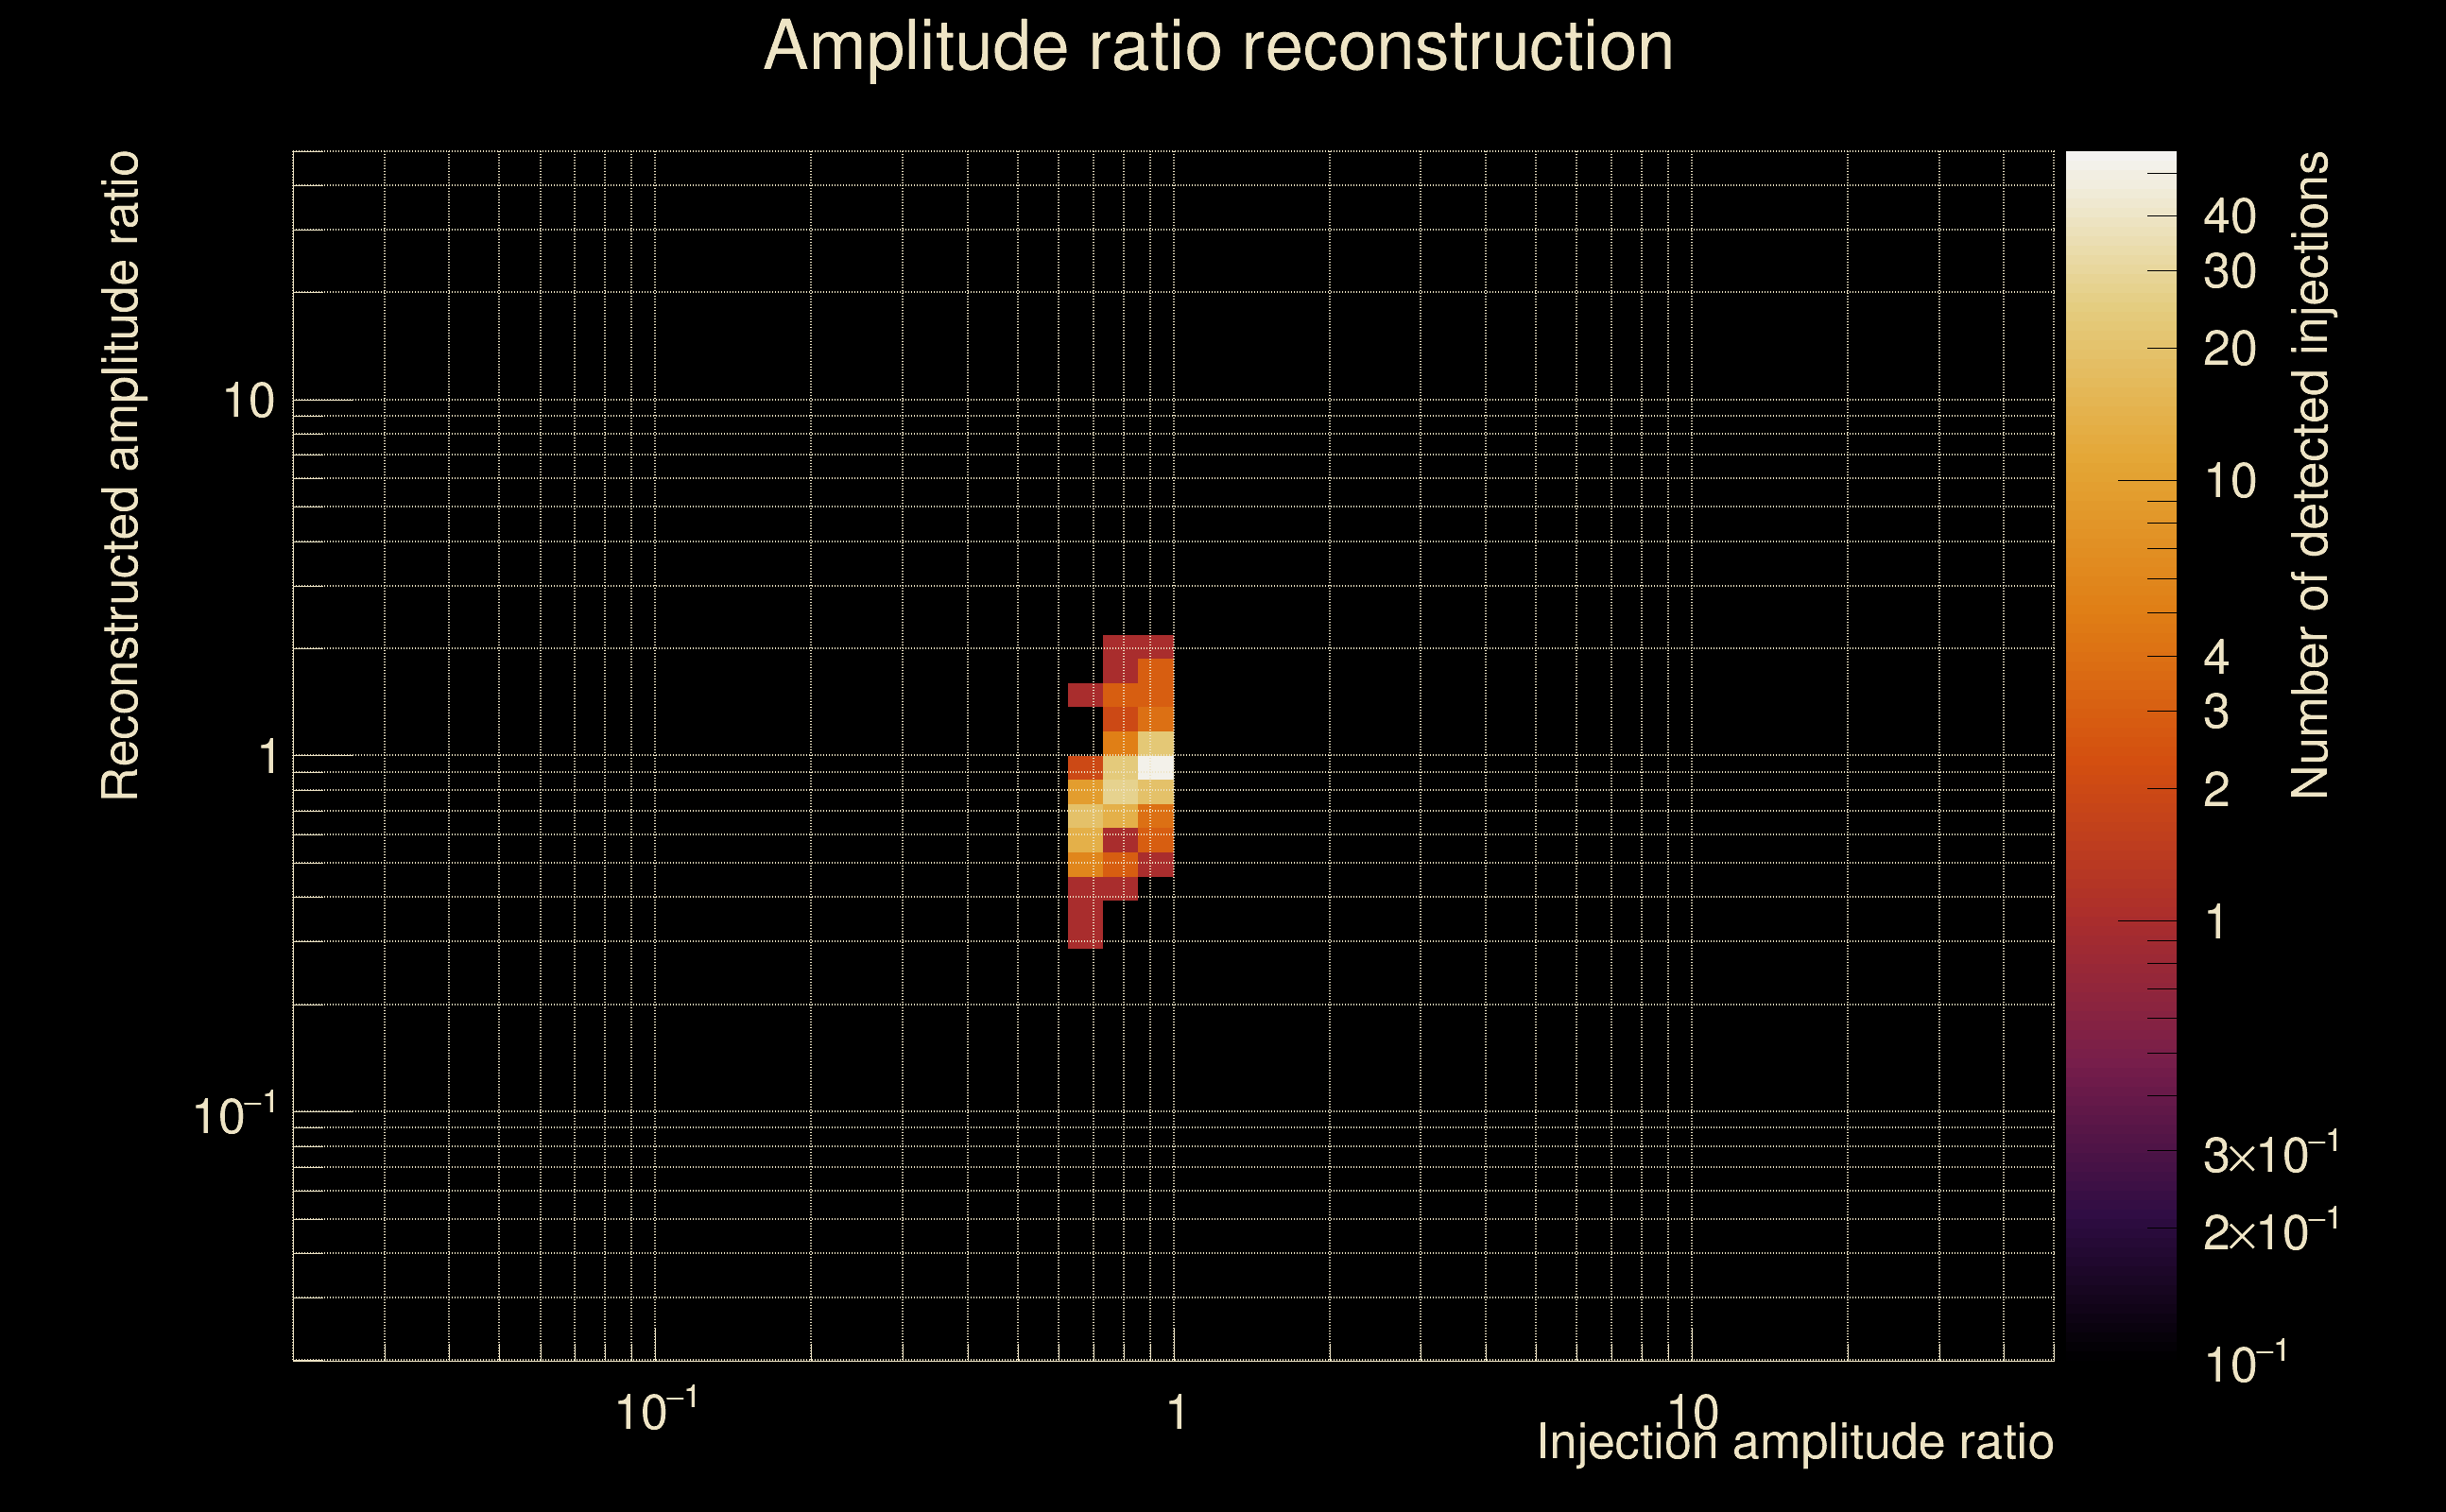
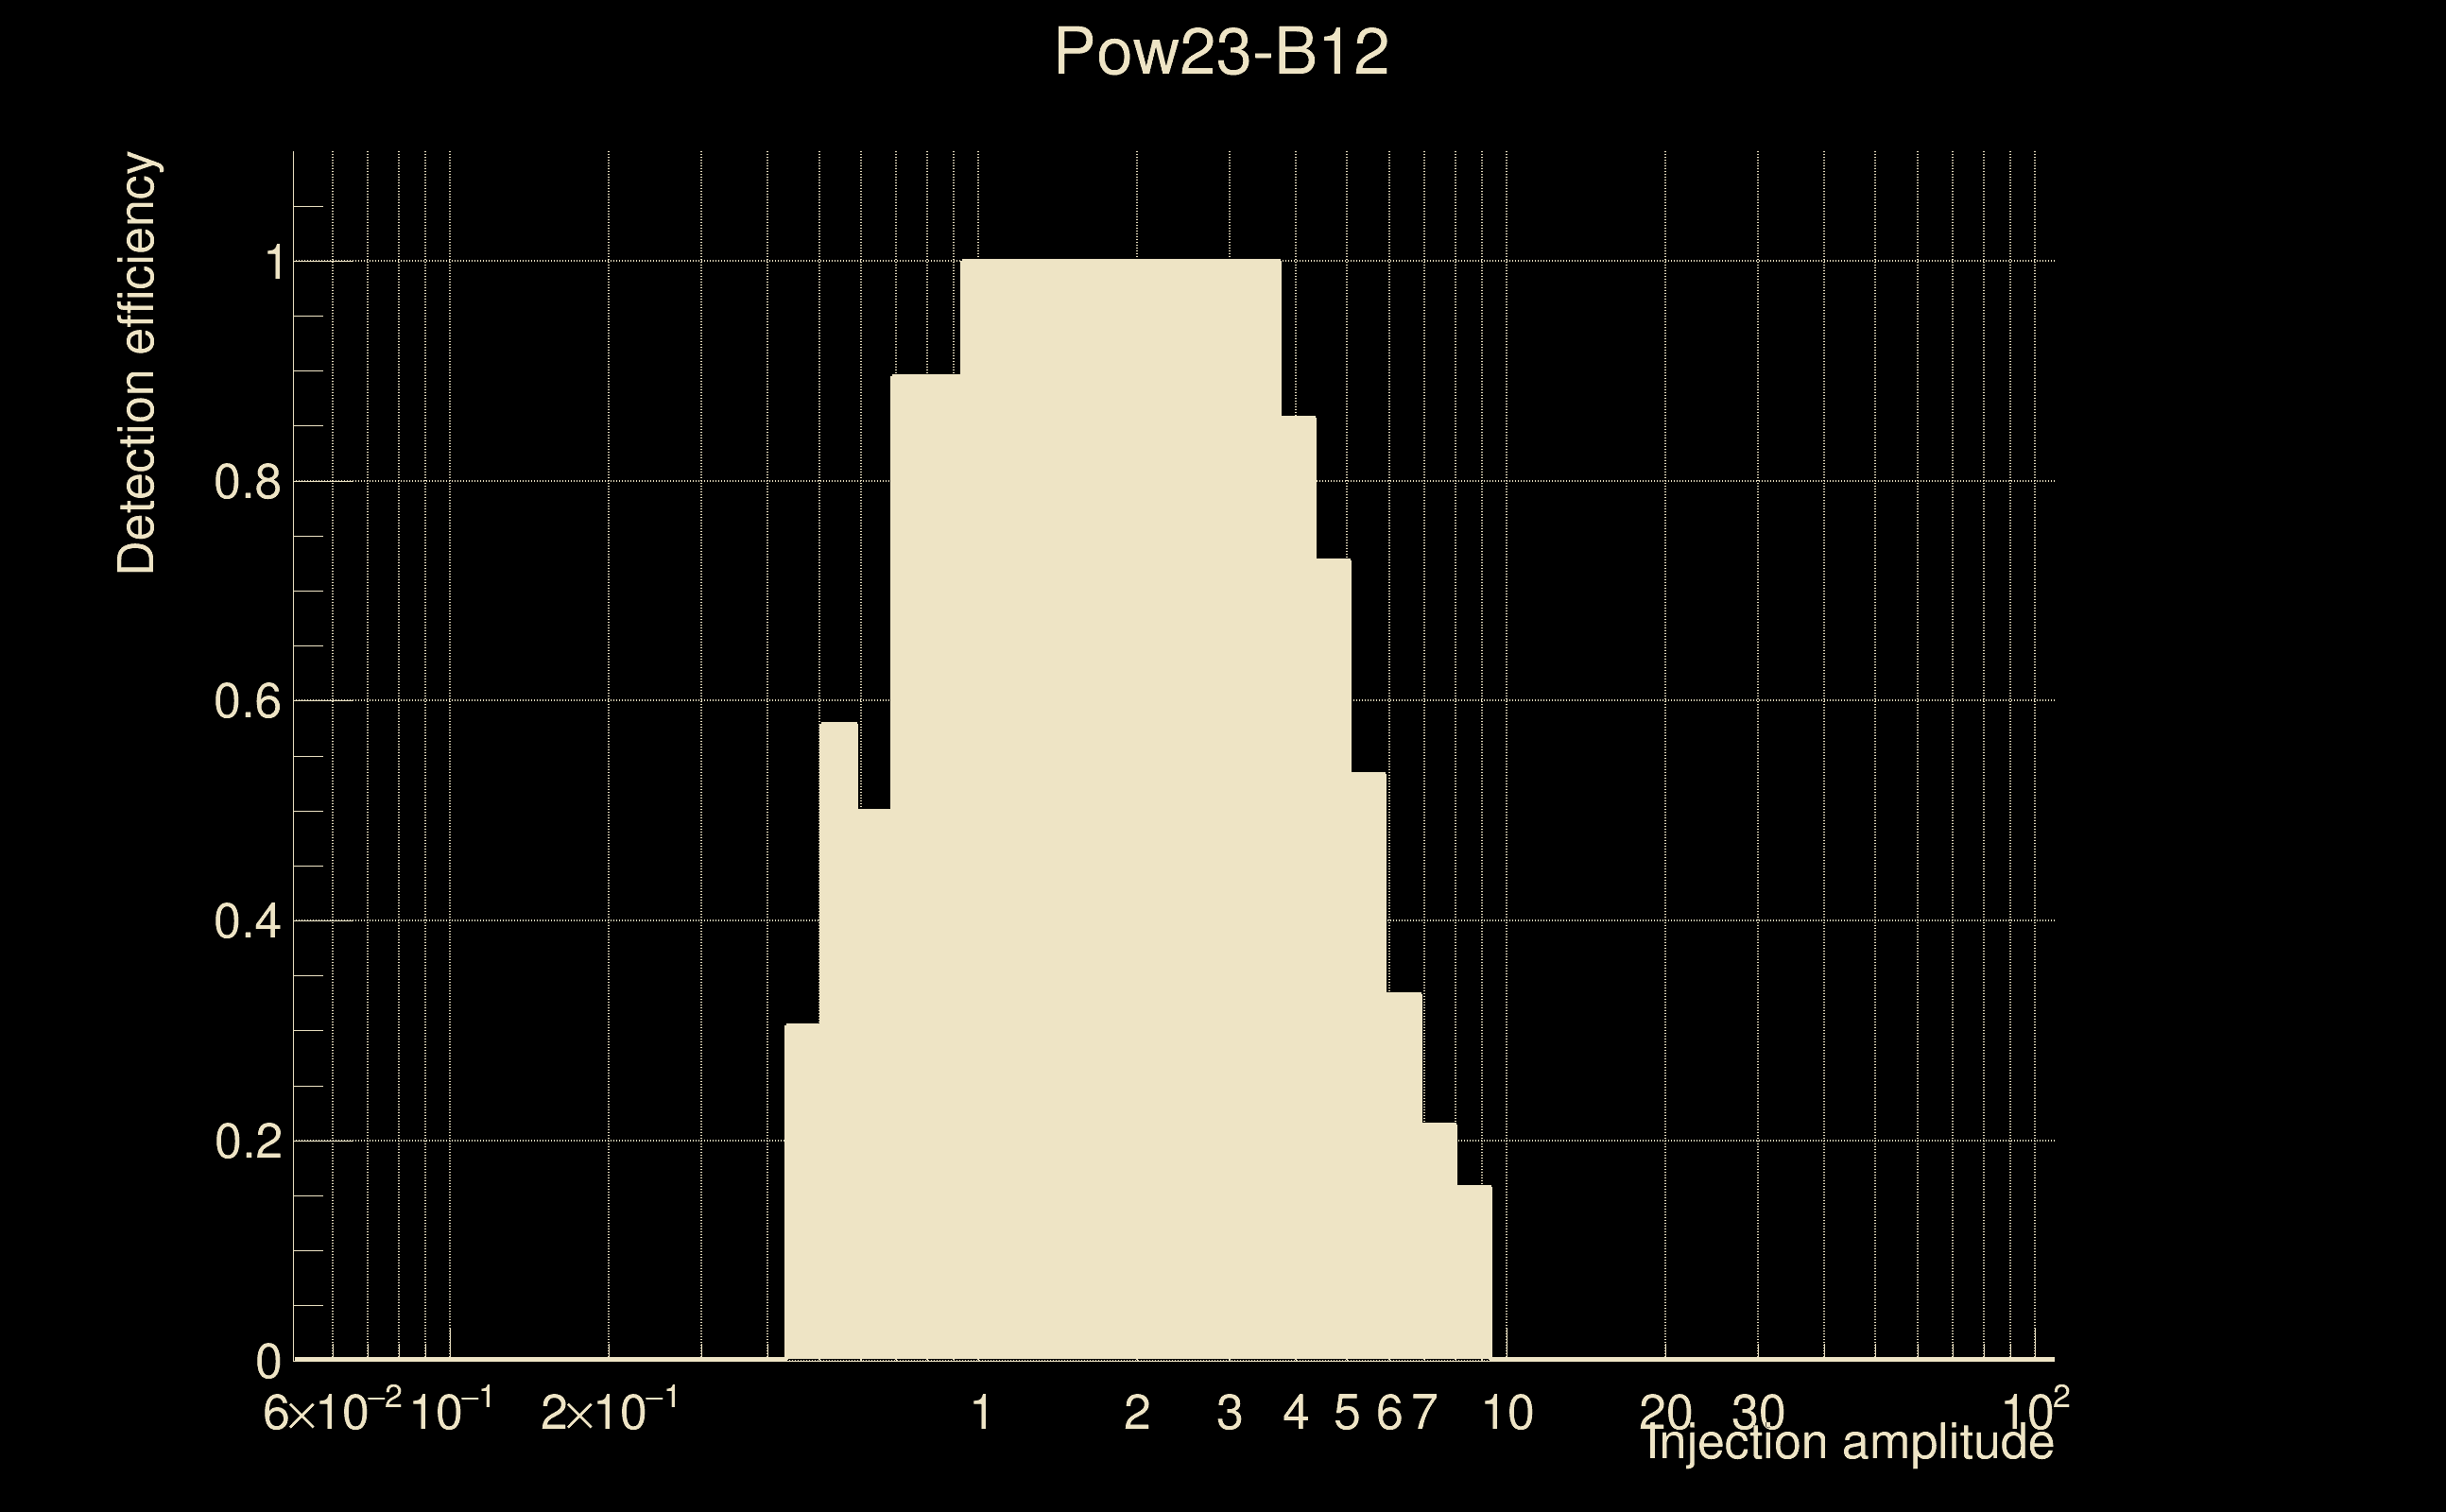
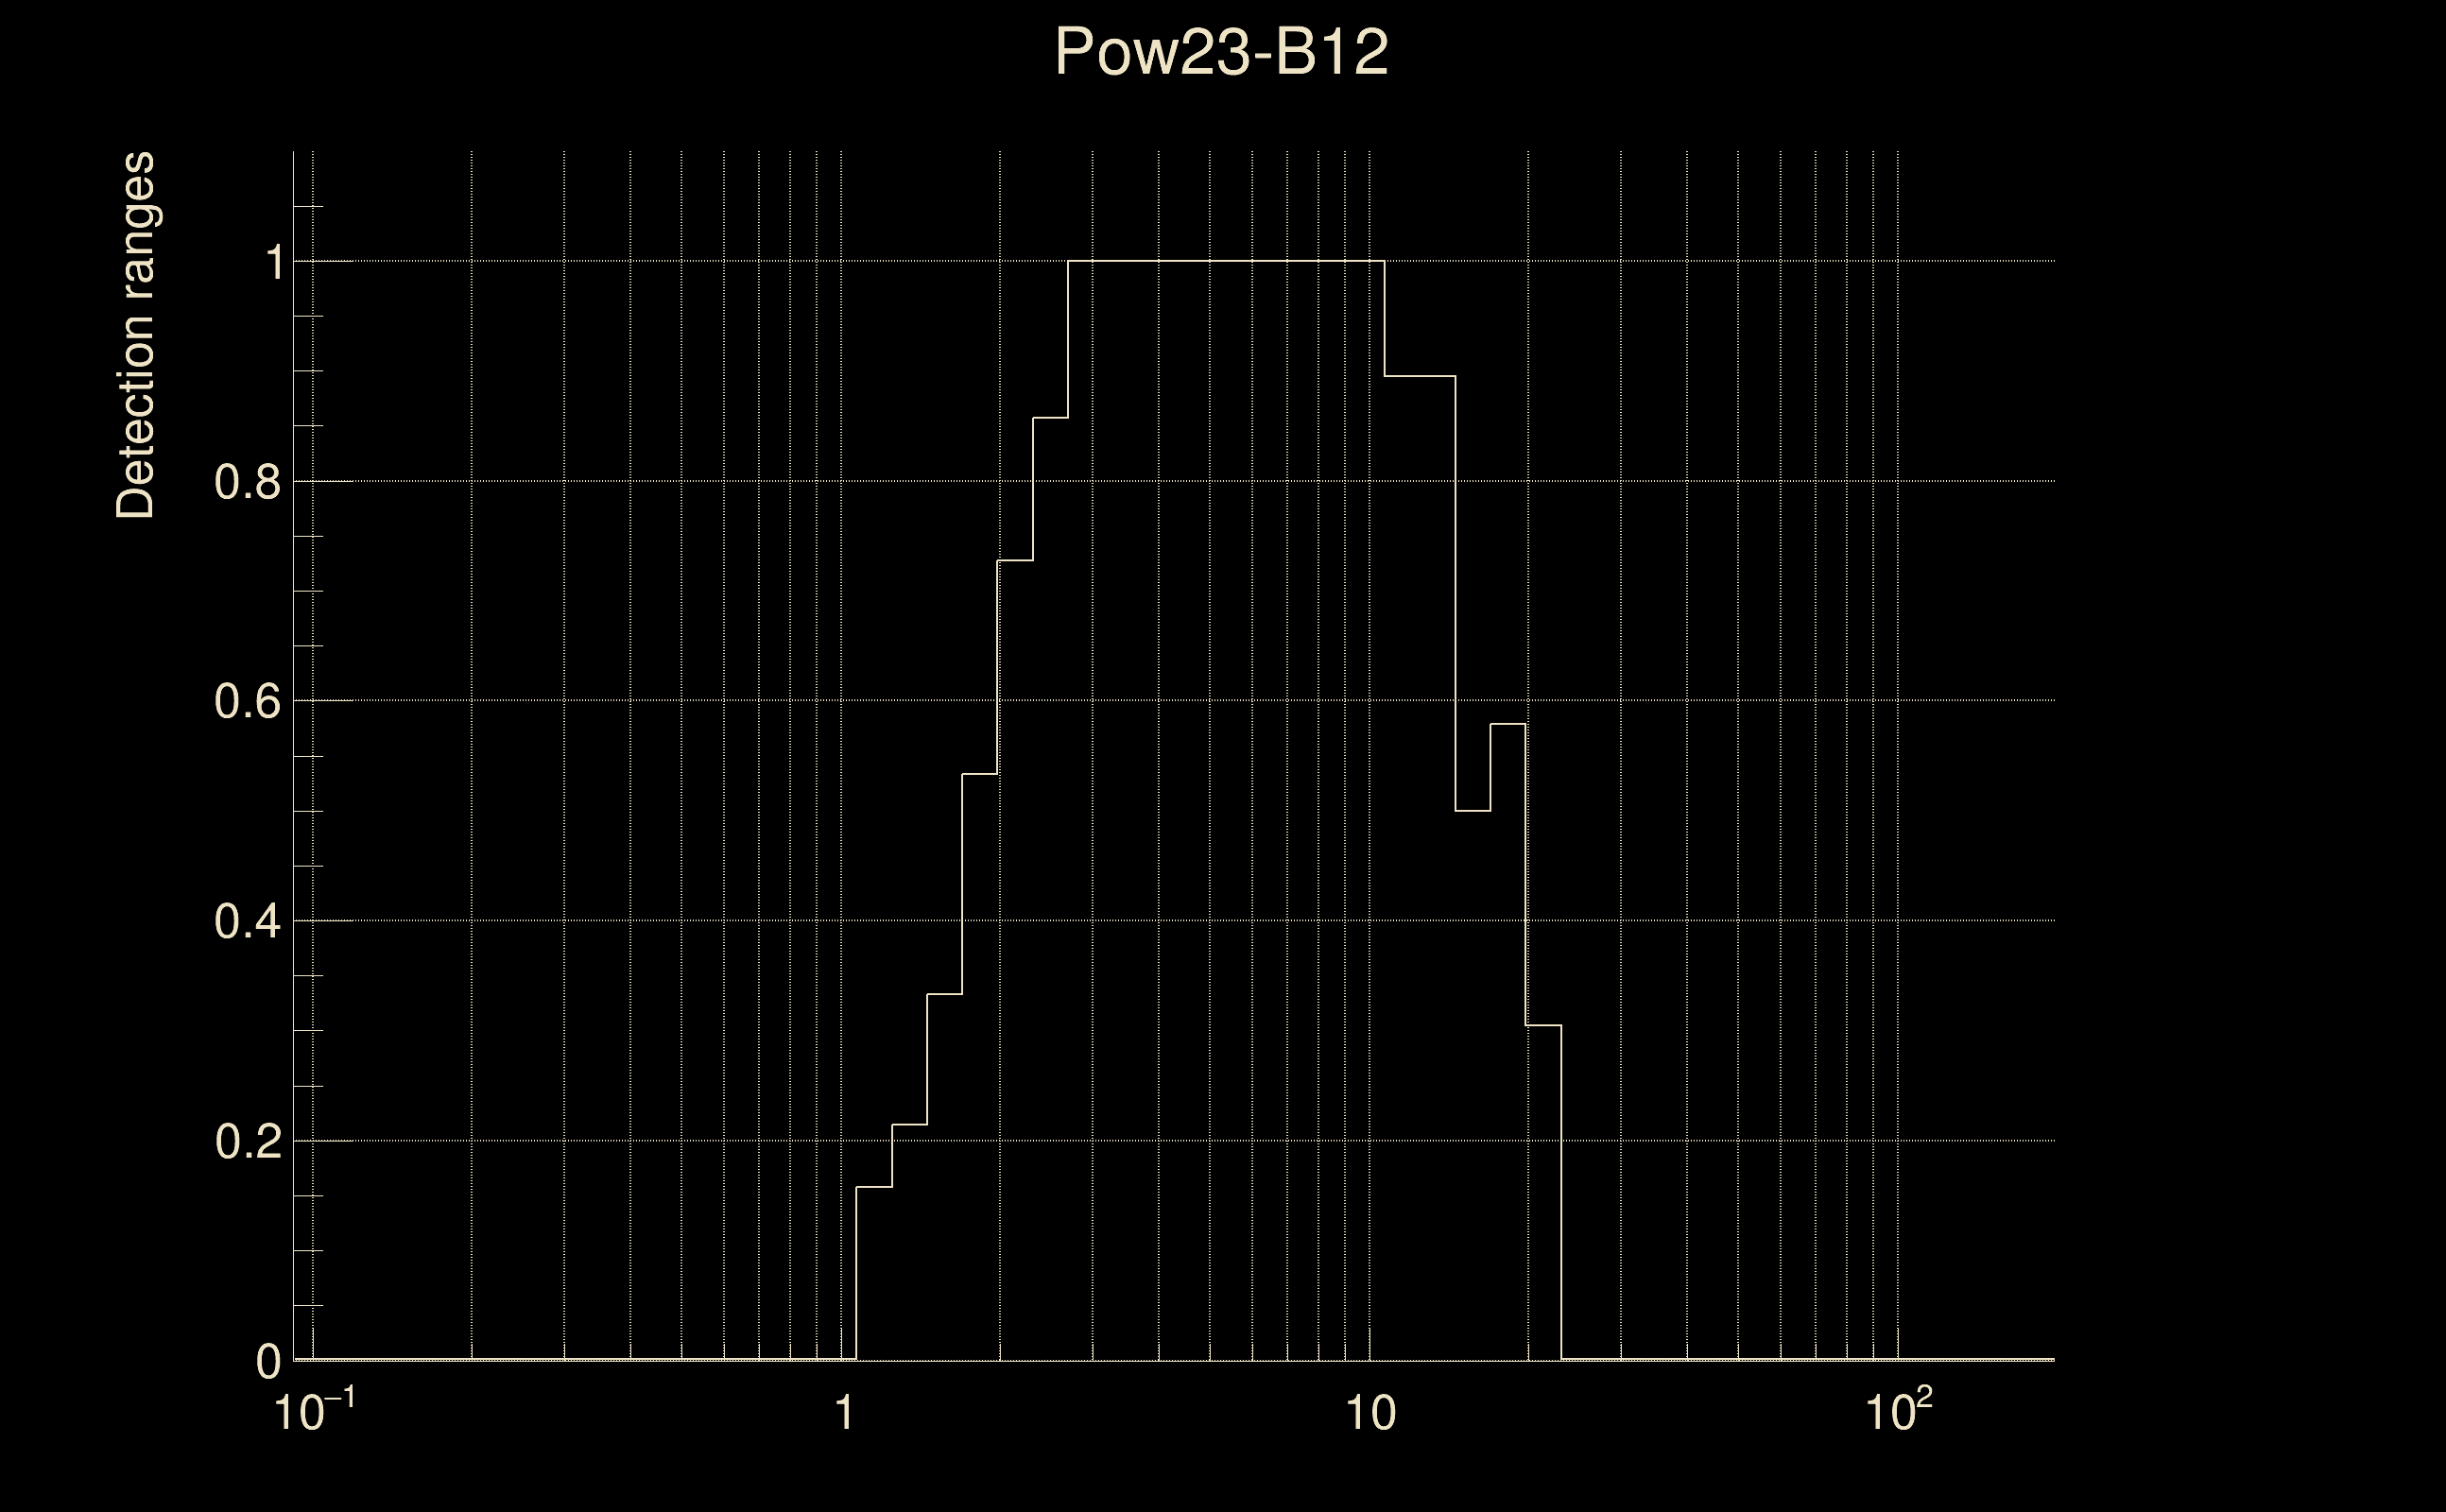
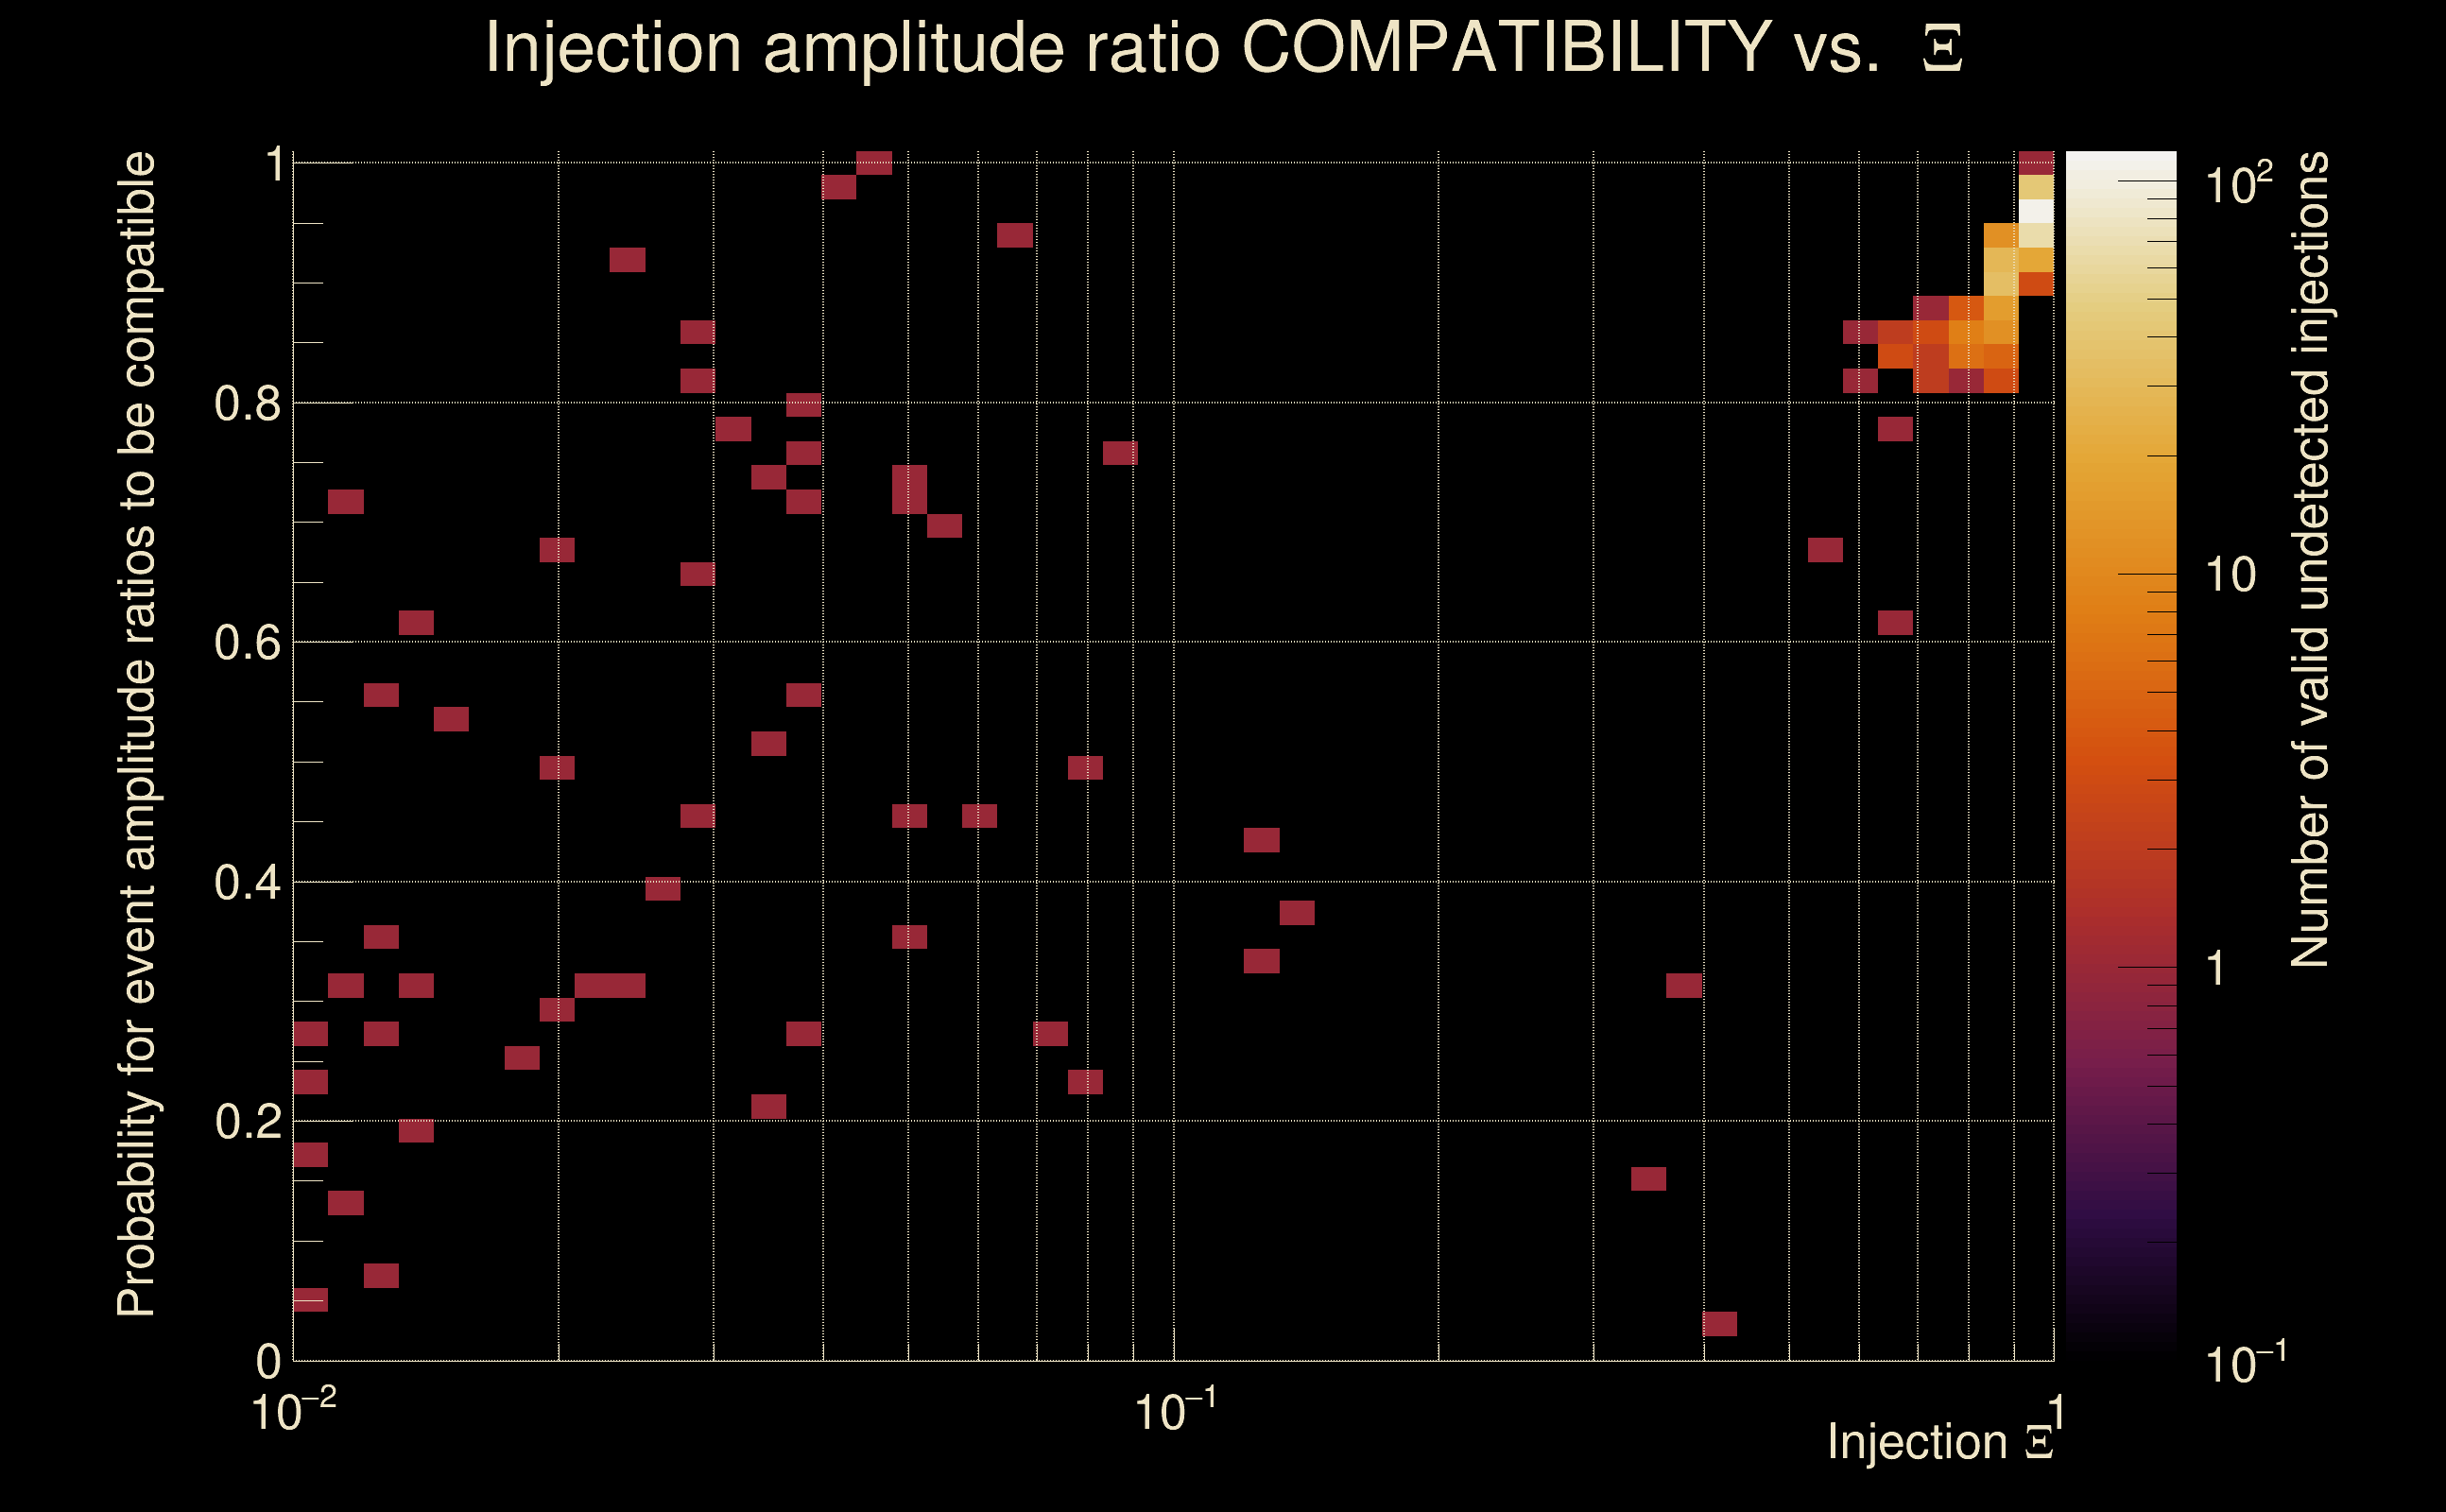
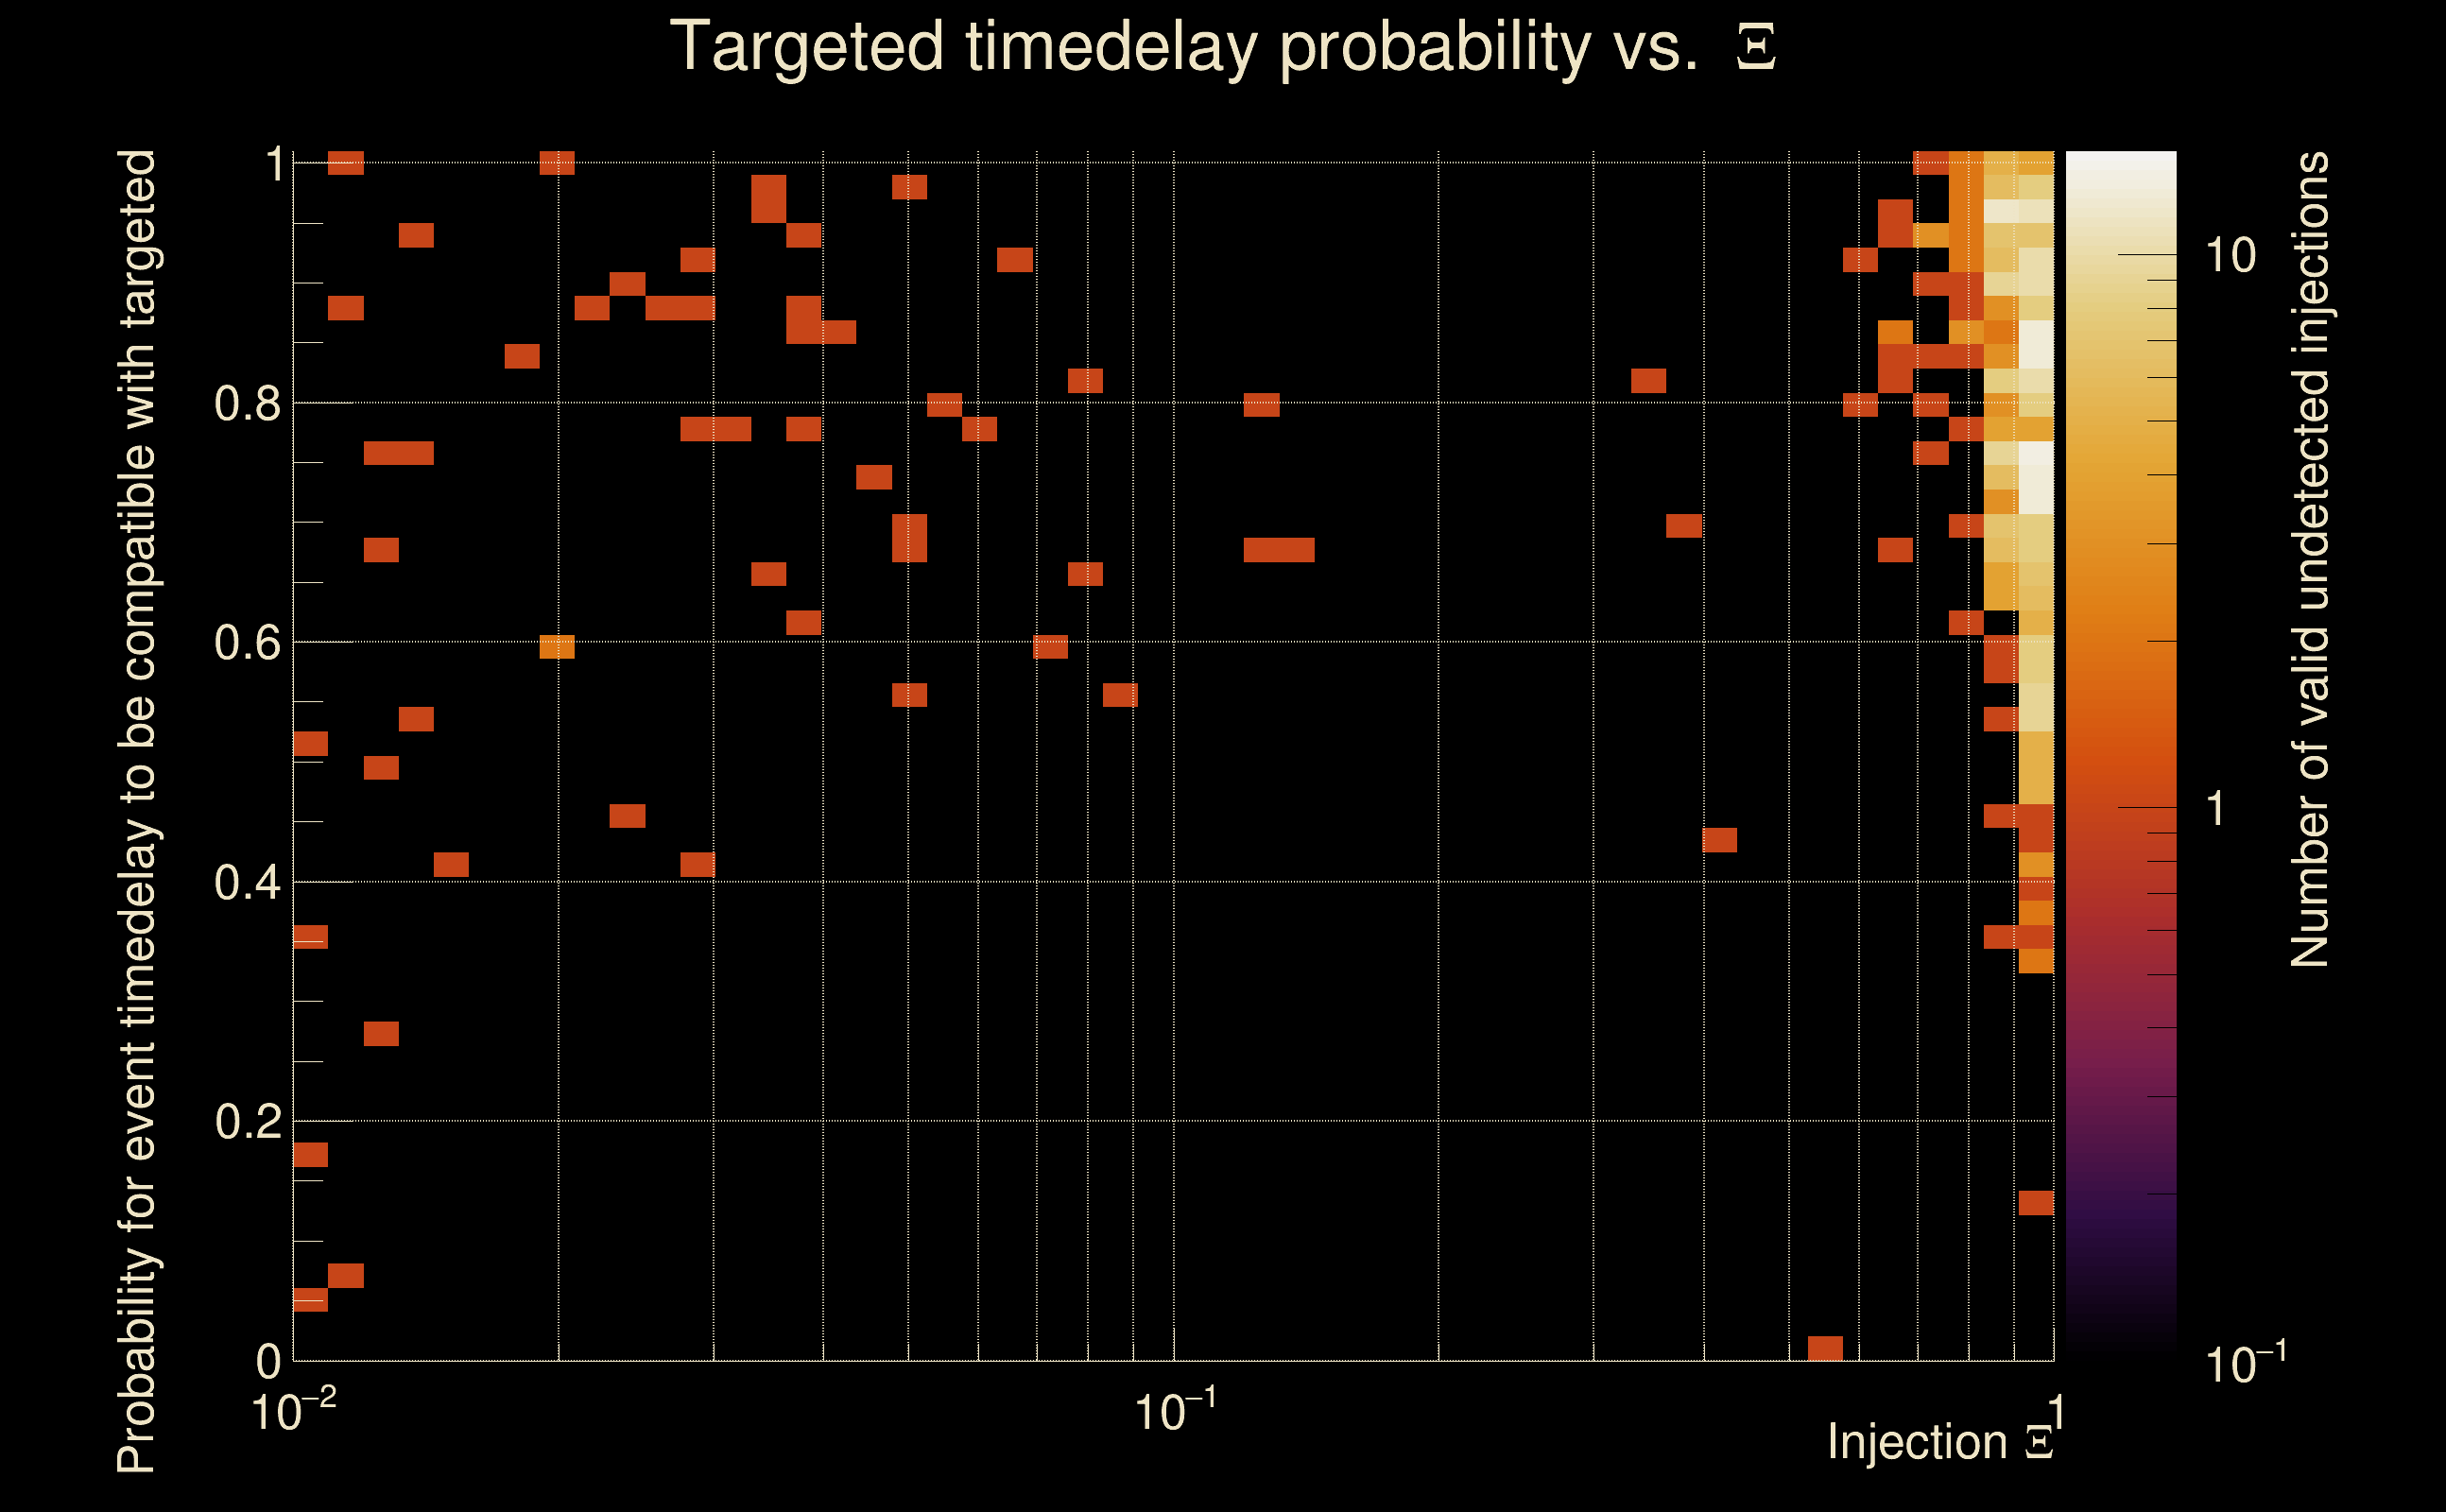
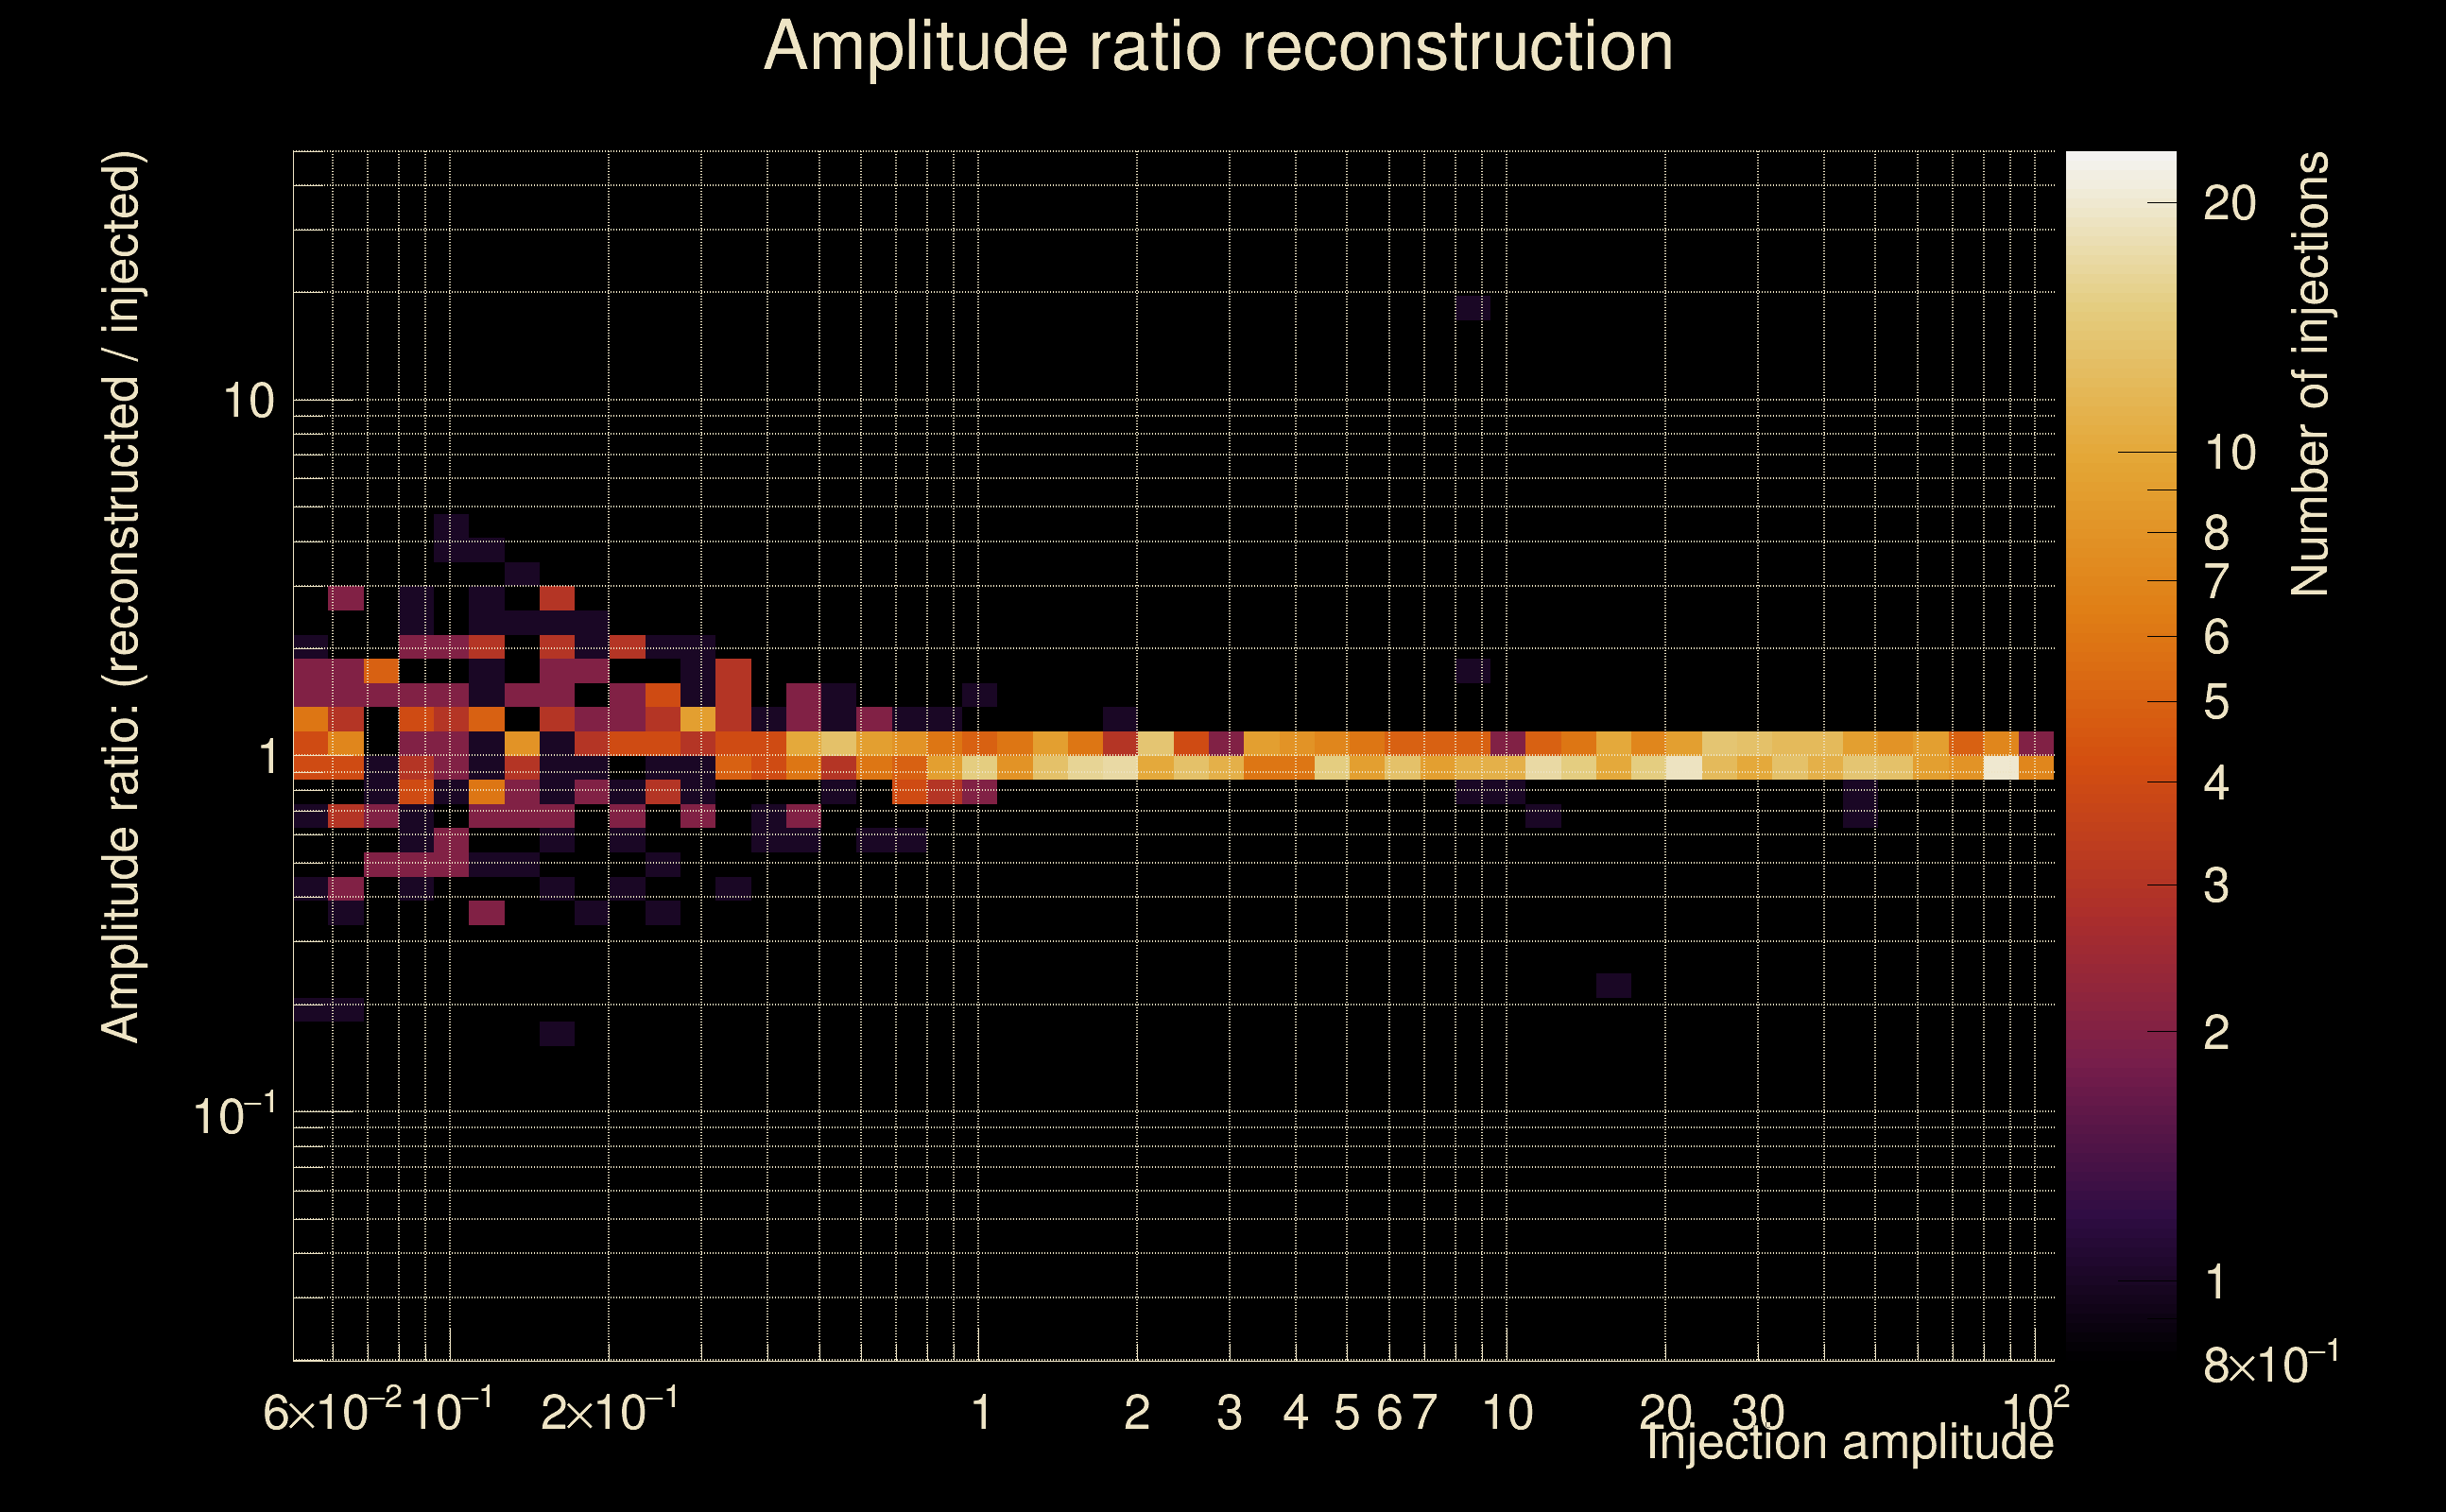
| Number of injections (total/valid/detected): | 1116 / 979 / 280 |
| List of missed injections: | ./Pow23-B12_missed.txt |
| Injection amplitude at 90% detection efficiency: | 0.871953 |
| Injection amplitude at 50% detection efficiency: | 0.523303 |
| Injection amplitude at 10% detection efficiency: | 0.423262 |
 |
 |
 |
 |
 |
 |
 |
|
 |
 |
|
 |
 |
|
 |
 |
|
 |
 |
|
 |
 |
|
 |
 |
|
 |
 |
|
 |
 |
 |
 |
 |
 |
 |
 |
 |
 |
 |
 |
 |
 |
 |
| florent.robinet@ijclab.in2p3.fr |