| Omicron version: | 4.2.0: documentation gitlab repository |
| Omicron run by: | unknown |
| Report produced on: | Mon Feb 23 09:23:20 2026 UTC |
| Ox option file: | TargIxf_feb2026_SN5_30s_options.txt |
| Omicron option files: | detector 0, detector 1 |
| Detector channel names: | H1:GDS-CALIB_STRAIN_CLEAN_AR_4096Hz, L1:GDS-CALIB_STRAIN_CLEAN_AR_4096Hz |
| Omicron analysis time window and overlap: | 16 s, 6 s |
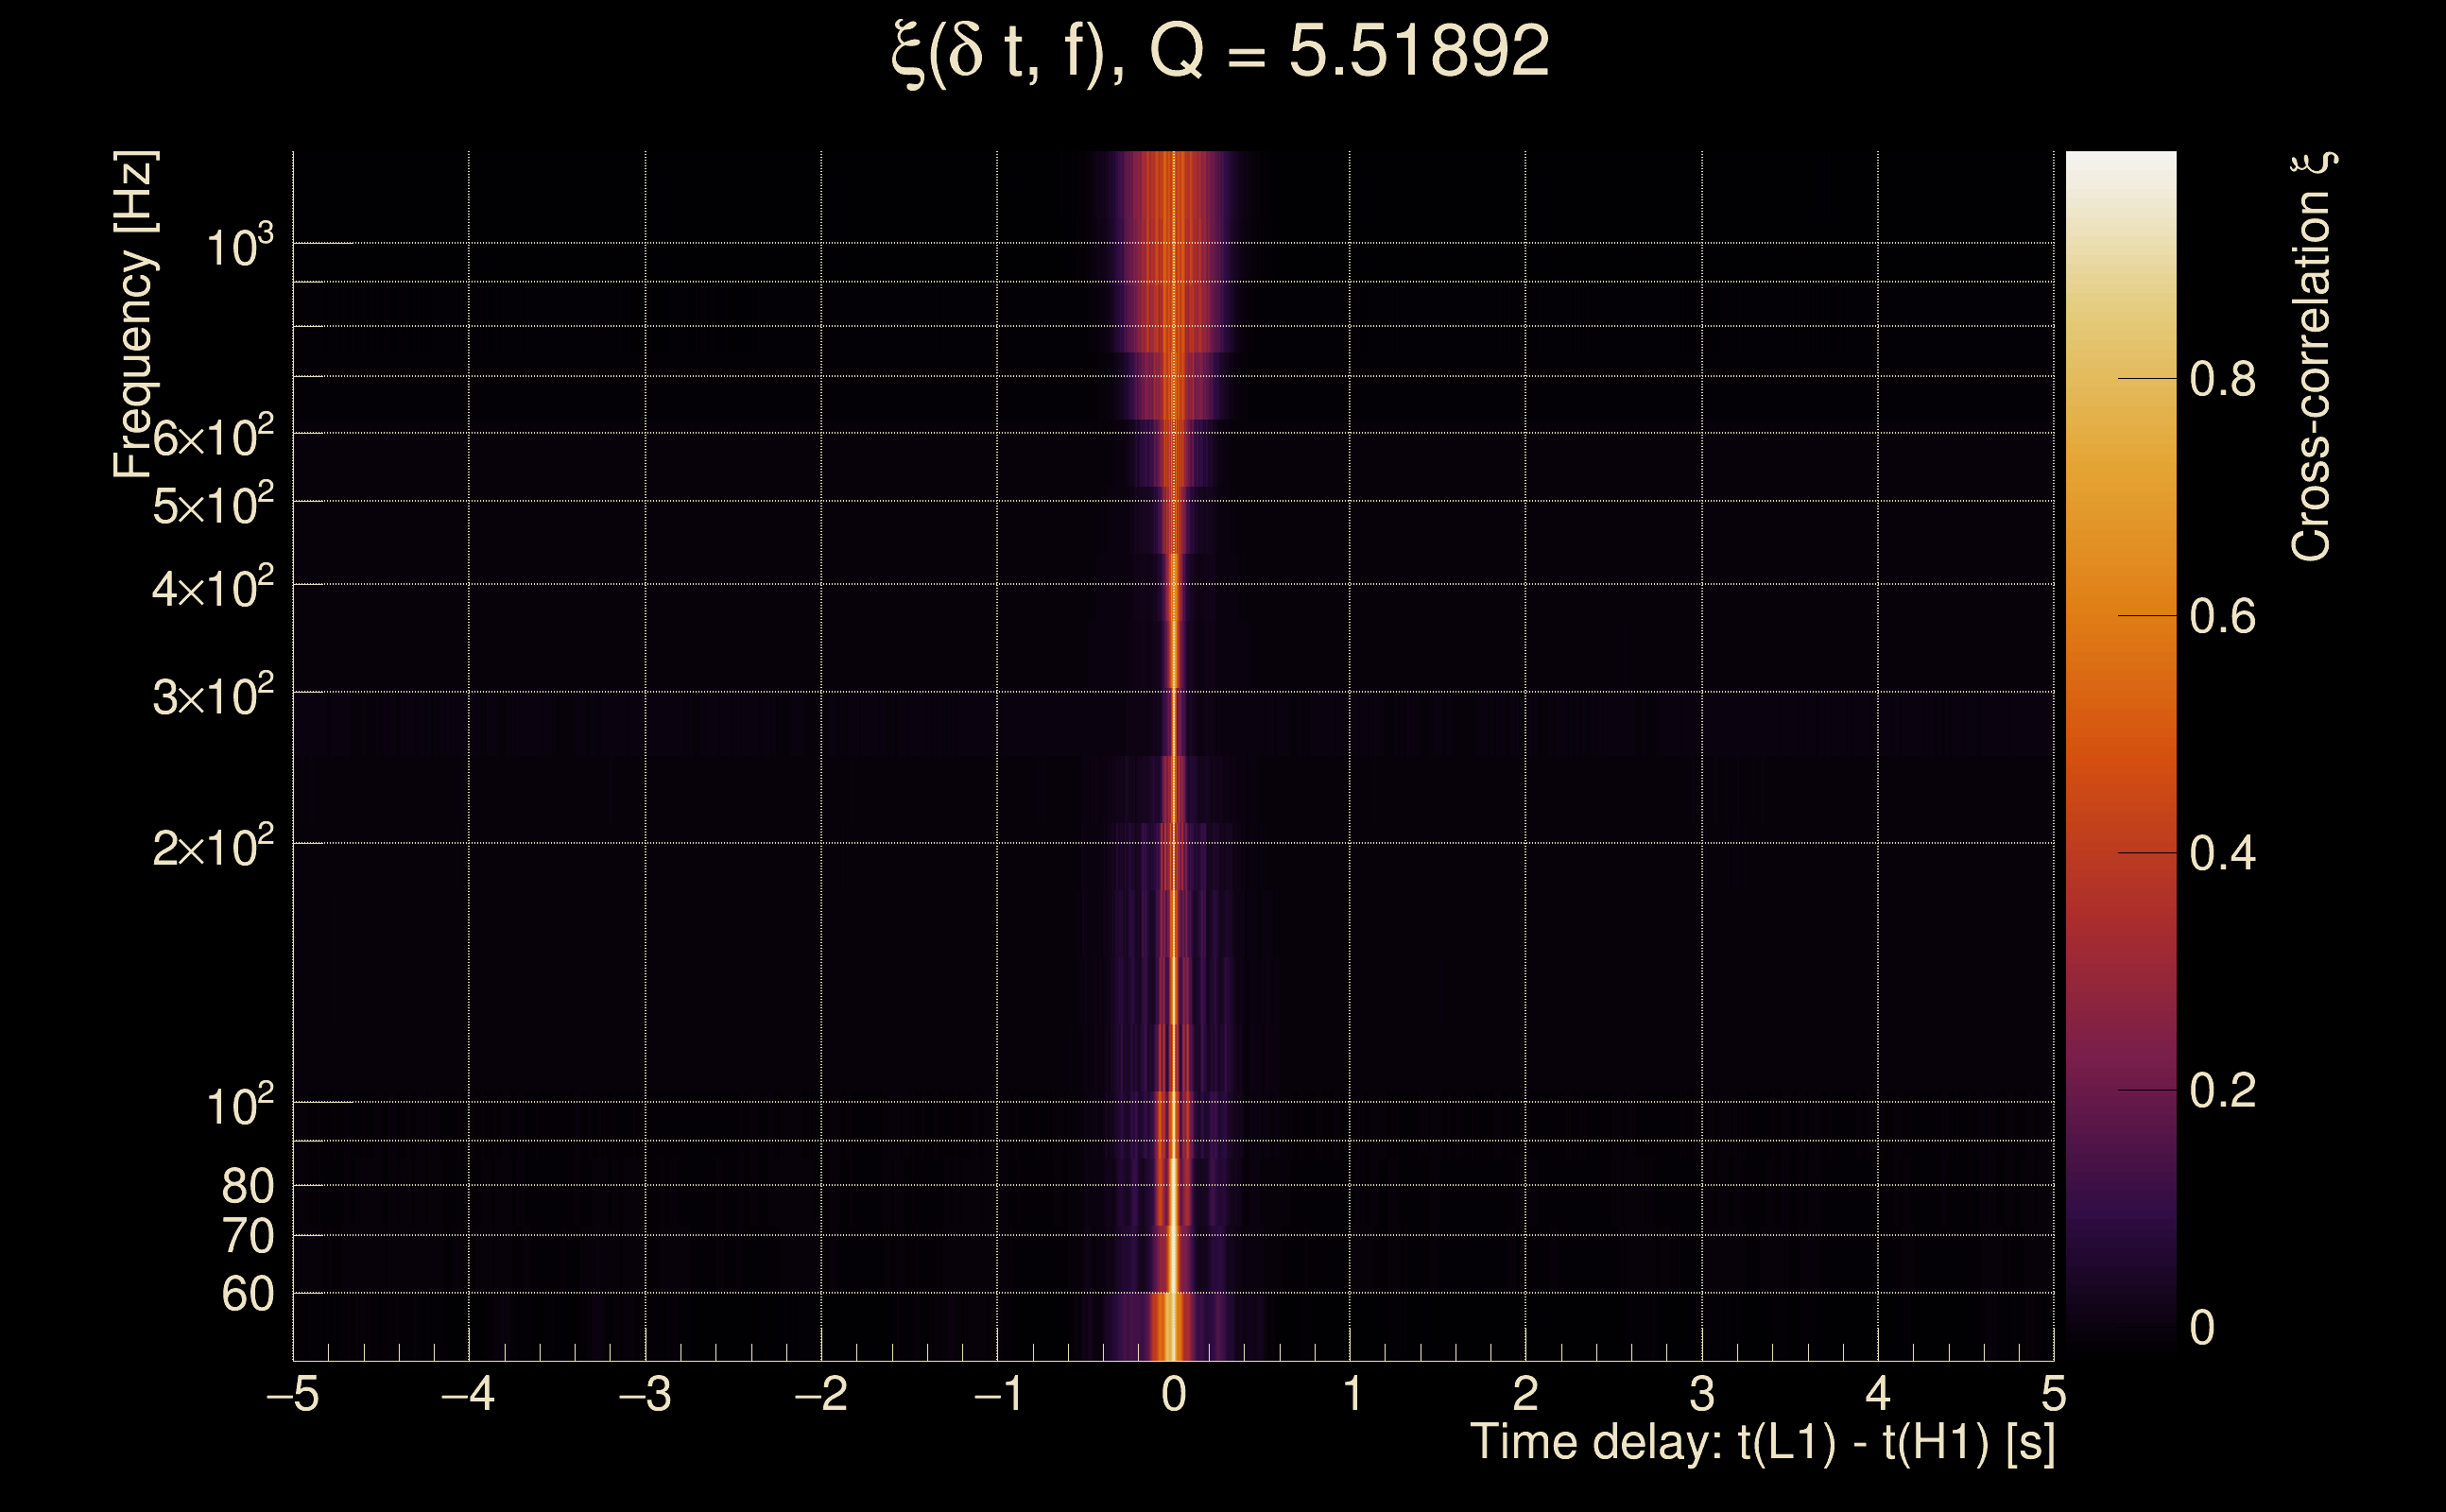
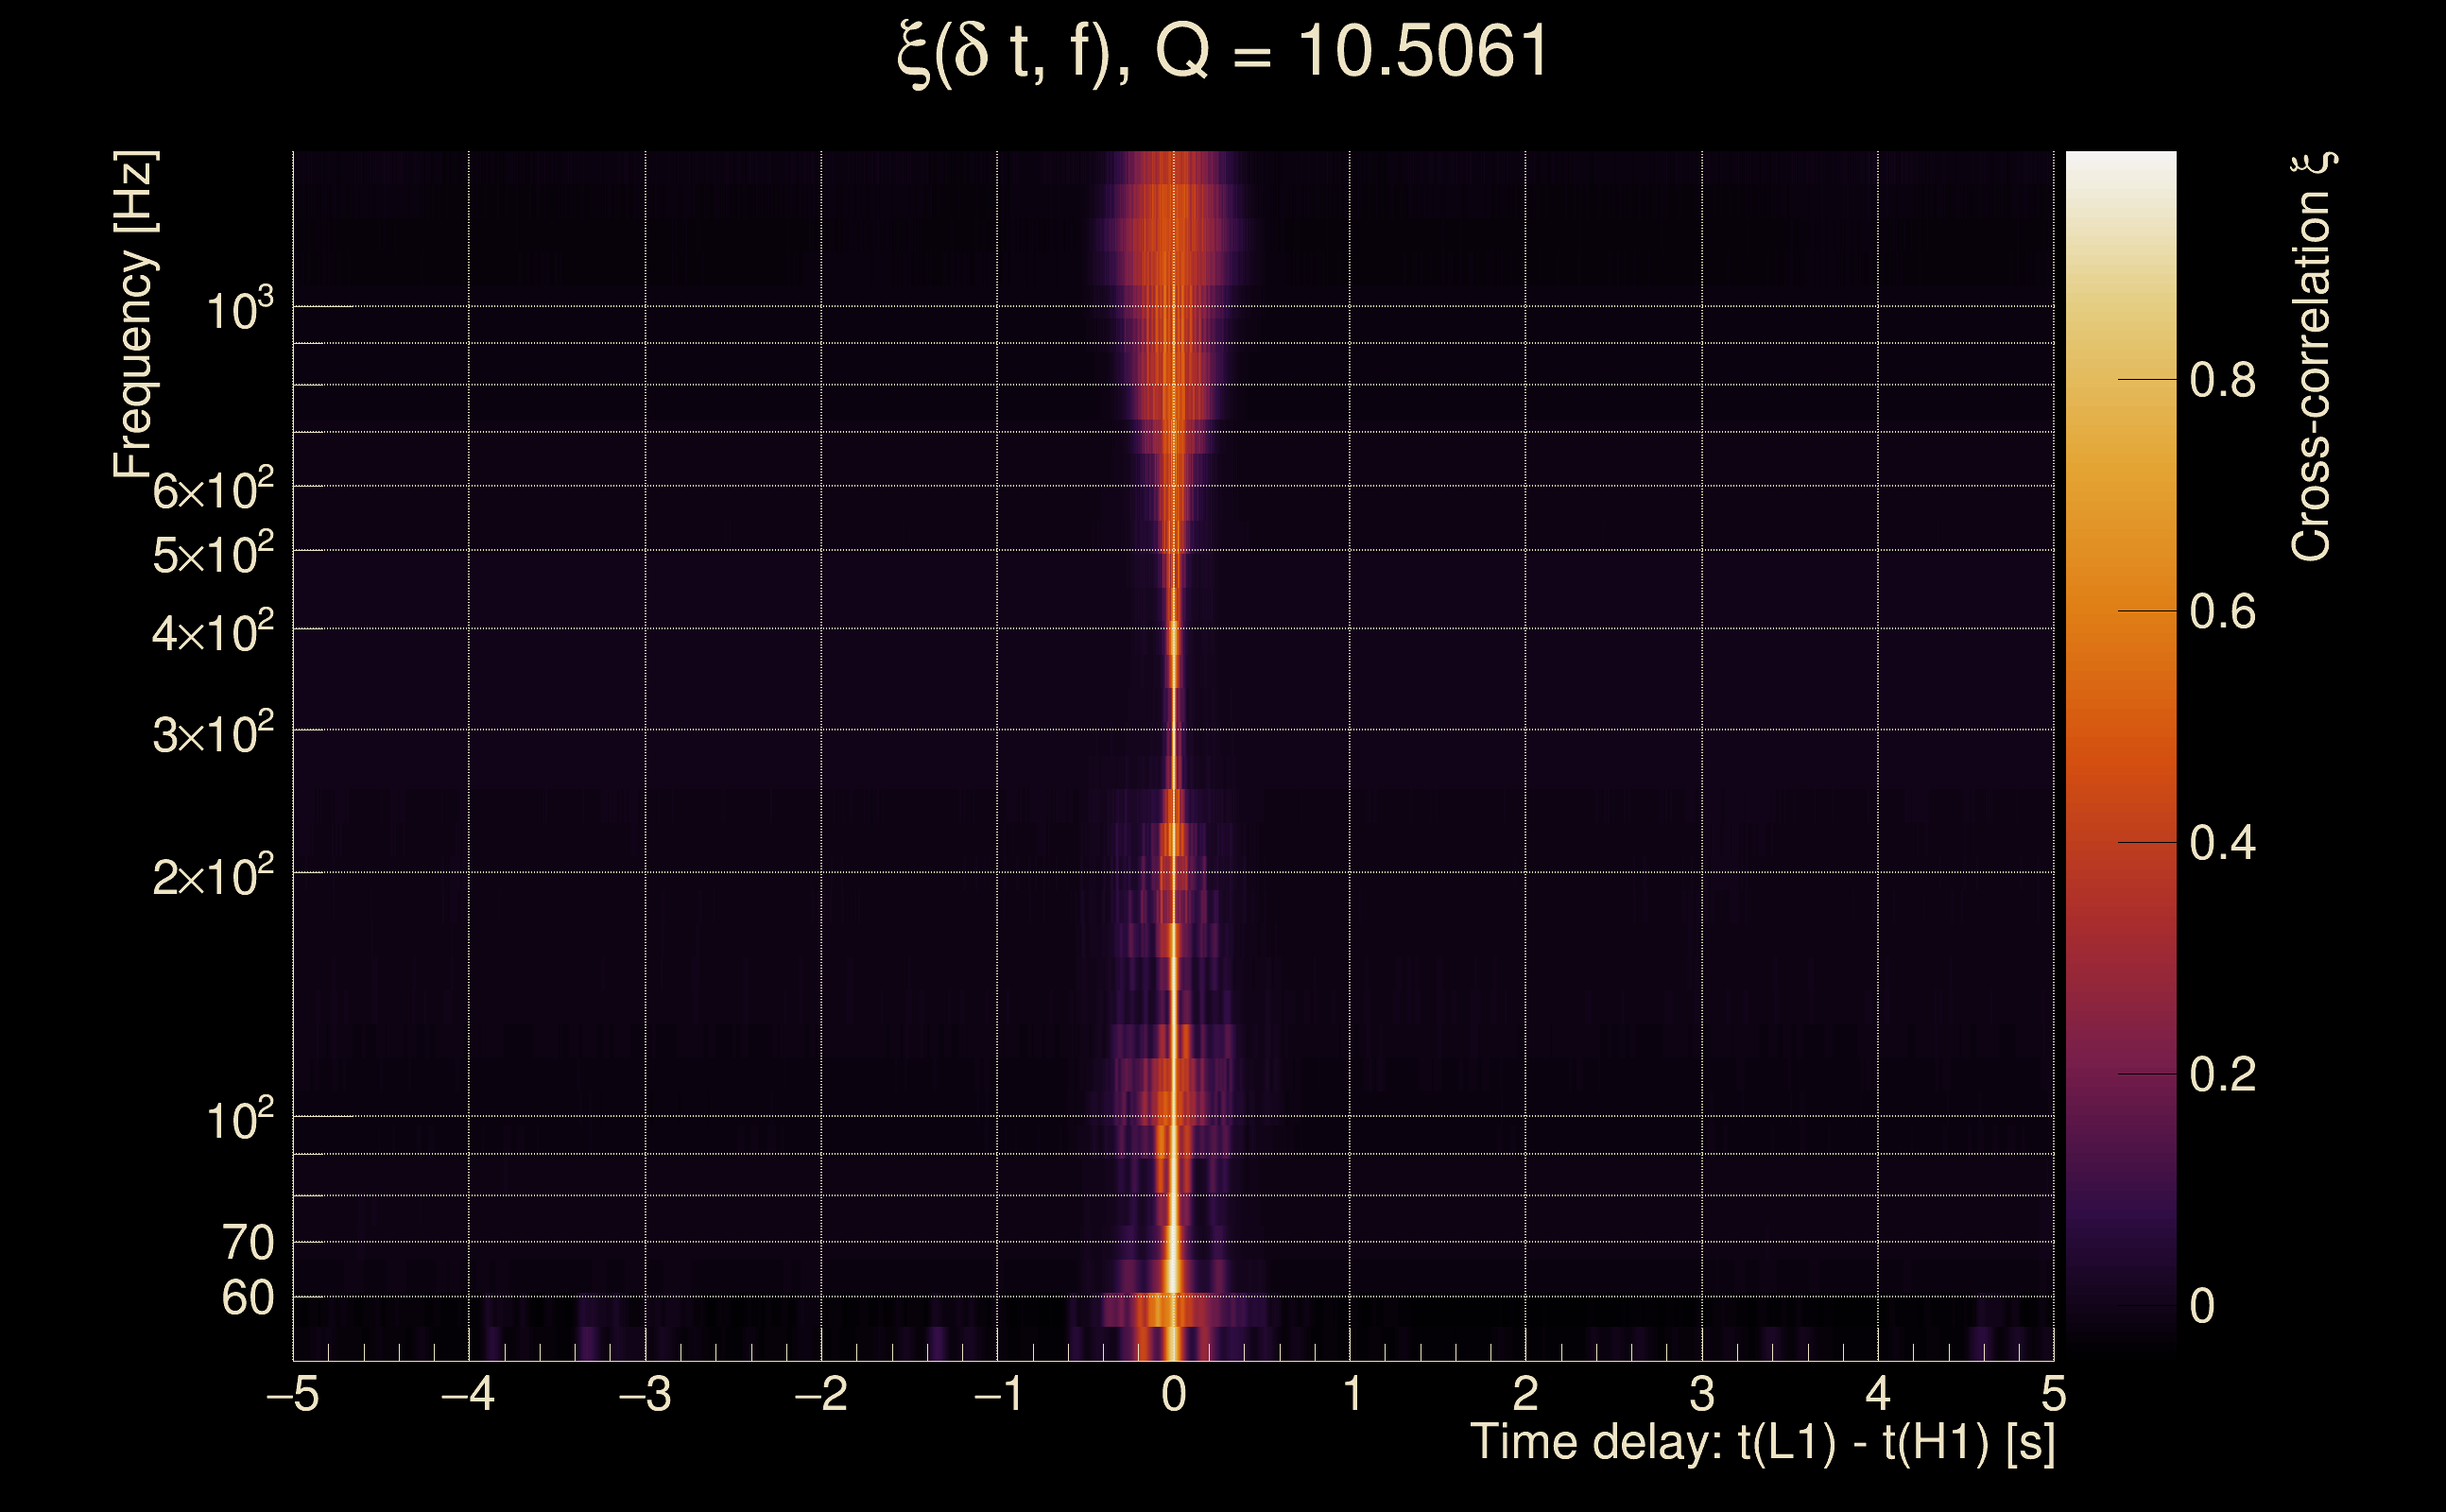
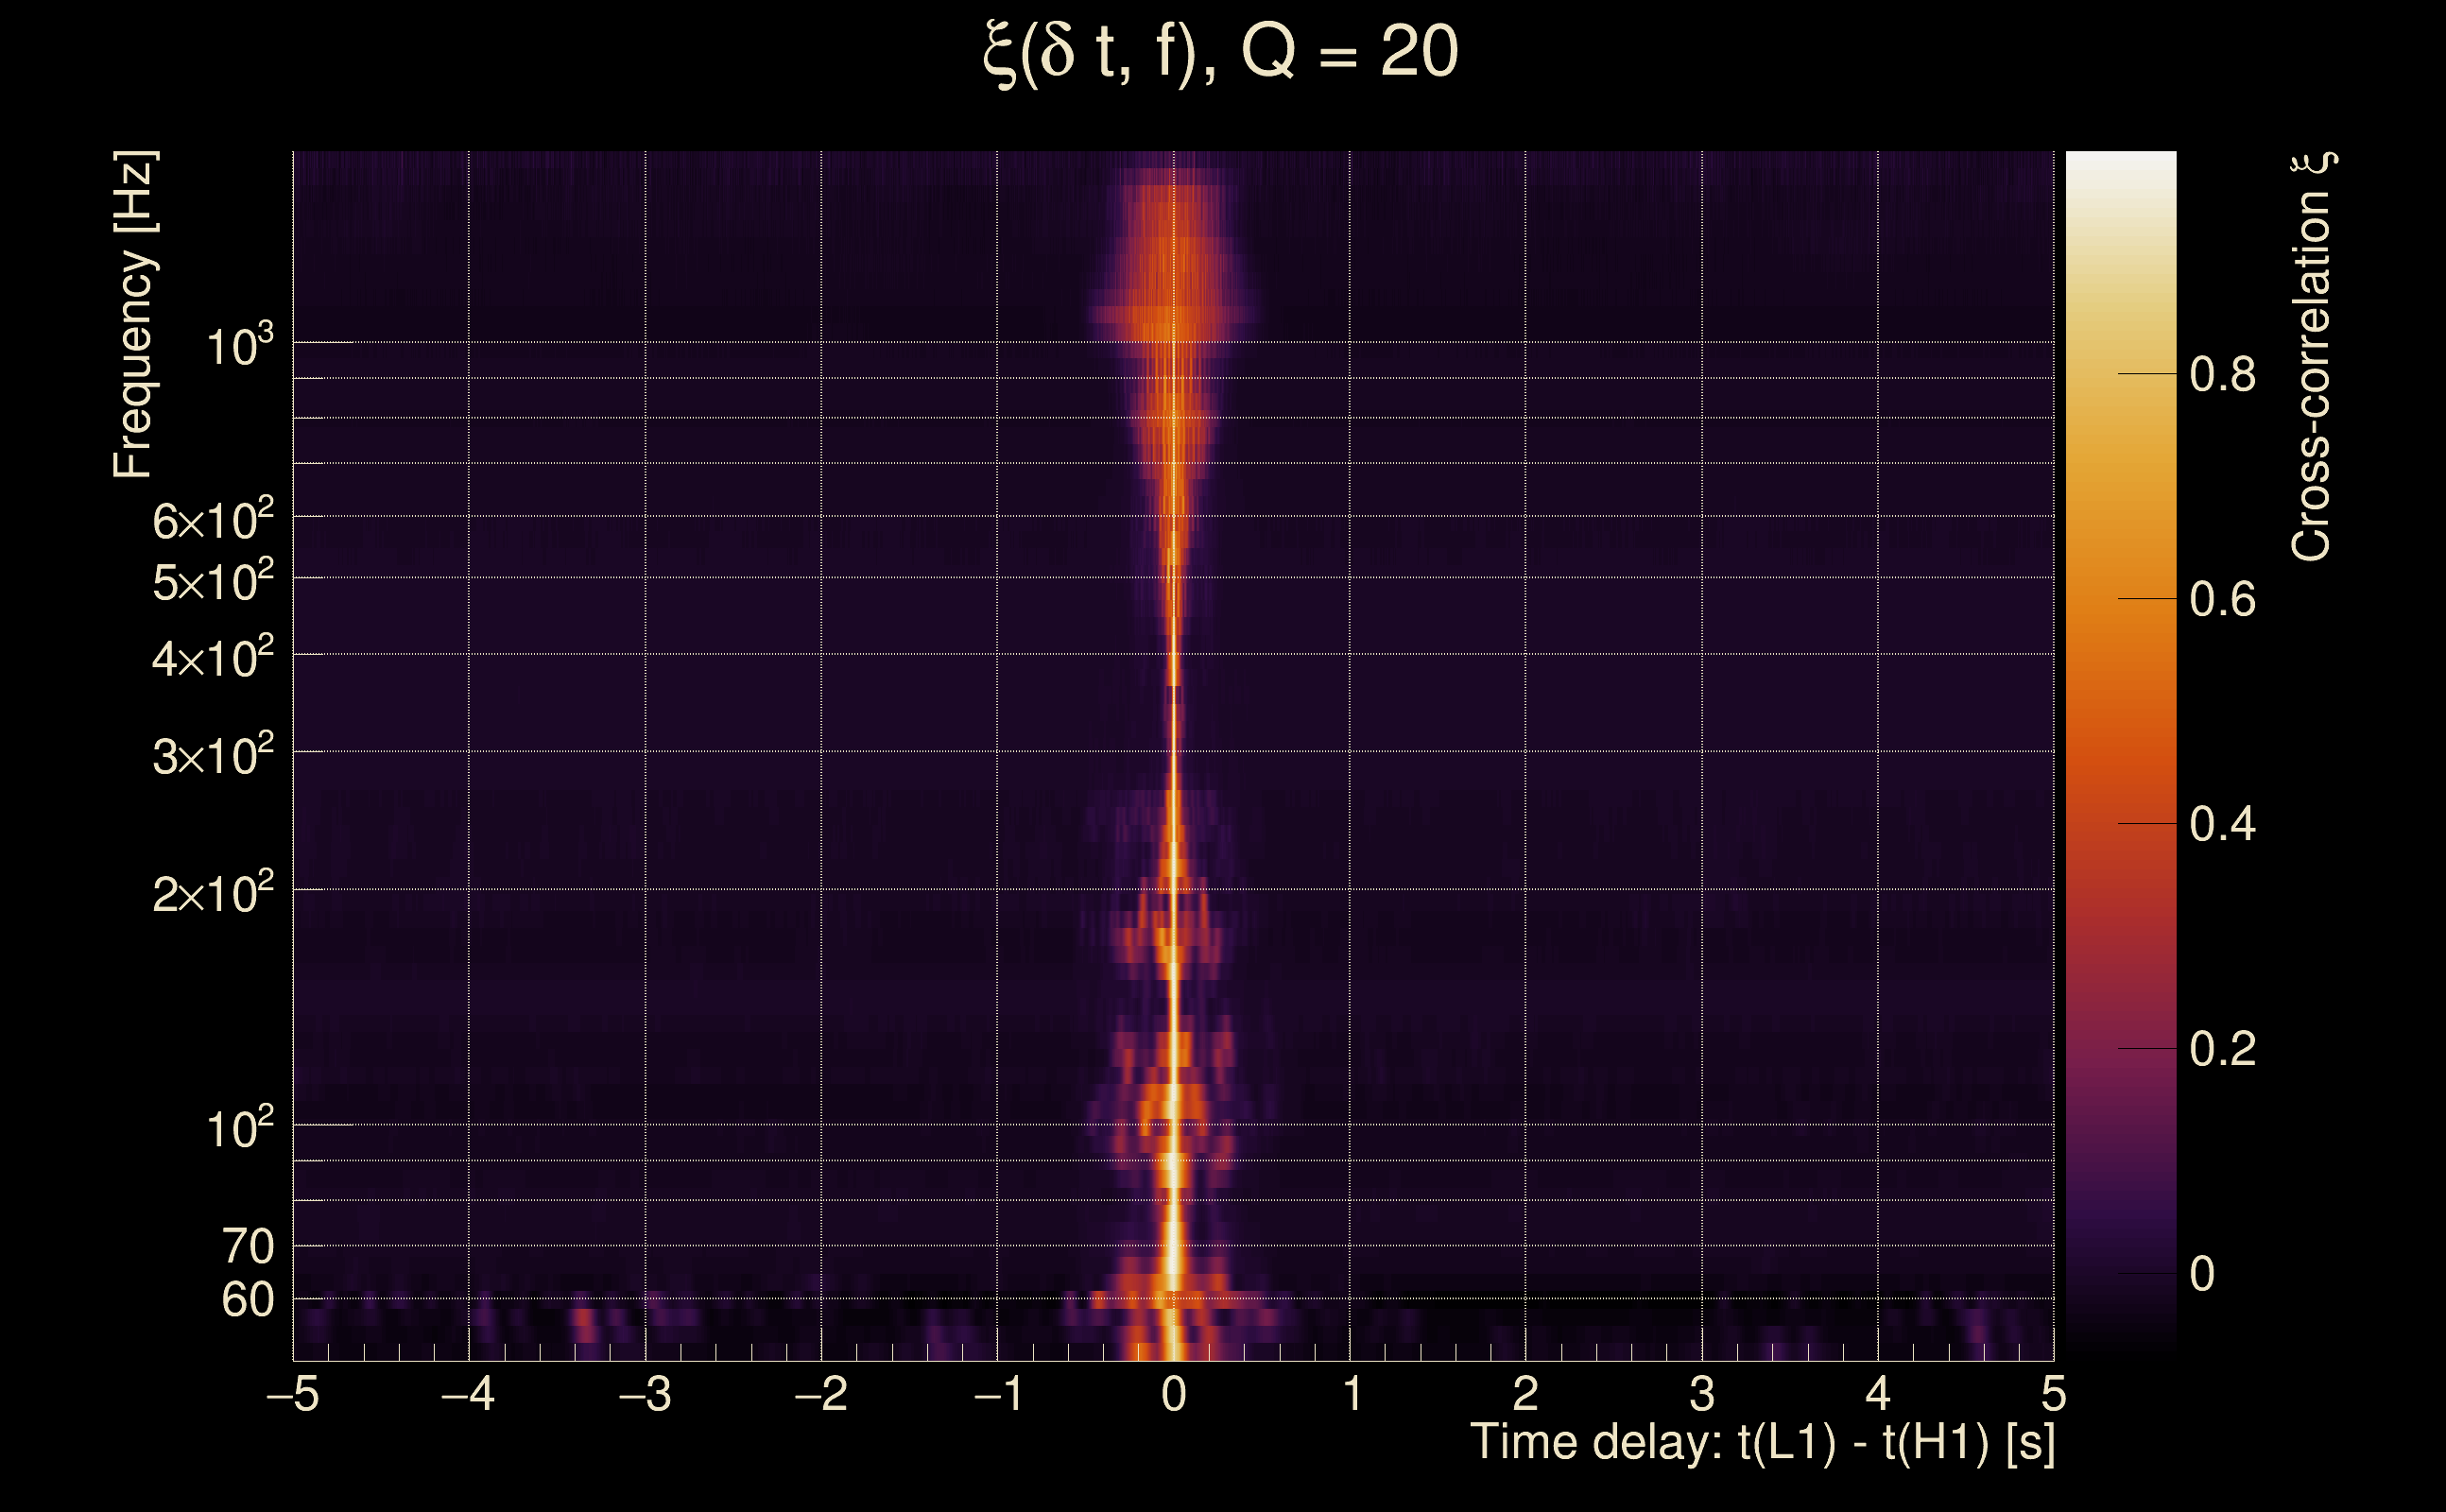
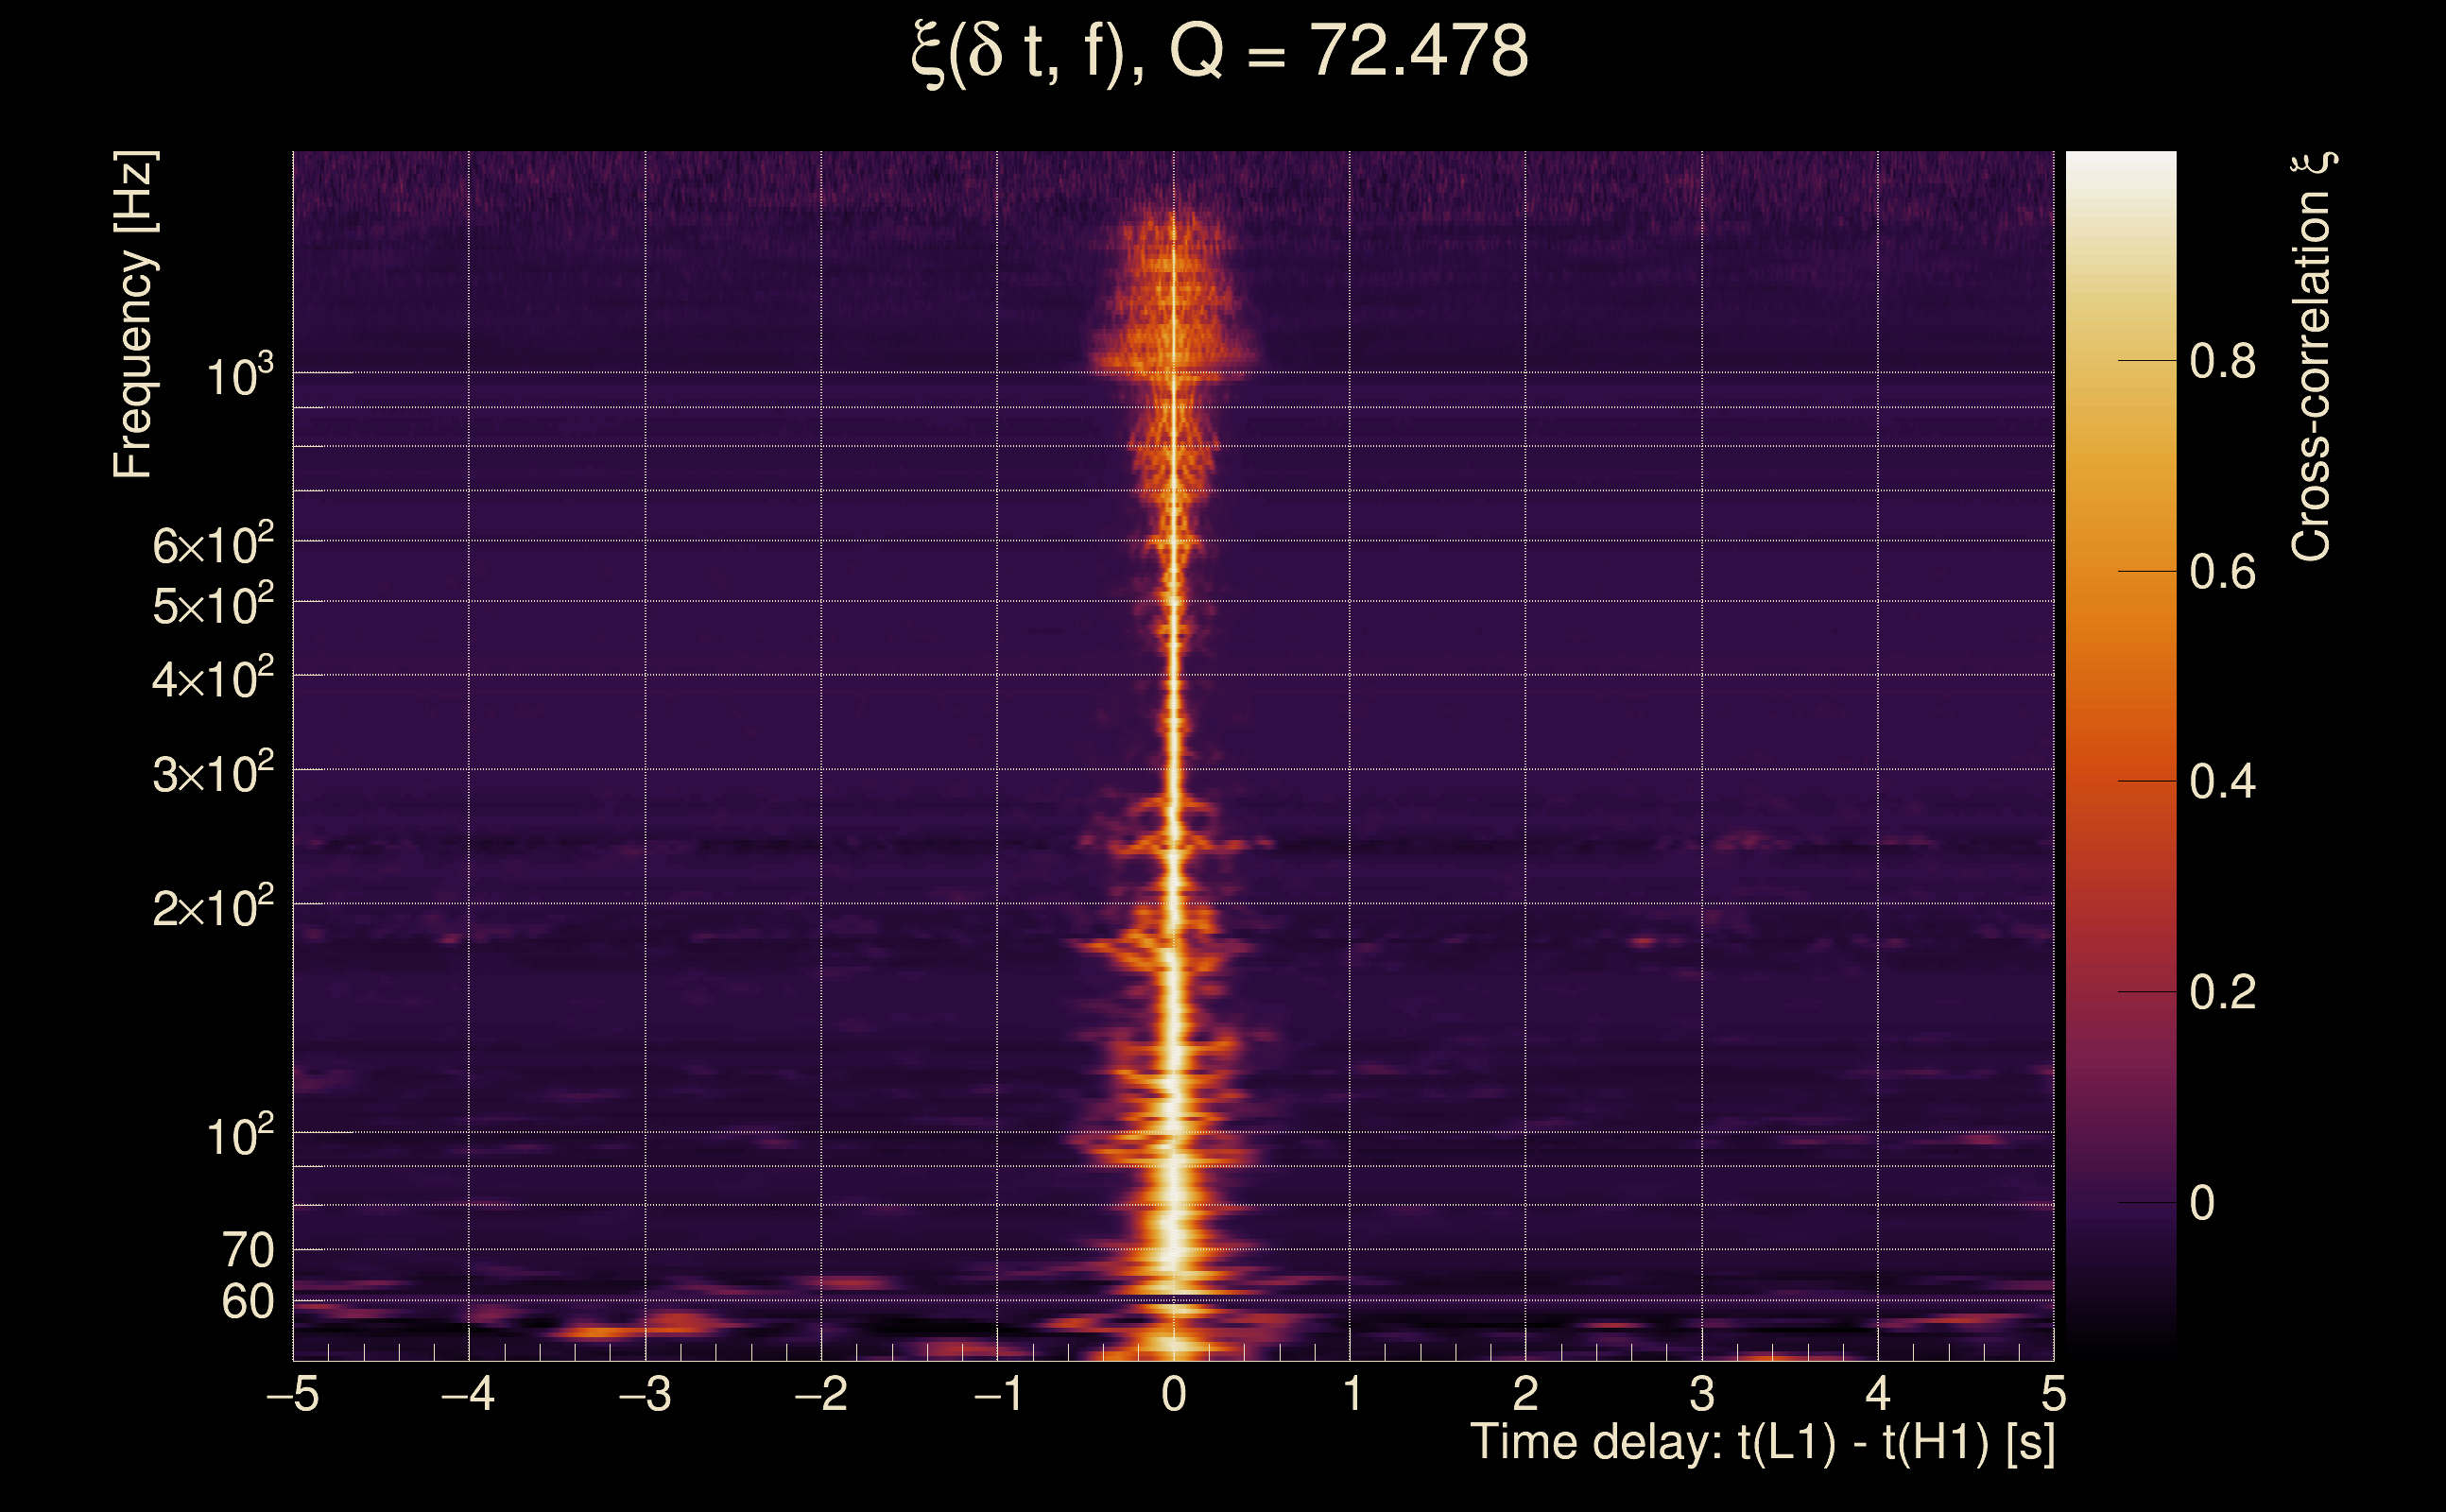
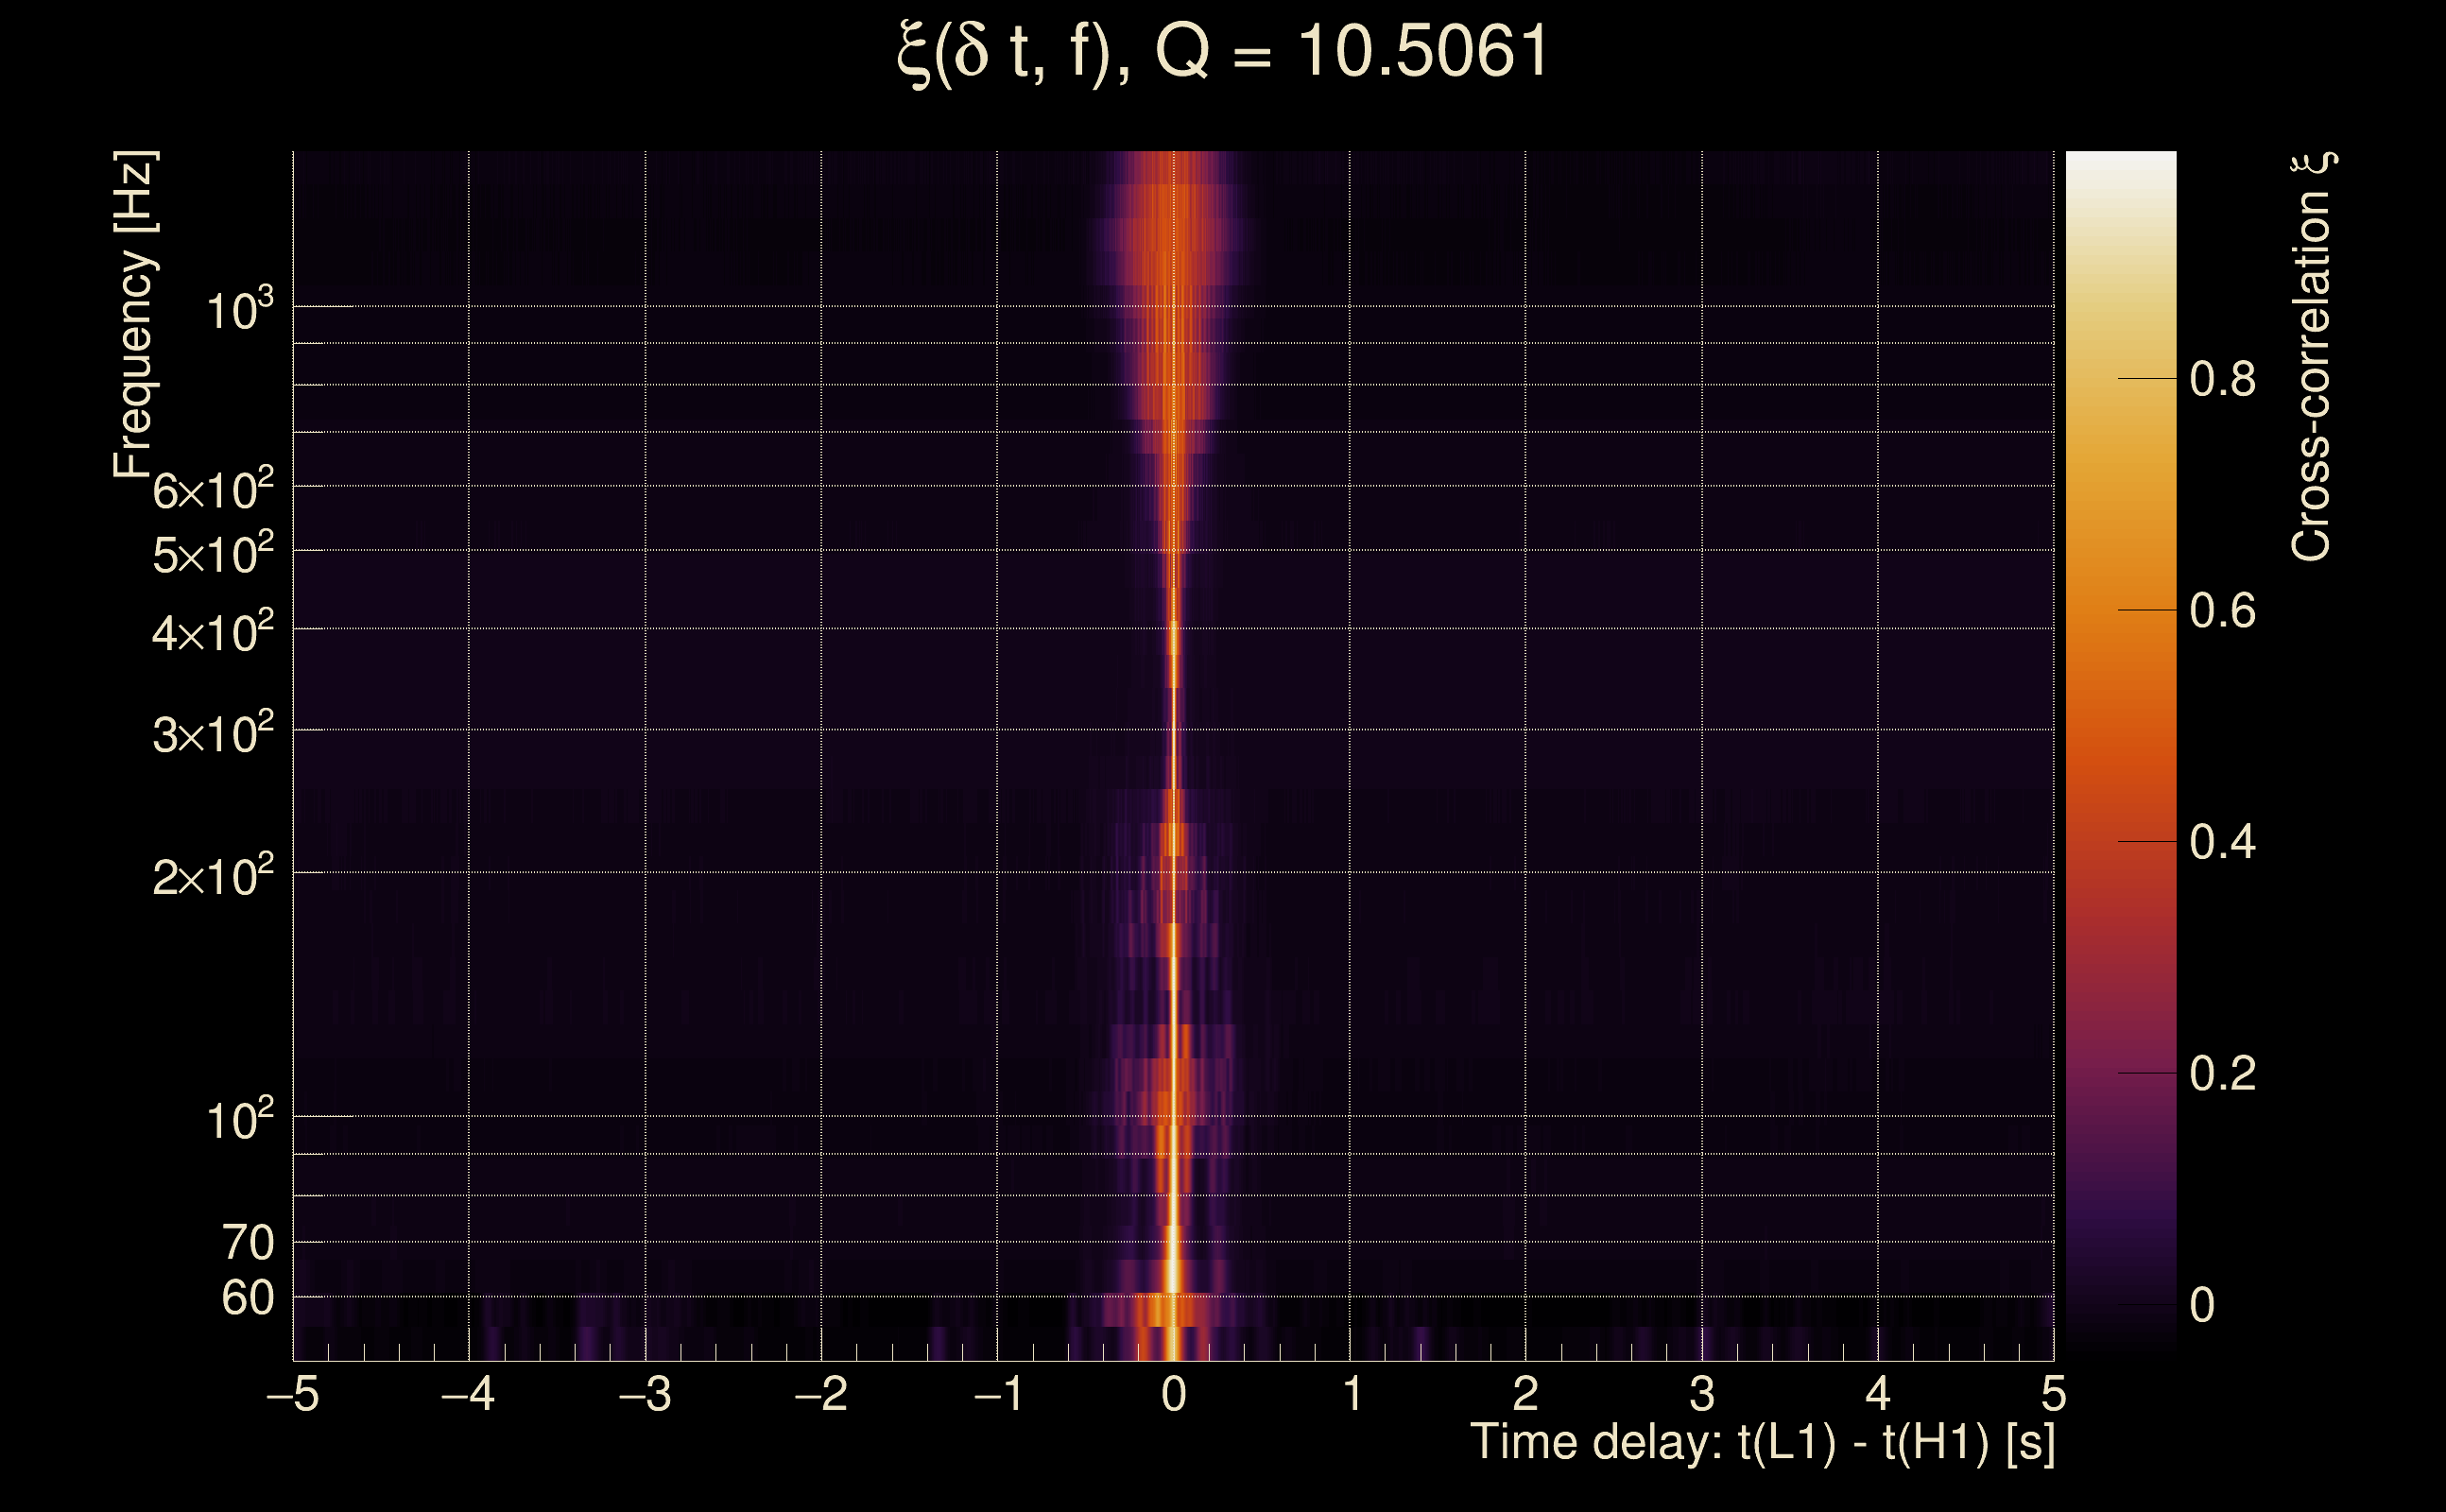
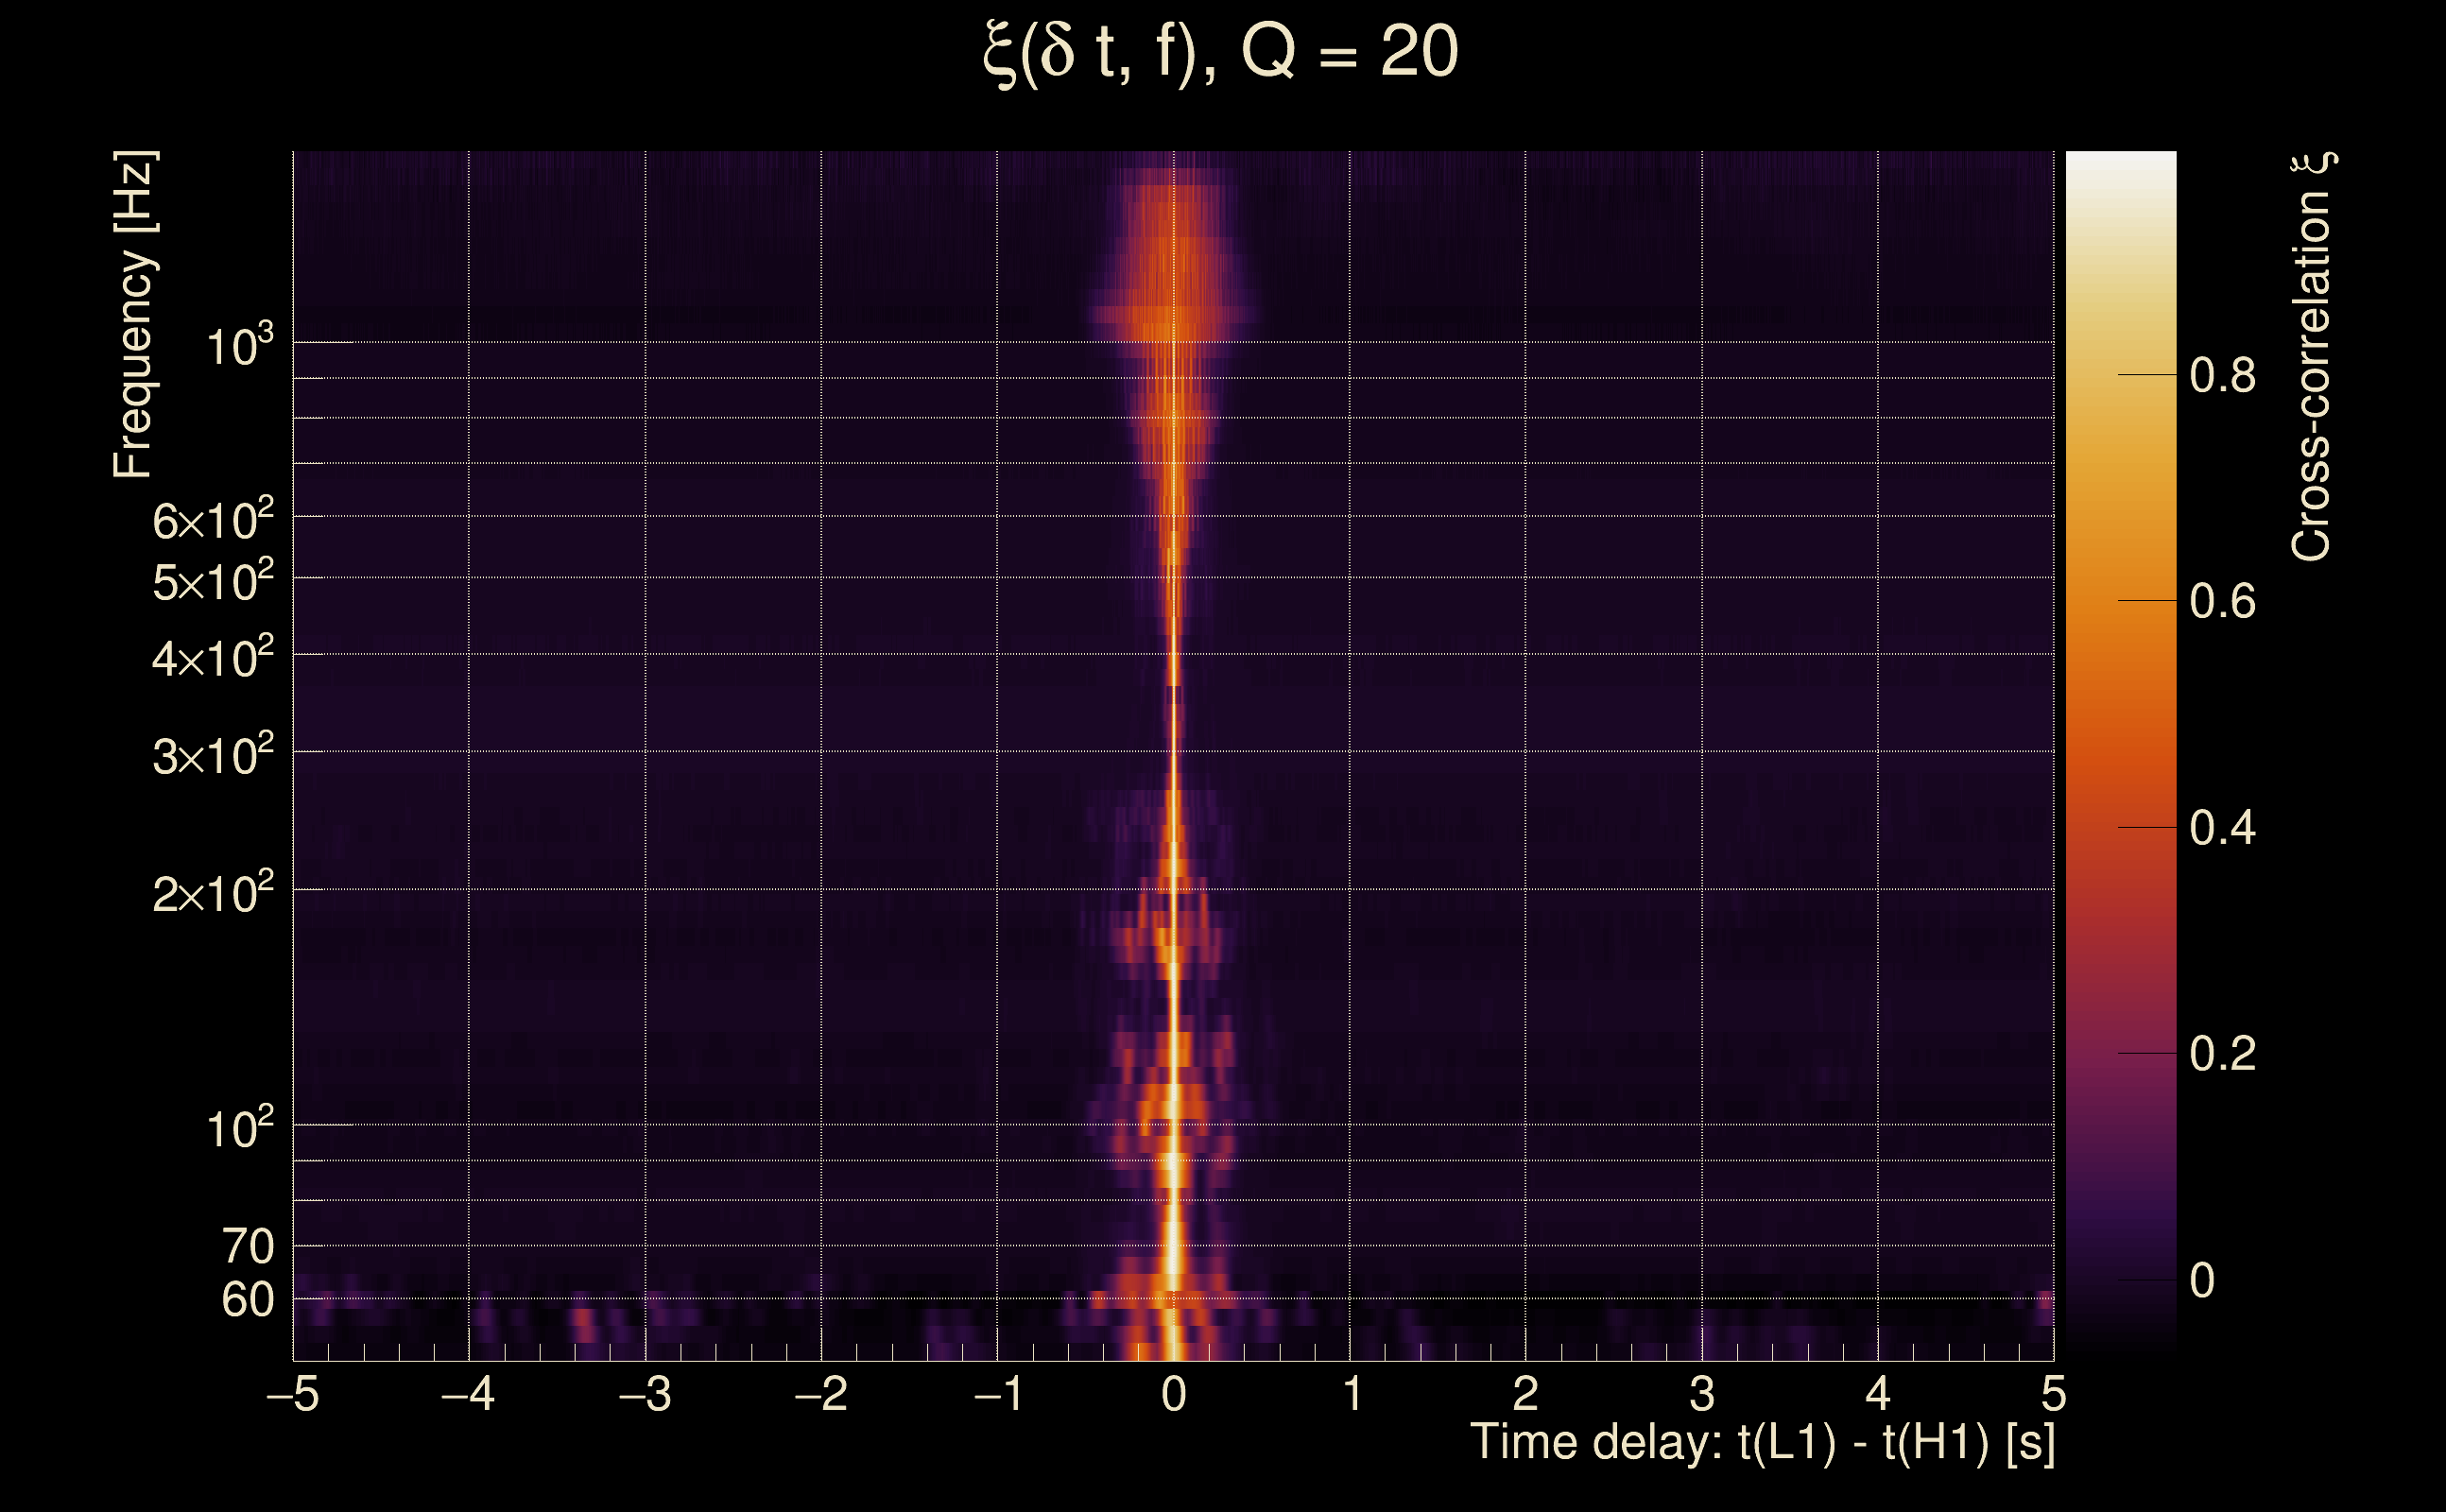
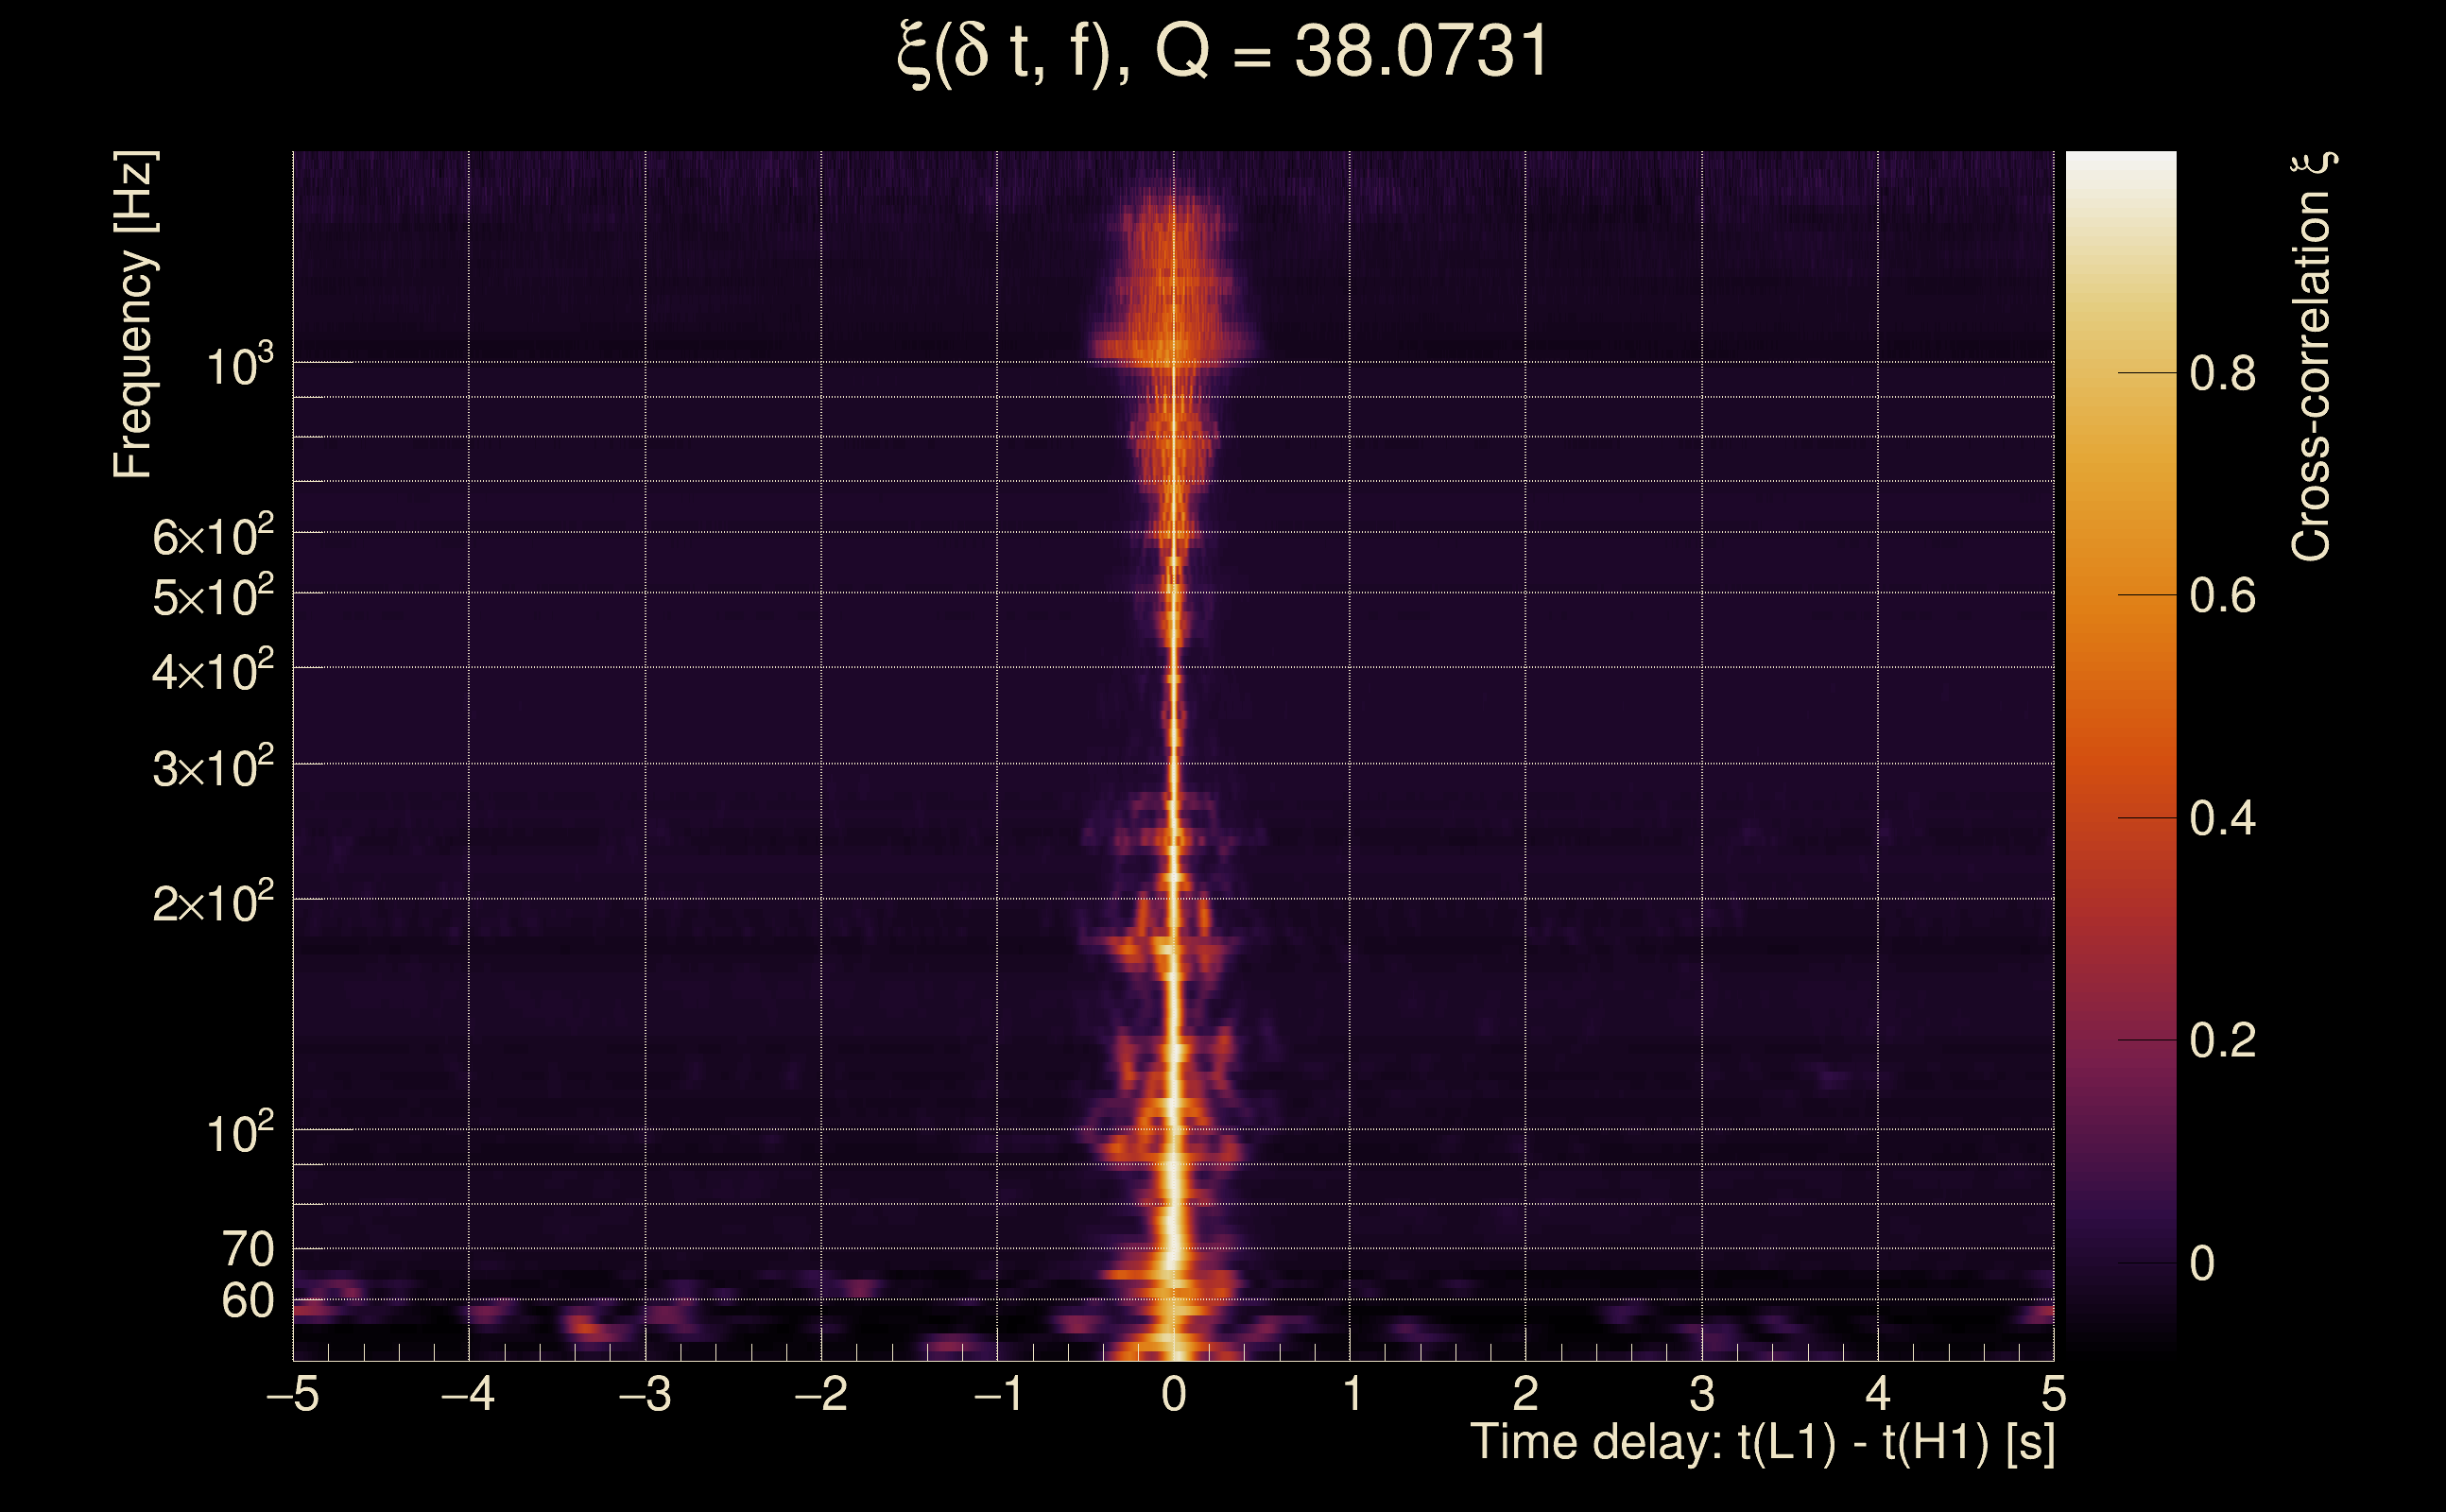
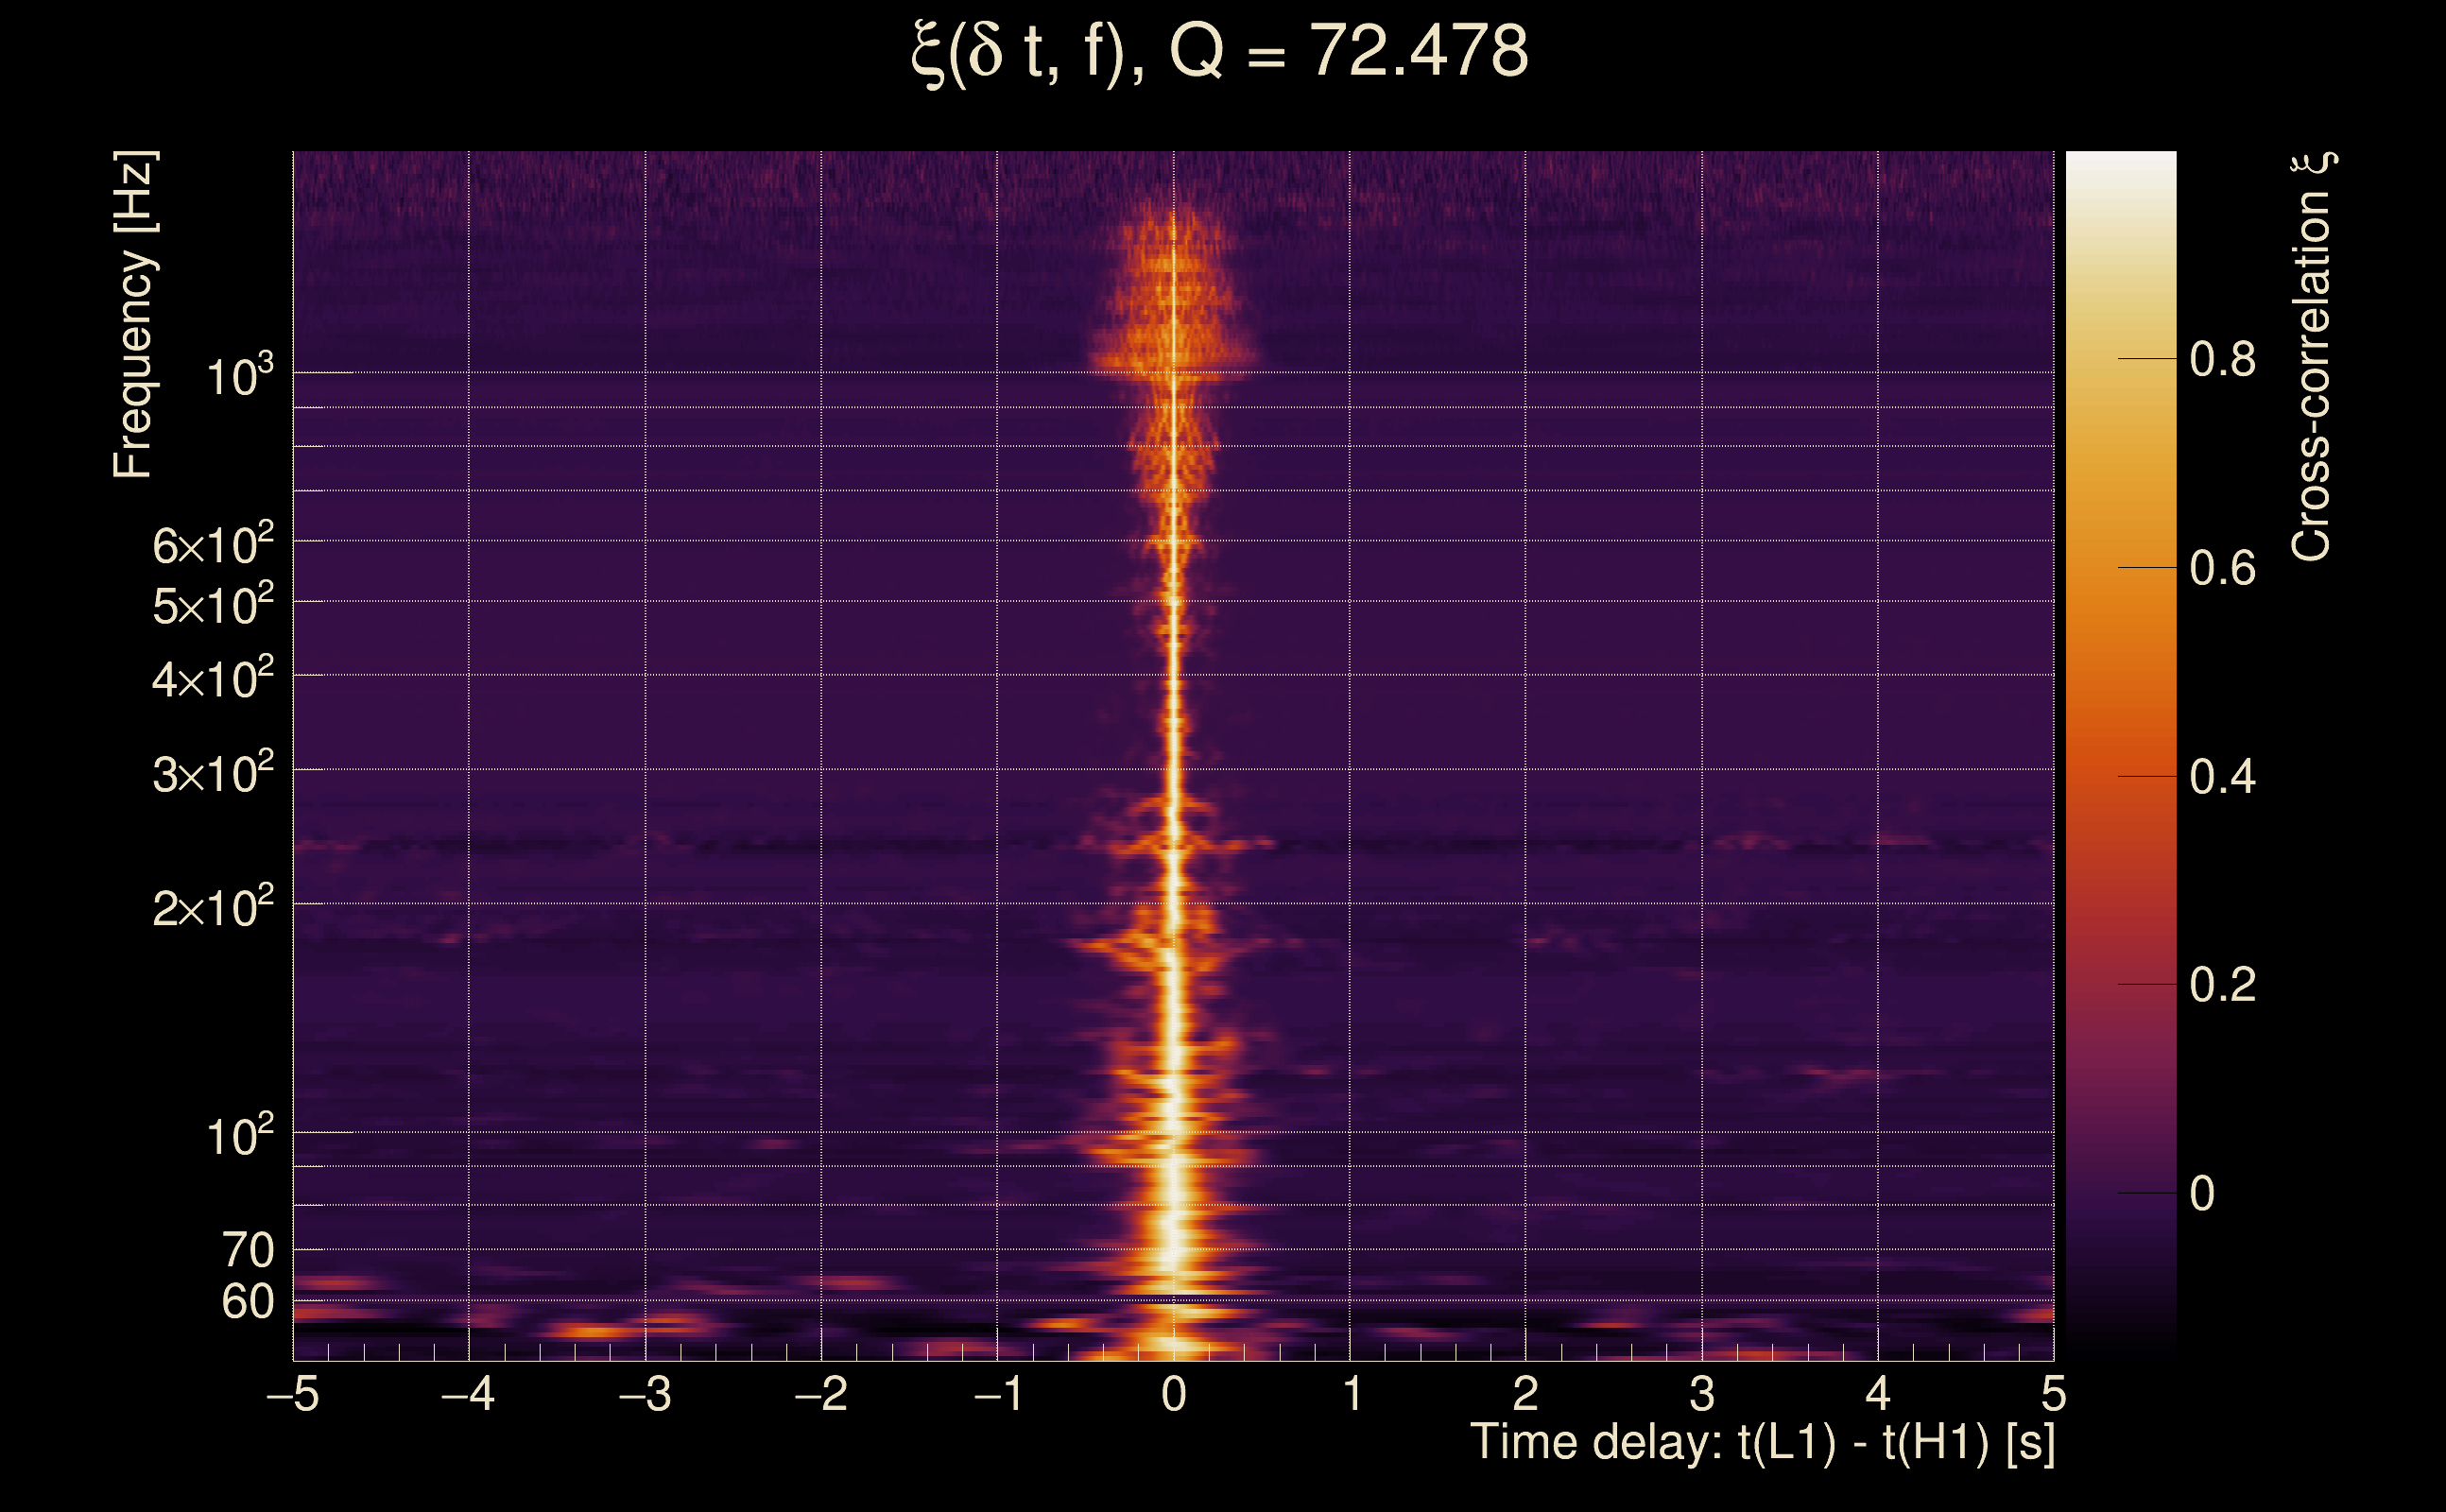
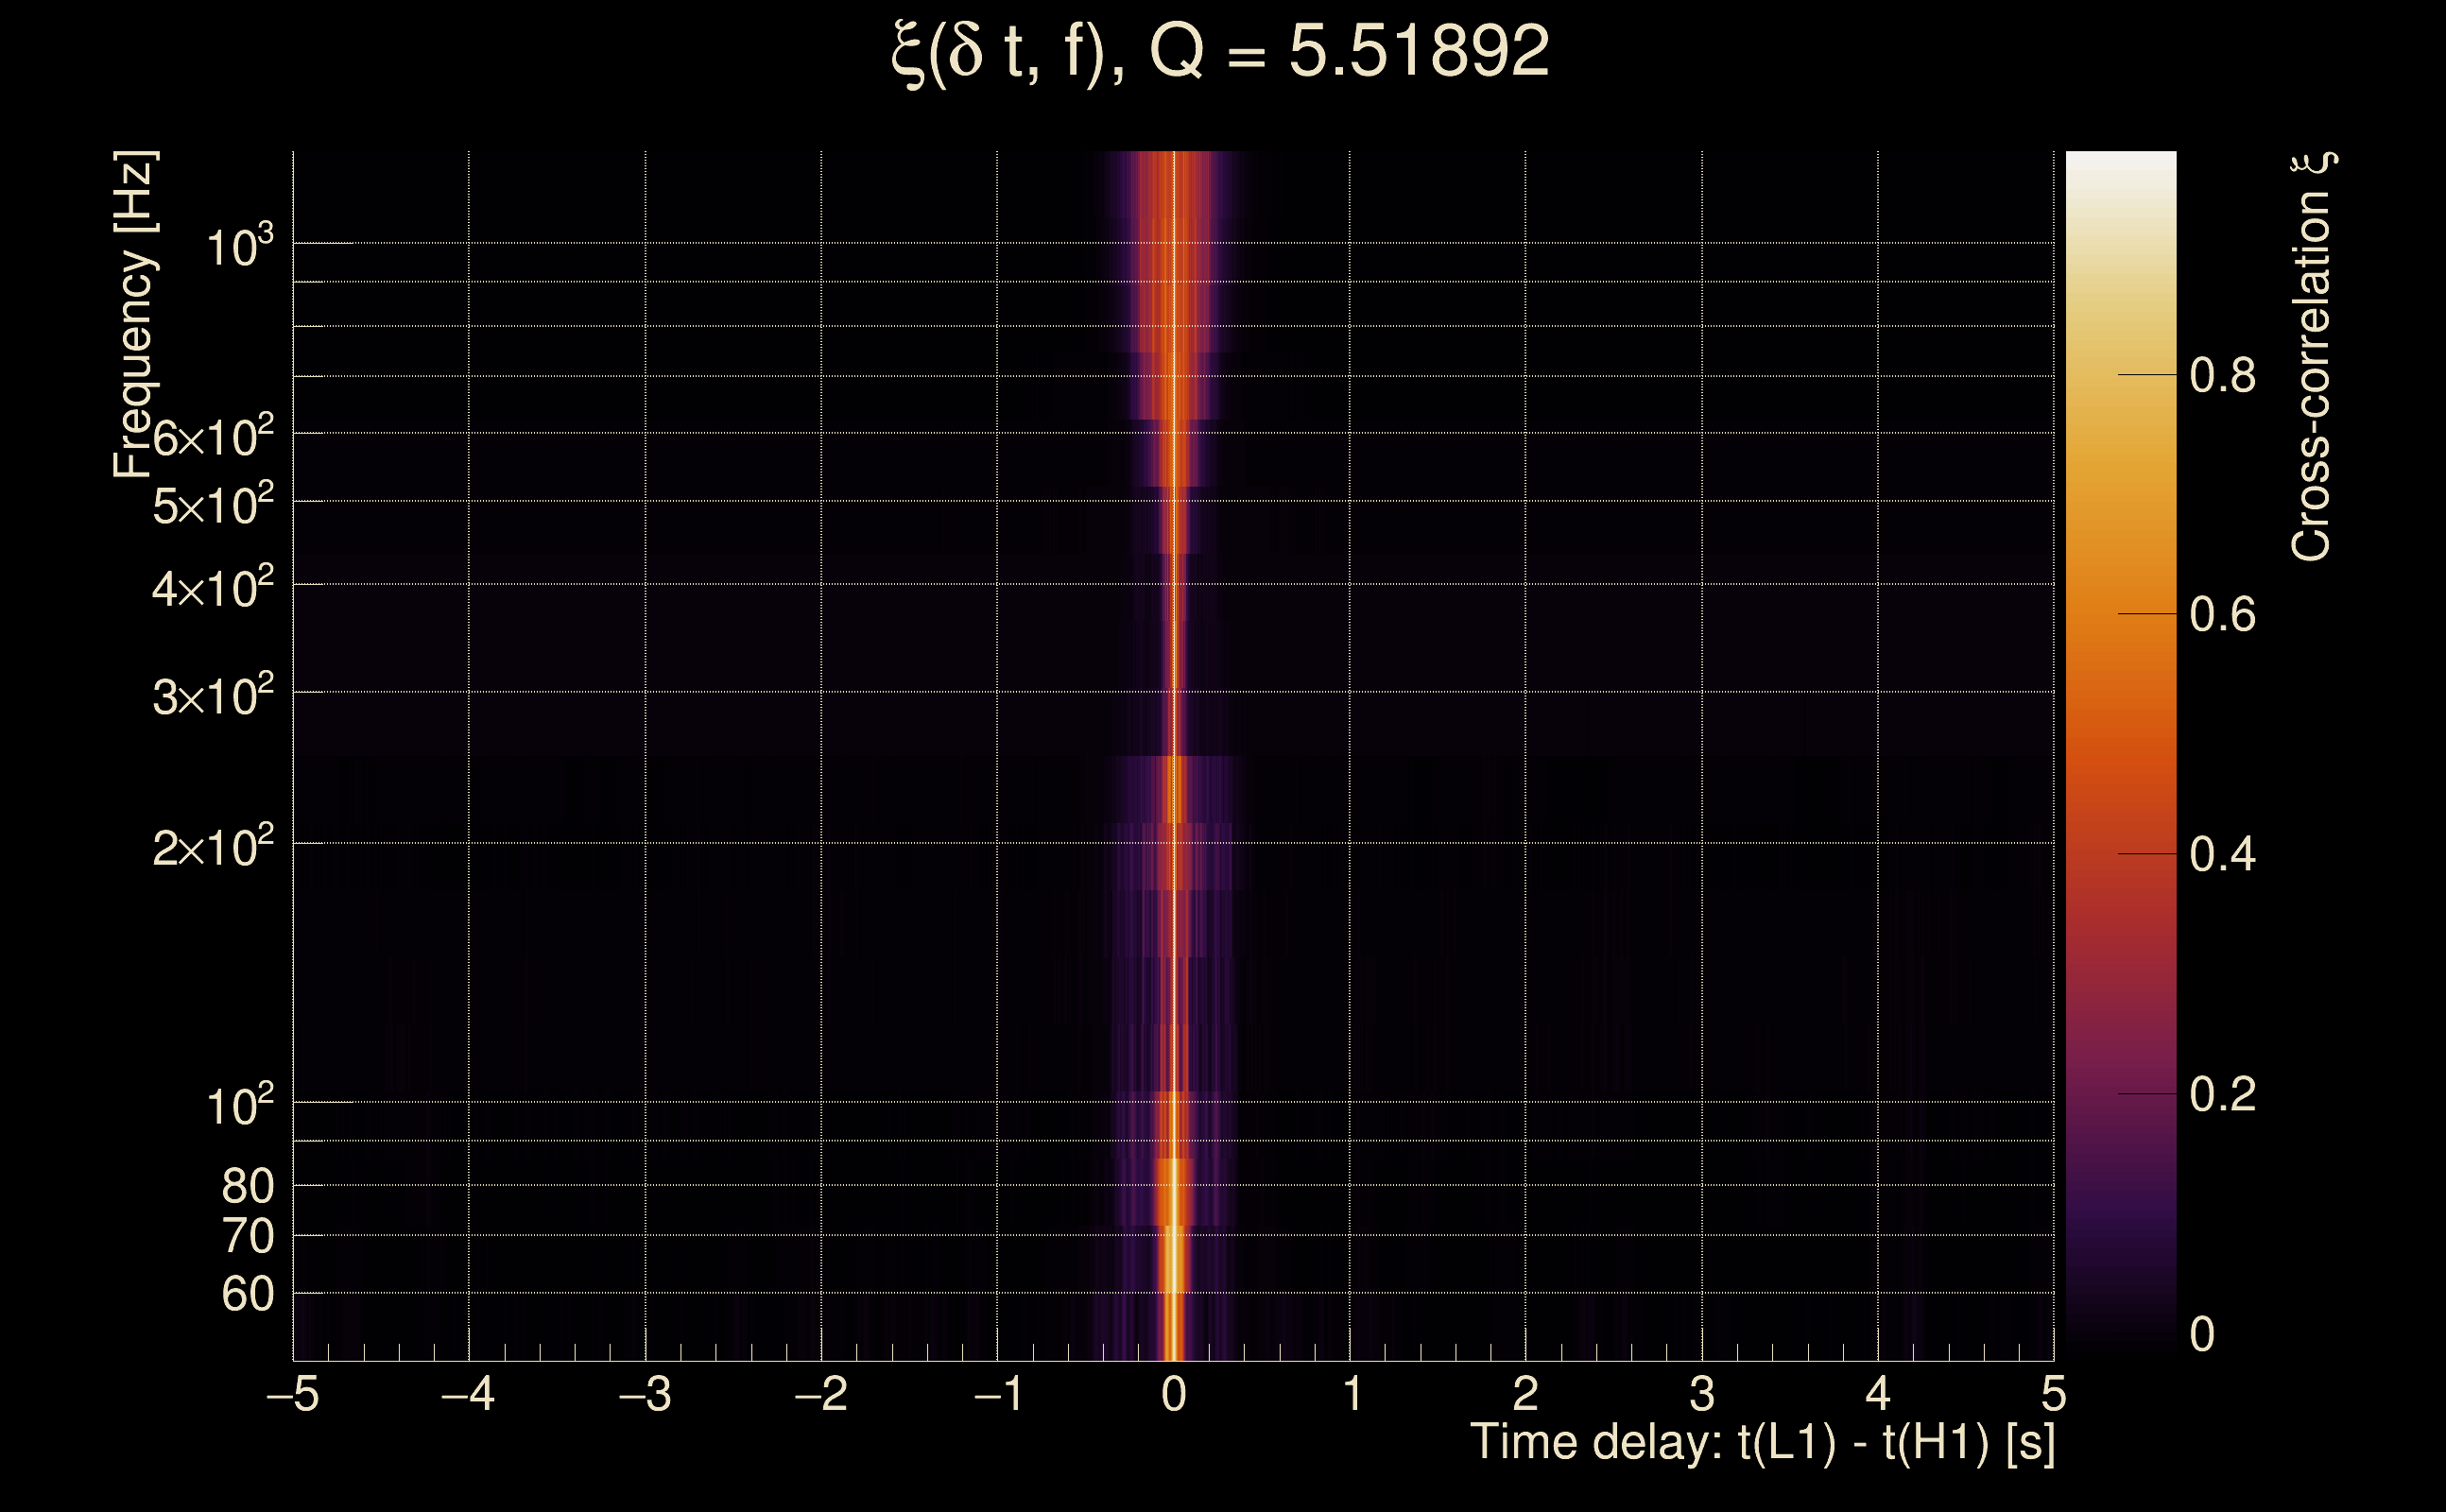
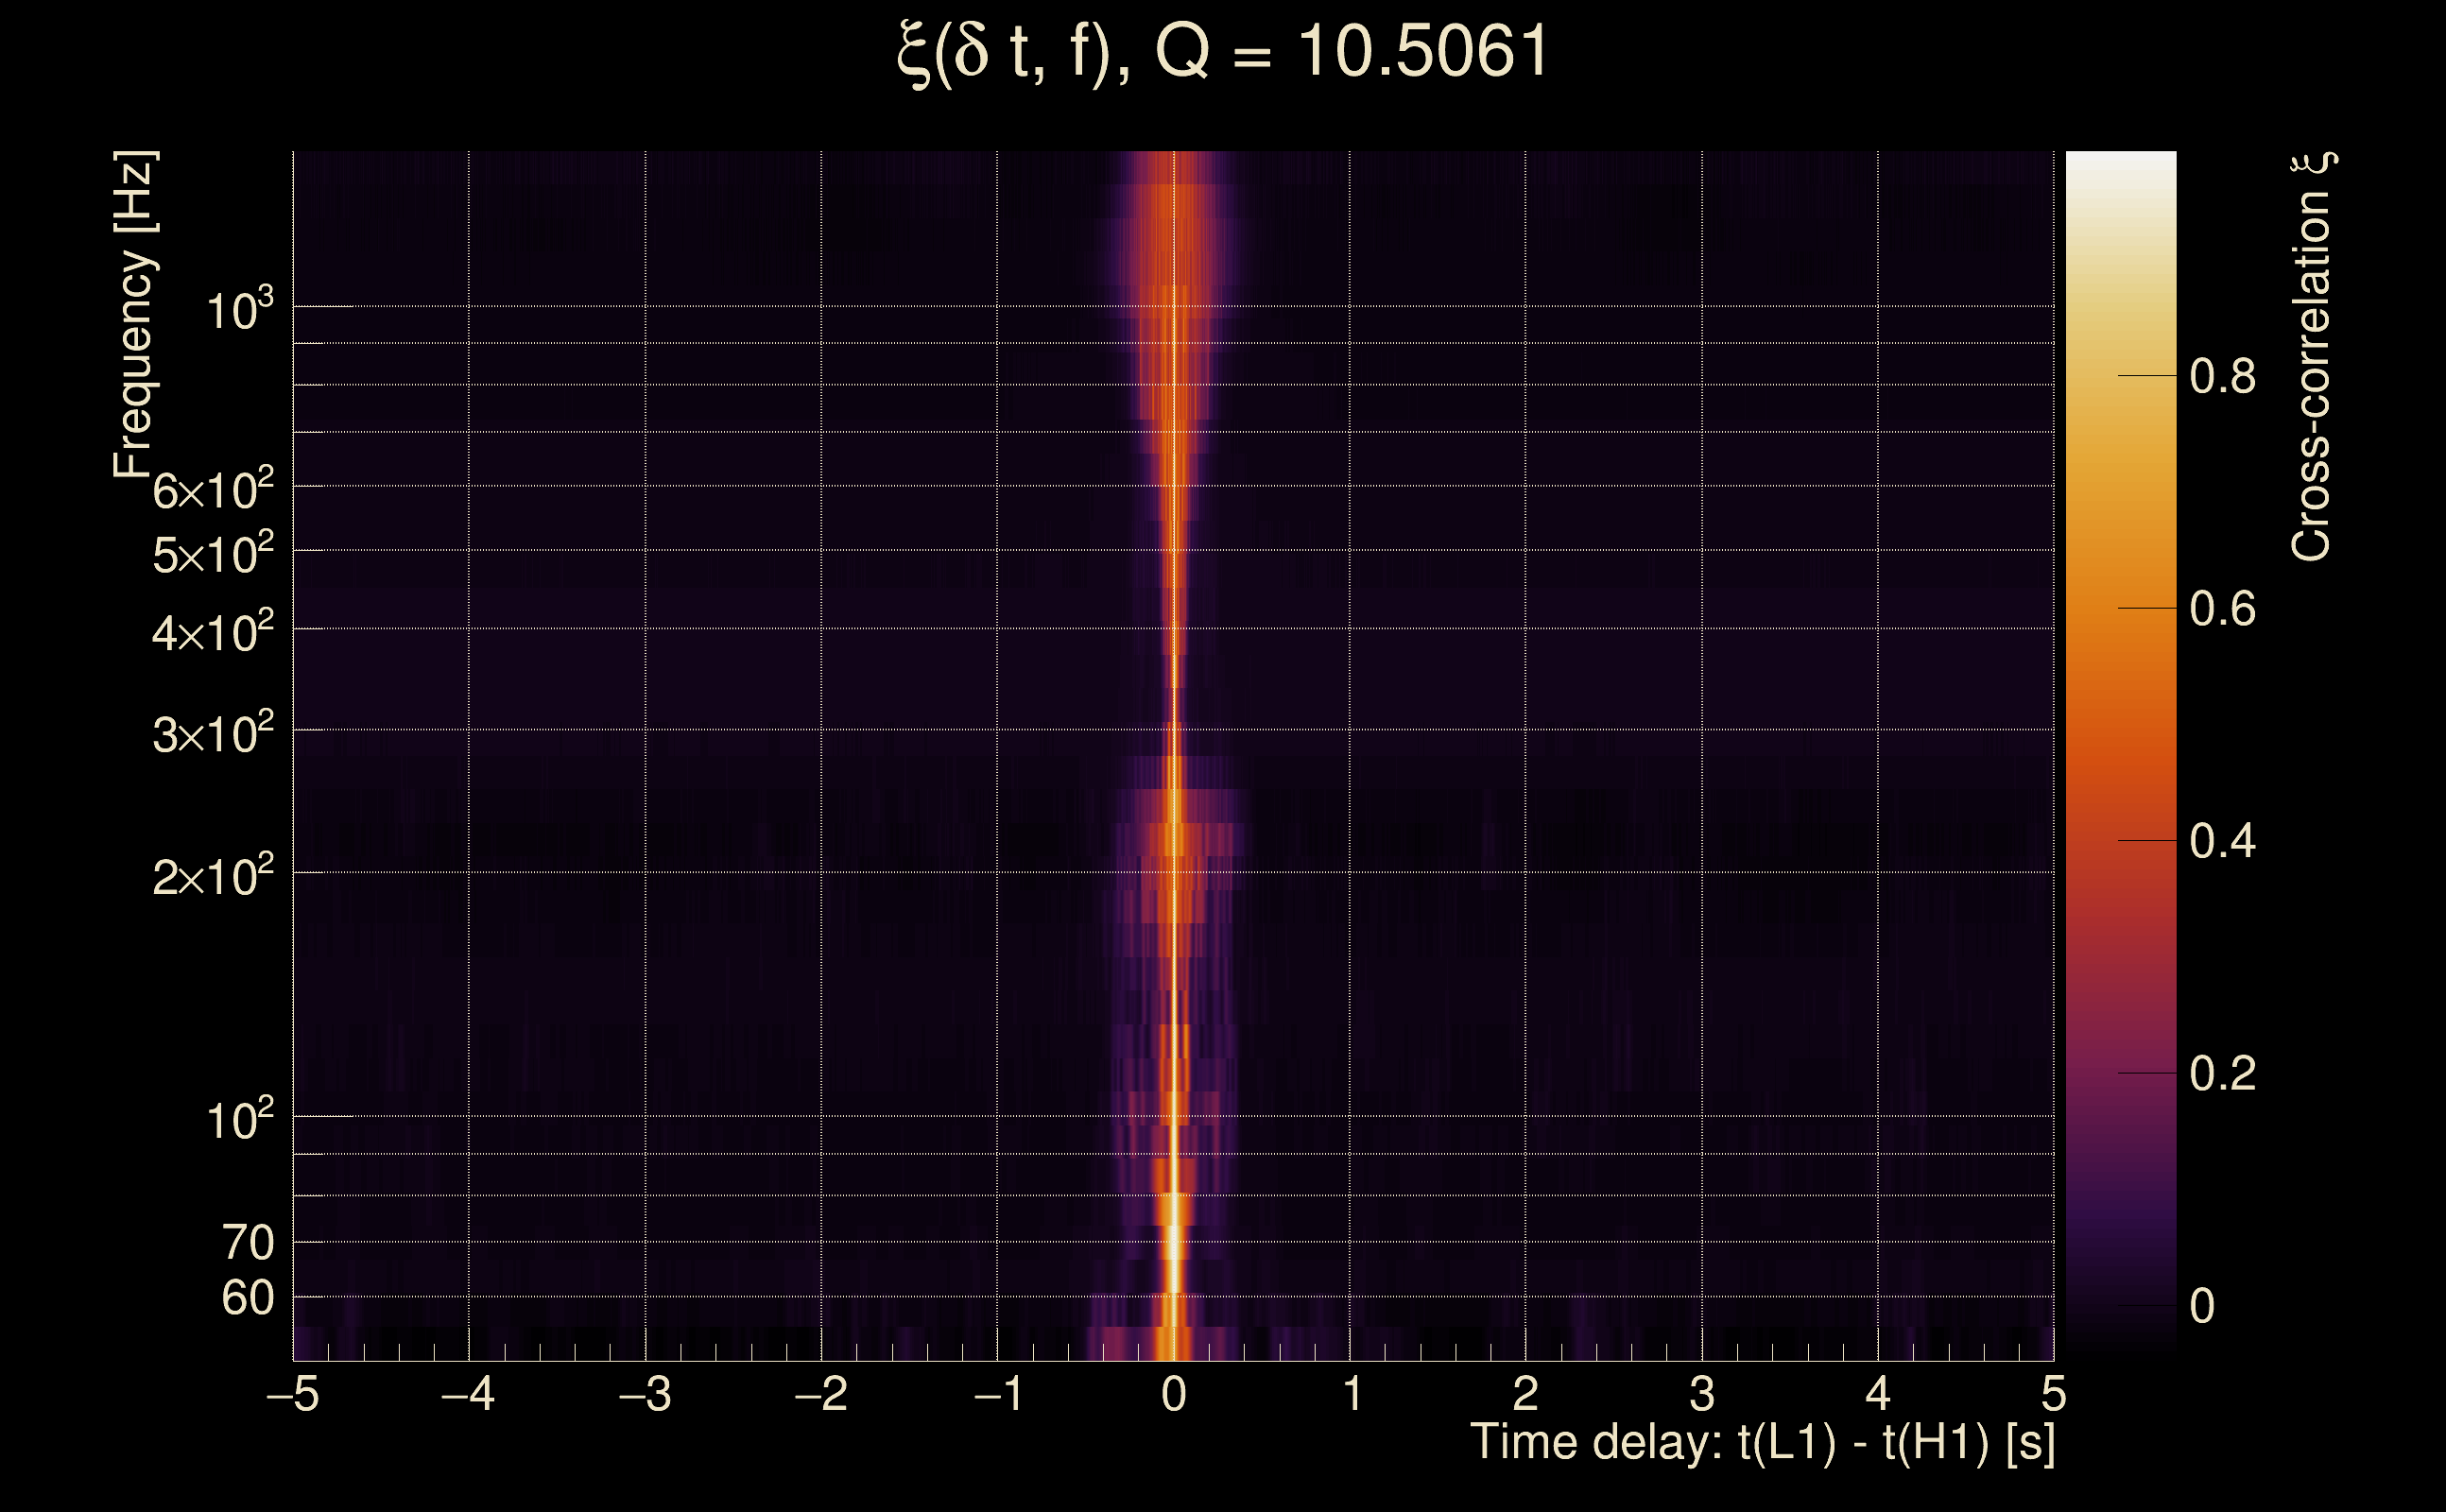
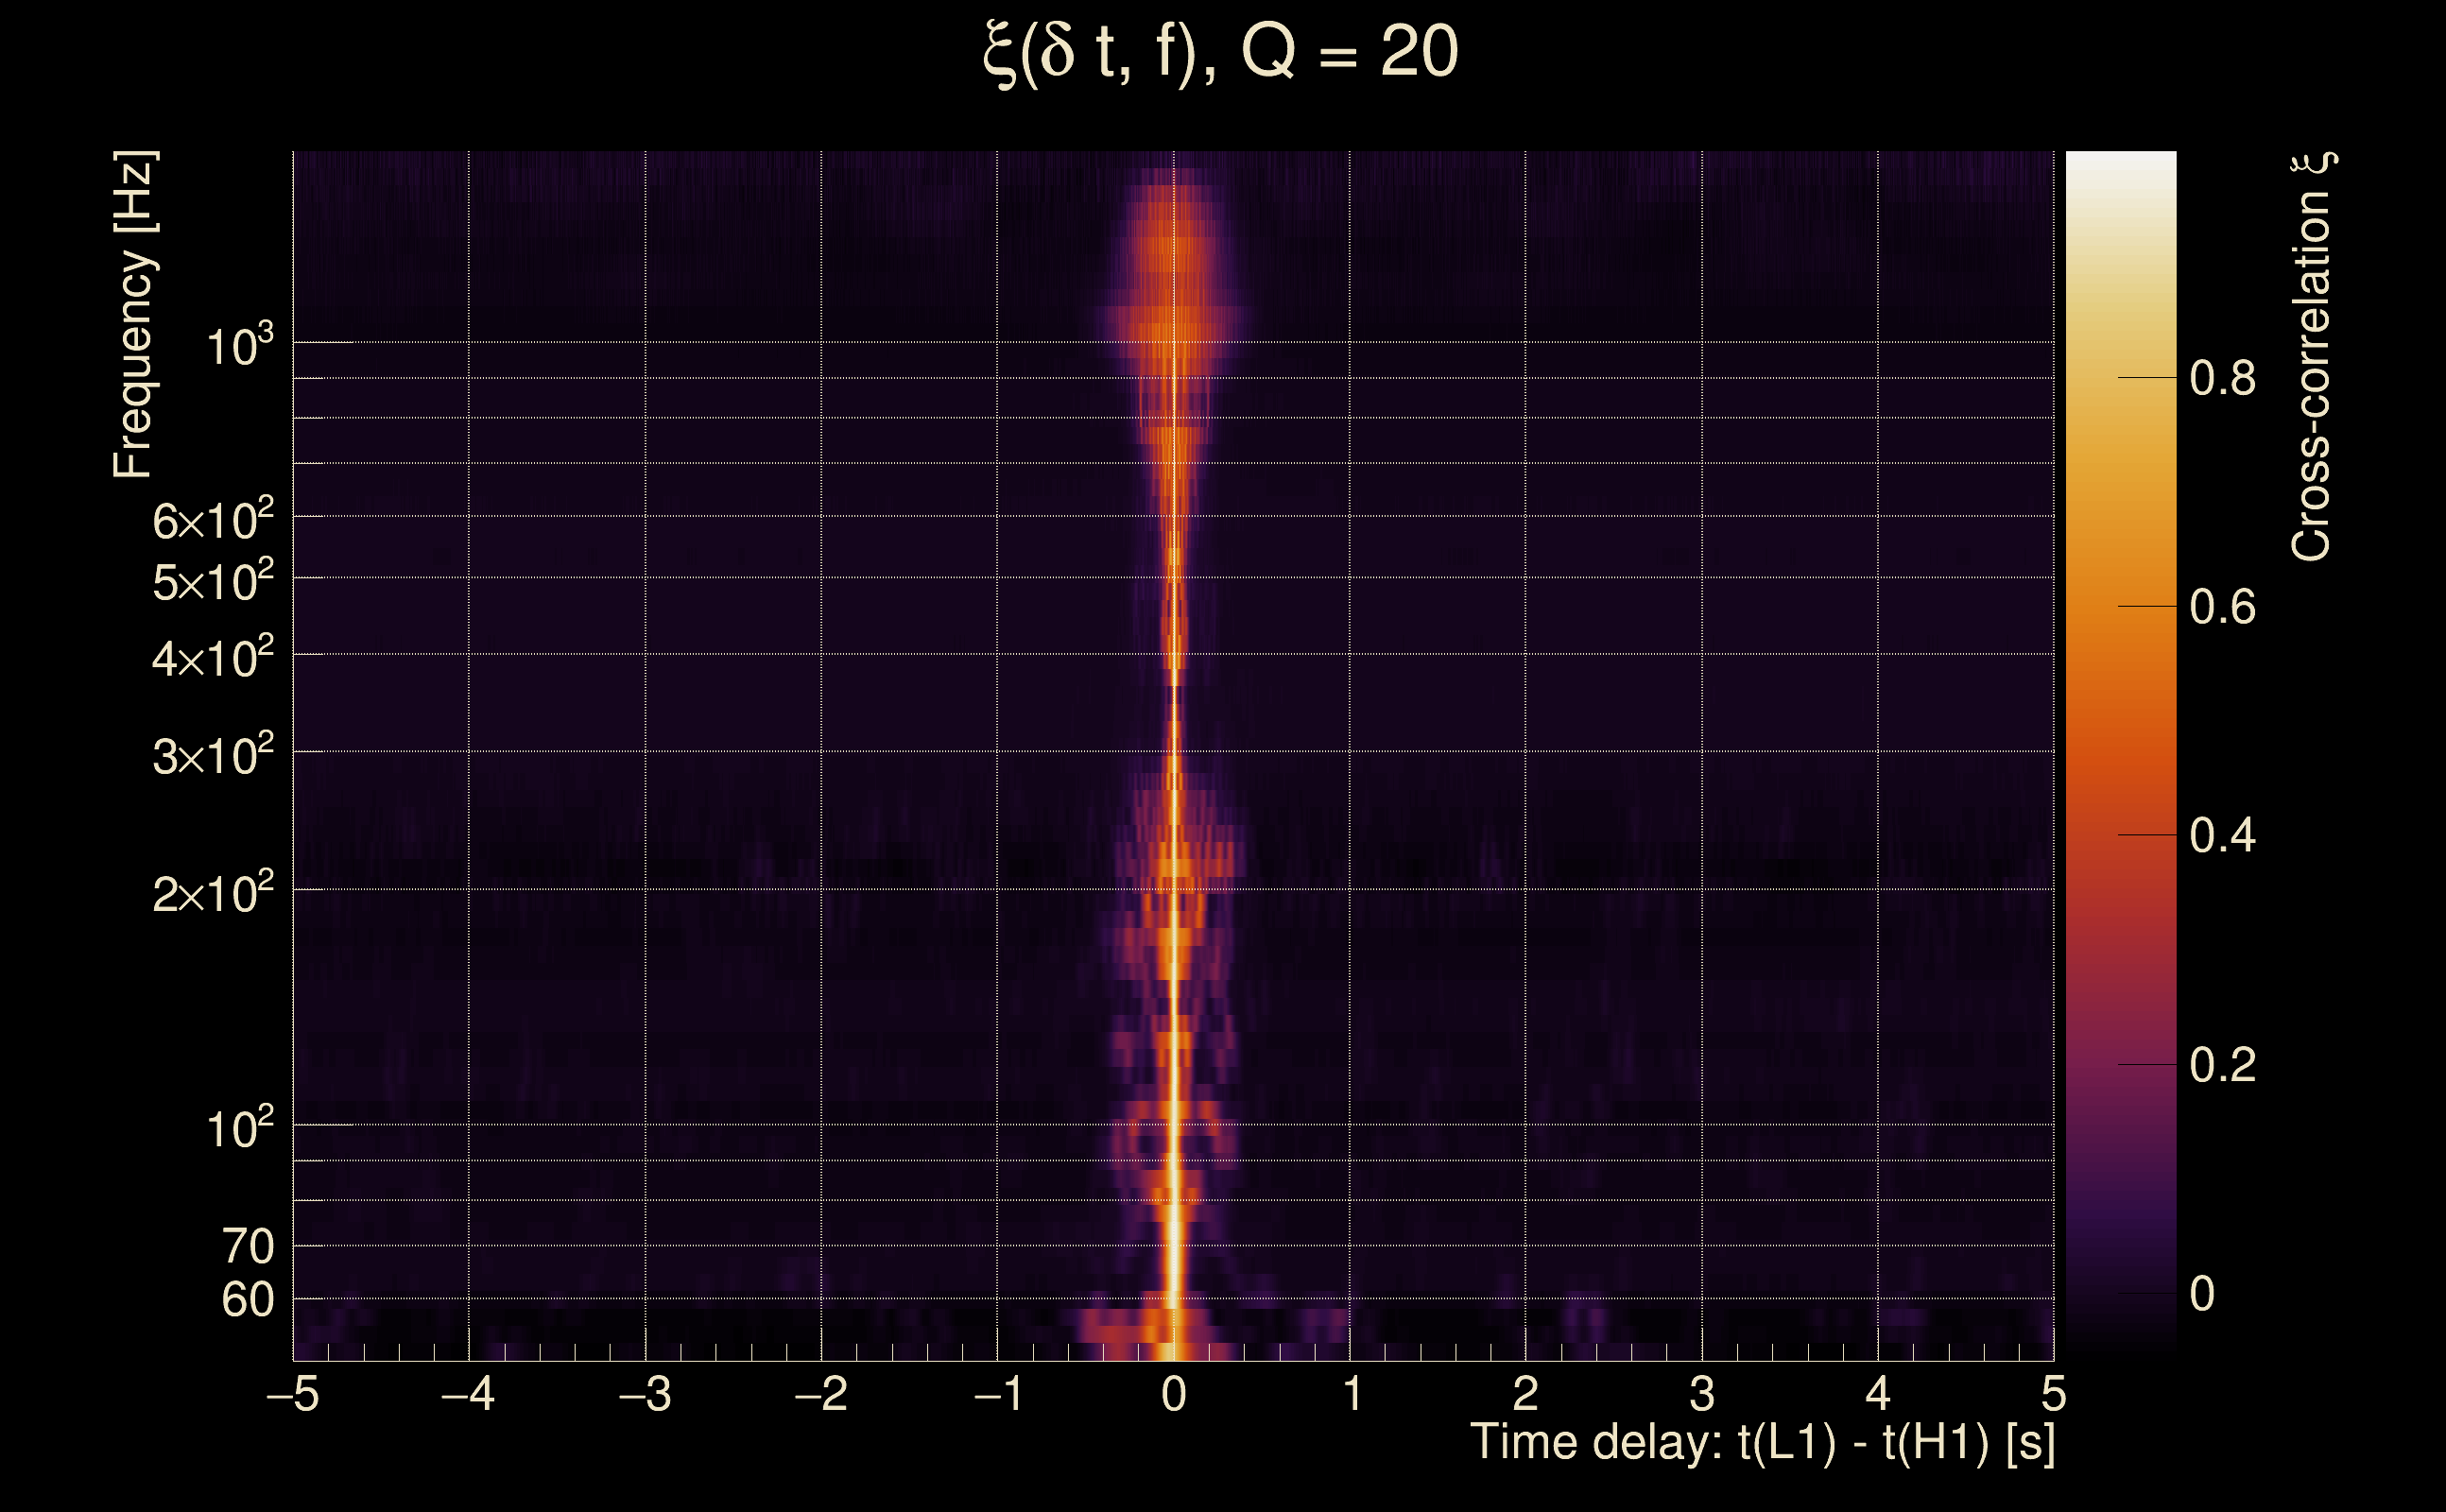
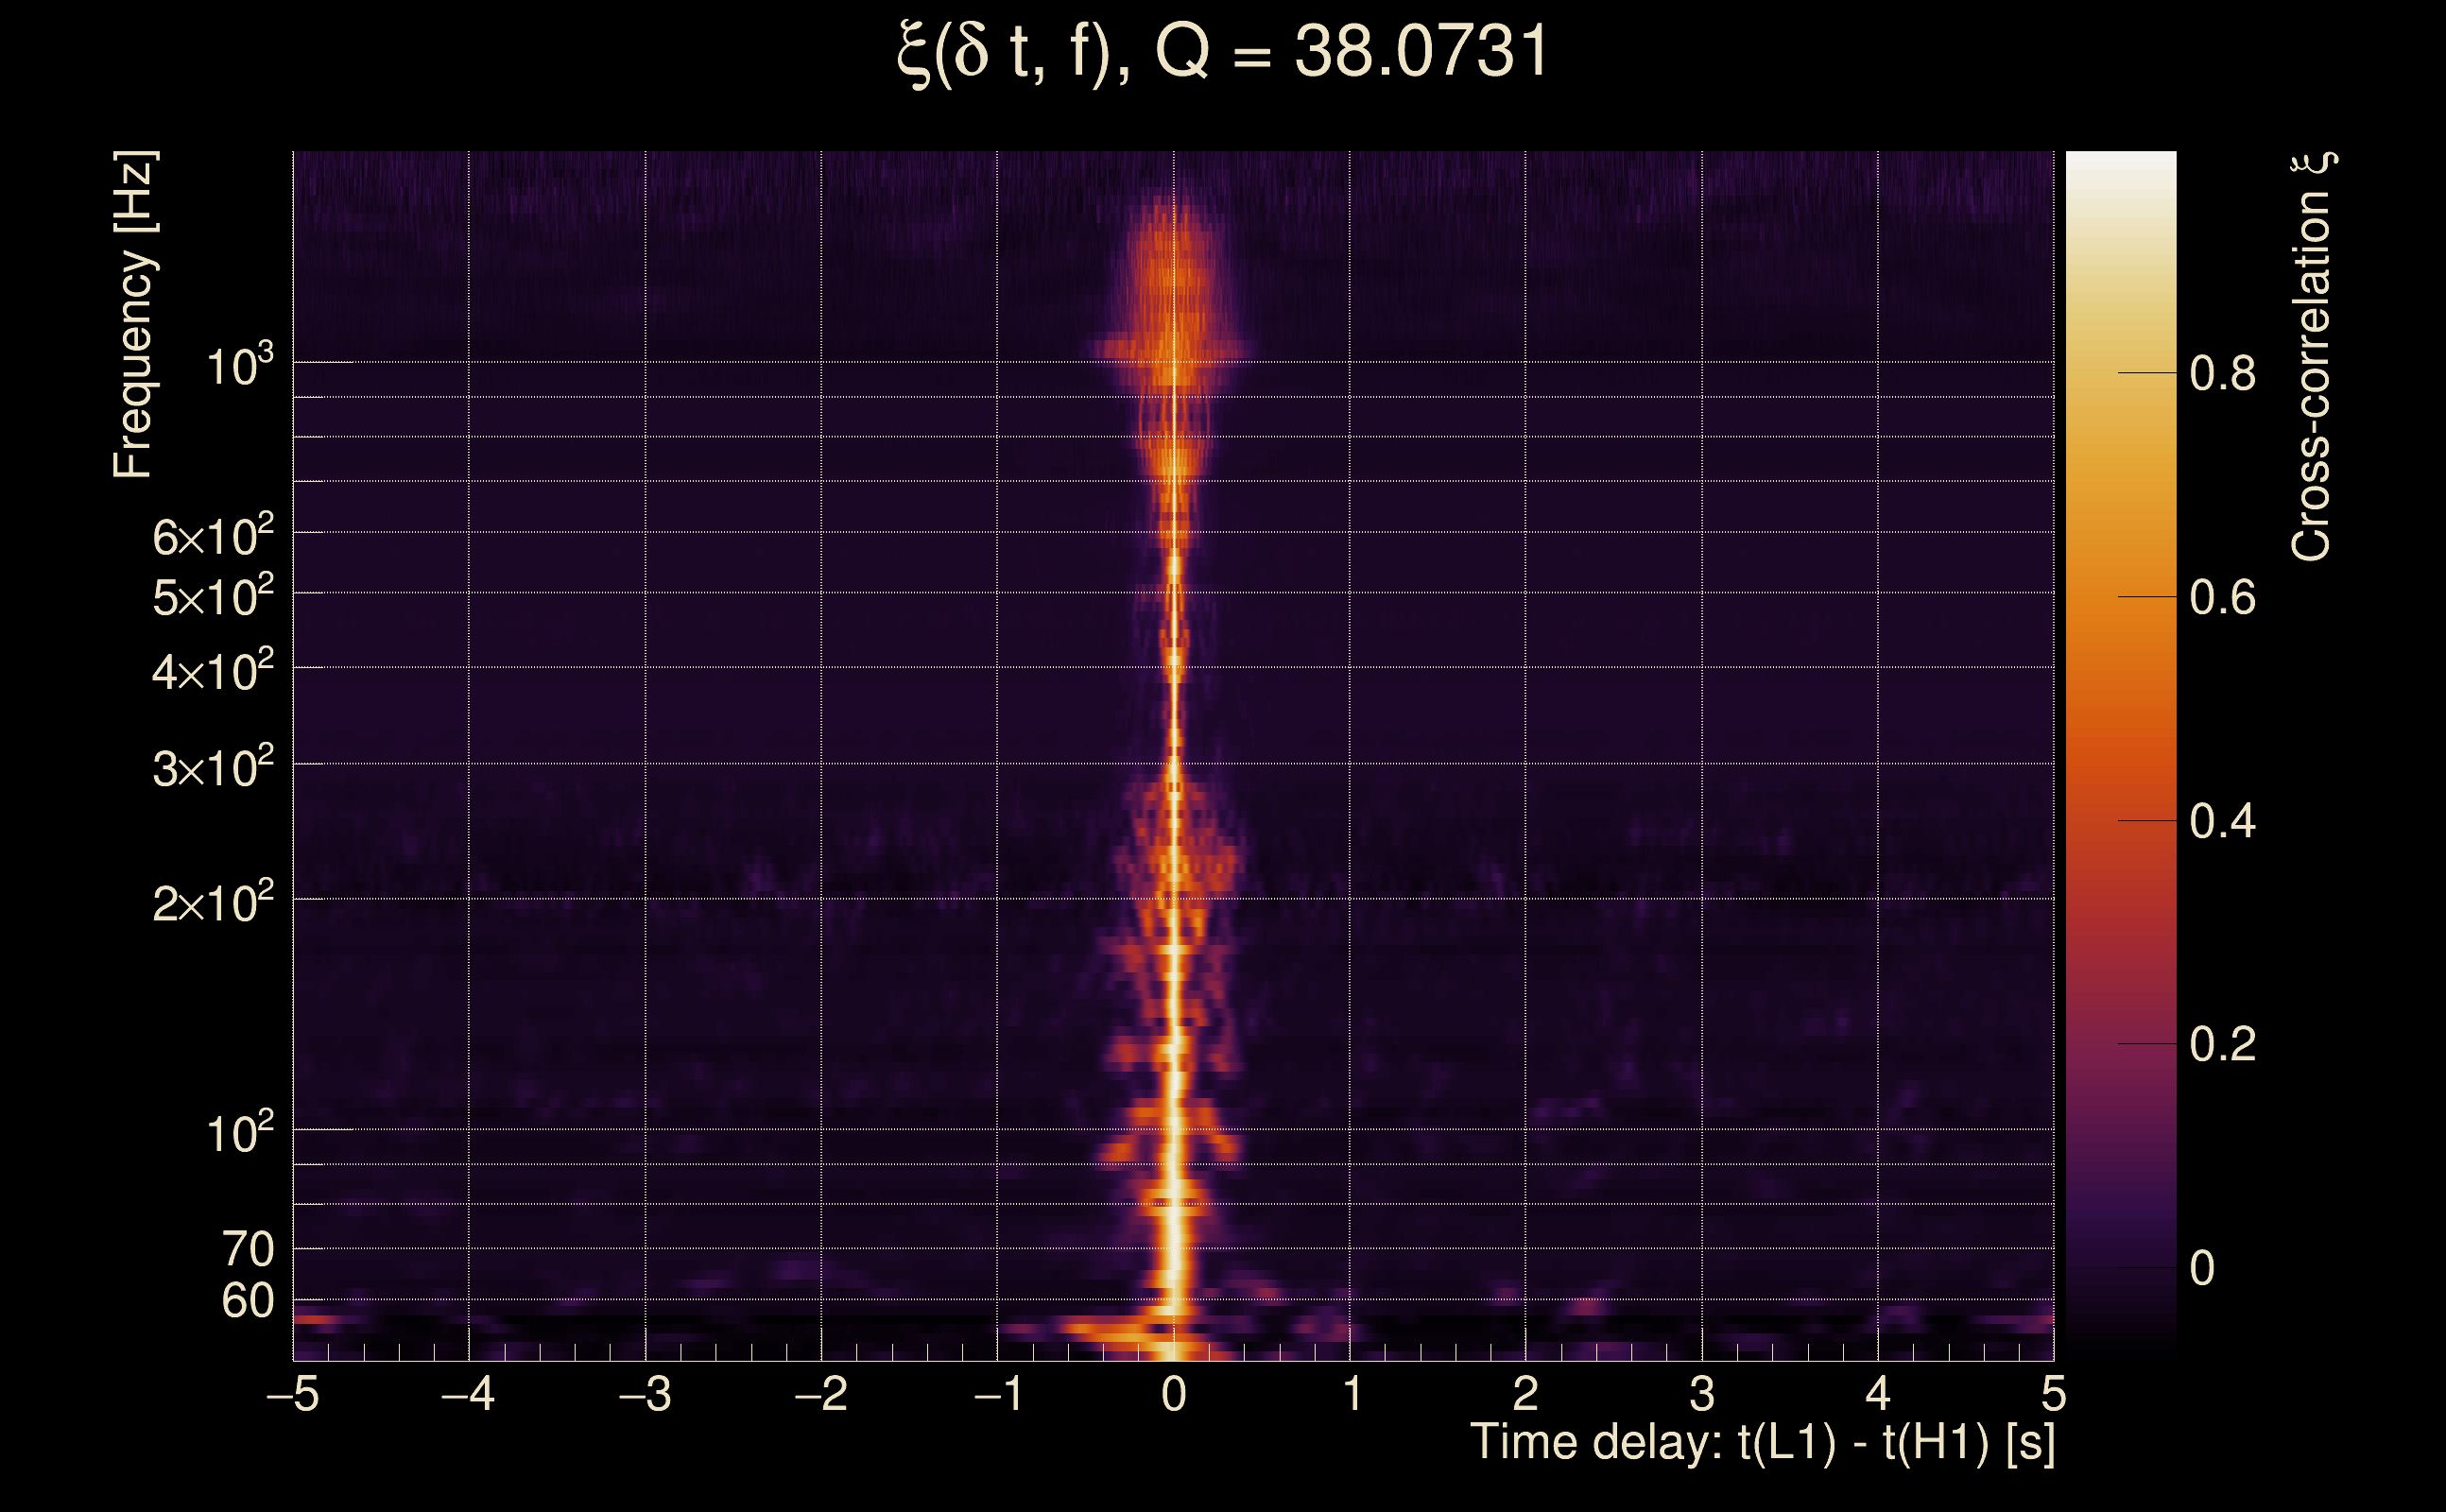
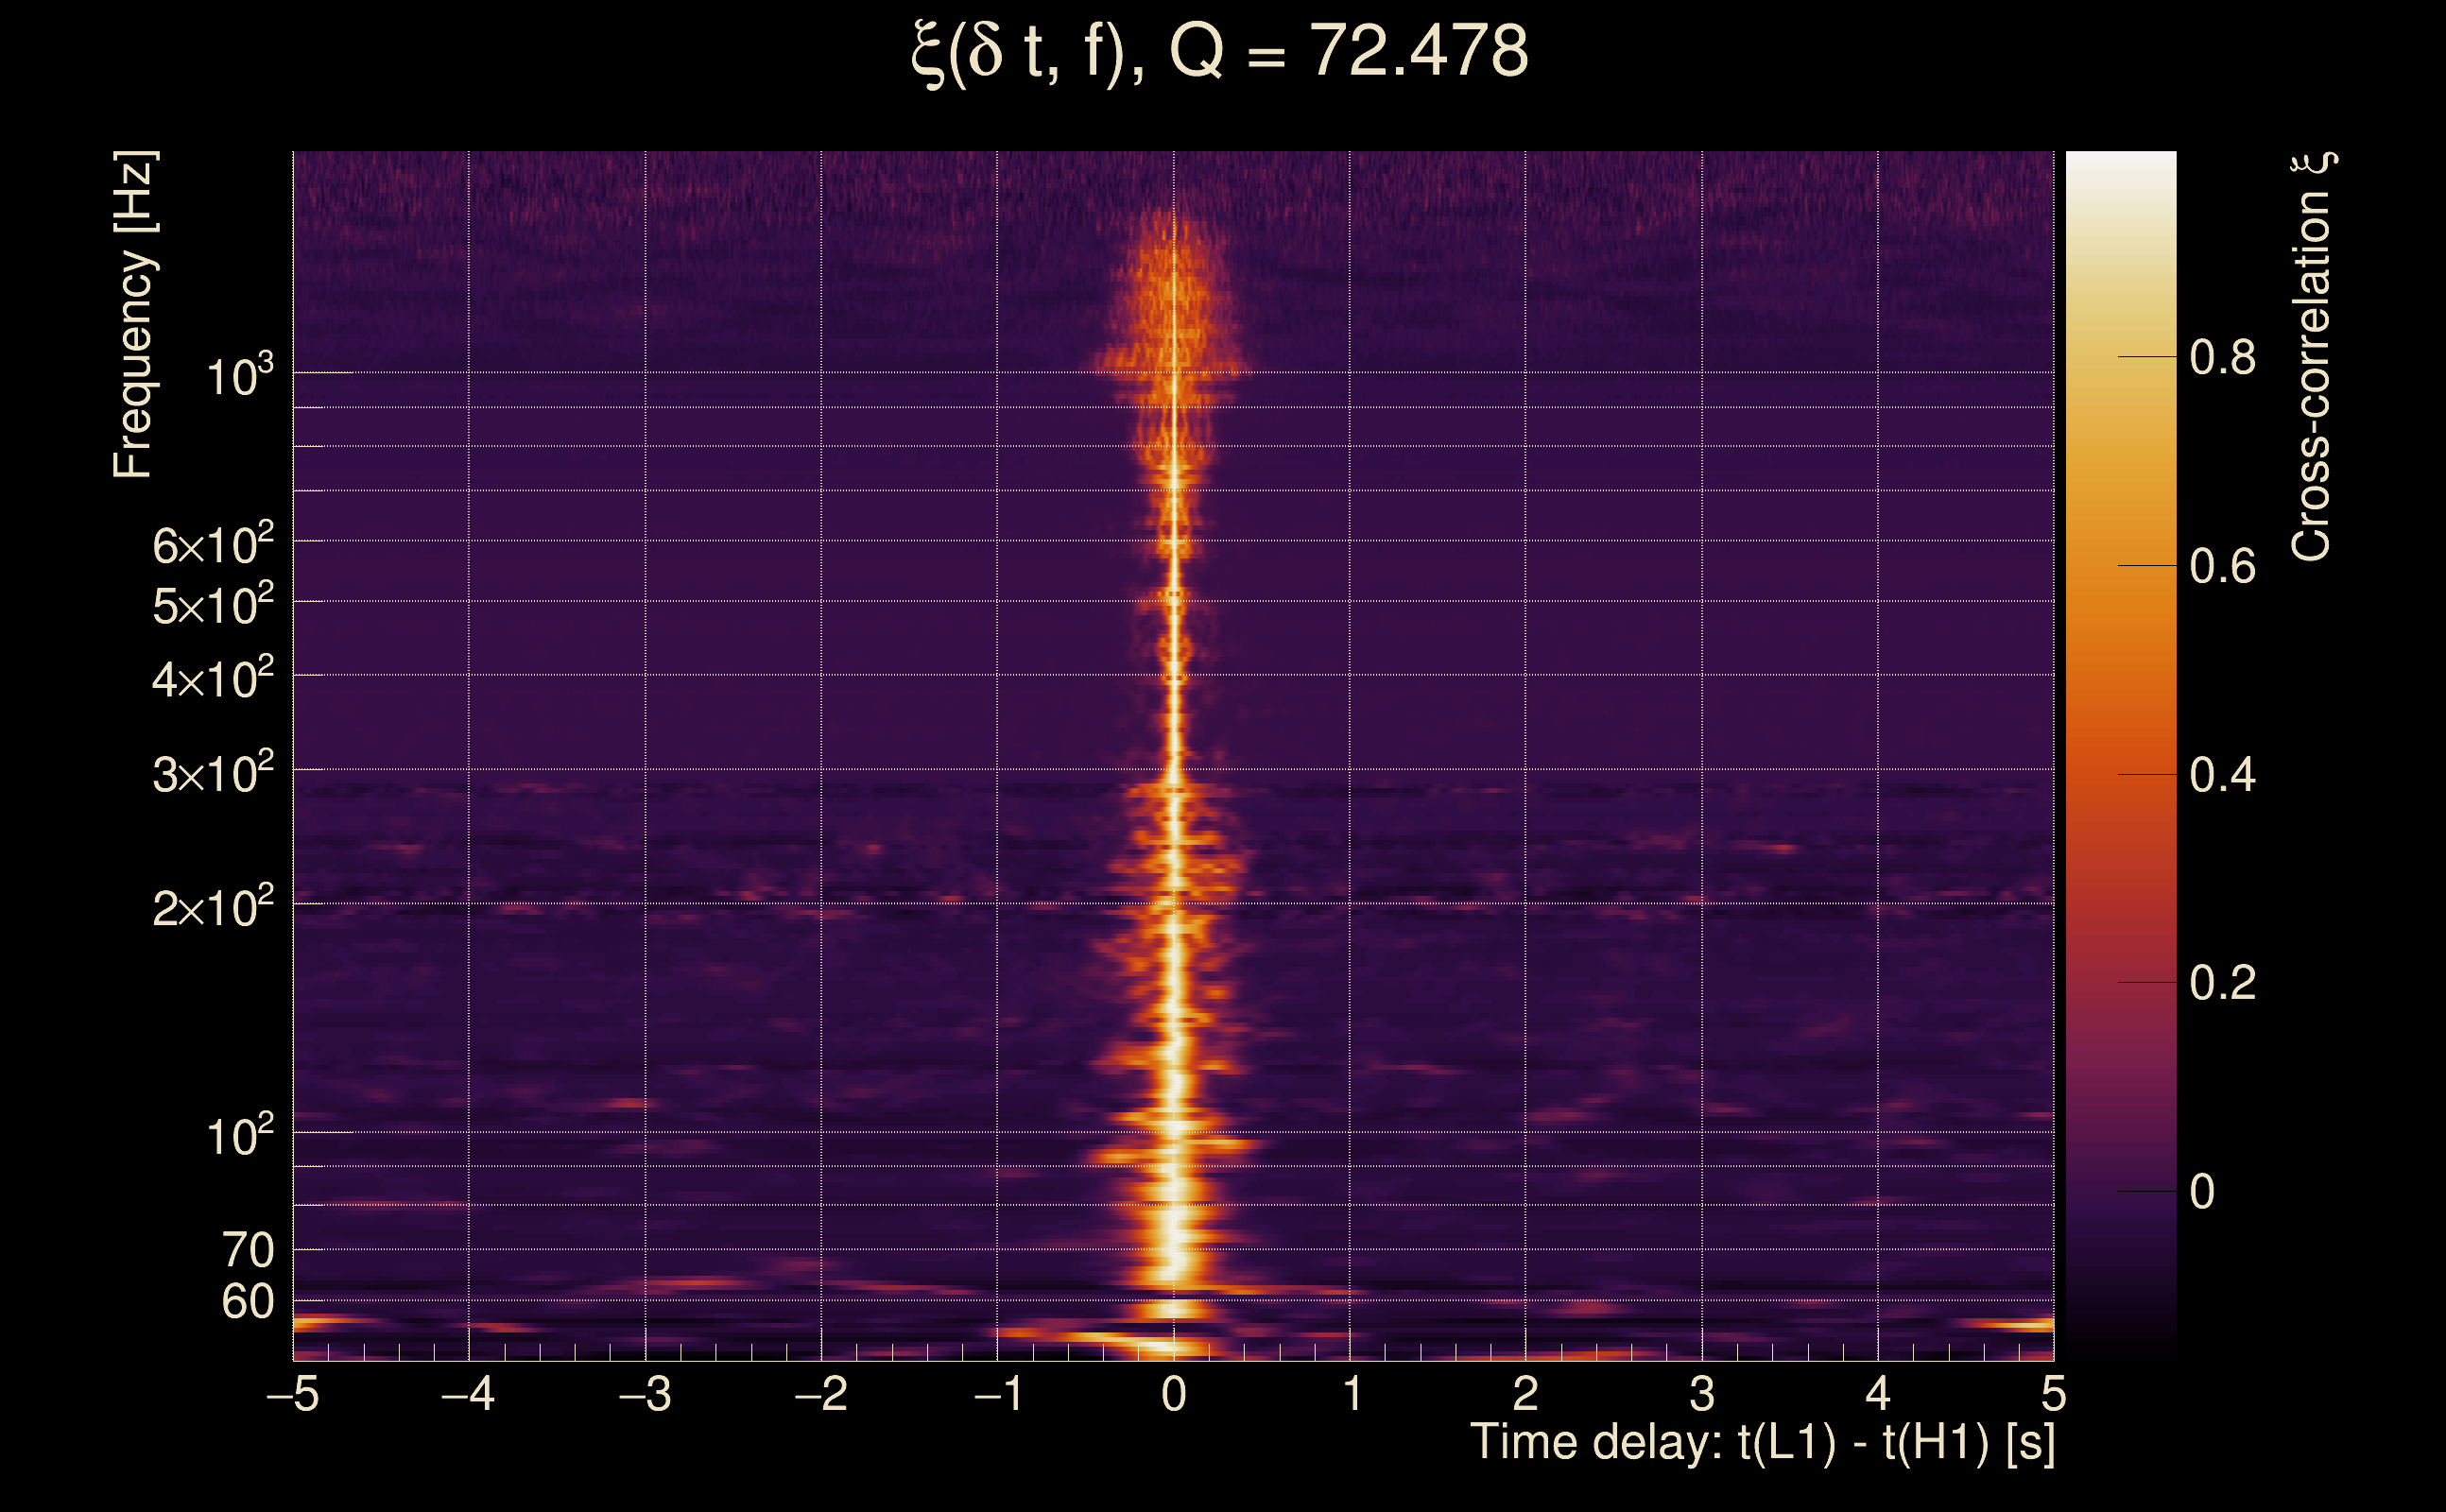
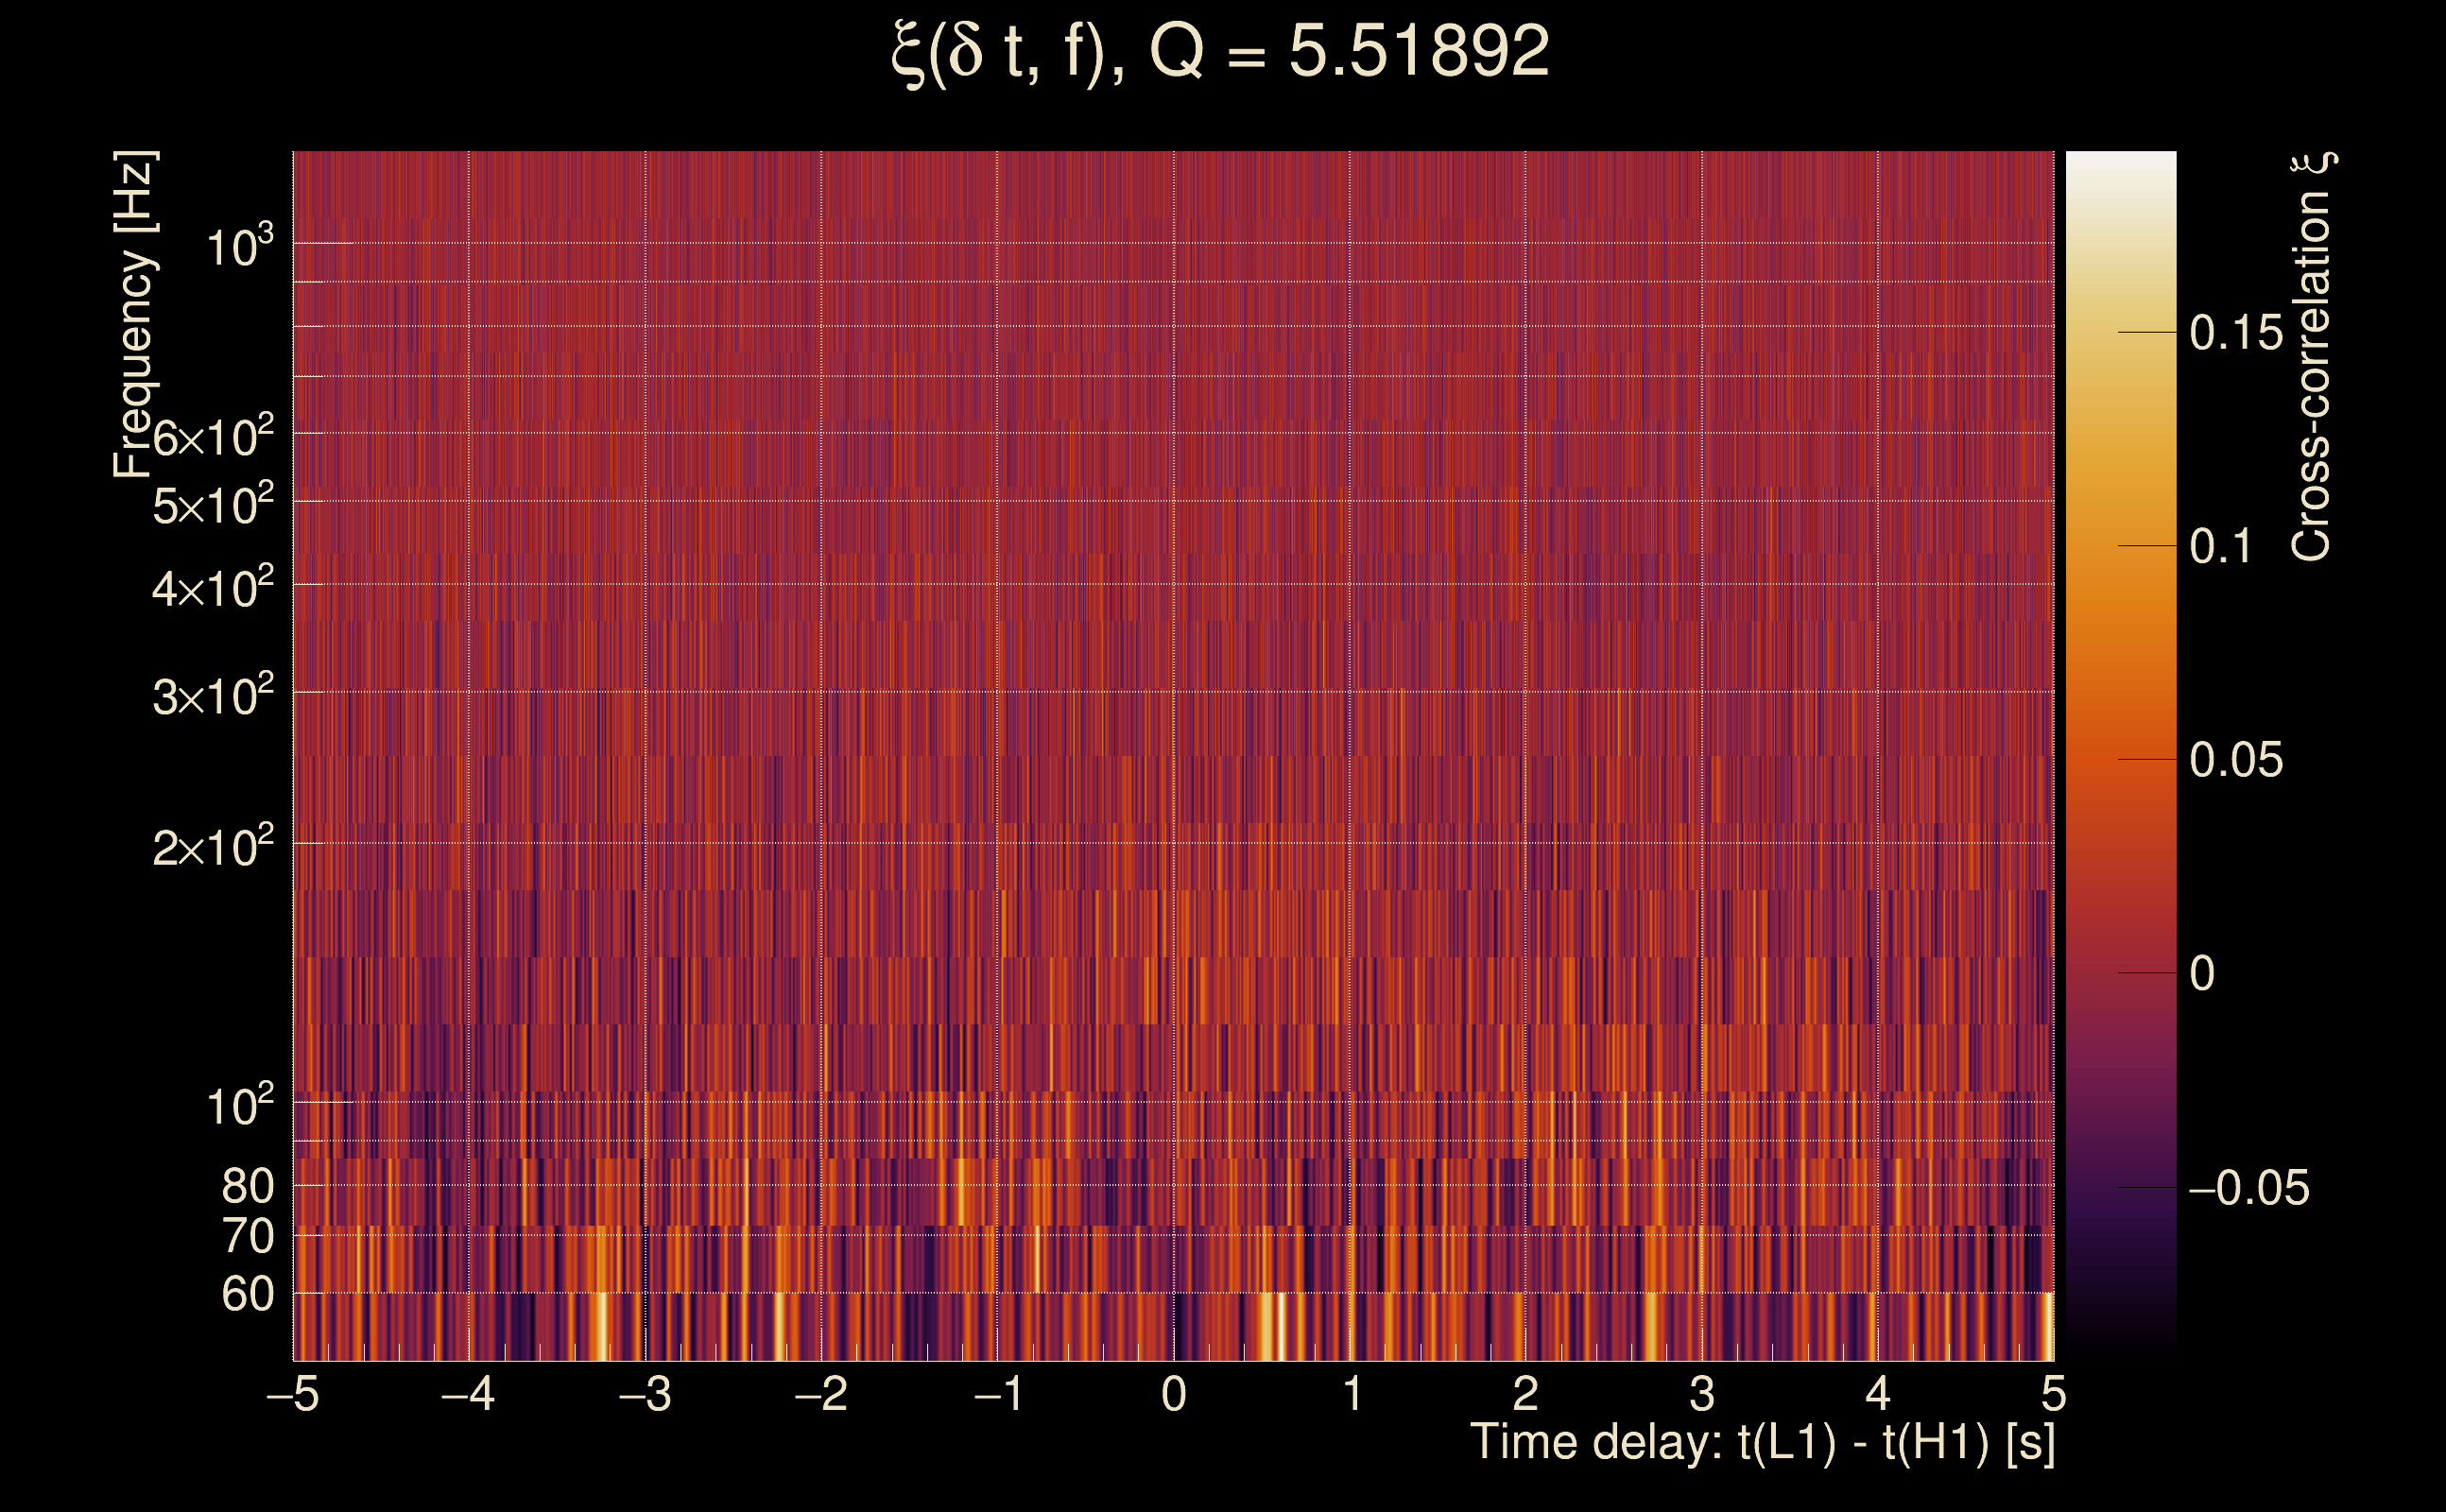
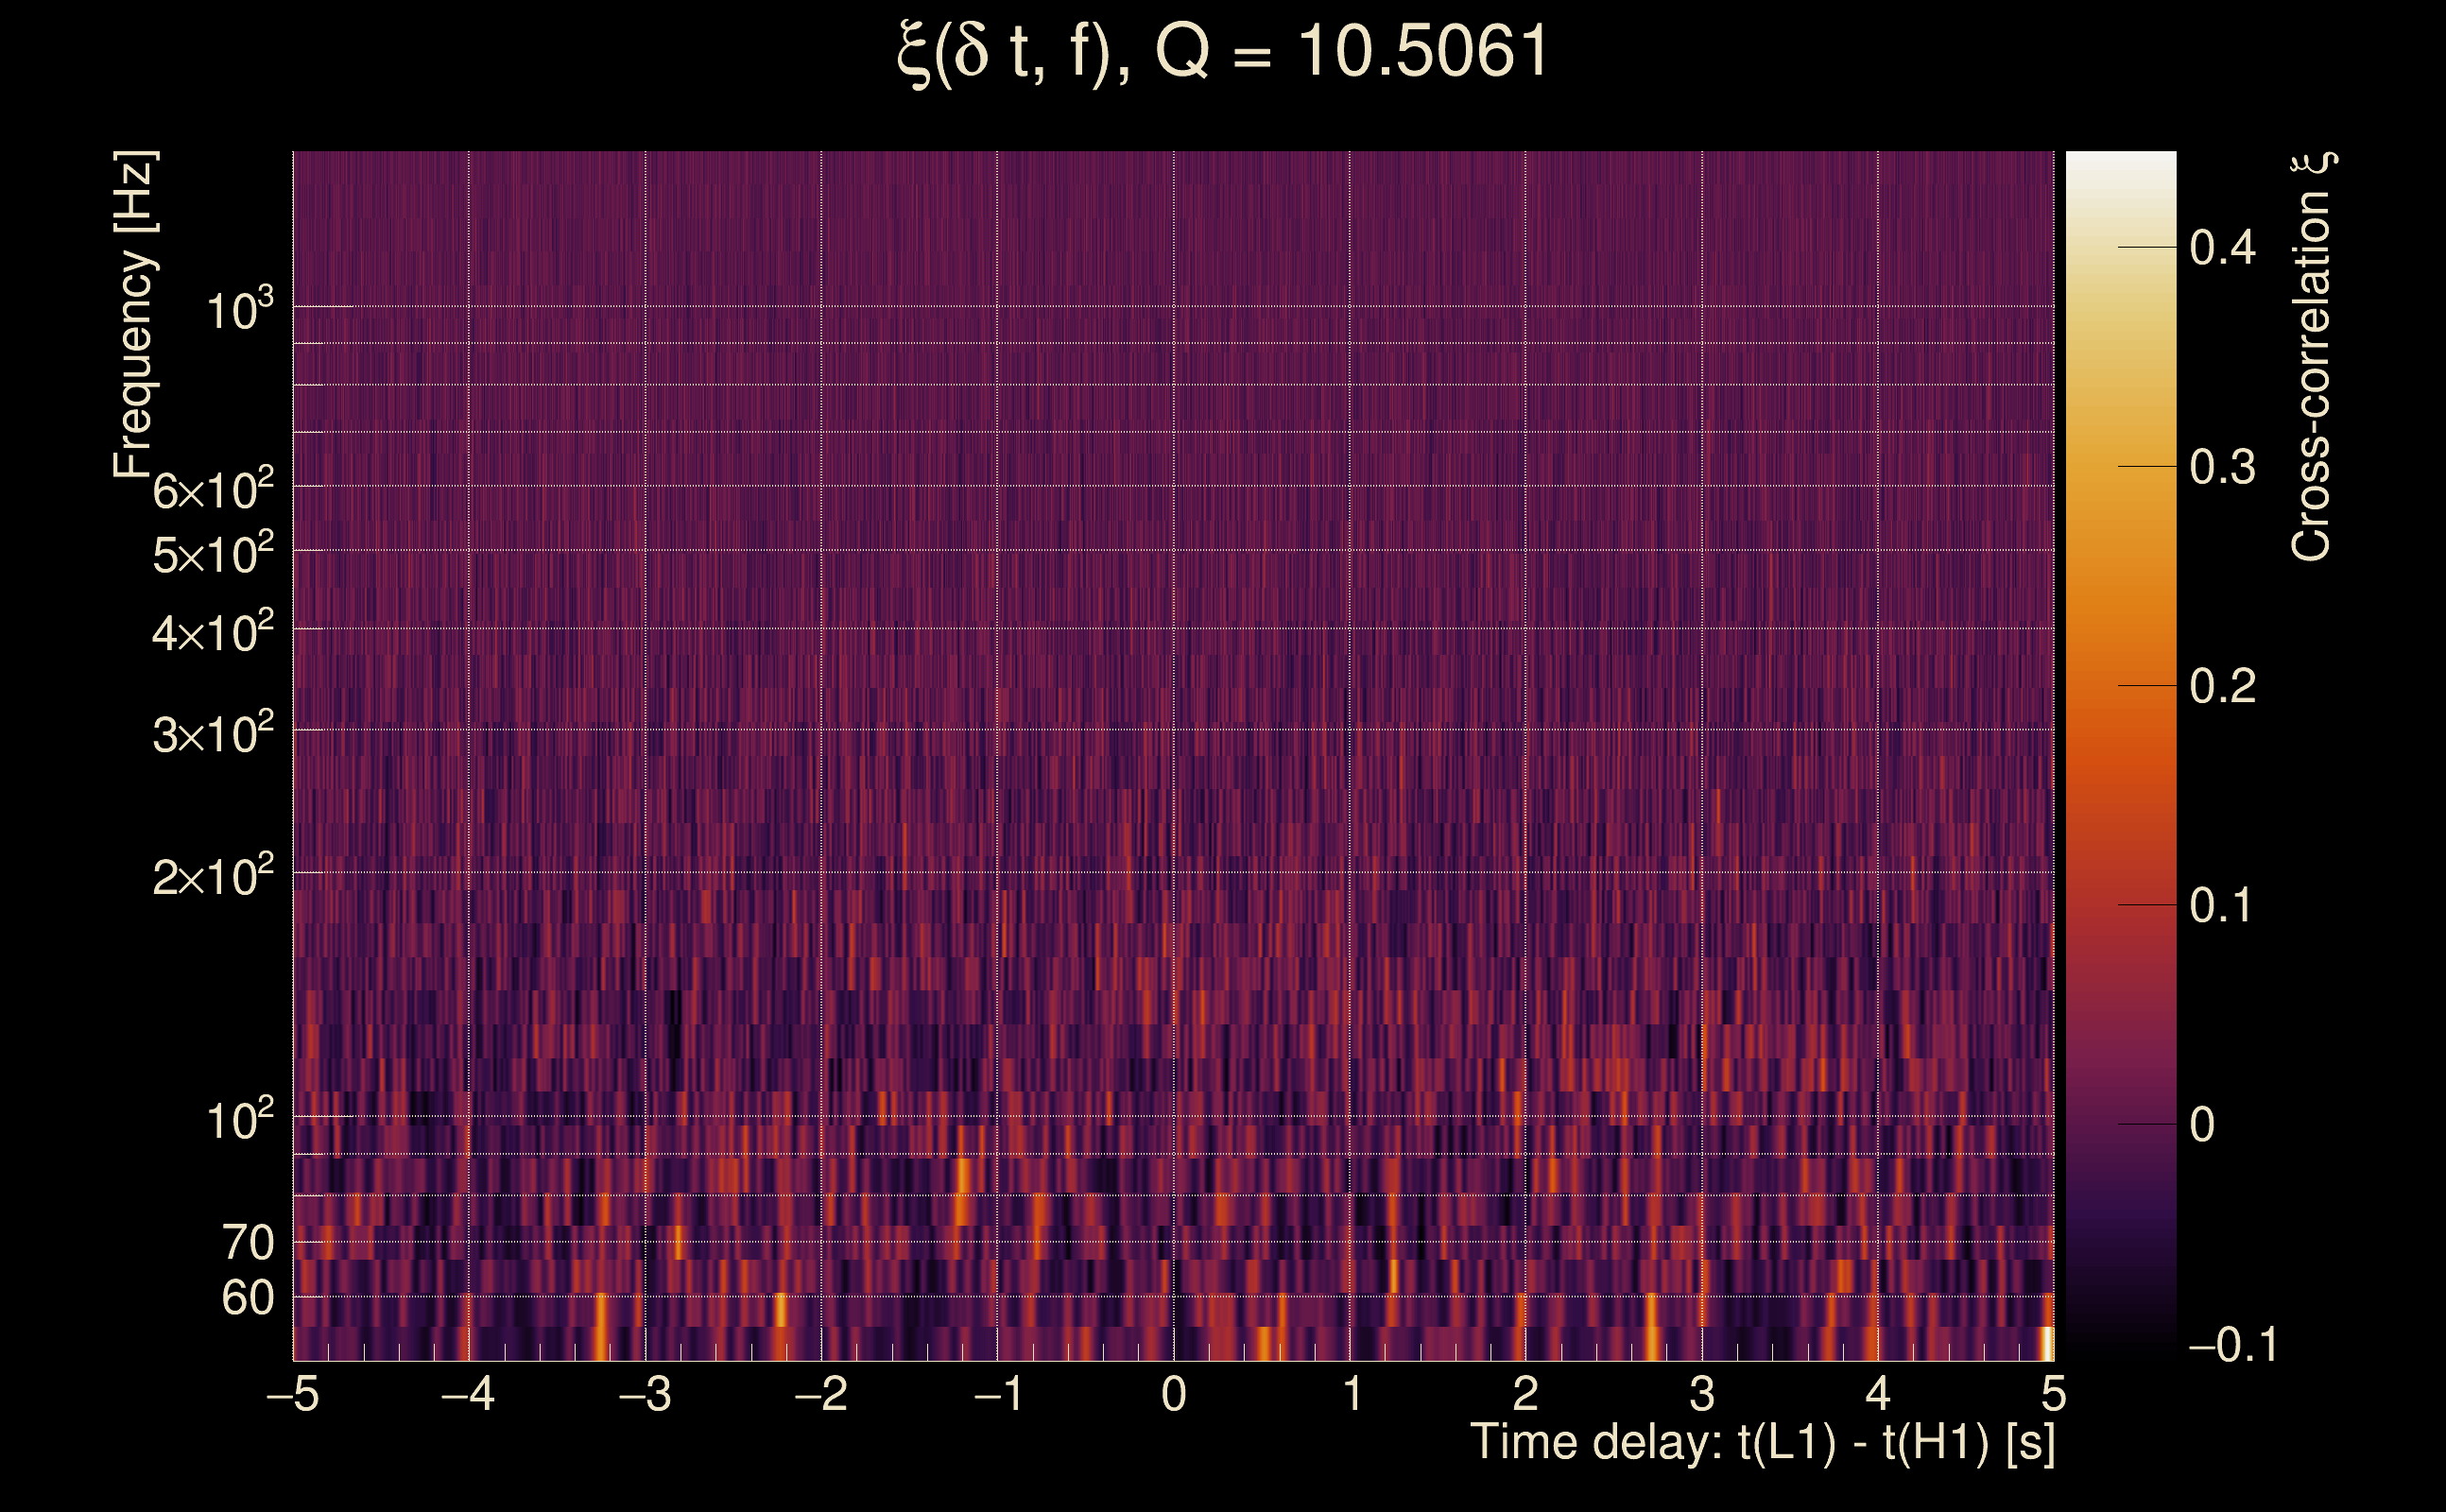
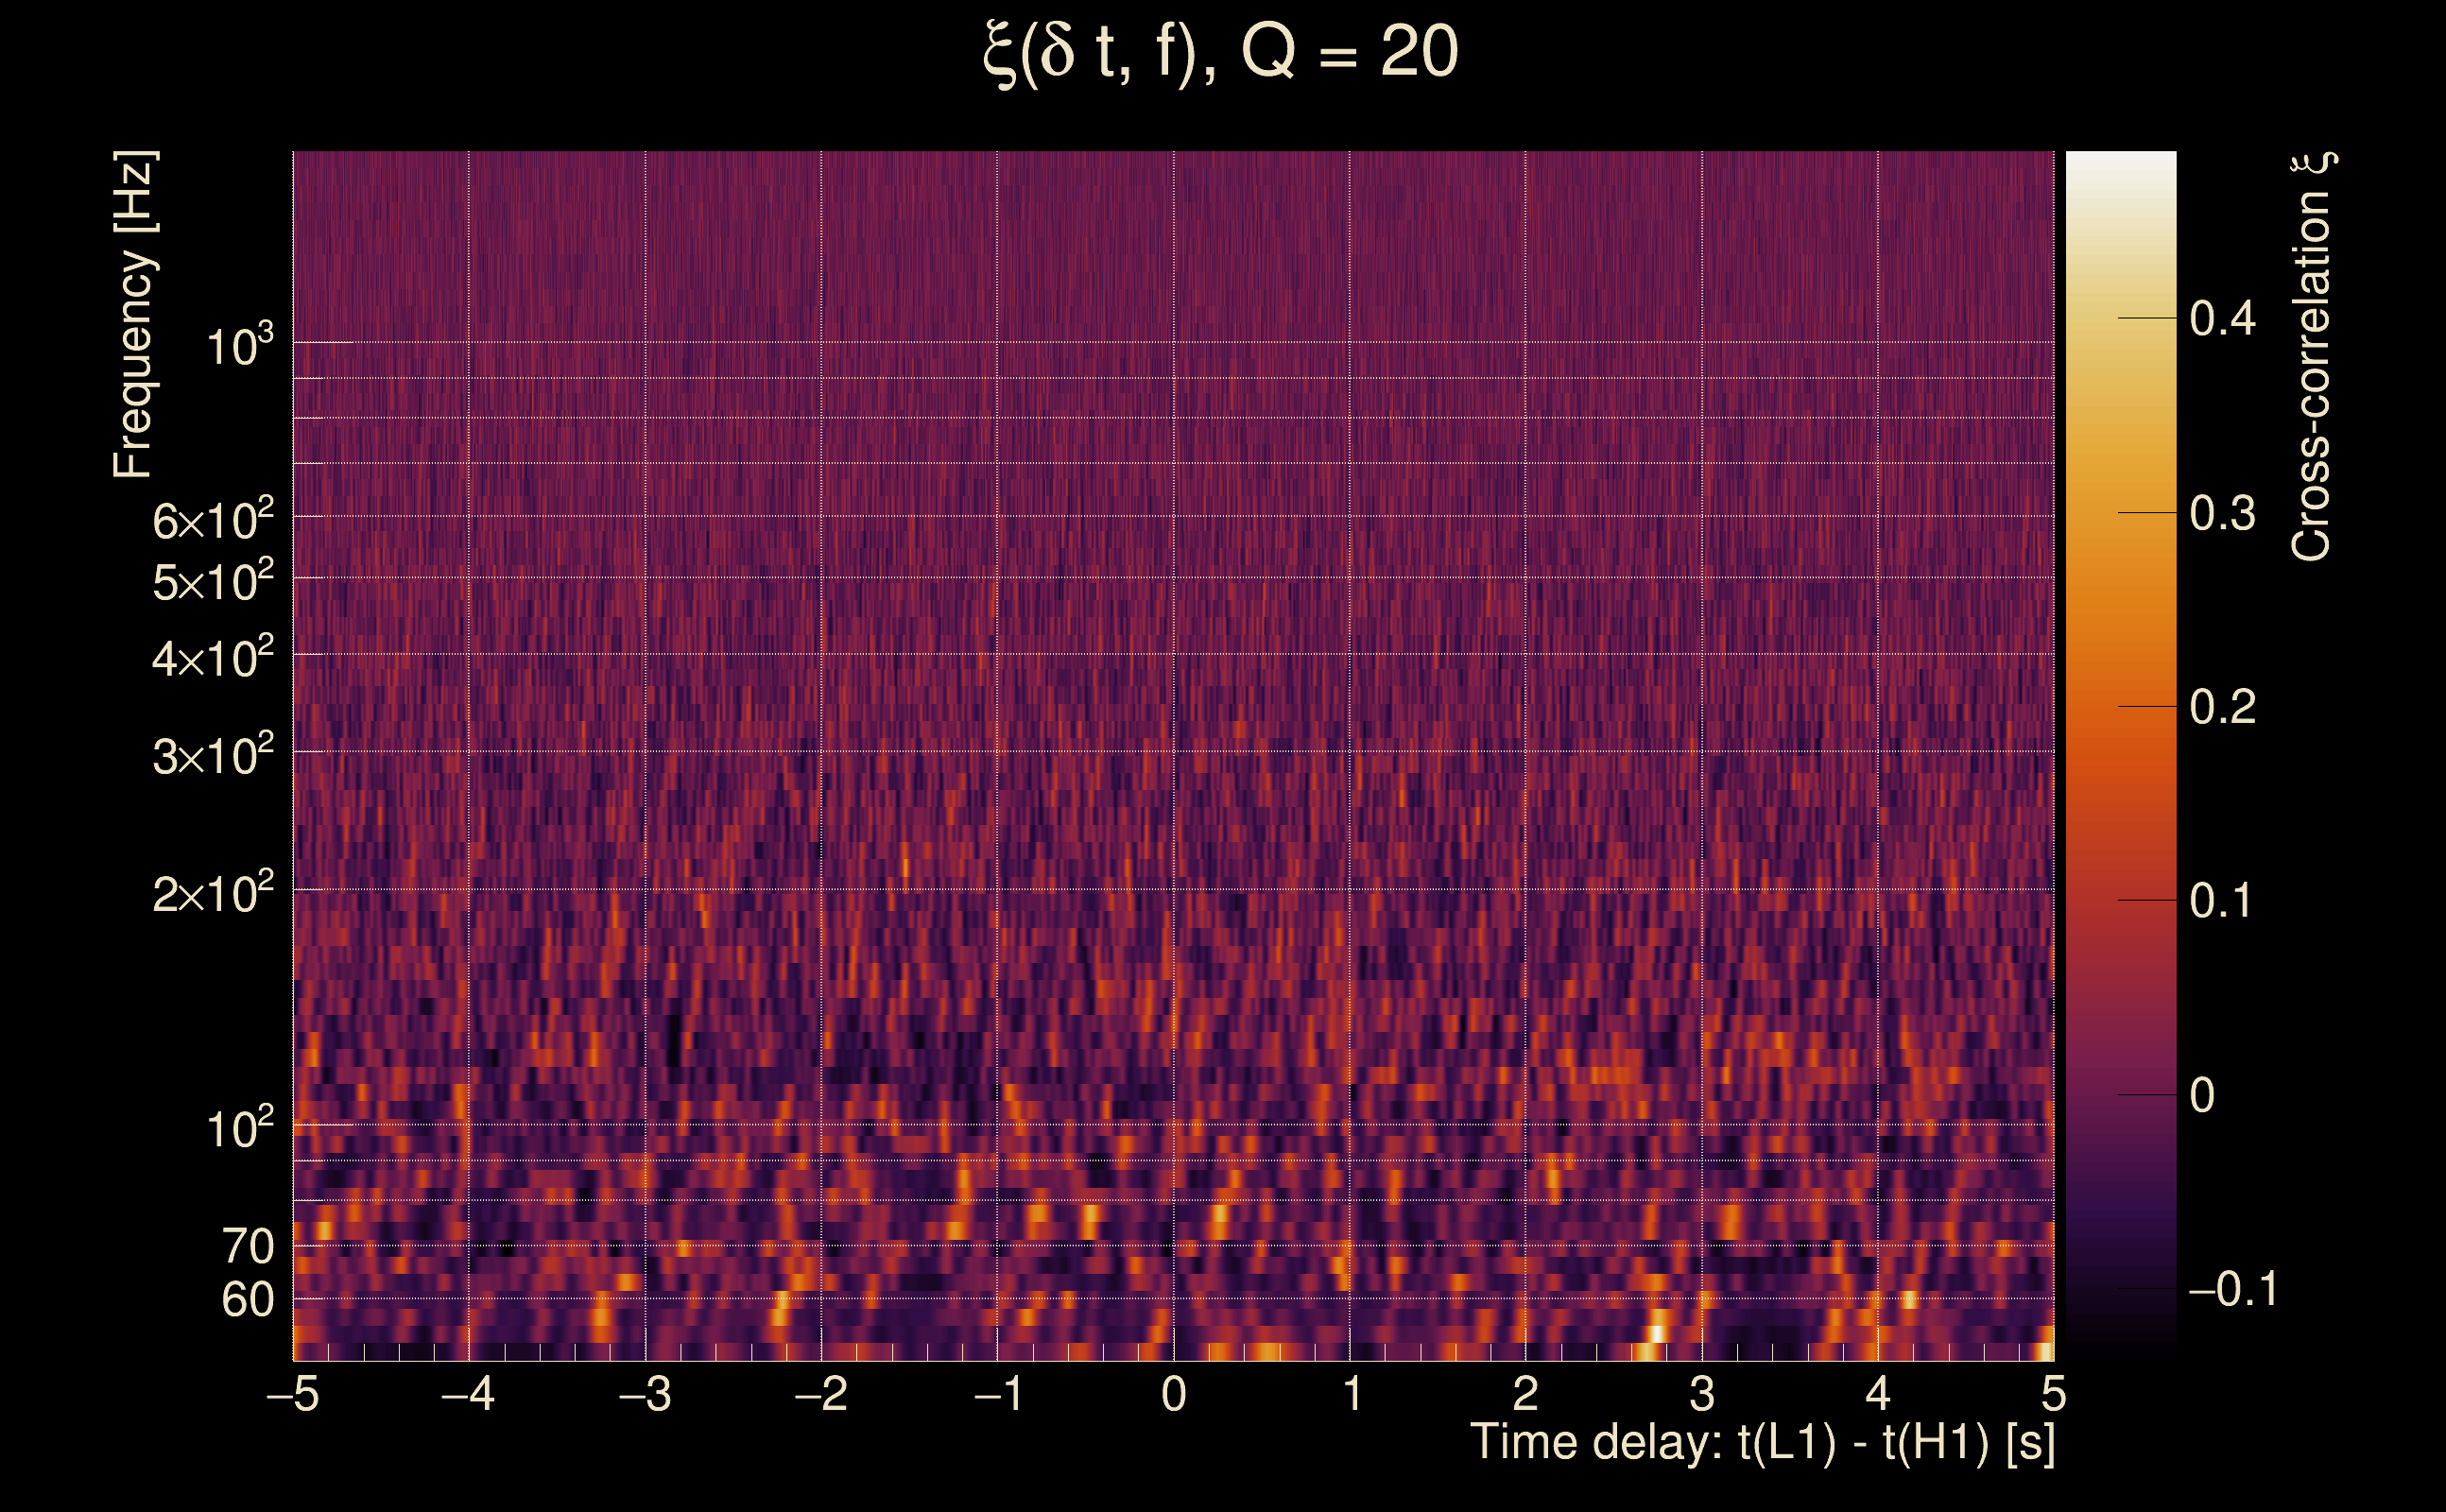
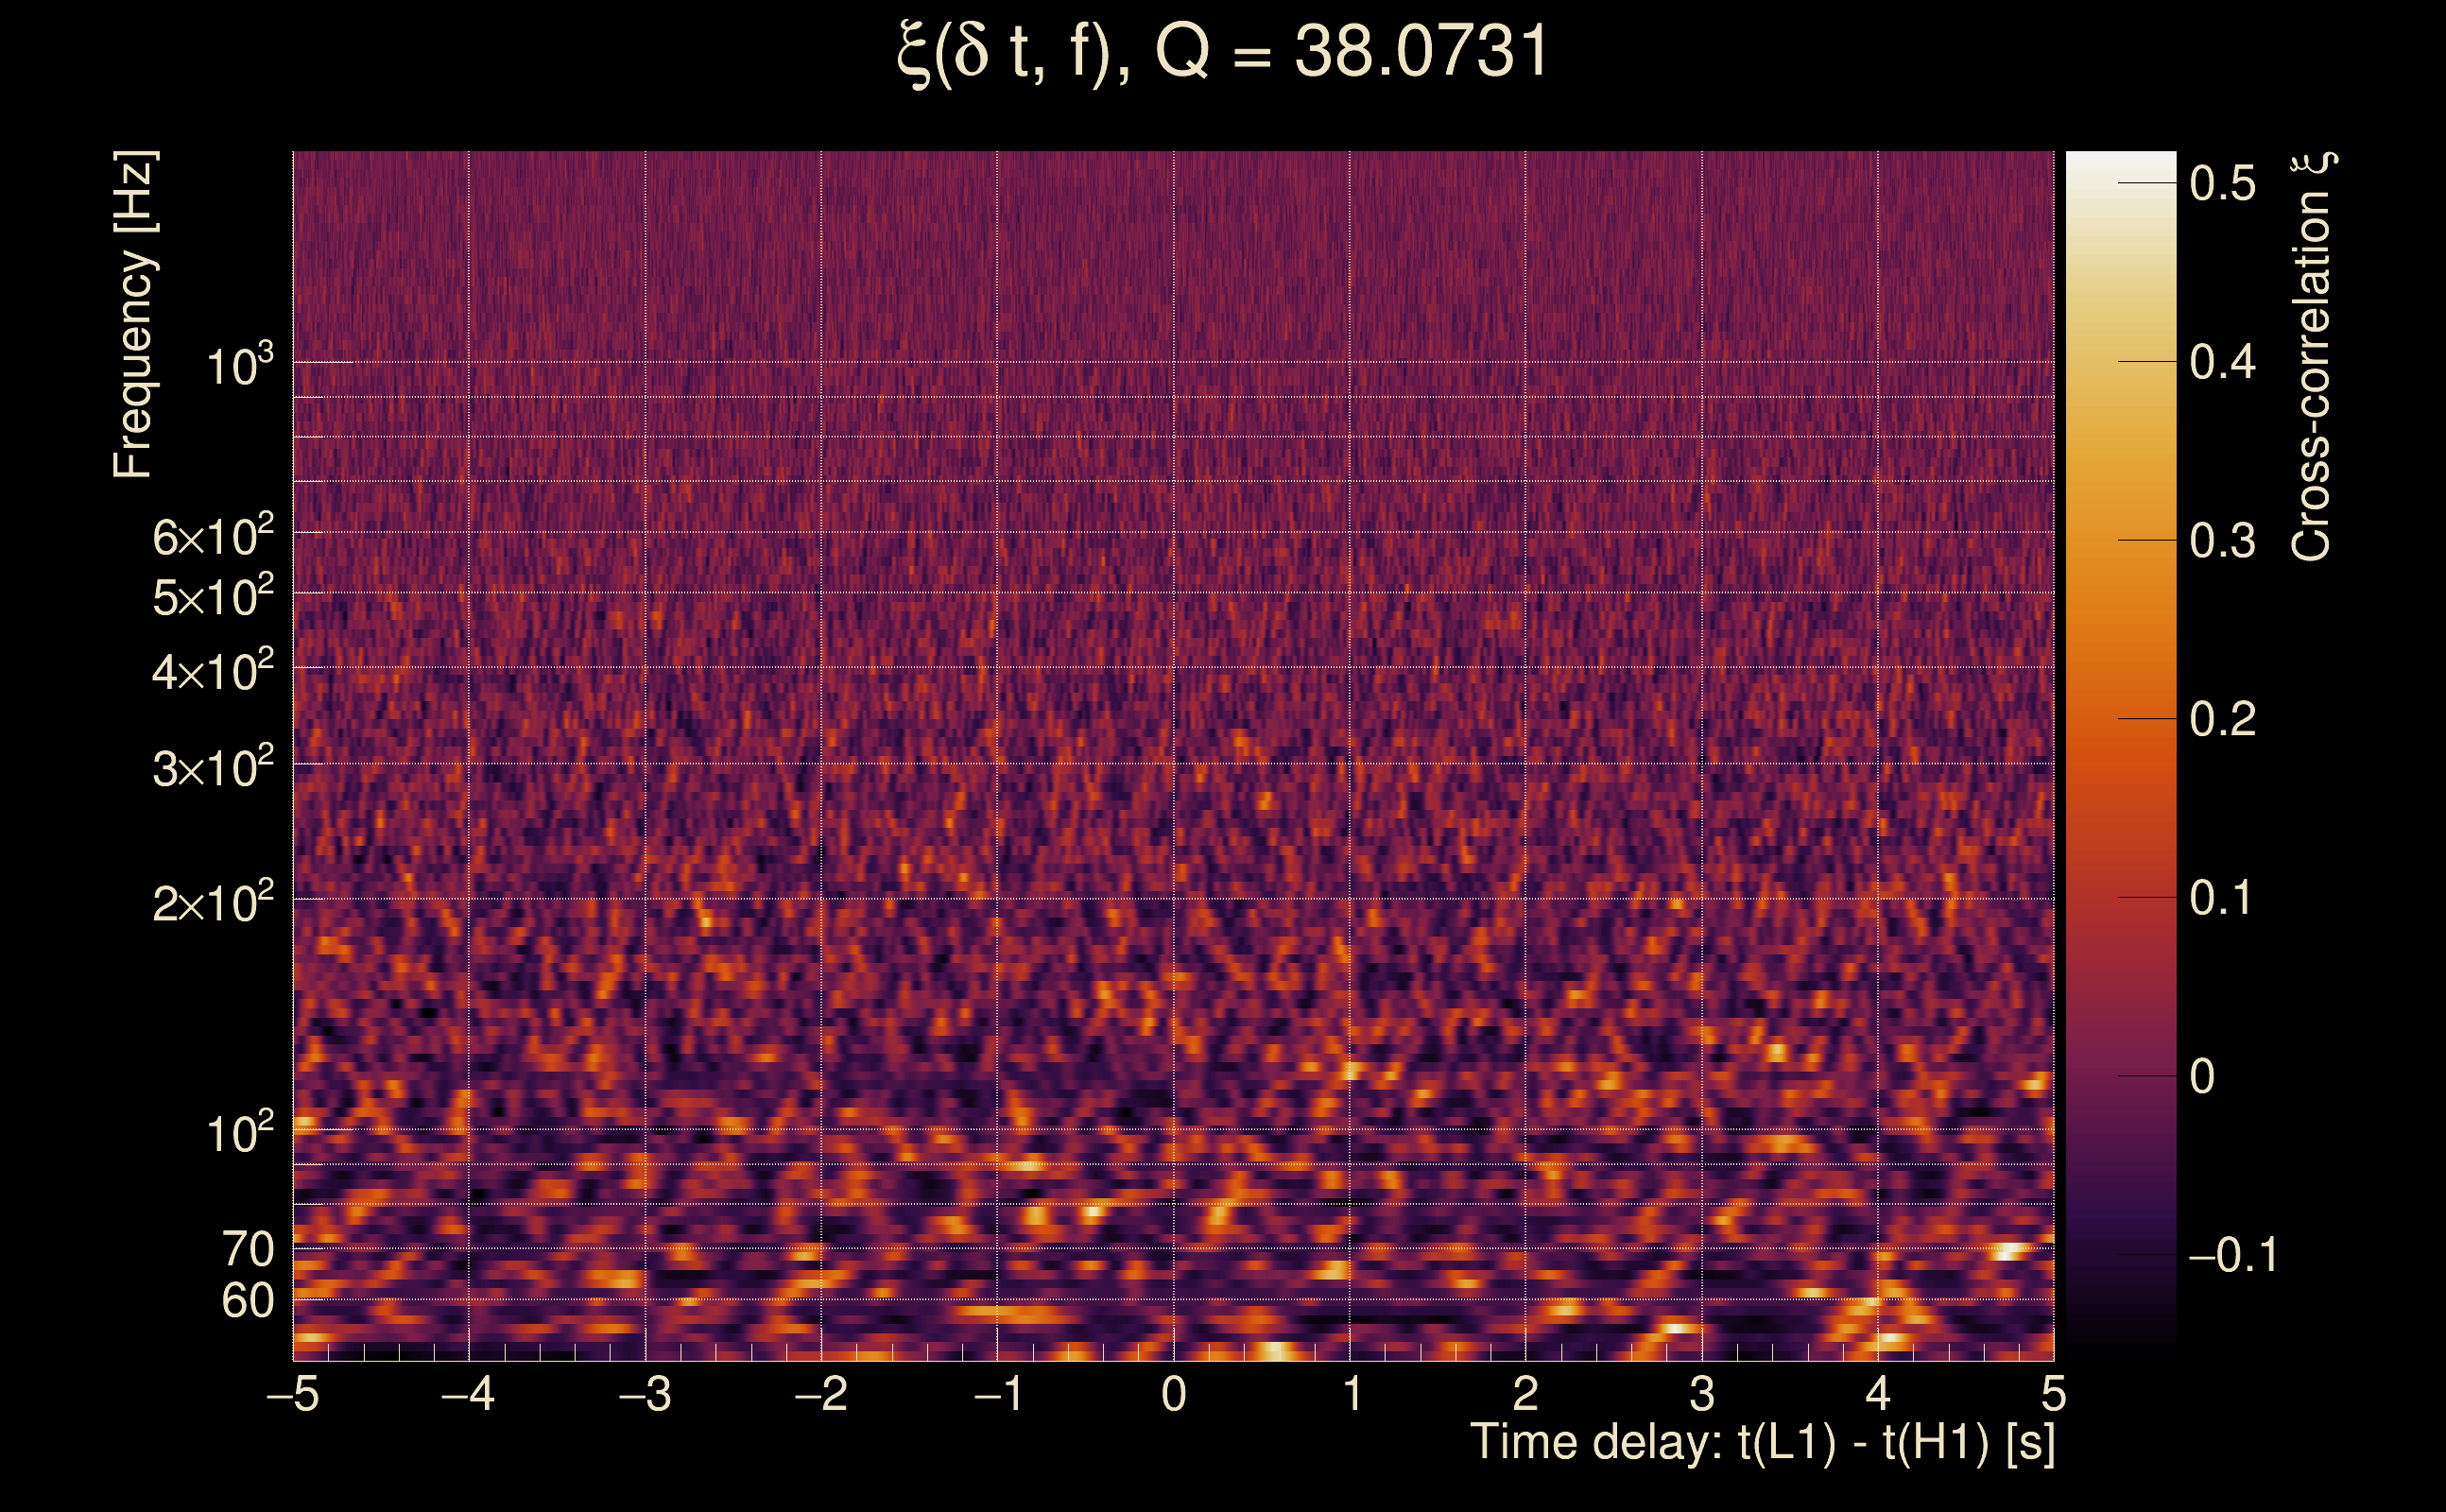
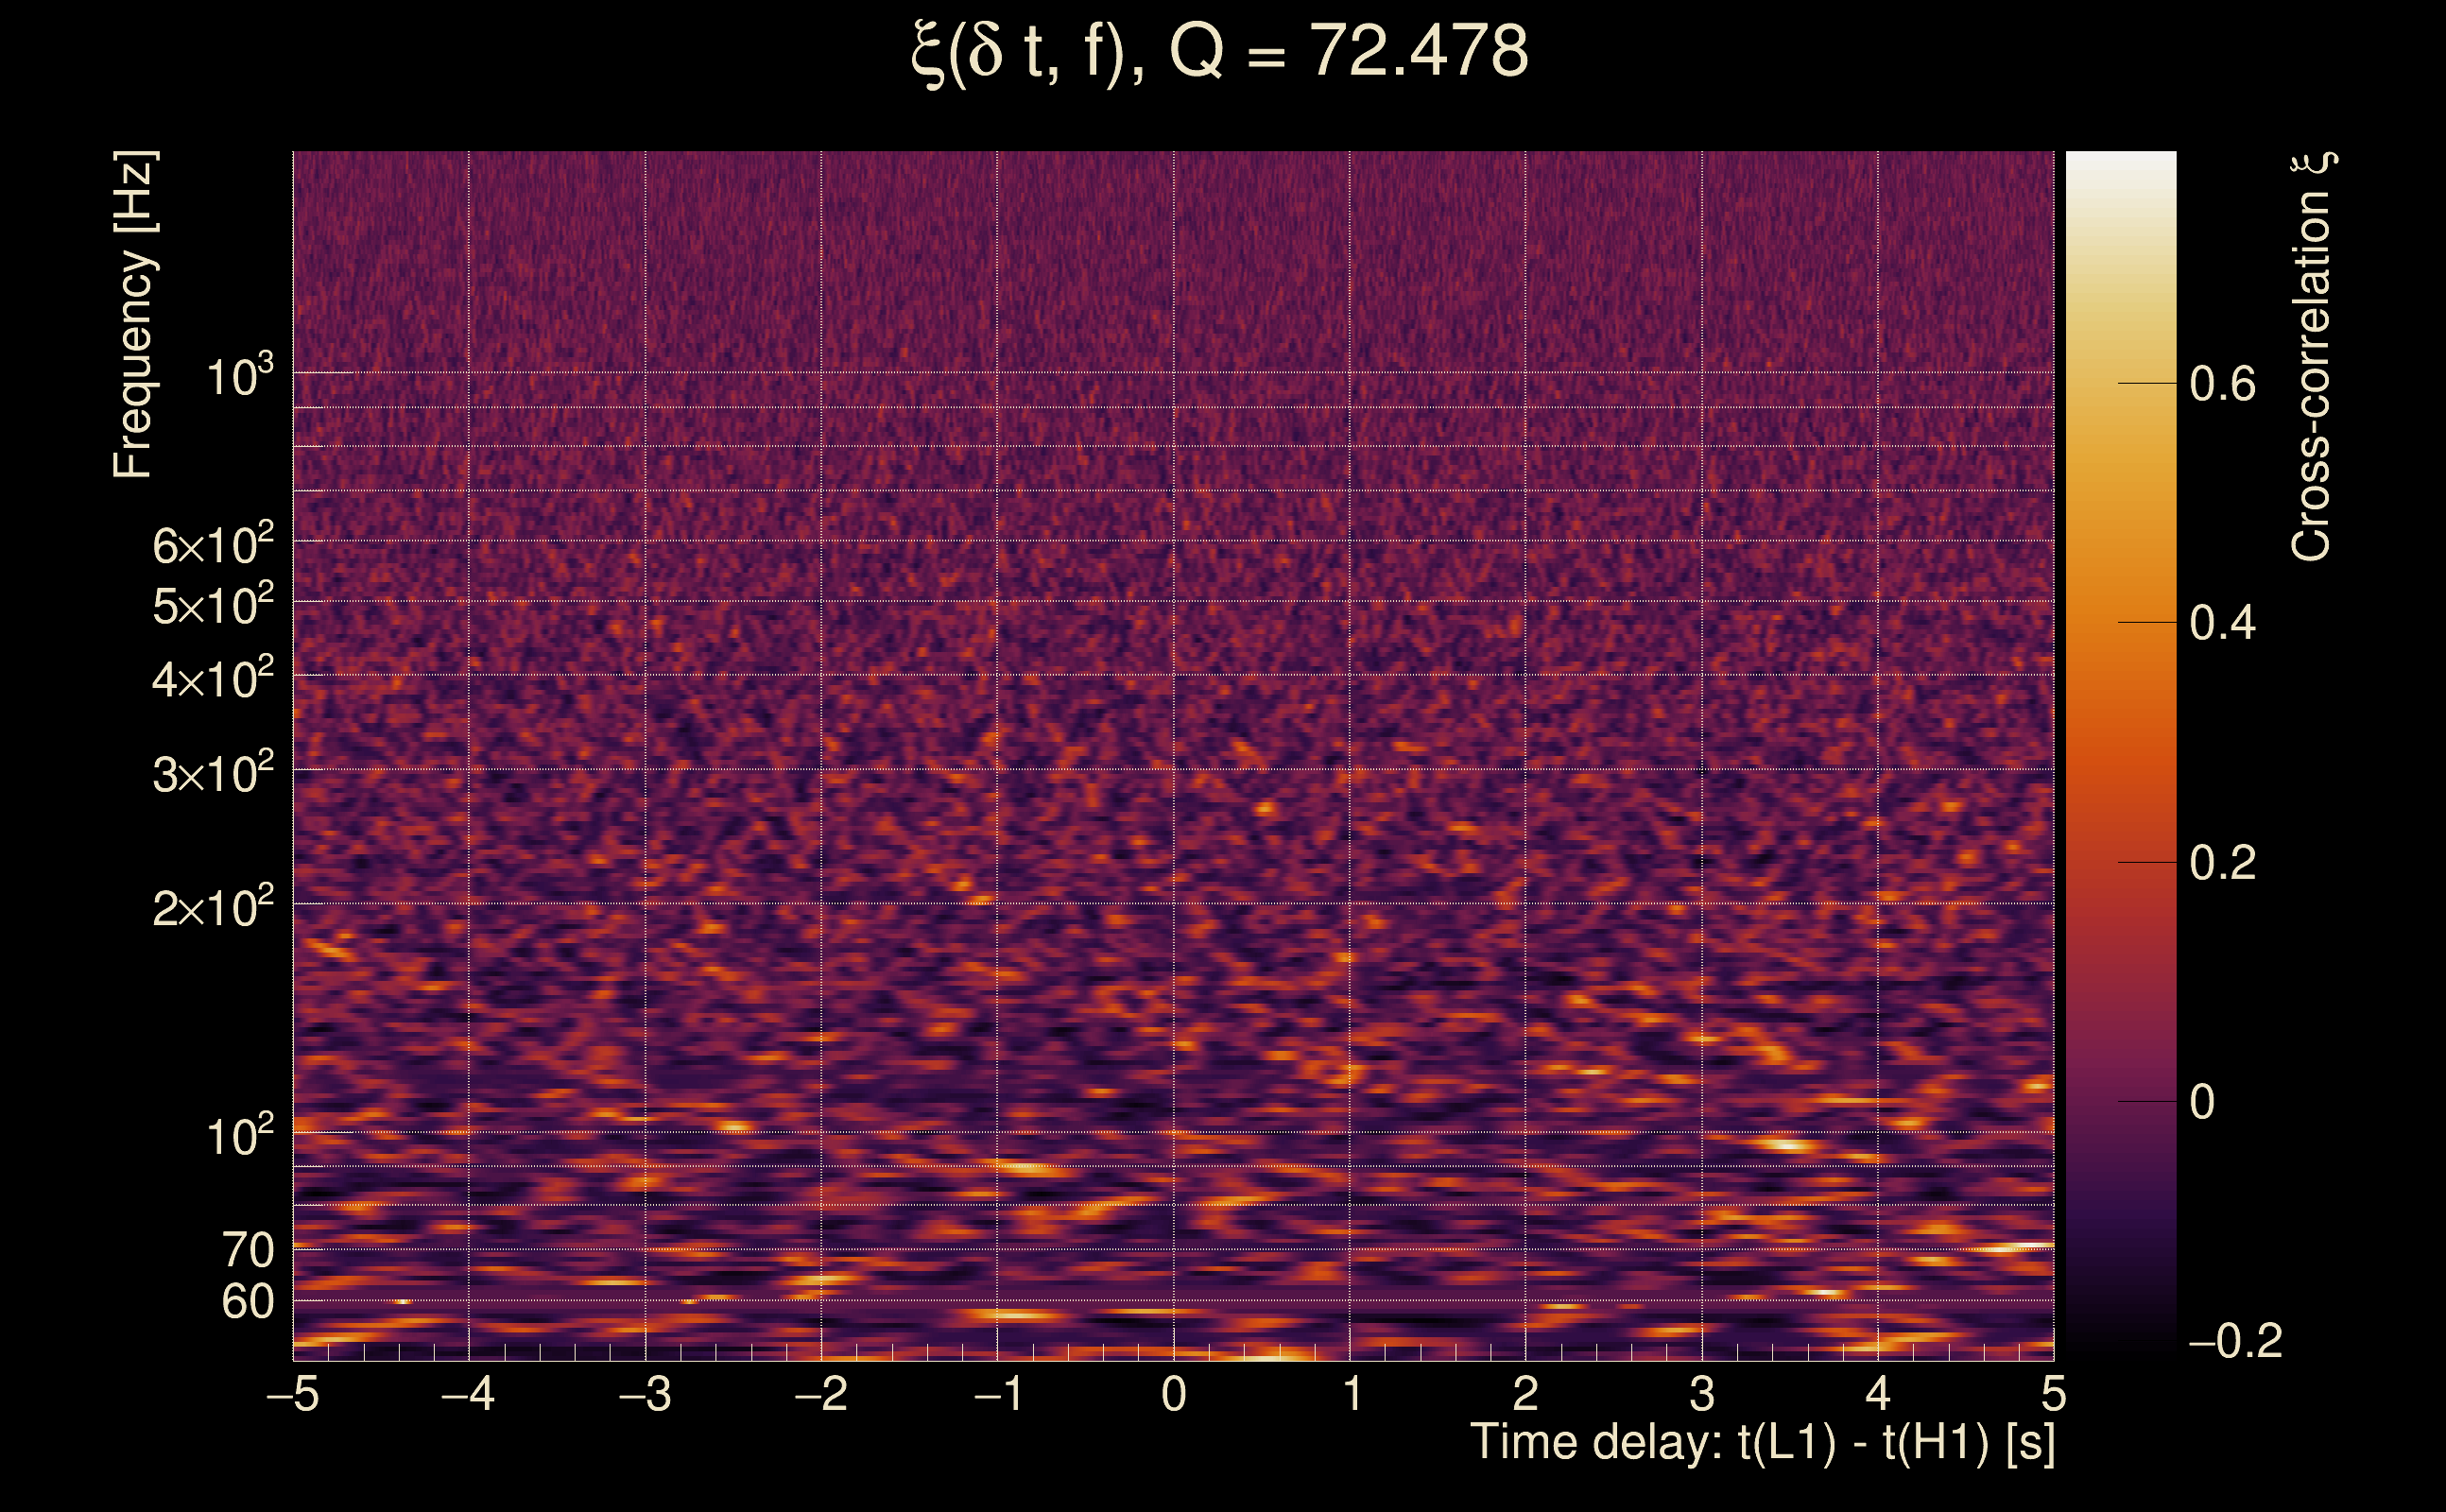
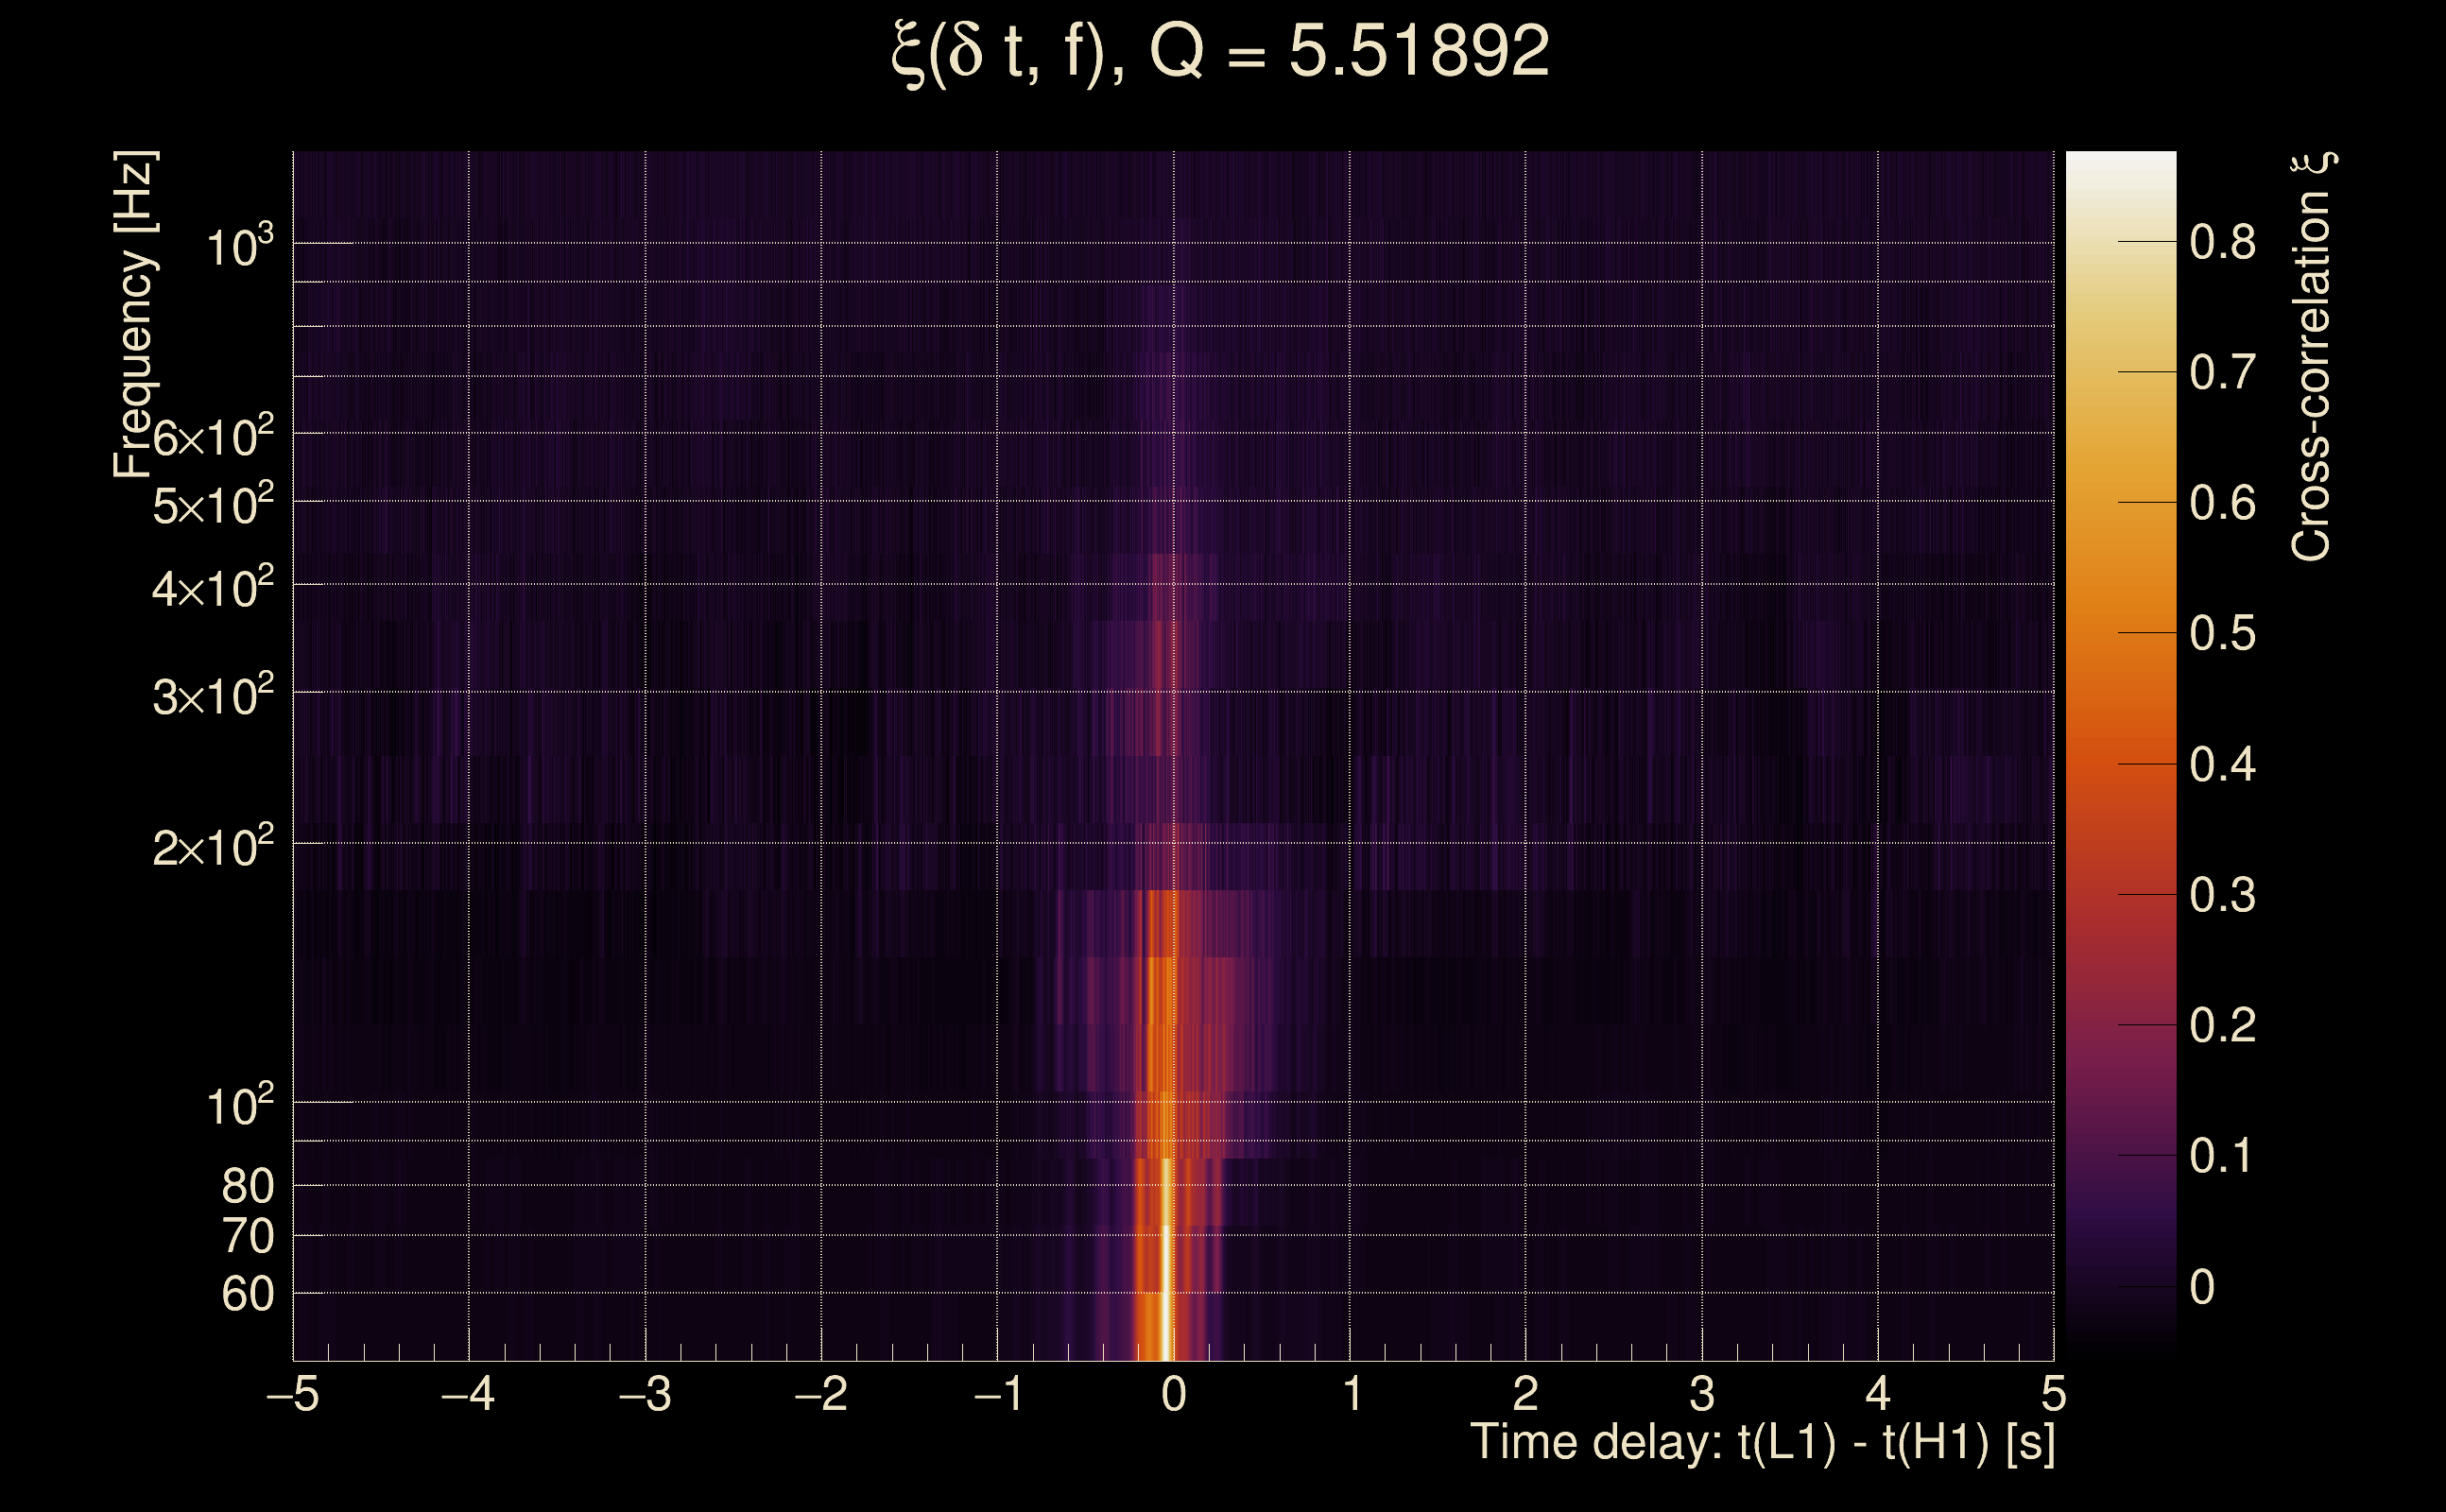
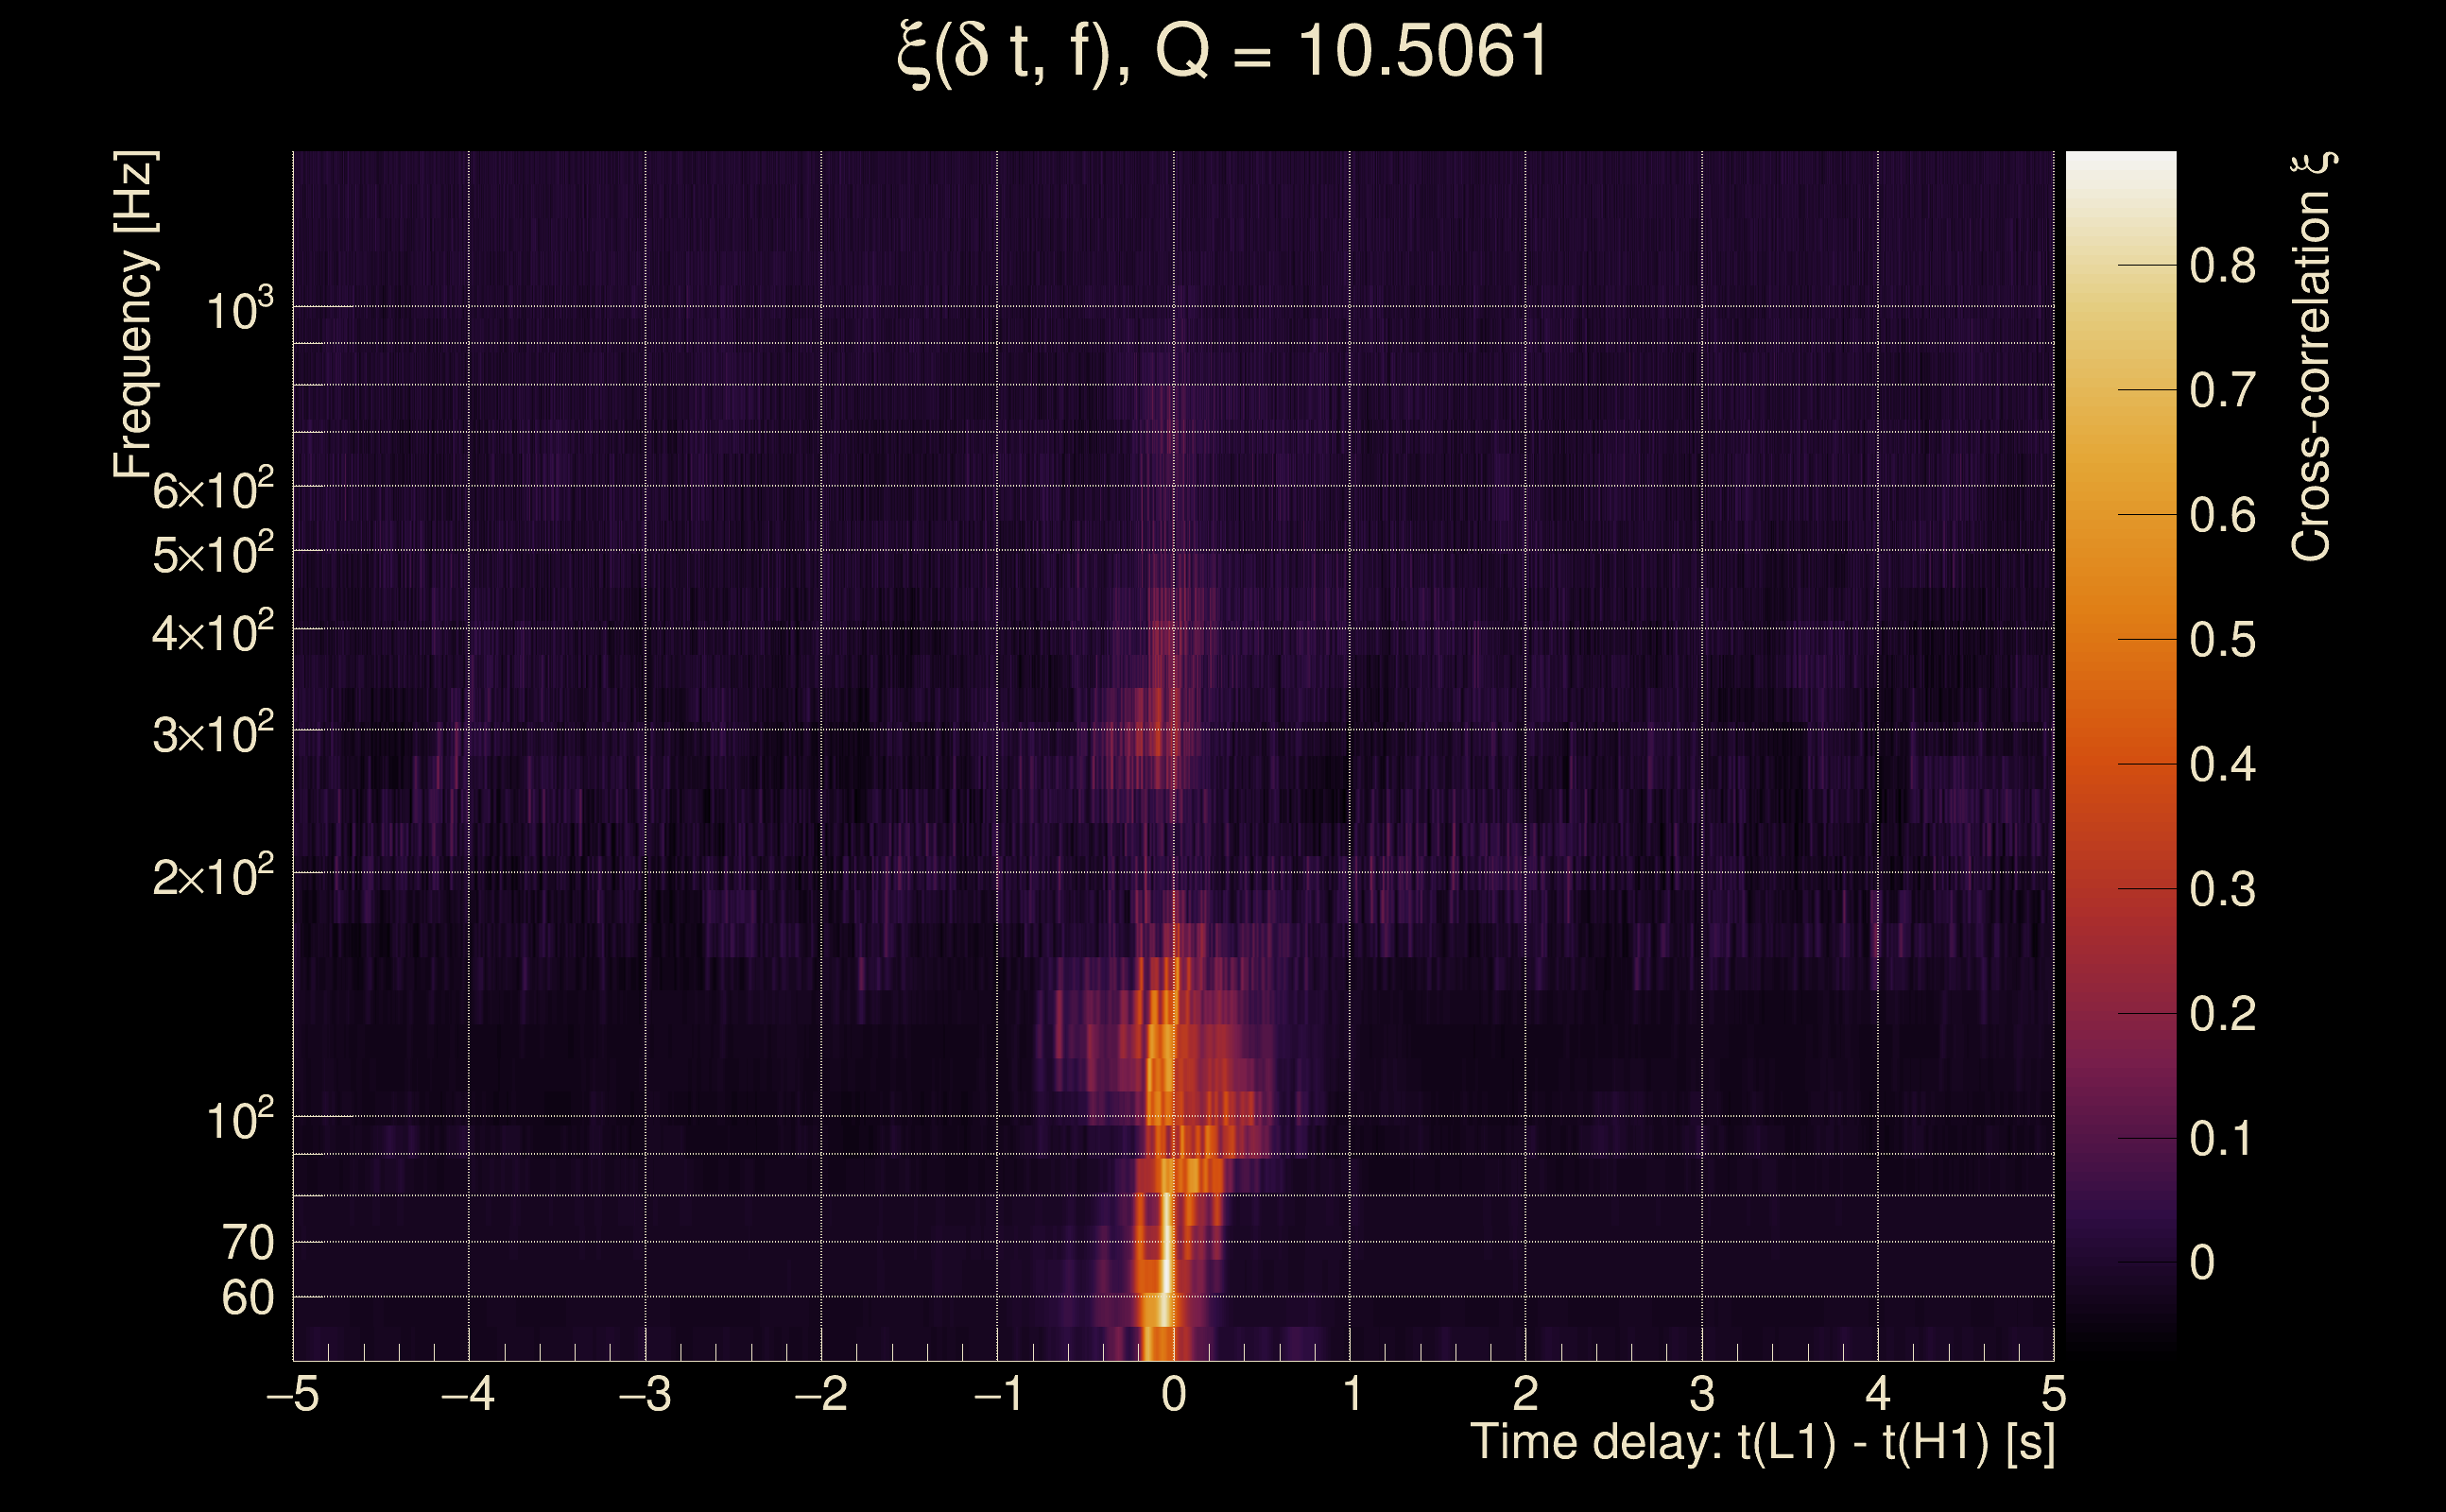
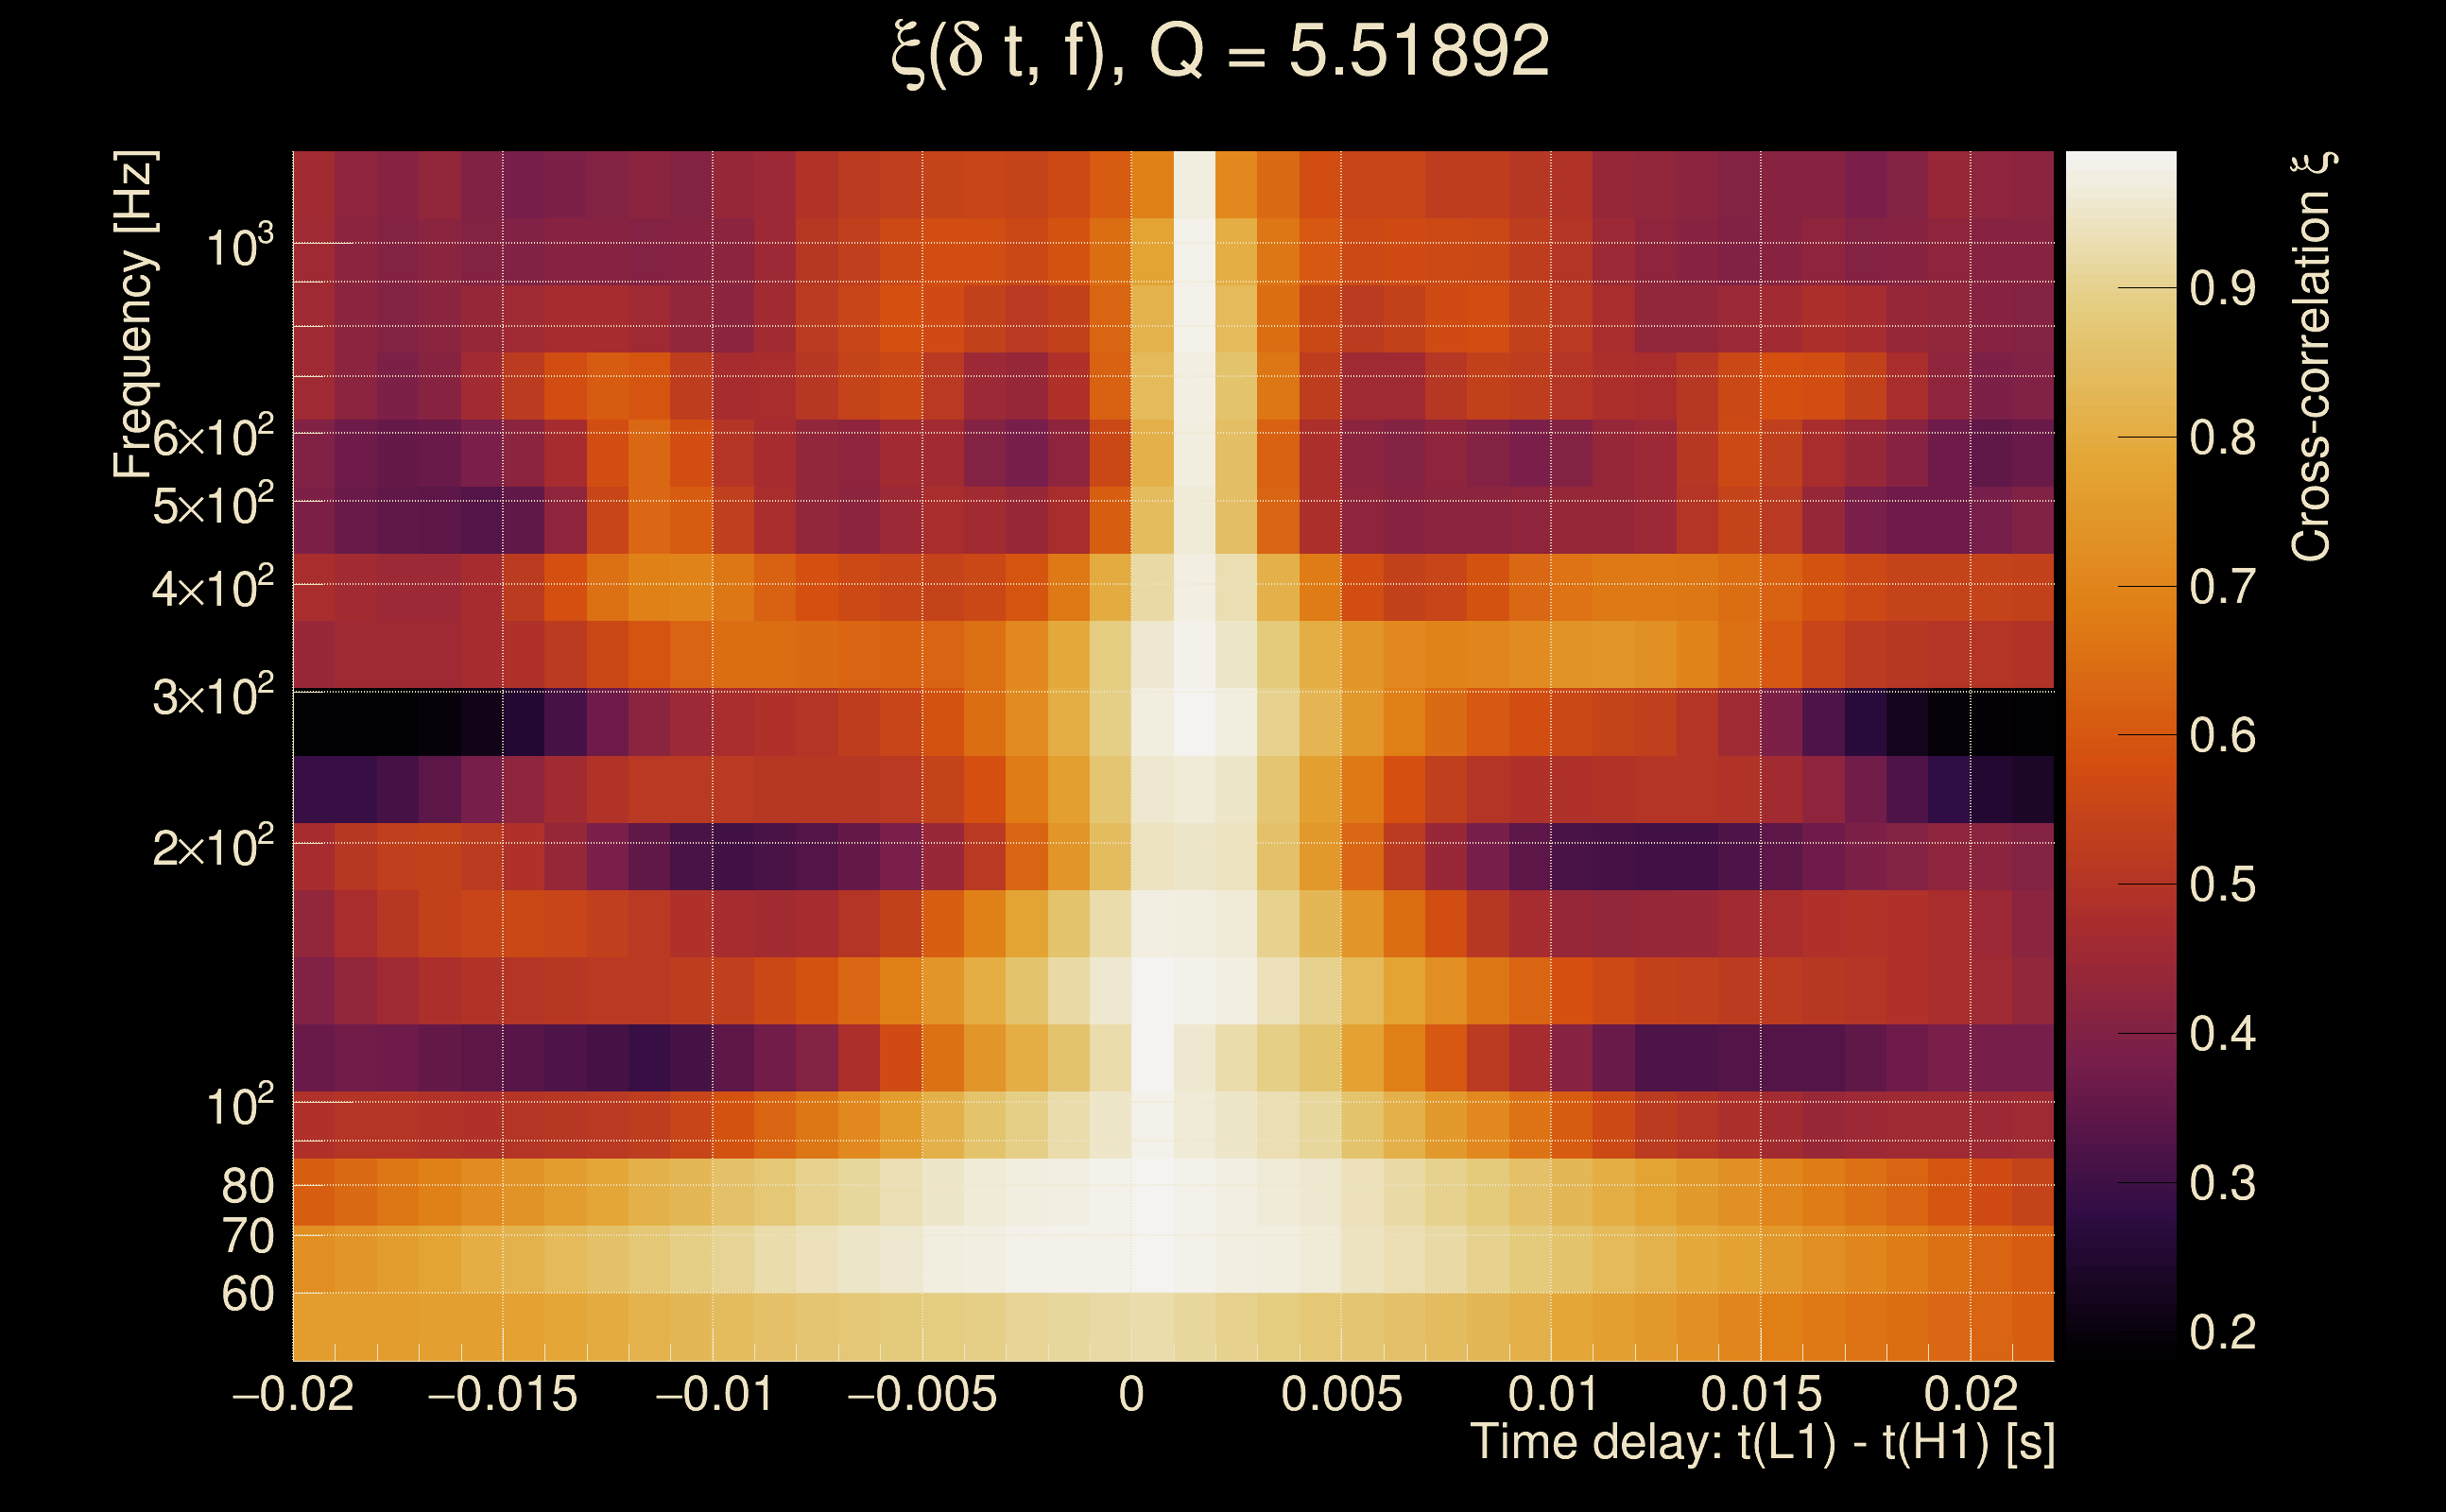
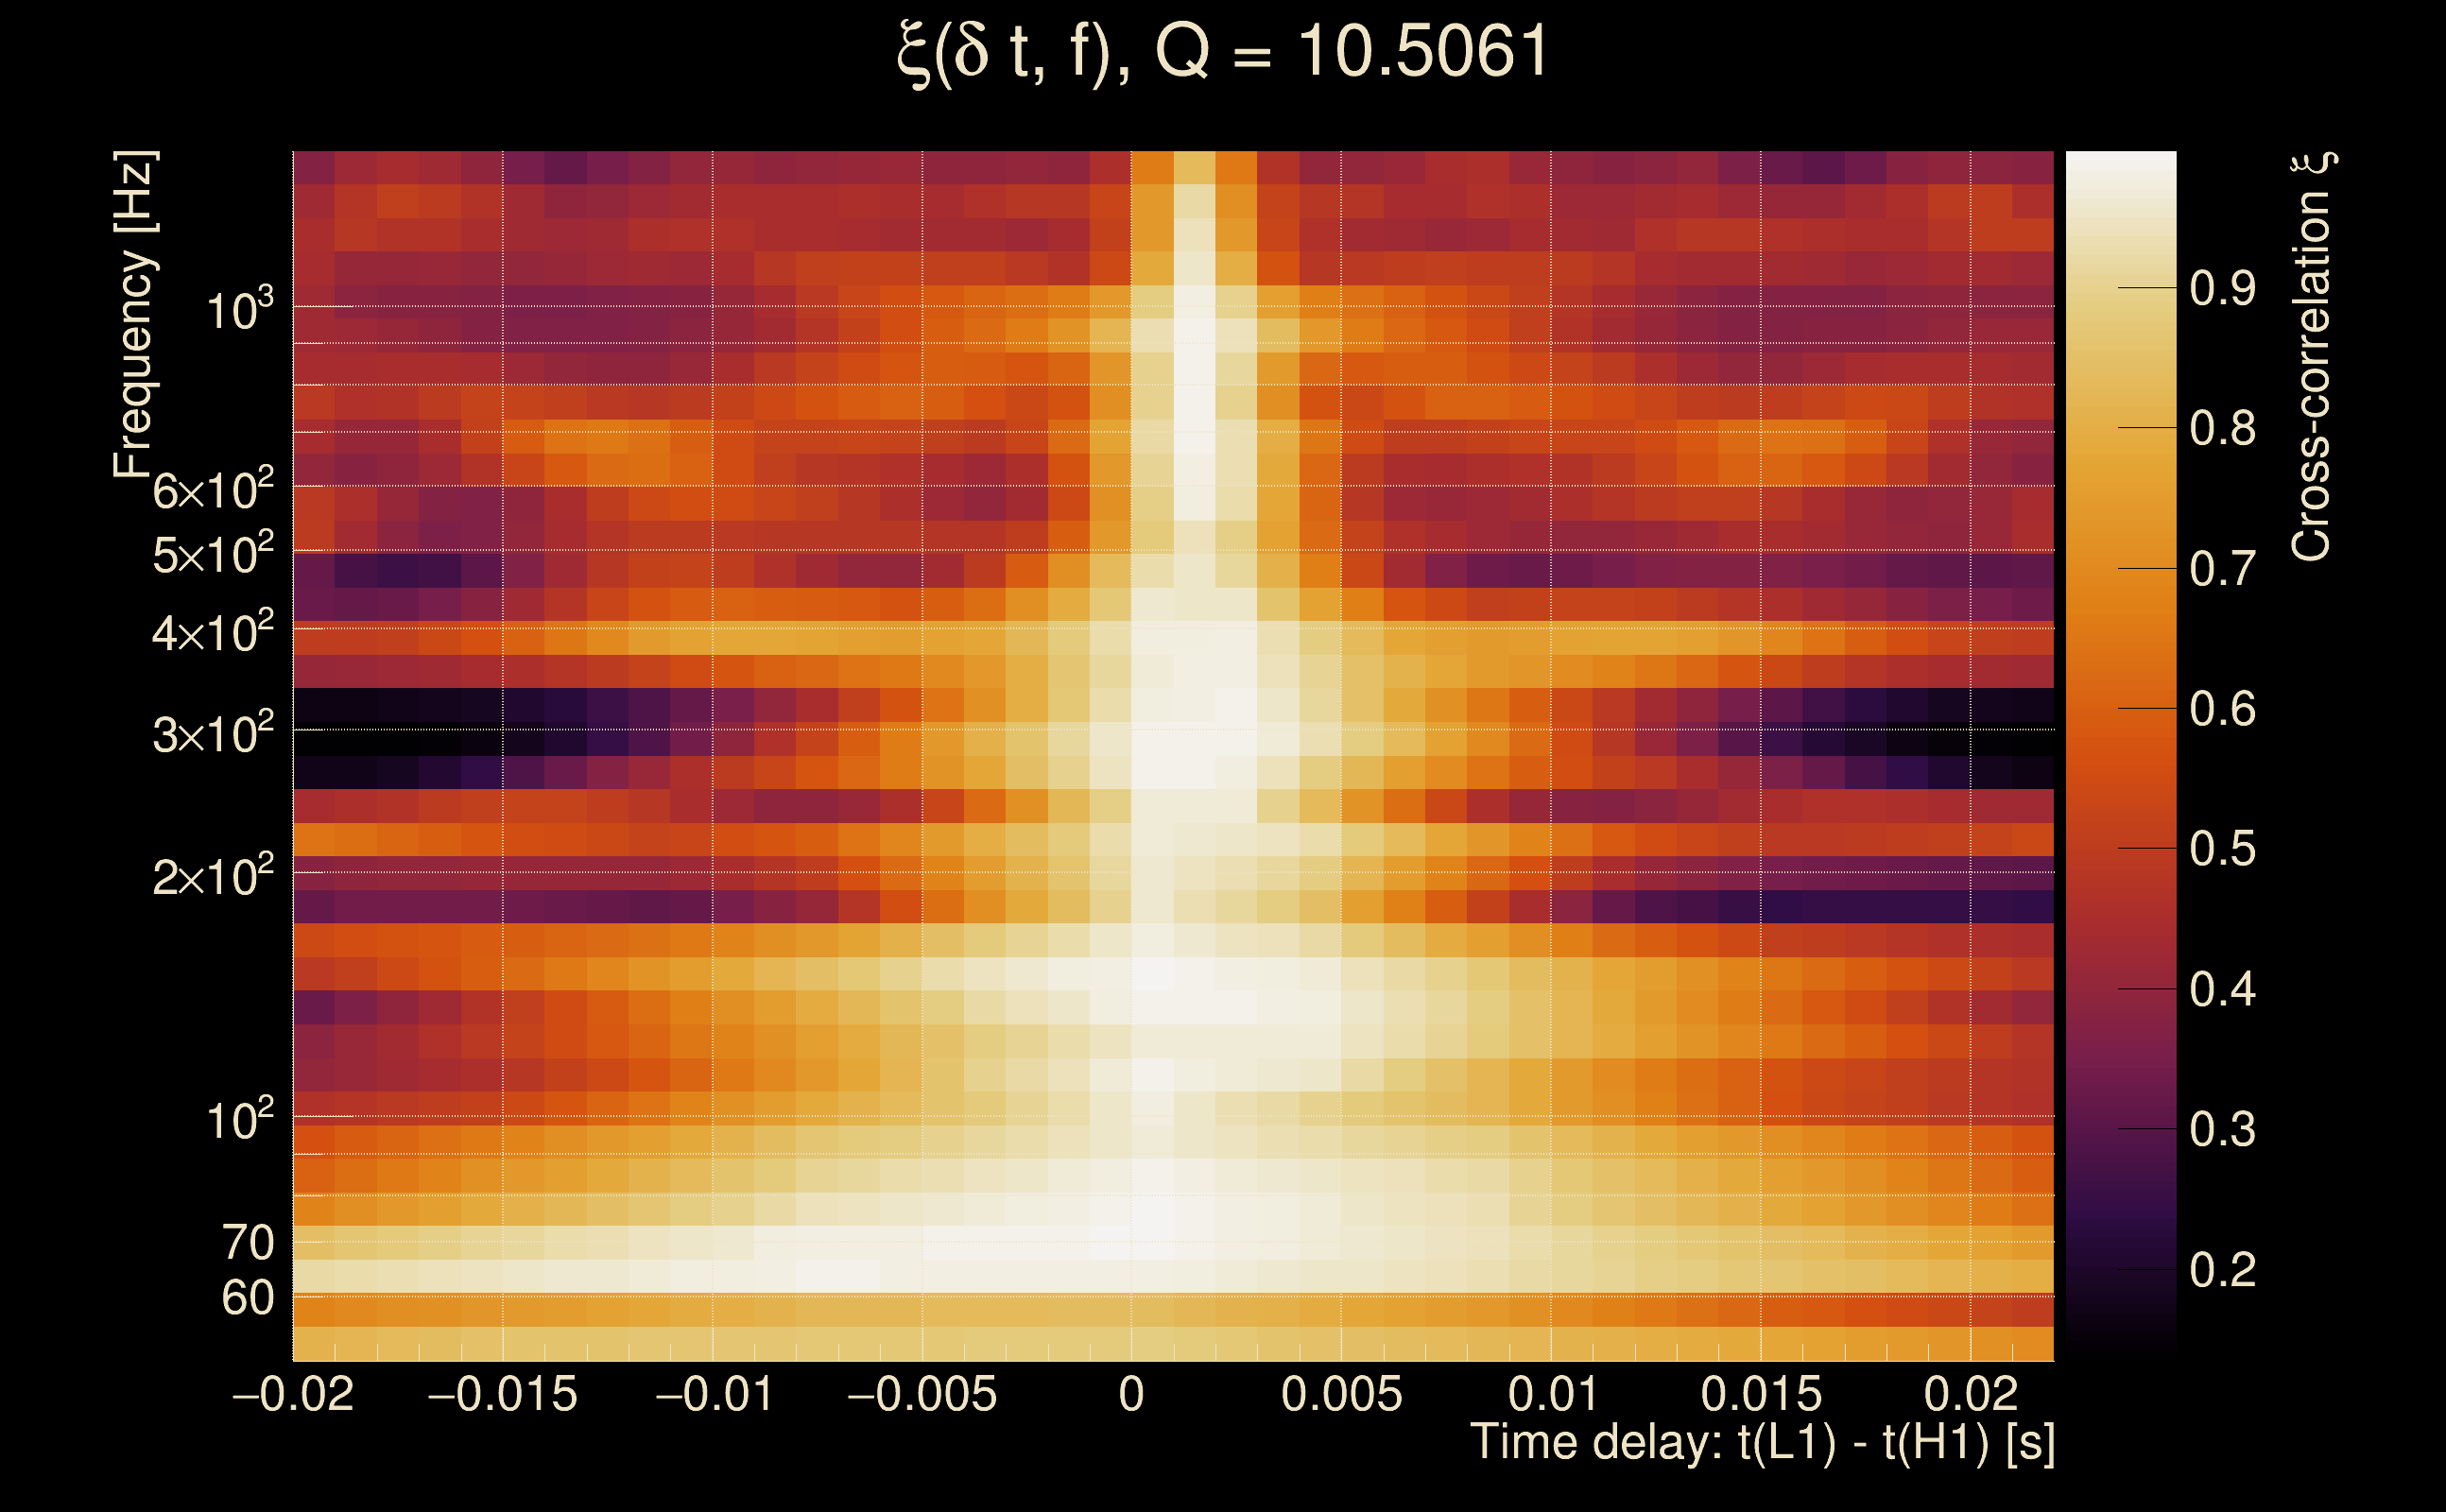
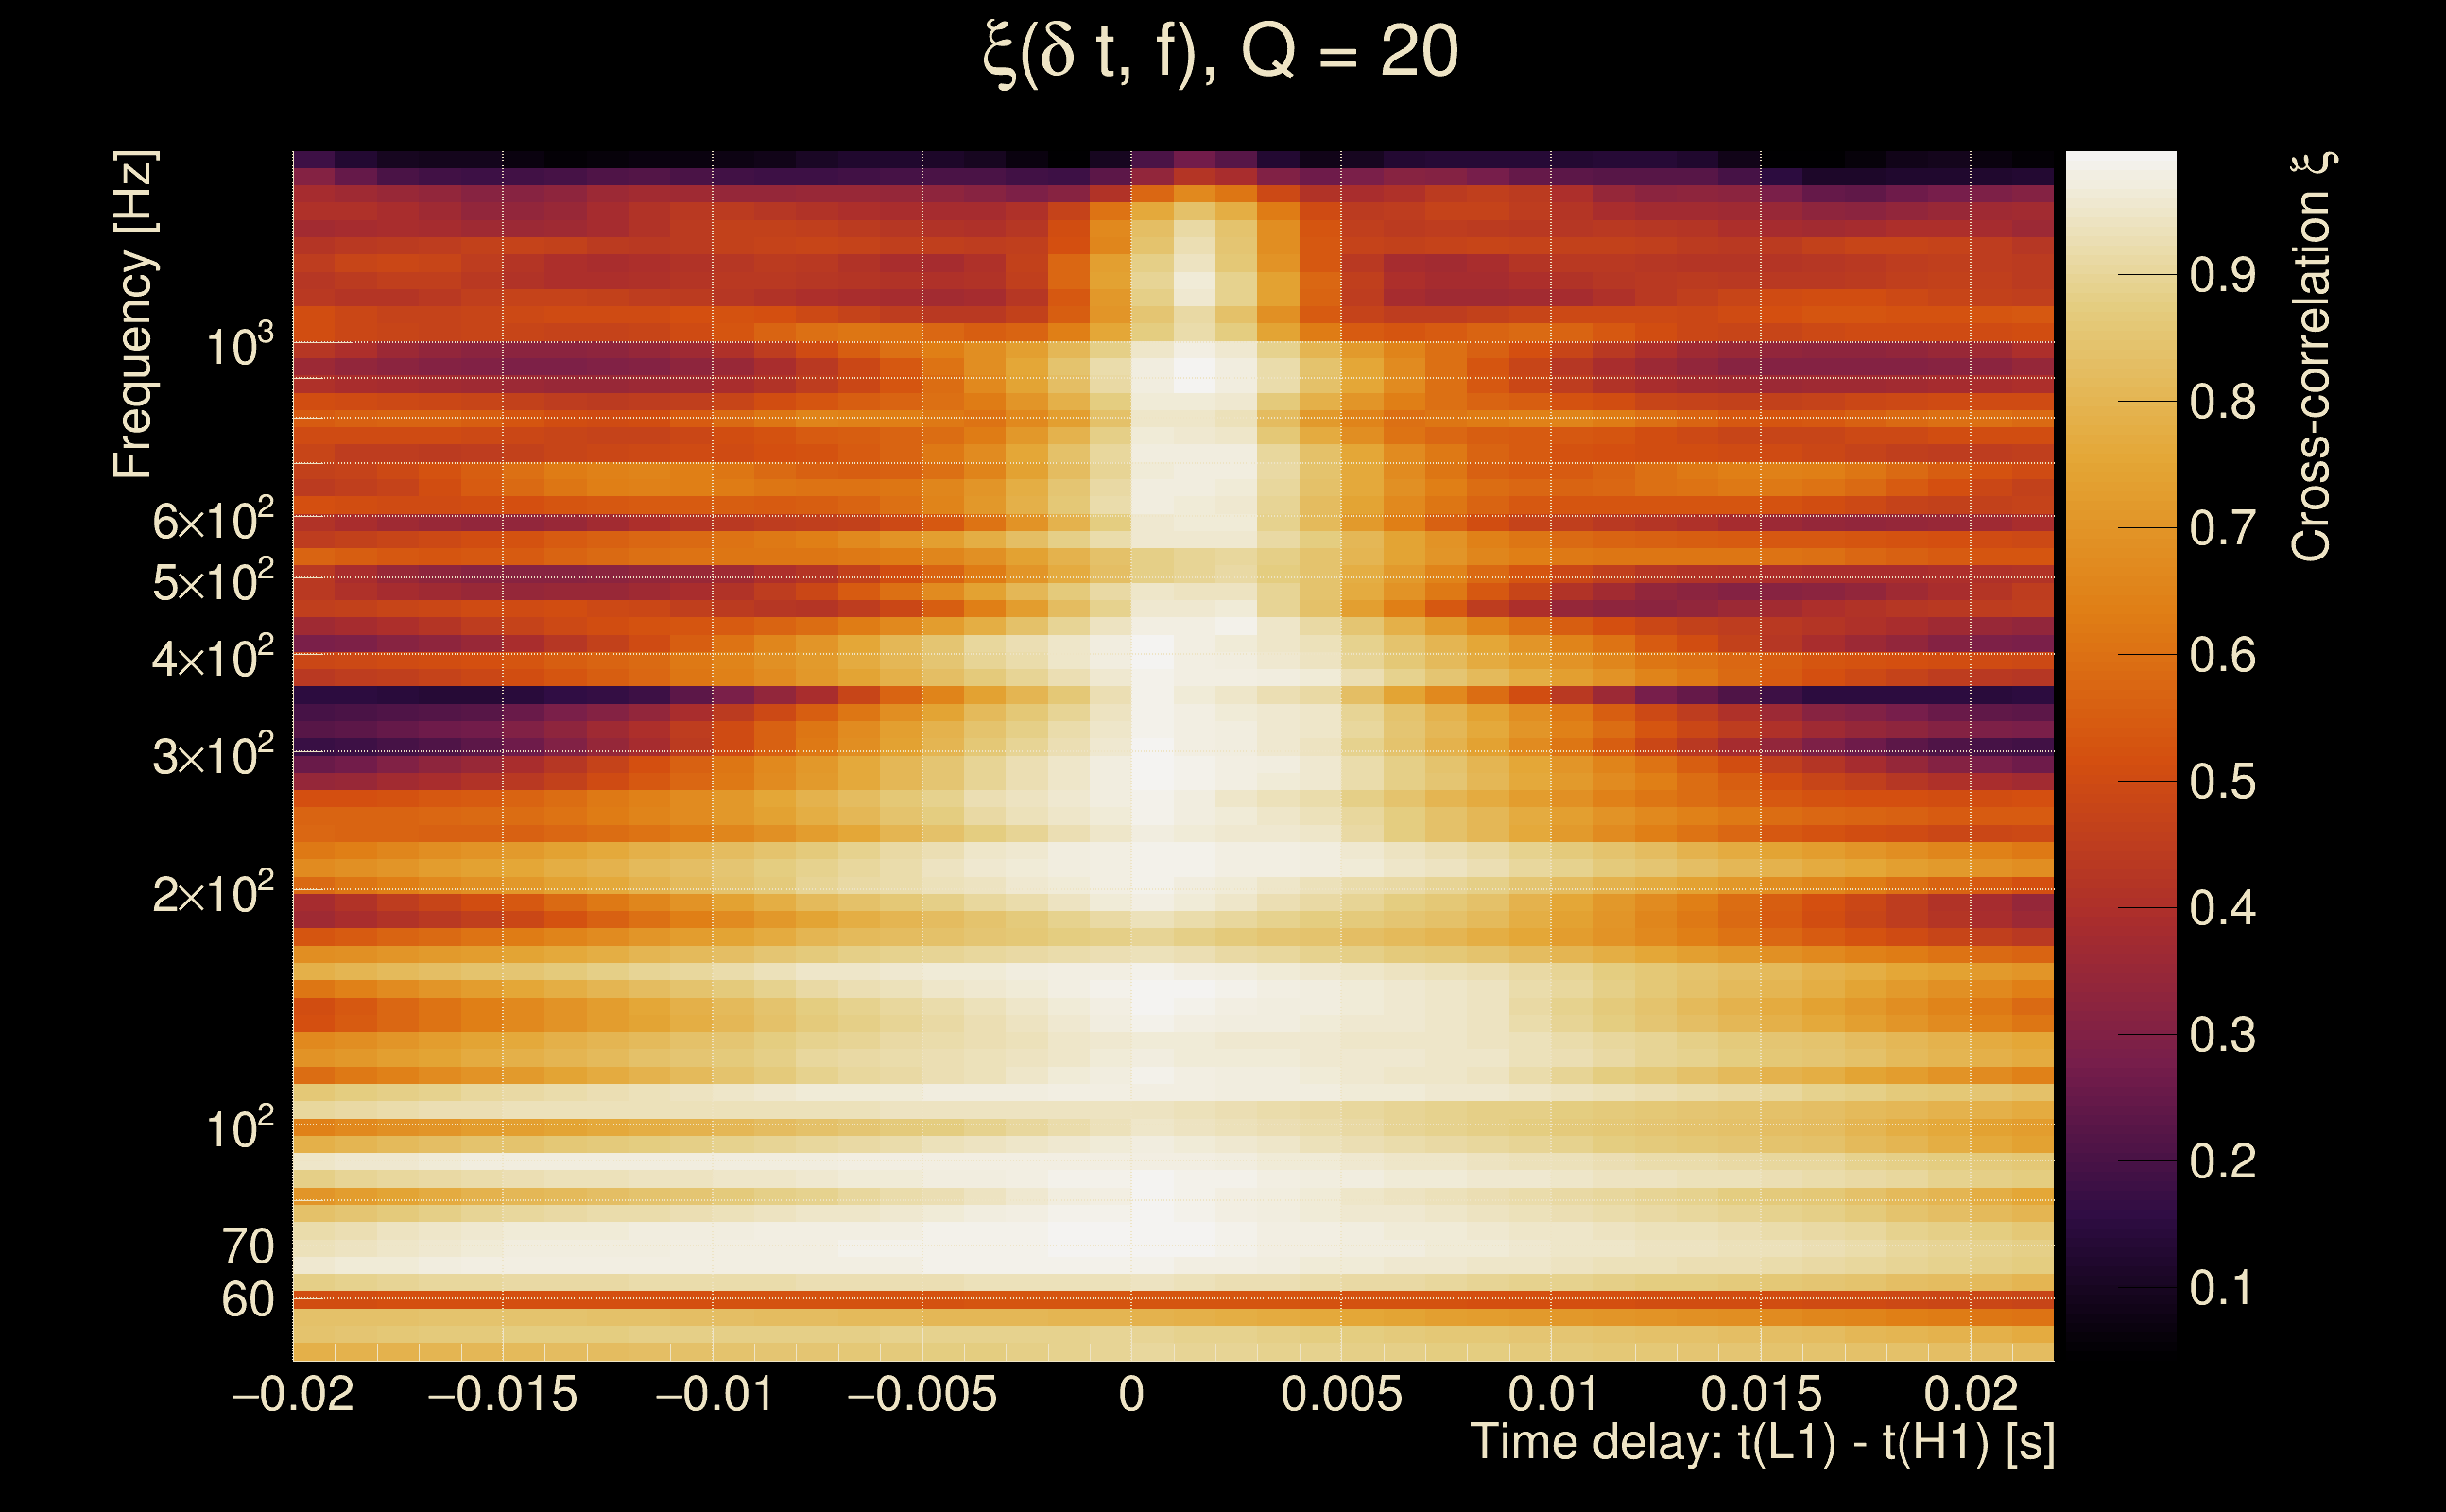
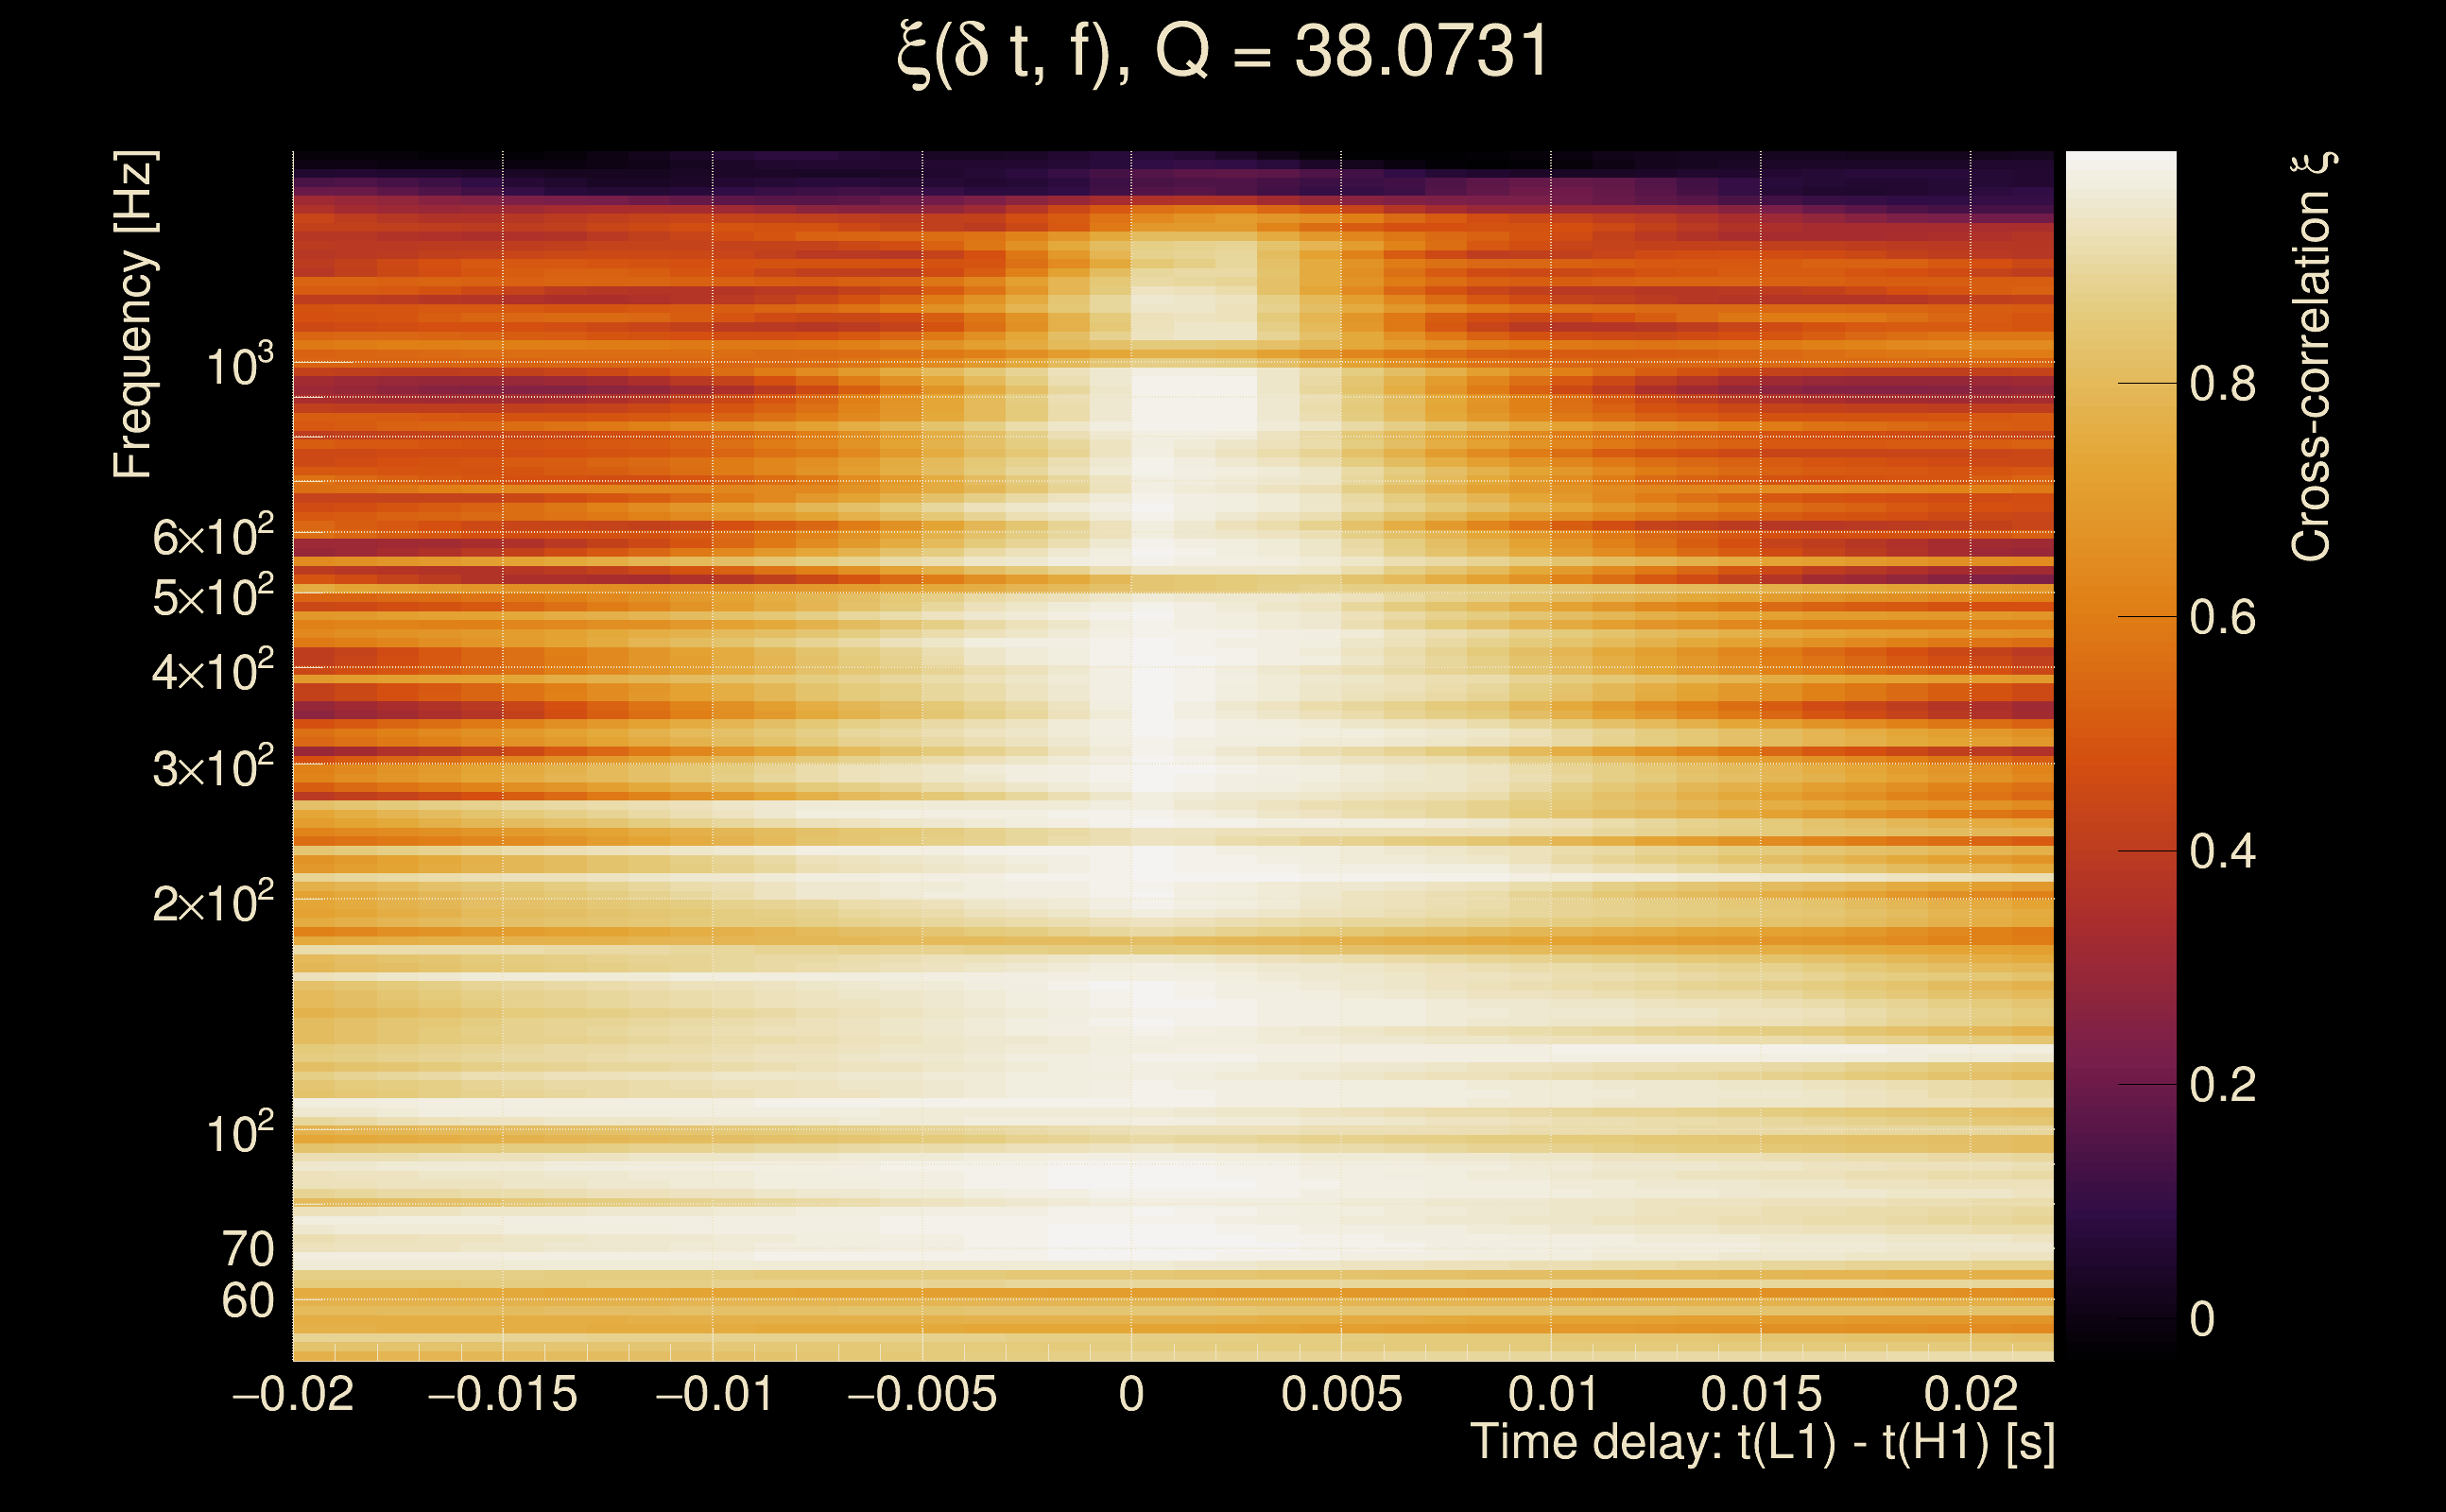
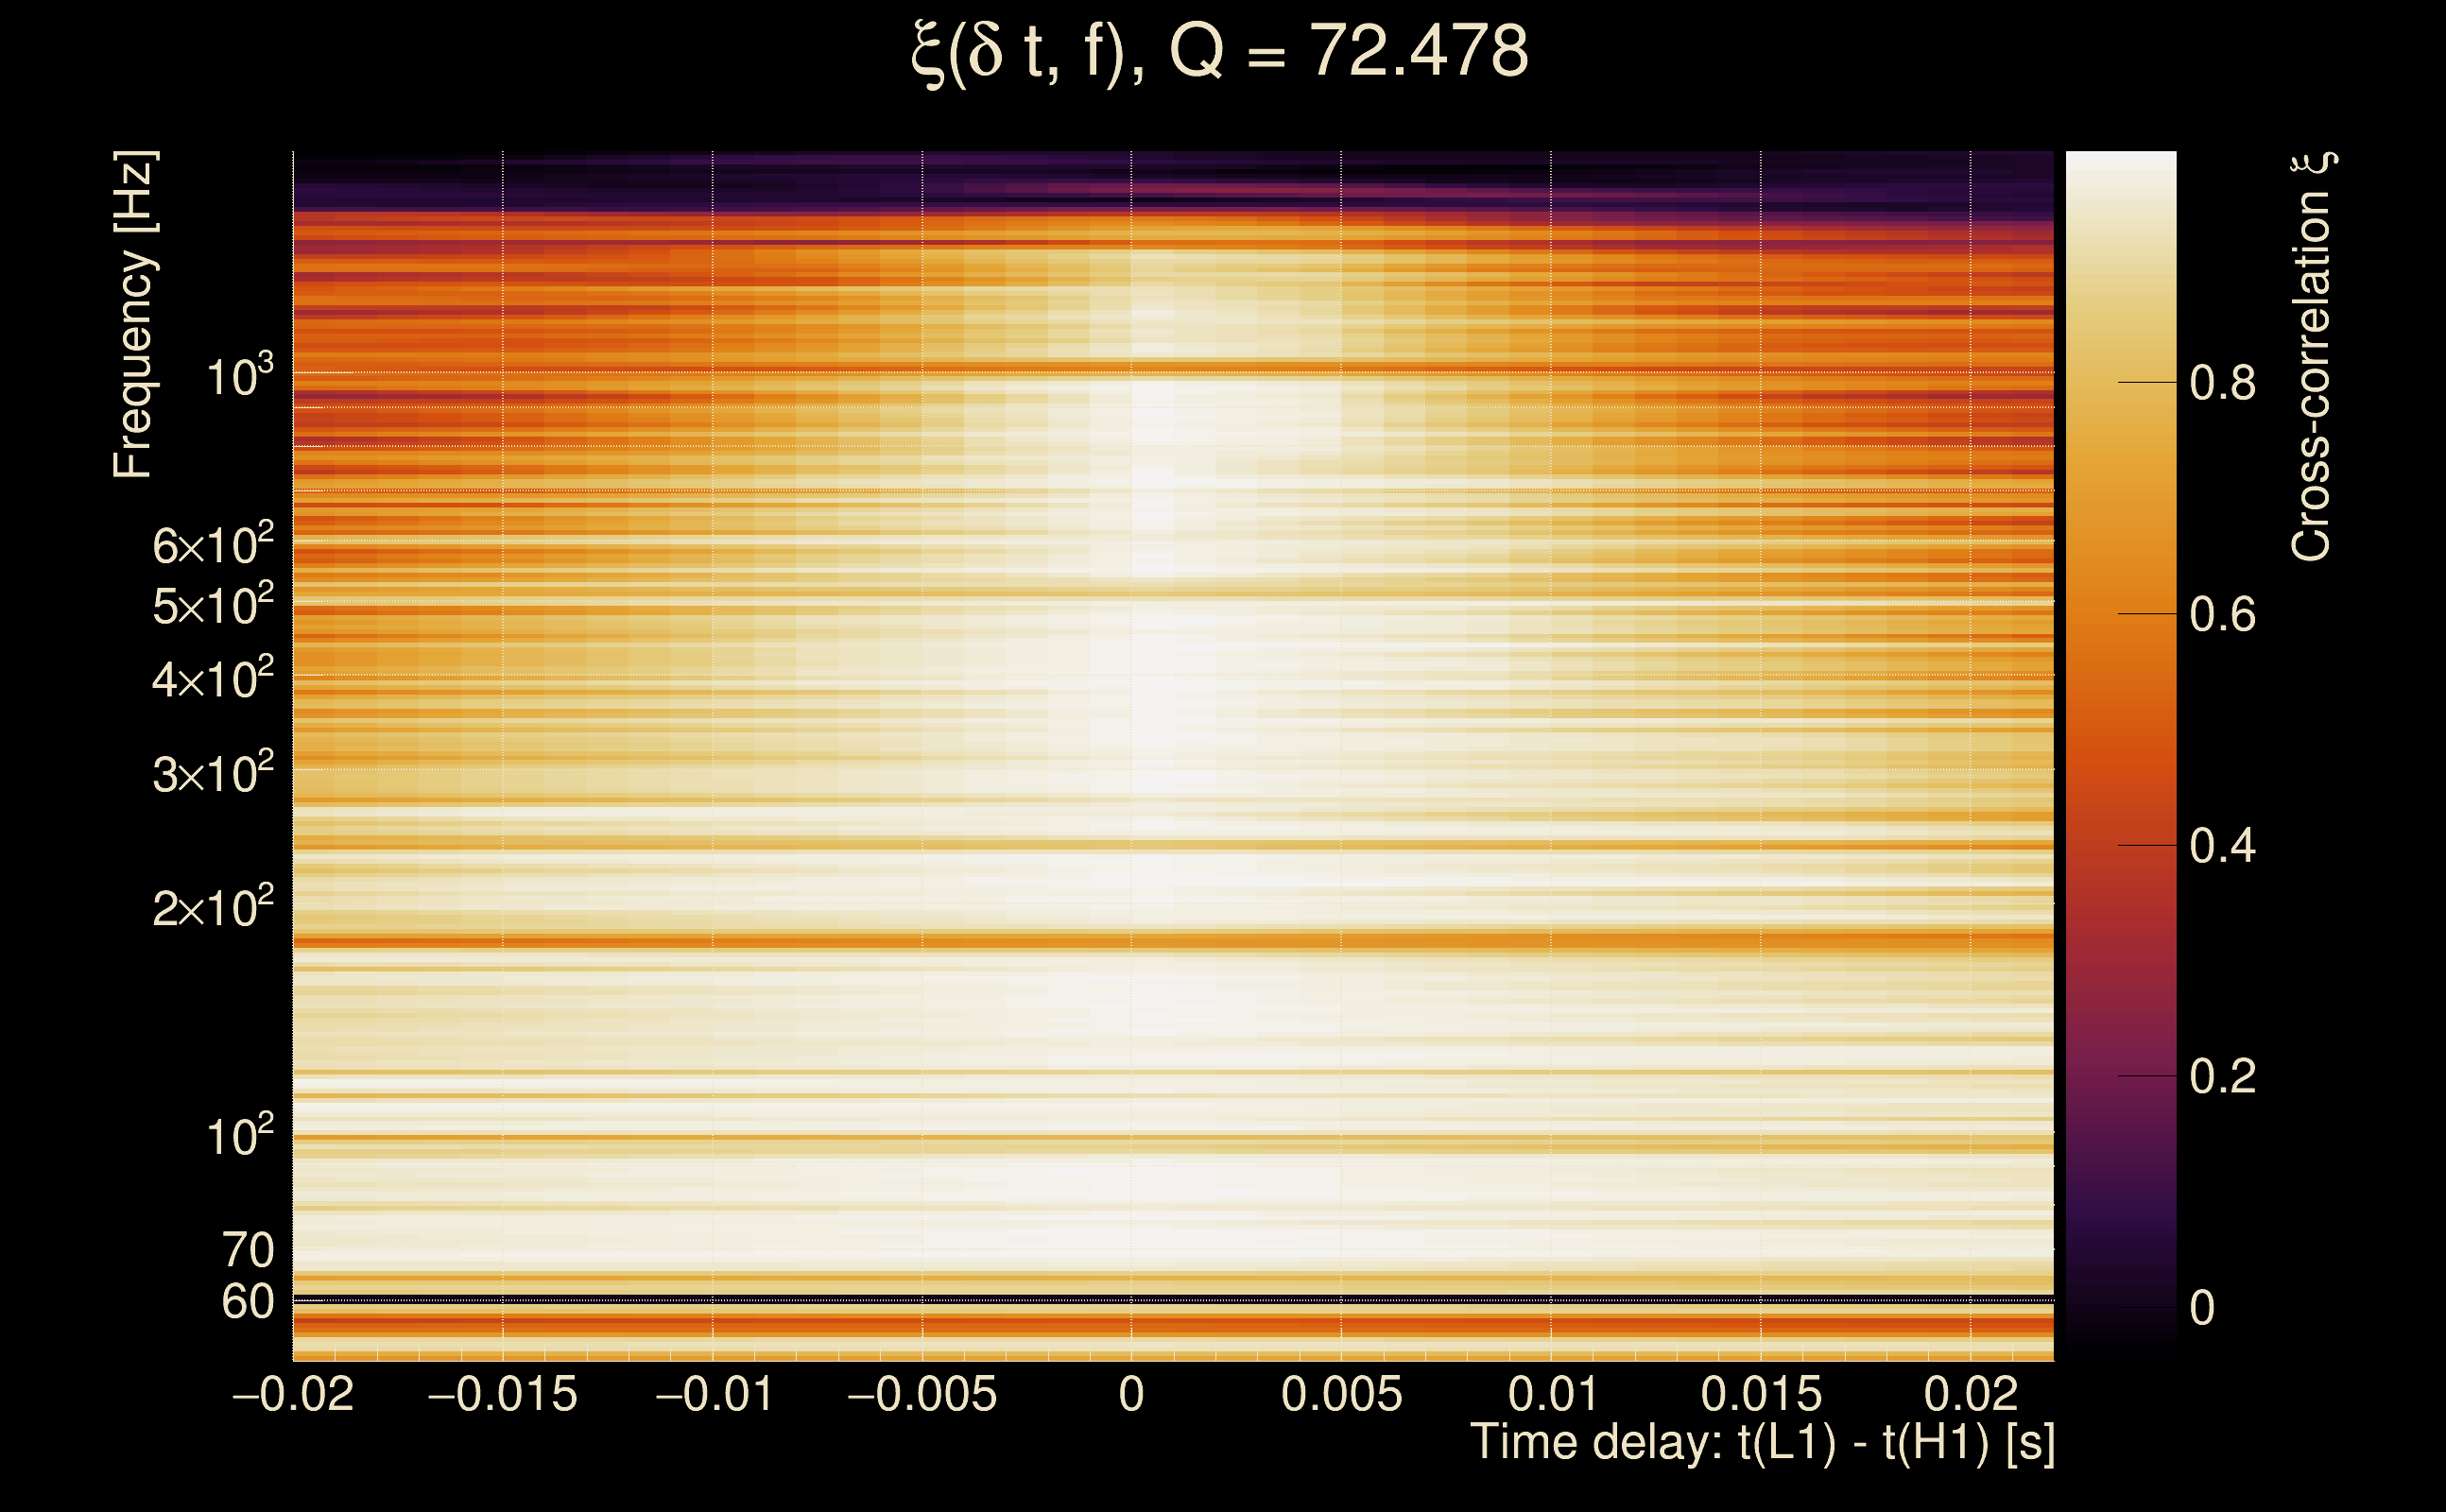
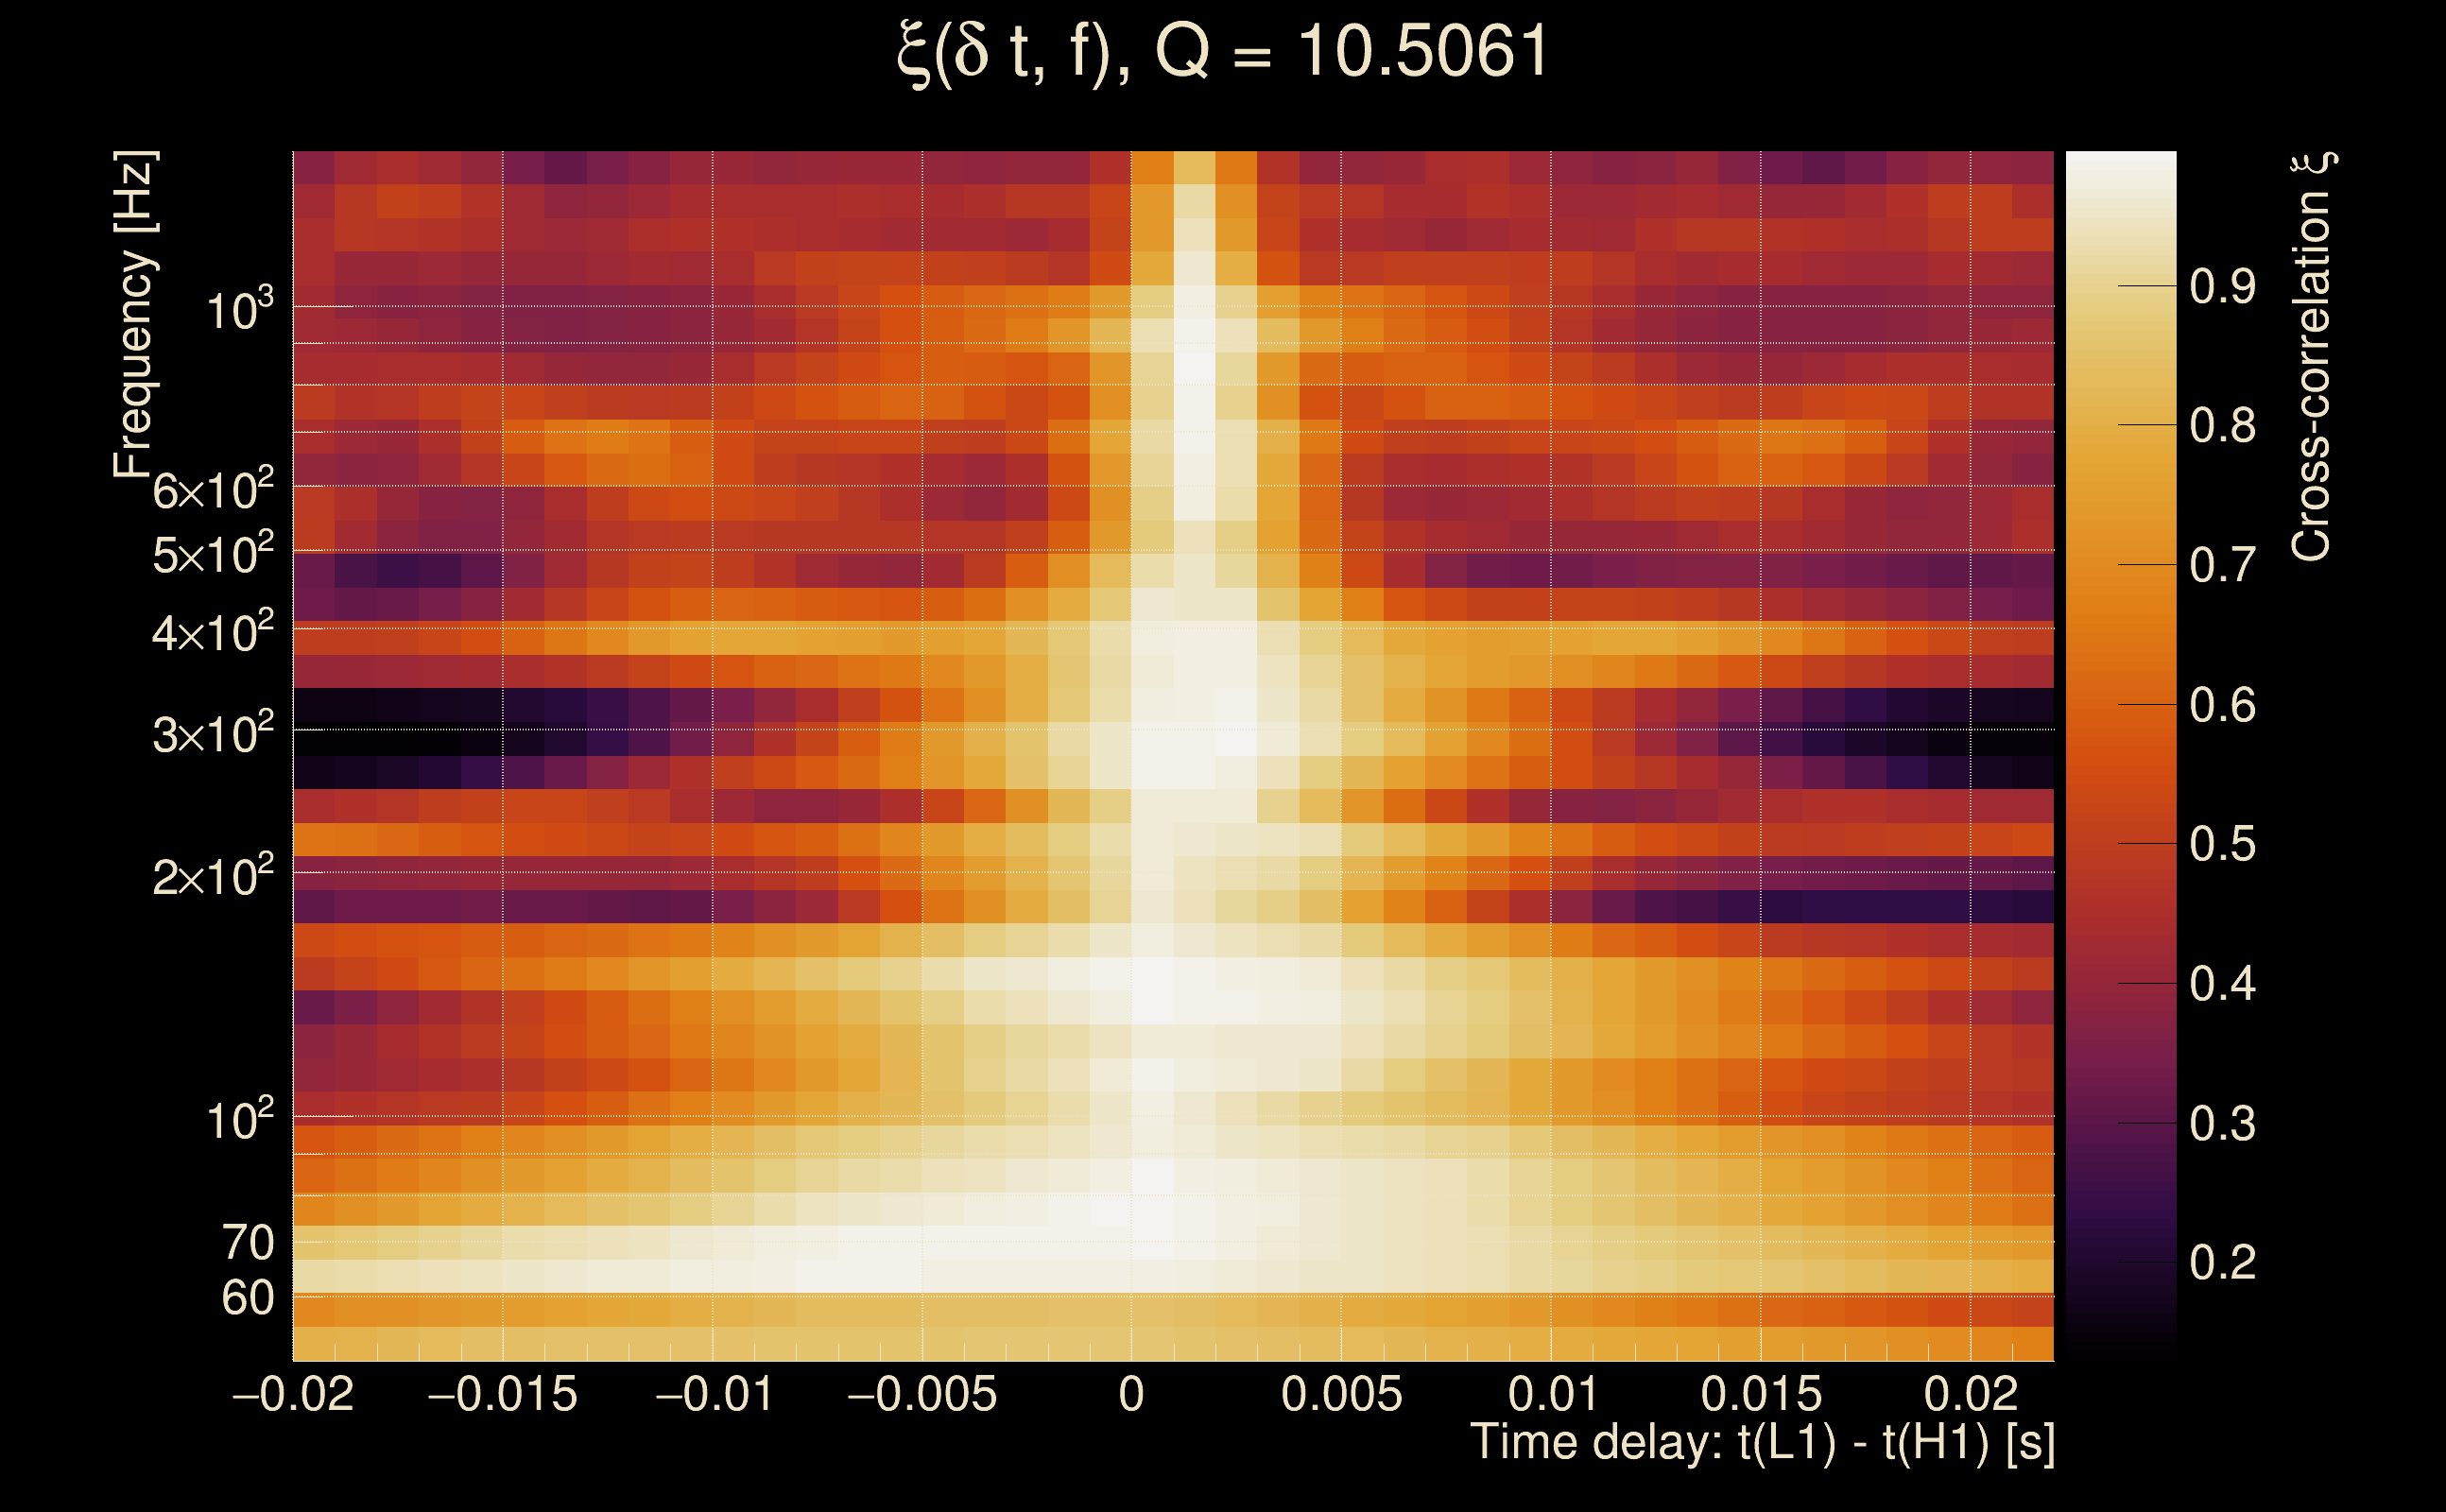
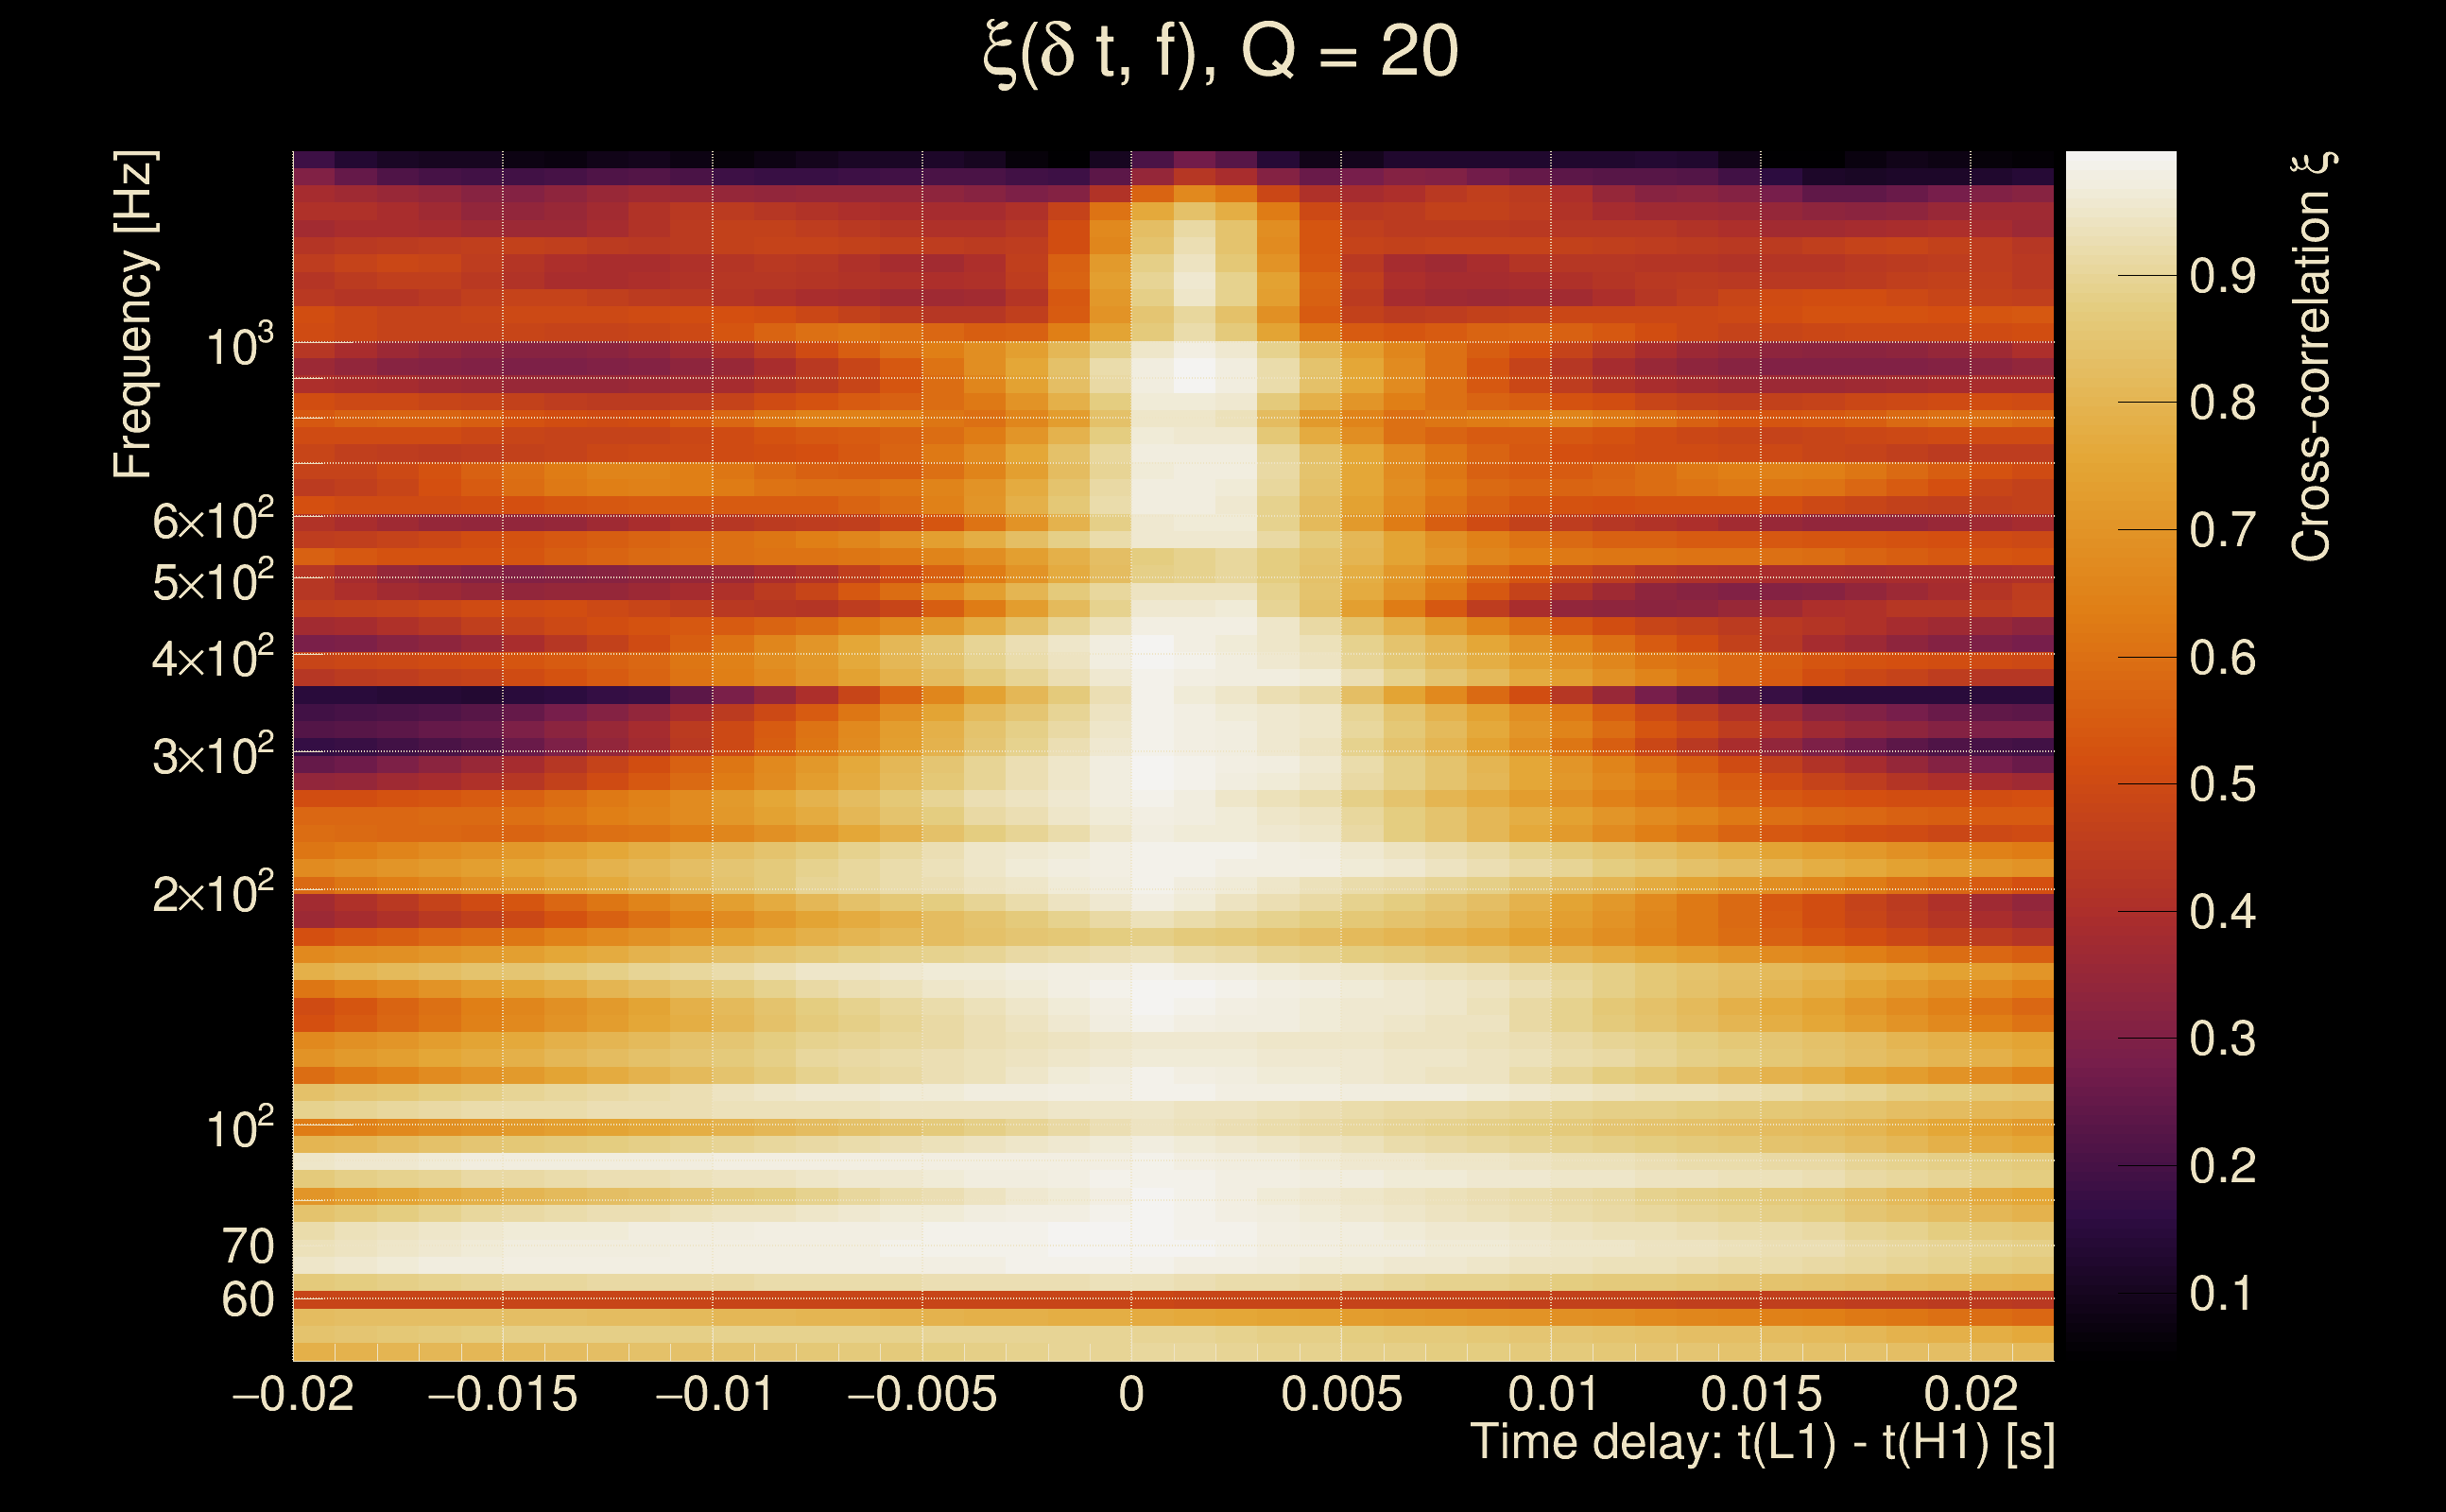
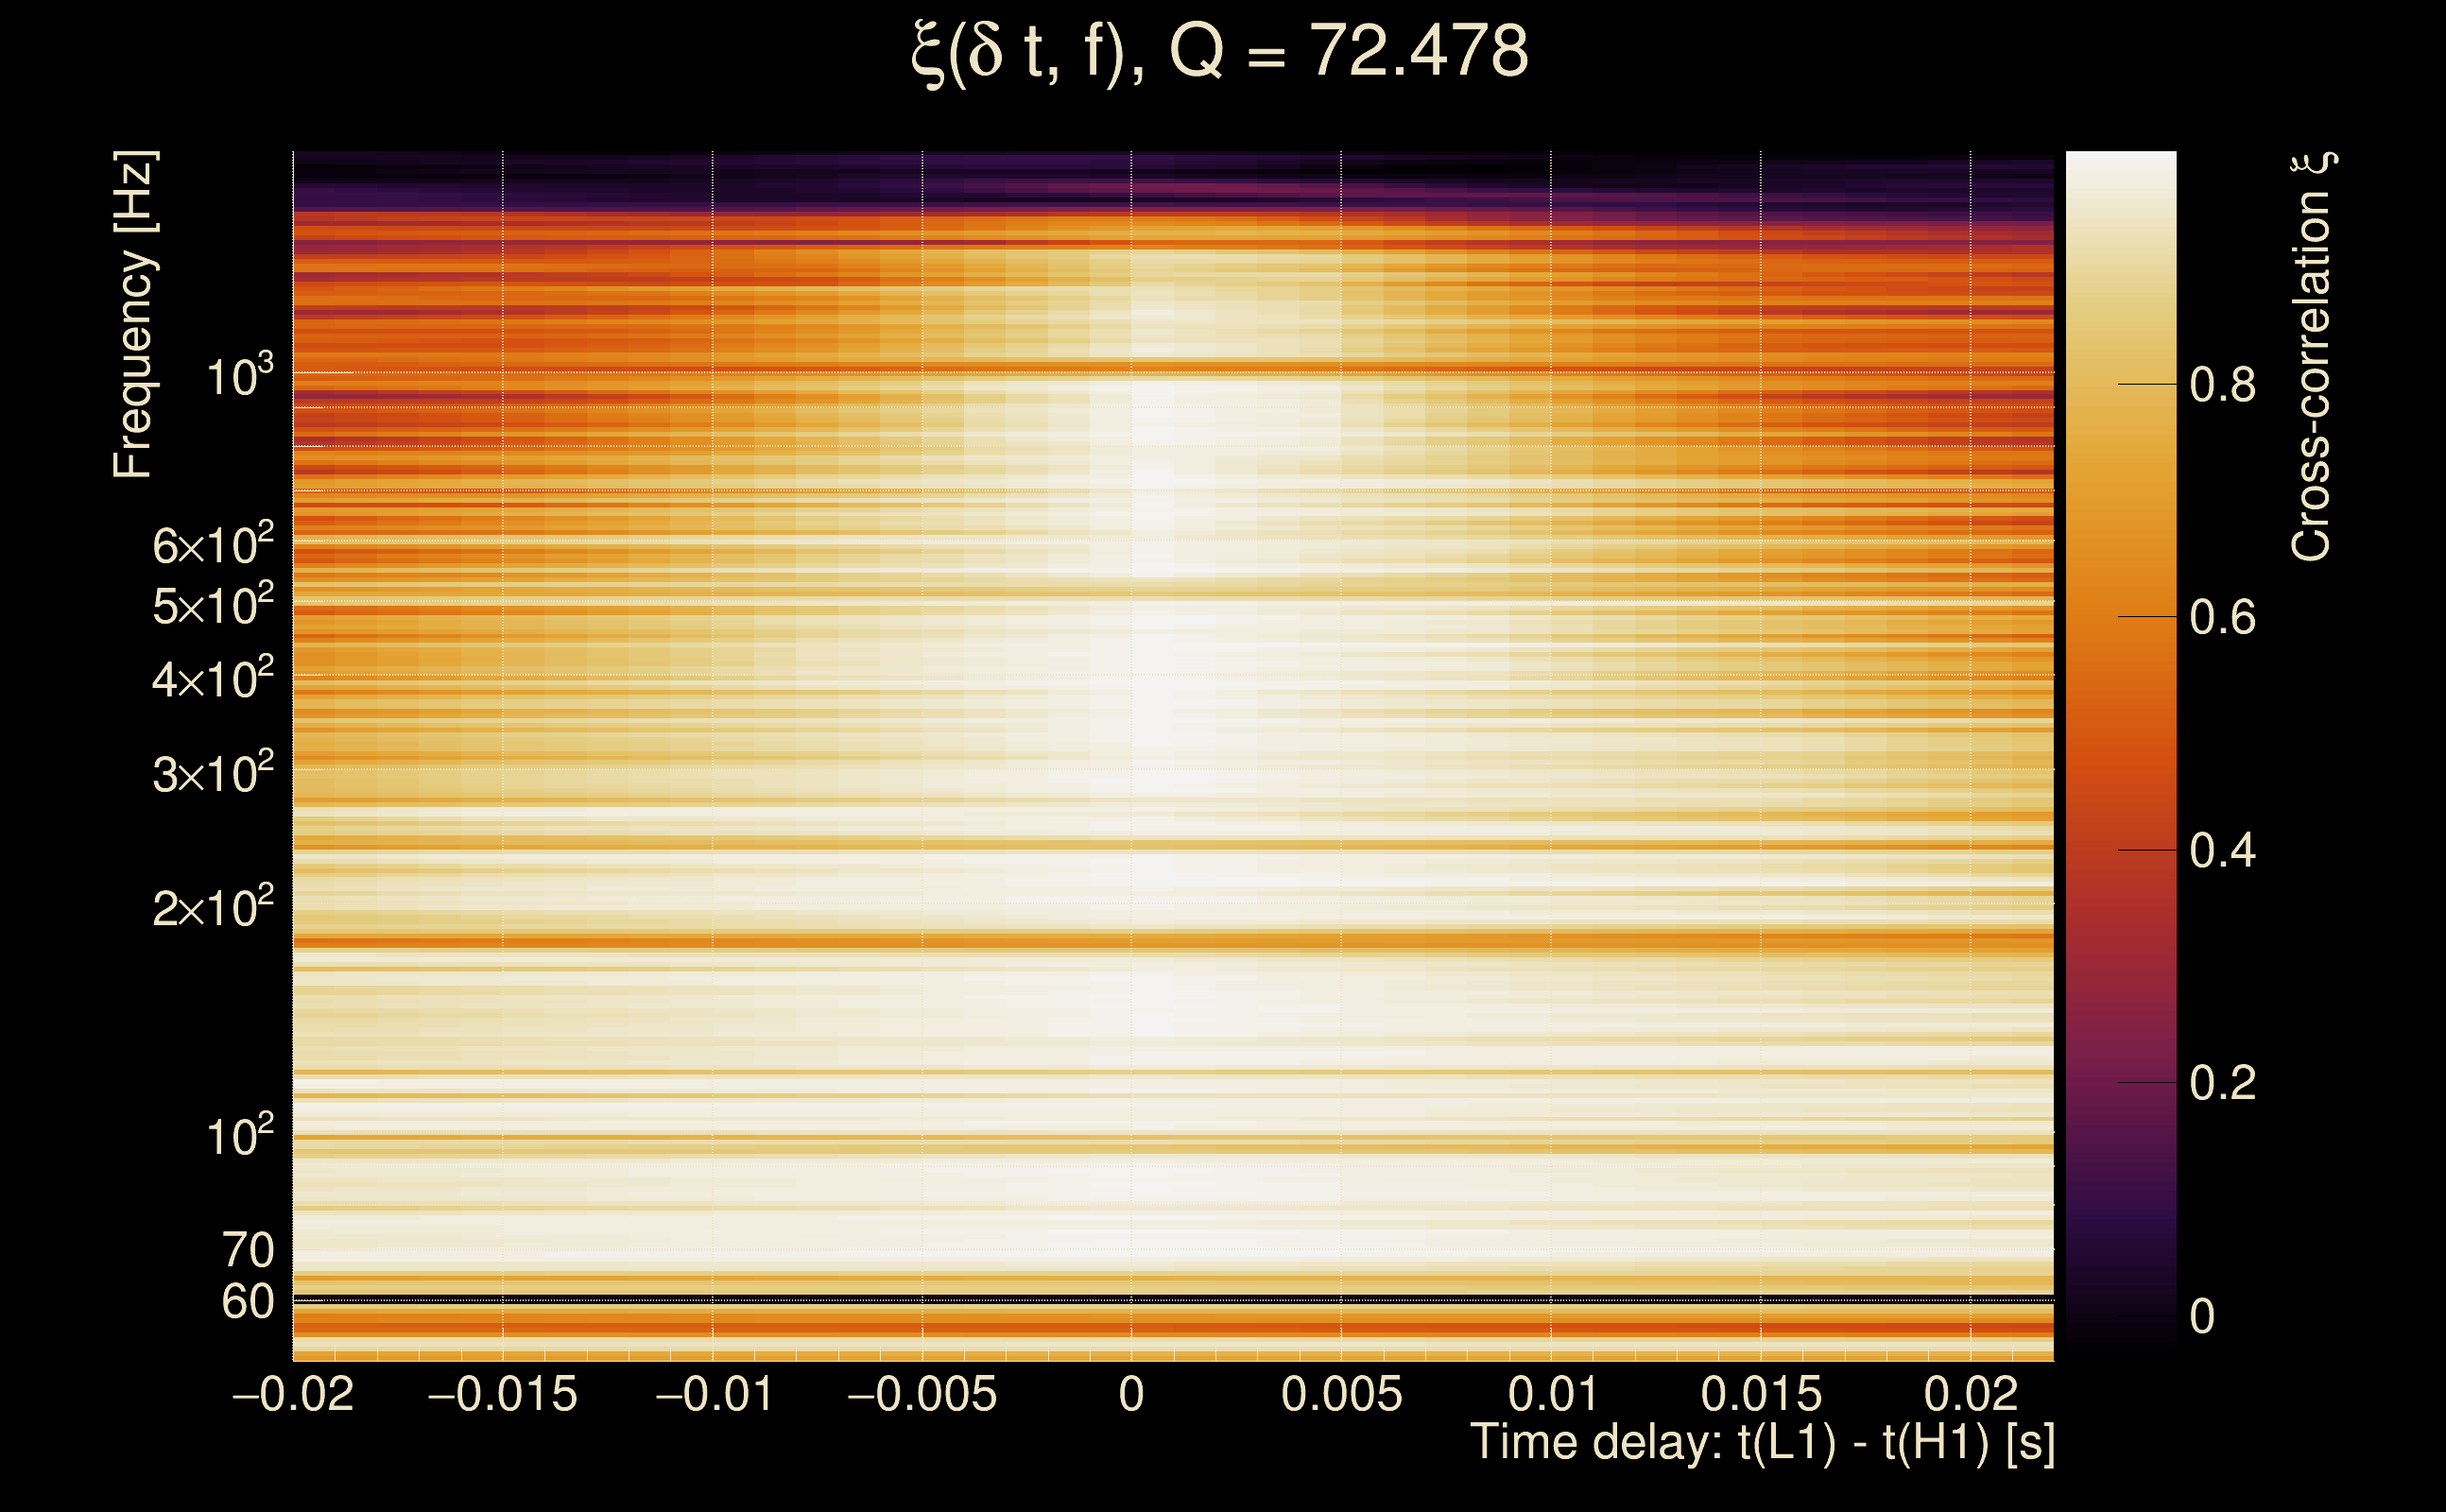
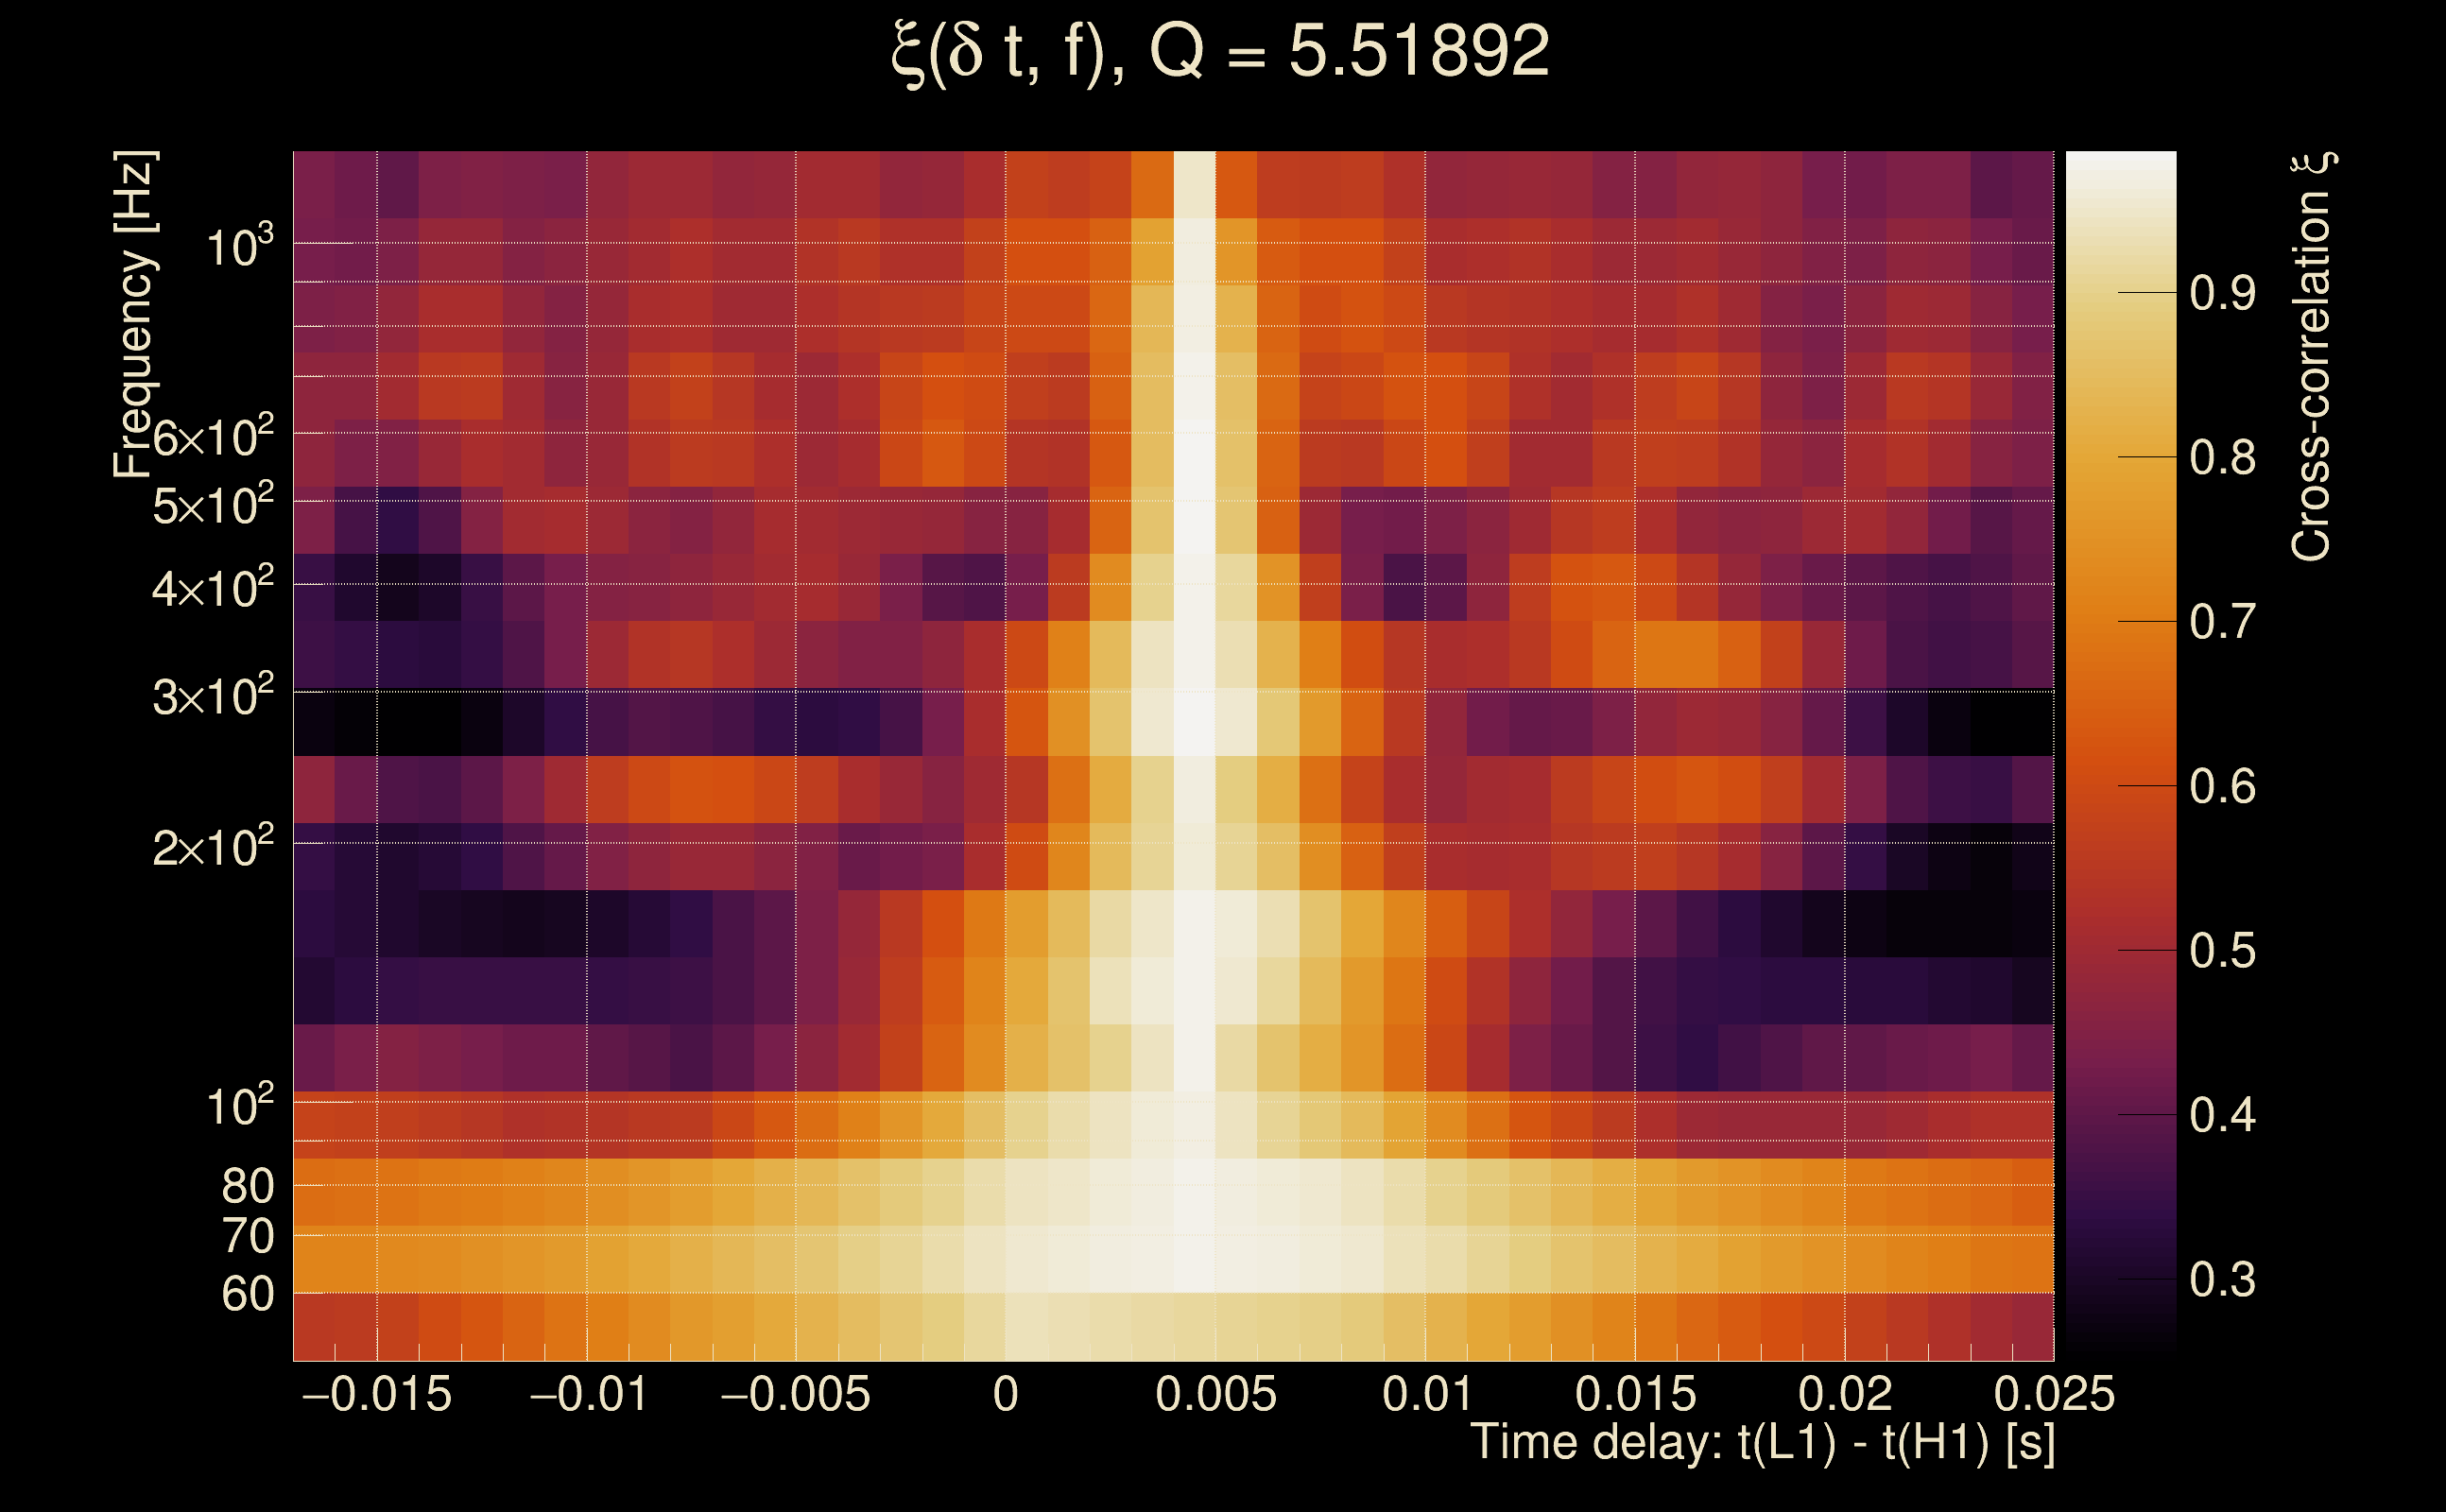
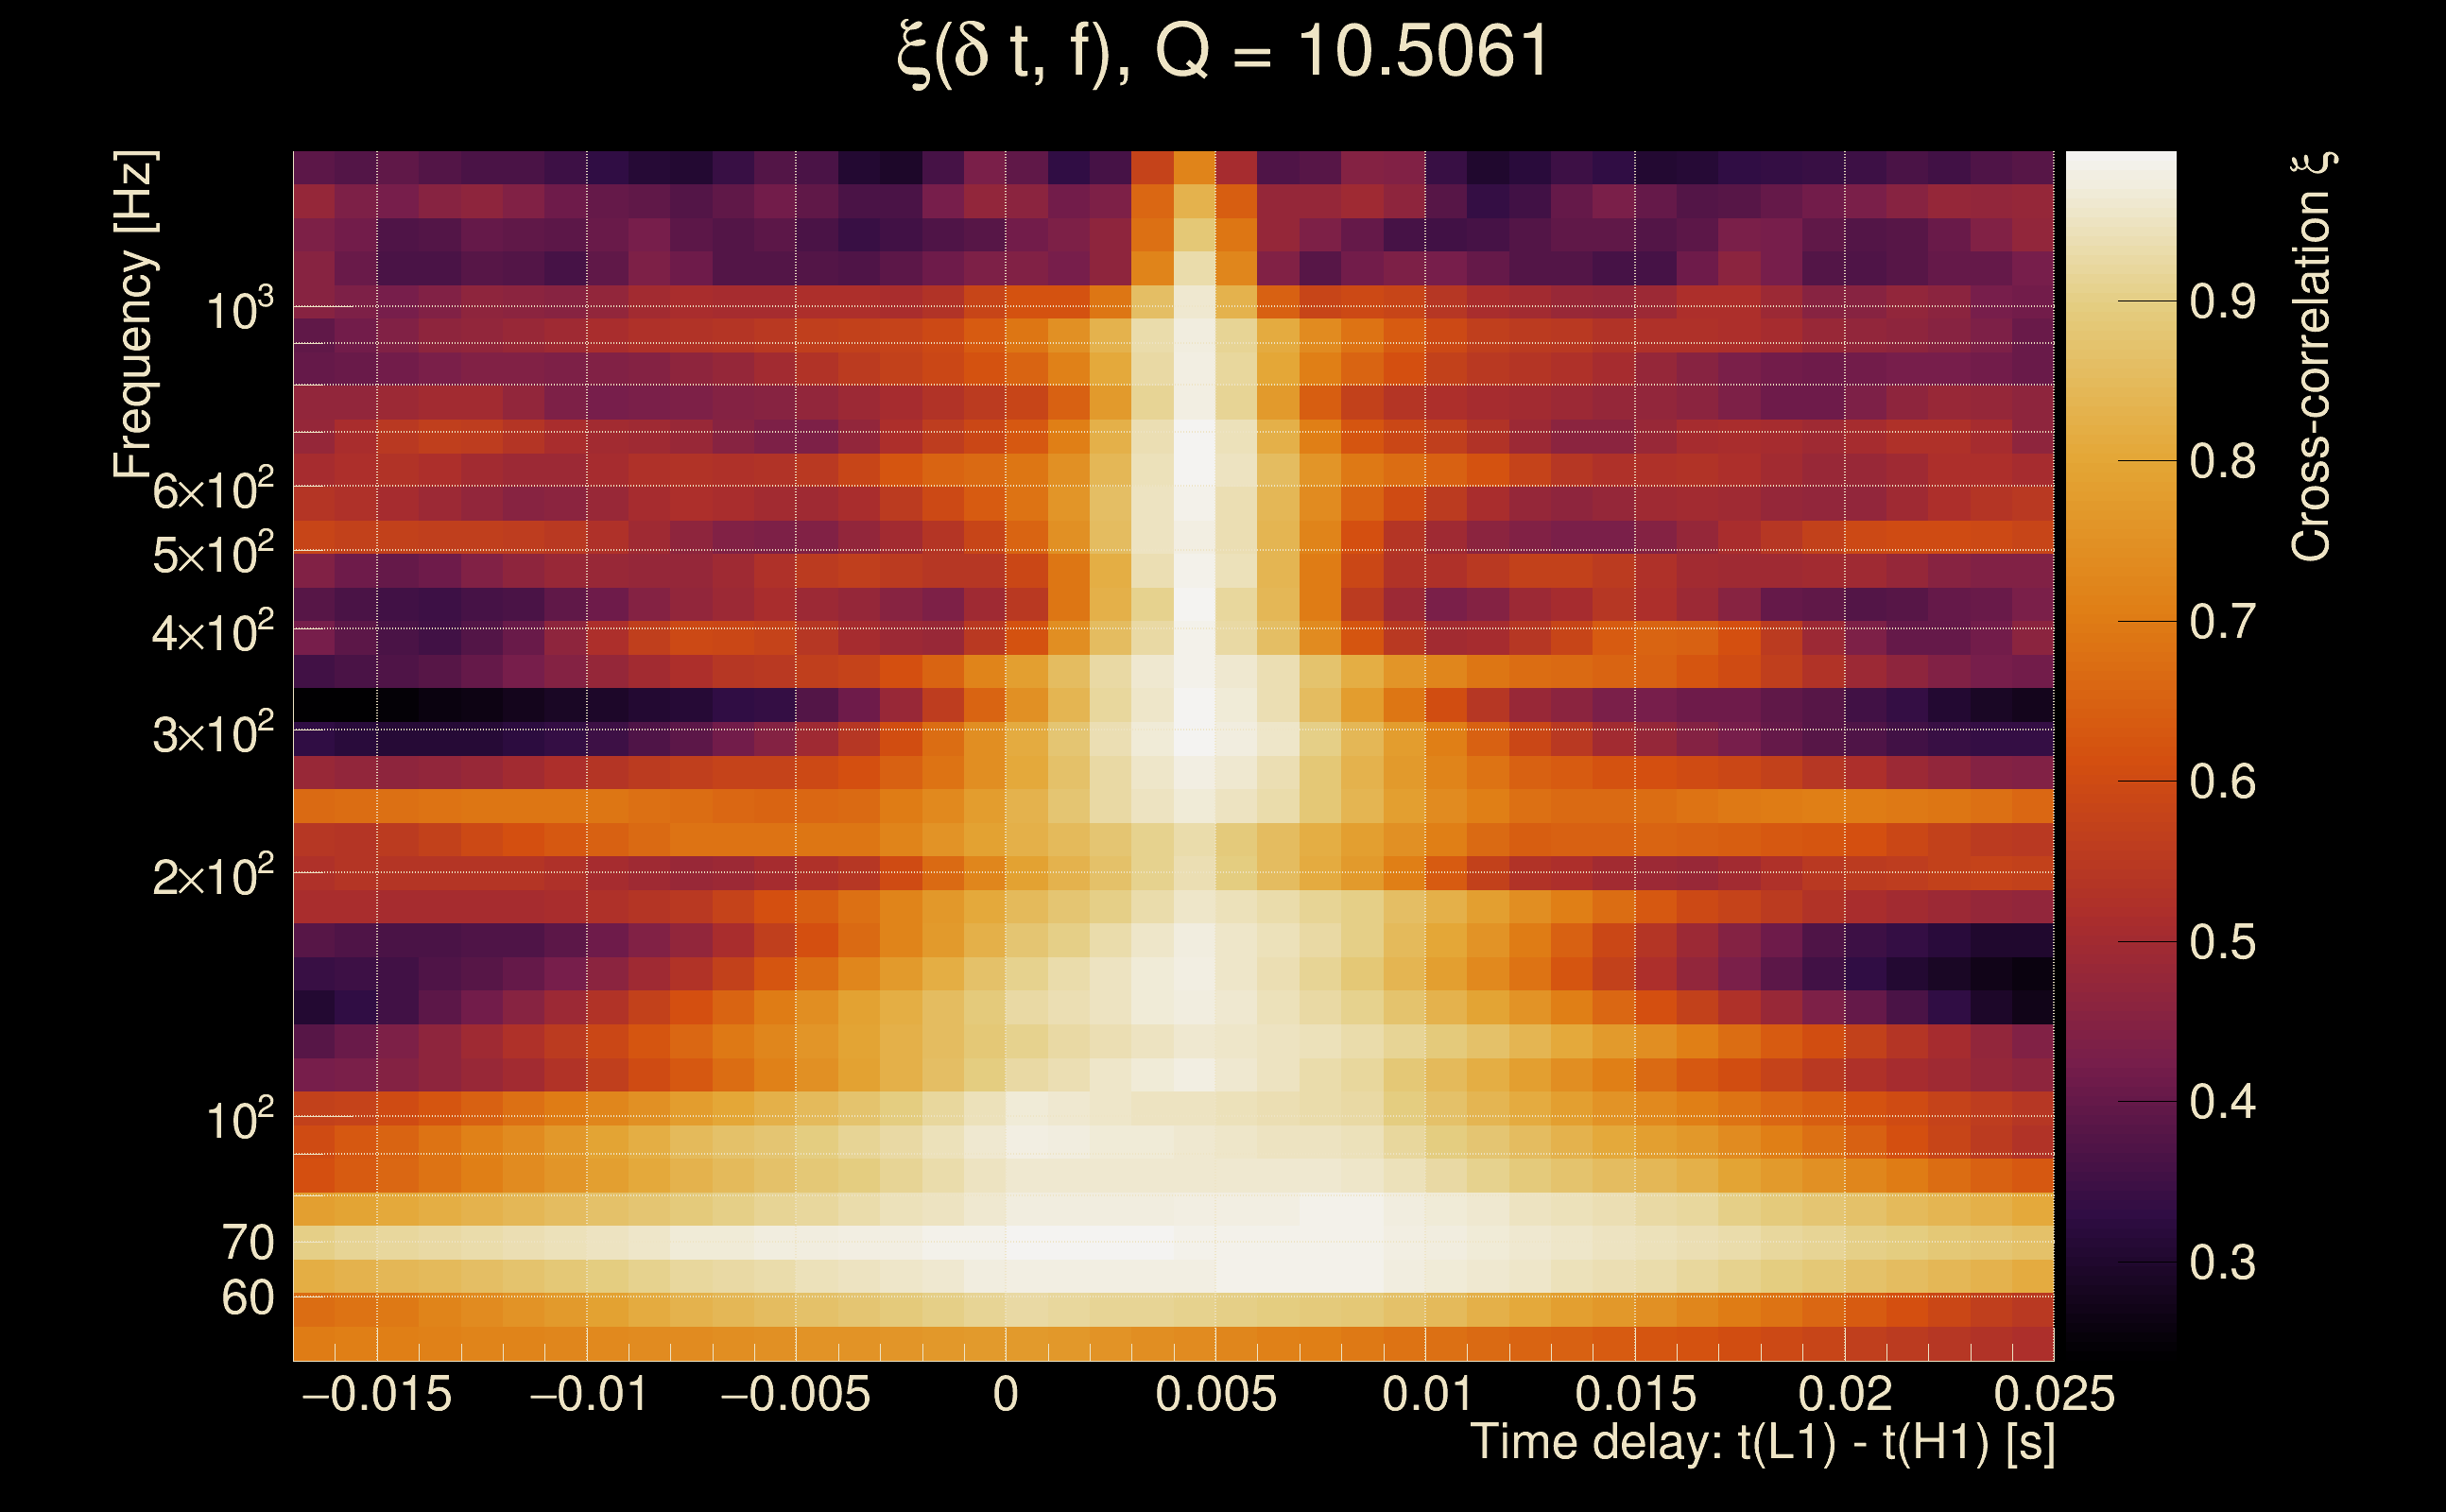
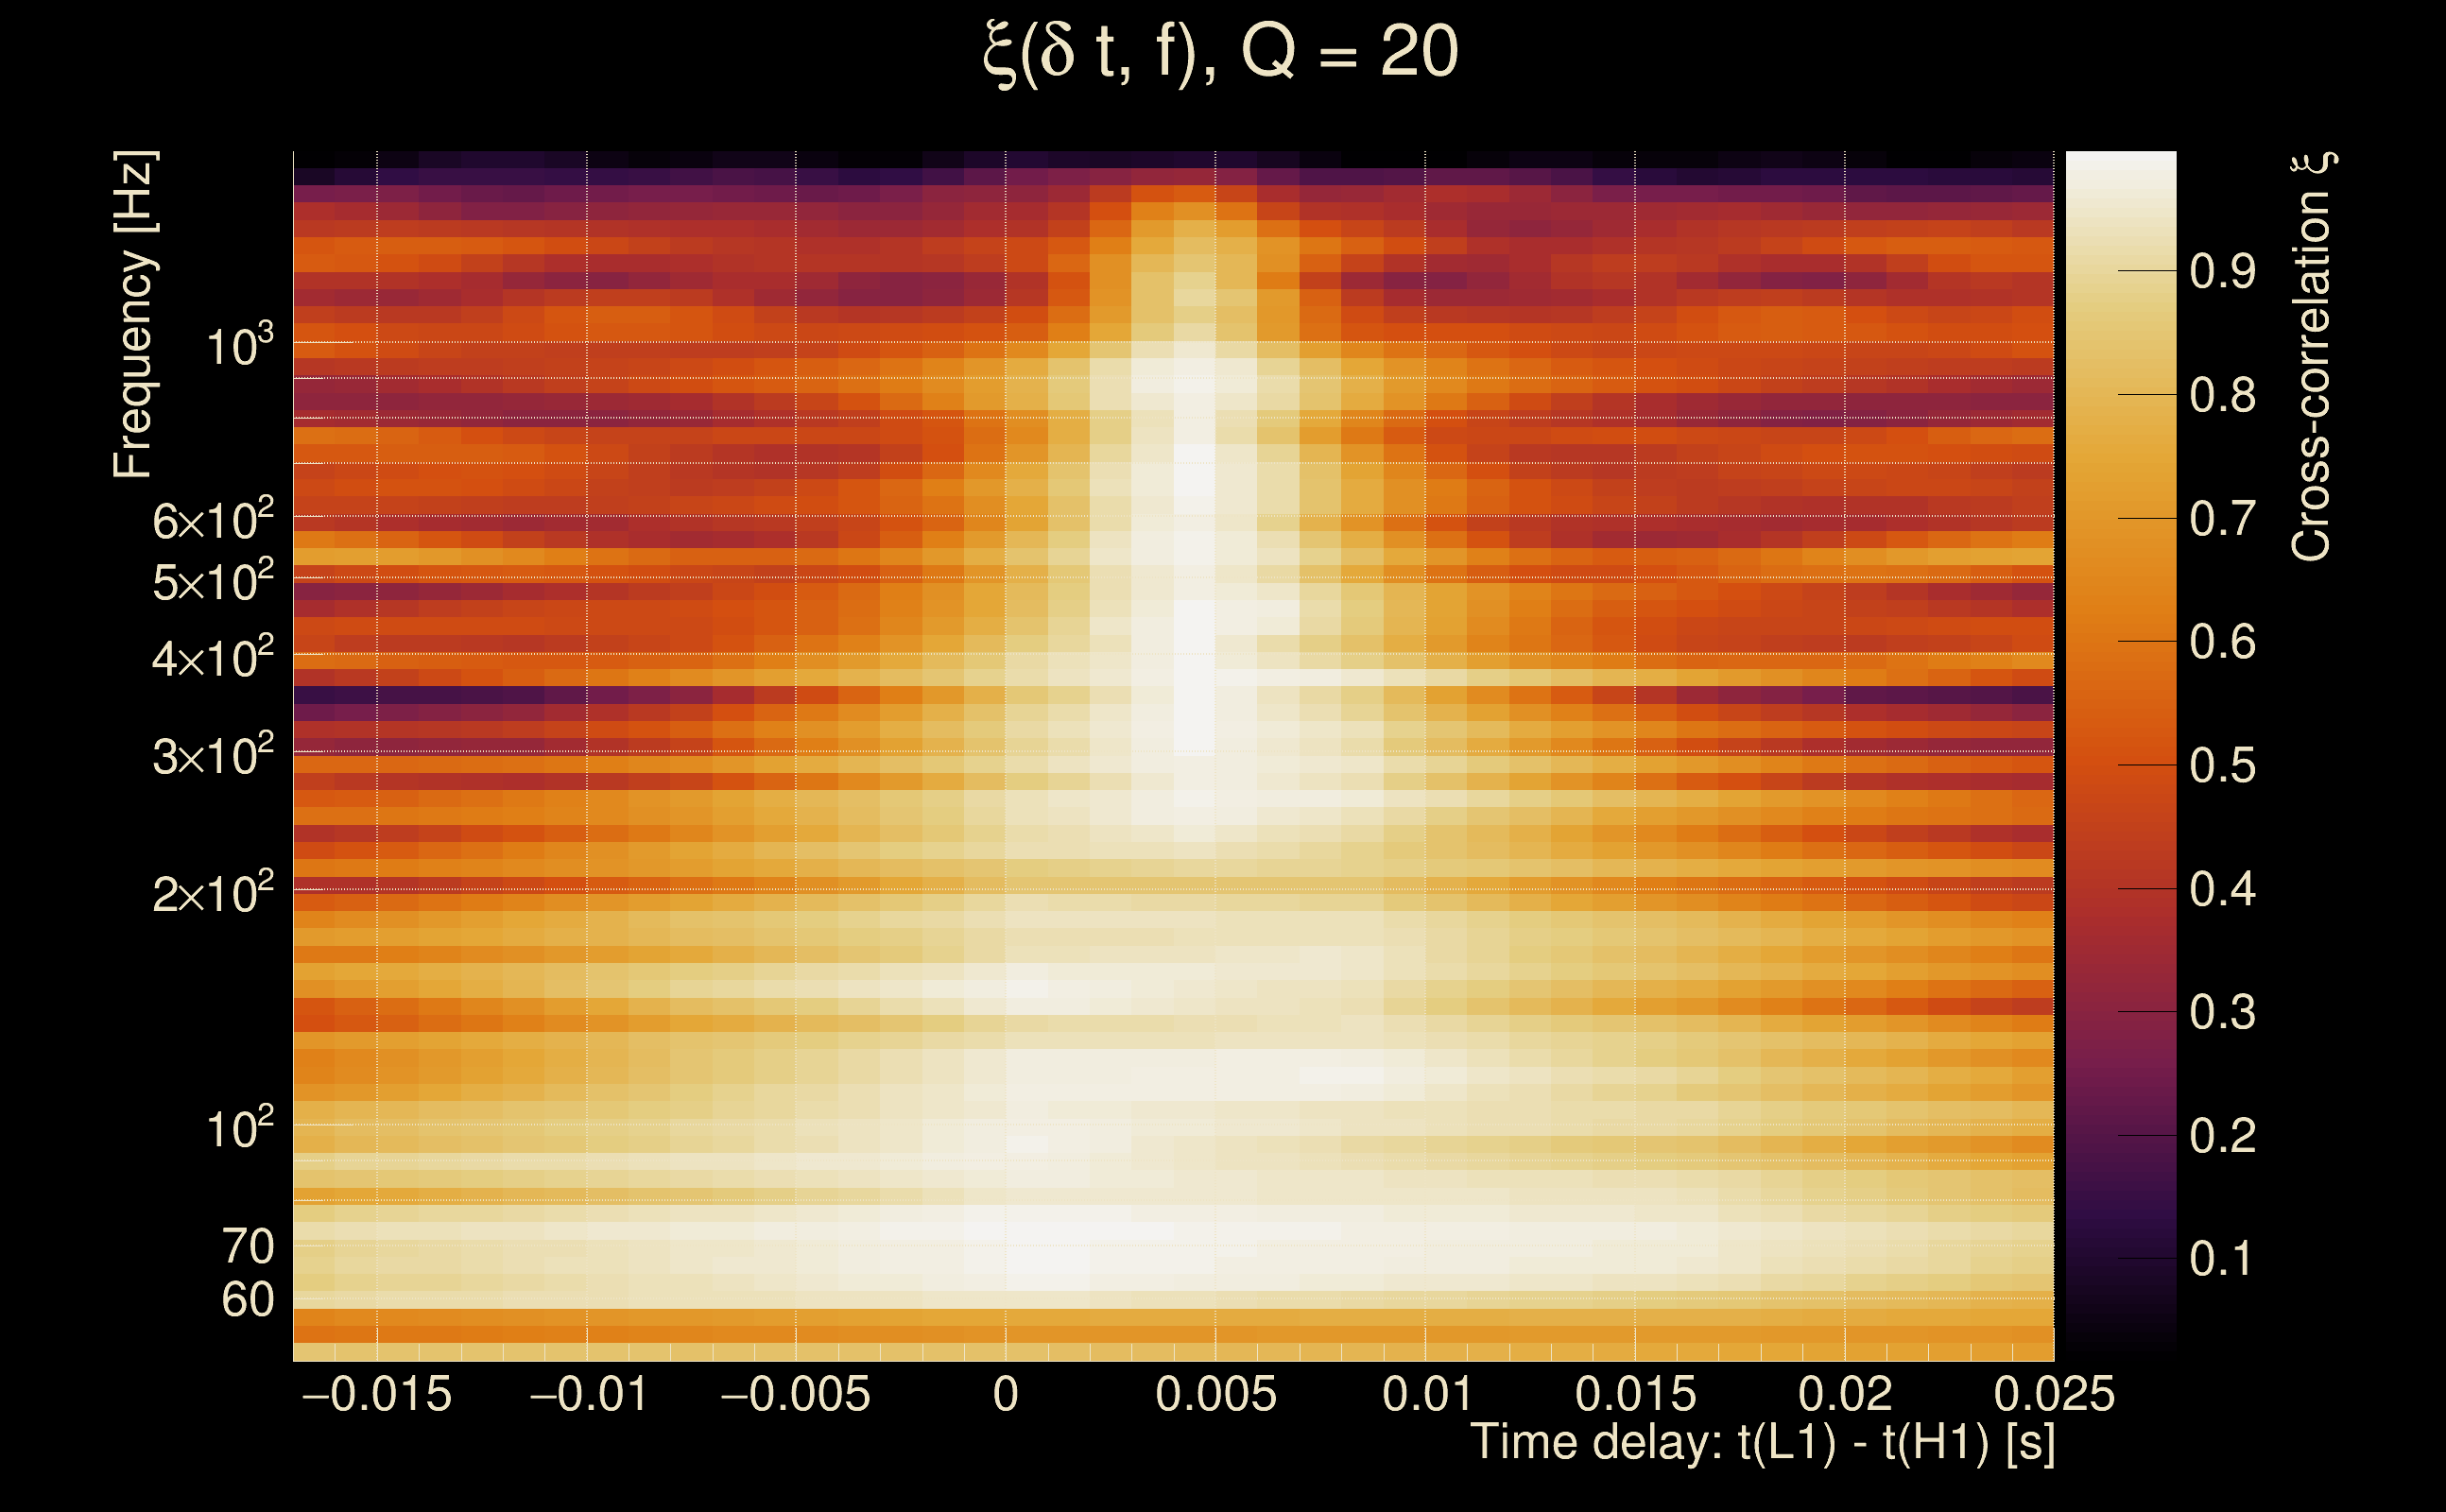
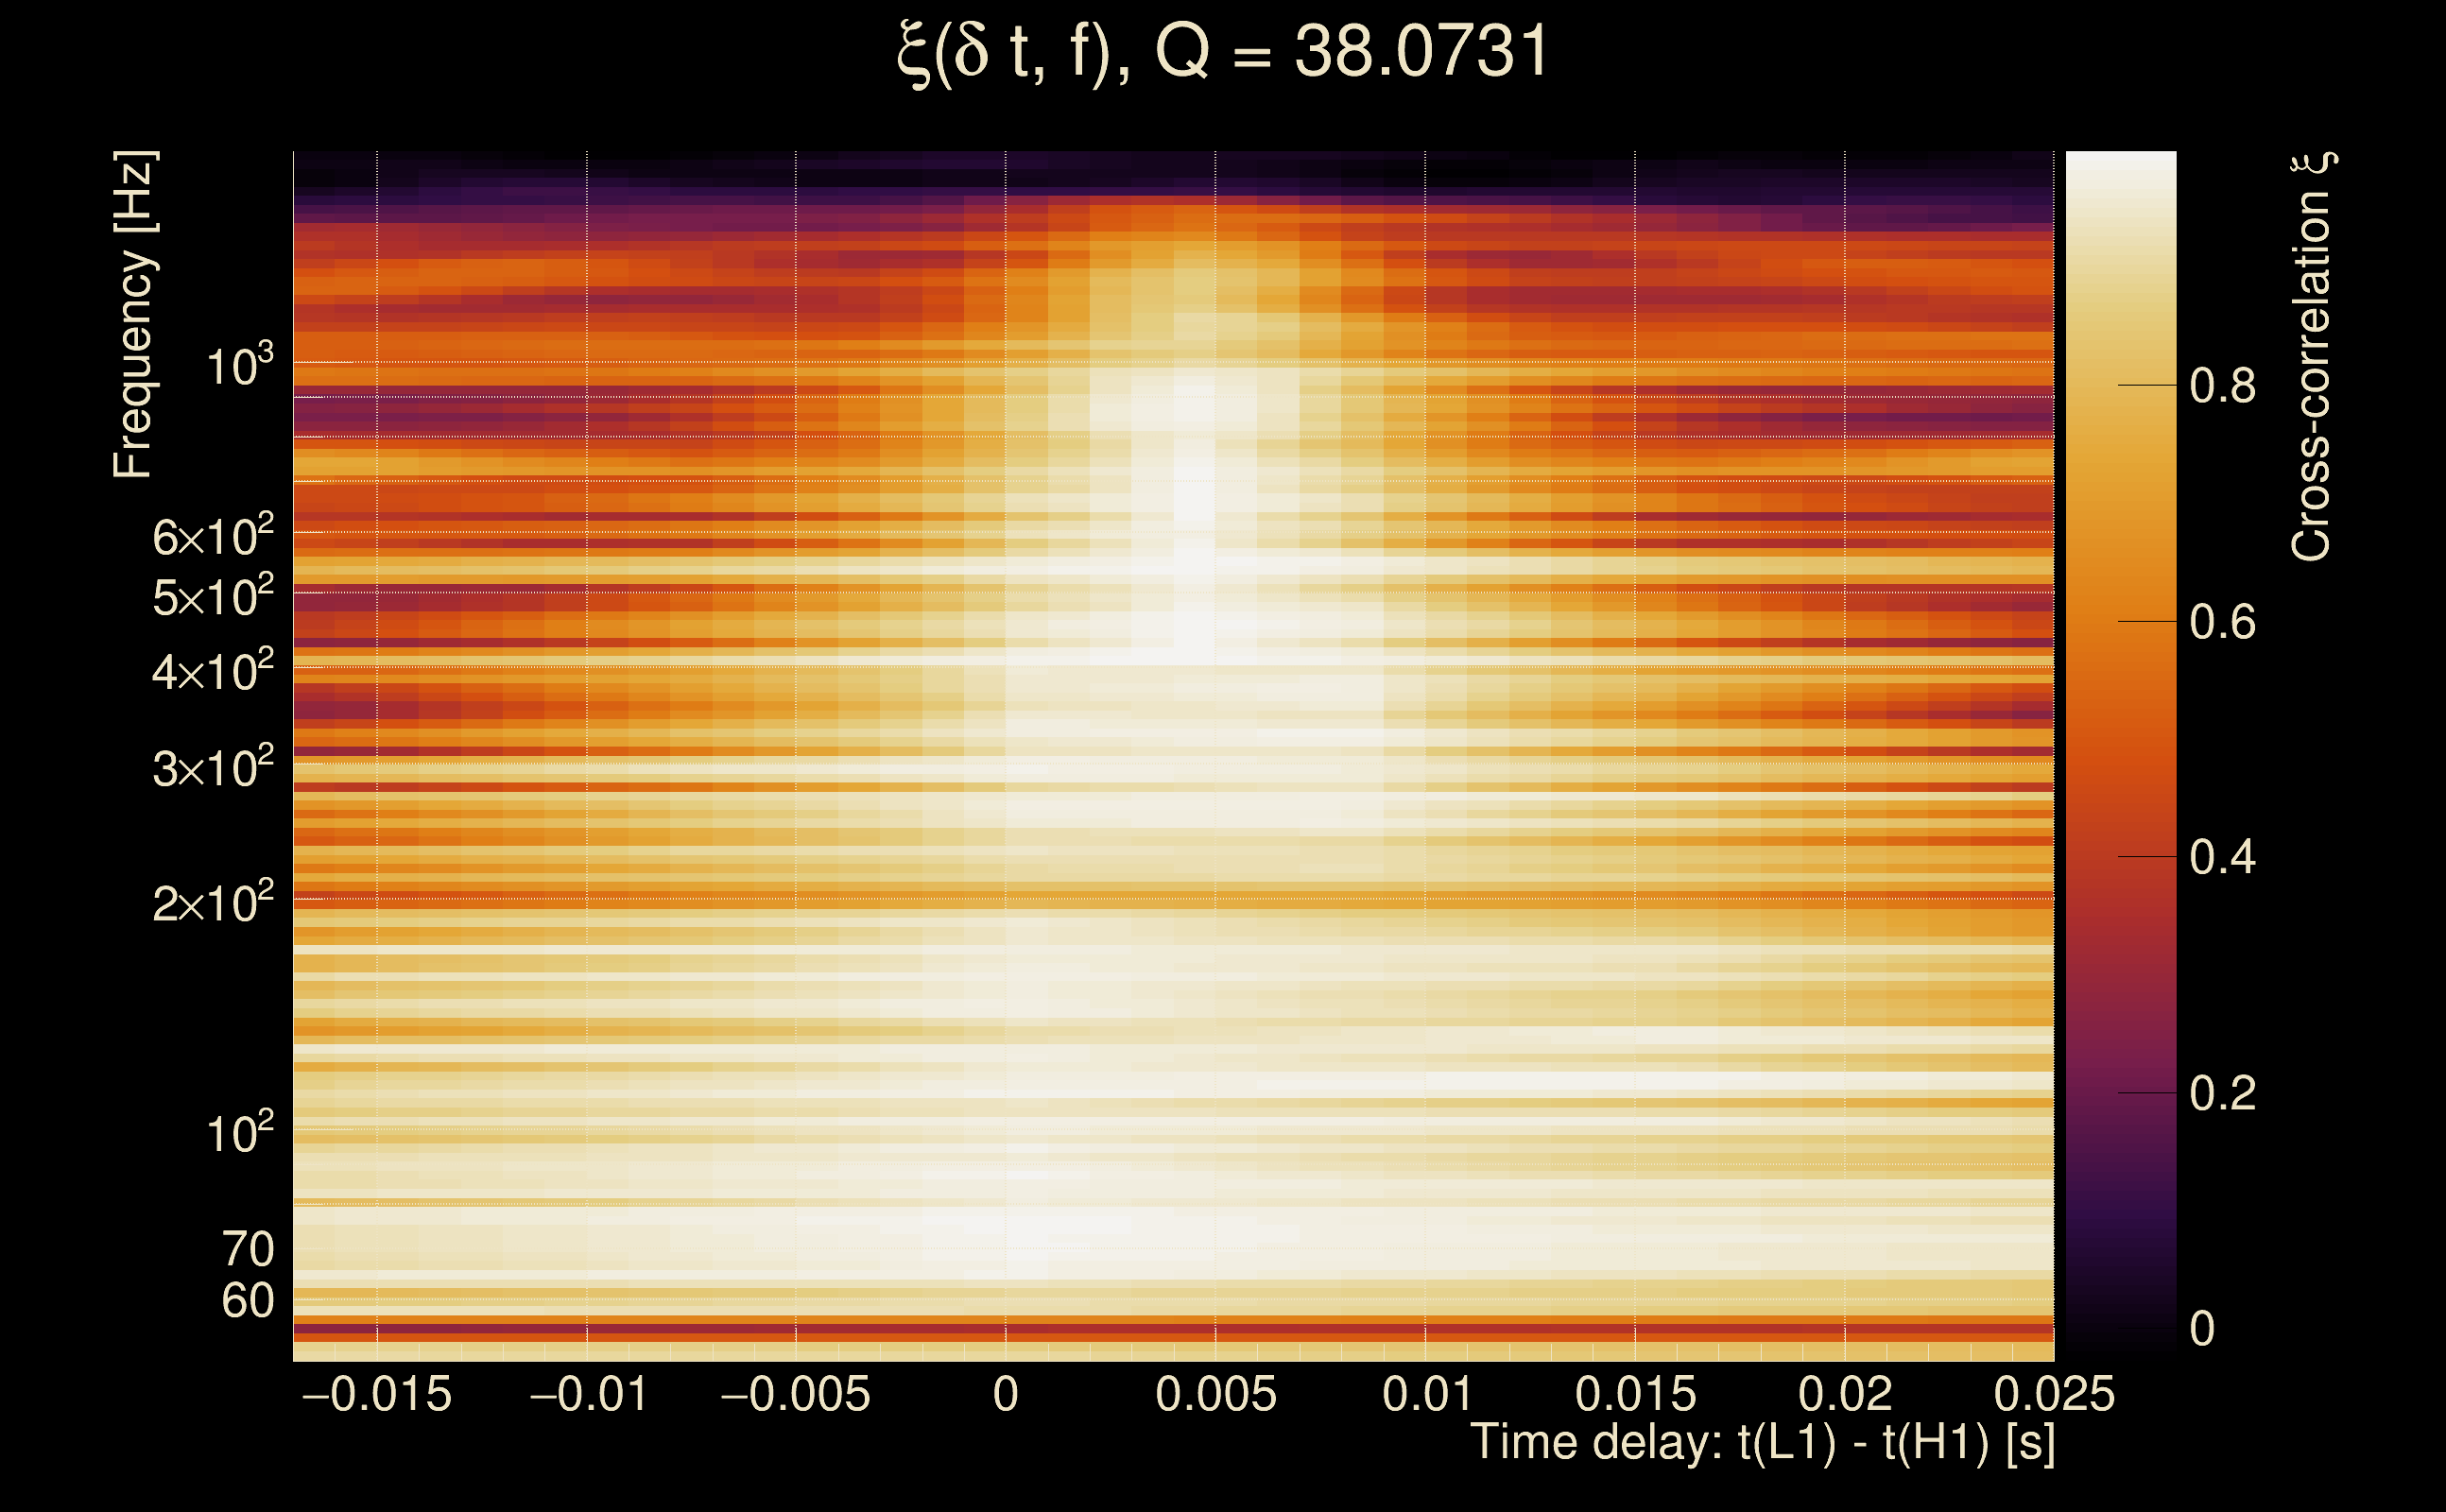
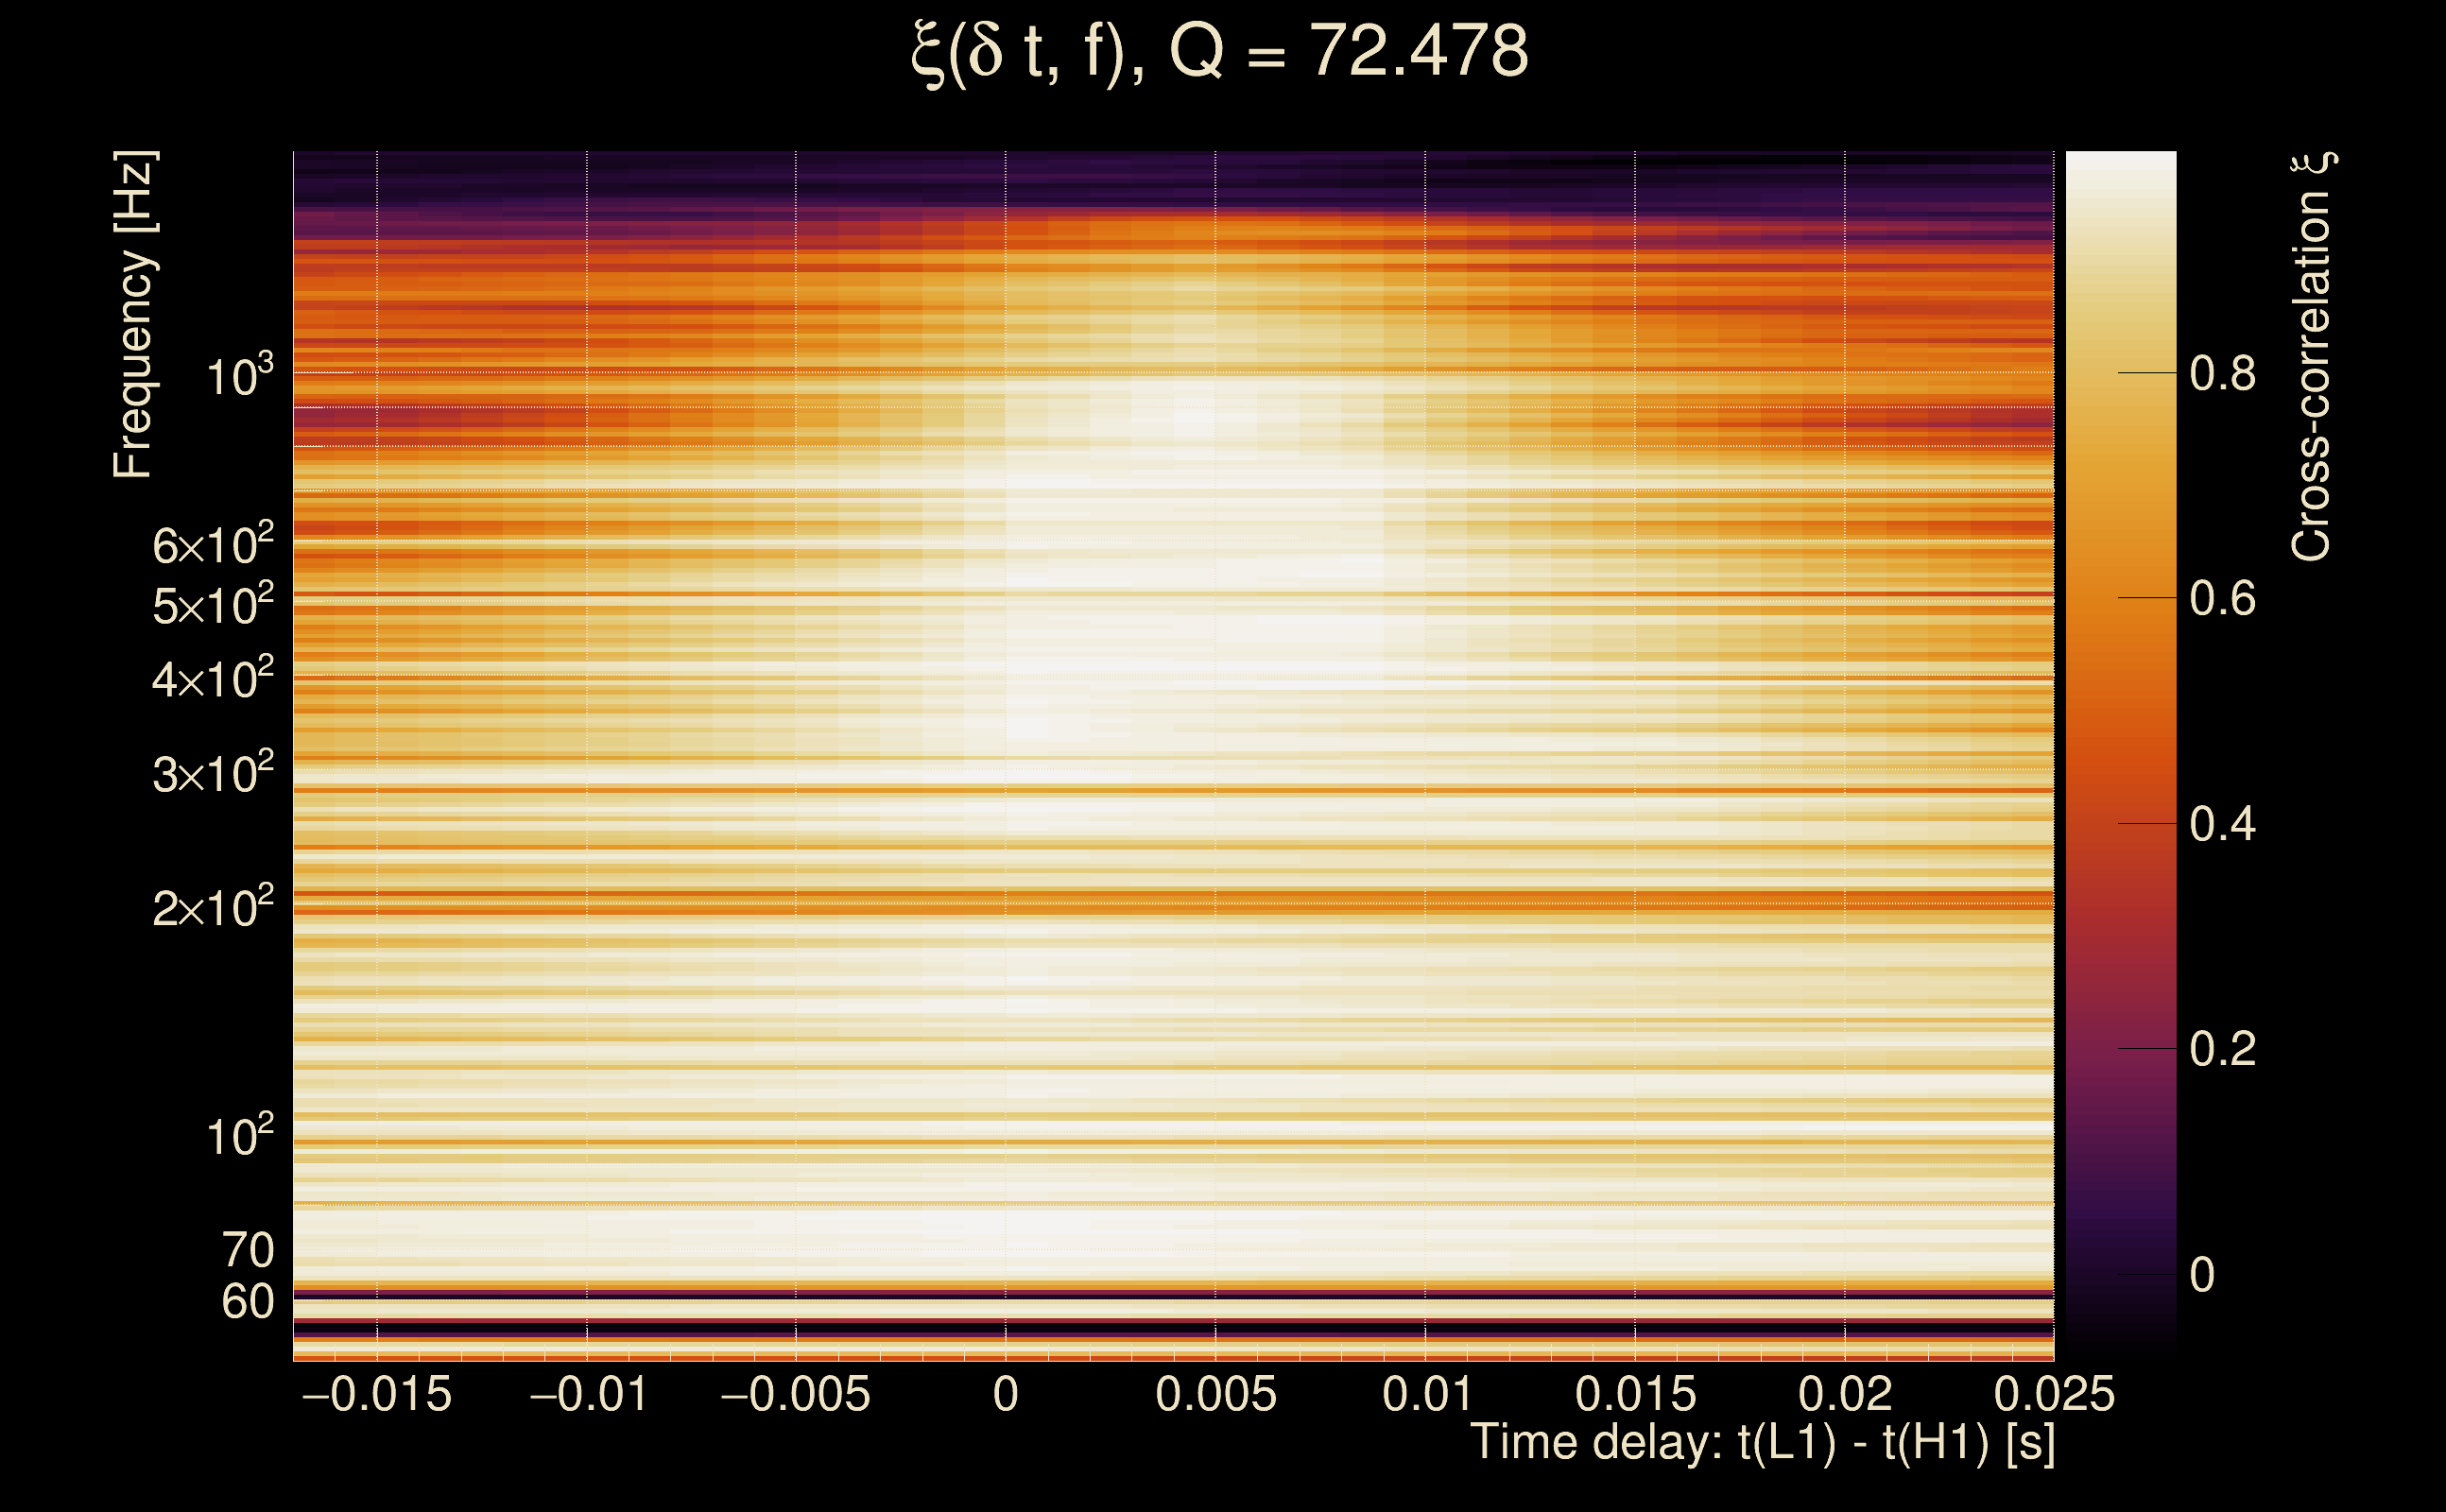
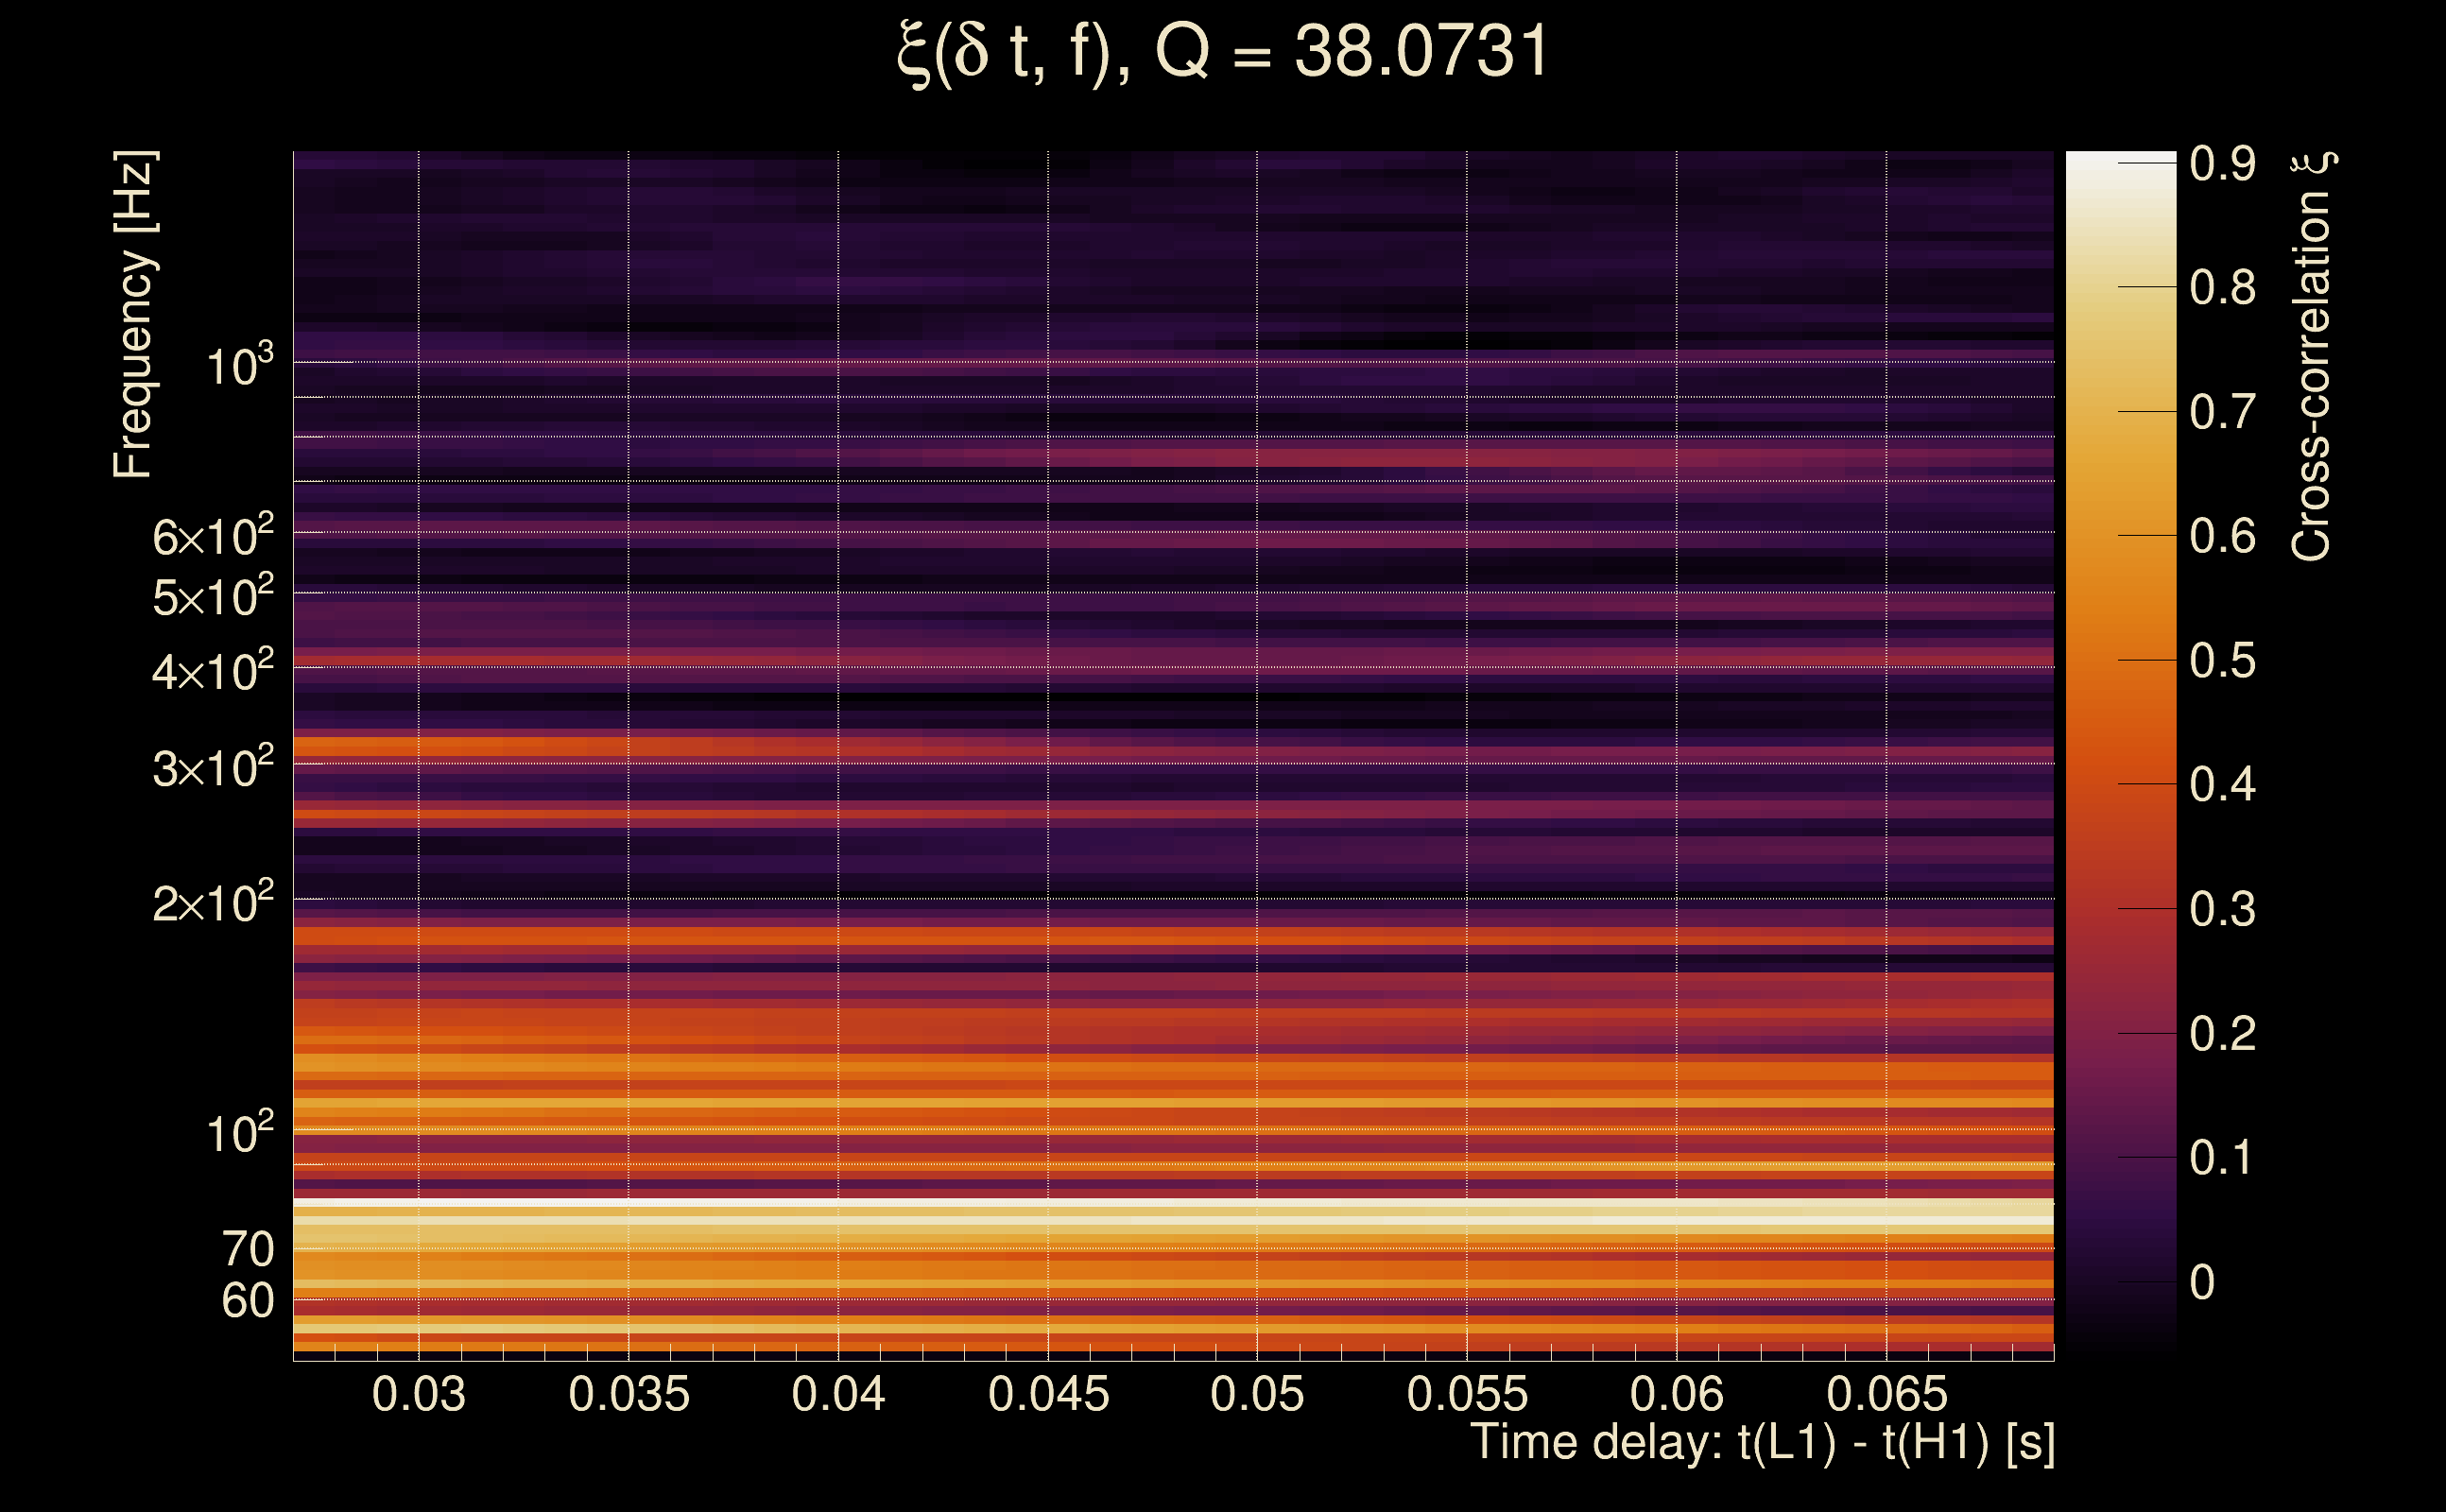
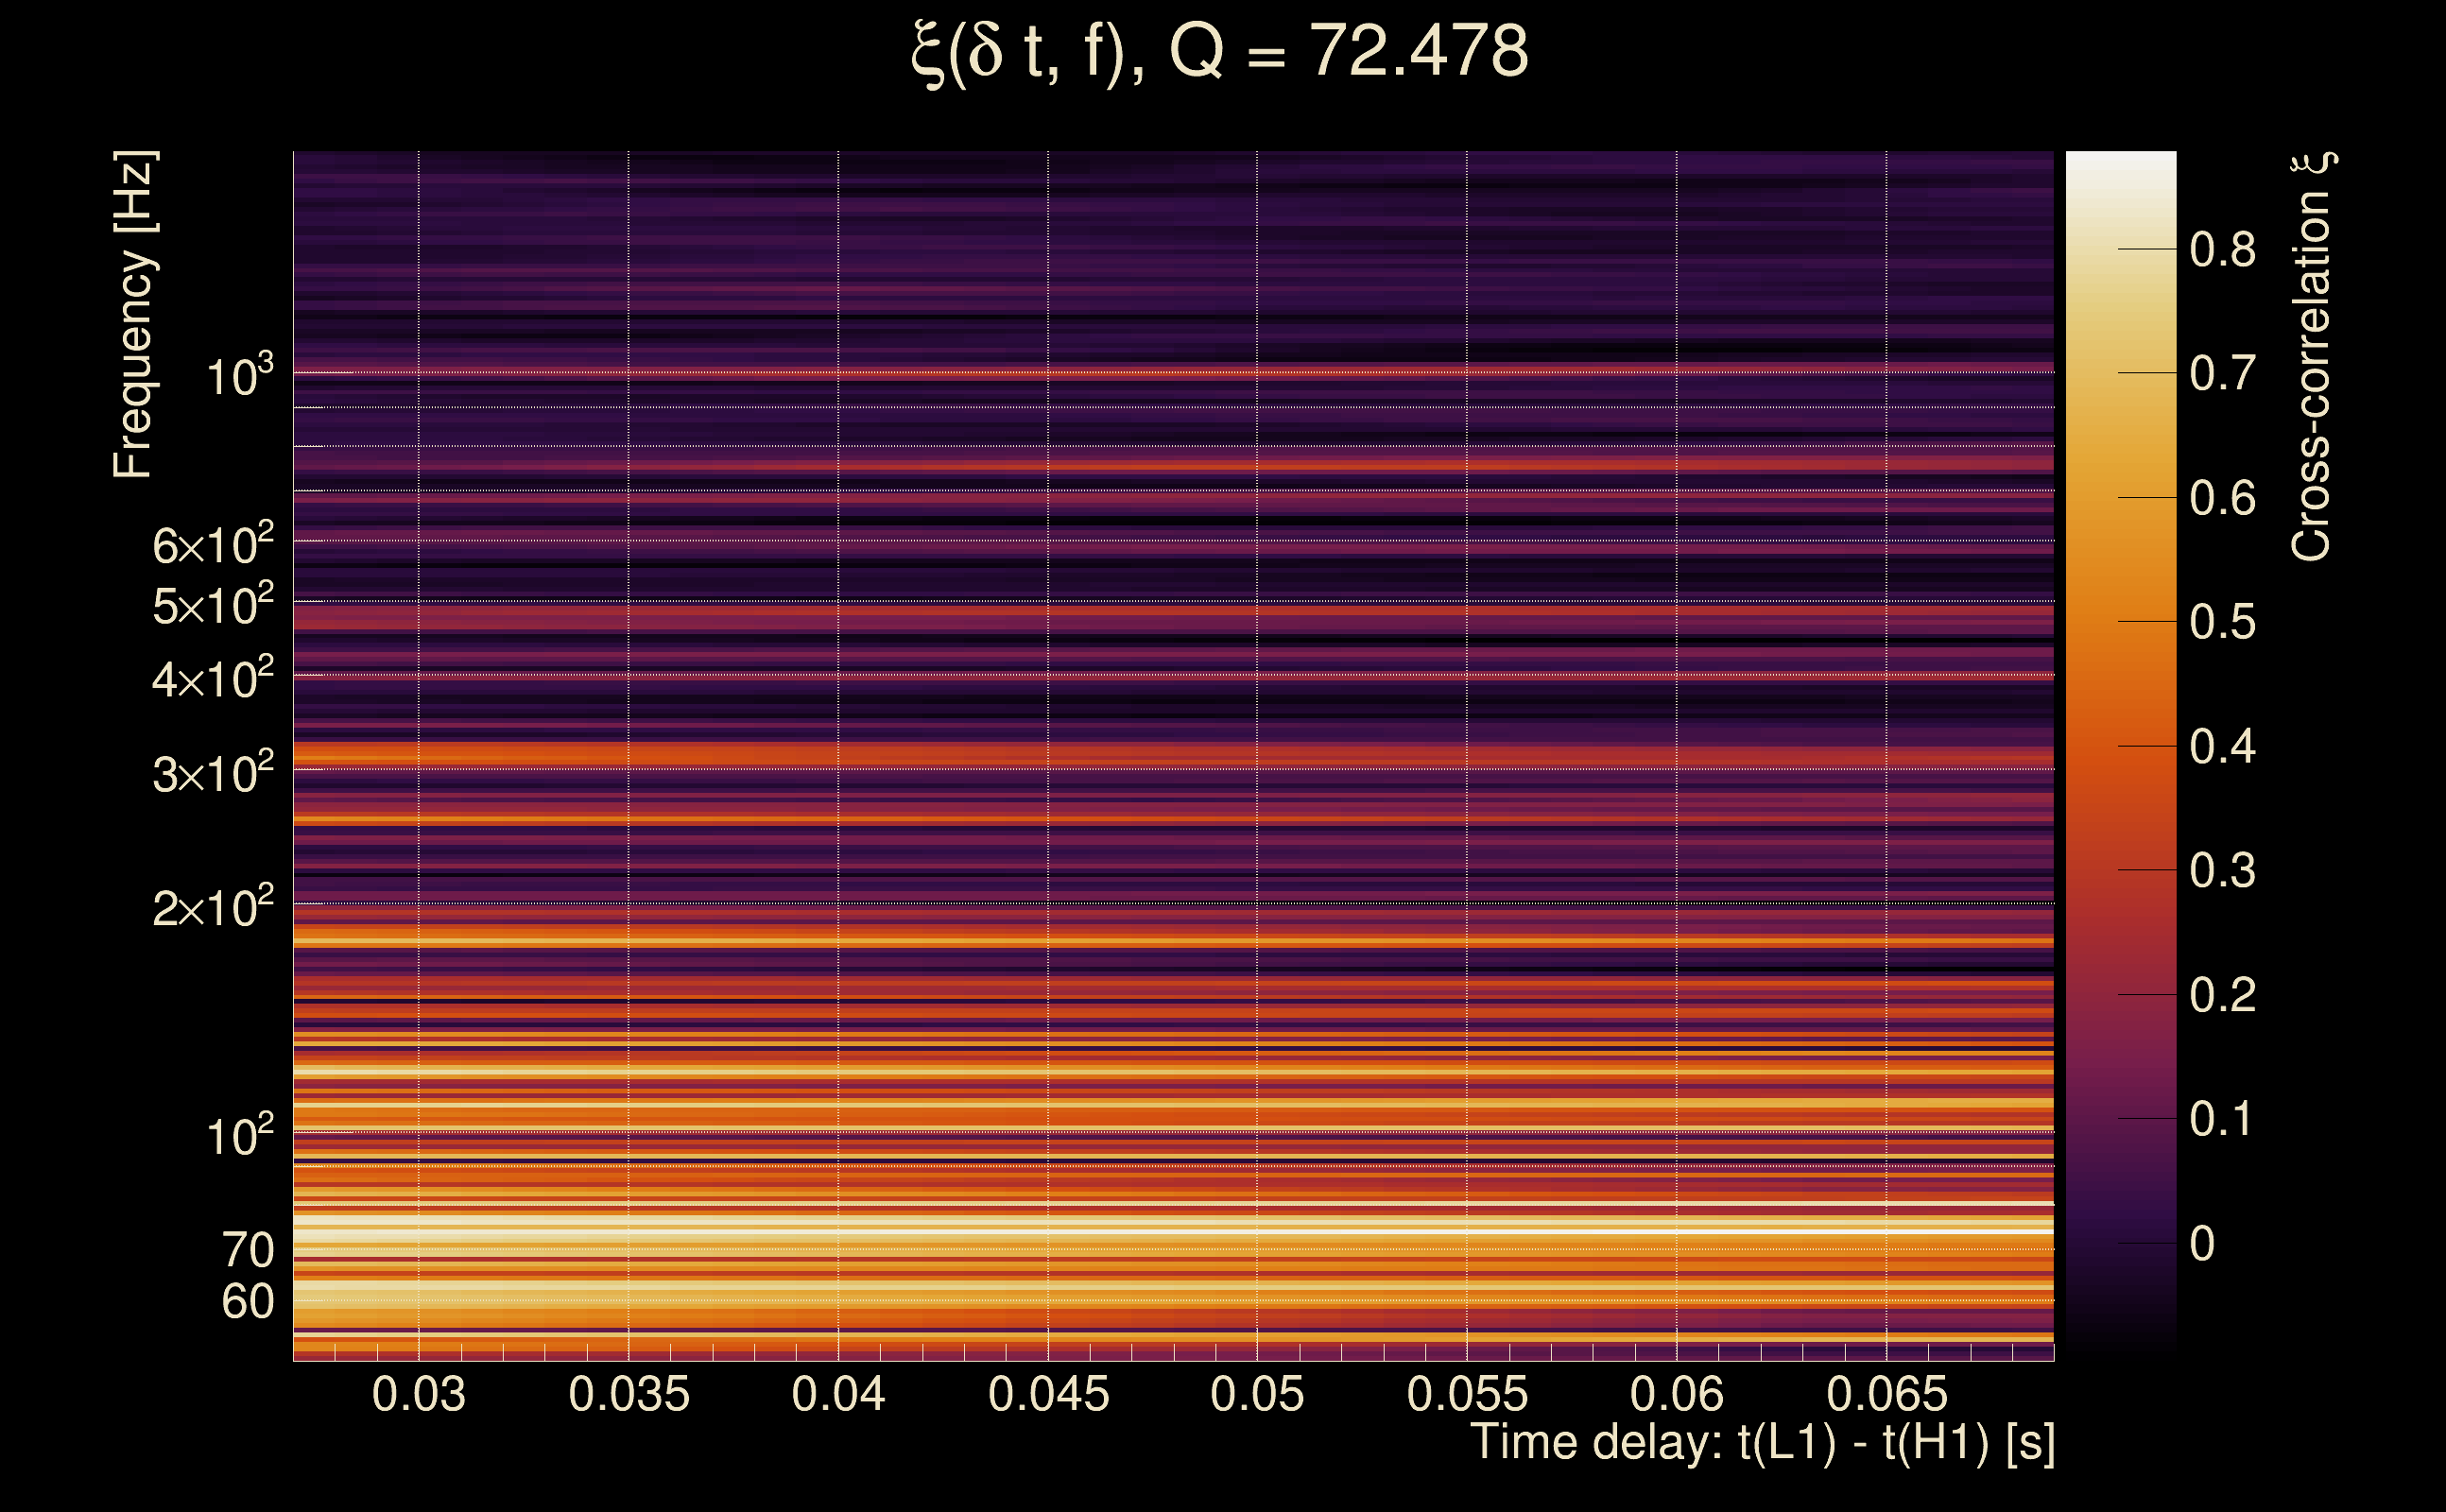
| Number of Q planes: | 5 (Q = 5.51892 → Q = 72.478) |
| Omicron frequency range: | 50 Hz → 1958.38 Hz |
| Light travel time between detectors: | 0.0100128 s |
| Slice extra-time (calibration uncertainty + slice veto): | 0.0129872 s |
| Number of time-delay bins in a cross-correlation map: | 10000 |
| Number of slices in a cross-correlation map: | 217 |
| Number of time-delay bins in a slice: | 46 |
| SNR gating: | < 100 (detector 0), < 100 (detector 1) |
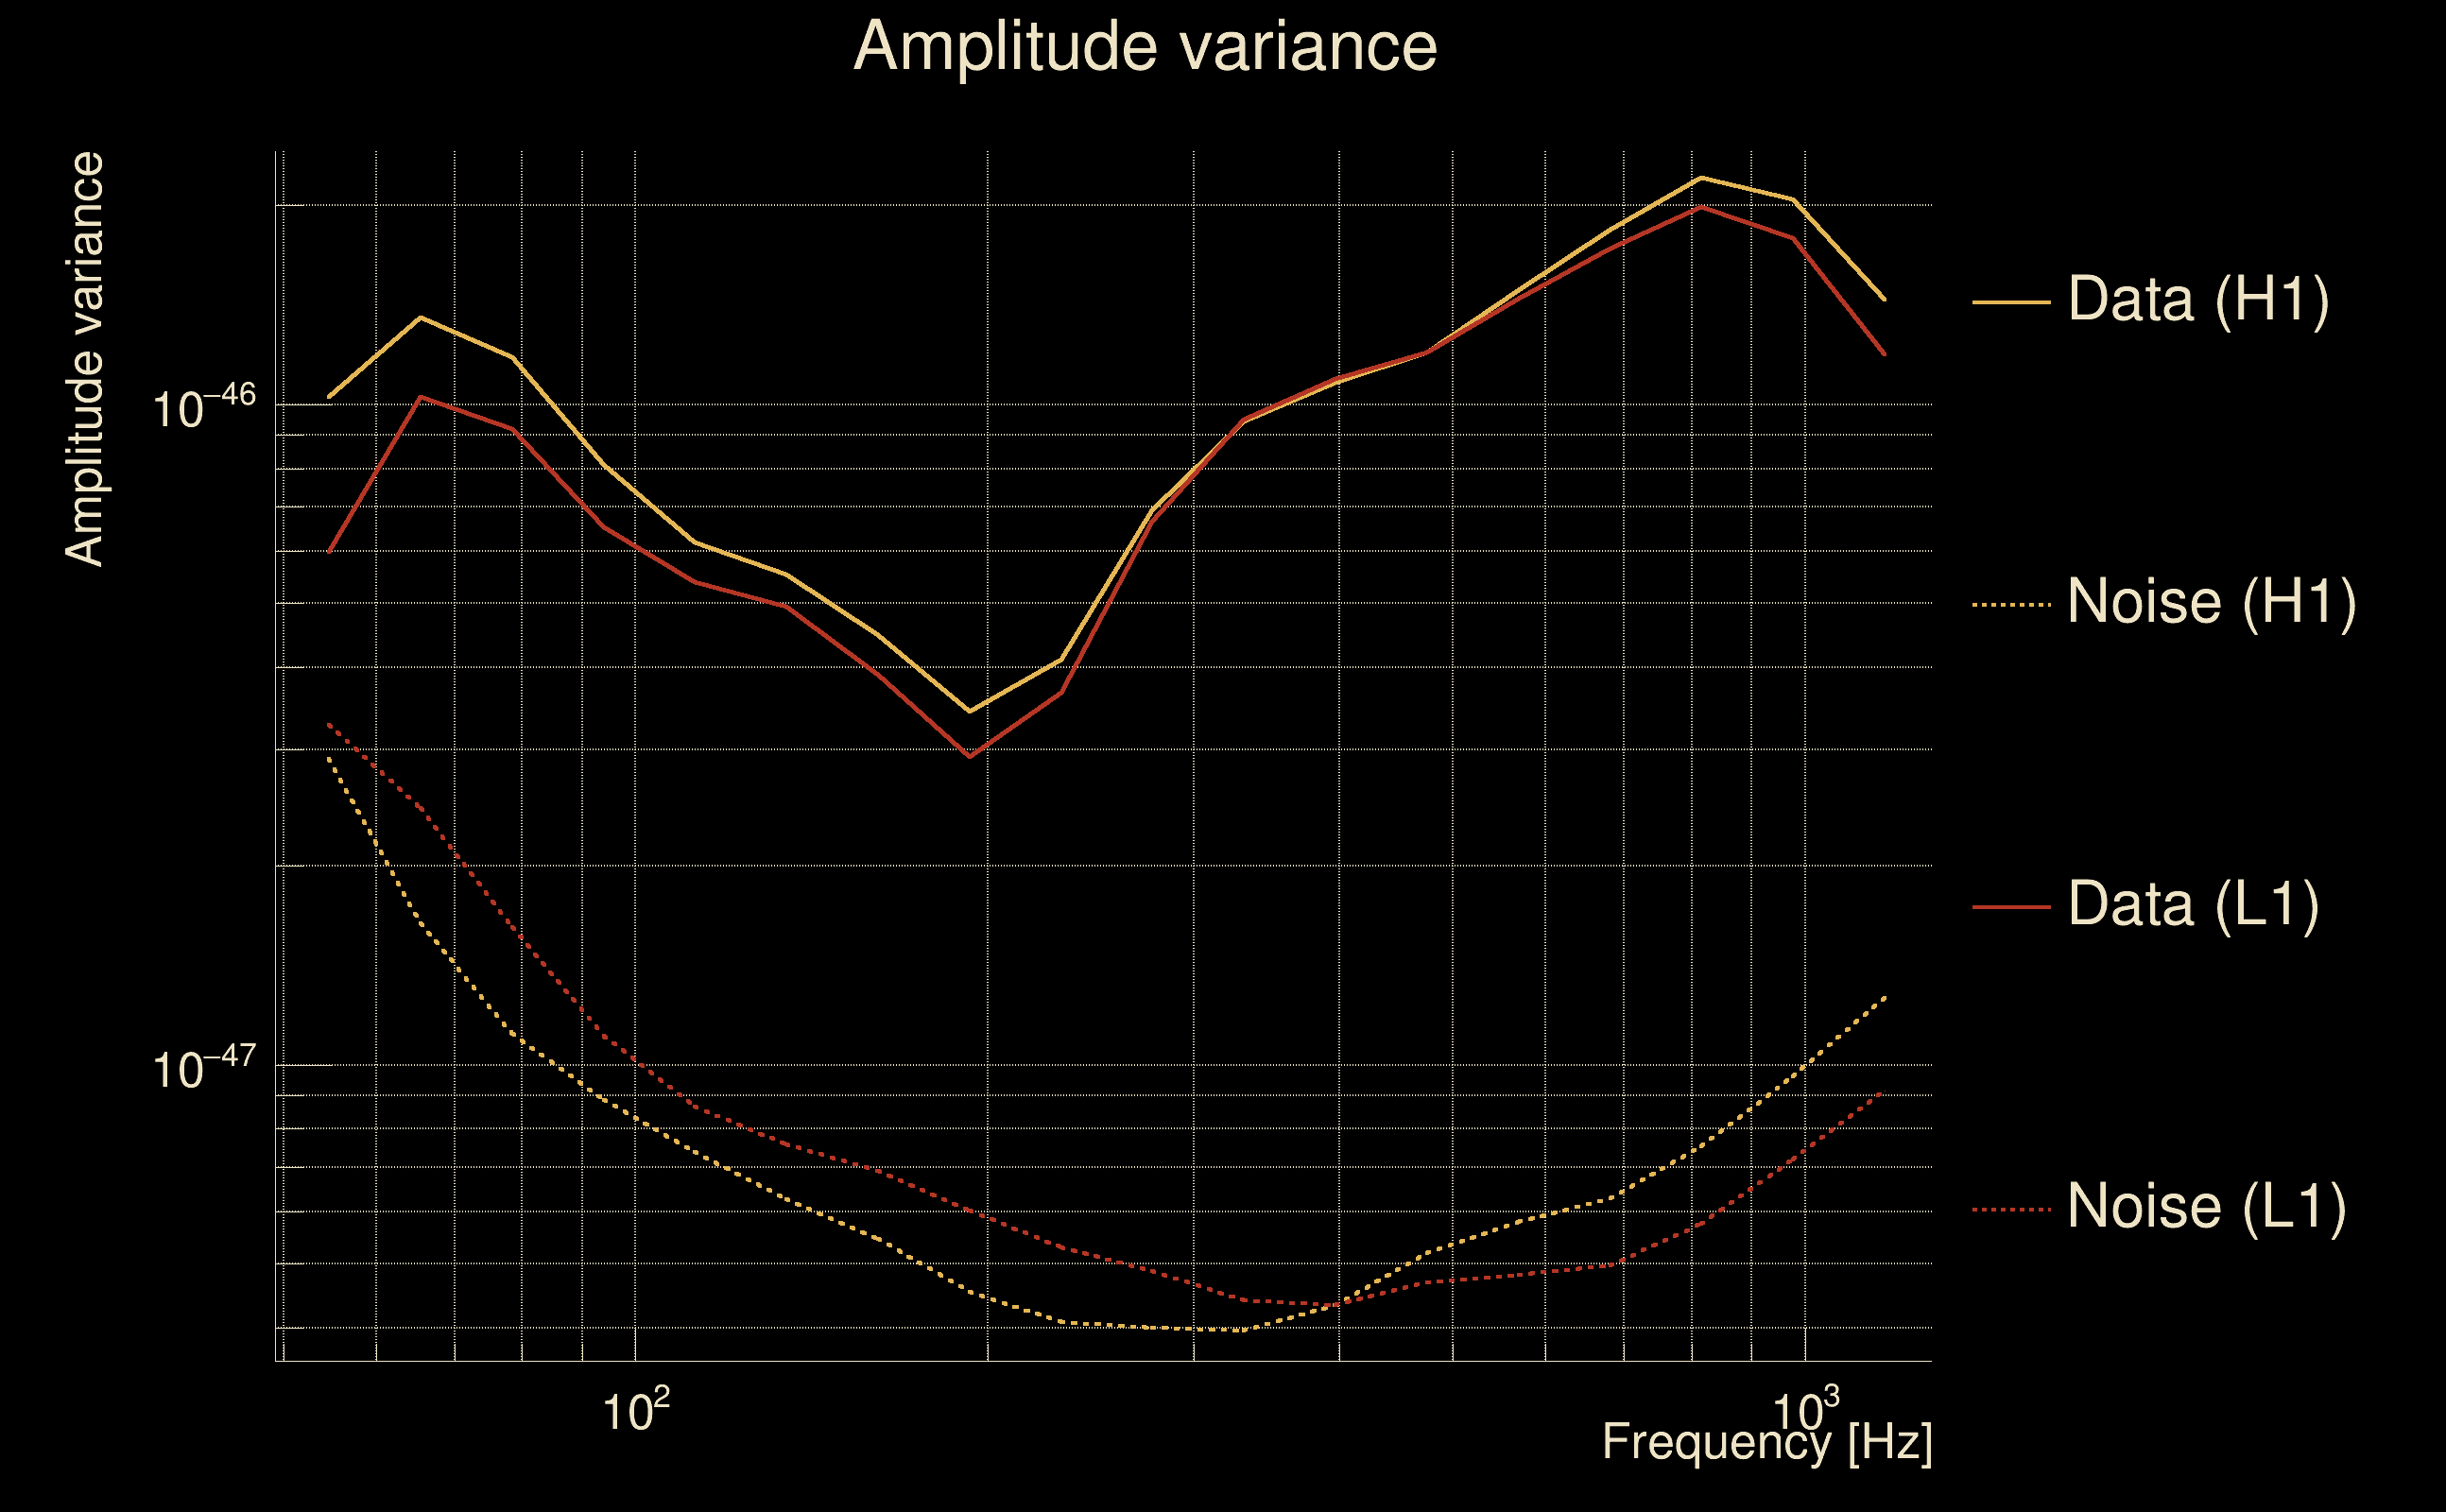
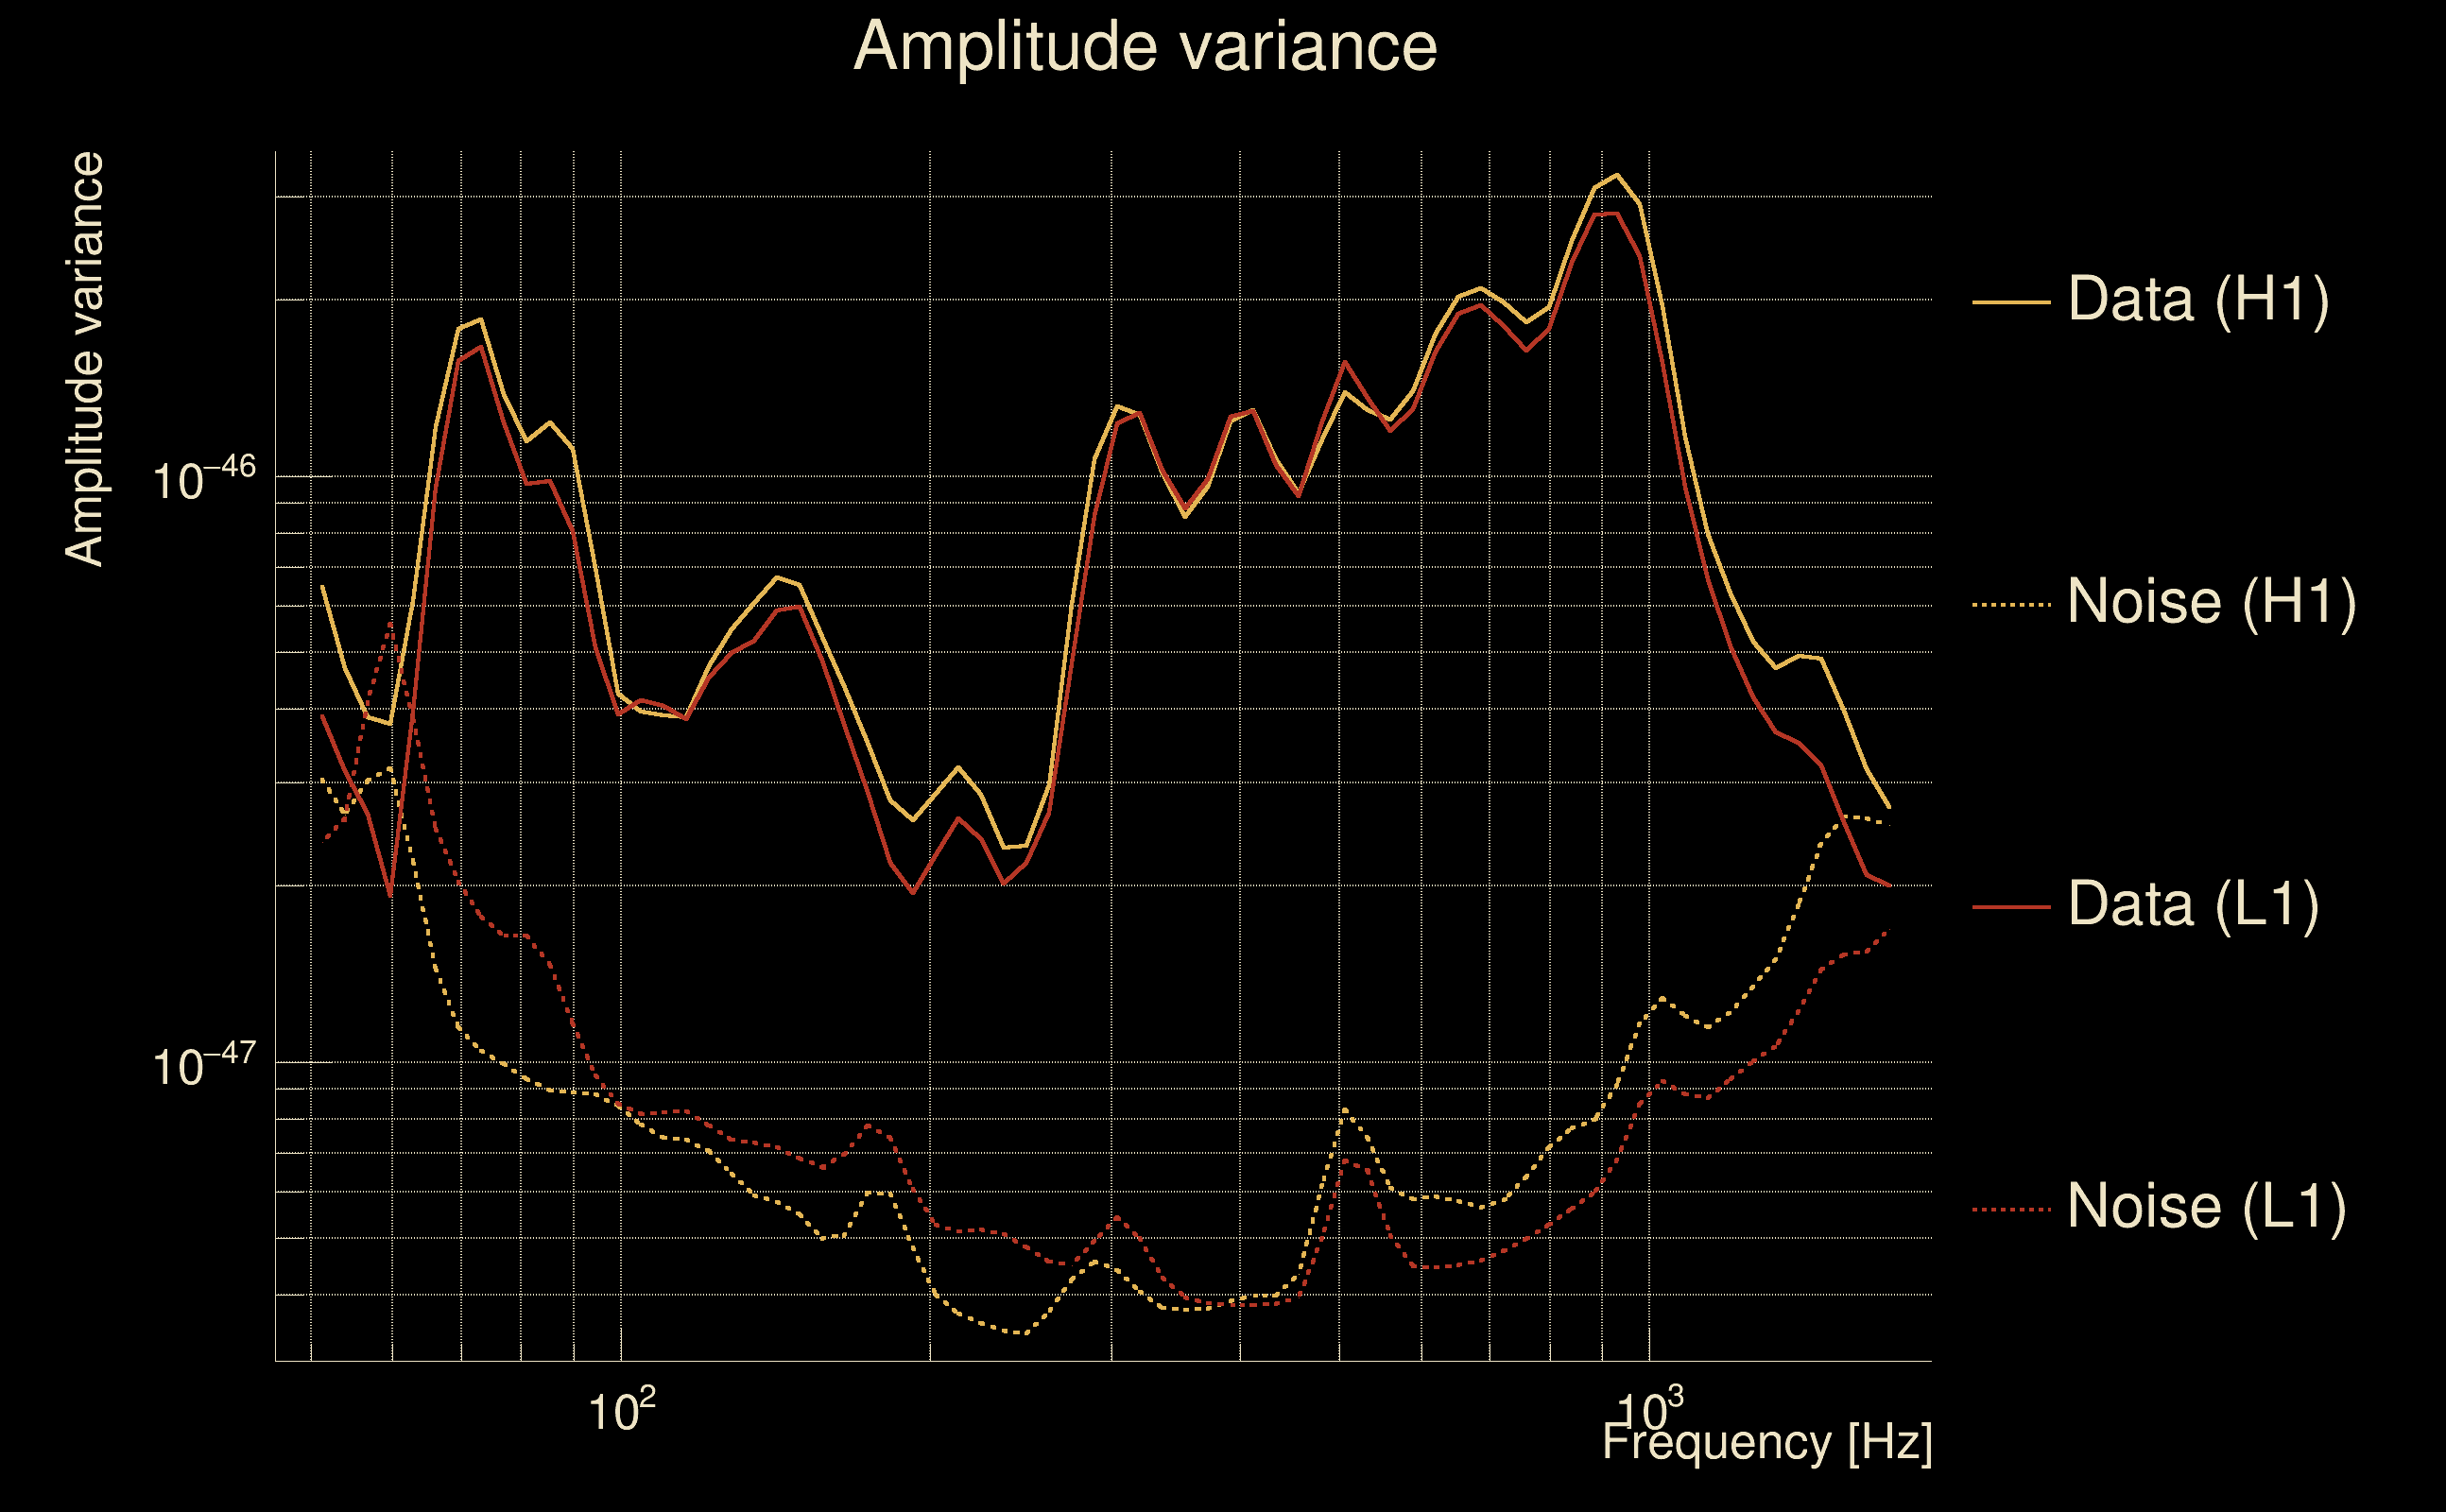
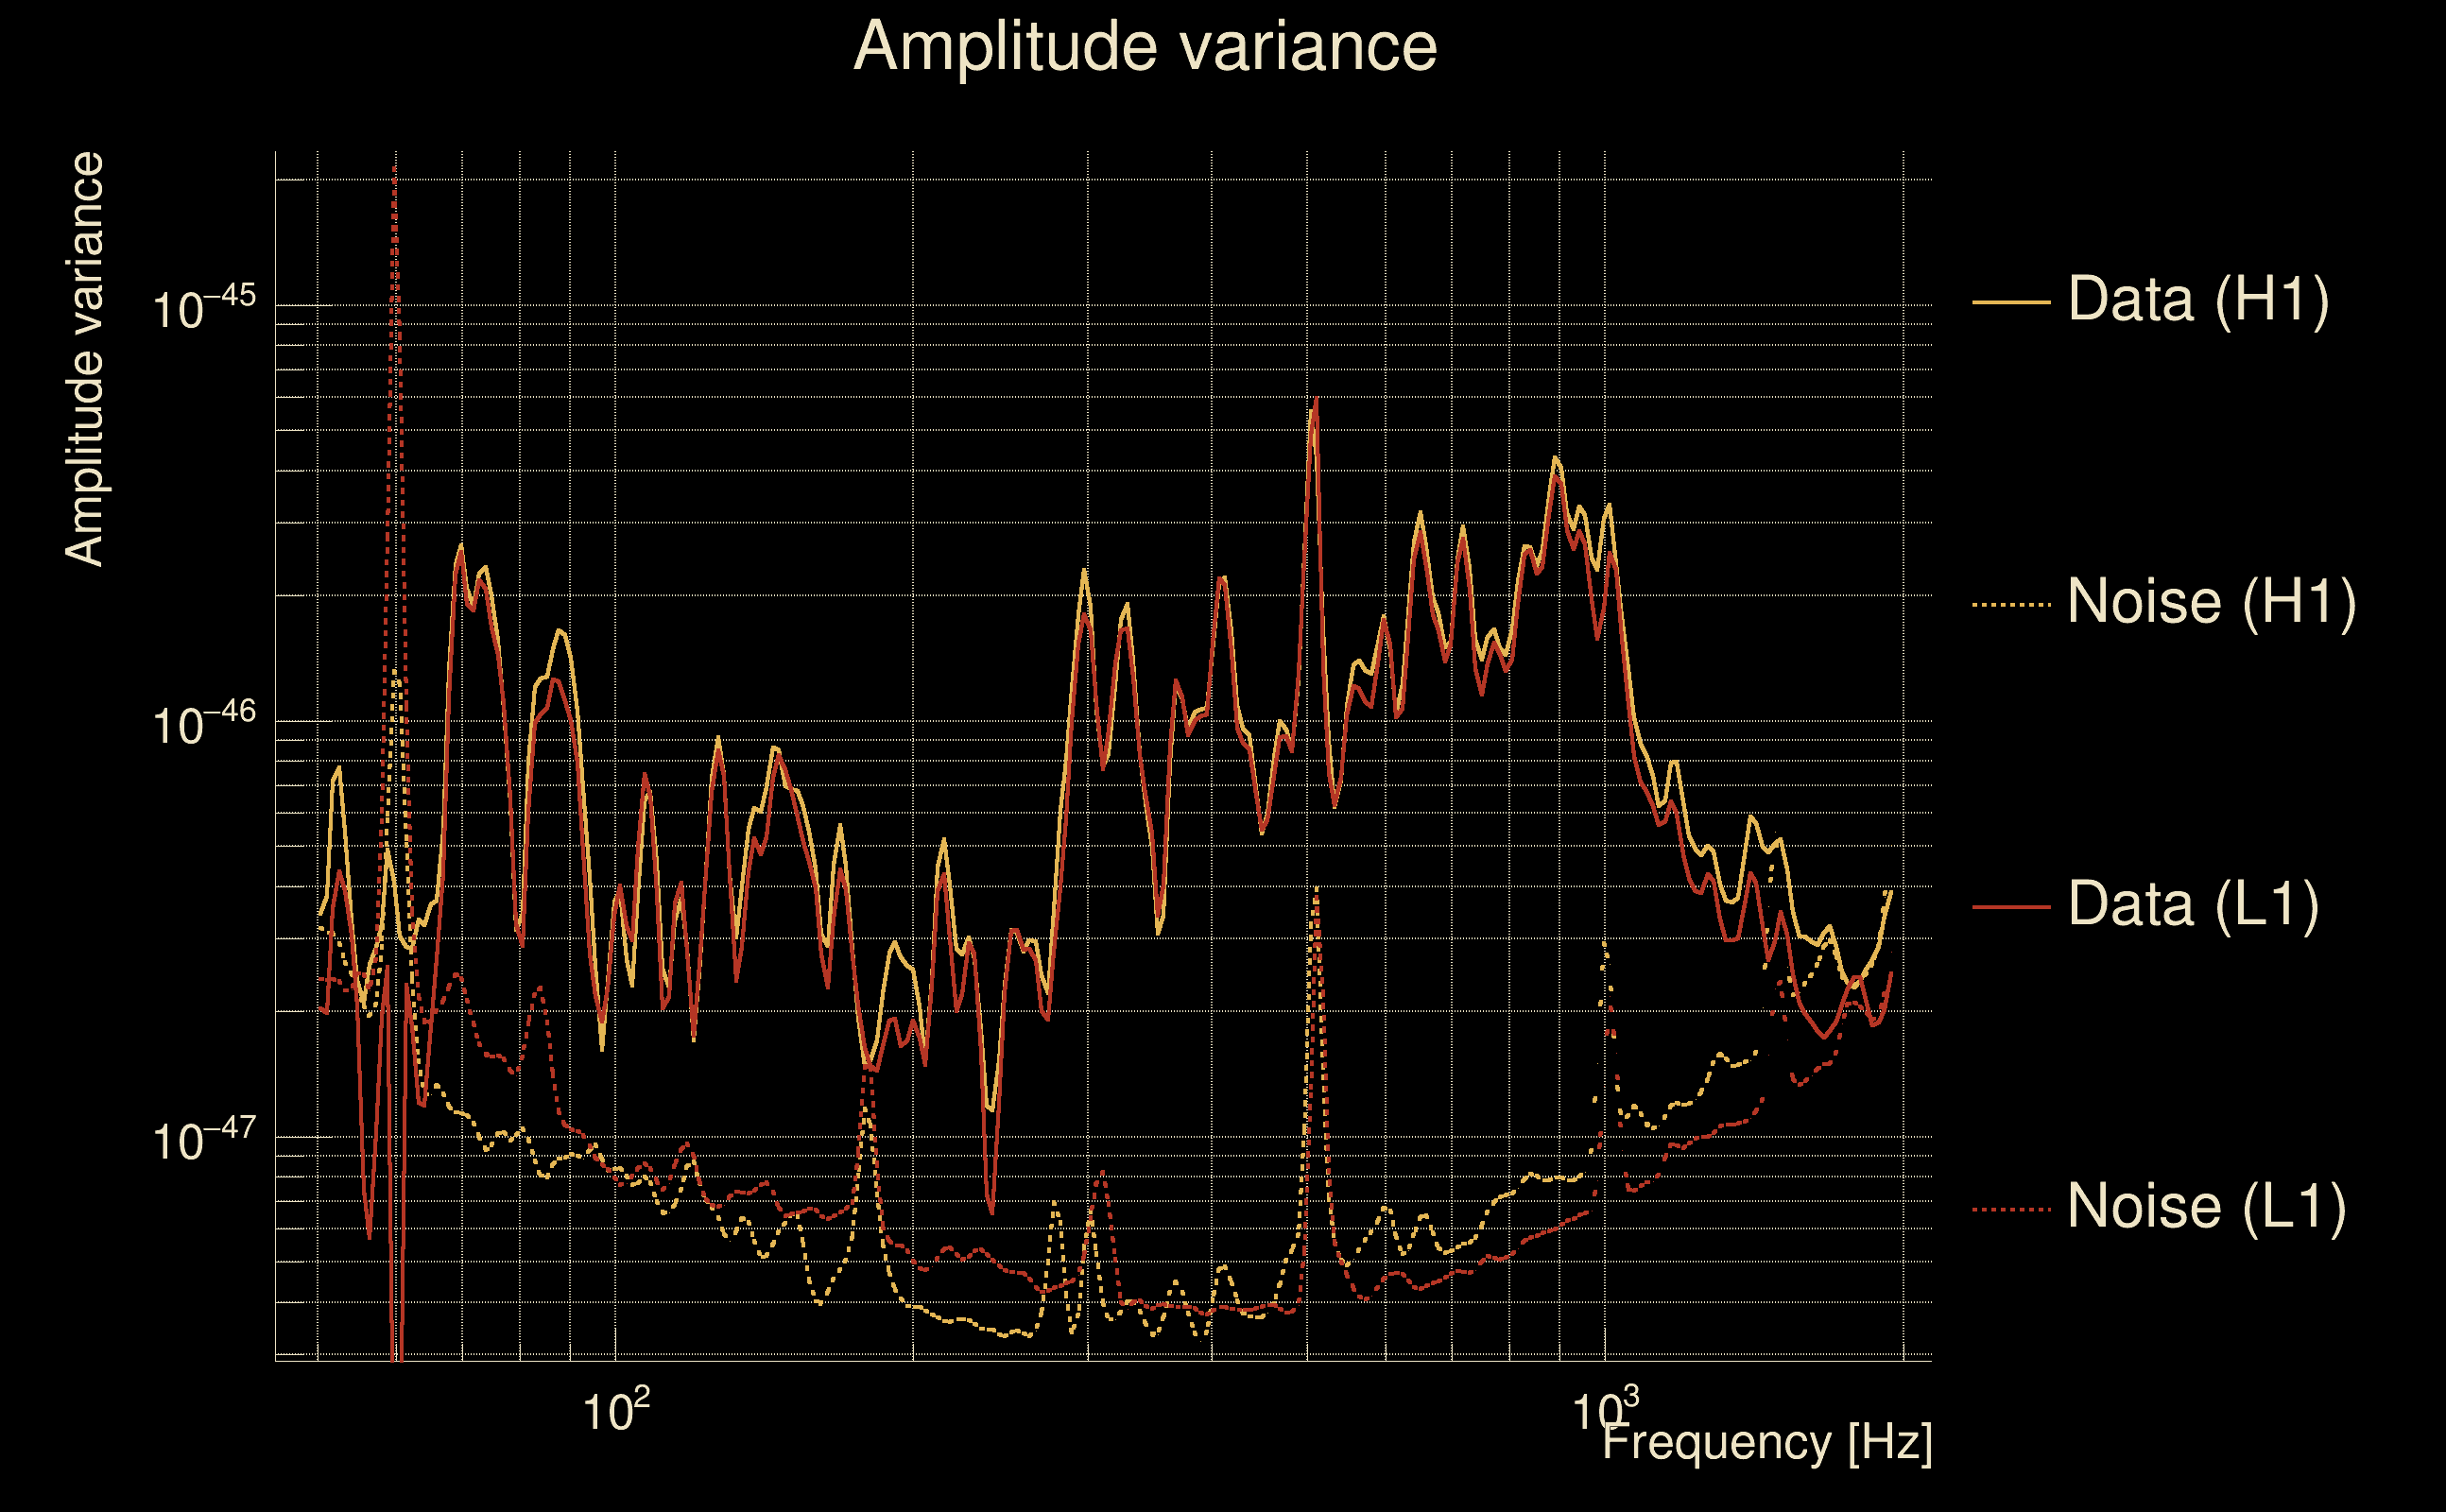
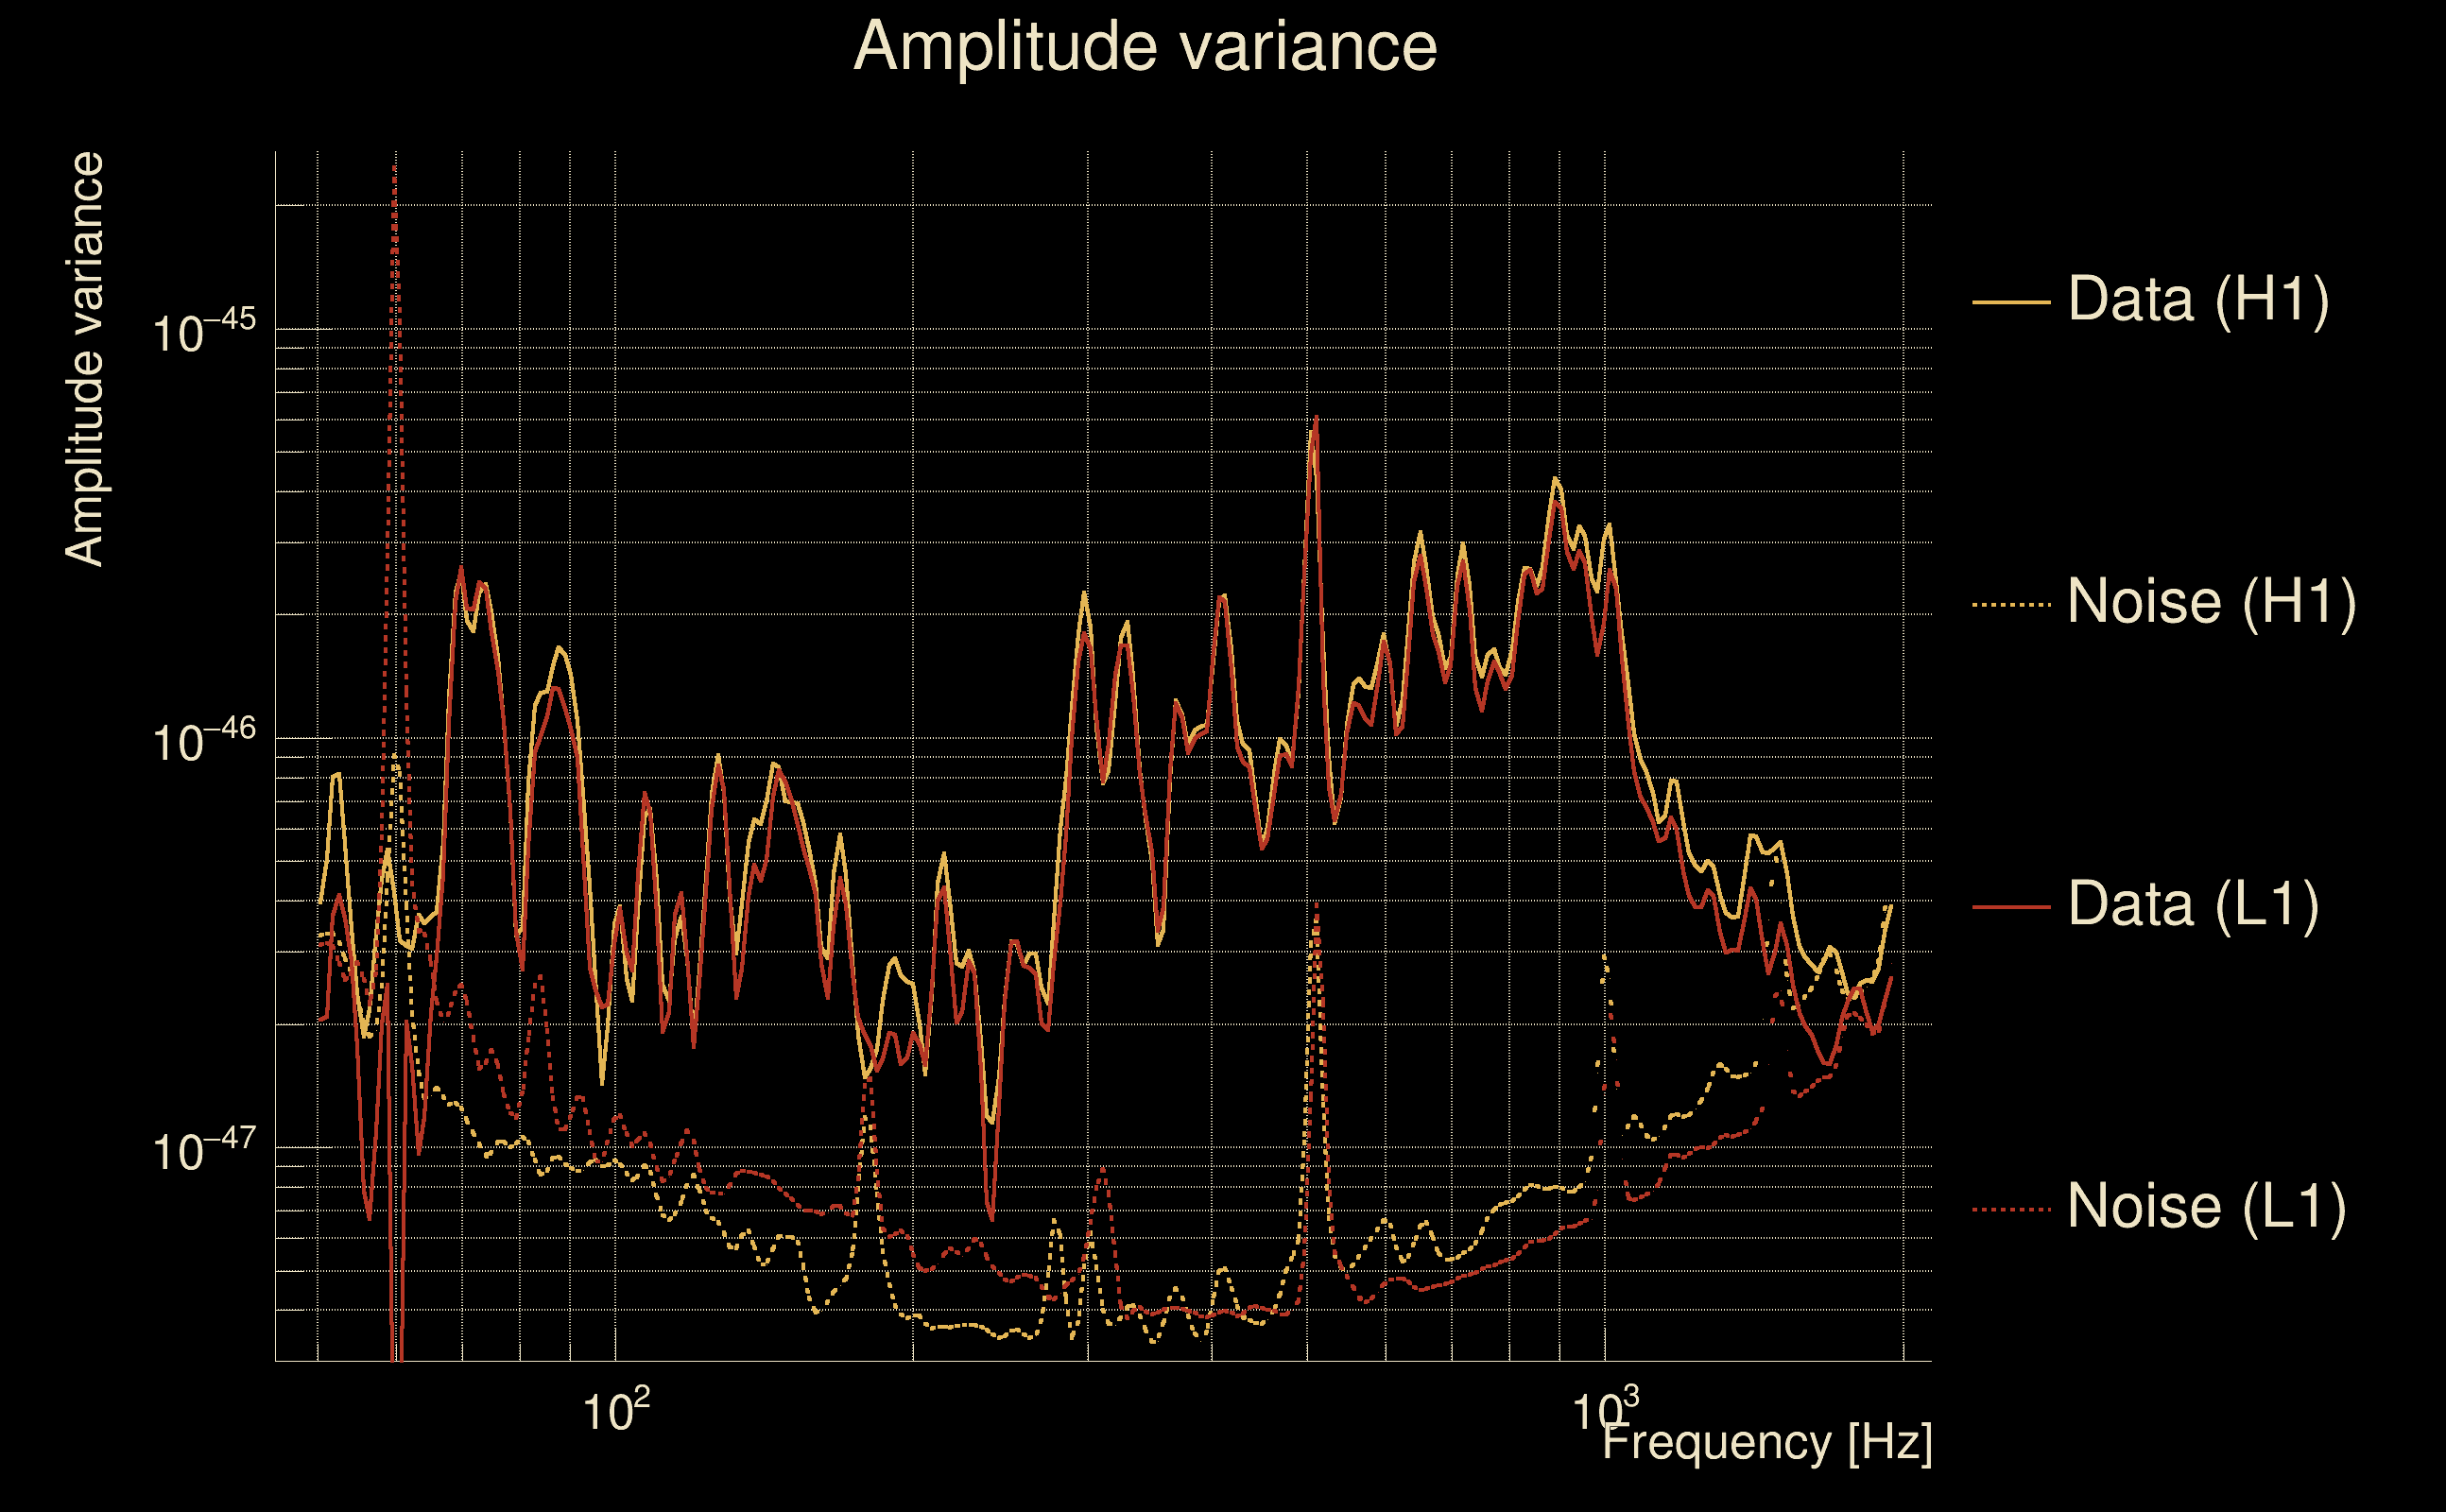
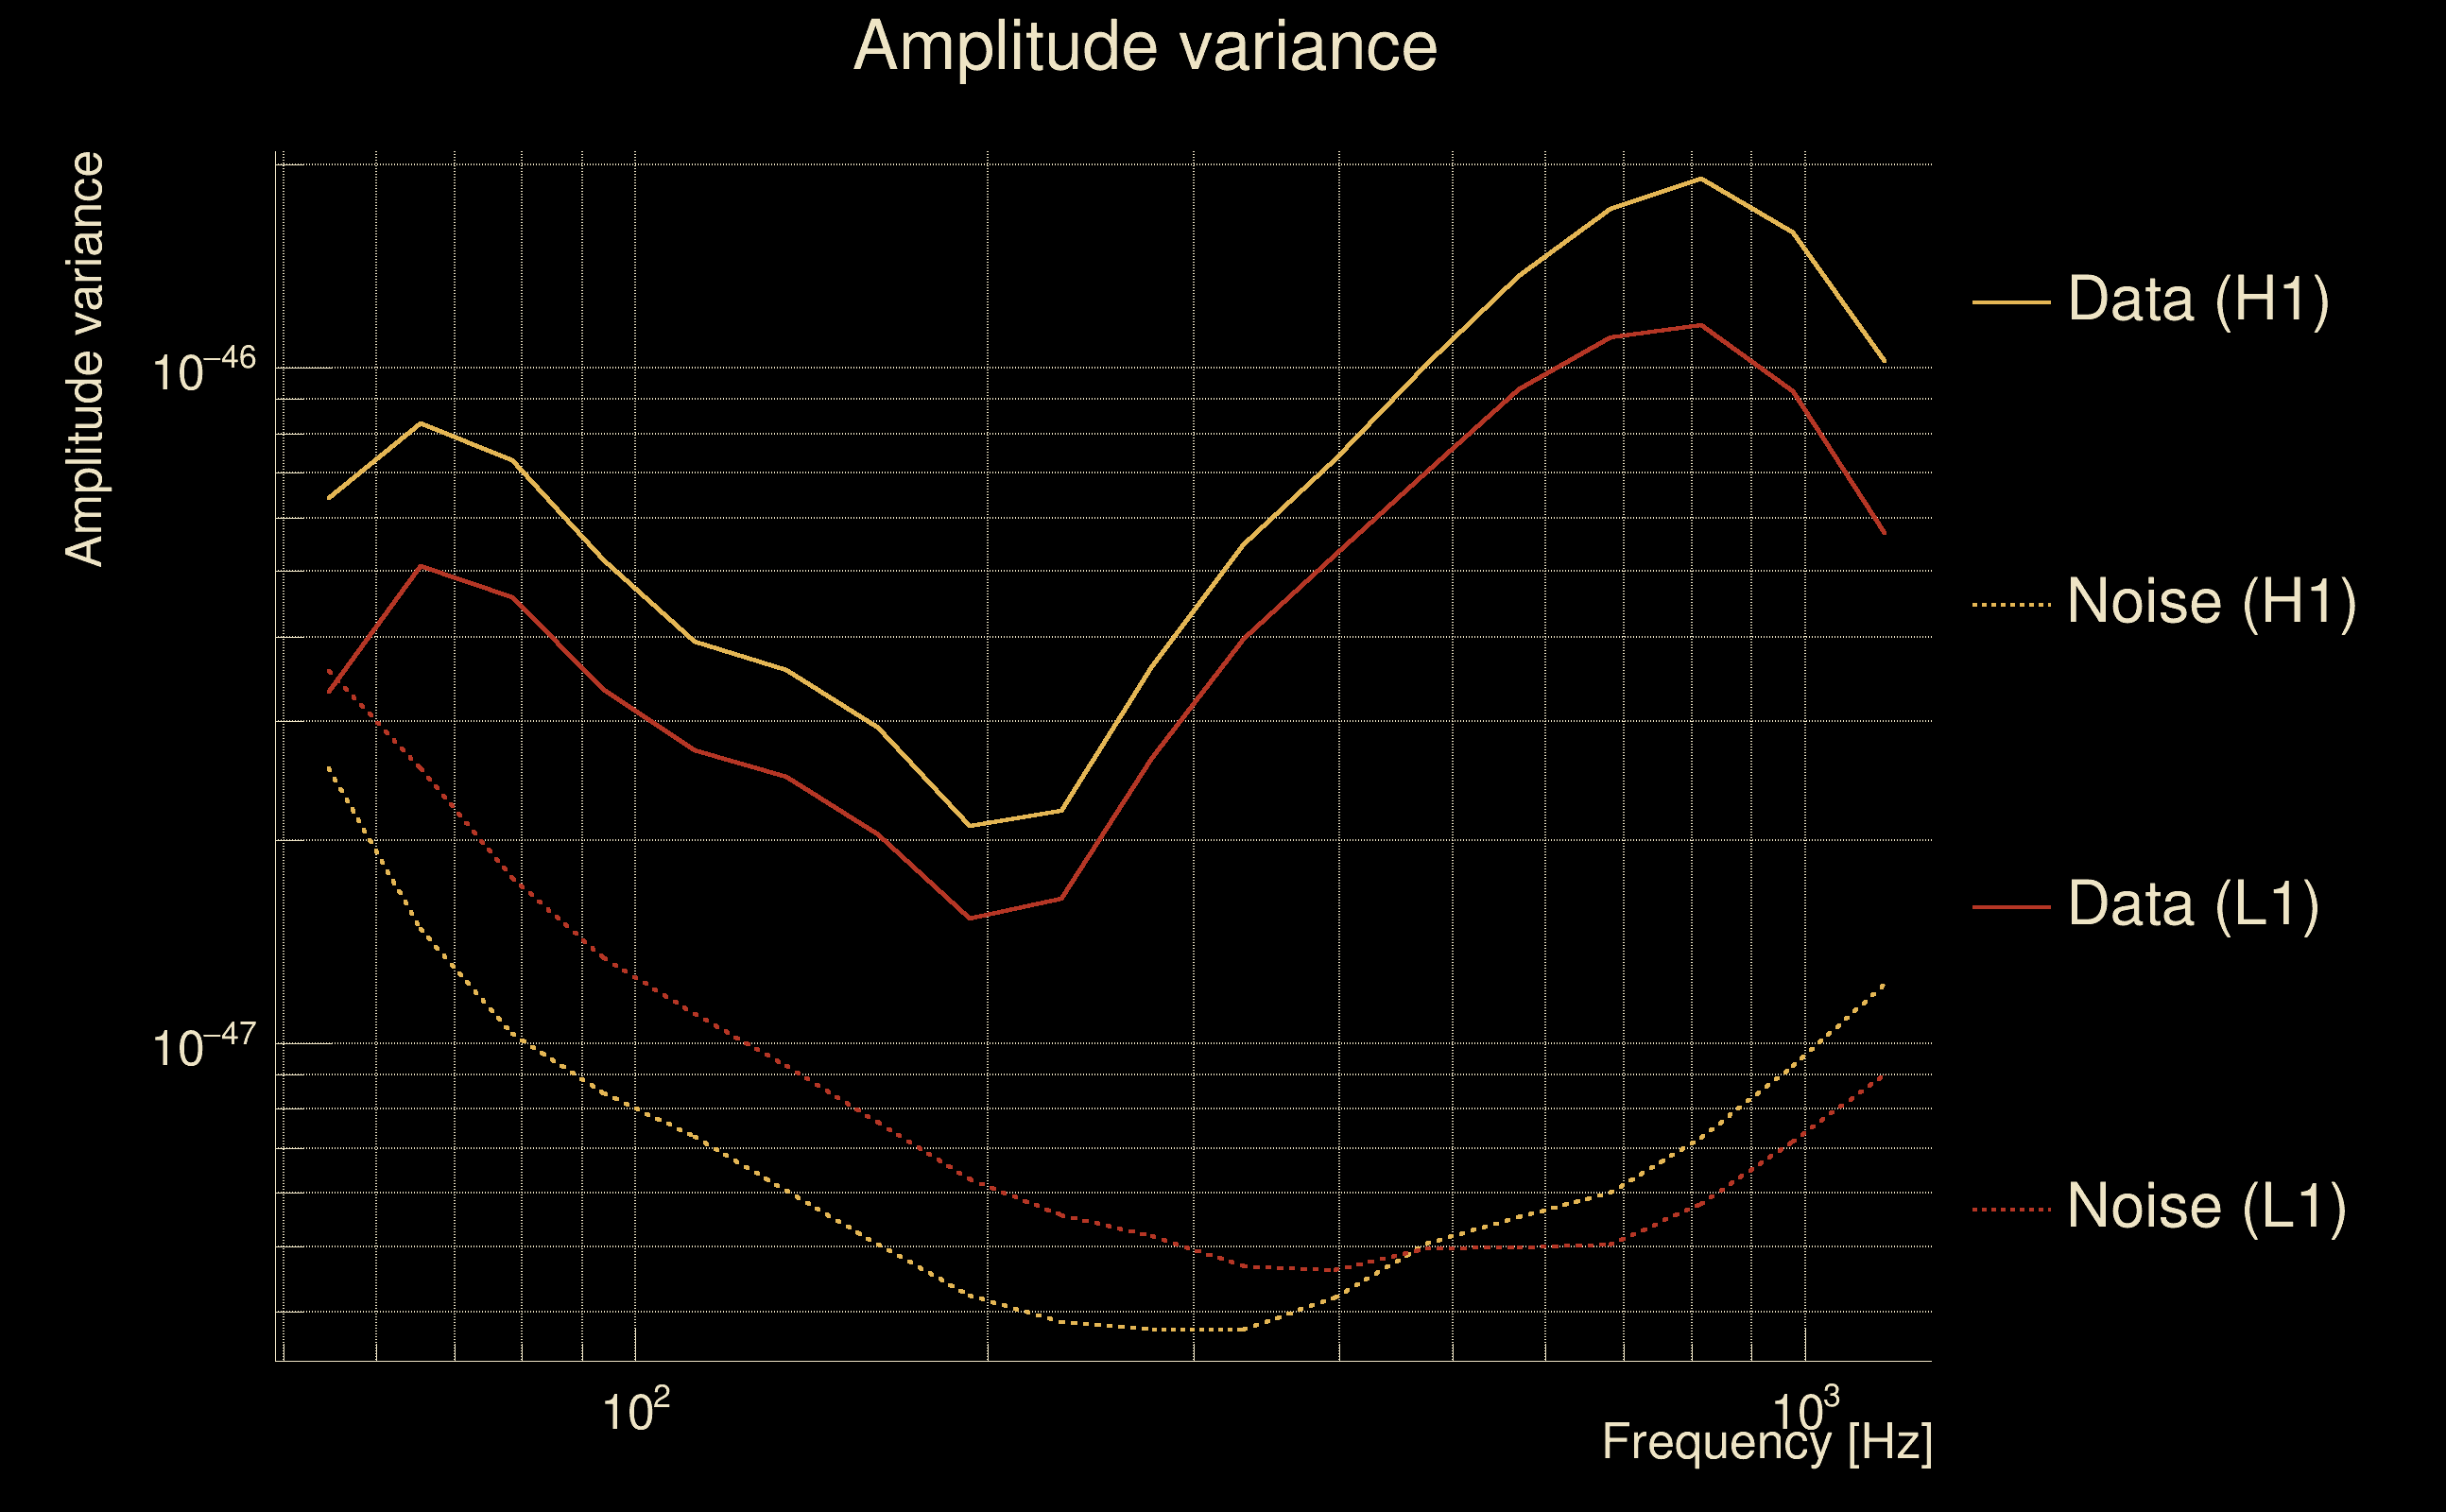
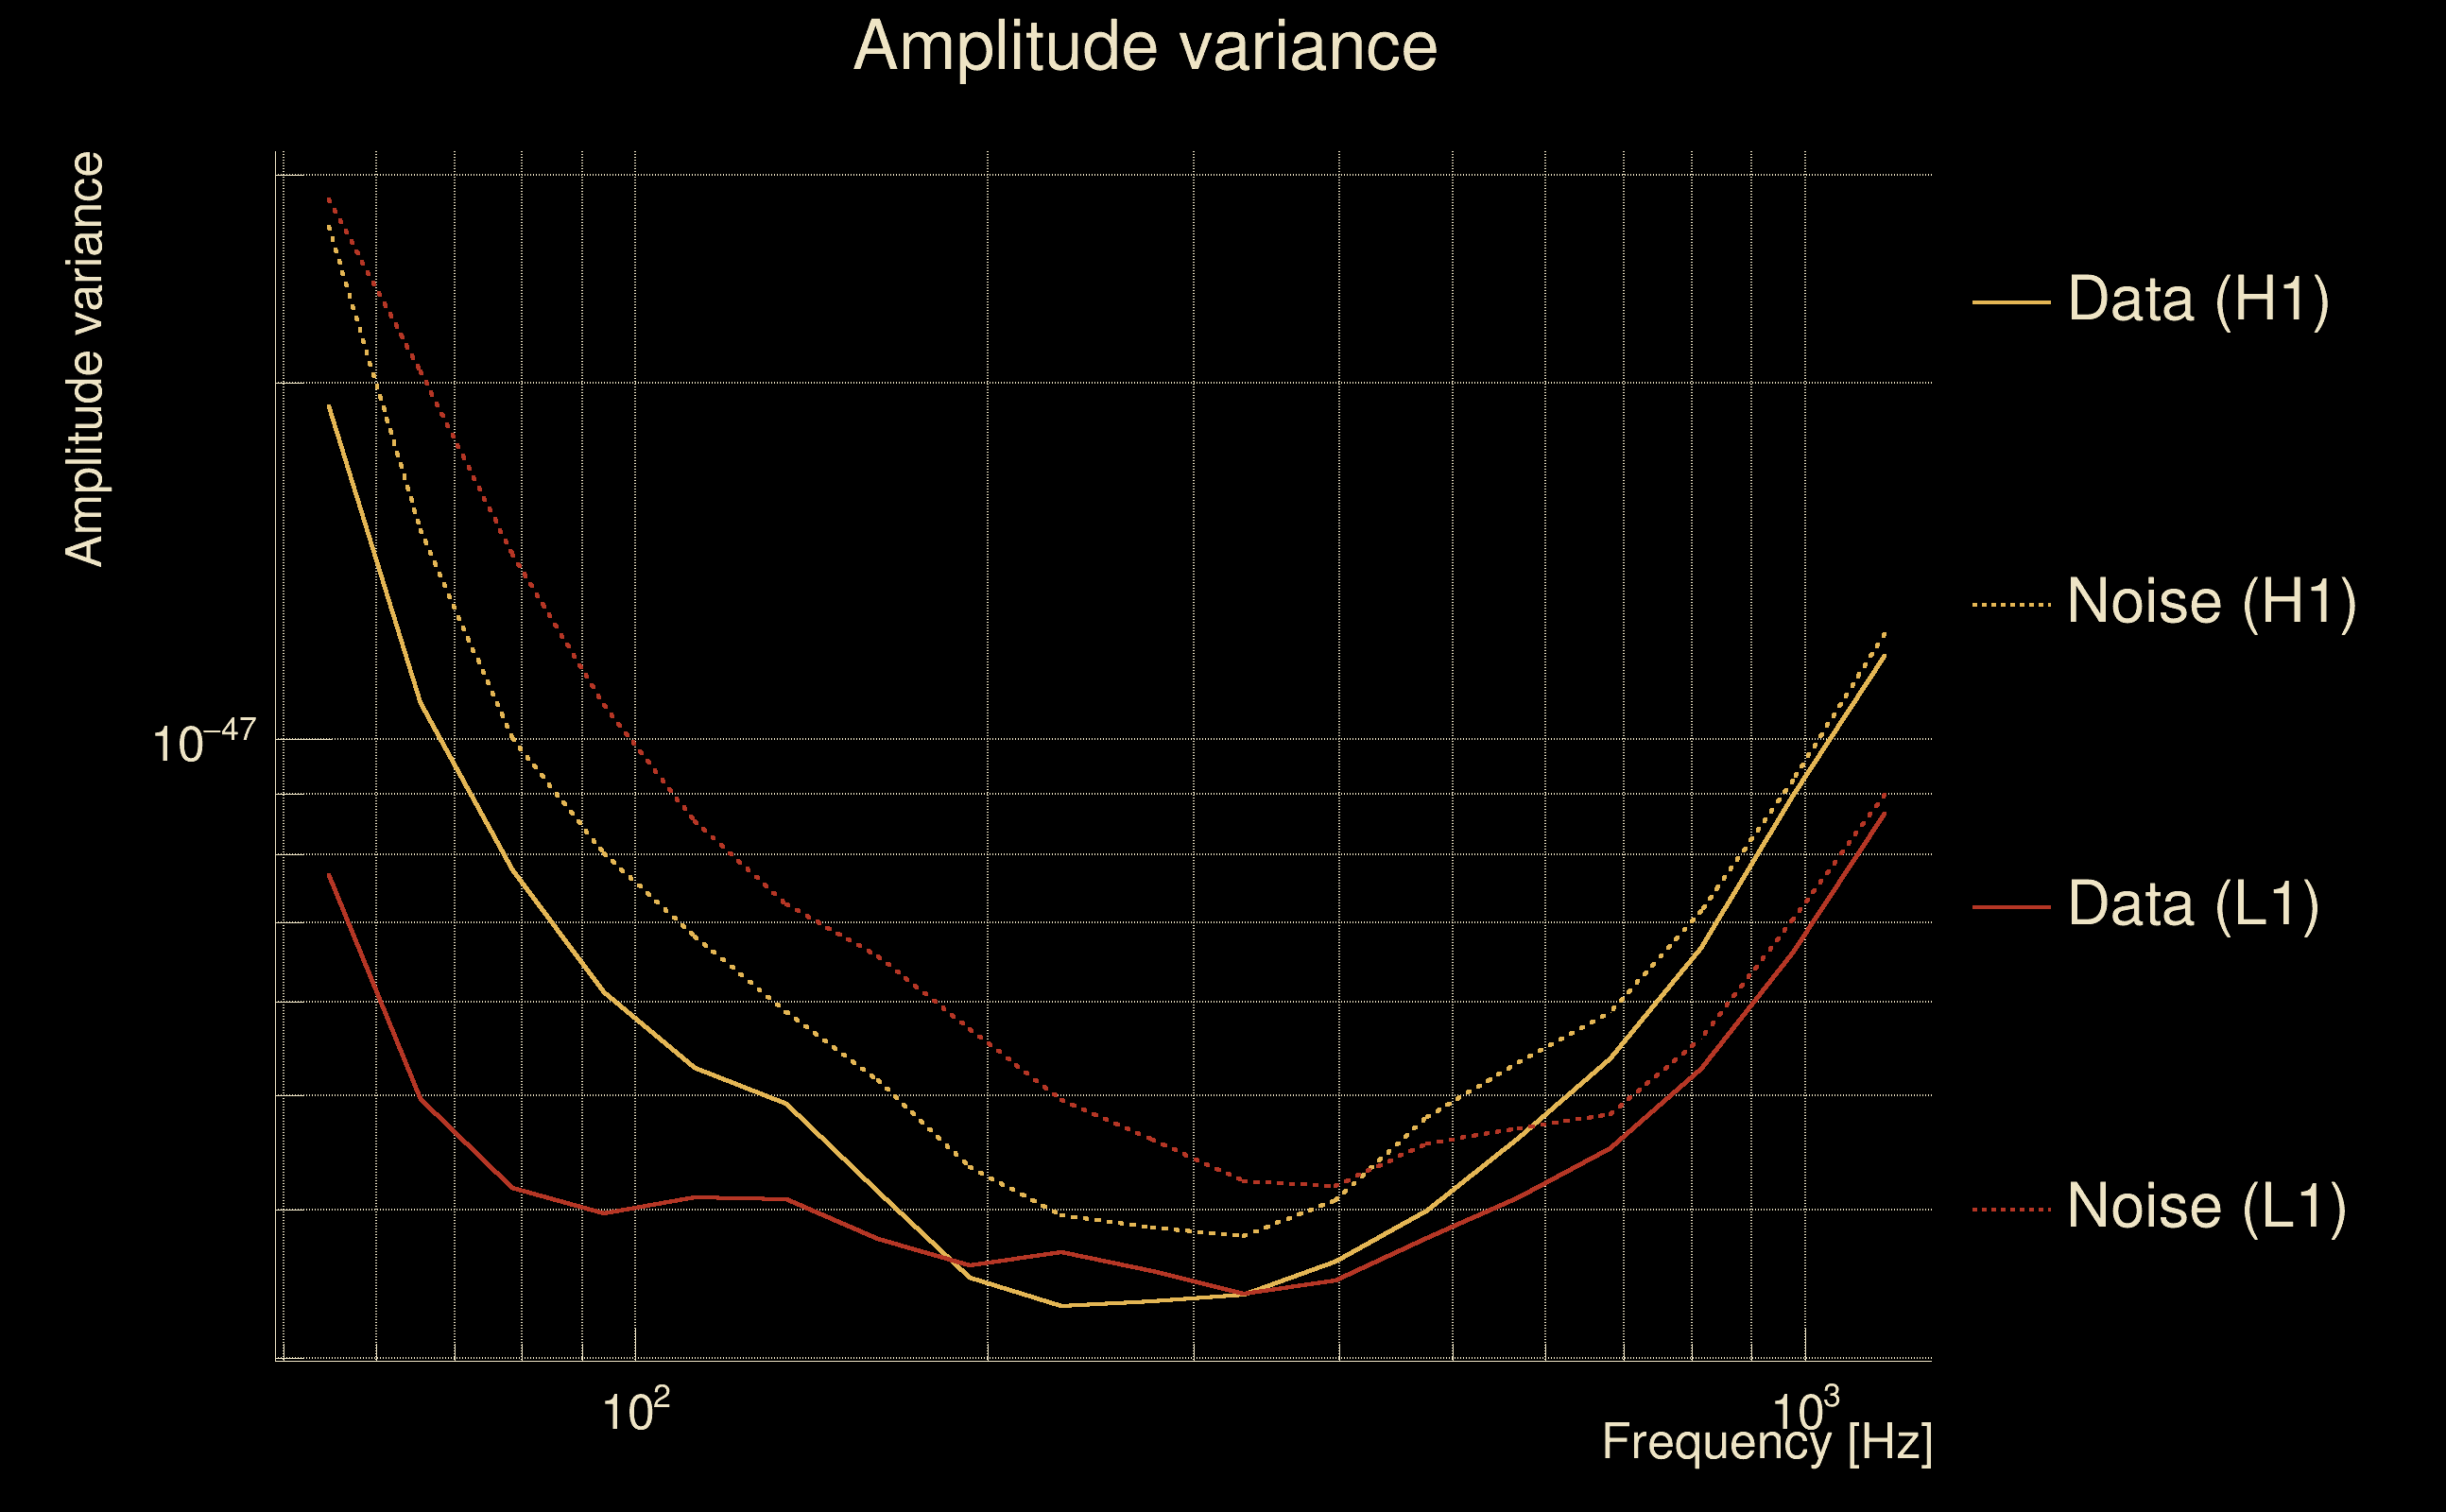
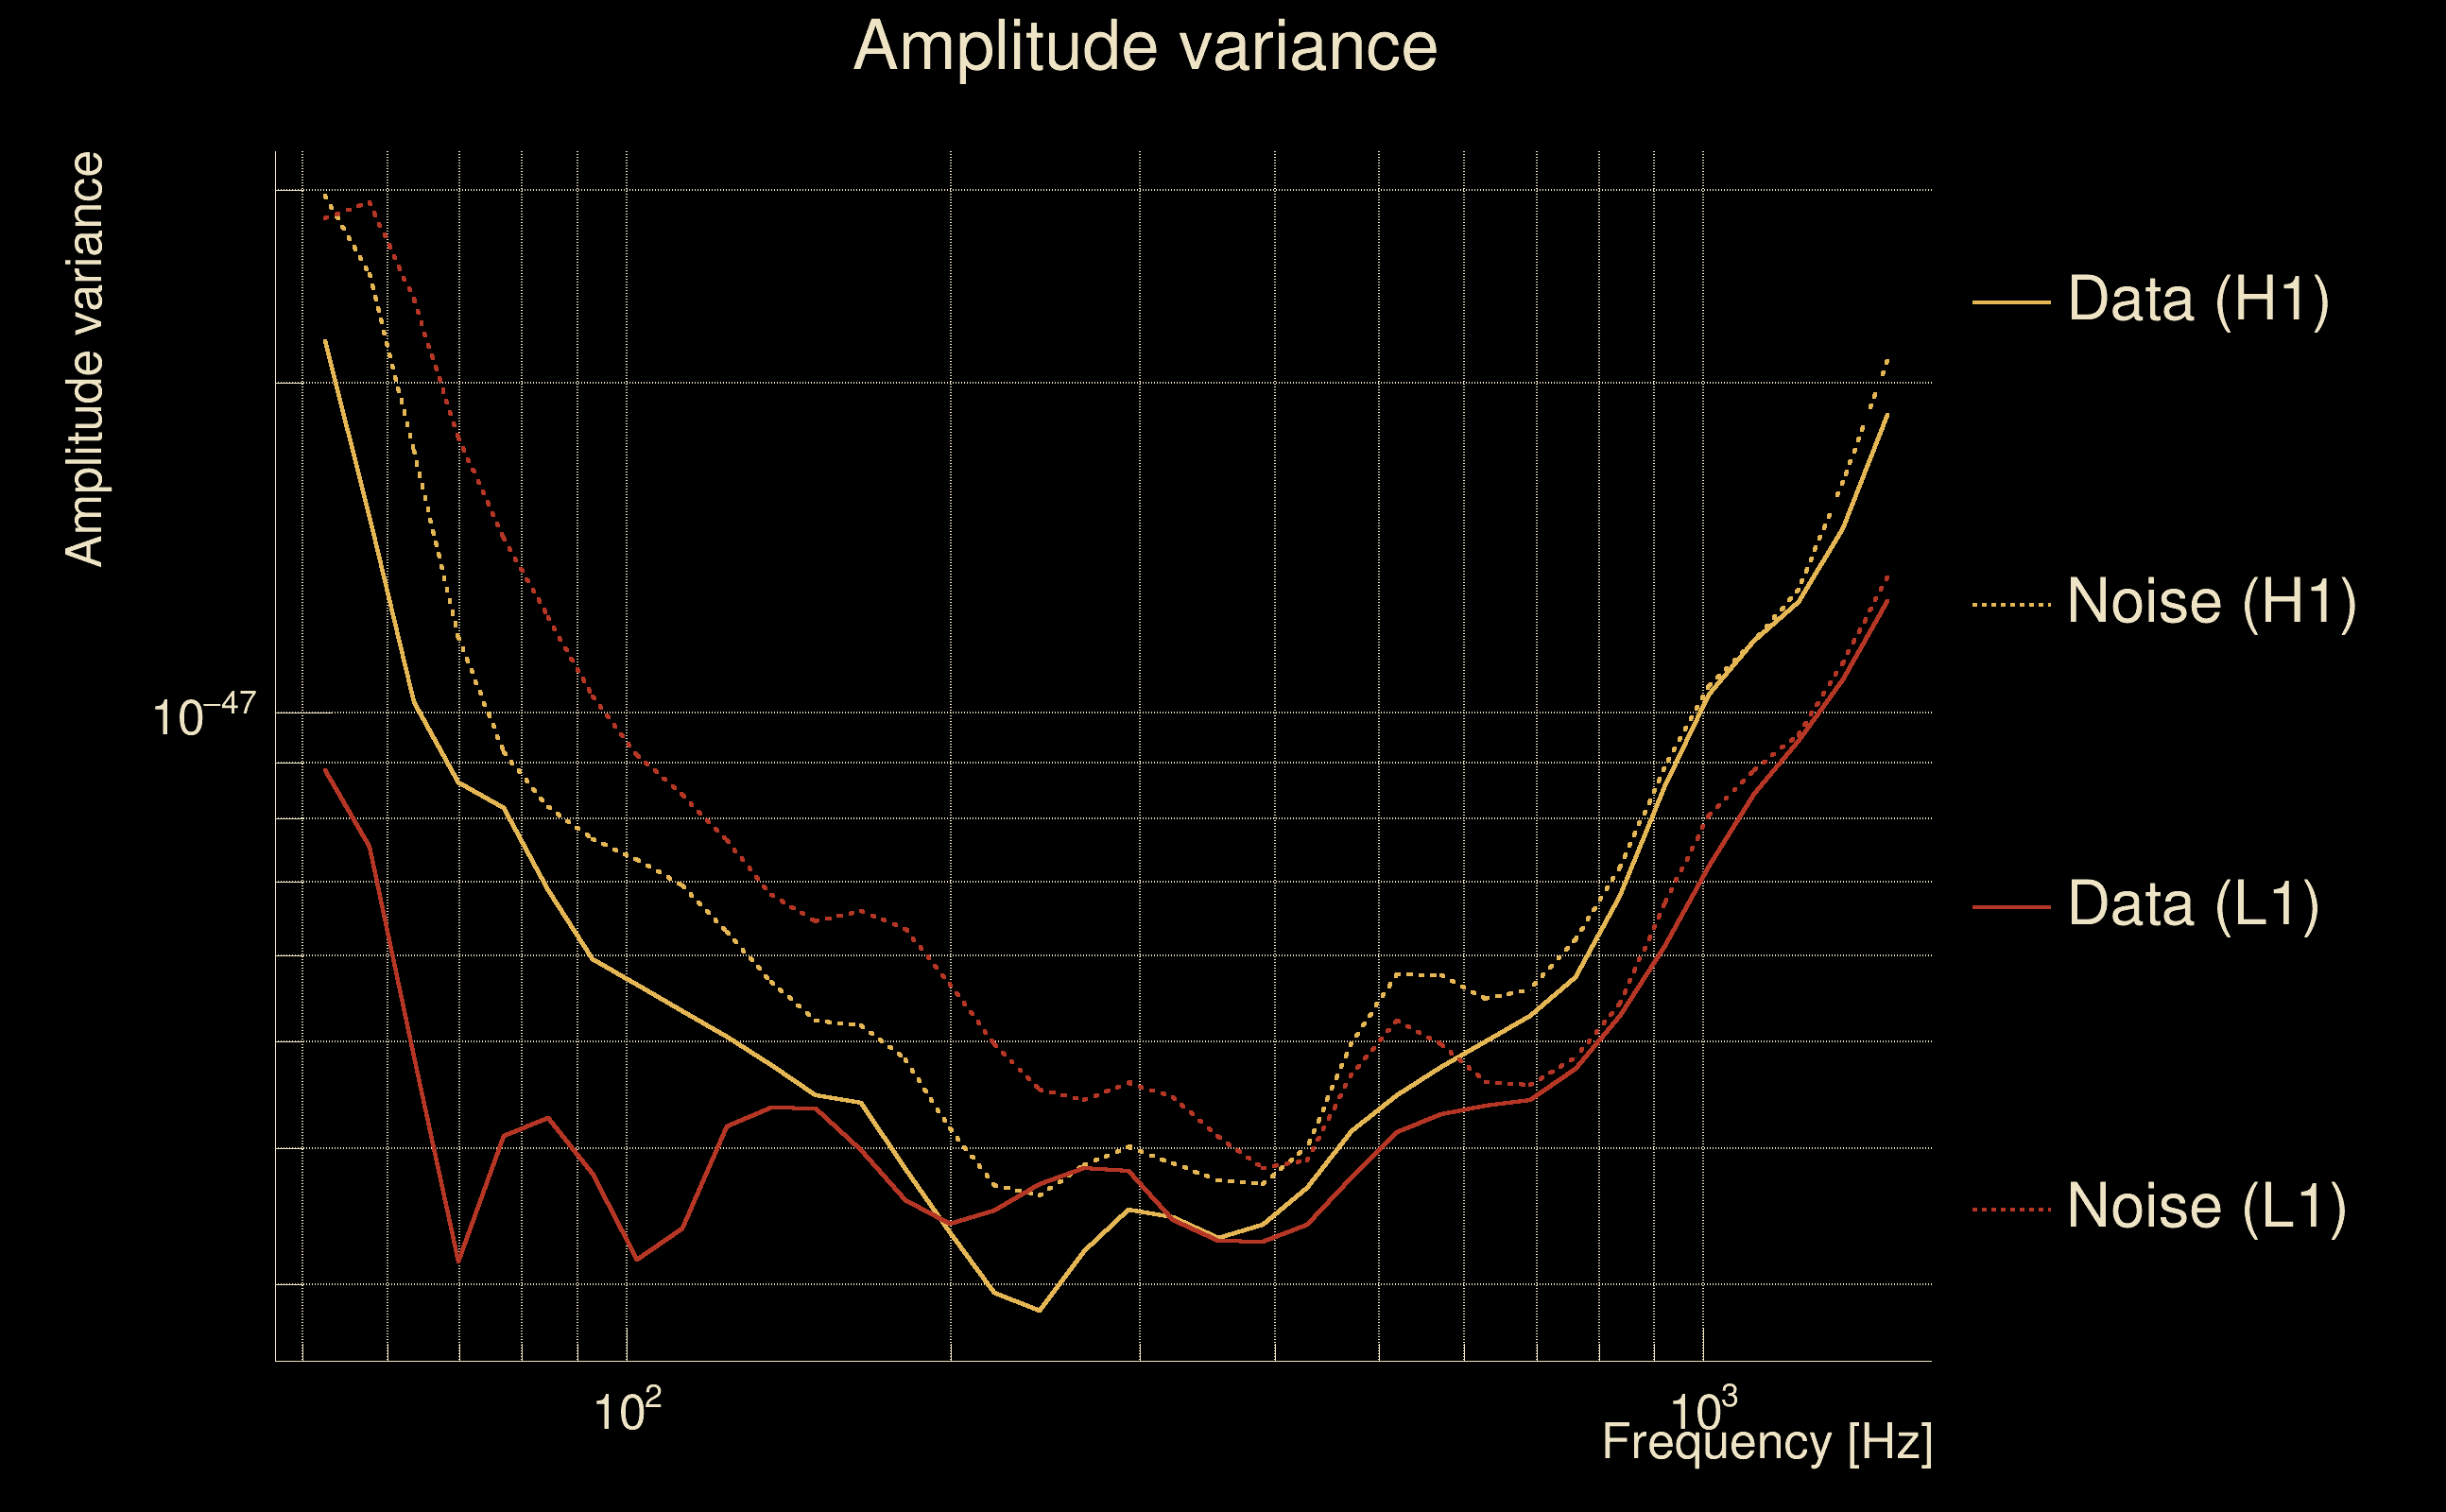
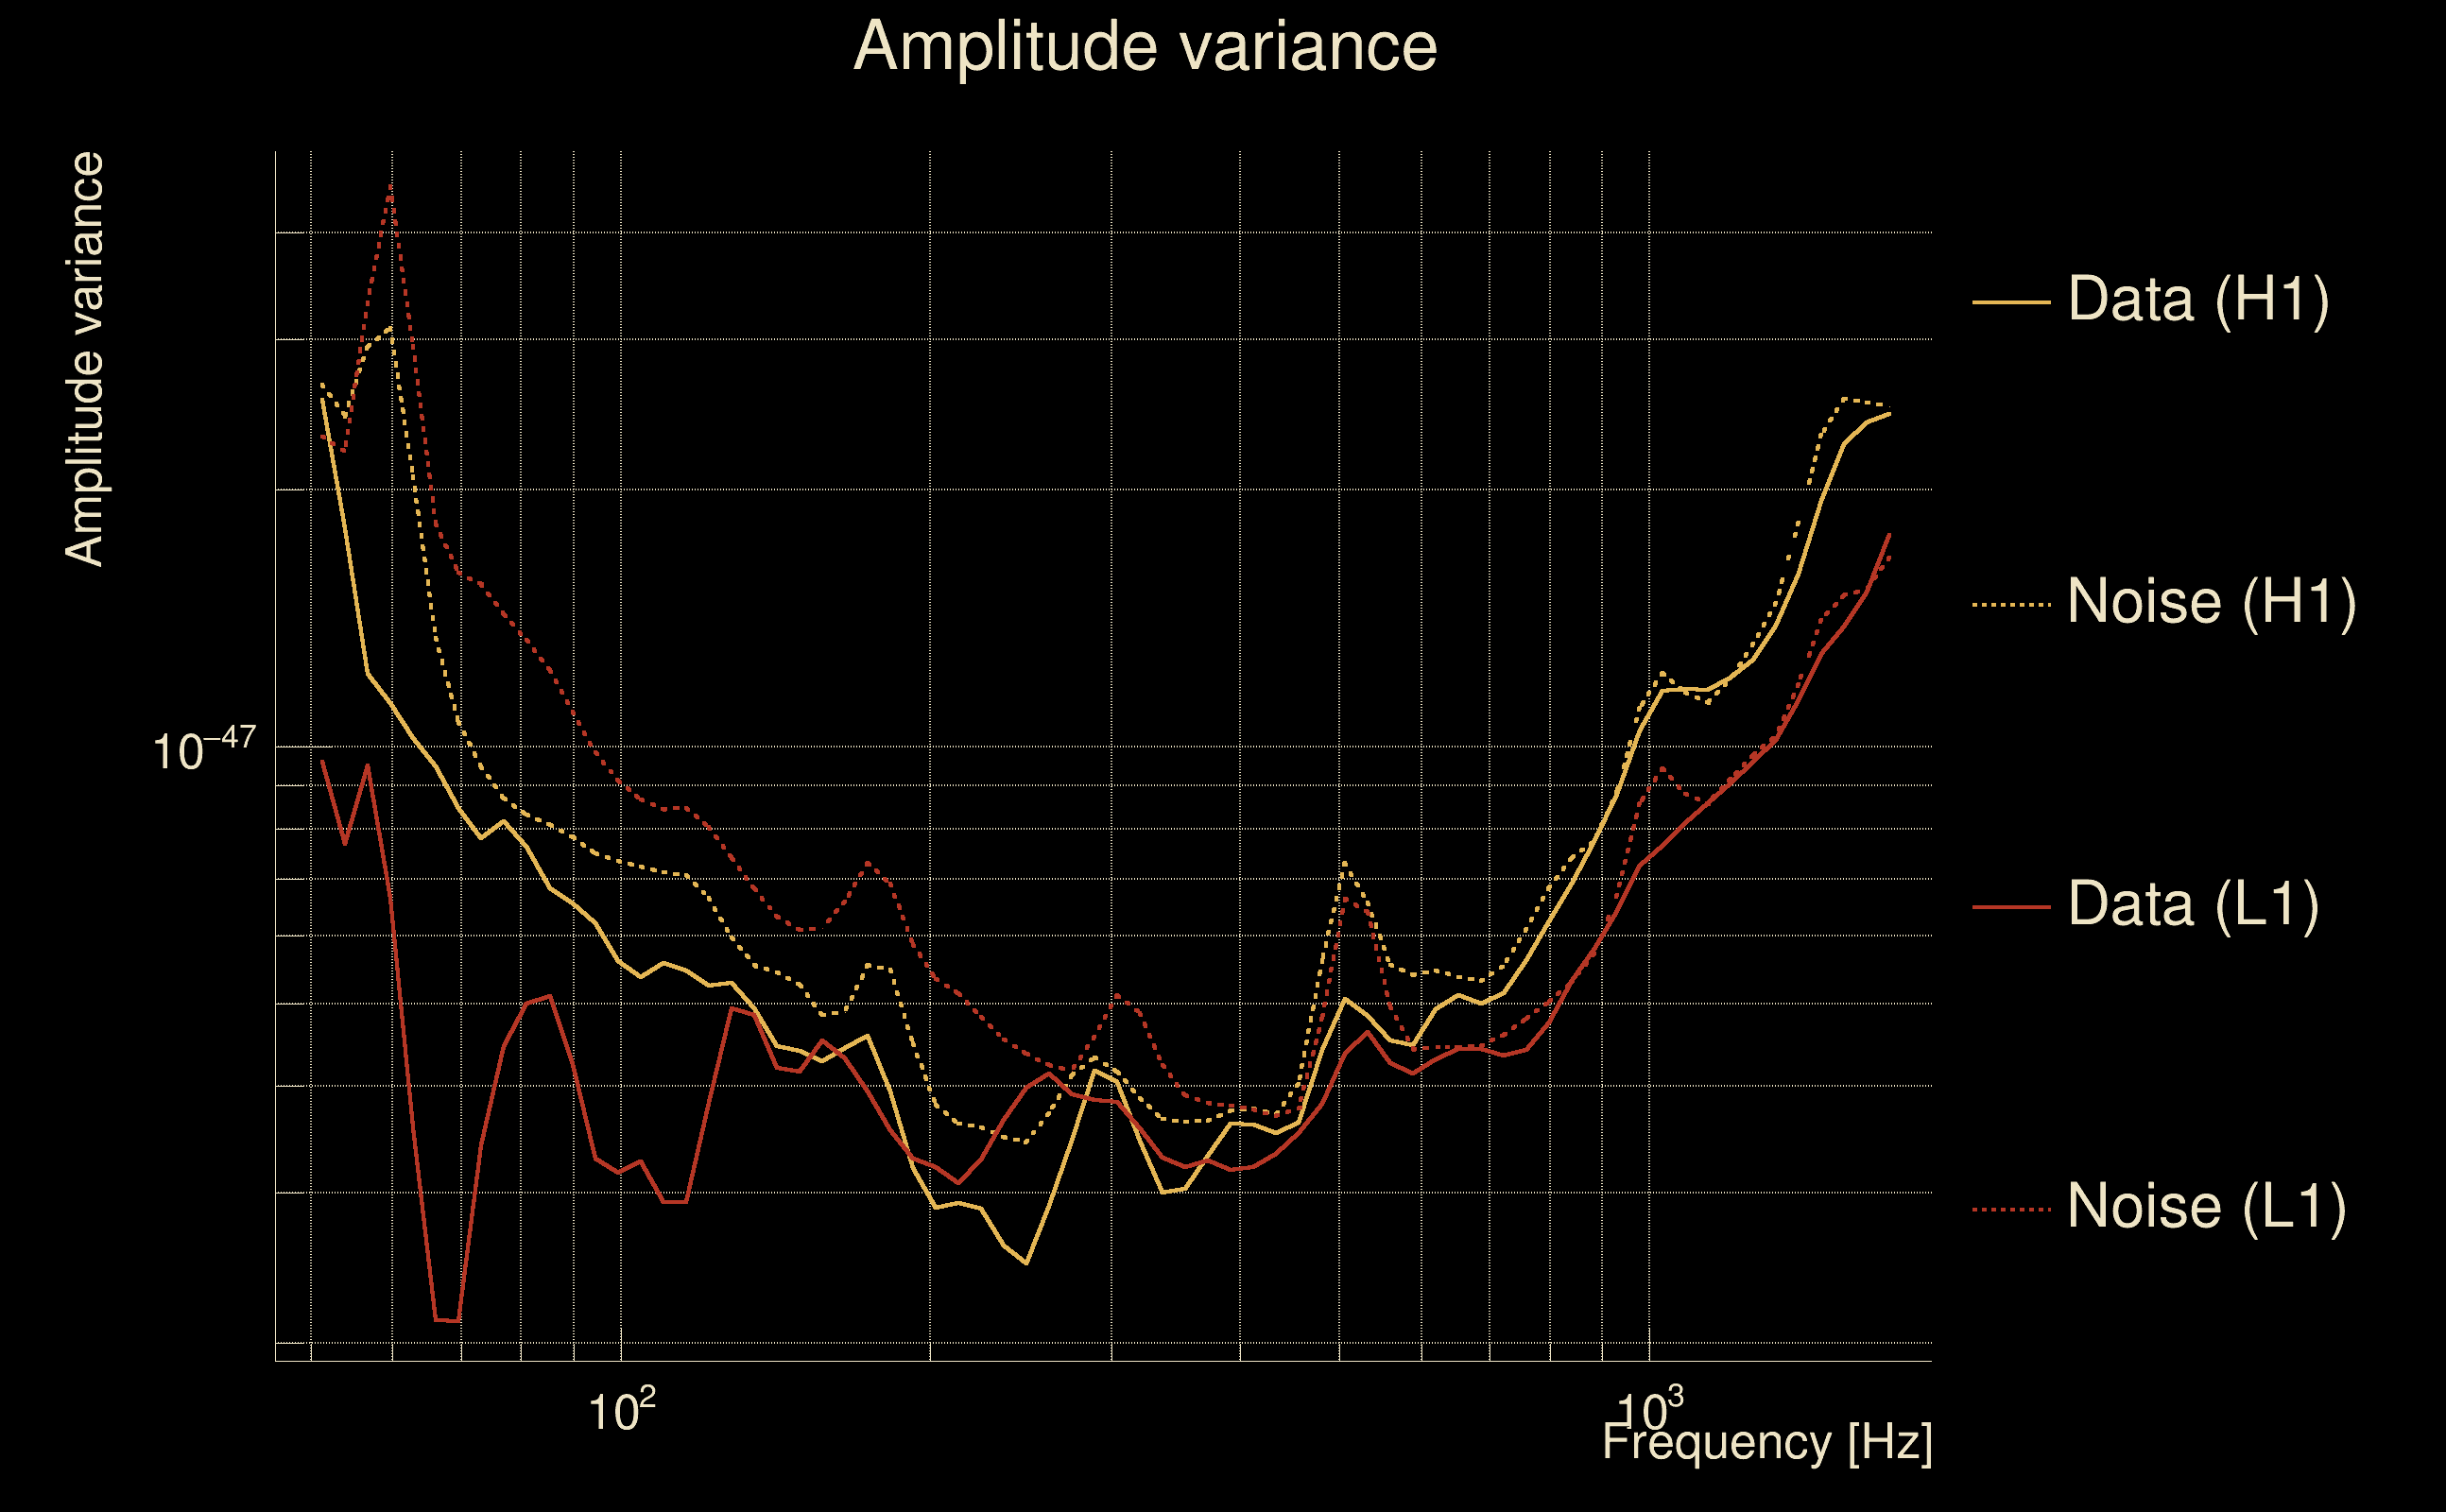
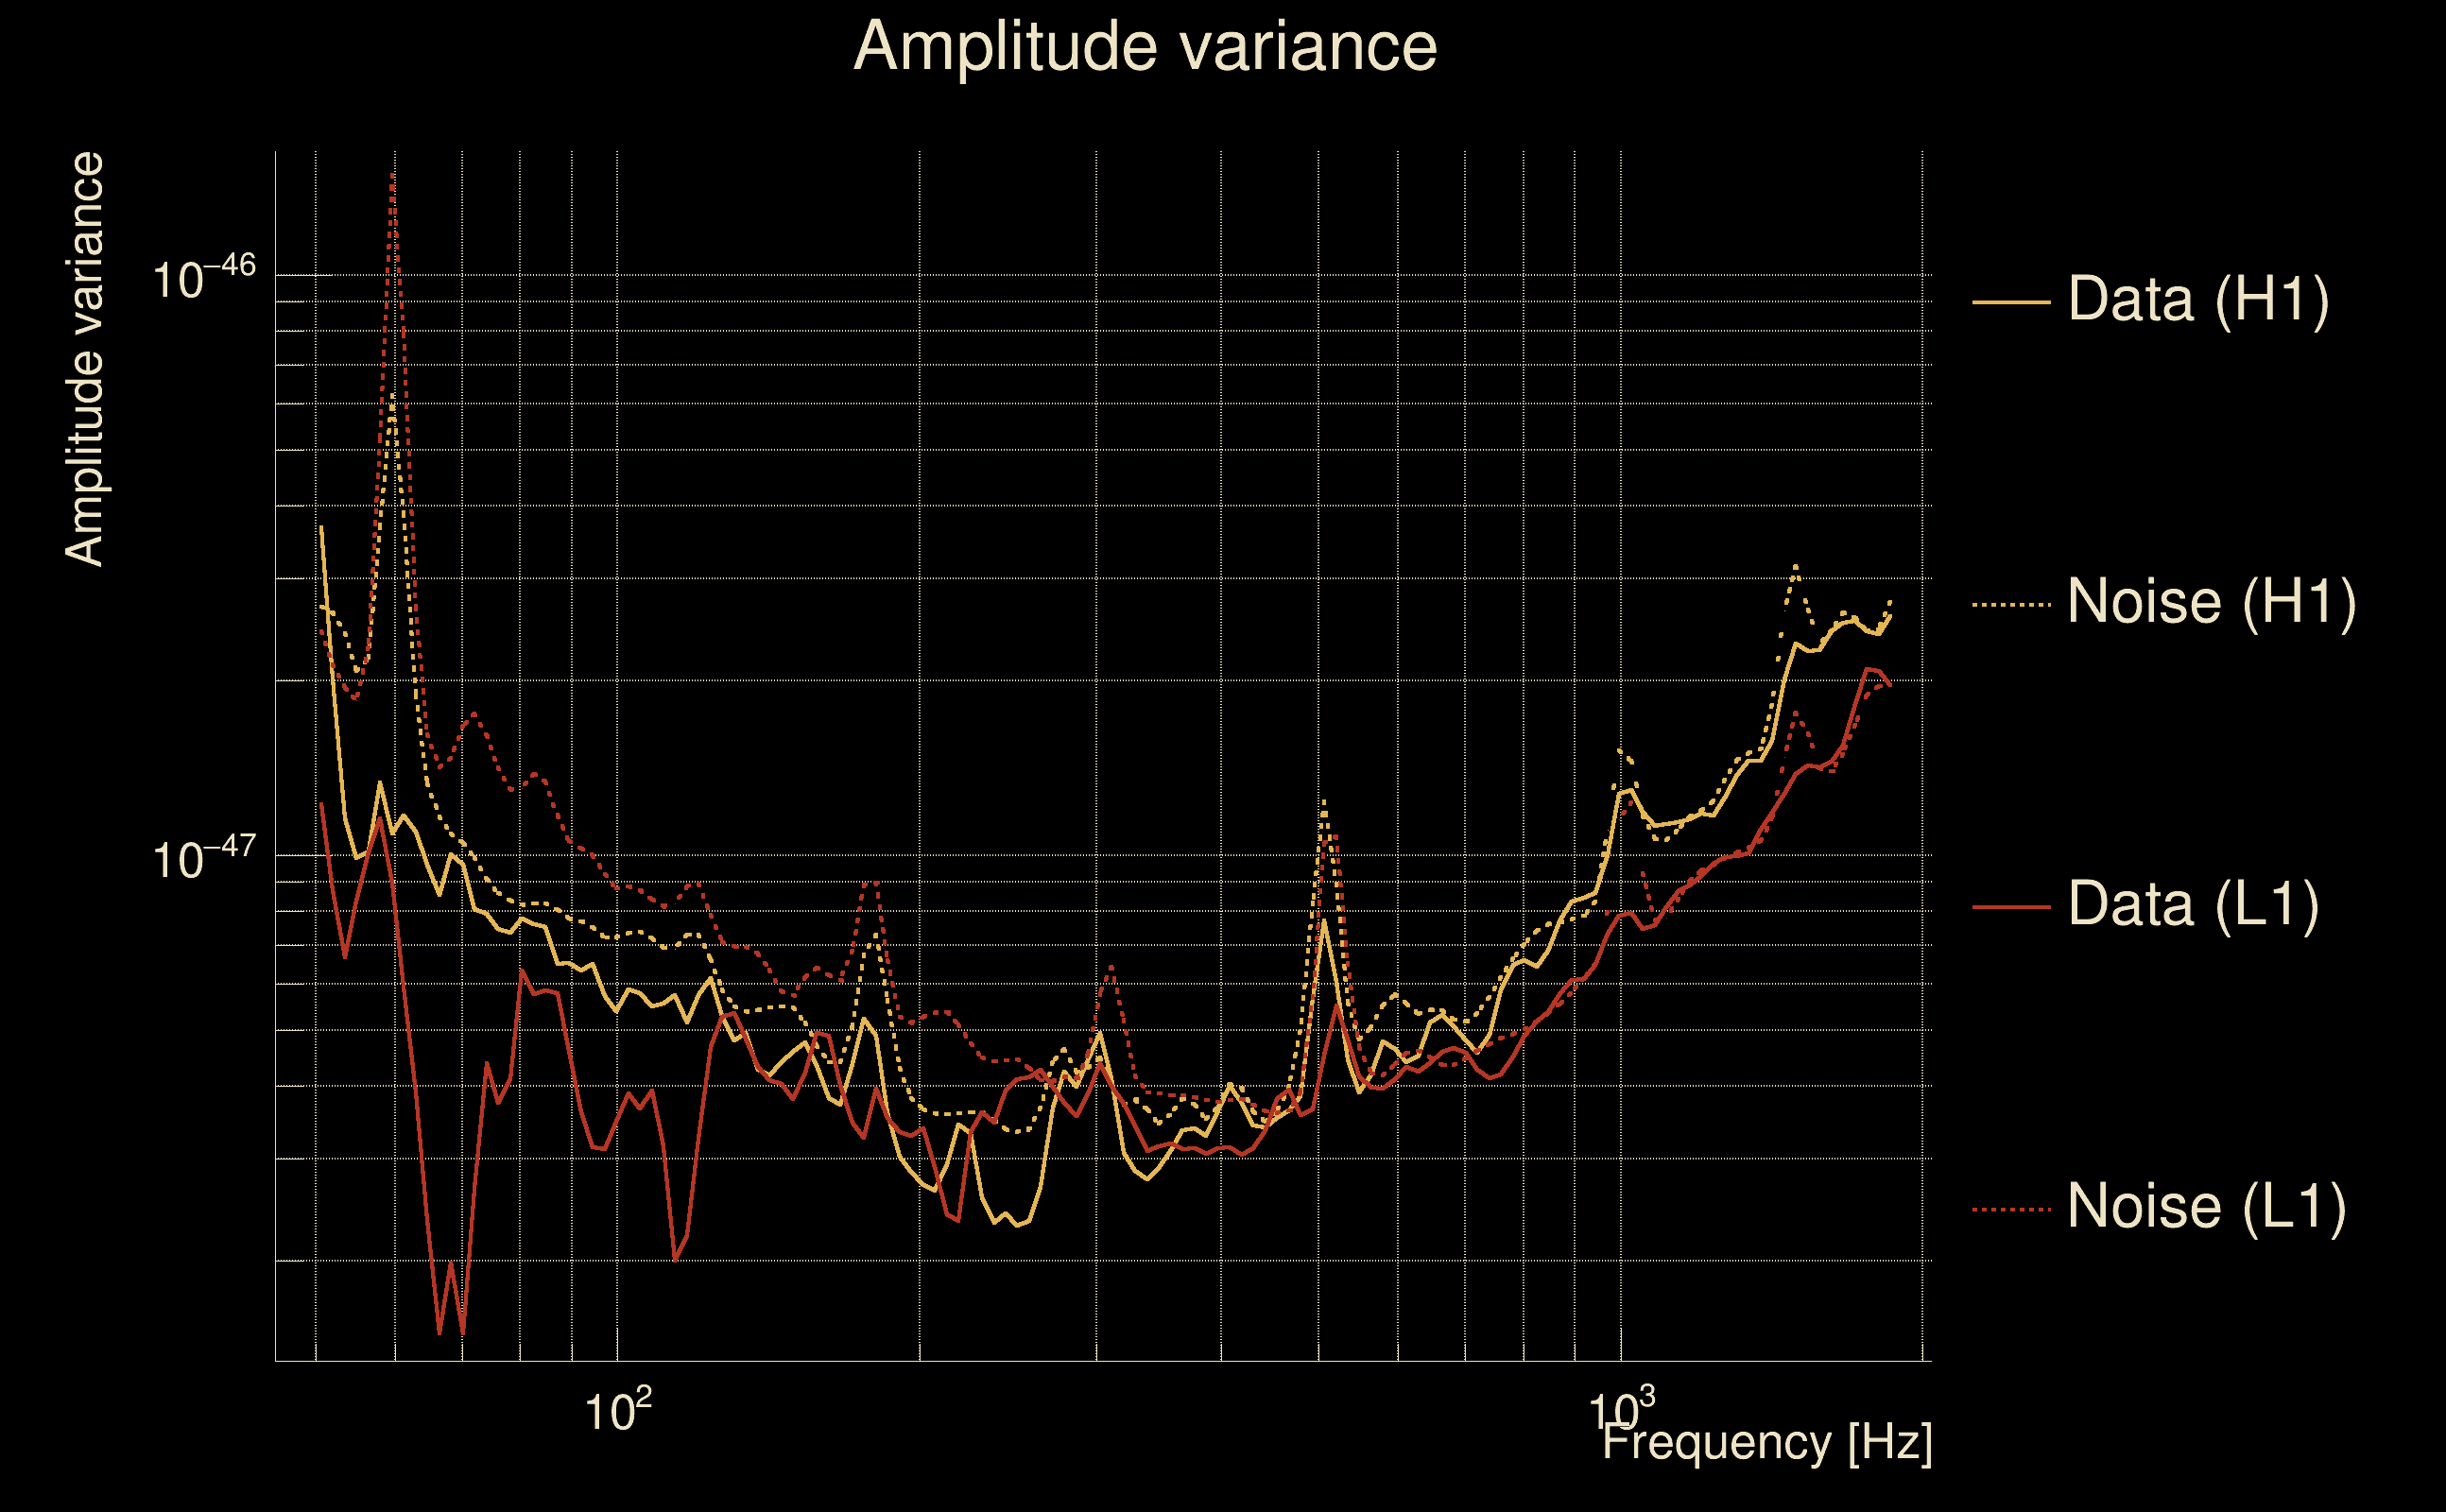
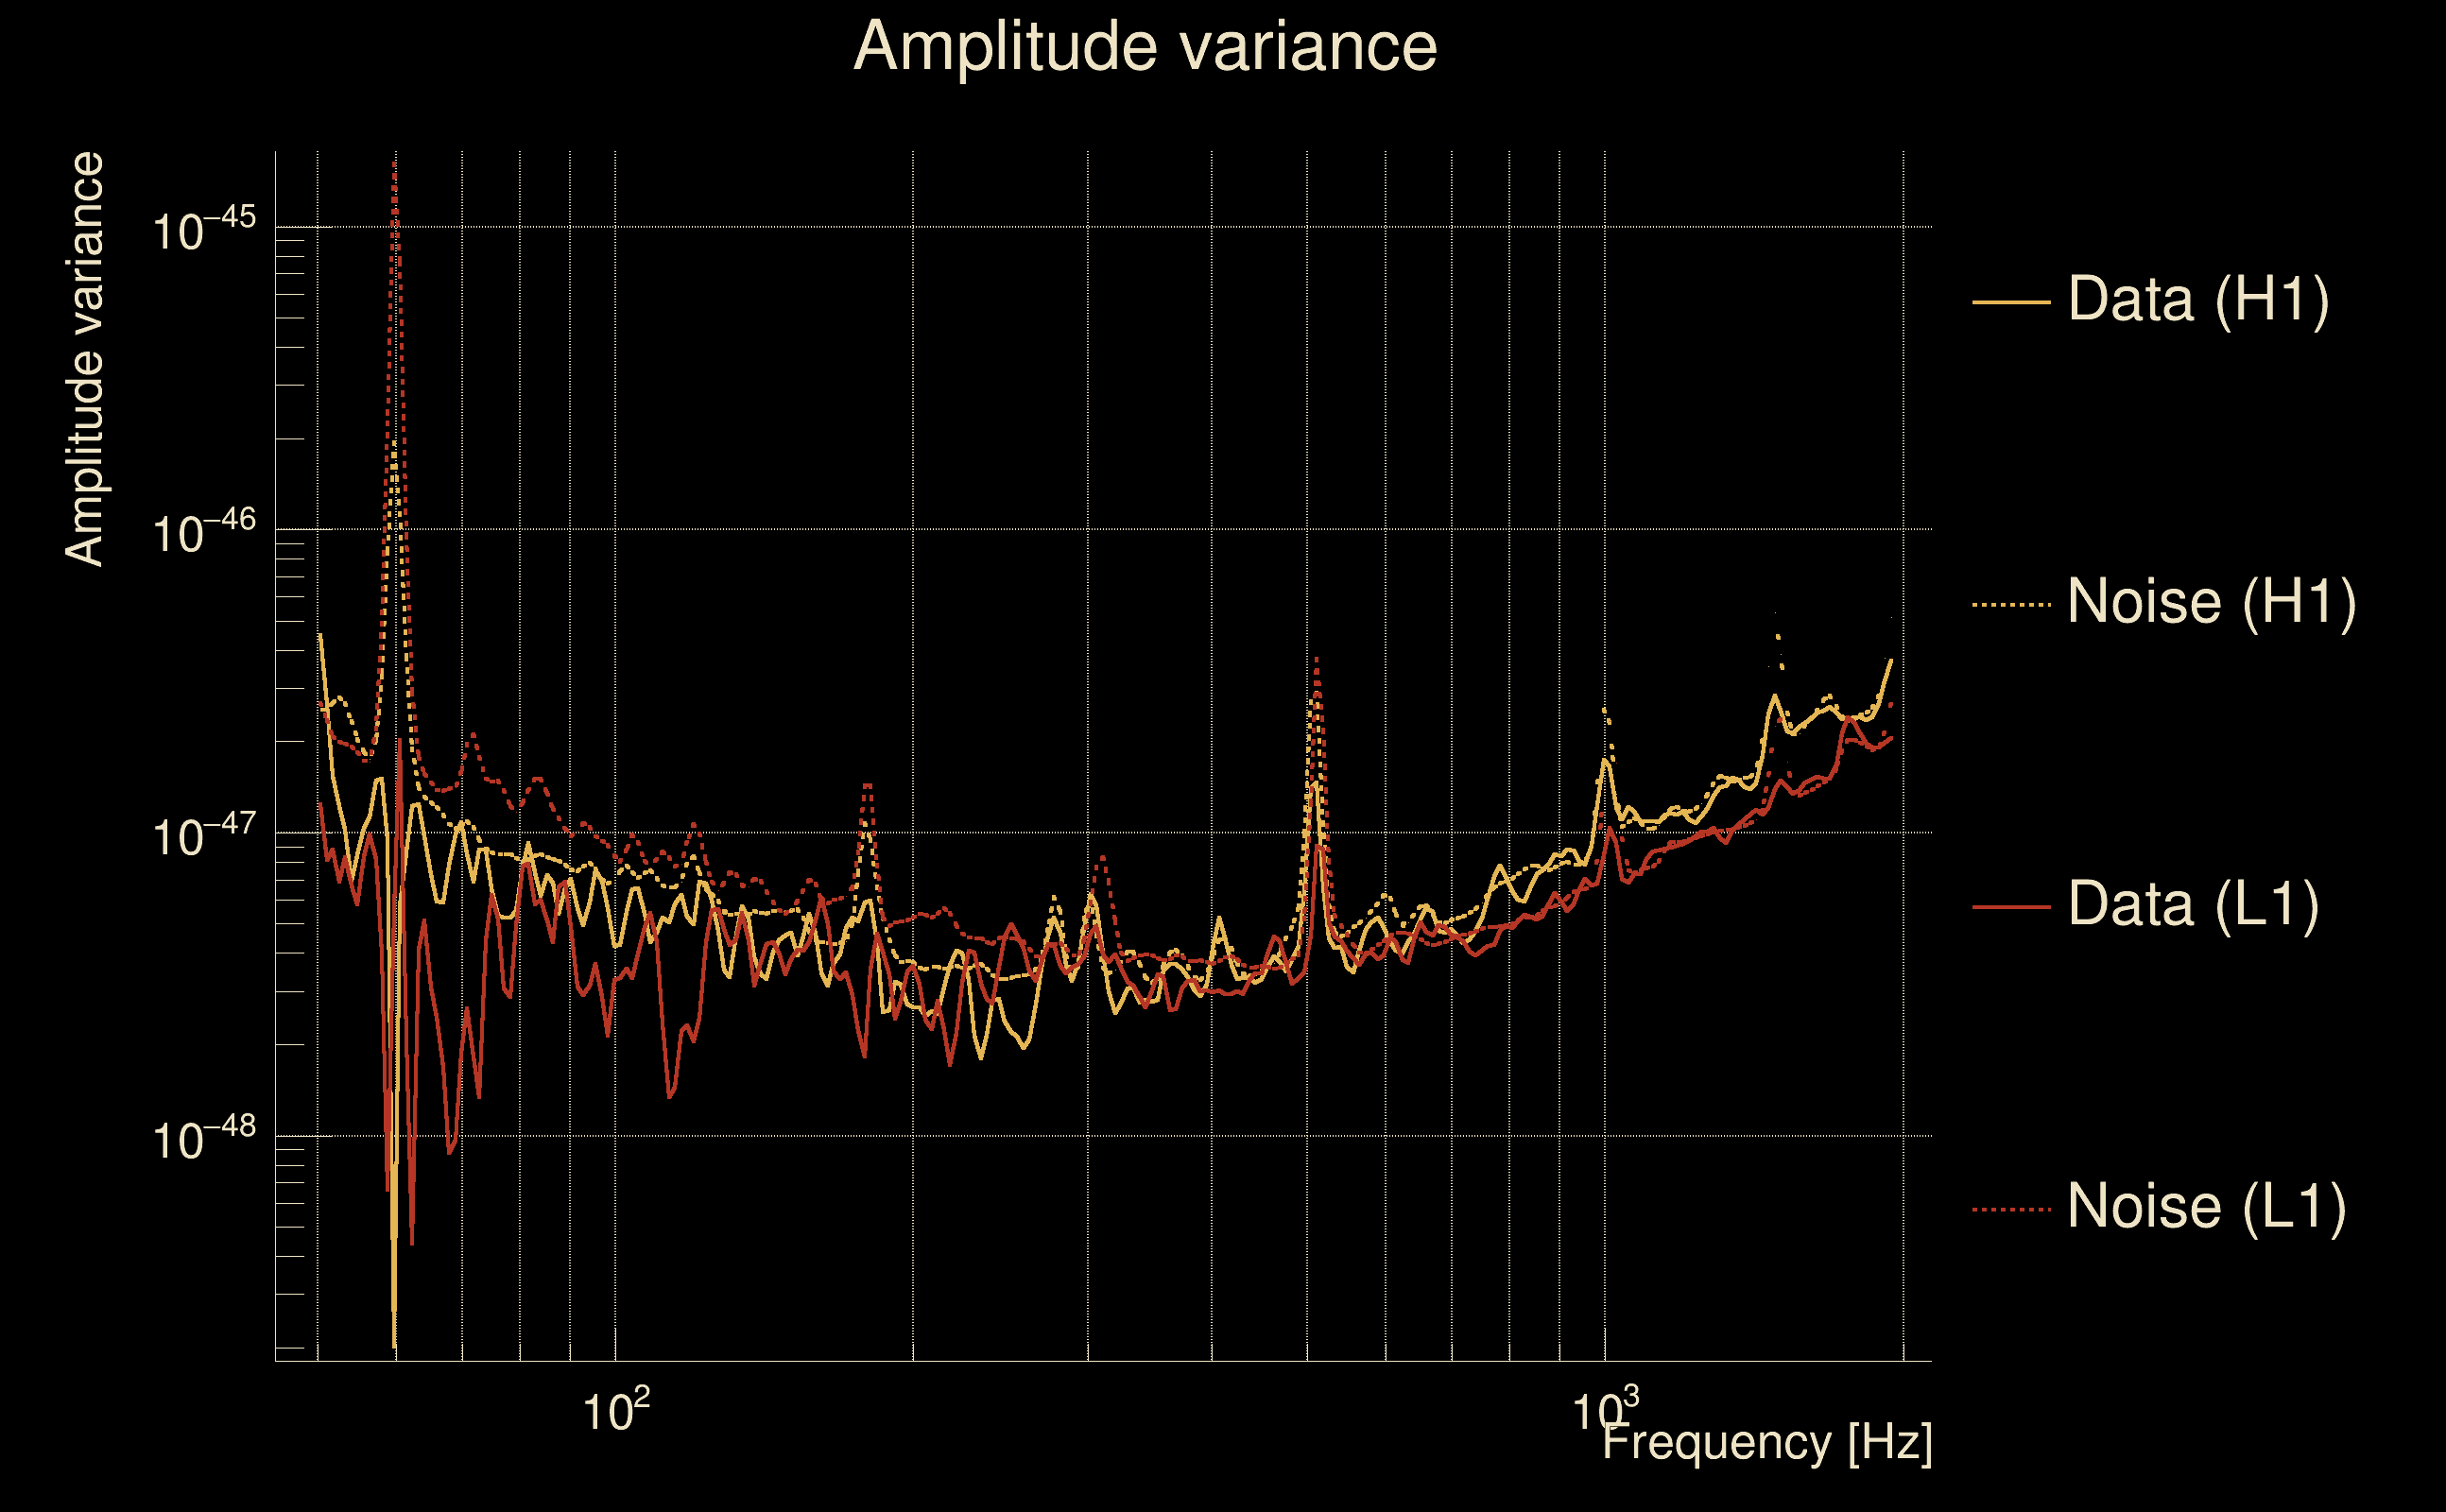
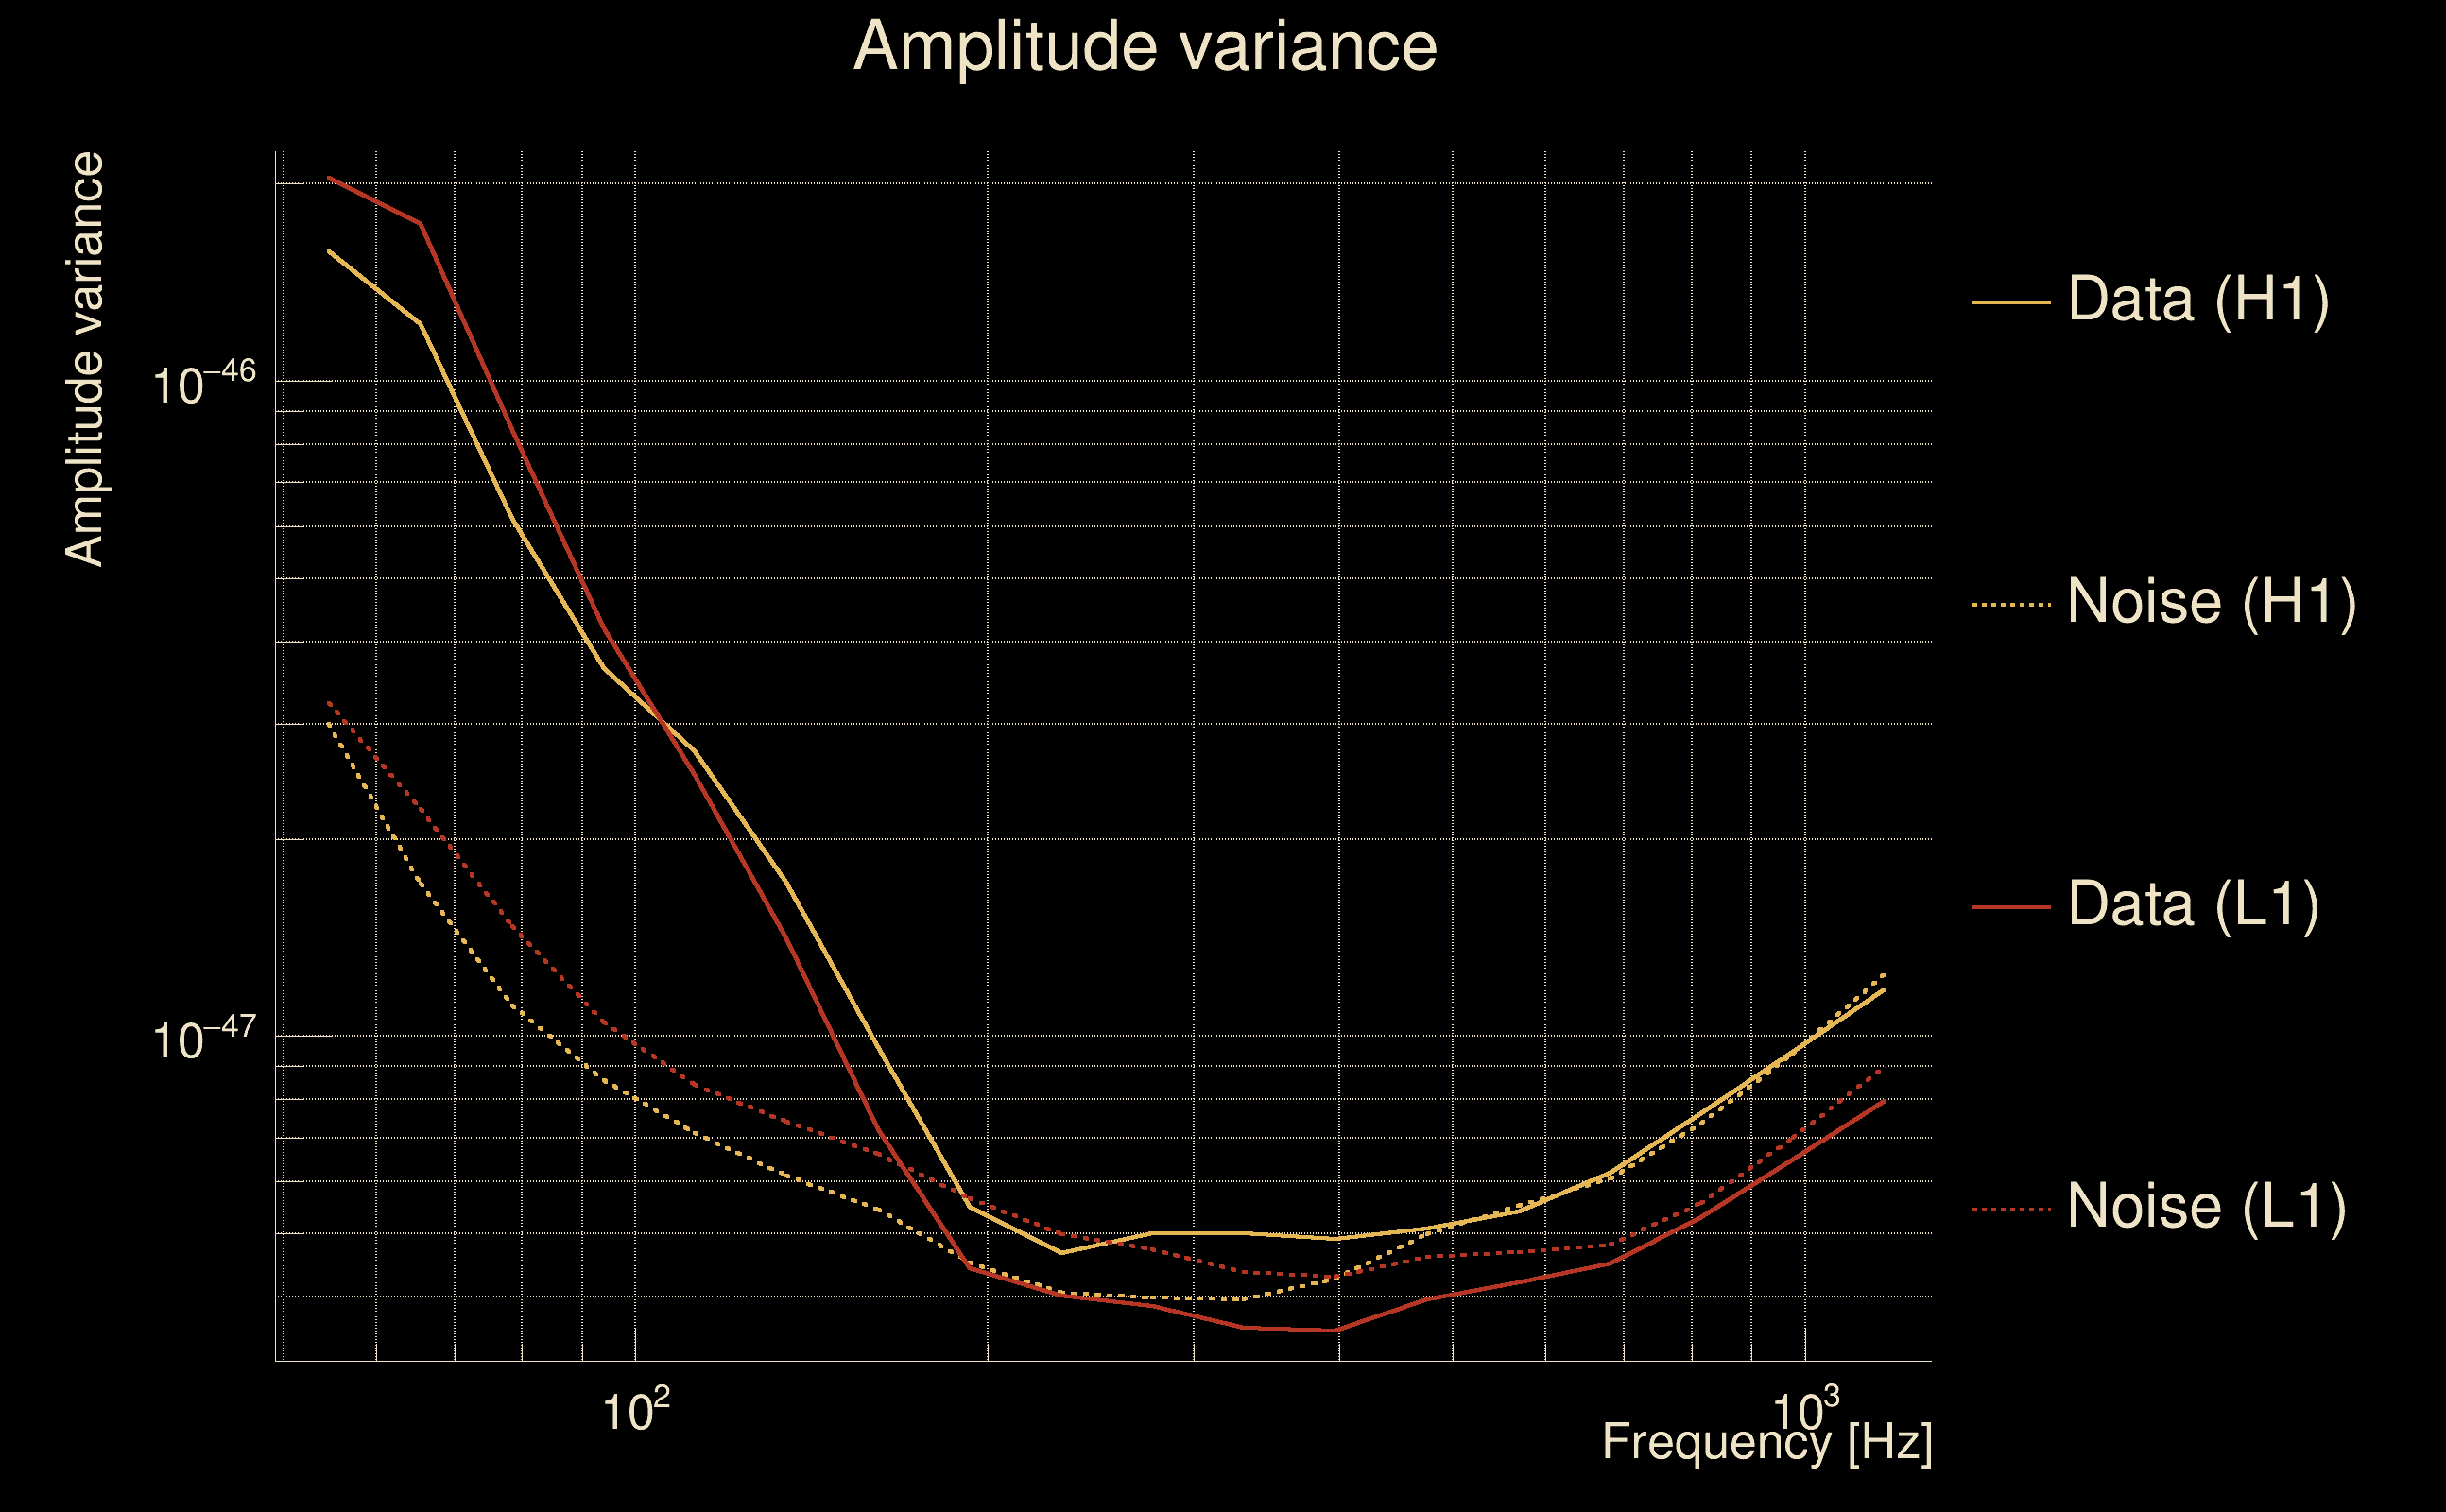
| Amplitude spectrograms: | normalization = 1e-22, power index = 2 |
| White noise SNR variance: | 0.523175 (after applying a correction factor = 1) |
| Amplitude ratio confidence level: | 3 sigma |
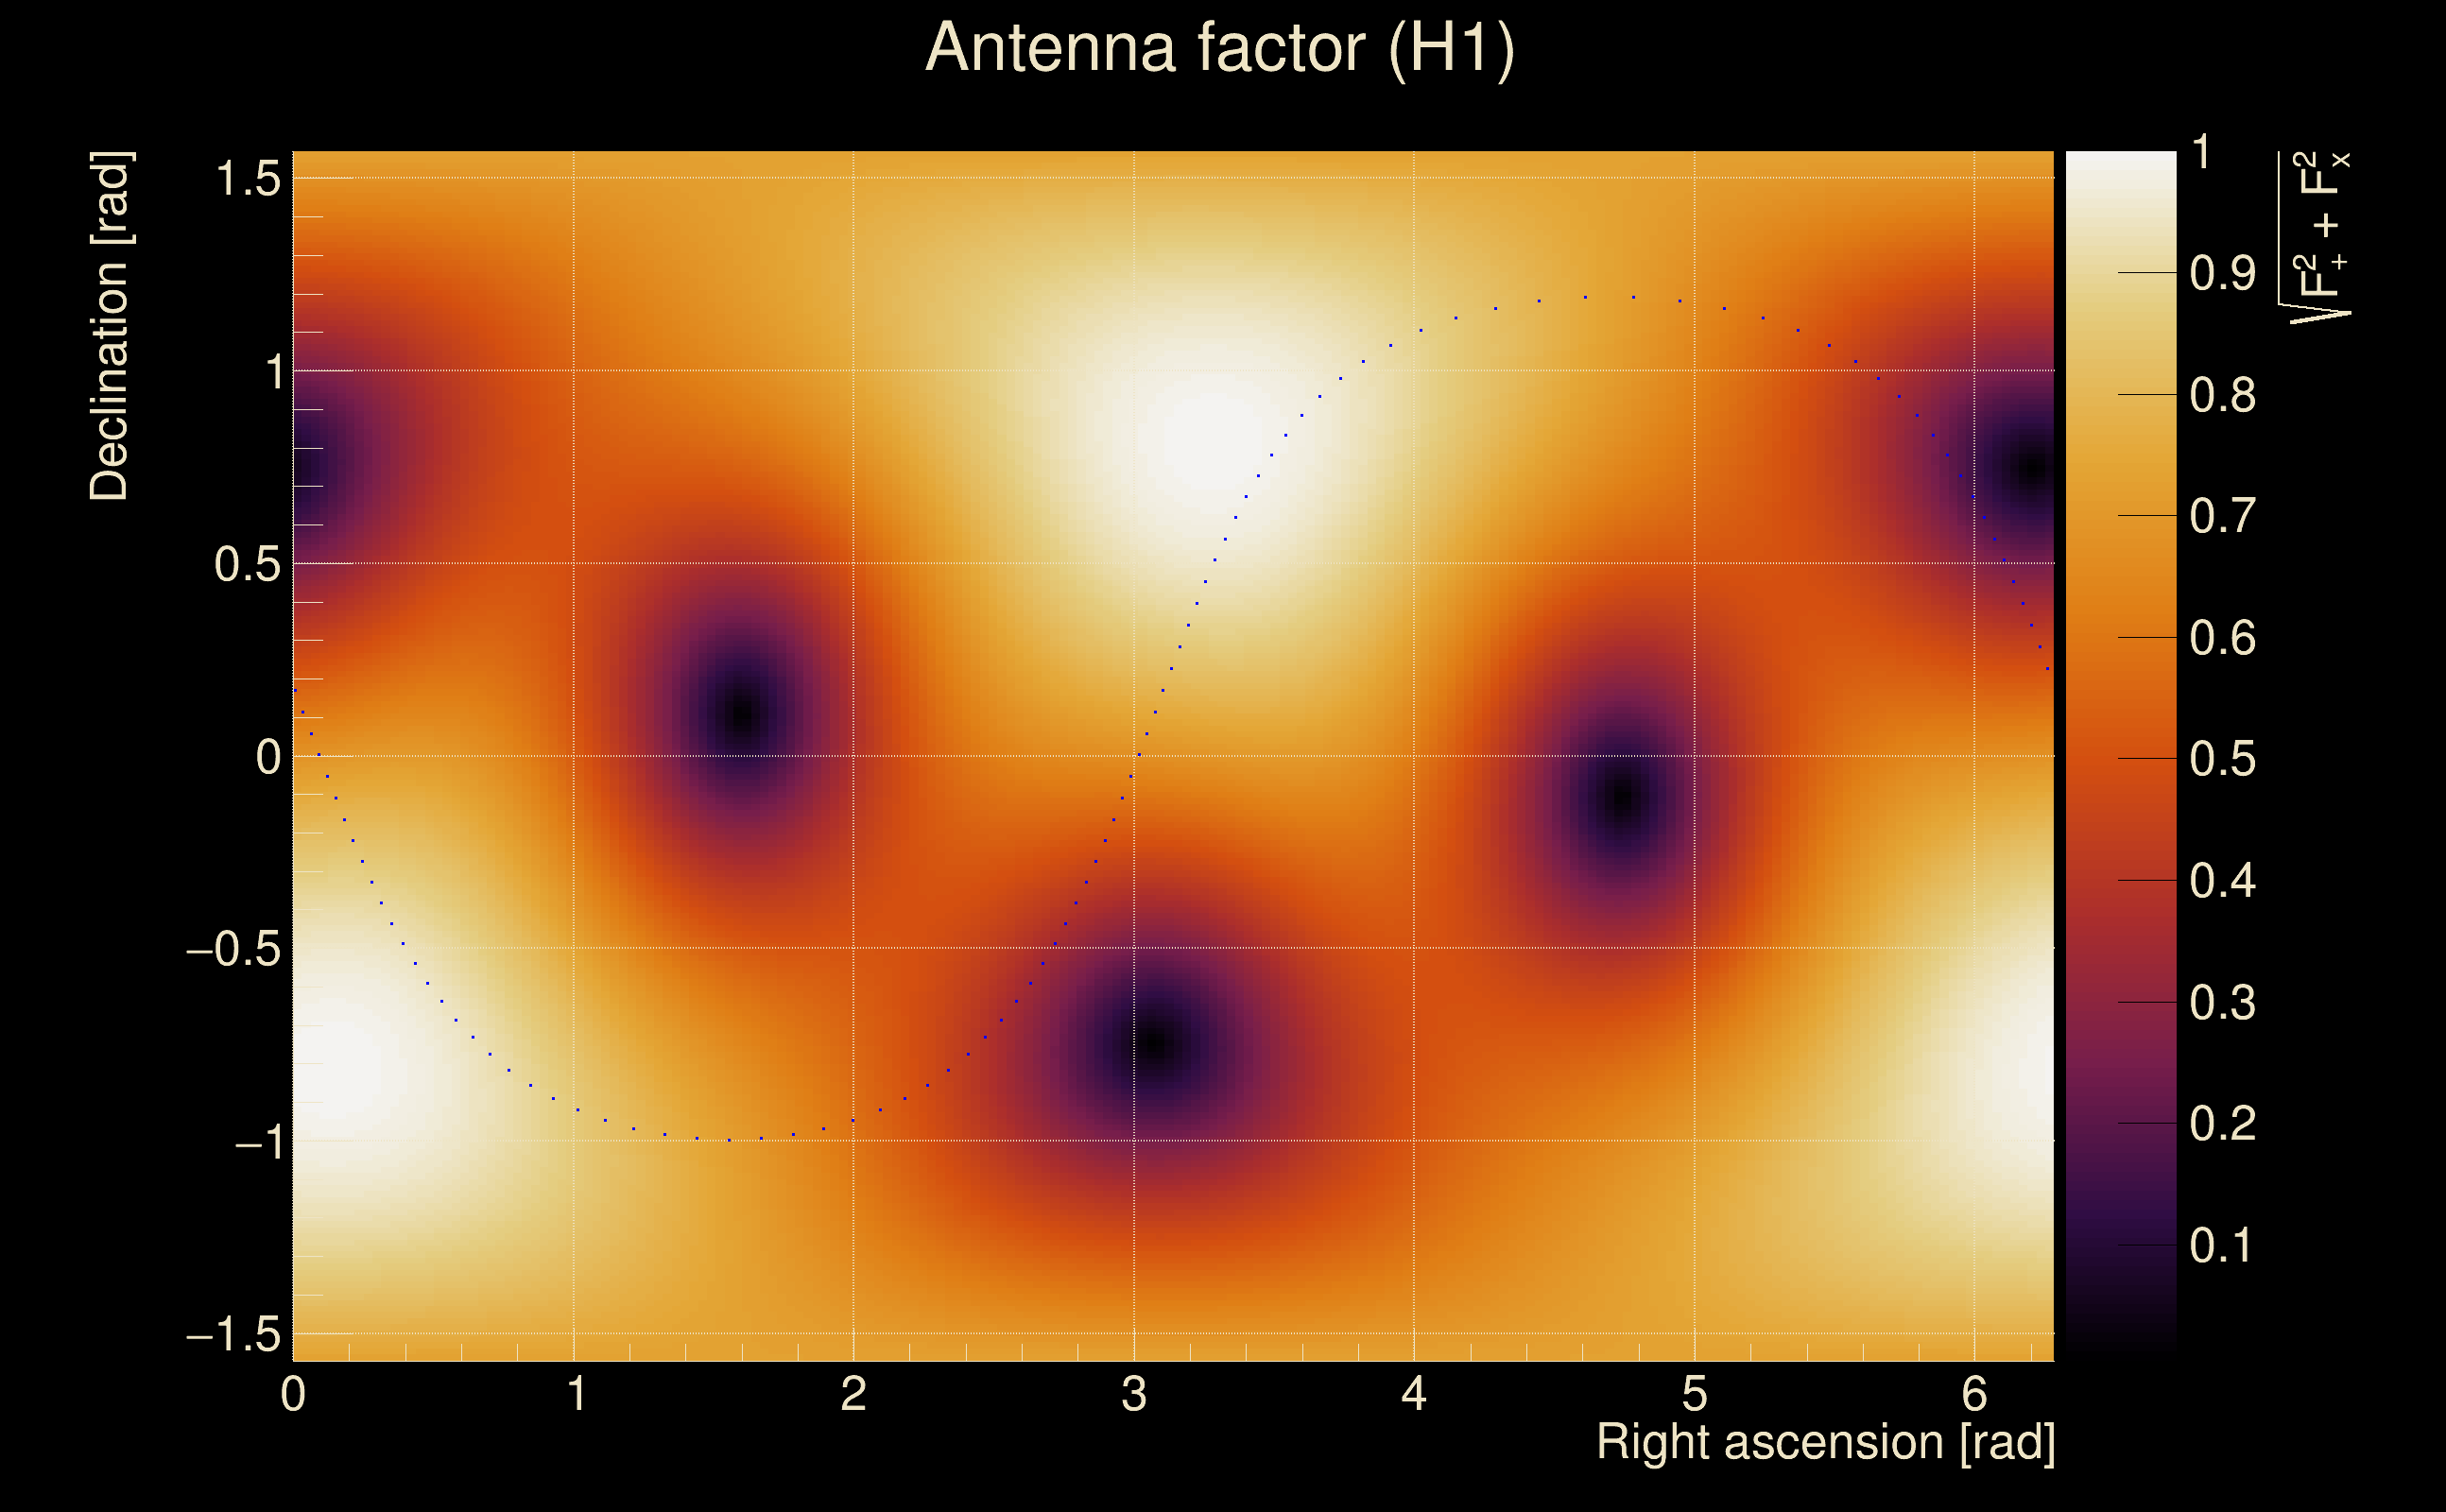
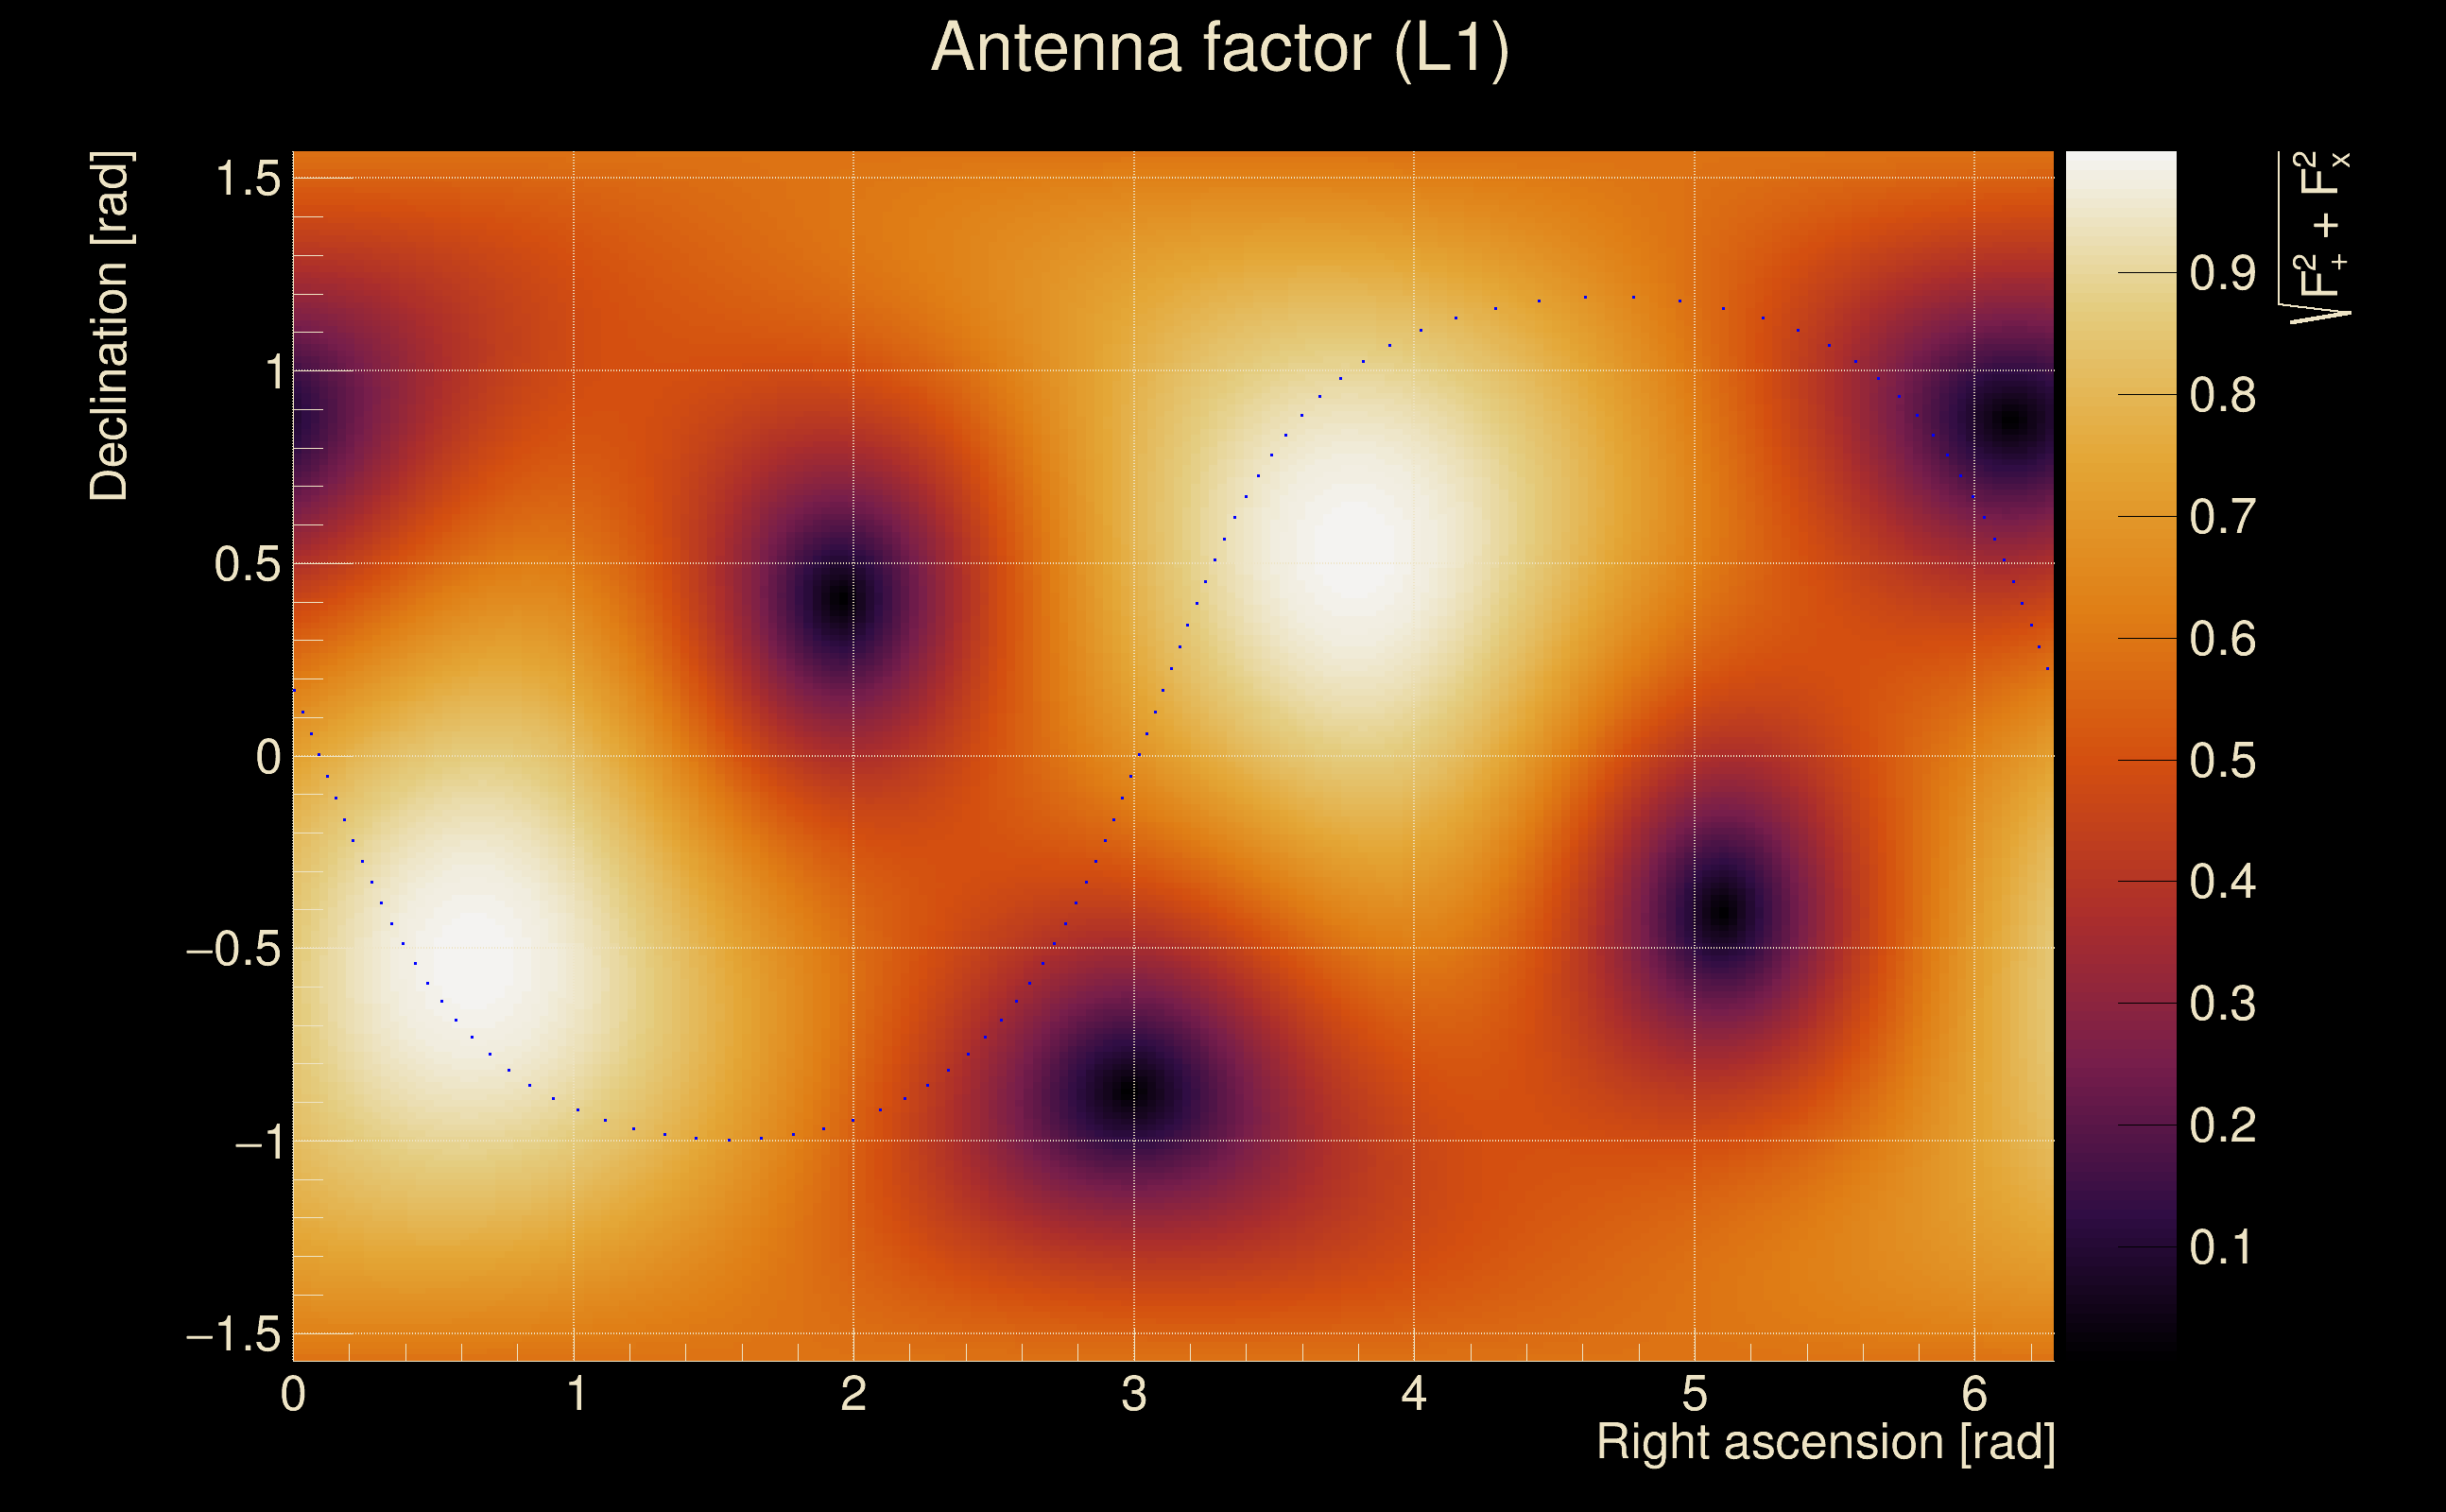
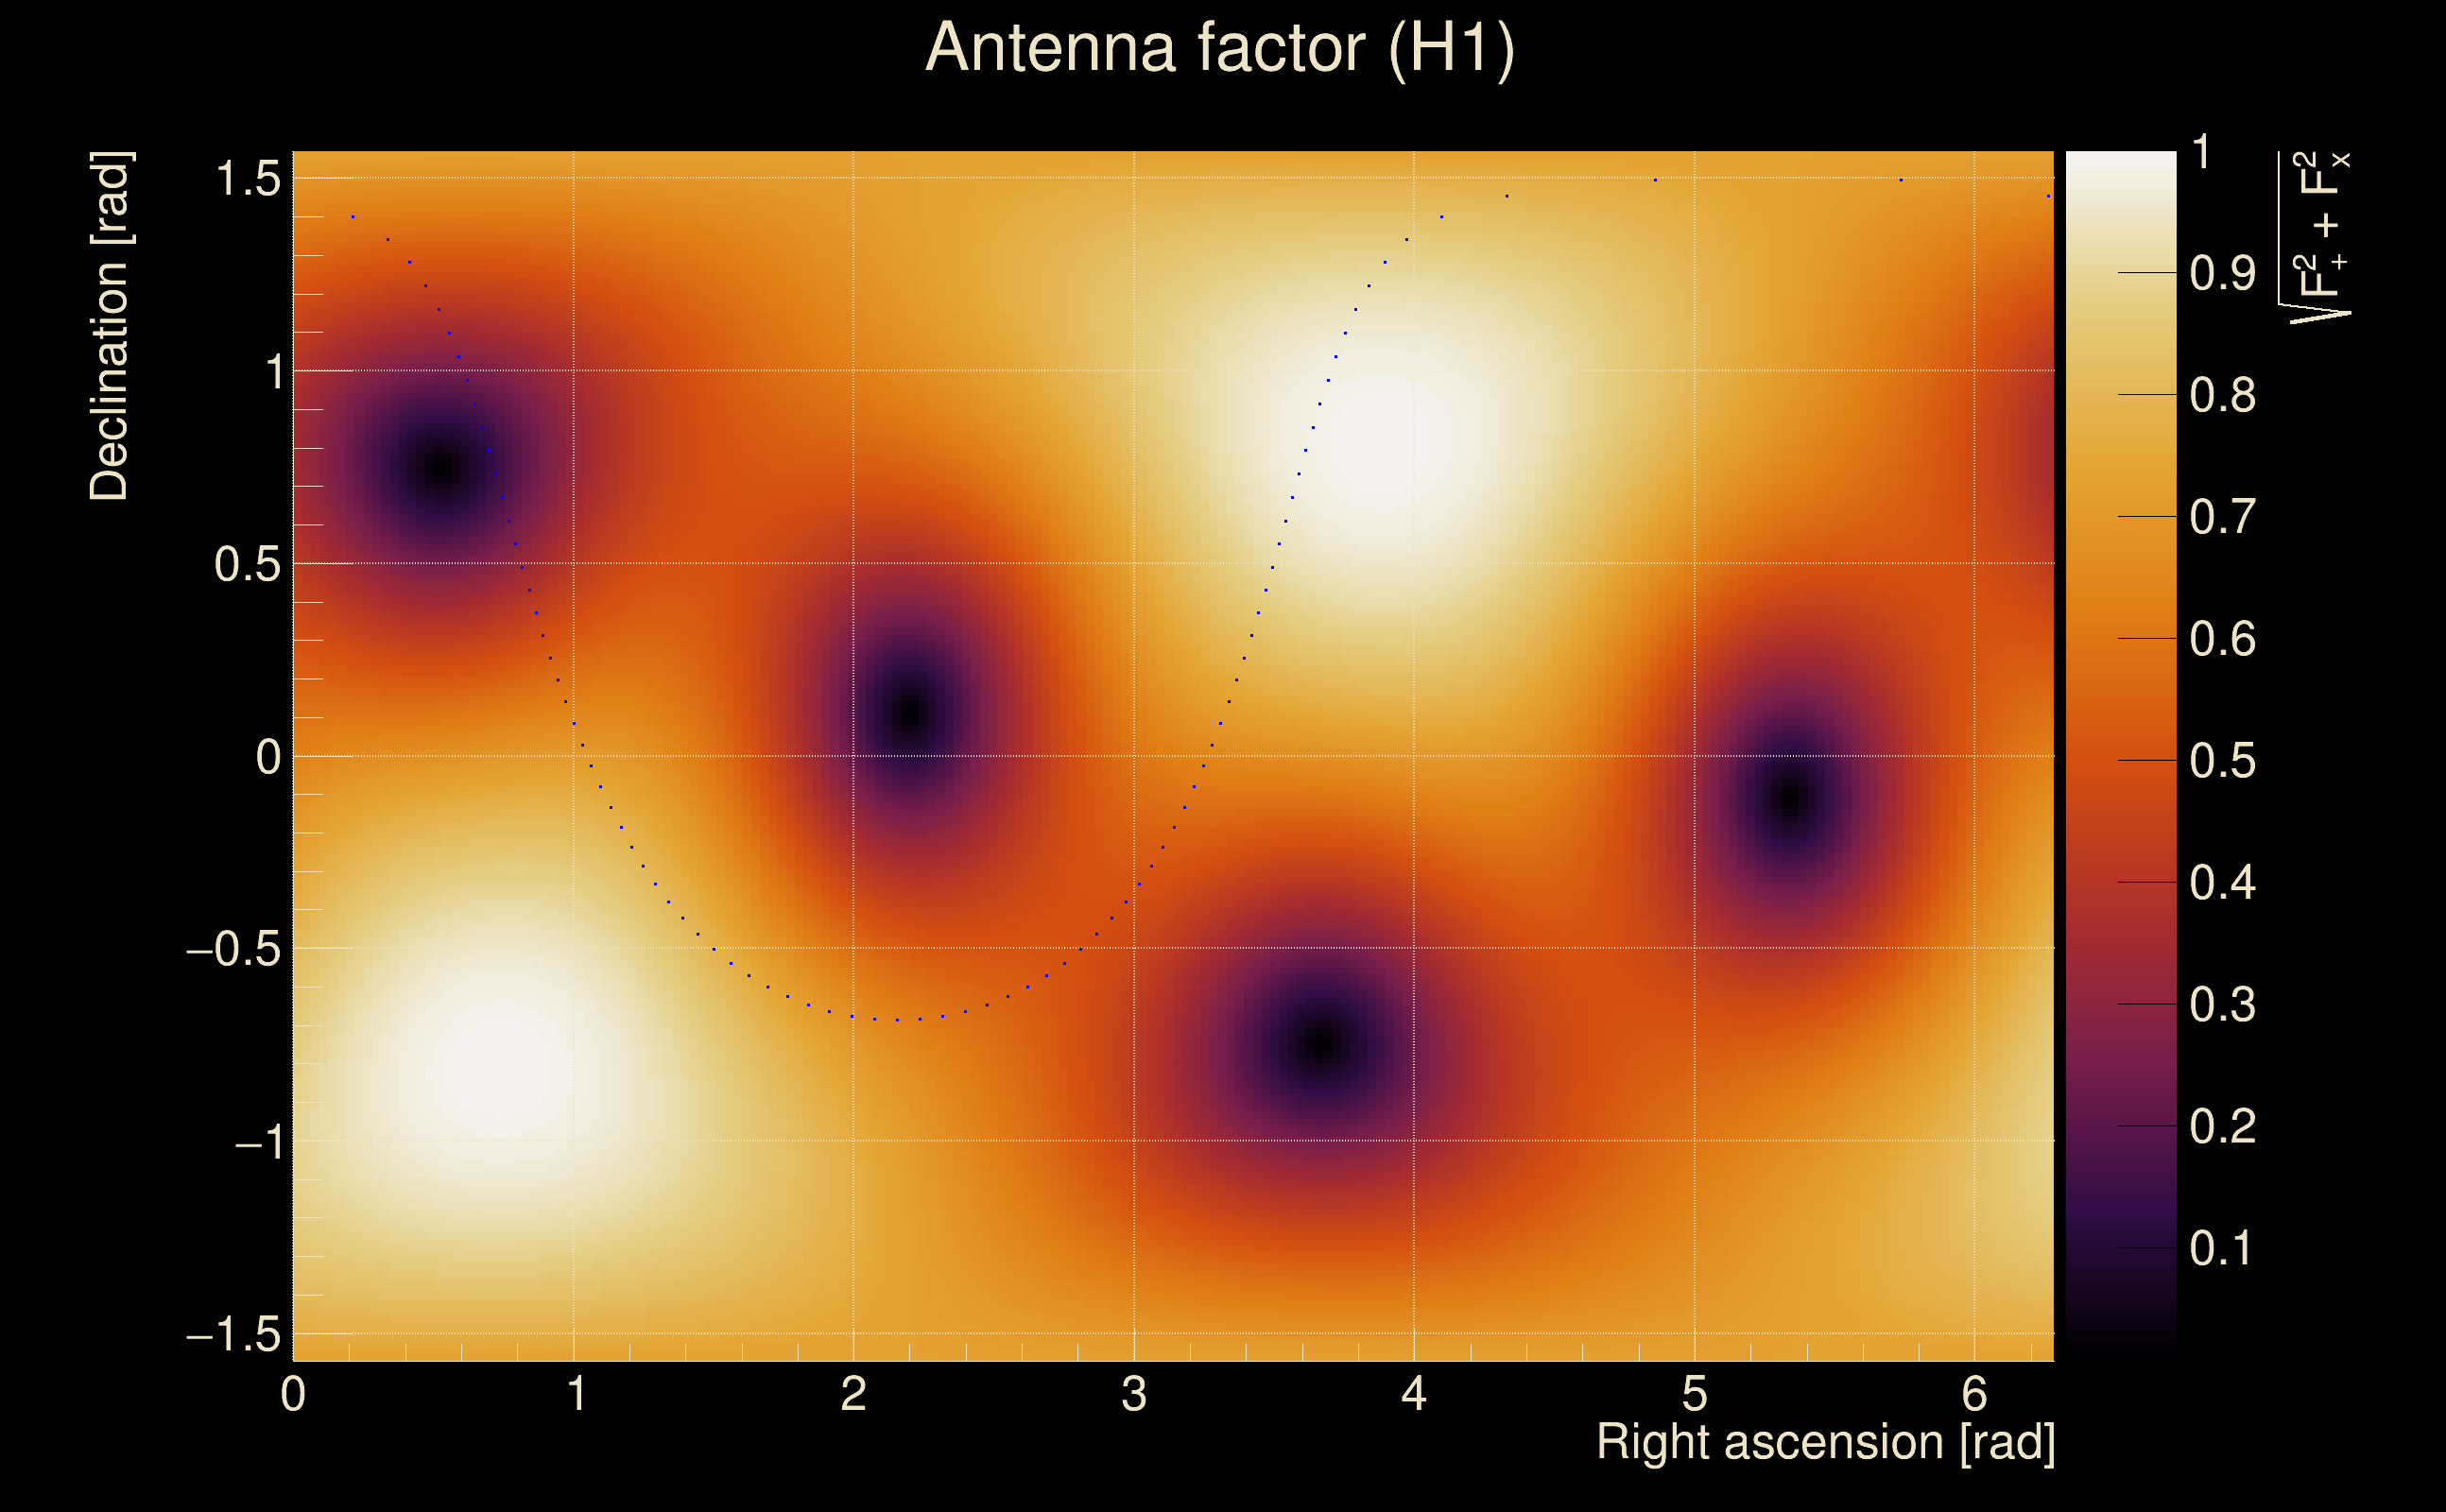
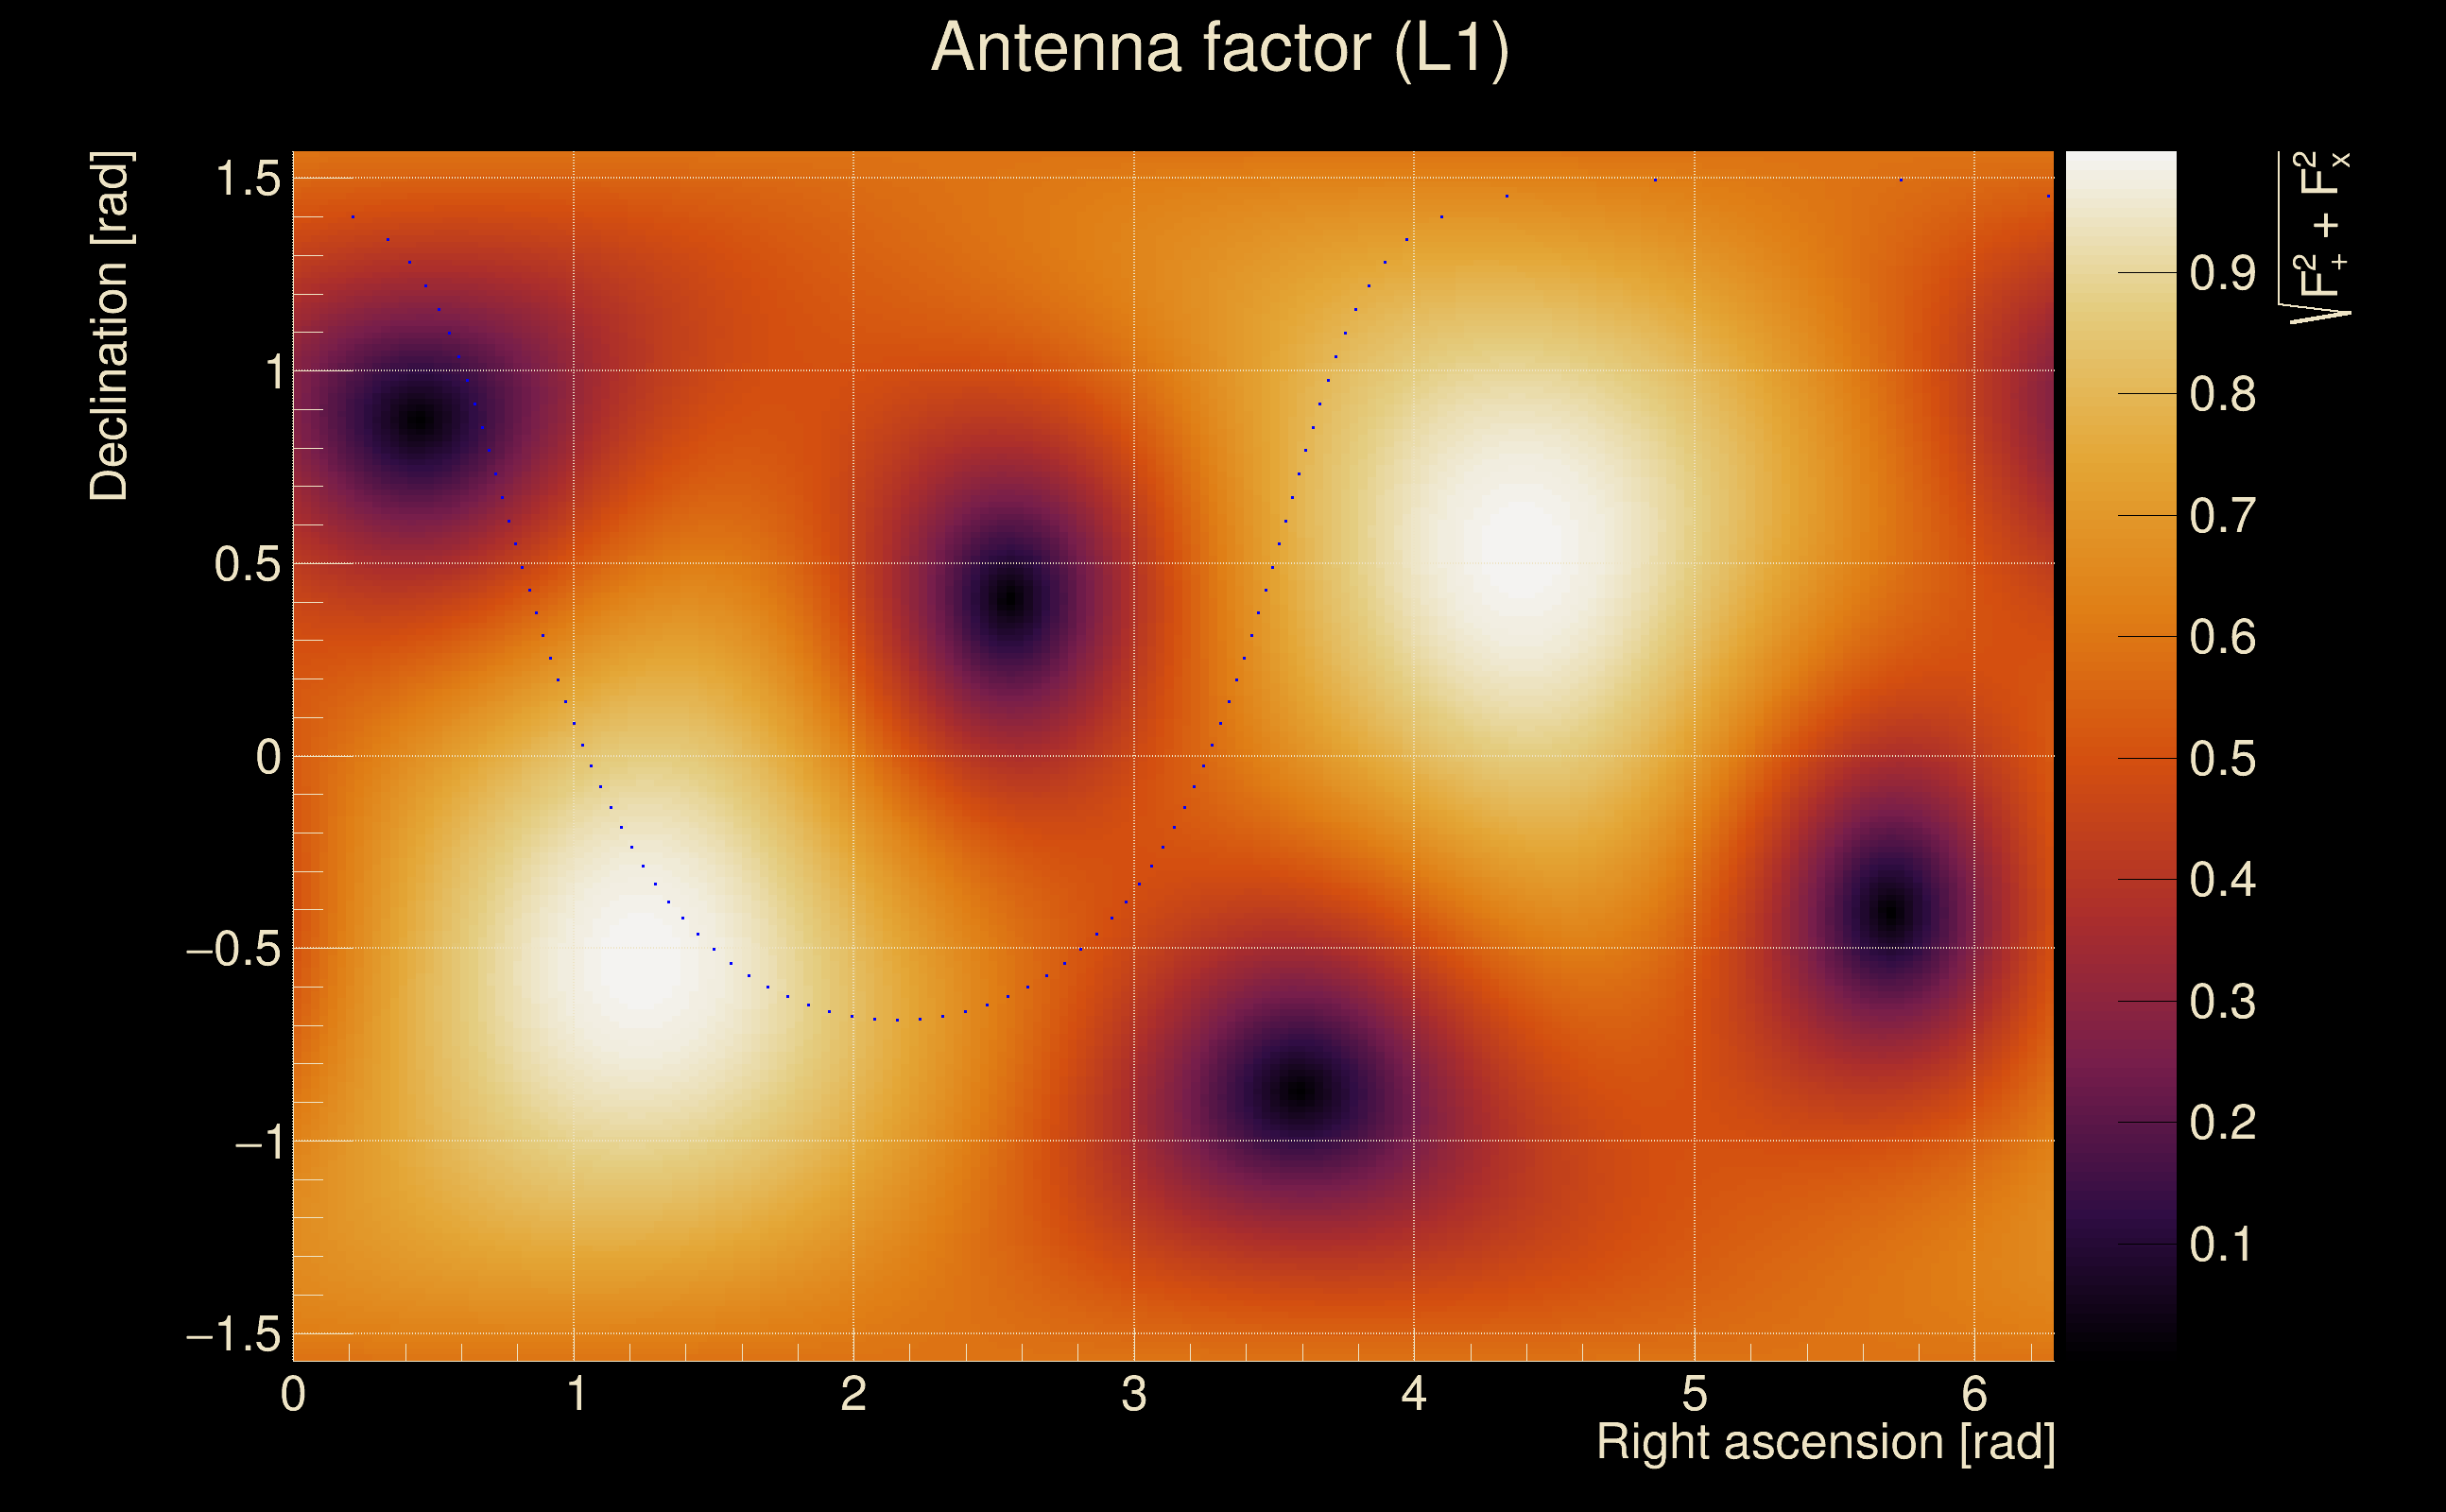
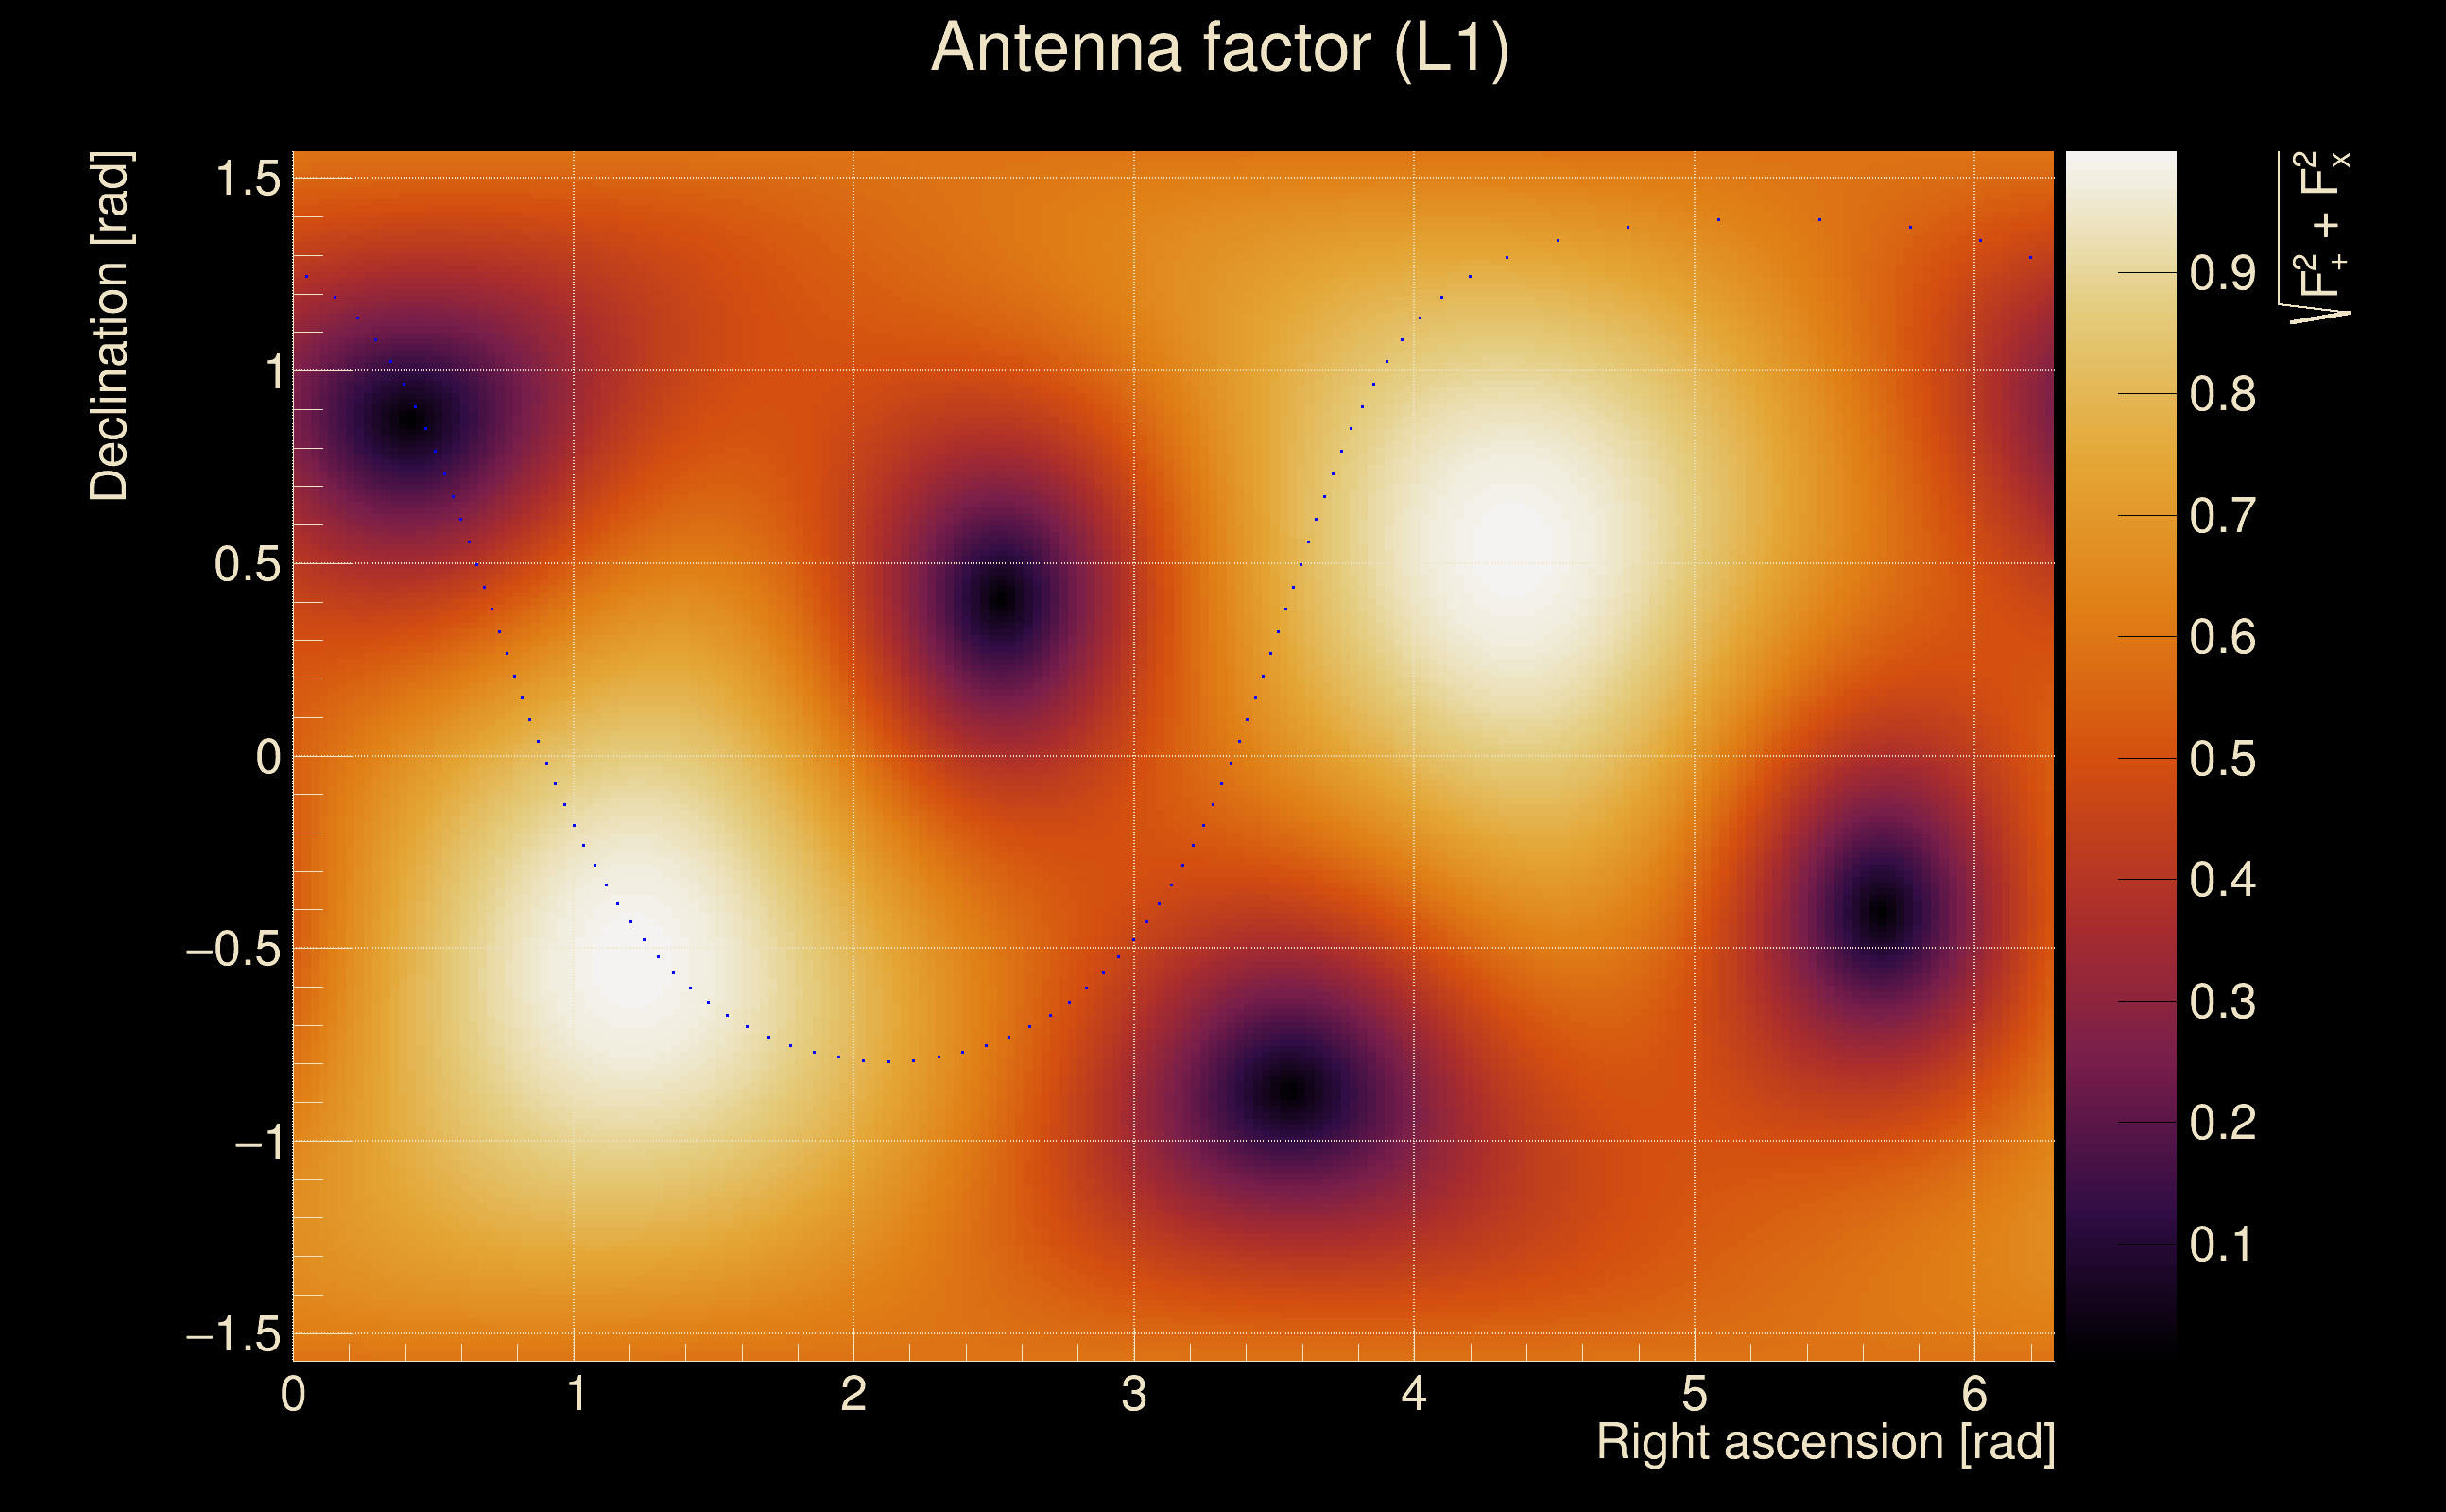
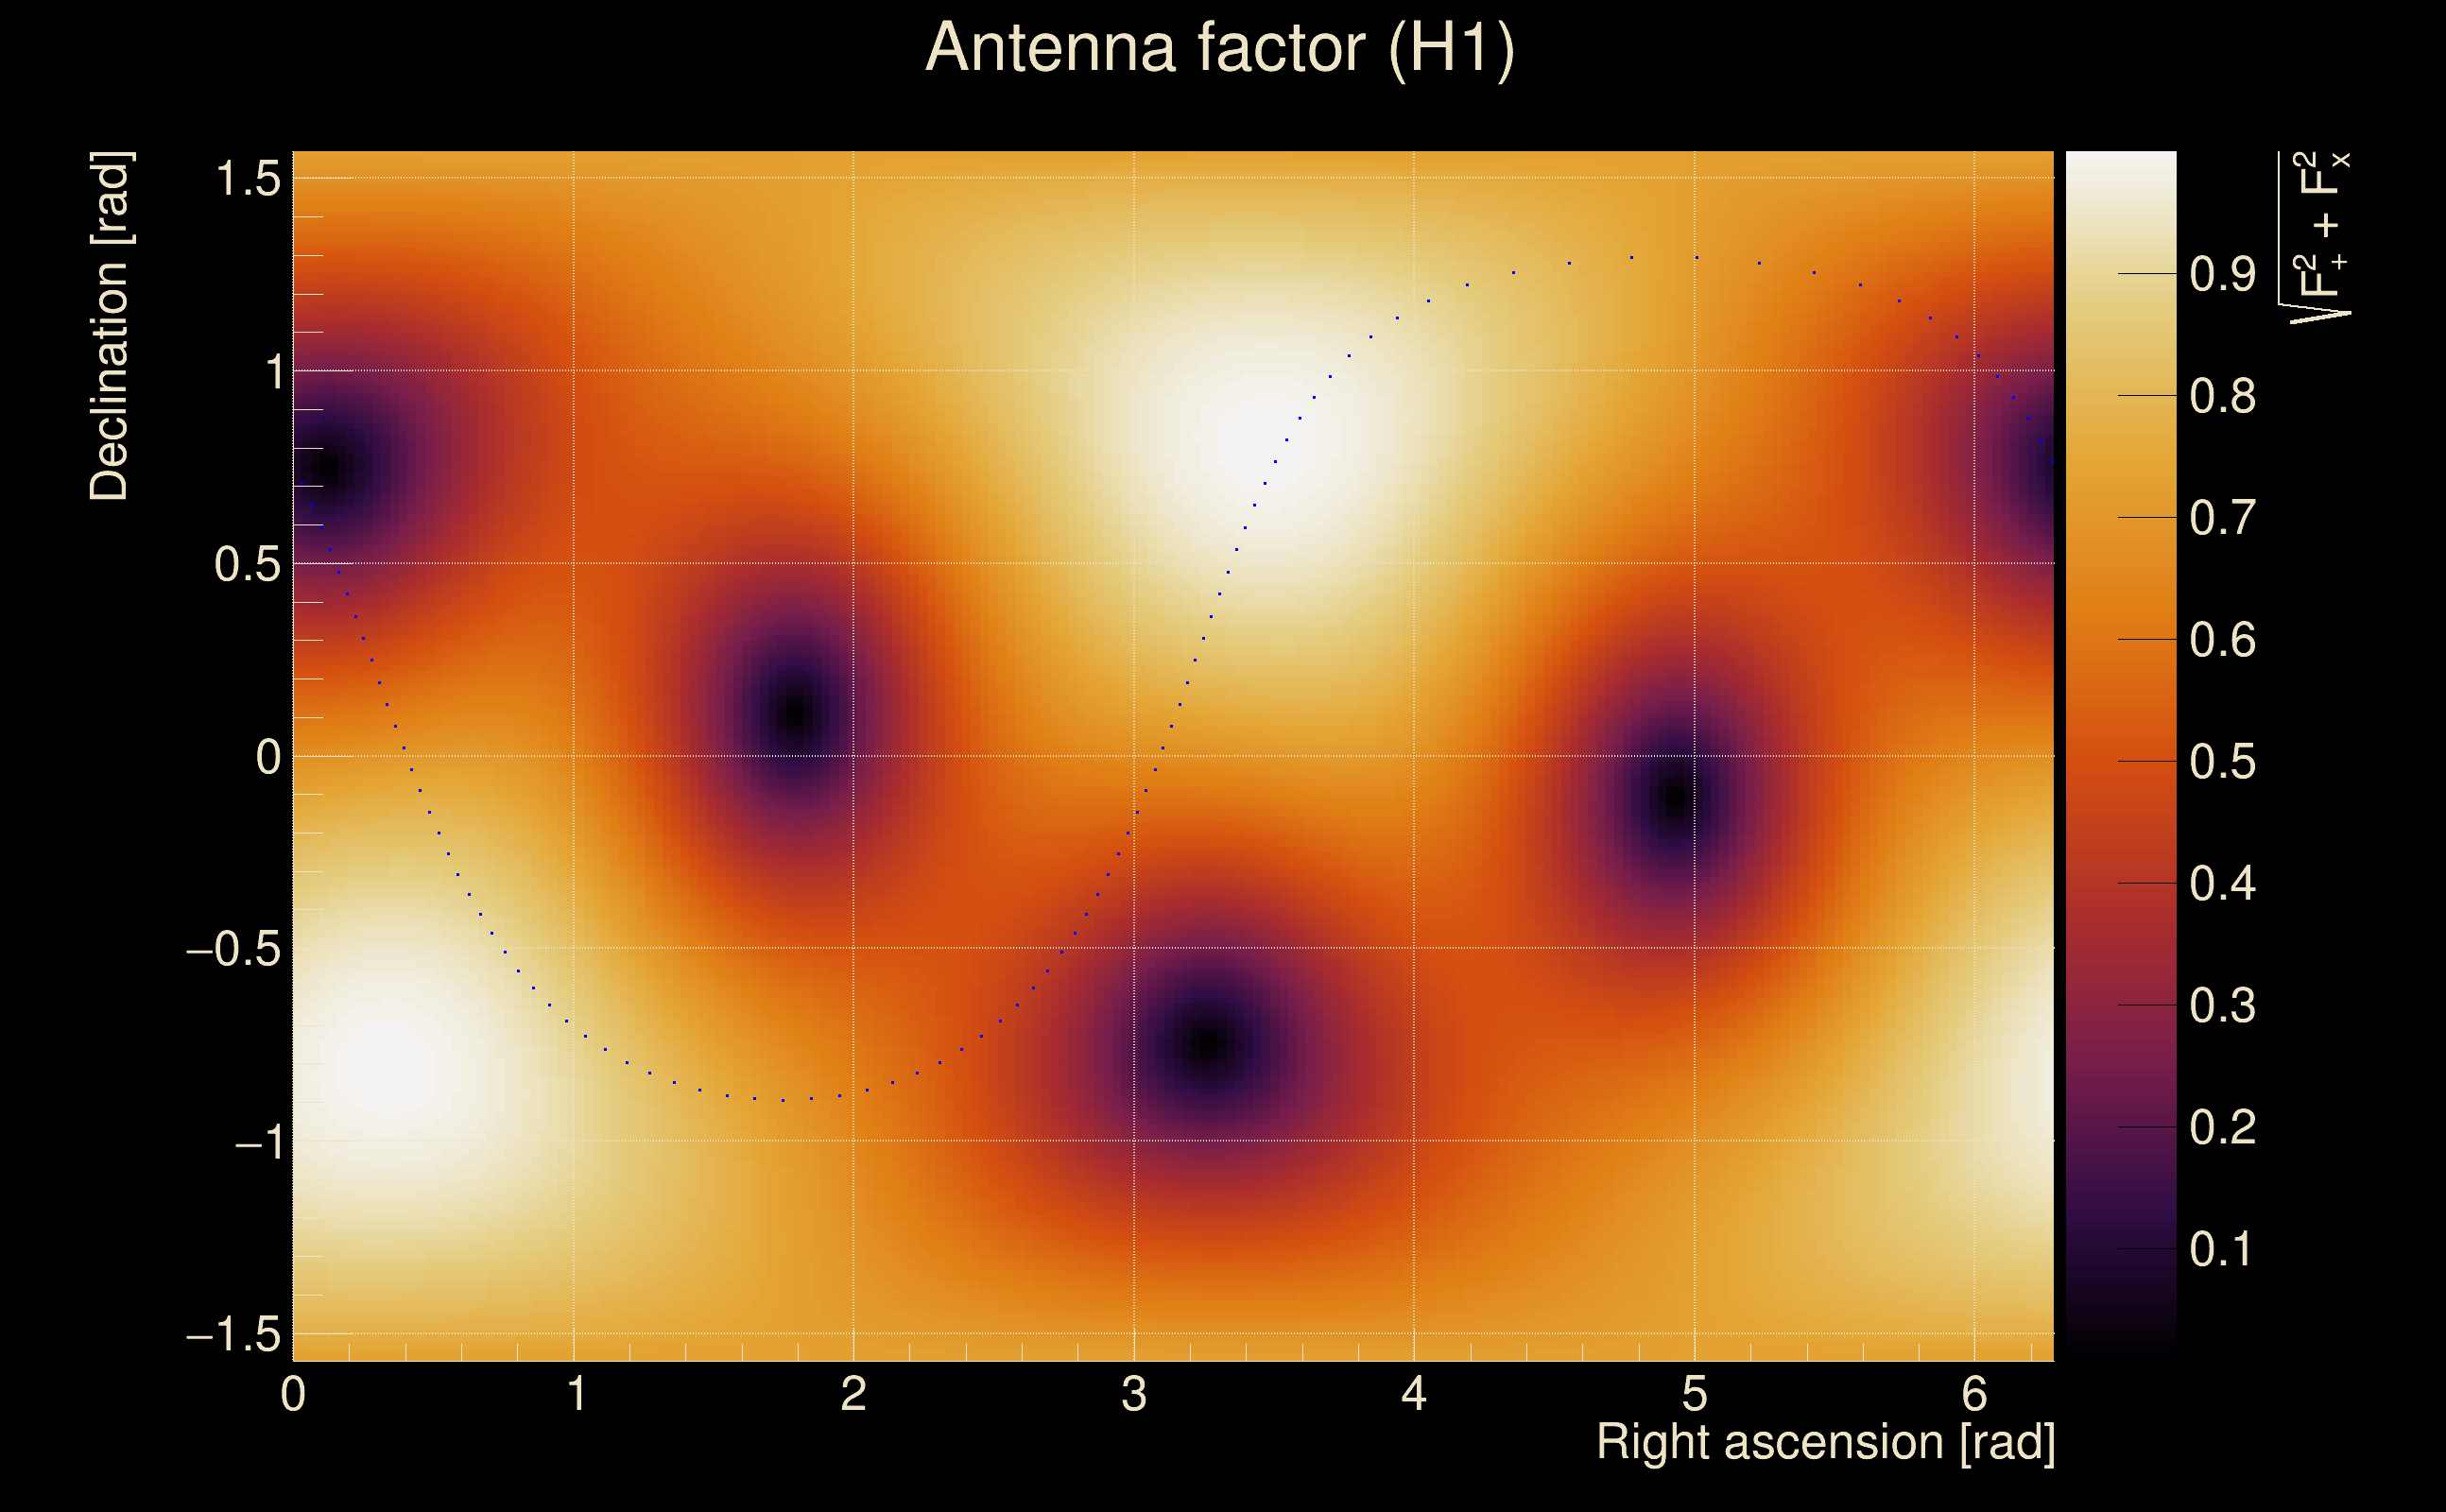
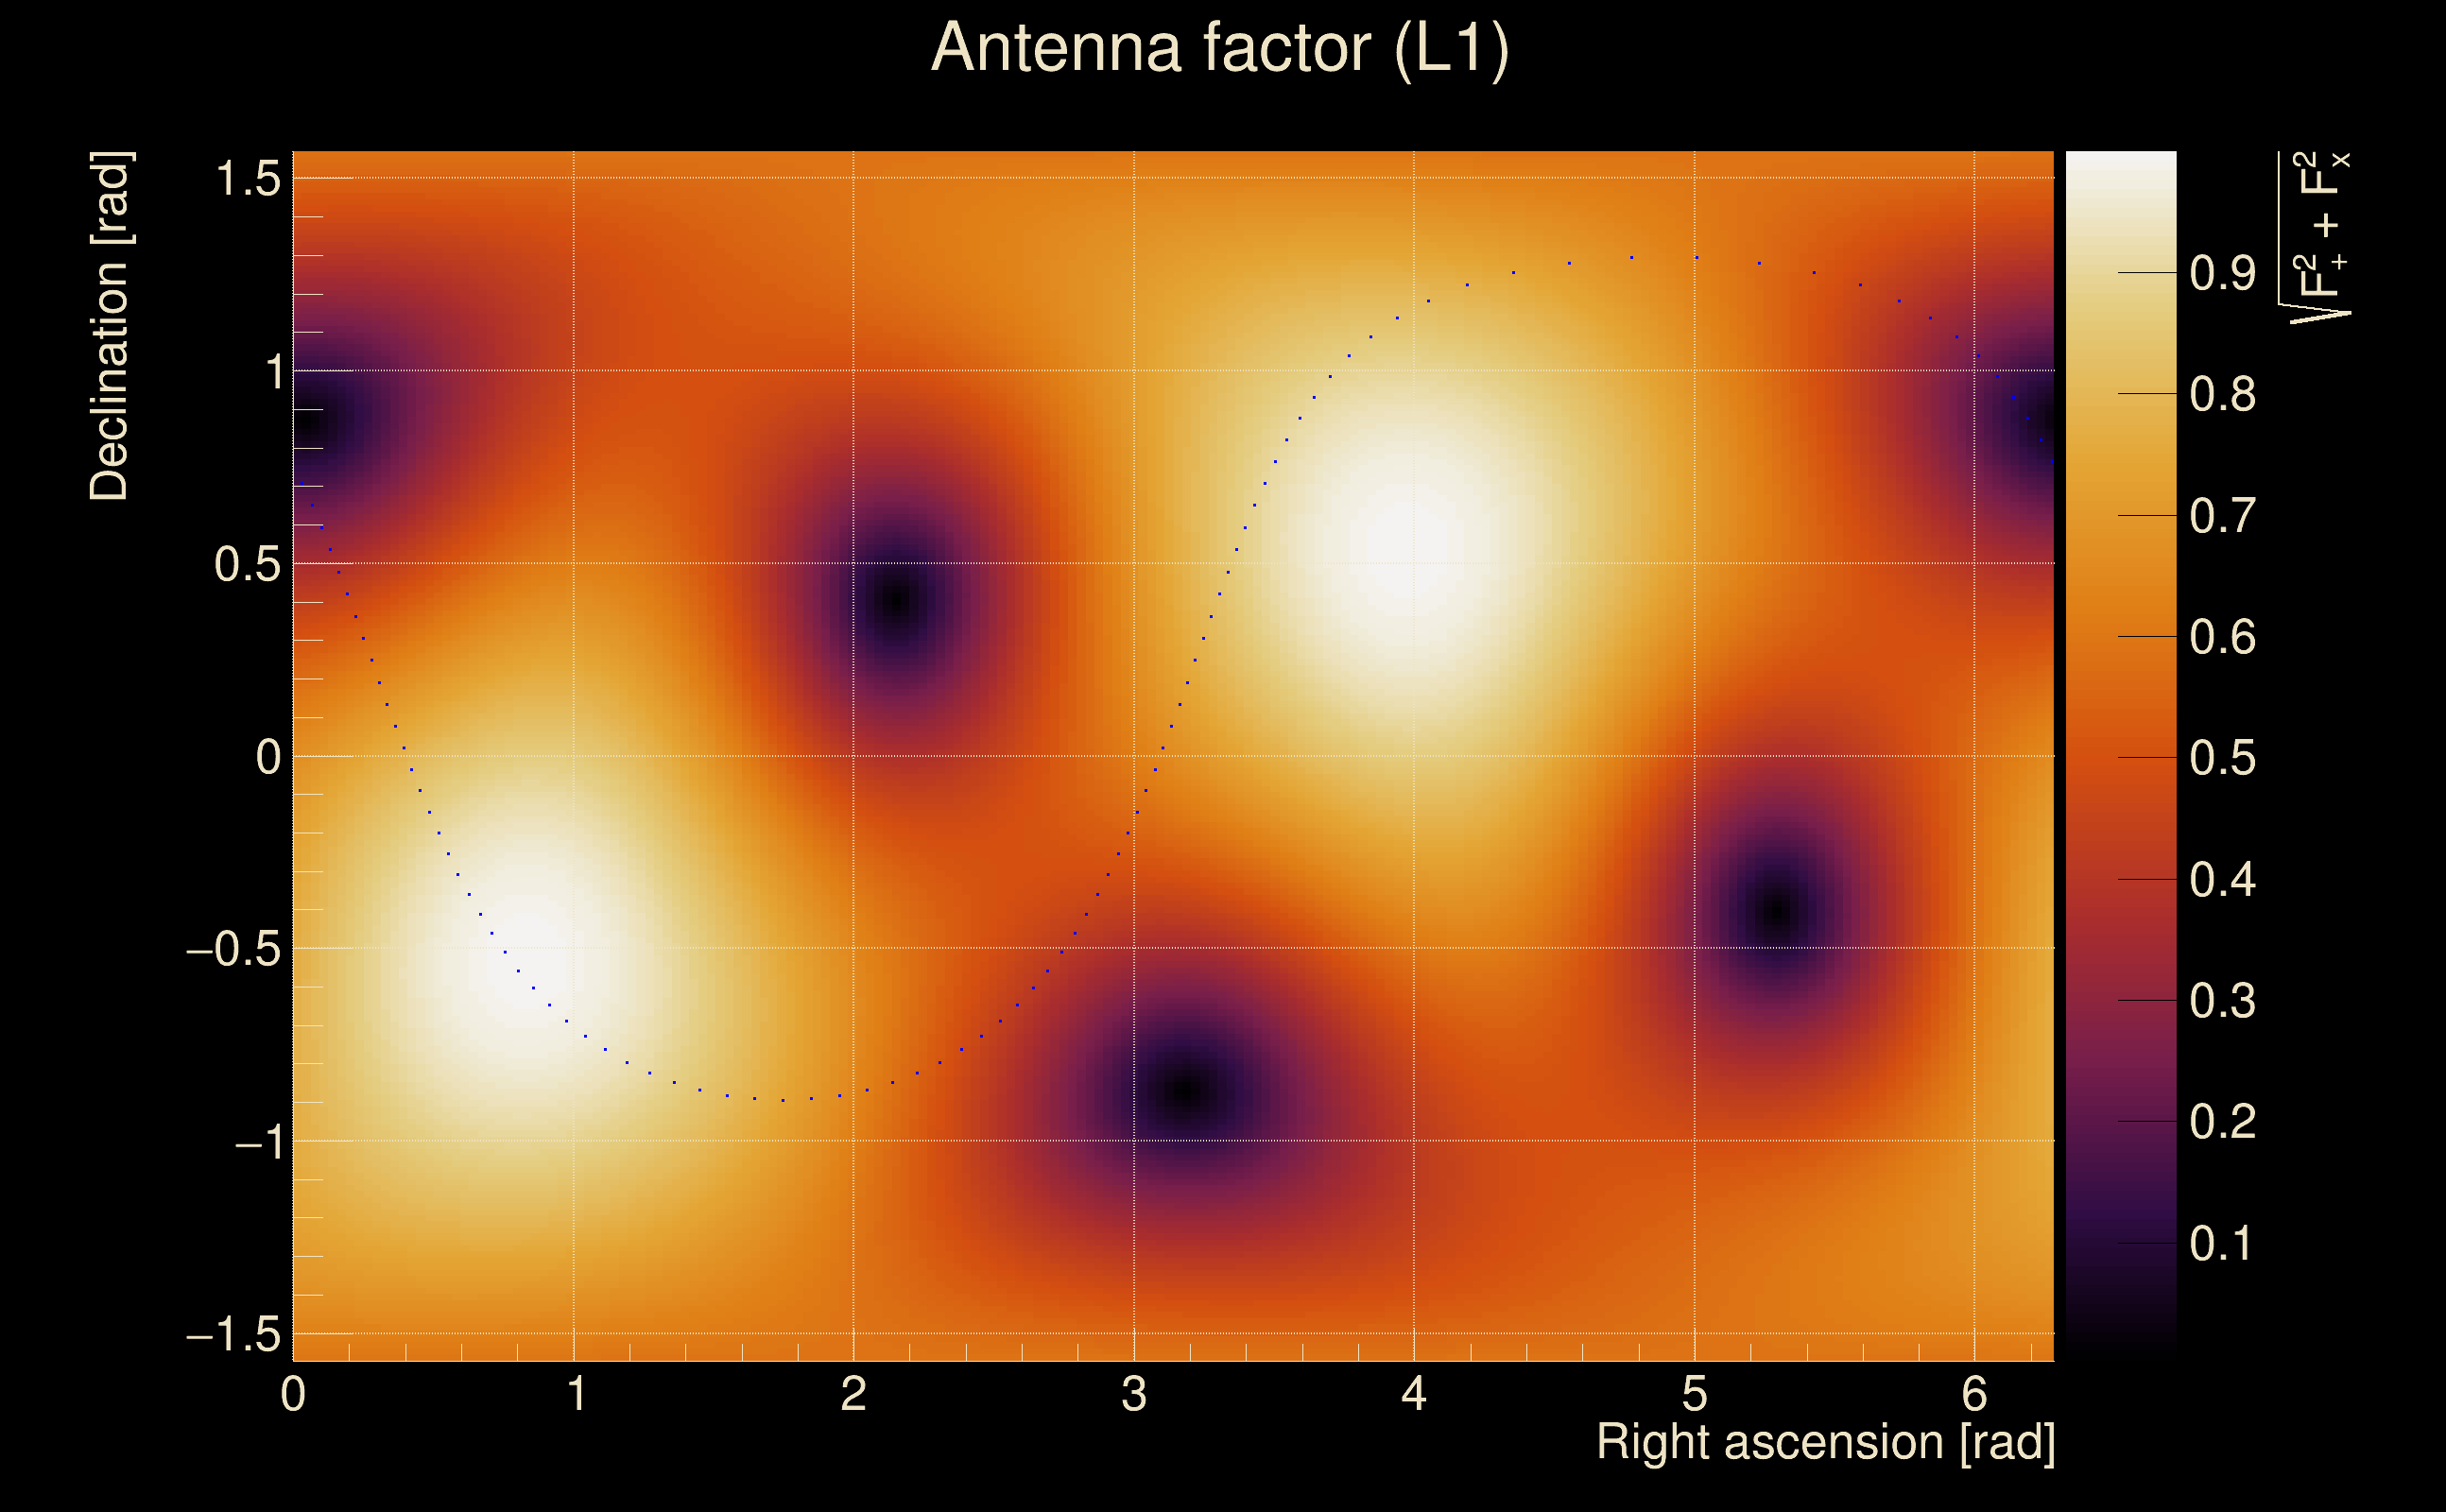
| Target sky positon: | Ra: 3.68109, Dec: 0.94792 [rad] |
| List of input Ox files: | TargIxf_feb2026_SN5_30s_file_list.txt (71 files) |
| Analysis result file: | TargIxf_feb2026_SN5_30s_results-0.root |
| Slice selected for the the fakeground: | slice index=35 (3.358 s), time lag = 0 s |
| Foreground | Fakeground | Background | ||
|---|---|---|---|---|
| Number of processed ox events | 12111 | 12111 | 2603865 | |
| Start Date (detector 0) | Mon May 15 14:13:25 2023 UTC | Mon May 15 14:13:25 2023 UTC | Mon May 15 14:13:25 2023 UTC | |
| End Date (detector 0) | Thu May 18 15:54:40 2023 UTC | Thu May 18 15:54:40 2023 UTC | Thu May 18 15:54:40 2023 UTC | |
| Start GPS (detector 0) | 1368195223 | 1368195223 | 1368195223 | |
| End GPS (detector 0) | 1368460498 | 1368460498 | 1368460498 | |
| Used livetime (detector 0) | 60875 s | 60875 s | 60875 s | |
| Start Date (detector 1) | Mon May 15 14:13:25 2023 UTC | Mon May 15 14:13:25 2023 UTC | Mon May 15 14:13:25 2023 UTC | |
| End Date (detector 1) | Thu May 18 15:54:40 2023 UTC | Thu May 18 15:54:40 2023 UTC | Thu May 18 15:54:40 2023 UTC | |
| Start GPS (detector 1) | 1368195223 | 1368195223 | 1368195223 | |
| End GPS (detector 1) | 1368460498 | 1368460498 | 1368460498 | |
| Used livetime (detector 1) | 60875 s | 60875 s | 60875 s | |
| Cumulative livetime | 121110 s | 121110 s | 26038650 s | |
| 0 years, 1 days, 9 hours, 38 min, 30 s | 0 years, 1 days, 9 hours, 38 min, 30 s | 0 years, 301 days, 8 hours, 57 min, 30 s |
|
|
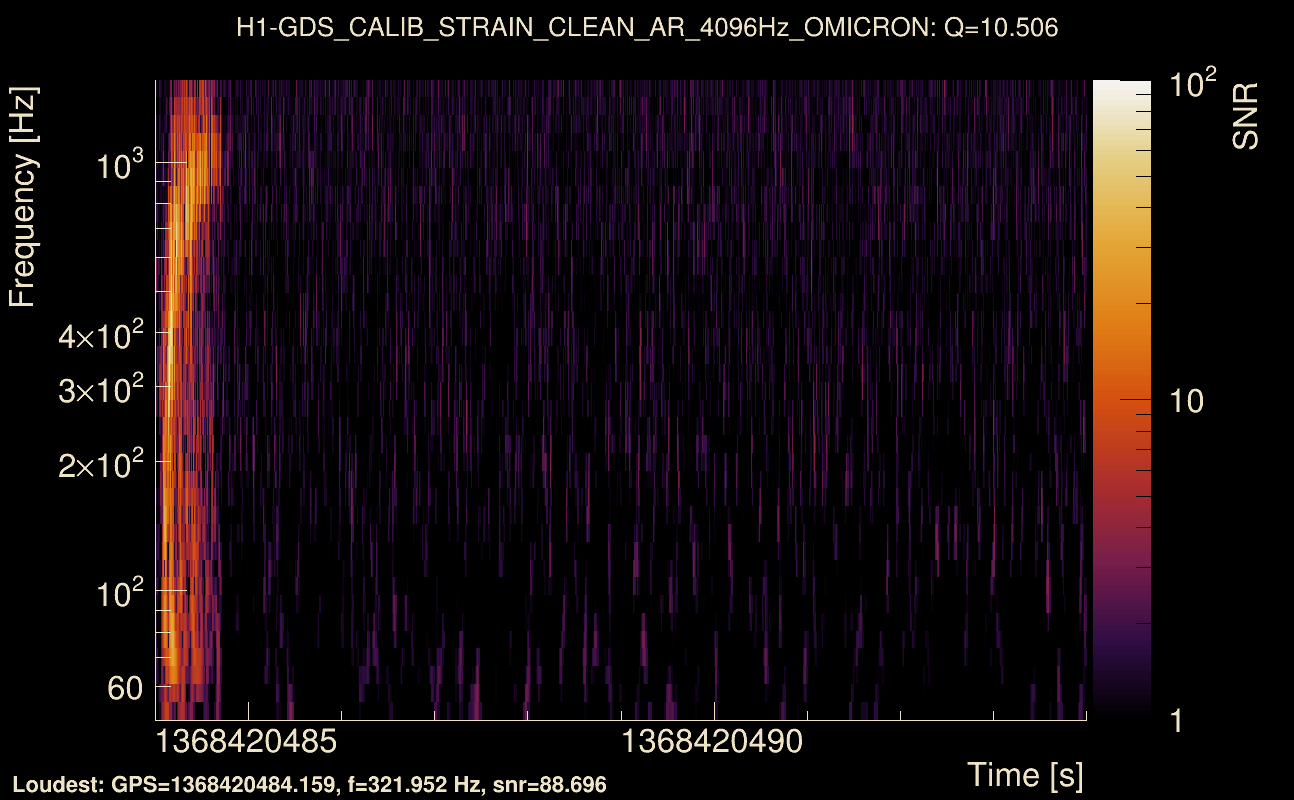
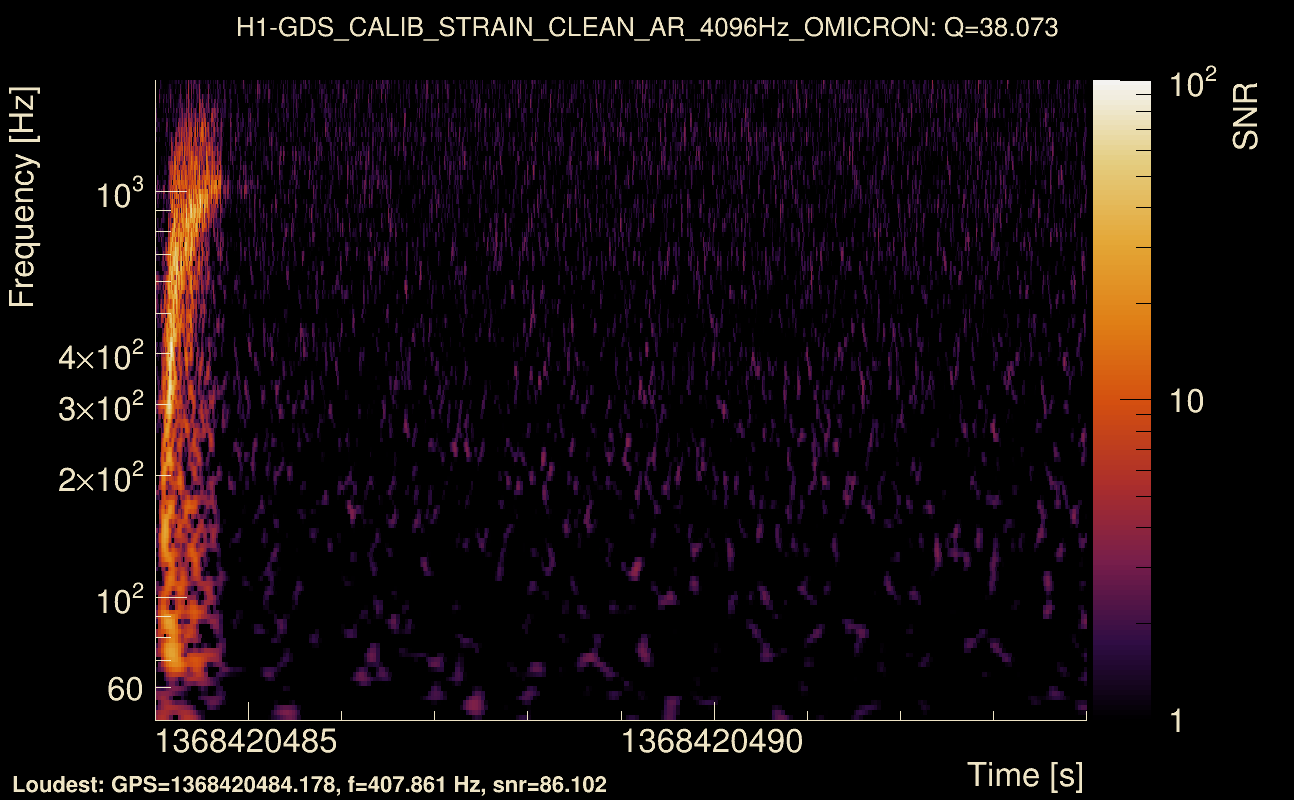
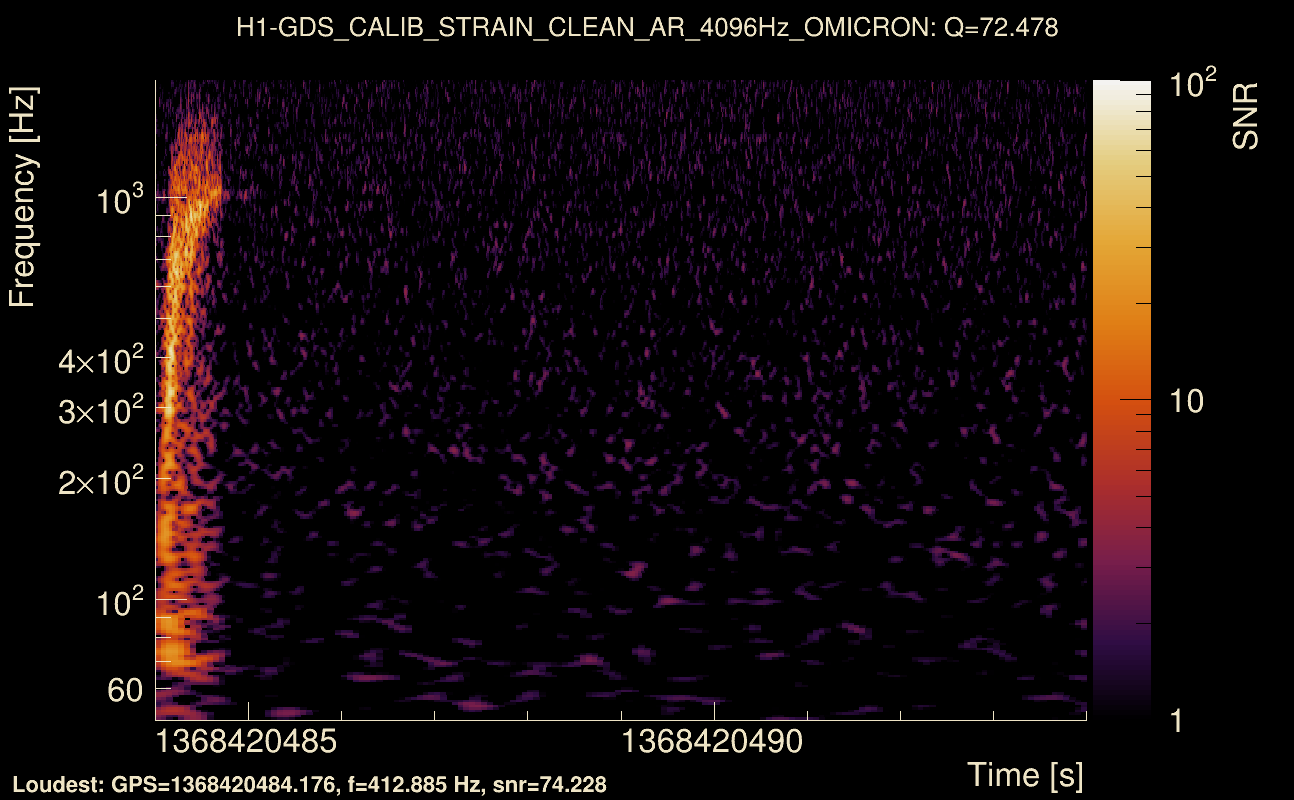
| Event time t(H1): | GPS = 1368420484 (Thu May 18 04:47:46 2023 ) → GPS = 1368420494 (Thu May 18 04:47:56 2023 ) |
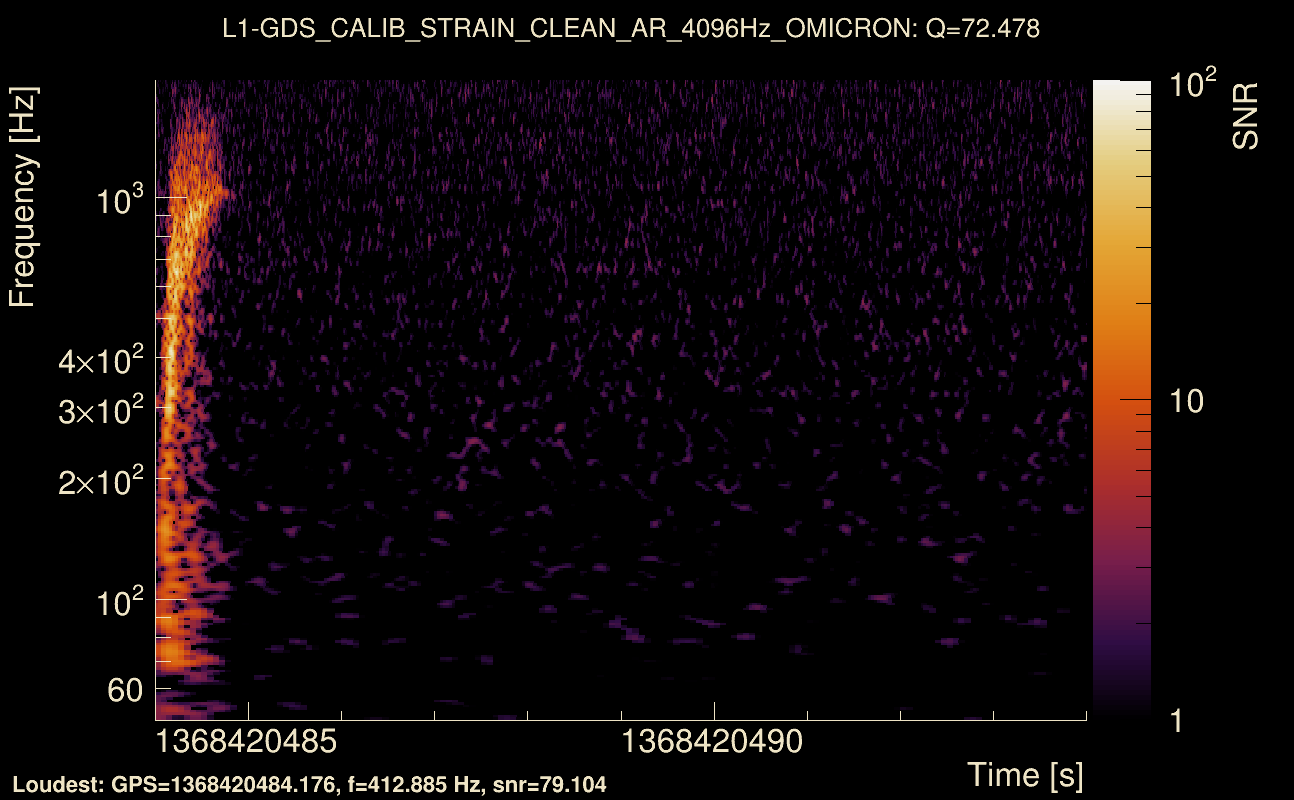
| Event time t(L1): | GPS = 1368420484 (Thu May 18 04:47:56 2023 ) → GPS = 1368420494 (Thu May 18 04:47:56 2023 ) |
| Omicron analysis time window (H1): | GPS = 1368420481 → GPS = 1368420497 |
| Omicron analysis time window (L1): | GPS = 1368420481 → GPS = 1368420497 |
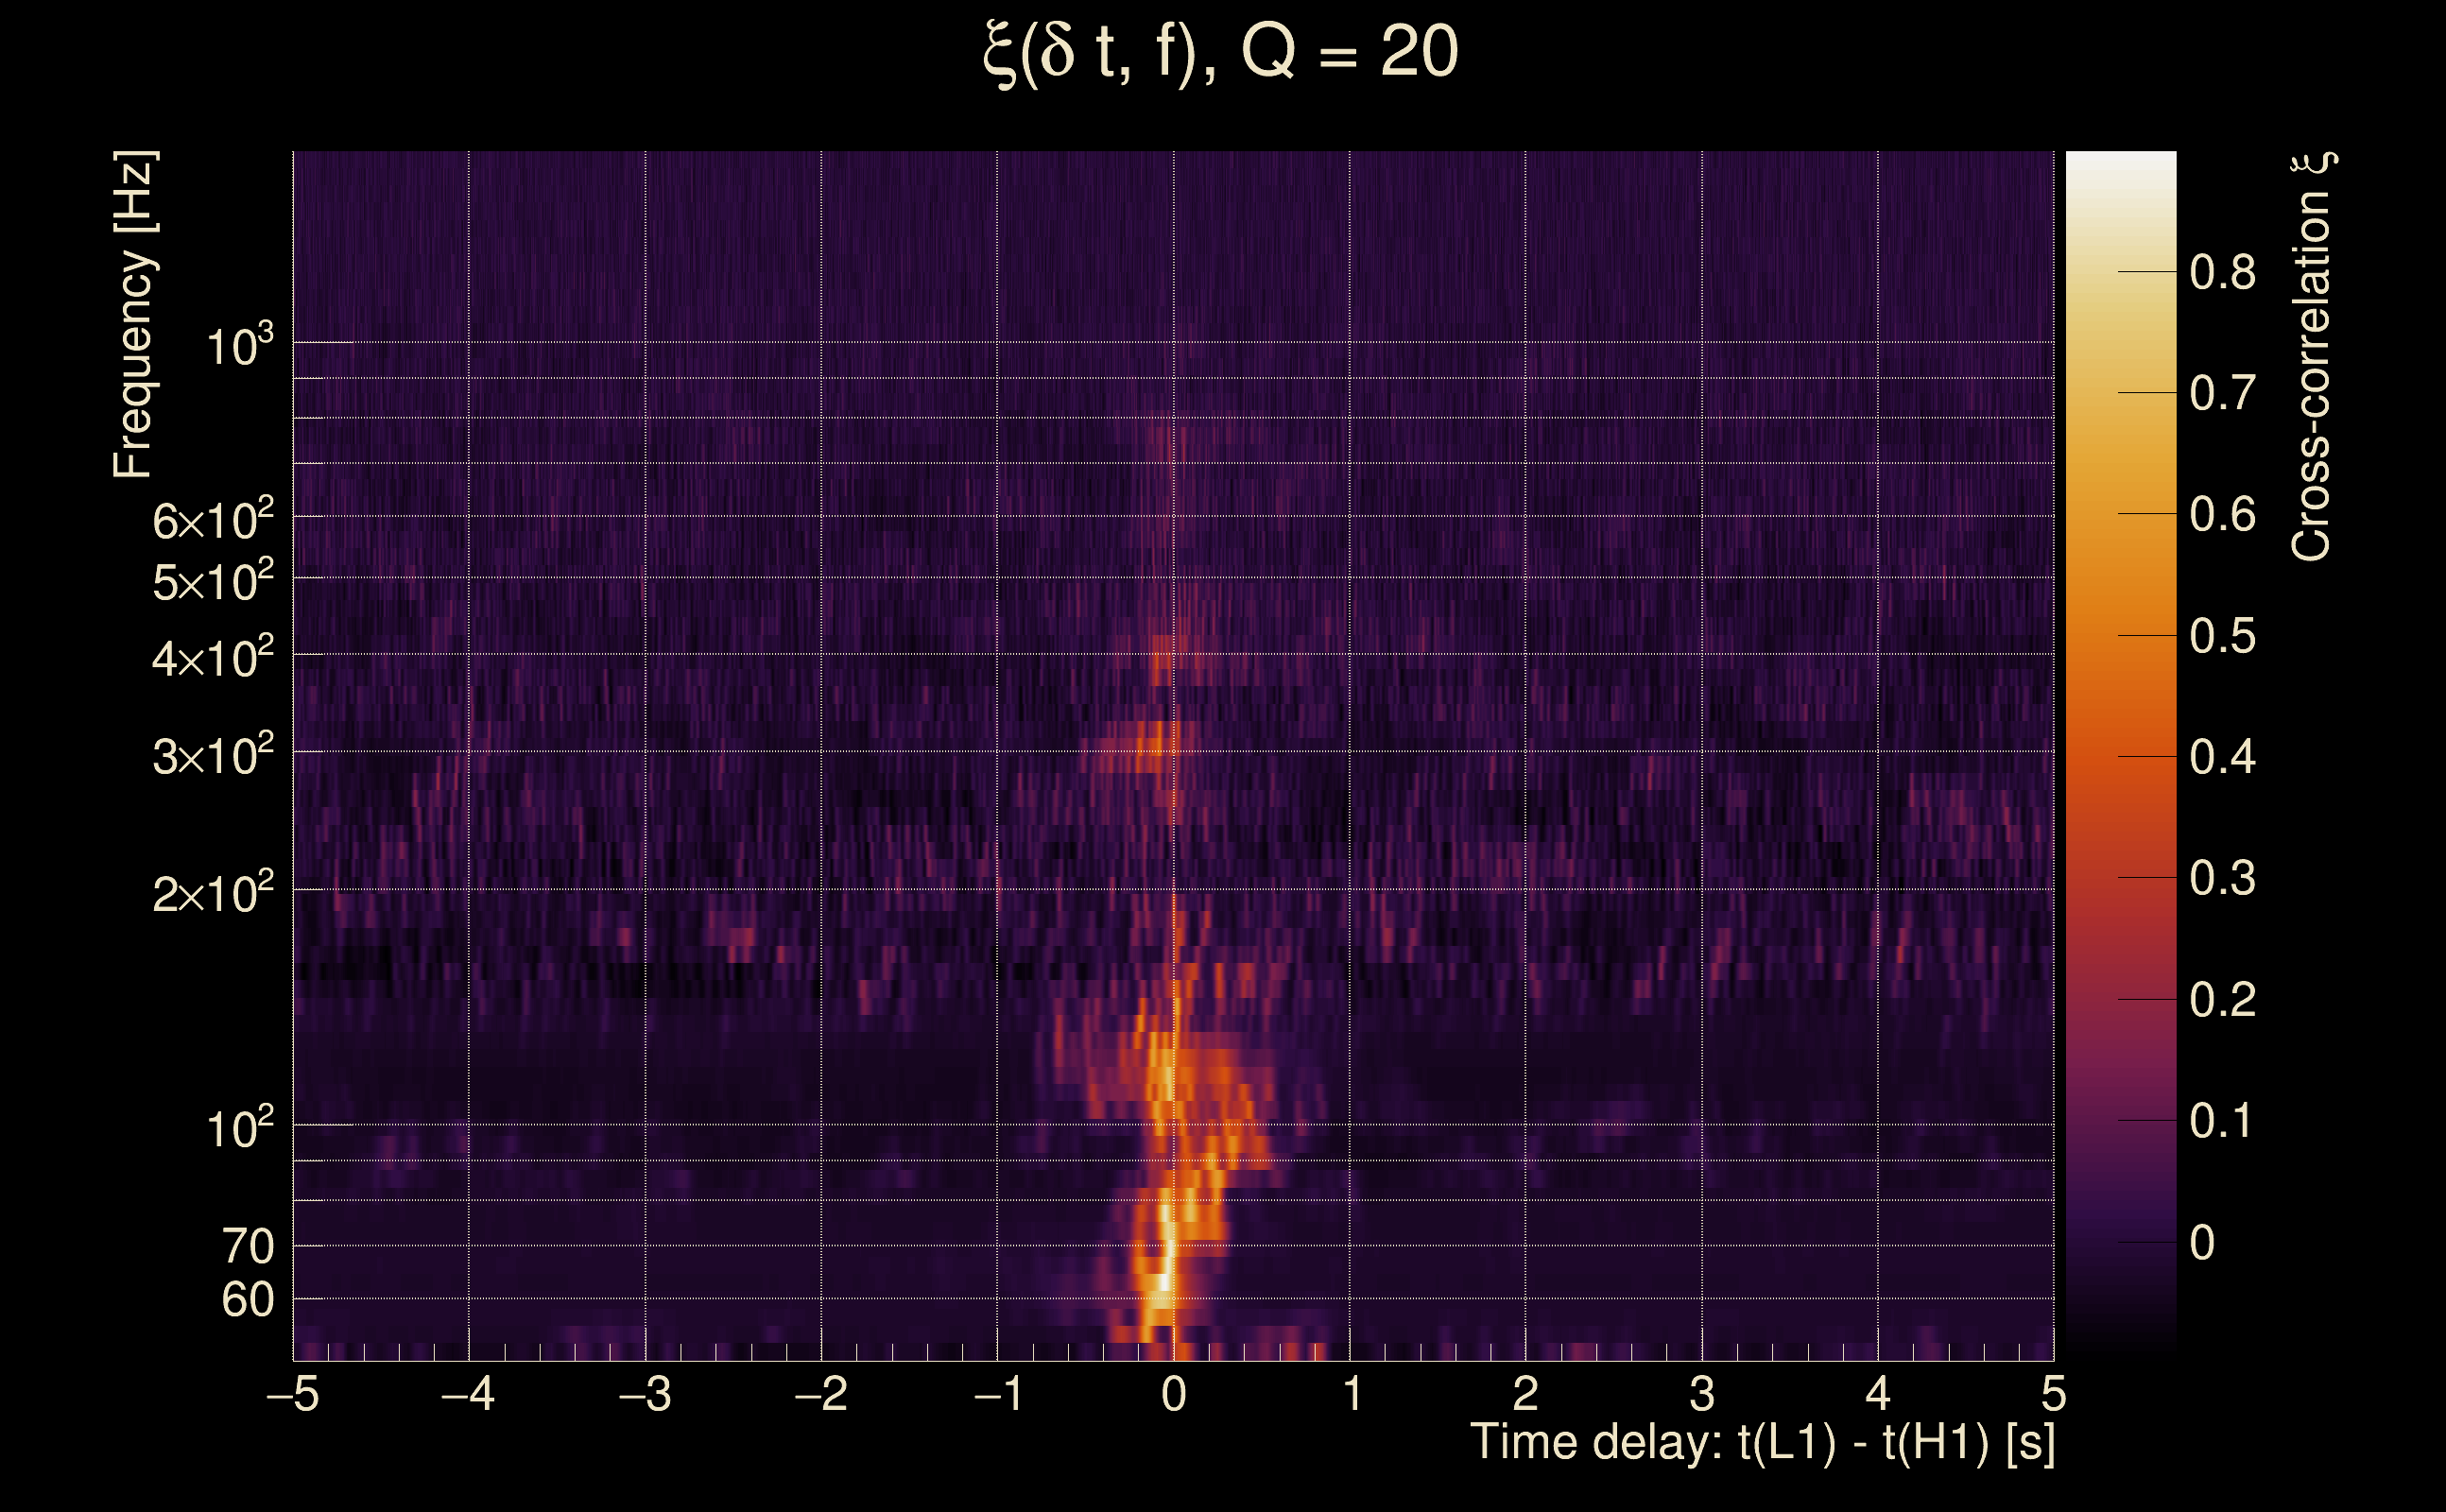
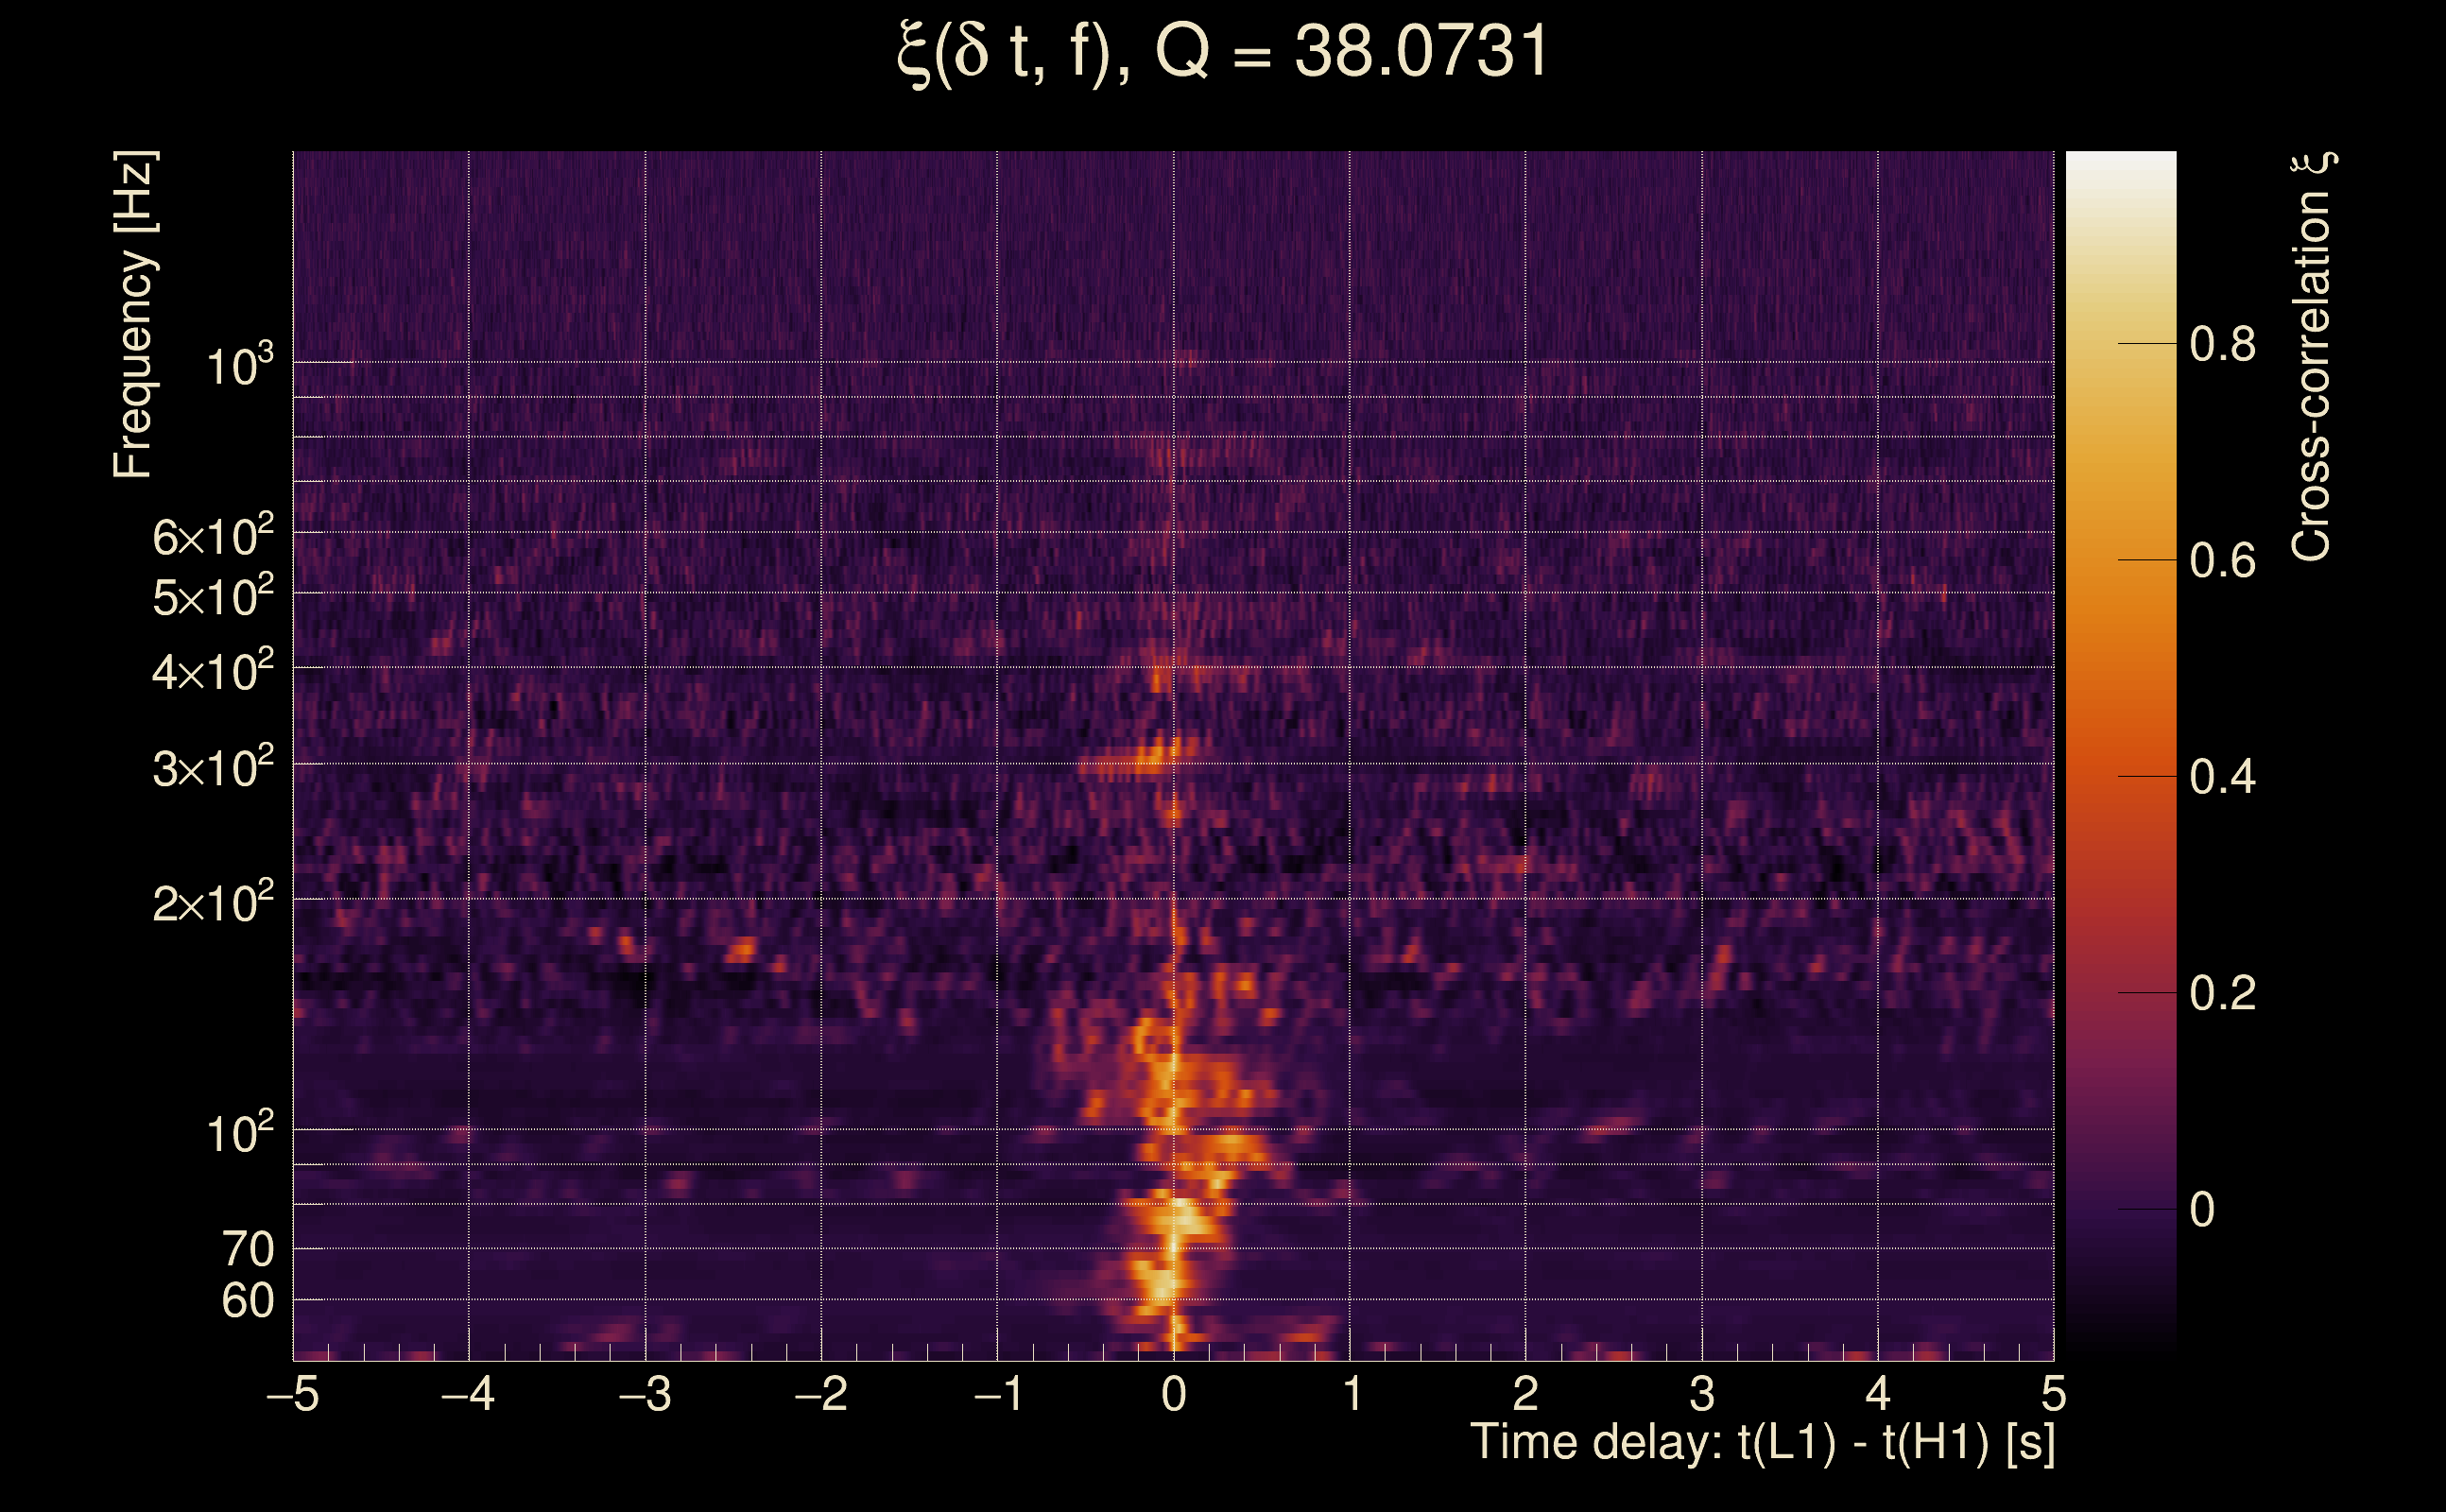
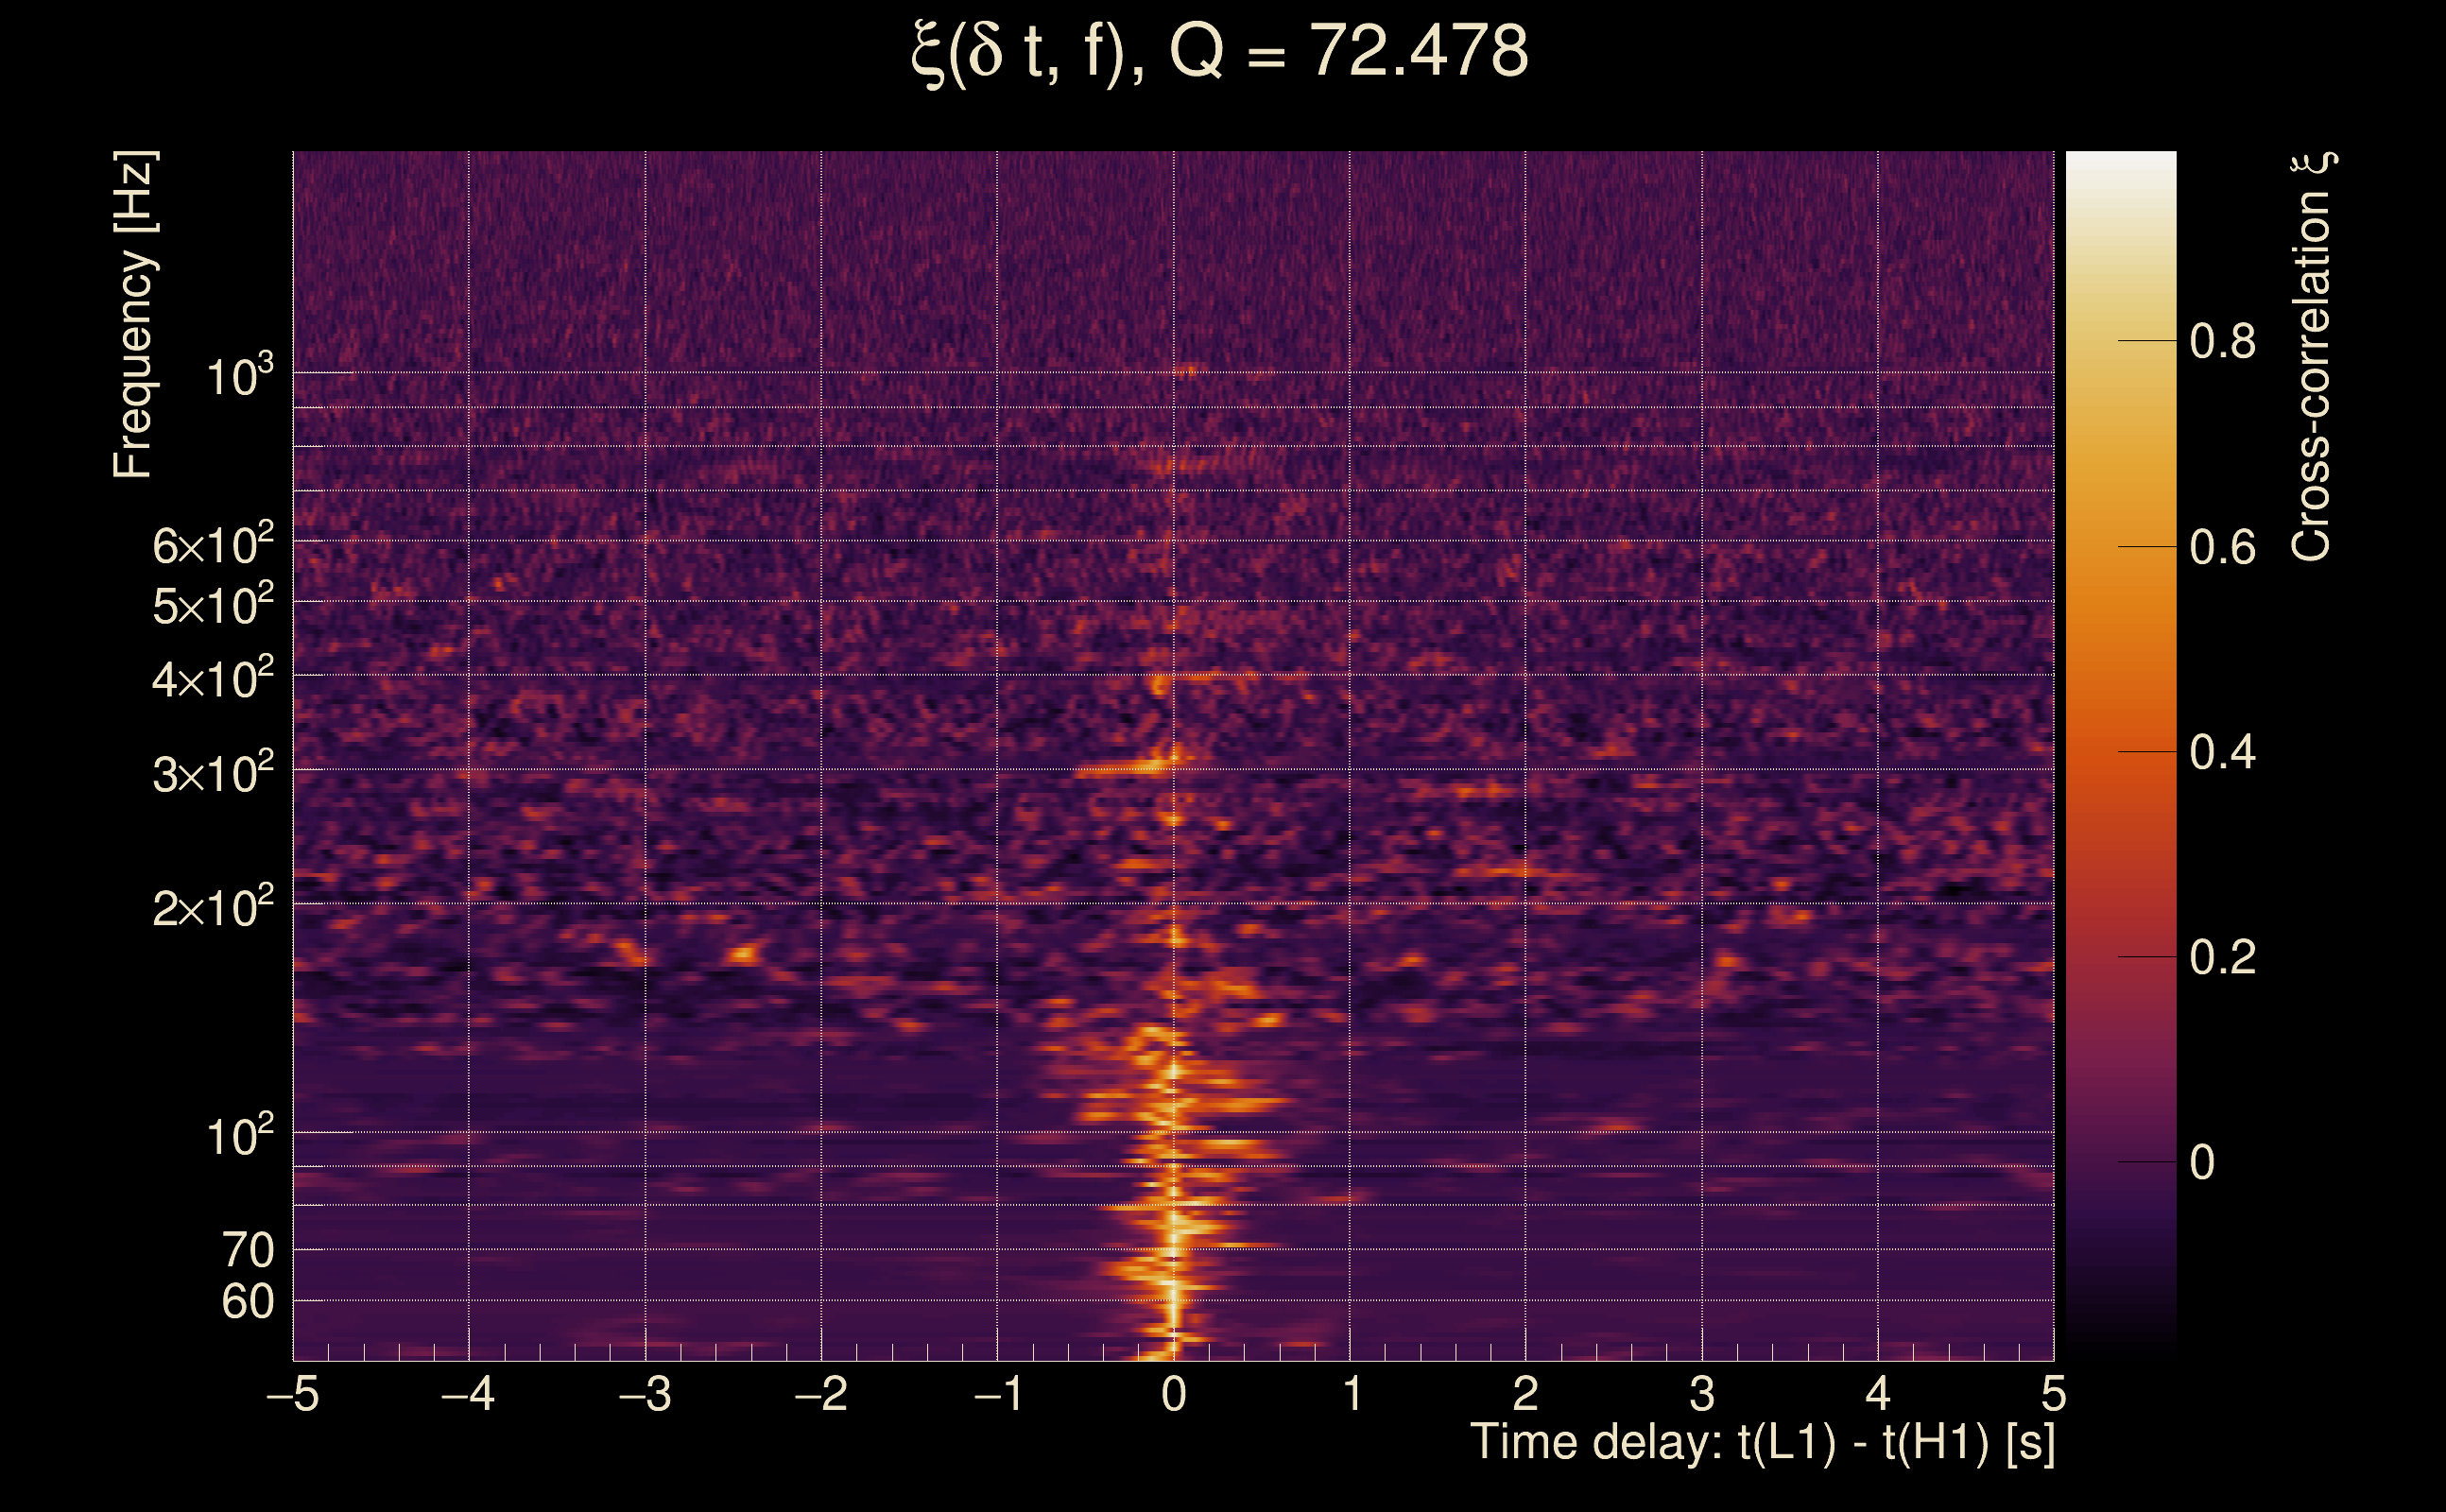
| Time delay between detectors t(L1) - t(H1): | 0.000981151 s (slice index = 108 / 217), δt_gw = 0.000981151 s |
| Time delay standard deviation: | 0.026369 s |
| [targeted mode] Time delay probability: | 0.994322 (0.00711593 sigmas), δt_target = 1.72247e+45 s |
| Frequency: | 287.45 Hz |
| Ξ: | 0.956819 ± 0.00856451 (variance = 7.33507e-05): Q0: 0.975157, Q1: 0.966306, Q2: 0.955228, Q3: 0.952688, Q4: 0.955013 |
| Rank: | R_A = 0.915624 |
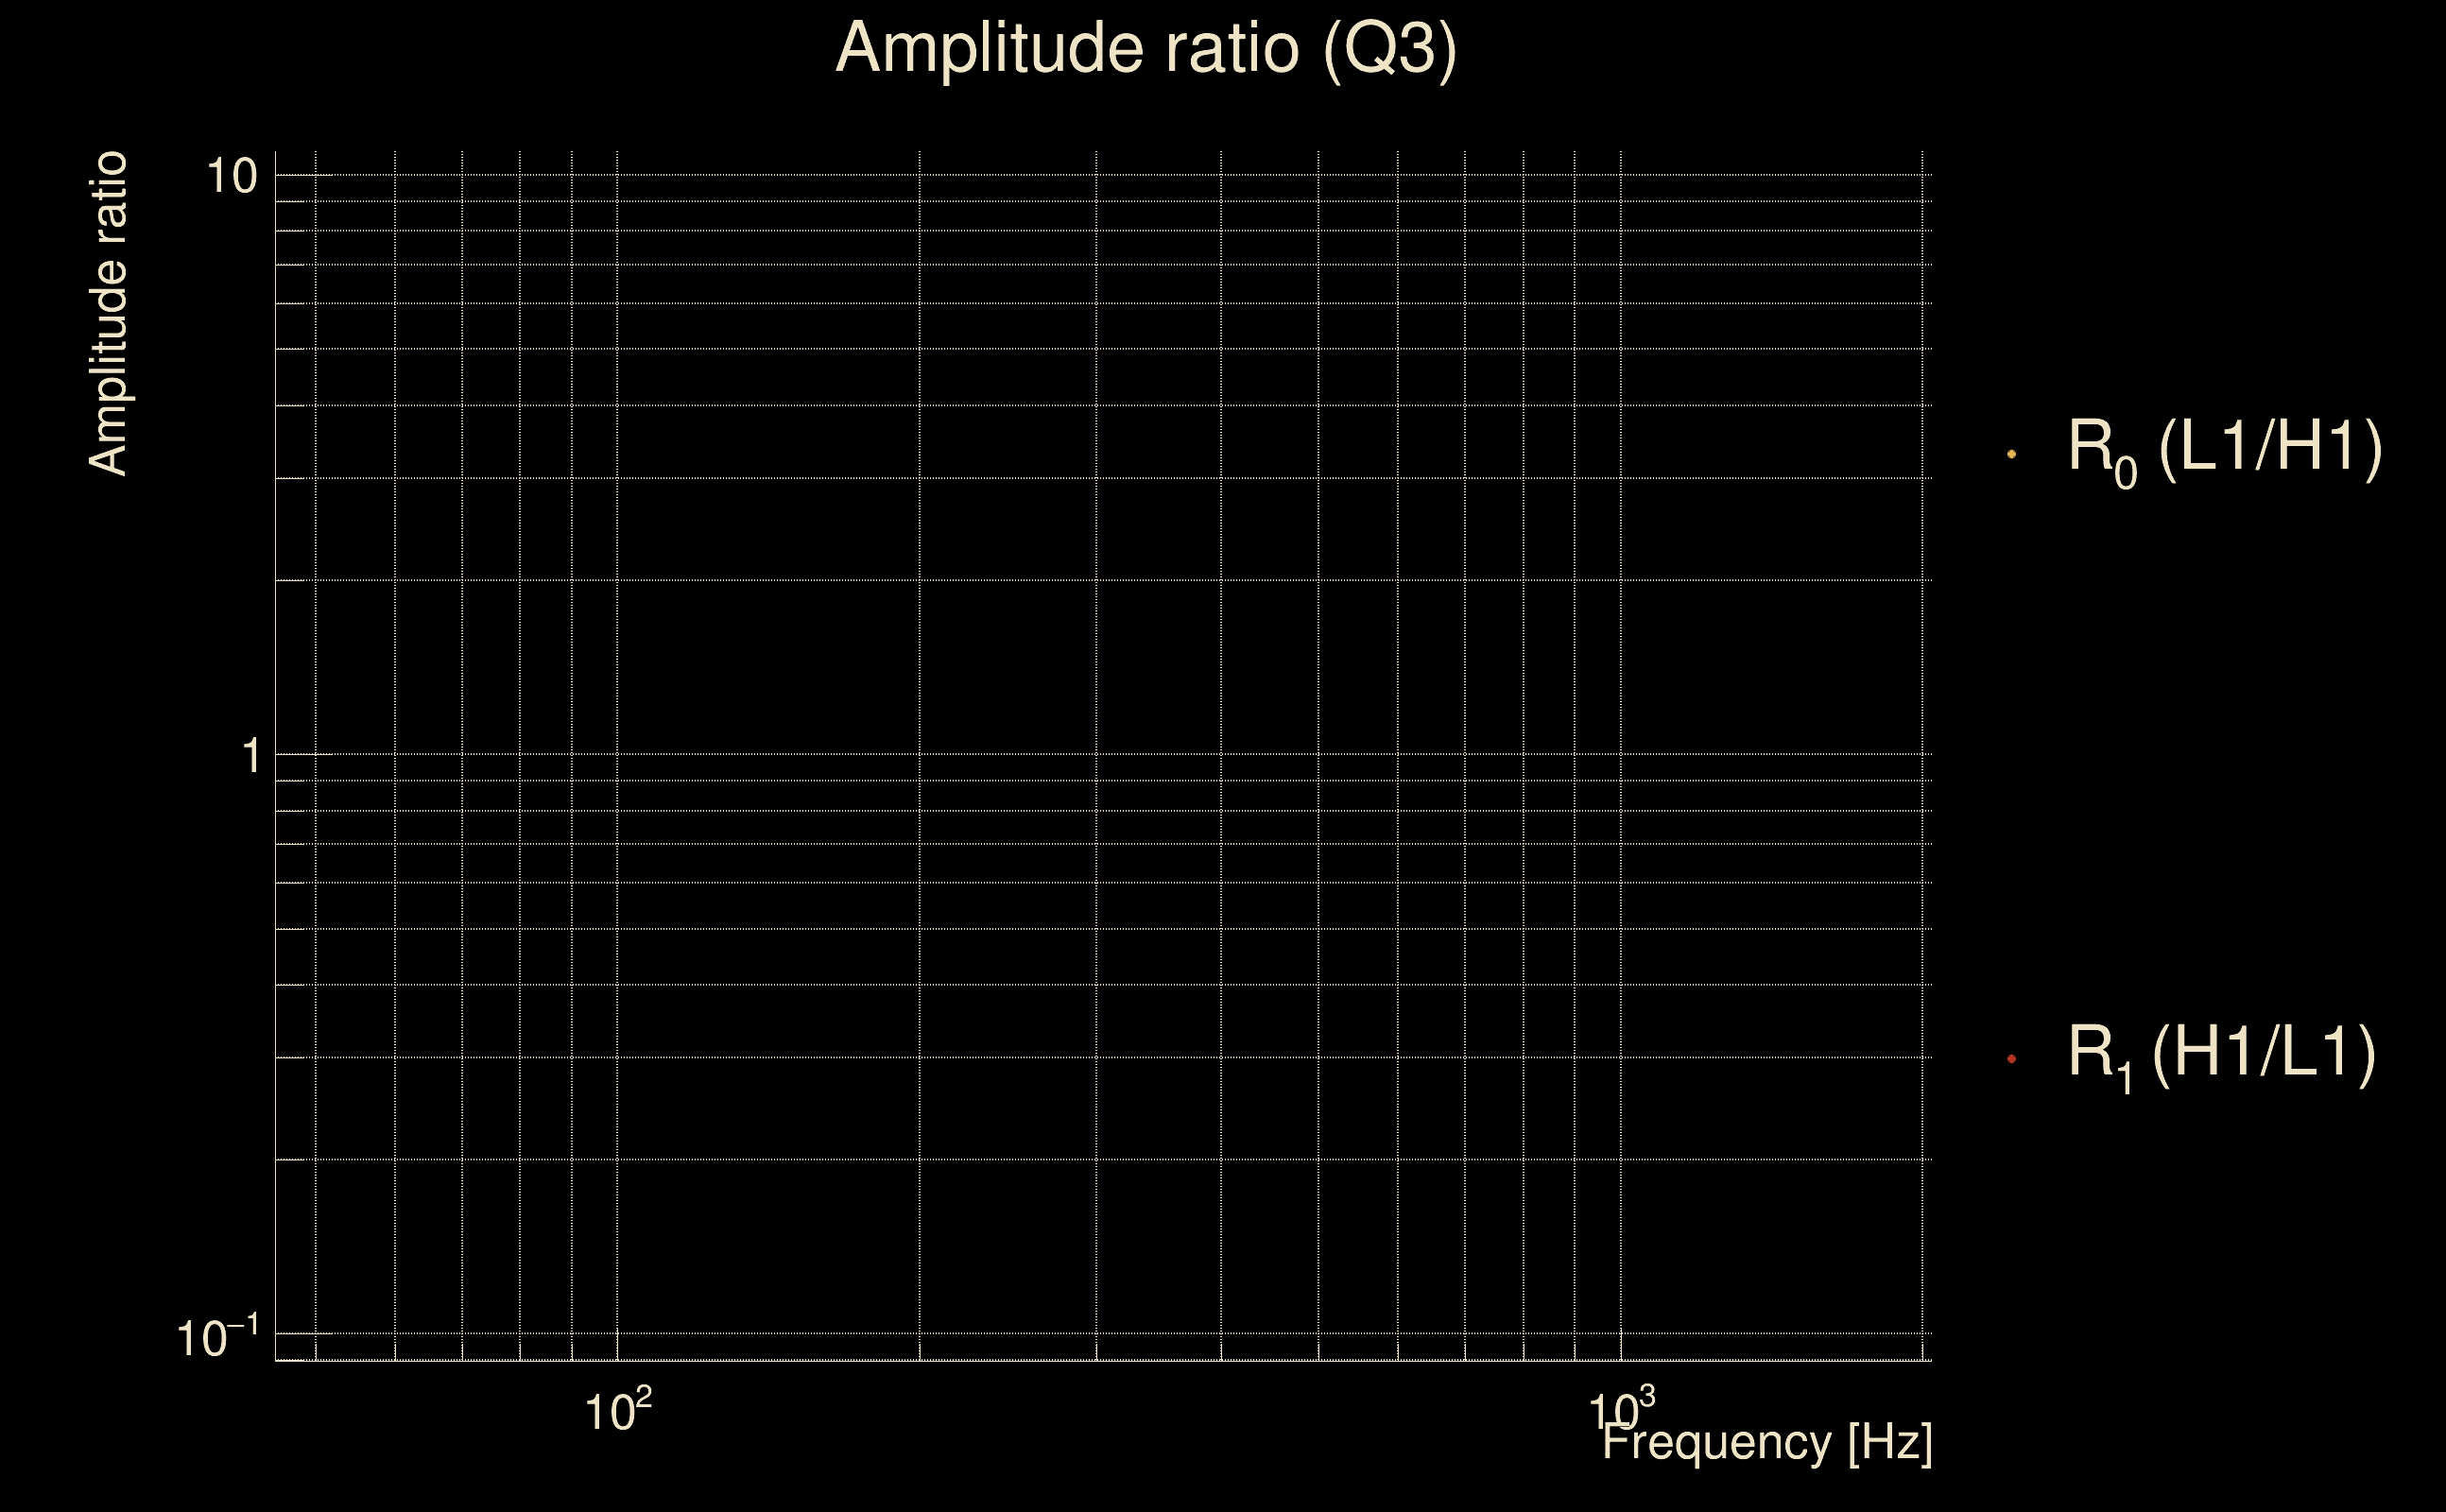
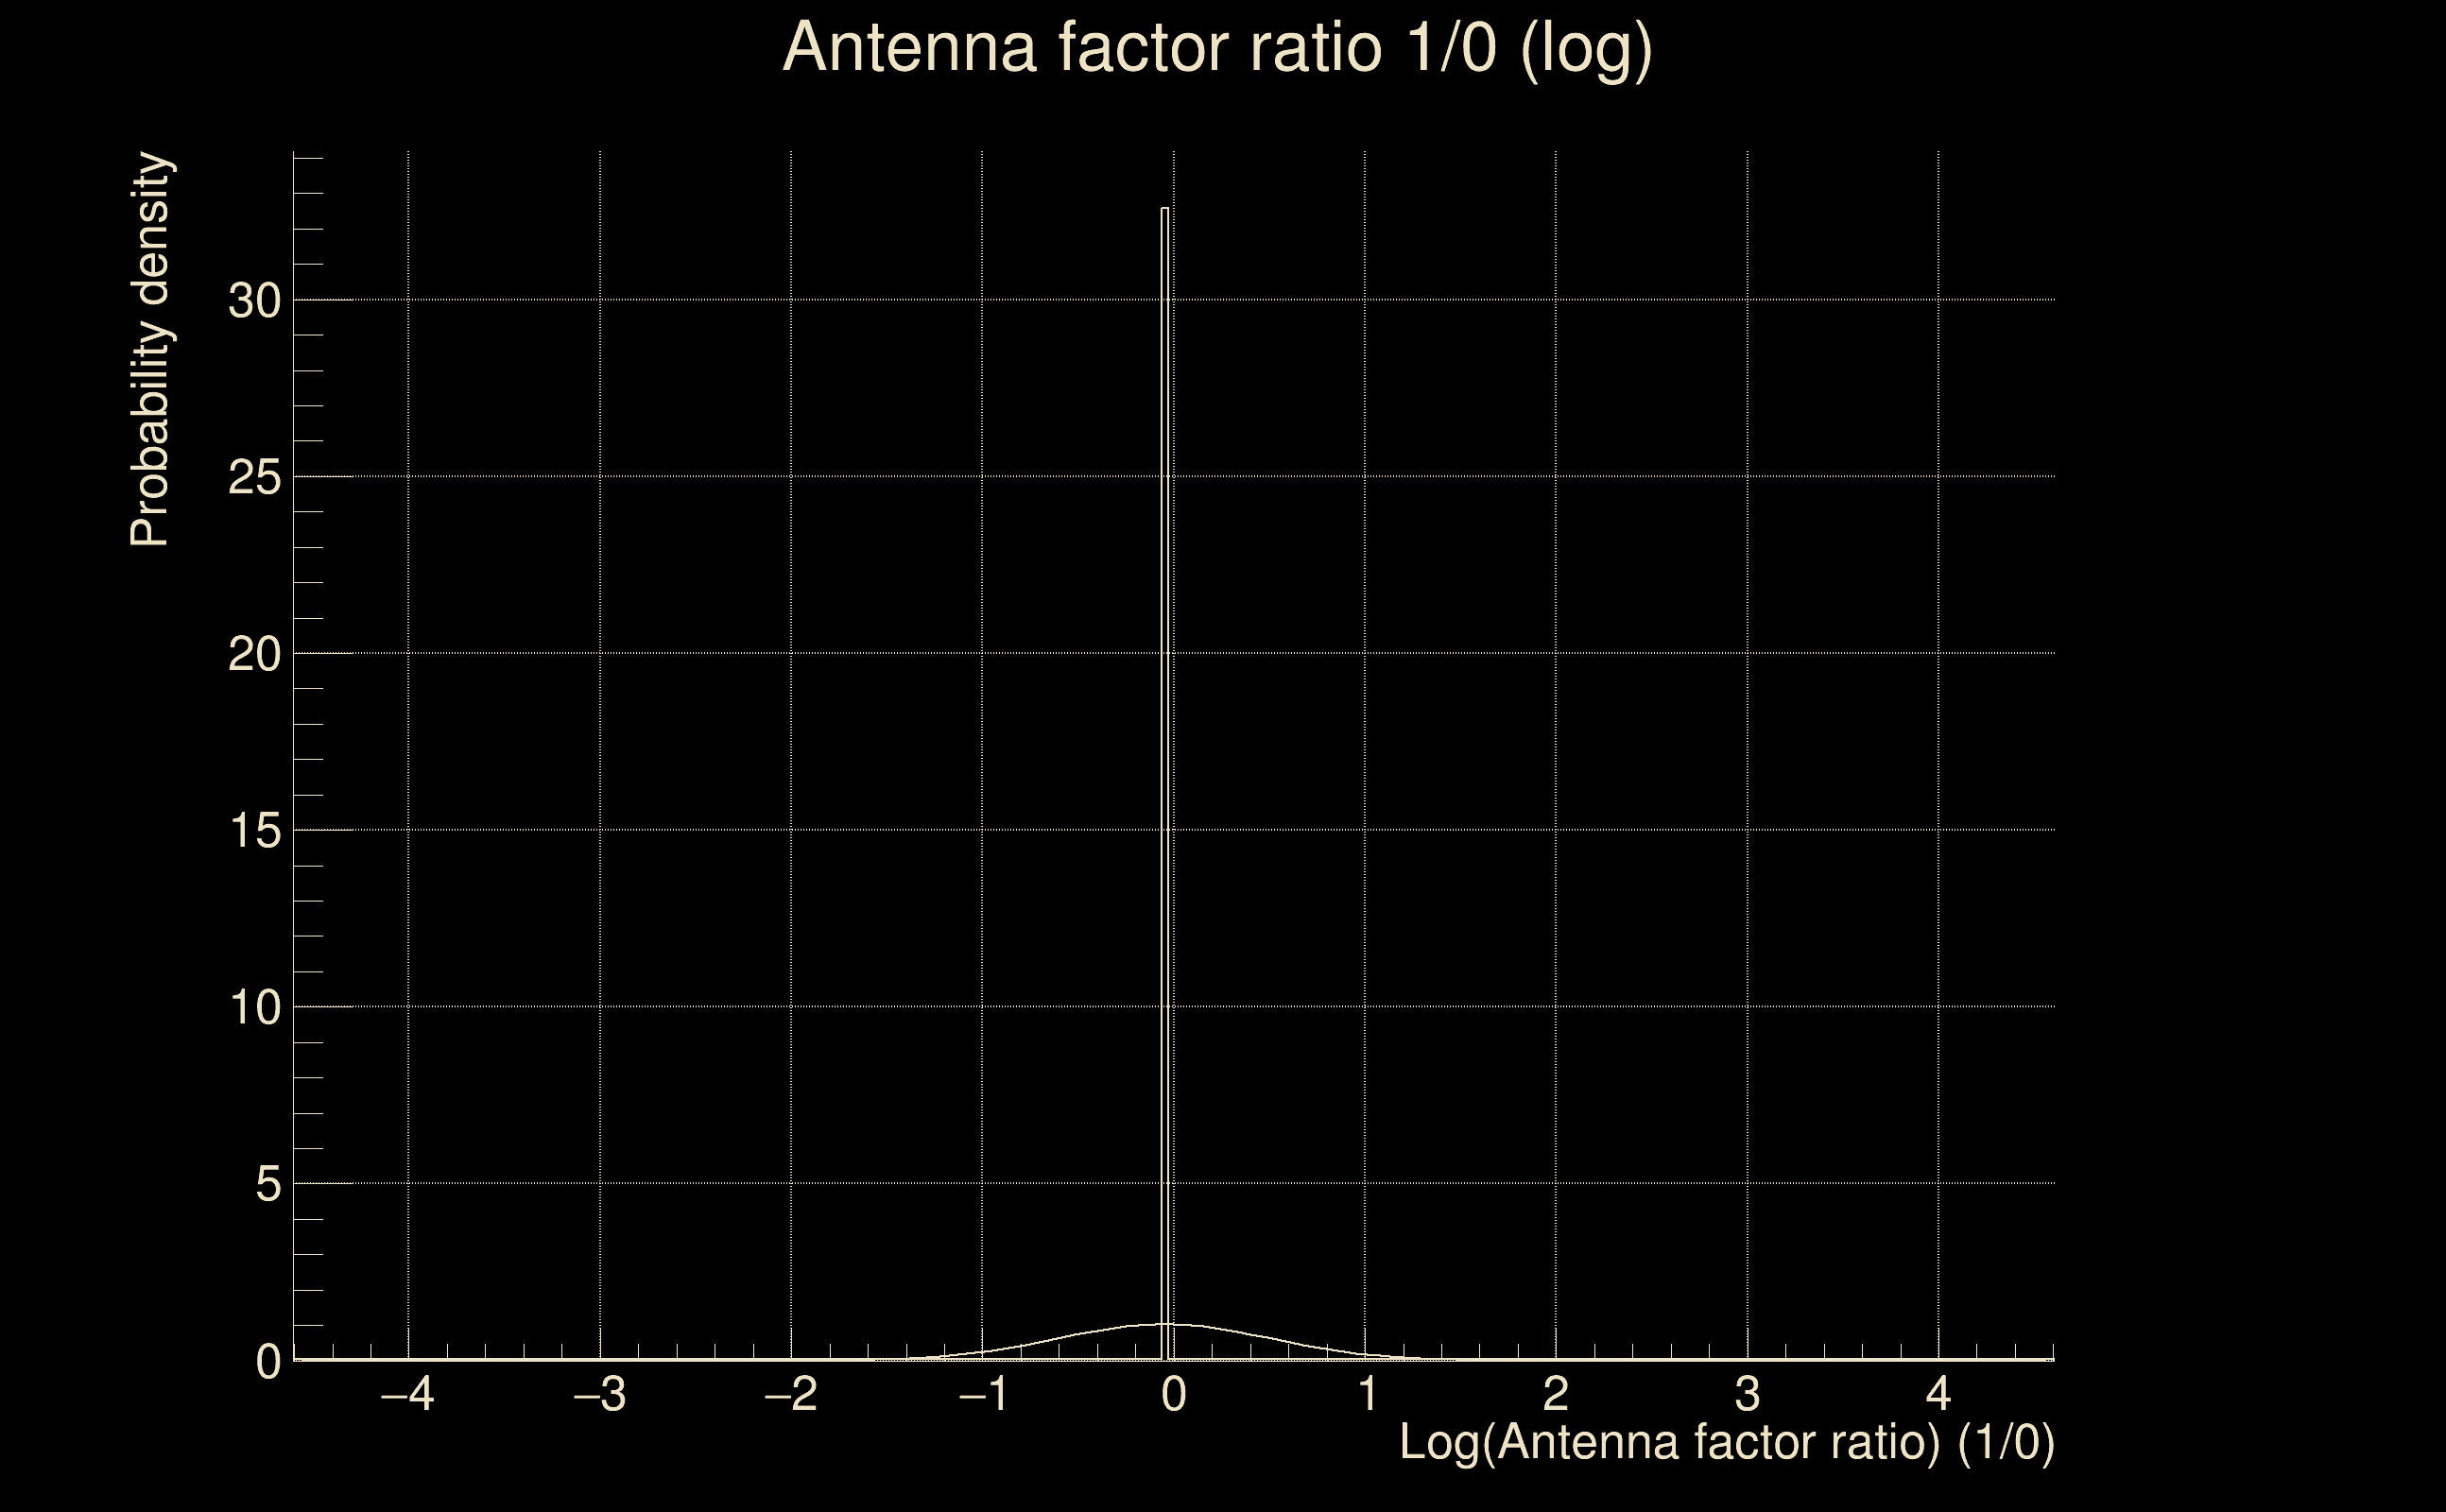
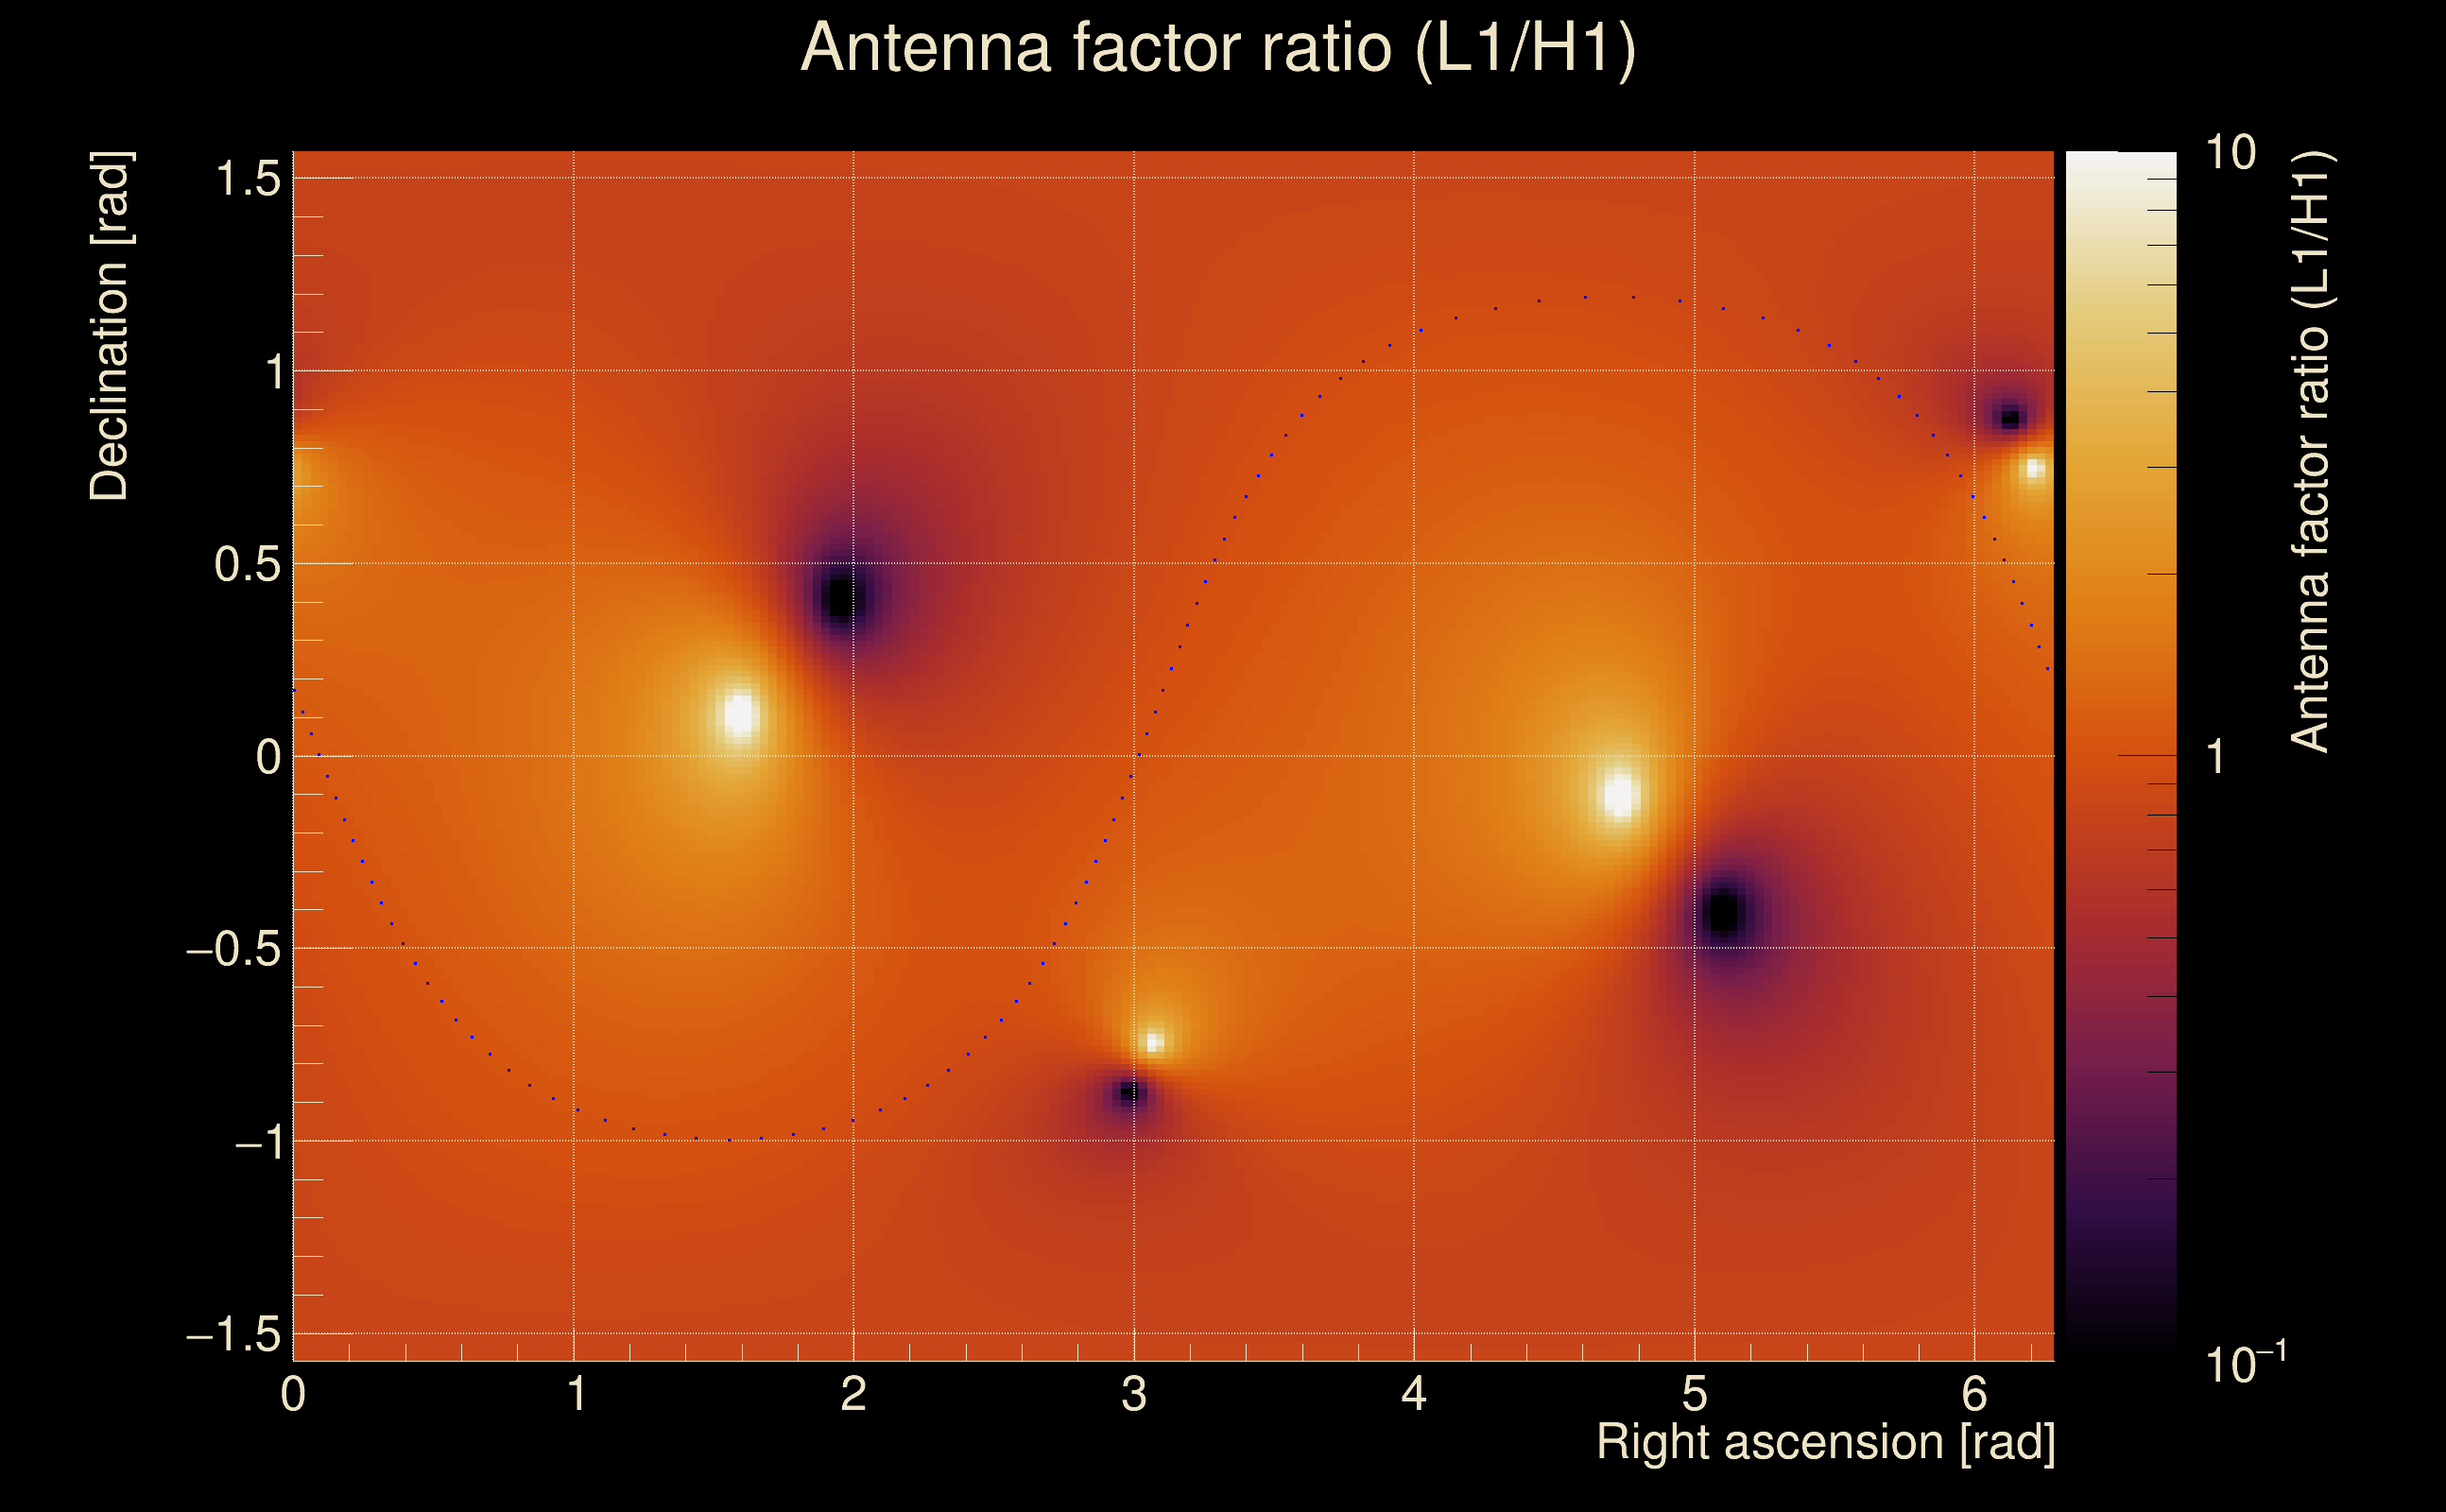
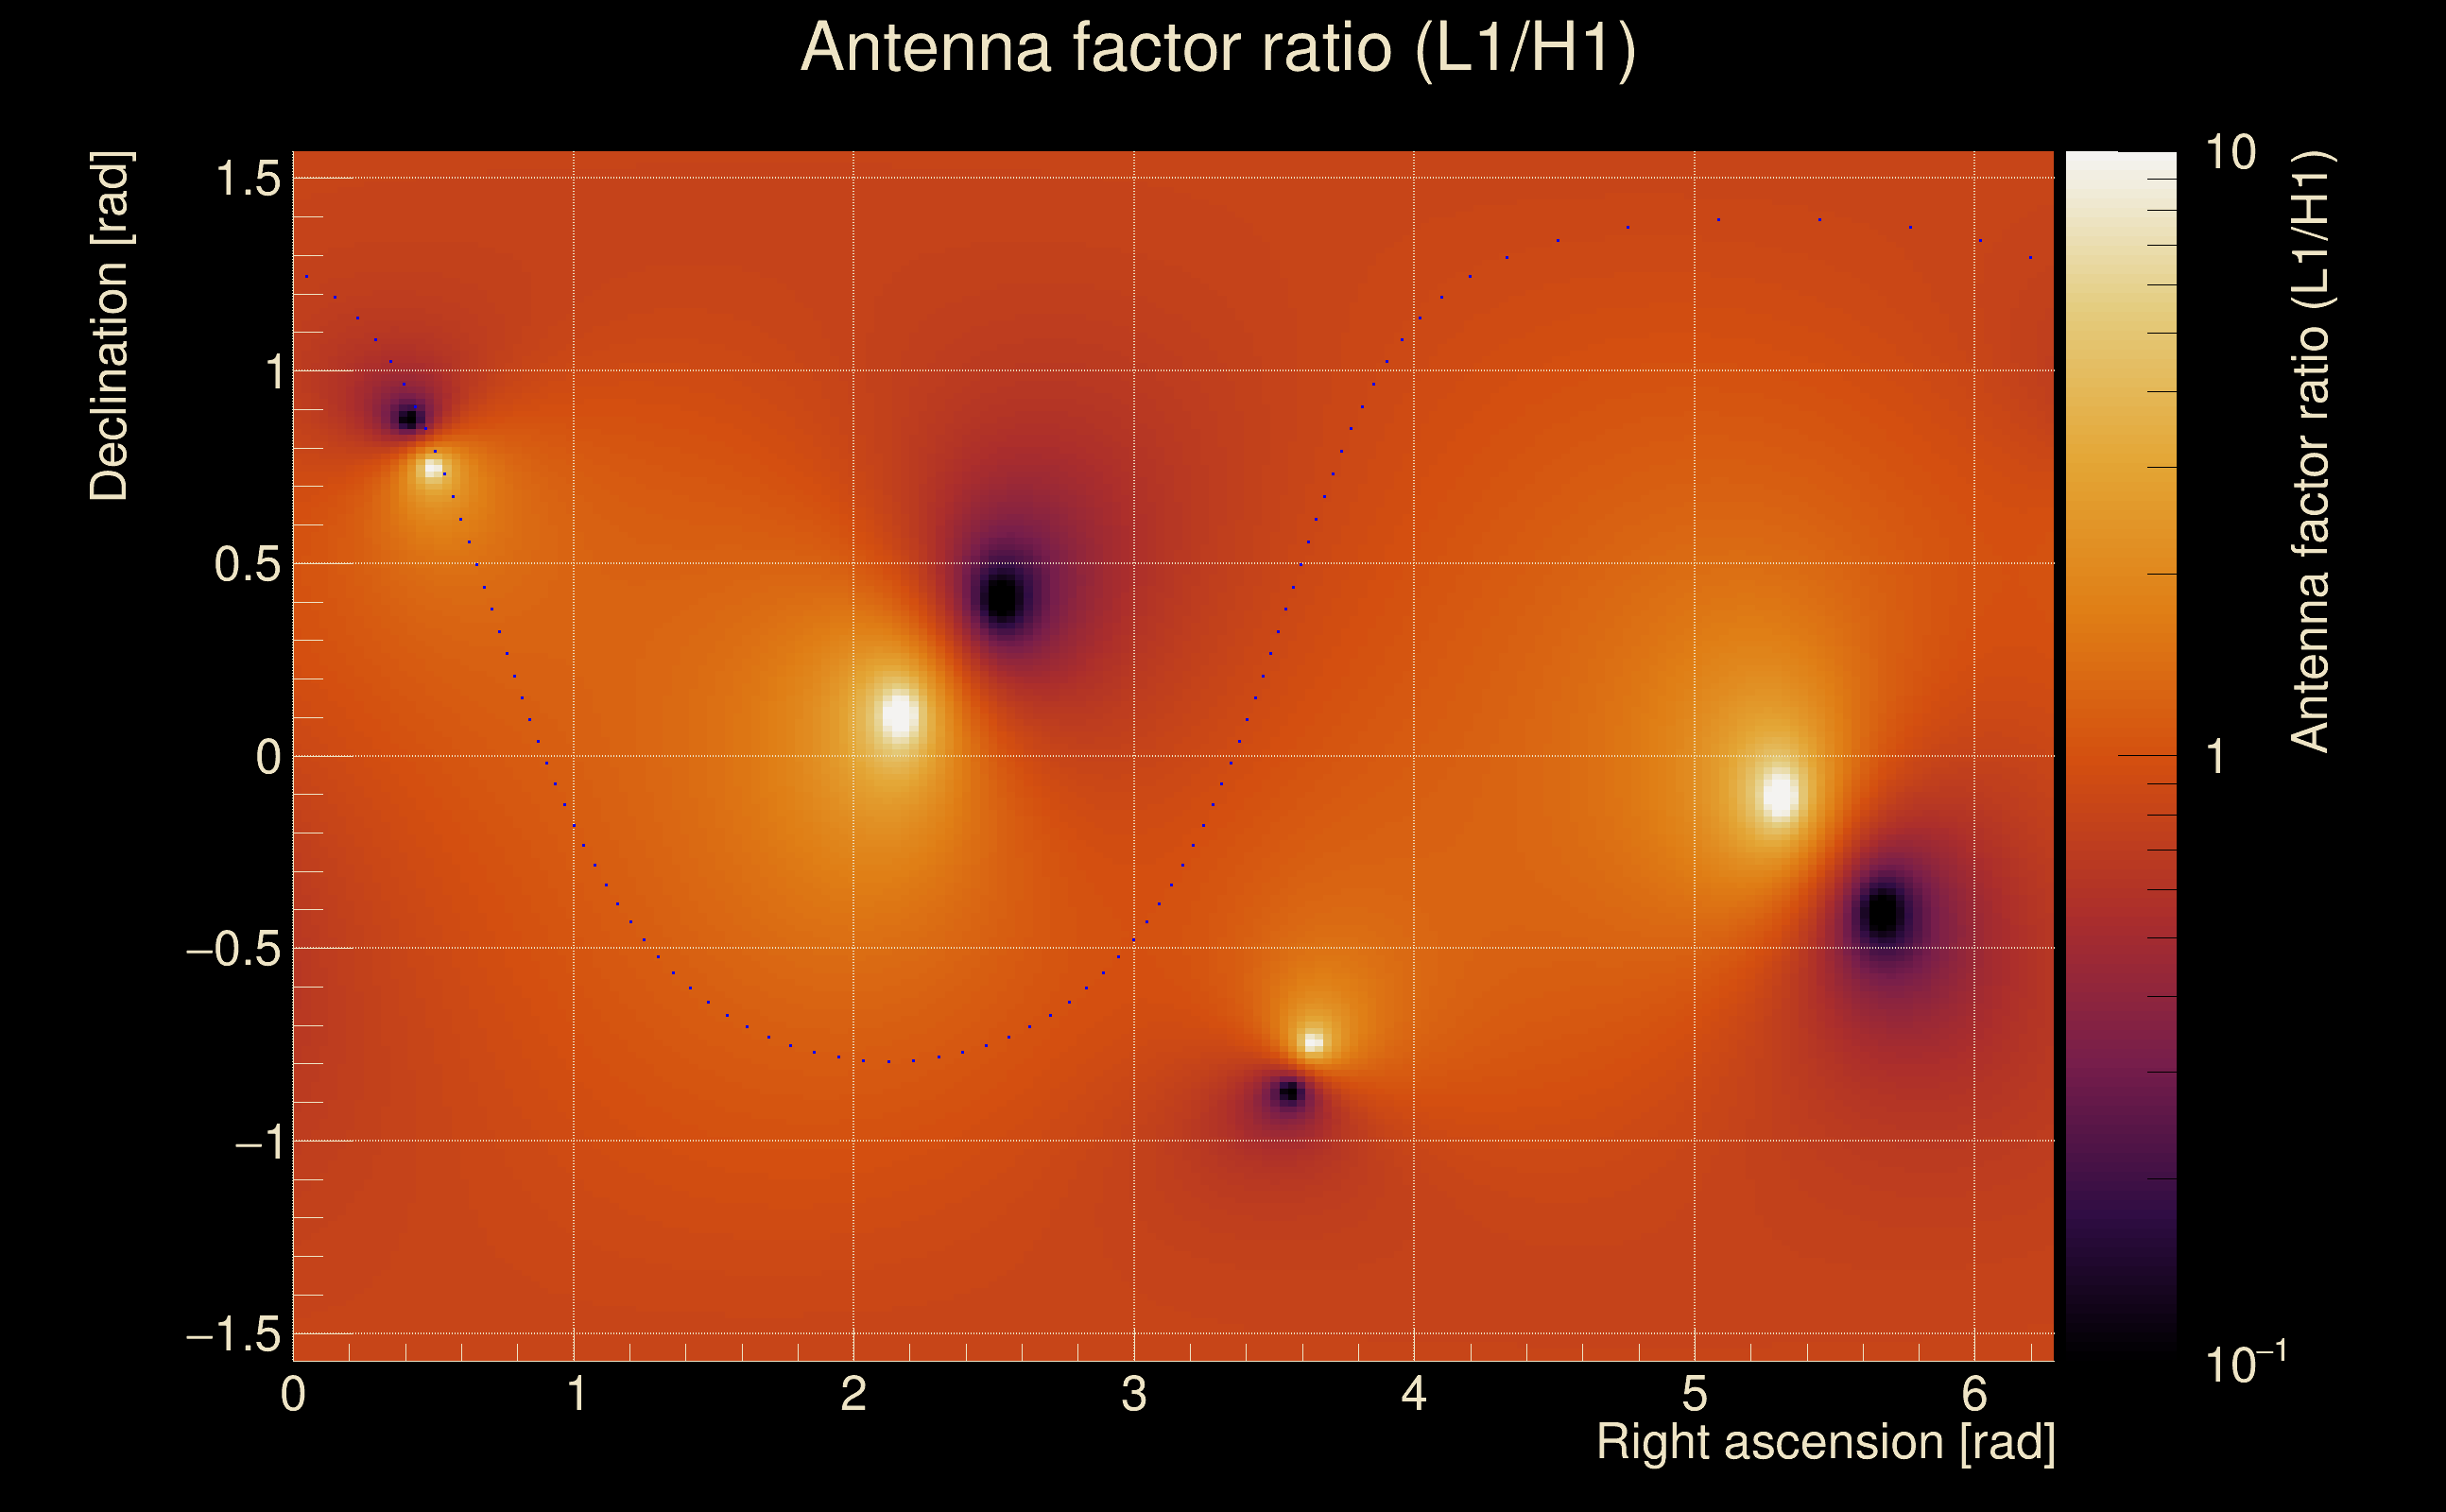
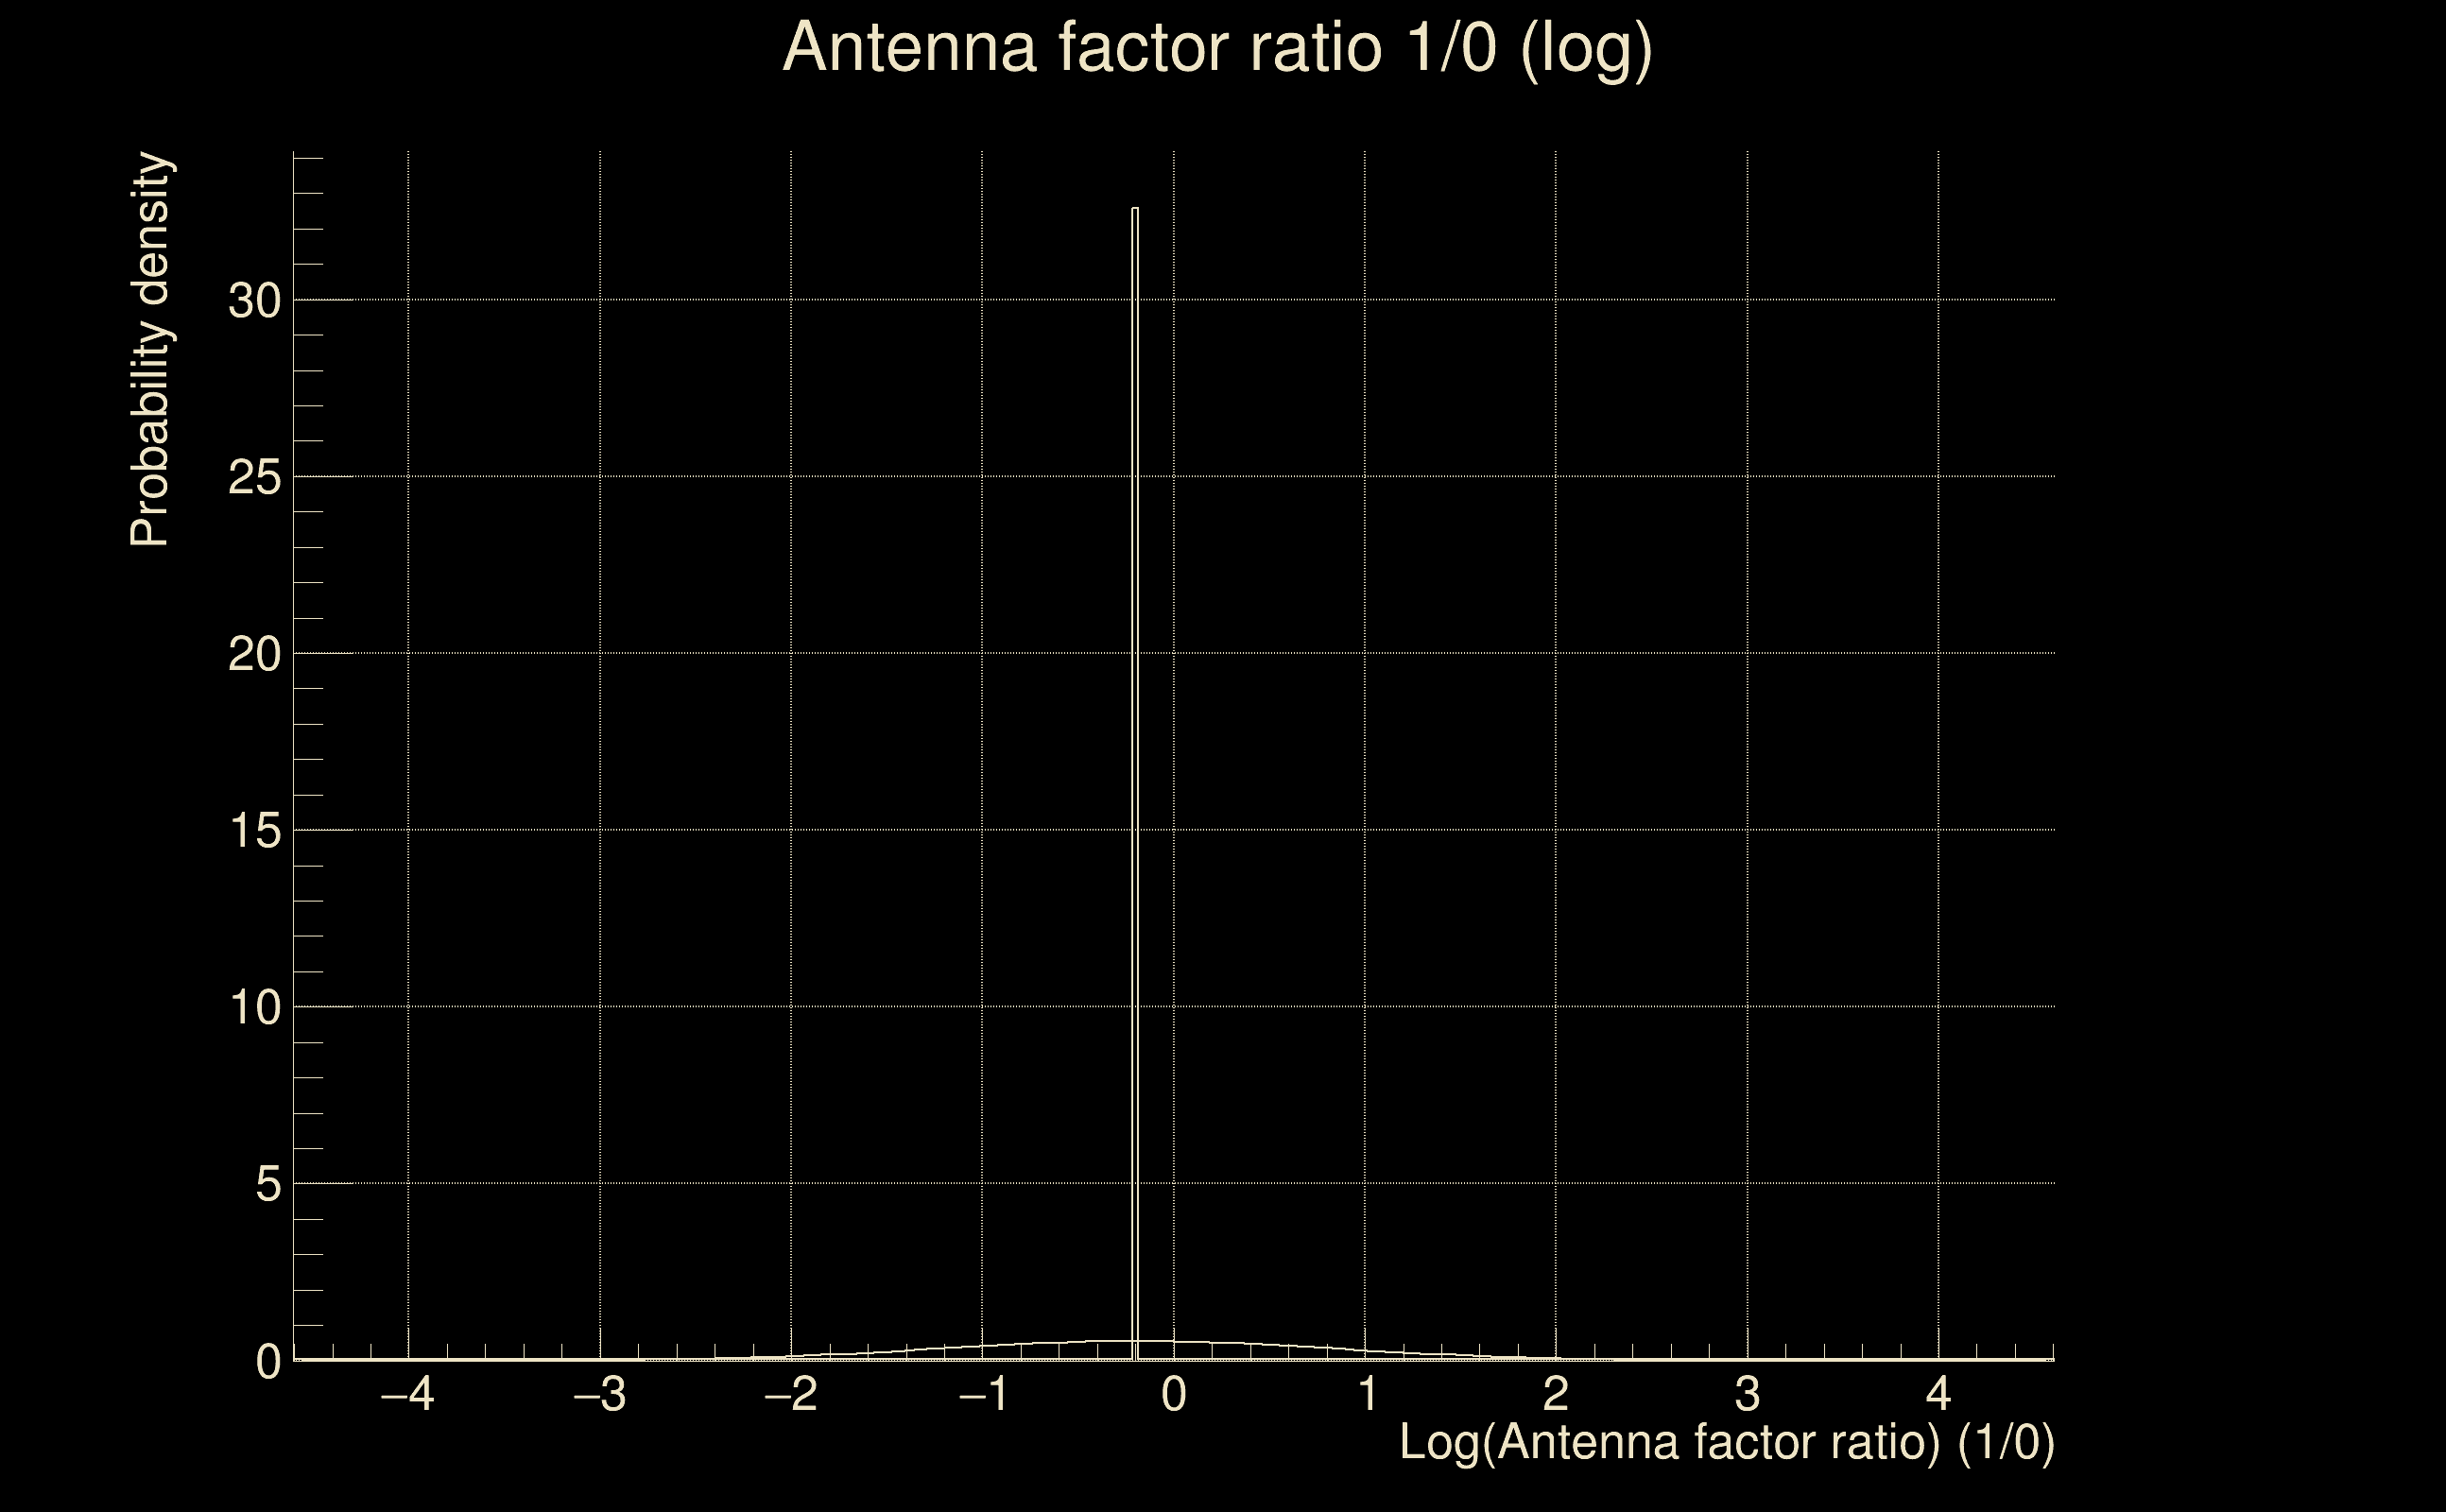
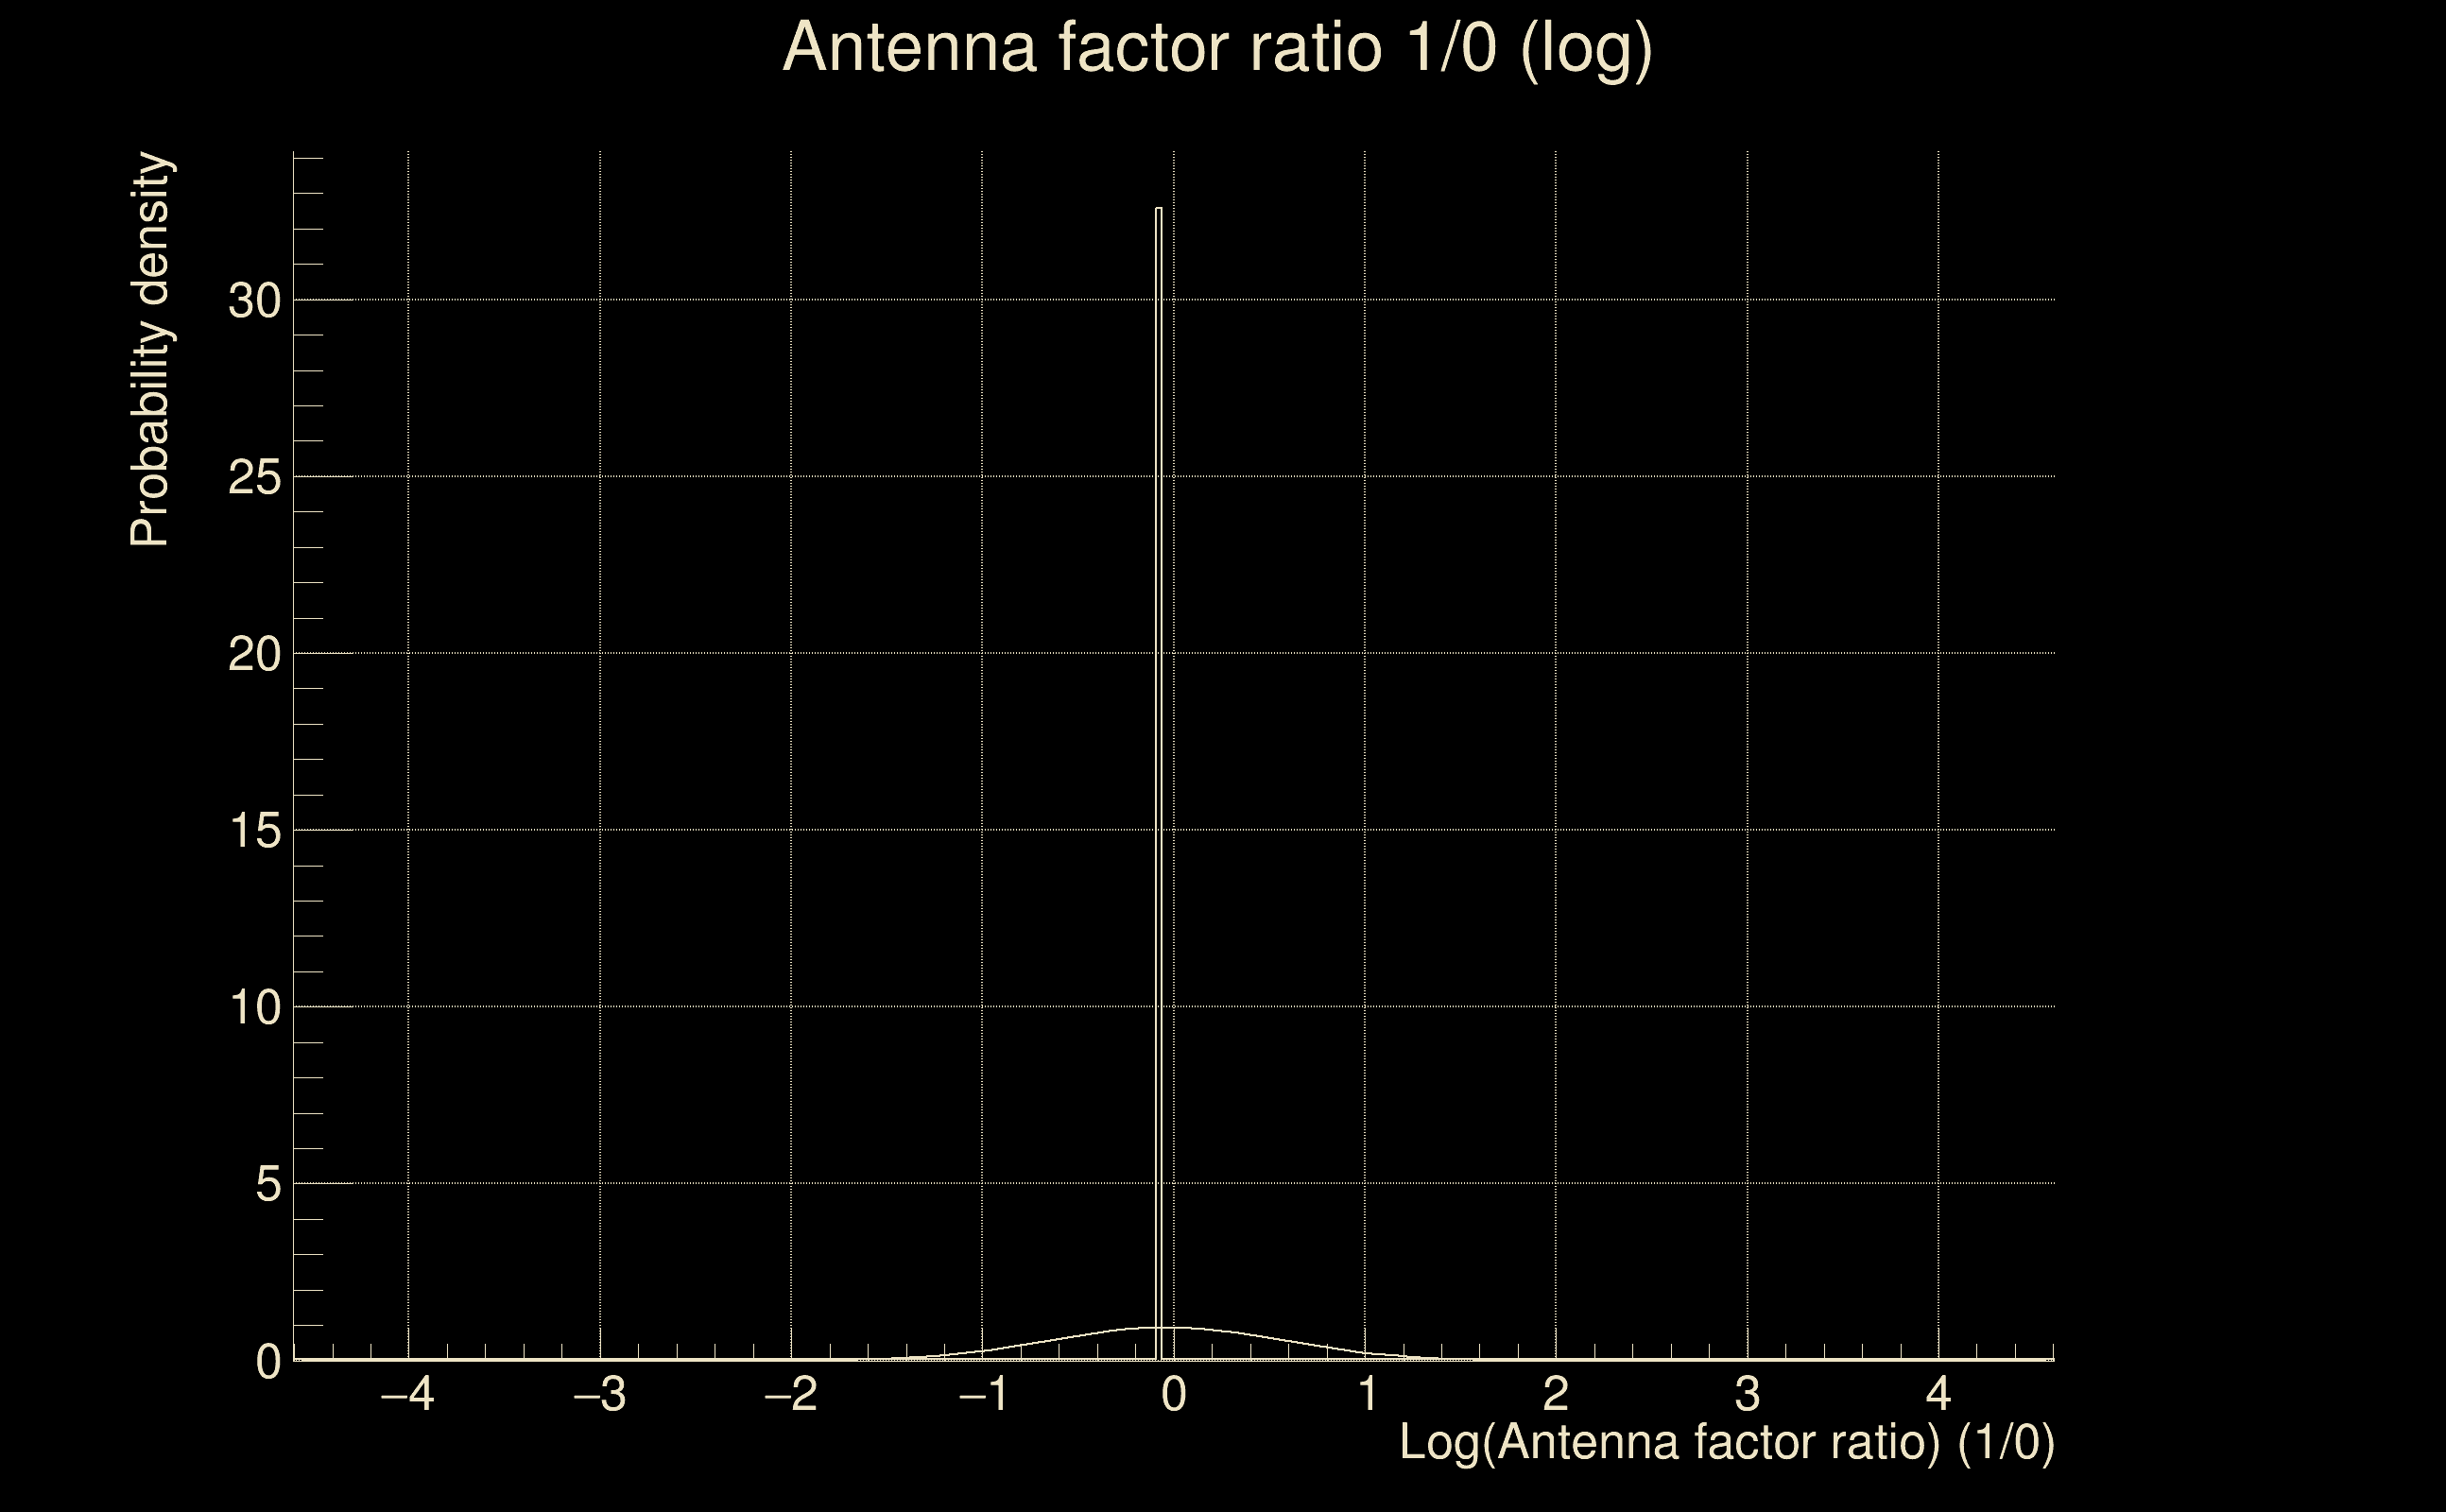
| Log of amplitude ratio (L1/H1): | -0.0492671, variance = 0.151342 (L1/H1: -0.0653451, variance = 0.302697, H1/L1: 0.0325883, variance = 0.302457) |
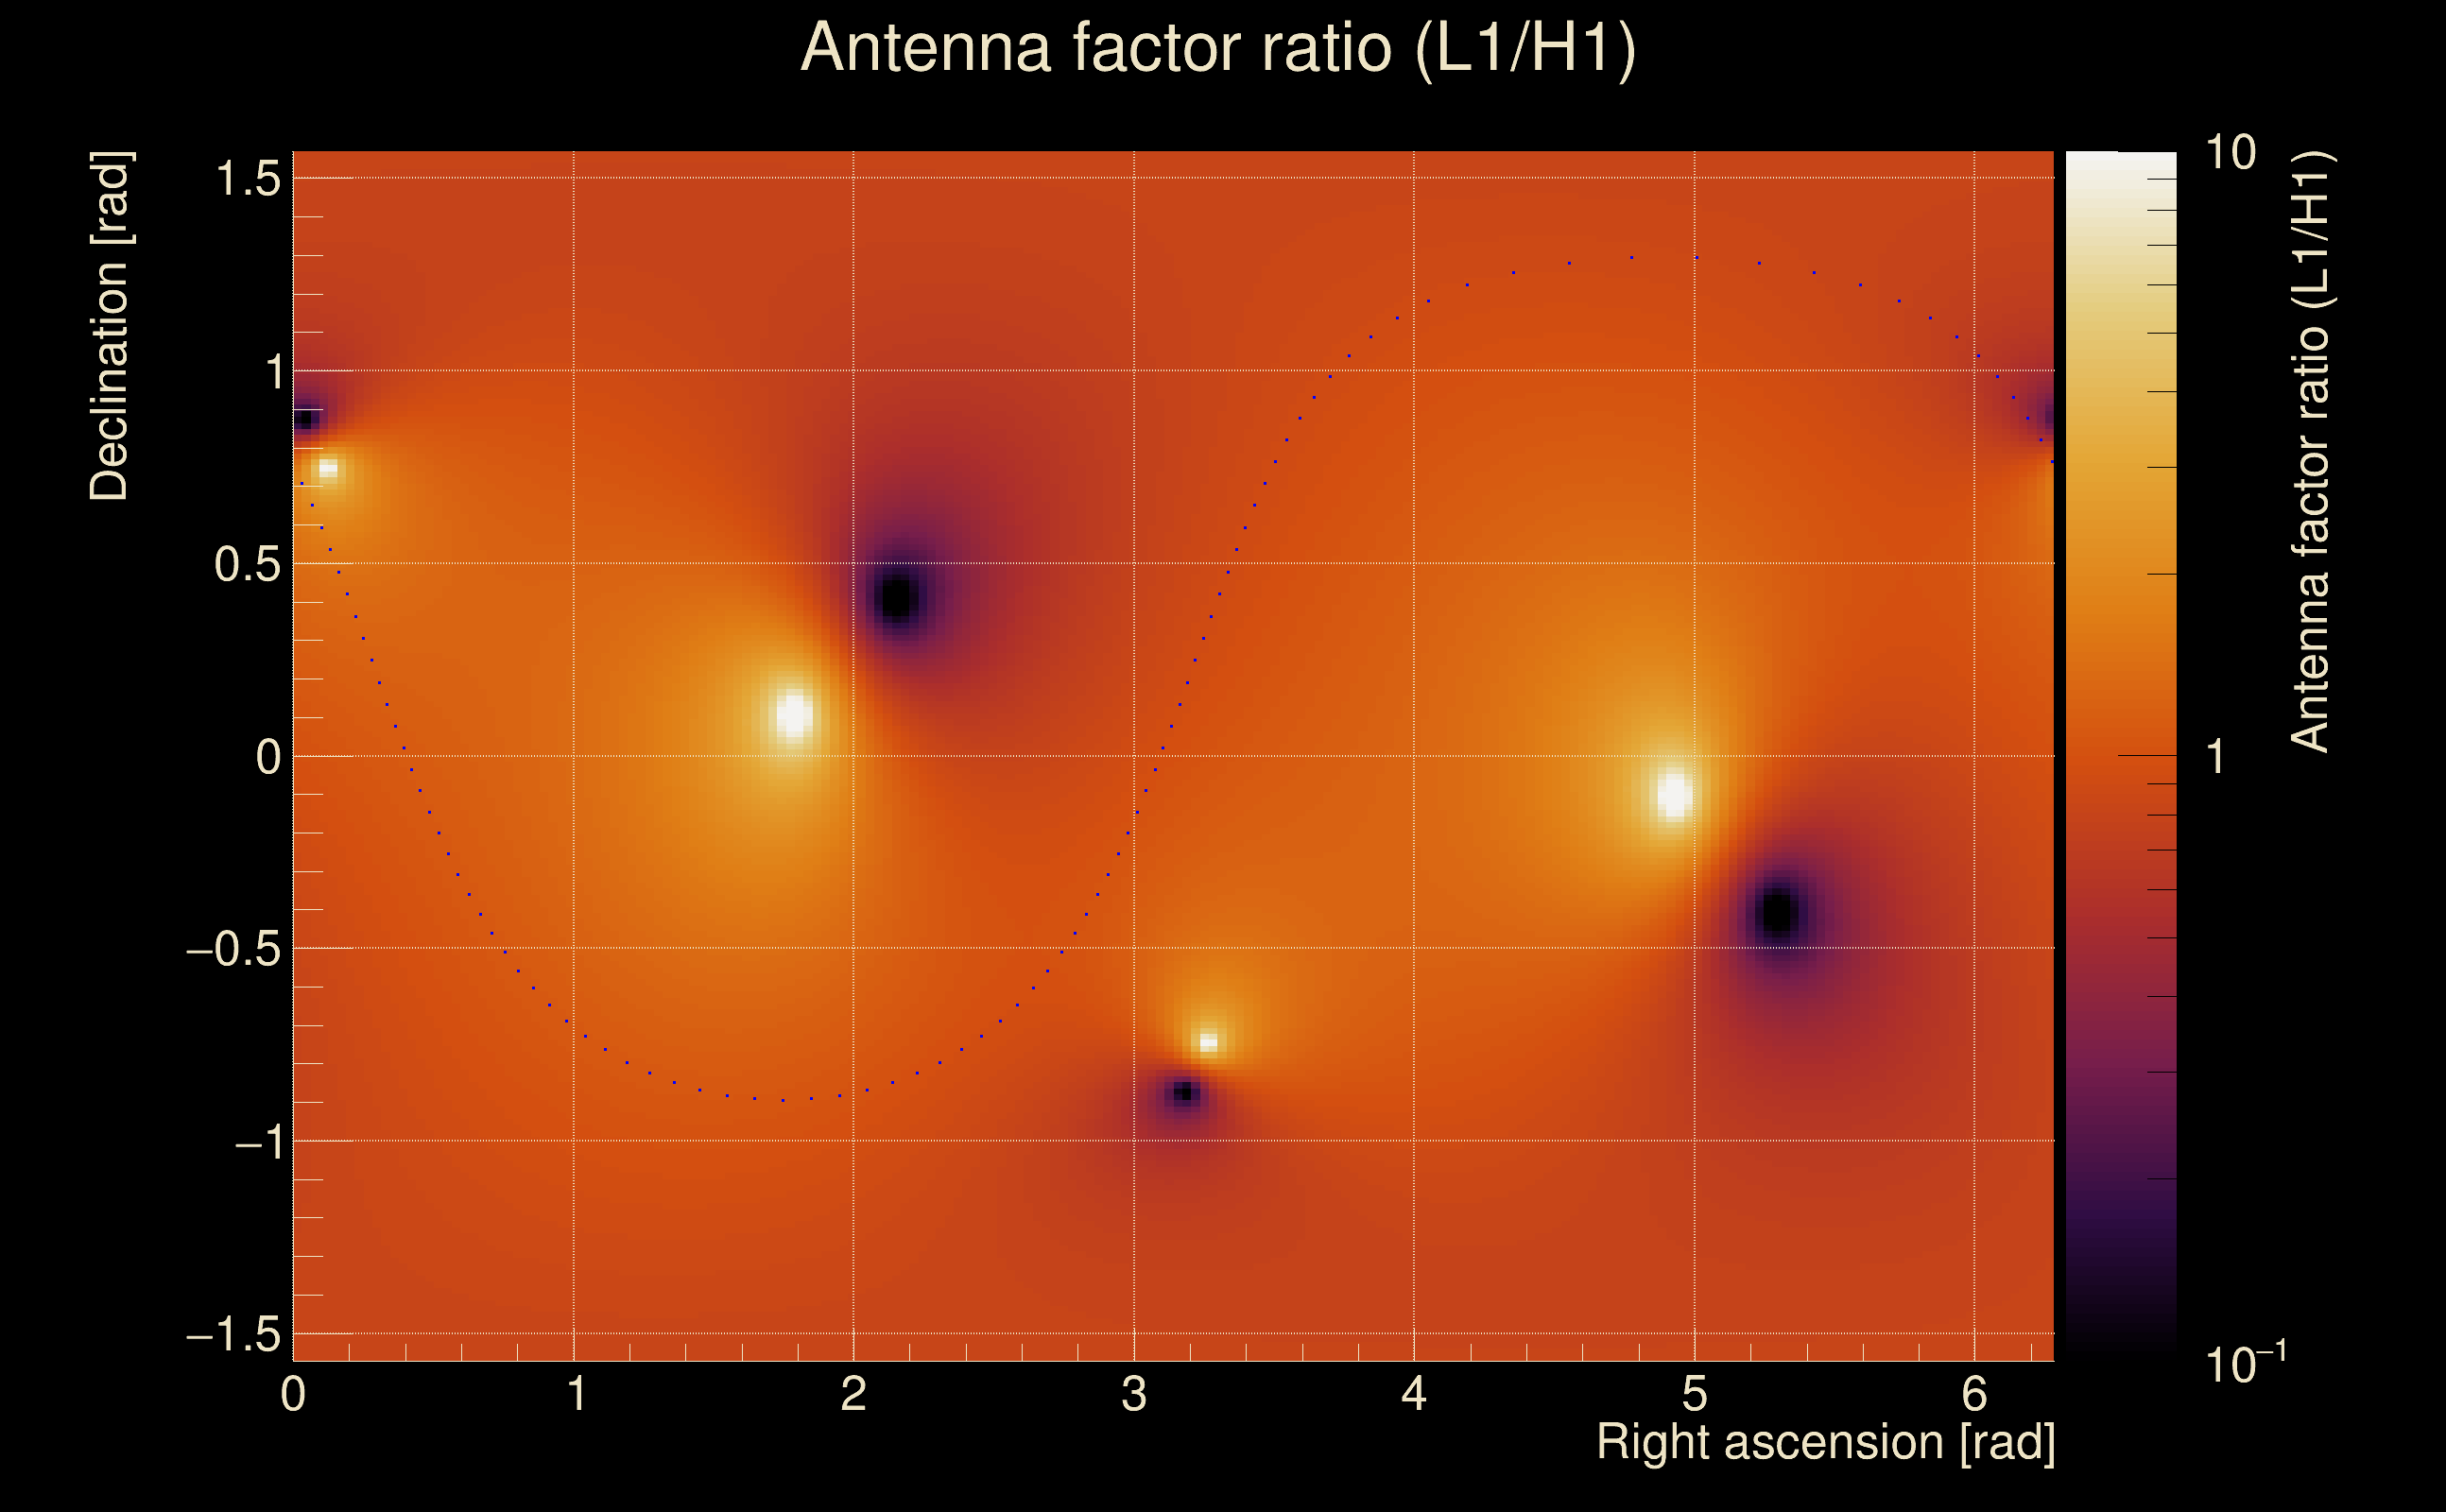
| Amplitude ratio (L1/H1): | 0.951927 ⋇ 1.47554 (L1/H1: 0.936744 ⋇ 1.73356, H1/L1: 1.03313 ⋇ 1.73319) |
| Amplitude ratio H1|L1 compatibility (probability): | 0.966412 |
| Antenna factor probability: | 0.995859 |
| Number of rejected frequency rows: | Q0: 0 / 18, Q1: 0 / 36, Q2: 2 / 70, Q3: 10 / 134, Q4: 21 / 258 |
| Maximum signal-to-noise ratio: | H1: 92.362, L1: 90.6836 |
| SNR variance: | H1: 8.23064, L1: 8.62114 |
| Click here for a zoomed plot | Click here for a zoomed plot | Click here for a zoomed plot | Click here for a zoomed plot | Click here for a zoomed plot |
 |
 |
 |
 |
 |
 |
 |
 |
 |
 |
 |
 |
 |
 |
 |
 |
 |
 |
 |
 |
 |
 |
 |
 |
 |
 |
 |
 |
 |
| Event time t(H1): | GPS = 1368420479 (Thu May 18 04:47:41 2023 ) → GPS = 1368420489 (Thu May 18 04:47:51 2023 ) |
| Event time t(L1): | GPS = 1368420479 (Thu May 18 04:47:51 2023 ) → GPS = 1368420489 (Thu May 18 04:47:51 2023 ) |
| Omicron analysis time window (H1): | GPS = 1368420476 → GPS = 1368420492 |
| Omicron analysis time window (L1): | GPS = 1368420476 → GPS = 1368420492 |
| Time delay between detectors t(L1) - t(H1): | 0.0009746 s (slice index = 108 / 217), δt_gw = 0.0009746 s |
| Time delay standard deviation: | 0.0224678 s |
| [targeted mode] Time delay probability: | 0.984463 (0.0194744 sigmas), δt_target = 0.000986099 s |
| Frequency: | 288.574 Hz |
| Ξ: | 0.95569 ± 0.00811262 (variance = 6.58146e-05): Q0: 0.974972, Q1: 0.965811, Q2: 0.955296, Q3: 0.953808, Q4: 0.955846 |
| Rank: | R_A = 0.893667 |
| Log of amplitude ratio (L1/H1): | -0.0513163, variance = 0.151396 (L1/H1: -0.0713392, variance = 0.302852, H1/L1: 0.0303627, variance = 0.3024) |
| Amplitude ratio (L1/H1): | 0.949978 ⋇ 1.47565 (L1/H1: 0.931146 ⋇ 1.73381, H1/L1: 1.03083 ⋇ 1.7331) |
| Amplitude ratio H1|L1 compatibility (probability): | 0.957995 |
| Antenna factor probability: | 0.991508 |
| Number of rejected frequency rows: | Q0: 0 / 18, Q1: 0 / 36, Q2: 2 / 70, Q3: 11 / 134, Q4: 25 / 258 |
| Maximum signal-to-noise ratio: | H1: 92.5416, L1: 90.4631 |
| SNR variance: | H1: 0.545612, L1: 0.521334 |
| Click here for a zoomed plot | Click here for a zoomed plot | Click here for a zoomed plot | Click here for a zoomed plot | Click here for a zoomed plot |
 |
 |
 |
 |
 |
 |
 |
 |
 |
 |
 |
 |
 |
 |
 |
 |
 |
 |
 |
 |
 |
 |
 |
 |
 |
 |
 |
 |
 |
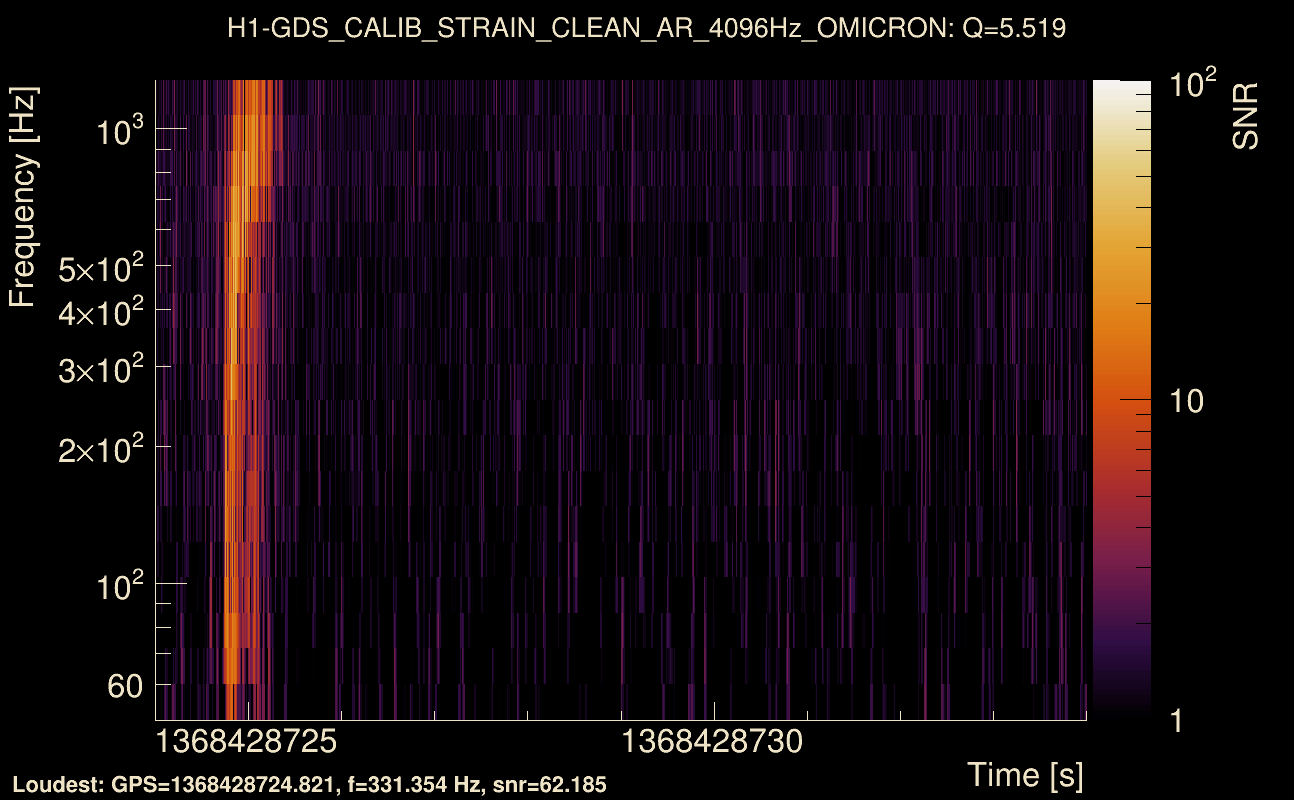
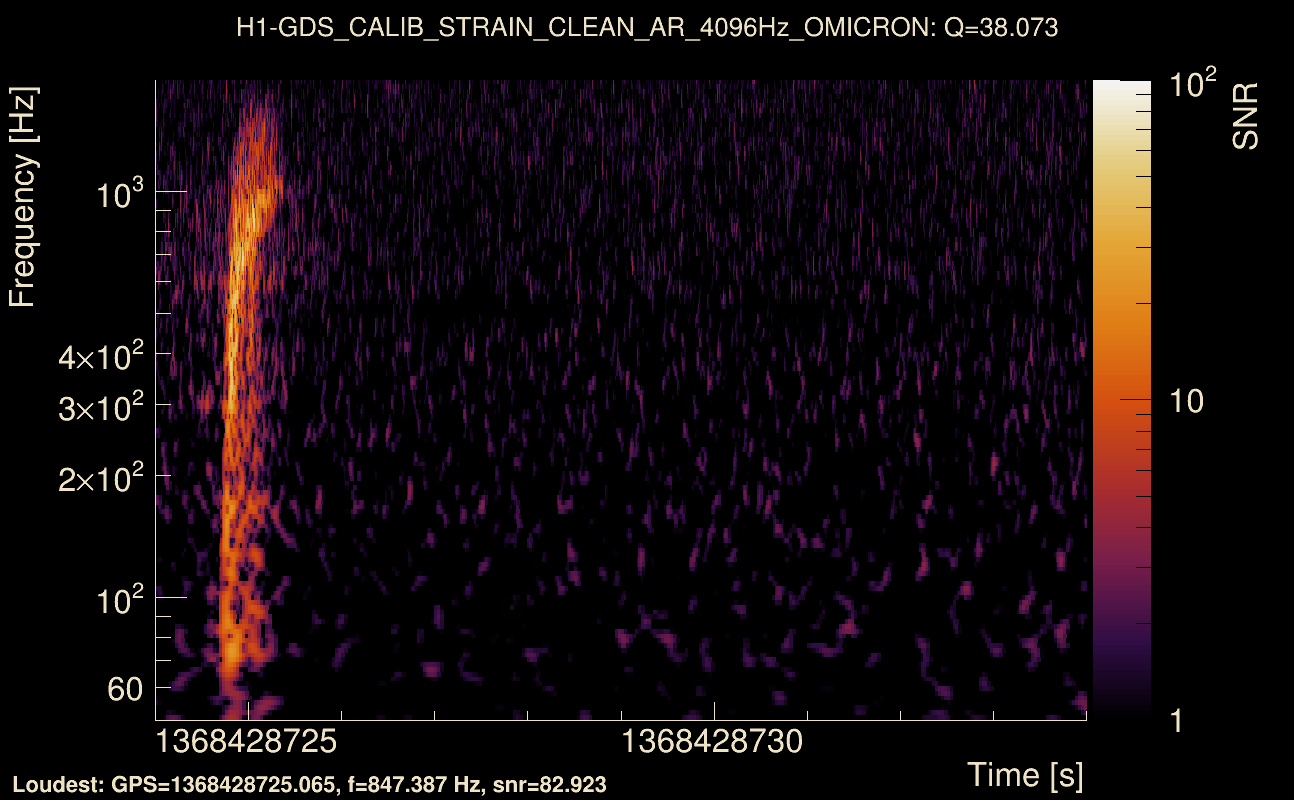
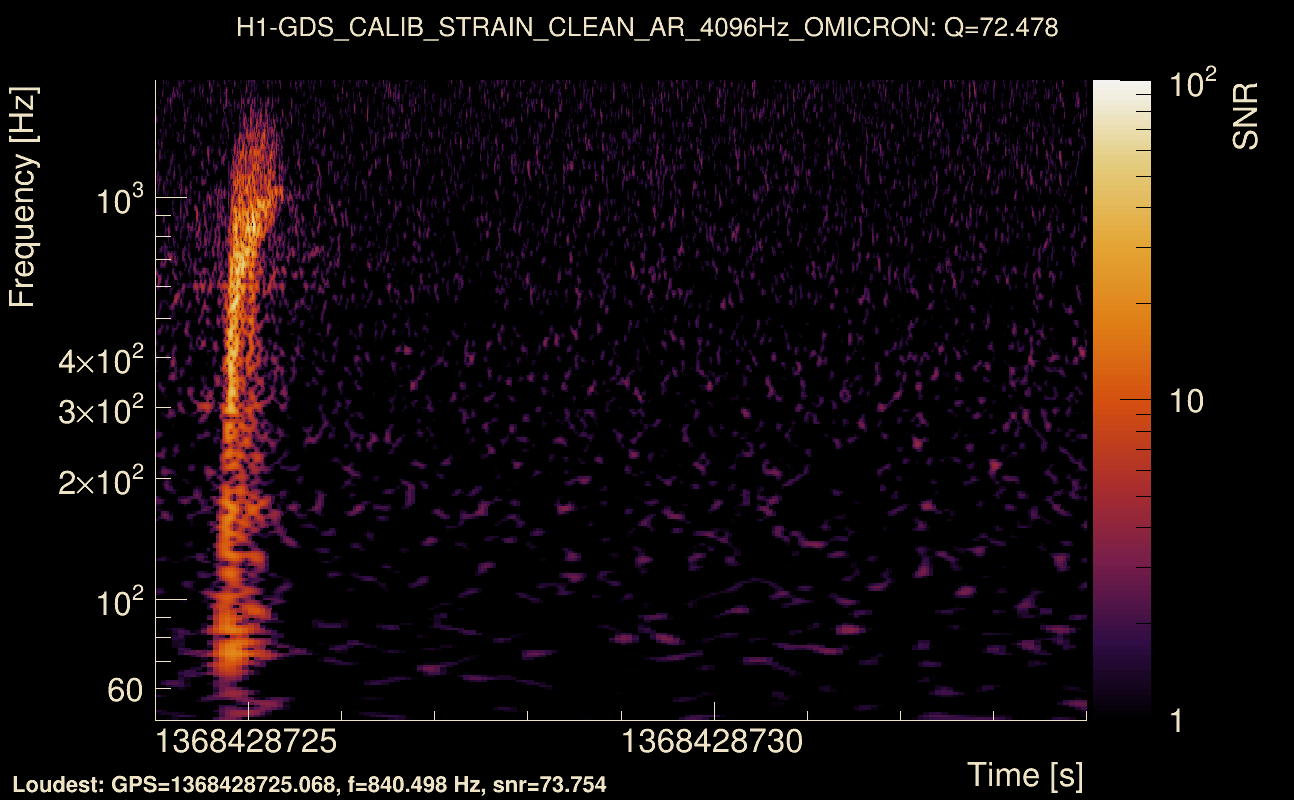
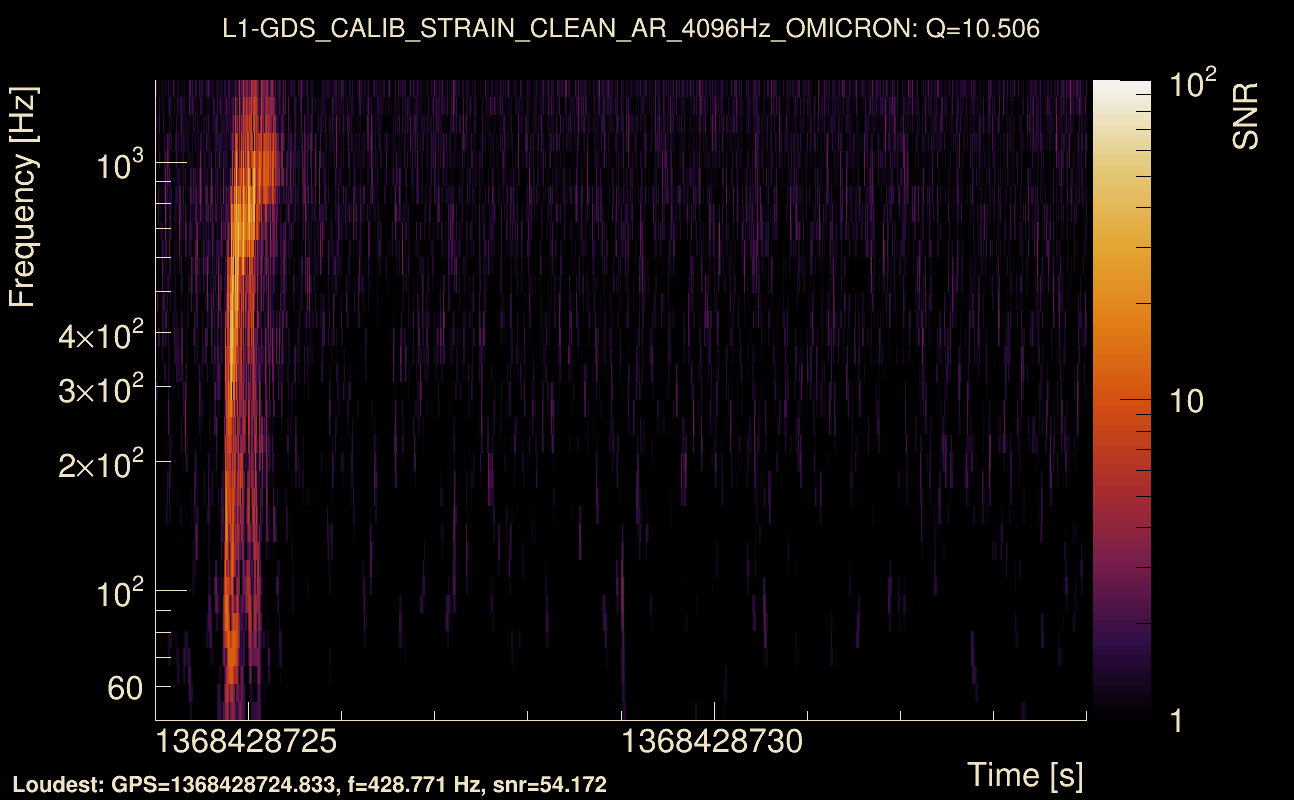
| Event time t(H1): | GPS = 1368428724 (Thu May 18 07:05:06 2023 ) → GPS = 1368428734 (Thu May 18 07:05:16 2023 ) |
| Event time t(L1): | GPS = 1368428724 (Thu May 18 07:05:16 2023 ) → GPS = 1368428734 (Thu May 18 07:05:16 2023 ) |
| Omicron analysis time window (H1): | GPS = 1368428721 → GPS = 1368428737 |
| Omicron analysis time window (L1): | GPS = 1368428721 → GPS = 1368428737 |
| Time delay between detectors t(L1) - t(H1): | 0.00397953 s (slice index = 108 / 217), δt_gw = 0.00397953 s |
| Time delay standard deviation: | 0.0208078 s |
| [targeted mode] Time delay probability: | 0.961201 (0.0486471 sigmas), δt_target = 0.00098443 s |
| Frequency: | 284.893 Hz |
| Ξ: | 0.946291 ± 0.0139097 (variance = 0.00019348): Q0: 0.97425, Q1: 0.953634, Q2: 0.947658, Q3: 0.938594, Q4: 0.934809 |
| Rank: | R_A = 0.836099 |
| Log of amplitude ratio (L1/H1): | -0.216589, variance = 0.154747 (L1/H1: -0.233859, variance = 0.303158, H1/L1: 0.193611, variance = 0.303806) |
| Amplitude ratio (L1/H1): | 0.805261 ⋇ 1.48198 (L1/H1: 0.791474 ⋇ 1.73429, H1/L1: 1.21362 ⋇ 1.73531) |
| Amplitude ratio H1|L1 compatibility (probability): | 0.958799 |
| Antenna factor probability: | 0.958718 |
| Number of rejected frequency rows: | Q0: 0 / 18, Q1: 0 / 36, Q2: 3 / 70, Q3: 11 / 134, Q4: 37 / 258 |
| Maximum signal-to-noise ratio: | H1: 82.1041, L1: 71.1799 |
| SNR variance: | H1: 6.38022, L1: 4.9545 |
| Click here for a zoomed plot | Click here for a zoomed plot | Click here for a zoomed plot | Click here for a zoomed plot | Click here for a zoomed plot |
 |
 |
 |
 |
 |
 |
 |
 |
 |
 |
 |
 |
 |
 |
 |
 |
 |
 |
 |
 |
 |
 |
 |
 |
 |
 |
 |
 |
 |
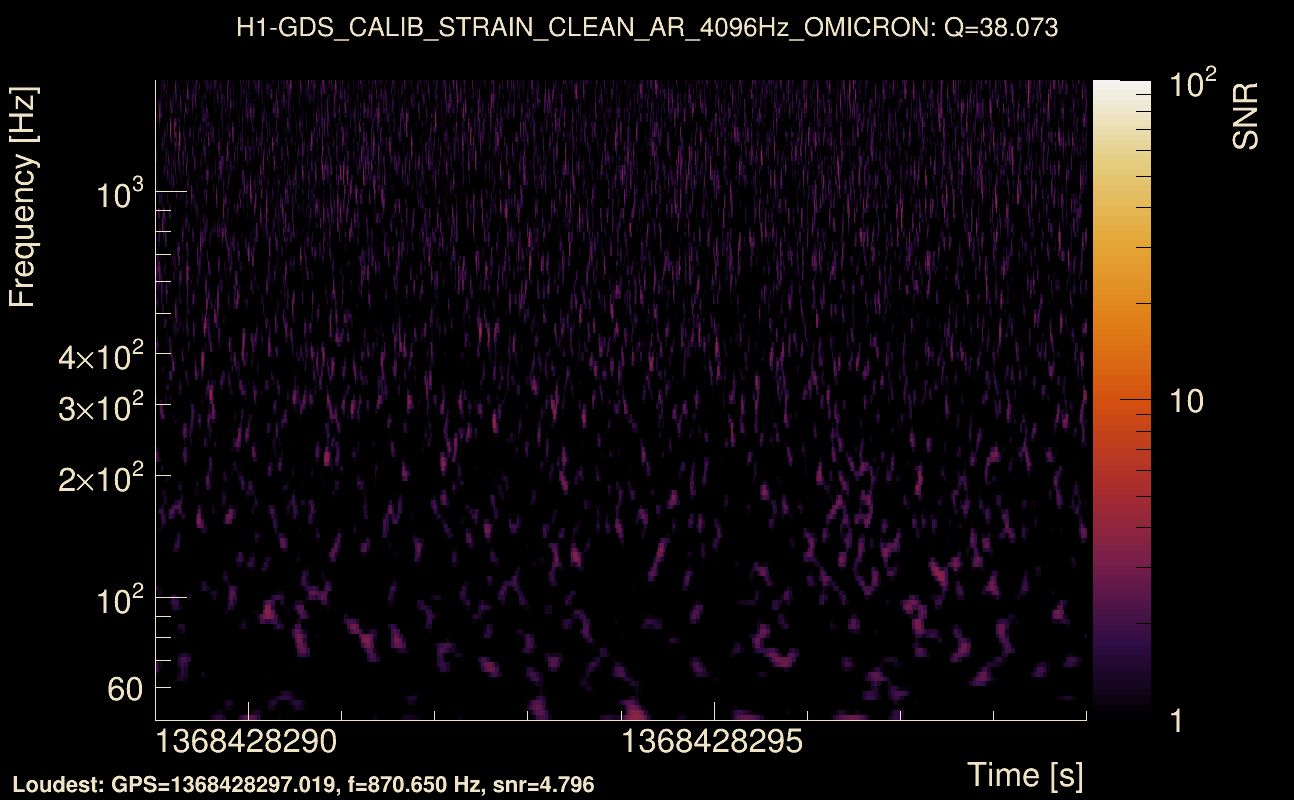
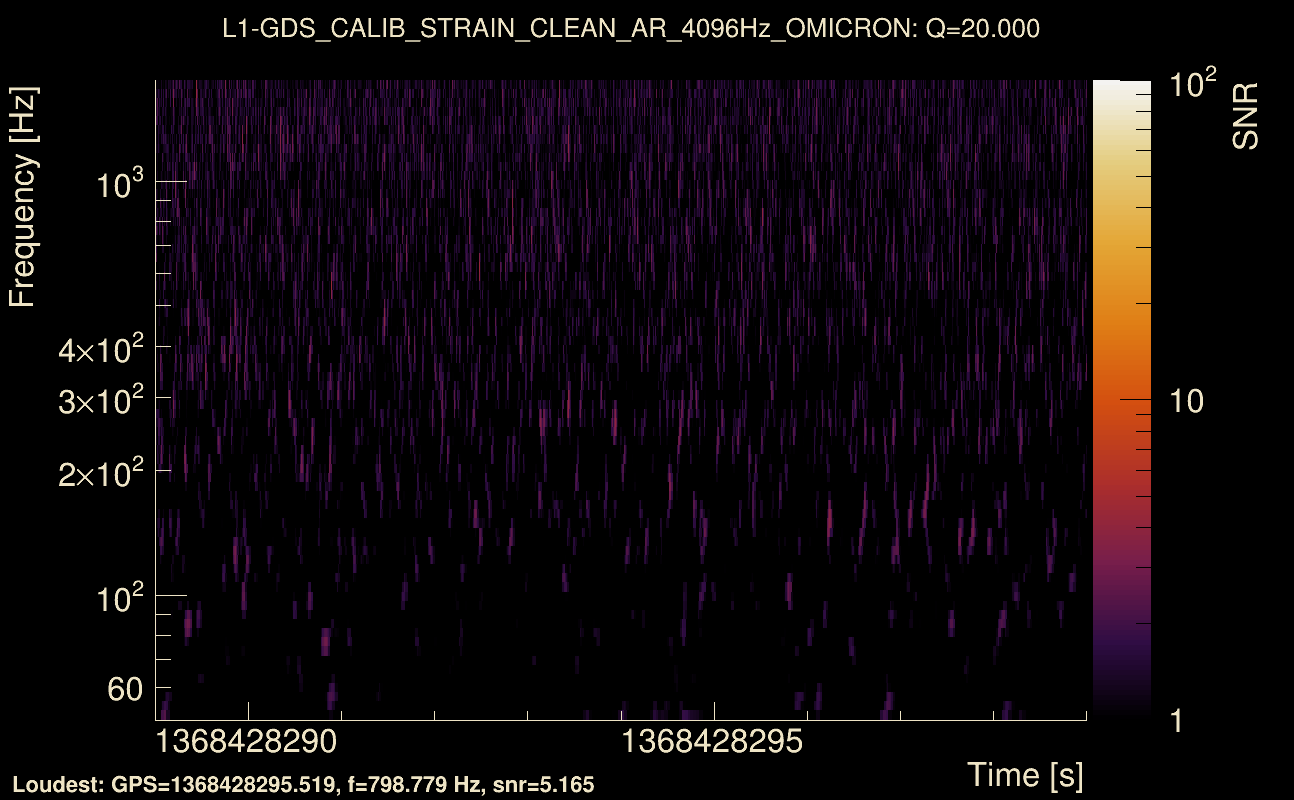
| Event time t(H1): | GPS = 1368428289 (Thu May 18 06:57:51 2023 ) → GPS = 1368428299 (Thu May 18 06:58:01 2023 ) |
| Event time t(L1): | GPS = 1368428289 (Thu May 18 06:58:01 2023 ) → GPS = 1368428299 (Thu May 18 06:58:01 2023 ) |
| Omicron analysis time window (H1): | GPS = 1368428286 → GPS = 1368428302 |
| Omicron analysis time window (L1): | GPS = 1368428286 → GPS = 1368428302 |
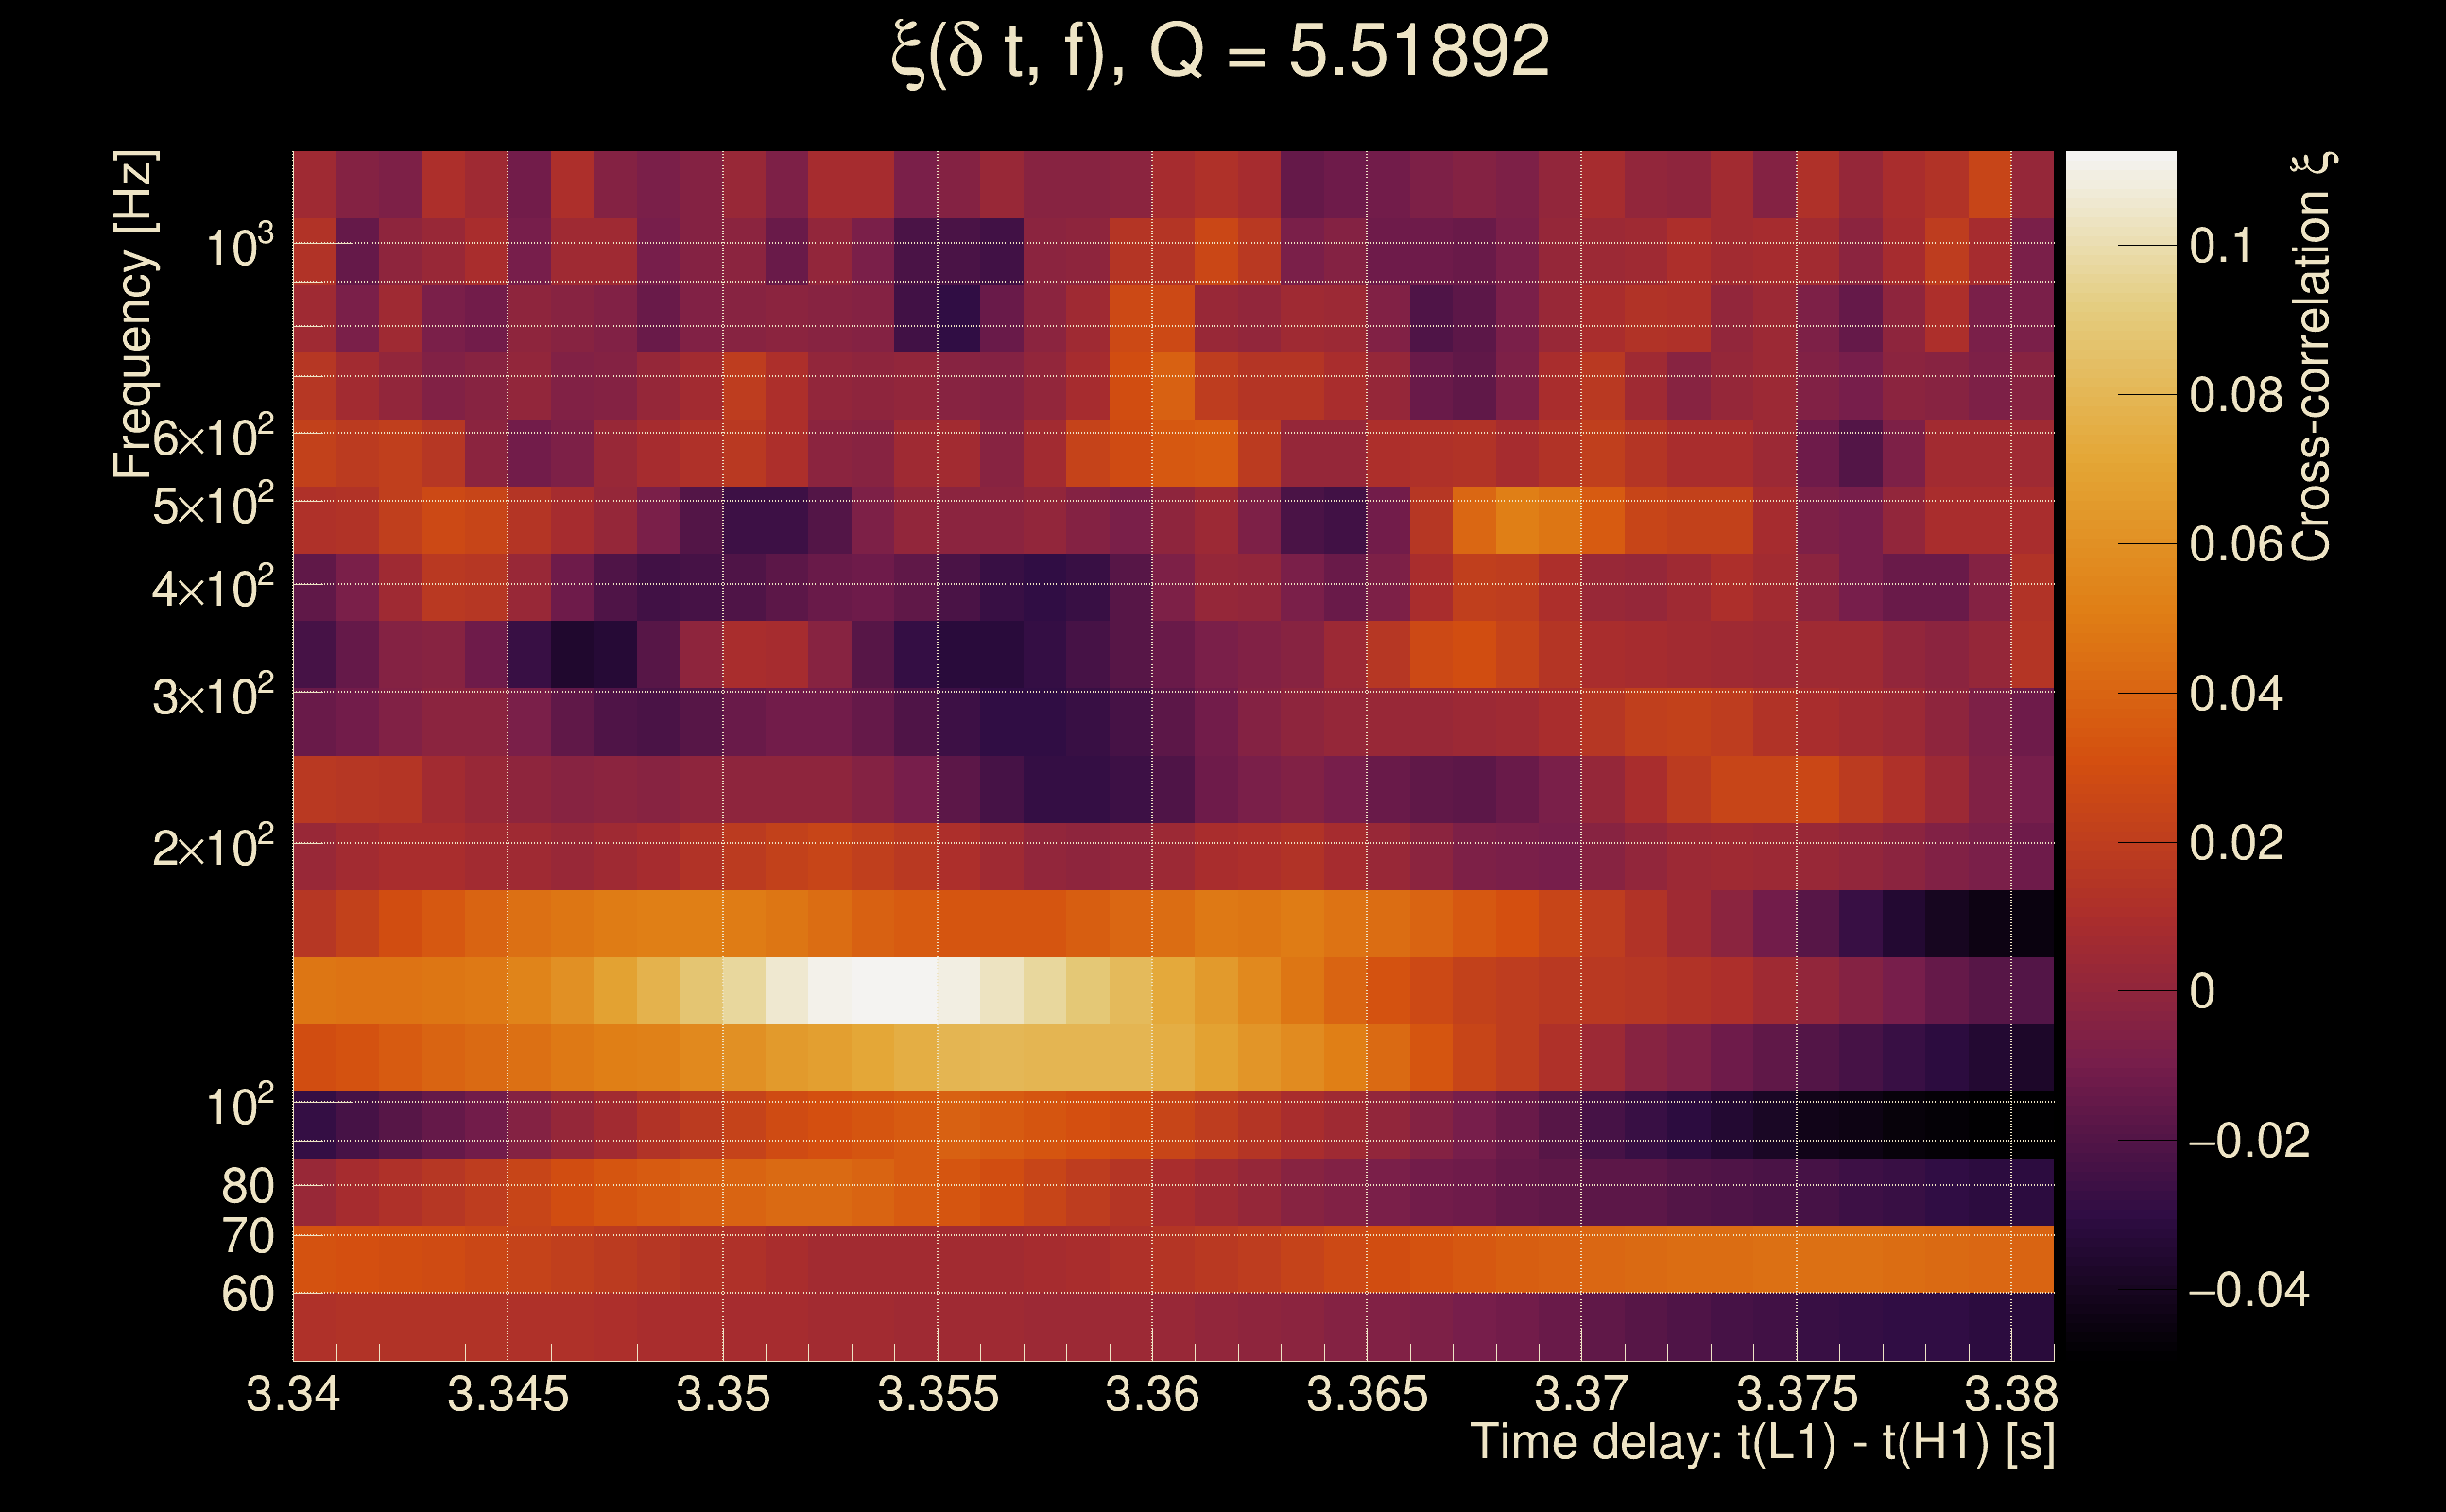
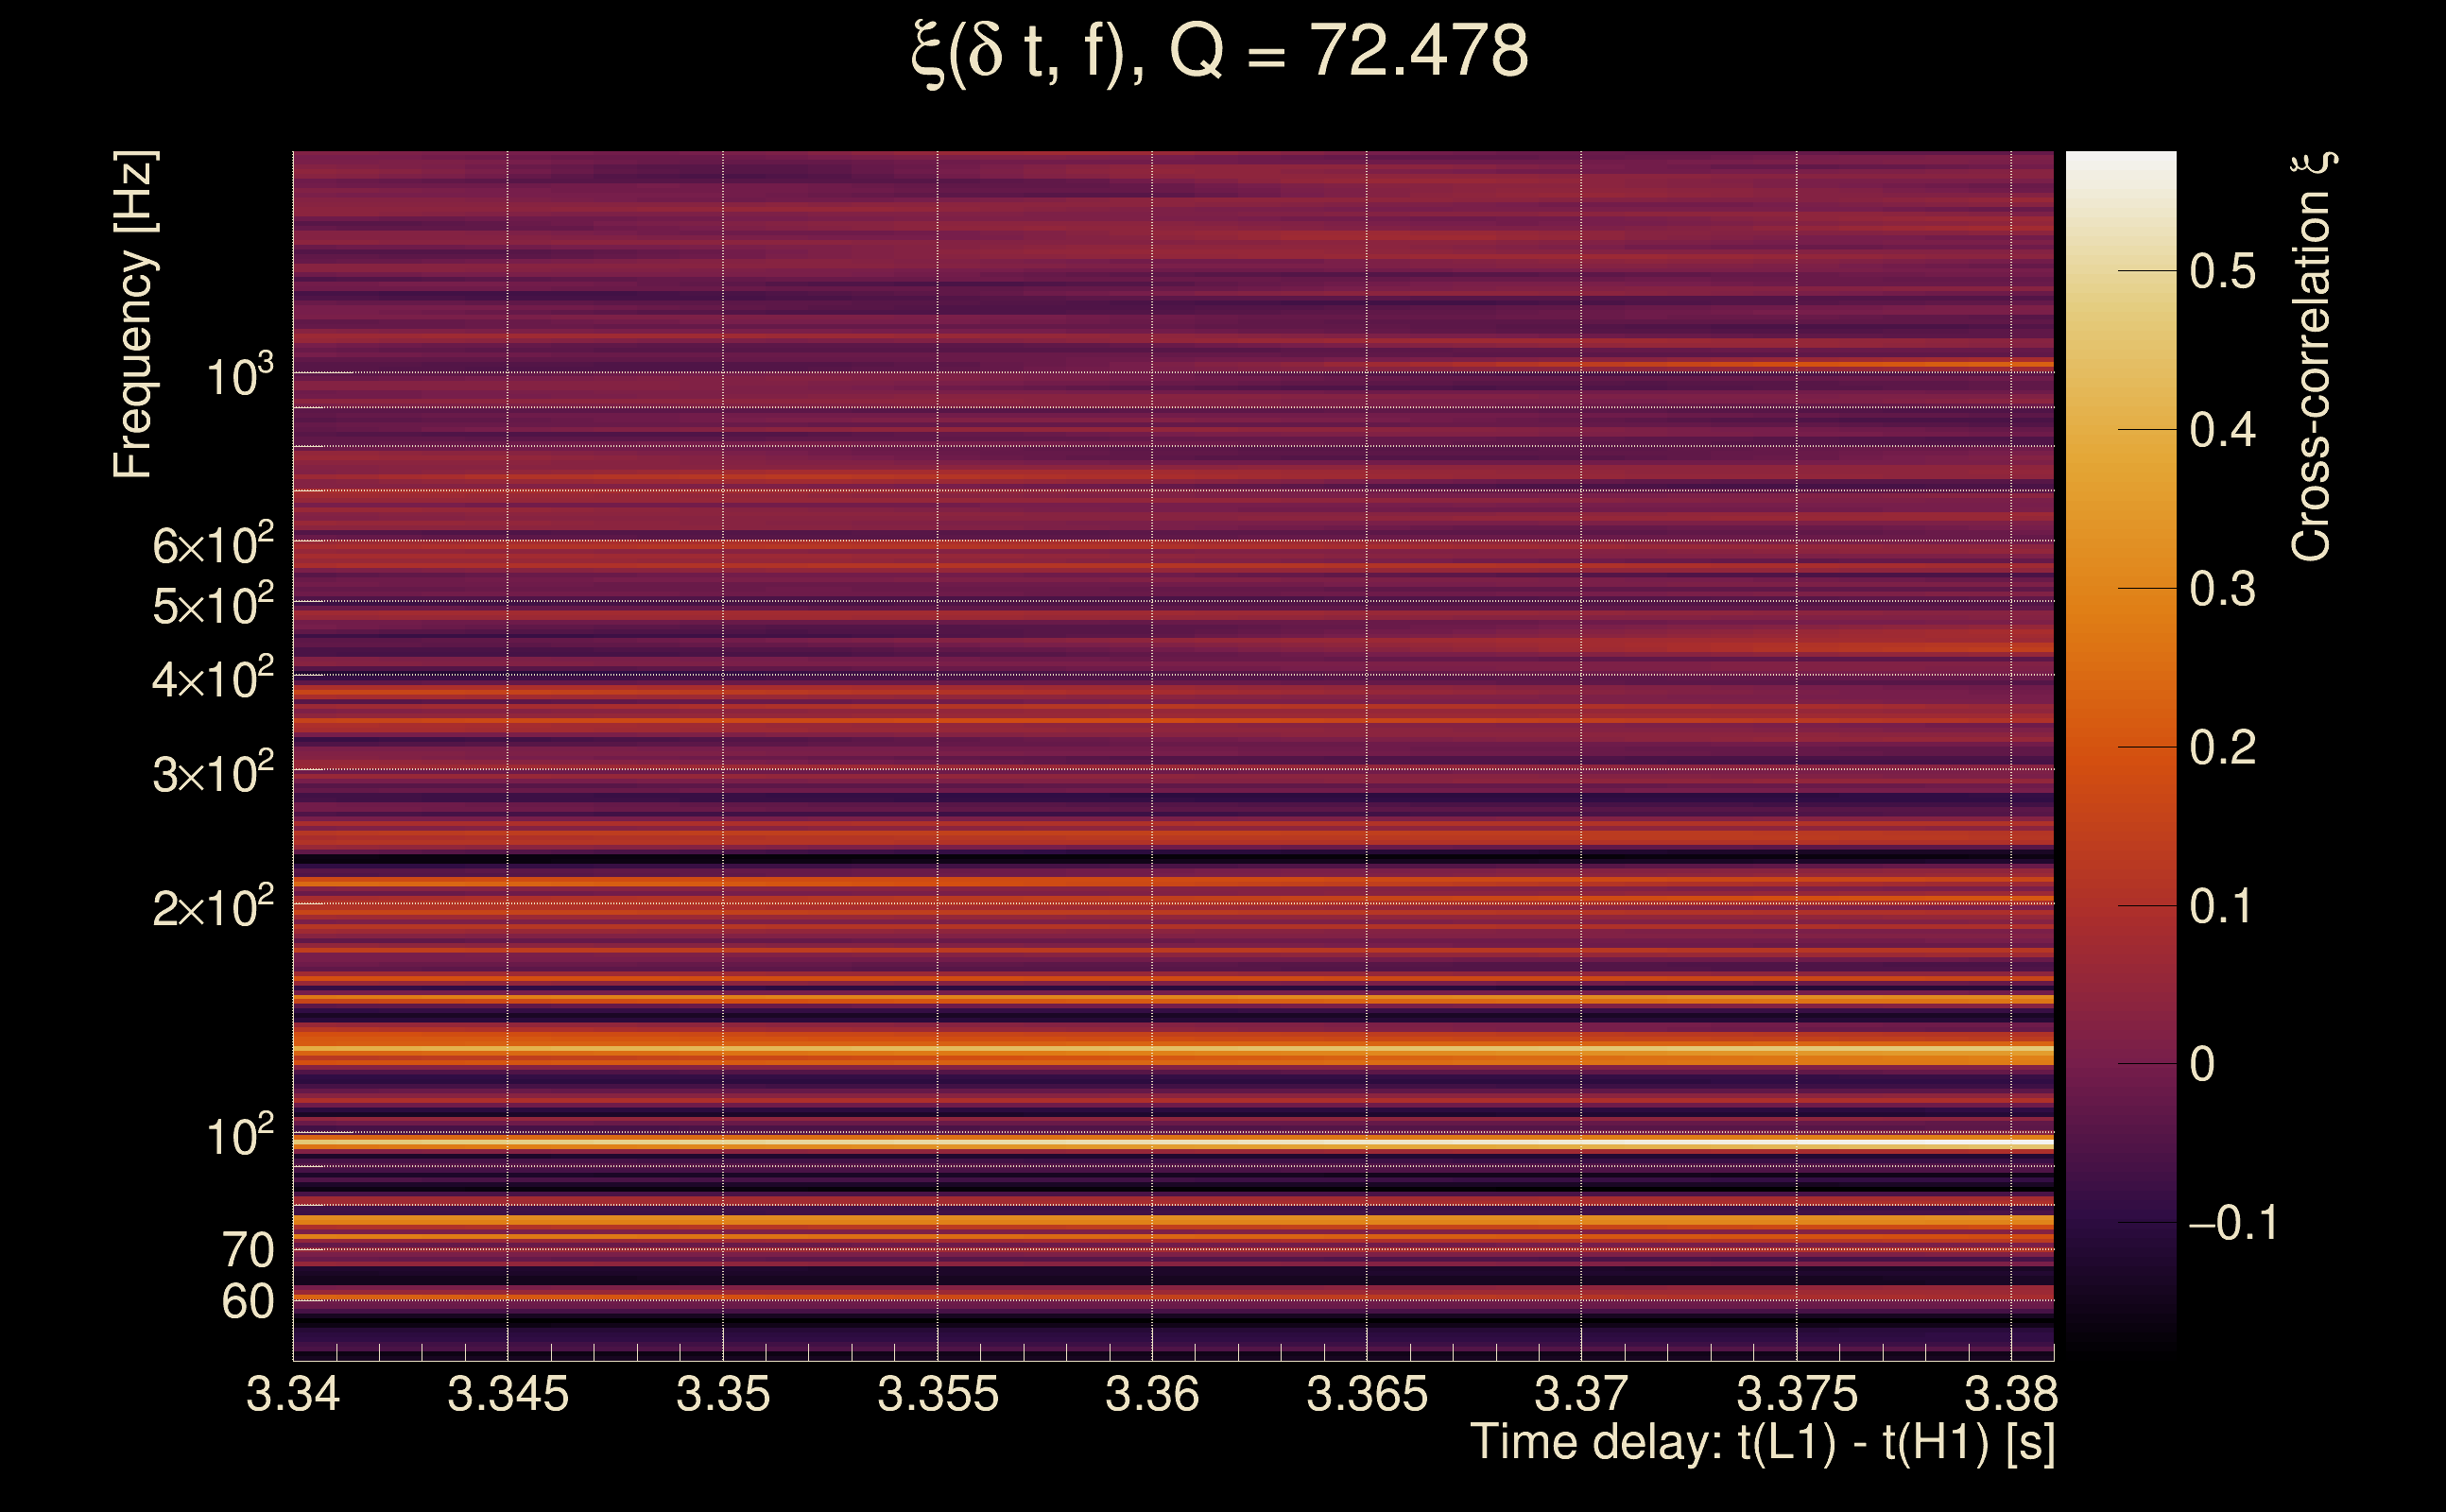
| Time delay between detectors t(L1) - t(H1): | 3.36097 s (slice index = 35 / 217), δt_gw = 0.00297168 s |
| Time delay standard deviation: | 0.0722464 s |
| [targeted mode] Time delay probability: | 0.874821 (0.157538 sigmas), δt_target = 0.00395846 s |
| Frequency: | 308.779 Hz |
| Ξ: | 0.014504 ± 0.00823839 (variance = 6.78711e-05): Q0: 0.0707627, Q1: 0.0499838, Q2: 0.0704927, Q3: 0.0555094, Q4: 0.0593638 |
| Rank: | R_A = 0.00987387 |
| Log of amplitude ratio (L1/H1): | -0.195969, variance = 0.535196 (L1/H1: -0.391052, variance = 1.17314, H1/L1: -0.0056898, variance = 0.959991) |
| Amplitude ratio (L1/H1): | 0.822037 ⋇ 2.07834 (L1/H1: 0.676345 ⋇ 2.95387, H1/L1: 0.994326 ⋇ 2.6639) |
| Amplitude ratio H1|L1 compatibility (probability): | 0.785896 |
| Antenna factor probability: | 0.990185 |
| Number of rejected frequency rows: | Q0: 13 / 18, Q1: 27 / 36, Q2: 64 / 70, Q3: 120 / 134, Q4: 245 / 258 |
| Maximum signal-to-noise ratio: | H1: 5.24036, L1: 5.1542 |
| SNR variance: | H1: 0.521324, L1: 0.541436 |
| Click here for a zoomed plot | Click here for a zoomed plot | Click here for a zoomed plot | Click here for a zoomed plot | Click here for a zoomed plot |
 |
 |
 |
 |
 |
 |
 |
 |
 |
 |
 |
 |
 |
 |
 |
 |
 |
 |
 |
 |
 |
 |
 |
 |
 |
 |
 |
 |
 |
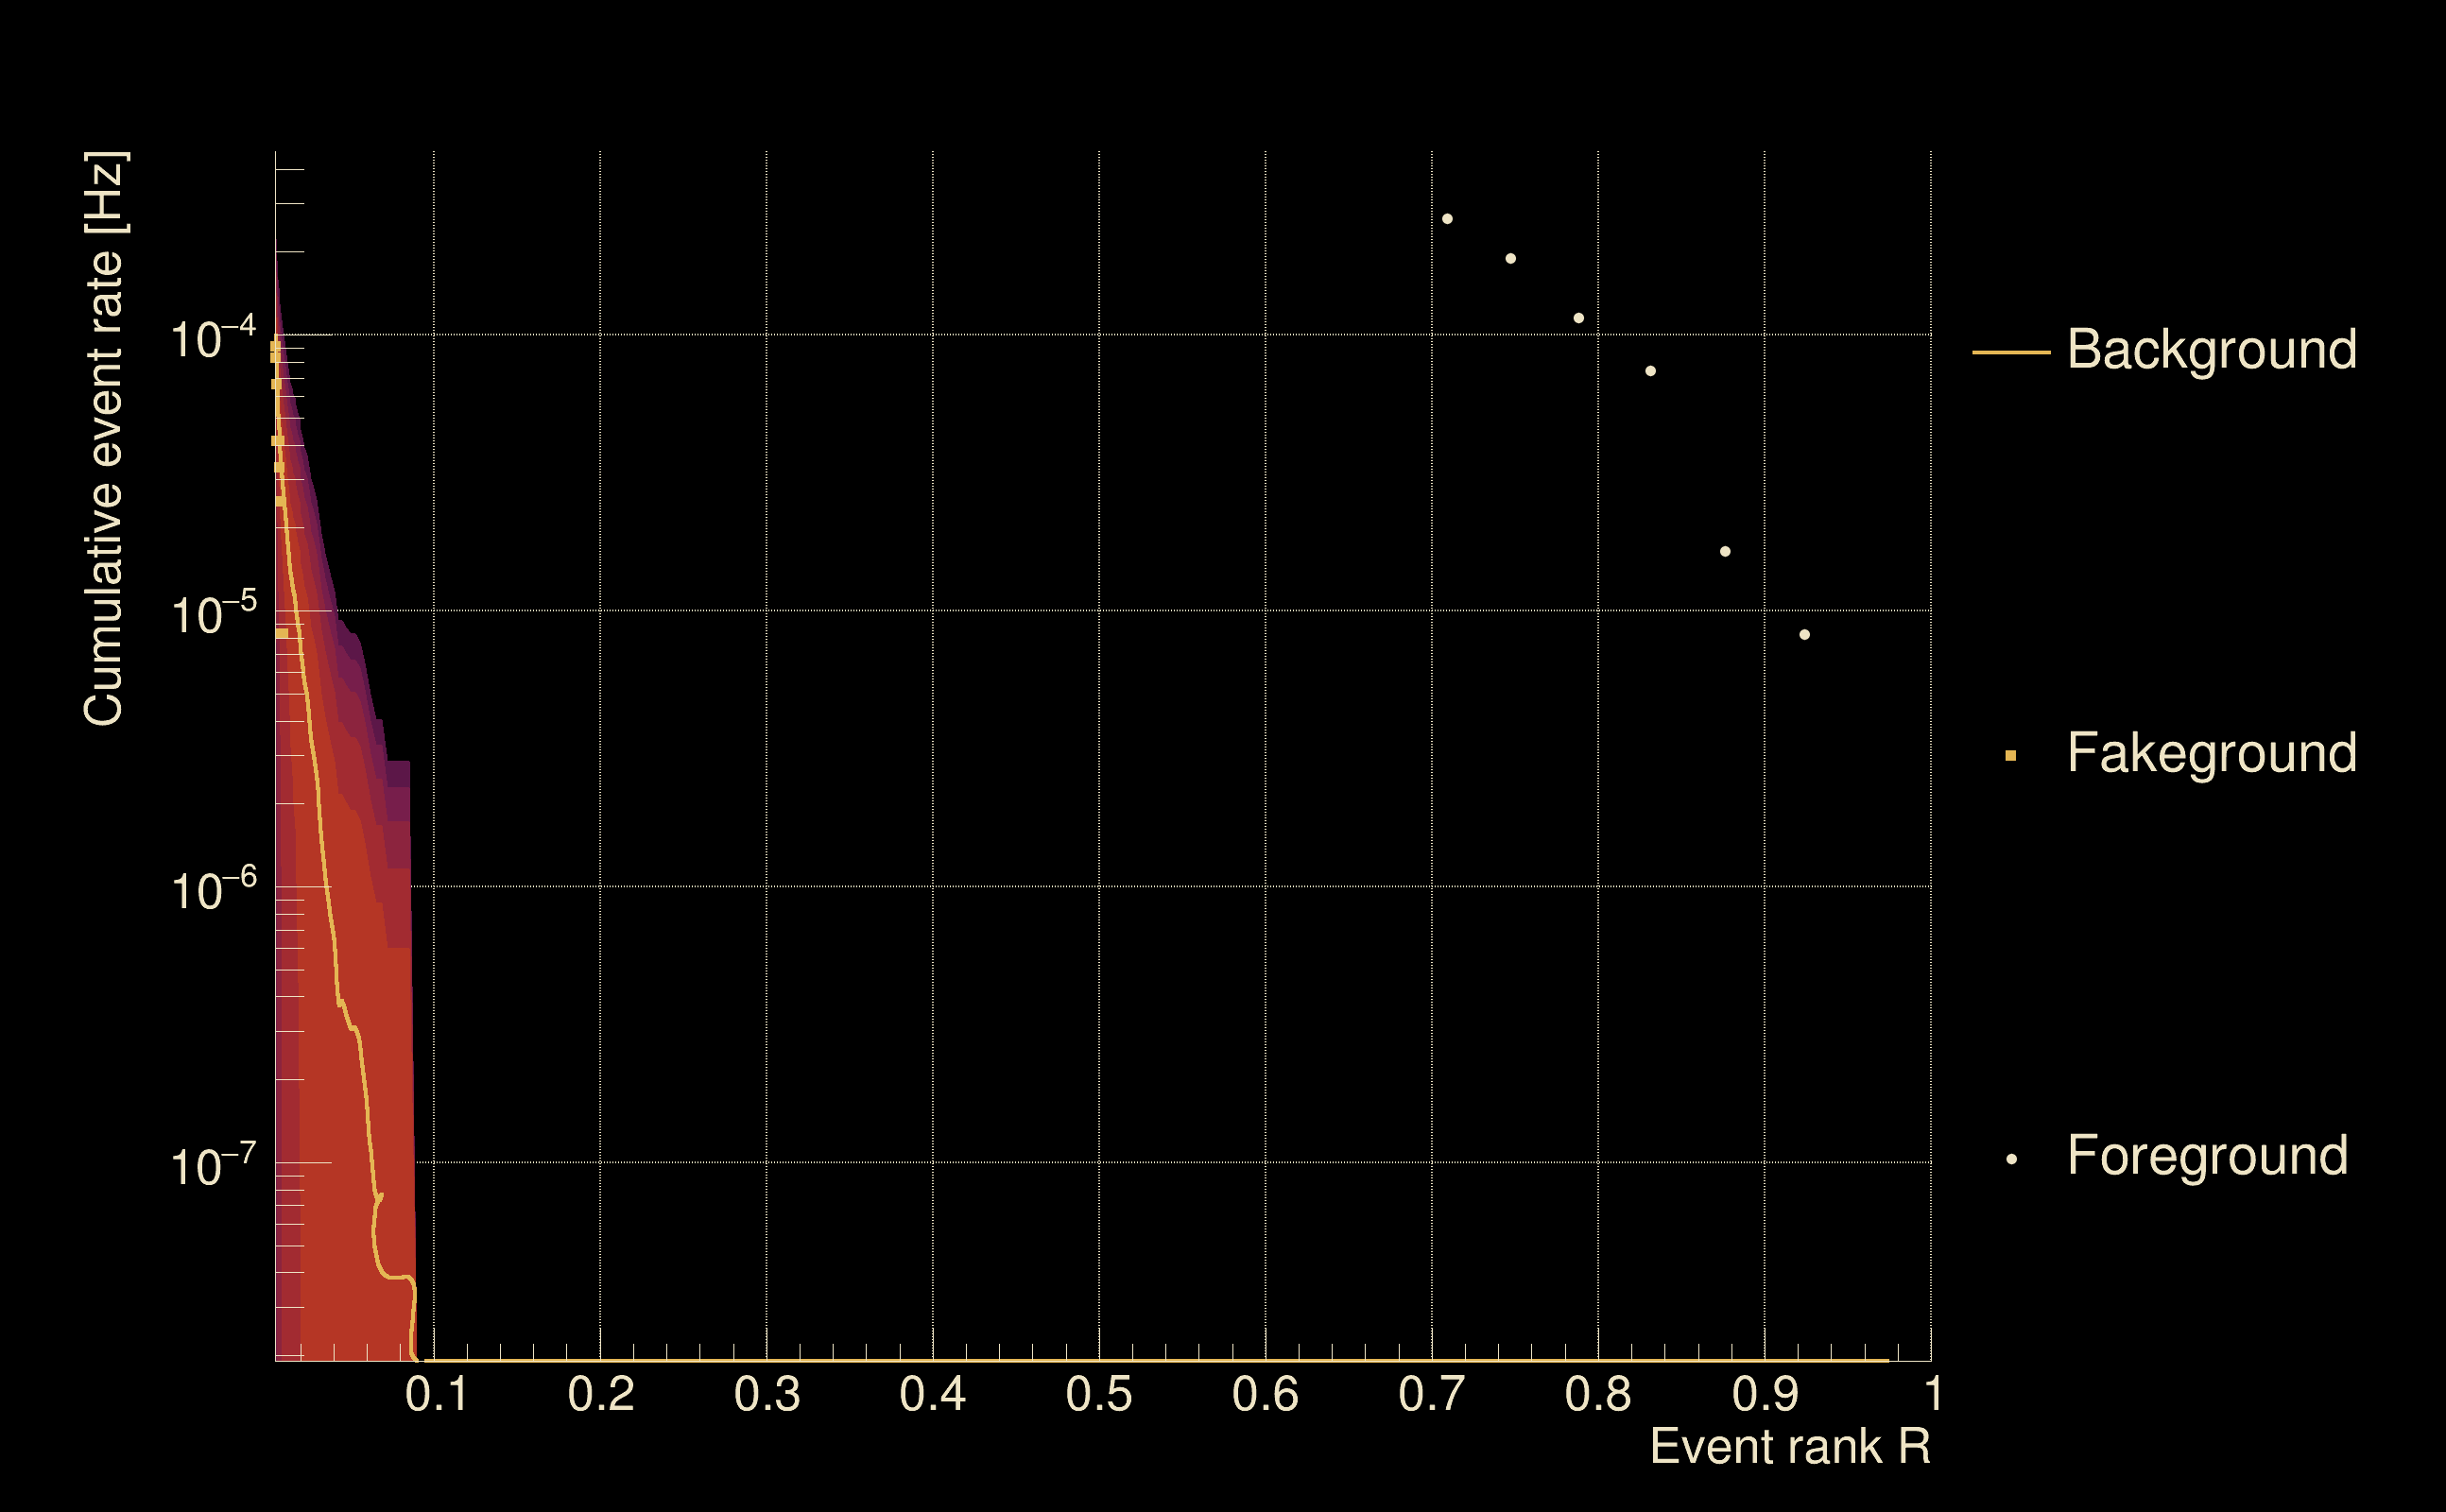
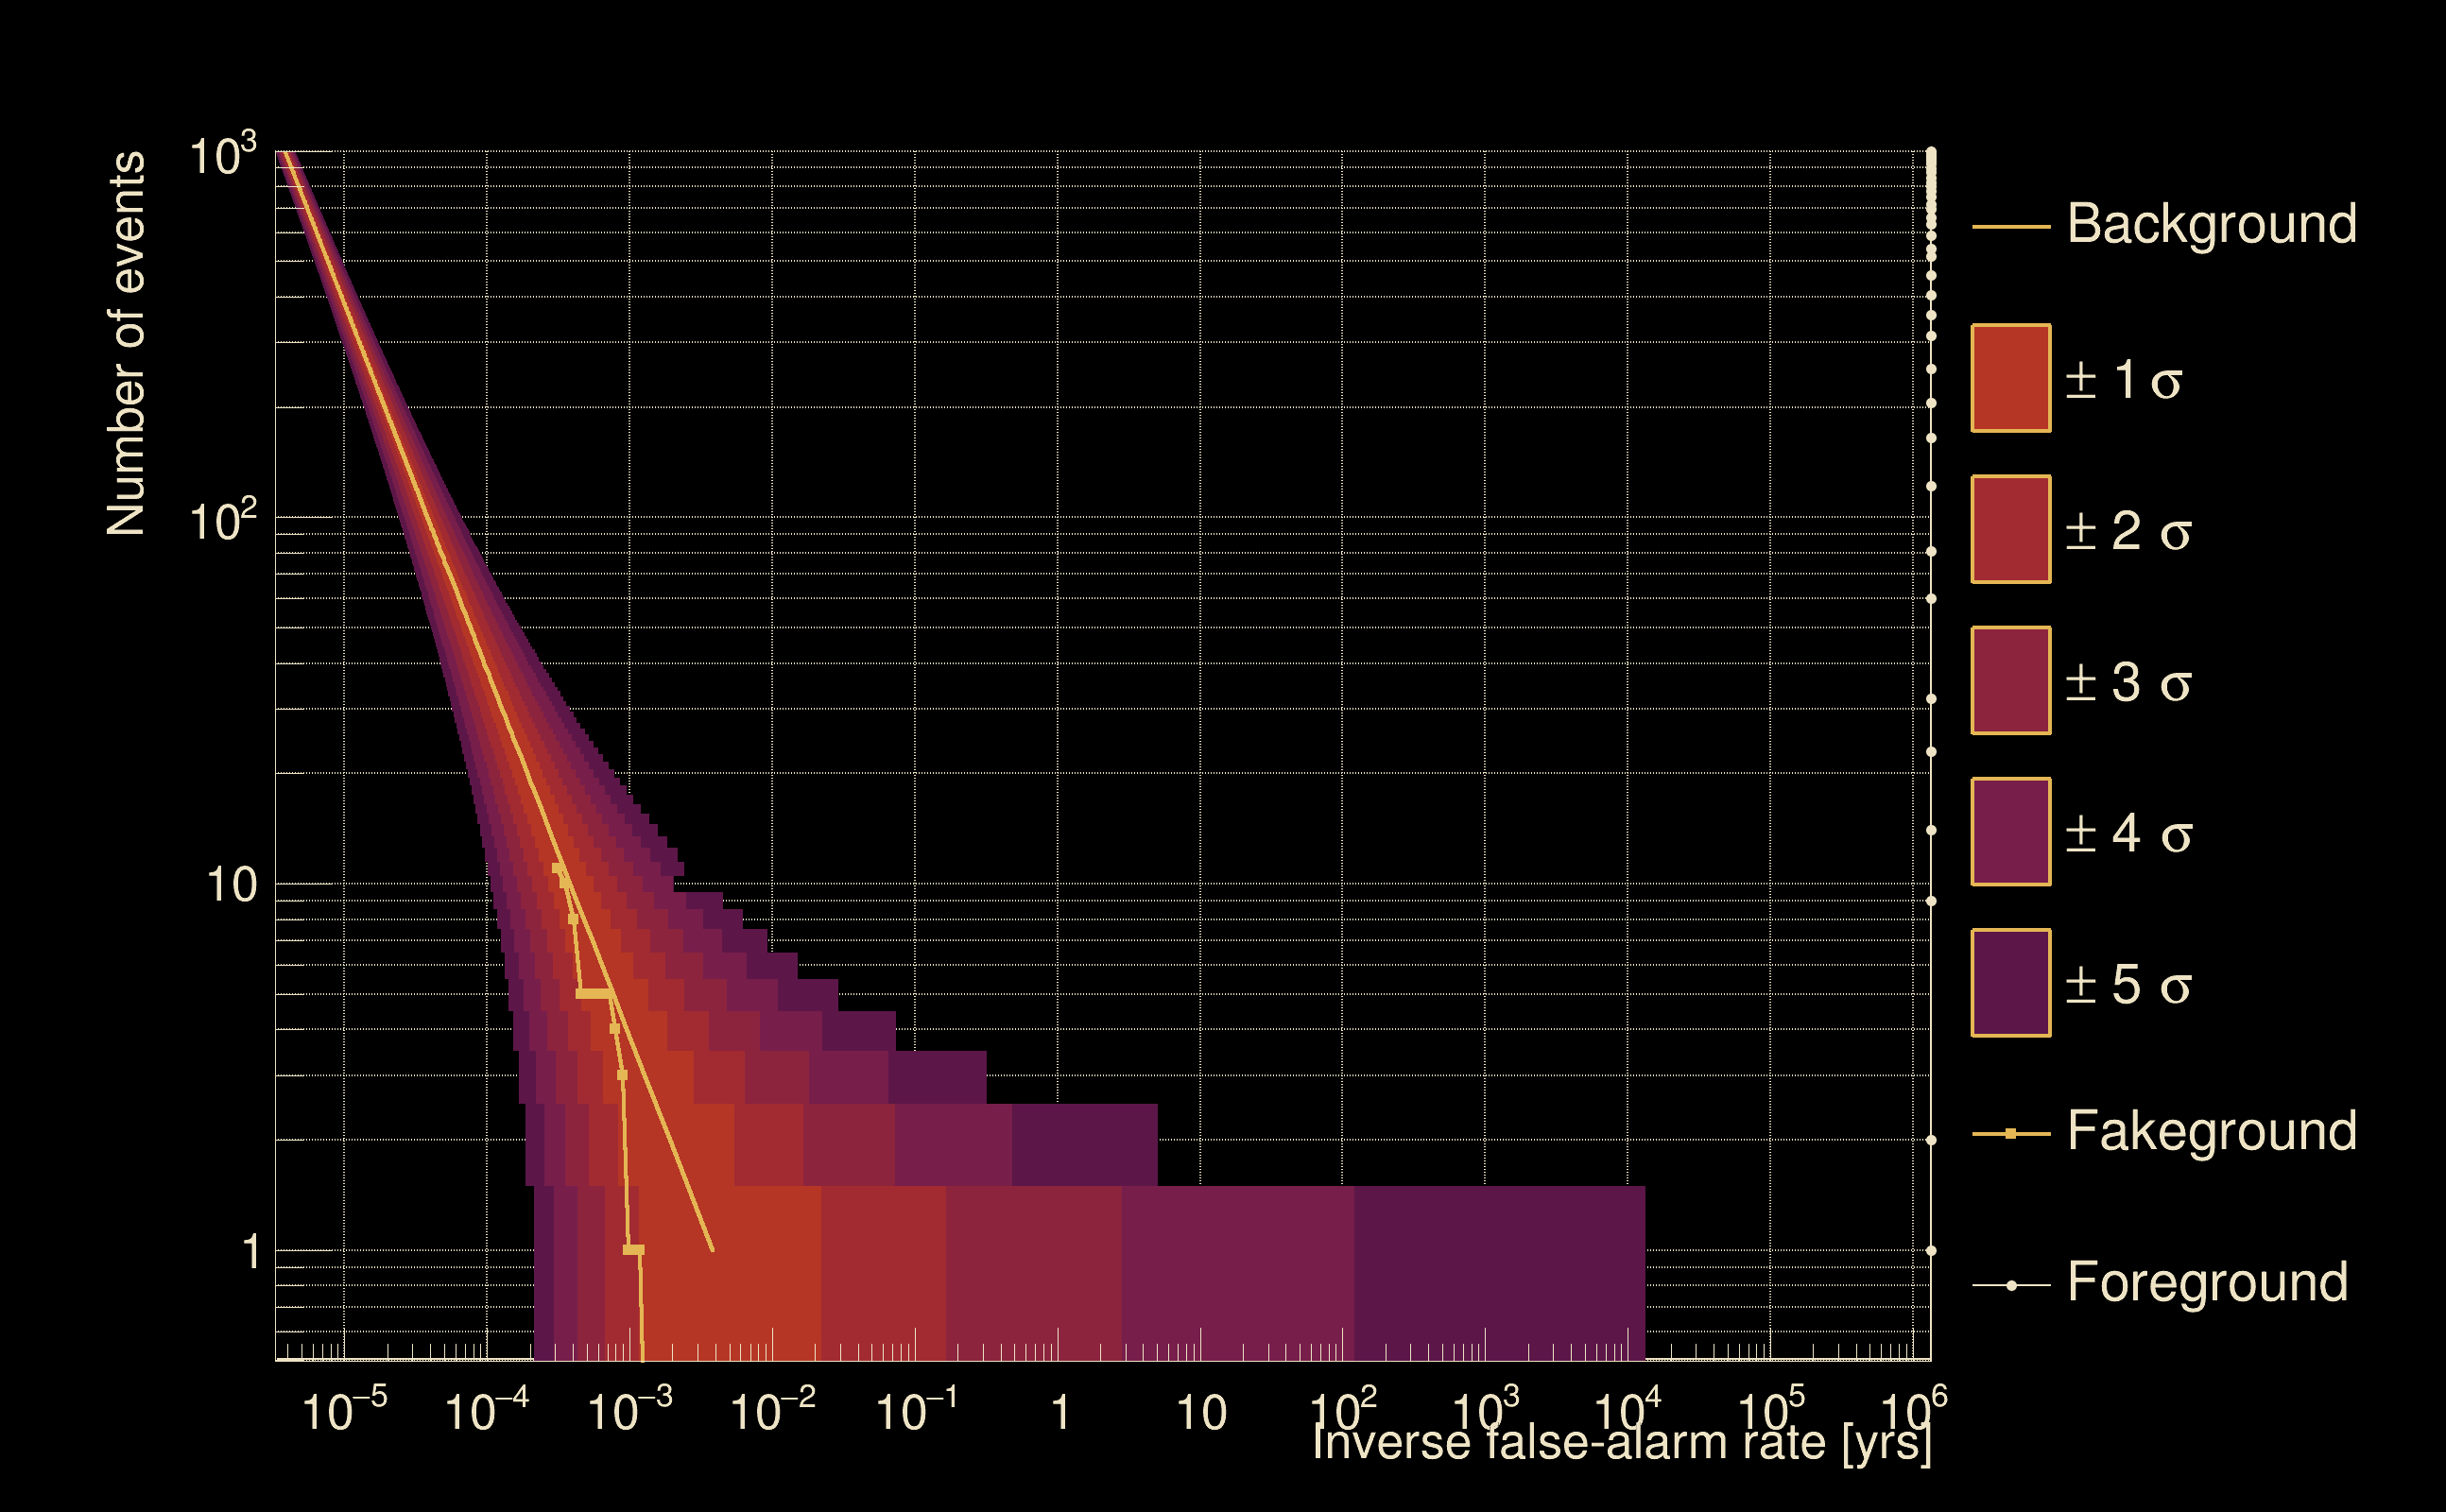
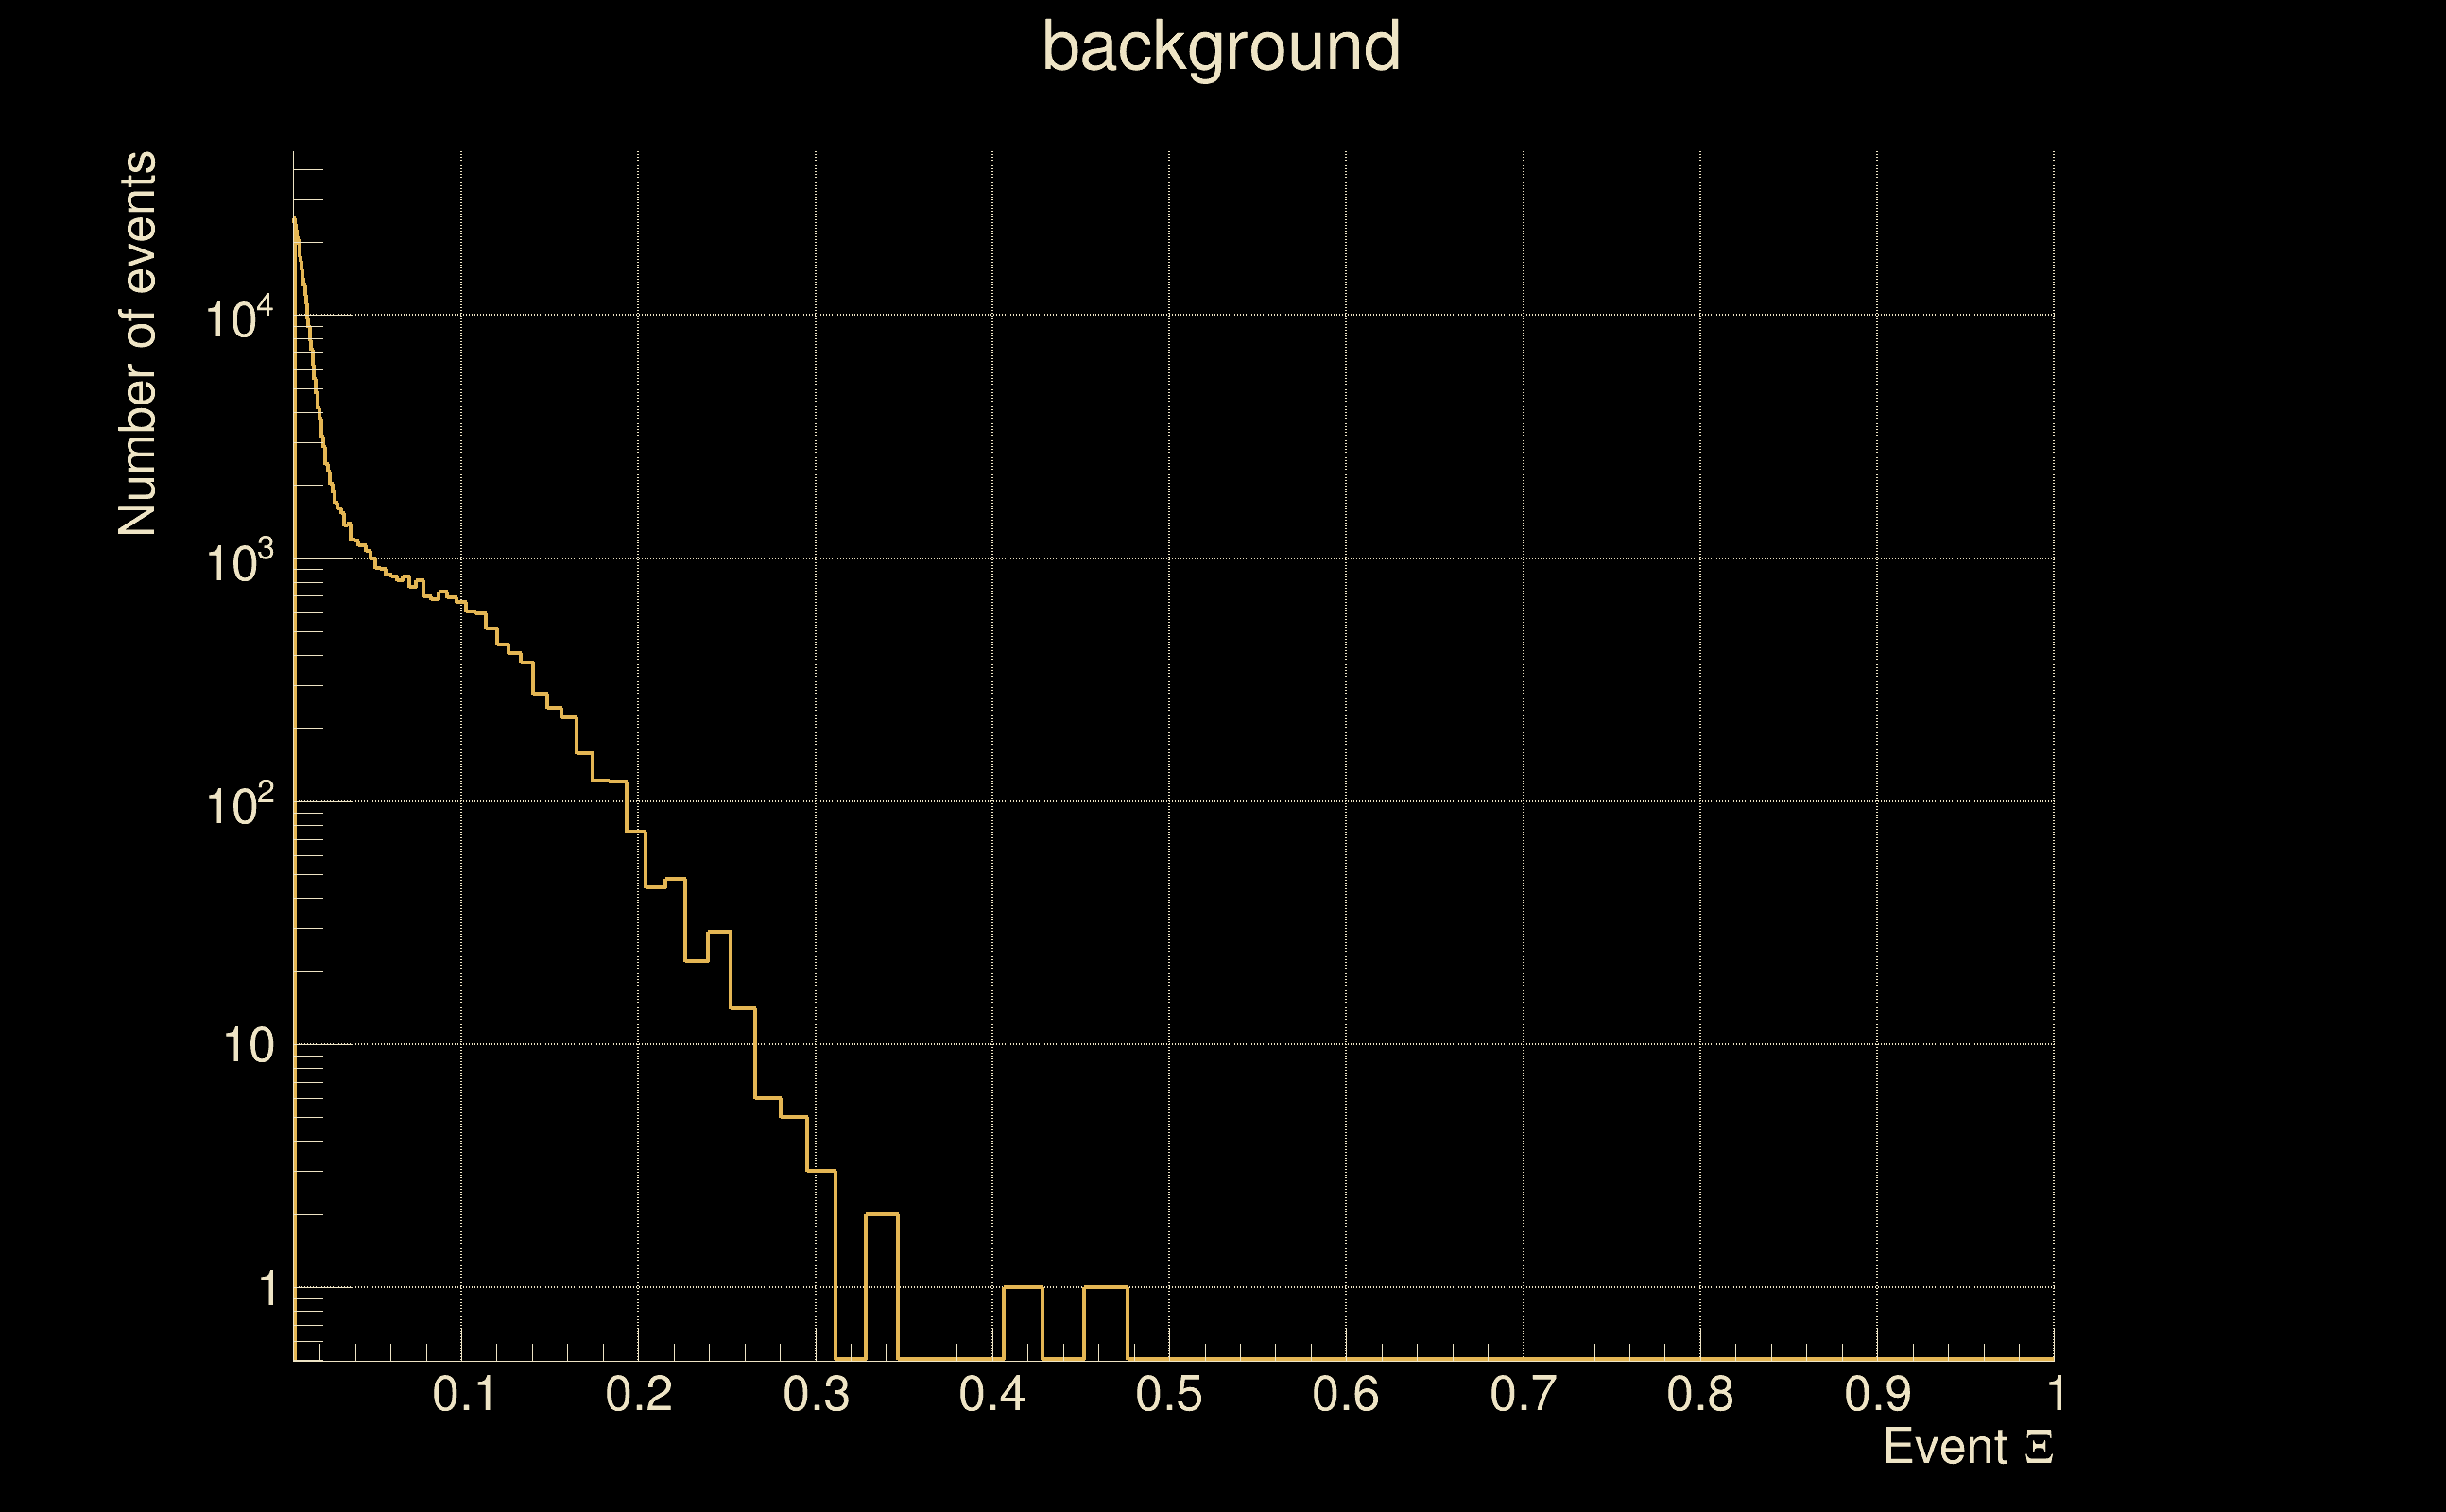
| Detection threshold: | R > 0.0314201 |
| False-alarm rate above that detection threshold: | 1.67937e-06 |
| Alternative threshold at 1/1000 yrs: | R > 0.0851478 |
| Alternative threshold at 1/100 yrs: | R > 0.0851478 |
| Alternative threshold at 1/10 yrs: | R > 0.0851478 |
| Alternative threshold at 1/1 yr: | R > 0.0851478 |
| Alternative threshold at 1/1 d: | R > 0.0156353 |
 |
|
 |
 |
 |
 |
 |
 |
 |
 |
 |
 |
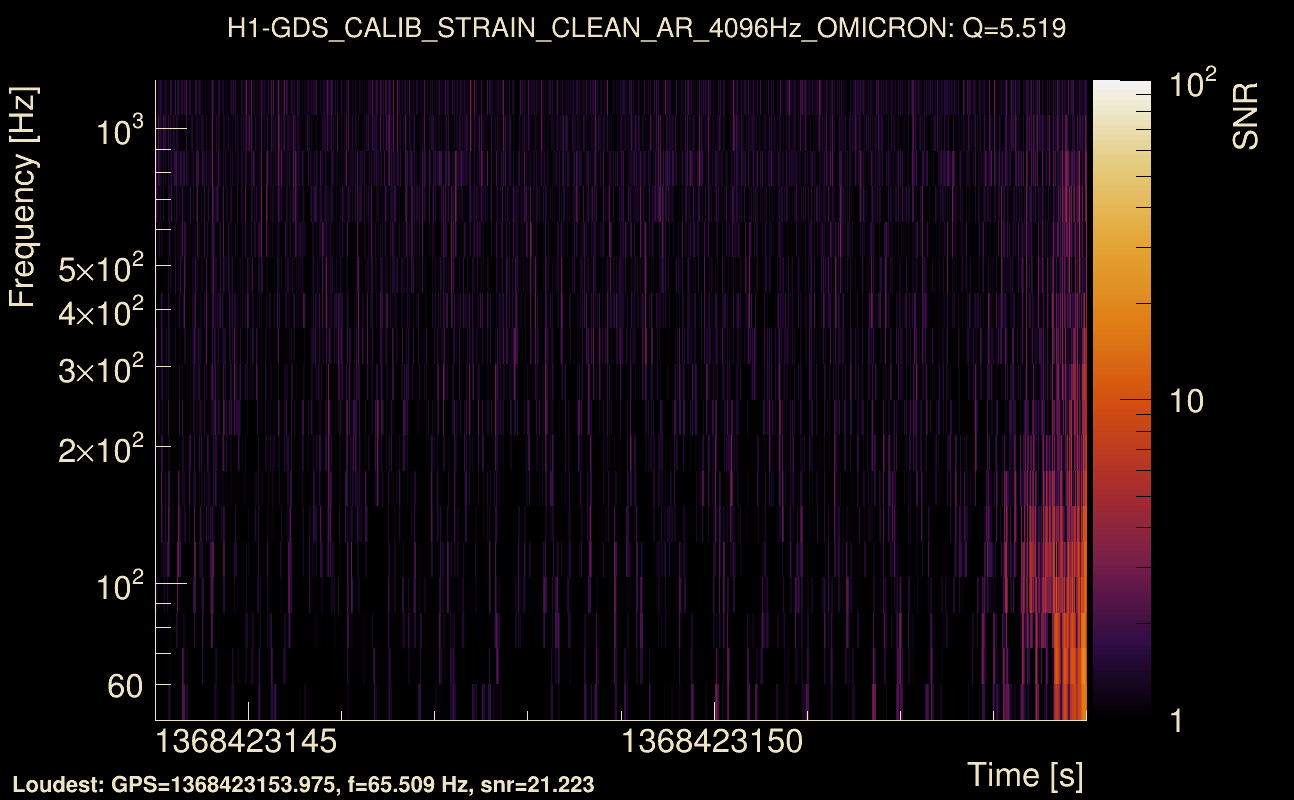
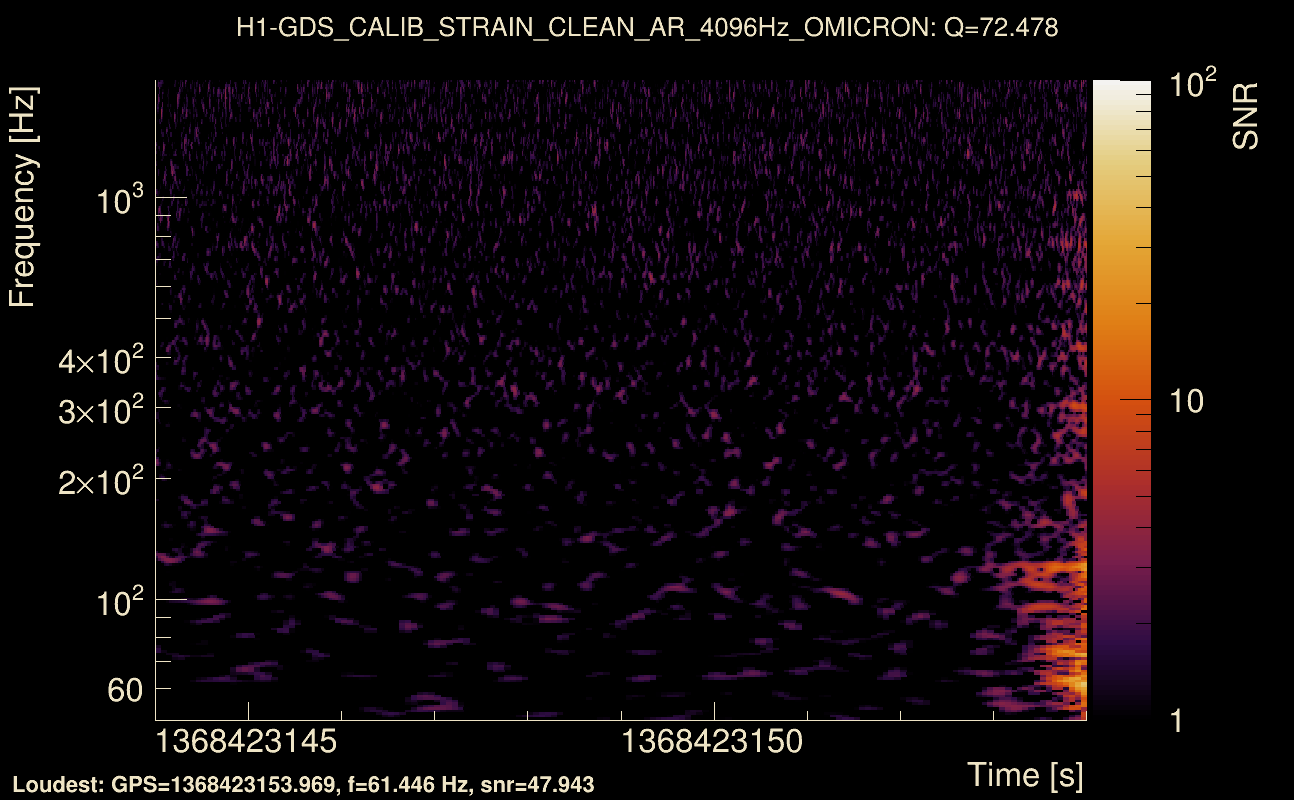
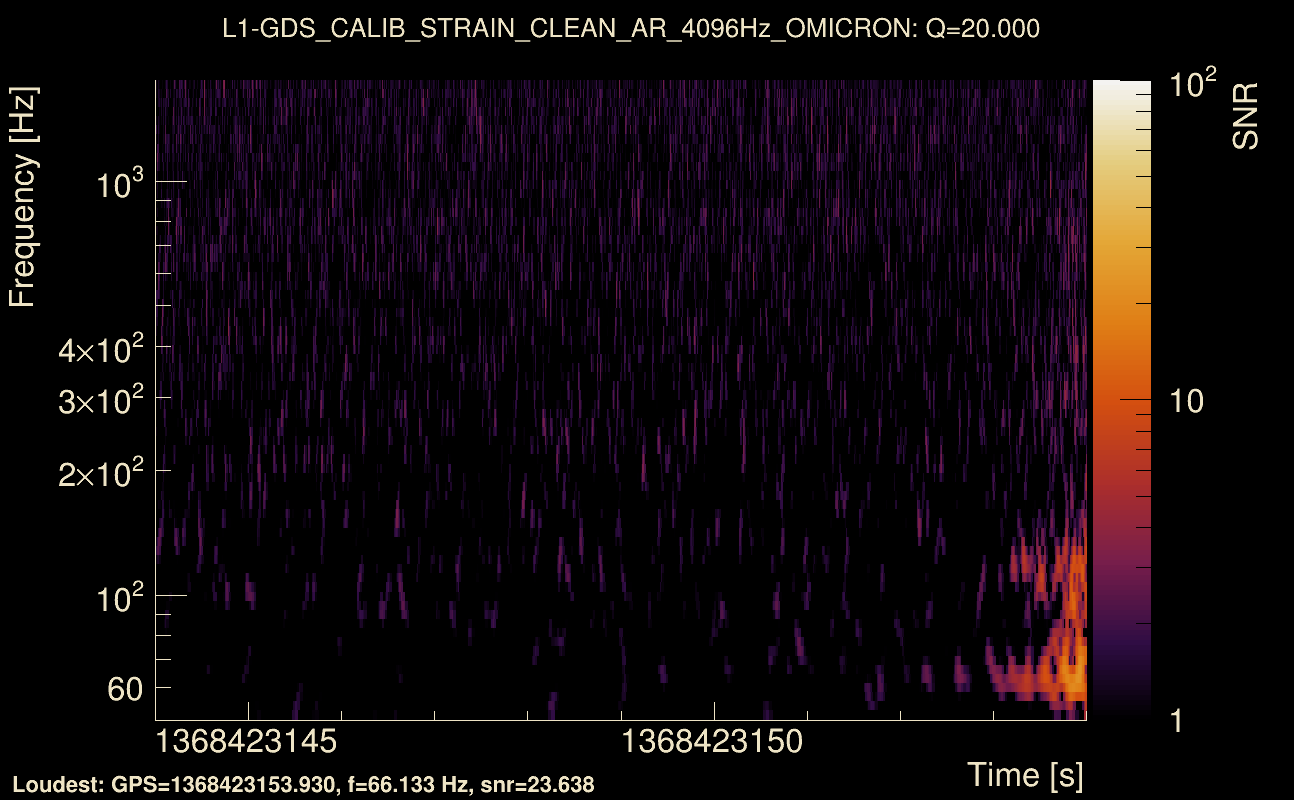
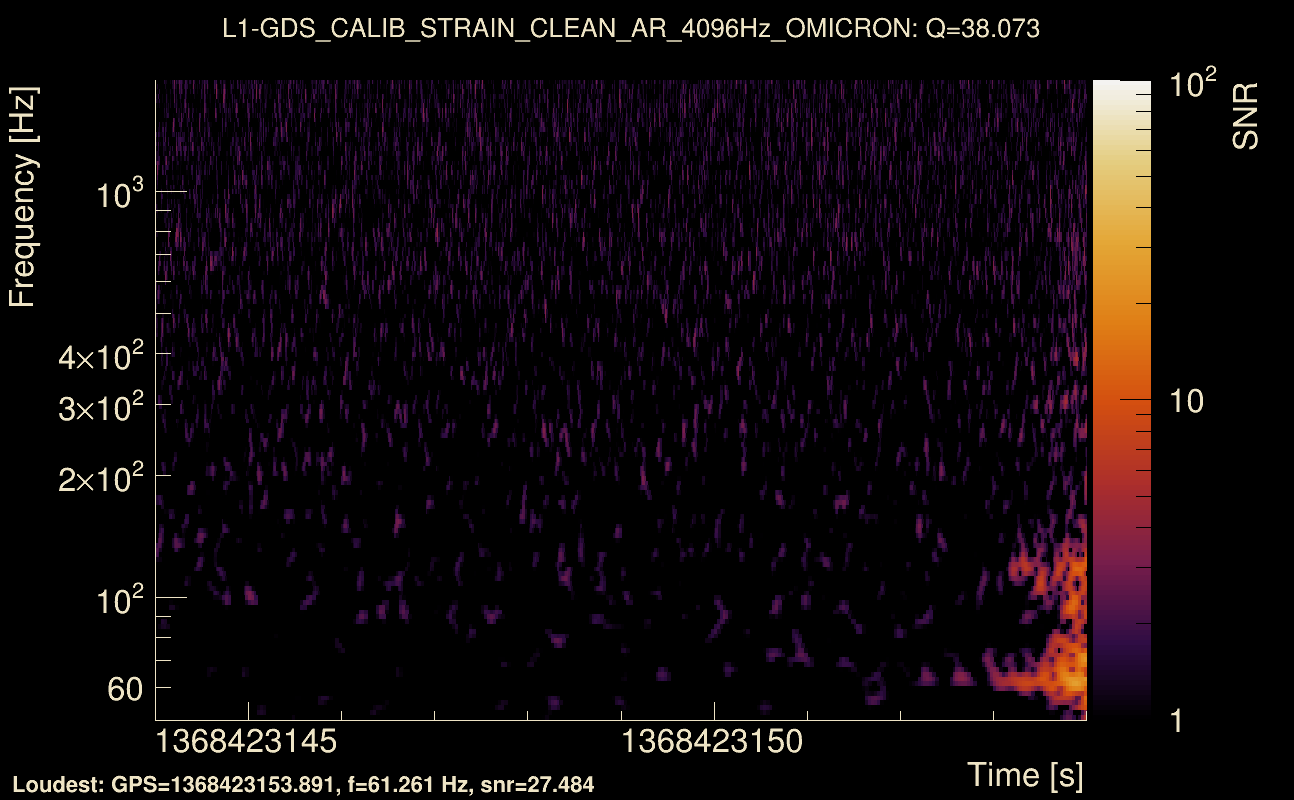
| Event time t(H1): | GPS = 1368423144 (Thu May 18 05:32:06 2023 ) → GPS = 1368423154 (Thu May 18 05:32:16 2023 ) |
| Event time t(L1): | GPS = 1368423144 (Thu May 18 05:32:16 2023 ) → GPS = 1368423154 (Thu May 18 05:32:16 2023 ) |
| Omicron analysis time window (H1): | GPS = 1368423141 → GPS = 1368423157 |
| Omicron analysis time window (L1): | GPS = 1368423141 → GPS = 1368423157 |
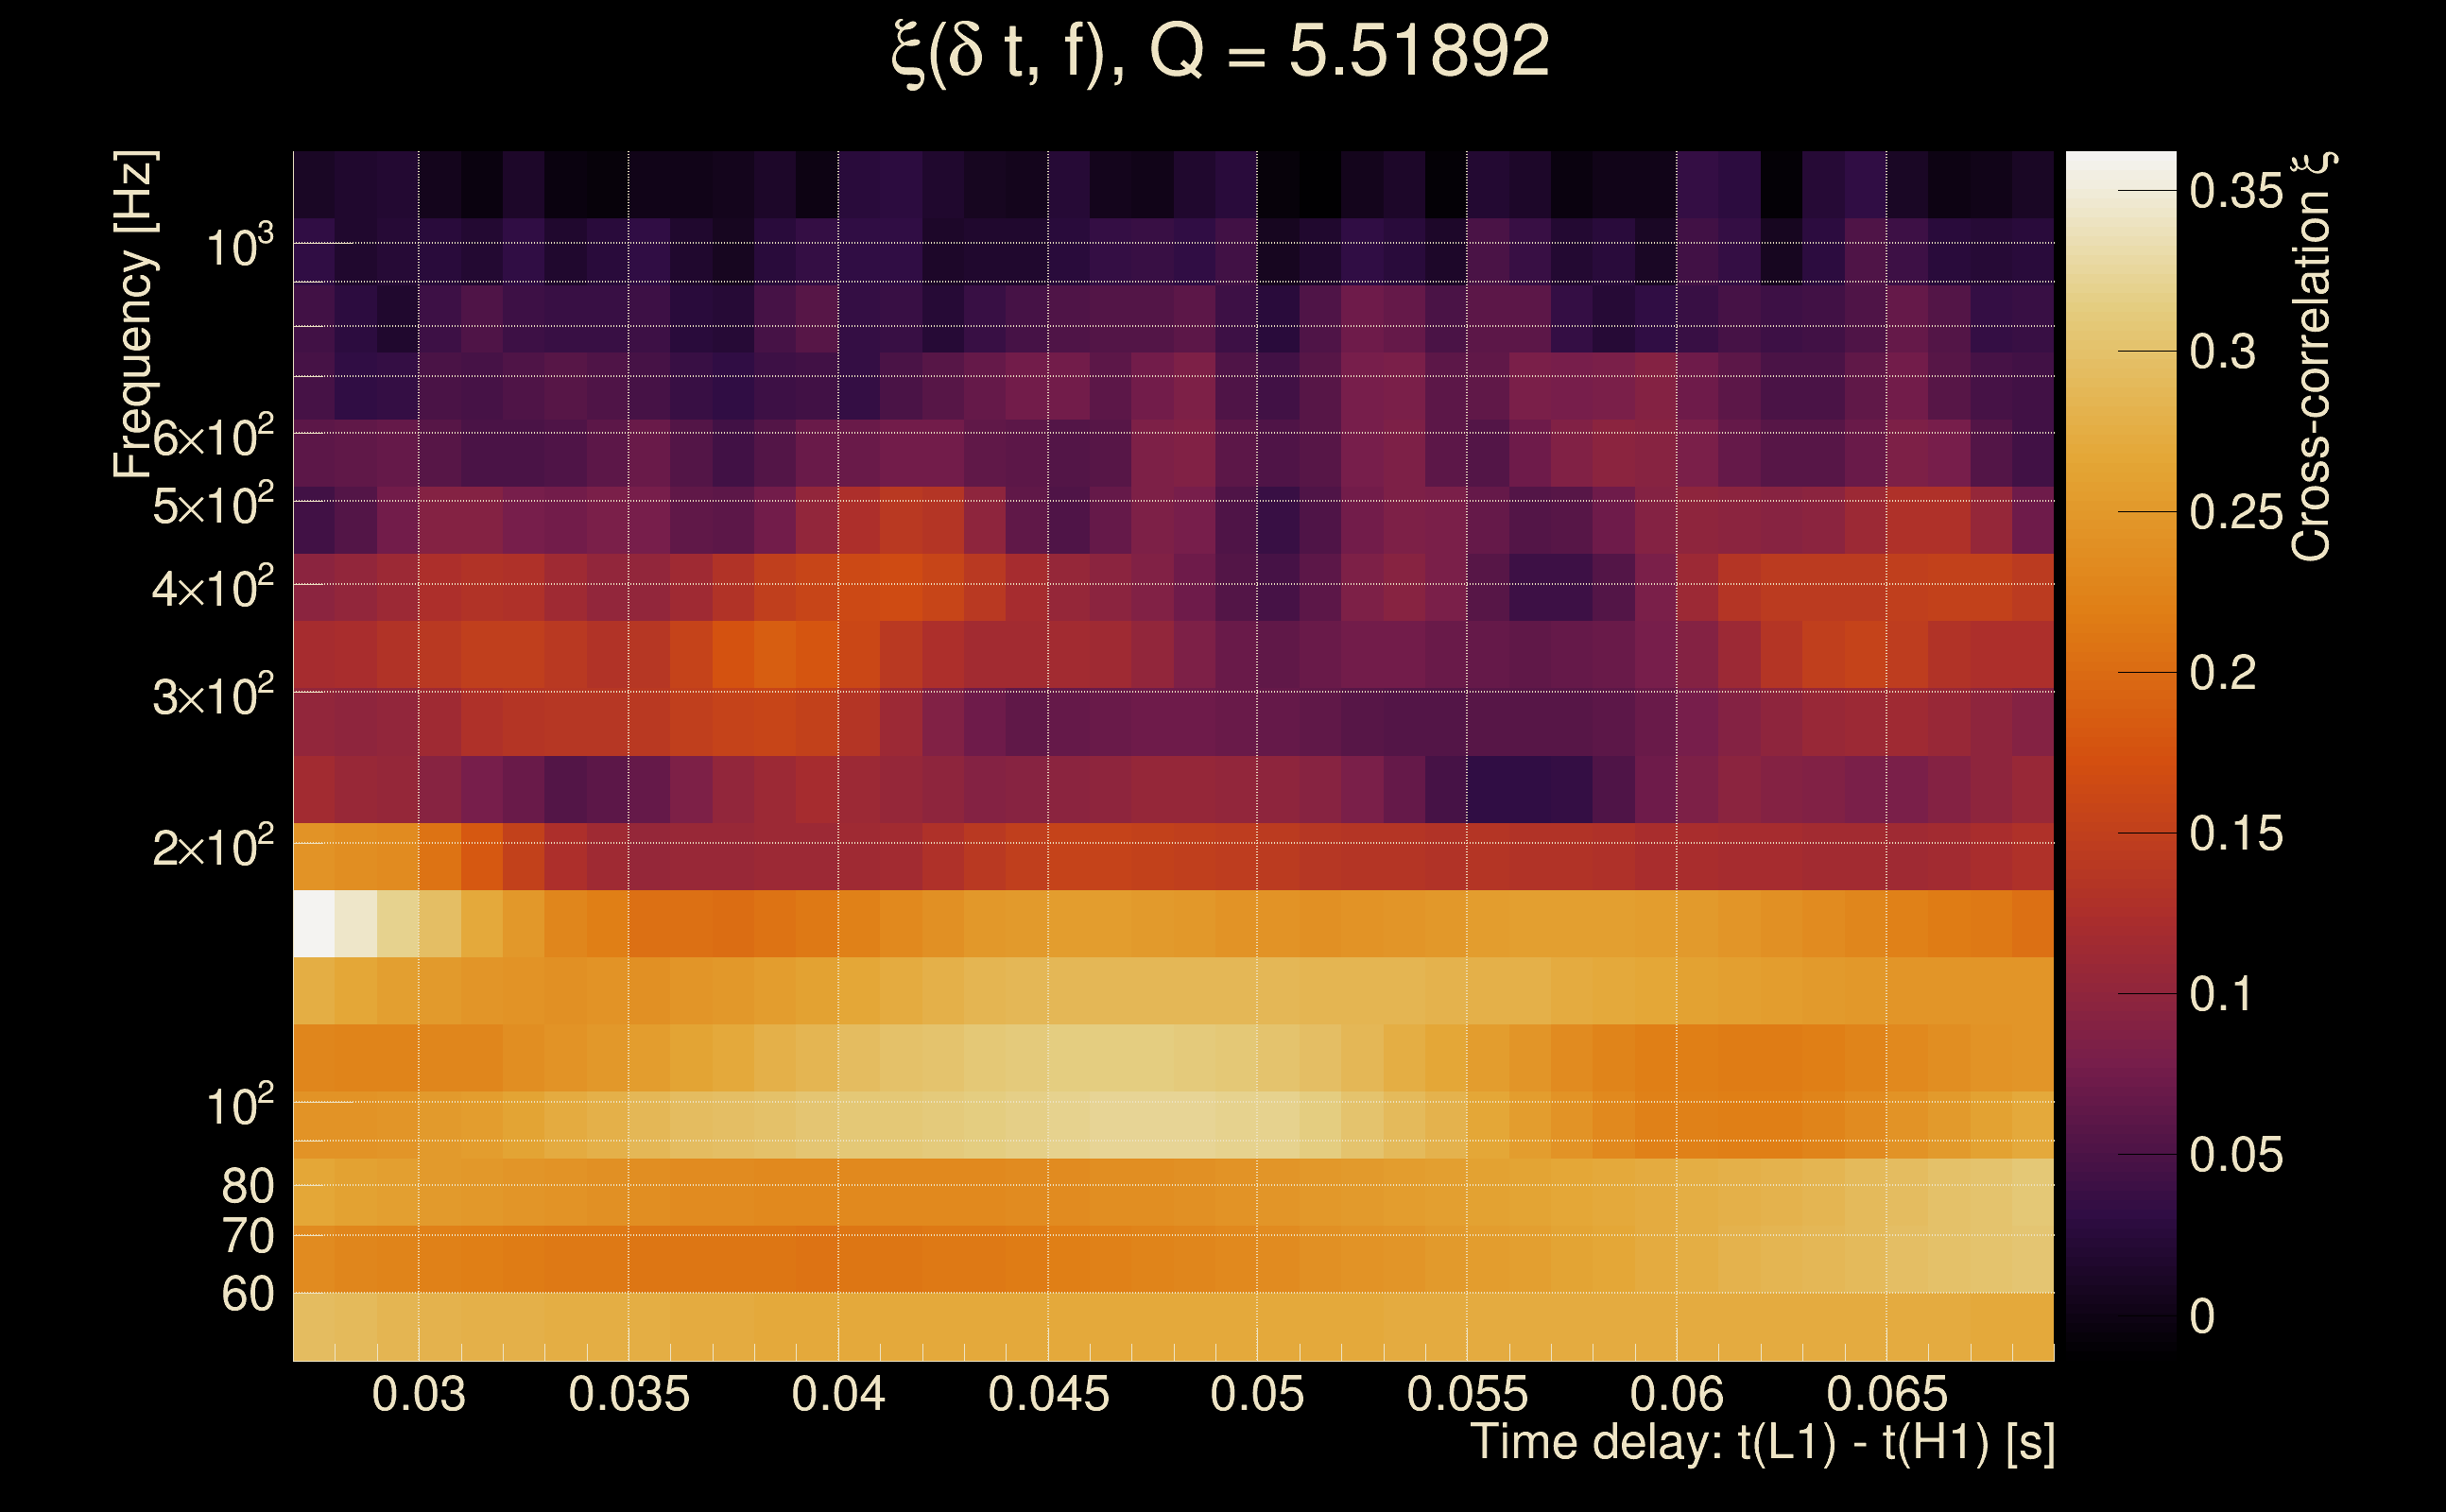
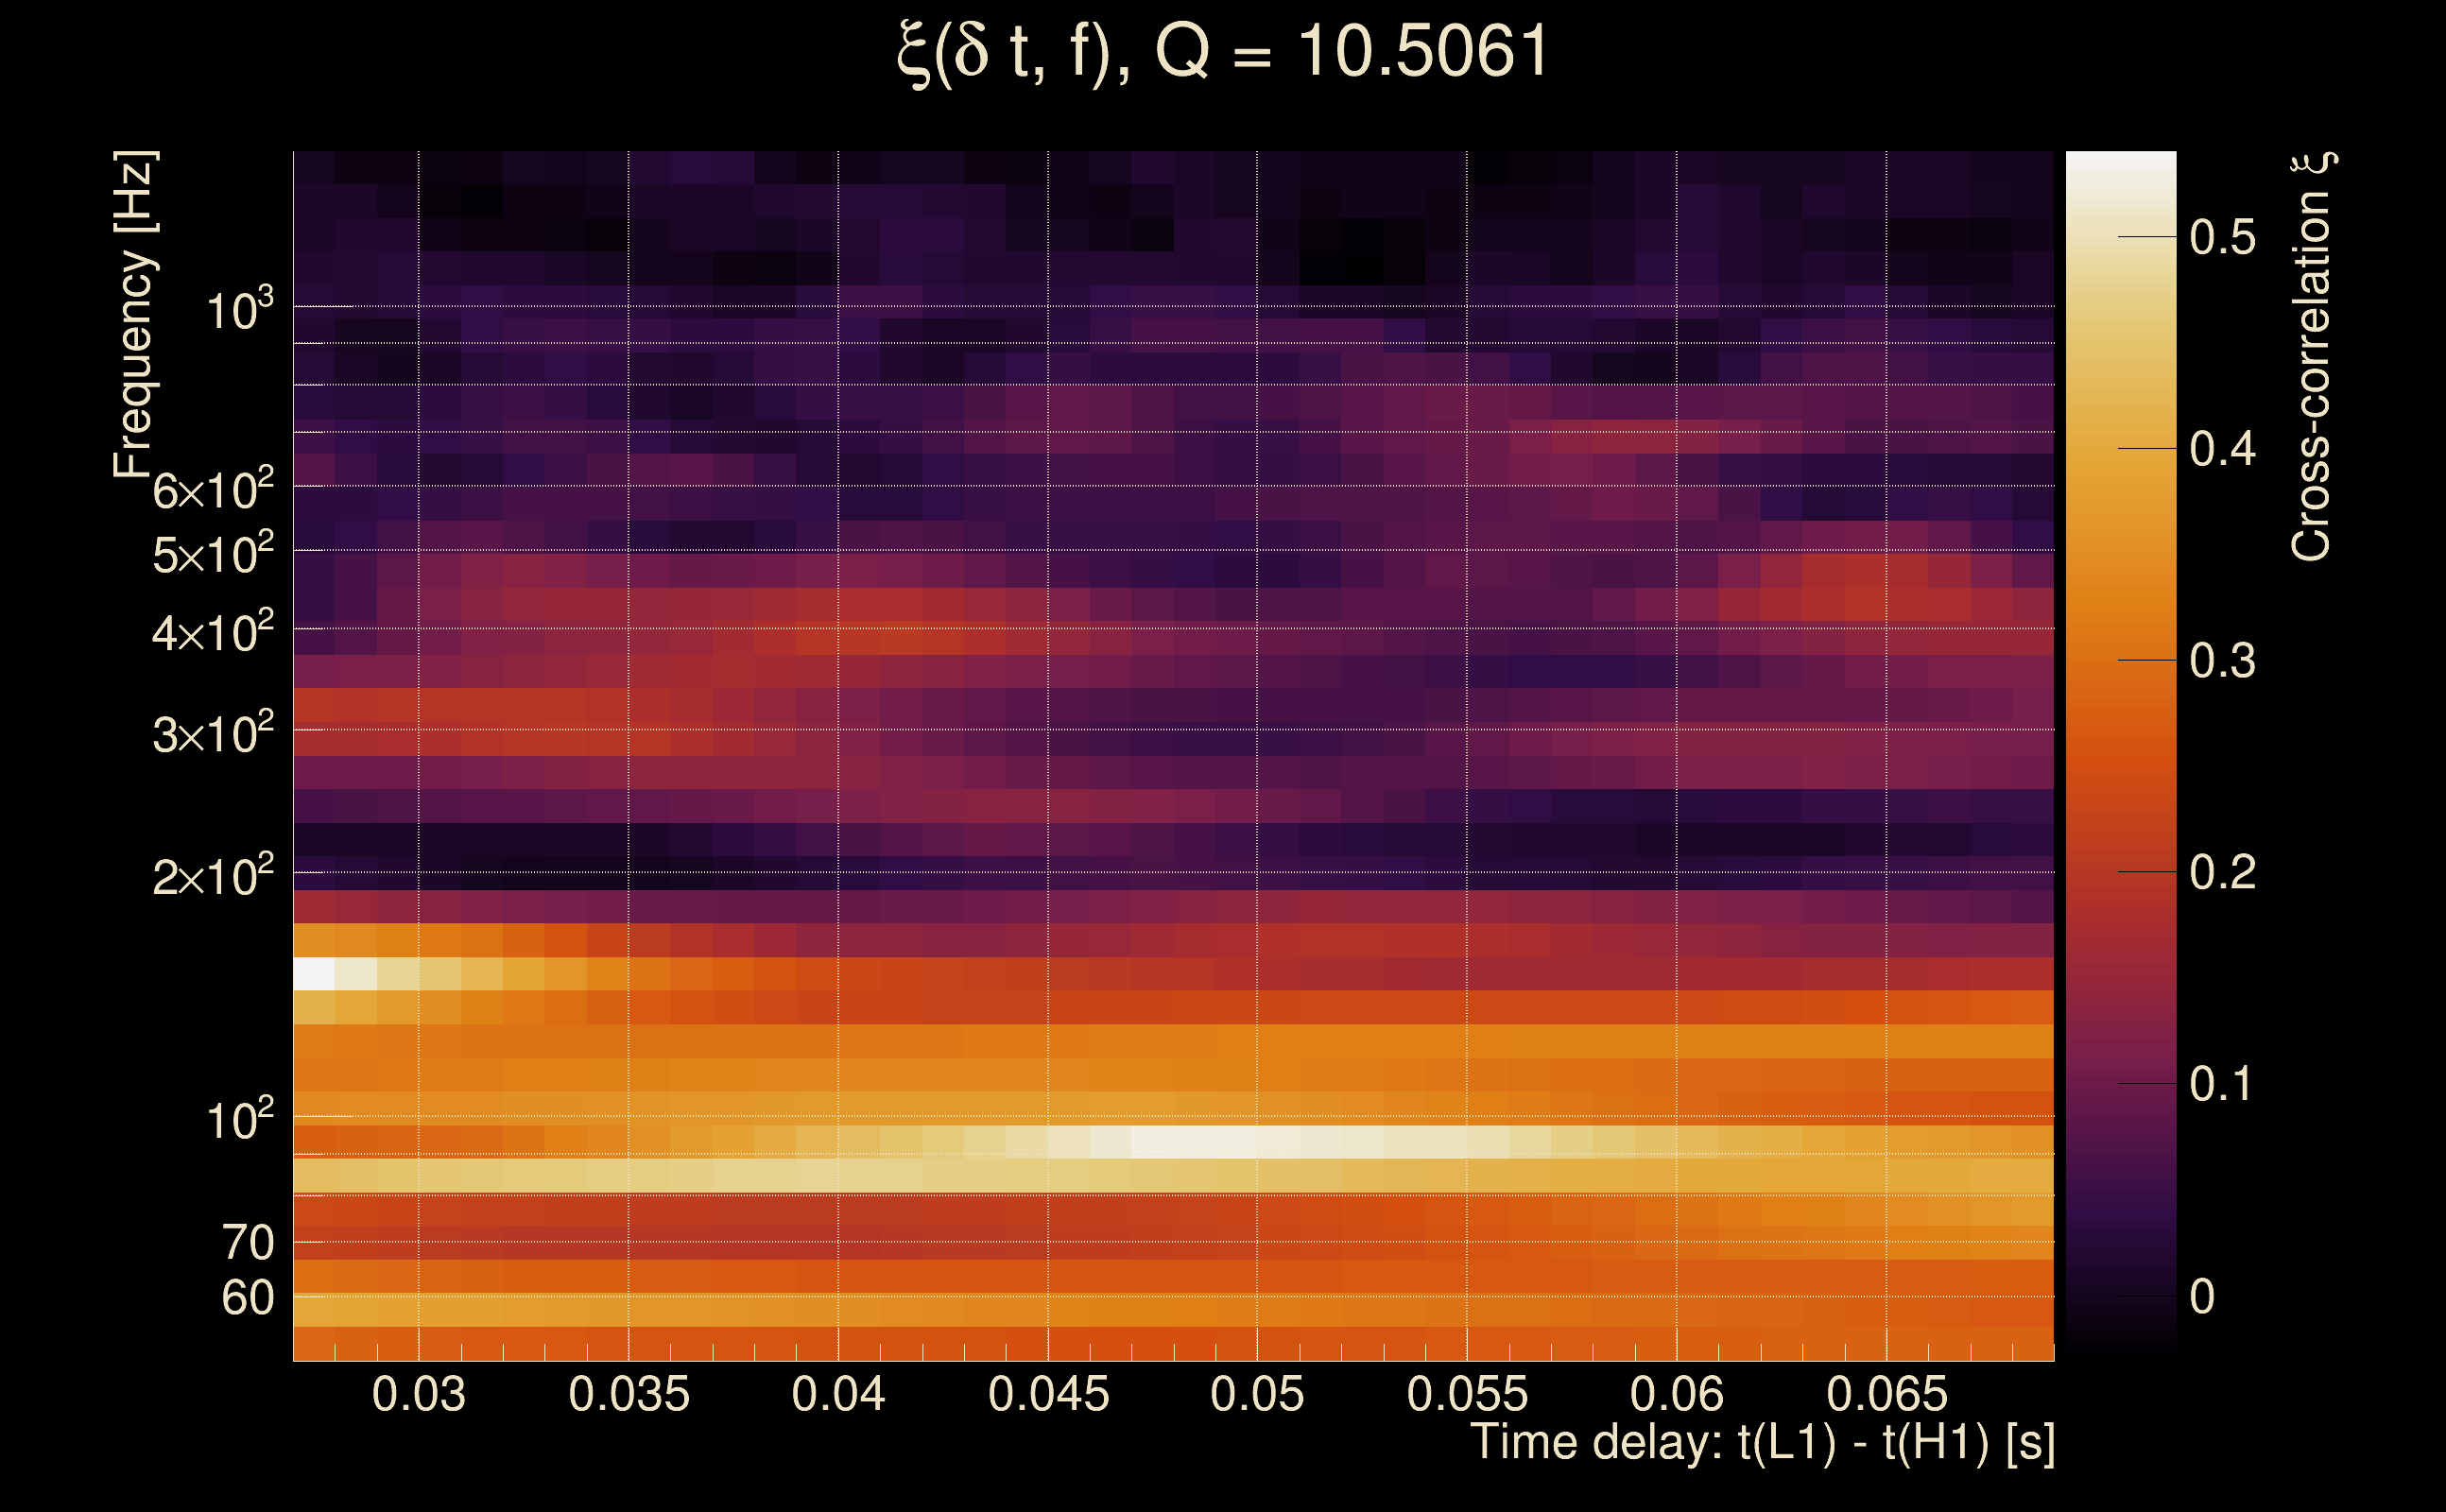
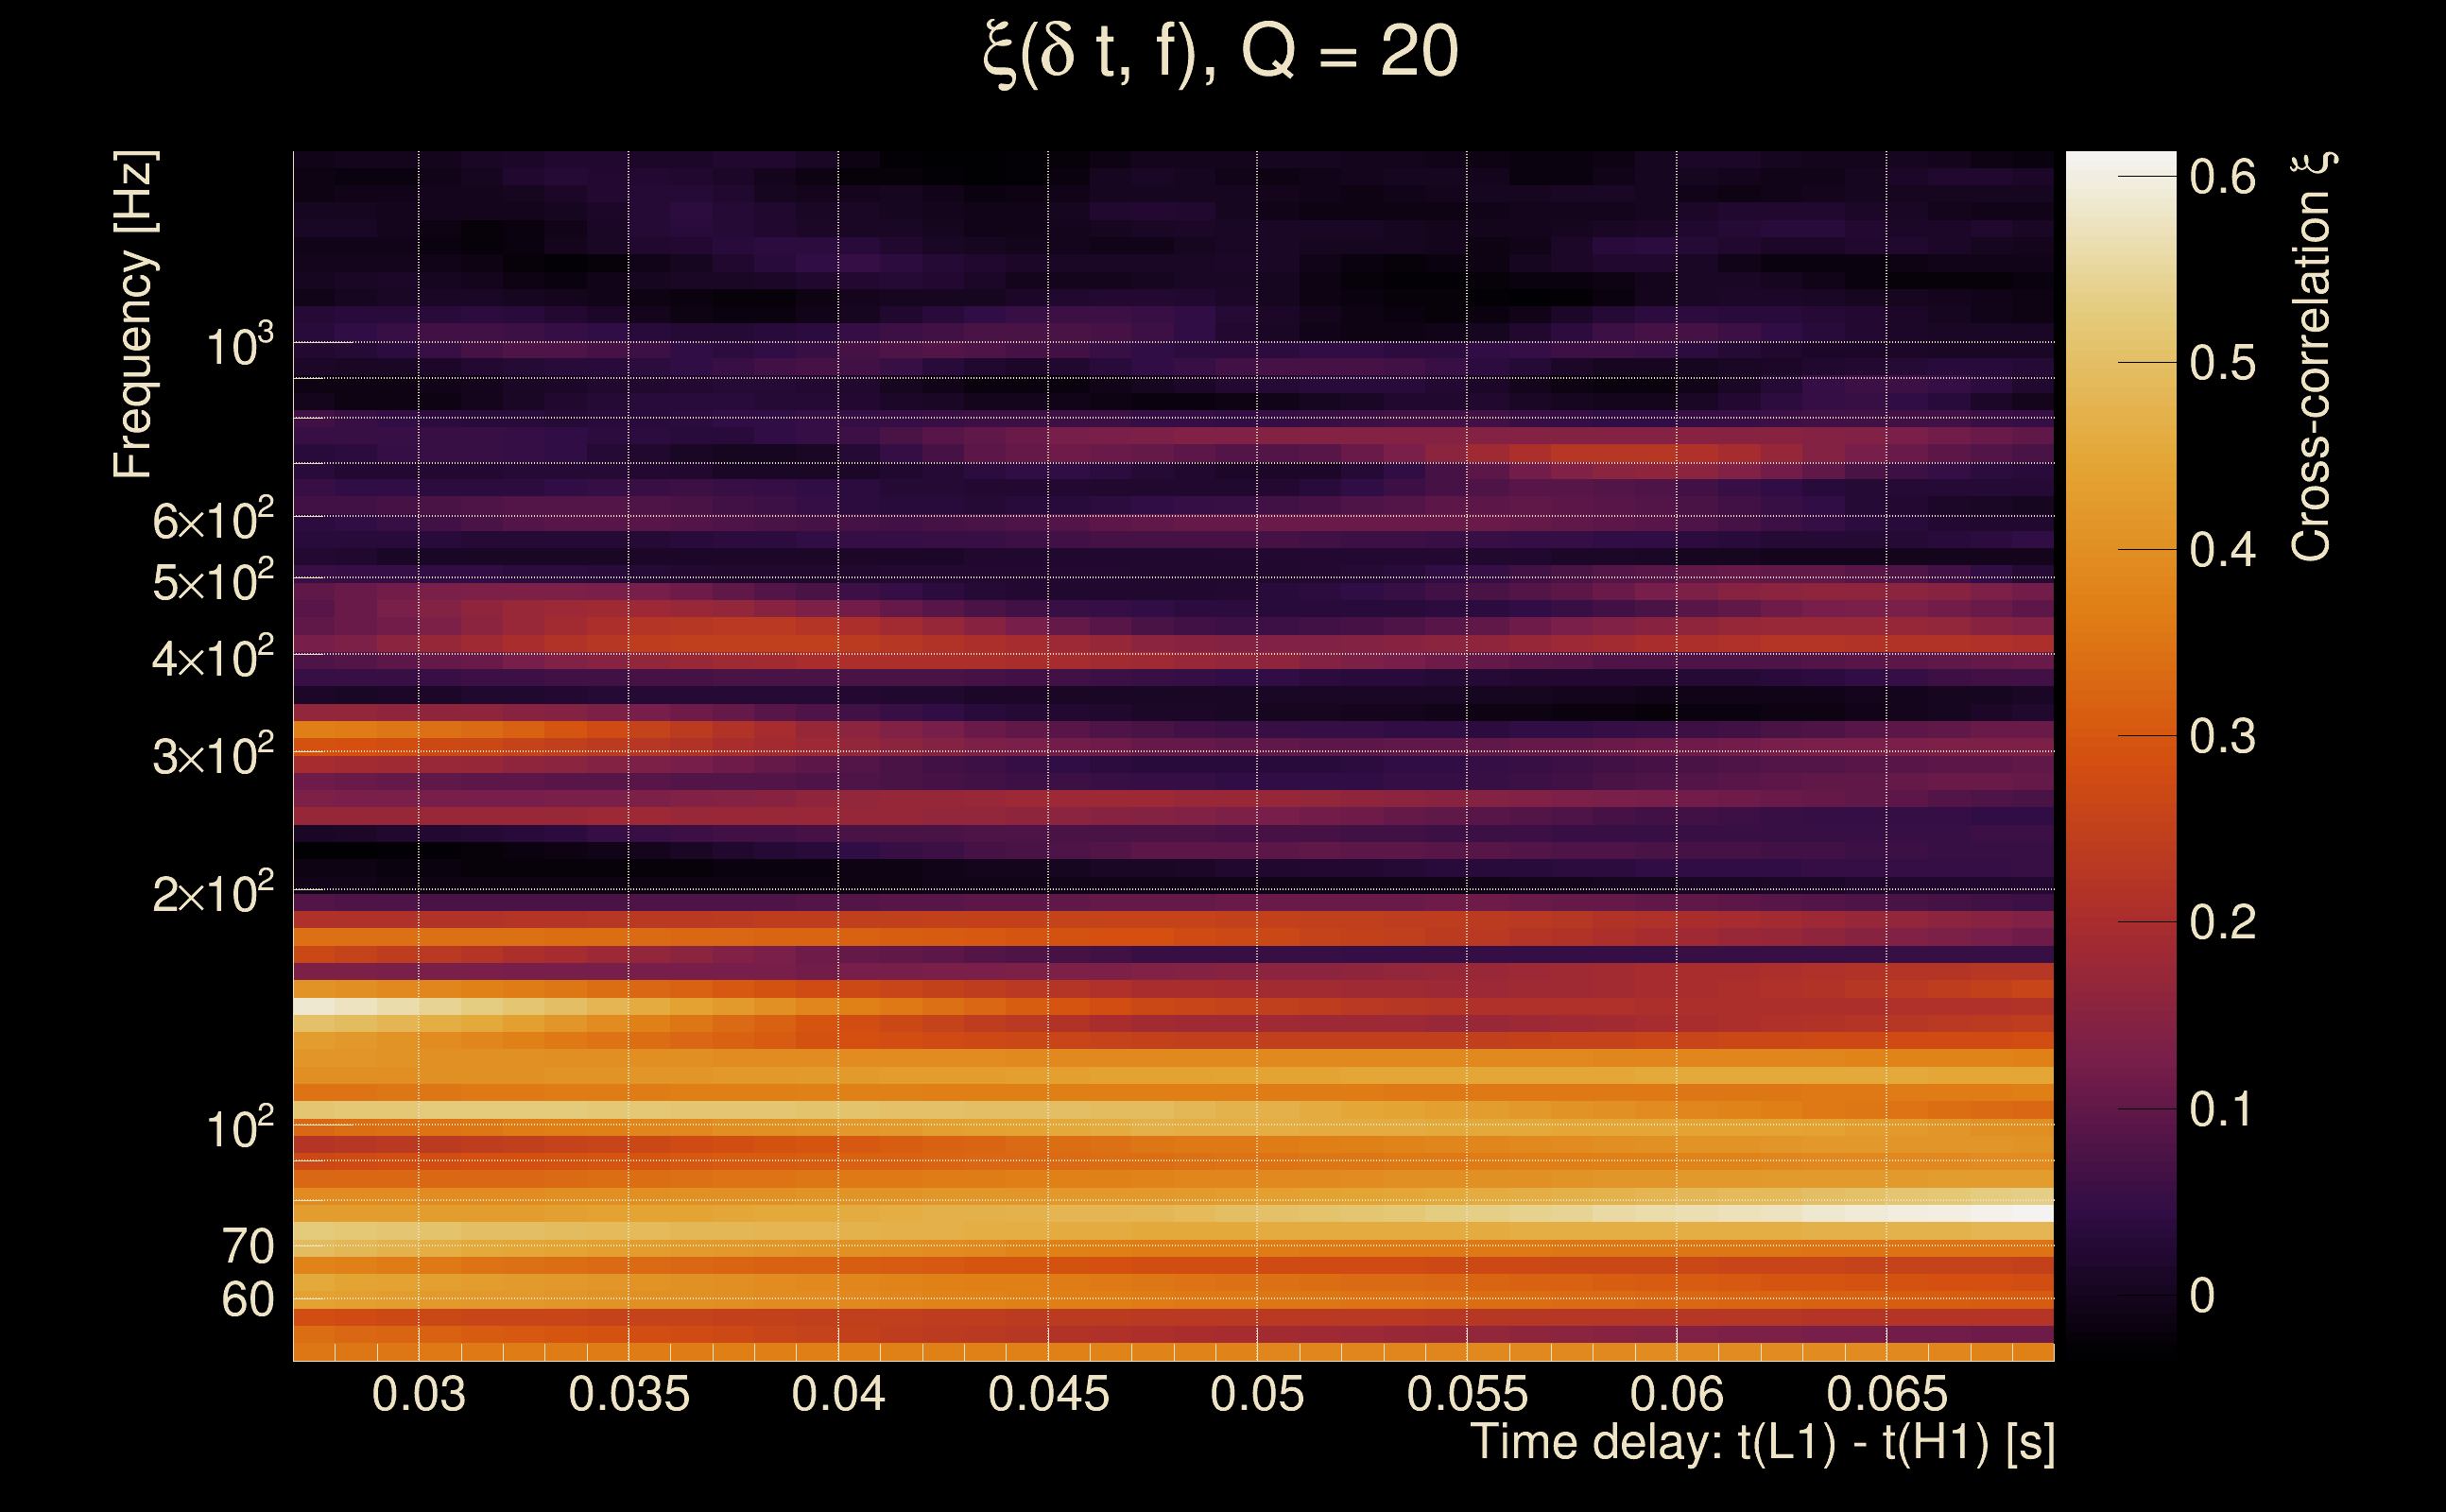
| Time delay between detectors t(L1) - t(H1): | 0.0480061 s (slice index = 107 / 217), δt_gw = 0.00200608 s |
| Time delay standard deviation: | 0.075649 s |
| [targeted mode] Time delay probability: | 0.983444 (0.0207512 sigmas), δt_target = 0.00379395 s |
| Frequency: | 171.901 Hz |
| Ξ: | 0.215116 ± 0.0817707 (variance = 0.00668645): Q0: 0.512738, Q1: 0.552868, Q2: 0.50863, Q3: 0.318515, Q4: 0.493783 |
| Rank: | R_A = 0.0853463 |
| Log of amplitude ratio (L1/H1): | 0.0375317, variance = 0.191144 (L1/H1: -0.338794, variance = 0.427757, H1/L1: -0.213412, variance = 0.318128) |
| Amplitude ratio (L1/H1): | 1.03824 ⋇ 1.54837 (L1/H1: 0.712629 ⋇ 1.92328, H1/L1: 0.807823 ⋇ 1.75774) |
| Amplitude ratio H1|L1 compatibility (probability): | 0.52257 |
| Antenna factor probability: | 0.772001 |
| Number of rejected frequency rows: | Q0: 8 / 18, Q1: 22 / 36, Q2: 57 / 70, Q3: 123 / 134, Q4: 245 / 258 |
| Maximum signal-to-noise ratio: | H1: 56.4786, L1: 82.6146 |
| SNR variance: | H1: 0.434483, L1: 0.462698 |
| Click here for a zoomed plot | Click here for a zoomed plot | Click here for a zoomed plot | Click here for a zoomed plot | Click here for a zoomed plot |
 |
 |
 |
 |
 |
 |
 |
 |
 |
 |
 |
 |
 |
 |
 |
 |
 |
 |
 |
 |
 |
 |
 |
 |
 |
 |
 |
 |
 |
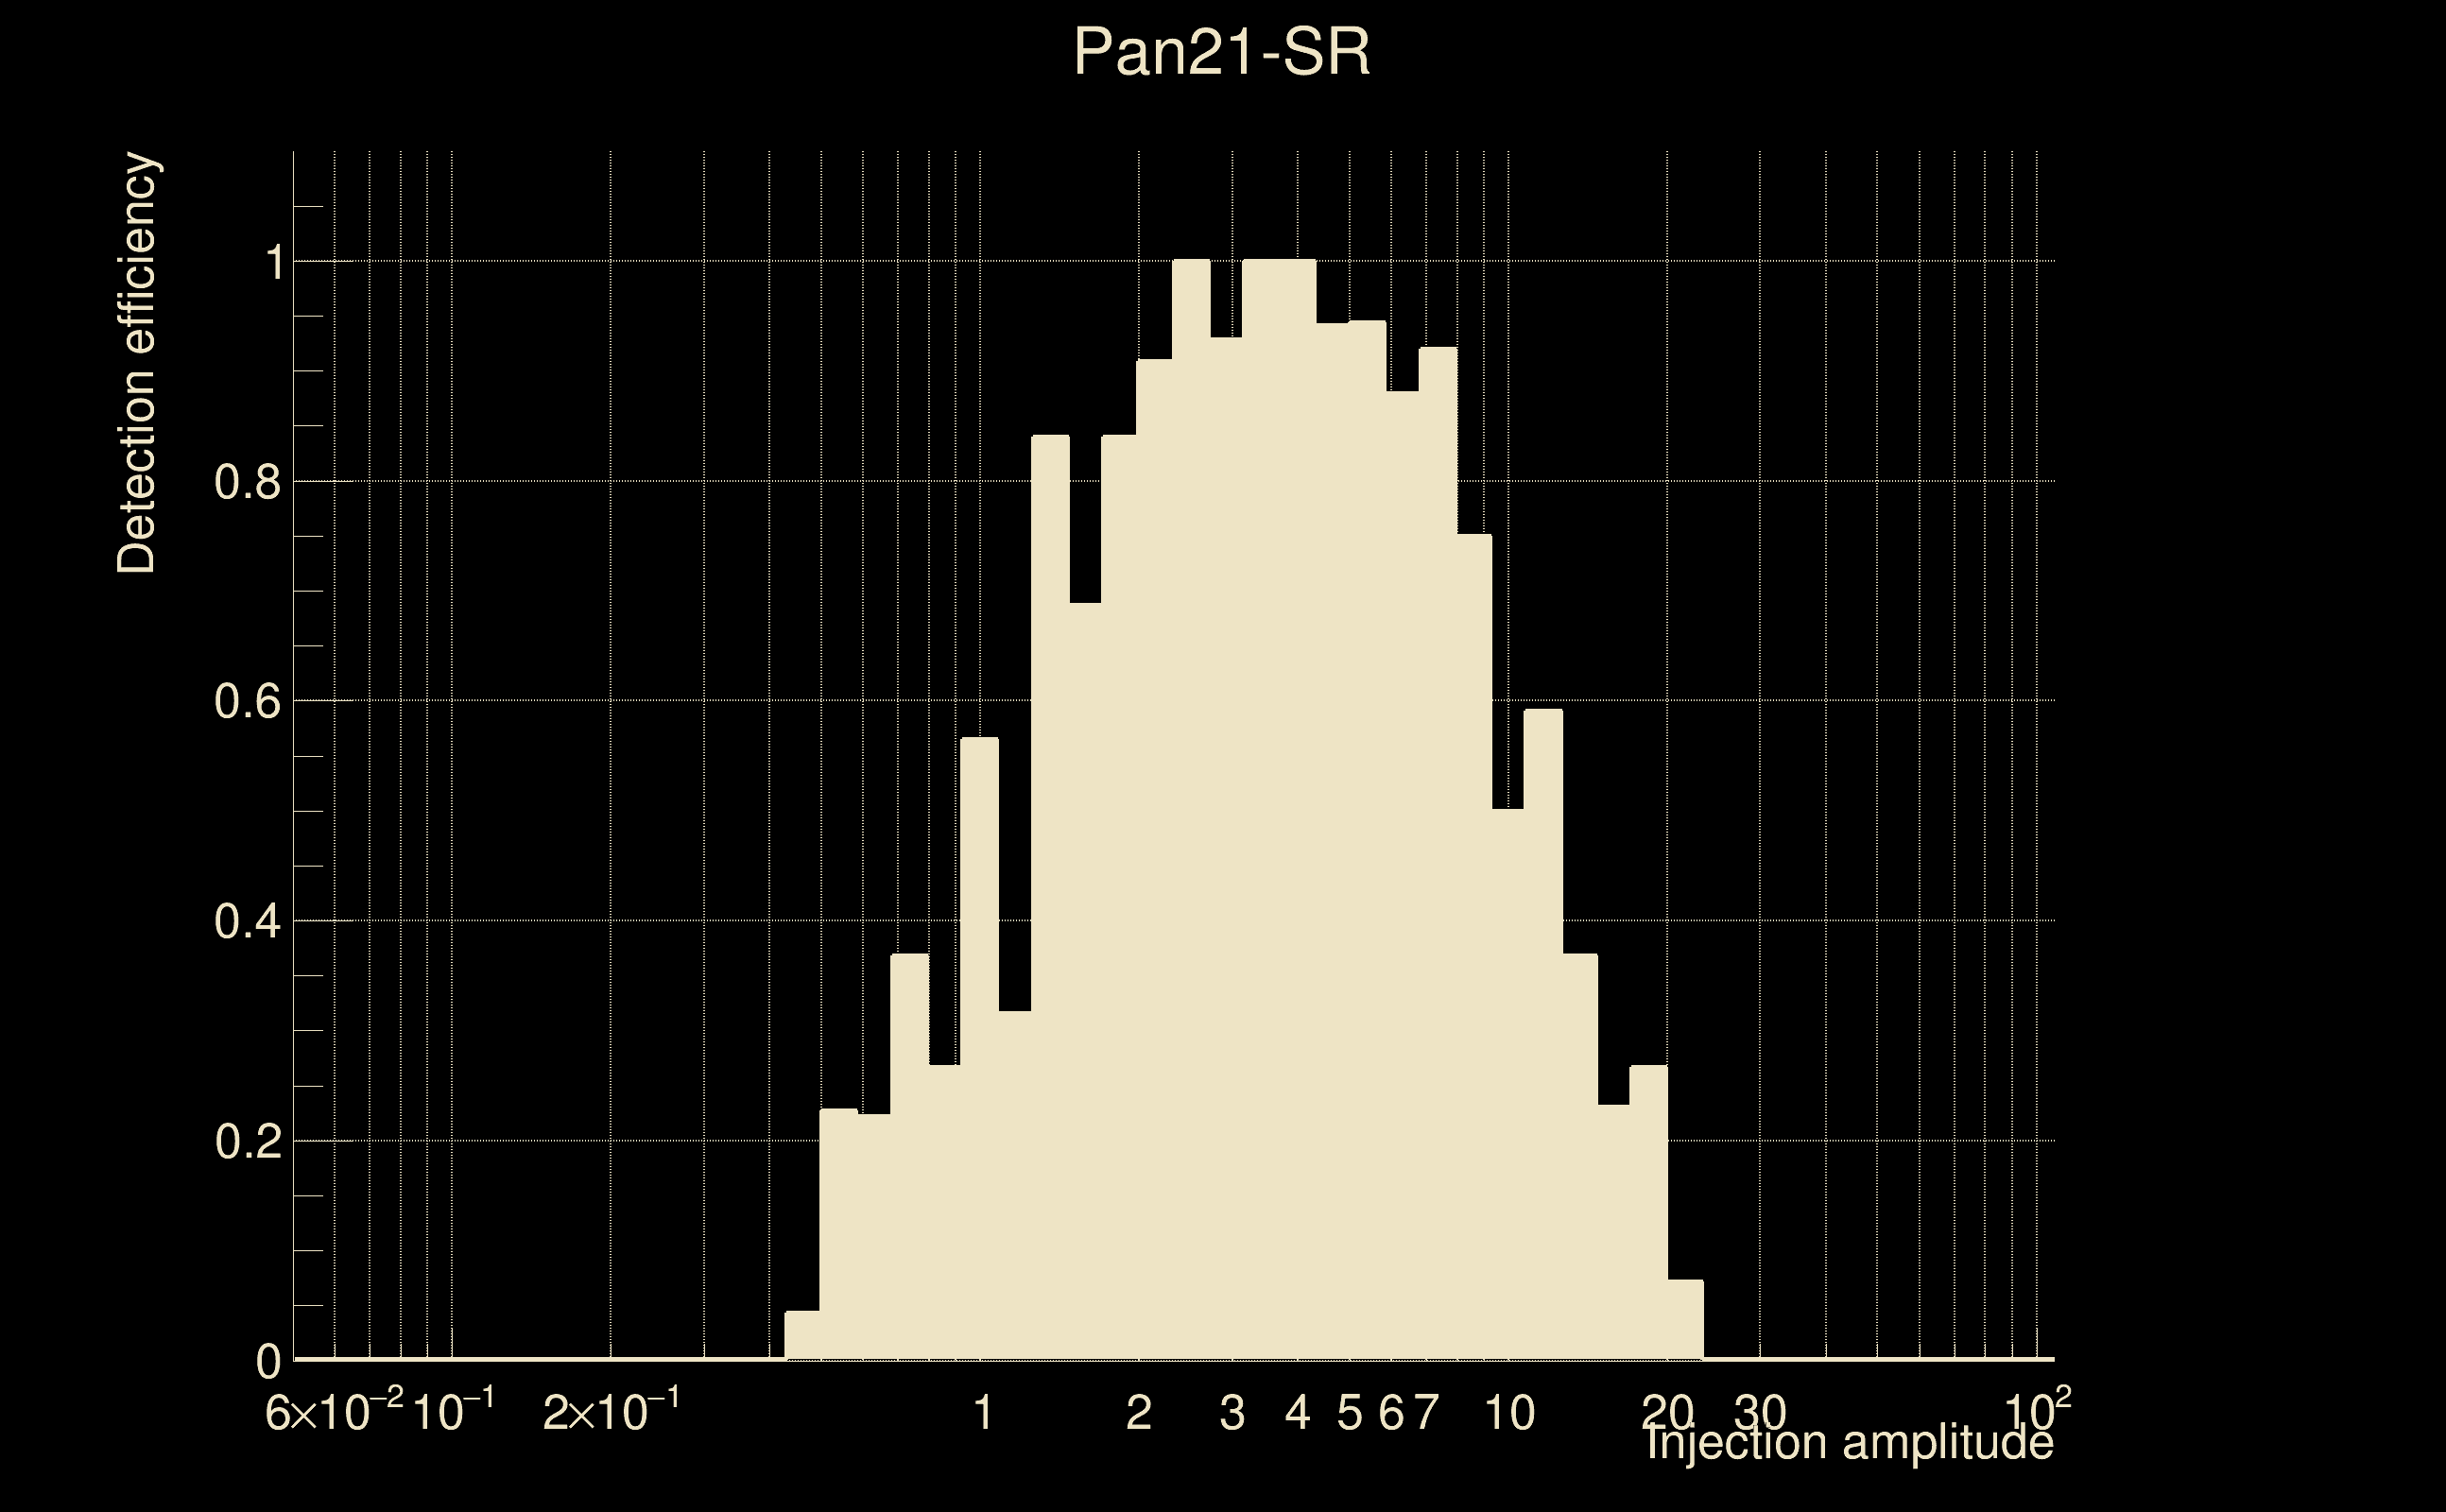
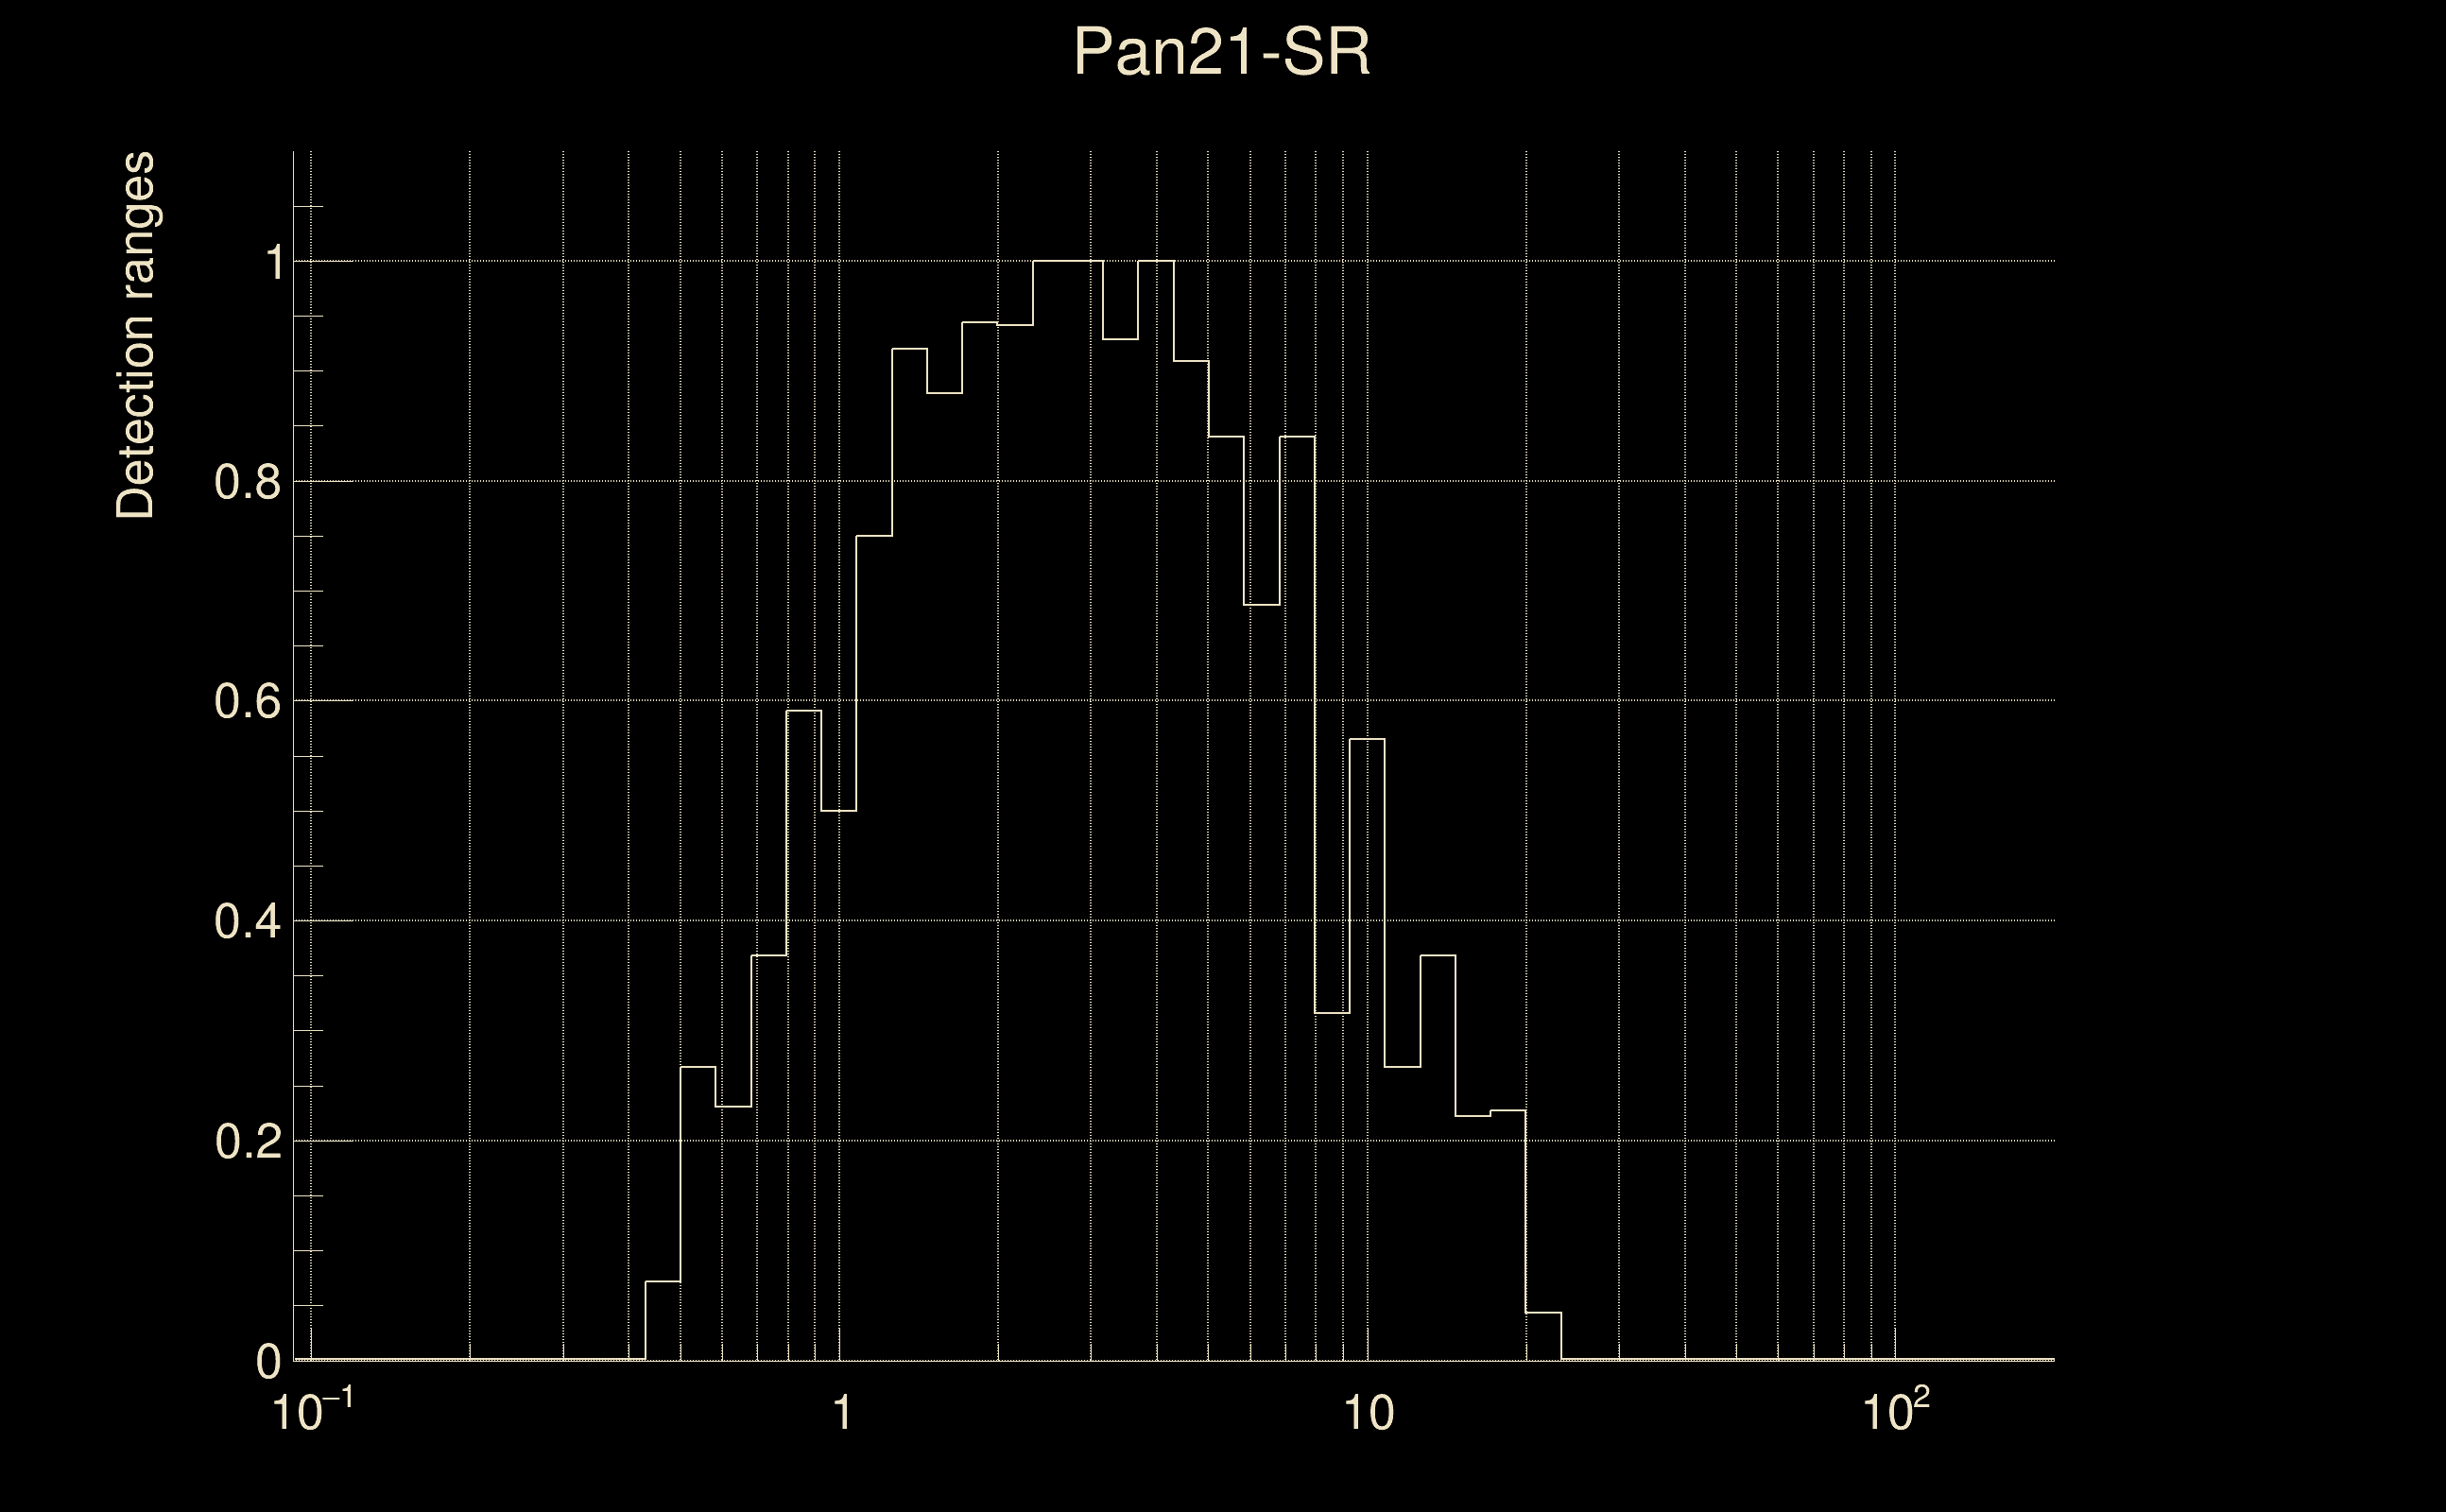
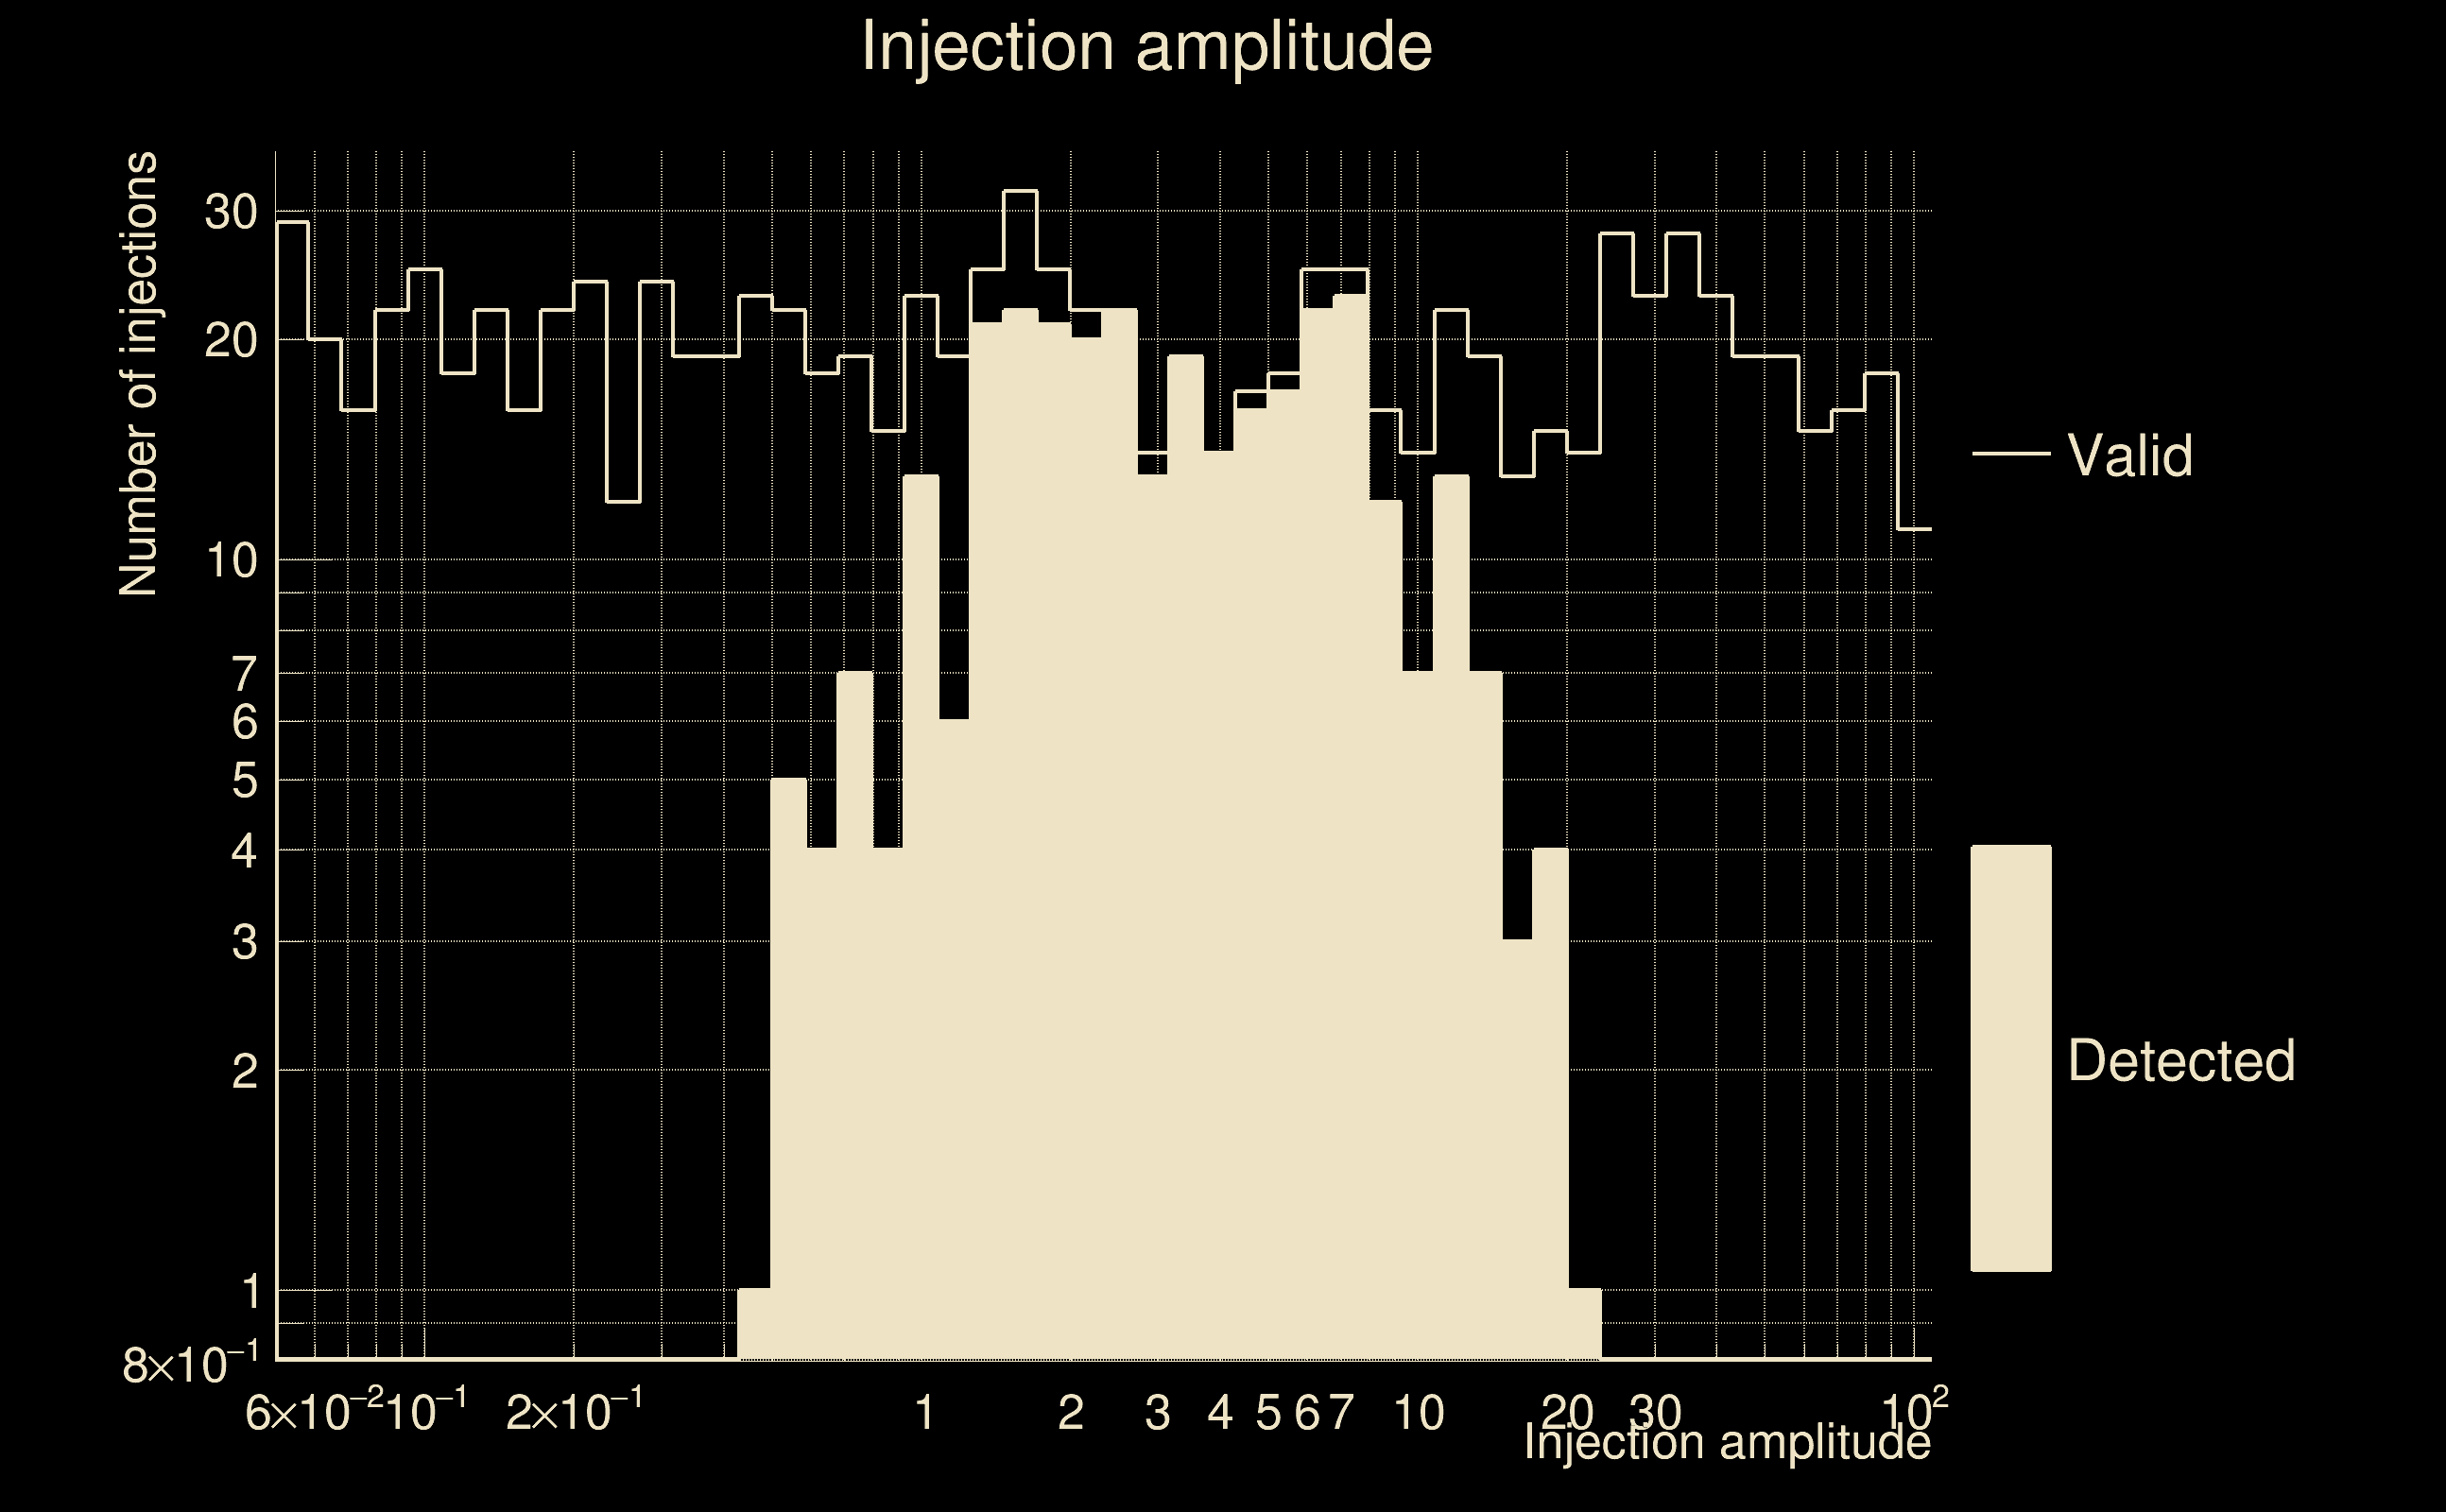
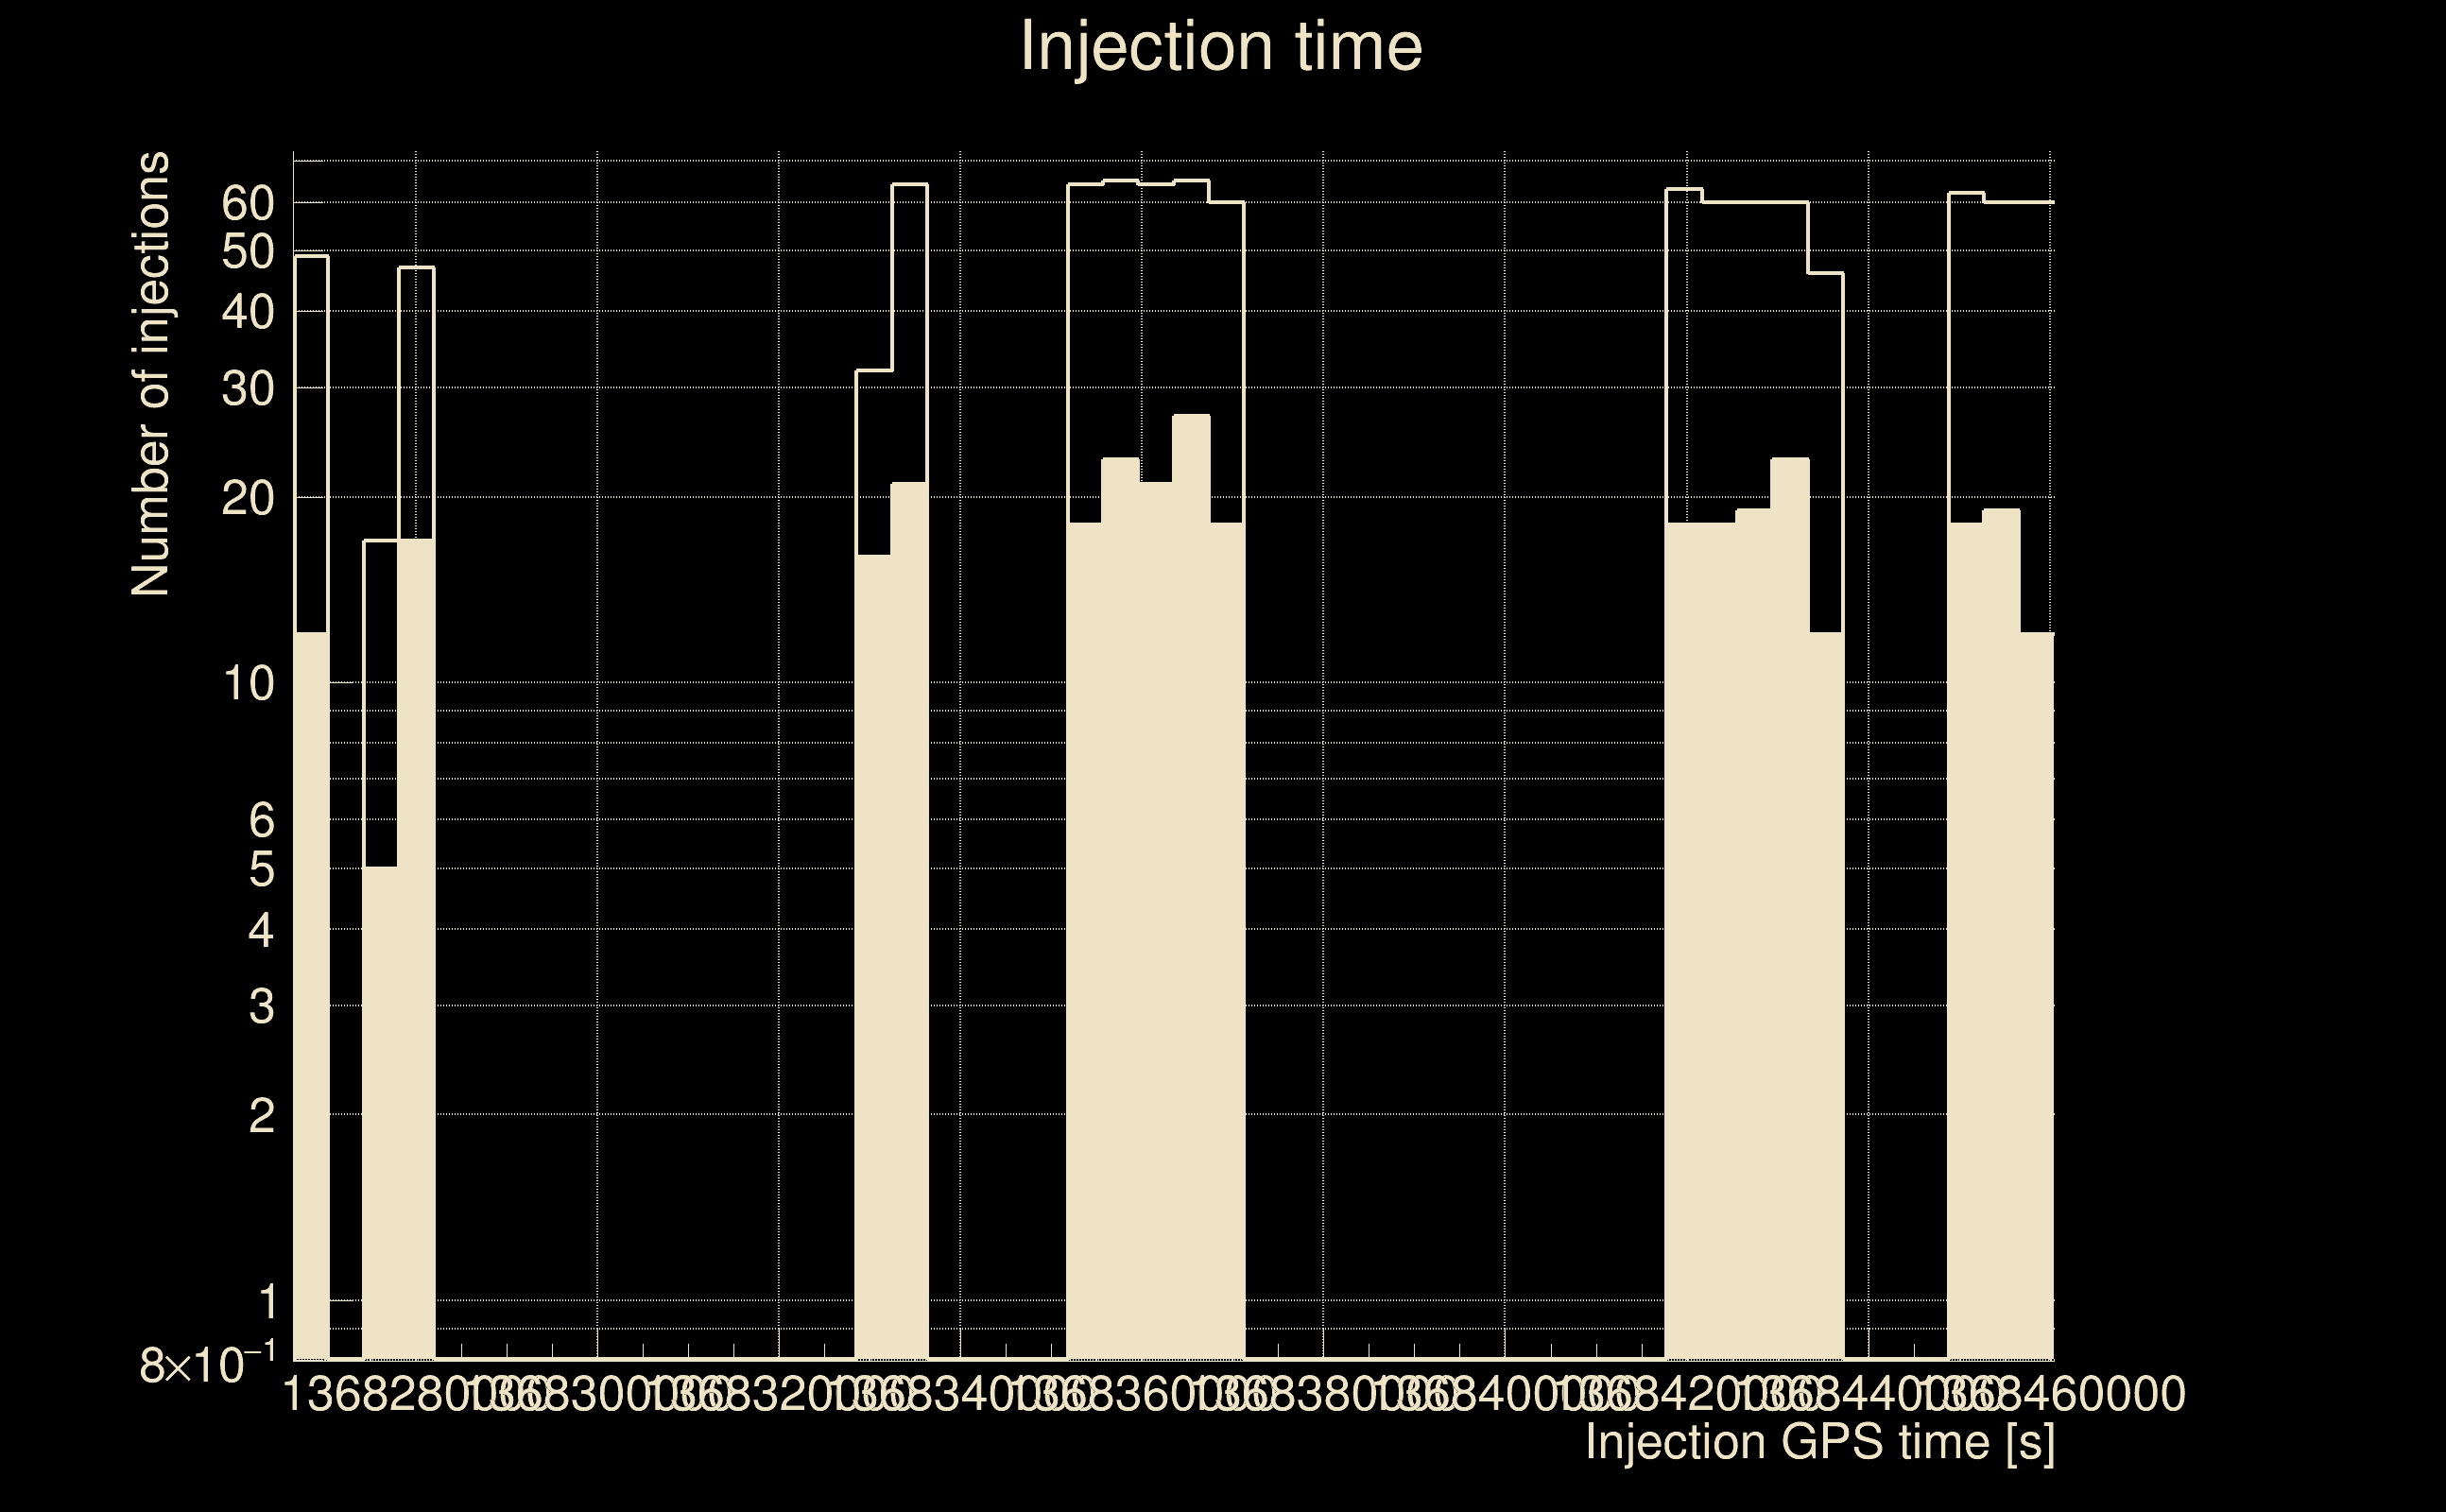
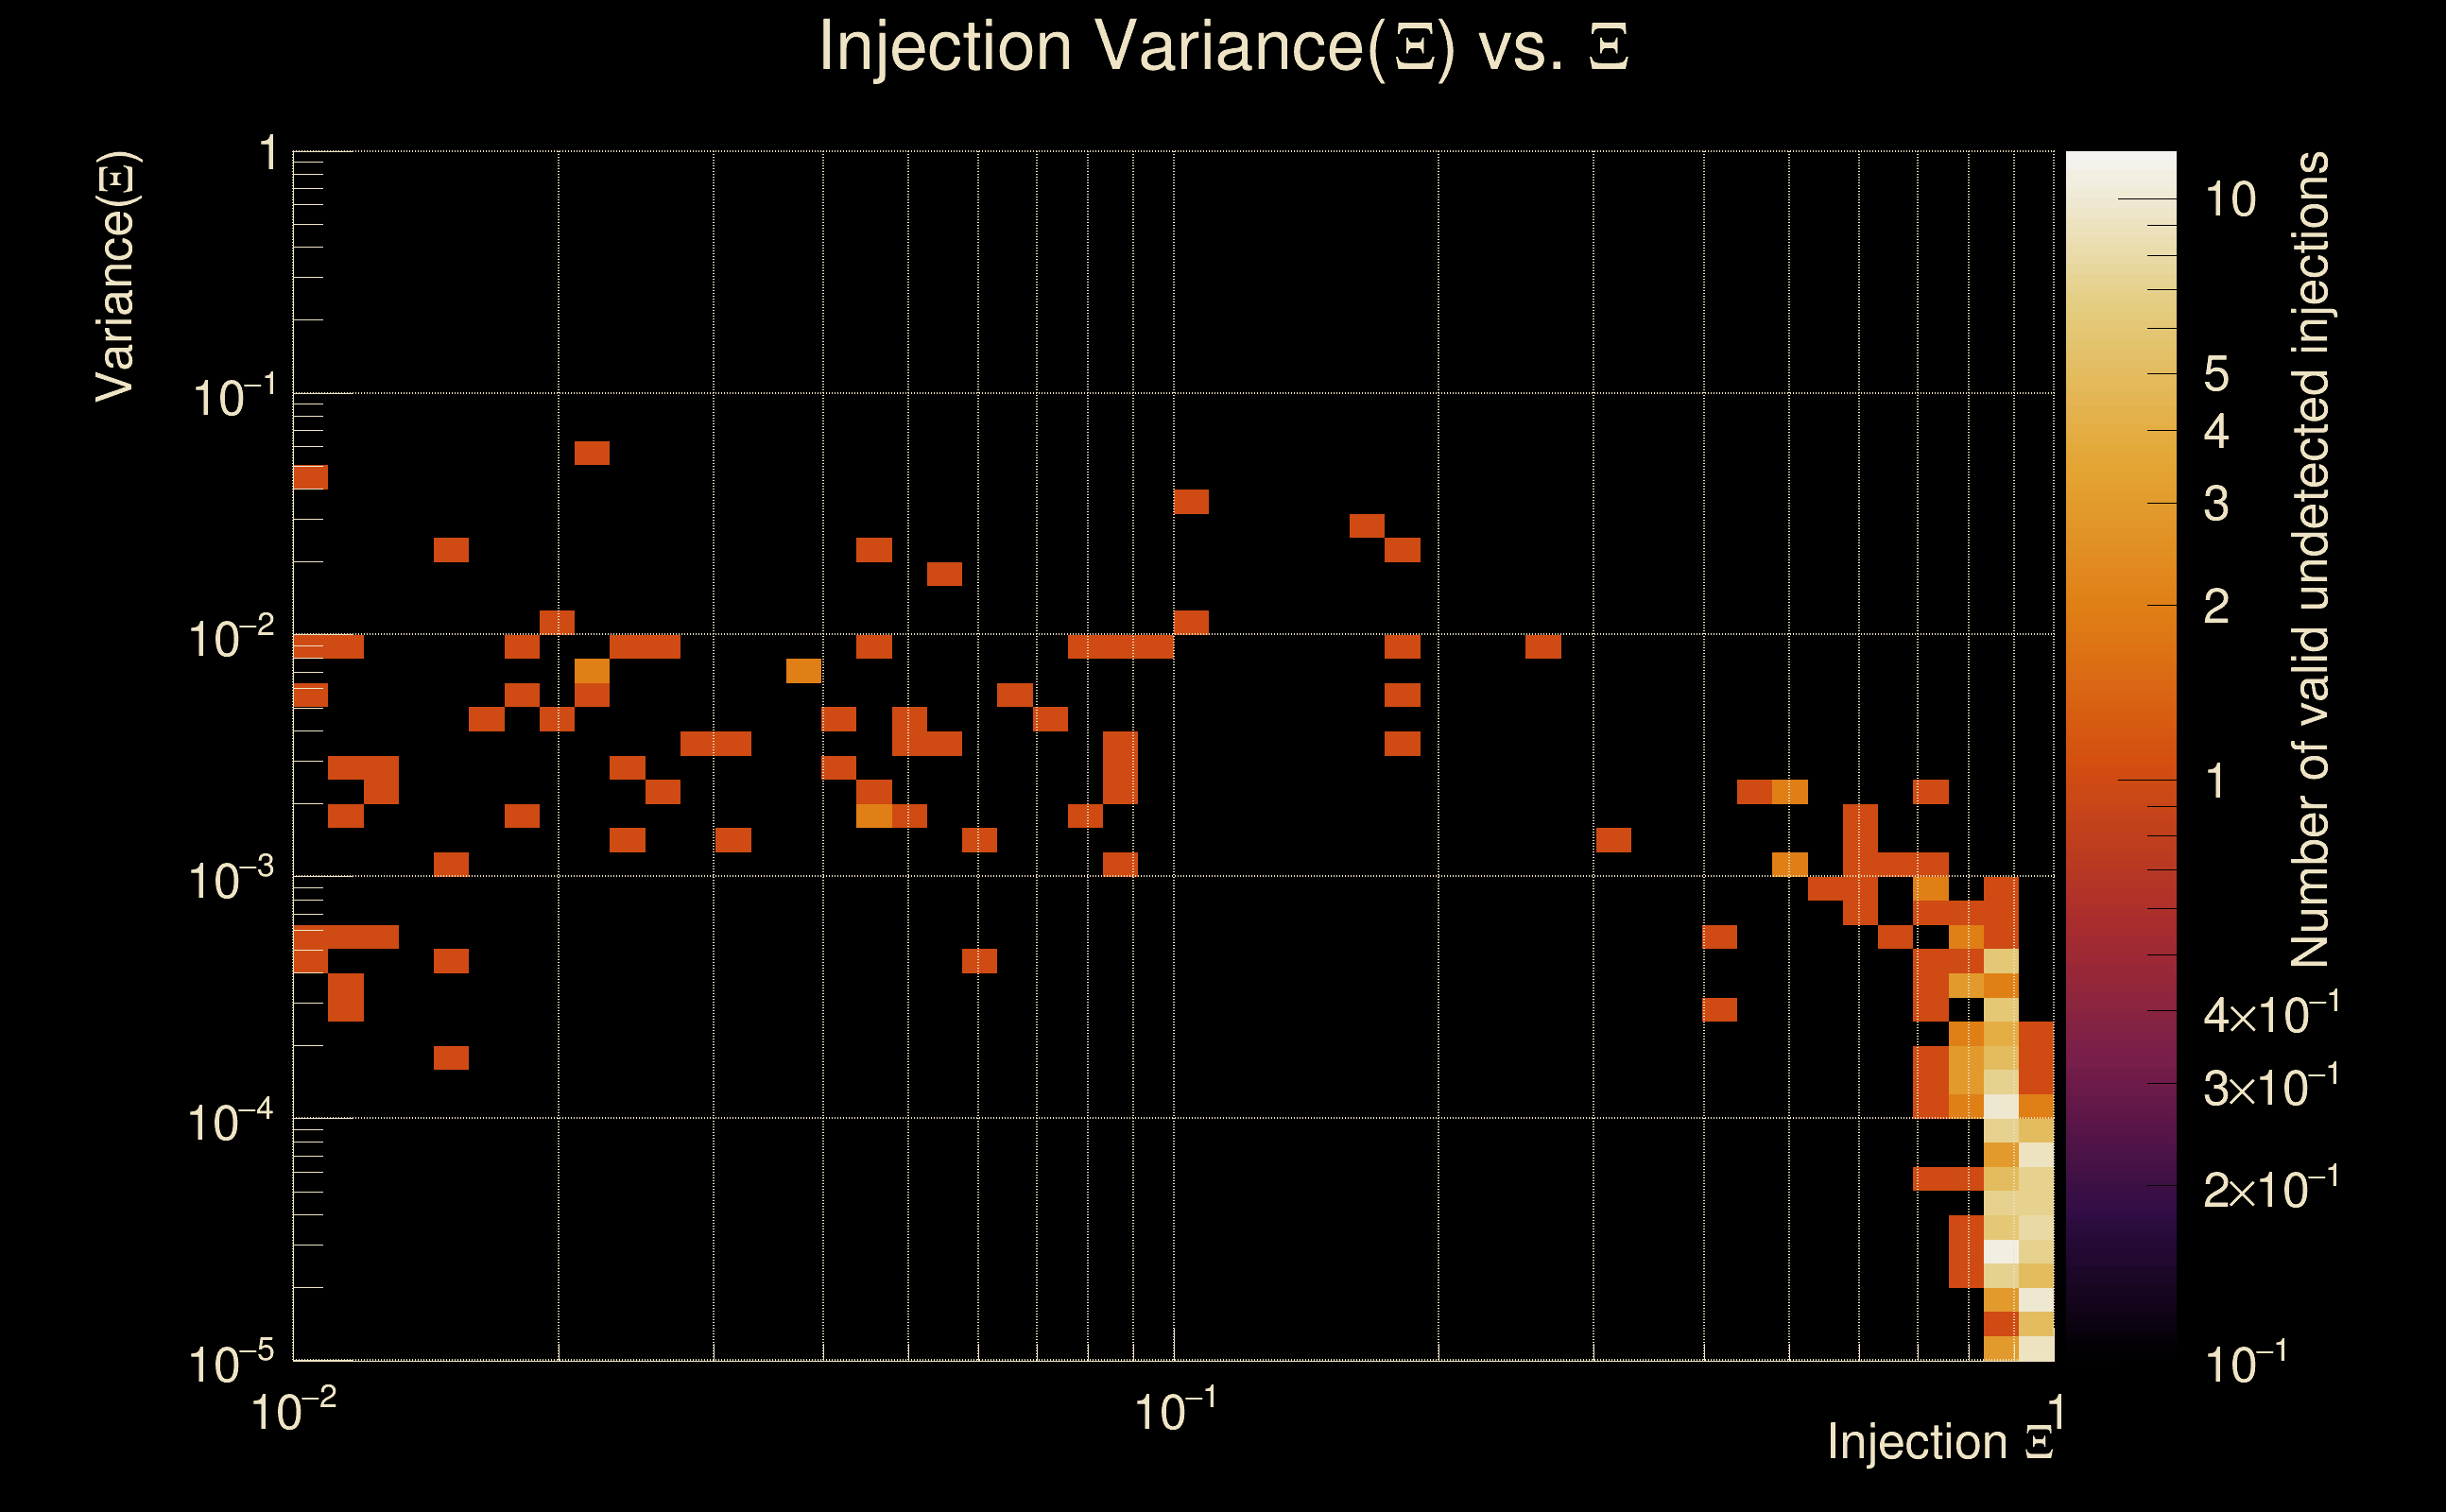
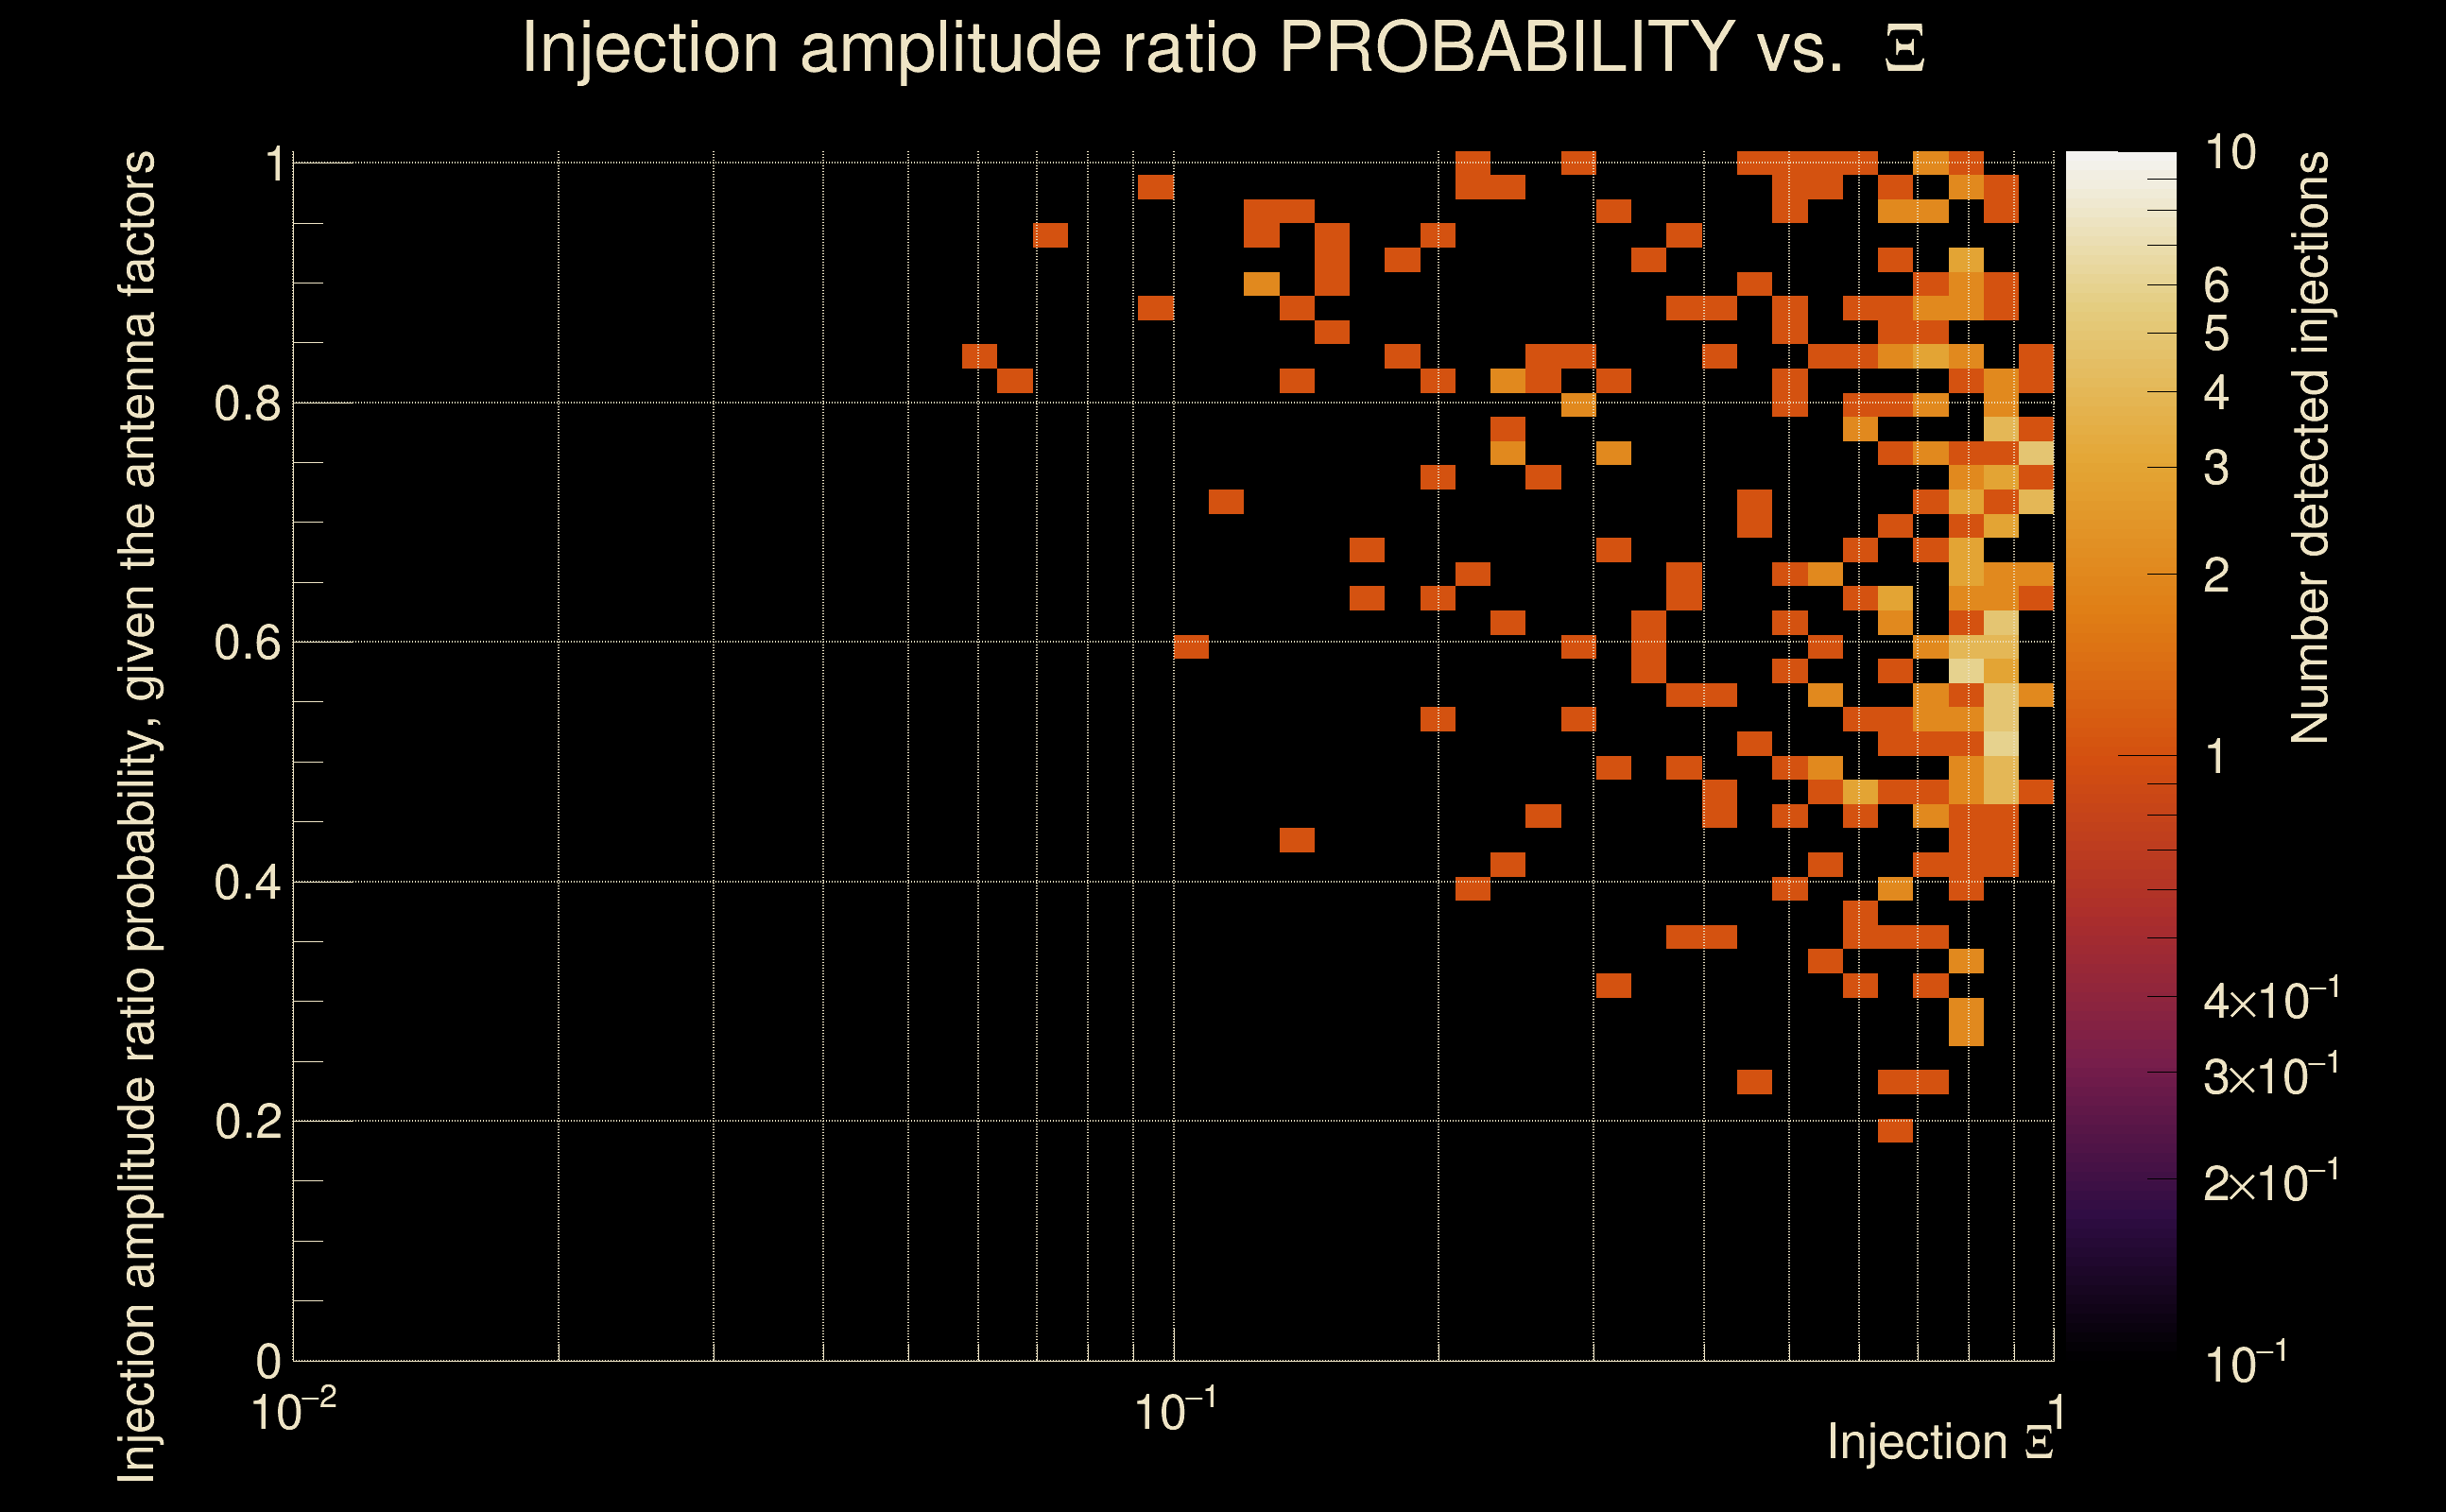
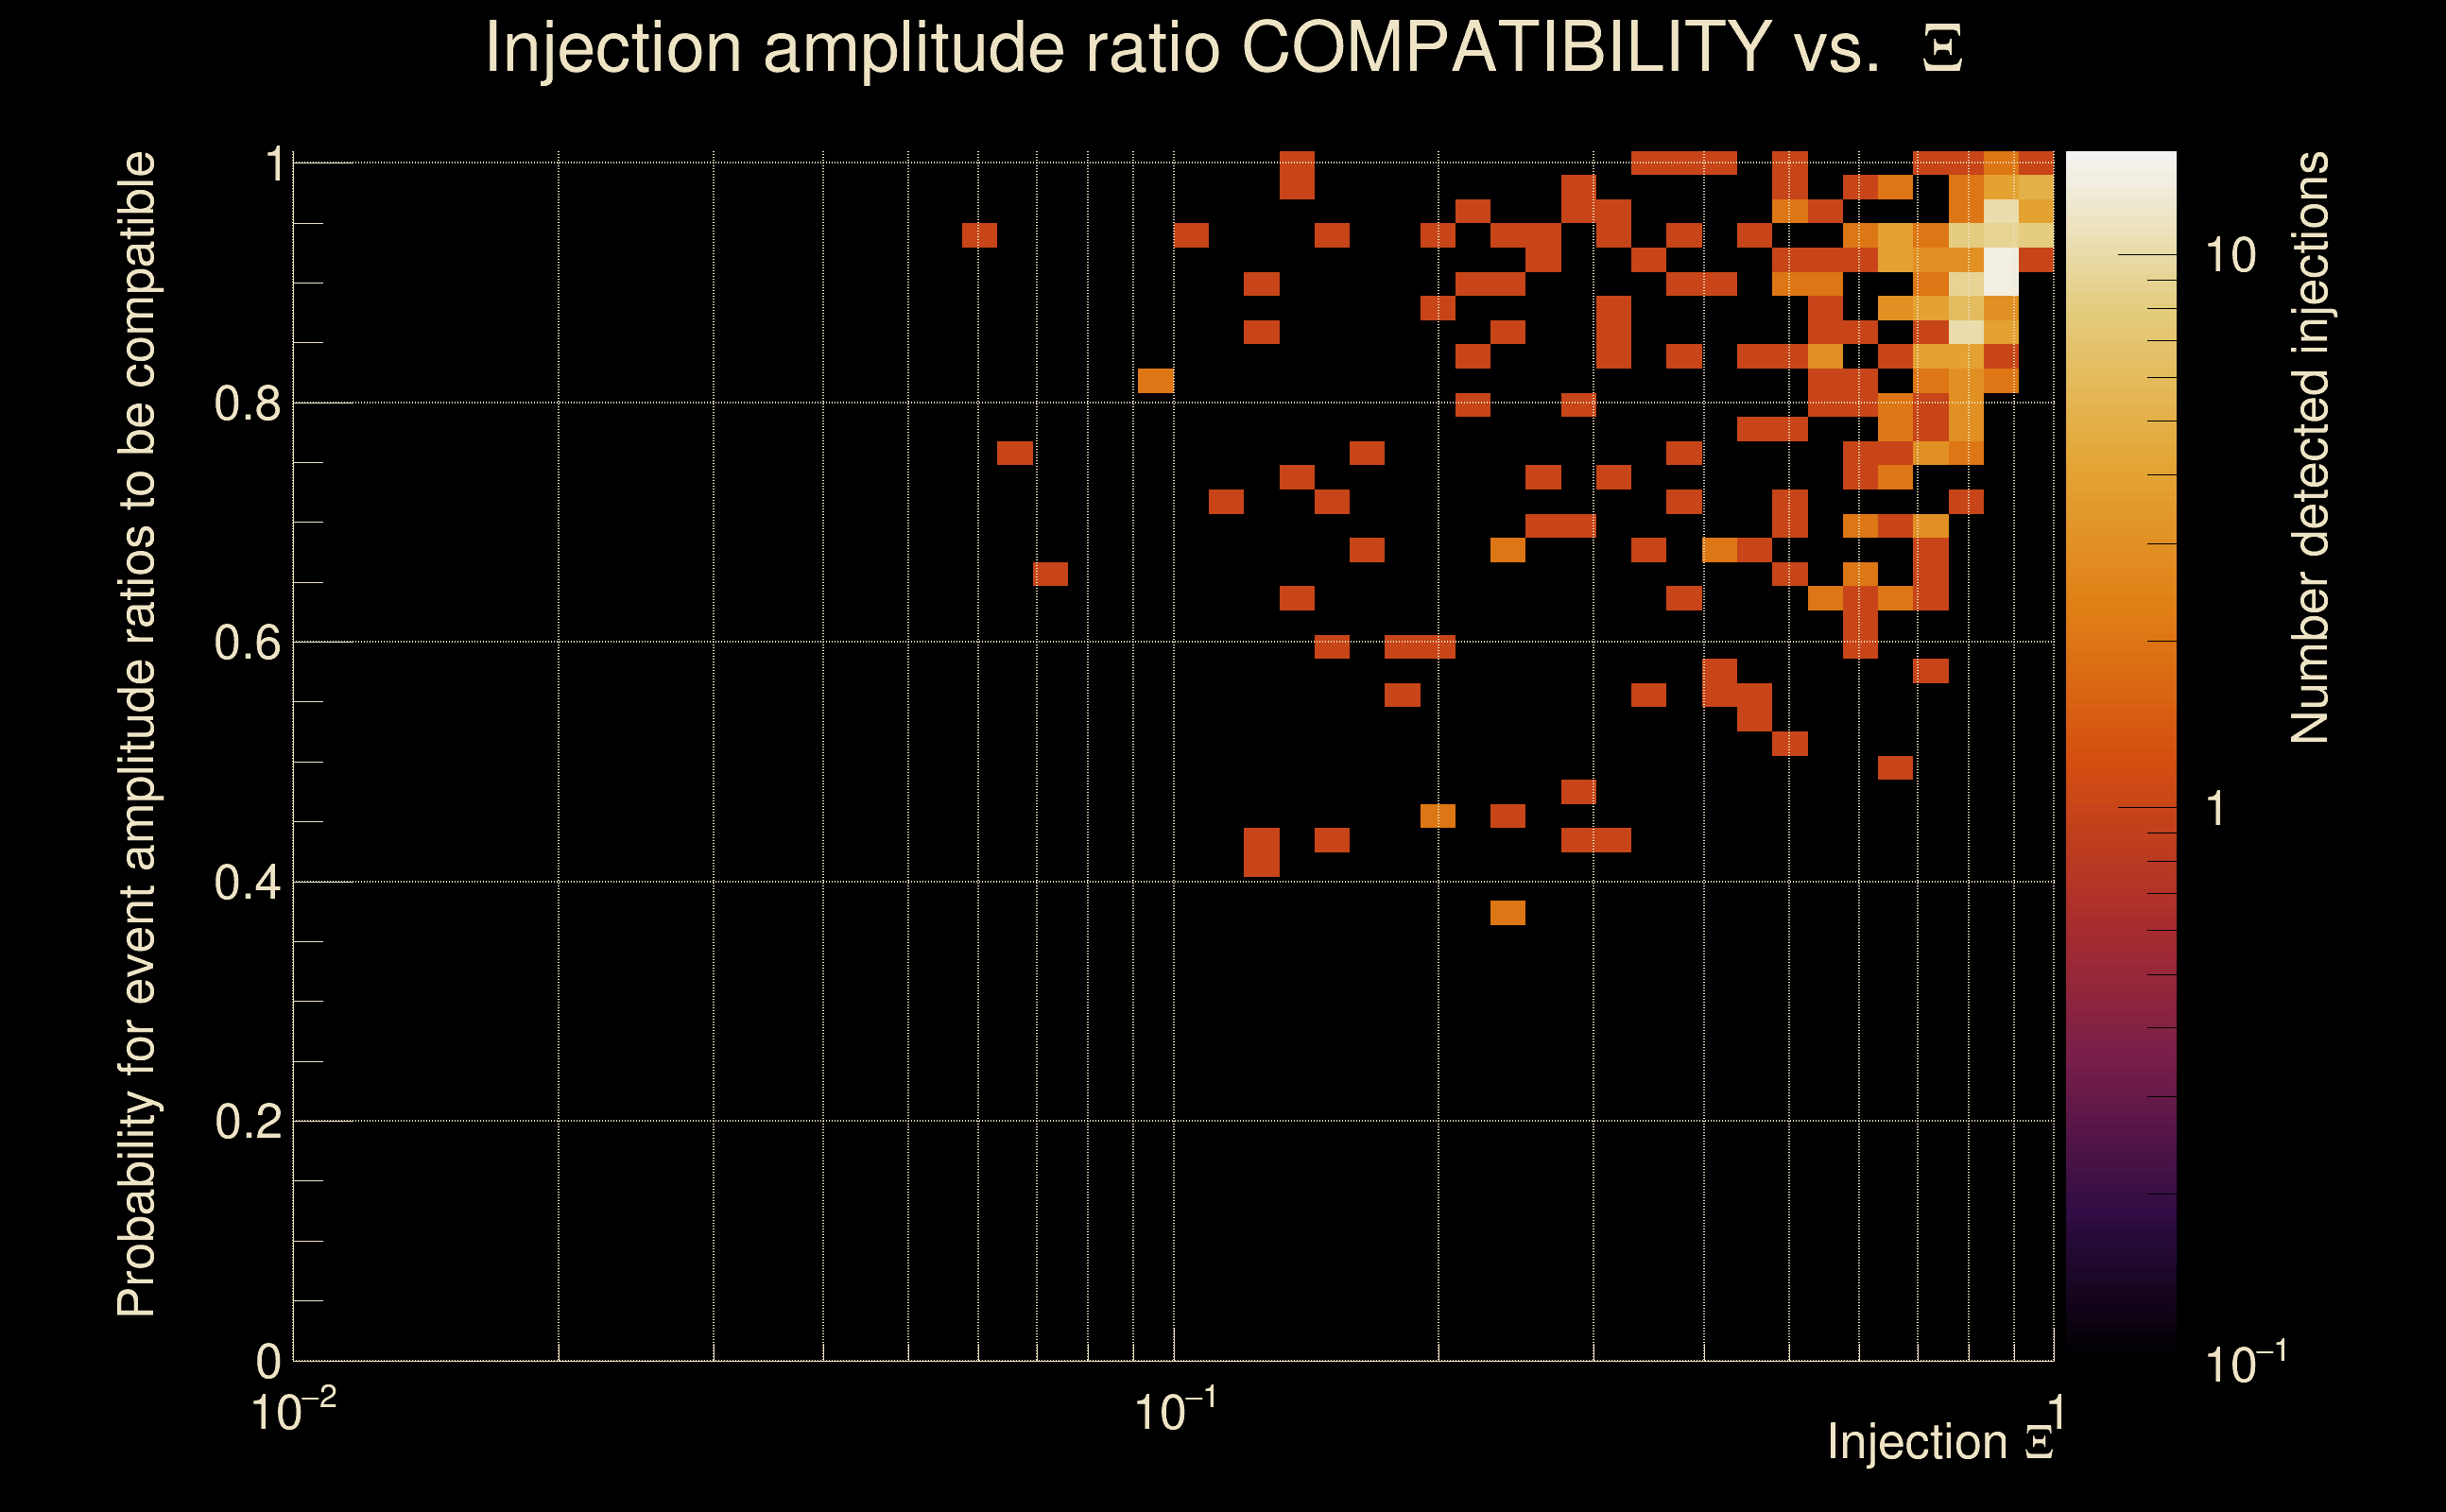
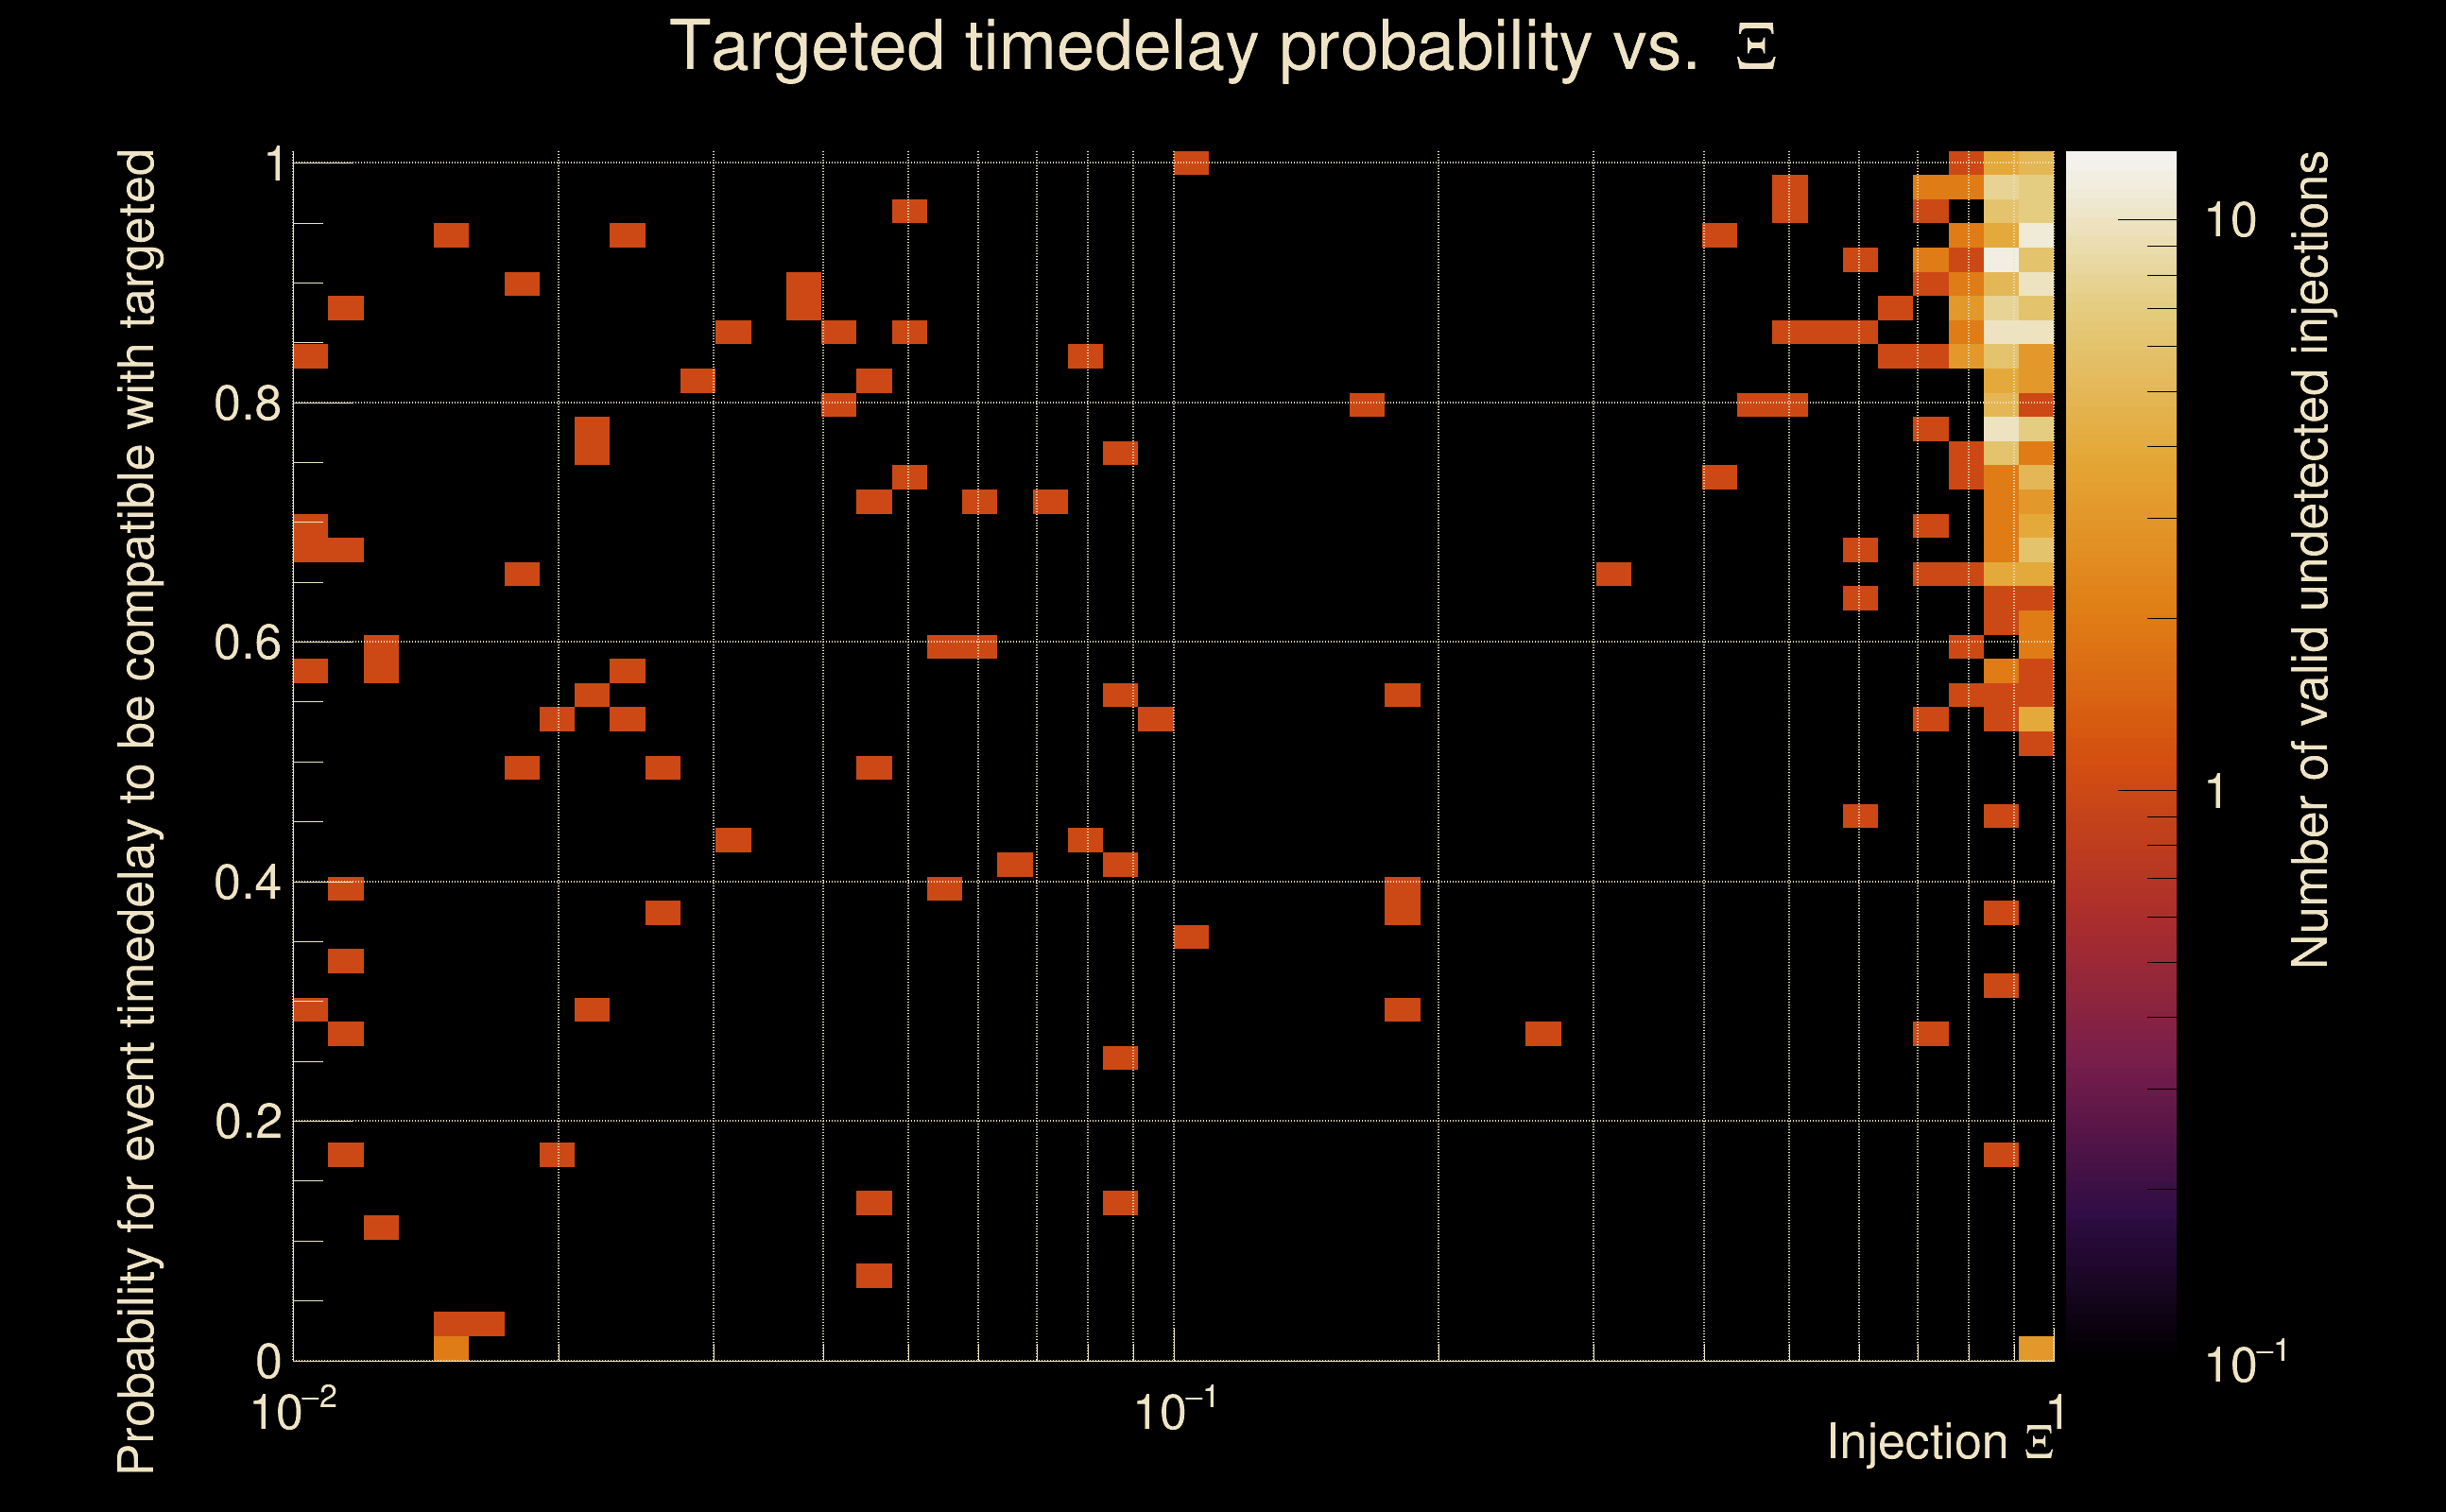
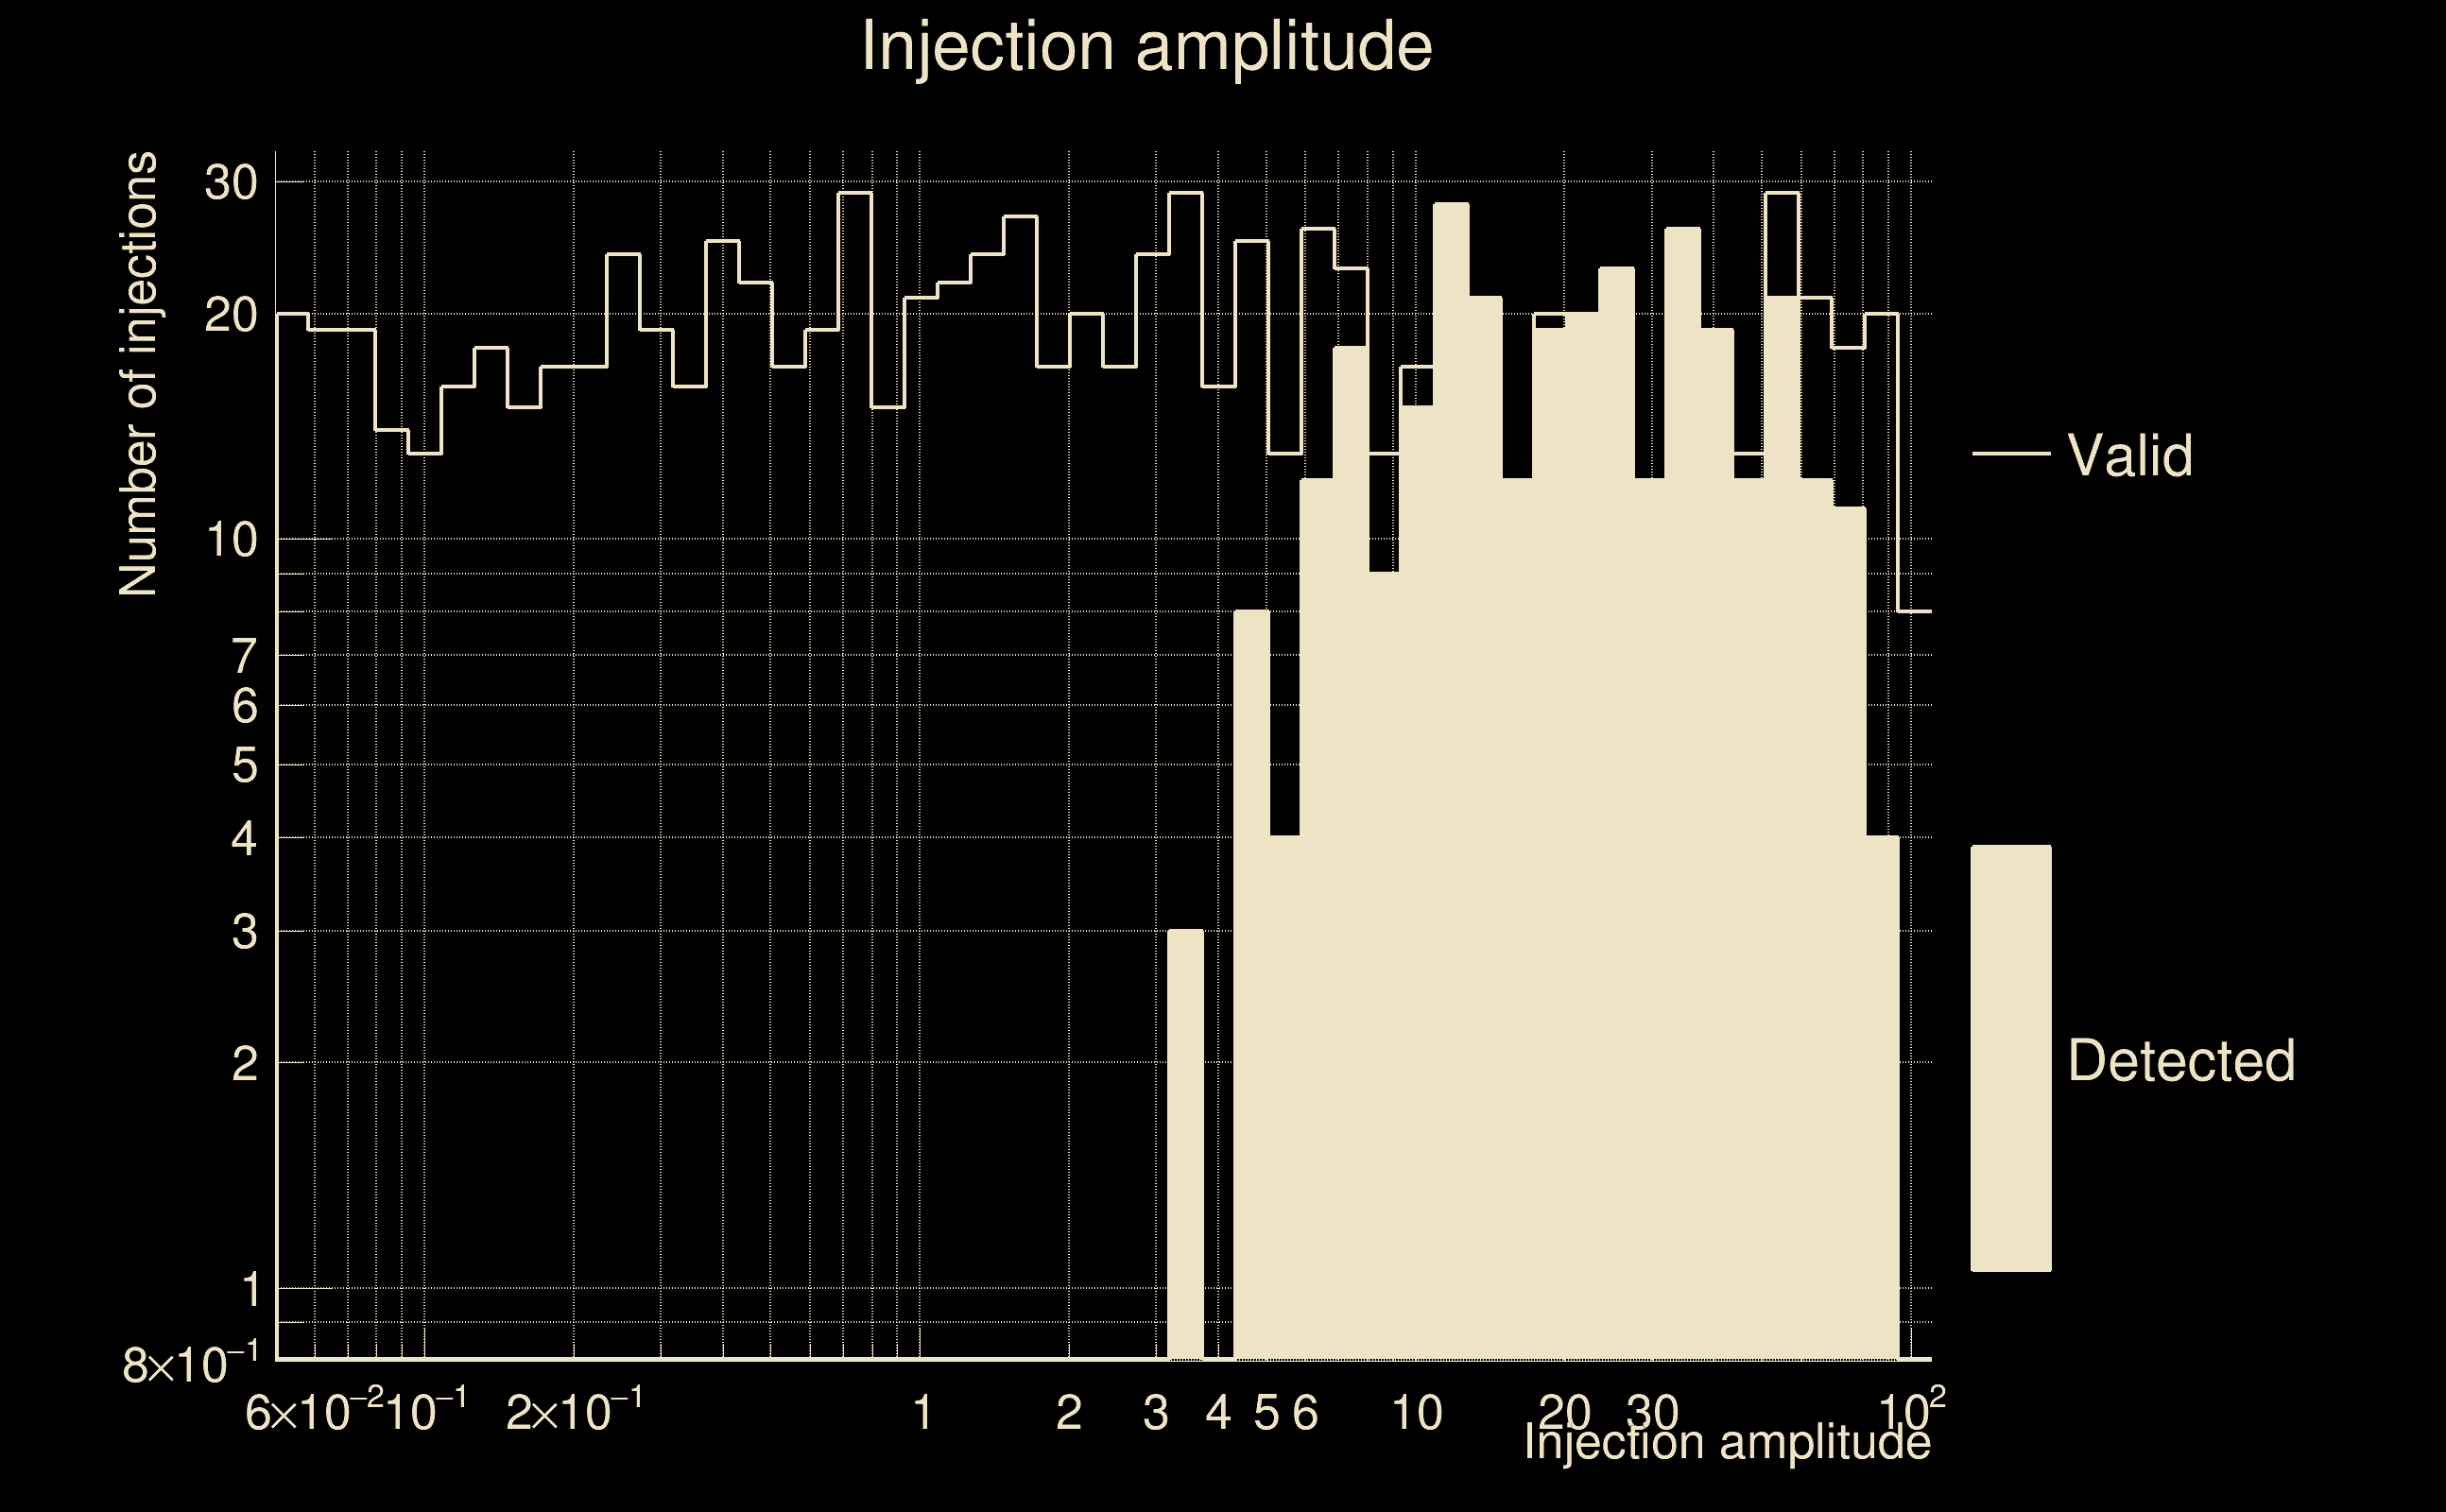
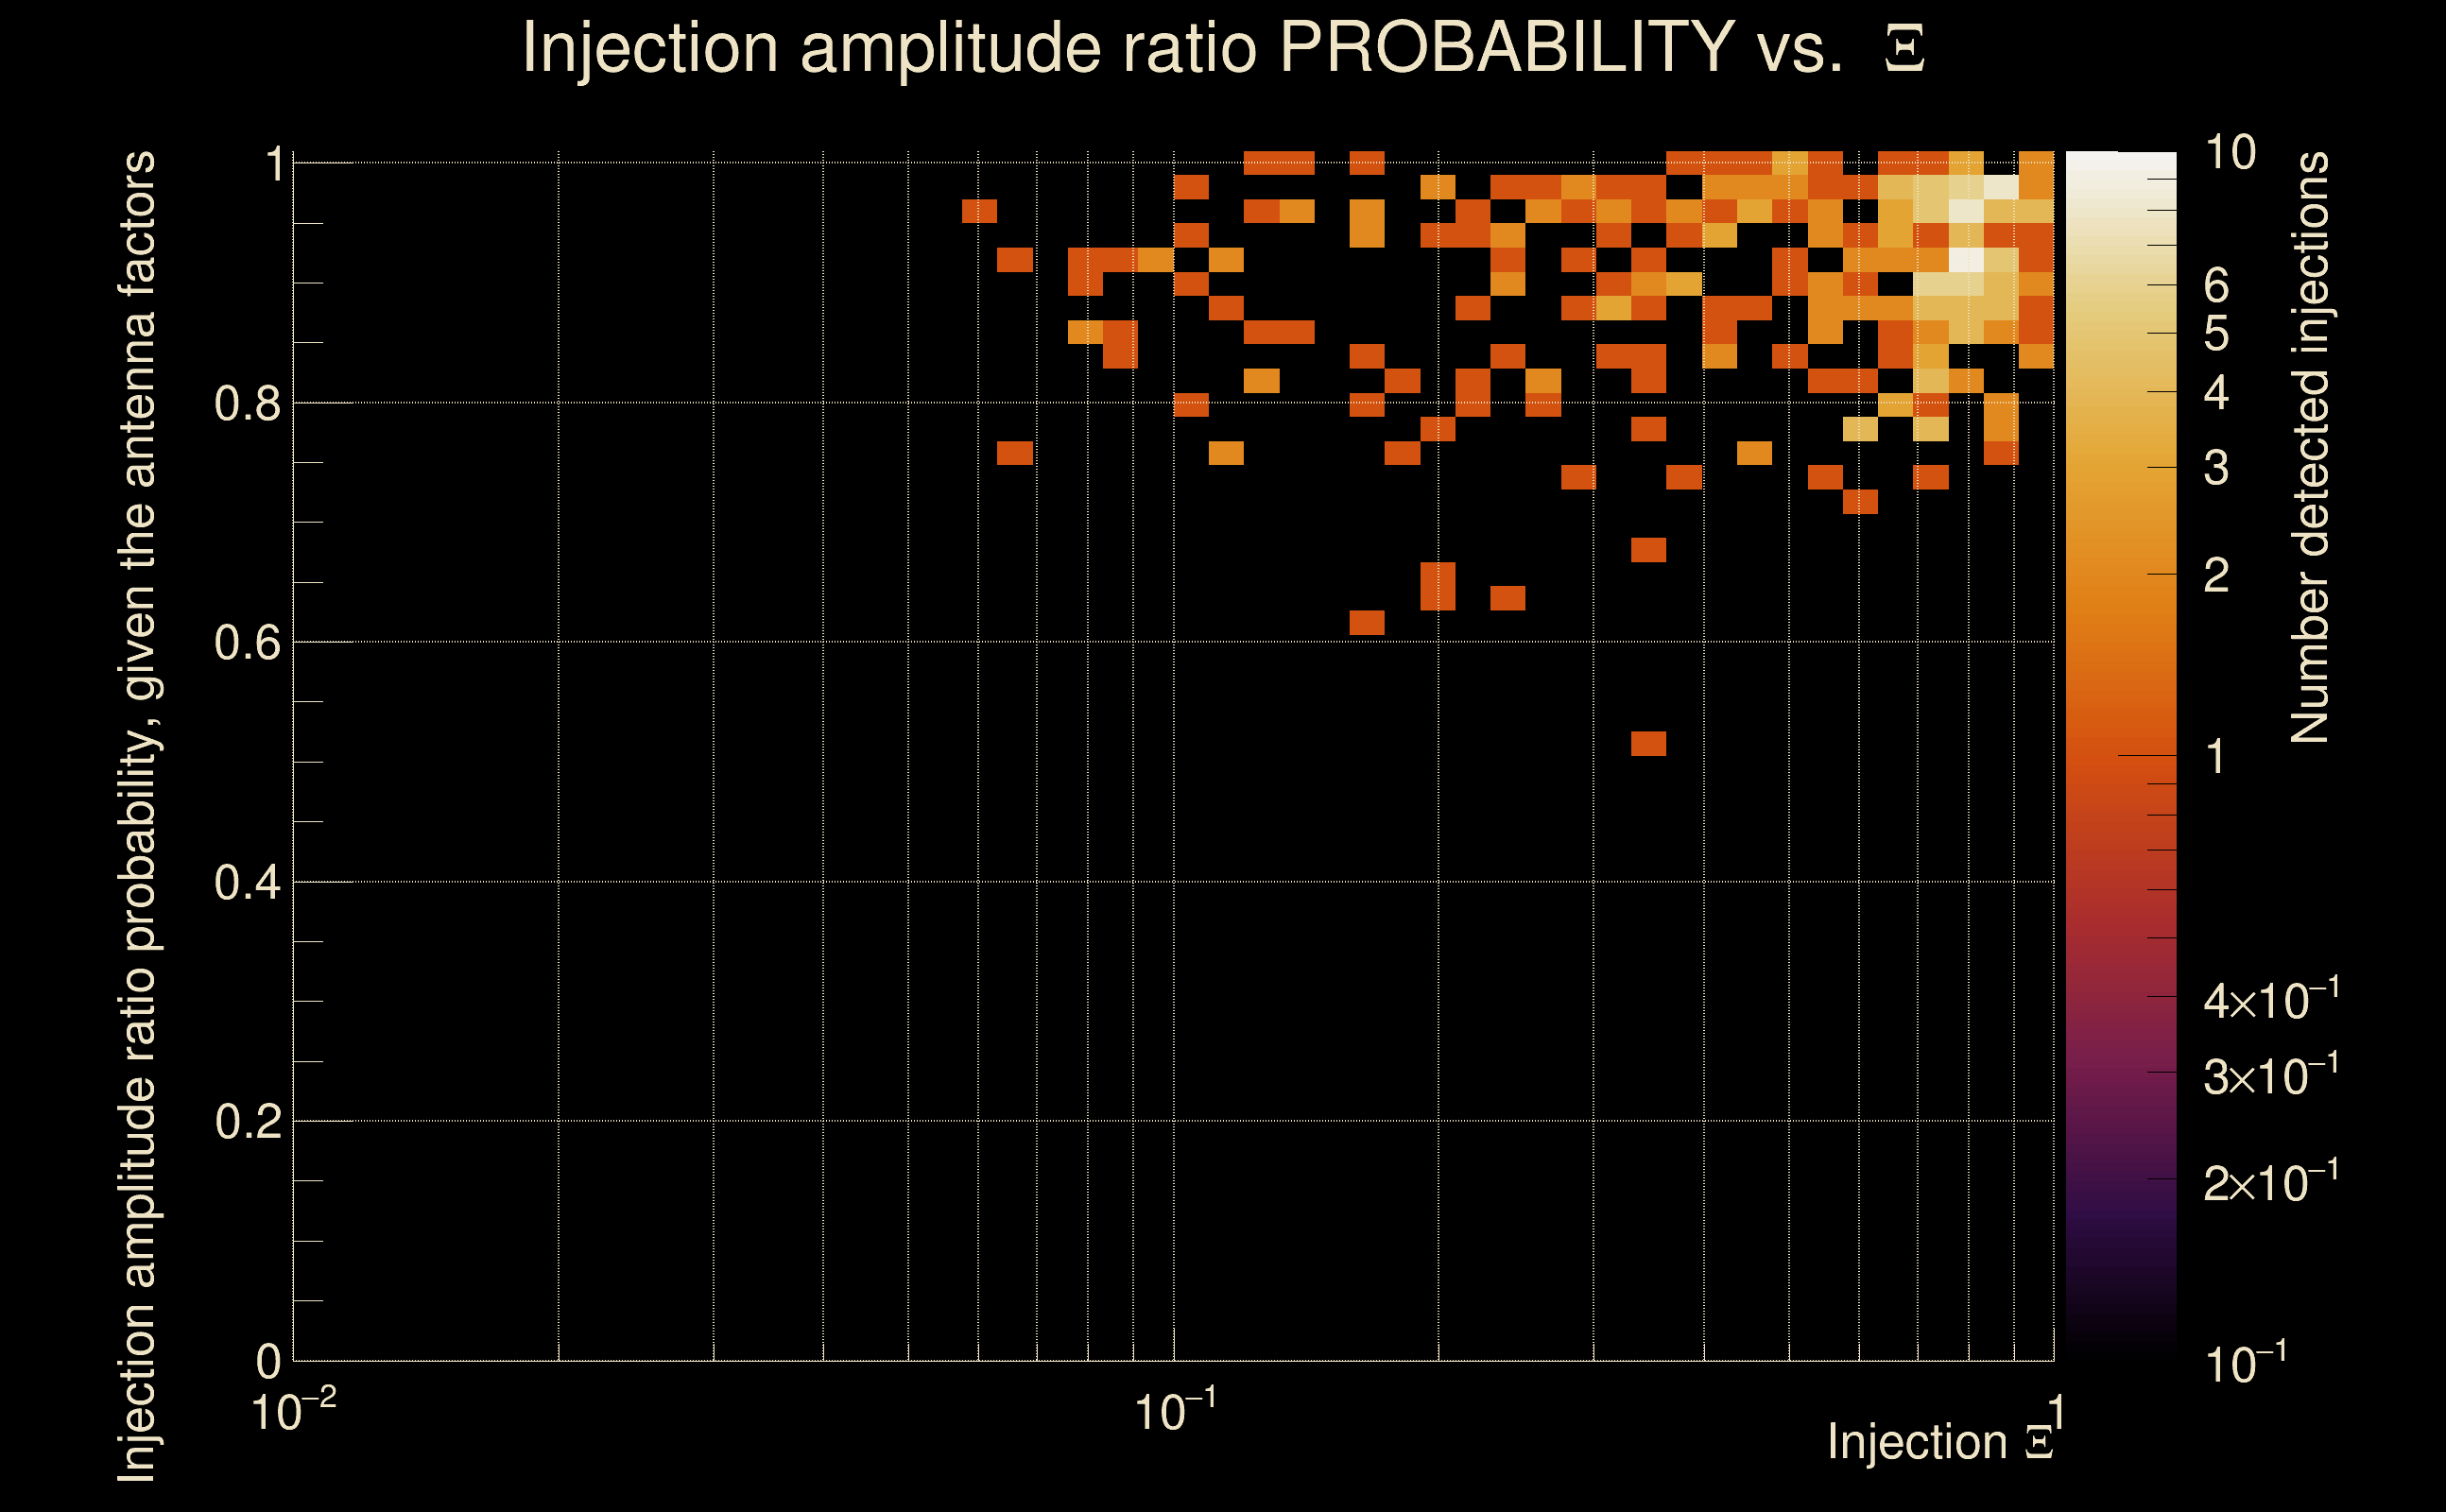
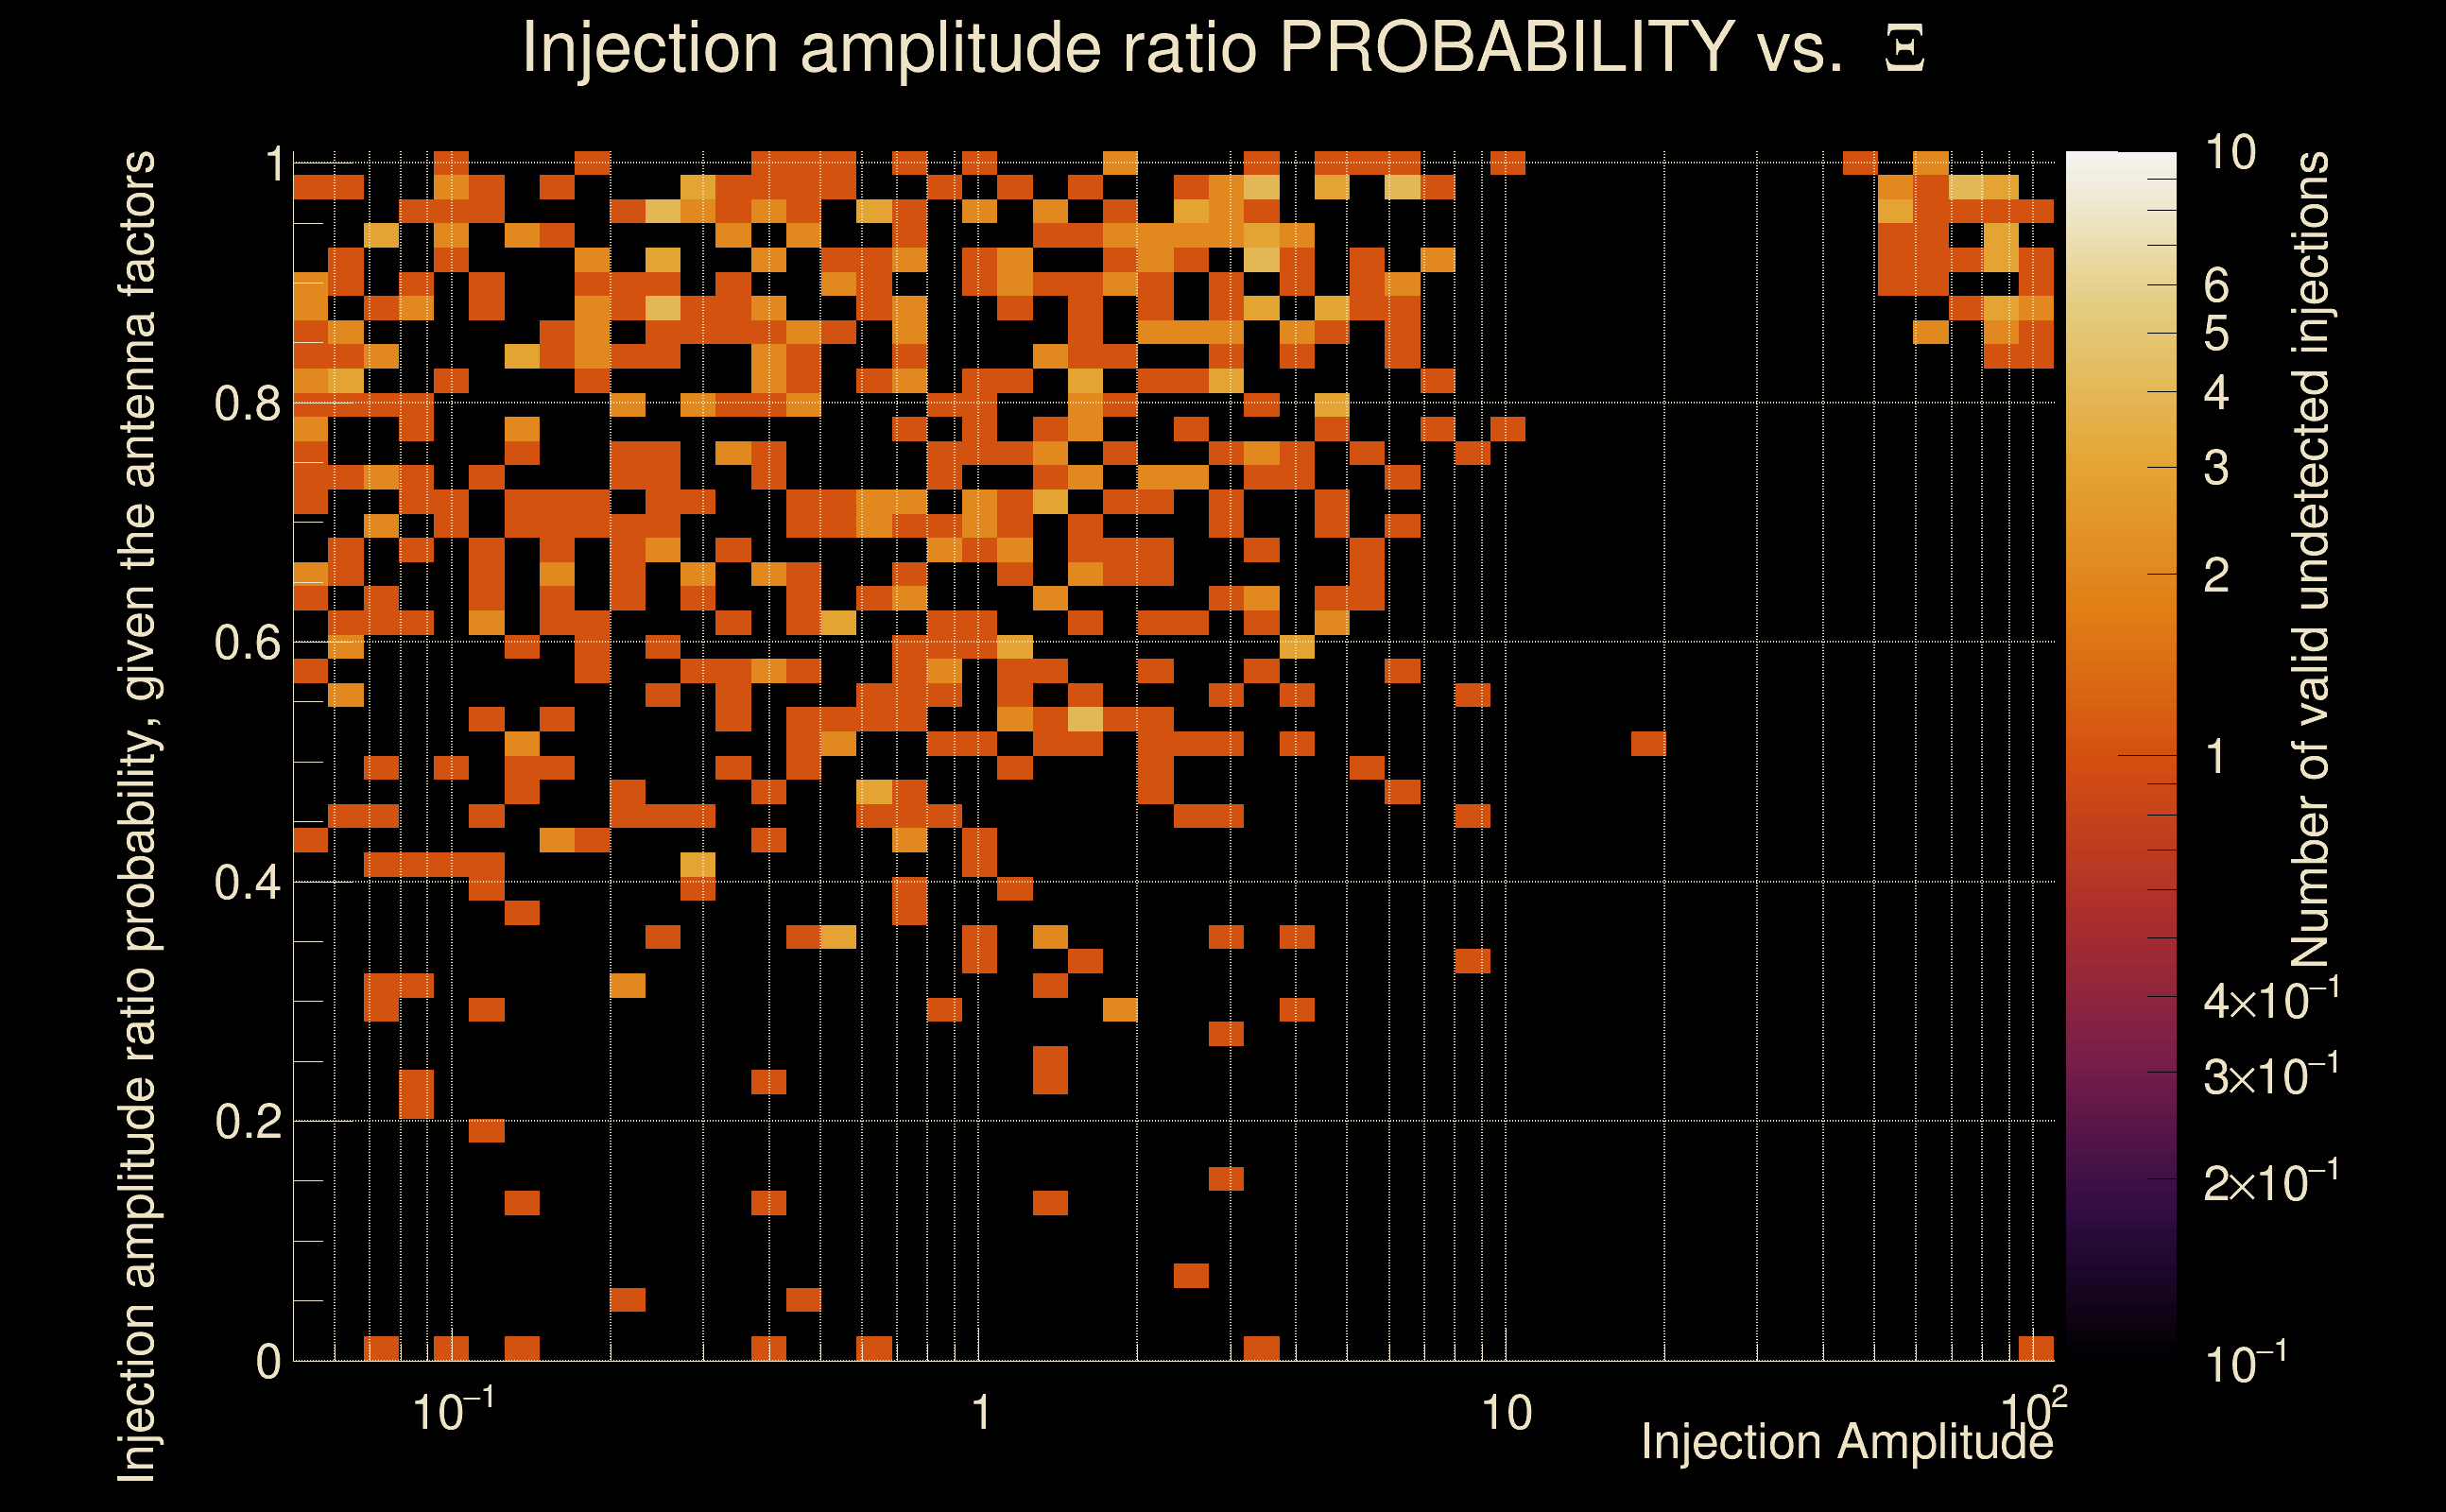
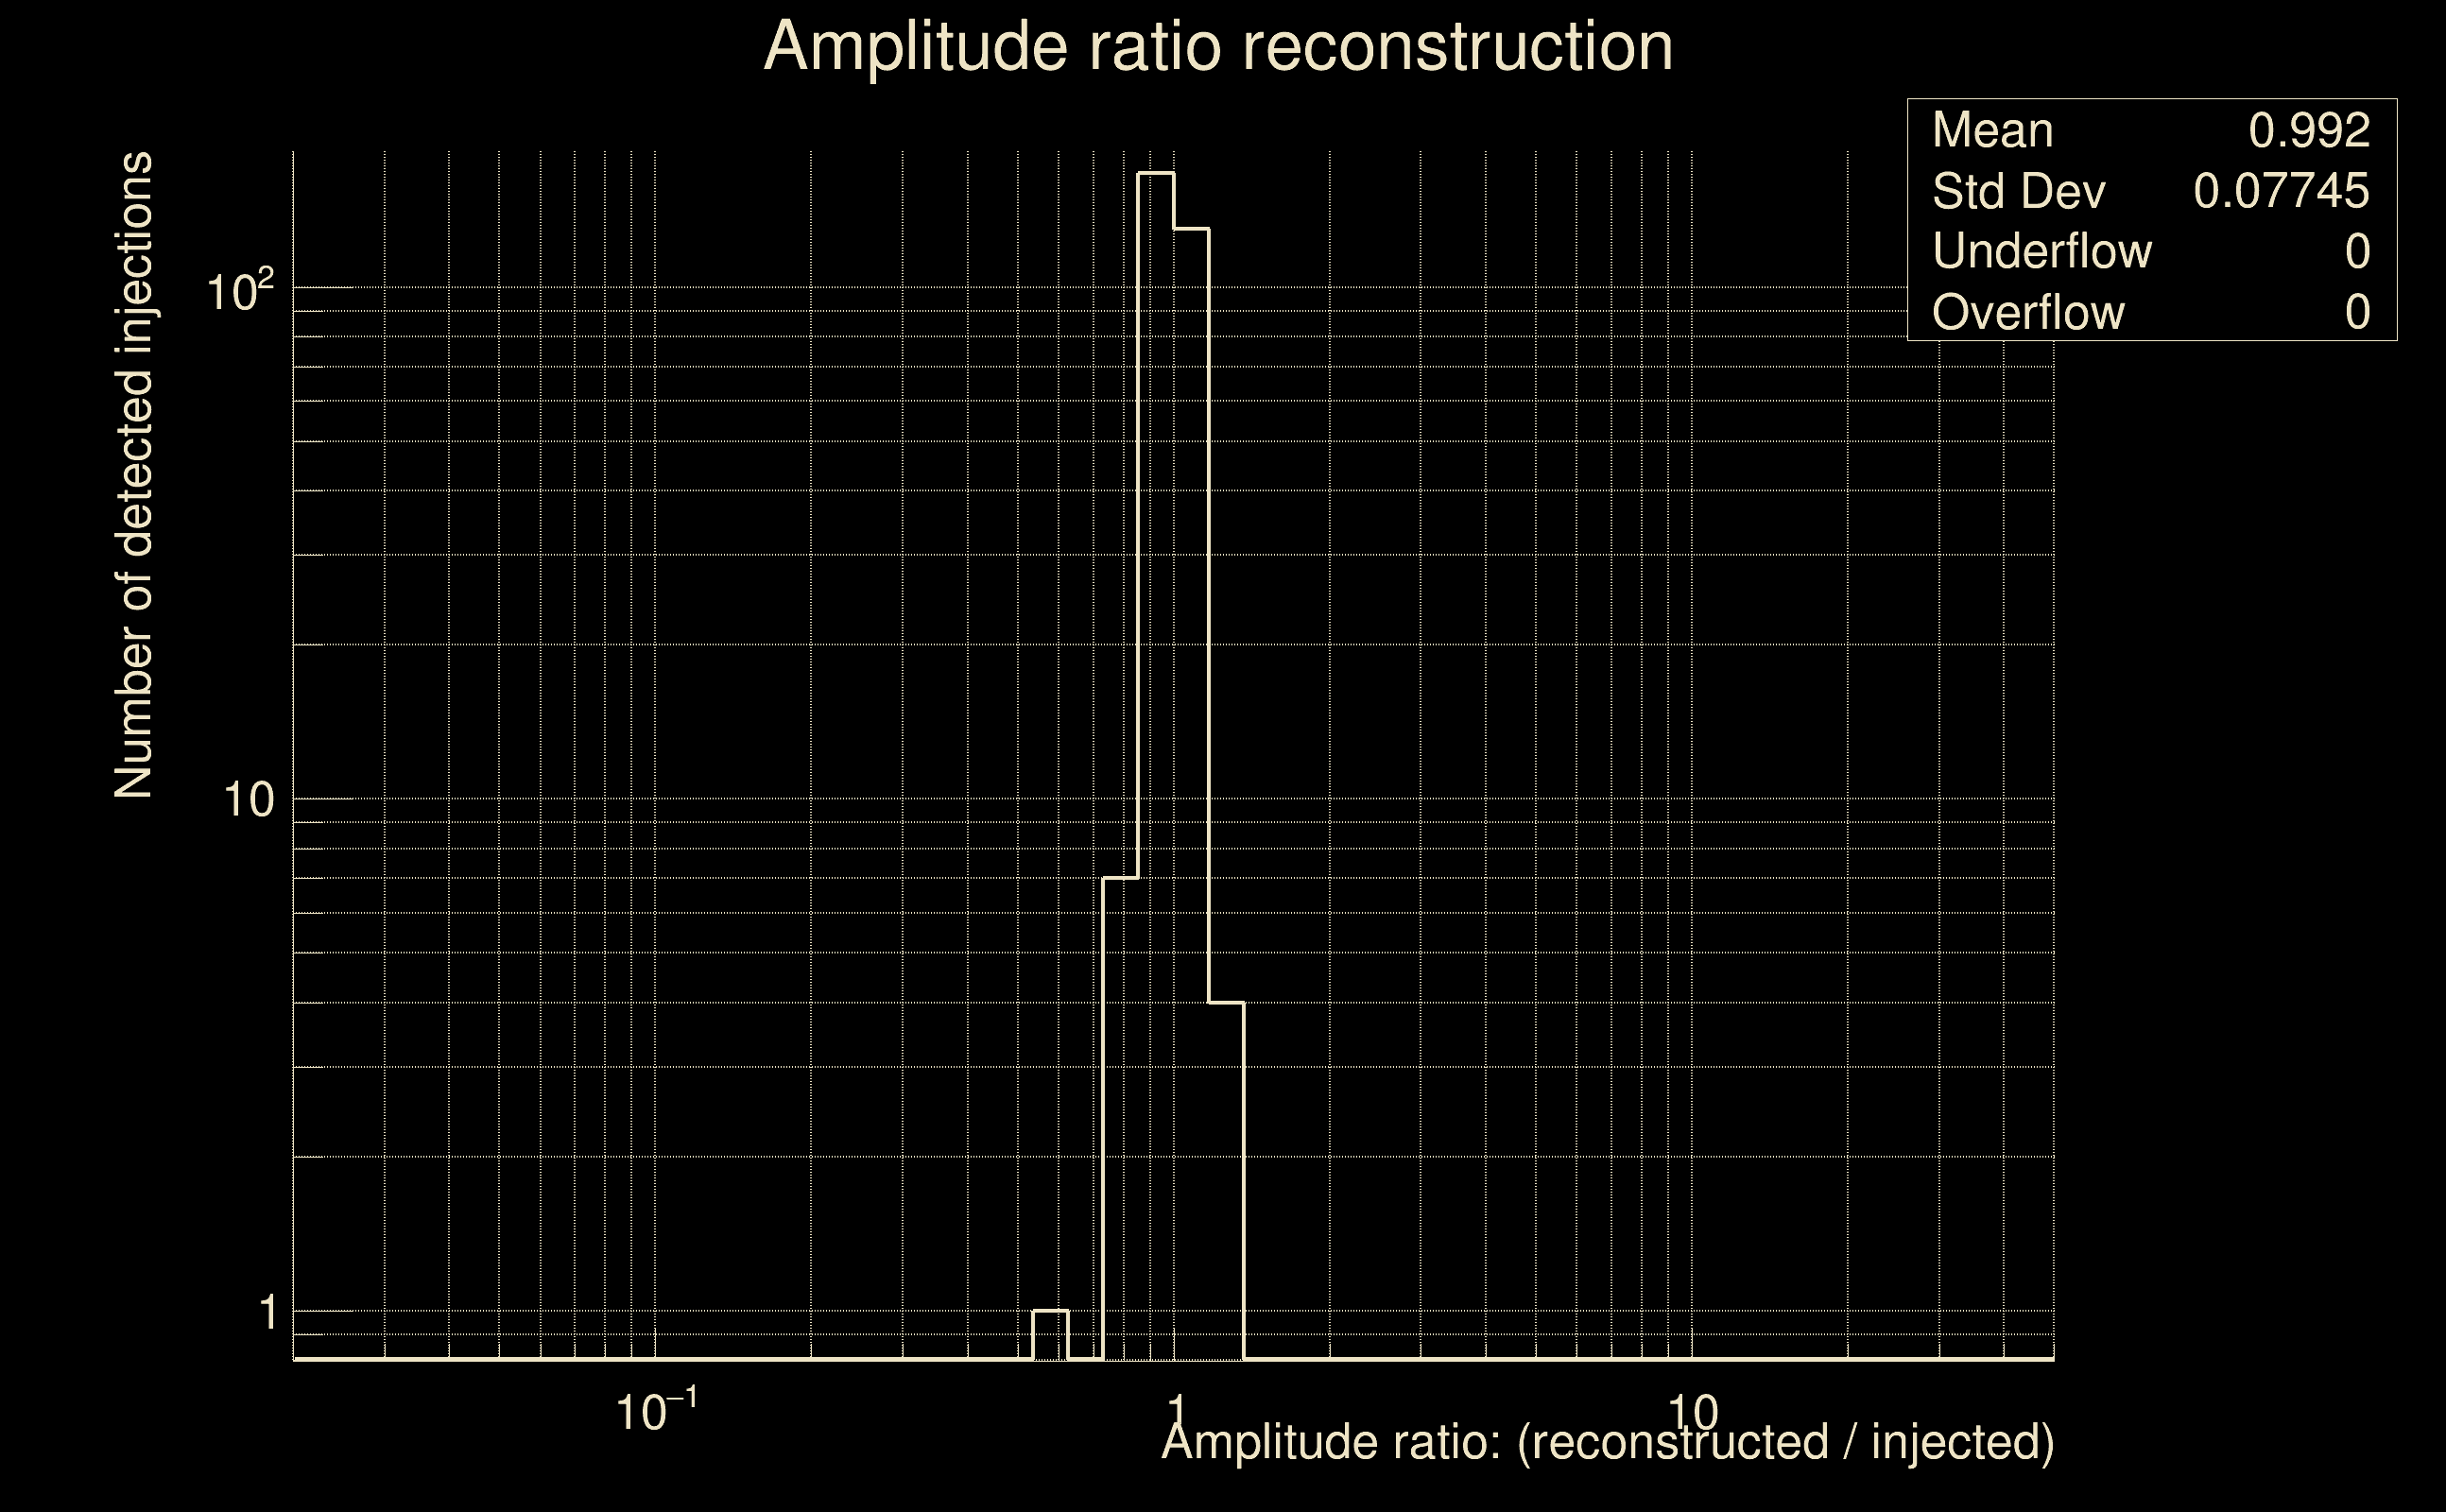
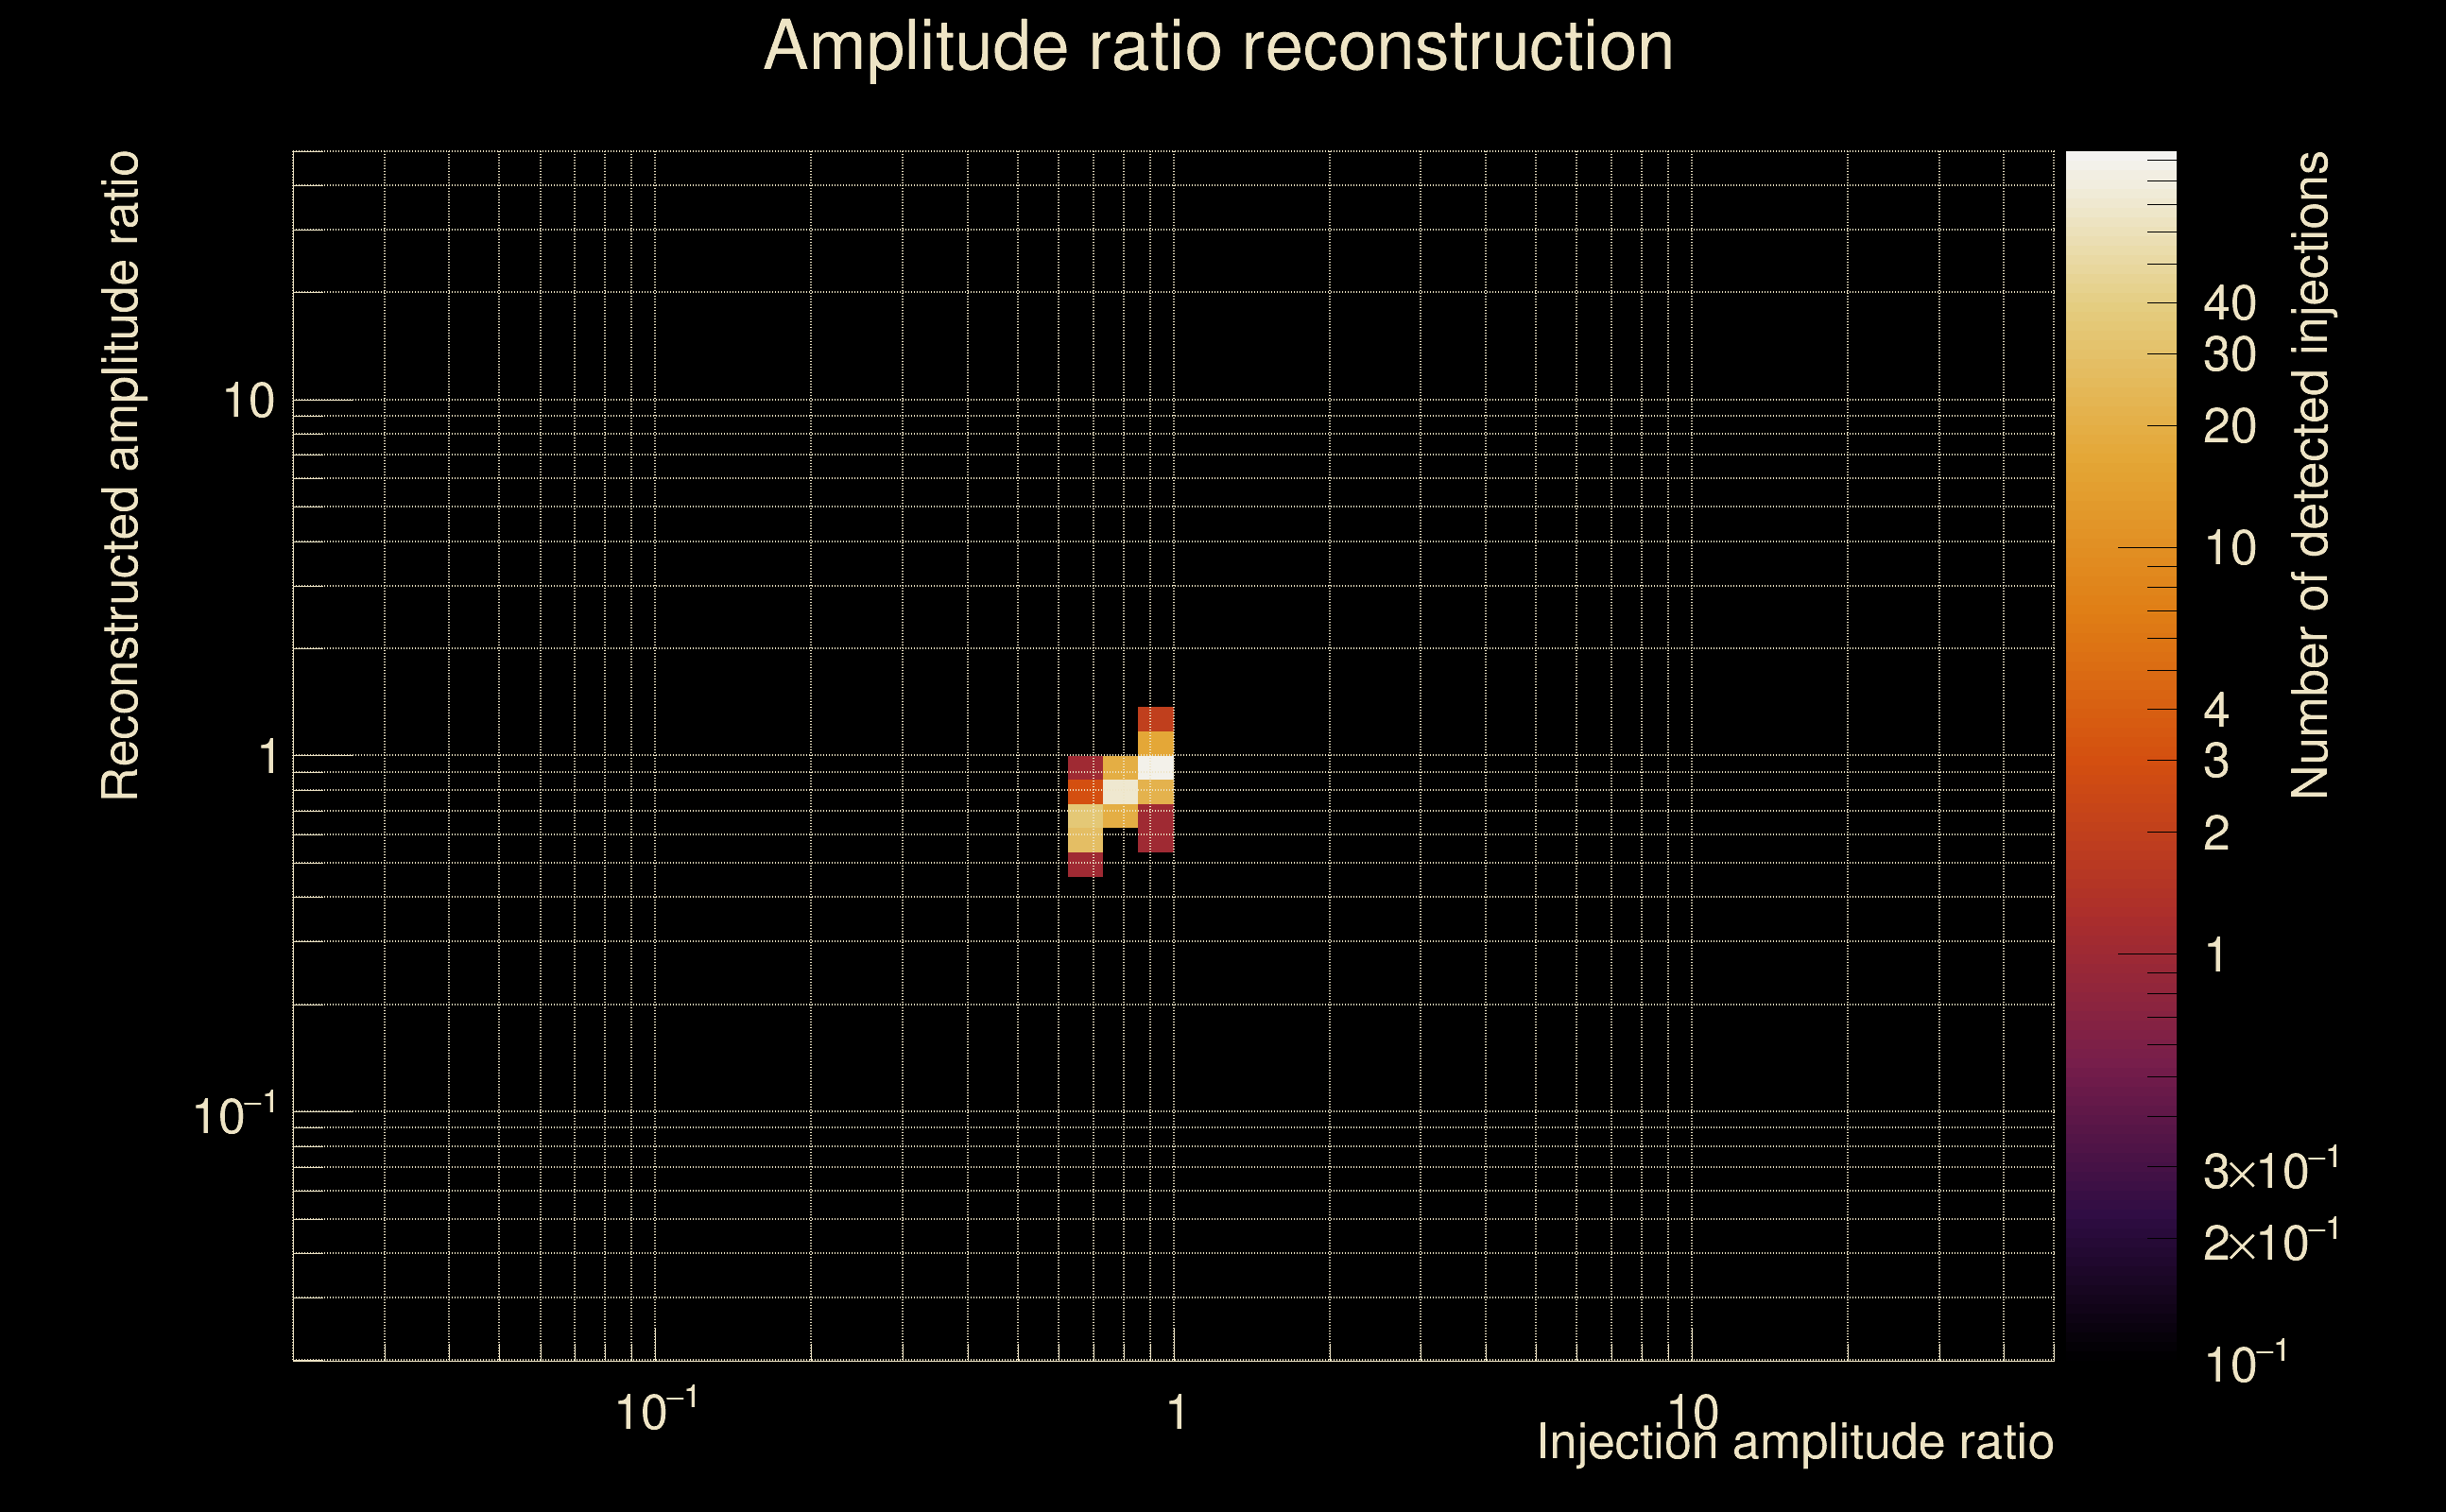
| Number of injections (total/valid/detected): | 1162 / 998 / 317 |
| List of missed injections: | ./Pan21-SR_missed.txt |
| Injection amplitude at 90% detection efficiency: | 2.11354 |
| Injection amplitude at 50% detection efficiency: | 1.23338 |
| Injection amplitude at 10% detection efficiency: | 0.487513 |
 |
 |
 |
 |
 |
 |
 |
|
 |
 |
|
 |
 |
|
 |
 |
|
 |
 |
|
 |
 |
|
 |
 |
|
 |
 |
|
 |
 |
 |
 |
 |
 |
 |
 |
 |
 |
 |
 |
 |
 |
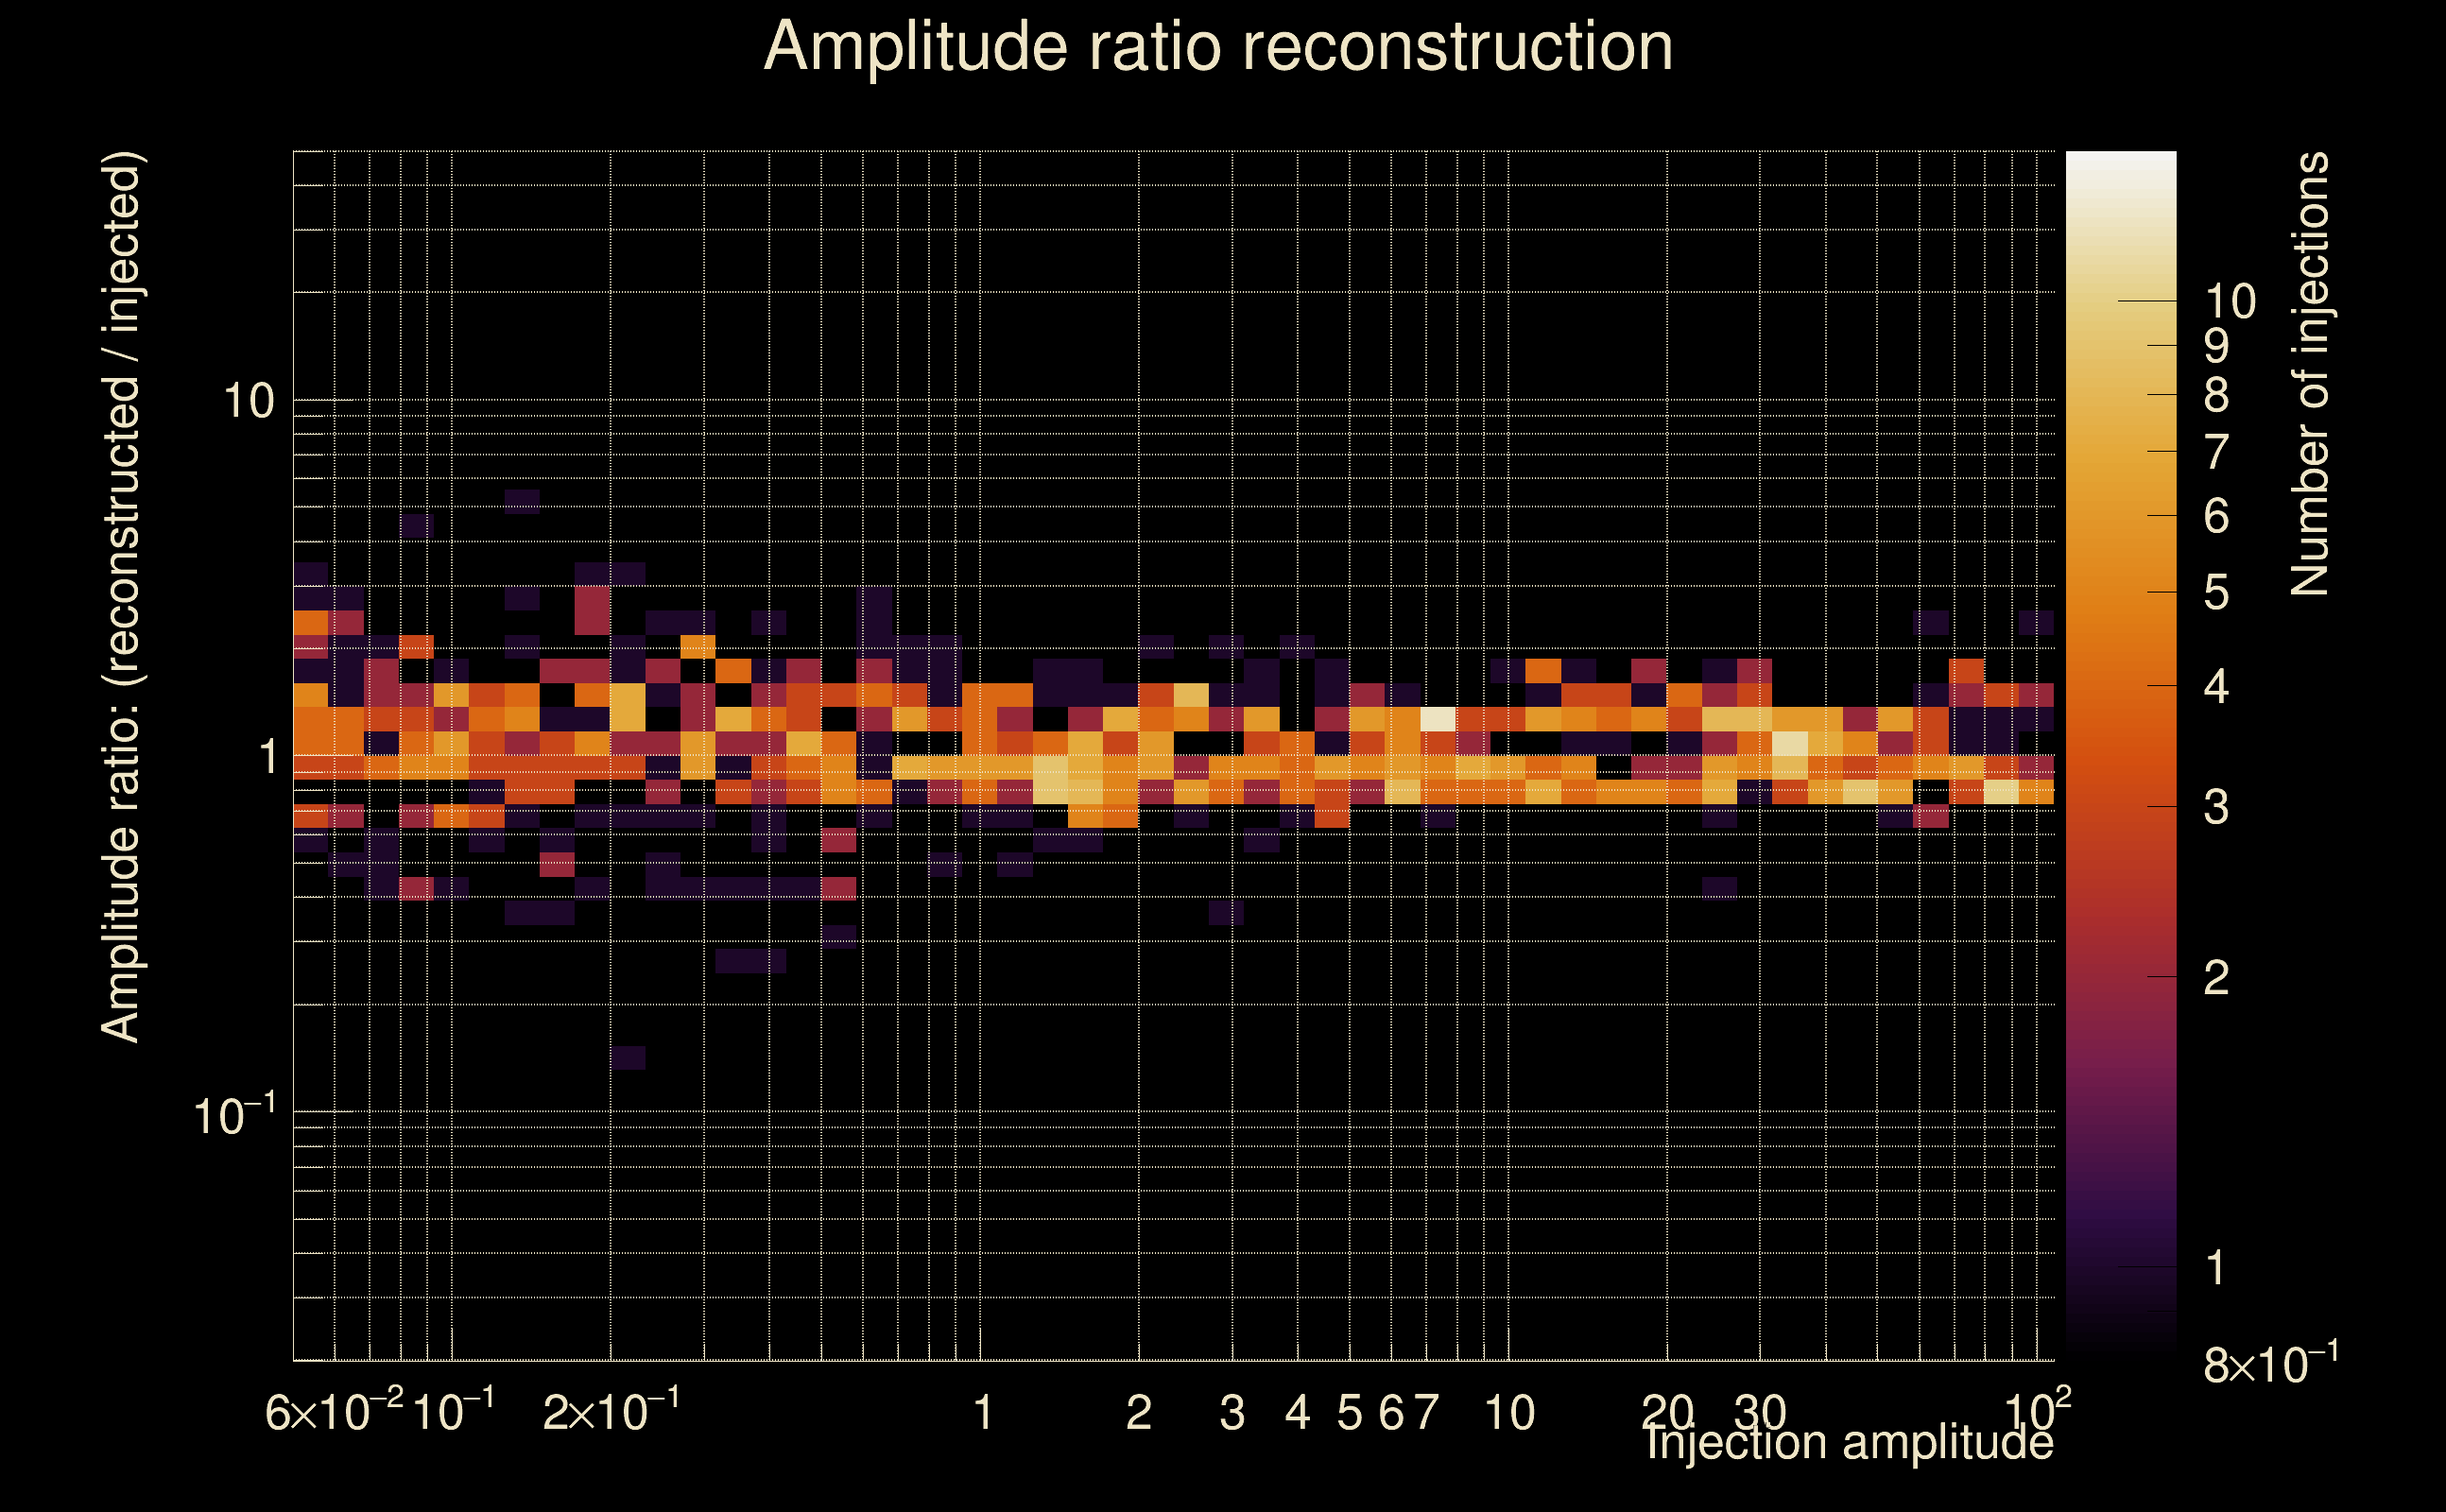 |
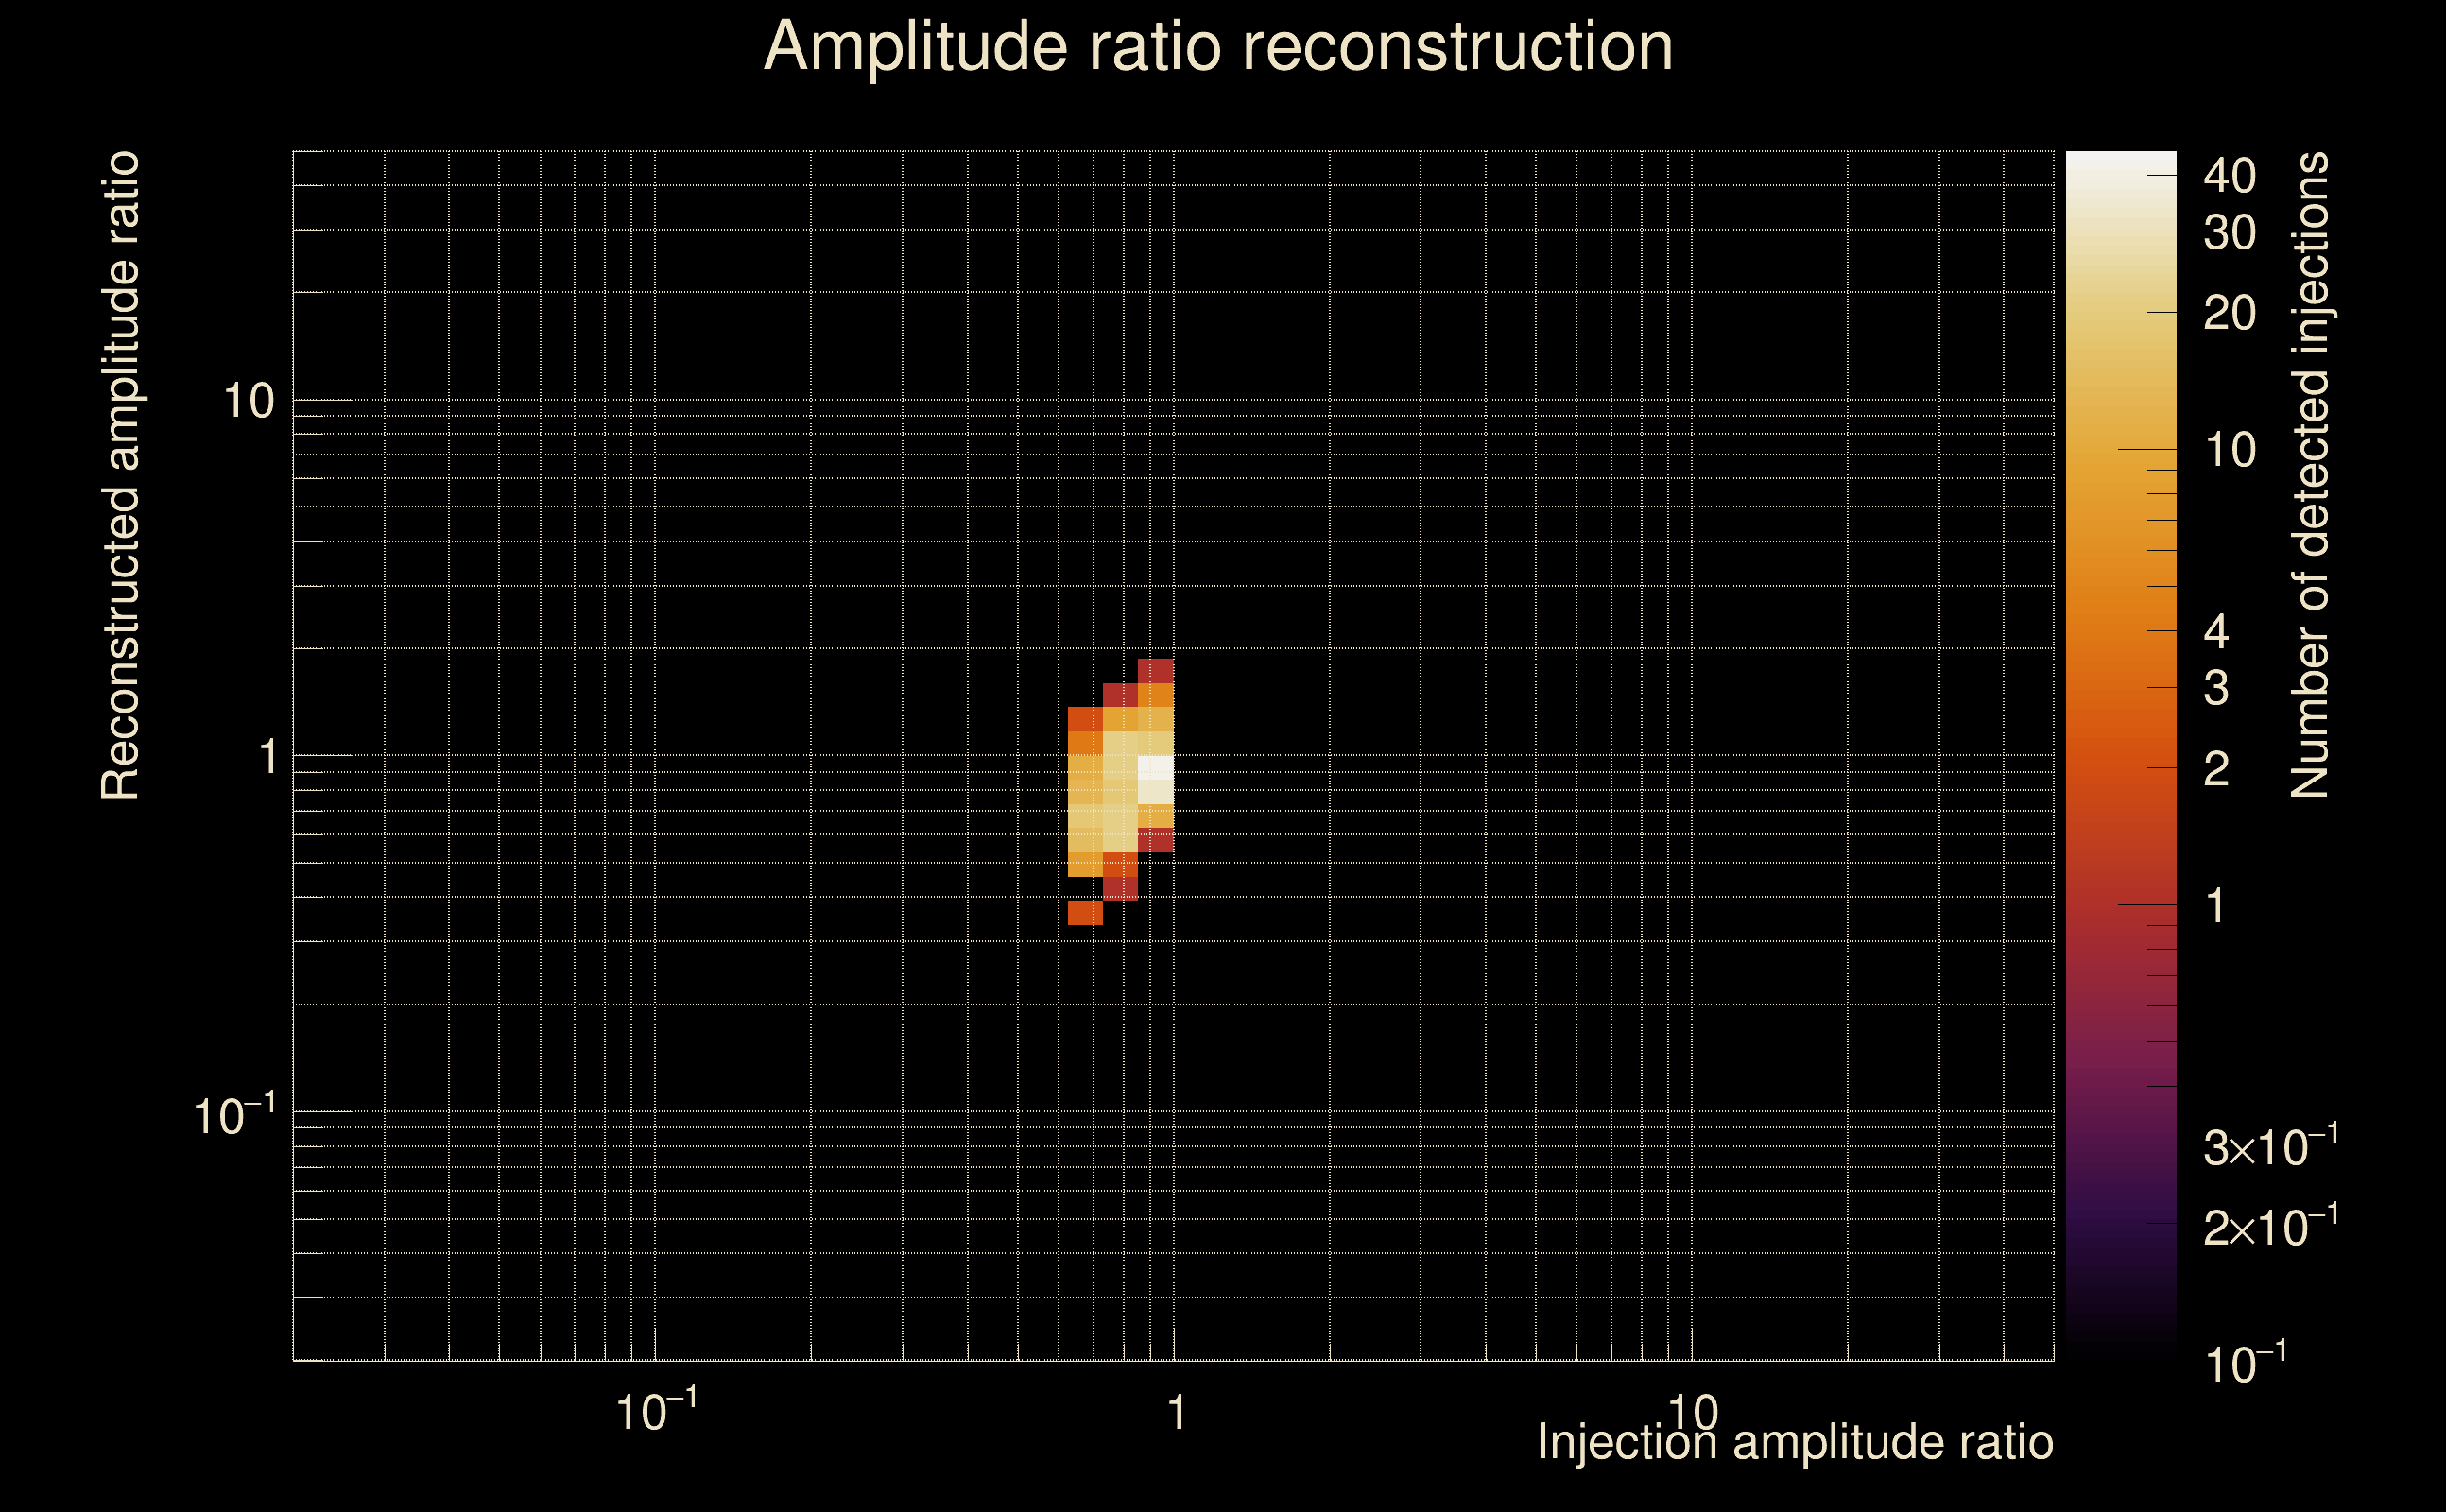
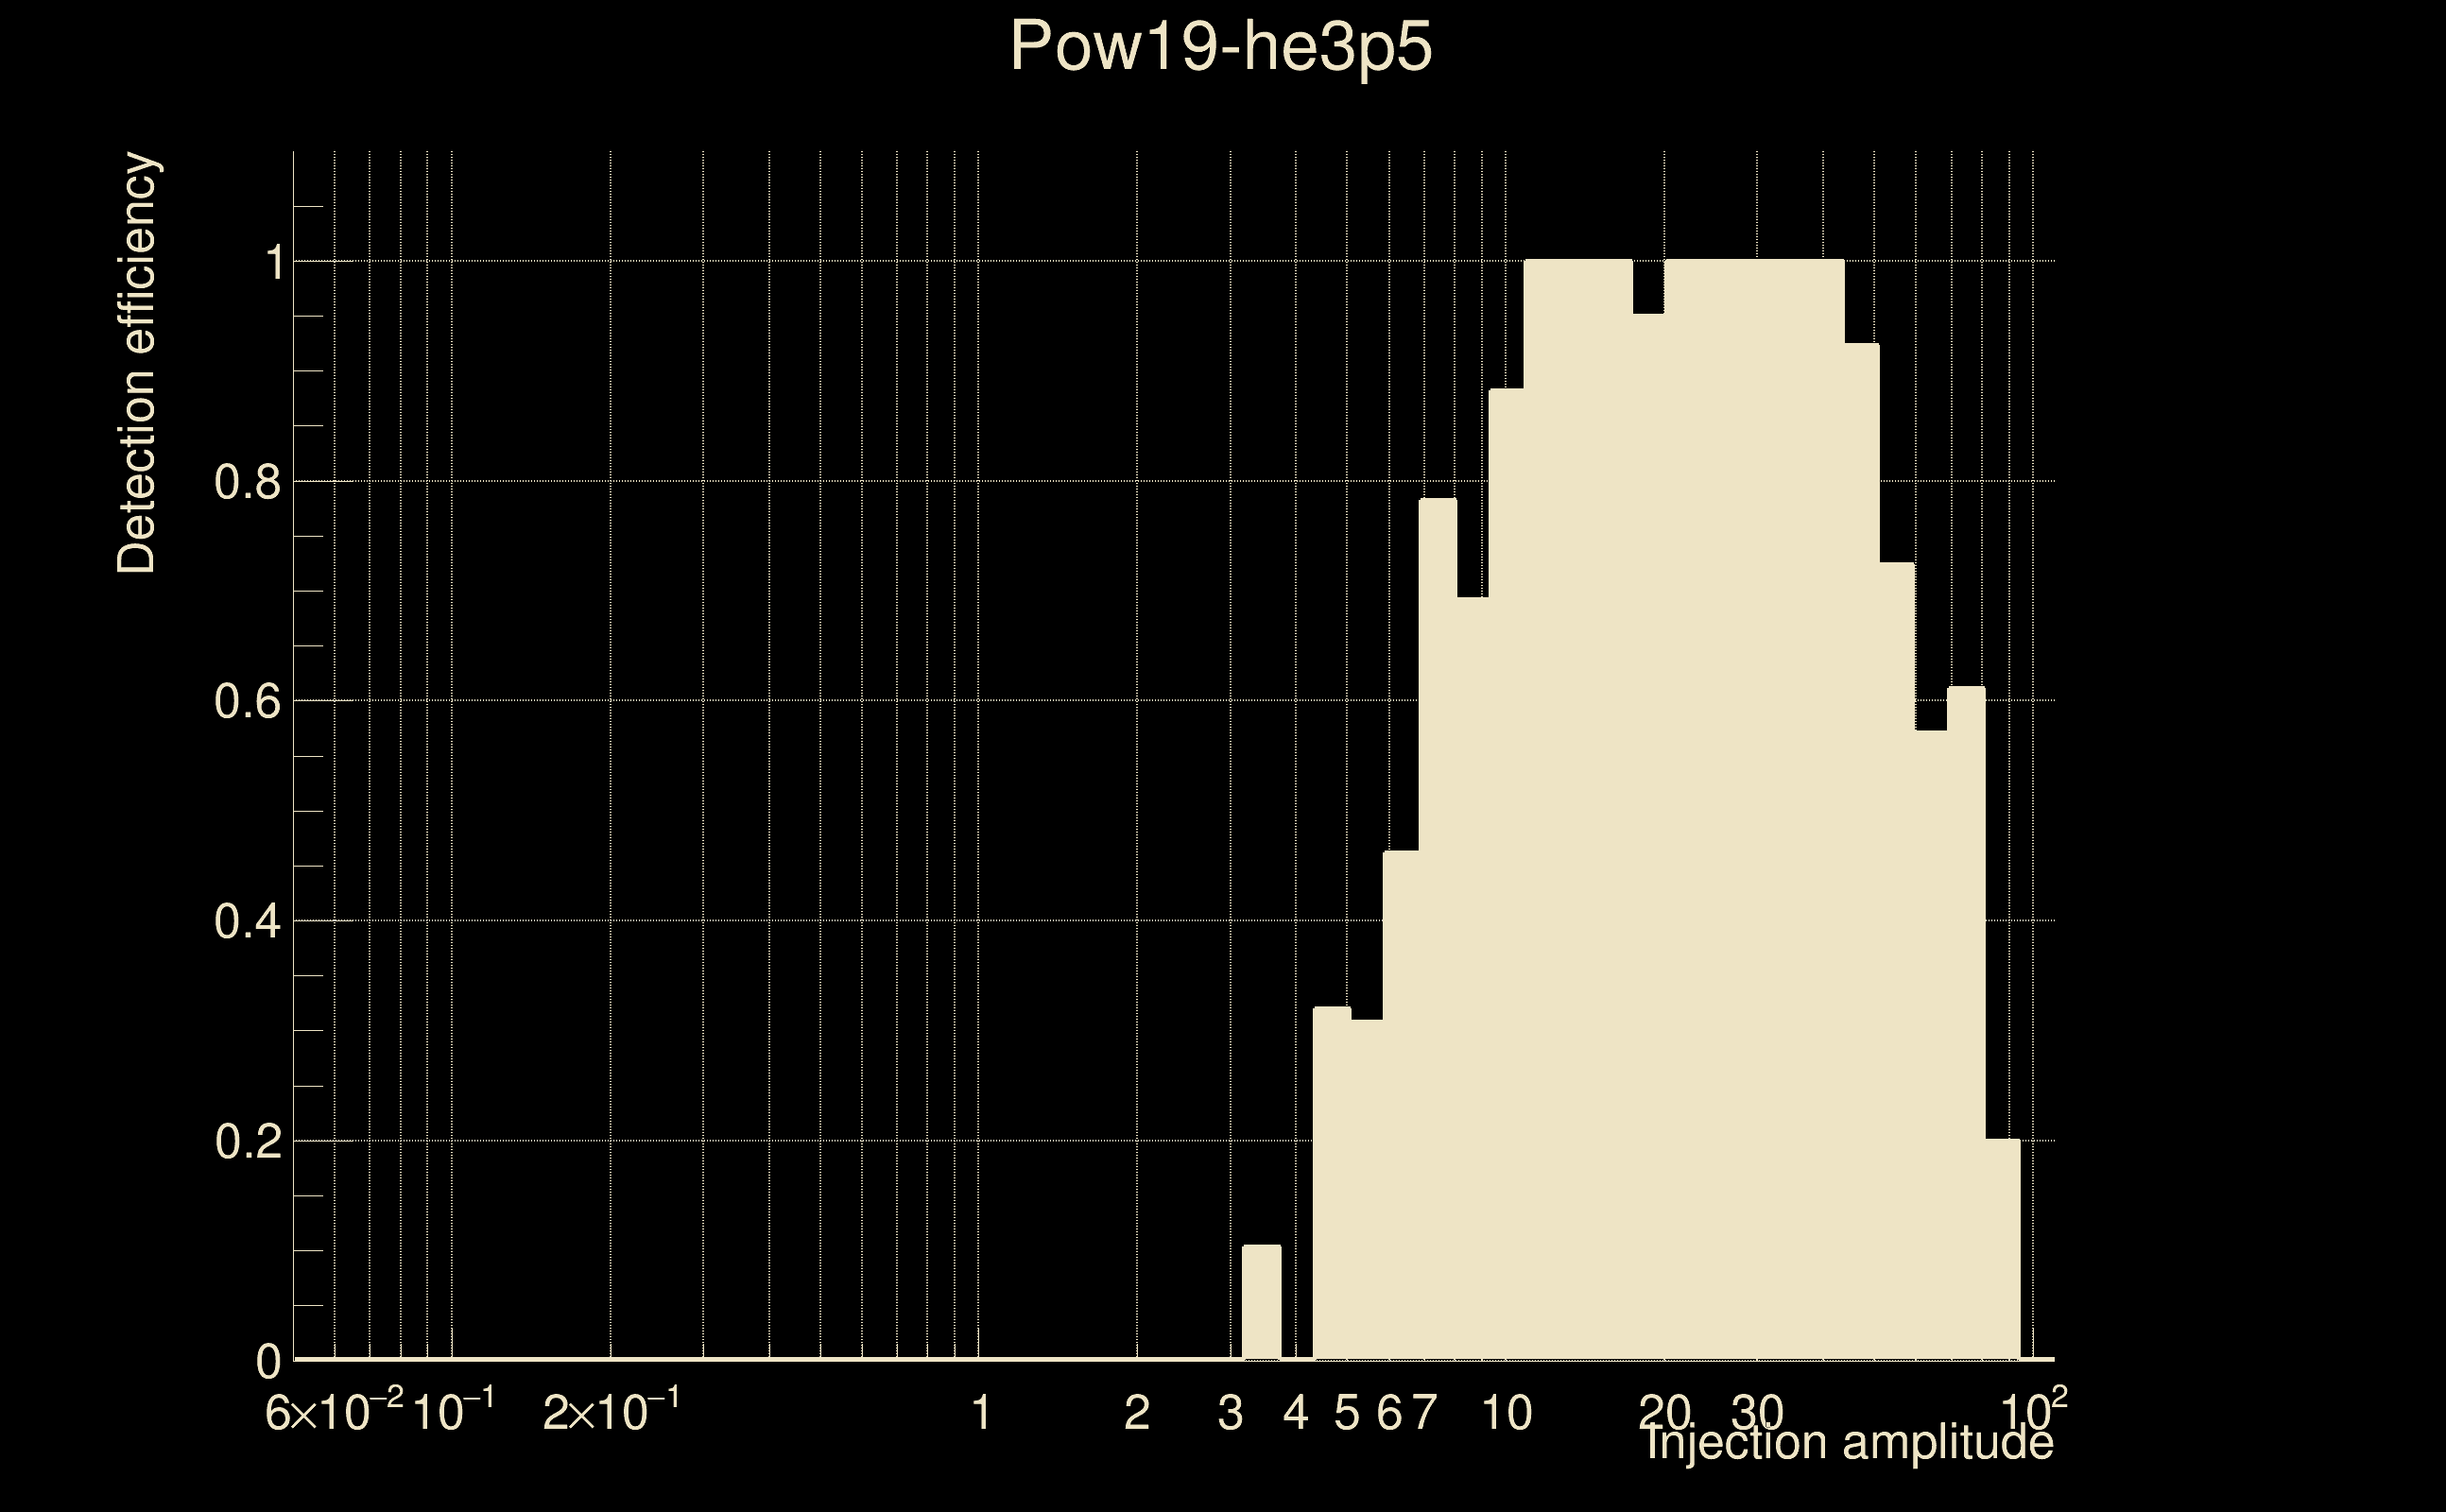
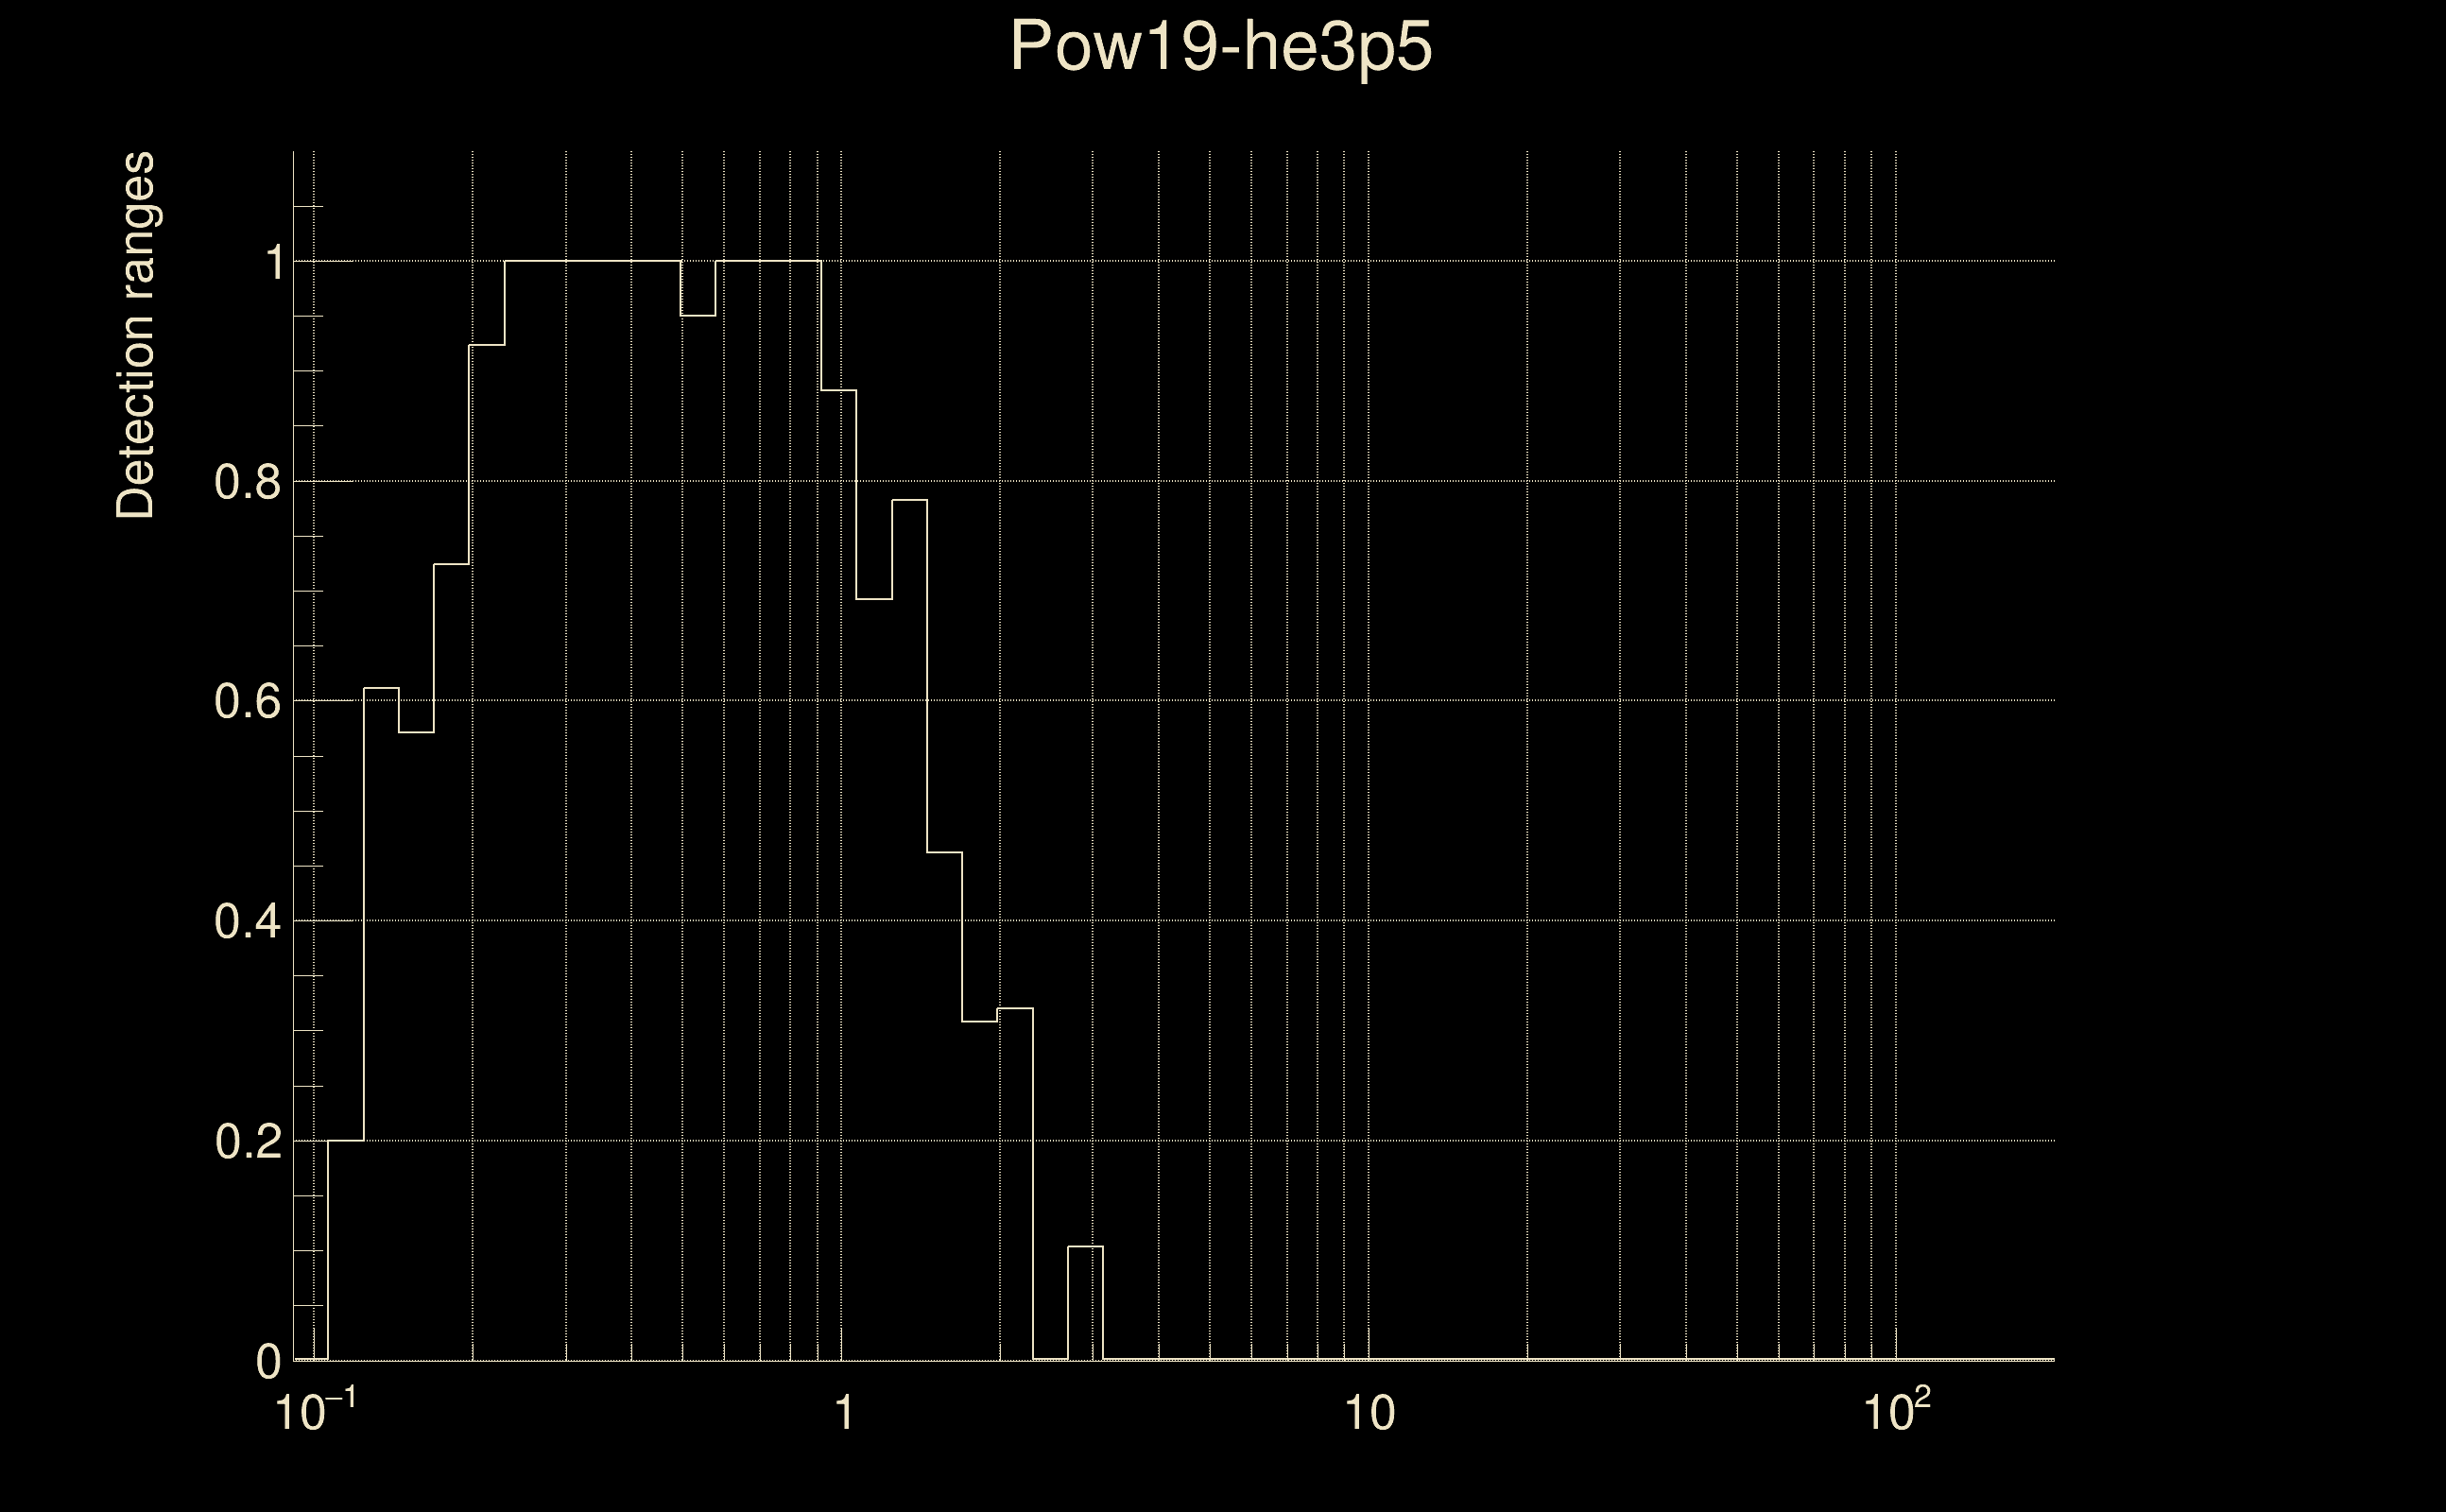
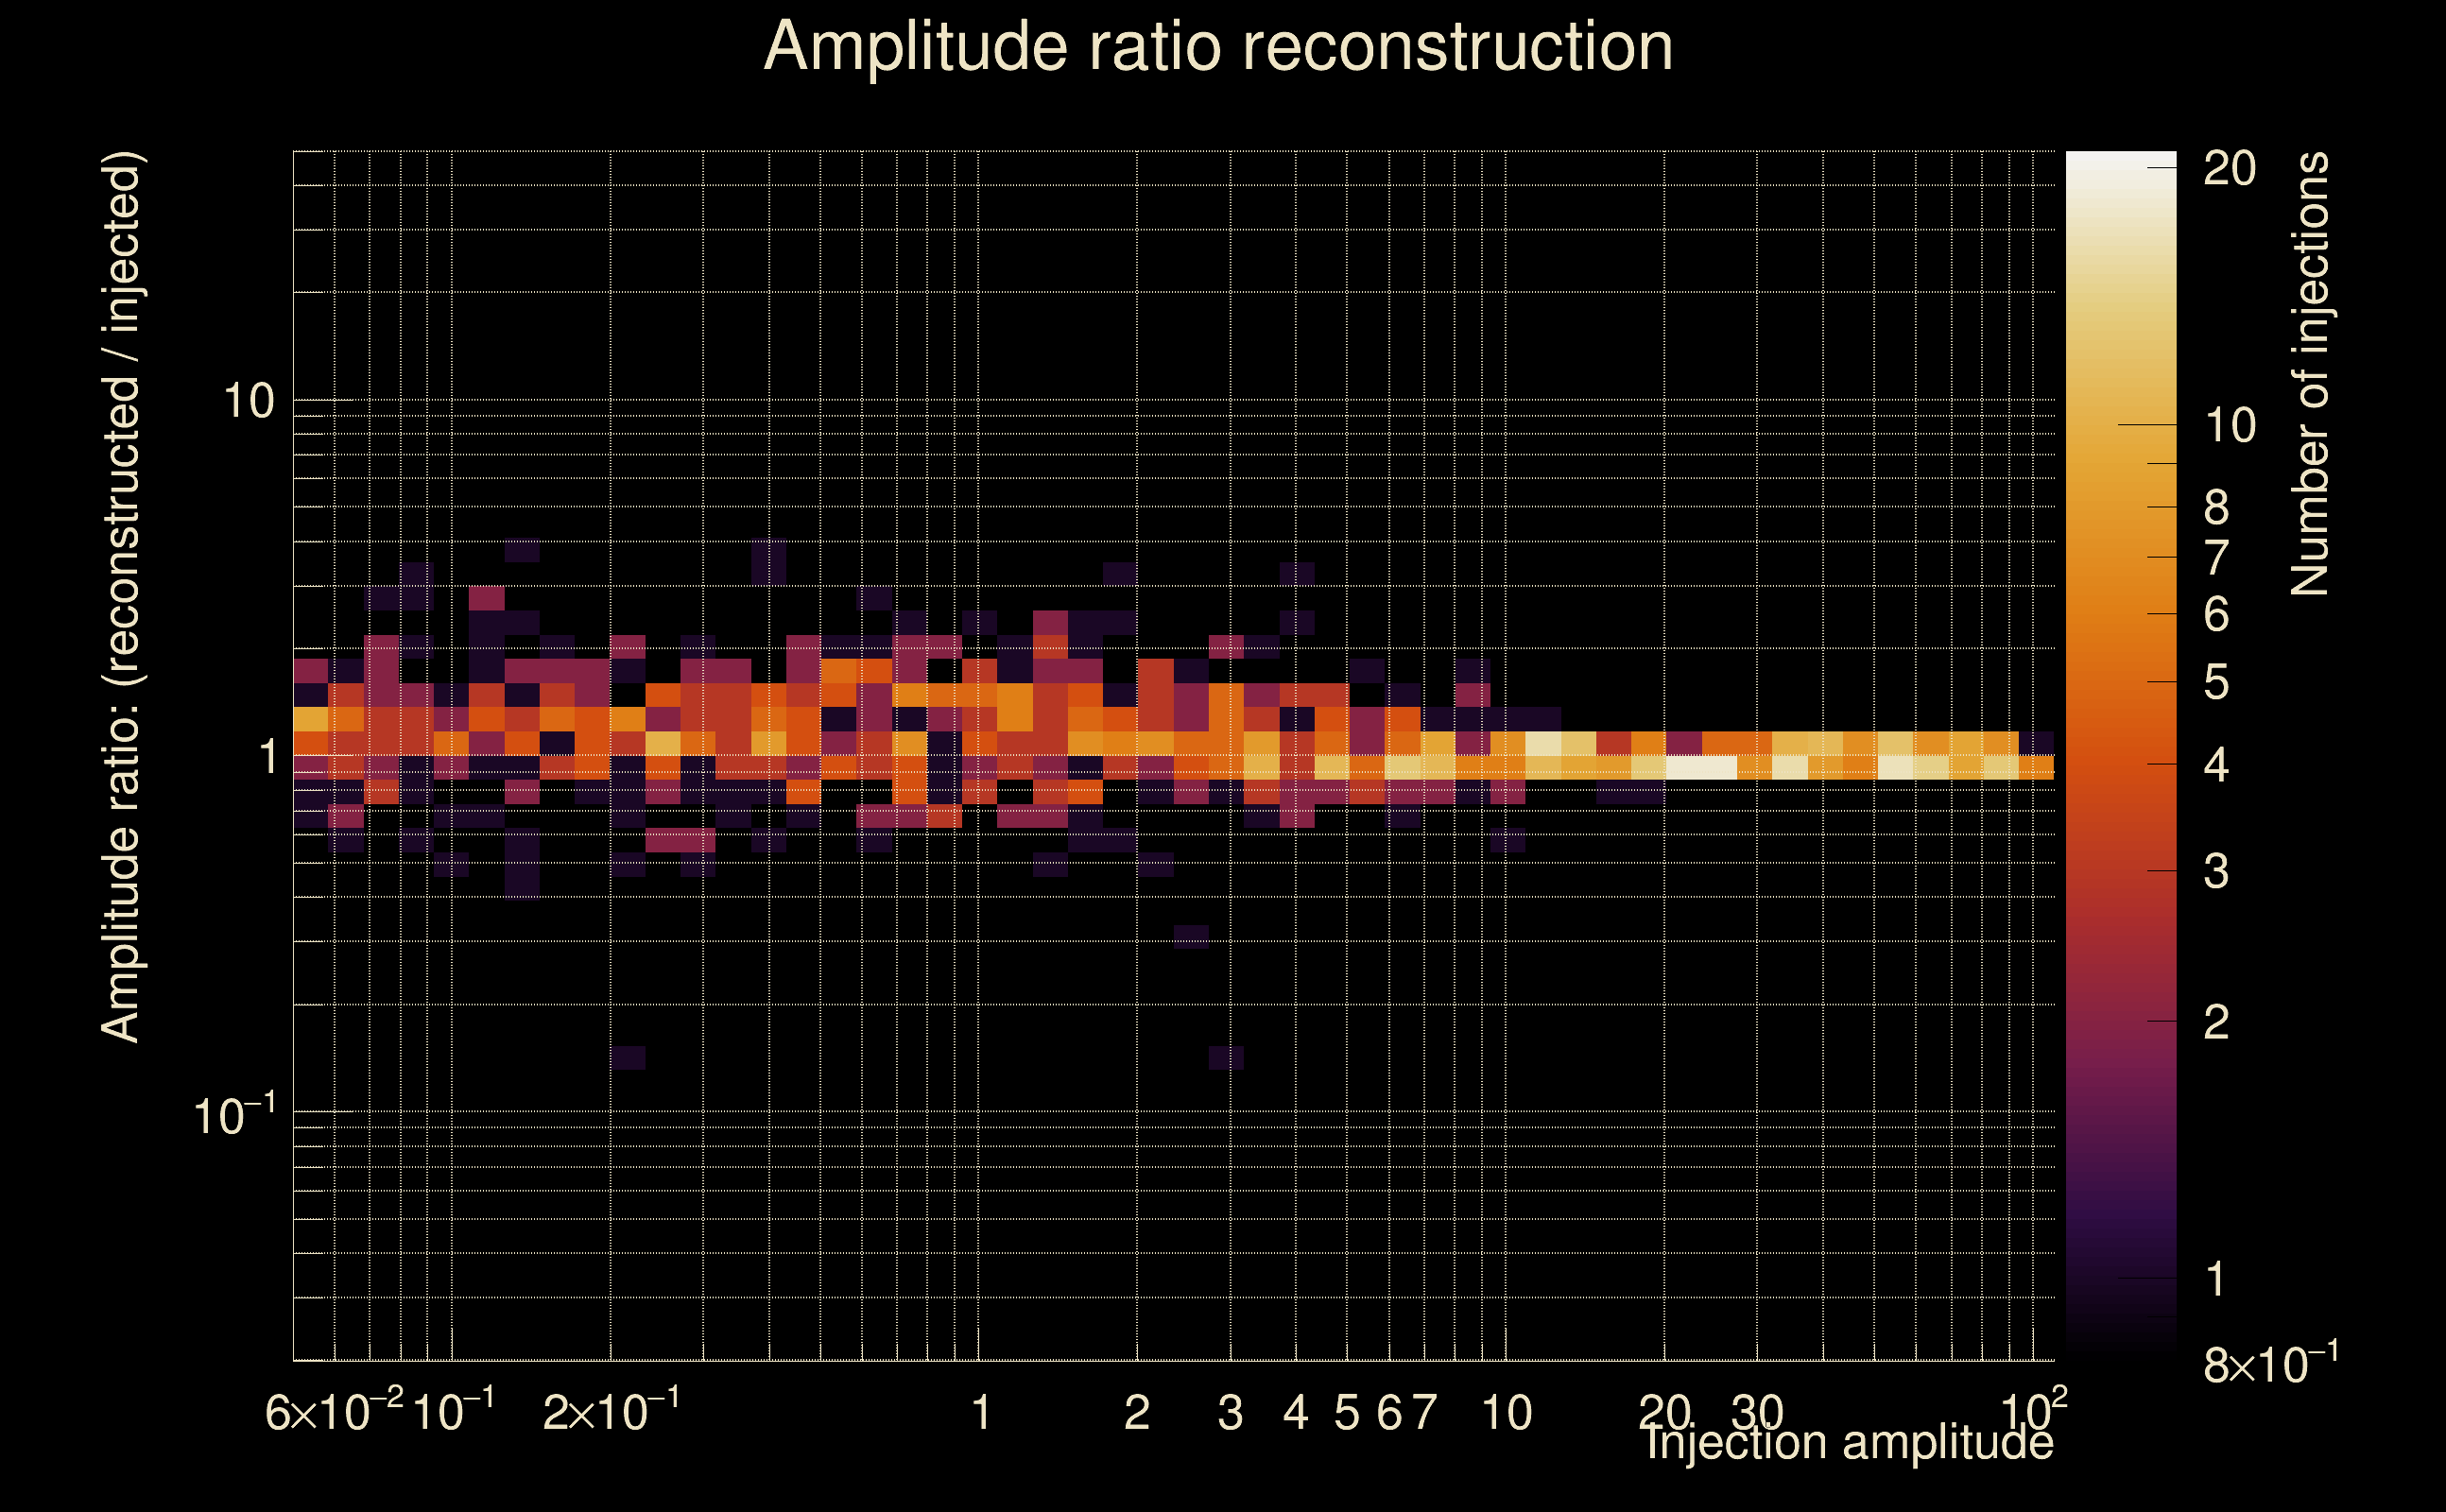
| Number of injections (total/valid/detected): | 1116 / 978 / 309 |
| List of missed injections: | ./Pow19-he3p5_missed.txt |
| Injection amplitude at 90% detection efficiency: | 10.3566 |
| Injection amplitude at 50% detection efficiency: | 6.49591 |
| Injection amplitude at 10% detection efficiency: | 4.22313 |
 |
 |
 |
 |
 |
 |
 |
|
 |
 |
|
 |
 |
|
 |
 |
|
 |
 |
|
 |
 |
|
 |
 |
|
 |
 |
|
 |
 |
 |
 |
 |
 |
 |
 |
 |
 |
 |
 |
 |
 |
 |
| florent.robinet@ijclab.in2p3.fr |