| Omicron version: | 4.2.0: documentation gitlab repository |
| Omicron run by: | unknown |
| Report produced on: | Tue Feb 24 09:10:37 2026 UTC |
| Ox option file: | TargIxf_feb2026_SN5_30s_depolarized_options.txt |
| Omicron option files: | detector 0, detector 1 |
| Detector channel names: | H1:GDS-CALIB_STRAIN_CLEAN_AR_4096Hz, L1:GDS-CALIB_STRAIN_CLEAN_AR_4096Hz |
| Omicron analysis time window and overlap: | 16 s, 6 s |
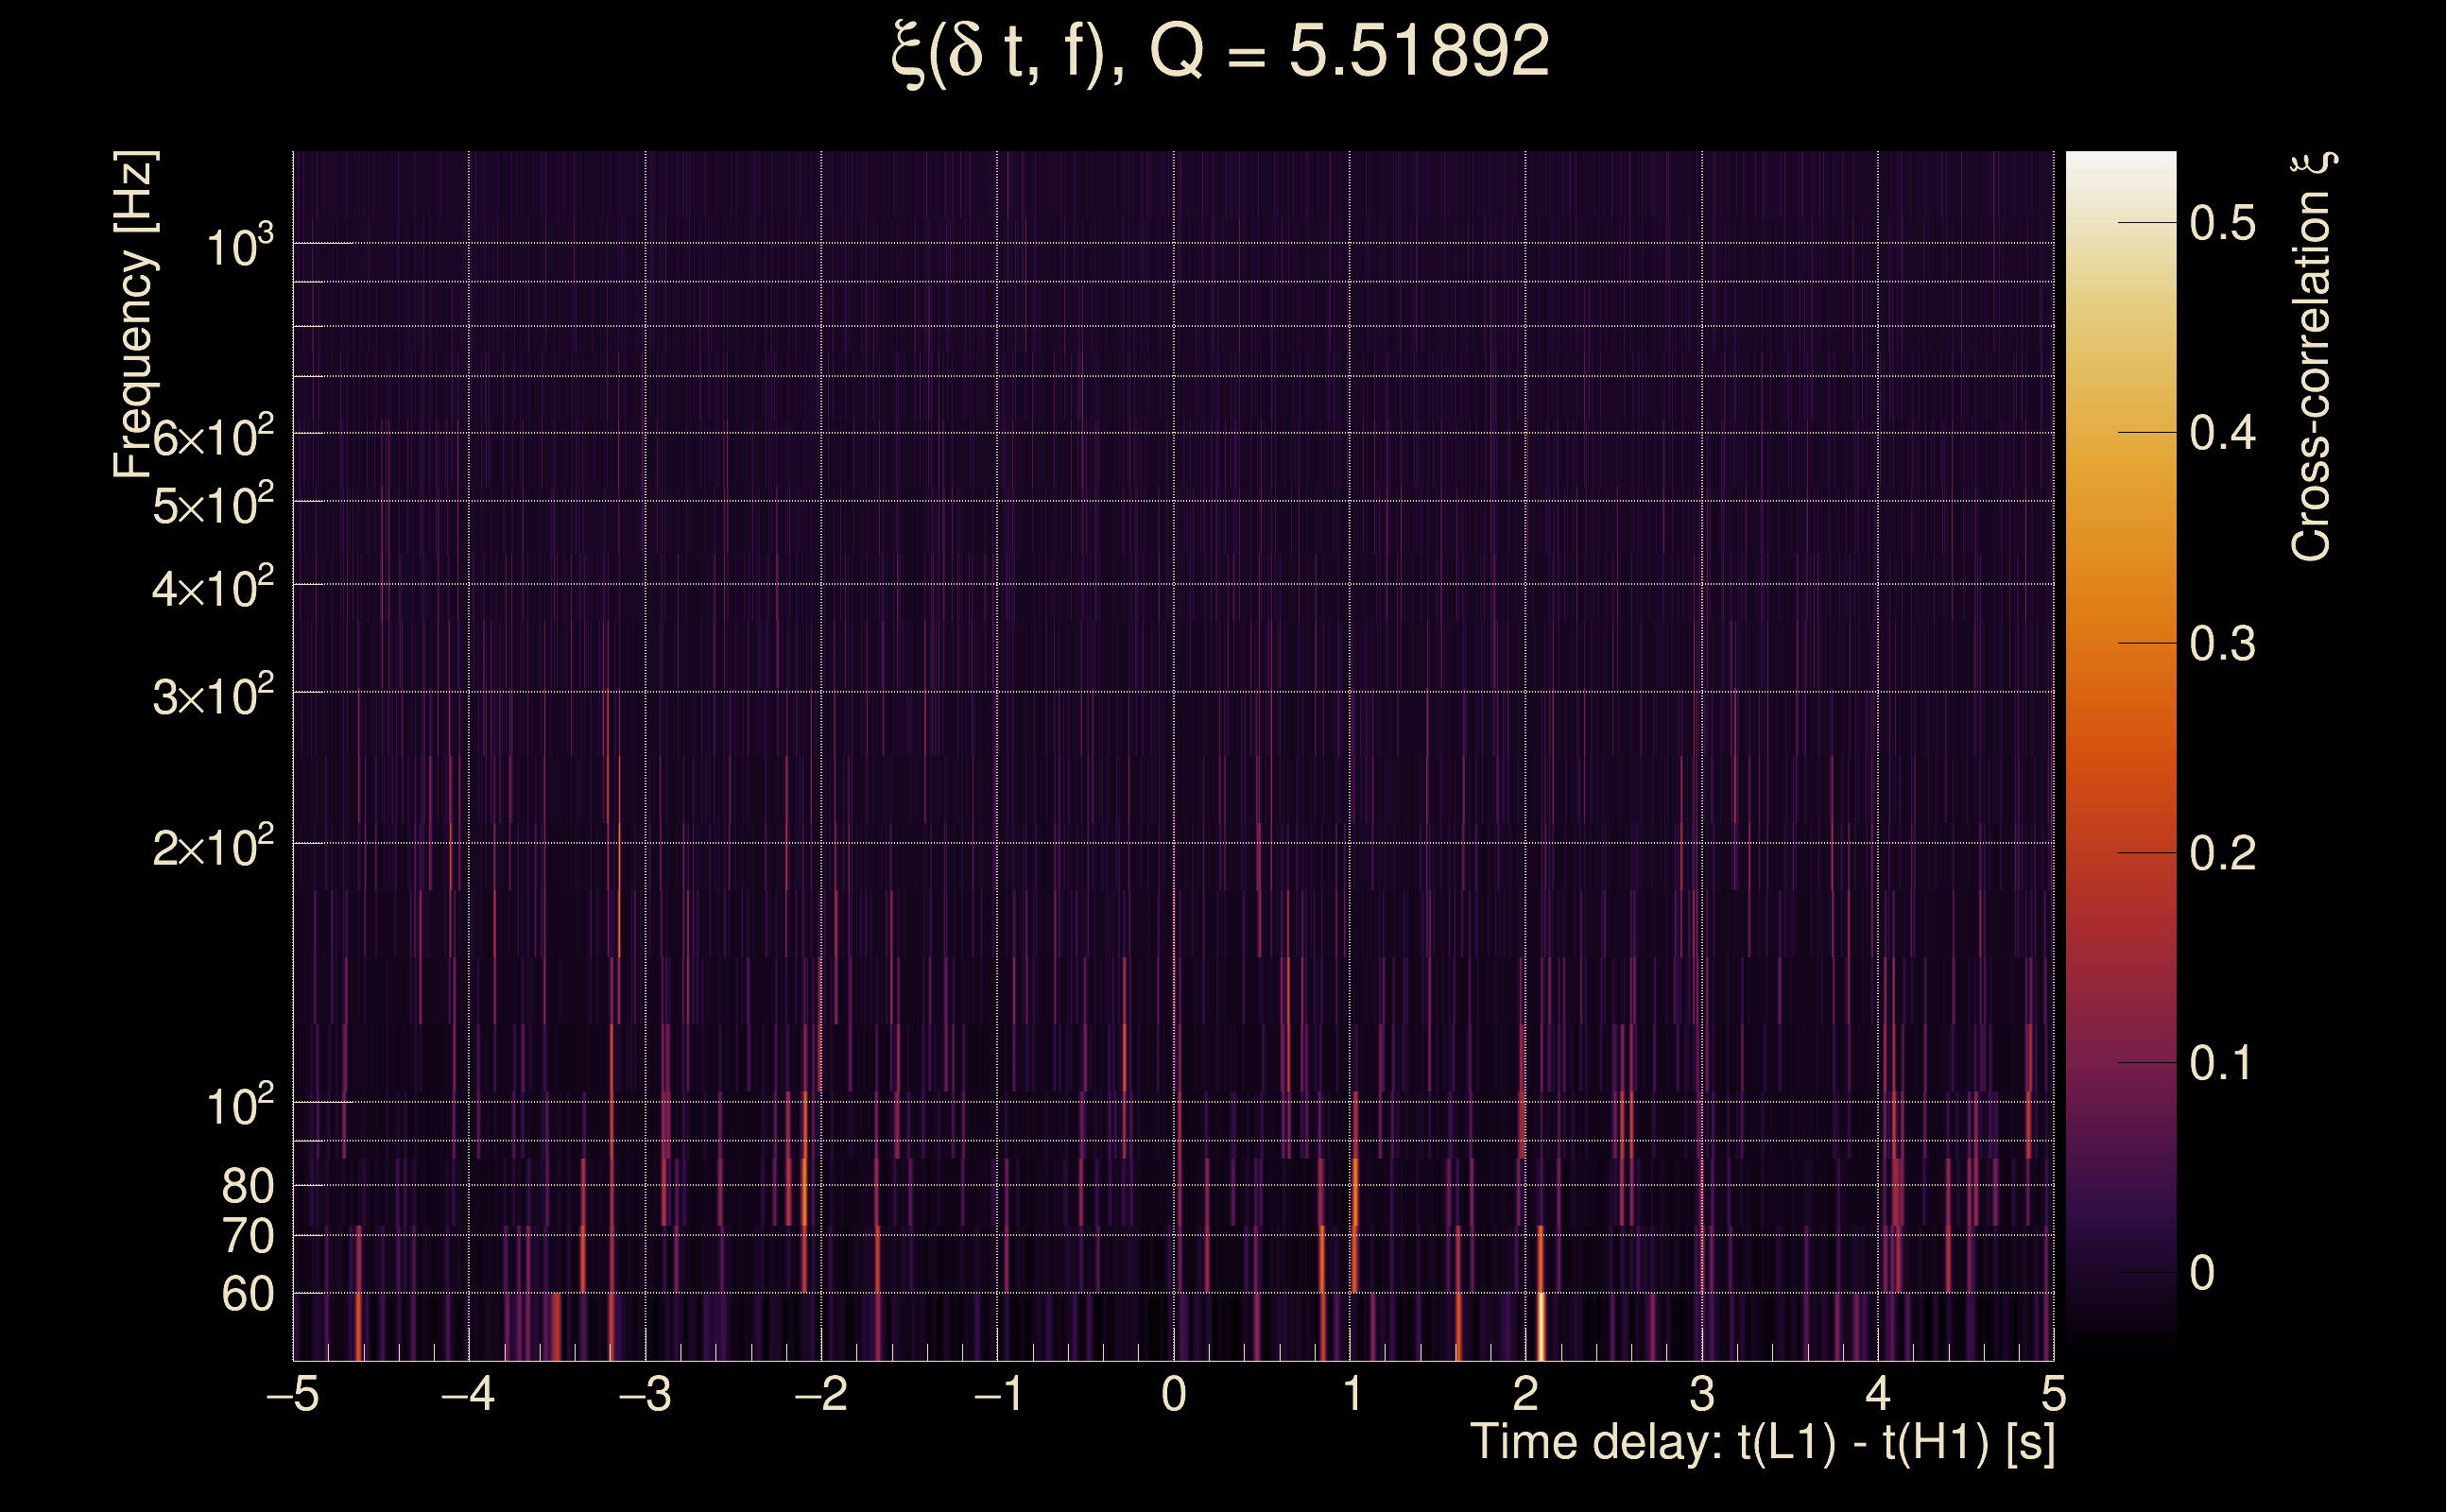
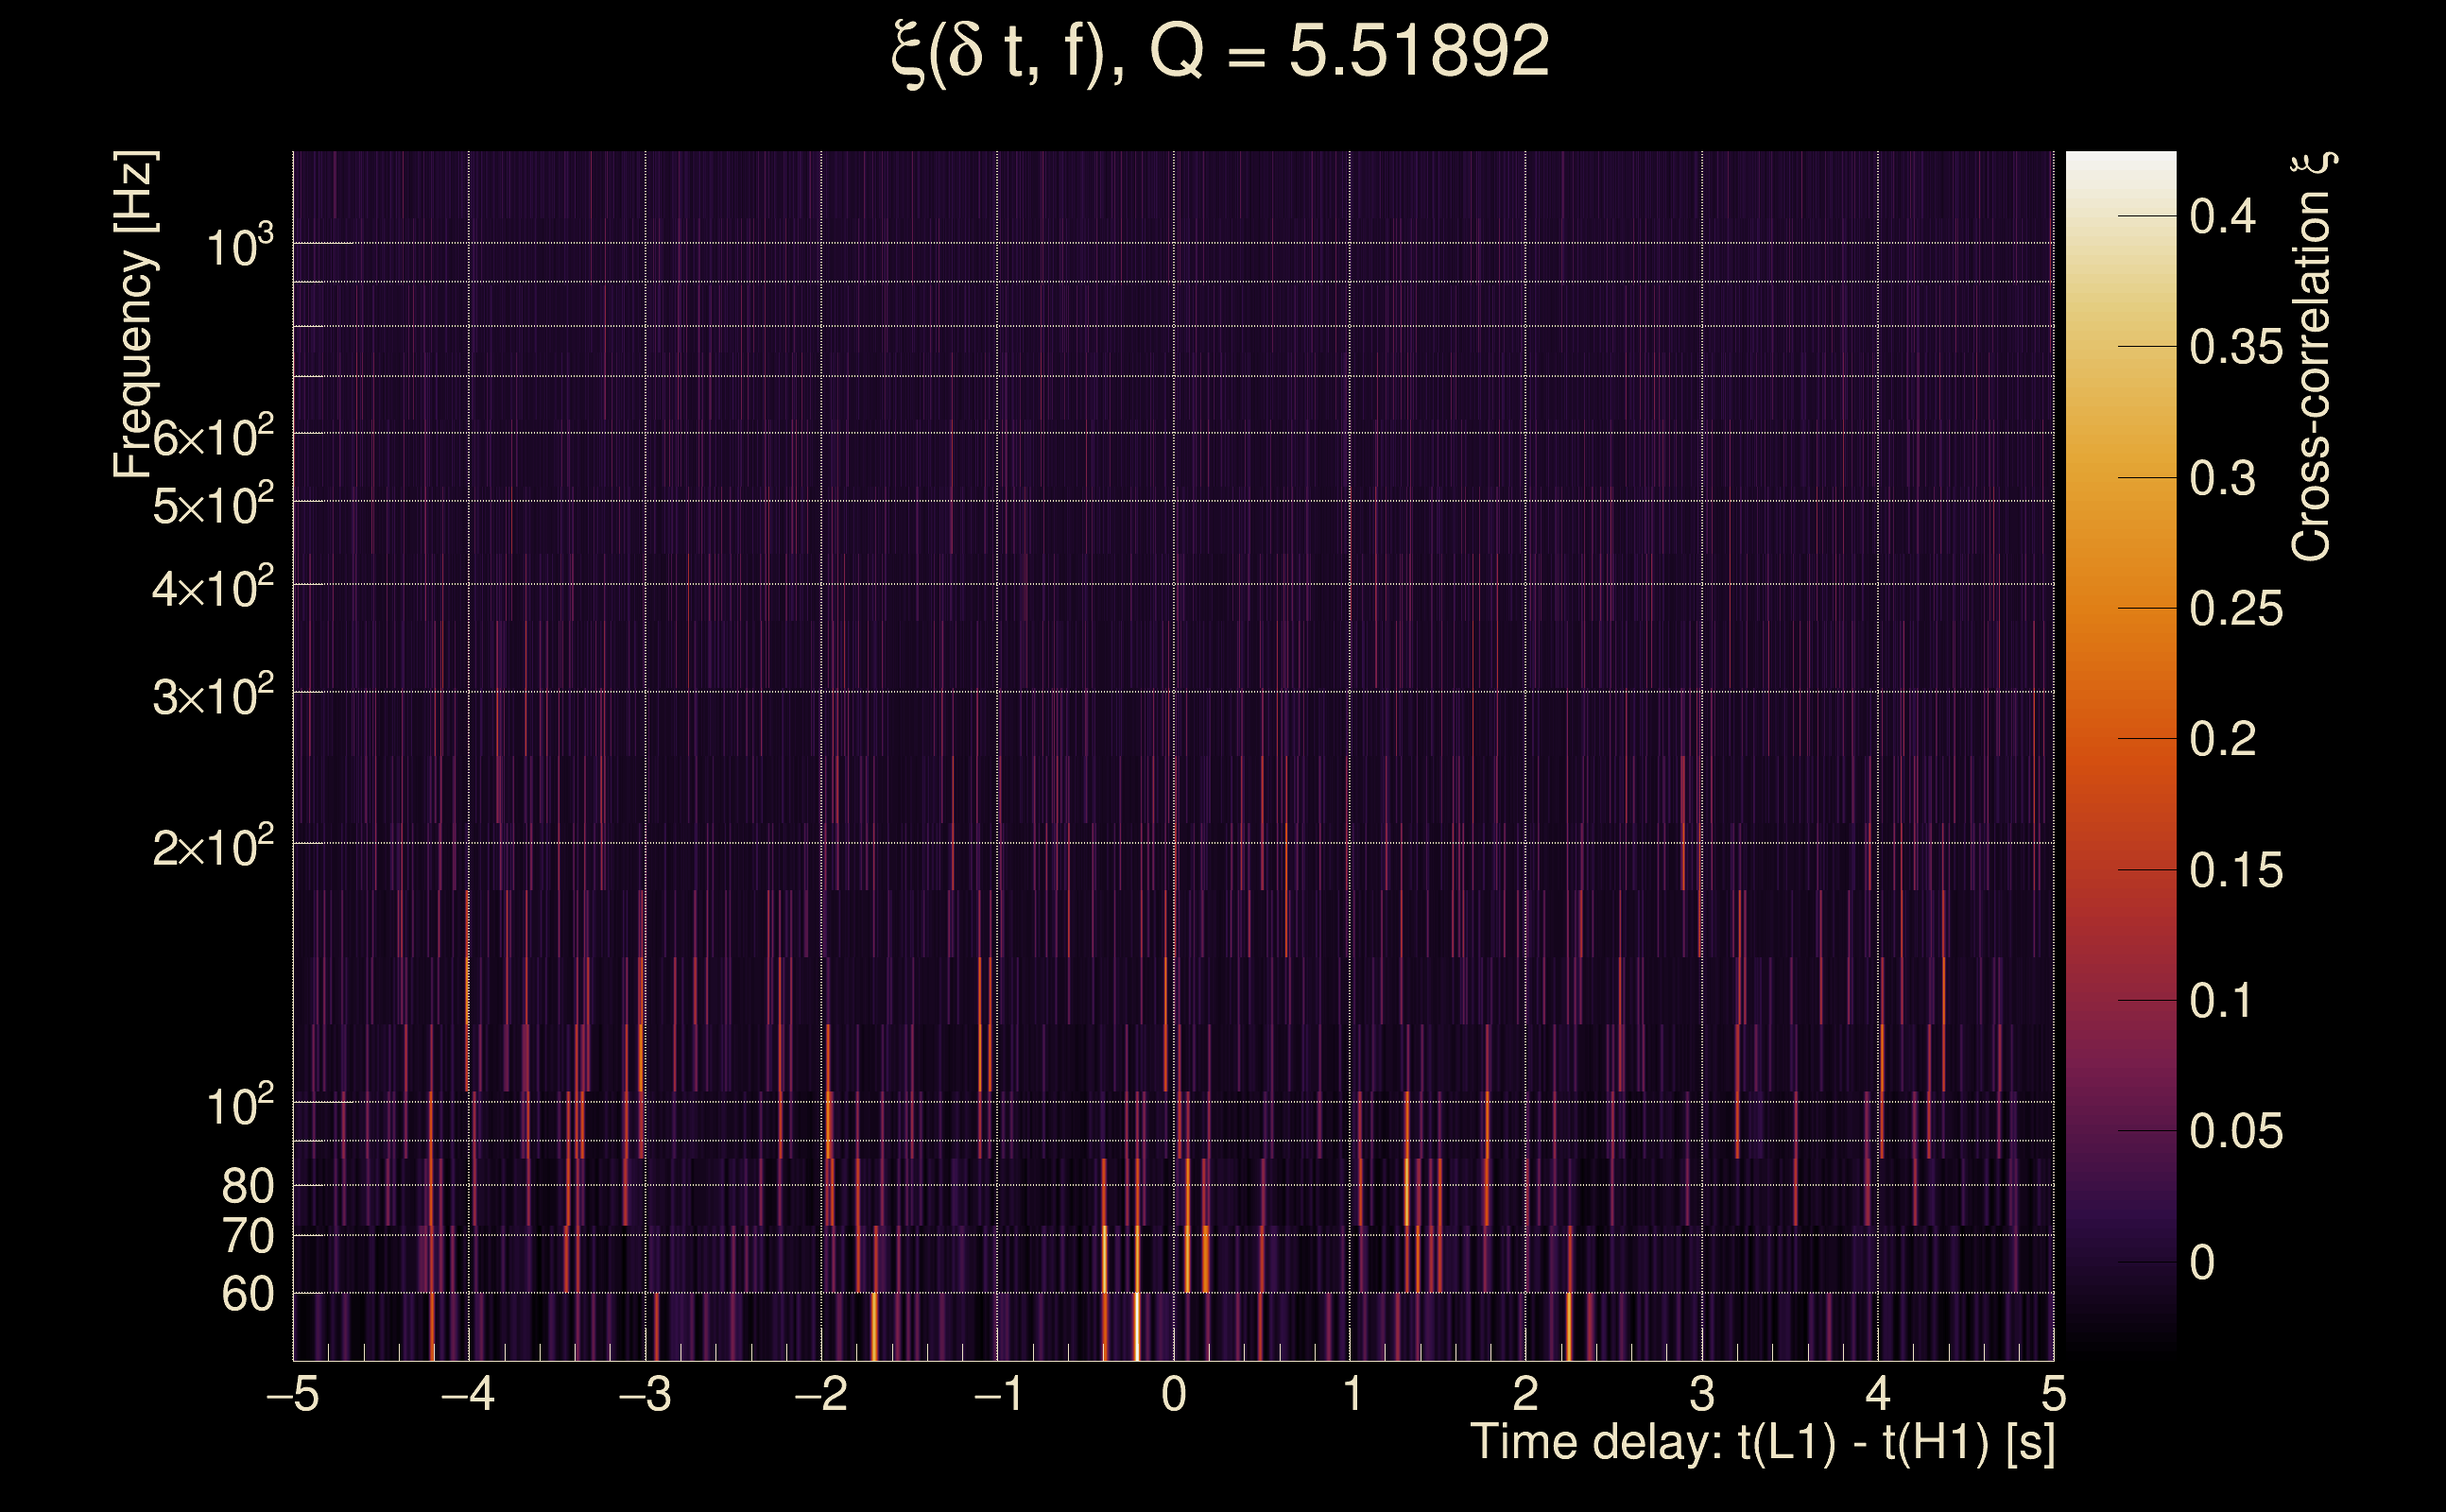
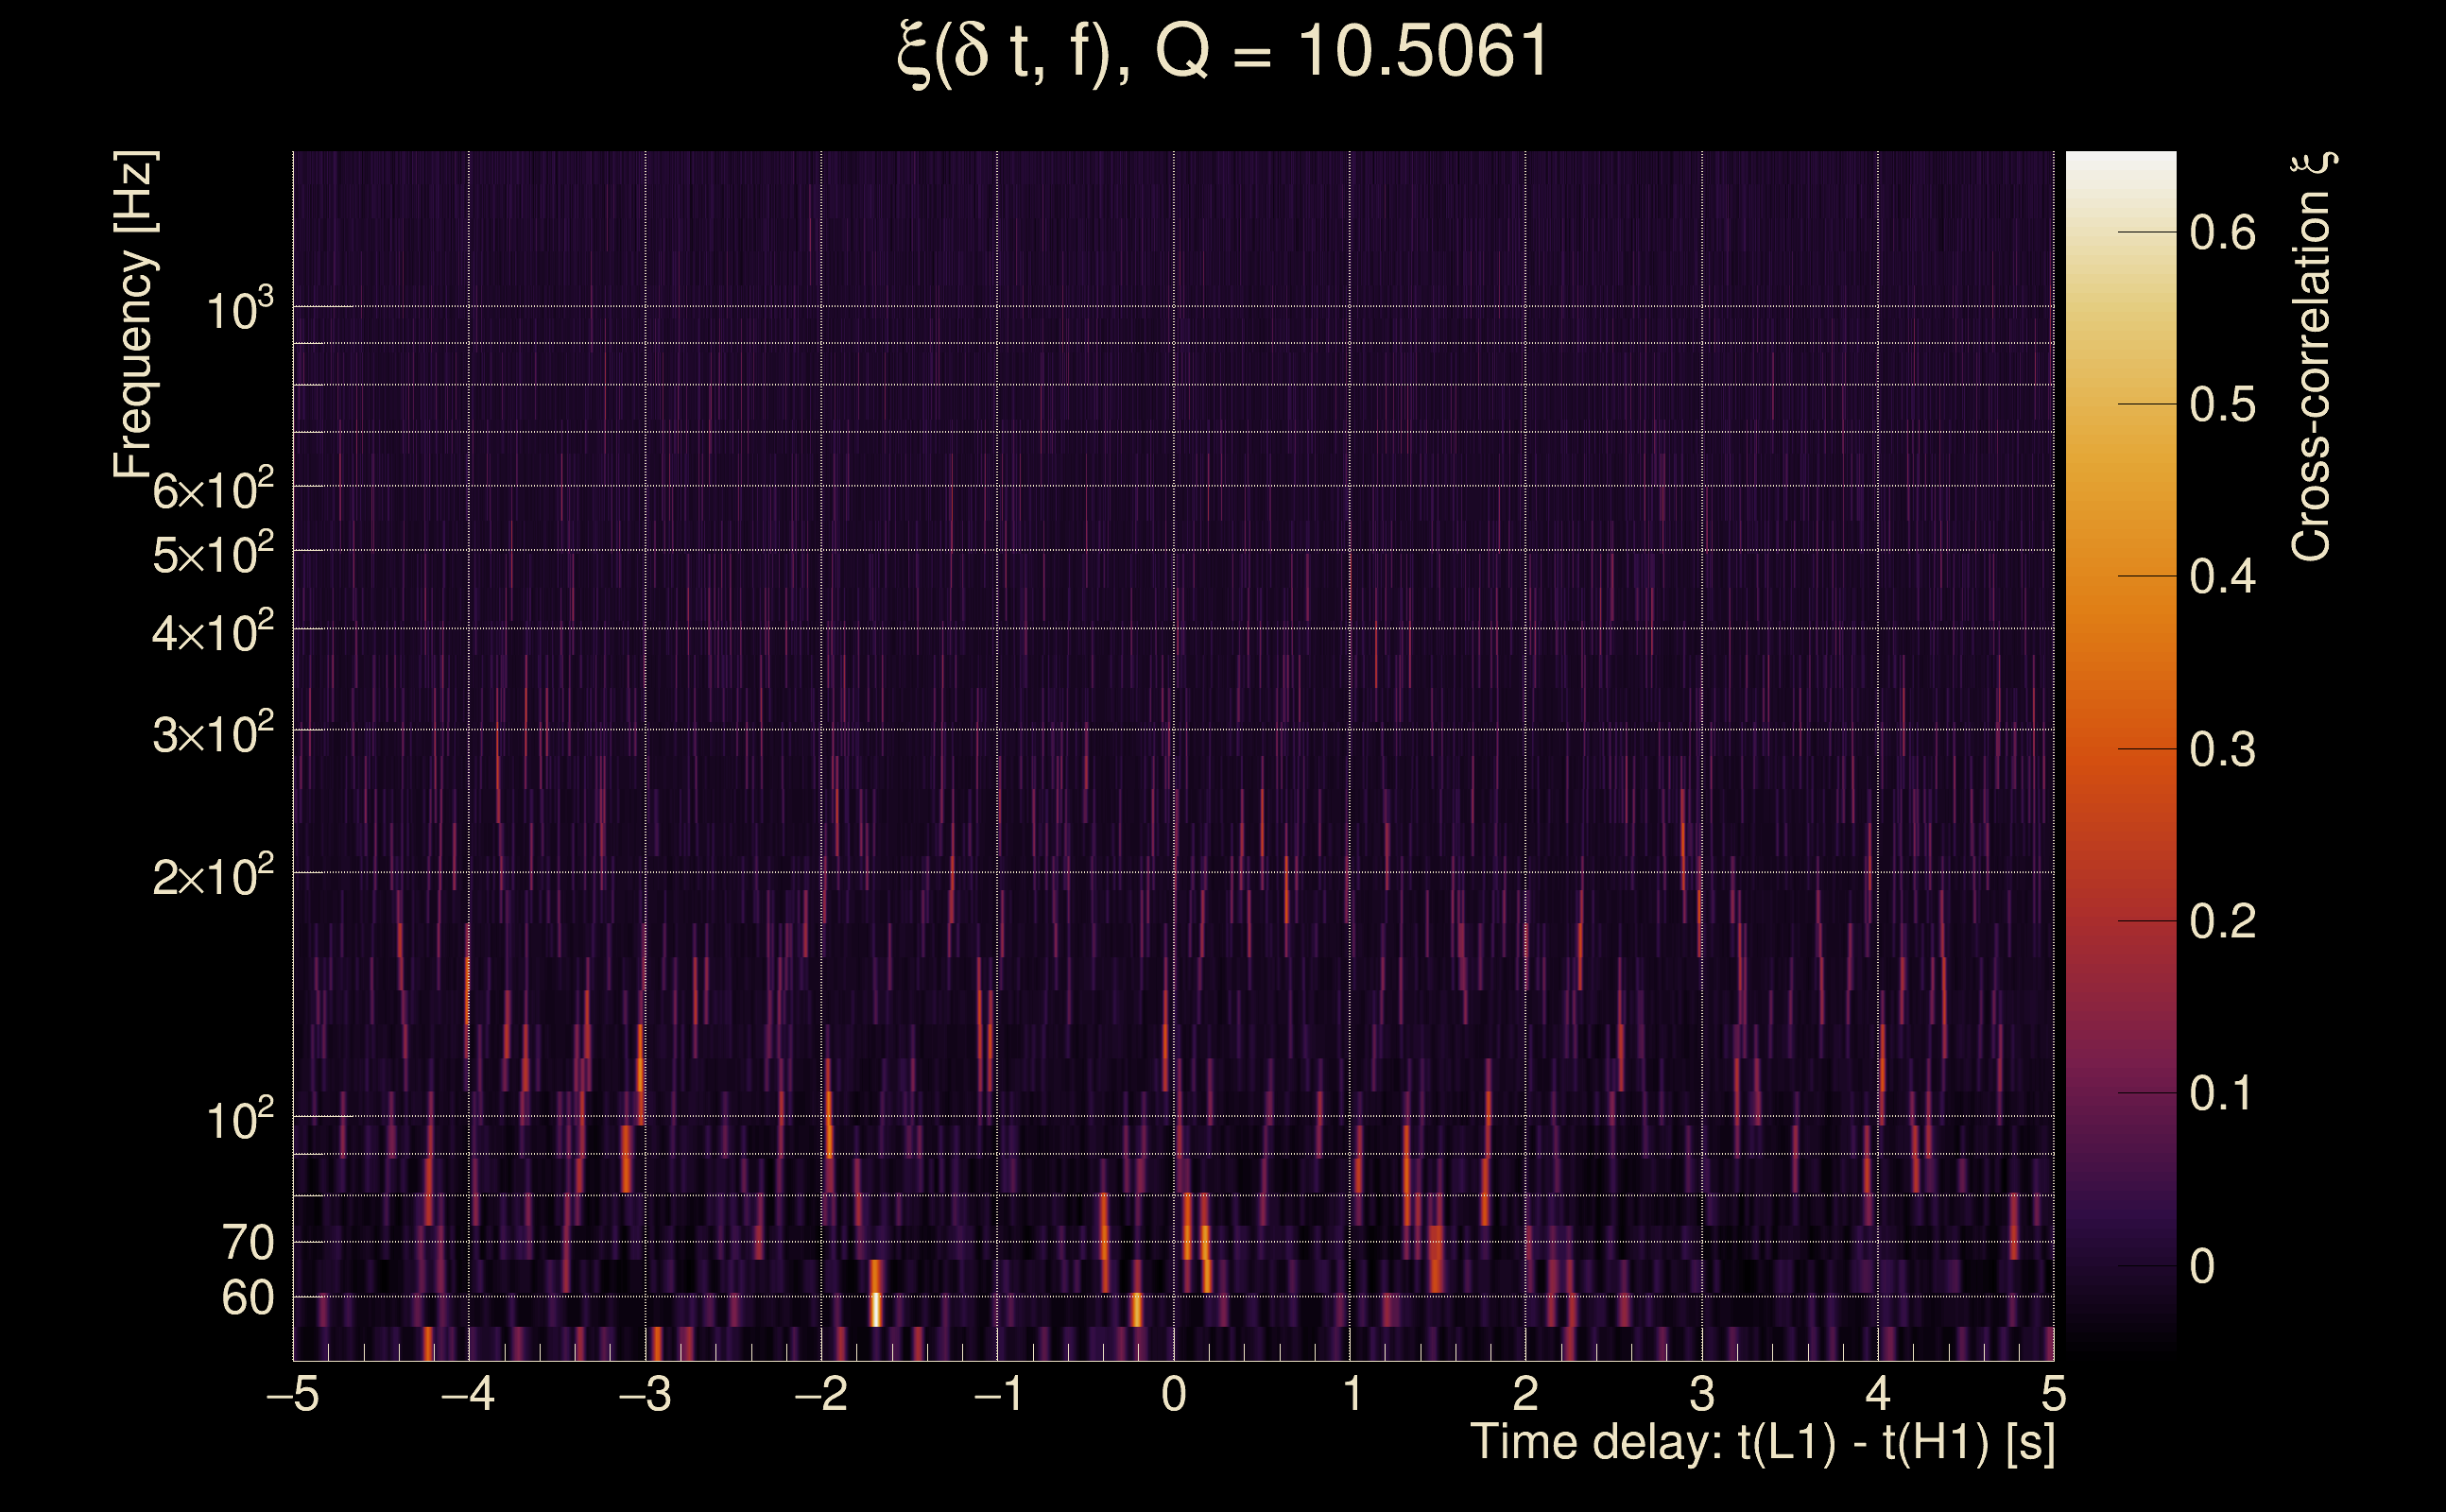
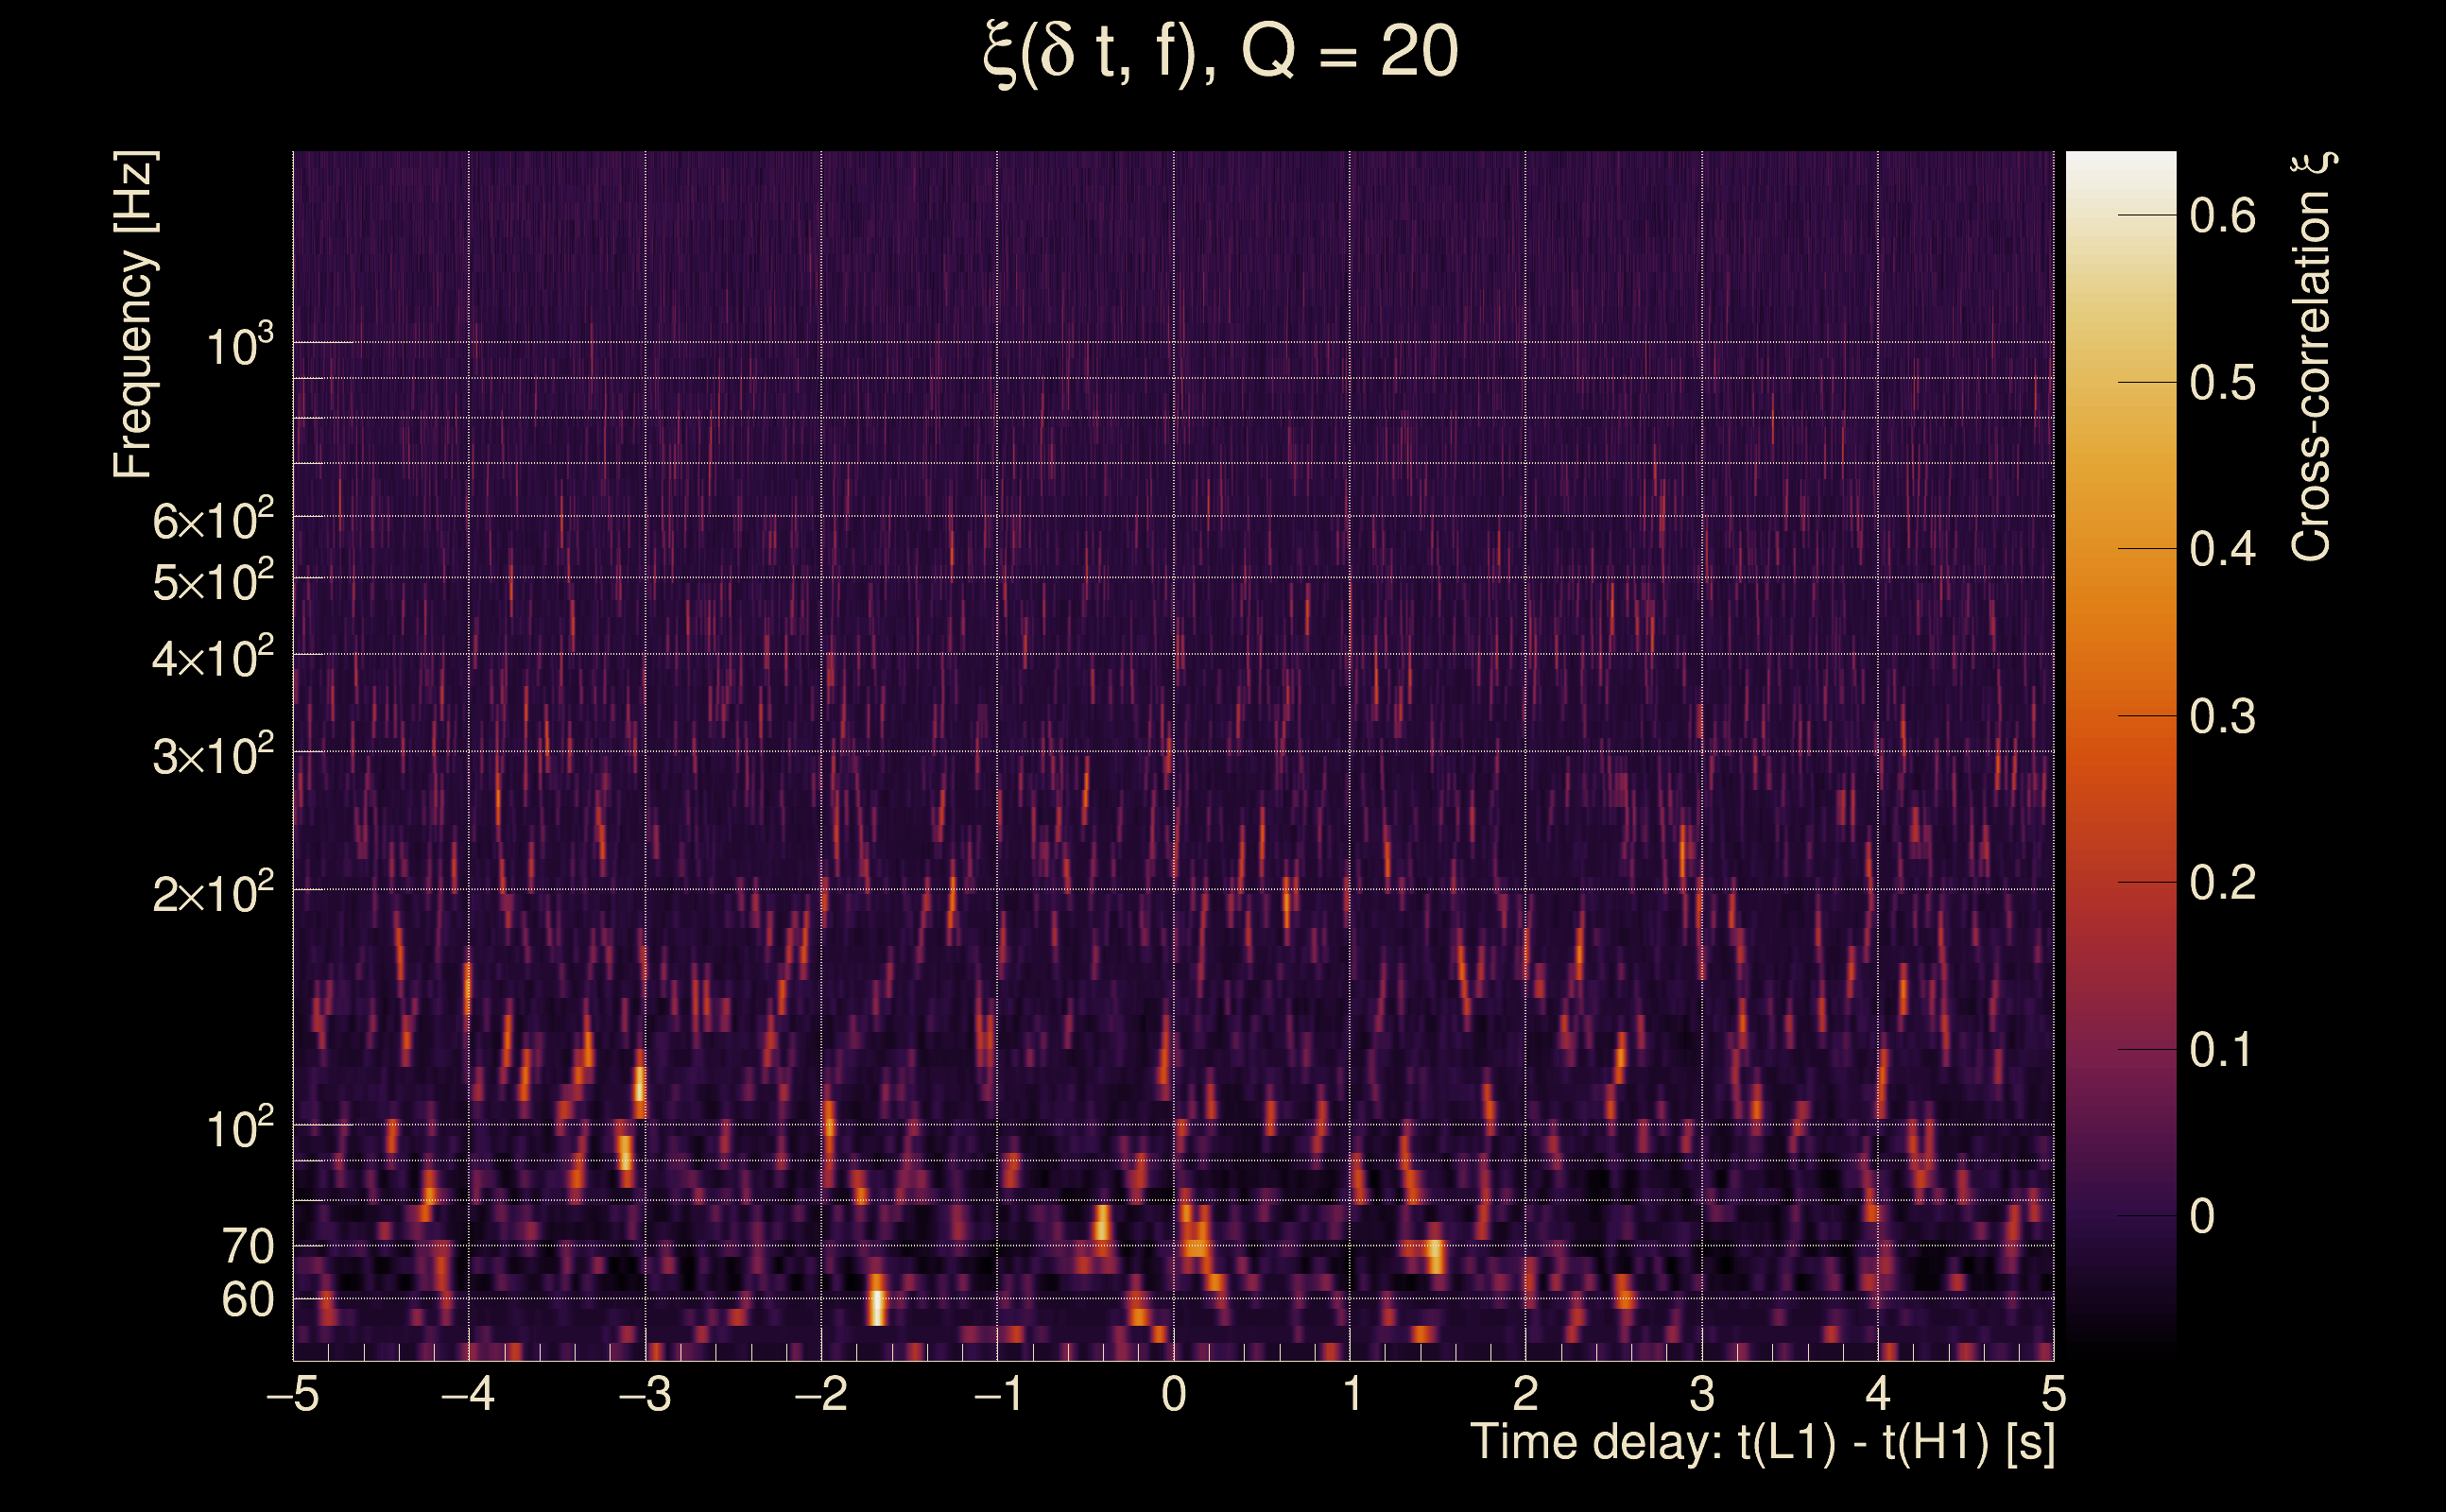
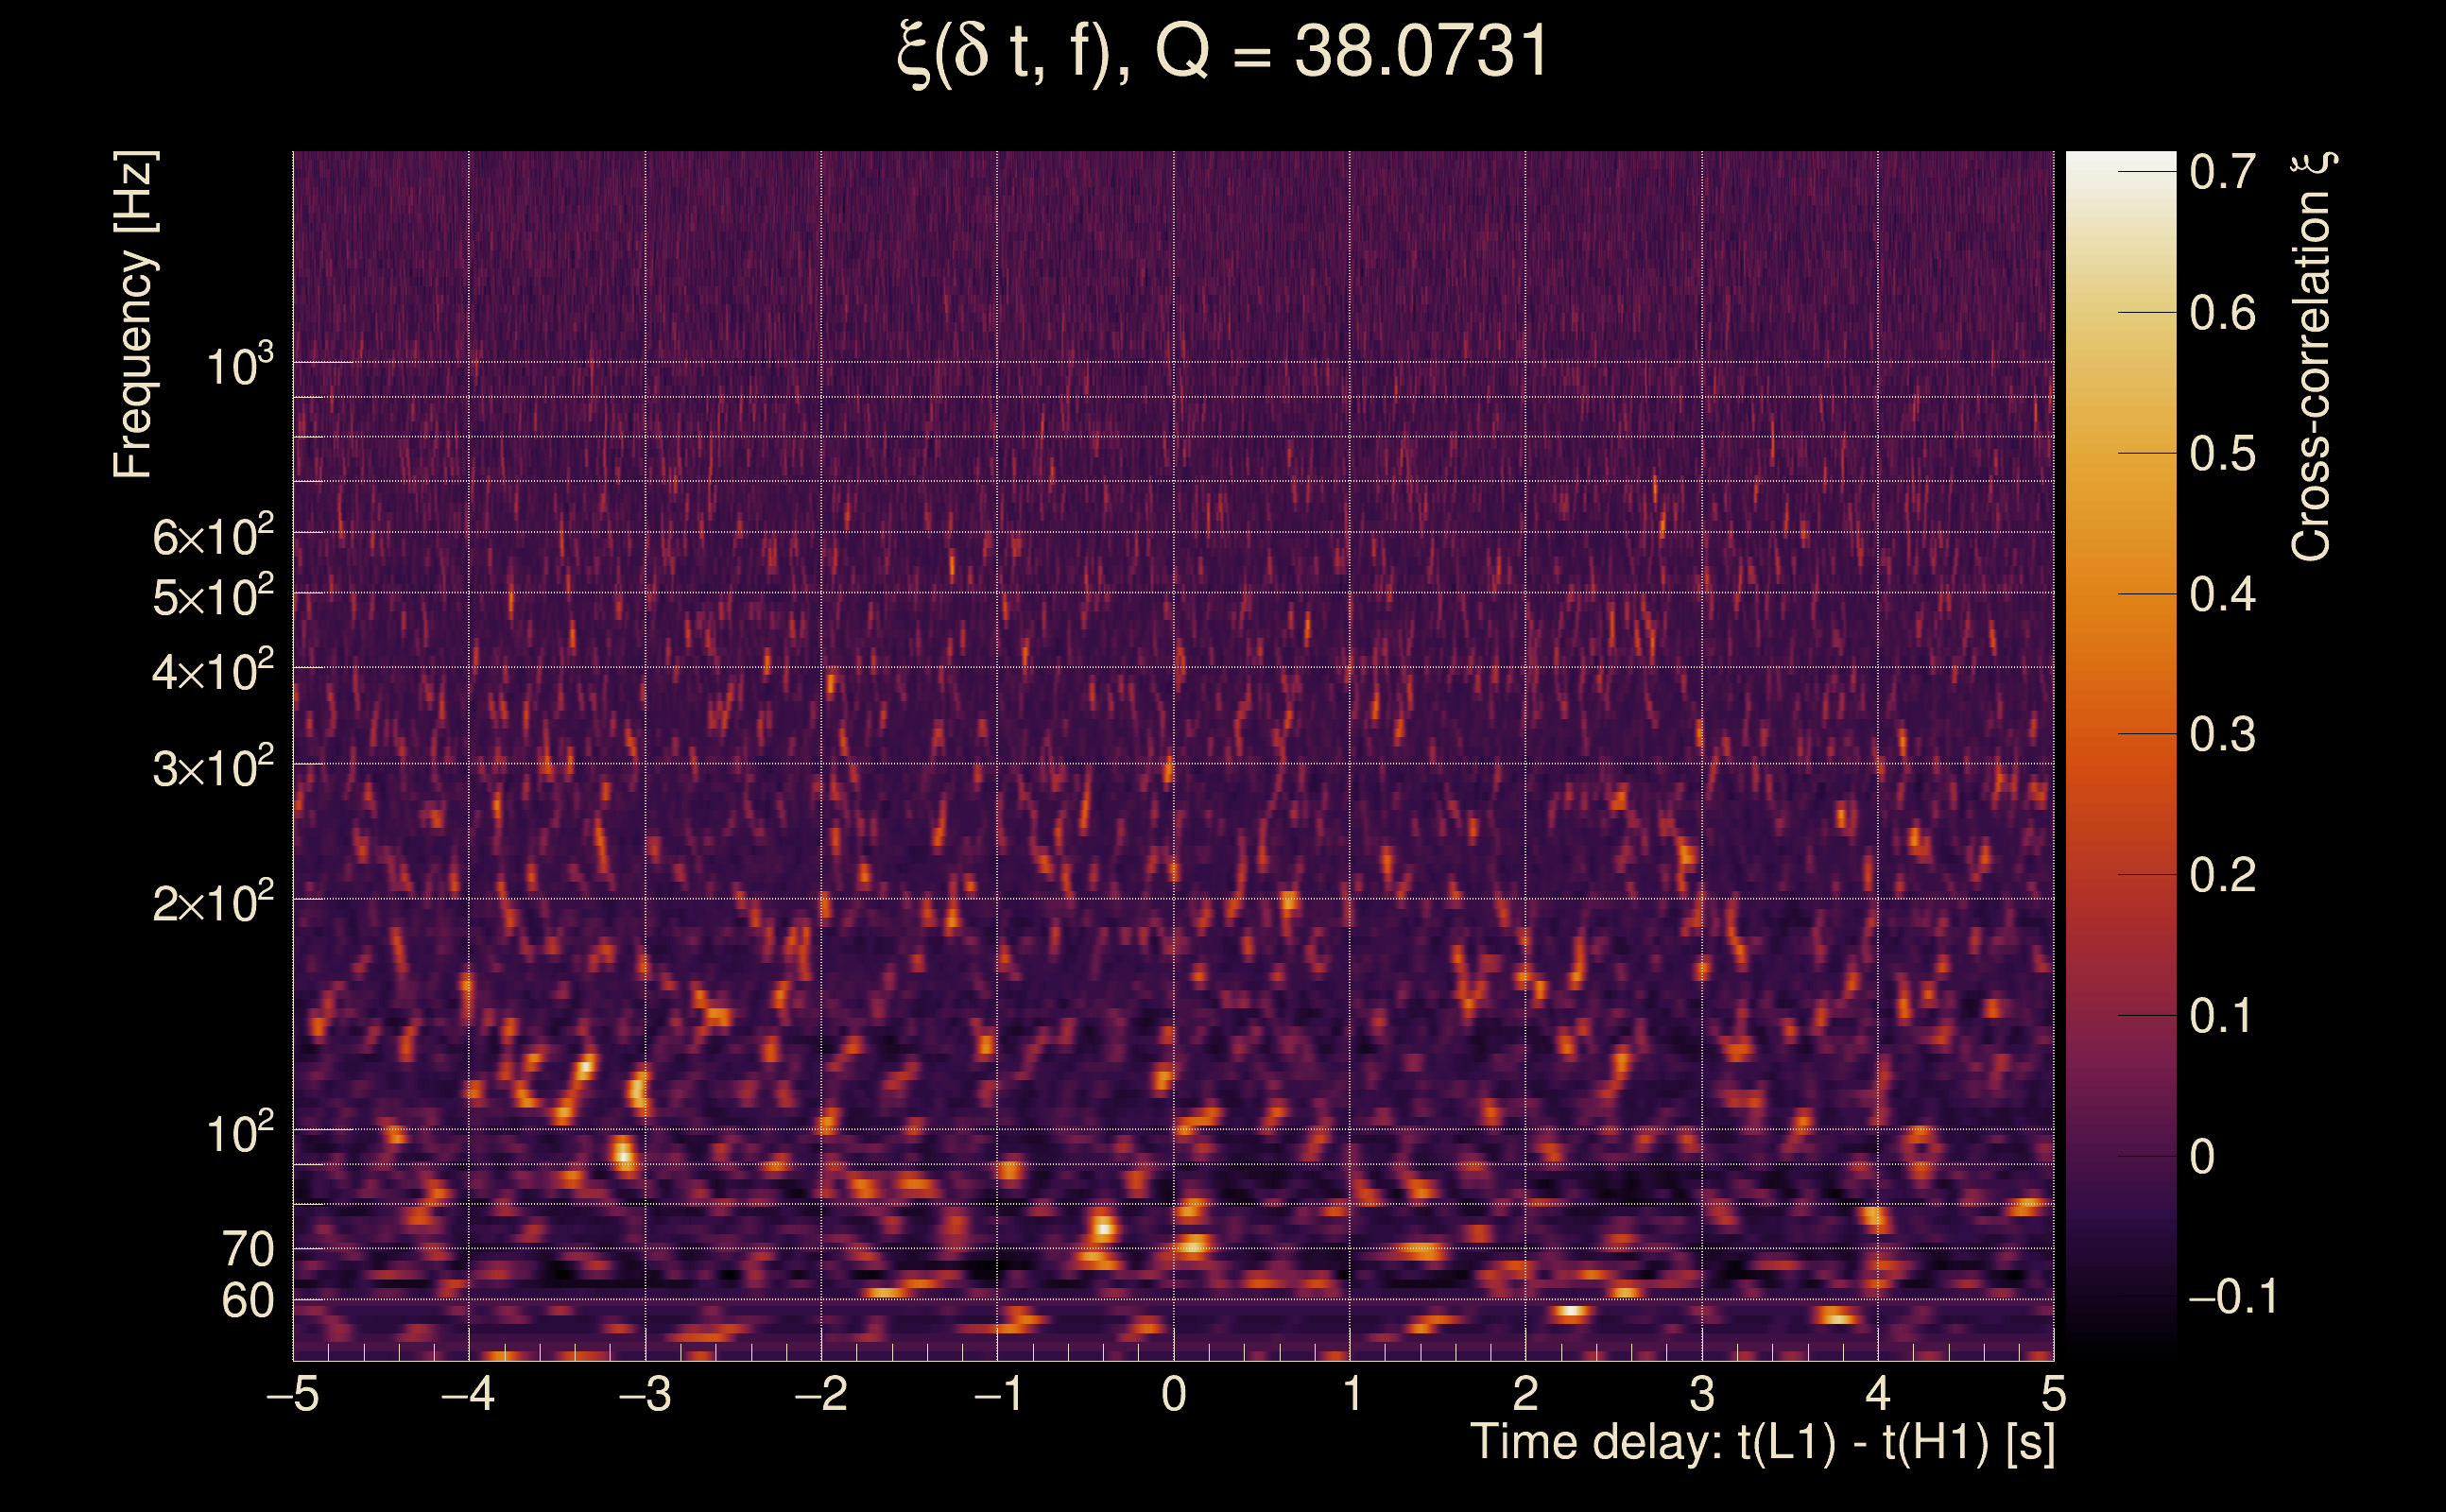
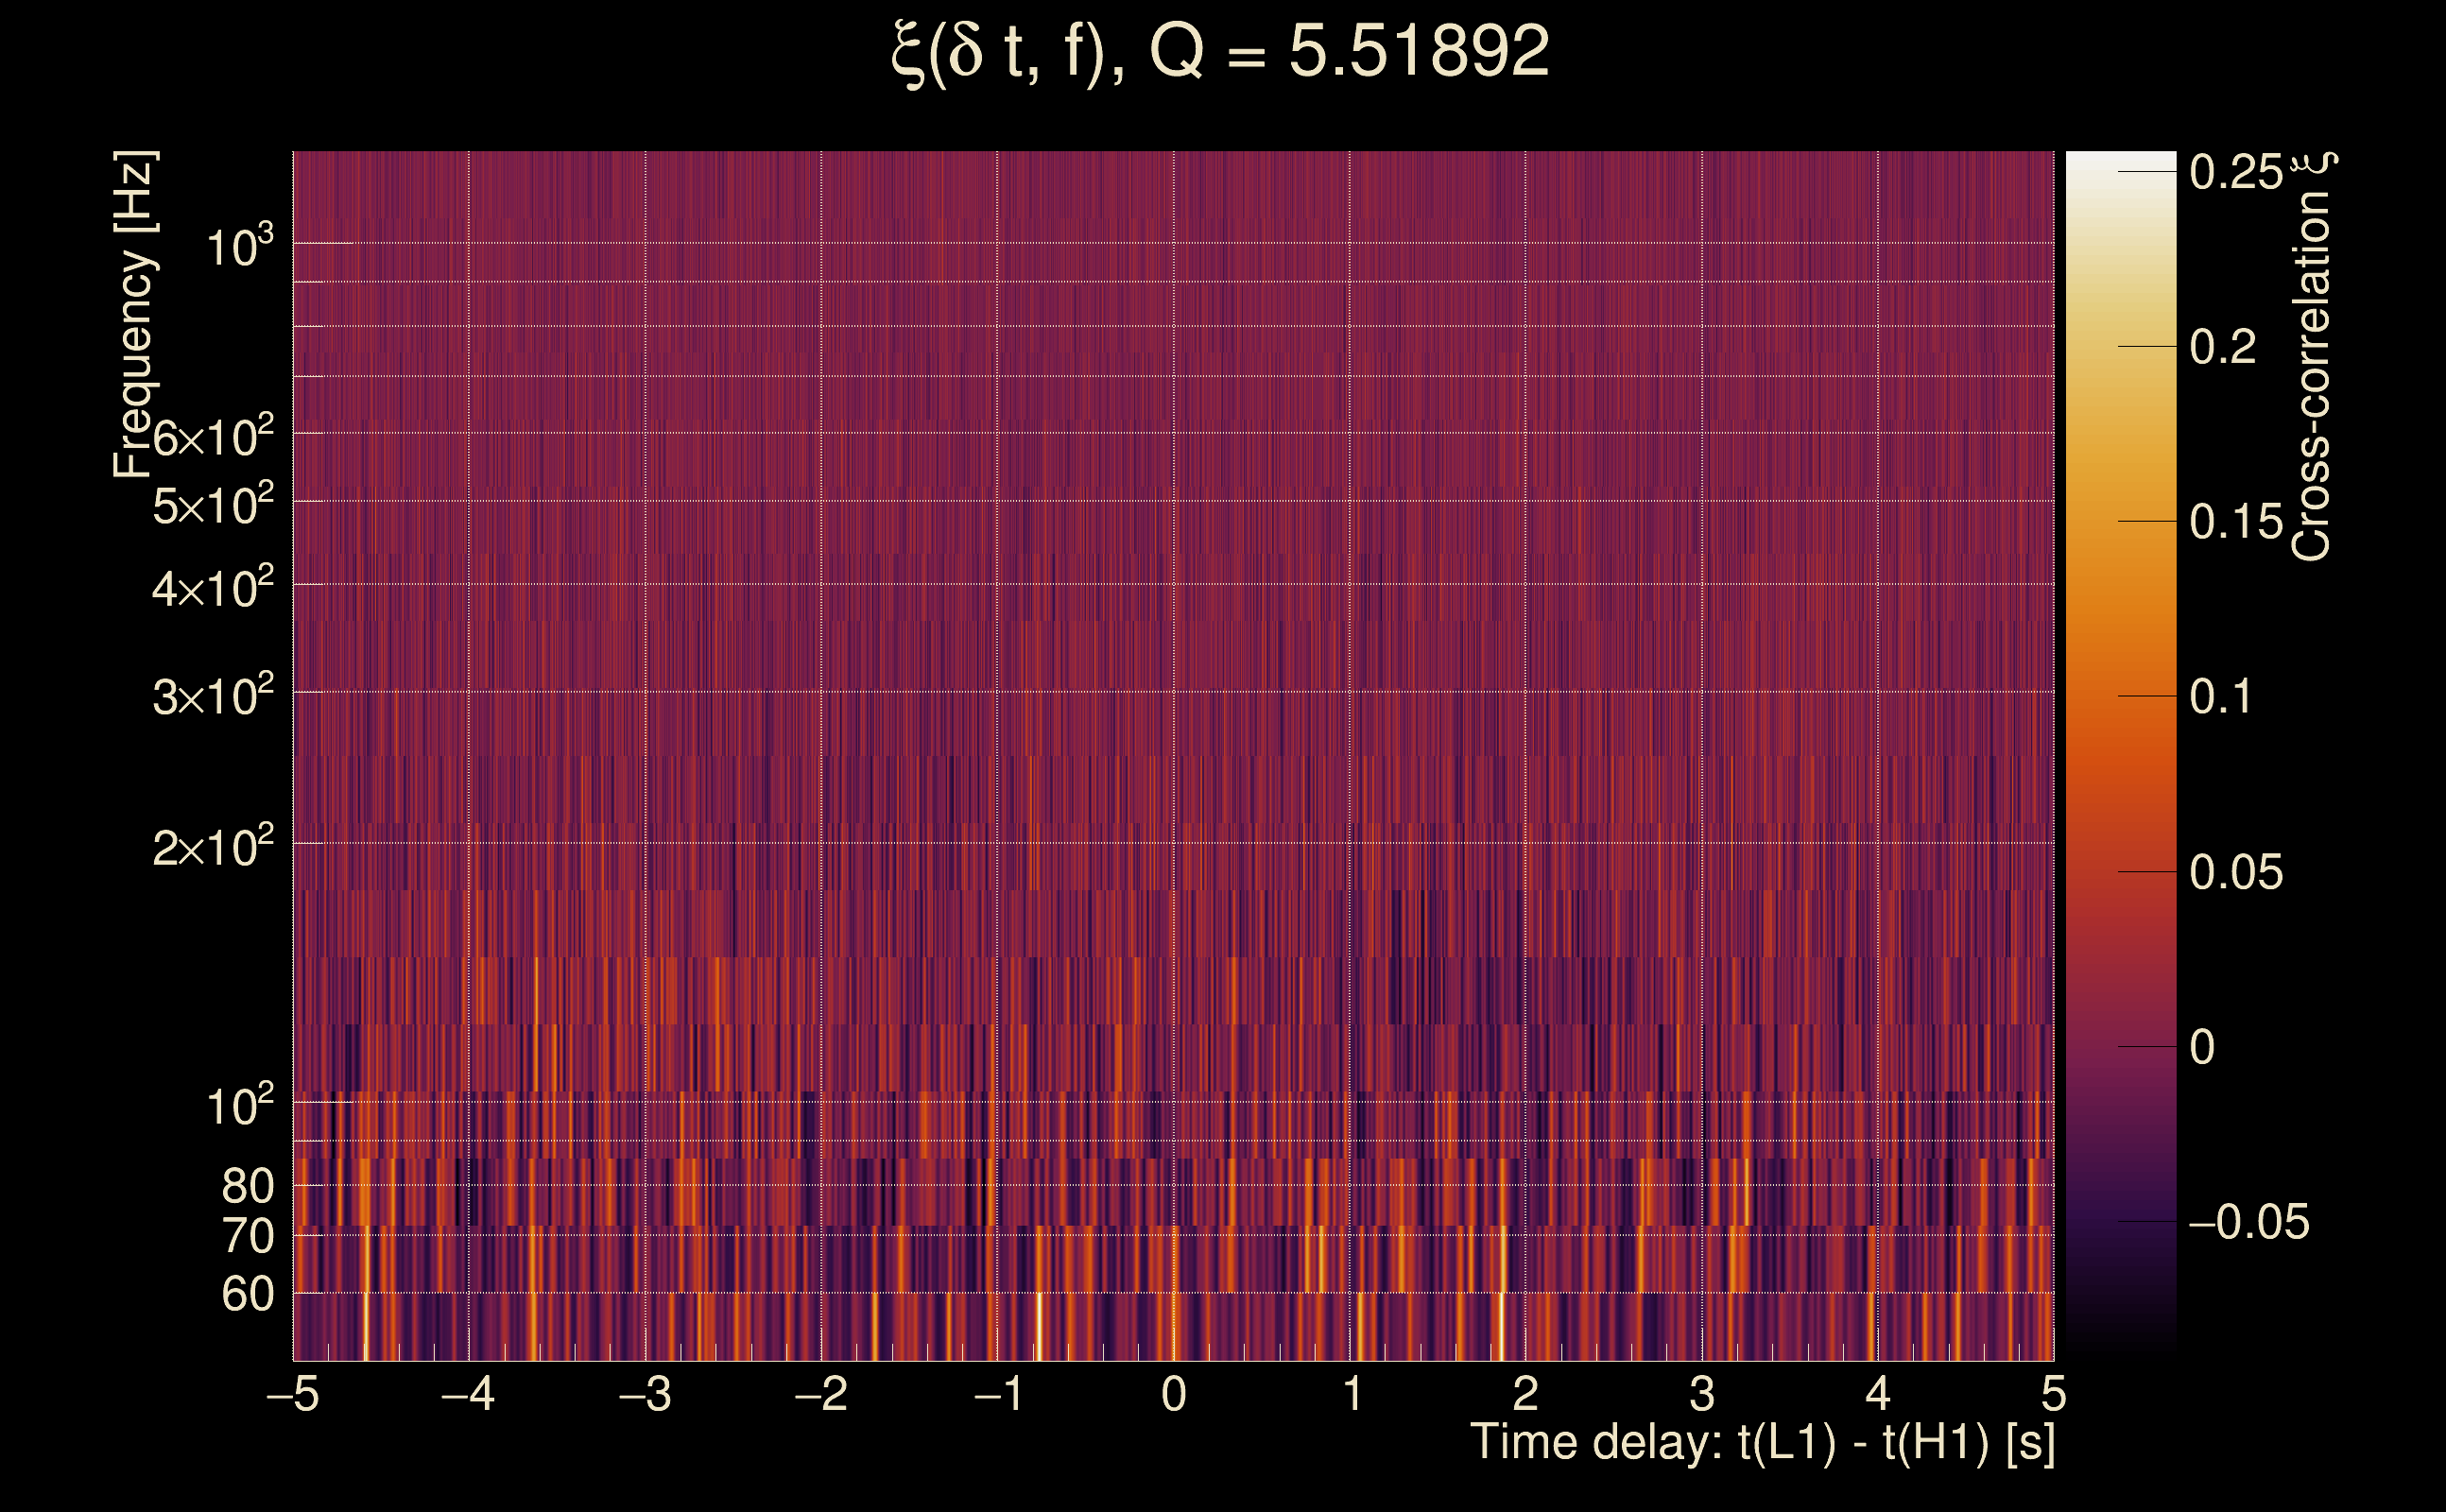
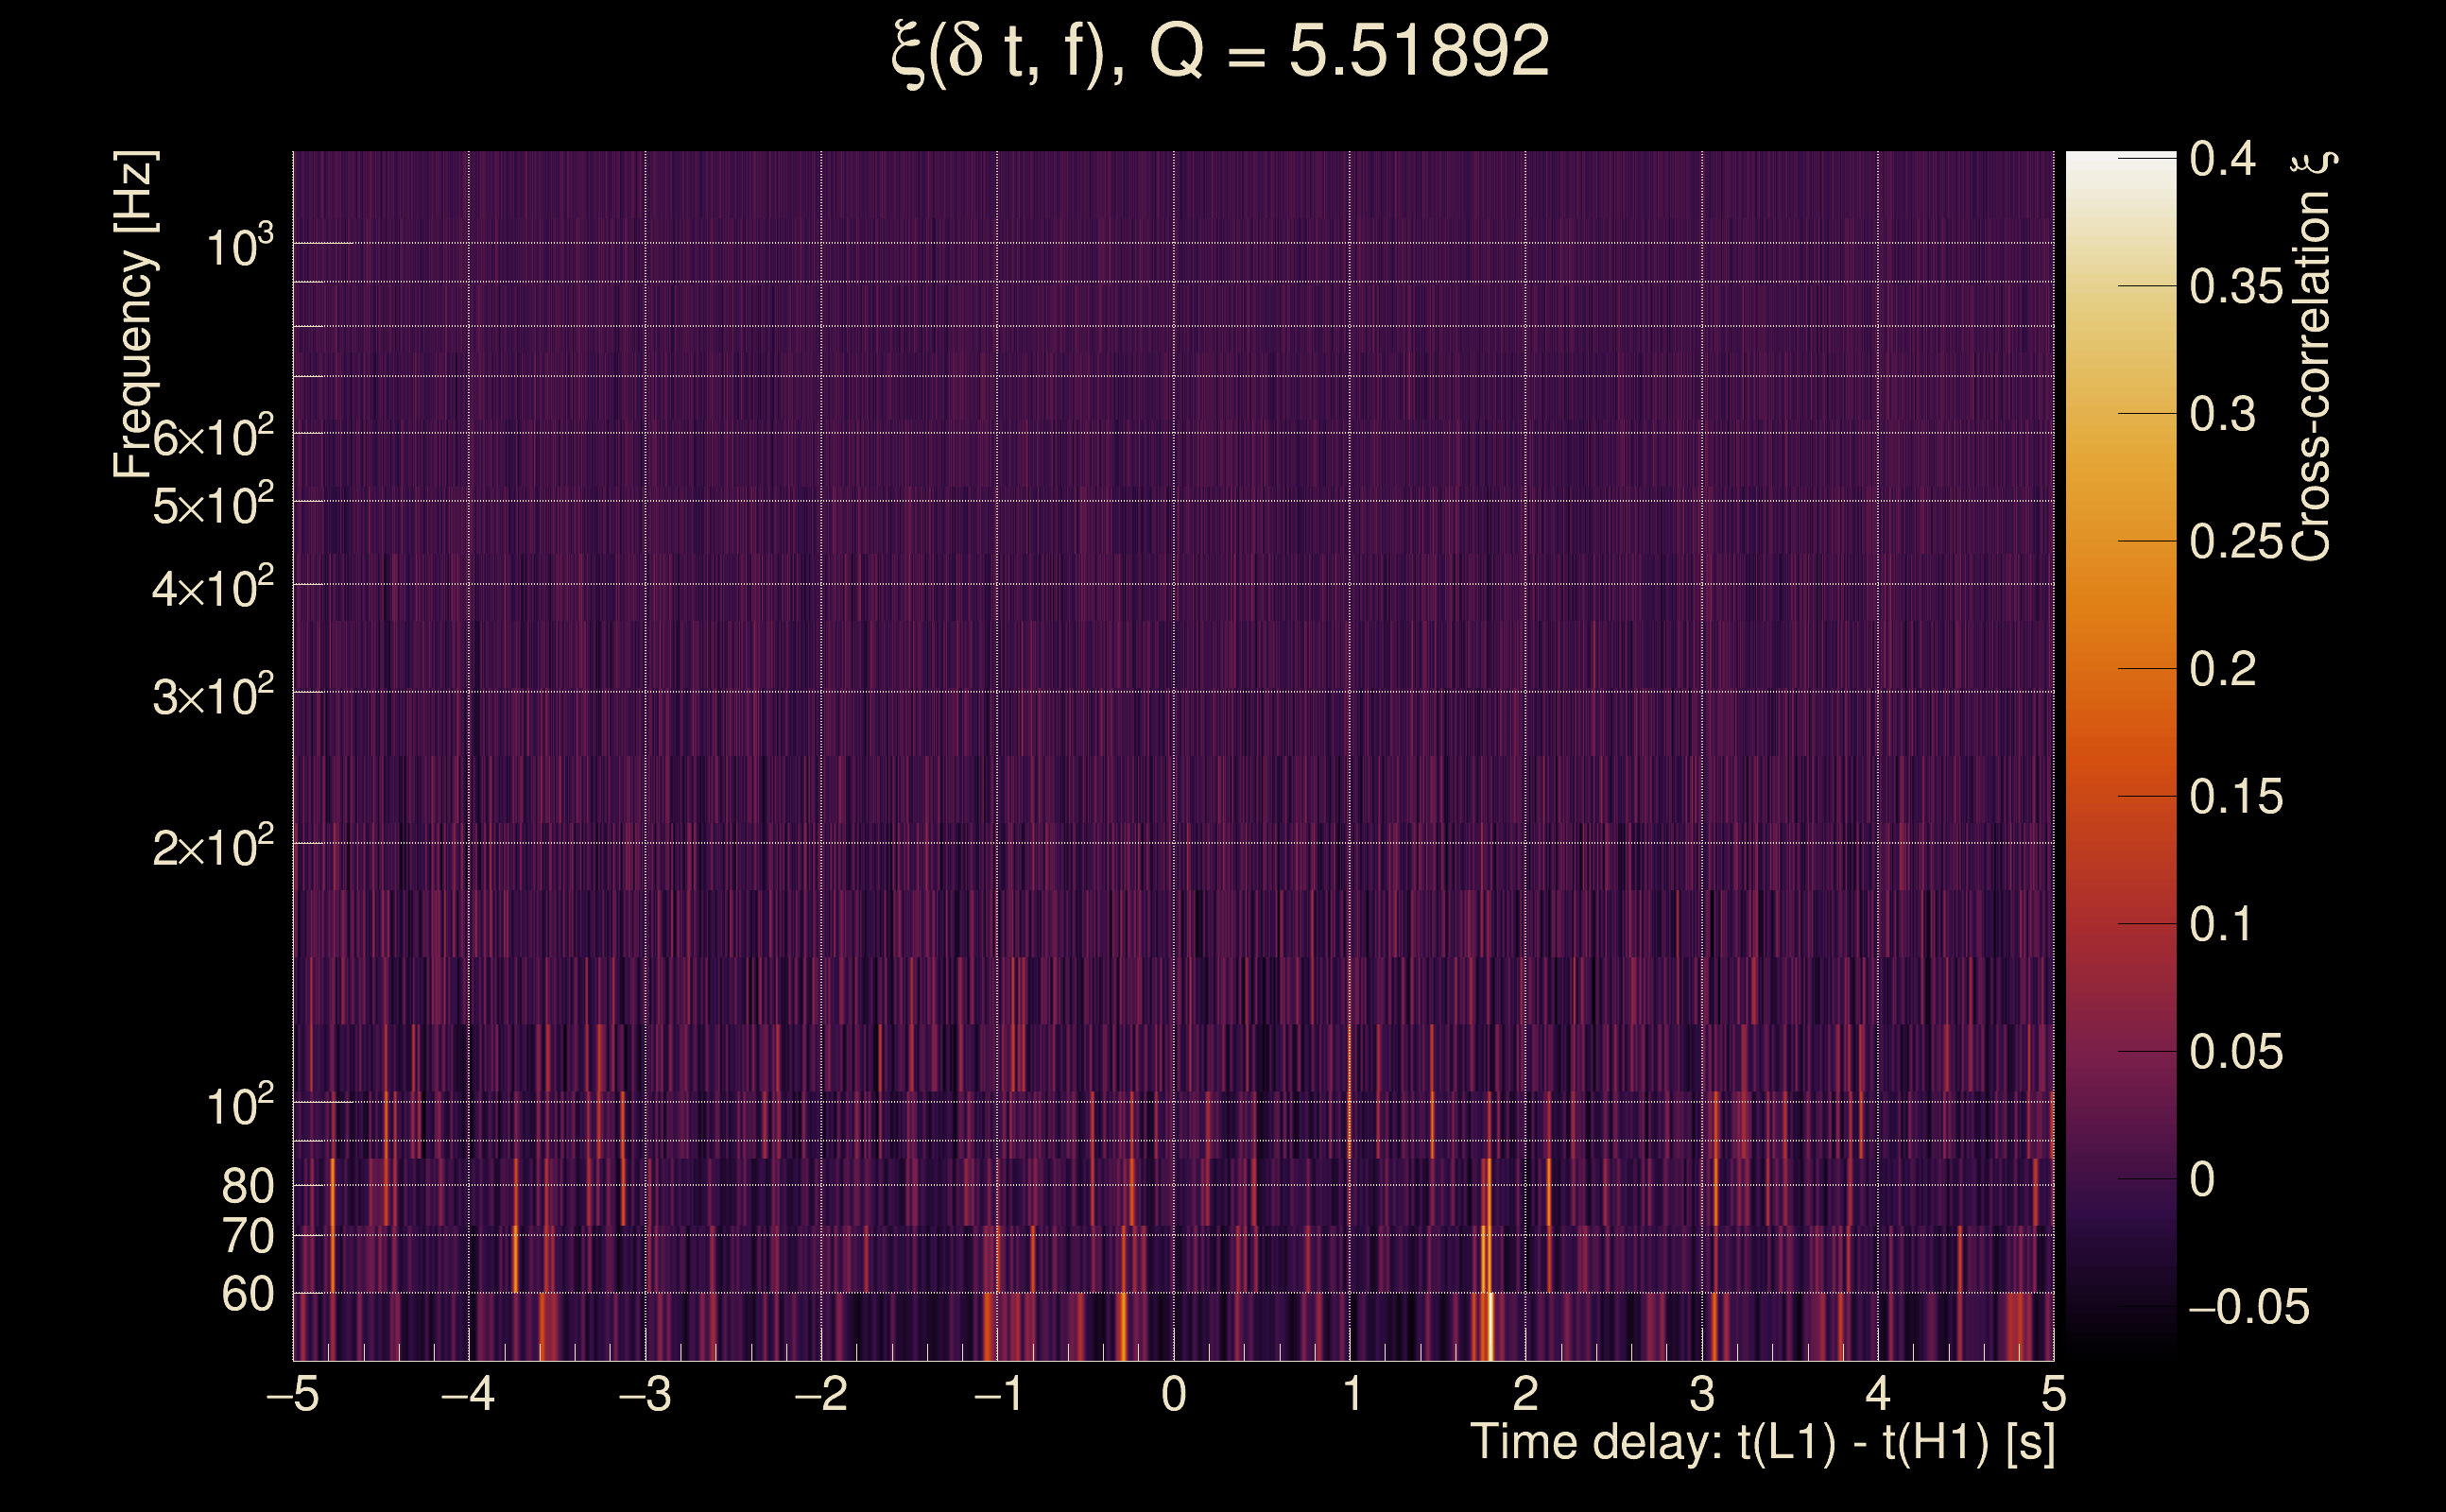
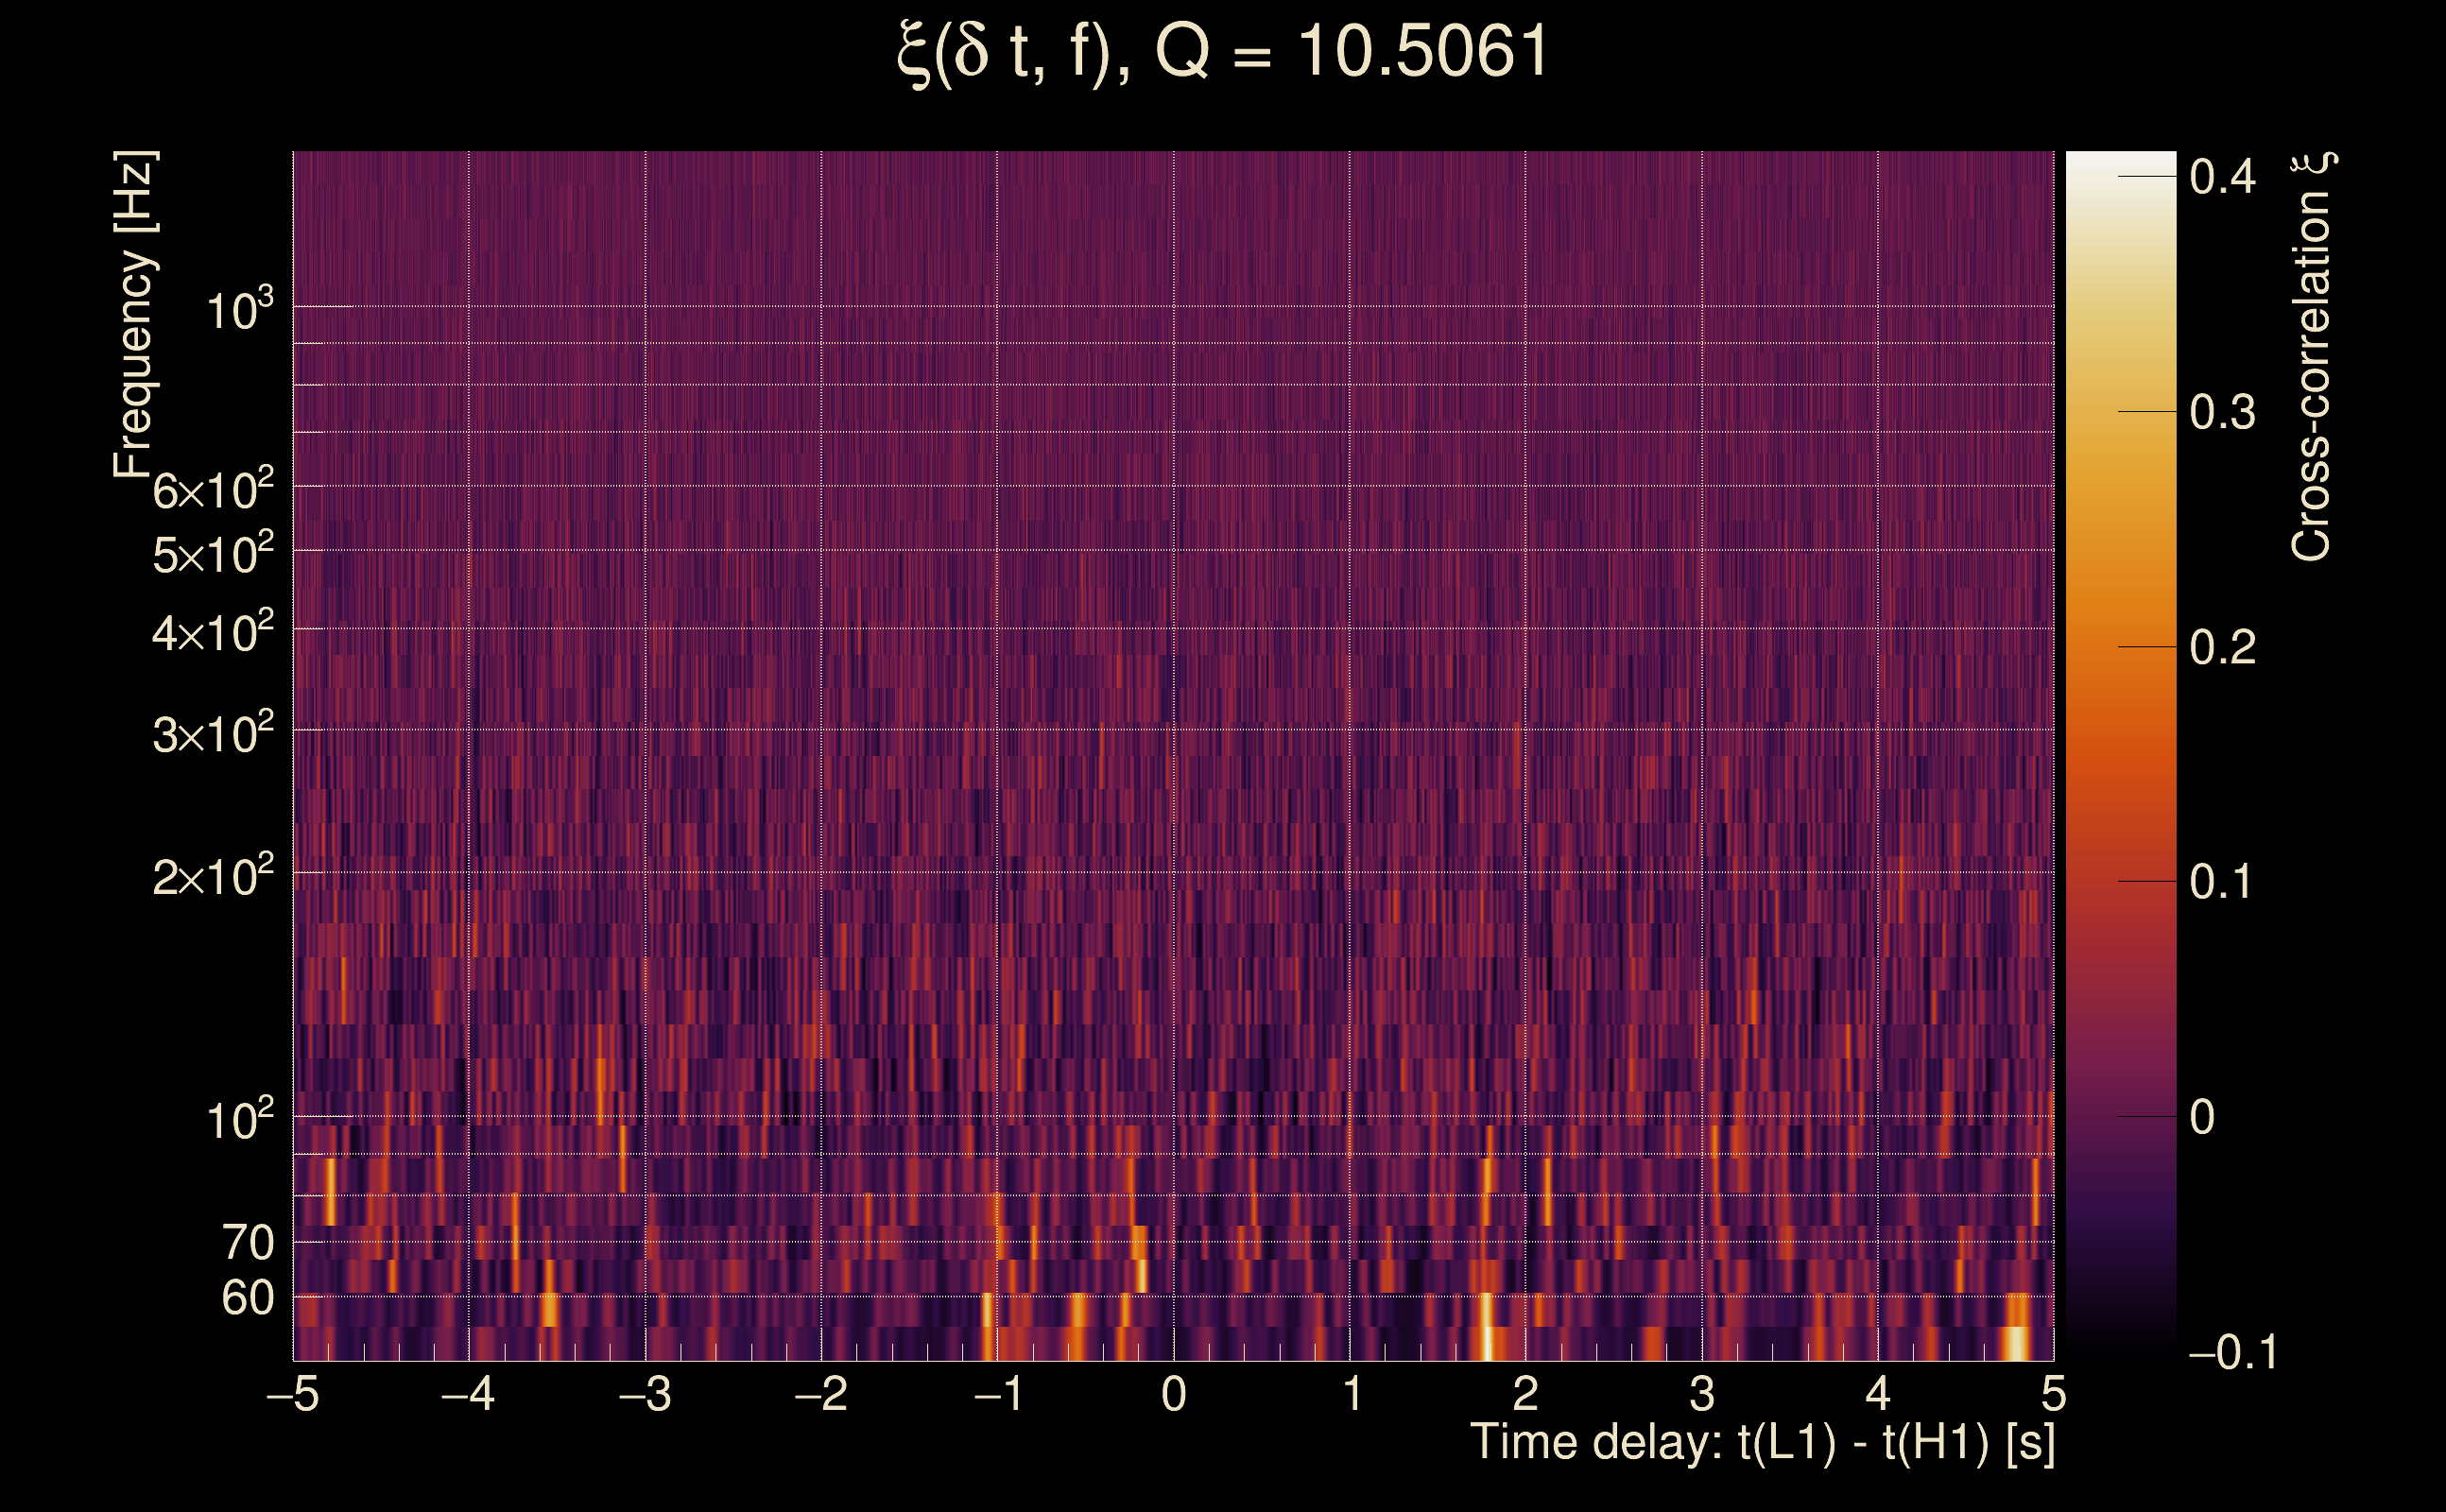
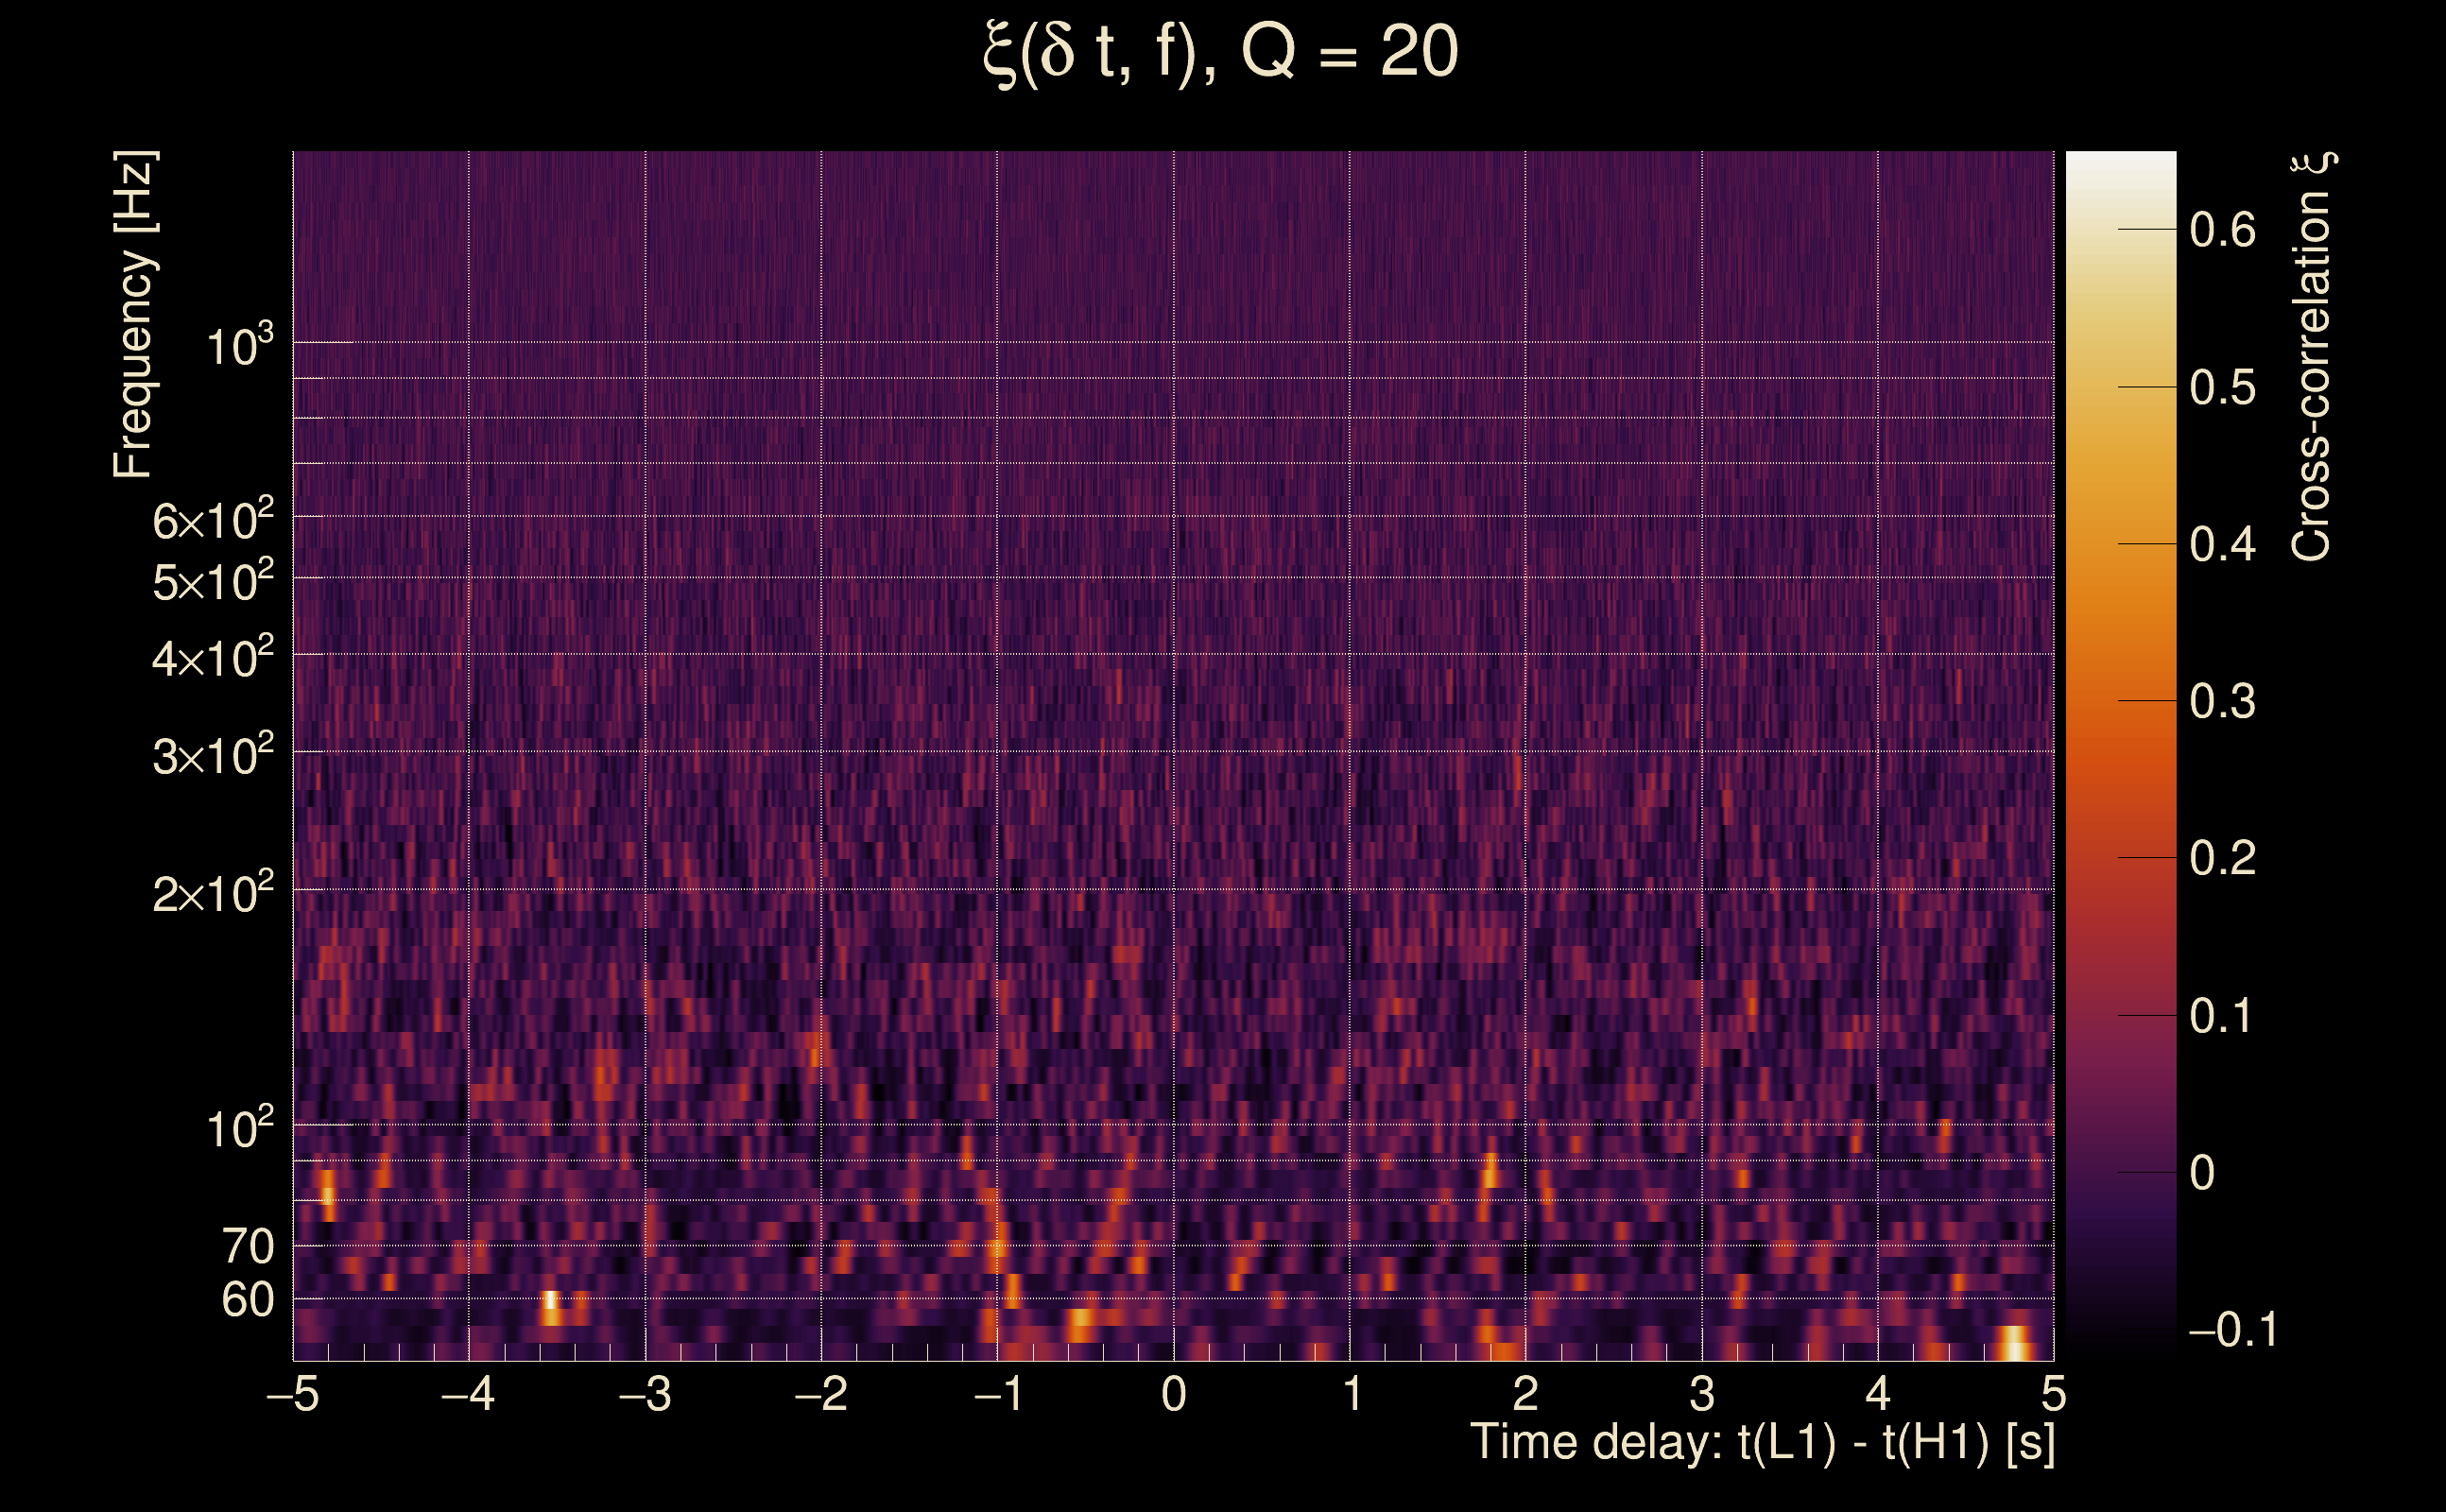
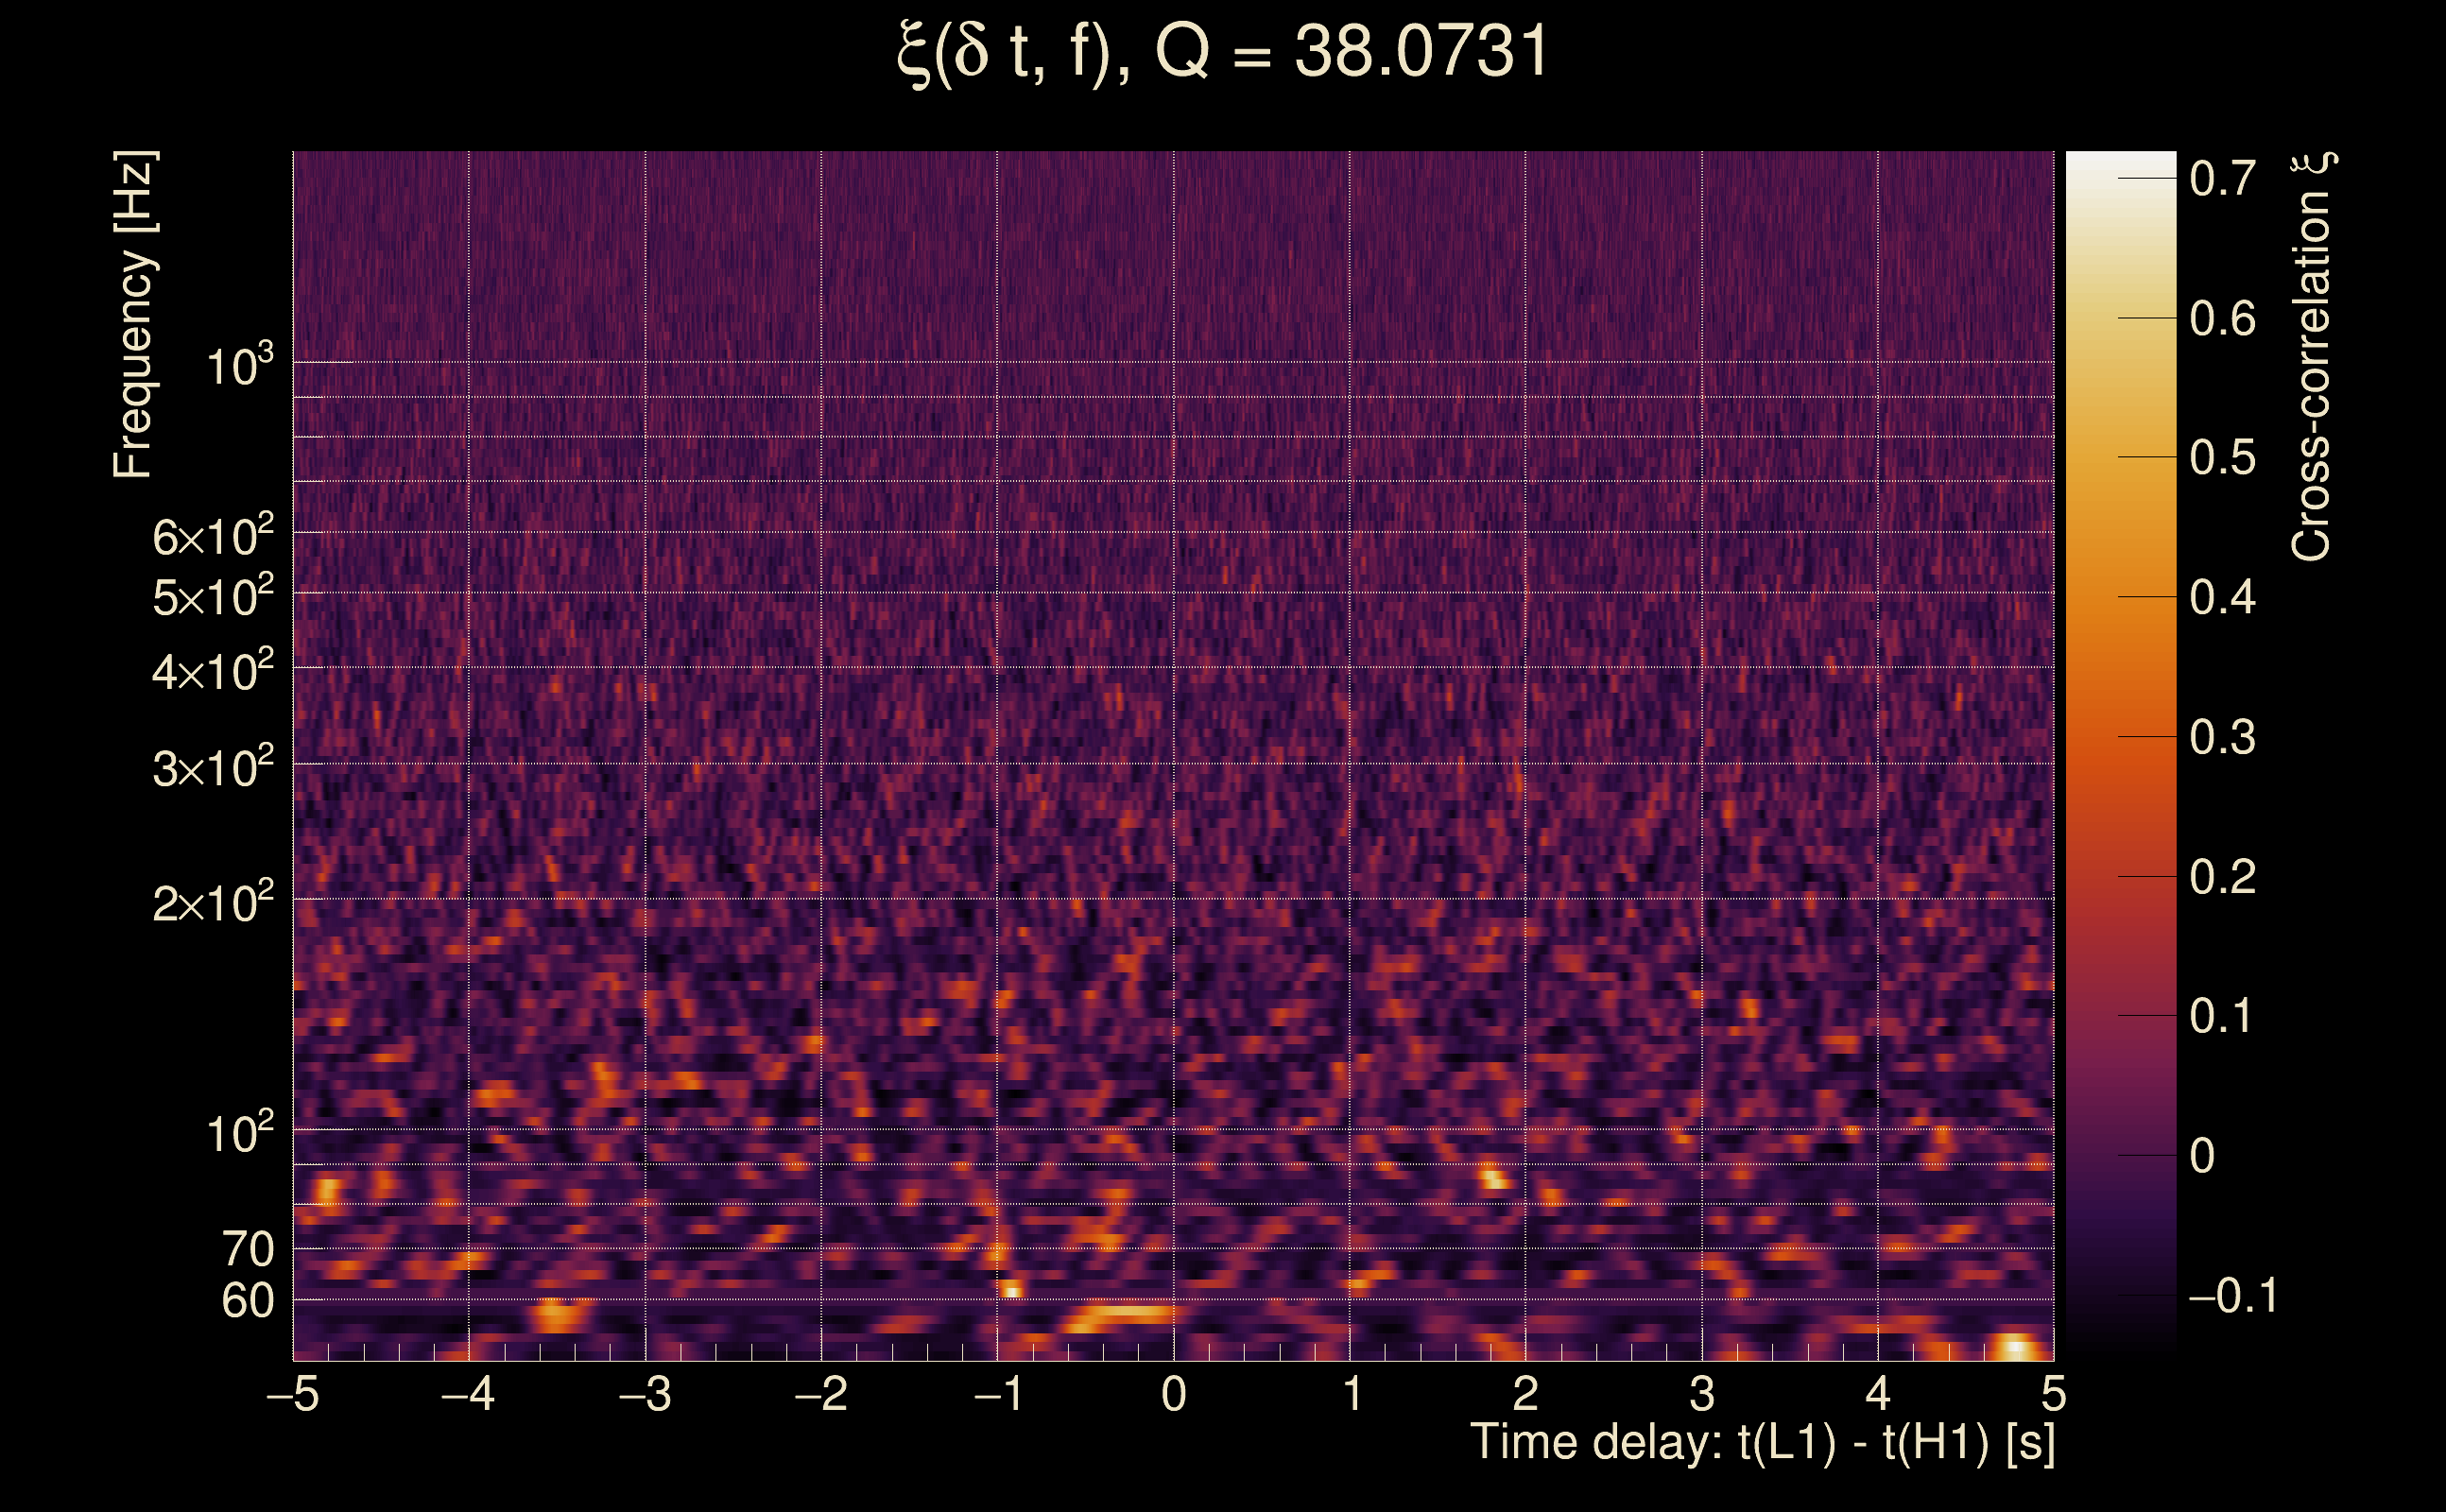
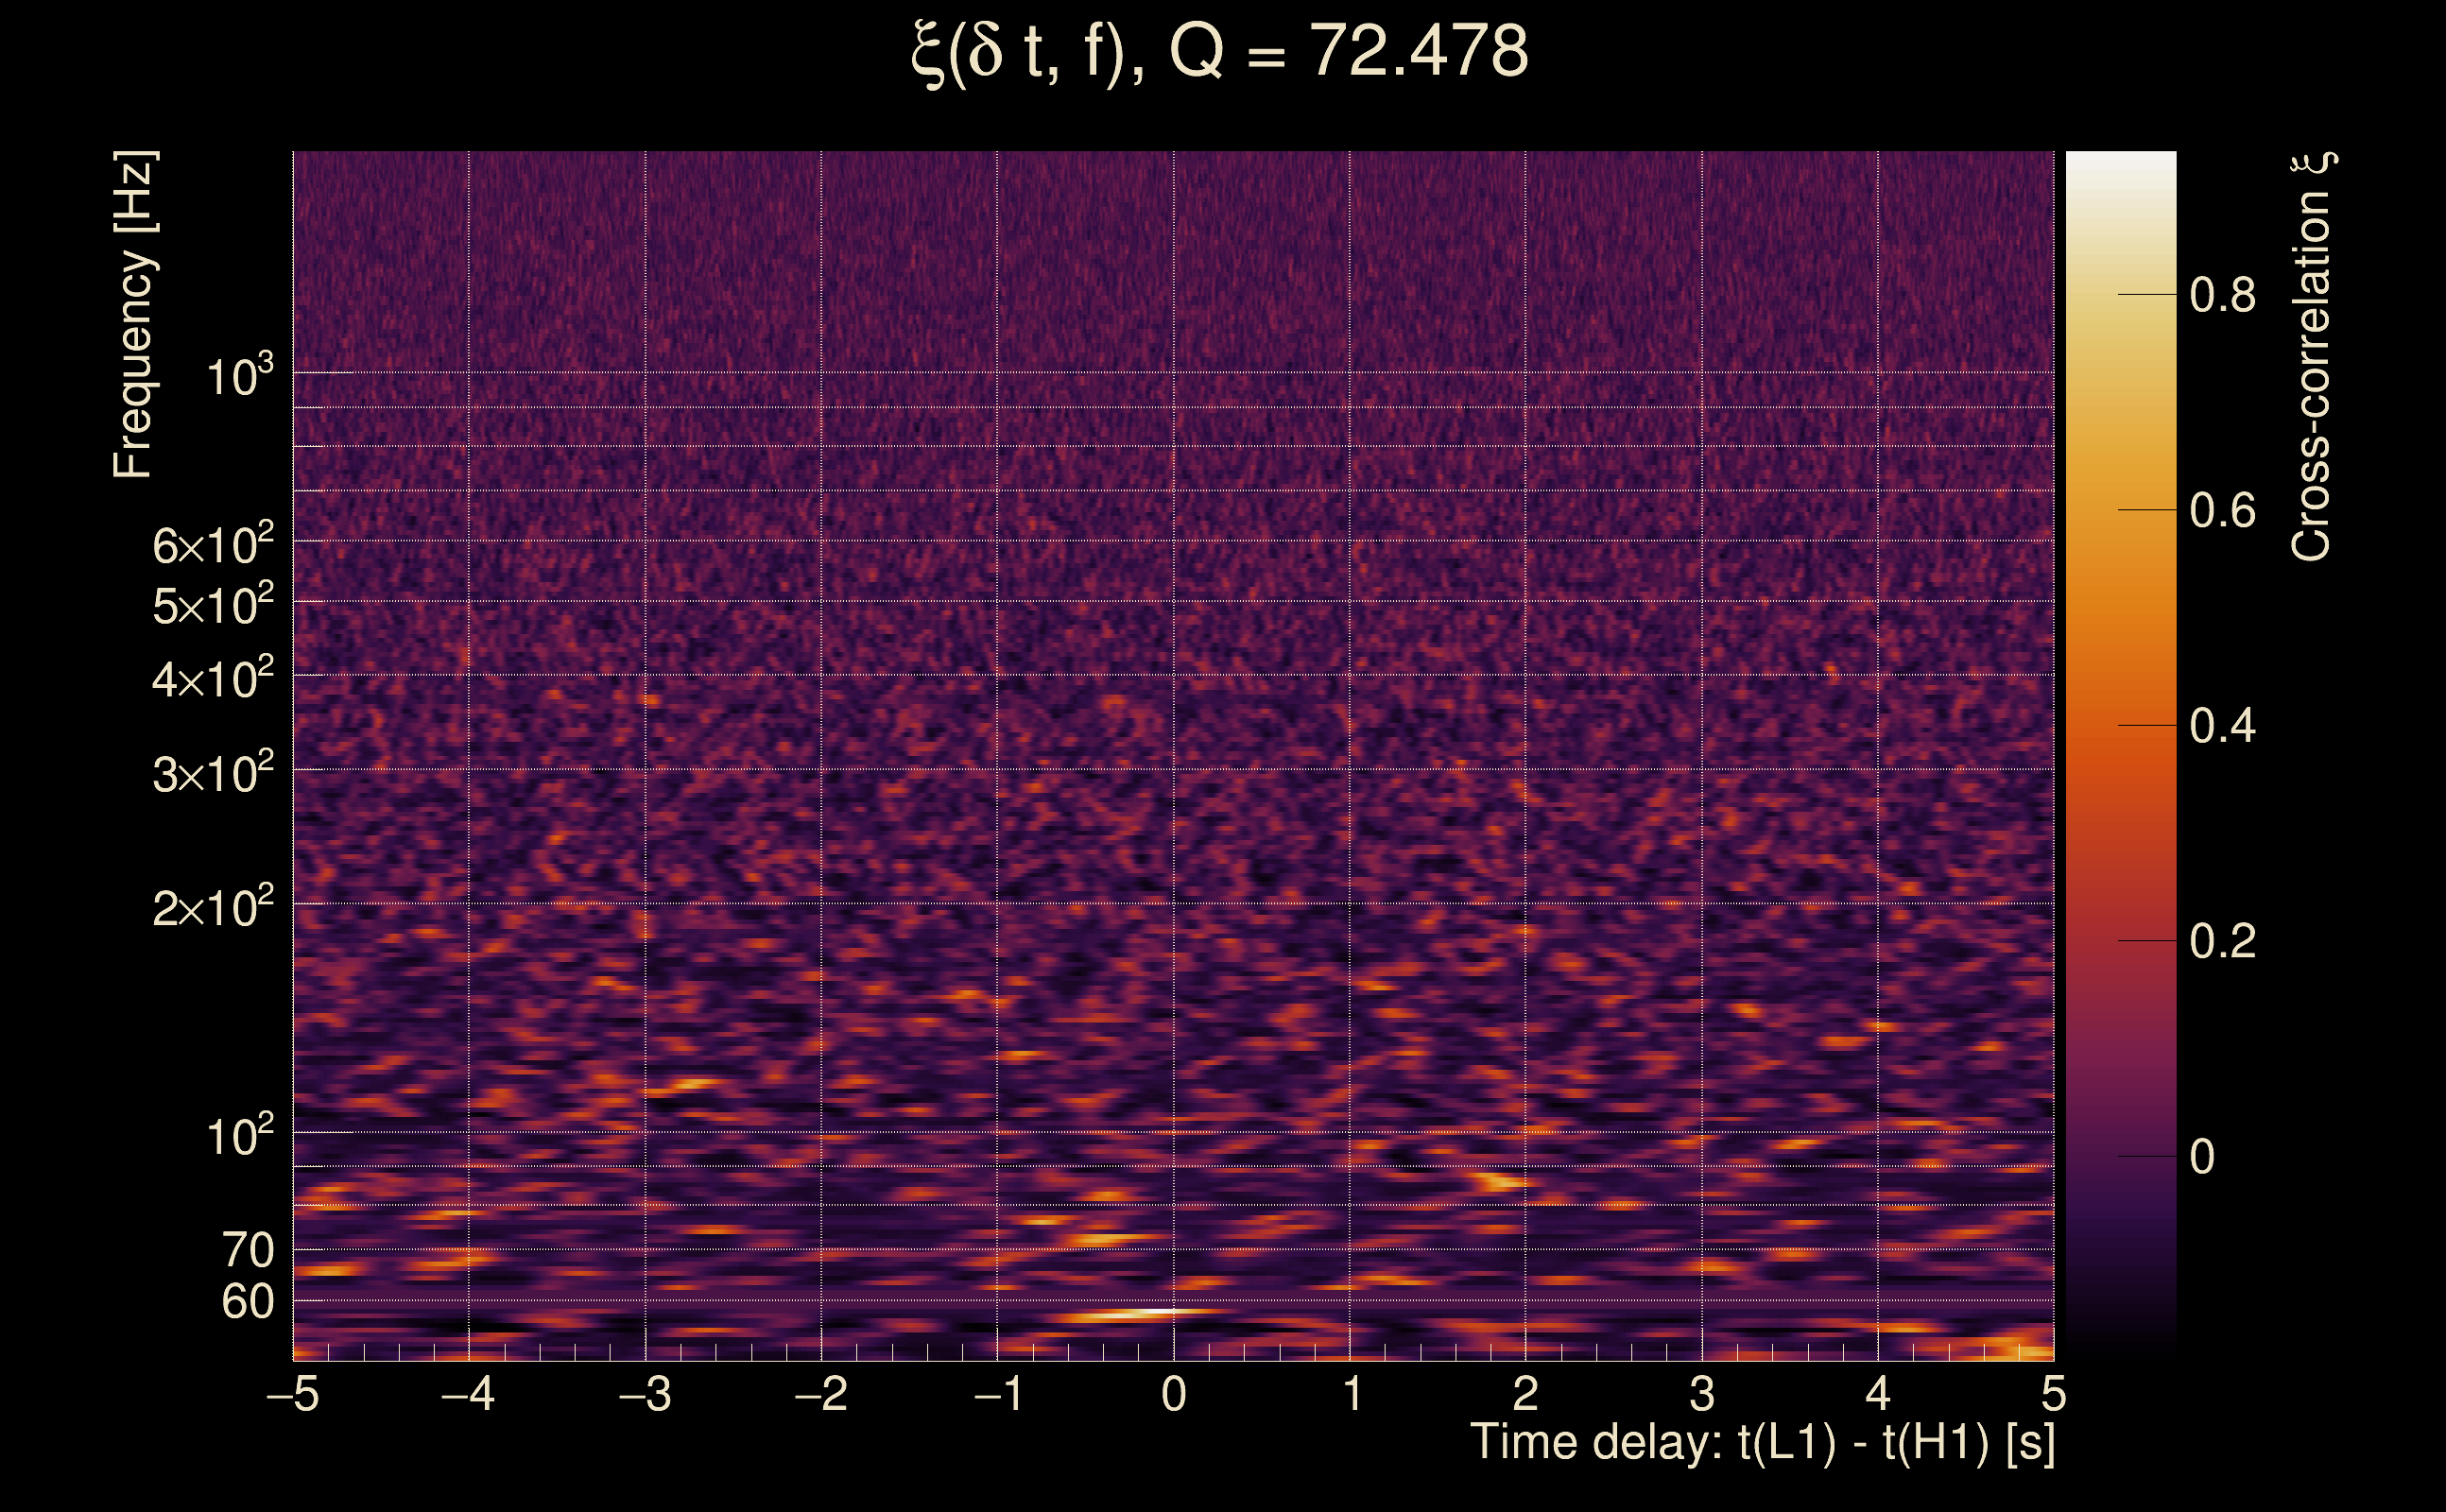
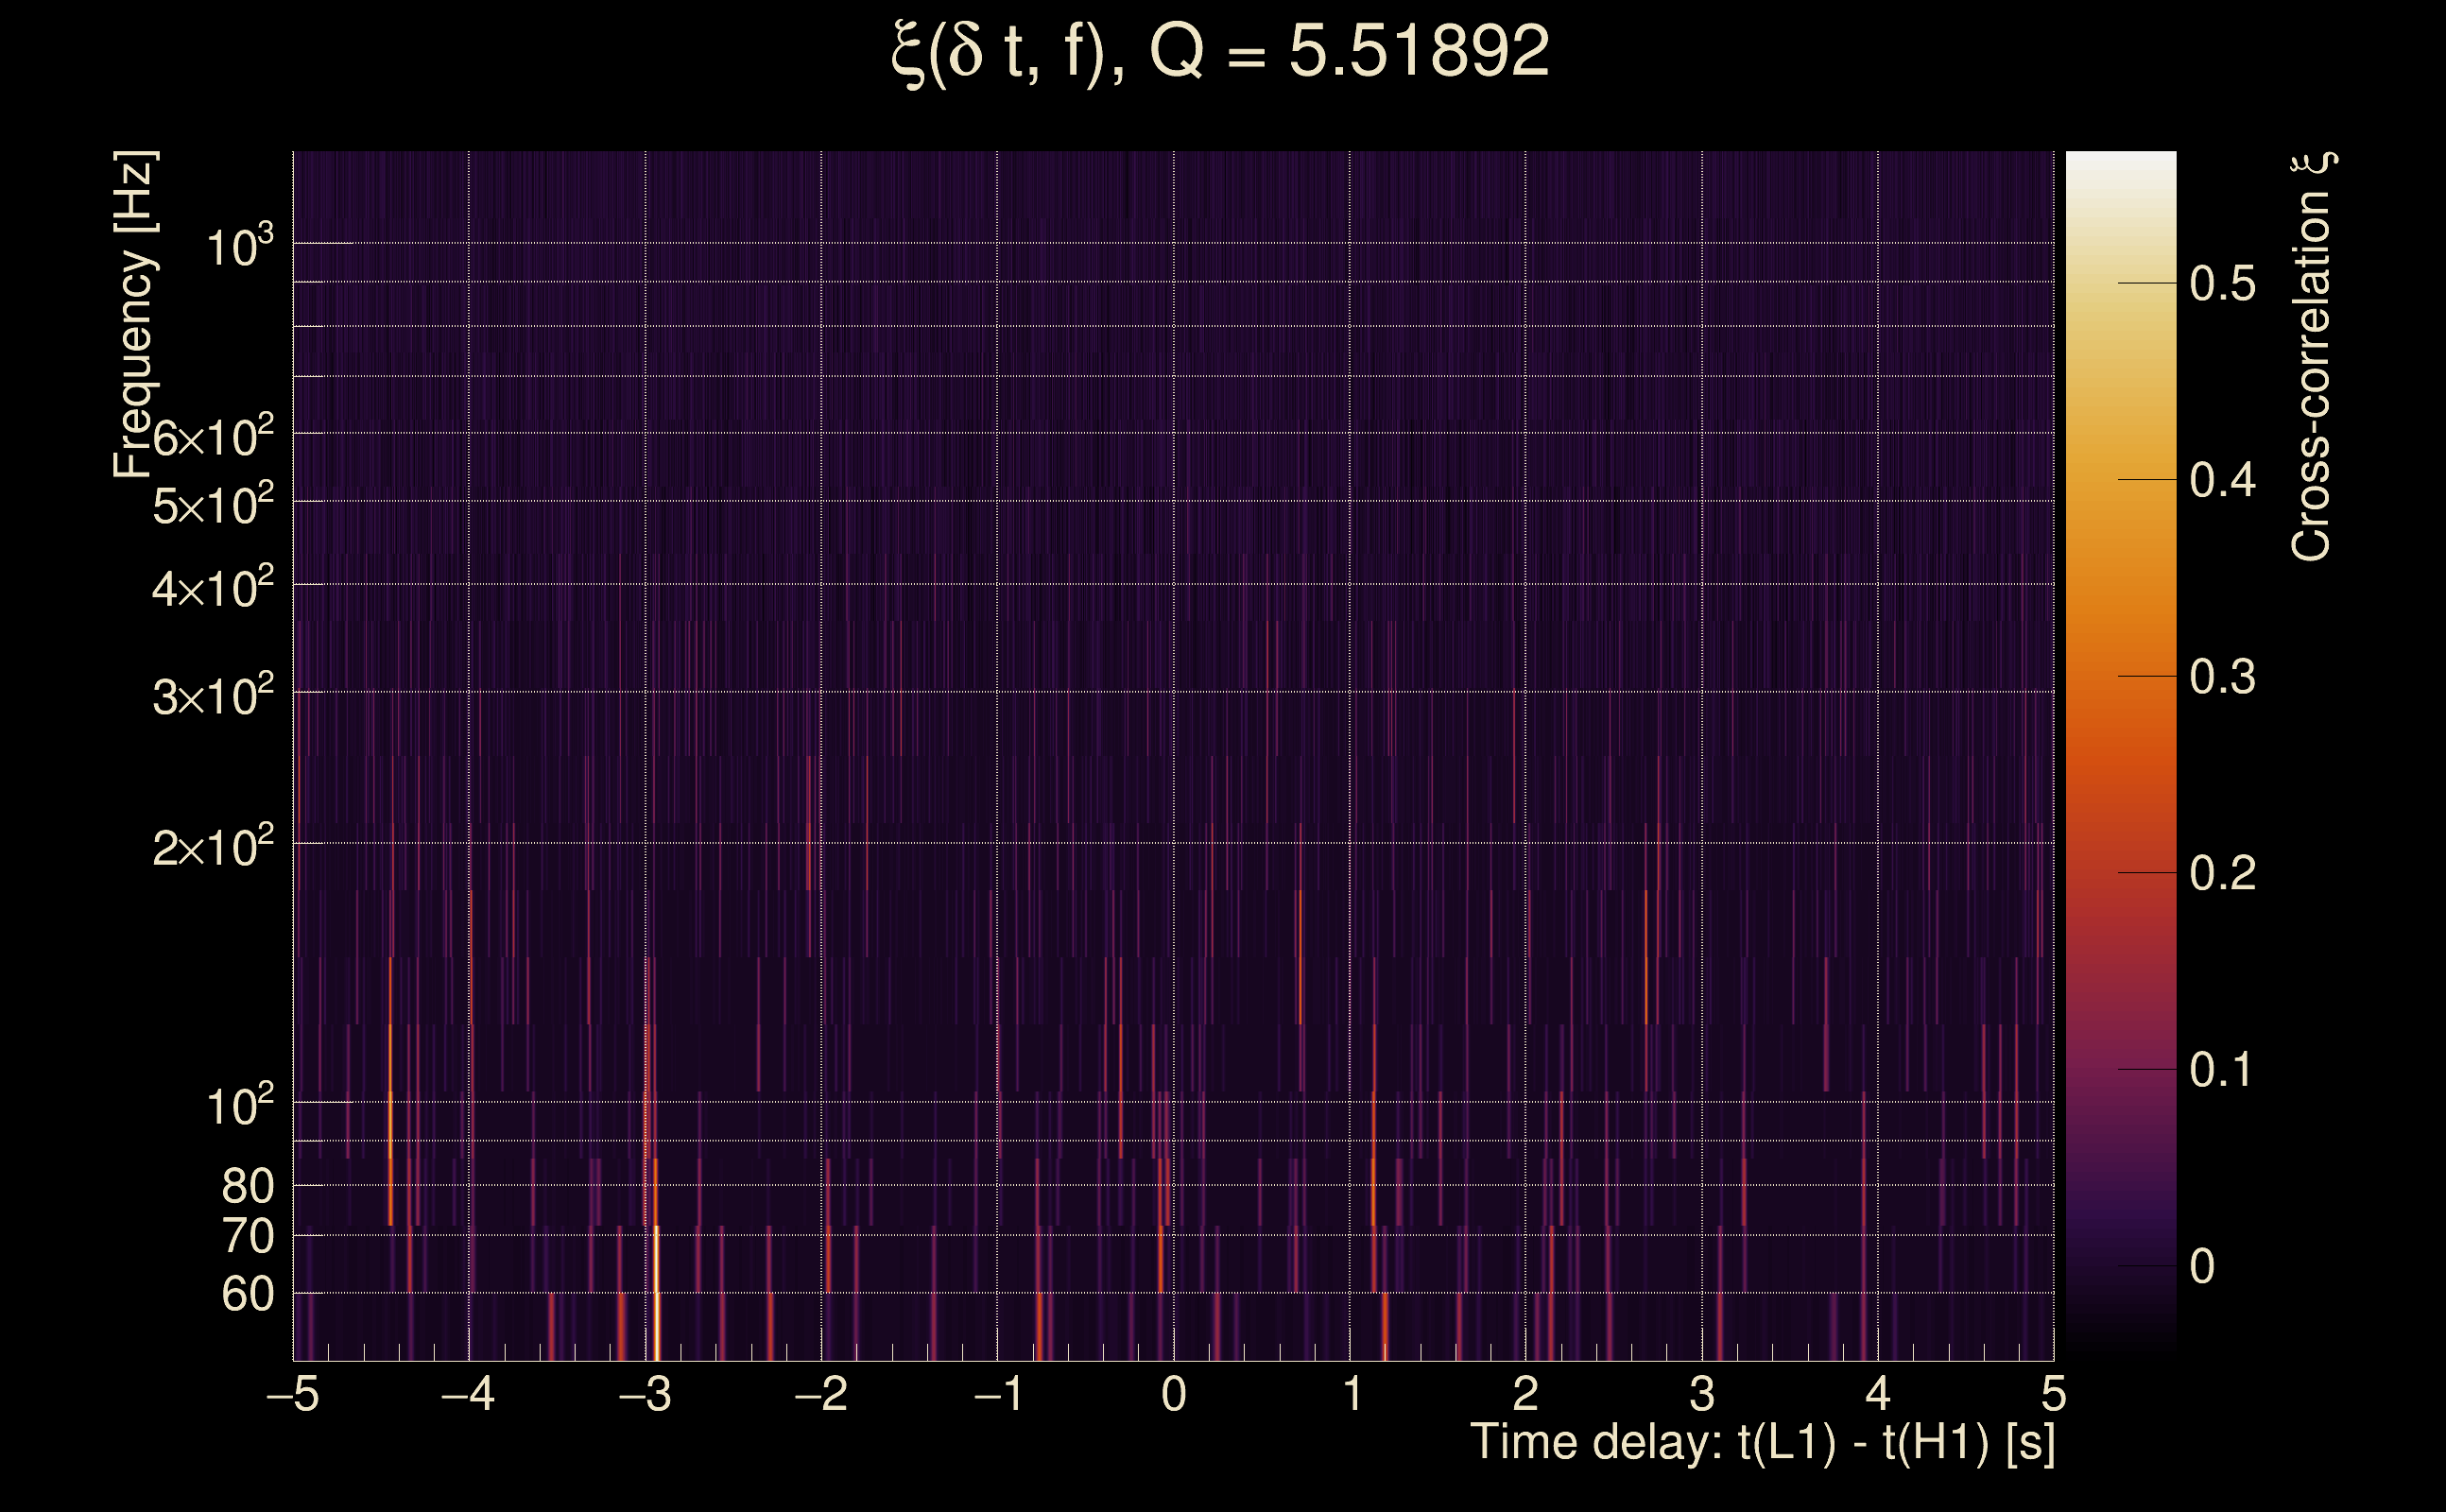
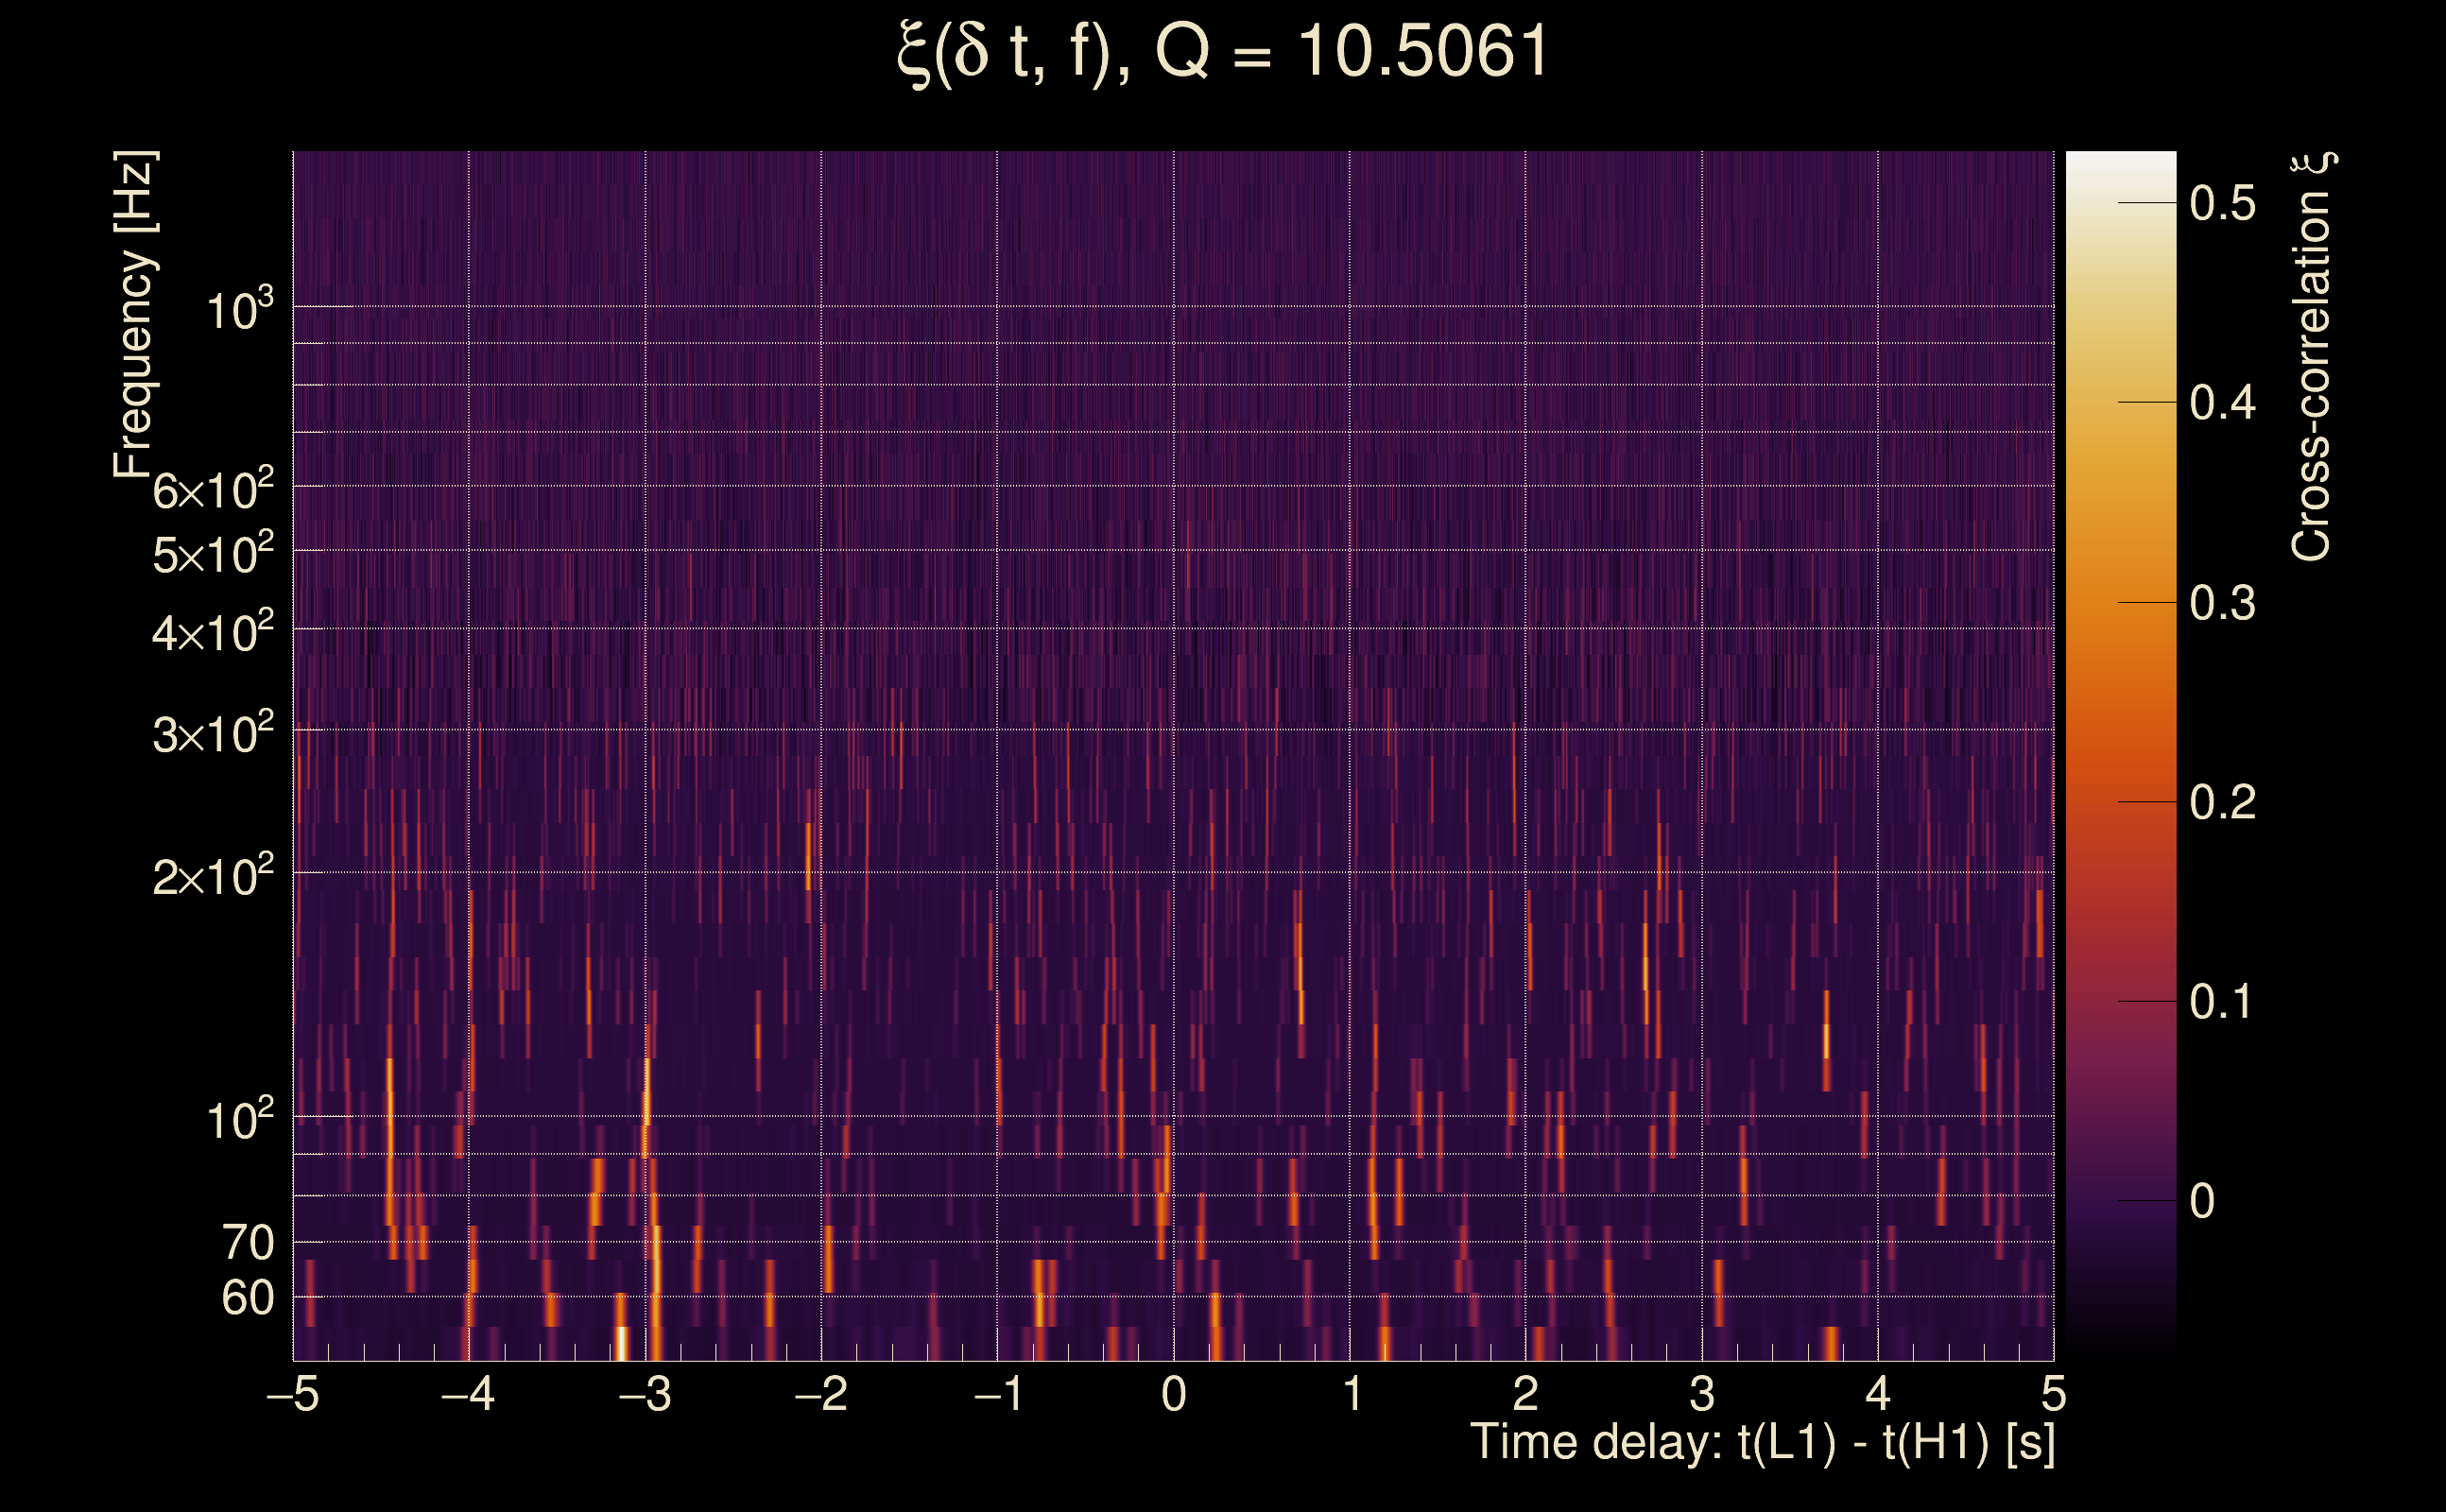
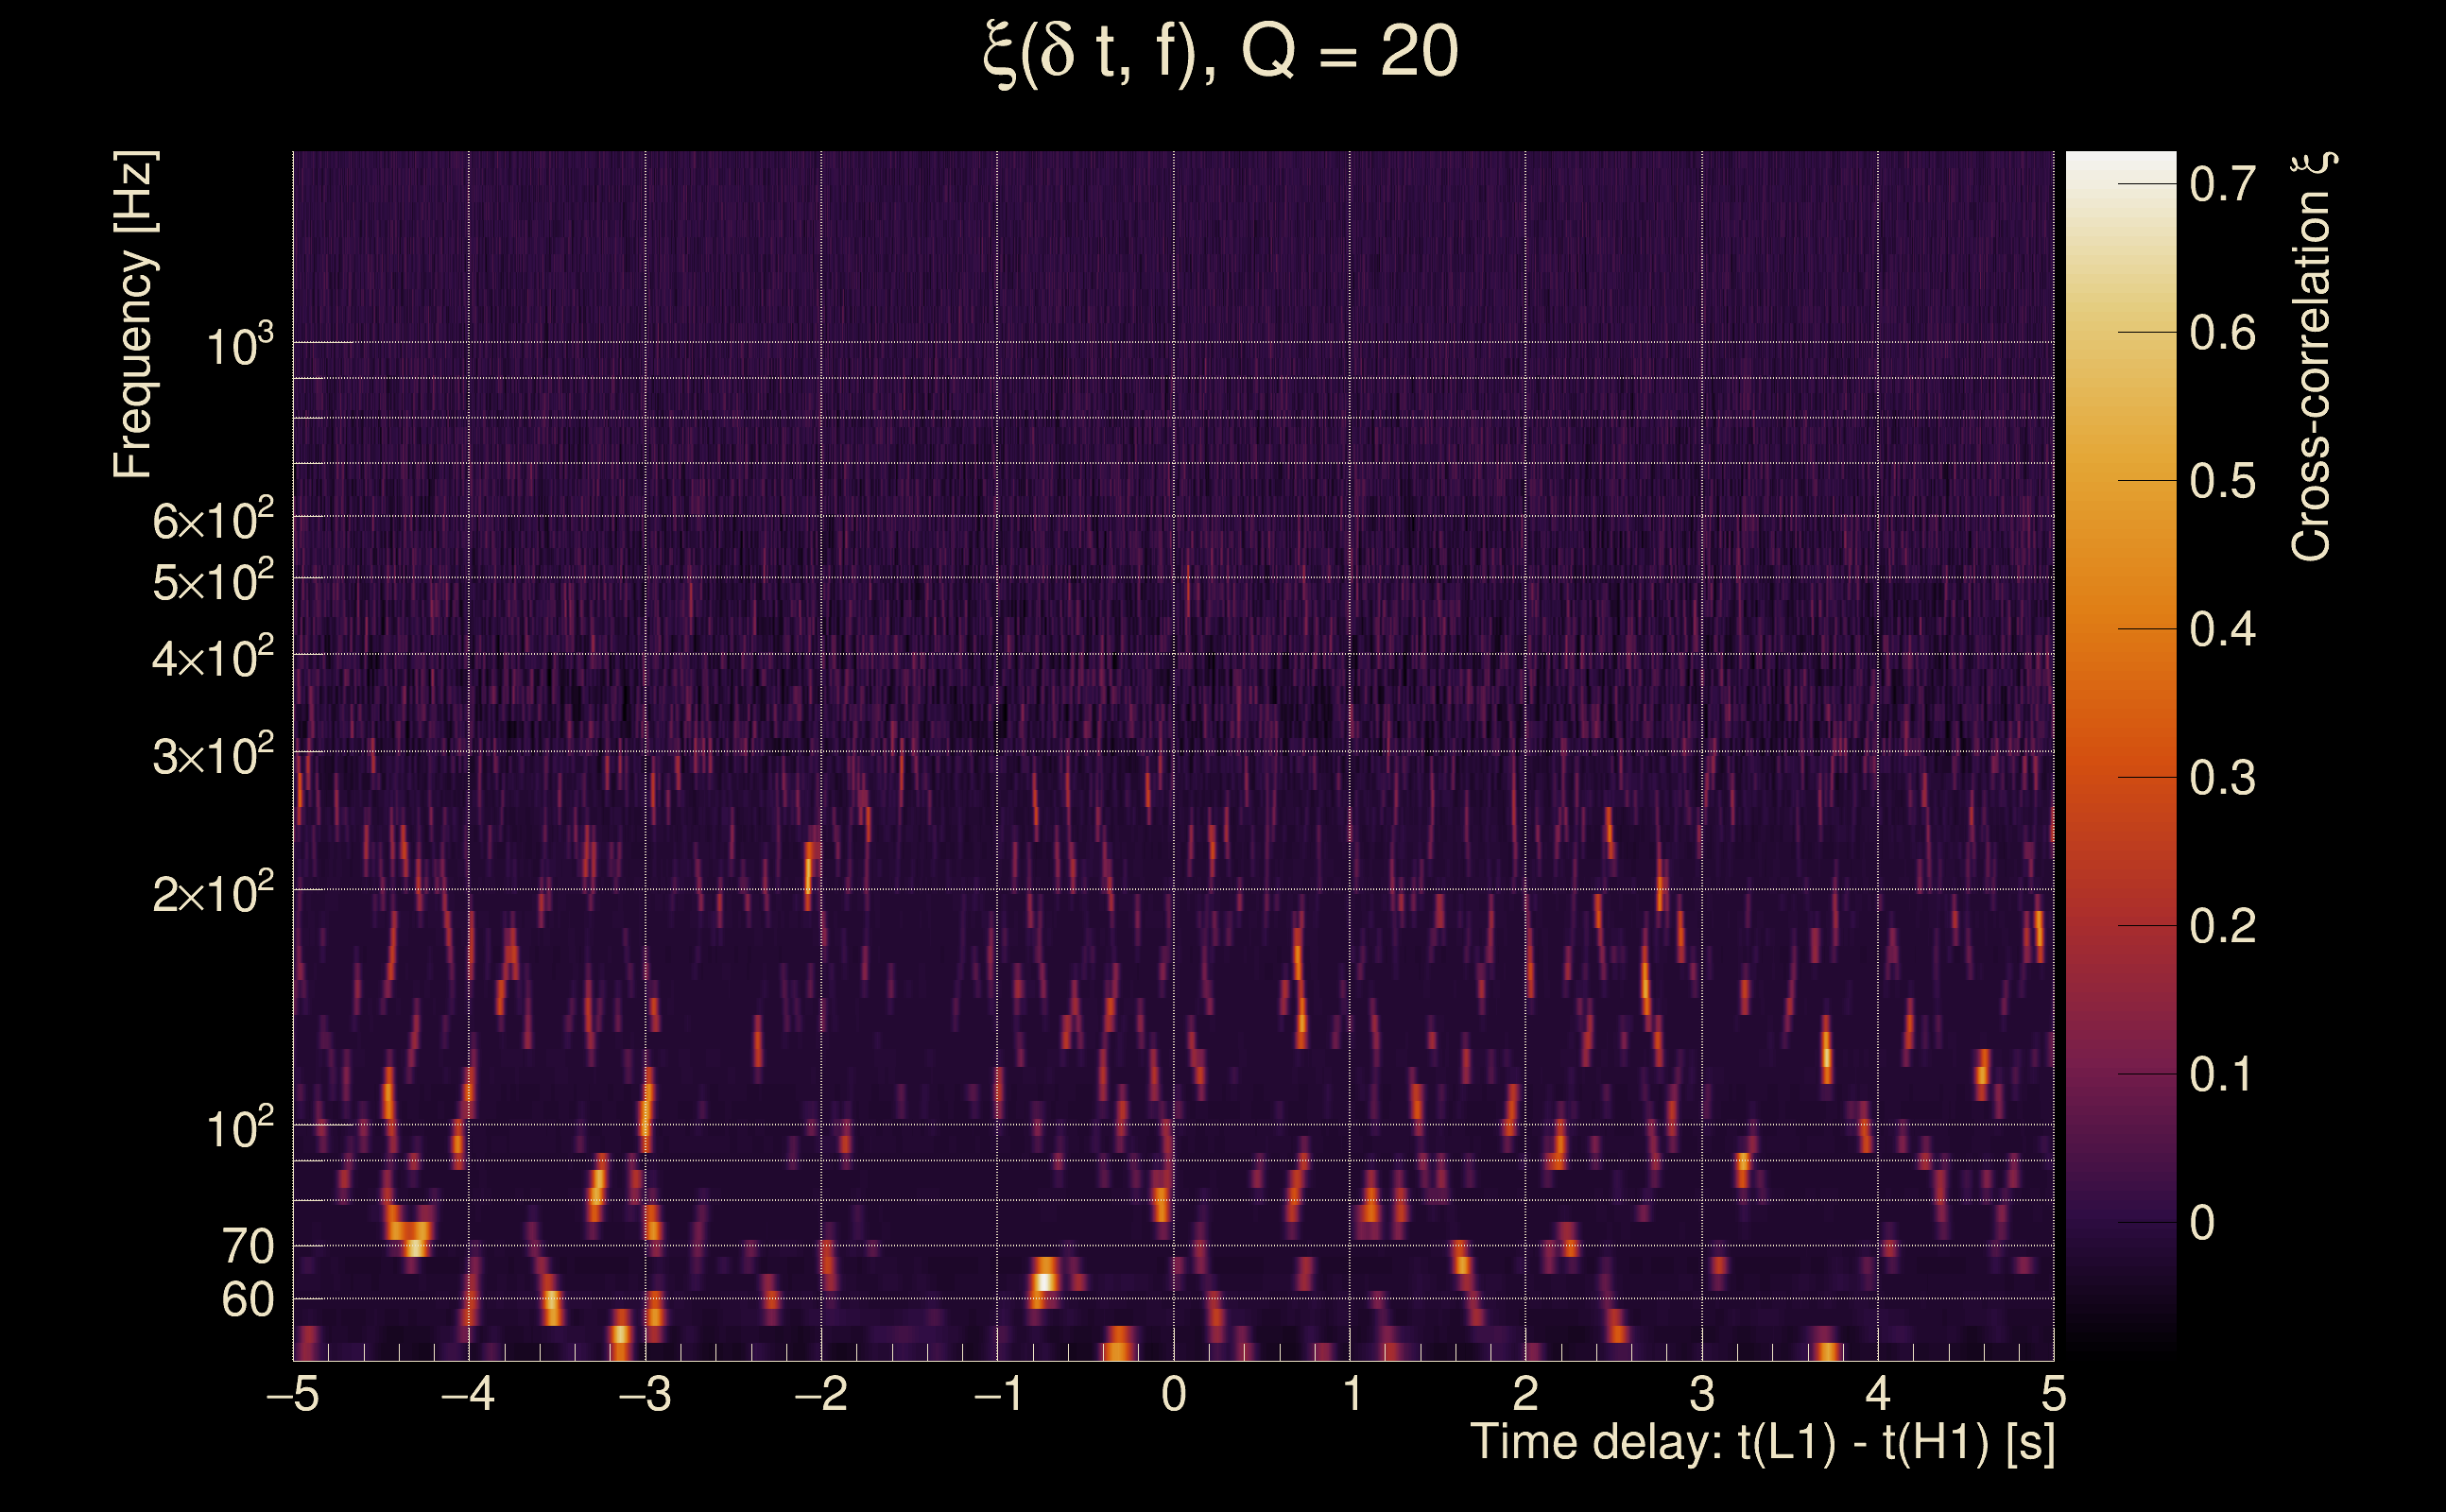
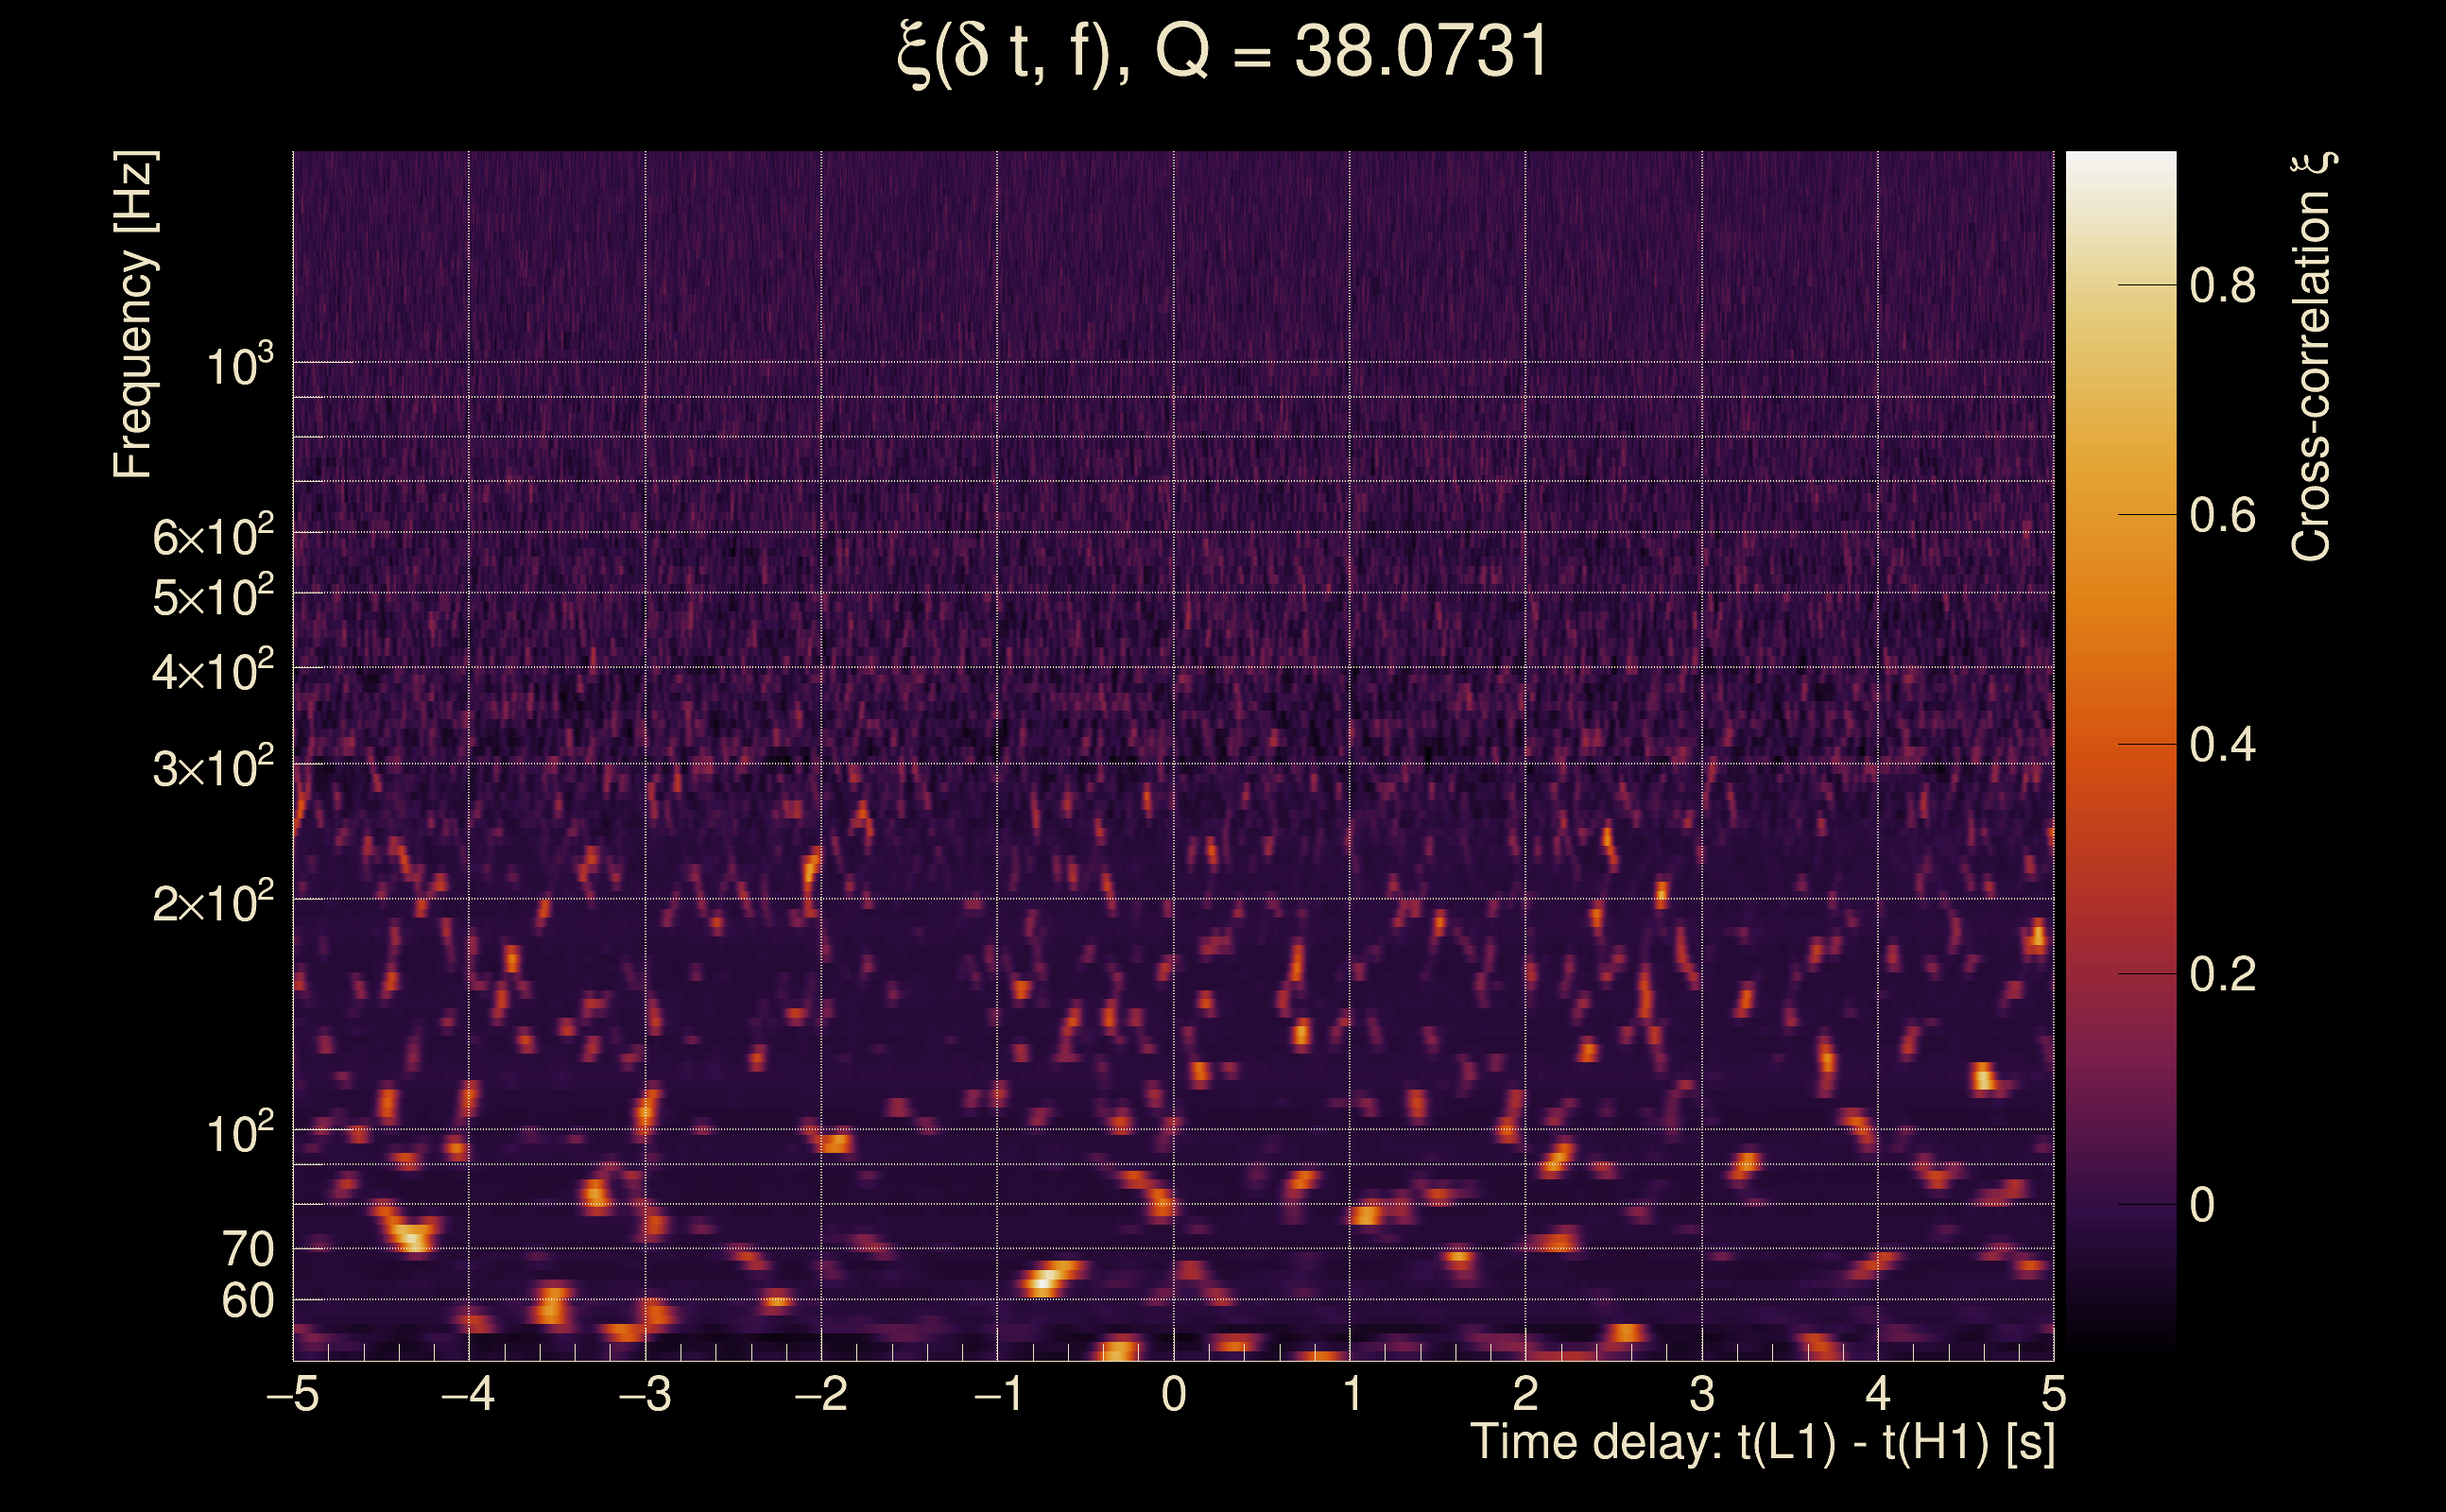
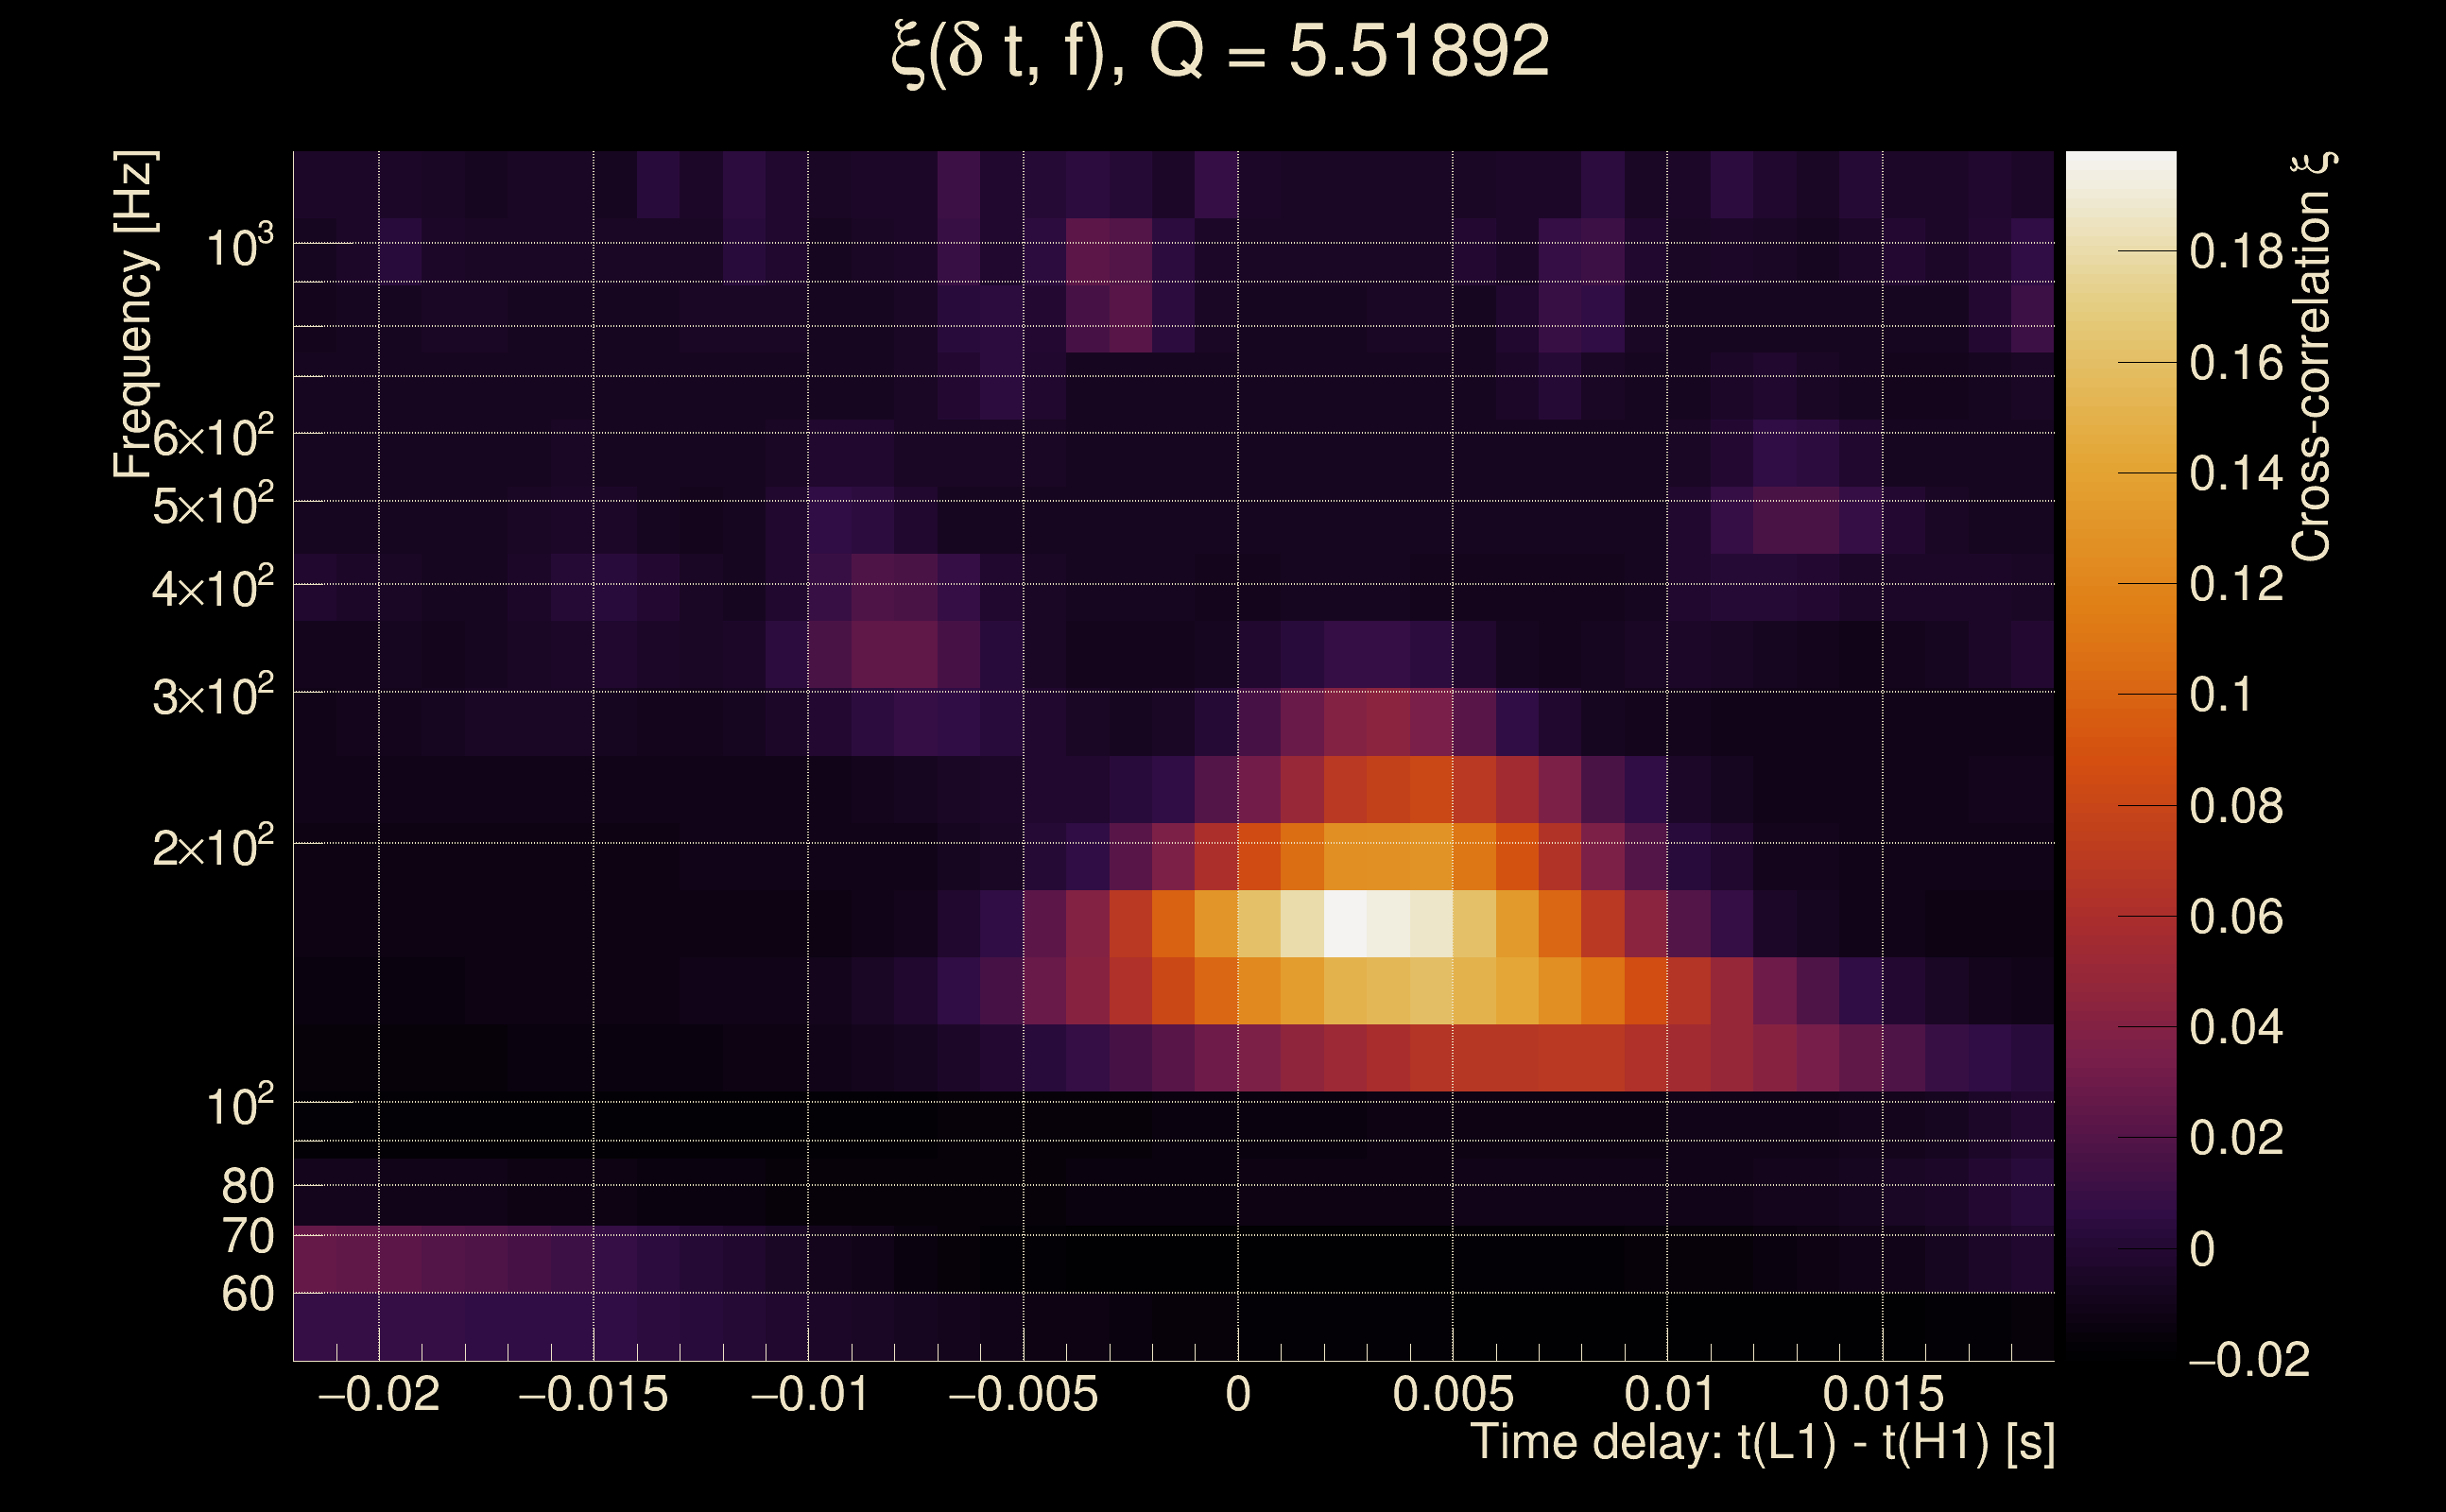
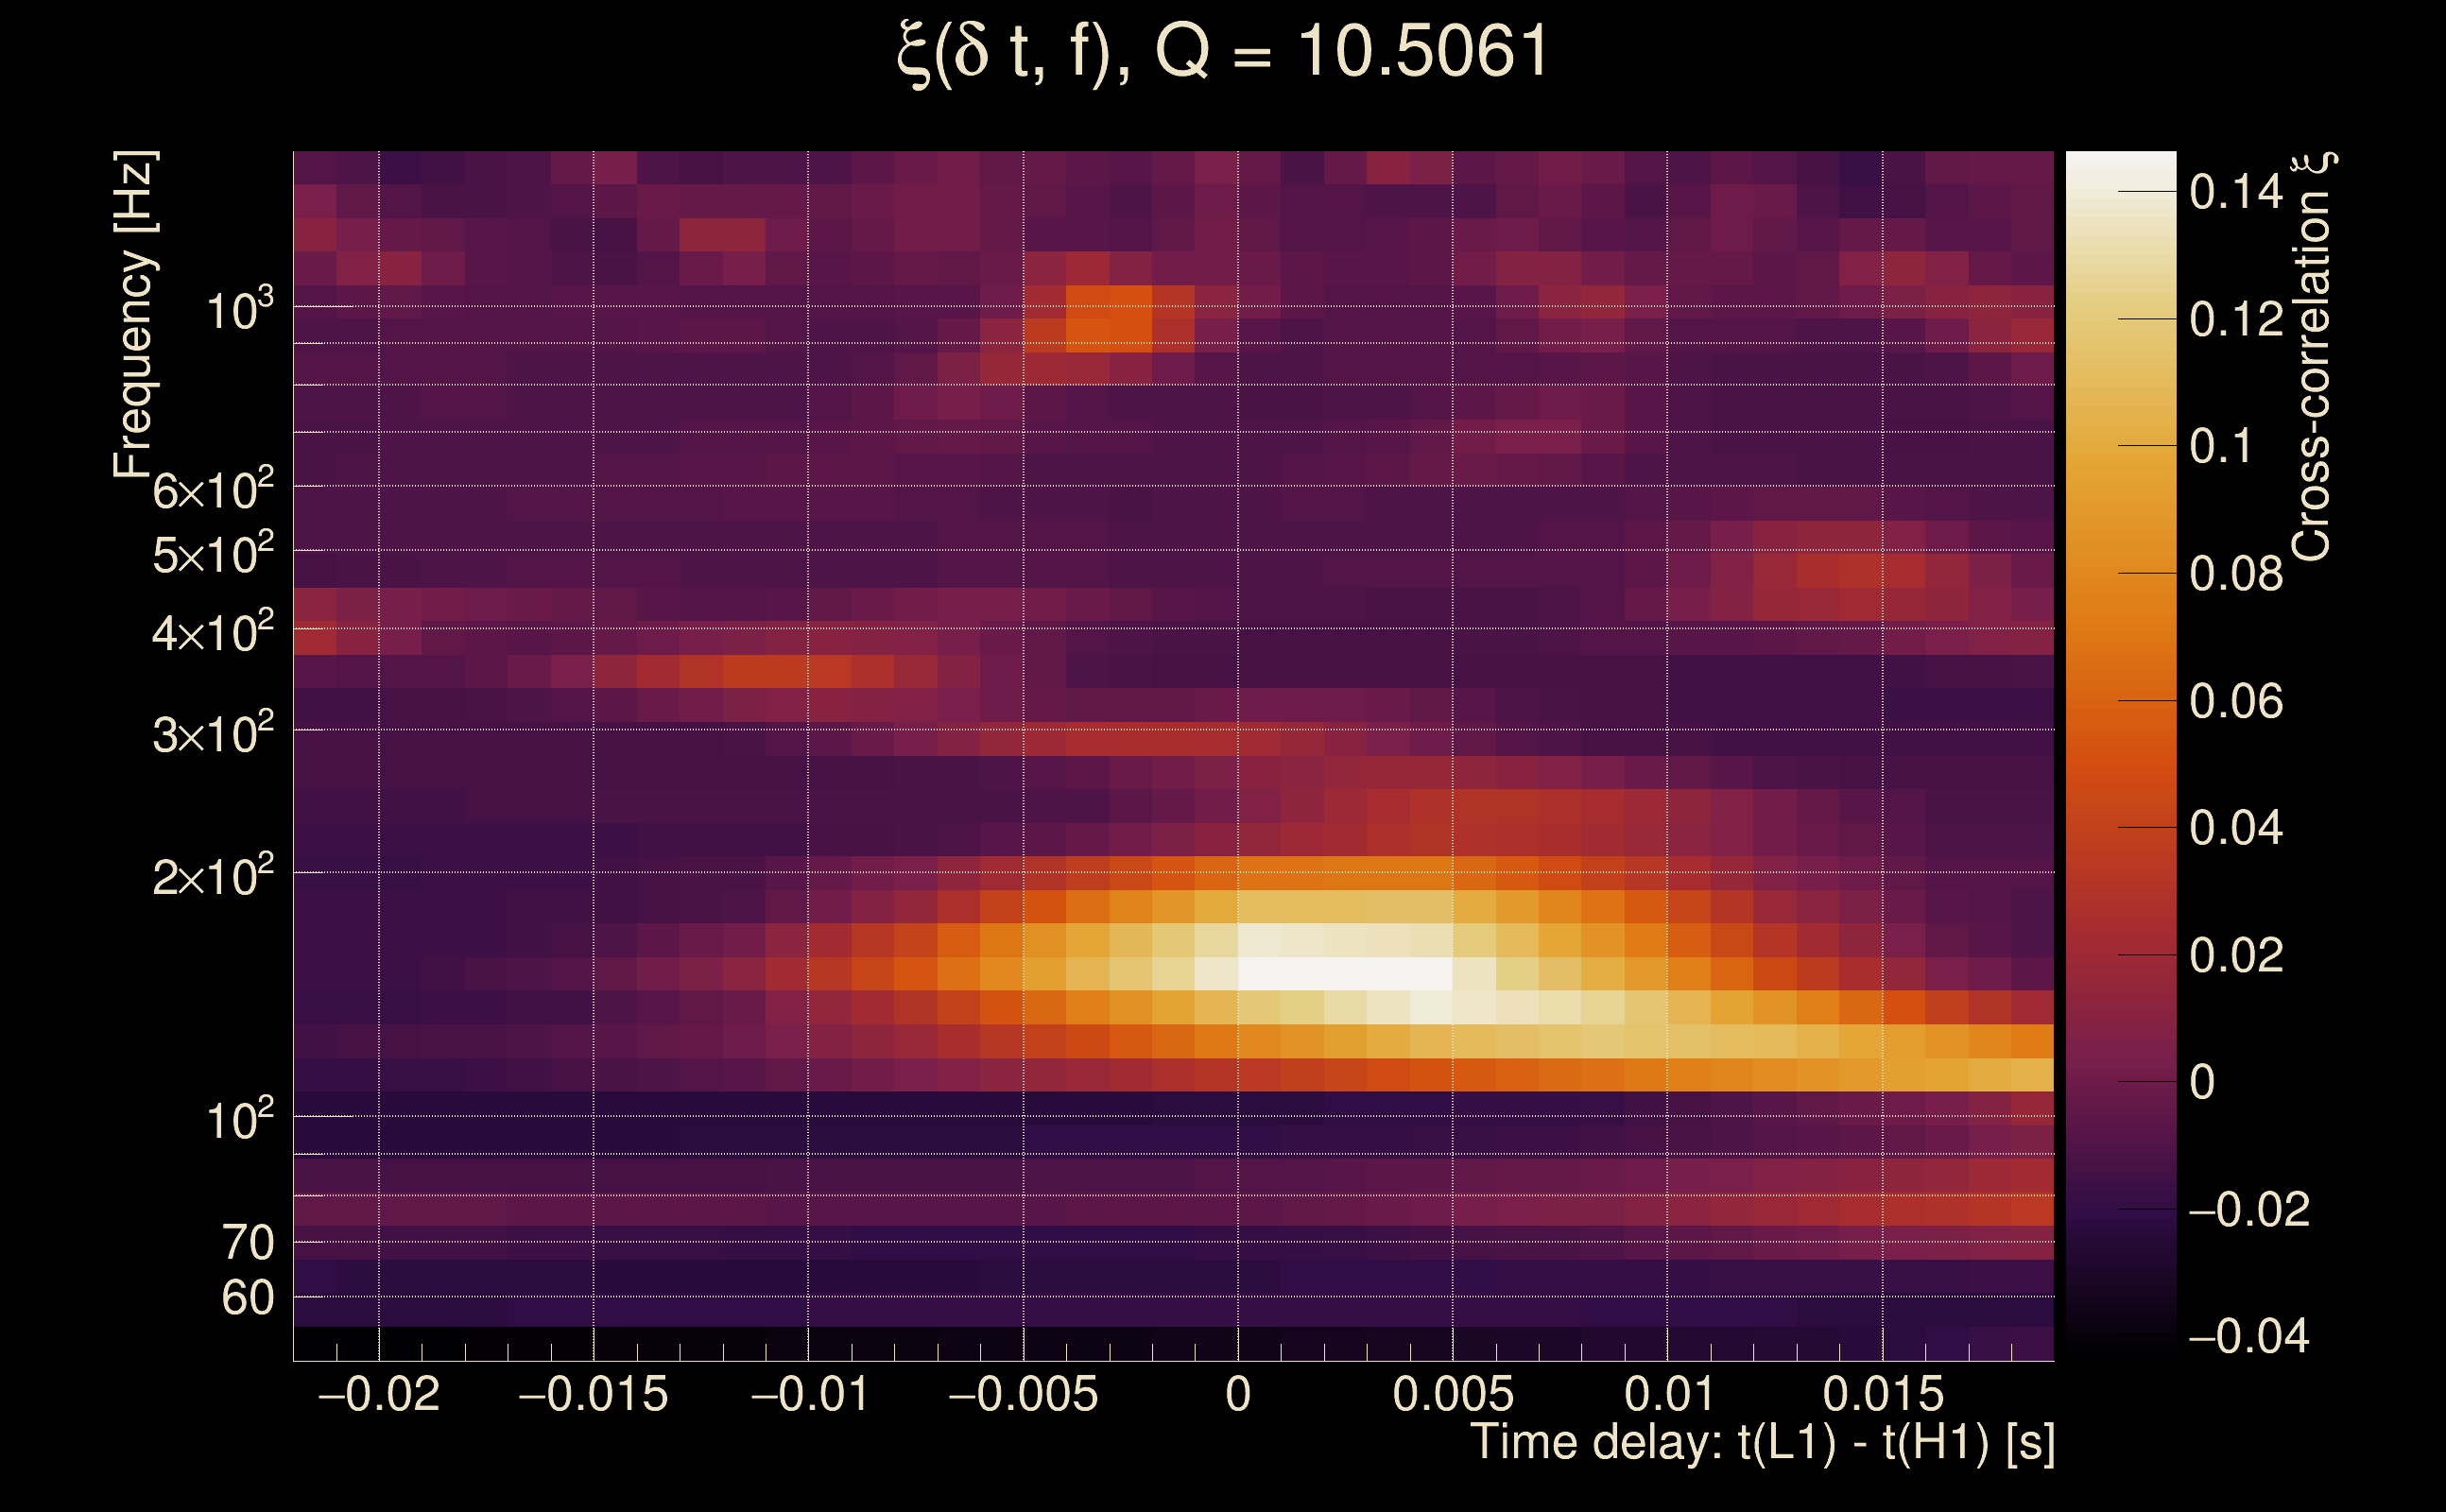
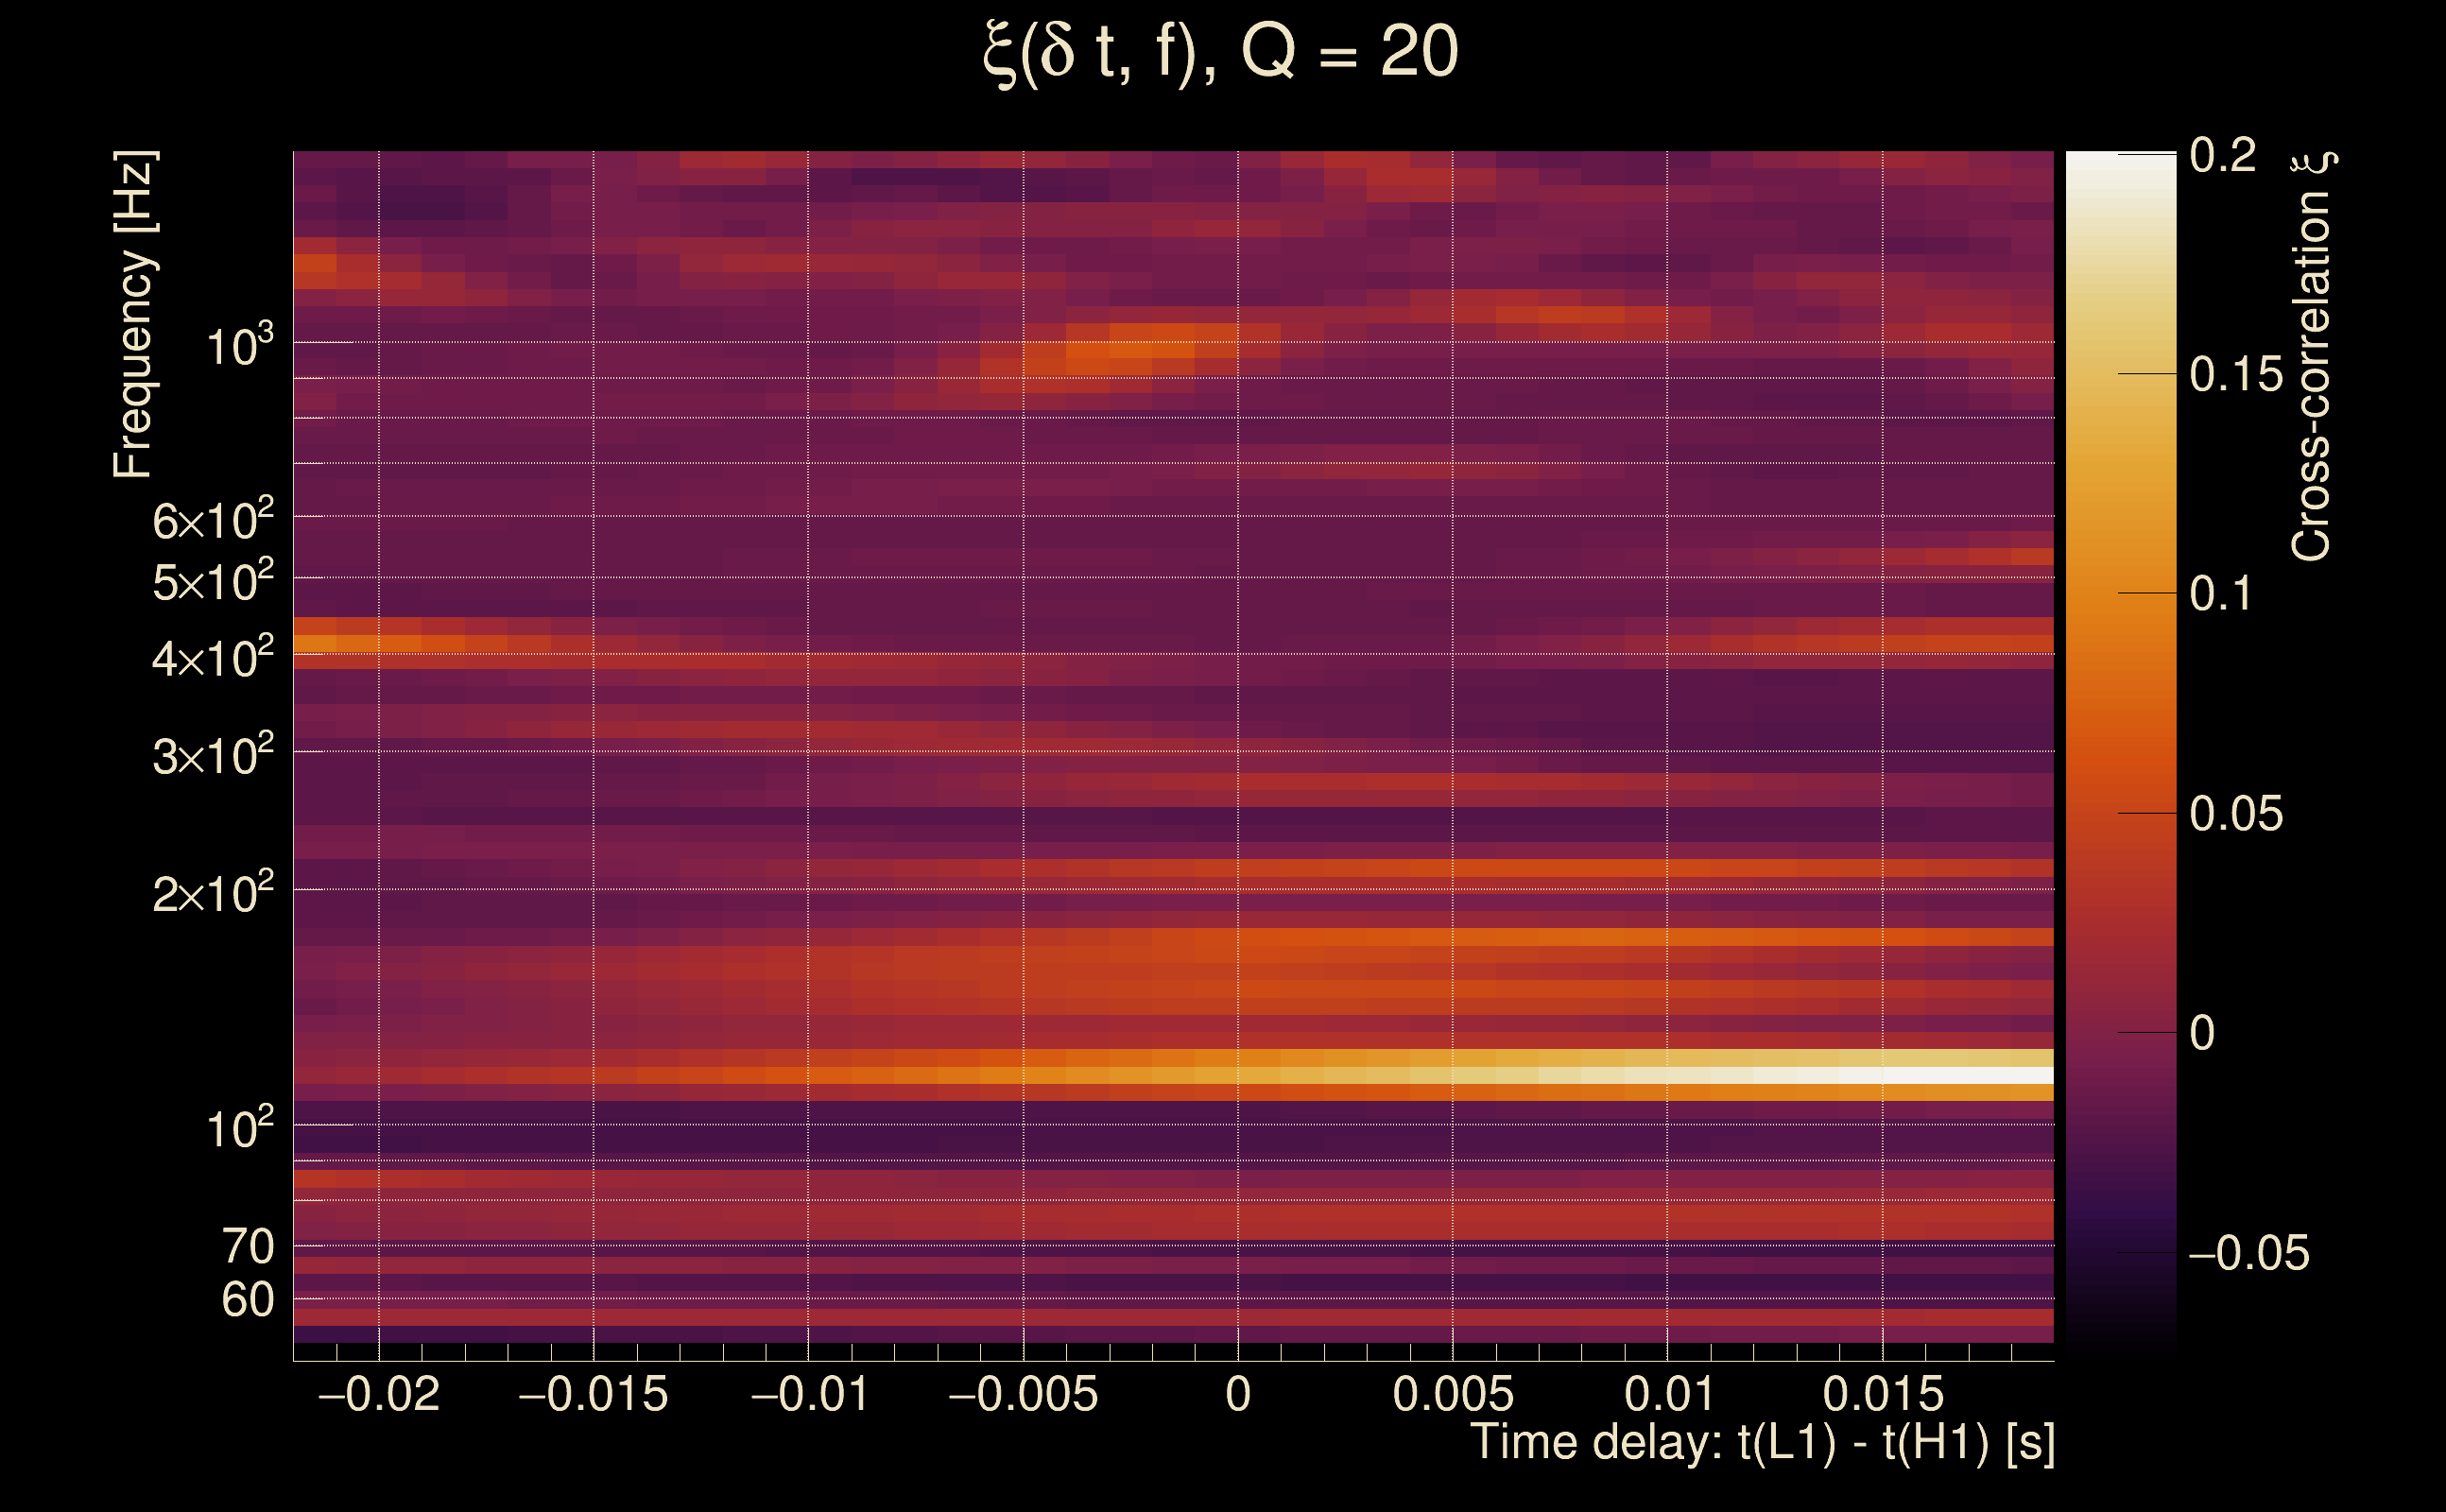
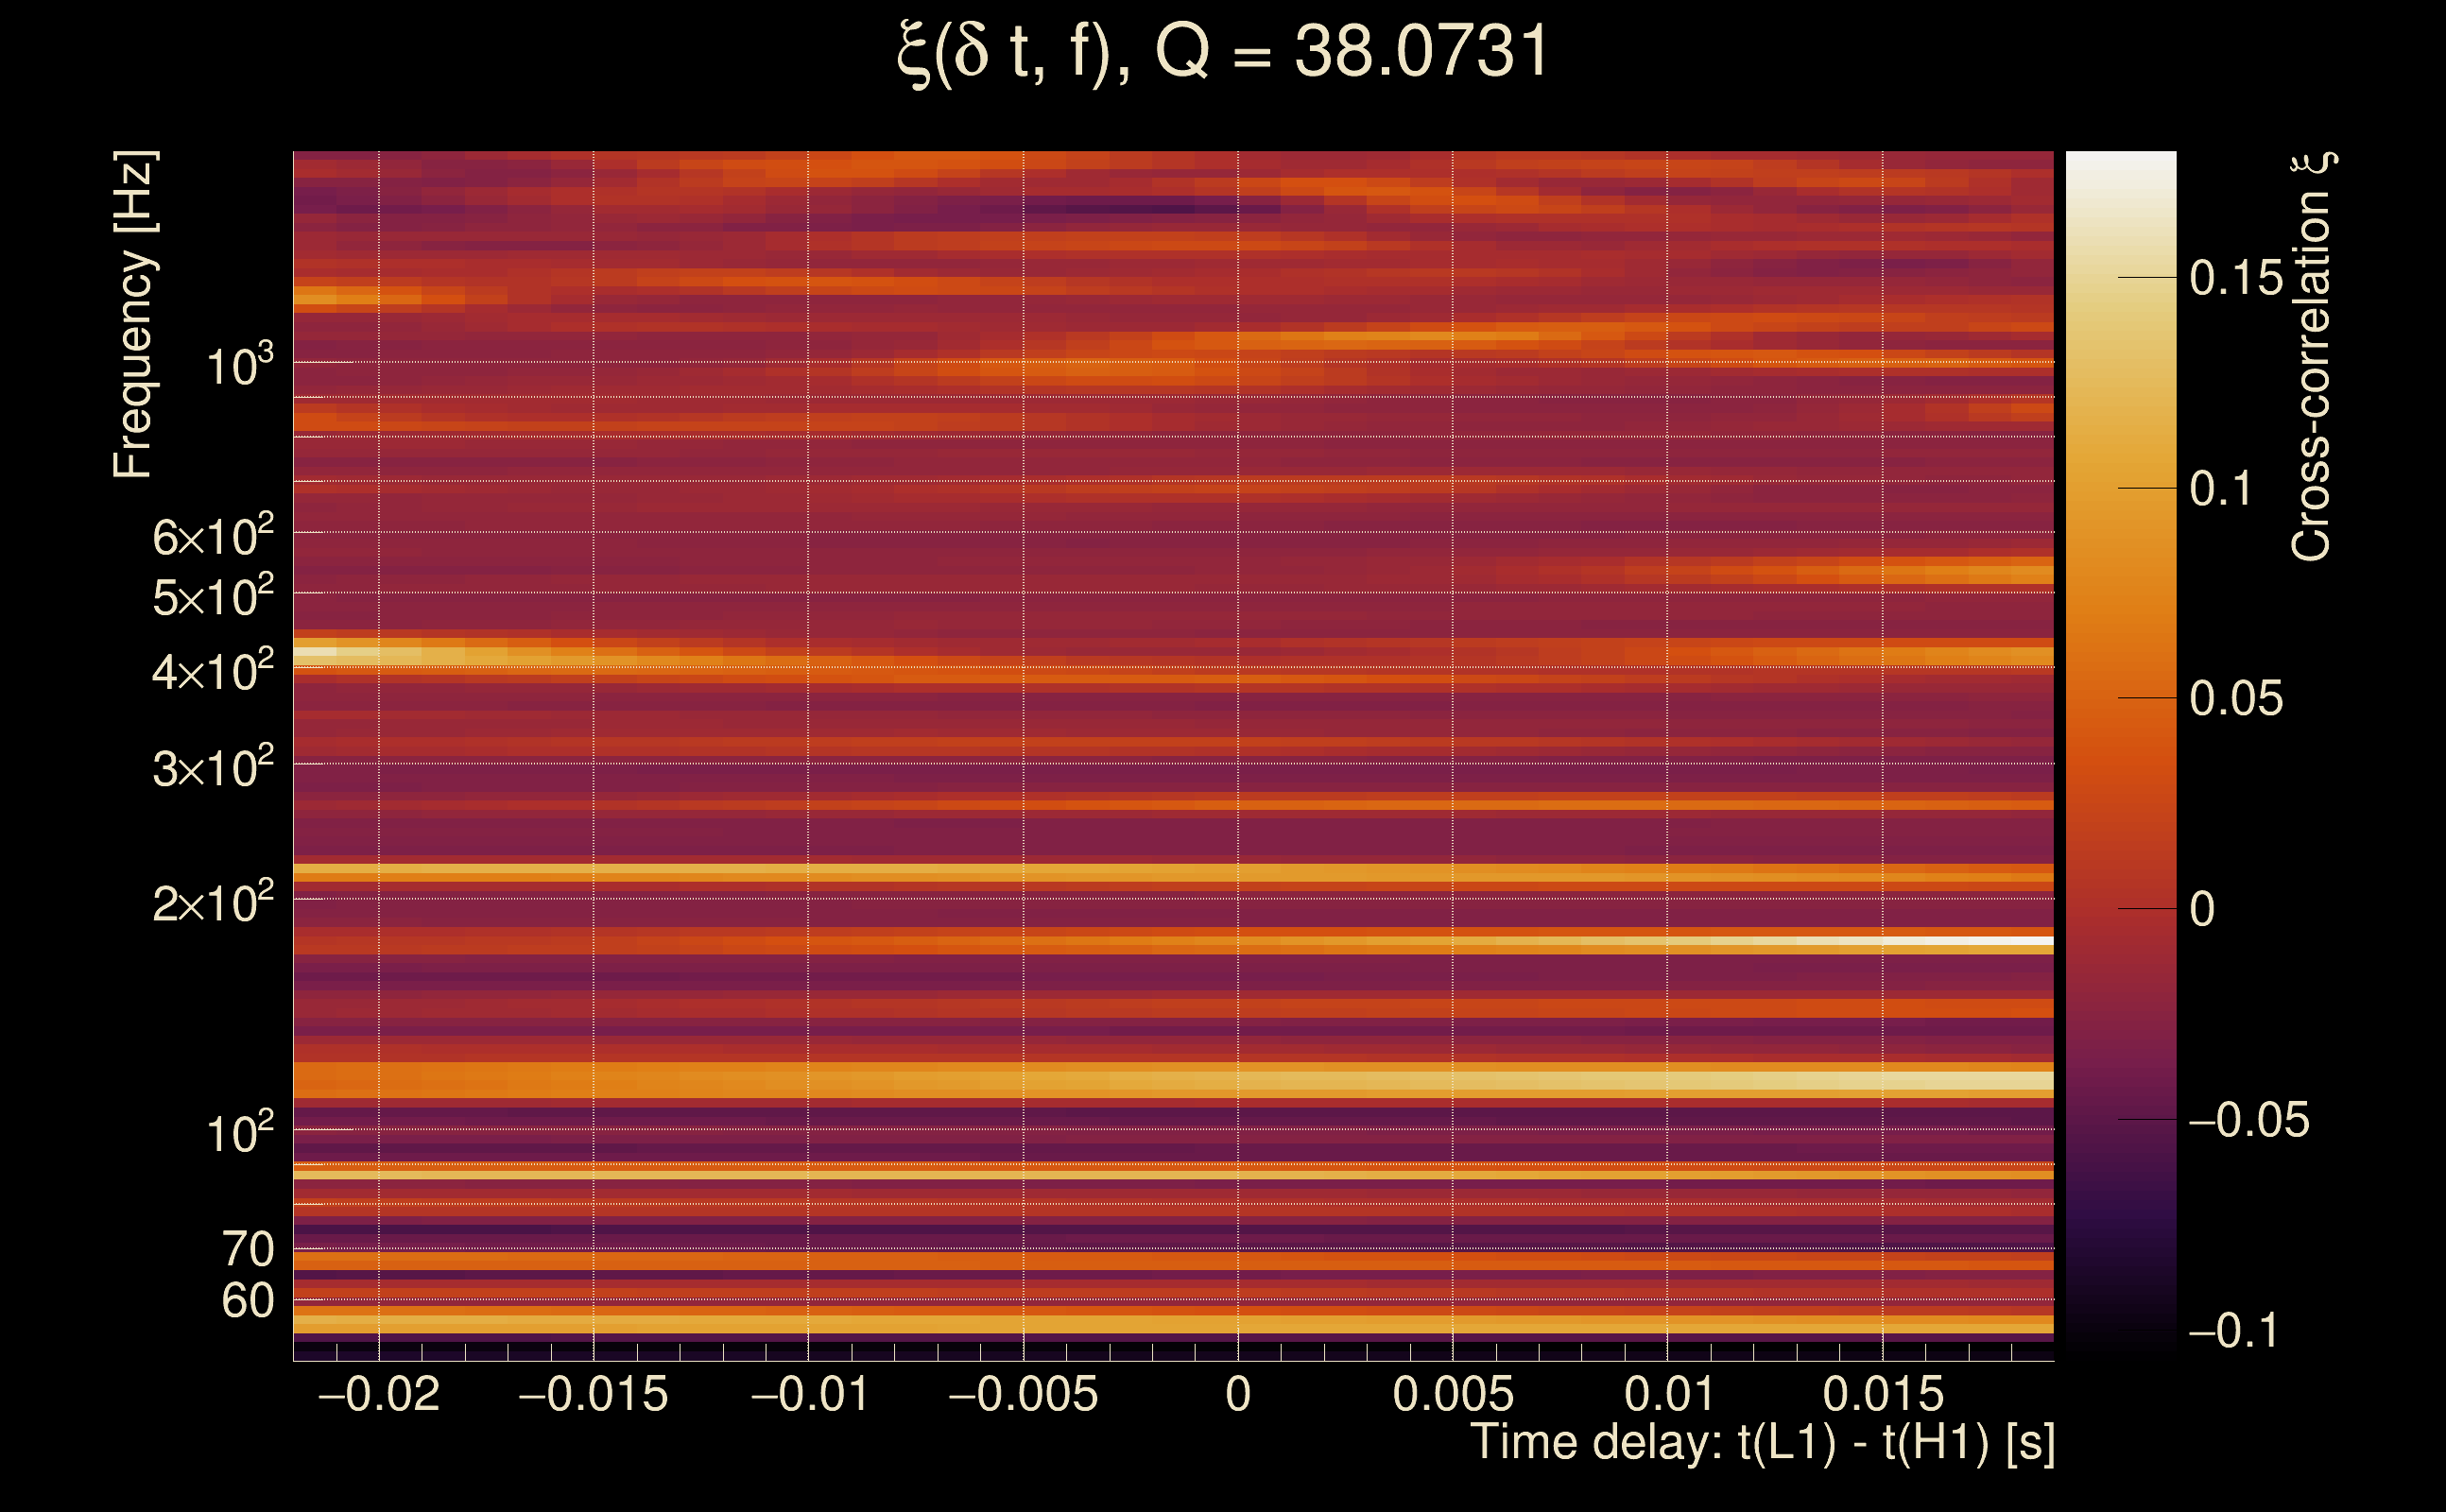
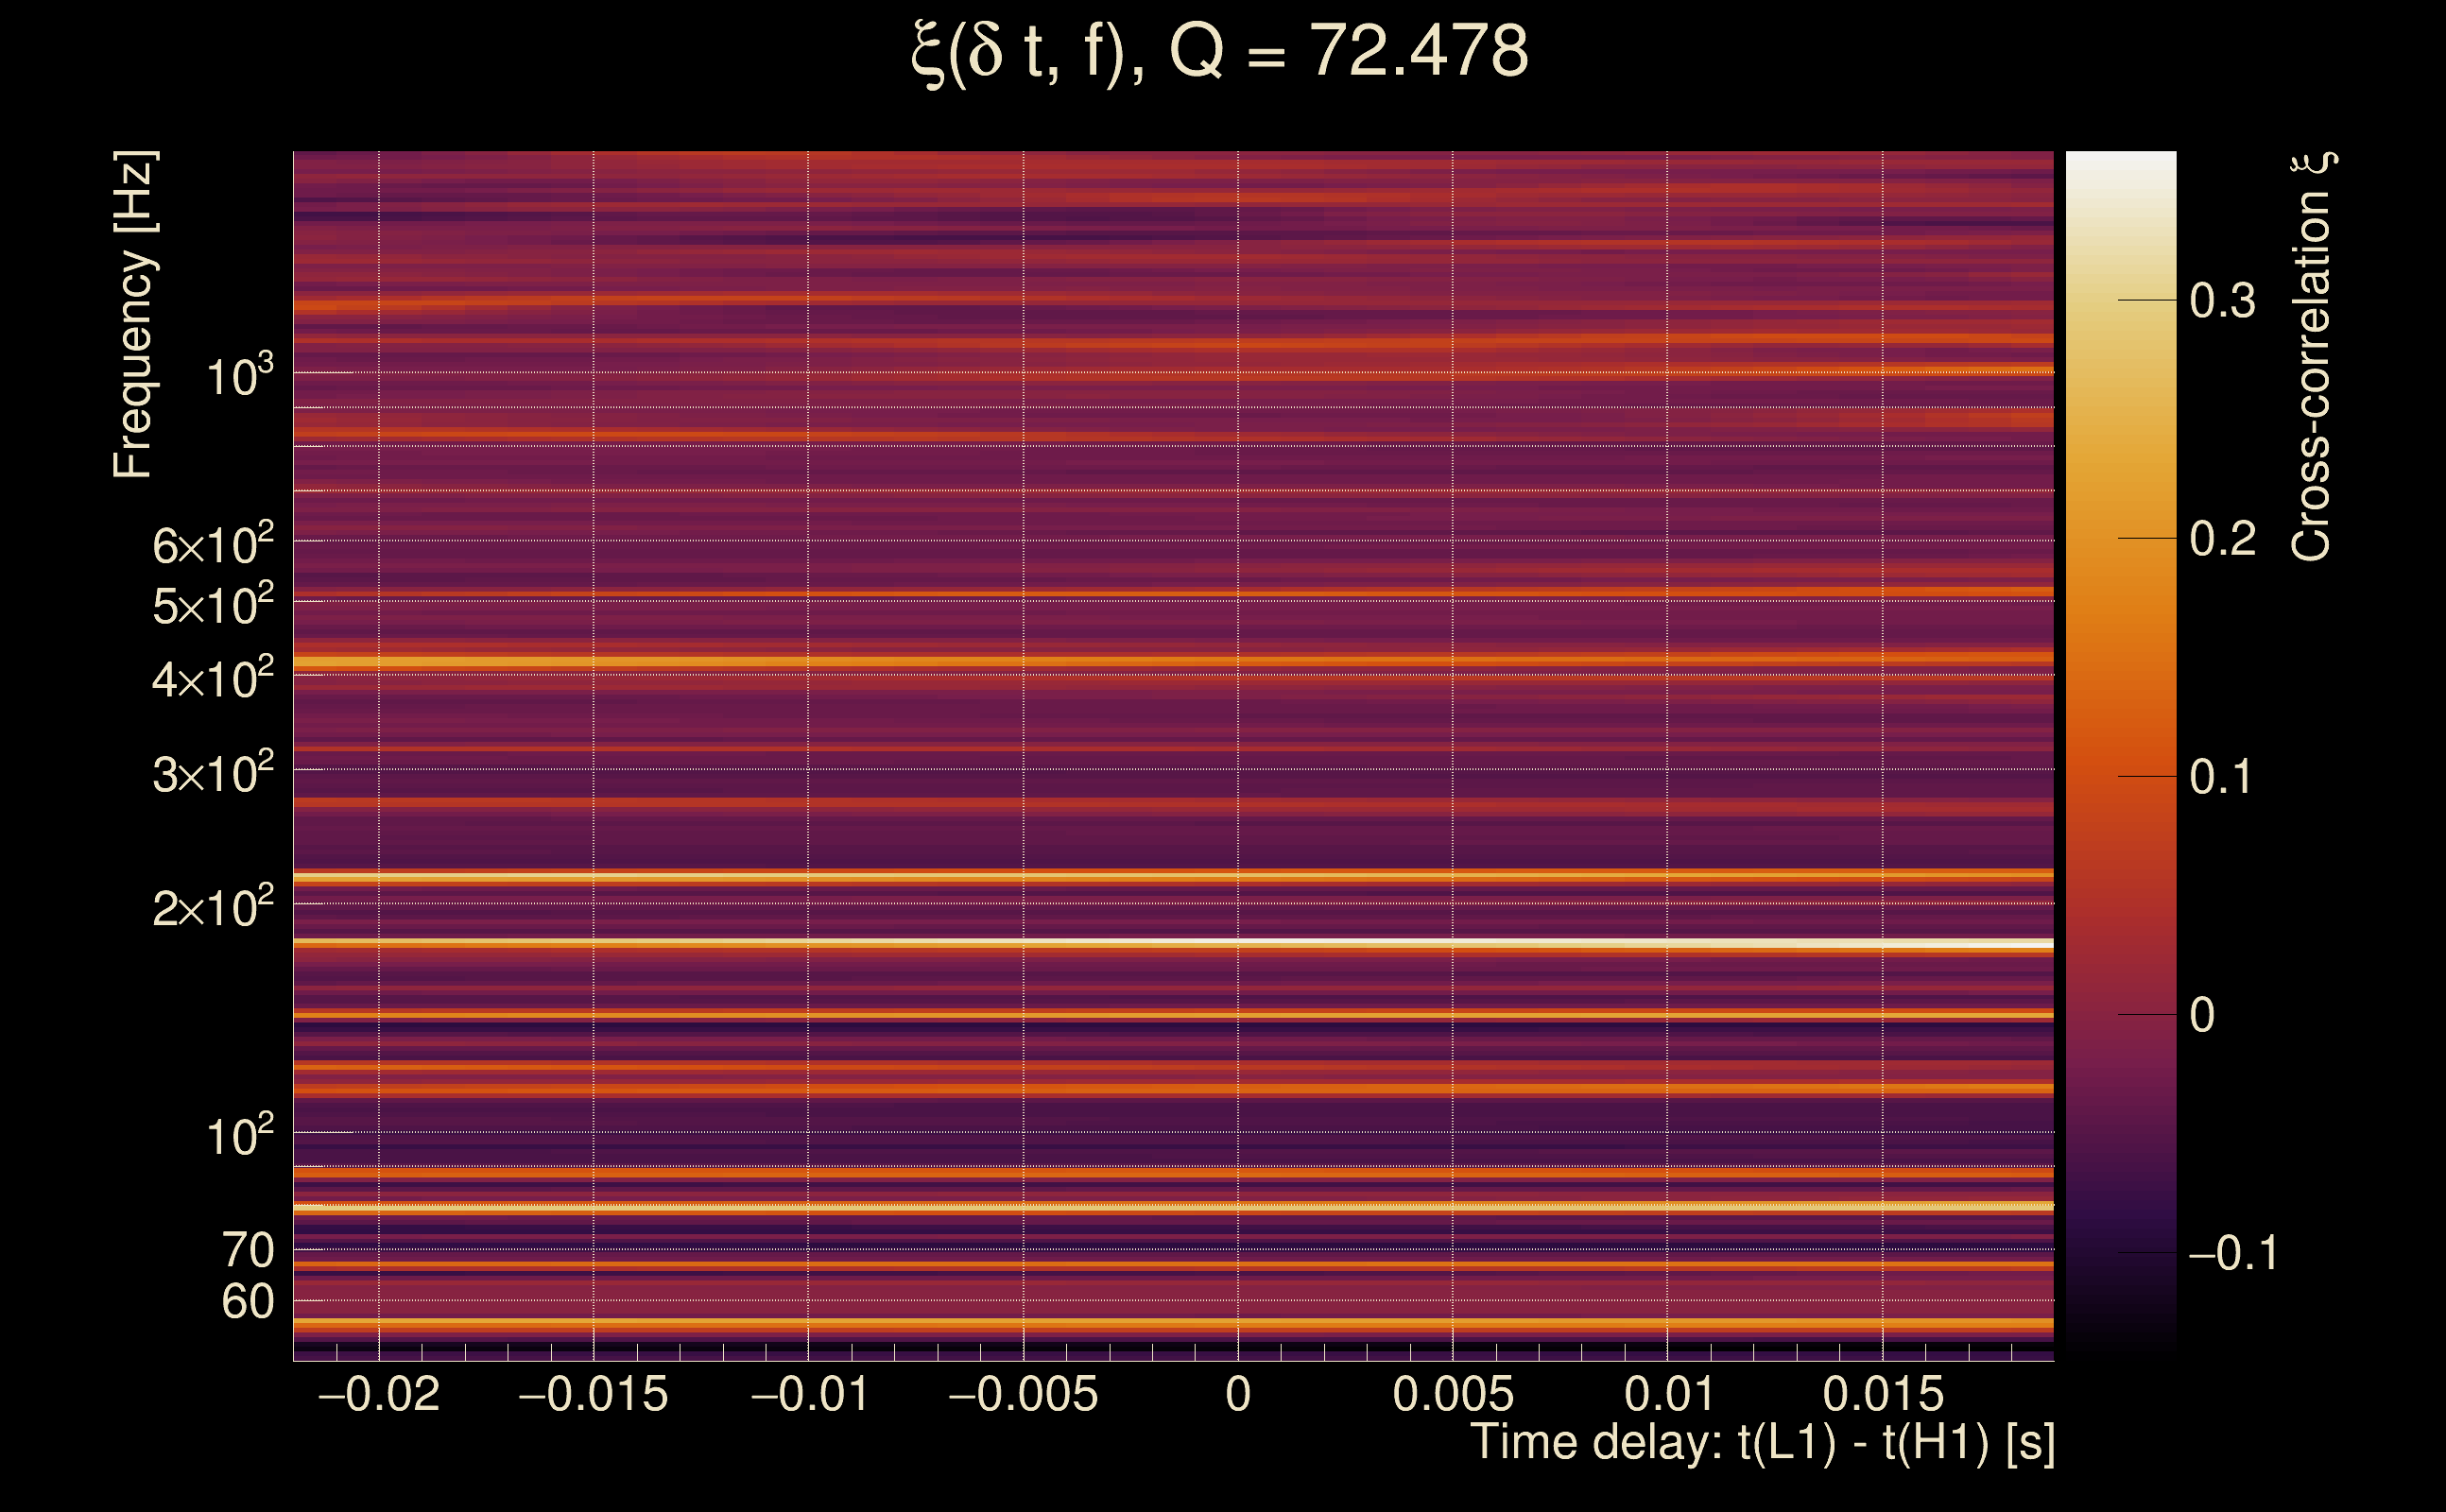
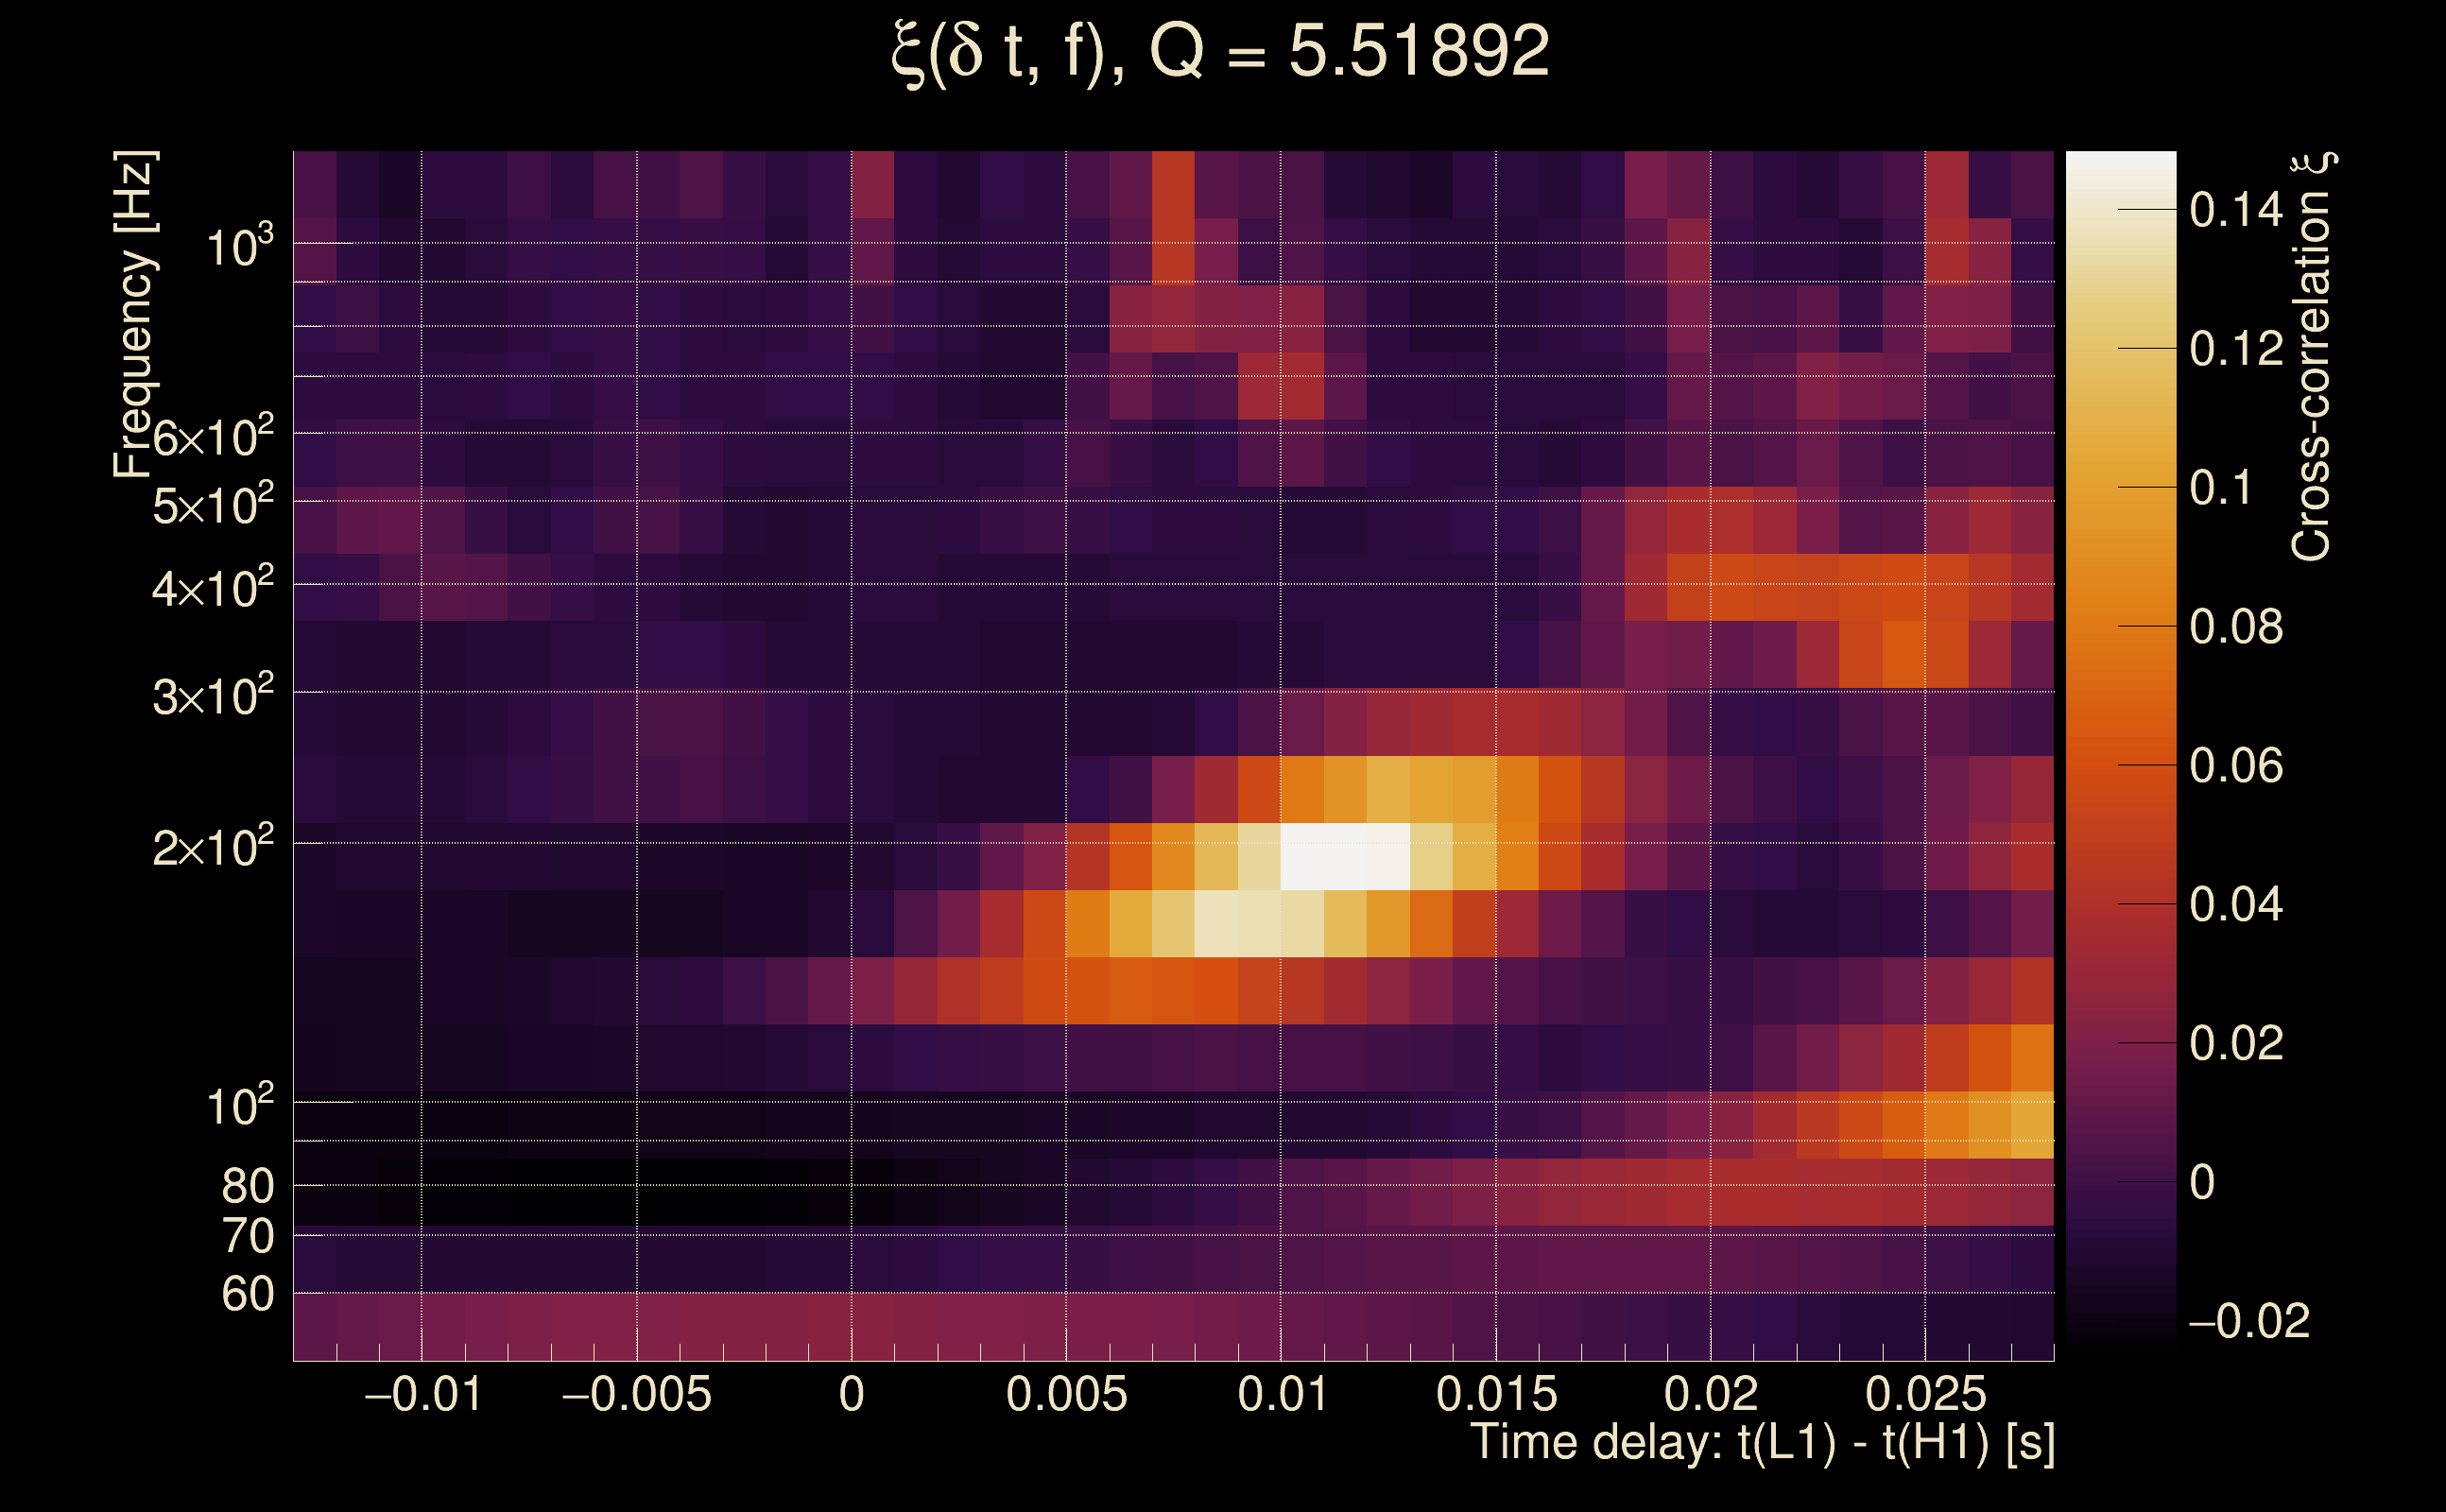
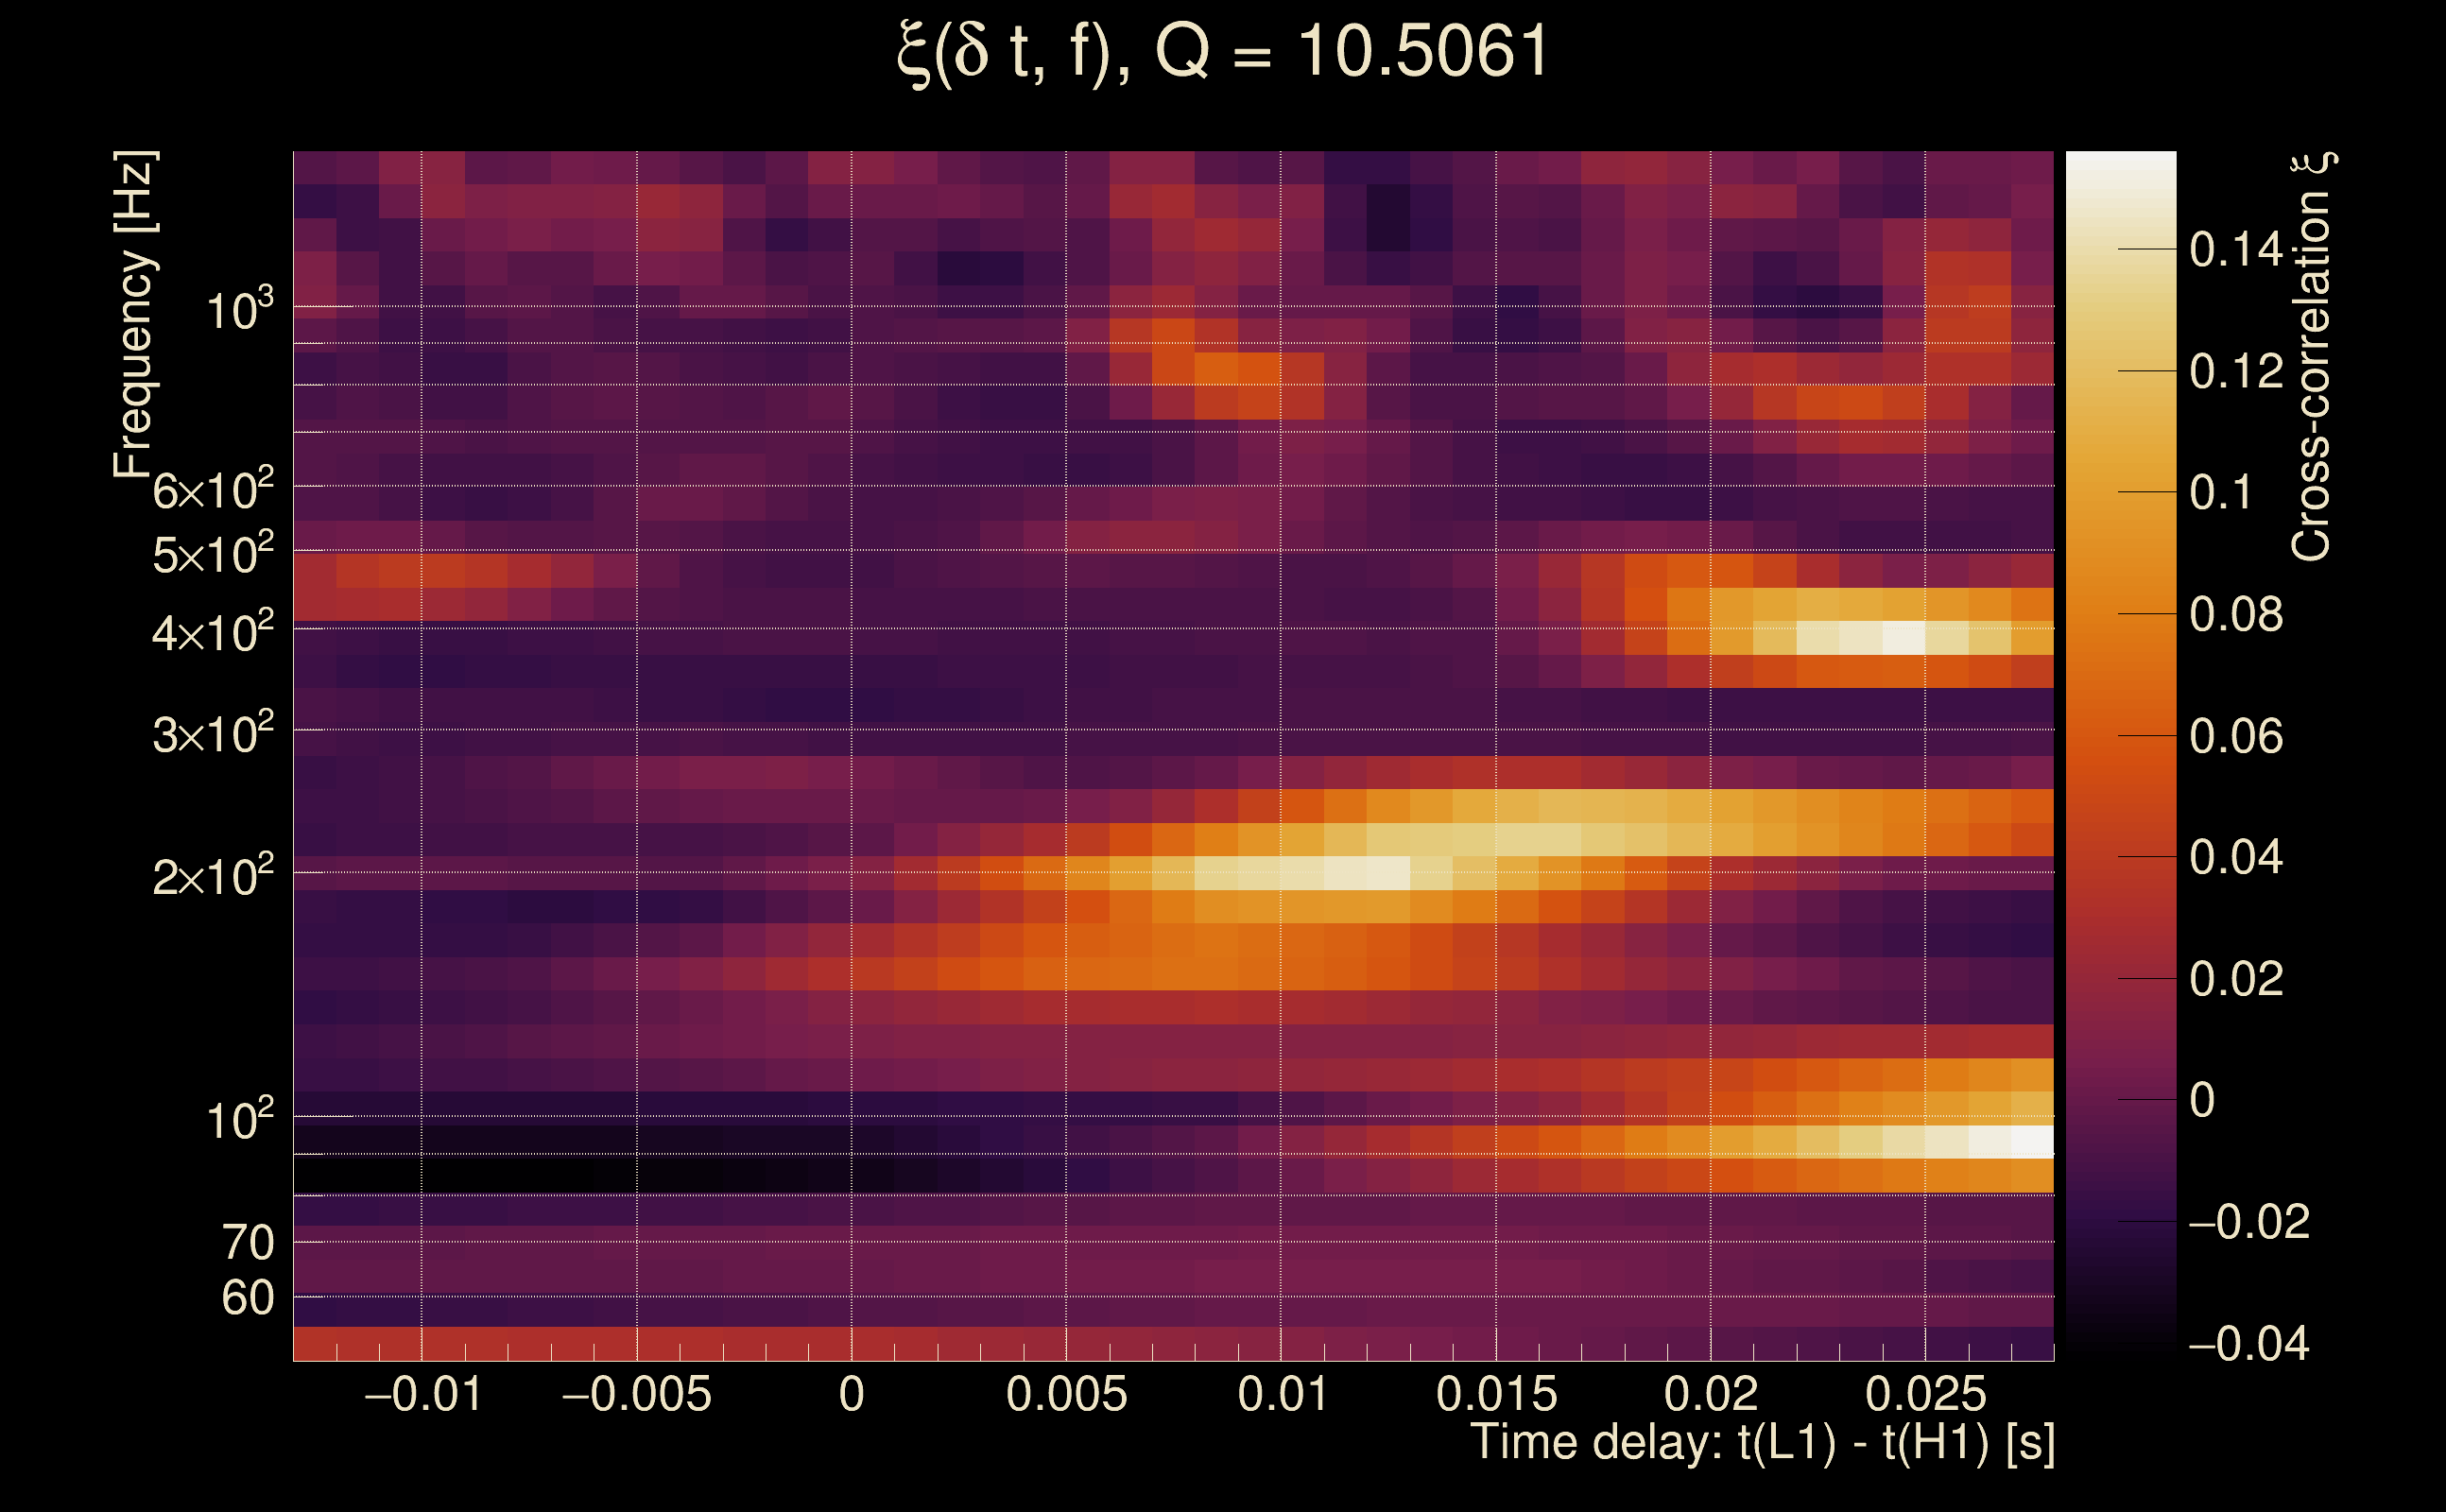
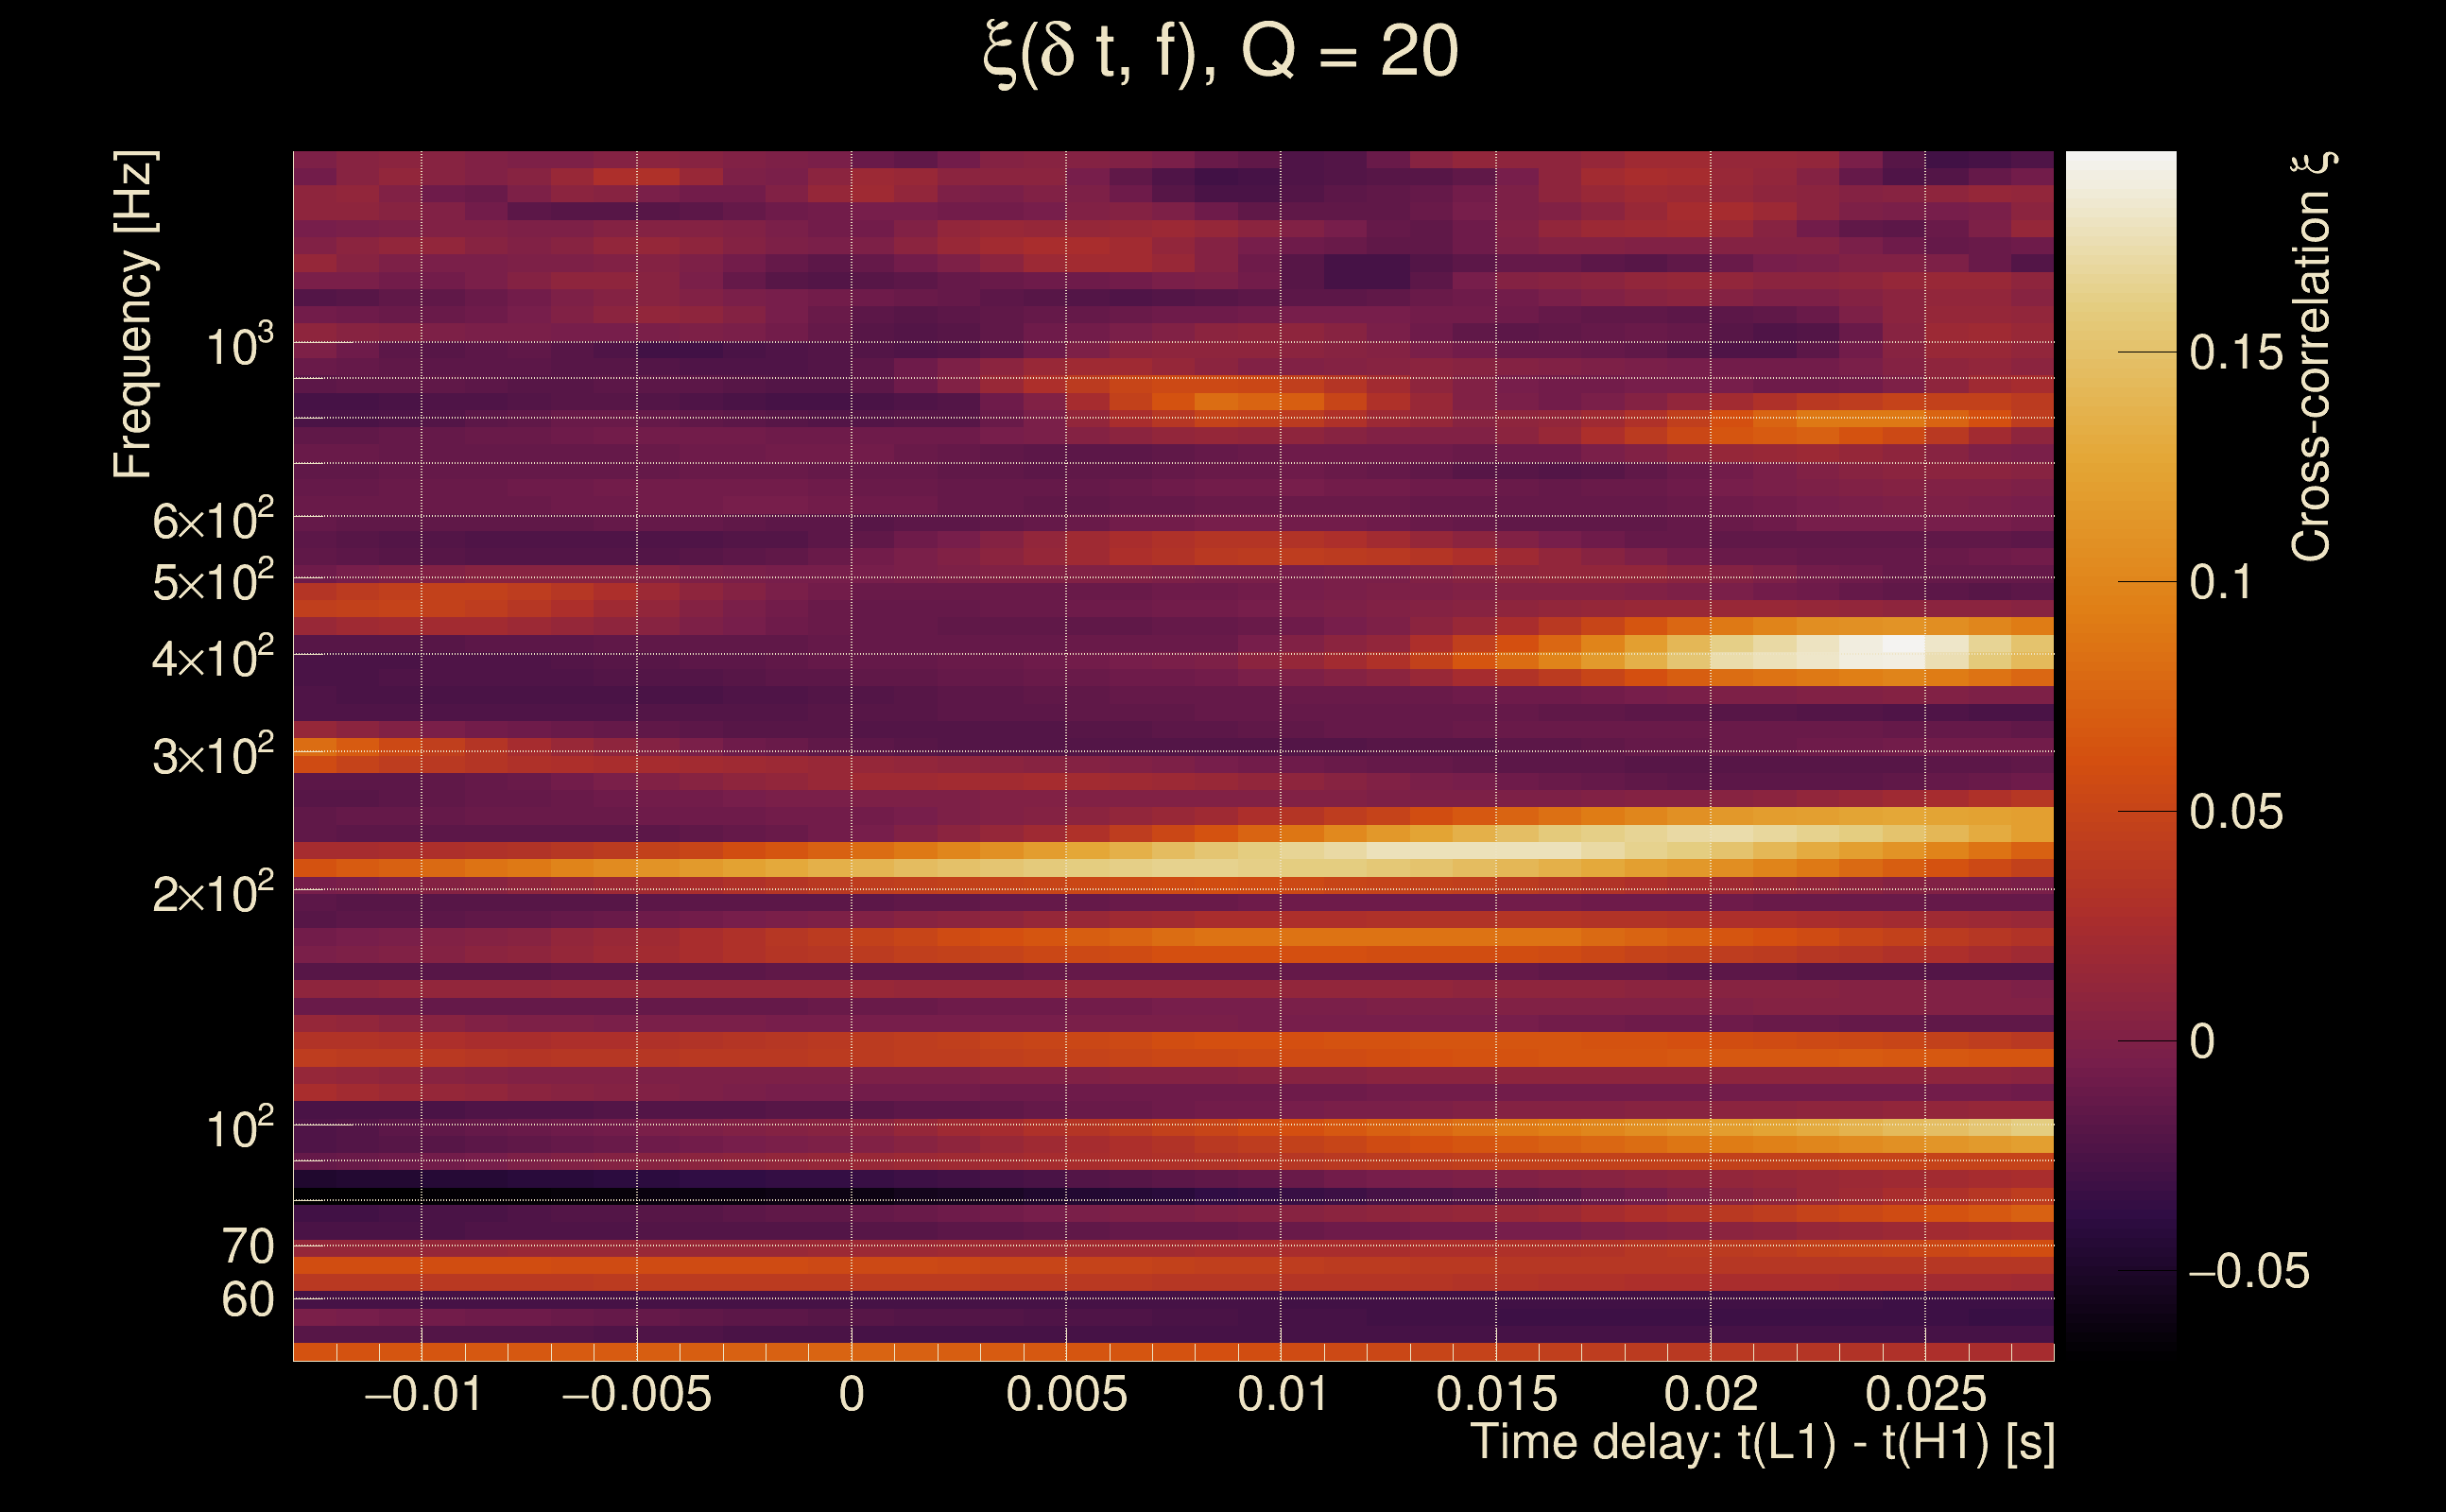
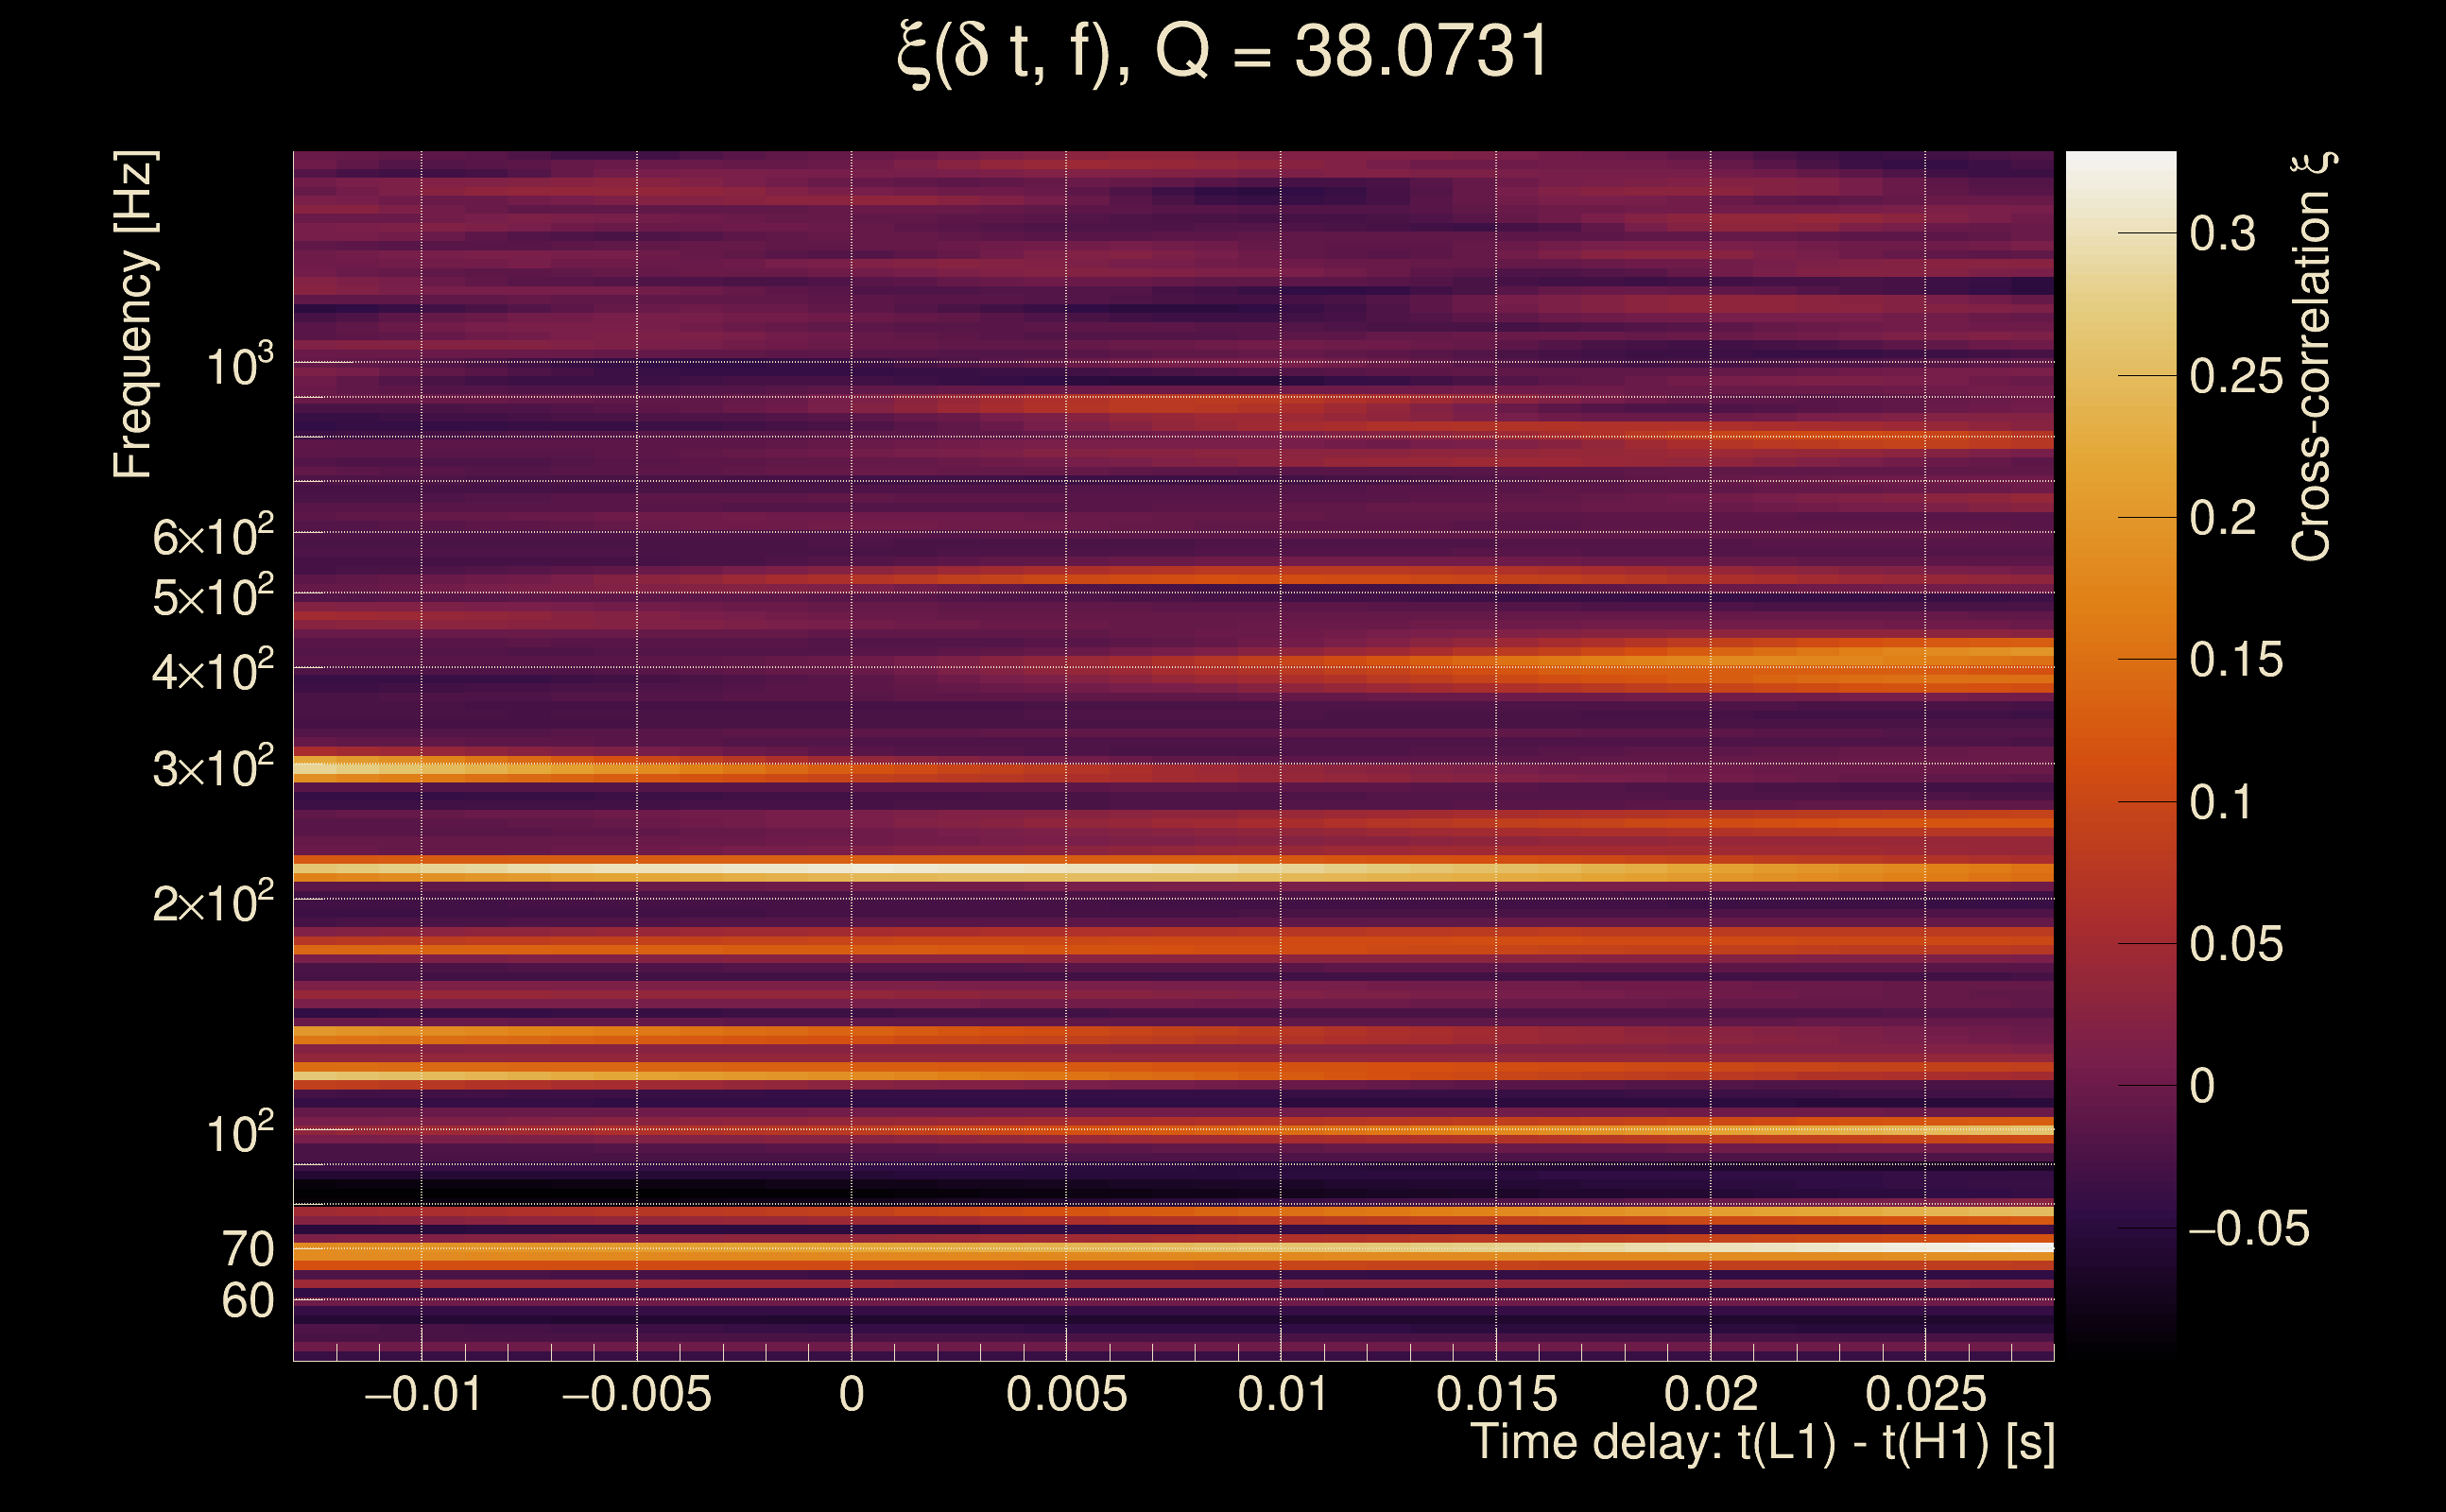
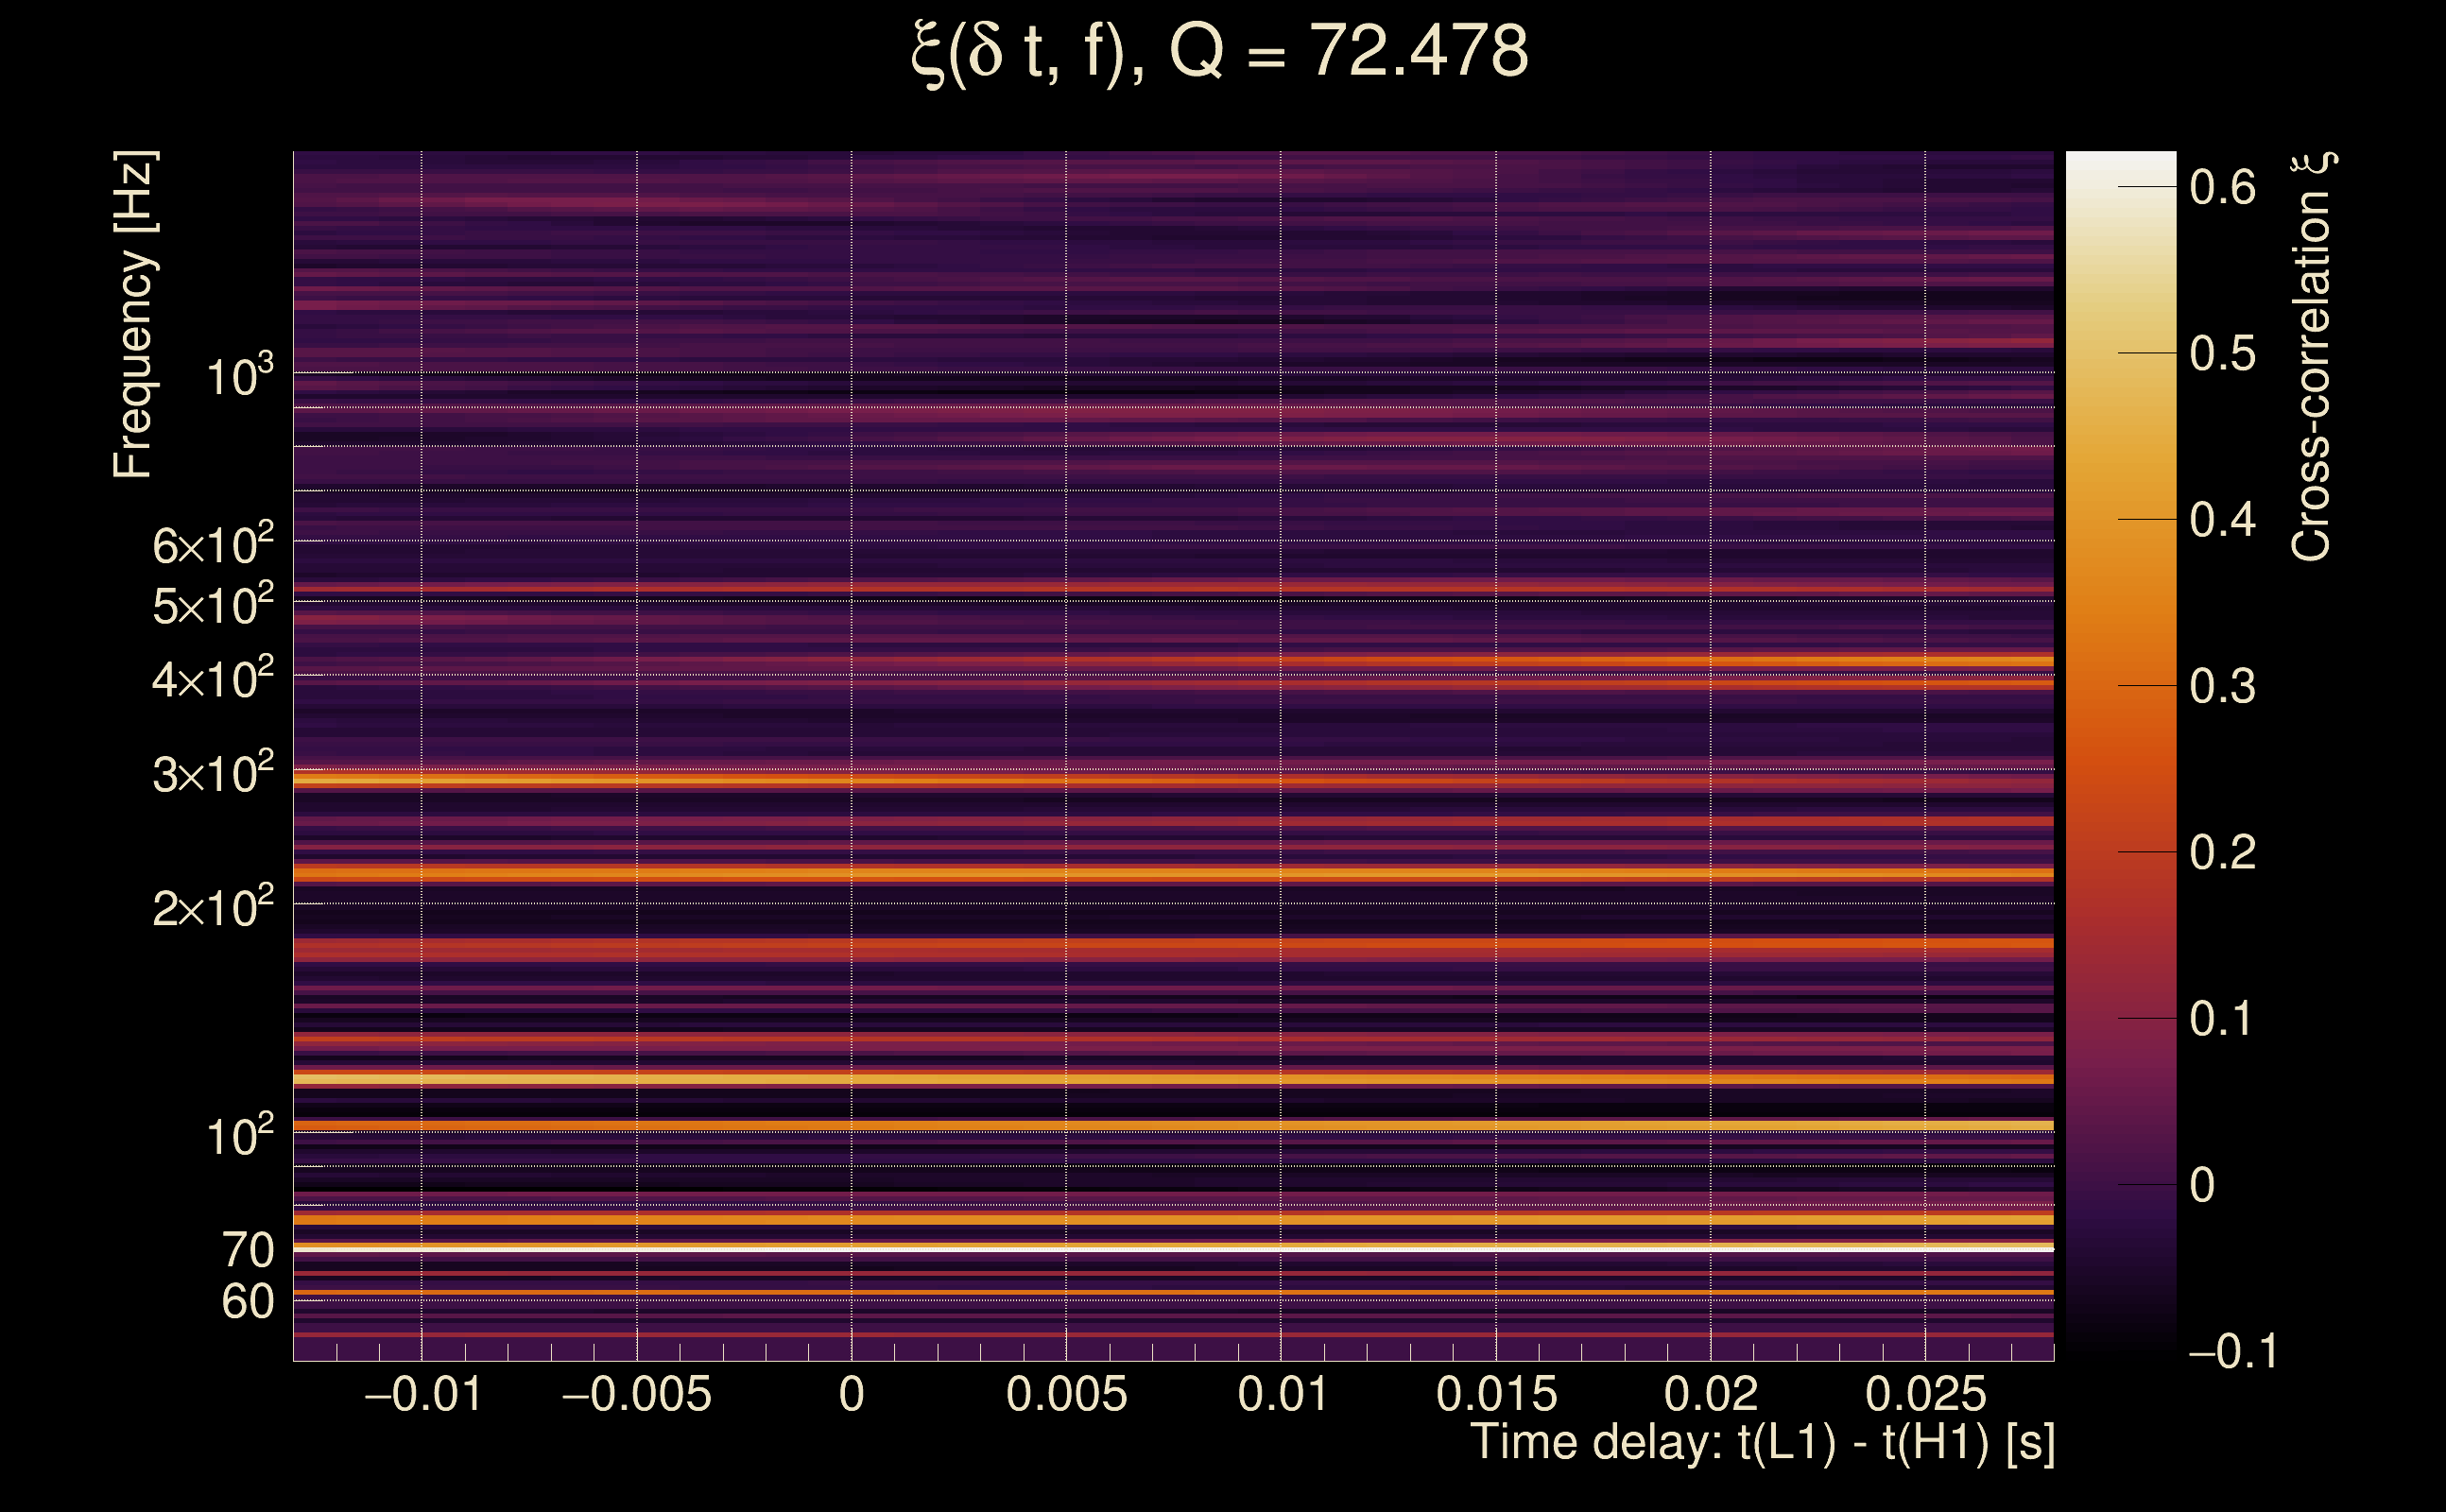
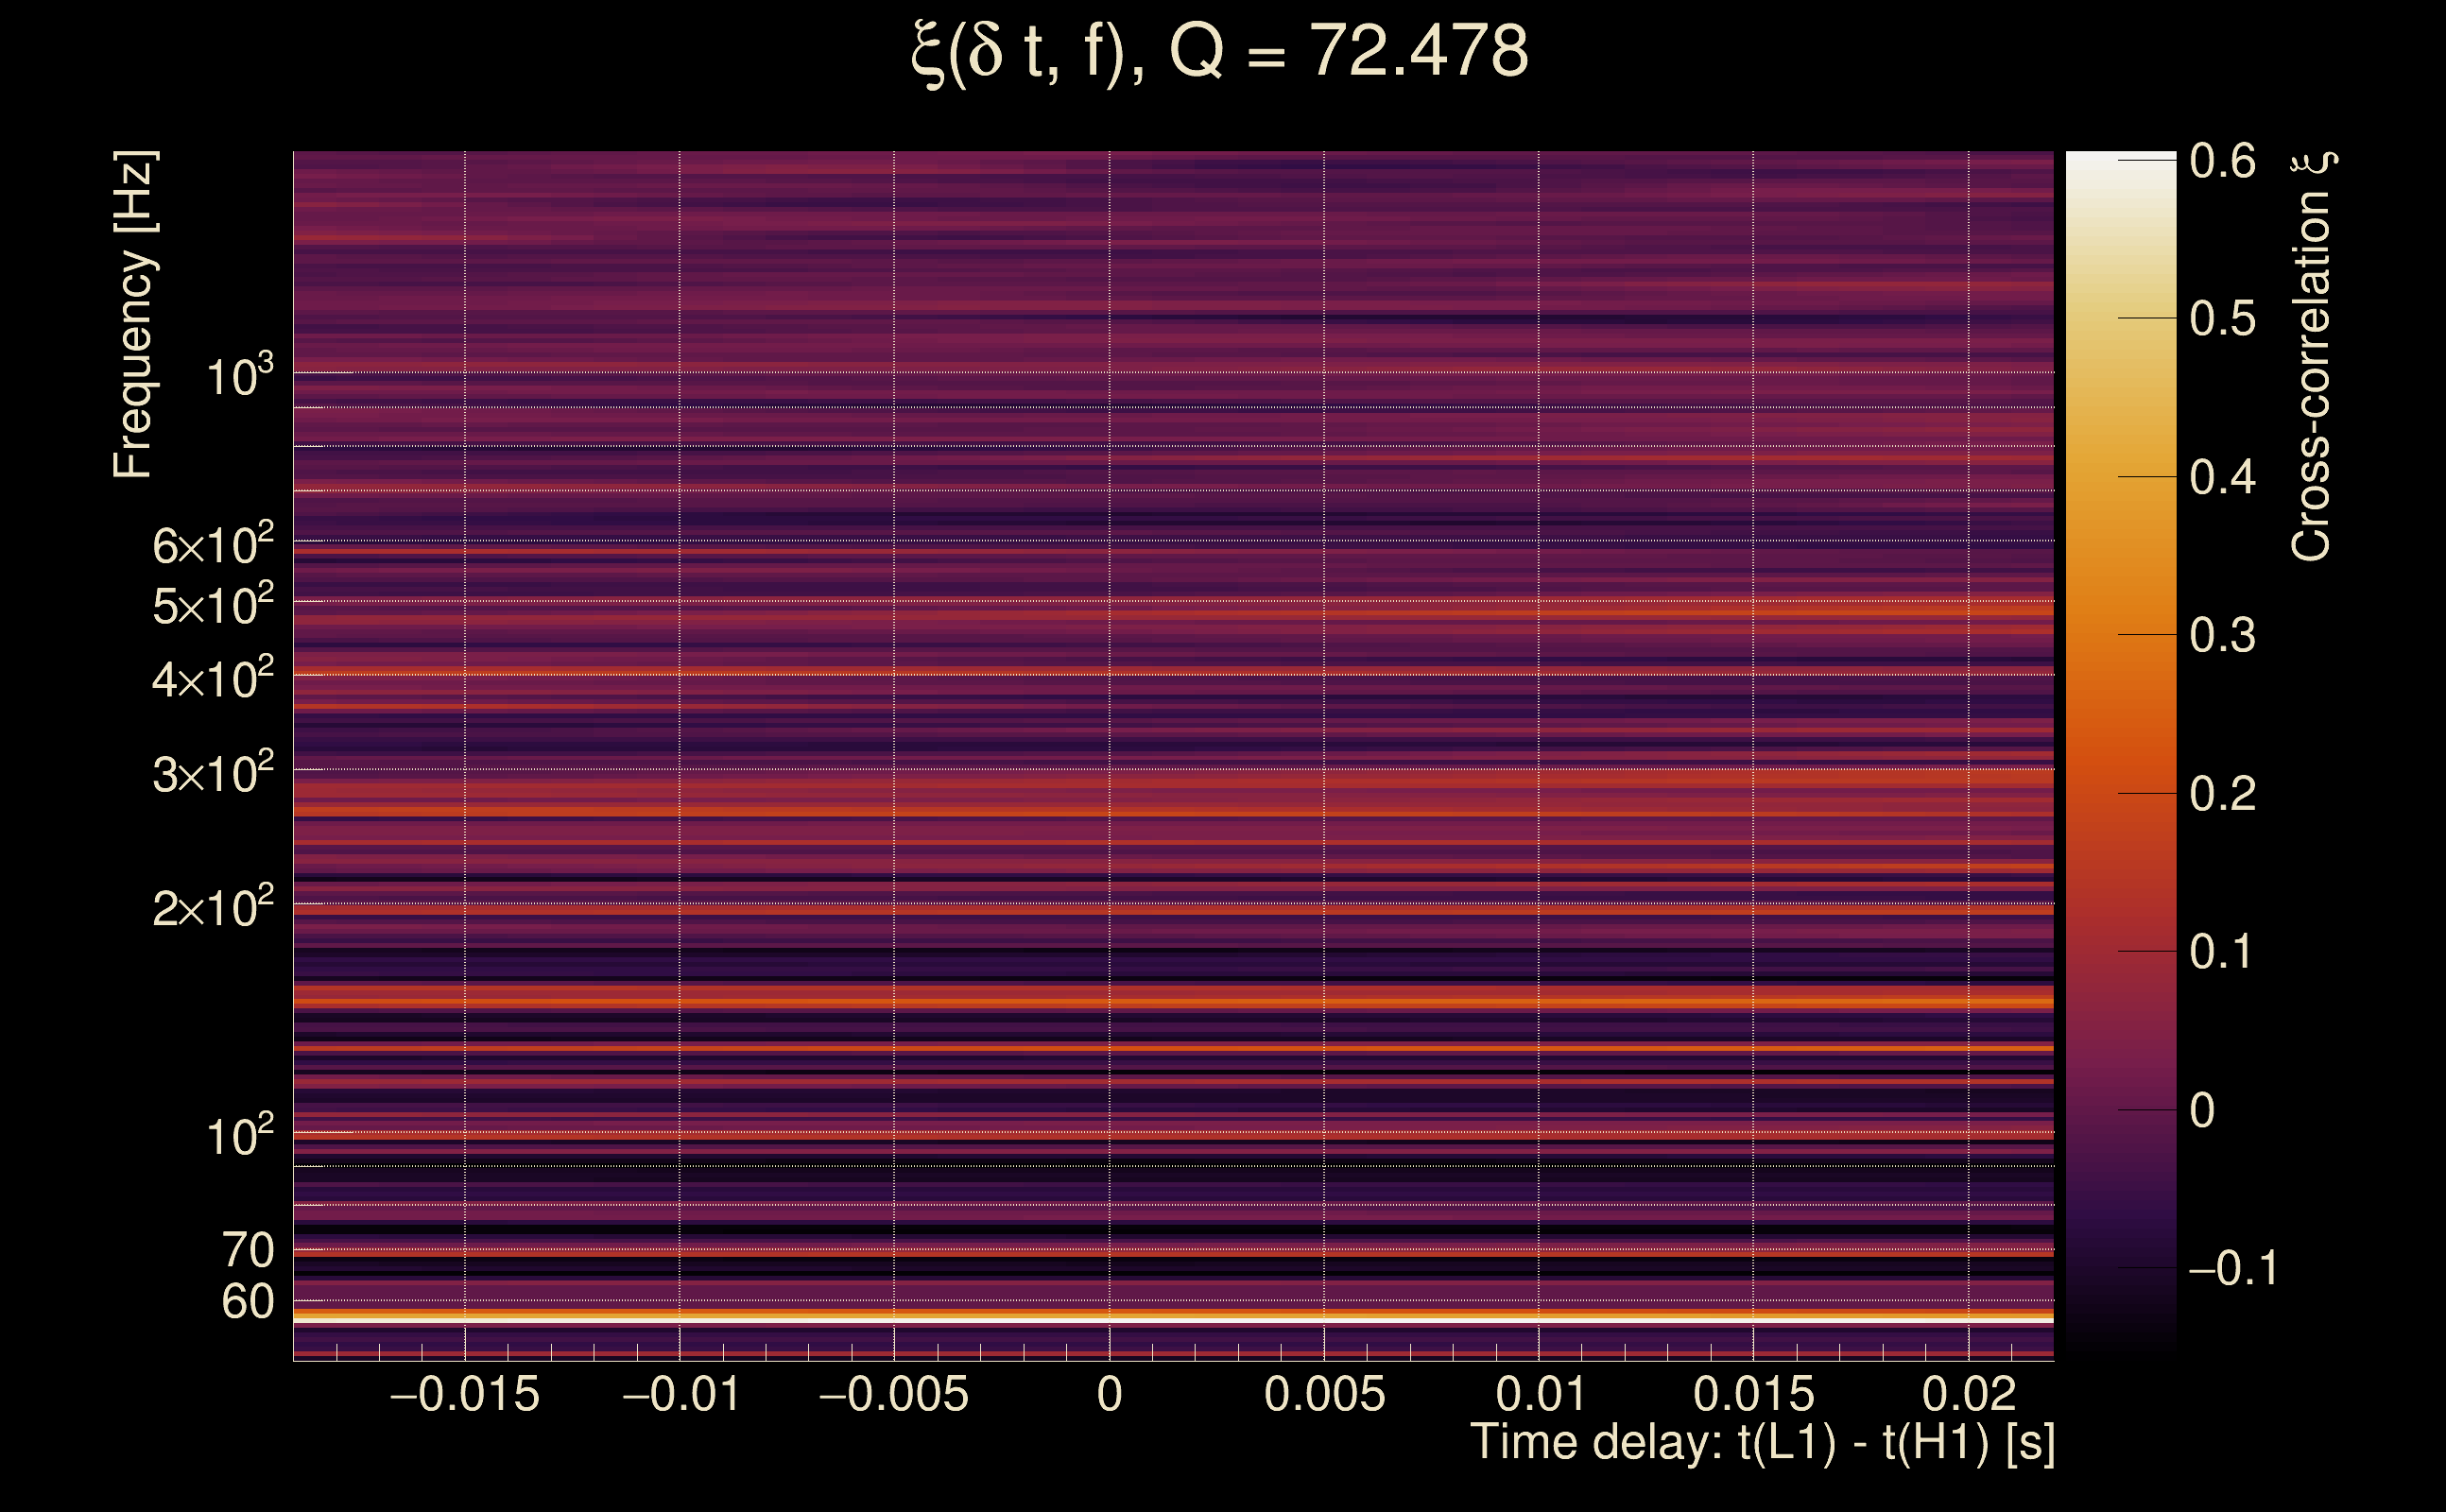
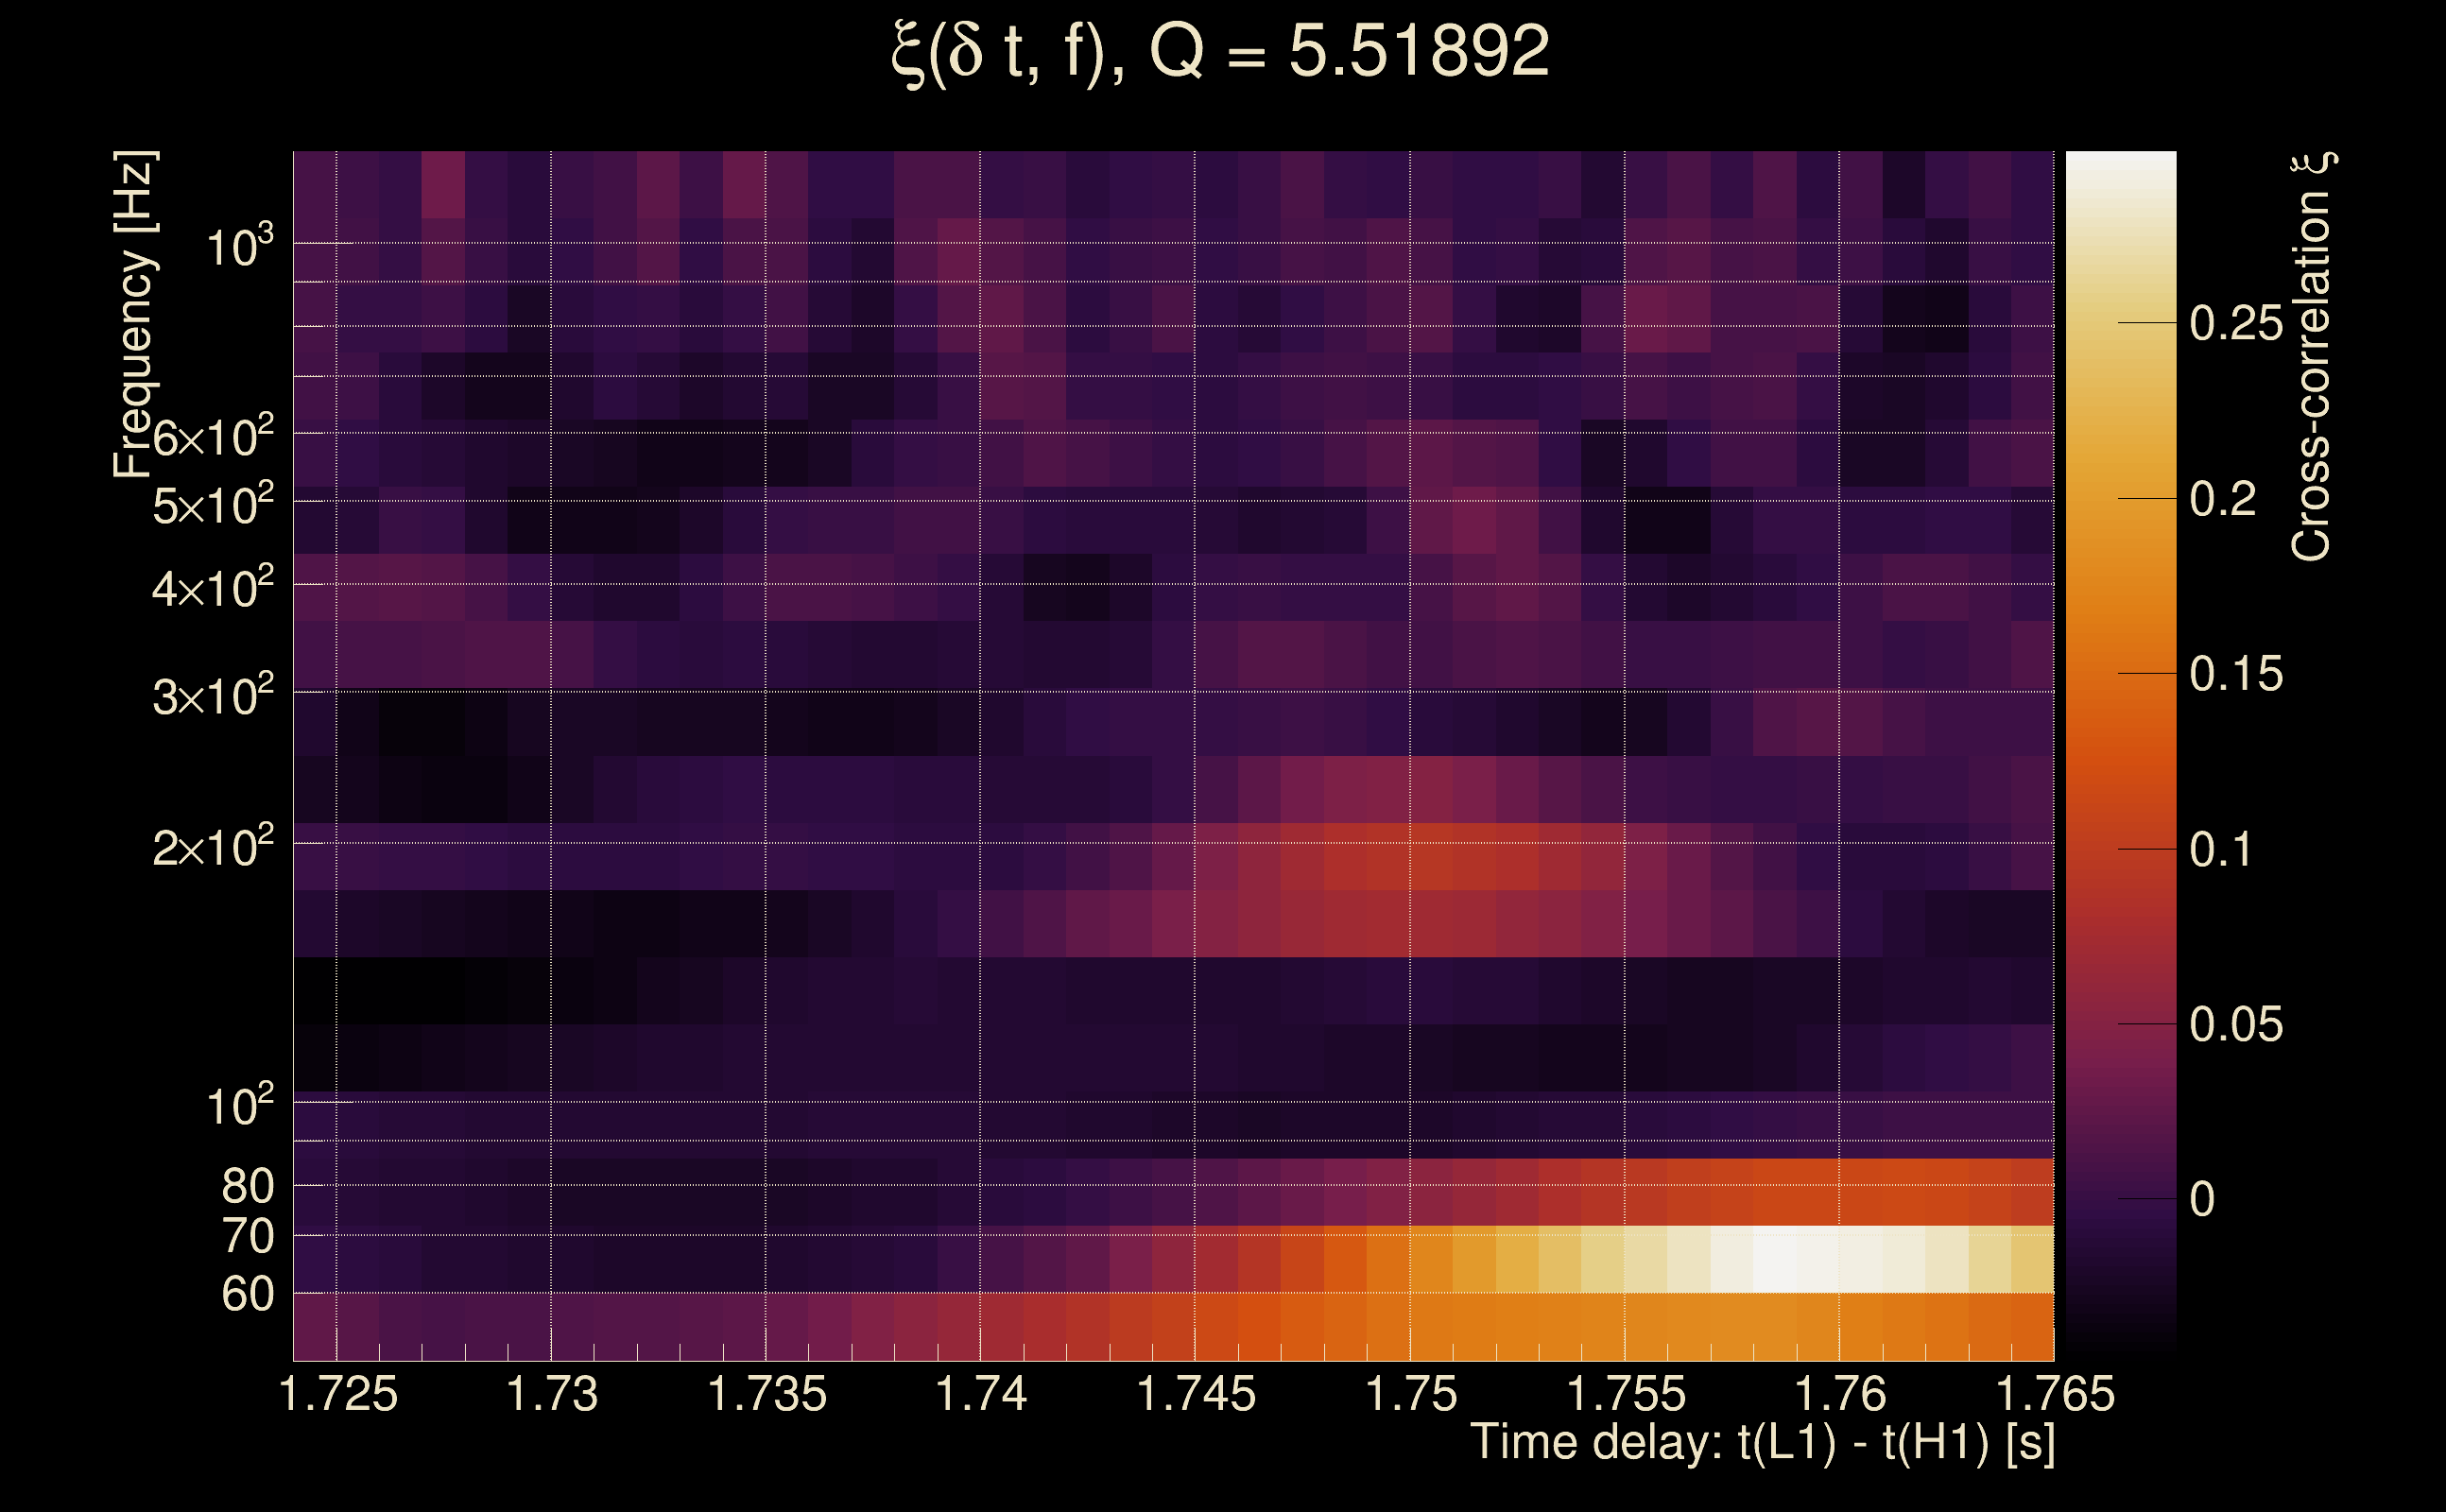
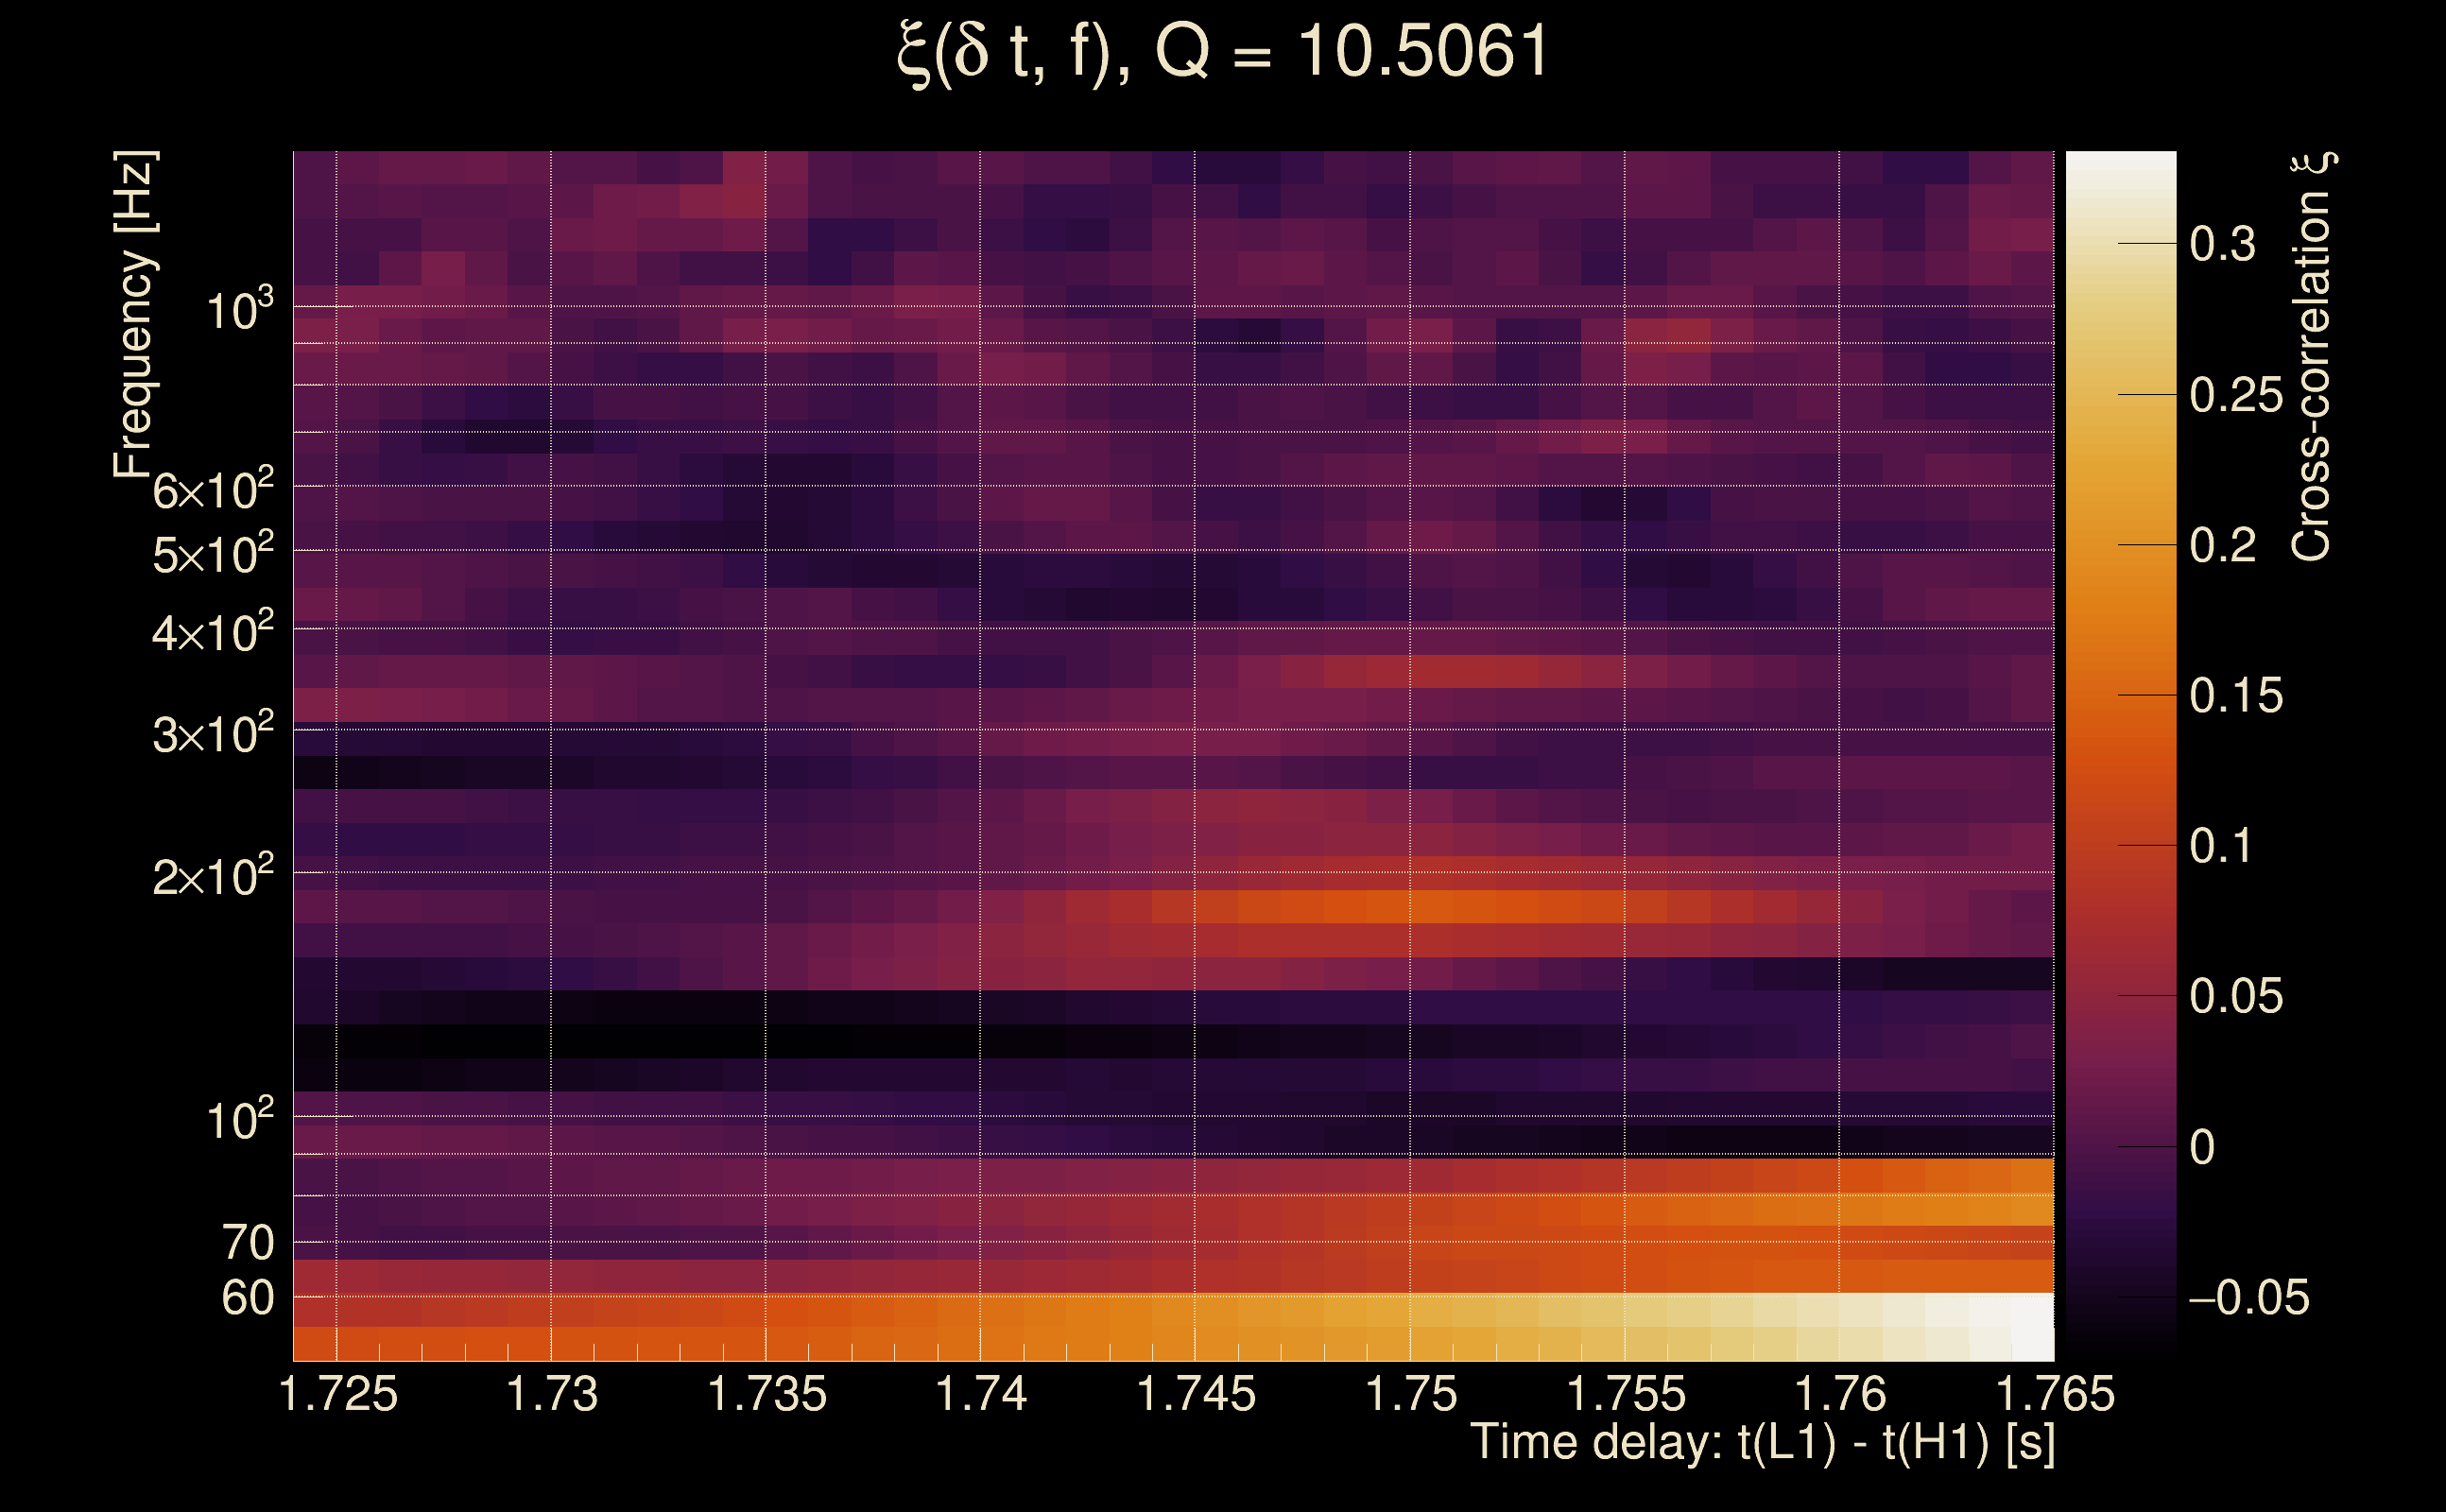
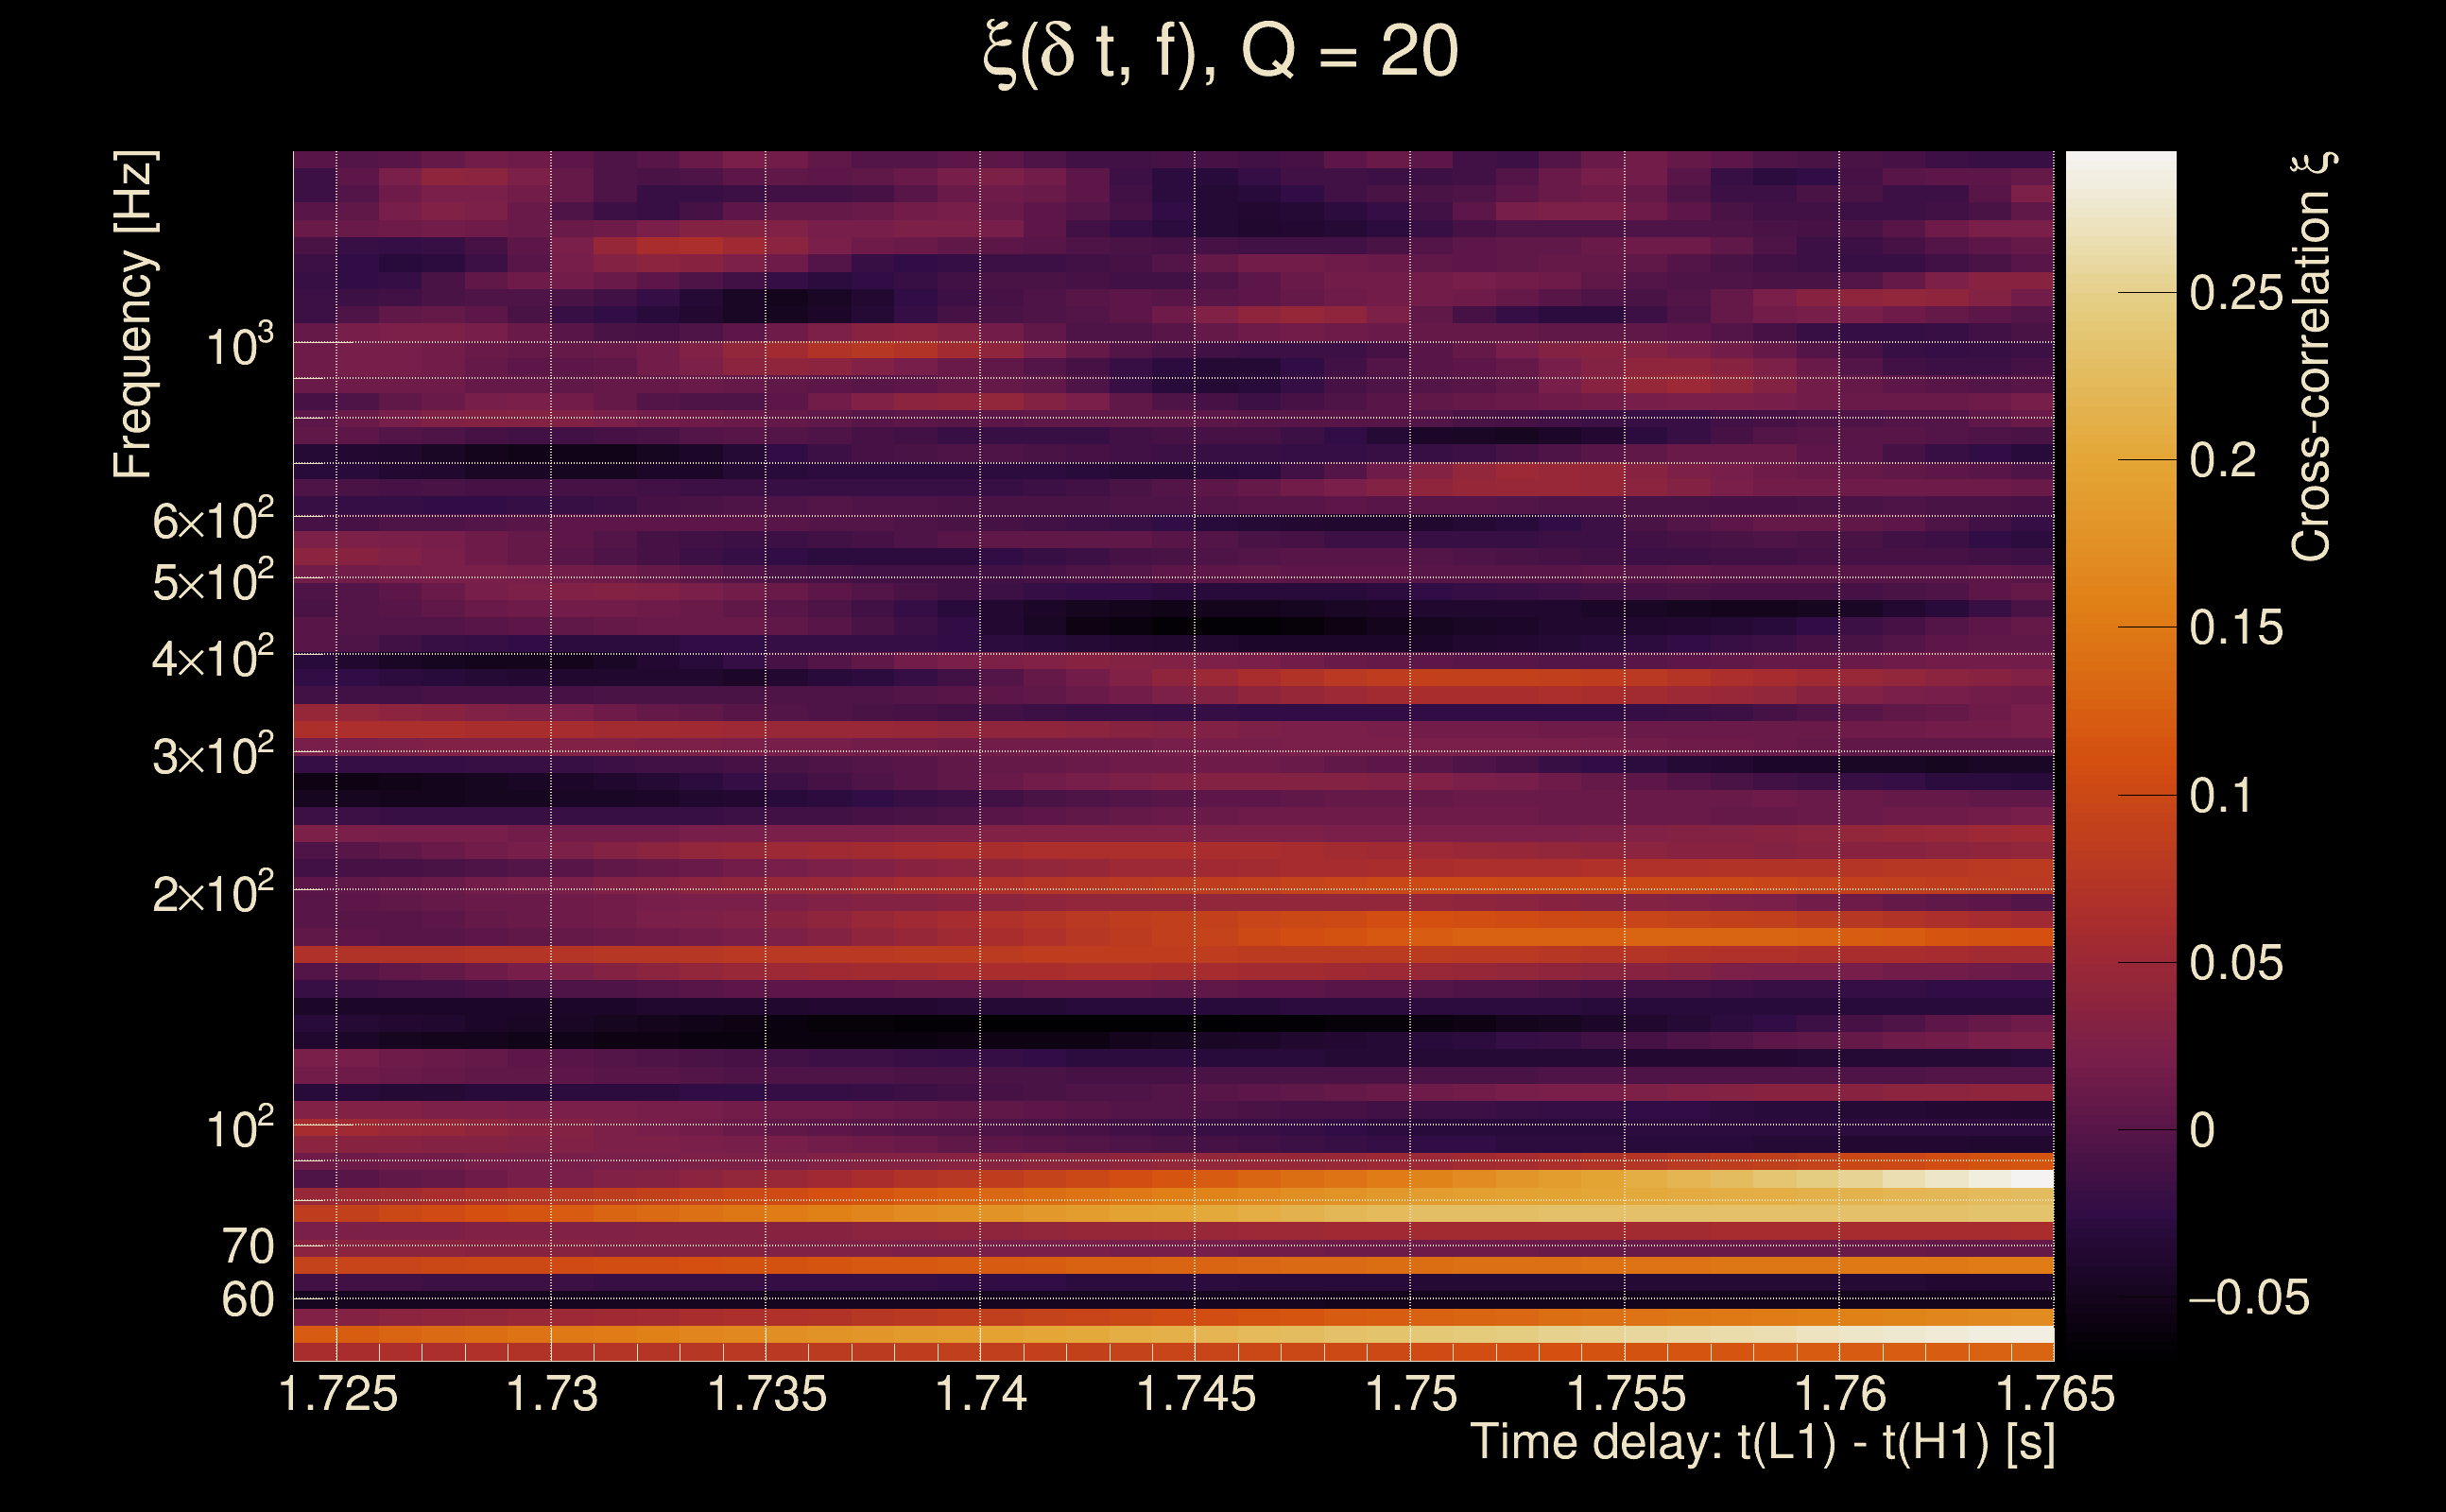
| Number of Q planes: | 5 (Q = 5.51892 → Q = 72.478) |
| Omicron frequency range: | 50 Hz → 1958.38 Hz |
| Light travel time between detectors: | 0.0100128 s |
| Slice extra-time (calibration uncertainty + slice veto): | 0.0129872 s |
| Number of time-delay bins in a cross-correlation map: | 10000 |
| Number of slices in a cross-correlation map: | 217 |
| Number of time-delay bins in a slice: | 46 |
| SNR gating: | < 100 (detector 0), < 100 (detector 1) |
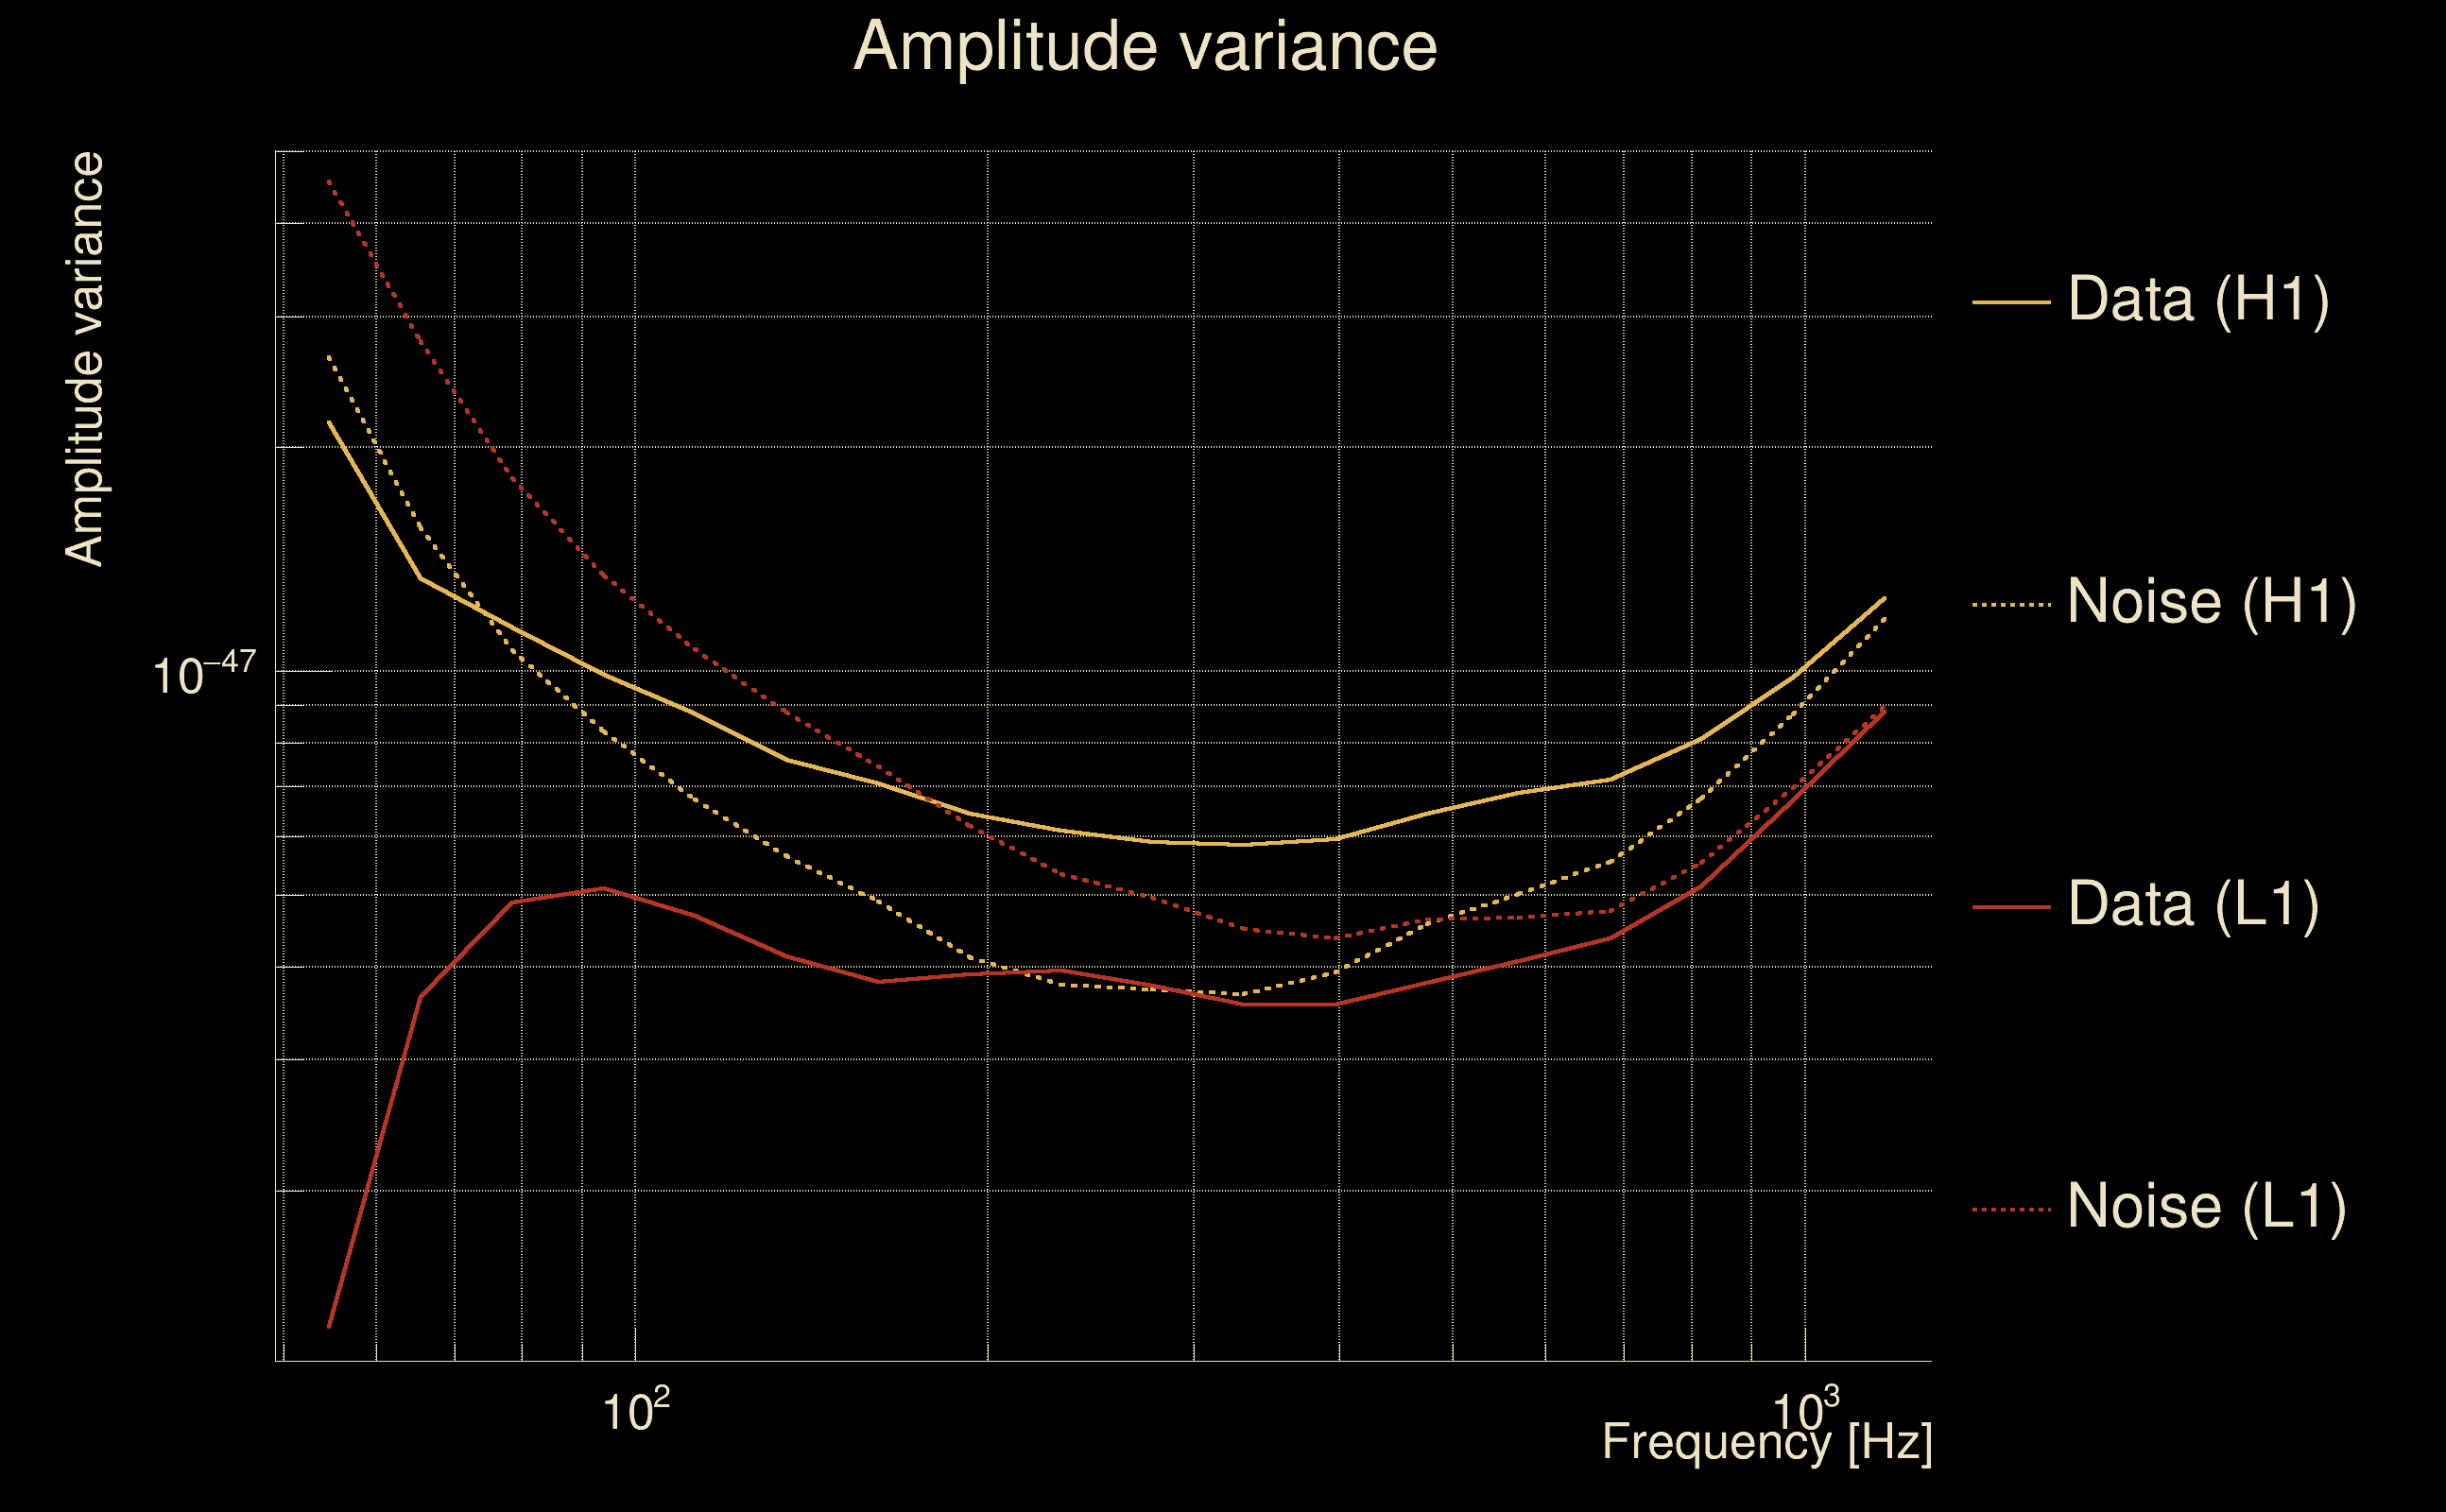
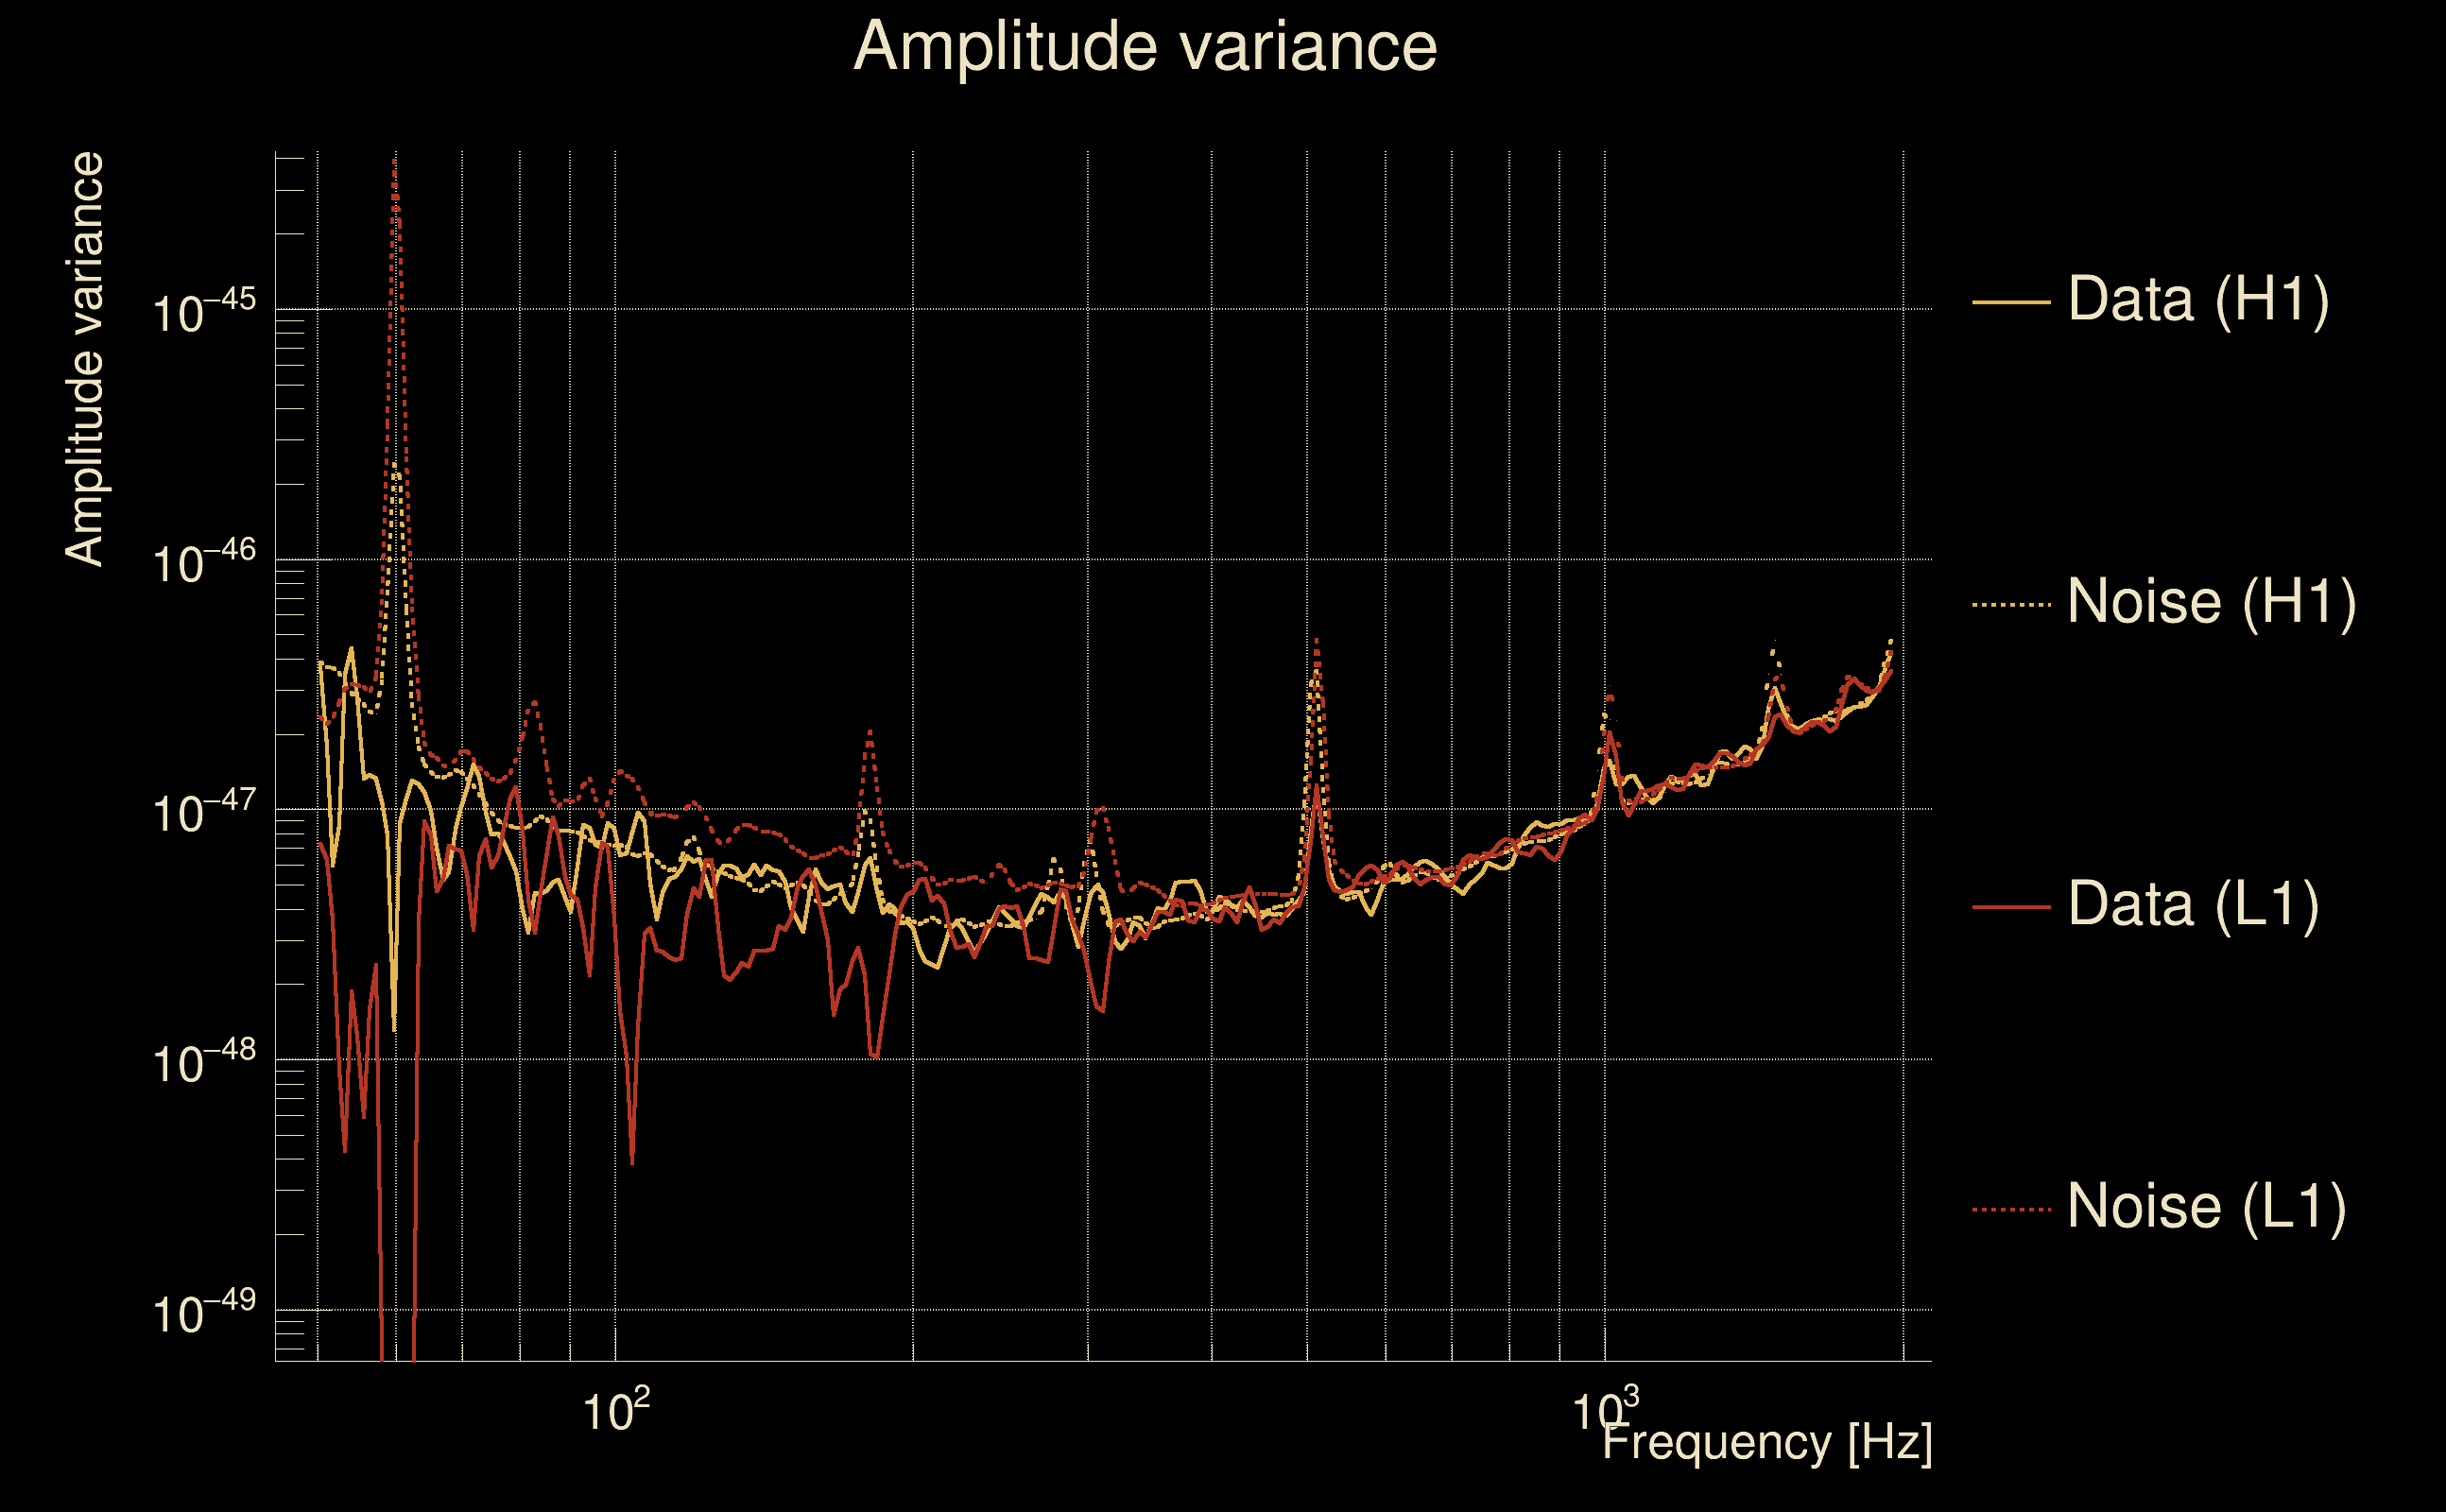
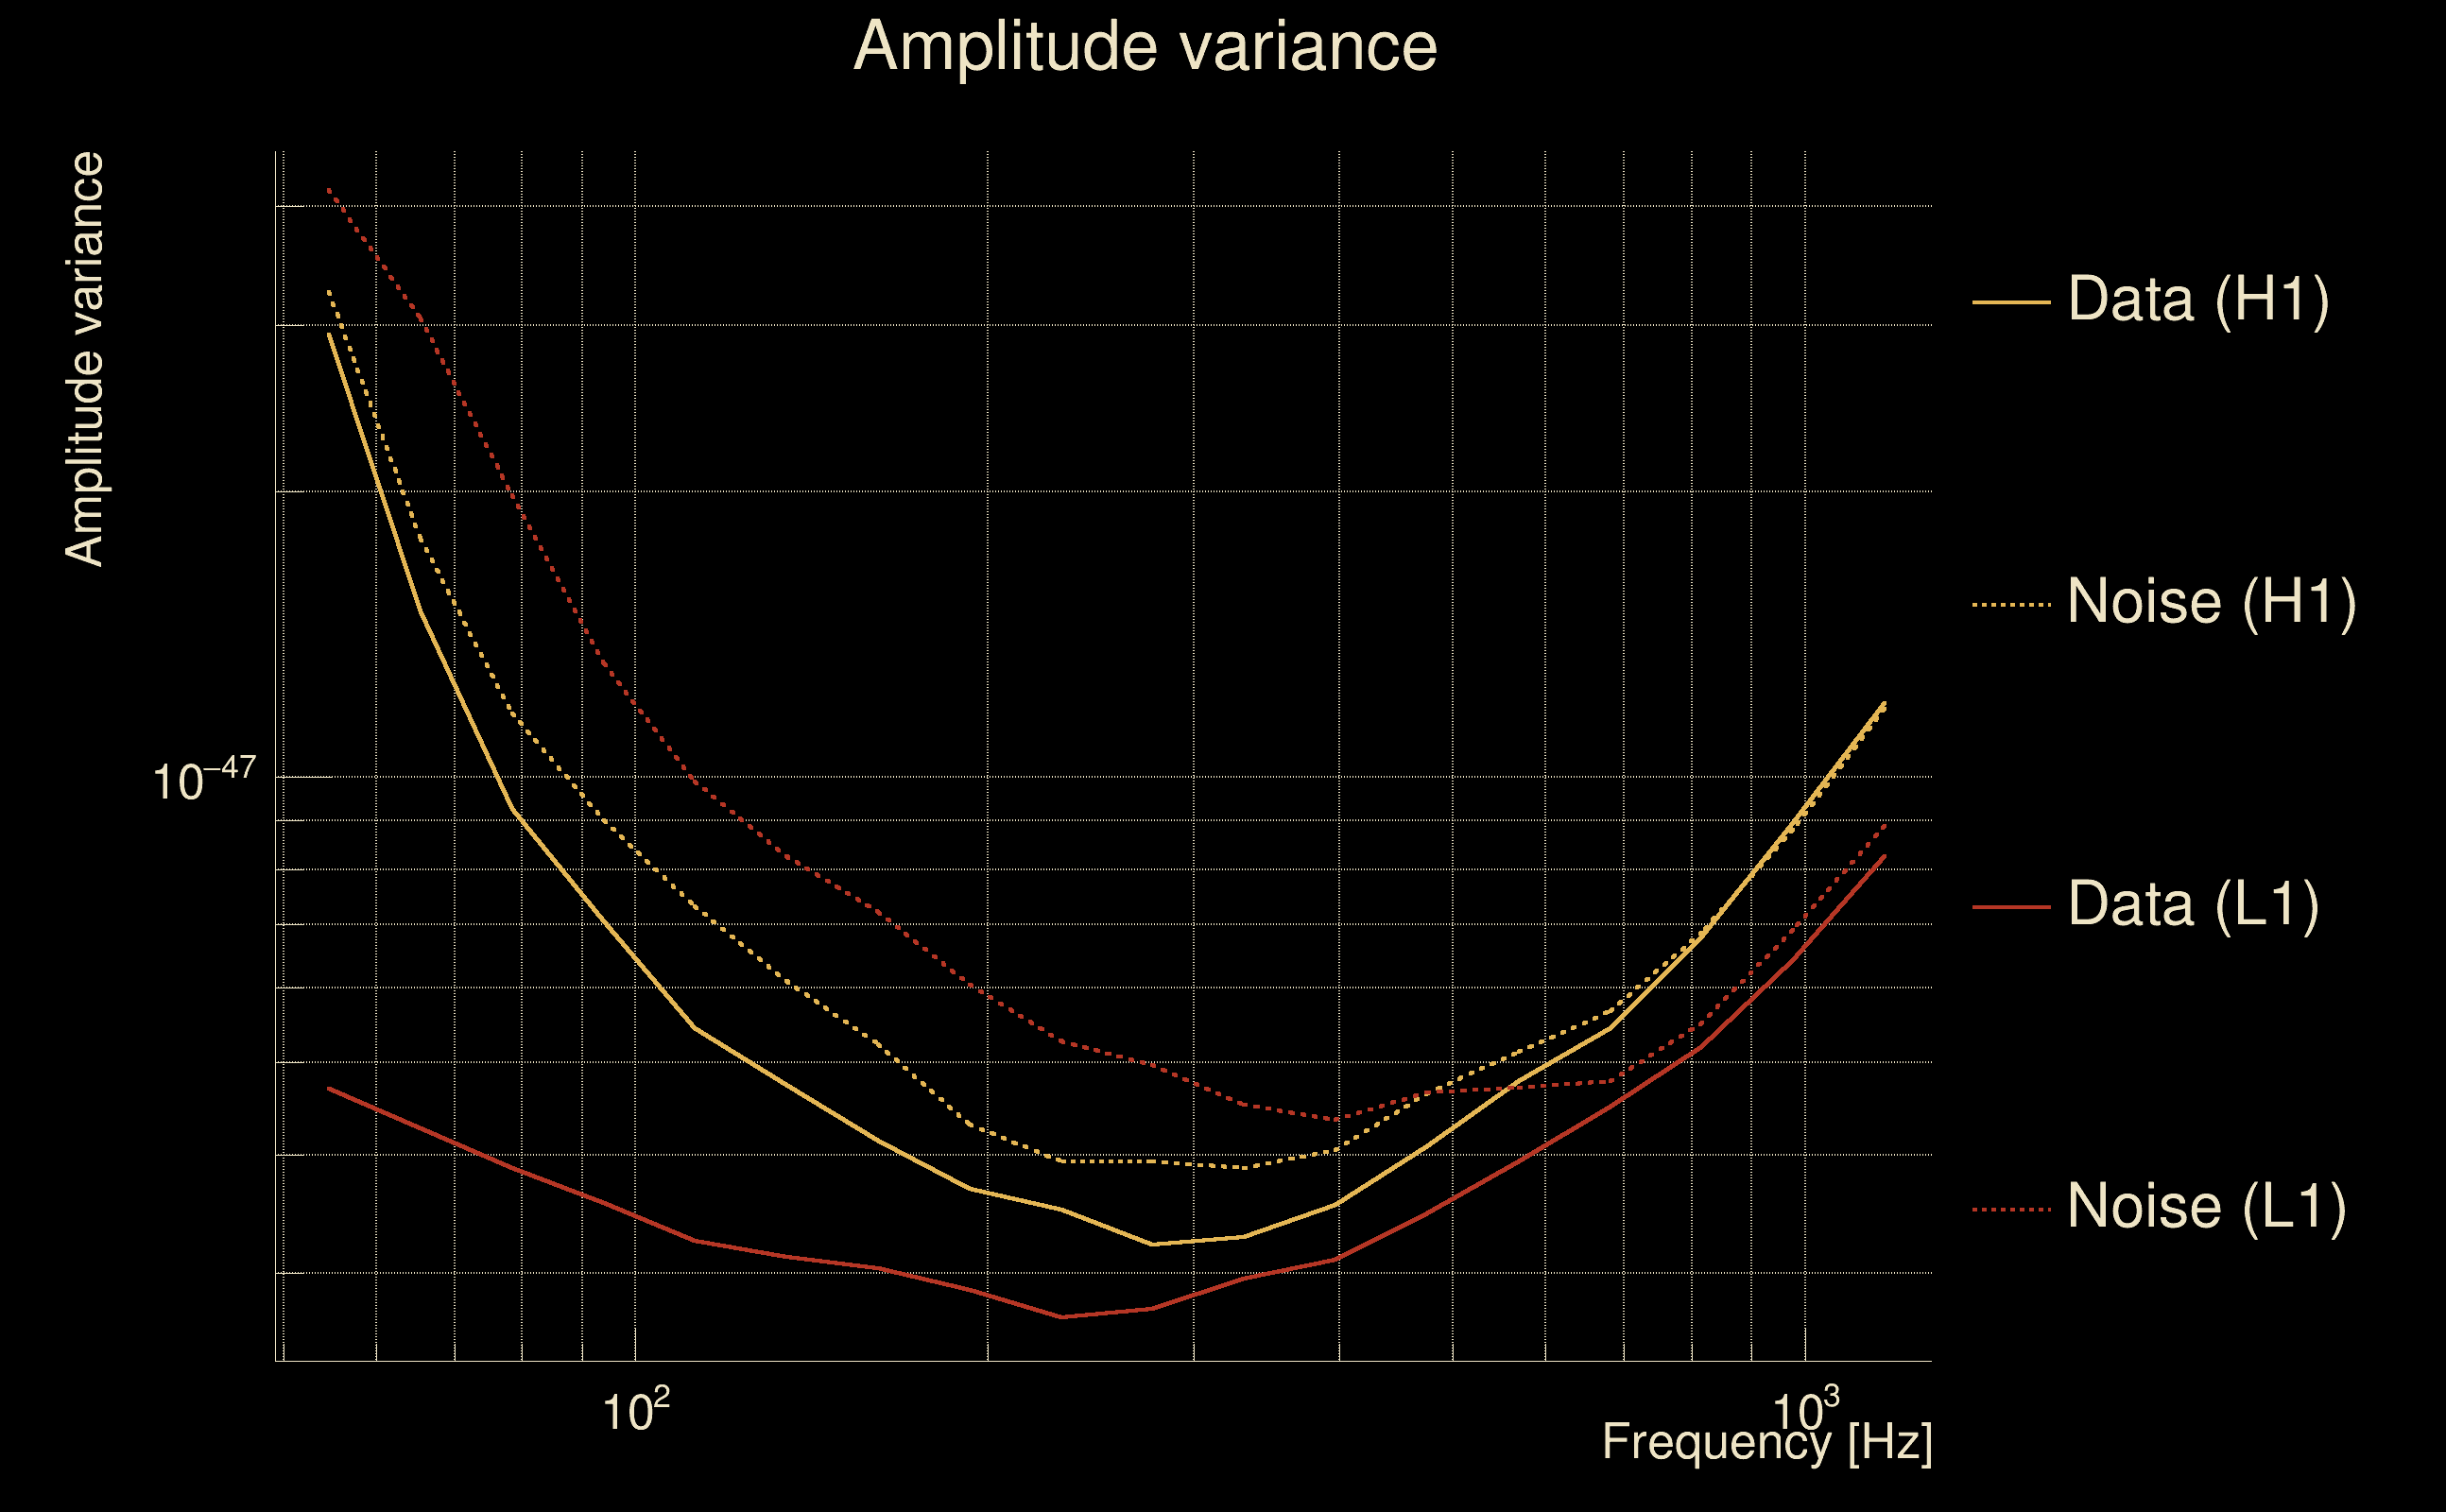
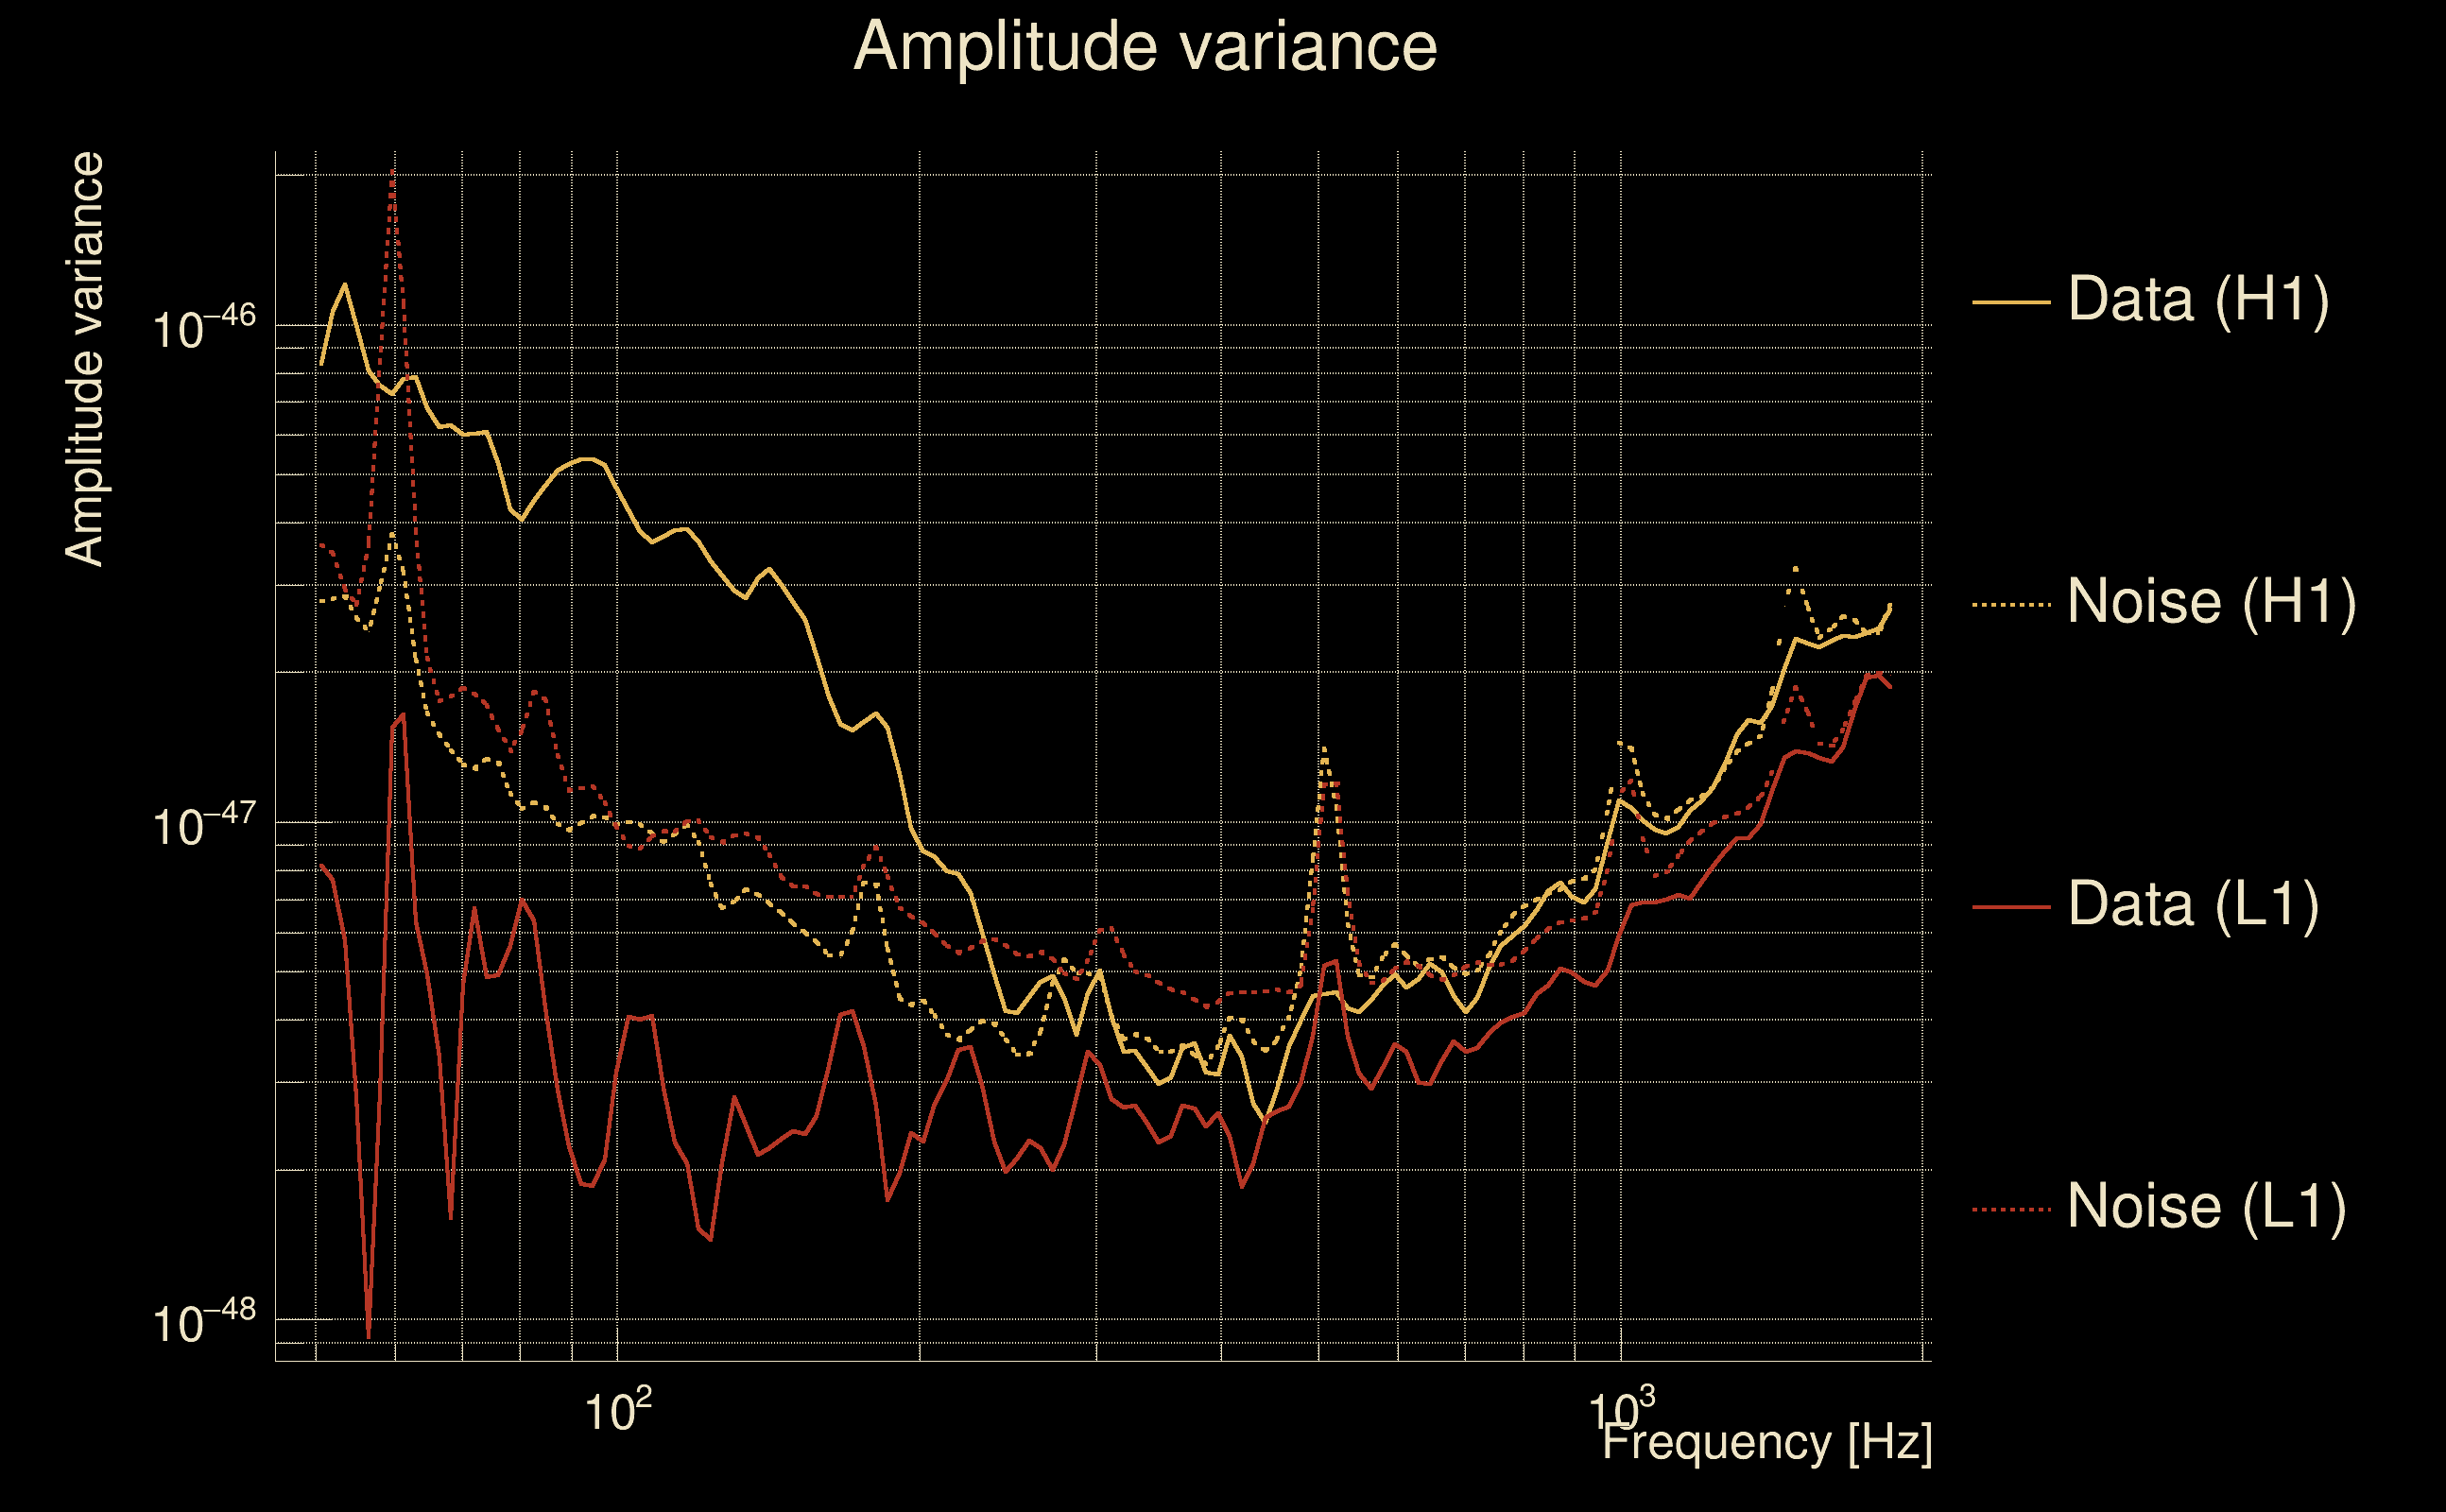
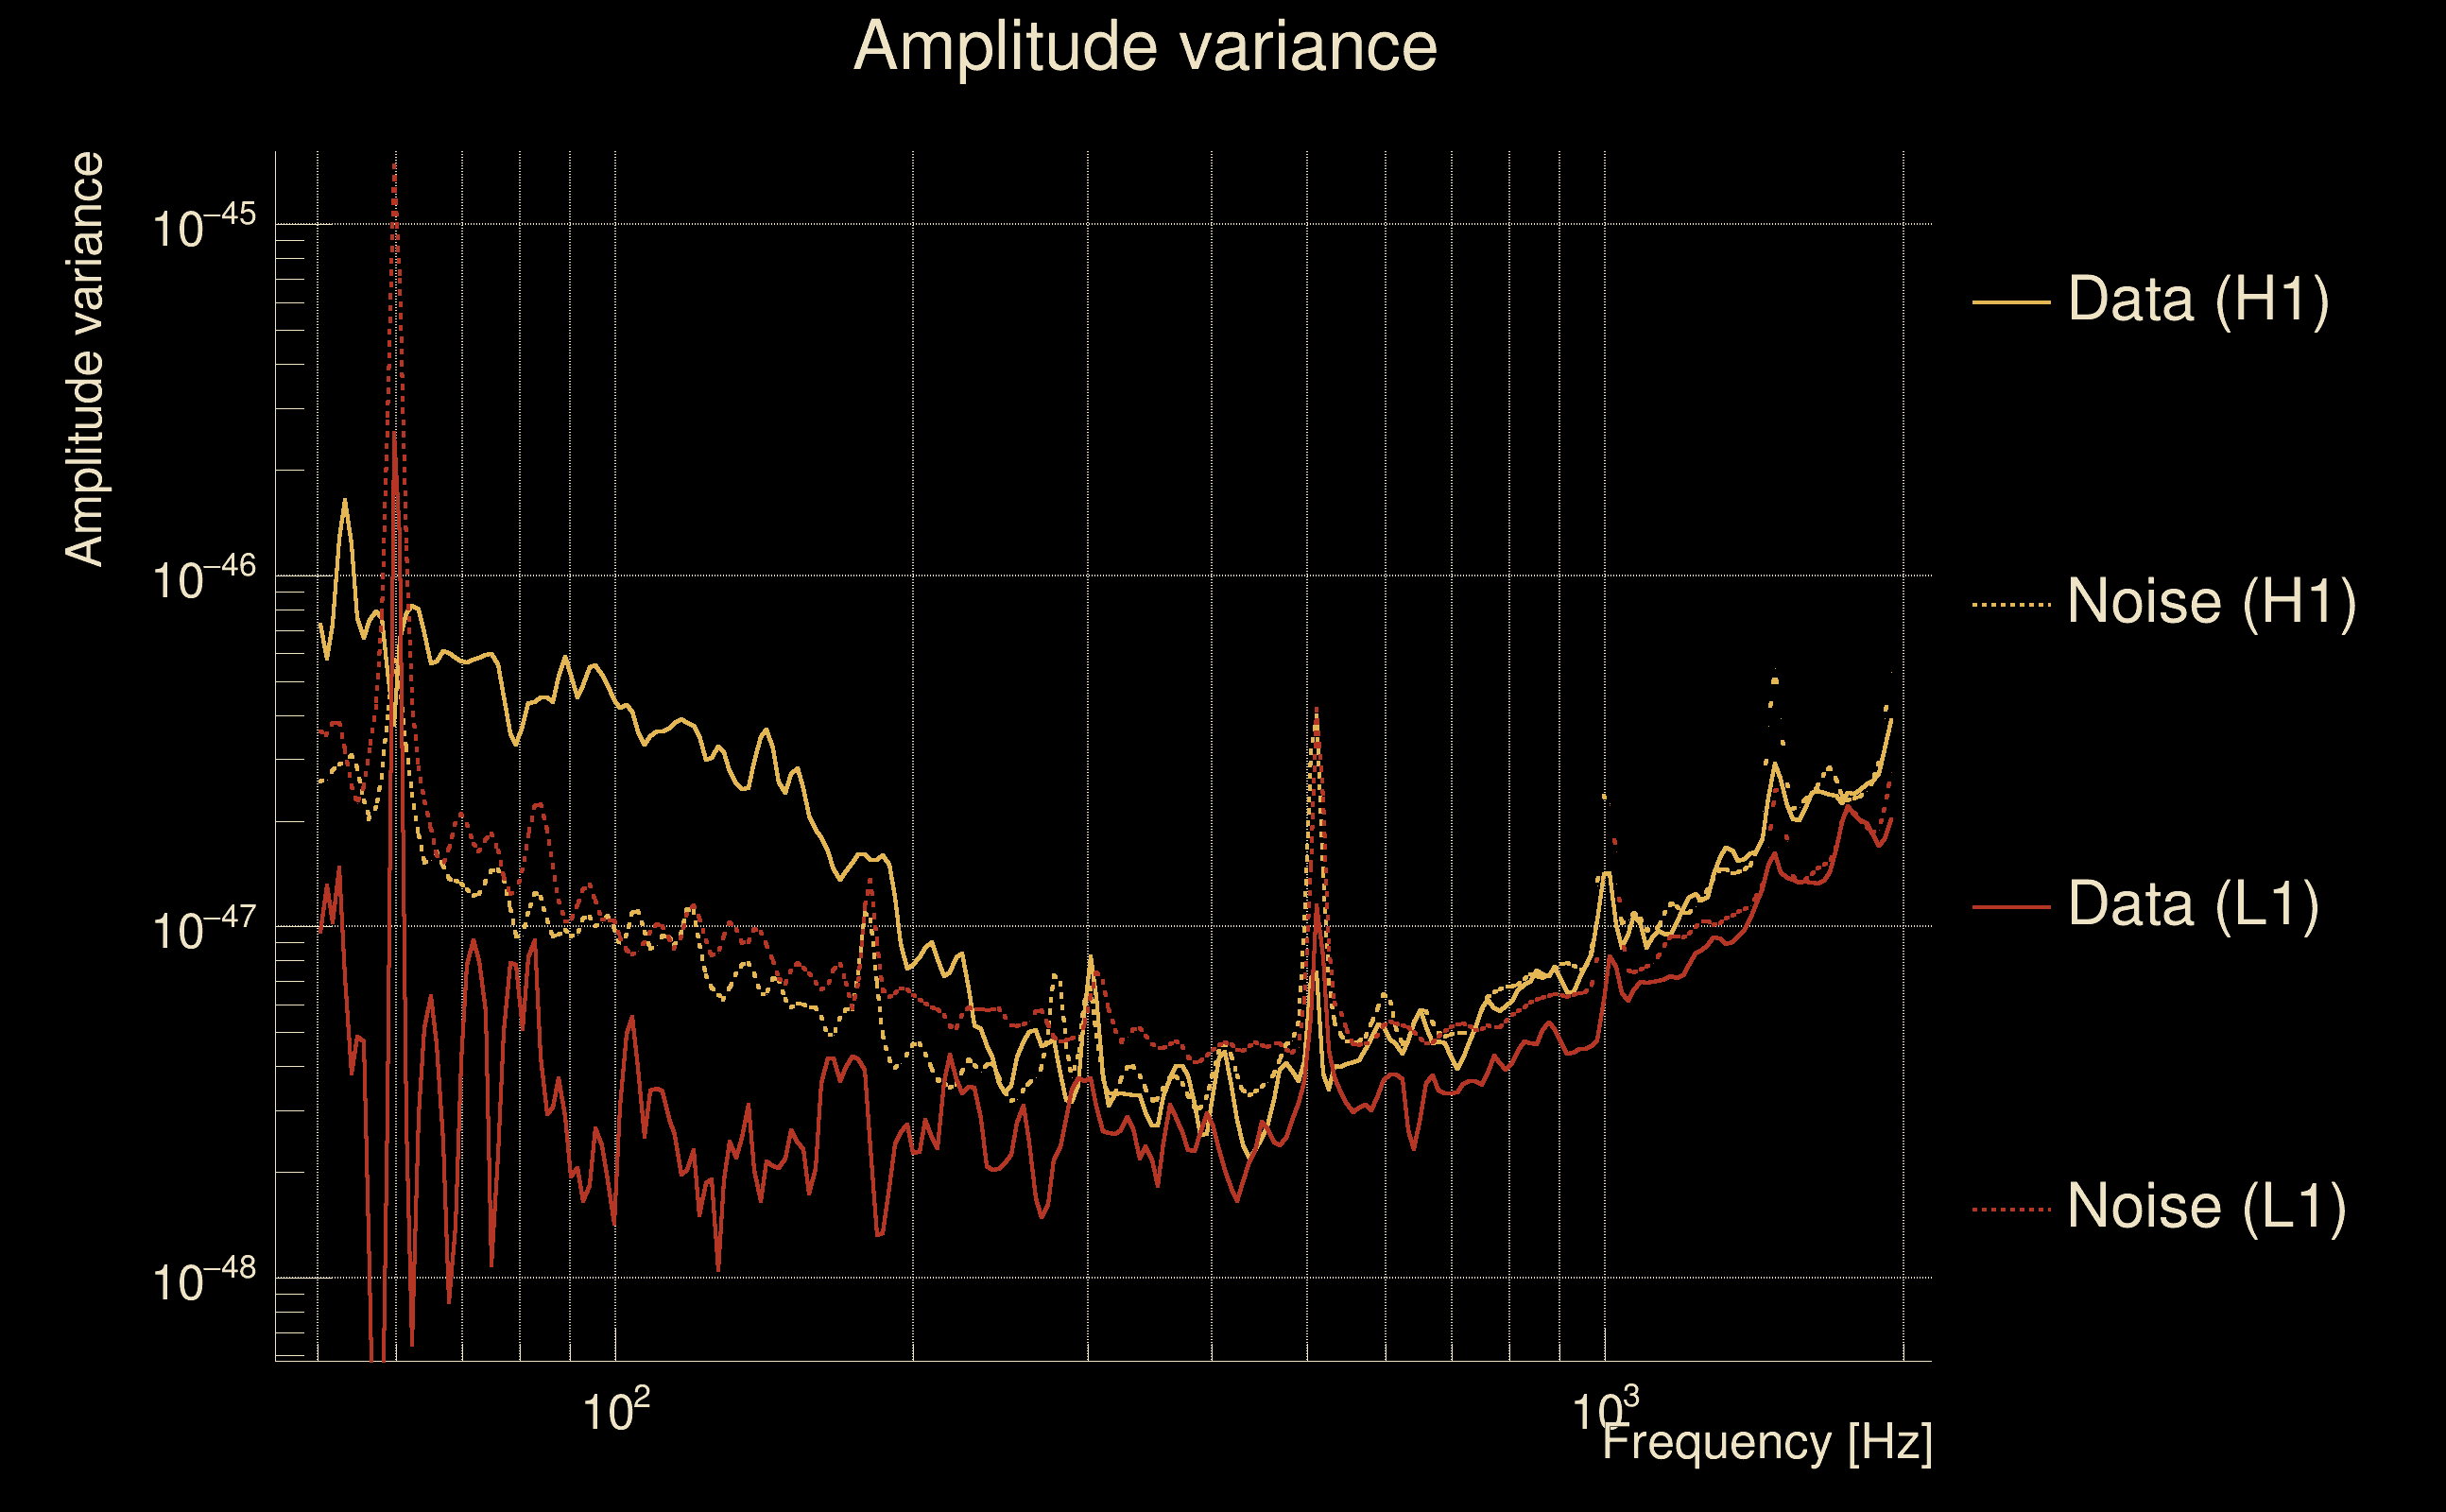
| Amplitude spectrograms: | normalization = 1e-22, power index = 2 |
| White noise SNR variance: | 0.523175 (after applying a correction factor = 1) |
| Amplitude ratio confidence level: | 3 sigma |
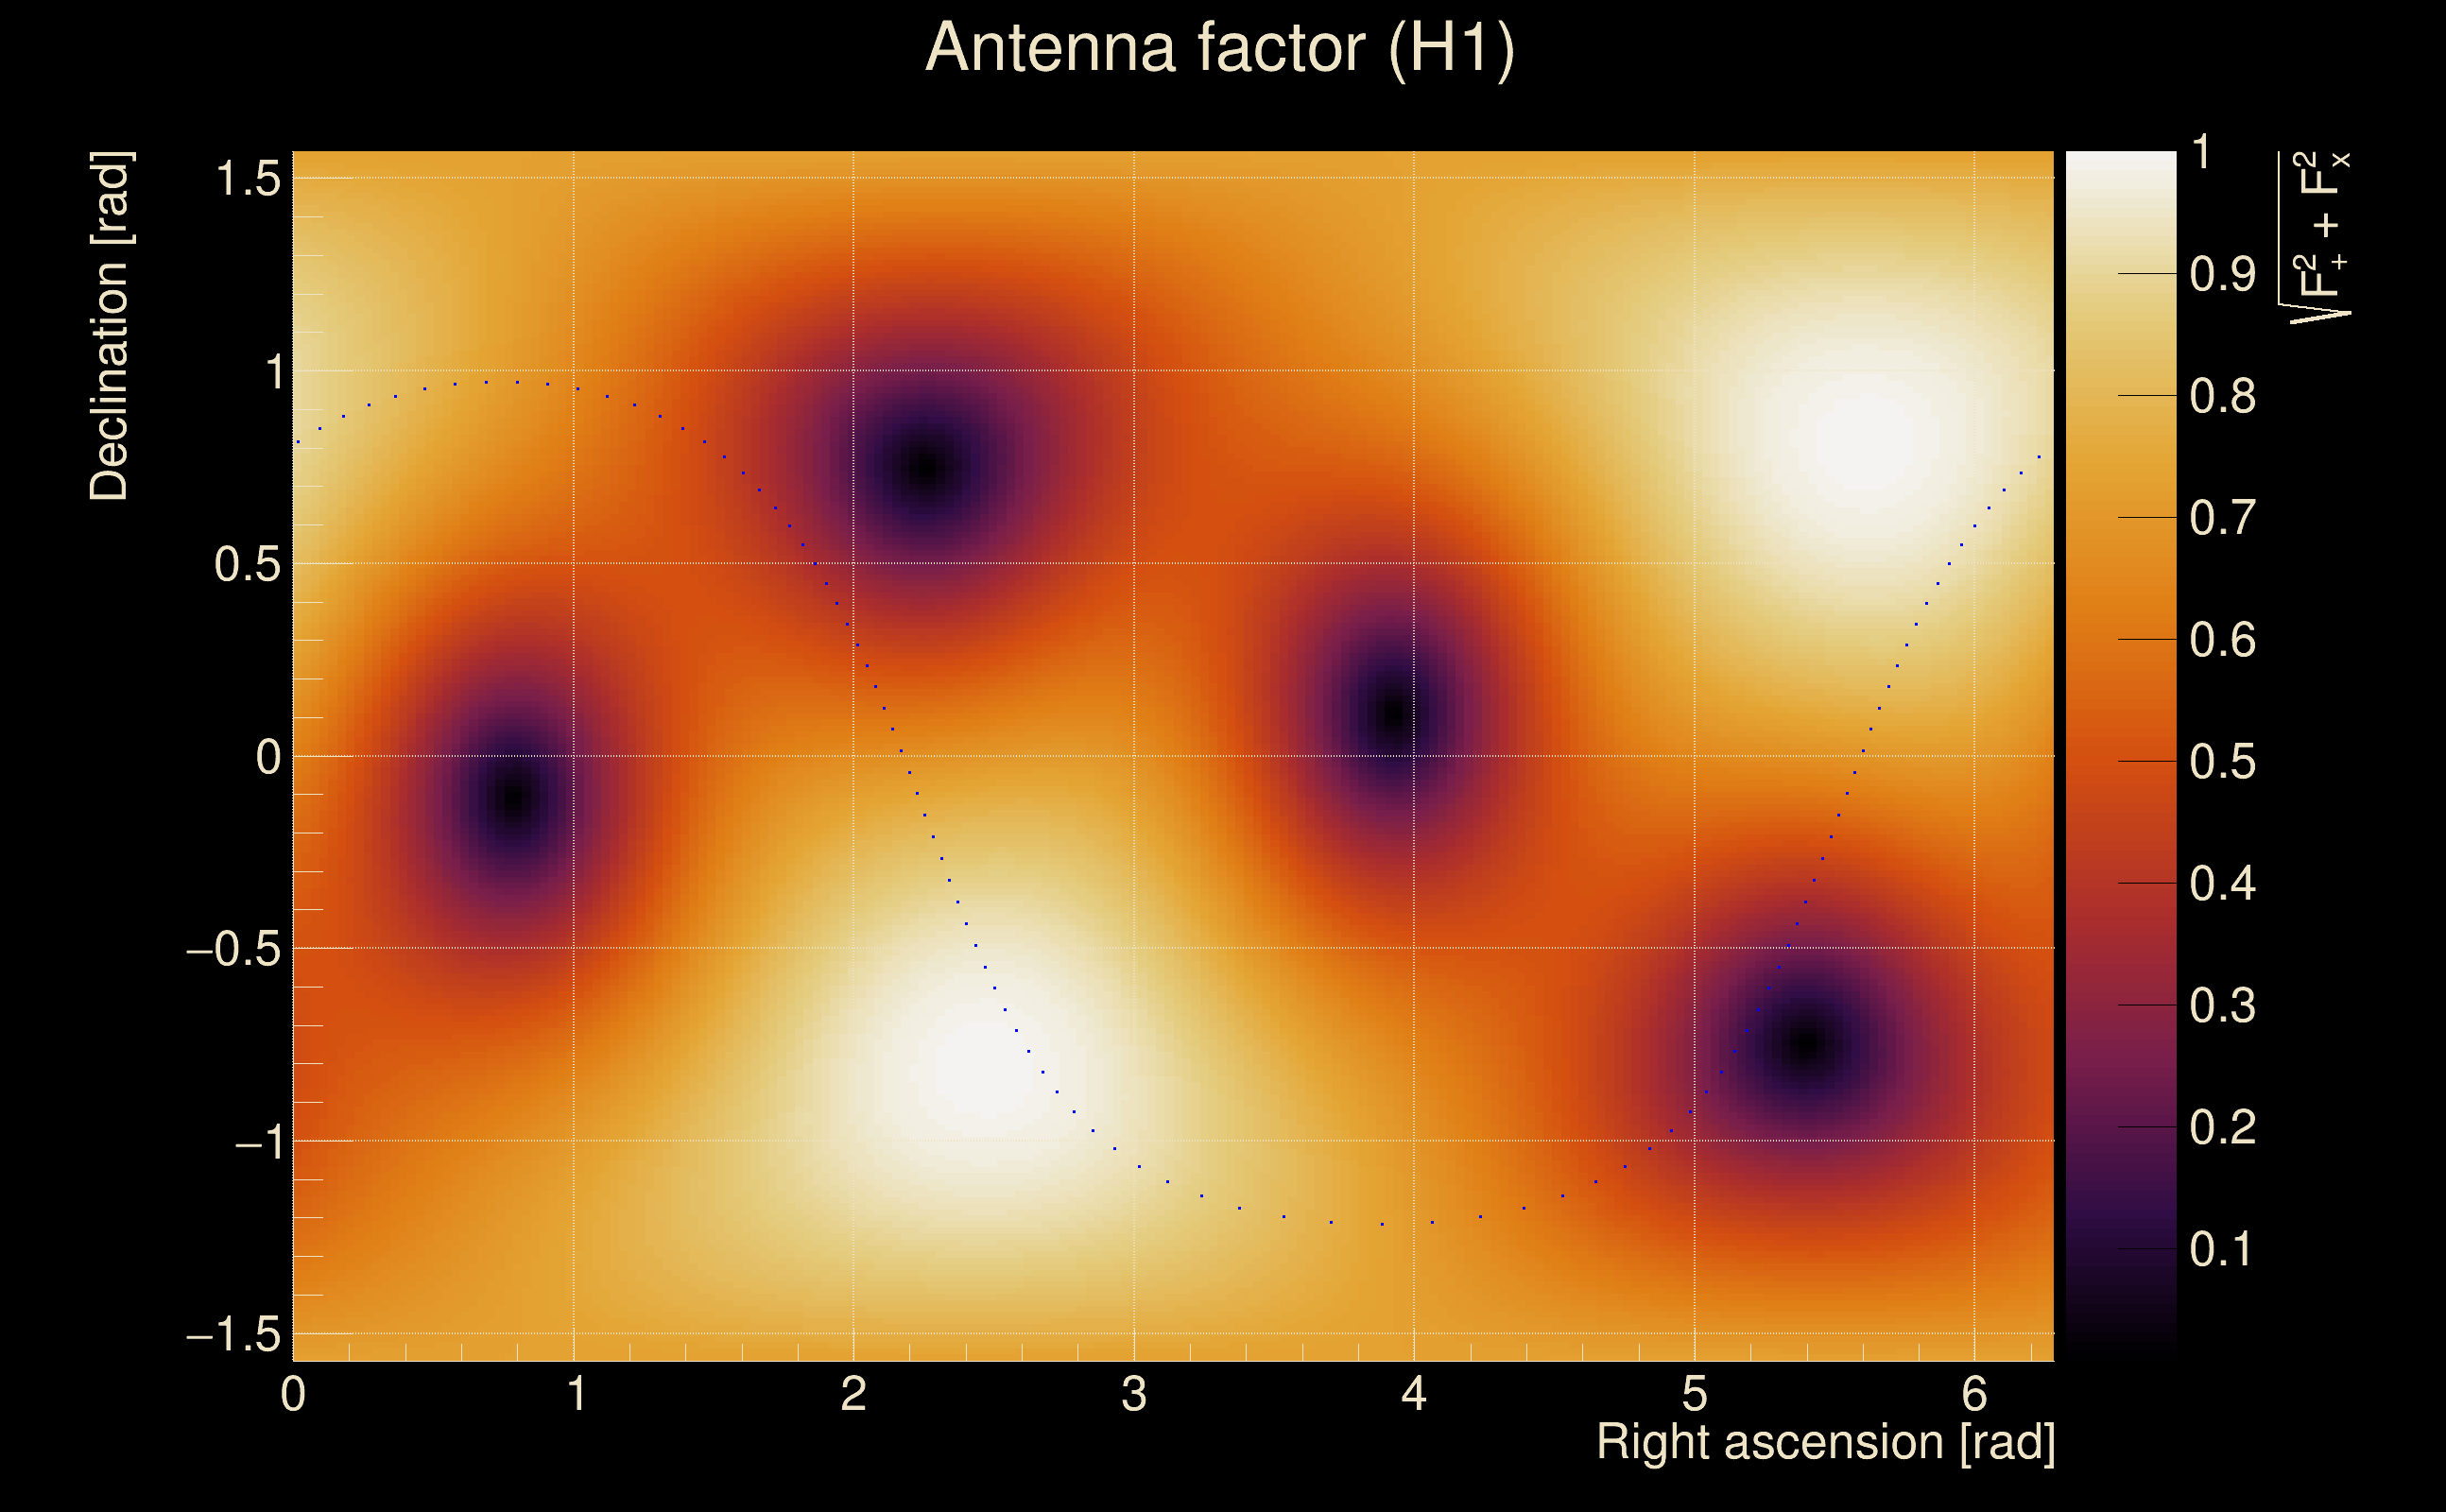
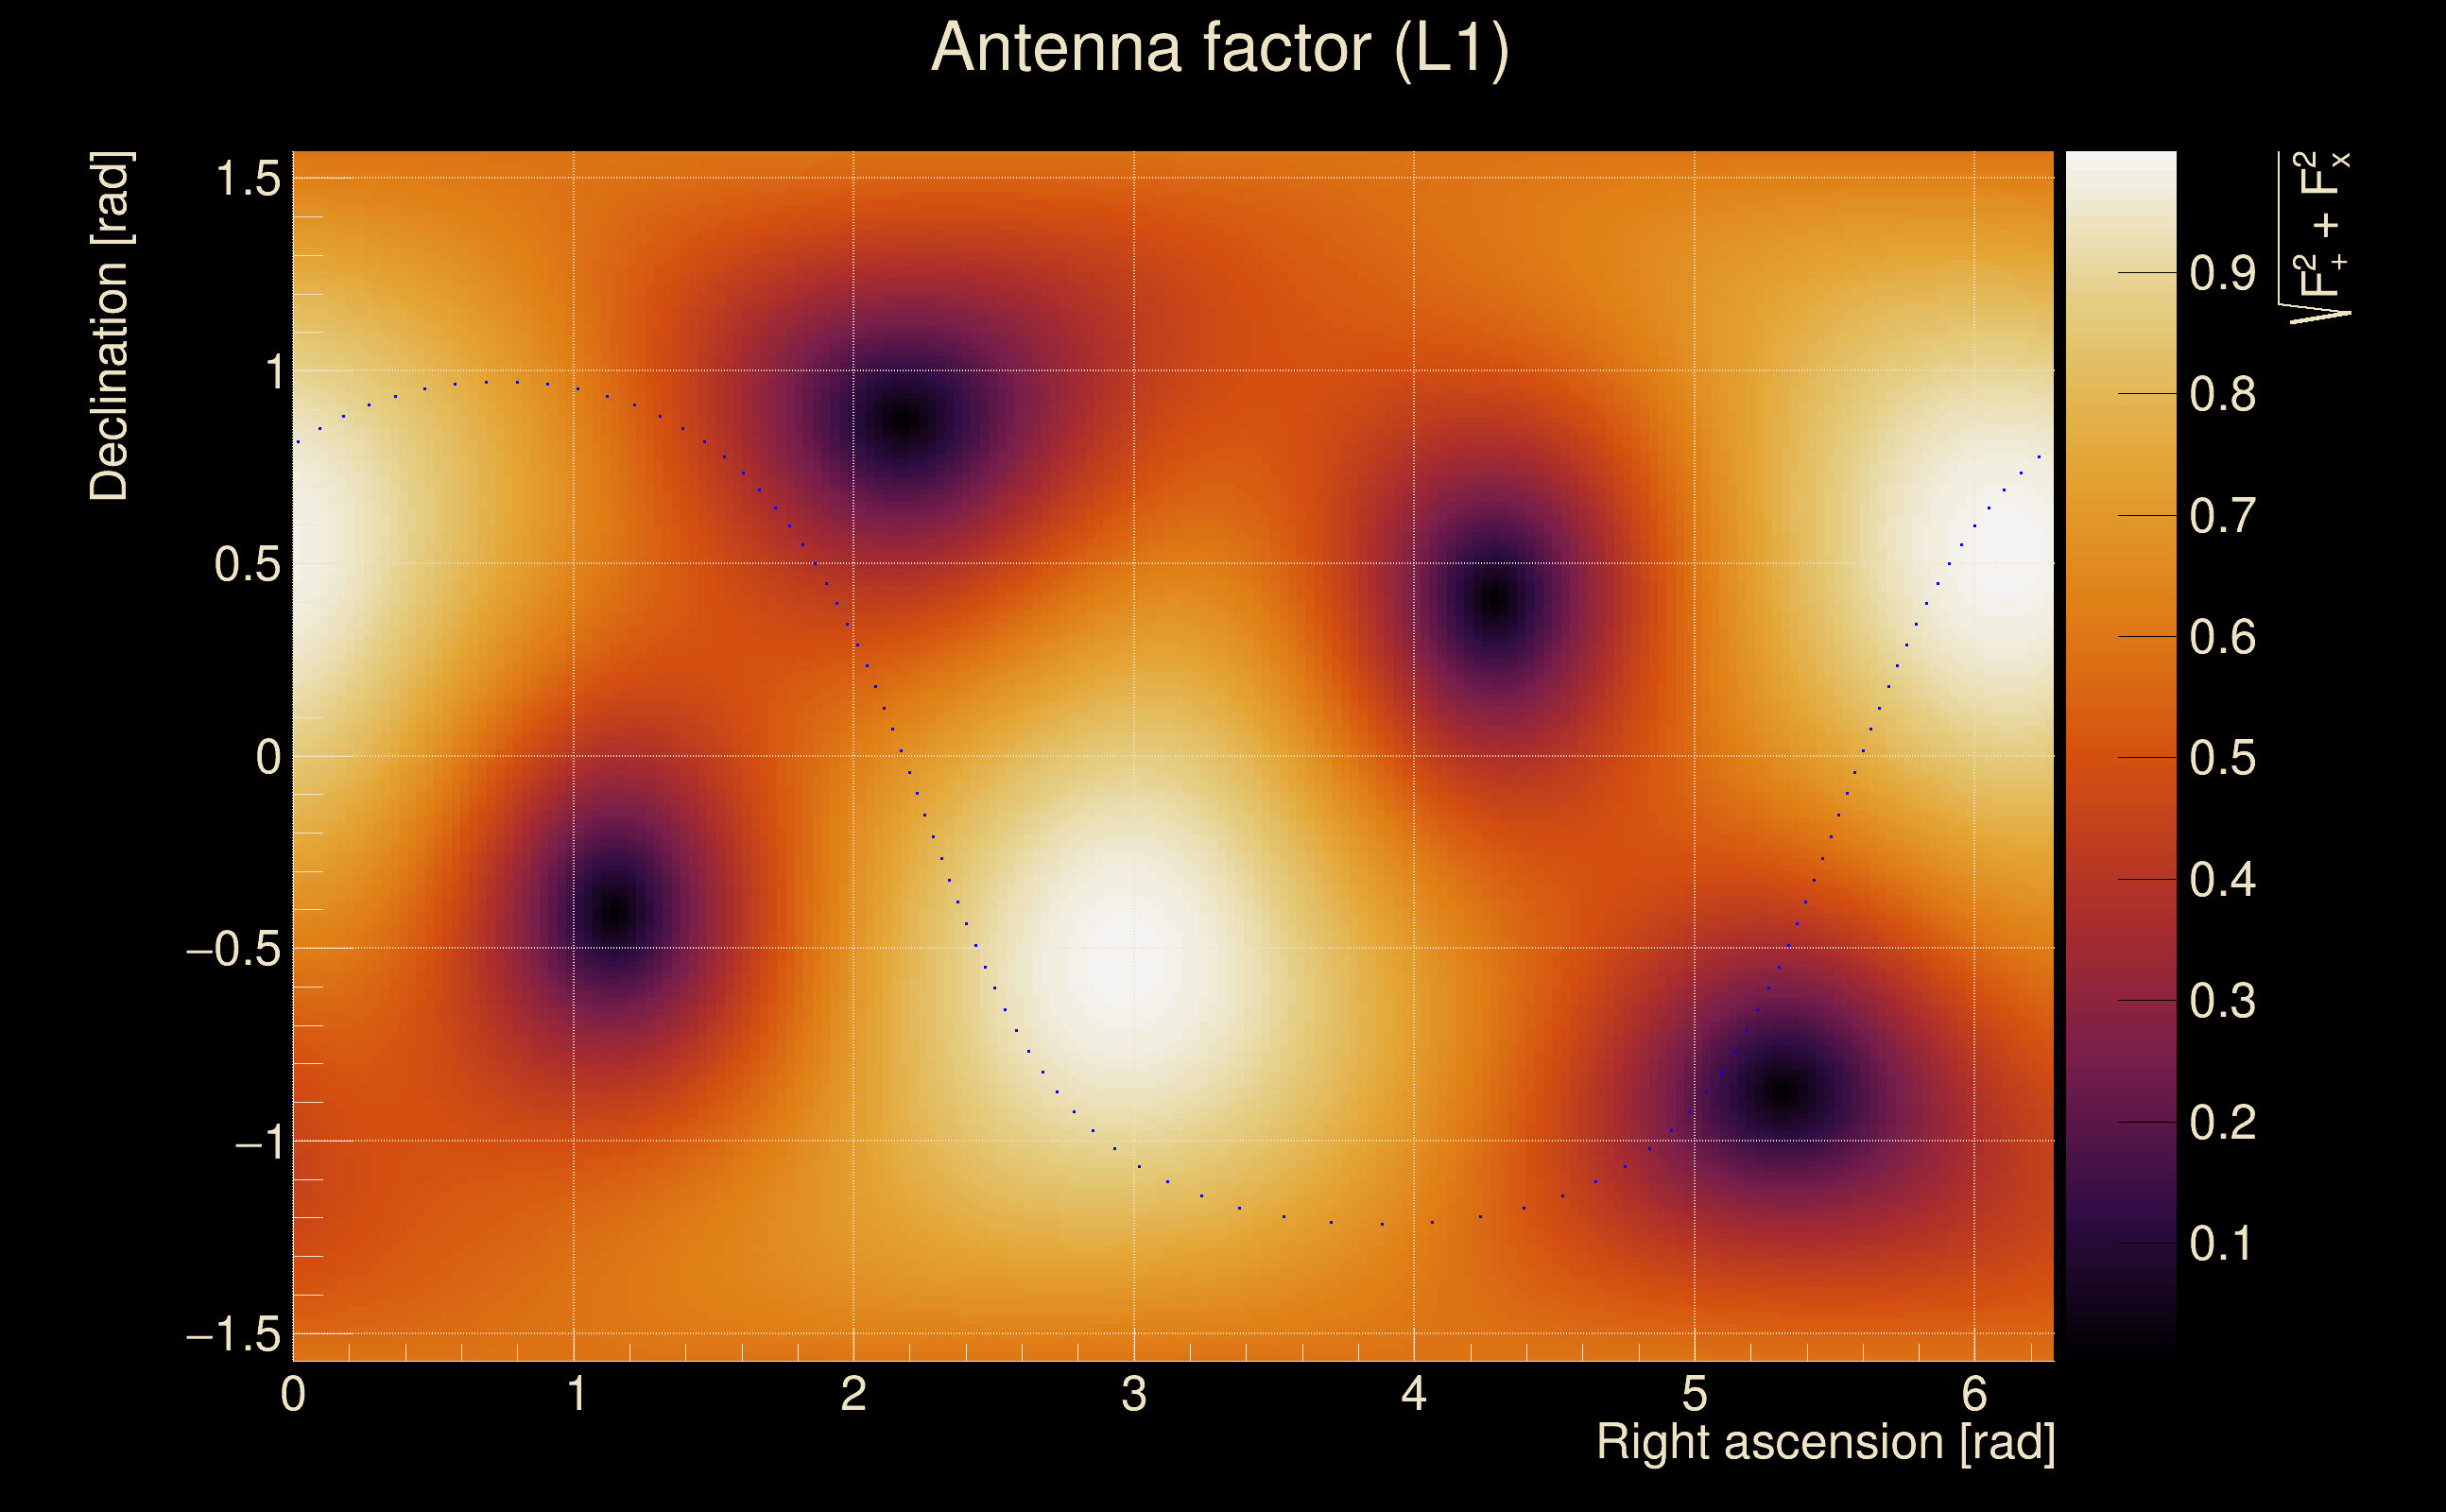
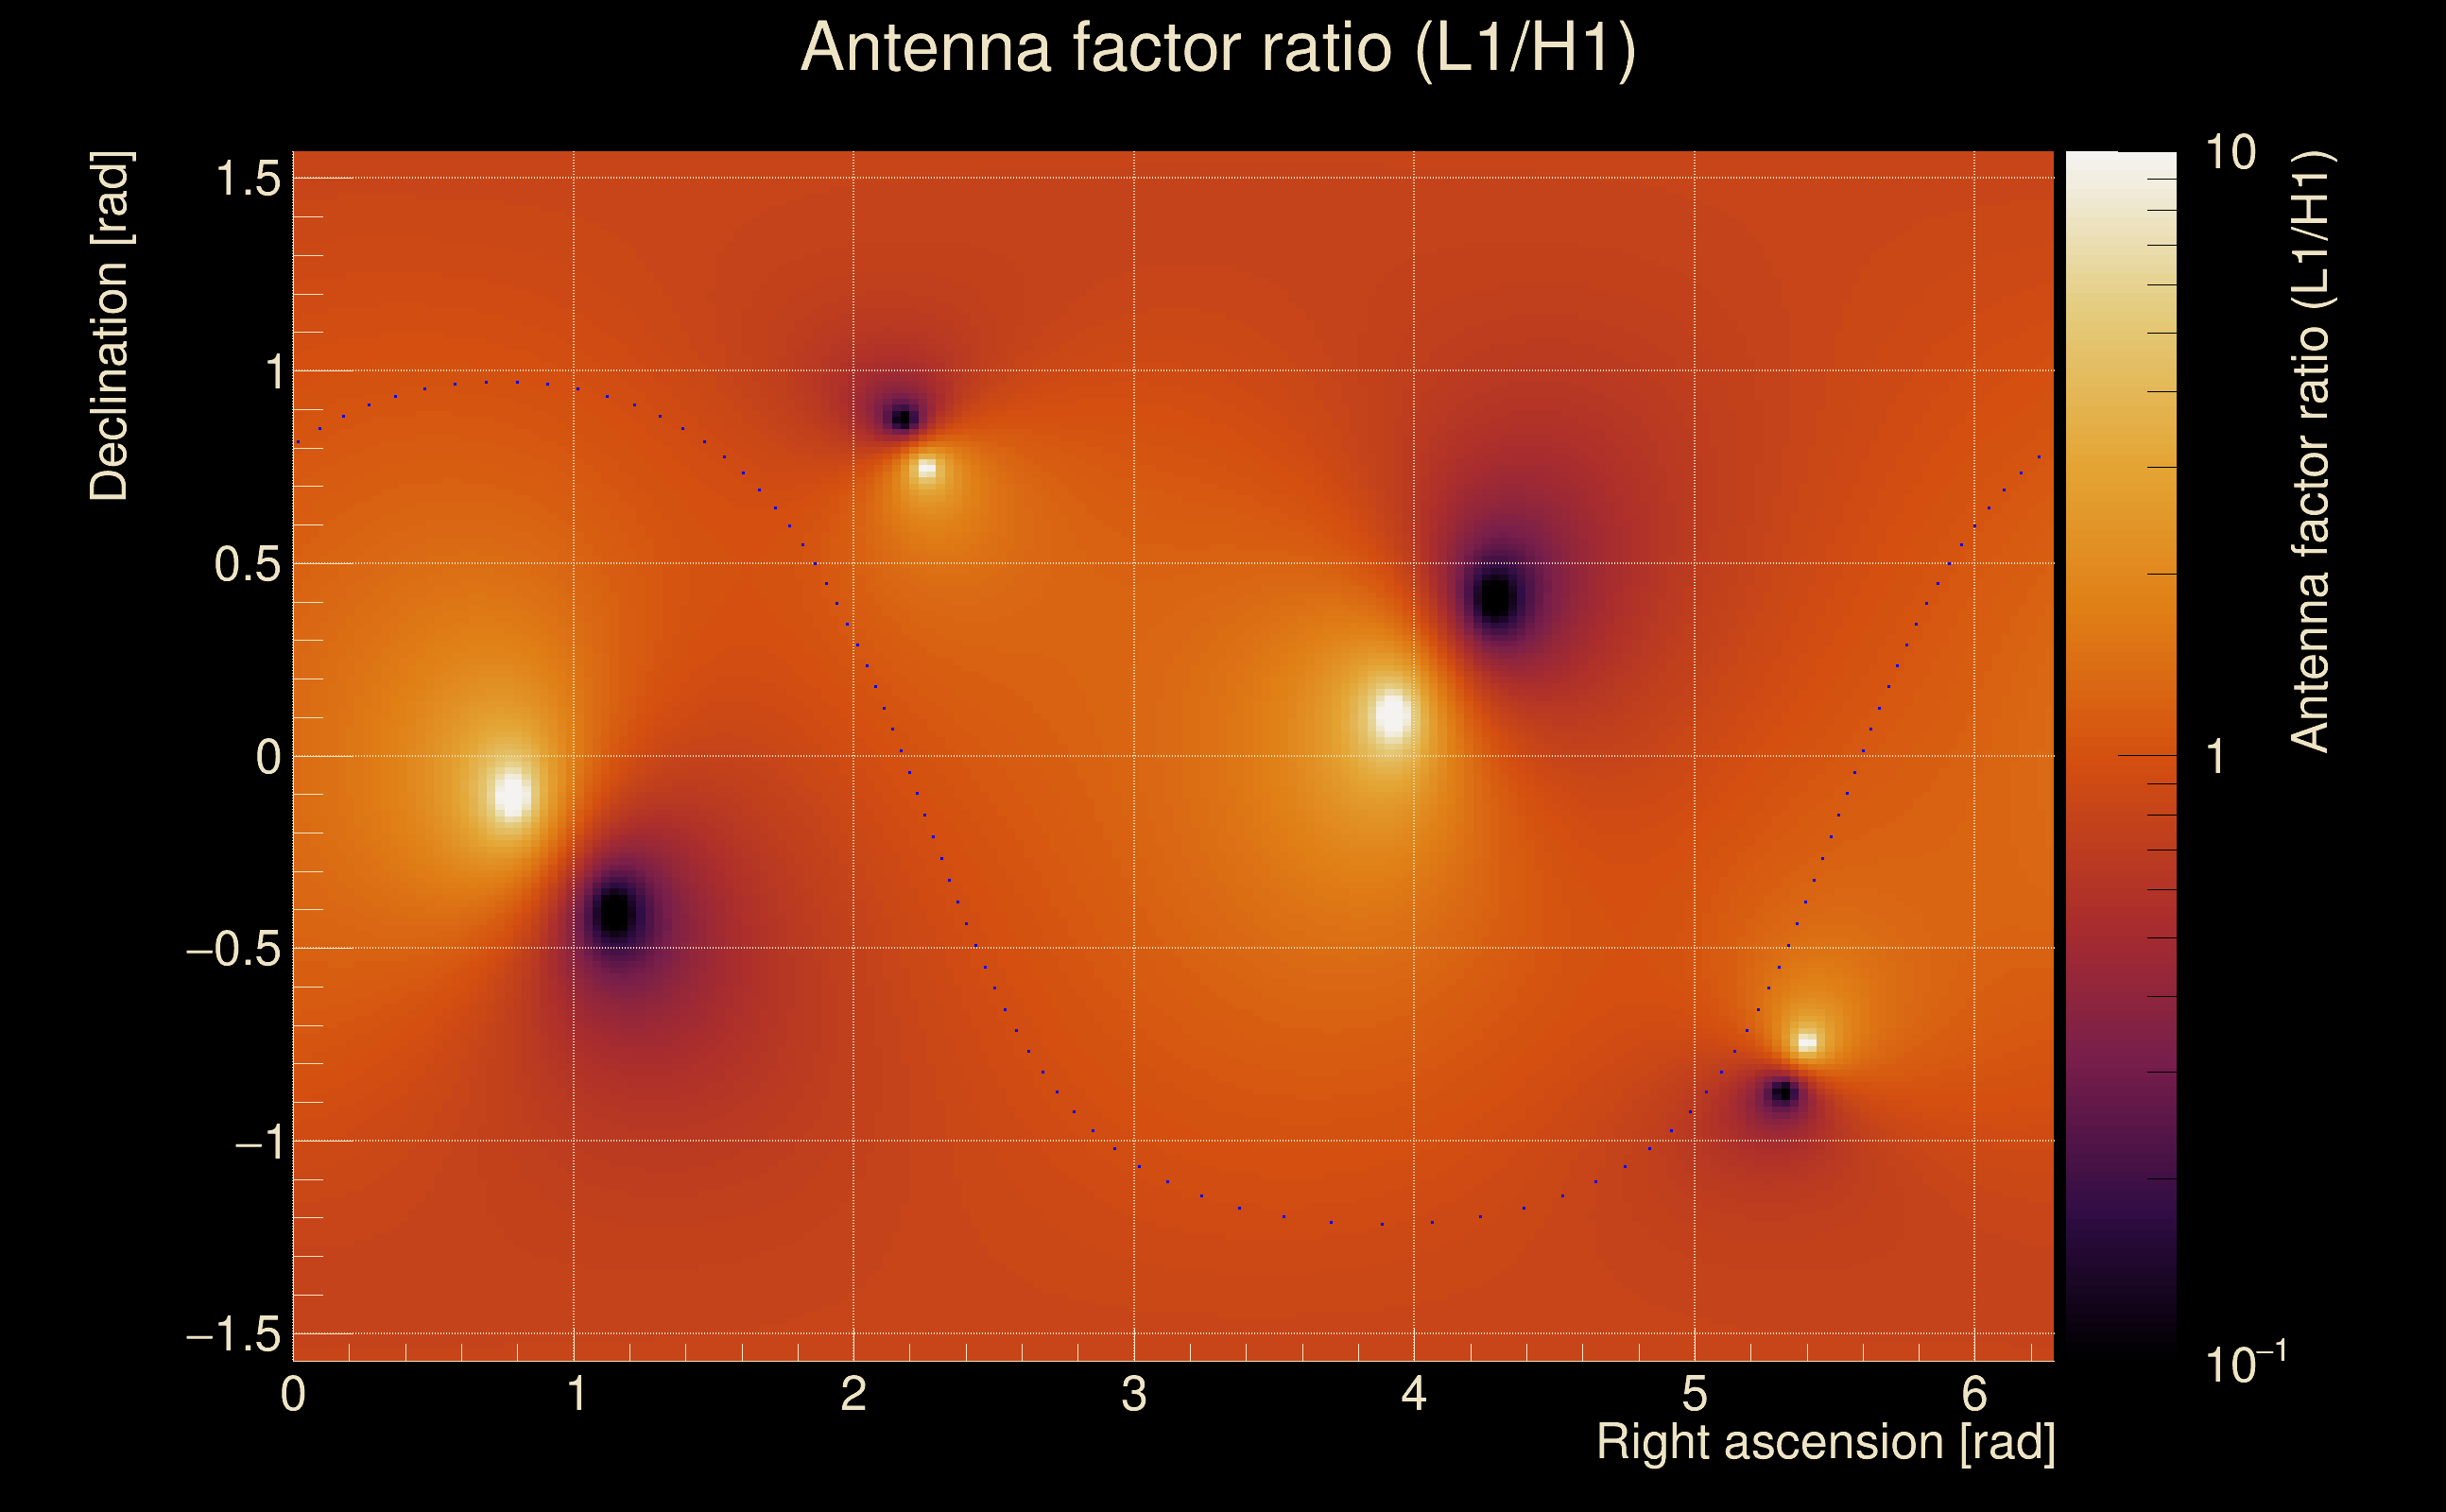
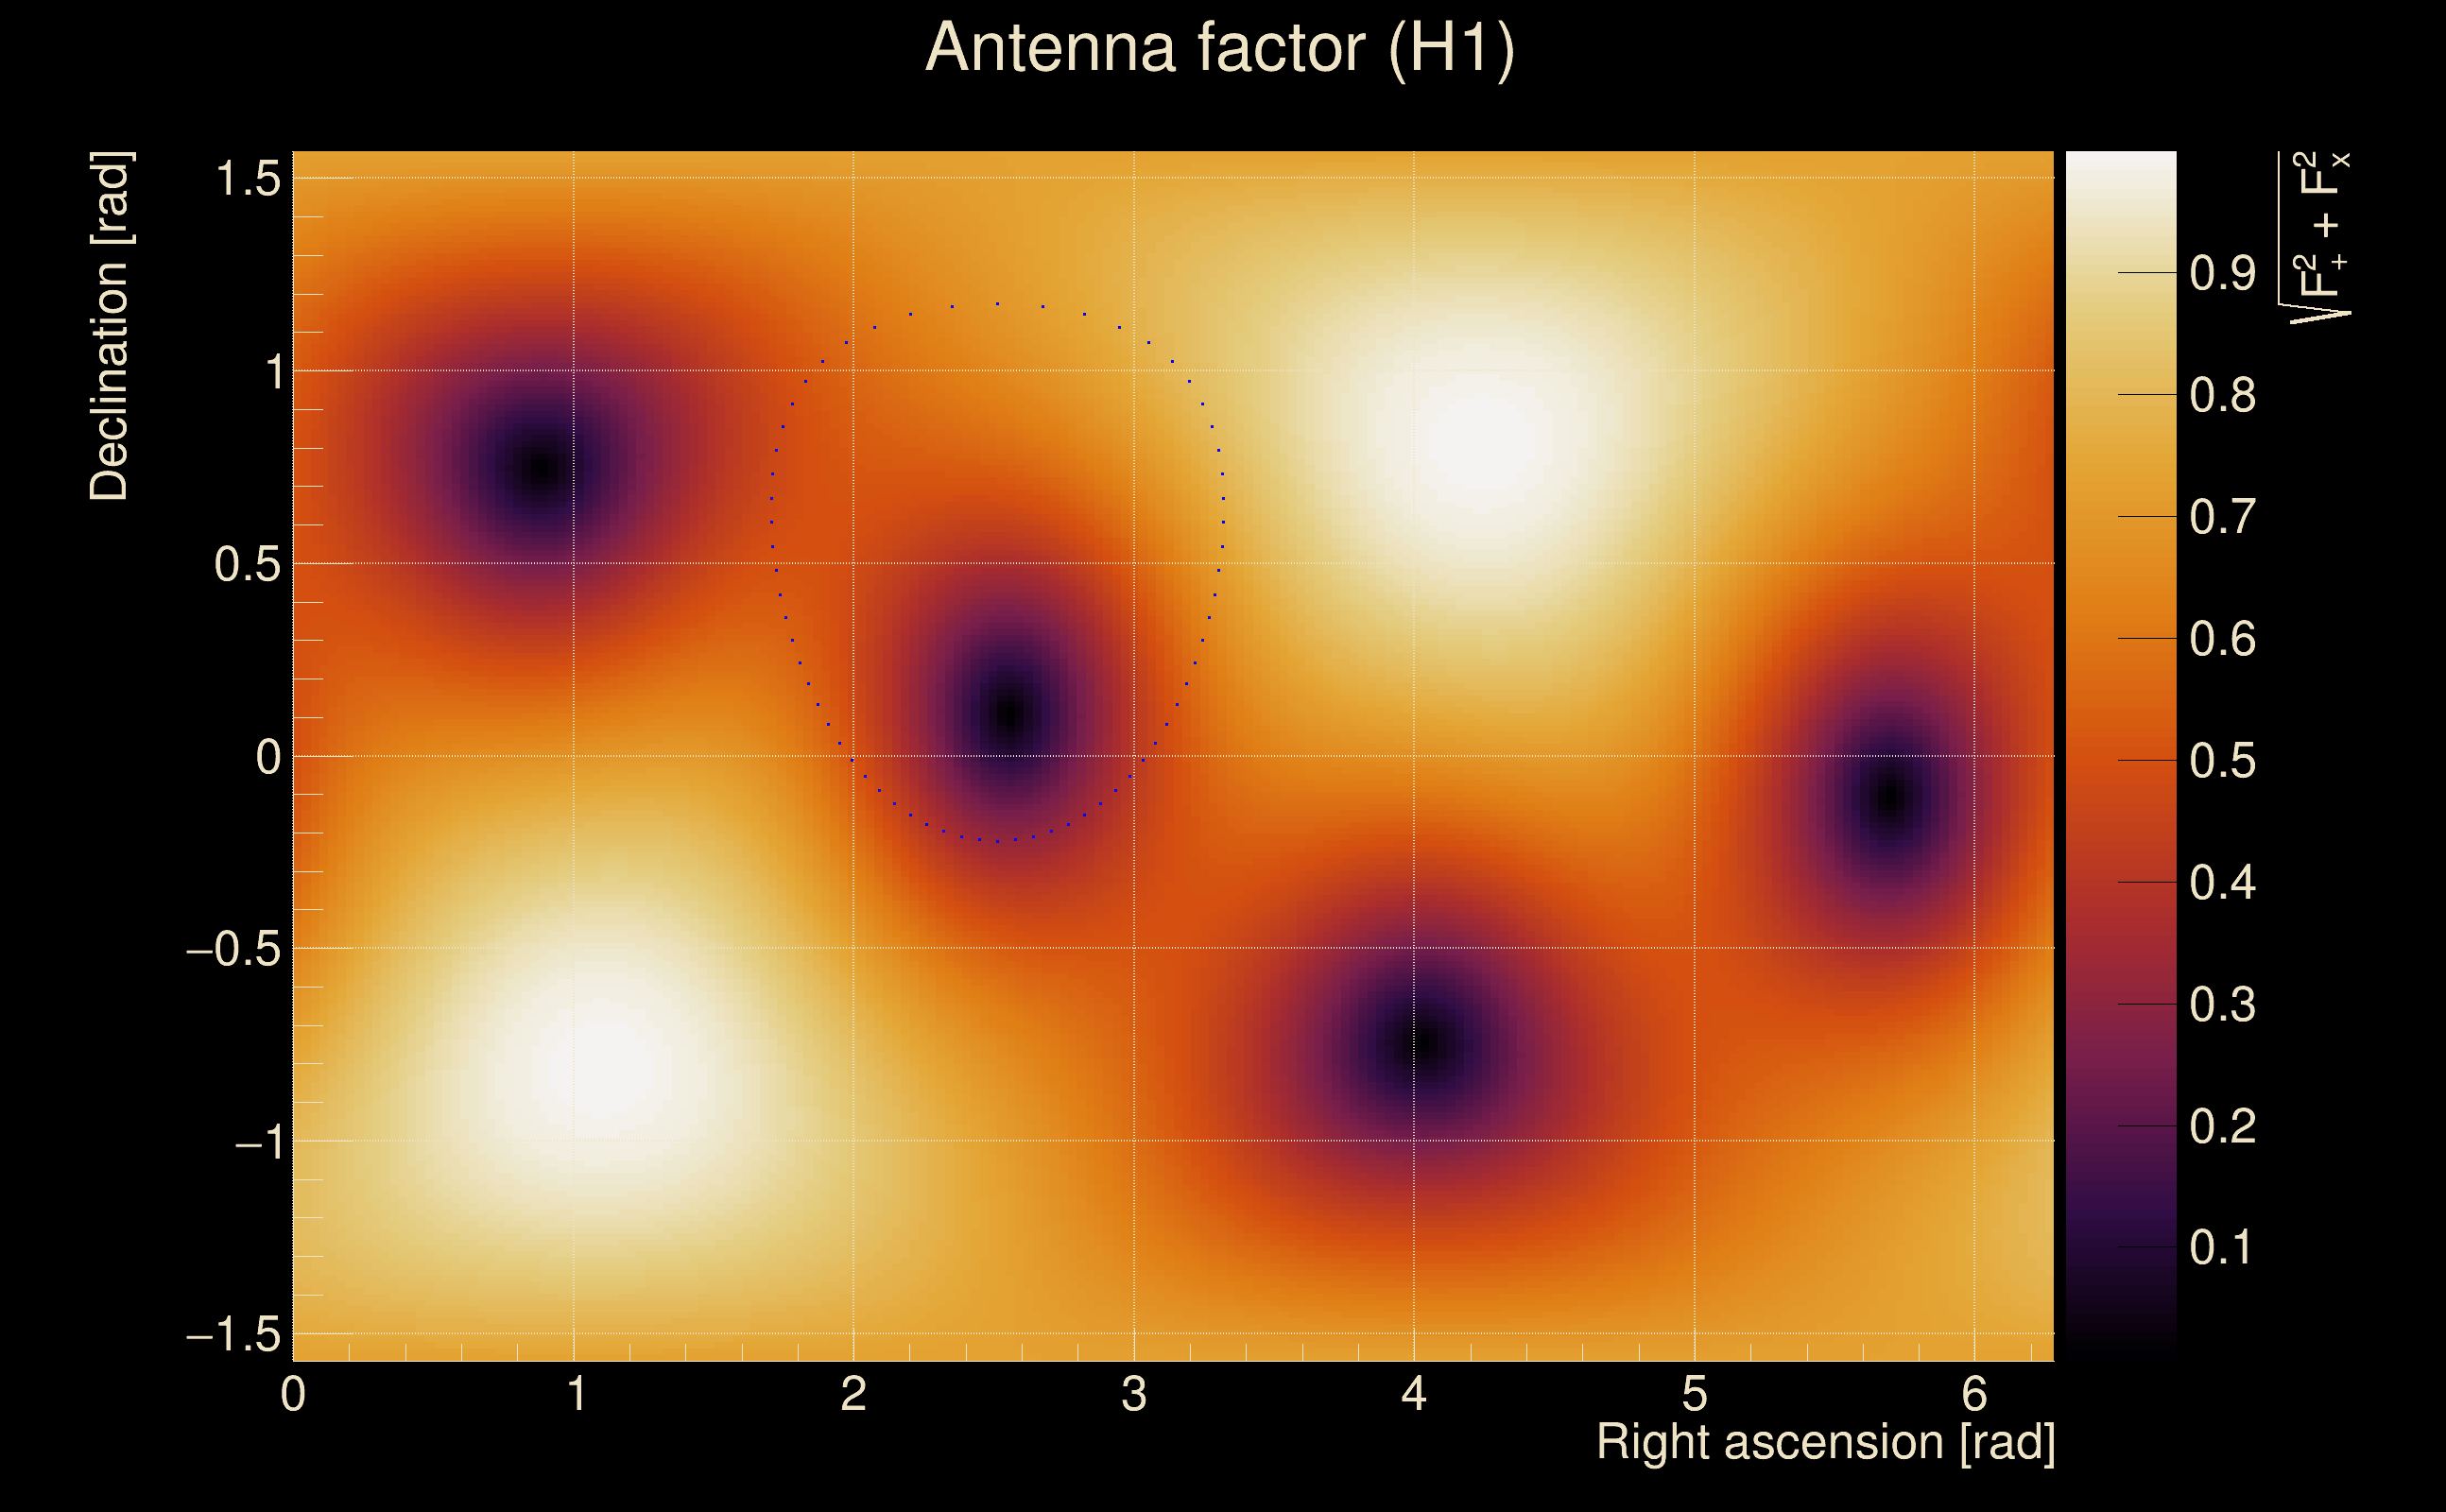
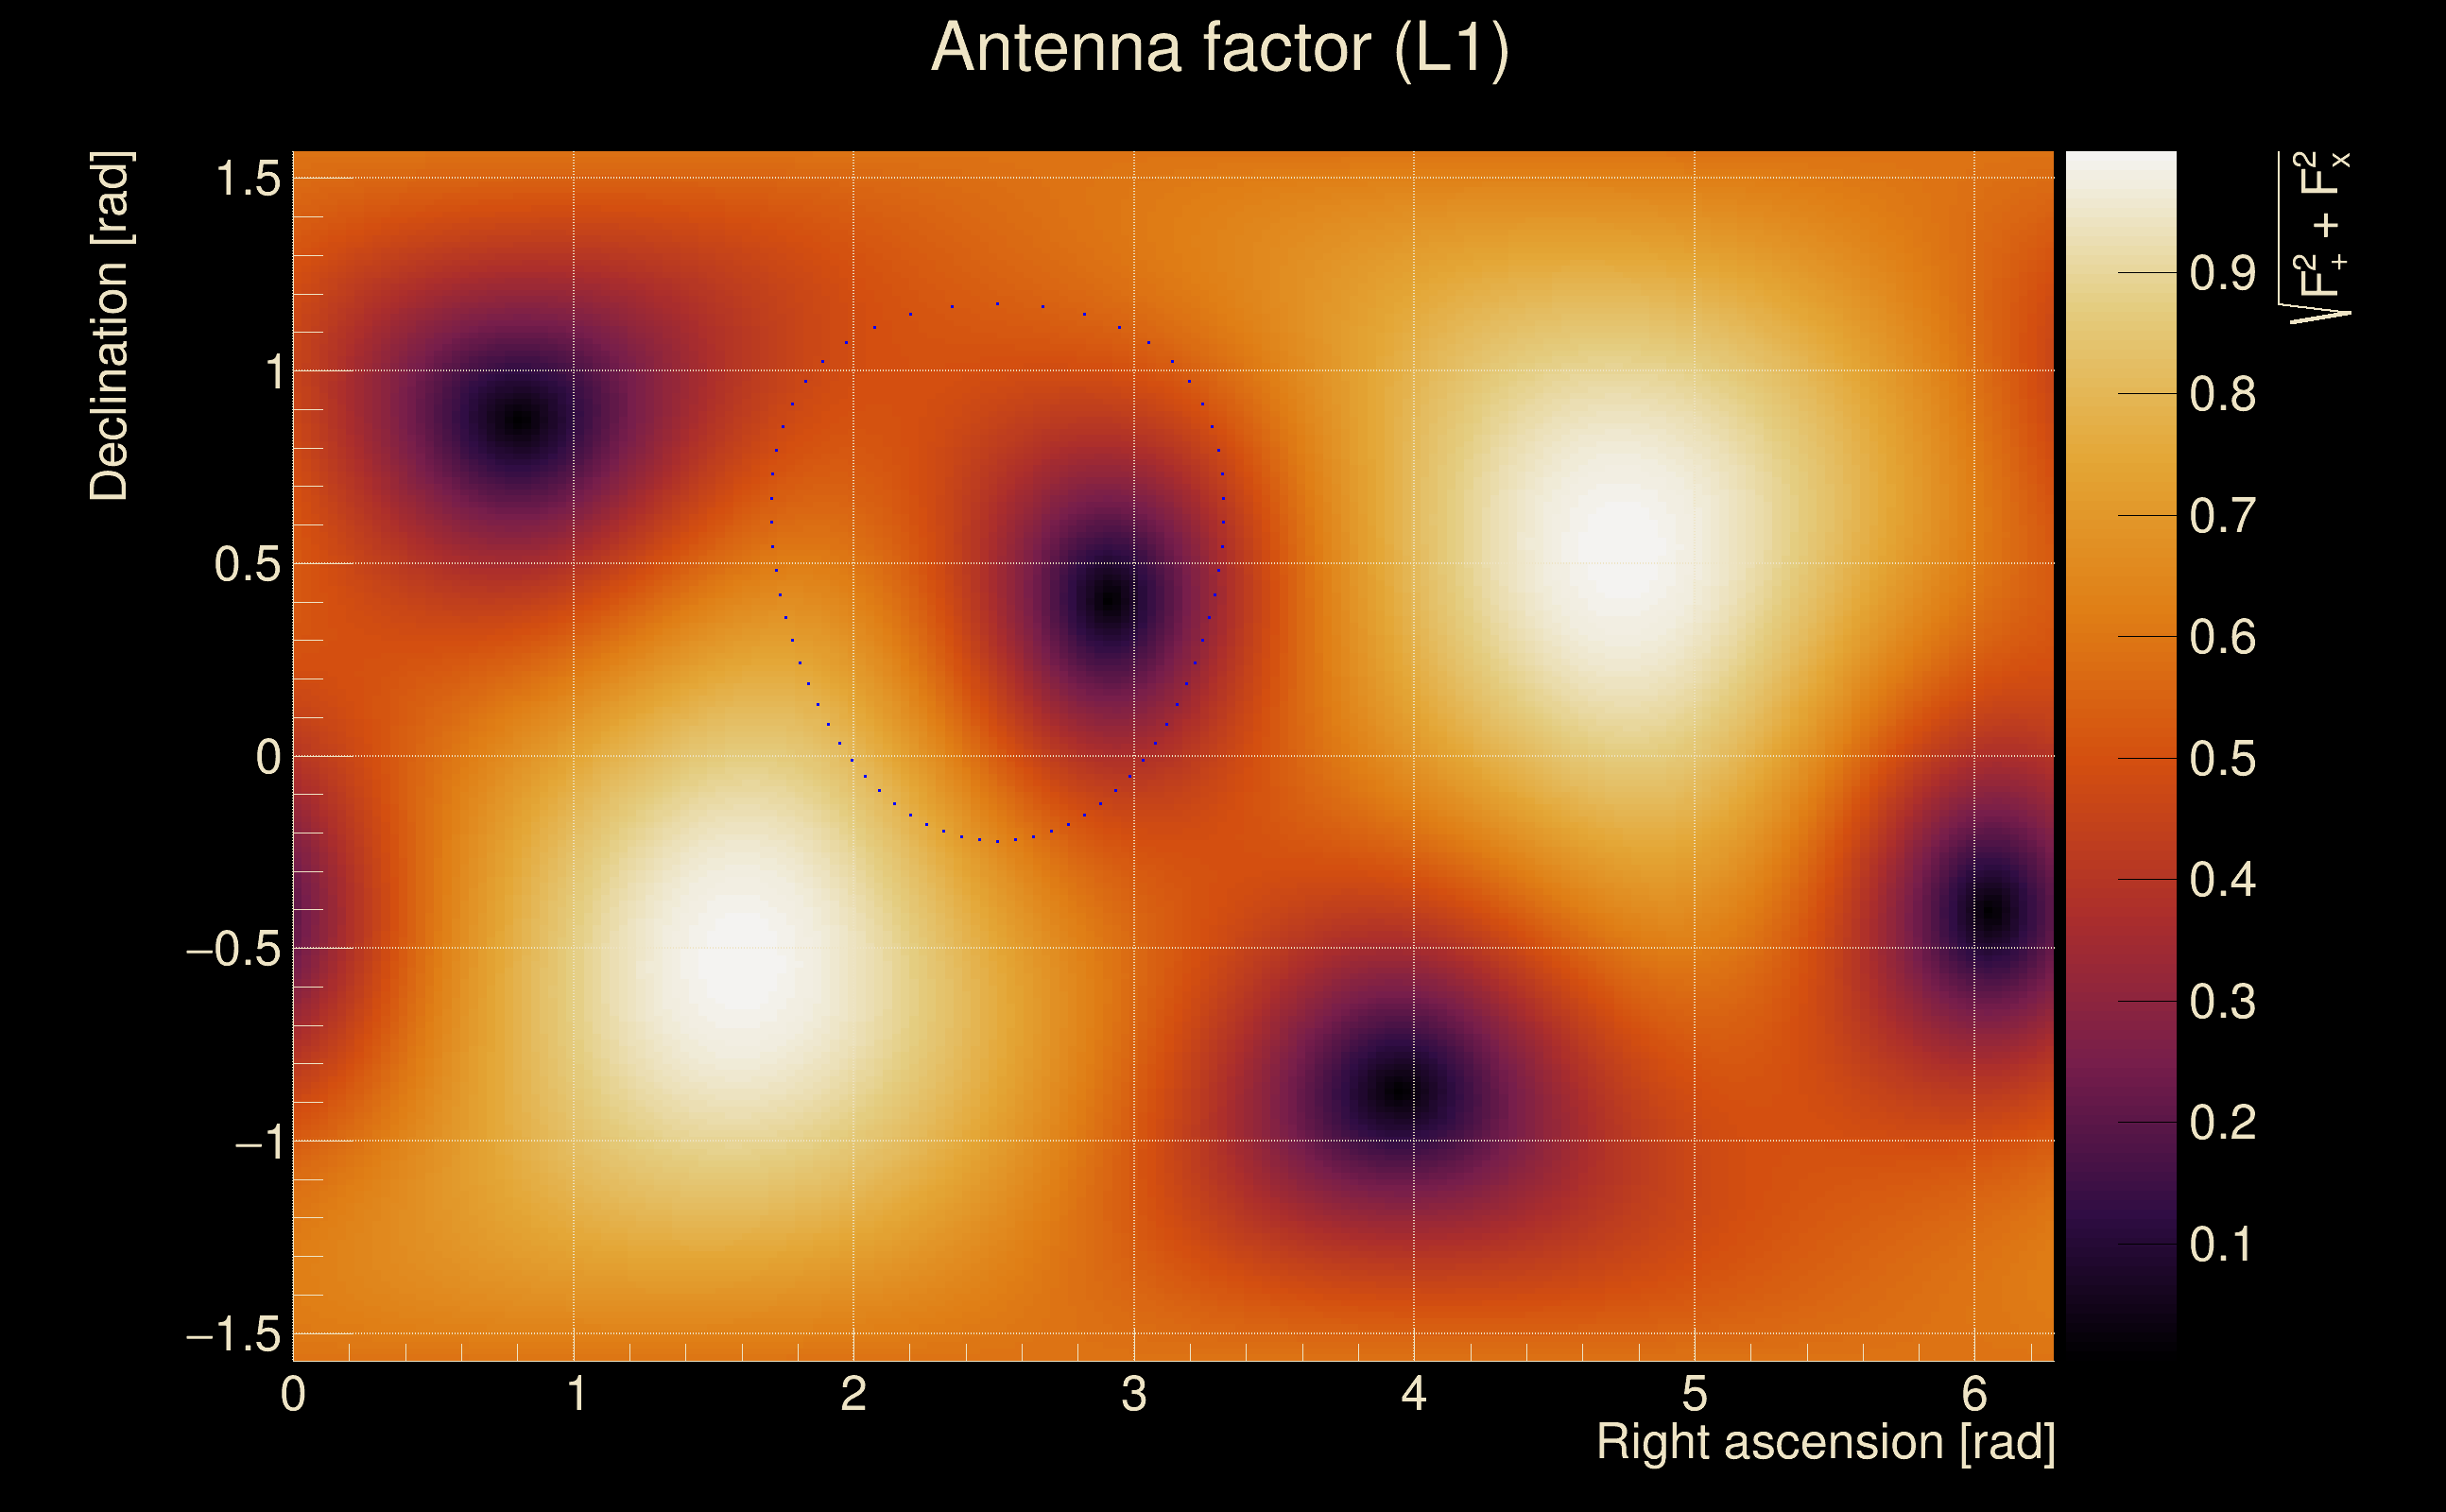
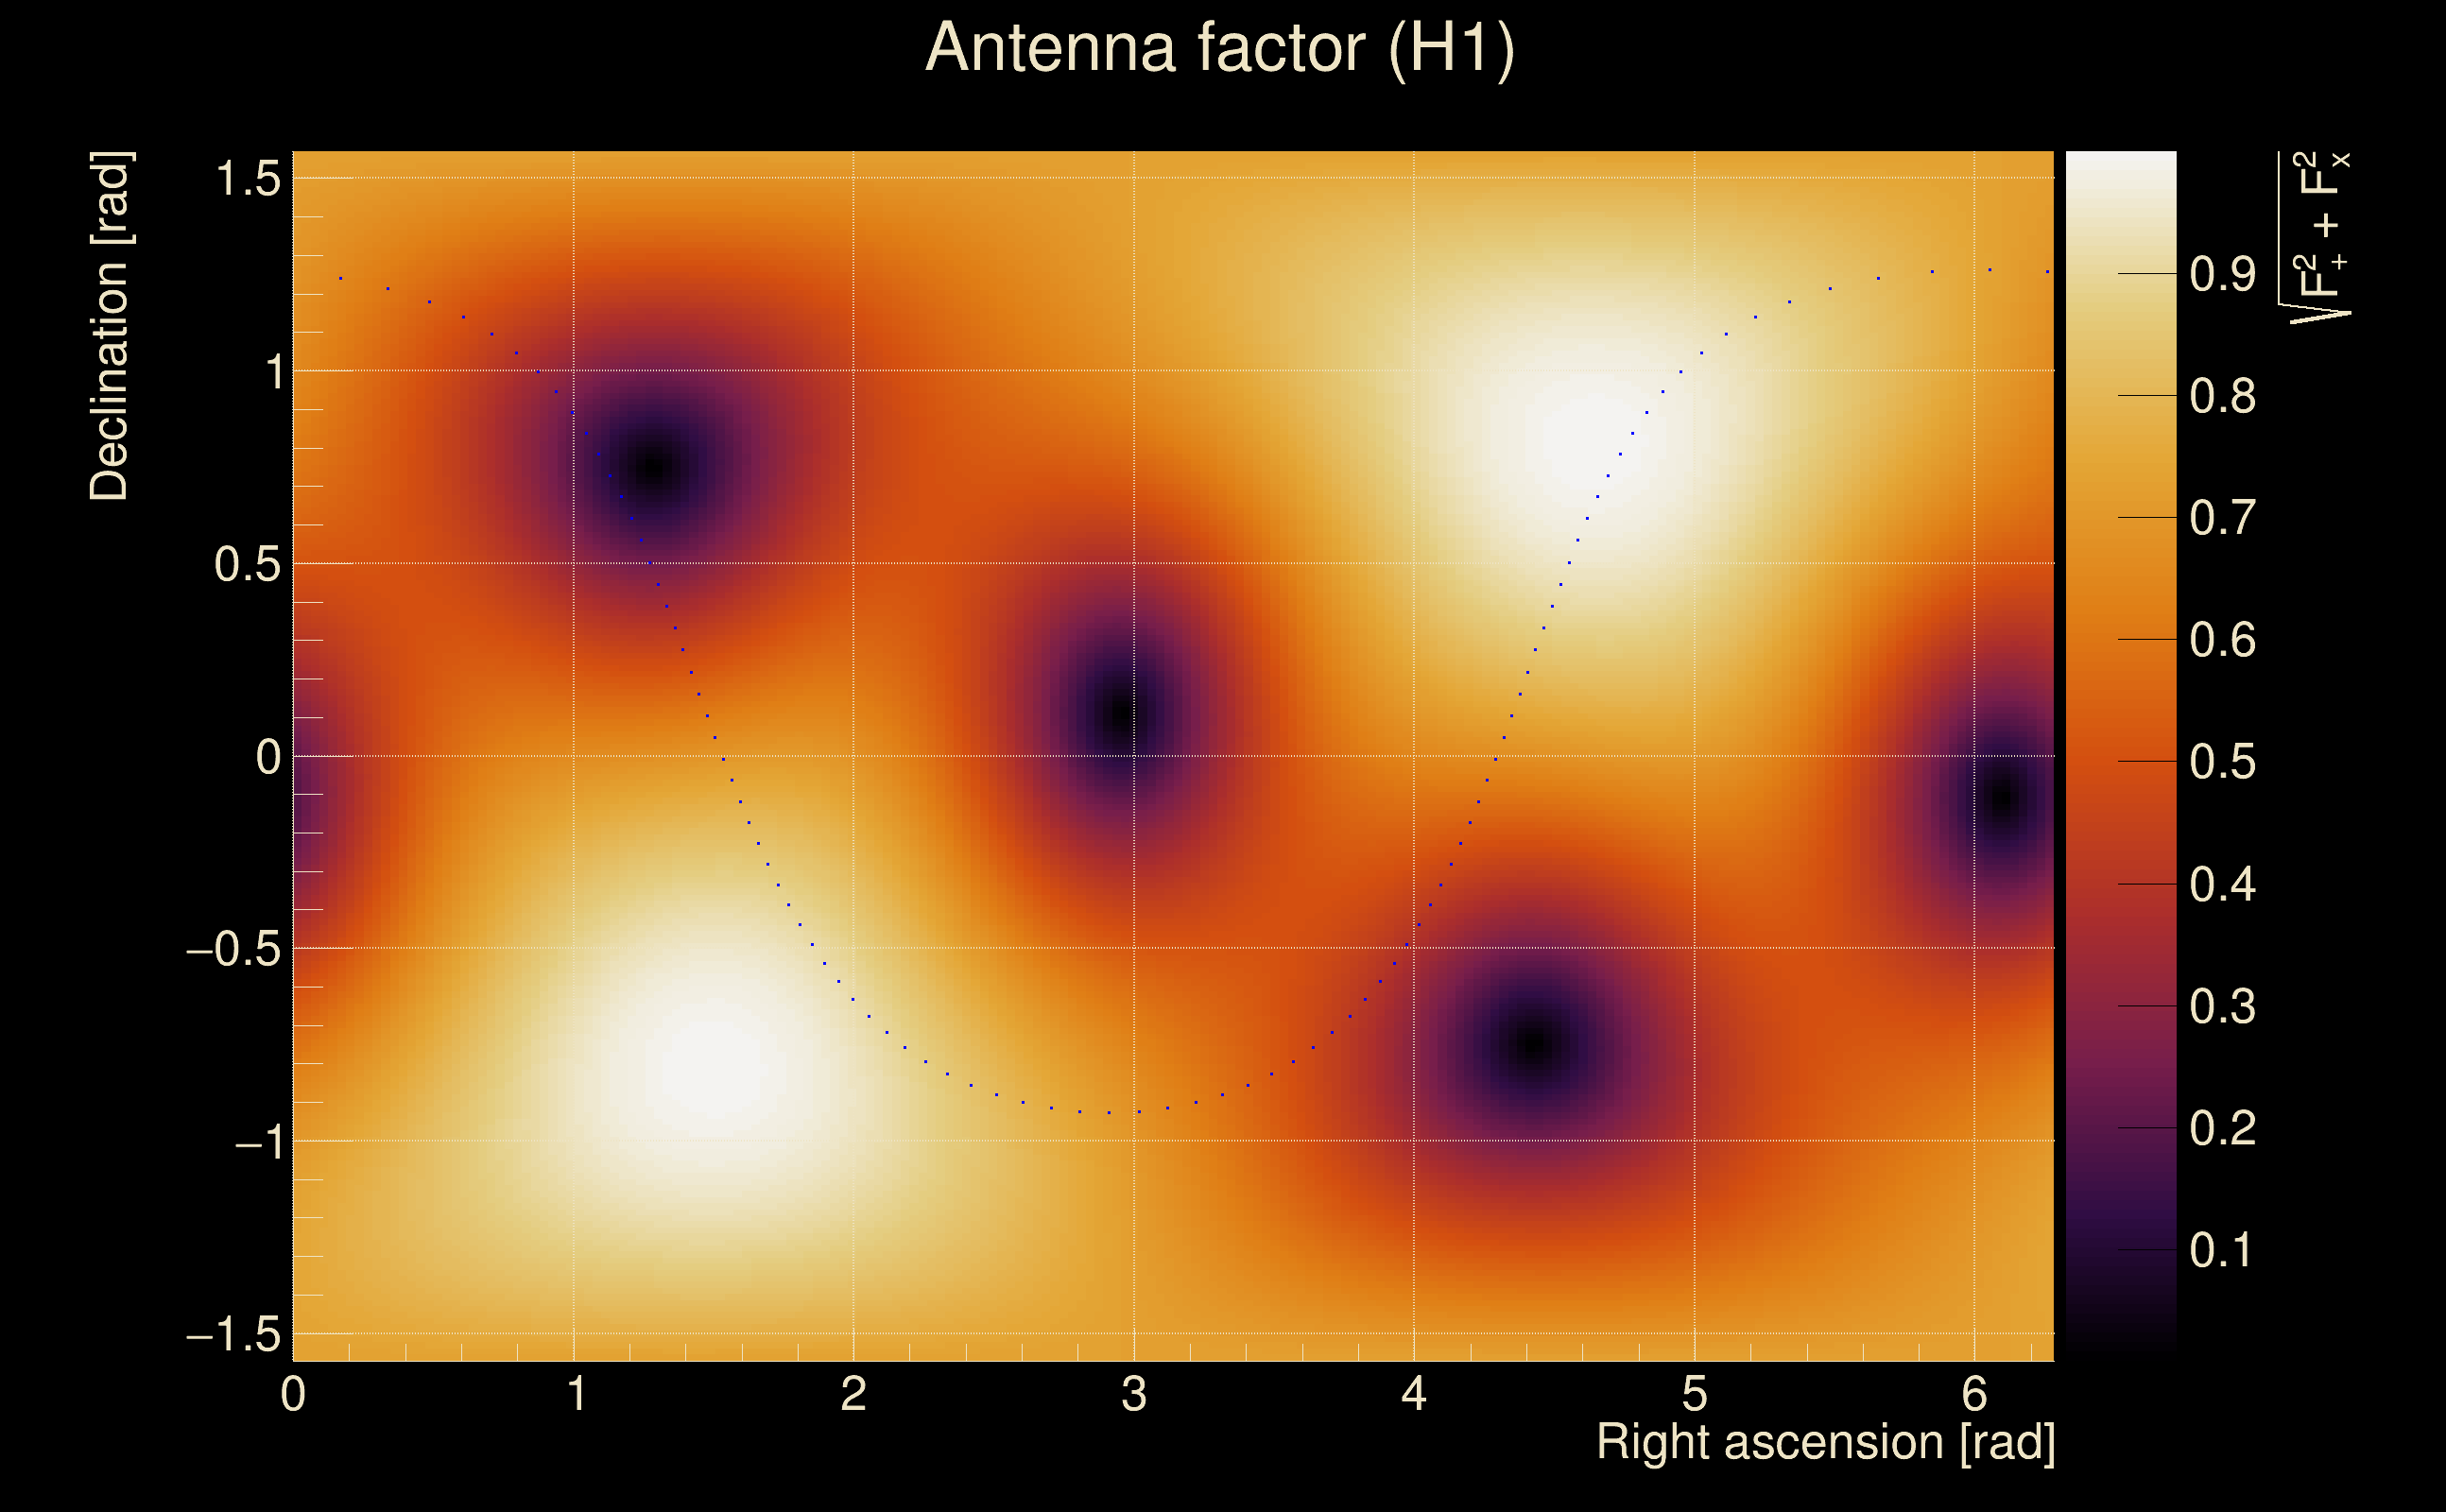
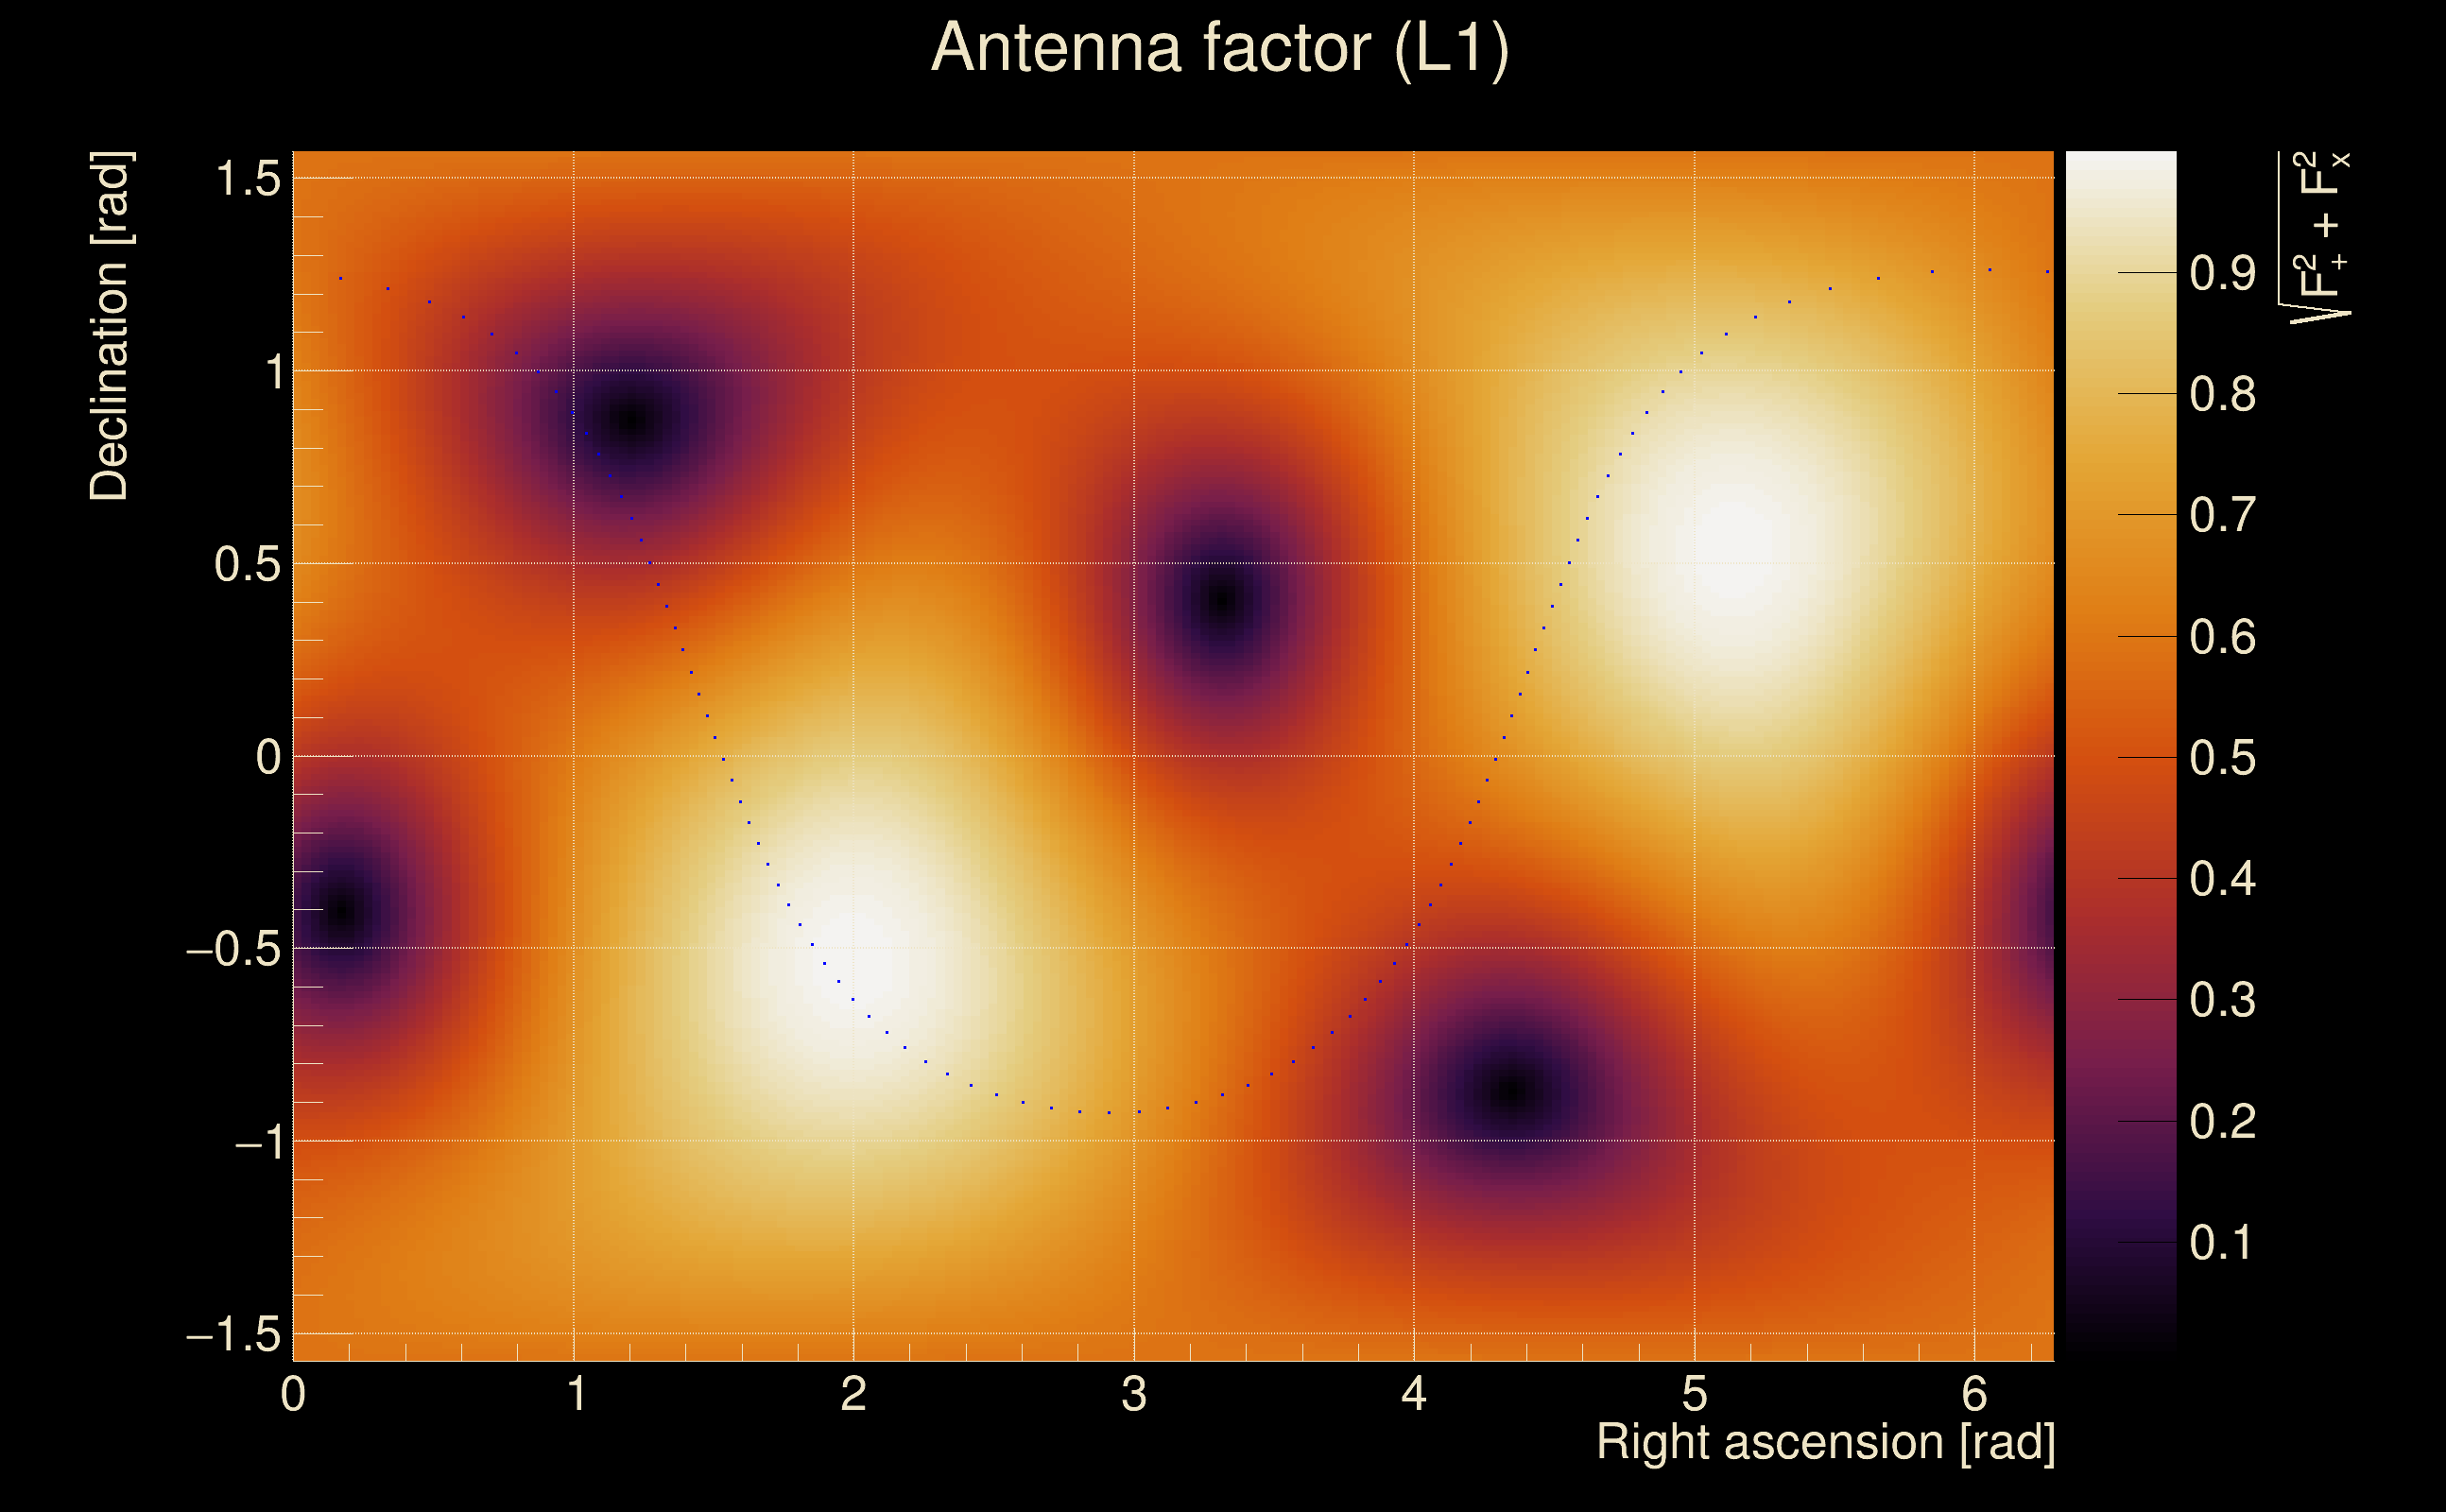
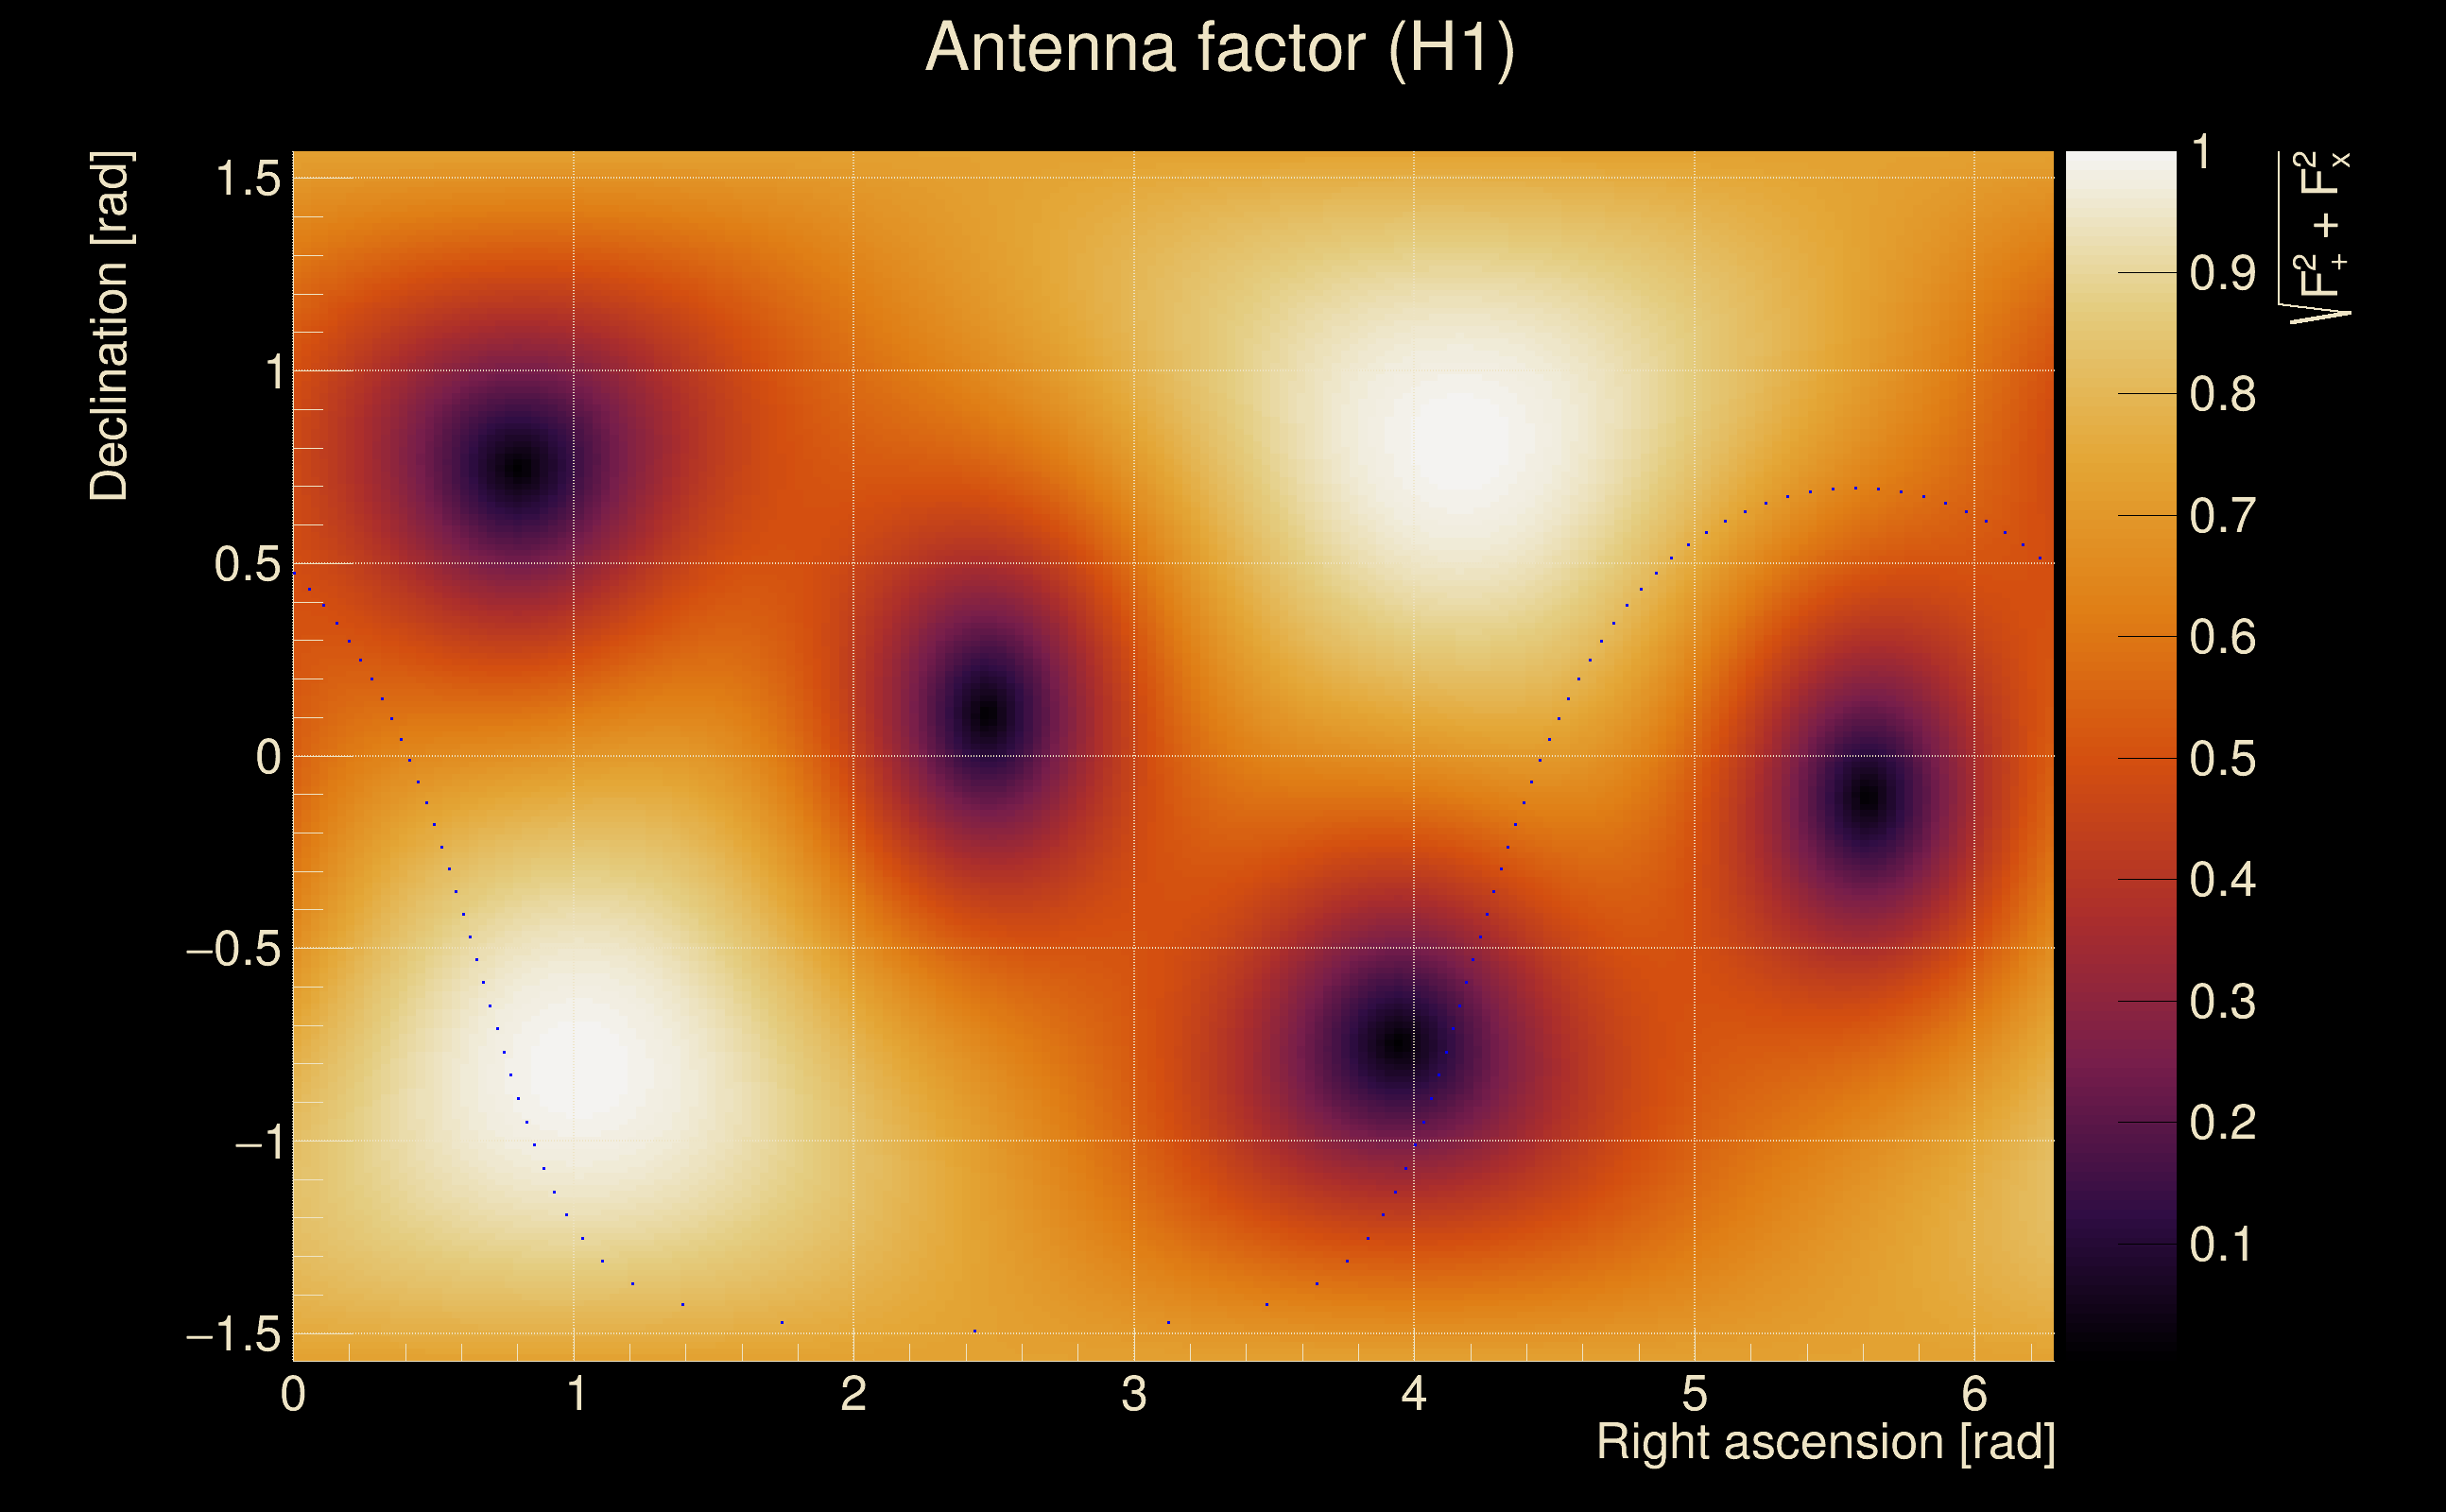
| Target sky positon: | Ra: 10, Dec: 10 [rad] |
| List of input Ox files: | TargIxf_feb2026_SN5_30s_depolarized_file_list.txt (71 files) |
| Analysis result file: | TargIxf_feb2026_SN5_30s_depolarized_results-1.root |
| Slice selected for the the fakeground: | slice index=70 (1.748 s), time lag = 0 s |
| Foreground | Fakeground | Background | ||
|---|---|---|---|---|
| Number of processed ox events | 12111 | 12111 | 2603865 | |
| Start Date (detector 0) | Mon May 15 14:13:25 2023 UTC | Mon May 15 14:13:25 2023 UTC | Mon May 15 14:13:25 2023 UTC | |
| End Date (detector 0) | Thu May 18 15:54:40 2023 UTC | Thu May 18 15:54:40 2023 UTC | Thu May 18 15:54:40 2023 UTC | |
| Start GPS (detector 0) | 1368195223 | 1368195223 | 1368195223 | |
| End GPS (detector 0) | 1368460498 | 1368460498 | 1368460498 | |
| Used livetime (detector 0) | 60875 s | 60875 s | 60875 s | |
| Start Date (detector 1) | Mon May 15 14:13:25 2023 UTC | Mon May 15 14:13:25 2023 UTC | Mon May 15 14:13:25 2023 UTC | |
| End Date (detector 1) | Thu May 18 15:54:40 2023 UTC | Thu May 18 15:54:40 2023 UTC | Thu May 18 15:54:40 2023 UTC | |
| Start GPS (detector 1) | 1368195223 | 1368195223 | 1368195223 | |
| End GPS (detector 1) | 1368460498 | 1368460498 | 1368460498 | |
| Used livetime (detector 1) | 60875 s | 60875 s | 60875 s | |
| Cumulative livetime | 121110 s | 121110 s | 26038650 s | |
| 0 years, 1 days, 9 hours, 38 min, 30 s | 0 years, 1 days, 9 hours, 38 min, 30 s | 0 years, 301 days, 8 hours, 57 min, 30 s |
|
|
| Event time t(H1): | GPS = 1368280103 (Tue May 16 13:48:05 2023 ) → GPS = 1368280113 (Tue May 16 13:48:15 2023 ) |
| Event time t(L1): | GPS = 1368280103 (Tue May 16 13:48:15 2023 ) → GPS = 1368280113 (Tue May 16 13:48:15 2023 ) |
| Omicron analysis time window (H1): | GPS = 1368280100 → GPS = 1368280116 |
| Omicron analysis time window (L1): | GPS = 1368280100 → GPS = 1368280116 |
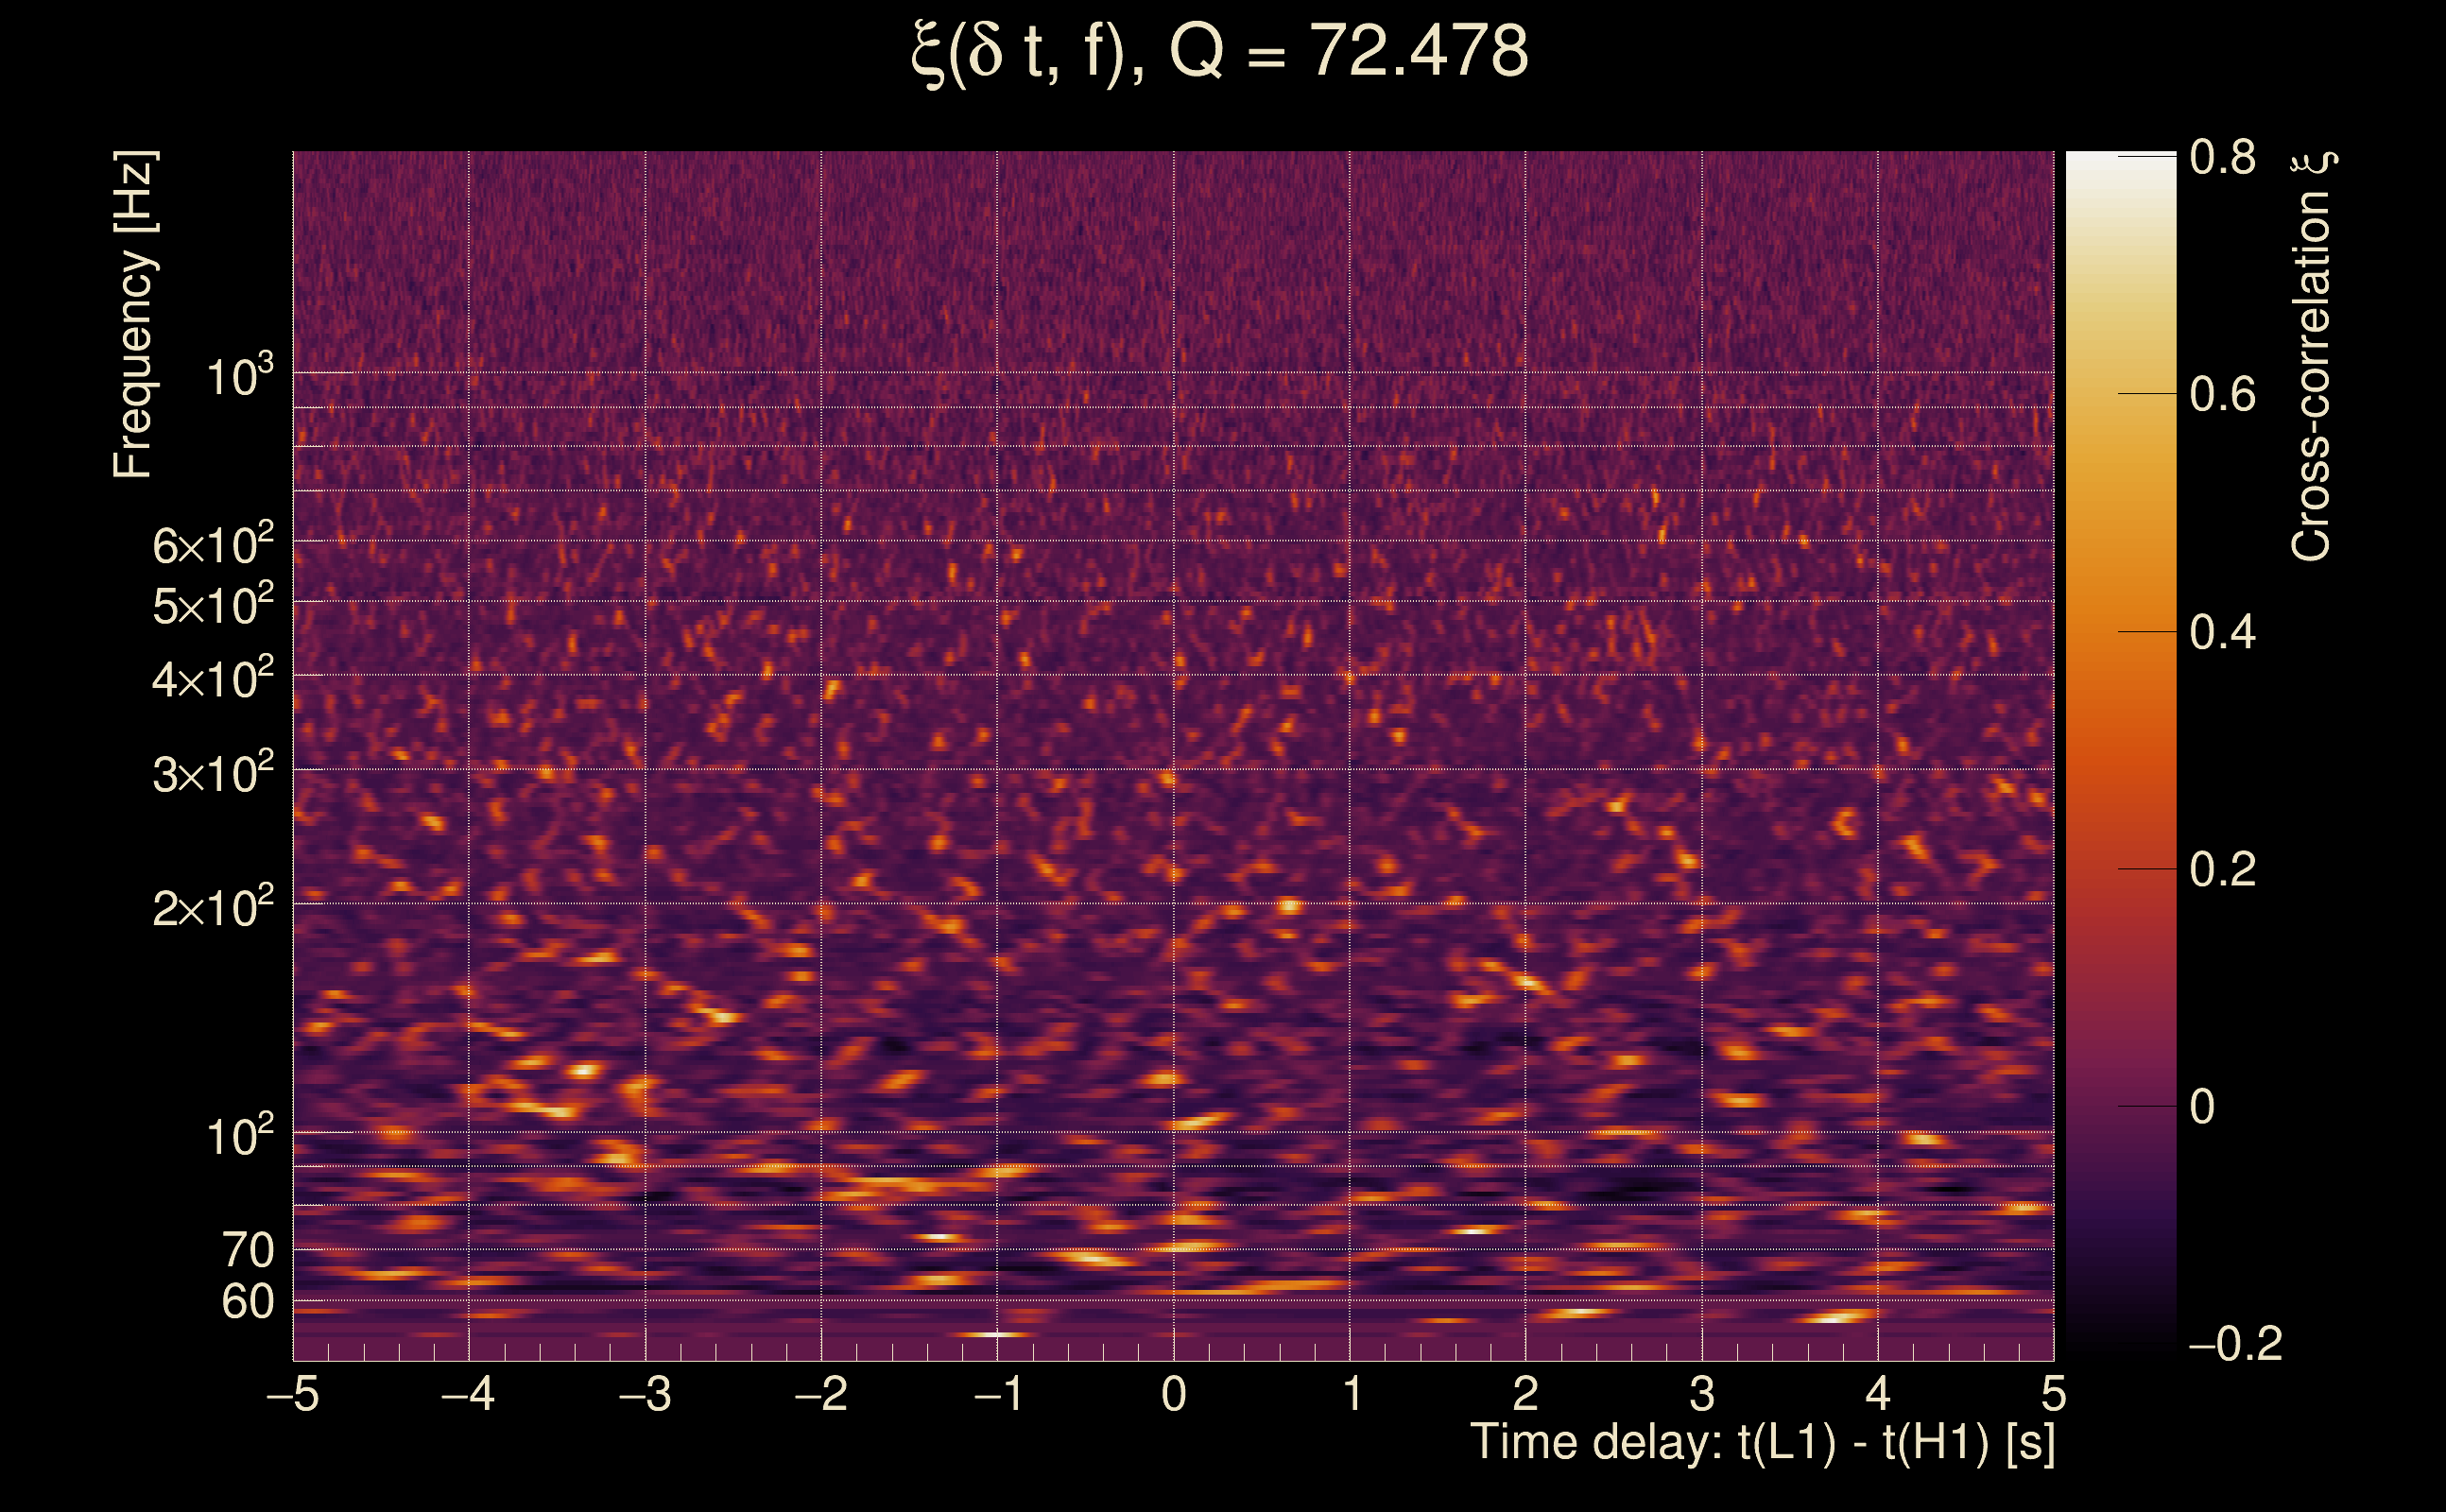
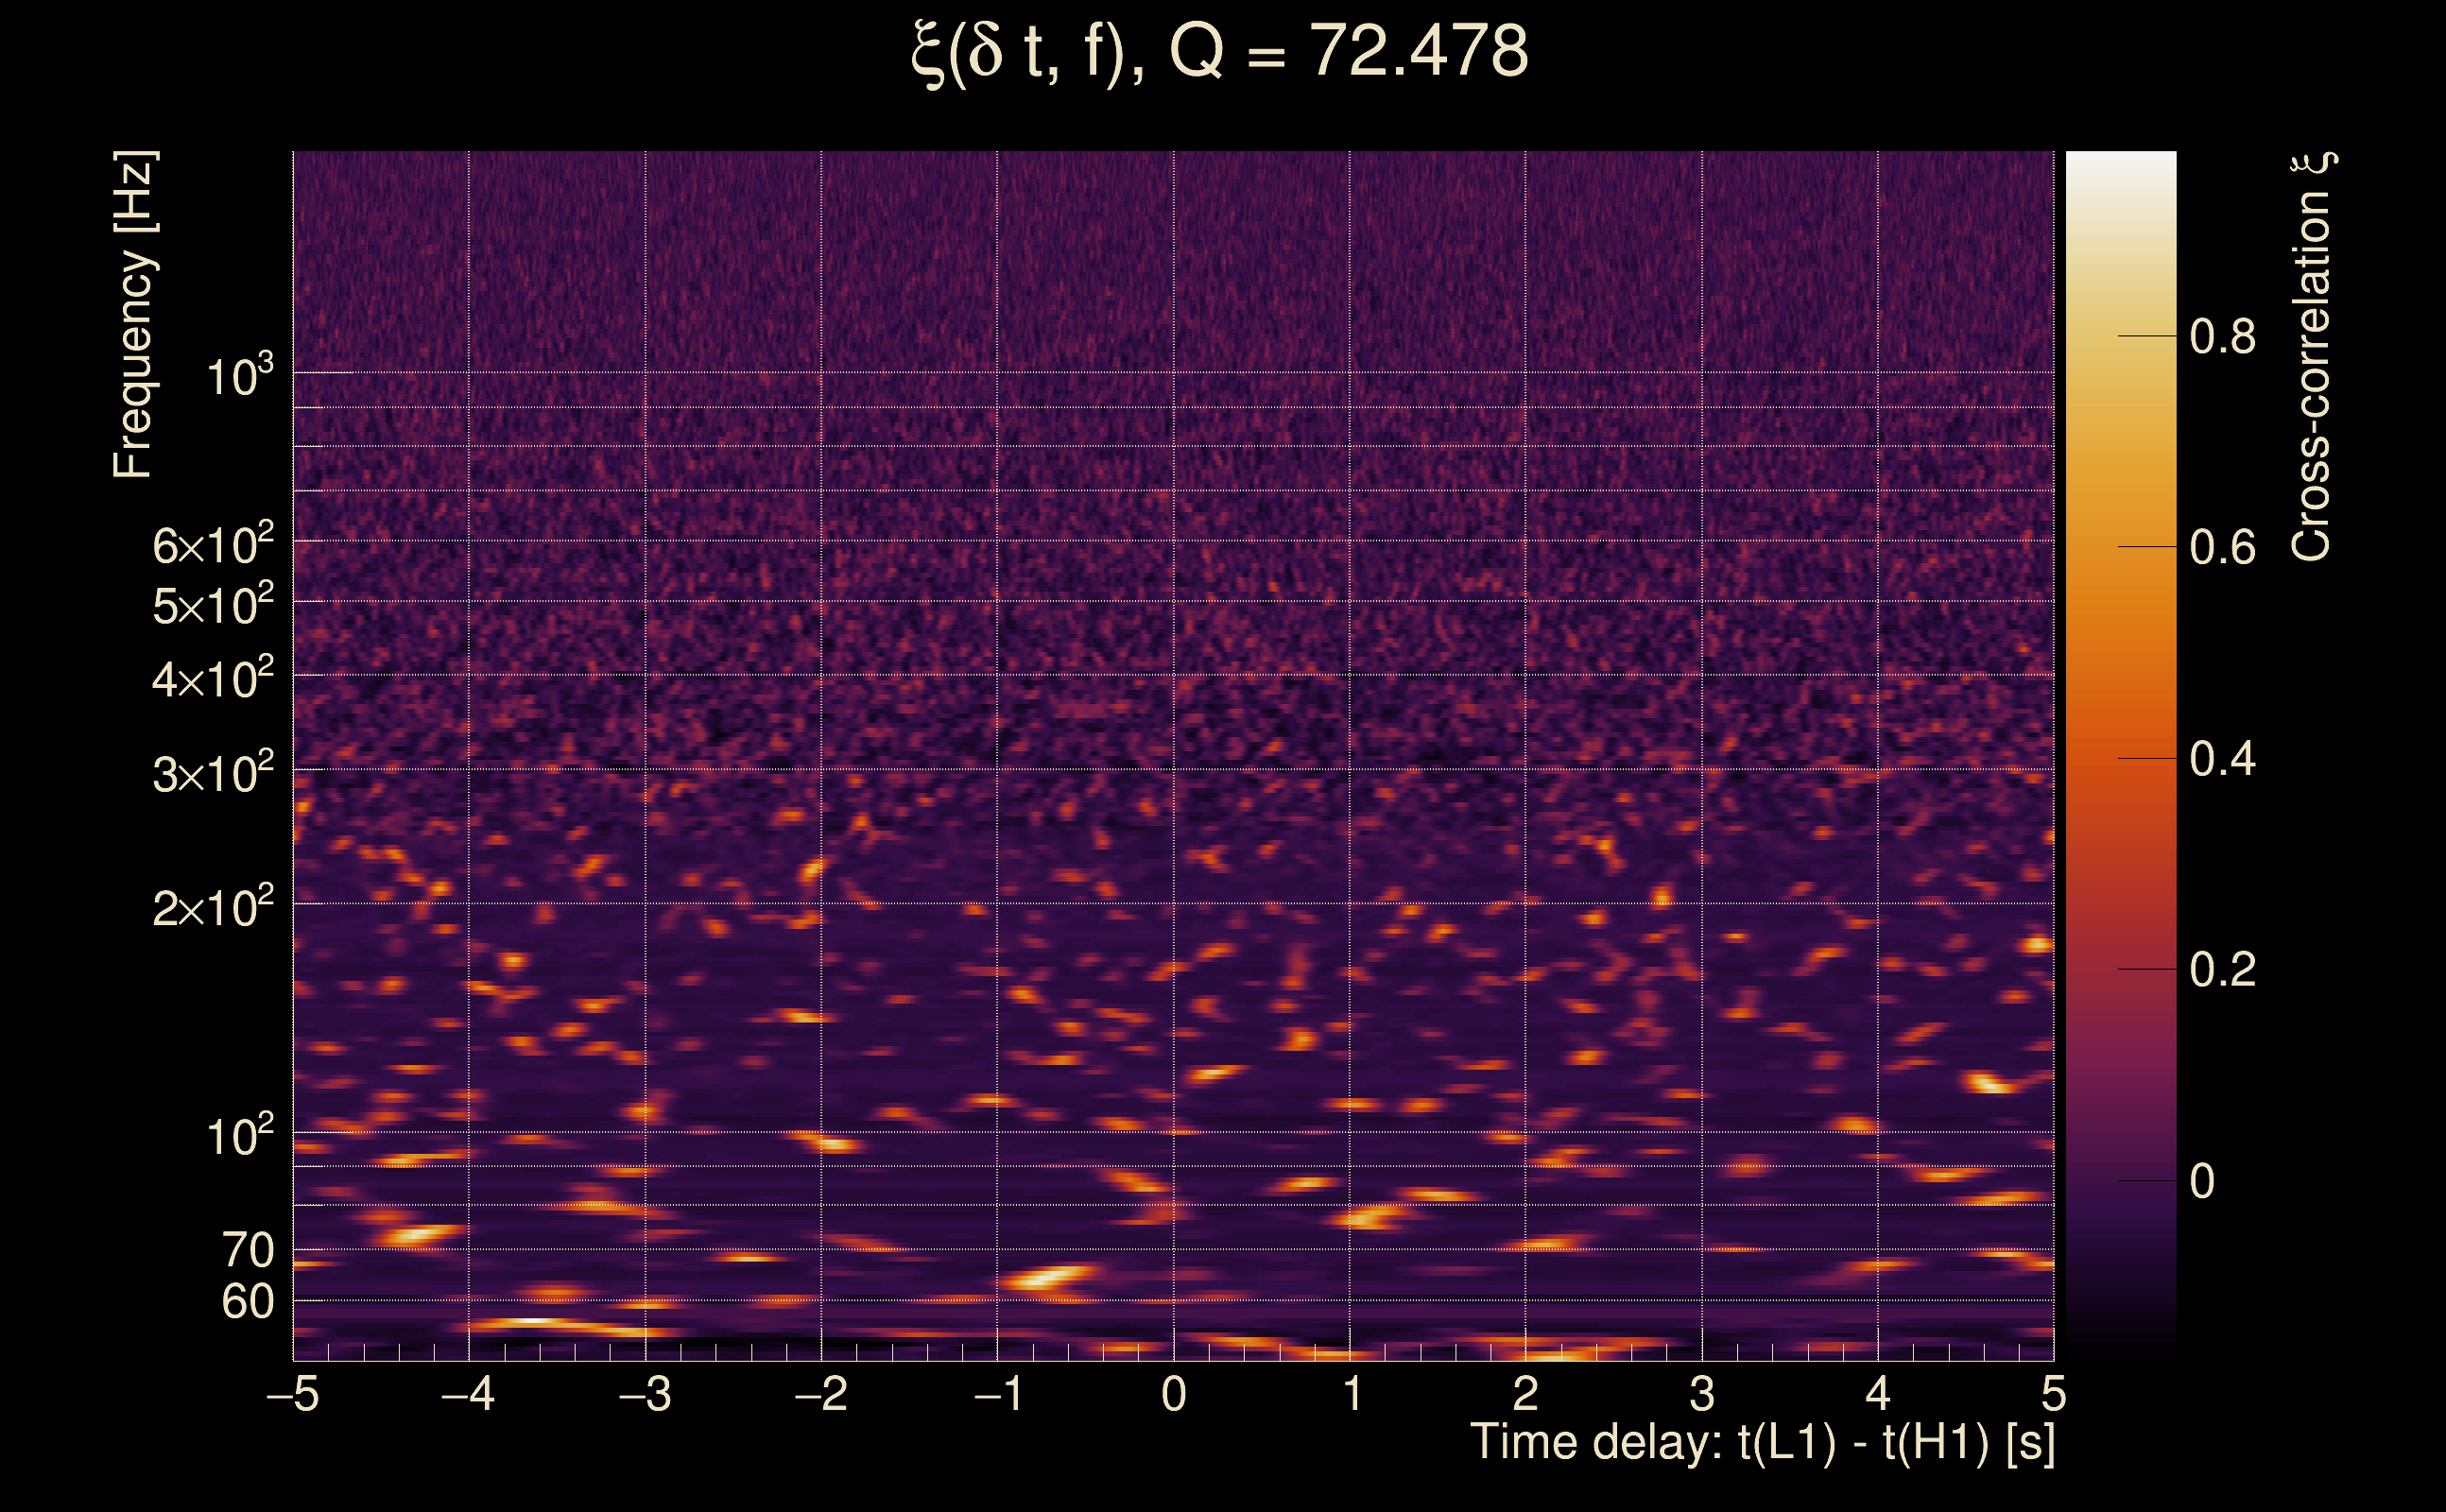
| Time delay between detectors t(L1) - t(H1): | -0.0012268 s (slice index = 108 / 217), δt_gw = -0.0012268 s |
| Time delay standard deviation: | 0.0735031 s |
| [targeted mode] Time delay probability: | 0.0631115 (1.85841 sigmas), δt_target = 1.72247e+45 s |
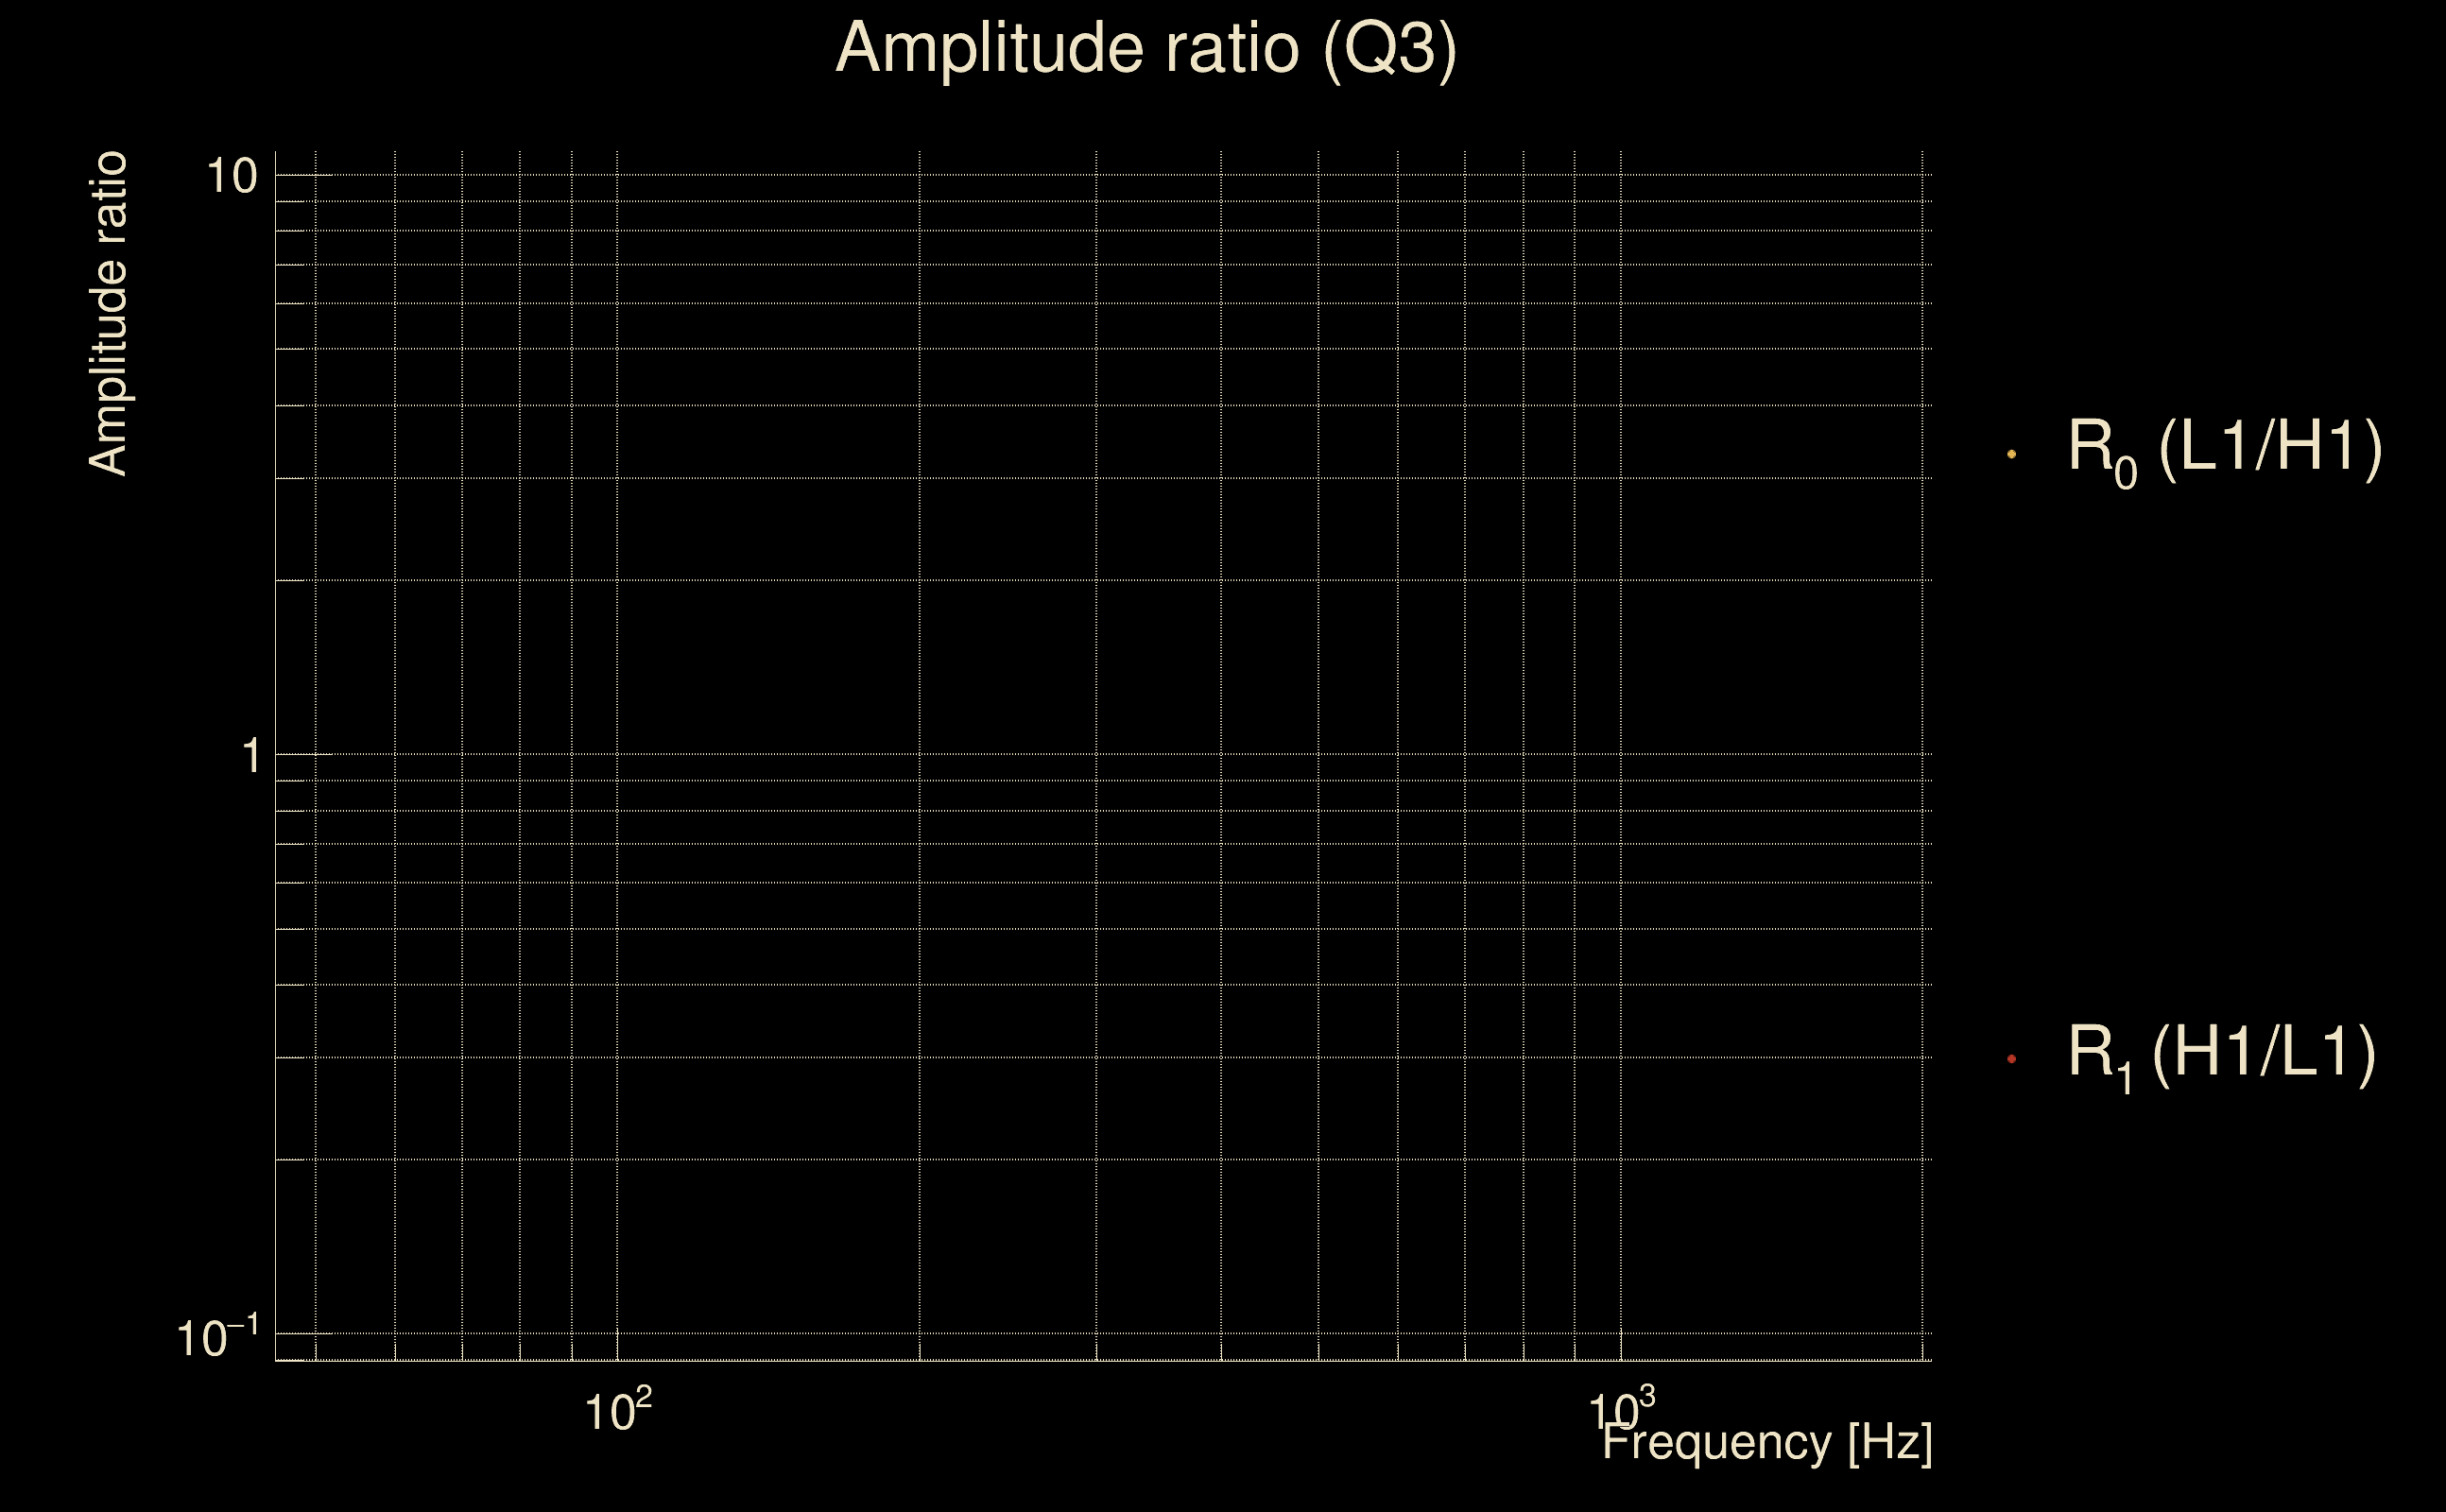
| Frequency: | 278.795 Hz |
| Ξ: | 0.0428266 ± 0.0152037 (variance = 0.000231152): Q0: 0.0898361, Q1: 0.0691241, Q2: 0.0435026, Q3: 0.0674676, Q4: 0.0575864 |
| Rank: | R_A = 0.0428266 |
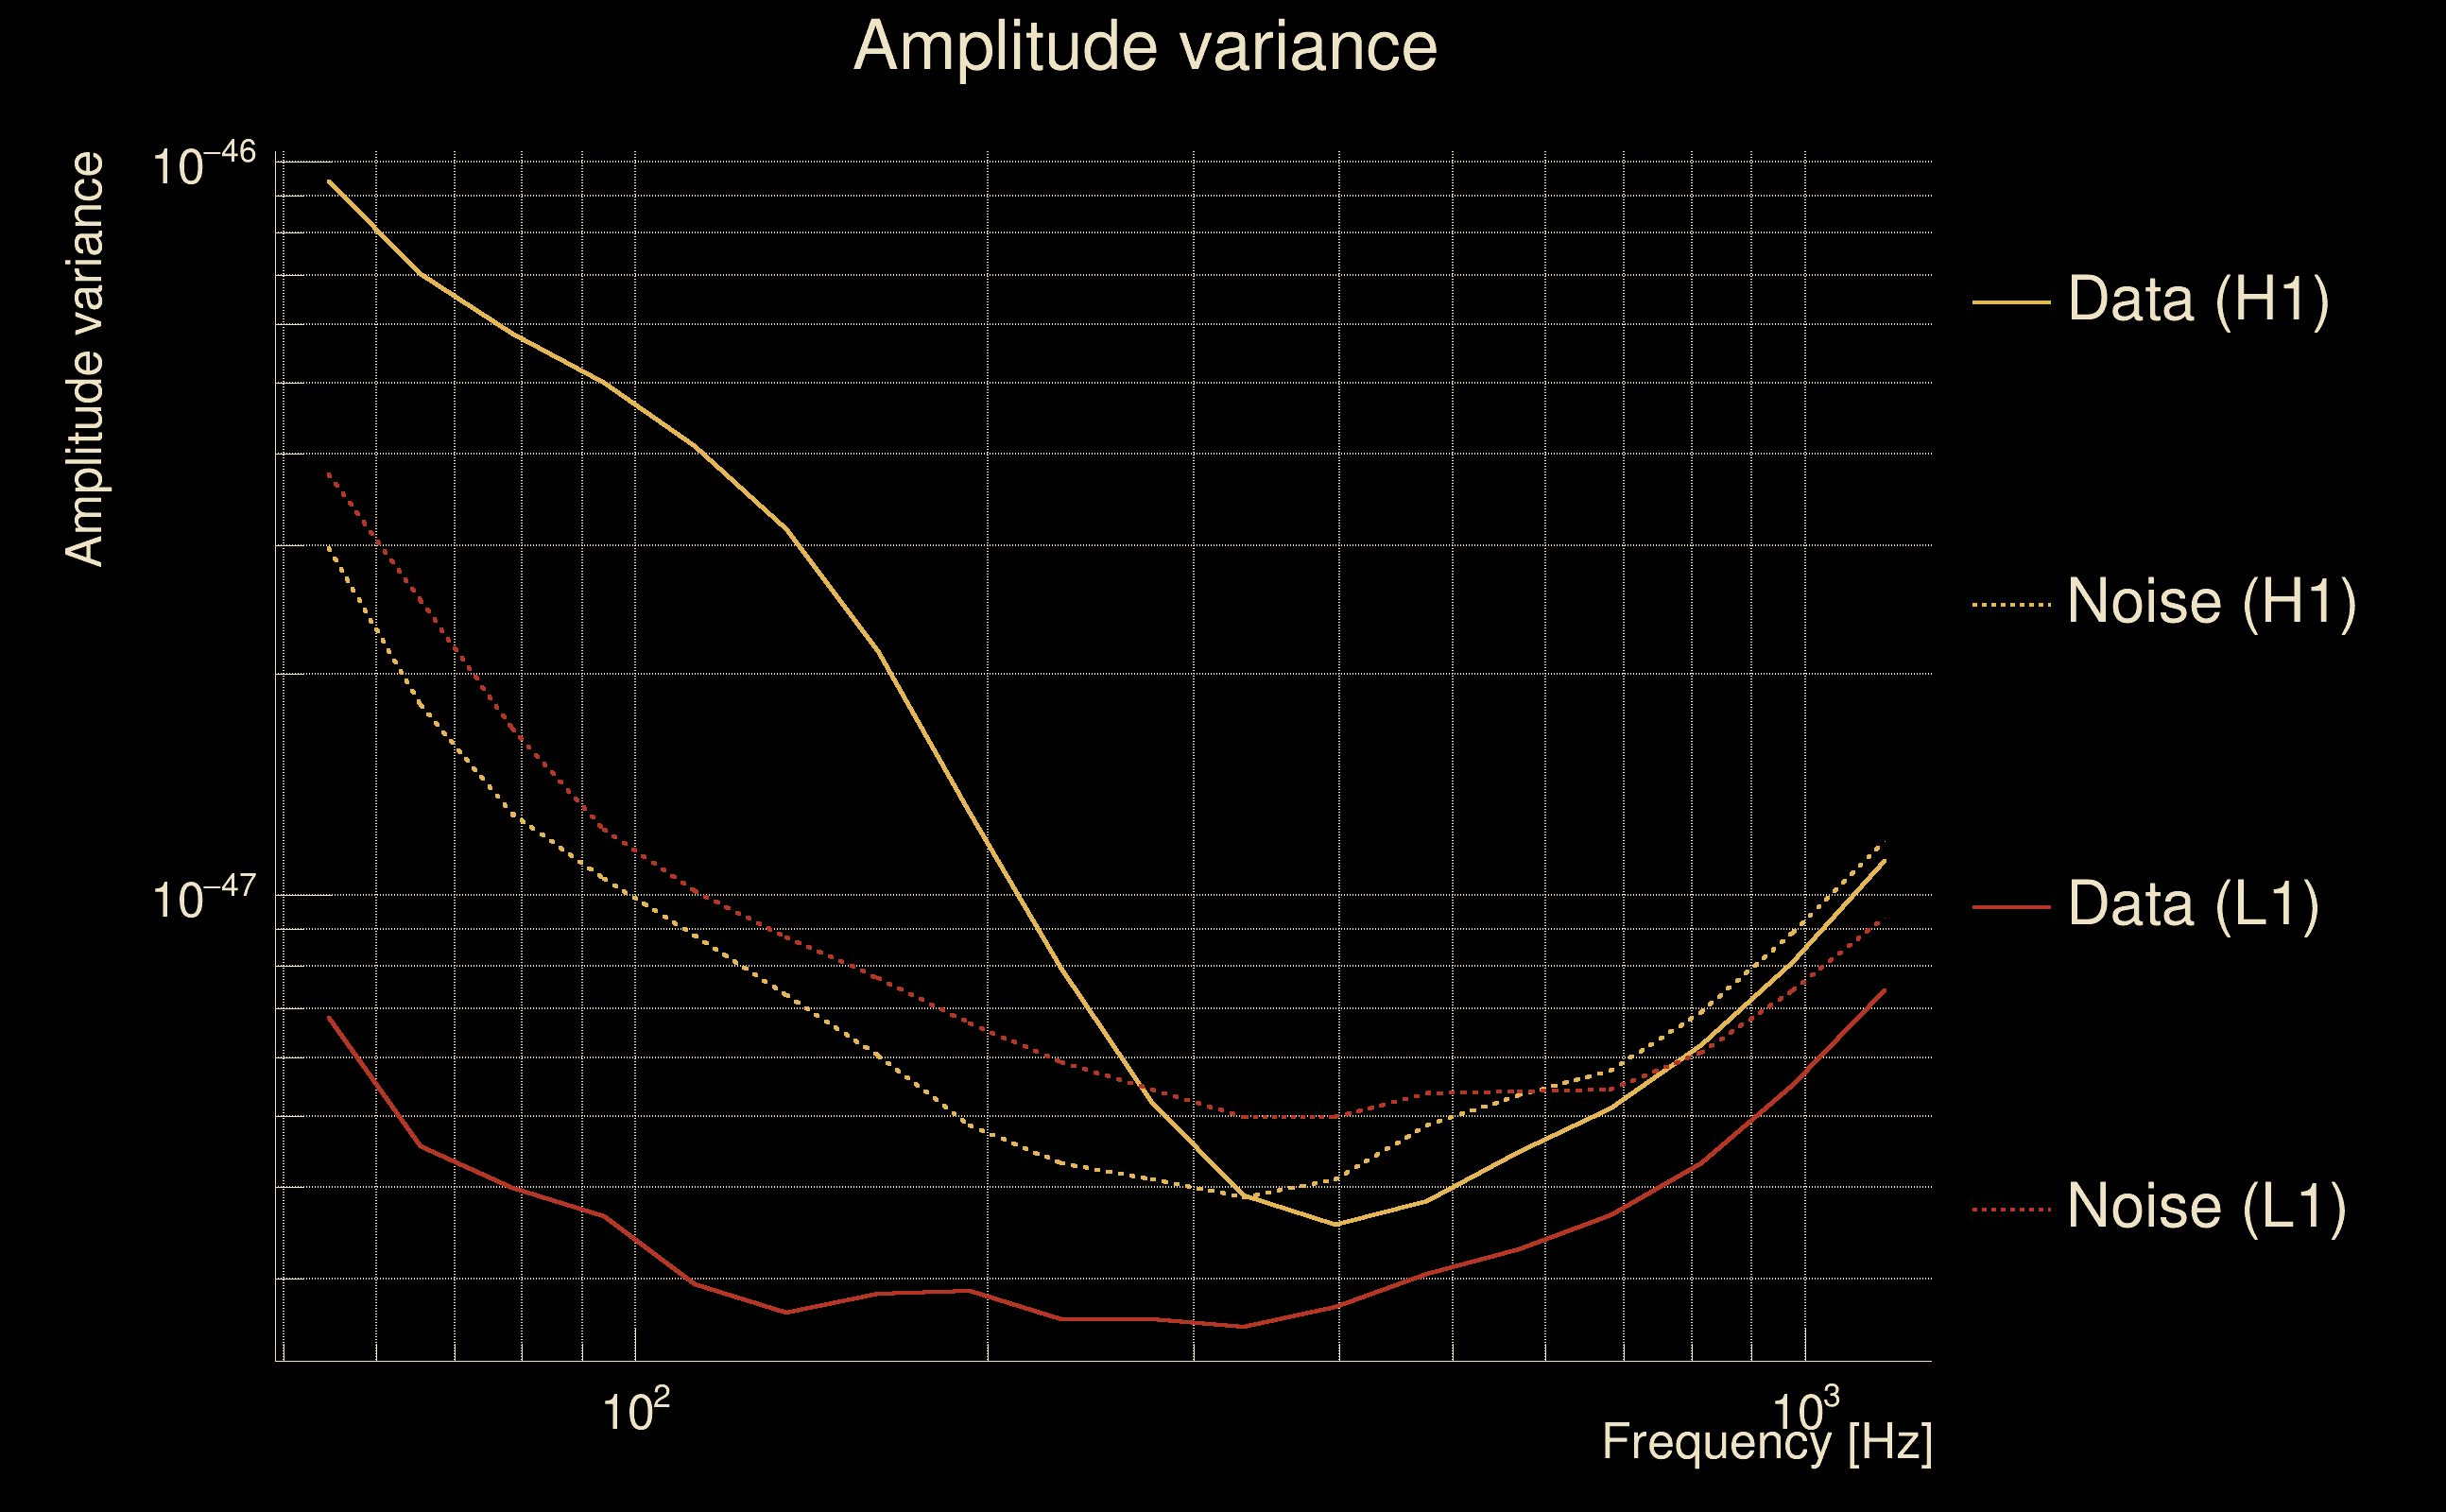
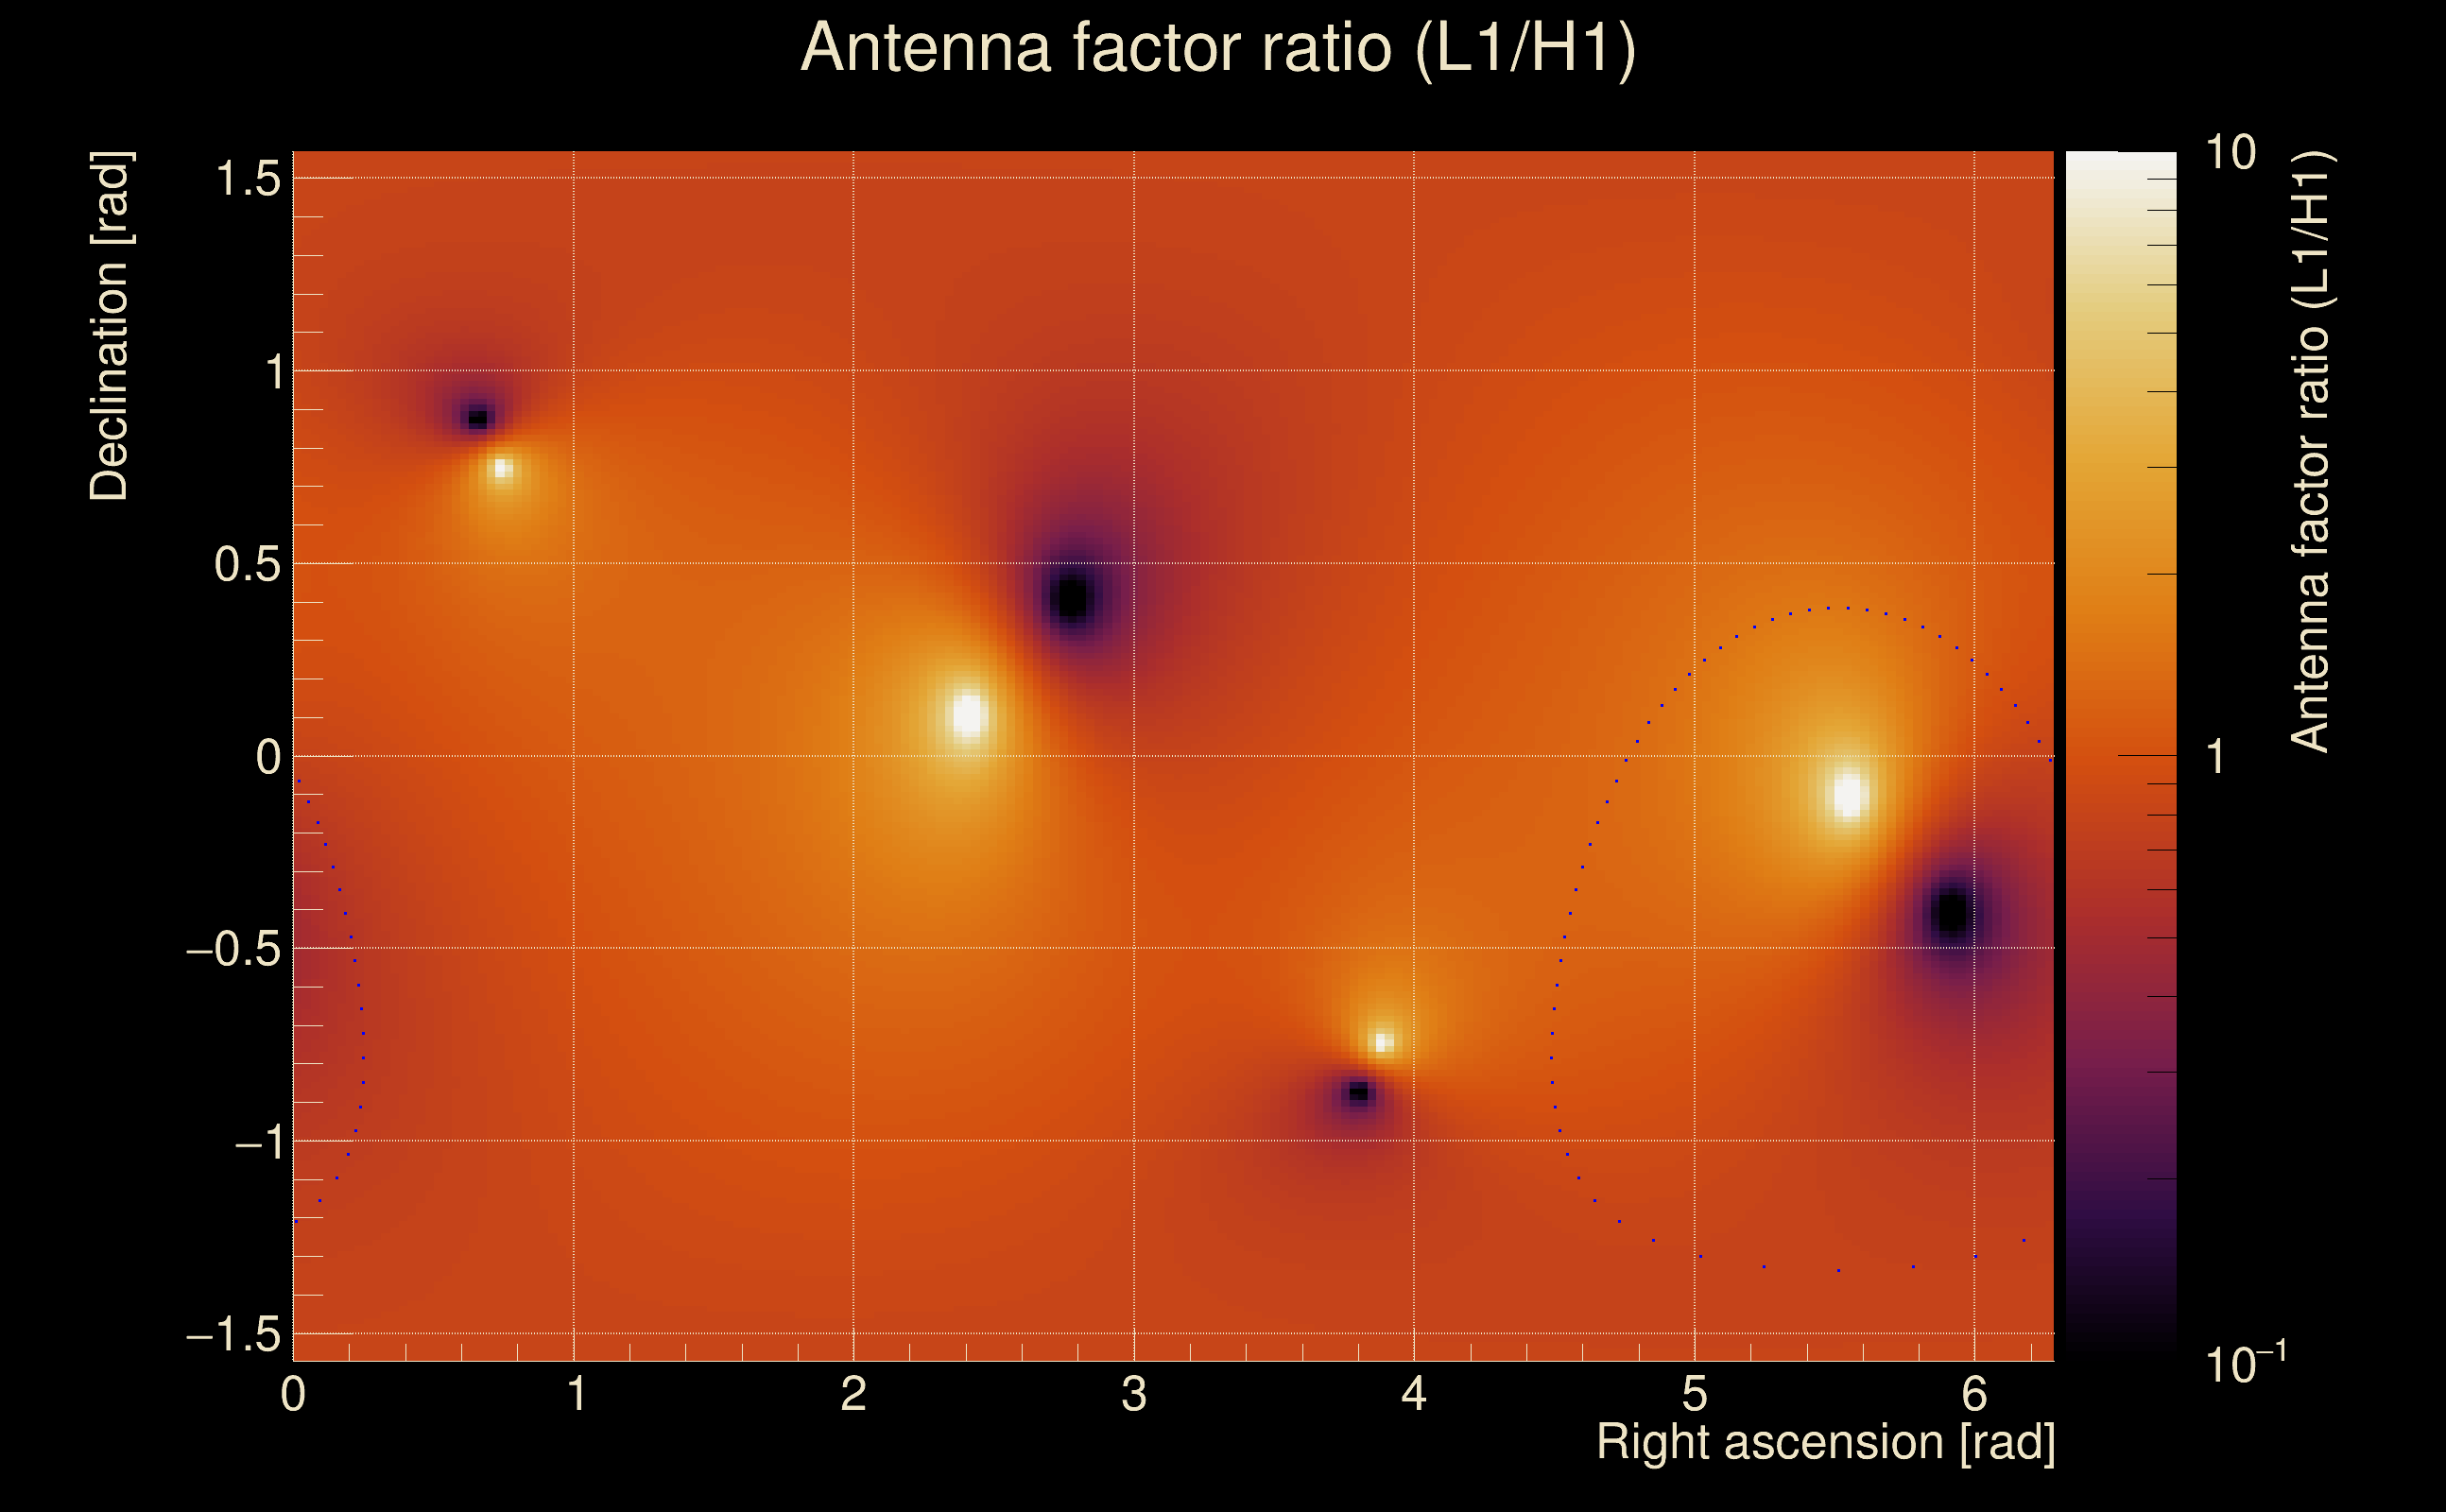
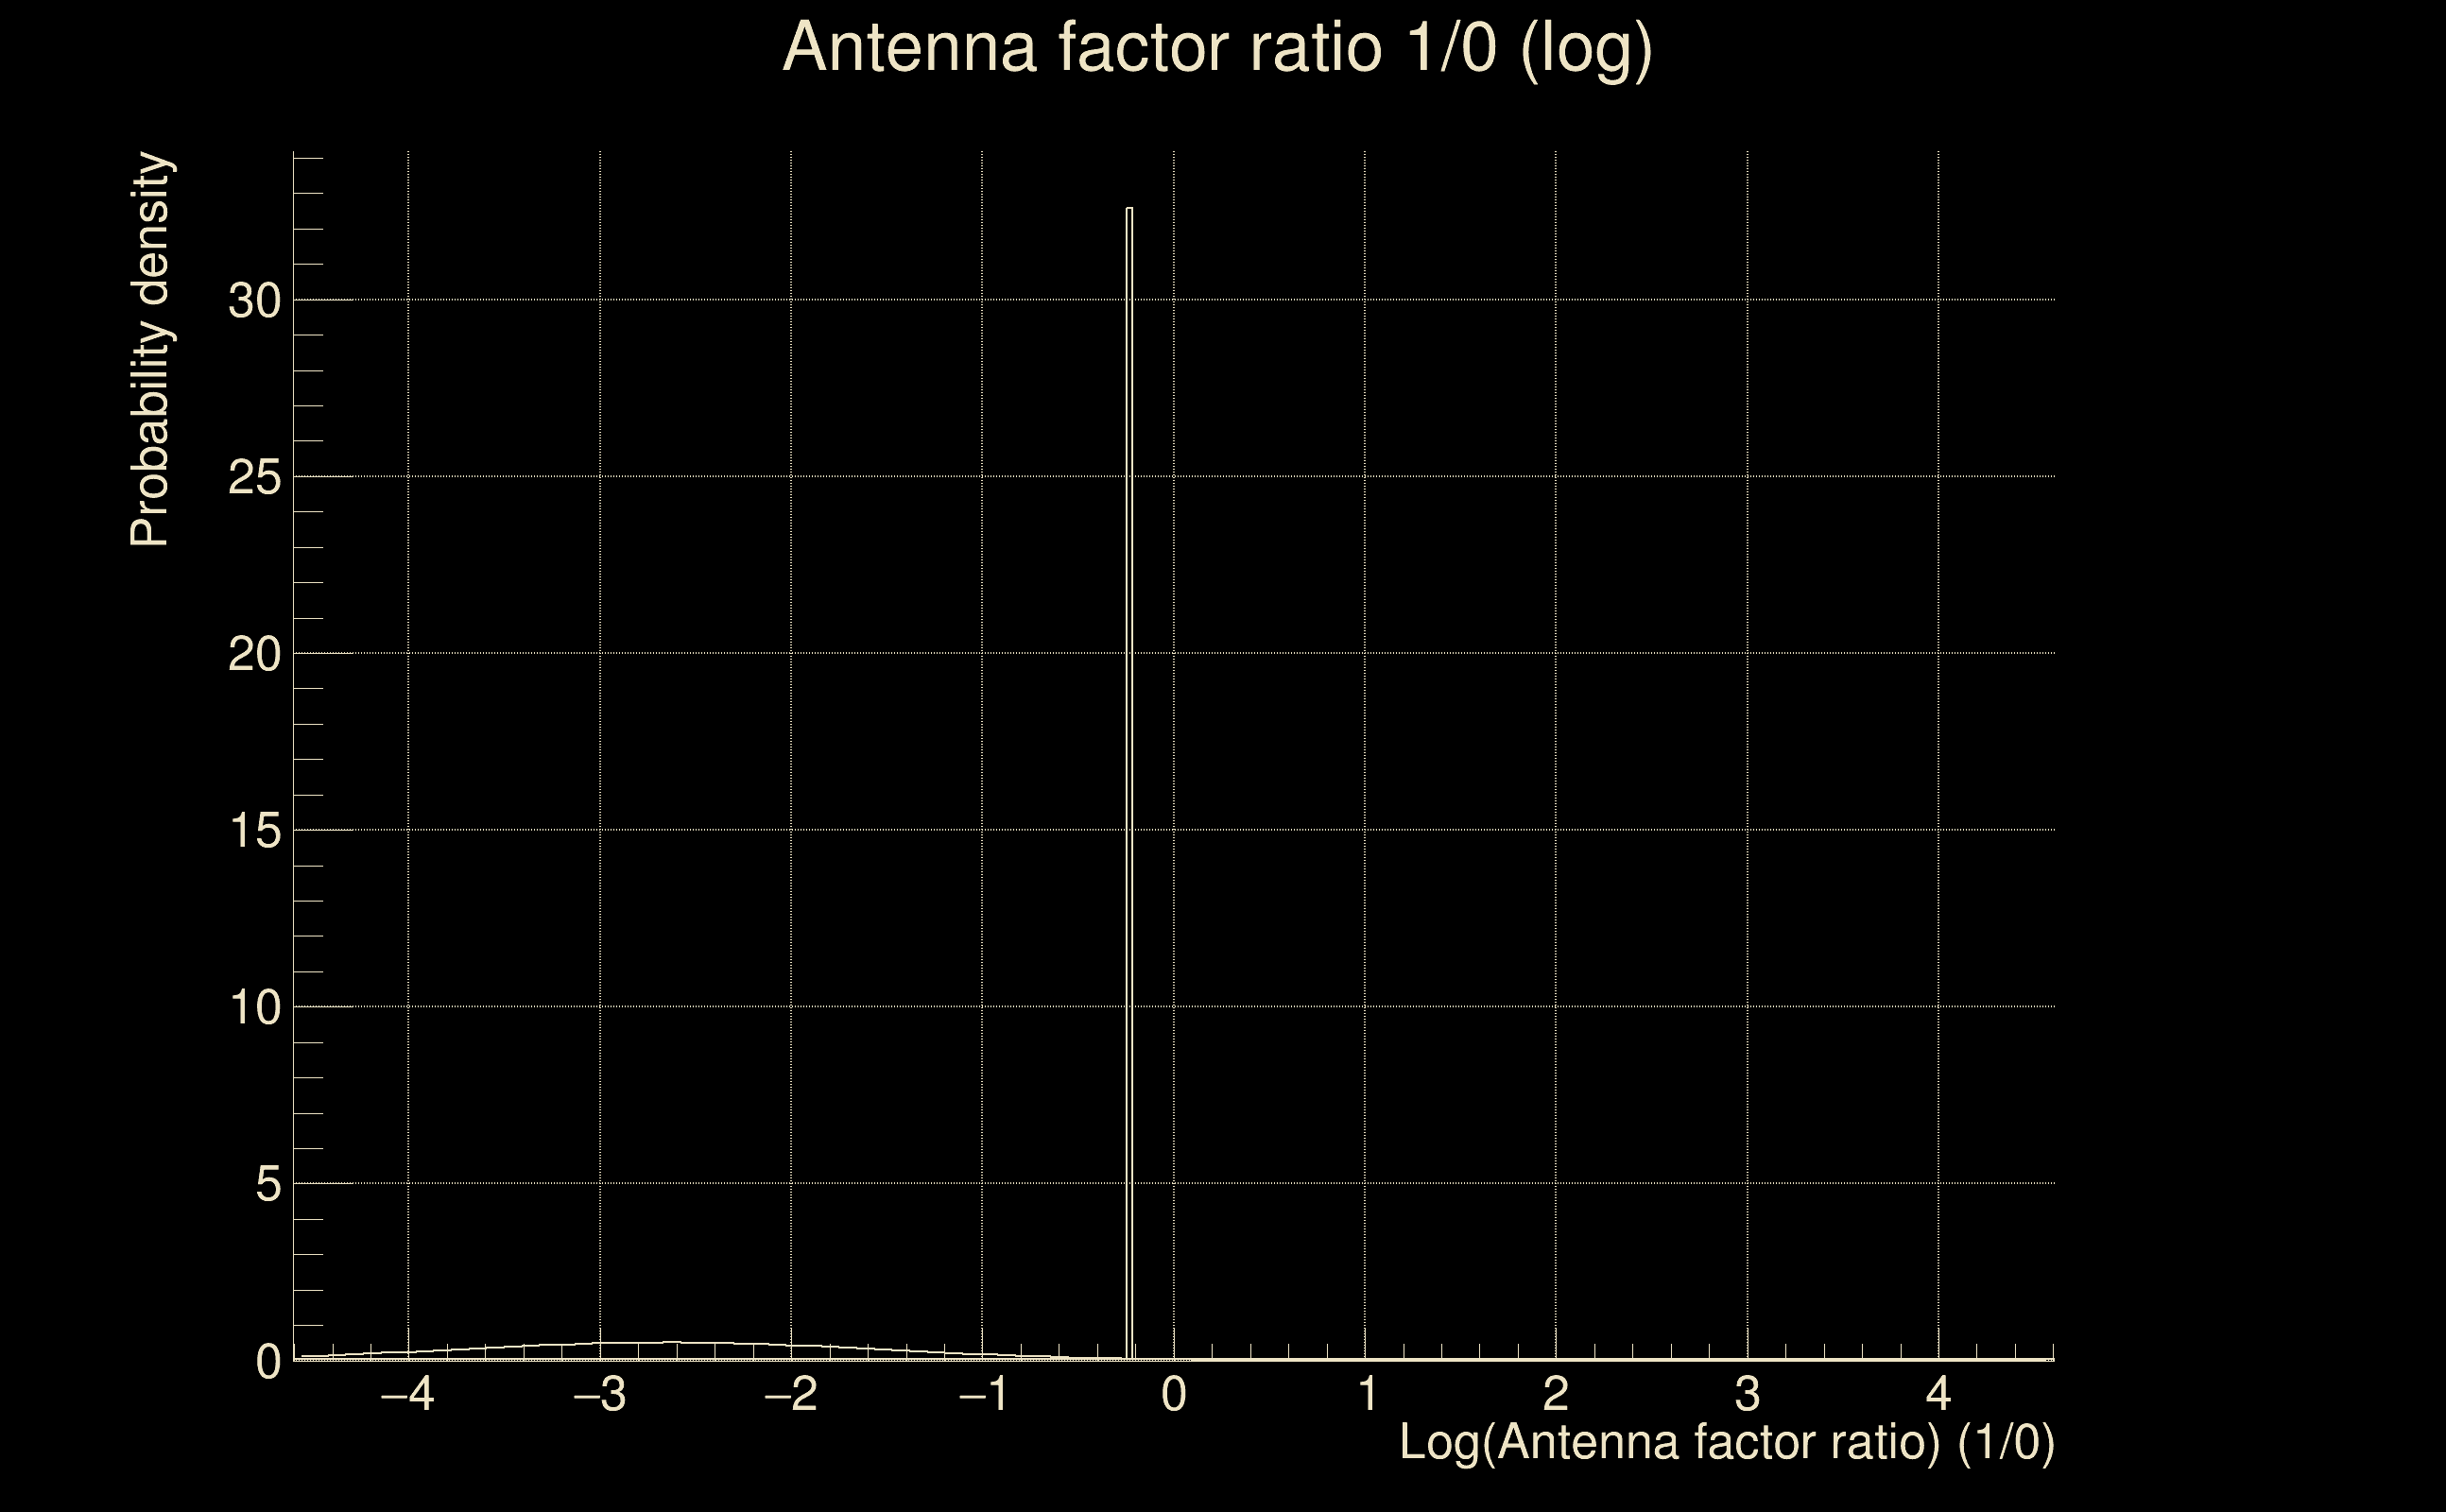
| Log of amplitude ratio (L1/H1): | -3.24945, variance = 1.1519 (L1/H1: -3.28569, variance = 1.17413, H1/L1: -0.49808, variance = 1.66953) |
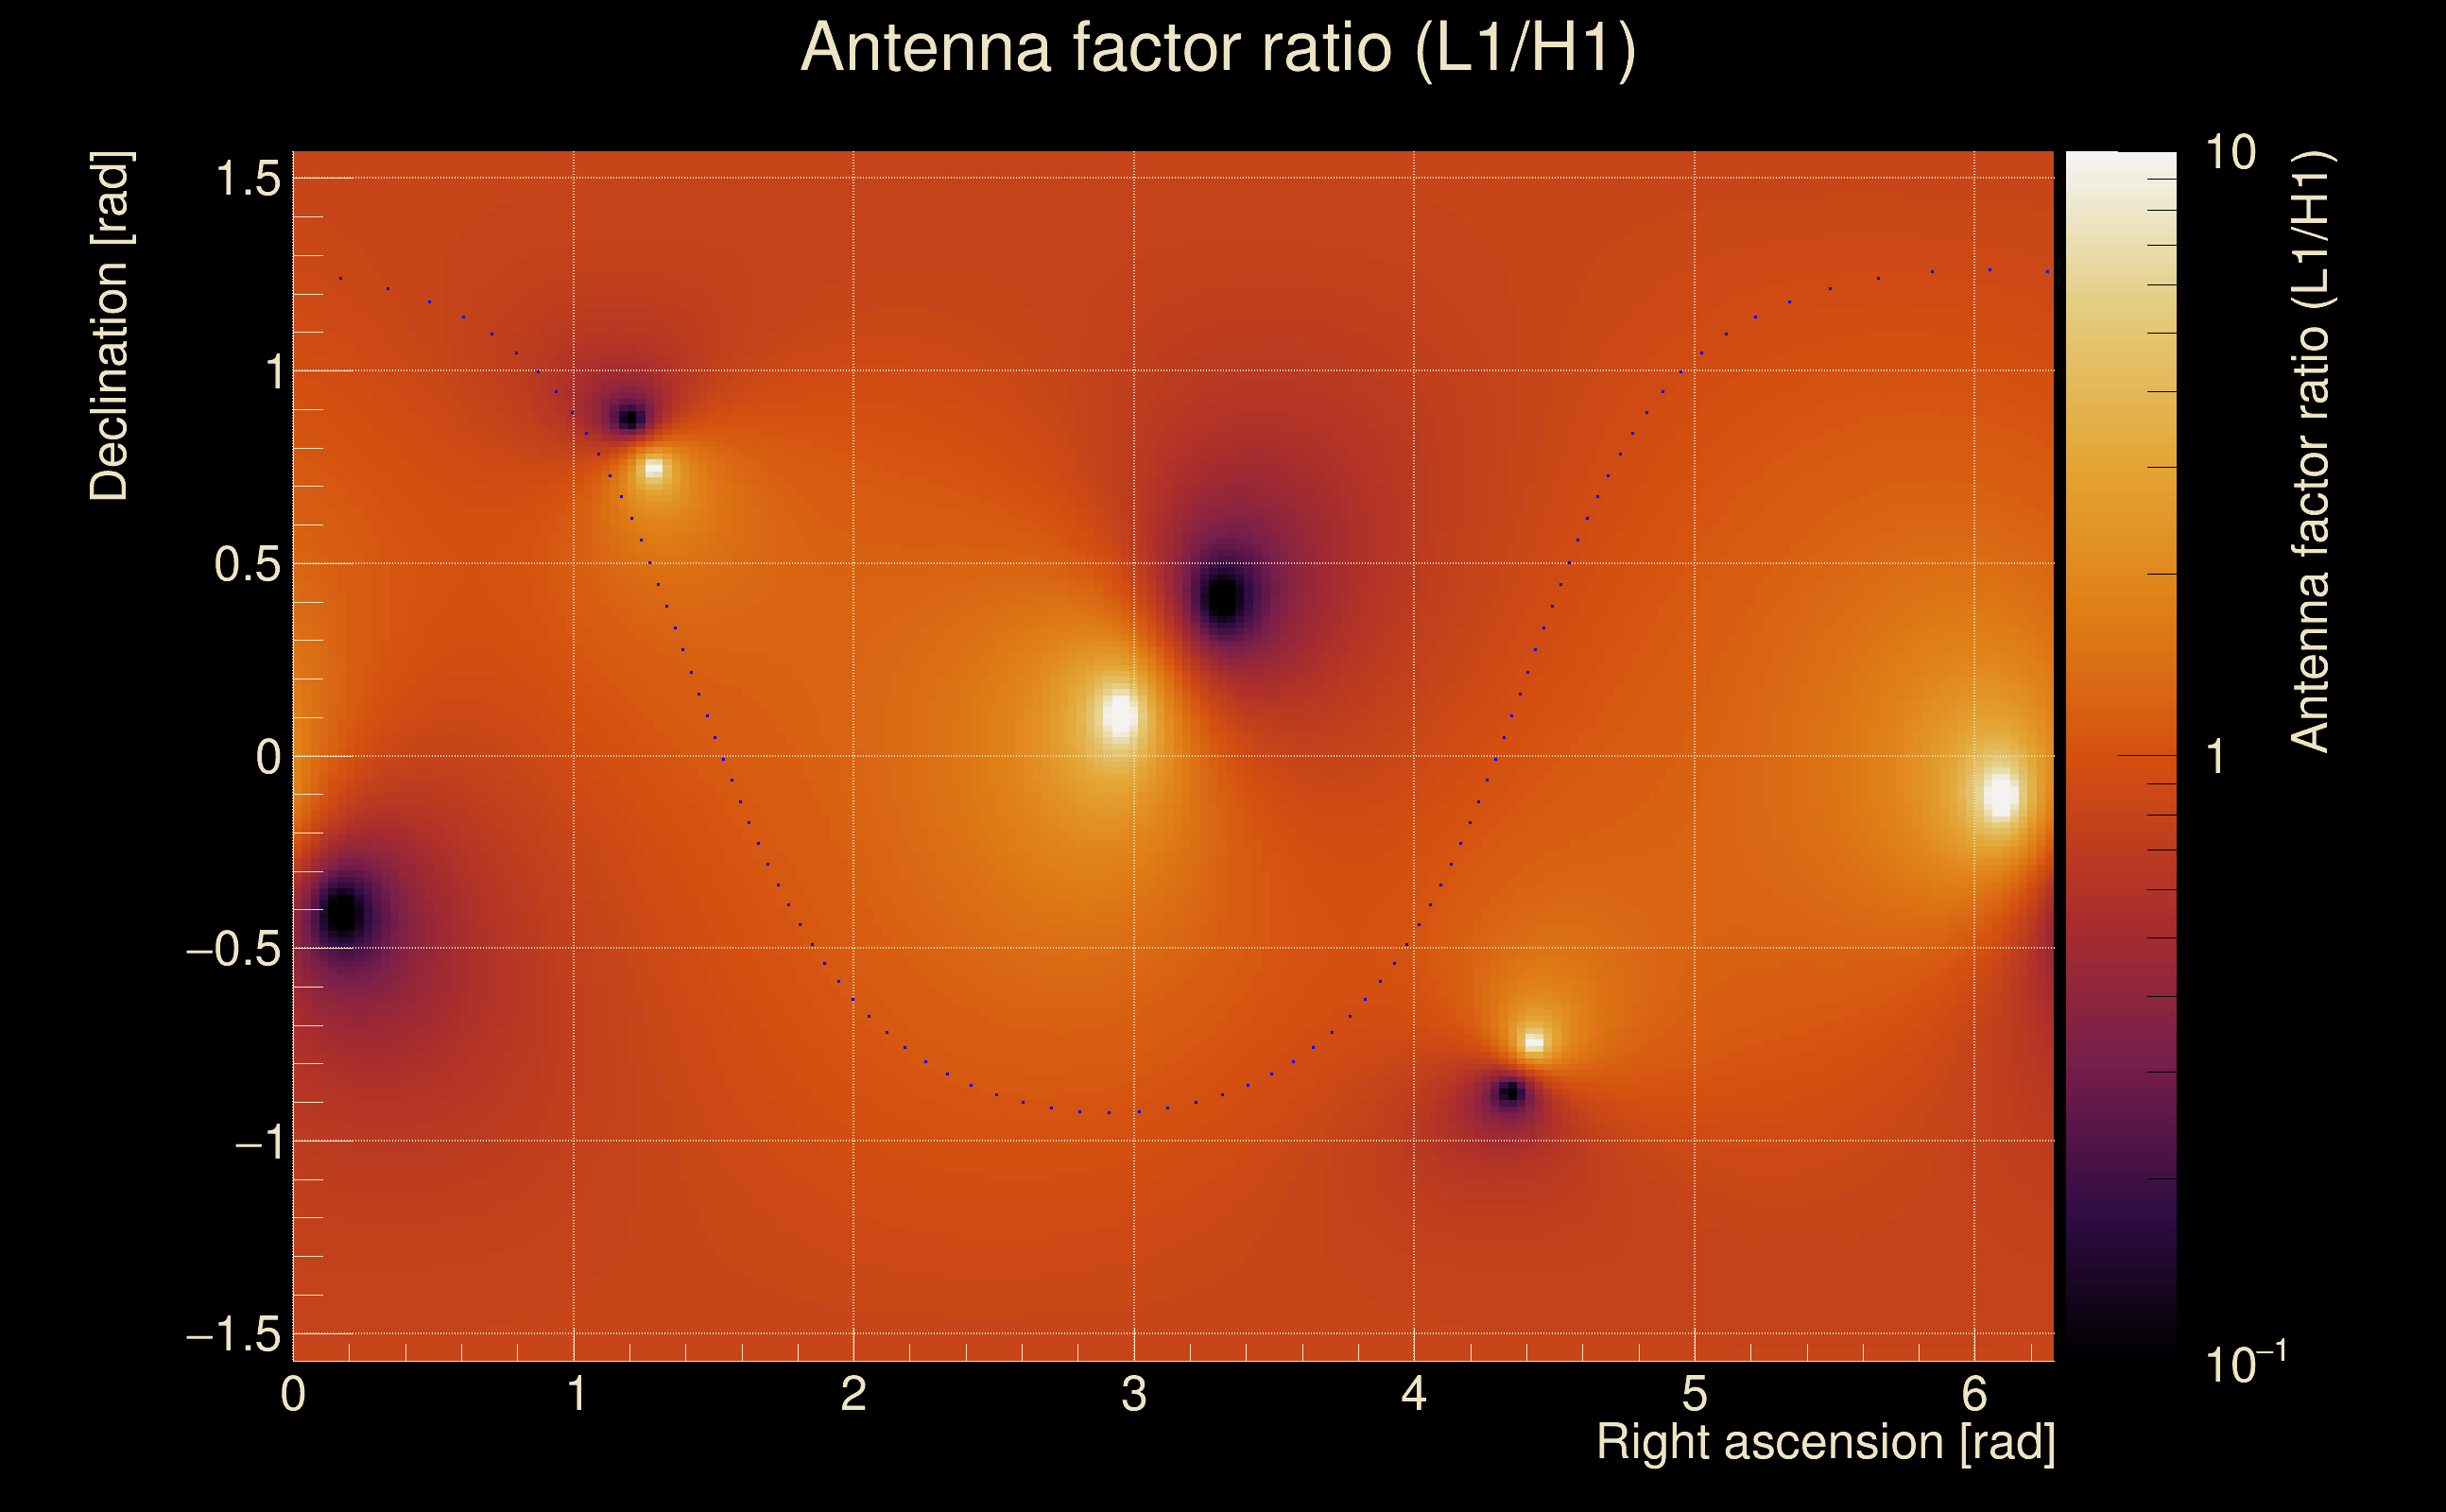
| Amplitude ratio (L1/H1): | 0.0387957 ⋇ 2.92491 (L1/H1: 0.0374148 ⋇ 2.95522, H1/L1: 0.607696 ⋇ 3.64043) |
| Amplitude ratio H1|L1 compatibility (probability): | 0.0248446 |
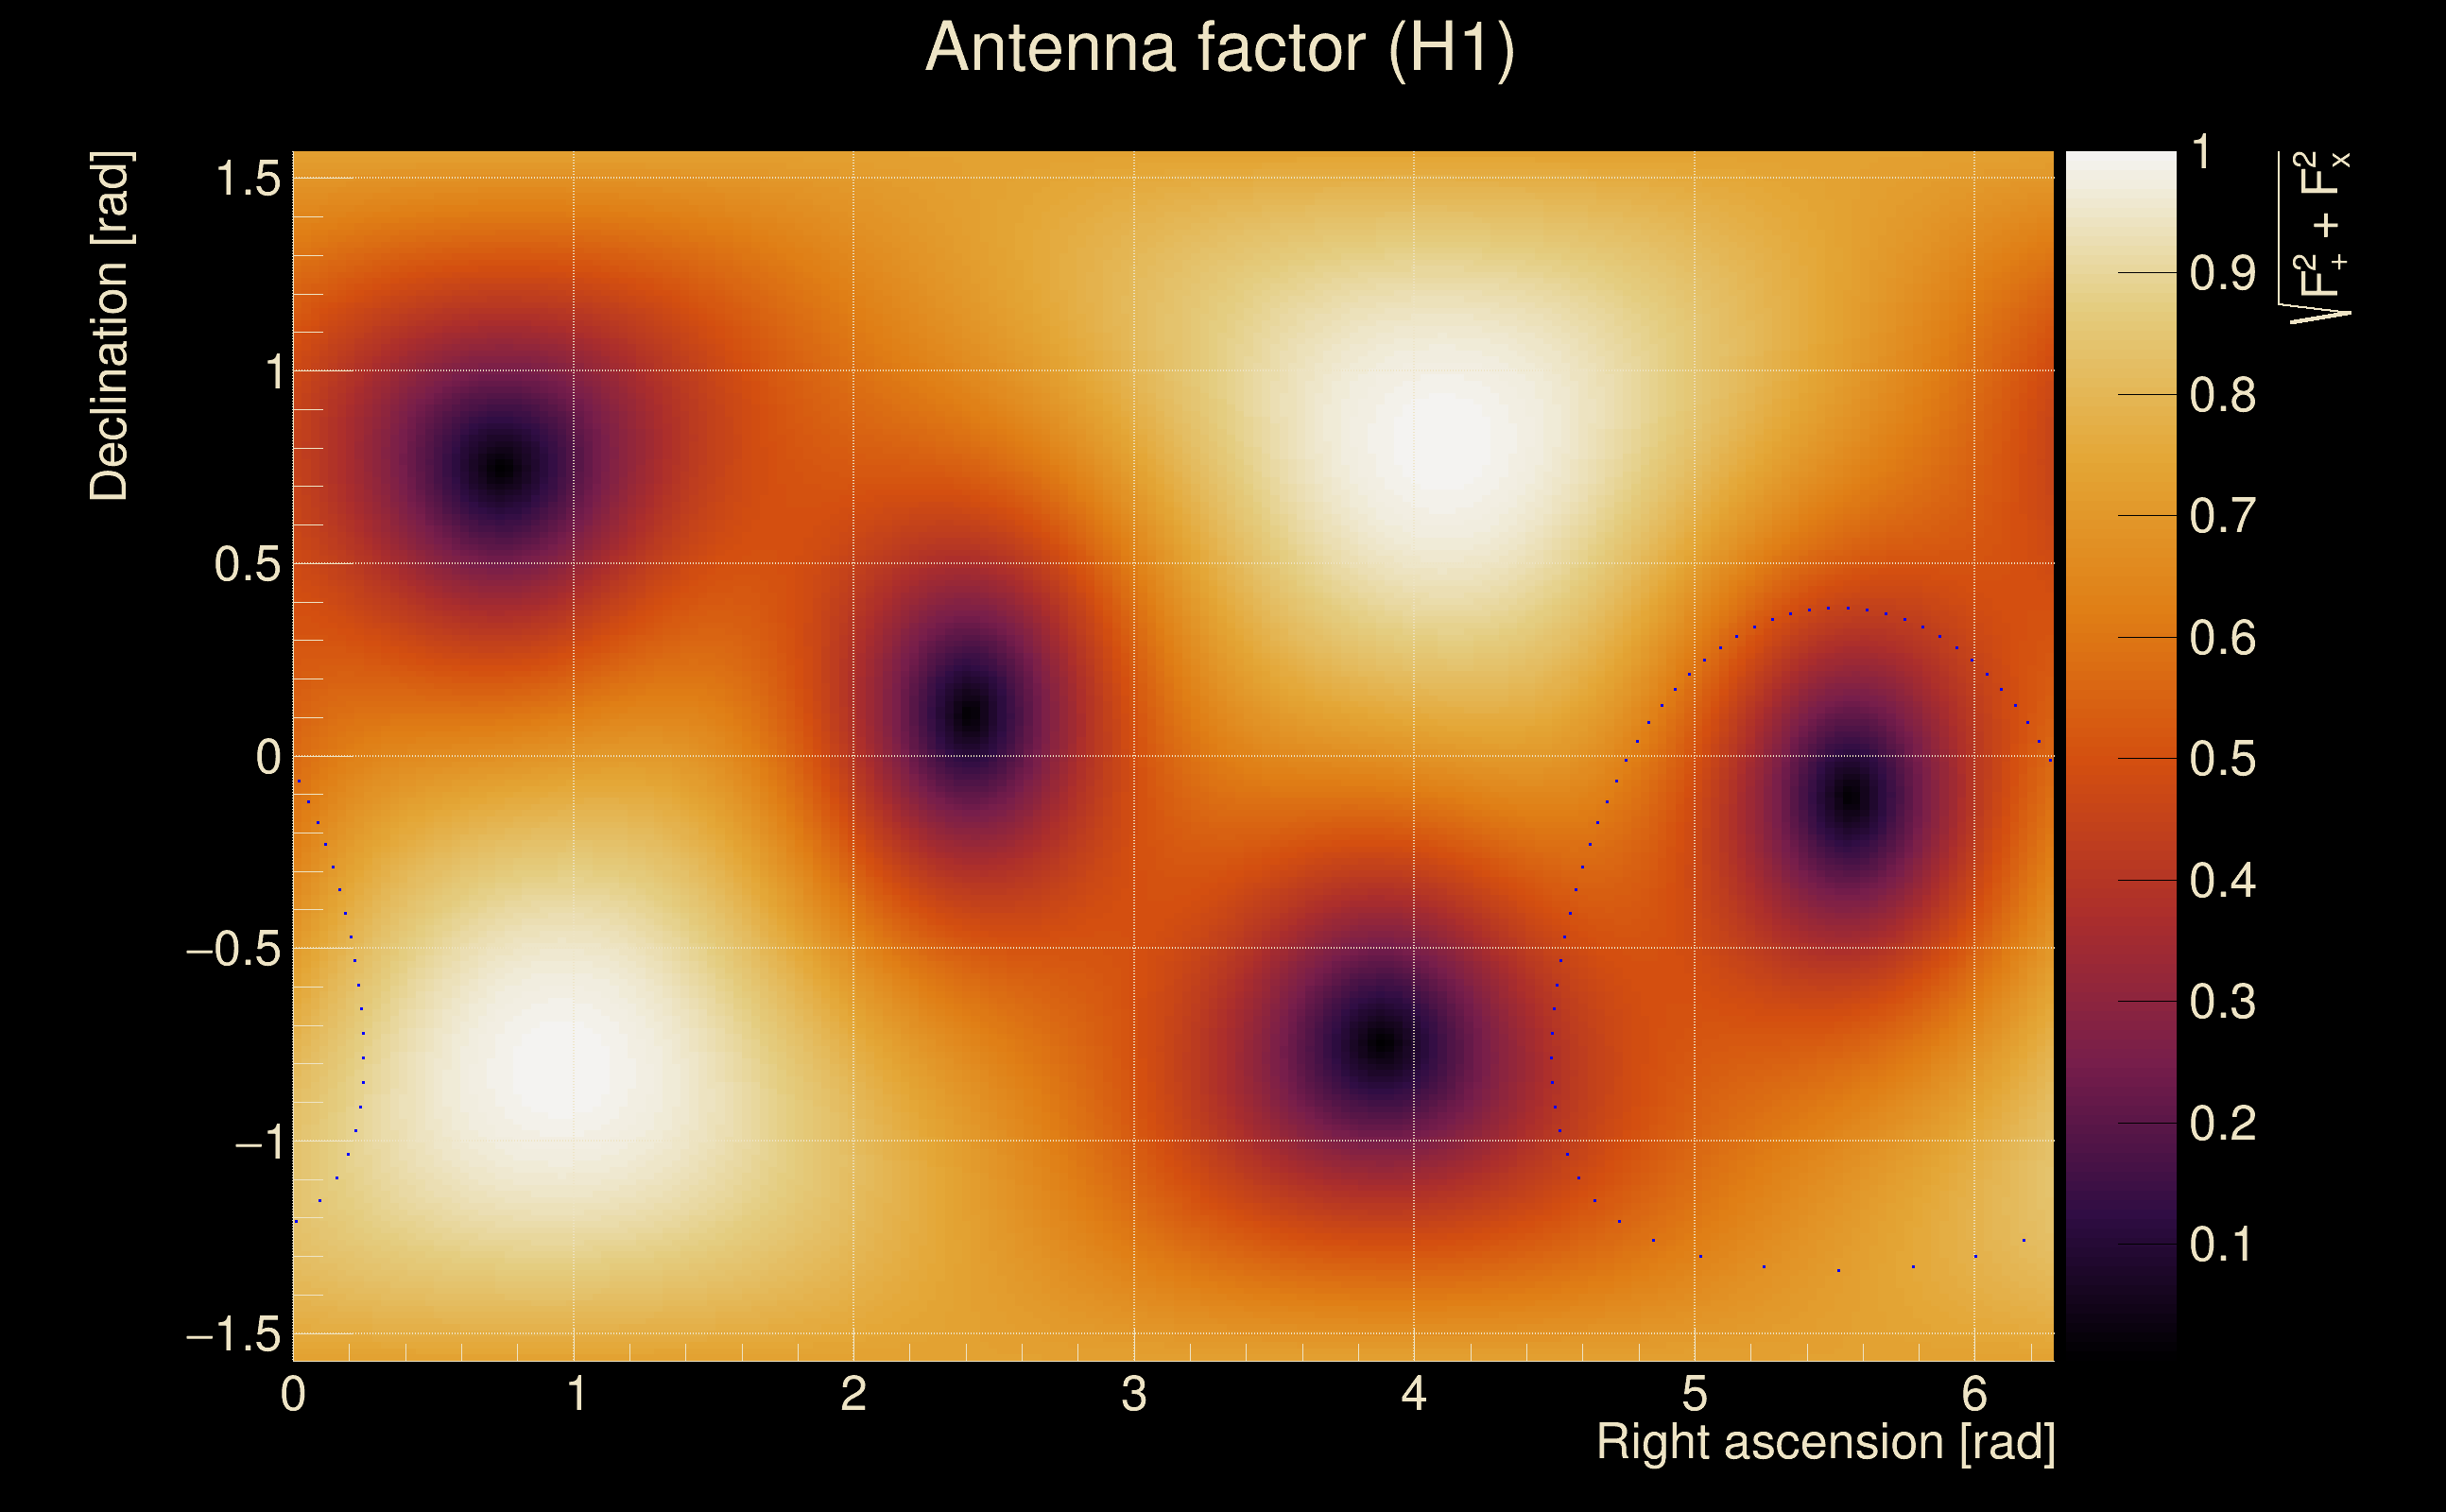
| Antenna factor probability: | 0.00441003 |
| Number of rejected frequency rows: | Q0: 5 / 18, Q1: 21 / 36, Q2: 51 / 70, Q3: 115 / 134, Q4: 233 / 258 |
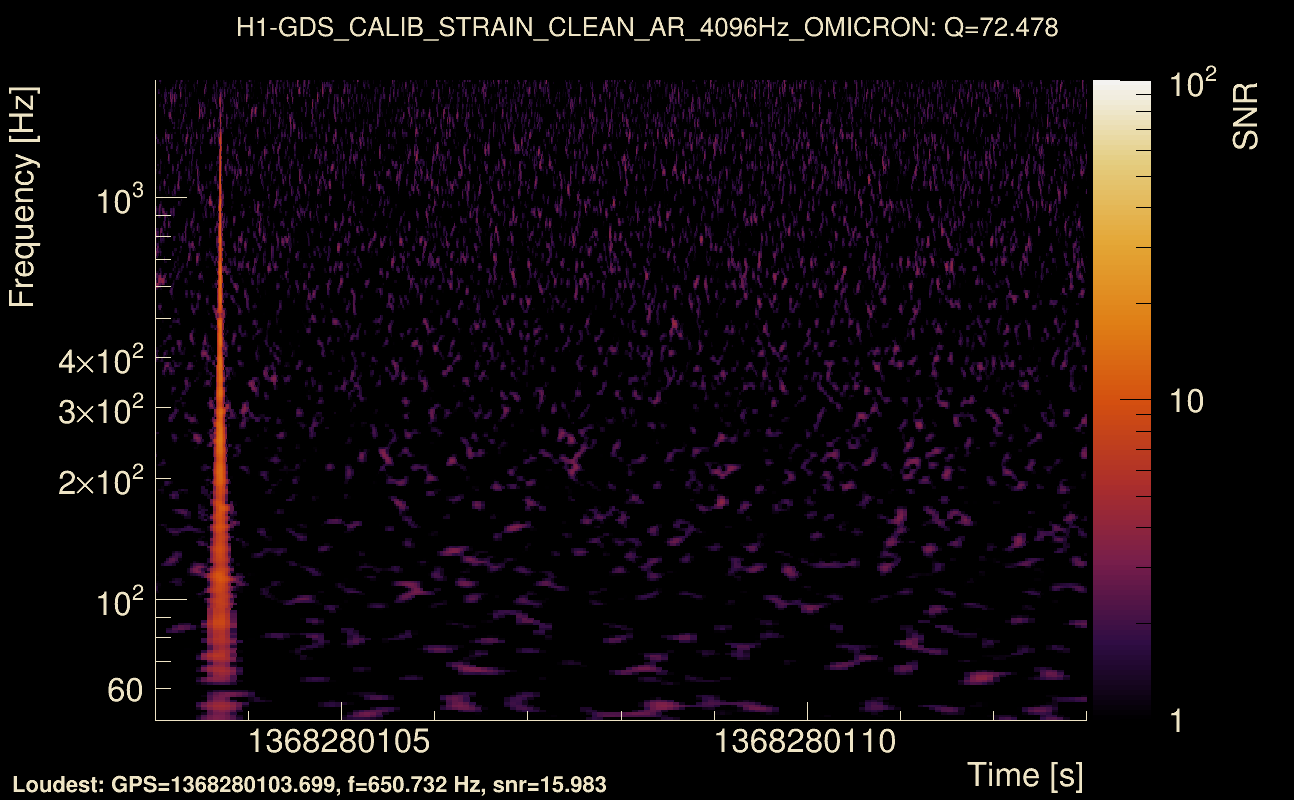
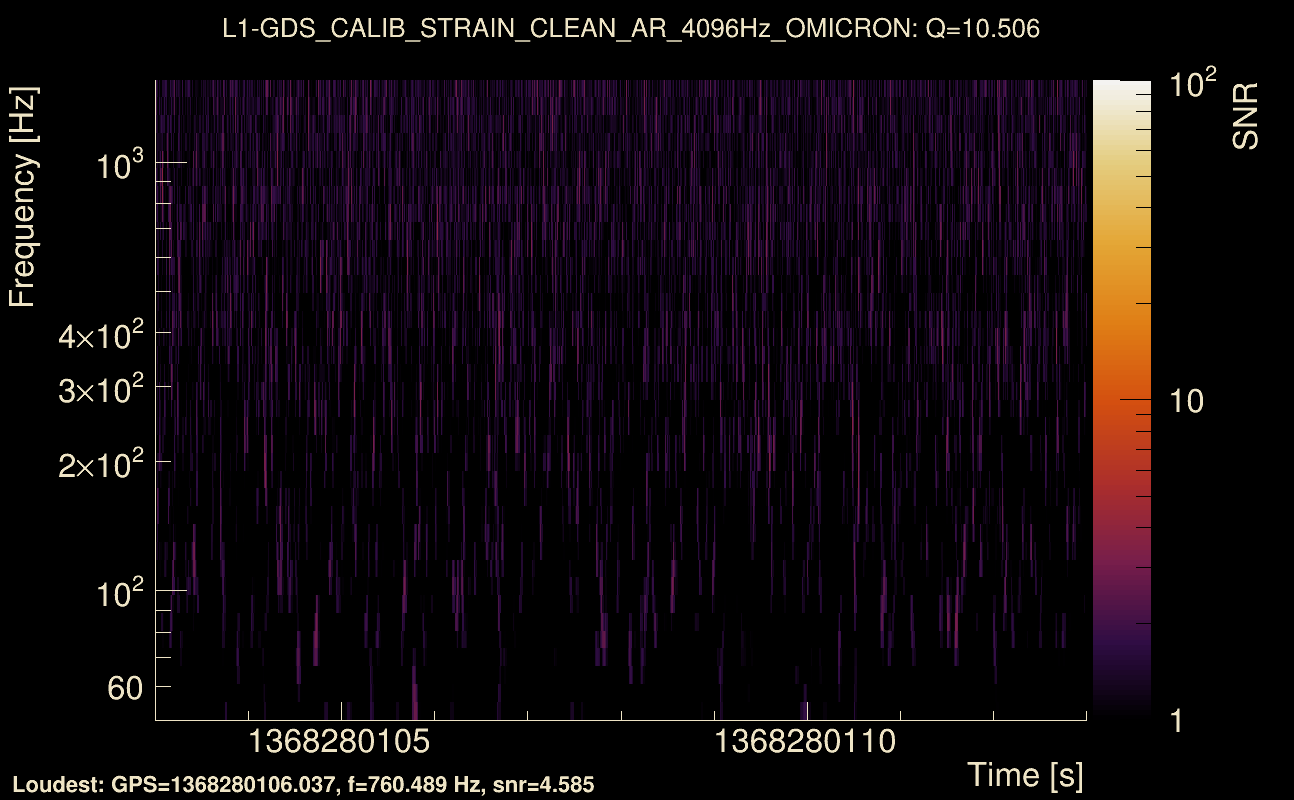
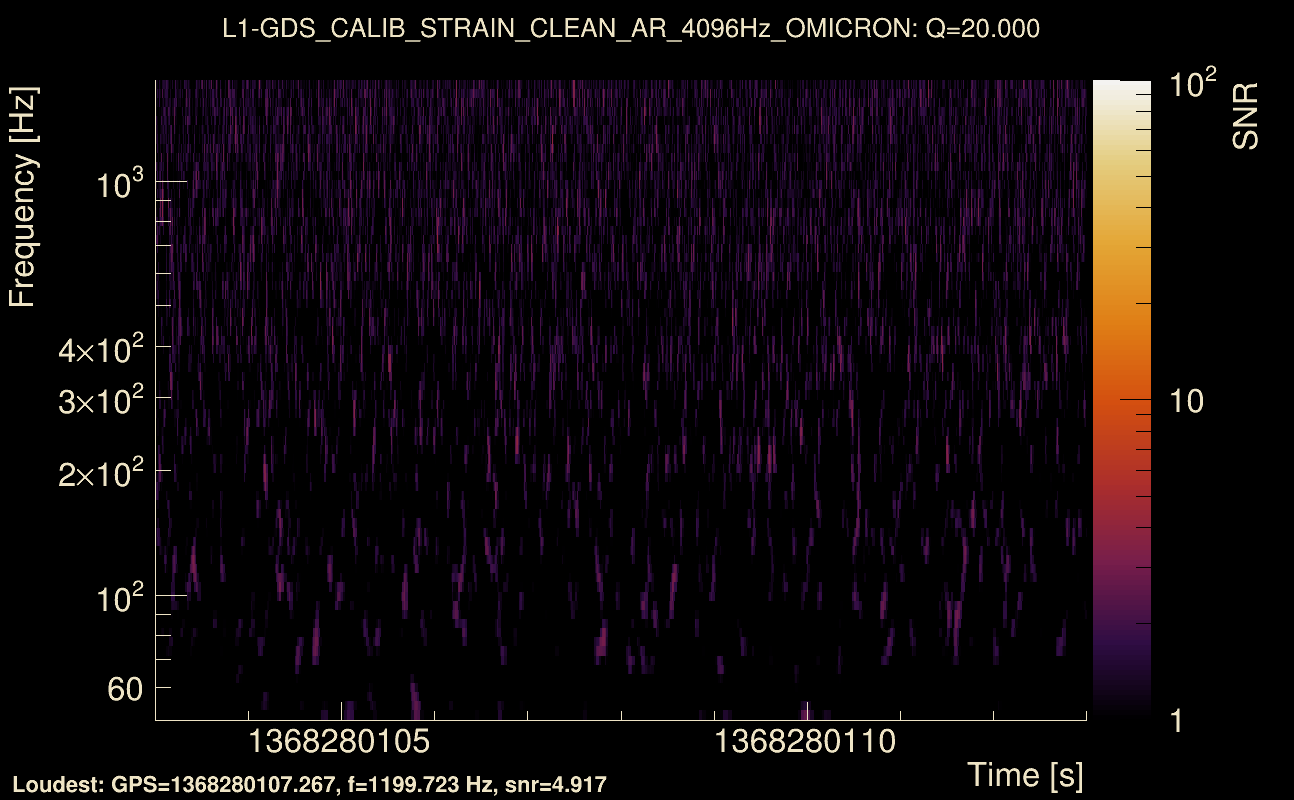
| Maximum signal-to-noise ratio: | H1: 51.7964, L1: 5.09388 |
| SNR variance: | H1: 1.11954, L1: 0.530862 |
| Click here for a zoomed plot | Click here for a zoomed plot | Click here for a zoomed plot | Click here for a zoomed plot | Click here for a zoomed plot |
 |
 |
 |
 |
 |
 |
 |
 |
 |
 |
 |
 |
 |
 |
 |
 |
 |
 |
 |
 |
 |
 |
 |
 |
 |
 |
 |
 |
 |
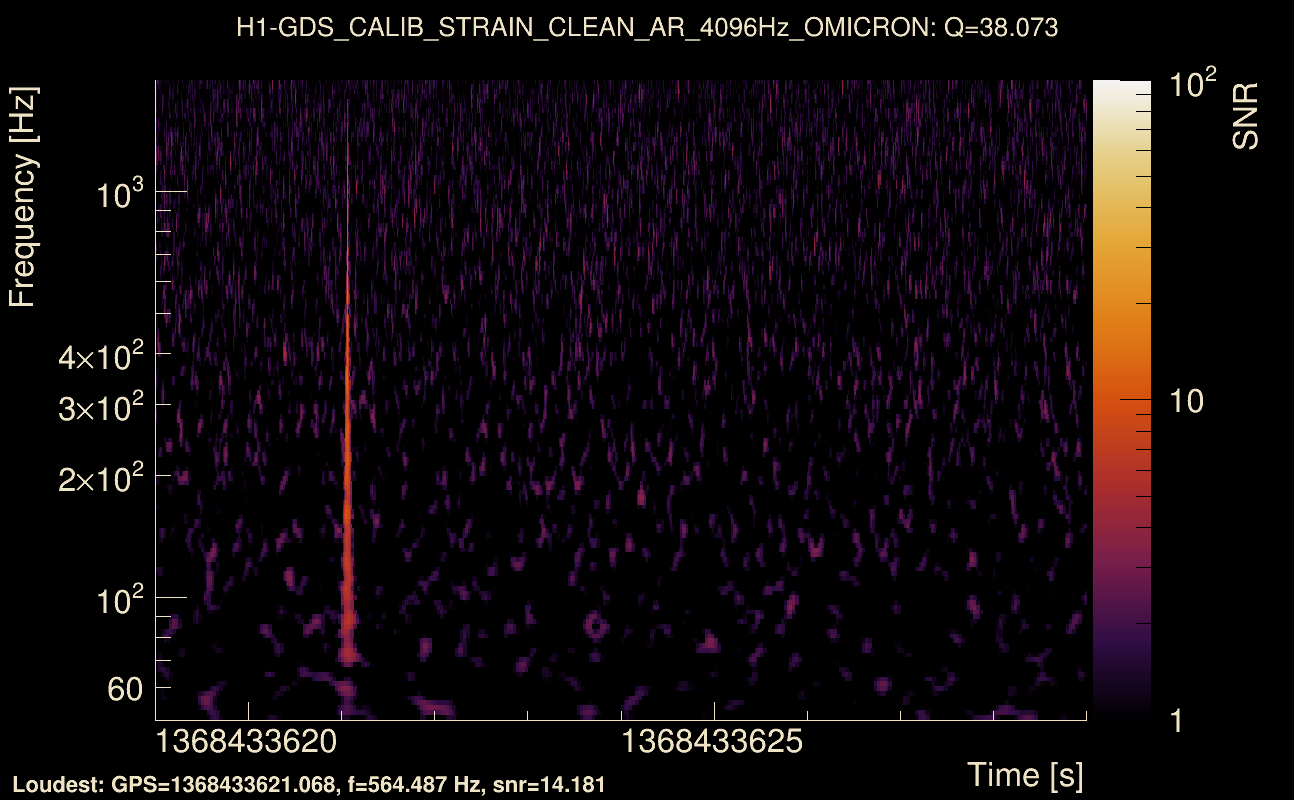
| Event time t(H1): | GPS = 1368433619 (Thu May 18 08:26:41 2023 ) → GPS = 1368433629 (Thu May 18 08:26:51 2023 ) |
| Event time t(L1): | GPS = 1368433619 (Thu May 18 08:26:51 2023 ) → GPS = 1368433629 (Thu May 18 08:26:51 2023 ) |
| Omicron analysis time window (H1): | GPS = 1368433616 → GPS = 1368433632 |
| Omicron analysis time window (L1): | GPS = 1368433616 → GPS = 1368433632 |
| Time delay between detectors t(L1) - t(H1): | 0.00767714 s (slice index = 108 / 217), δt_gw = 0.00767714 s |
| Time delay standard deviation: | 0.0532596 s |
| [targeted mode] Time delay probability: | 0.498264 (0.677223 sigmas), δt_target = -0.00986028 s |
| Frequency: | 247.874 Hz |
| Ξ: | 0.0334561 ± 0.0606779 (variance = 0.0036818): Q0: 0.10605, Q1: 0.0958576, Q2: 0.109297, Q3: 0.172516, Q4: 0.256773 |
| Rank: | R_A = 0.0334561 |
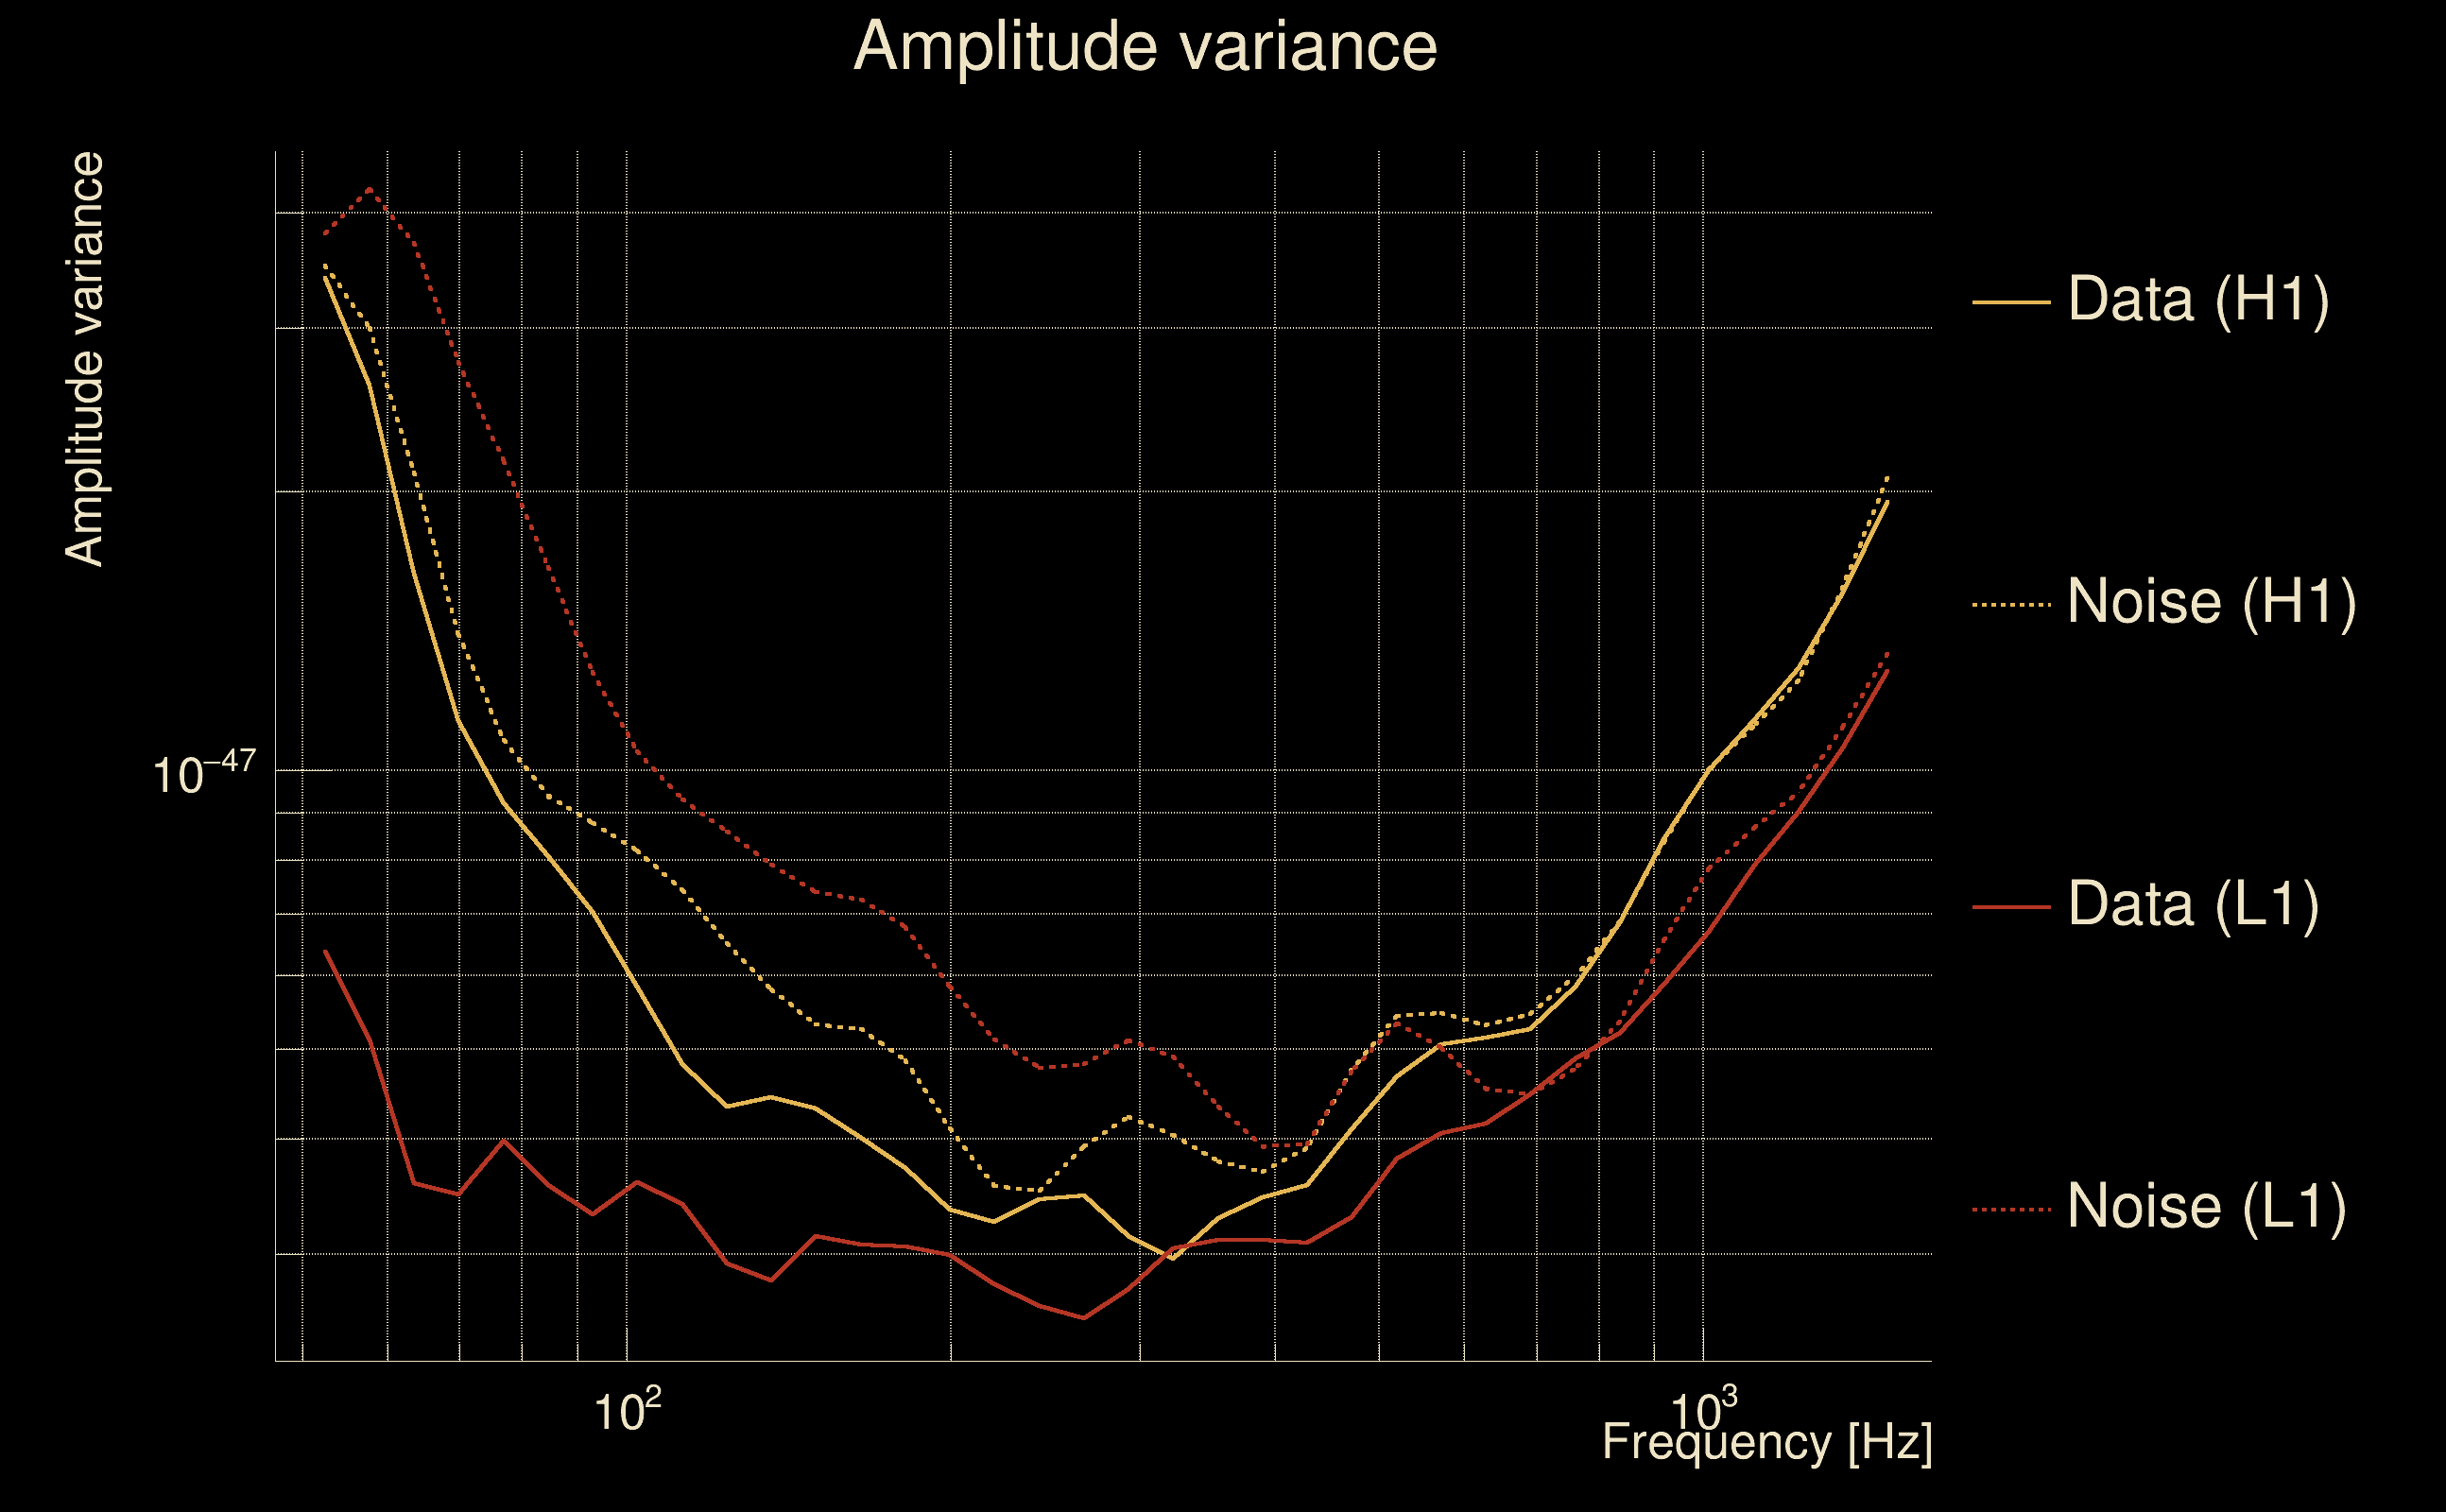
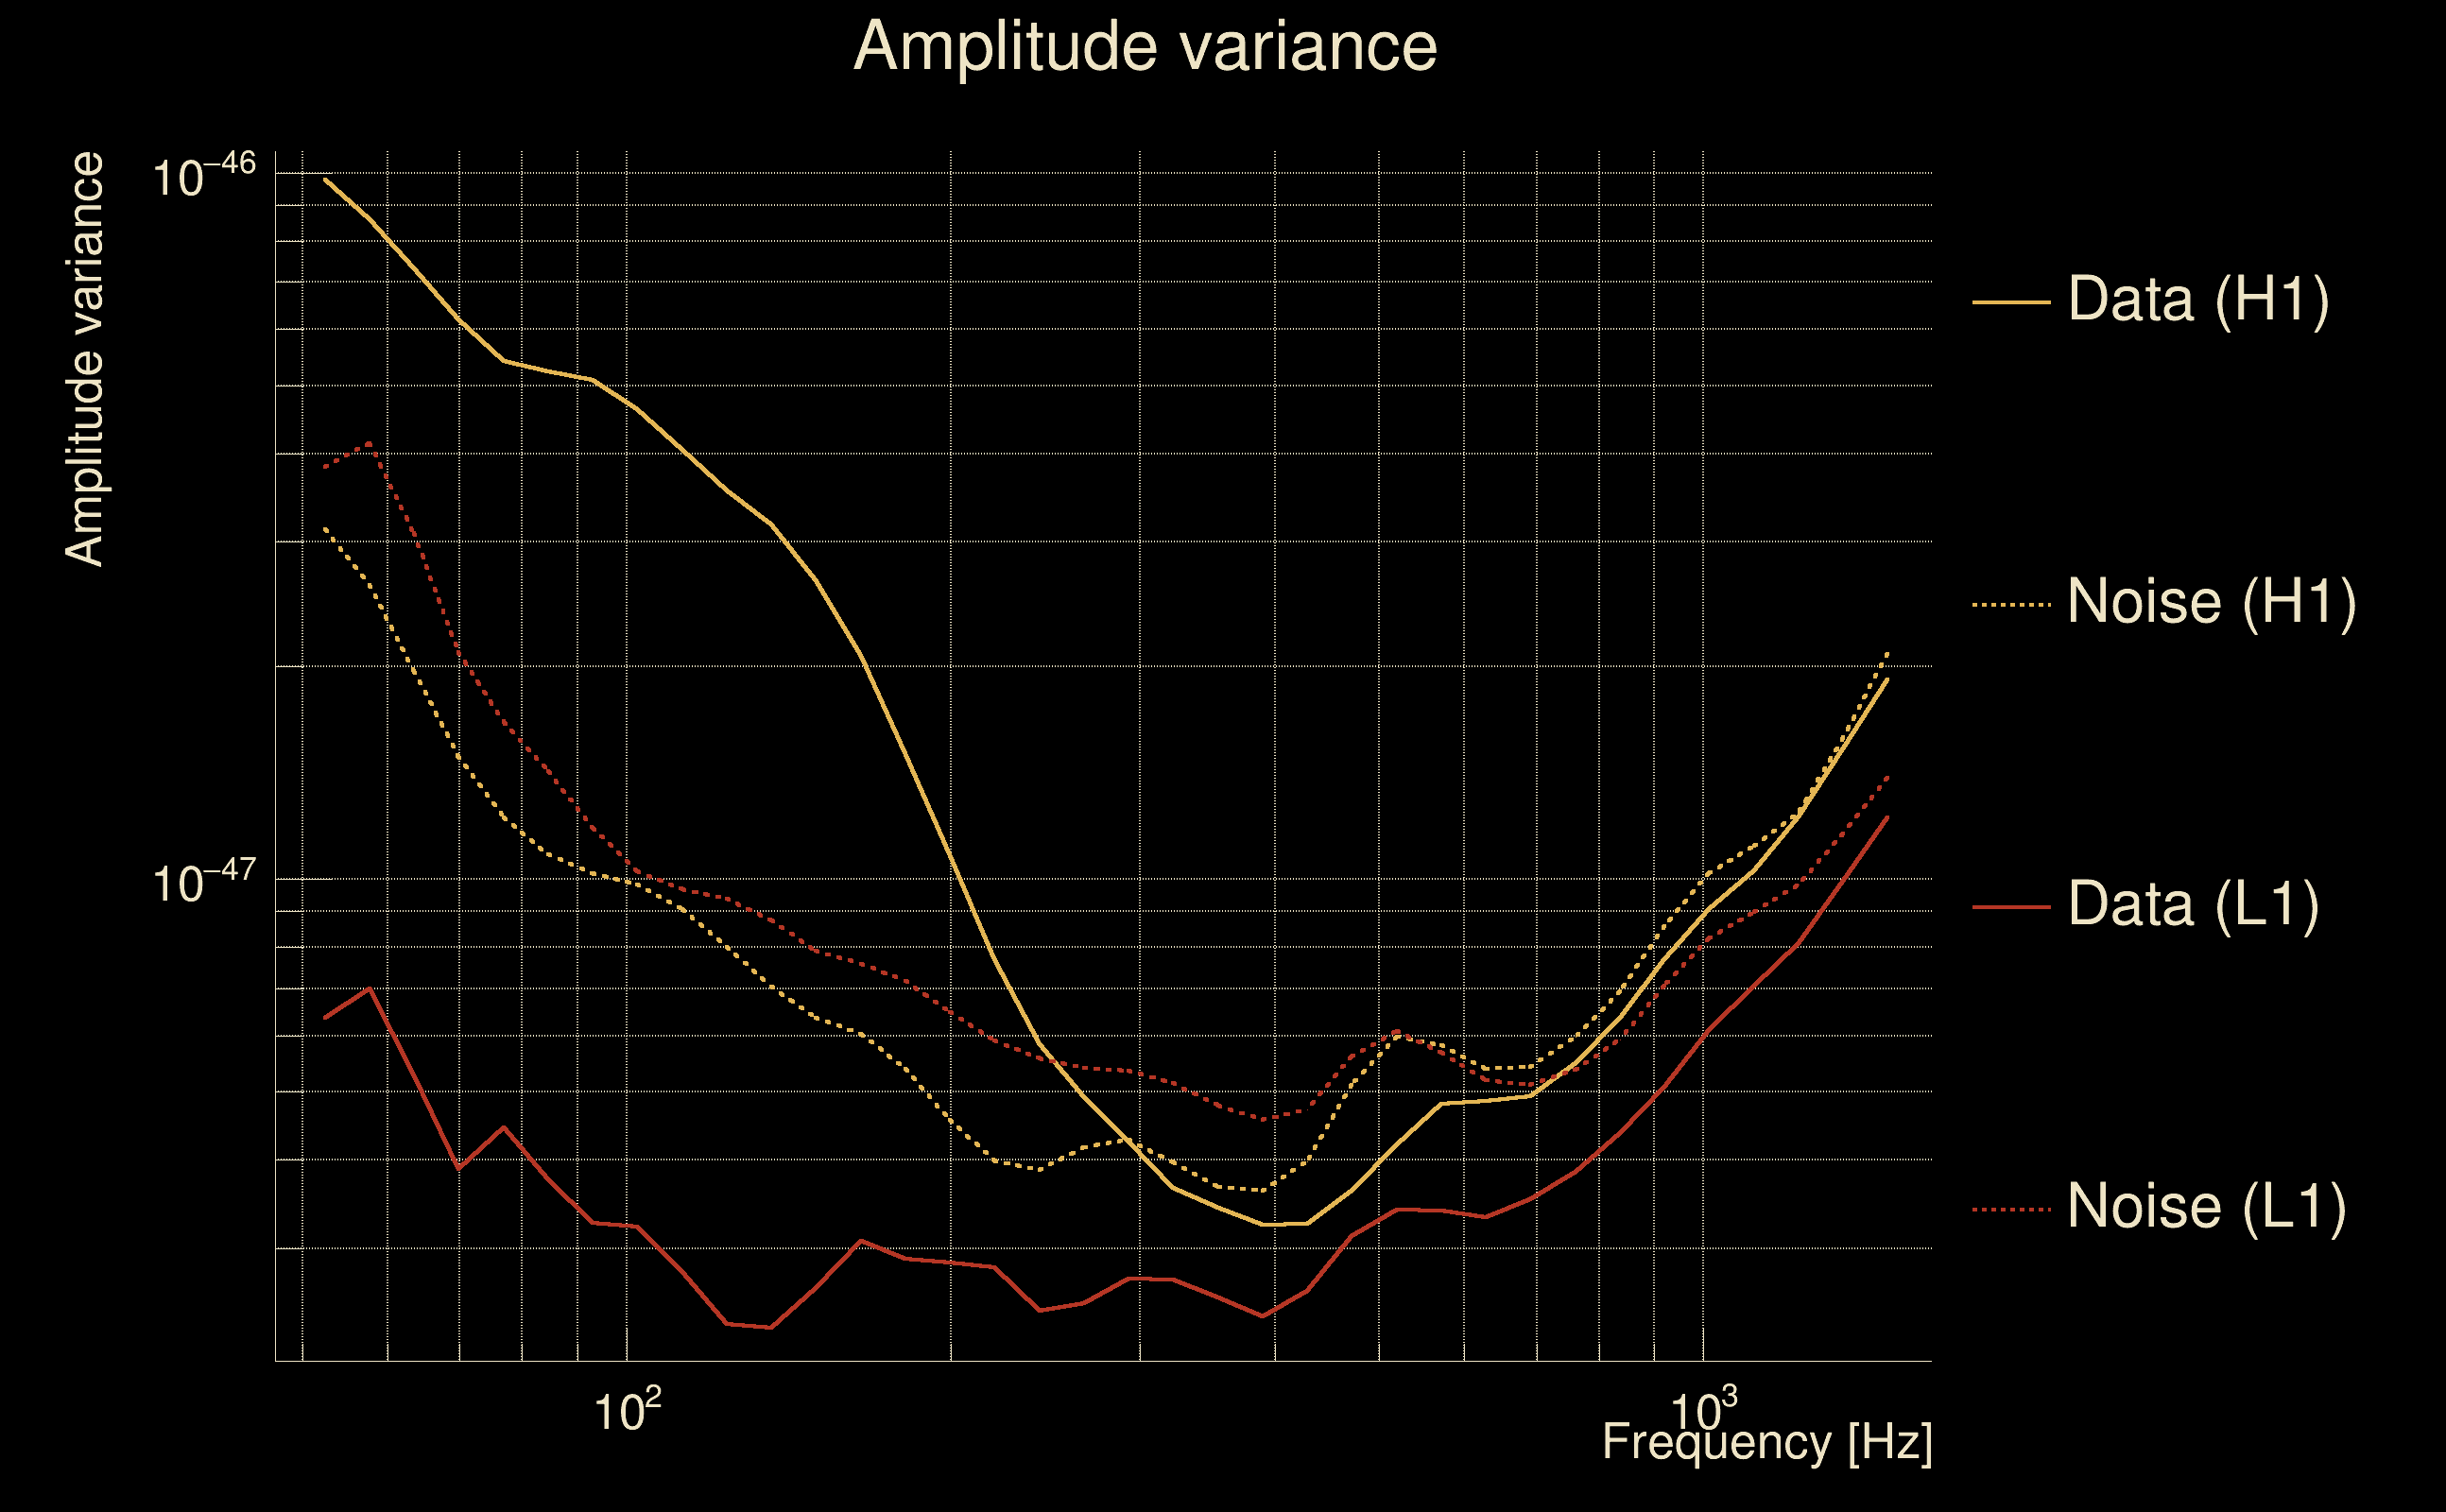
| Log of amplitude ratio (L1/H1): | -2.05567, variance = 0.509229 (L1/H1: -2.1325, variance = 0.533921, H1/L1: -1.10577, variance = 0.606745) |
| Amplitude ratio (L1/H1): | 0.128007 ⋇ 2.04133 (L1/H1: 0.118541 ⋇ 2.07653, H1/L1: 0.330956 ⋇ 2.17916) |
| Amplitude ratio H1|L1 compatibility (probability): | 0.00242917 |
| Antenna factor probability: | 0.0143839 |
| Number of rejected frequency rows: | Q0: 11 / 18, Q1: 25 / 36, Q2: 55 / 70, Q3: 121 / 134, Q4: 237 / 258 |
| Maximum signal-to-noise ratio: | H1: 32.9188, L1: 5.13162 |
| SNR variance: | H1: 0.725245, L1: 0.571683 |
| Click here for a zoomed plot | Click here for a zoomed plot | Click here for a zoomed plot | Click here for a zoomed plot | Click here for a zoomed plot |
 |
 |
 |
 |
 |
 |
 |
 |
 |
 |
 |
 |
 |
 |
 |
 |
 |
 |
 |
 |
 |
 |
 |
 |
 |
 |
 |
 |
 |
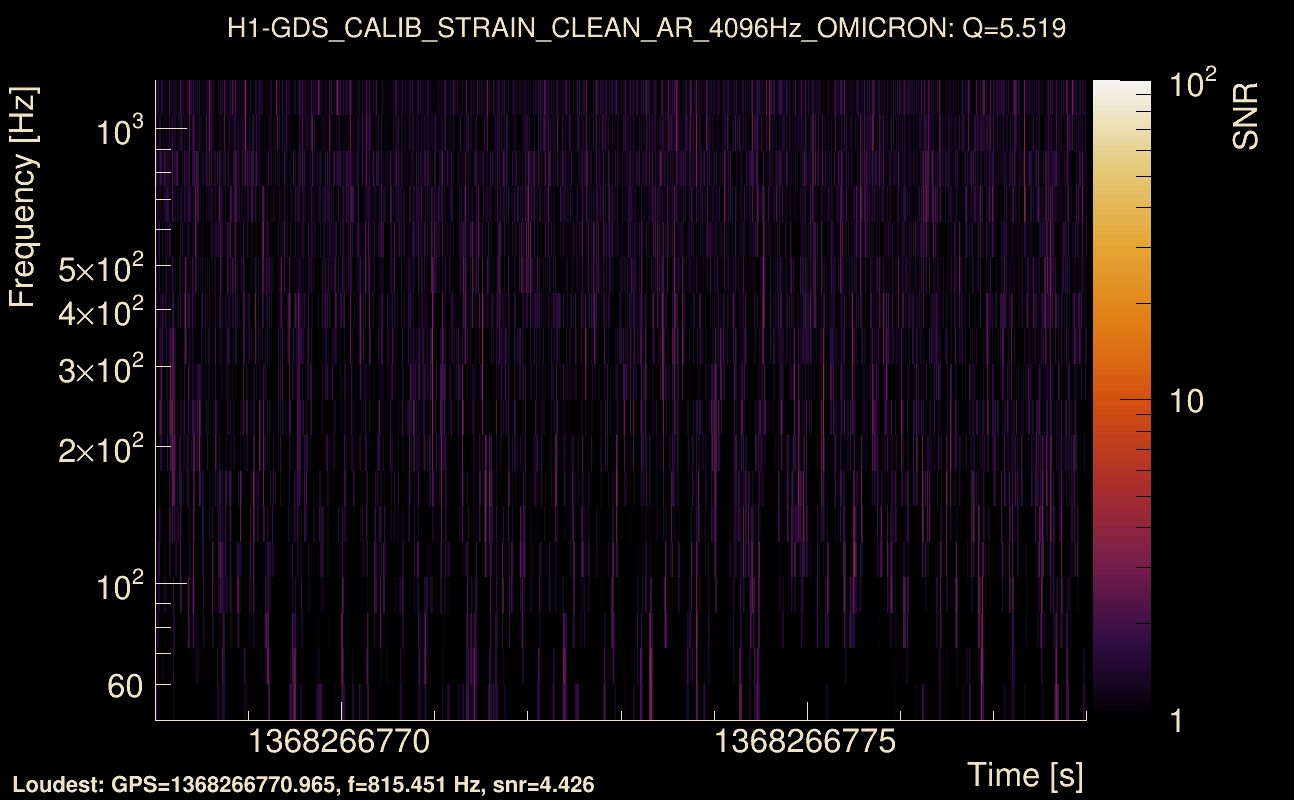
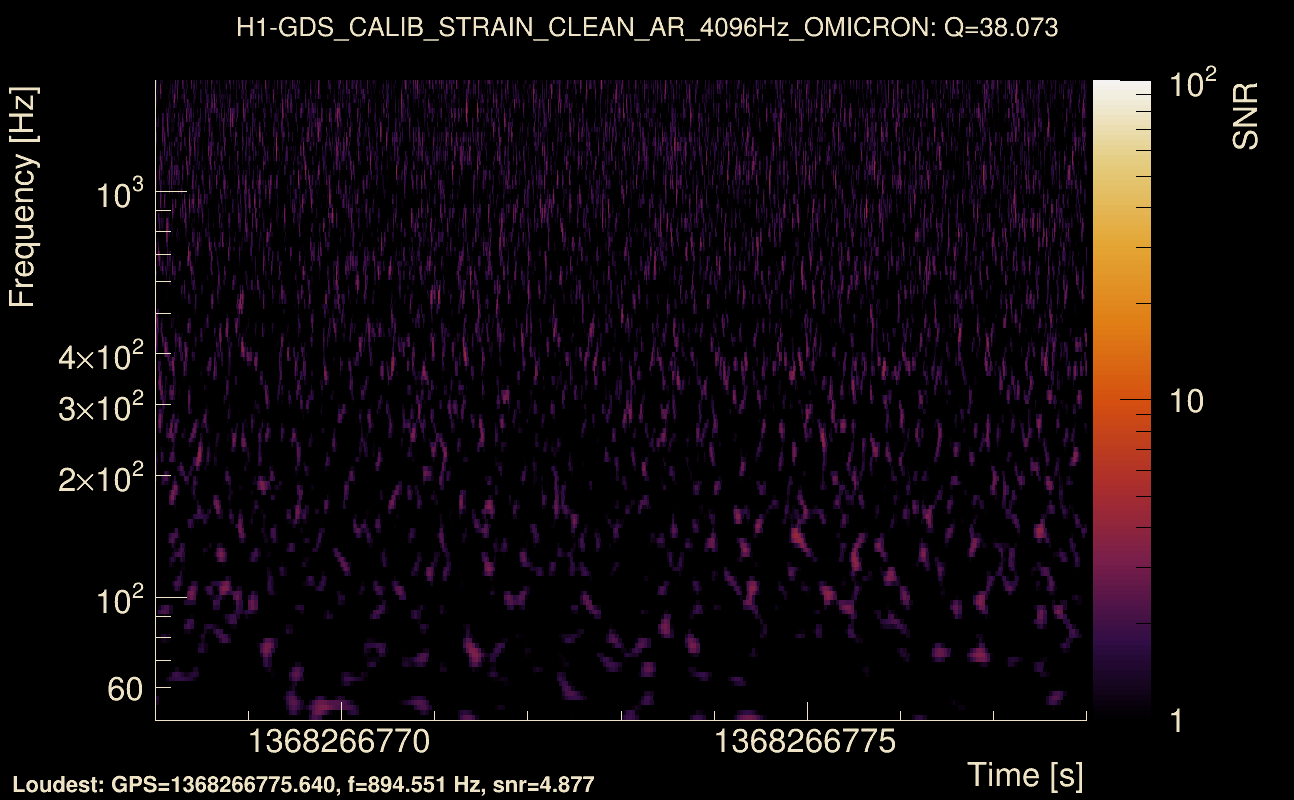
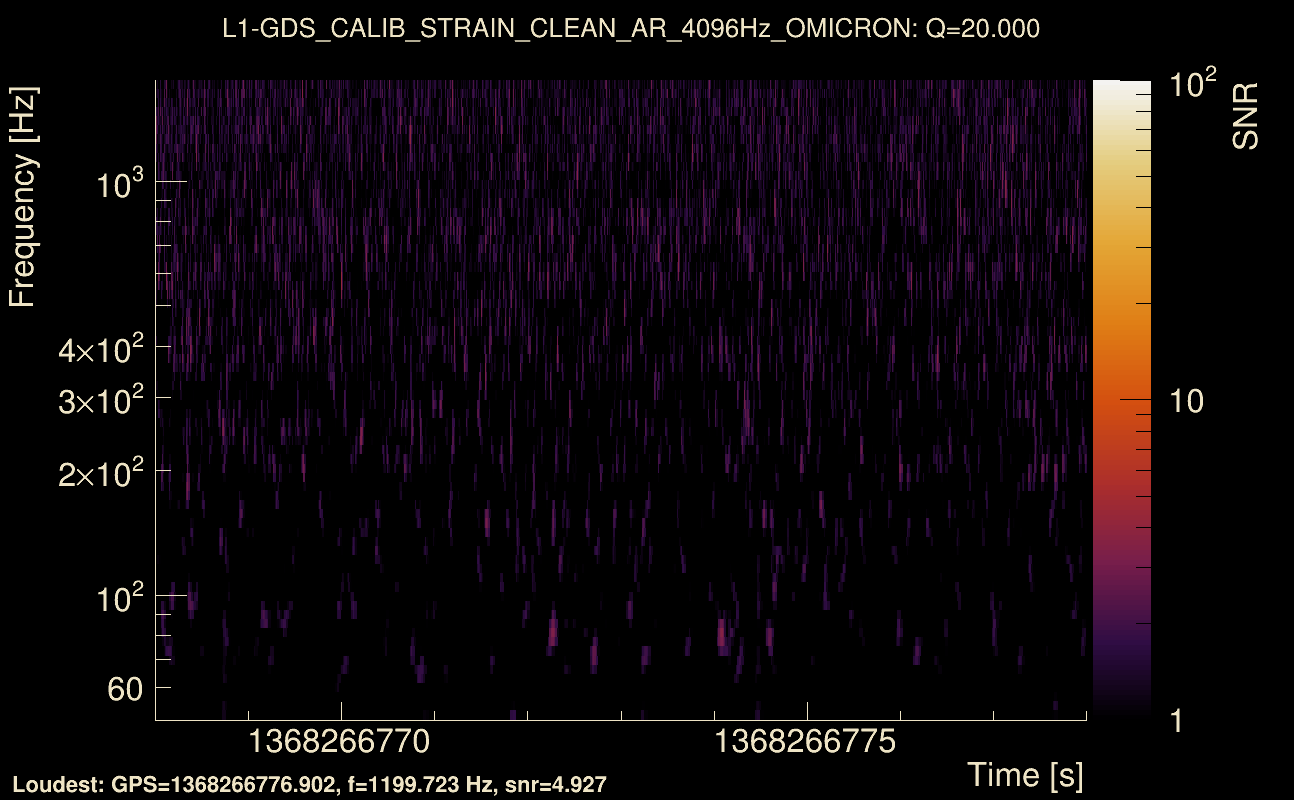
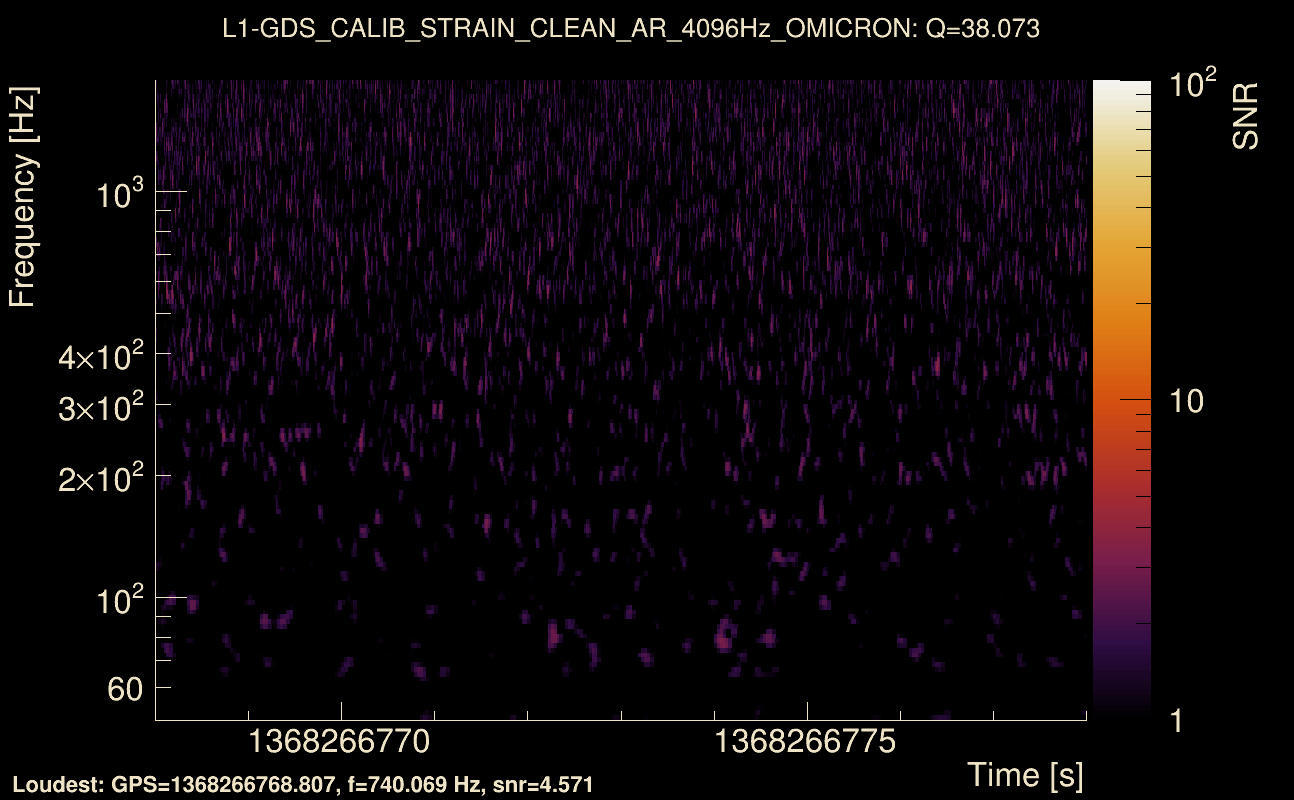
| Event time t(H1): | GPS = 1368266768 (Tue May 16 10:05:50 2023 ) → GPS = 1368266778 (Tue May 16 10:06:00 2023 ) |
| Event time t(L1): | GPS = 1368266768 (Tue May 16 10:06:00 2023 ) → GPS = 1368266778 (Tue May 16 10:06:00 2023 ) |
| Omicron analysis time window (H1): | GPS = 1368266765 → GPS = 1368266781 |
| Omicron analysis time window (L1): | GPS = 1368266765 → GPS = 1368266781 |
| Time delay between detectors t(L1) - t(H1): | 0.00167815 s (slice index = 108 / 217), δt_gw = 0.00167815 s |
| Time delay standard deviation: | 0.0791526 s |
| [targeted mode] Time delay probability: | 0.356507 (0.922042 sigmas), δt_target = -0.00516677 s |
| Frequency: | 104.571 Hz |
| Ξ: | 0.0321211 ± 0.0623162 (variance = 0.00388331): Q0: 0.127861, Q1: 0.22962, Q2: 0.171057, Q3: 0.0952346, Q4: 0.0482067 |
| Rank: | R_A = 0.0321211 |
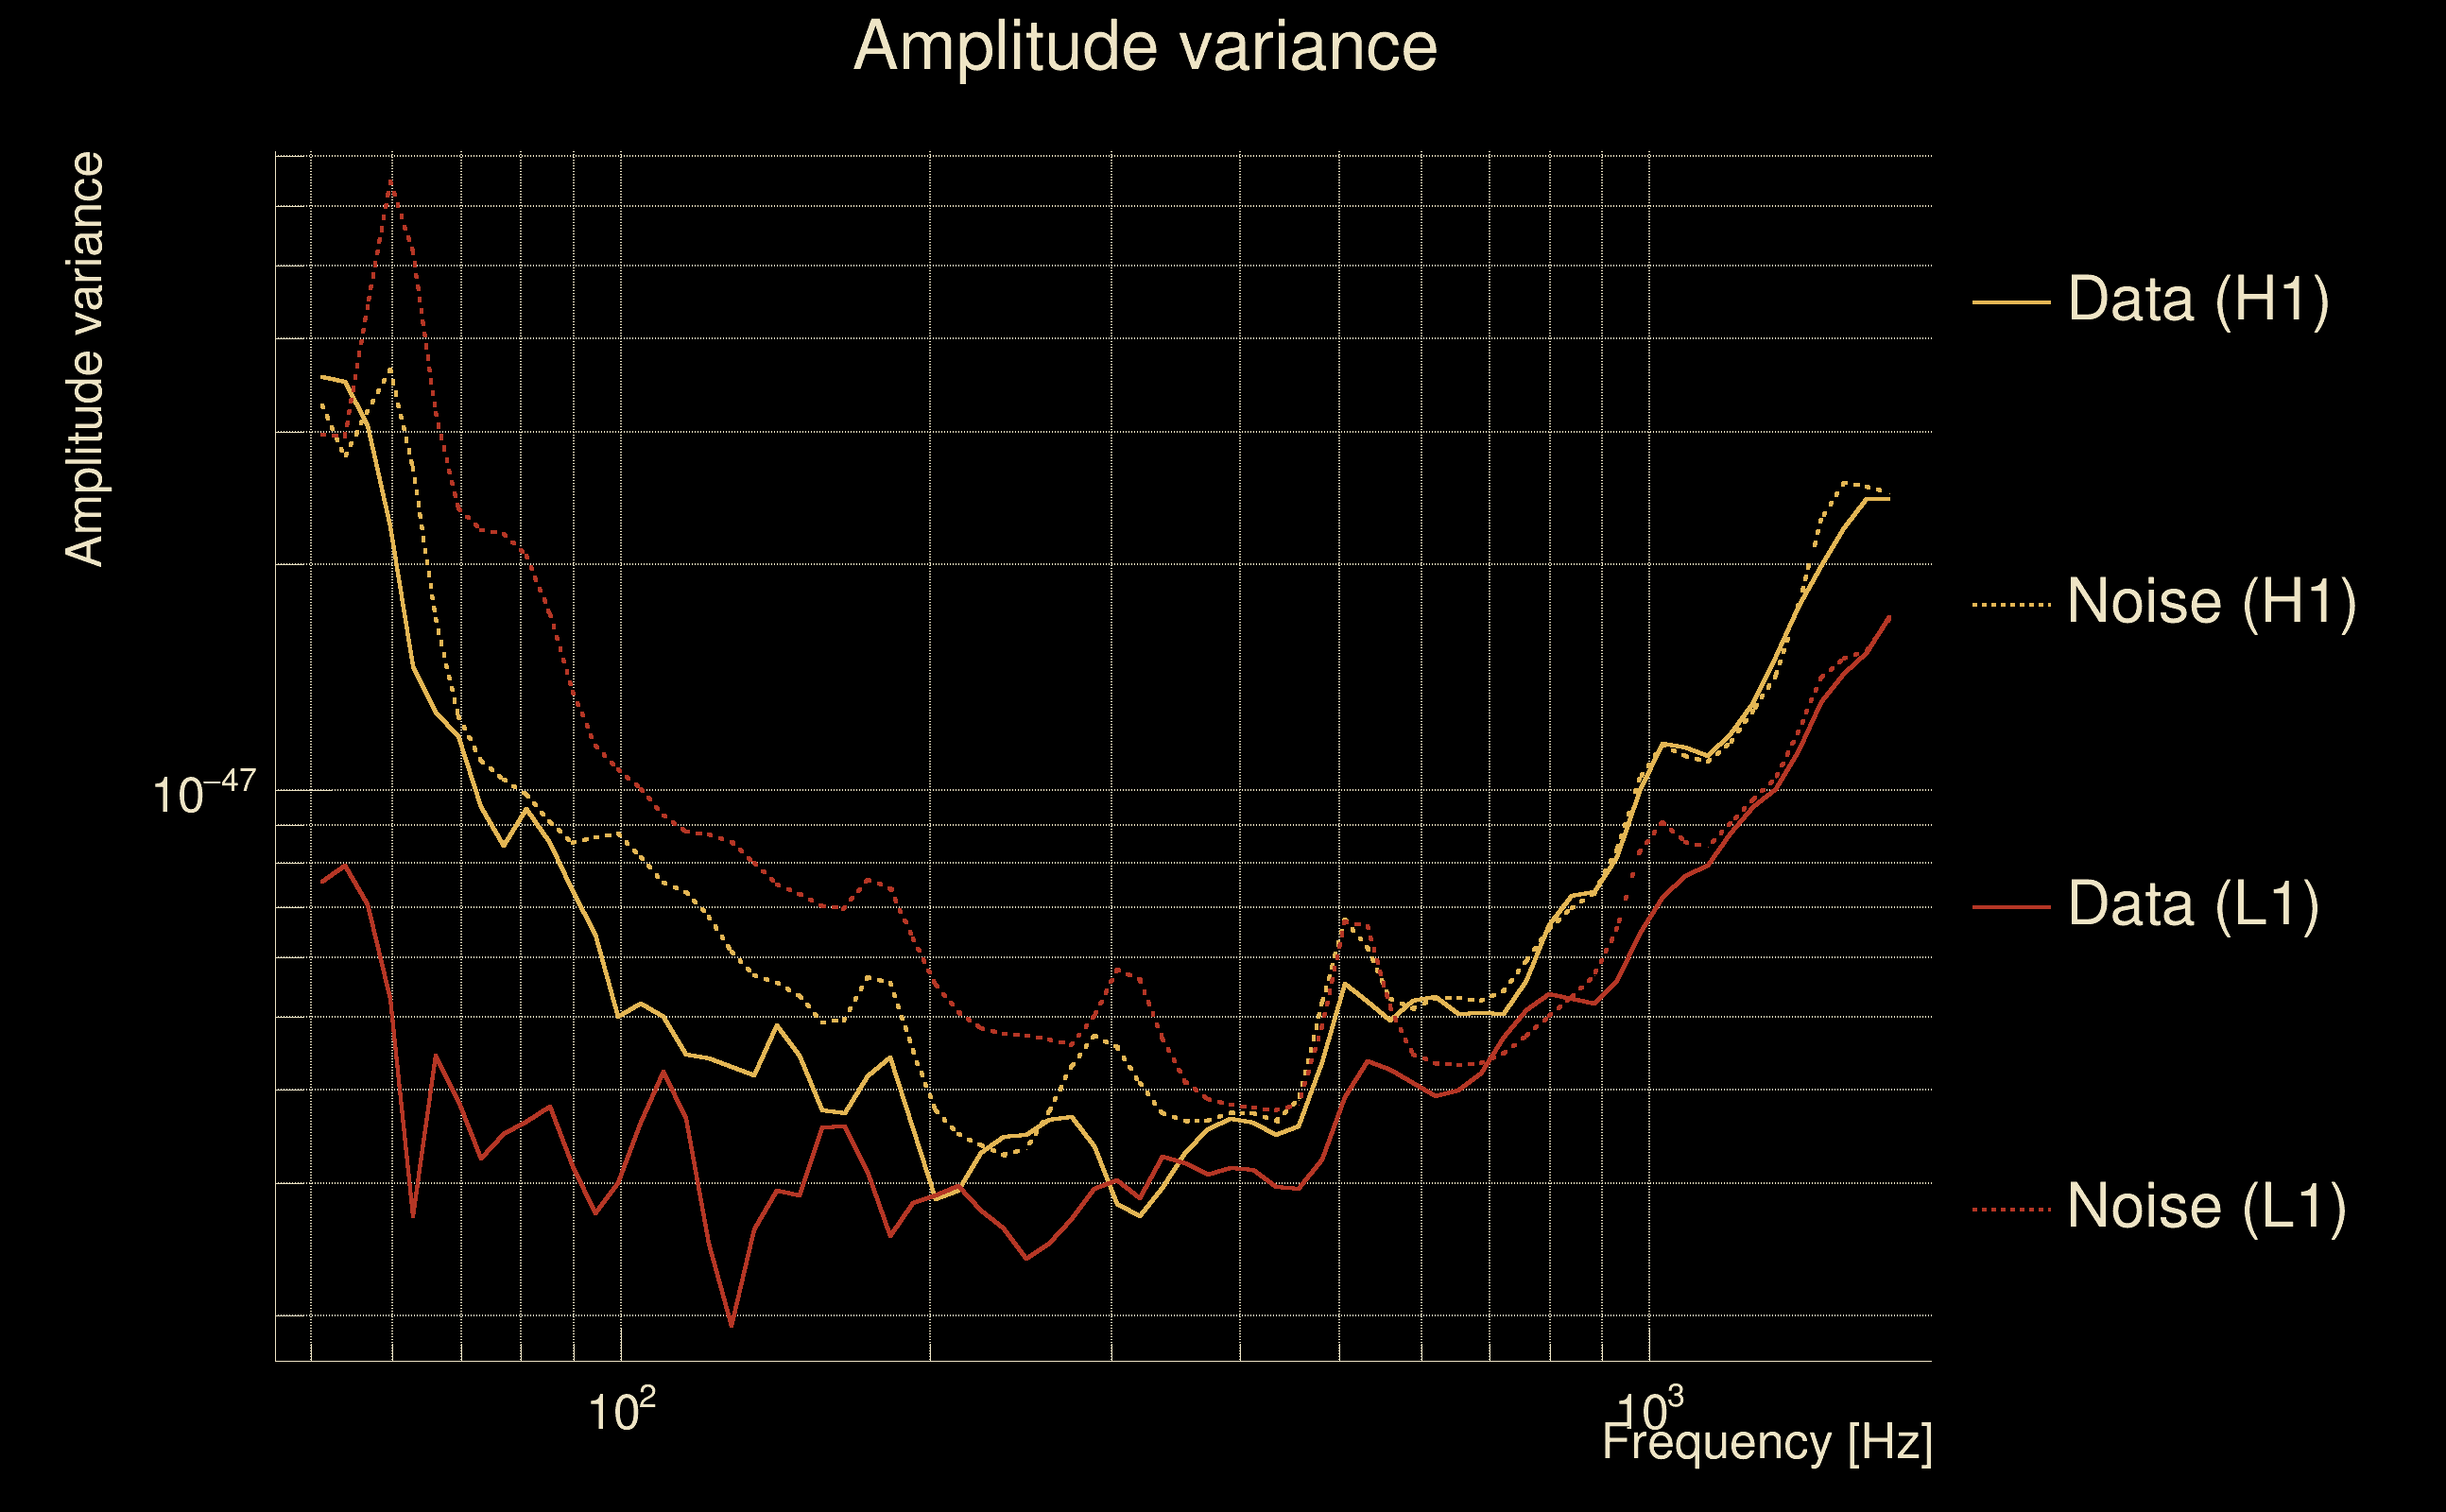
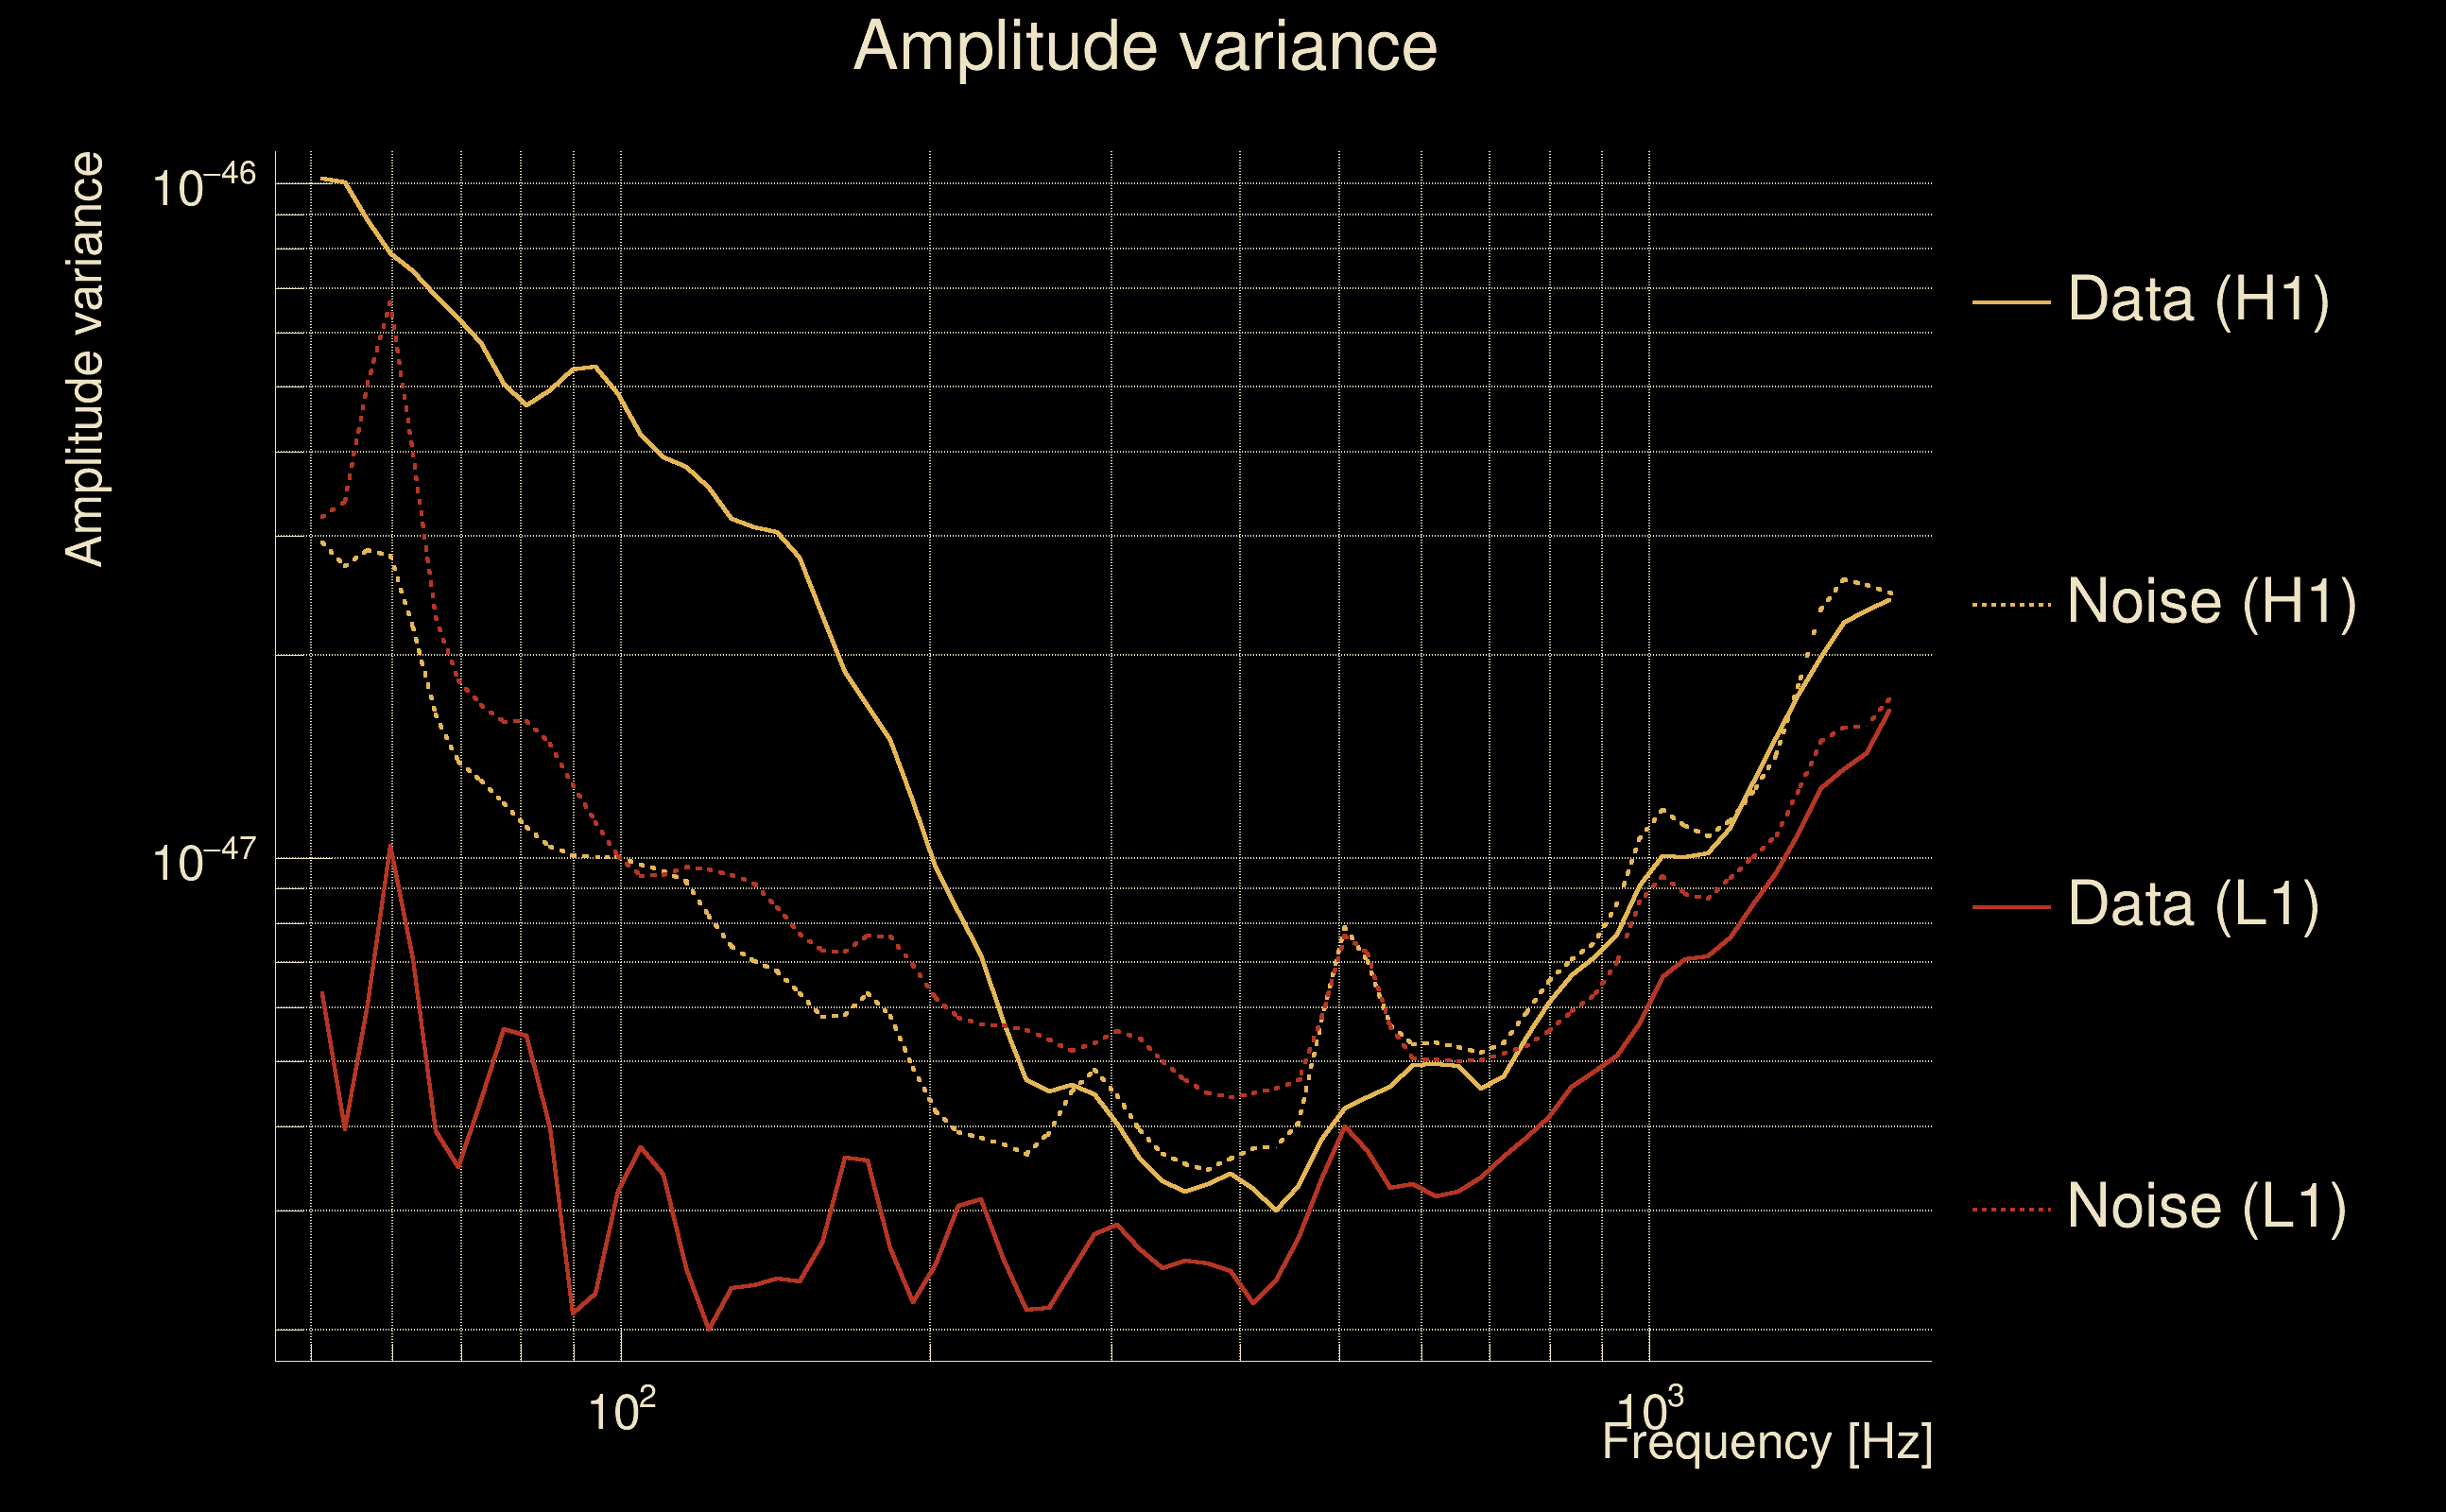
| Log of amplitude ratio (L1/H1): | -0.107545, variance = 0.45521 (L1/H1: -0.445232, variance = 0.813247, H1/L1: -0.228448, variance = 1.00661) |
| Amplitude ratio (L1/H1): | 0.898037 ⋇ 1.96343 (L1/H1: 0.640676 ⋇ 2.46404, H1/L1: 0.795768 ⋇ 2.72726) |
| Amplitude ratio H1|L1 compatibility (probability): | 0.617508 |
| Antenna factor probability: | 0.633692 |
| Number of rejected frequency rows: | Q0: 12 / 18, Q1: 31 / 36, Q2: 65 / 70, Q3: 122 / 134, Q4: 247 / 258 |
| Maximum signal-to-noise ratio: | H1: 4.79126, L1: 4.80333 |
| SNR variance: | H1: 0.536751, L1: 0.566297 |
| Click here for a zoomed plot | Click here for a zoomed plot | Click here for a zoomed plot | Click here for a zoomed plot | Click here for a zoomed plot |
 |
 |
 |
 |
 |
 |
 |
 |
 |
 |
 |
 |
 |
 |
 |
 |
 |
 |
 |
 |
 |
 |
 |
 |
 |
 |
 |
 |
 |
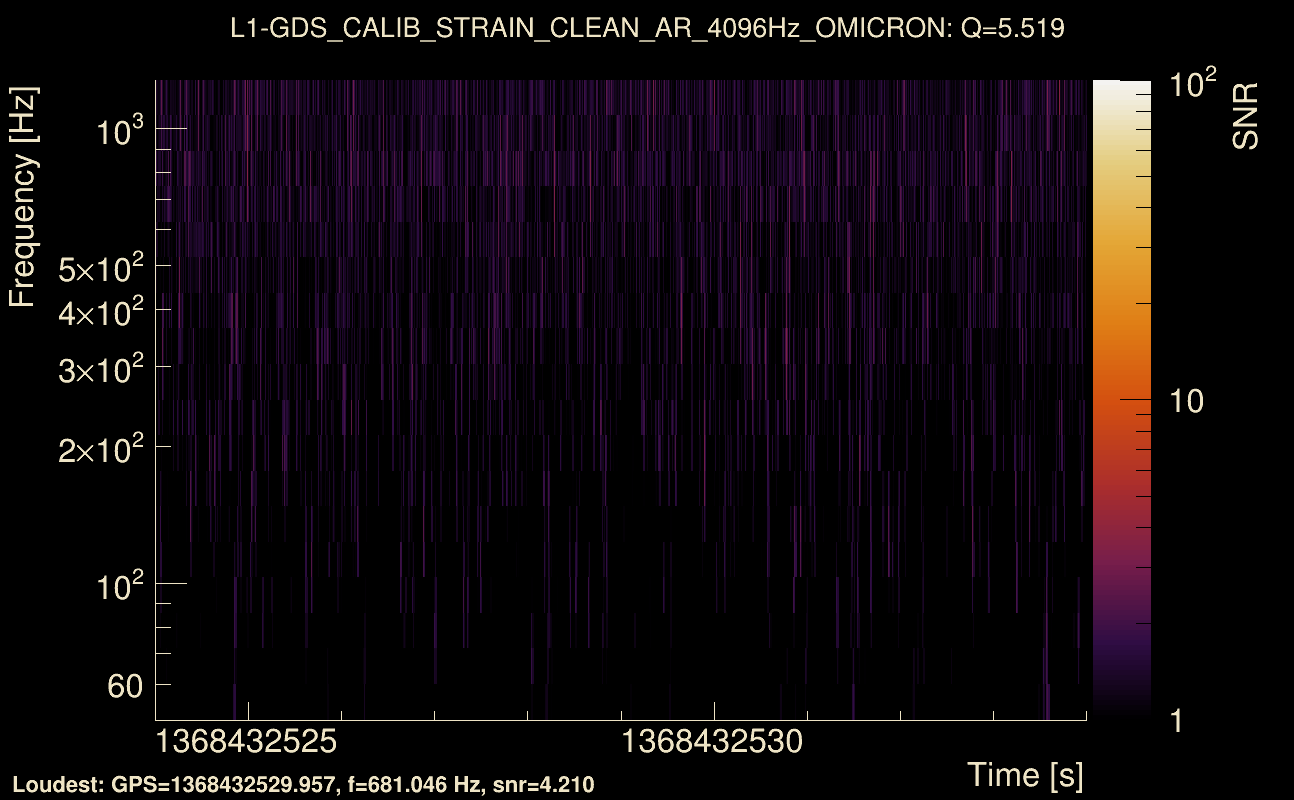
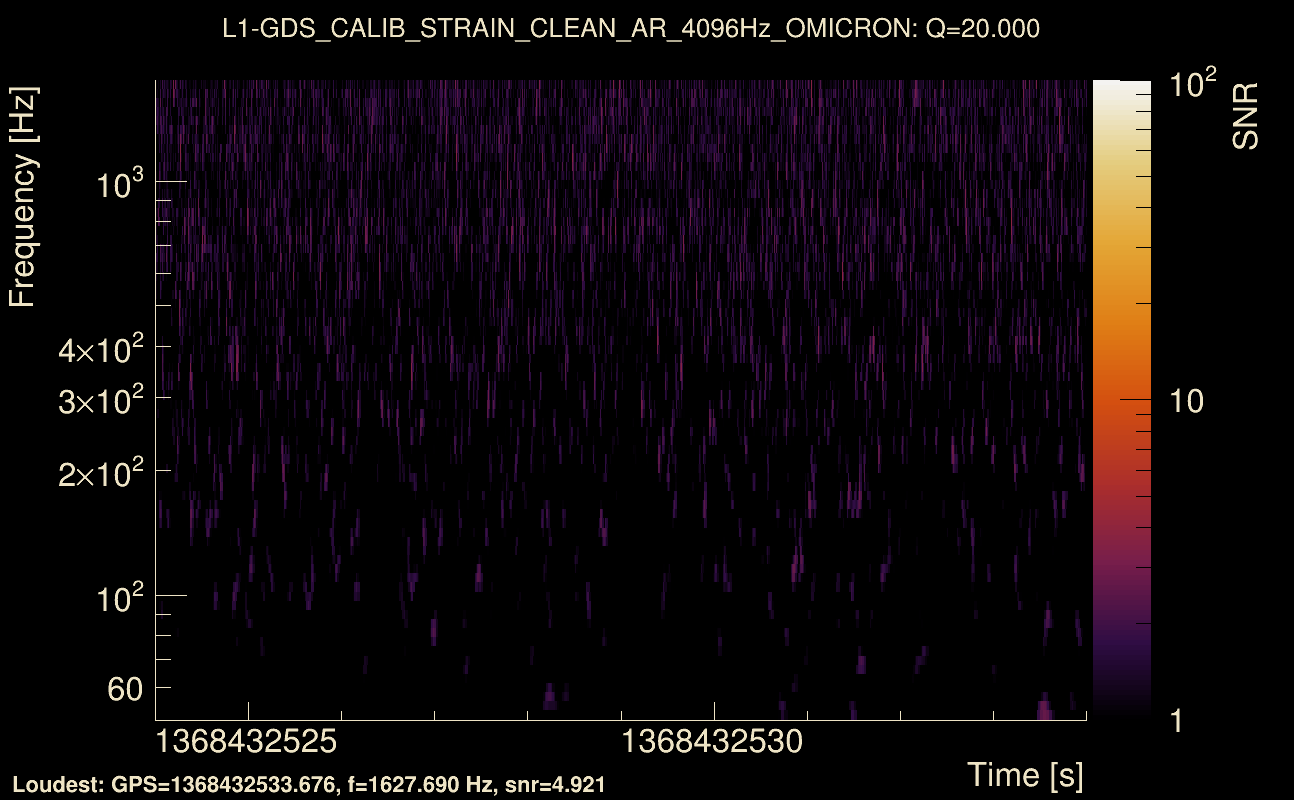
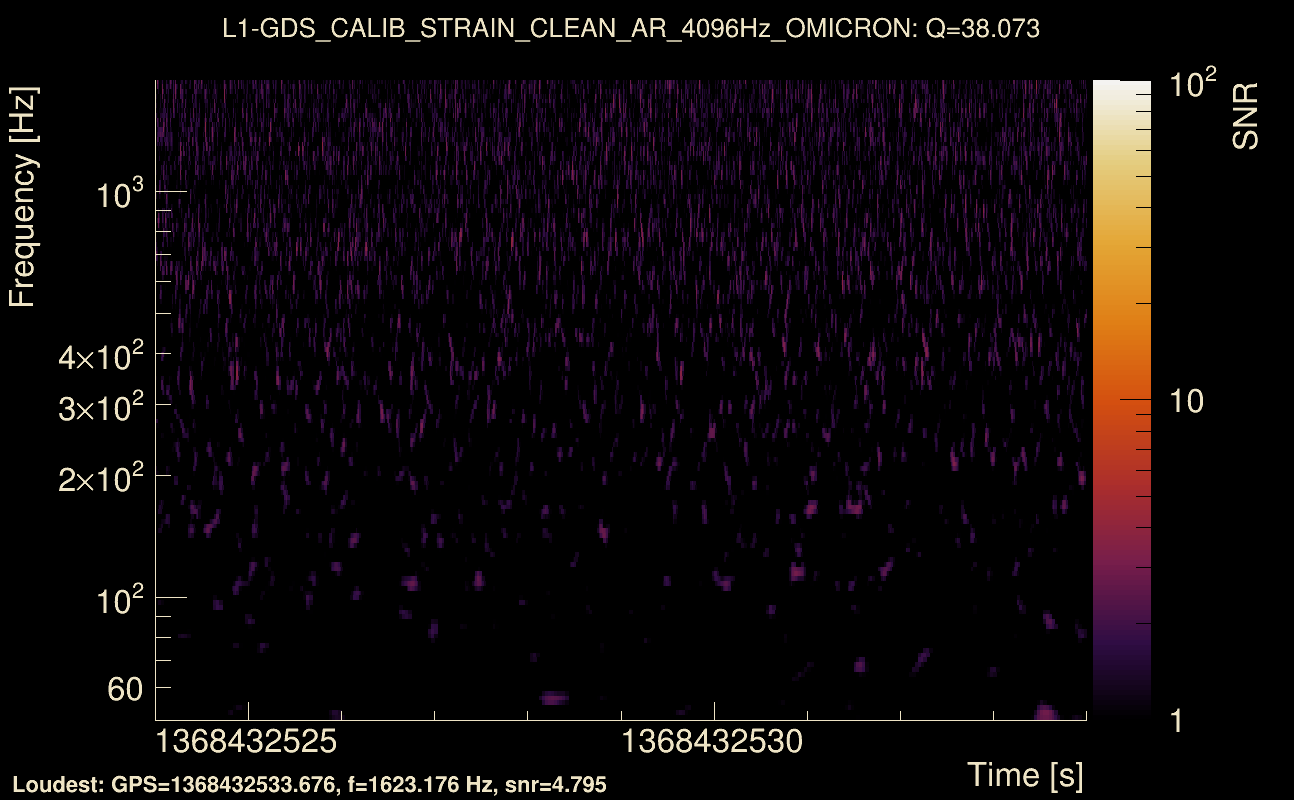
| Event time t(H1): | GPS = 1368432524 (Thu May 18 08:08:26 2023 ) → GPS = 1368432534 (Thu May 18 08:08:36 2023 ) |
| Event time t(L1): | GPS = 1368432524 (Thu May 18 08:08:36 2023 ) → GPS = 1368432534 (Thu May 18 08:08:36 2023 ) |
| Omicron analysis time window (H1): | GPS = 1368432521 → GPS = 1368432537 |
| Omicron analysis time window (L1): | GPS = 1368432521 → GPS = 1368432537 |
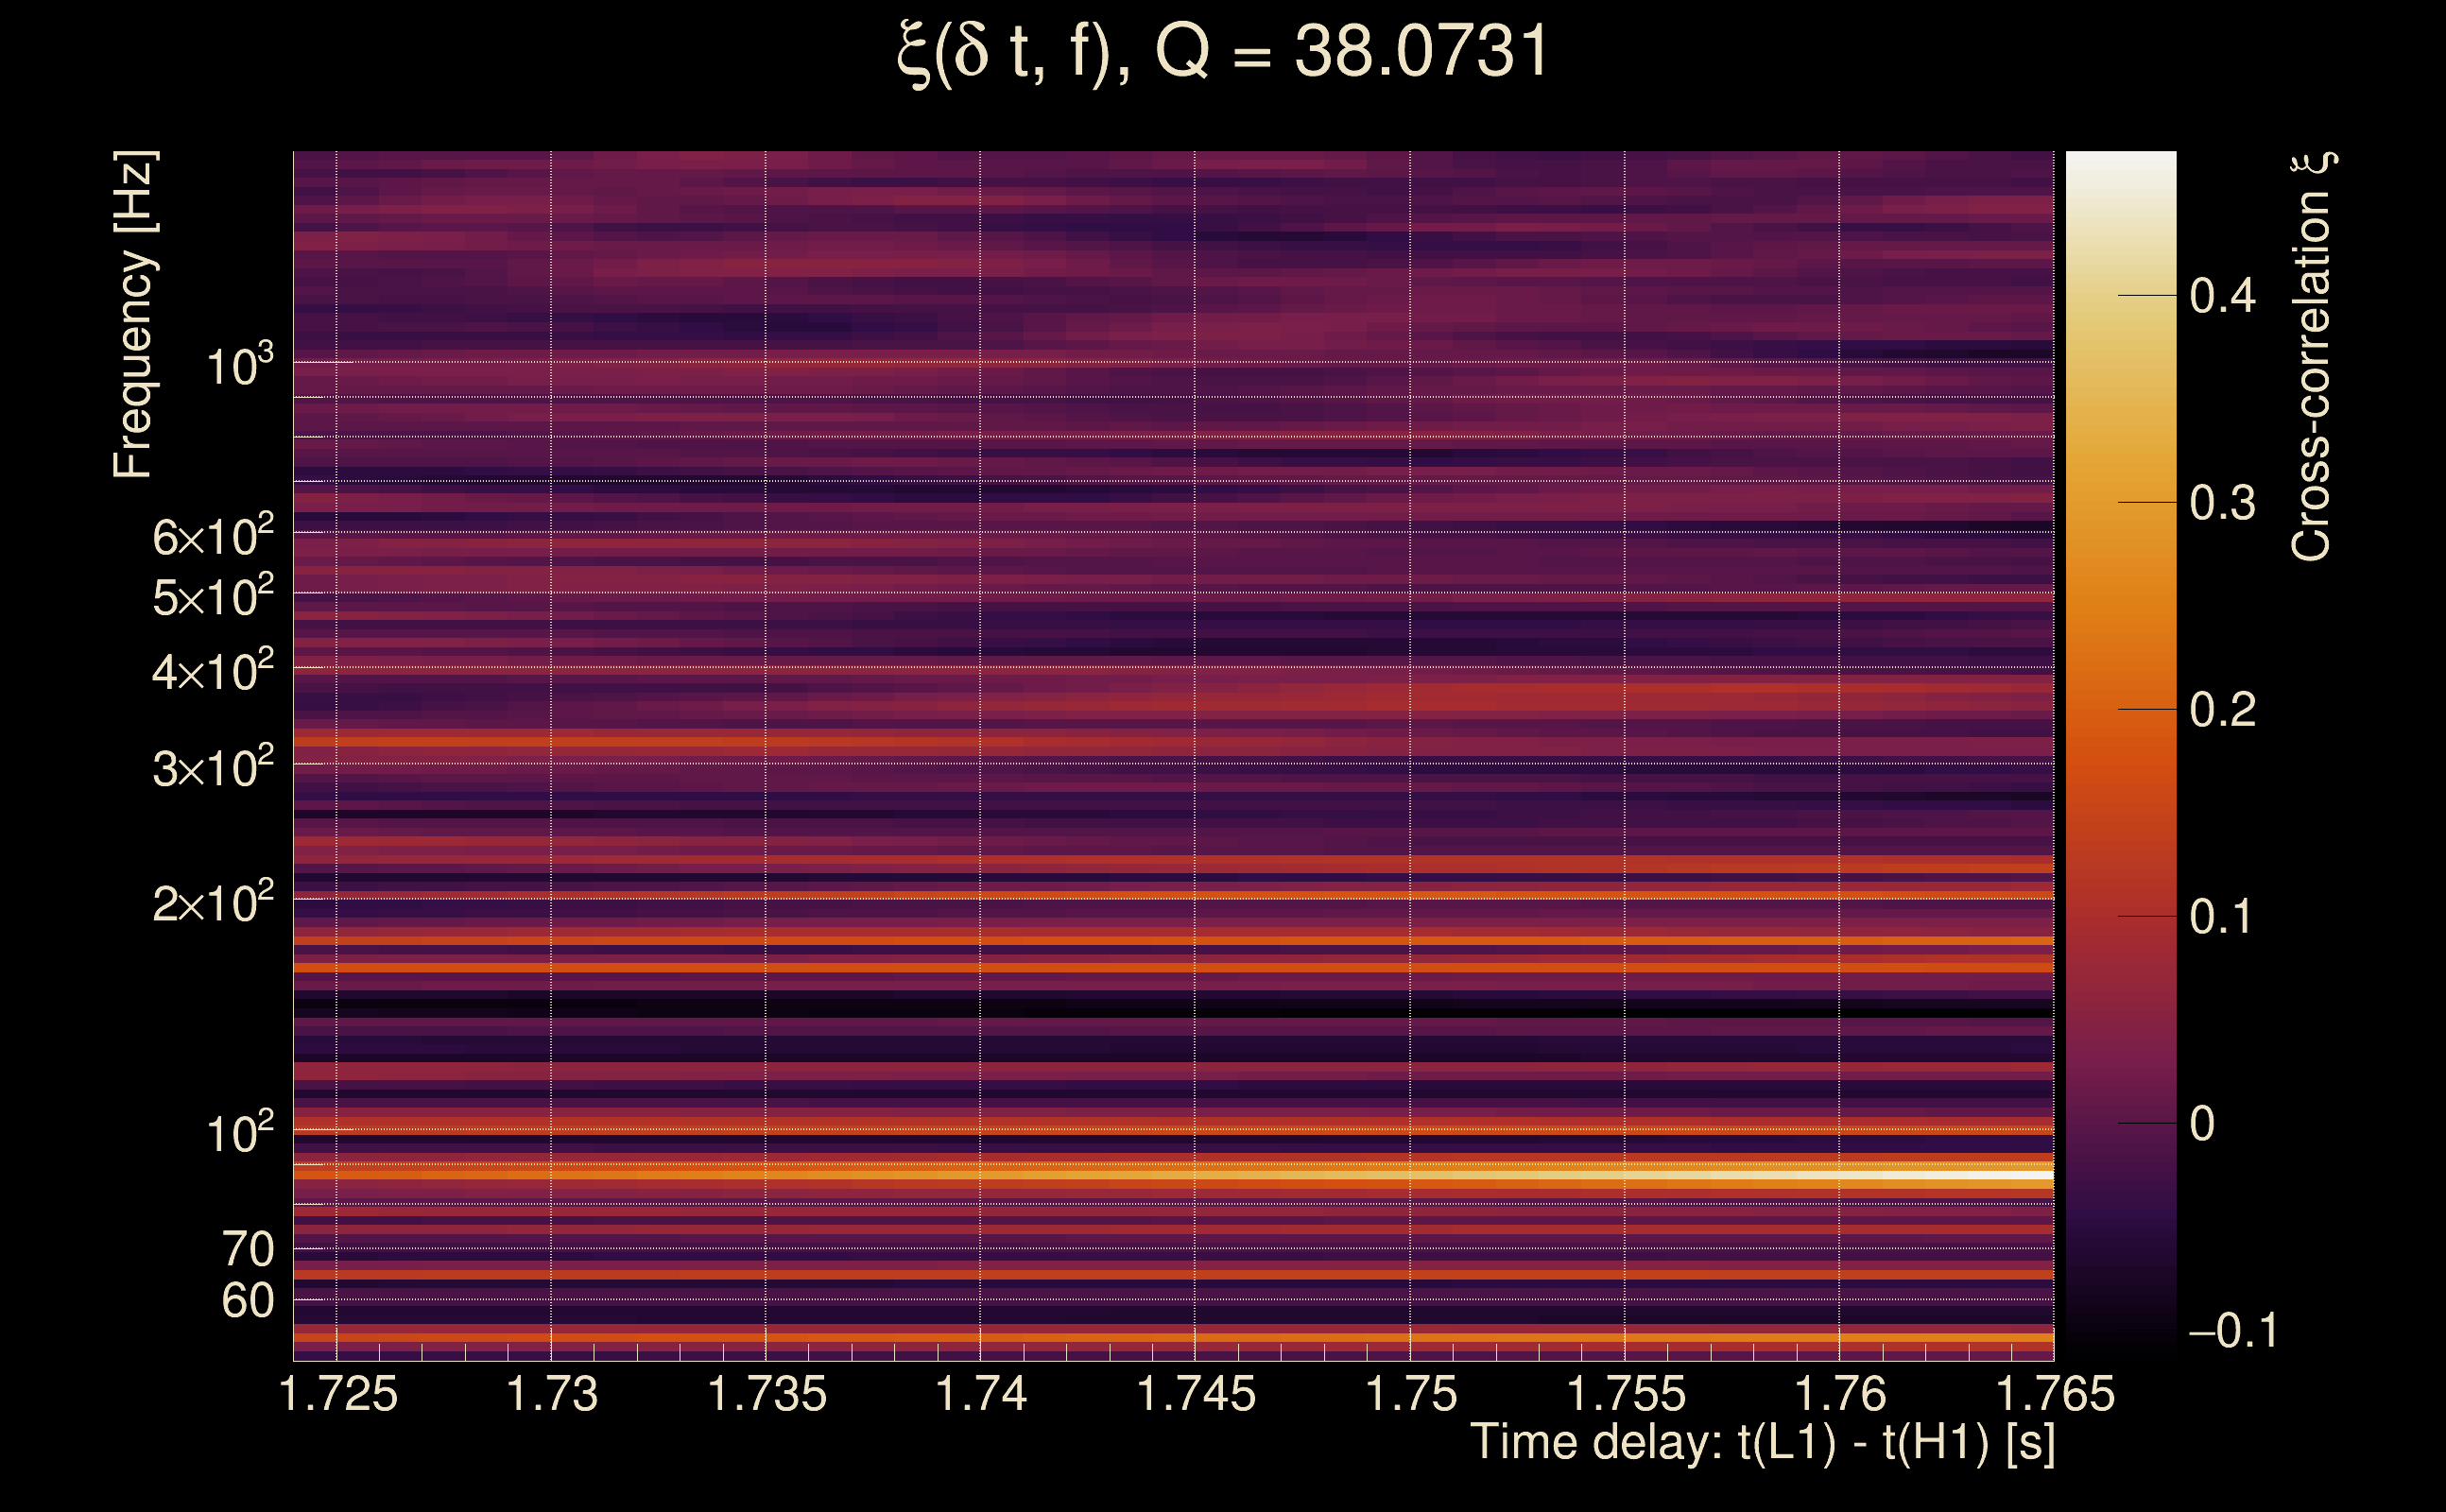
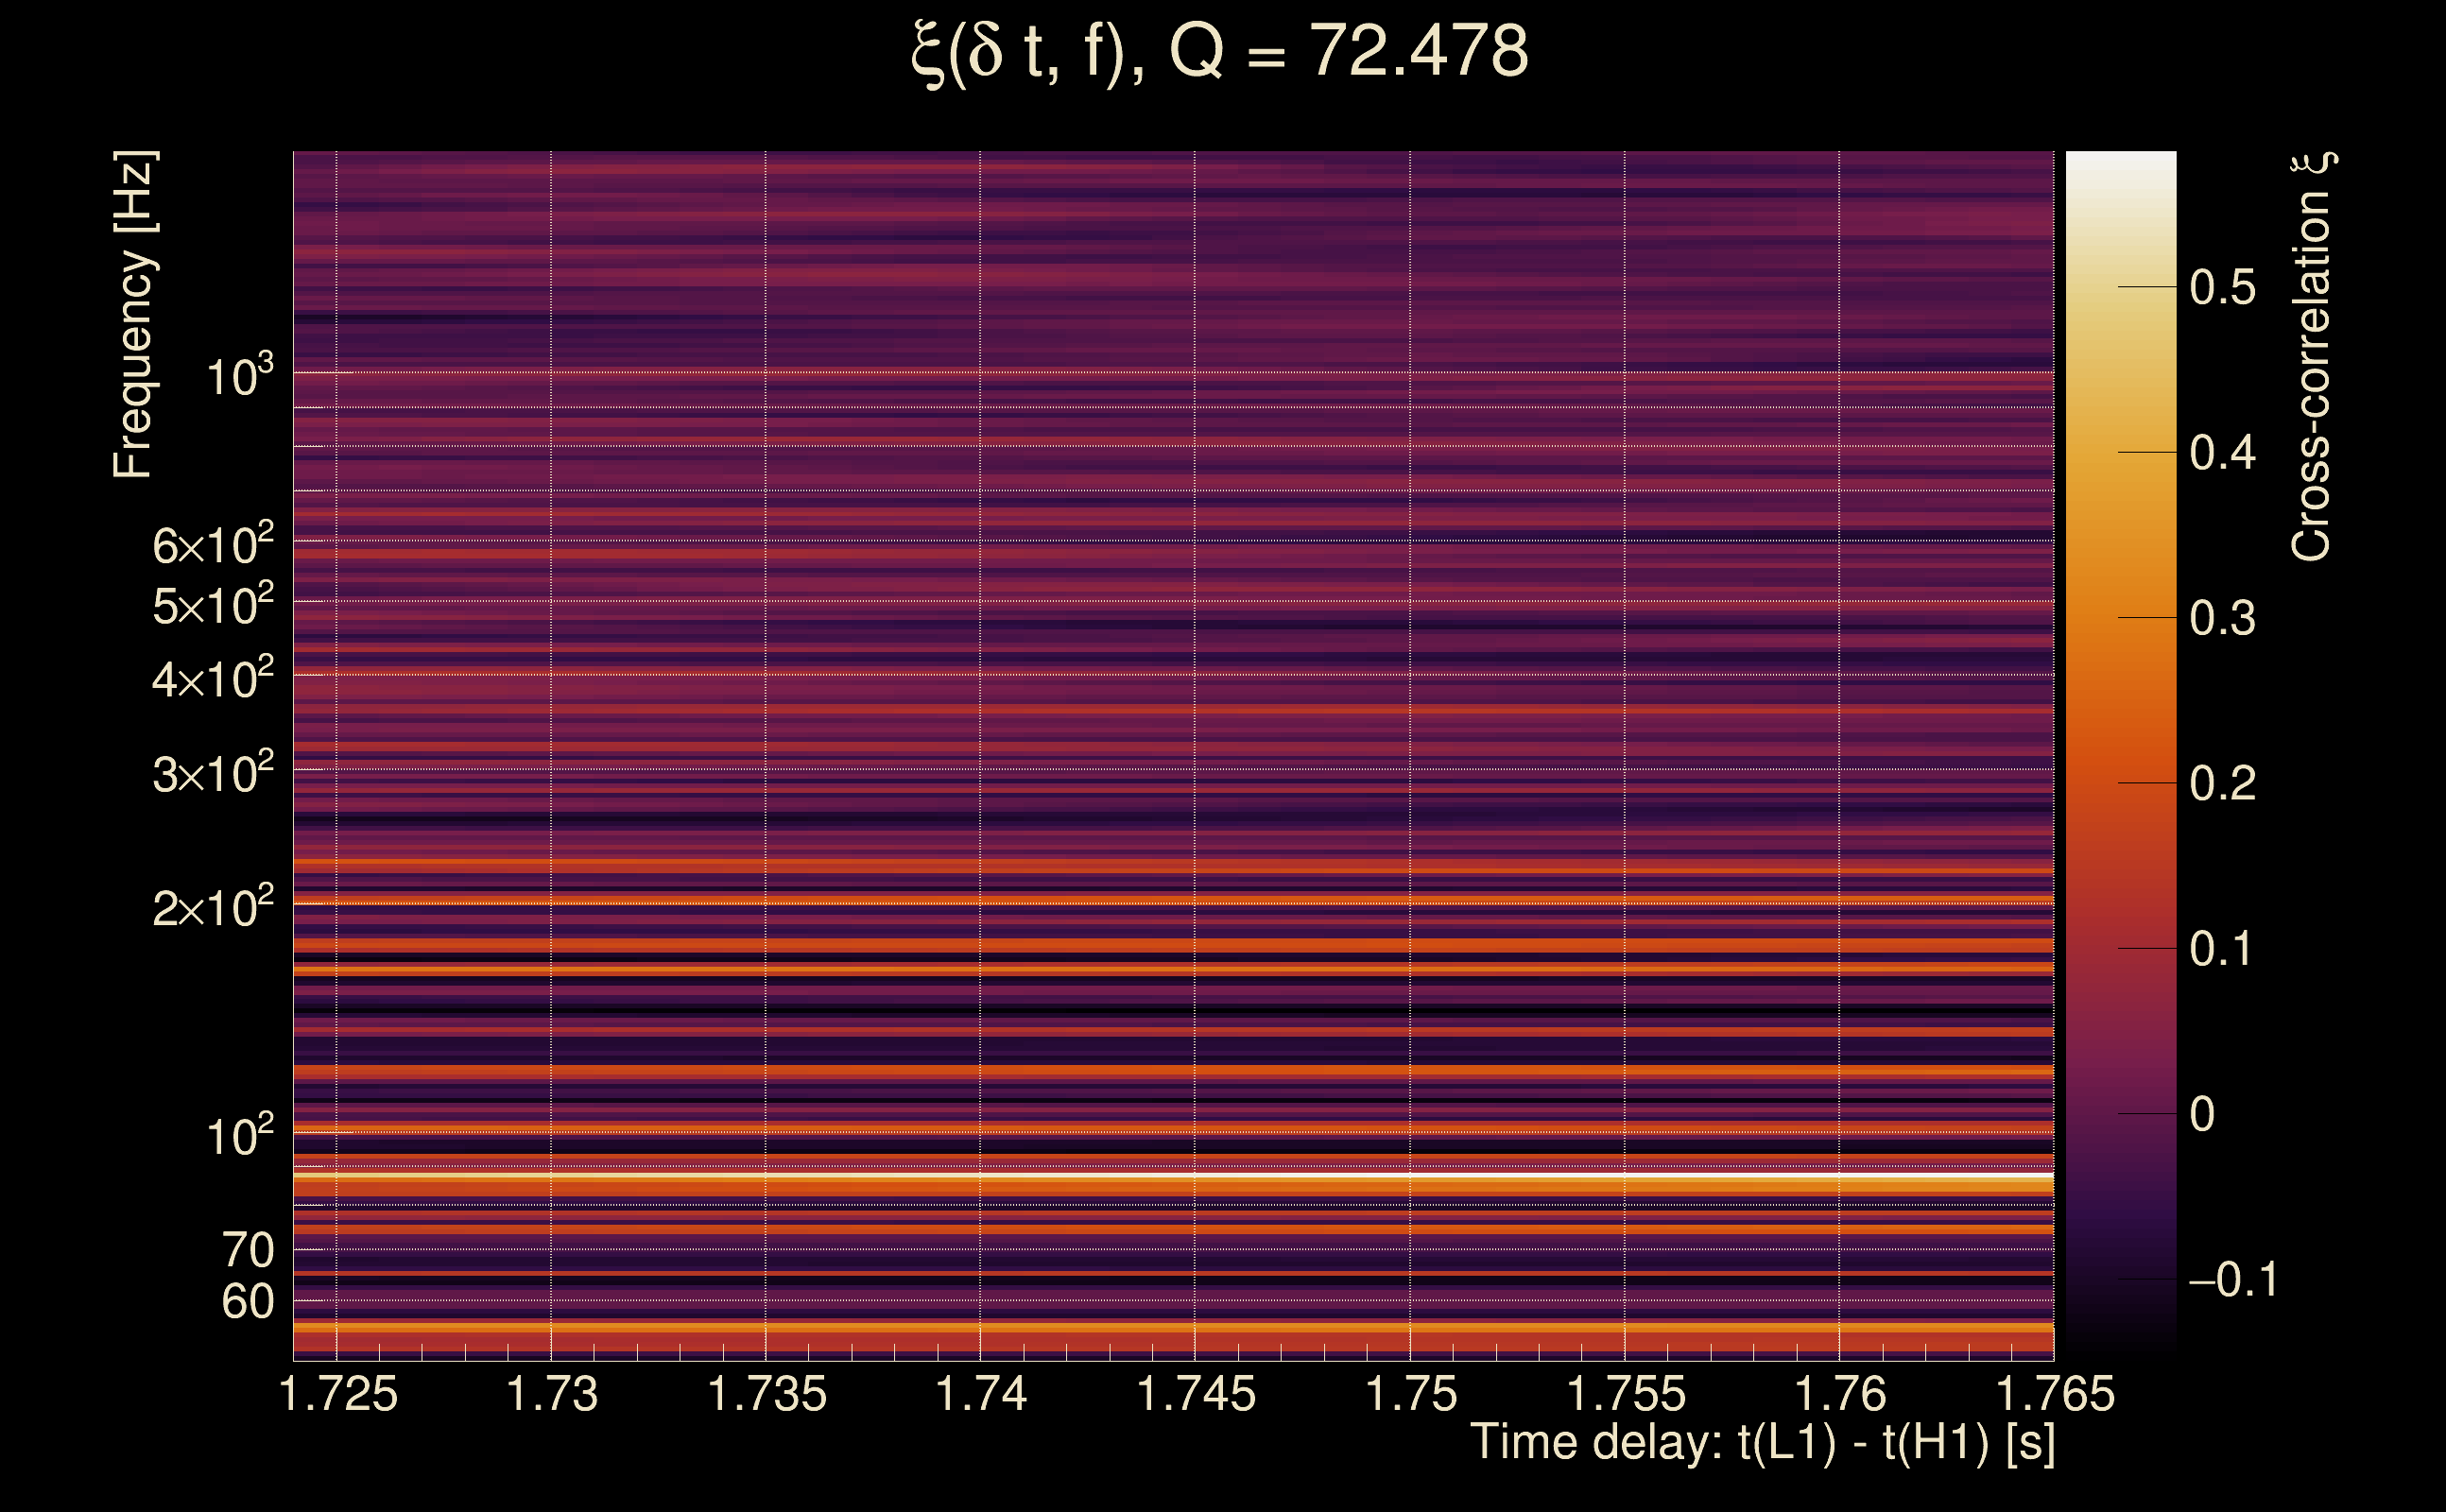
| Time delay between detectors t(L1) - t(H1): | 1.74411 s (slice index = 70 / 217), δt_gw = -0.00388862 s |
| Time delay standard deviation: | 0.0857511 s |
| [targeted mode] Time delay probability: | 0.208062 (1.25891 sigmas), δt_target = -0.00766826 s |
| Frequency: | 114.022 Hz |
| Ξ: | 0.0530597 ± 0.0481801 (variance = 0.00232133): Q0: 0.21116, Q1: 0.164485, Q2: 0.101037, Q3: 0.0739284, Q4: 0.14777 |
| Rank: | R_A = 0.0530597 |
| Log of amplitude ratio (L1/H1): | -0.822912, variance = 0.493026 (L1/H1: -1.40039, variance = 0.817714, H1/L1: -0.769729, variance = 0.742873) |
| Amplitude ratio (L1/H1): | 0.439151 ⋇ 2.0181 (L1/H1: 0.2465 ⋇ 2.47014, H1/L1: 0.463139 ⋇ 2.36766) |
| Amplitude ratio H1|L1 compatibility (probability): | 0.0823587 |
| Antenna factor probability: | 0.441759 |
| Number of rejected frequency rows: | Q0: 11 / 18, Q1: 29 / 36, Q2: 59 / 70, Q3: 119 / 134, Q4: 239 / 258 |
| Maximum signal-to-noise ratio: | H1: 8.2233, L1: 4.95172 |
| SNR variance: | H1: 0.570488, L1: 0.521435 |
| Click here for a zoomed plot | Click here for a zoomed plot | Click here for a zoomed plot | Click here for a zoomed plot | Click here for a zoomed plot |
 |
 |
 |
 |
 |
 |
 |
 |
 |
 |
 |
 |
 |
 |
 |
 |
 |
 |
 |
 |
 |
 |
 |
 |
 |
 |
 |
 |
 |
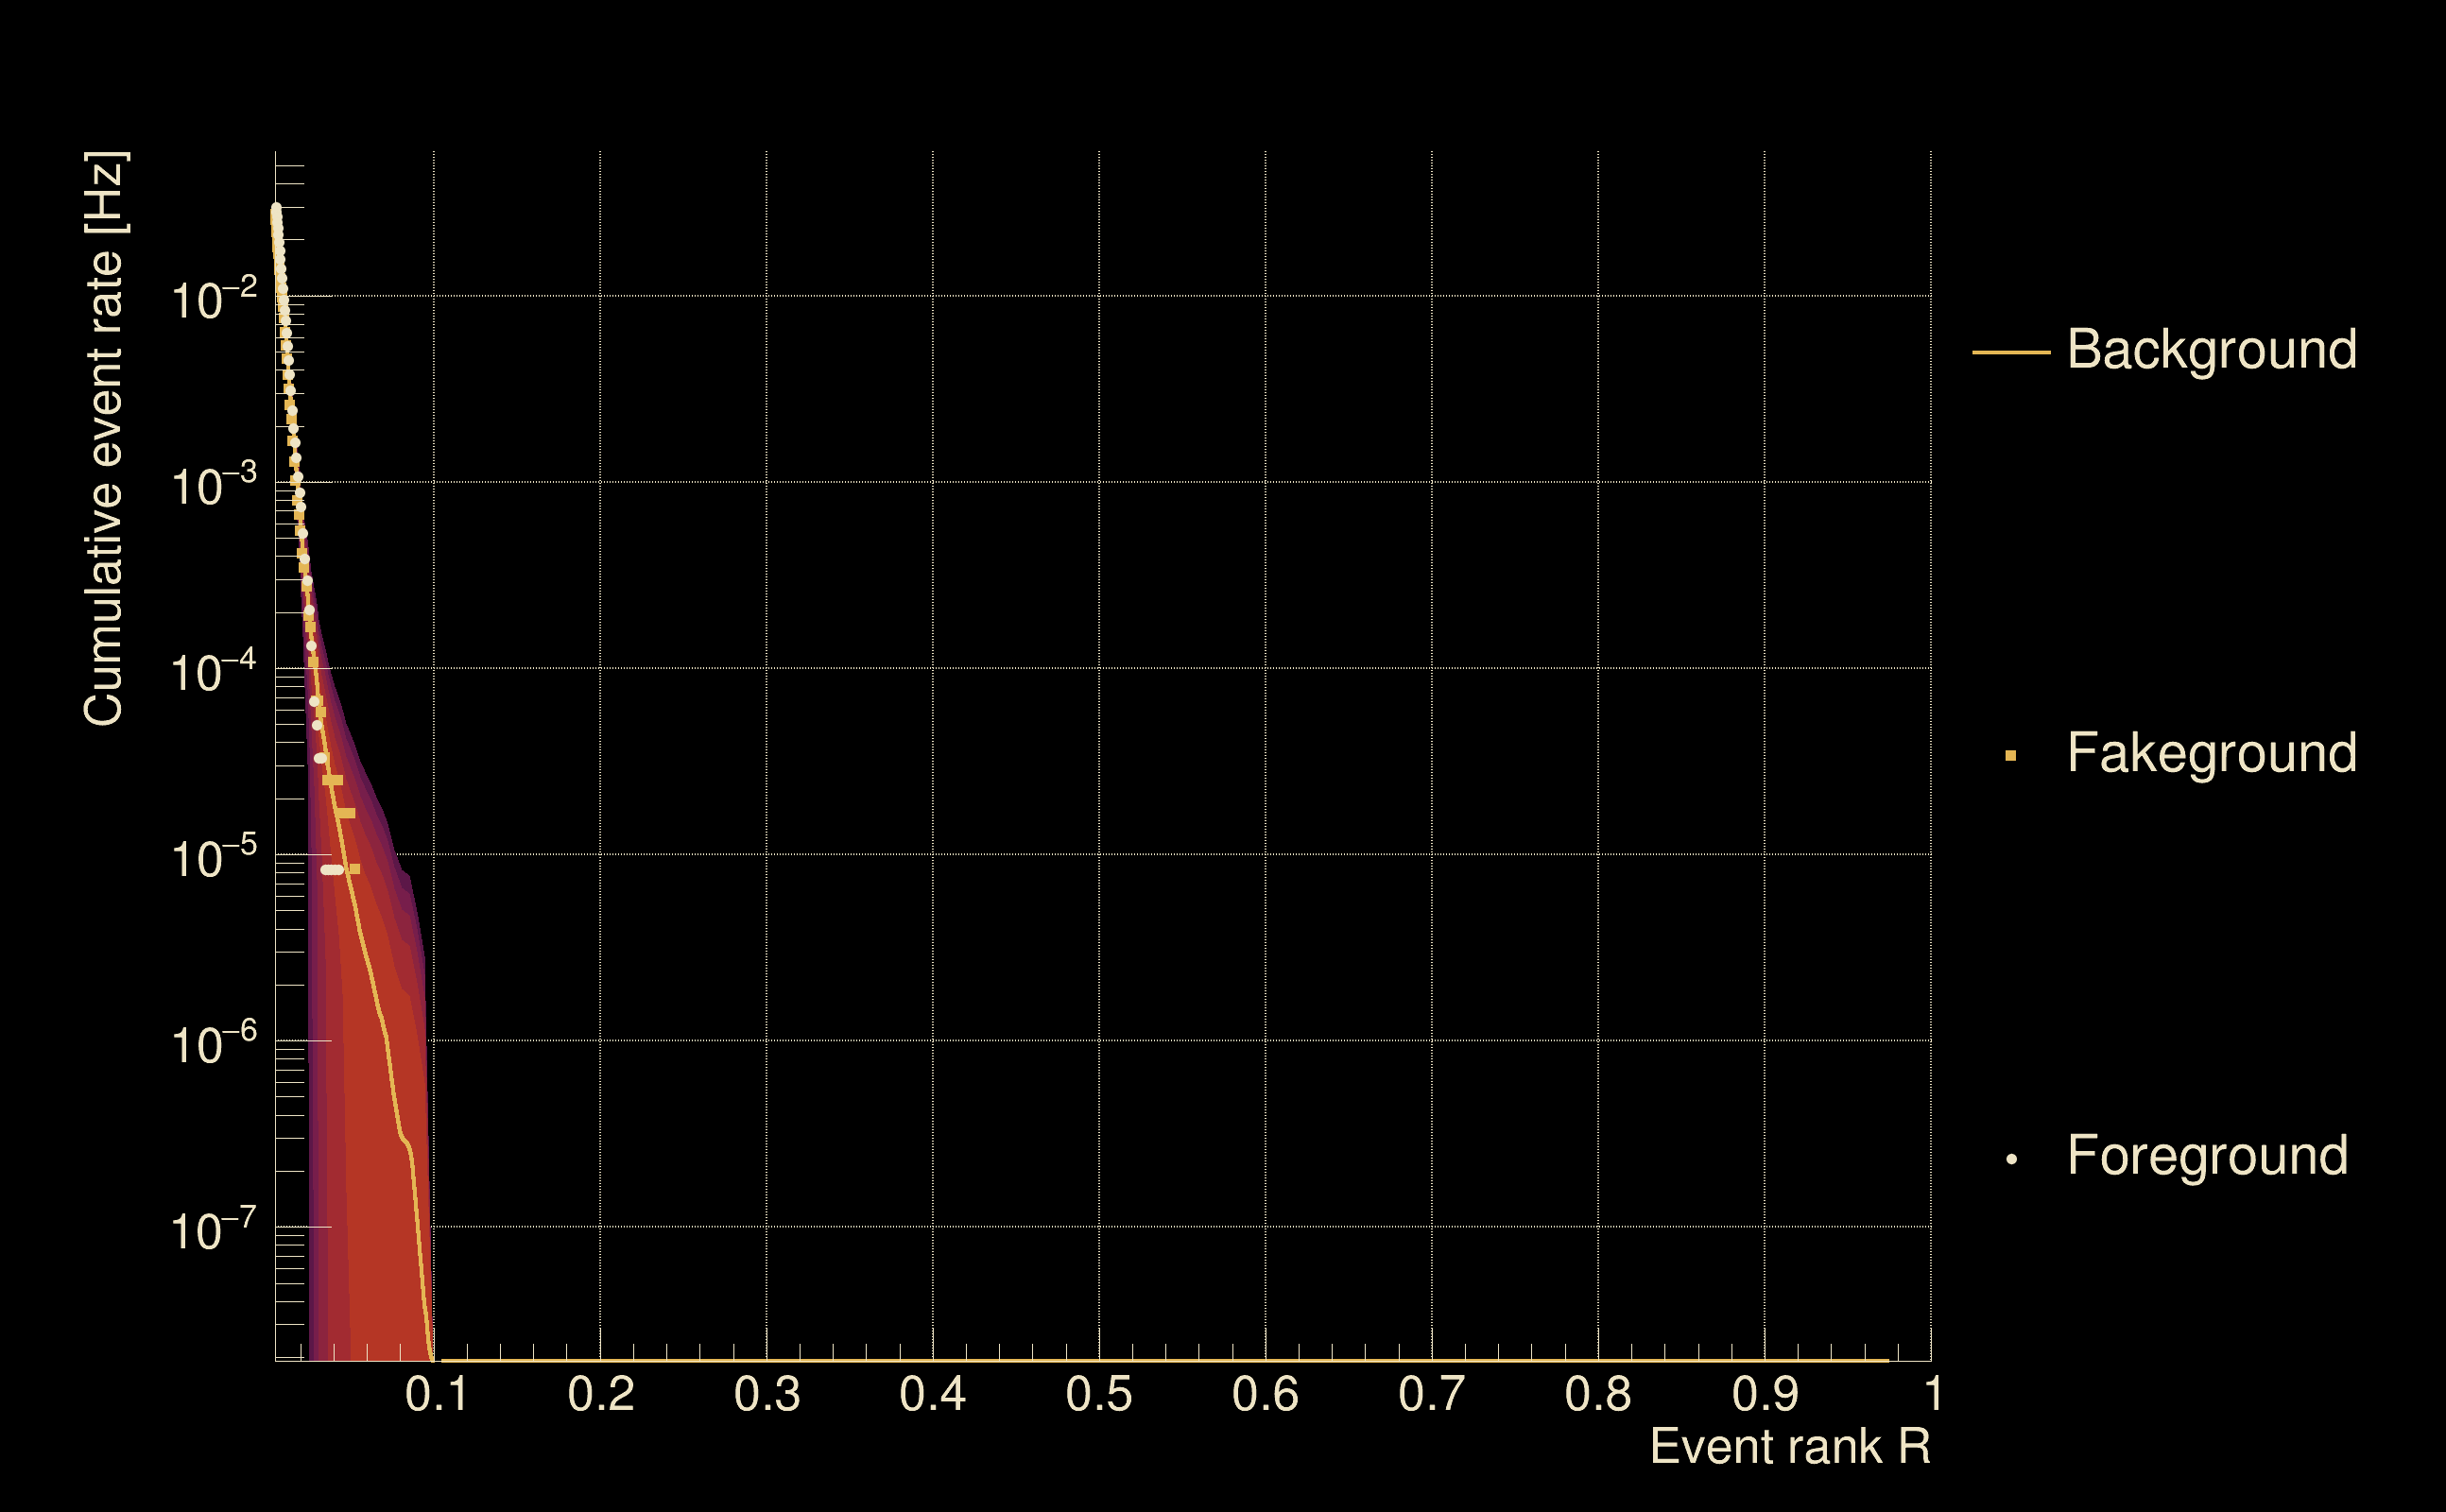
| Detection threshold: | R > 0.172388 |
| False-alarm rate above that detection threshold: | 0 |
| Alternative threshold at 1/1000 yrs: | R > 0.094666 |
| Alternative threshold at 1/100 yrs: | R > 0.094666 |
| Alternative threshold at 1/10 yrs: | R > 0.094666 |
| Alternative threshold at 1/1 yr: | R > 0.094666 |
| Alternative threshold at 1/1 d: | R > 0.0428888 |
 |
|
 |
 |
 |
 |
 |
 |
 |
 |
 |
 |
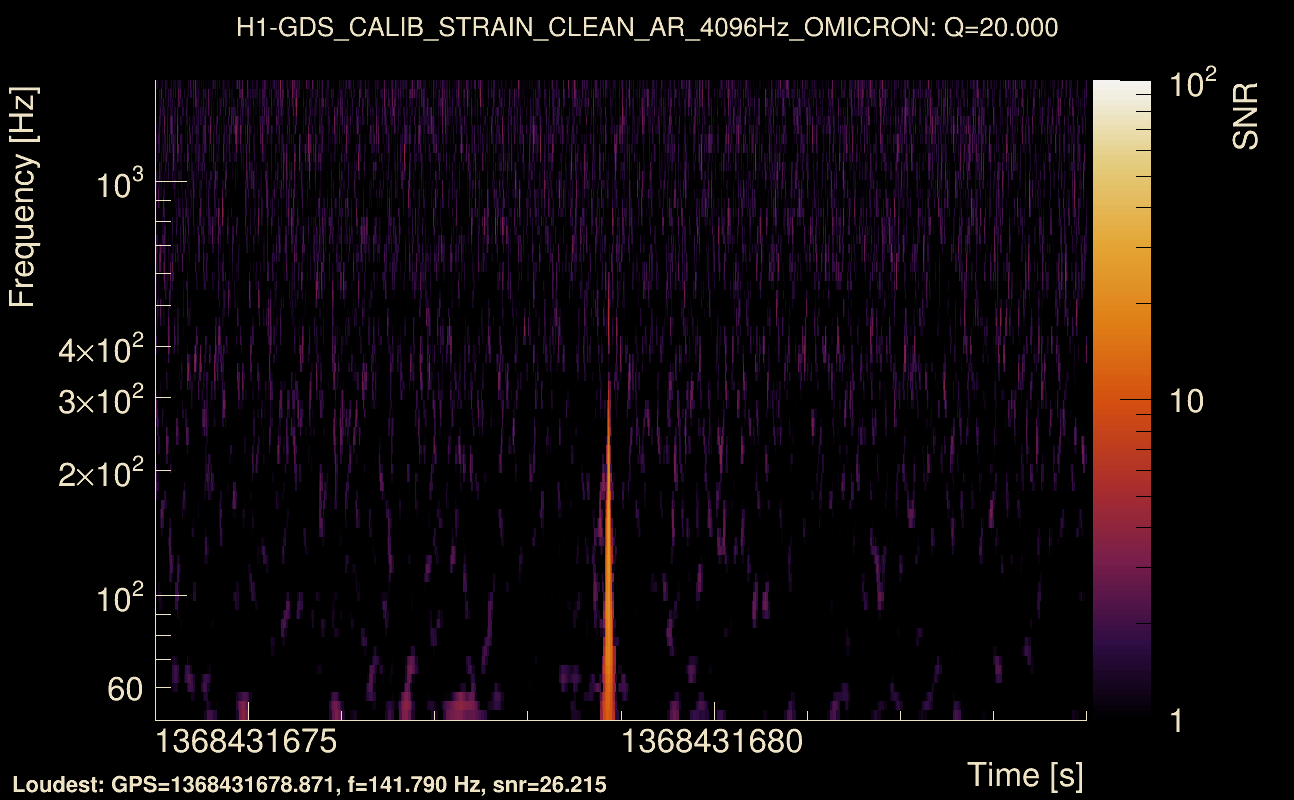
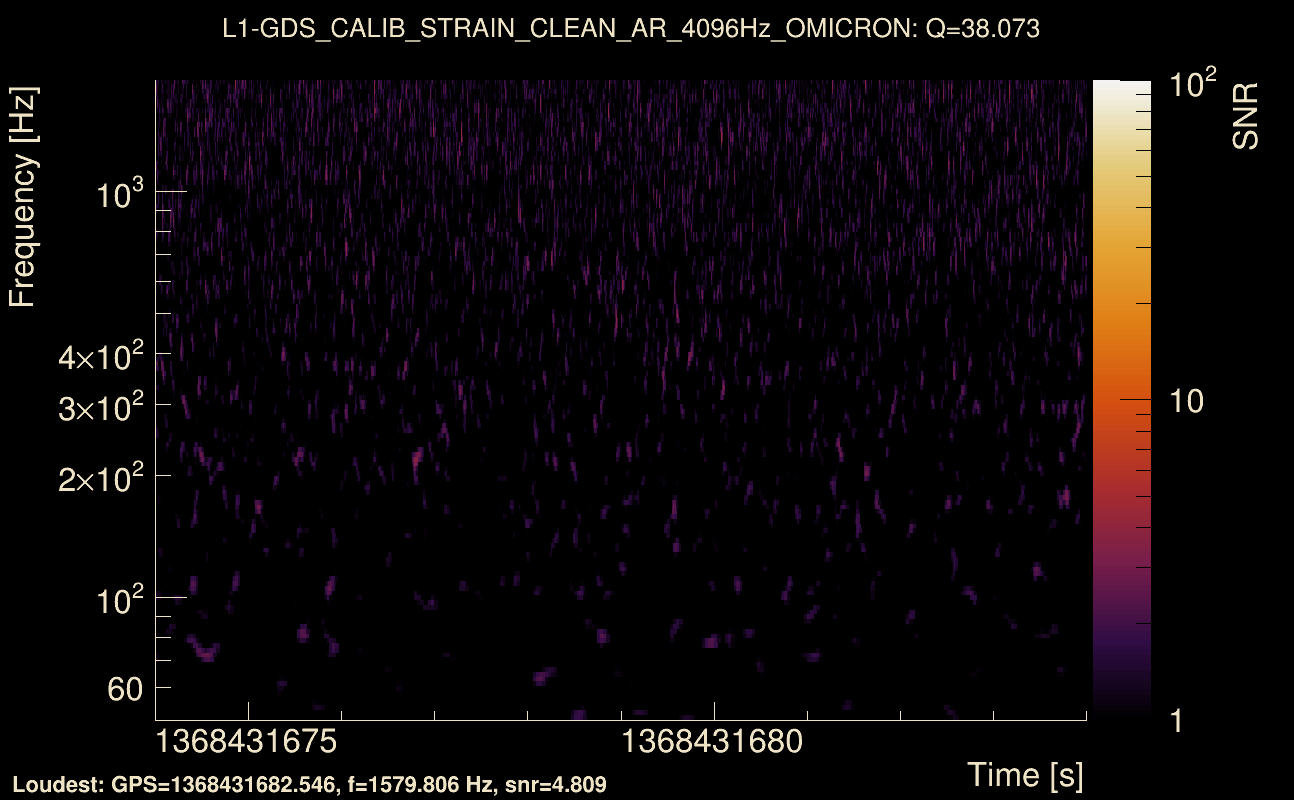
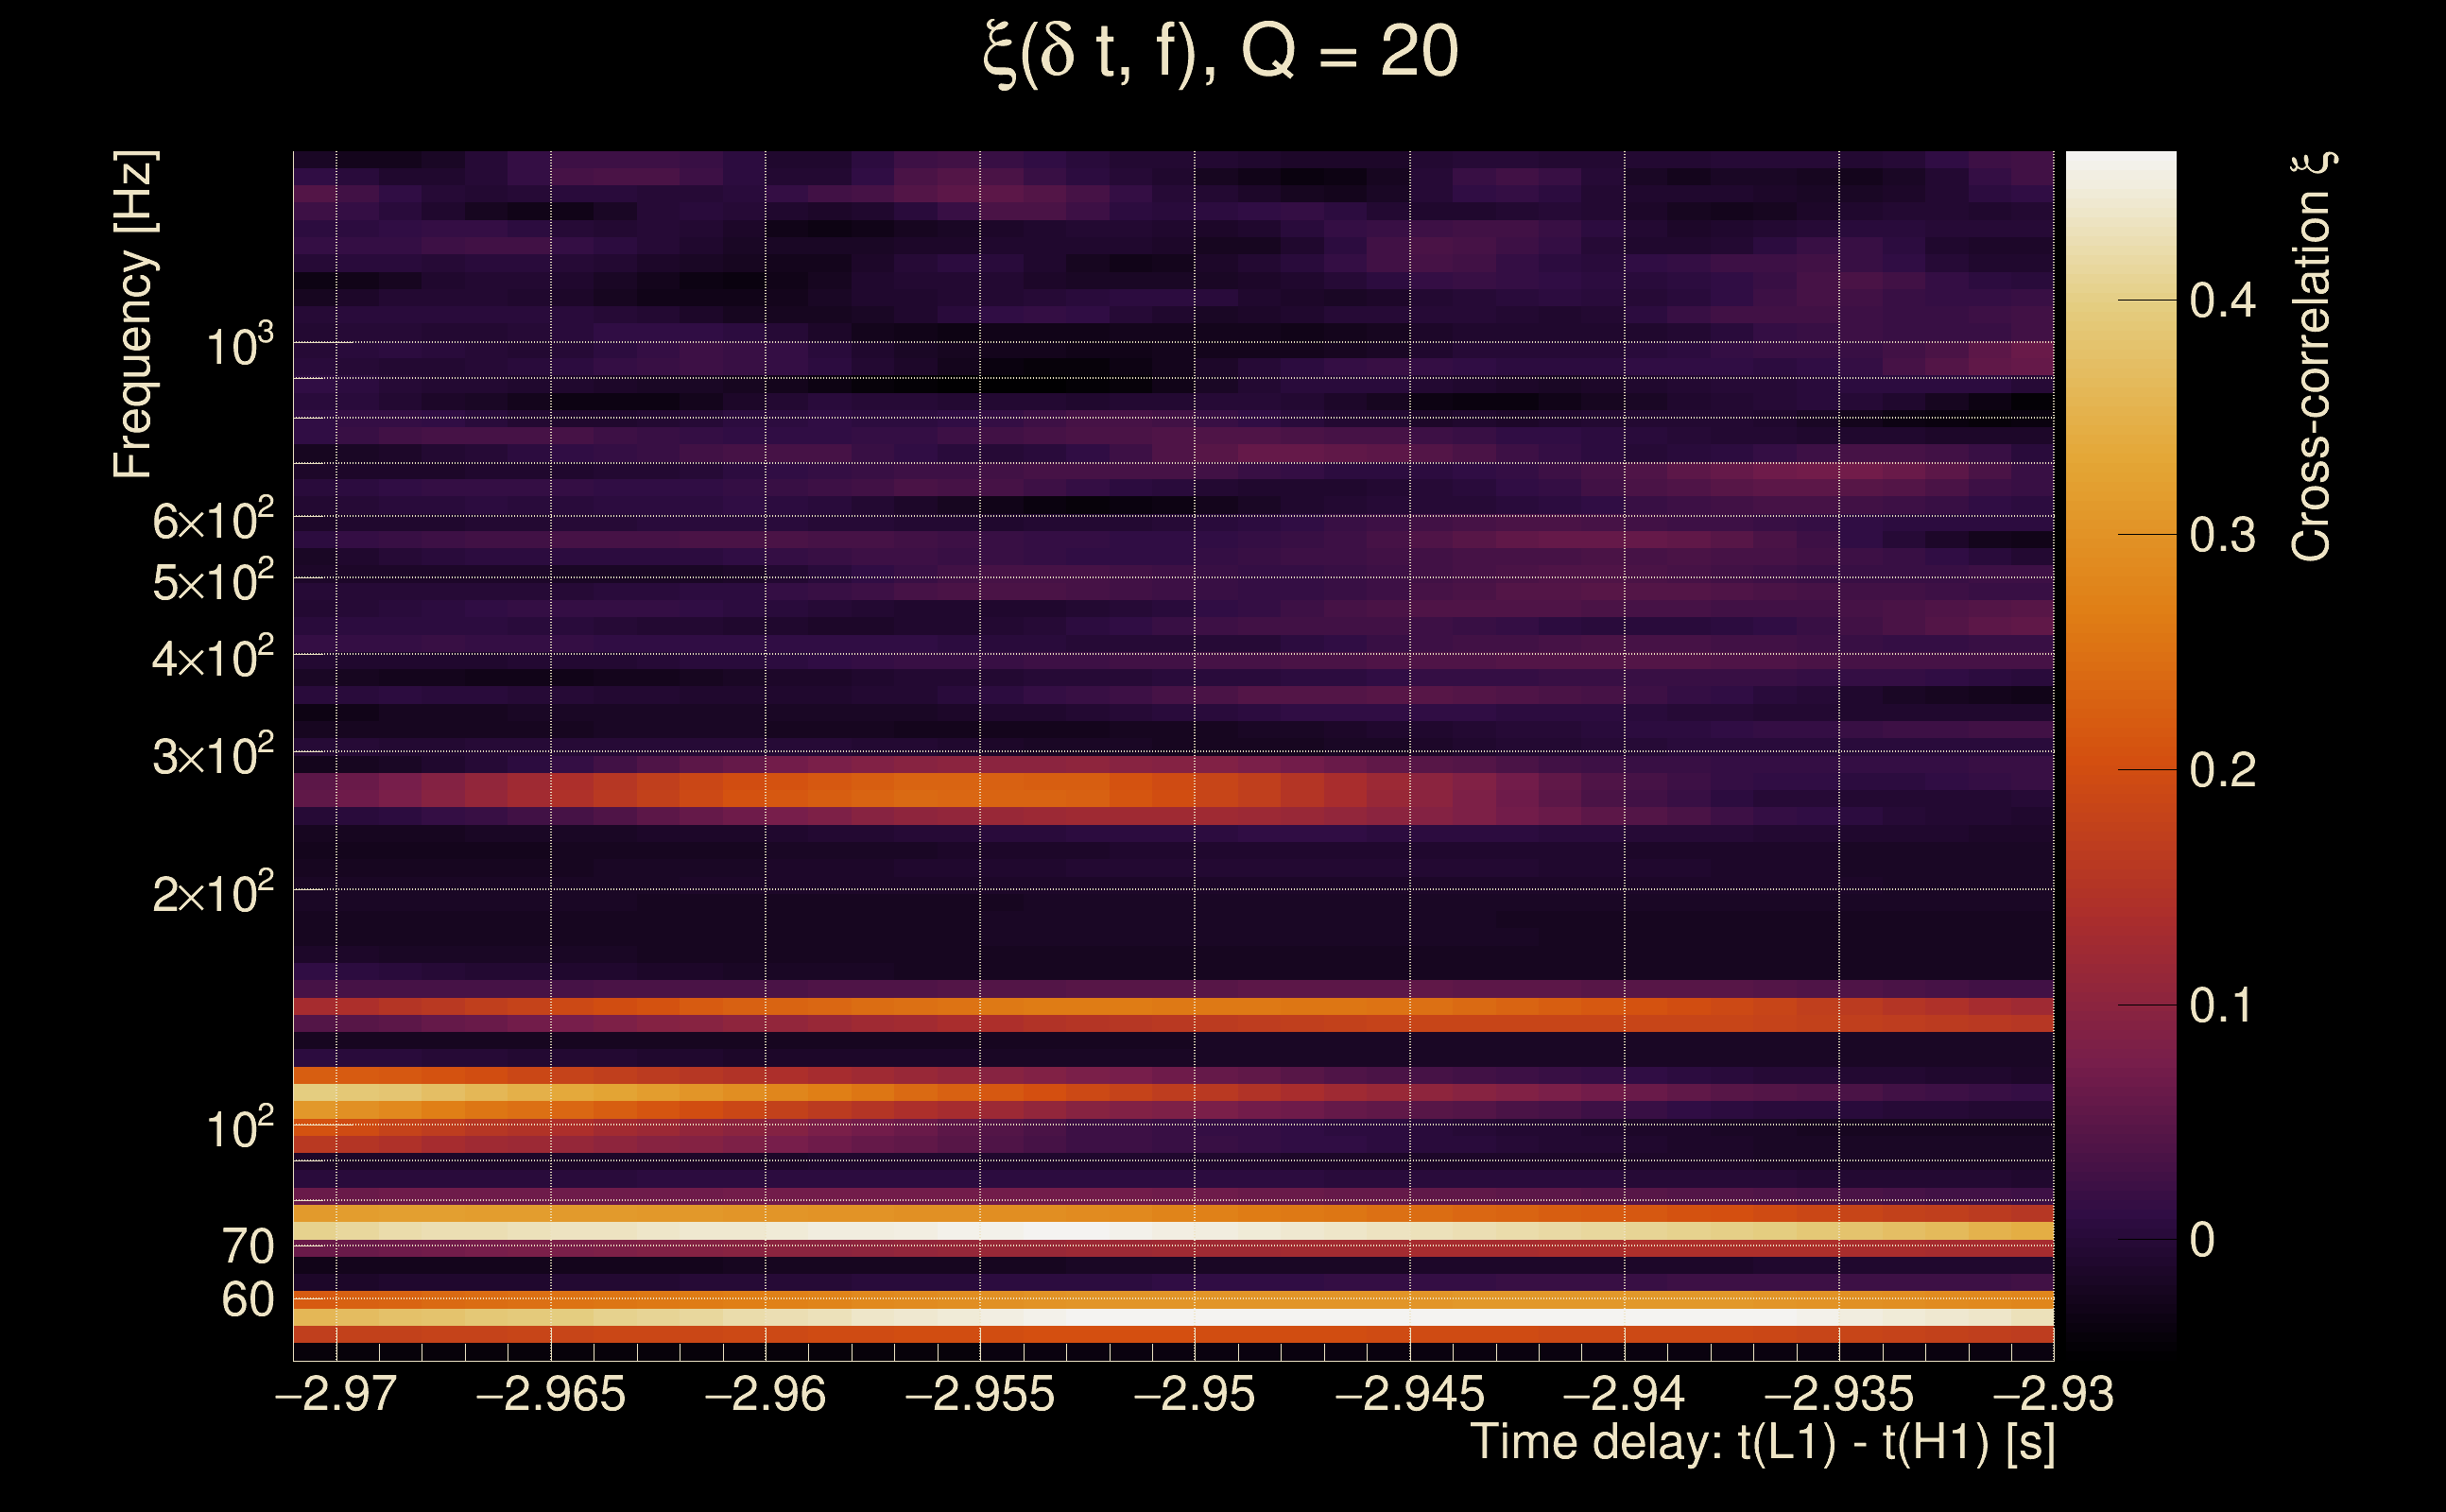
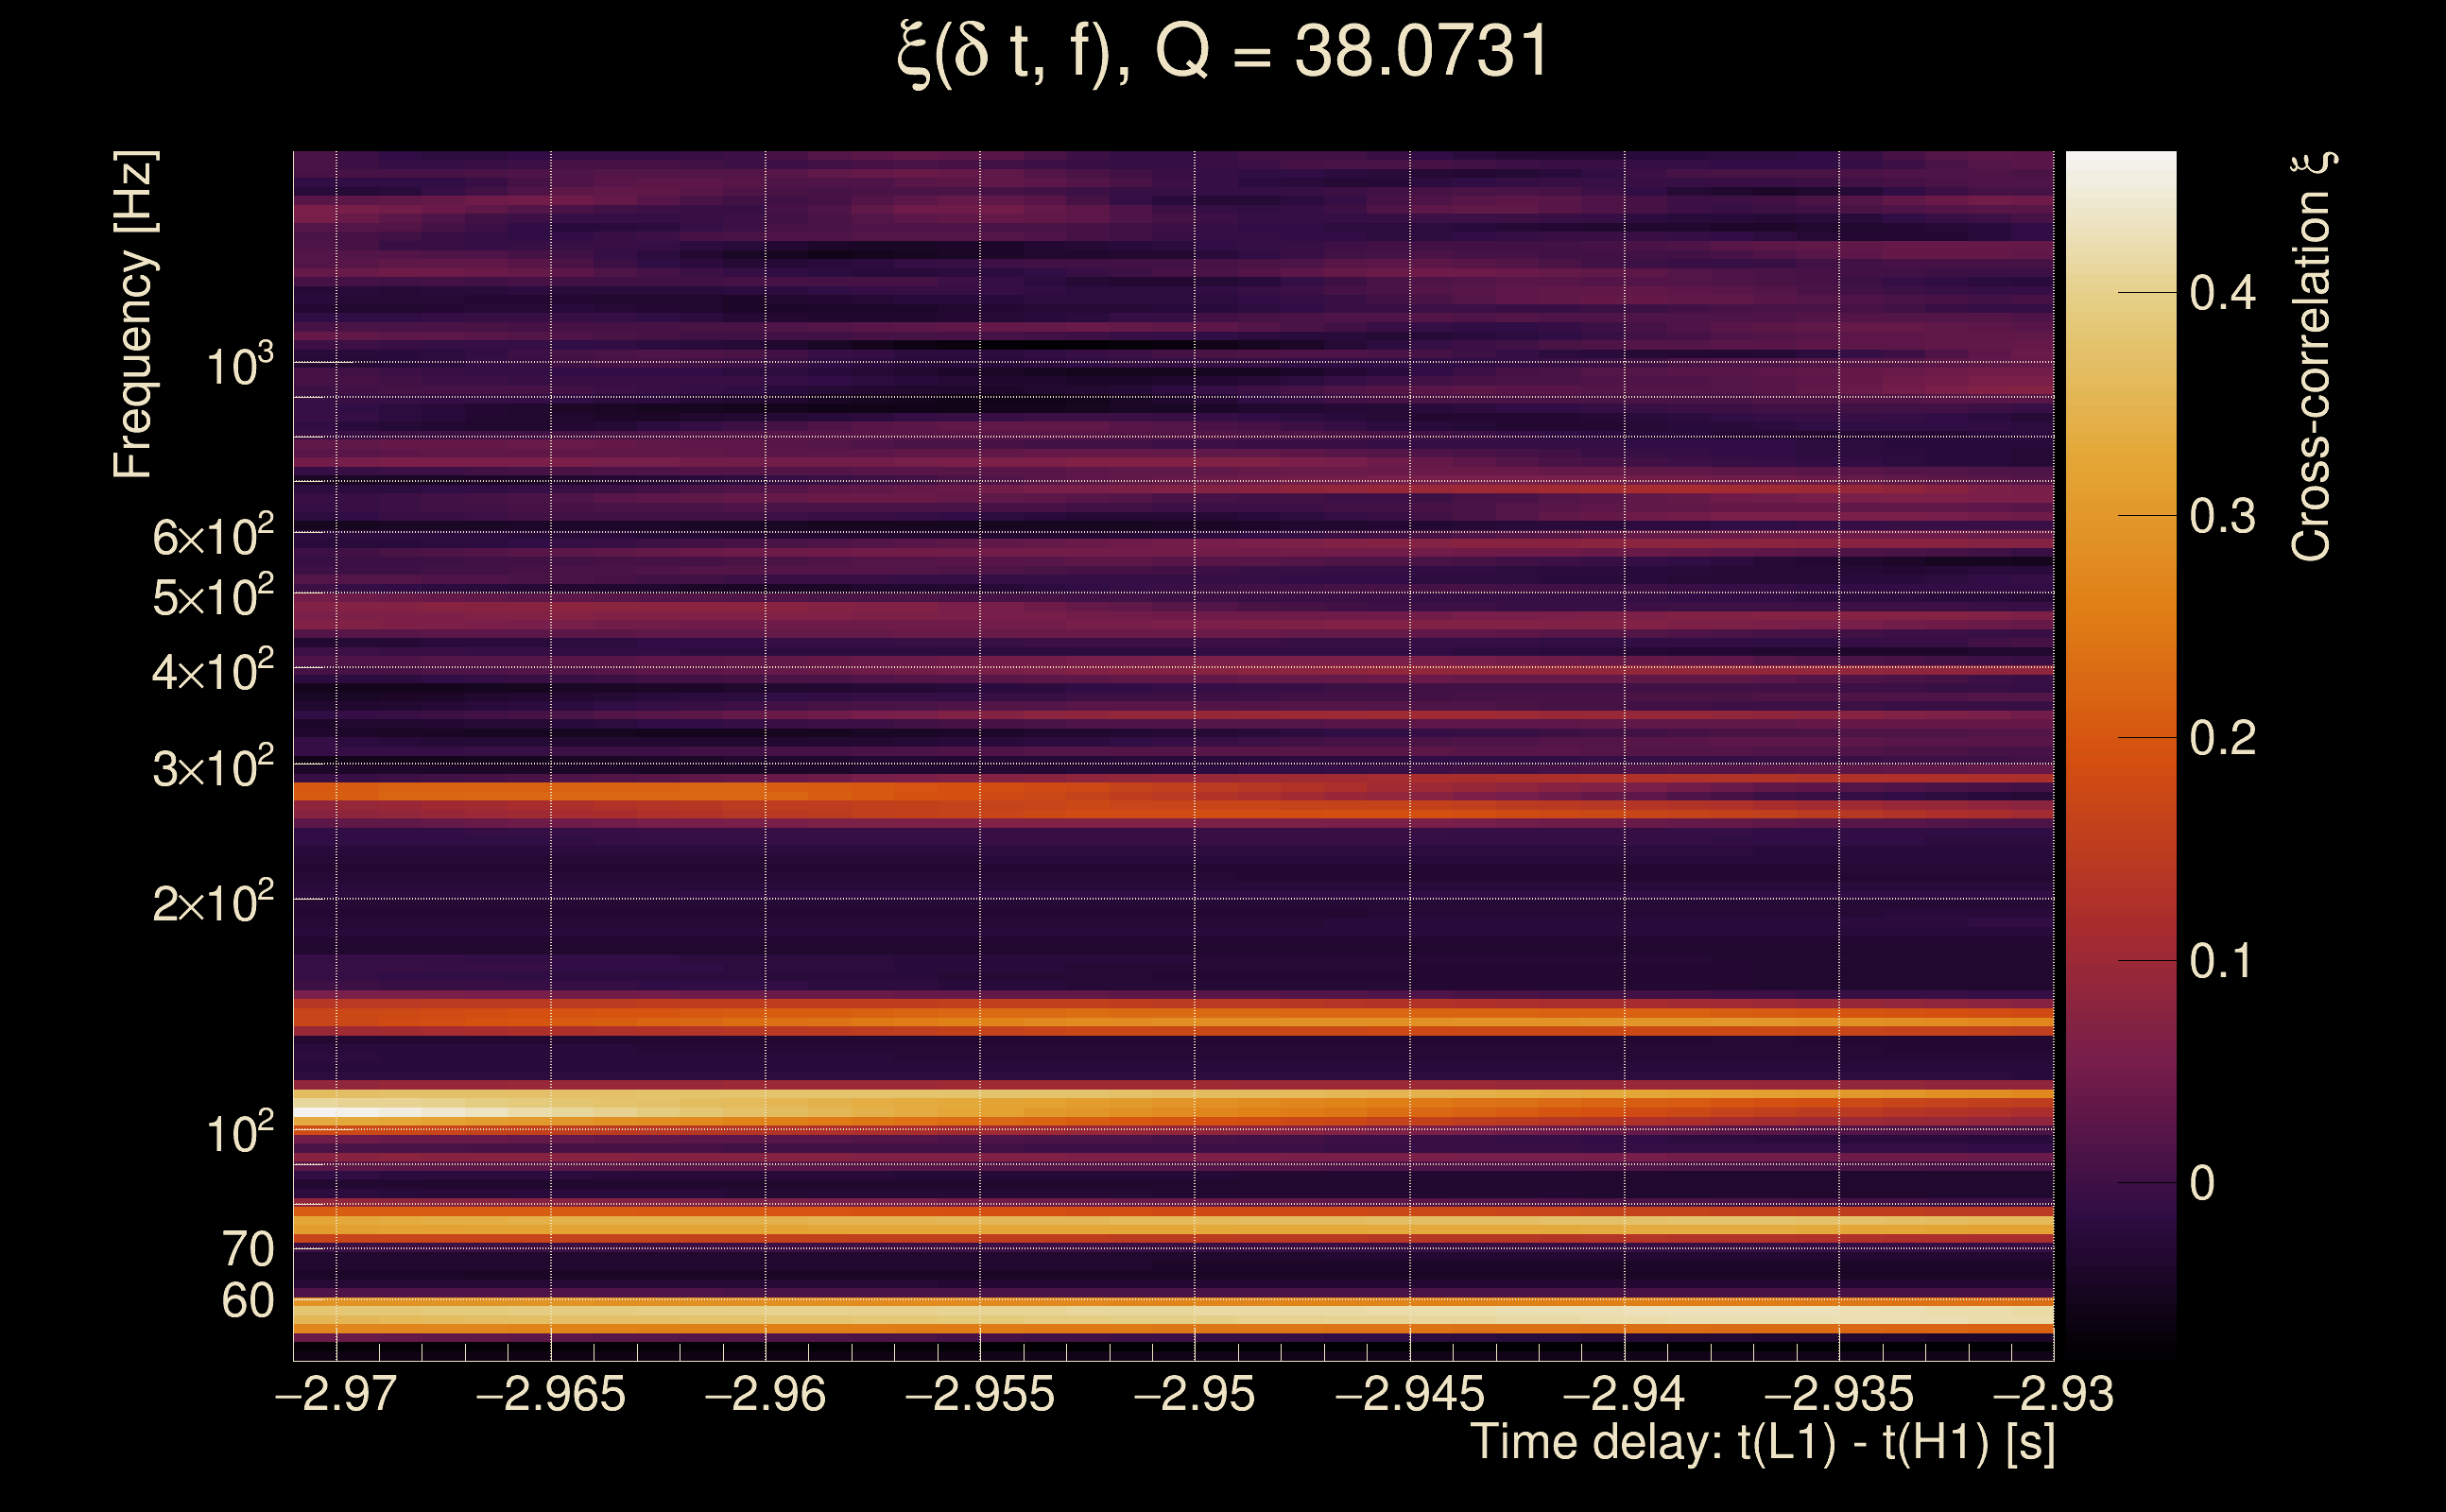
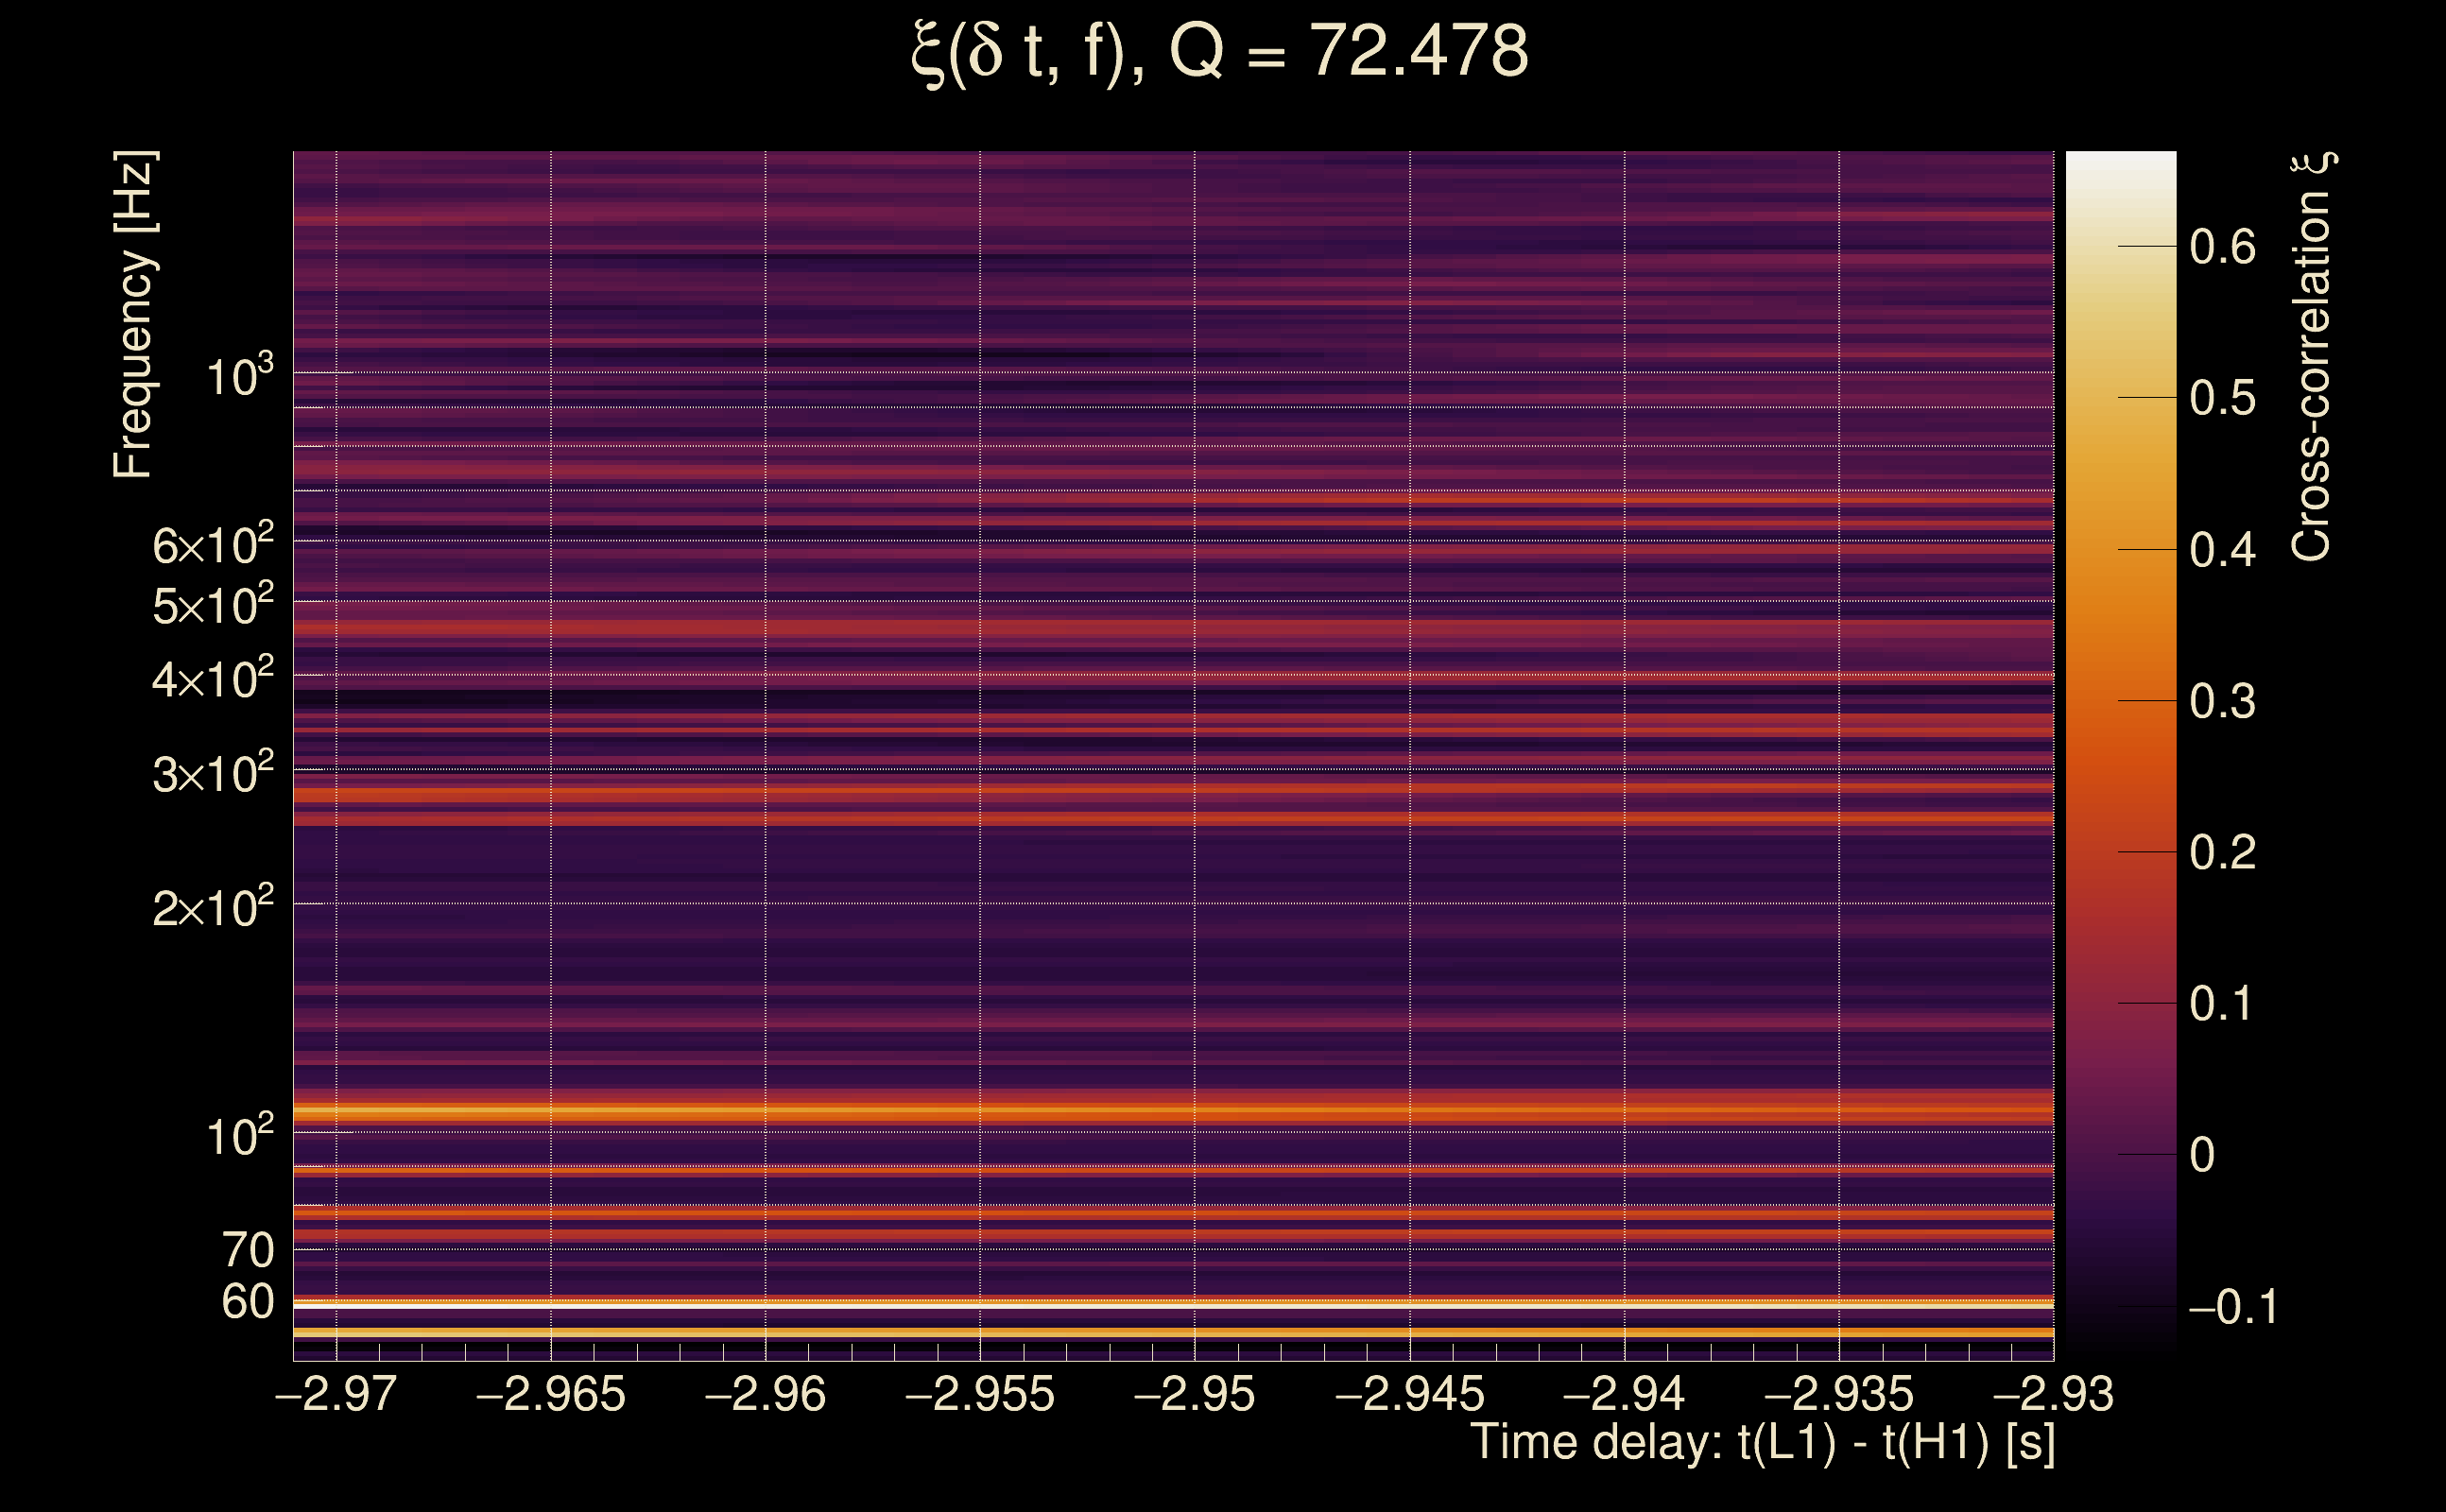
| Event time t(H1): | GPS = 1368431674 (Thu May 18 07:54:16 2023 ) → GPS = 1368431684 (Thu May 18 07:54:26 2023 ) |
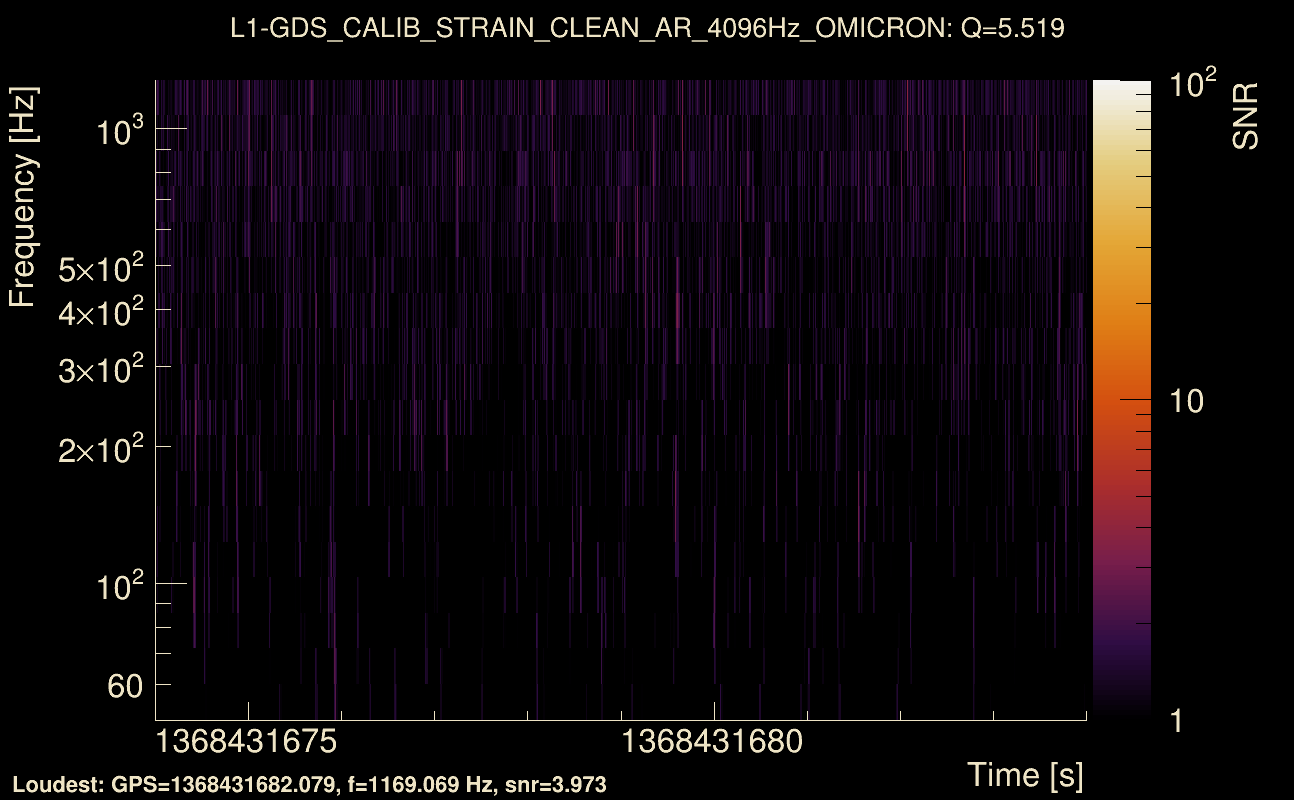
| Event time t(L1): | GPS = 1368431674 (Thu May 18 07:54:26 2023 ) → GPS = 1368431684 (Thu May 18 07:54:26 2023 ) |
| Omicron analysis time window (H1): | GPS = 1368431671 → GPS = 1368431687 |
| Omicron analysis time window (L1): | GPS = 1368431671 → GPS = 1368431687 |
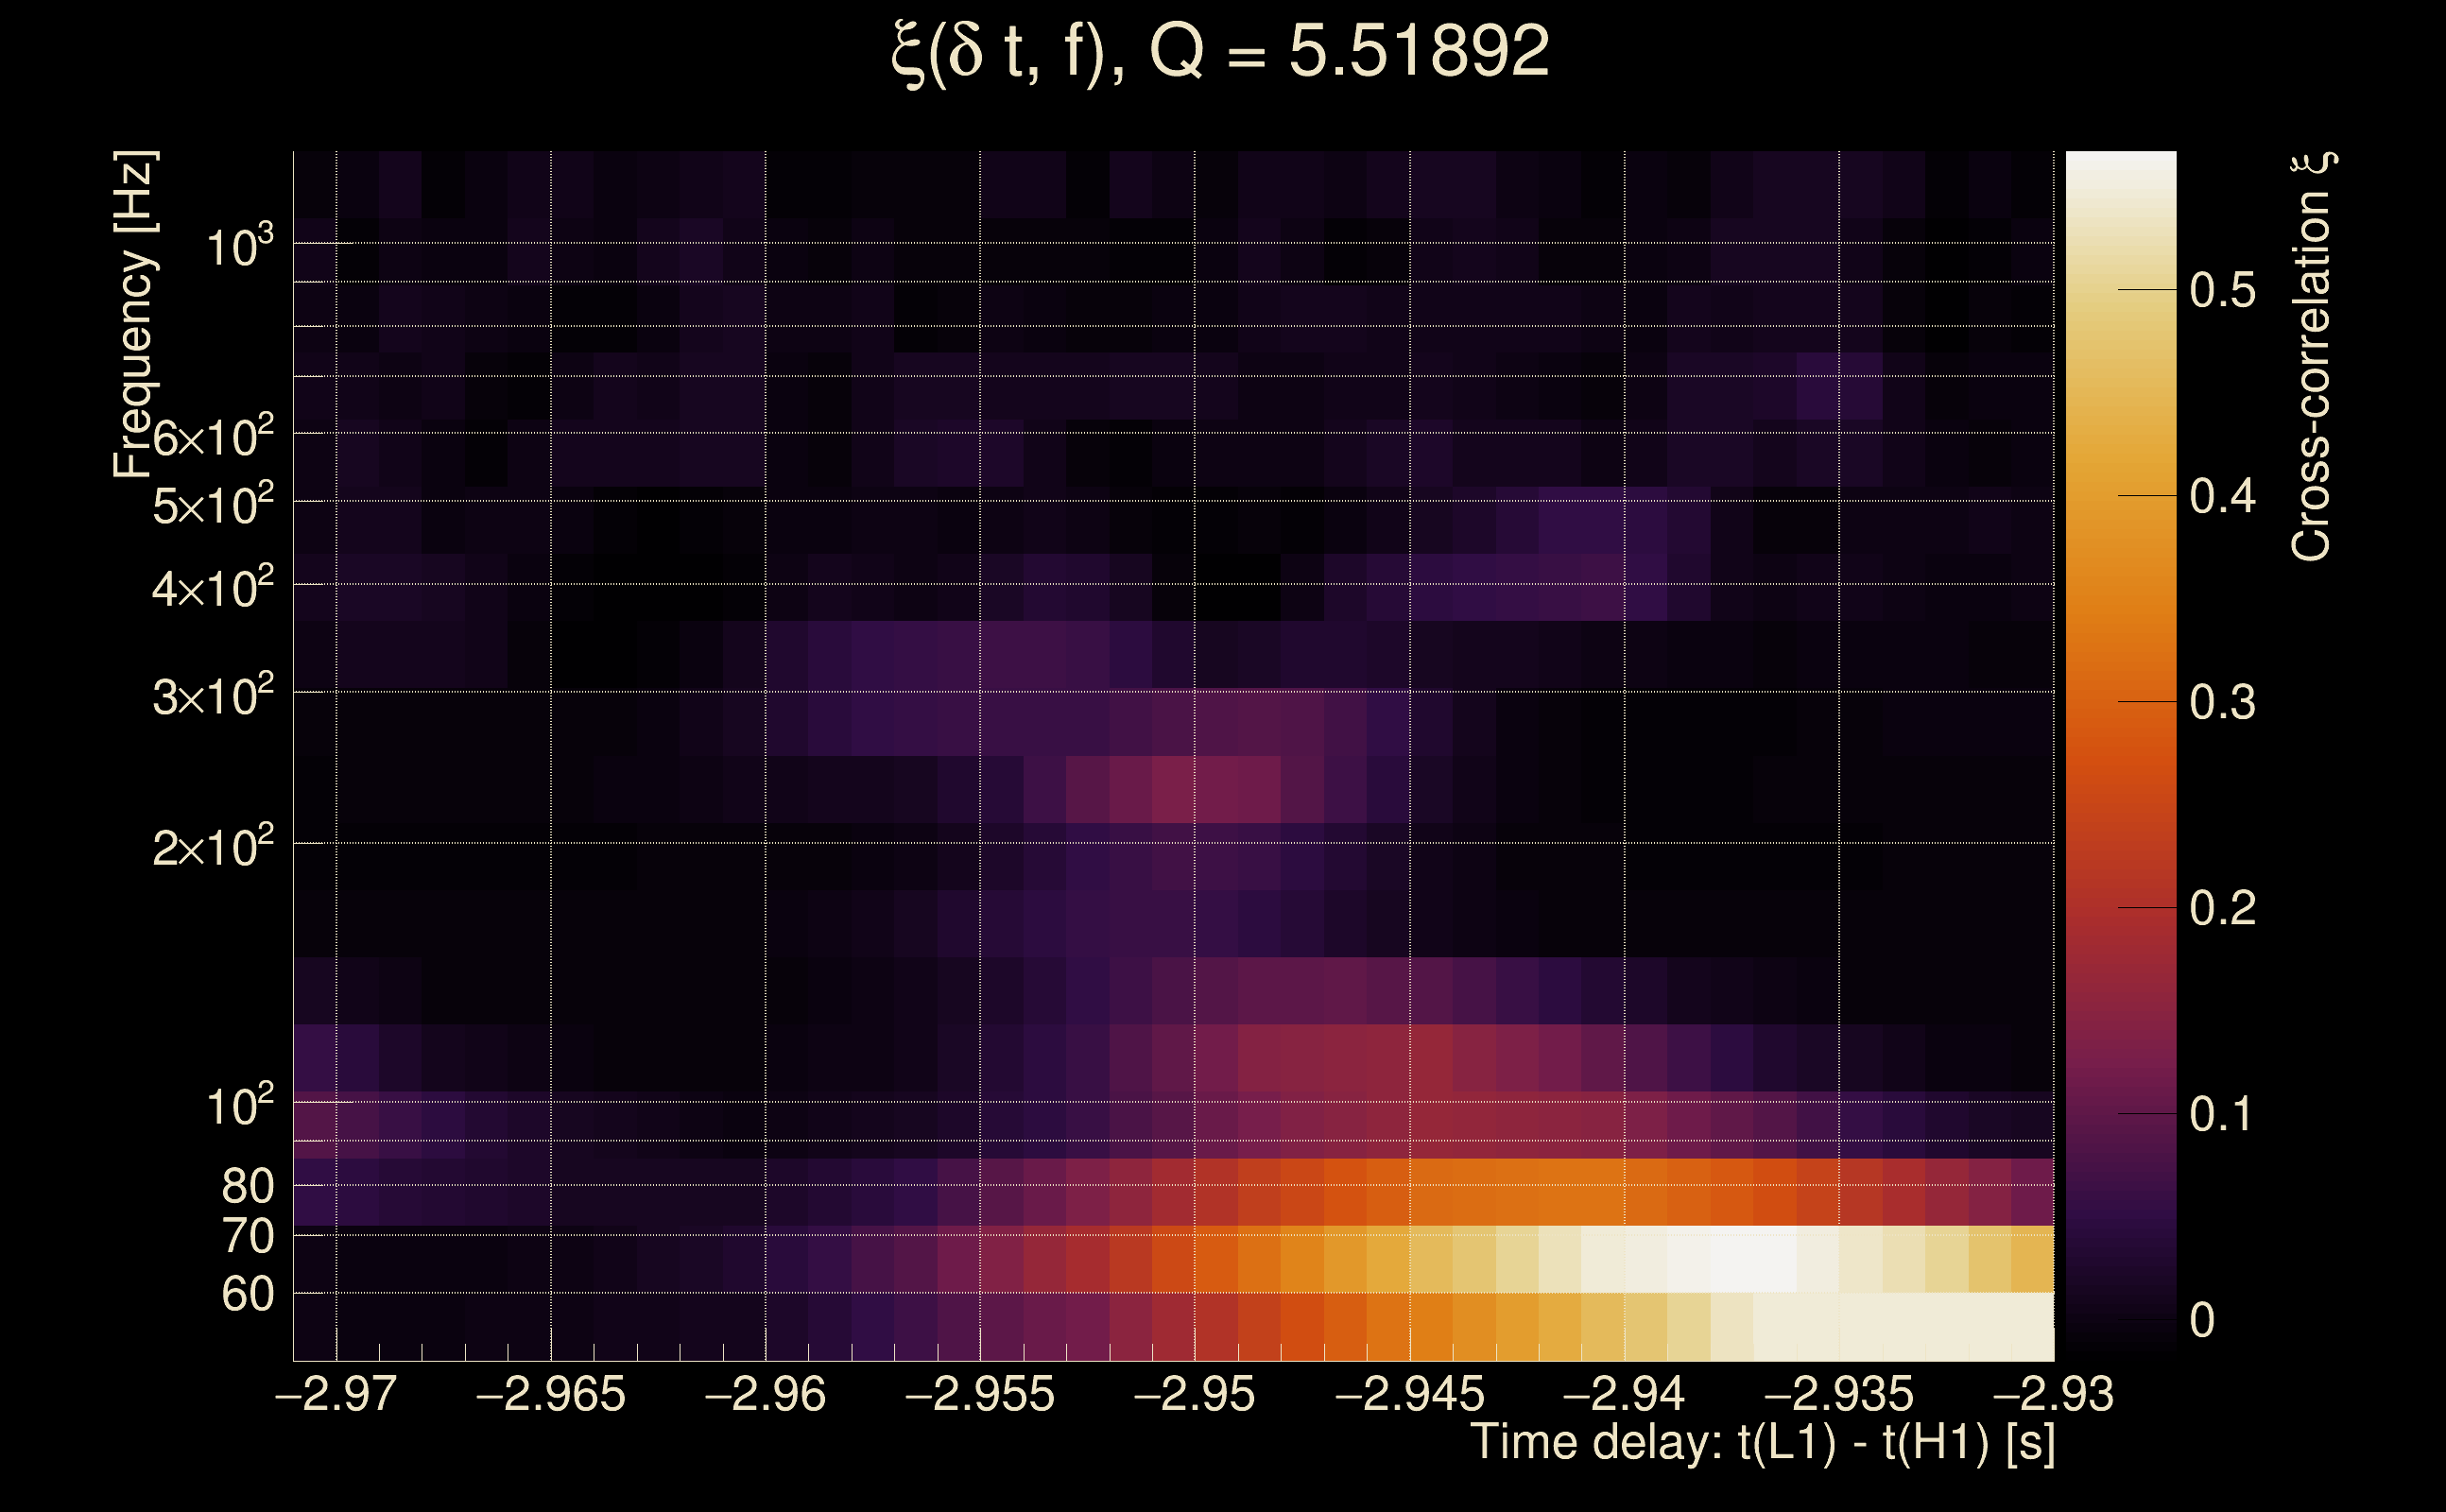
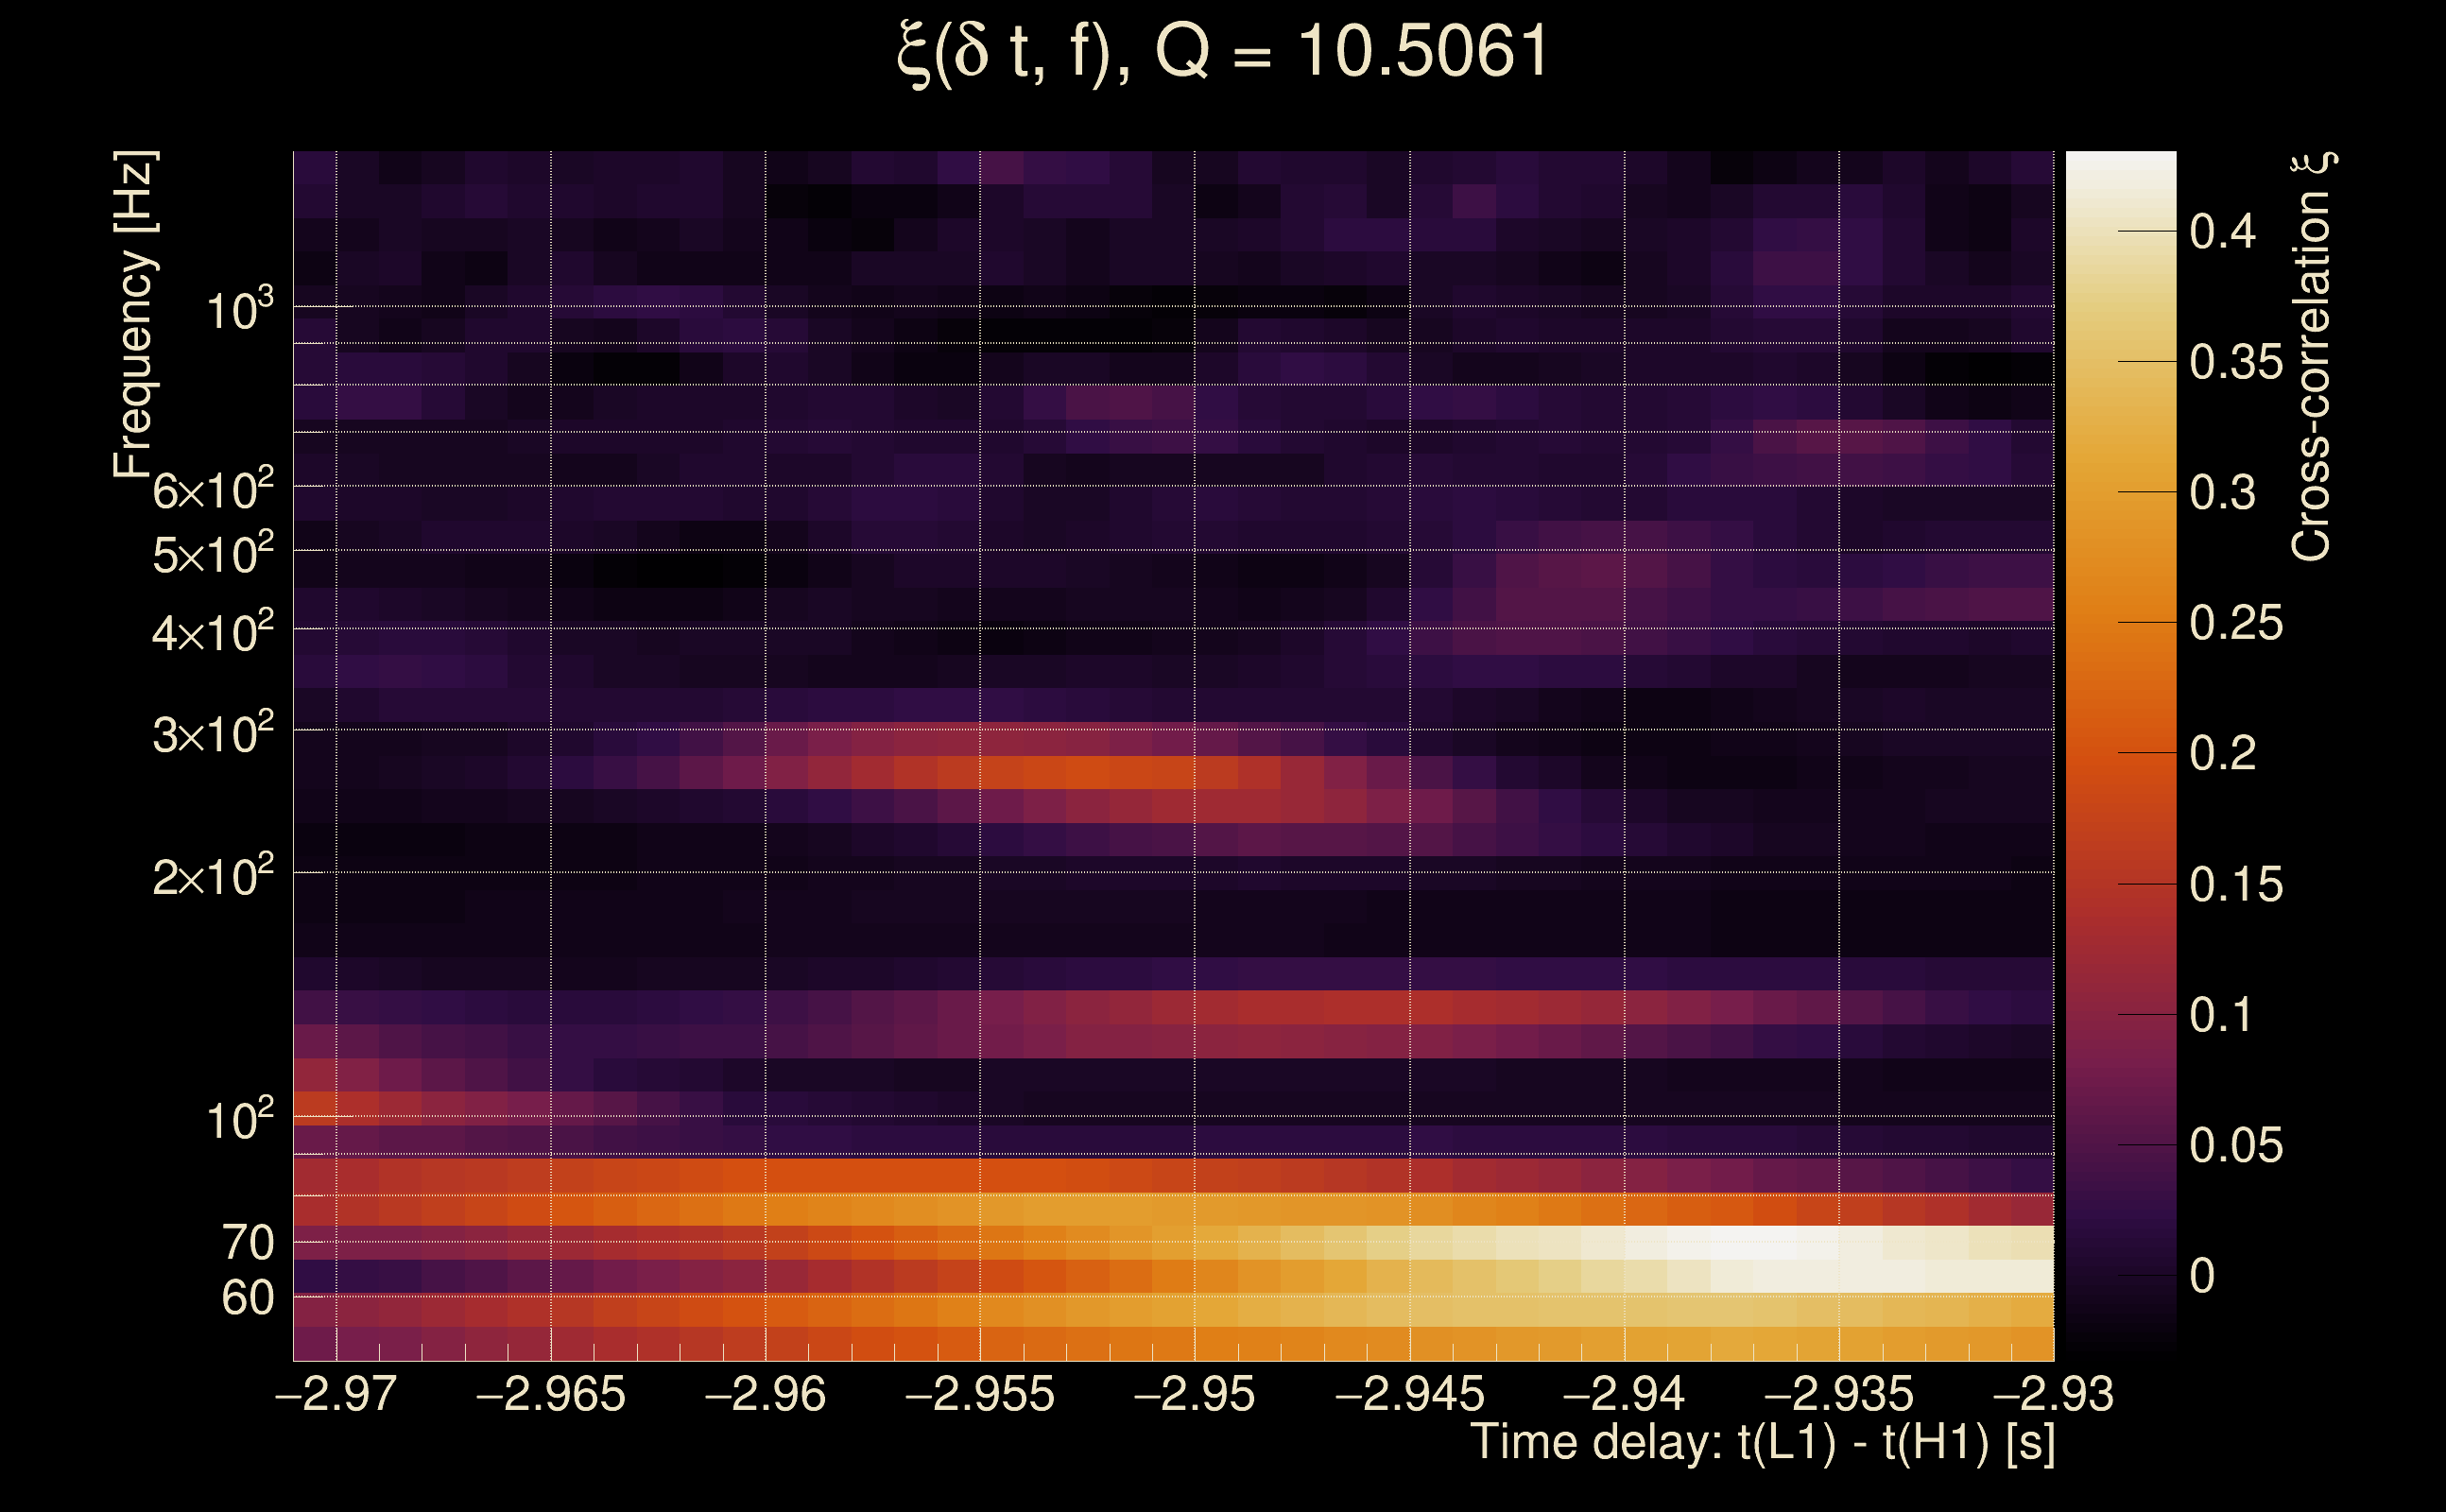
| Time delay between detectors t(L1) - t(H1): | -2.95052 s (slice index = 172 / 217), δt_gw = -0.00652129 s |
| Time delay standard deviation: | 0.0776984 s |
| [targeted mode] Time delay probability: | 0.0550595 (1.91841 sigmas), δt_target = -0.00460196 s |
| Frequency: | 87.9503 Hz |
| Ξ: | 0.0949535 ± 0.0551116 (variance = 0.00303729): Q0: 0.329542, Q1: 0.31479, Q2: 0.285553, Q3: 0.24056, Q4: 0.177657 |
| Rank: | R_A = 0.0949535 |
| Log of amplitude ratio (L1/H1): | -2.65064, variance = 0.619396 (L1/H1: -2.67286, variance = 0.629446, H1/L1: -0.0811659, variance = 1.00206) |
| Amplitude ratio (L1/H1): | 0.070606 ⋇ 2.19683 (L1/H1: 0.0690545 ⋇ 2.21085, H1/L1: 0.922041 ⋇ 2.72108) |
| Amplitude ratio H1|L1 compatibility (probability): | 0.0310738 |
| Antenna factor probability: | 0.00241165 |
| Number of rejected frequency rows: | Q0: 11 / 18, Q1: 27 / 36, Q2: 55 / 70, Q3: 124 / 134, Q4: 246 / 258 |
| Maximum signal-to-noise ratio: | H1: 56.4655, L1: 5.0923 |
| SNR variance: | H1: 1.57151, L1: 0.547931 |
| Click here for a zoomed plot | Click here for a zoomed plot | Click here for a zoomed plot | Click here for a zoomed plot | Click here for a zoomed plot |
 |
 |
 |
 |
 |
 |
 |
 |
 |
 |
 |
 |
 |
 |
 |
 |
 |
 |
 |
 |
 |
 |
 |
 |
 |
 |
 |
 |
 |
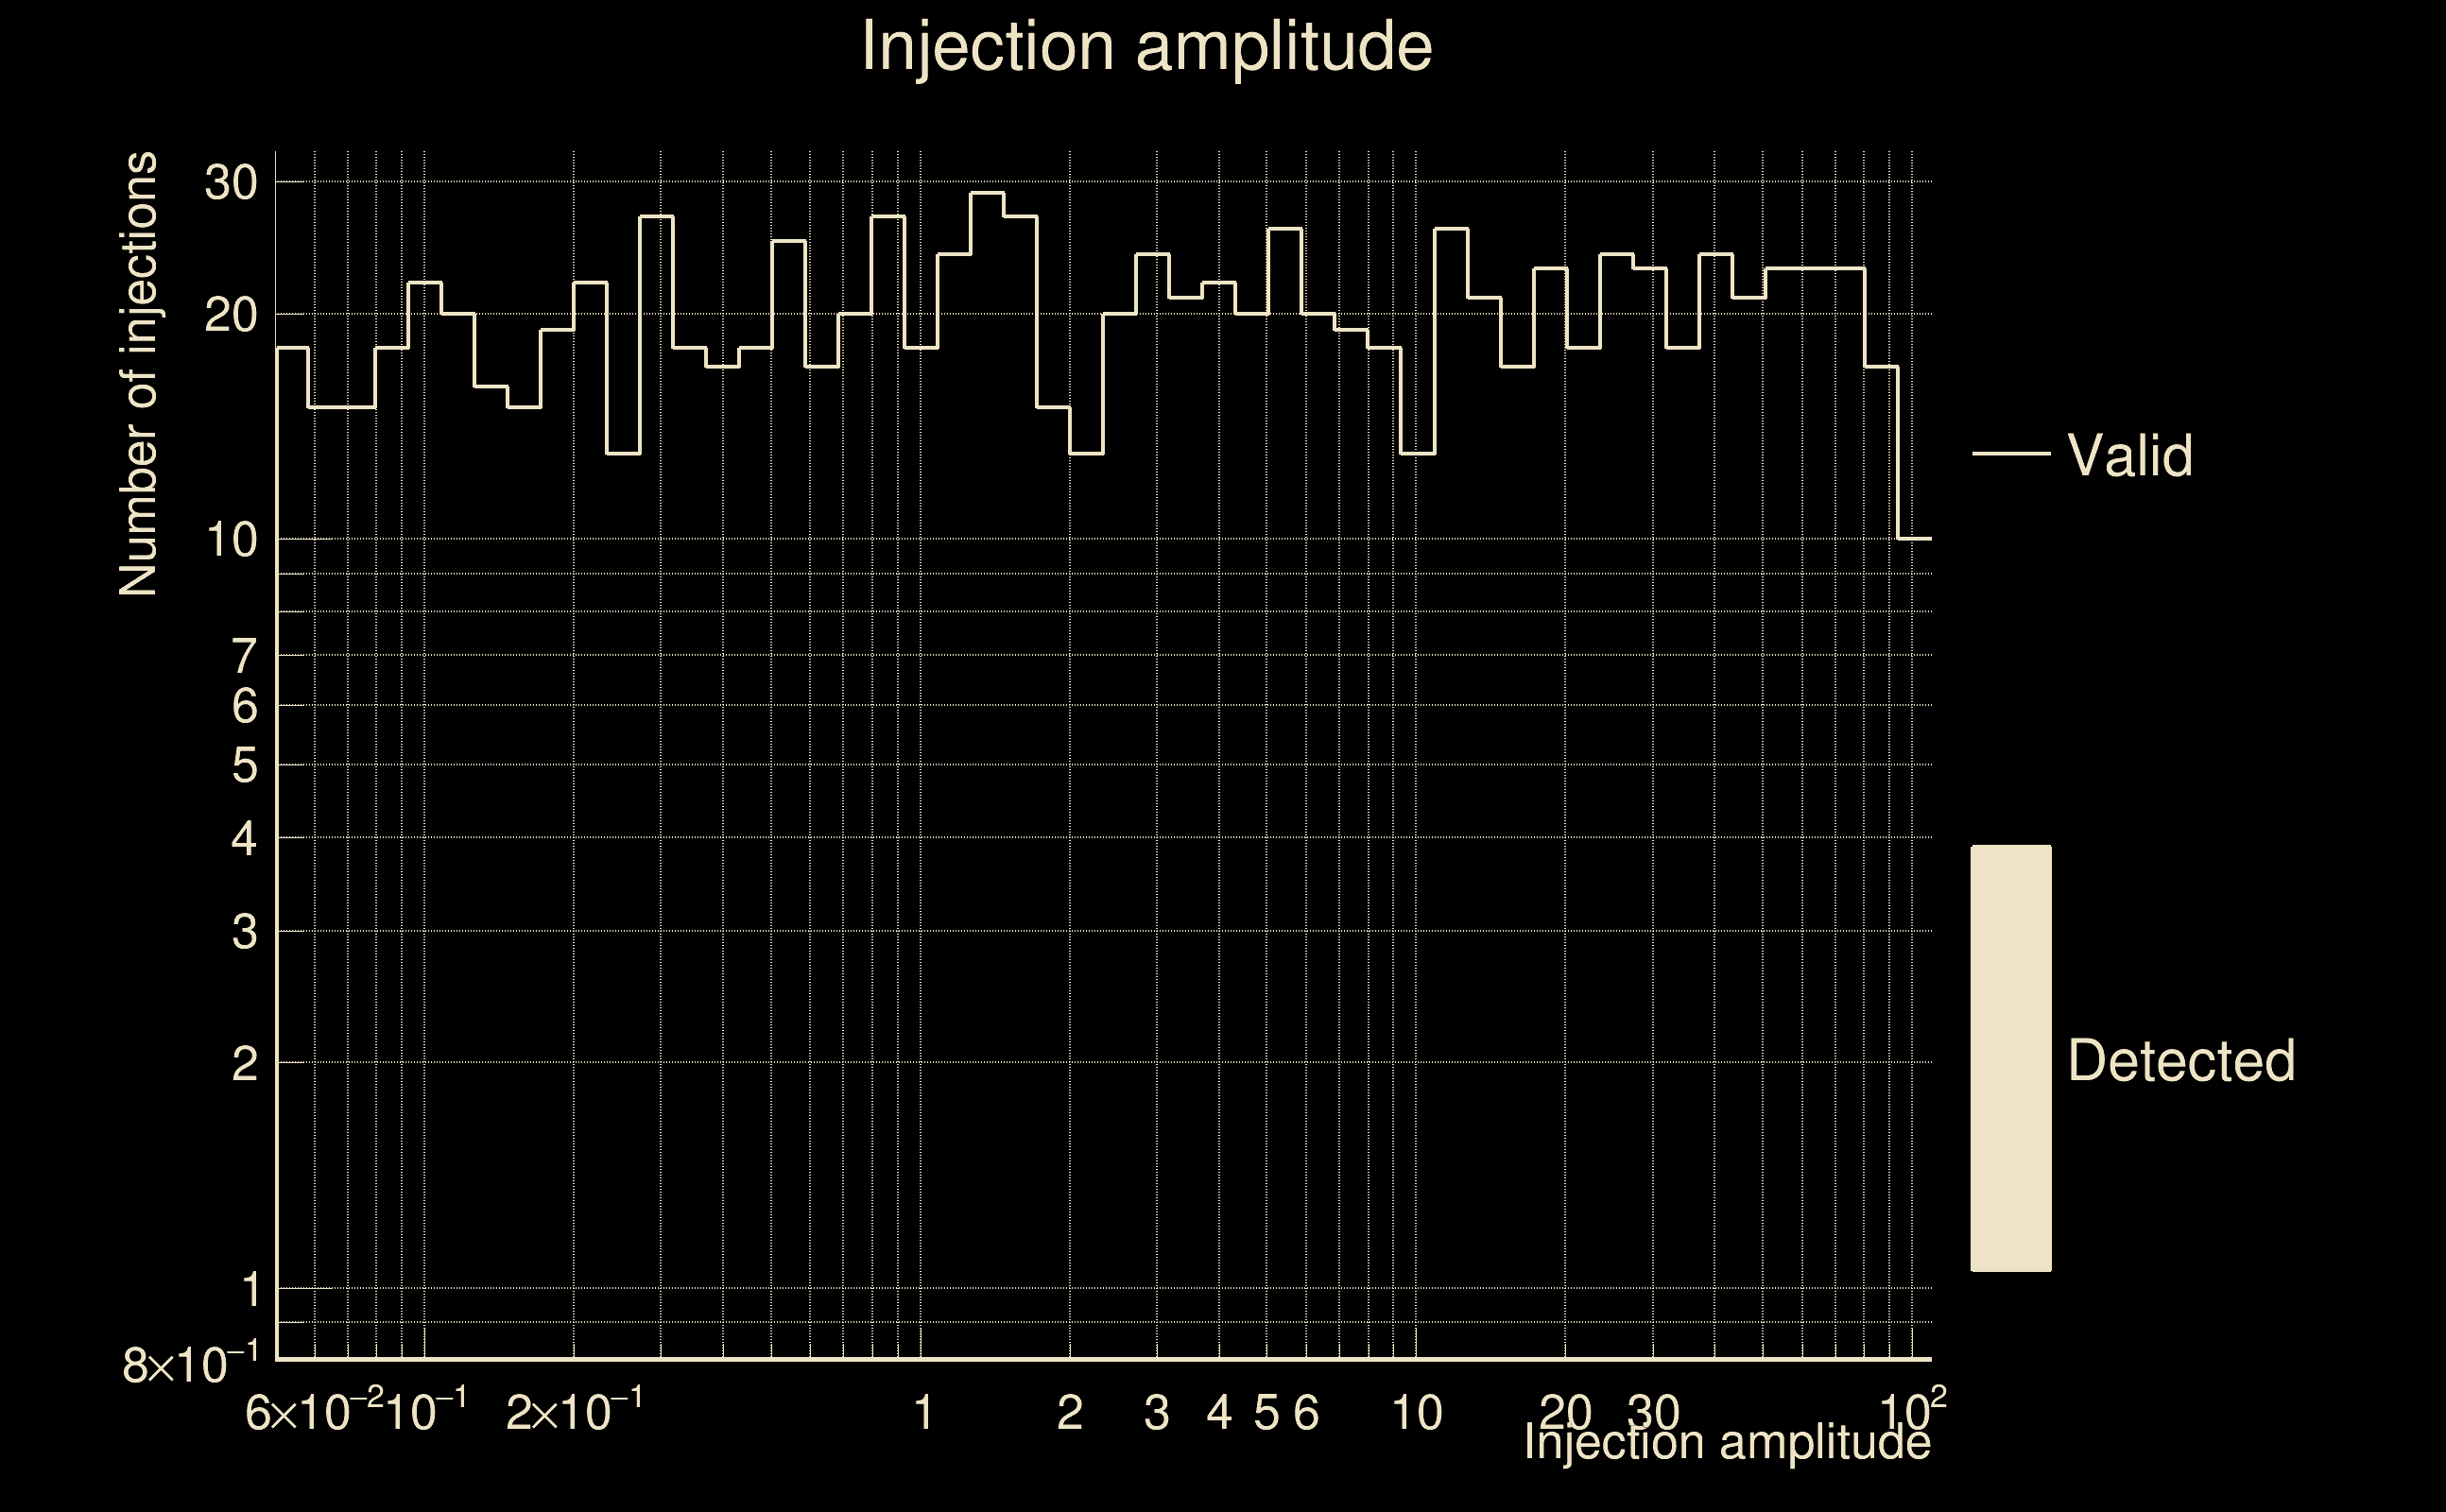
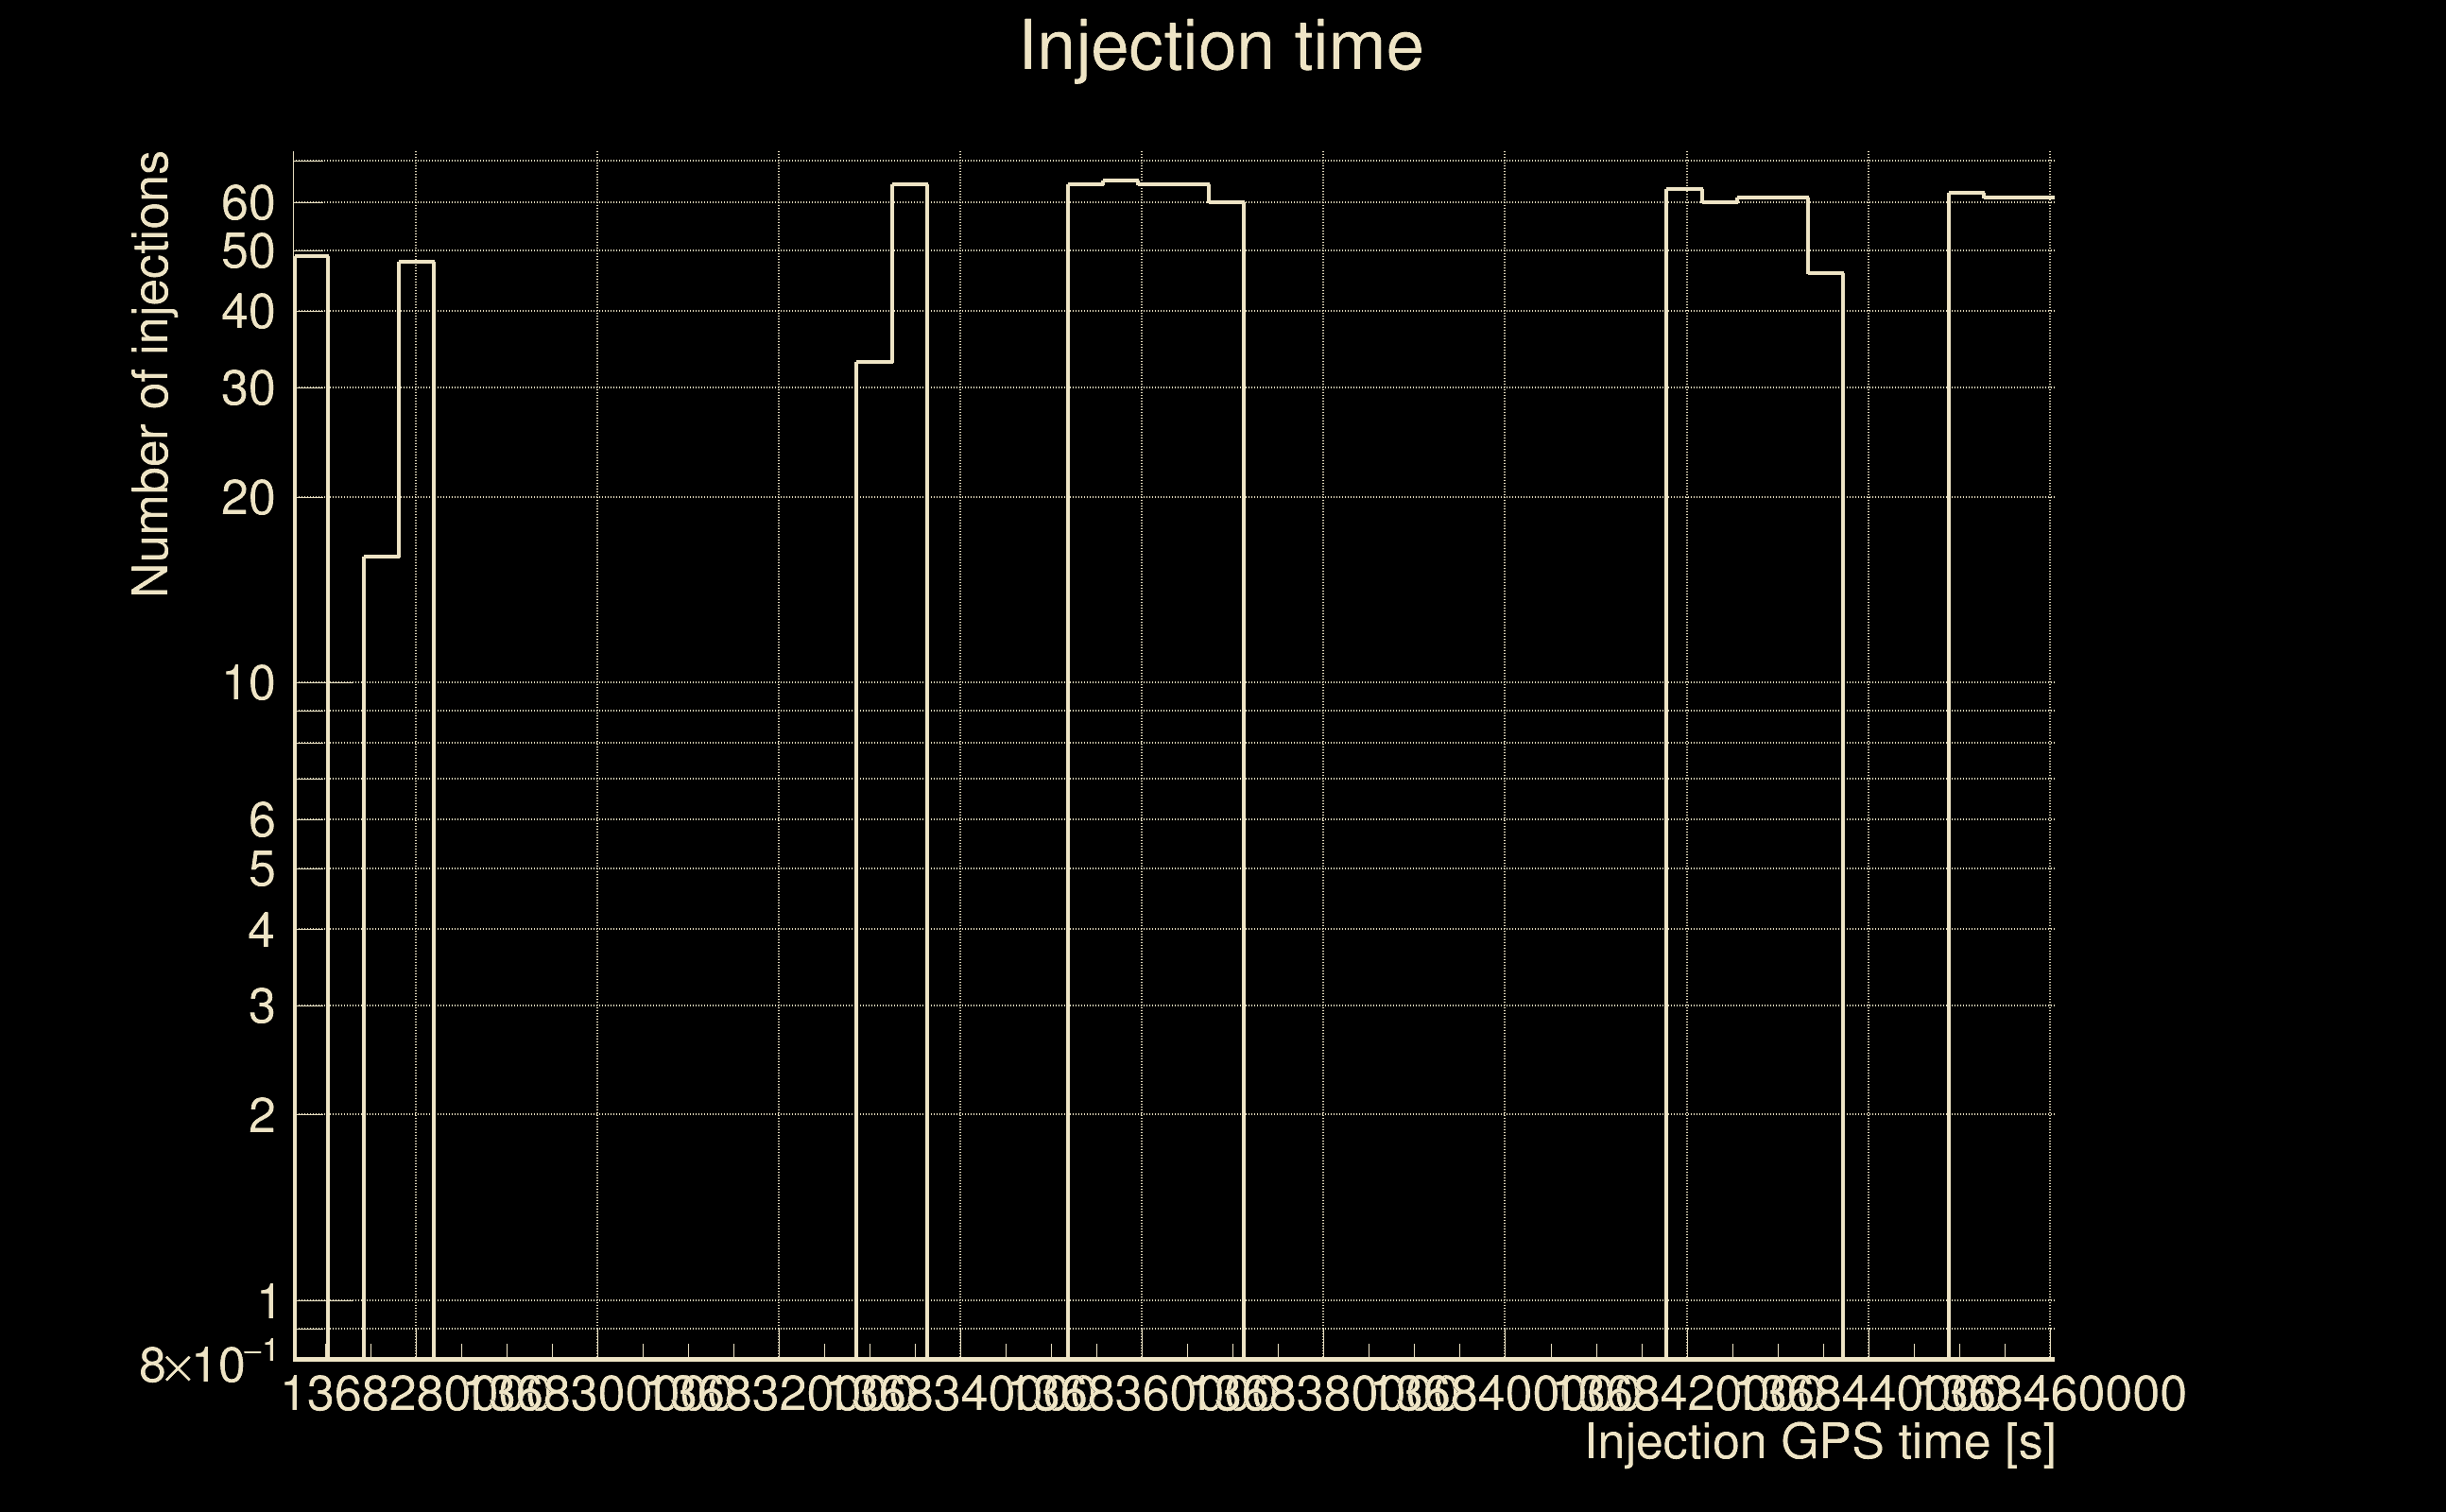
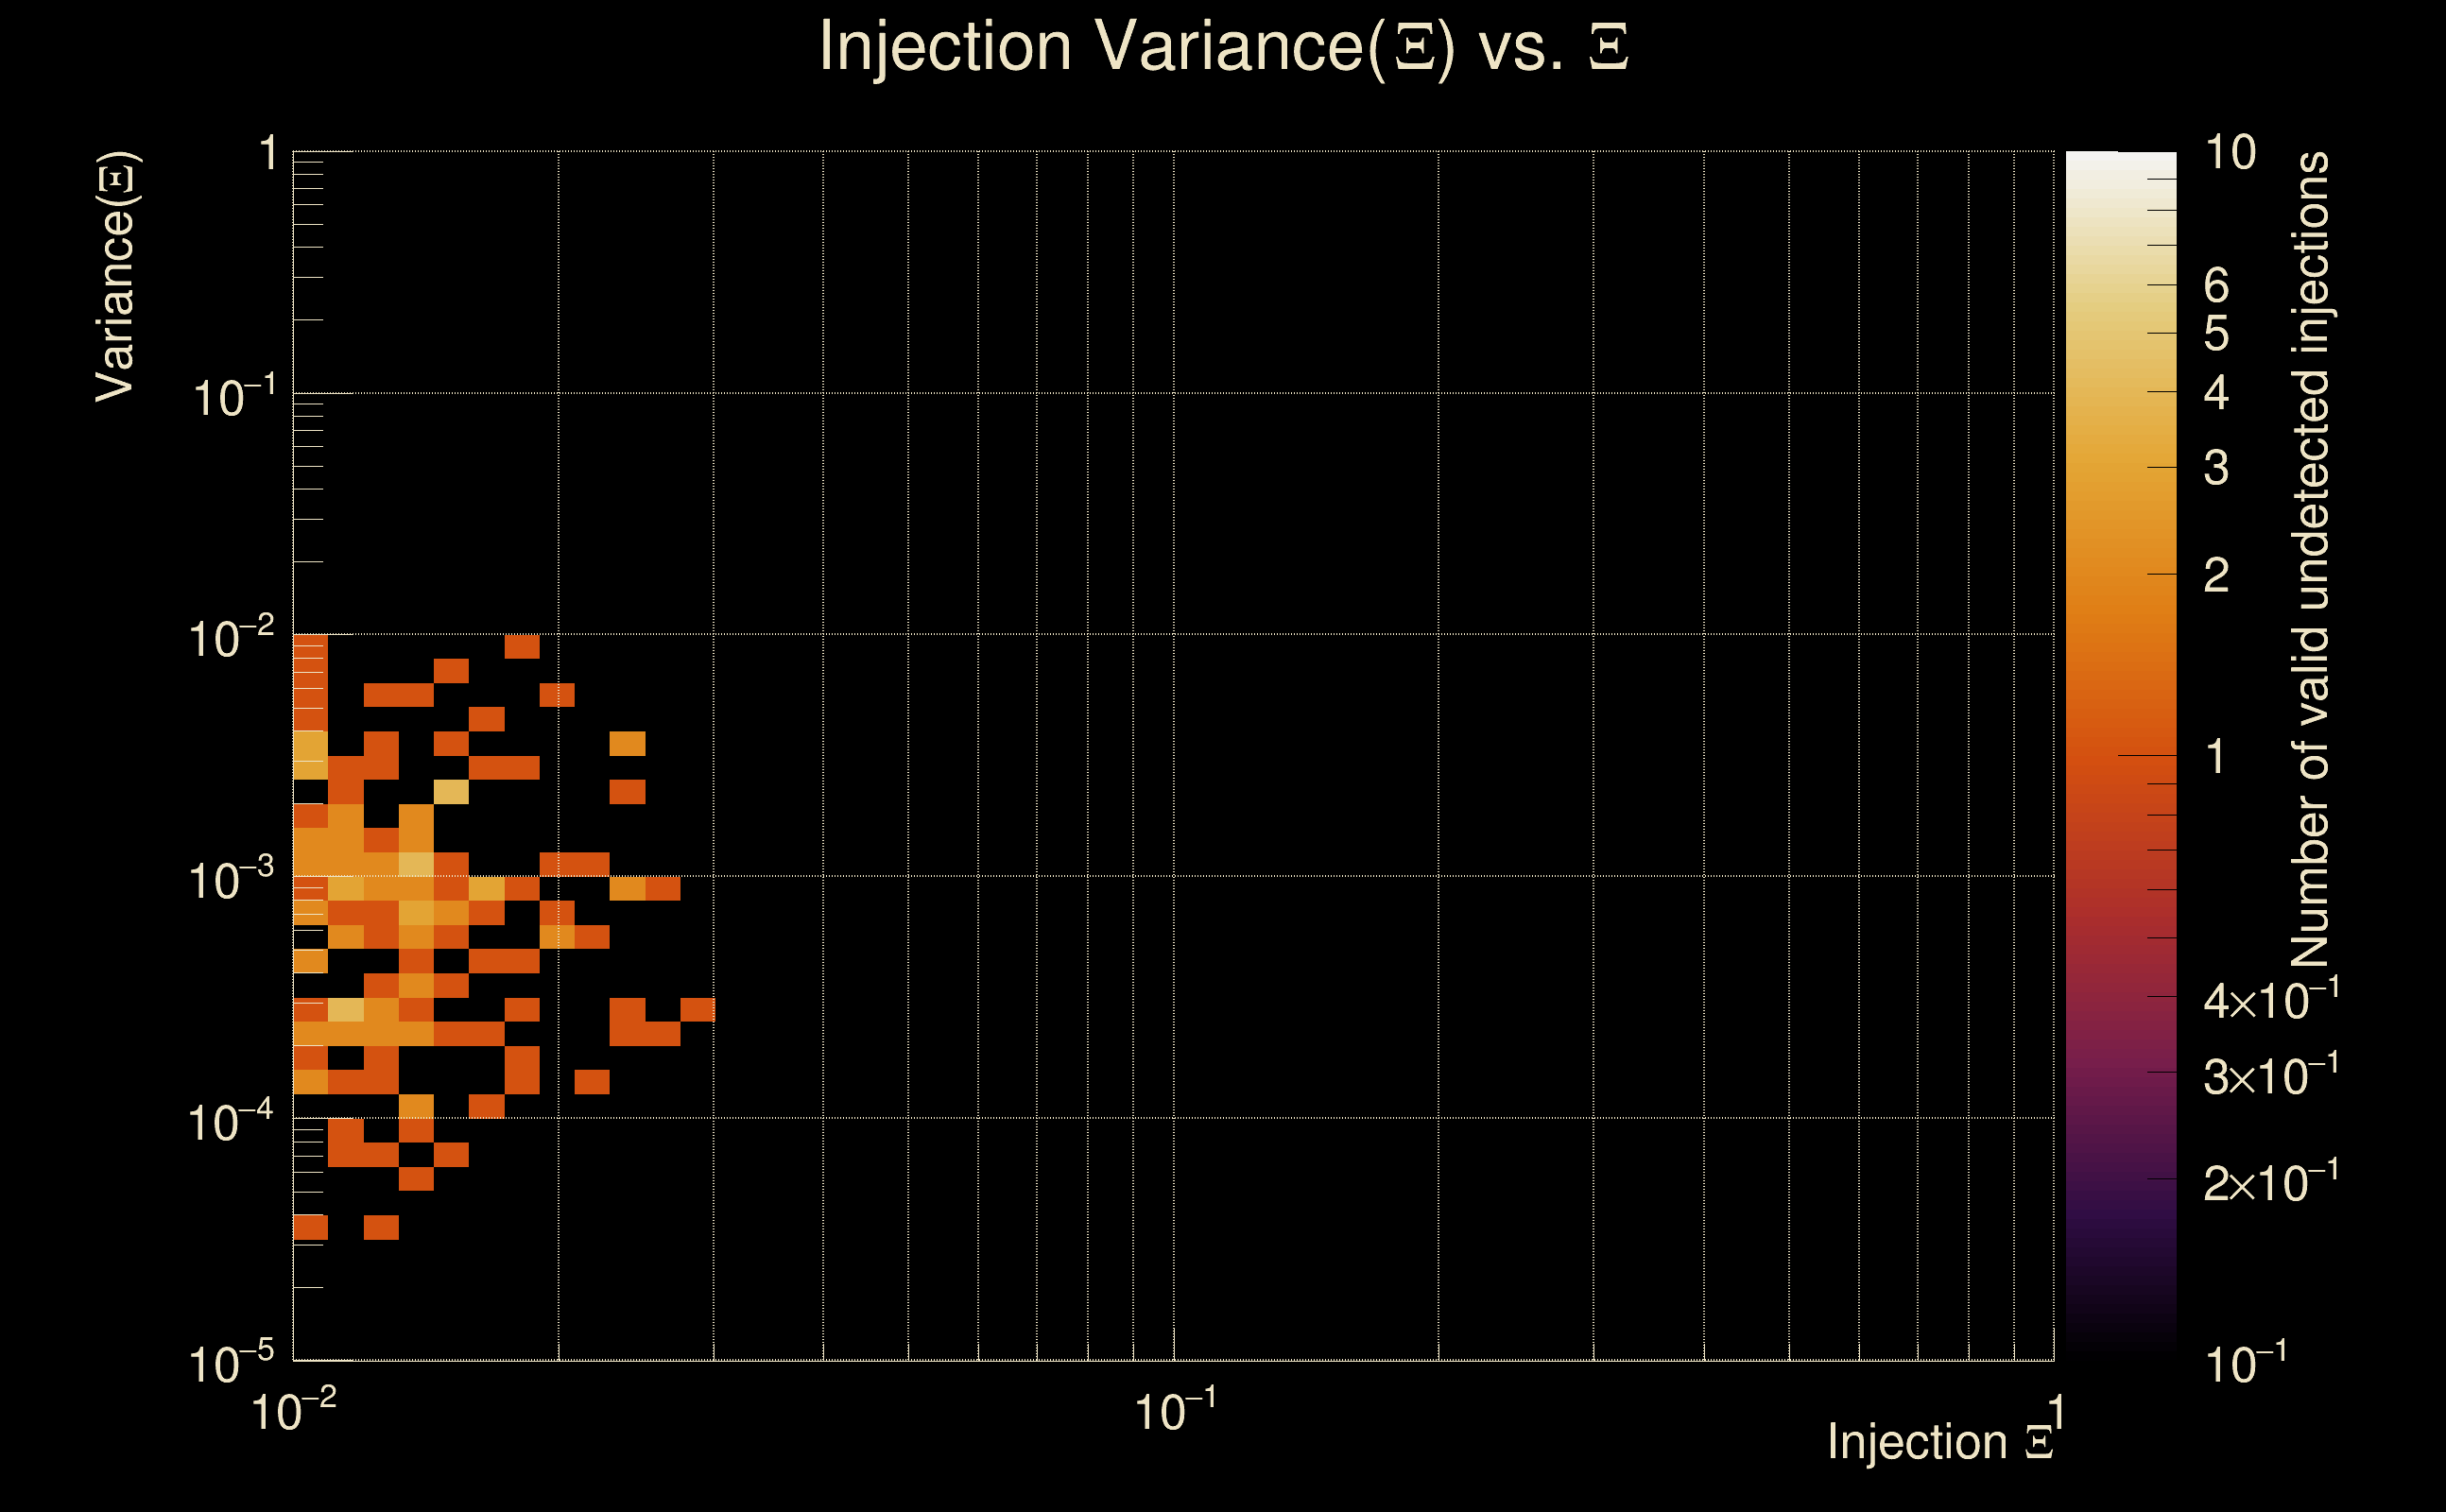
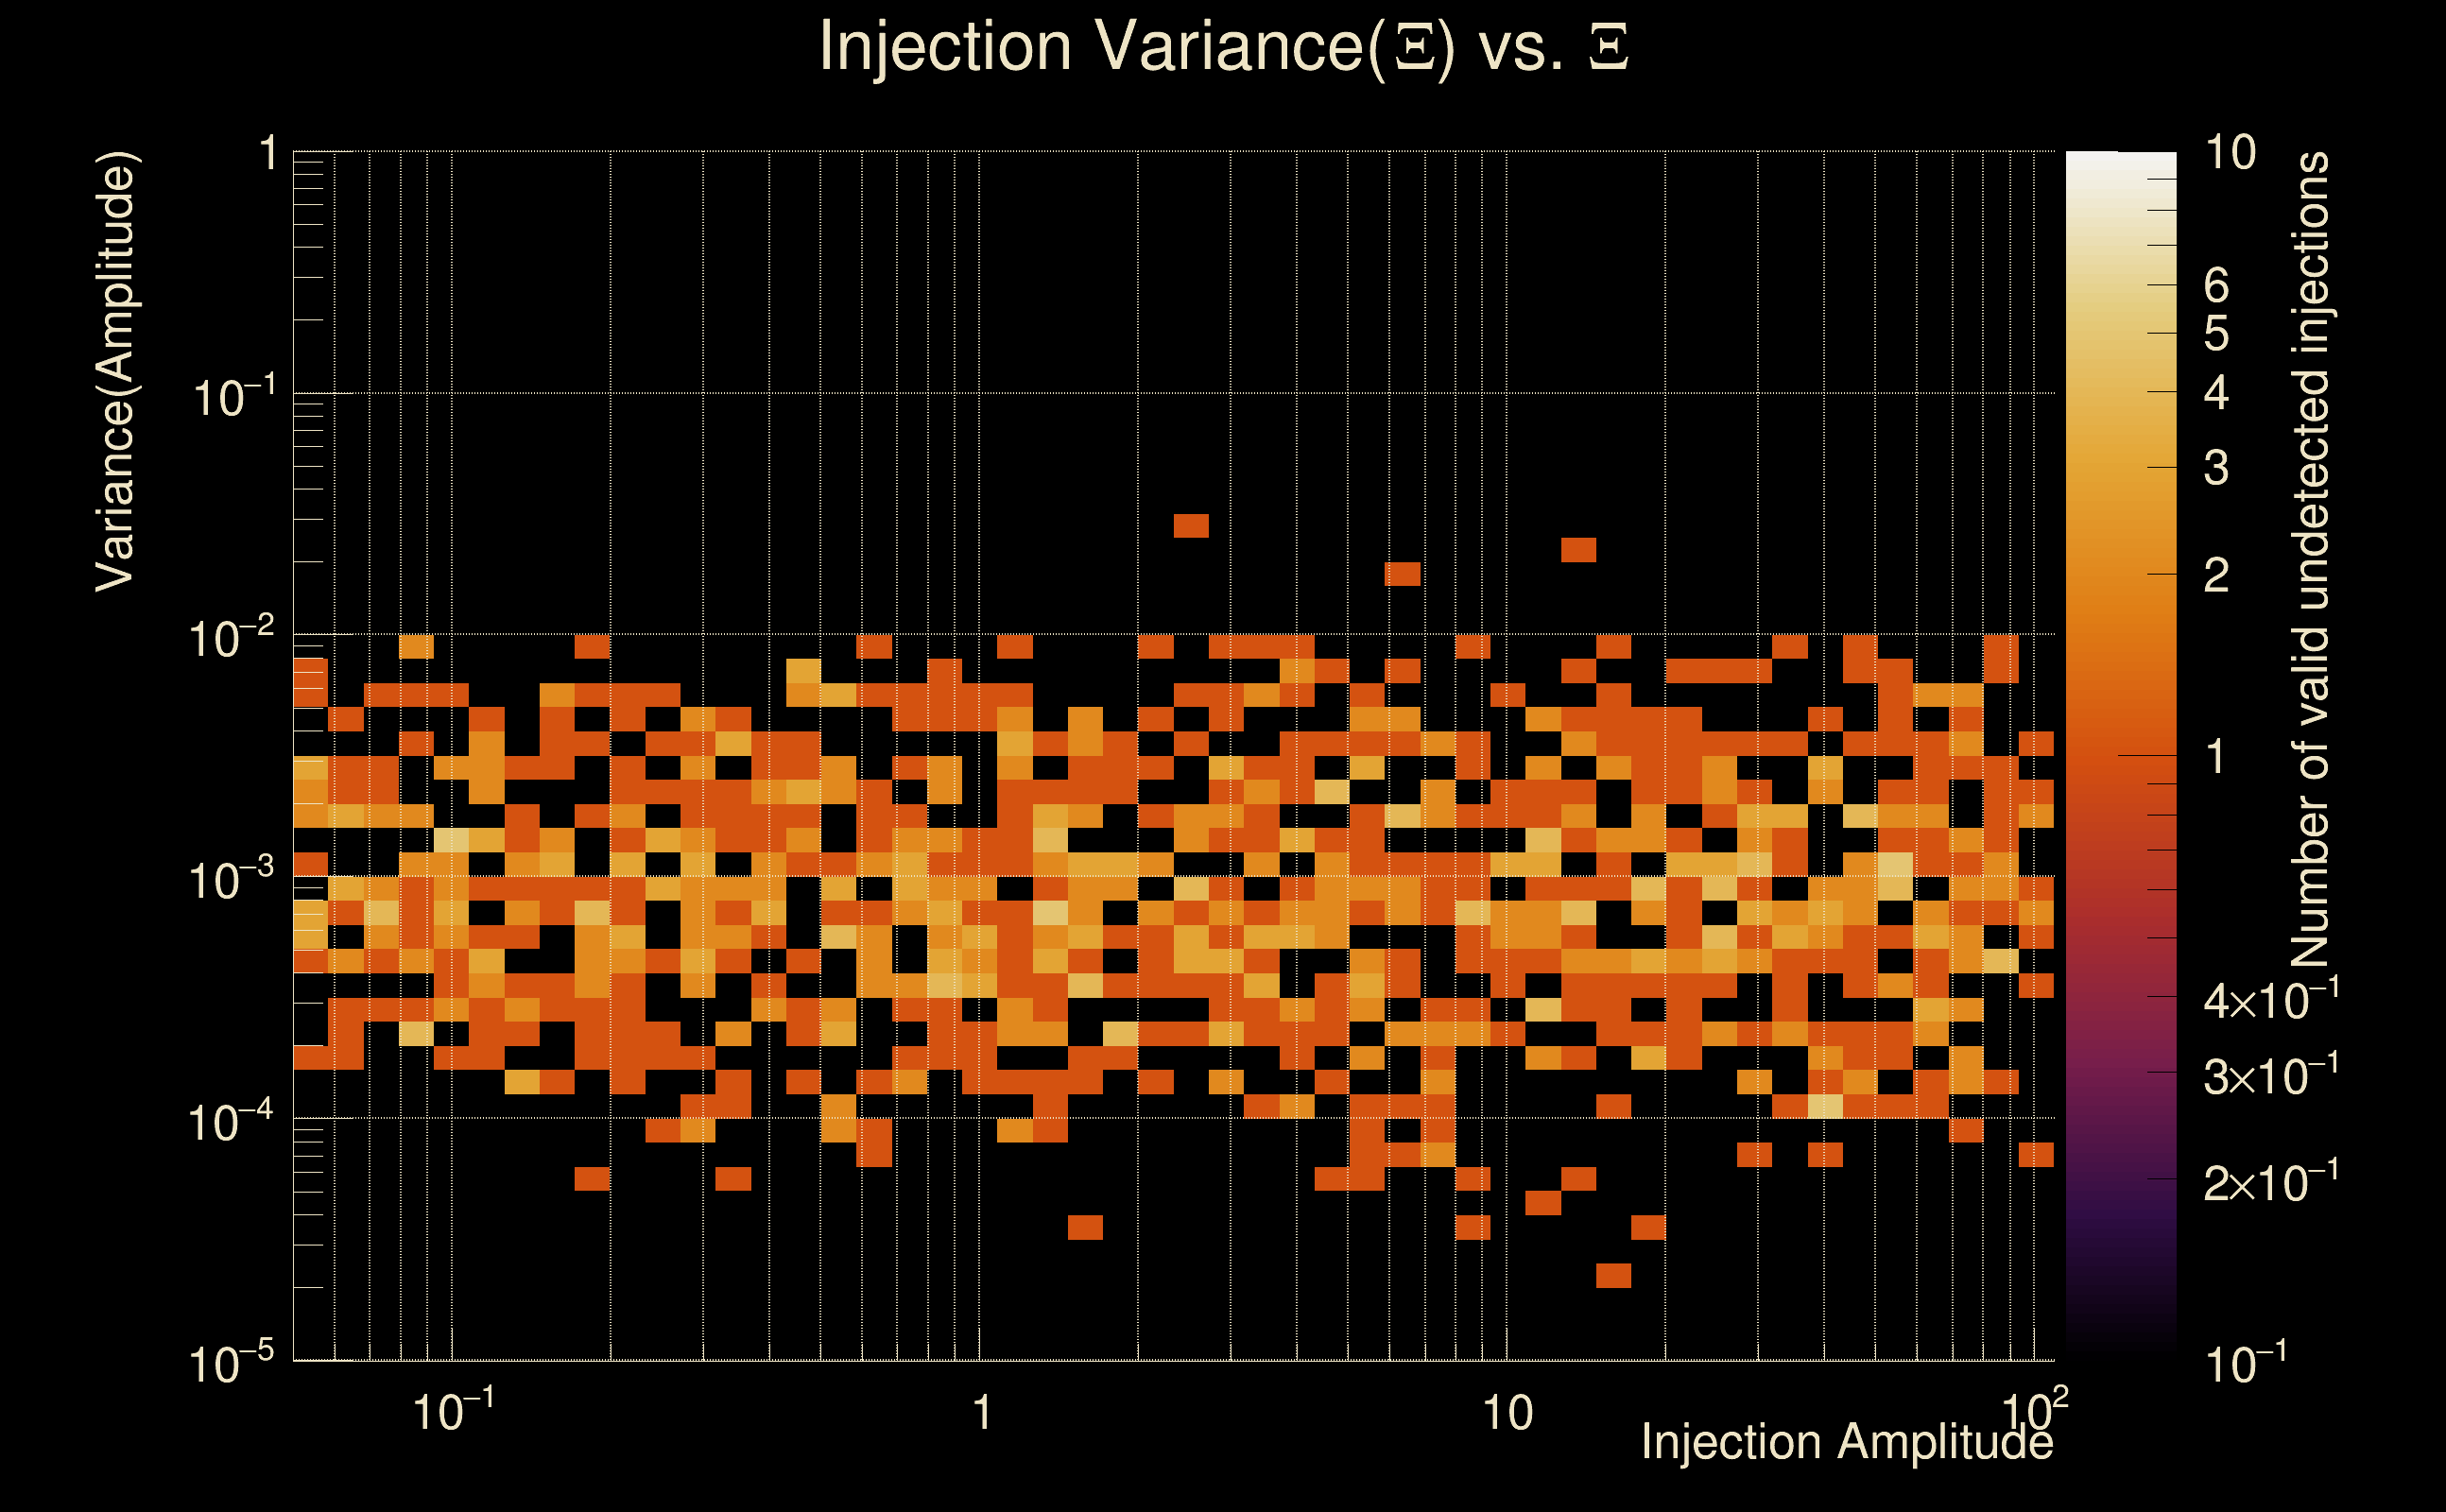
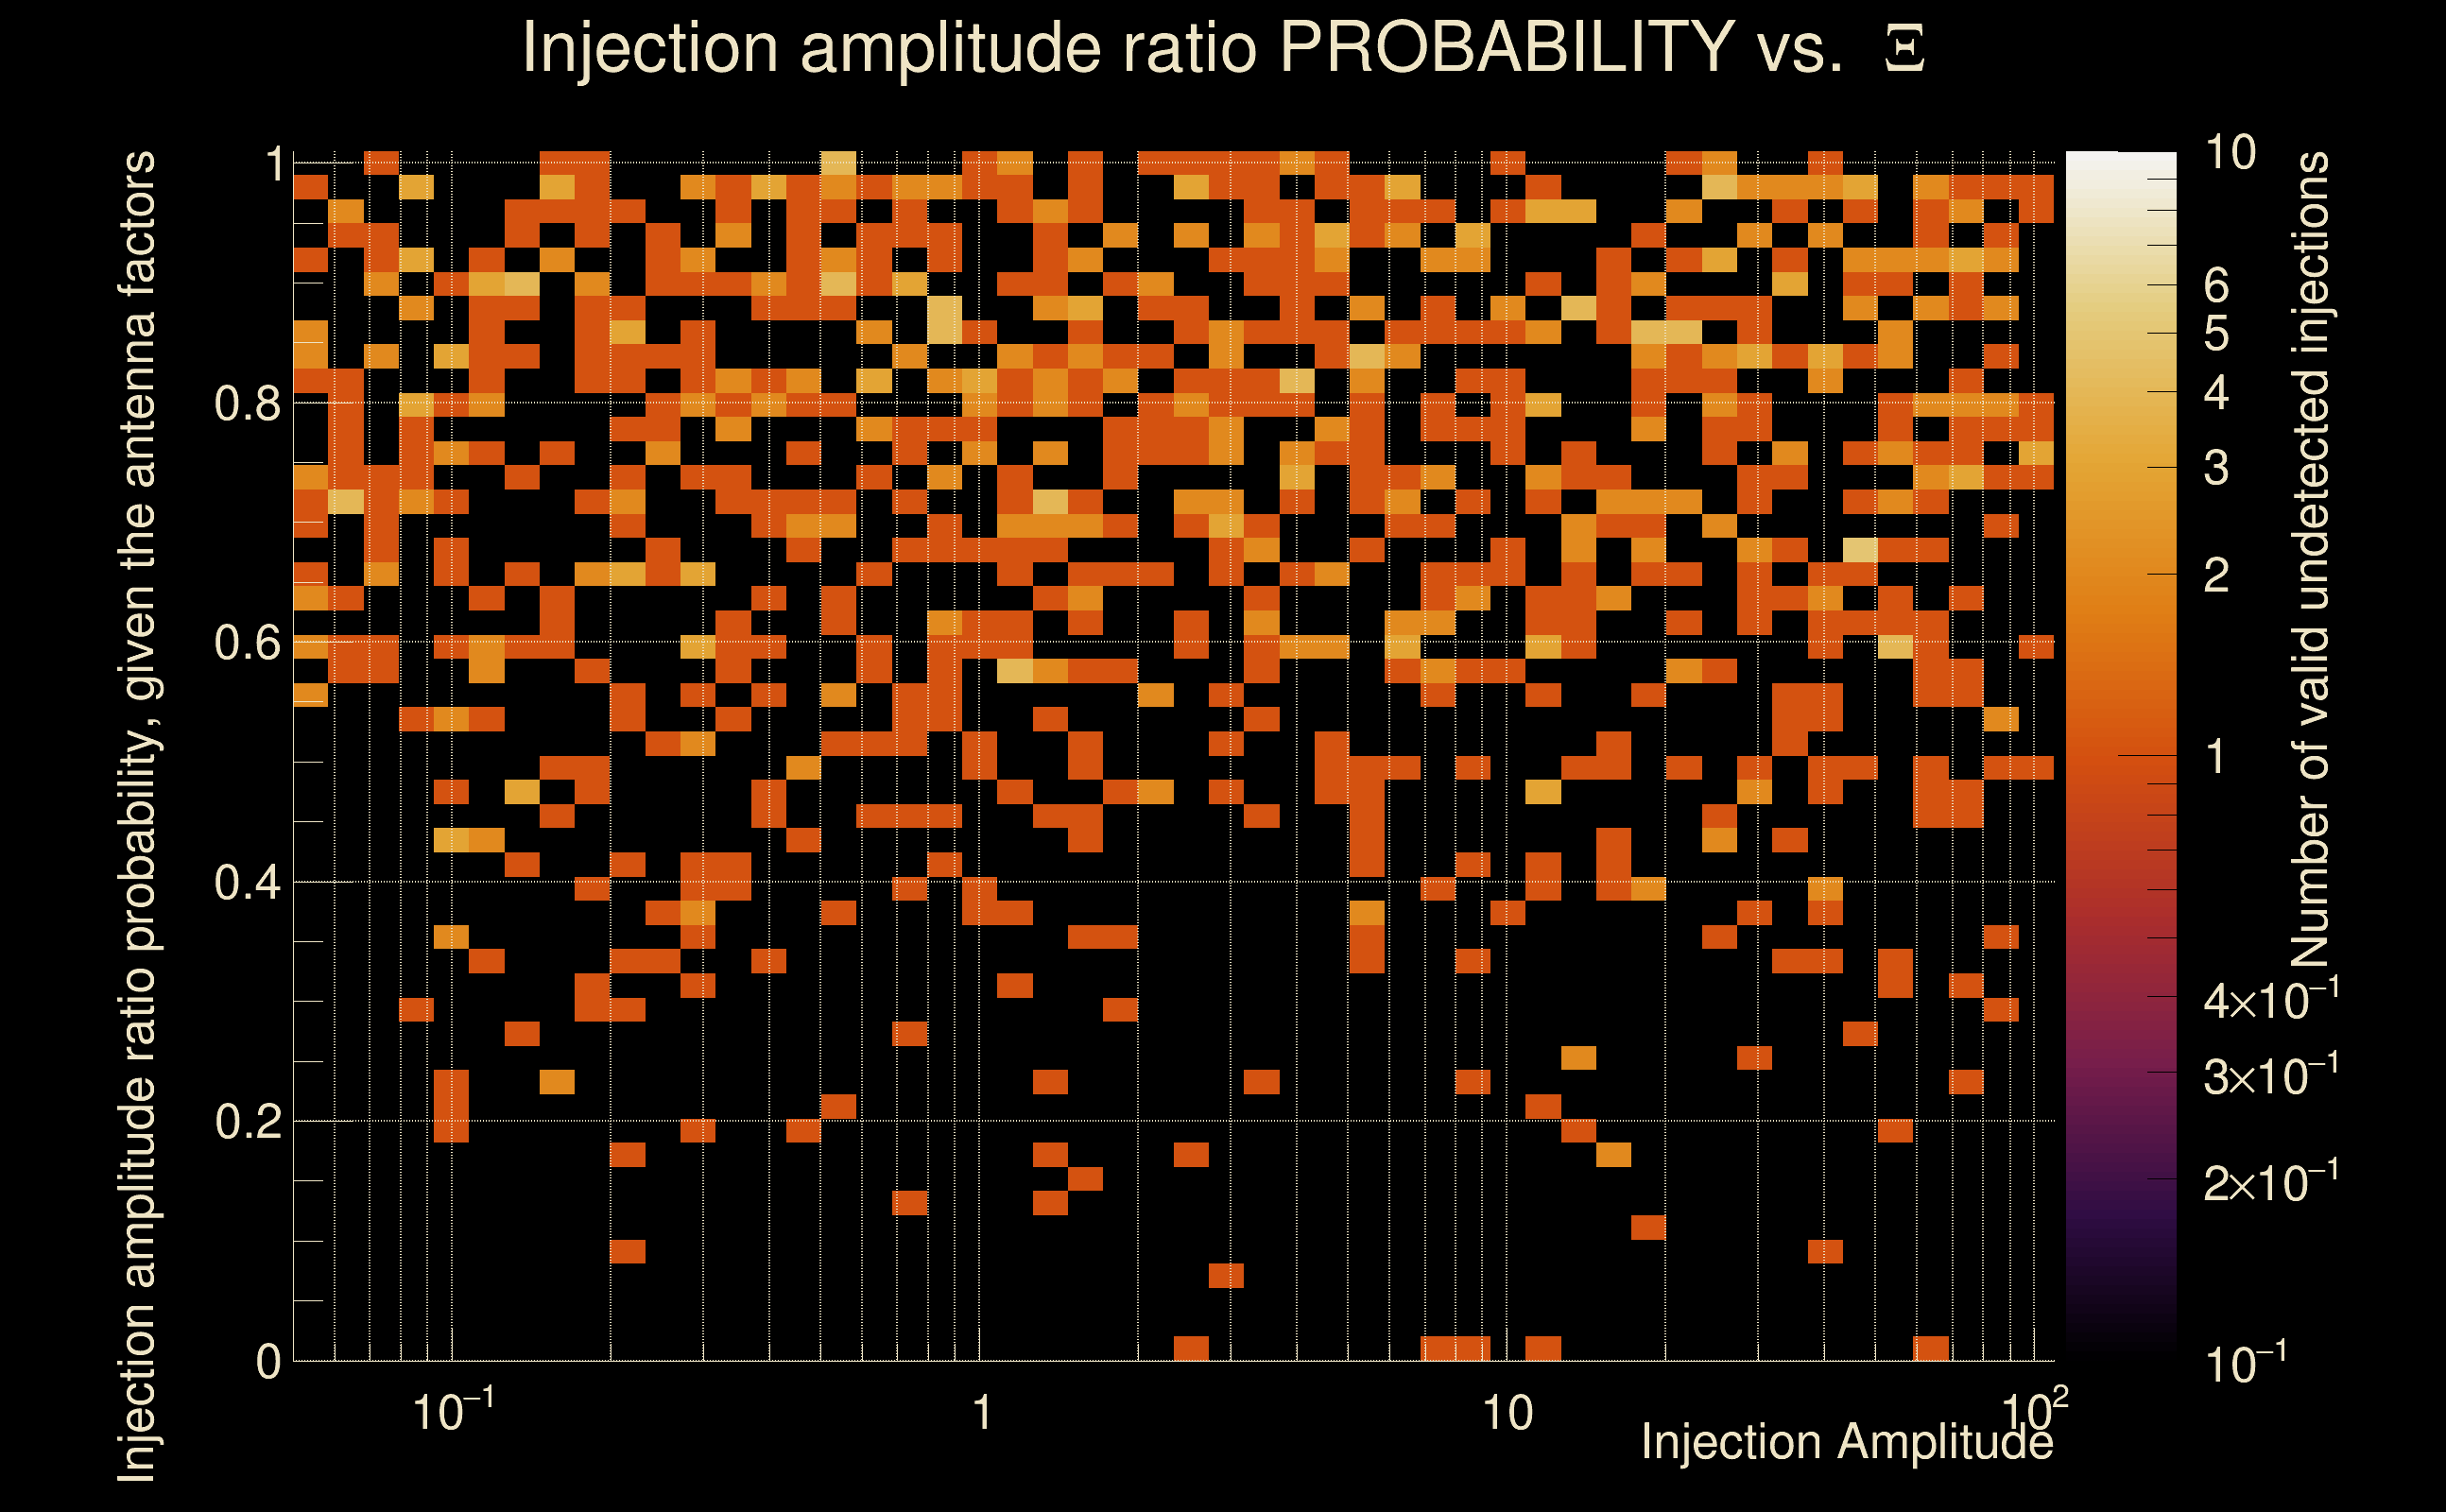
| Number of injections (total/valid/detected): | 1162 / 1002 / 0 |
| List of missed injections: | ./Pan21-SR_missed.txt |
| Injection amplitude at 90% detection efficiency: | -1 |
| Injection amplitude at 50% detection efficiency: | -1 |
| Injection amplitude at 10% detection efficiency: | -1 |
 |
 |
 |
 |
 |
 |
 |
|
 |
 |
|
 |
 |
|
 |
 |
|
 |
 |
|
 |
 |
|
 |
 |
|
 |
 |
|
 |
 |
 |
 |
 |
 |
 |
 |
 |
 |
 |
 |
 |
 |
 |
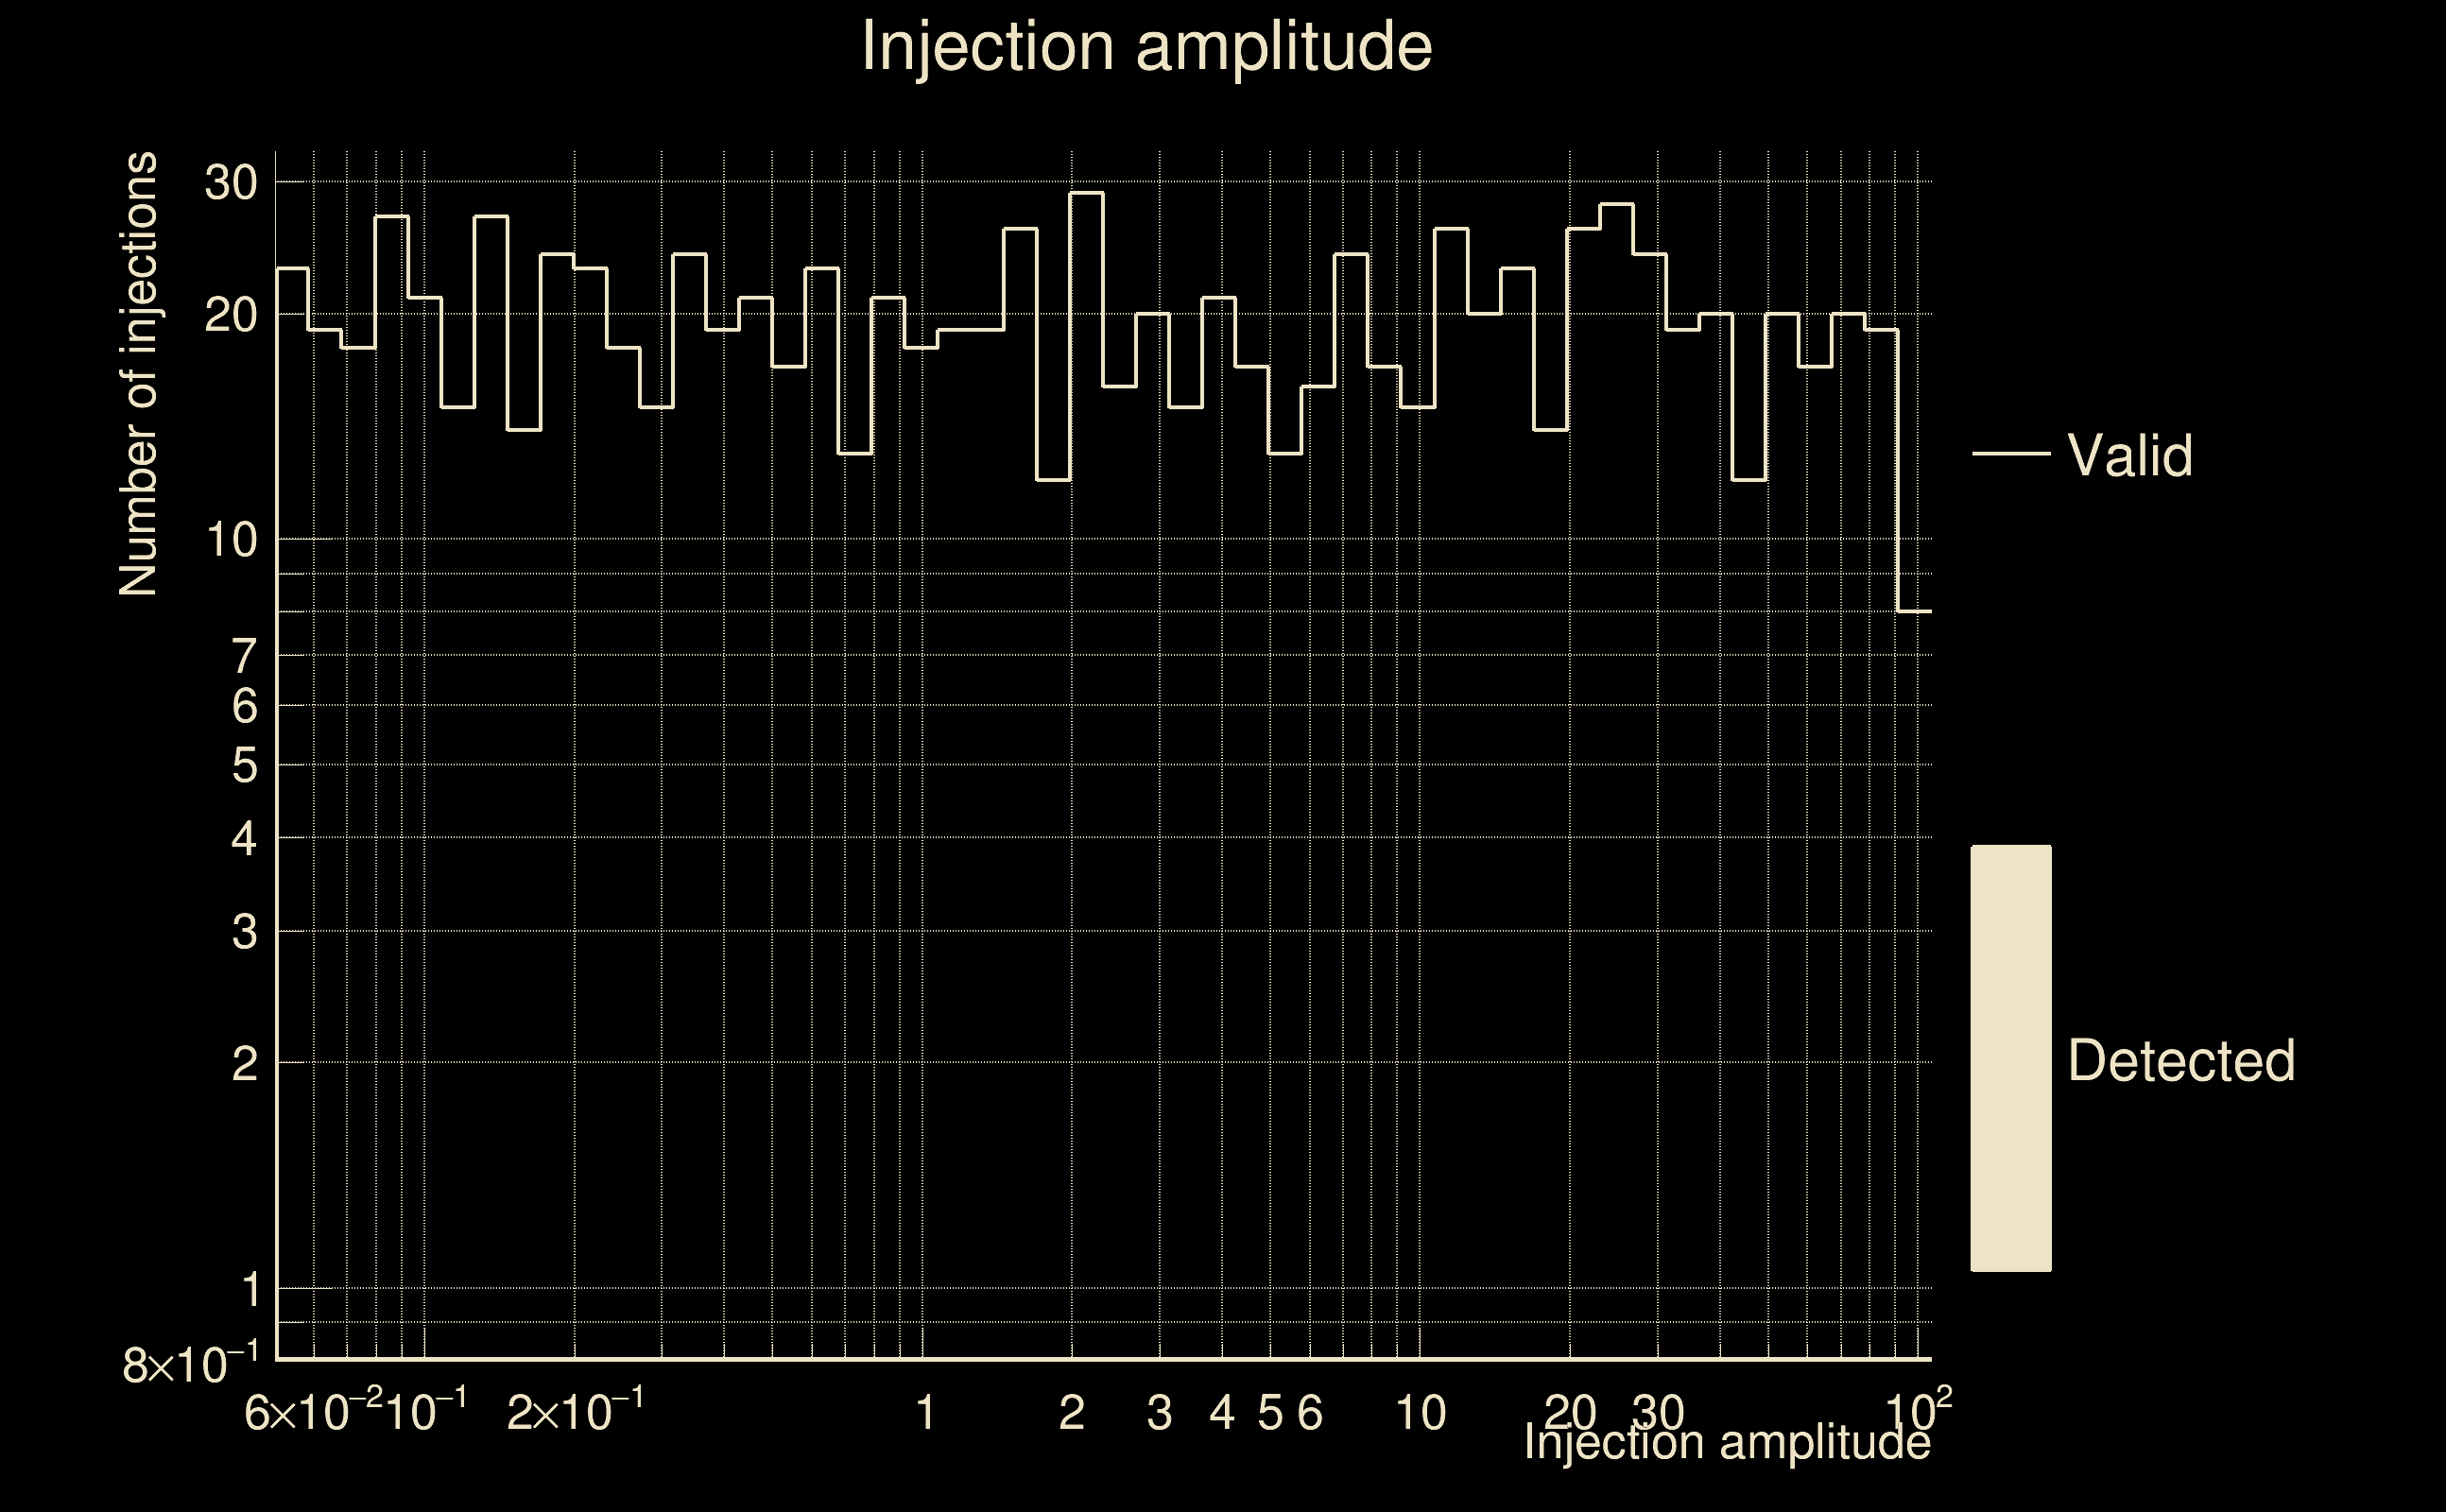
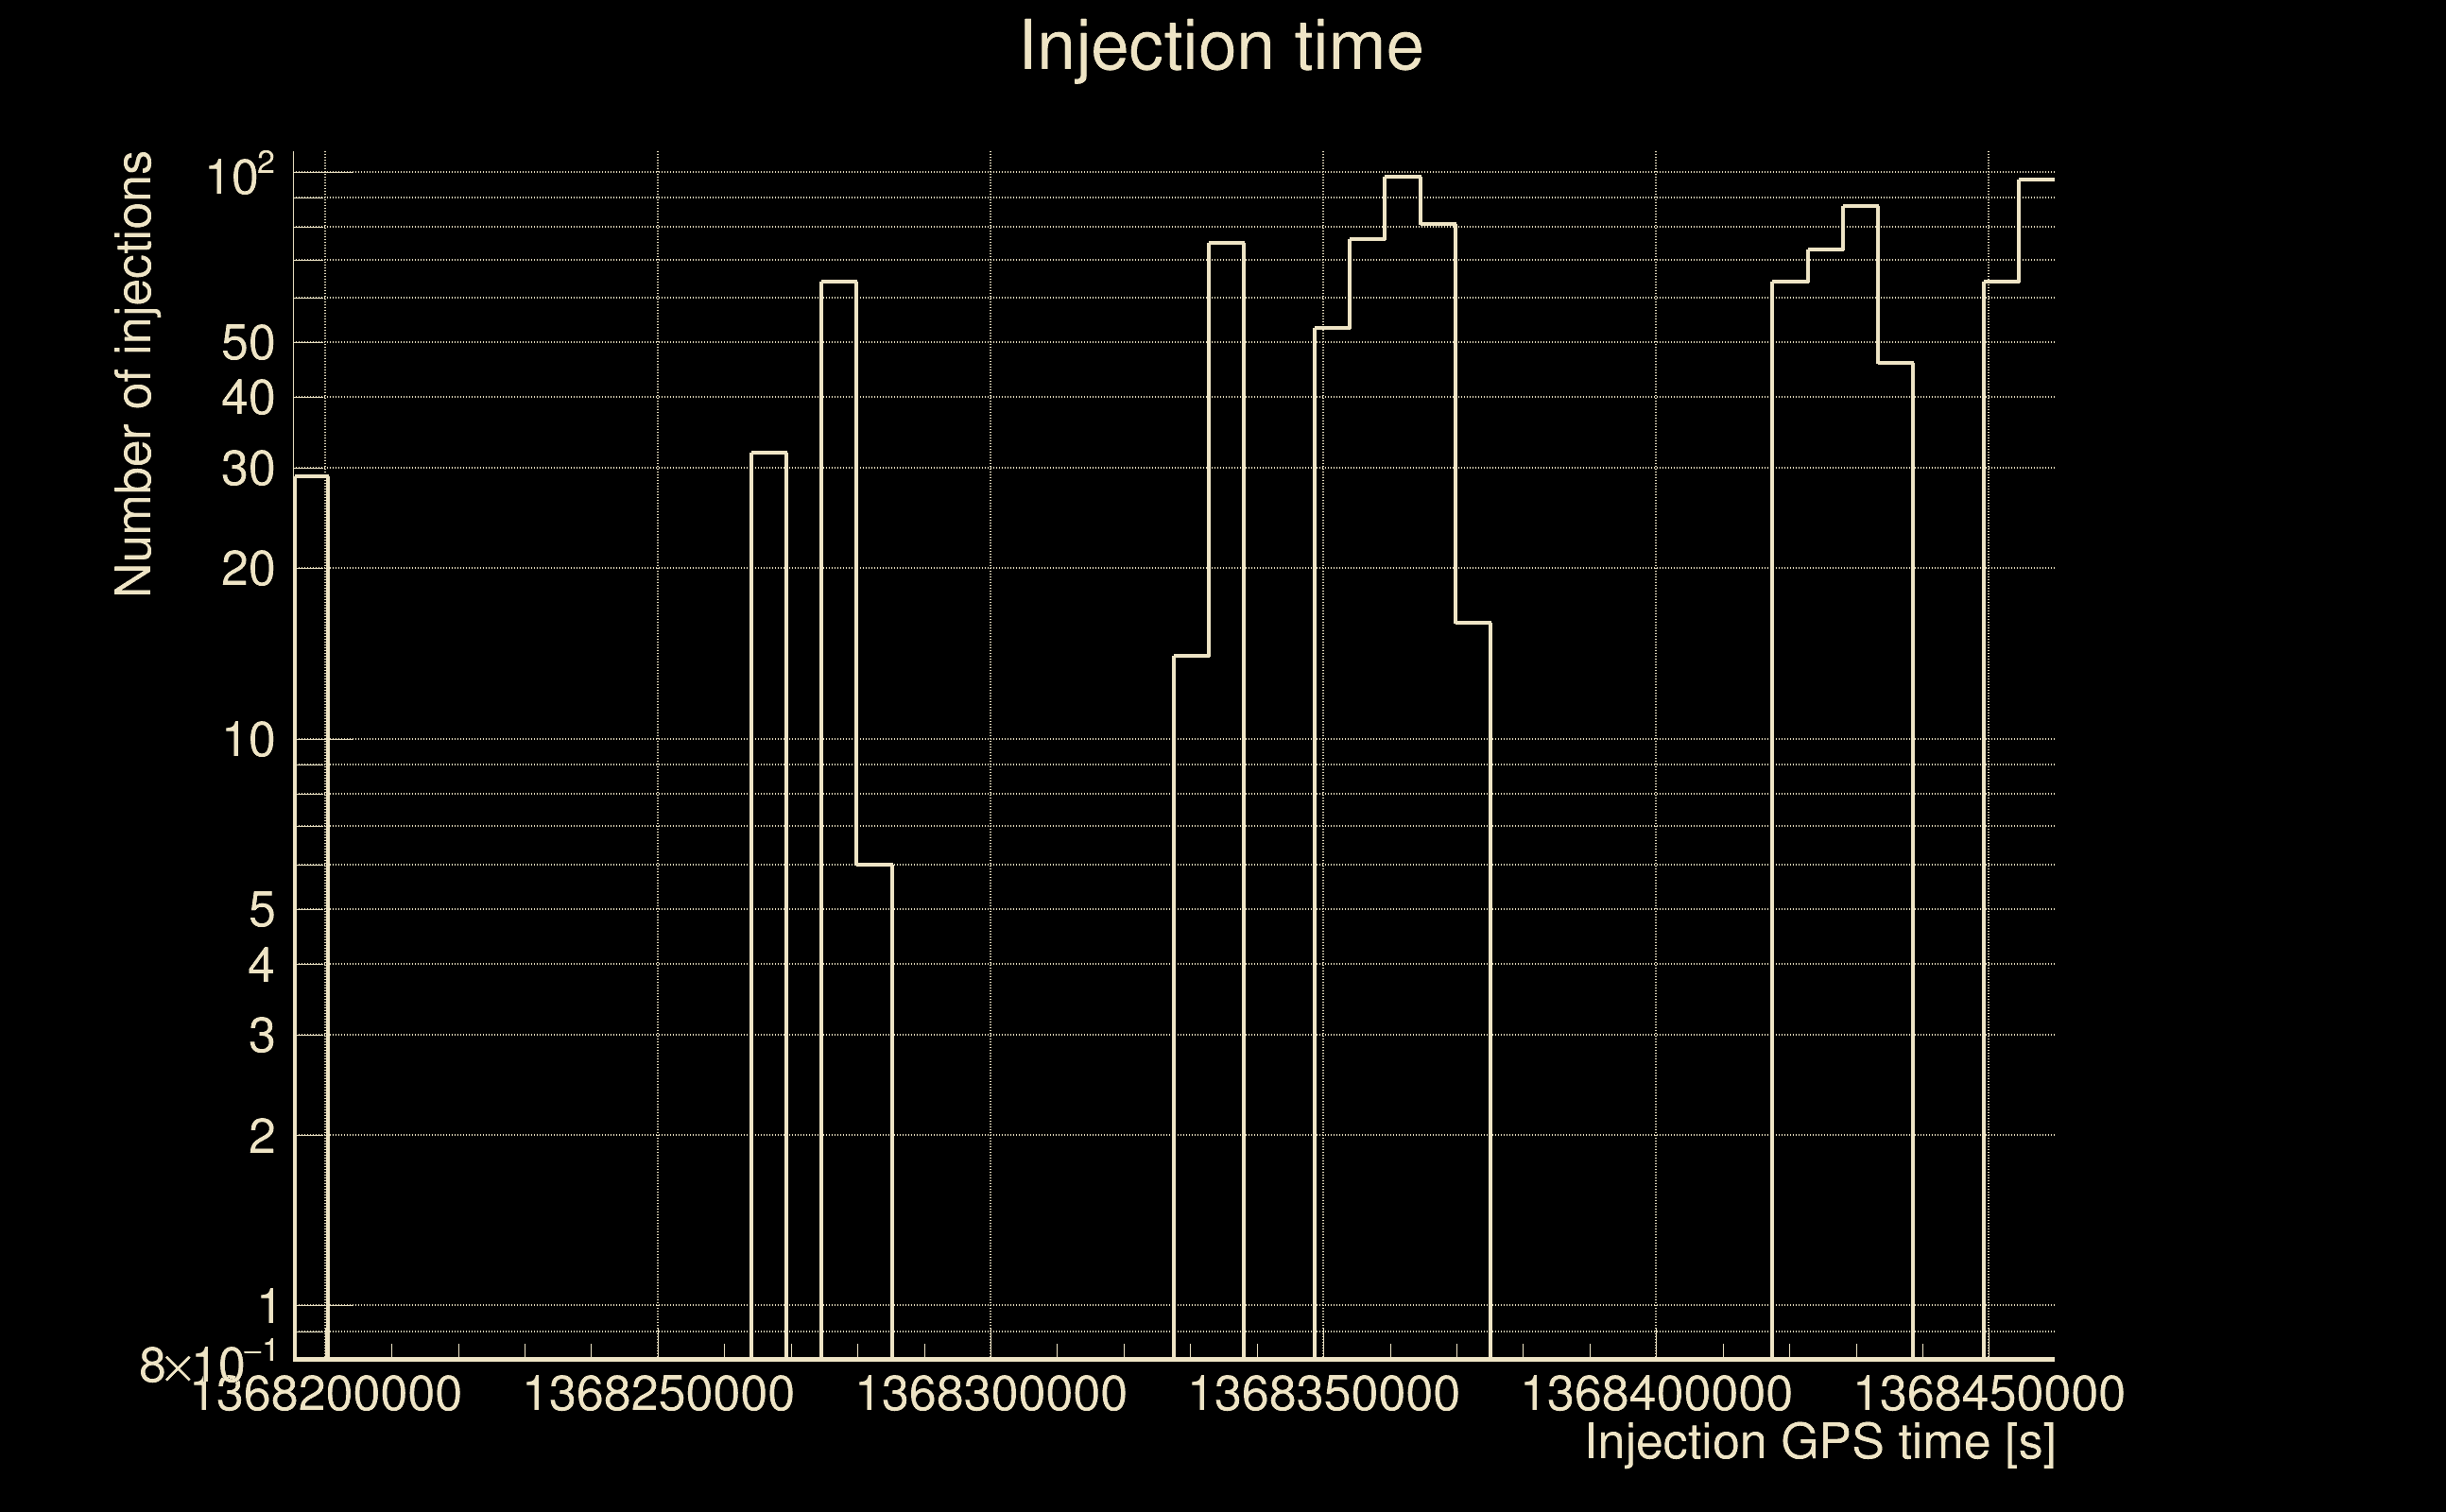
| Number of injections (total/valid/detected): | 1116 / 975 / 0 |
| List of missed injections: | ./Pow19-he3p5_missed.txt |
| Injection amplitude at 90% detection efficiency: | -1 |
| Injection amplitude at 50% detection efficiency: | -1 |
| Injection amplitude at 10% detection efficiency: | -1 |
 |
 |
 |
 |
 |
 |
 |
|
 |
 |
|
 |
 |
|
 |
 |
|
 |
 |
|
 |
 |
|
 |
 |
|
 |
 |
|
 |
 |
 |
 |
 |
 |
 |
 |
 |
 |
 |
 |
 |
 |
 |
| florent.robinet@ijclab.in2p3.fr |