| Omicron version: | 4.2.0: documentation gitlab repository |
| Omicron run by: | unknown |
| Report produced on: | Mon Feb 23 09:20:26 2026 UTC |
| Ox option file: | TargIxf_feb2026_SN4_30s_options.txt |
| Omicron option files: | detector 0, detector 1 |
| Detector channel names: | H1:GDS-CALIB_STRAIN_CLEAN_AR_4096Hz, L1:GDS-CALIB_STRAIN_CLEAN_AR_4096Hz |
| Omicron analysis time window and overlap: | 16 s, 6 s |
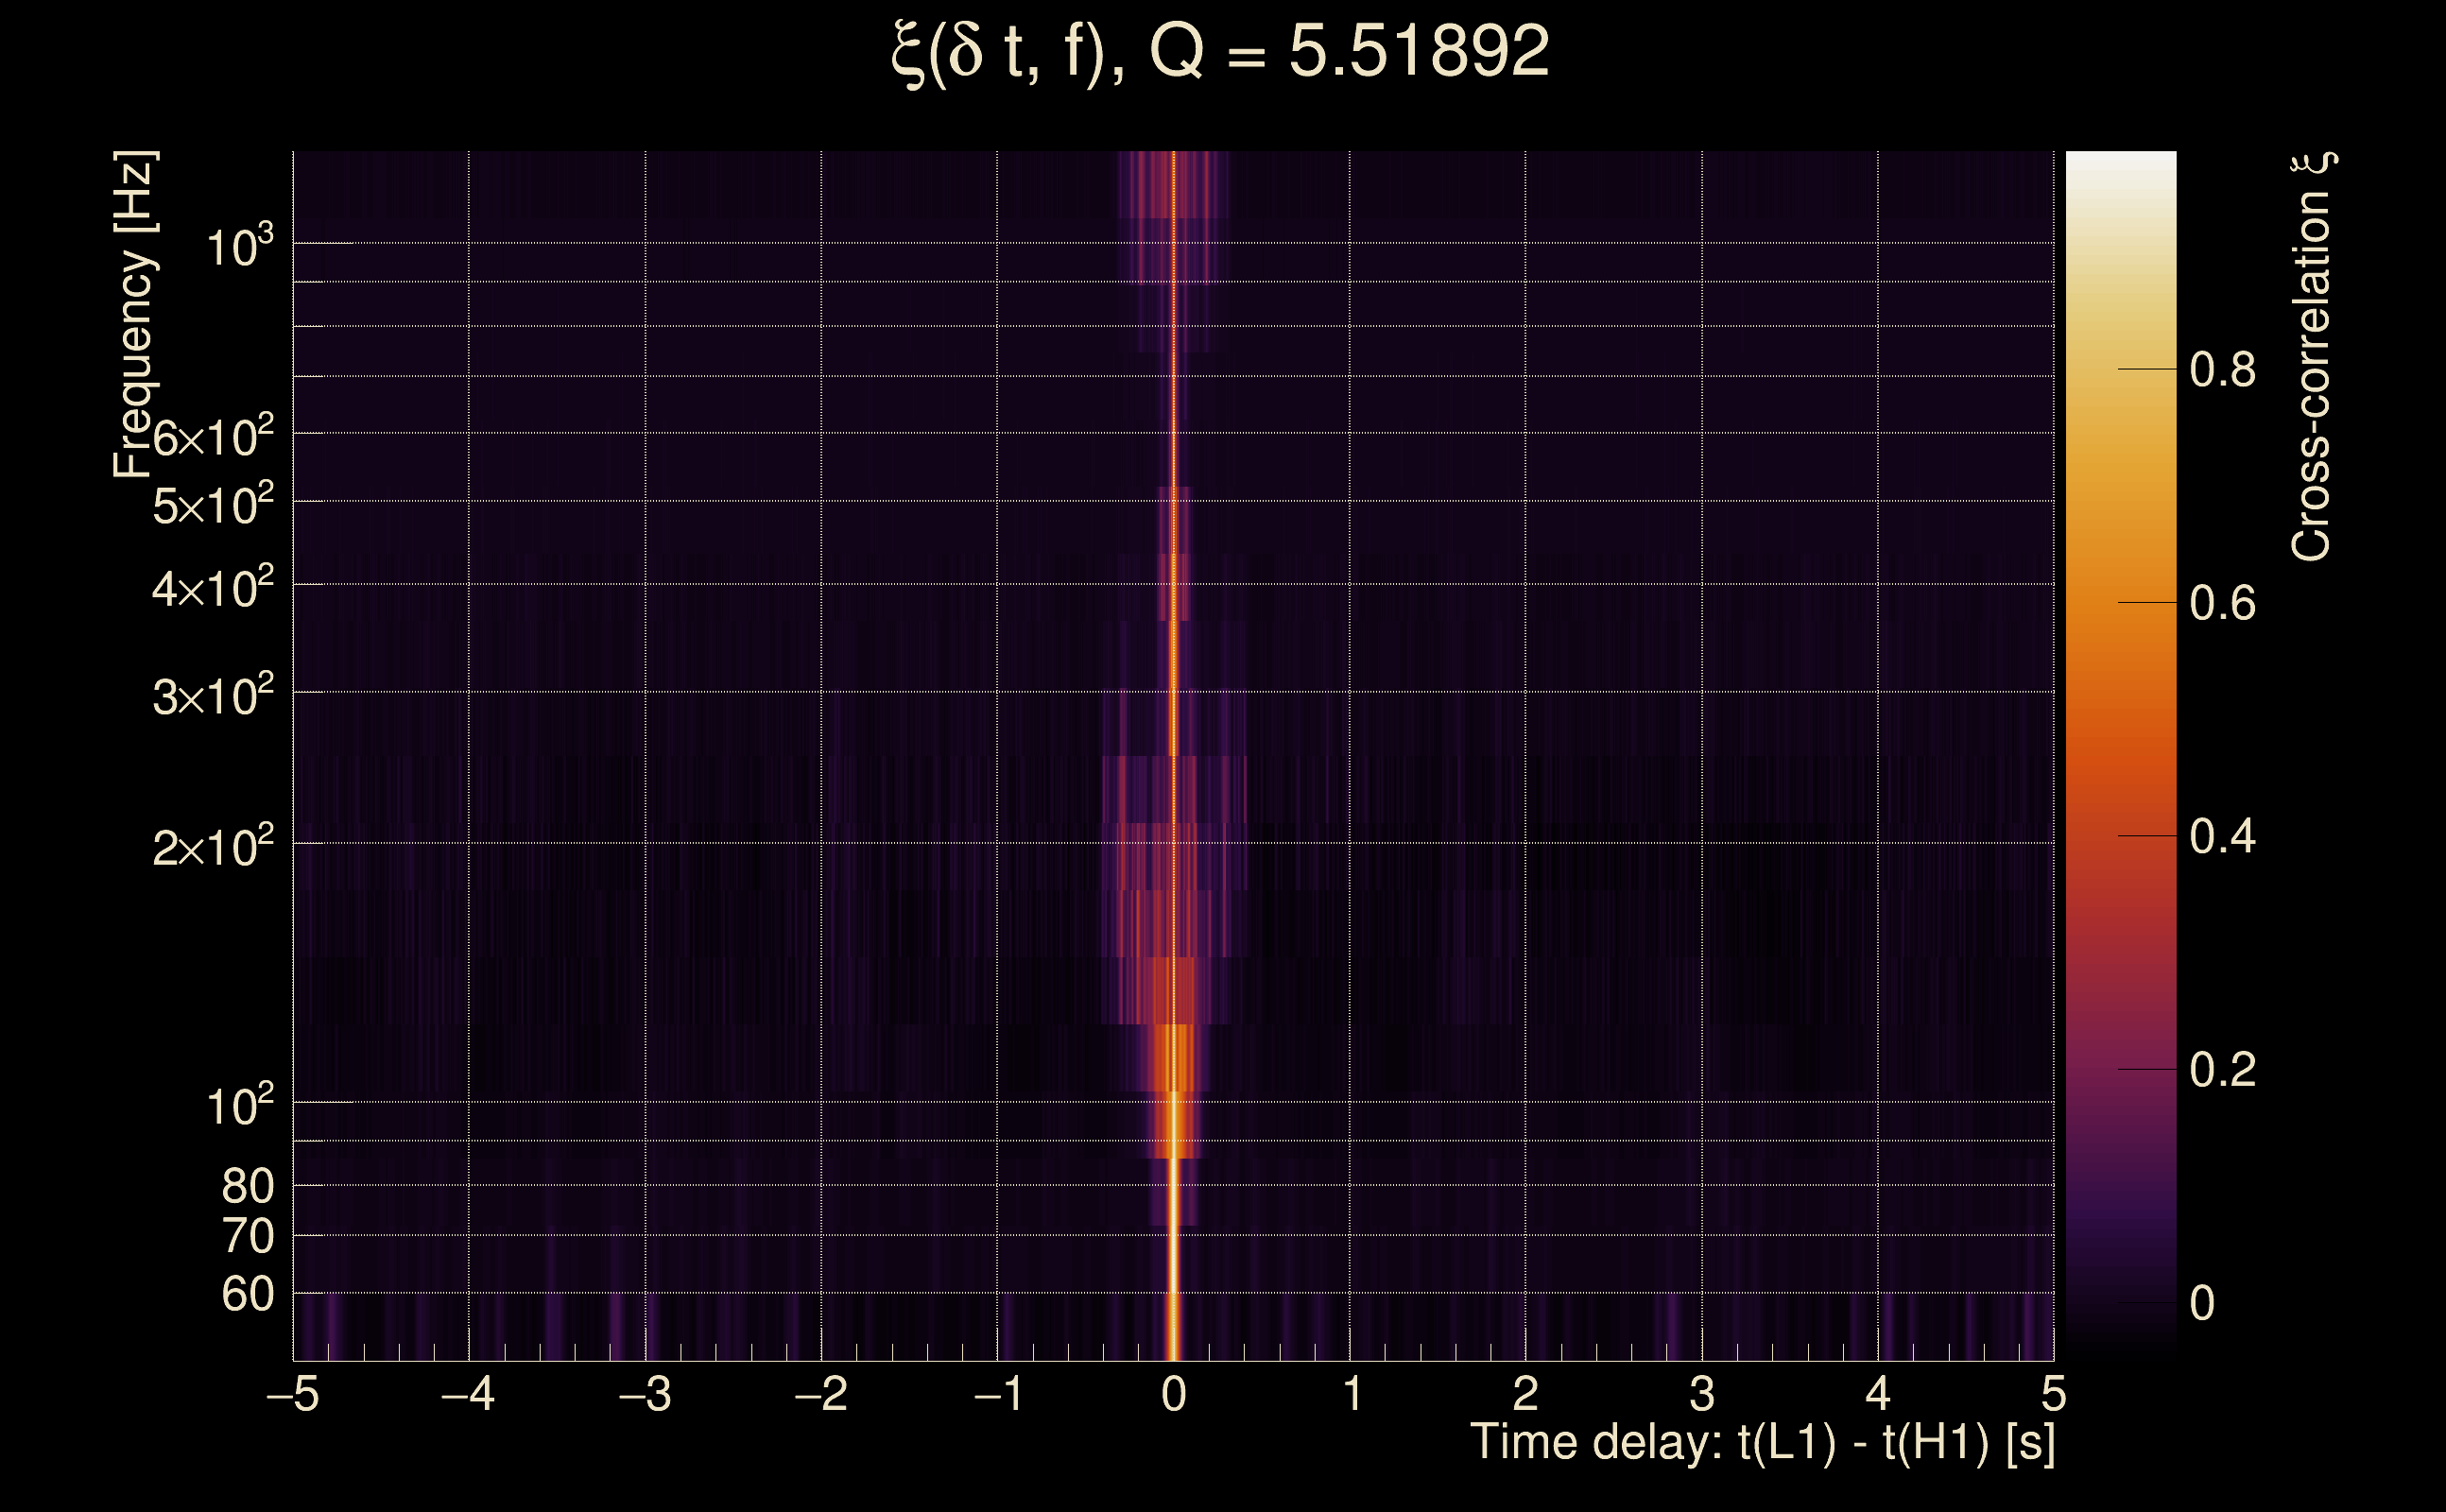
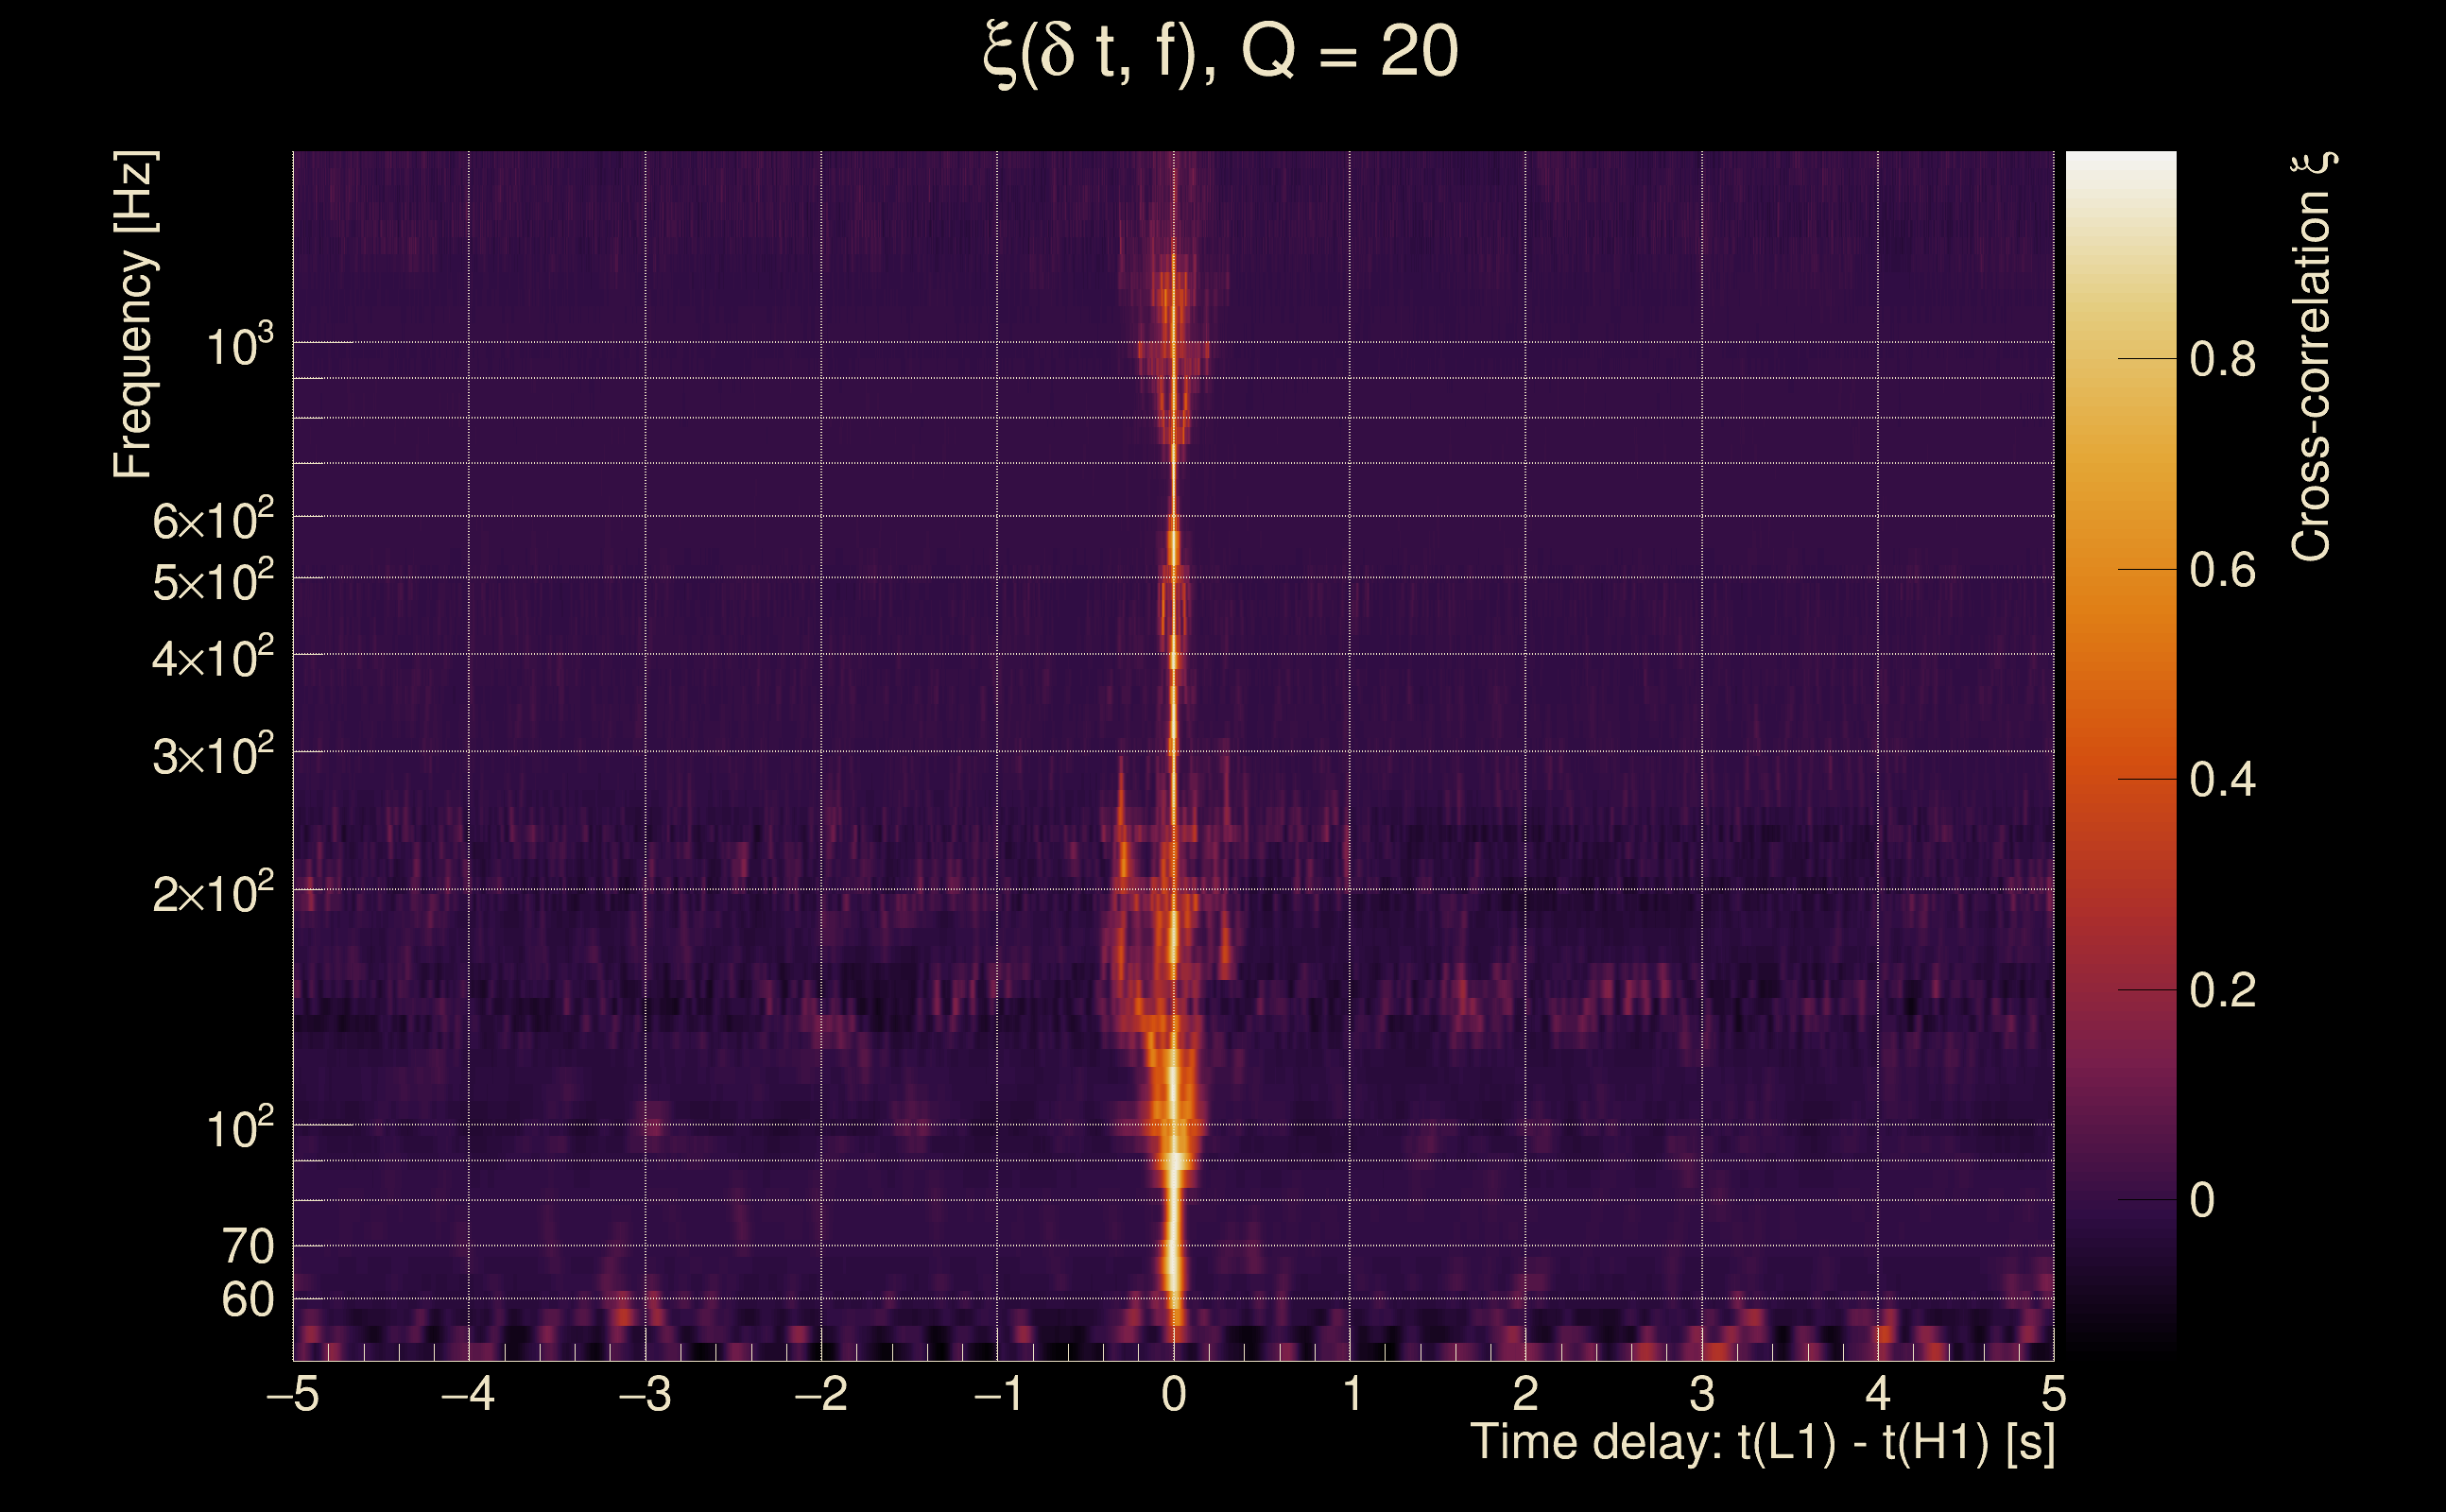
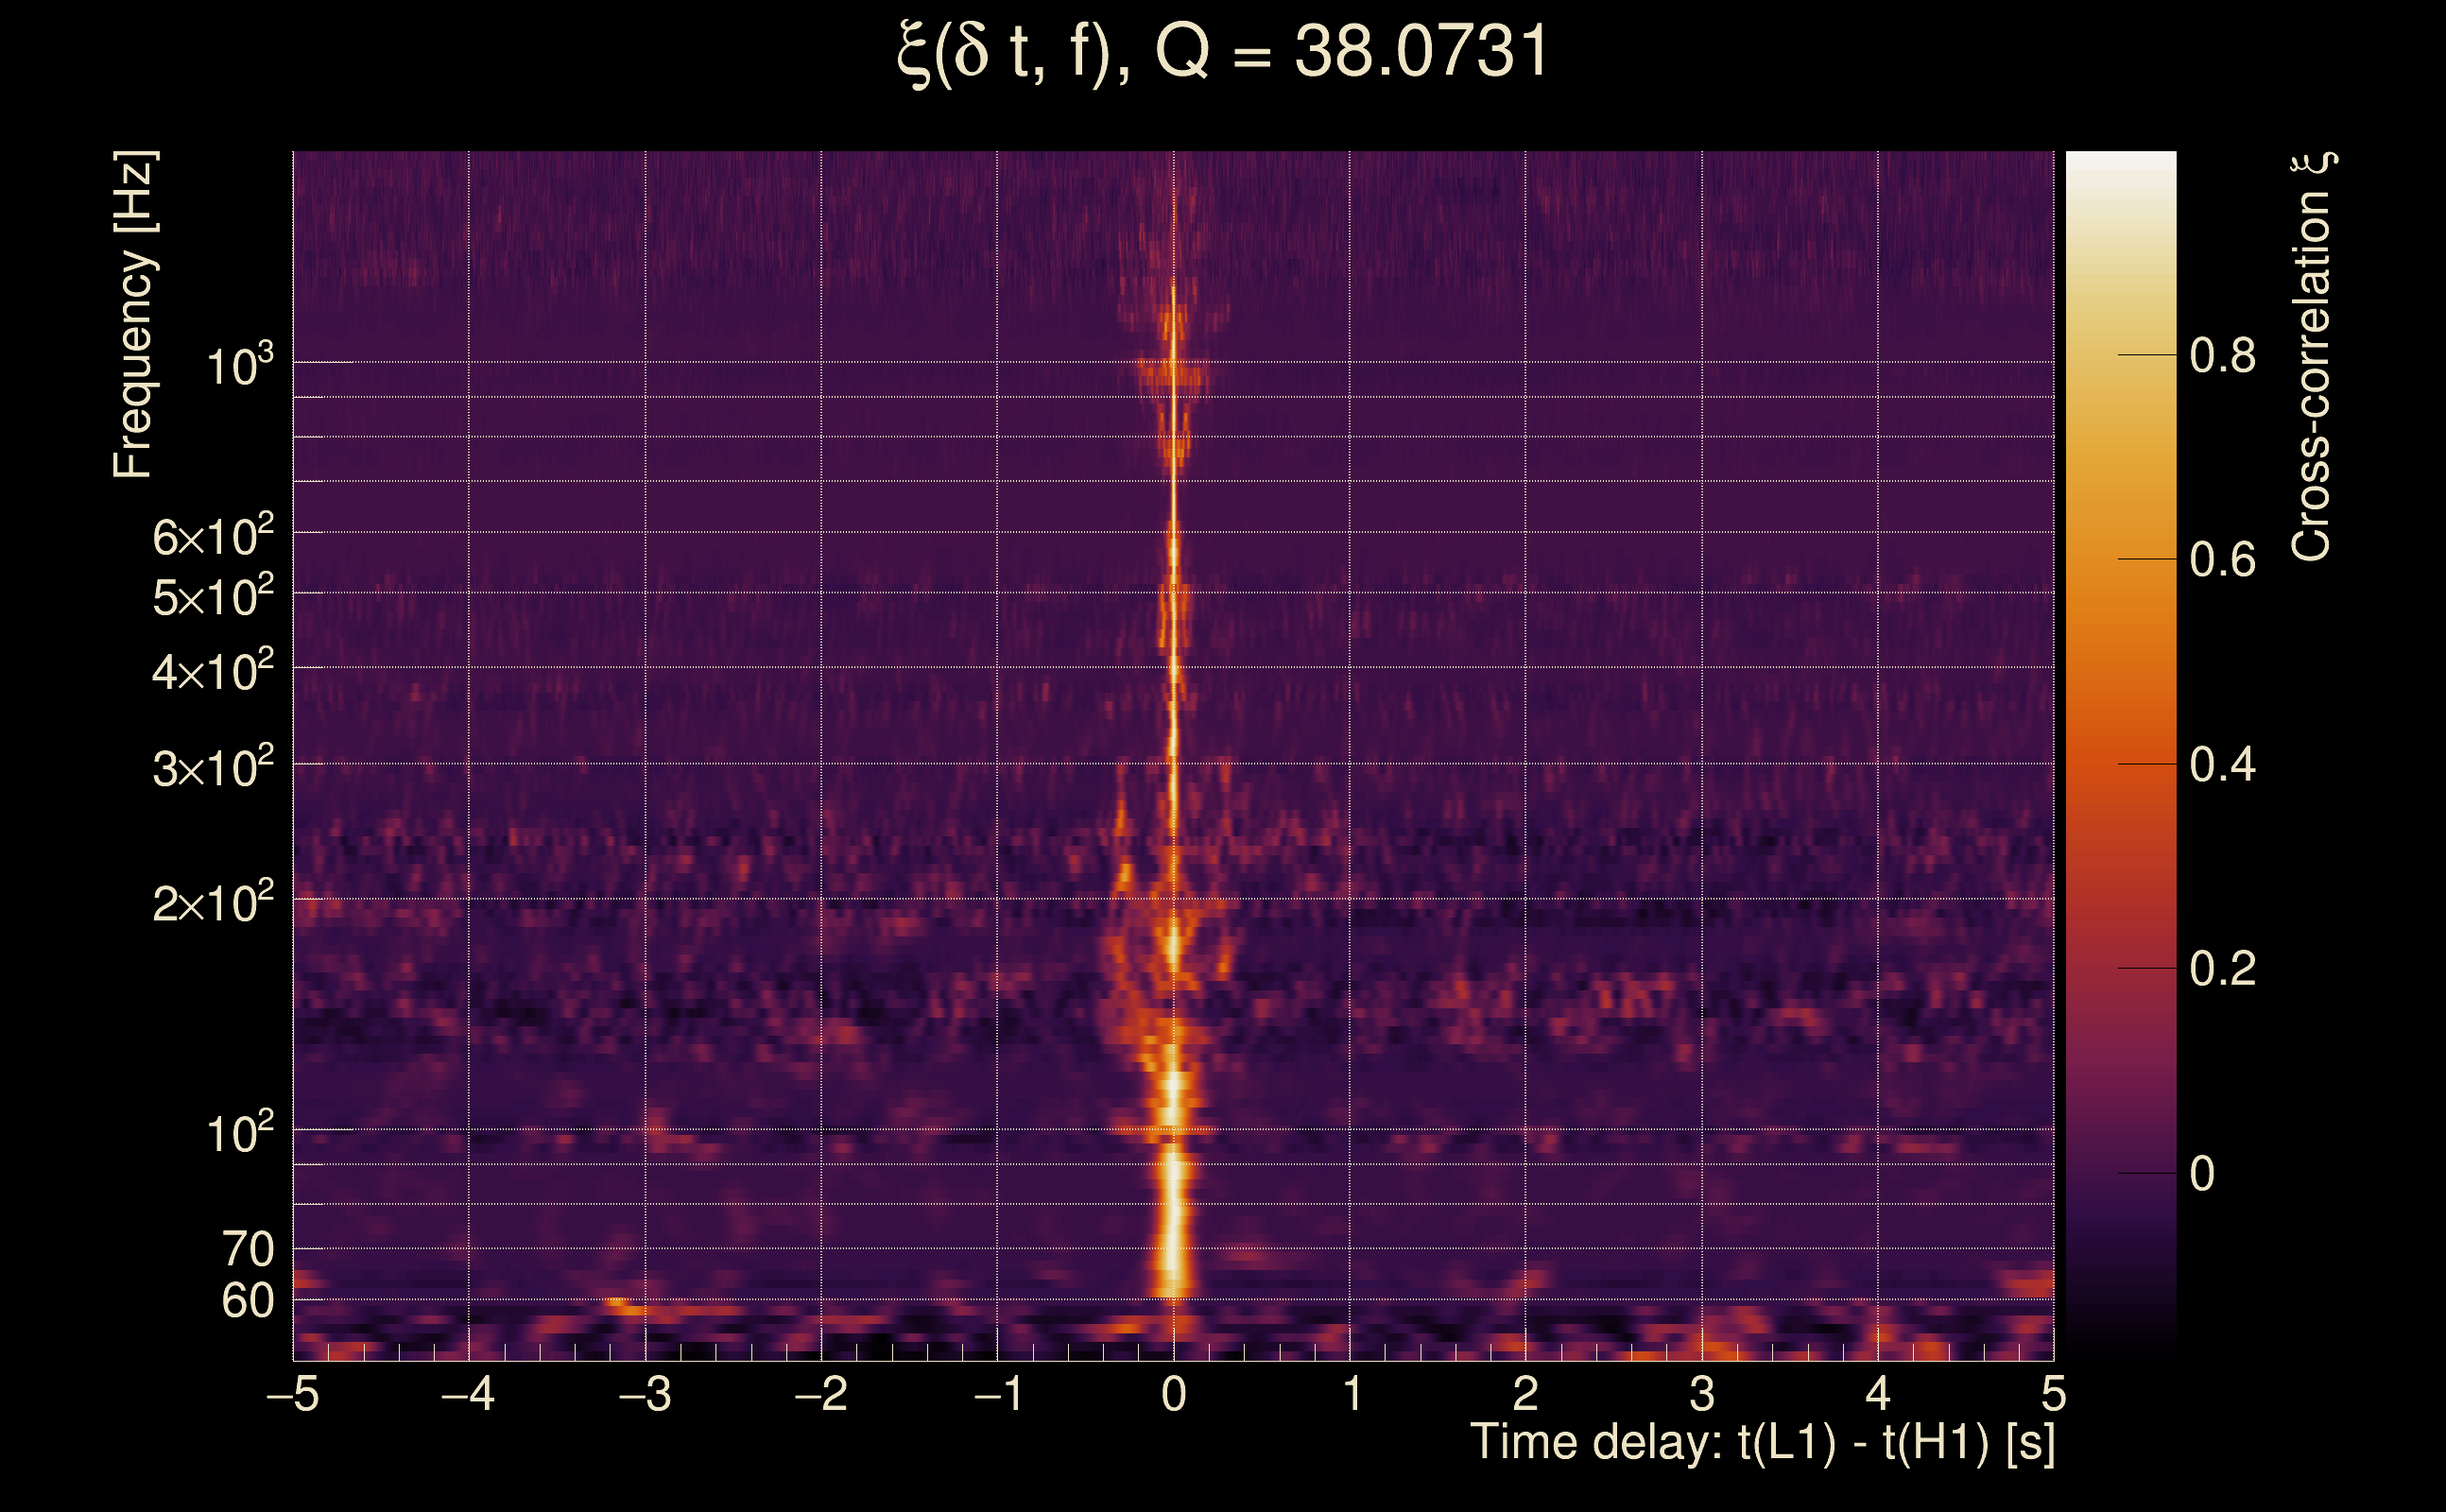
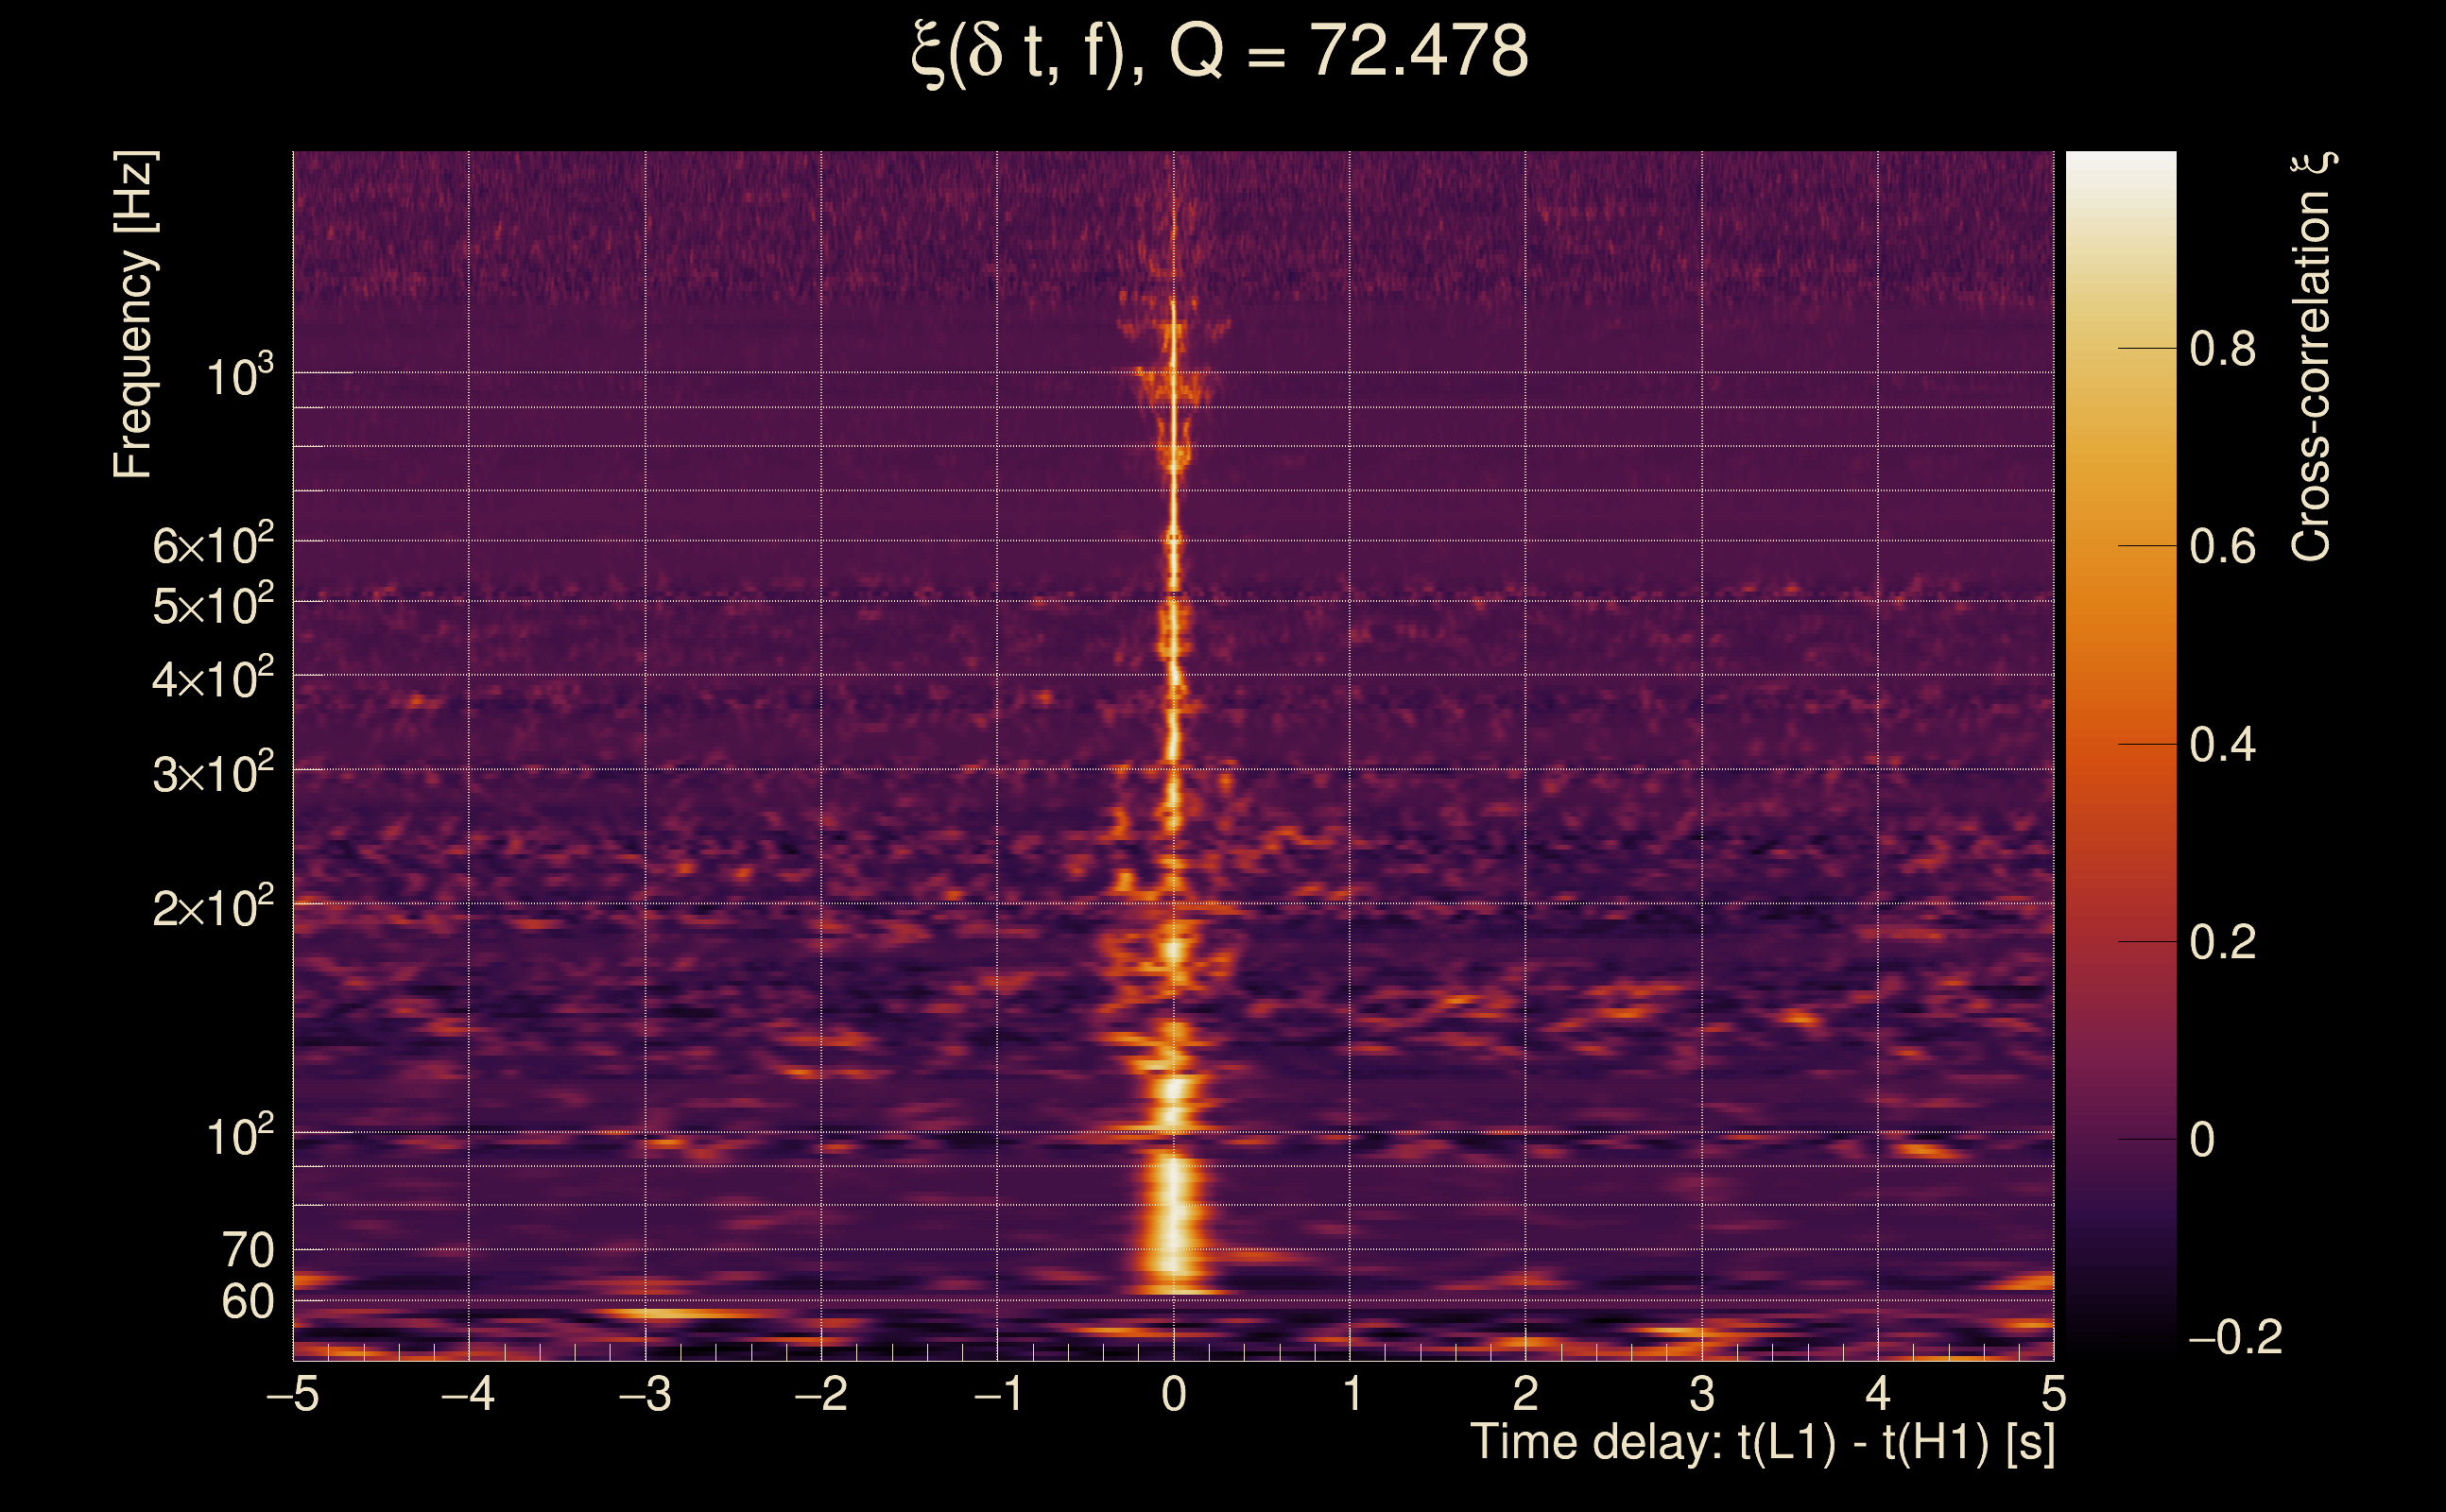
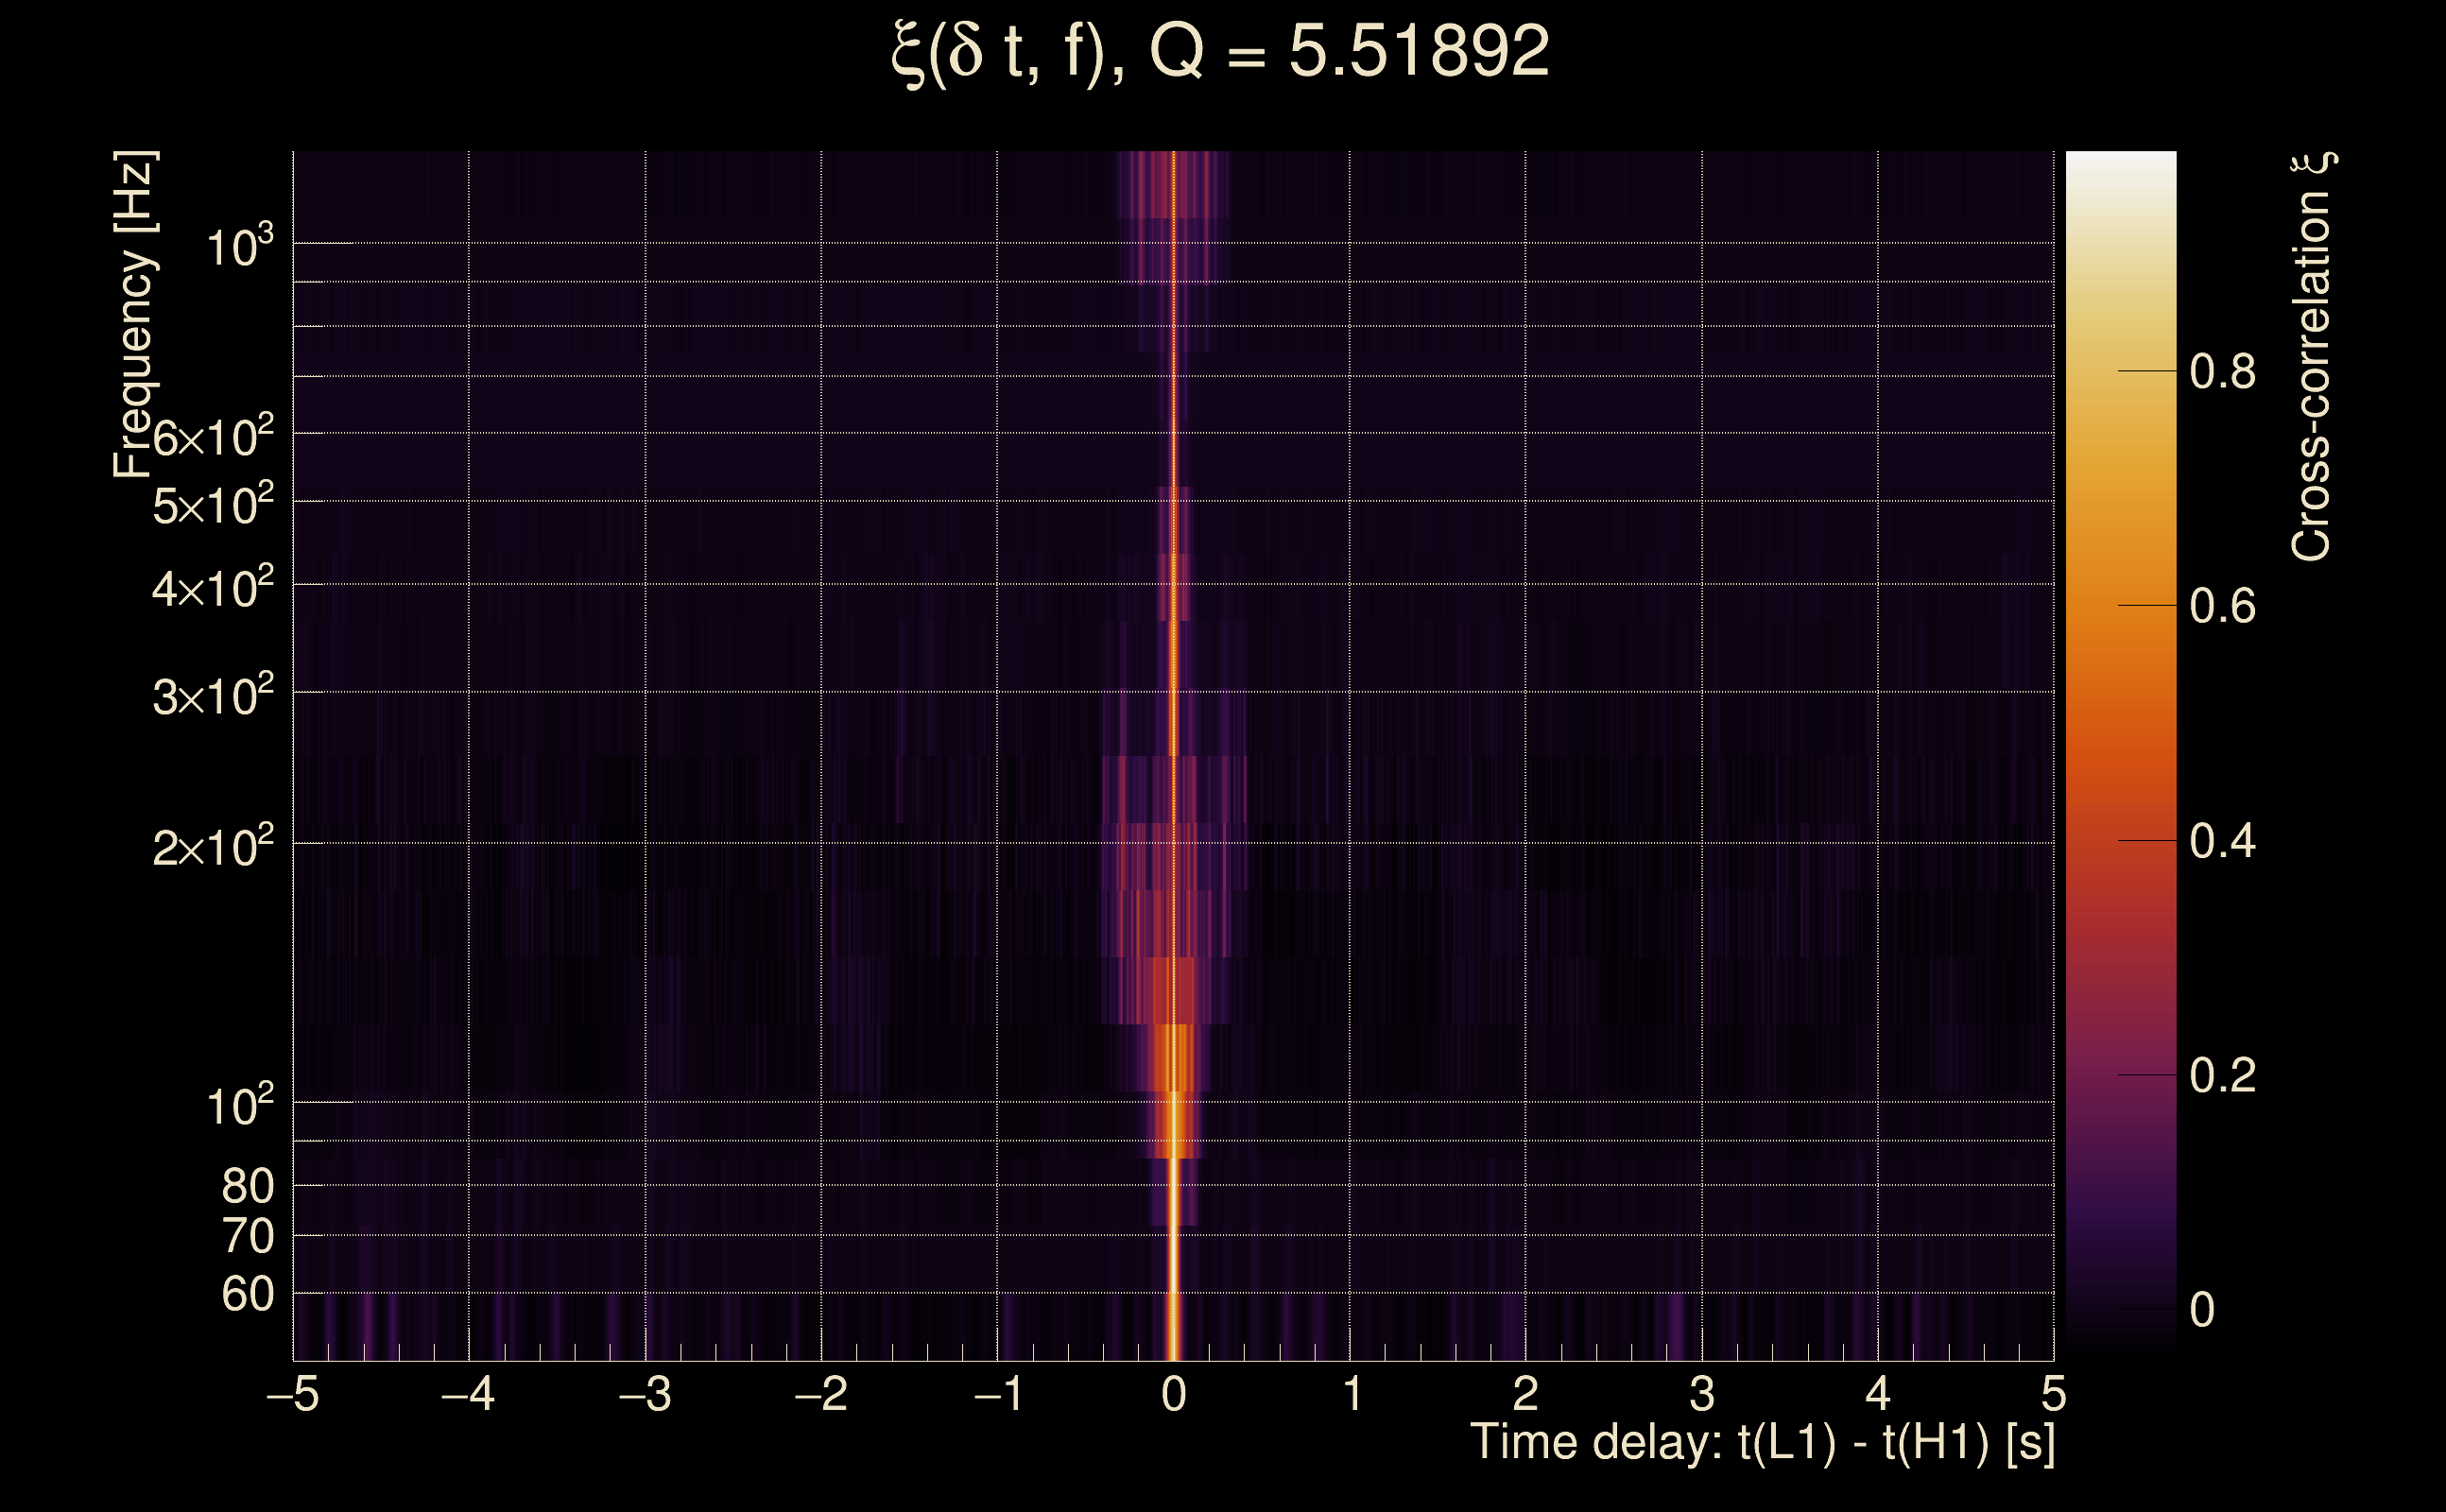
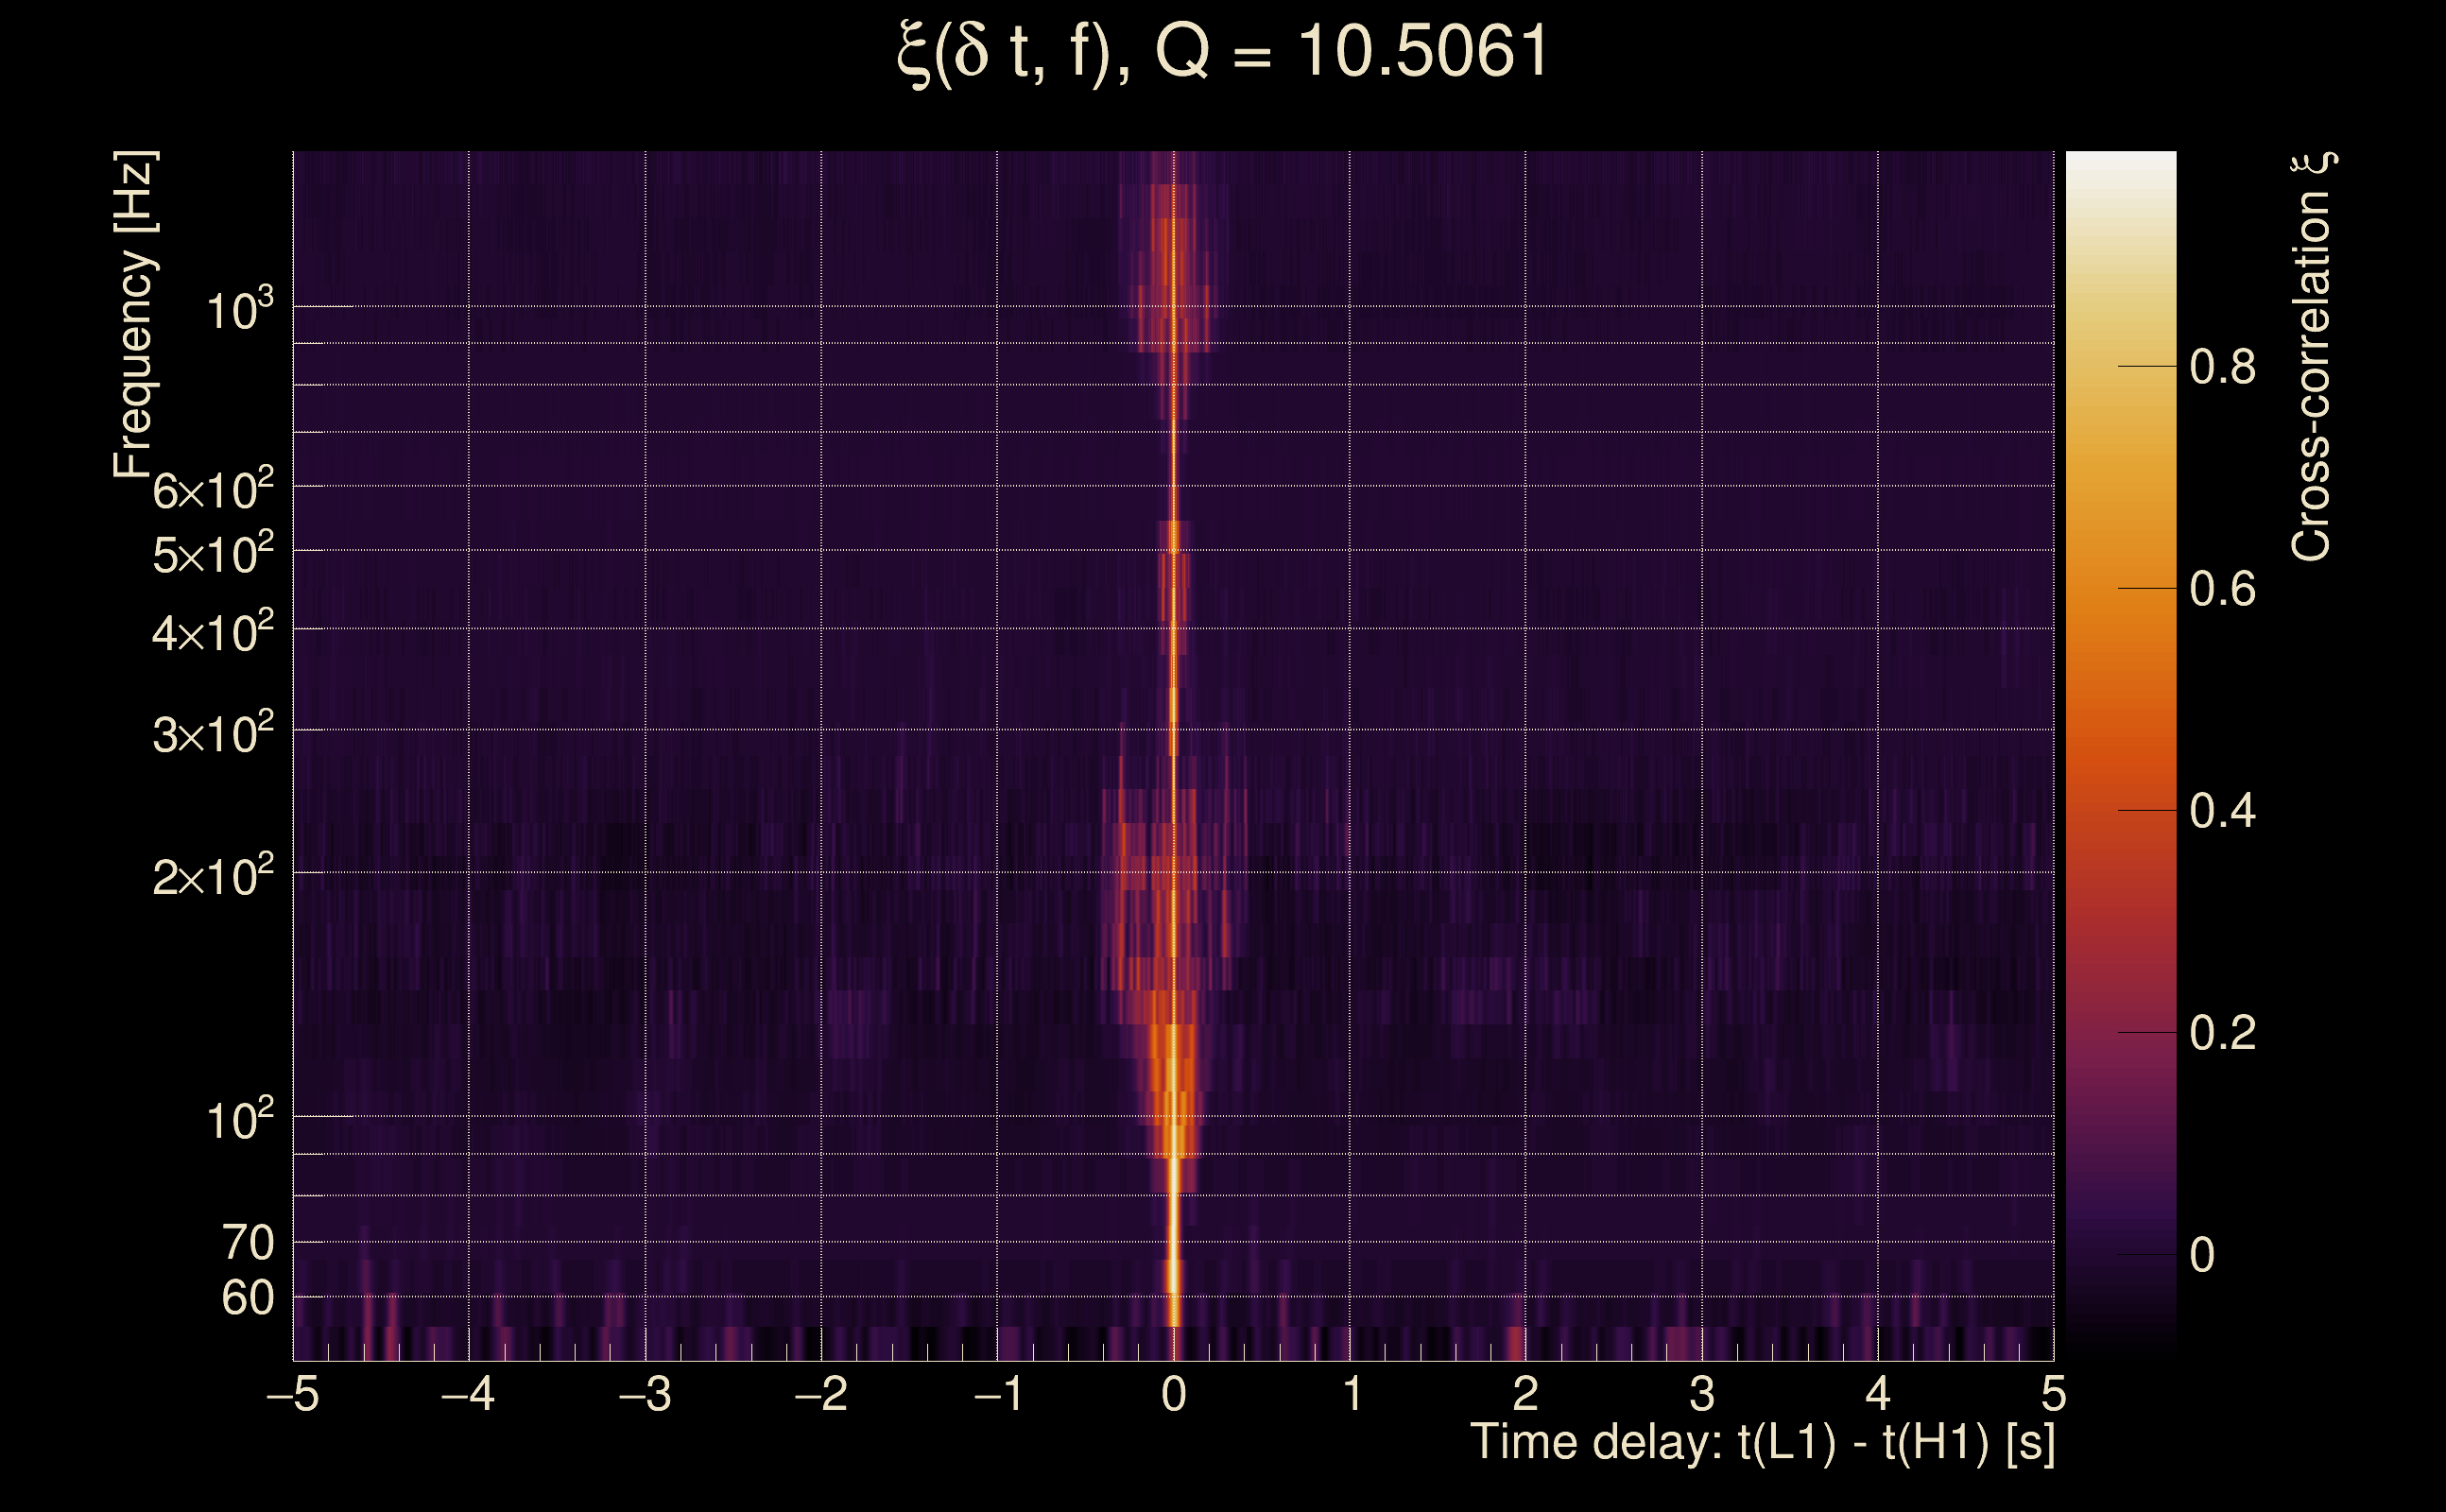
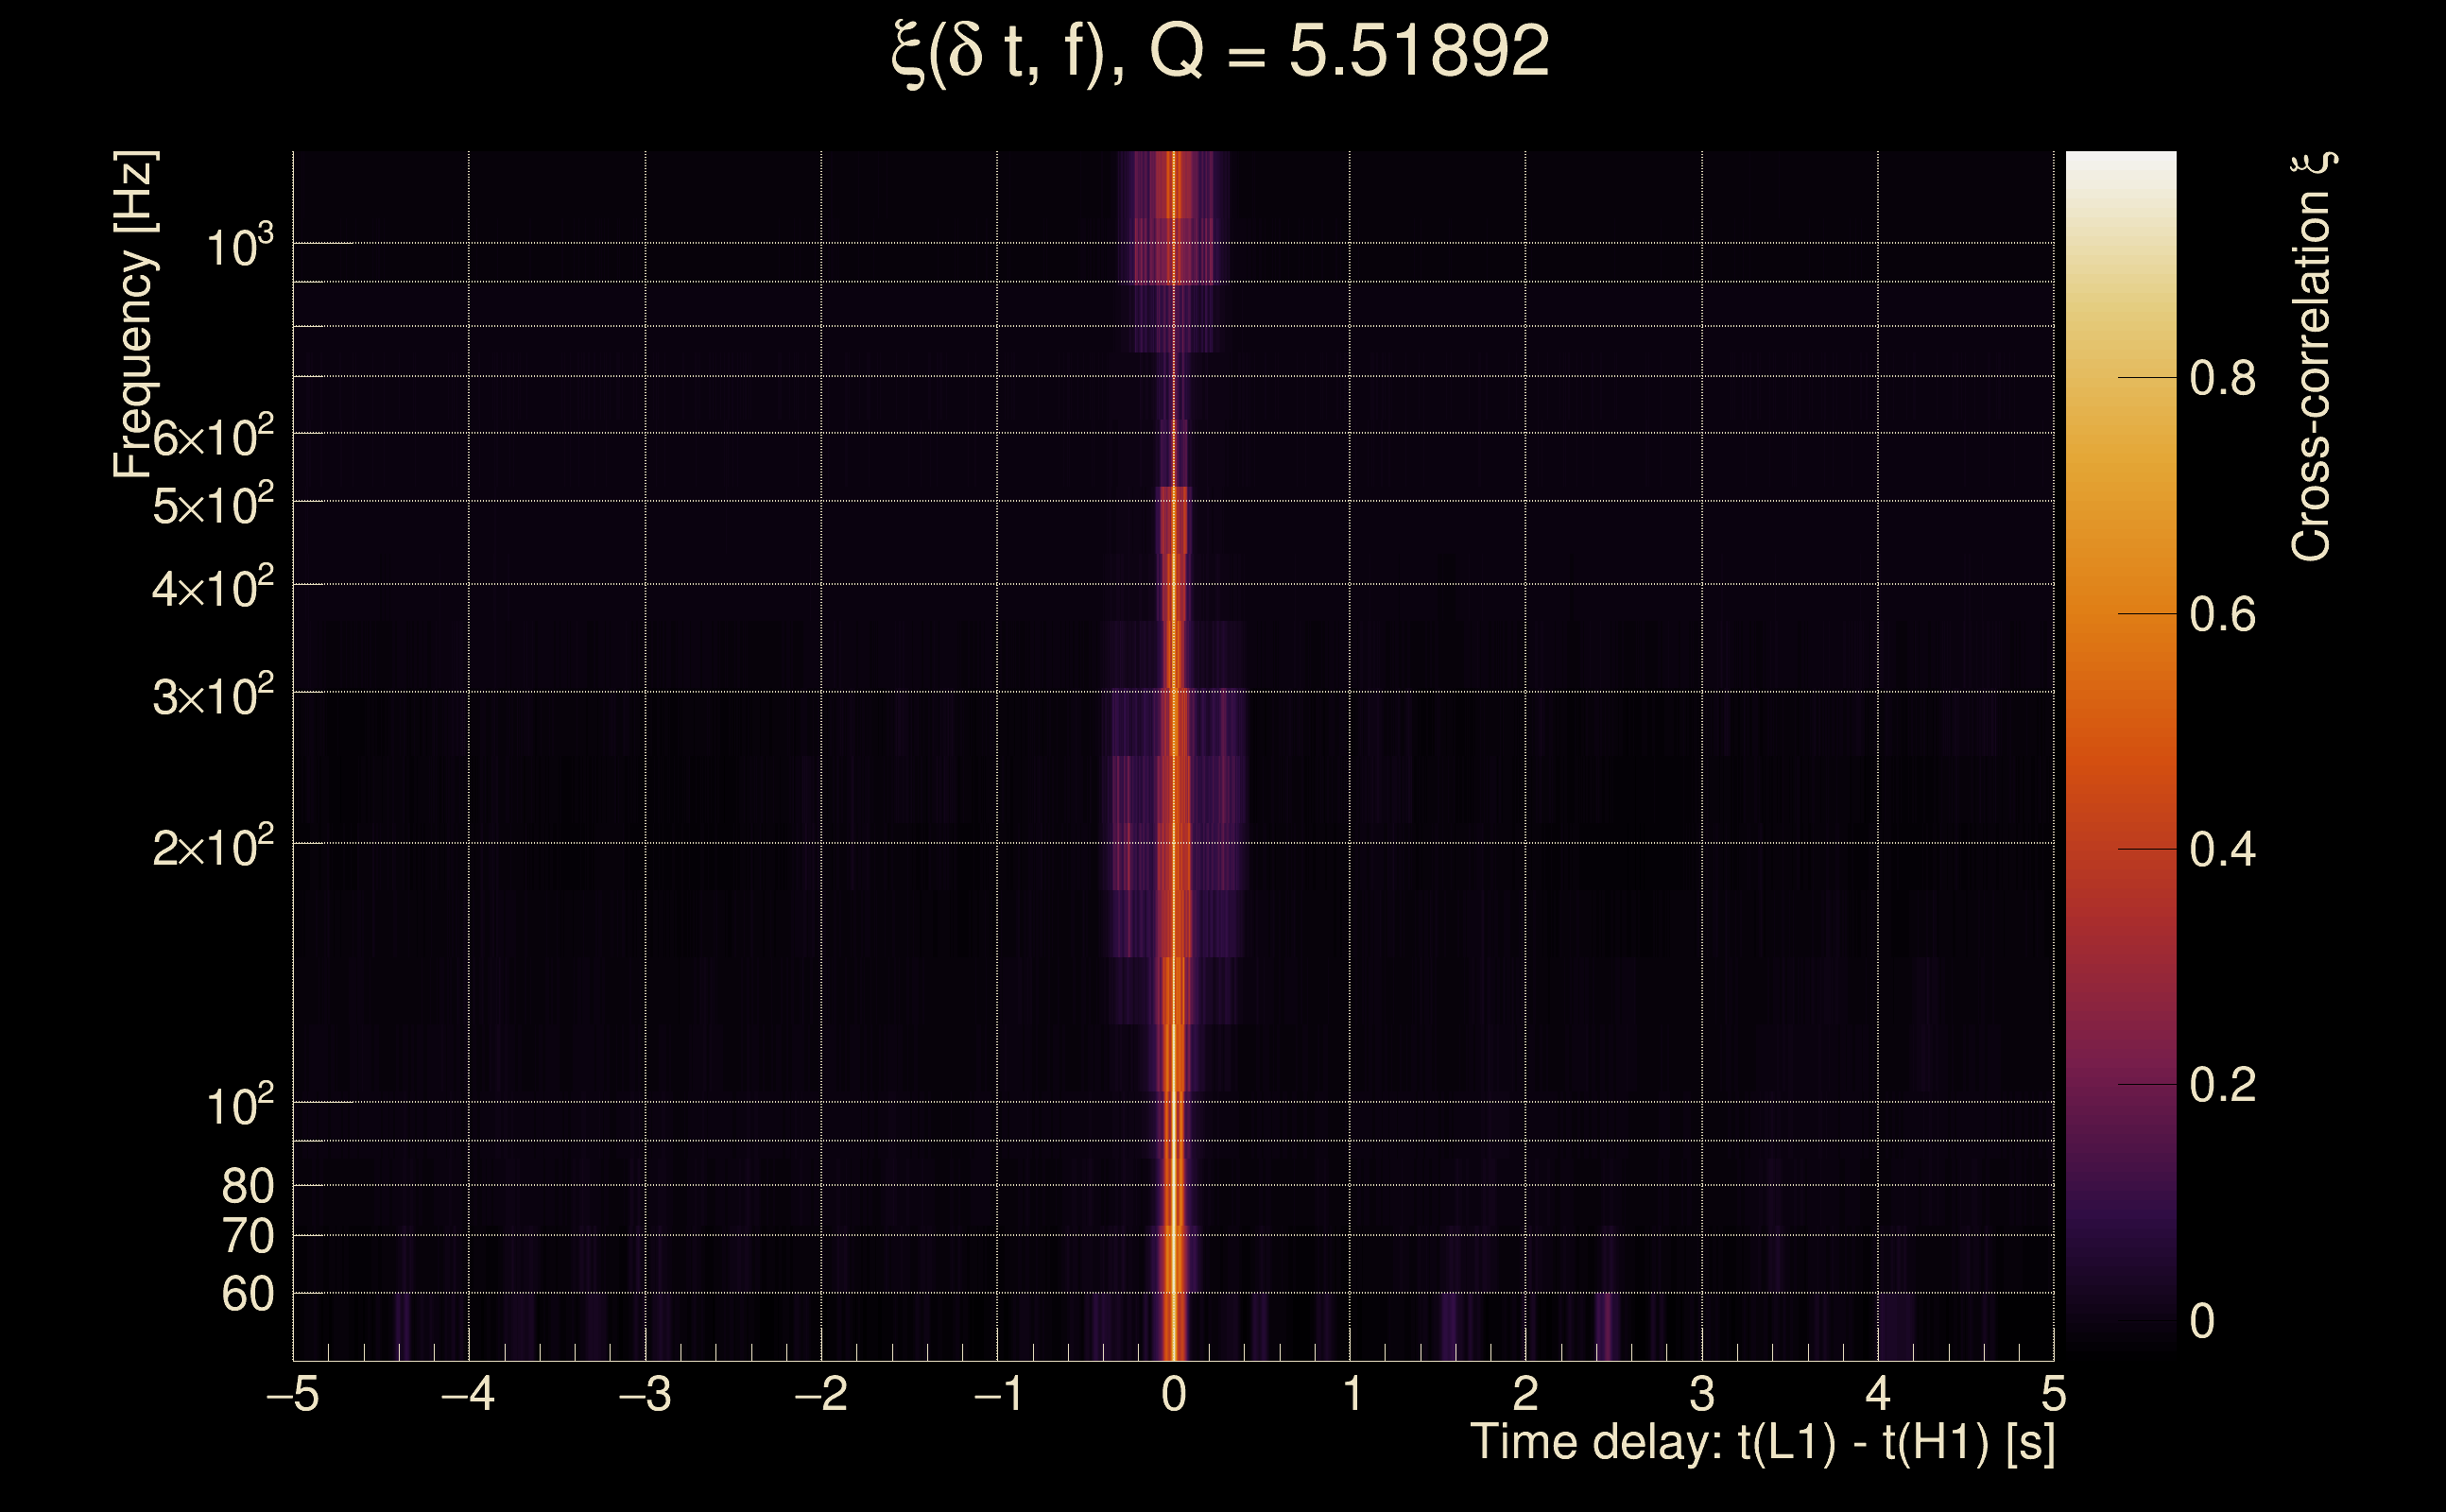
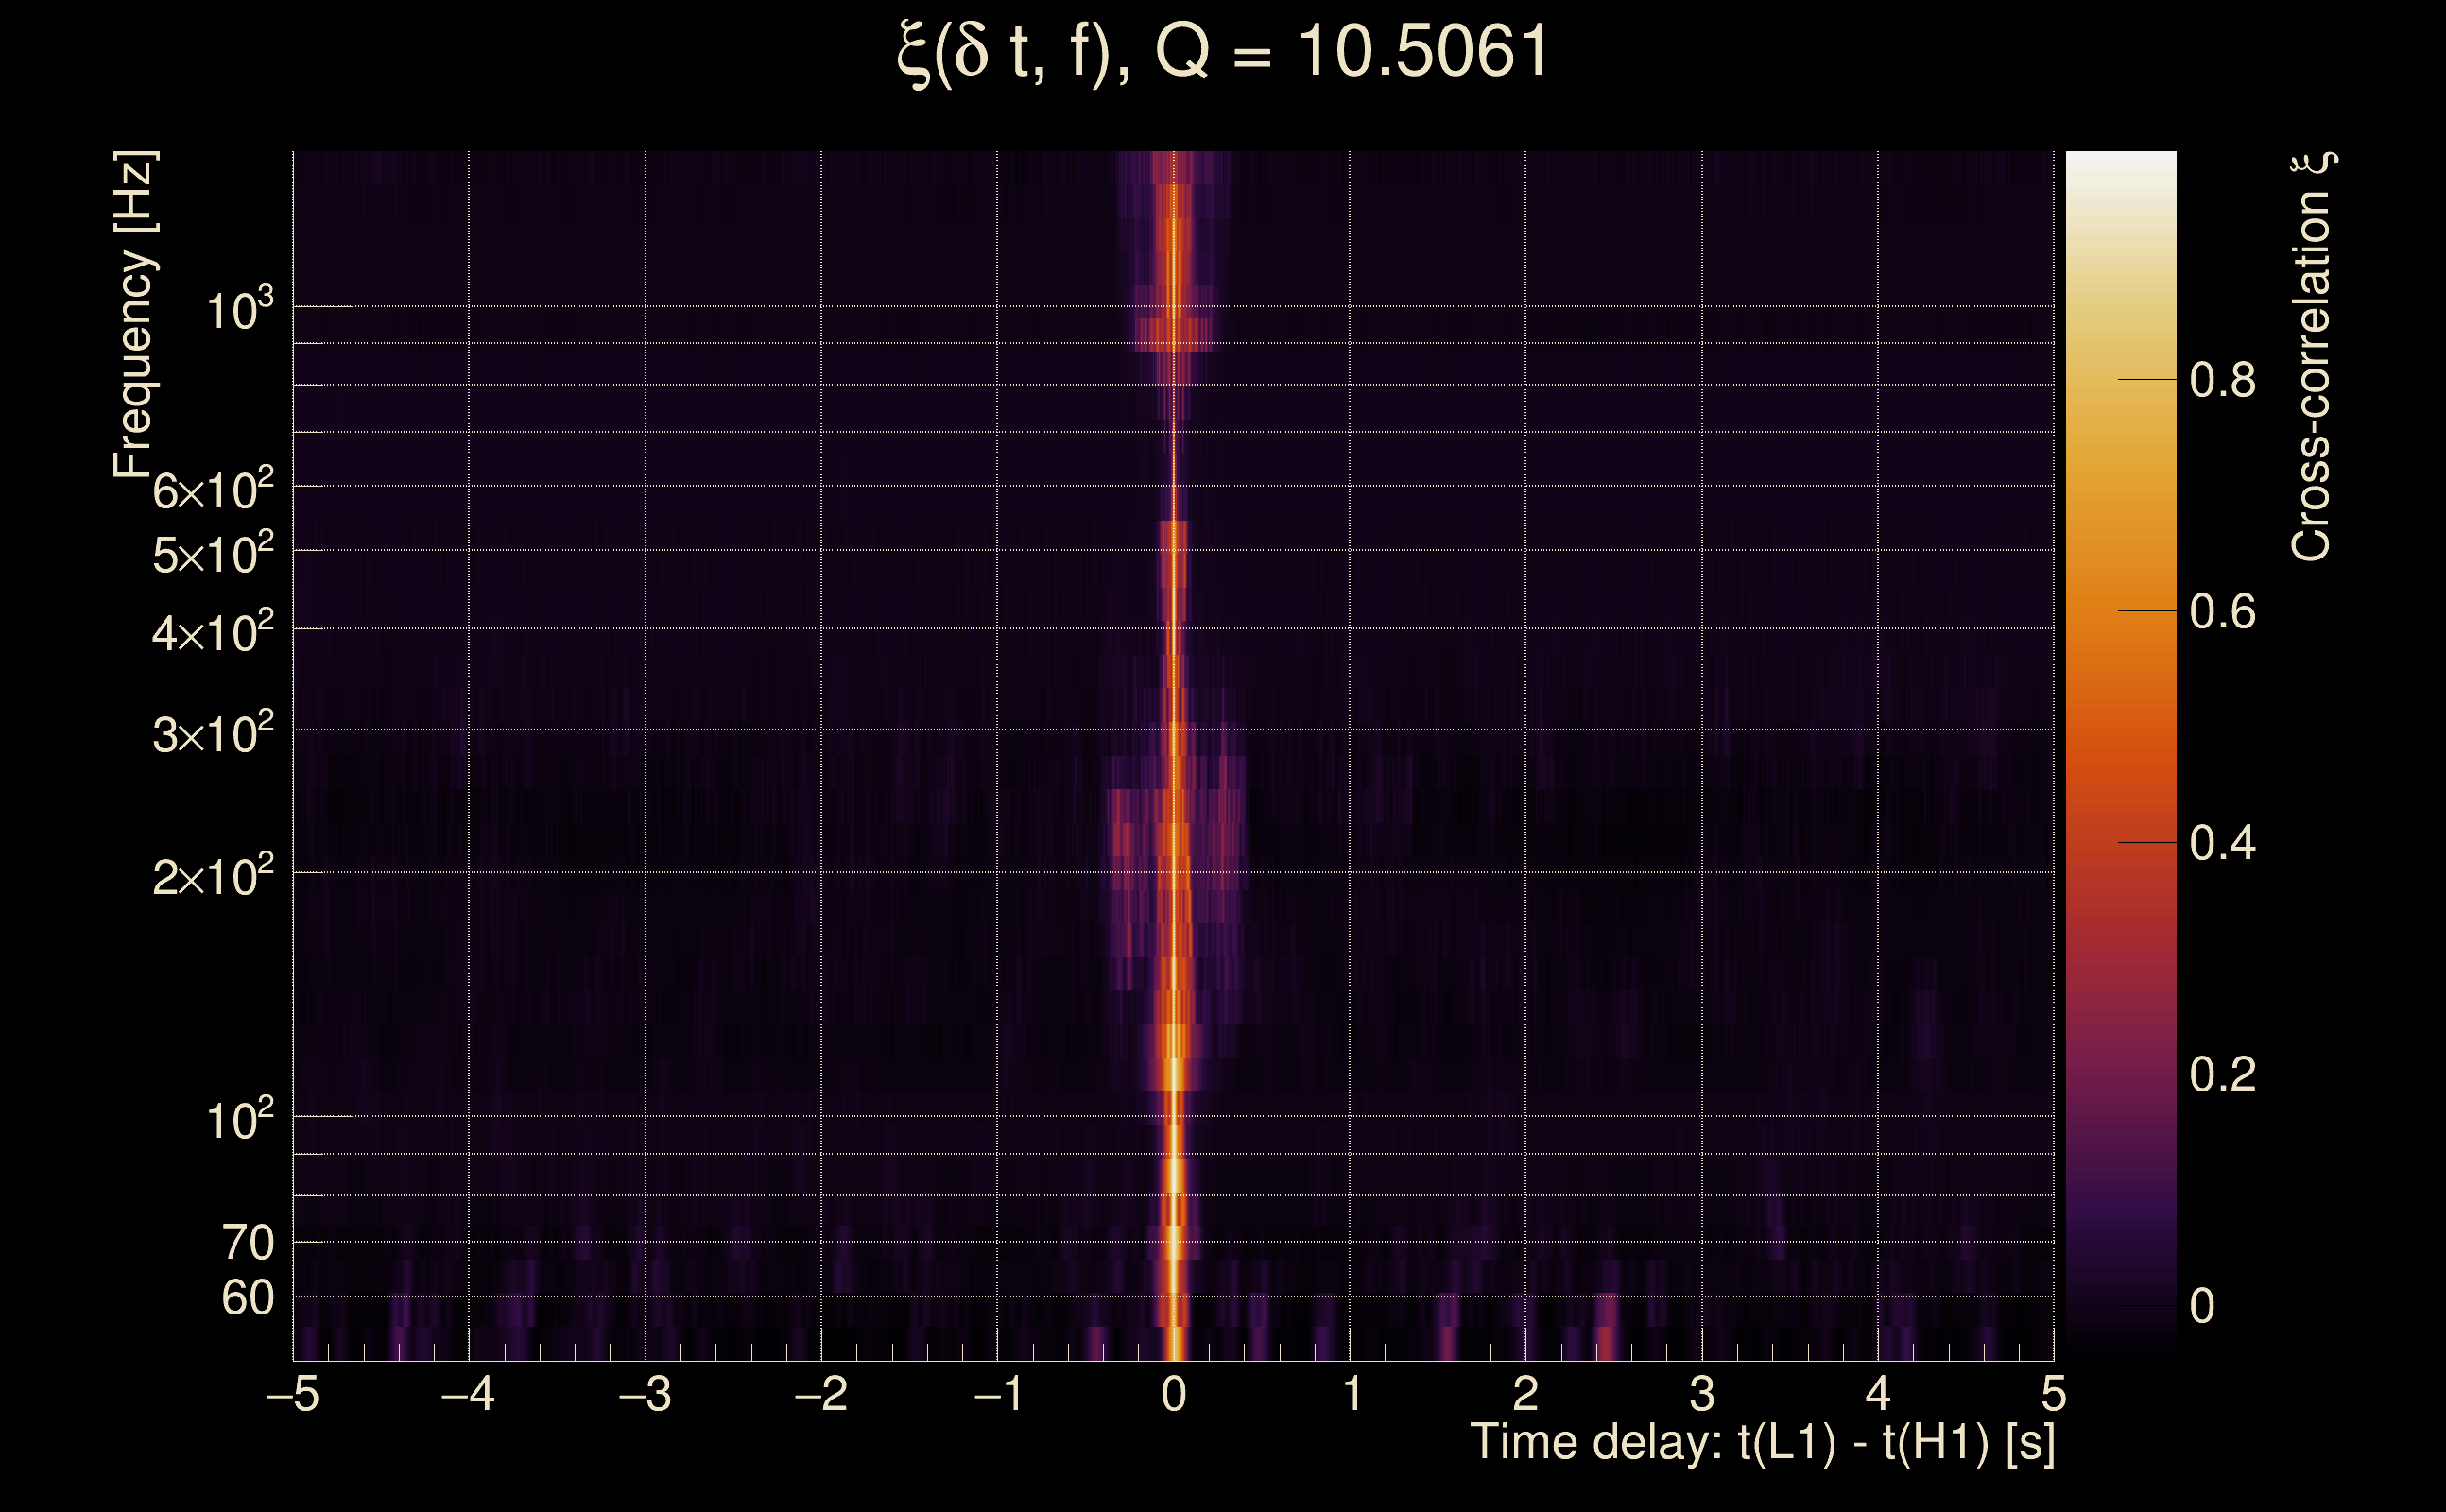
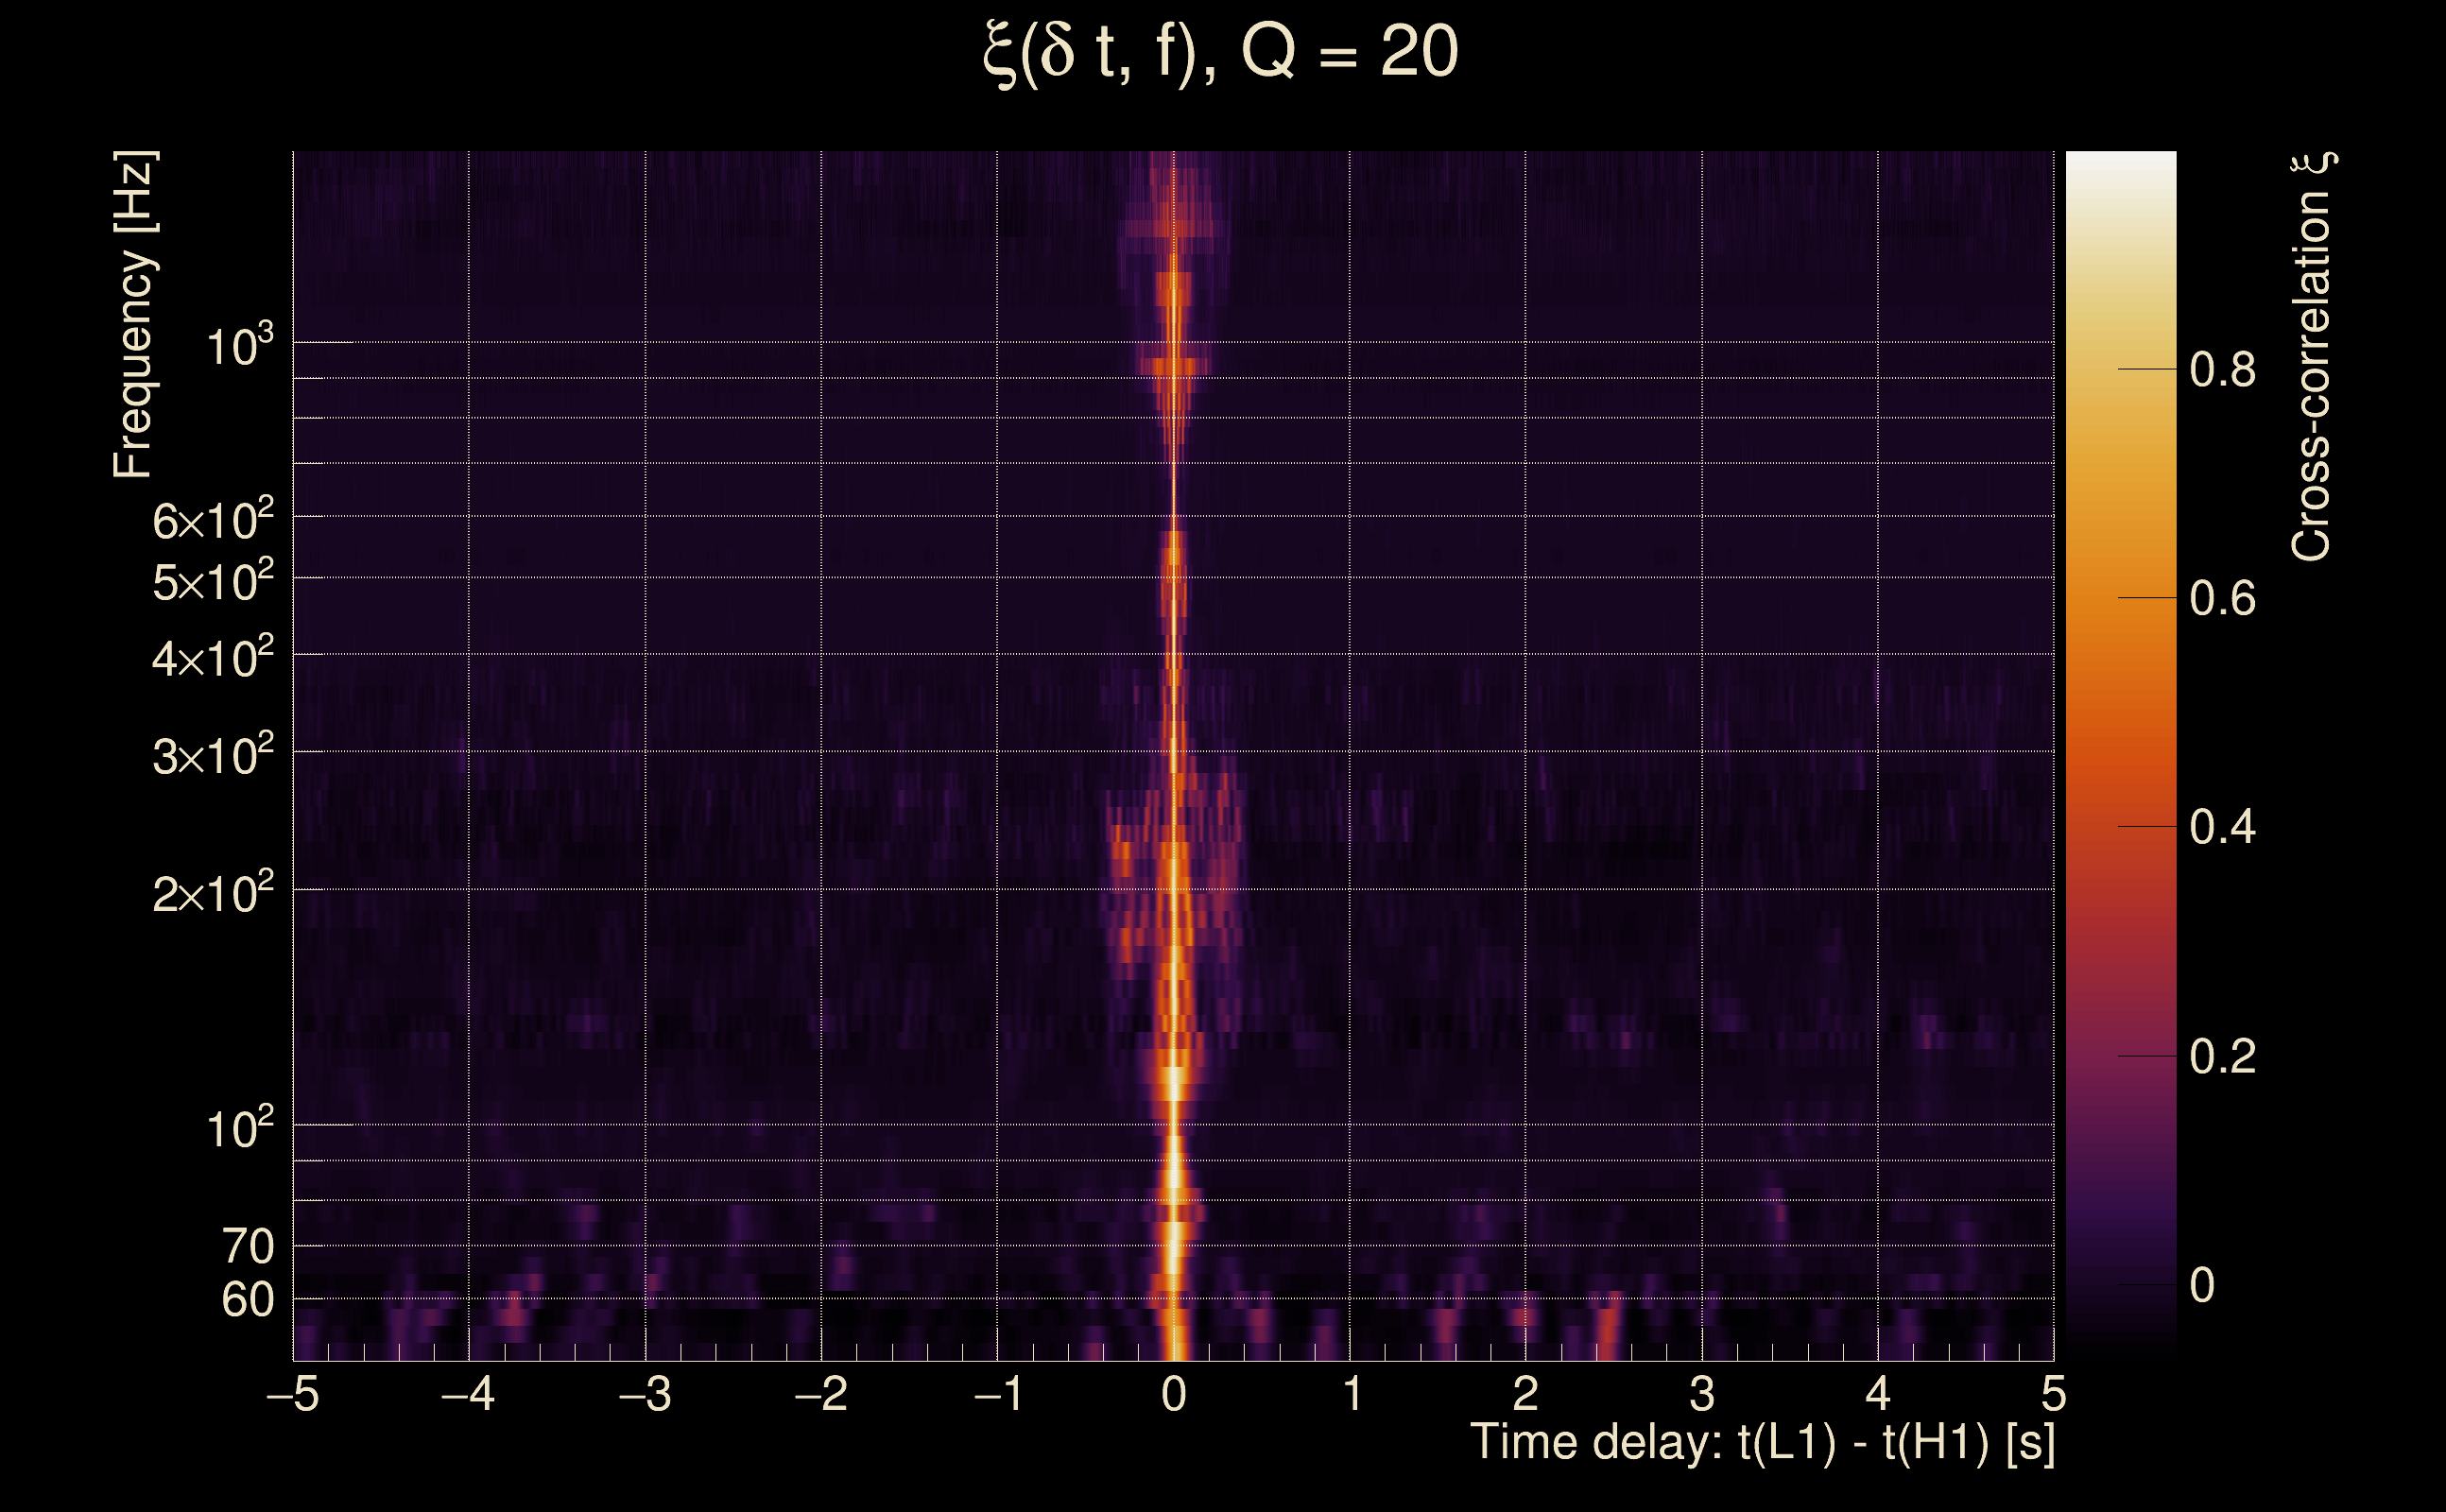
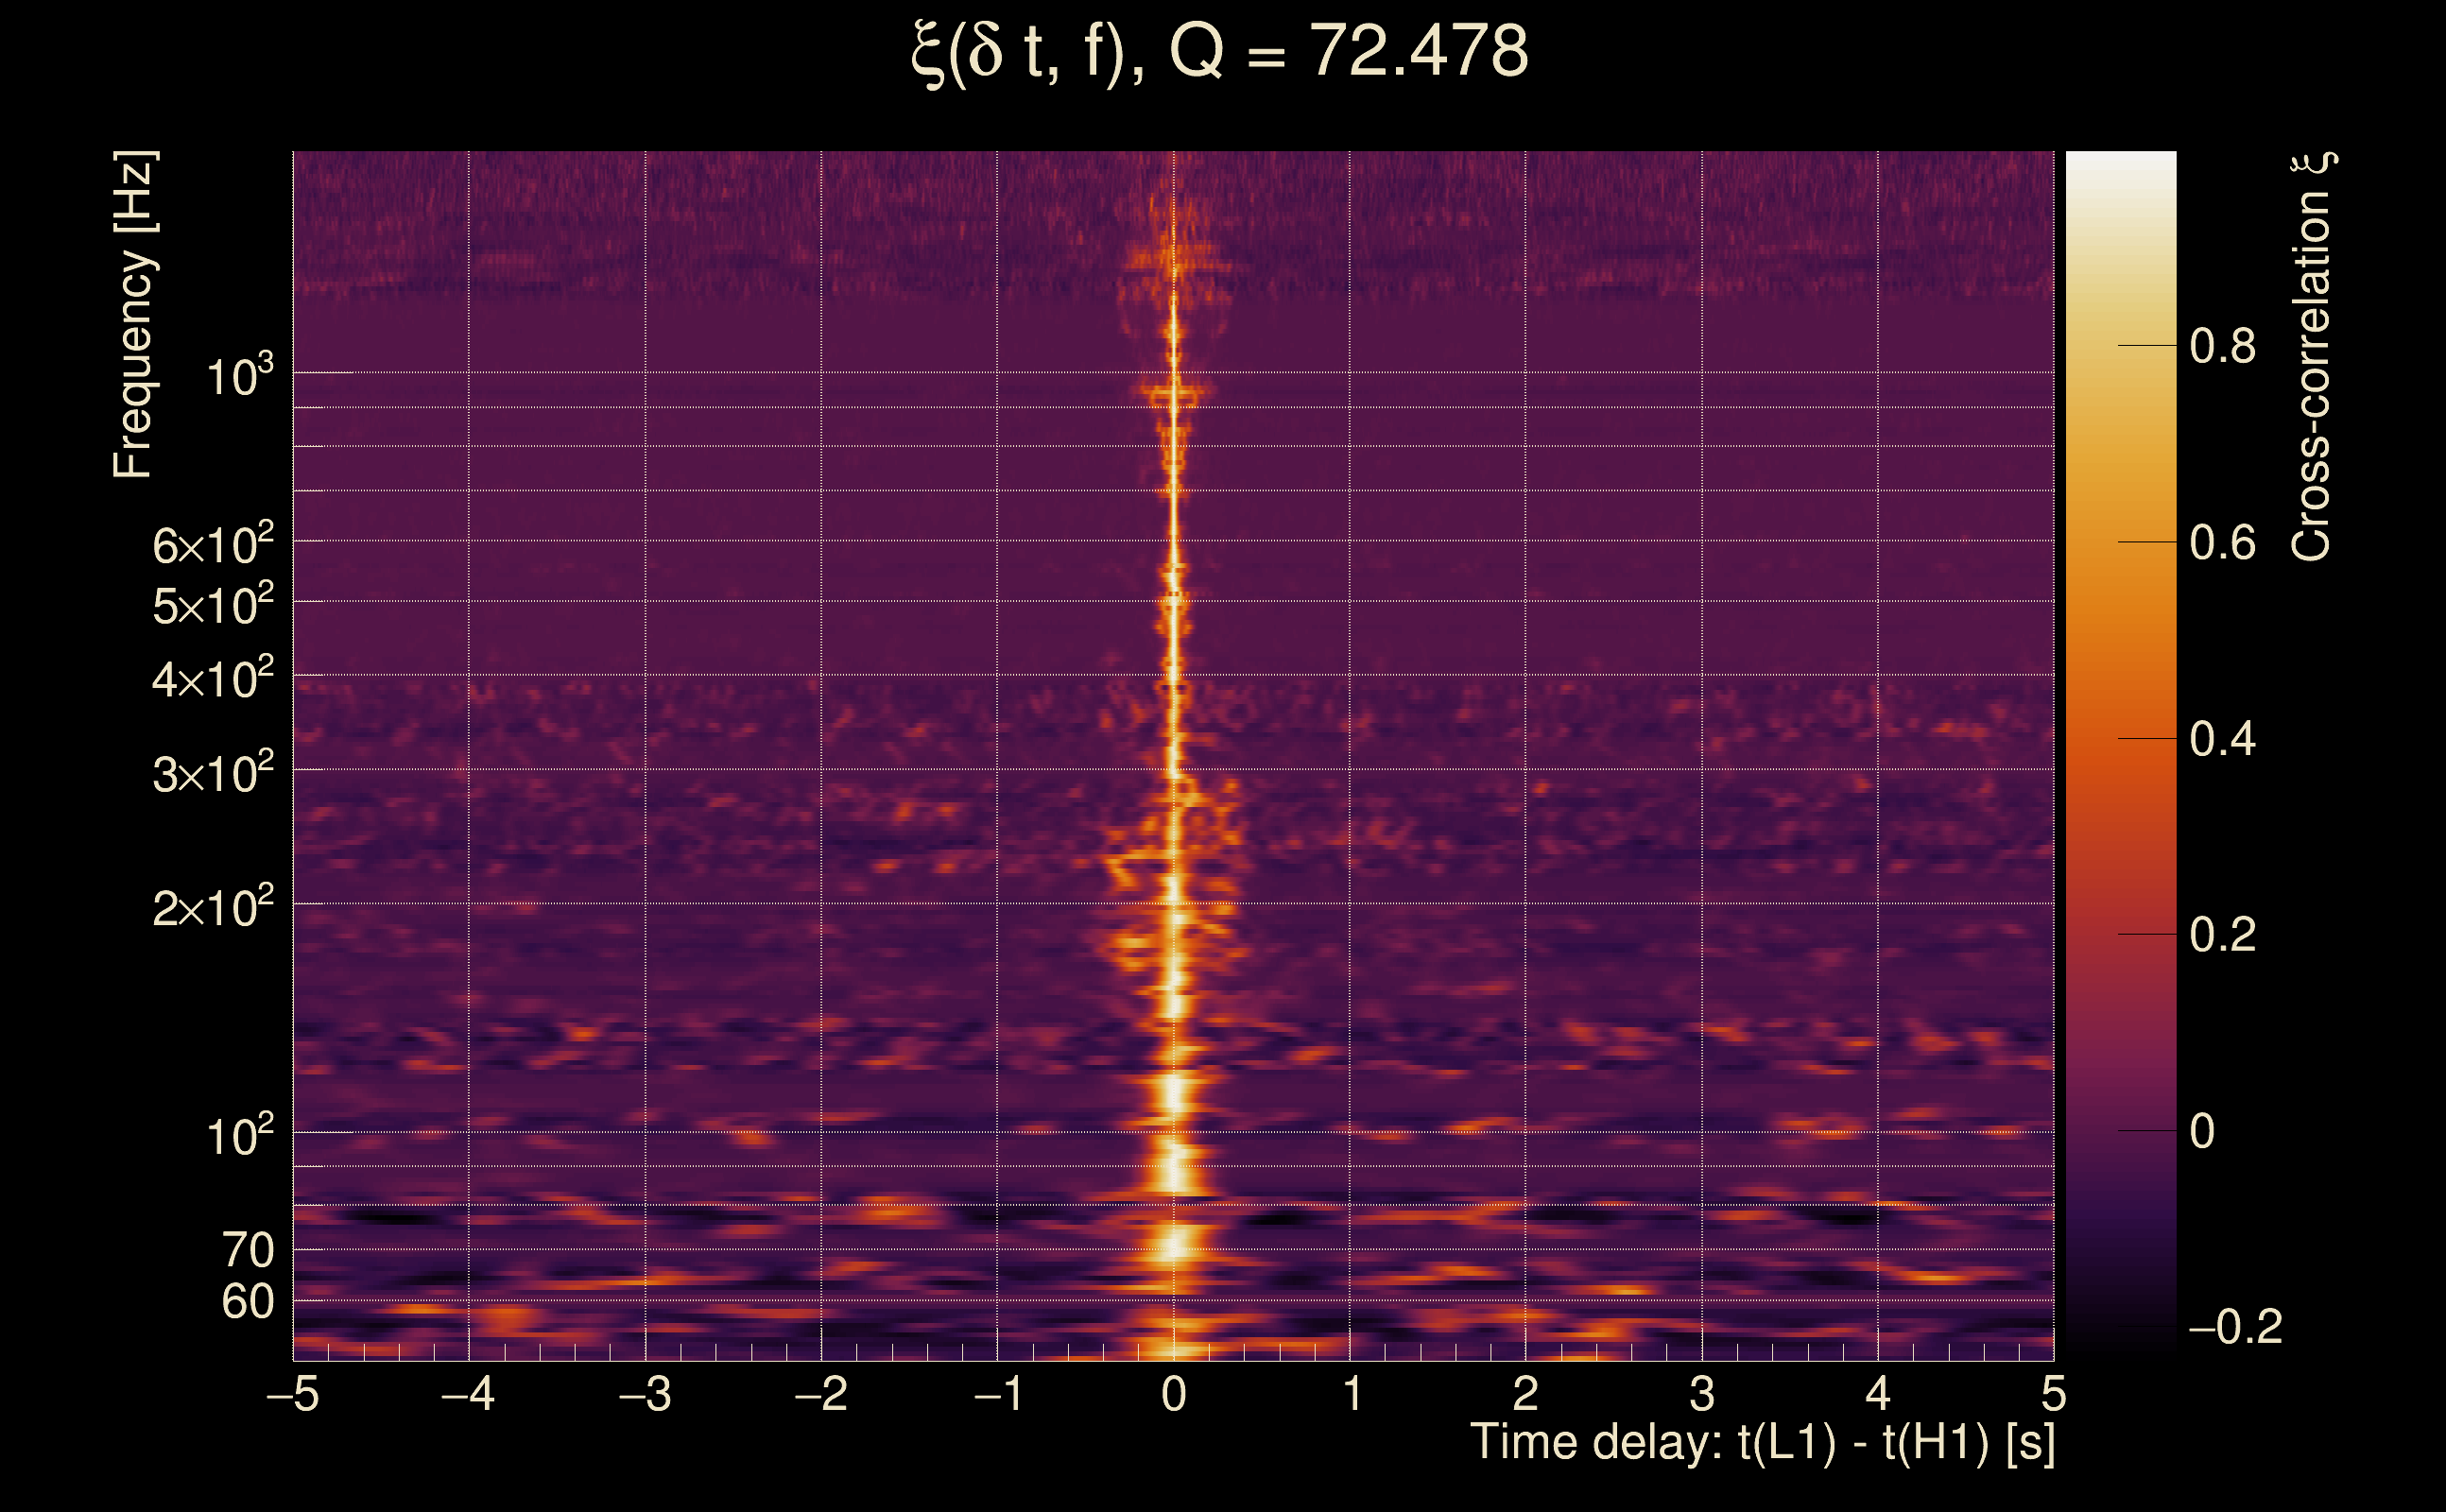
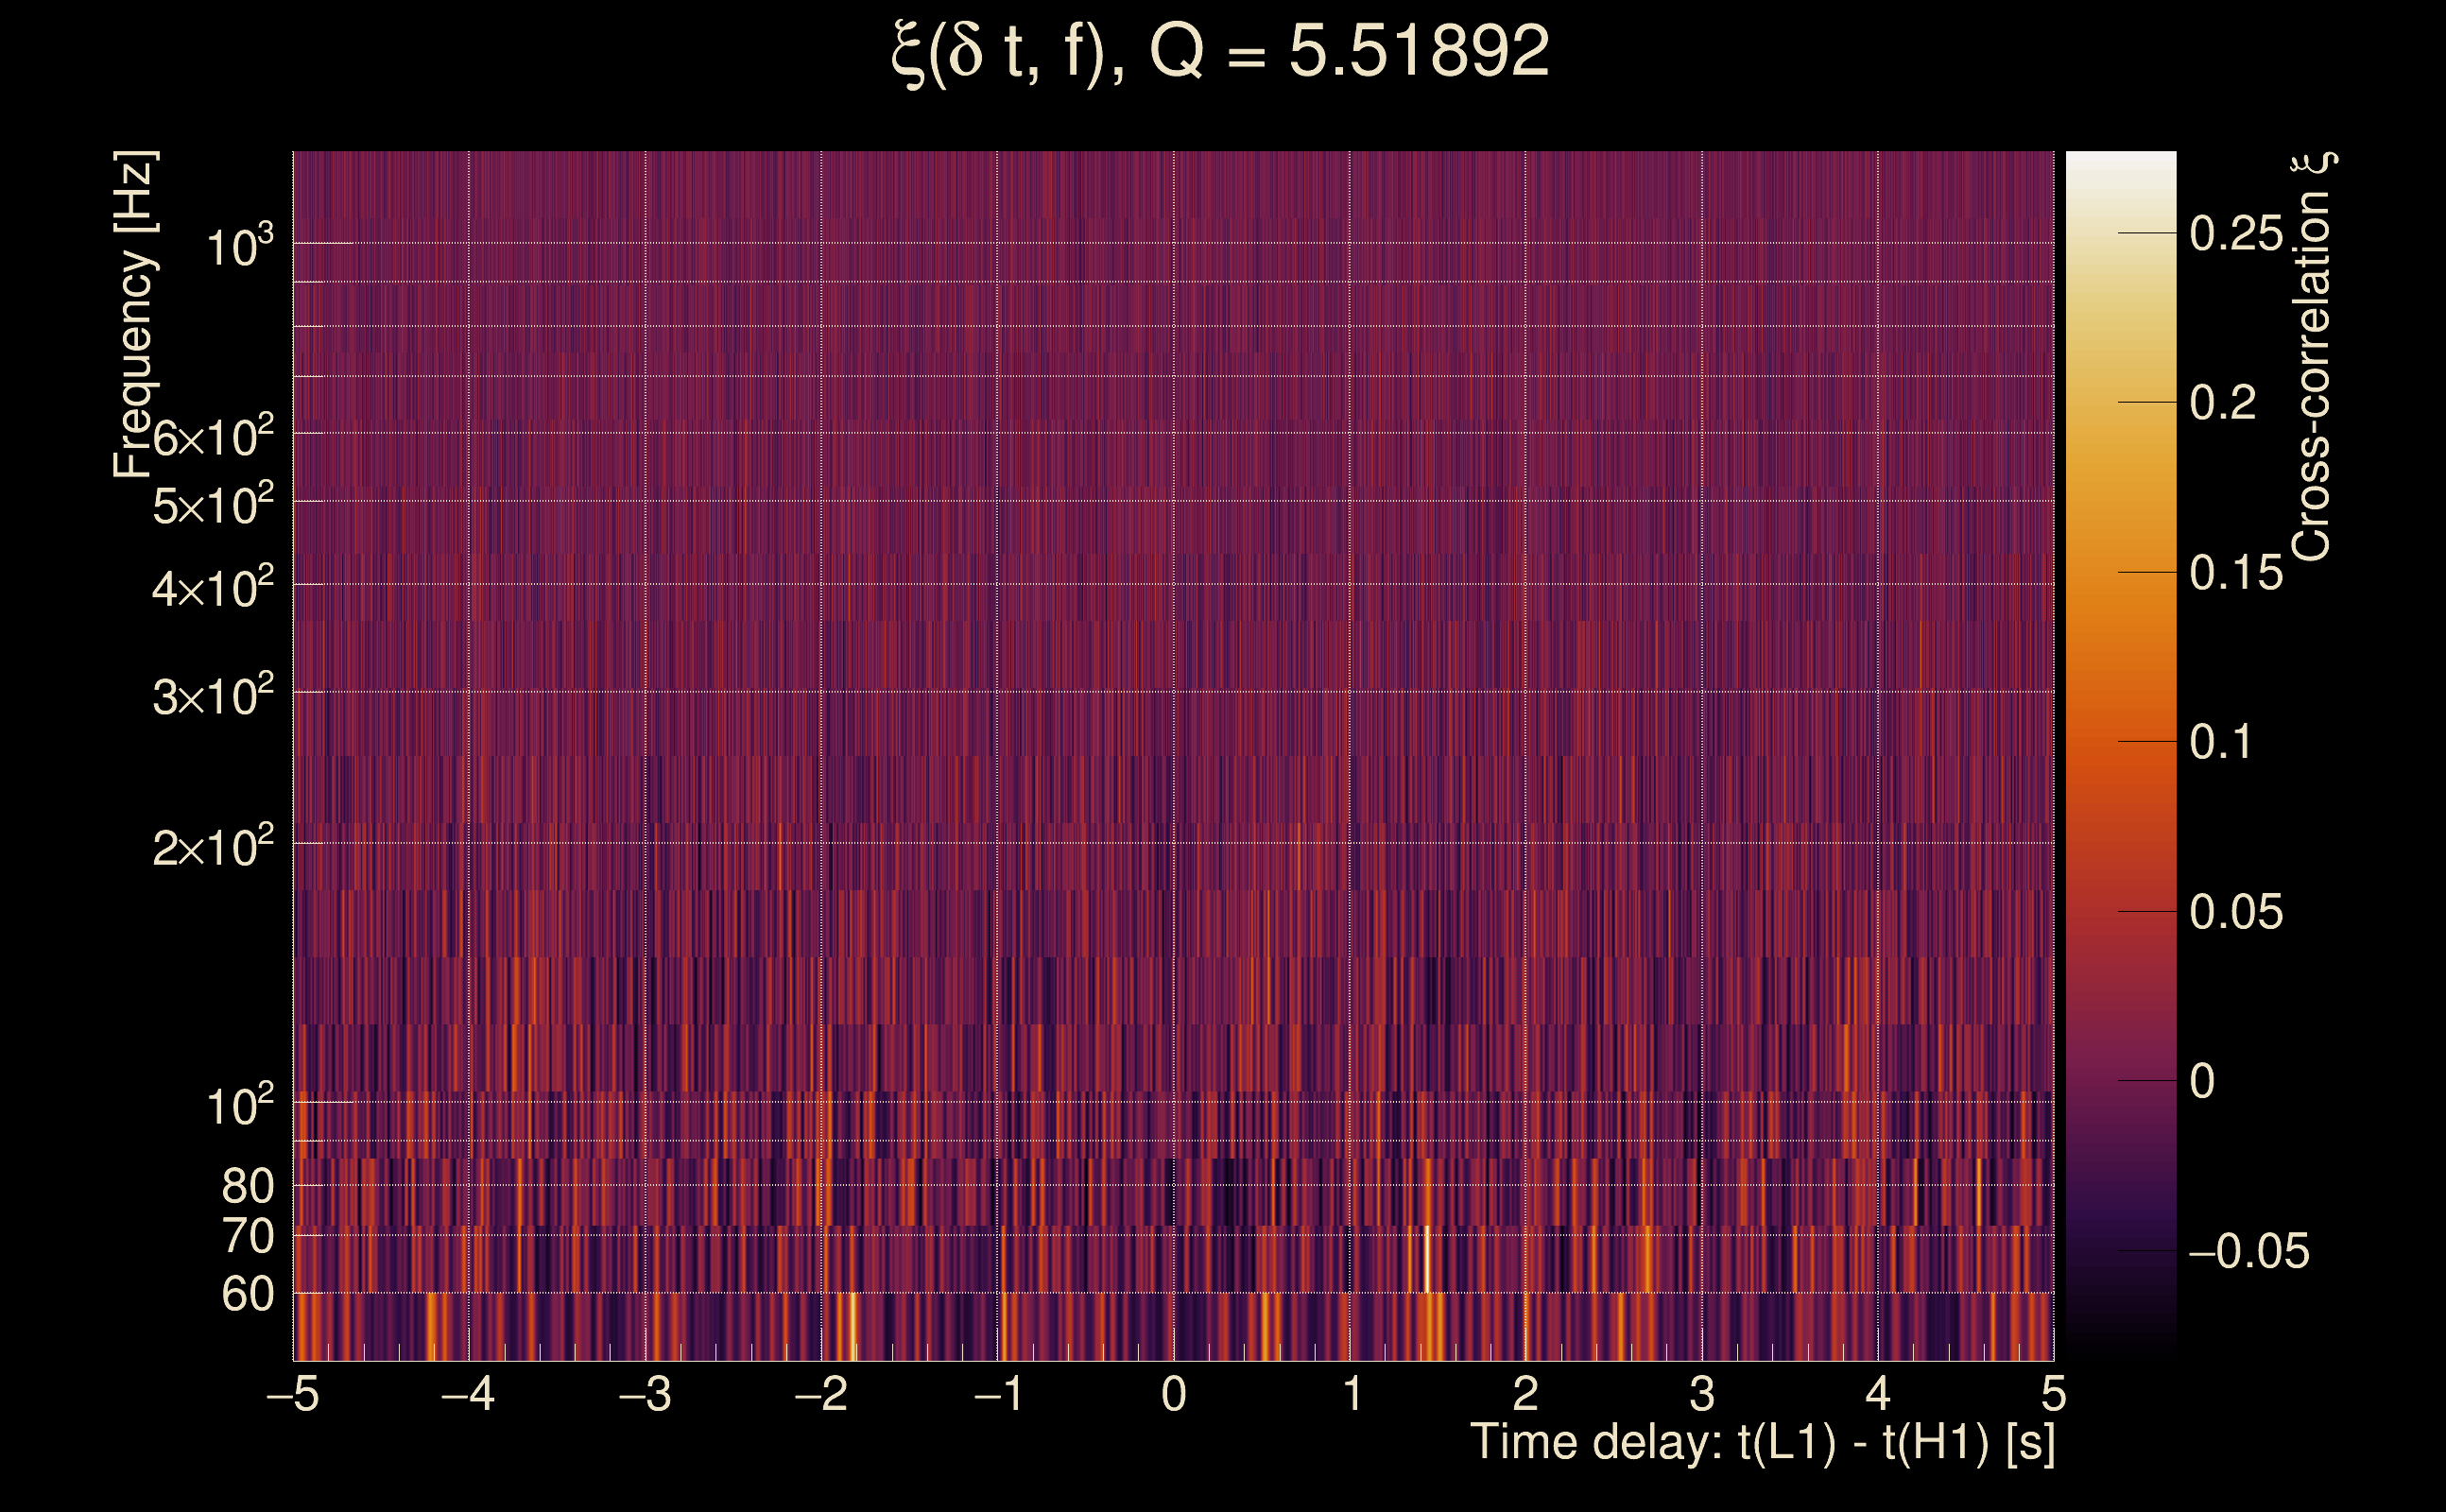
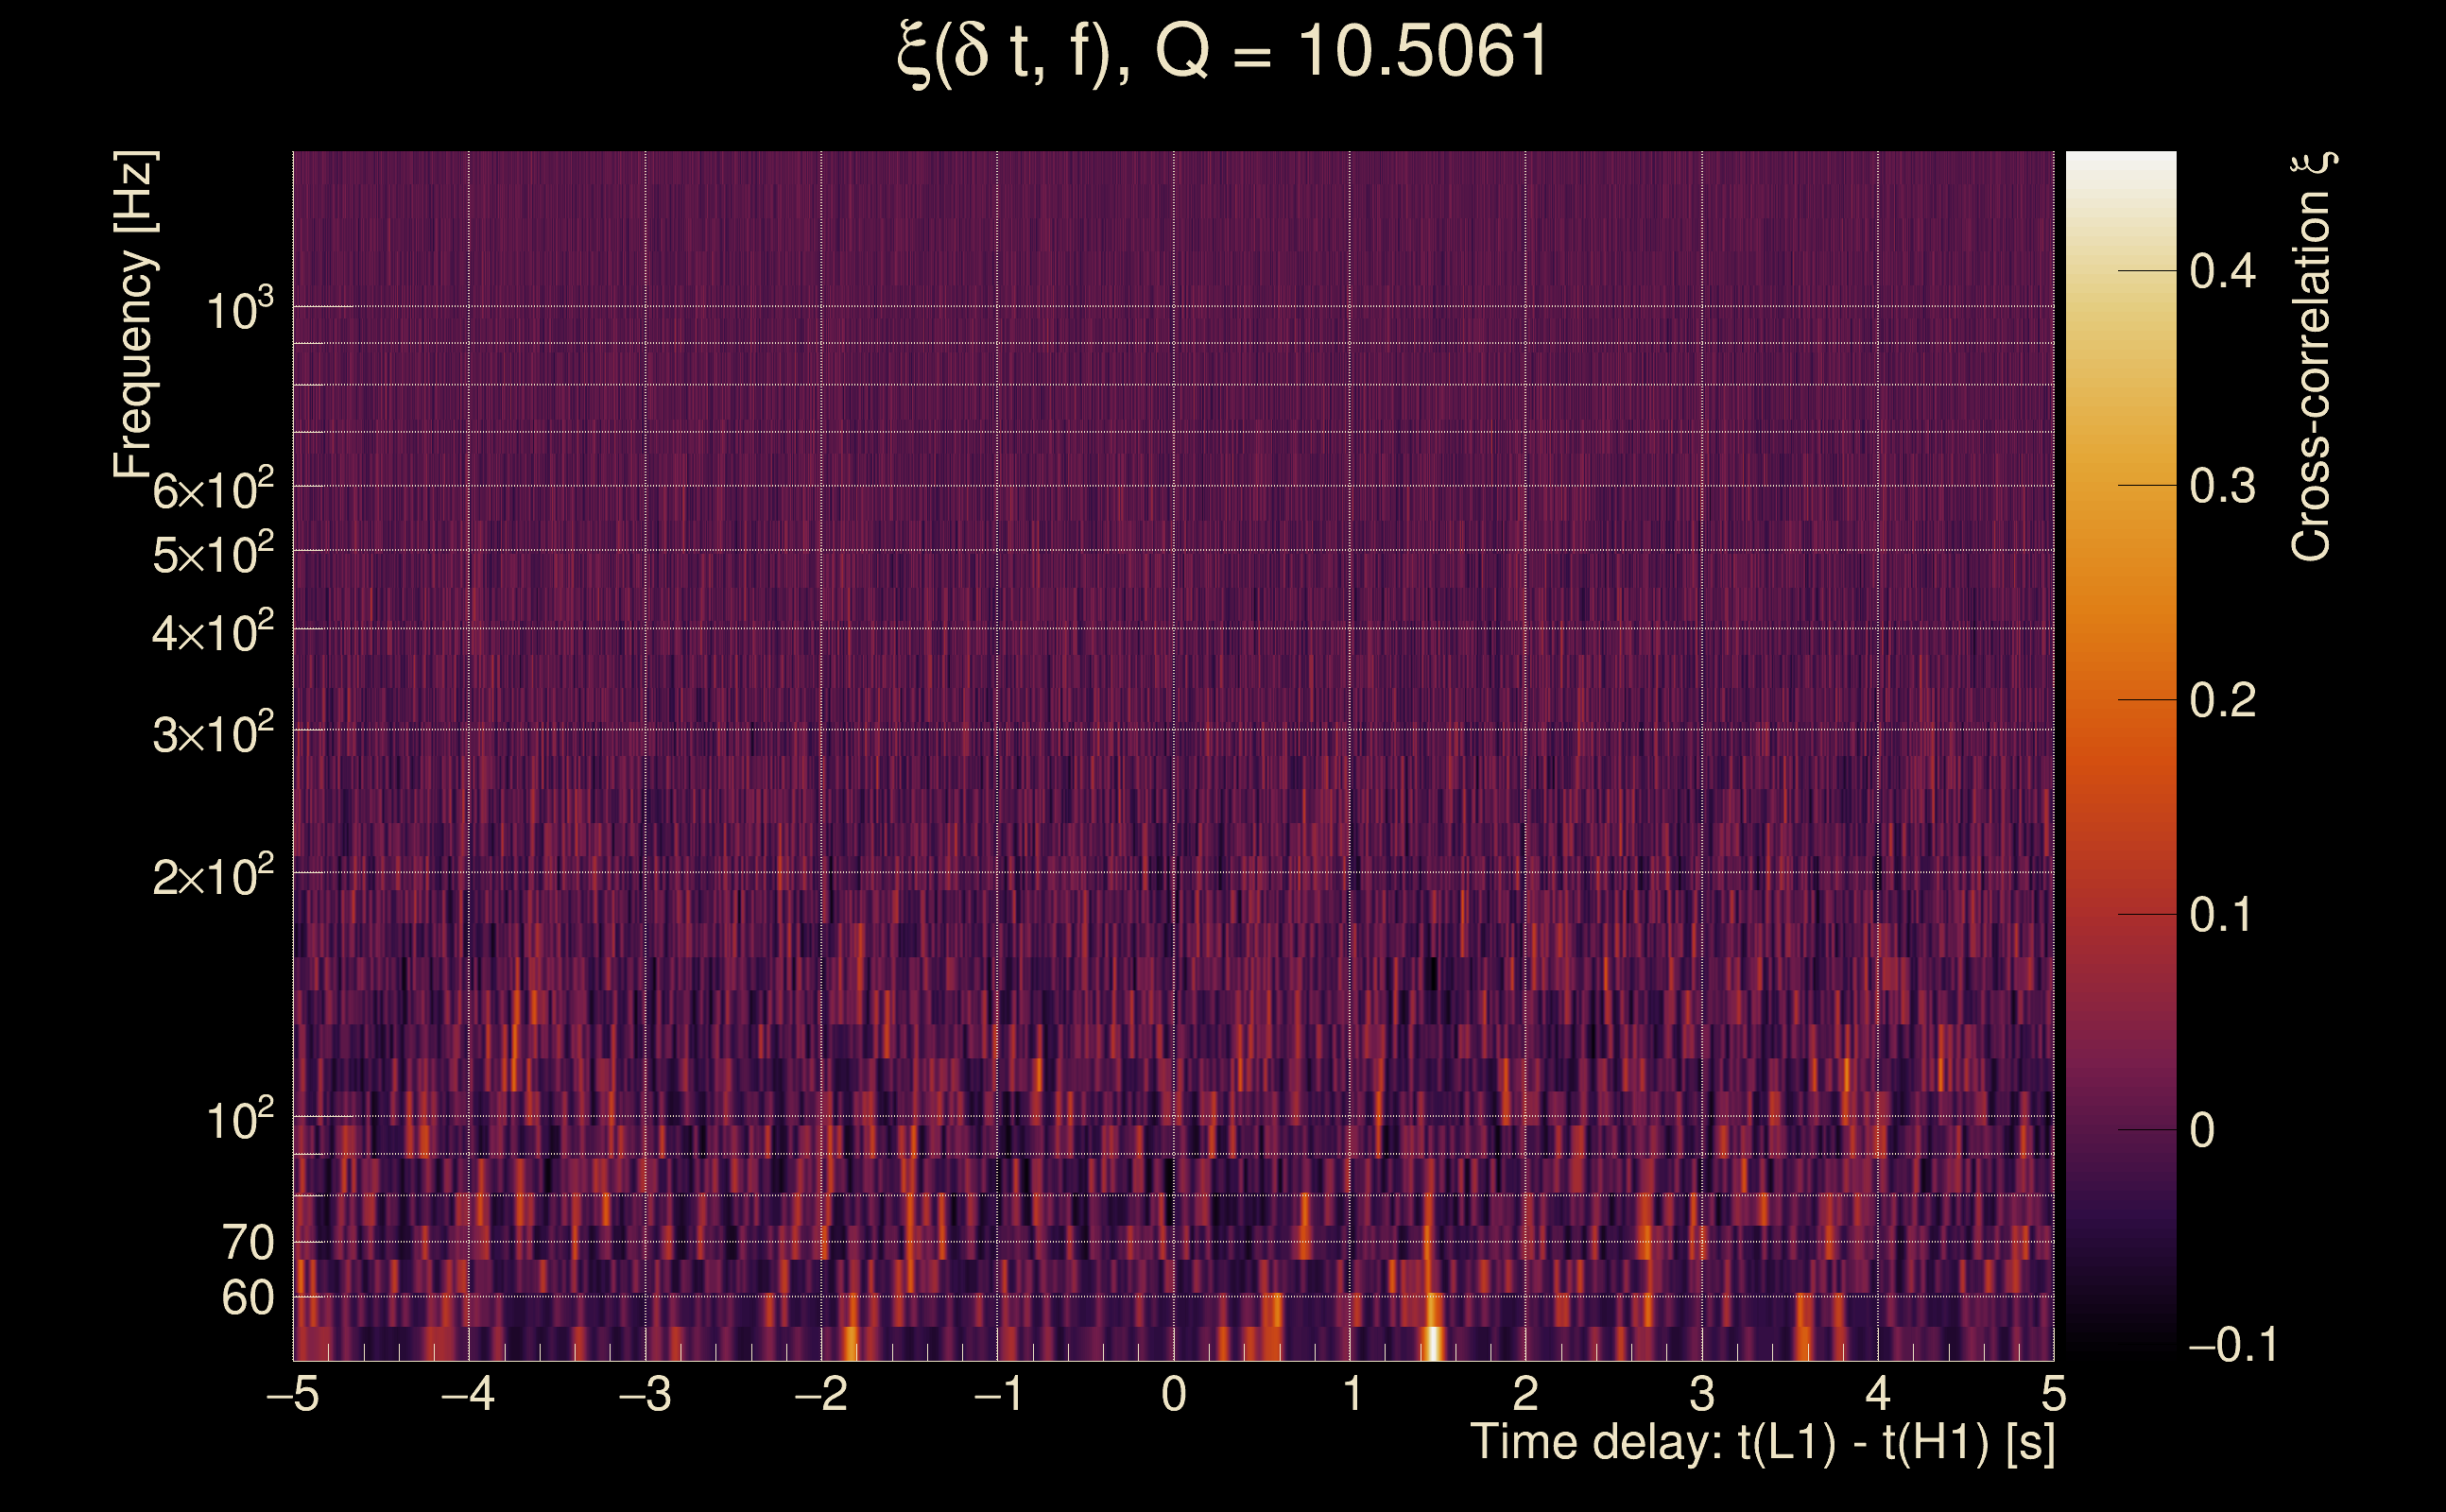
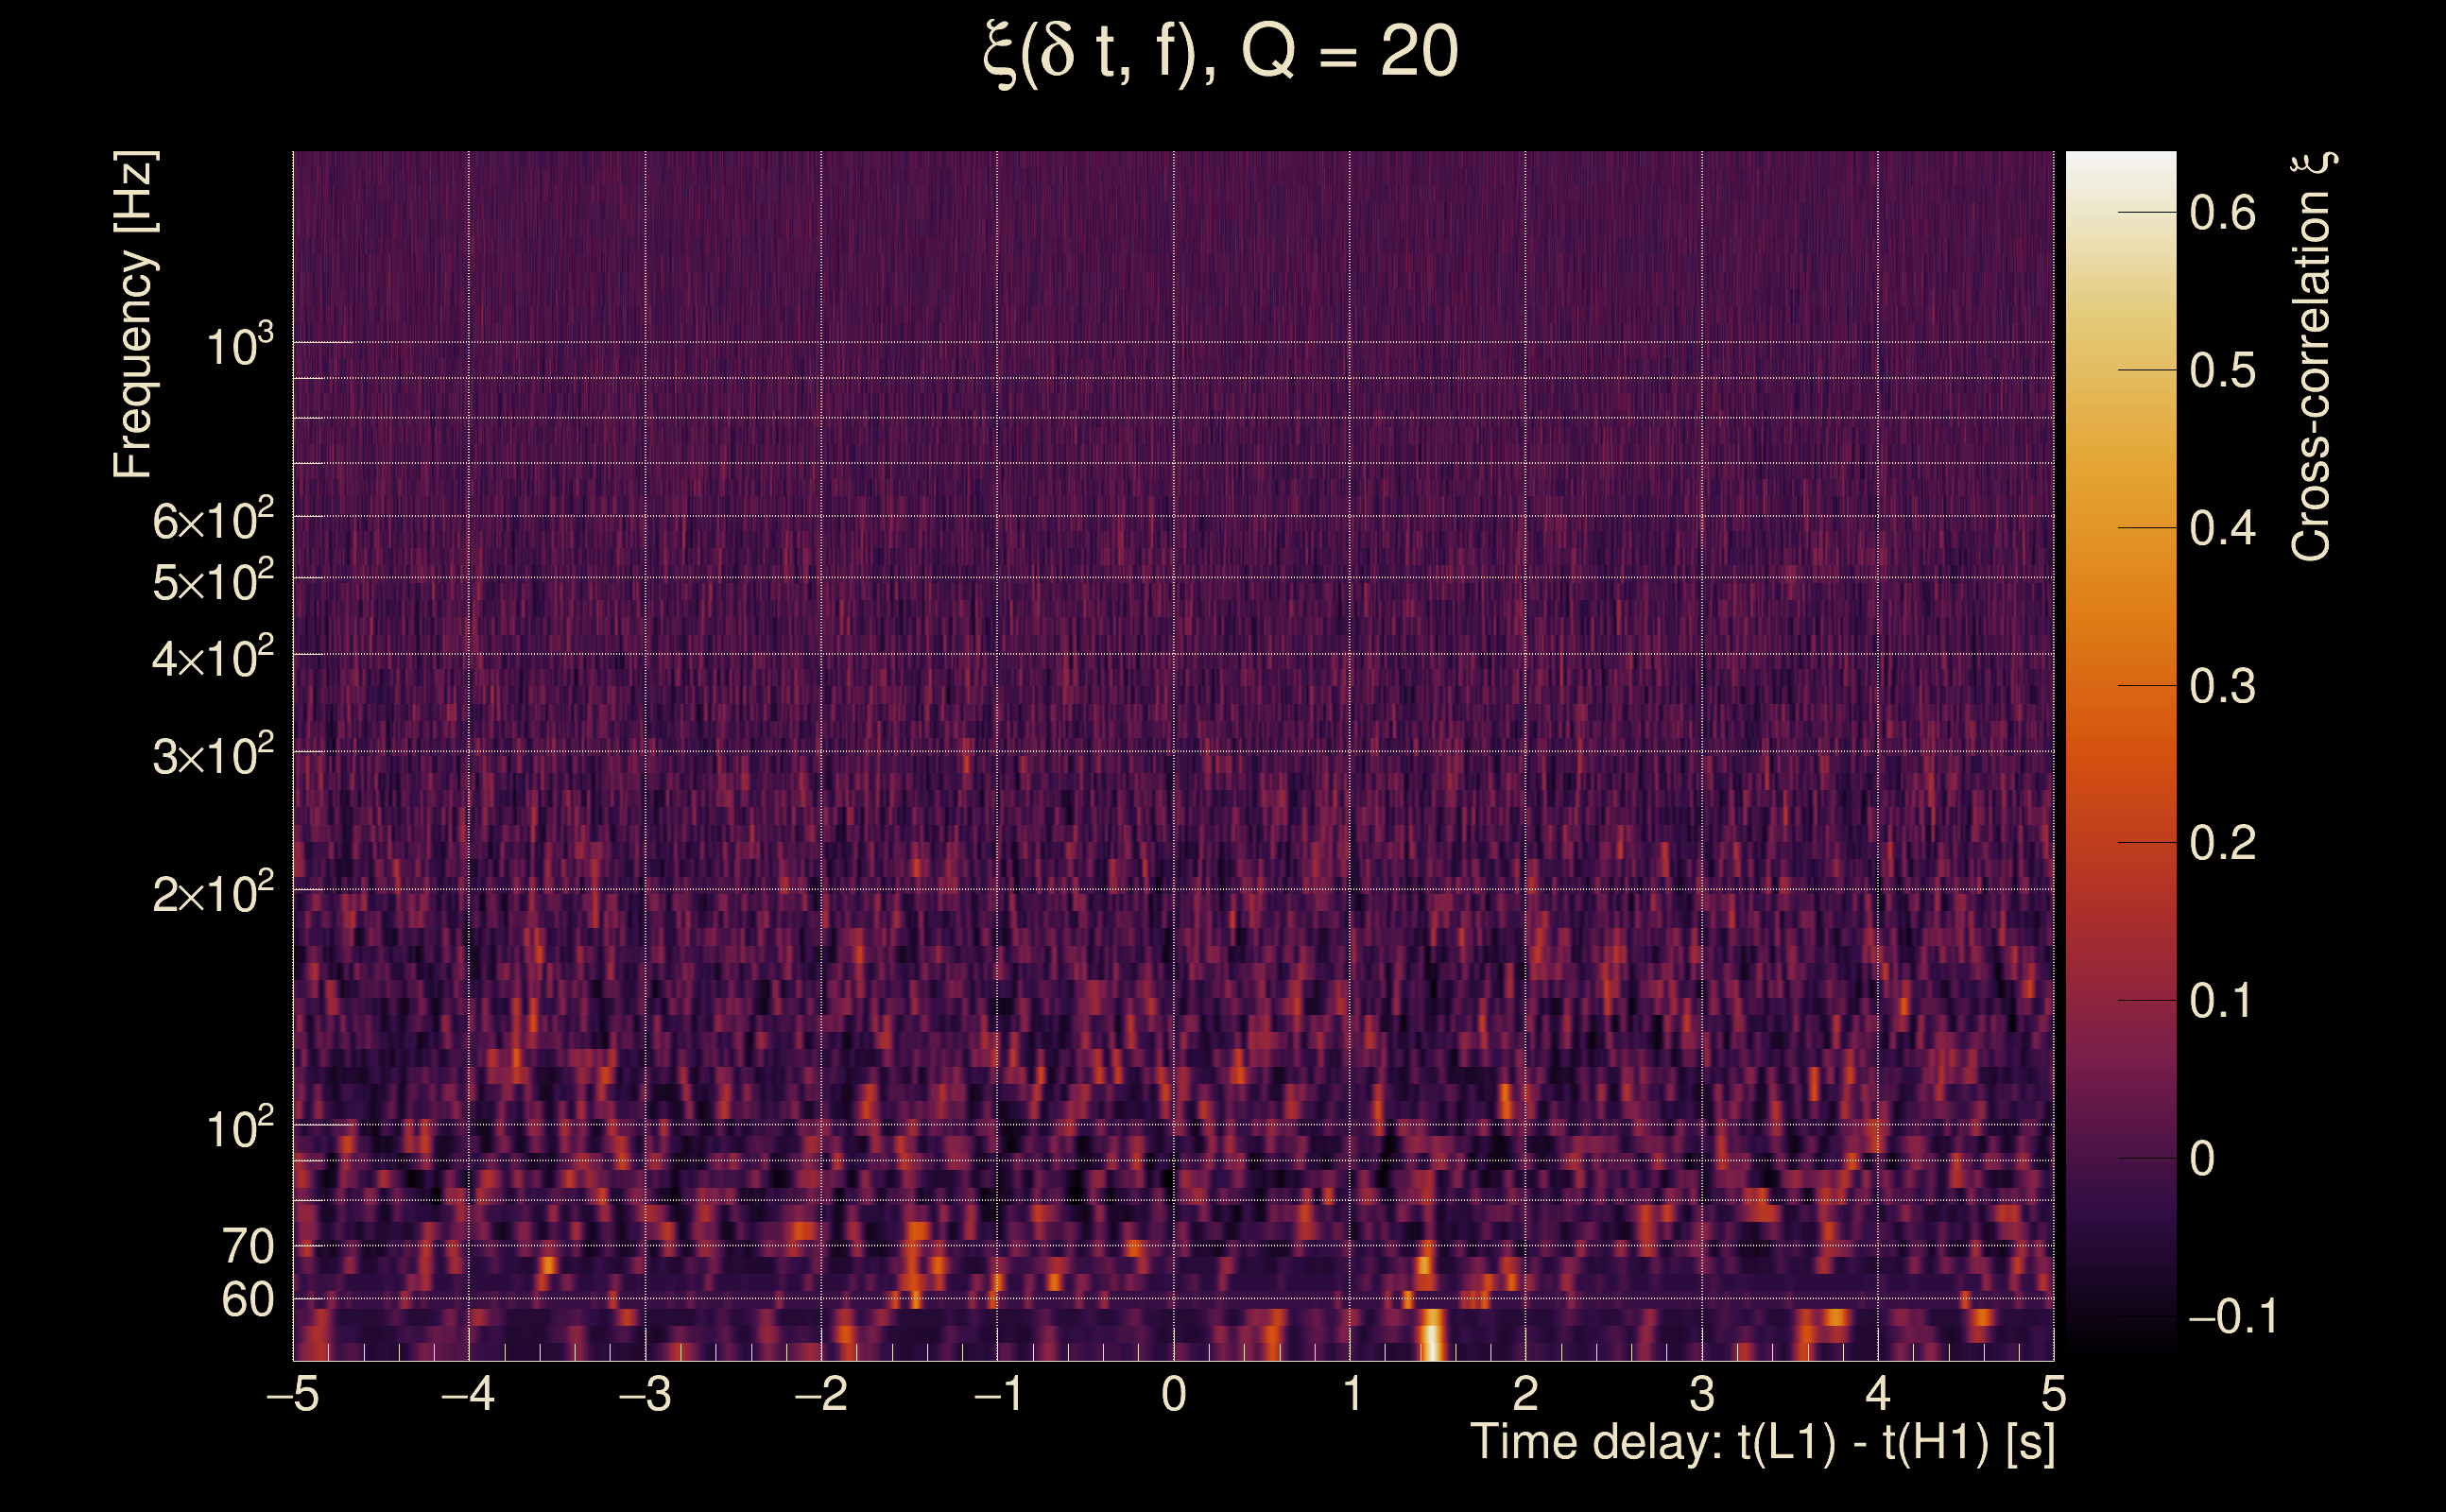
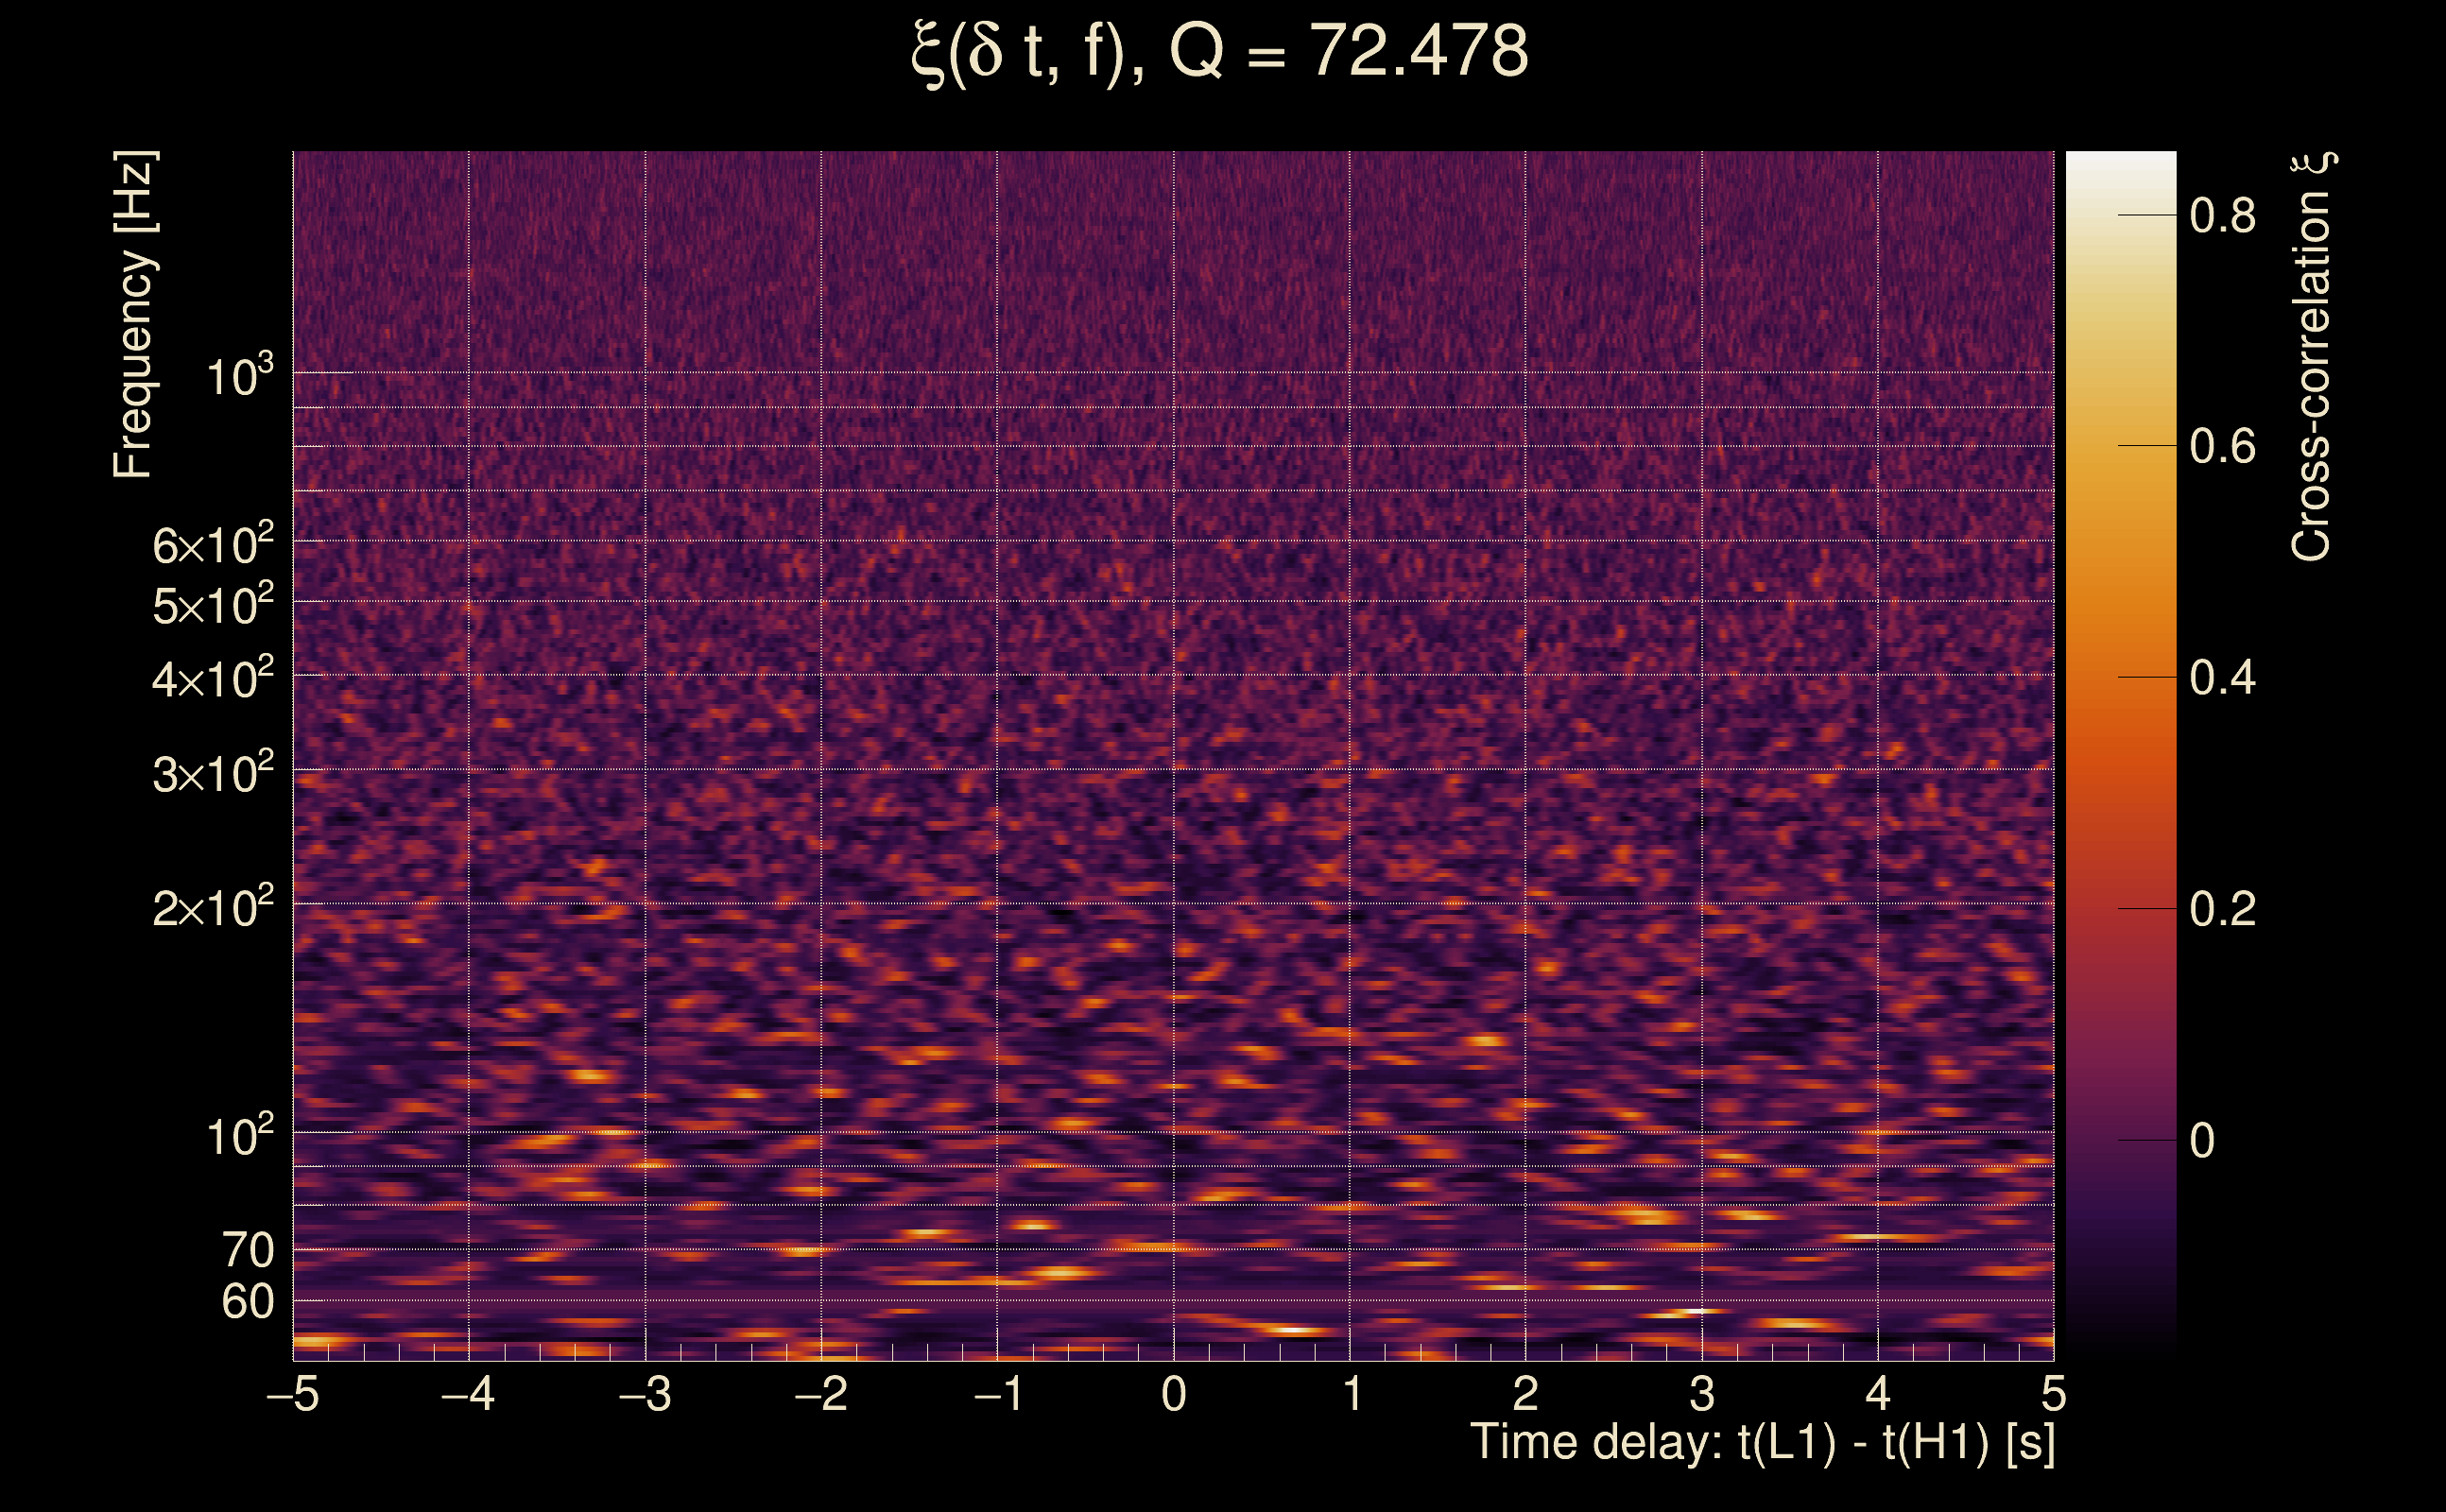
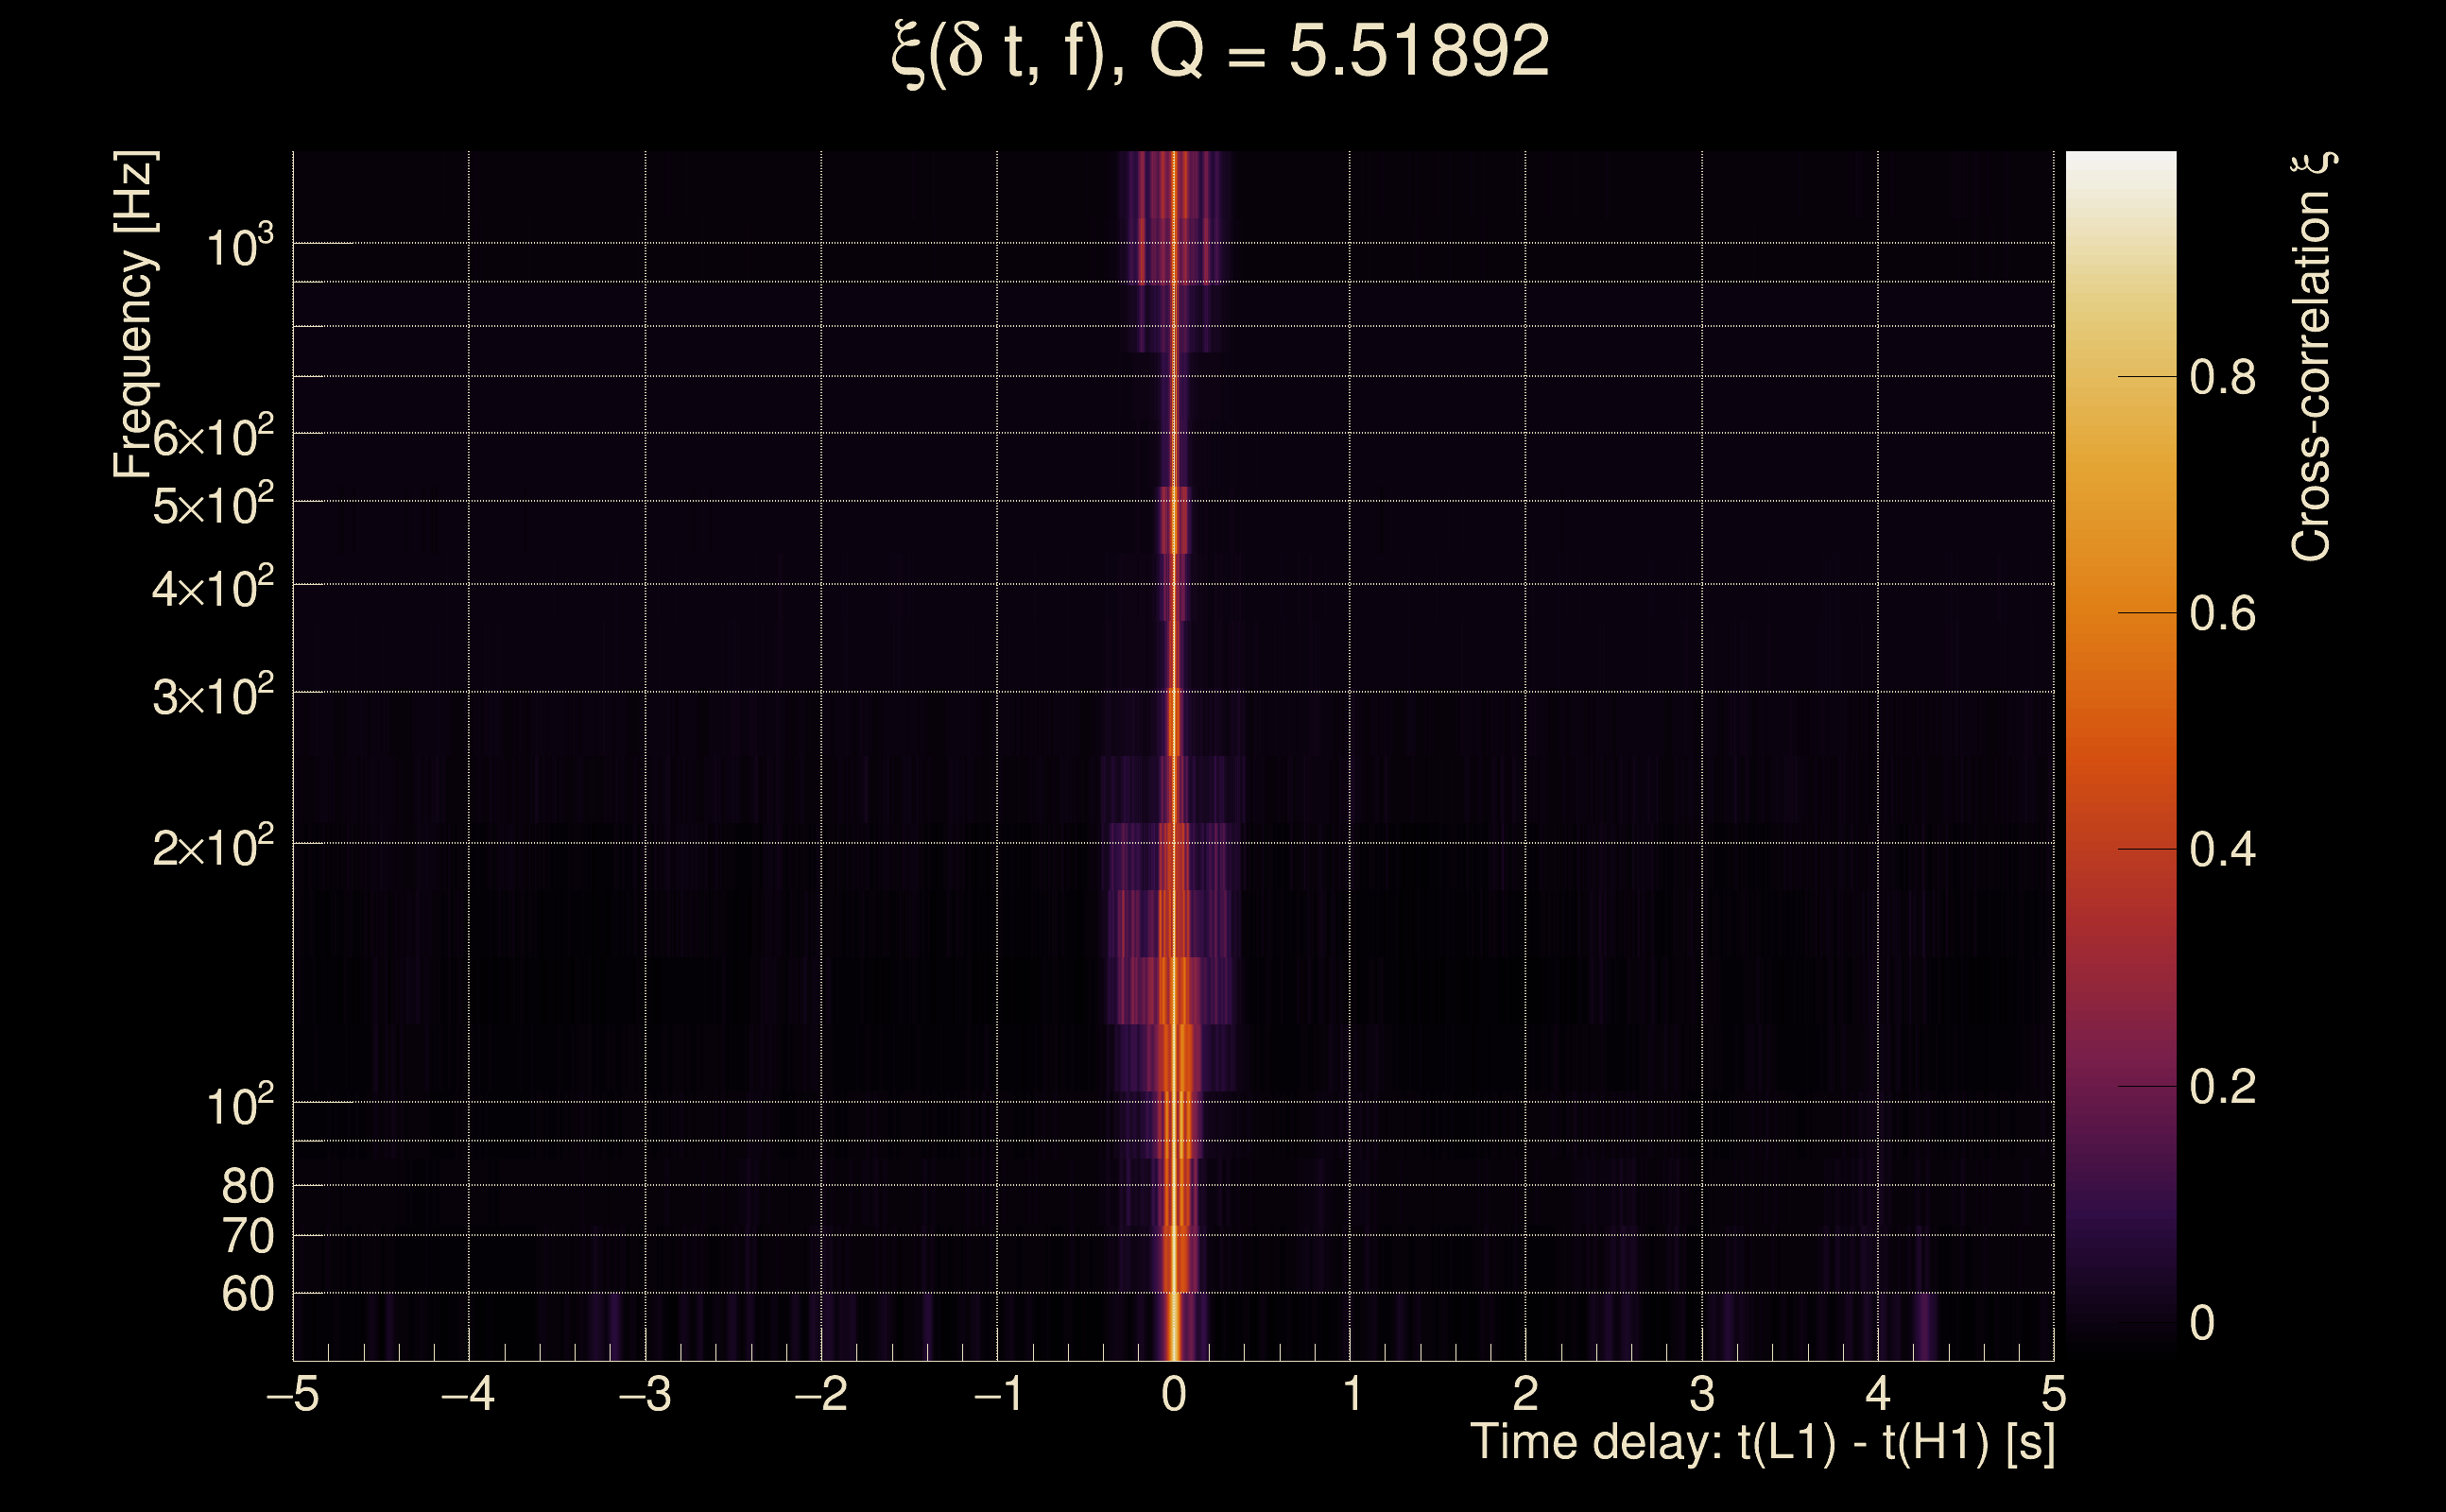
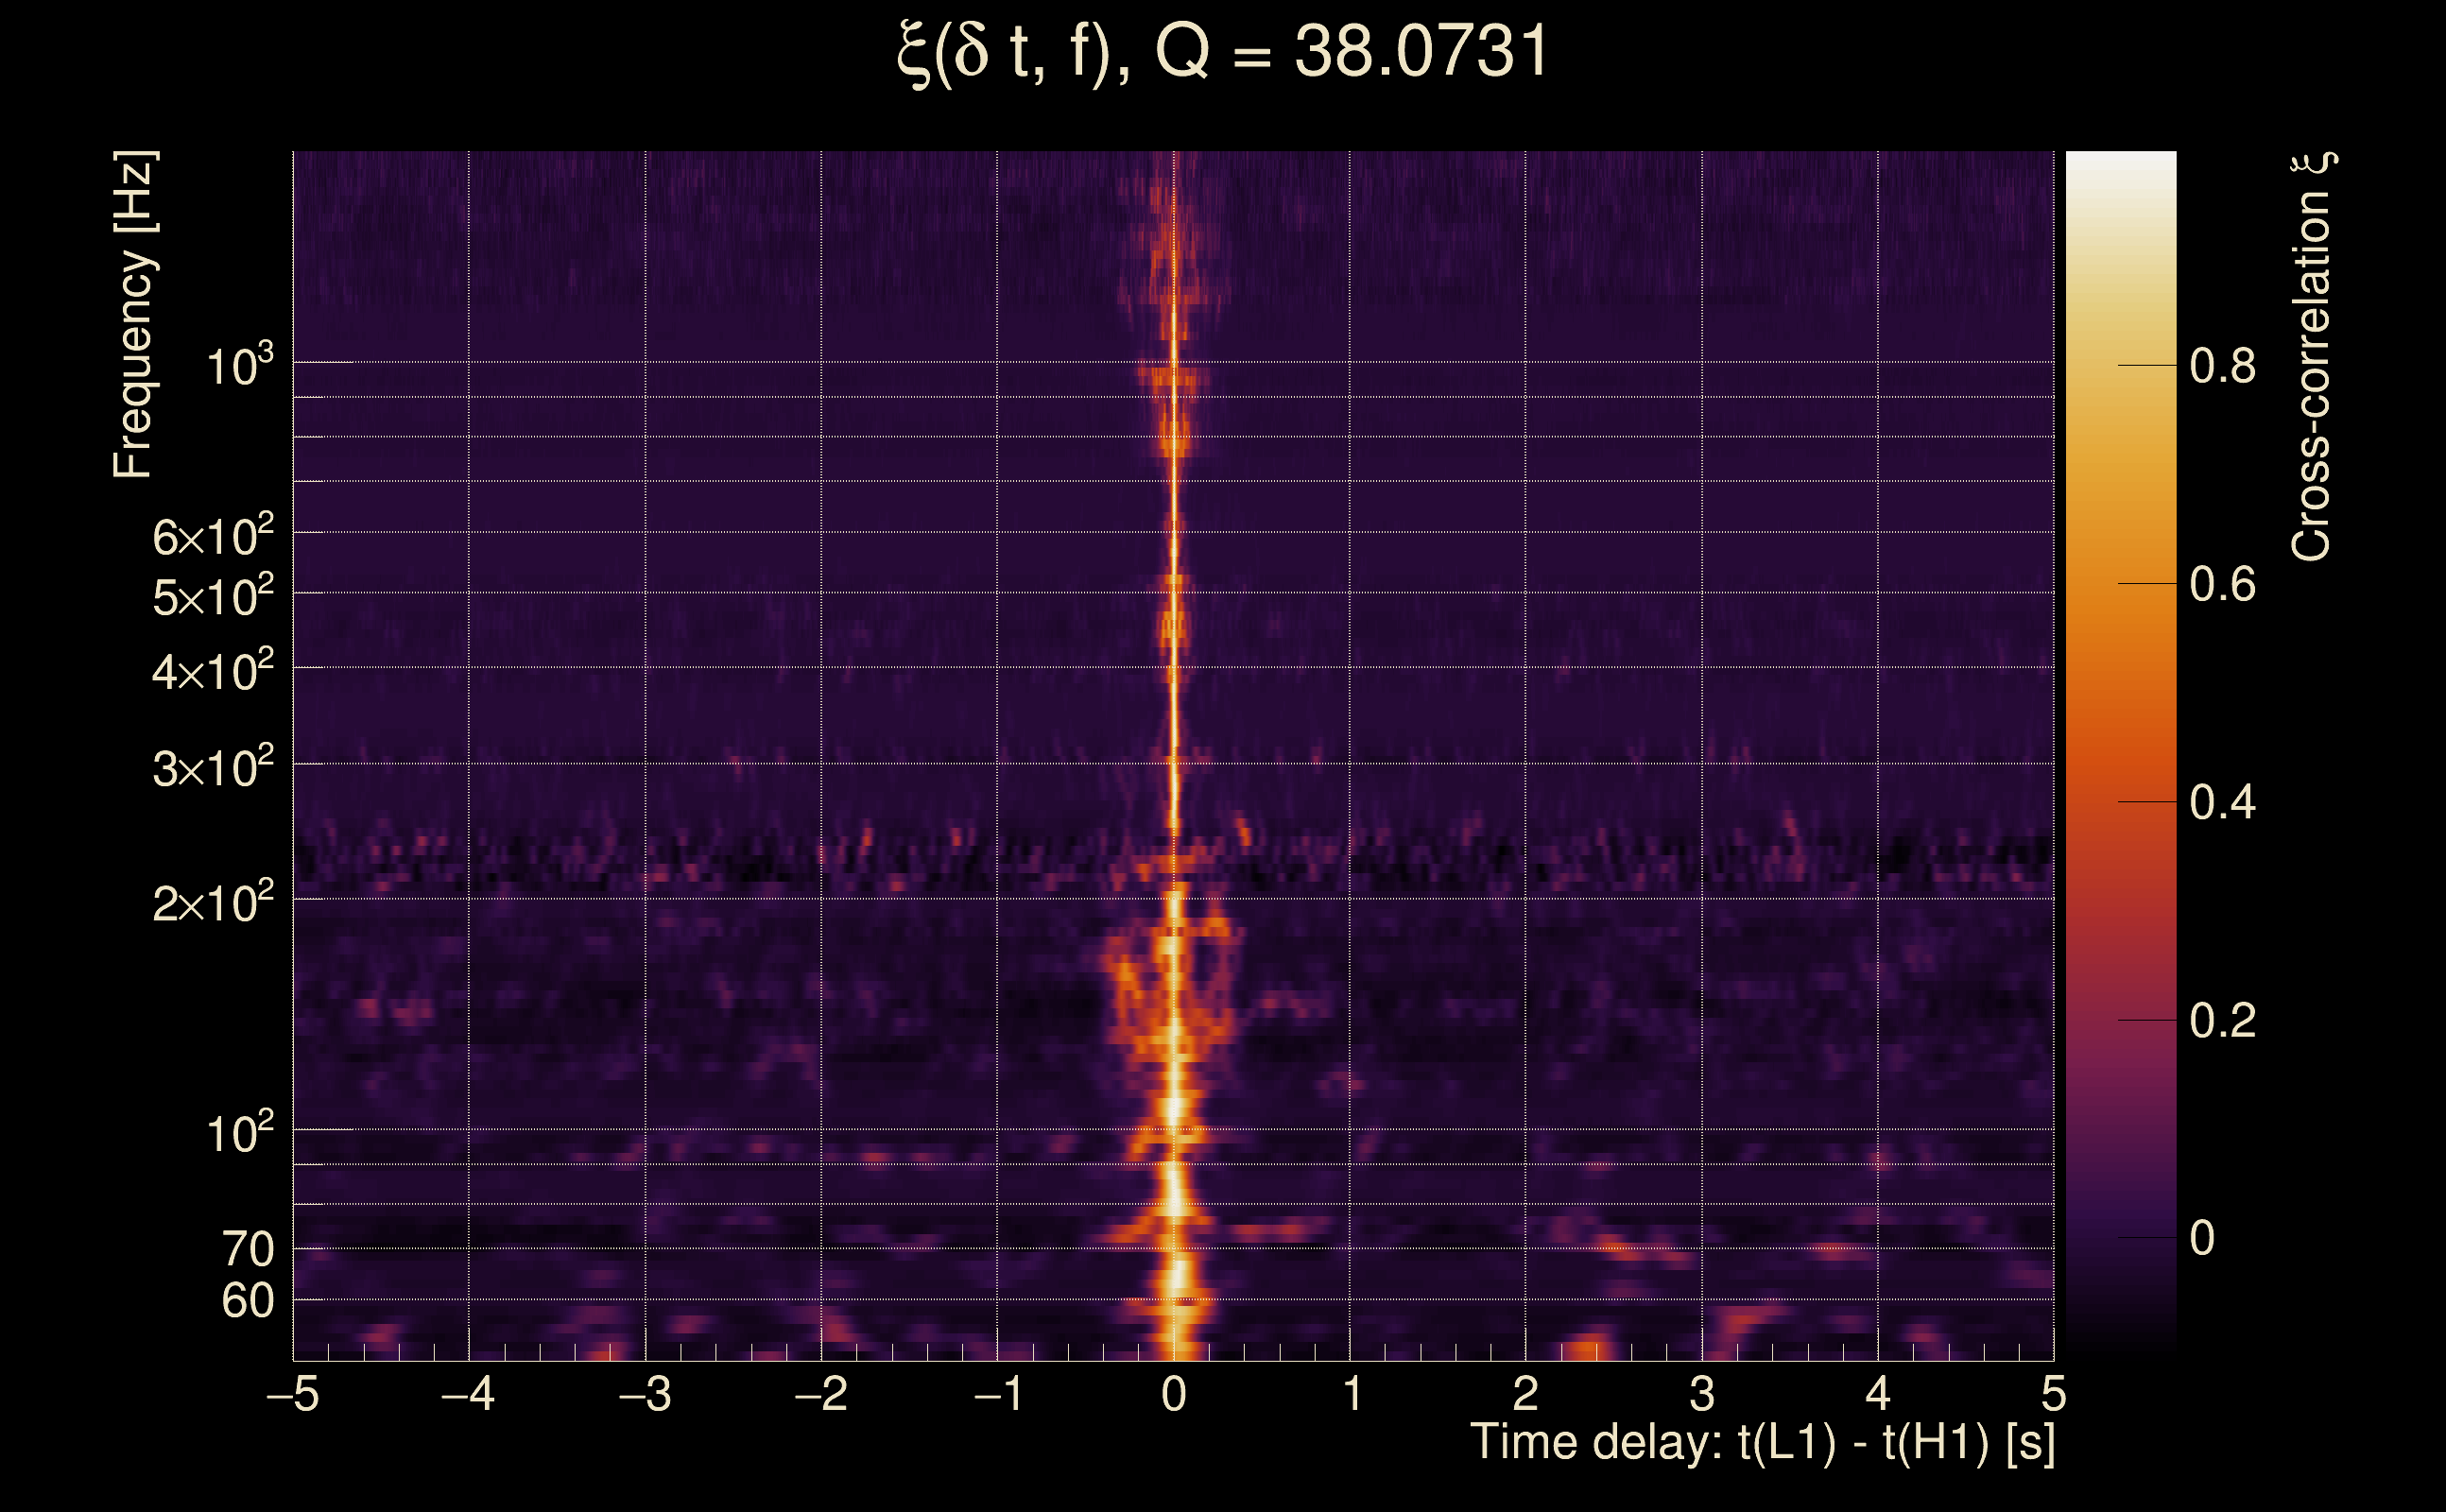
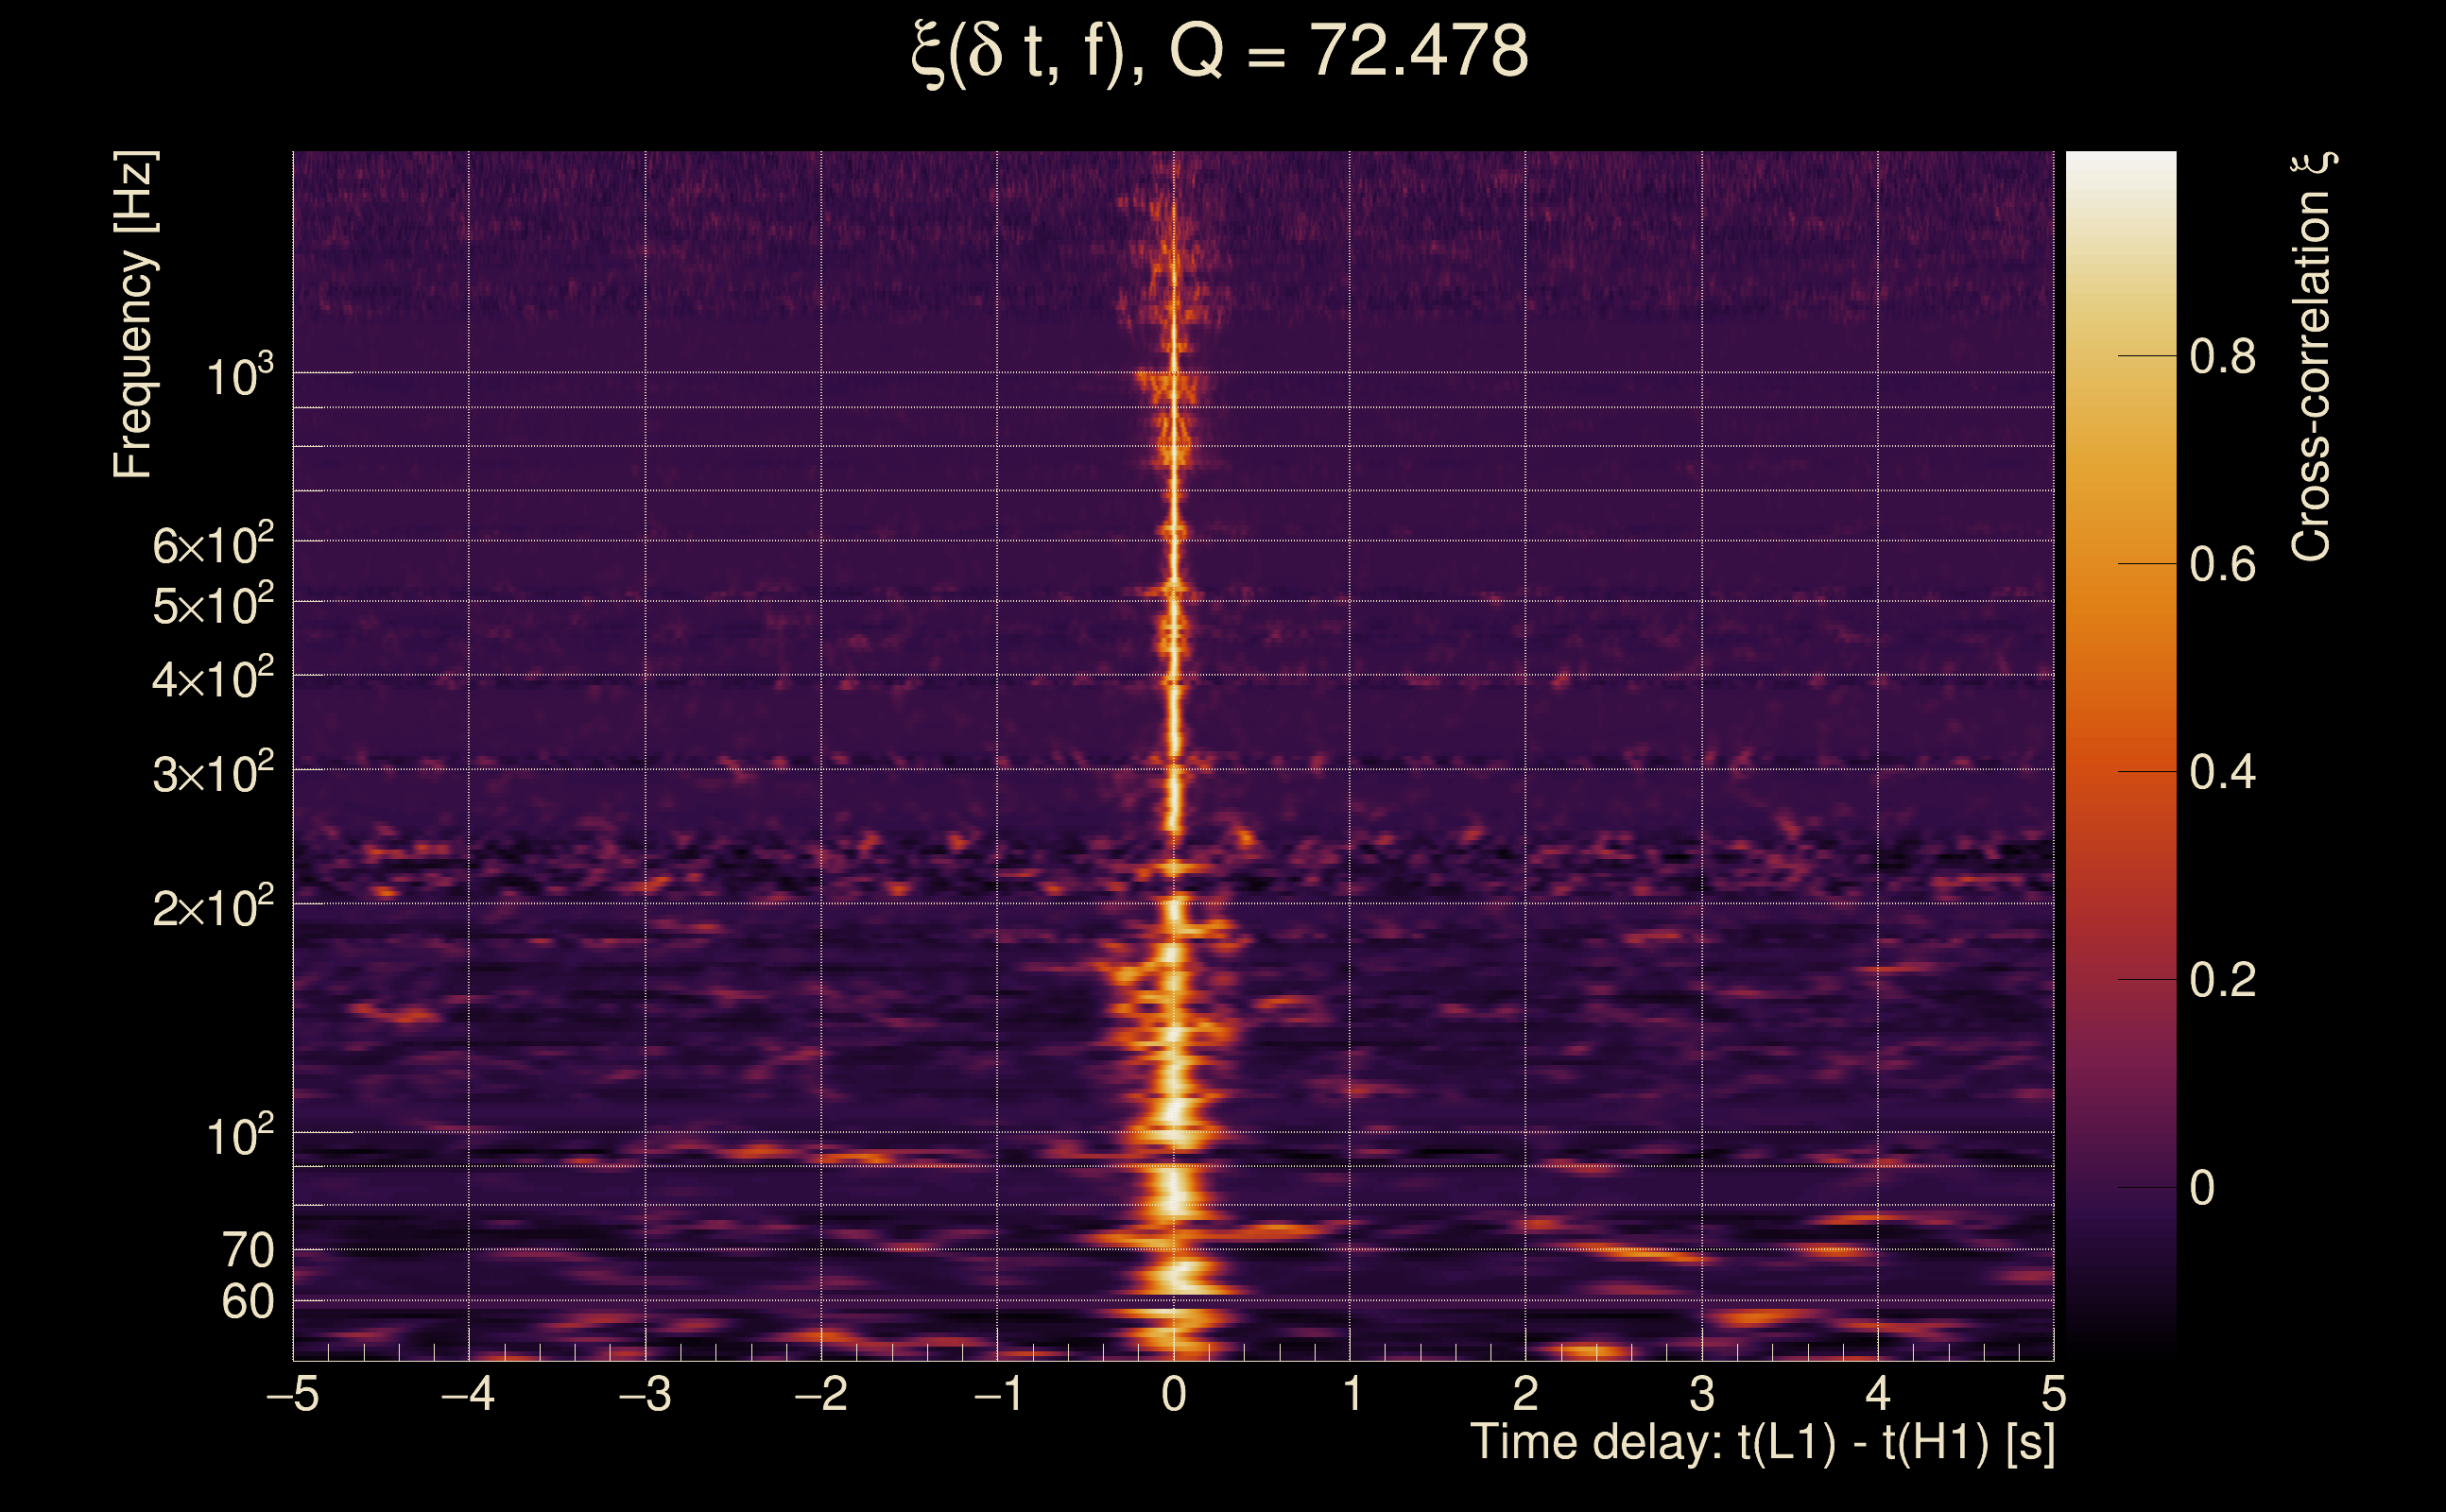
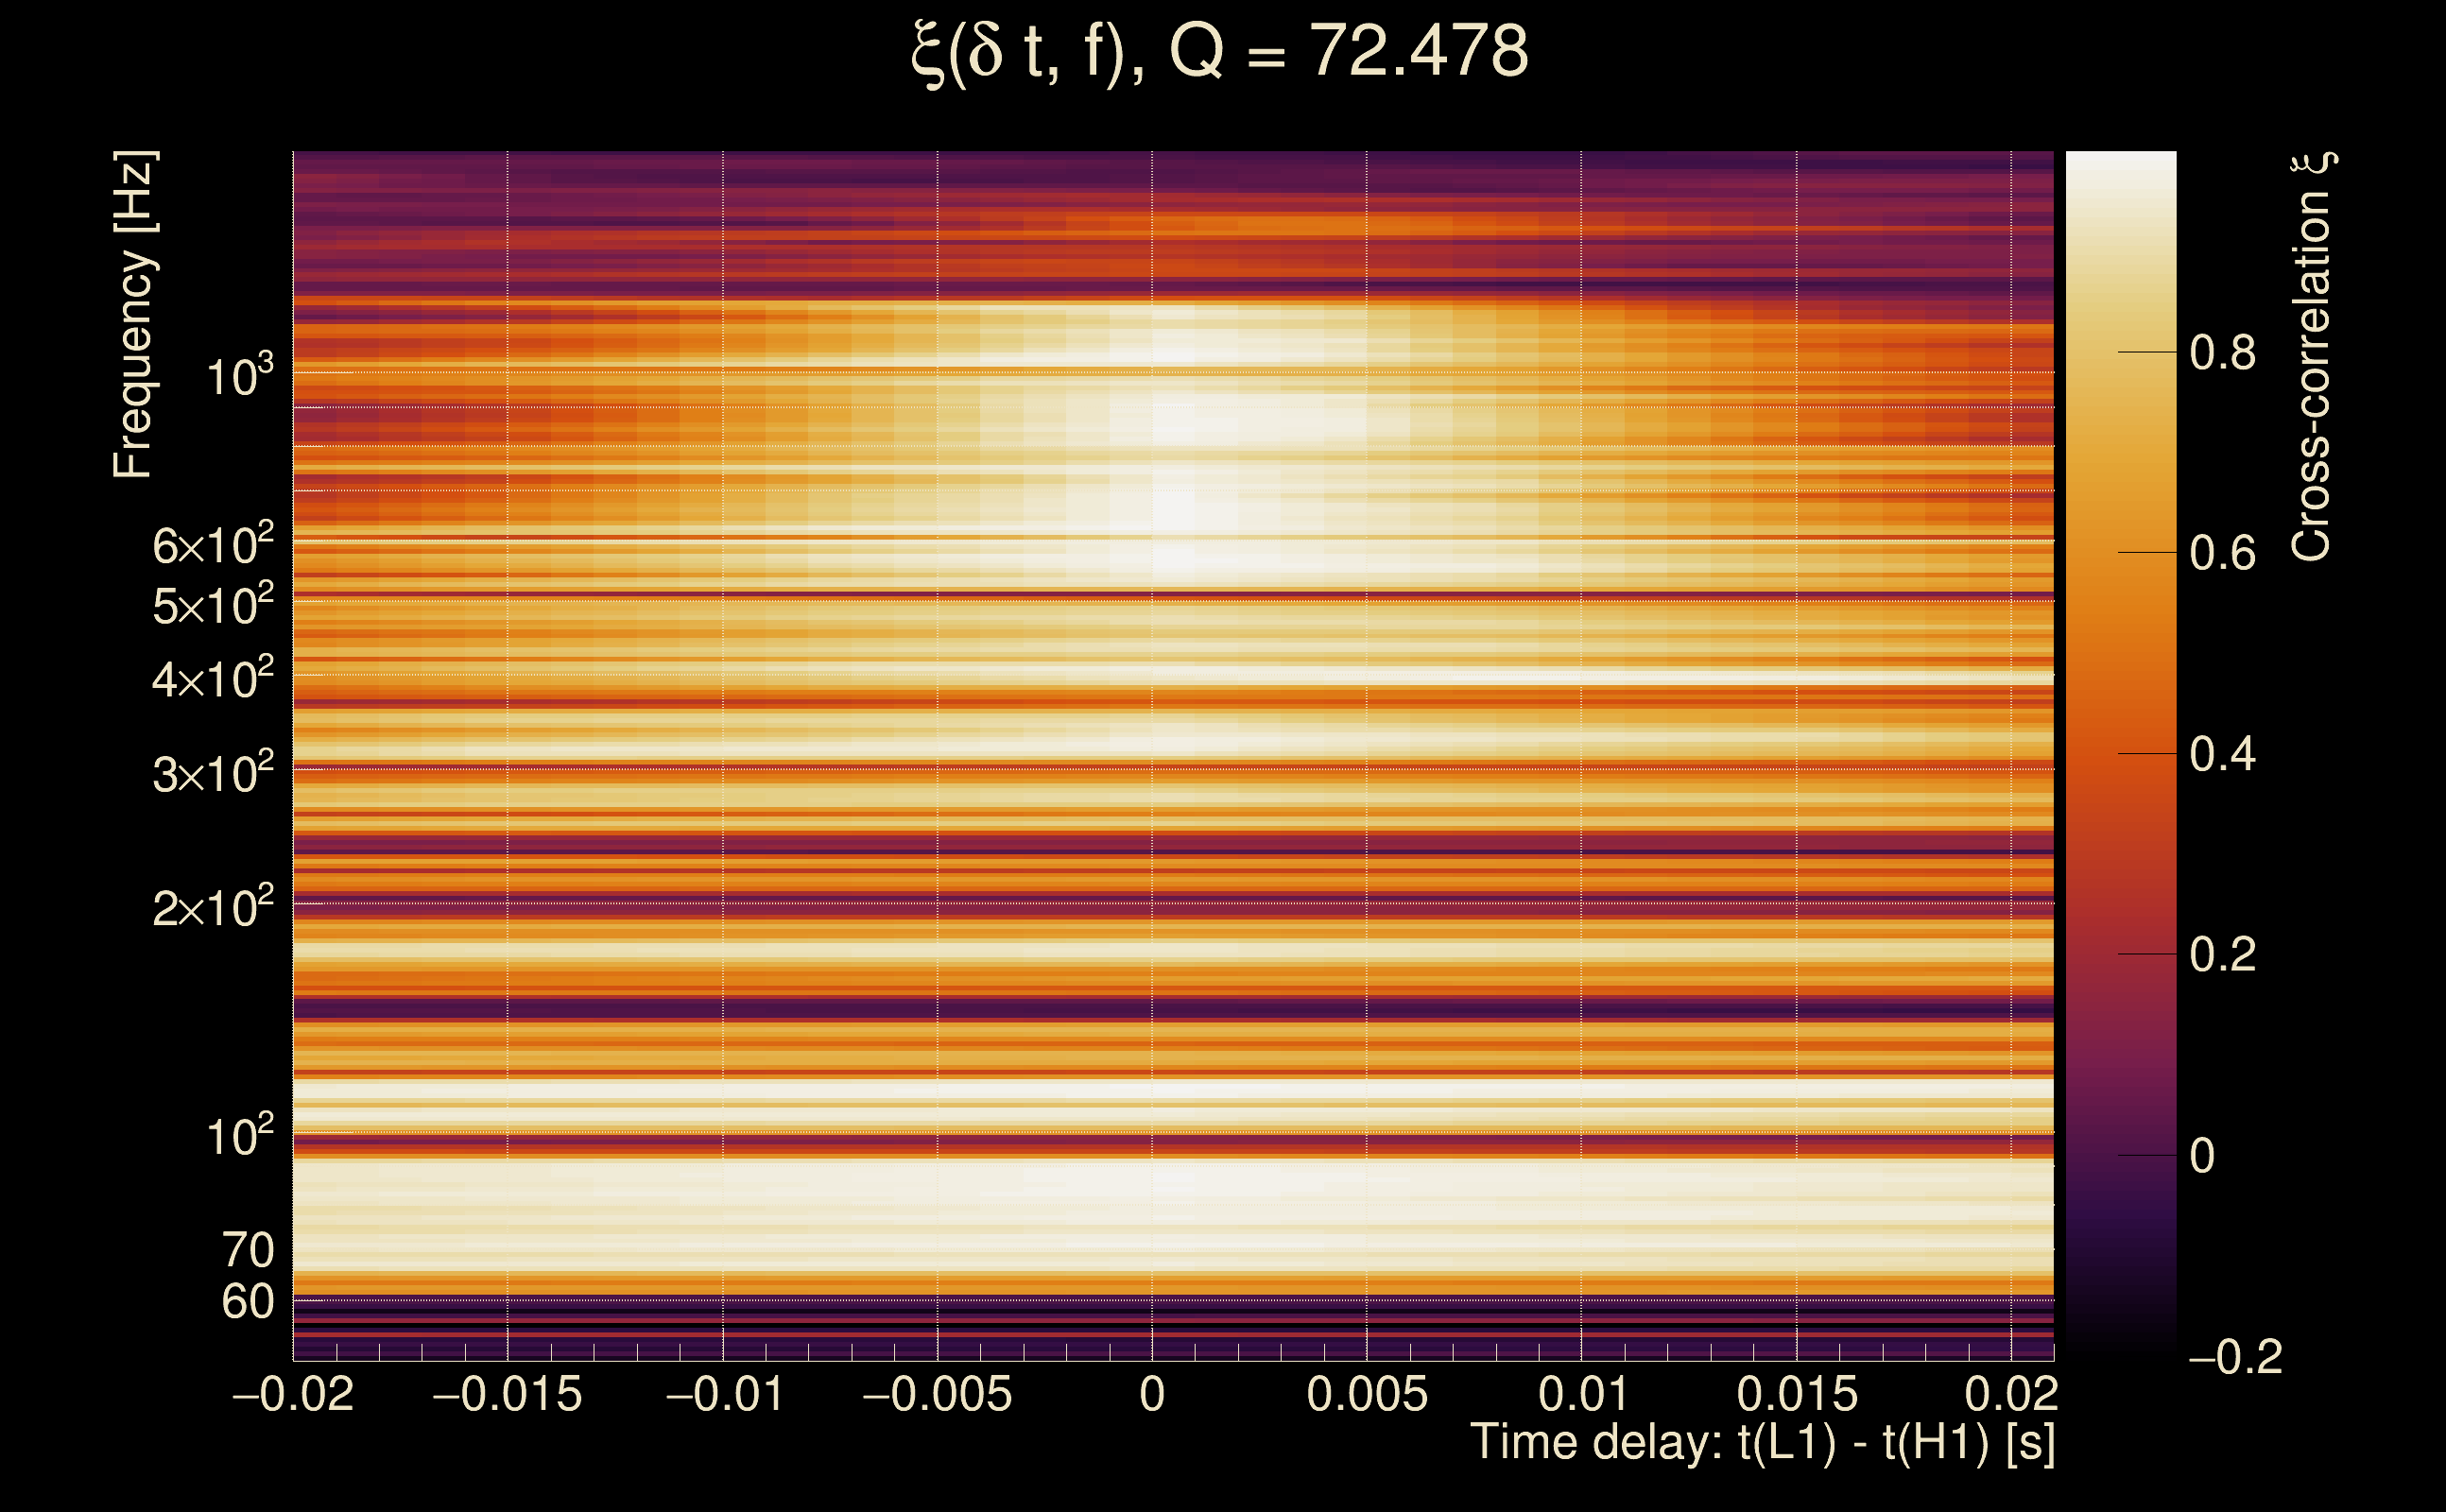
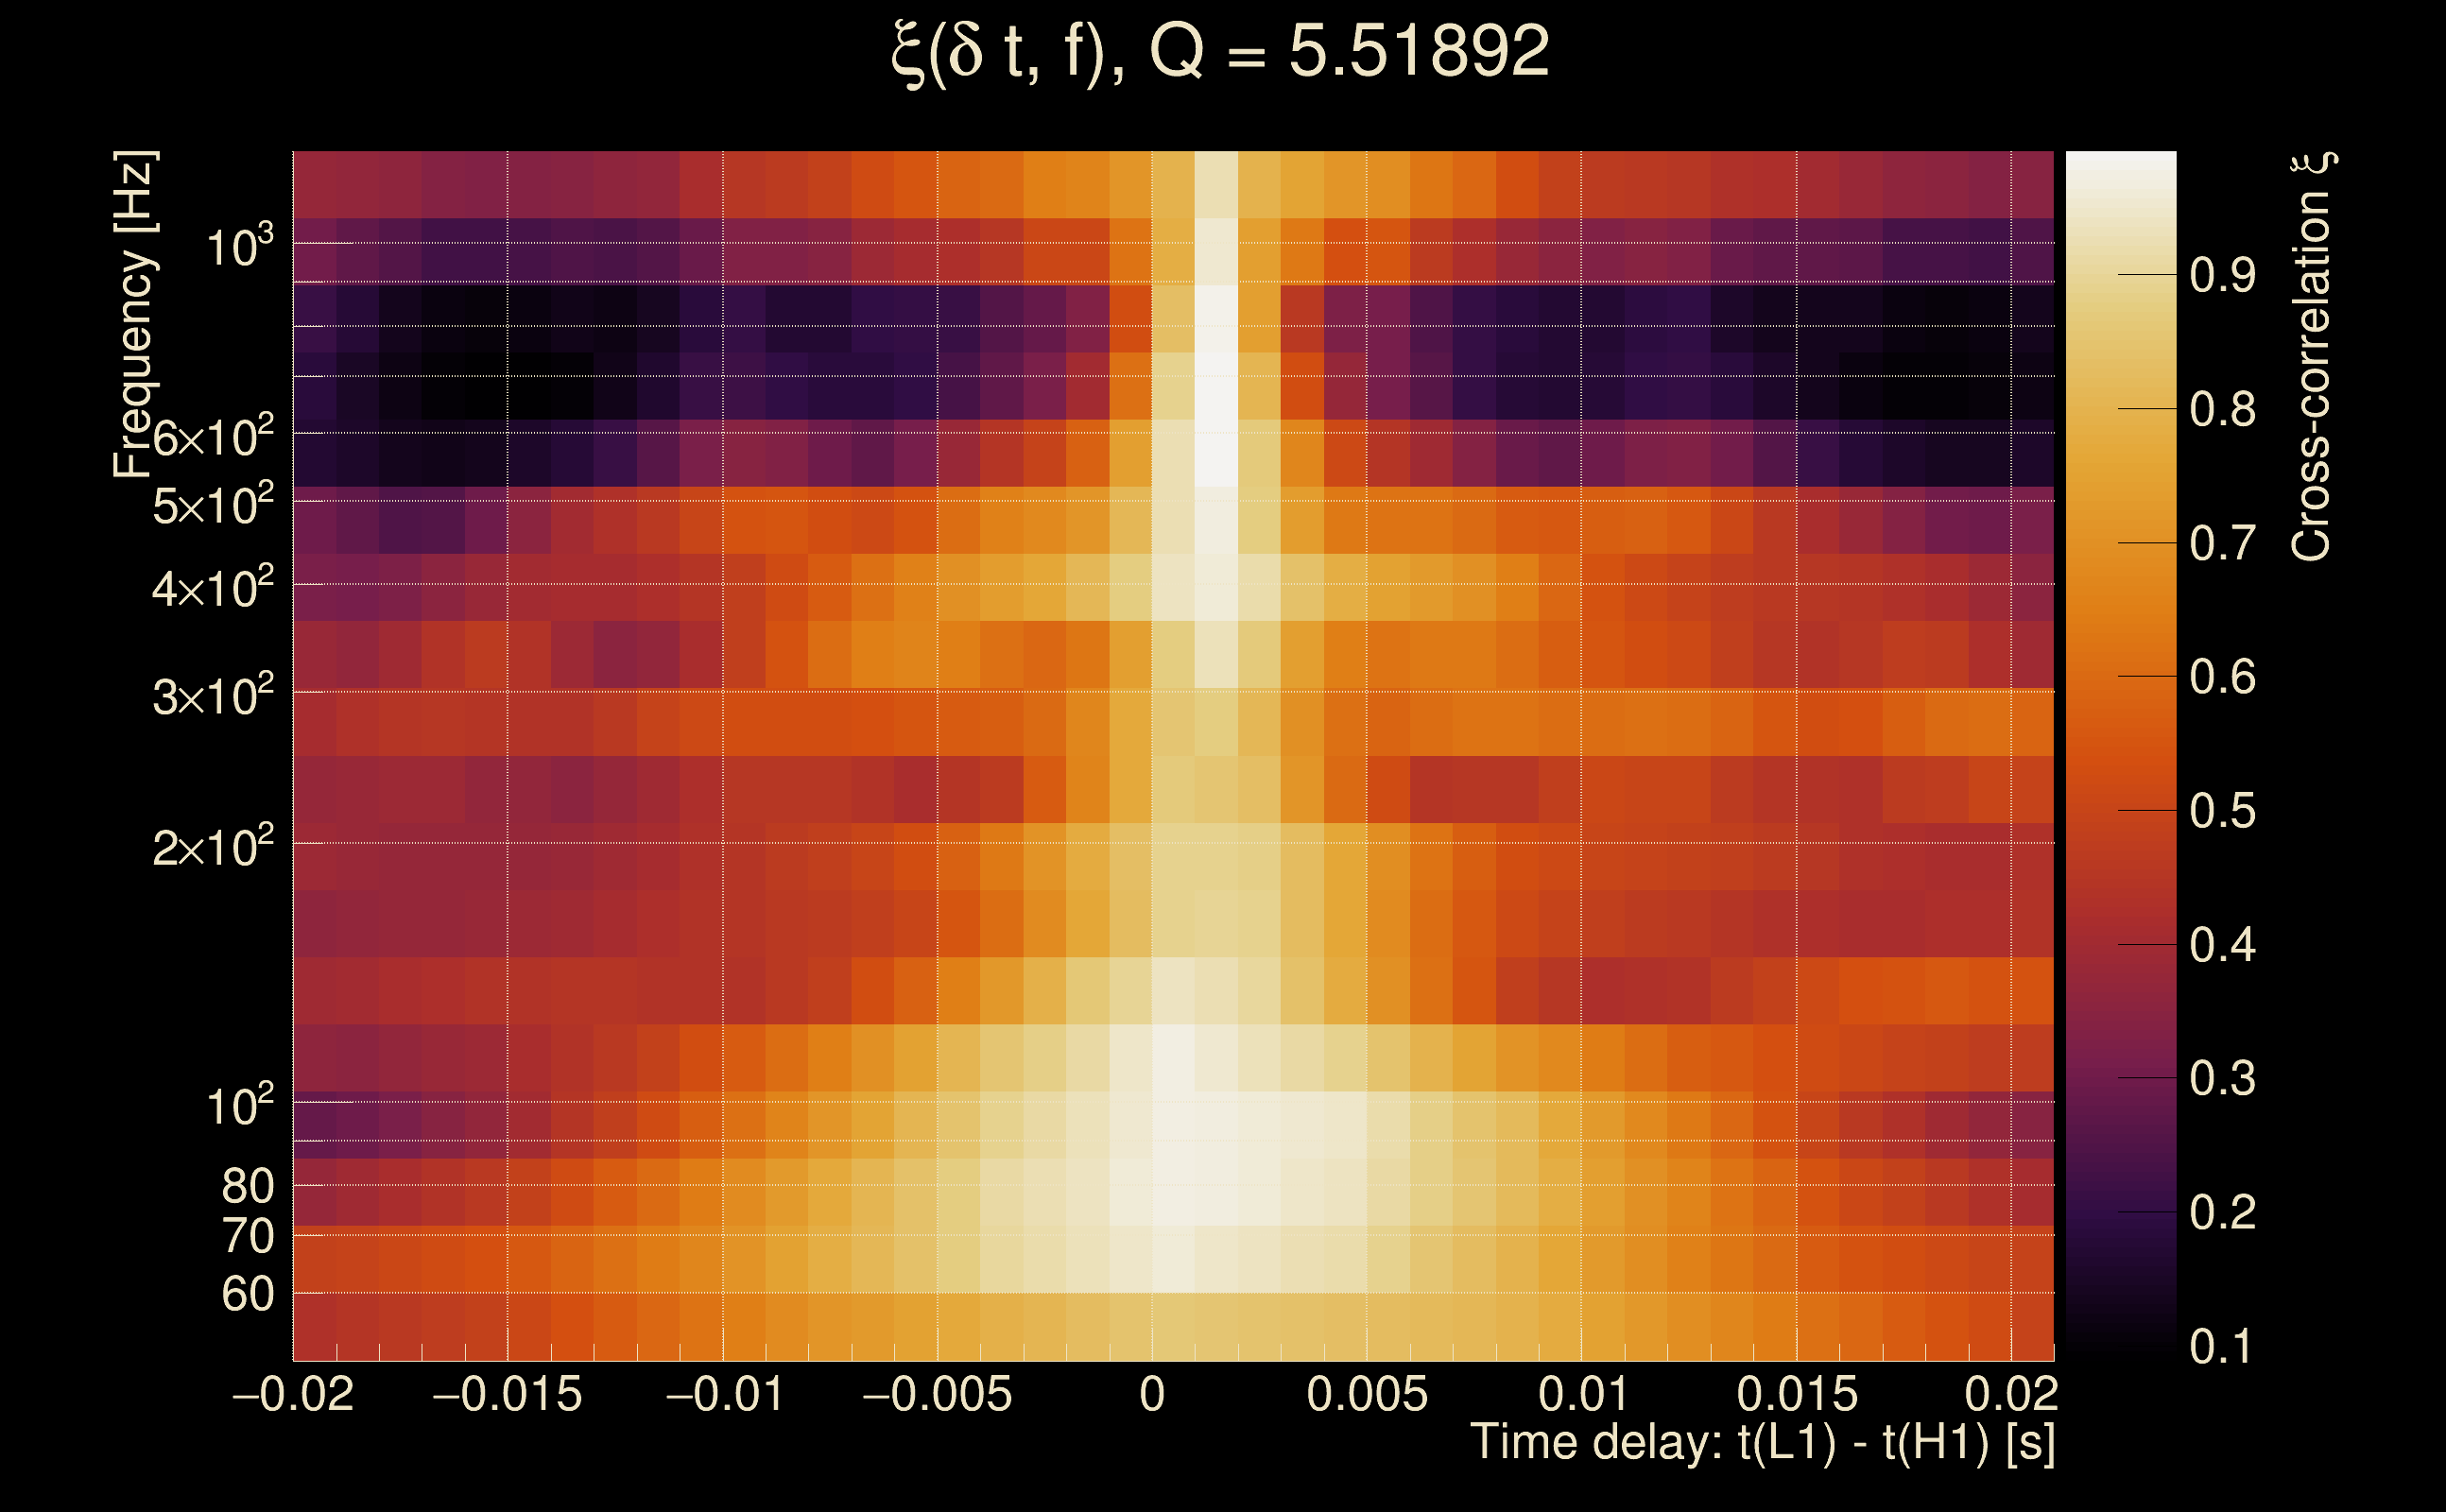
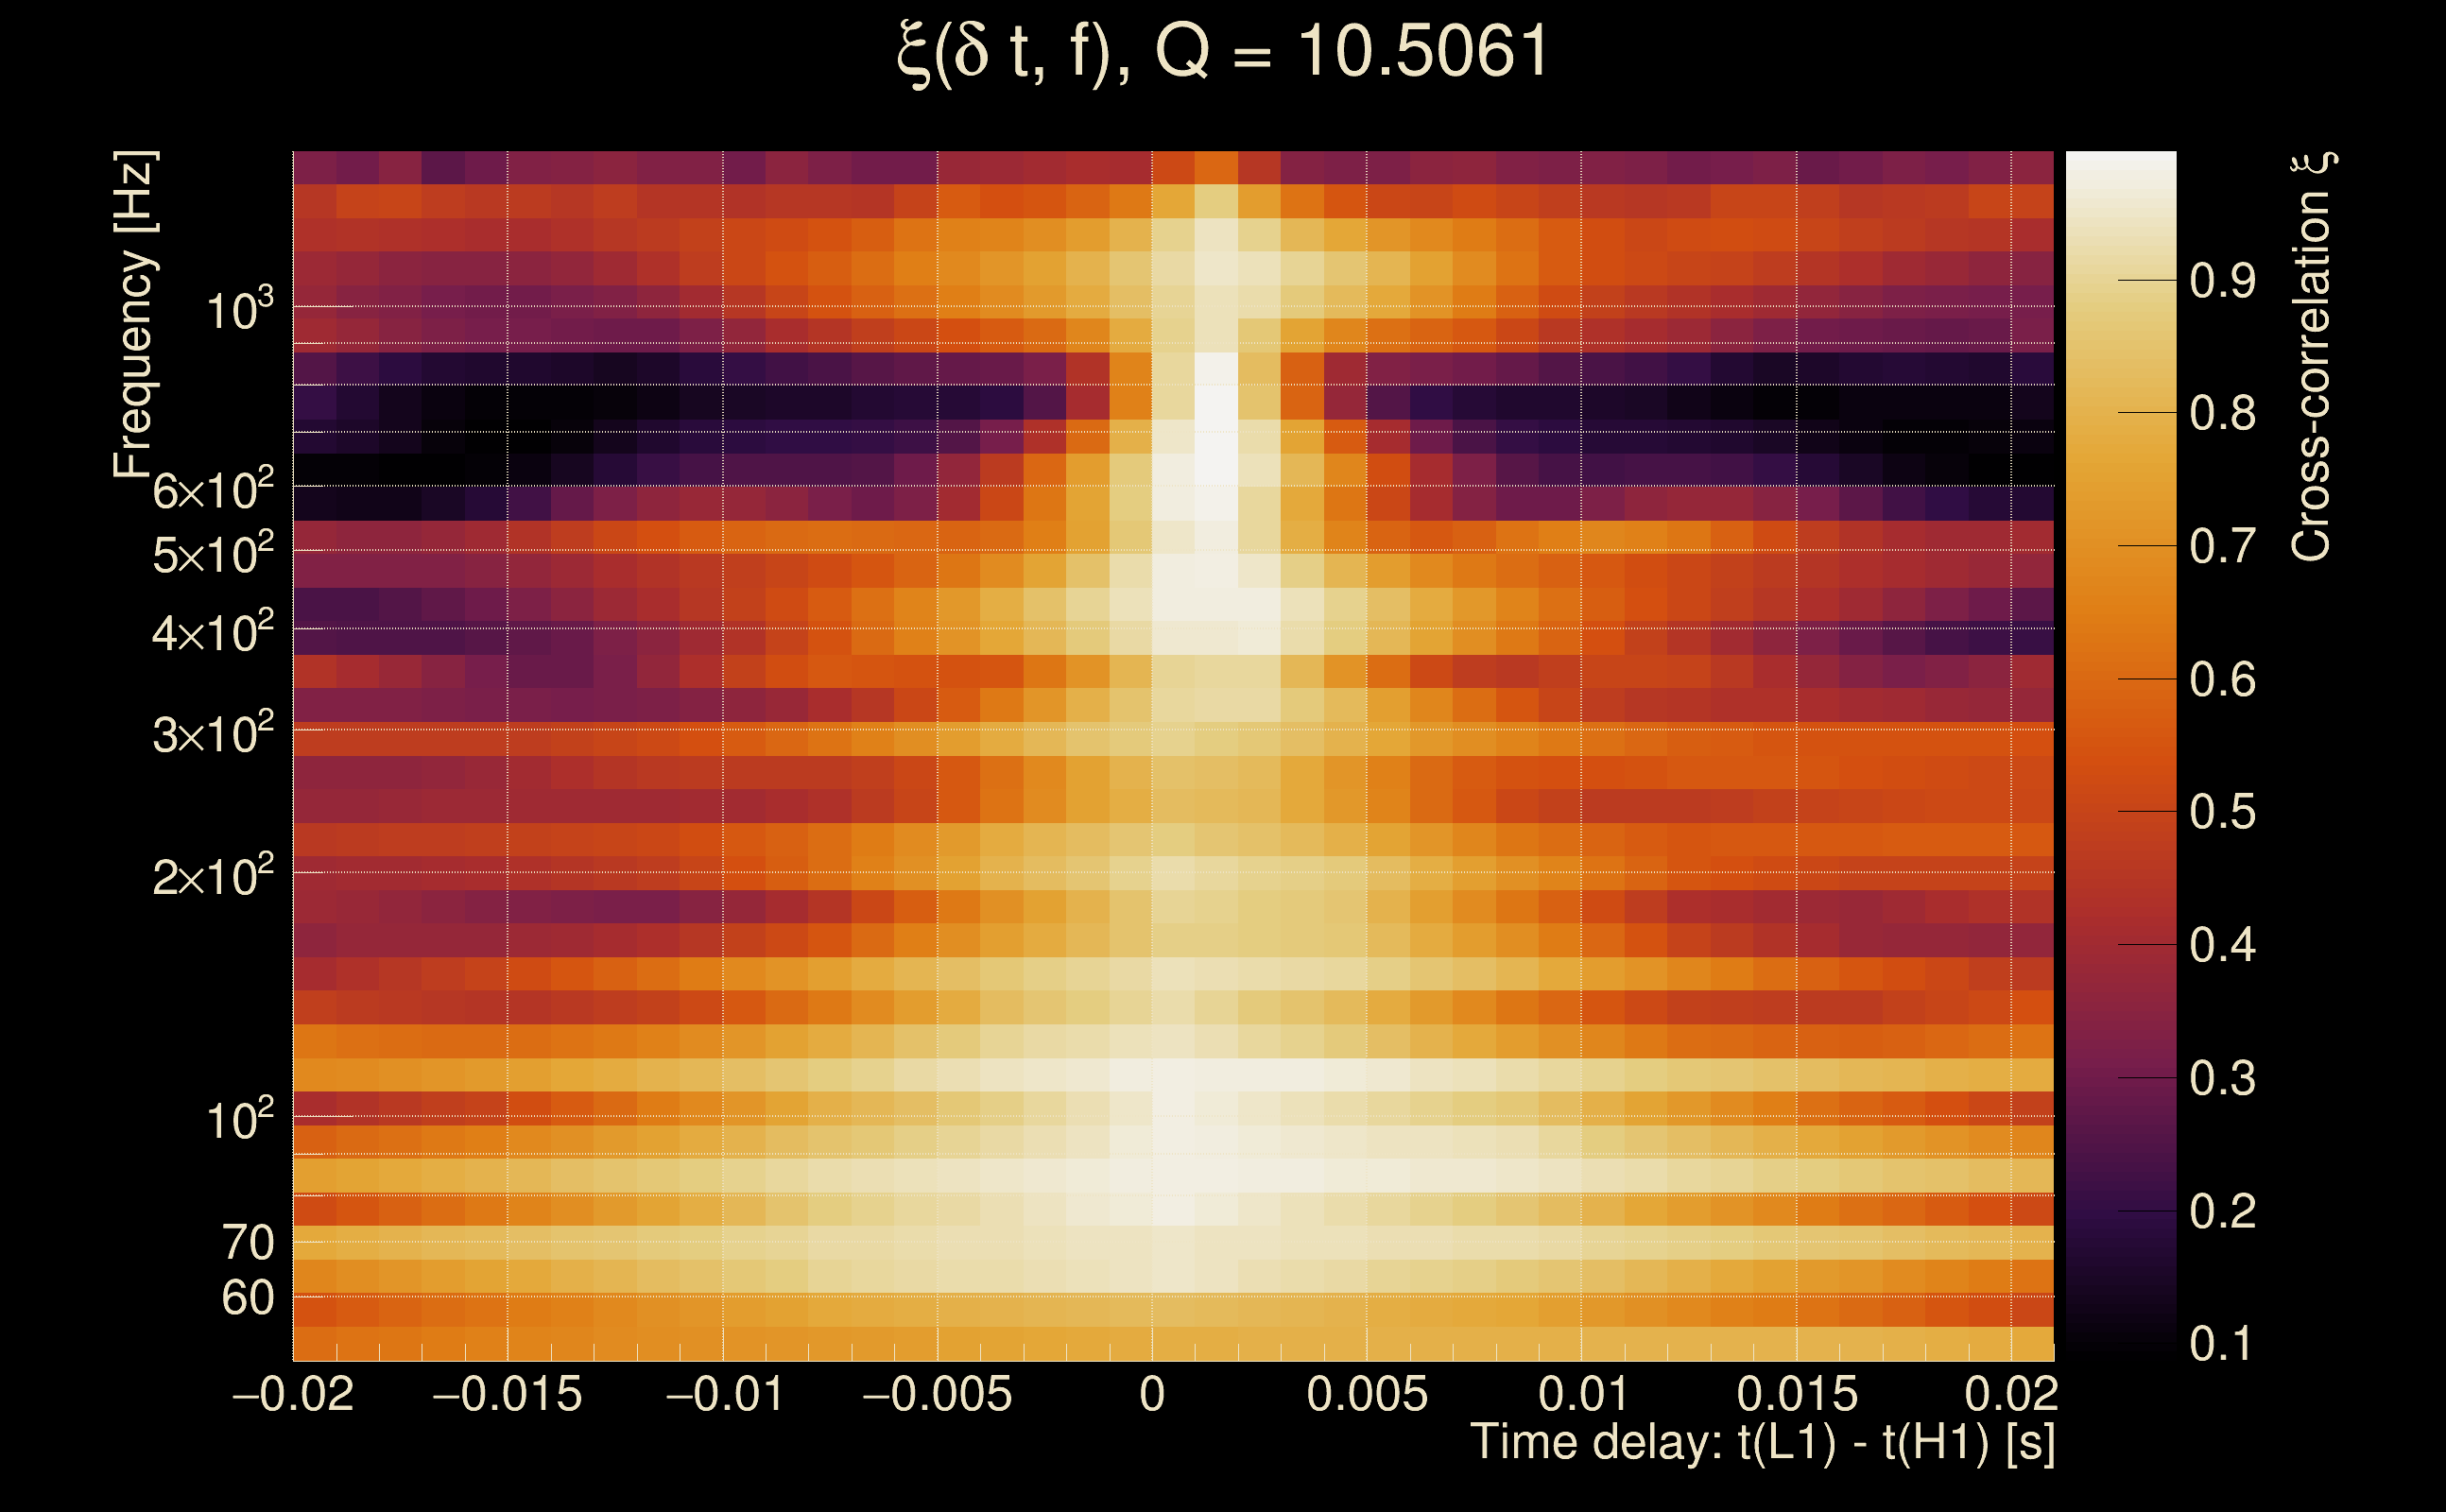
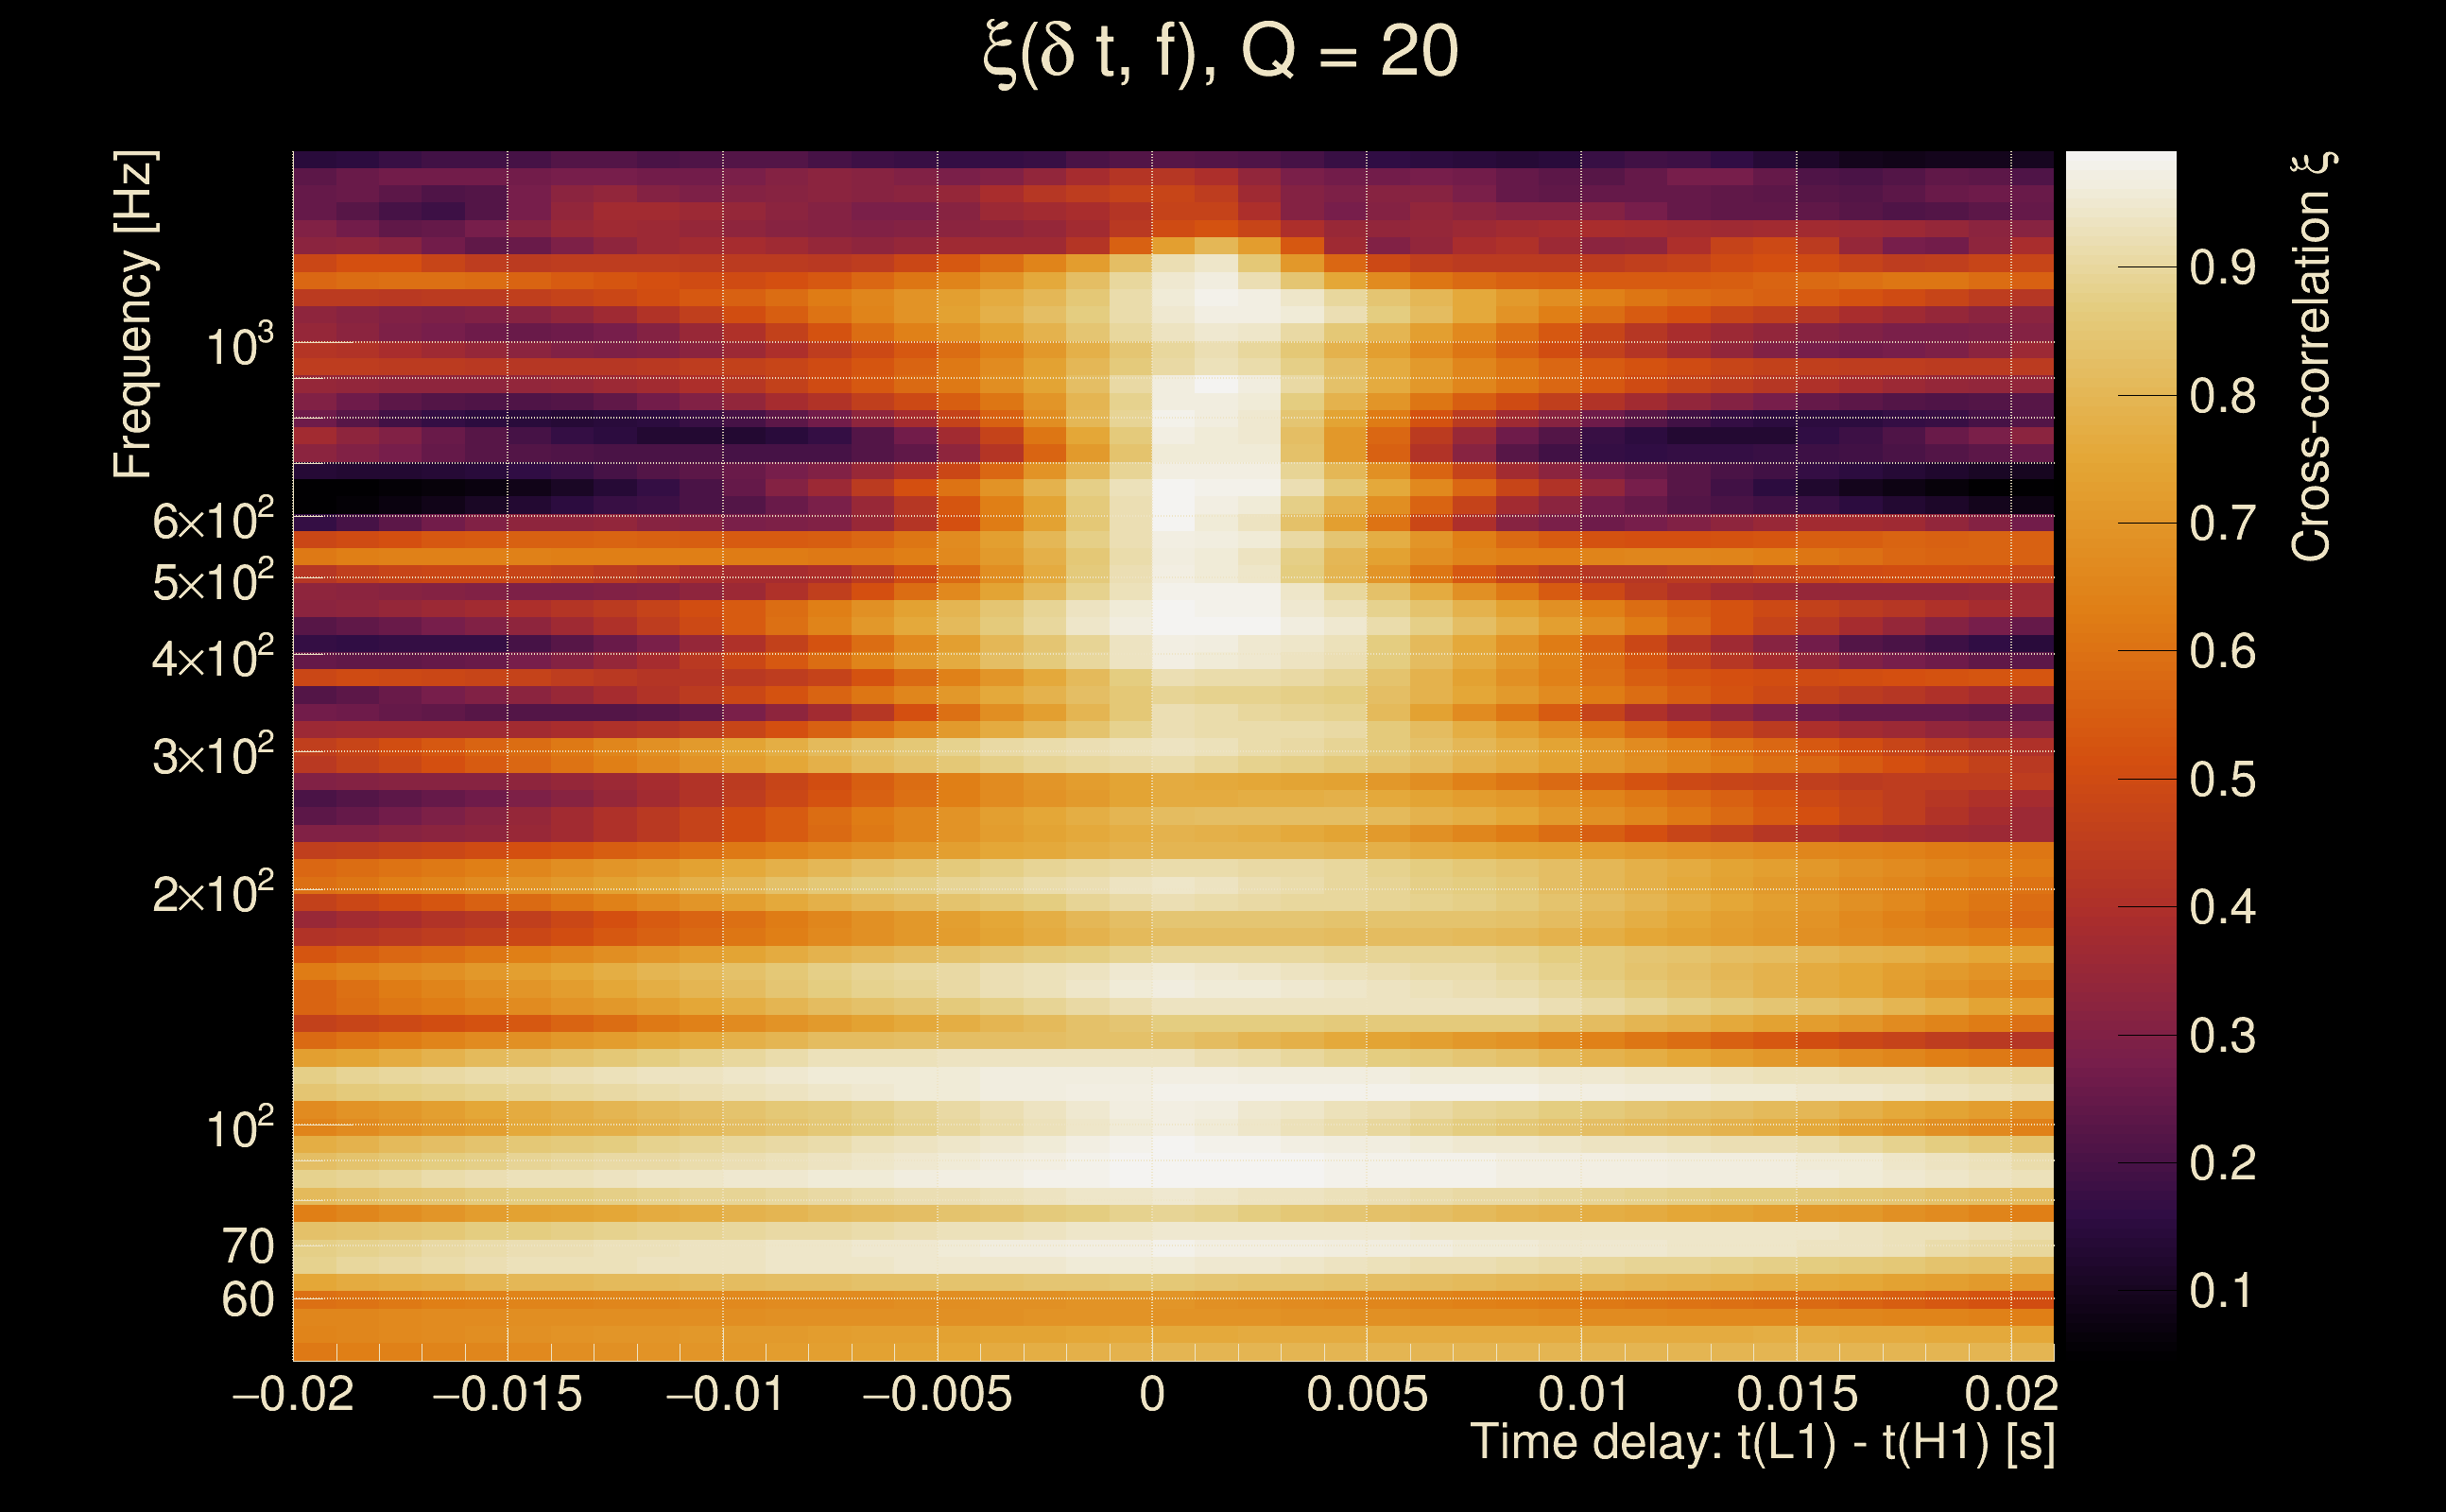
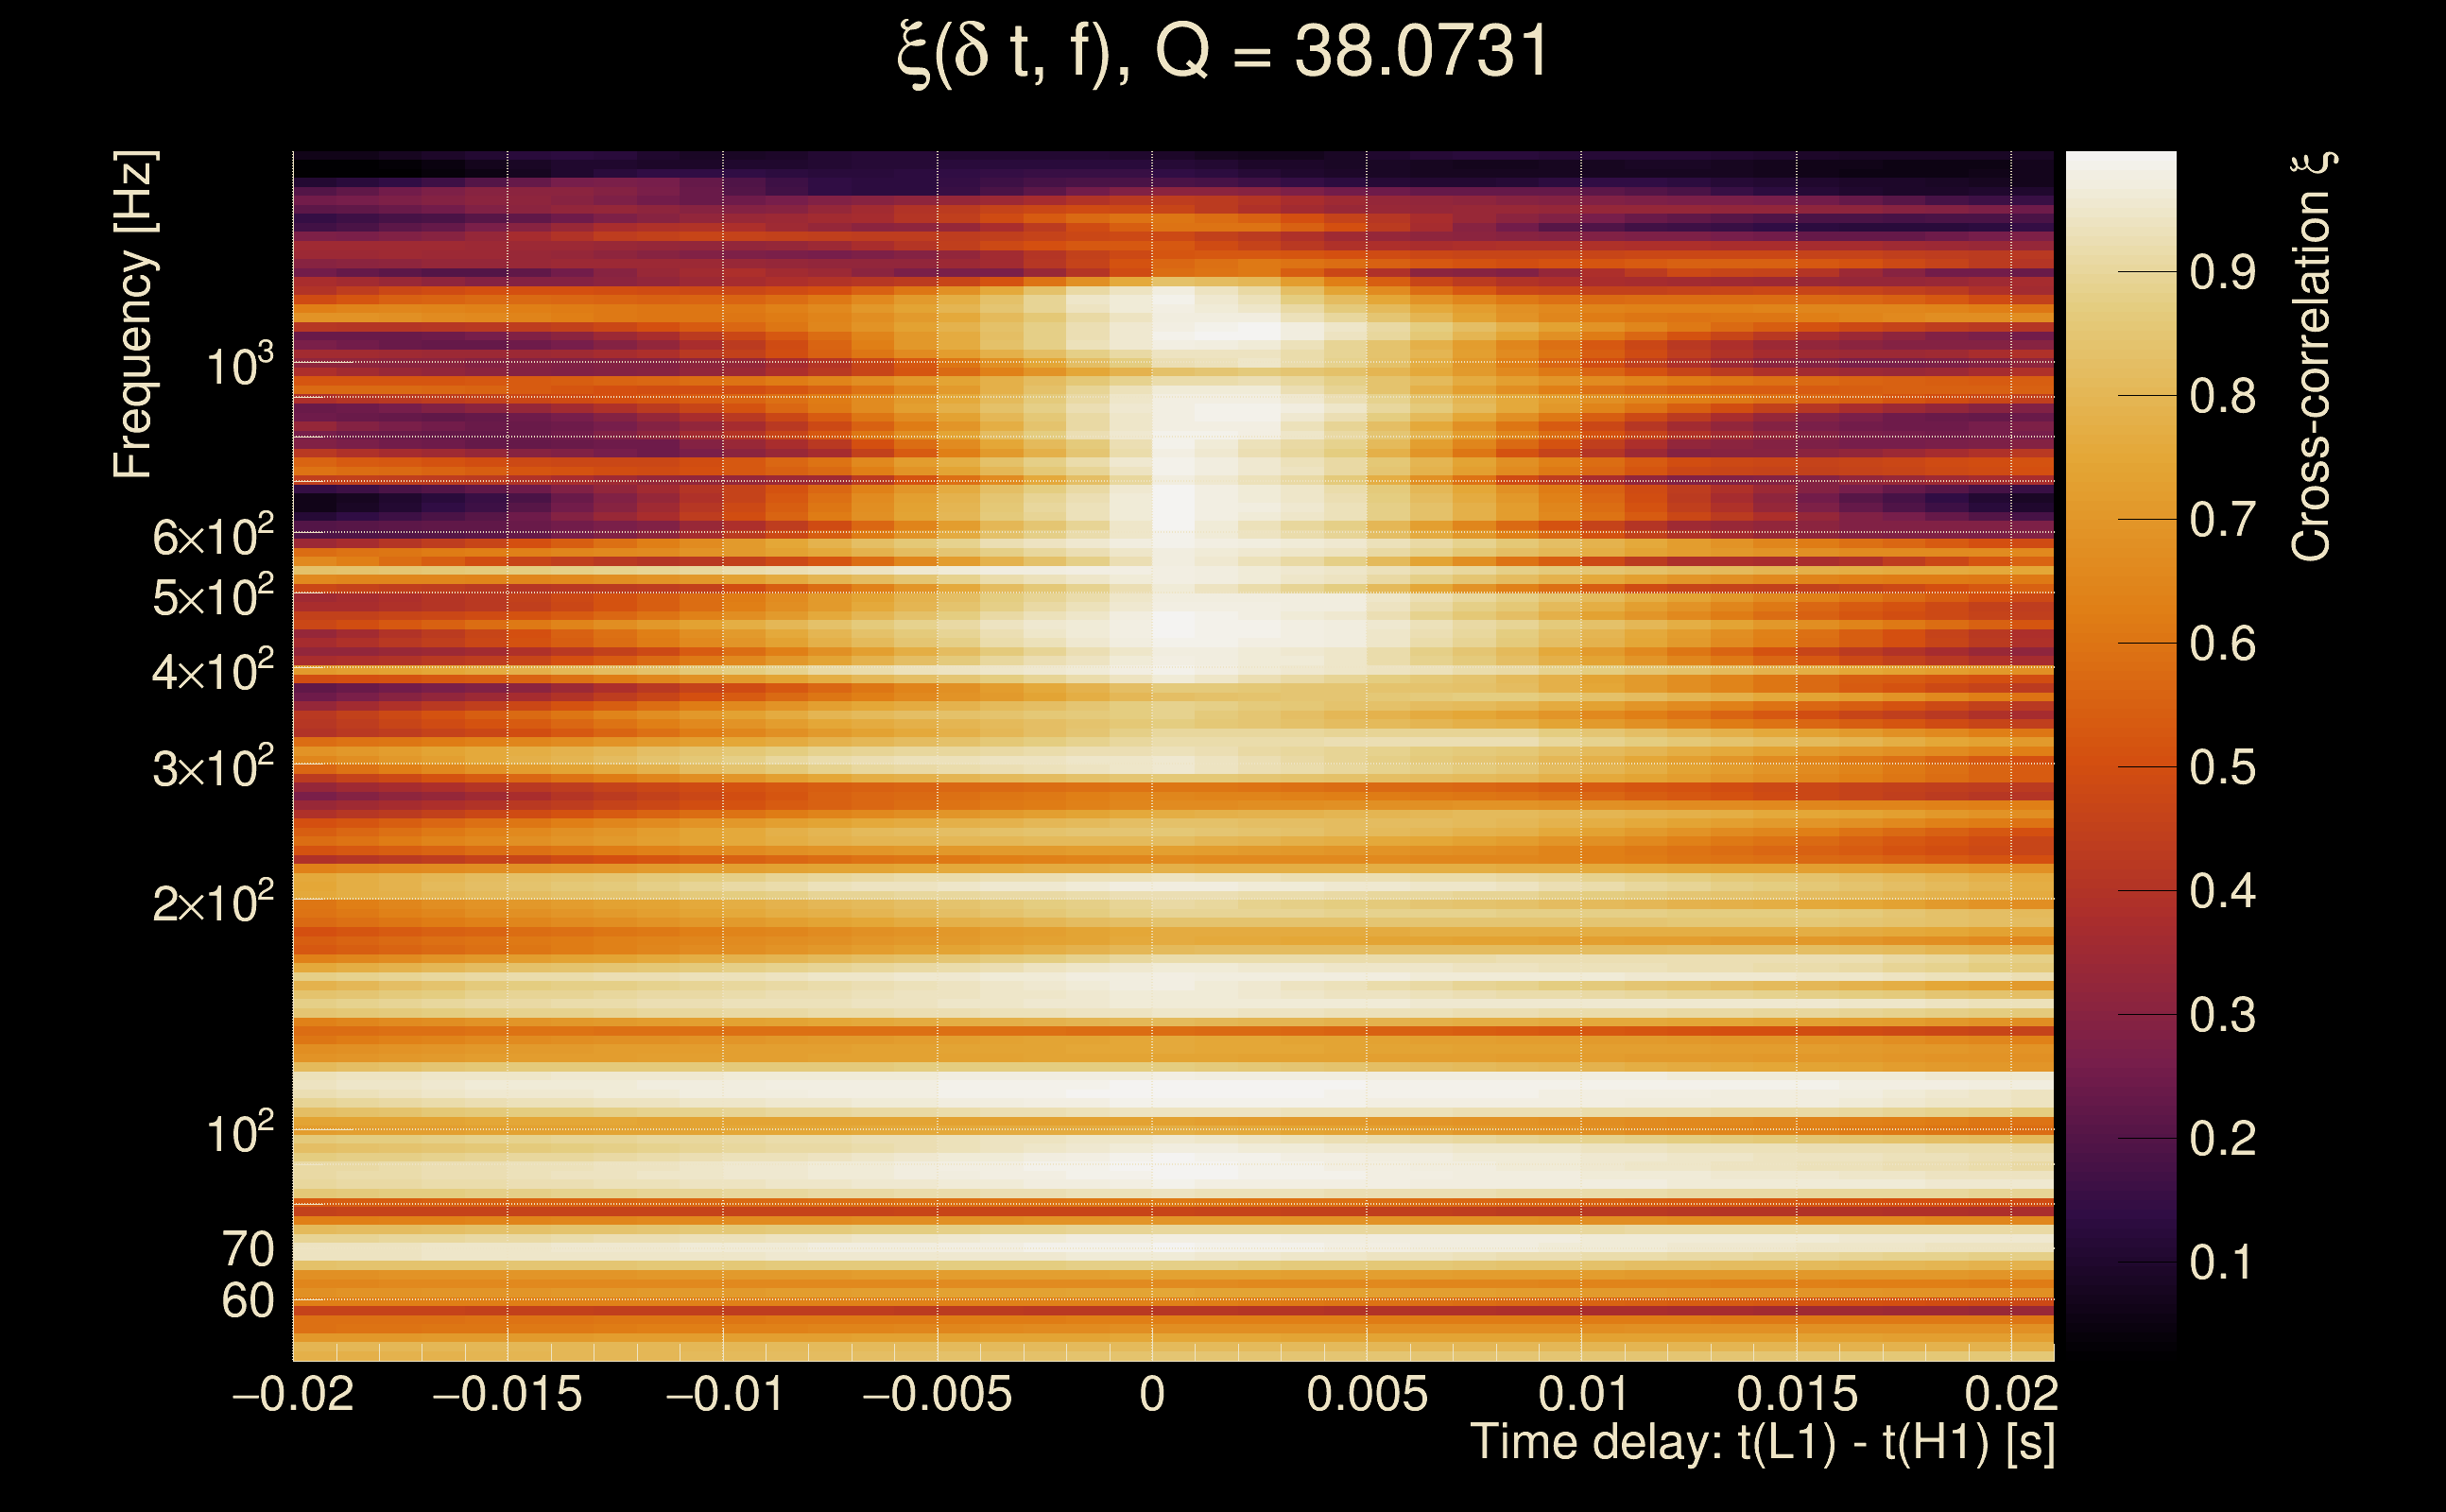
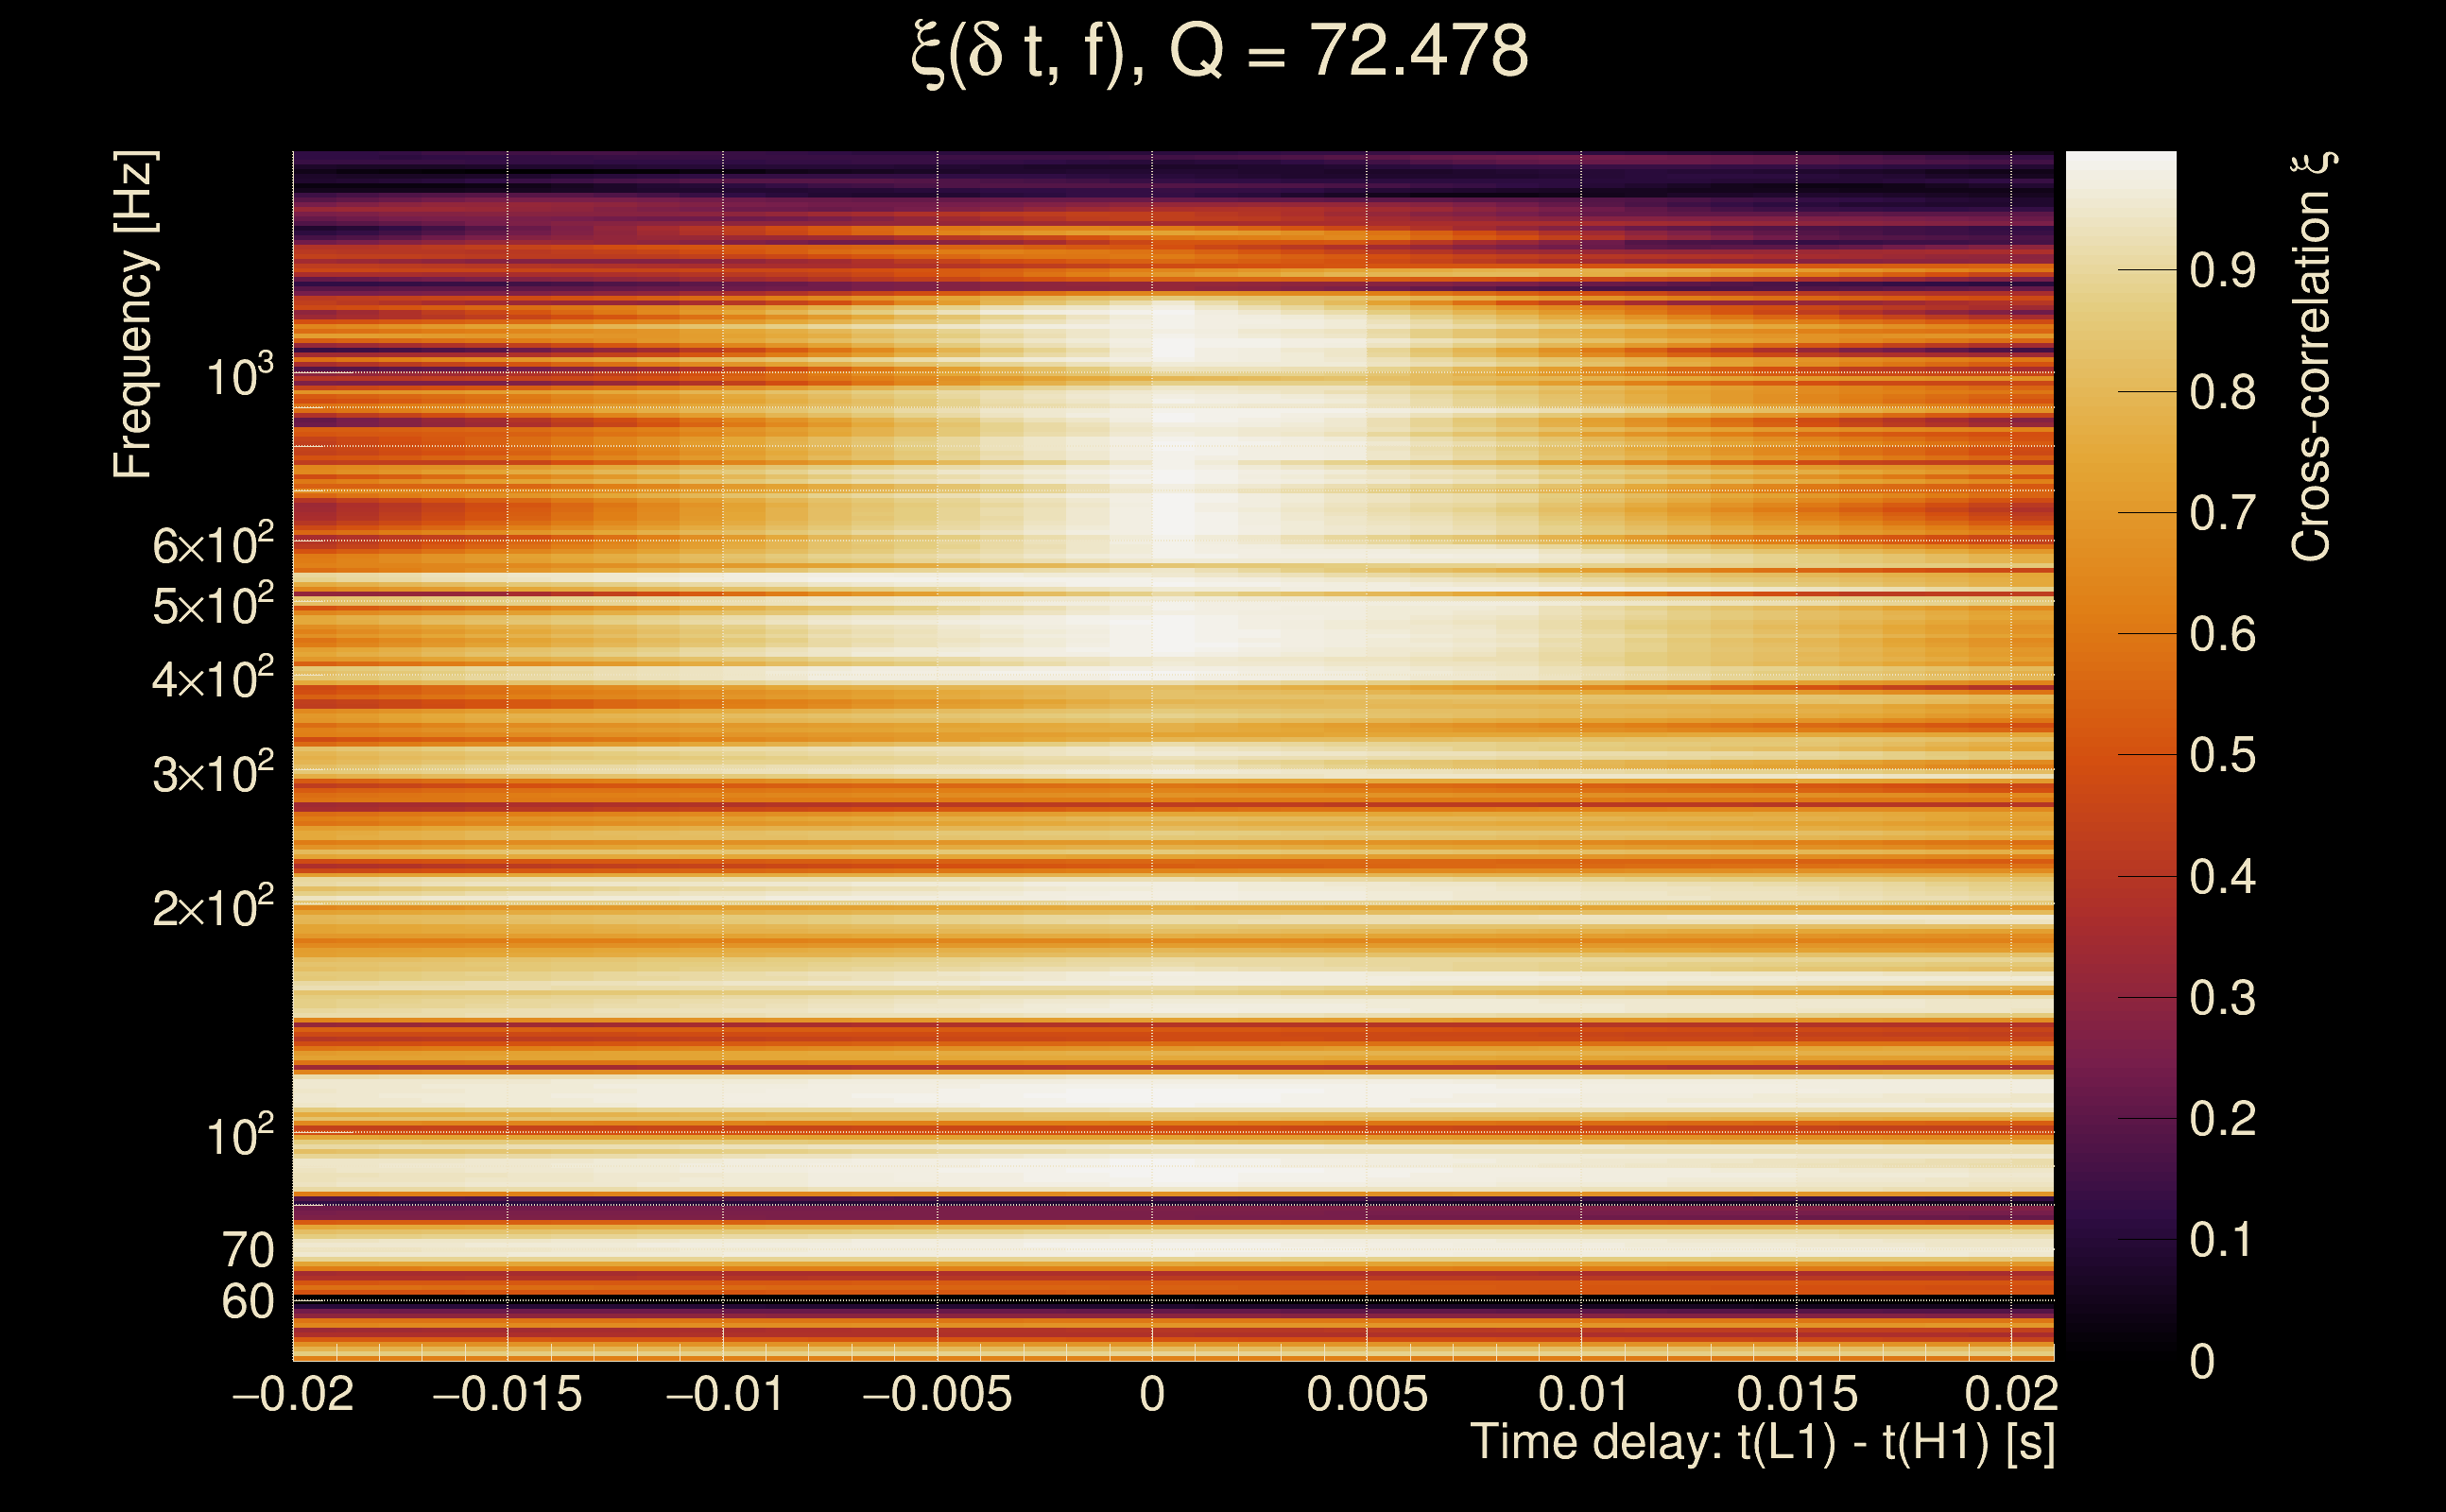
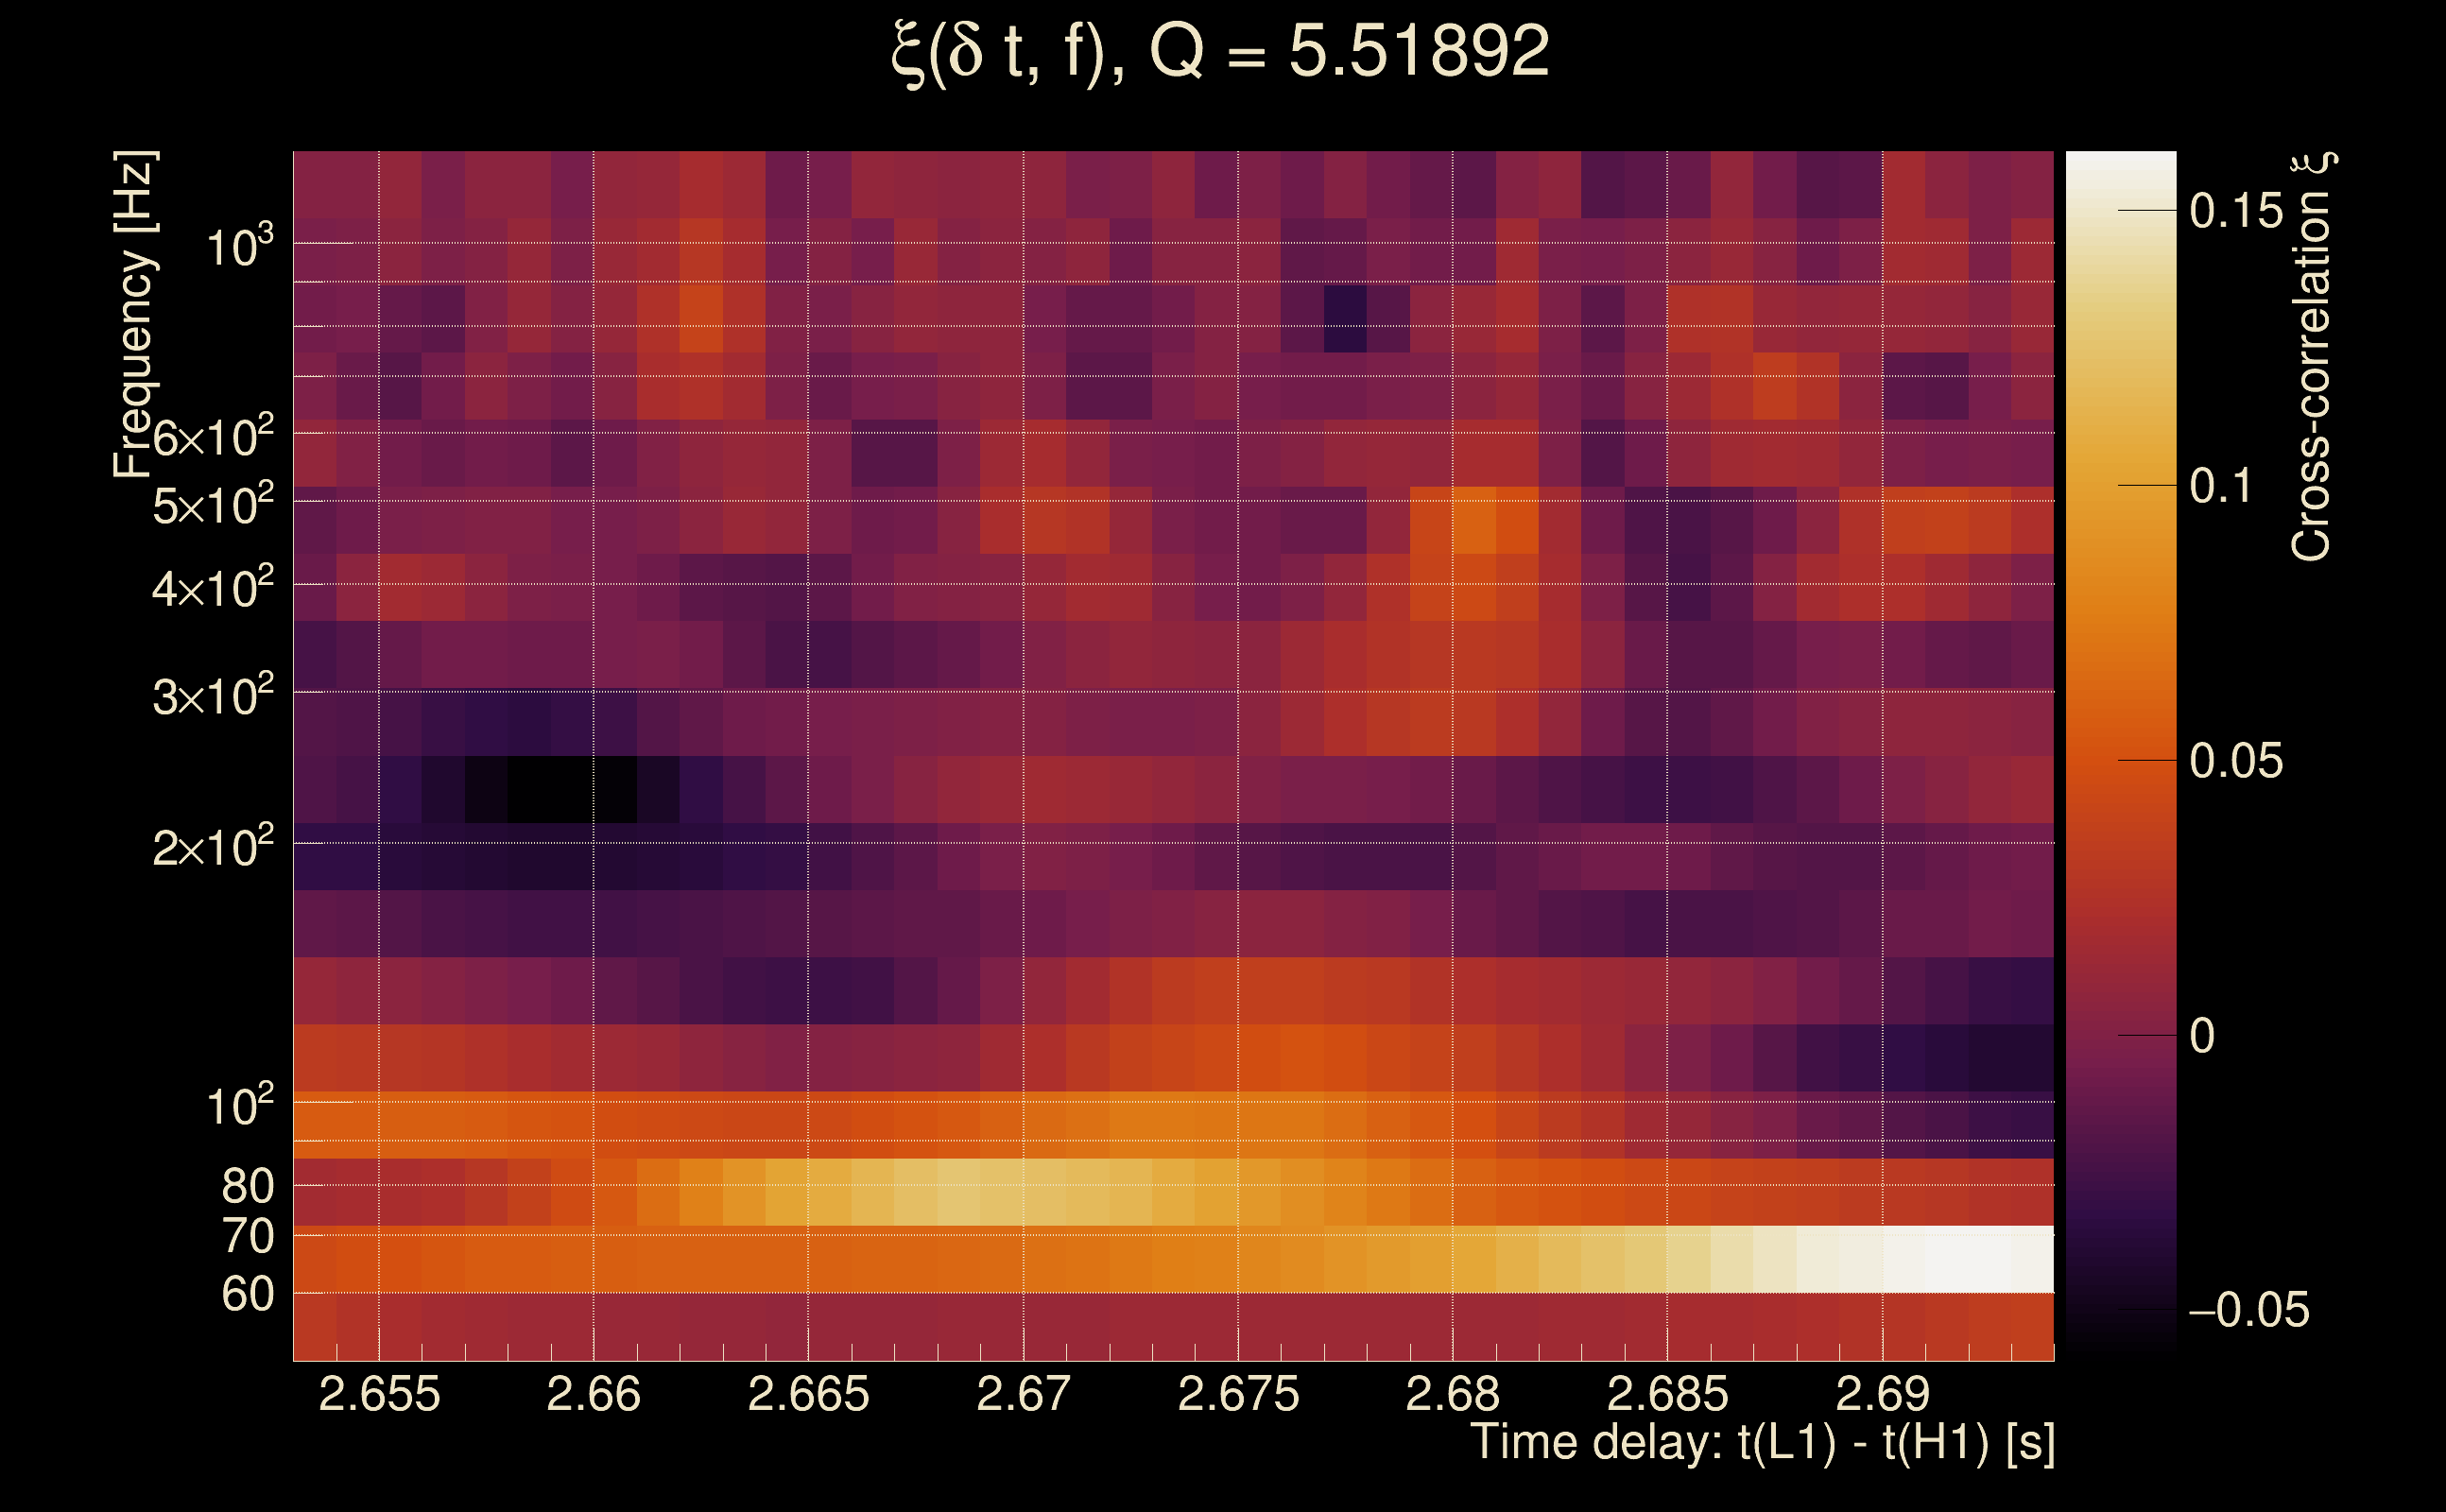
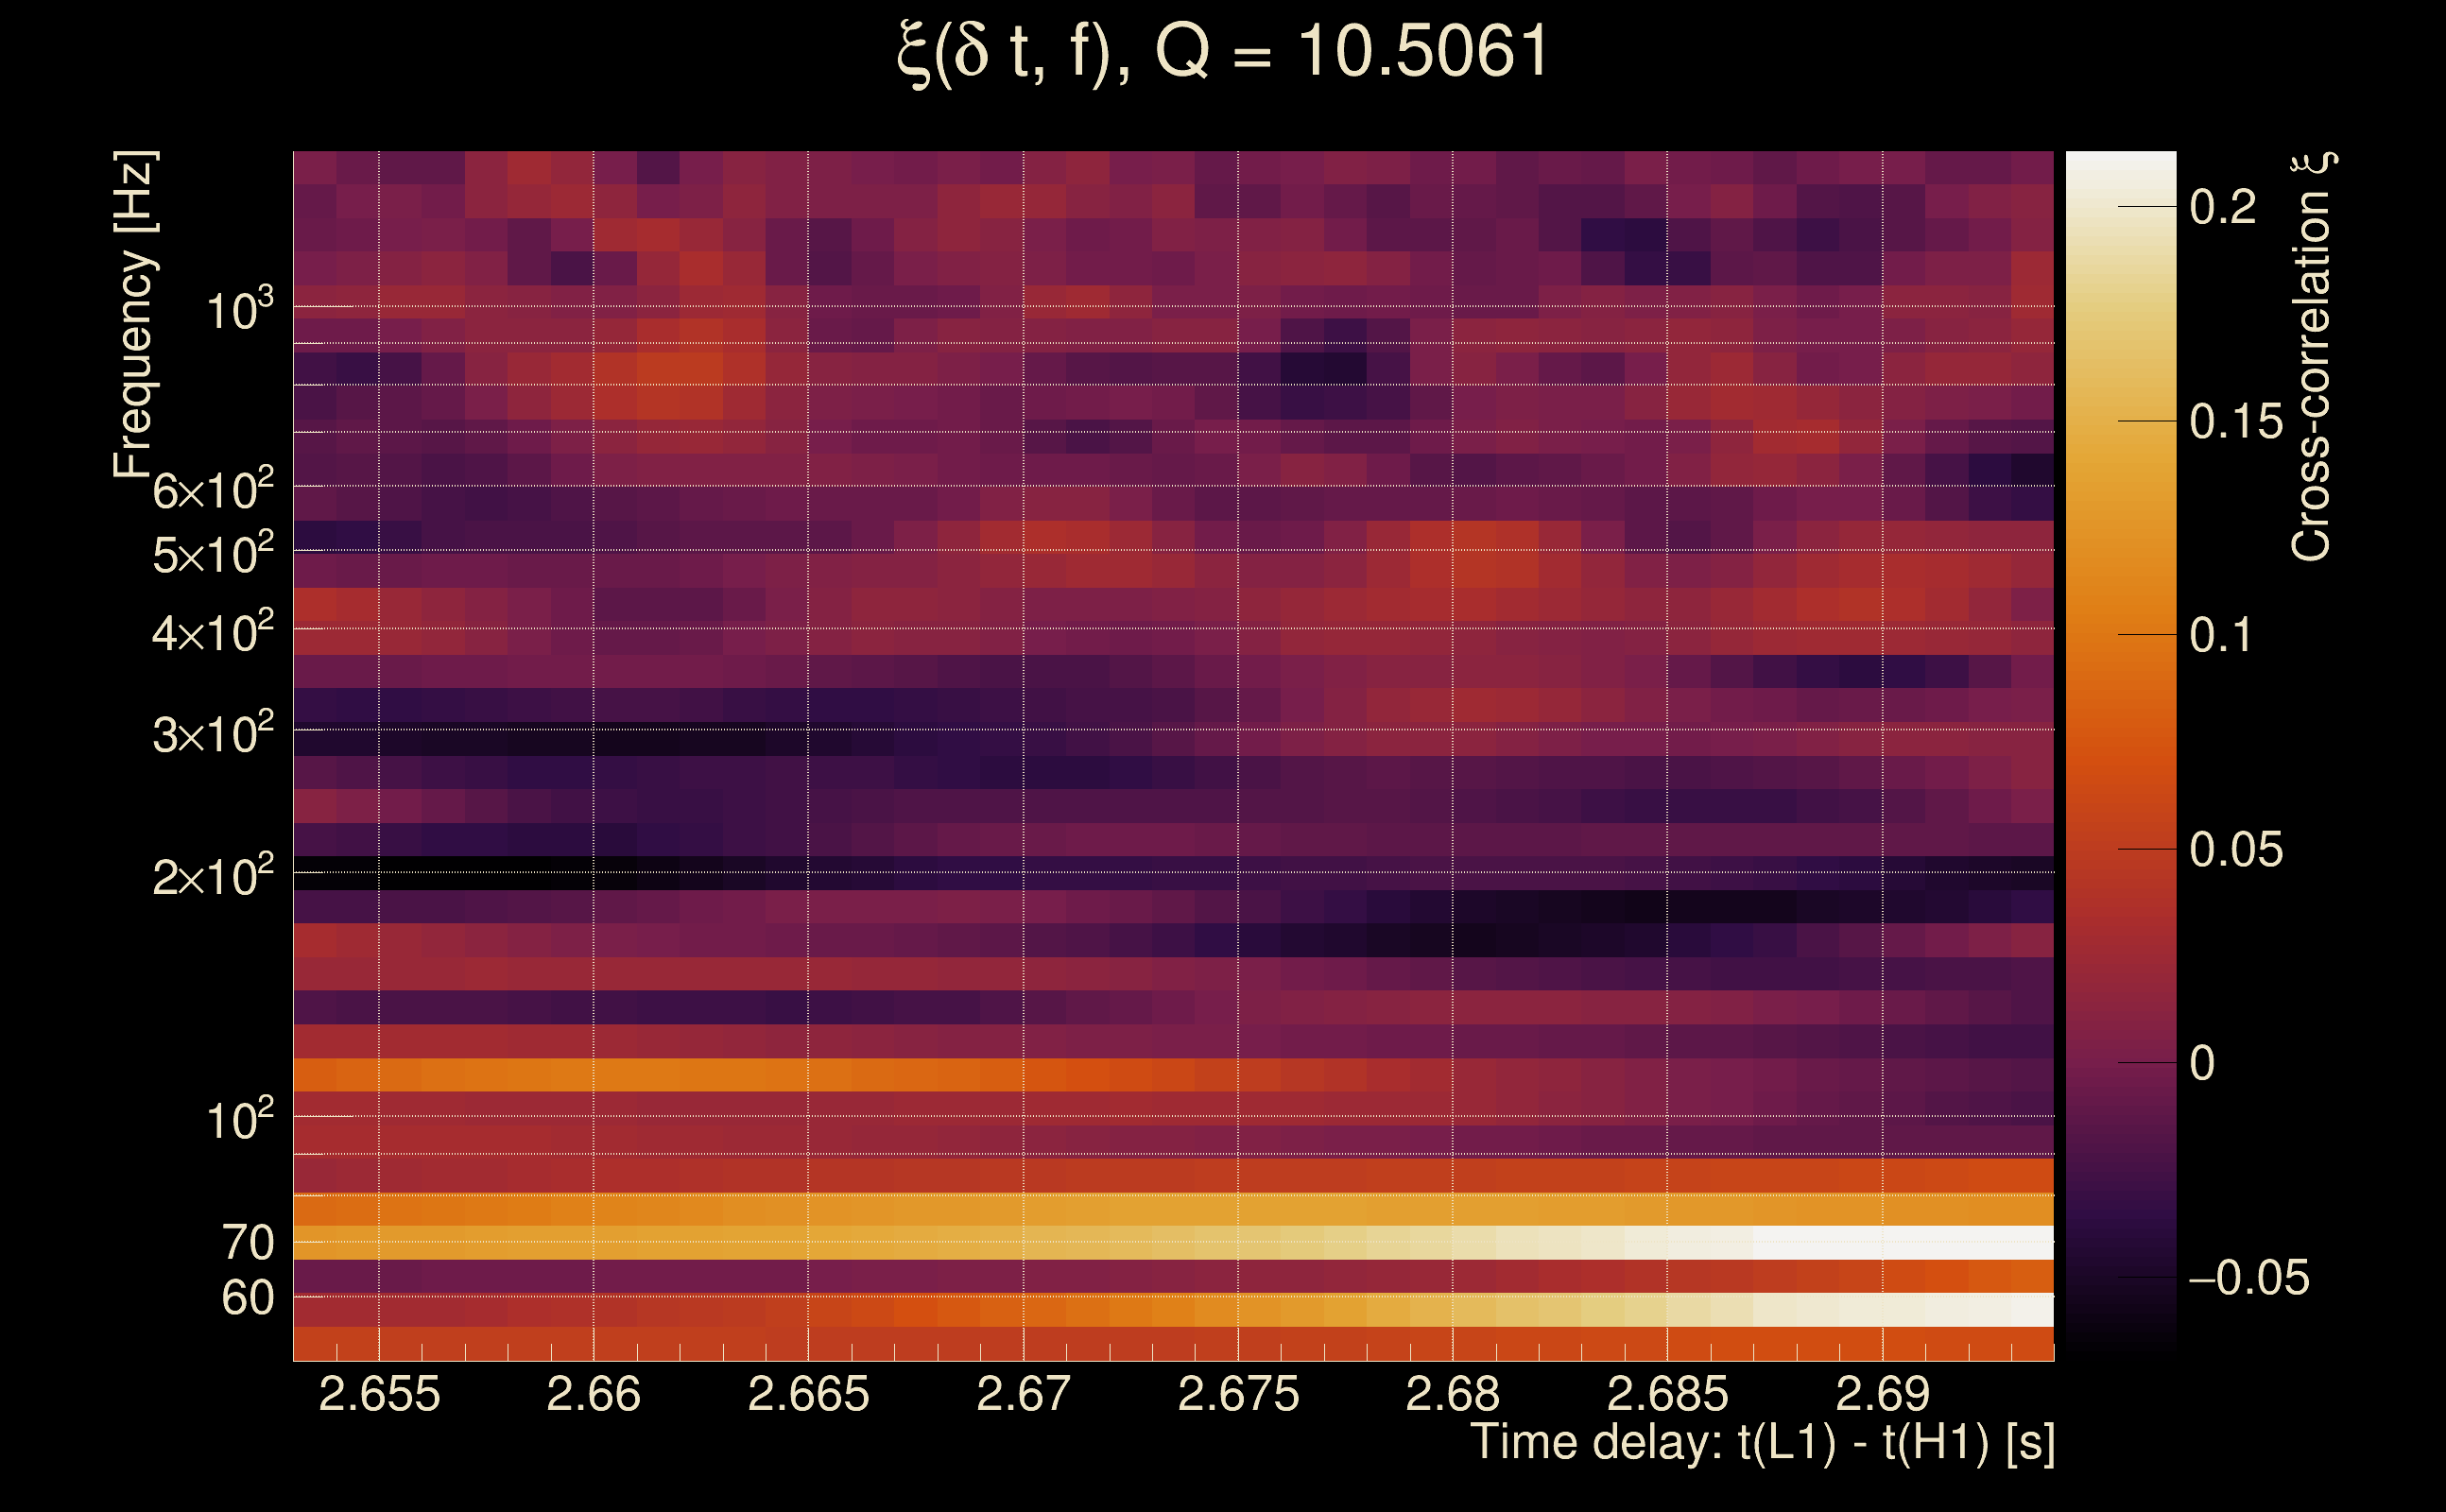
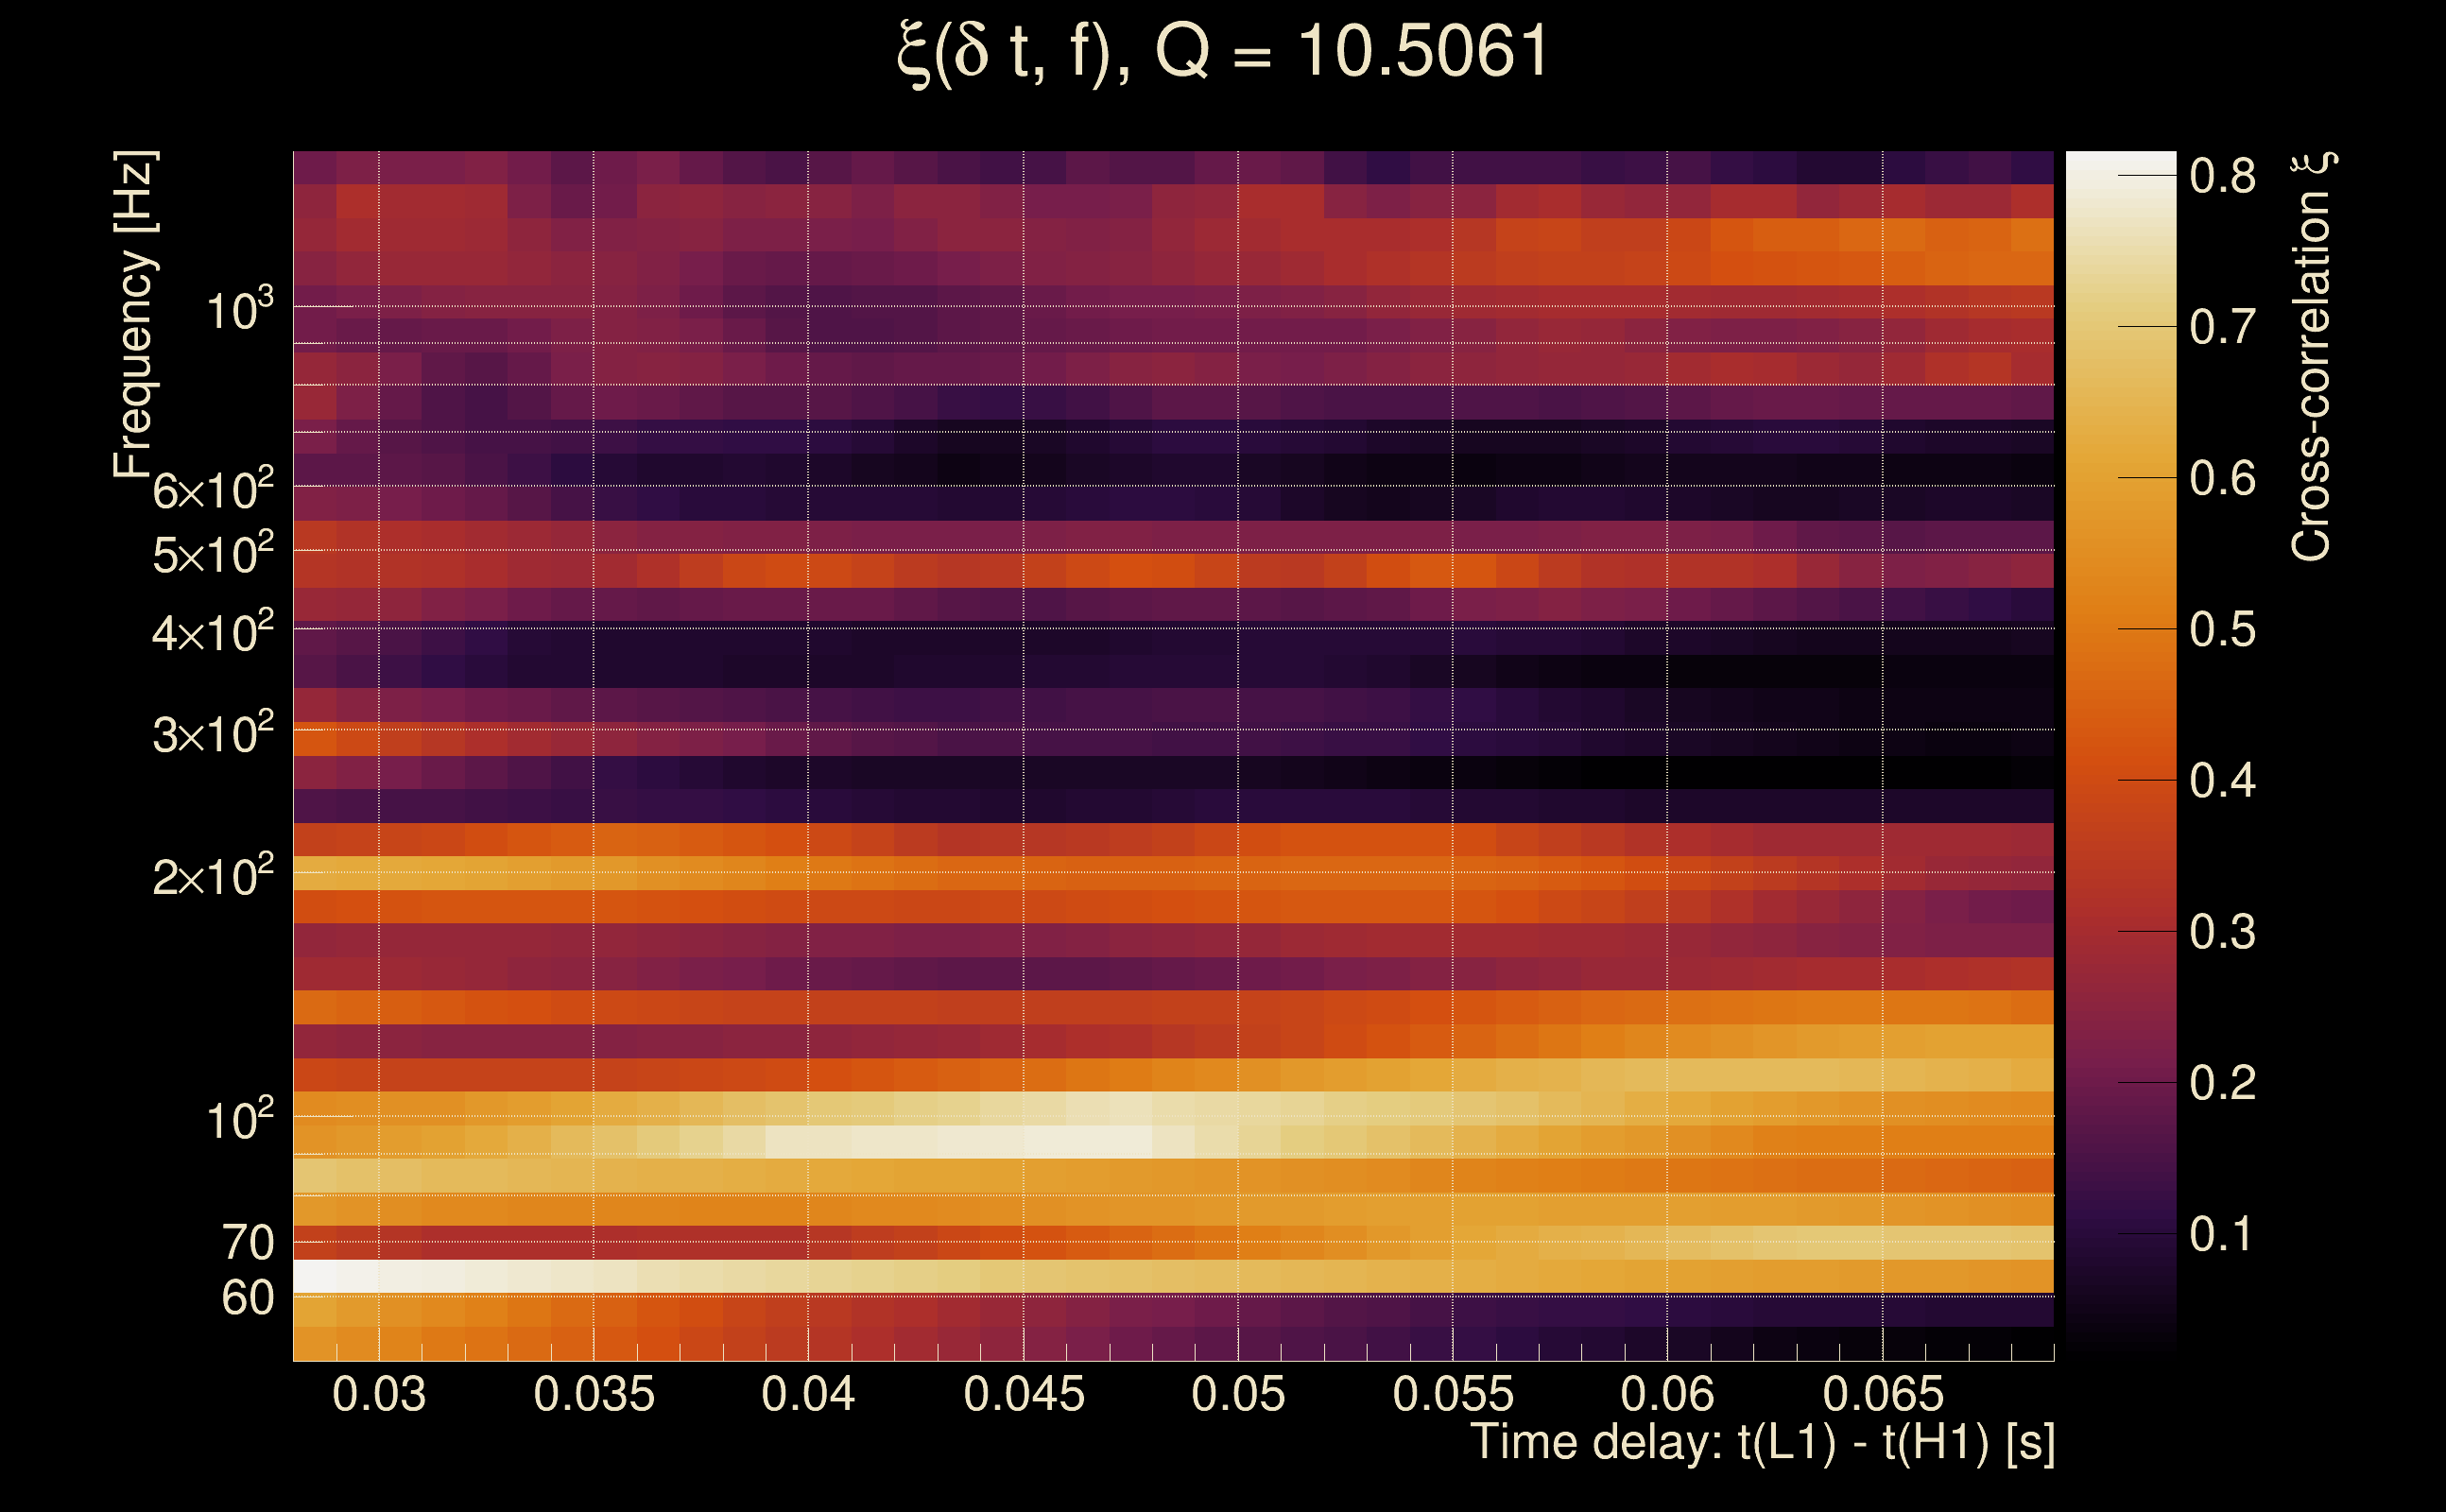
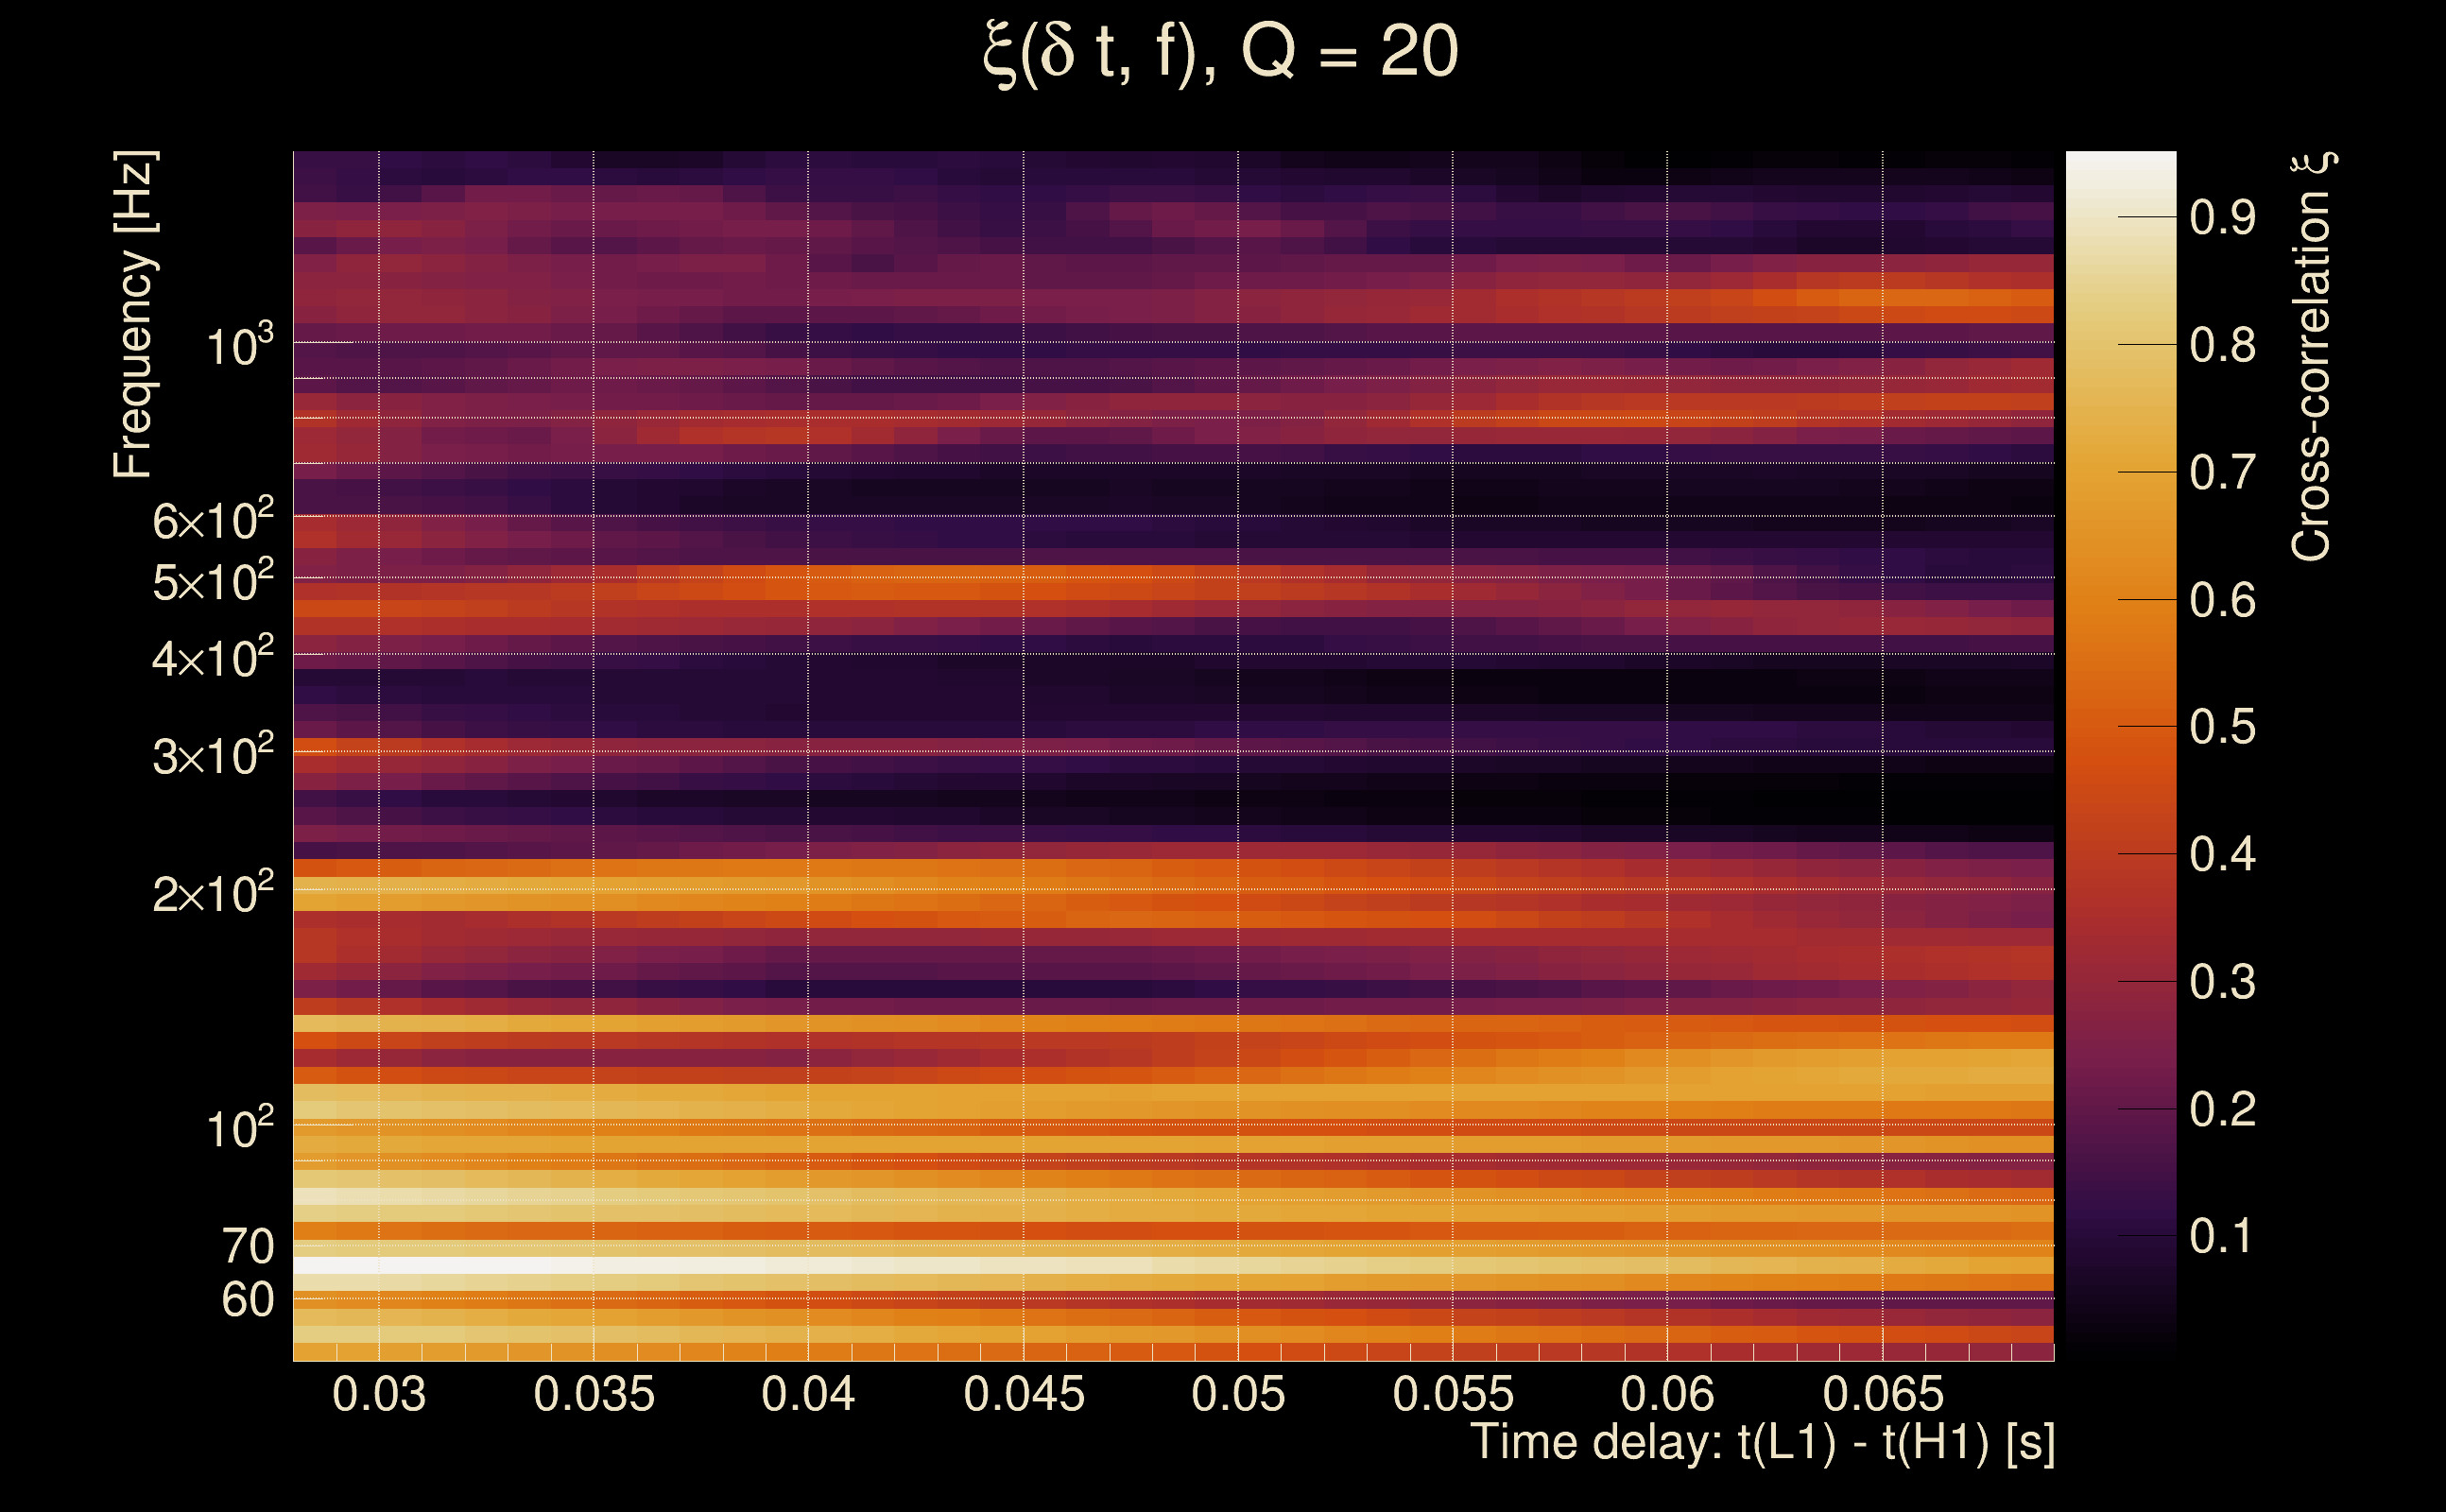
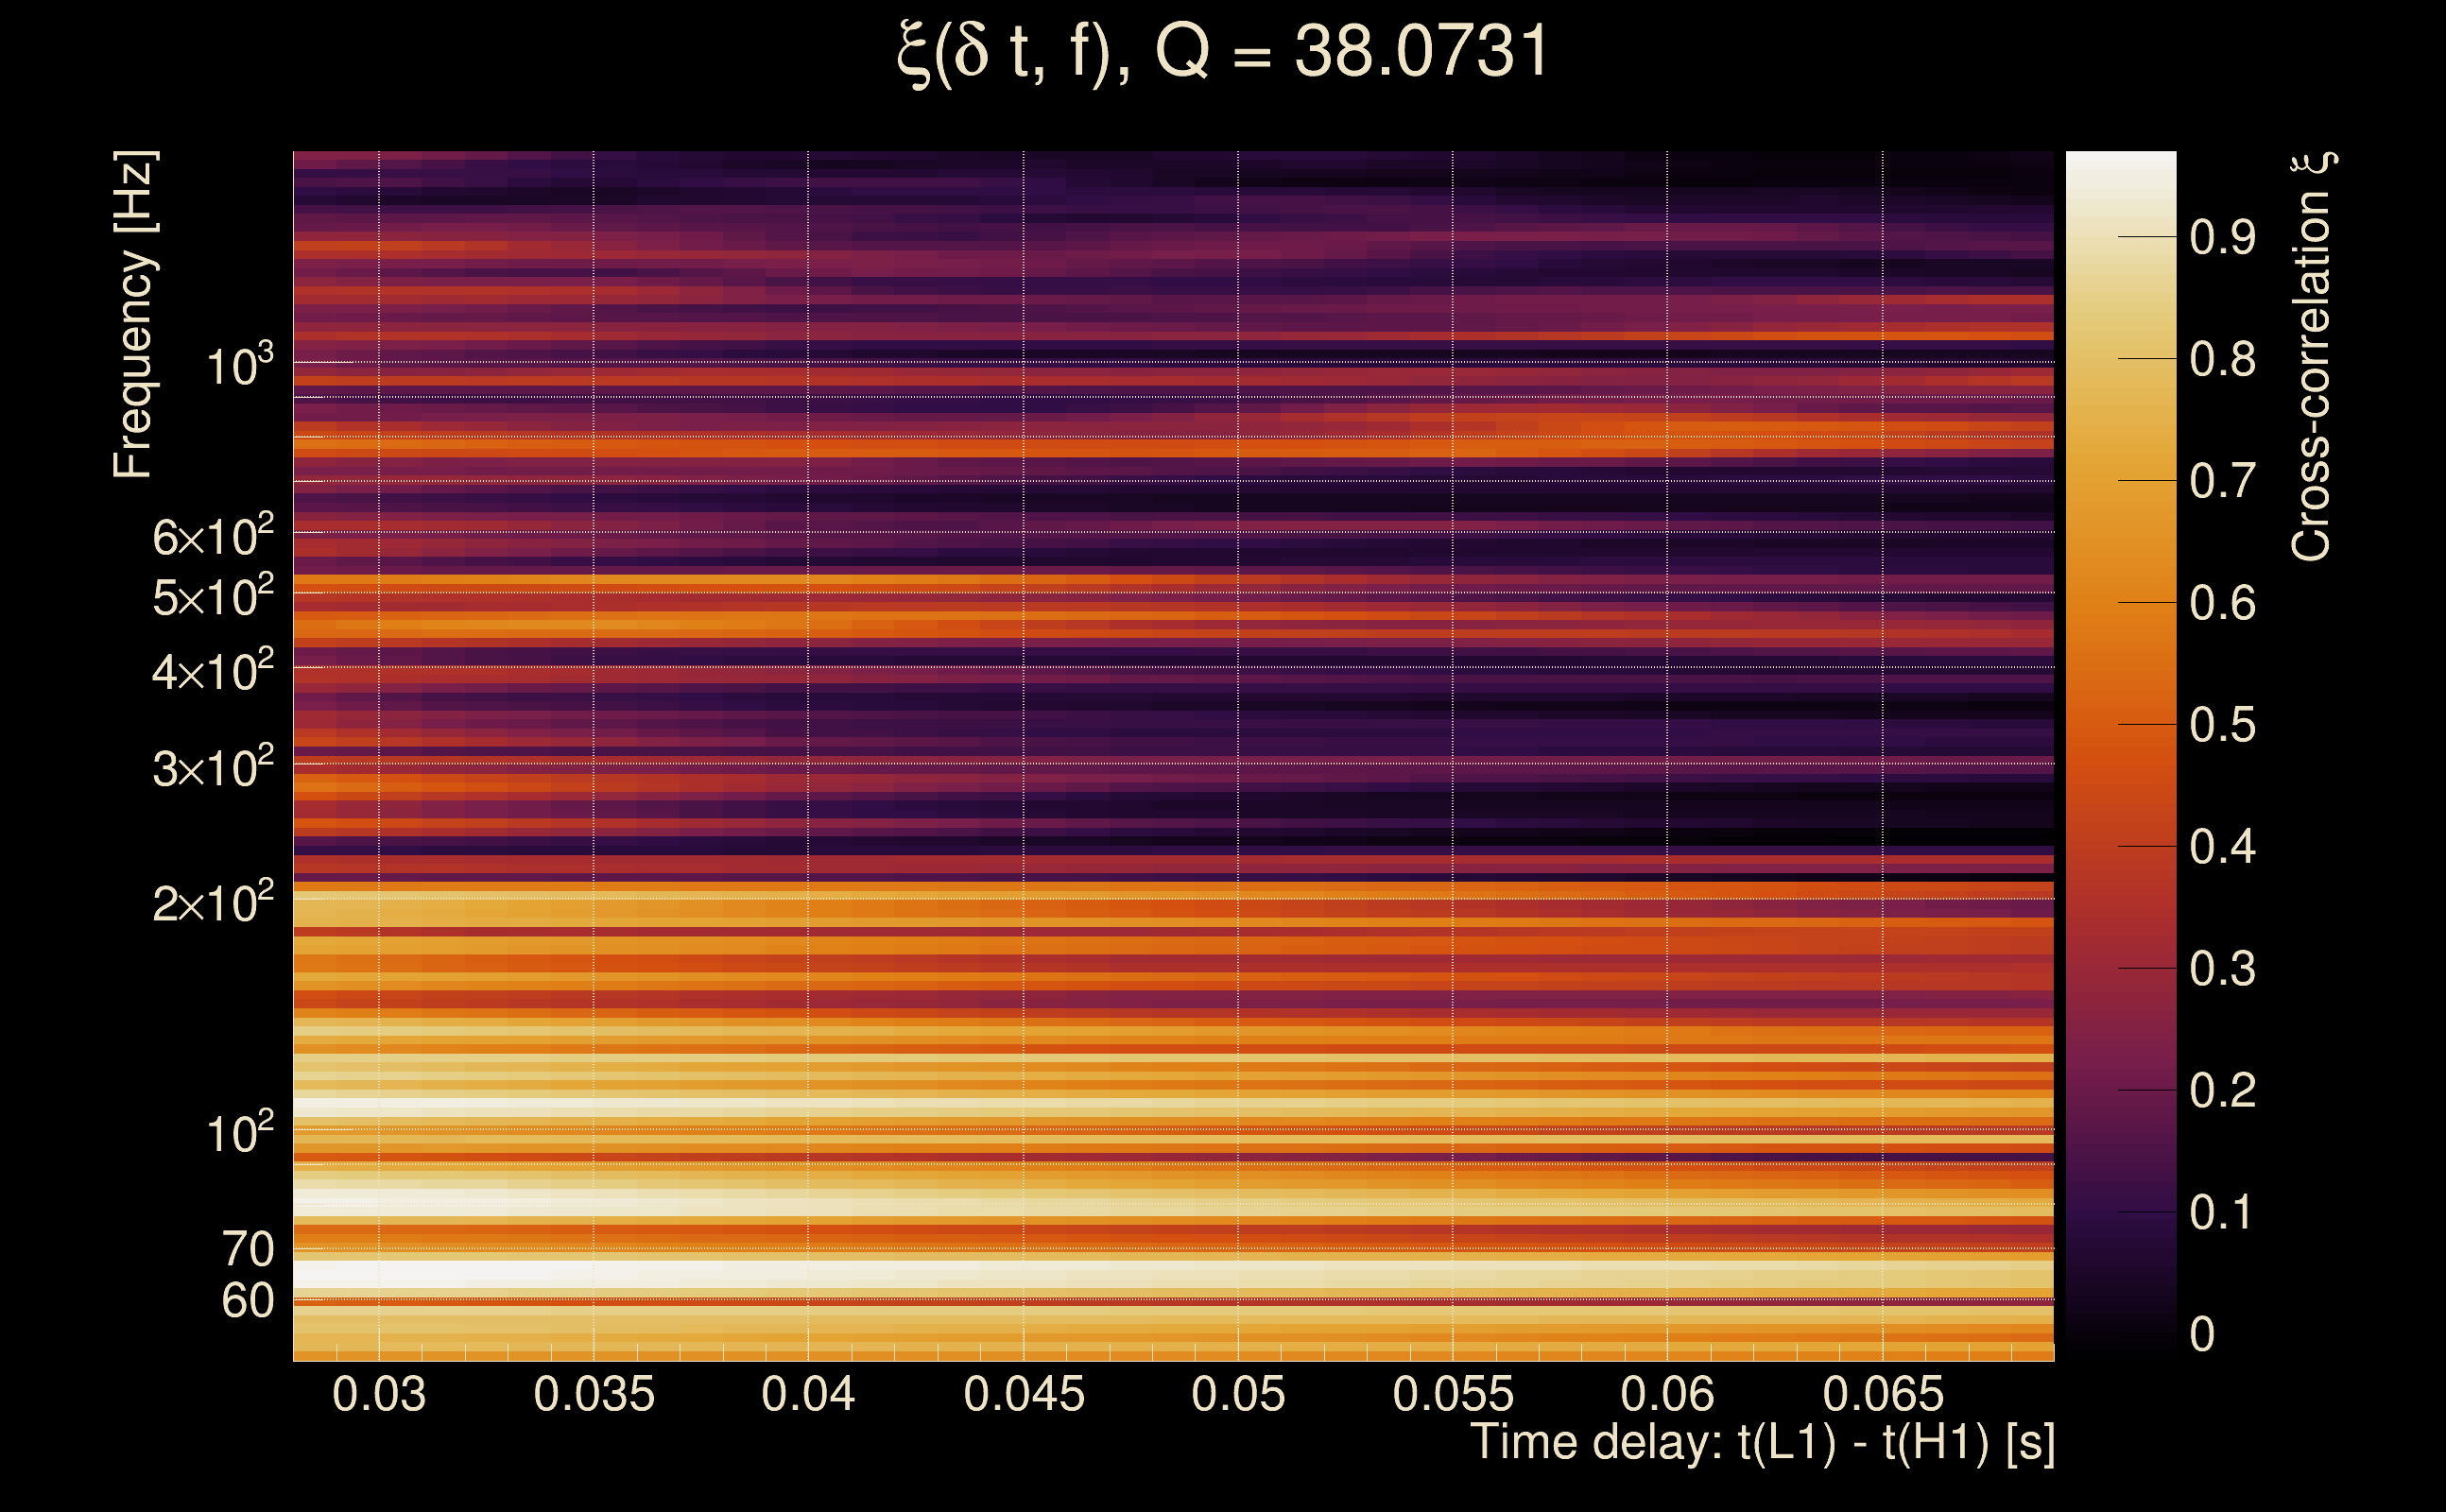
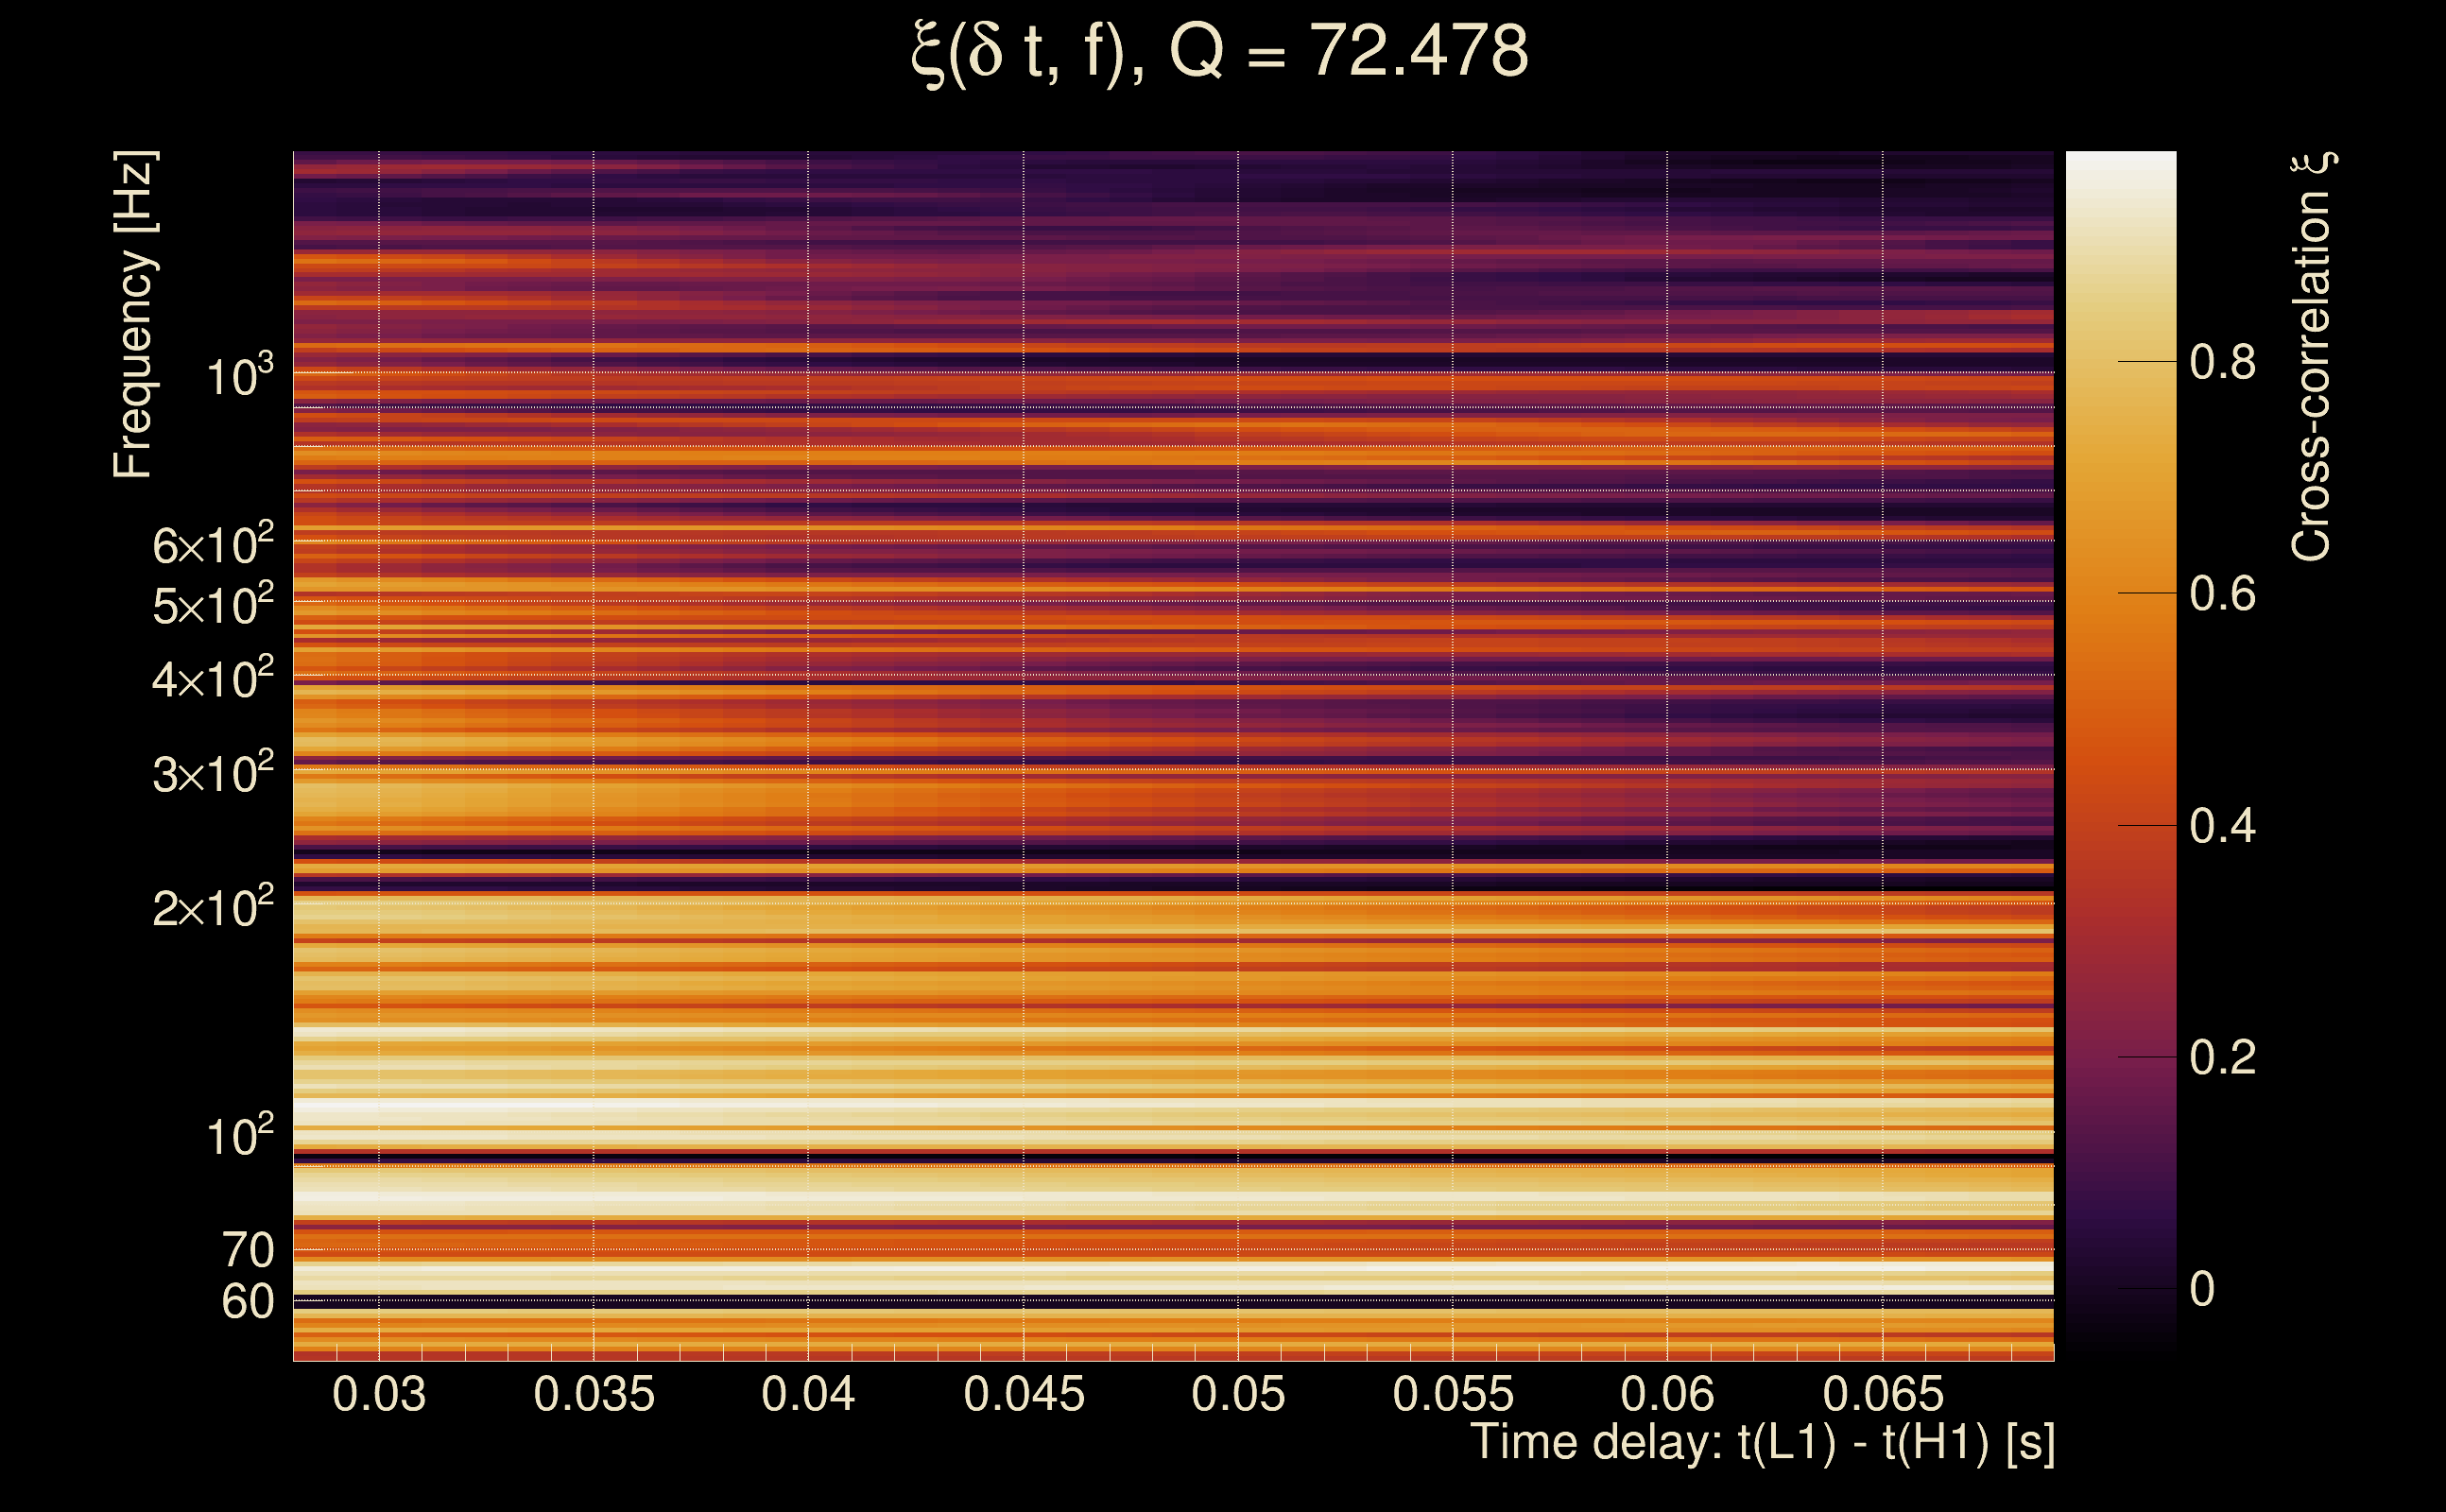
| Number of Q planes: | 5 (Q = 5.51892 → Q = 72.478) |
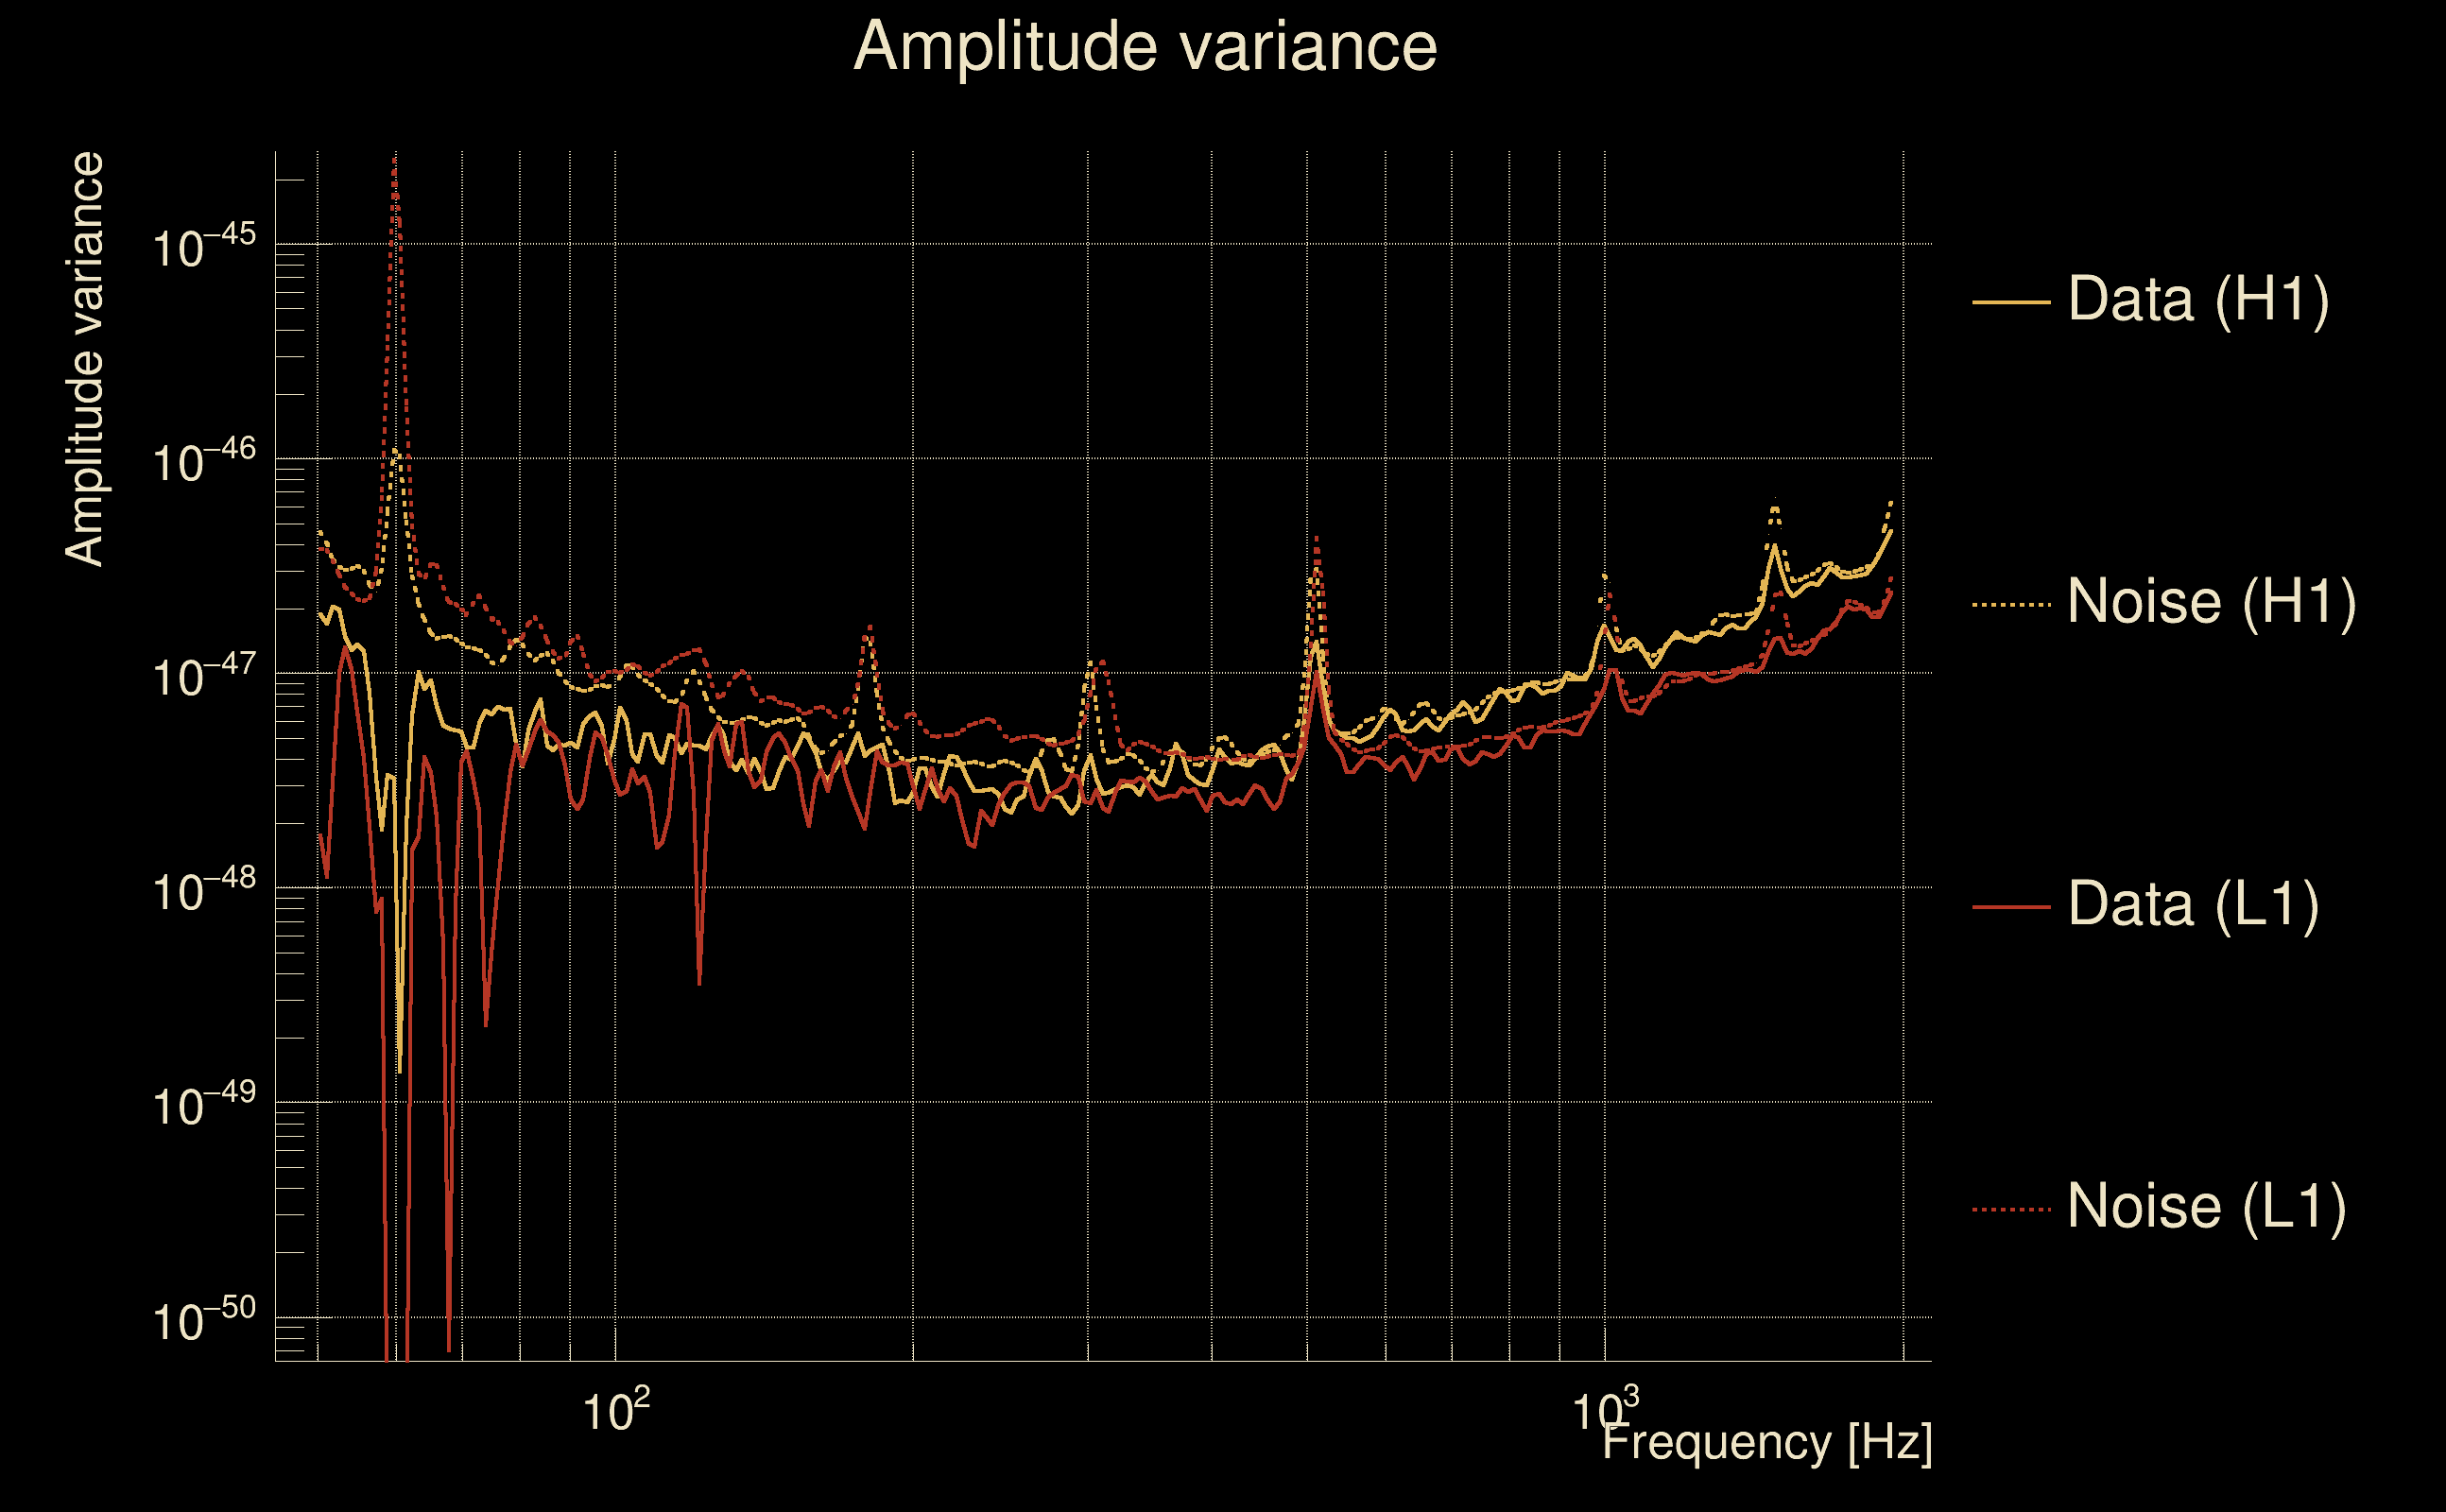
| Omicron frequency range: | 50 Hz → 1958.38 Hz |
| Light travel time between detectors: | 0.0100128 s |
| Slice extra-time (calibration uncertainty + slice veto): | 0.0129872 s |
| Number of time-delay bins in a cross-correlation map: | 10000 |
| Number of slices in a cross-correlation map: | 217 |
| Number of time-delay bins in a slice: | 46 |
| SNR gating: | < 100 (detector 0), < 100 (detector 1) |
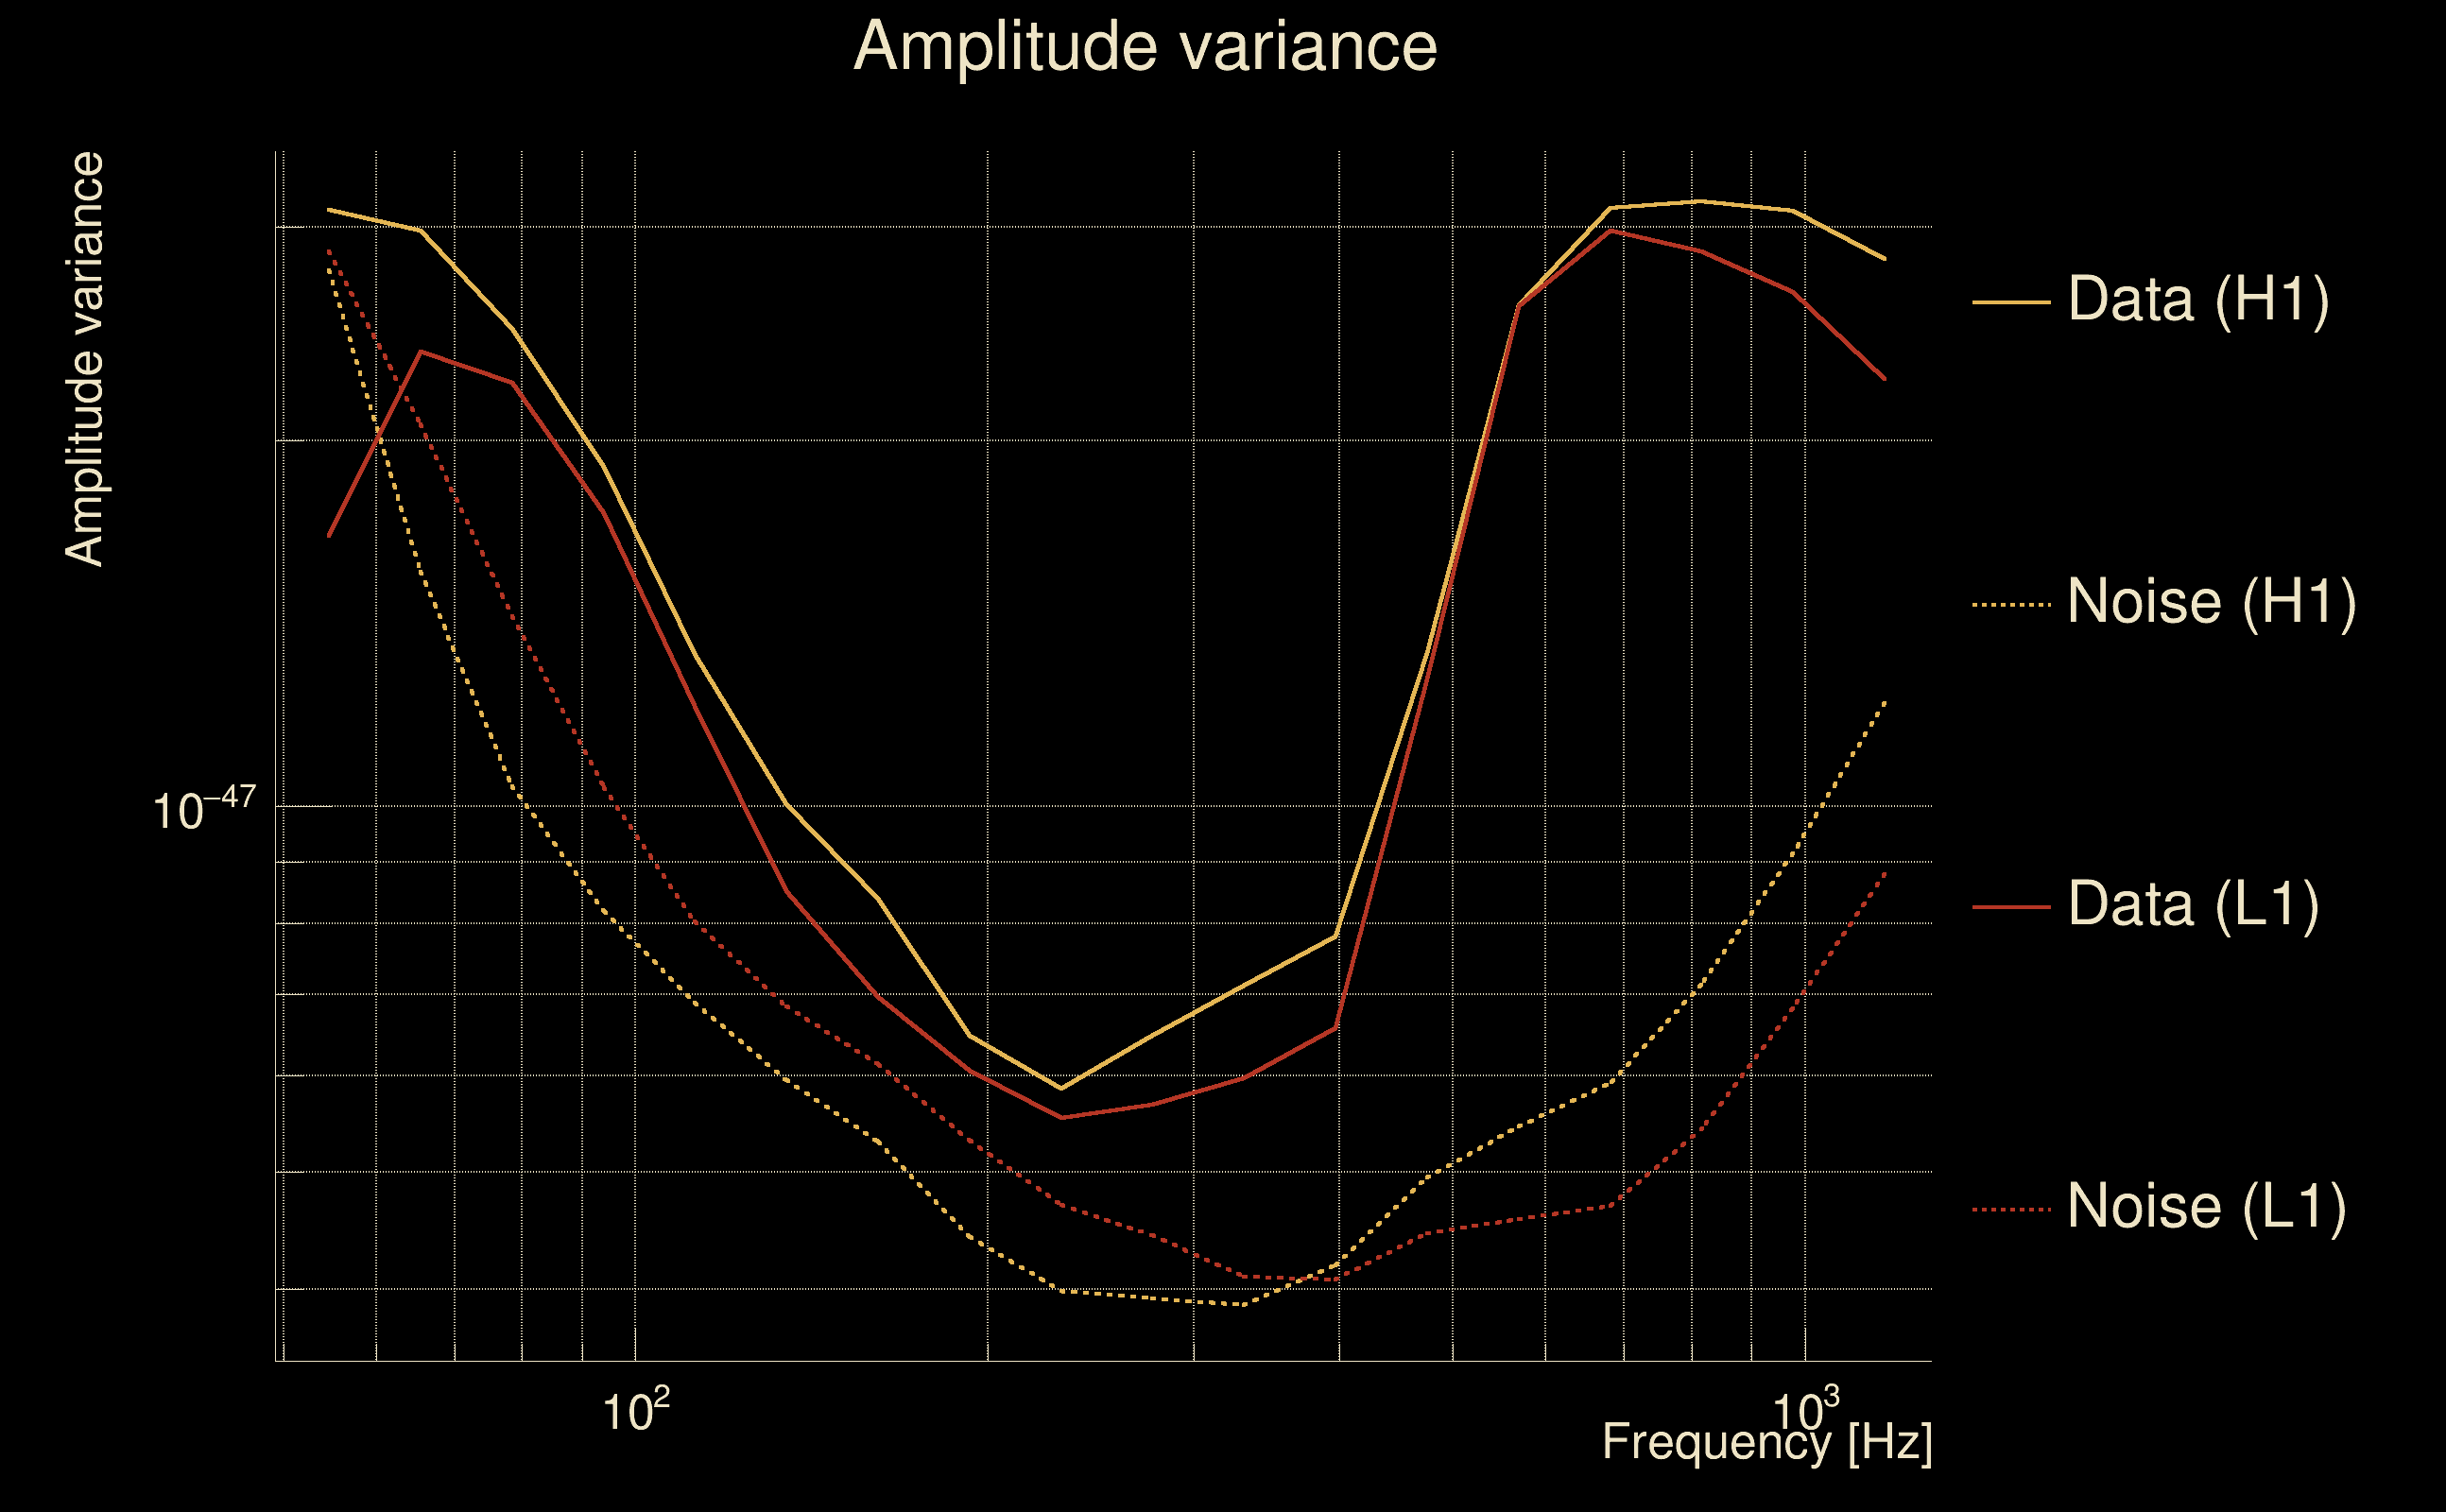
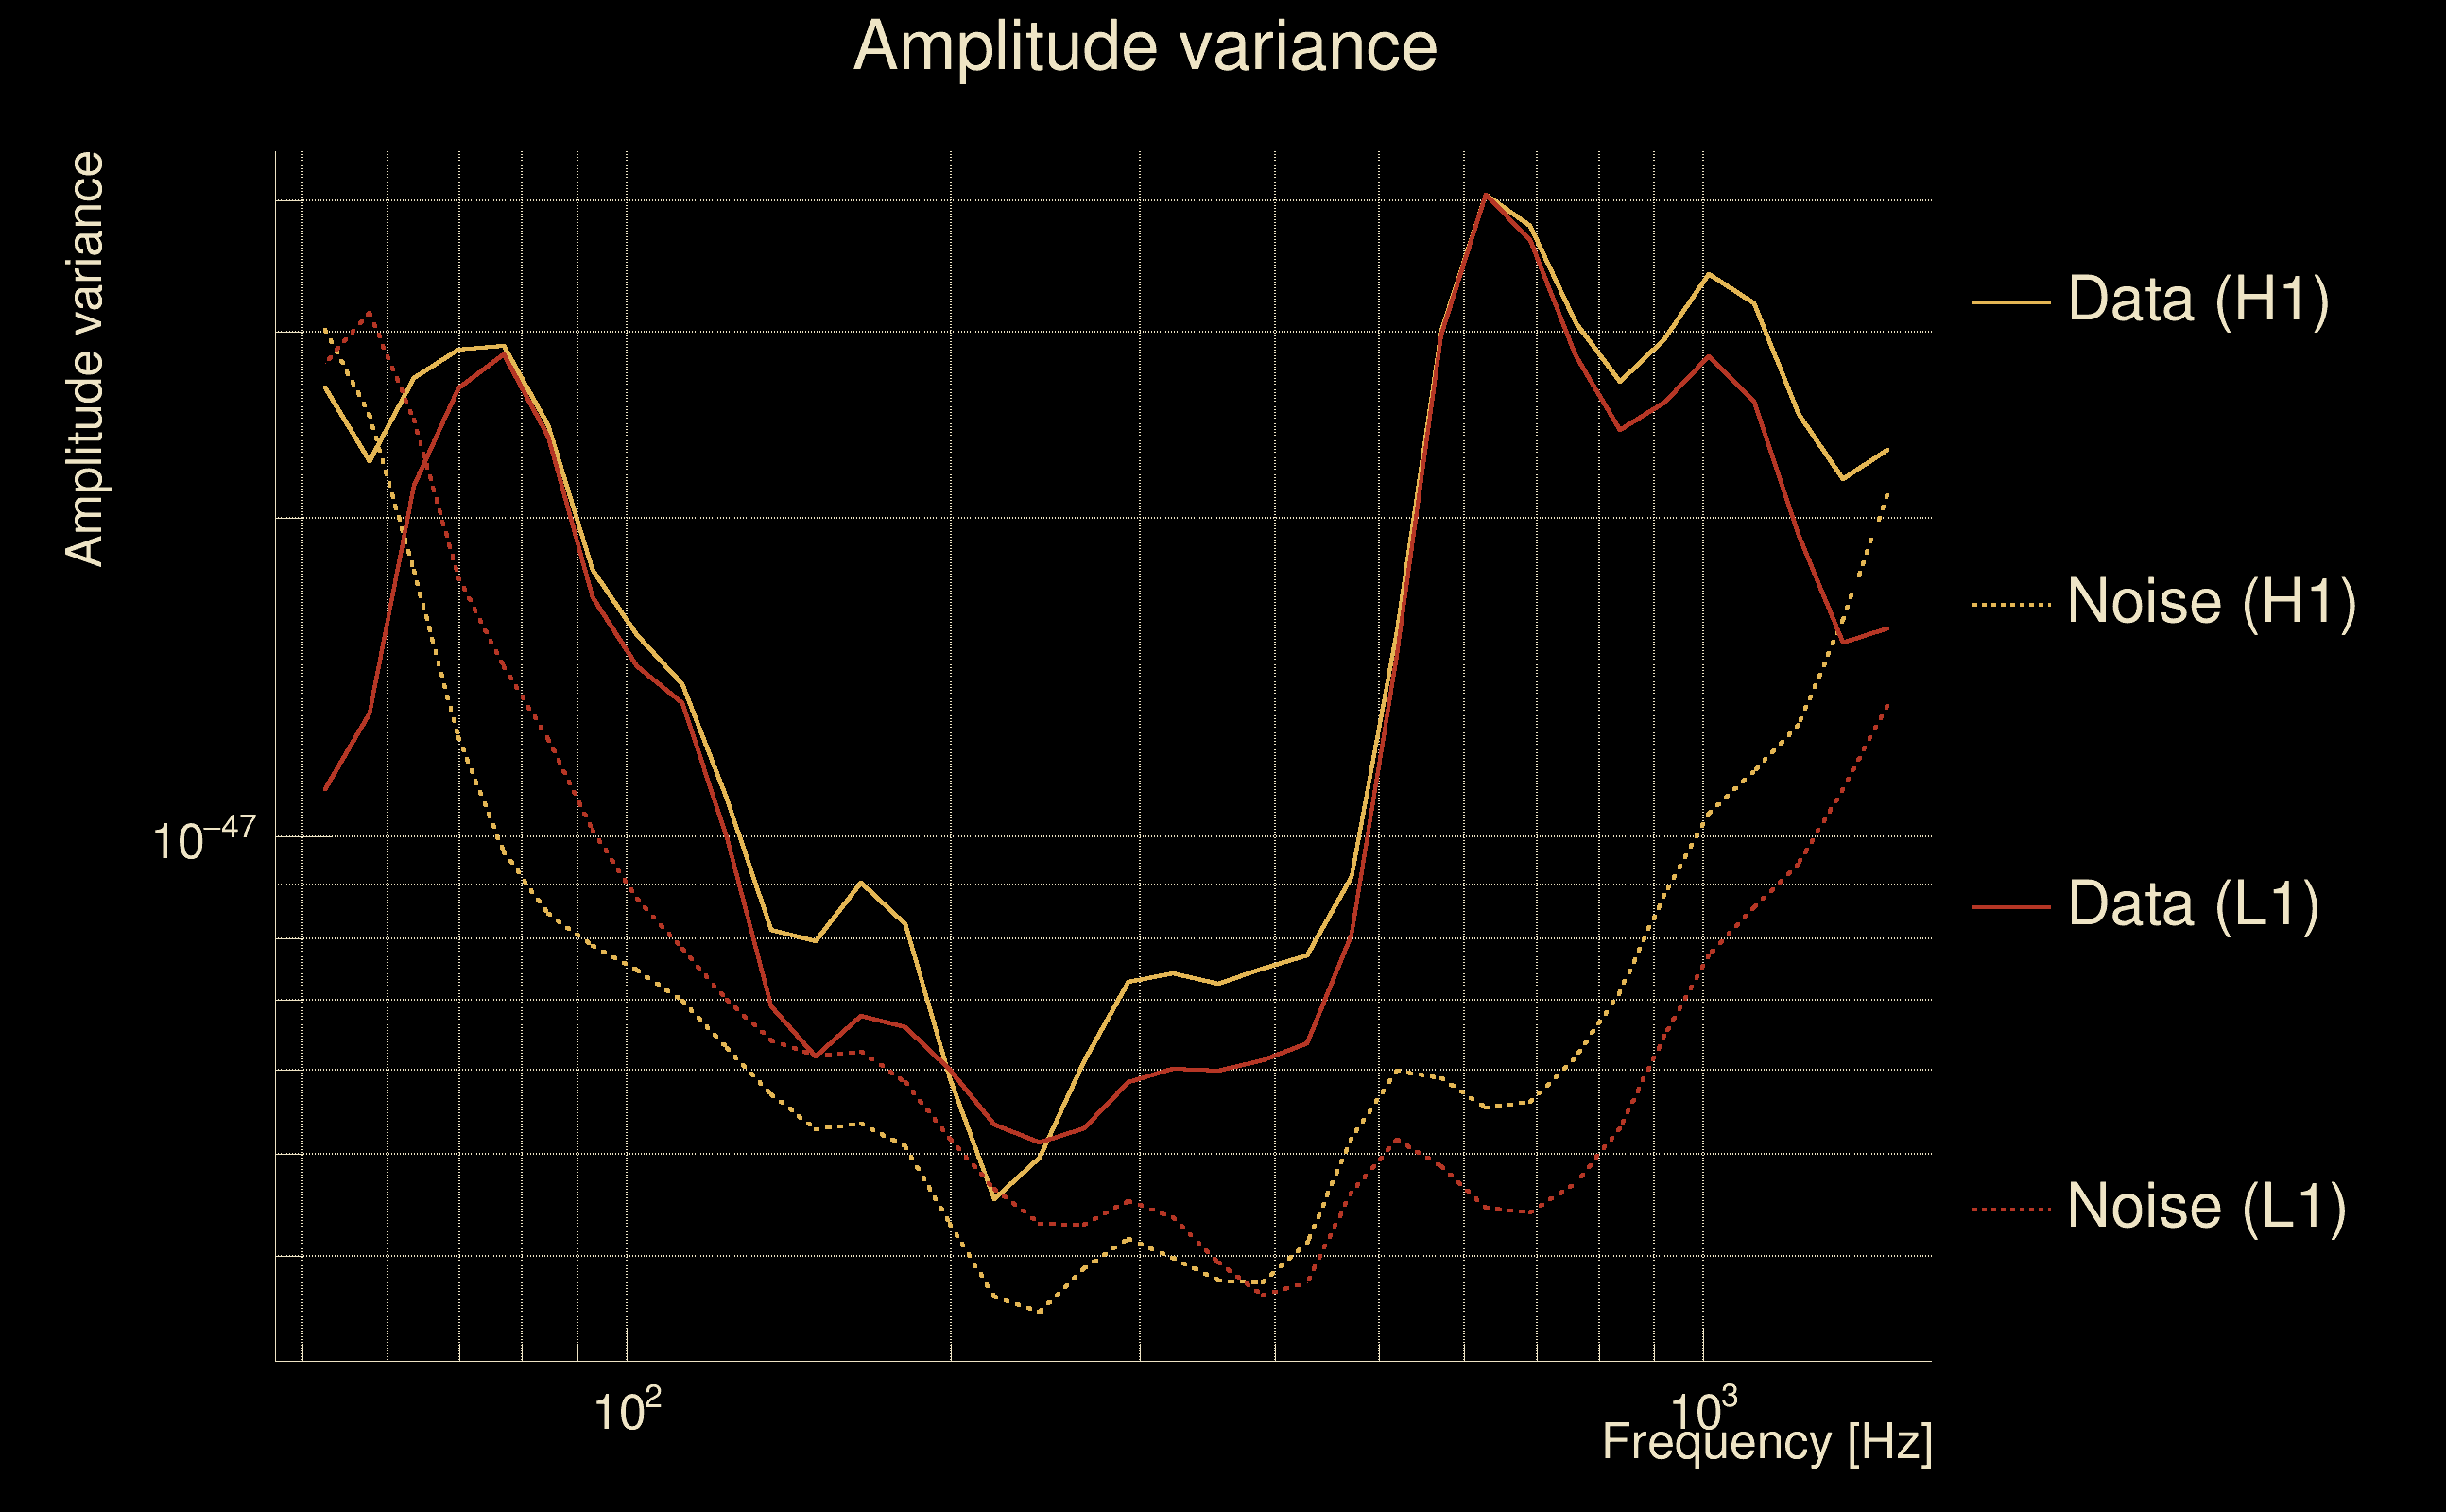
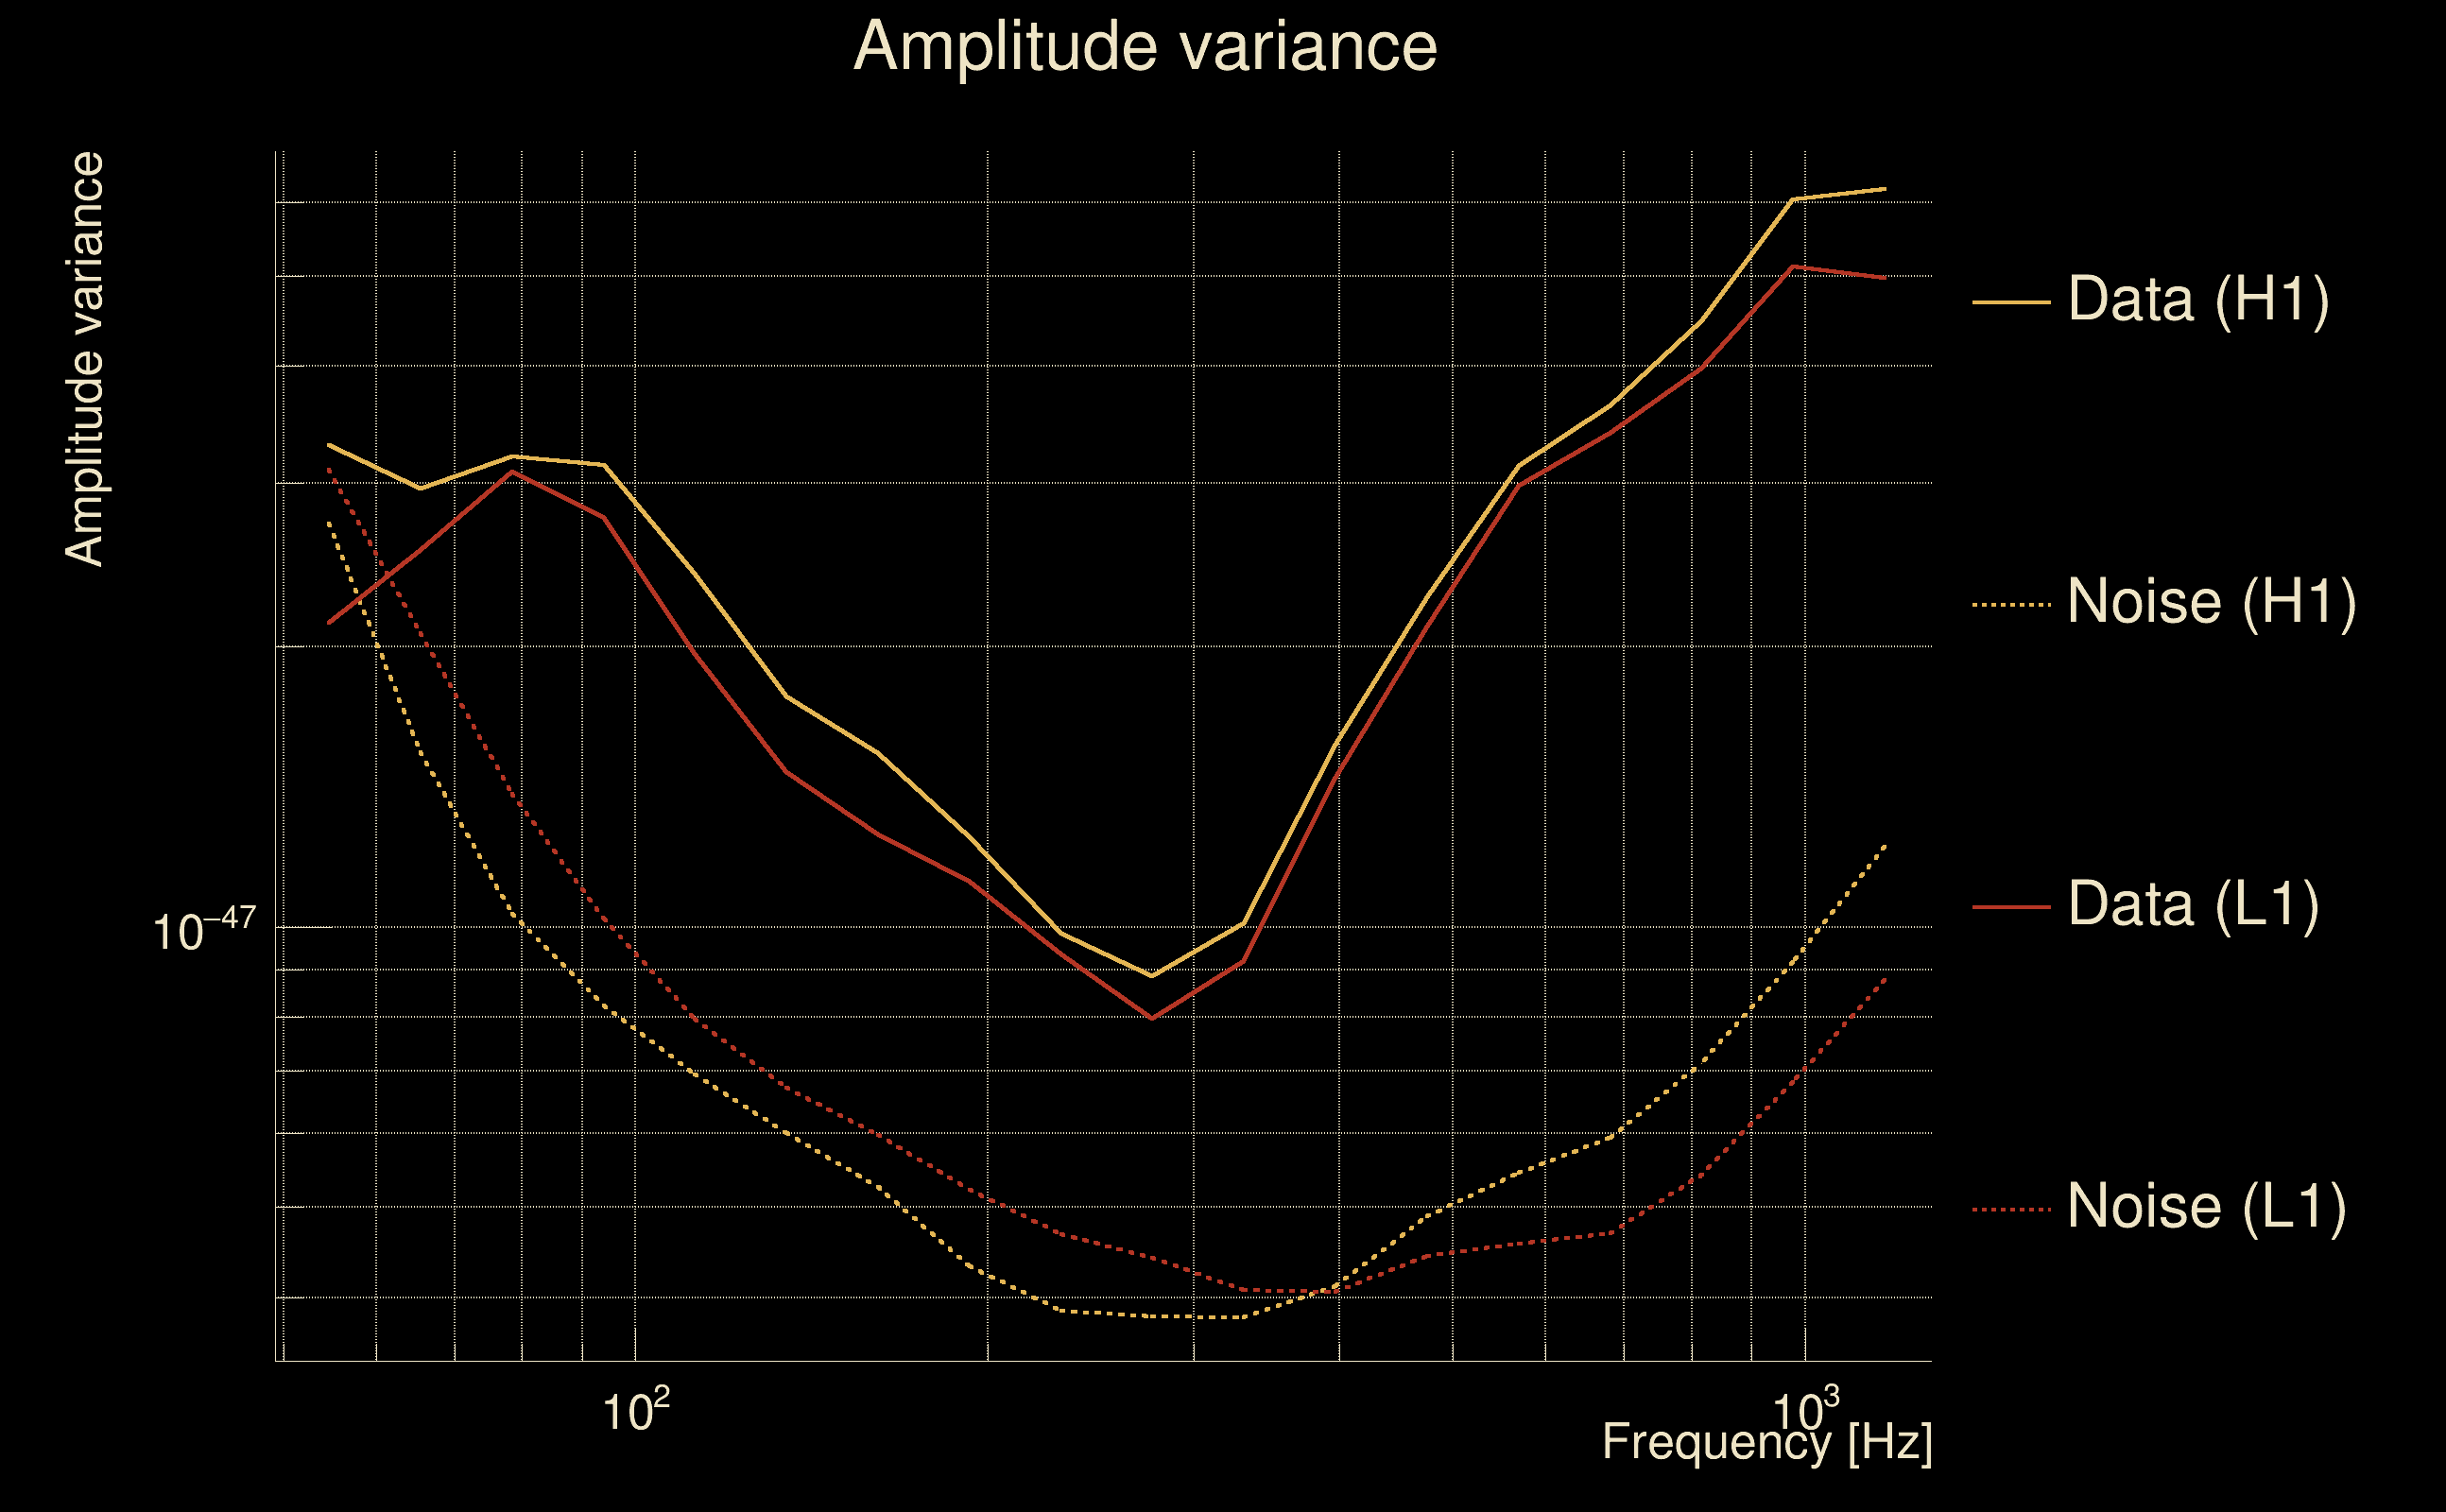
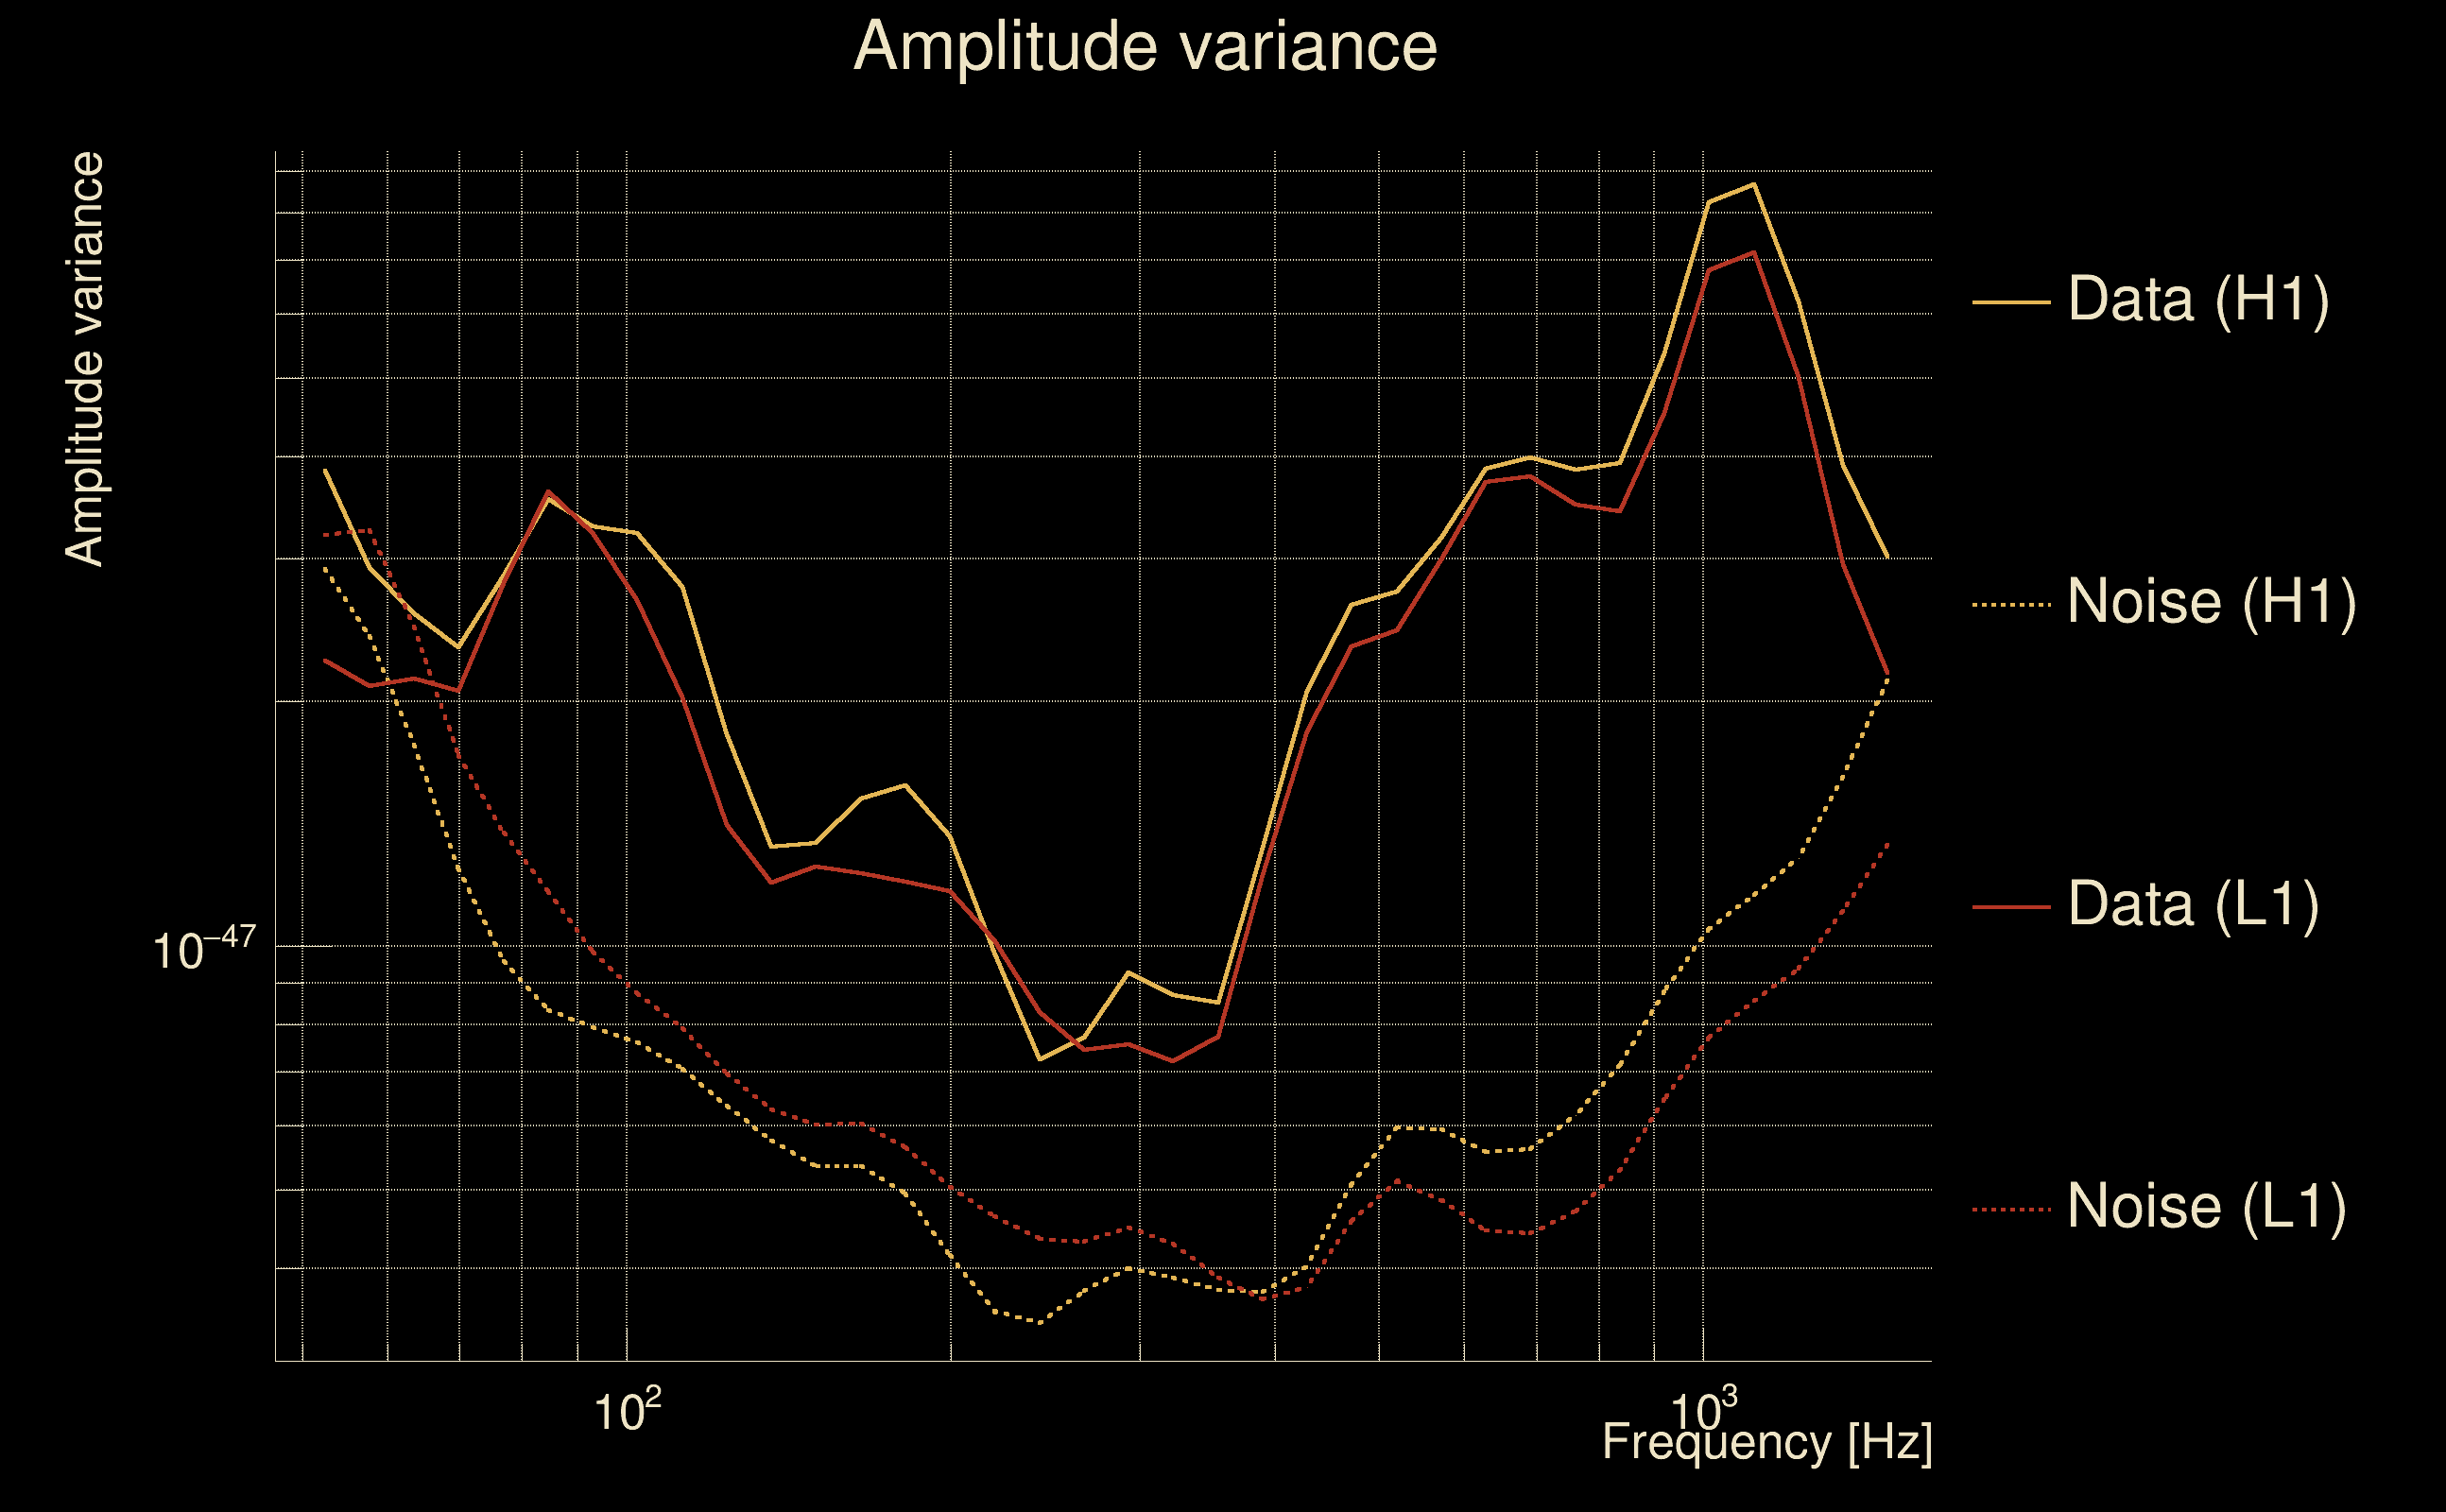
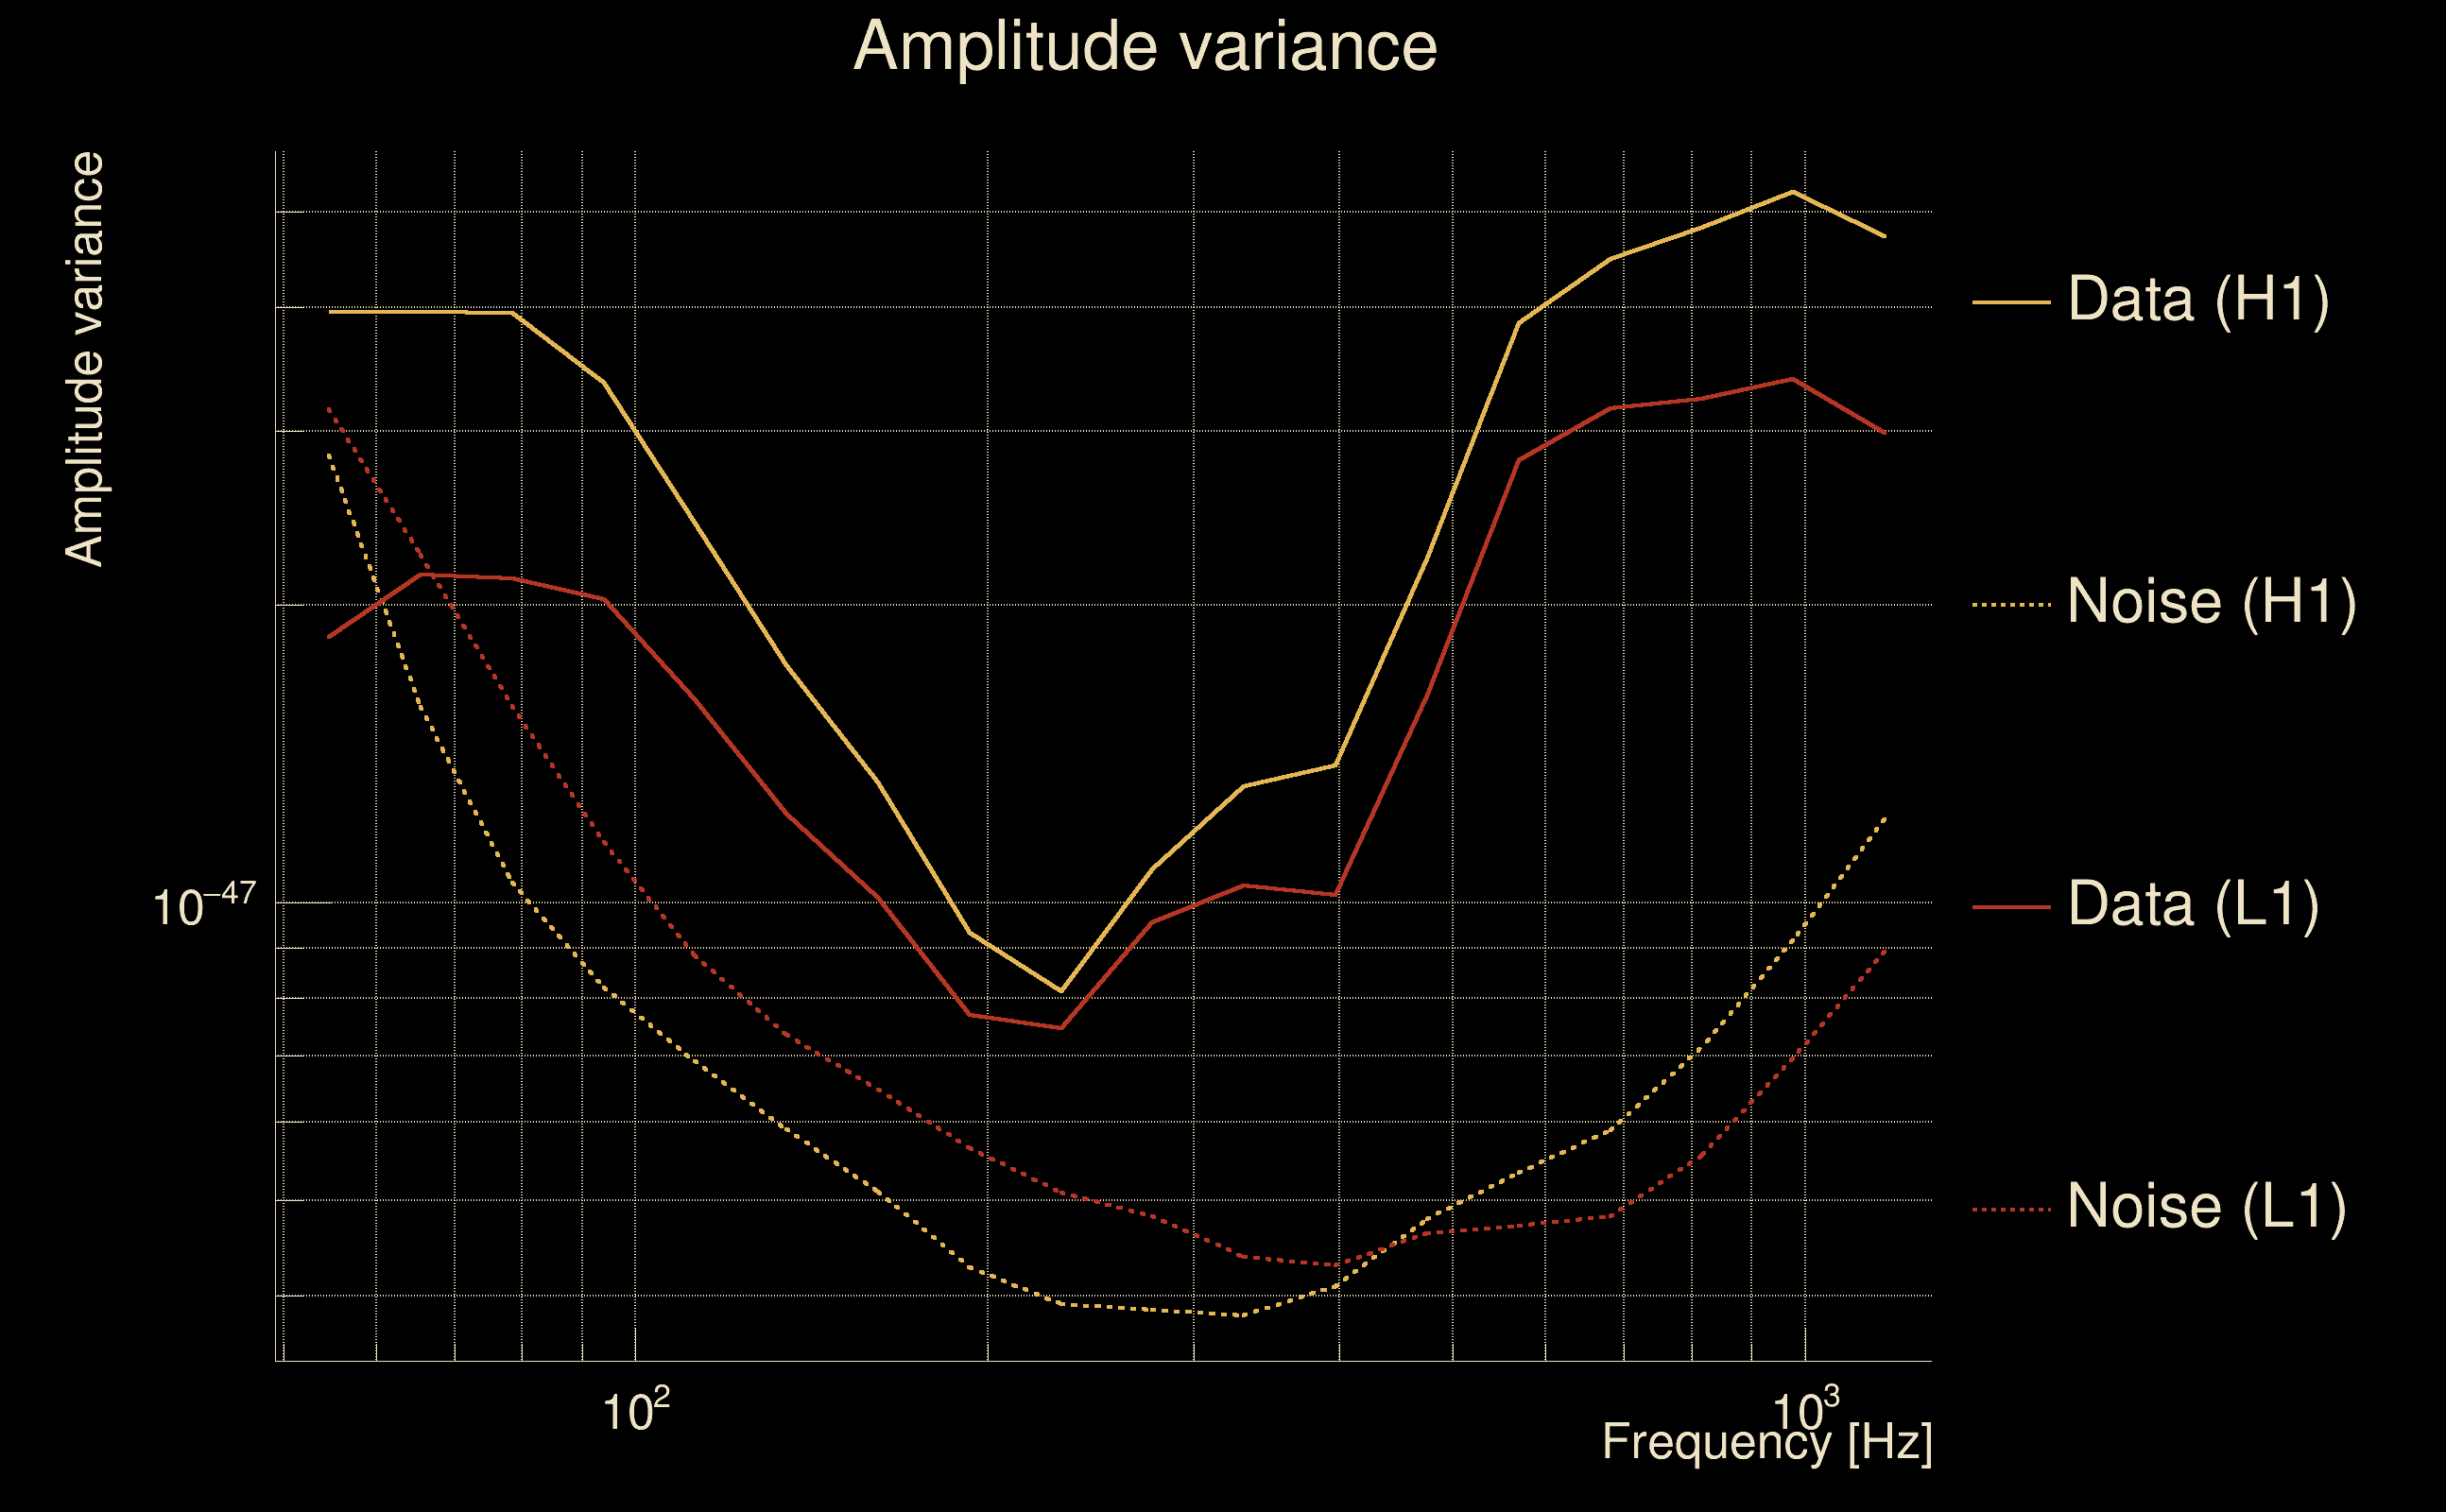
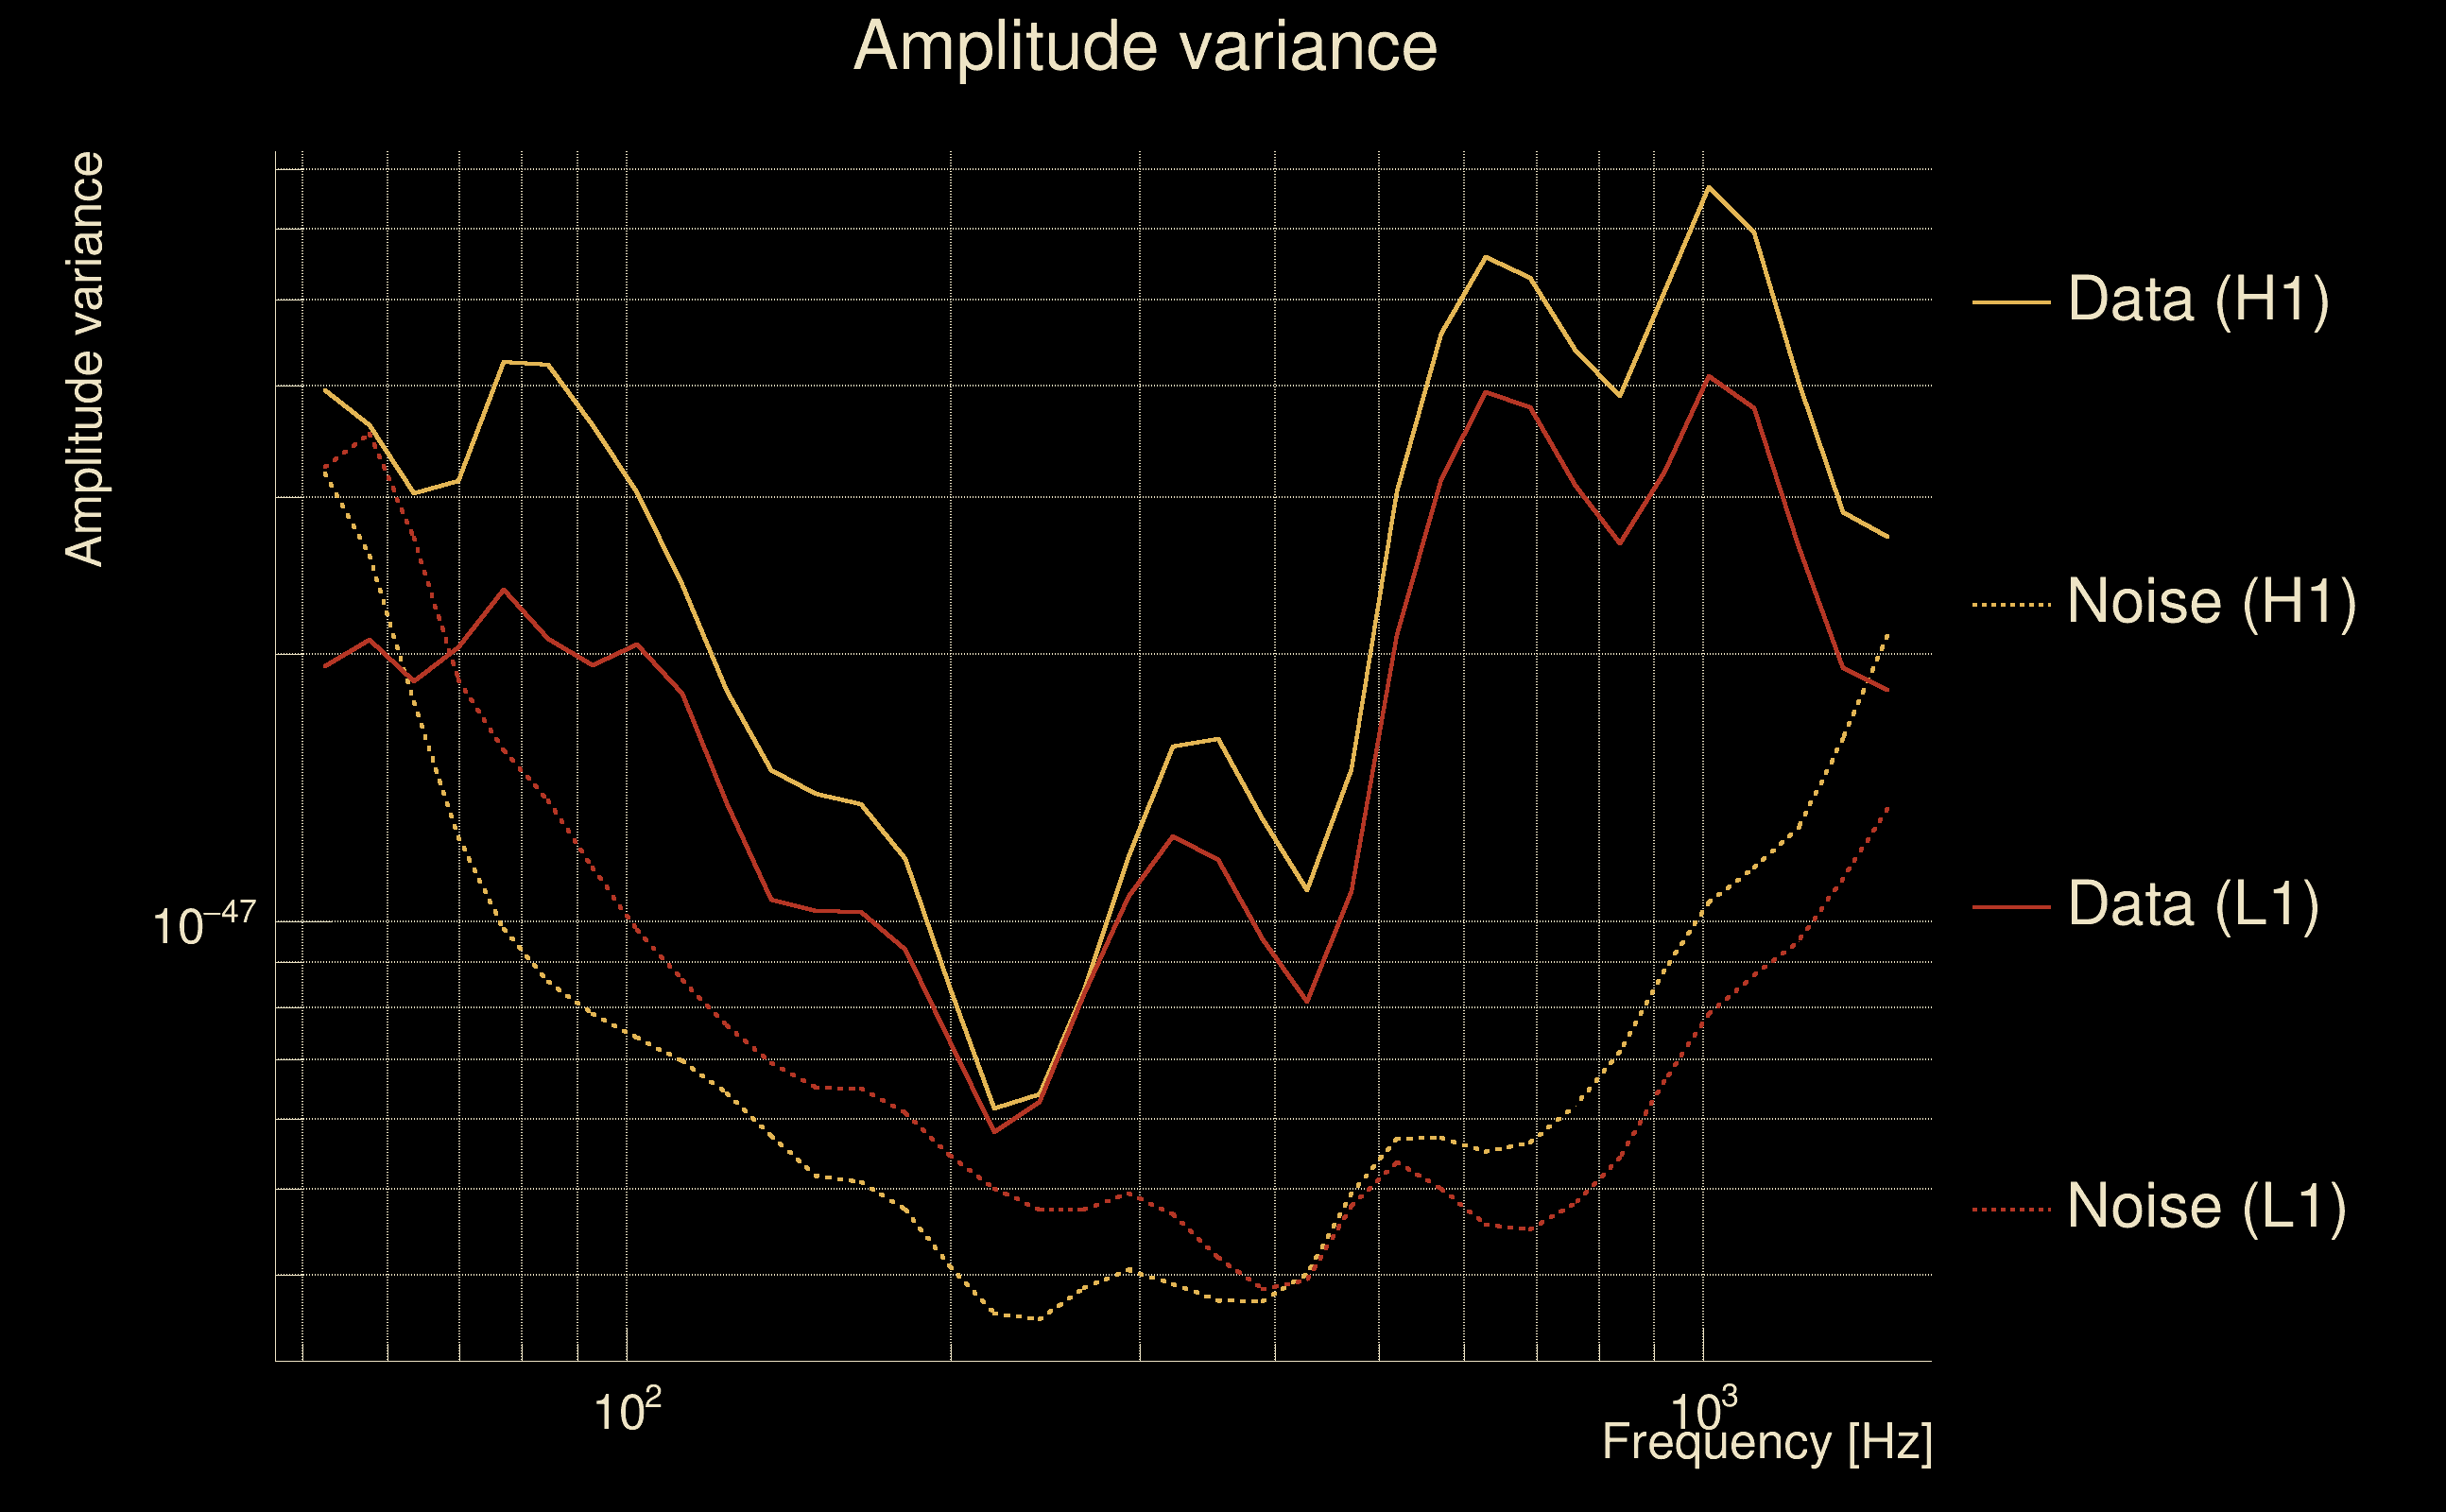
| Amplitude spectrograms: | normalization = 1e-22, power index = 2 |
| White noise SNR variance: | 0.523175 (after applying a correction factor = 1) |
| Amplitude ratio confidence level: | 3 sigma |
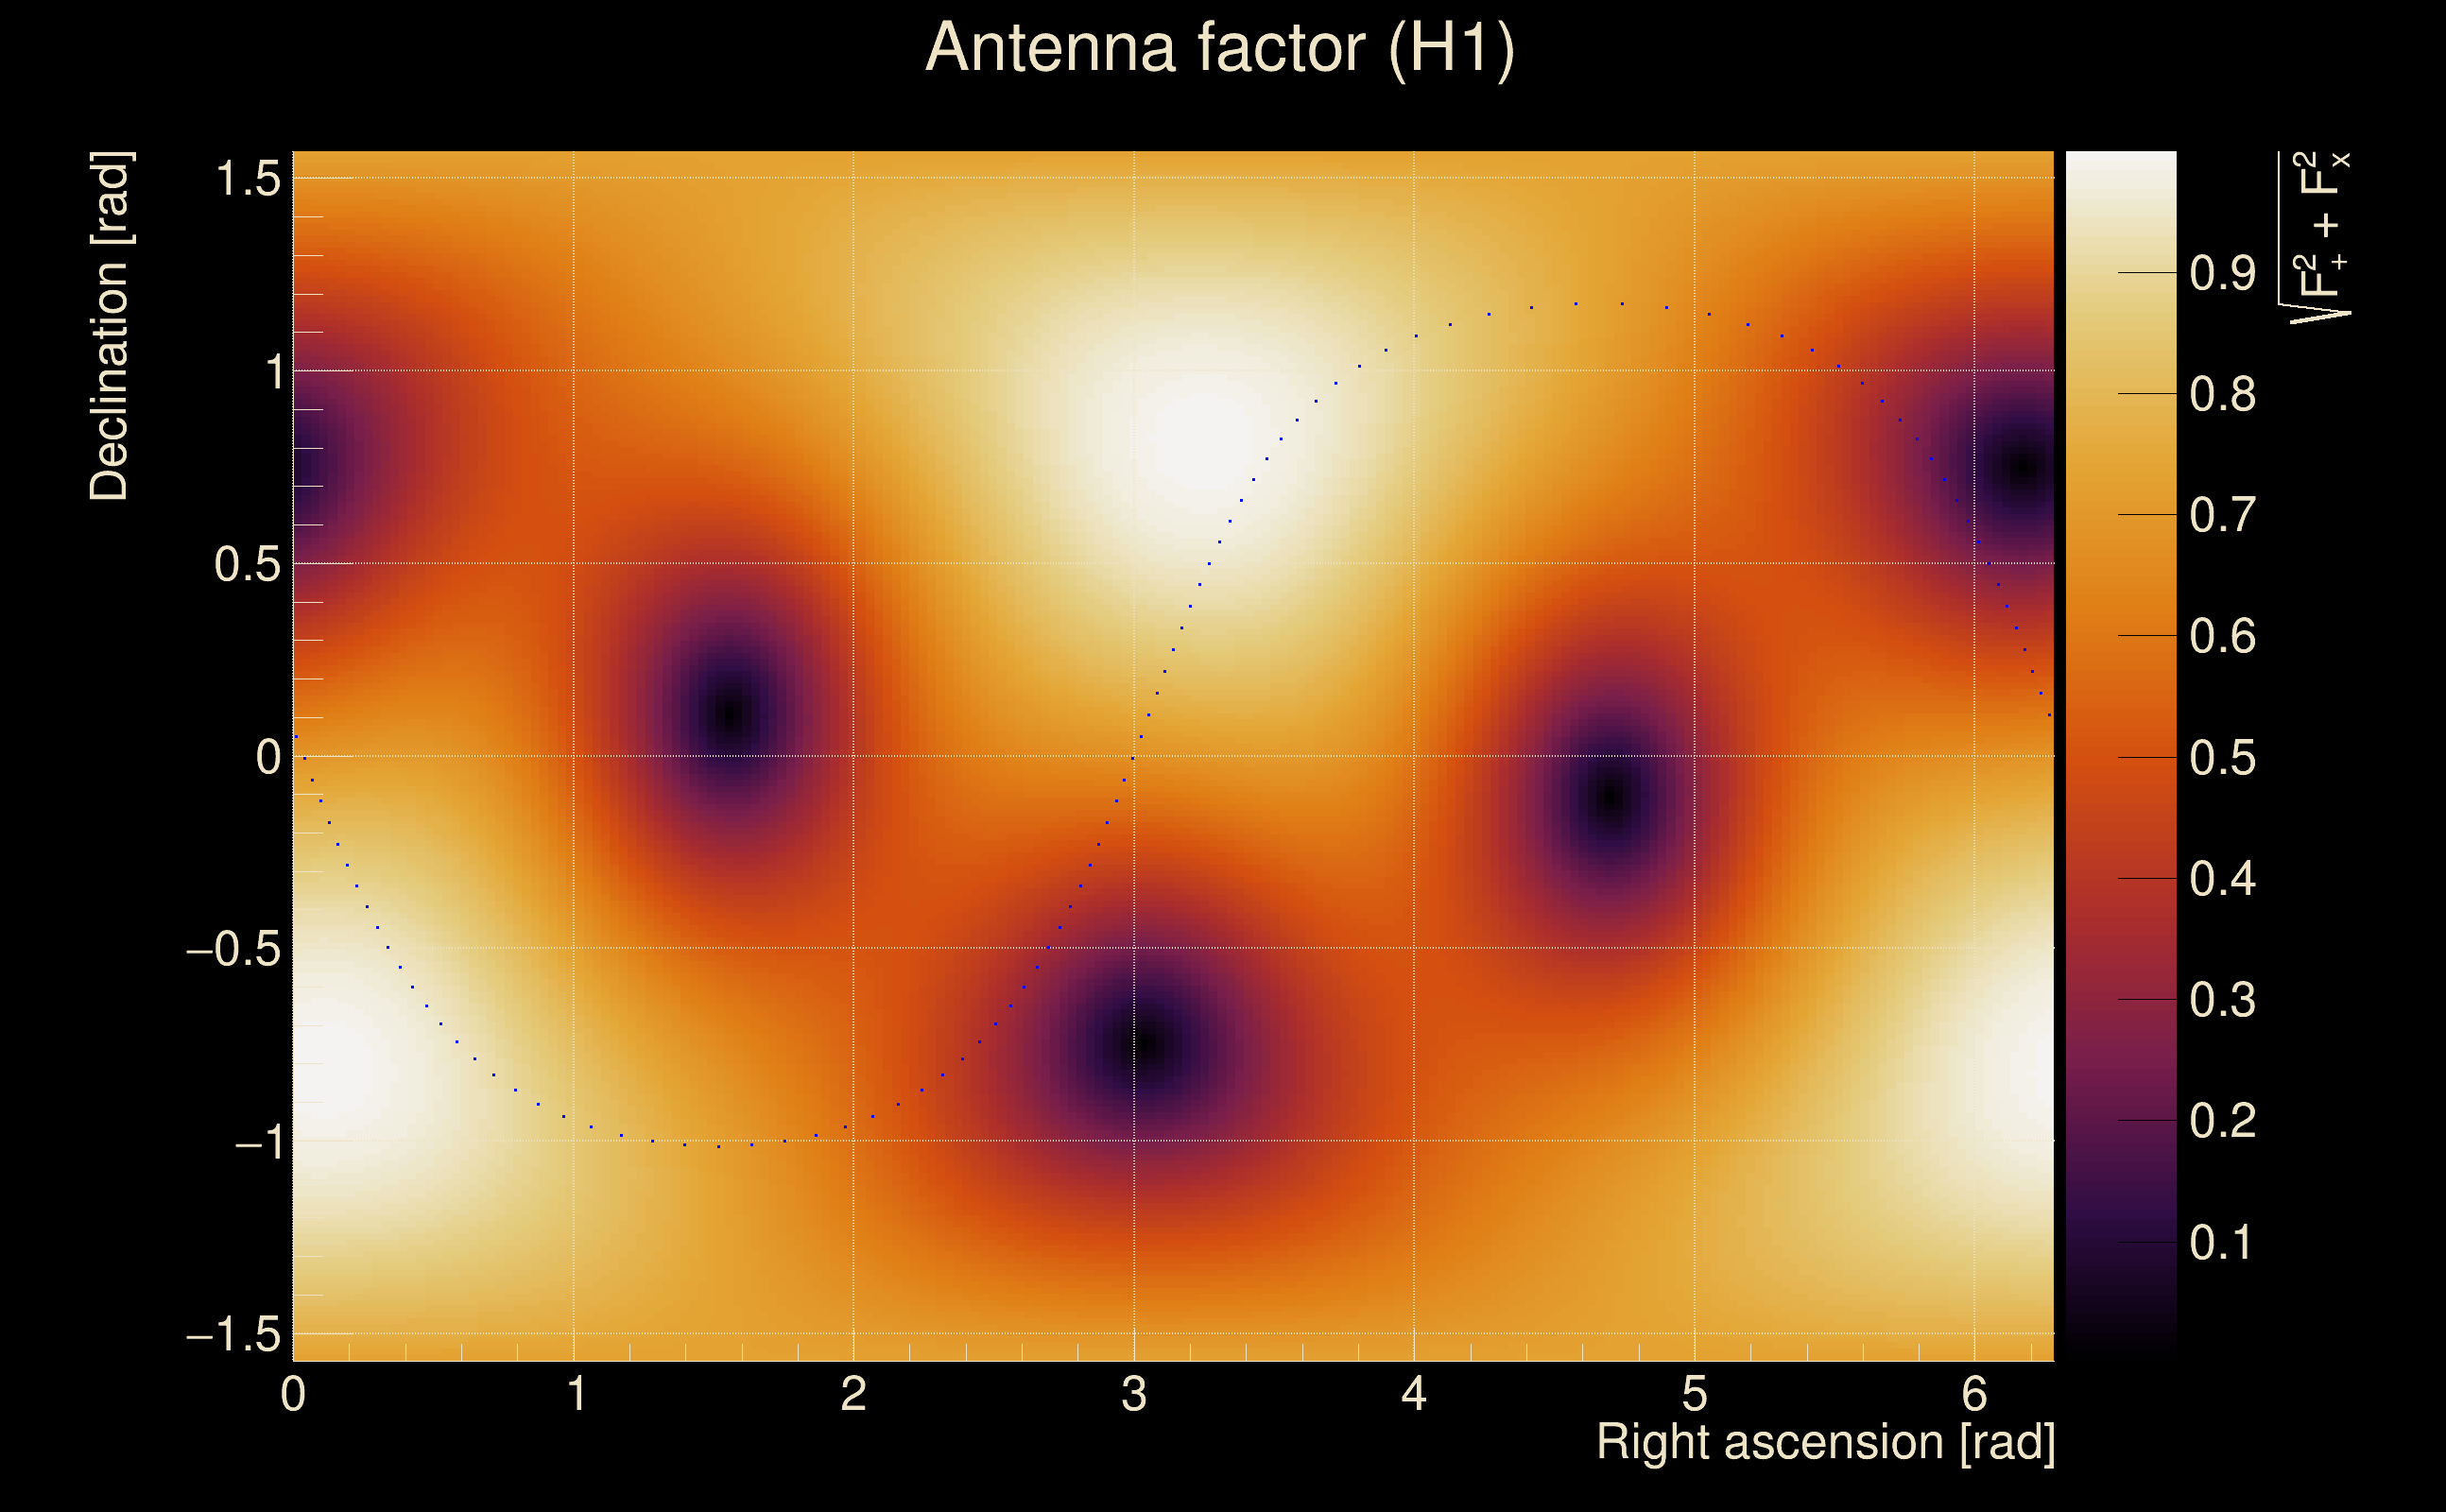
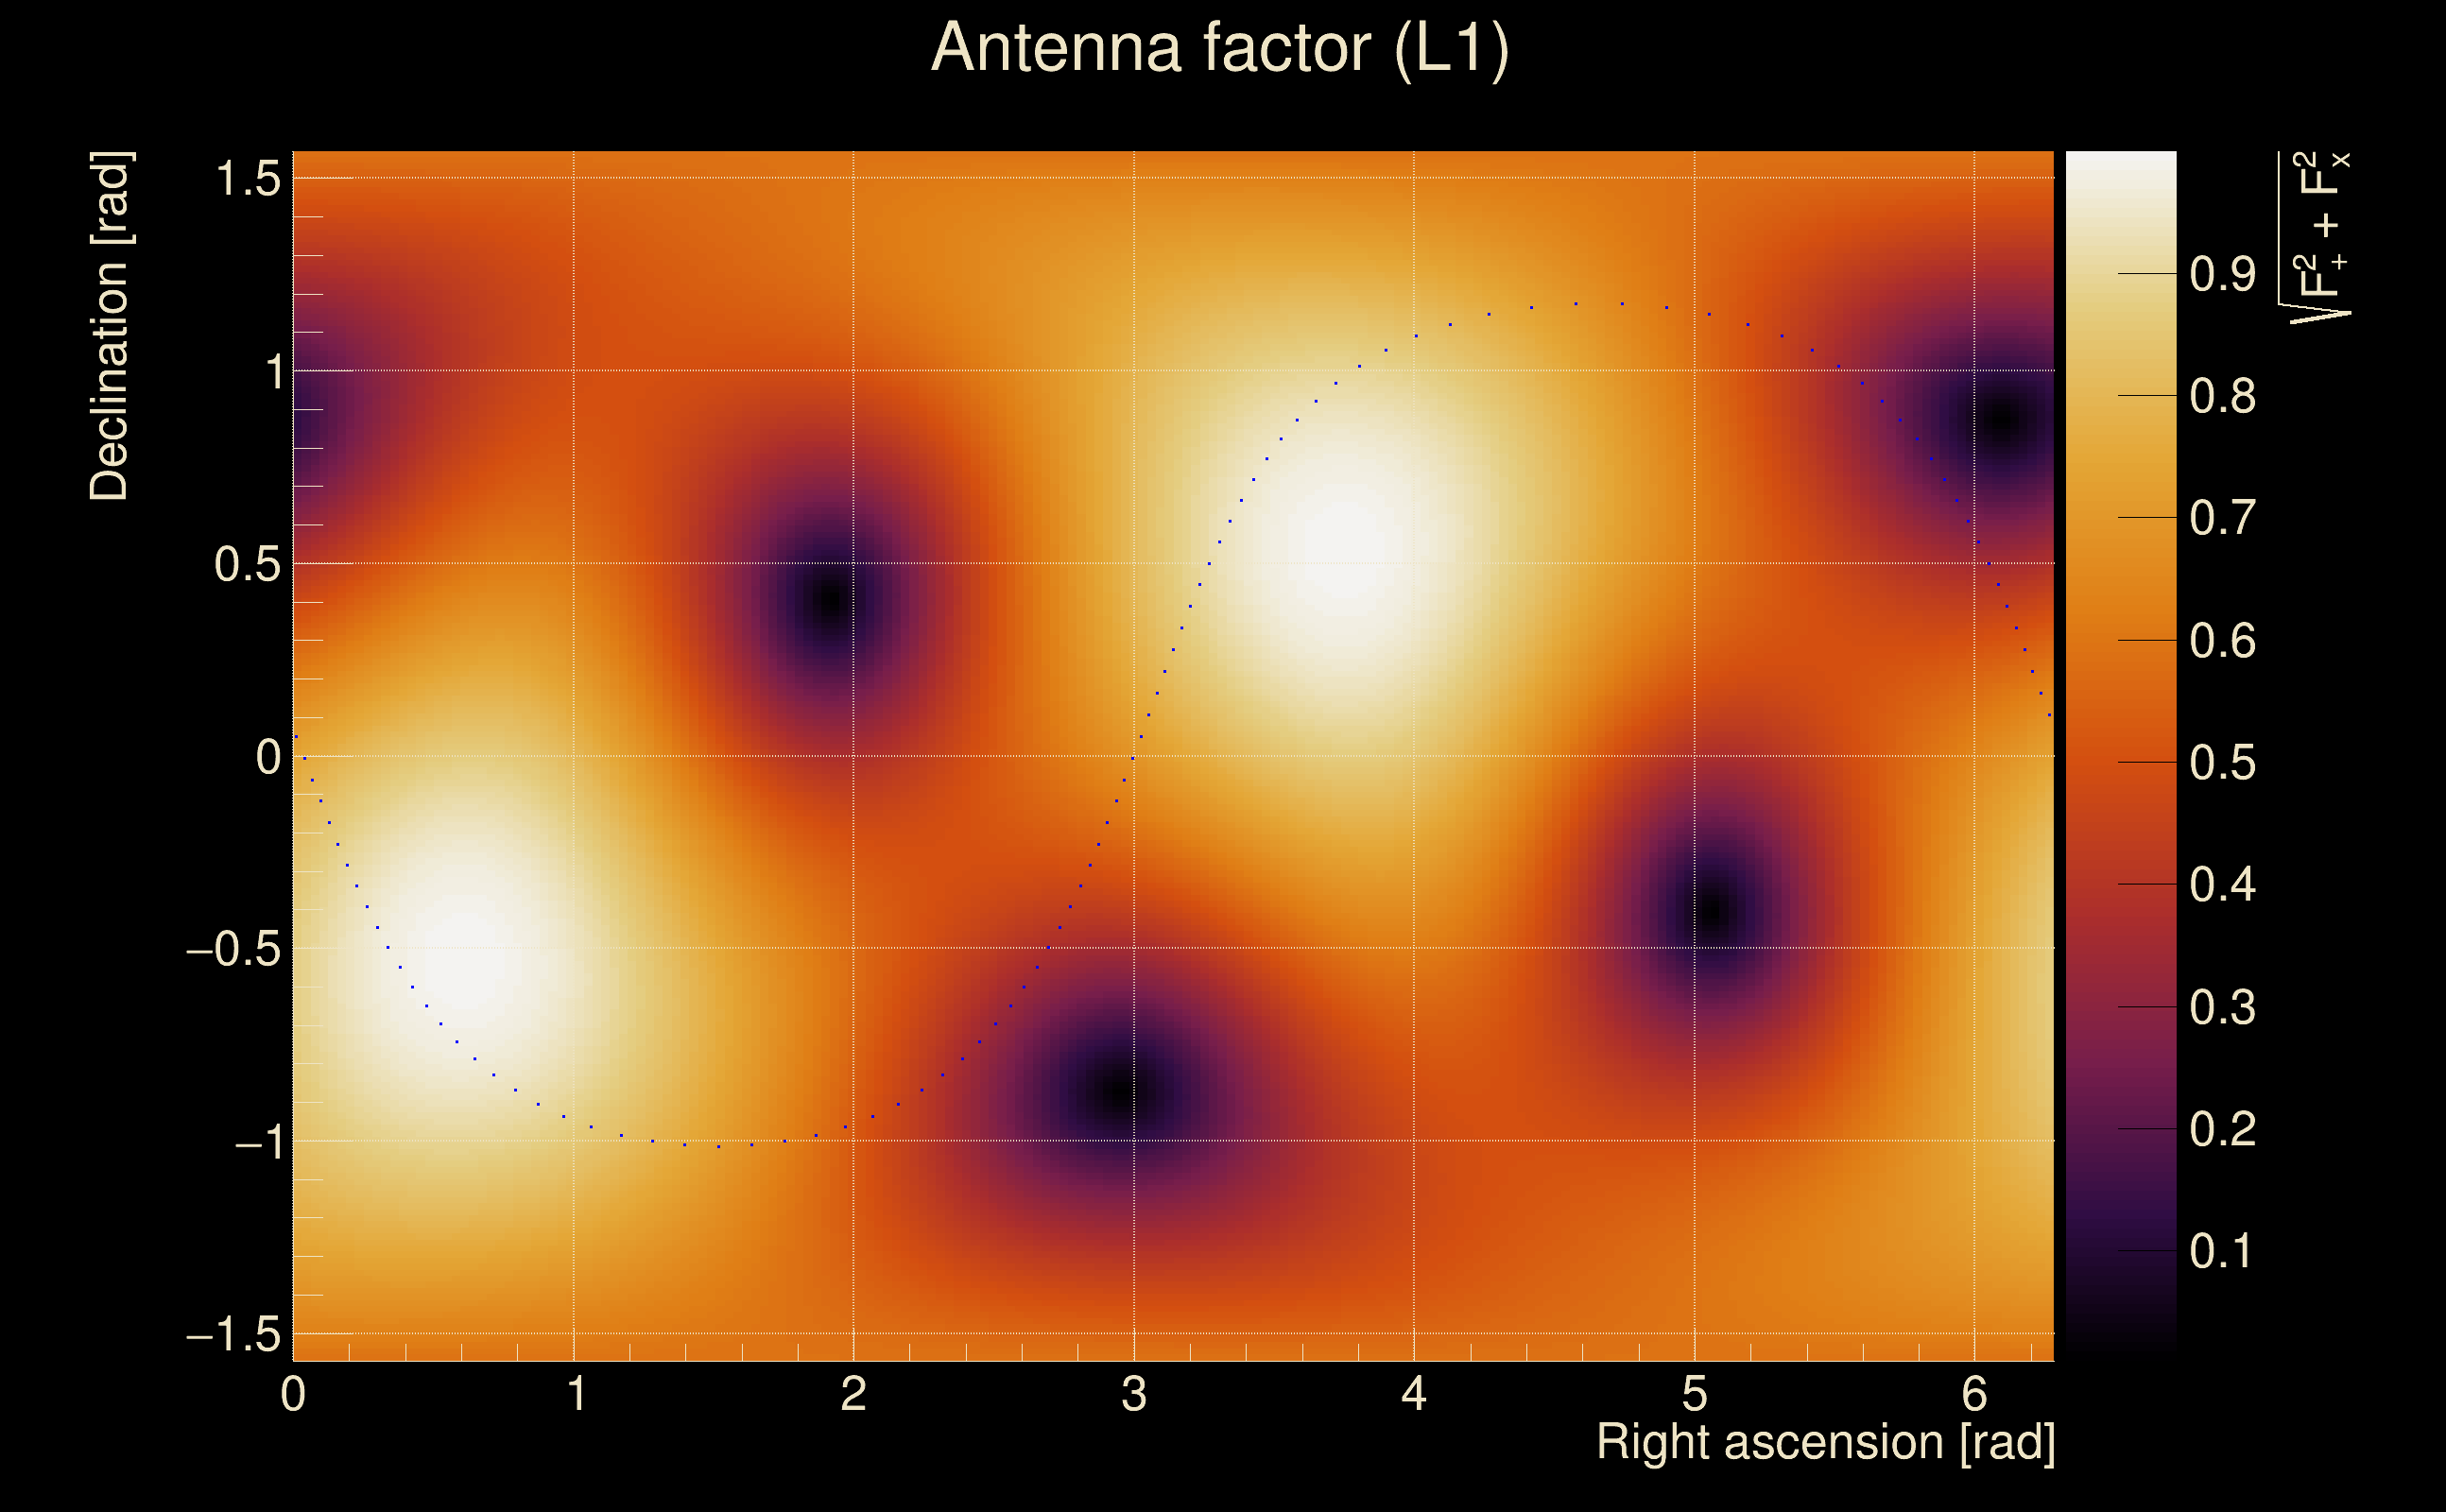
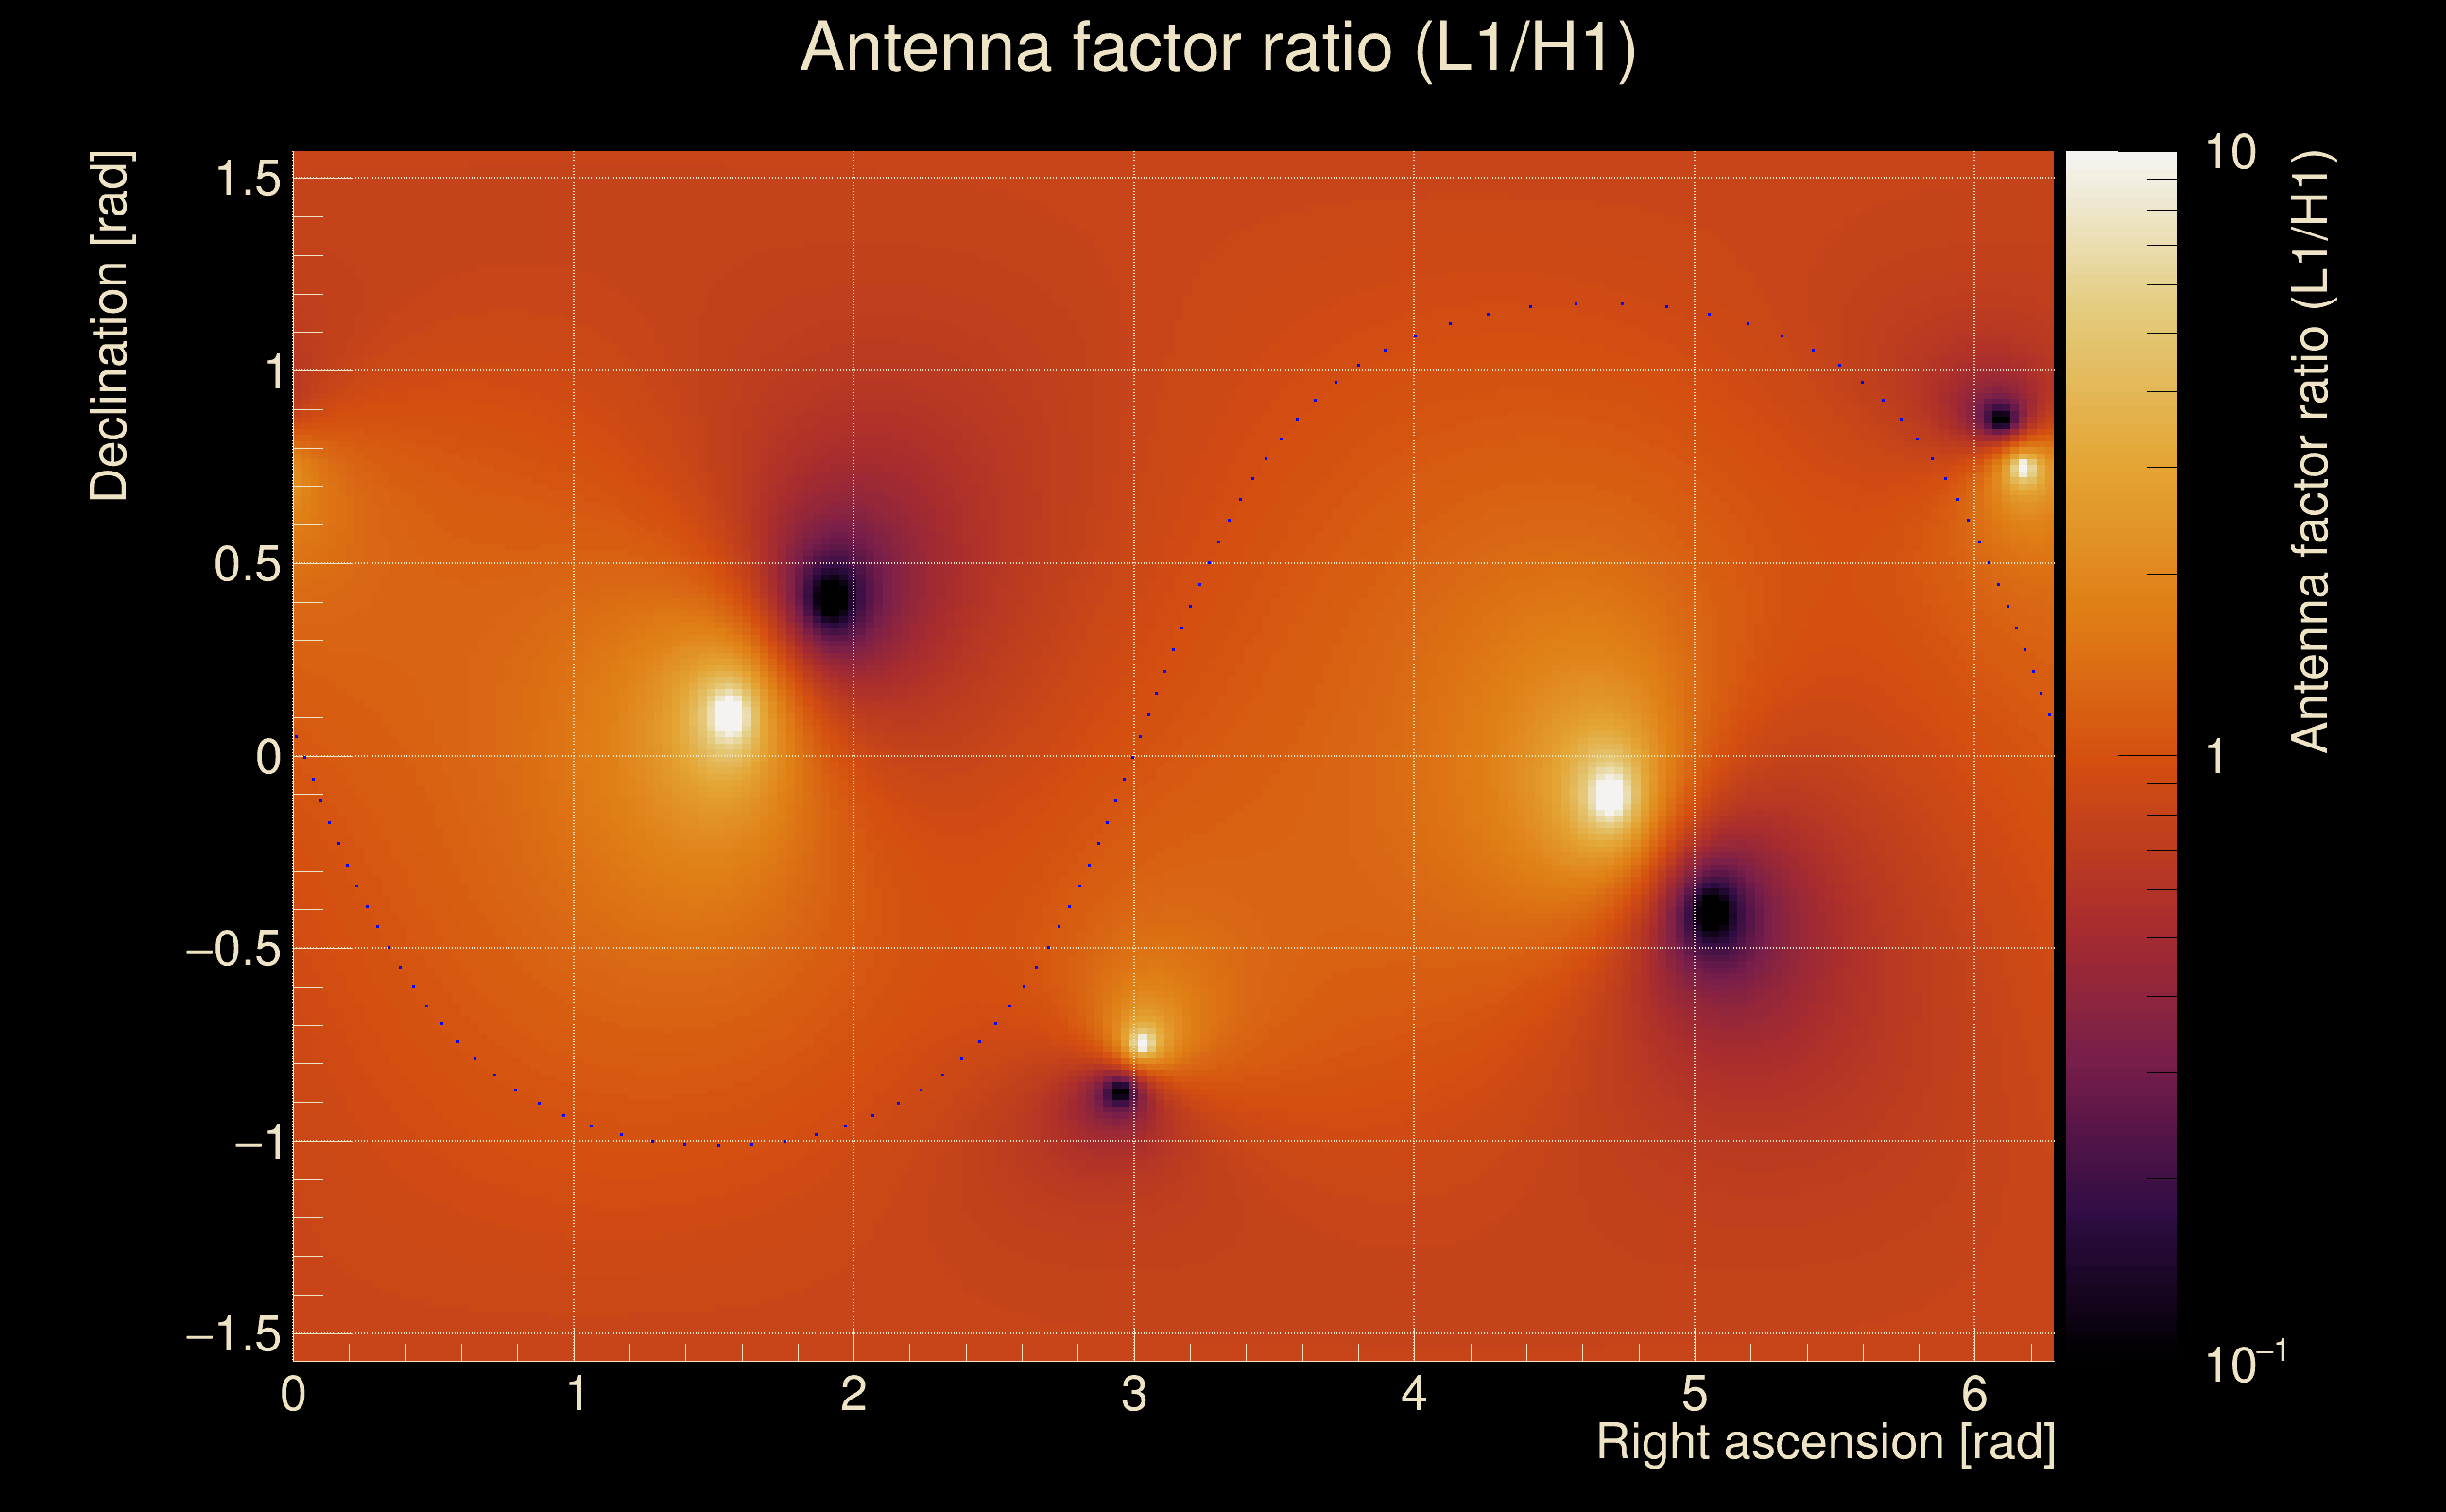
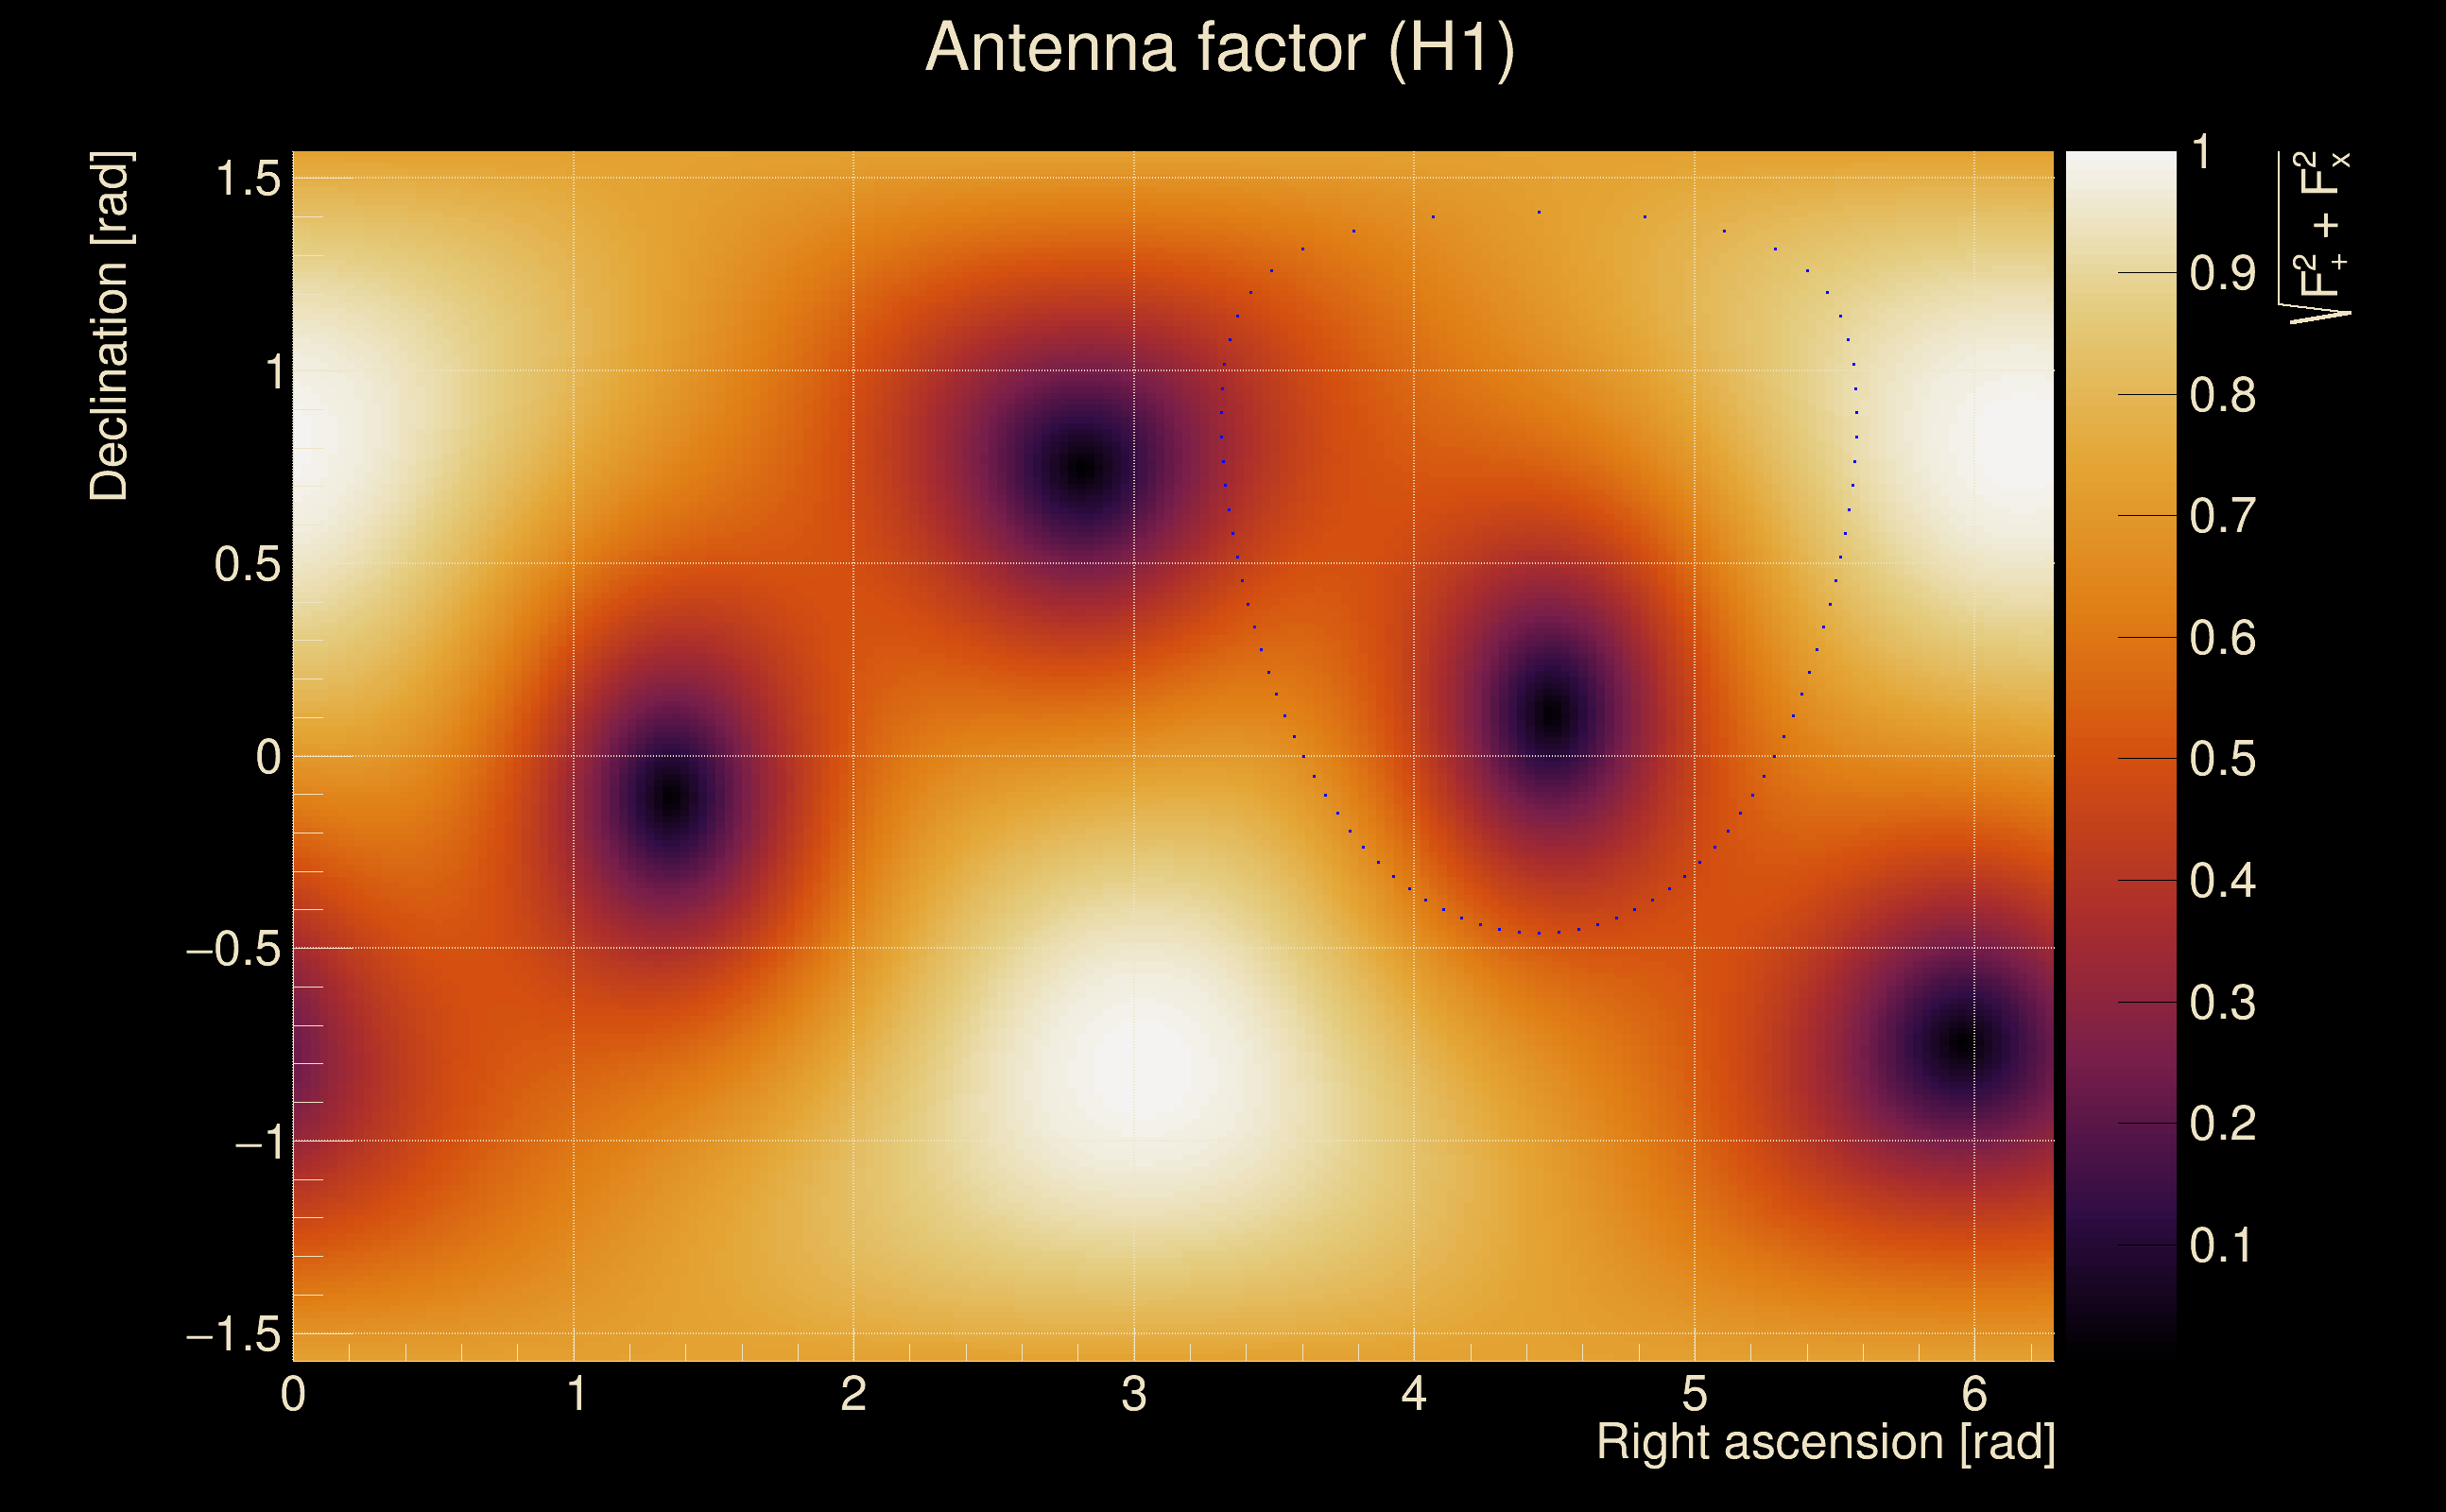
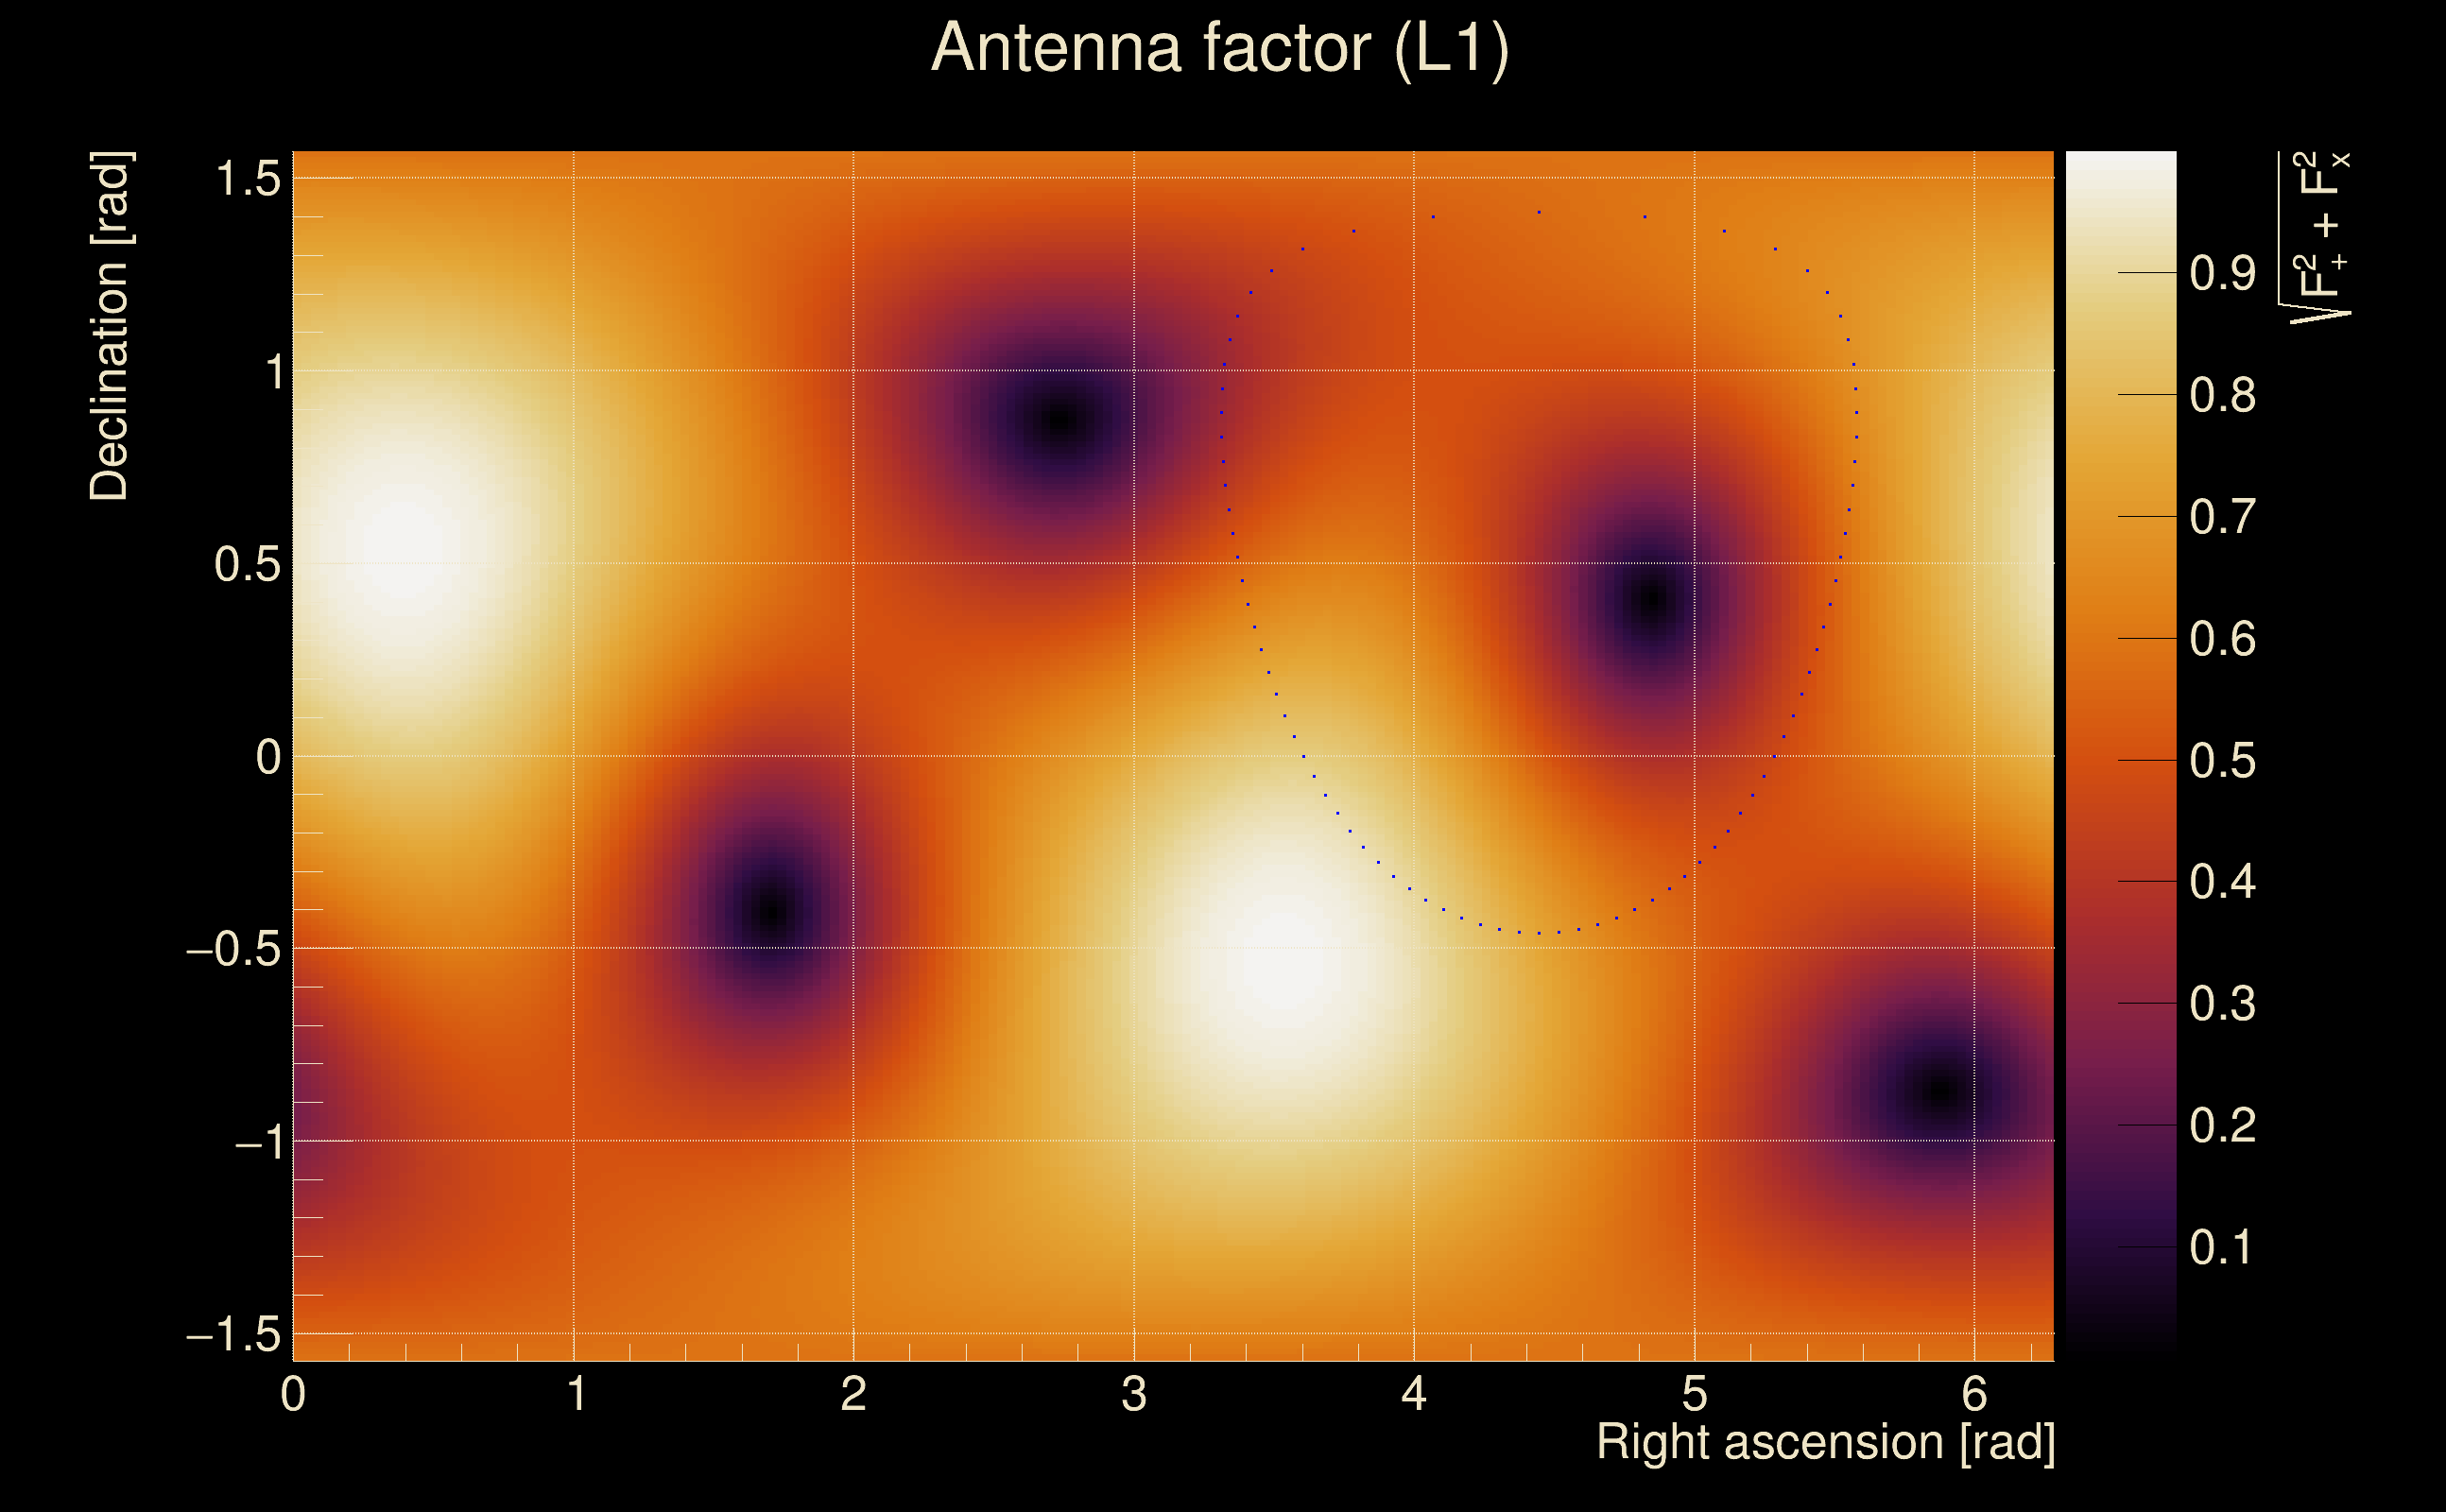
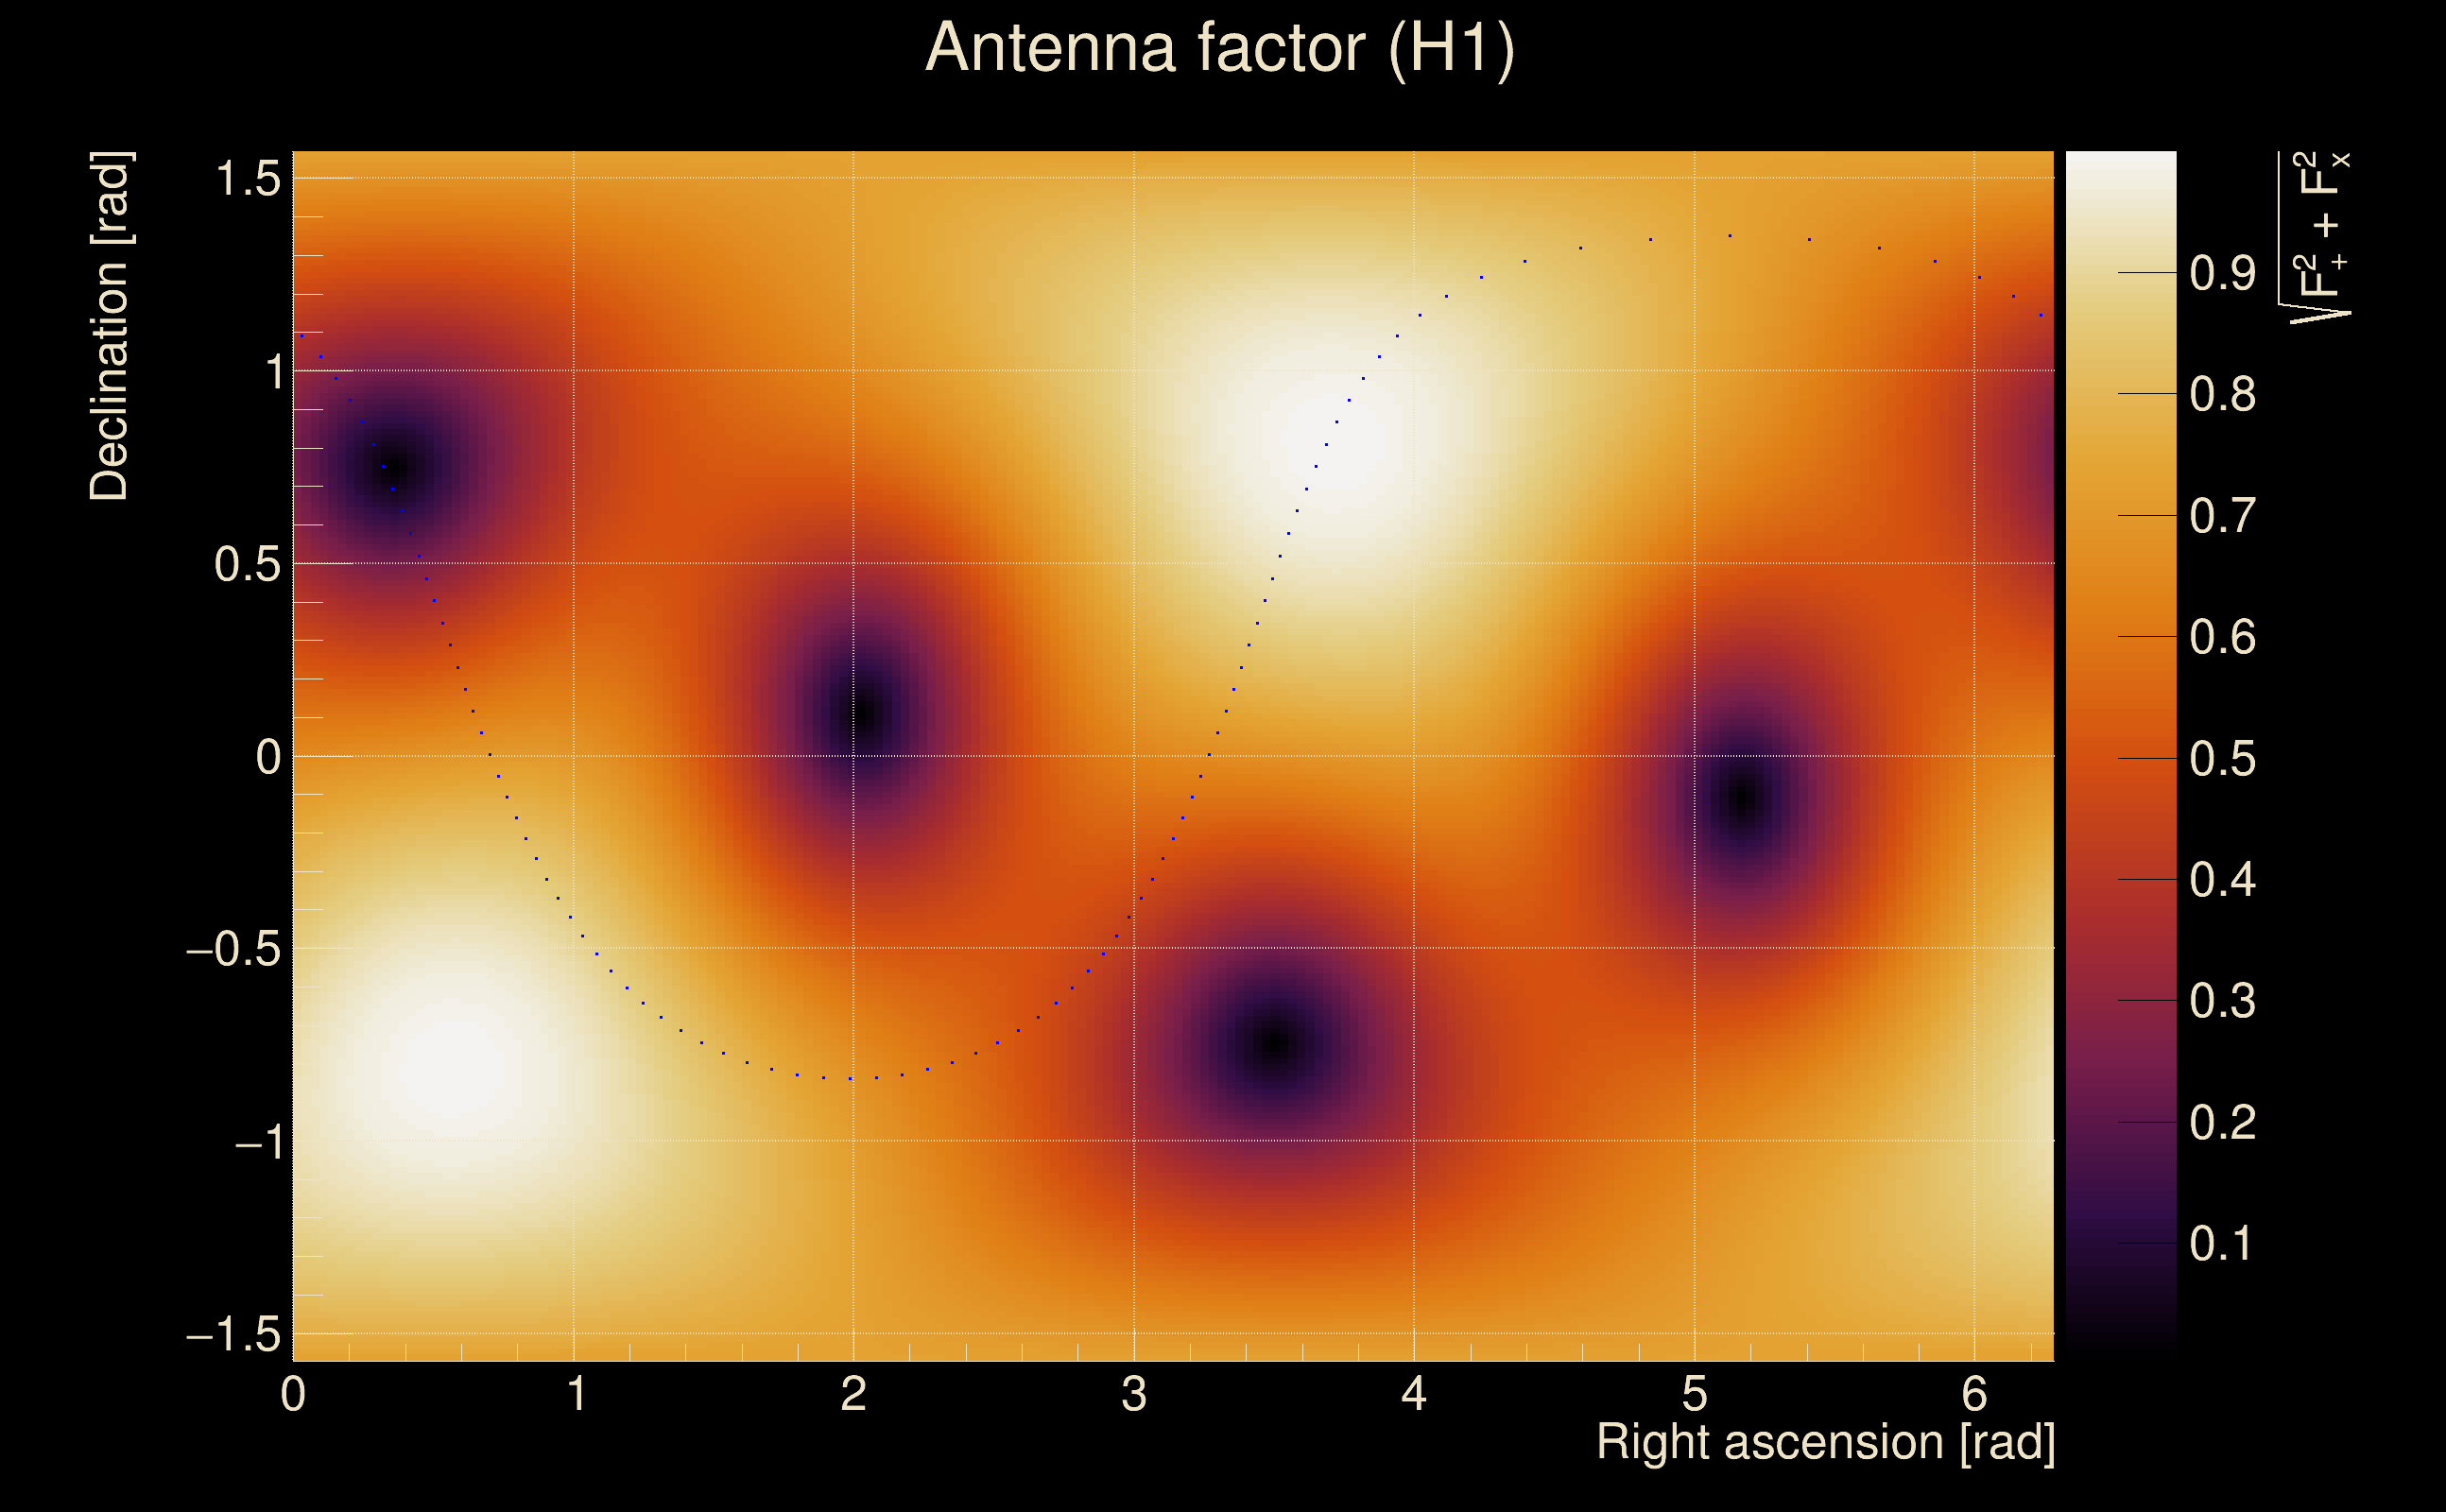
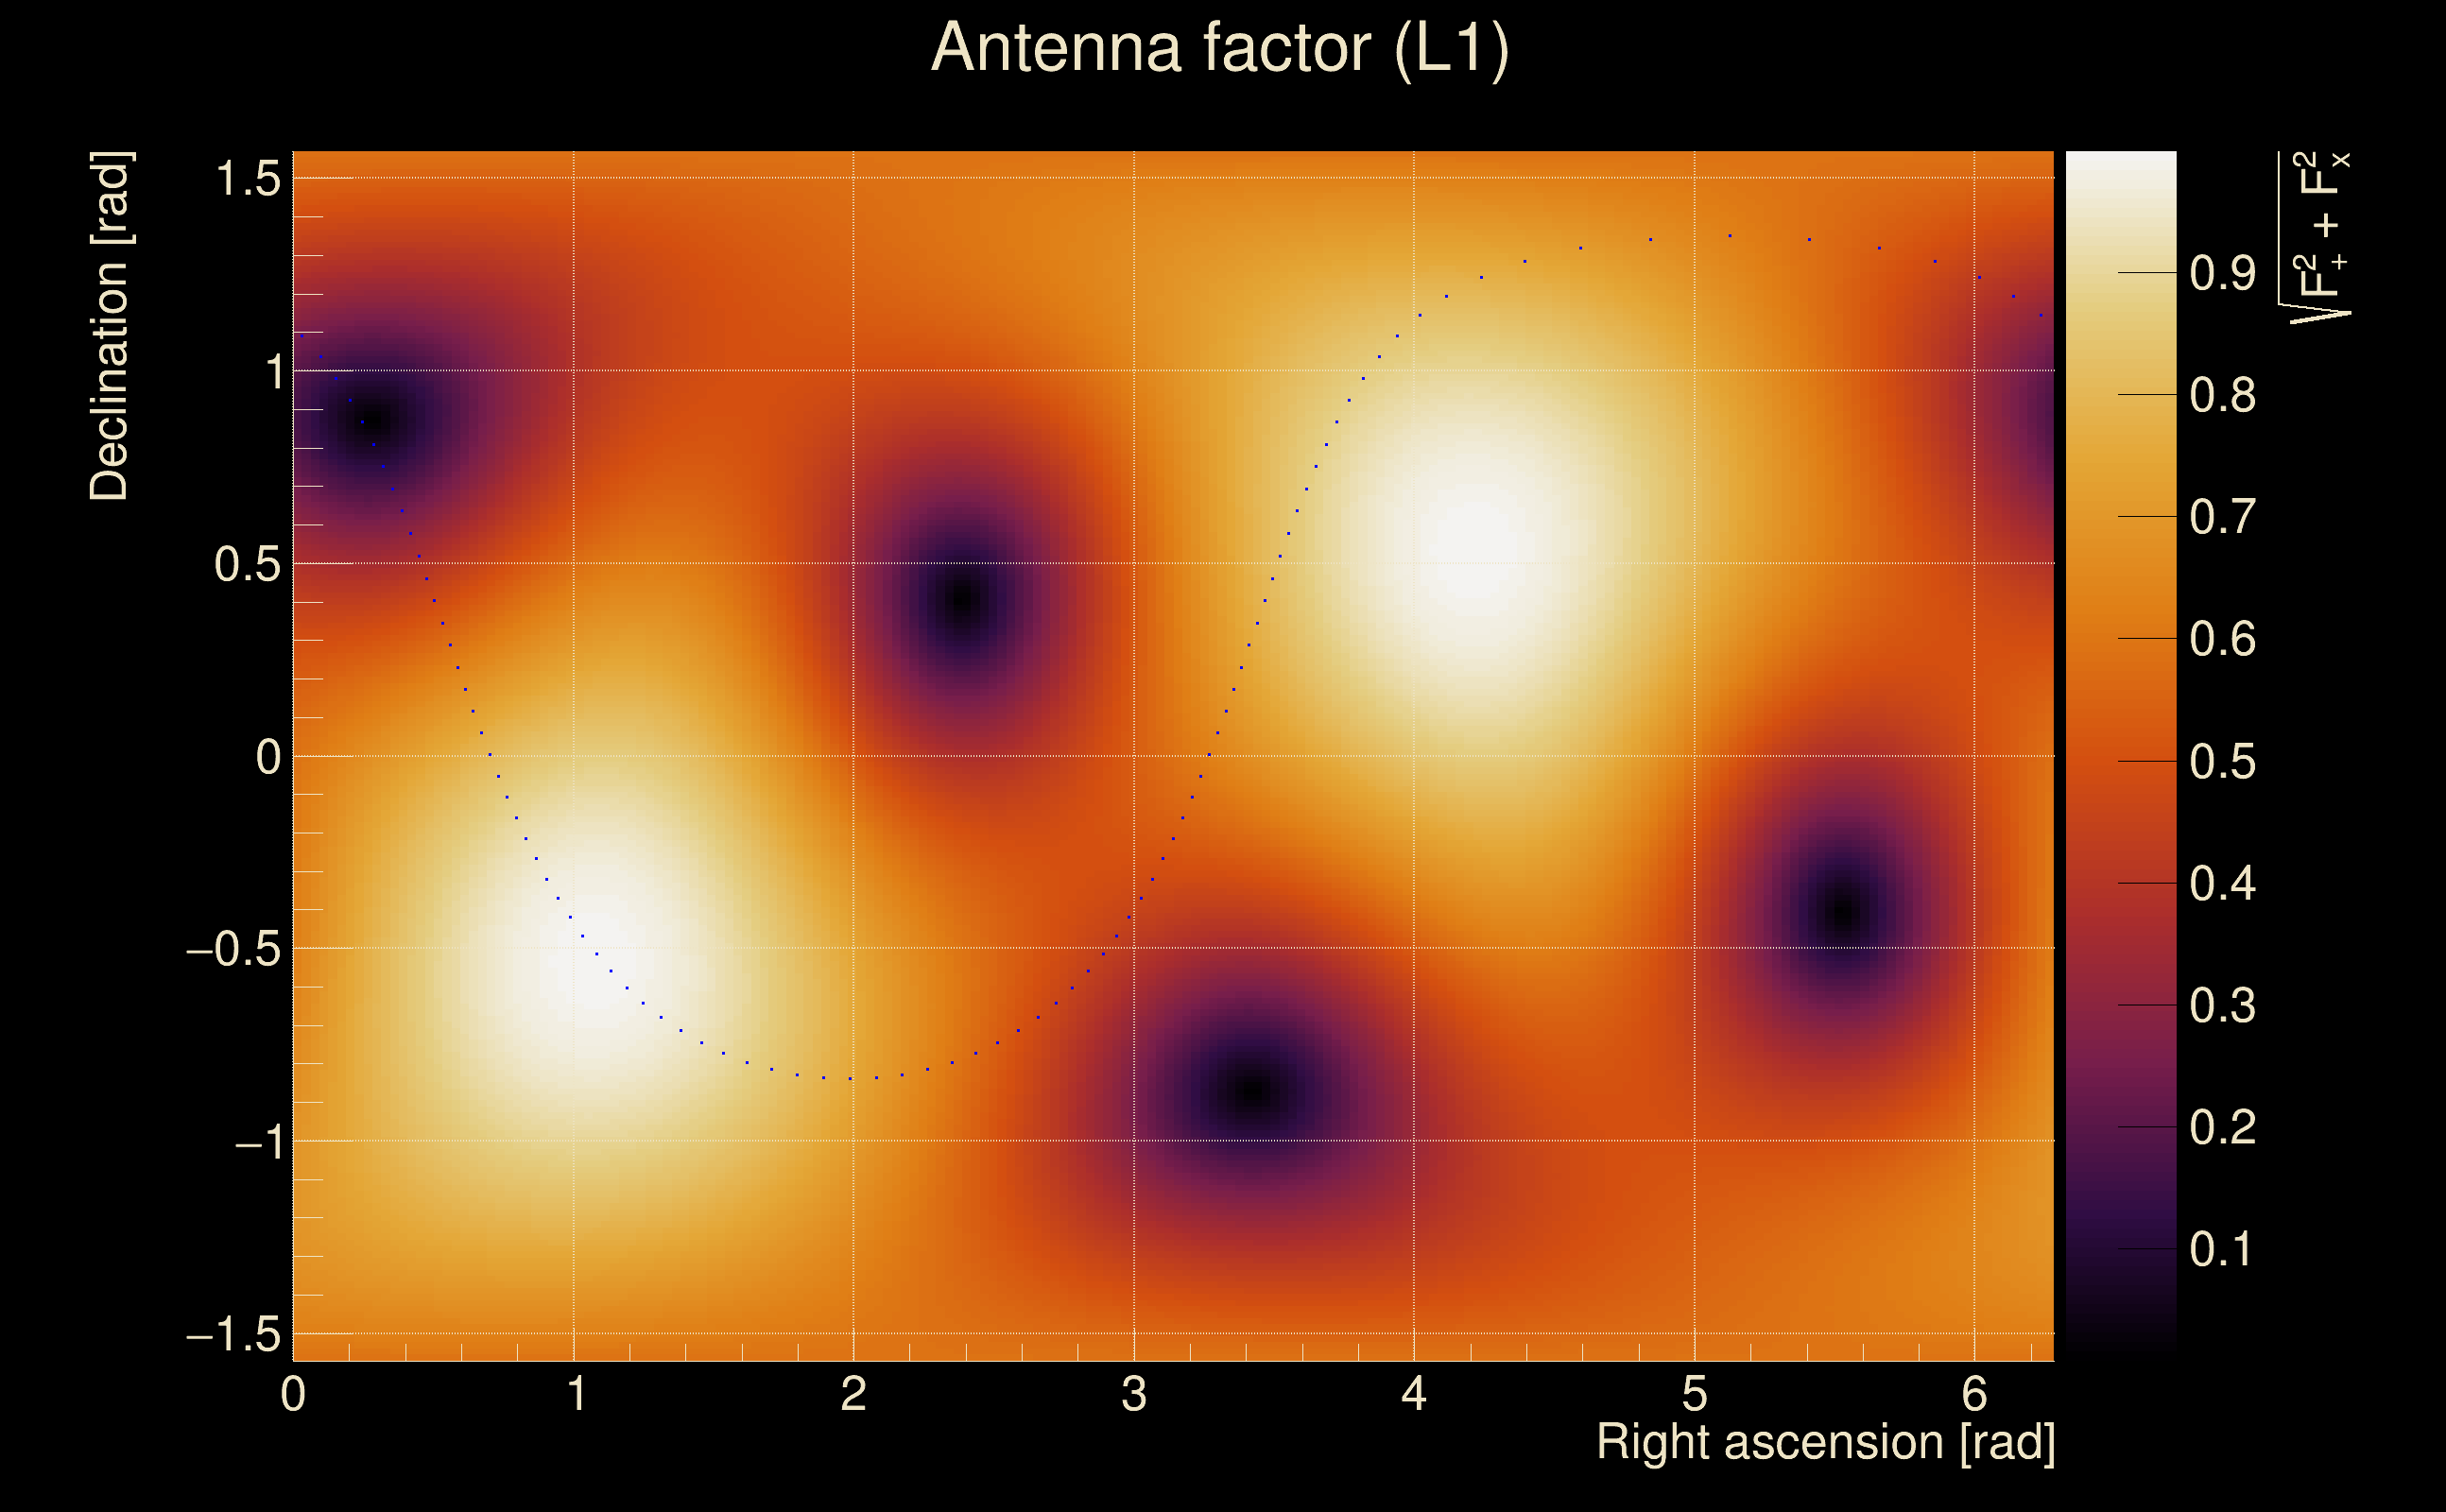
| Target sky positon: | Ra: 3.68109, Dec: 0.94792 [rad] |
| List of input Ox files: | TargIxf_feb2026_SN4_30s_file_list.txt (71 files) |
| Analysis result file: | TargIxf_feb2026_SN4_30s_results-0.root |
| Slice selected for the the fakeground: | slice index=50 (2.668 s), time lag = 0 s |
| Foreground | Fakeground | Background | ||
|---|---|---|---|---|
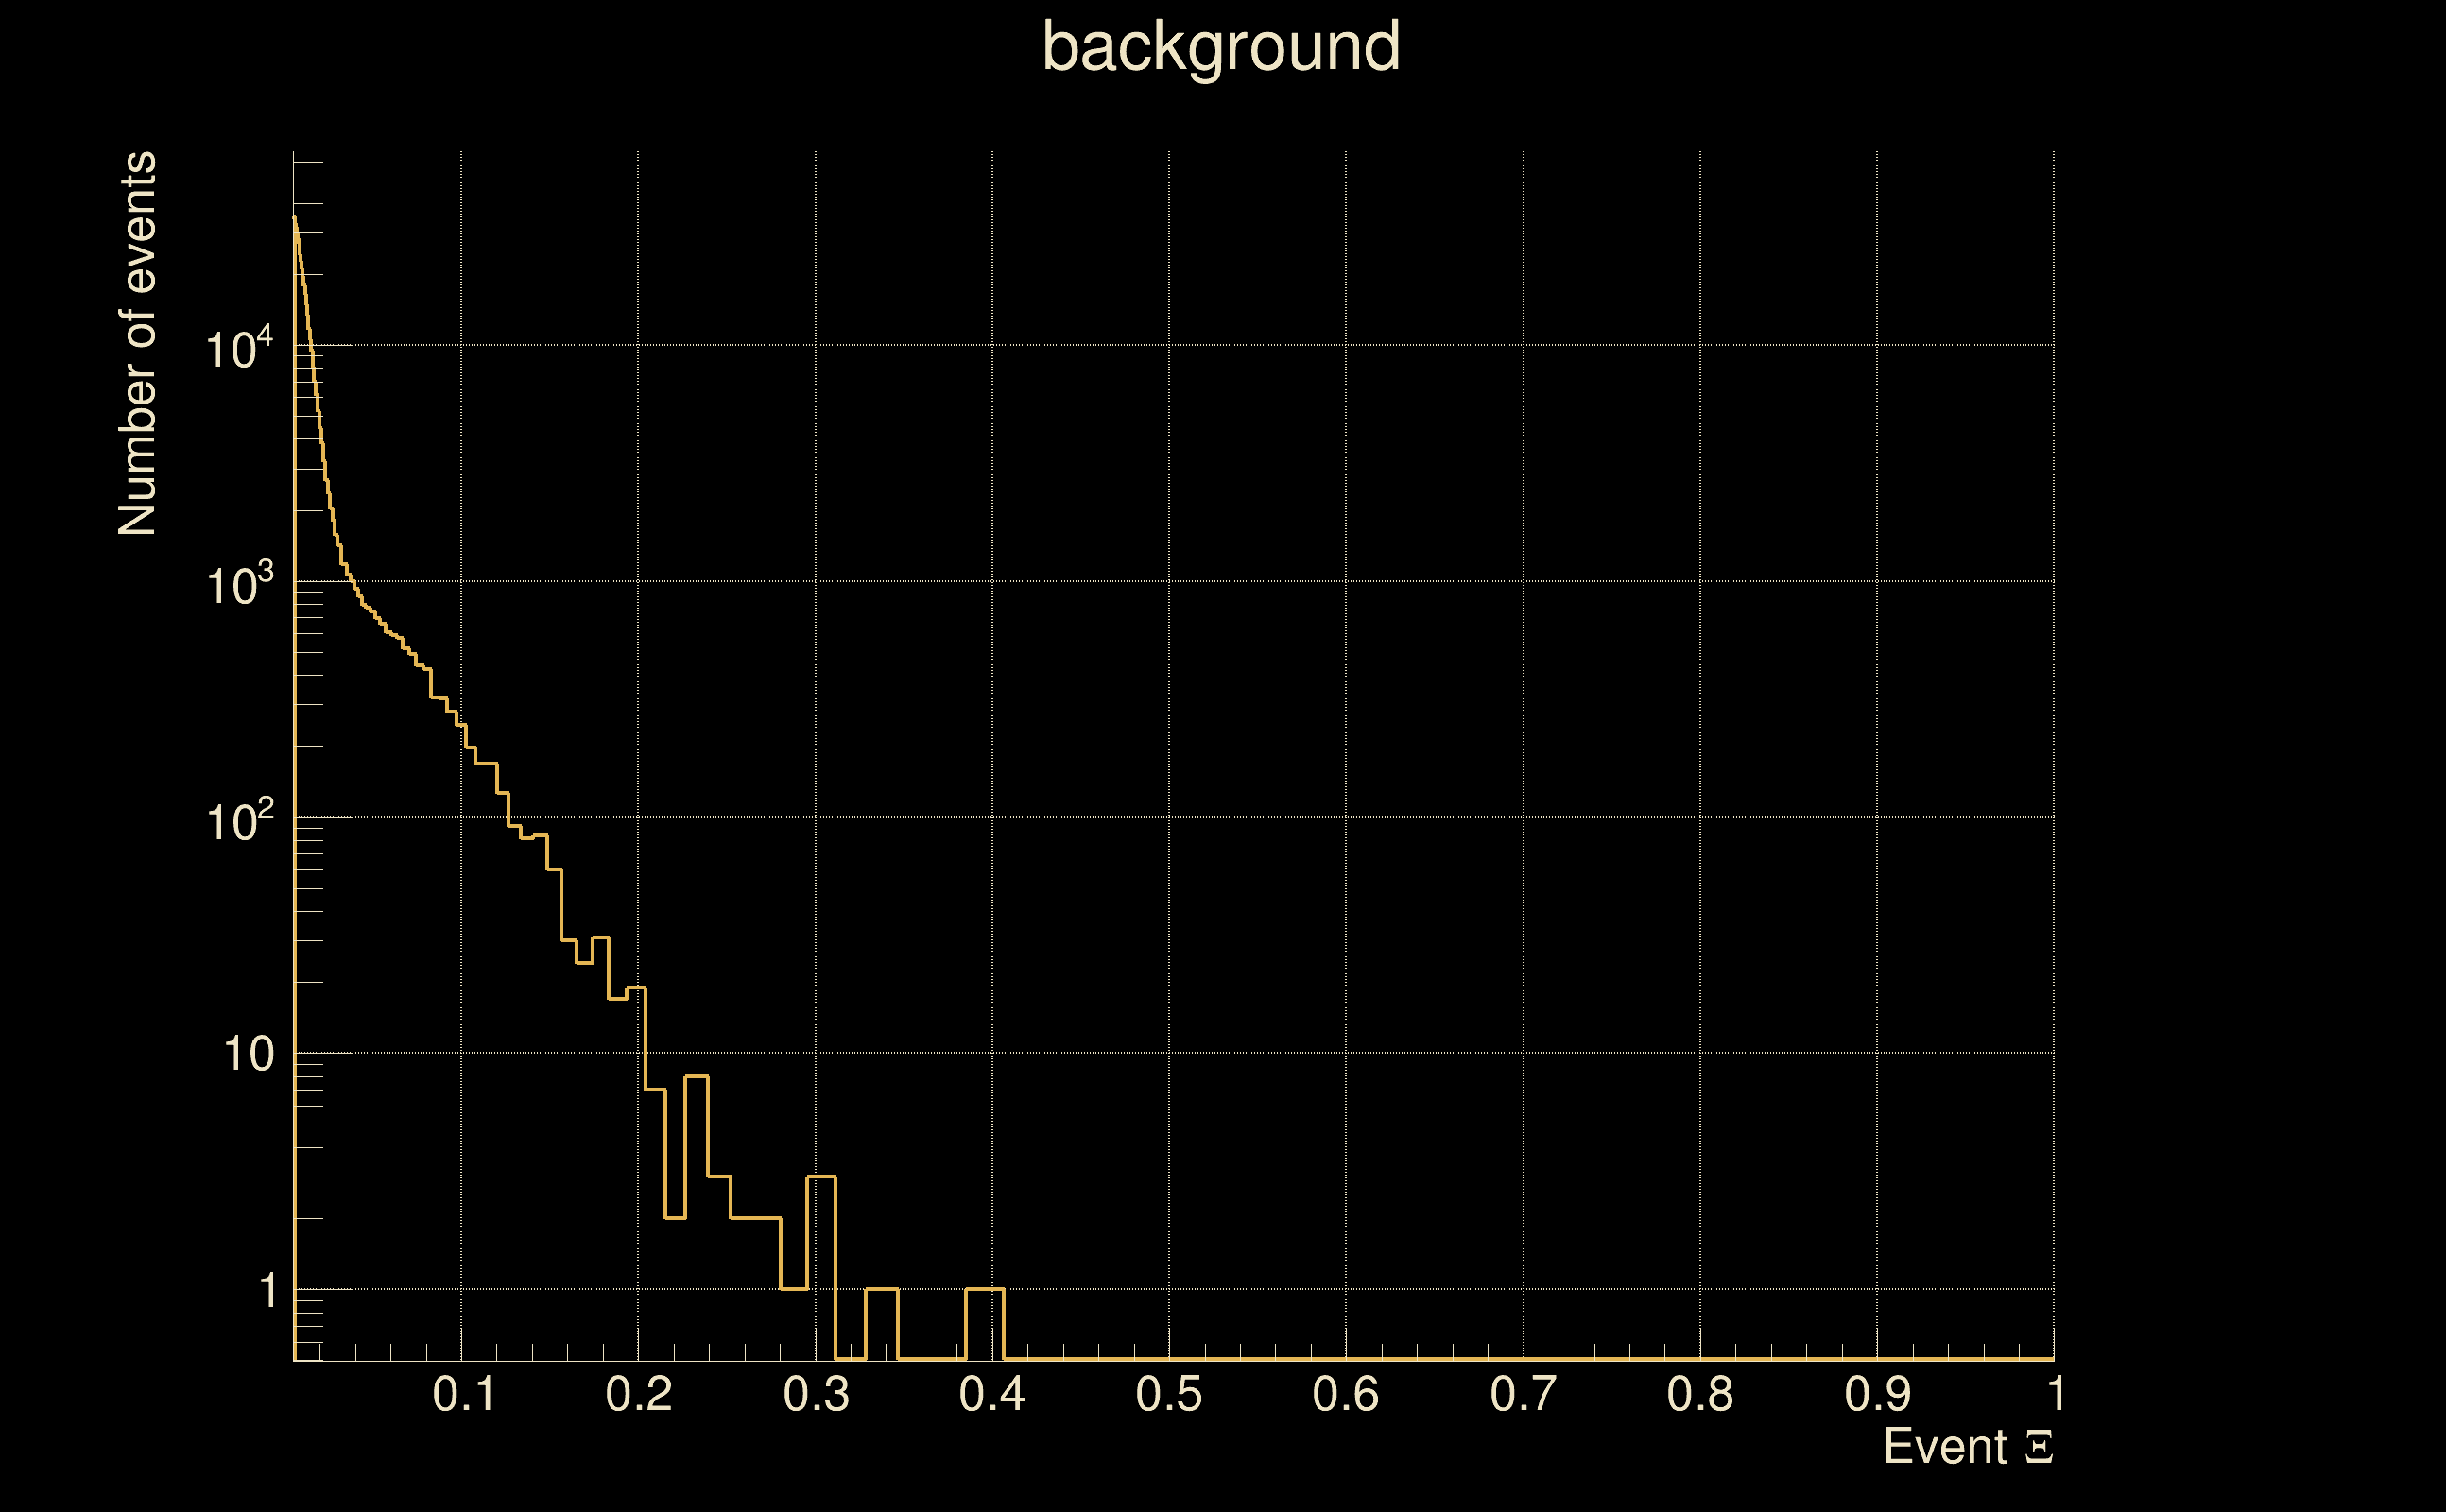
| Number of processed ox events | 12111 | 12111 | 2603865 | |
| Start Date (detector 0) | Mon May 15 14:13:25 2023 UTC | Mon May 15 14:13:25 2023 UTC | Mon May 15 14:13:25 2023 UTC | |
| End Date (detector 0) | Thu May 18 15:54:40 2023 UTC | Thu May 18 15:54:40 2023 UTC | Thu May 18 15:54:40 2023 UTC | |
| Start GPS (detector 0) | 1368195223 | 1368195223 | 1368195223 | |
| End GPS (detector 0) | 1368460498 | 1368460498 | 1368460498 | |
| Used livetime (detector 0) | 60875 s | 60875 s | 60875 s | |
| Start Date (detector 1) | Mon May 15 14:13:25 2023 UTC | Mon May 15 14:13:25 2023 UTC | Mon May 15 14:13:25 2023 UTC | |
| End Date (detector 1) | Thu May 18 15:54:40 2023 UTC | Thu May 18 15:54:40 2023 UTC | Thu May 18 15:54:40 2023 UTC | |
| Start GPS (detector 1) | 1368195223 | 1368195223 | 1368195223 | |
| End GPS (detector 1) | 1368460498 | 1368460498 | 1368460498 | |
| Used livetime (detector 1) | 60875 s | 60875 s | 60875 s | |
| Cumulative livetime | 121110 s | 121110 s | 26038650 s | |
| 0 years, 1 days, 9 hours, 38 min, 30 s | 0 years, 1 days, 9 hours, 38 min, 30 s | 0 years, 301 days, 8 hours, 57 min, 30 s |
|
|
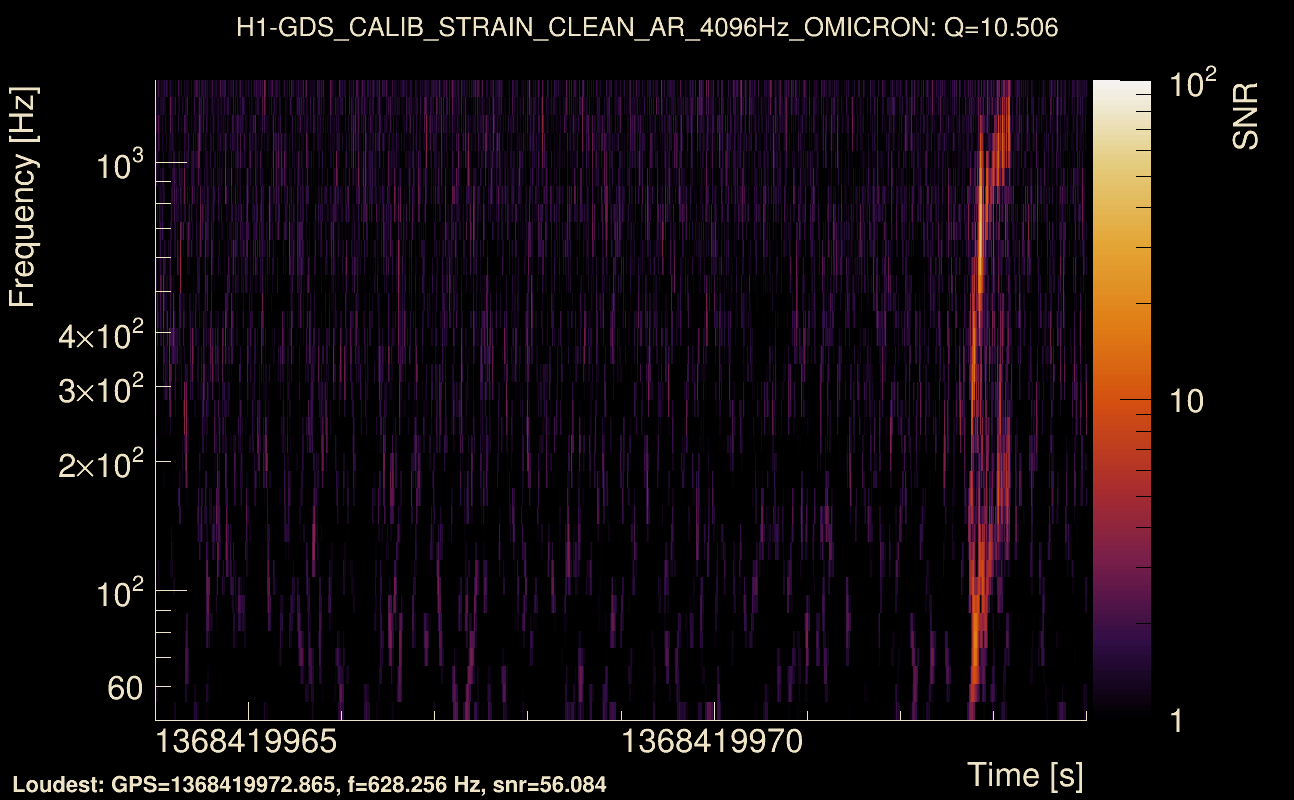
| Event time t(H1): | GPS = 1368419969 (Thu May 18 04:39:11 2023 ) → GPS = 1368419979 (Thu May 18 04:39:21 2023 ) |
| Event time t(L1): | GPS = 1368419969 (Thu May 18 04:39:21 2023 ) → GPS = 1368419979 (Thu May 18 04:39:21 2023 ) |
| Omicron analysis time window (H1): | GPS = 1368419966 → GPS = 1368419982 |
| Omicron analysis time window (L1): | GPS = 1368419966 → GPS = 1368419982 |
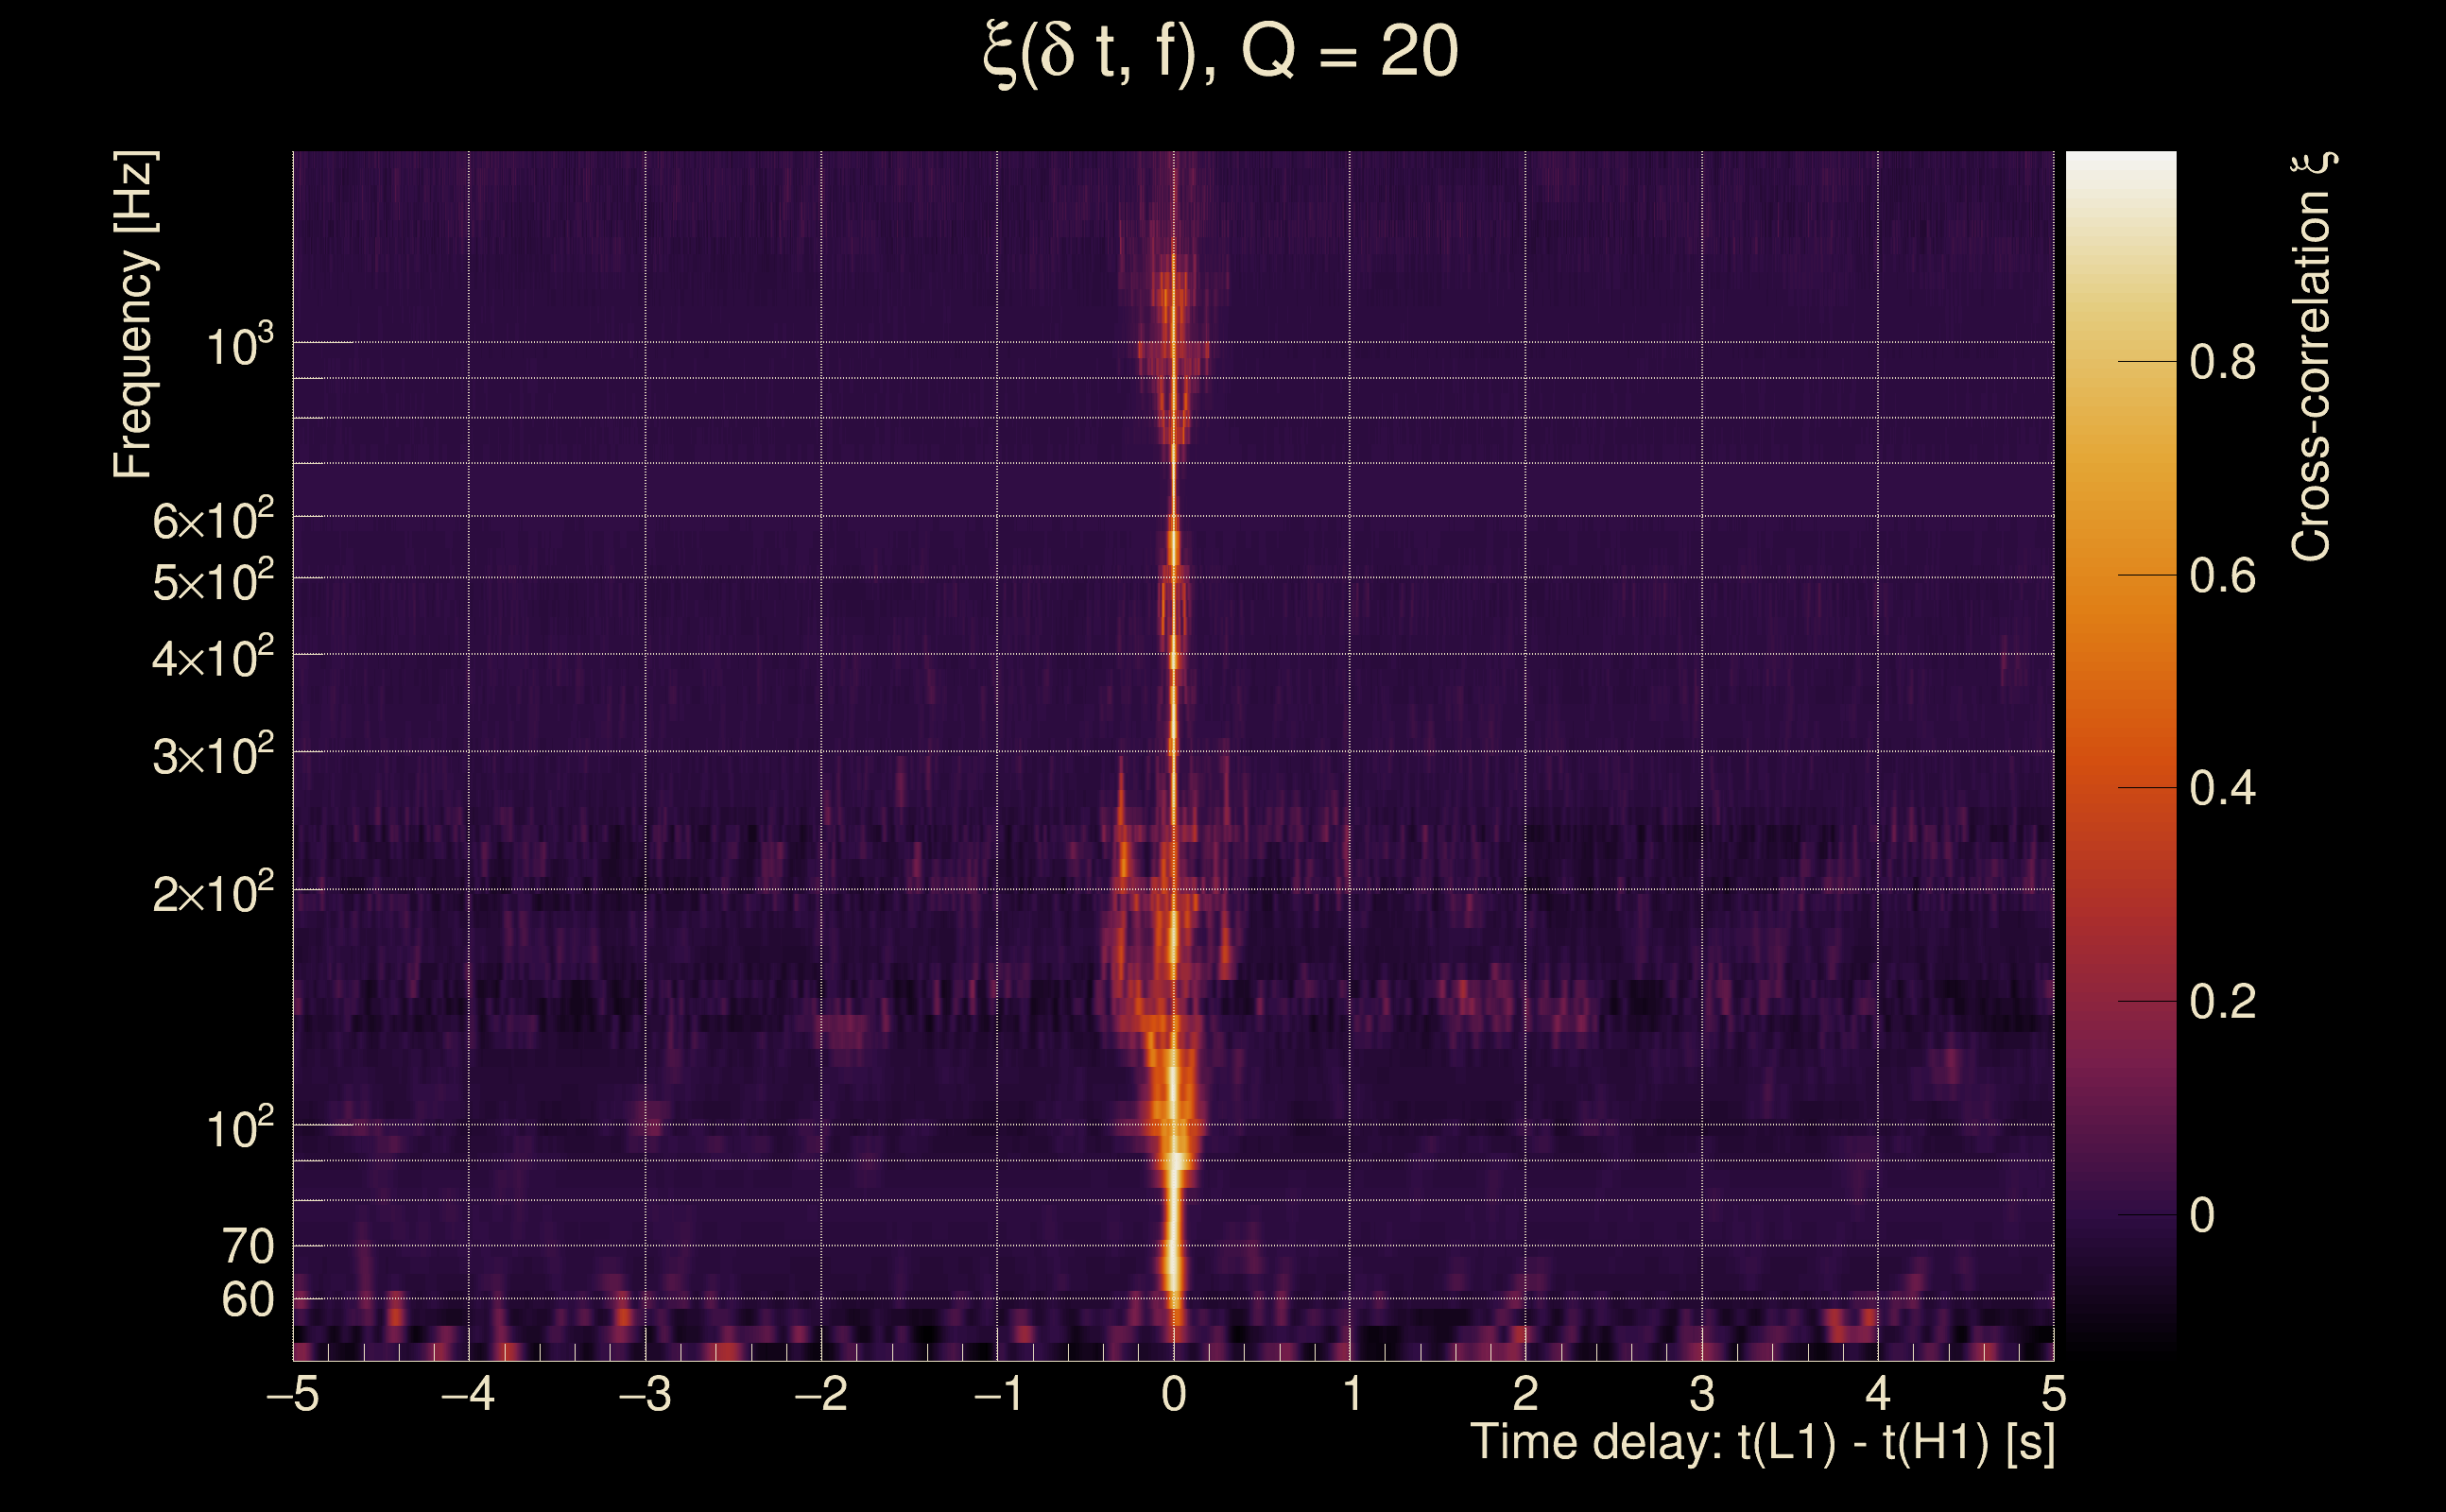
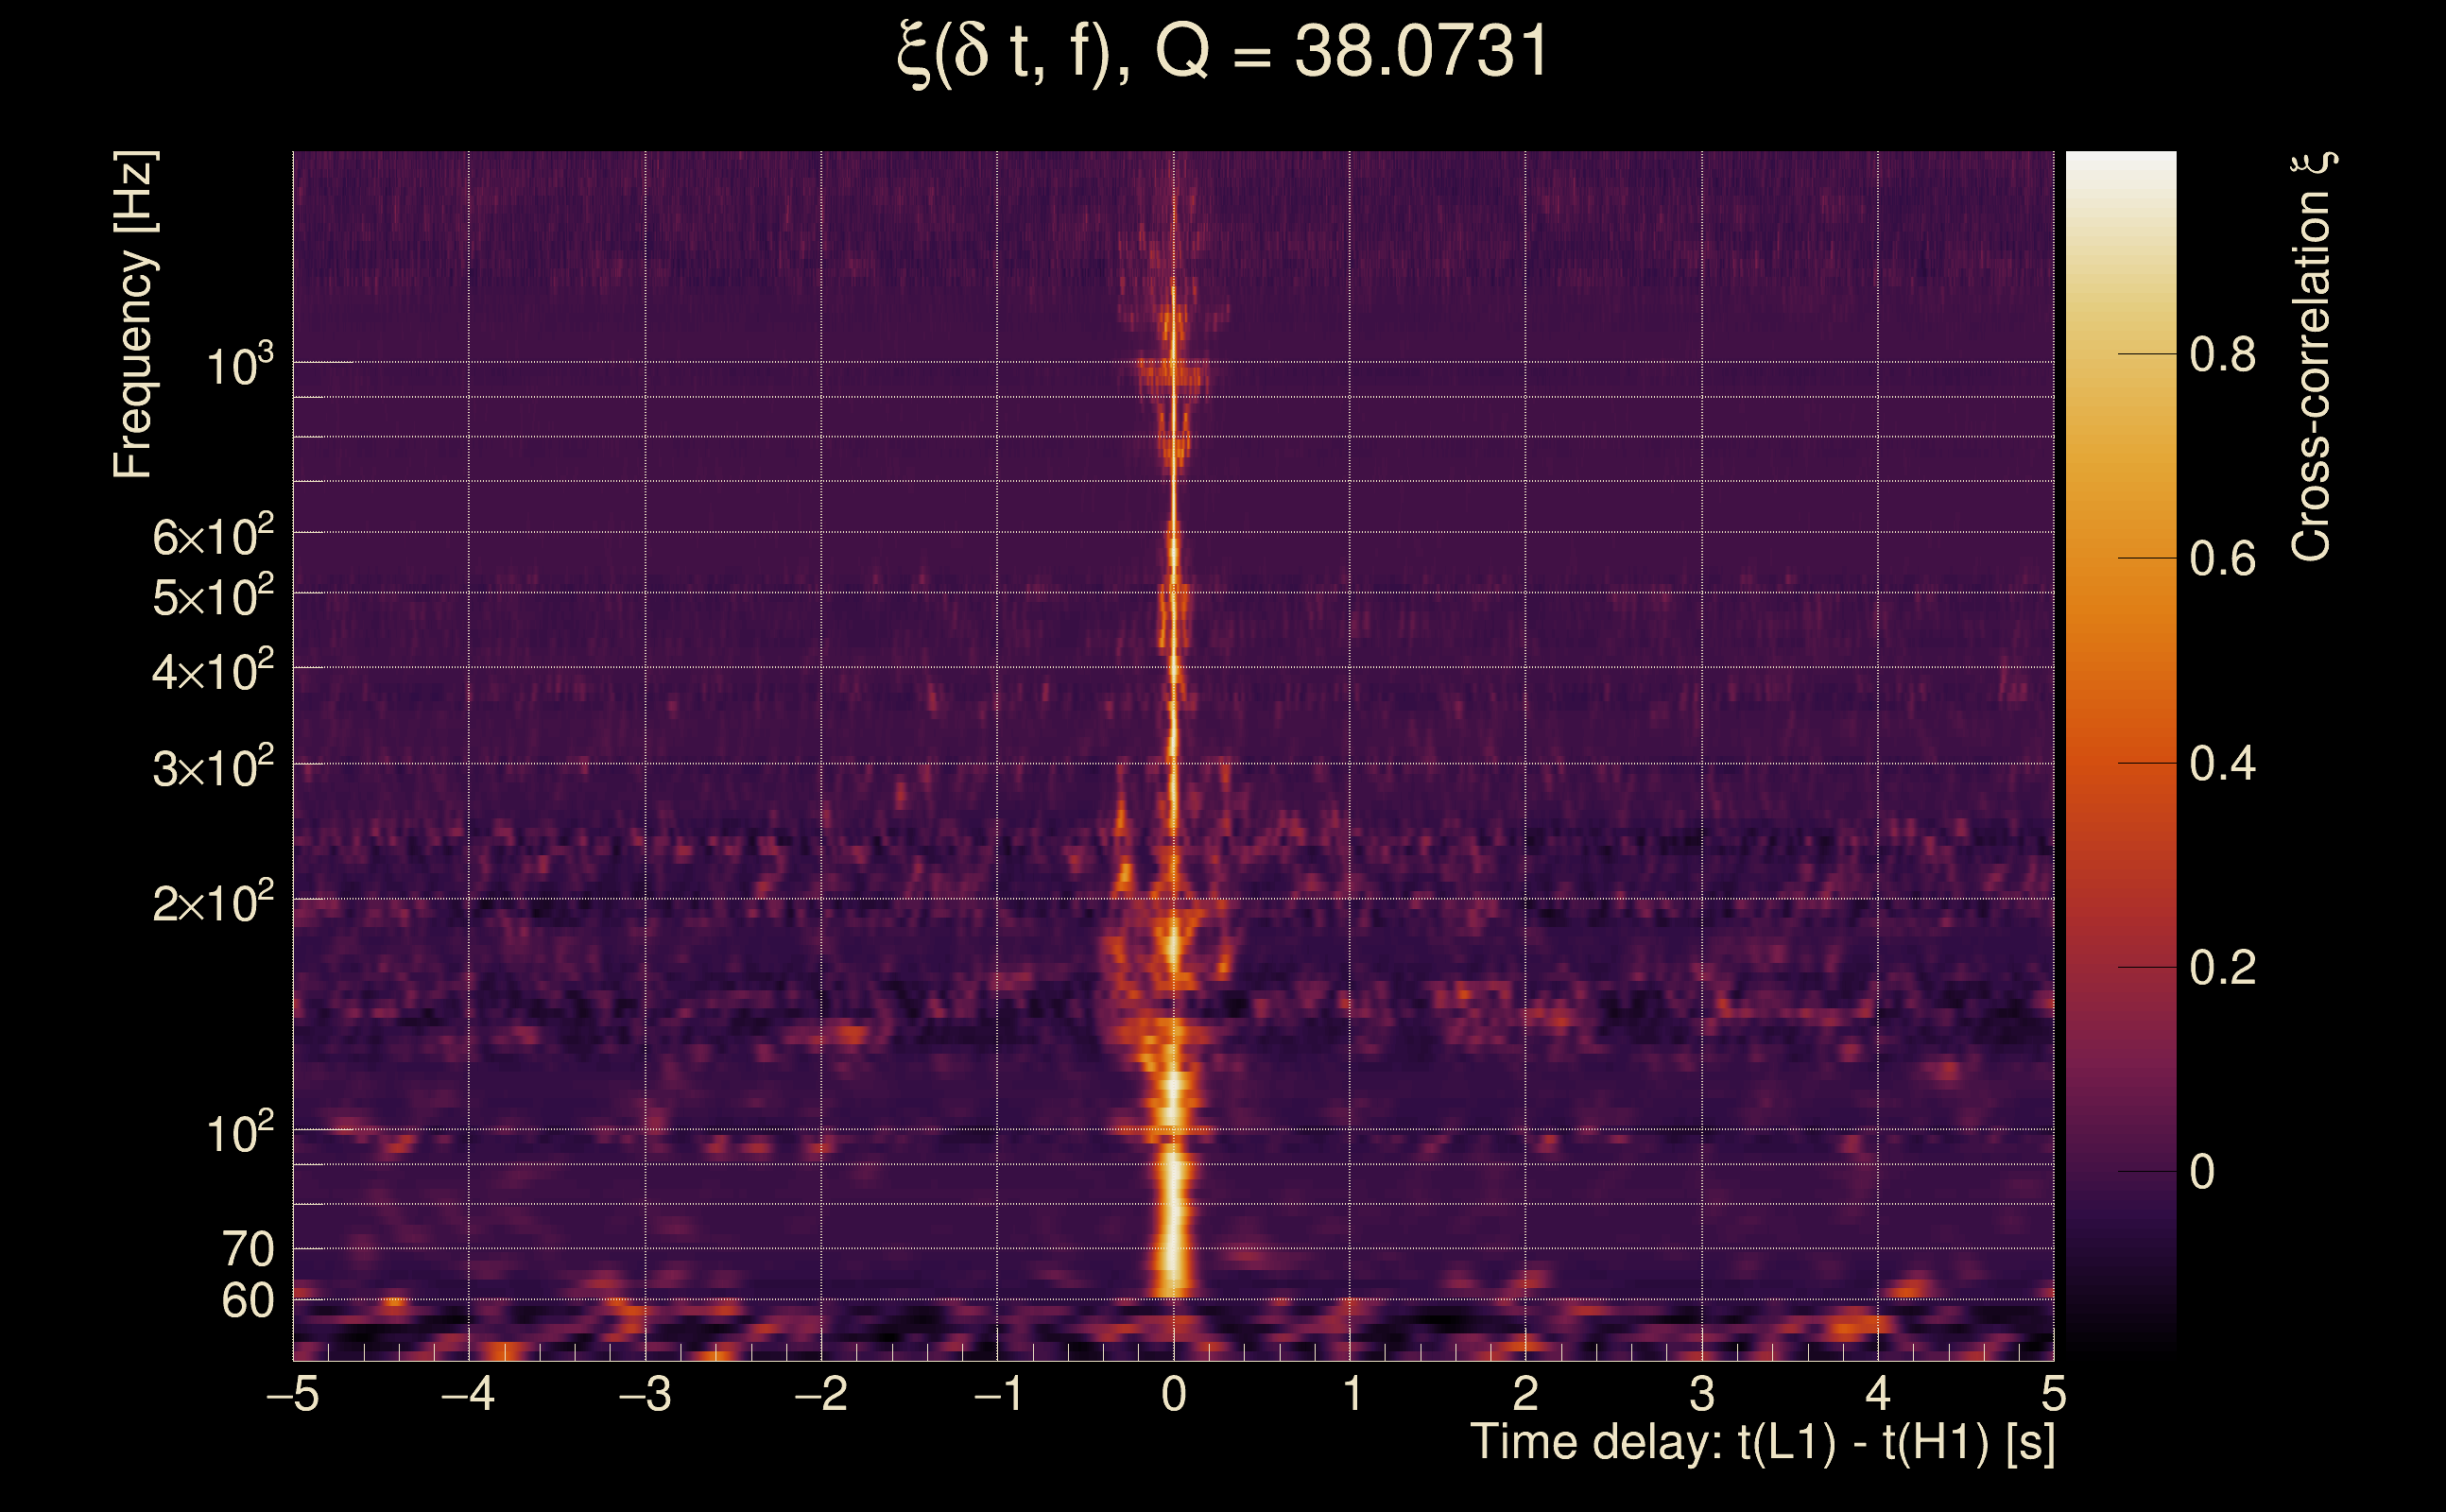
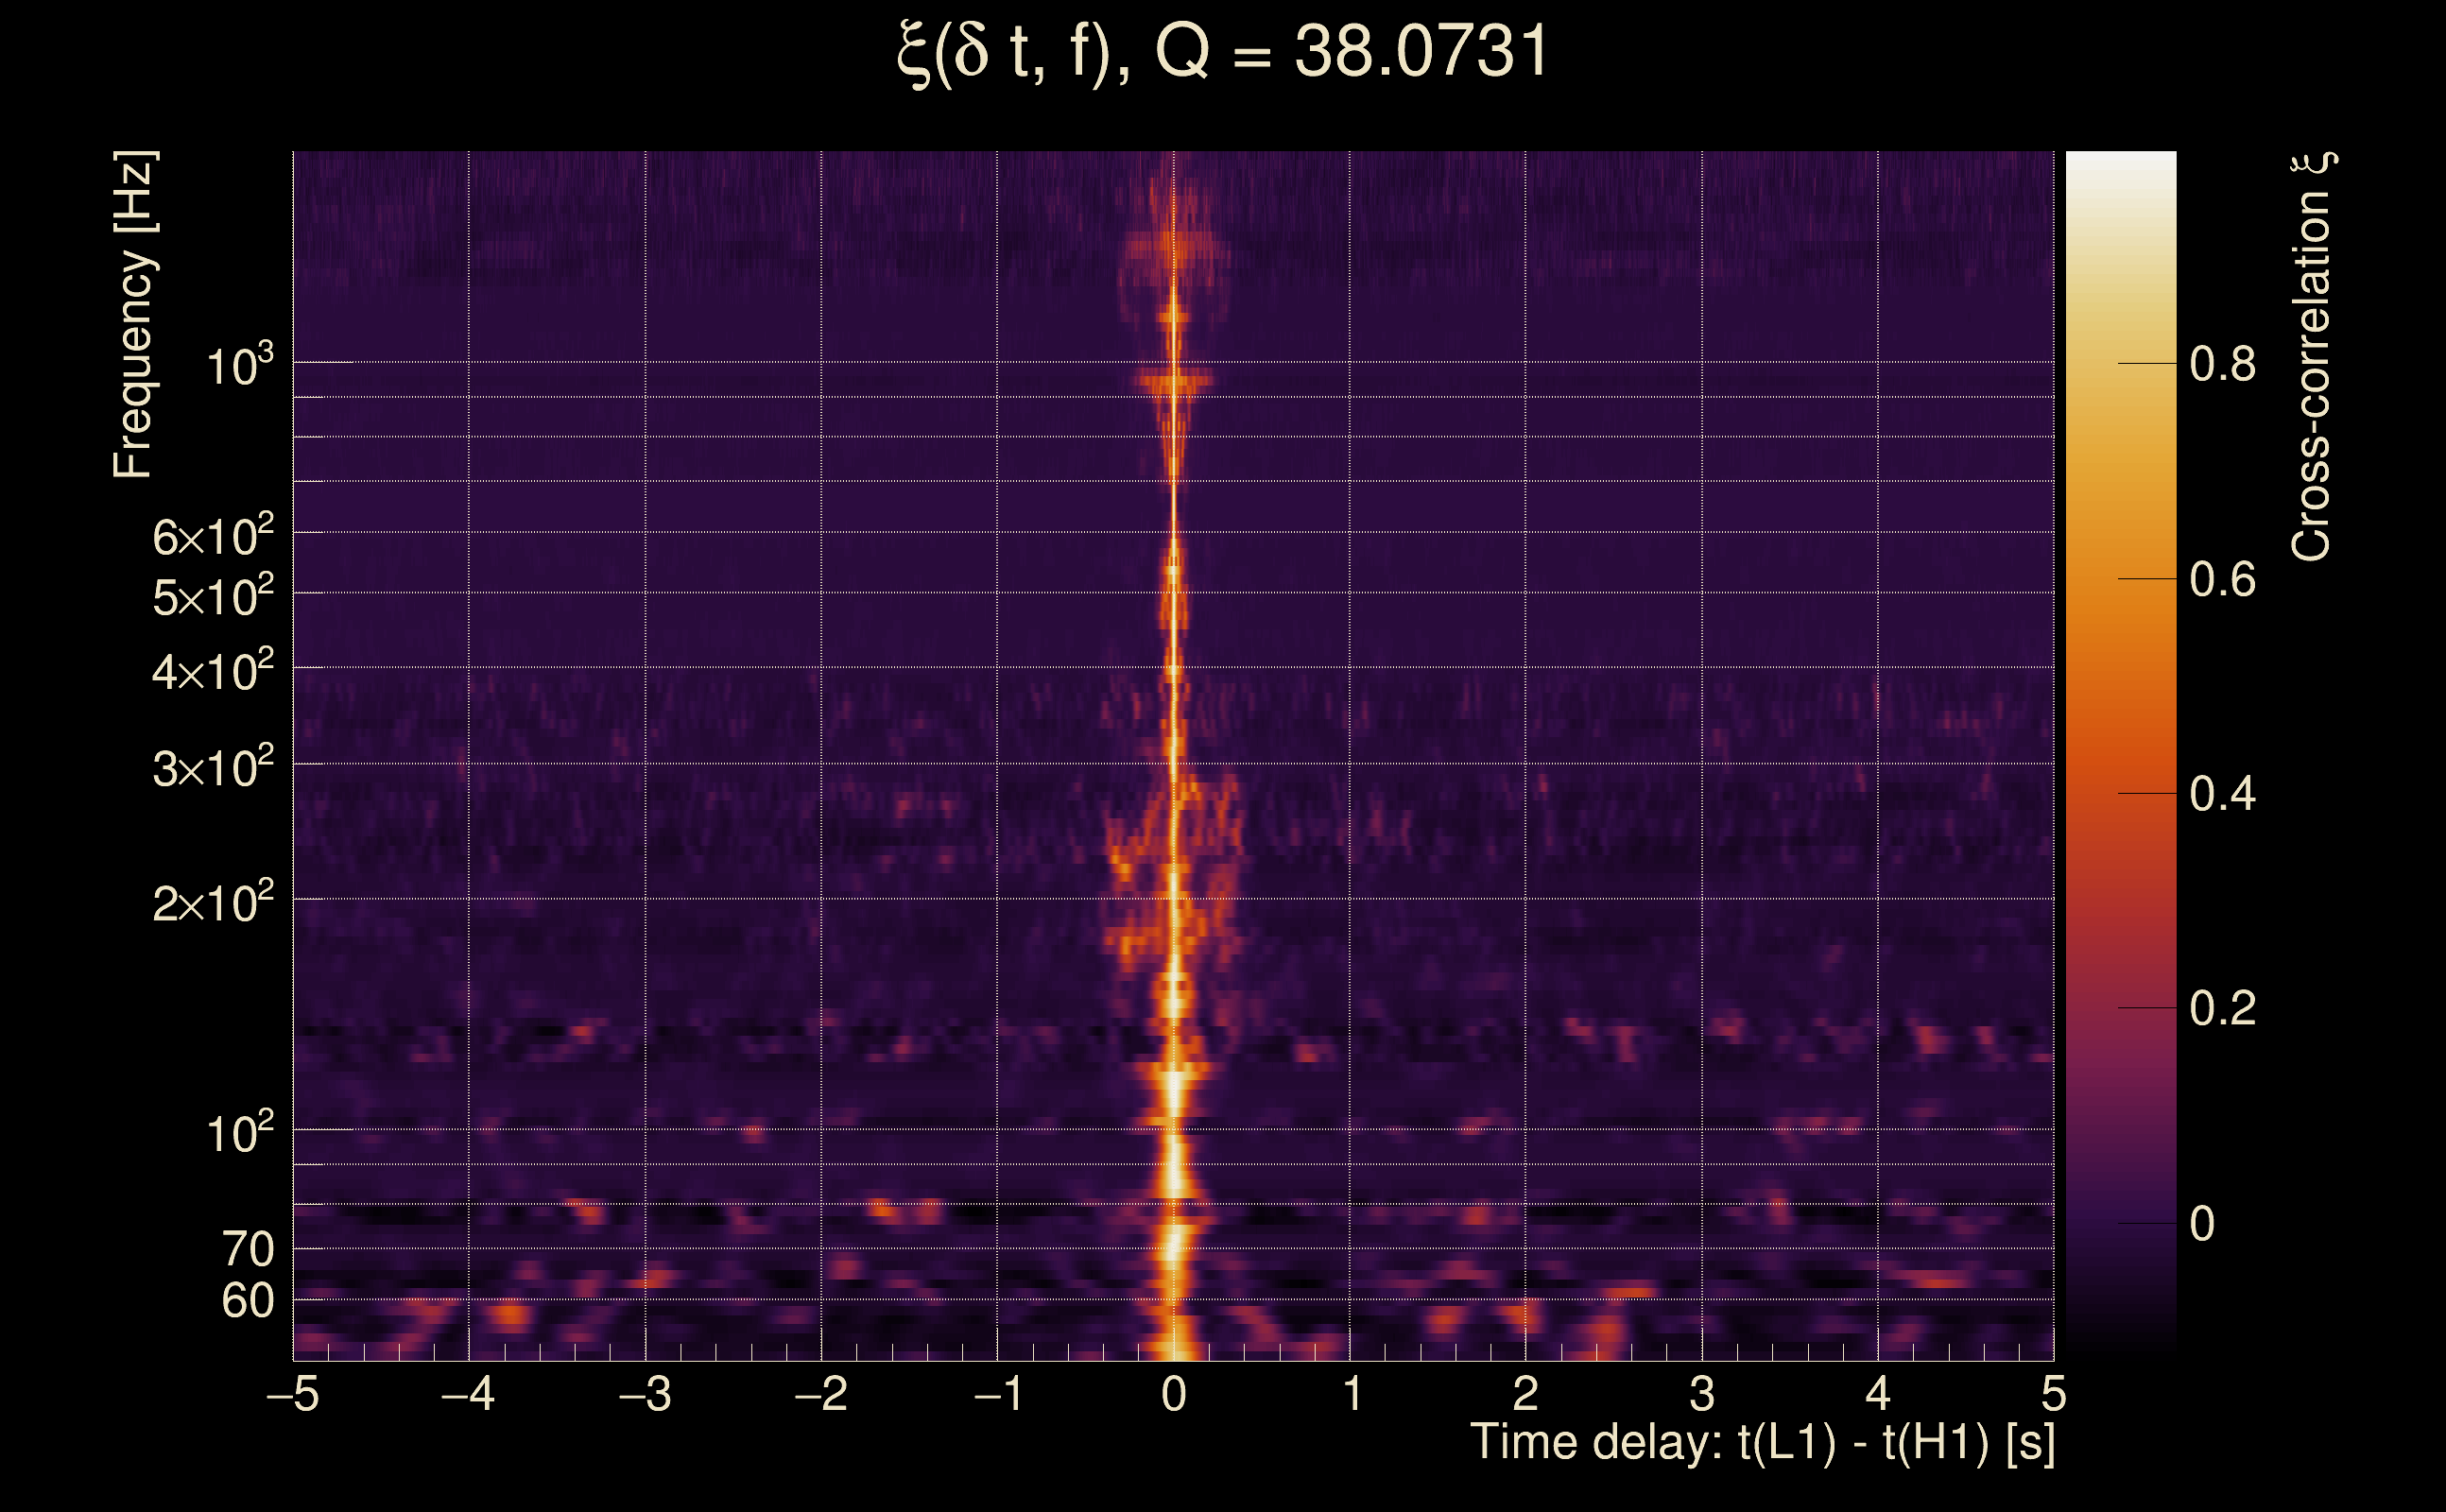
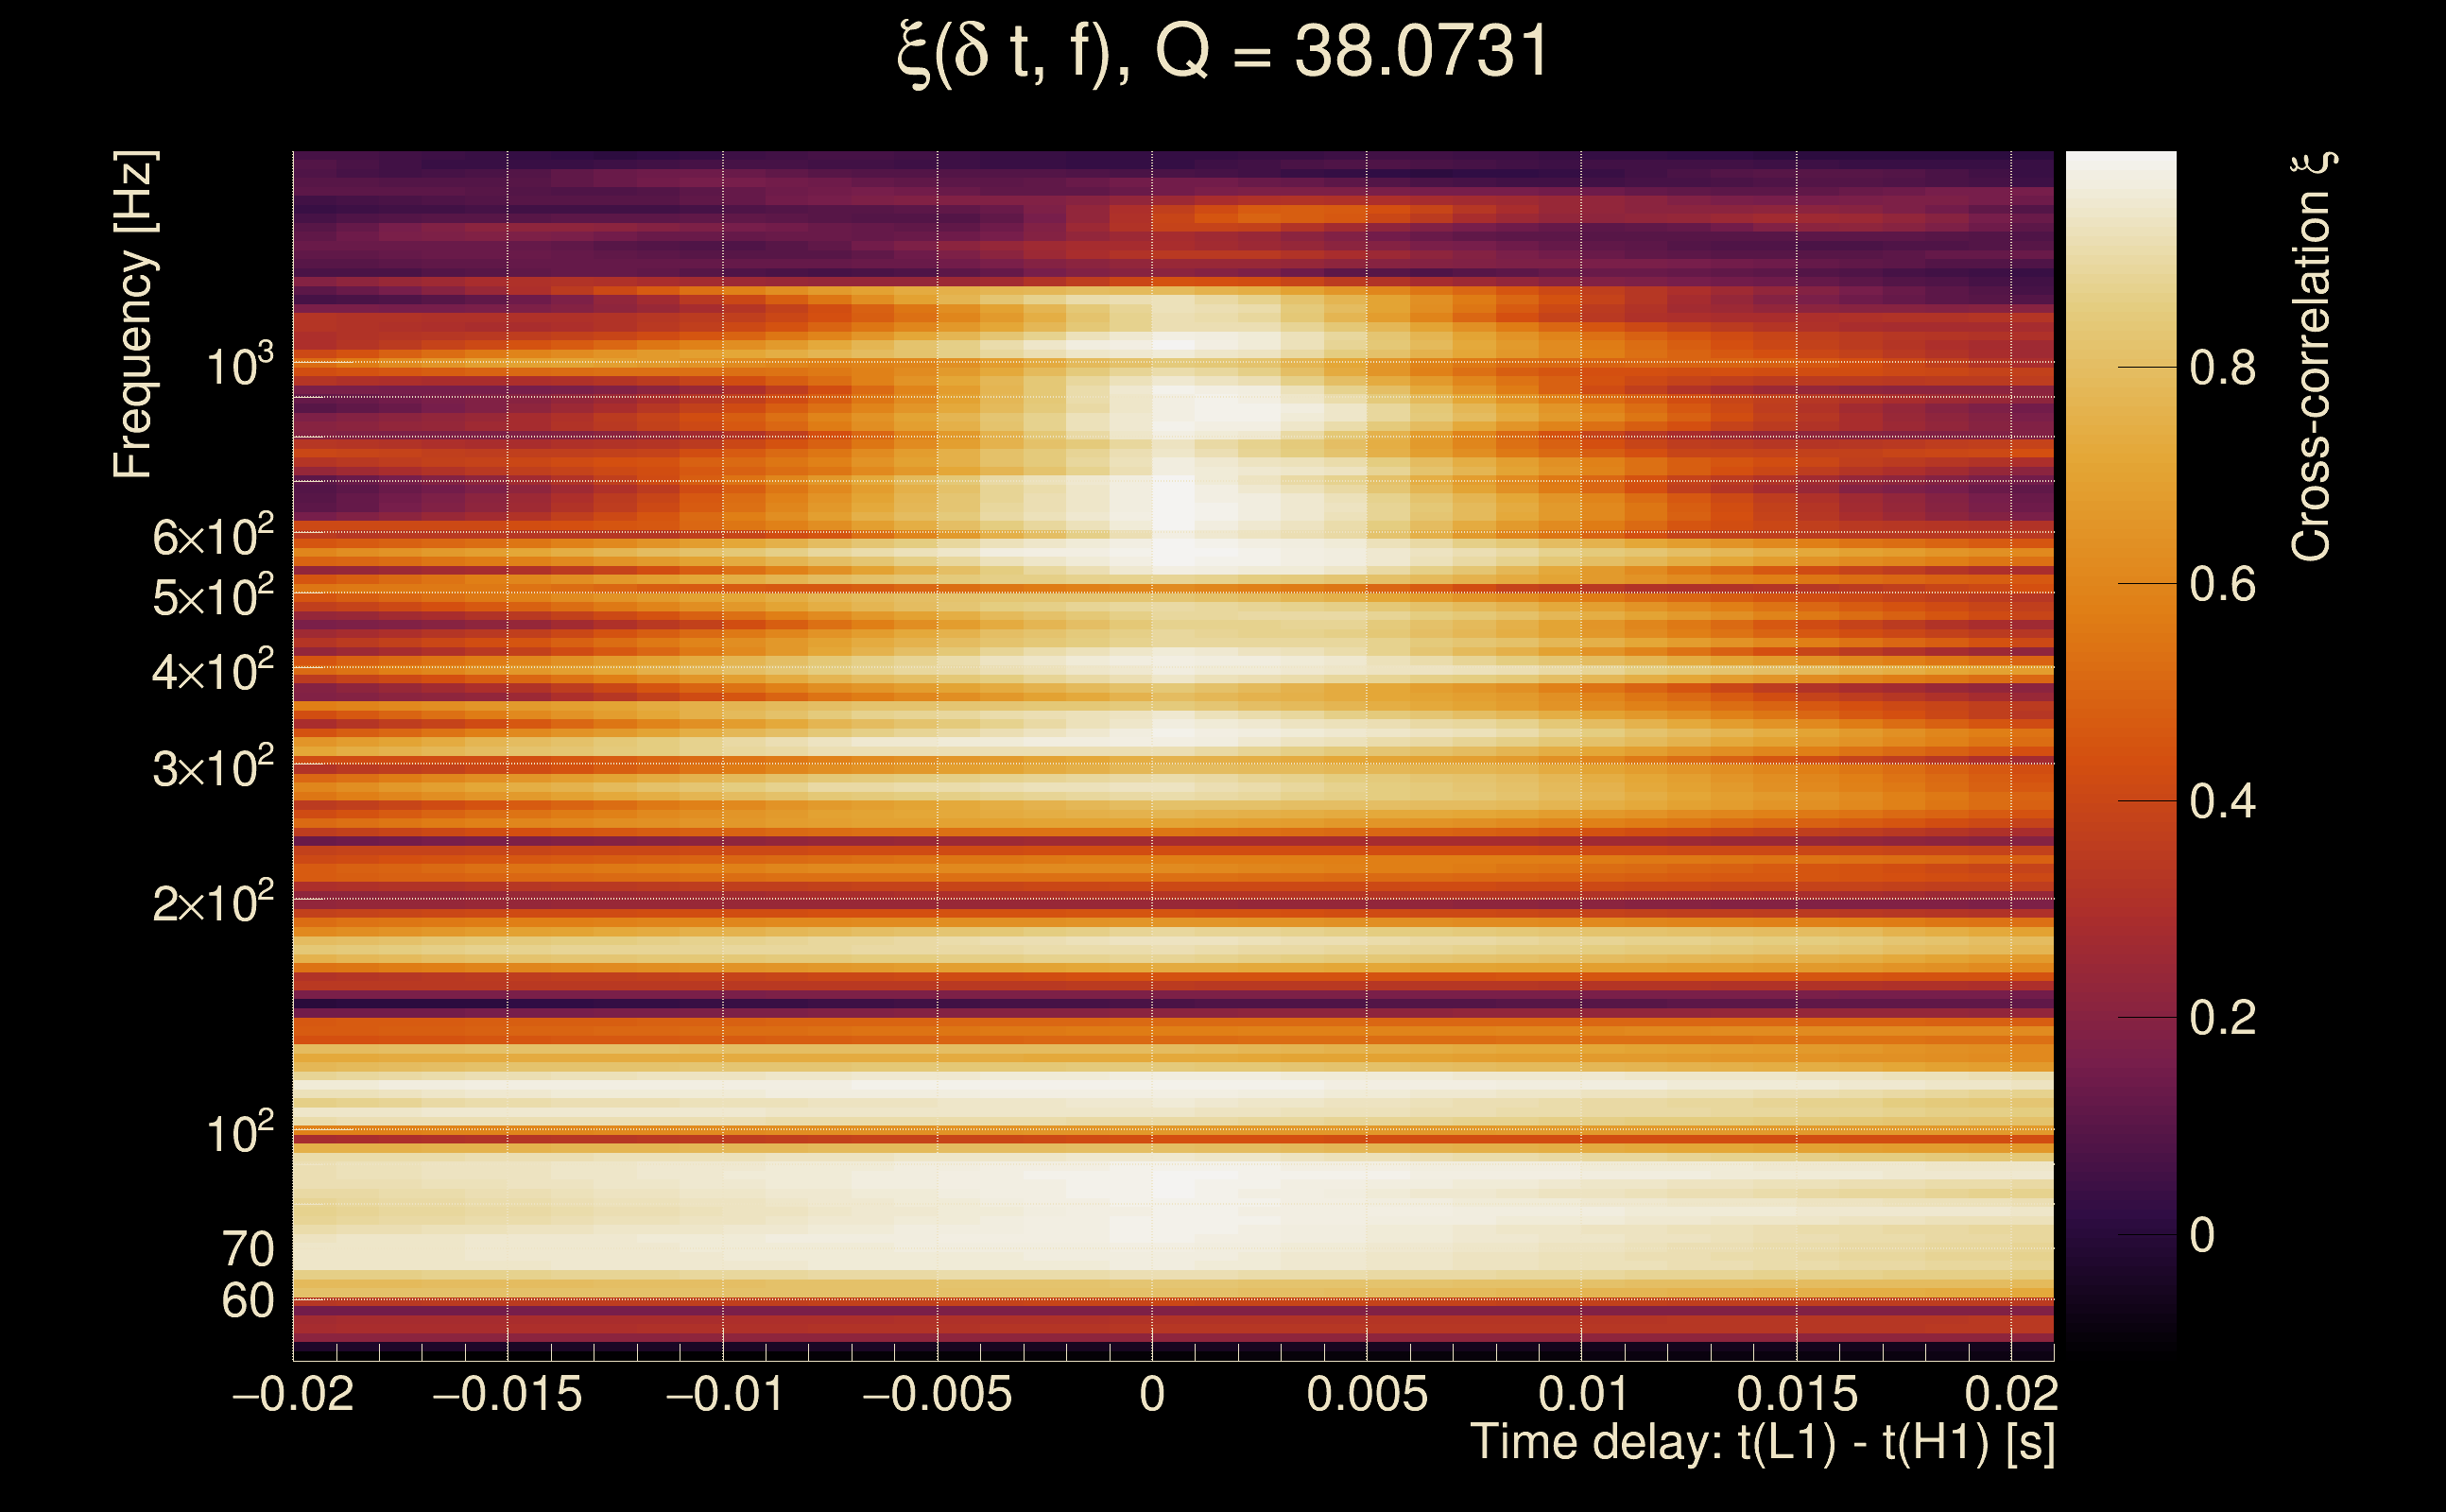
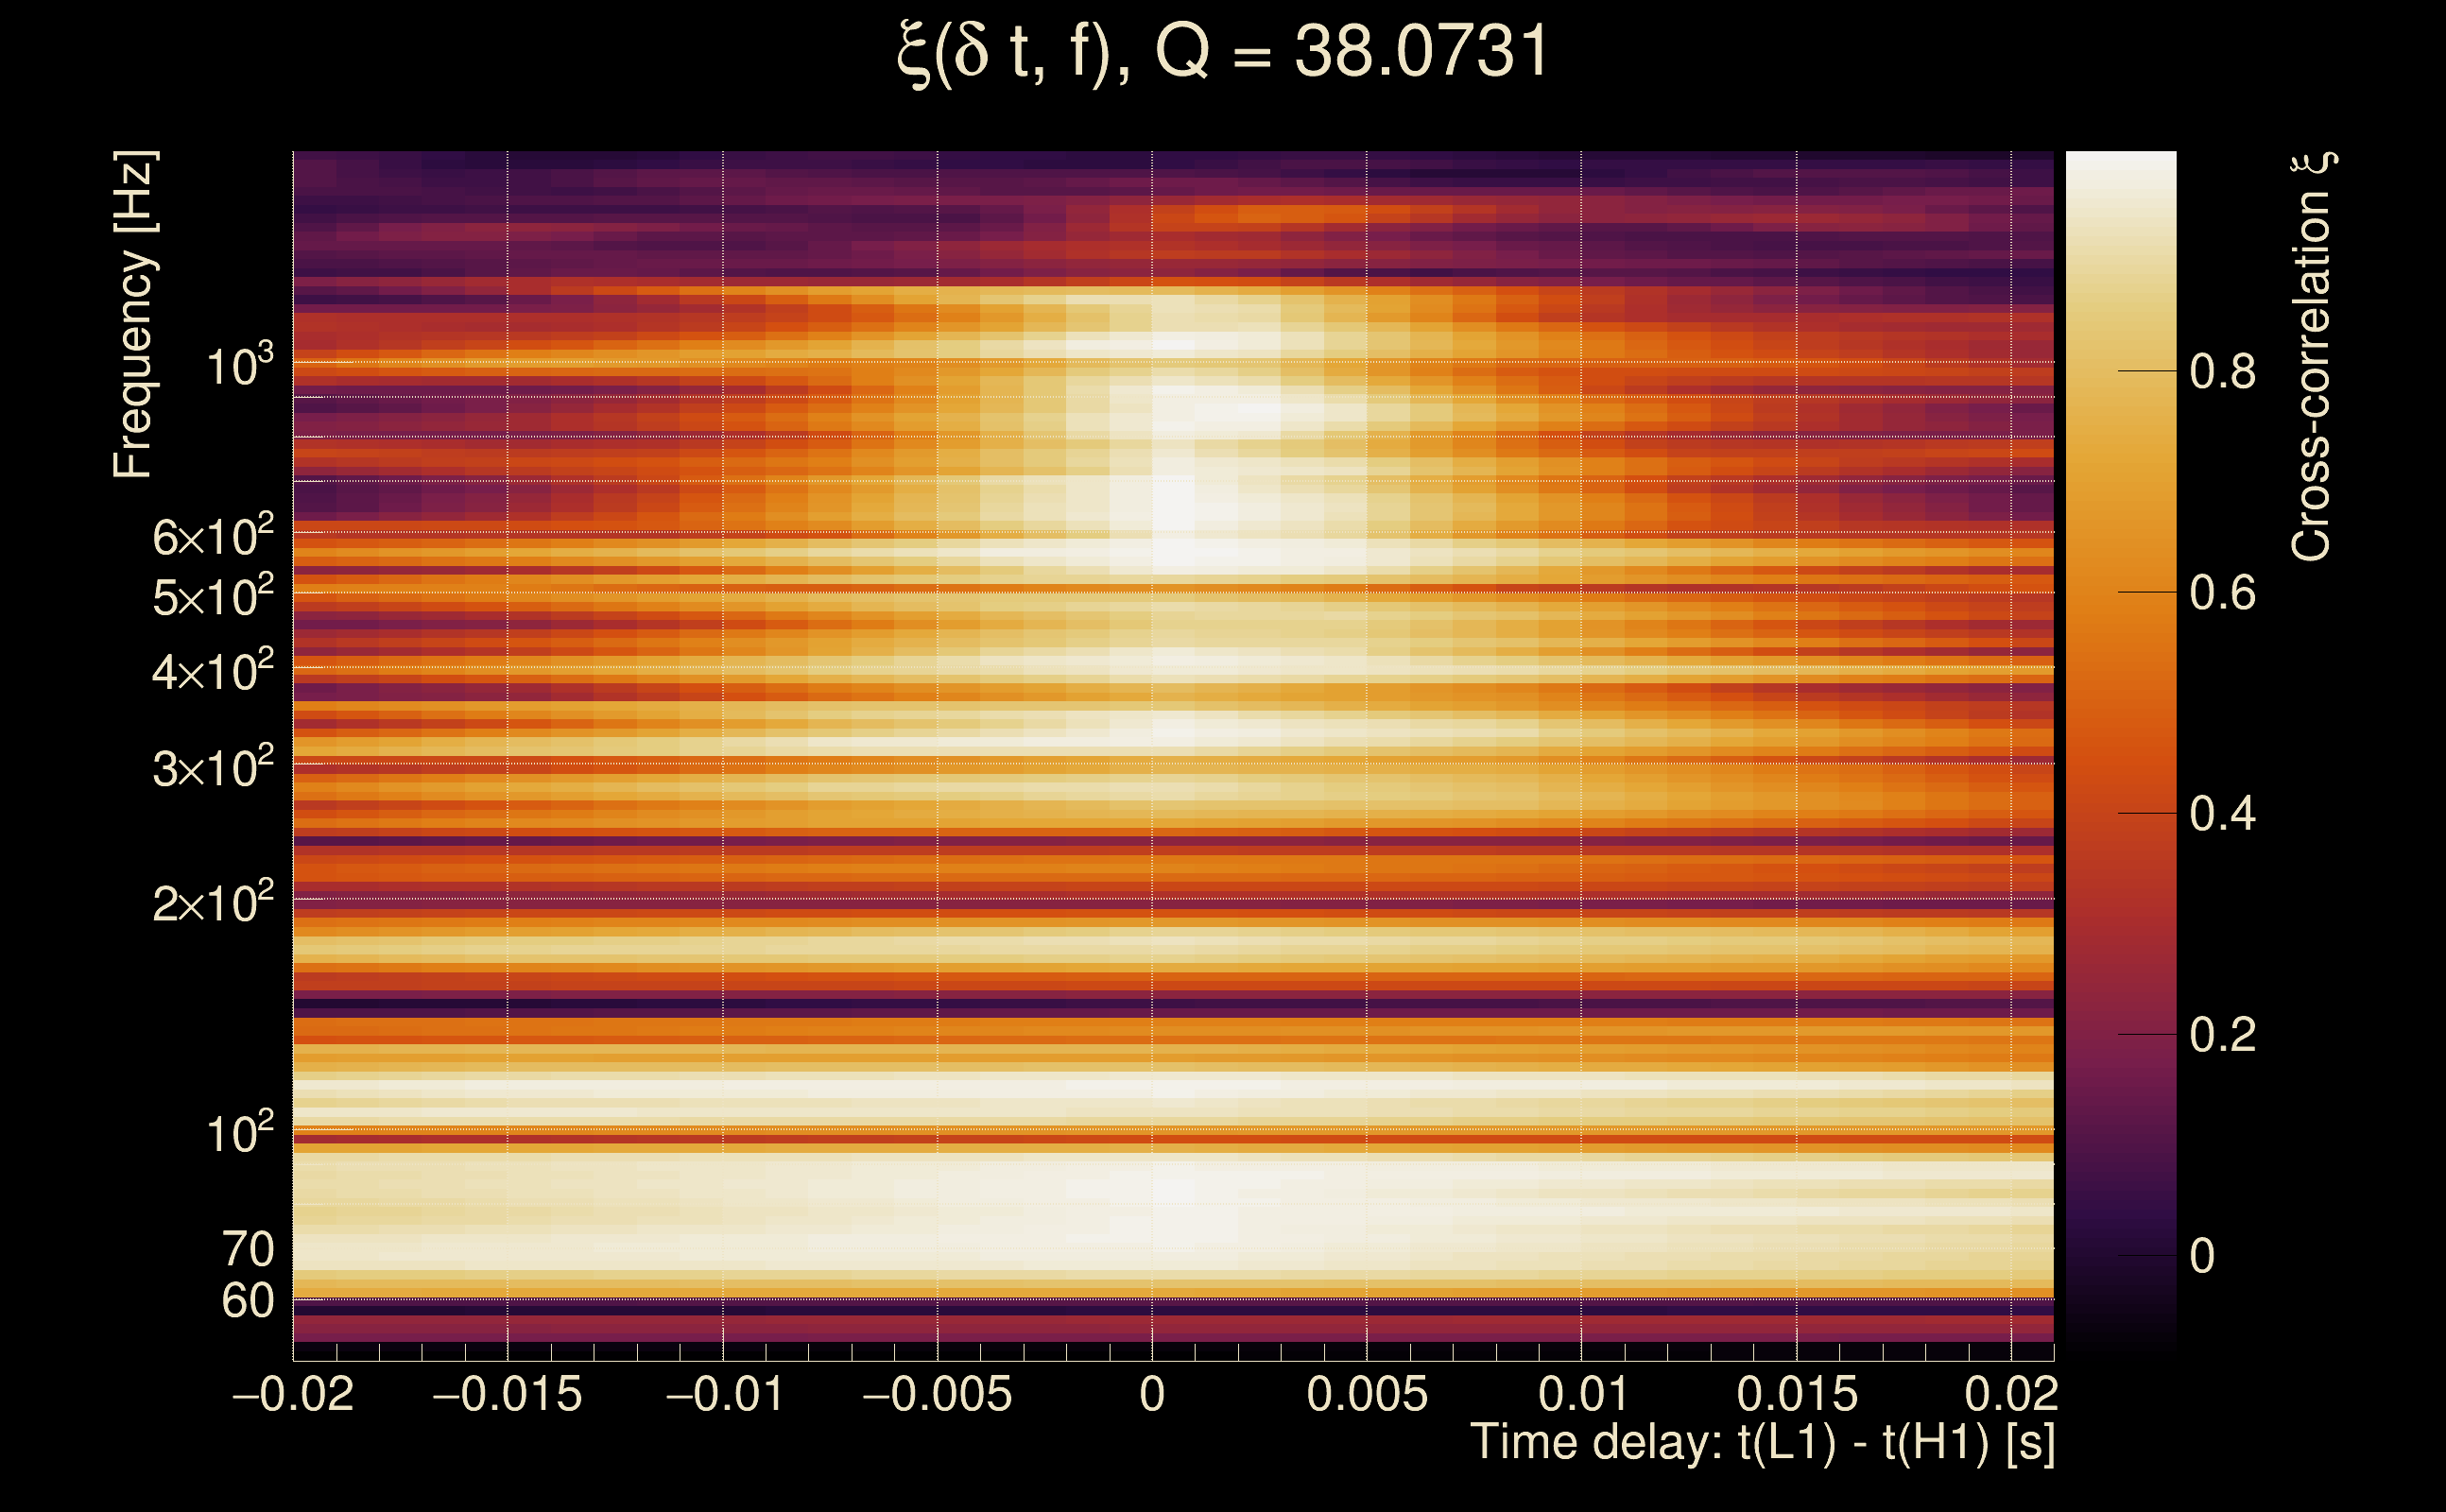
| Time delay between detectors t(L1) - t(H1): | 0.000805017 s (slice index = 108 / 217), δt_gw = 0.000805017 s |
| Time delay standard deviation: | 0.0327682 s |
| [targeted mode] Time delay probability: | 0.986977 (0.0163232 sigmas), δt_target = 1.72247e+45 s |
| Frequency: | 302.391 Hz |
| Ξ: | 0.852941 ± 0.00844796 (variance = 7.13679e-05): Q0: 0.89358, Q1: 0.885832, Q2: 0.873532, Q3: 0.870074, Q4: 0.880096 |
| Rank: | R_A = 0.775146 |
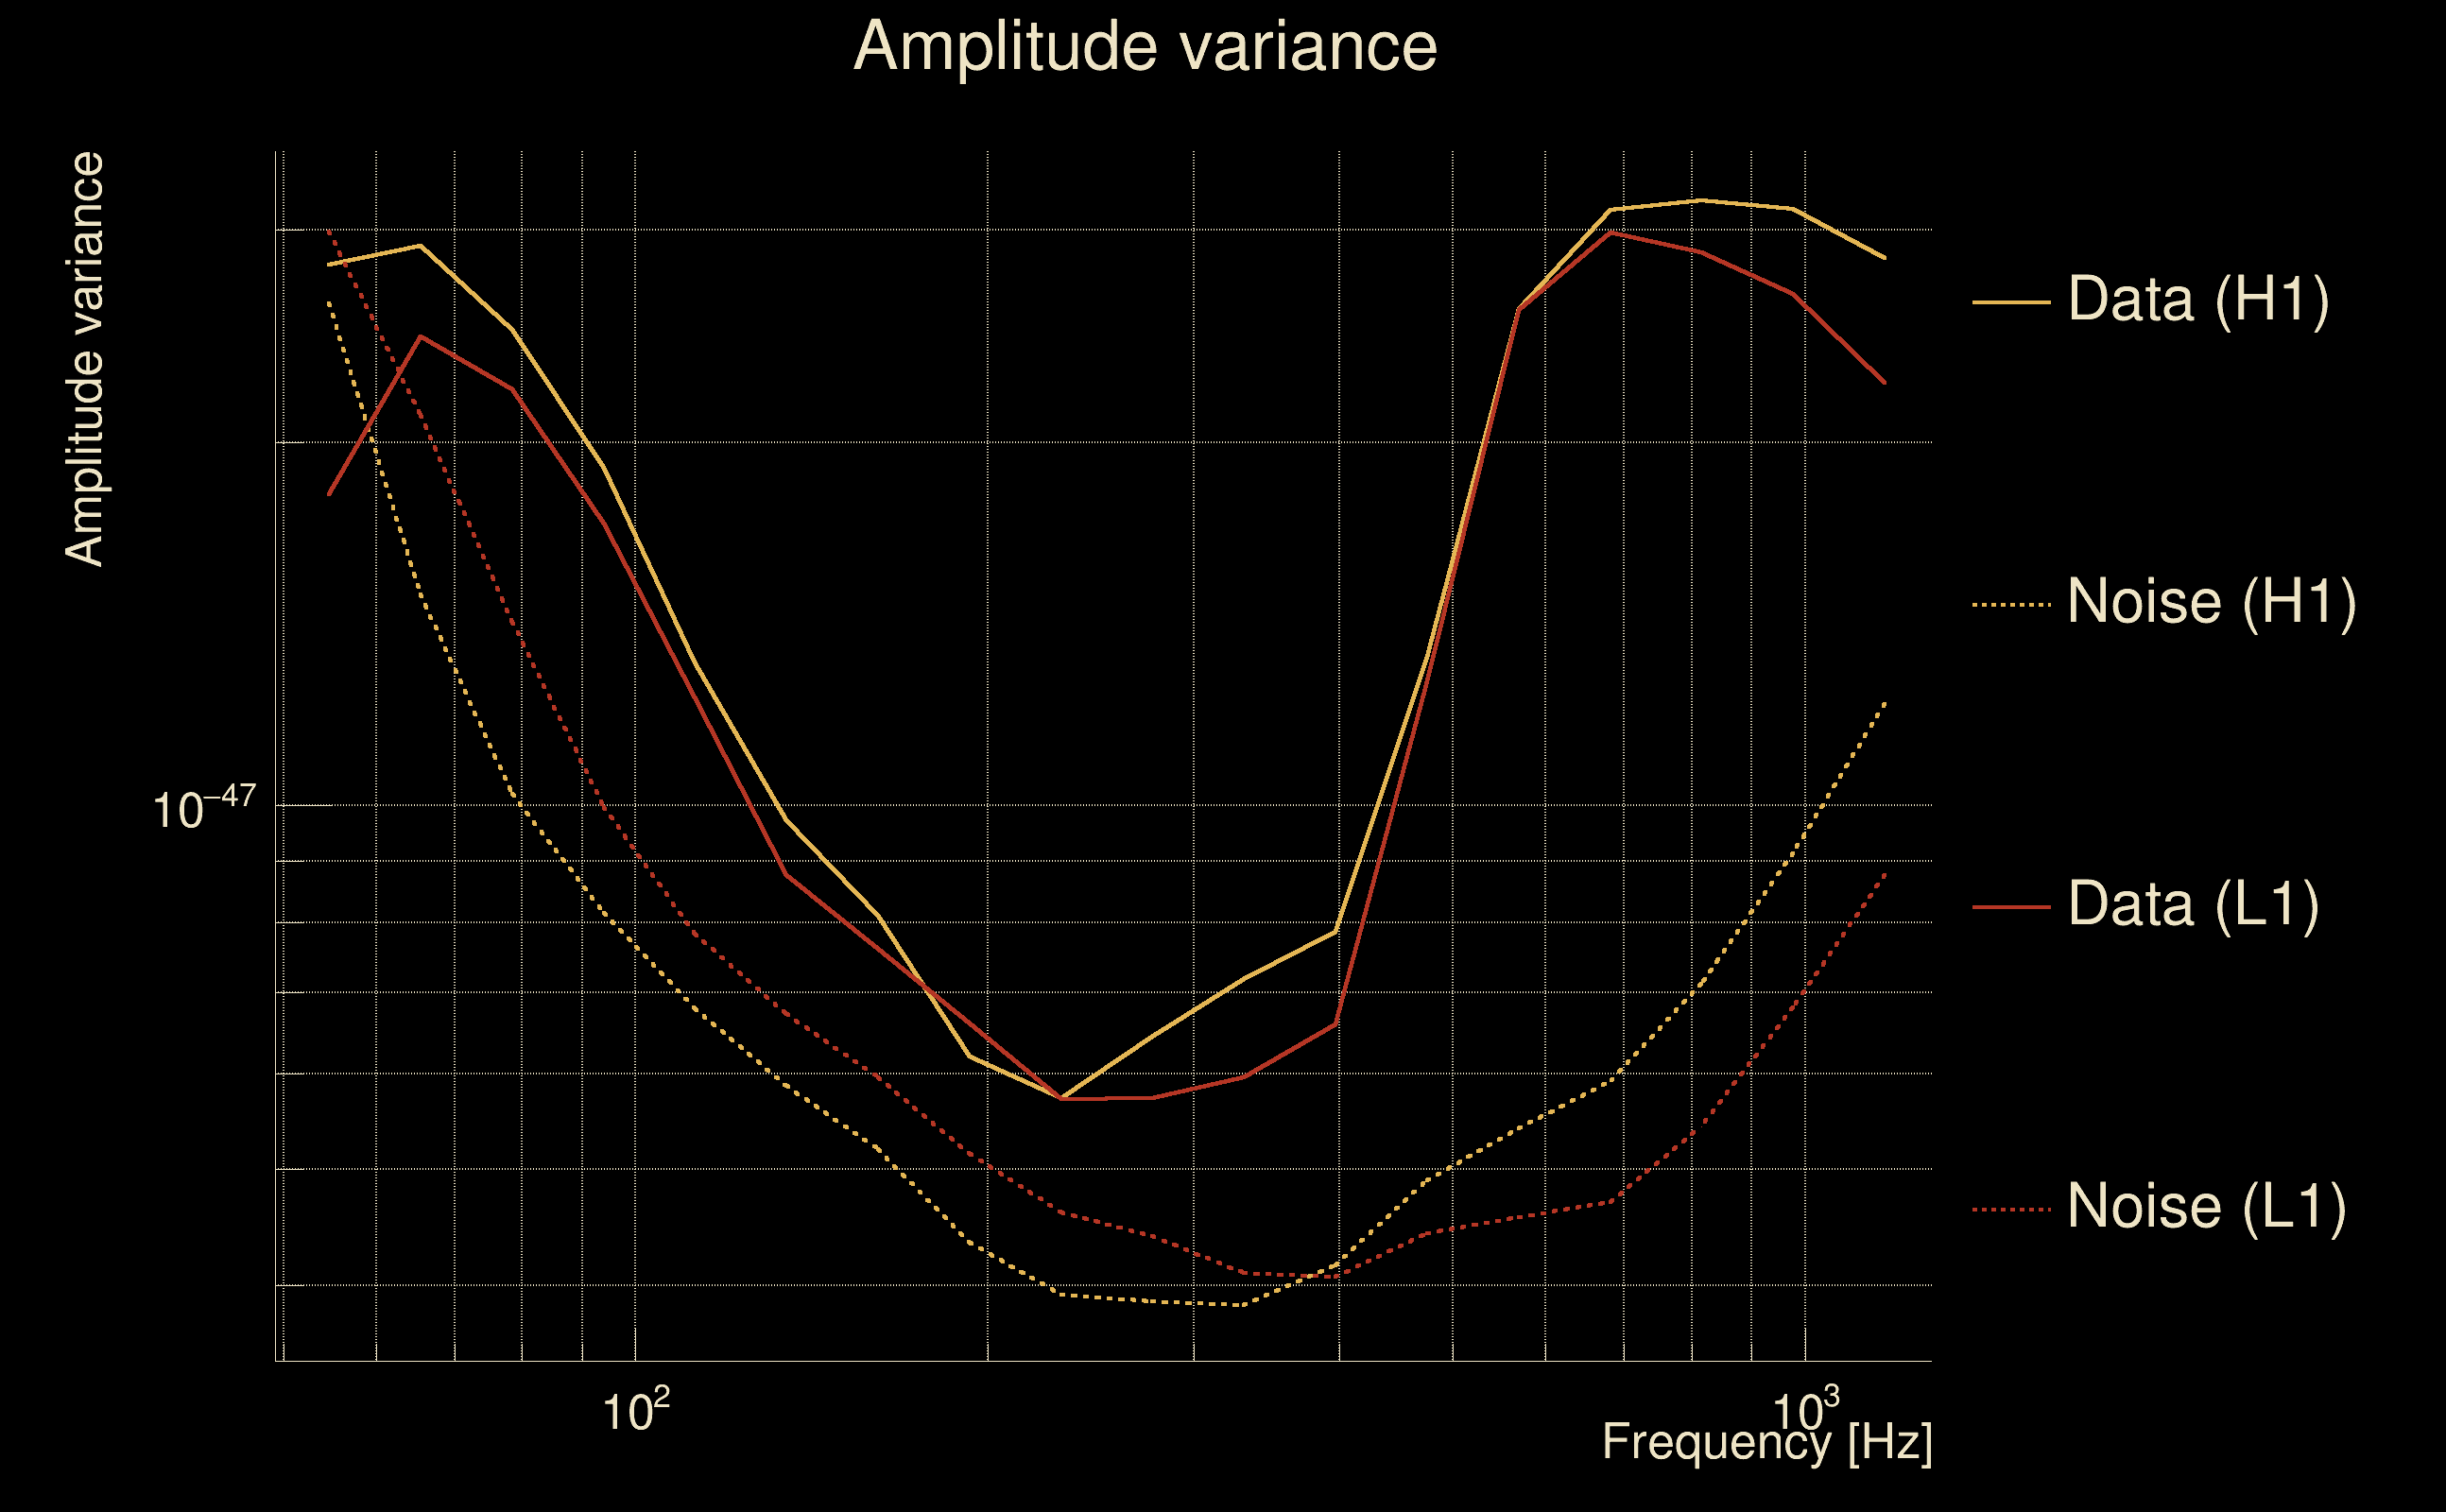
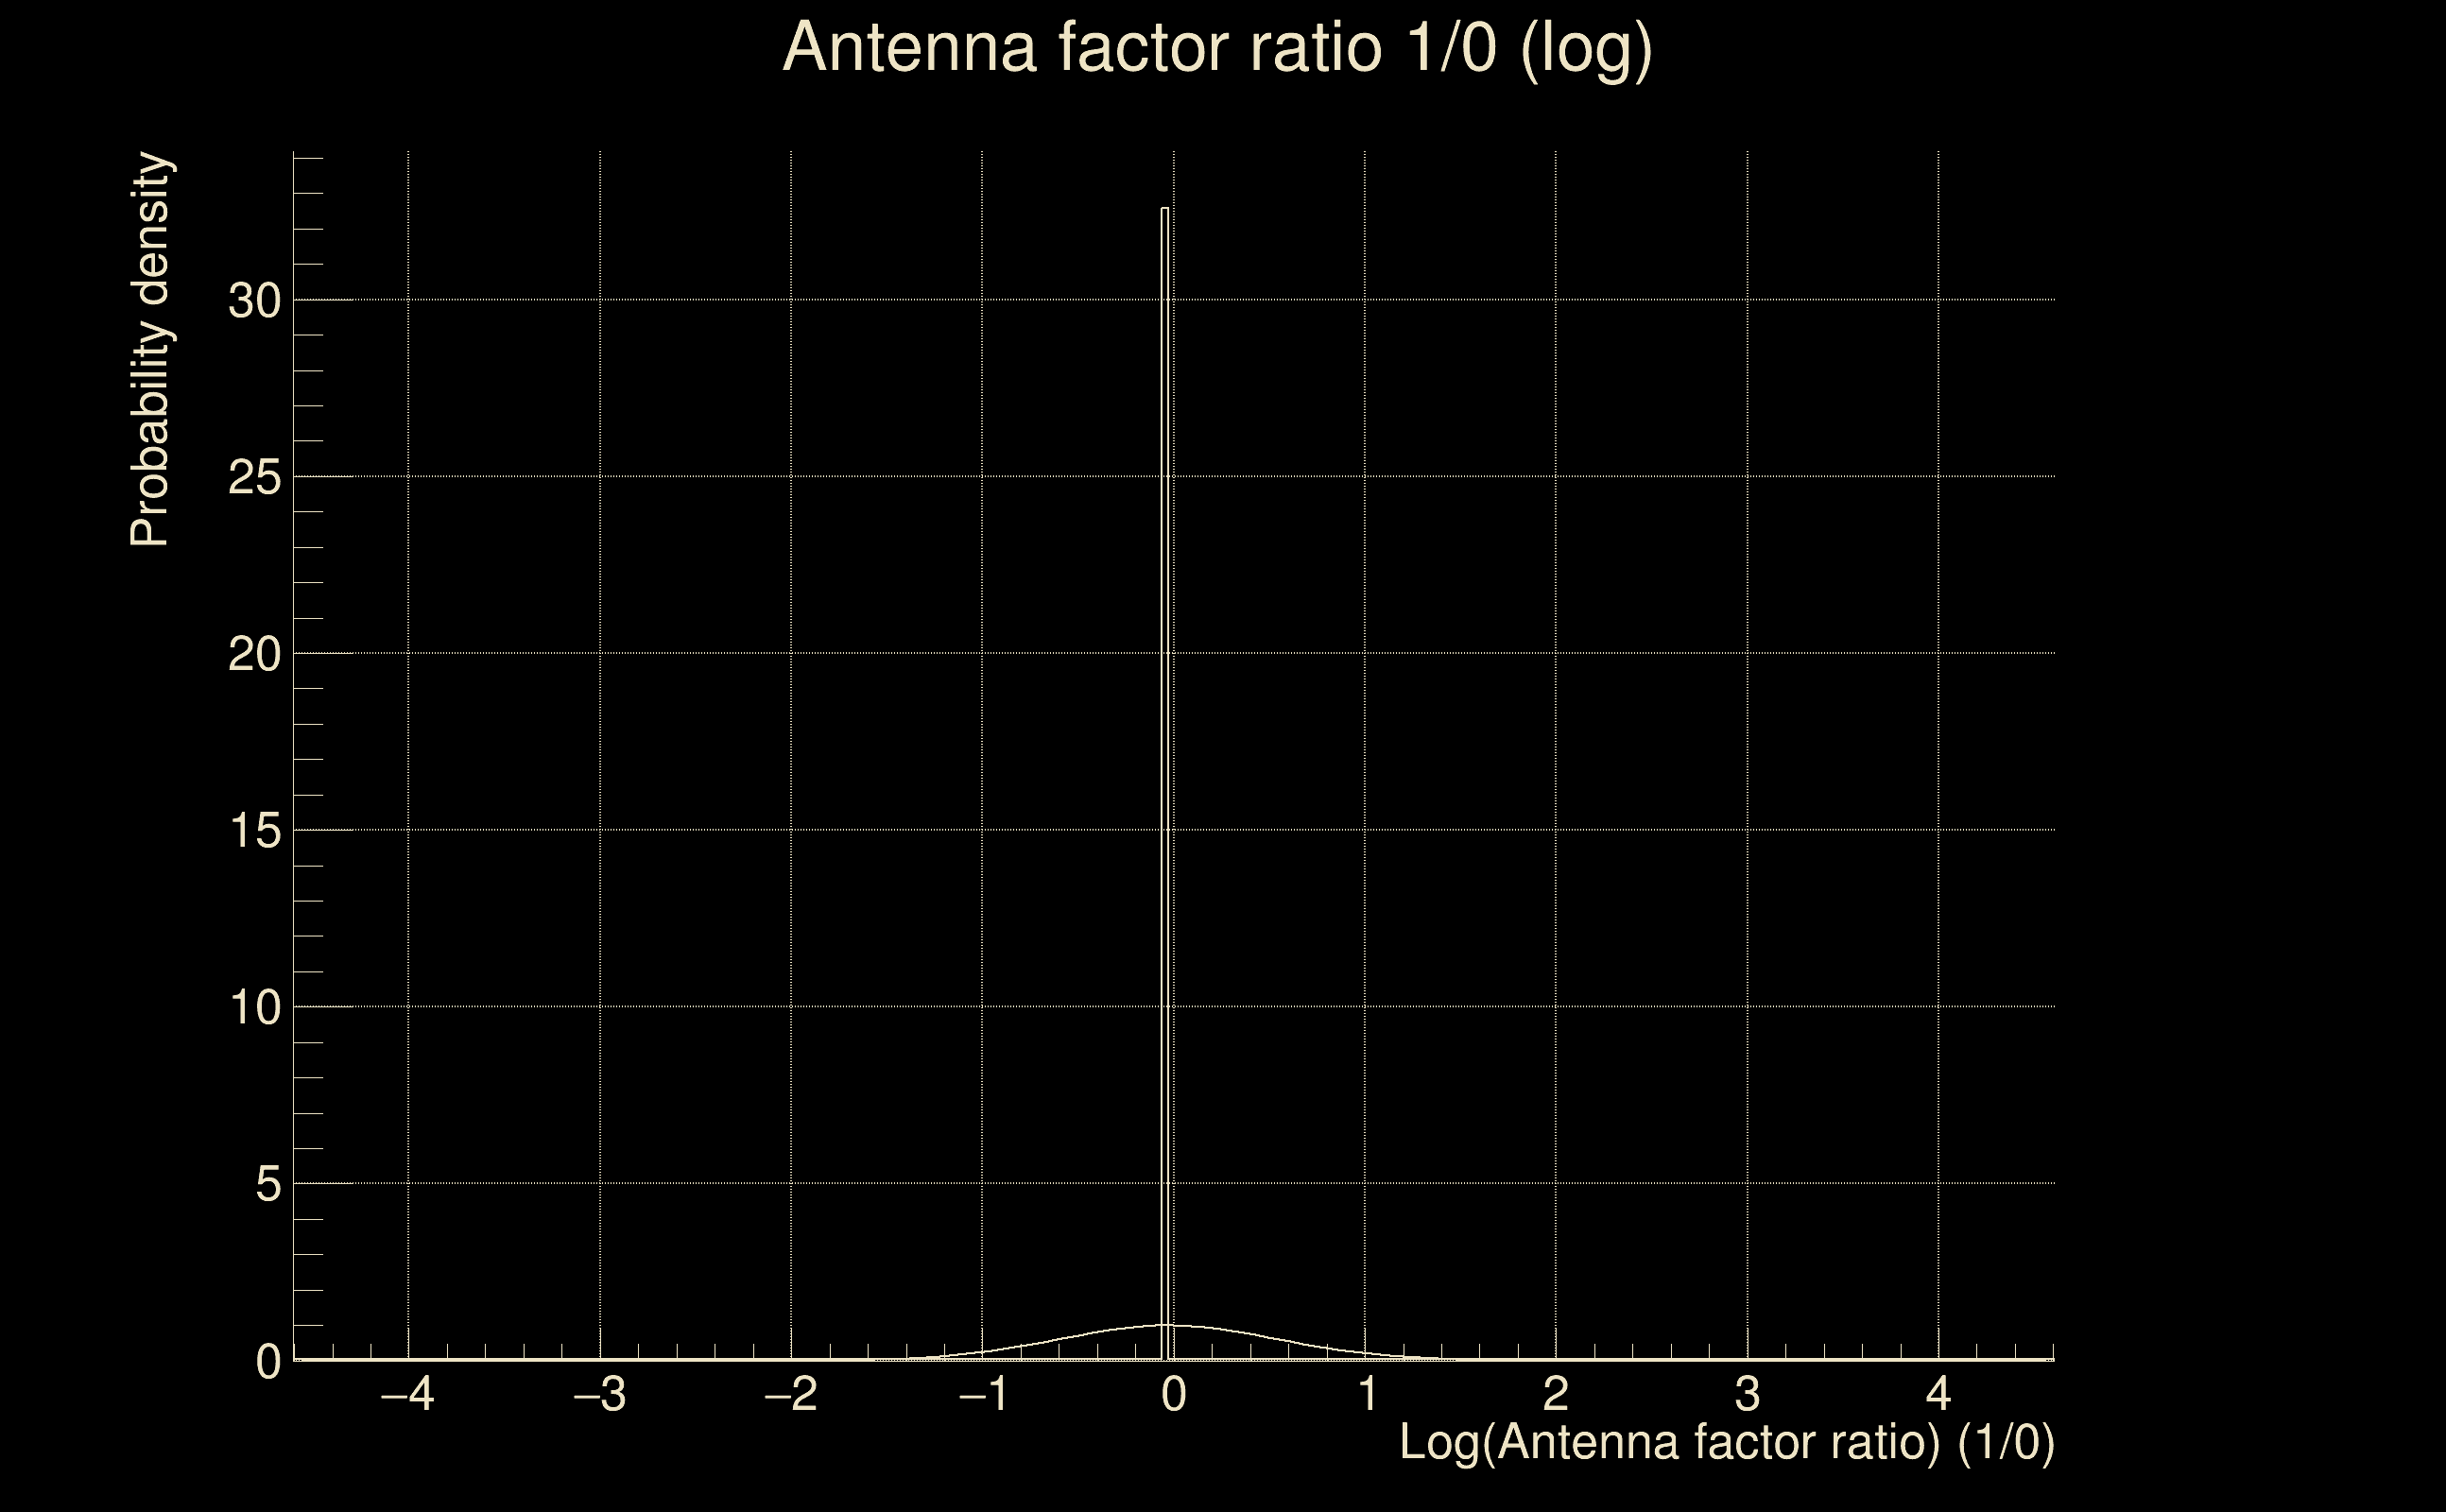
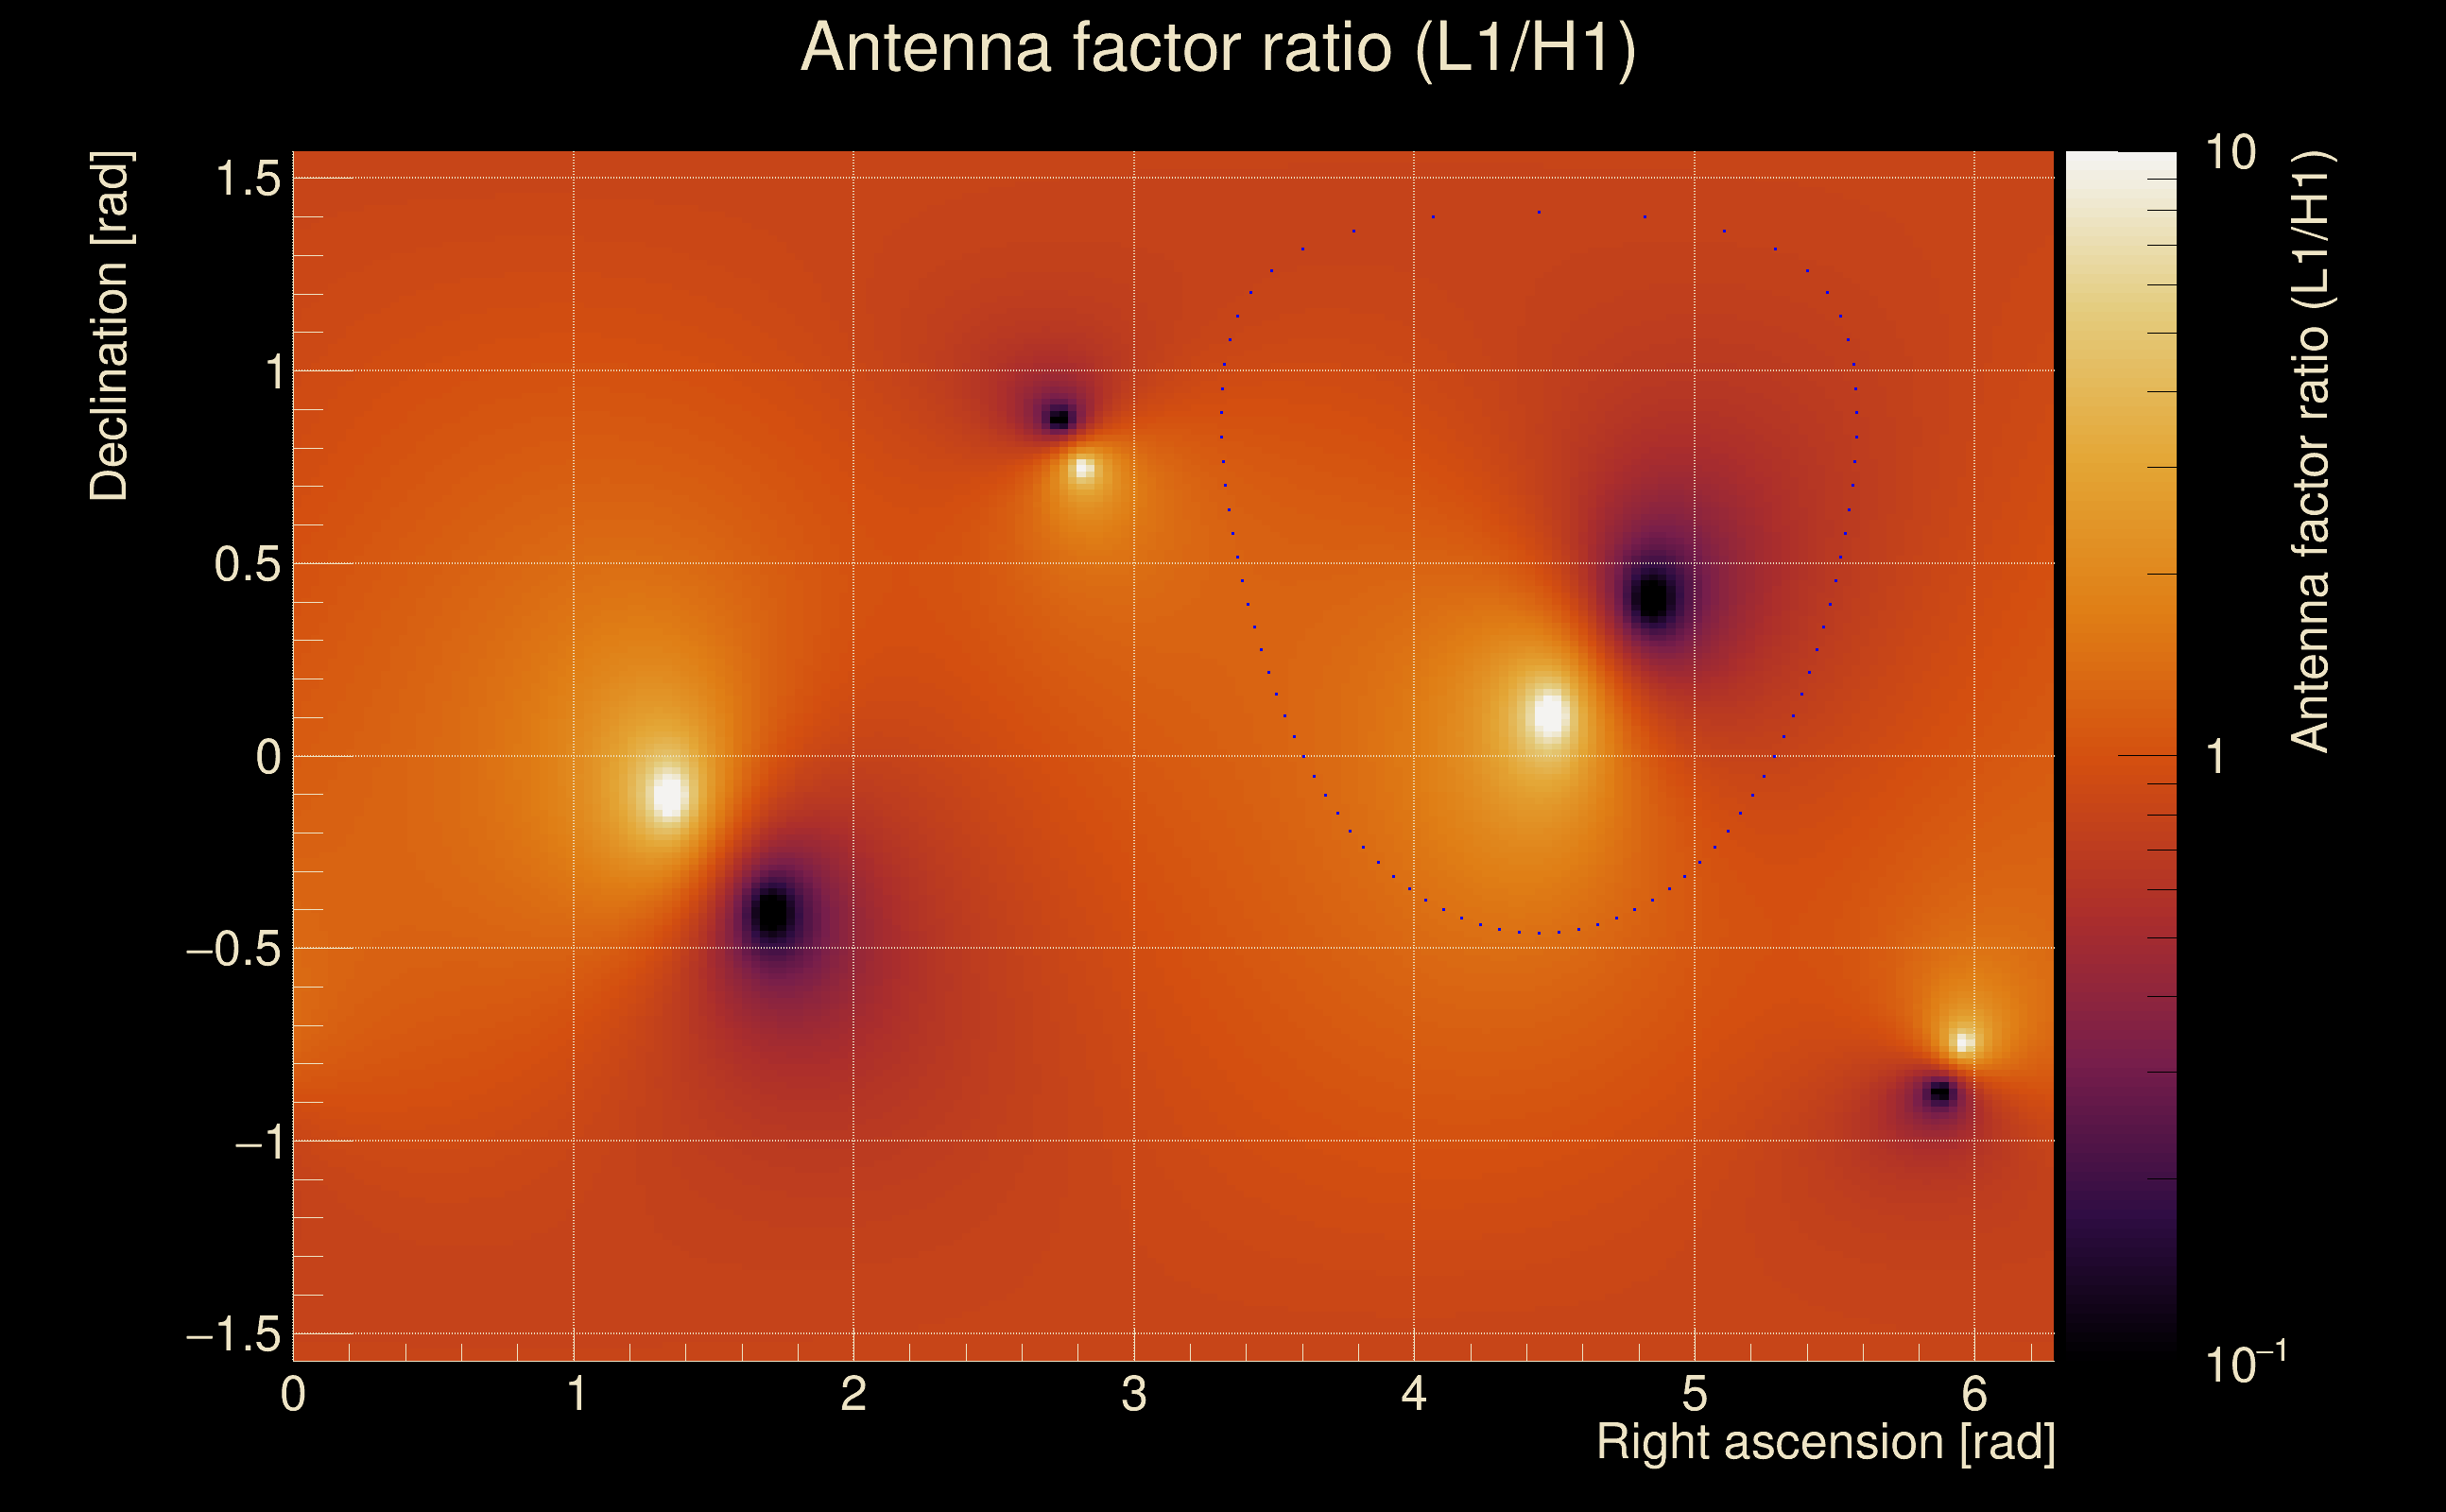
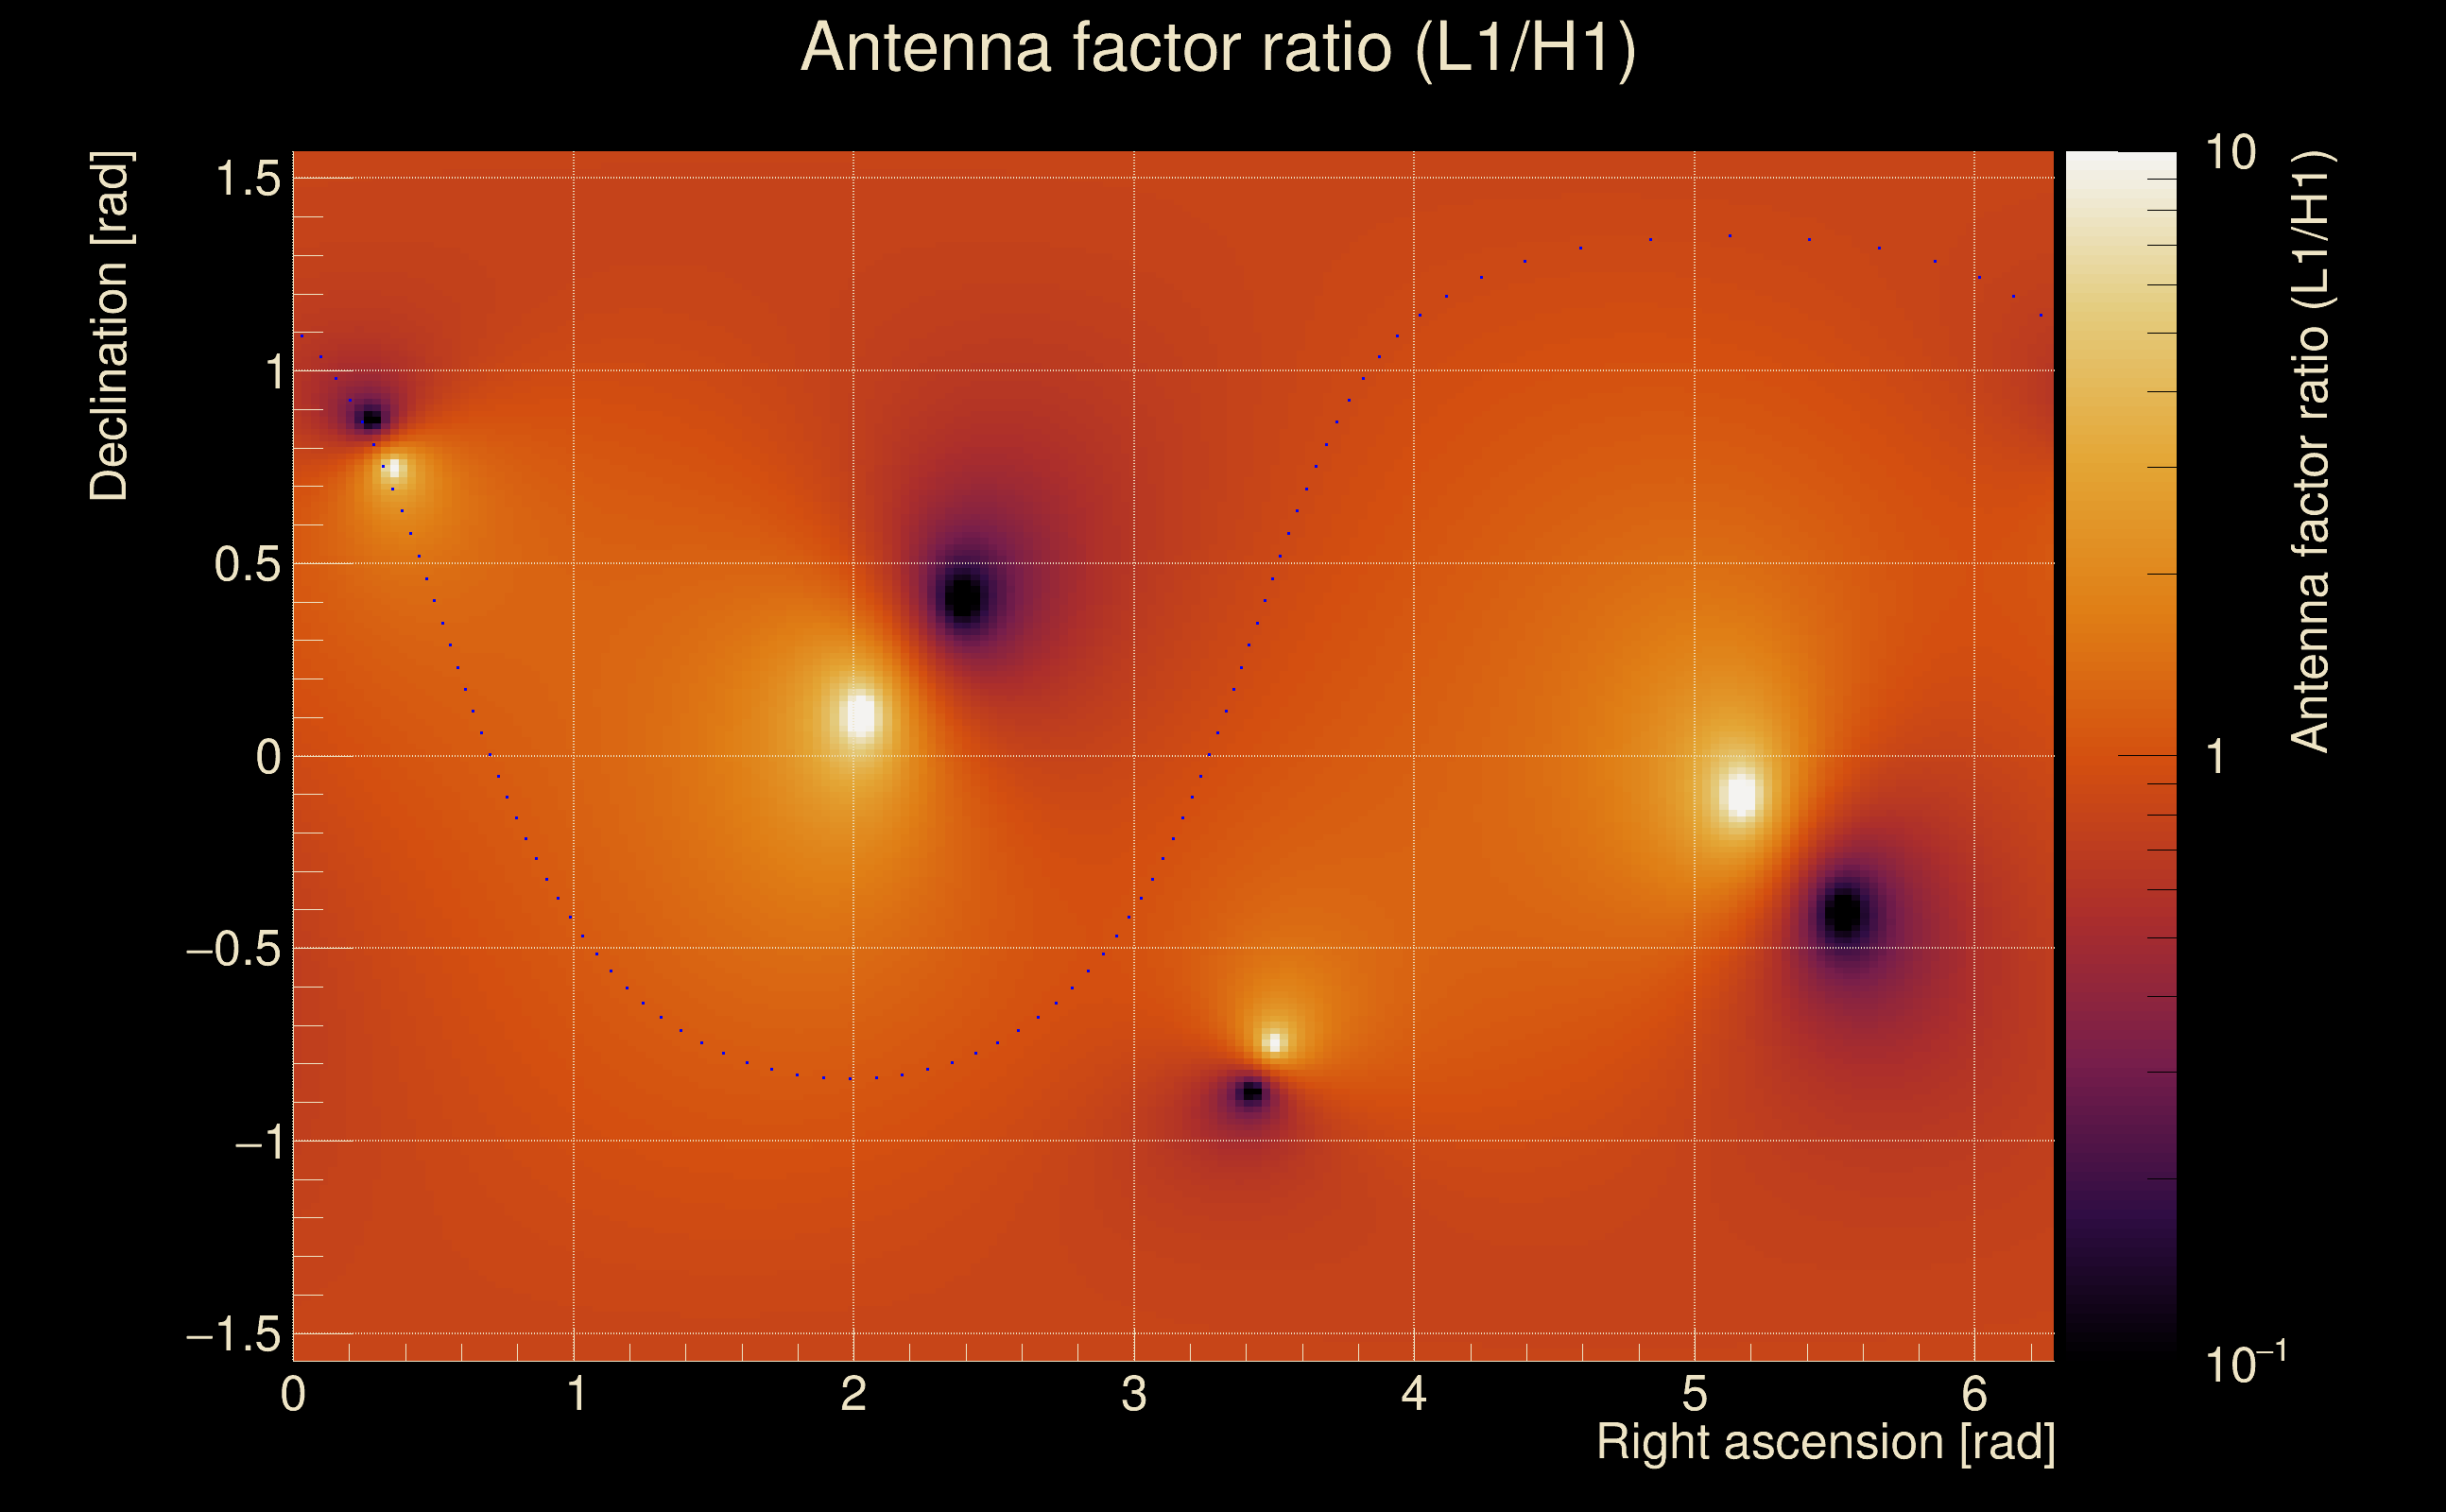
| Log of amplitude ratio (L1/H1): | -0.0276982, variance = 0.161342 (L1/H1: -0.0602643, variance = 0.319633, H1/L1: 0.00399556, variance = 0.312349) |
| Amplitude ratio (L1/H1): | 0.972682 ⋇ 1.49432 (L1/H1: 0.941516 ⋇ 1.76008, H1/L1: 1.004 ⋇ 1.74872) |
| Amplitude ratio H1|L1 compatibility (probability): | 0.943572 |
| Antenna factor probability: | 0.975849 |
| Number of rejected frequency rows: | Q0: 0 / 18, Q1: 1 / 36, Q2: 5 / 70, Q3: 22 / 134, Q4: 80 / 258 |
| Maximum signal-to-noise ratio: | H1: 62.8806, L1: 73.7056 |
| SNR variance: | H1: 1.35688, L1: 1.46053 |
| Click here for a zoomed plot | Click here for a zoomed plot | Click here for a zoomed plot | Click here for a zoomed plot | Click here for a zoomed plot |
 |
 |
 |
 |
 |
 |
 |
 |
 |
 |
 |
 |
 |
 |
 |
 |
 |
 |
 |
 |
 |
 |
 |
 |
 |
 |
 |
 |
 |
| Event time t(H1): | GPS = 1368419964 (Thu May 18 04:39:06 2023 ) → GPS = 1368419974 (Thu May 18 04:39:16 2023 ) |
| Event time t(L1): | GPS = 1368419964 (Thu May 18 04:39:16 2023 ) → GPS = 1368419974 (Thu May 18 04:39:16 2023 ) |
| Omicron analysis time window (H1): | GPS = 1368419961 → GPS = 1368419977 |
| Omicron analysis time window (L1): | GPS = 1368419961 → GPS = 1368419977 |
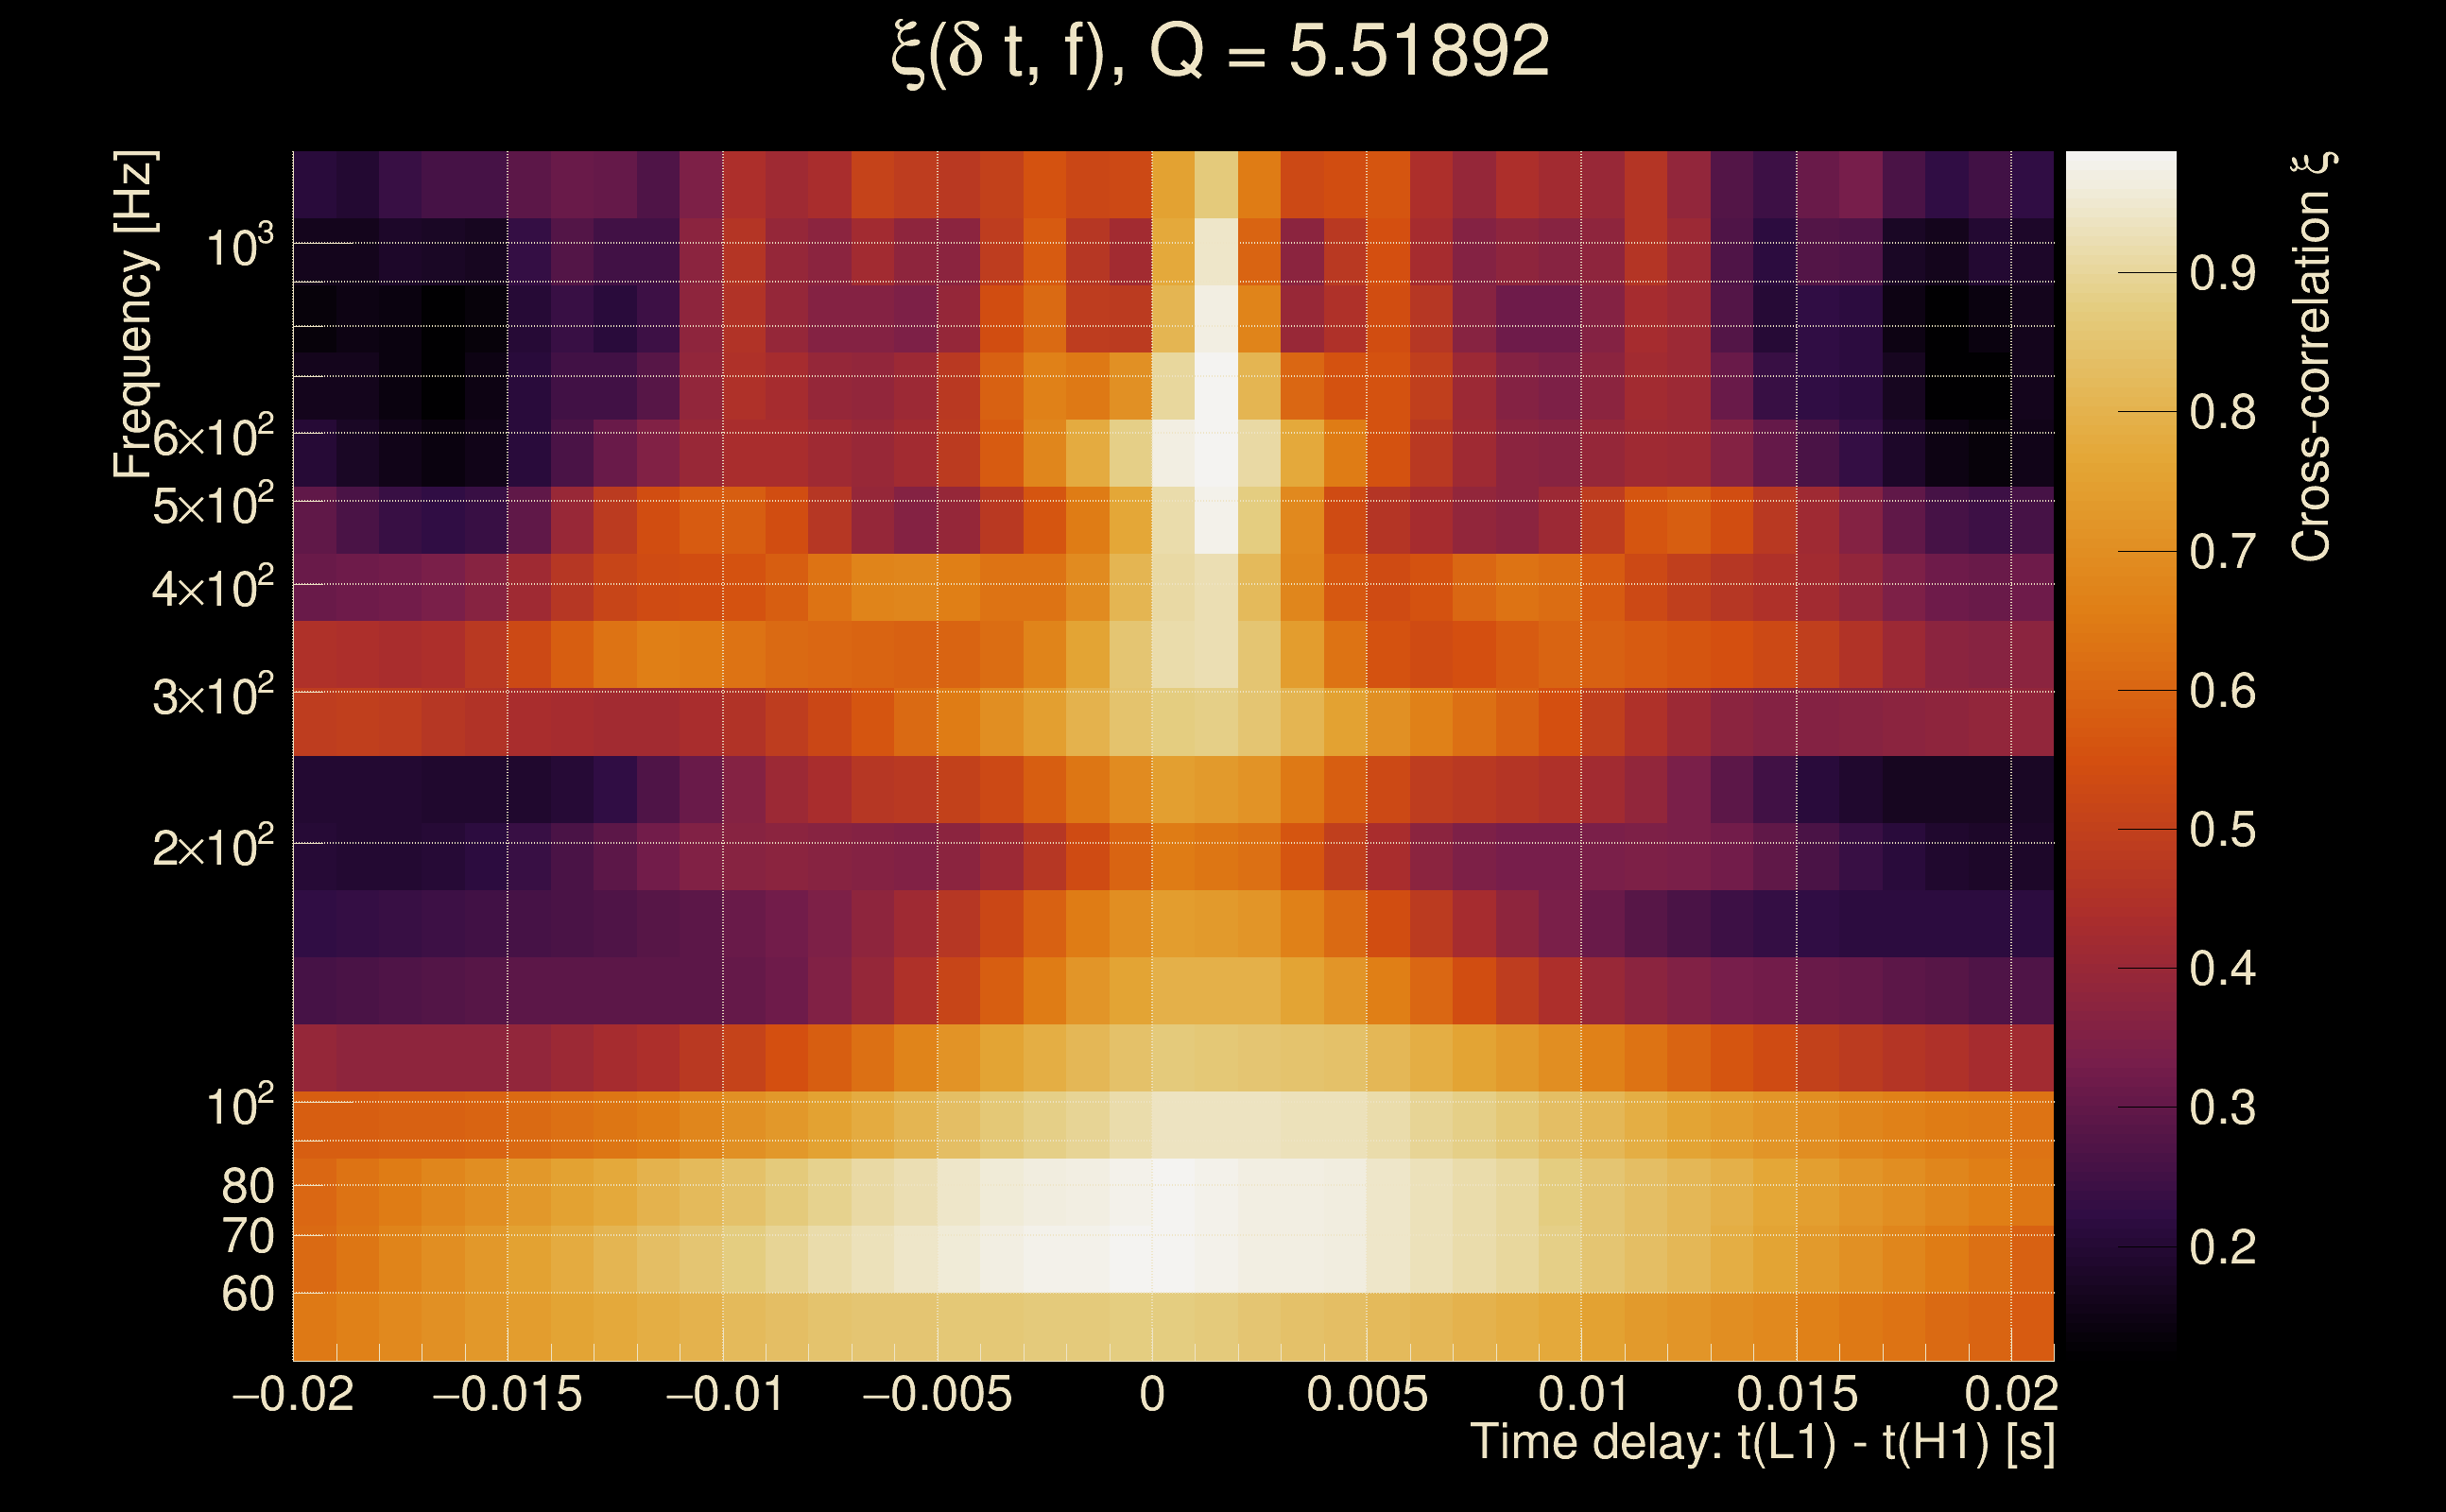
| Time delay between detectors t(L1) - t(H1): | 0.000819266 s (slice index = 108 / 217), δt_gw = 0.000819266 s |
| Time delay standard deviation: | 0.0309217 s |
| [targeted mode] Time delay probability: | 0.998657 (0.00168294 sigmas), δt_target = 0.000822544 s |
| Frequency: | 301.946 Hz |
| Ξ: | 0.852479 ± 0.00944377 (variance = 8.91849e-05): Q0: 0.894039, Q1: 0.884792, Q2: 0.87251, Q3: 0.866942, Q4: 0.879545 |
| Rank: | R_A = 0.766409 |
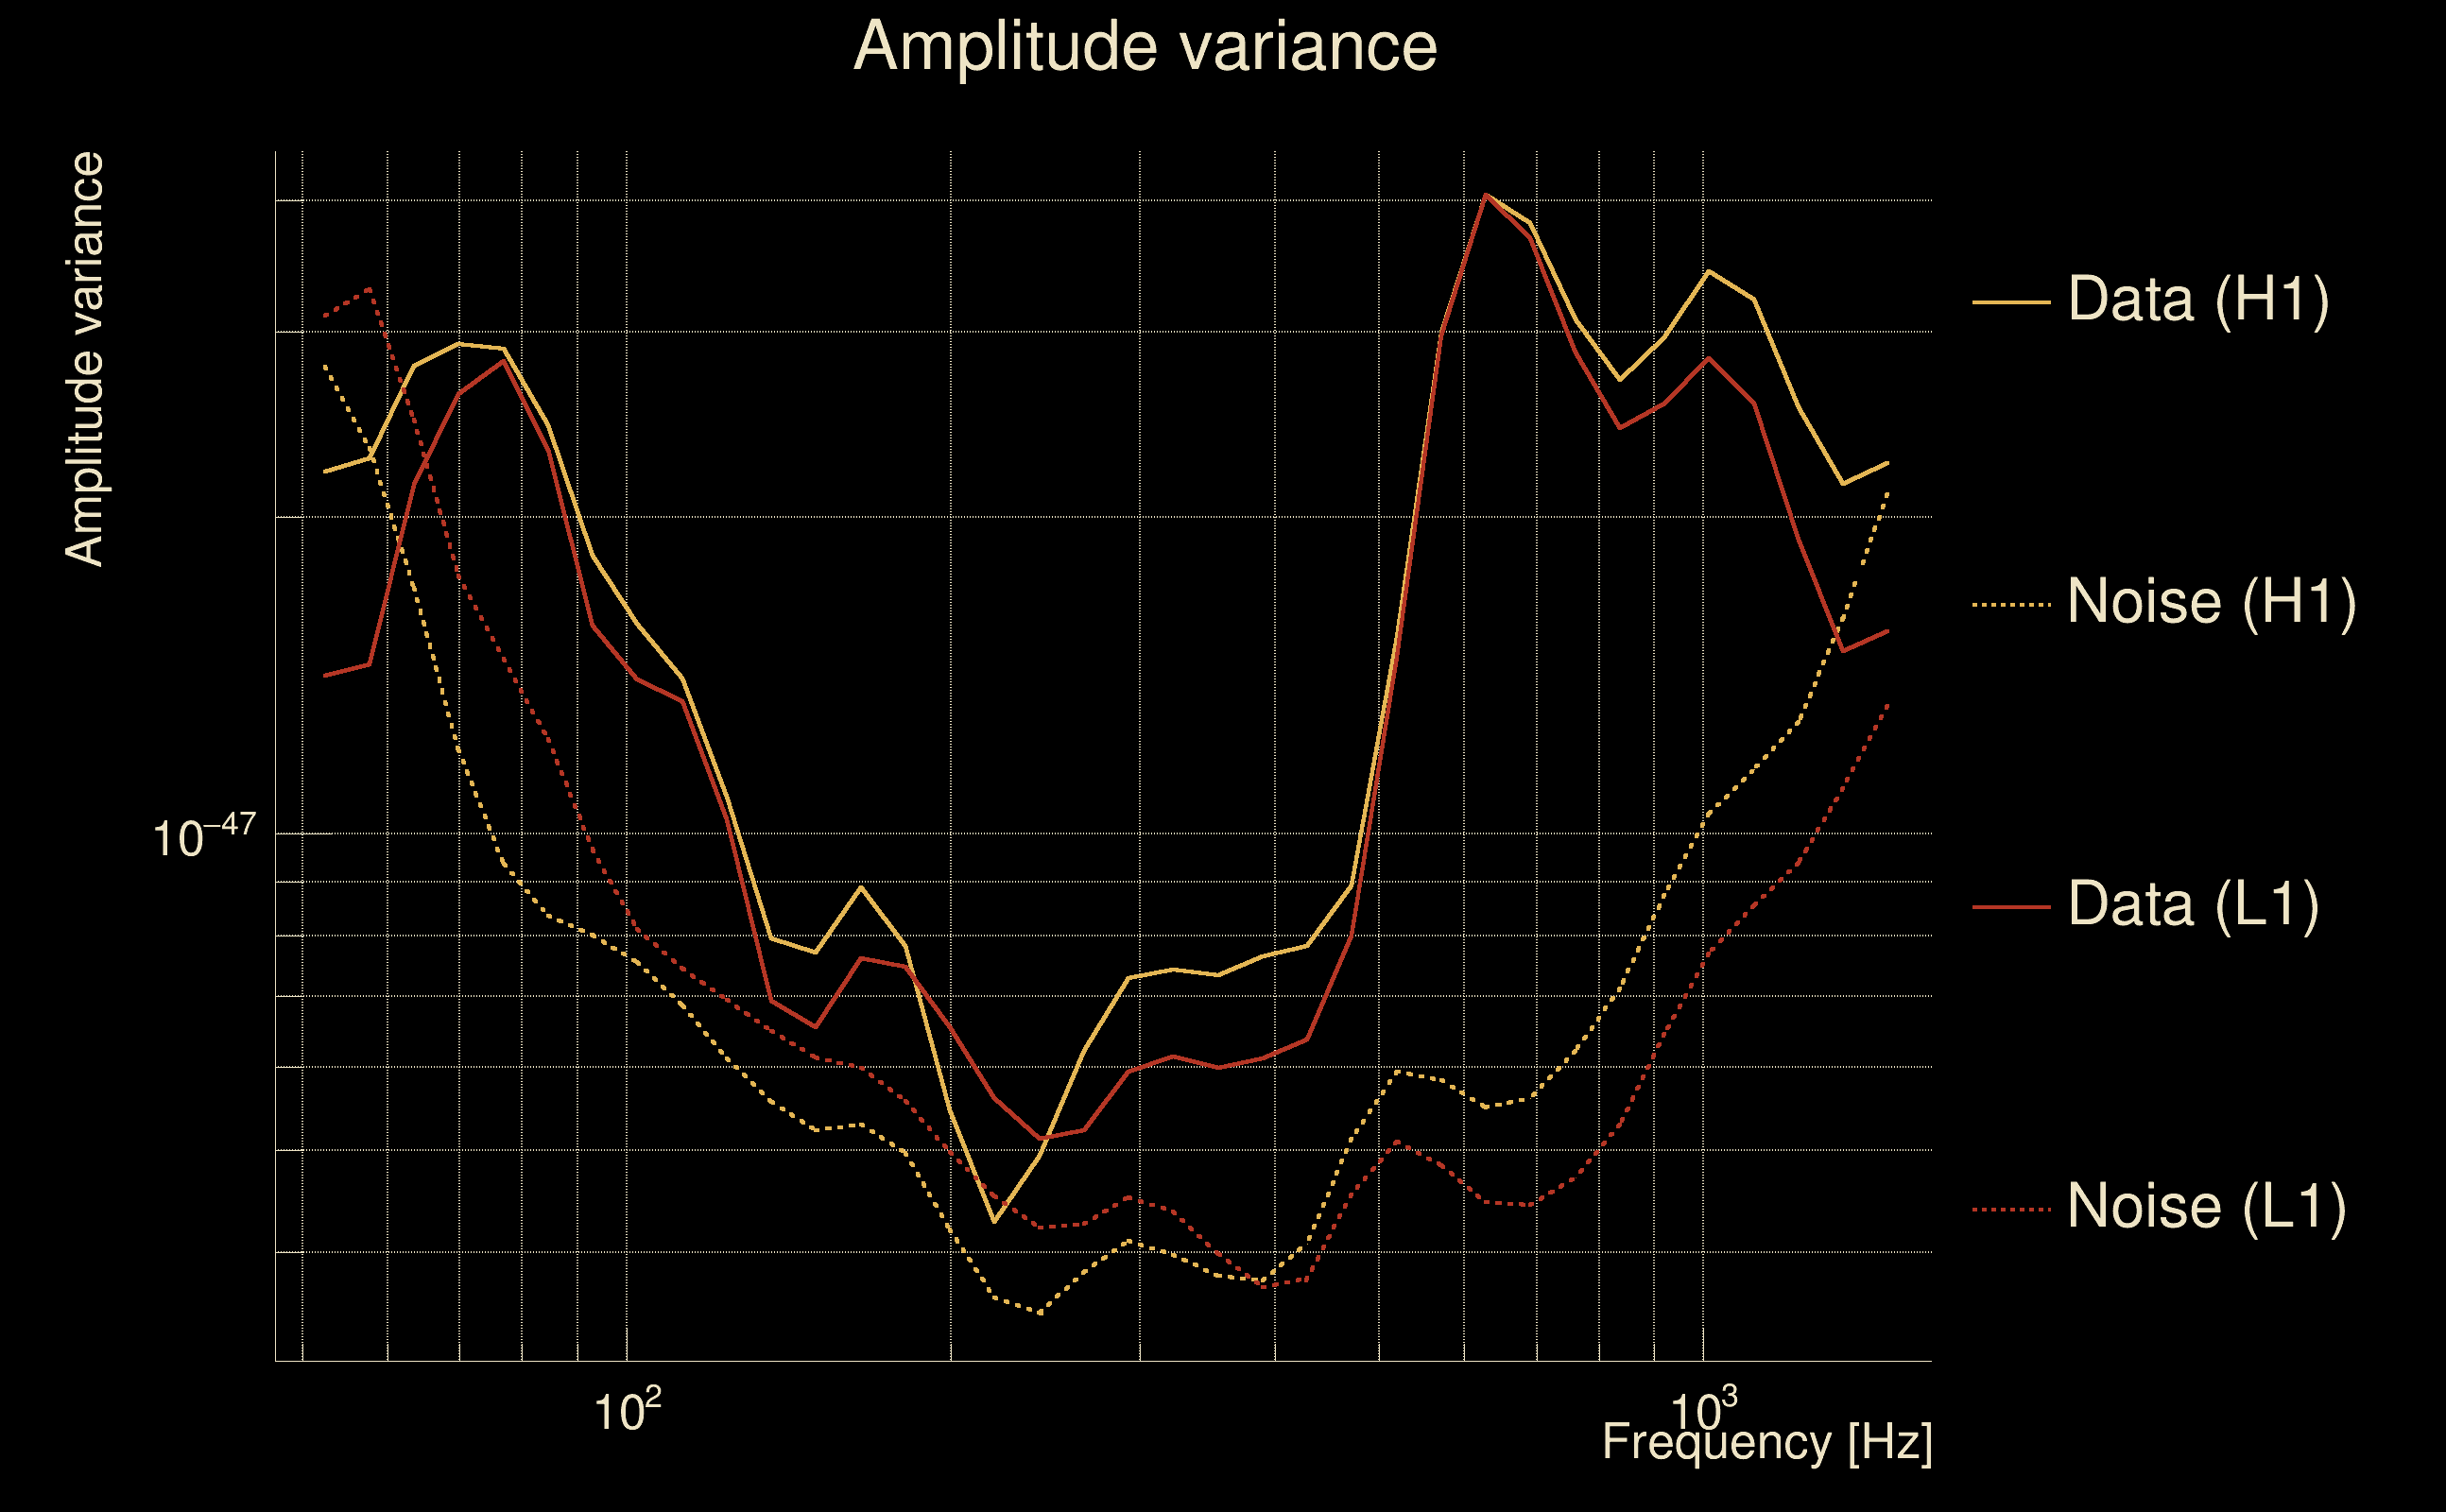
| Log of amplitude ratio (L1/H1): | -0.0241837, variance = 0.163292 (L1/H1: -0.0653677, variance = 0.321457, H1/L1: -0.00601342, variance = 0.31772) |
| Amplitude ratio (L1/H1): | 0.976106 ⋇ 1.49795 (L1/H1: 0.936723 ⋇ 1.76292, H1/L1: 0.994005 ⋇ 1.7571) |
| Amplitude ratio H1|L1 compatibility (probability): | 0.928856 |
| Antenna factor probability: | 0.969198 |
| Number of rejected frequency rows: | Q0: 0 / 18, Q1: 1 / 36, Q2: 5 / 70, Q3: 22 / 134, Q4: 81 / 258 |
| Maximum signal-to-noise ratio: | H1: 63.2363, L1: 73.8496 |
| SNR variance: | H1: 0.558658, L1: 0.517672 |
| Click here for a zoomed plot | Click here for a zoomed plot | Click here for a zoomed plot | Click here for a zoomed plot | Click here for a zoomed plot |
 |
 |
 |
 |
 |
 |
 |
 |
 |
 |
 |
 |
 |
 |
 |
 |
 |
 |
 |
 |
 |
 |
 |
 |
 |
 |
 |
 |
 |
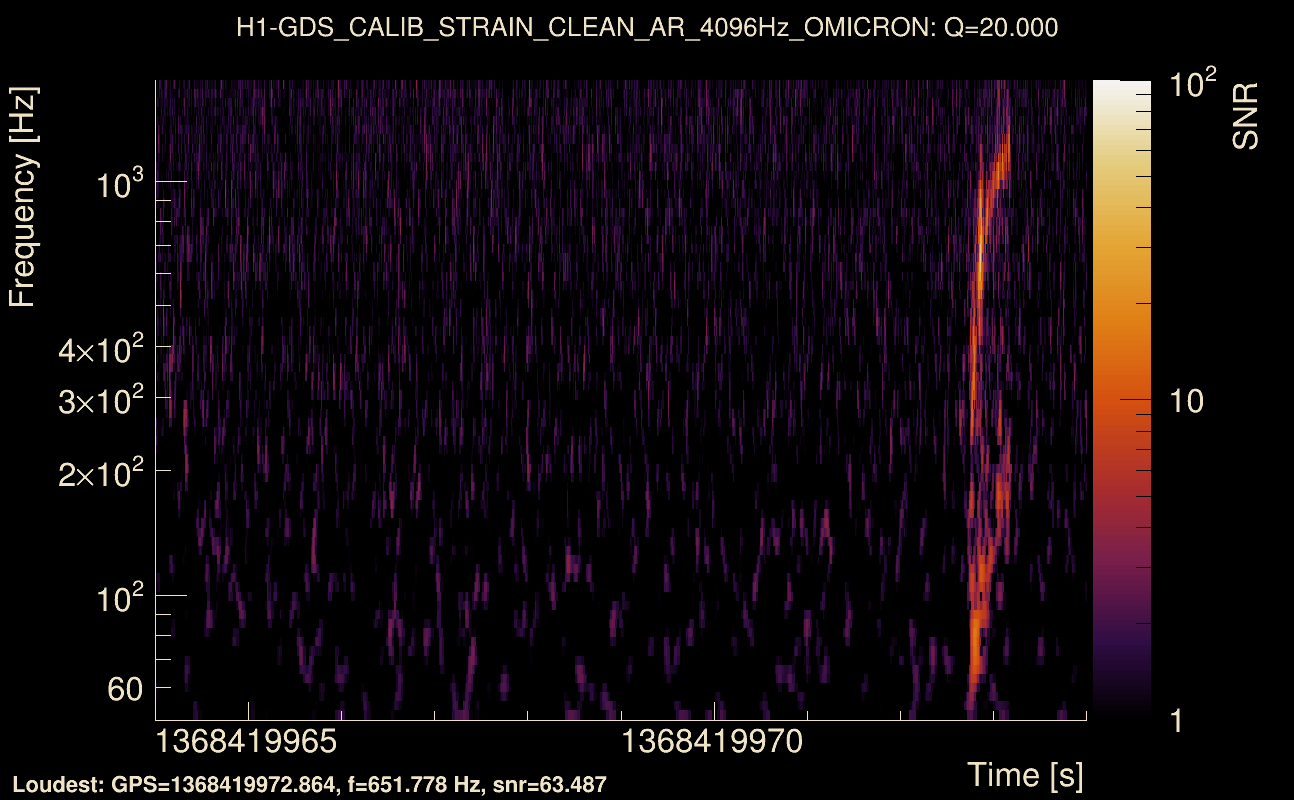
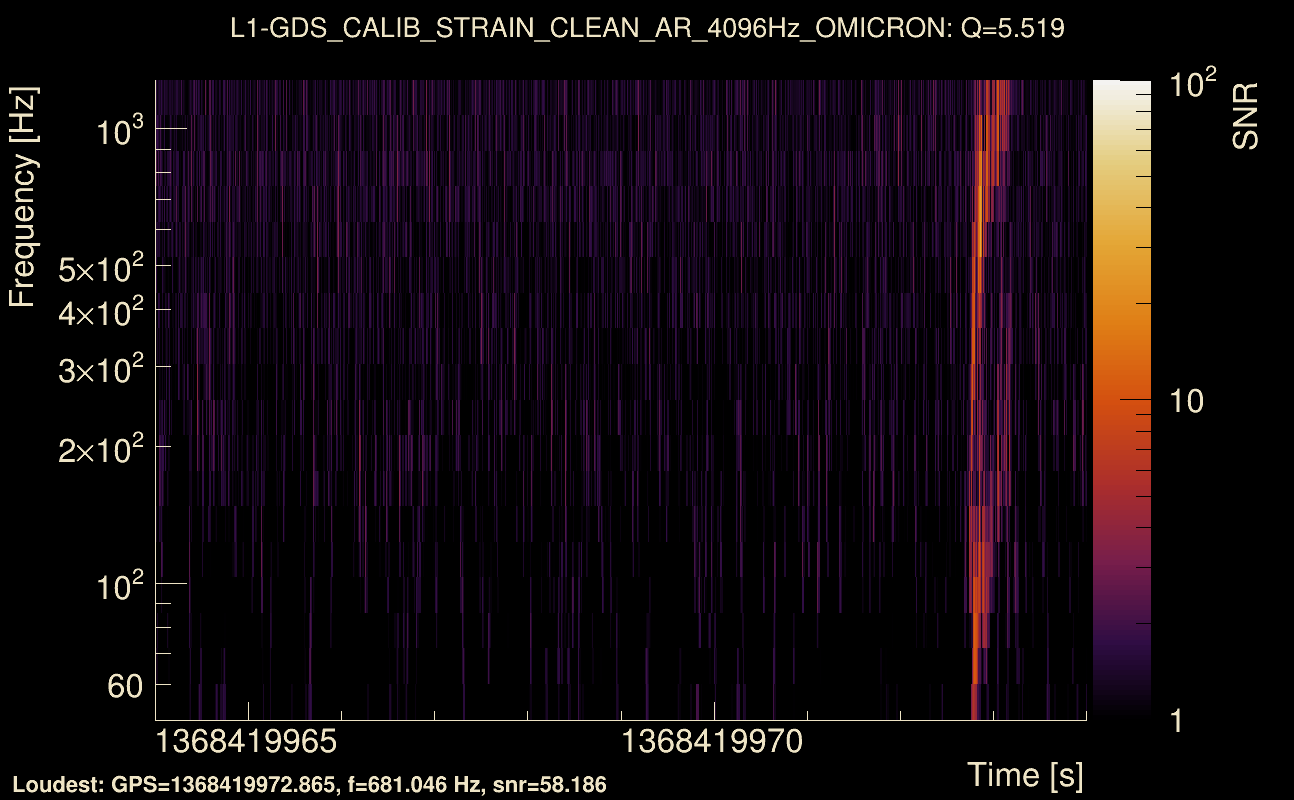
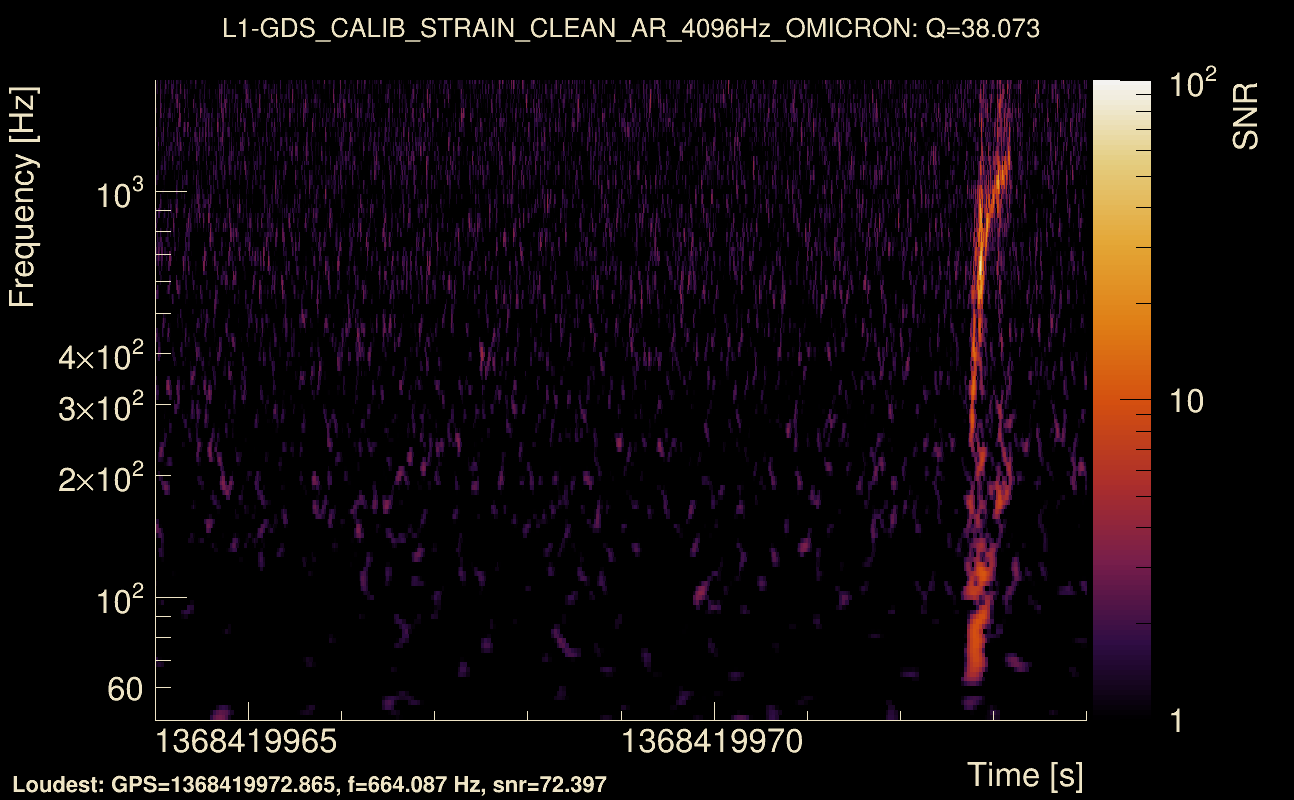
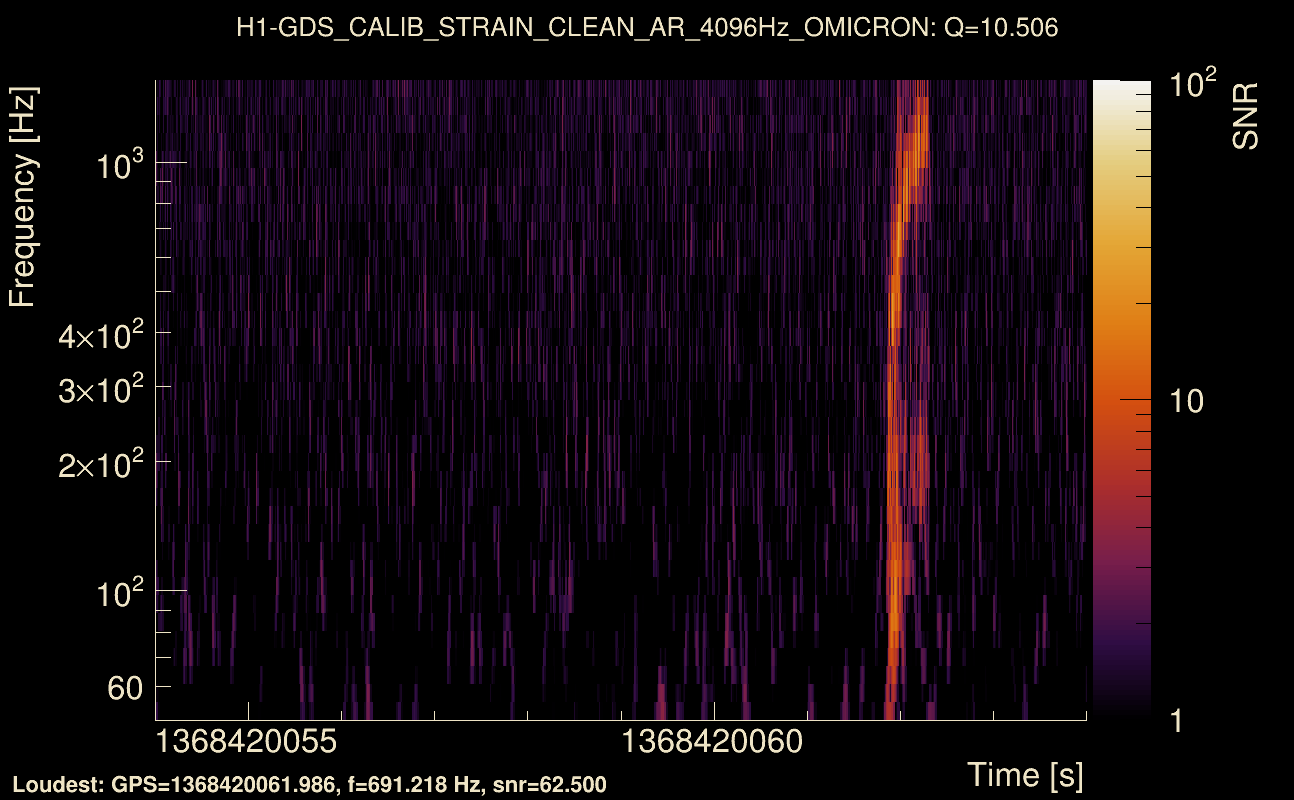
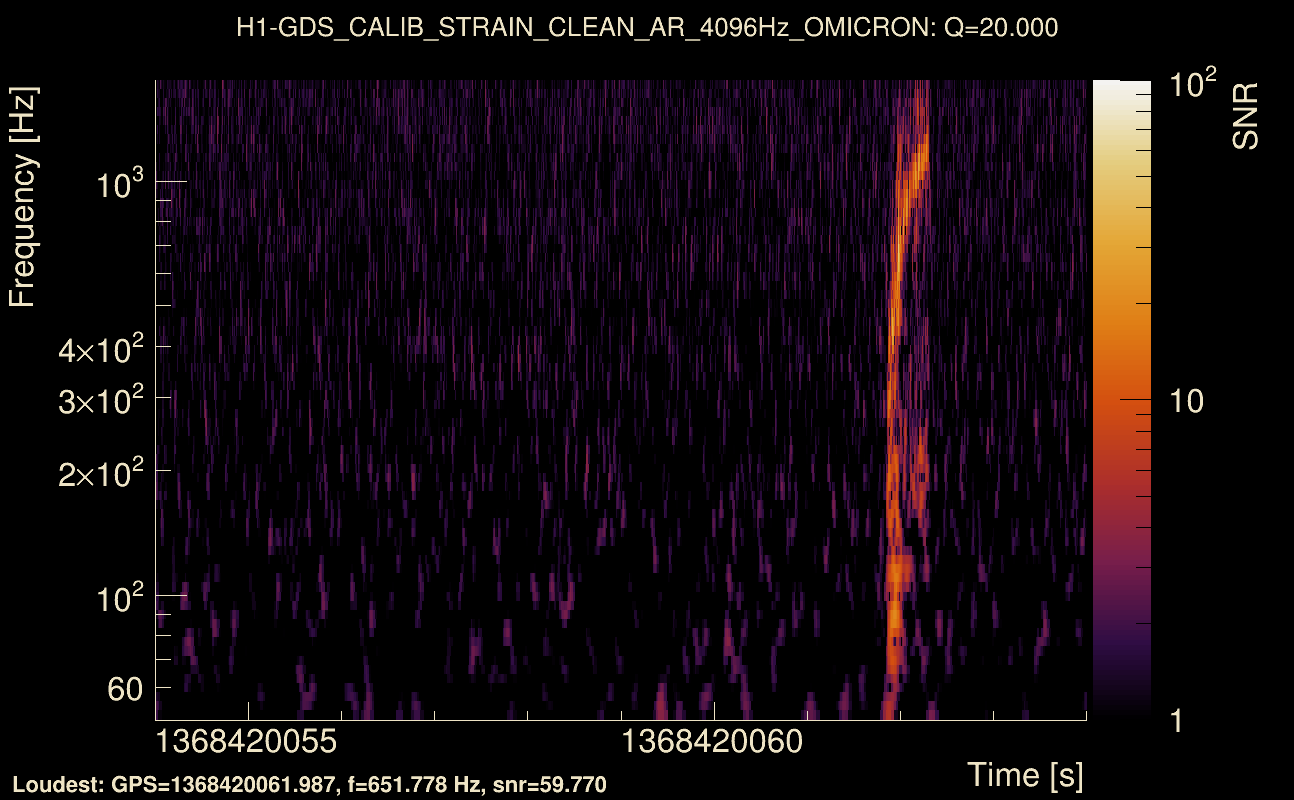
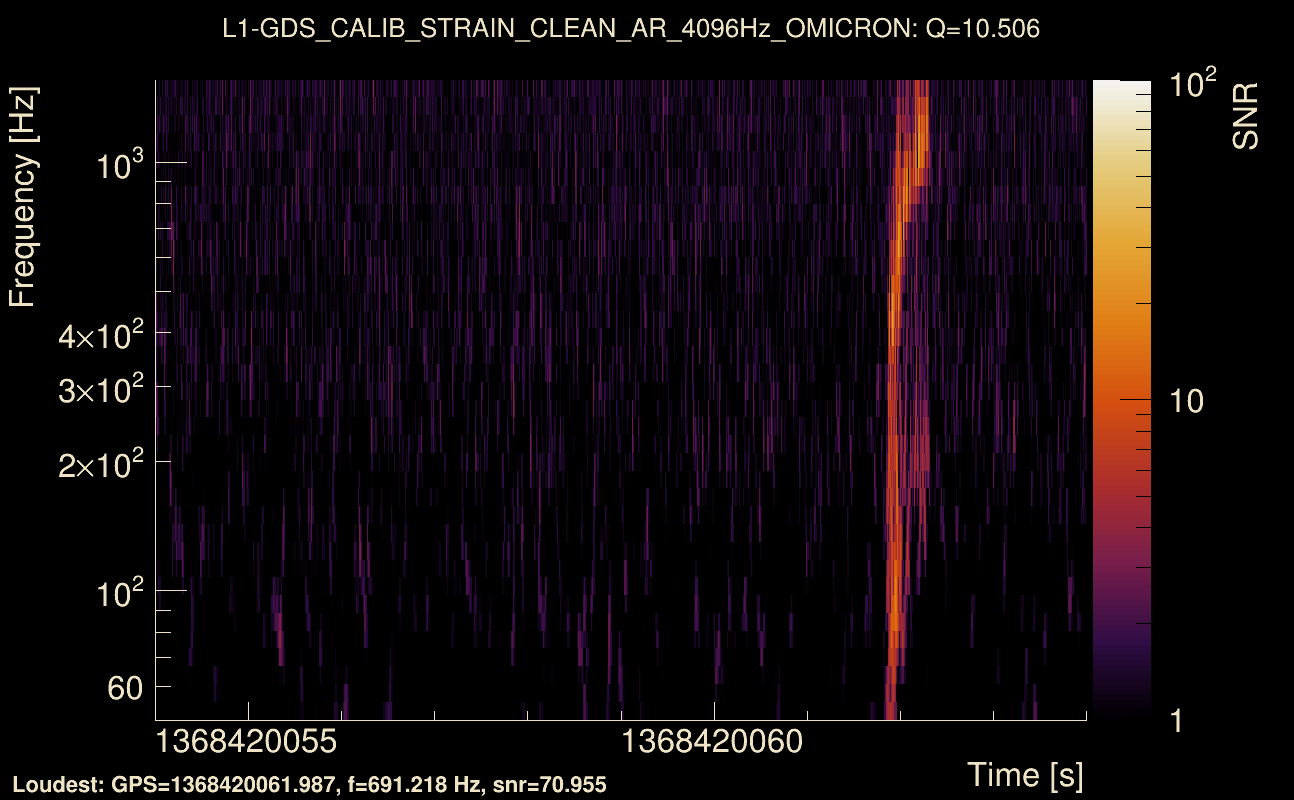
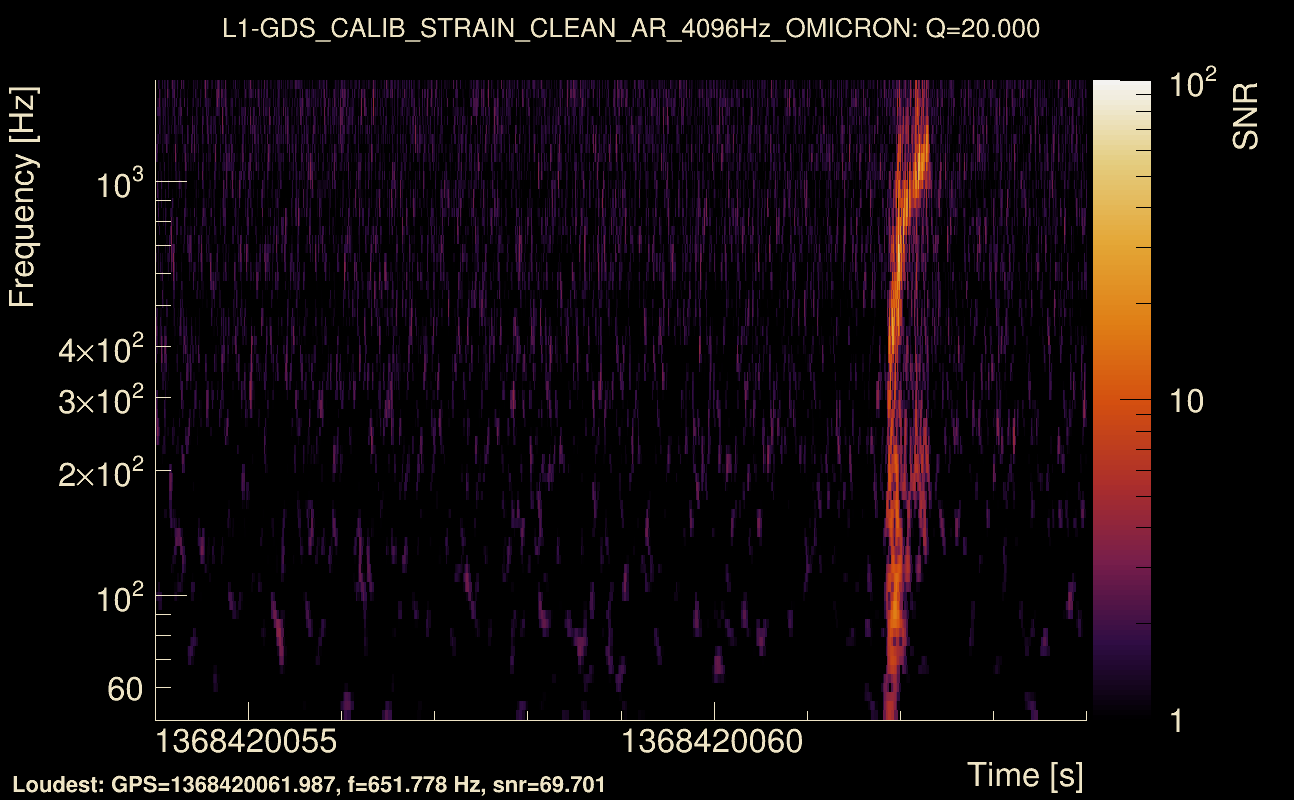
| Event time t(H1): | GPS = 1368420054 (Thu May 18 04:40:36 2023 ) → GPS = 1368420064 (Thu May 18 04:40:46 2023 ) |
| Event time t(L1): | GPS = 1368420054 (Thu May 18 04:40:46 2023 ) → GPS = 1368420064 (Thu May 18 04:40:46 2023 ) |
| Omicron analysis time window (H1): | GPS = 1368420051 → GPS = 1368420067 |
| Omicron analysis time window (L1): | GPS = 1368420051 → GPS = 1368420067 |
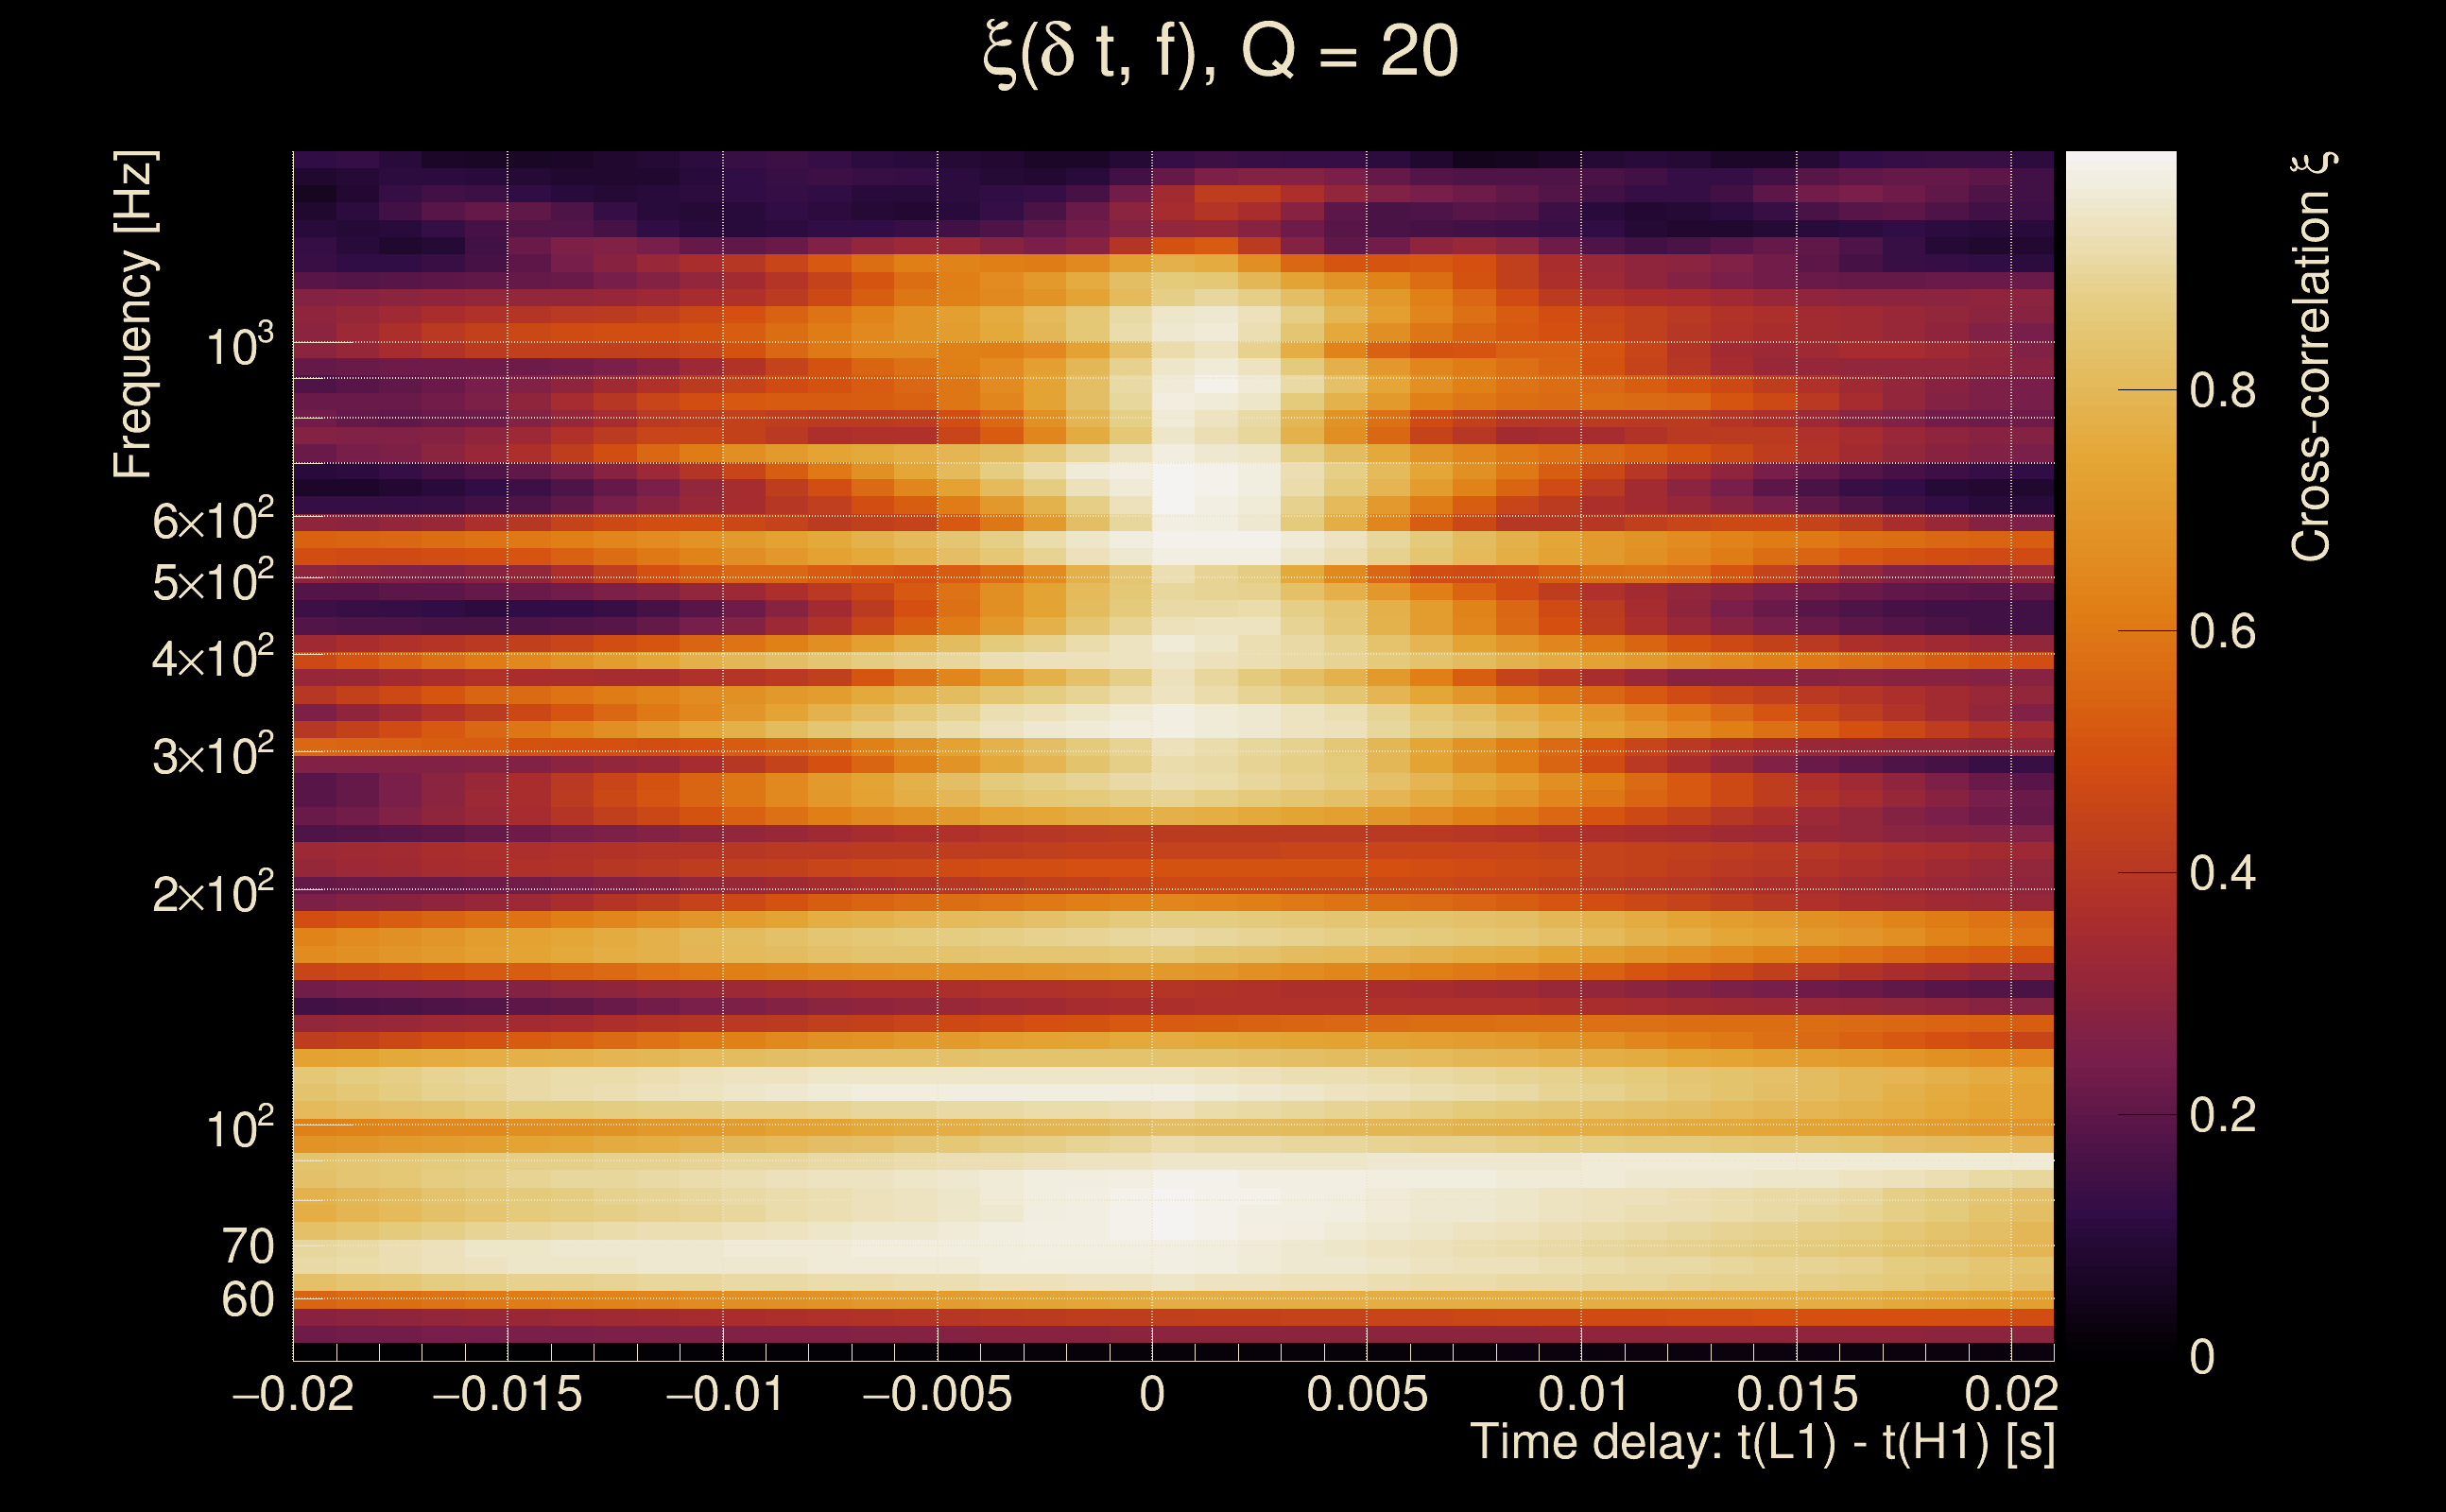
| Time delay between detectors t(L1) - t(H1): | 0.000918331 s (slice index = 108 / 217), δt_gw = 0.000918331 s |
| Time delay standard deviation: | 0.0224579 s |
| [targeted mode] Time delay probability: | 0.891051 (0.136975 sigmas), δt_target = 0.000820875 s |
| Frequency: | 297.792 Hz |
| Ξ: | 0.90903 ± 0.0182484 (variance = 0.000333003): Q0: 0.939508, Q1: 0.93166, Q2: 0.907607, Q3: 0.898422, Q4: 0.893529 |
| Rank: | R_A = 0.765674 |
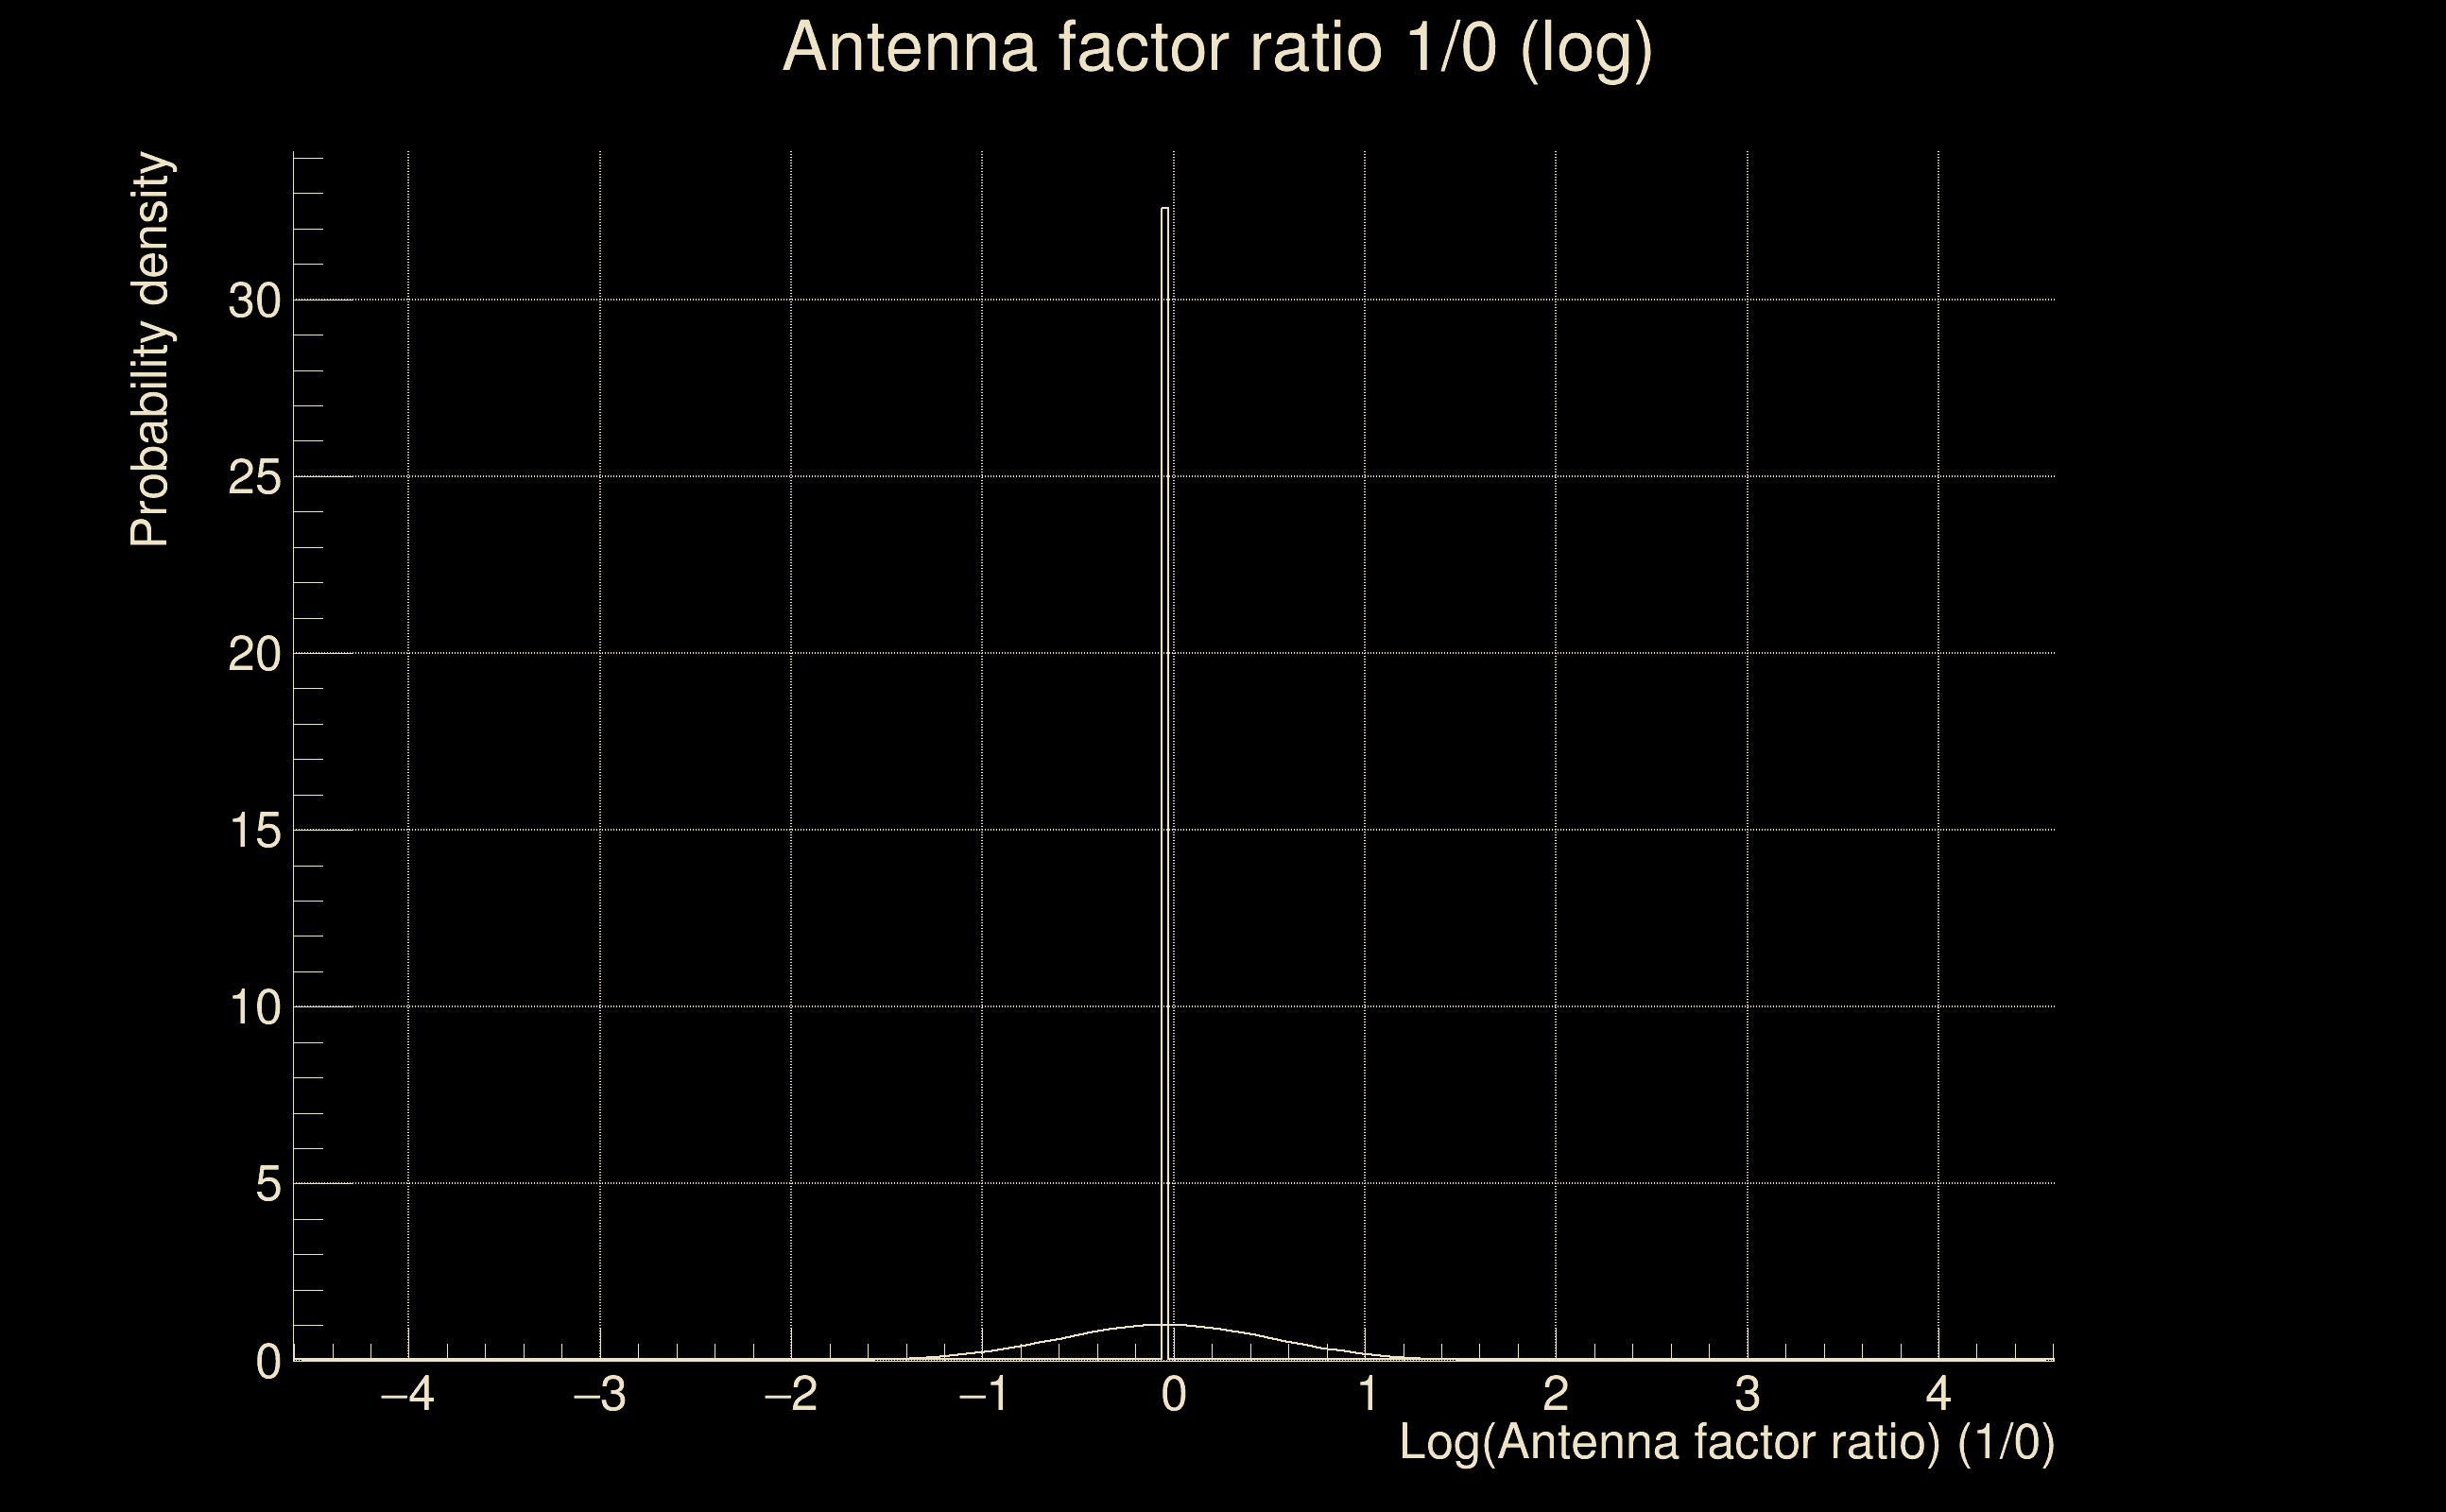
| Log of amplitude ratio (L1/H1): | -0.0389467, variance = 0.157794 (L1/H1: -0.067174, variance = 0.311393, H1/L1: 0.017062, variance = 0.310142) |
| Amplitude ratio (L1/H1): | 0.961802 ⋇ 1.4877 (L1/H1: 0.935033 ⋇ 1.74722, H1/L1: 1.01721 ⋇ 1.74526) |
| Amplitude ratio H1|L1 compatibility (probability): | 0.949318 |
| Antenna factor probability: | 0.995753 |
| Number of rejected frequency rows: | Q0: 0 / 18, Q1: 1 / 36, Q2: 1 / 70, Q3: 12 / 134, Q4: 49 / 258 |
| Maximum signal-to-noise ratio: | H1: 63.7812, L1: 72.4363 |
| SNR variance: | H1: 0.5009, L1: 0.523846 |
| Click here for a zoomed plot | Click here for a zoomed plot | Click here for a zoomed plot | Click here for a zoomed plot | Click here for a zoomed plot |
 |
 |
 |
 |
 |
 |
 |
 |
 |
 |
 |
 |
 |
 |
 |
 |
 |
 |
 |
 |
 |
 |
 |
 |
 |
 |
 |
 |
 |
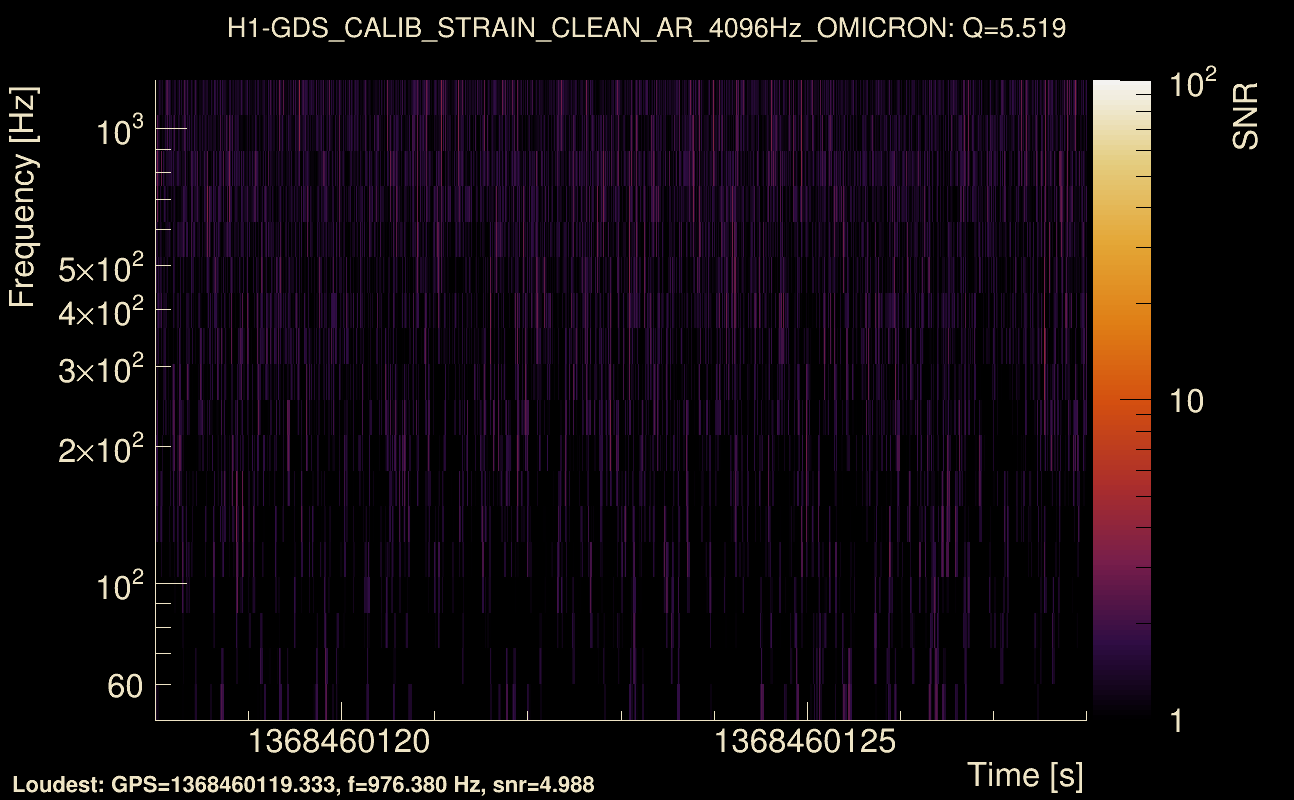
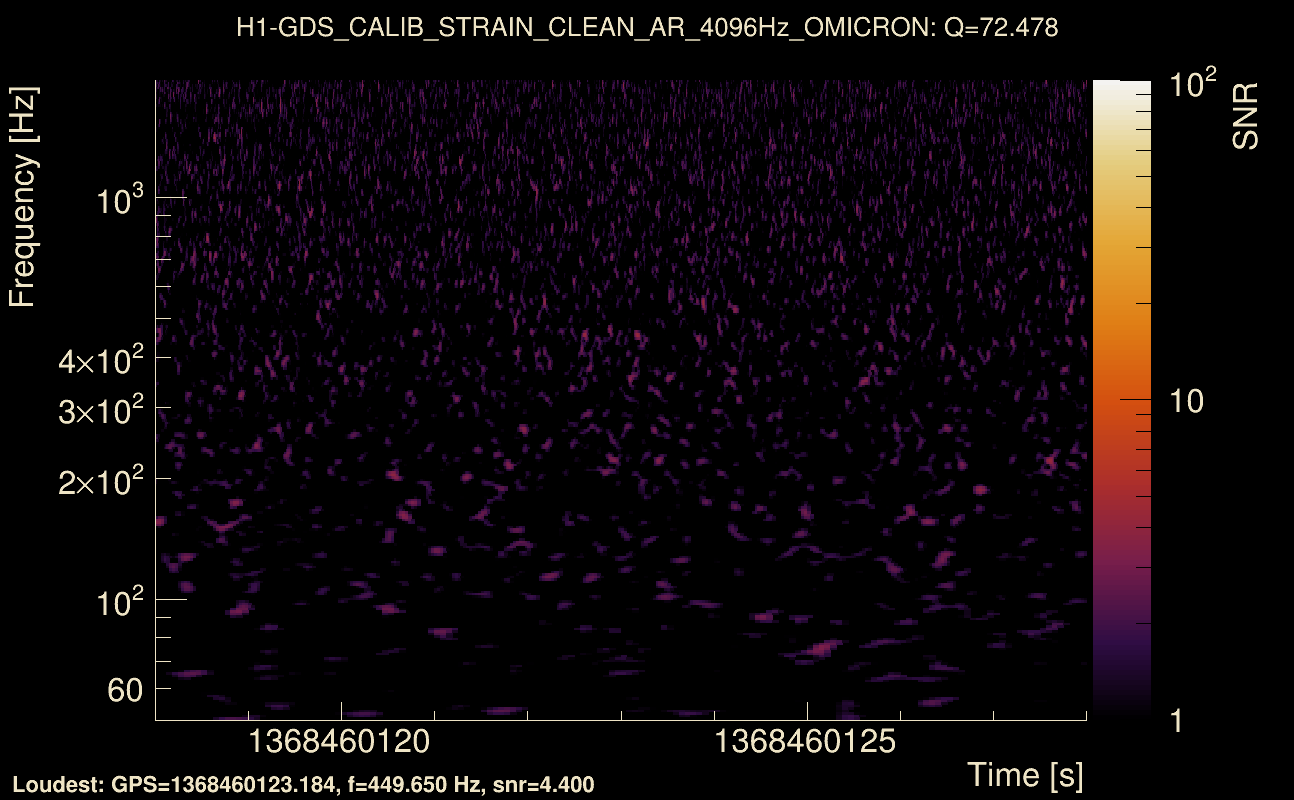
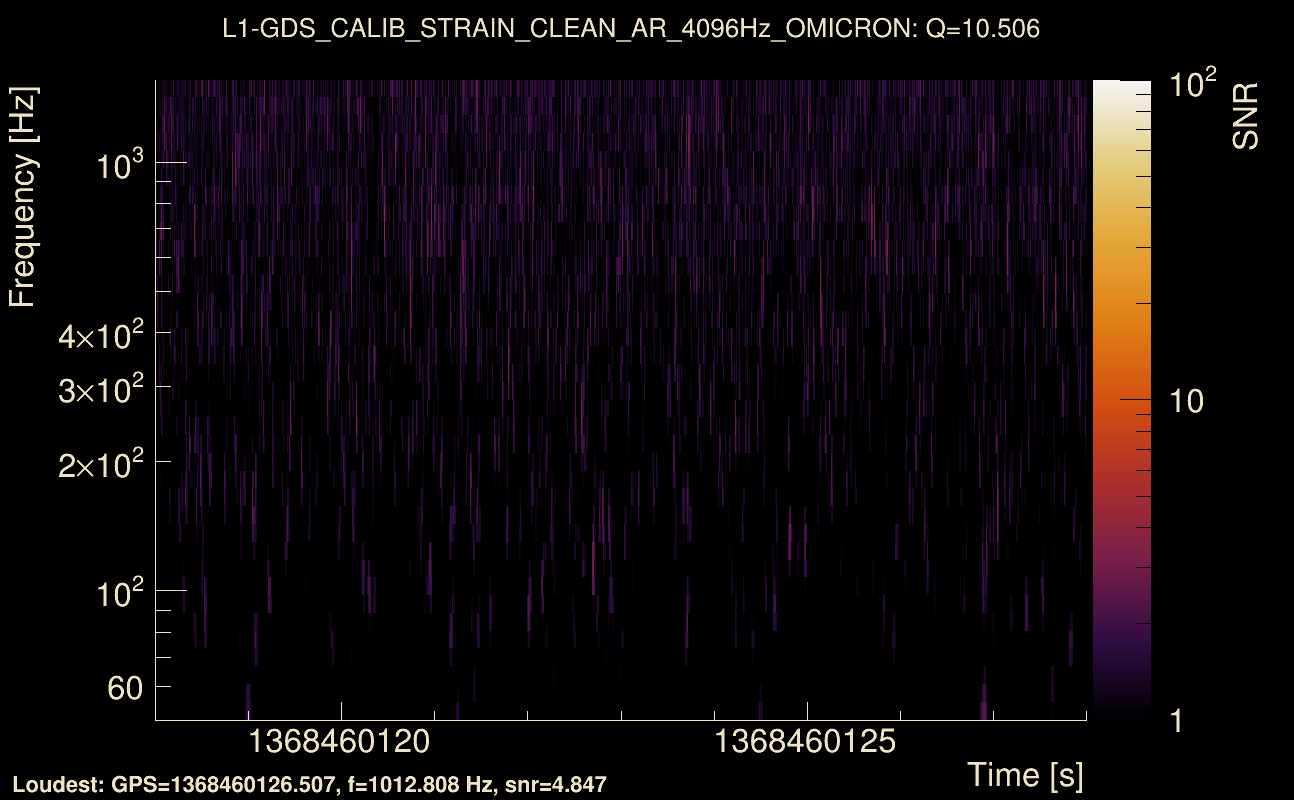
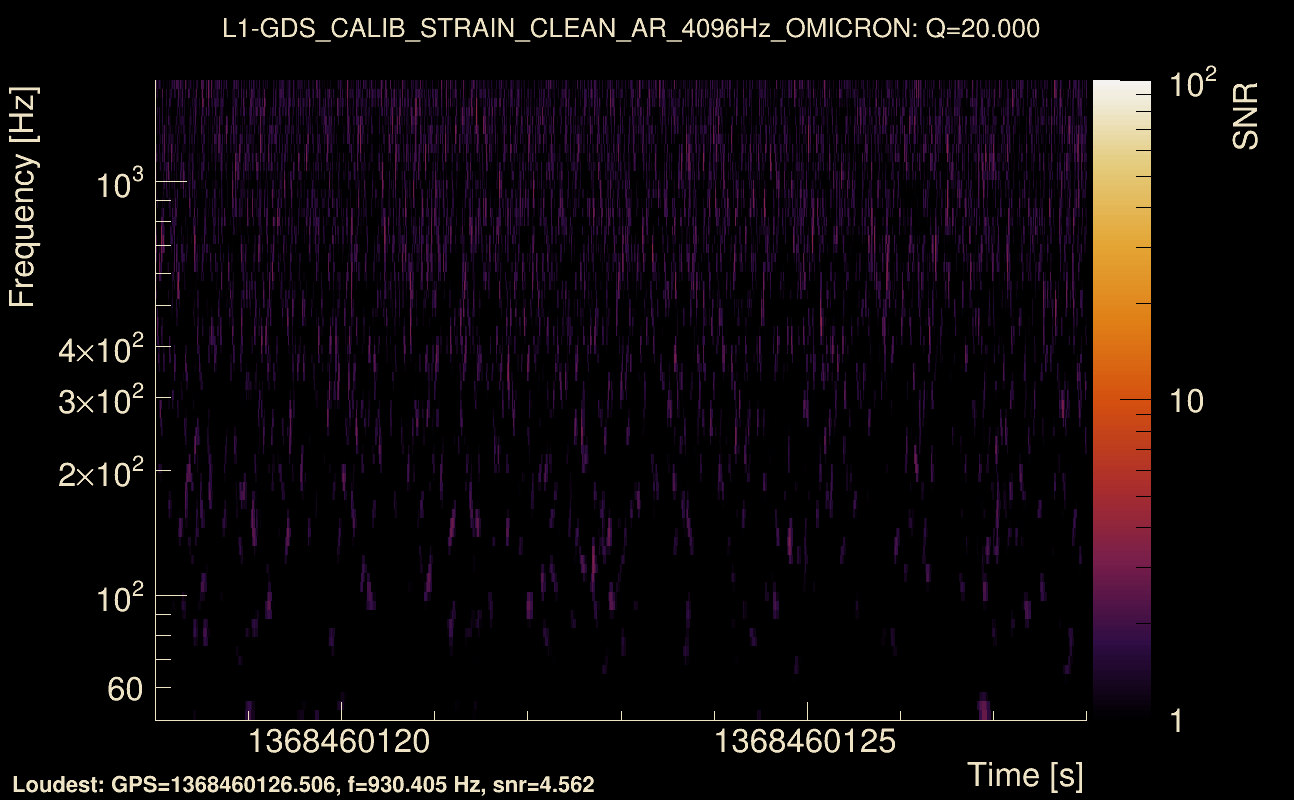
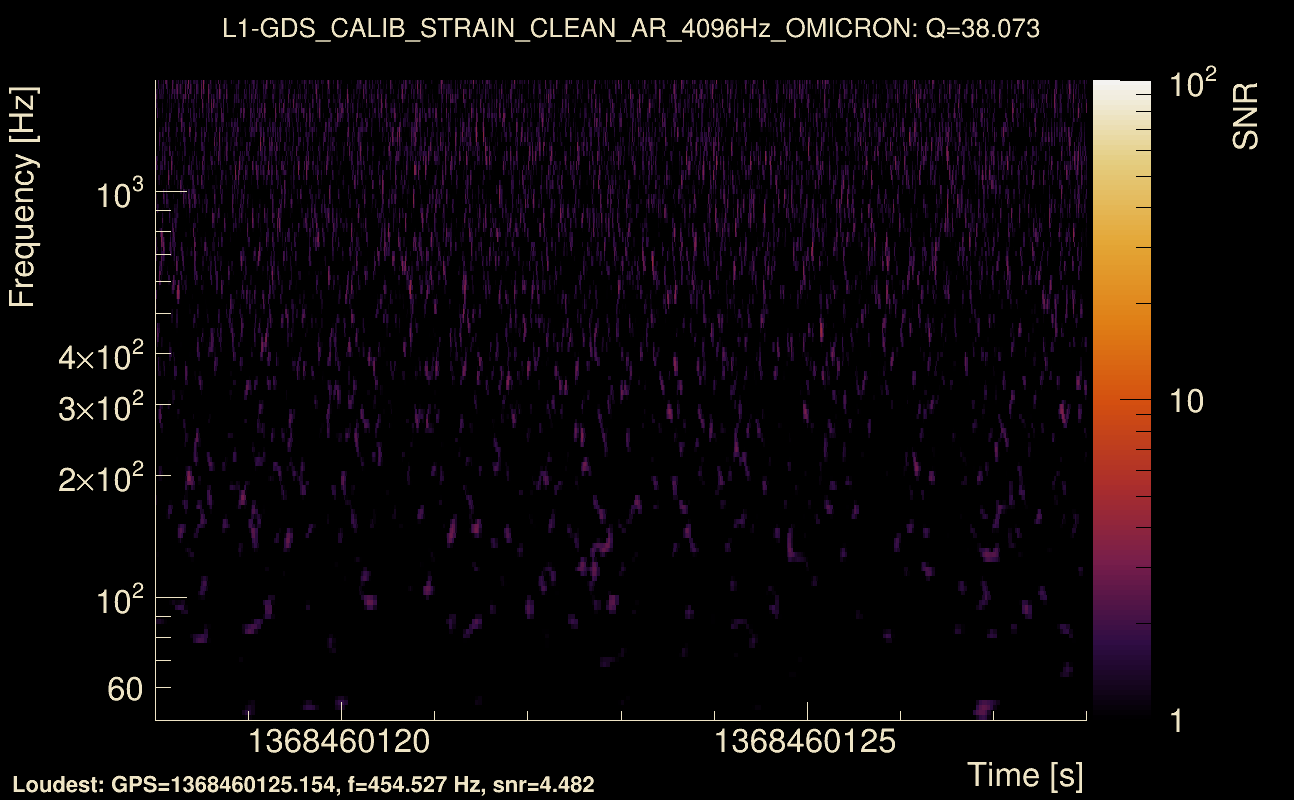
| Event time t(H1): | GPS = 1368460118 (Thu May 18 15:48:20 2023 ) → GPS = 1368460128 (Thu May 18 15:48:30 2023 ) |
| Event time t(L1): | GPS = 1368460118 (Thu May 18 15:48:30 2023 ) → GPS = 1368460128 (Thu May 18 15:48:30 2023 ) |
| Omicron analysis time window (H1): | GPS = 1368460115 → GPS = 1368460131 |
| Omicron analysis time window (L1): | GPS = 1368460115 → GPS = 1368460131 |
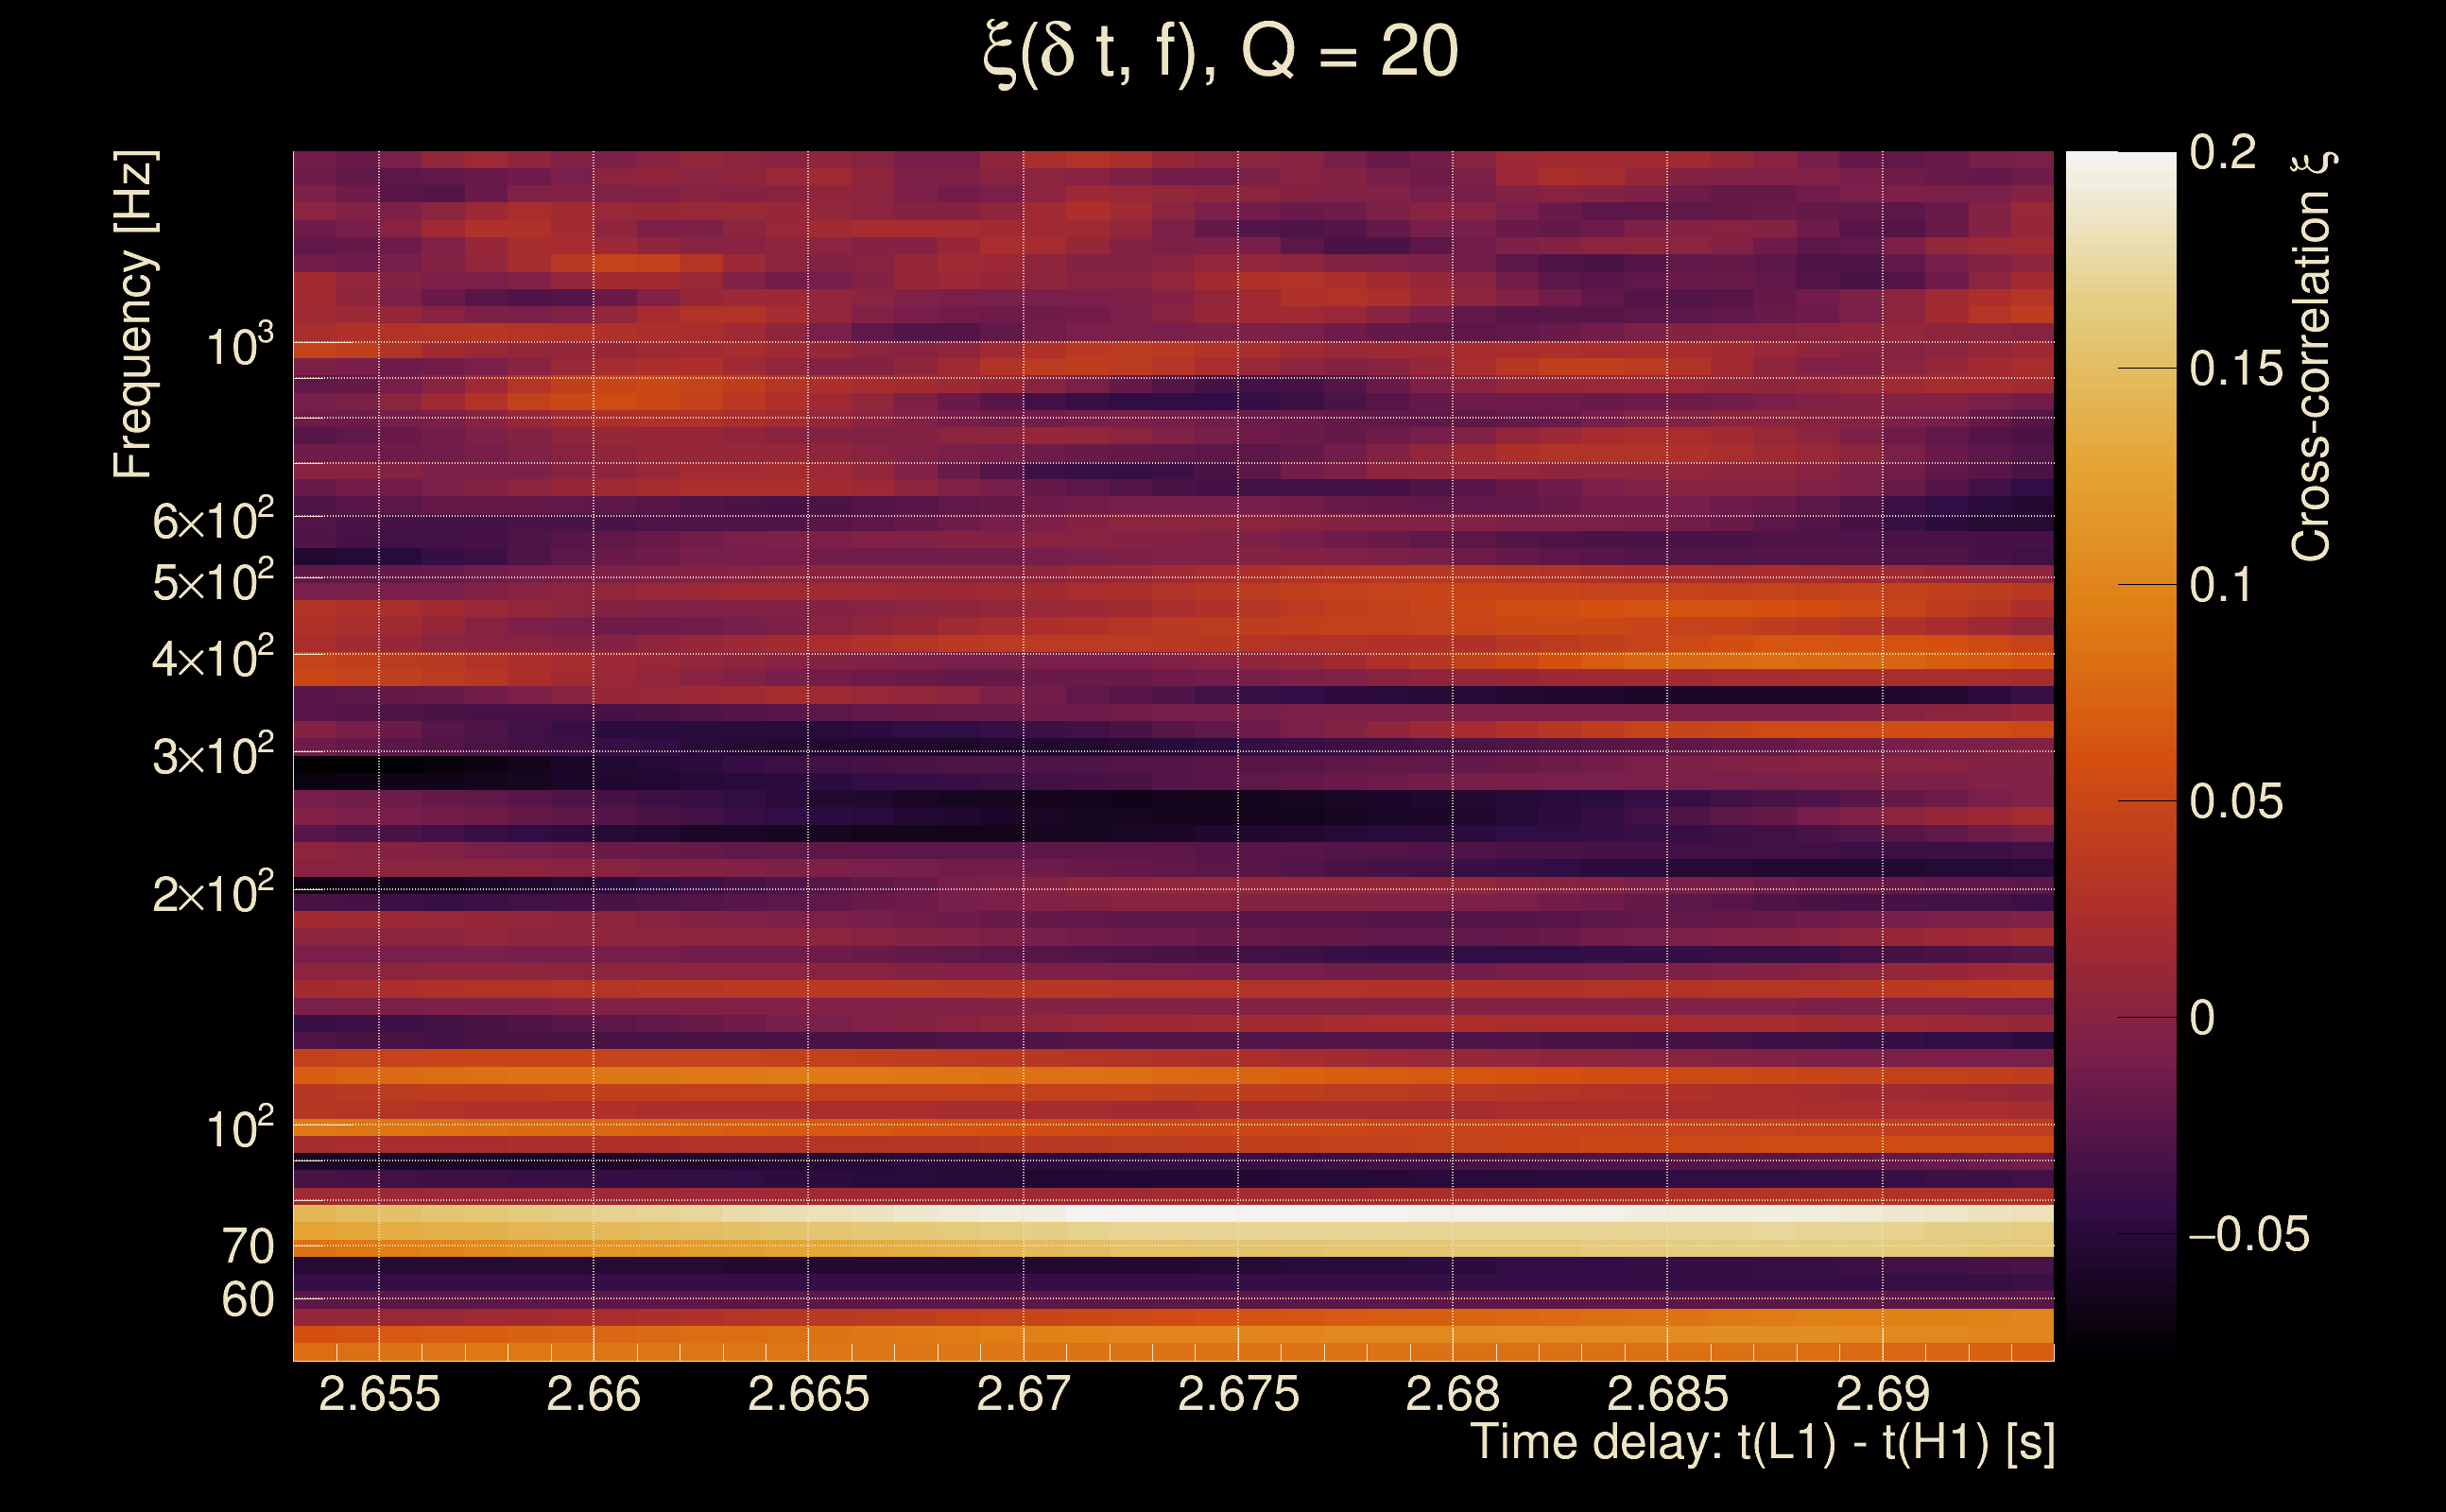
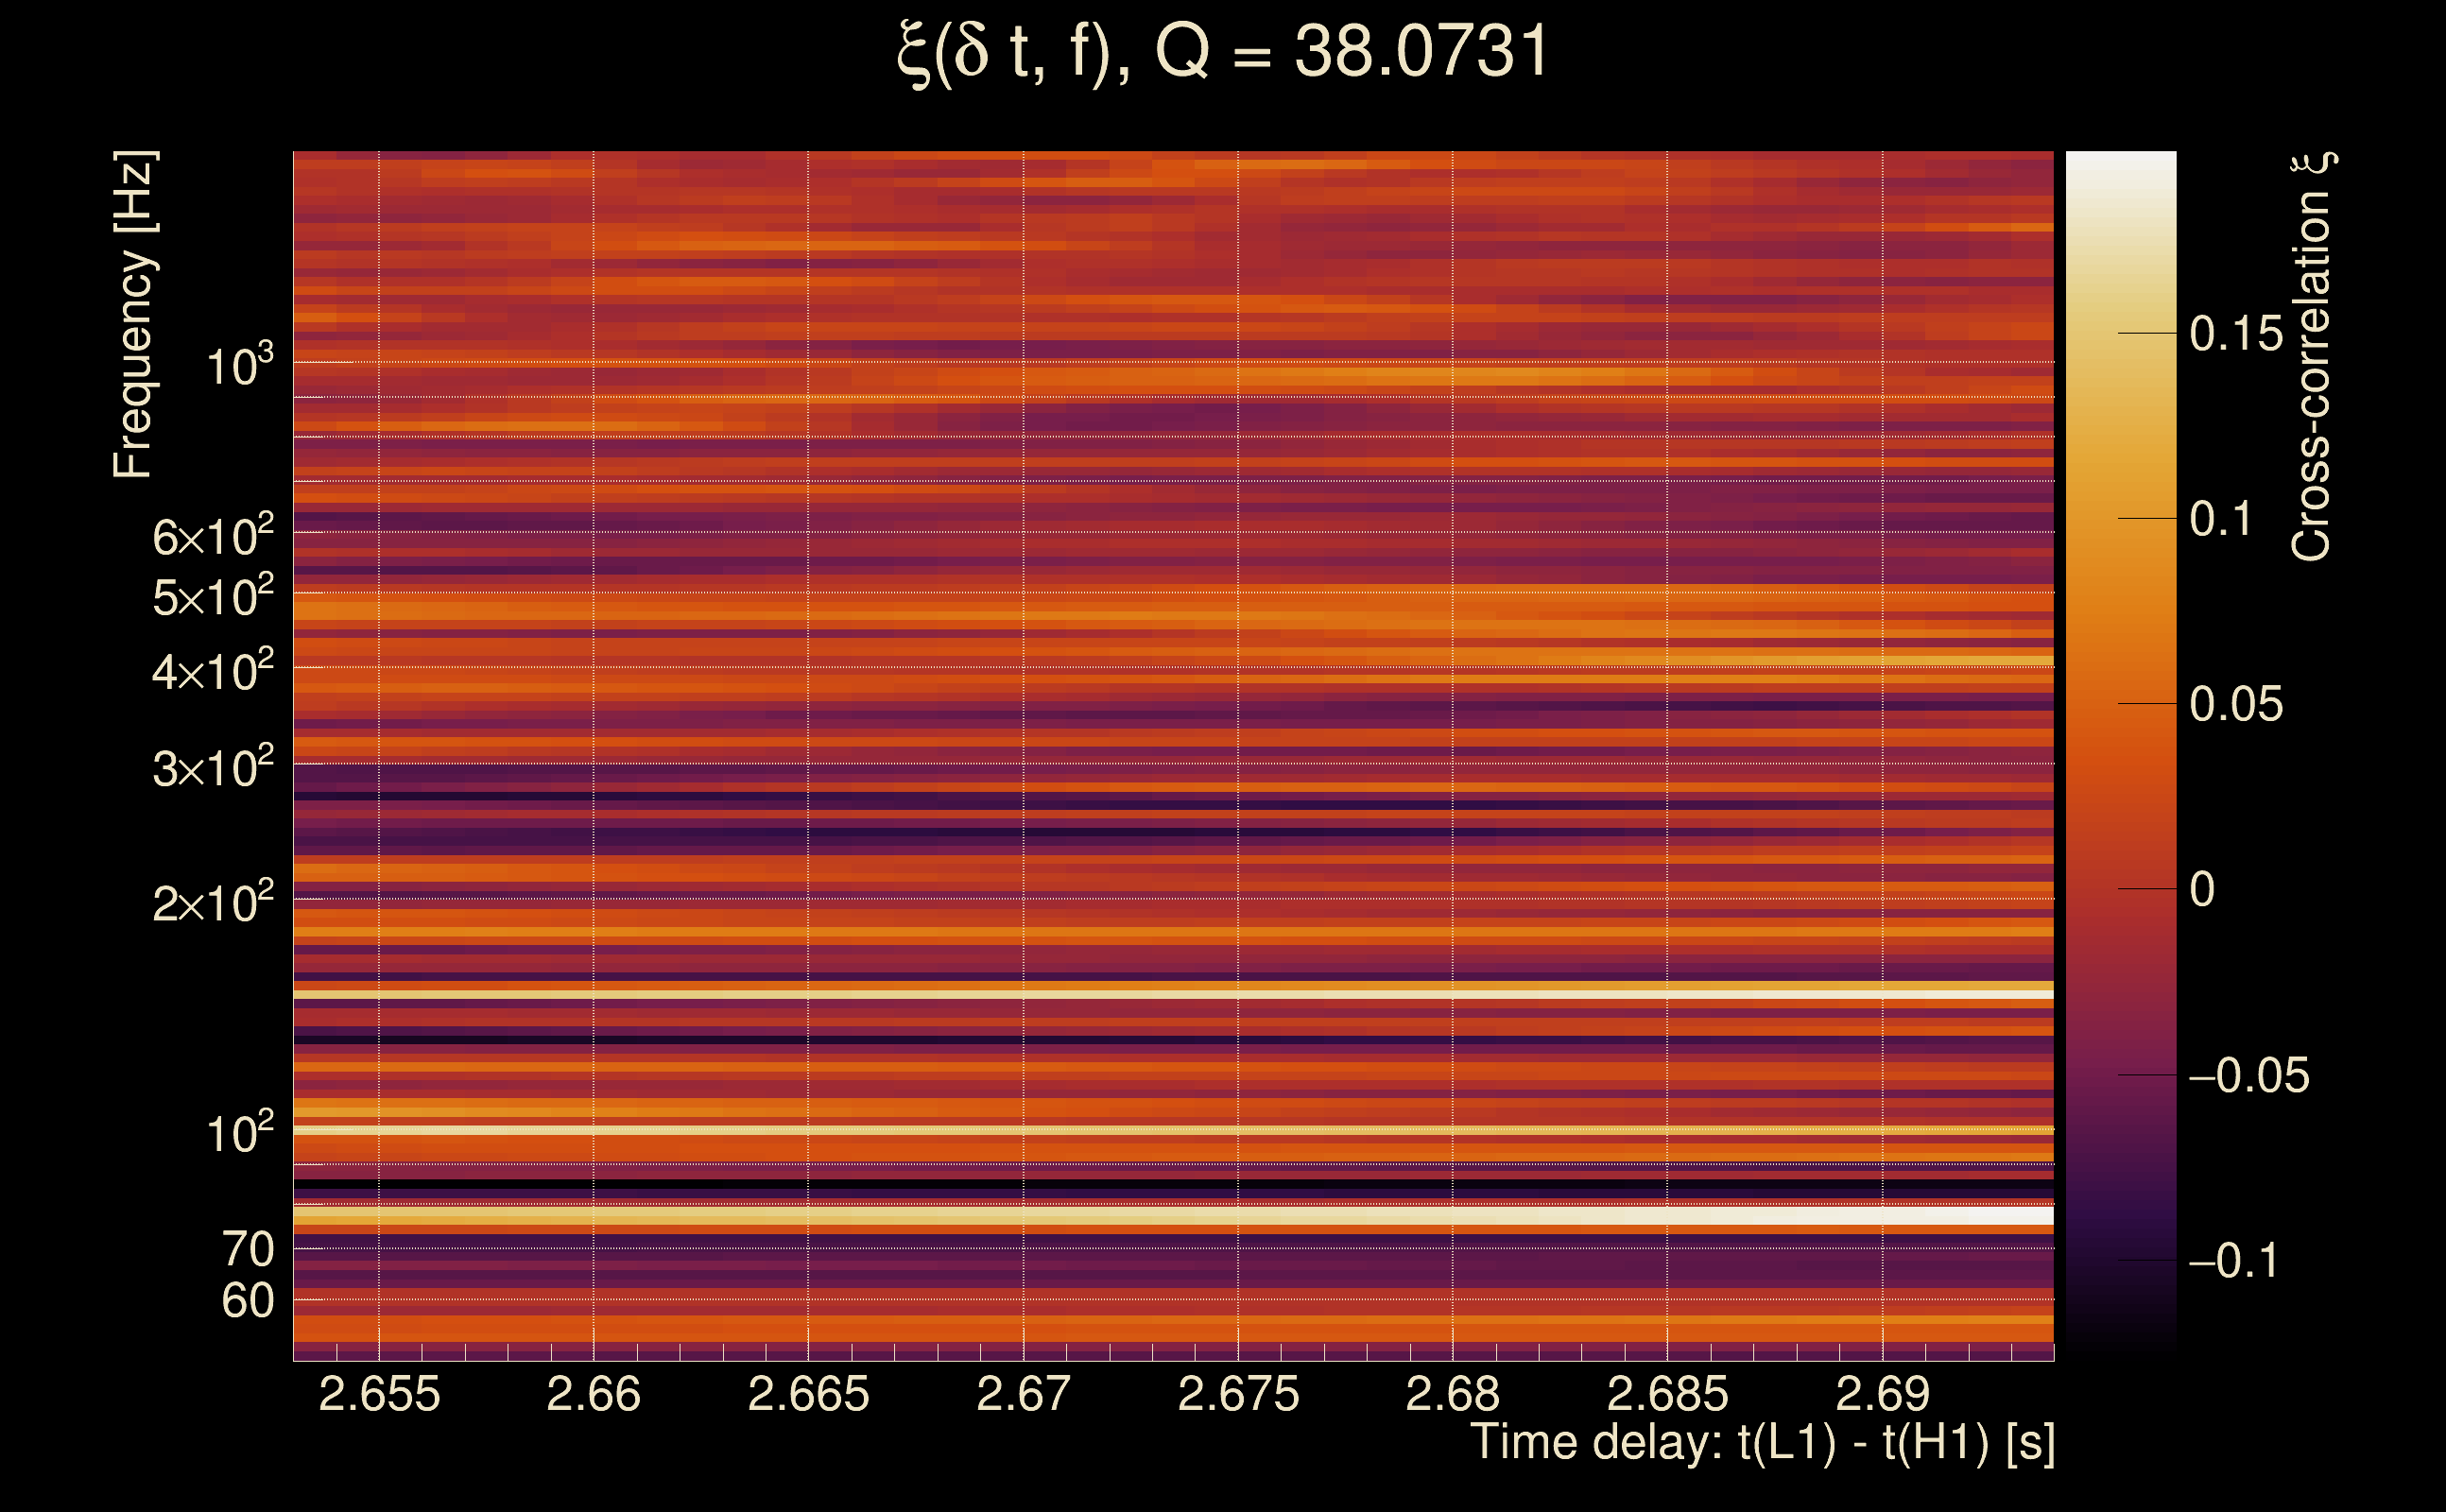
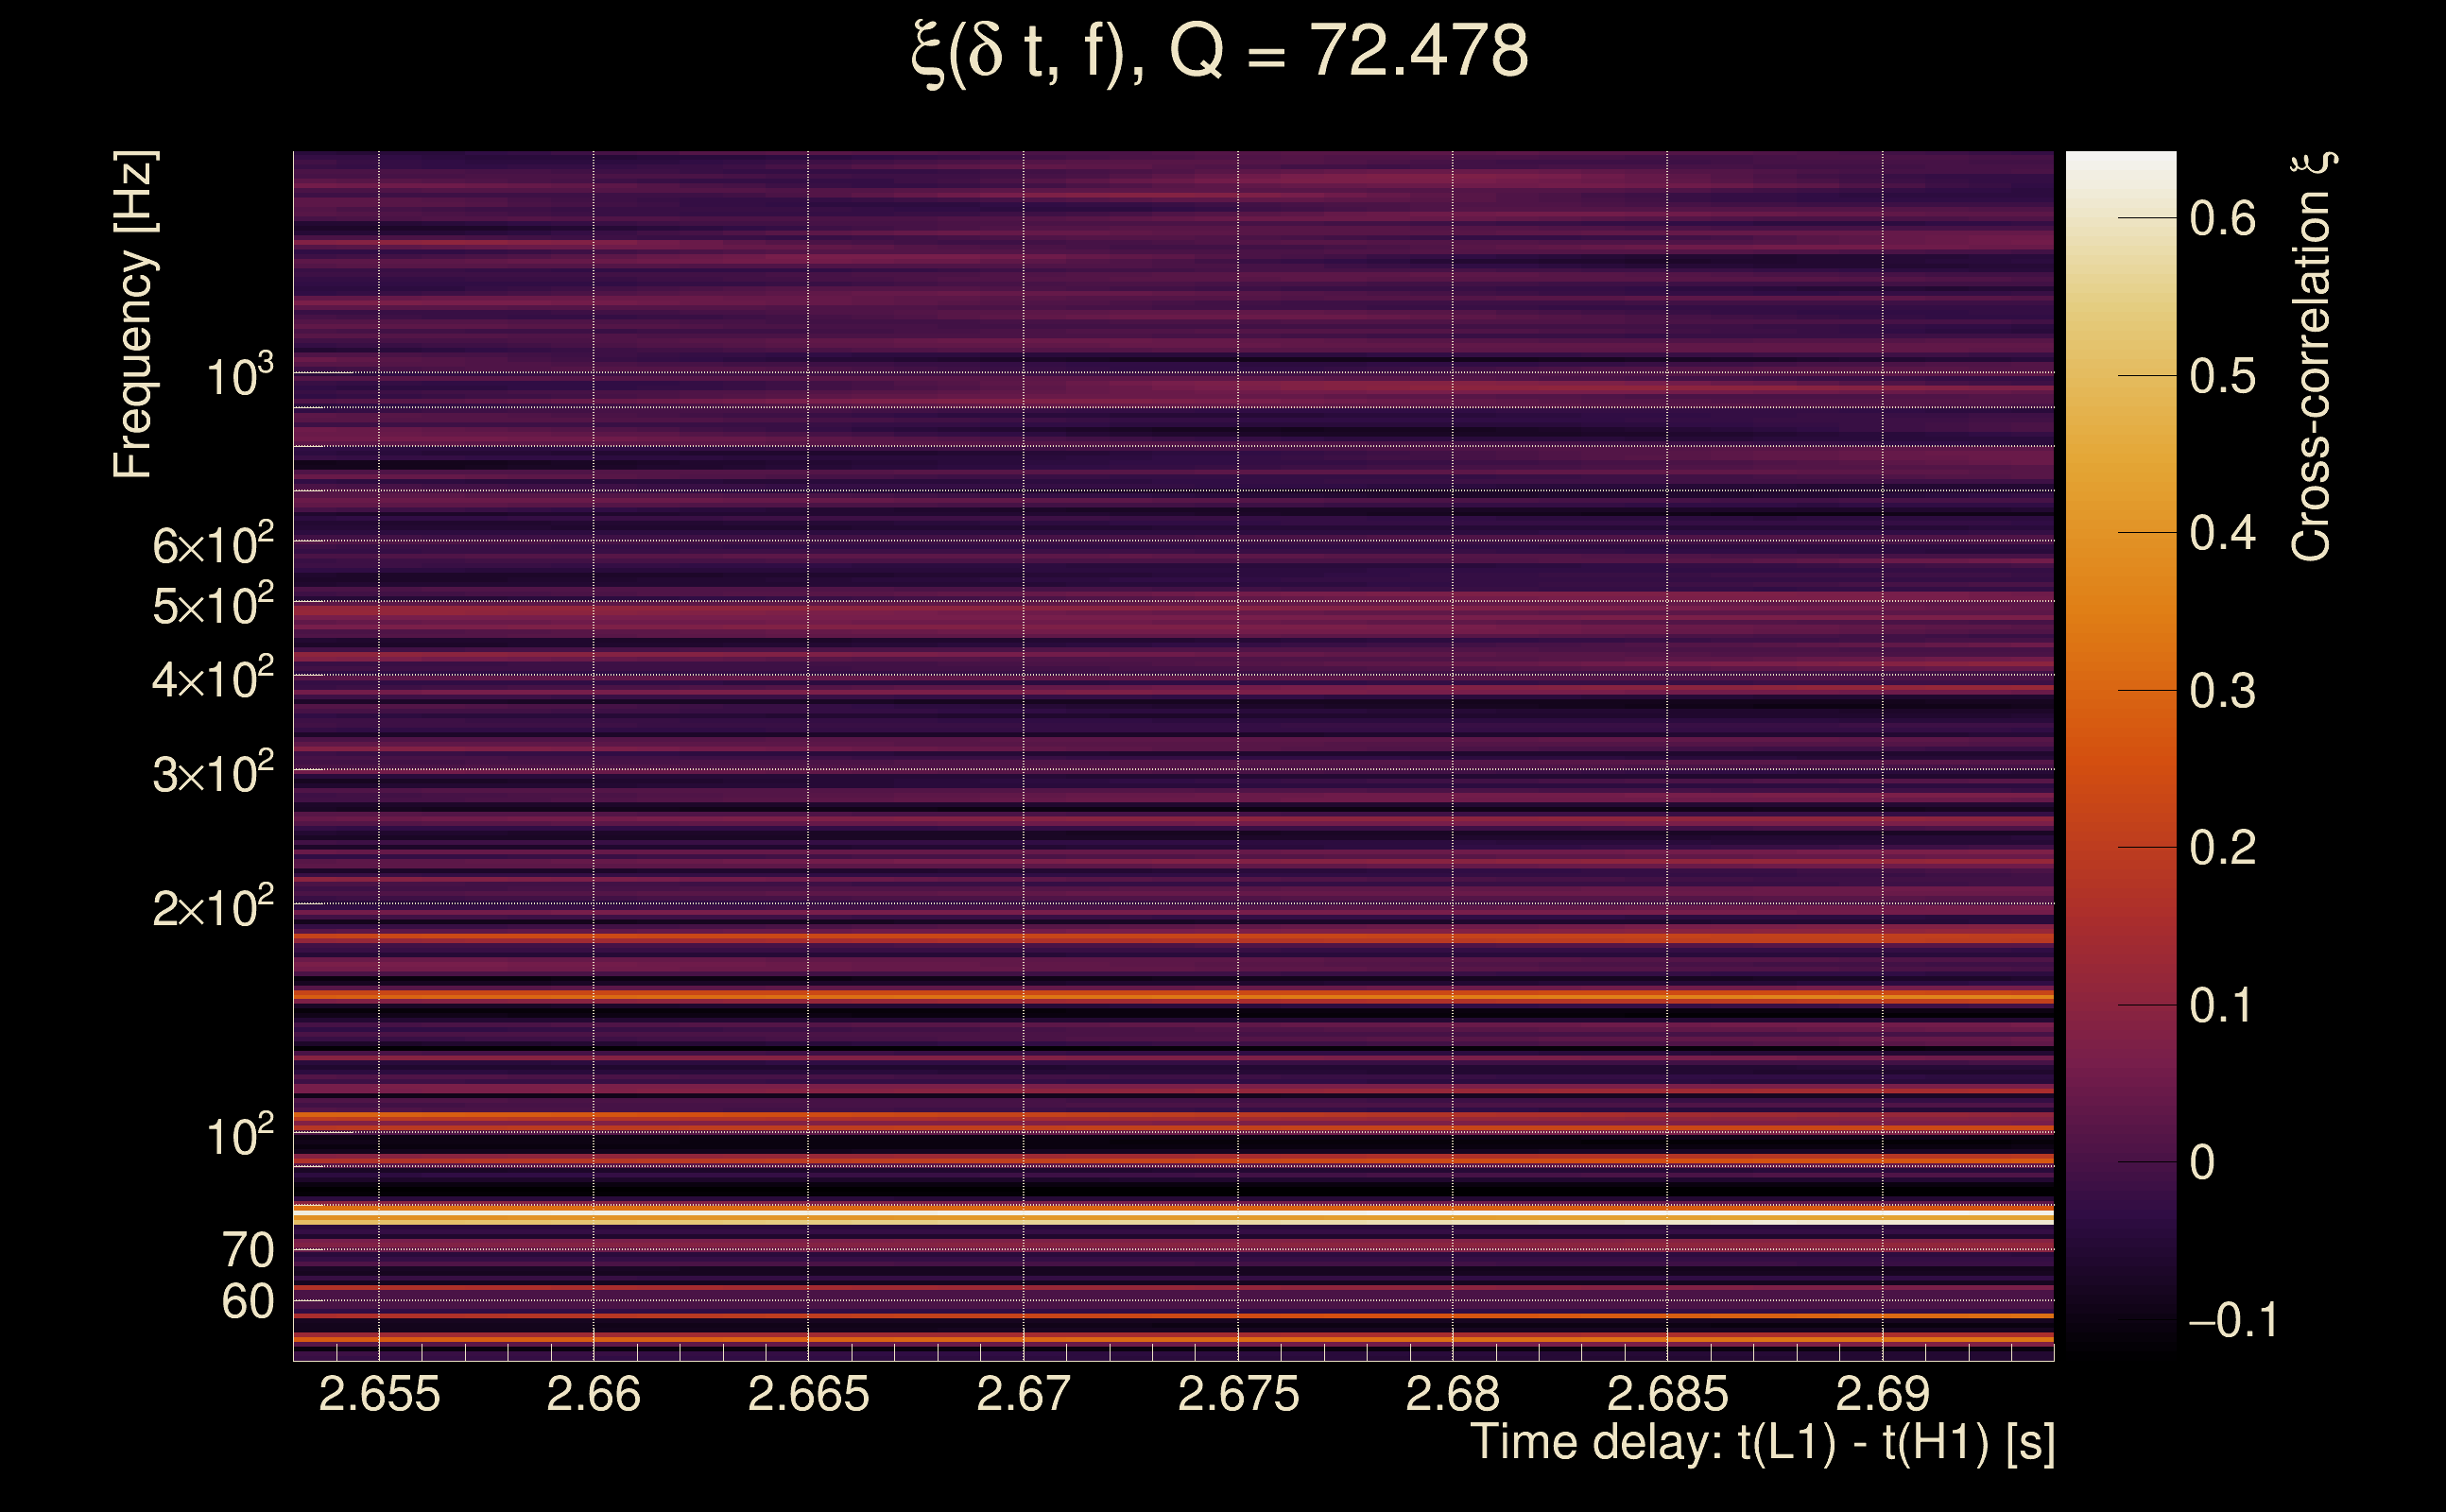
| Time delay between detectors t(L1) - t(H1): | 2.67393 s (slice index = 50 / 217), δt_gw = 0.00593393 s |
| Time delay standard deviation: | 0.0779564 s |
| [targeted mode] Time delay probability: | 0.799103 (0.254508 sigmas), δt_target = 0.000849247 s |
| Frequency: | 94.2731 Hz |
| Ξ: | 0.0166064 ± 0.0296999 (variance = 0.000882082): Q0: 0.0649747, Q1: 0.136482, Q2: 0.139328, Q3: 0.0809311, Q4: 0.11411 |
| Rank: | R_A = 0.00981721 |
| Log of amplitude ratio (L1/H1): | -0.00305922, variance = 0.548417 (L1/H1: -0.212139, variance = 0.943562, H1/L1: -0.172832, variance = 1.19149) |
| Amplitude ratio (L1/H1): | 0.996945 ⋇ 2.09709 (L1/H1: 0.808852 ⋇ 2.64156, H1/L1: 0.841279 ⋇ 2.9789) |
| Amplitude ratio H1|L1 compatibility (probability): | 0.792192 |
| Antenna factor probability: | 0.933856 |
| Number of rejected frequency rows: | Q0: 14 / 18, Q1: 29 / 36, Q2: 61 / 70, Q3: 132 / 134, Q4: 255 / 258 |
| Maximum signal-to-noise ratio: | H1: 5.1331, L1: 5.59647 |
| SNR variance: | H1: 0.523482, L1: 0.522761 |
| Click here for a zoomed plot | Click here for a zoomed plot | Click here for a zoomed plot | Click here for a zoomed plot | Click here for a zoomed plot |
 |
 |
 |
 |
 |
 |
 |
 |
 |
 |
 |
 |
 |
 |
 |
 |
 |
 |
 |
 |
 |
 |
 |
 |
 |
 |
 |
 |
 |
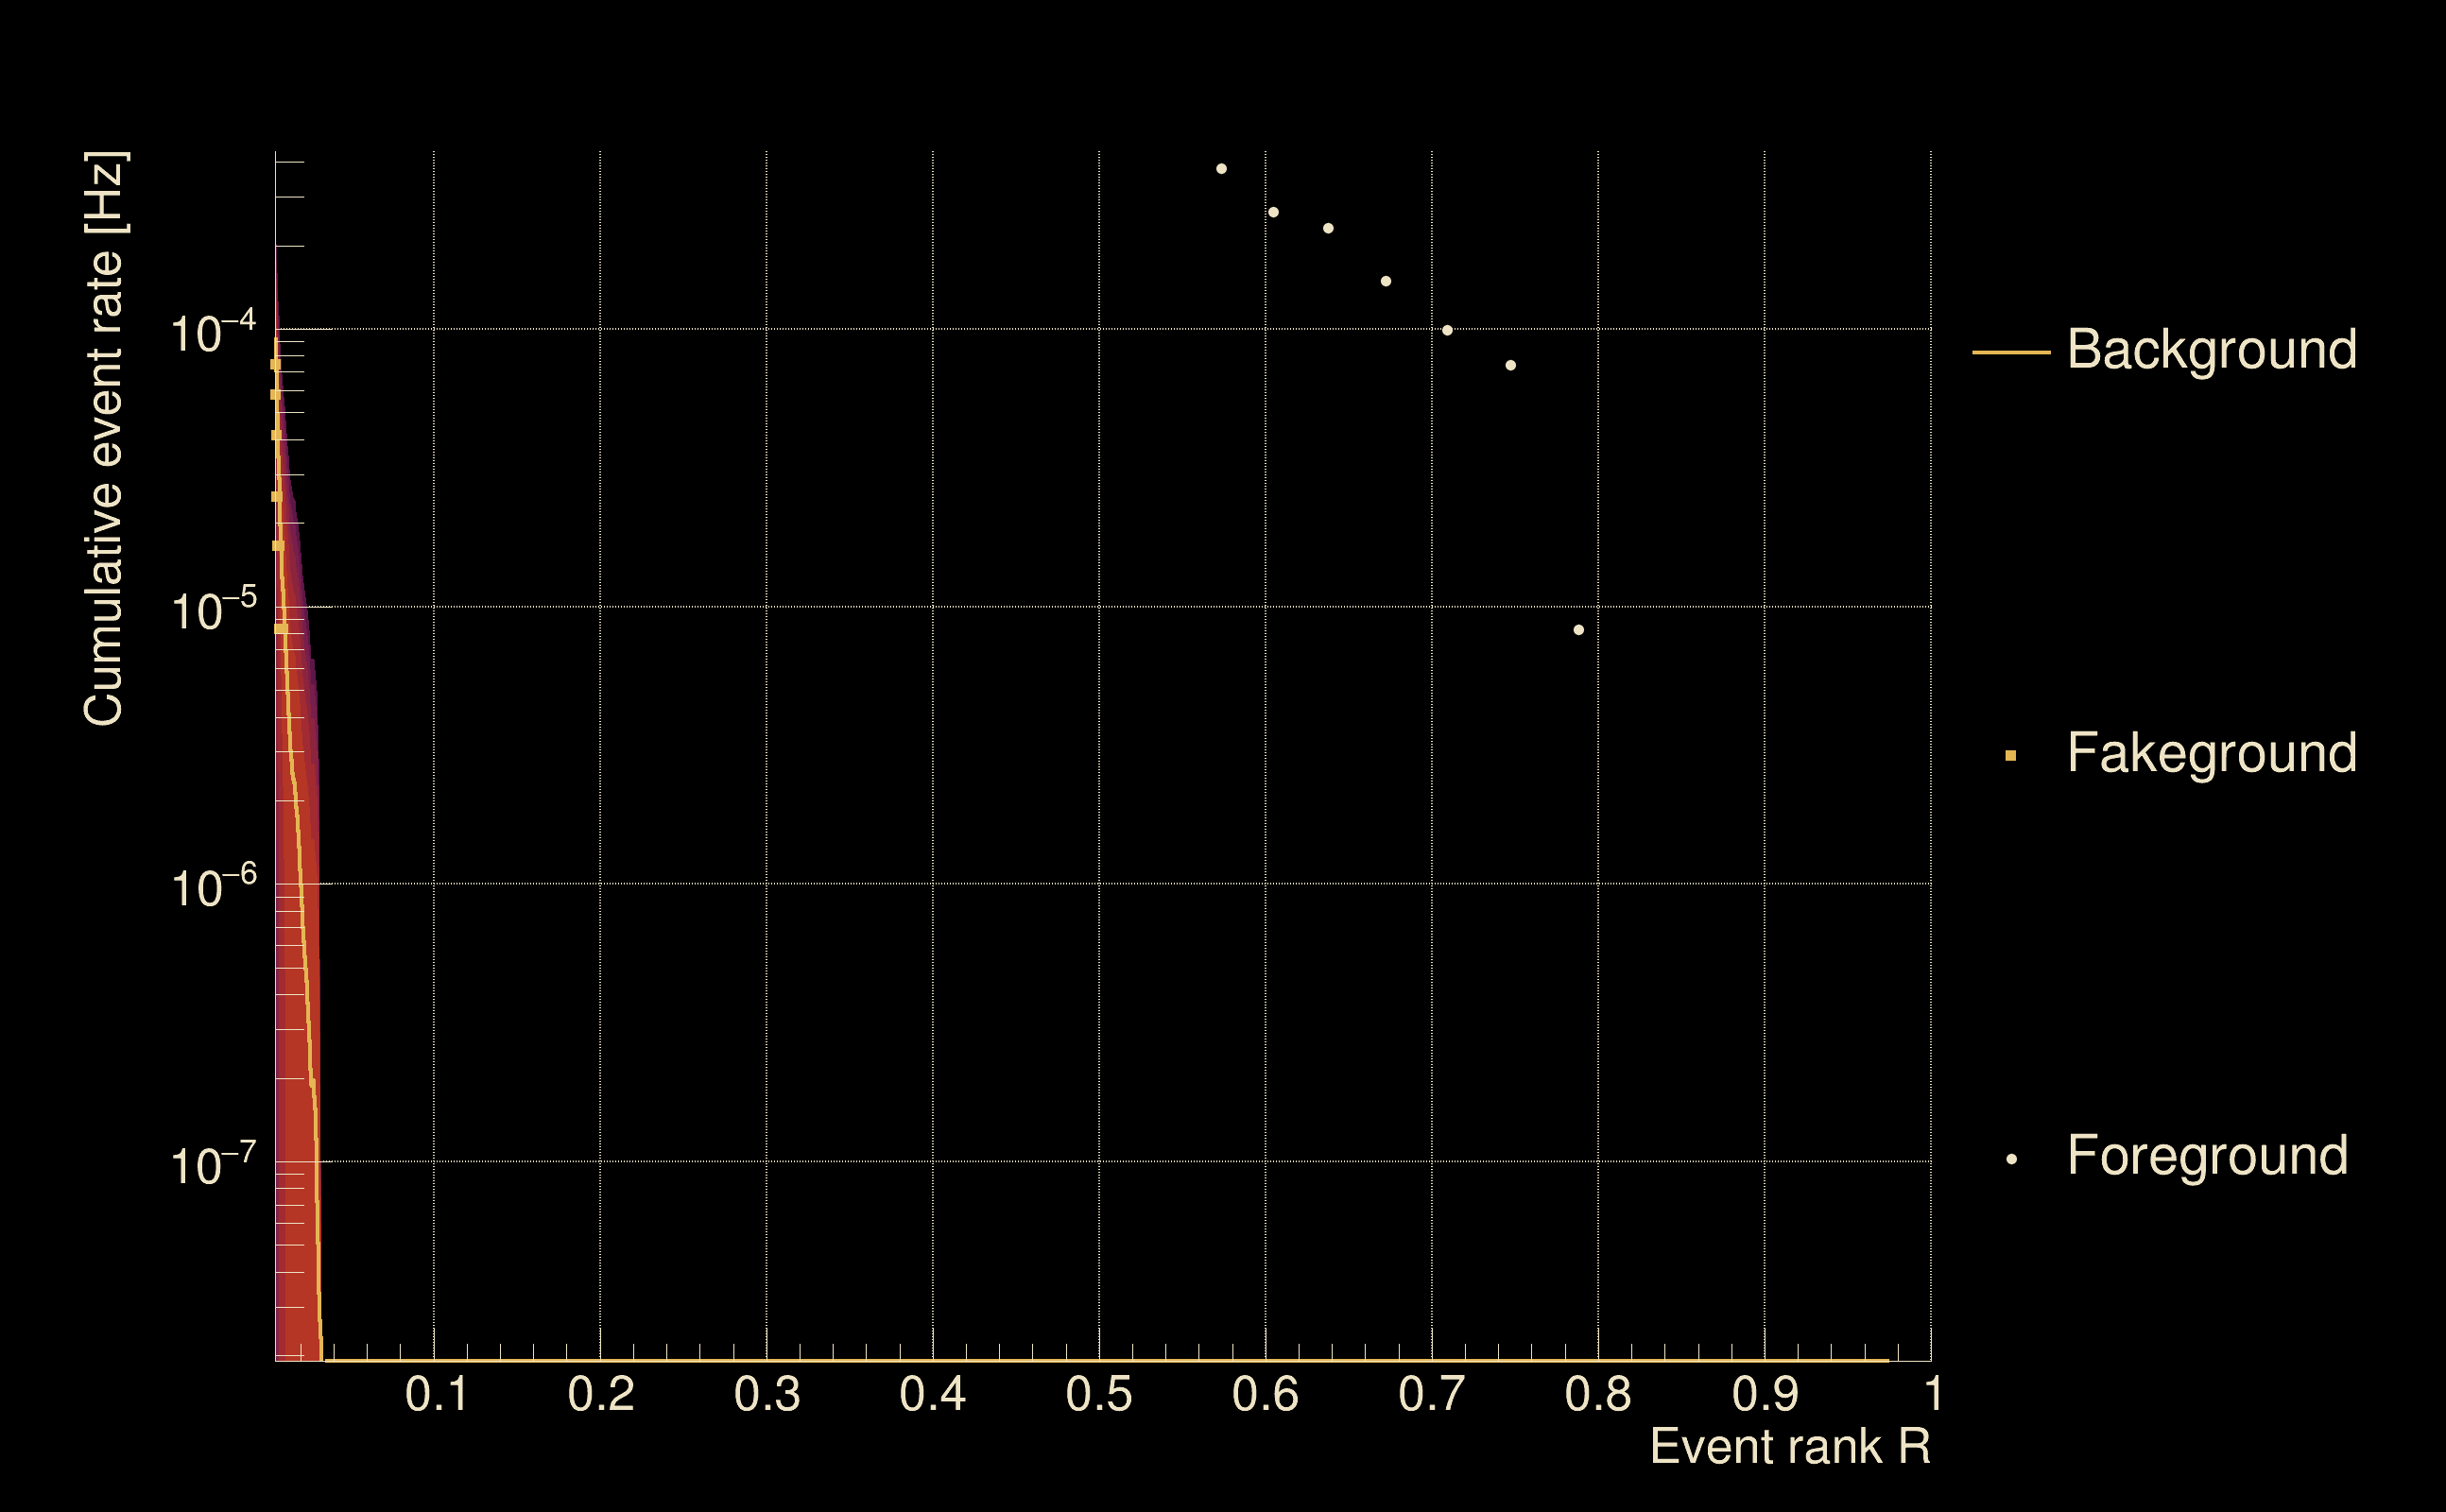
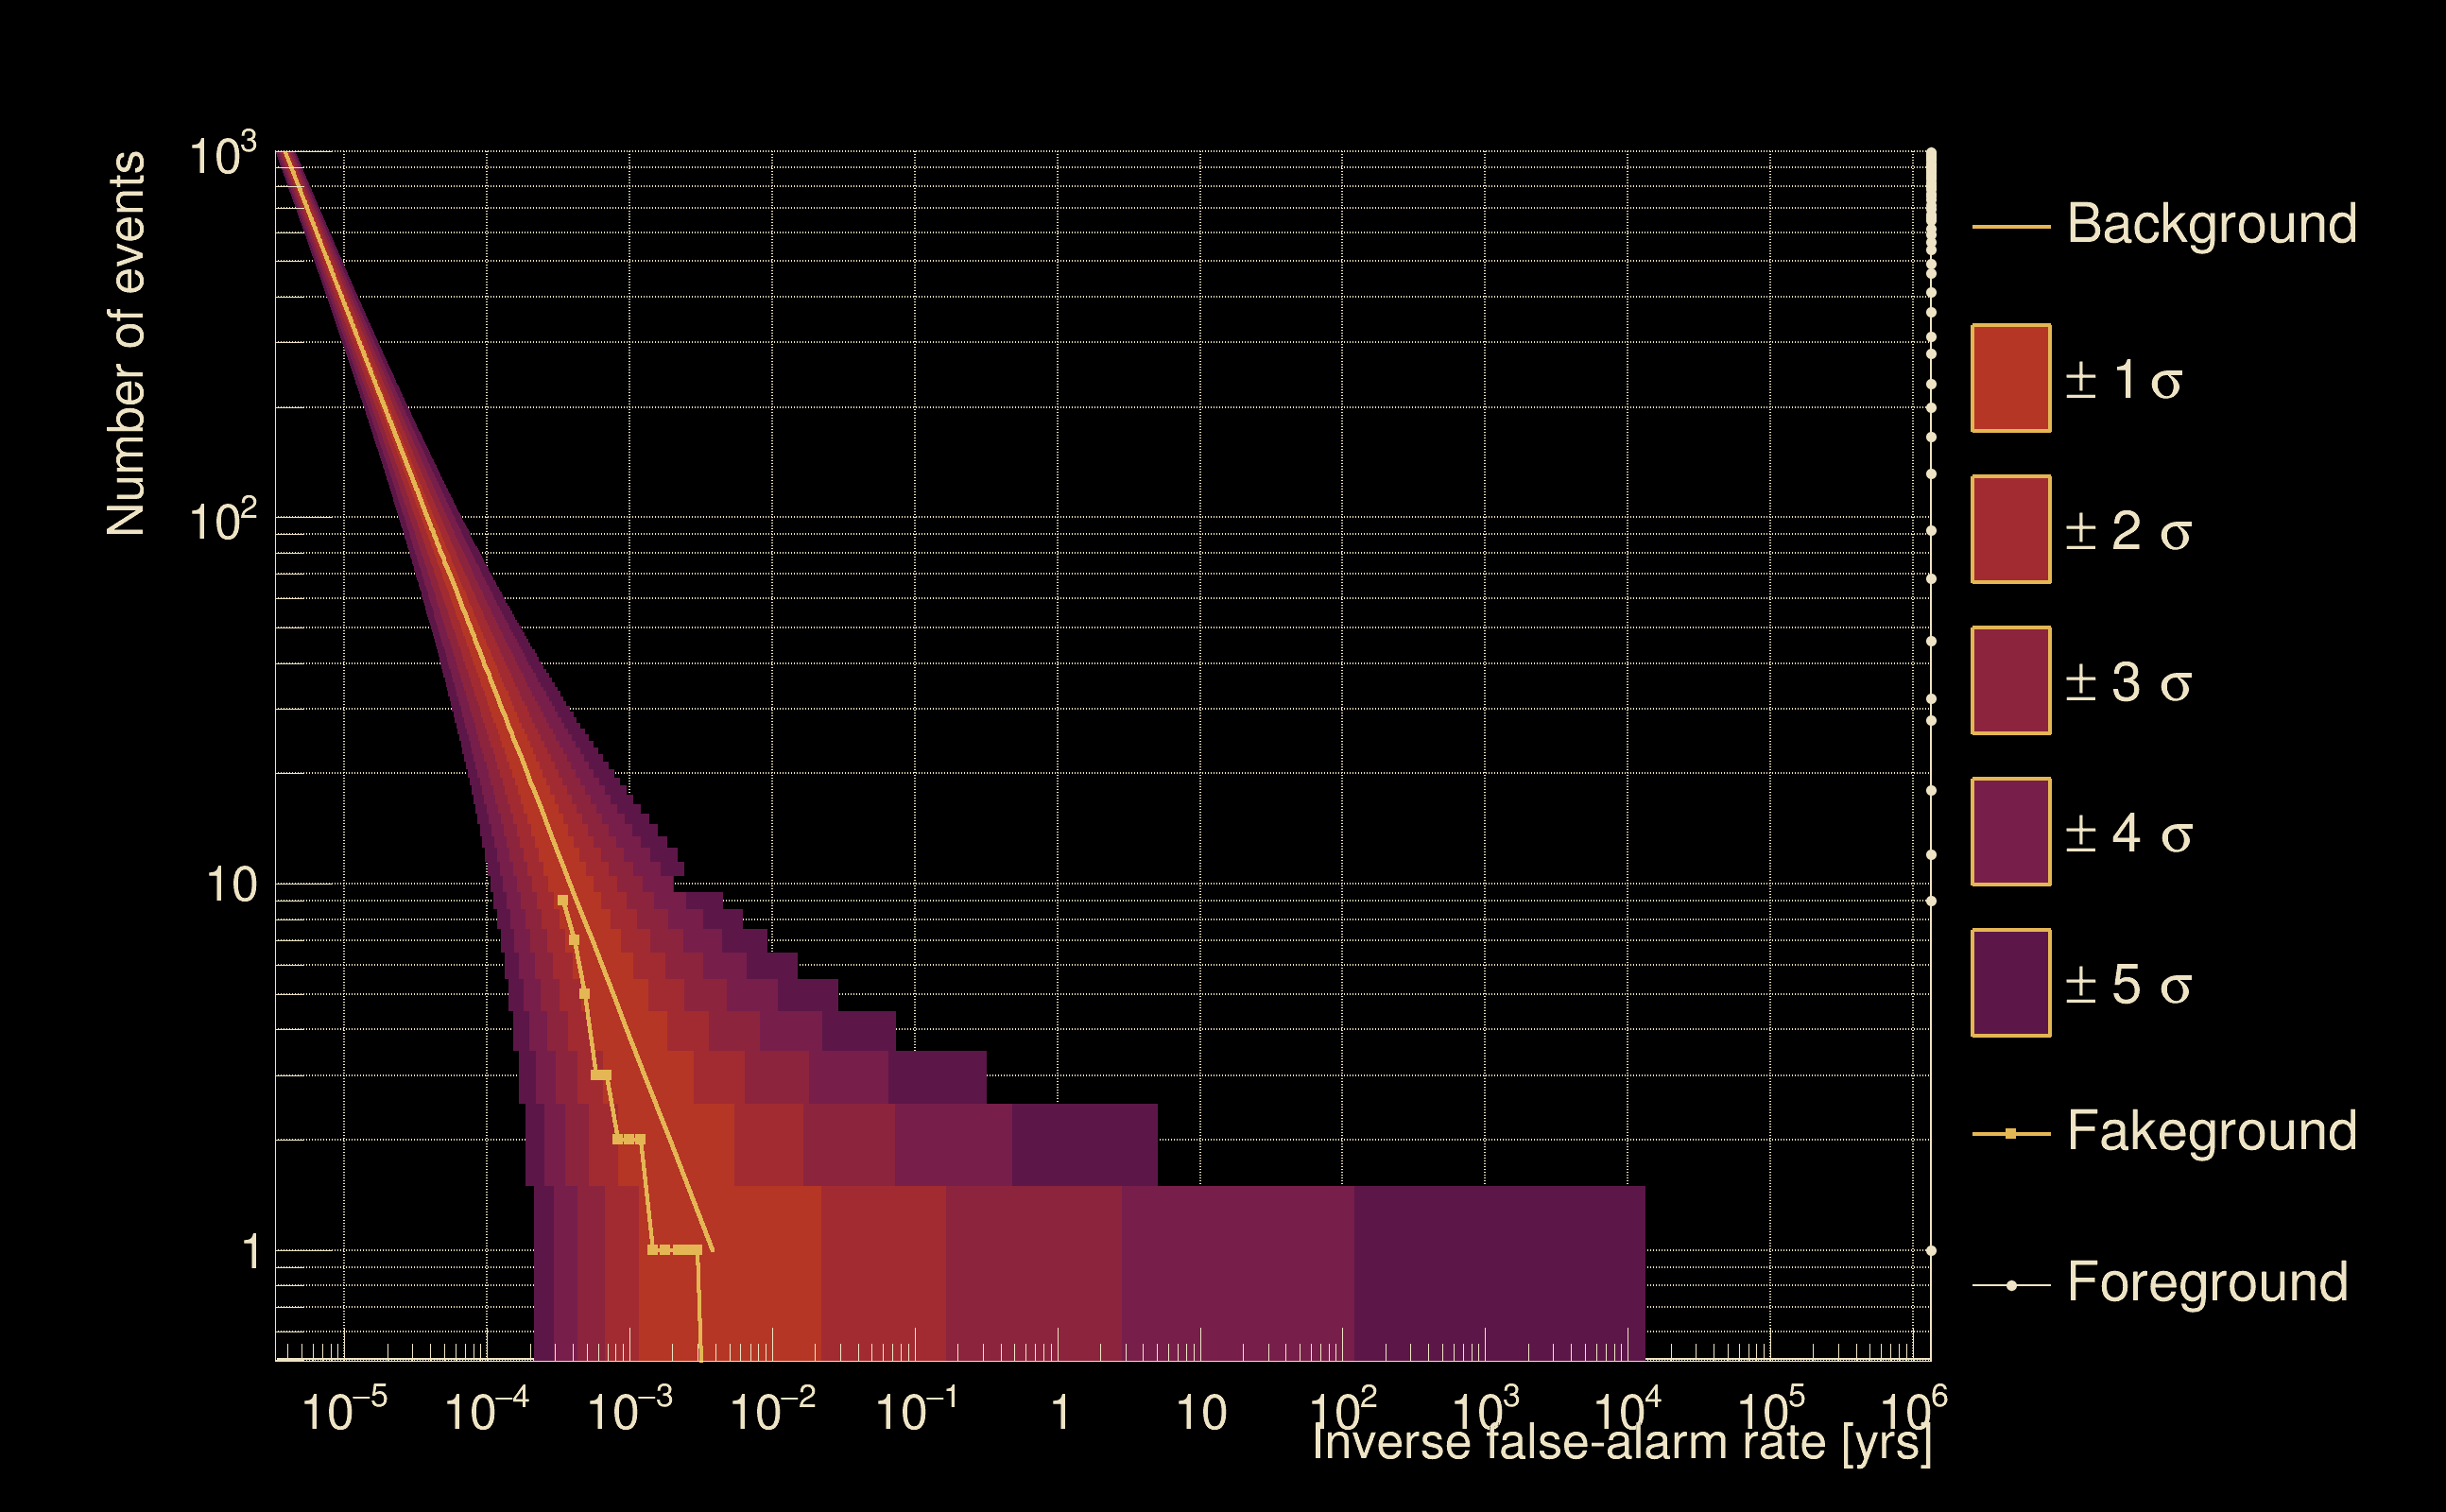
| Detection threshold: | R > 0.0314201 |
| False-alarm rate above that detection threshold: | 1.21064e-08 |
| Alternative threshold at 1/1000 yrs: | R > 0.0311156 |
| Alternative threshold at 1/100 yrs: | R > 0.0311156 |
| Alternative threshold at 1/10 yrs: | R > 0.0311156 |
| Alternative threshold at 1/1 yr: | R > 0.0311156 |
| Alternative threshold at 1/1 d: | R > 0.00920766 |
 |
|
 |
 |
 |
 |
 |
 |
 |
 |
 |
 |
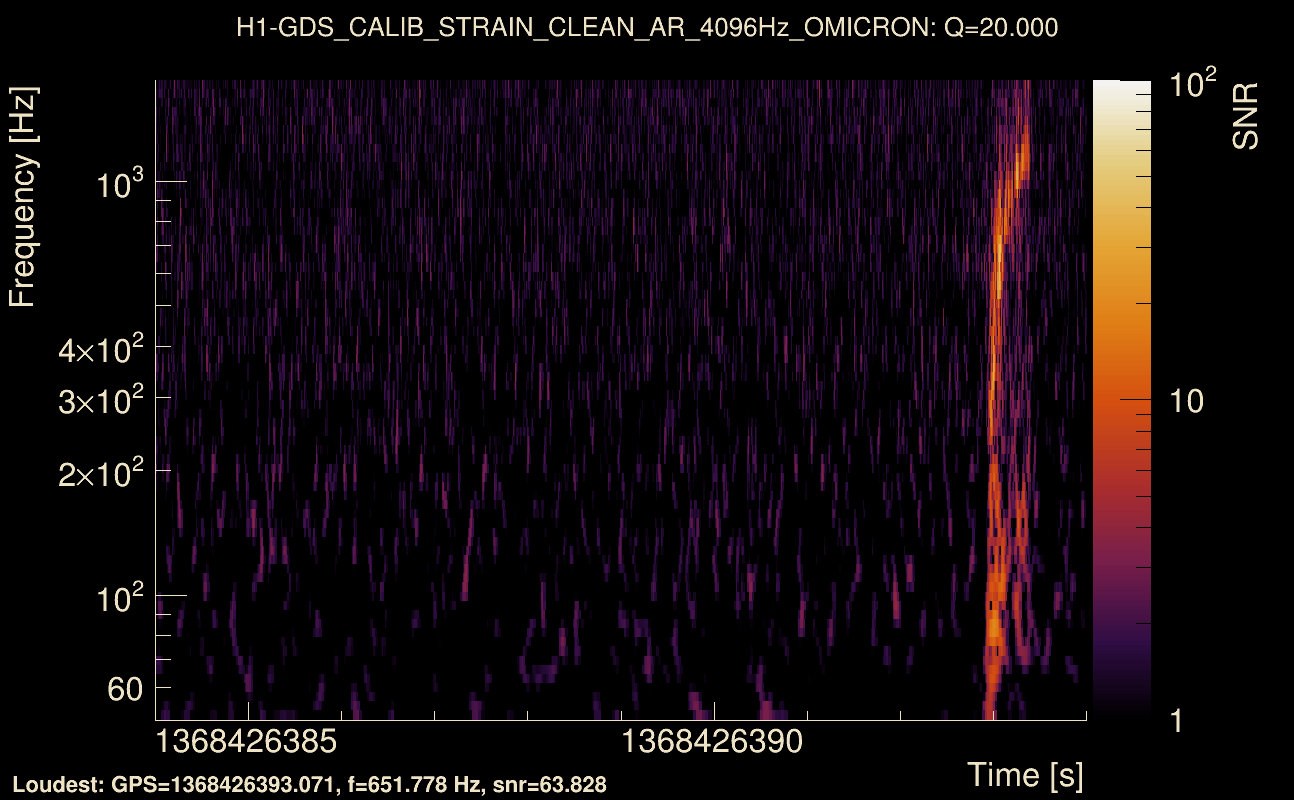
| Event time t(H1): | GPS = 1368426384 (Thu May 18 06:26:06 2023 ) → GPS = 1368426394 (Thu May 18 06:26:16 2023 ) |
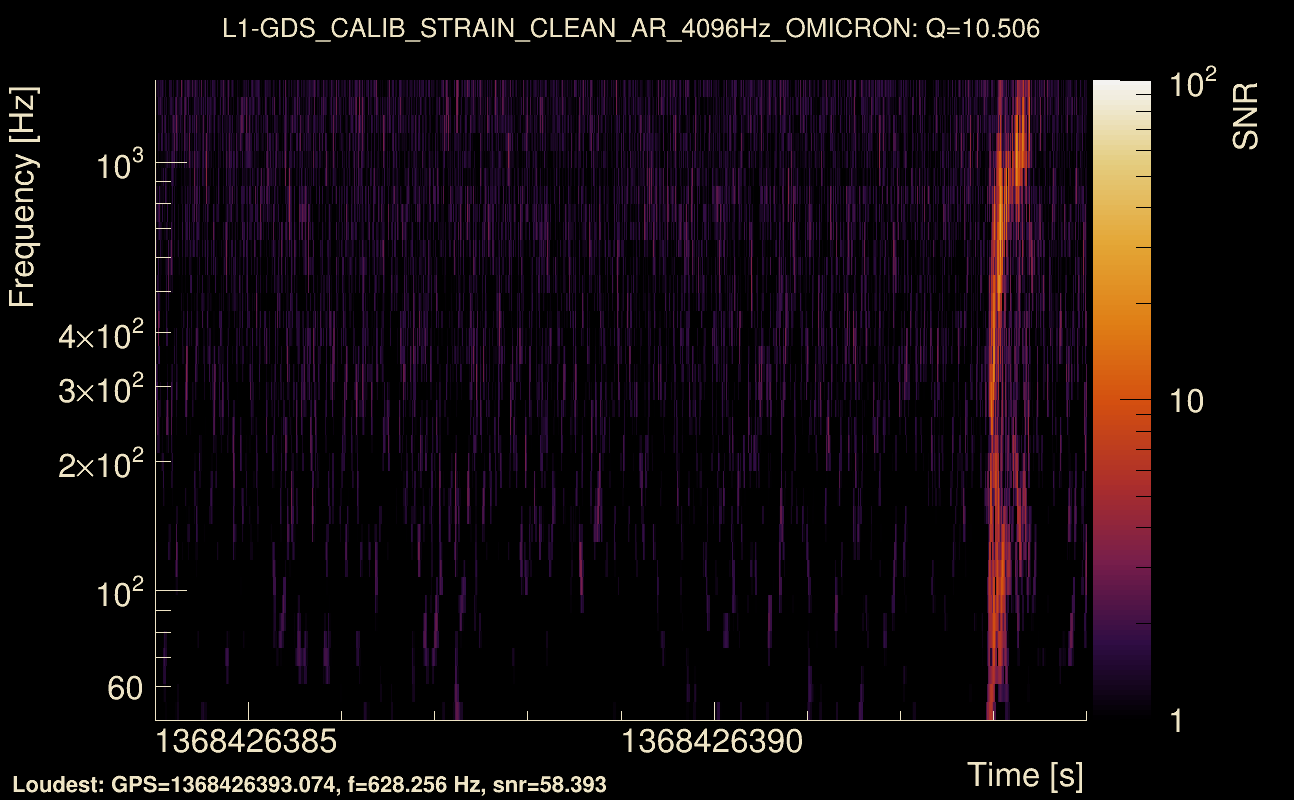
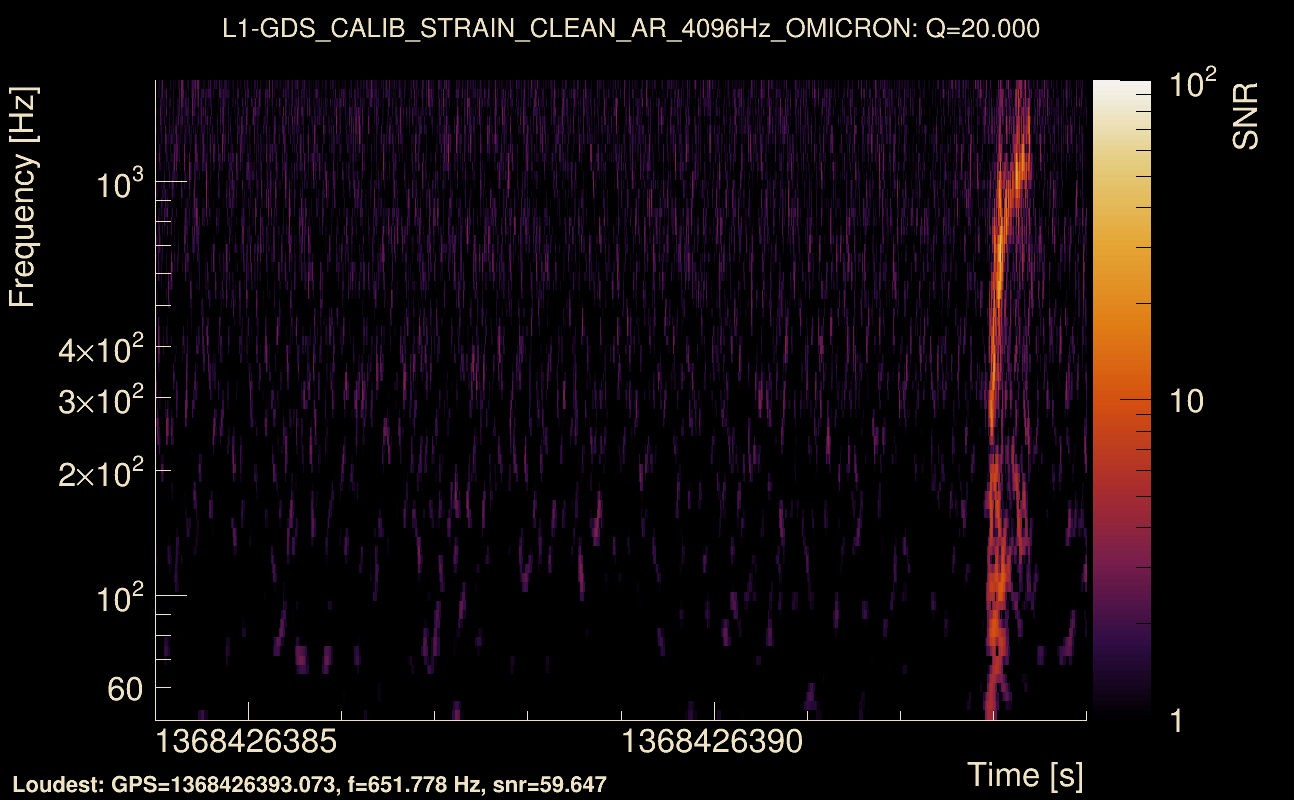
| Event time t(L1): | GPS = 1368426384 (Thu May 18 06:26:16 2023 ) → GPS = 1368426394 (Thu May 18 06:26:16 2023 ) |
| Omicron analysis time window (H1): | GPS = 1368426381 → GPS = 1368426397 |
| Omicron analysis time window (L1): | GPS = 1368426381 → GPS = 1368426397 |
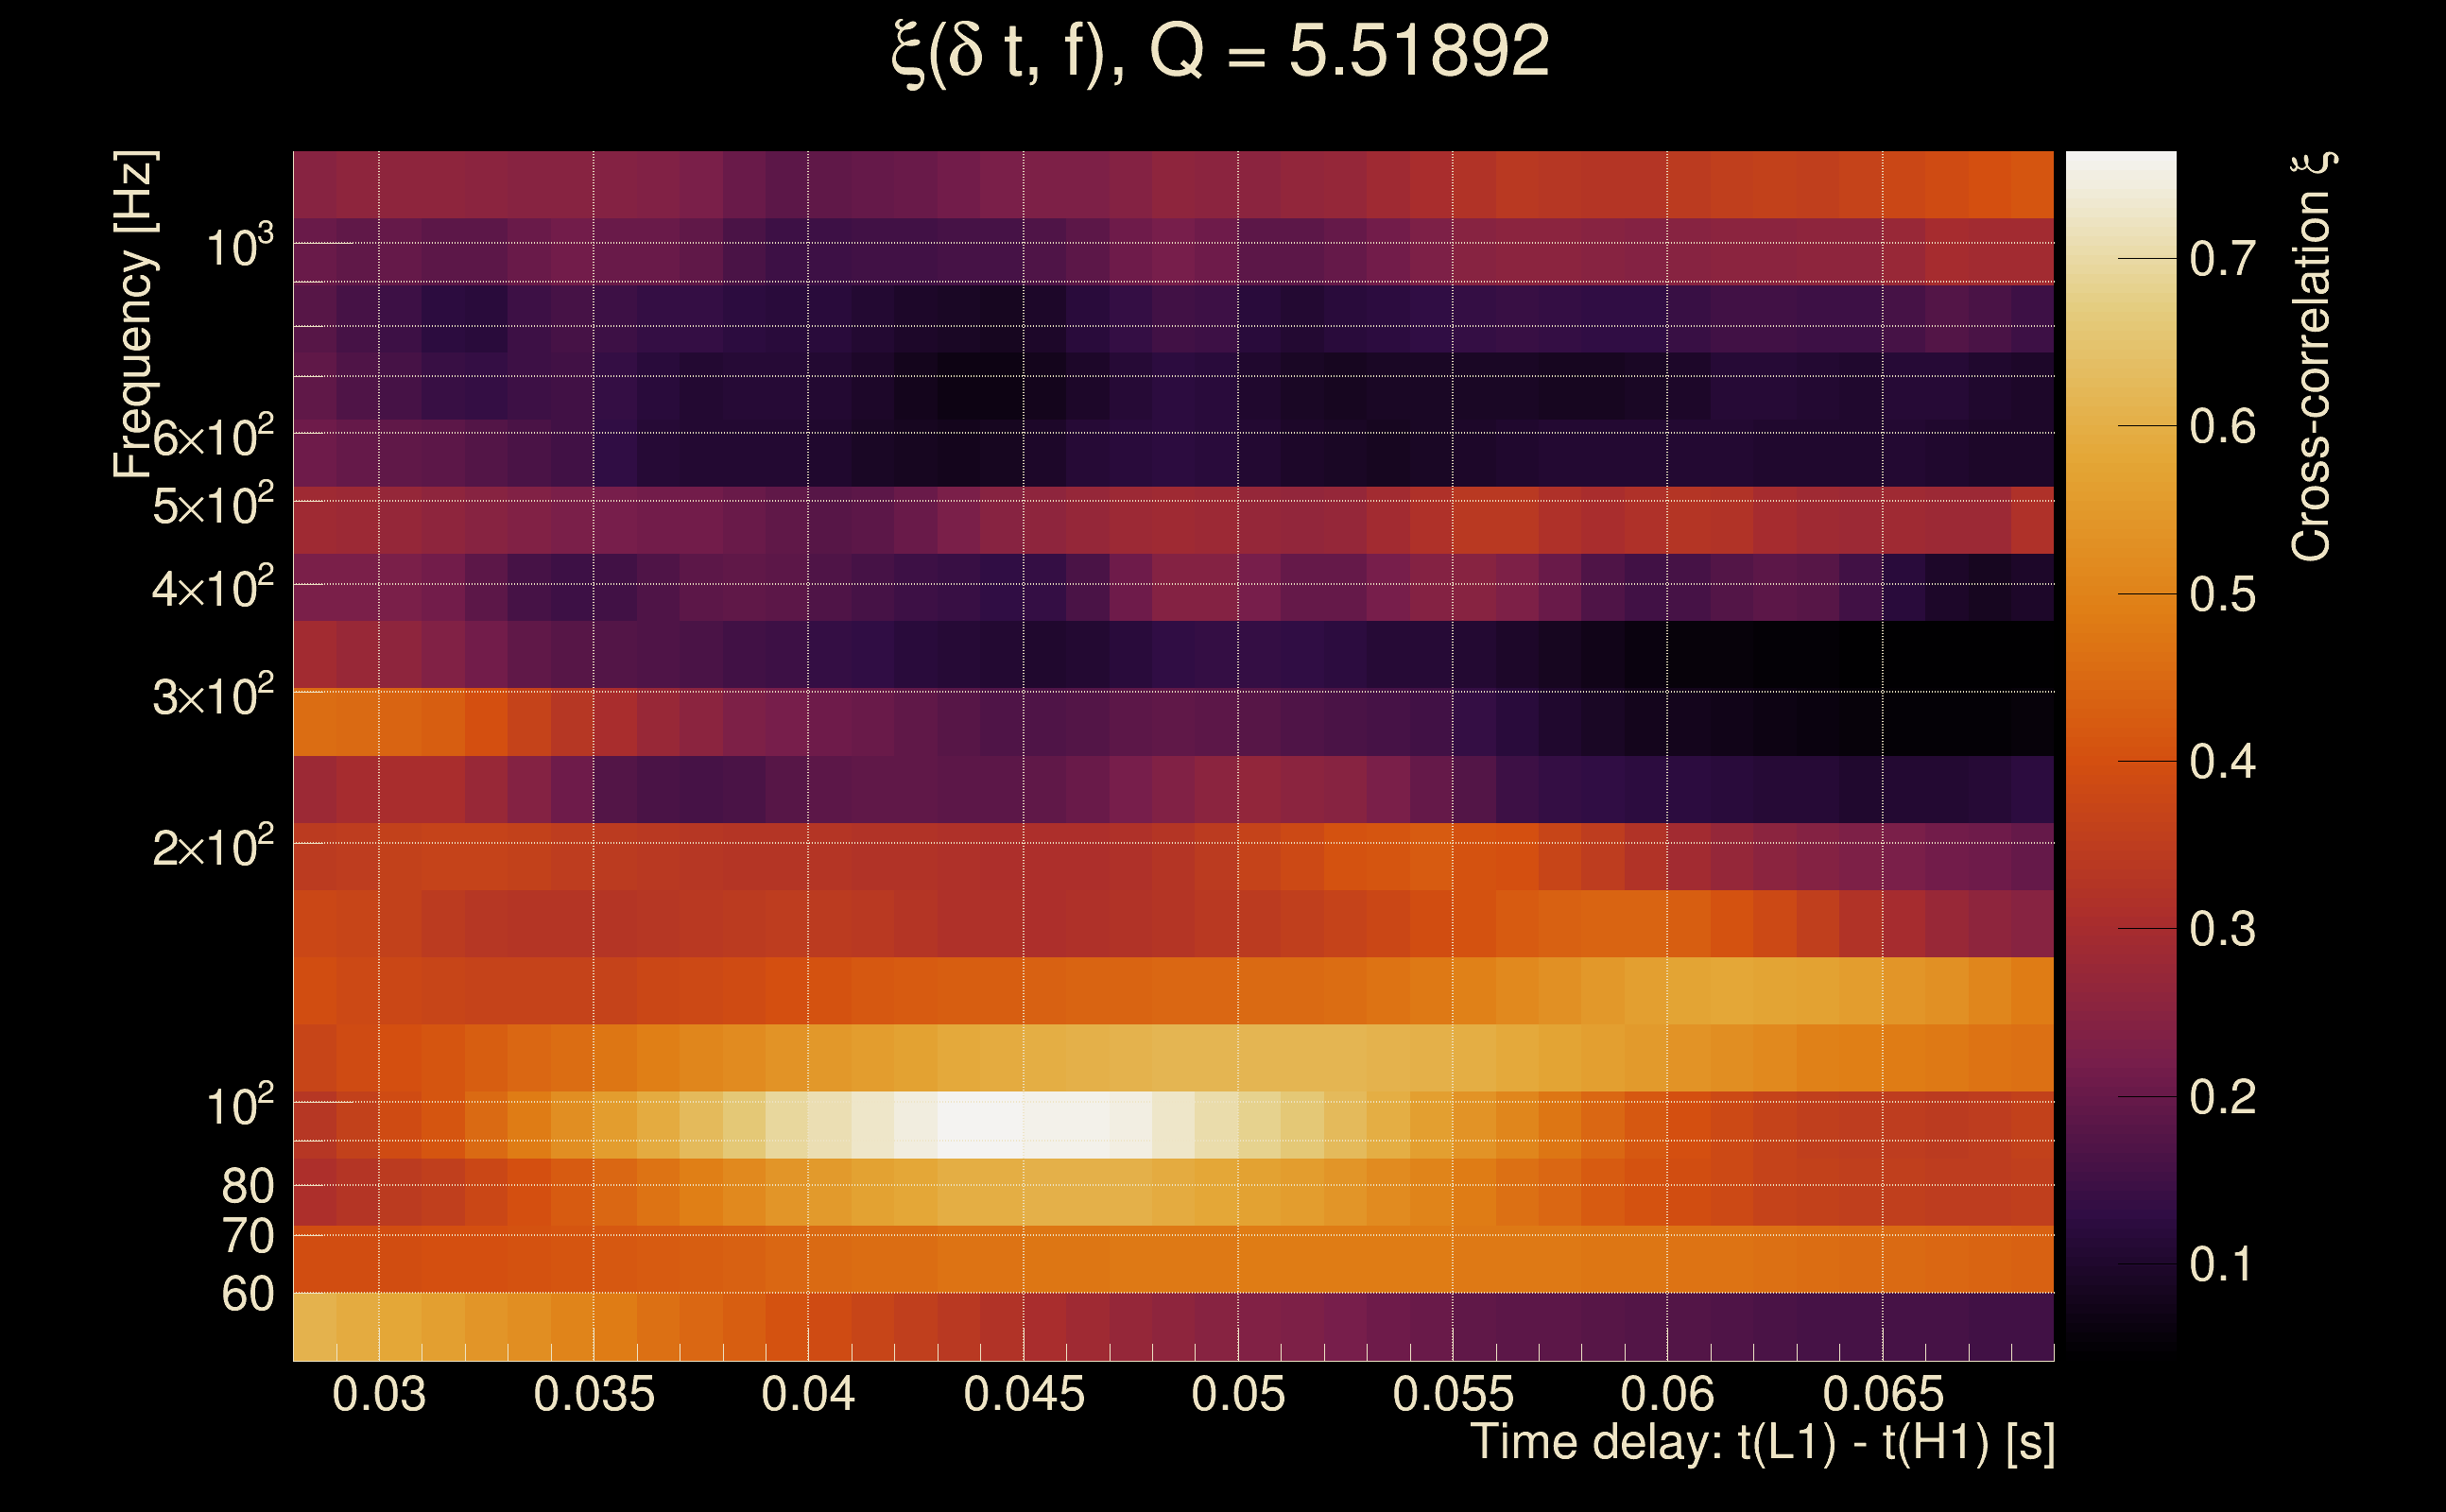
| Time delay between detectors t(L1) - t(H1): | 0.0485412 s (slice index = 107 / 217), δt_gw = 0.00254117 s |
| Time delay standard deviation: | 0.0838494 s |
| [targeted mode] Time delay probability: | 0.939516 (0.0758784 sigmas), δt_target = 0.00748062 s |
| Frequency: | 173.828 Hz |
| Ξ: | 0.124573 ± 0.0771523 (variance = 0.00595247): Q0: 0.569163, Q1: 0.644409, Q2: 0.469245, Q3: 0.51766, Q4: 0.423062 |
| Rank: | R_A = 0.0303344 |
| Log of amplitude ratio (L1/H1): | -0.245764, variance = 0.167628 (L1/H1: -0.642397, variance = 0.321517, H1/L1: -0.173721, variance = 0.350067) |
| Amplitude ratio (L1/H1): | 0.782107 ⋇ 1.50595 (L1/H1: 0.52603 ⋇ 1.76301, H1/L1: 0.840531 ⋇ 1.80699) |
| Amplitude ratio H1|L1 compatibility (probability): | 0.319313 |
| Antenna factor probability: | 0.81169 |
| Number of rejected frequency rows: | Q0: 12 / 18, Q1: 32 / 36, Q2: 63 / 70, Q3: 125 / 134, Q4: 240 / 258 |
| Maximum signal-to-noise ratio: | H1: 66.177, L1: 64.3491 |
| SNR variance: | H1: 0.549149, L1: 0.522537 |
| Click here for a zoomed plot | Click here for a zoomed plot | Click here for a zoomed plot | Click here for a zoomed plot | Click here for a zoomed plot |
 |
 |
 |
 |
 |
 |
 |
 |
 |
 |
 |
 |
 |
 |
 |
 |
 |
 |
 |
 |
 |
 |
 |
 |
 |
 |
 |
 |
 |
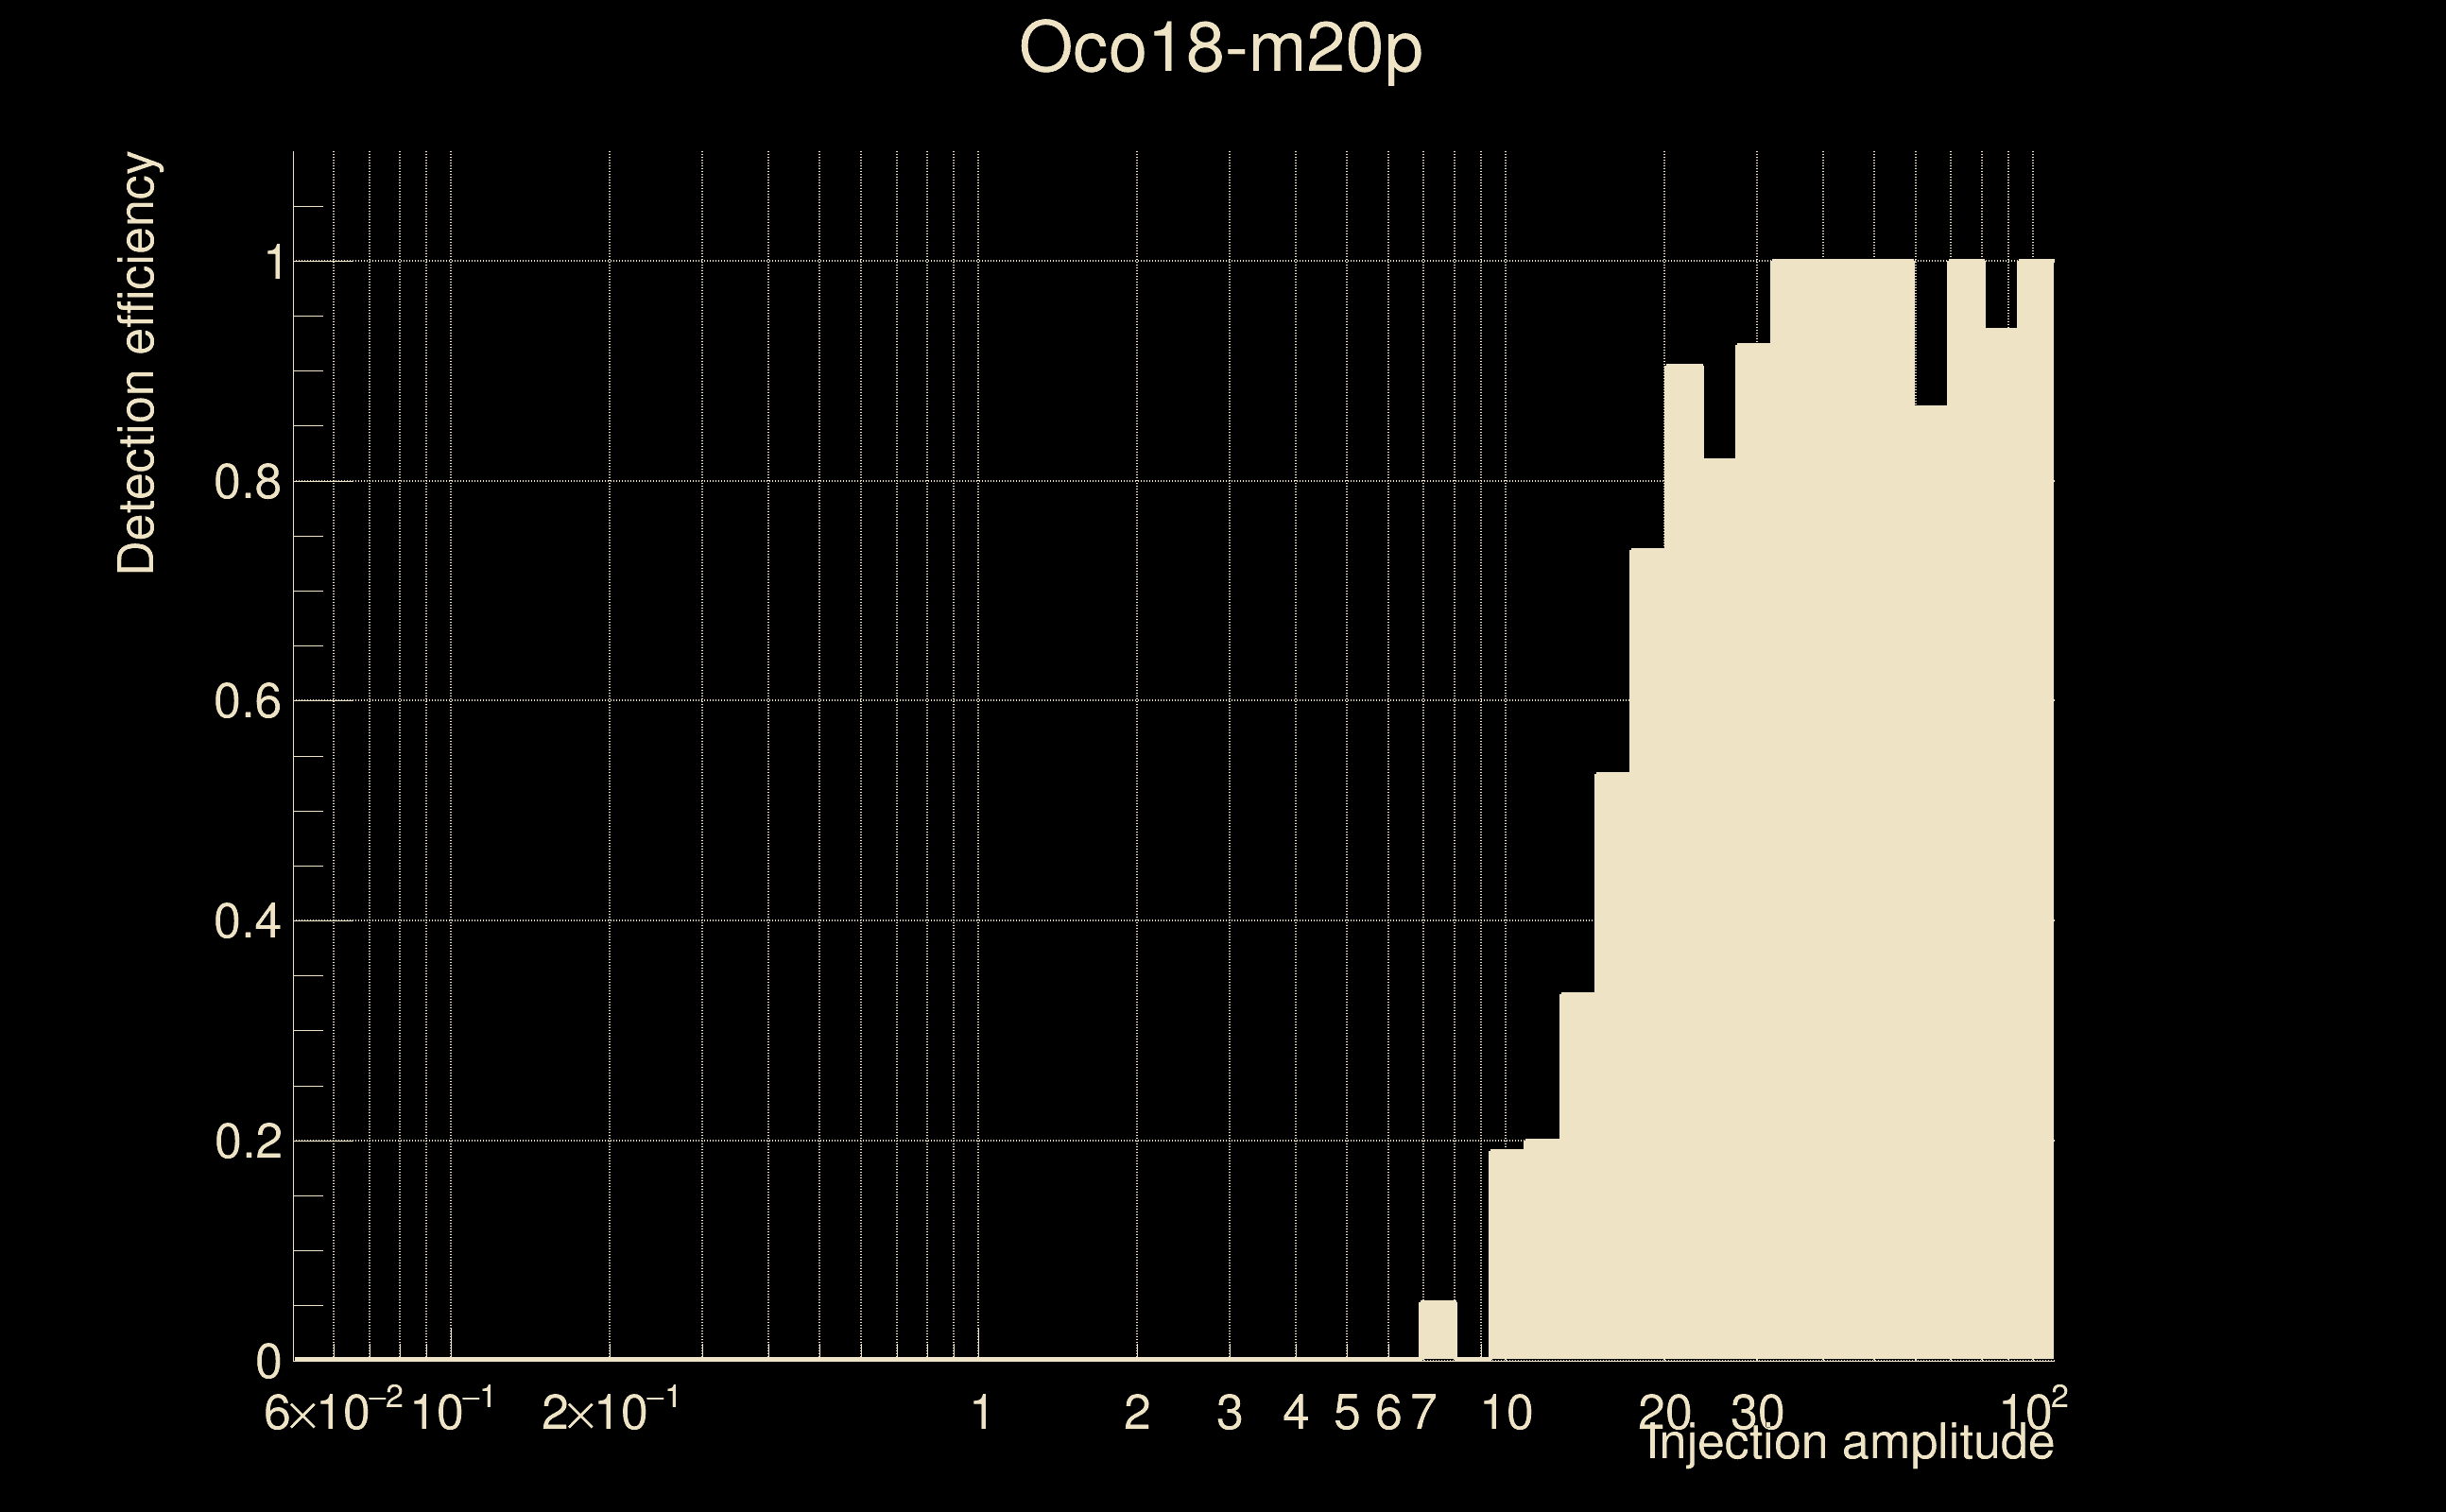
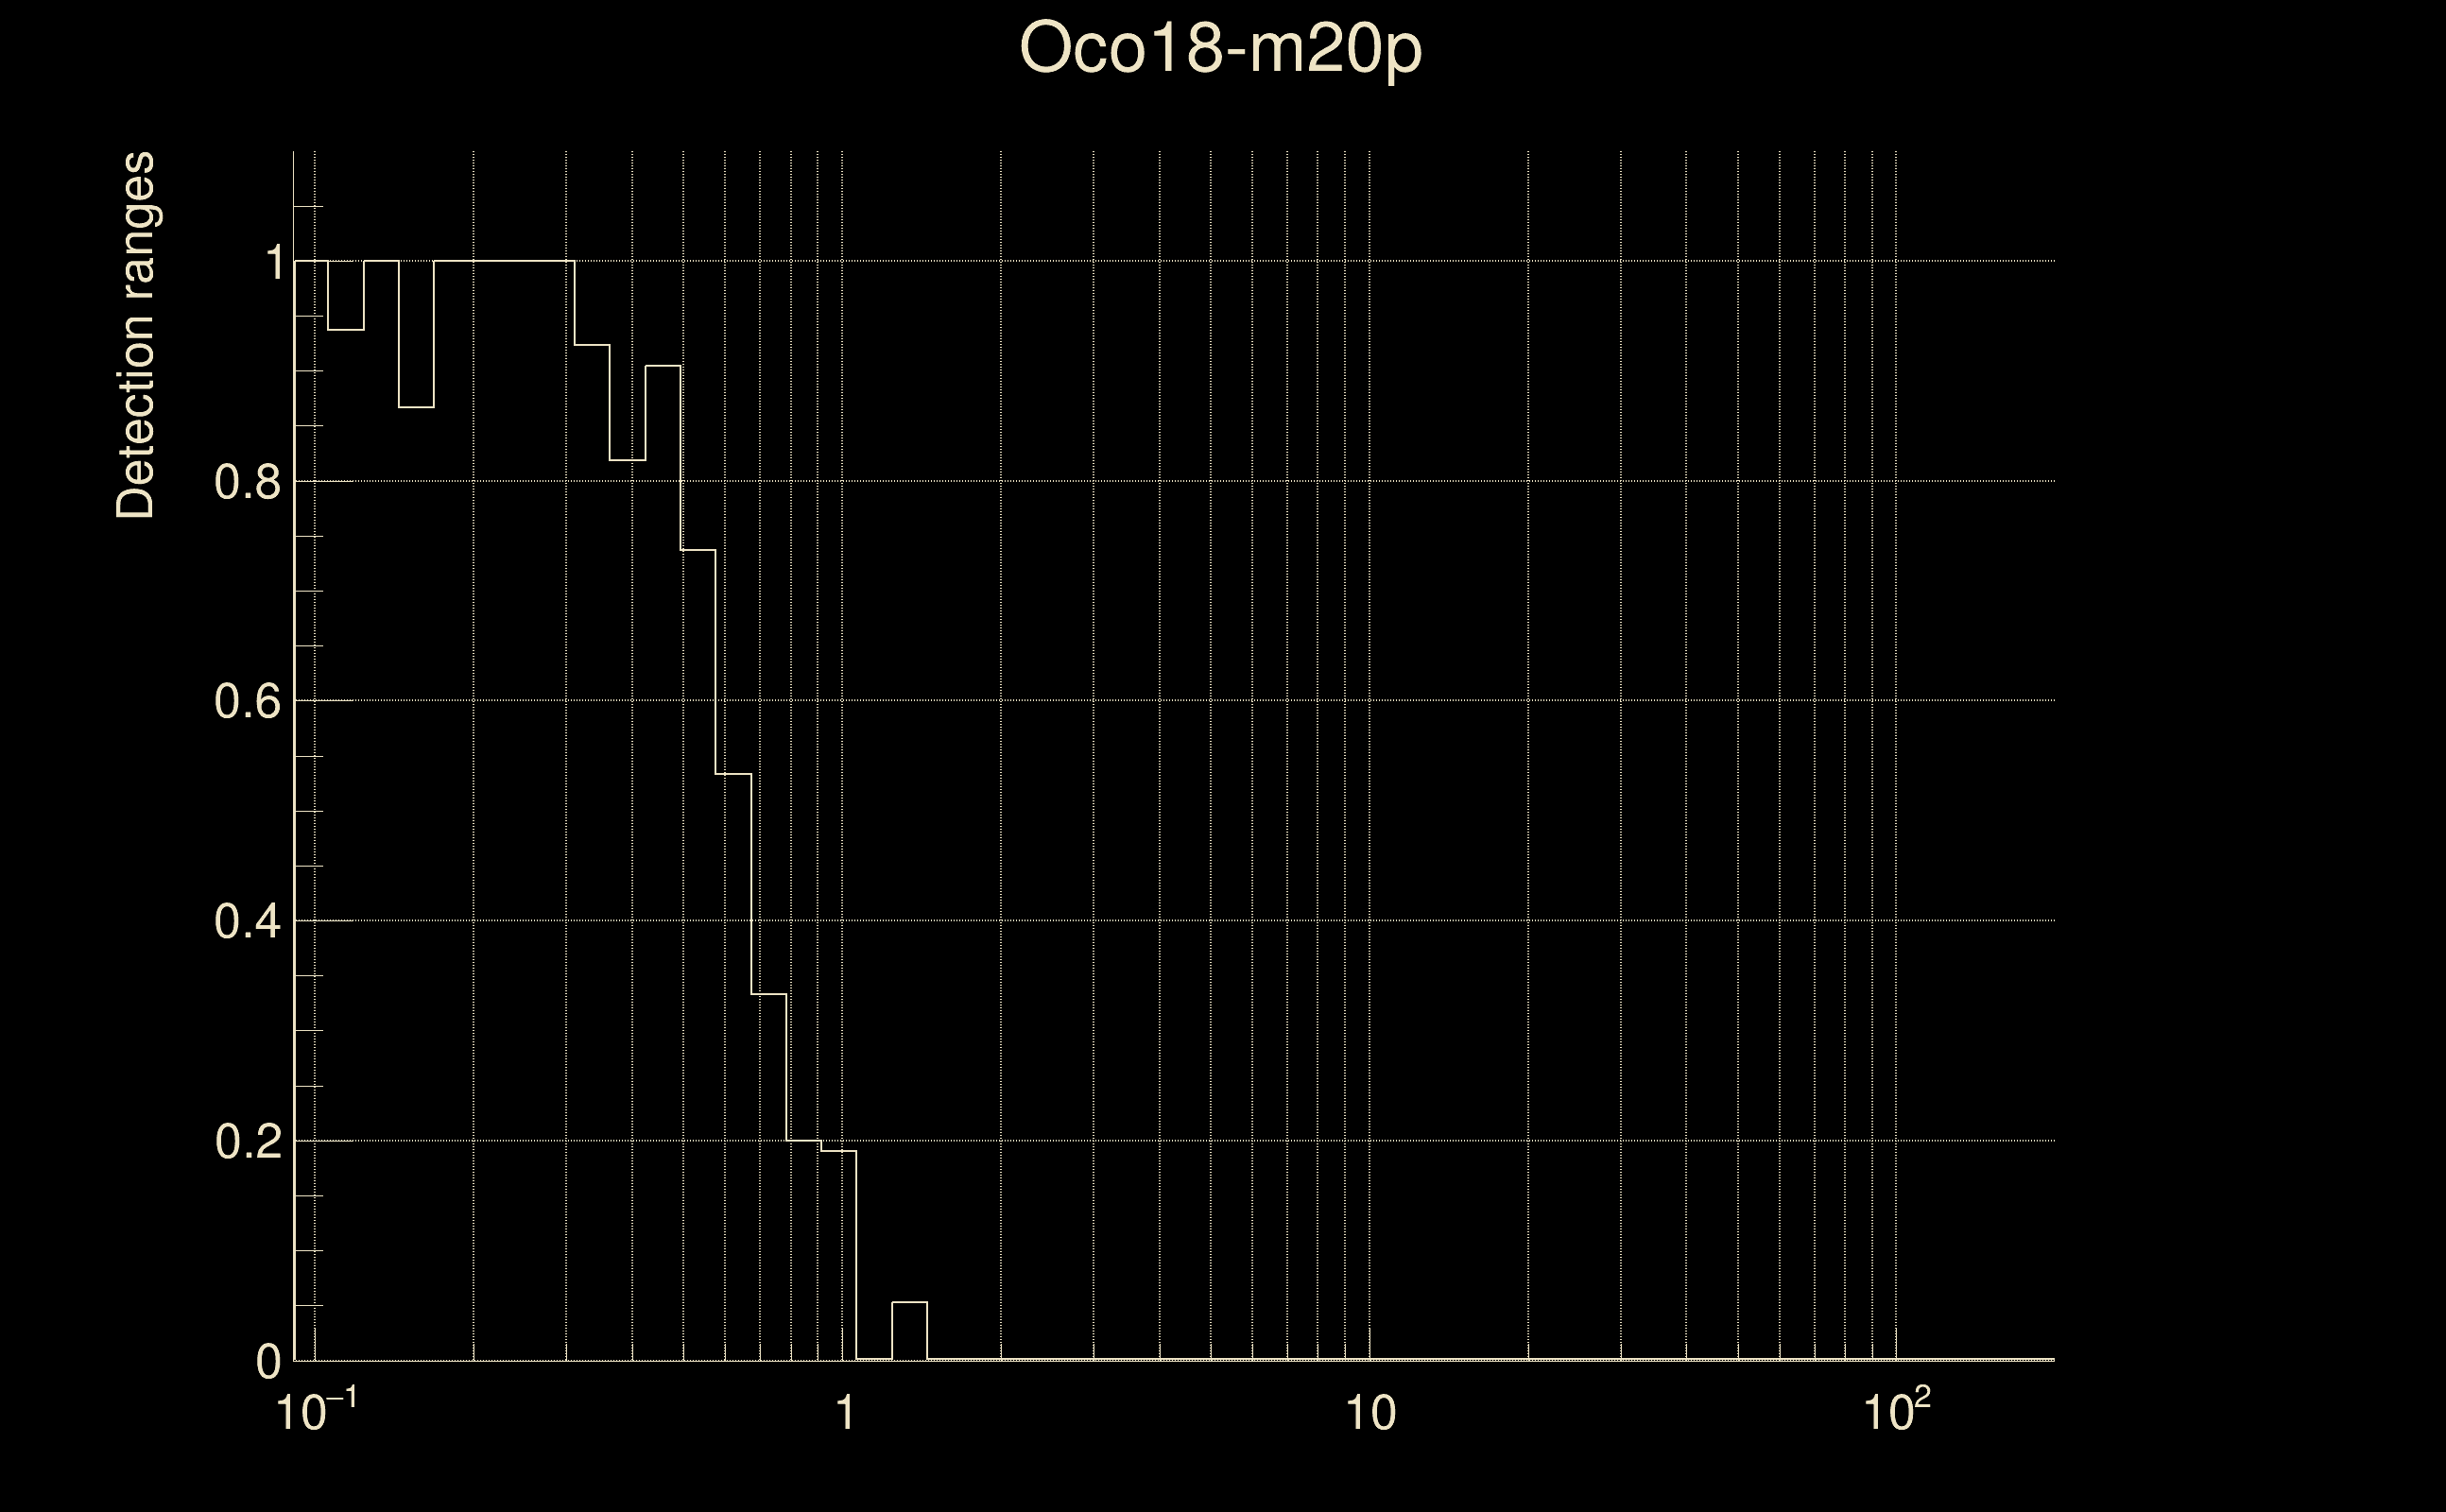
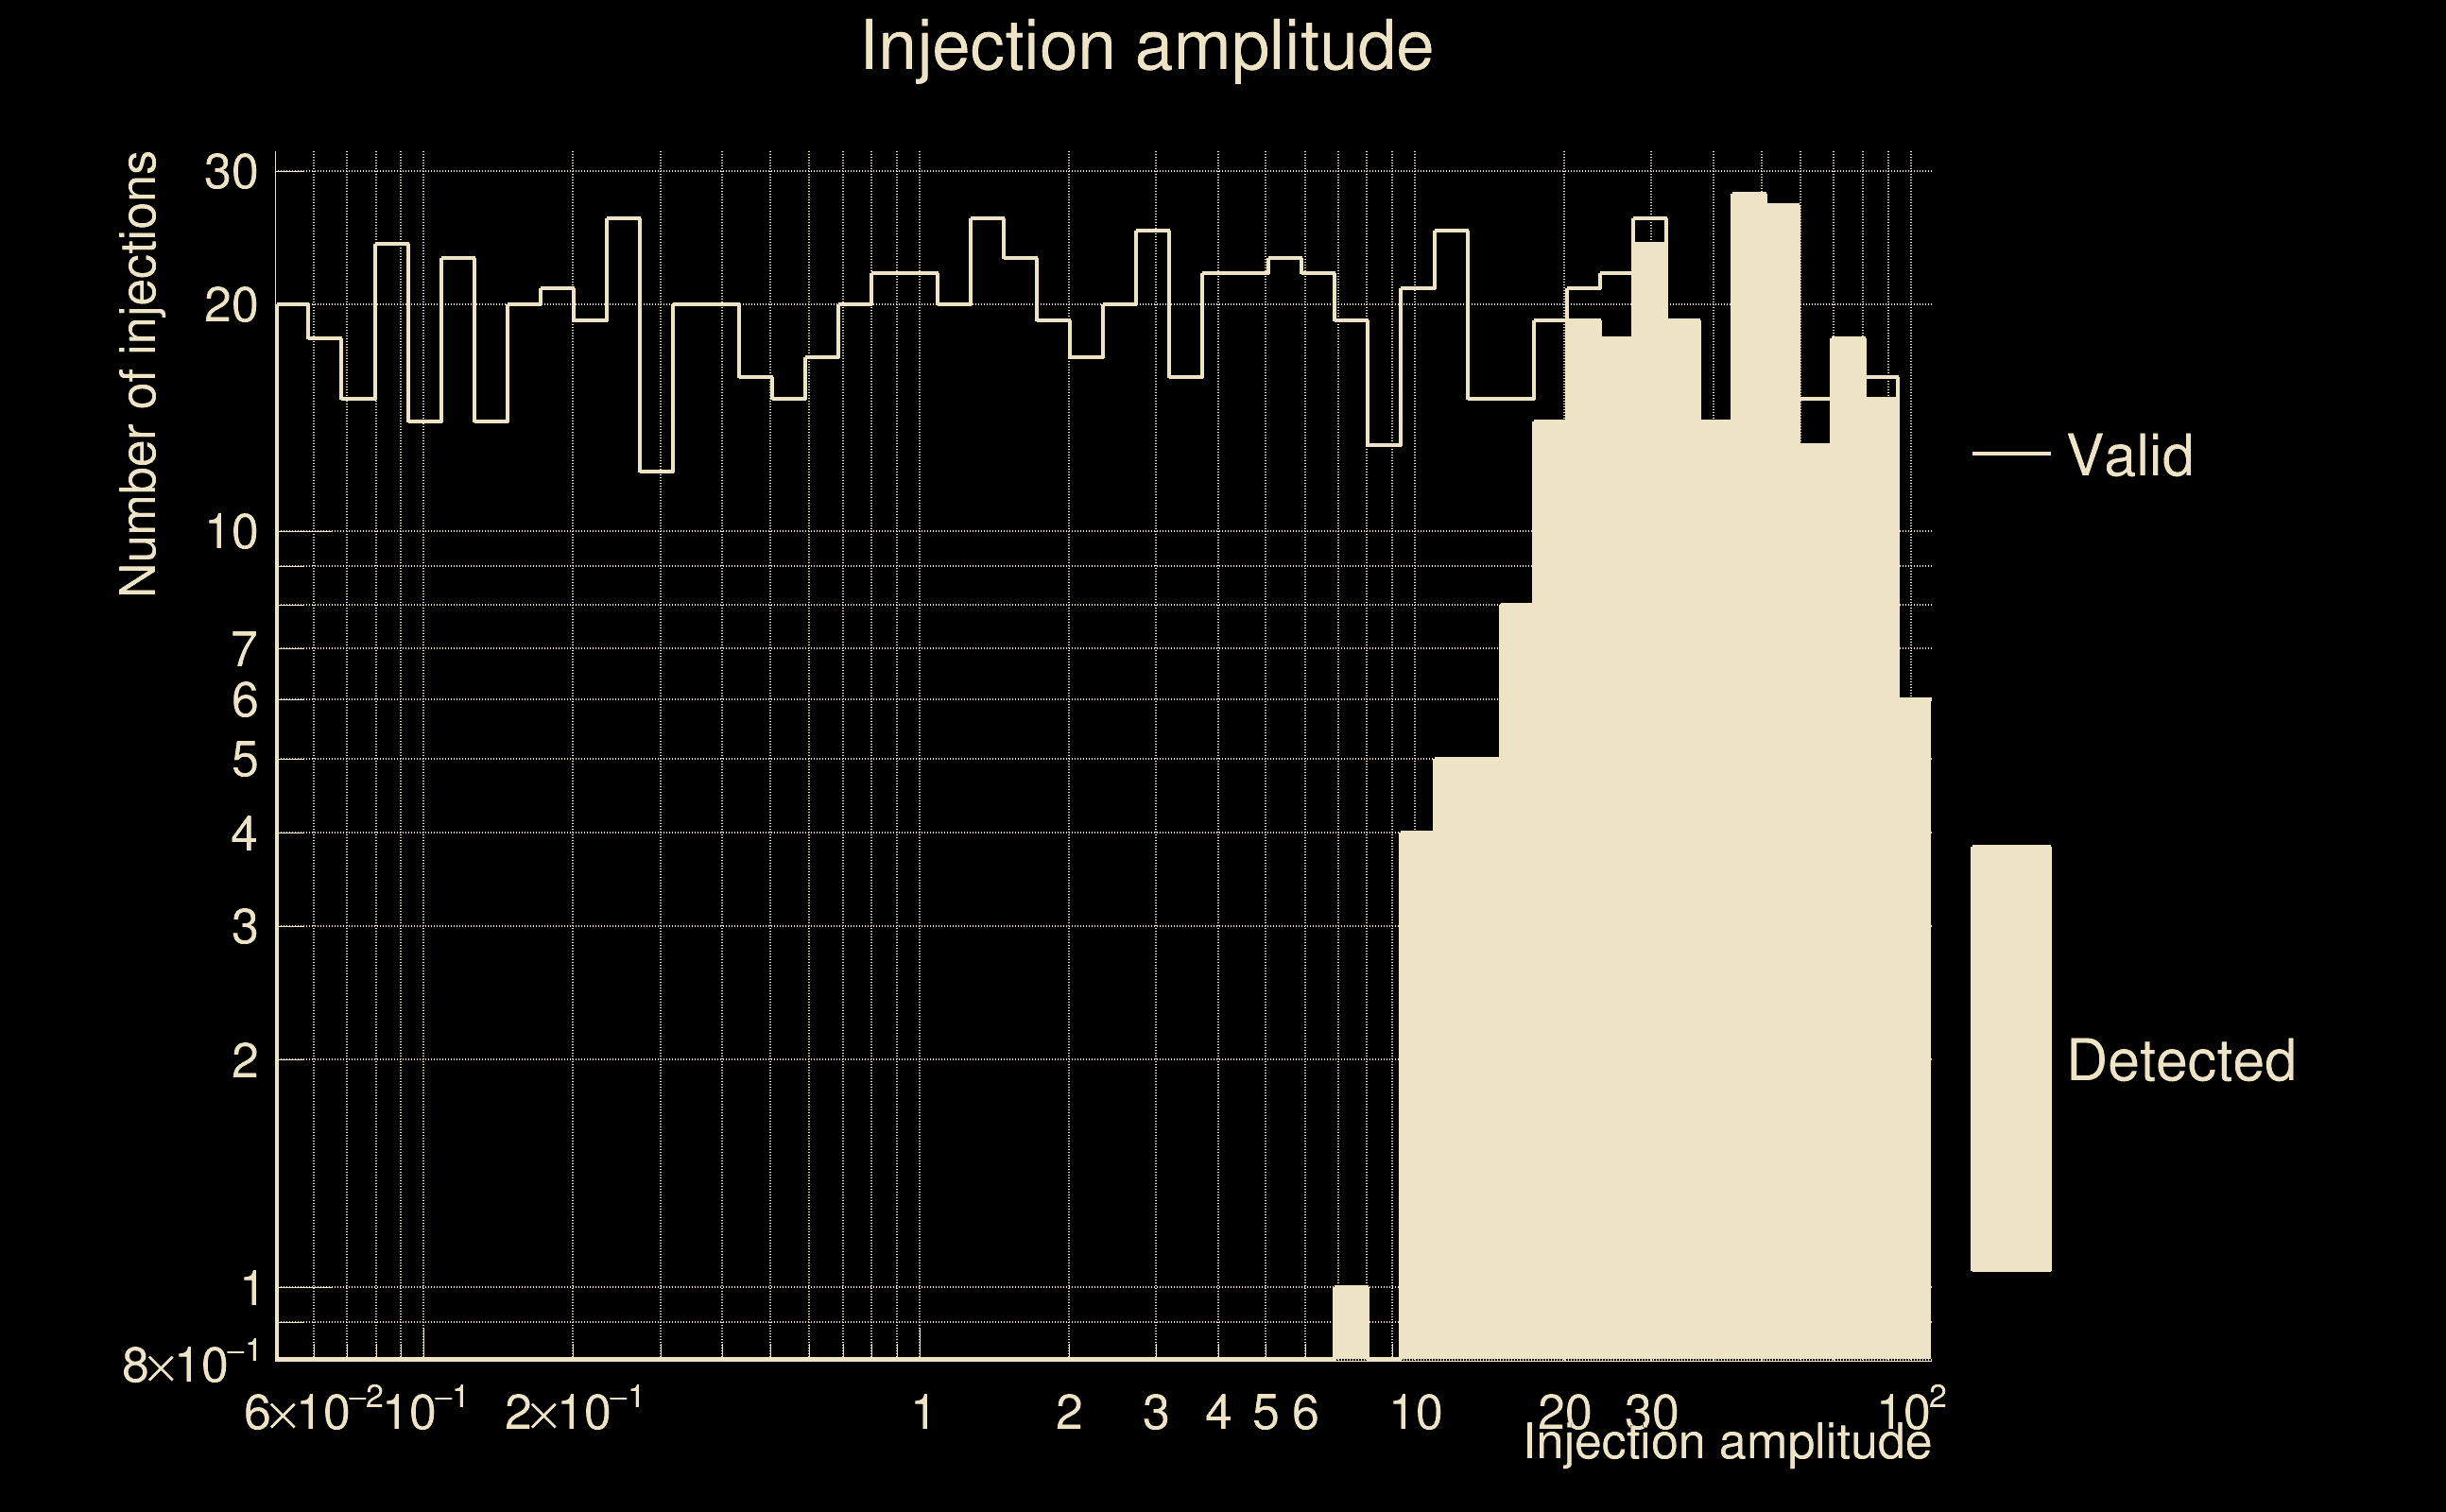
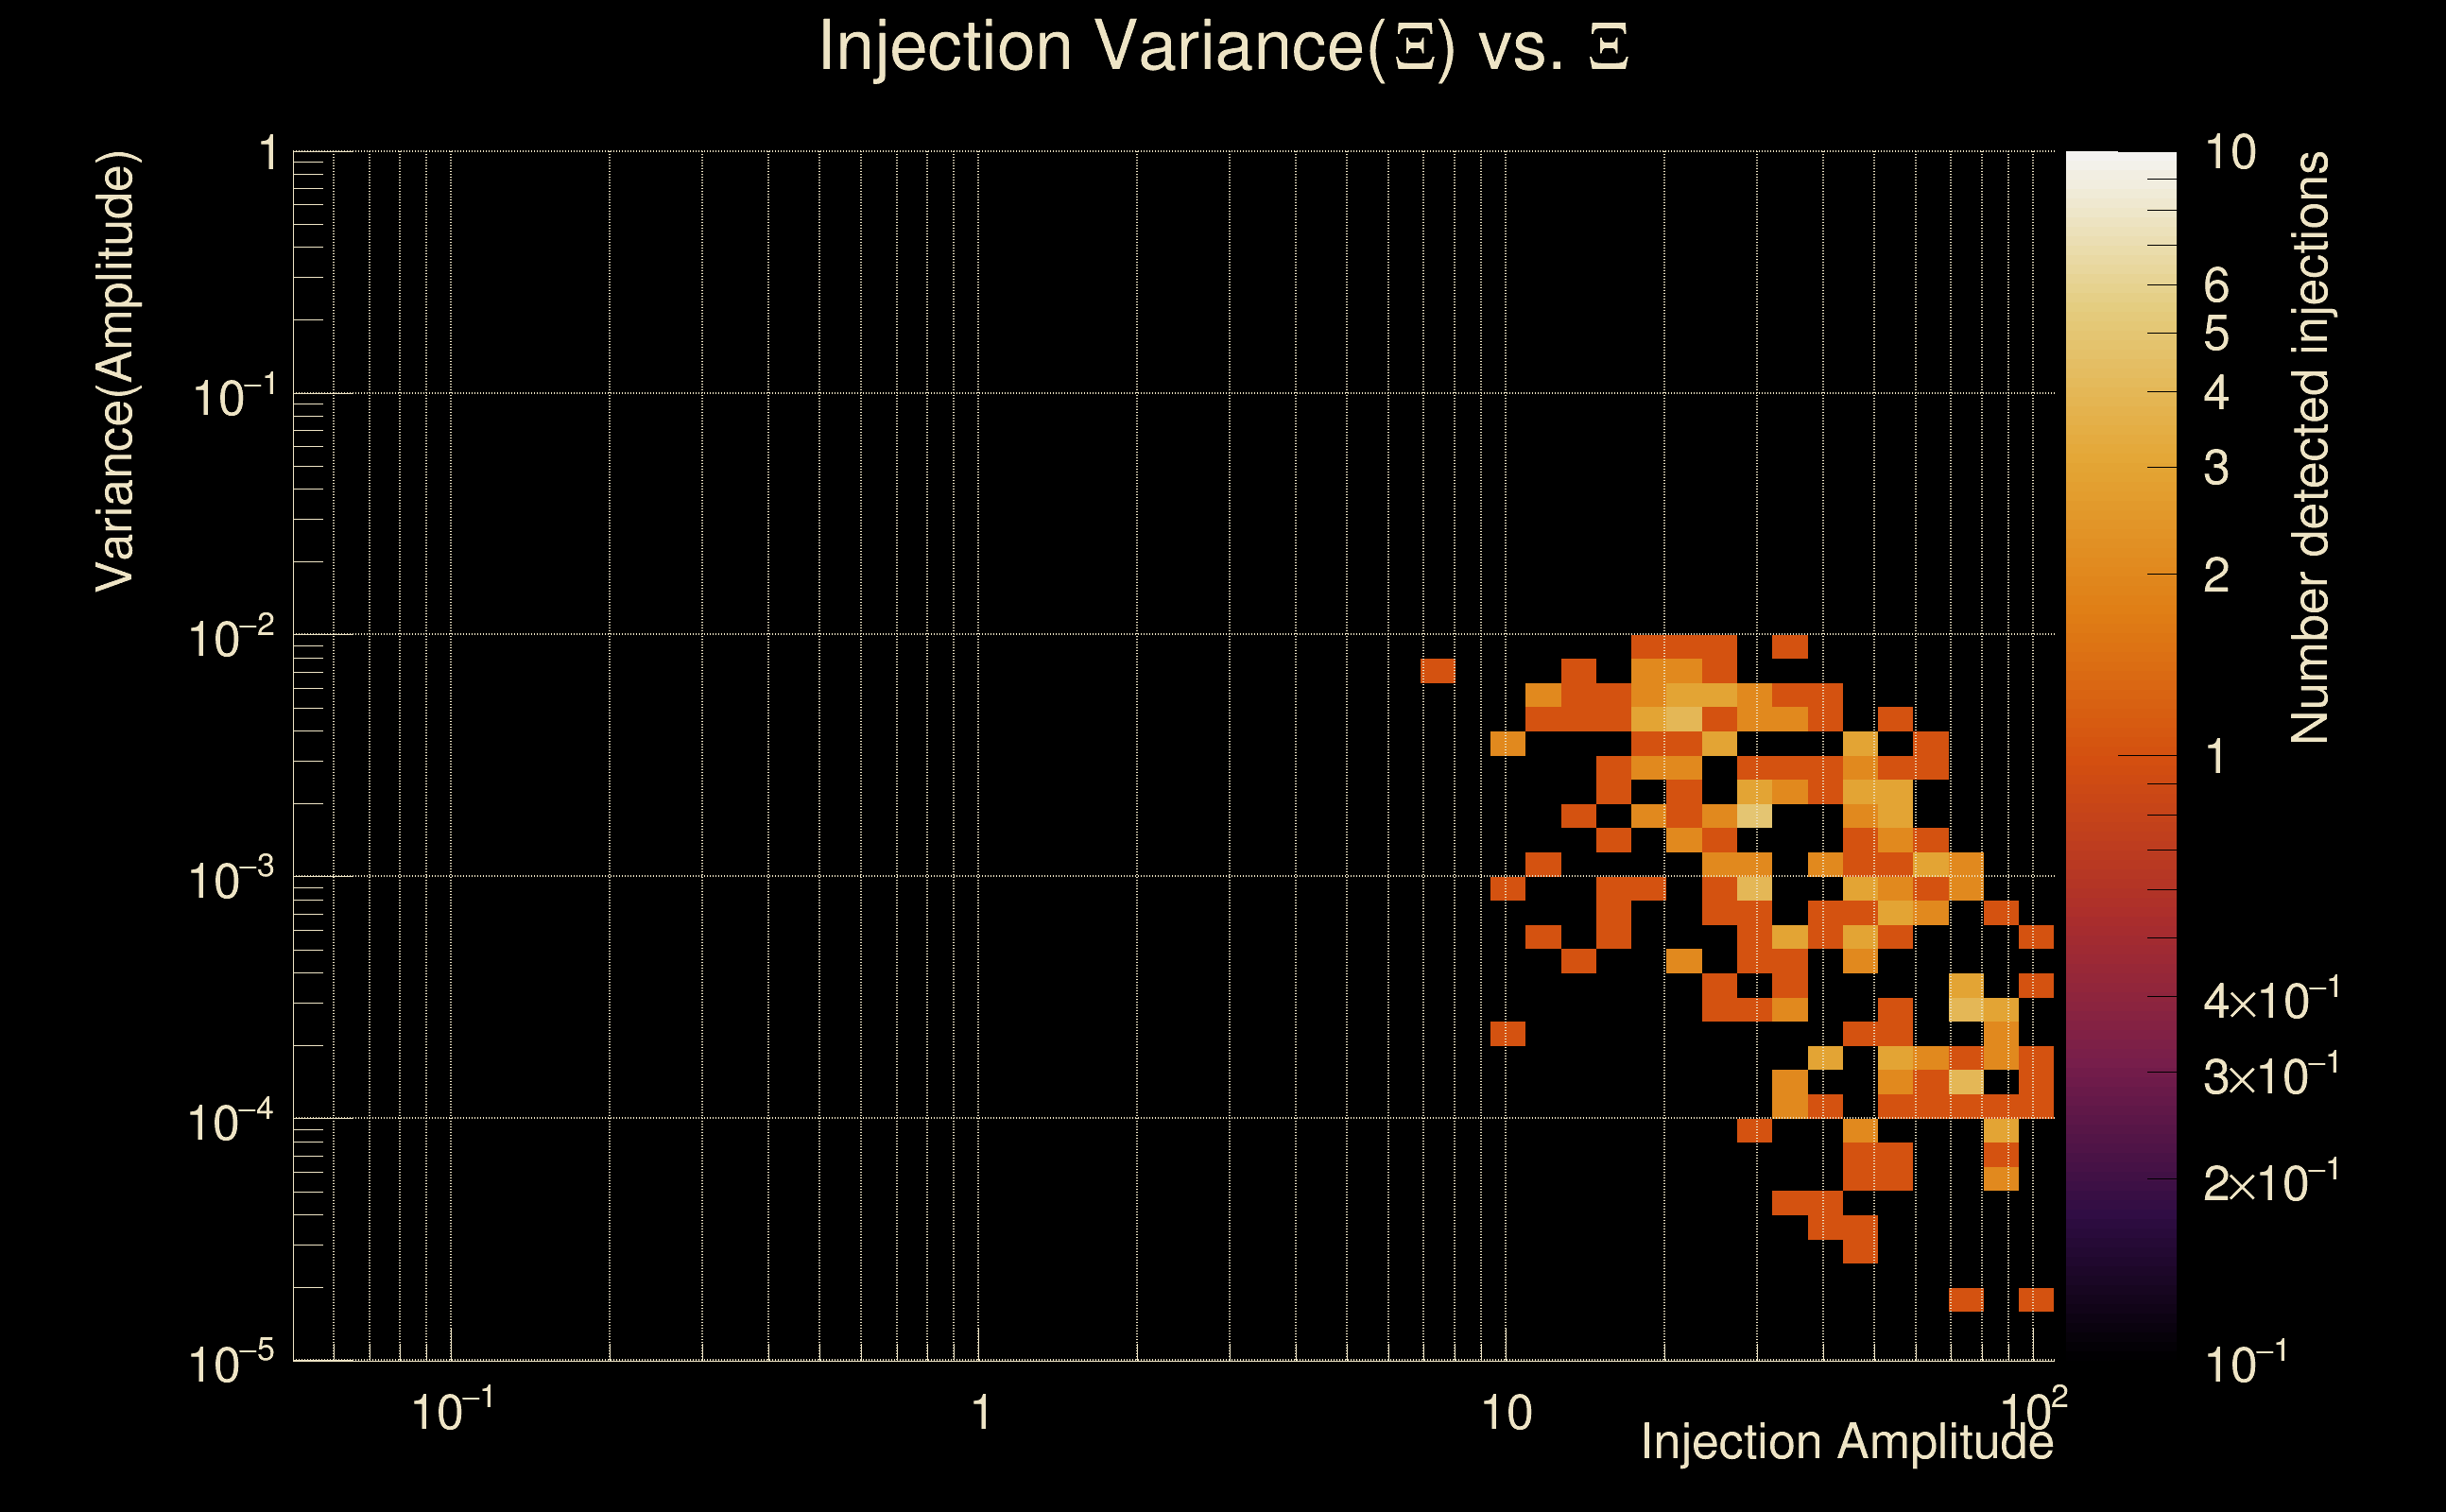
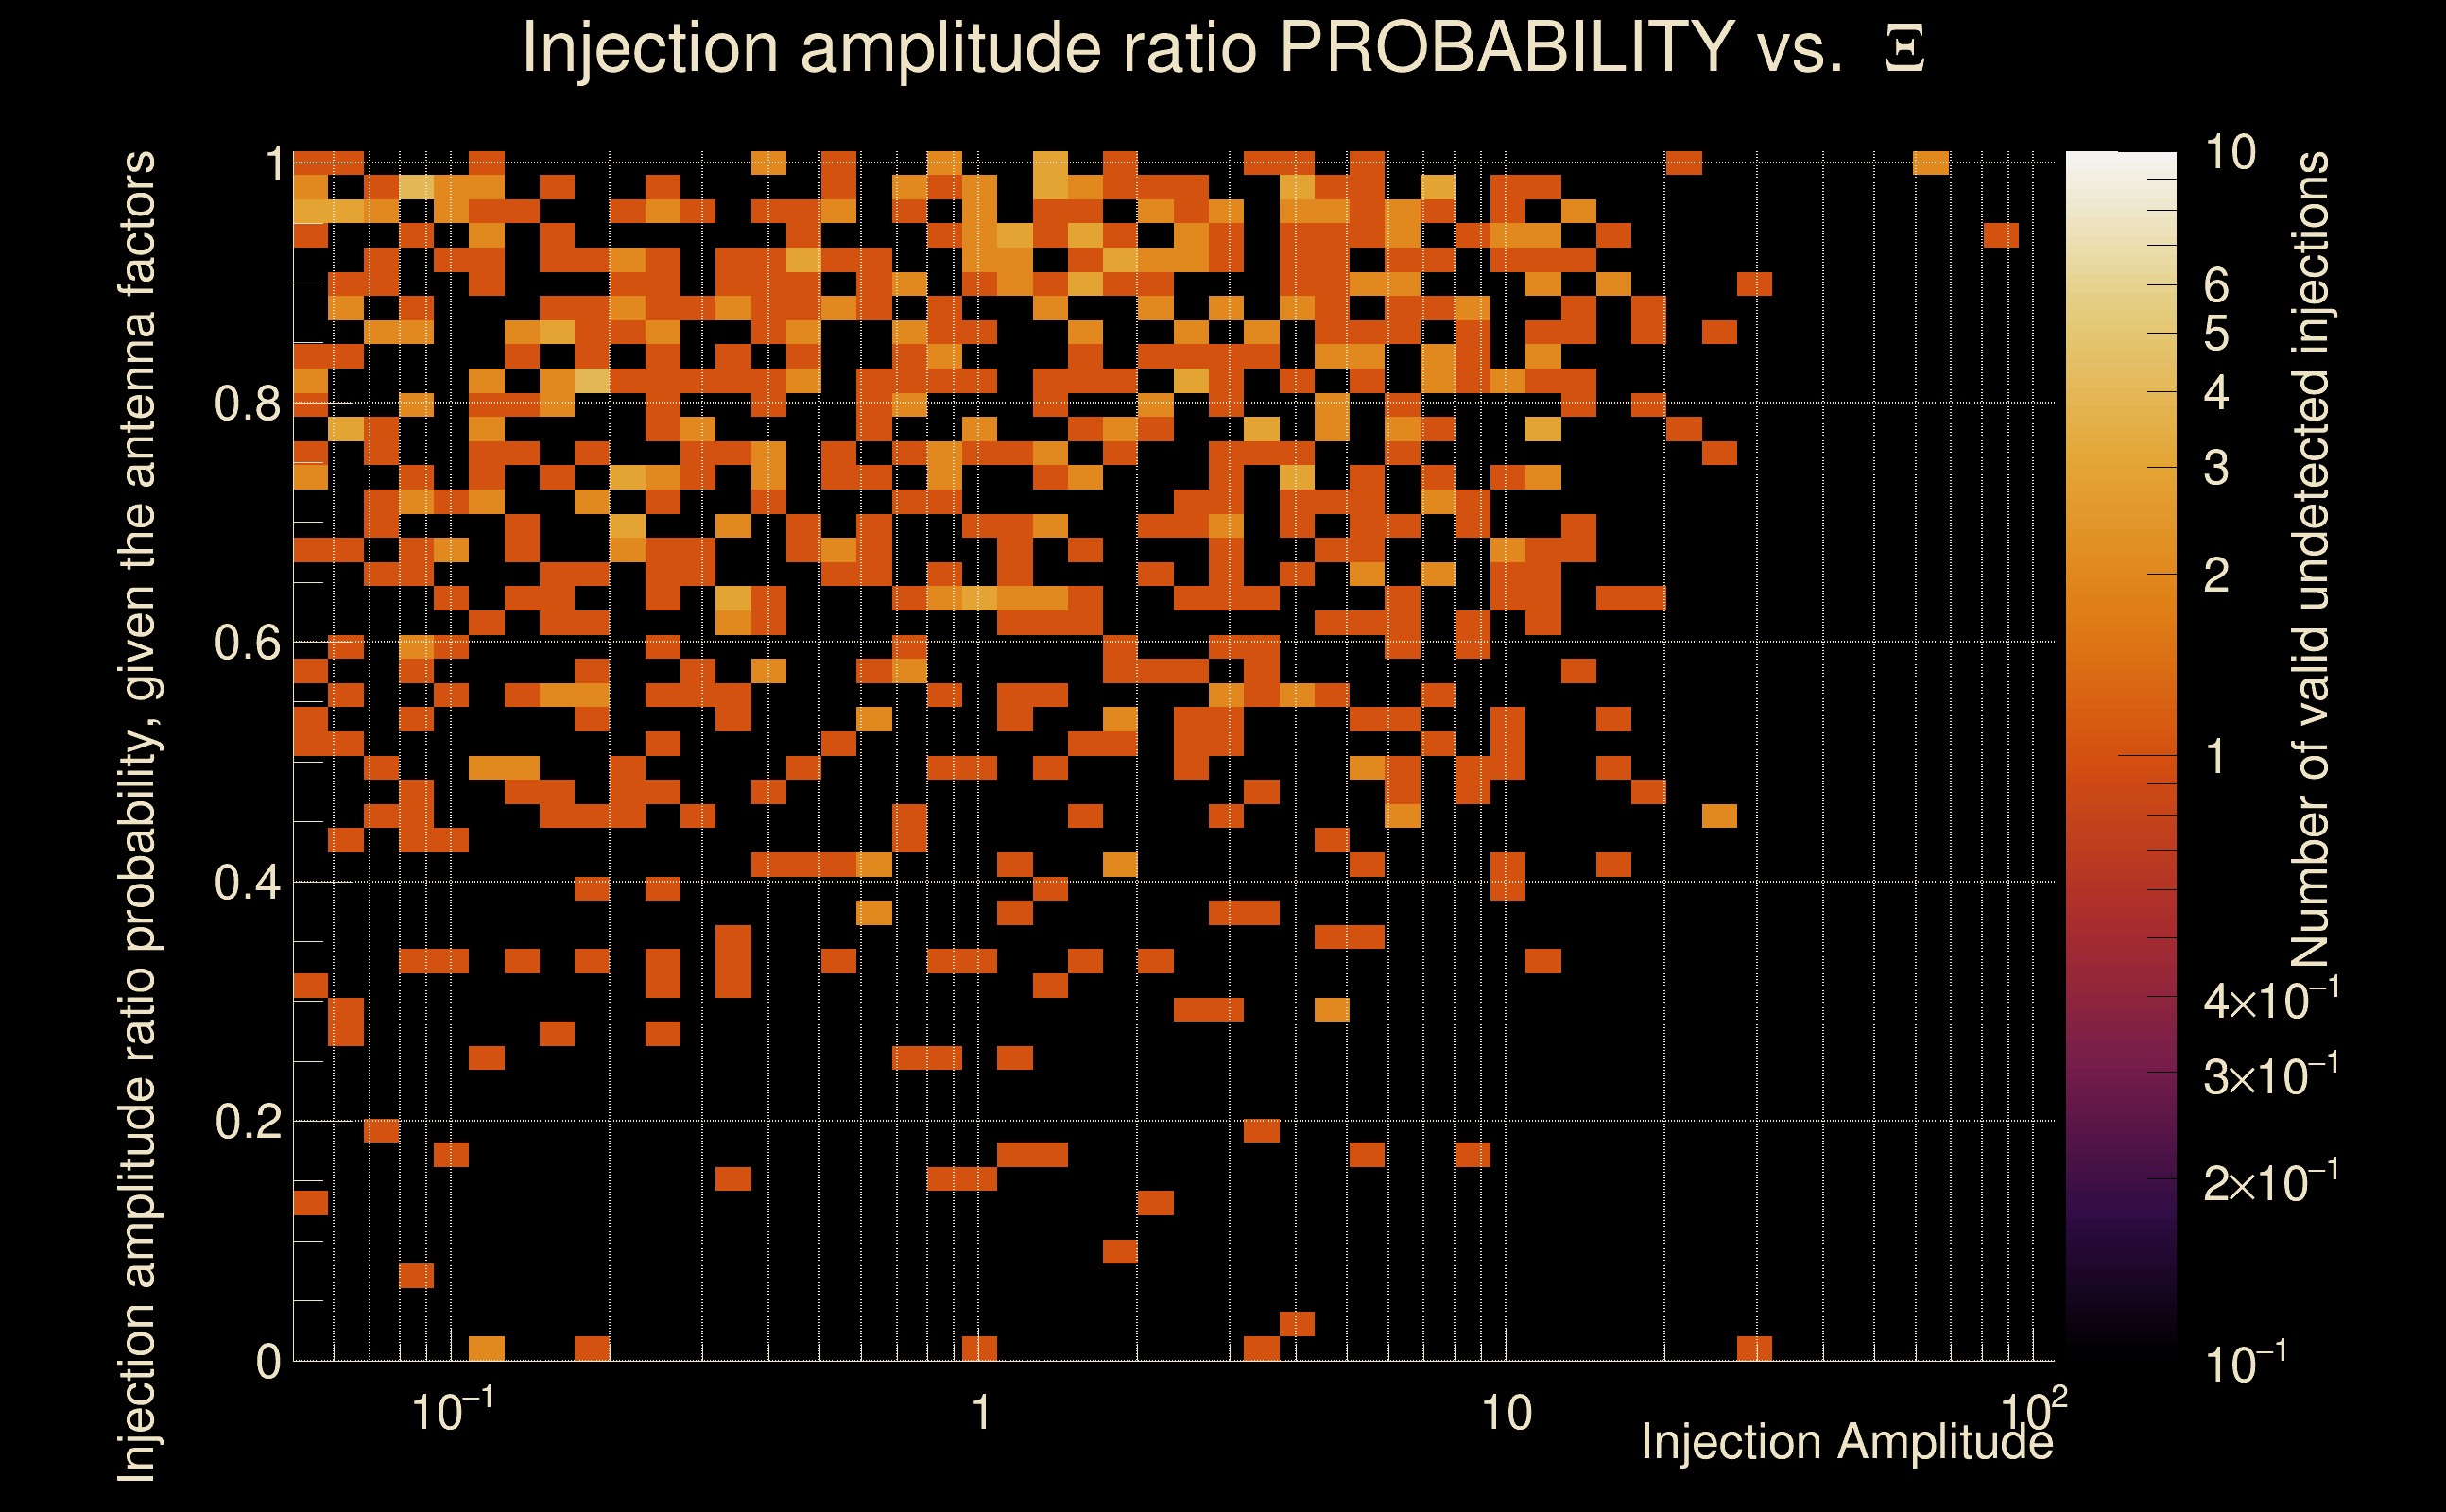
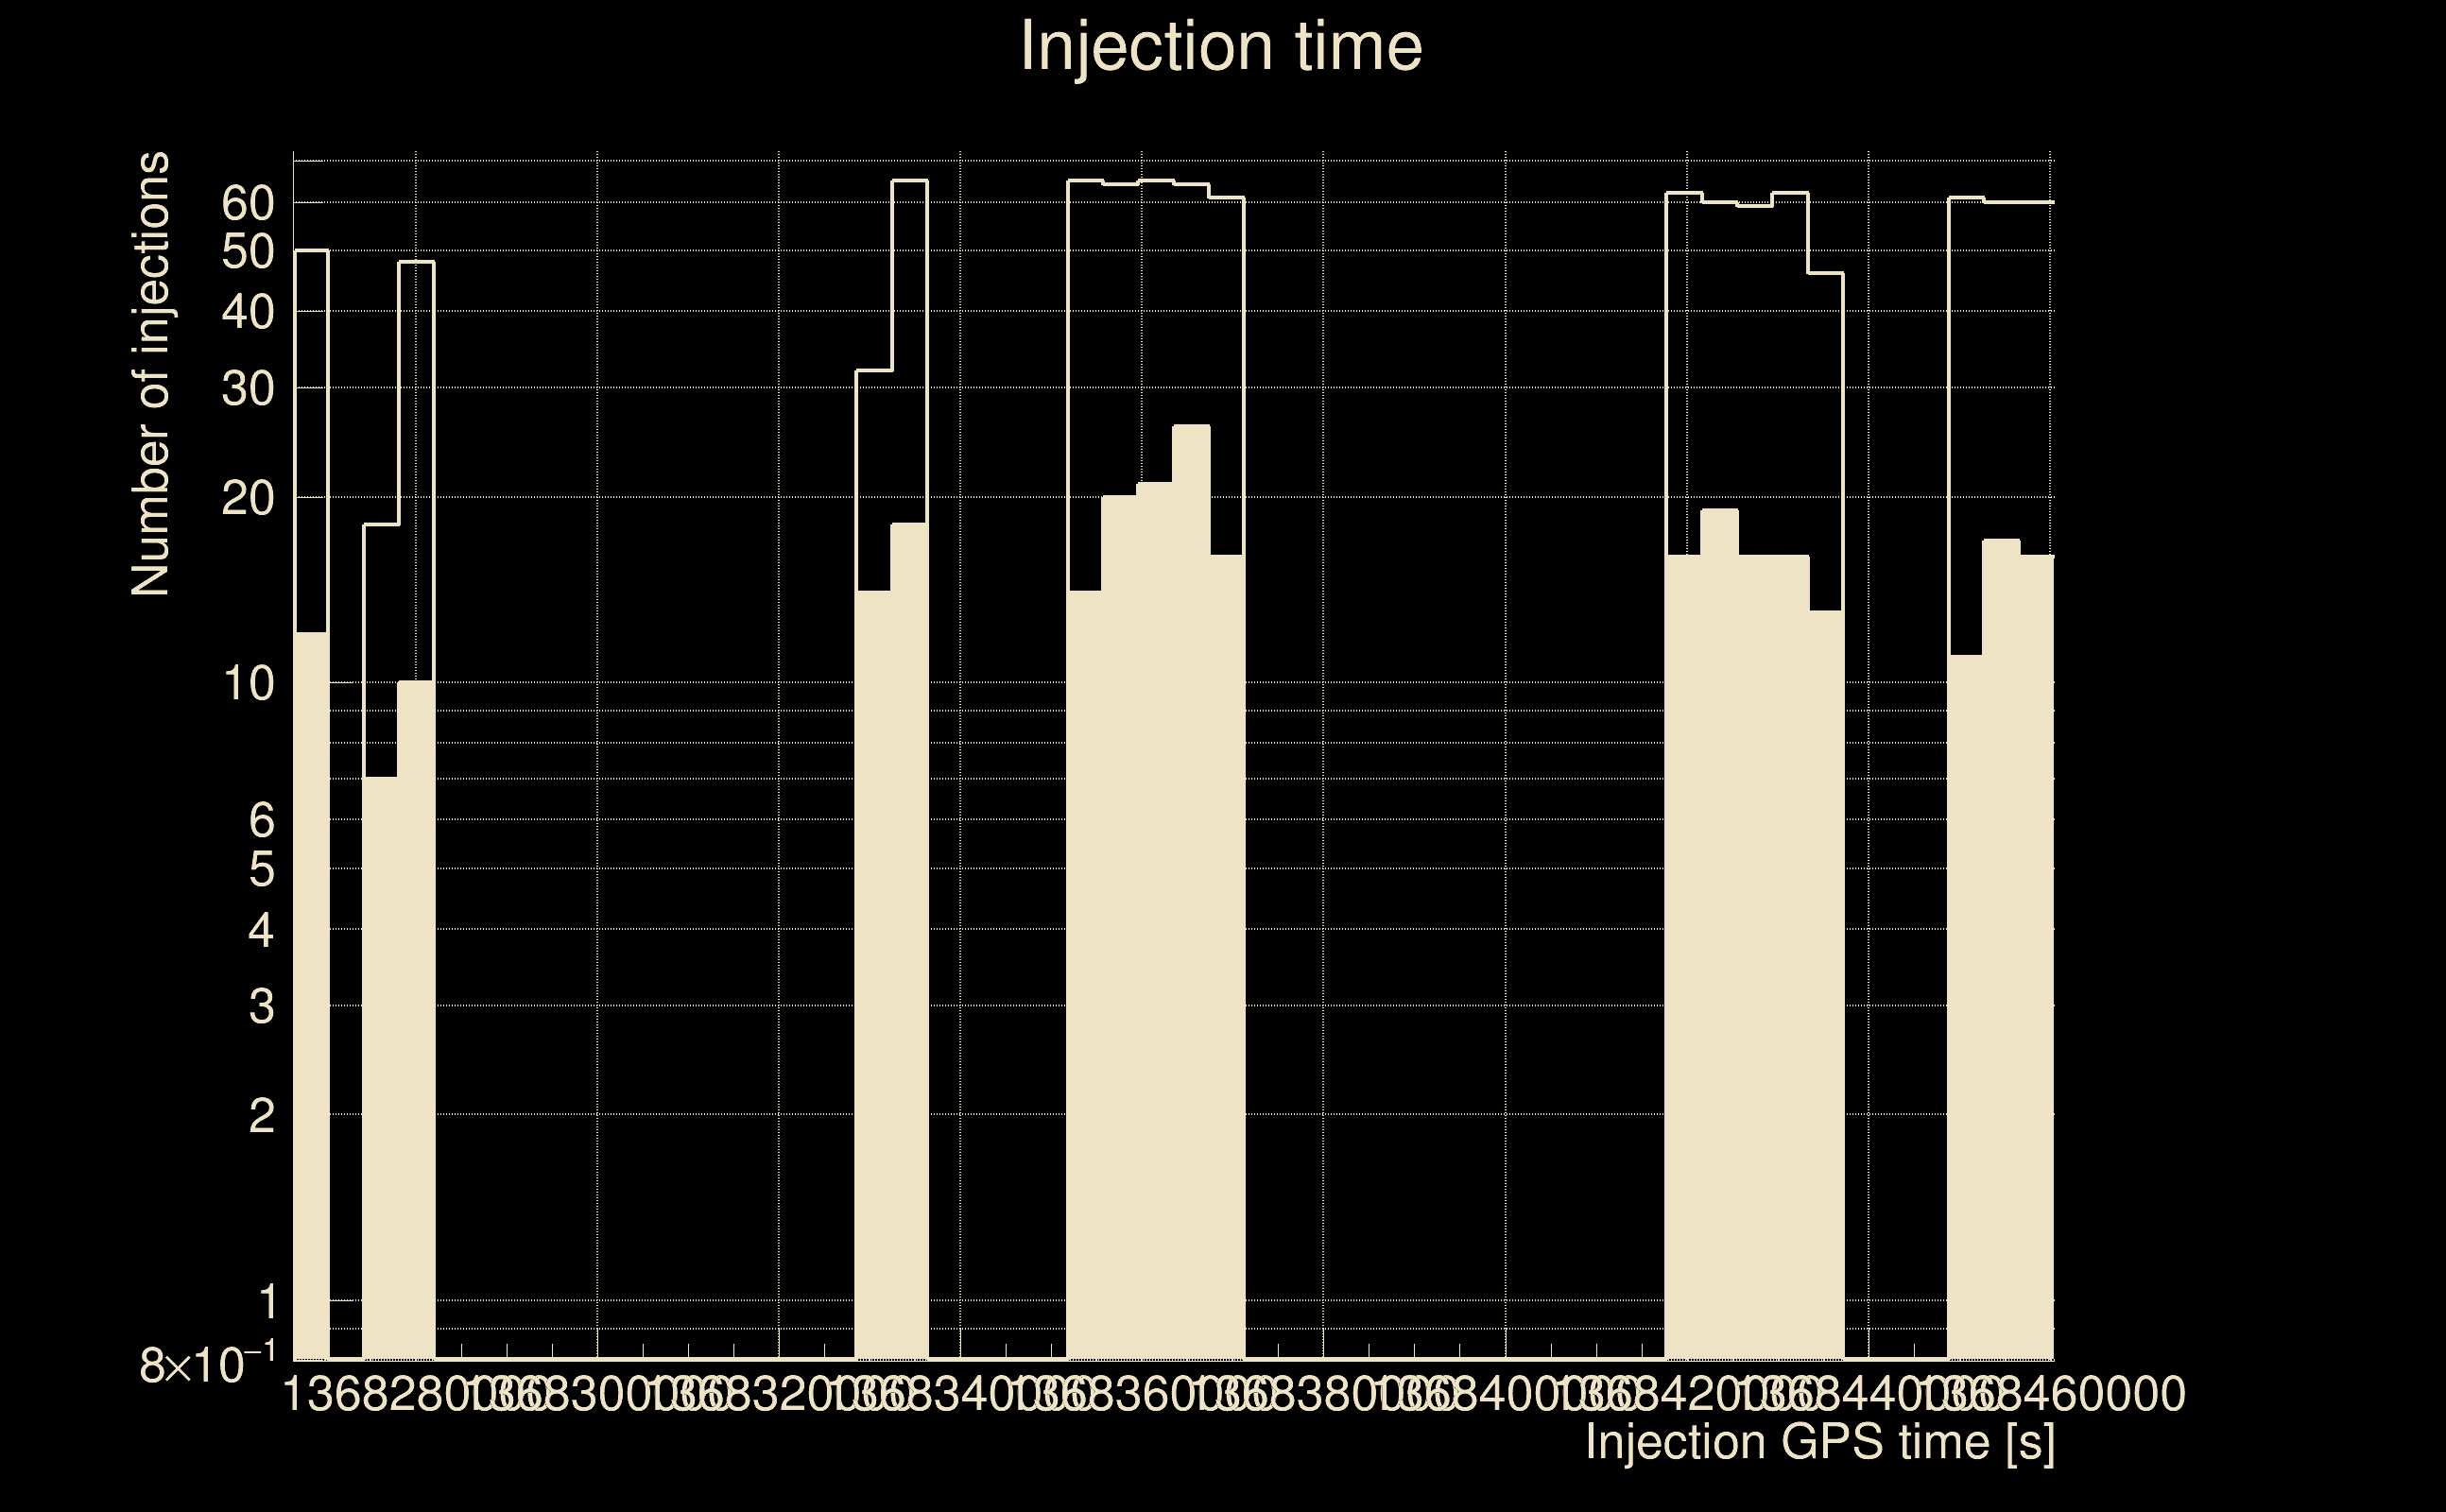
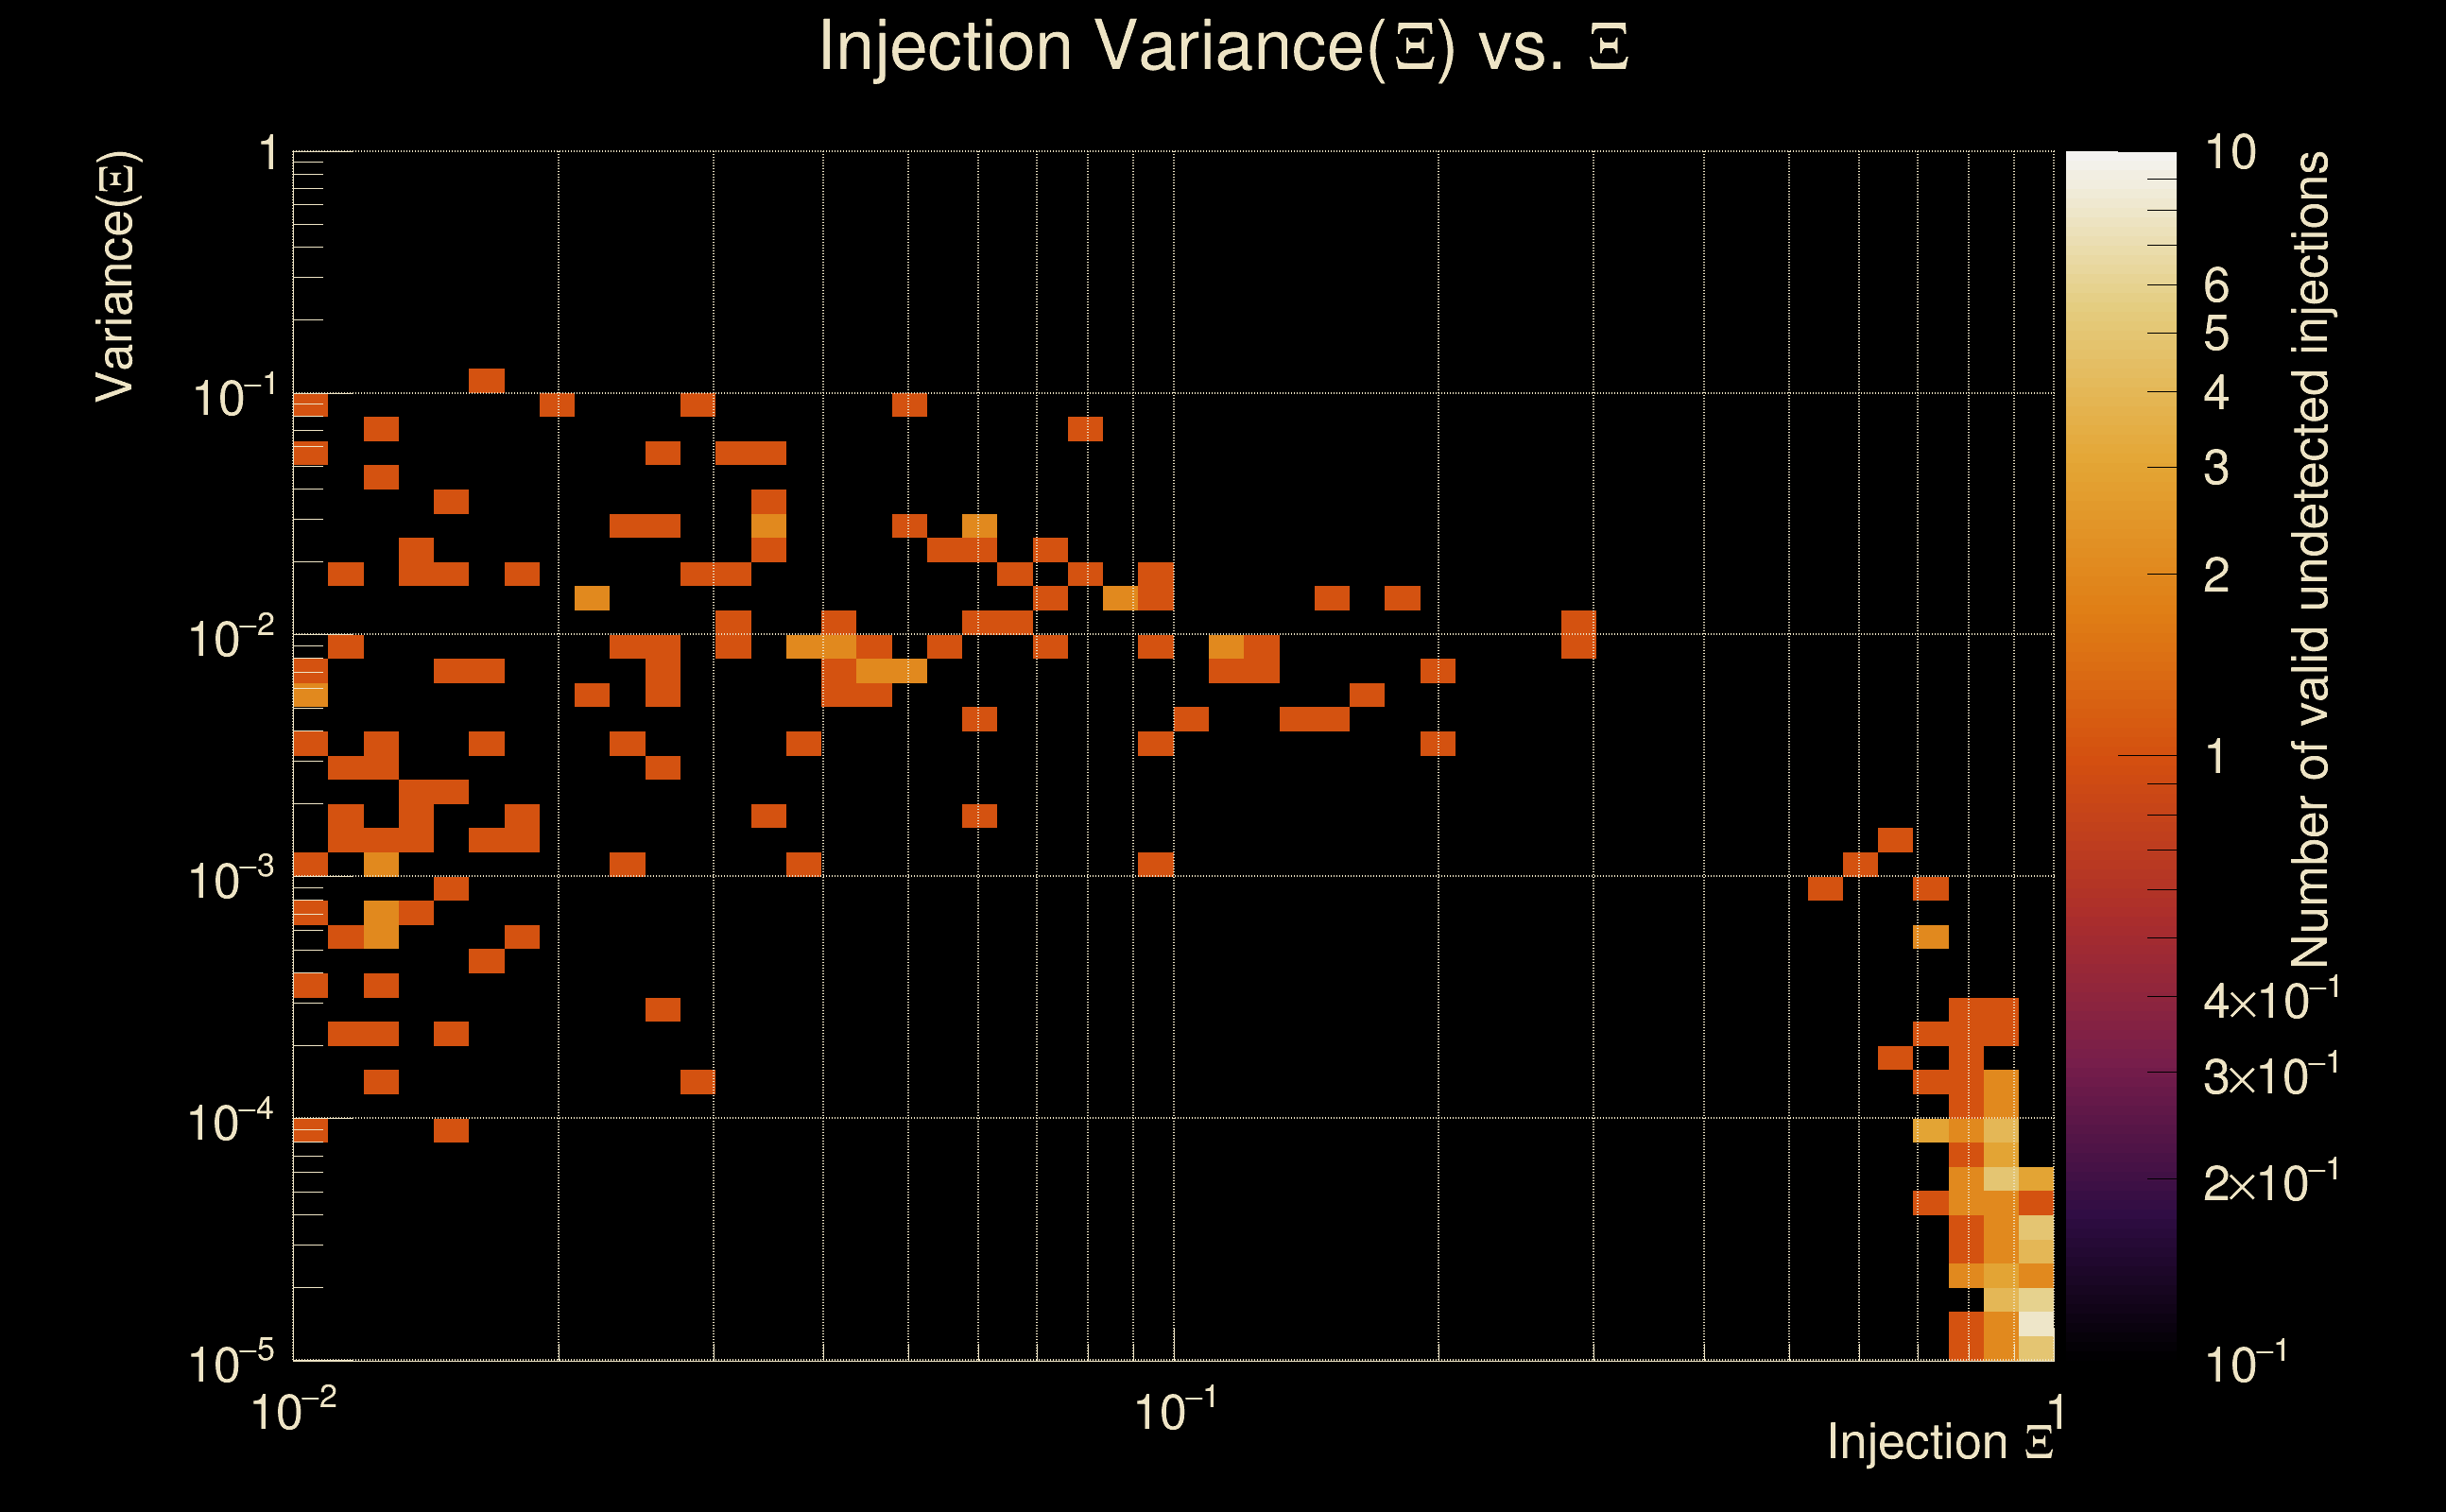
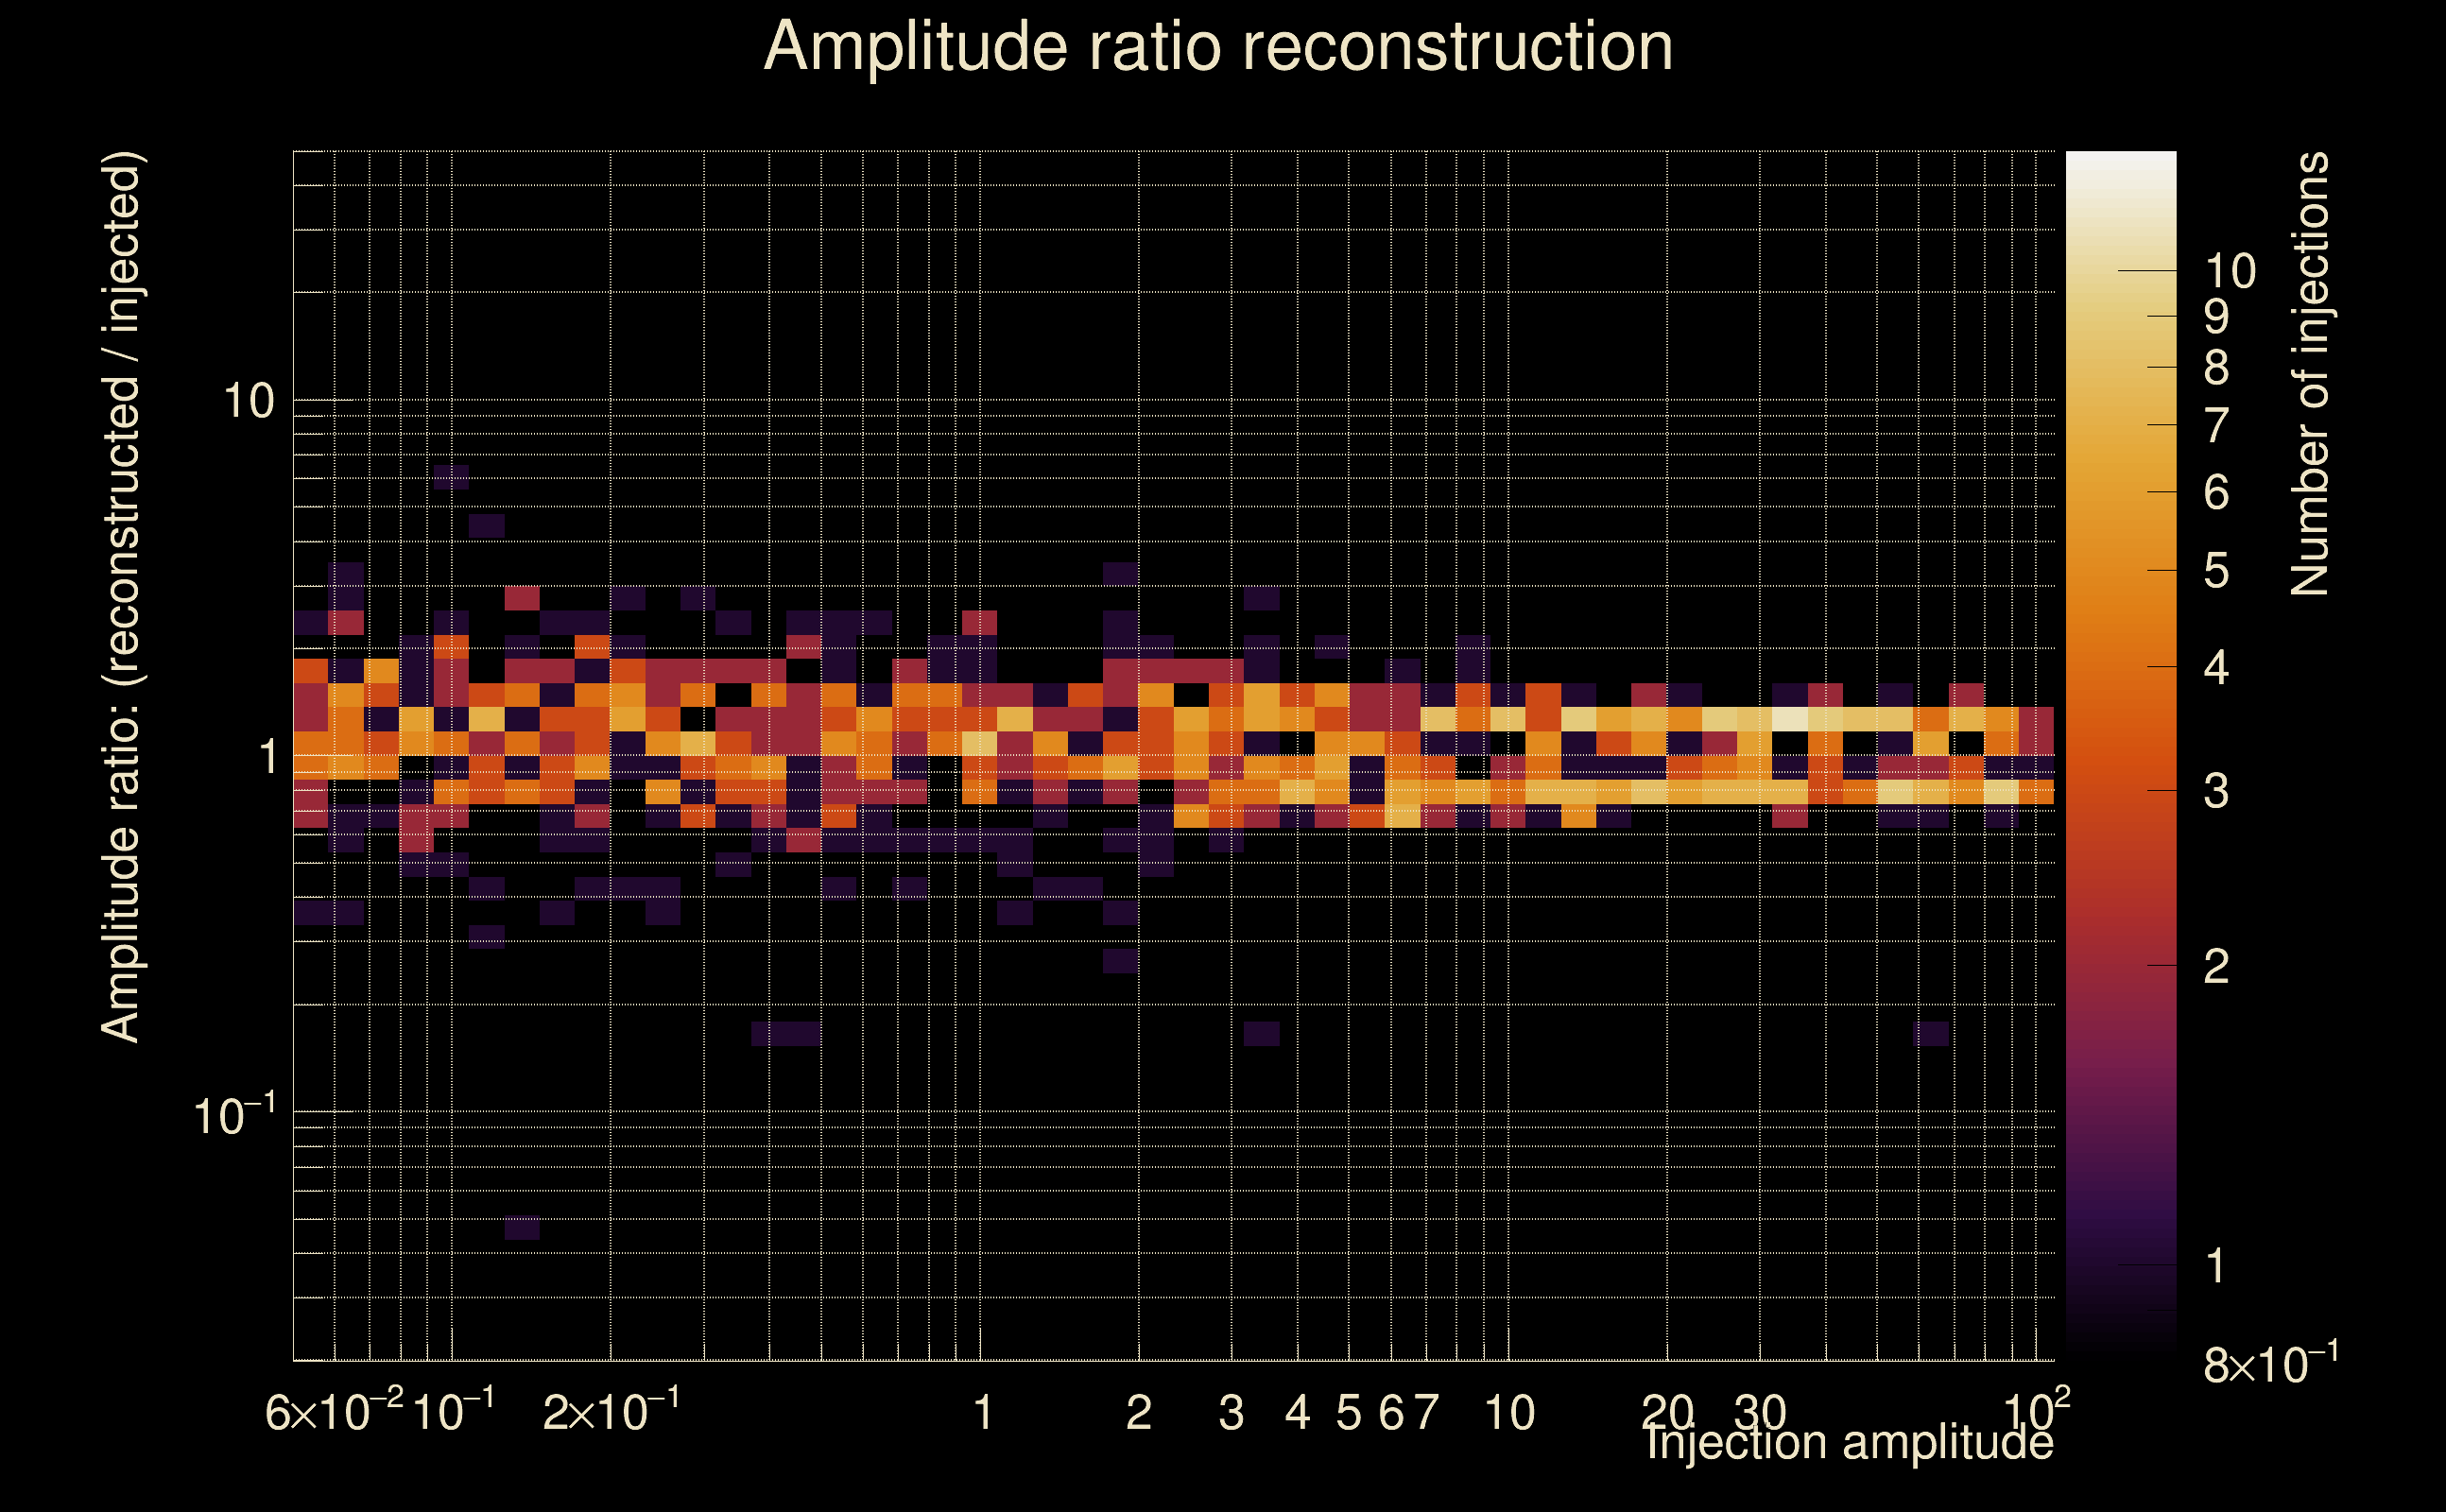
| Number of injections (total/valid/detected): | 1116 / 972 / 238 |
| List of missed injections: | ./Oco18-m20p_missed.txt |
| Injection amplitude at 90% detection efficiency: | 28.7707 |
| Injection amplitude at 50% detection efficiency: | 15.6735 |
| Injection amplitude at 10% detection efficiency: | 9.43564 |
 |
 |
 |
 |
 |
 |
 |
|
 |
 |
|
 |
 |
|
 |
 |
|
 |
 |
|
 |
 |
|
 |
 |
|
 |
 |
|
 |
 |
 |
 |
 |
 |
 |
 |
 |
 |
 |
 |
 |
 |
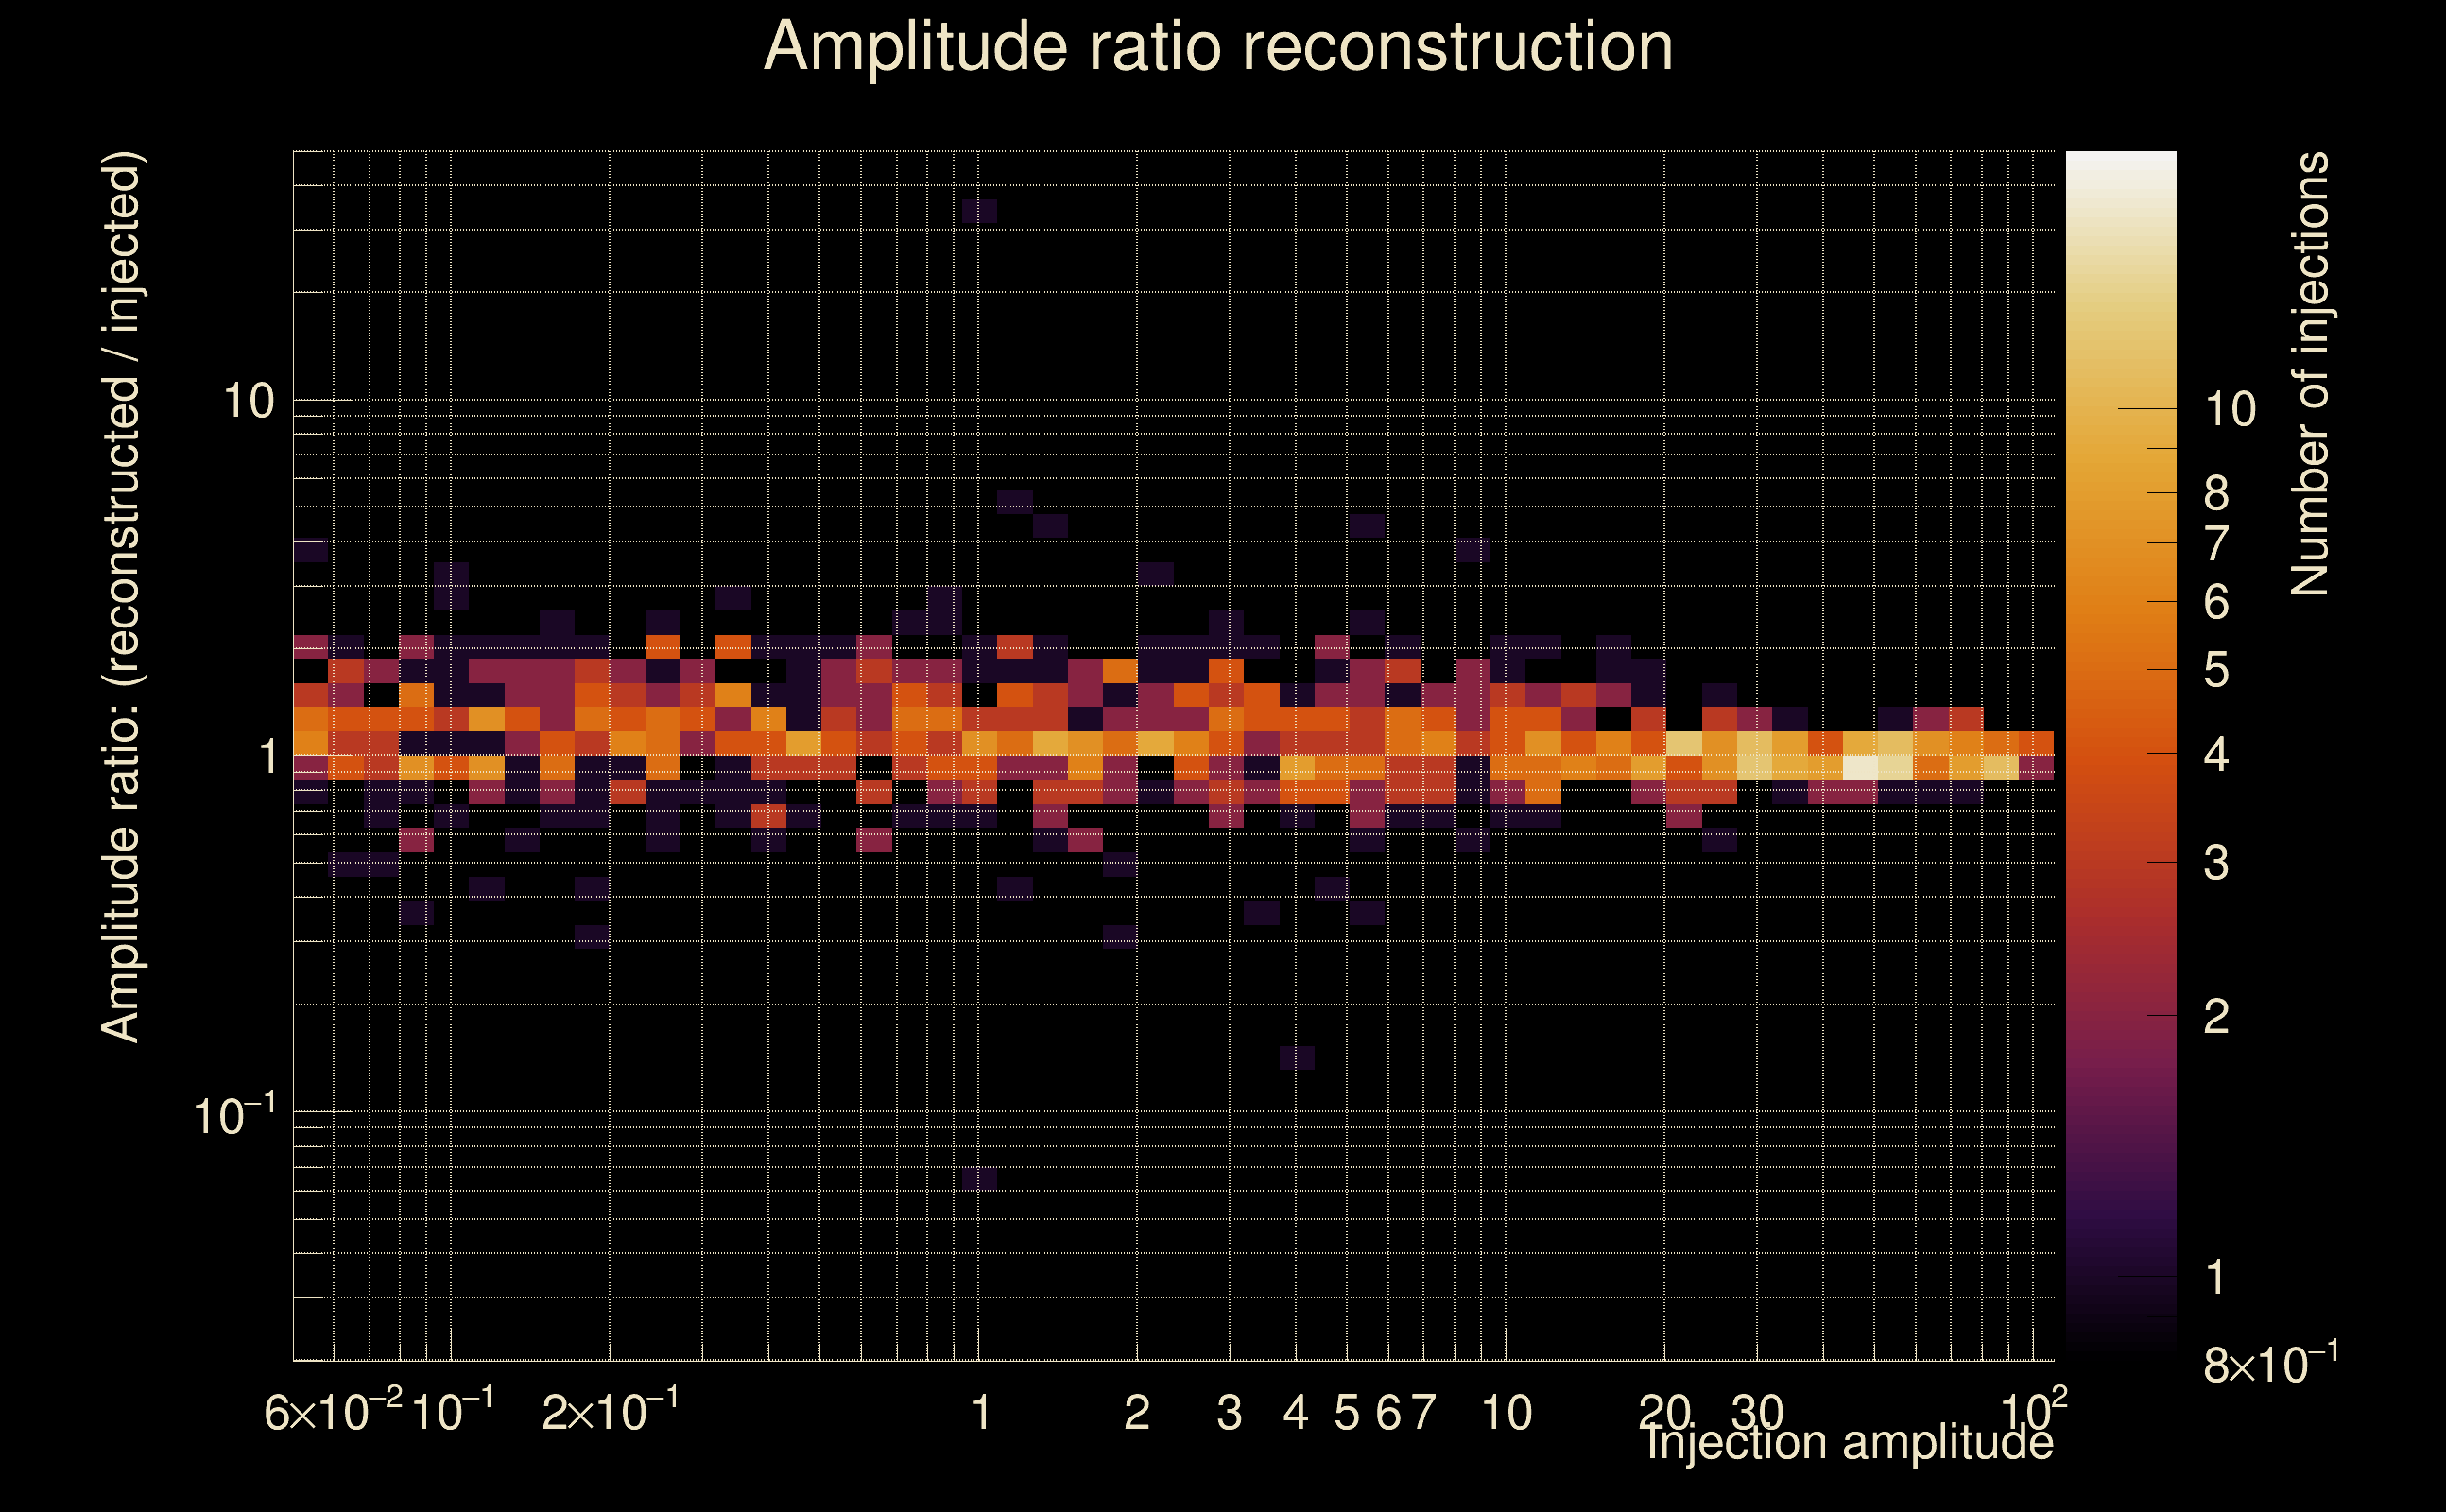 |
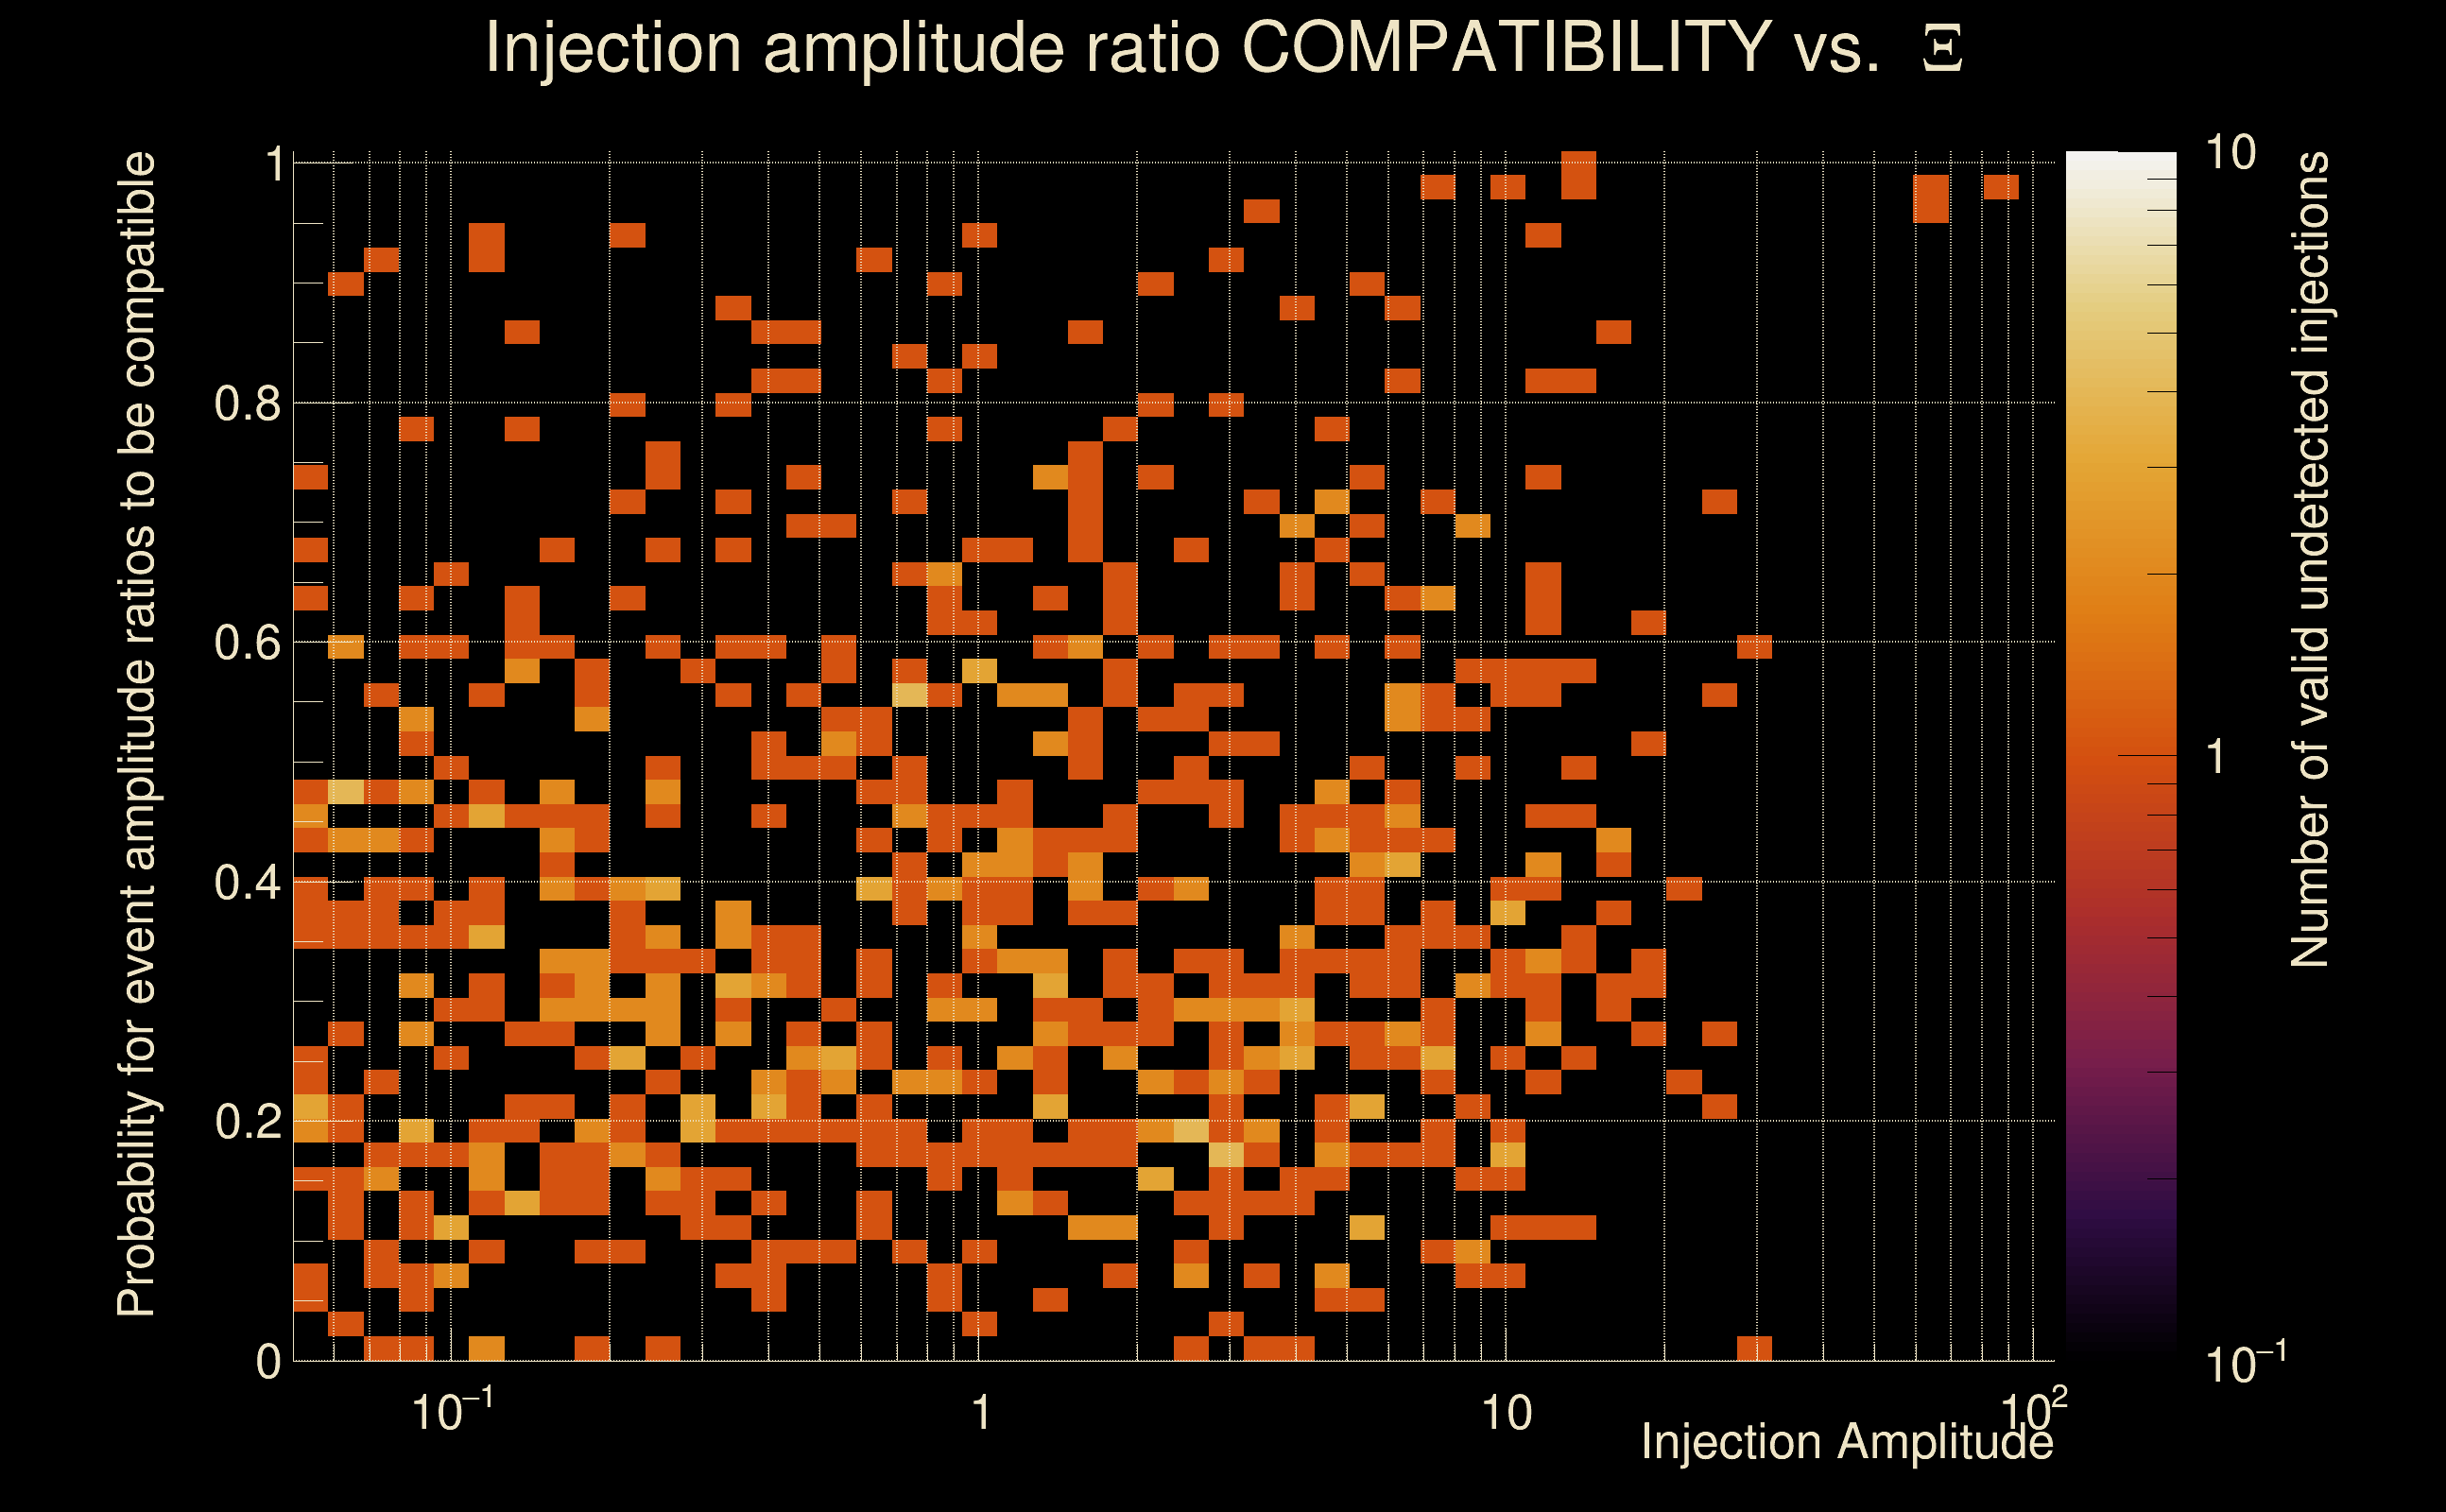
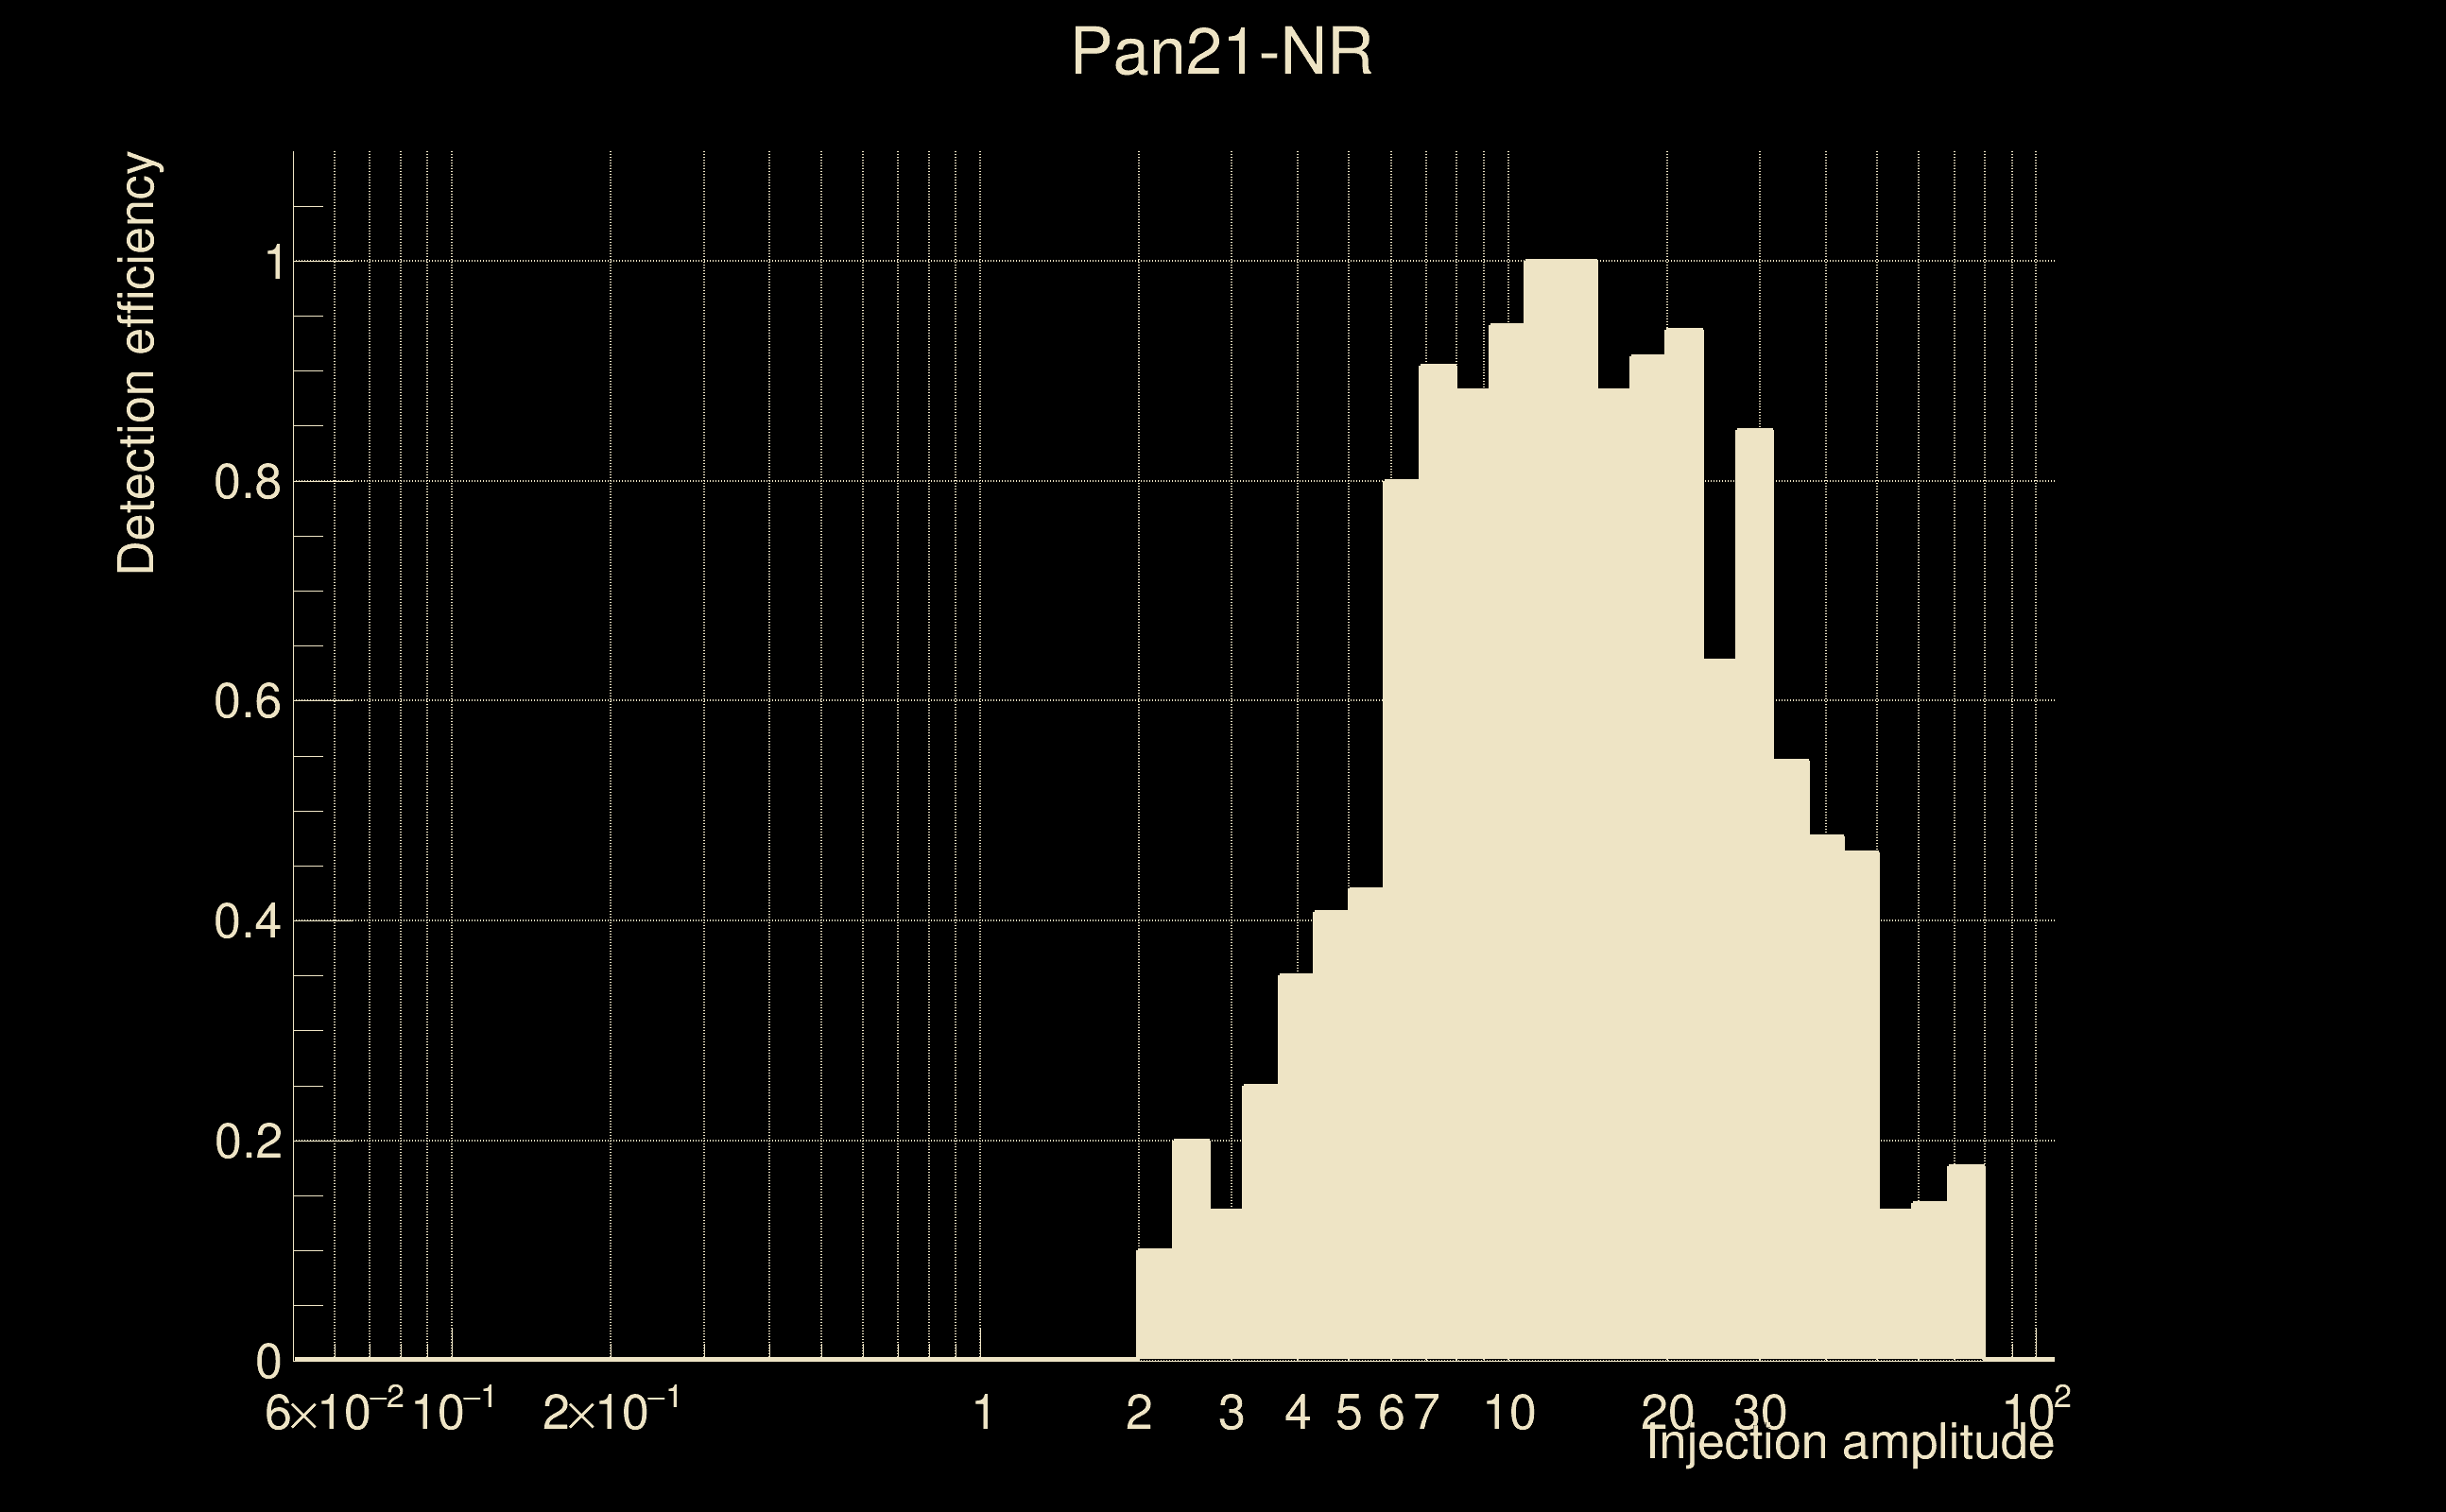
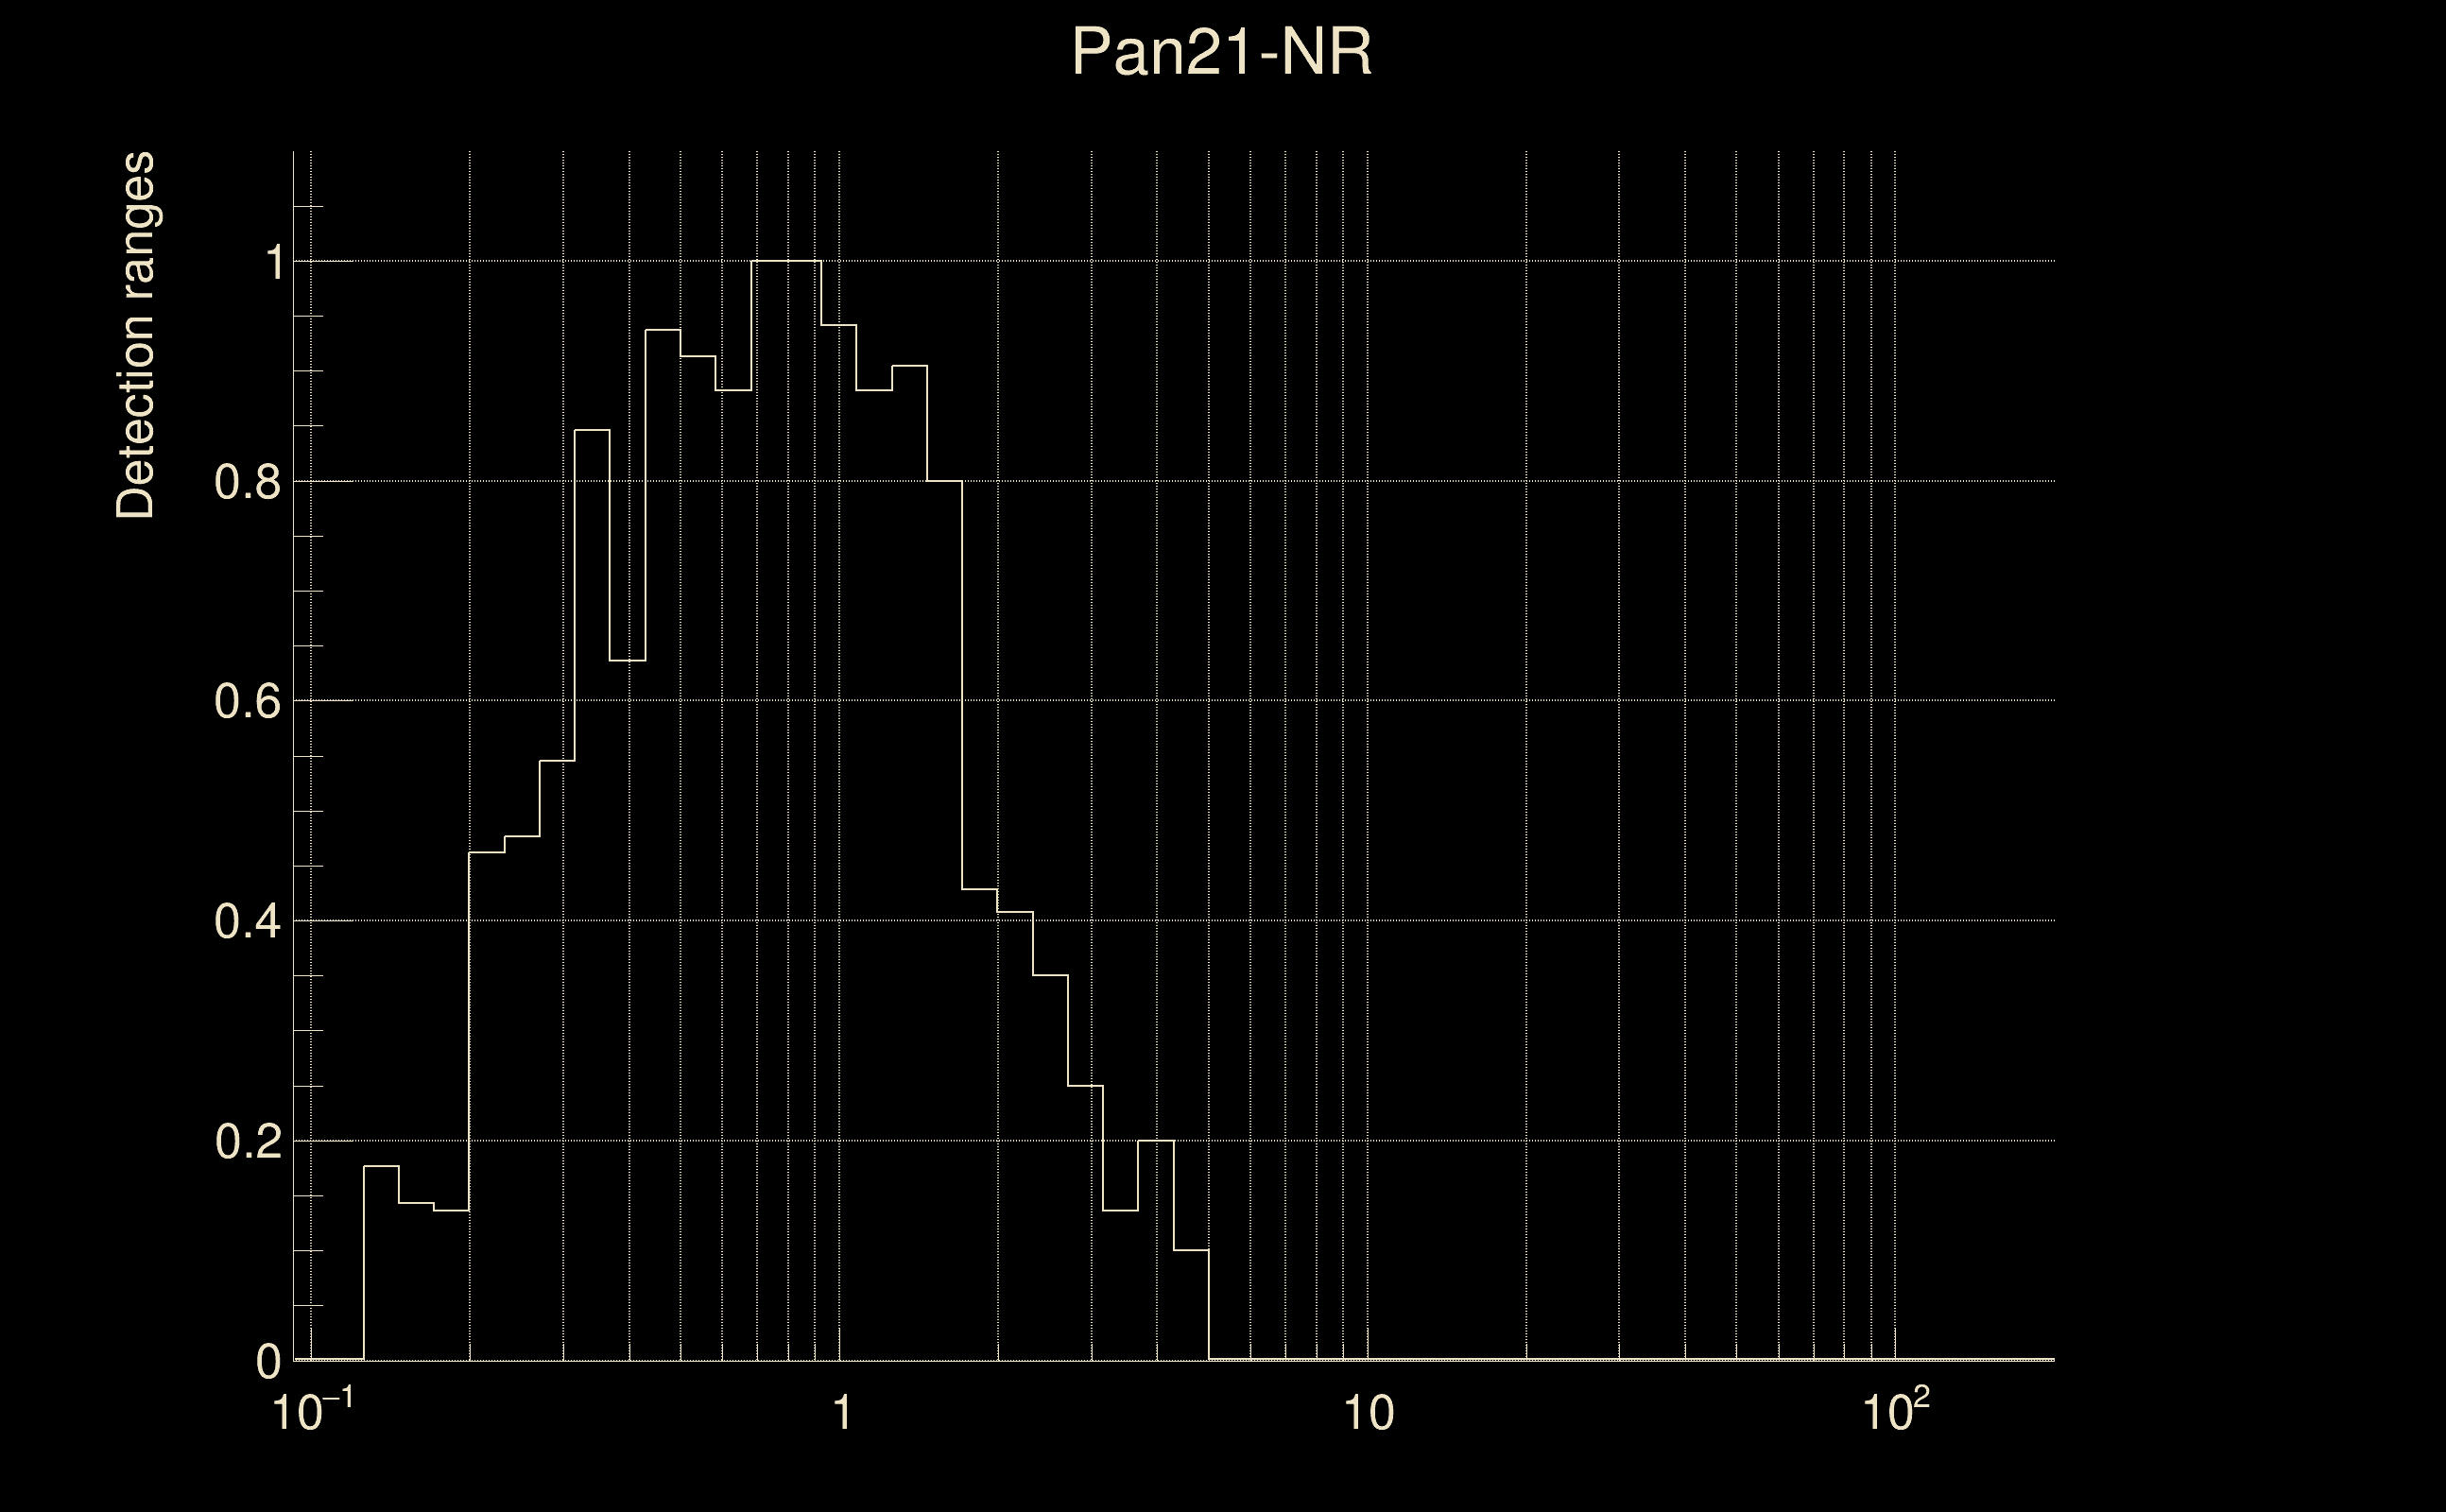
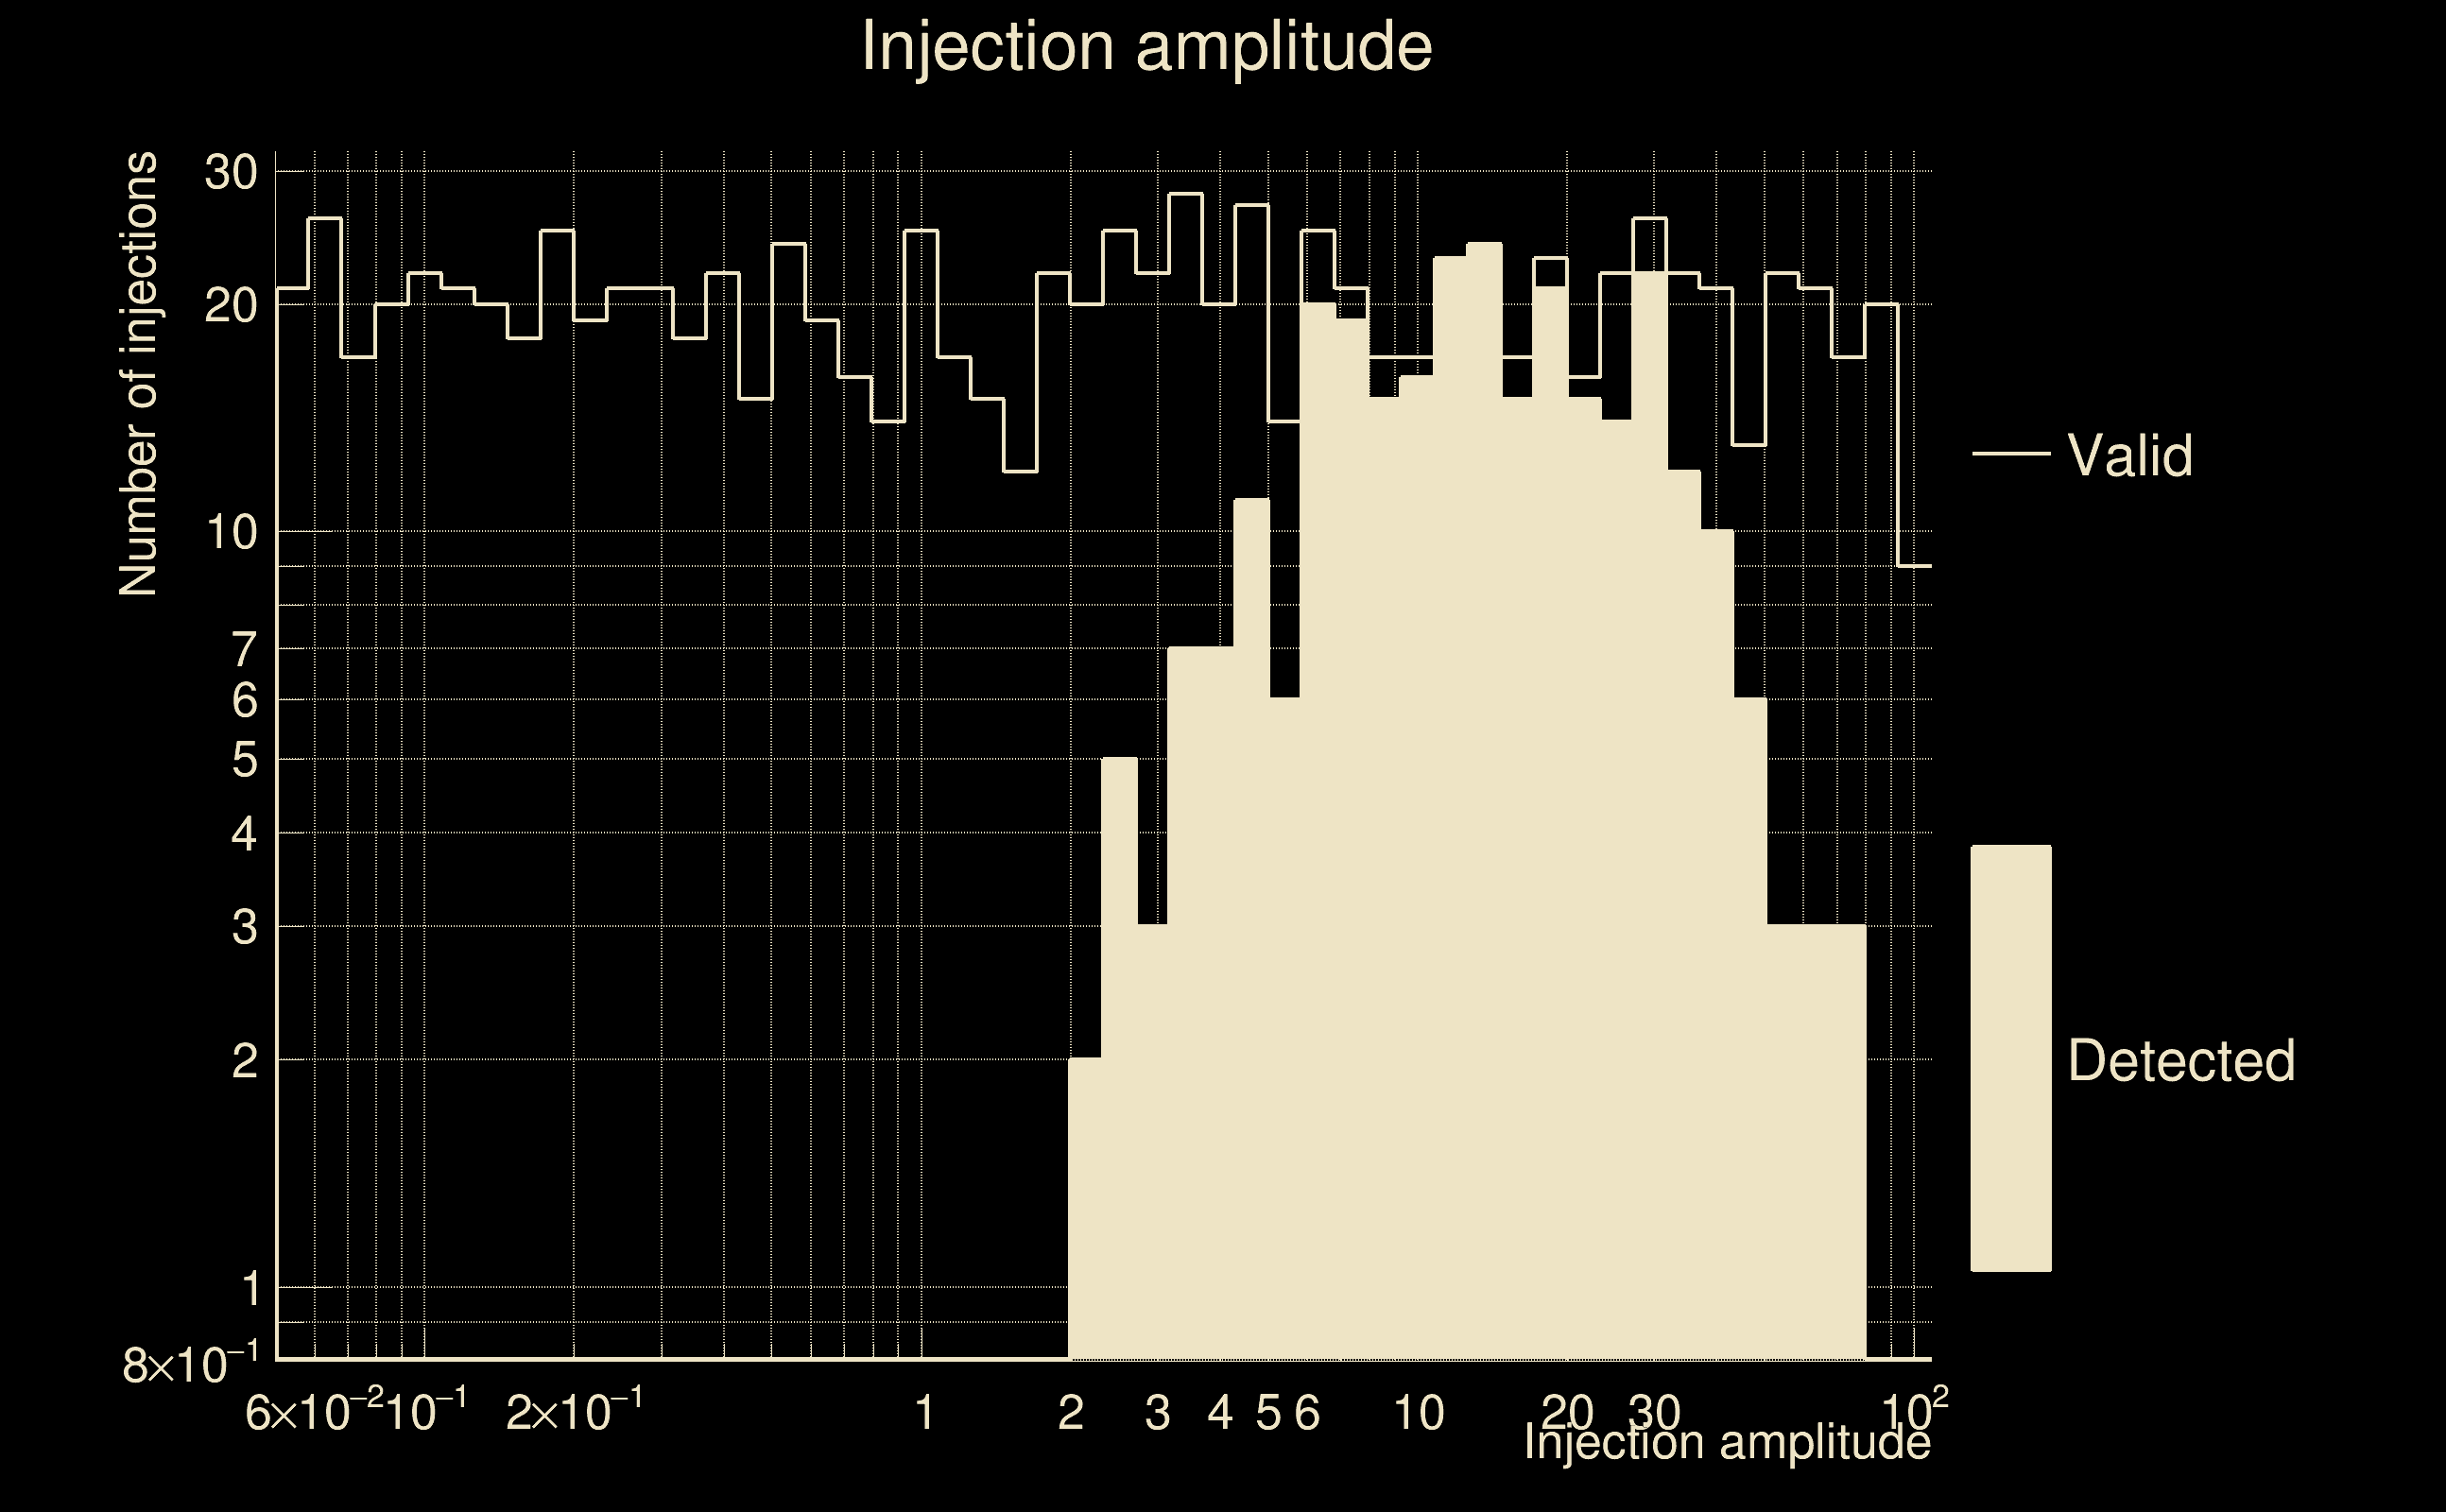
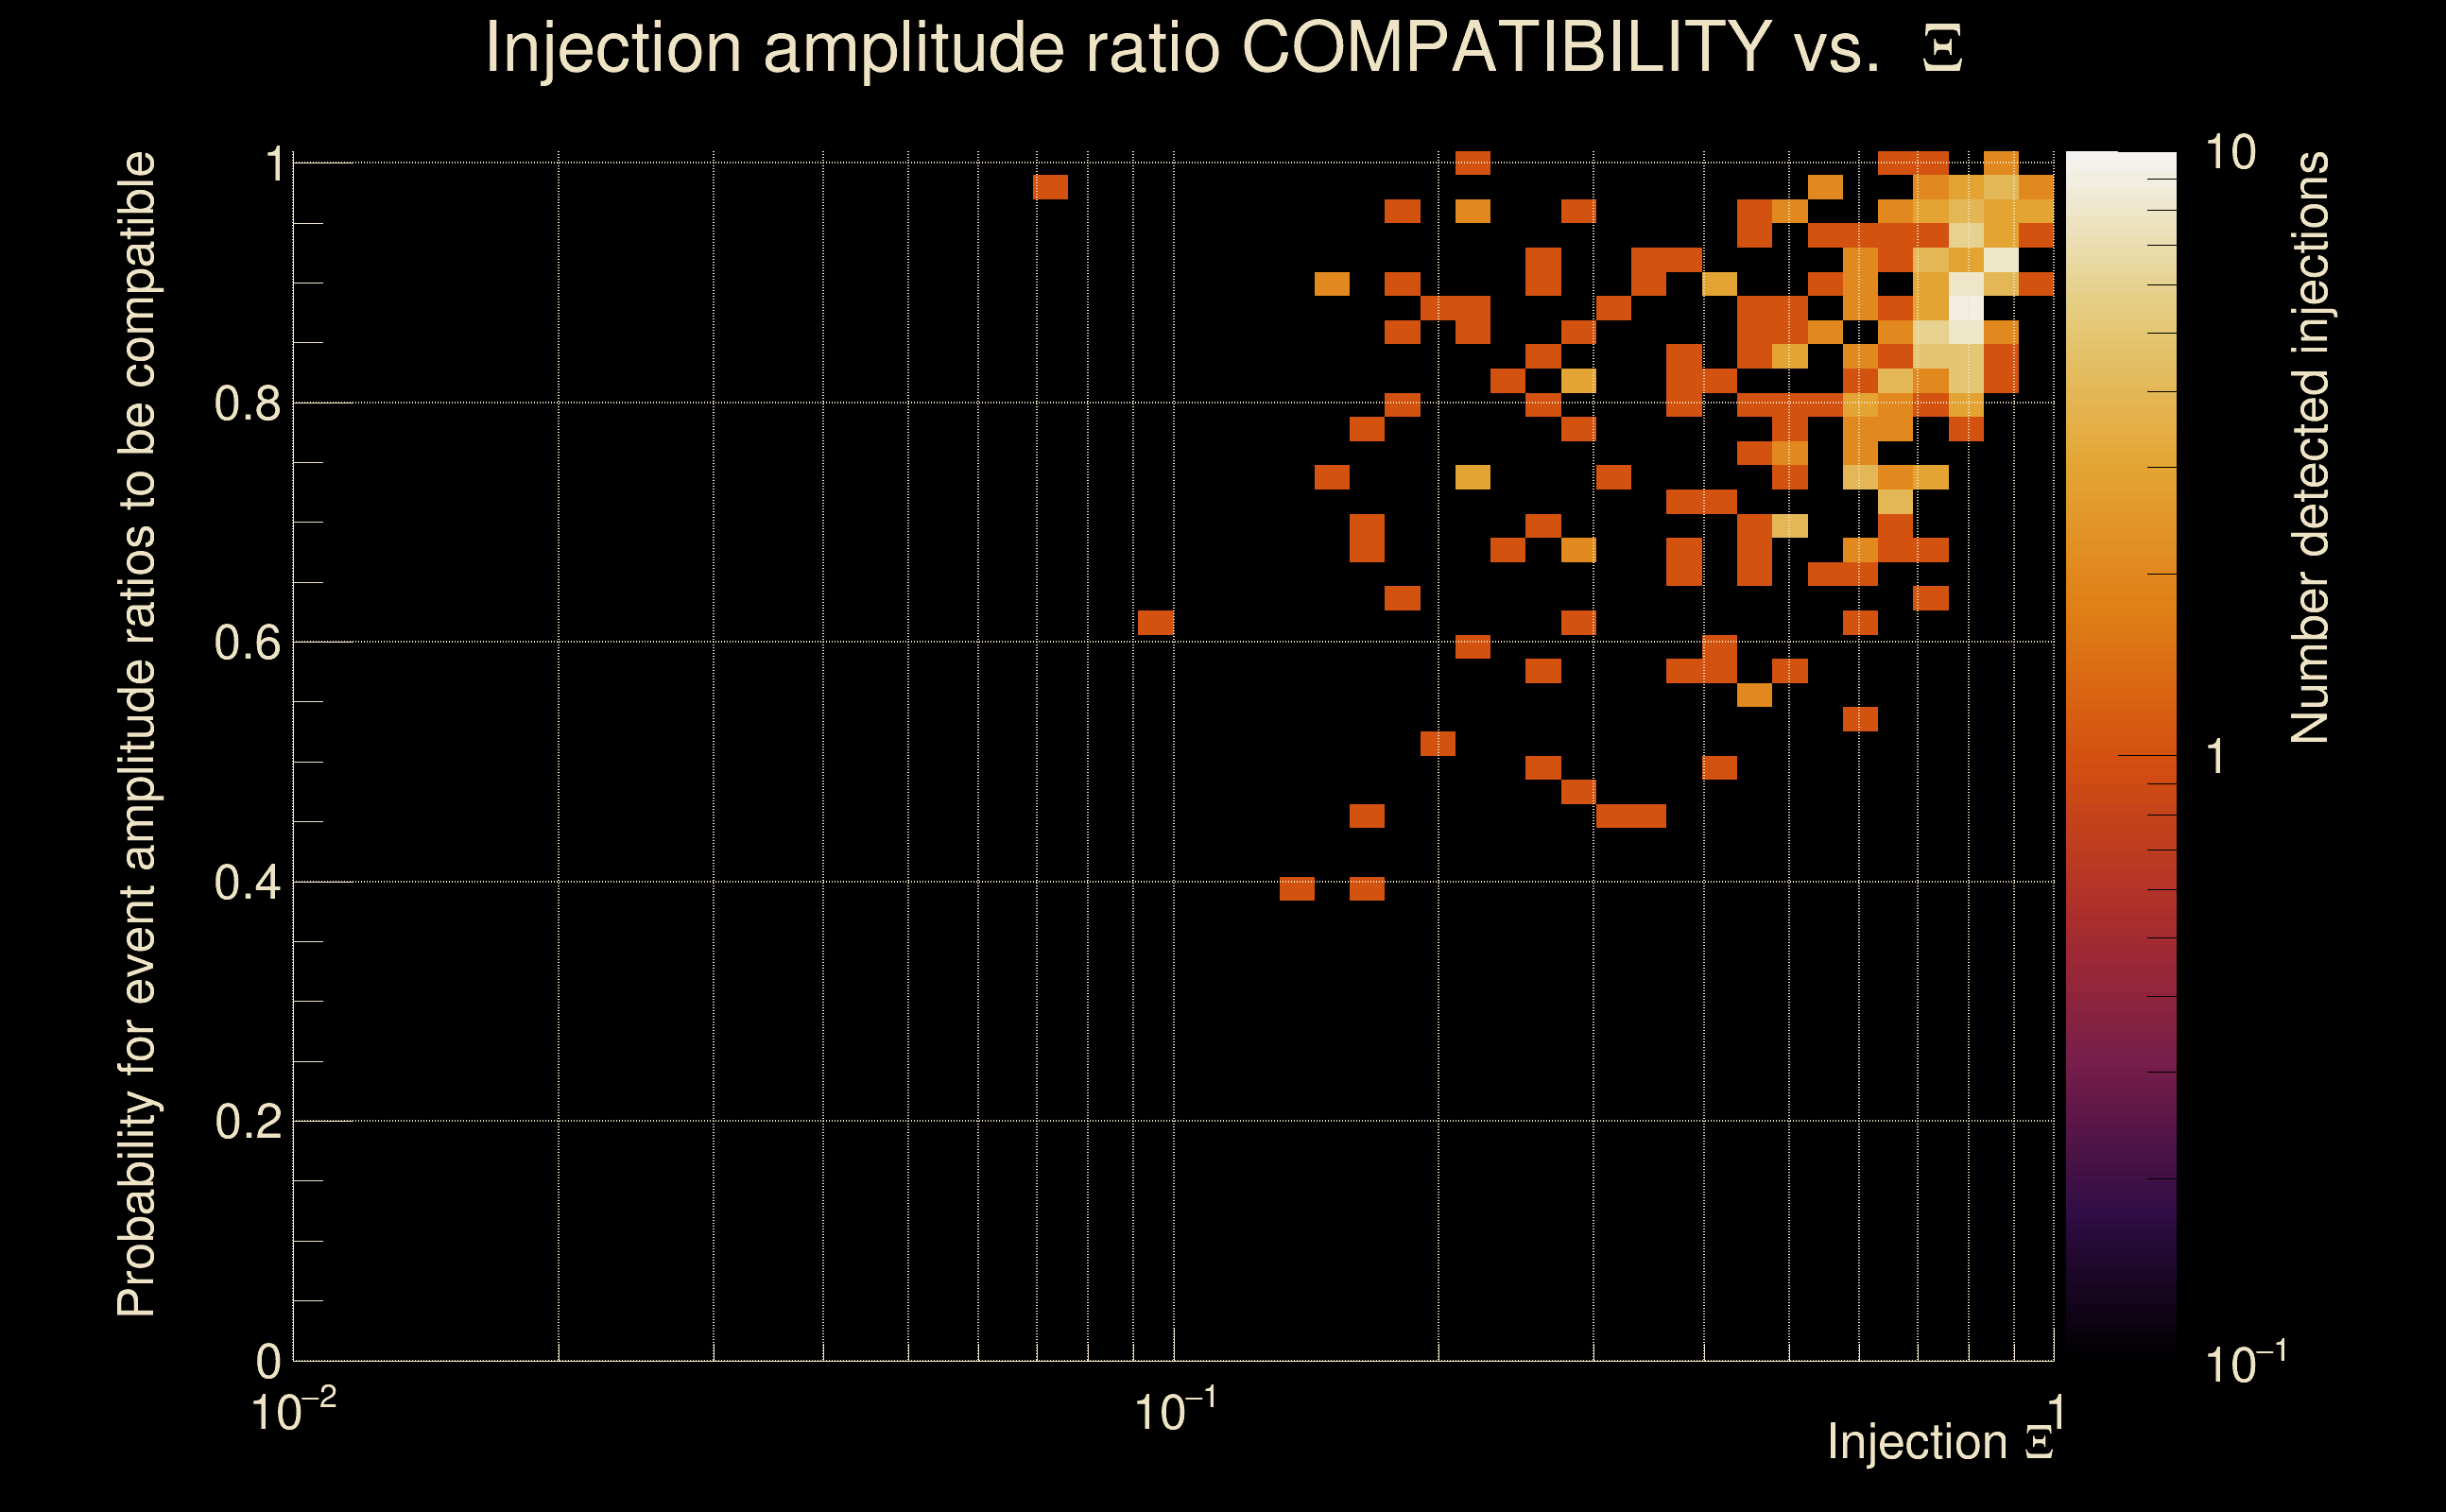
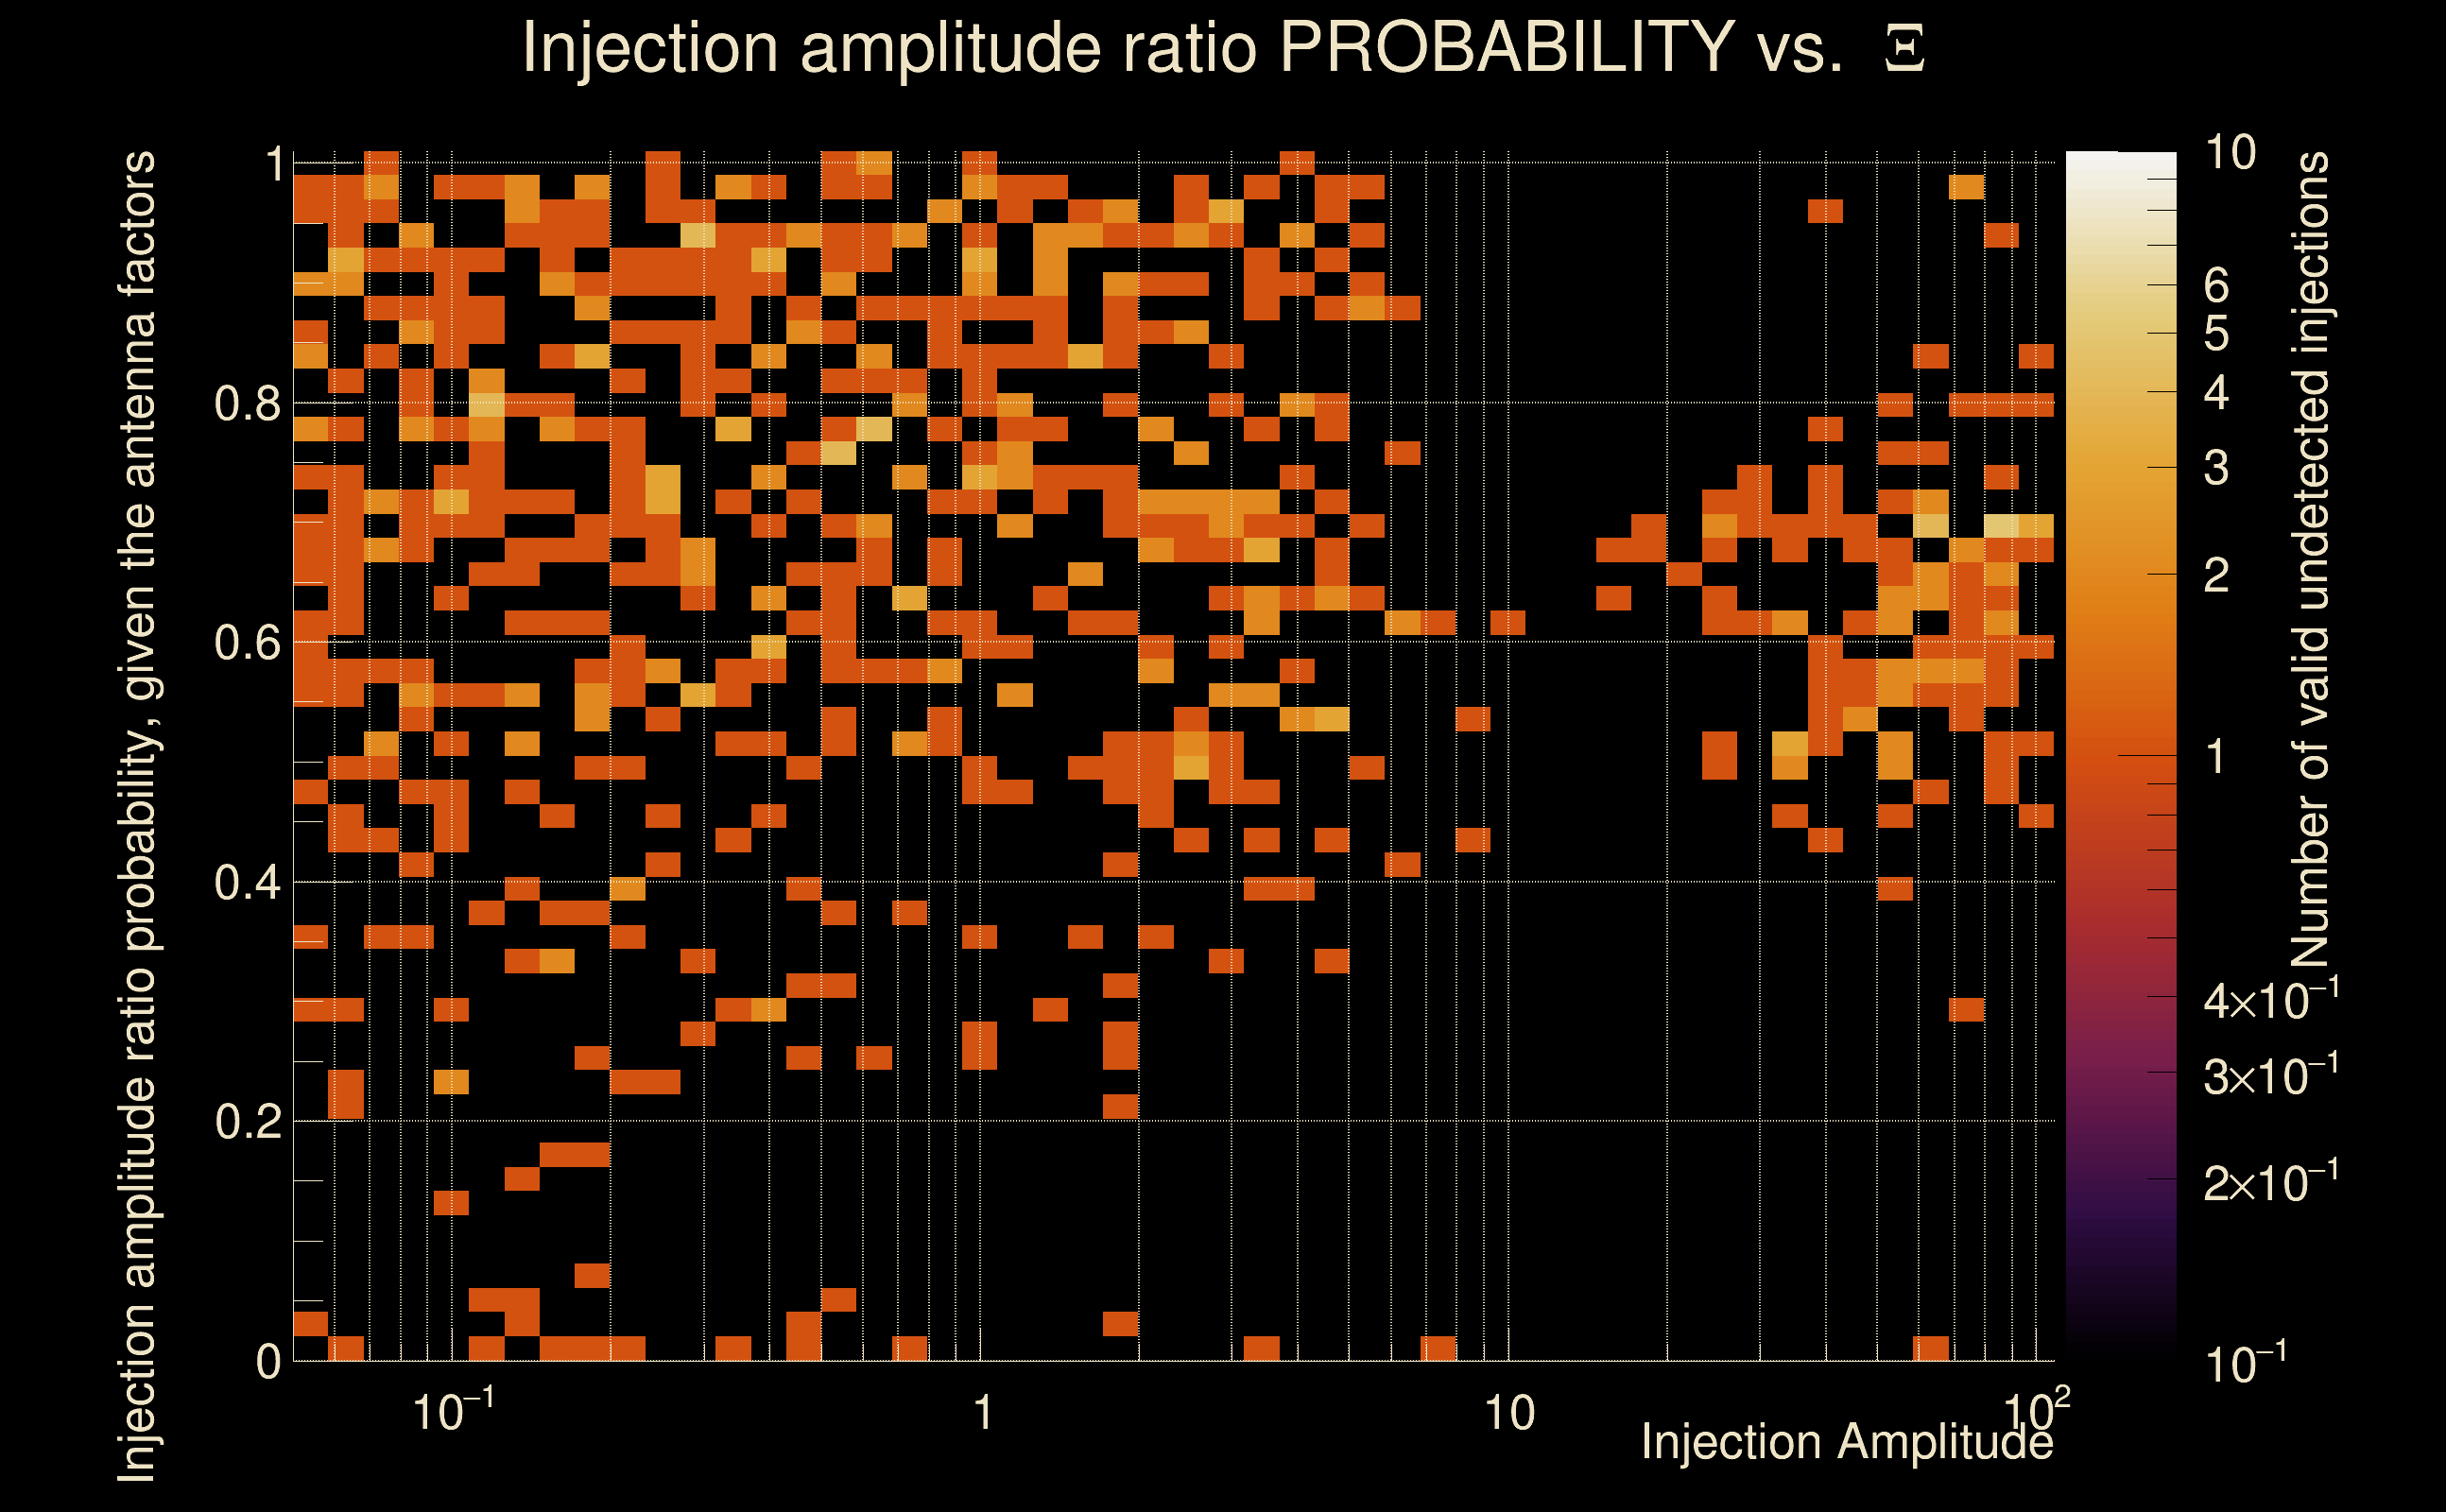
| Number of injections (total/valid/detected): | 1162 / 1002 / 282 |
| List of missed injections: | ./Pan21-NR_missed.txt |
| Injection amplitude at 90% detection efficiency: | 9.01354 |
| Injection amplitude at 50% detection efficiency: | 5.58913 |
| Injection amplitude at 10% detection efficiency: | 2.15533 |
 |
 |
 |
 |
 |
 |
 |
|
 |
 |
|
 |
 |
|
 |
 |
|
 |
 |
|
 |
 |
|
 |
 |
|
 |
 |
|
 |
 |
 |
 |
 |
 |
 |
 |
 |
 |
 |
 |
 |
 |
 |
| florent.robinet@ijclab.in2p3.fr |