| Omicron version: | 4.2.0: documentation gitlab repository |
| Omicron run by: | unknown |
| Report produced on: | Mon Feb 23 13:09:21 2026 UTC |
| Ox option file: | TargIxf_feb2026_SN3_options.txt |
| Omicron option files: | detector 0, detector 1 |
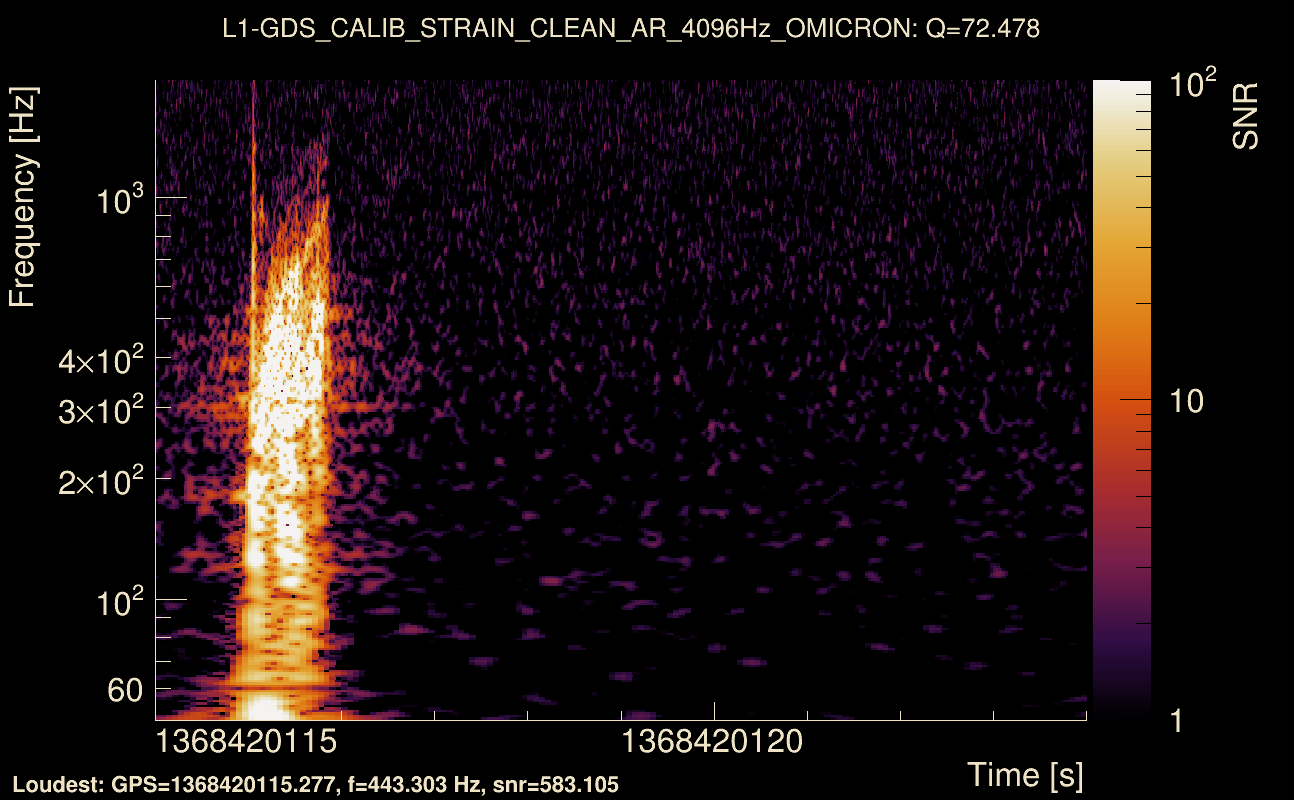
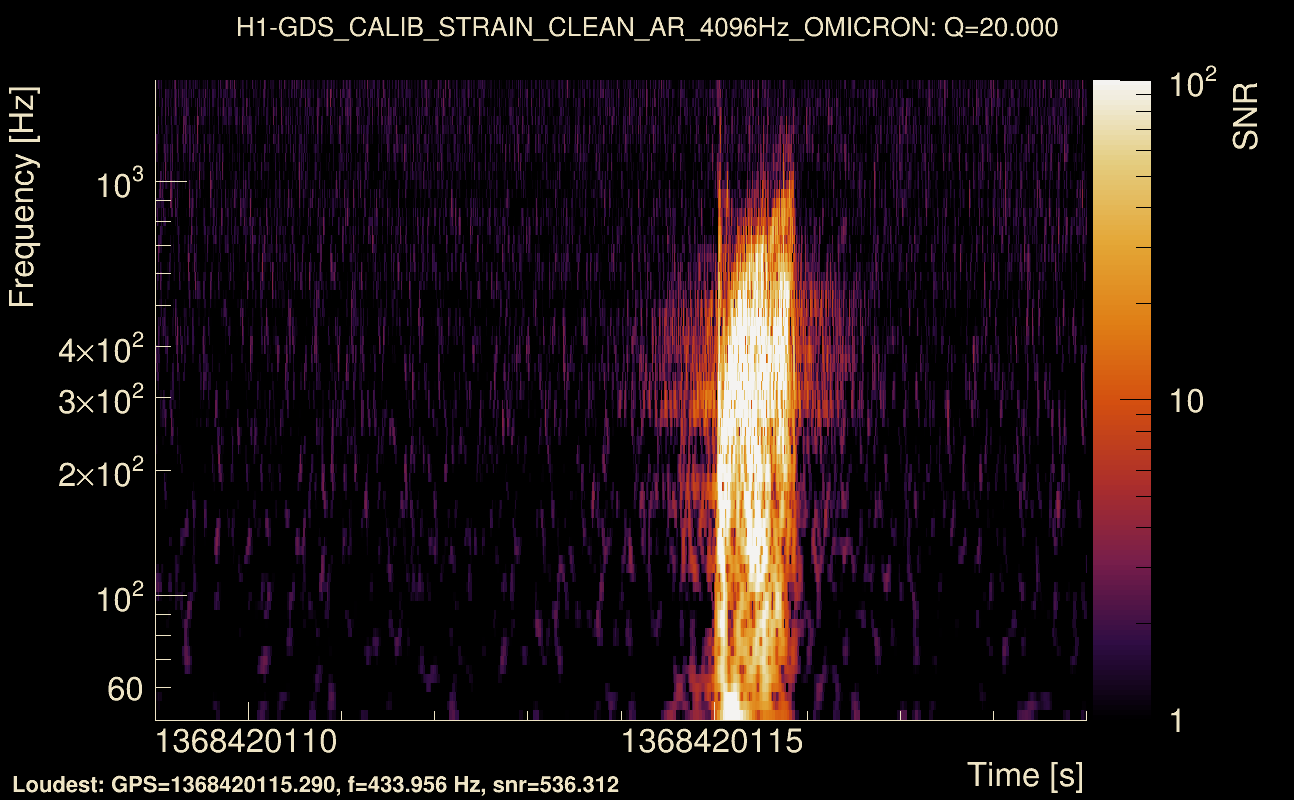
| Detector channel names: | H1:GDS-CALIB_STRAIN_CLEAN_AR_4096Hz, L1:GDS-CALIB_STRAIN_CLEAN_AR_4096Hz |
| Omicron analysis time window and overlap: | 16 s, 6 s |
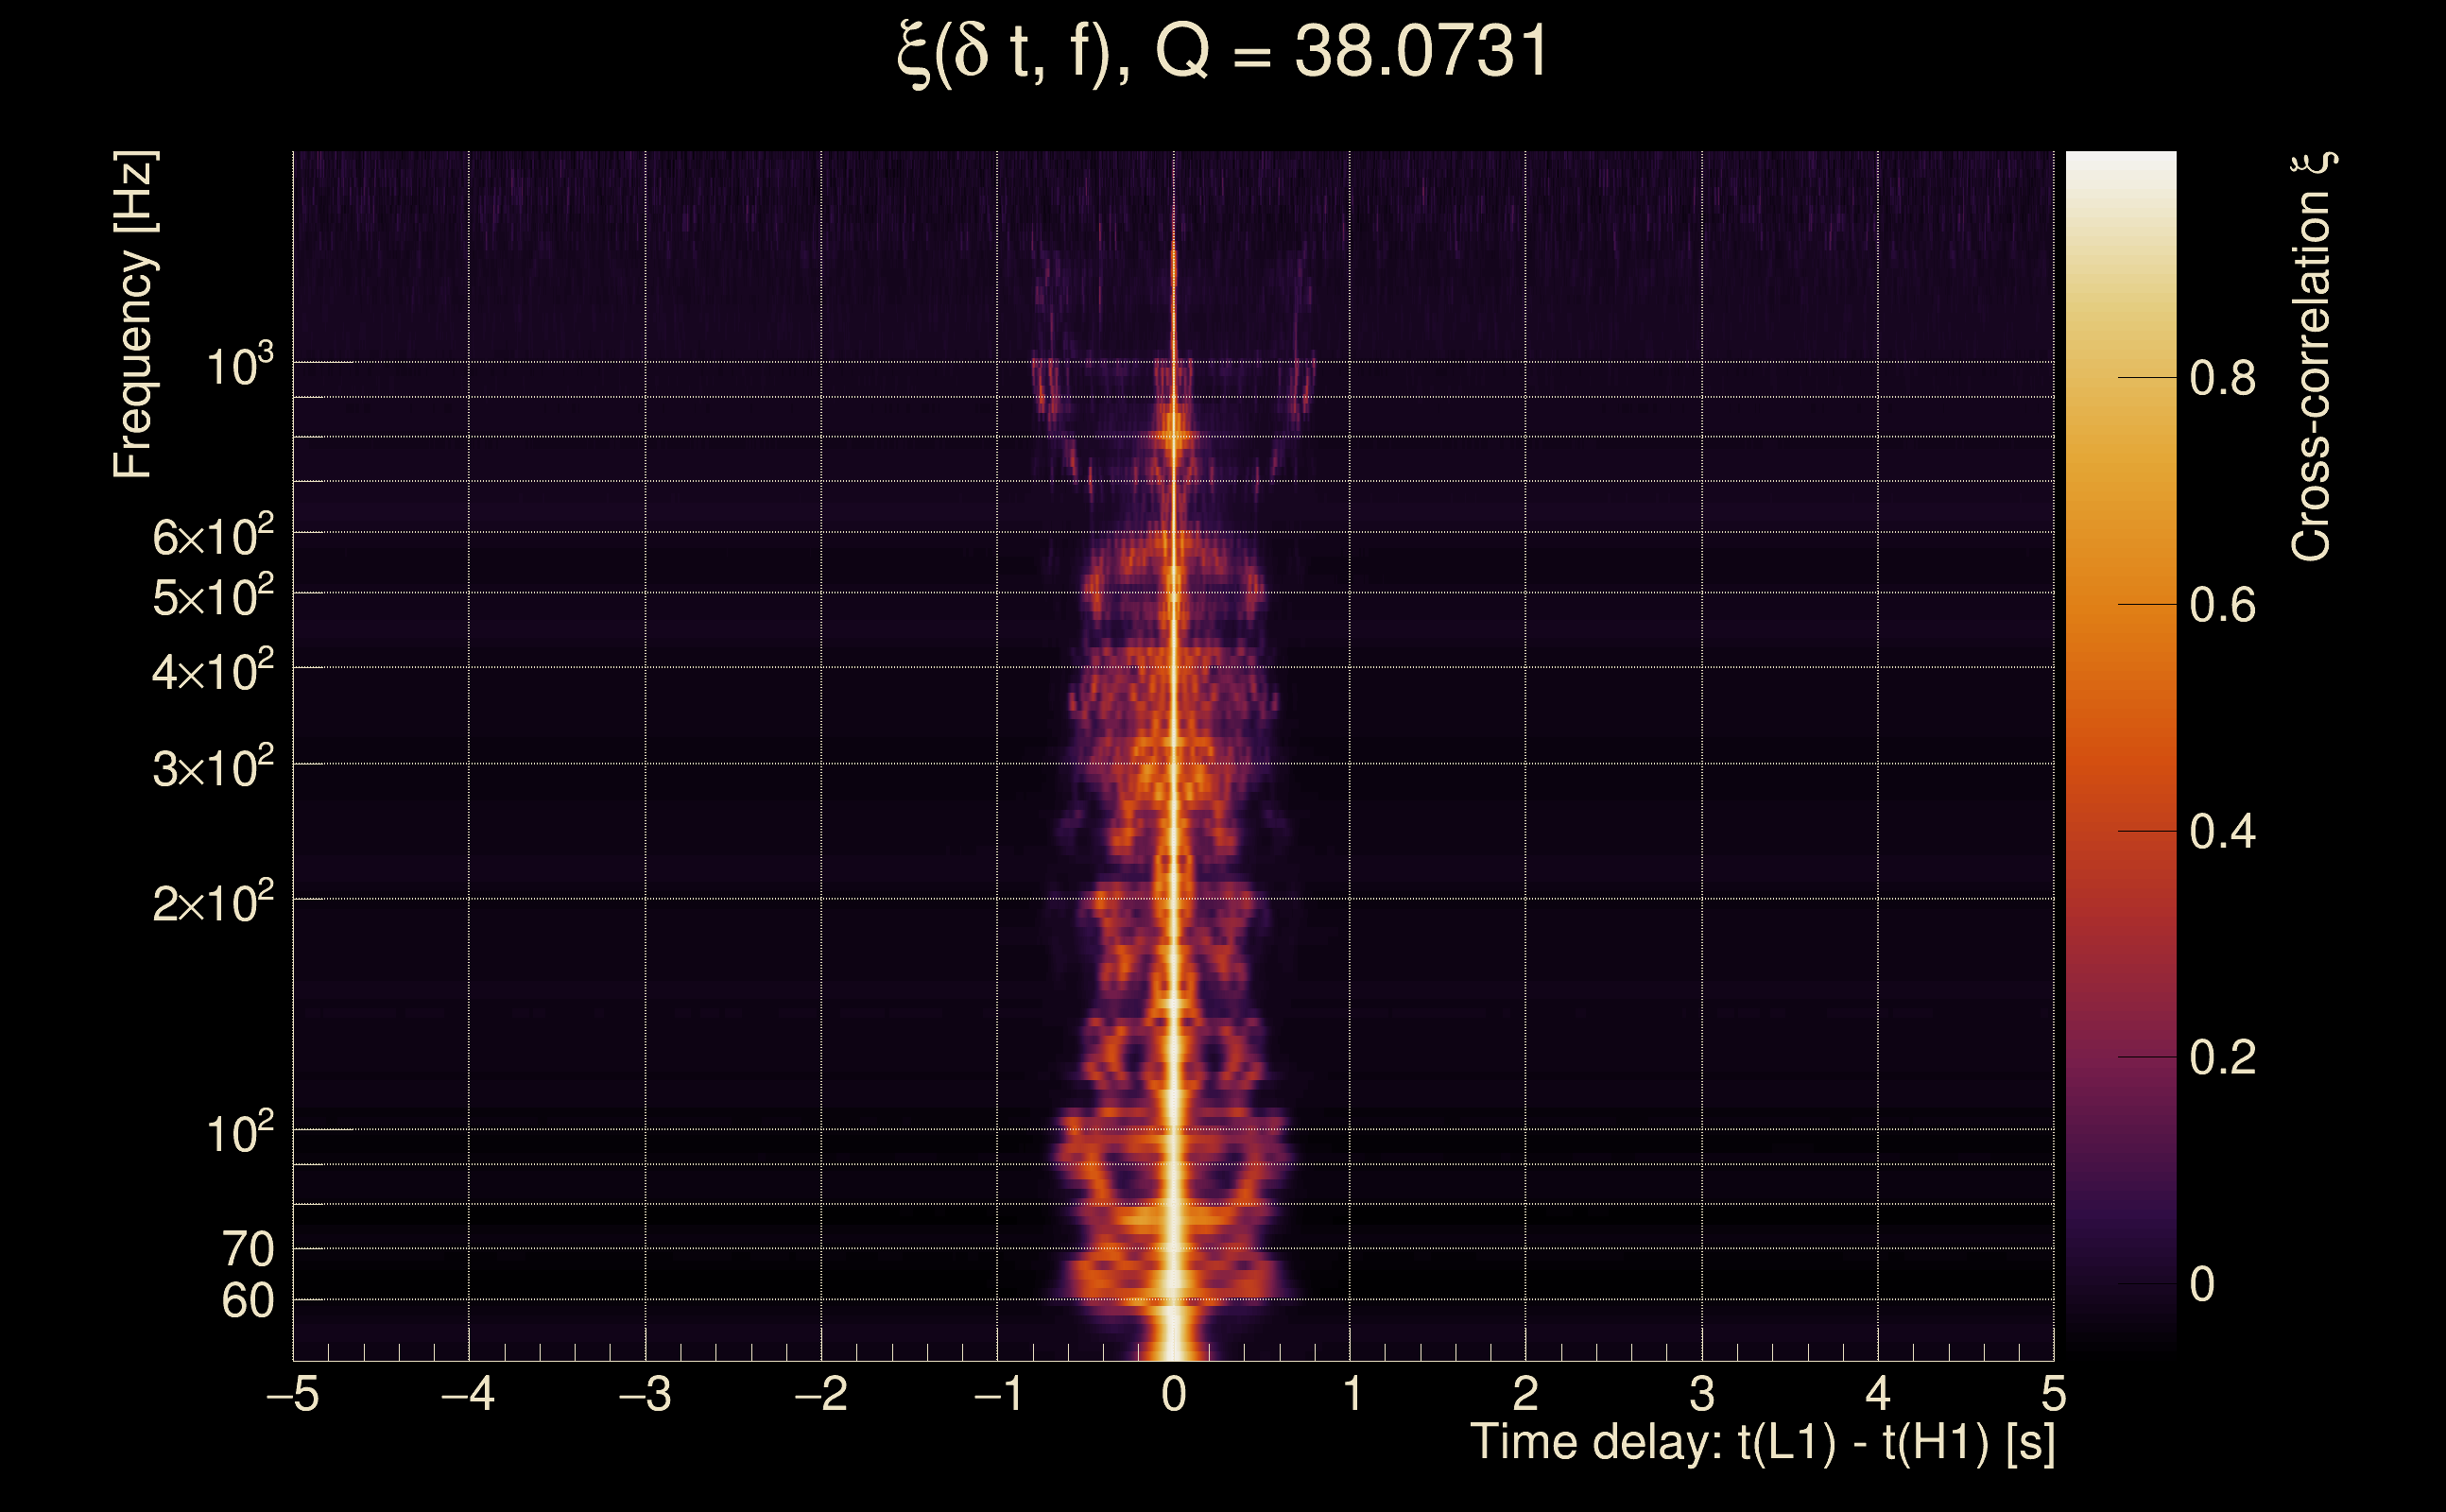
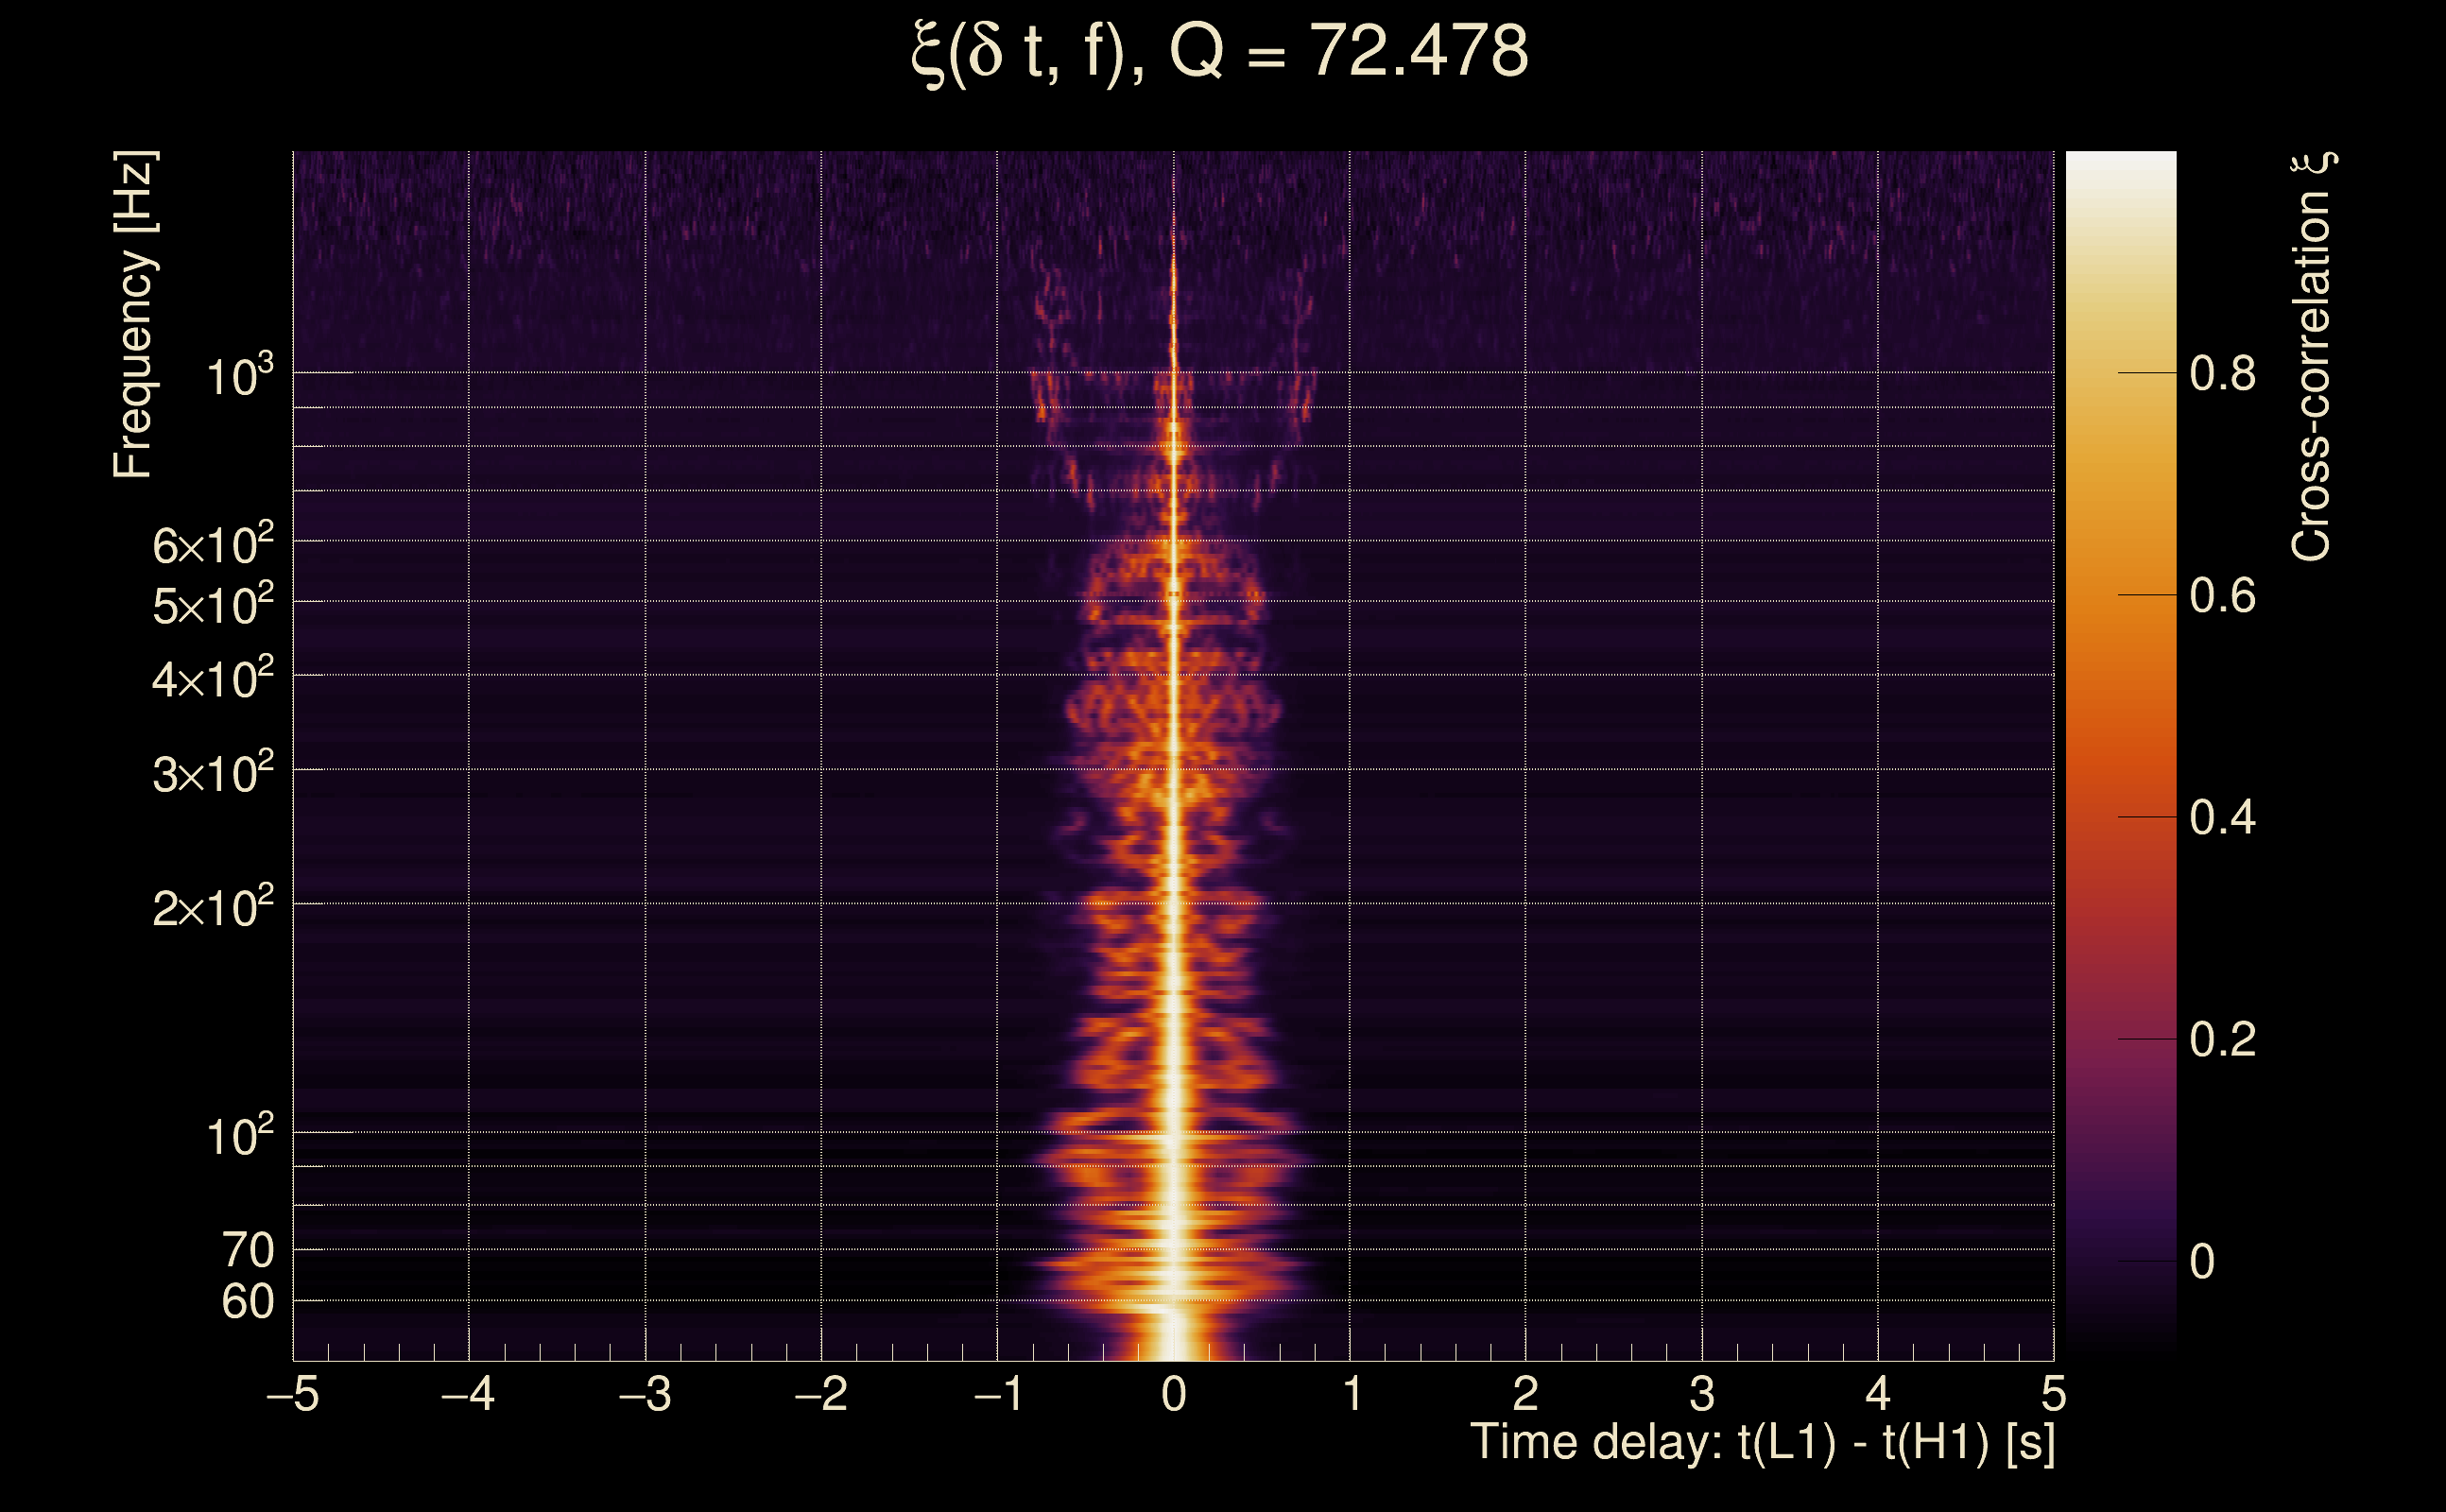
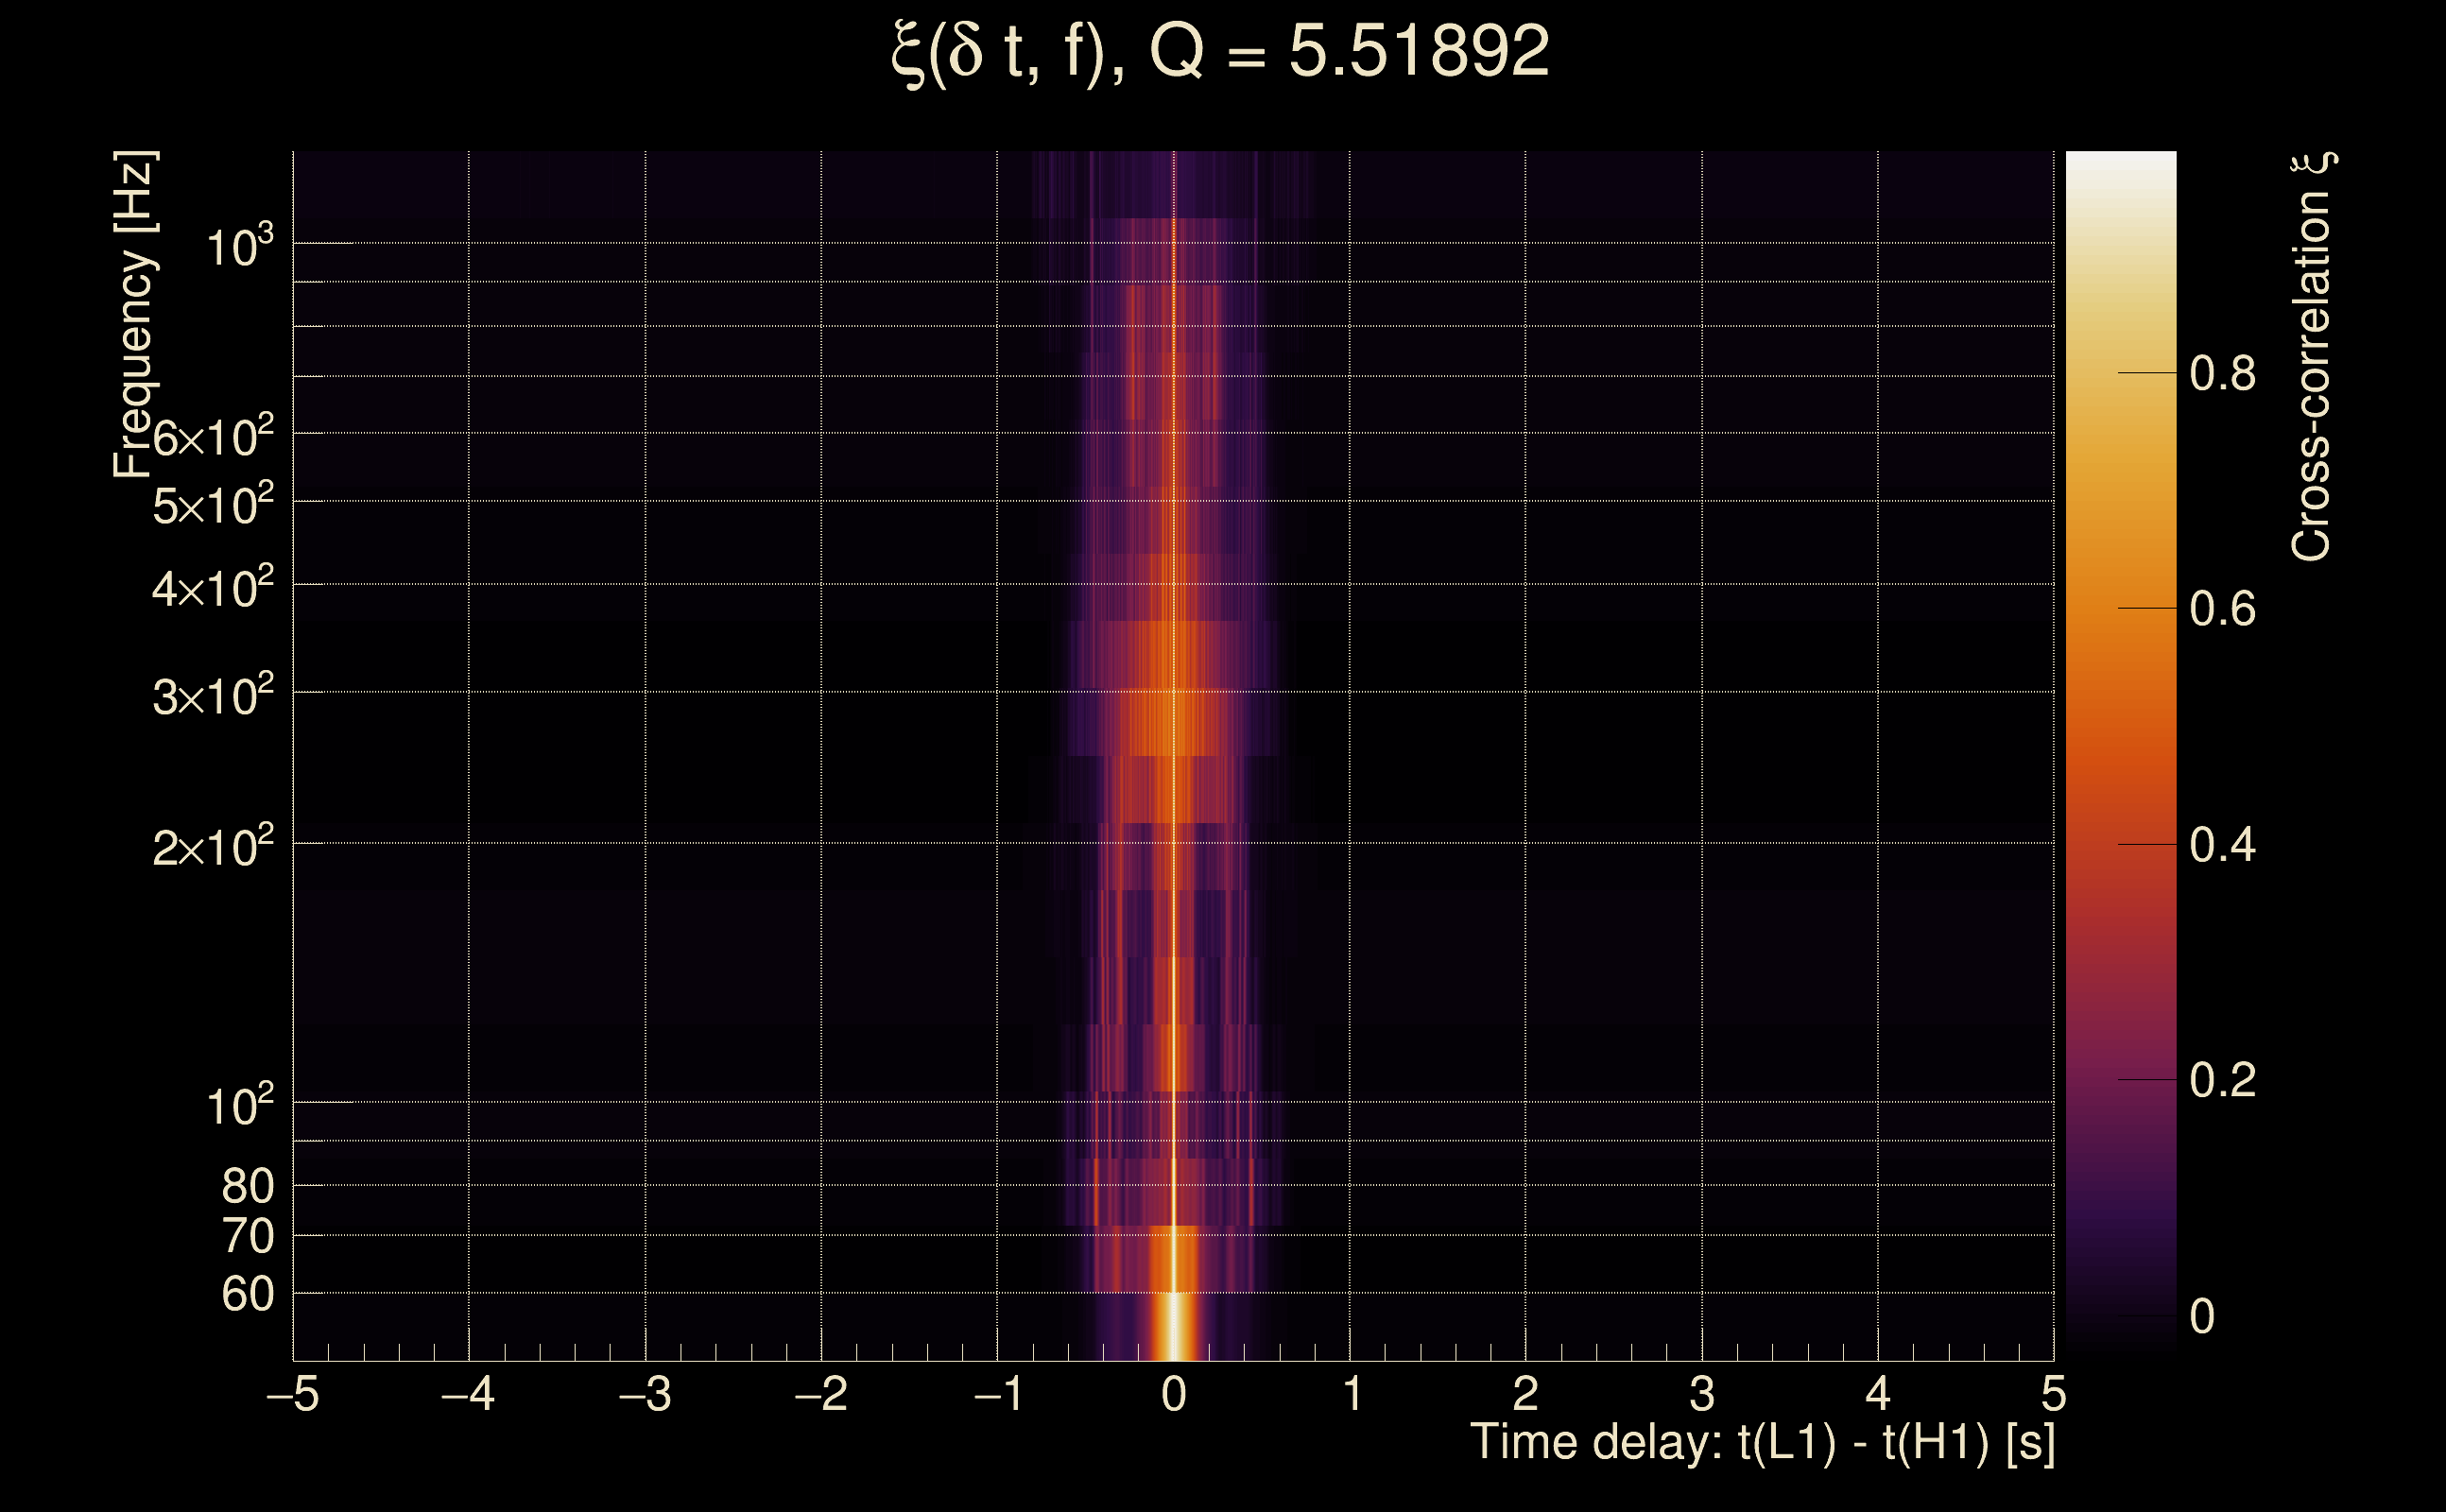
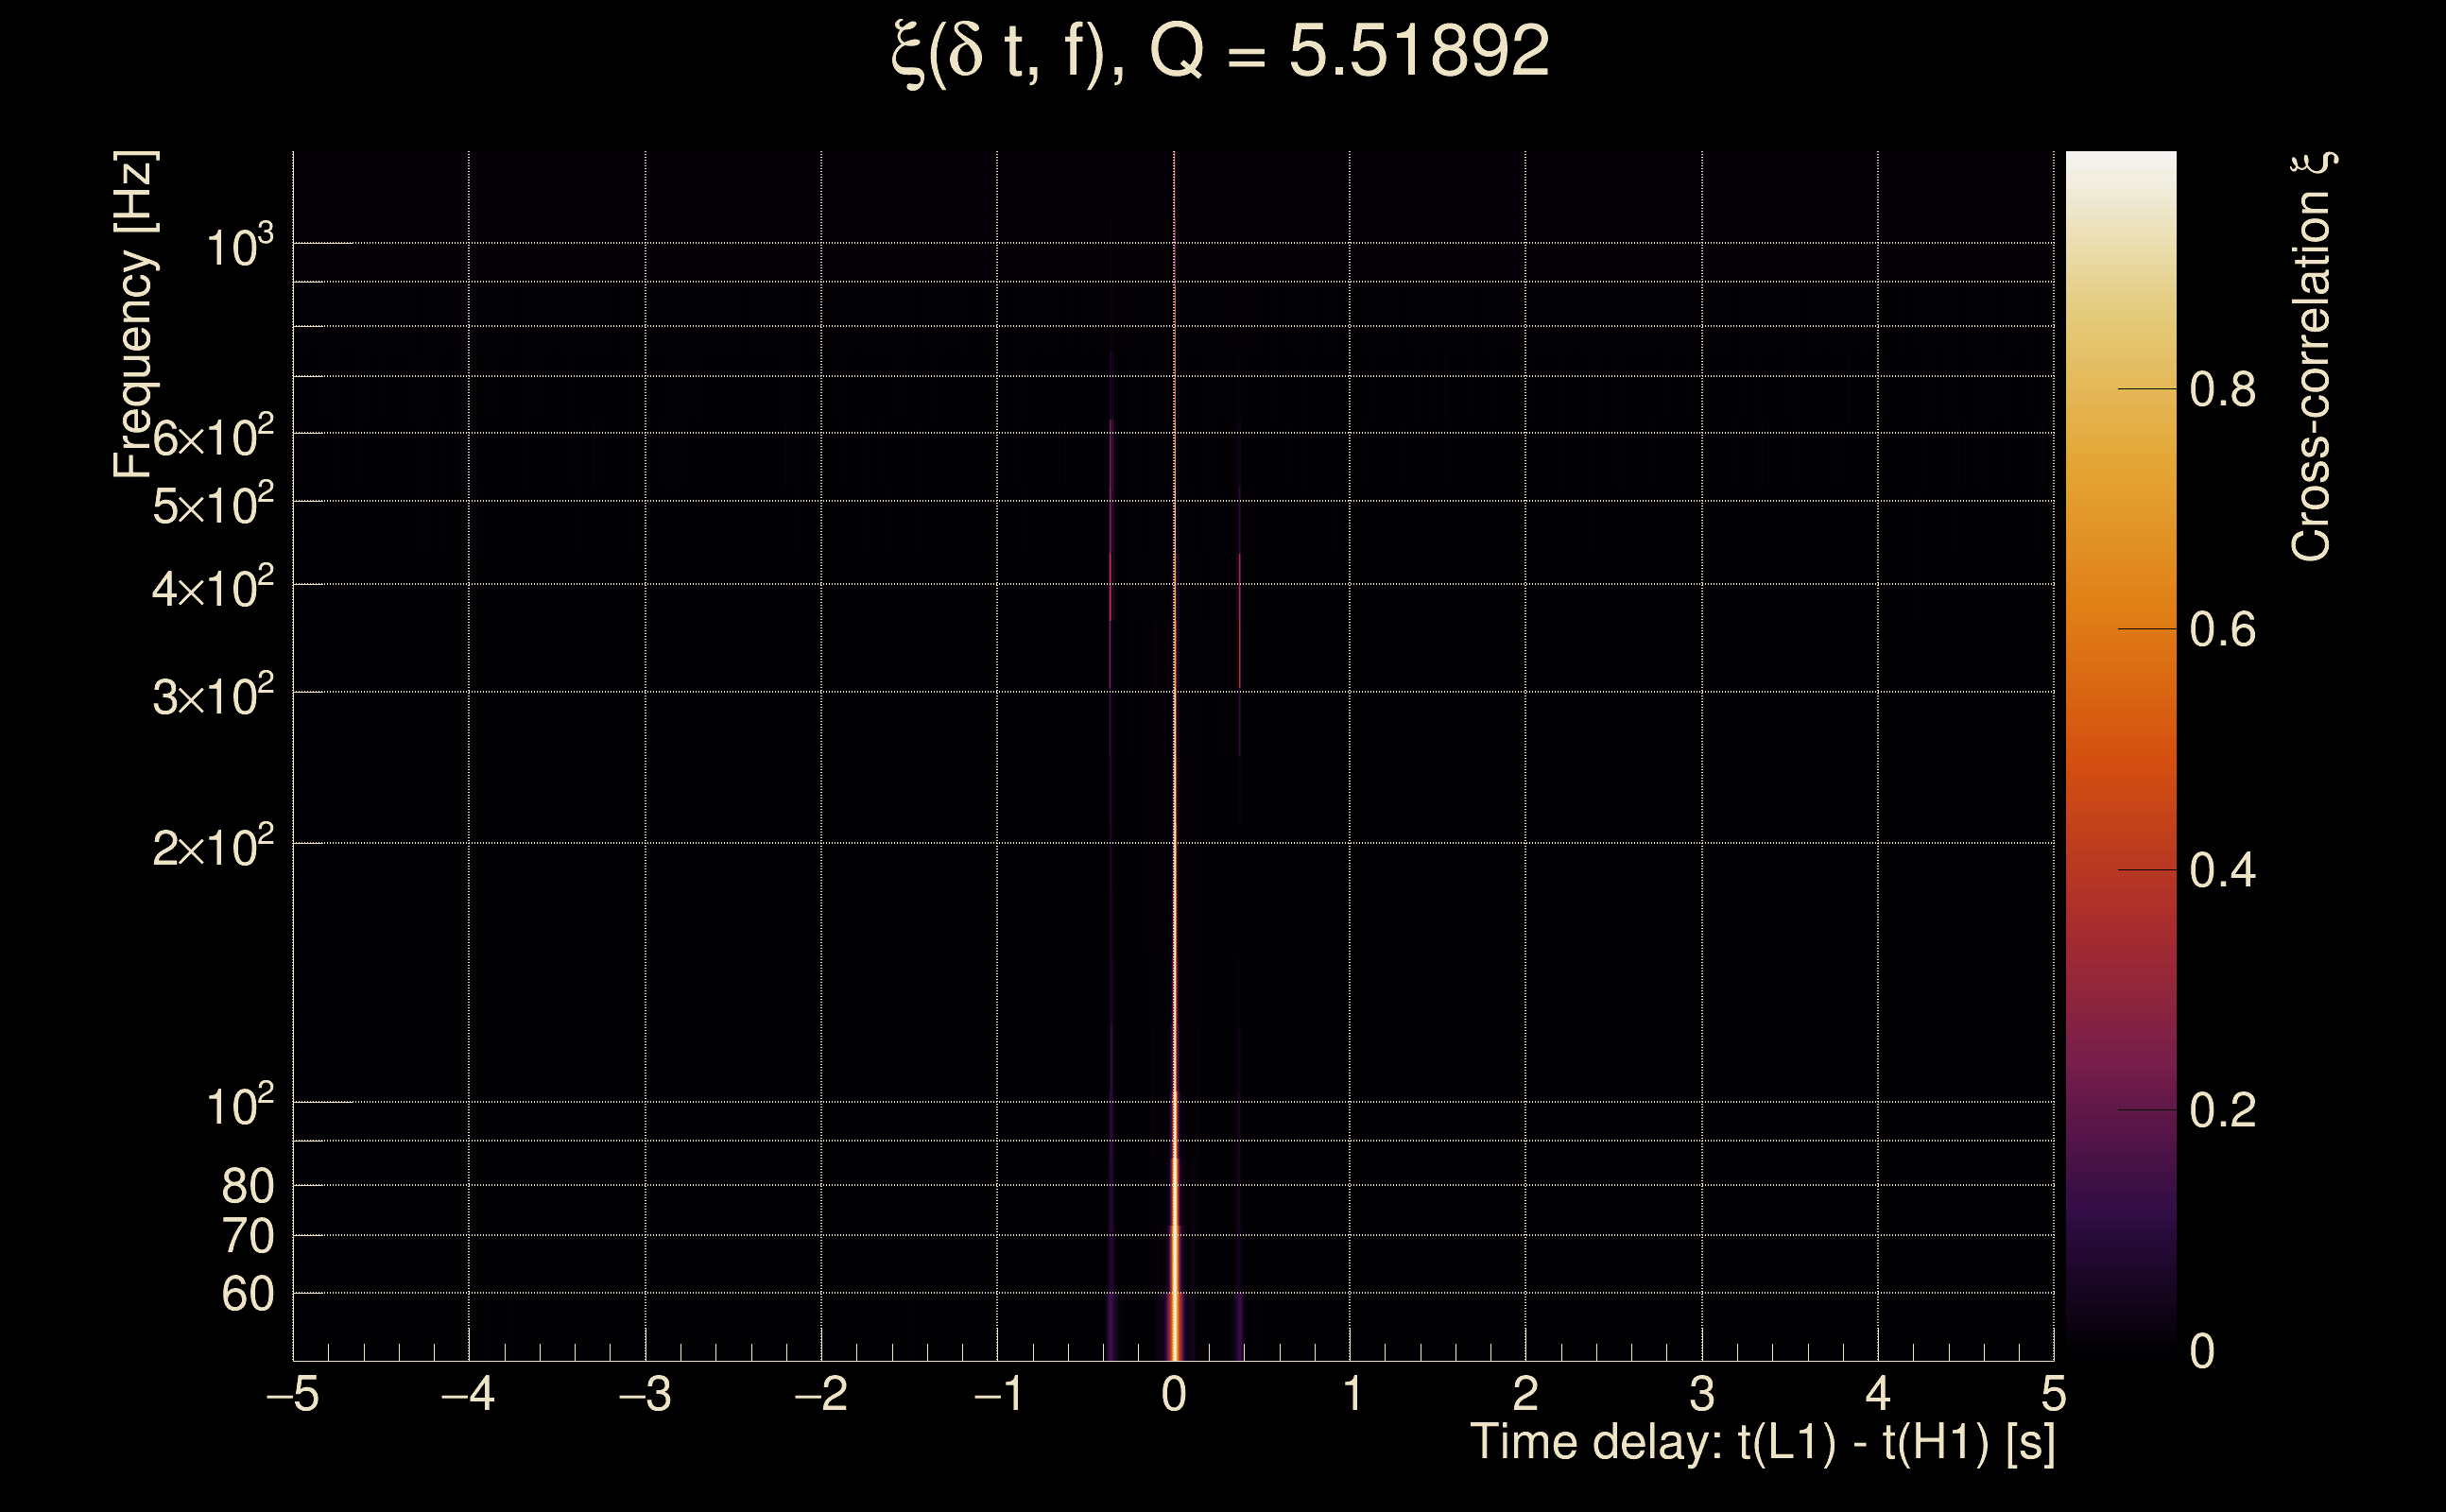
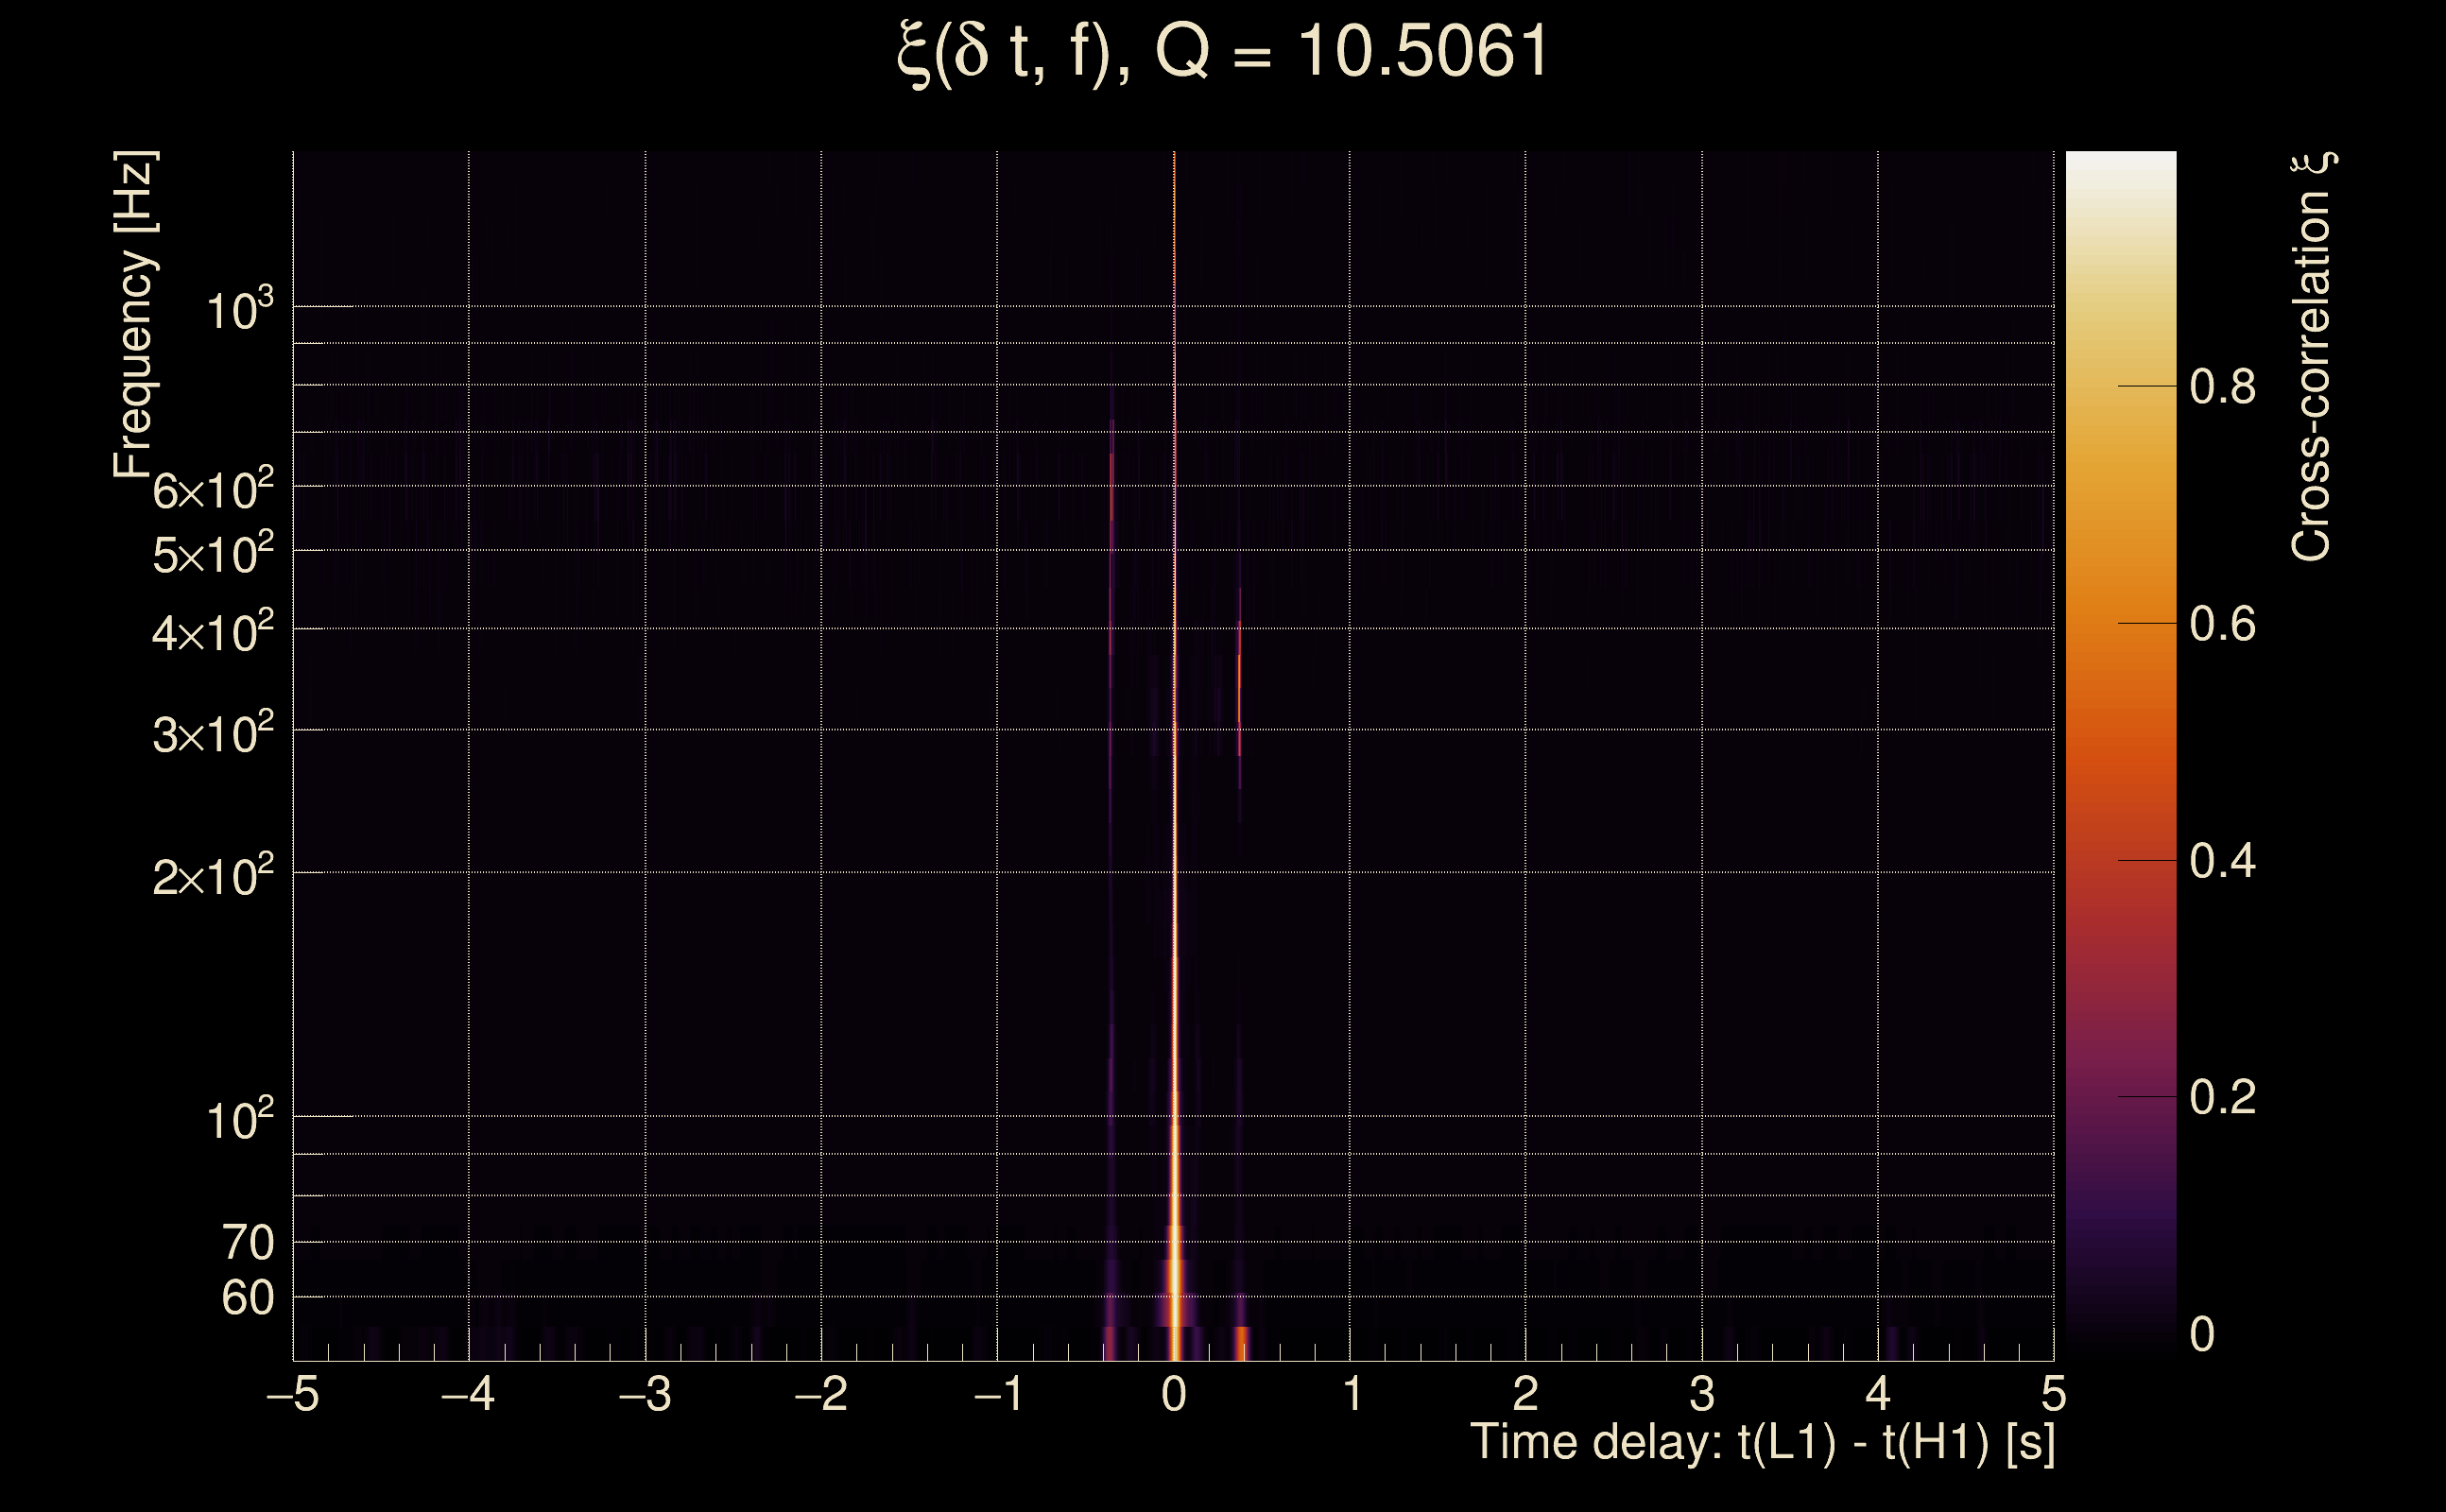
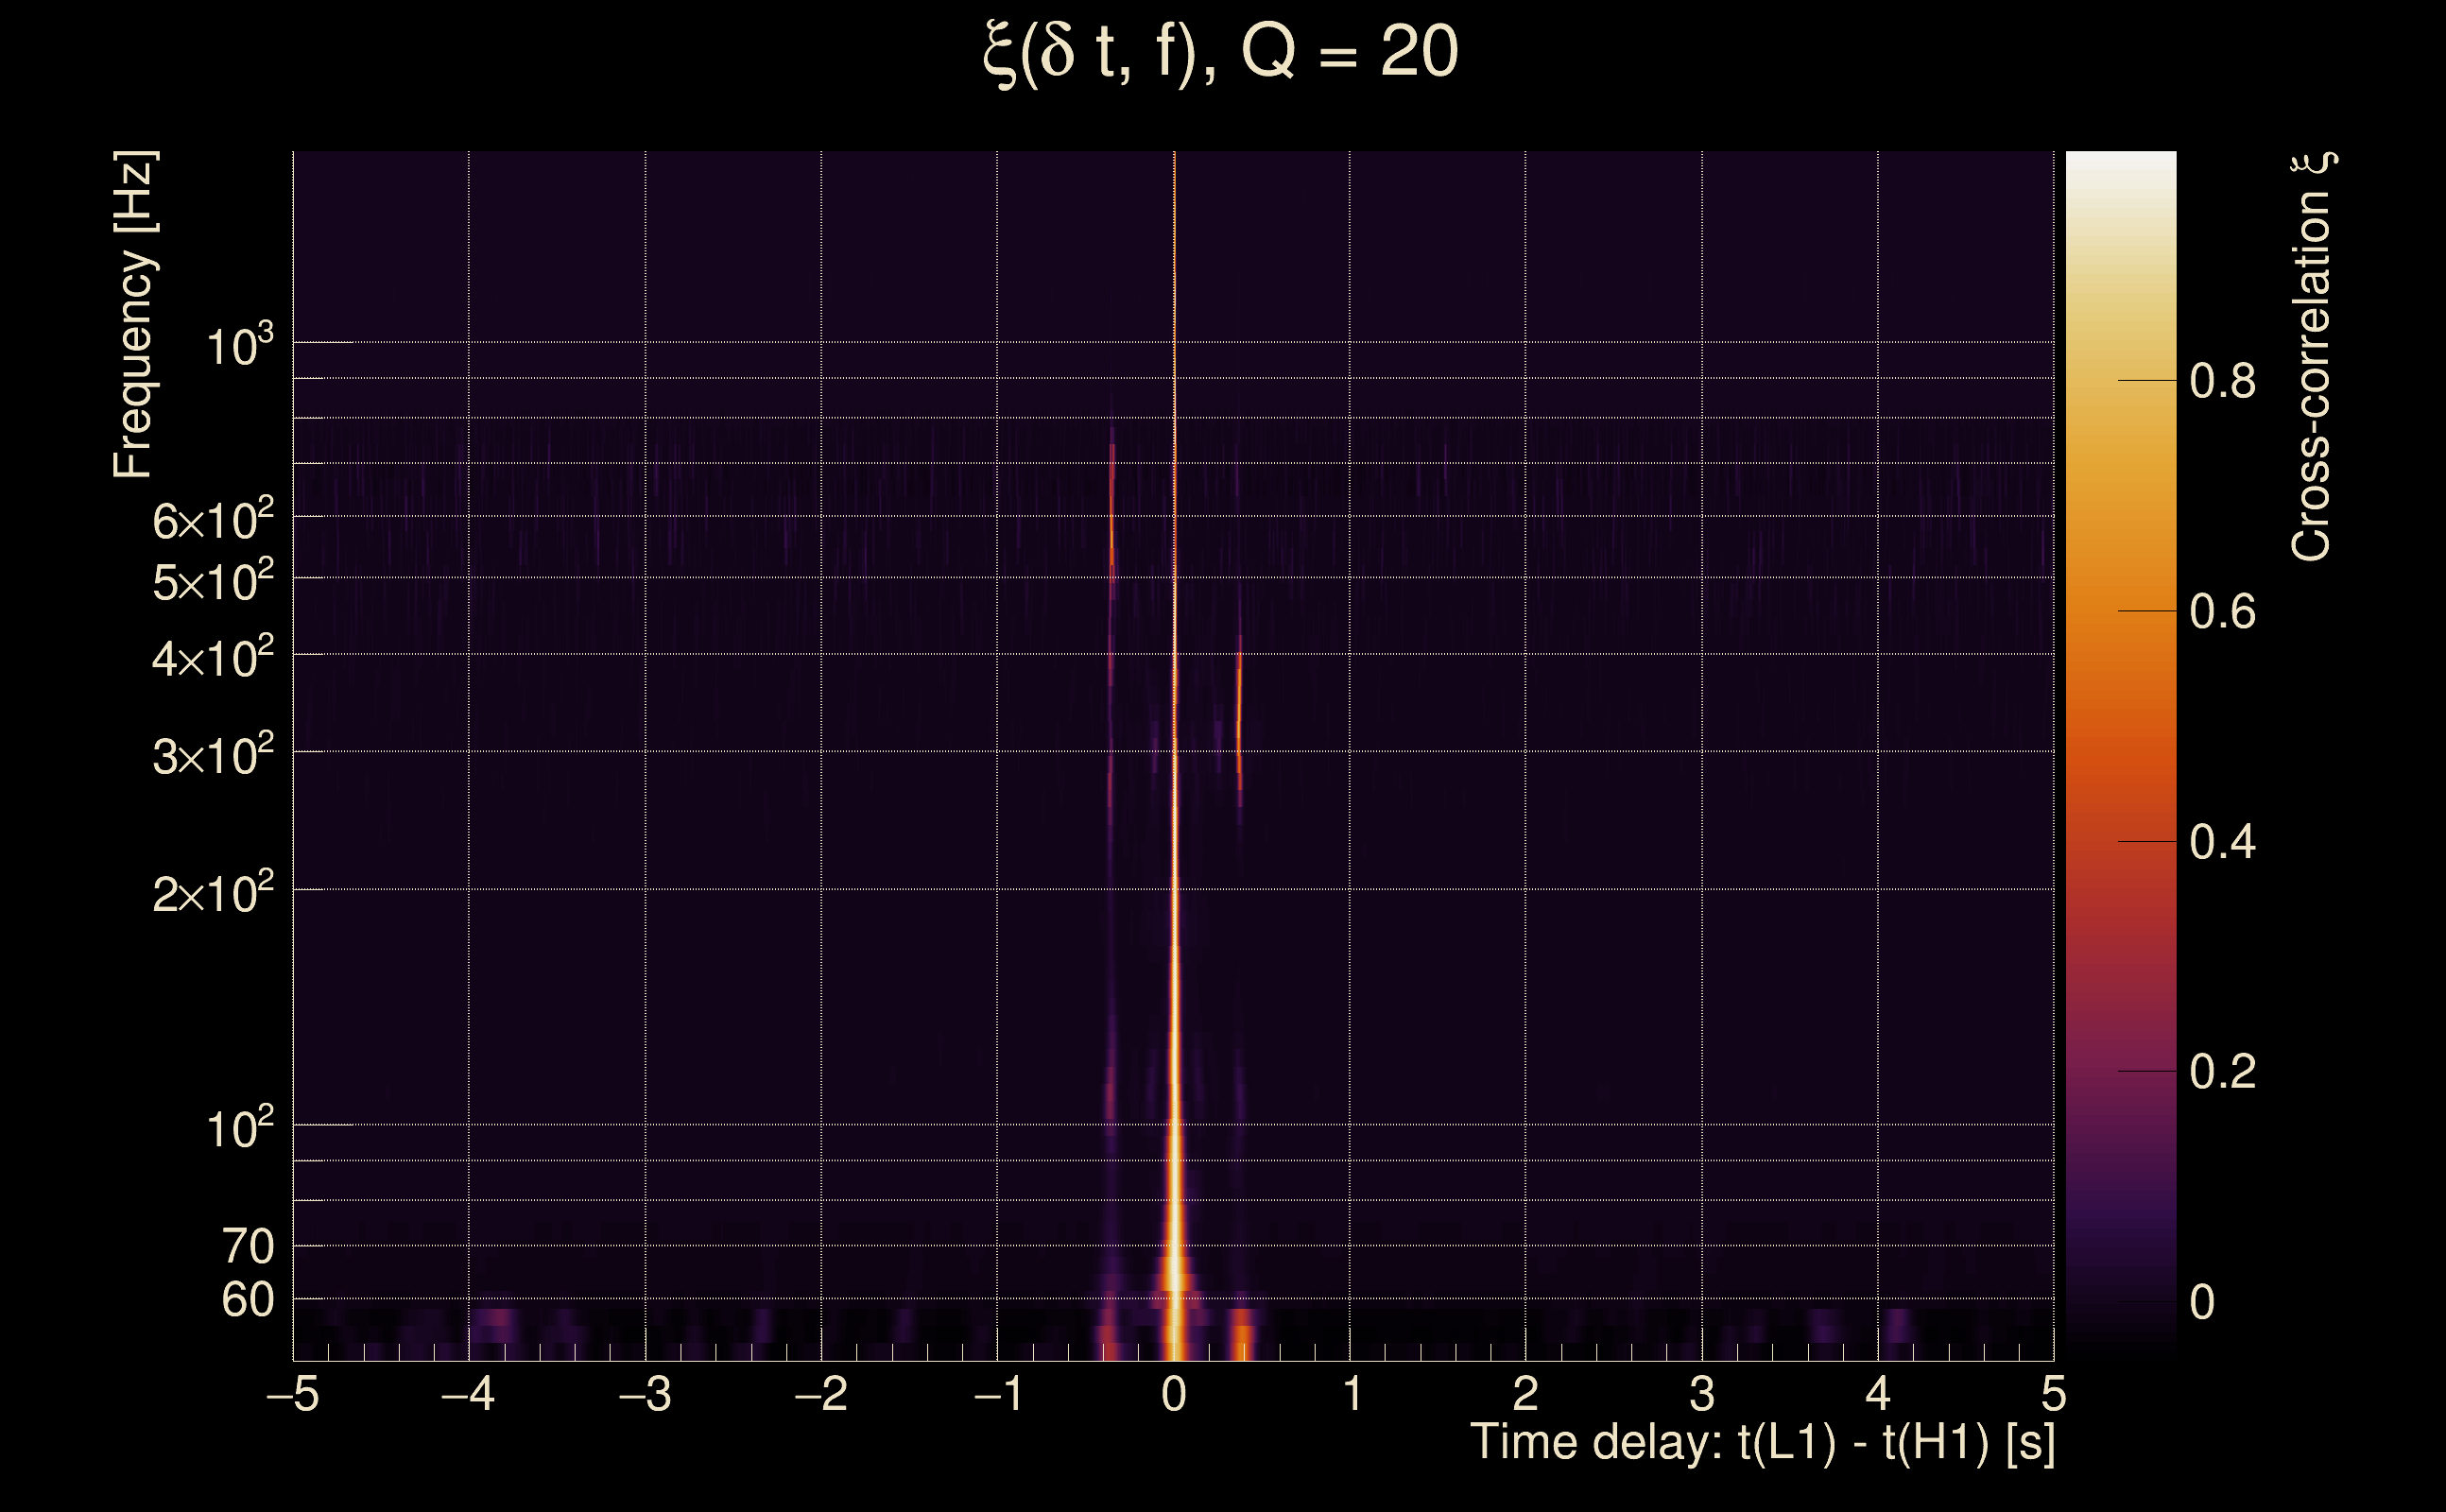
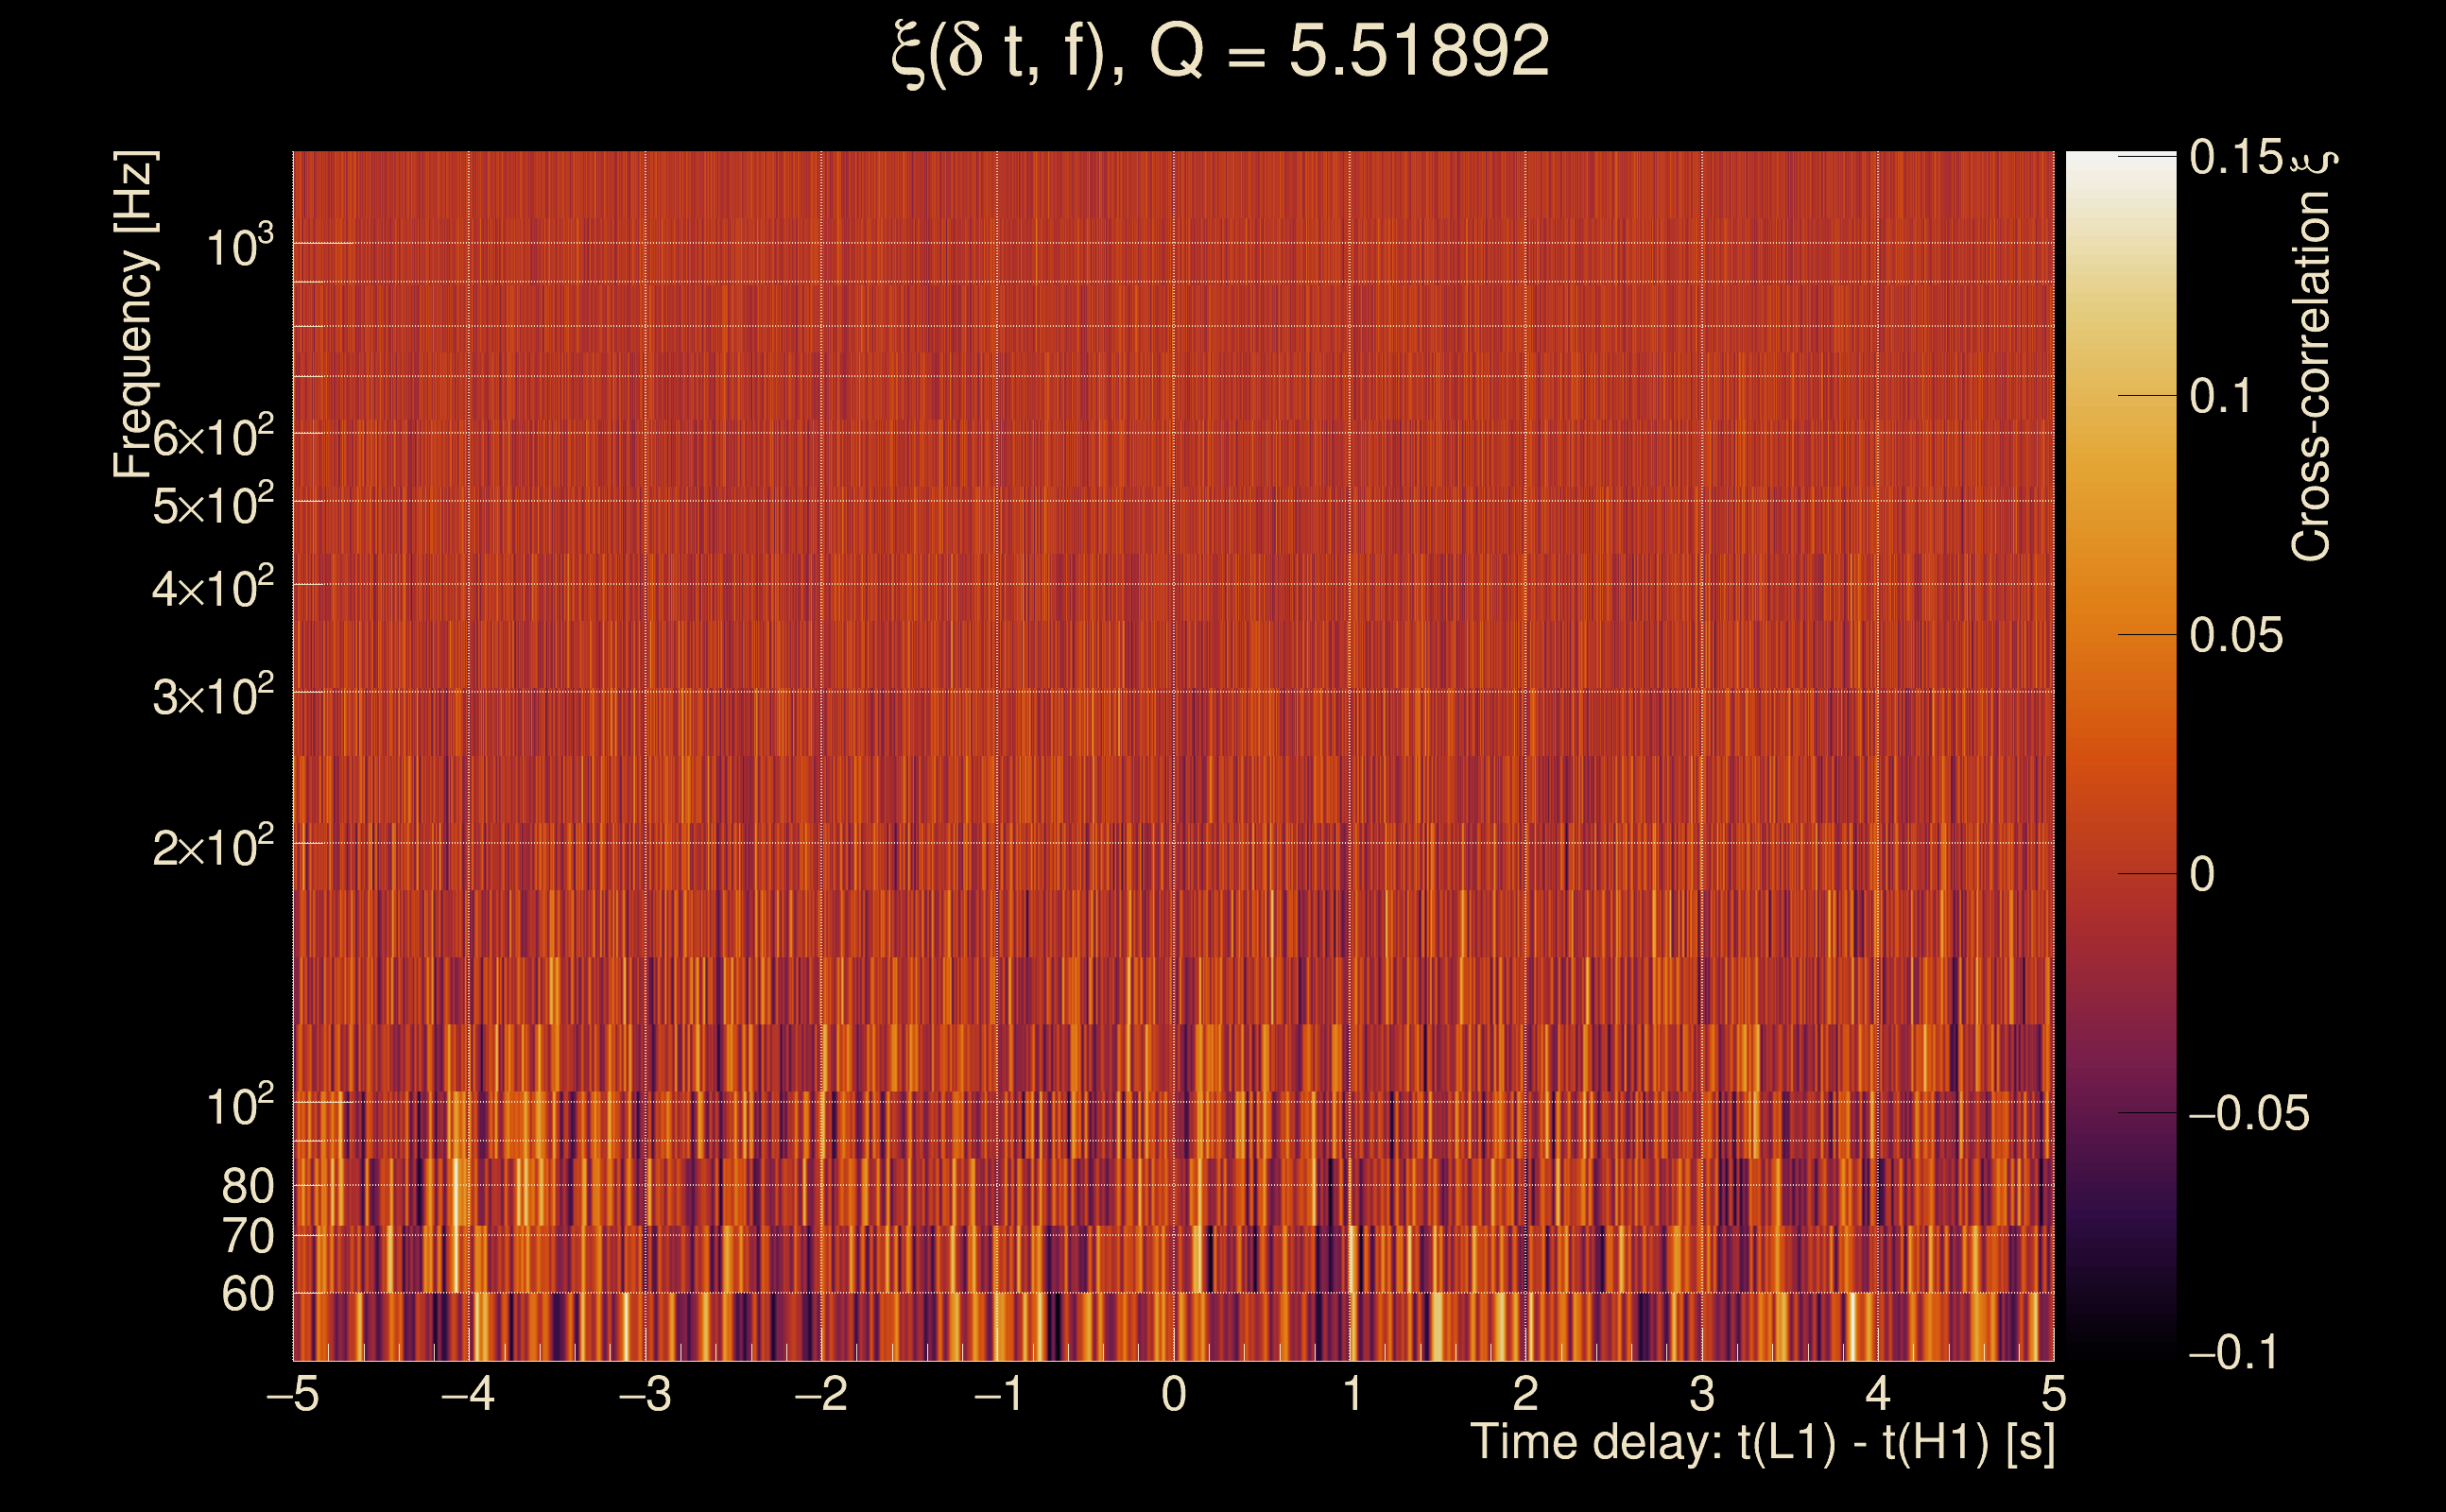
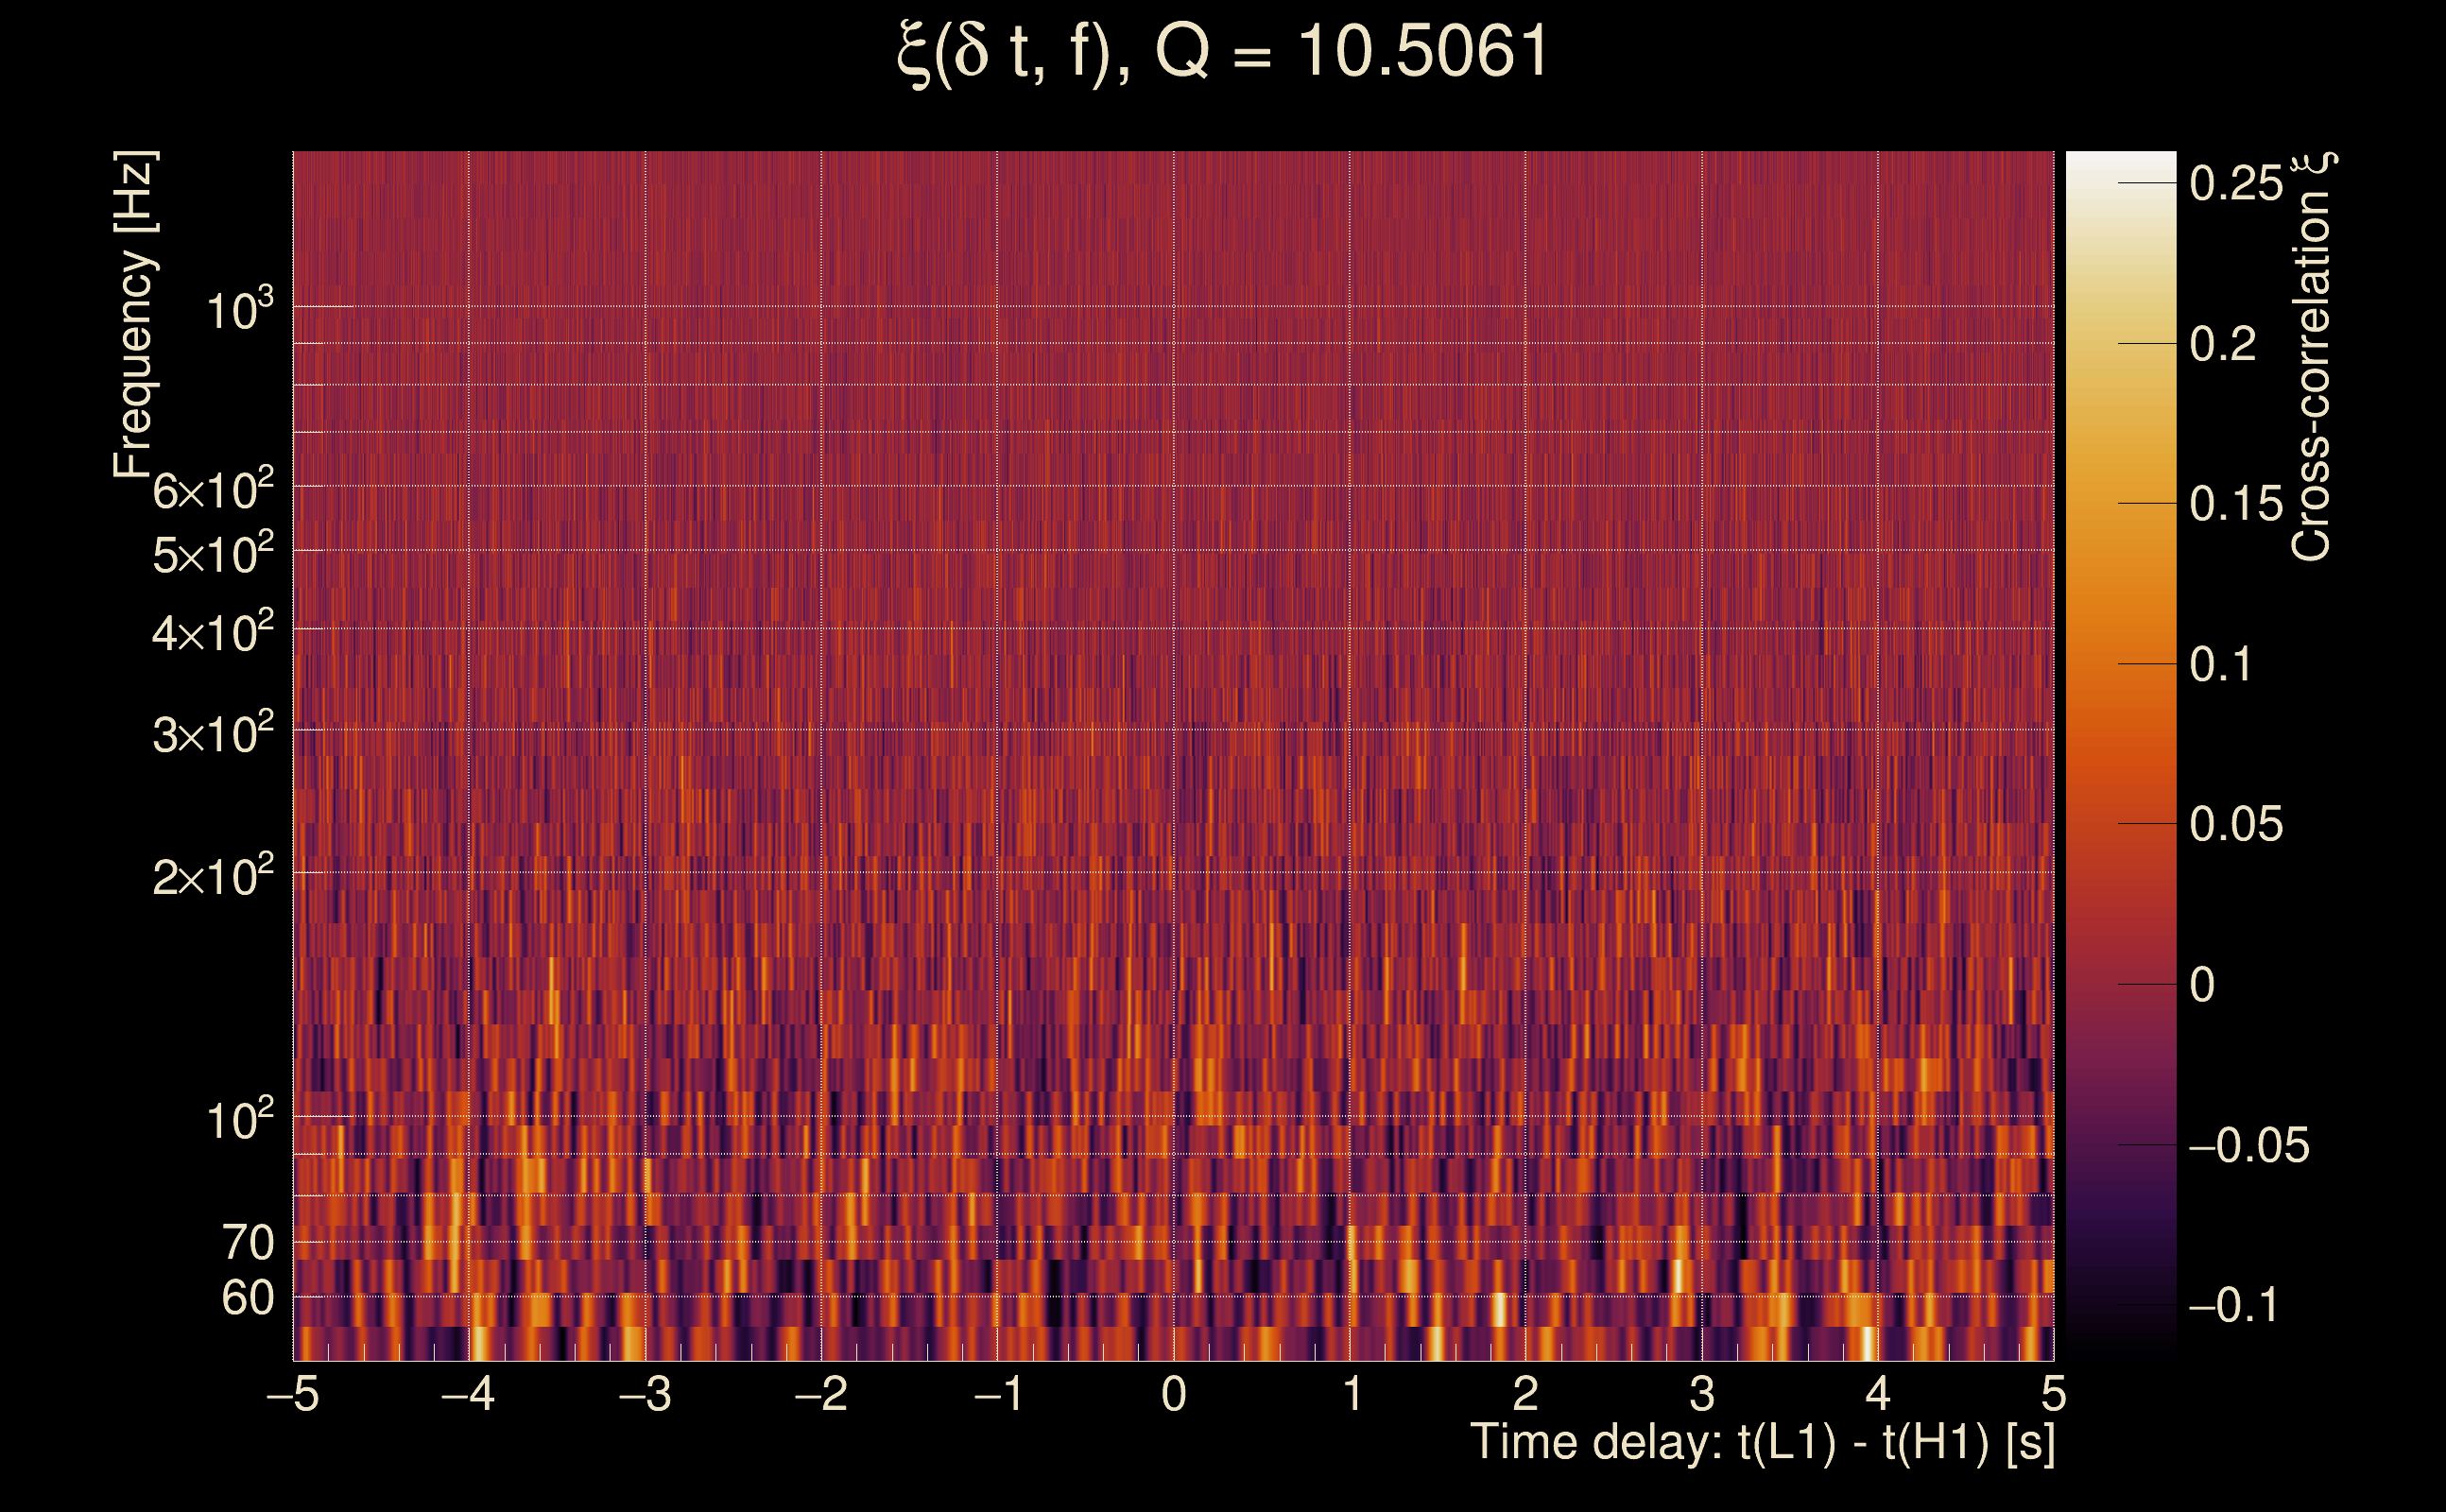
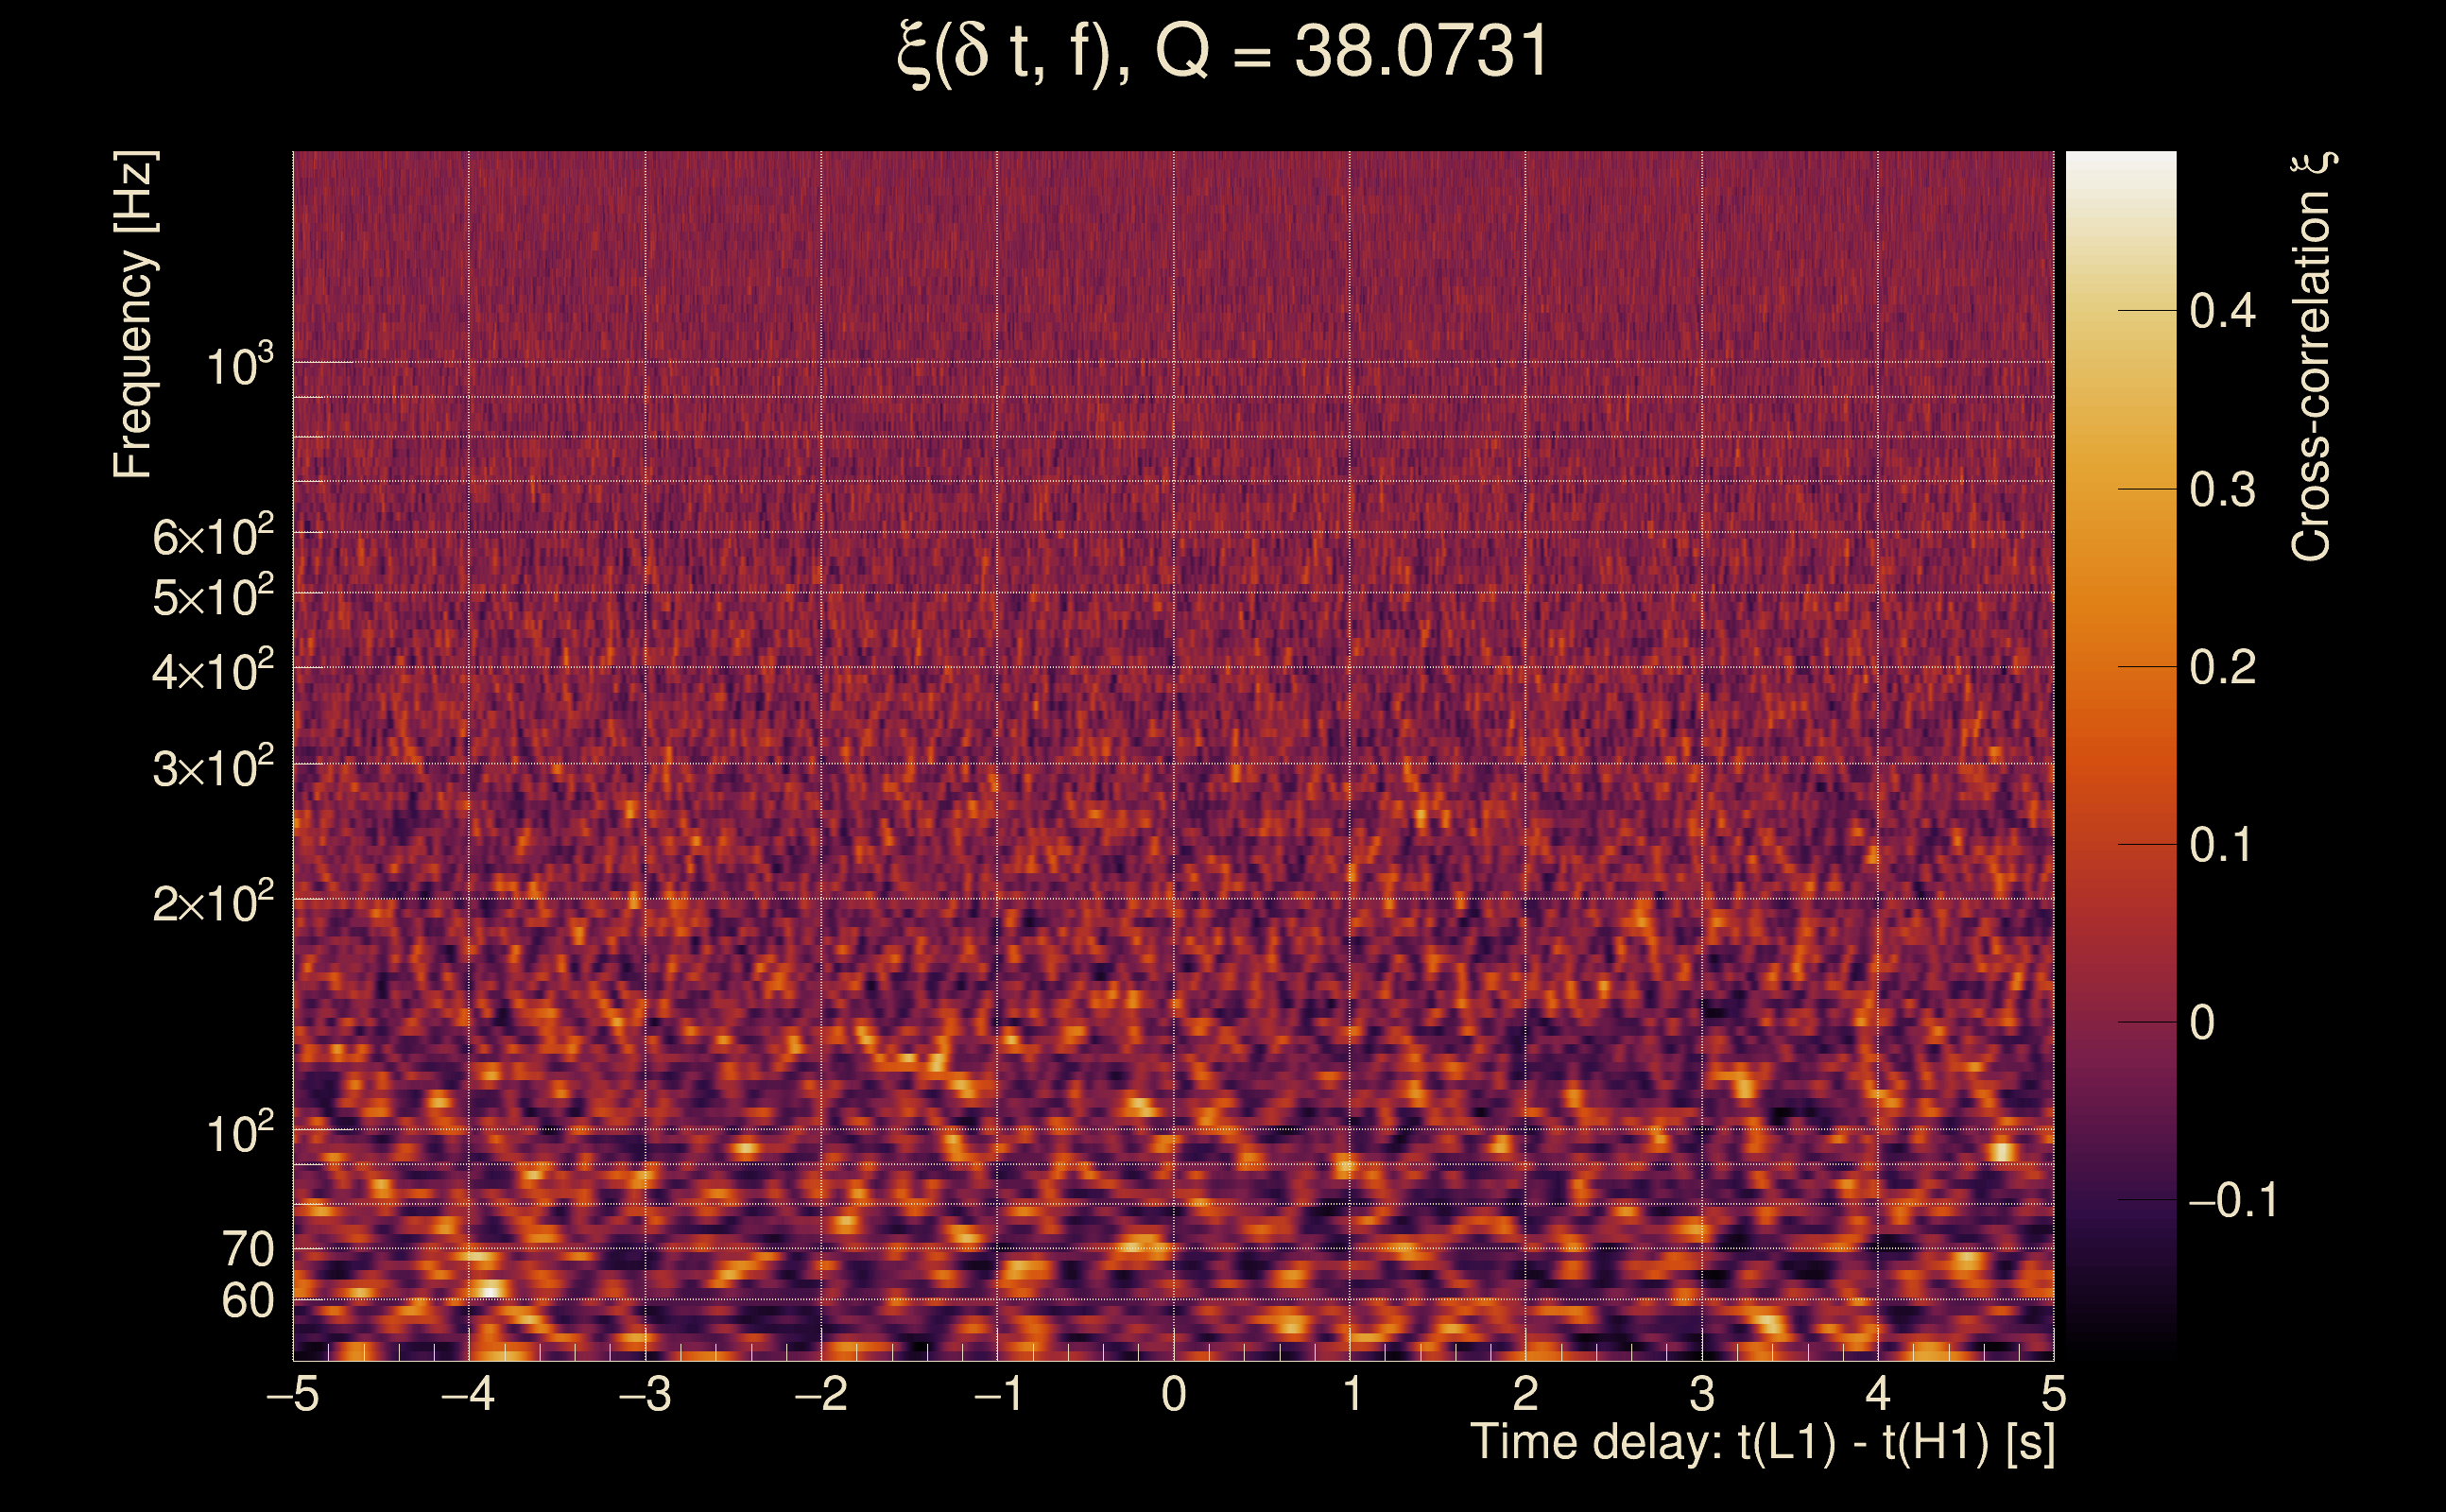
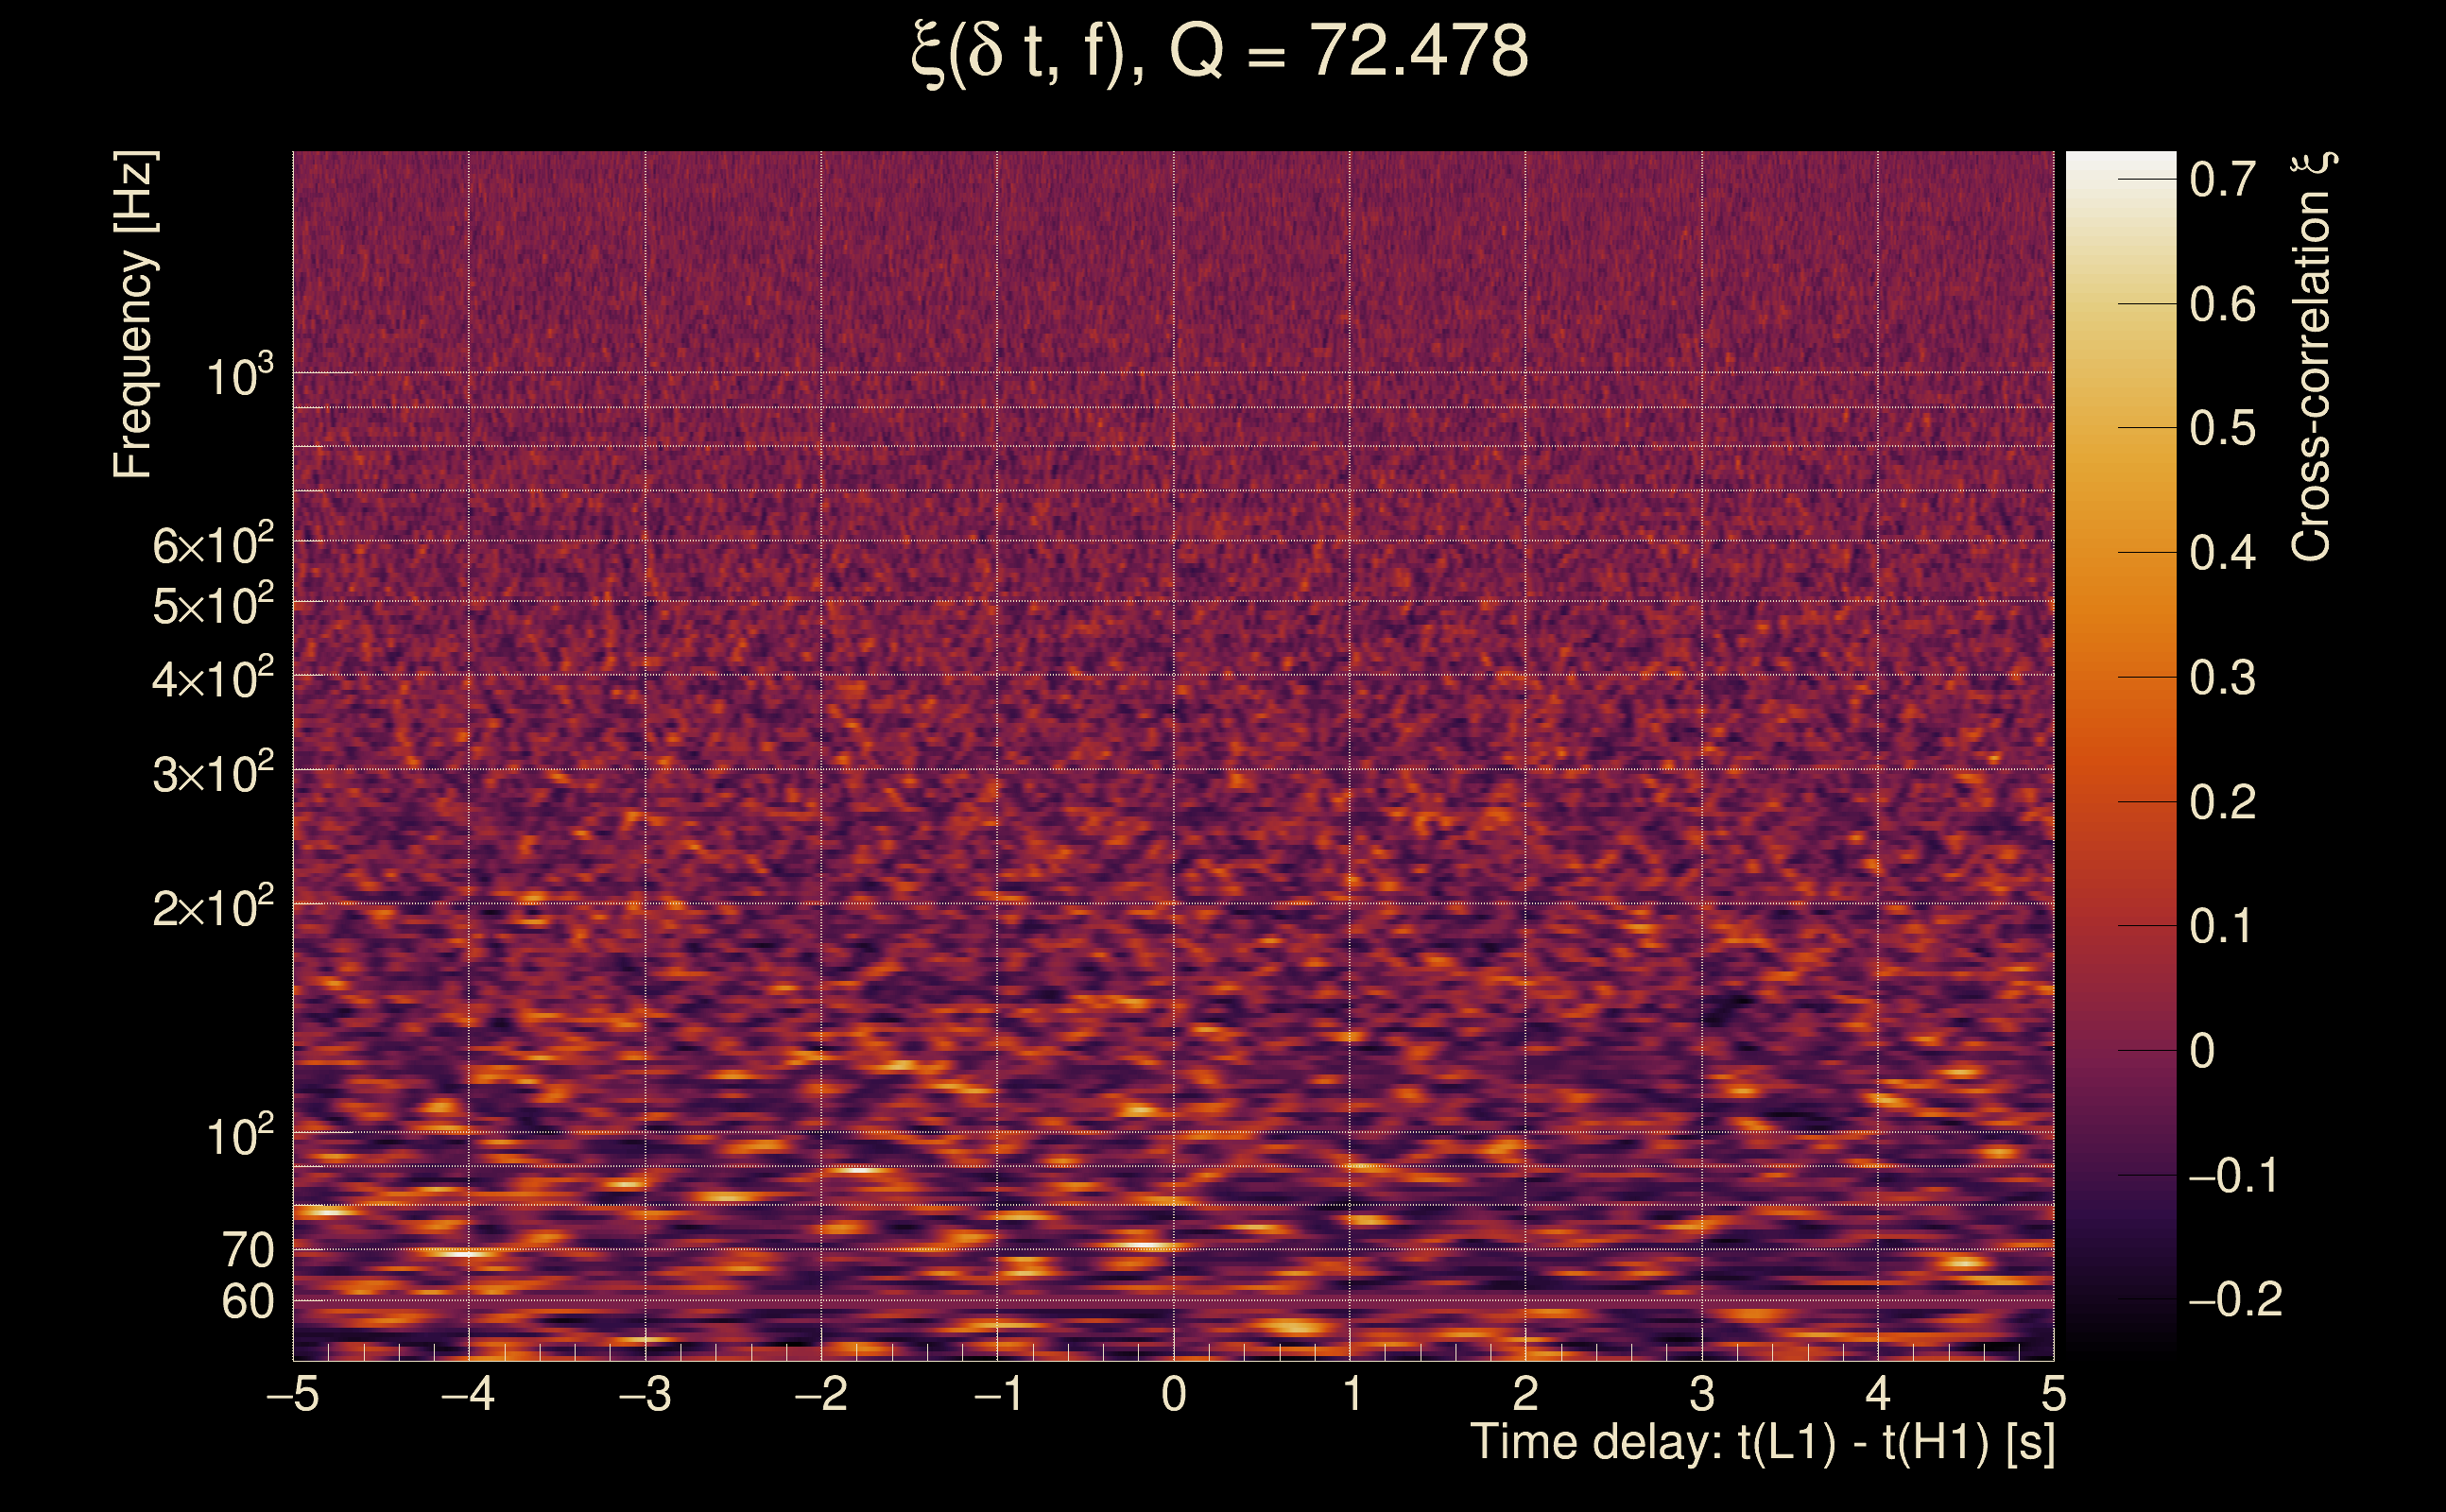
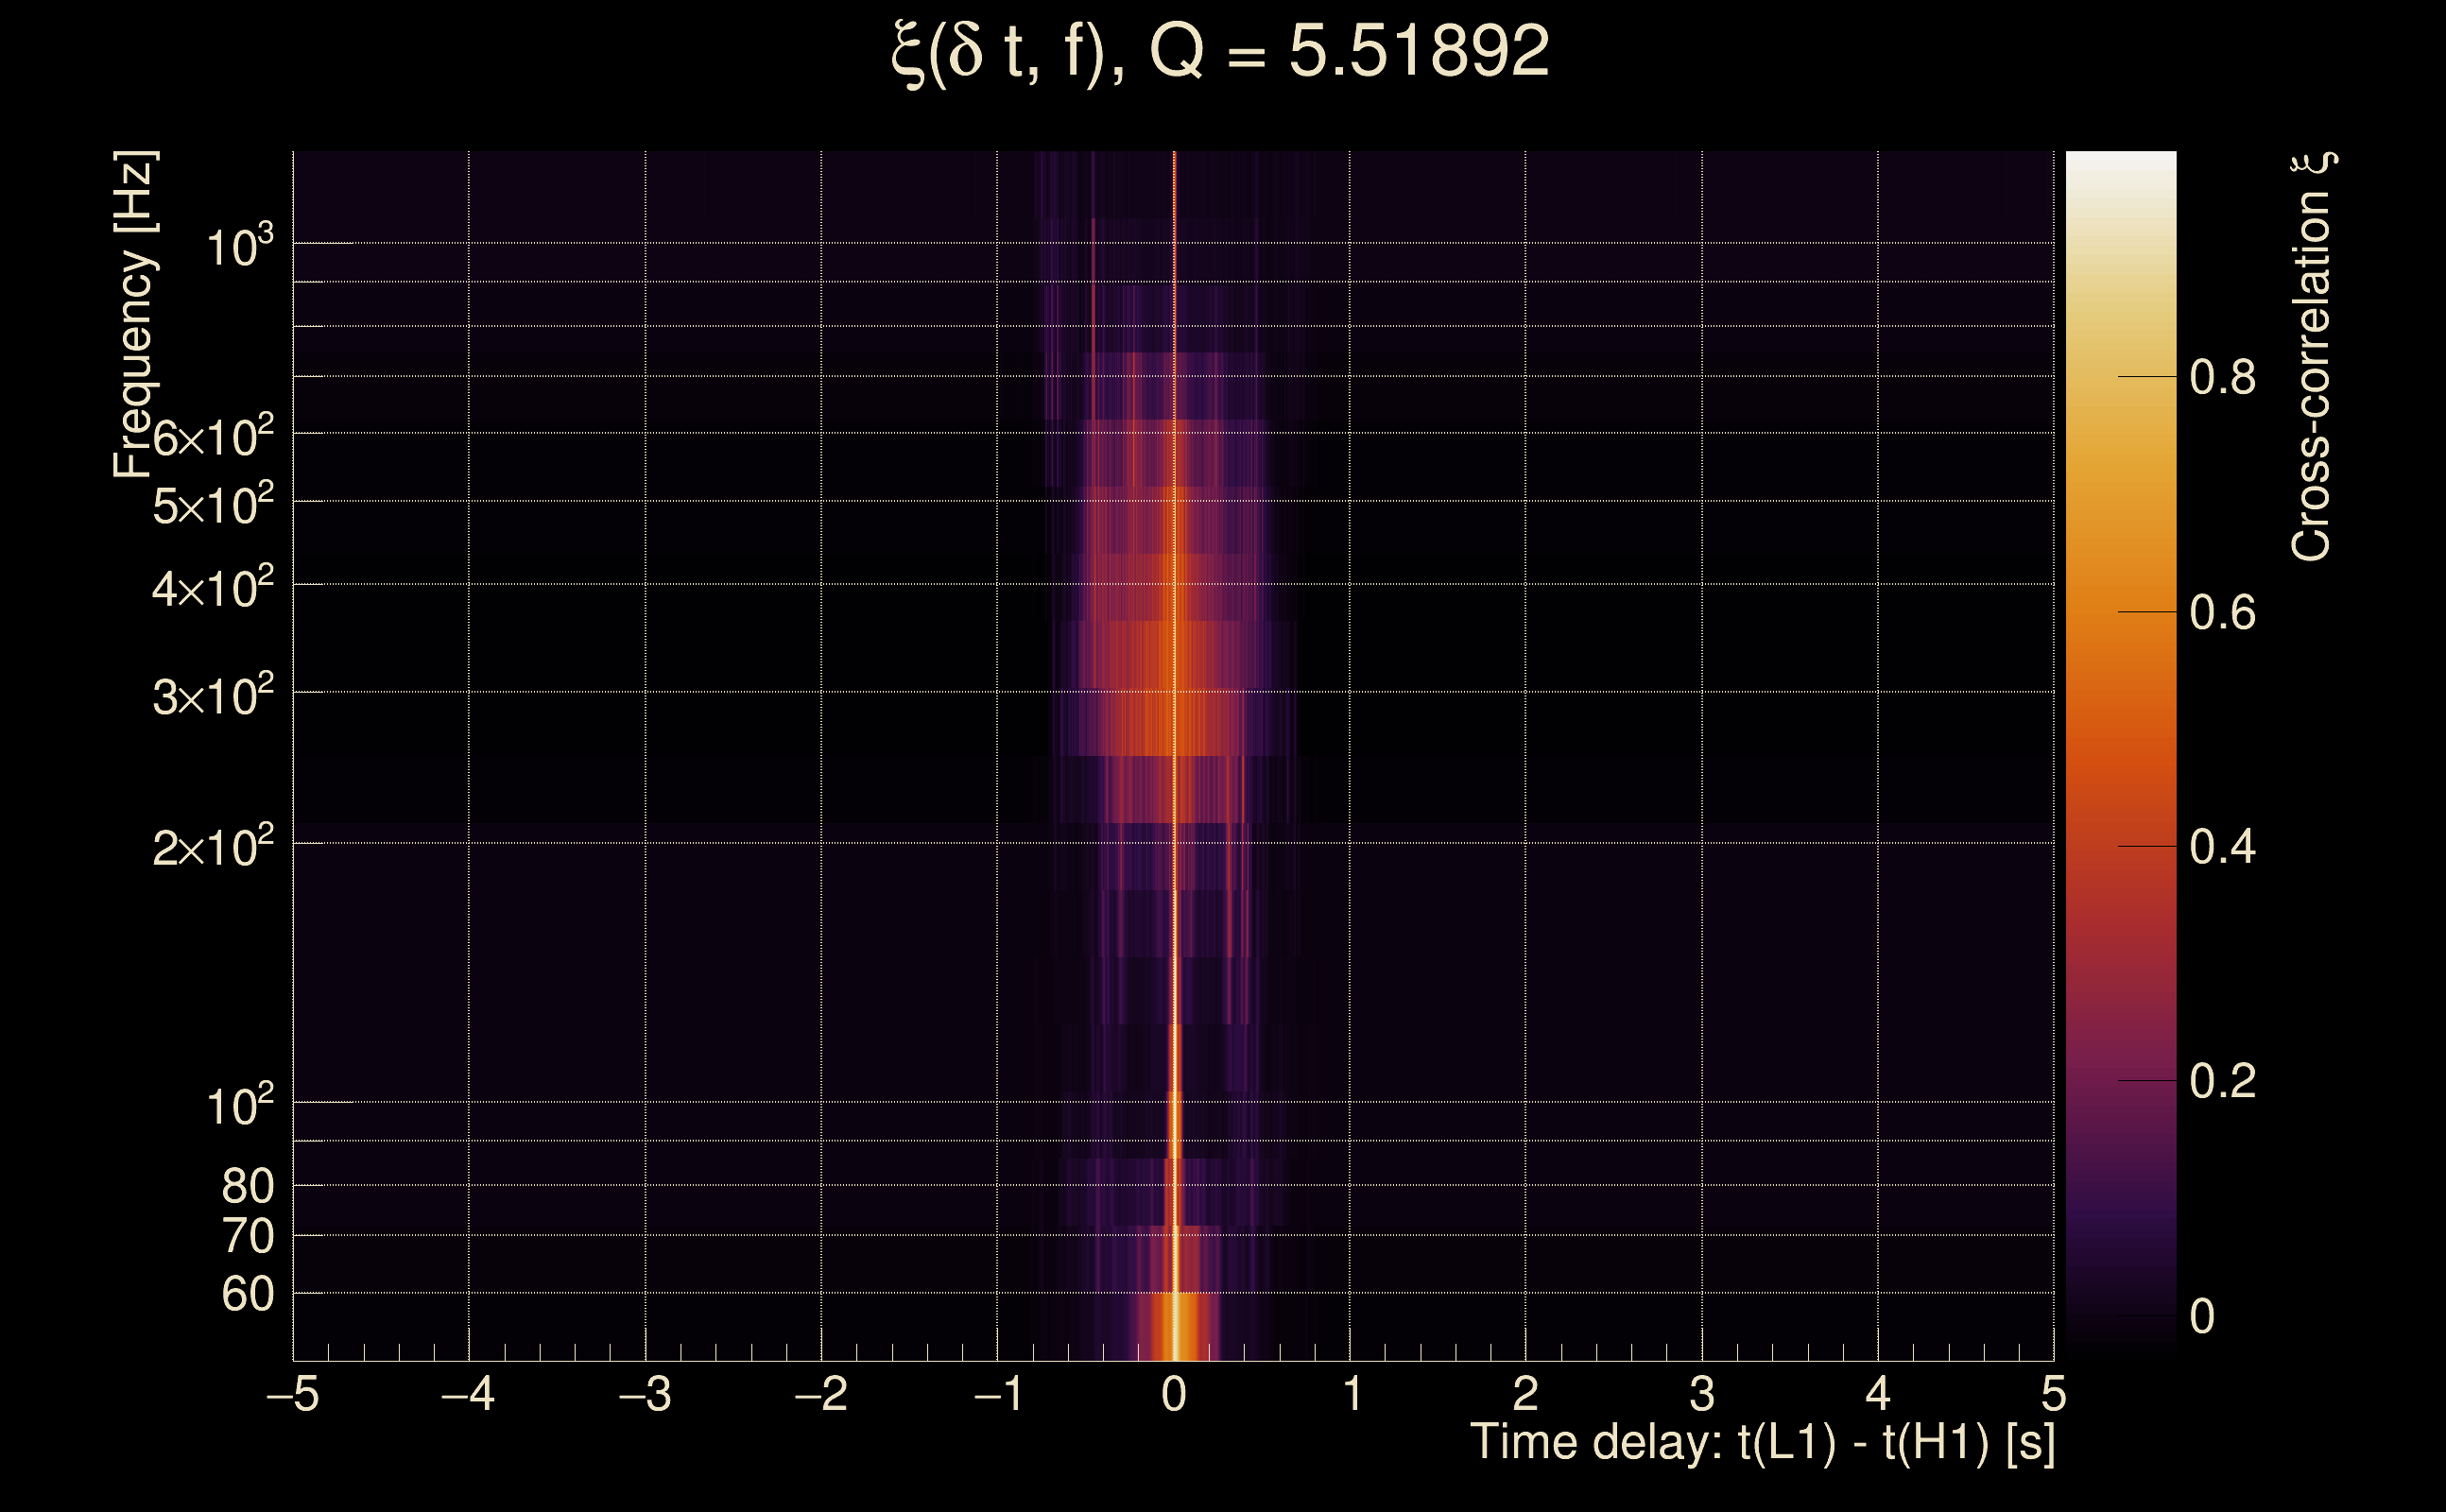
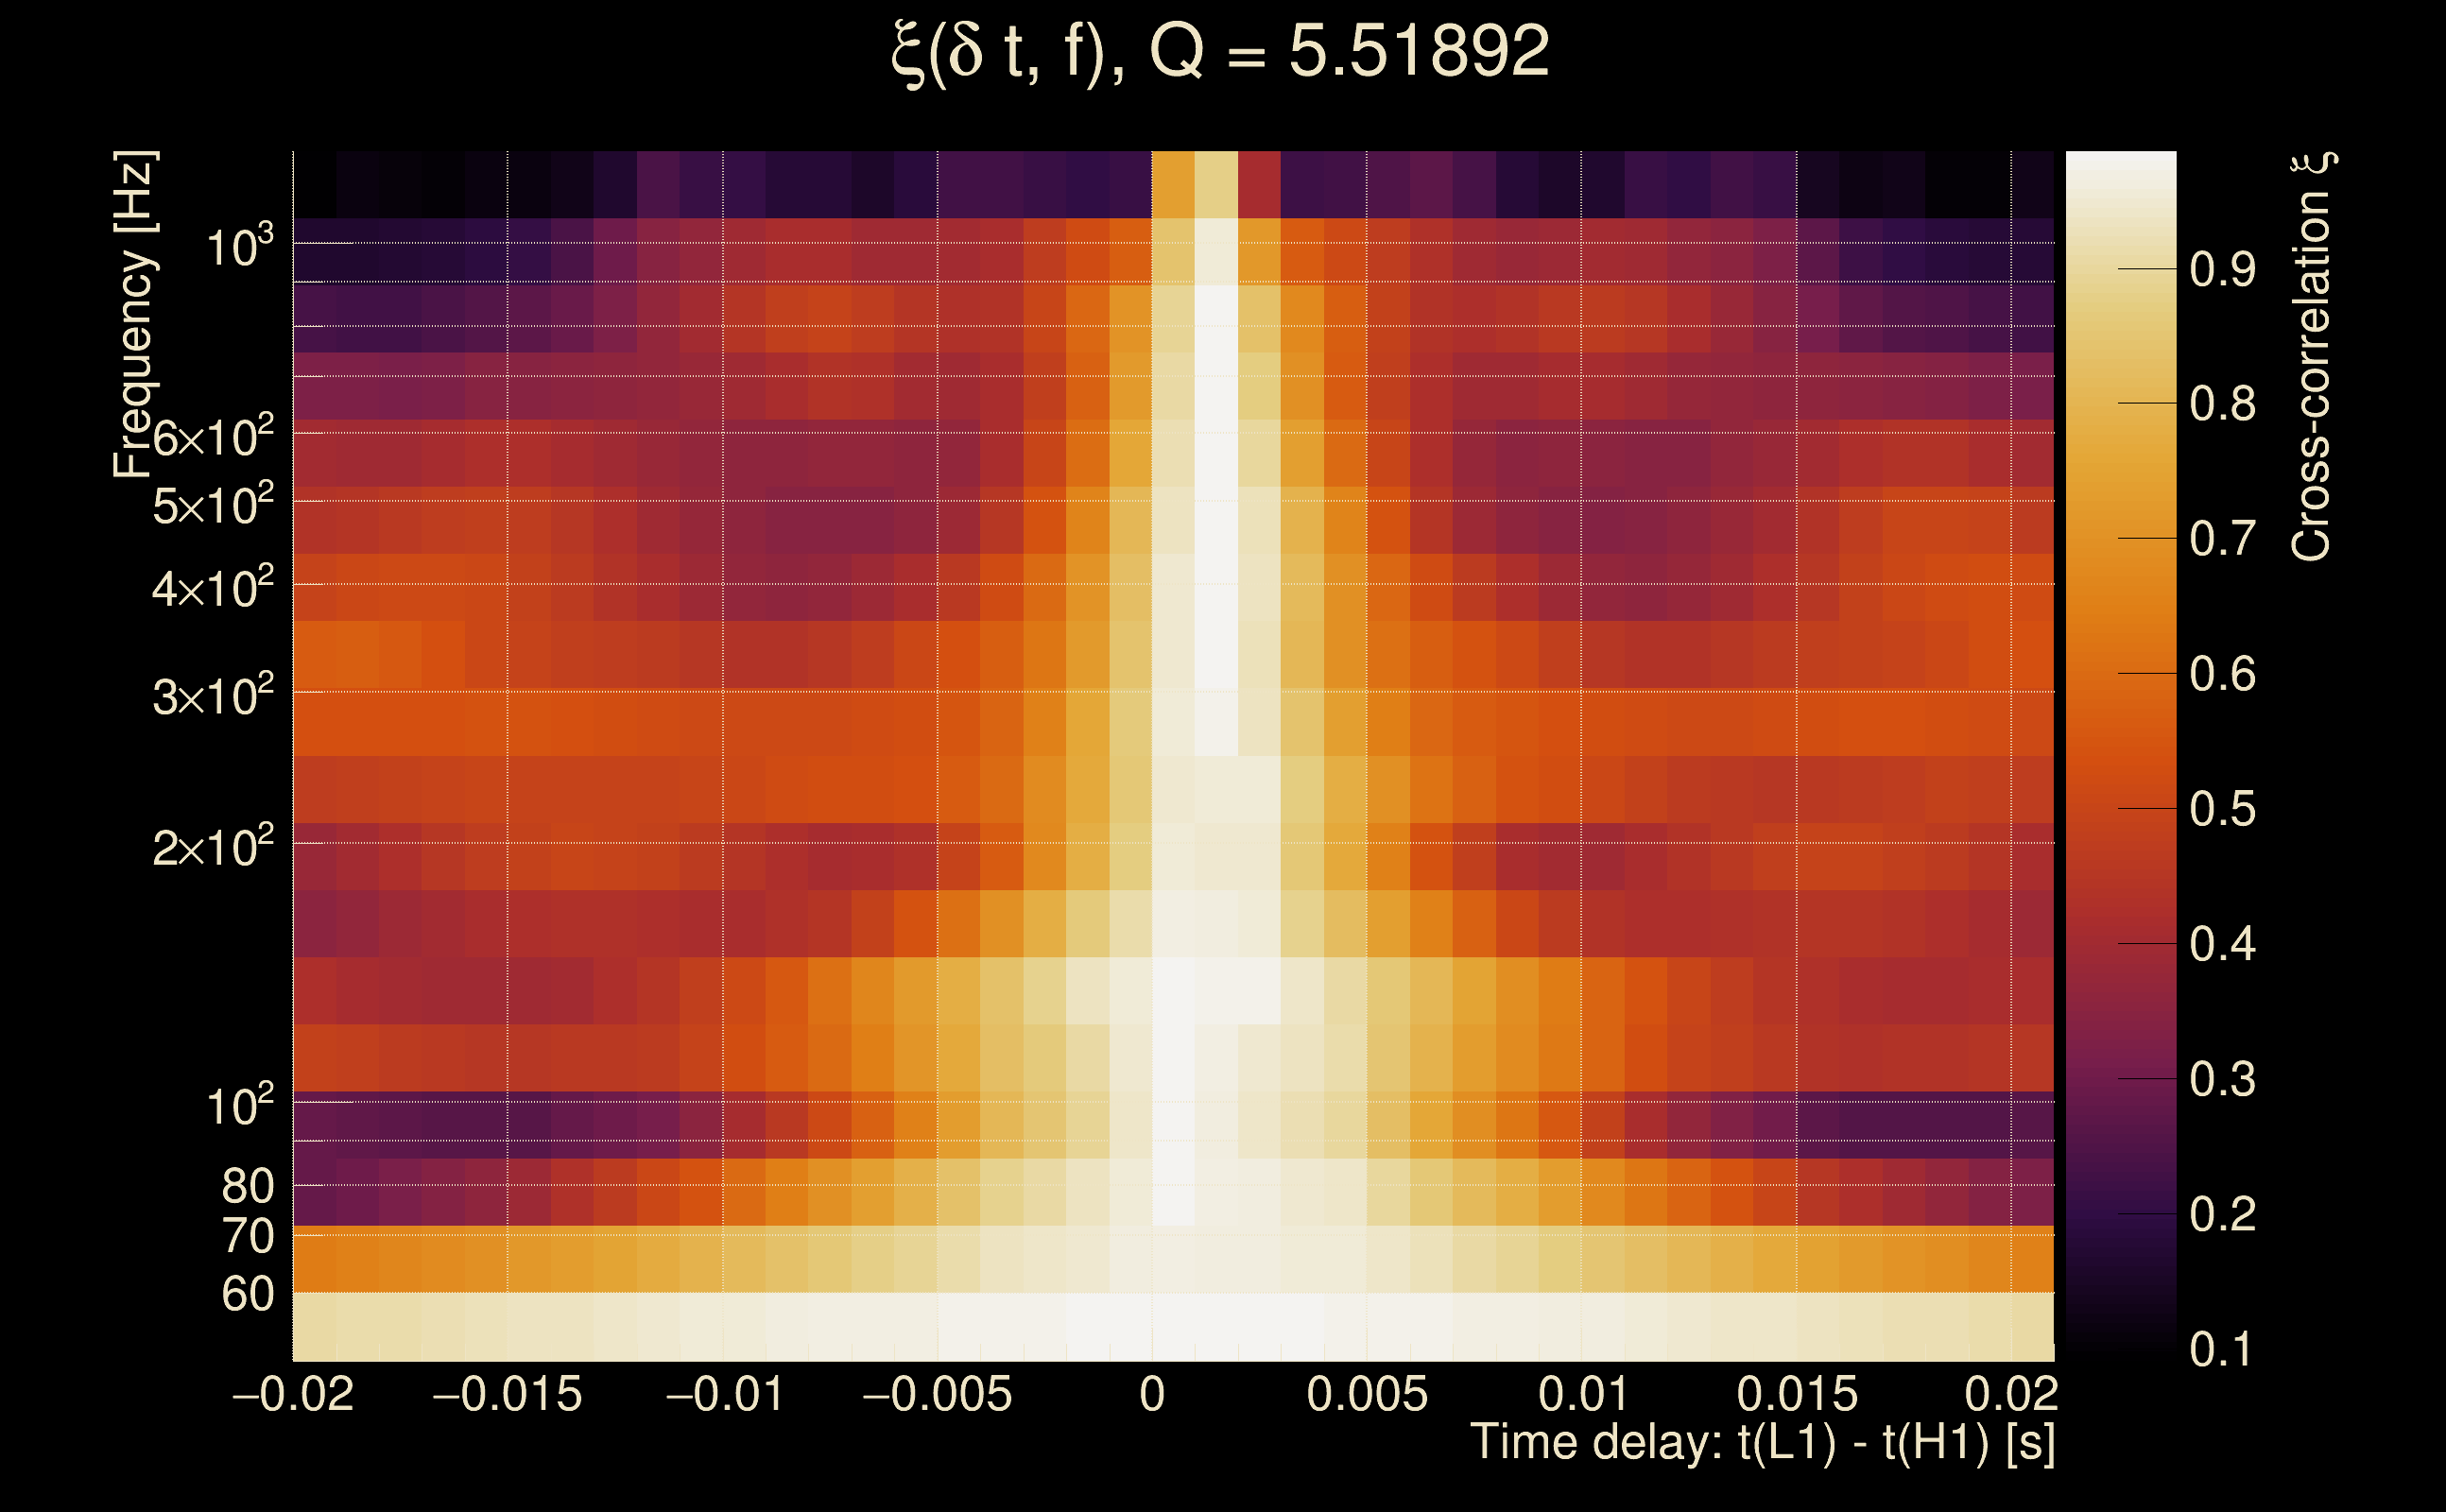
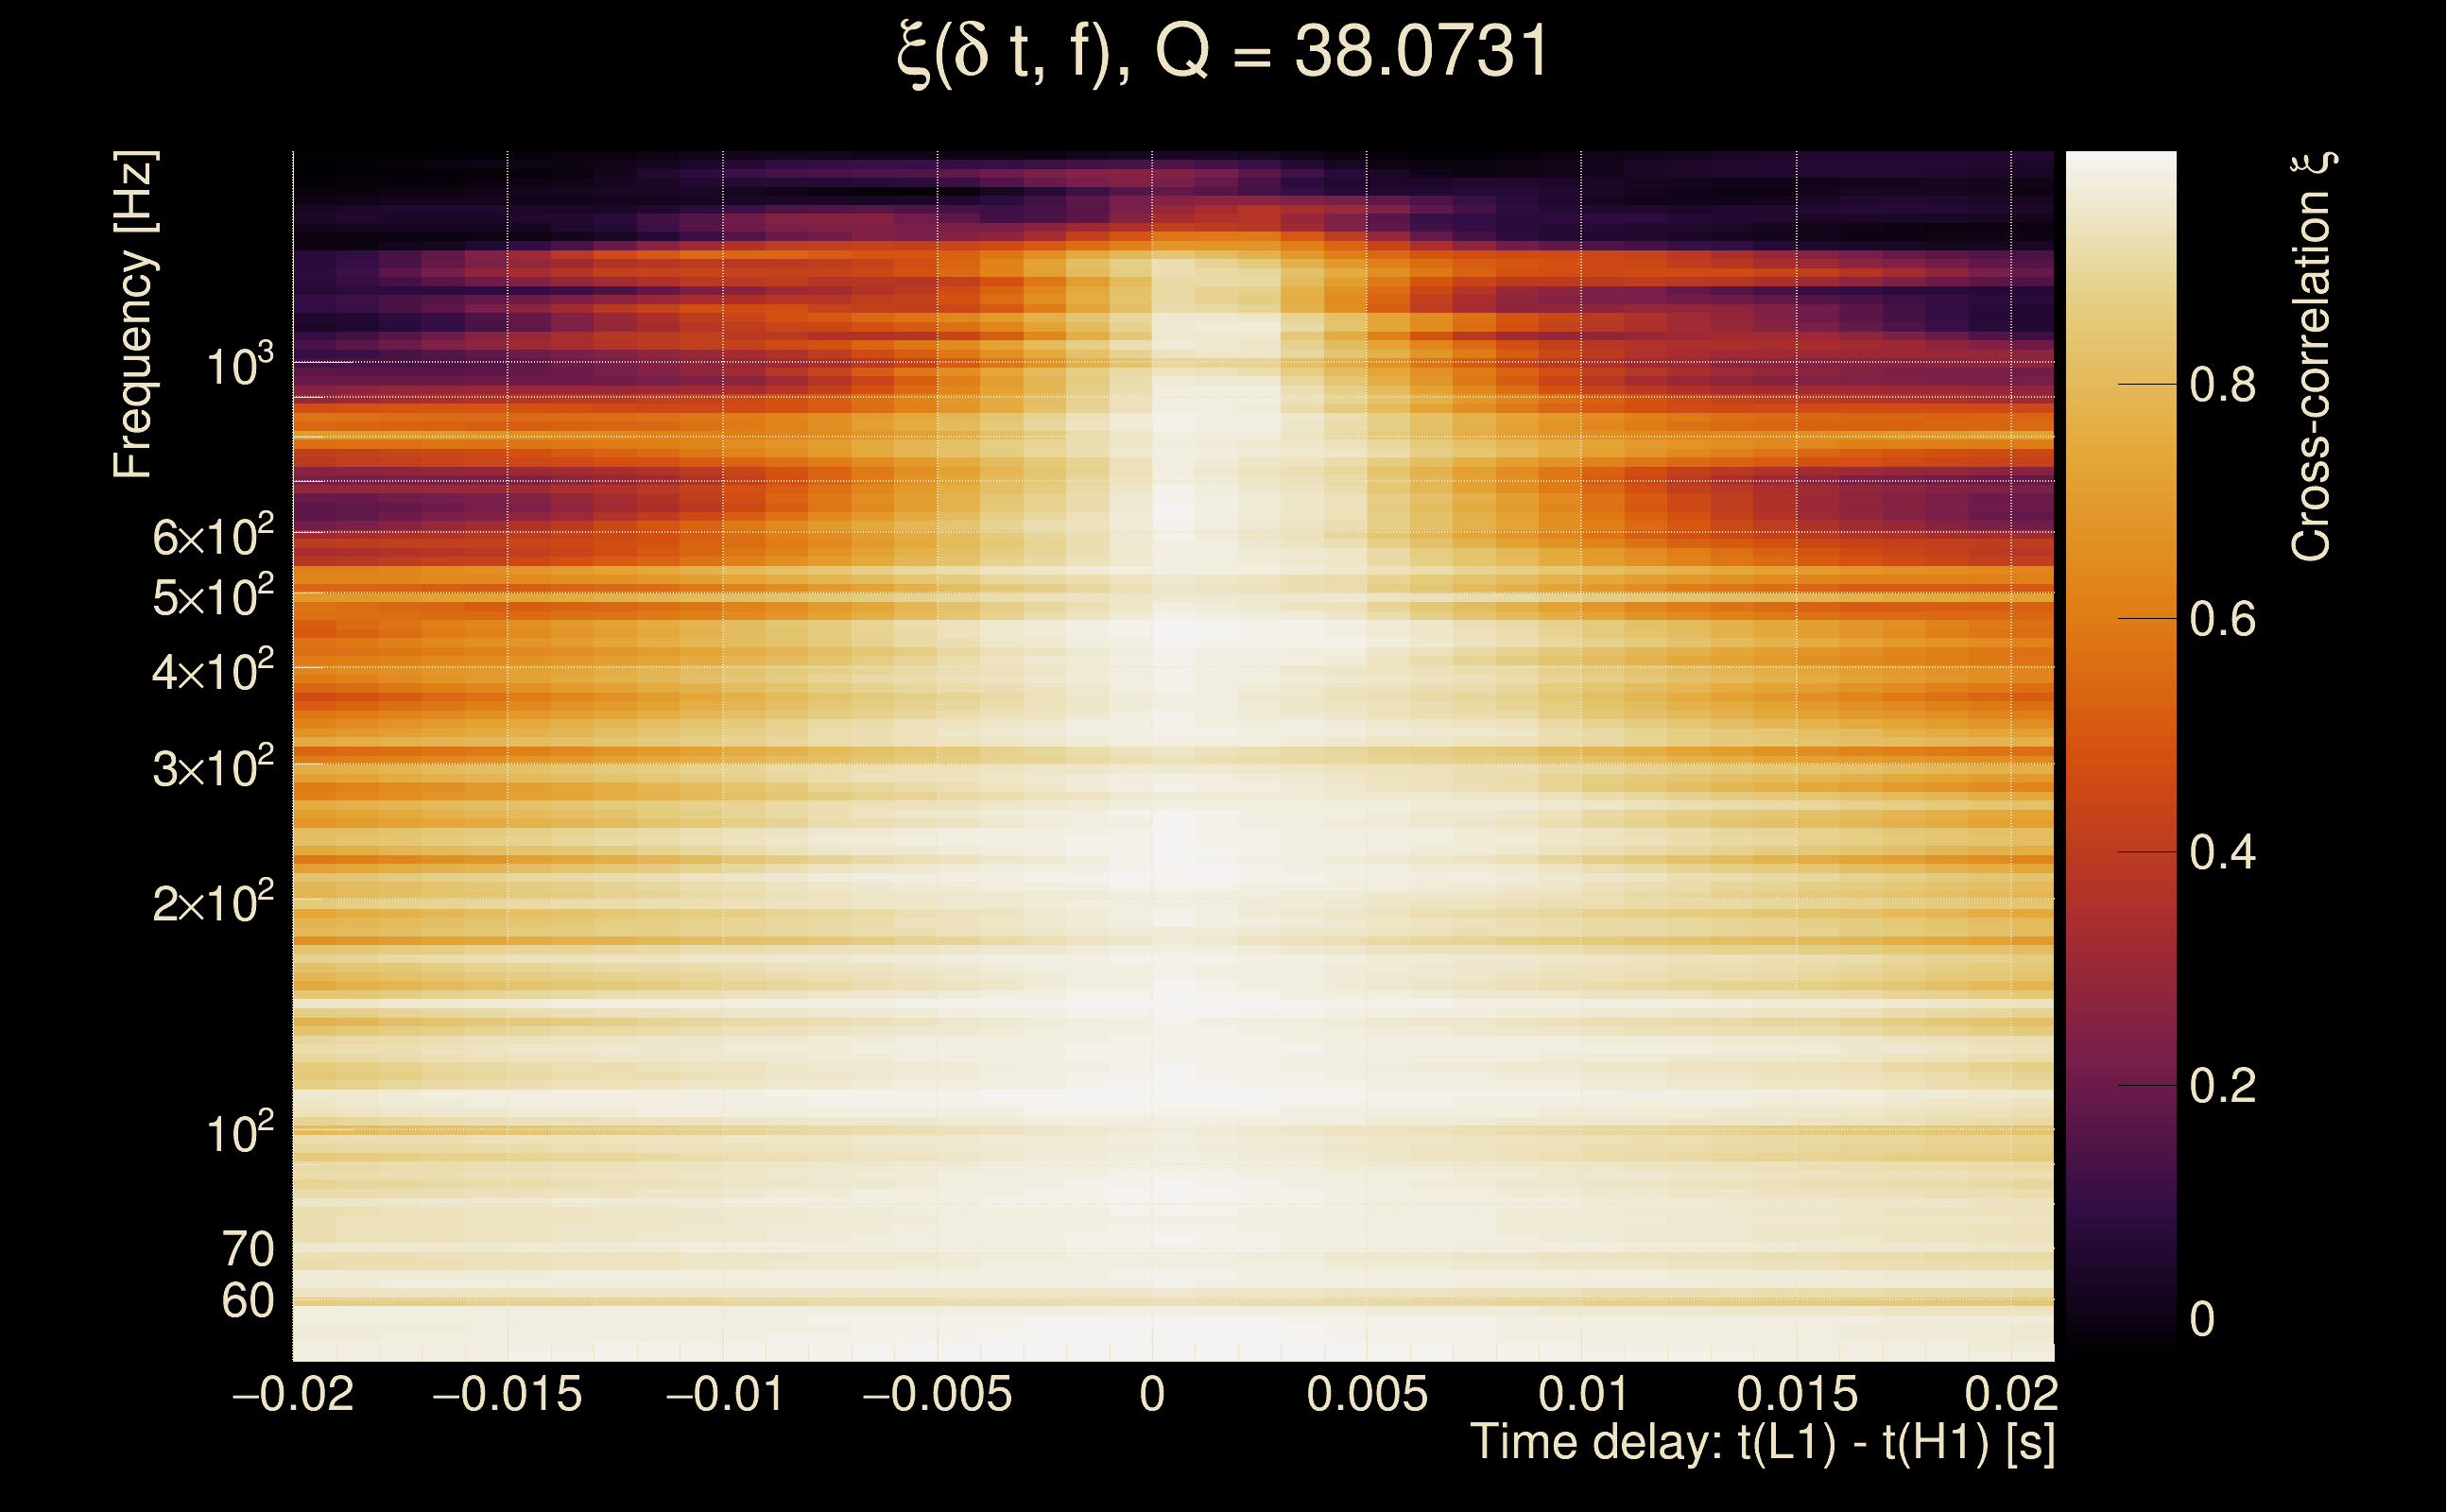
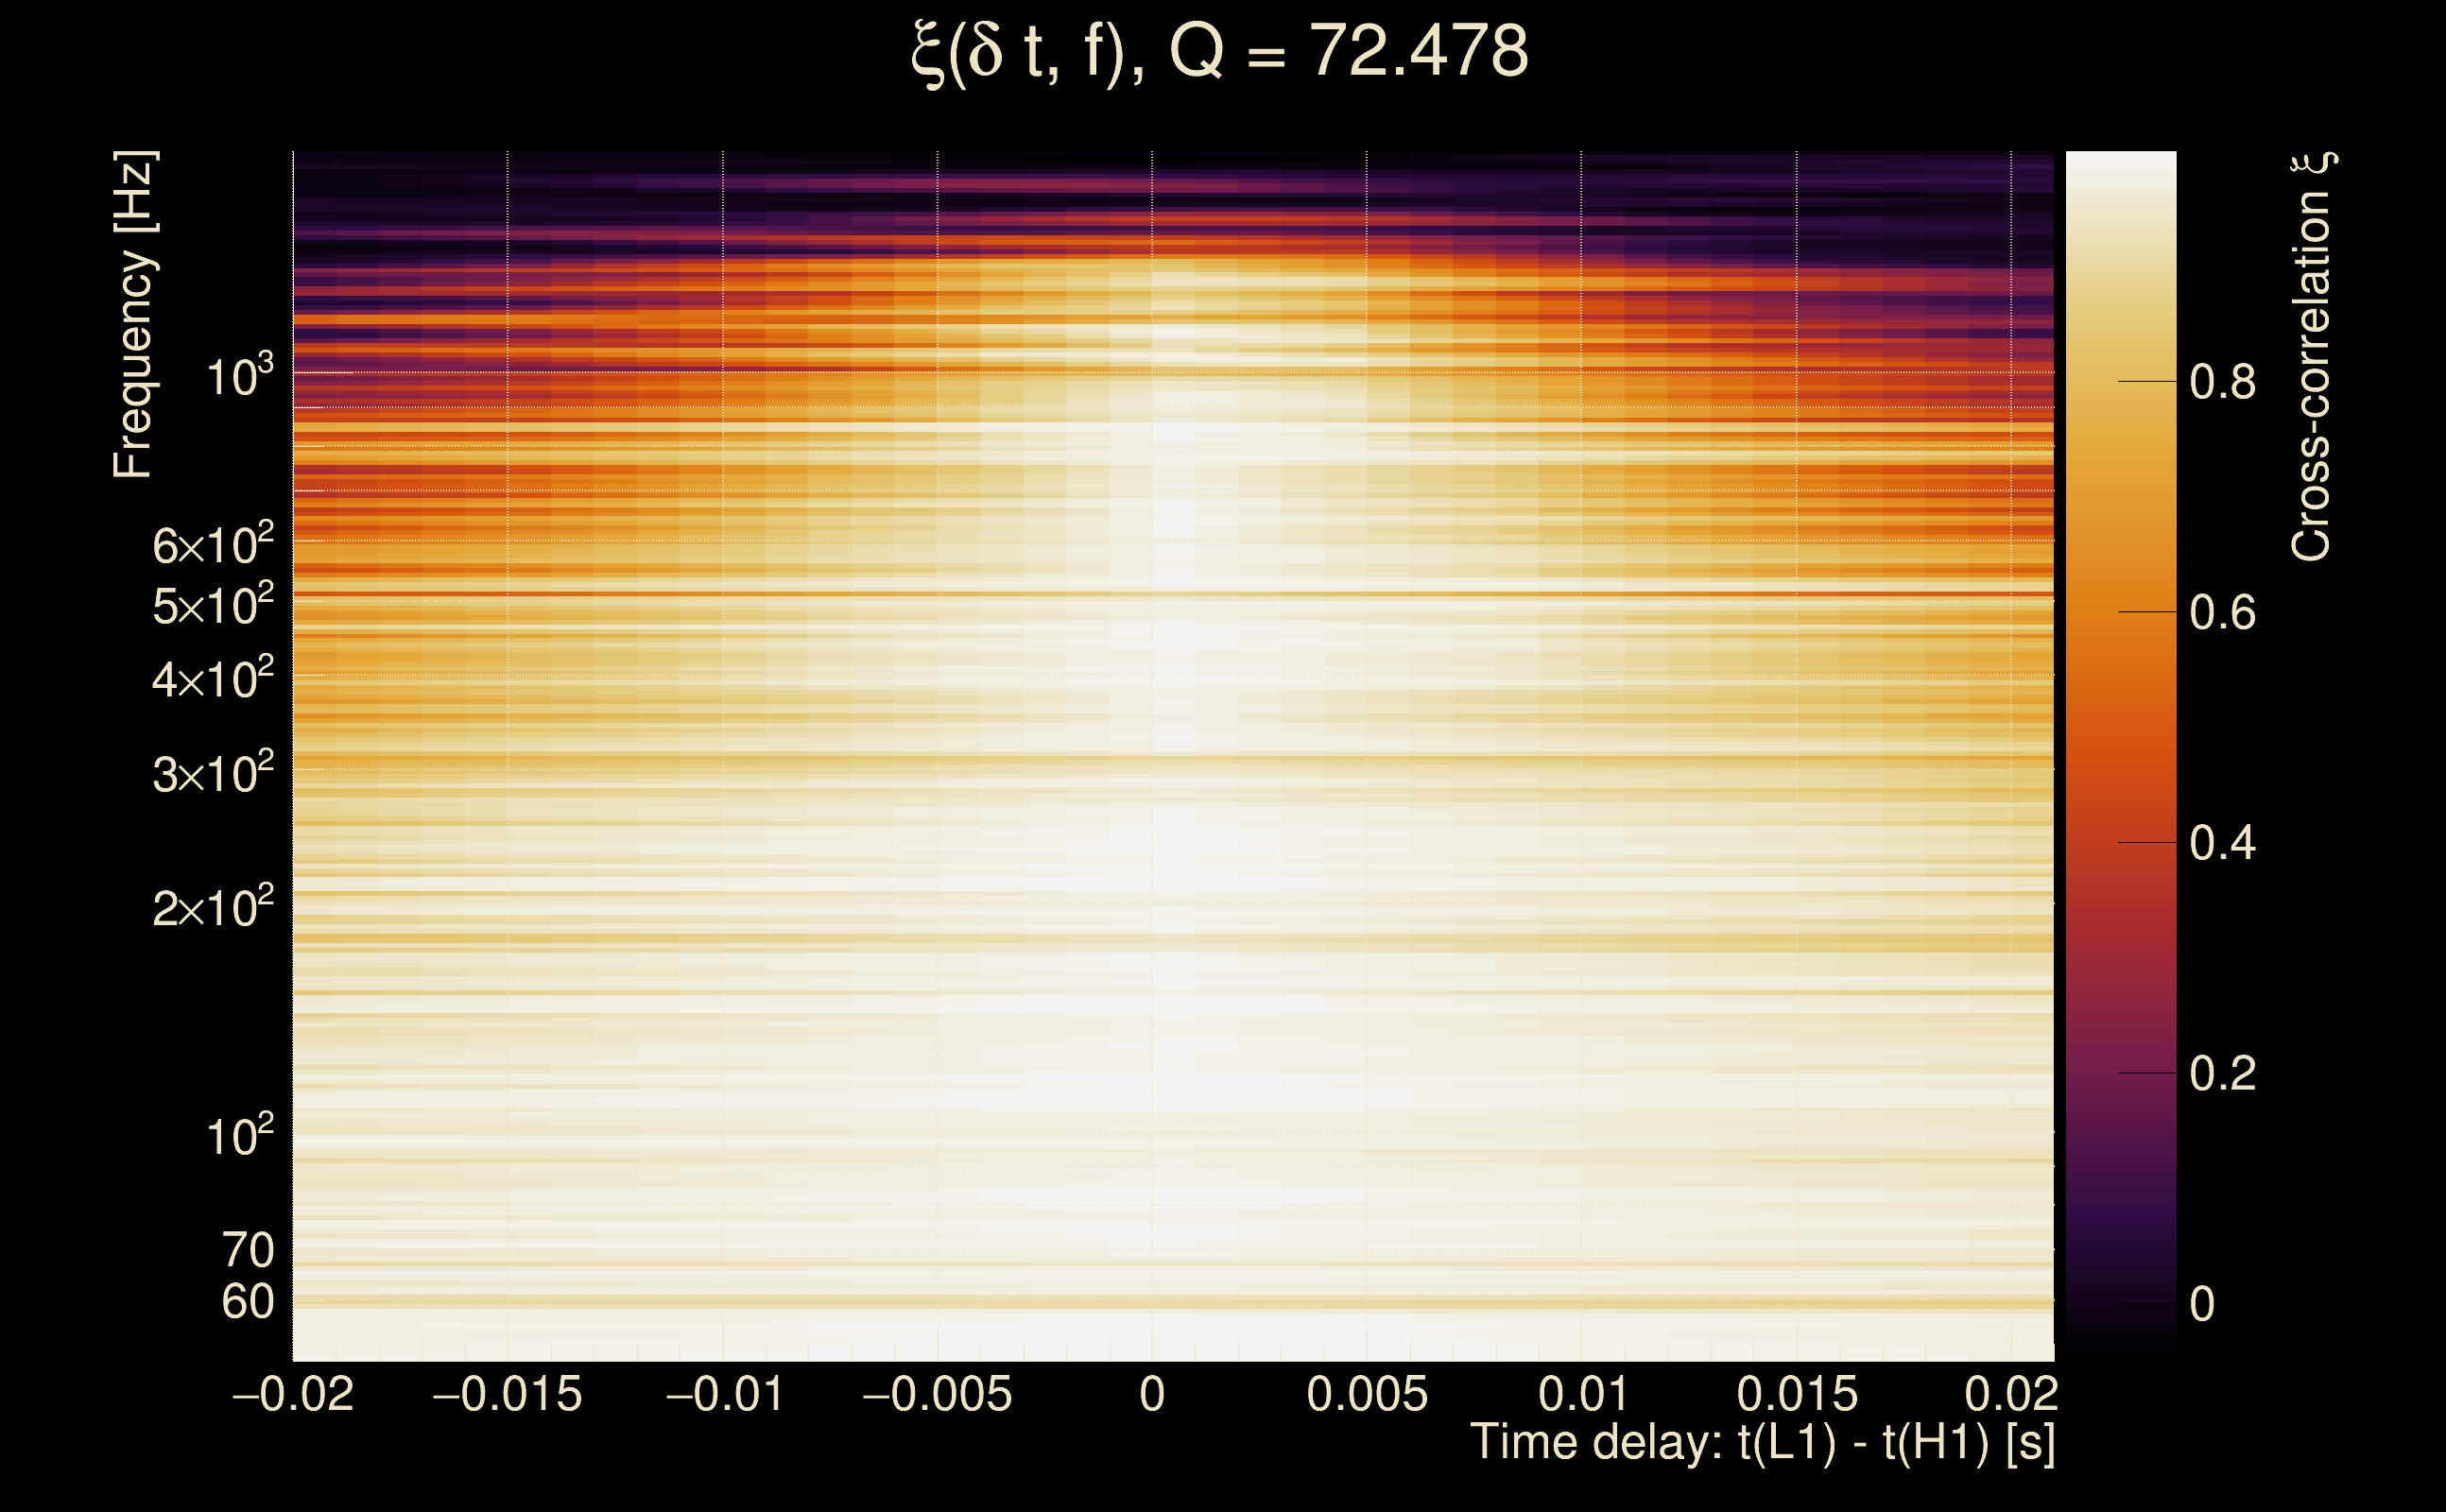
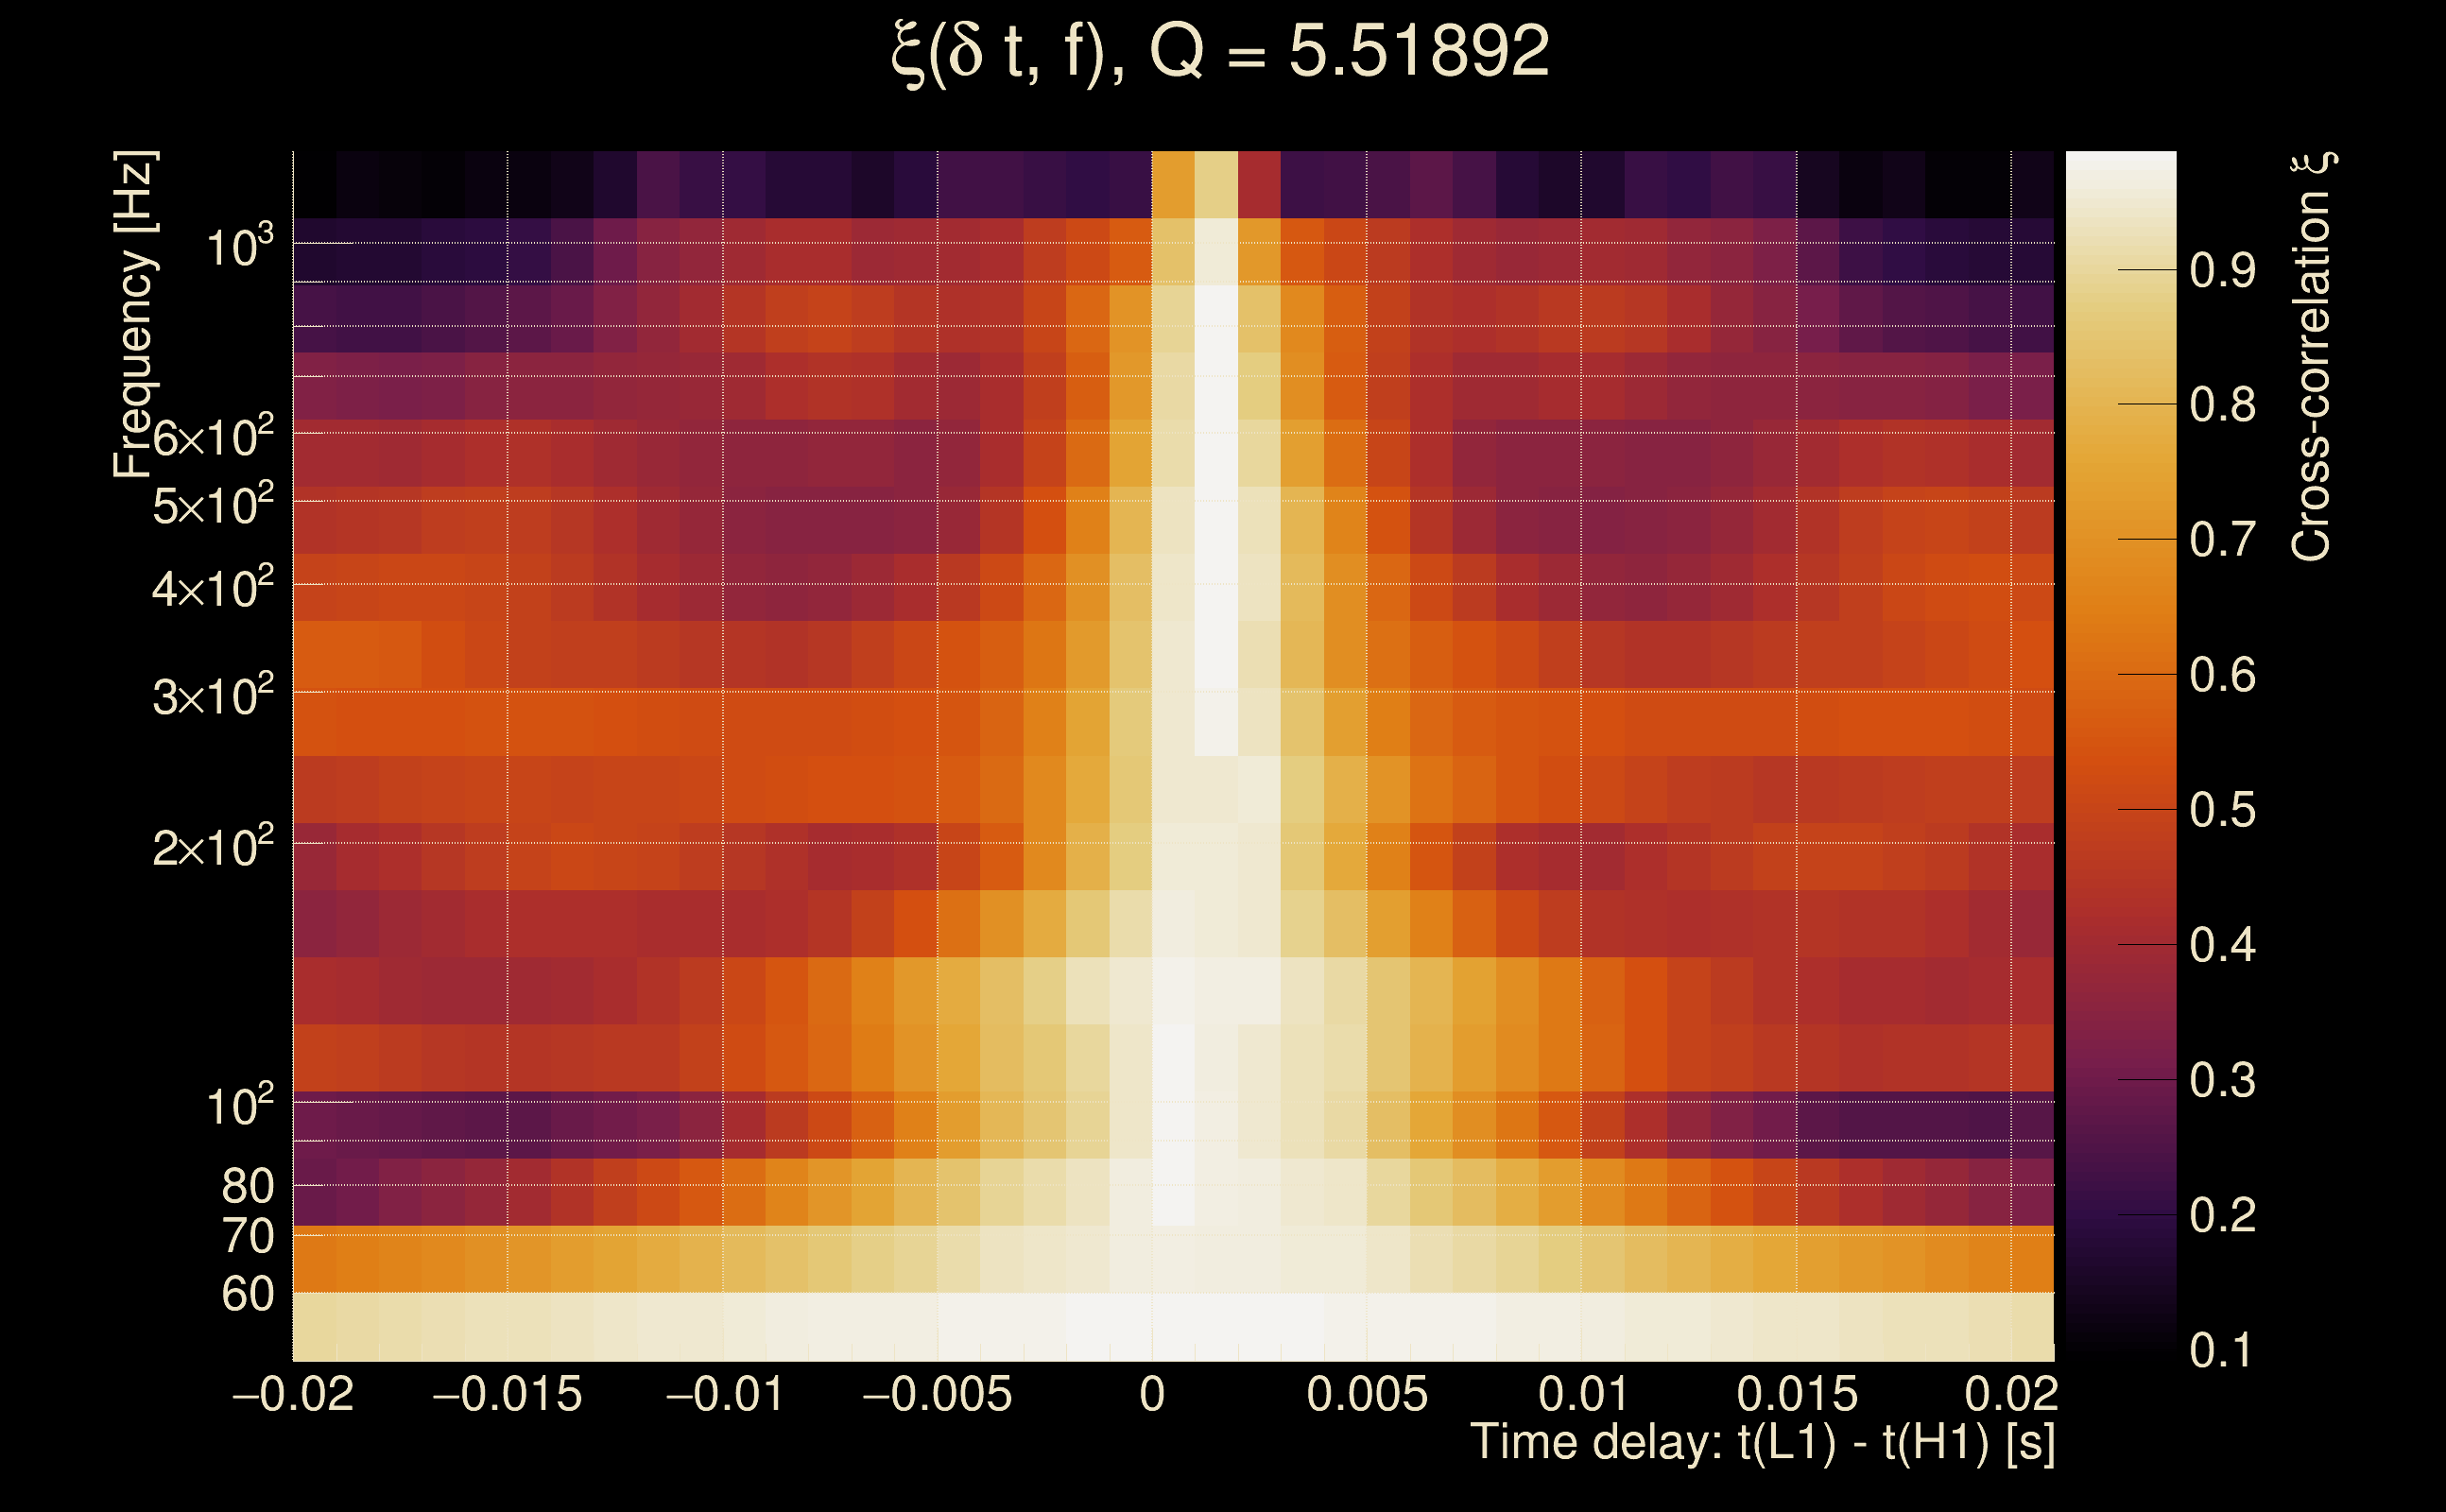
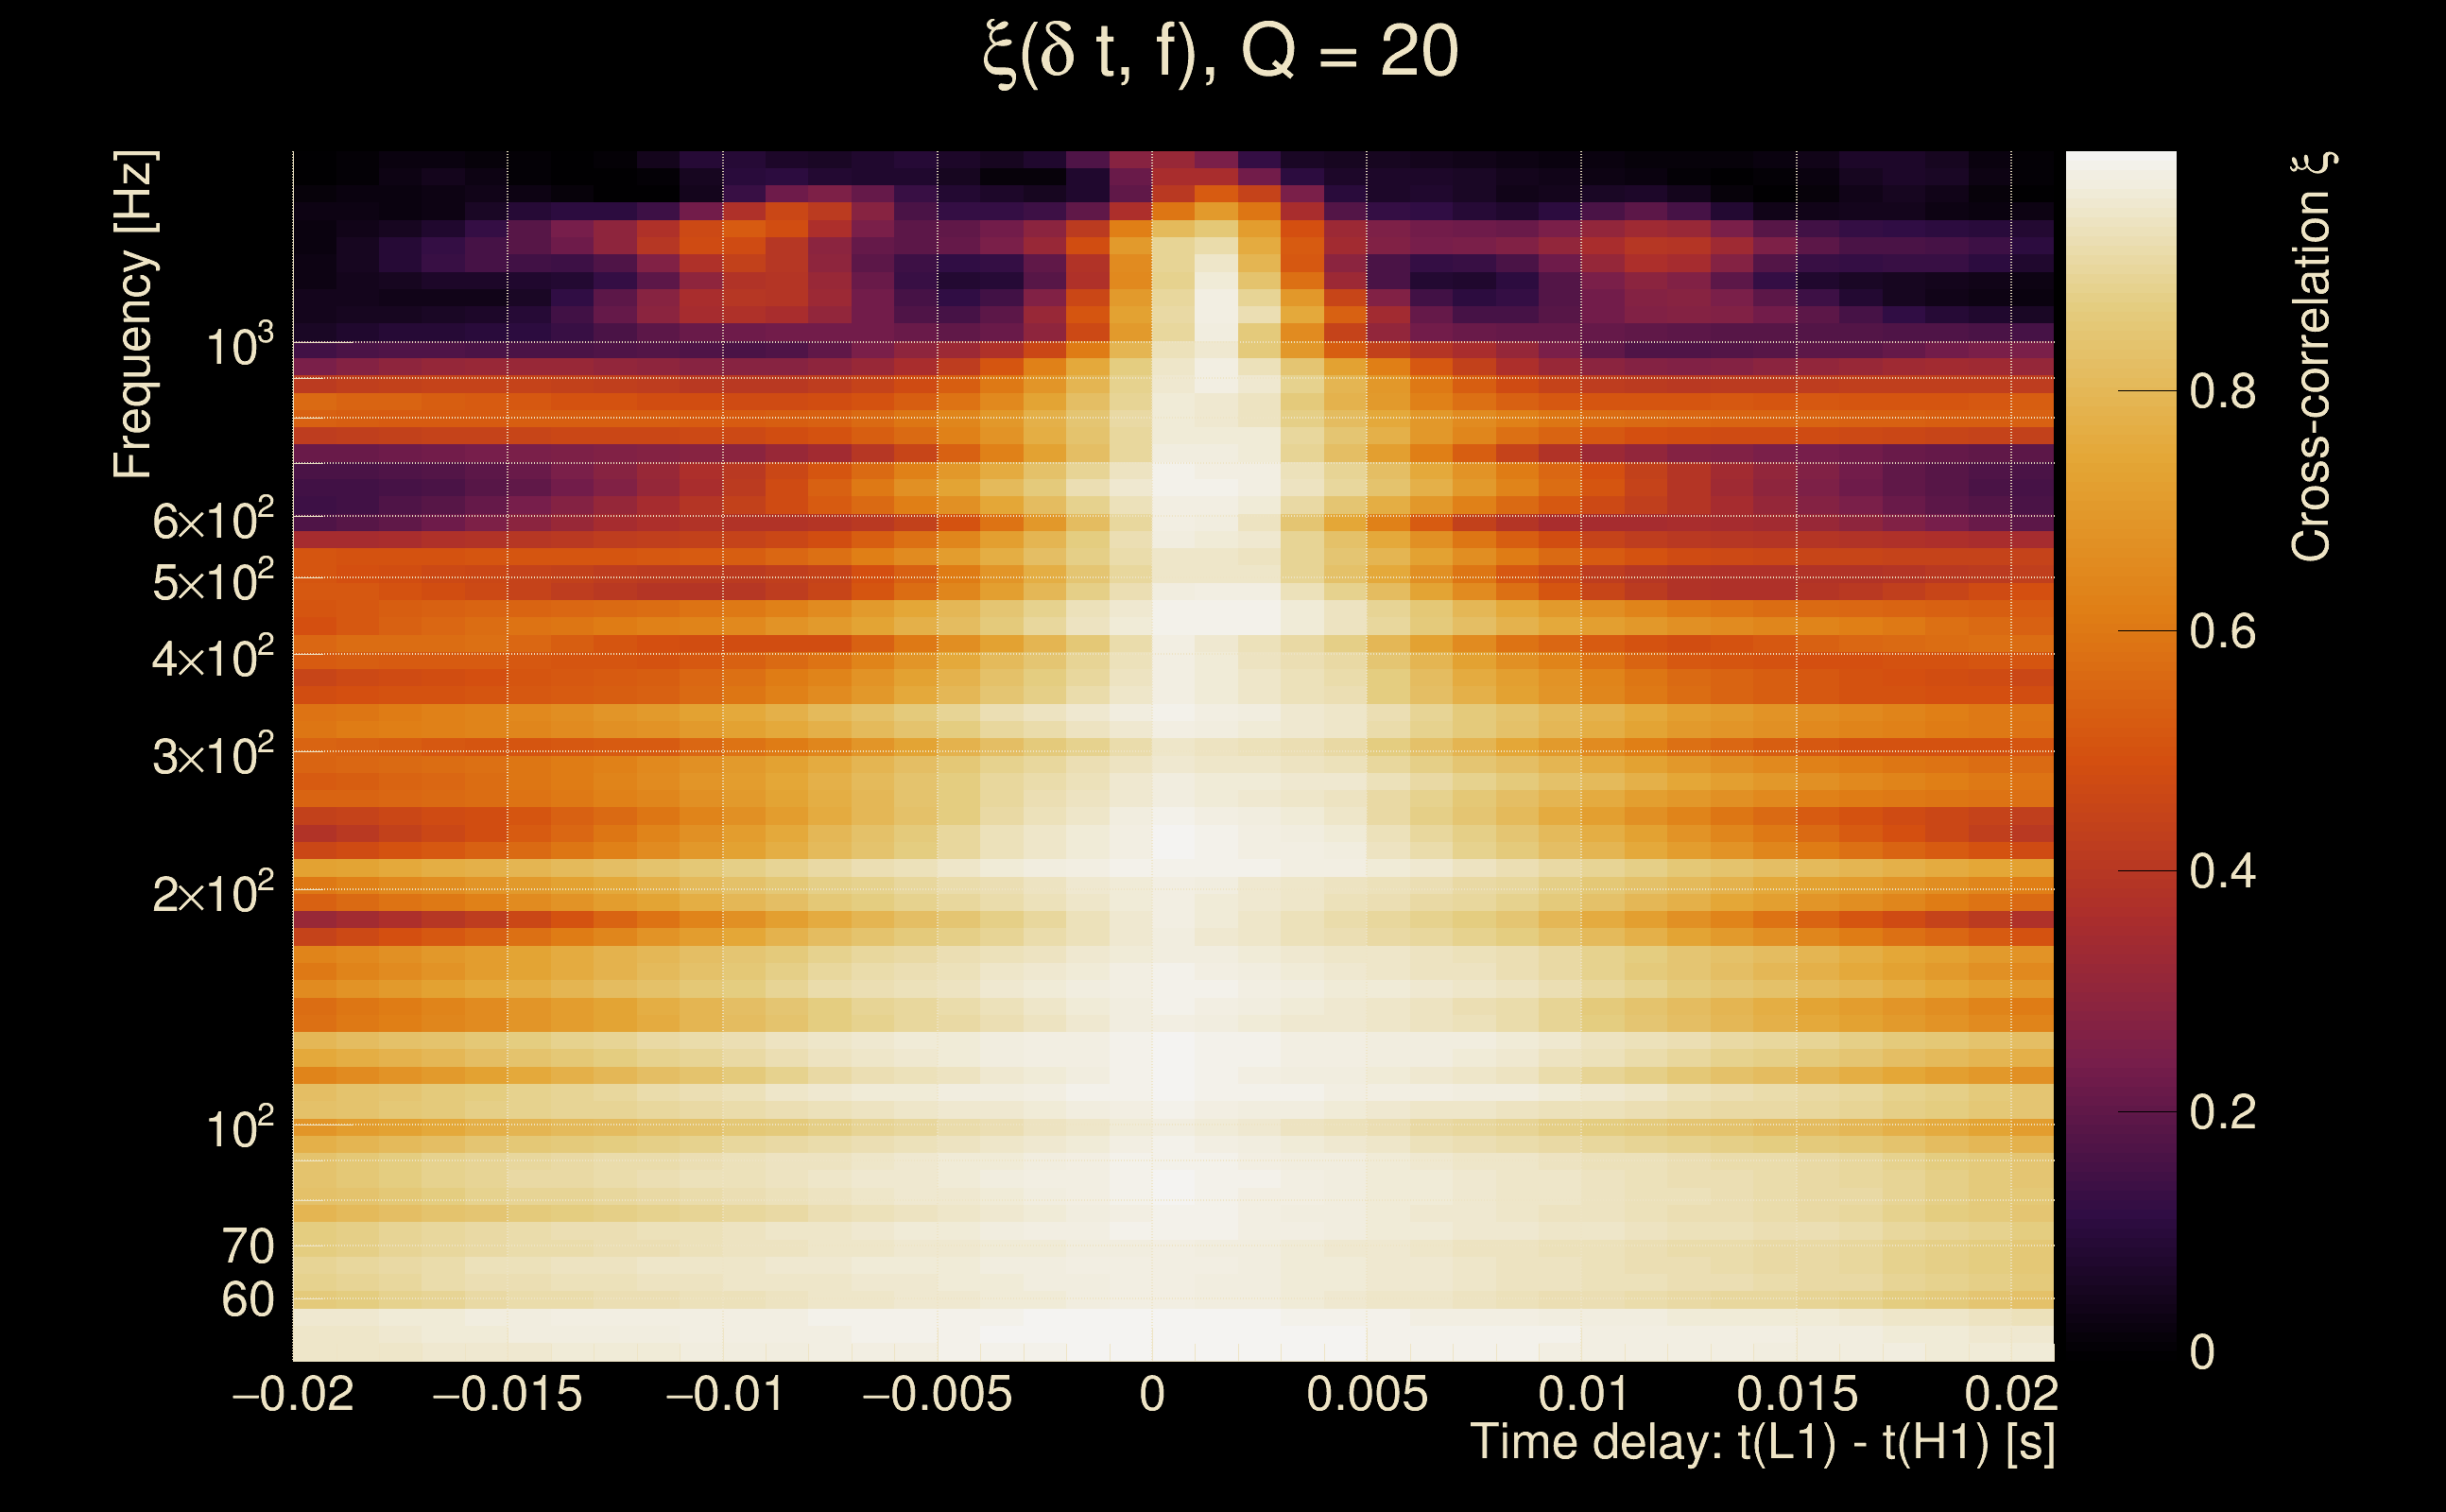
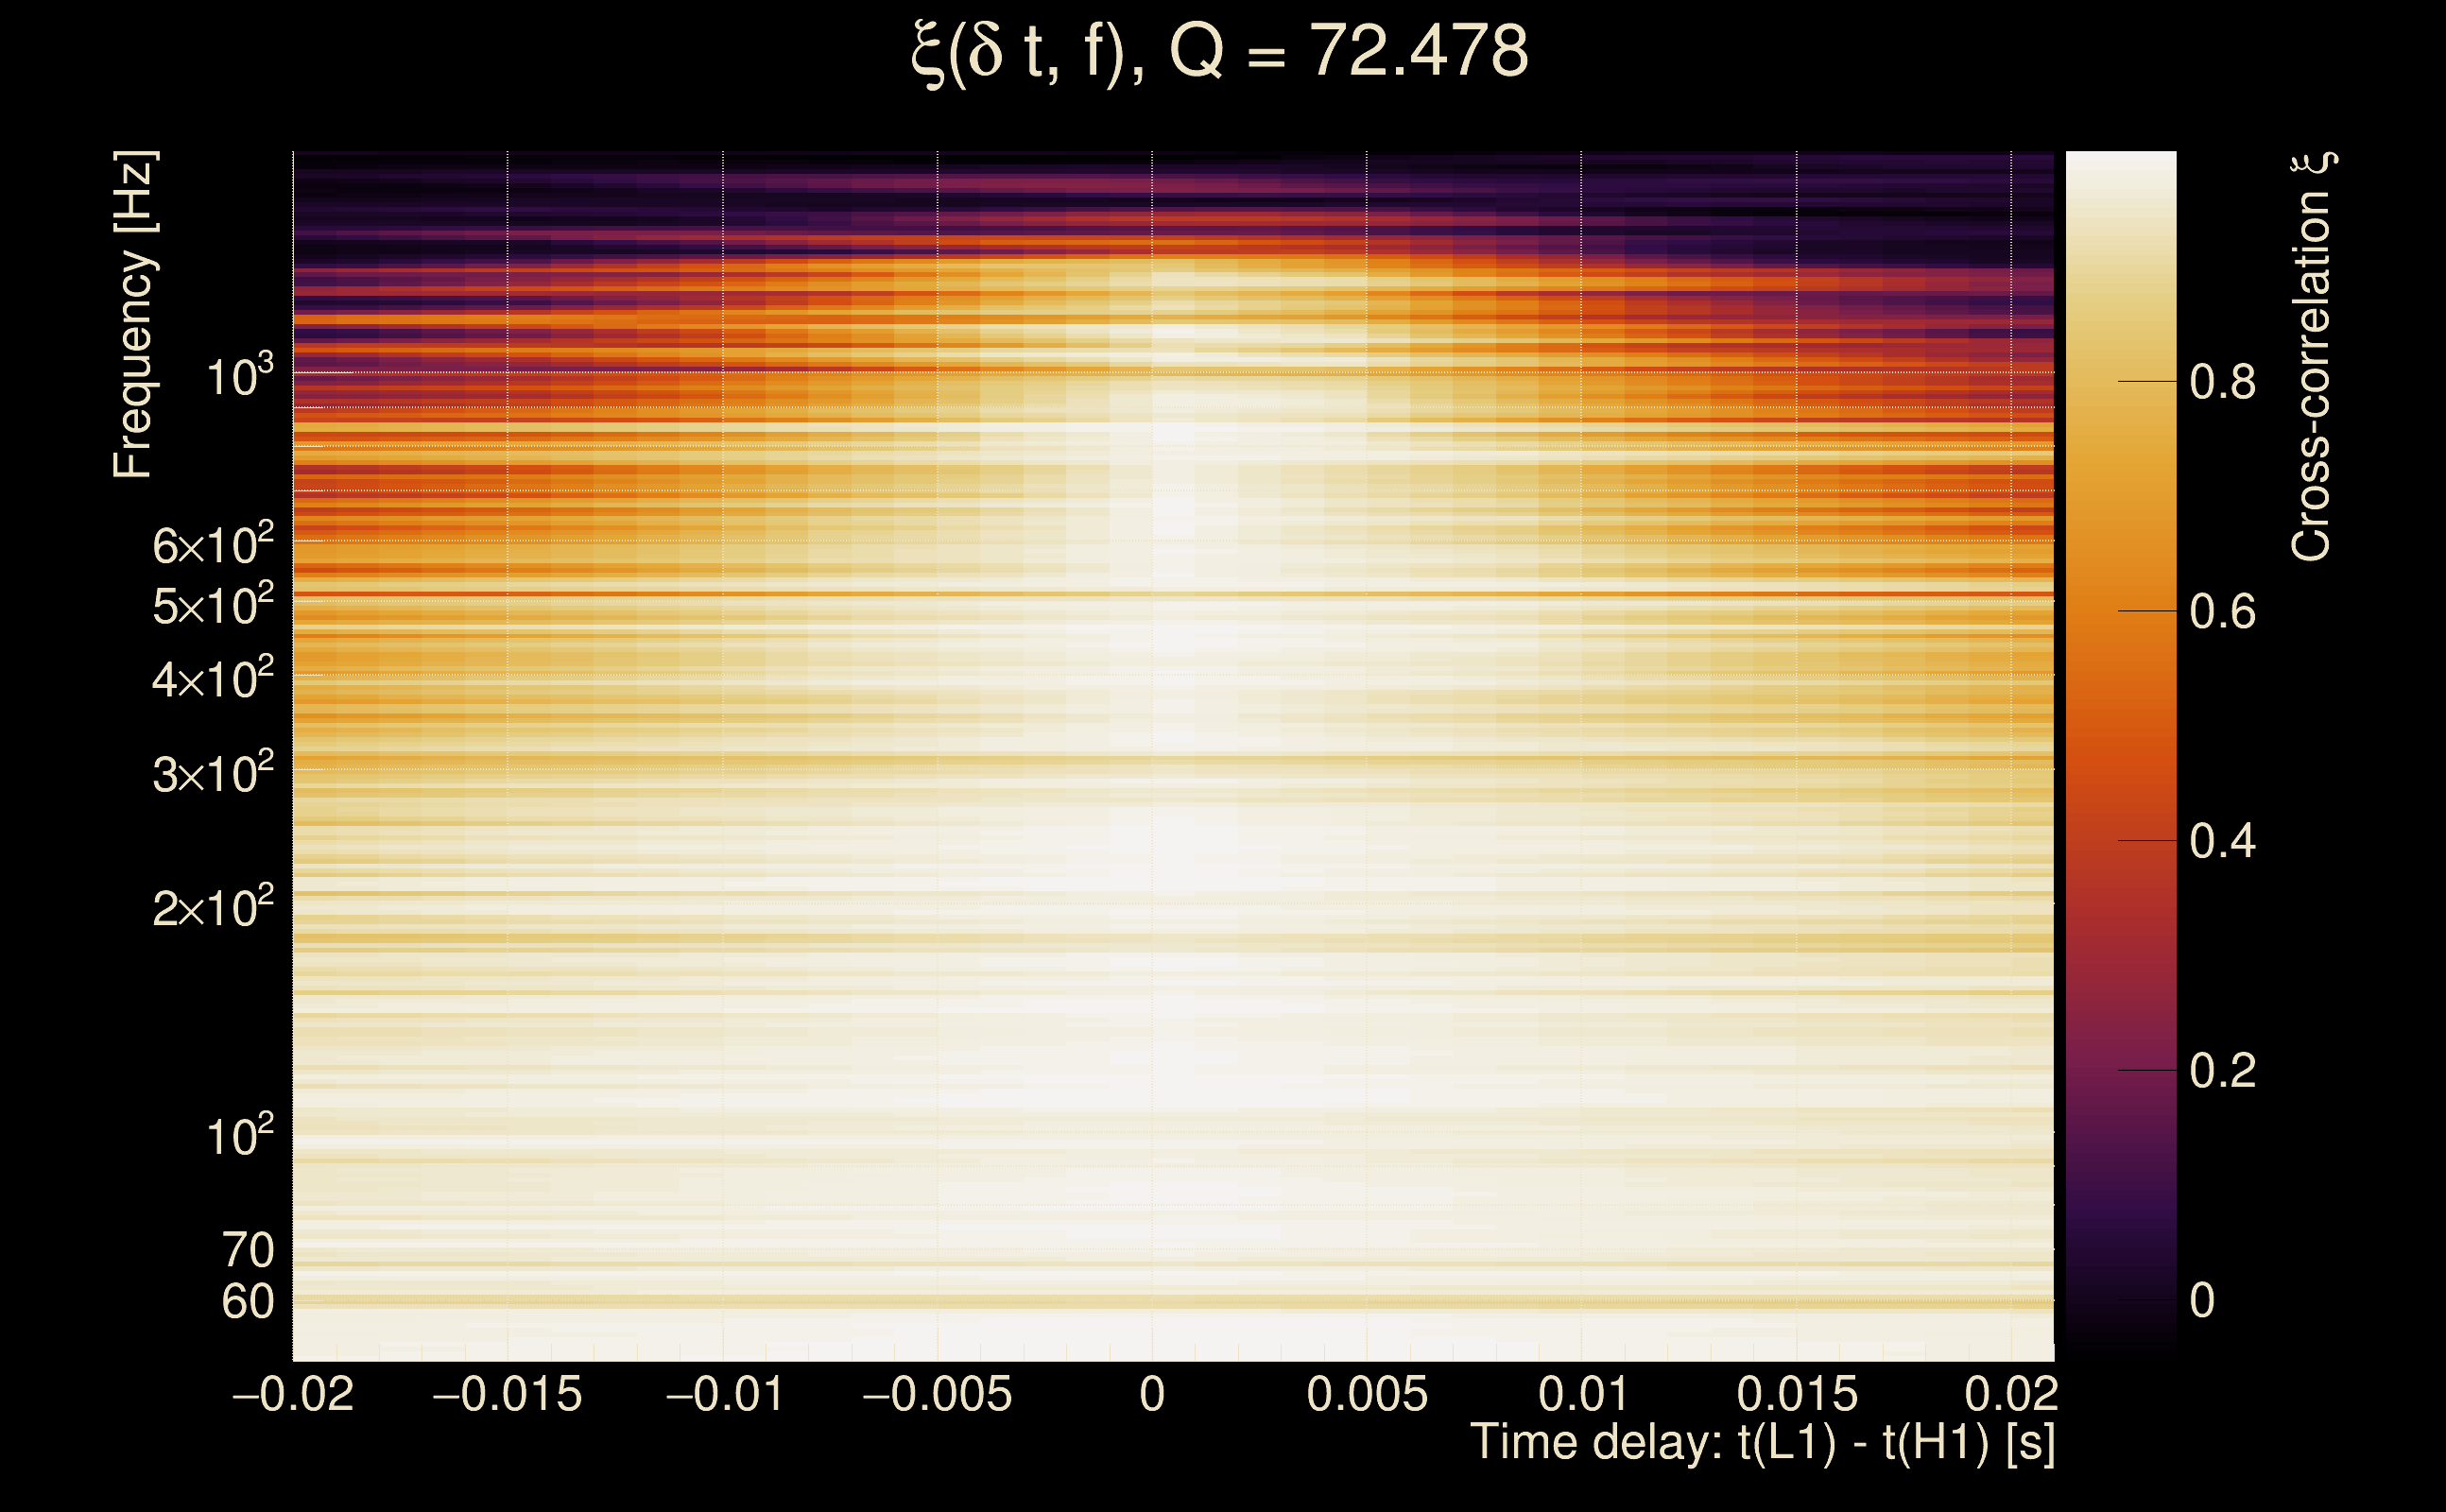
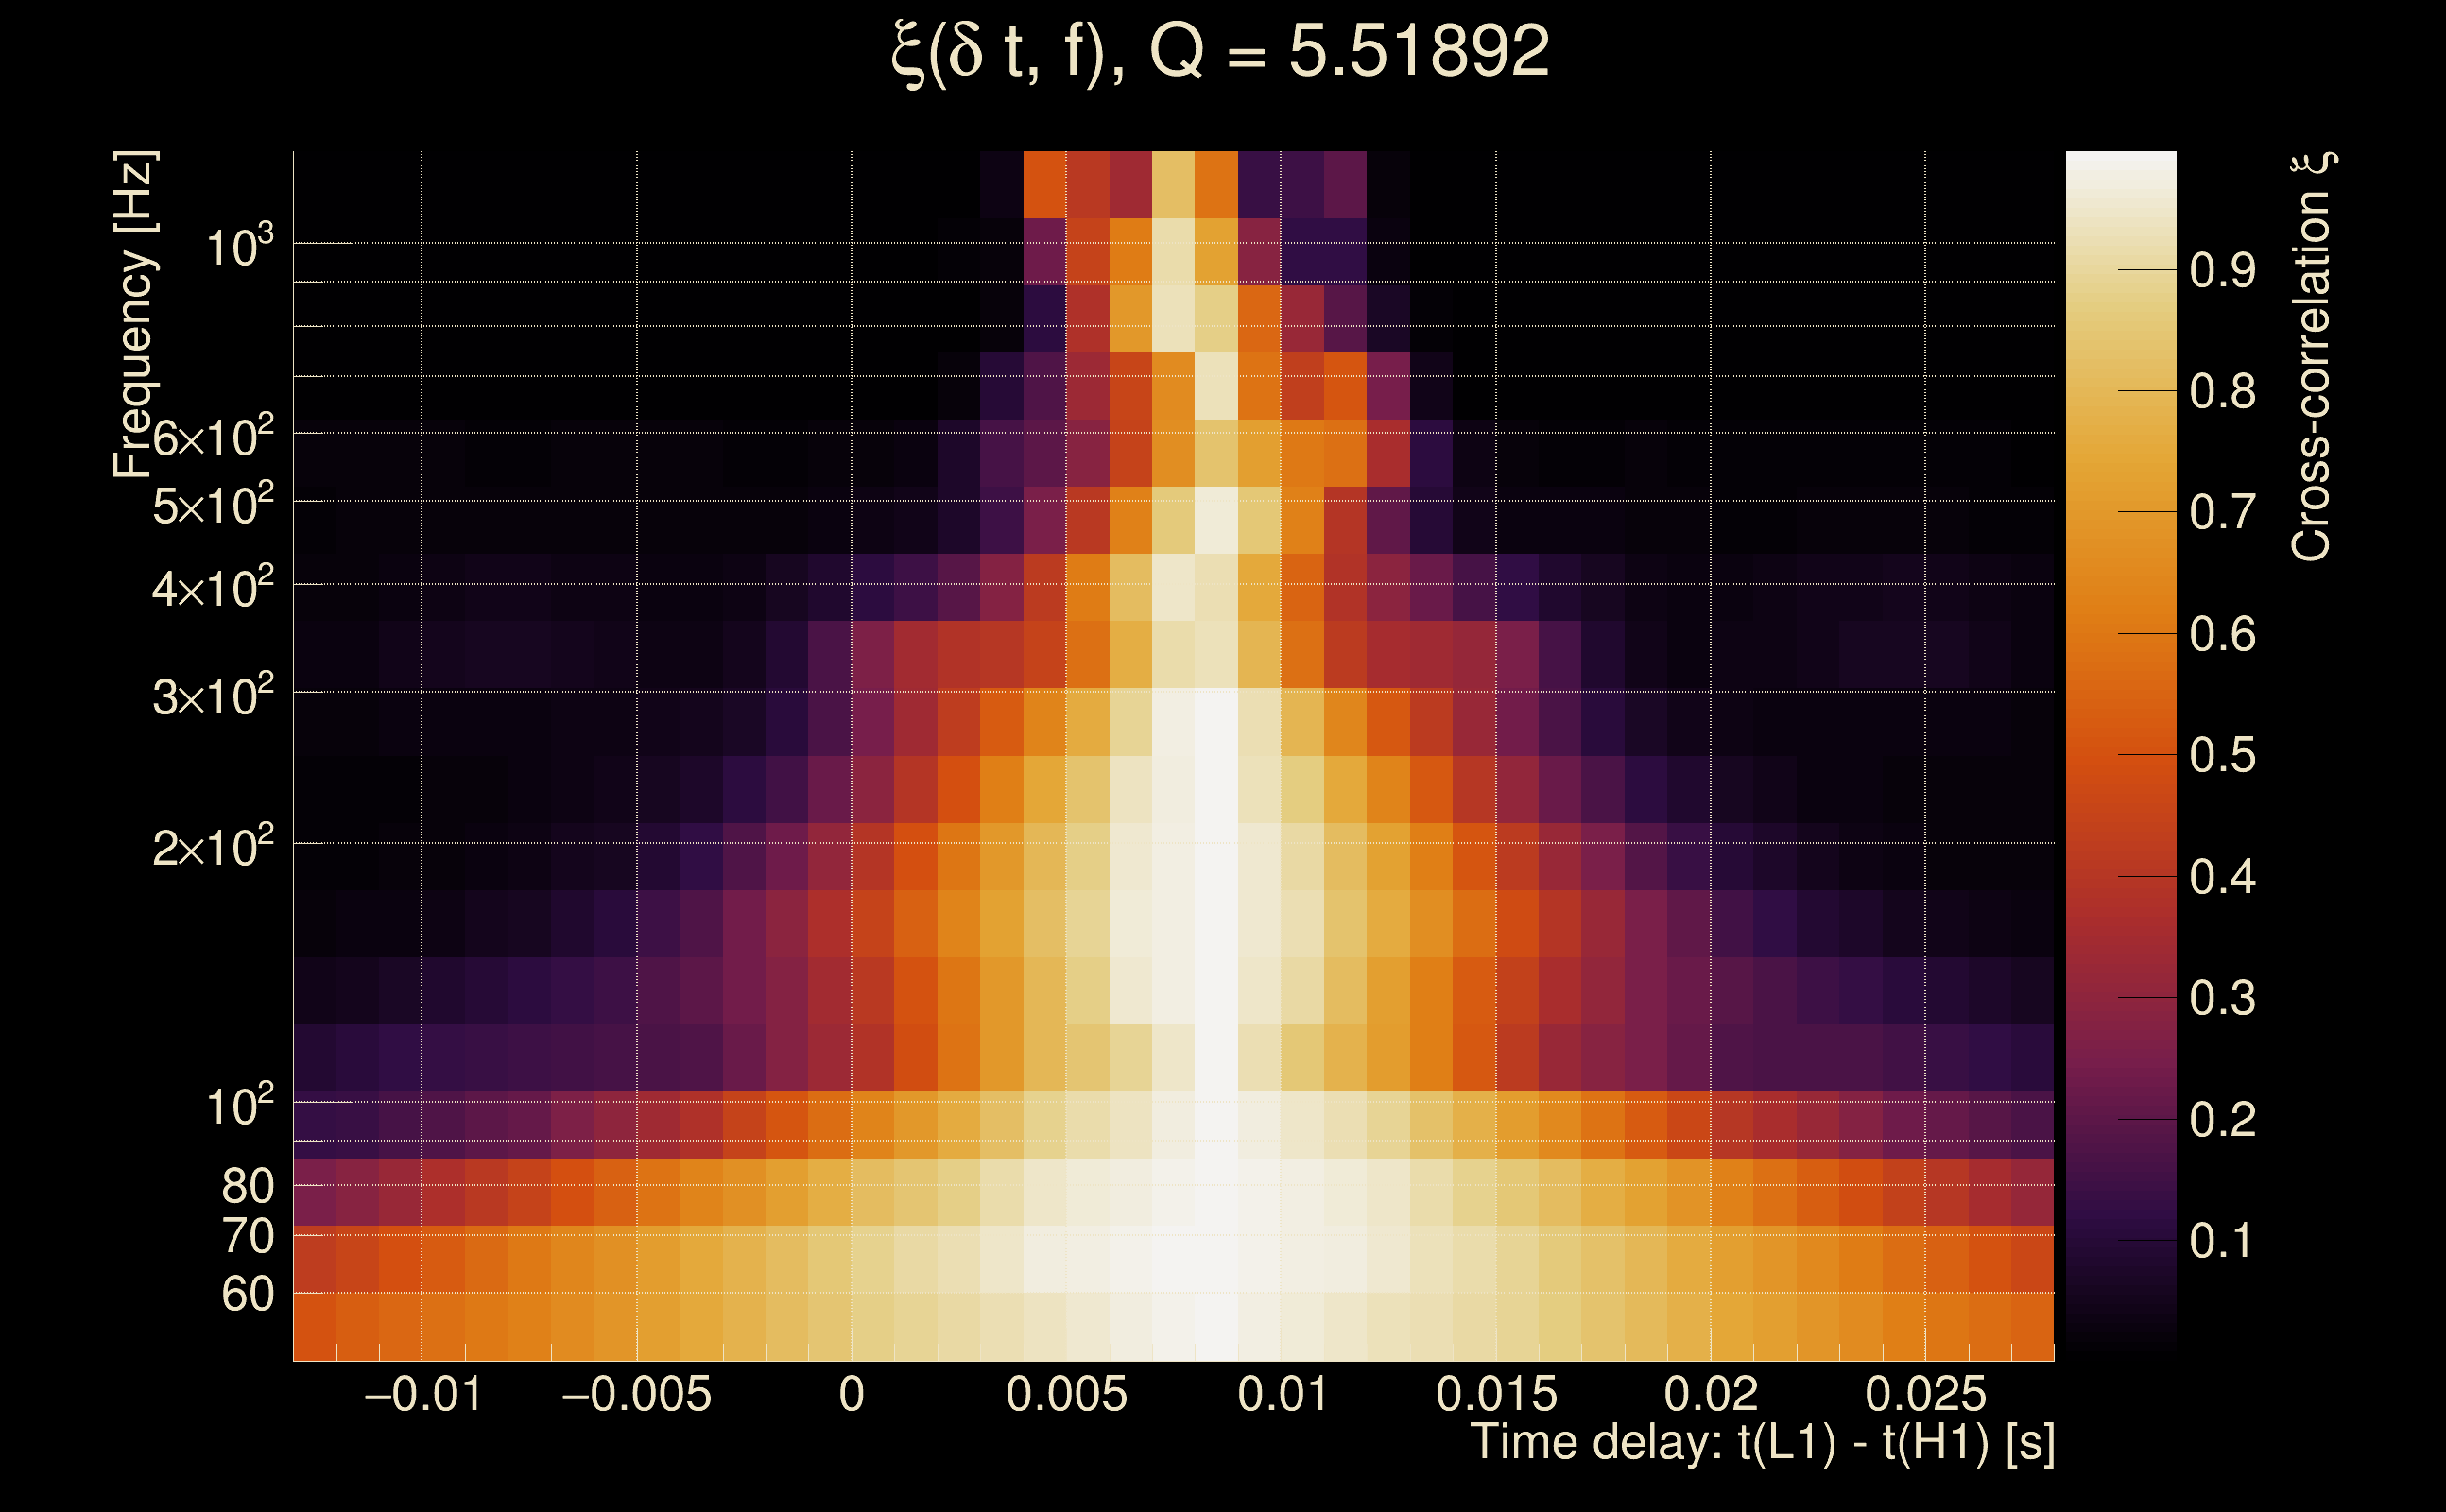
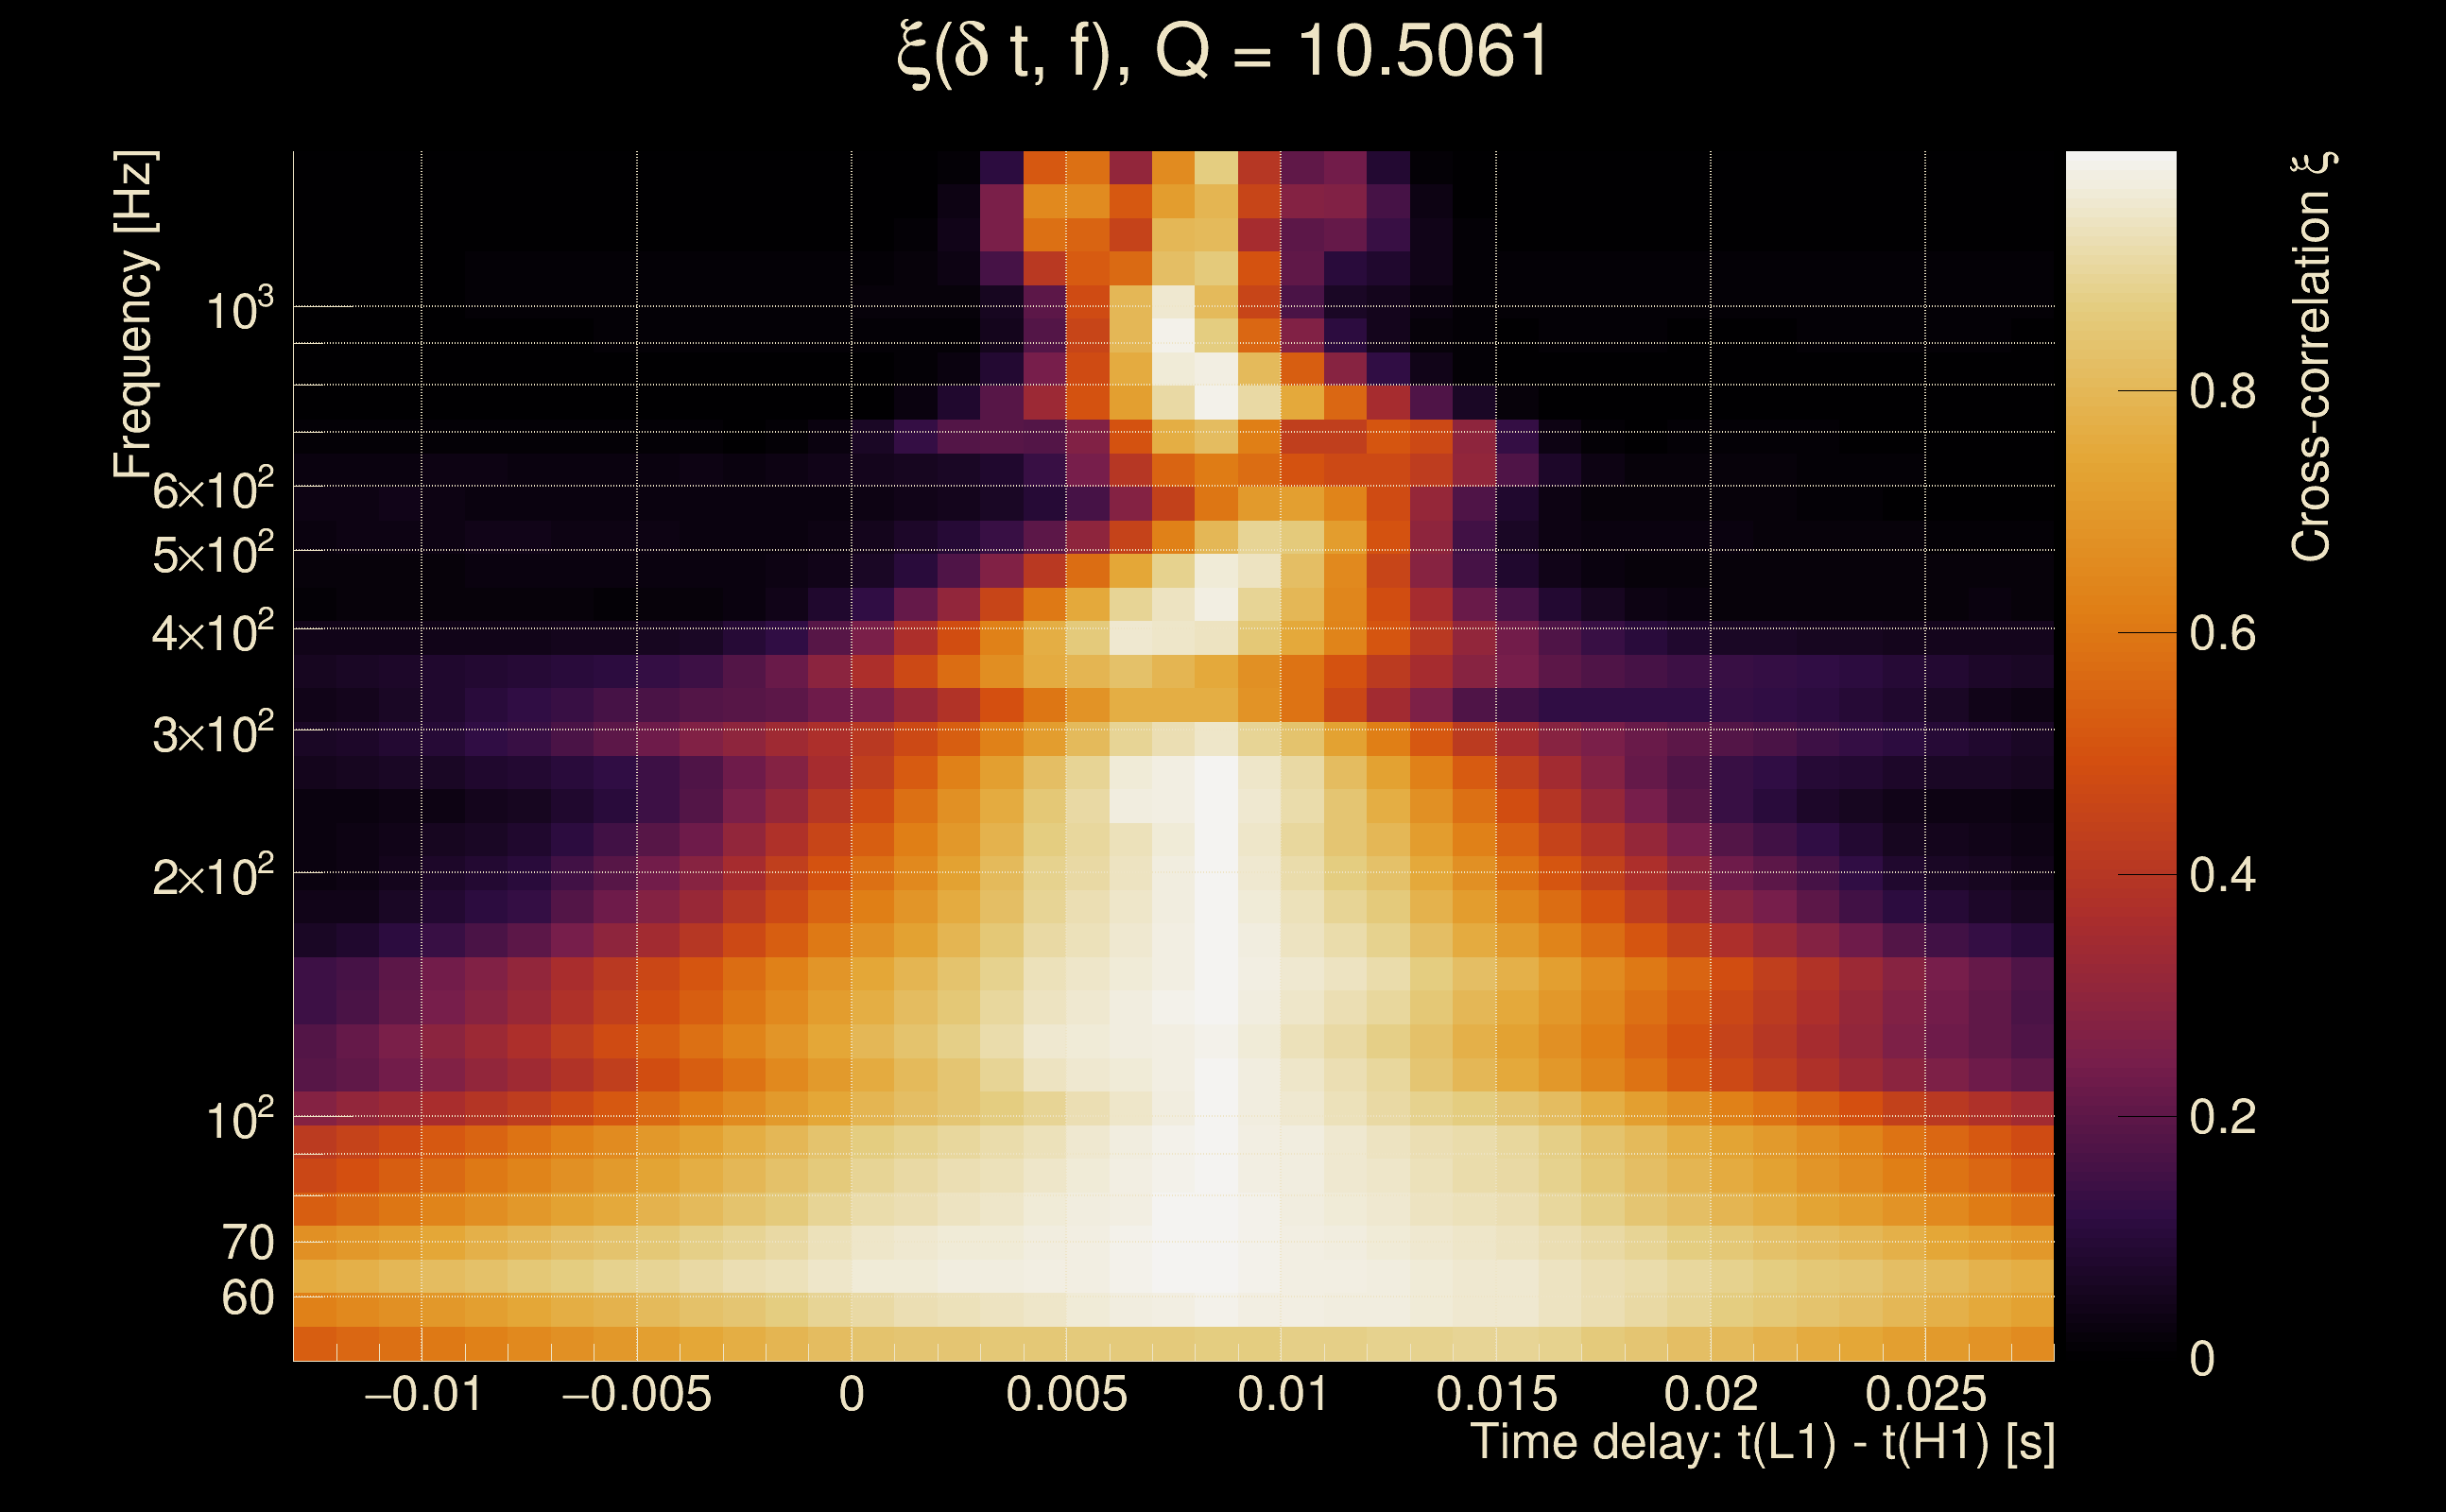
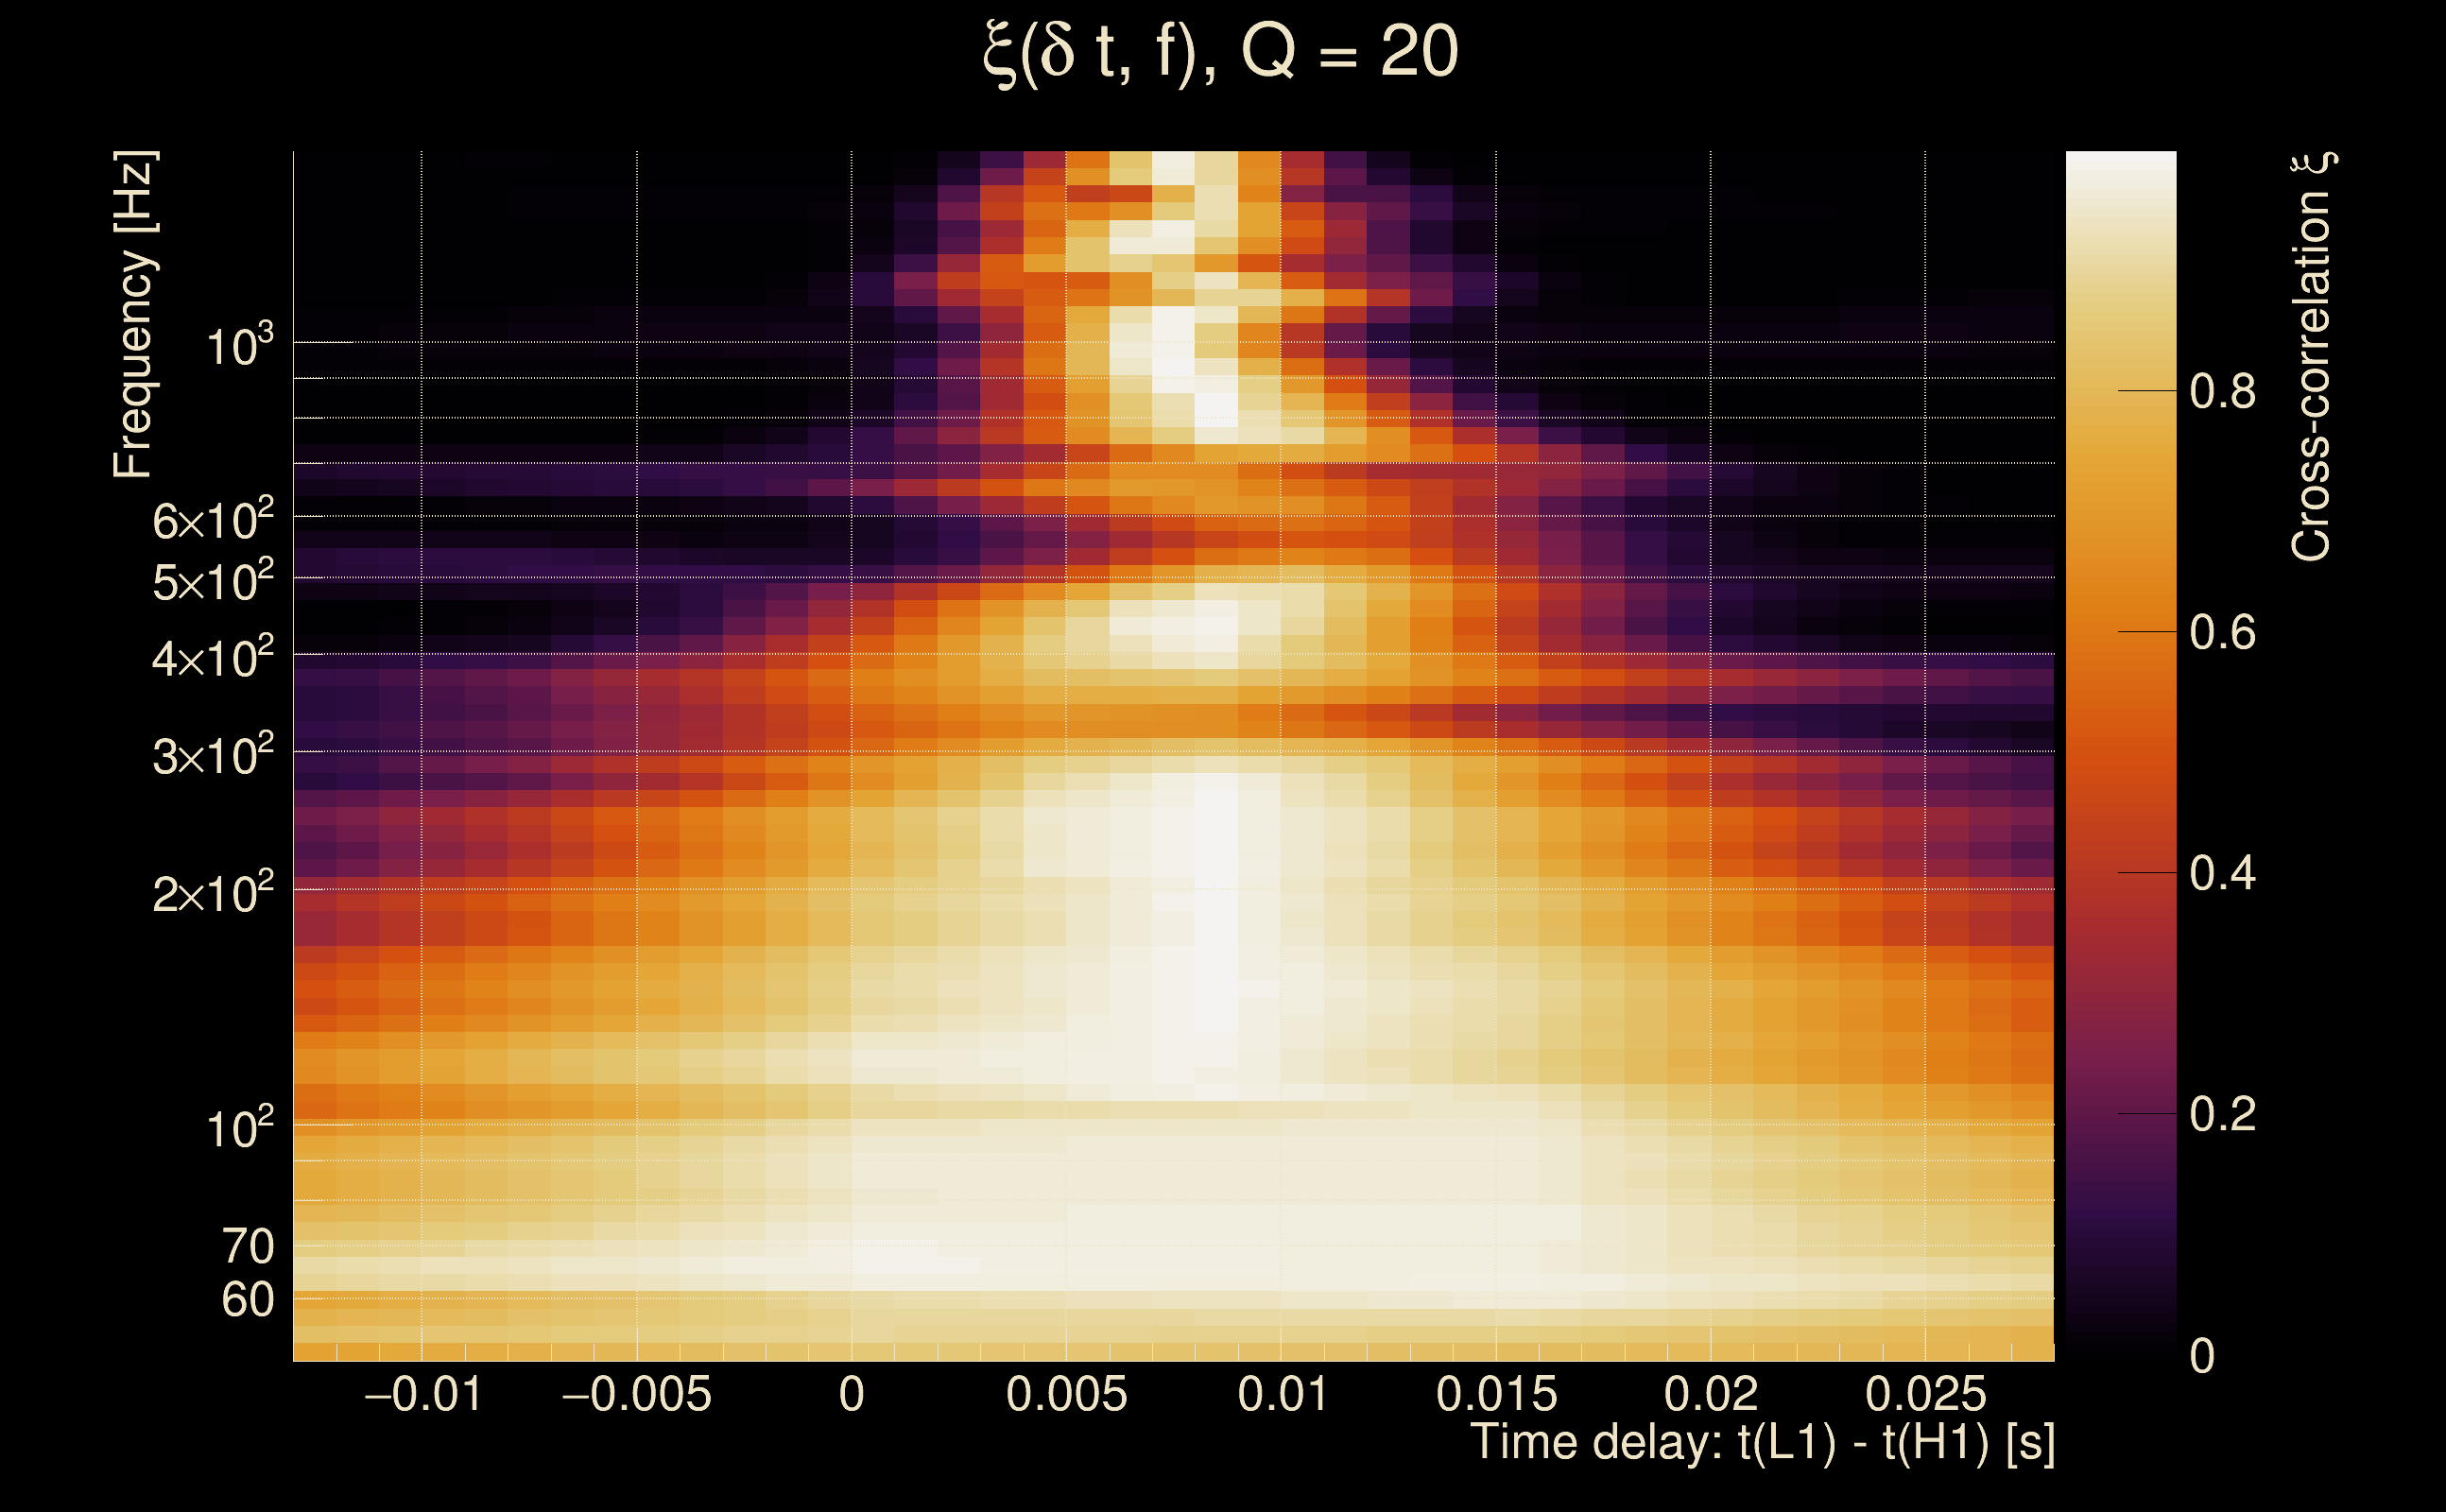
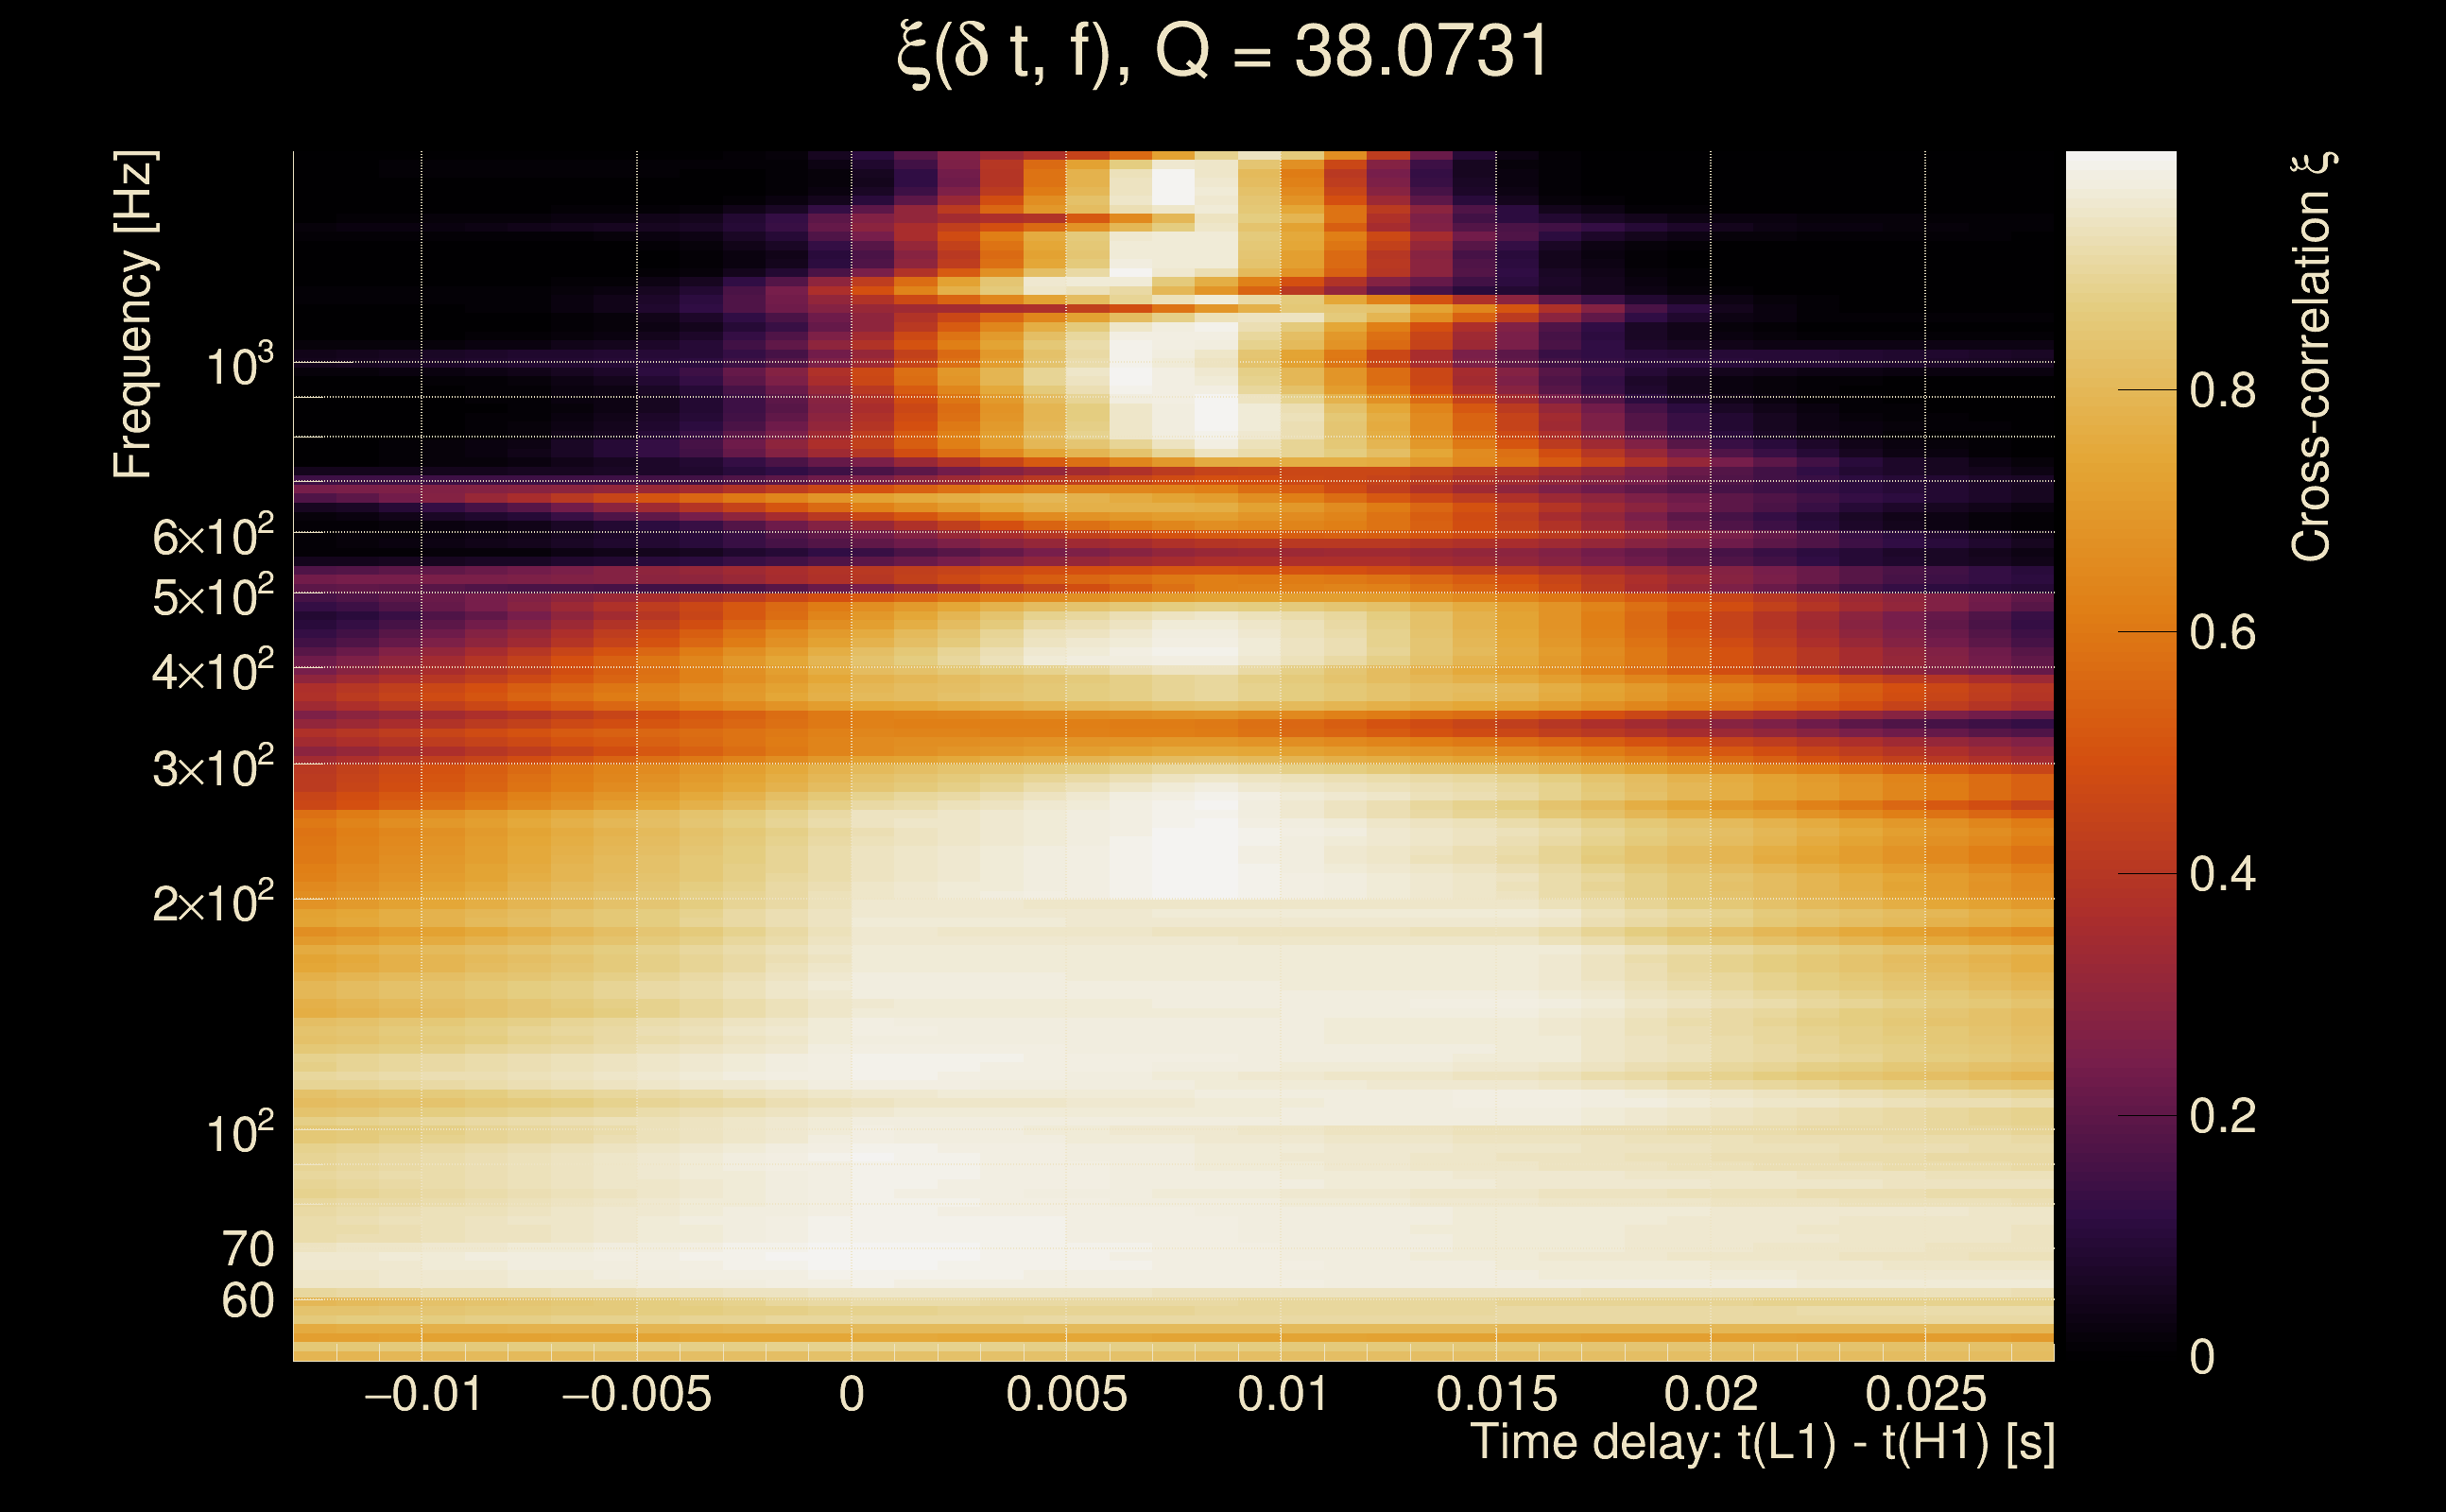
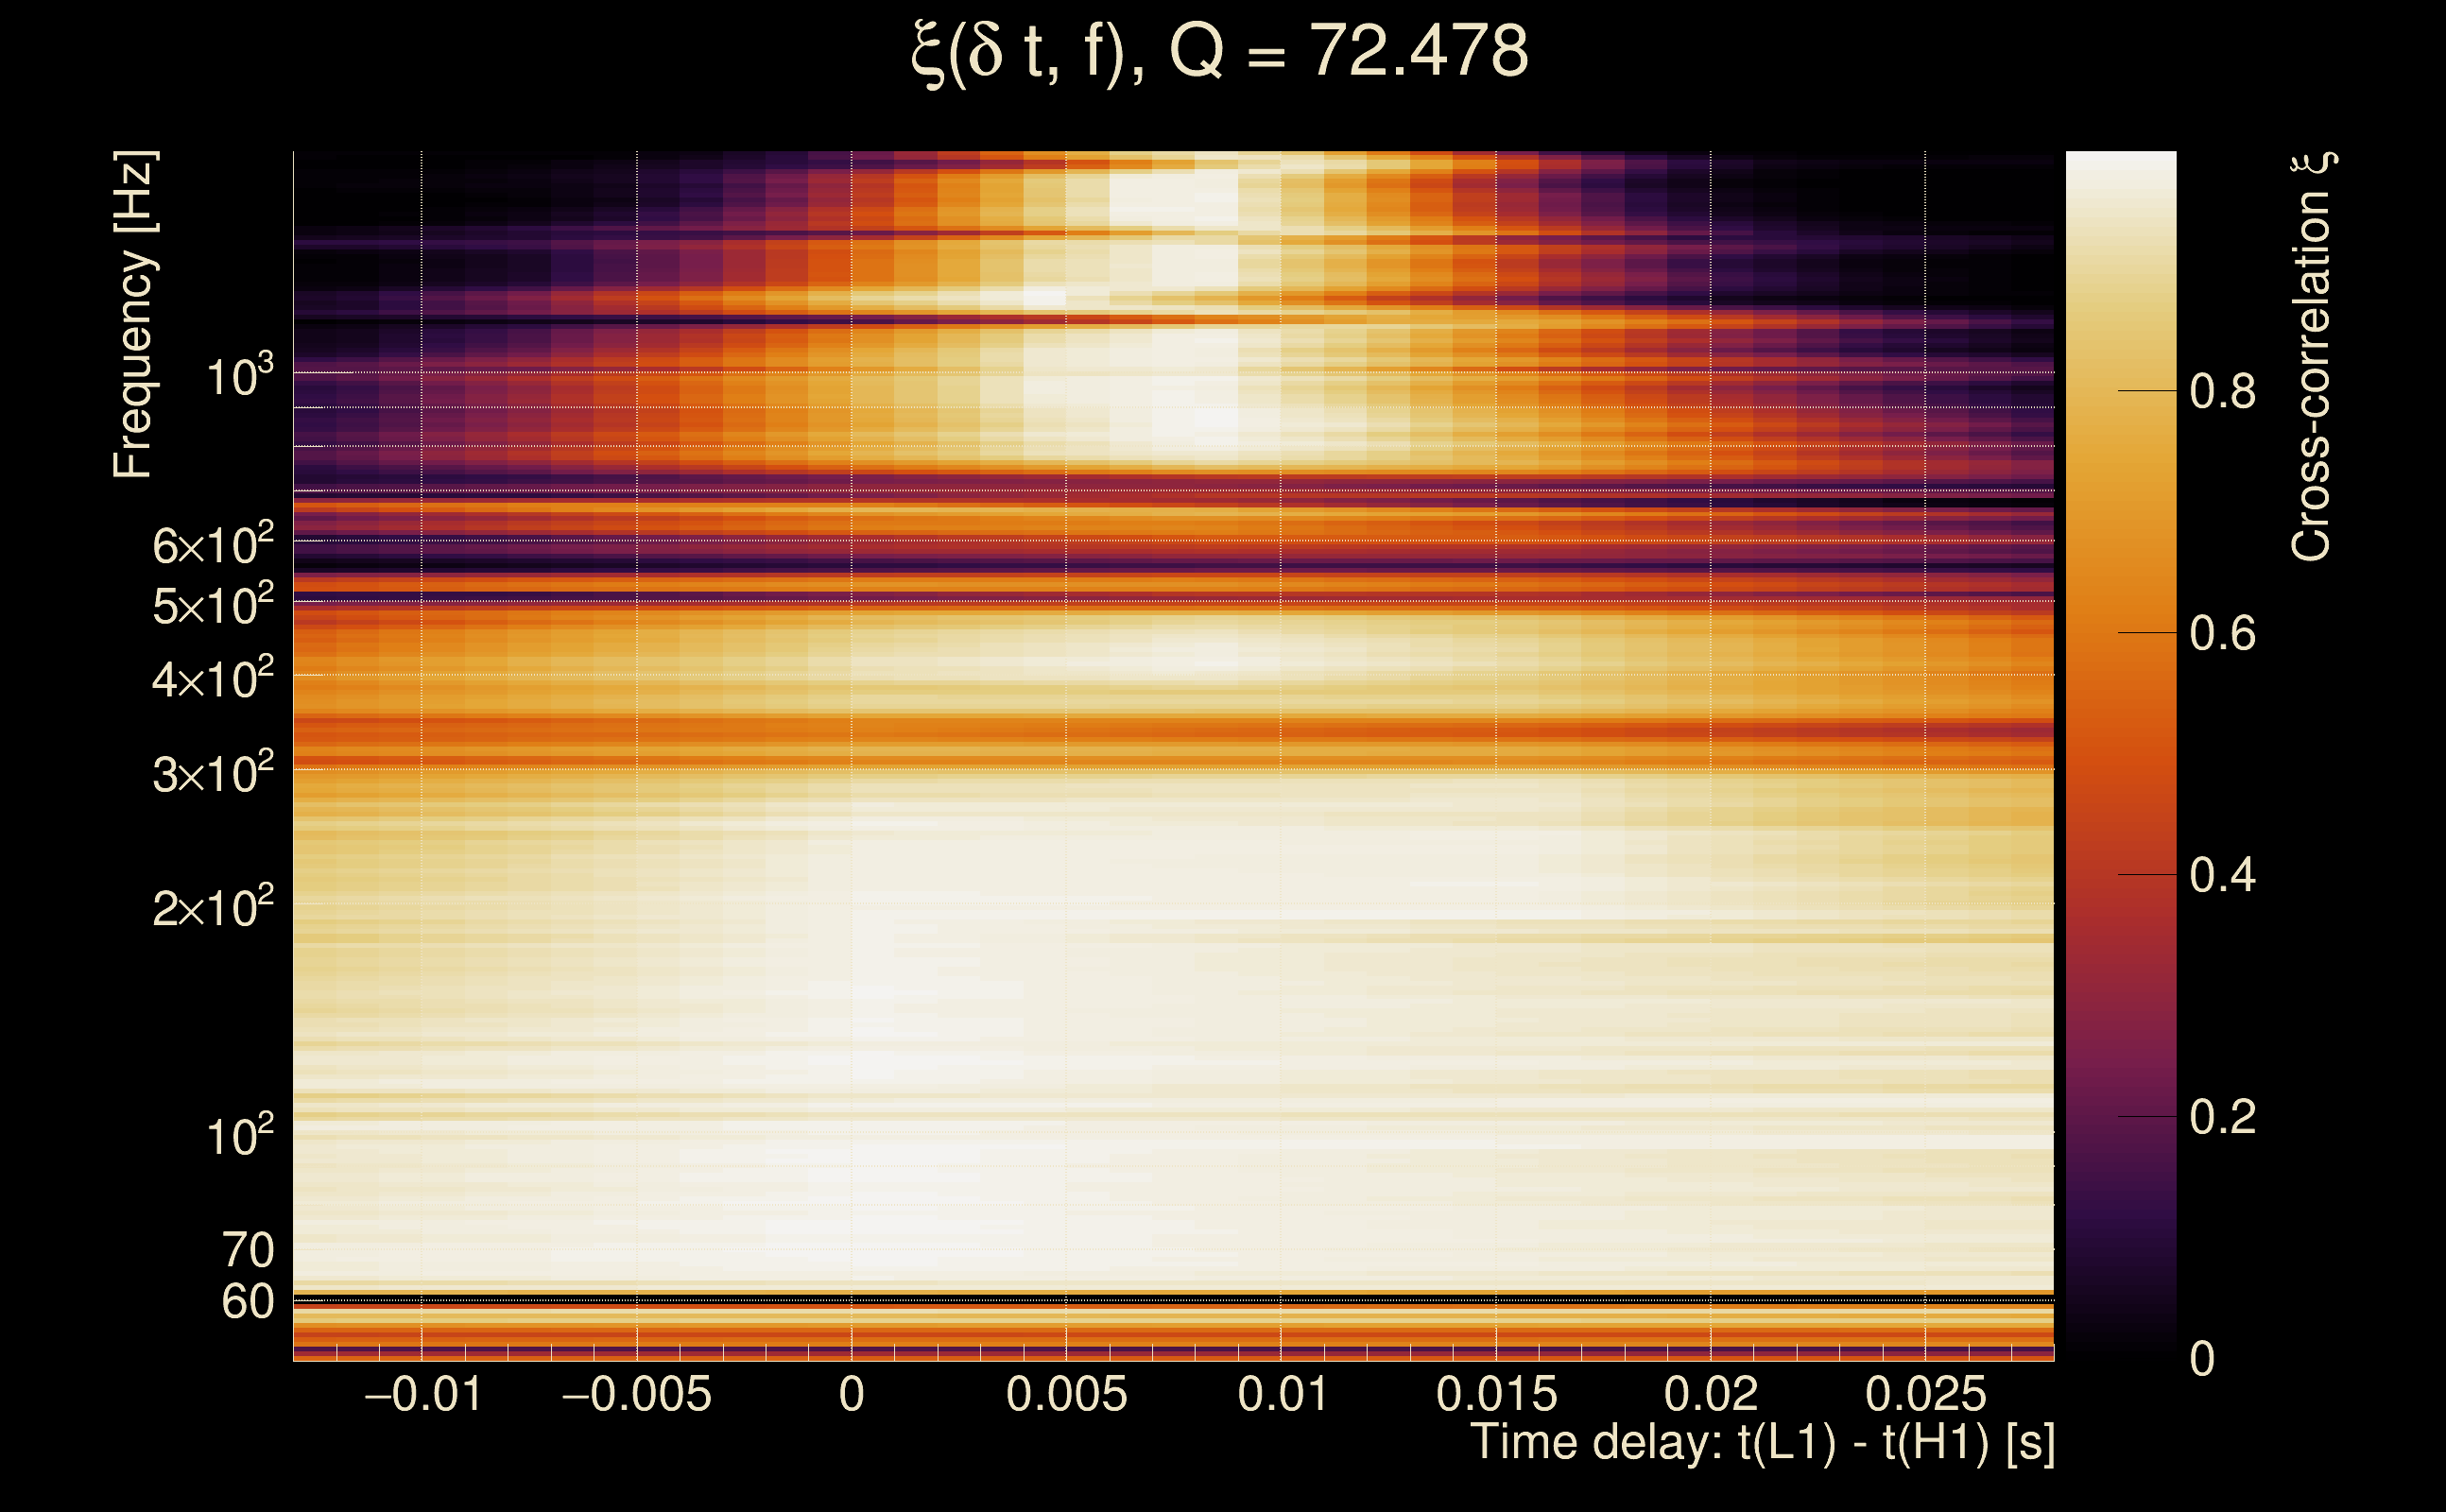
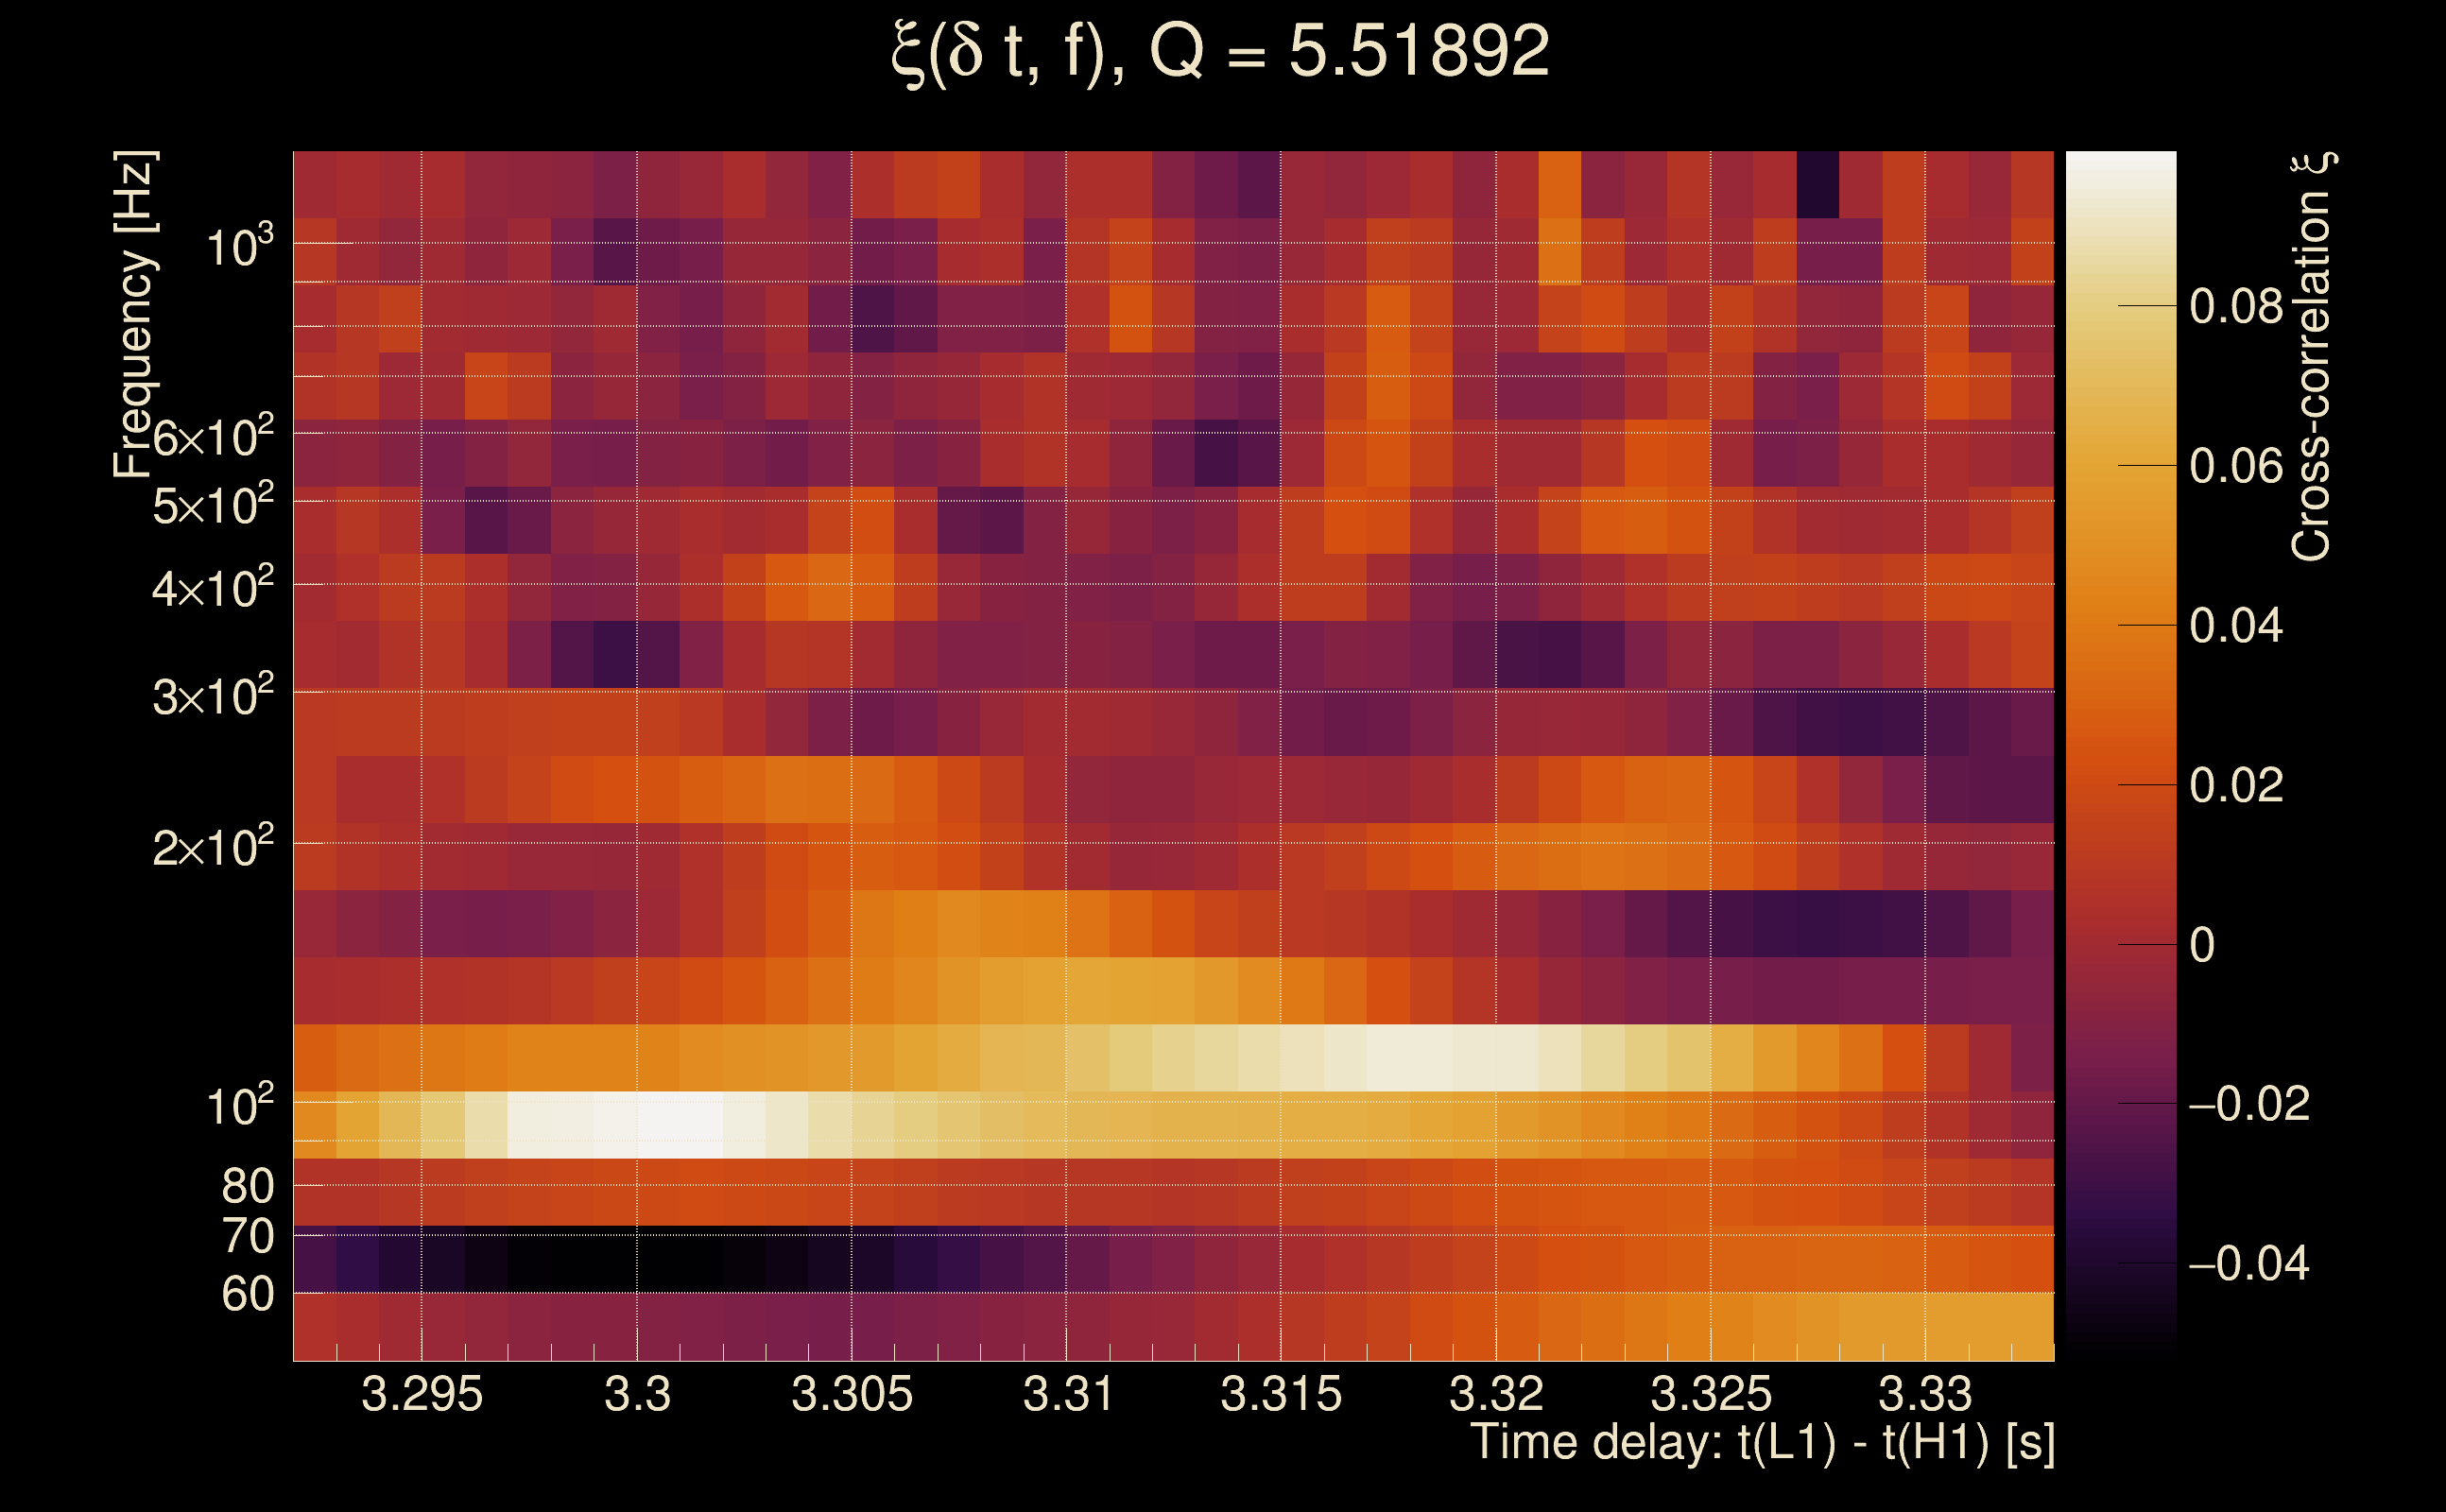
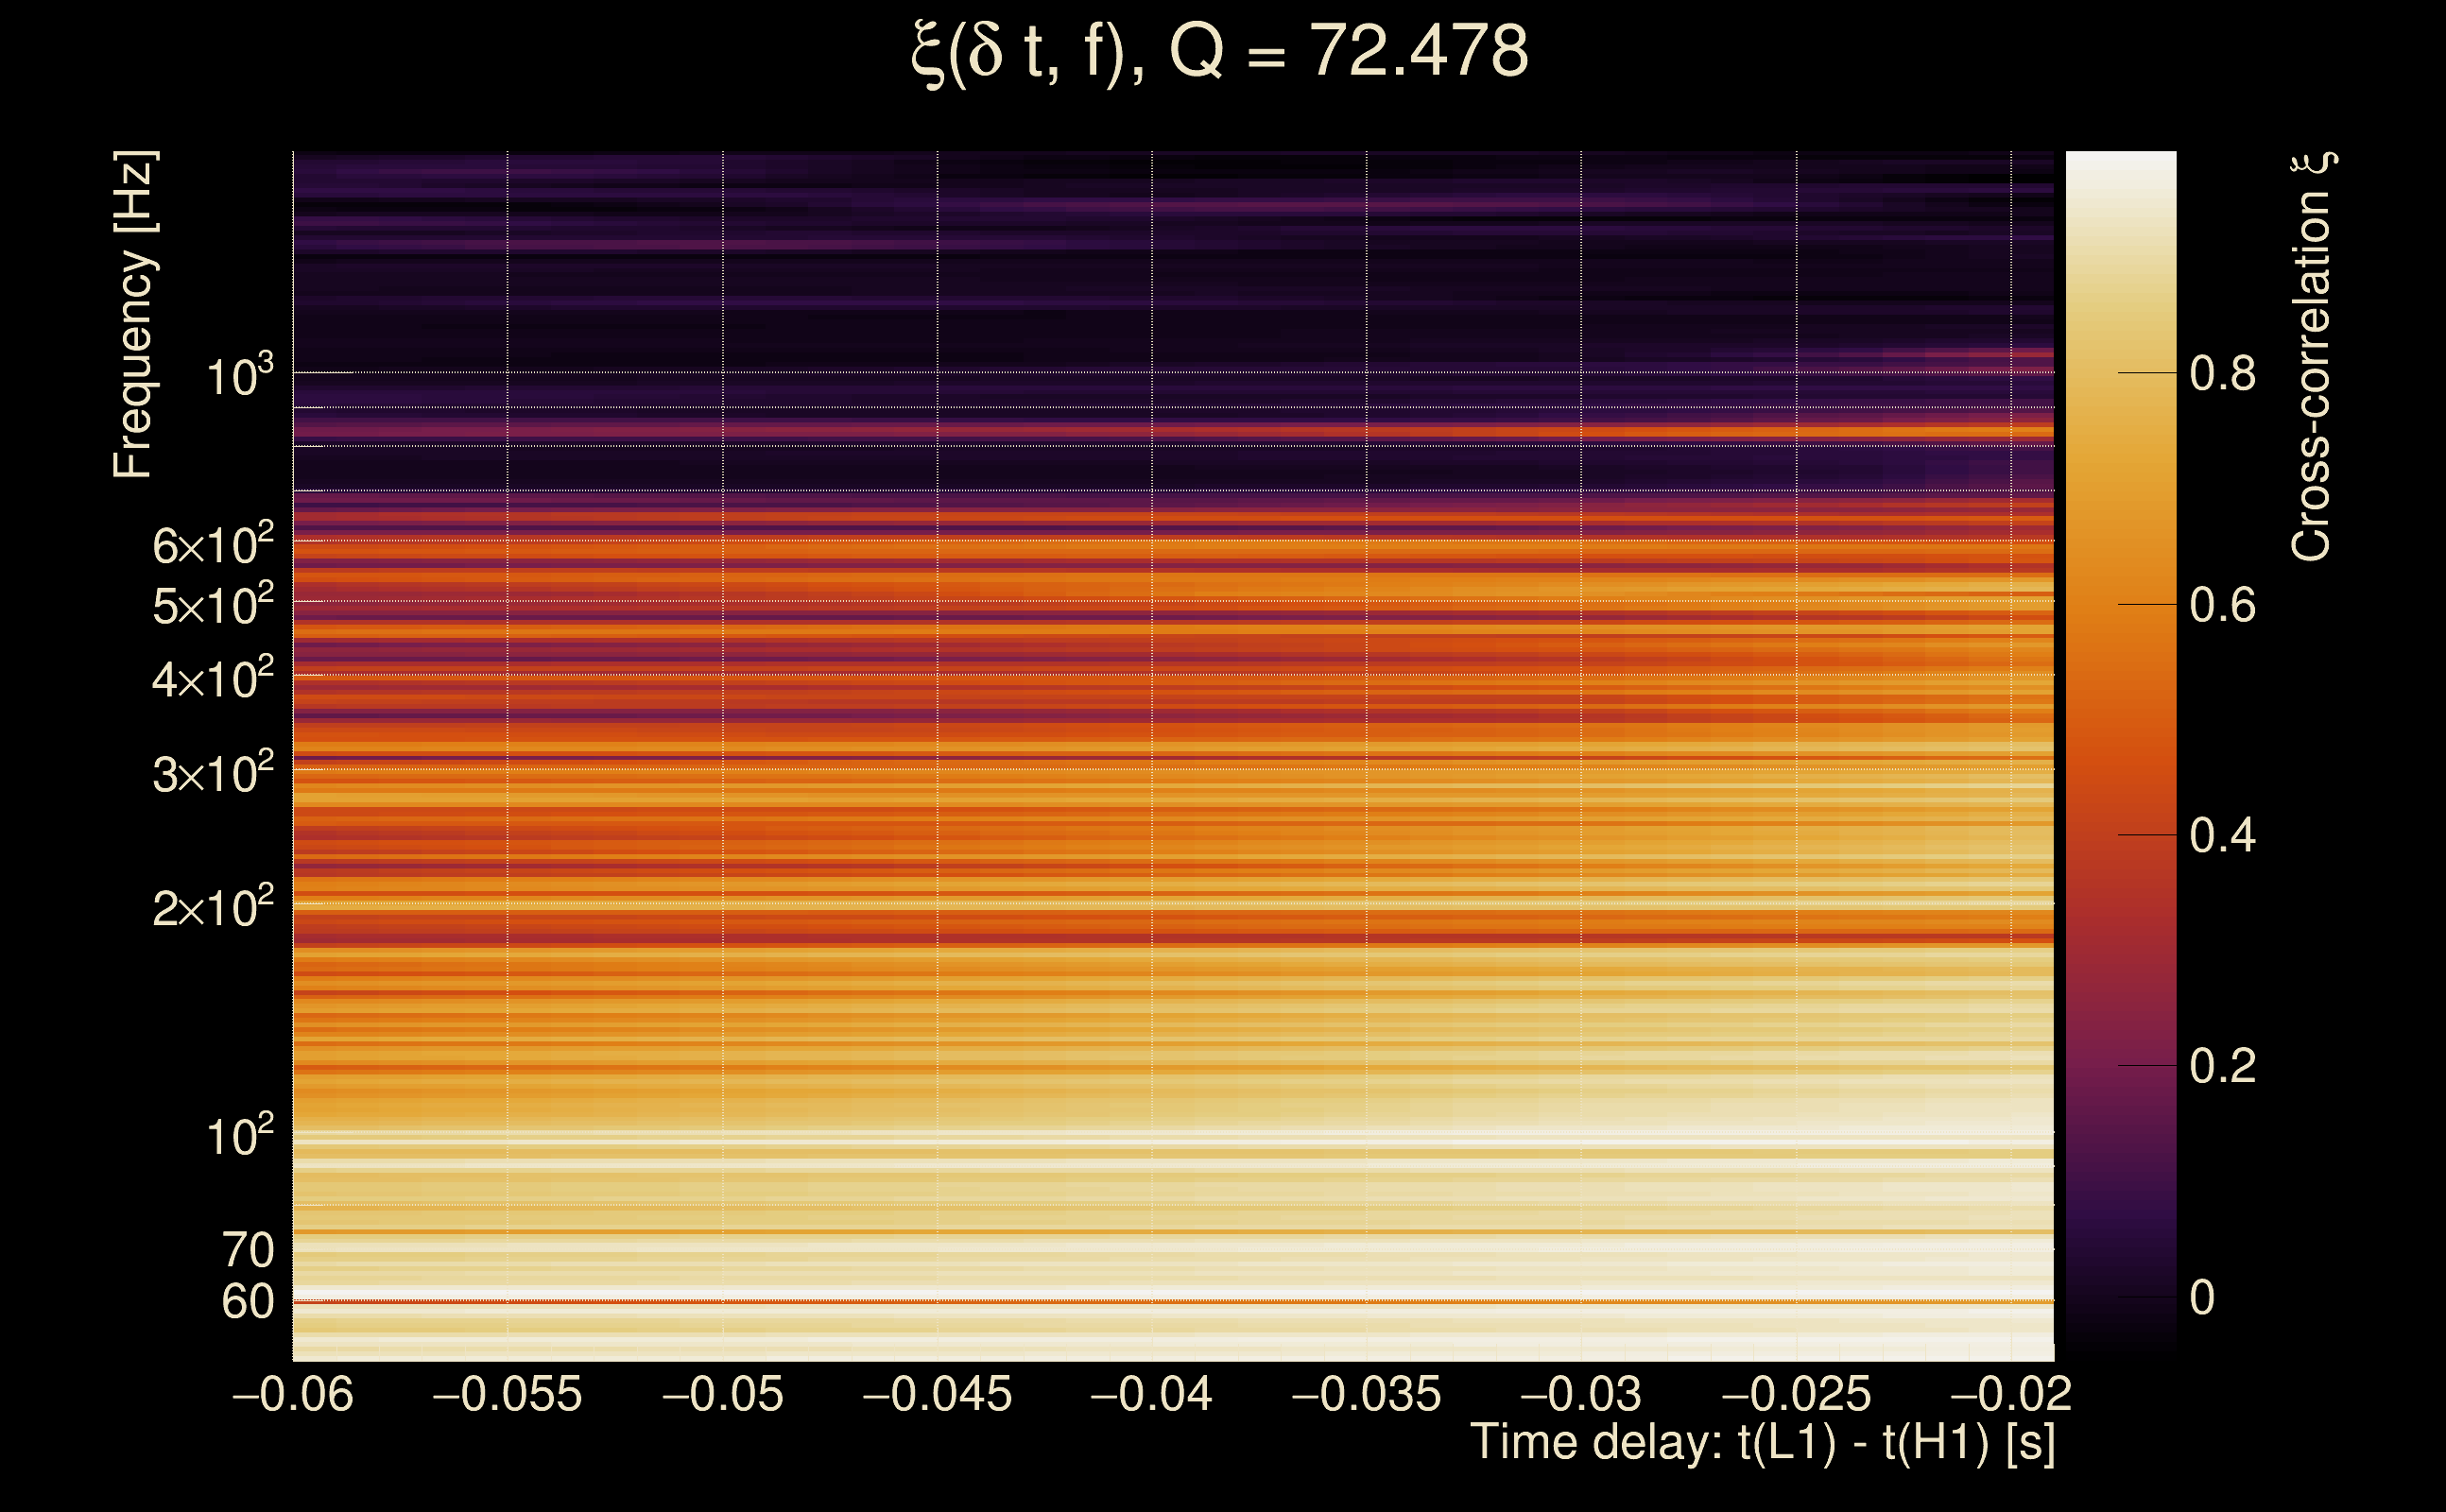
| Number of Q planes: | 5 (Q = 5.51892 → Q = 72.478) |
| Omicron frequency range: | 50 Hz → 1958.38 Hz |
| Light travel time between detectors: | 0.0100128 s |
| Slice extra-time (calibration uncertainty + slice veto): | 0.0129872 s |
| Number of time-delay bins in a cross-correlation map: | 10000 |
| Number of slices in a cross-correlation map: | 217 |
| Number of time-delay bins in a slice: | 46 |
| SNR gating: | < 1000 (detector 0), < 1000 (detector 1) |
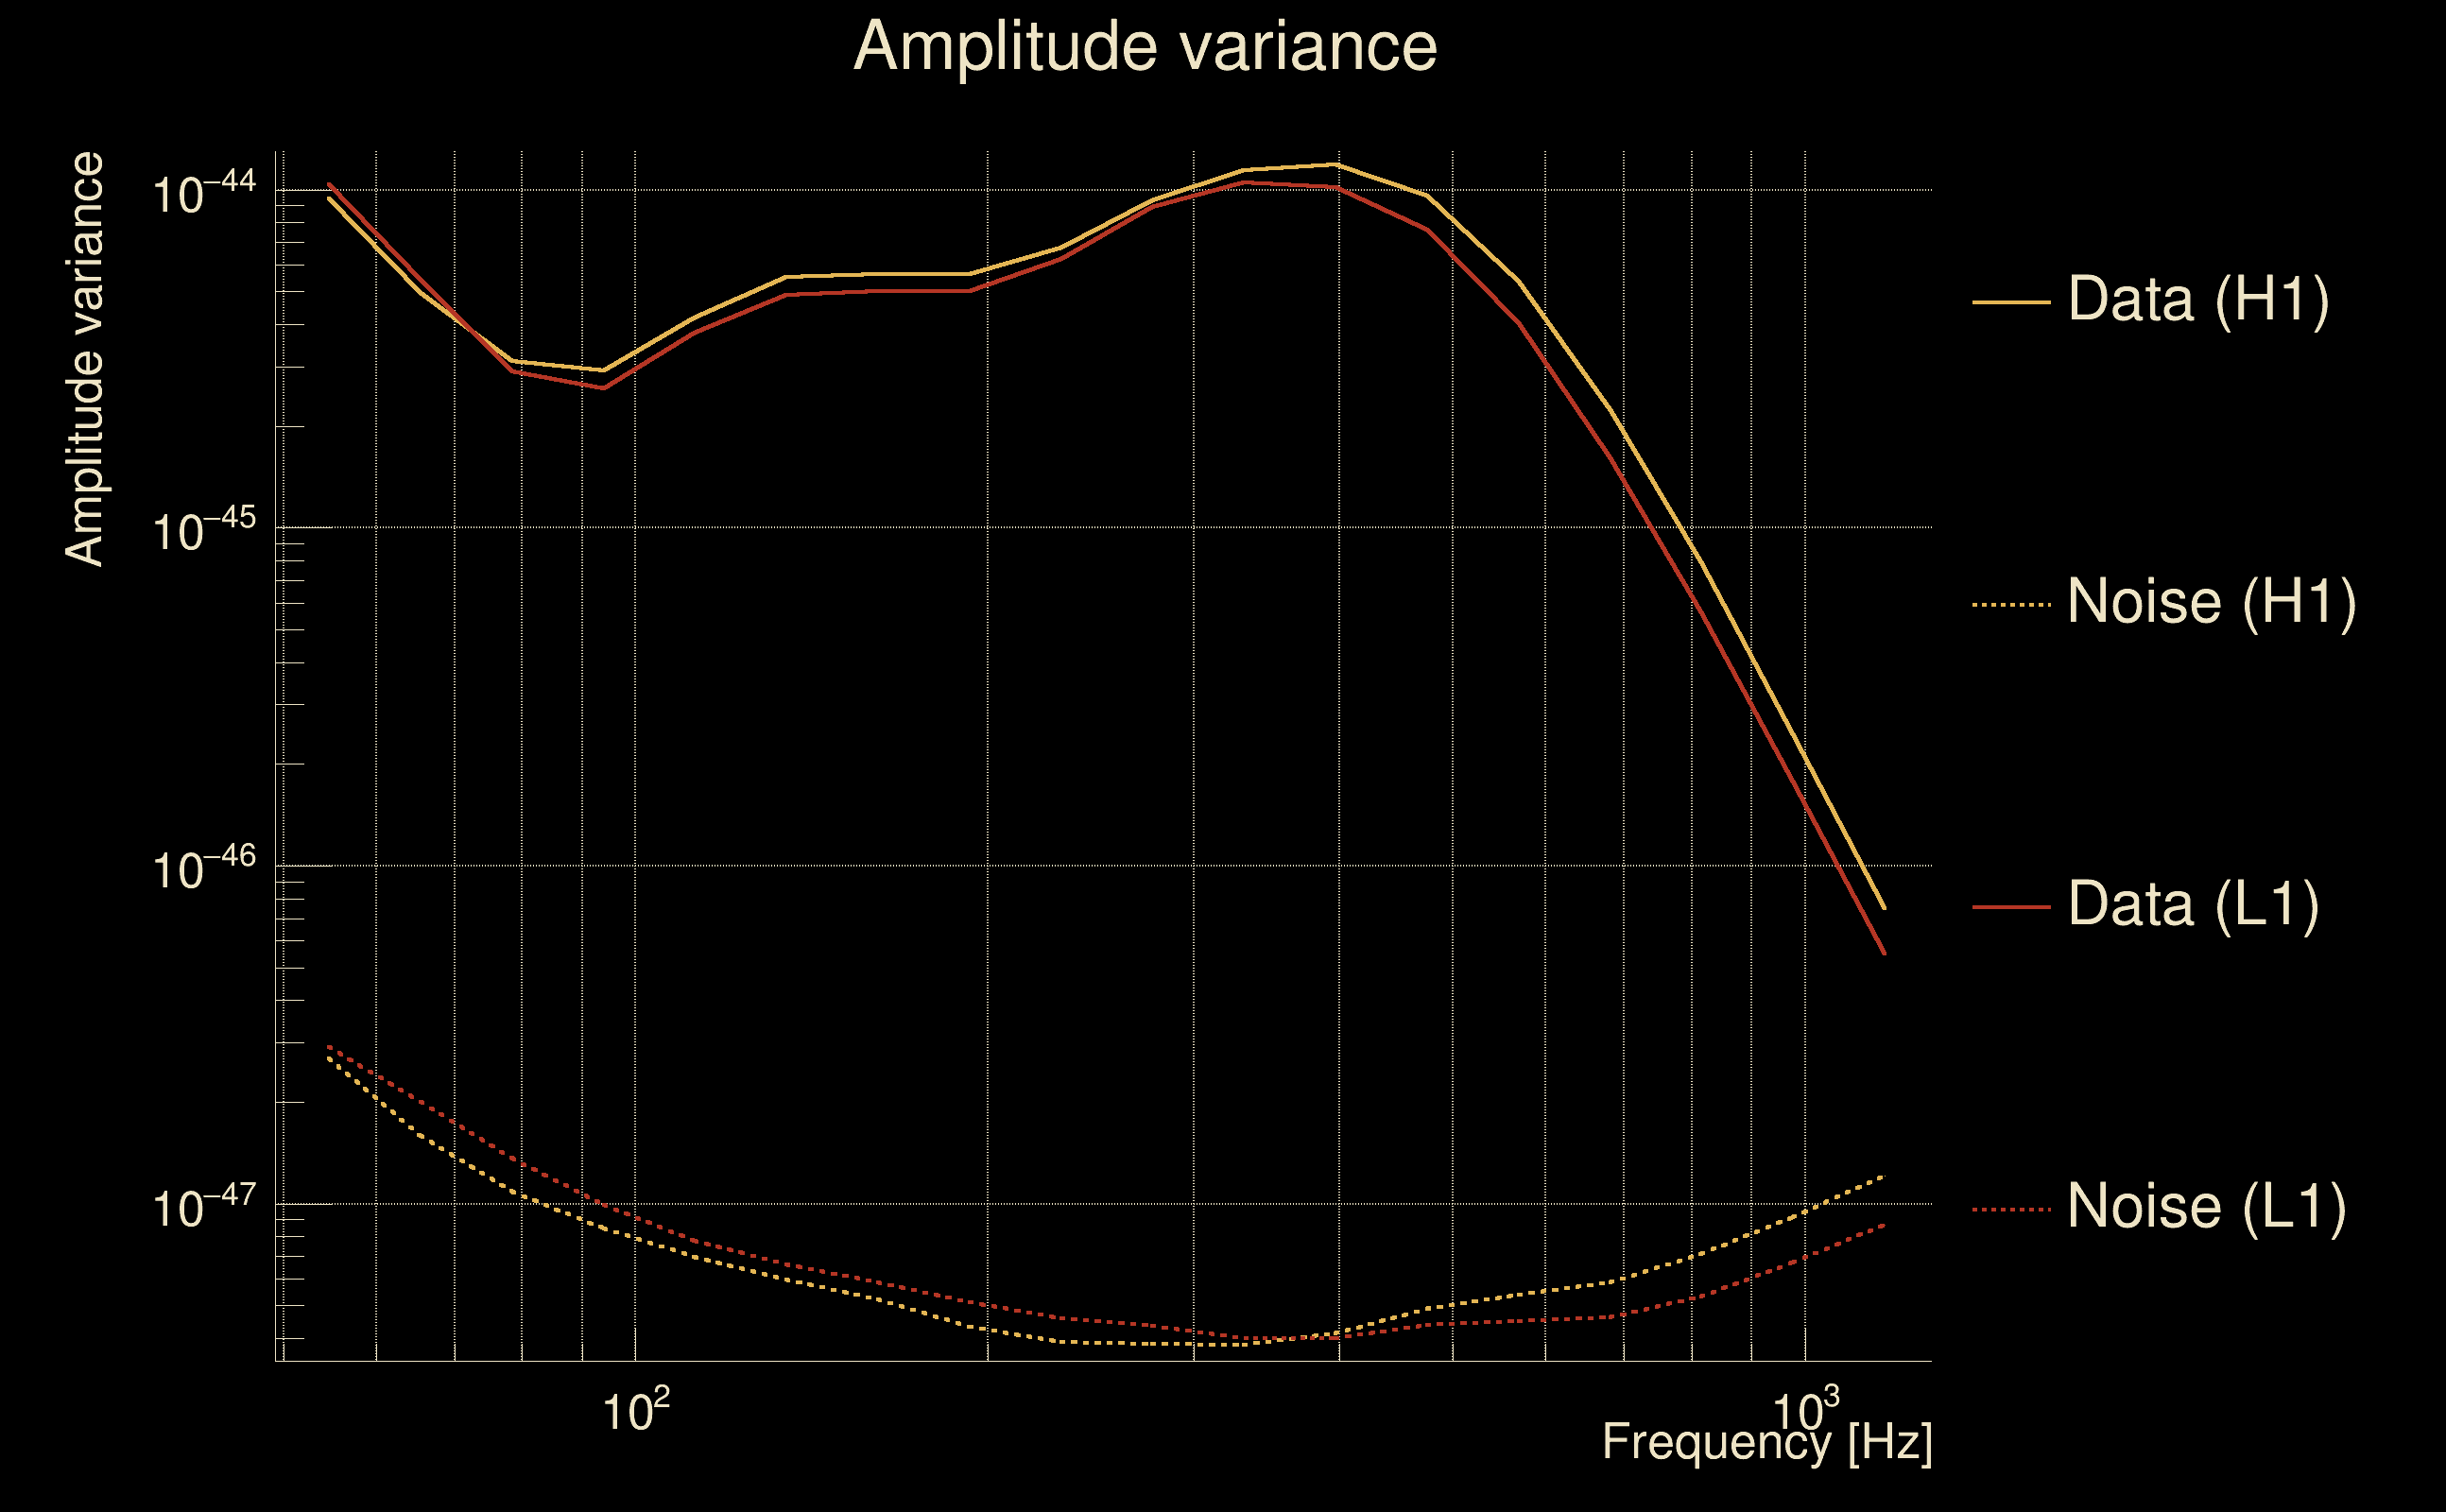
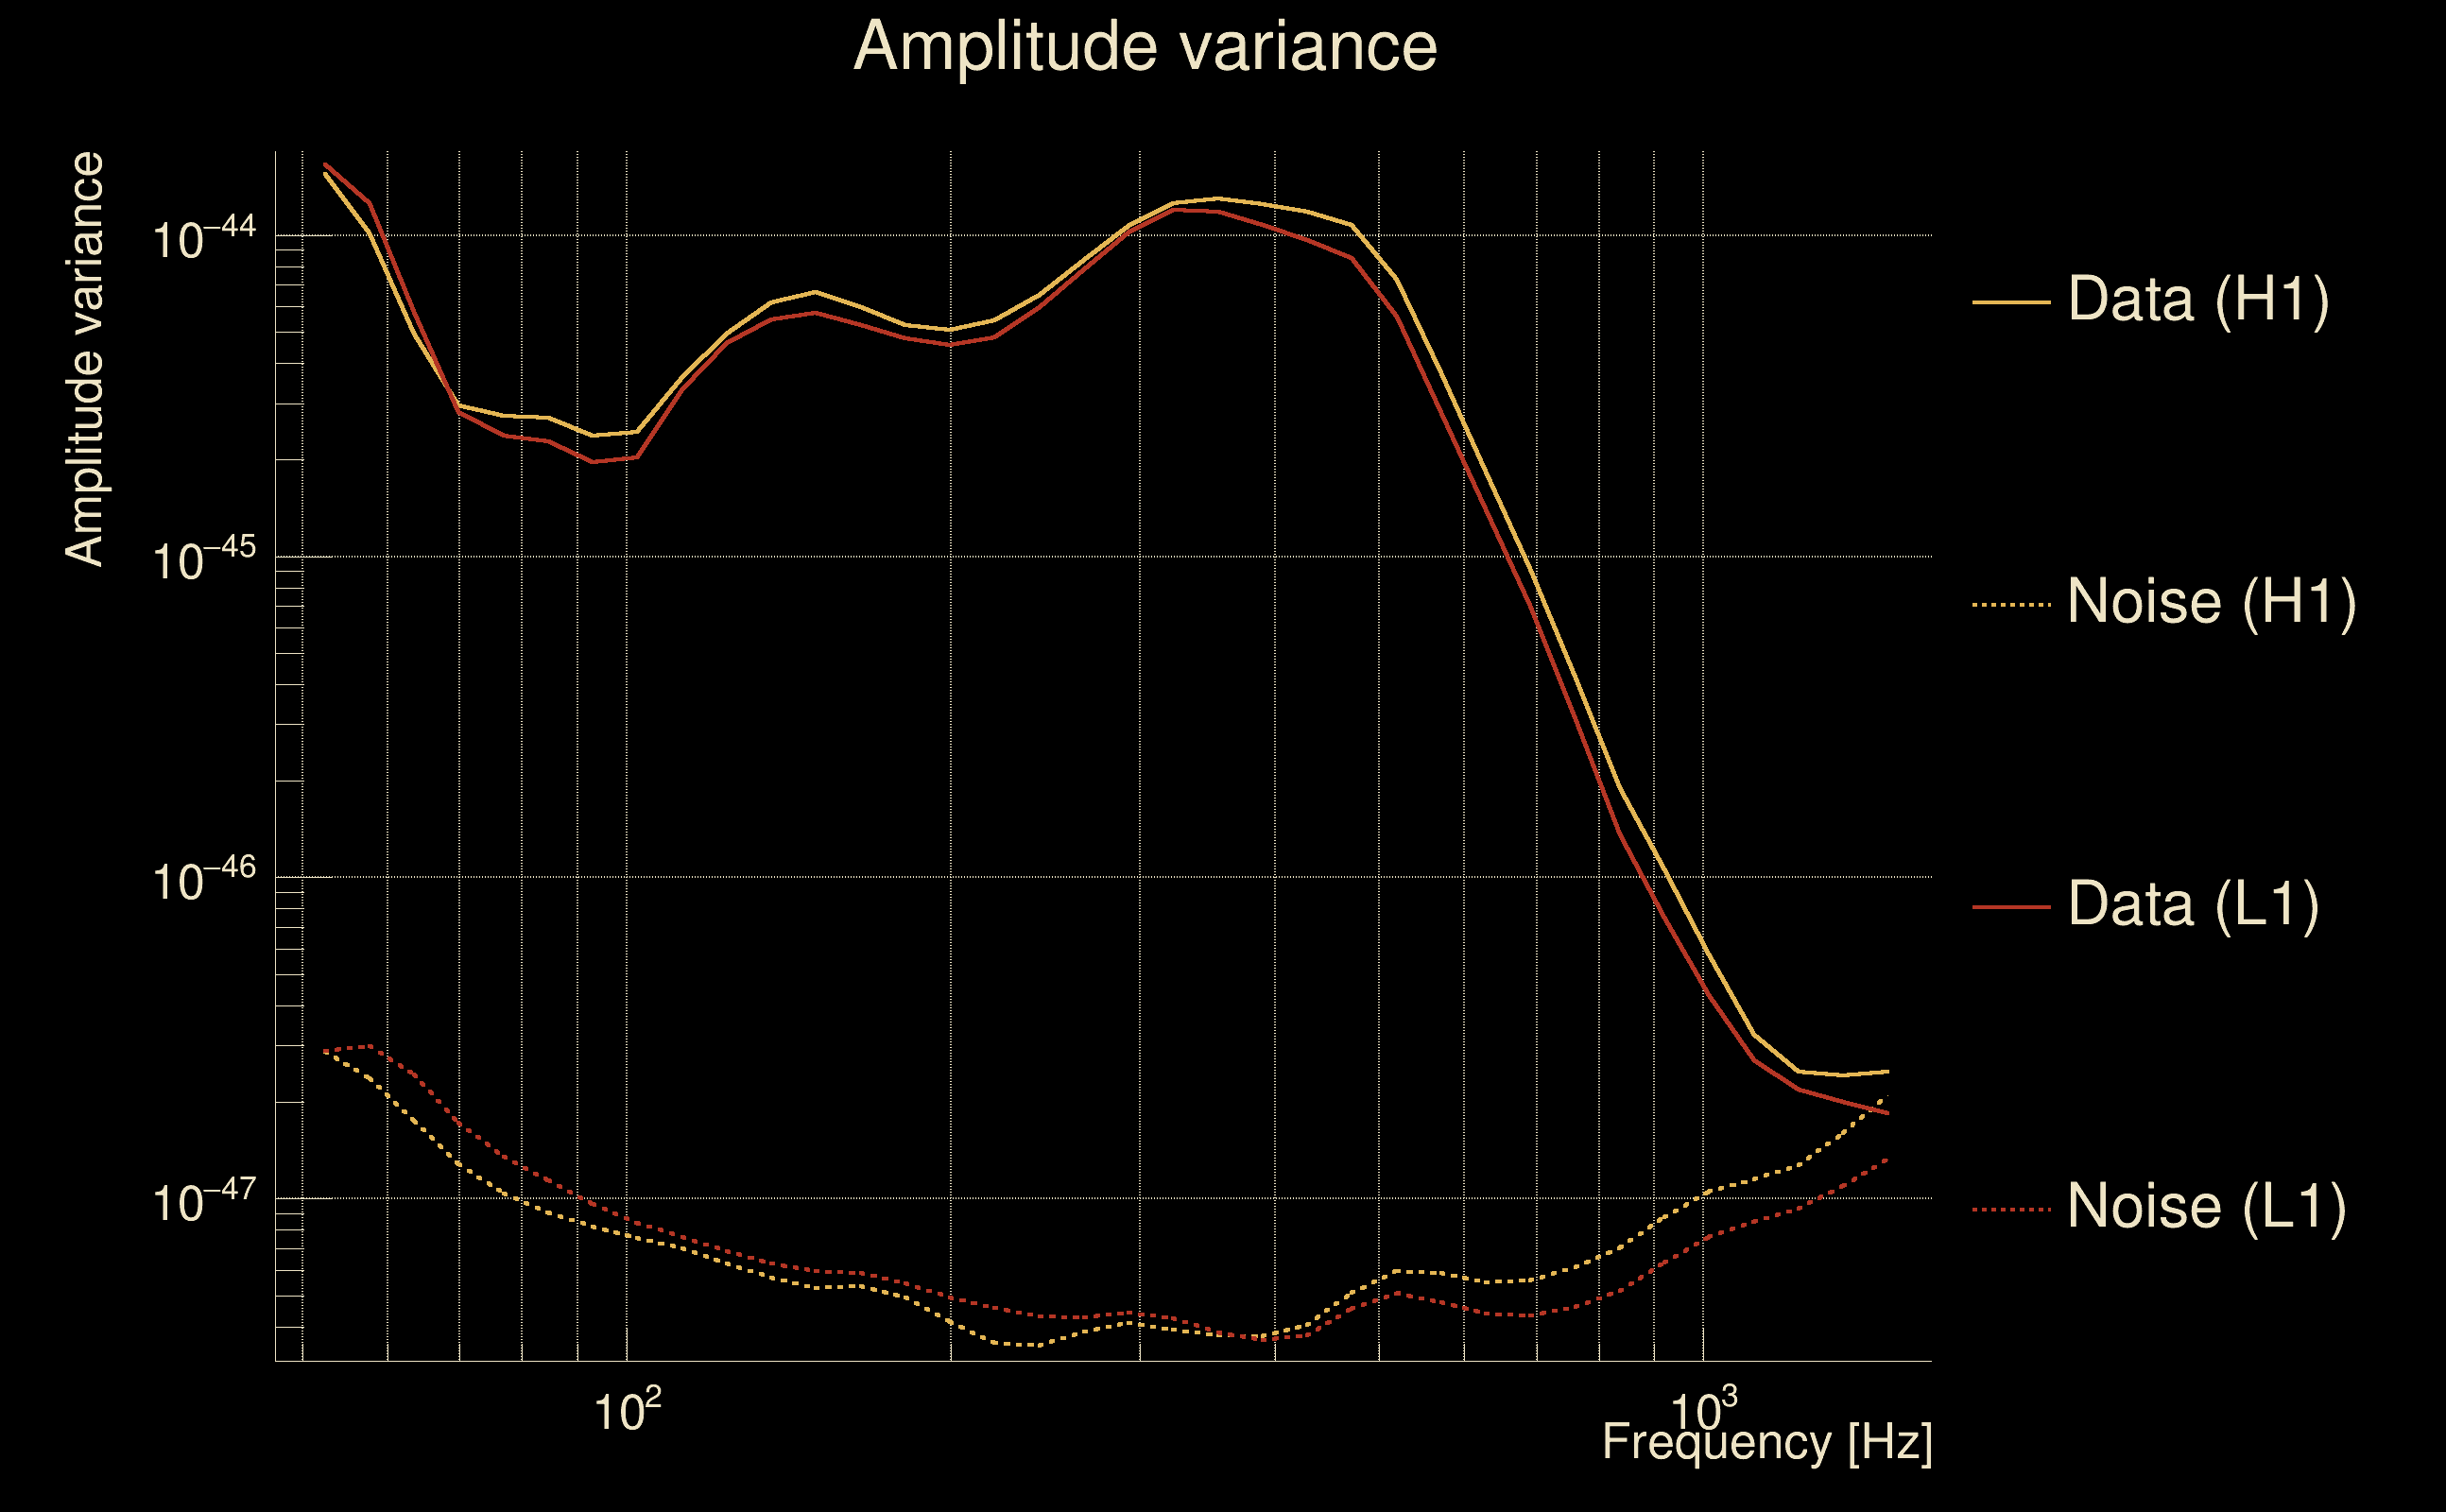
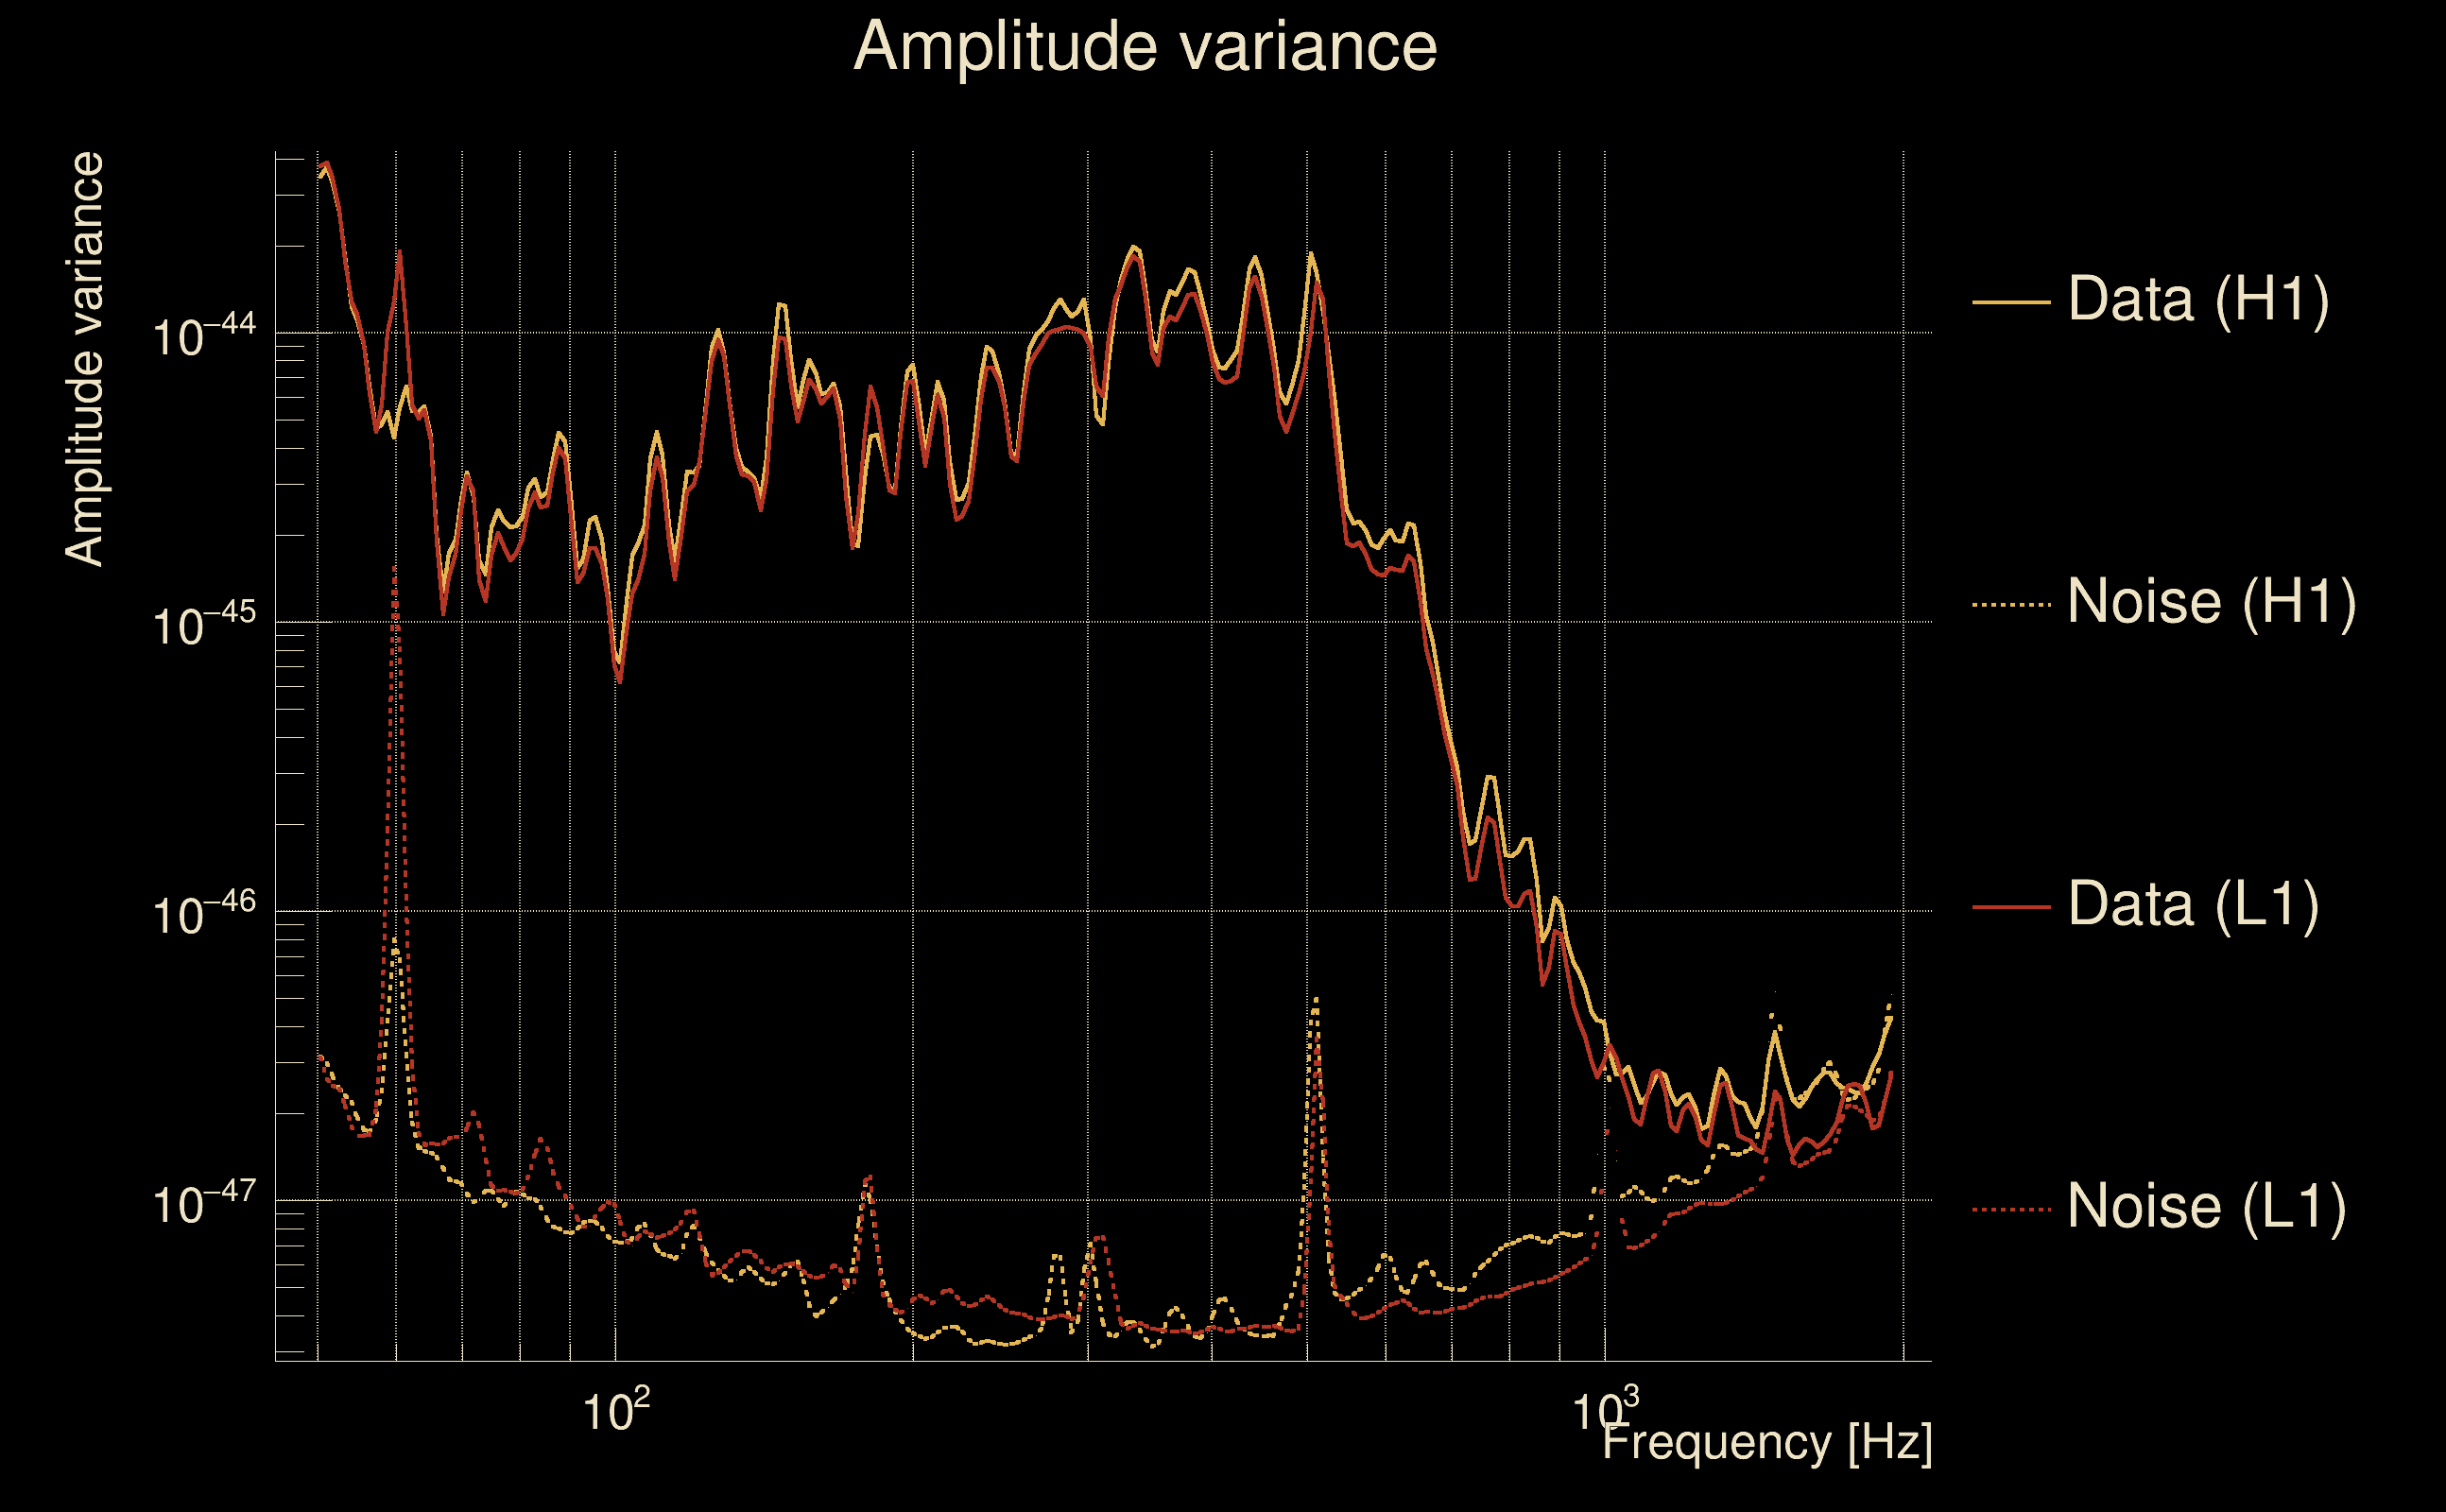
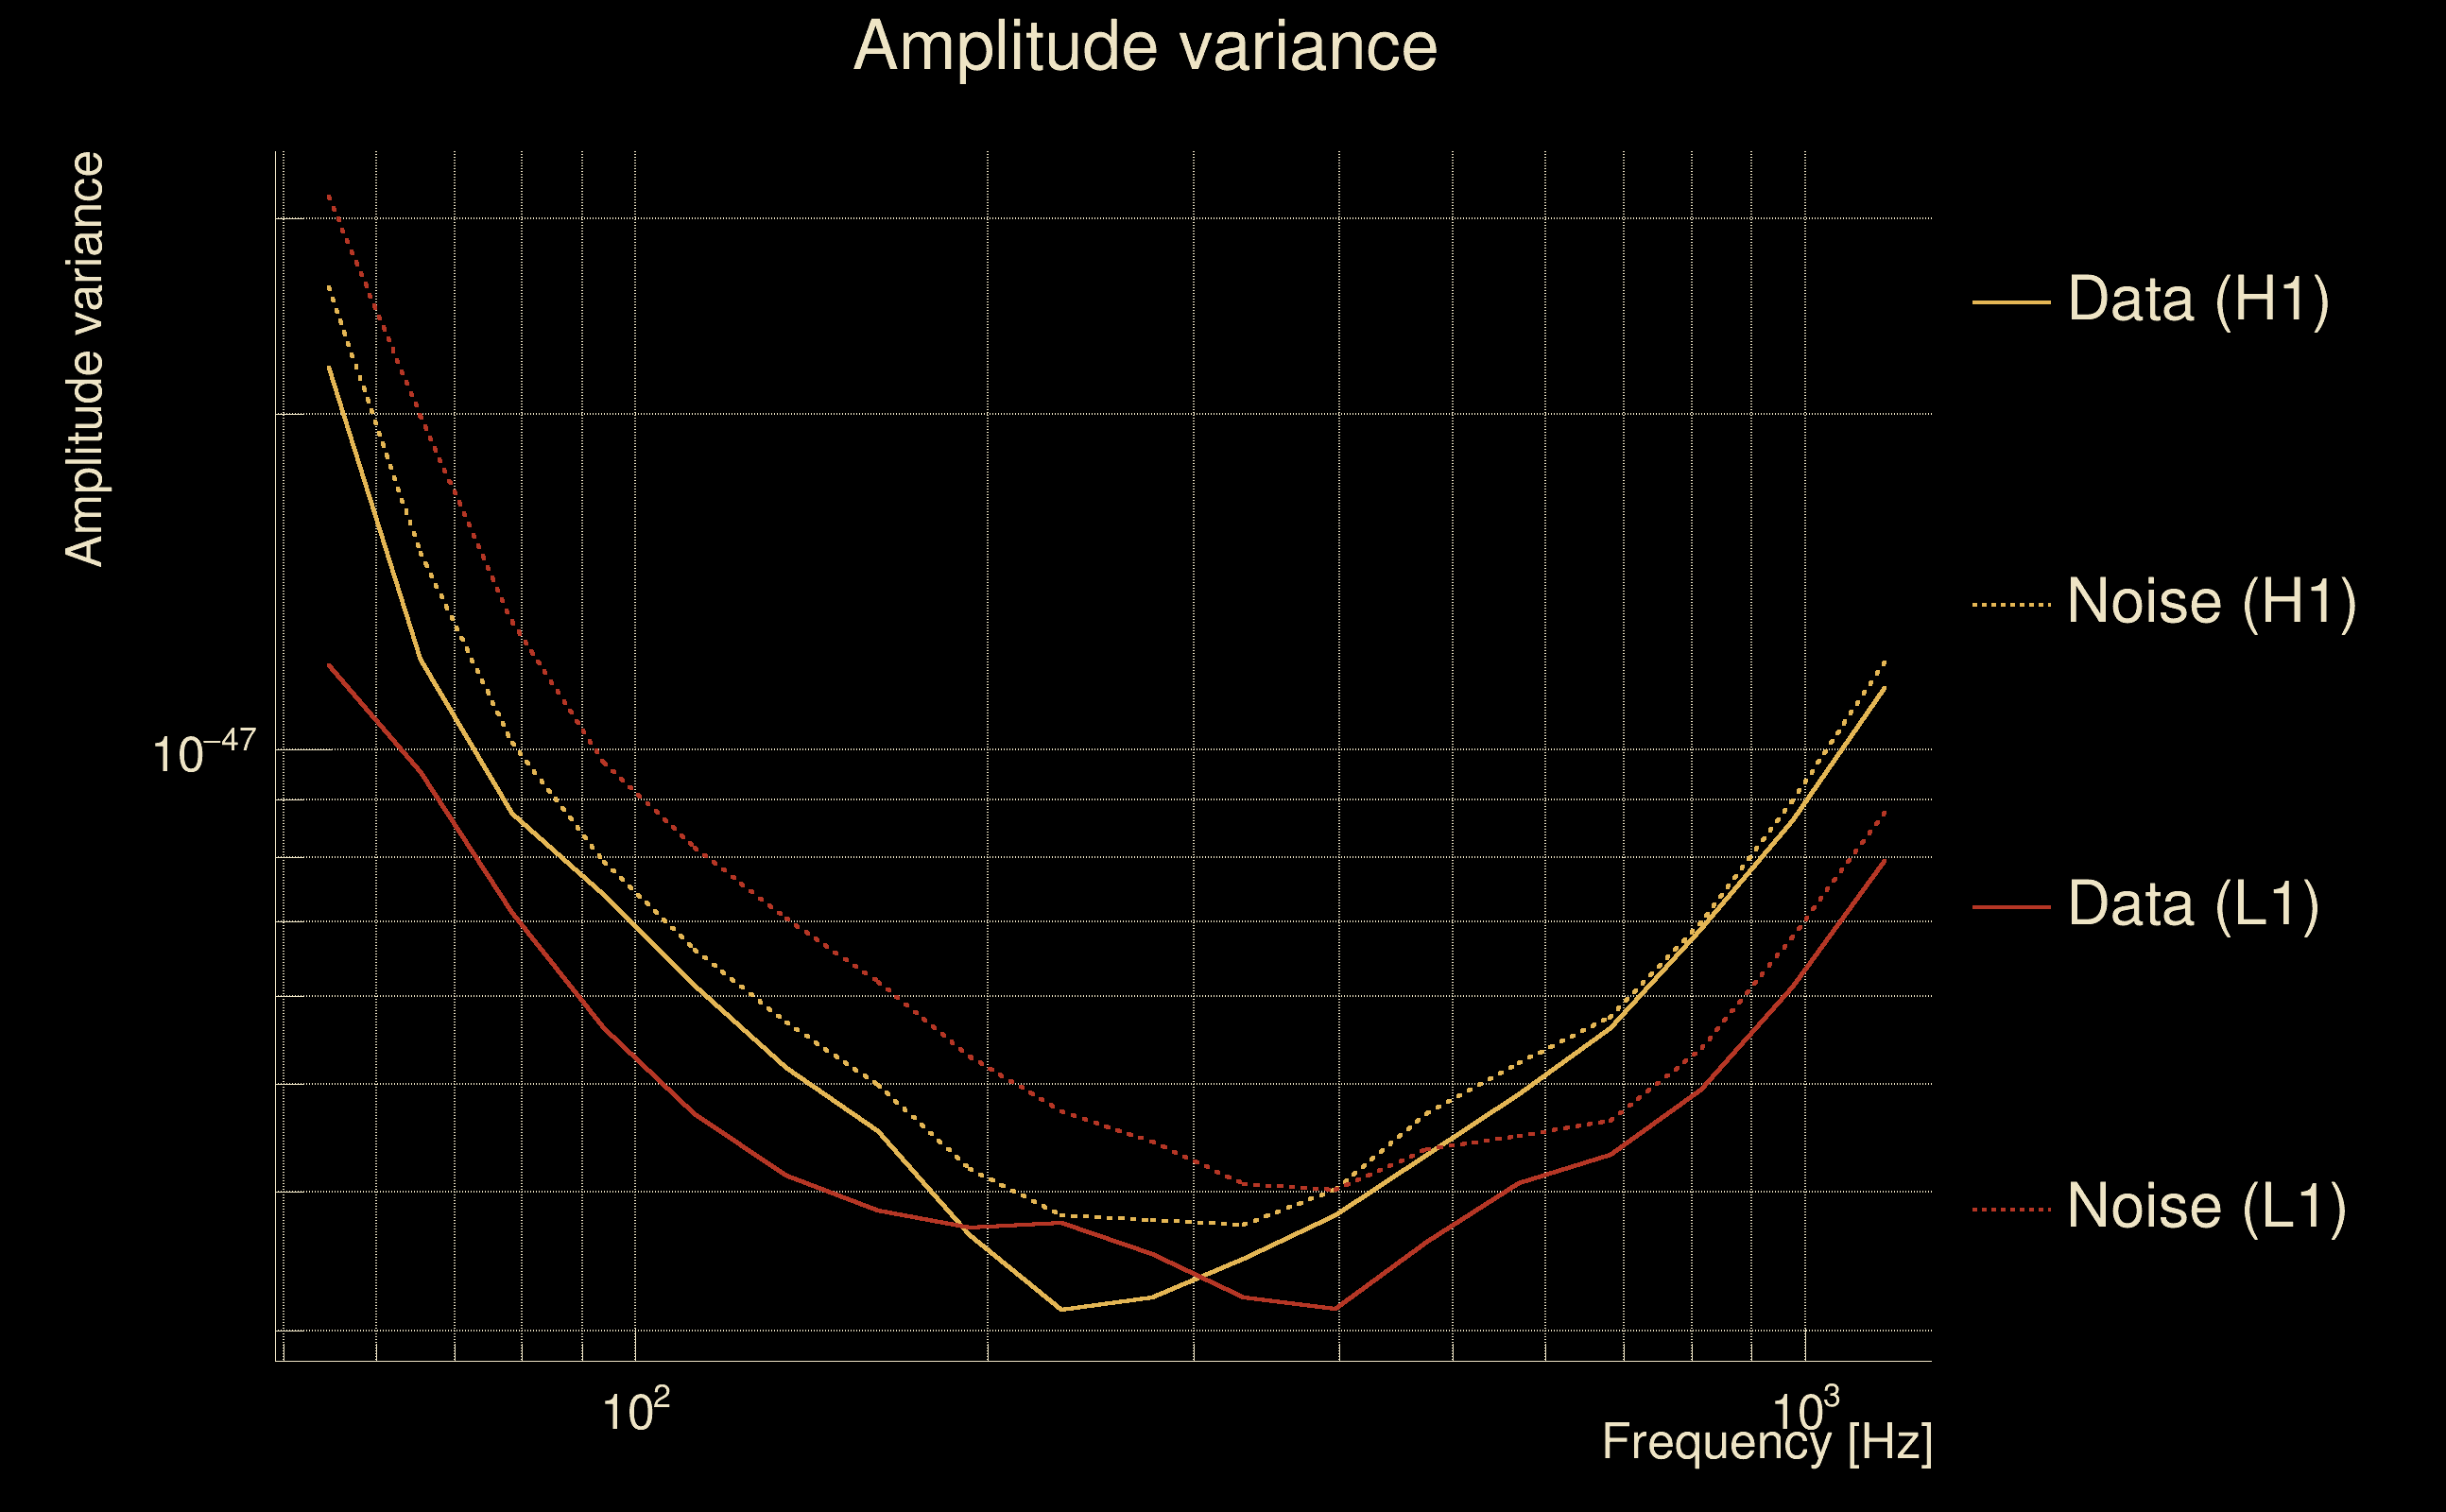
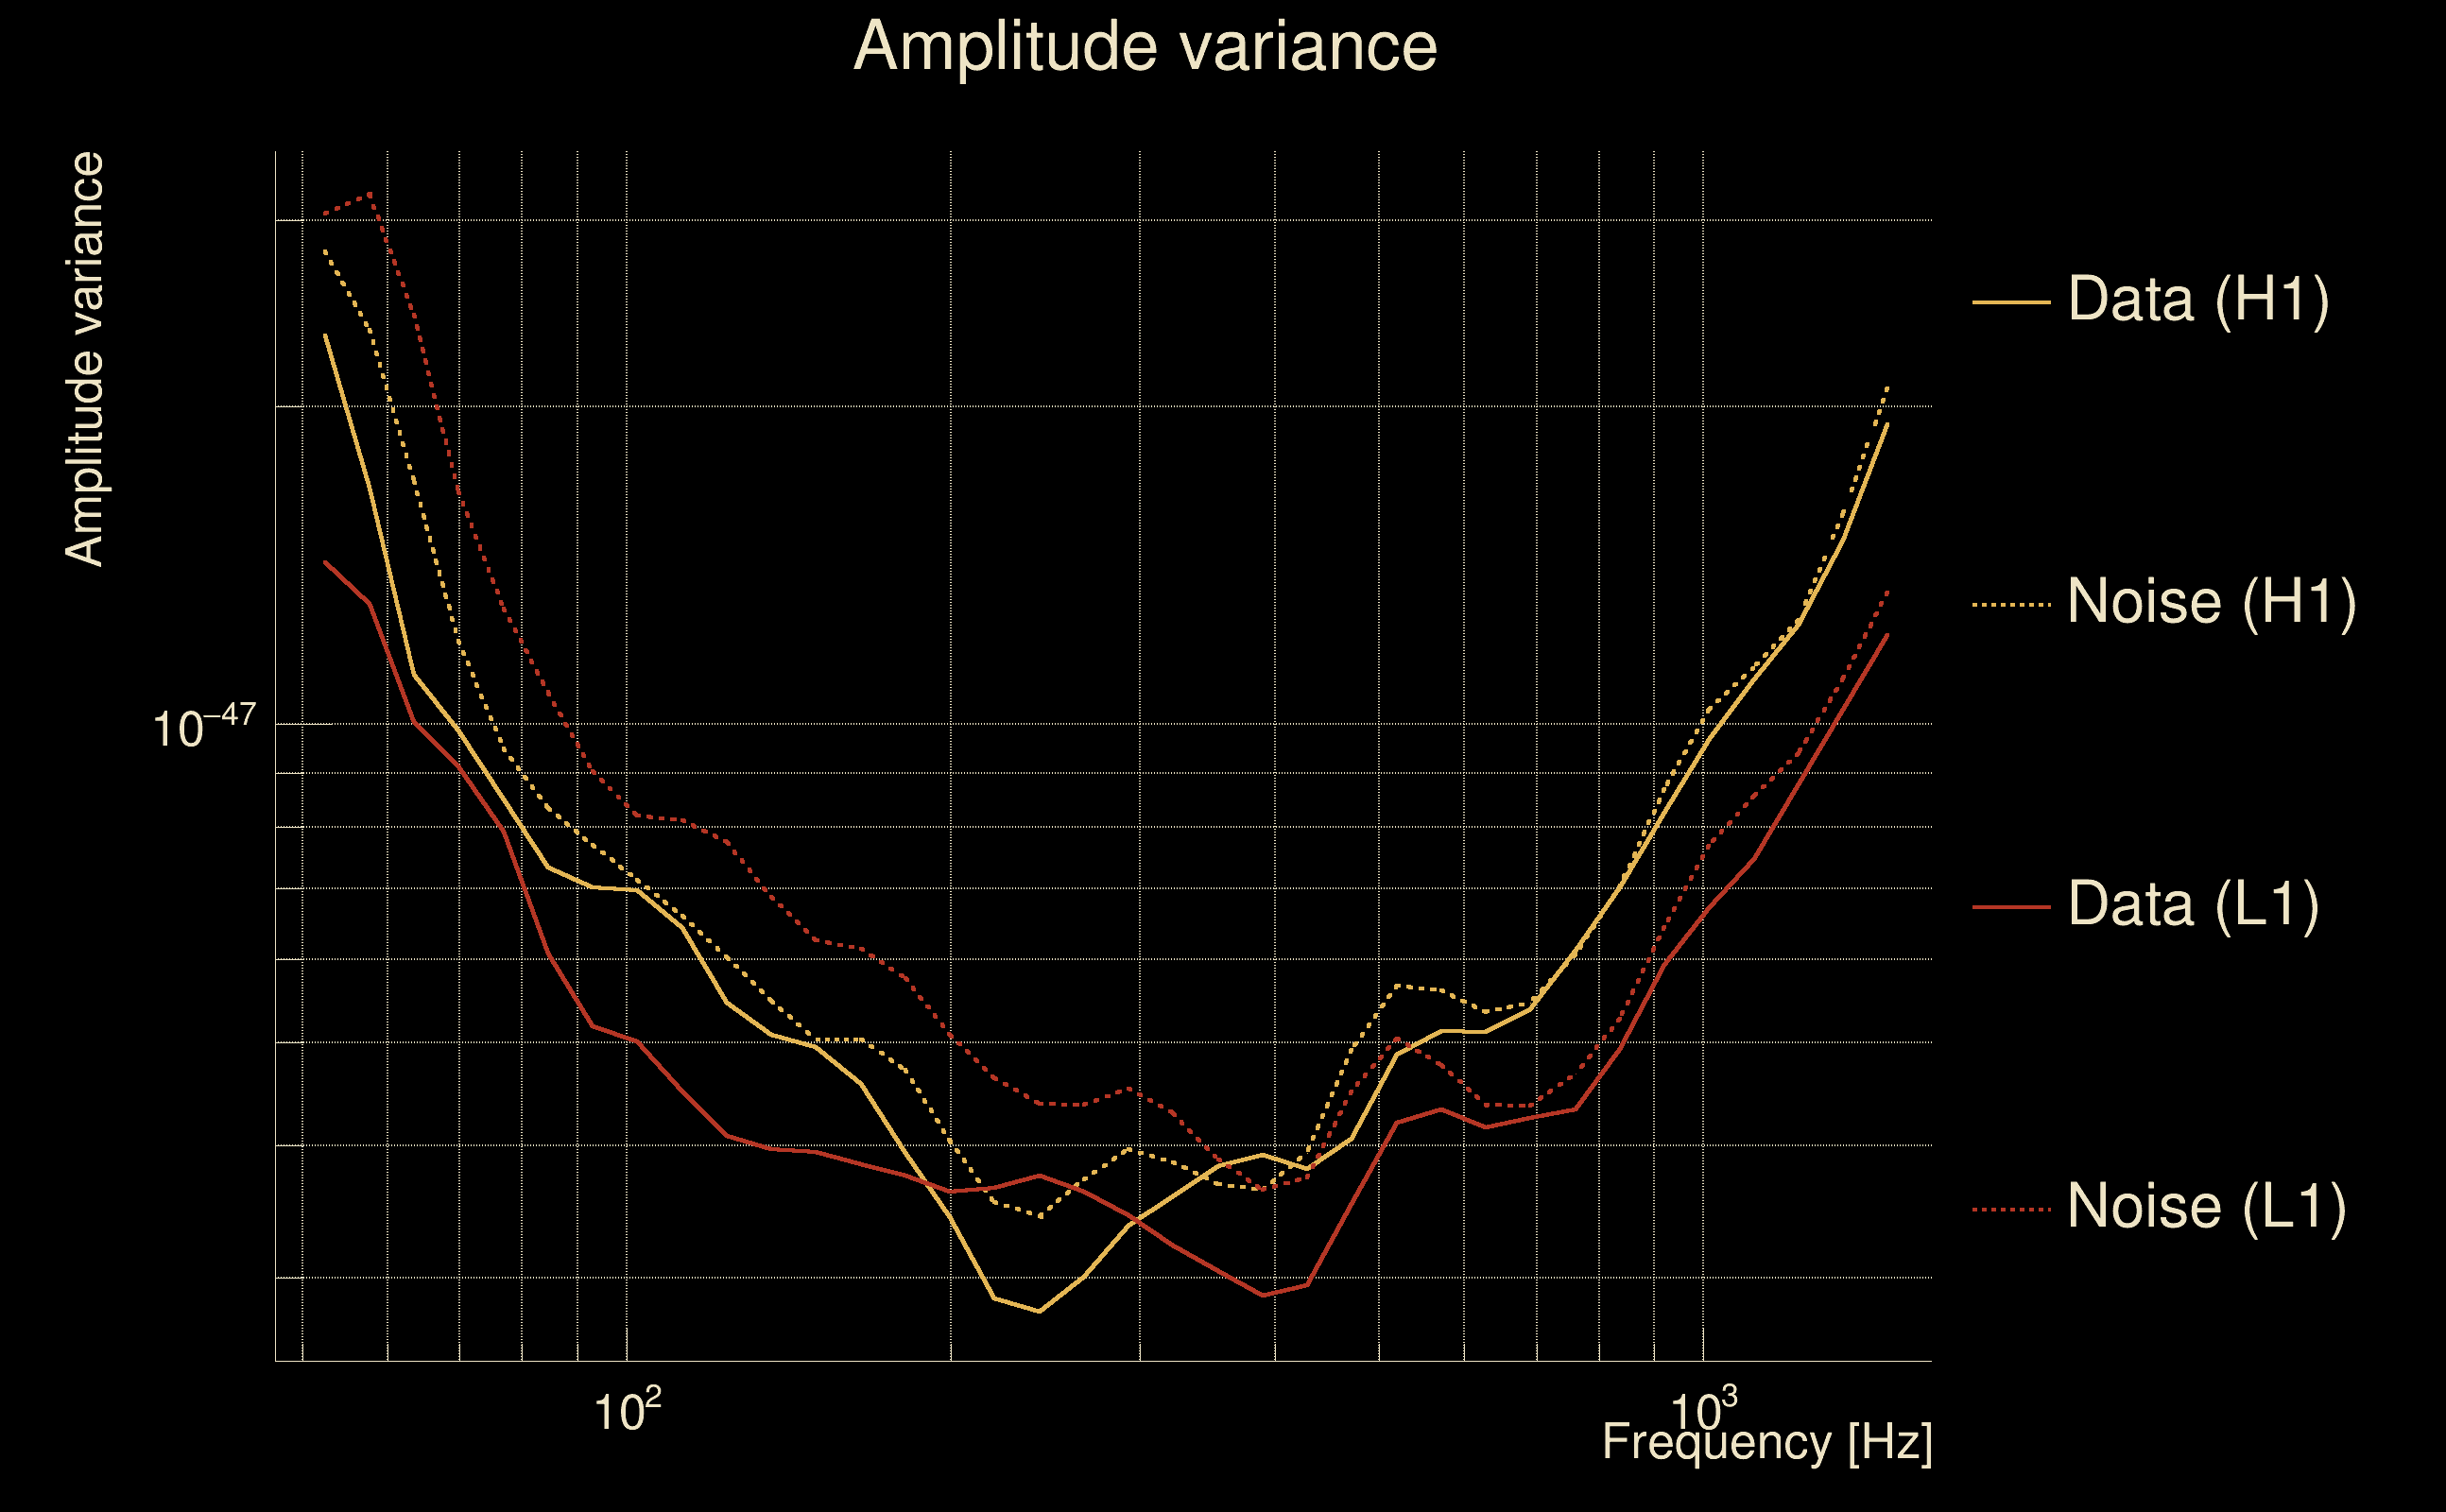
| Amplitude spectrograms: | normalization = 1e-22, power index = 2 |
| White noise SNR variance: | 0.523175 (after applying a correction factor = 1) |
| Amplitude ratio confidence level: | 3 sigma |
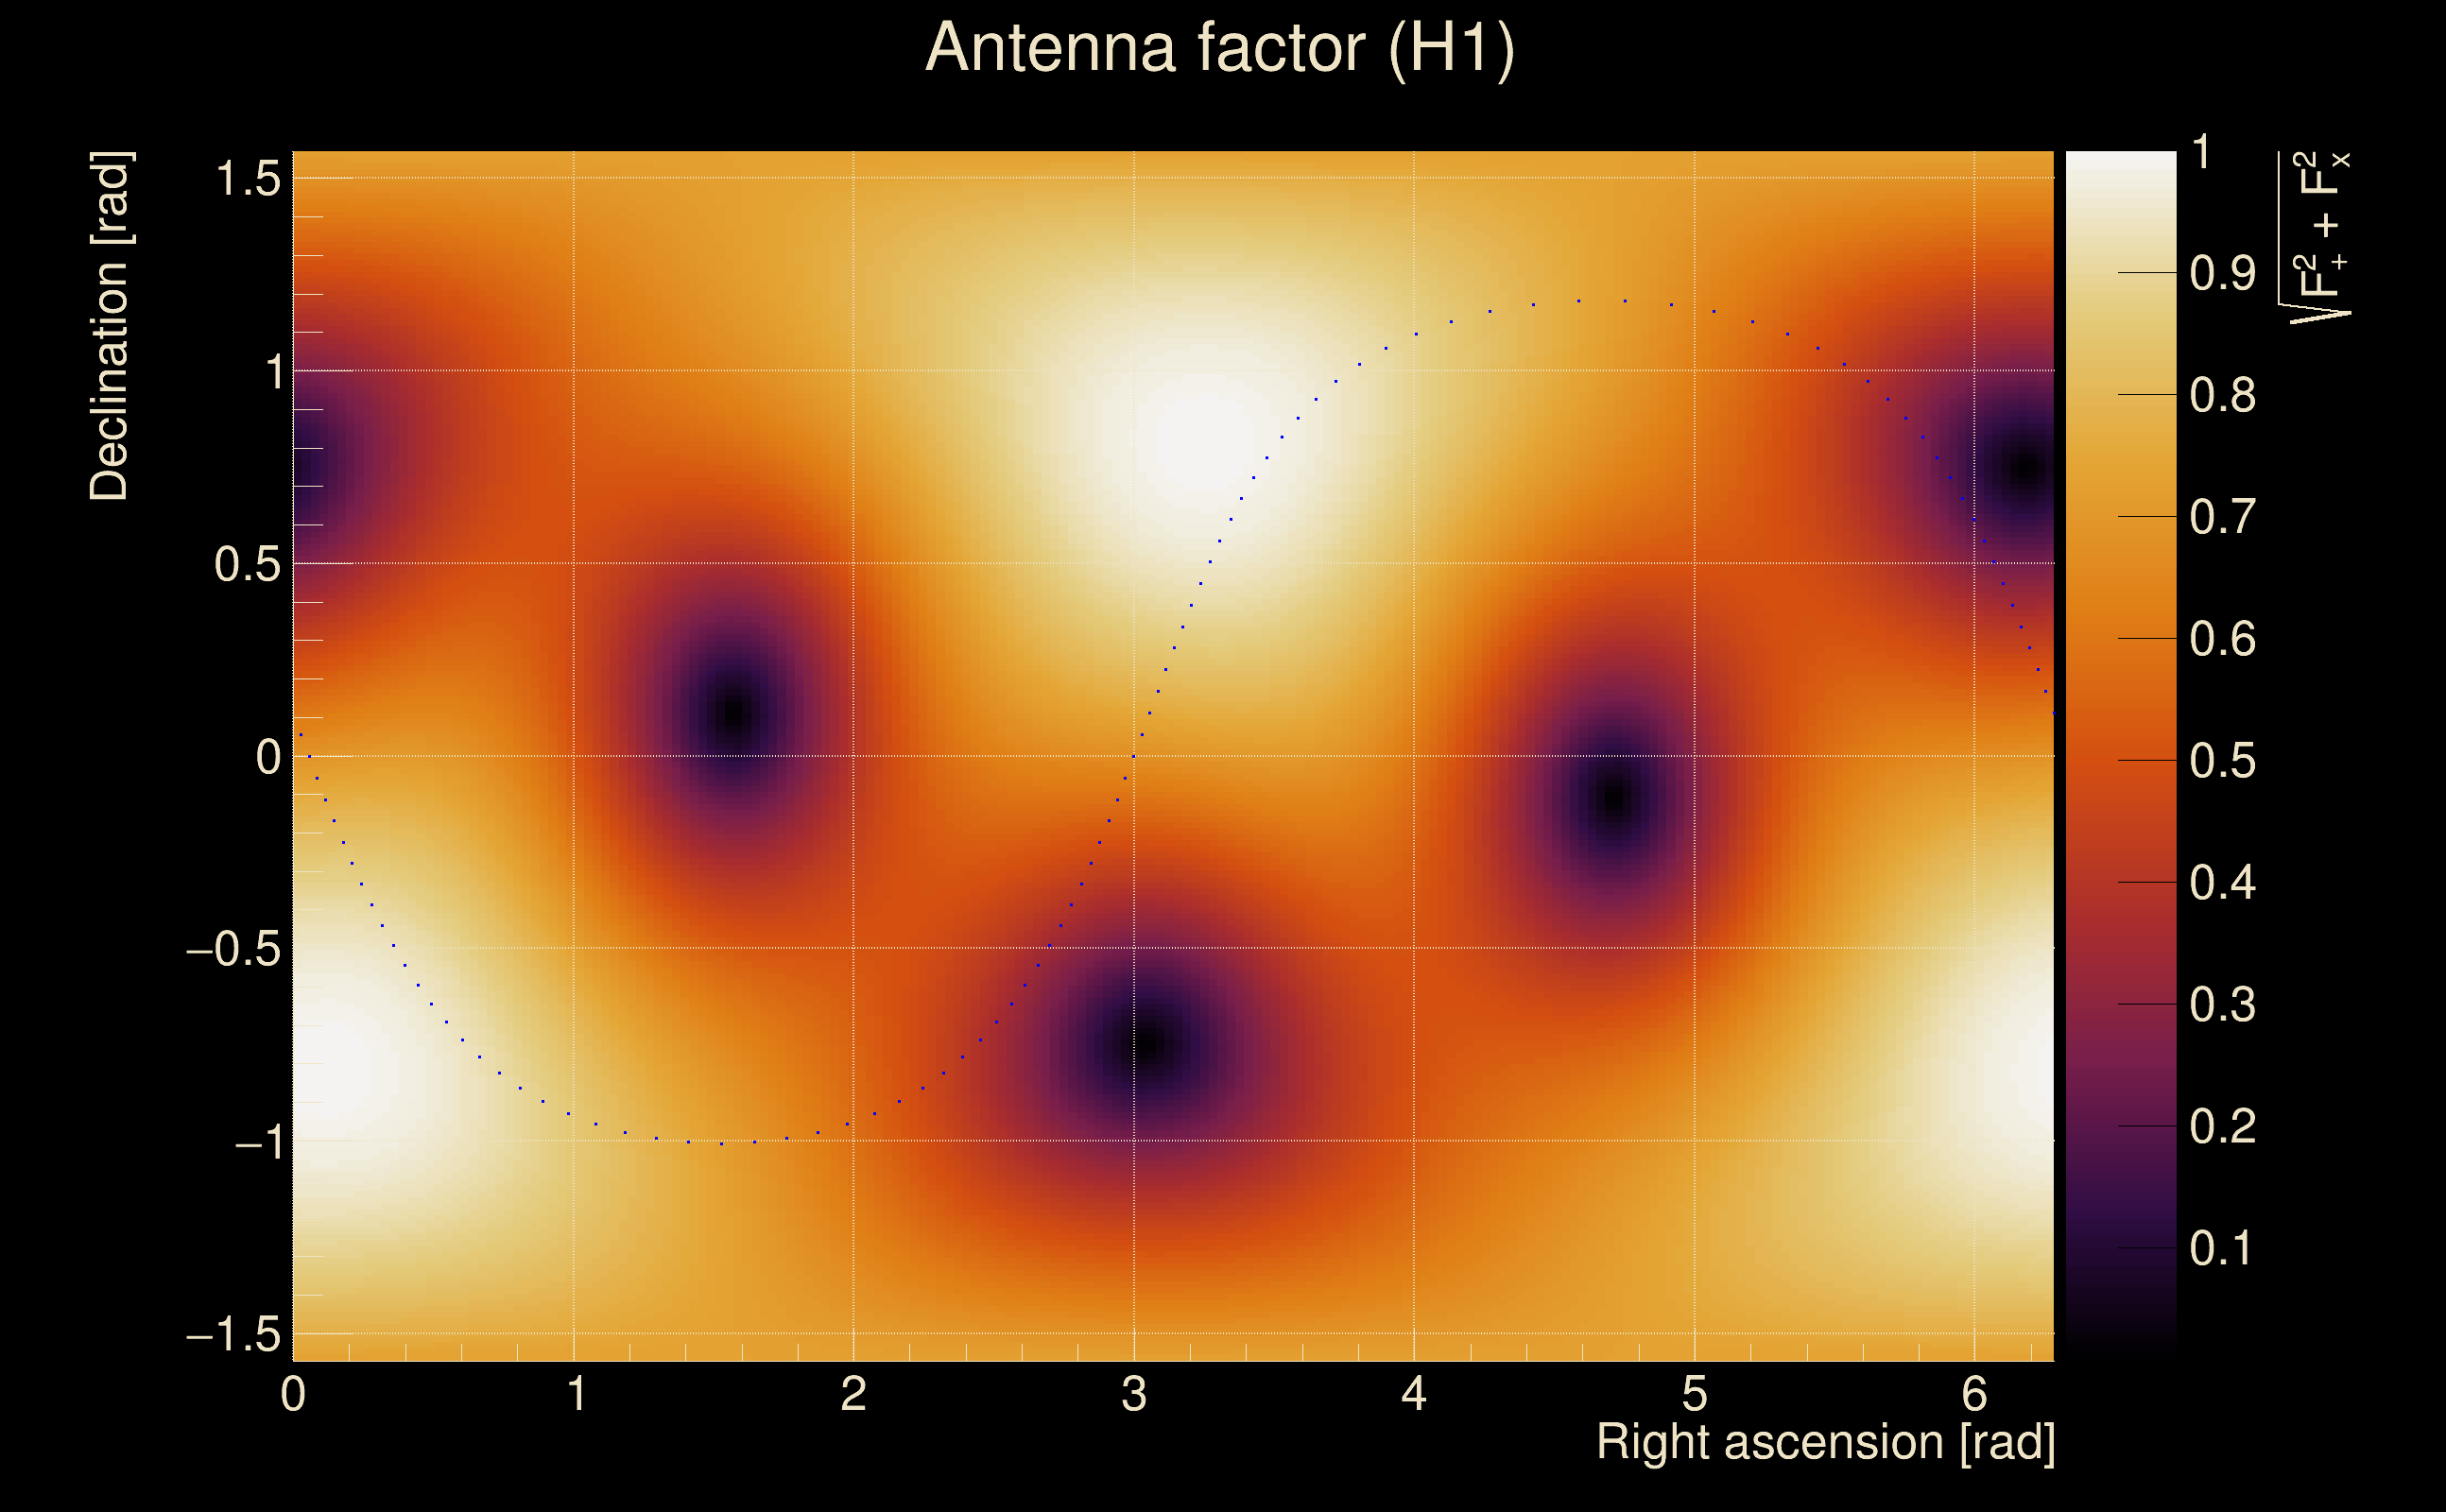
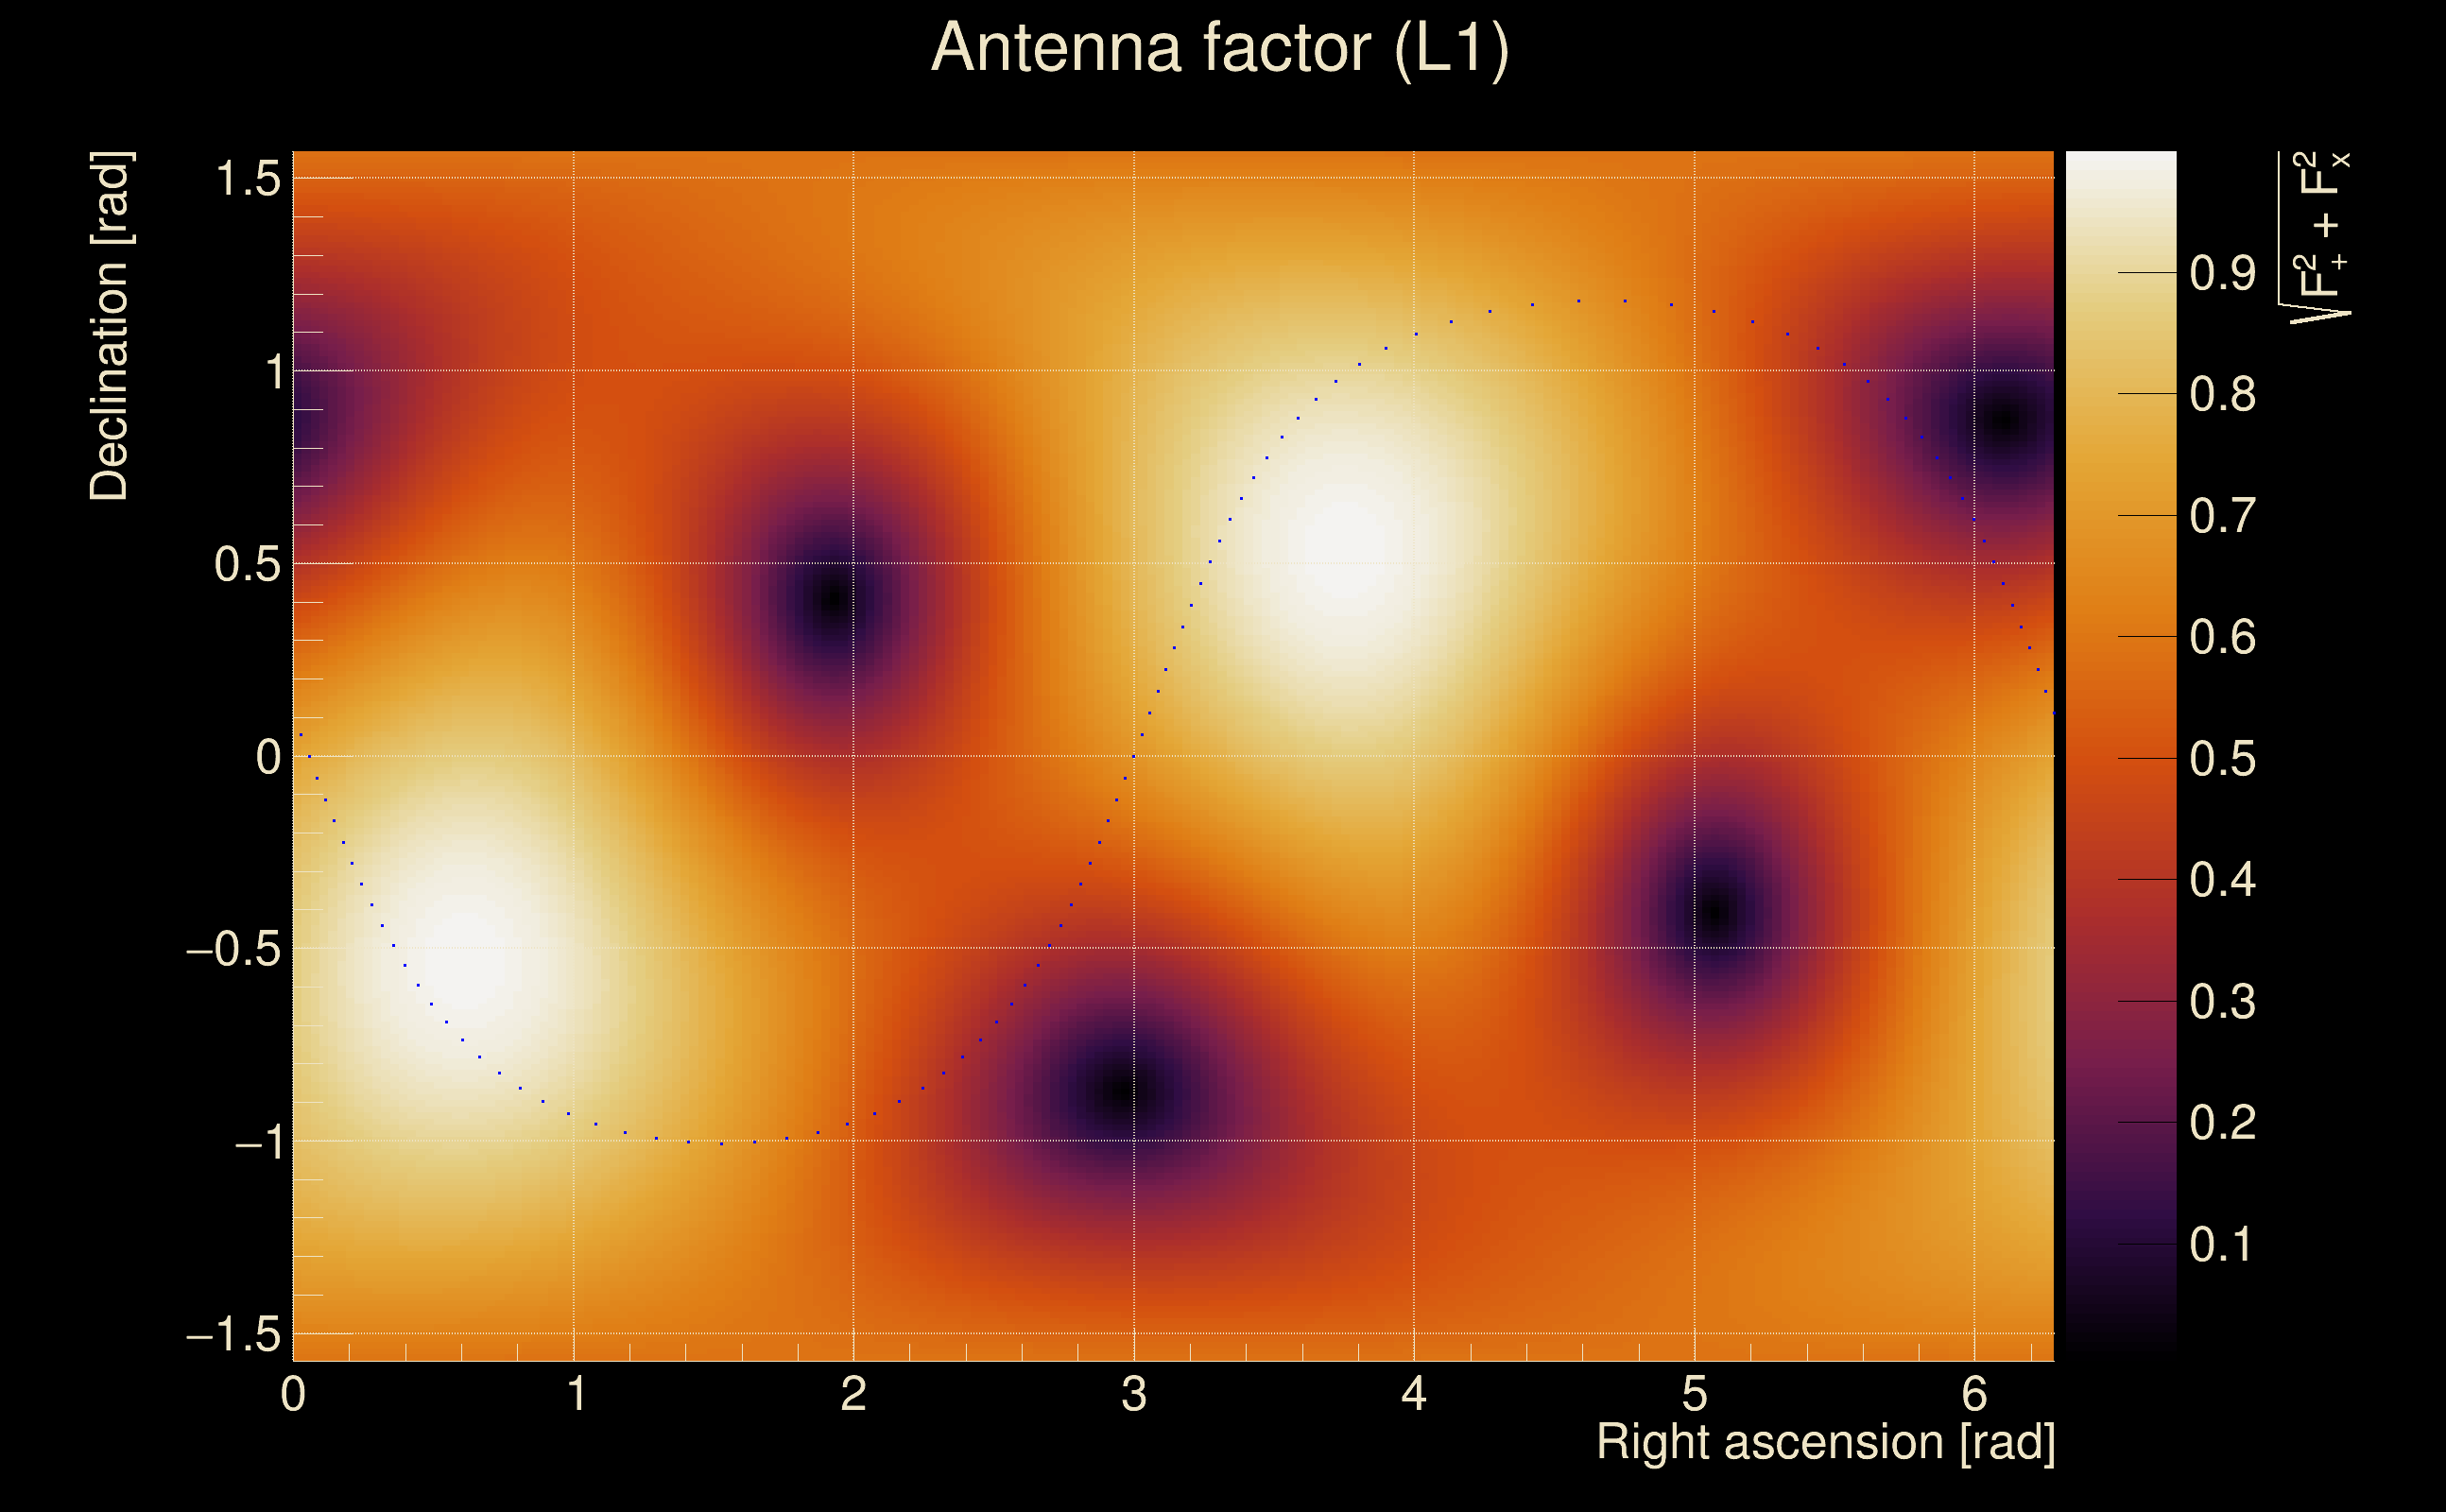
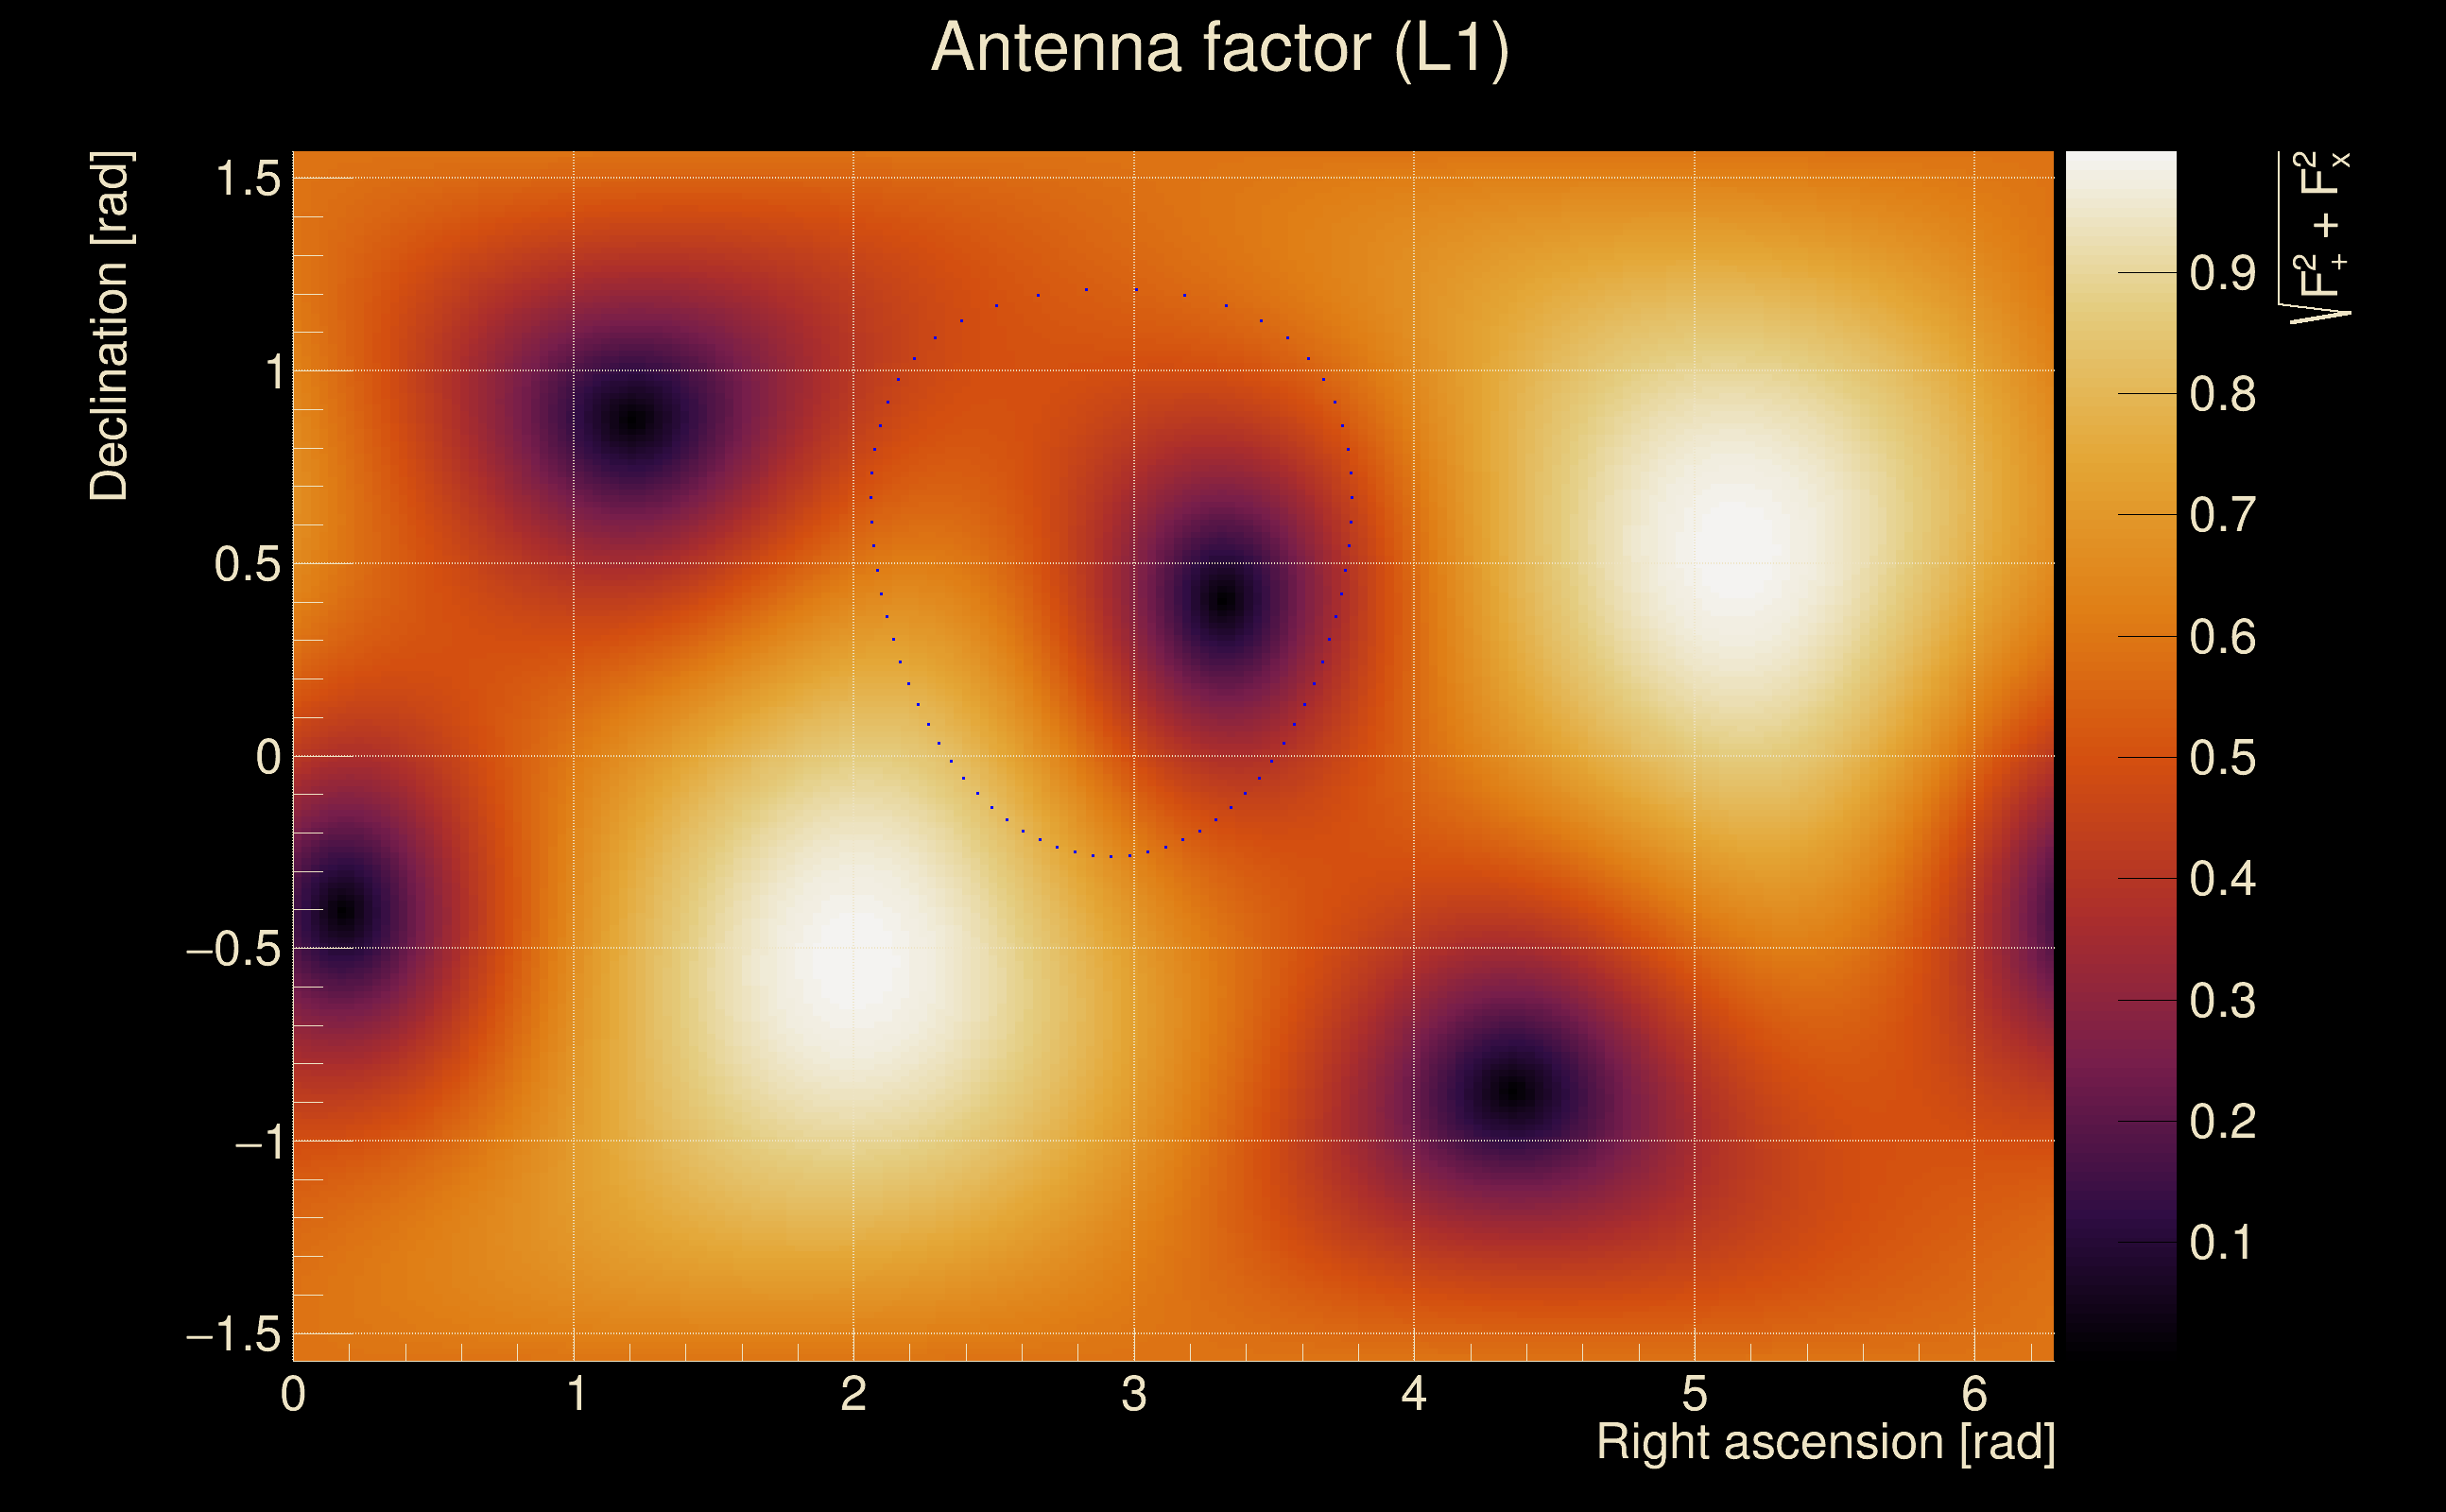
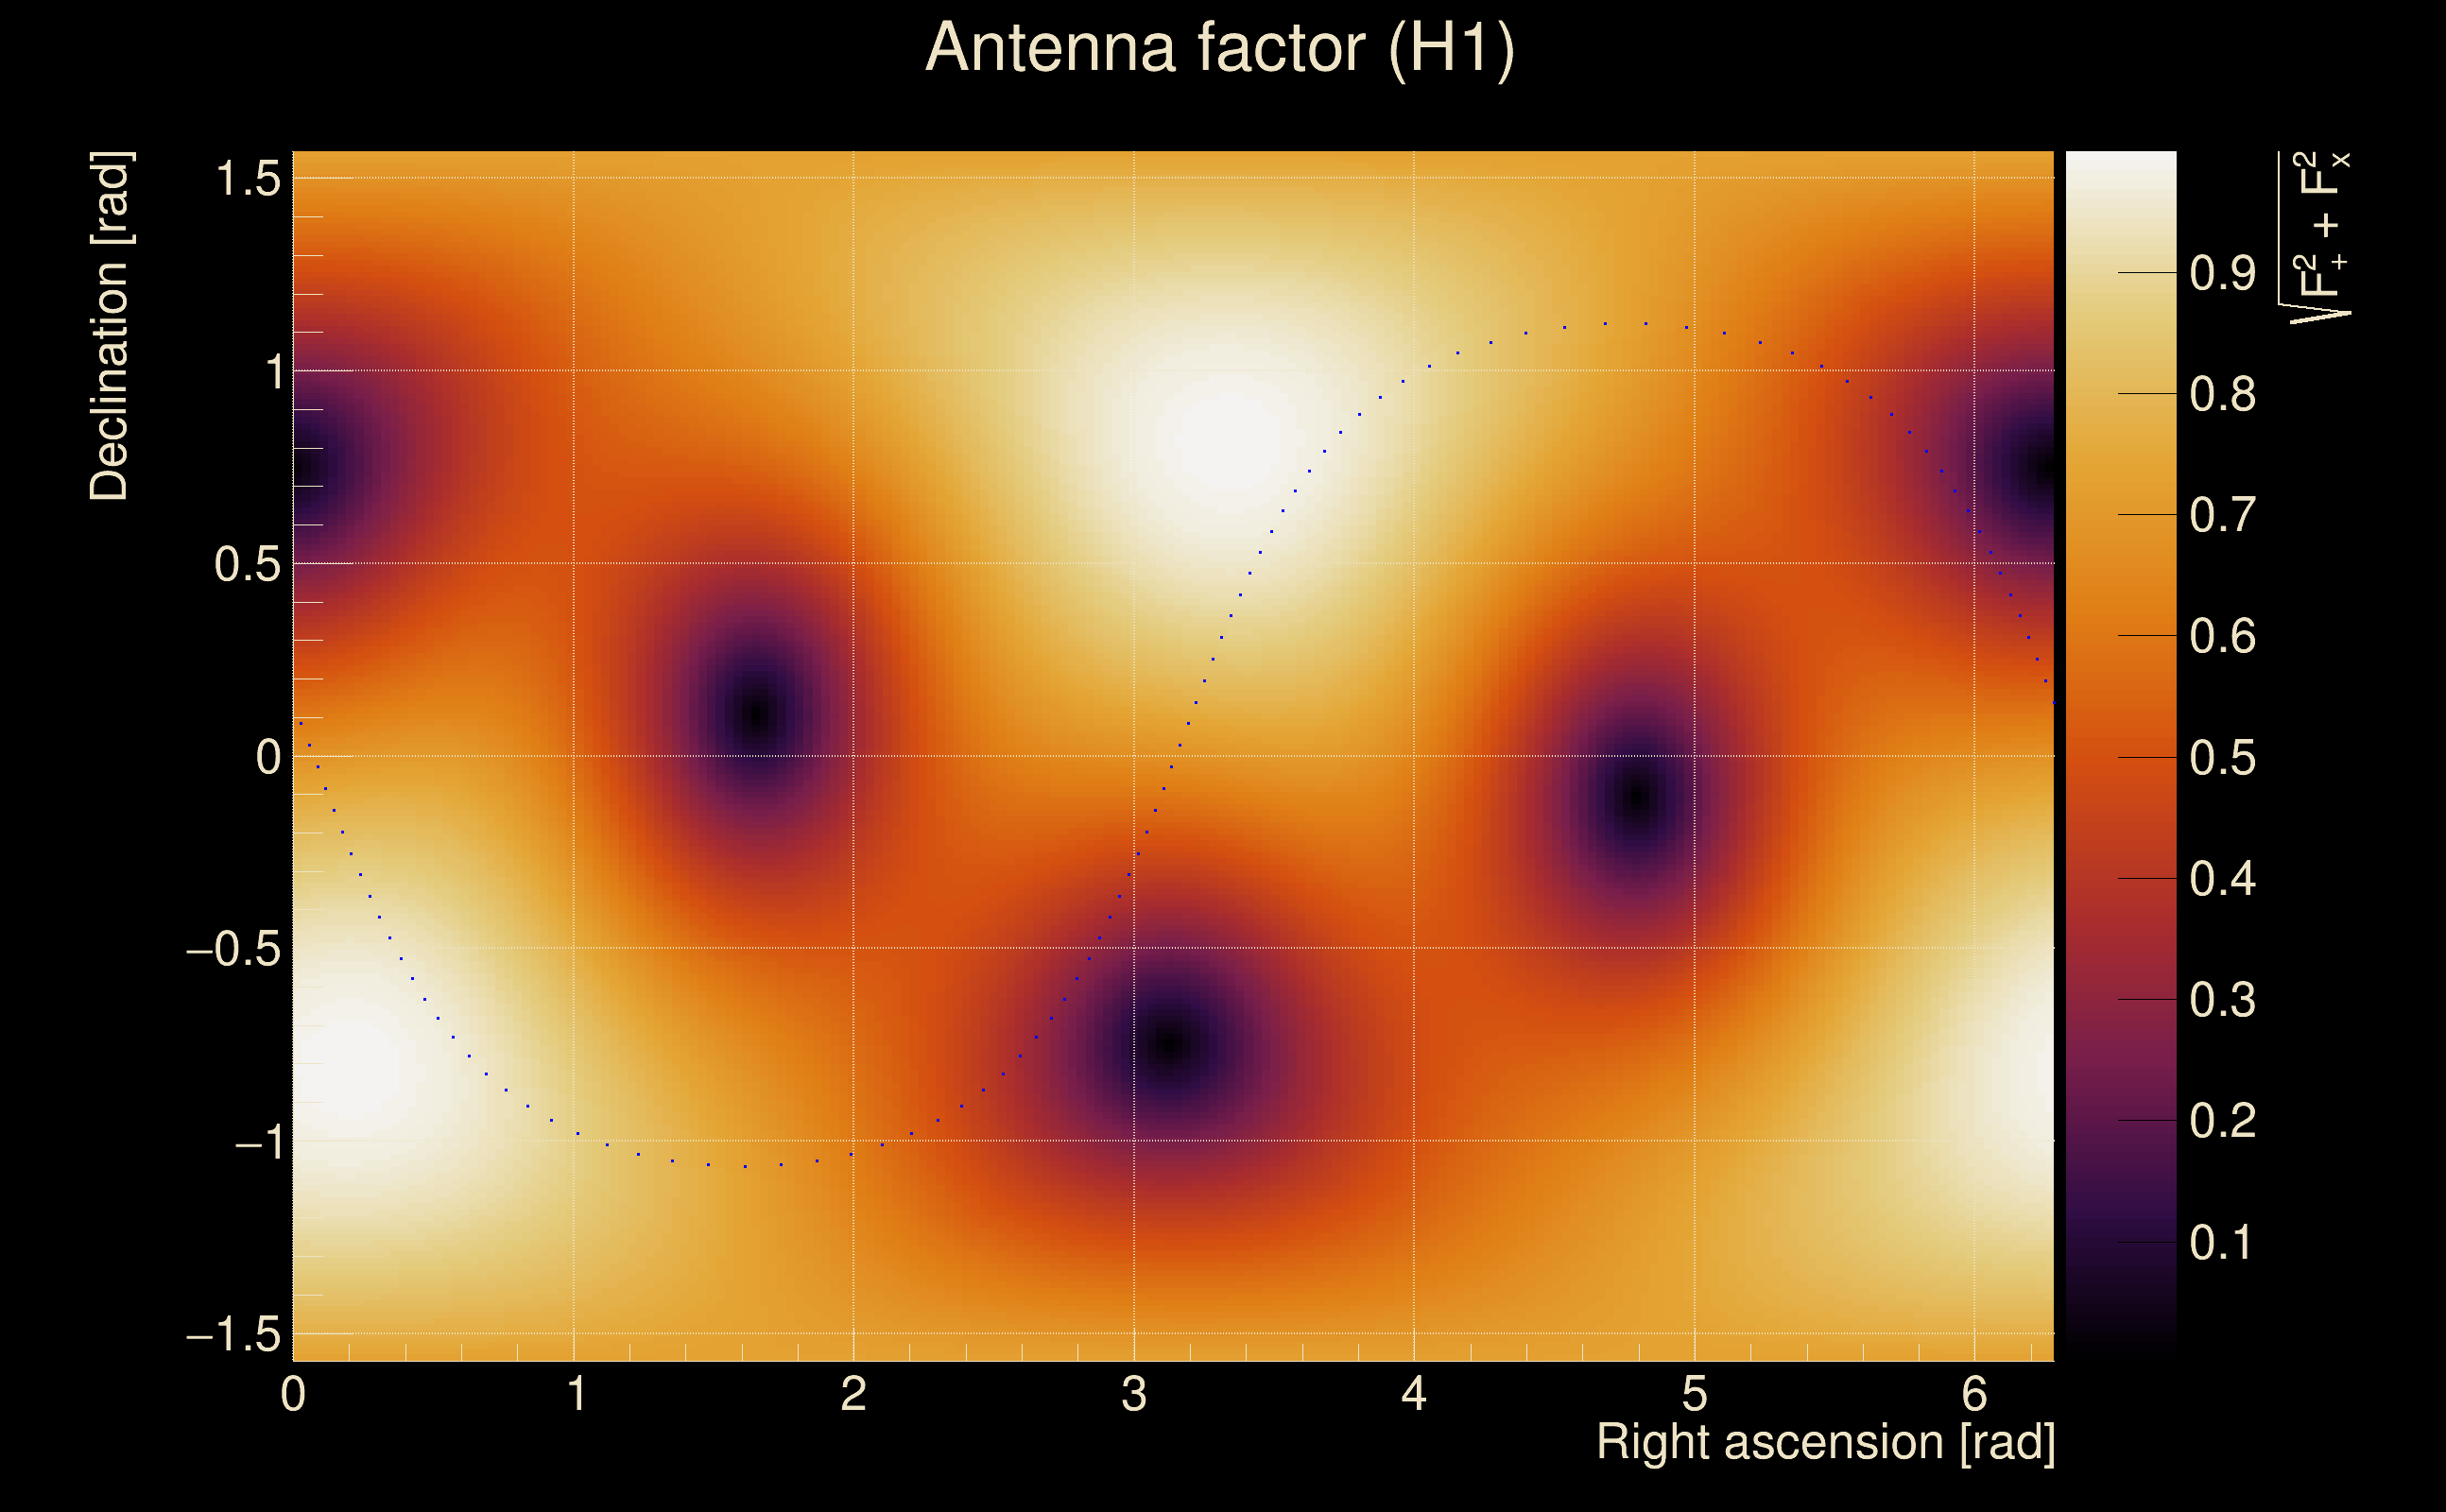
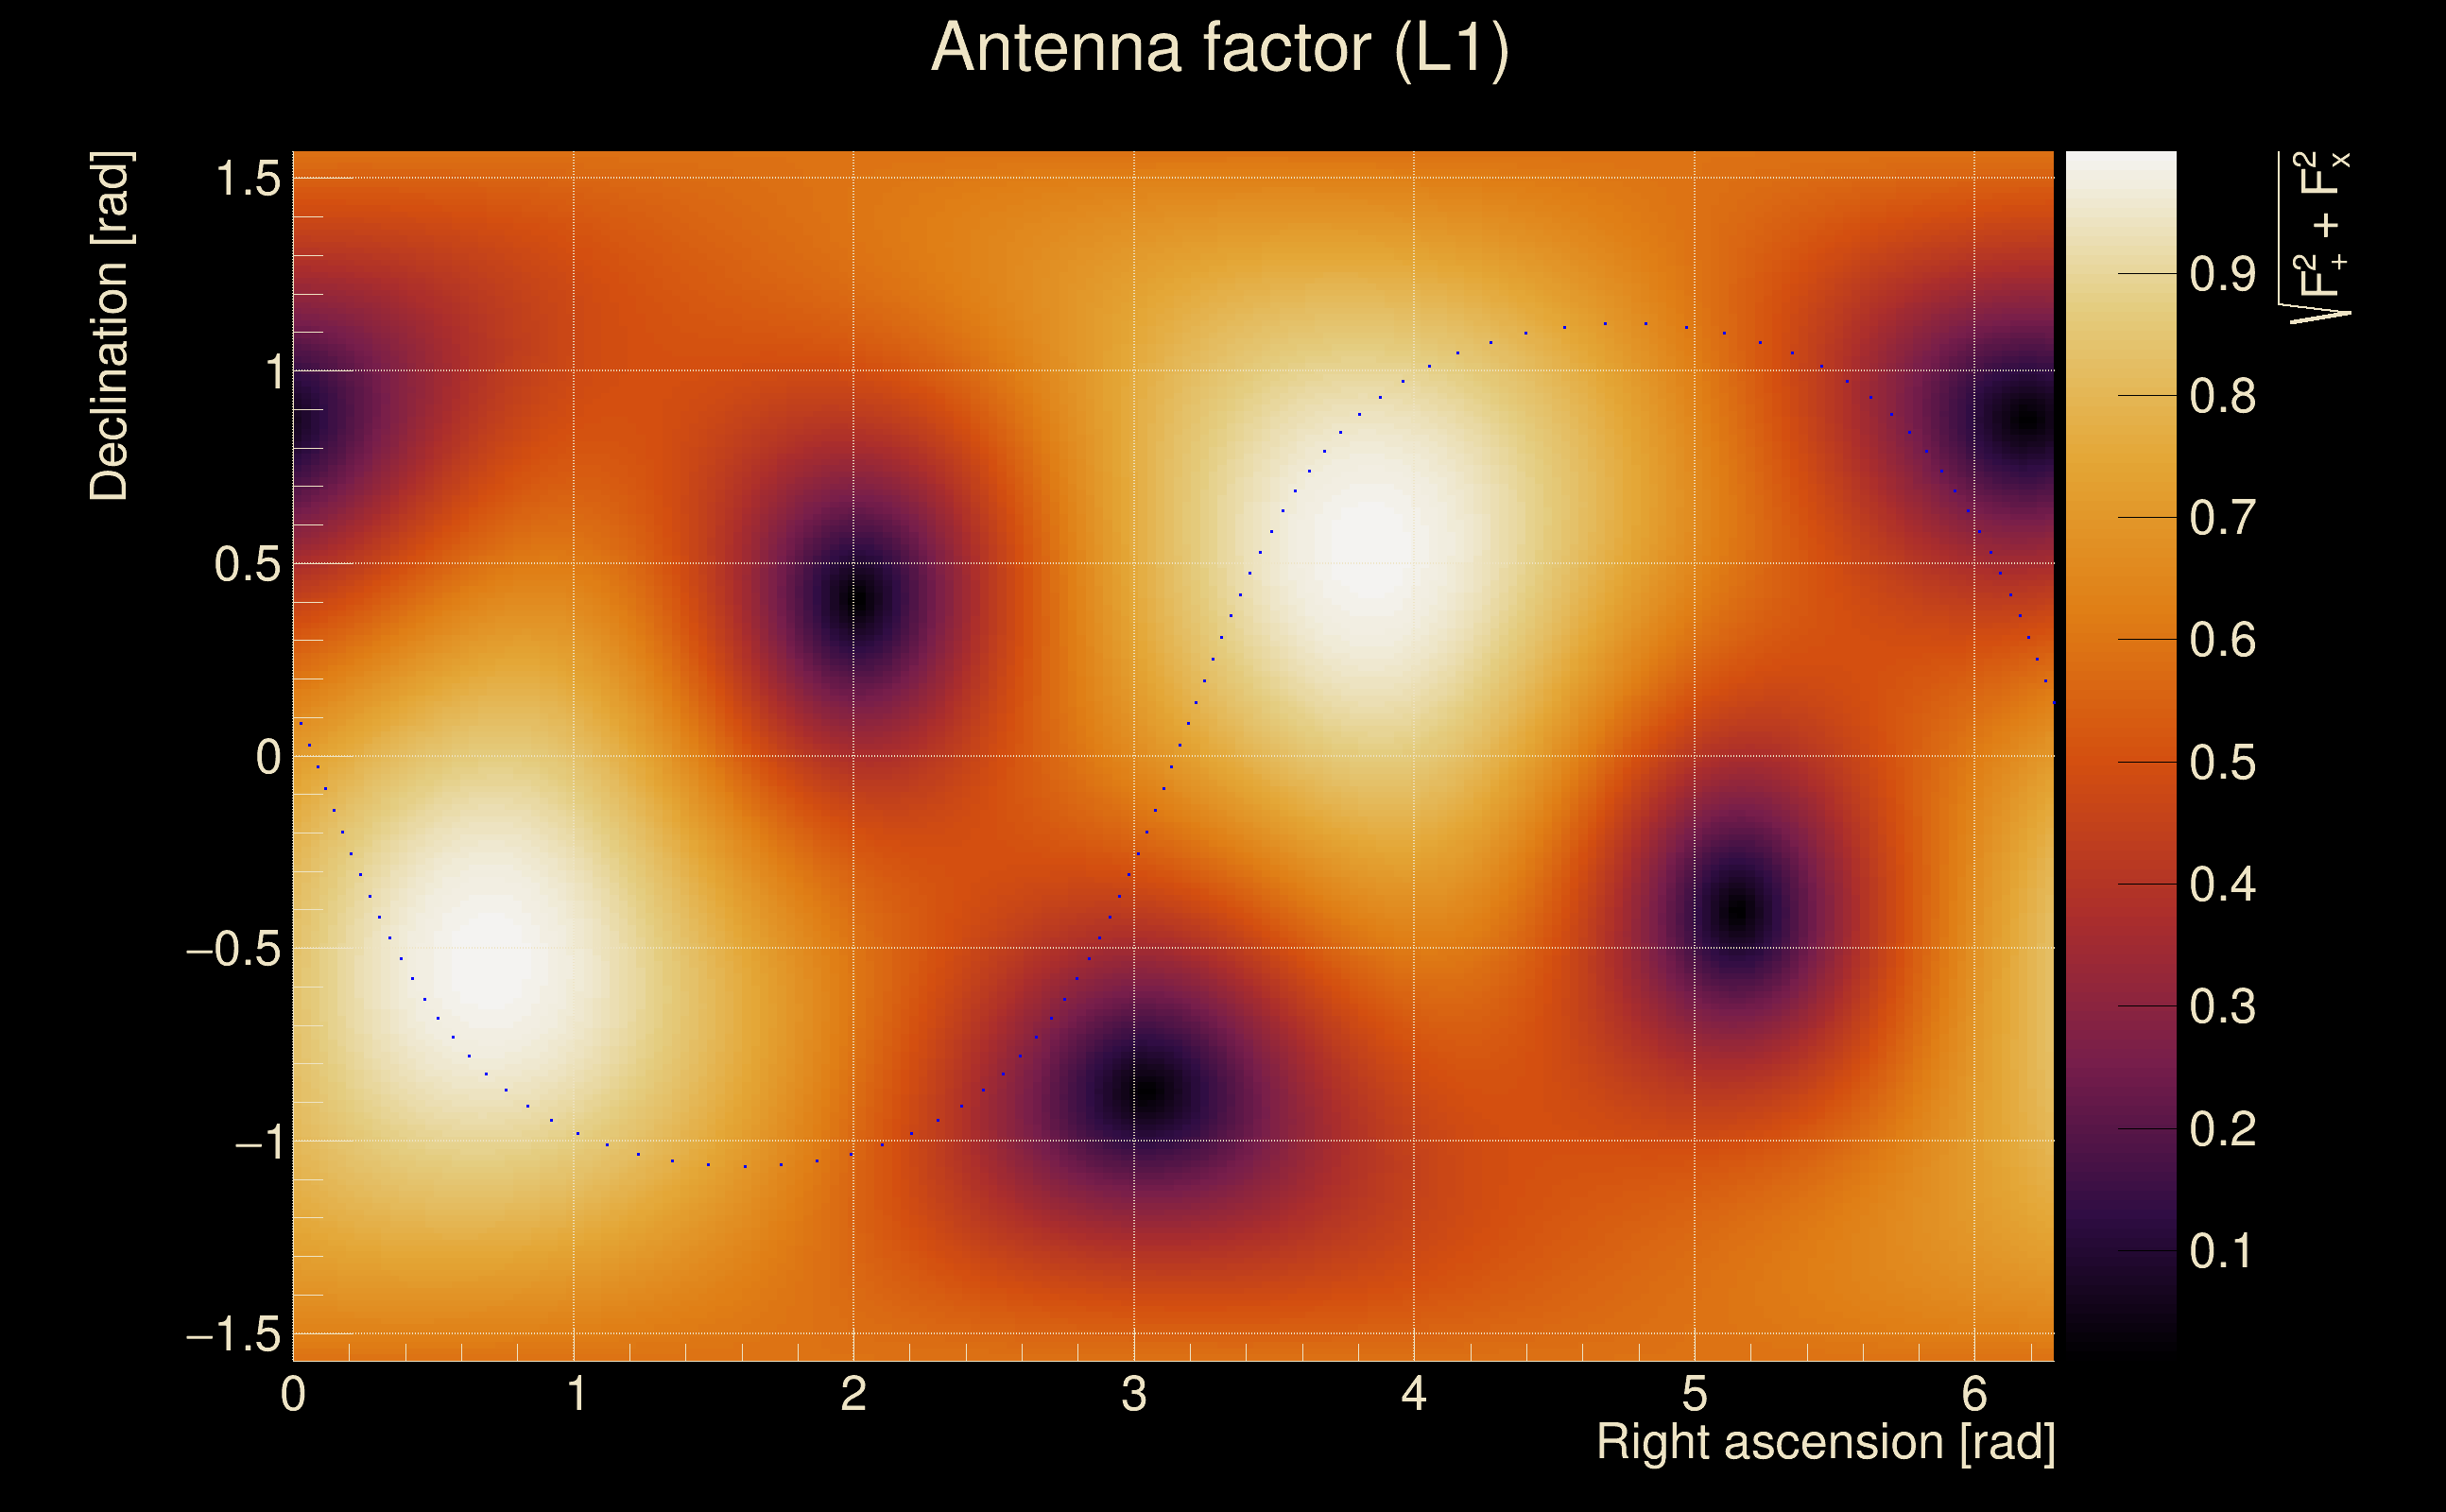
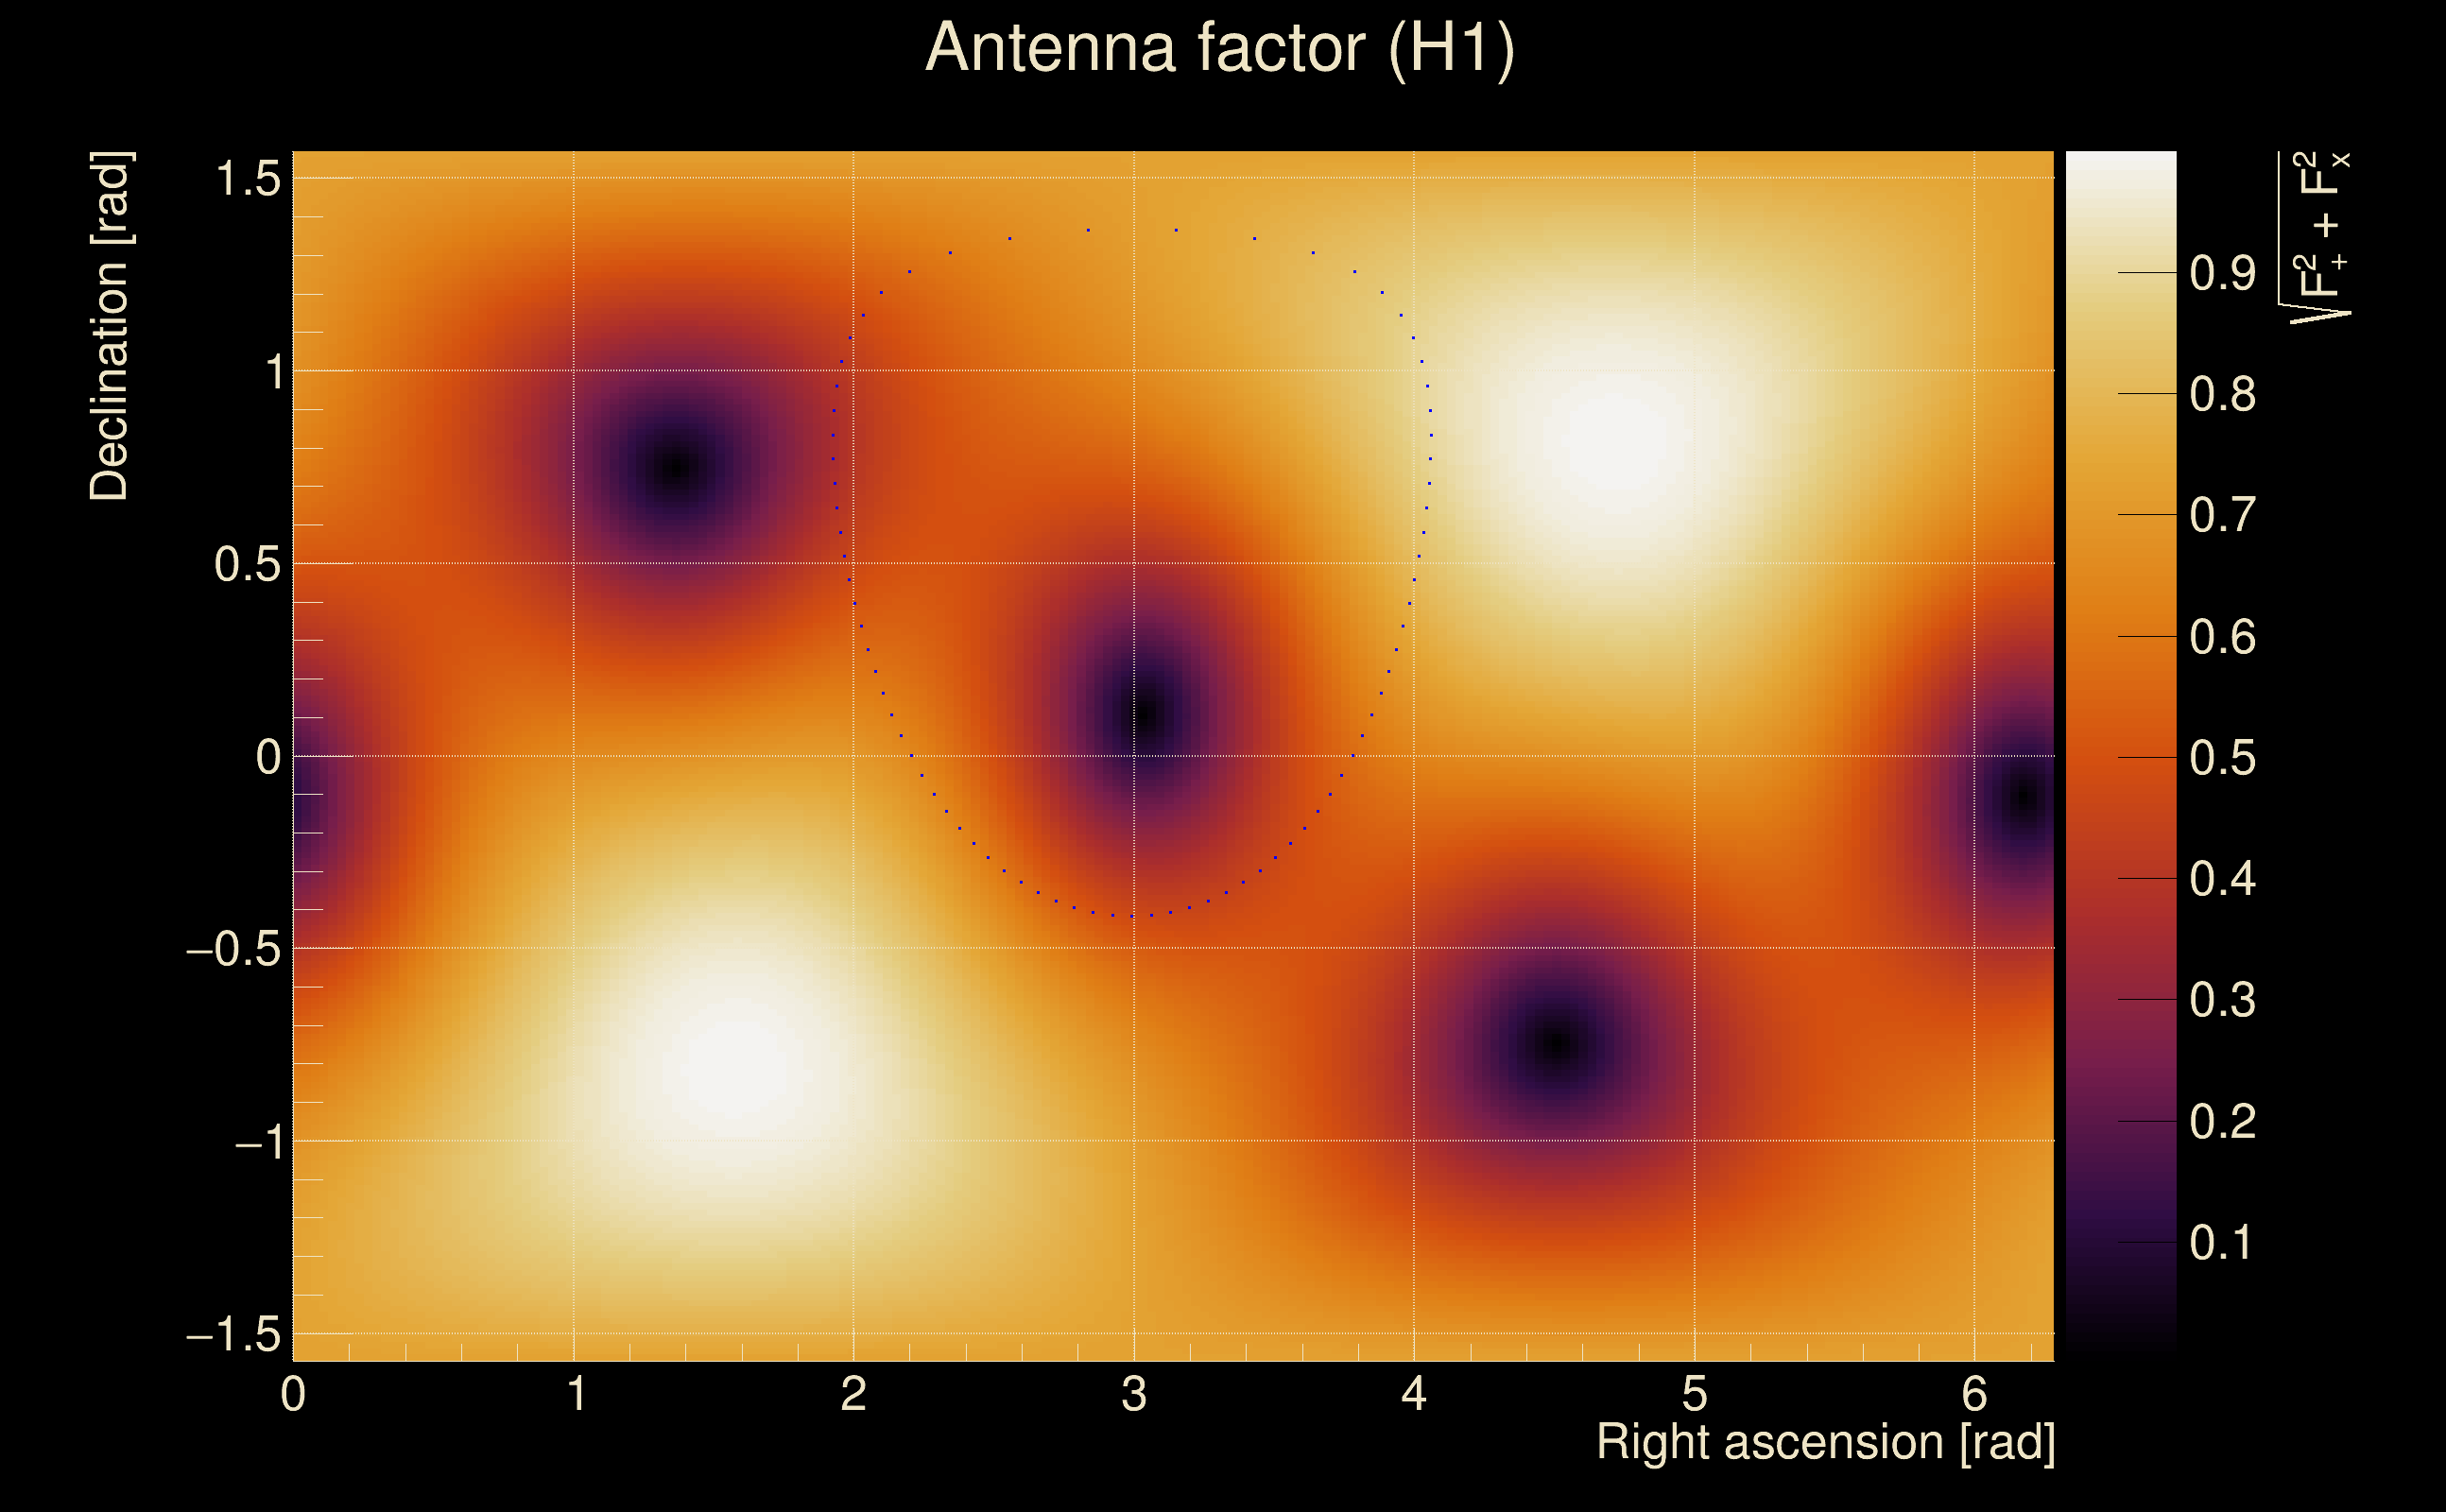
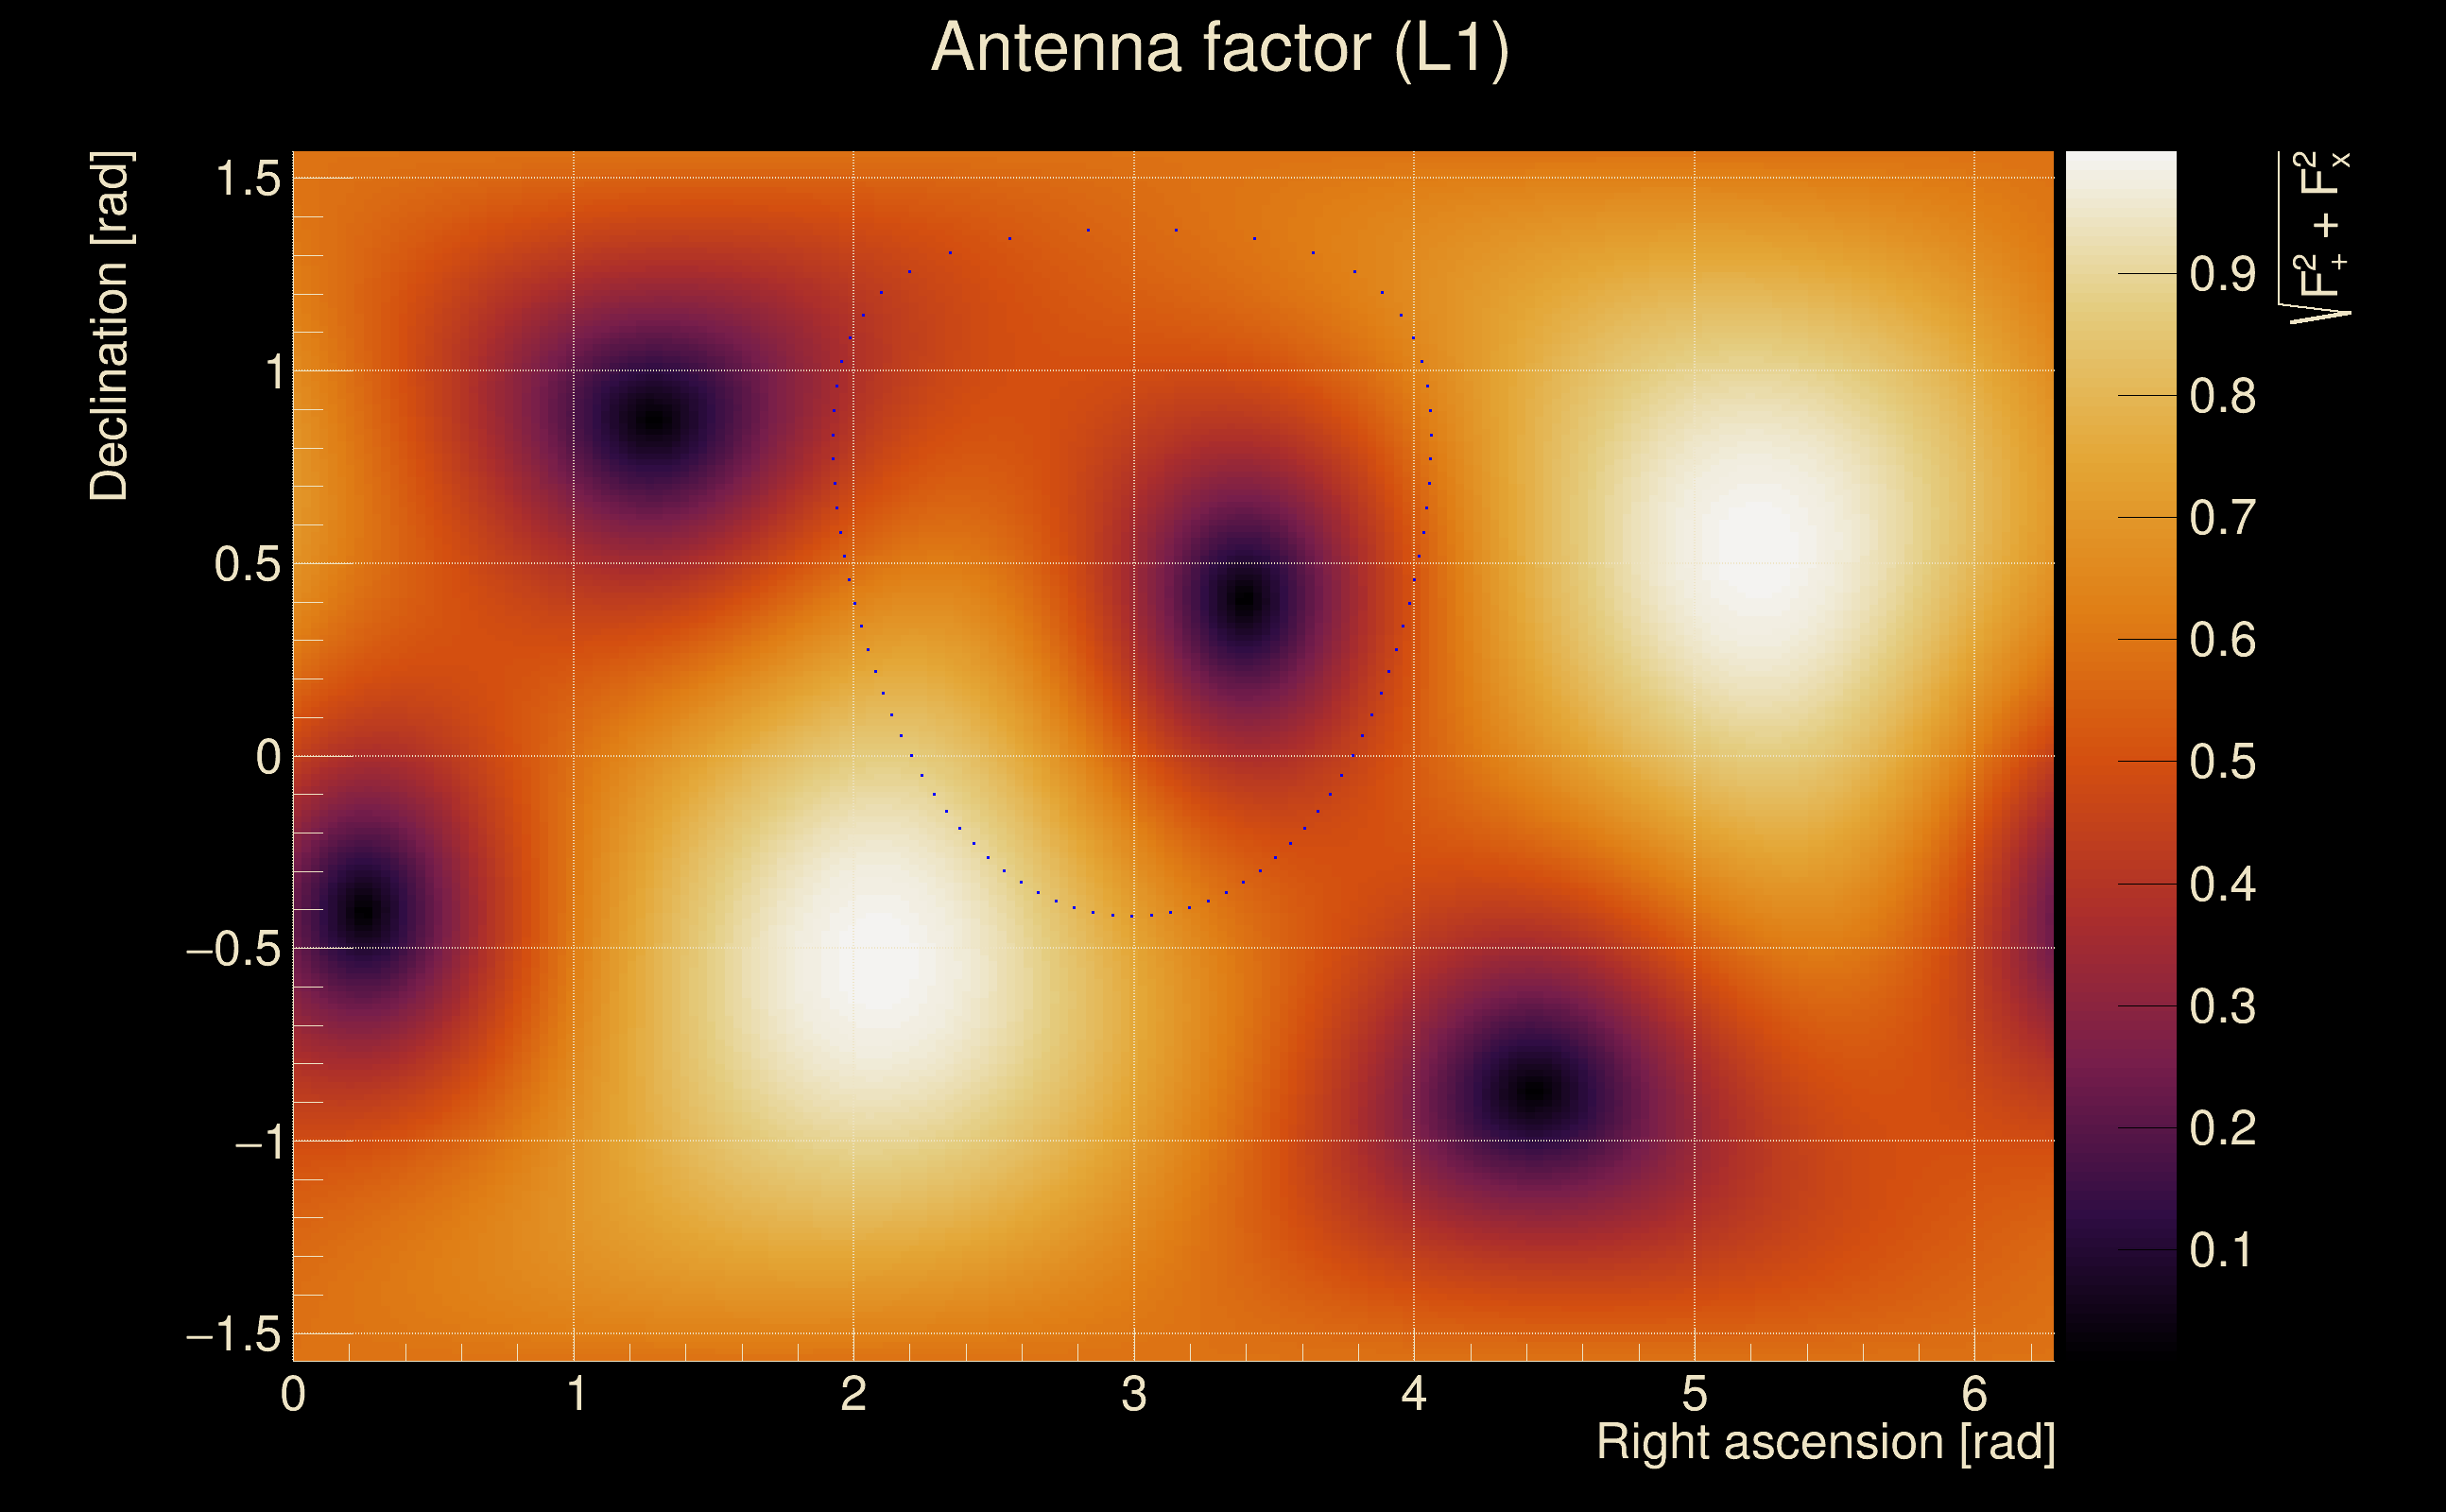
| Target sky positon: | Ra: 3.68109, Dec: 0.94792 [rad] |
| List of input Ox files: | TargIxf_feb2026_SN3_file_list.txt (71 files) |
| Analysis result file: | TargIxf_feb2026_SN3_results-0.root |
| Slice selected for the the fakeground: | slice index=36 (3.312 s), time lag = 0 s |
| Foreground | Fakeground | Background | ||
|---|---|---|---|---|
| Number of processed ox events | 12111 | 12111 | 2603865 | |
| Start Date (detector 0) | Mon May 15 14:13:25 2023 UTC | Mon May 15 14:13:25 2023 UTC | Mon May 15 14:13:25 2023 UTC | |
| End Date (detector 0) | Thu May 18 15:54:40 2023 UTC | Thu May 18 15:54:40 2023 UTC | Thu May 18 15:54:40 2023 UTC | |
| Start GPS (detector 0) | 1368195223 | 1368195223 | 1368195223 | |
| End GPS (detector 0) | 1368460498 | 1368460498 | 1368460498 | |
| Used livetime (detector 0) | 60875 s | 60875 s | 60875 s | |
| Start Date (detector 1) | Mon May 15 14:13:25 2023 UTC | Mon May 15 14:13:25 2023 UTC | Mon May 15 14:13:25 2023 UTC | |
| End Date (detector 1) | Thu May 18 15:54:40 2023 UTC | Thu May 18 15:54:40 2023 UTC | Thu May 18 15:54:40 2023 UTC | |
| Start GPS (detector 1) | 1368195223 | 1368195223 | 1368195223 | |
| End GPS (detector 1) | 1368460498 | 1368460498 | 1368460498 | |
| Used livetime (detector 1) | 60875 s | 60875 s | 60875 s | |
| Cumulative livetime | 121110 s | 121110 s | 26038650 s | |
| 0 years, 1 days, 9 hours, 38 min, 30 s | 0 years, 1 days, 9 hours, 38 min, 30 s | 0 years, 301 days, 8 hours, 57 min, 30 s |
|
|
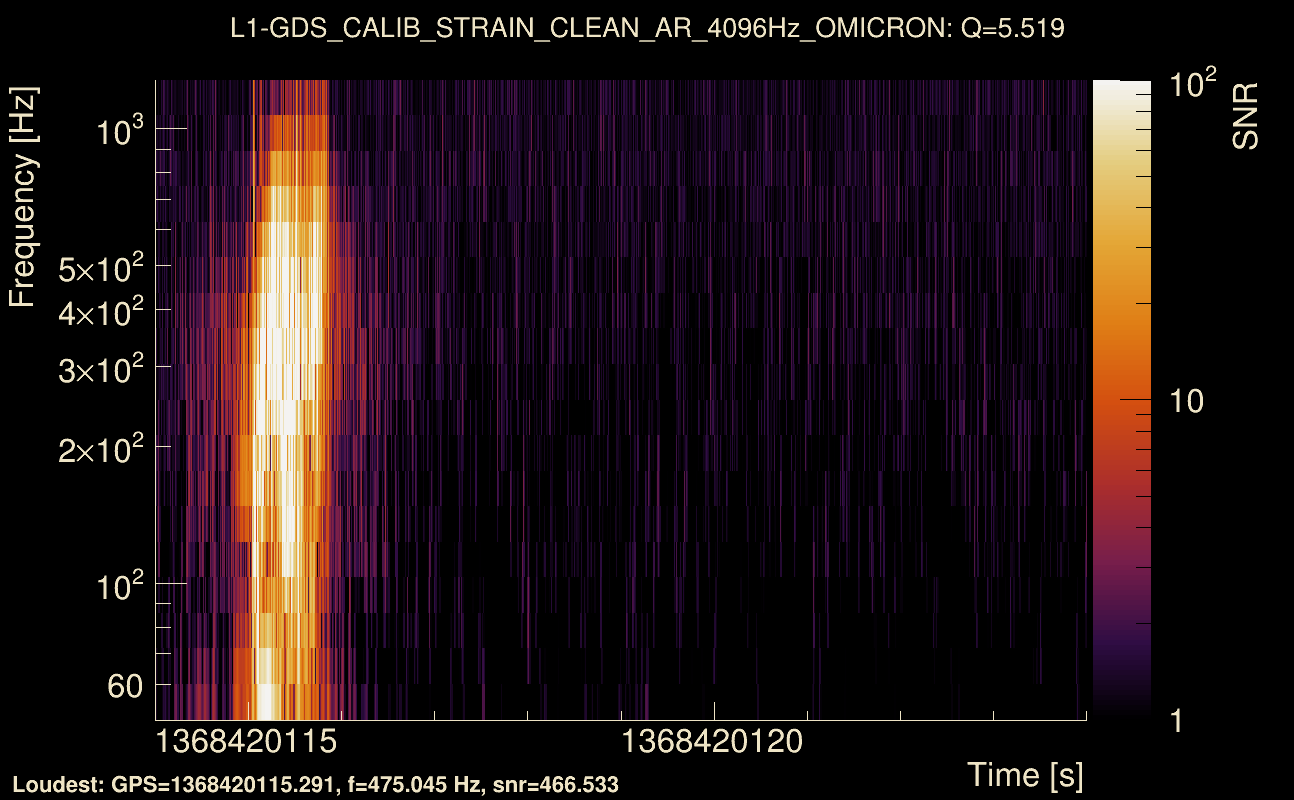
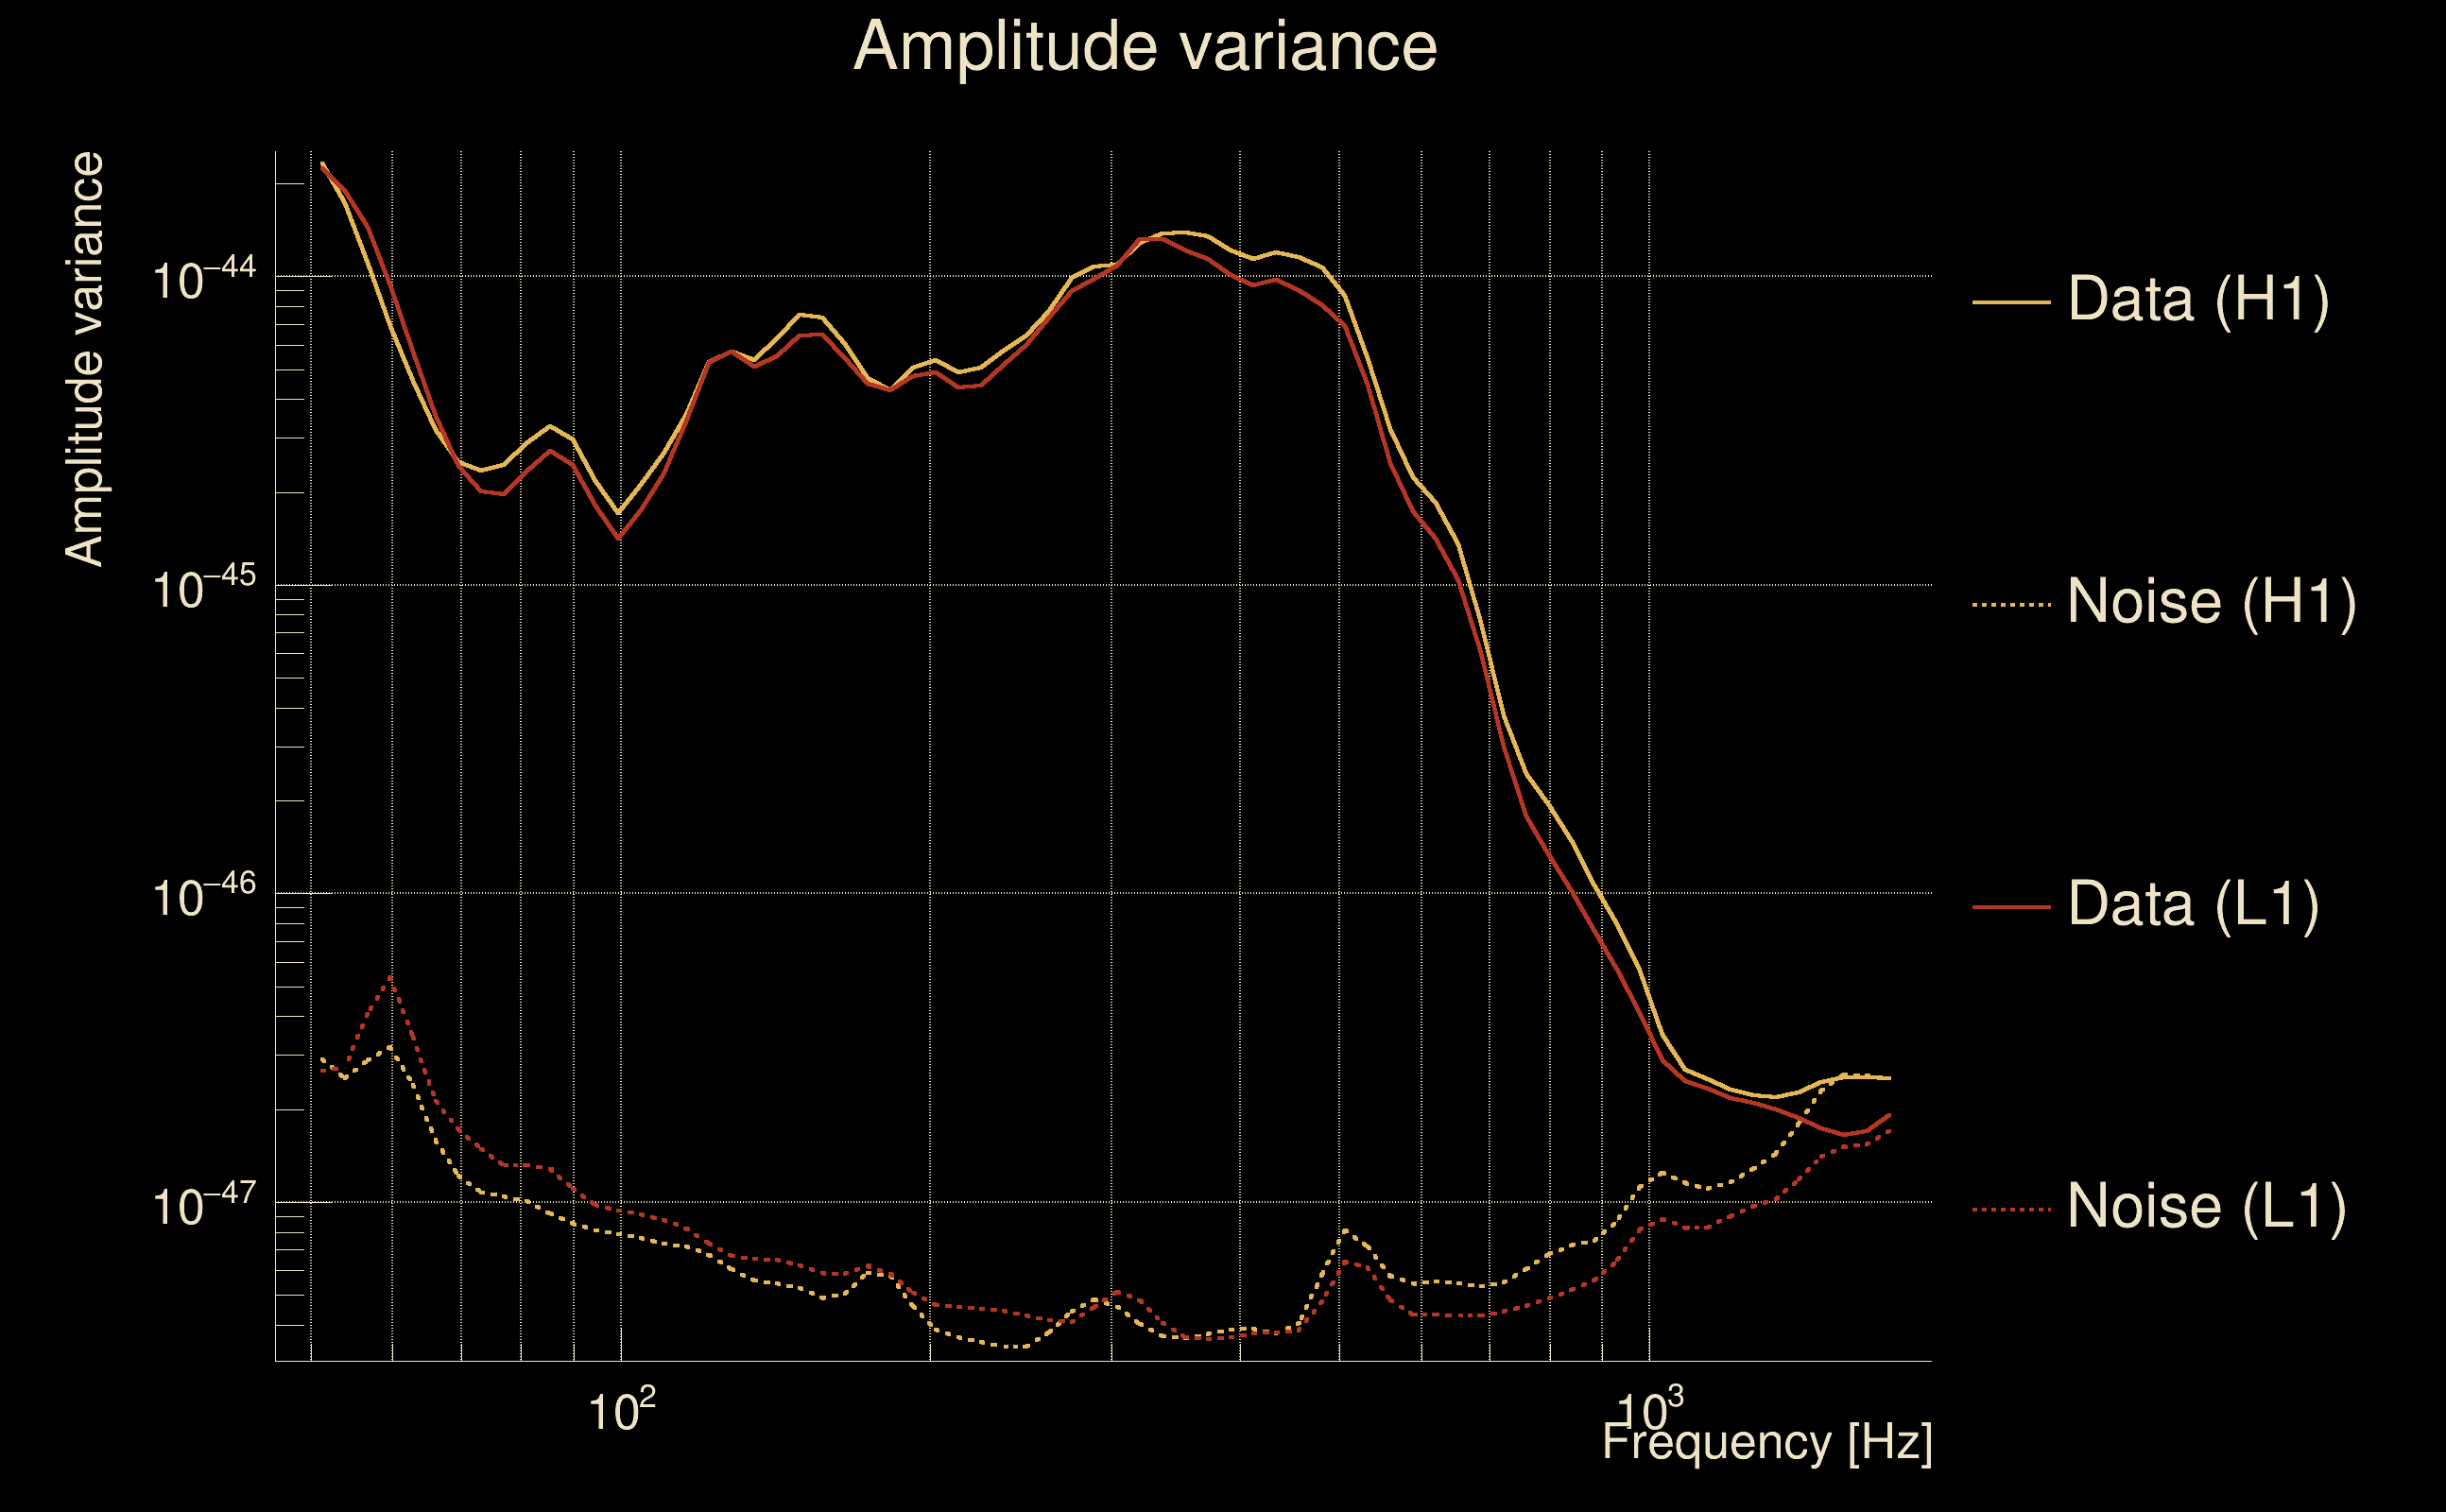
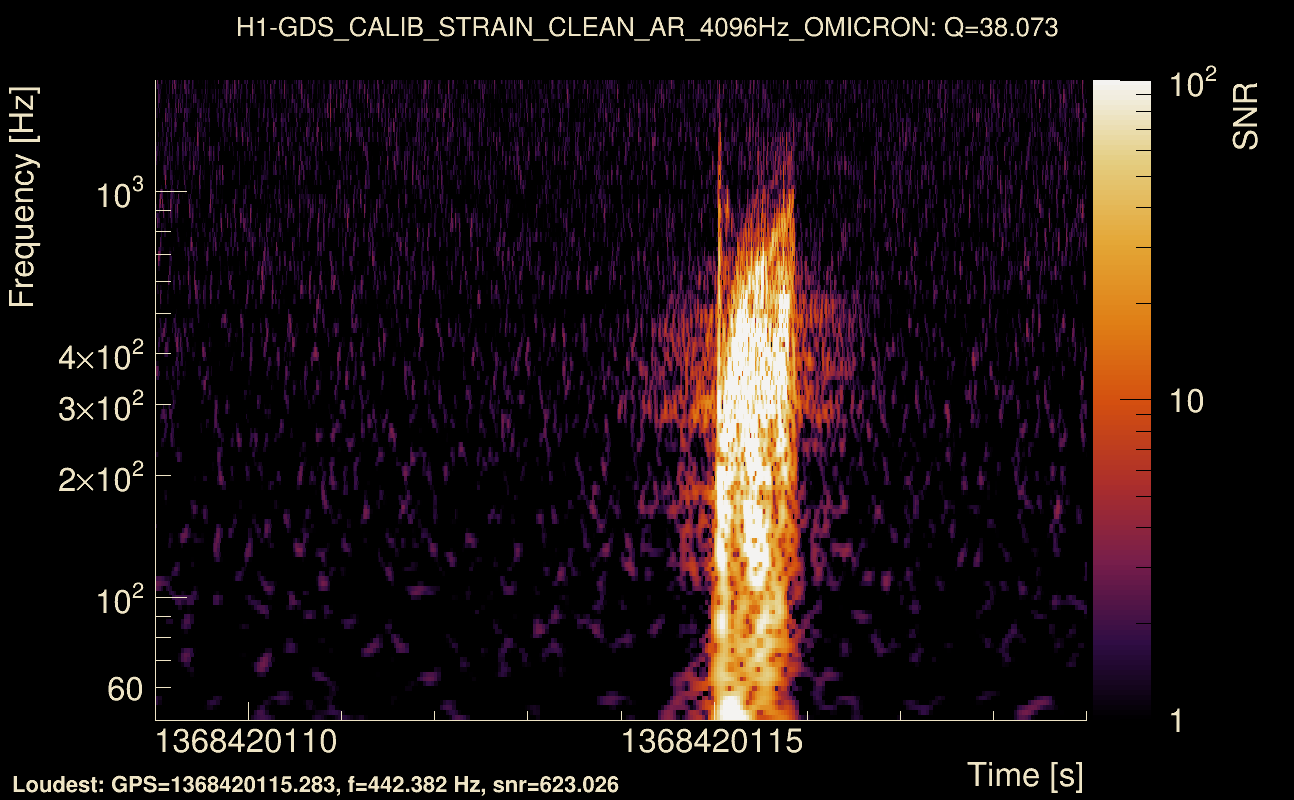
| Event time t(H1): | GPS = 1368420114 (Thu May 18 04:41:36 2023 ) → GPS = 1368420124 (Thu May 18 04:41:46 2023 ) |
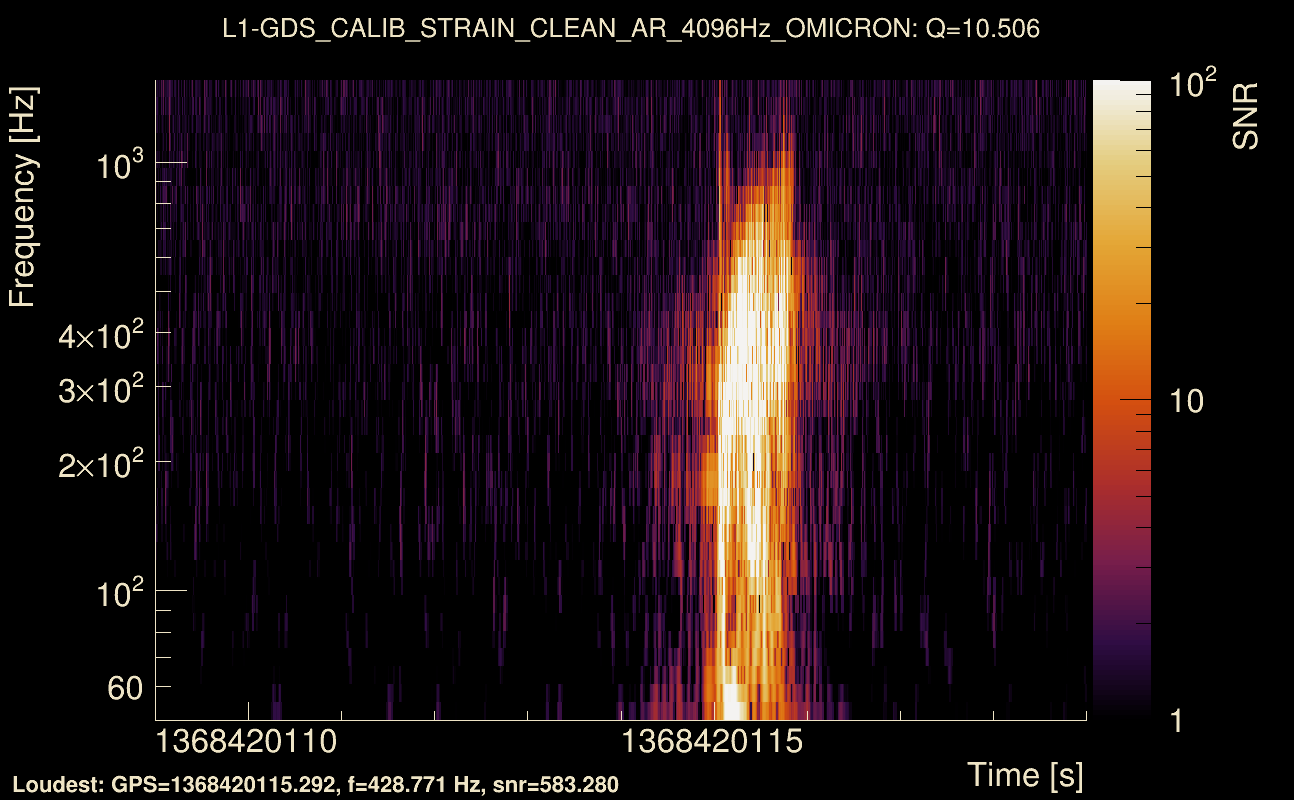
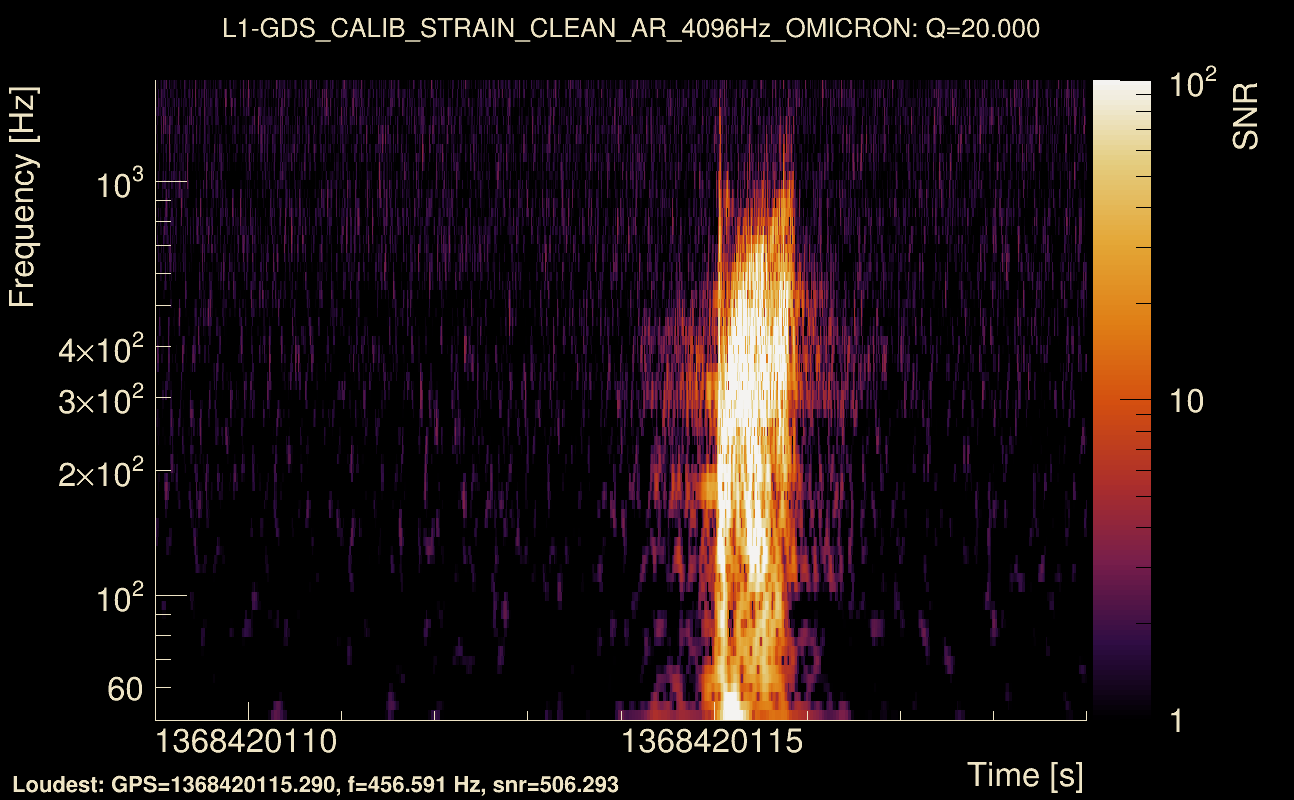
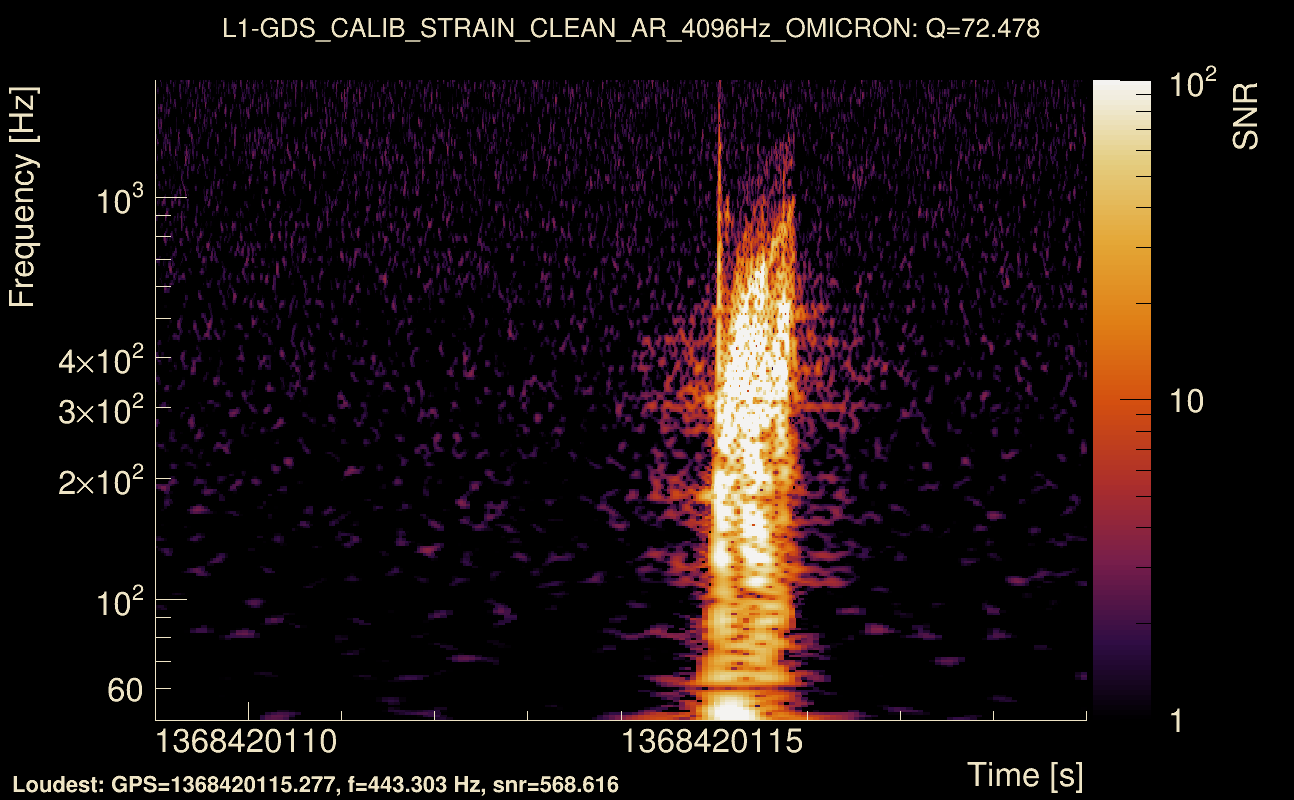
| Event time t(L1): | GPS = 1368420114 (Thu May 18 04:41:46 2023 ) → GPS = 1368420124 (Thu May 18 04:41:46 2023 ) |
| Omicron analysis time window (H1): | GPS = 1368420111 → GPS = 1368420127 |
| Omicron analysis time window (L1): | GPS = 1368420111 → GPS = 1368420127 |
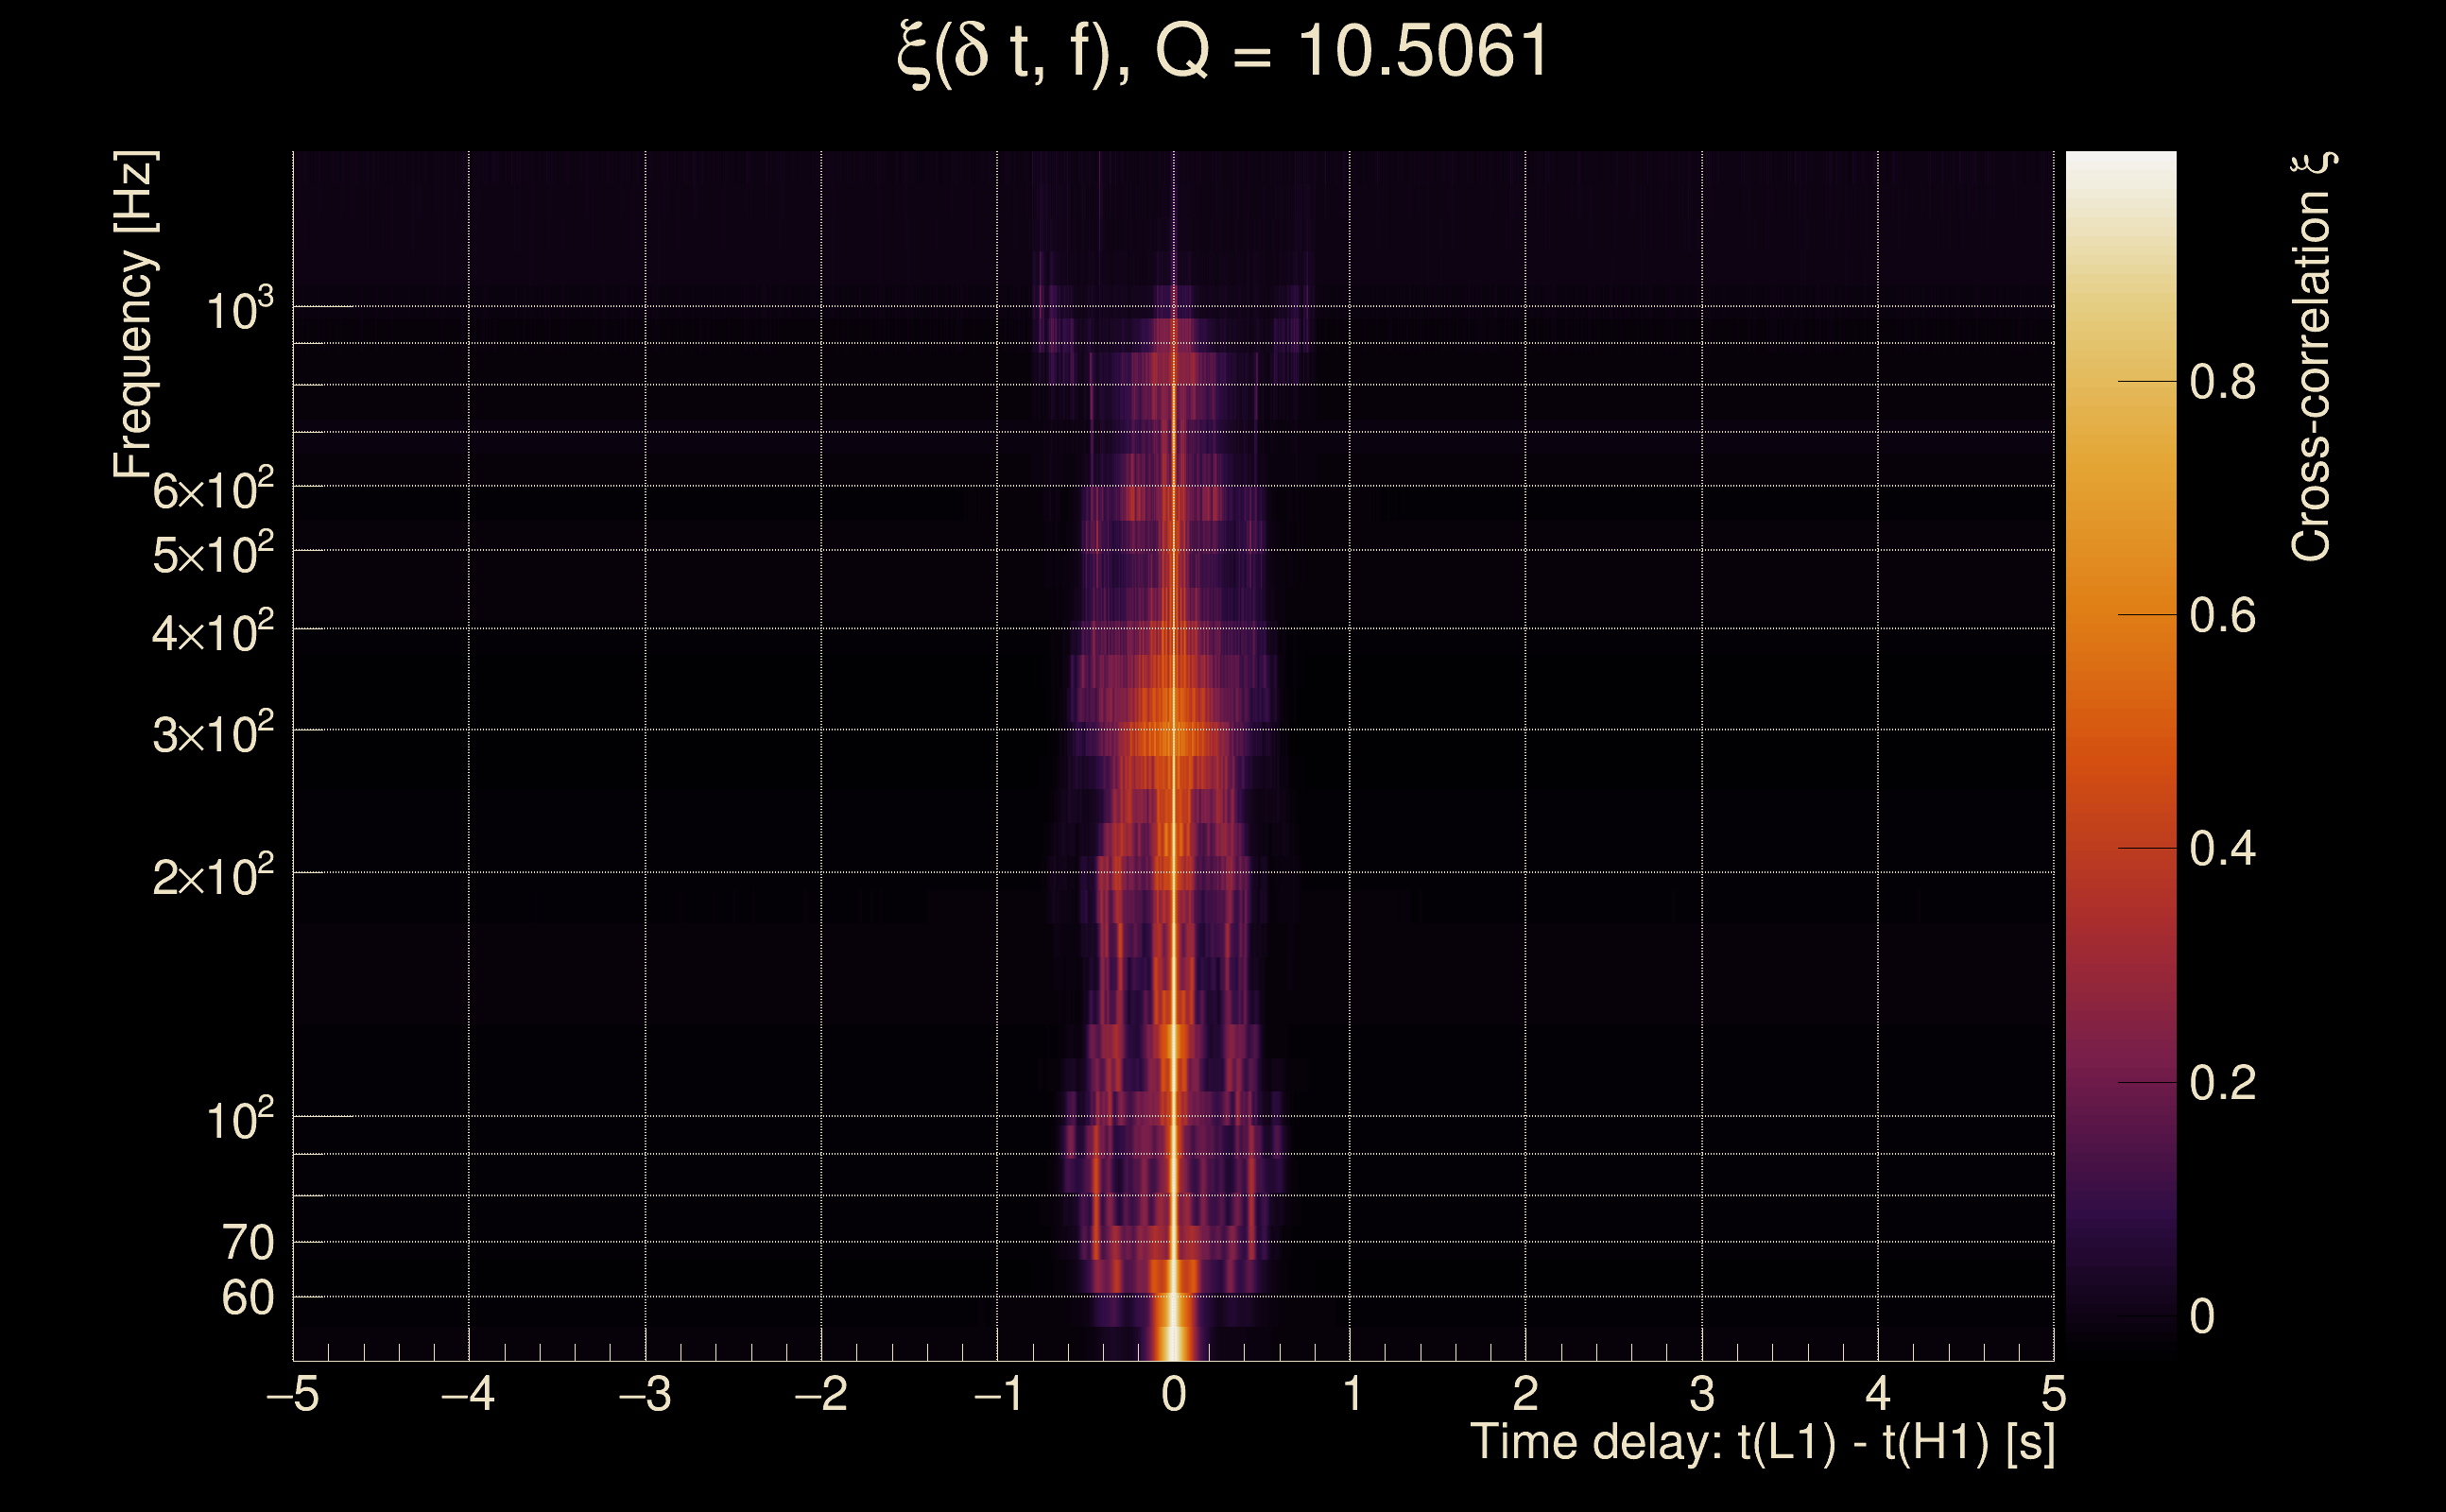
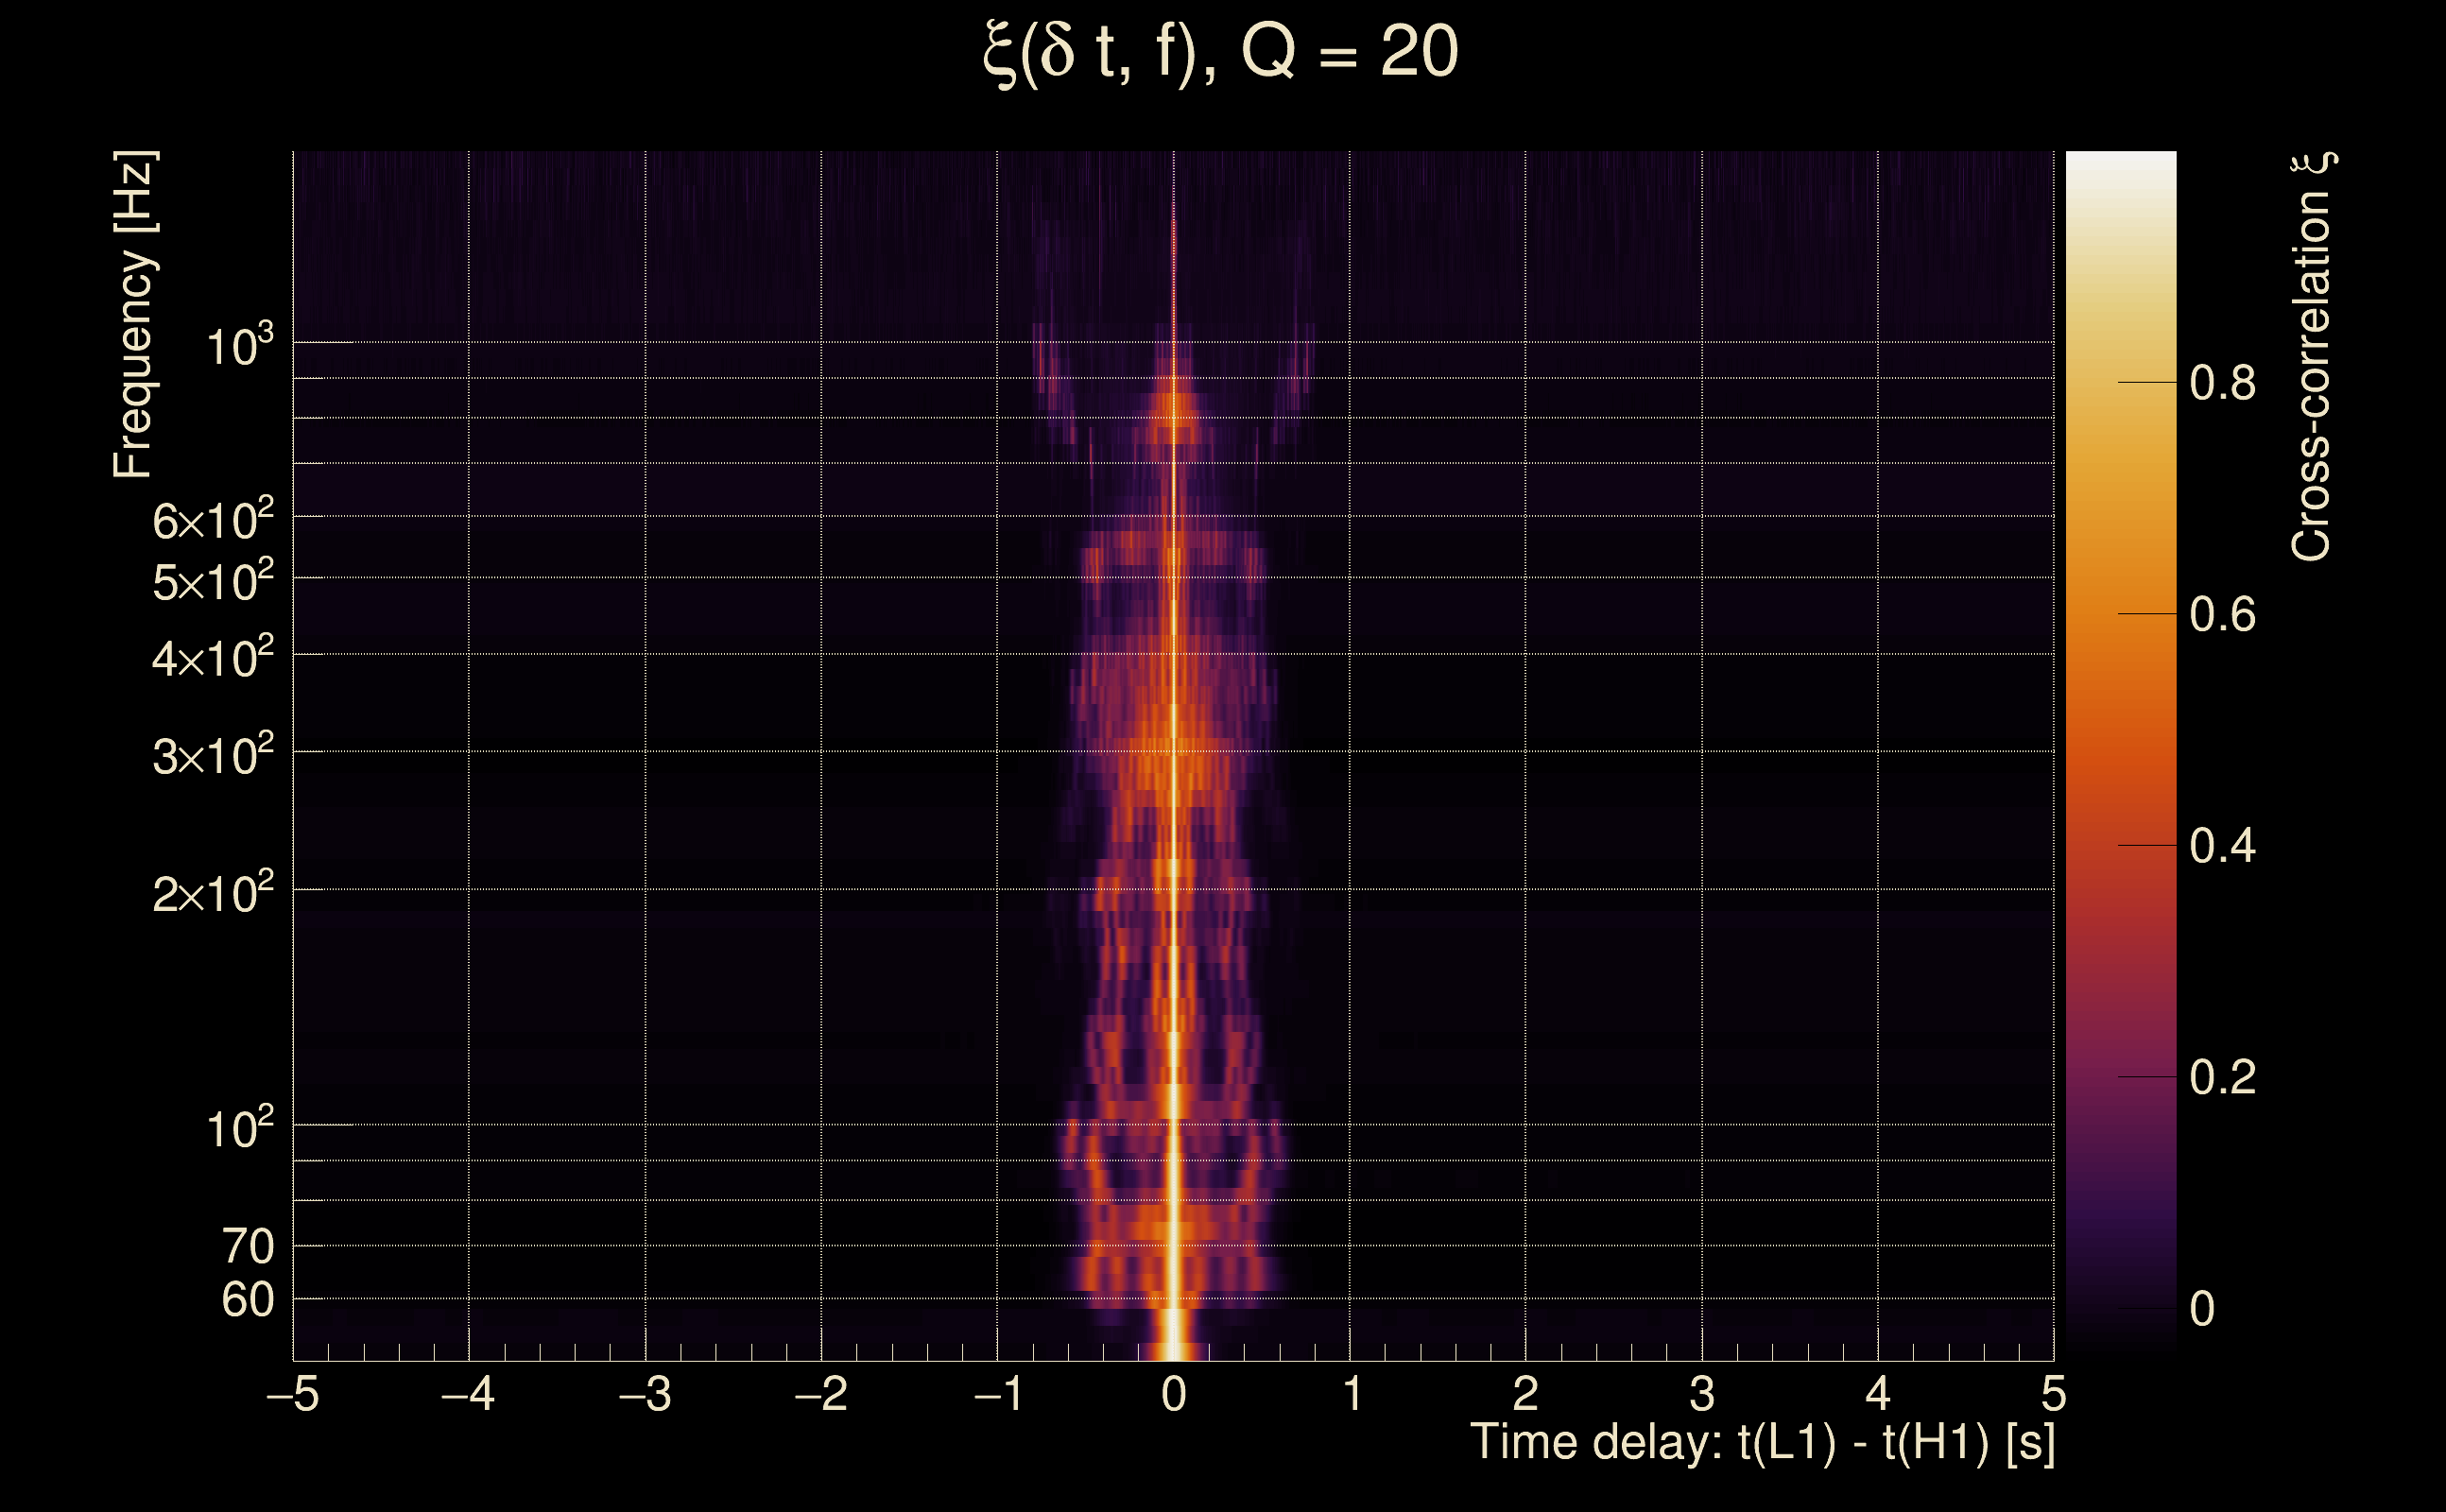
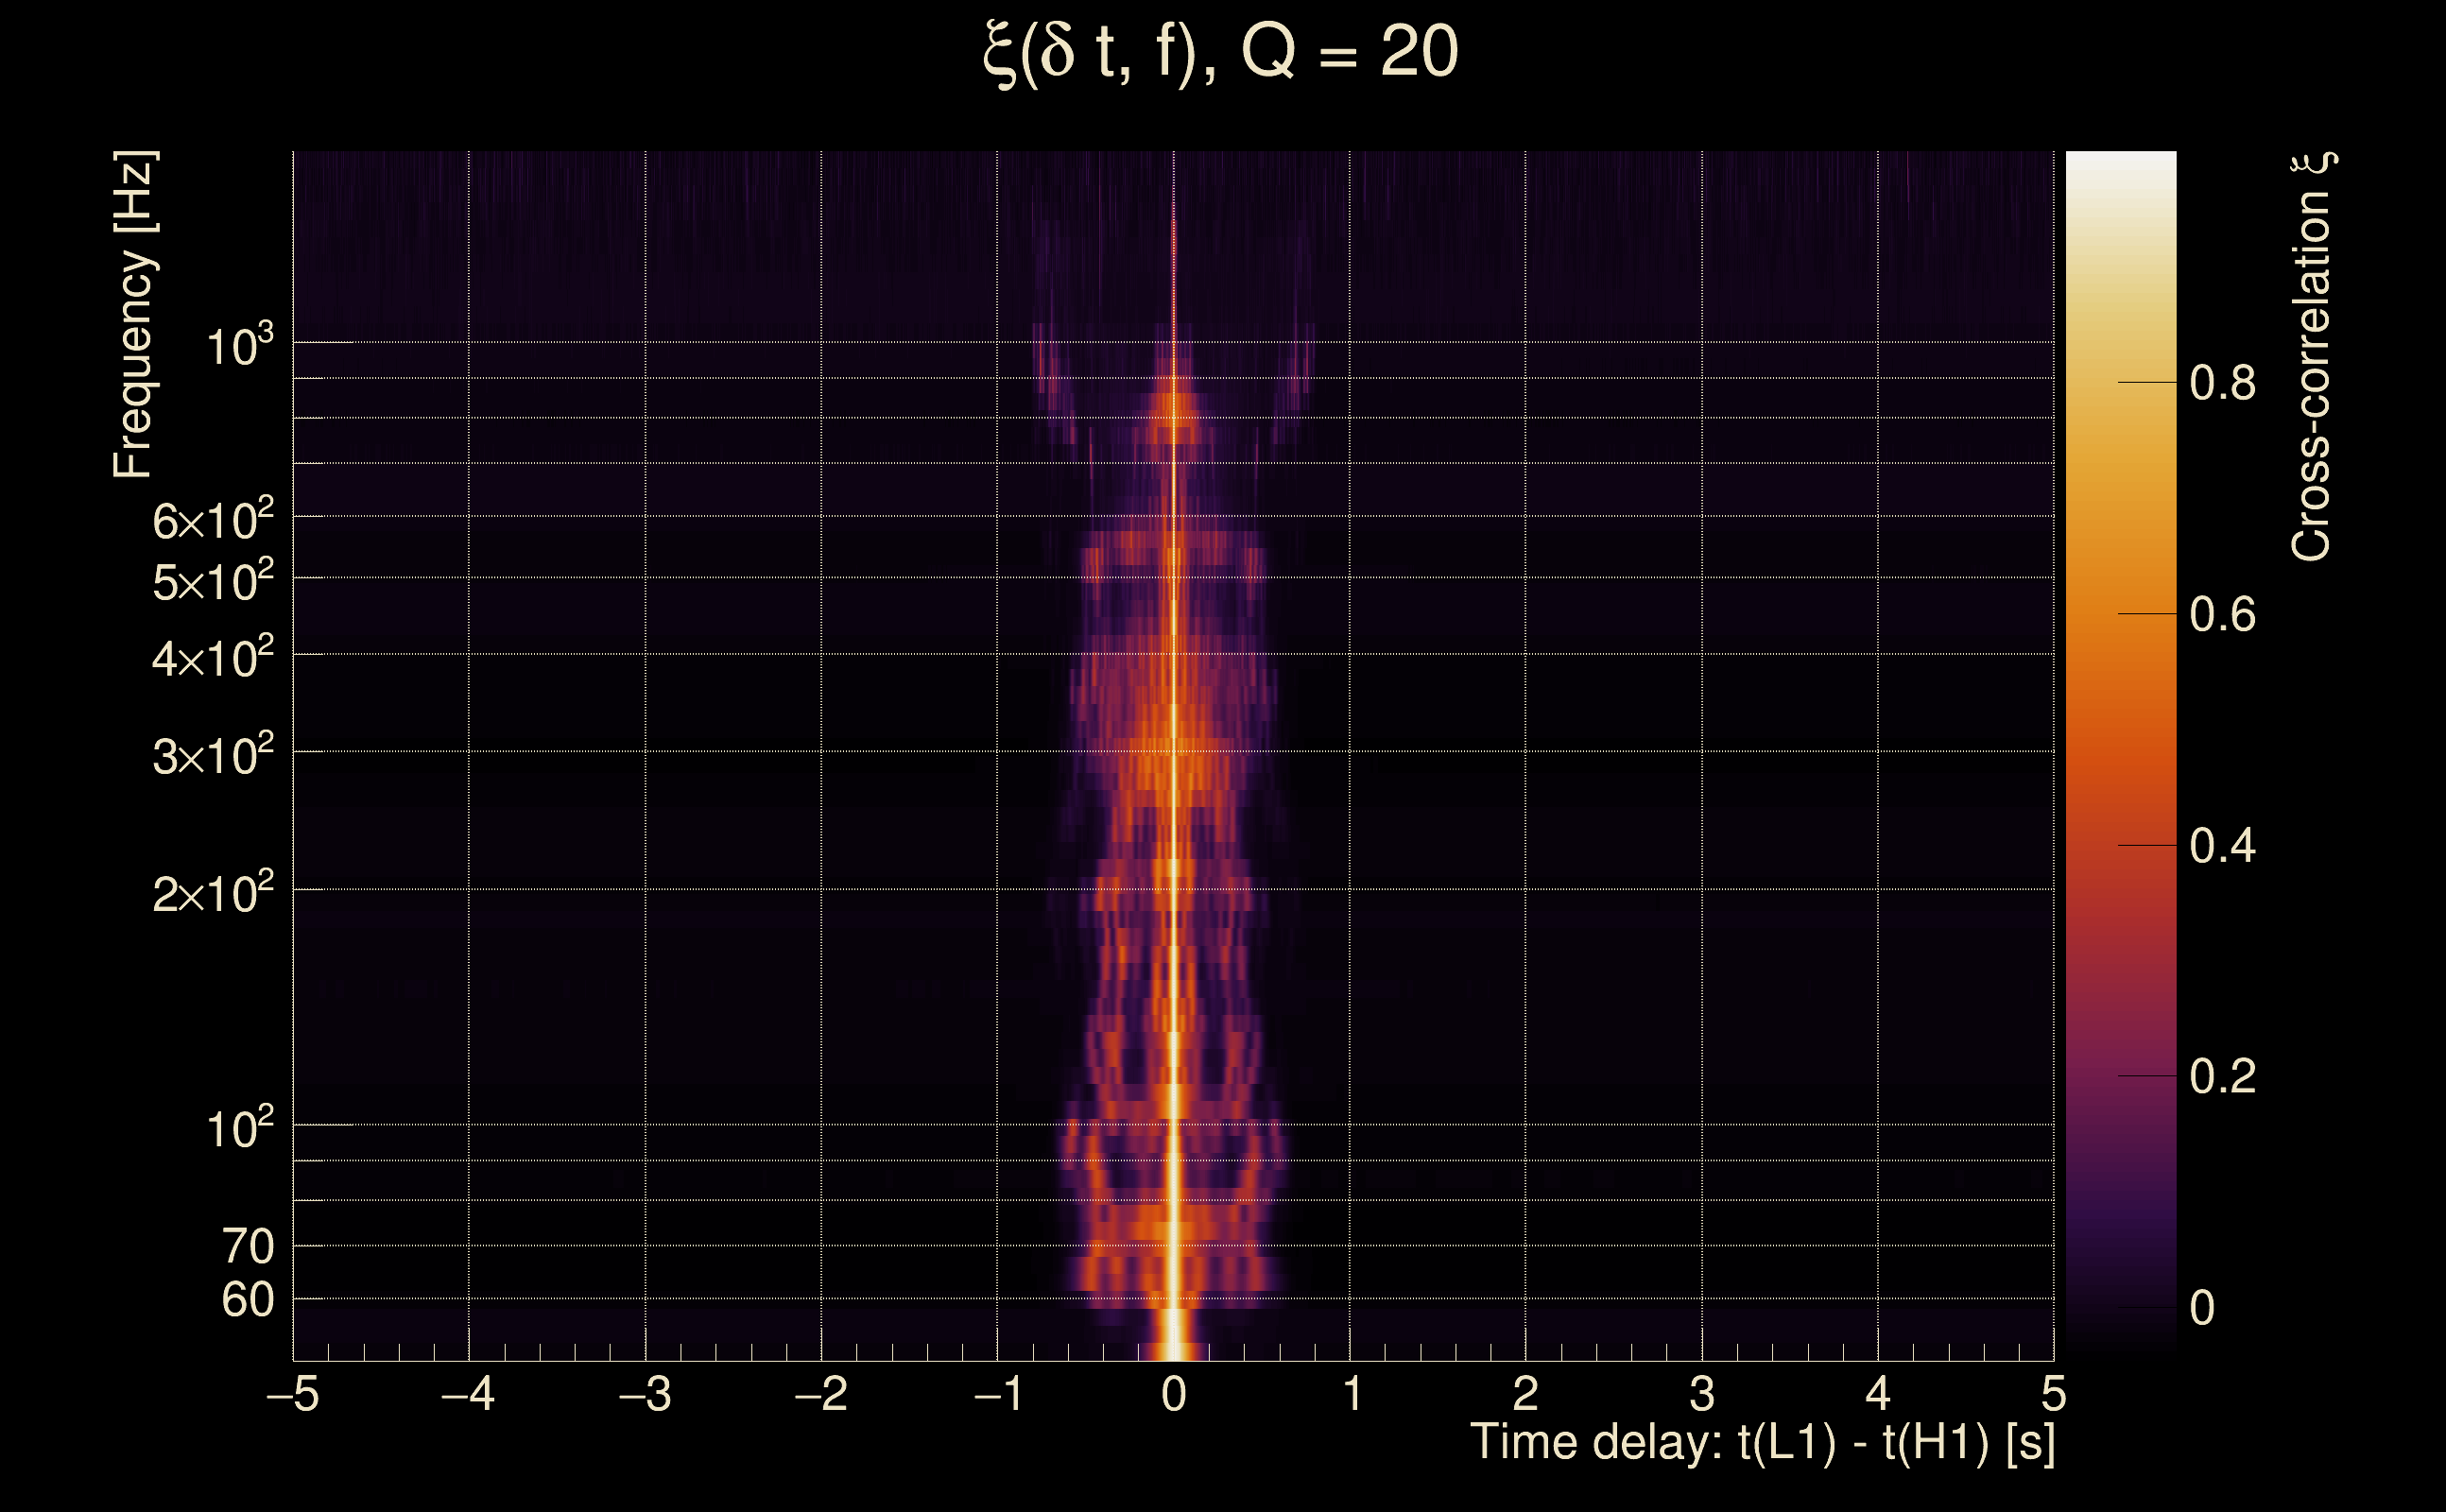
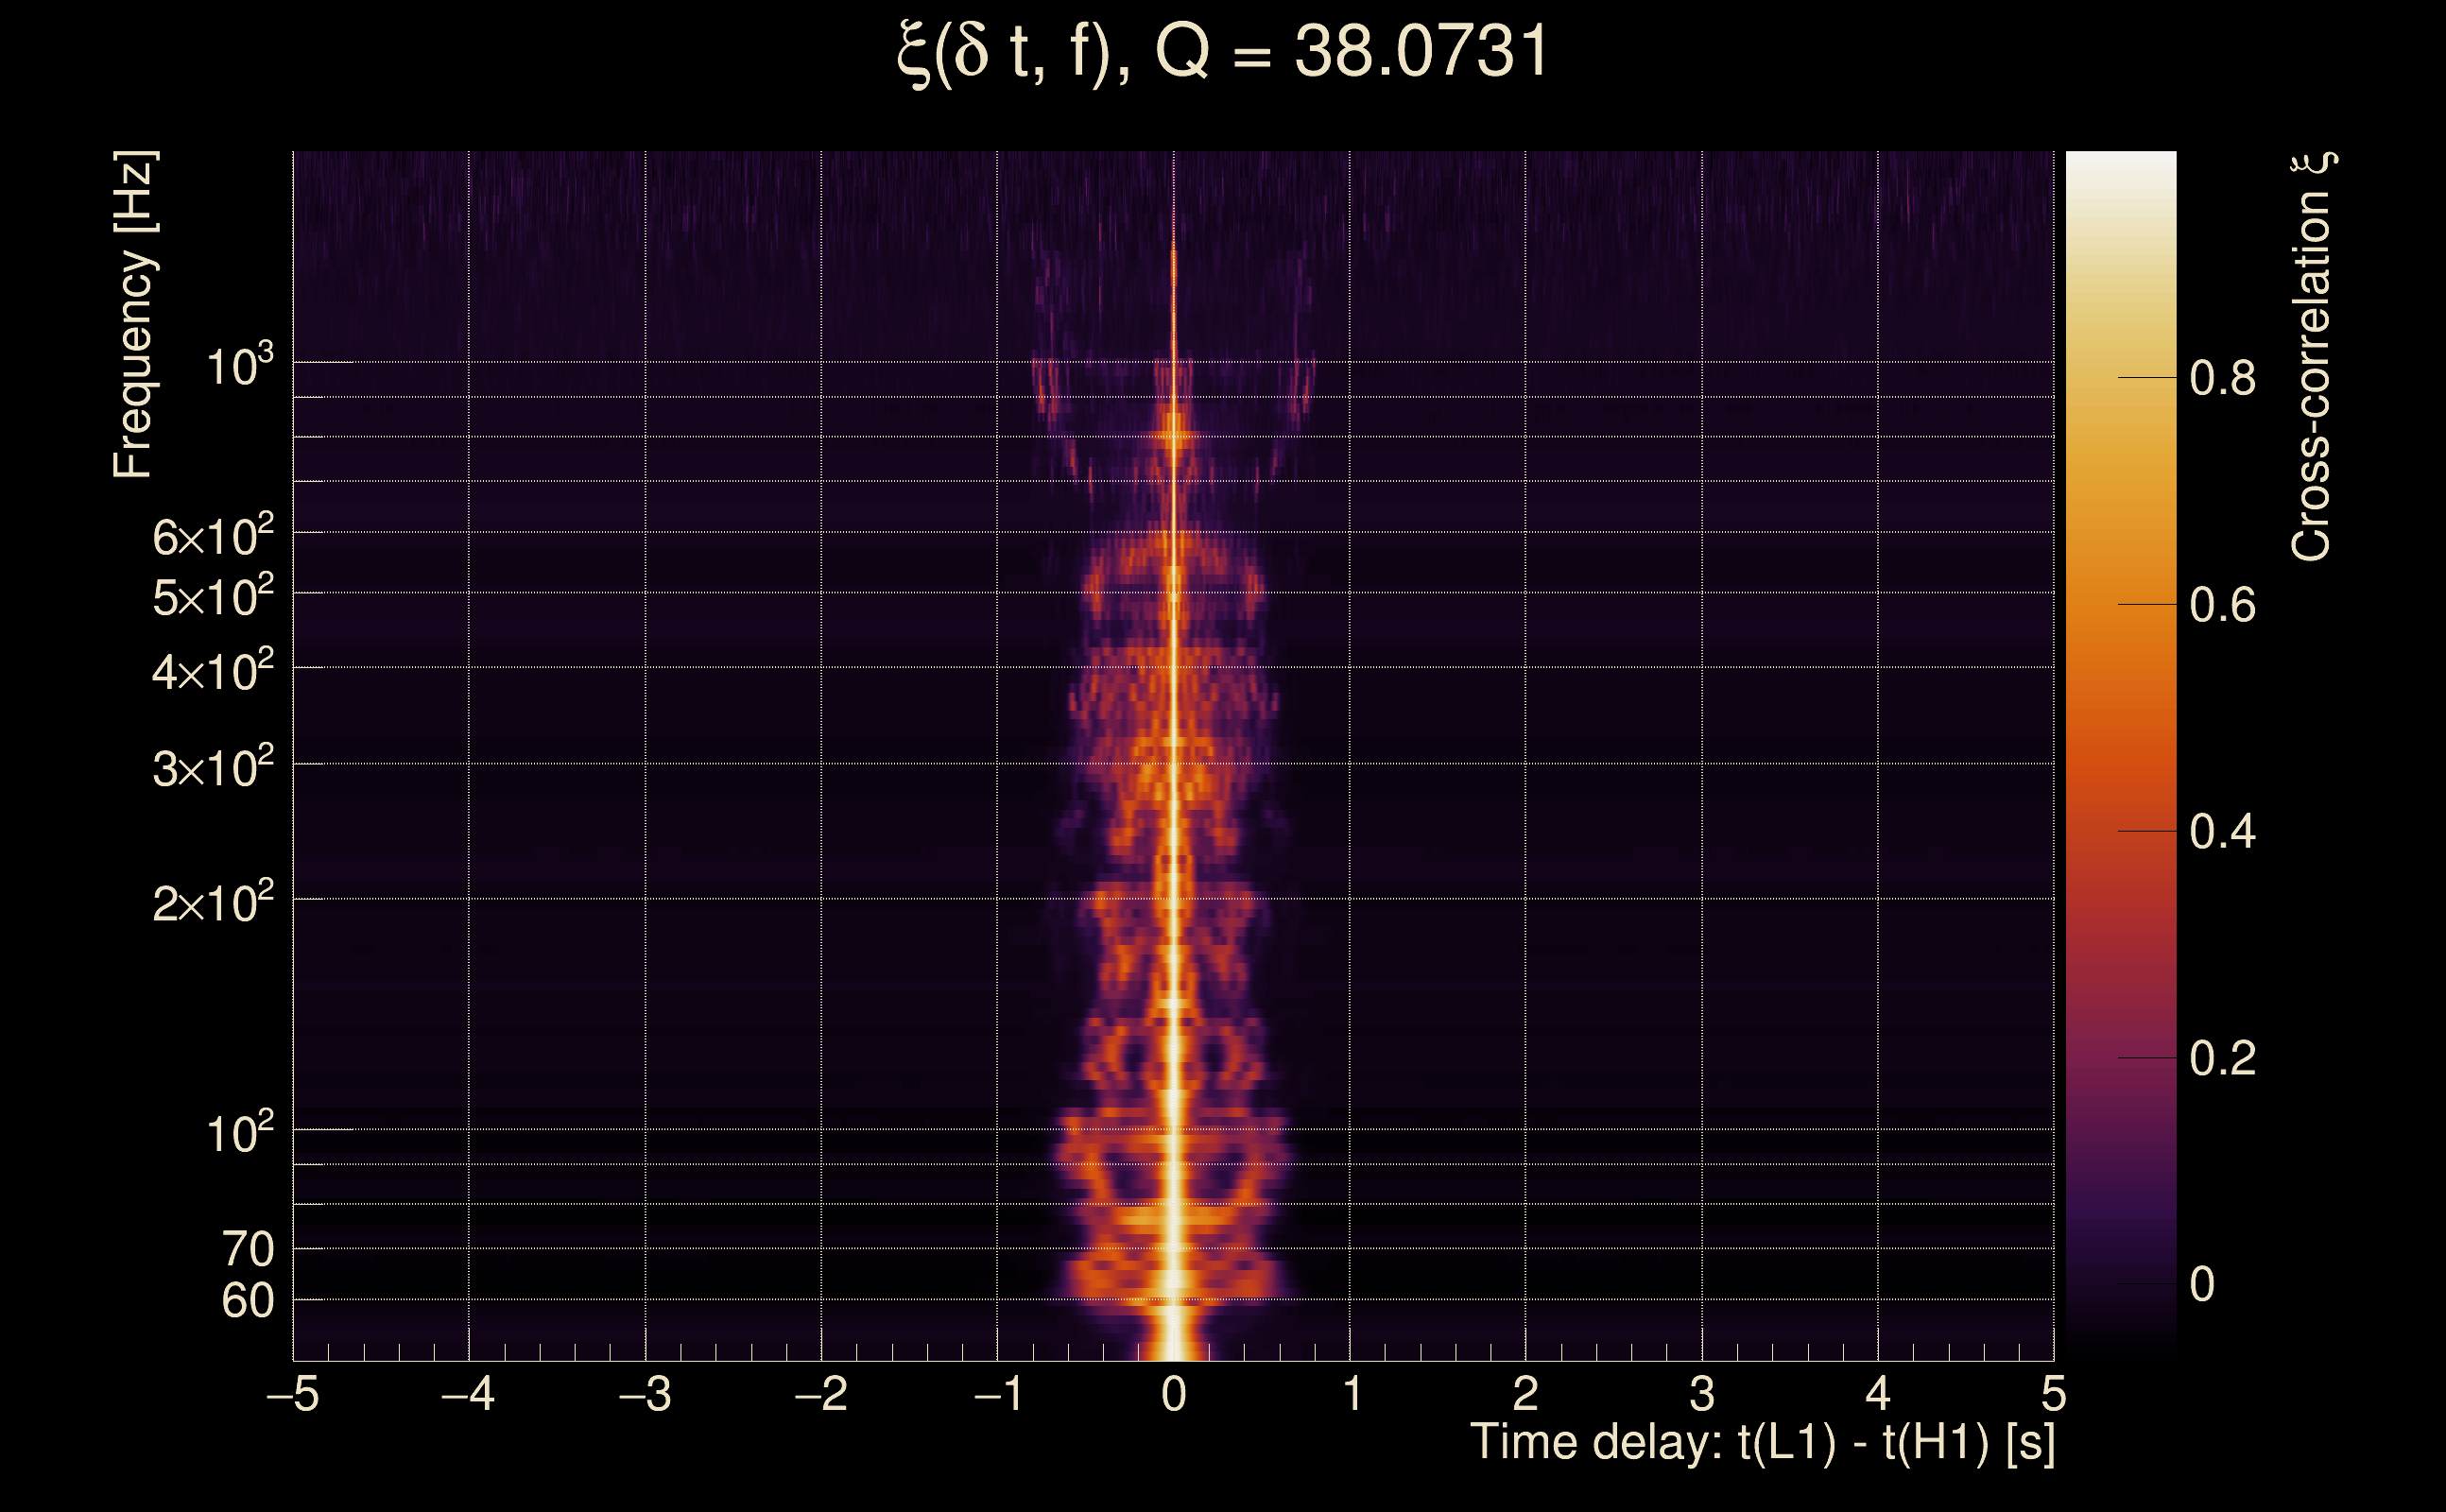
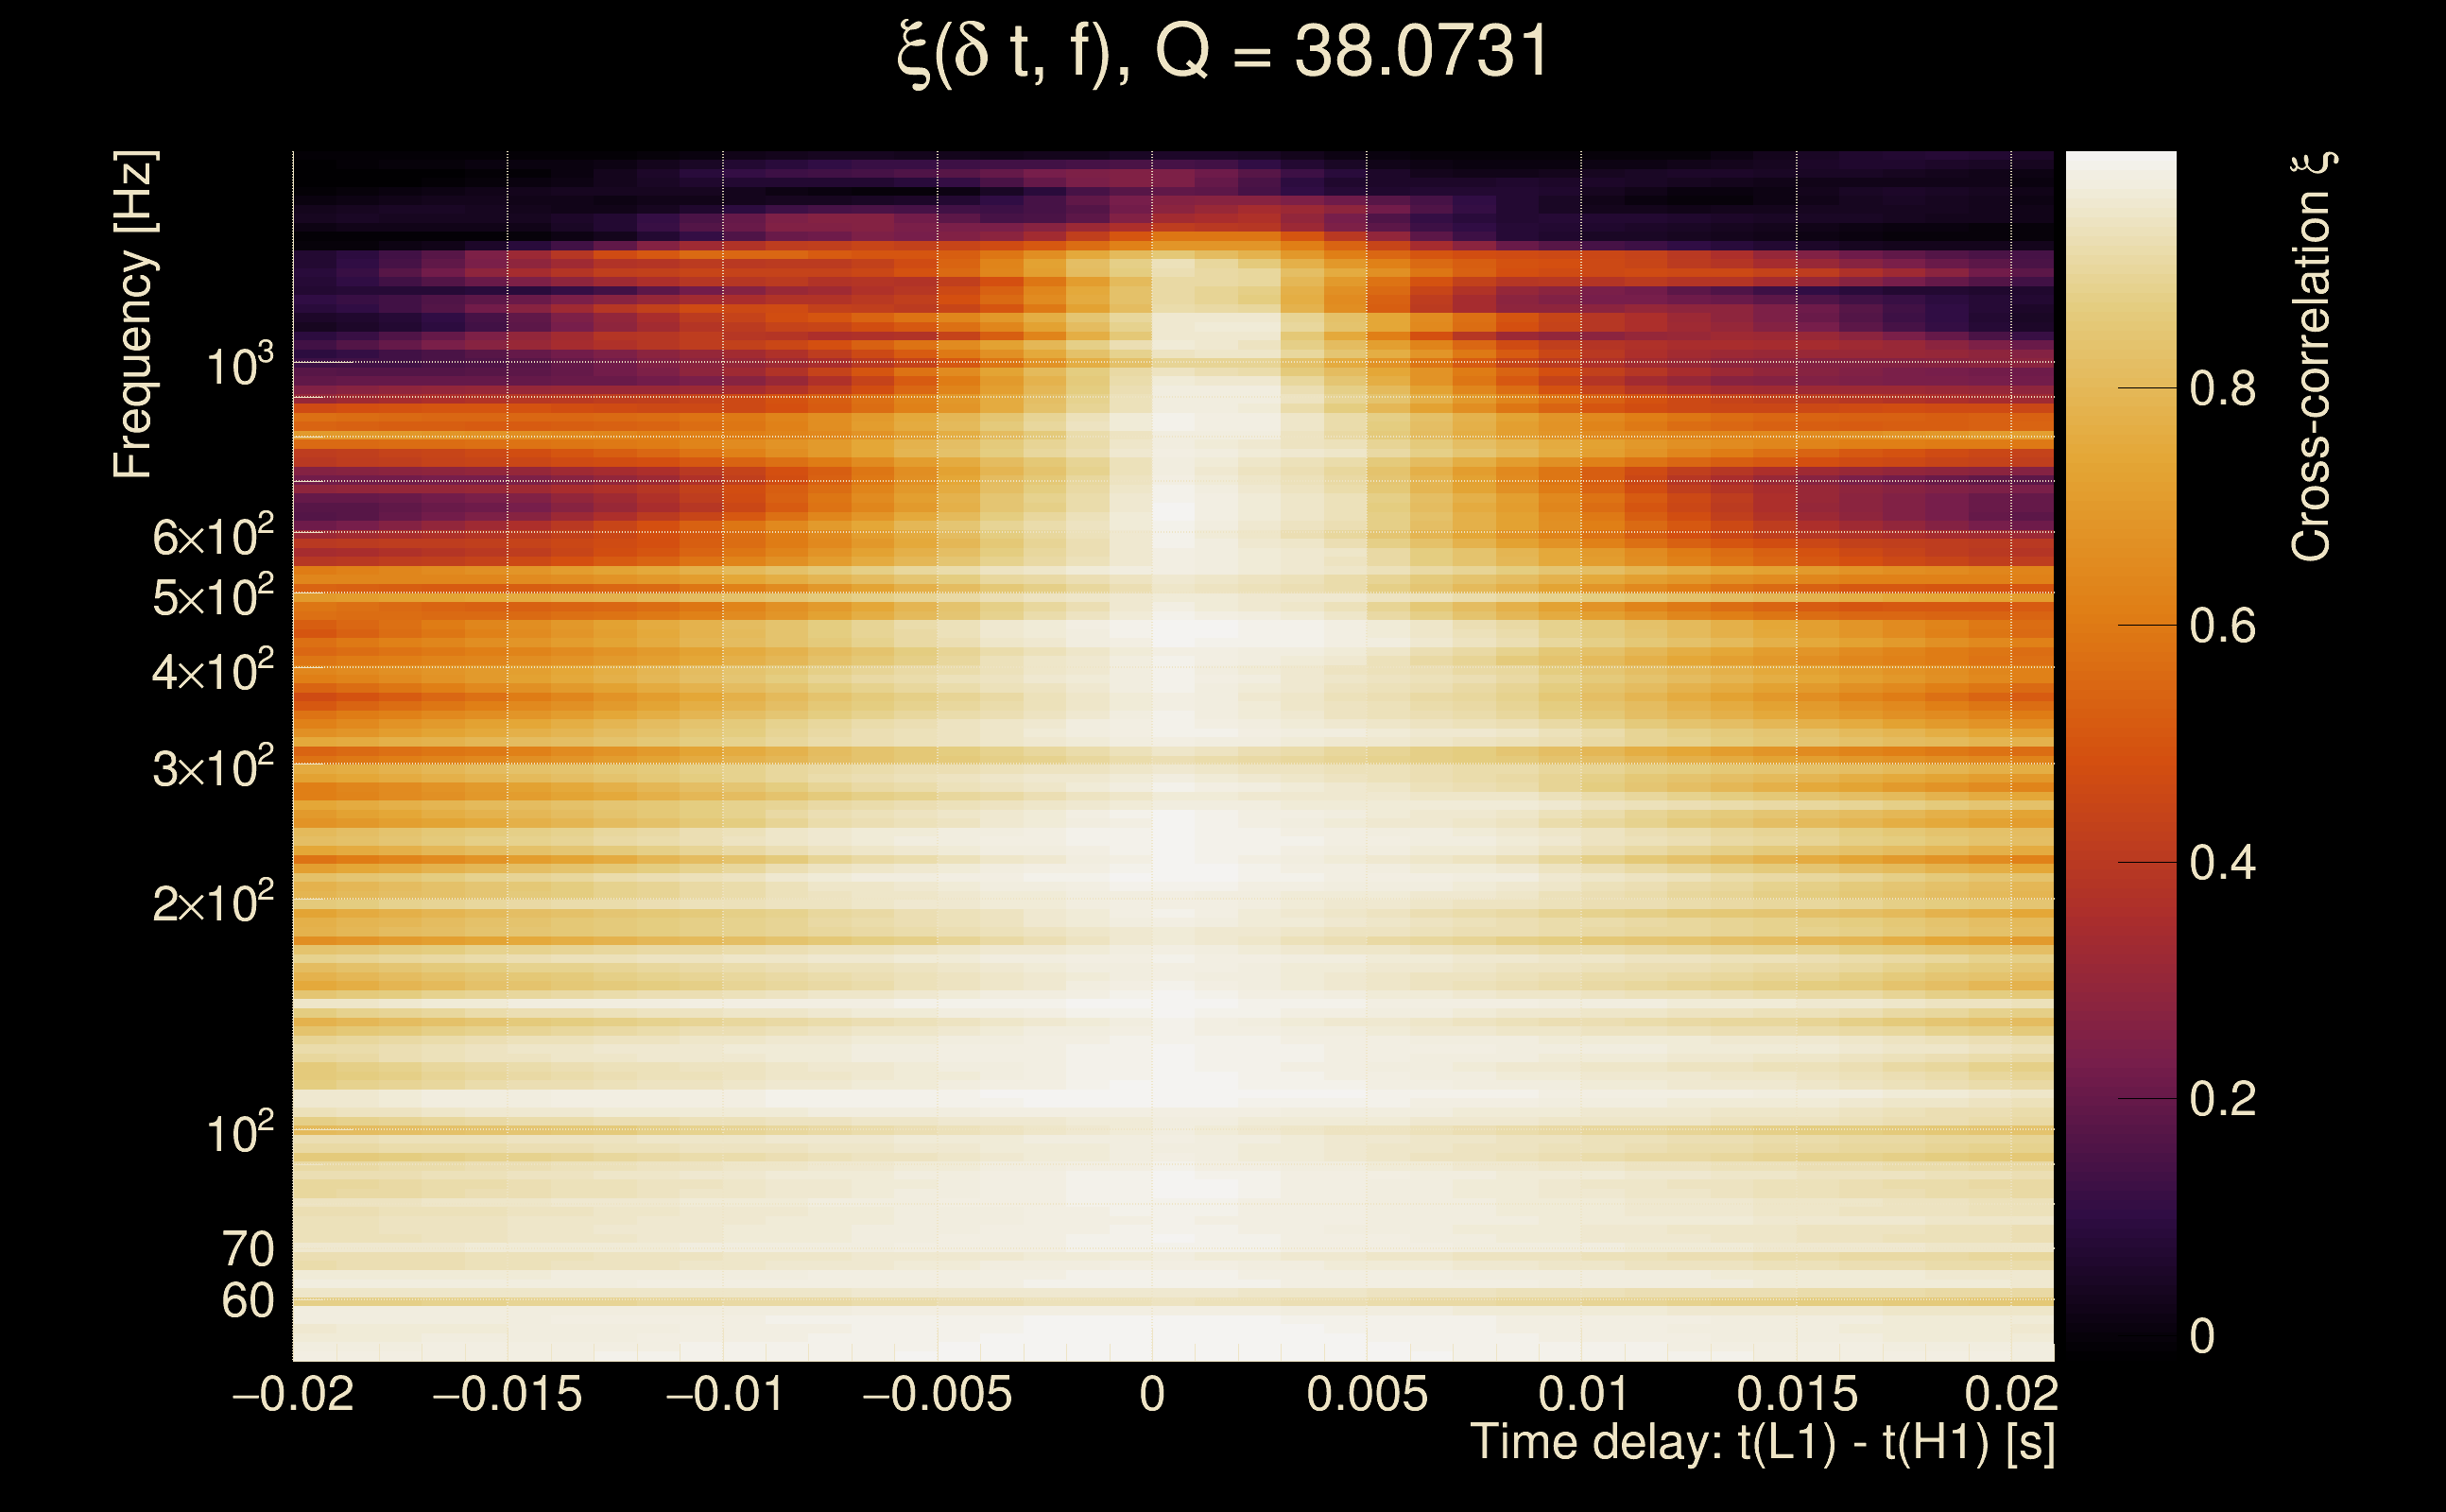
| Time delay between detectors t(L1) - t(H1): | 0.000881593 s (slice index = 108 / 217), δt_gw = 0.000881593 s |
| Time delay standard deviation: | 0.0196608 s |
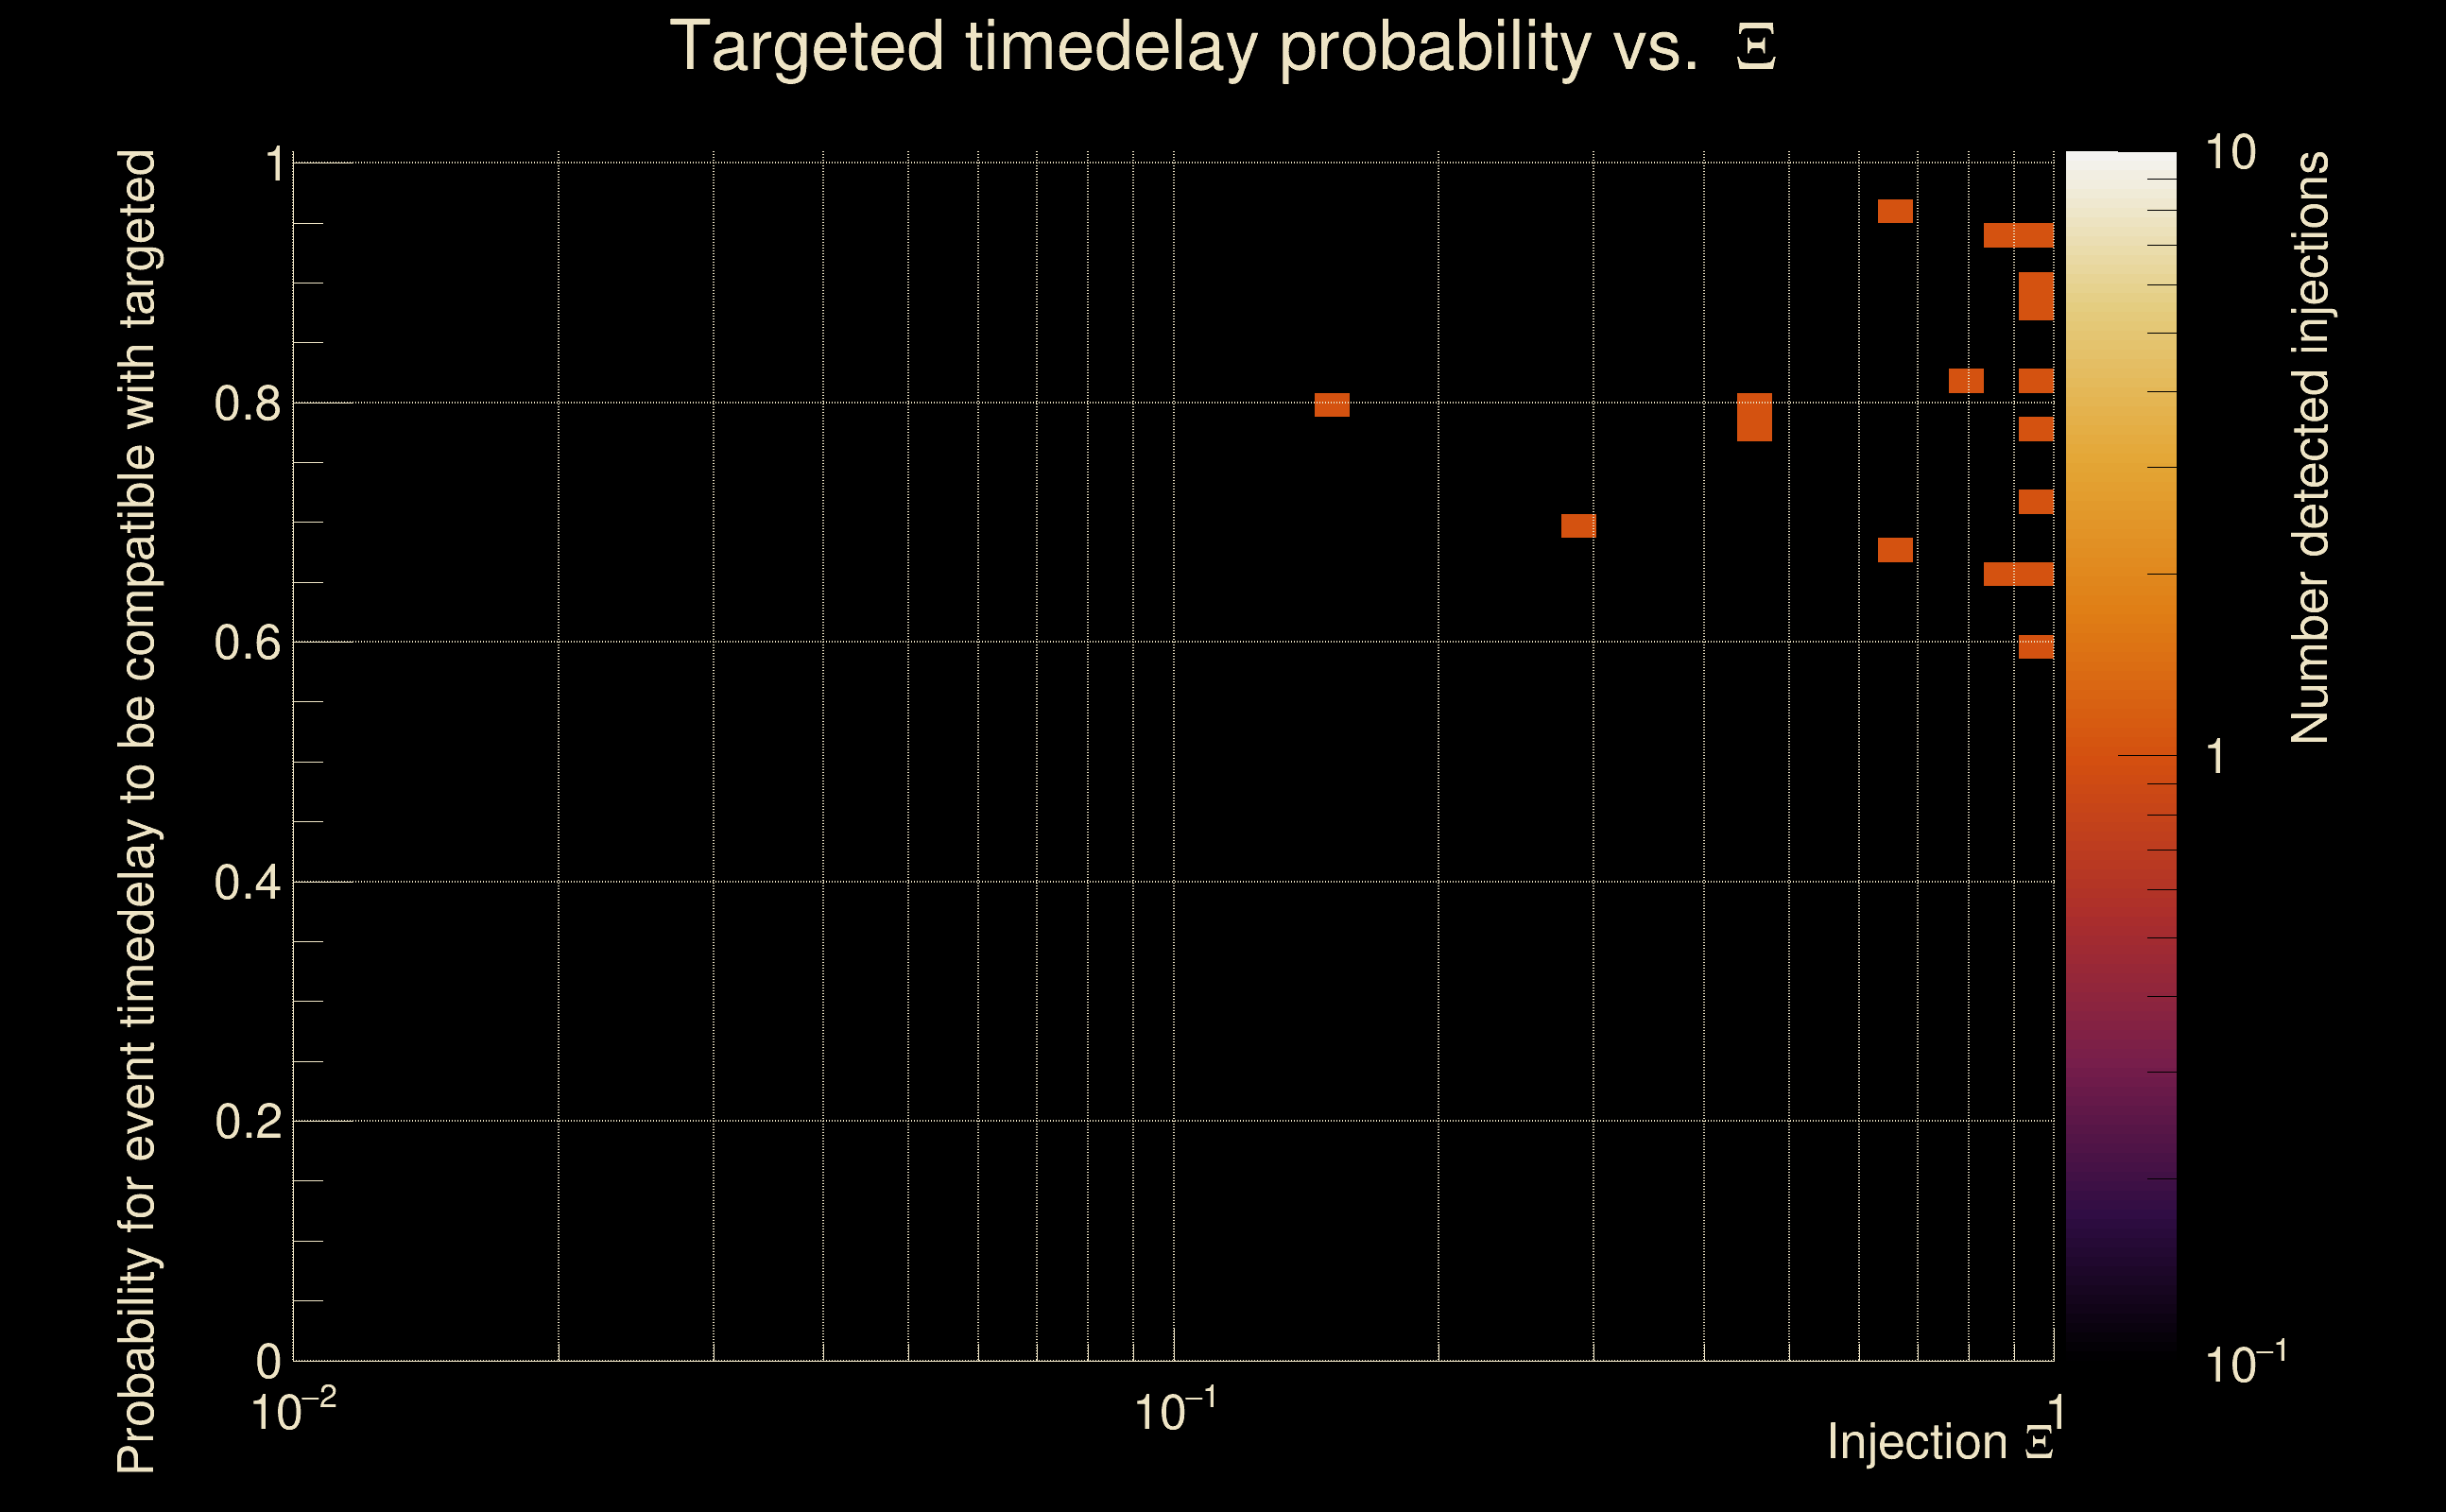
| [targeted mode] Time delay probability: | 0.972609 (0.0343359 sigmas), δt_target = 1.72247e+45 s |
| Frequency: | 266.899 Hz |
| Ξ: | 0.96129 ± 0.001588 (variance = 2.52173e-06): Q0: 0.967951, Q1: 0.972415, Q2: 0.970107, Q3: 0.968815, Q4: 0.971093 |
| Rank: | R_A = 0.874792 |
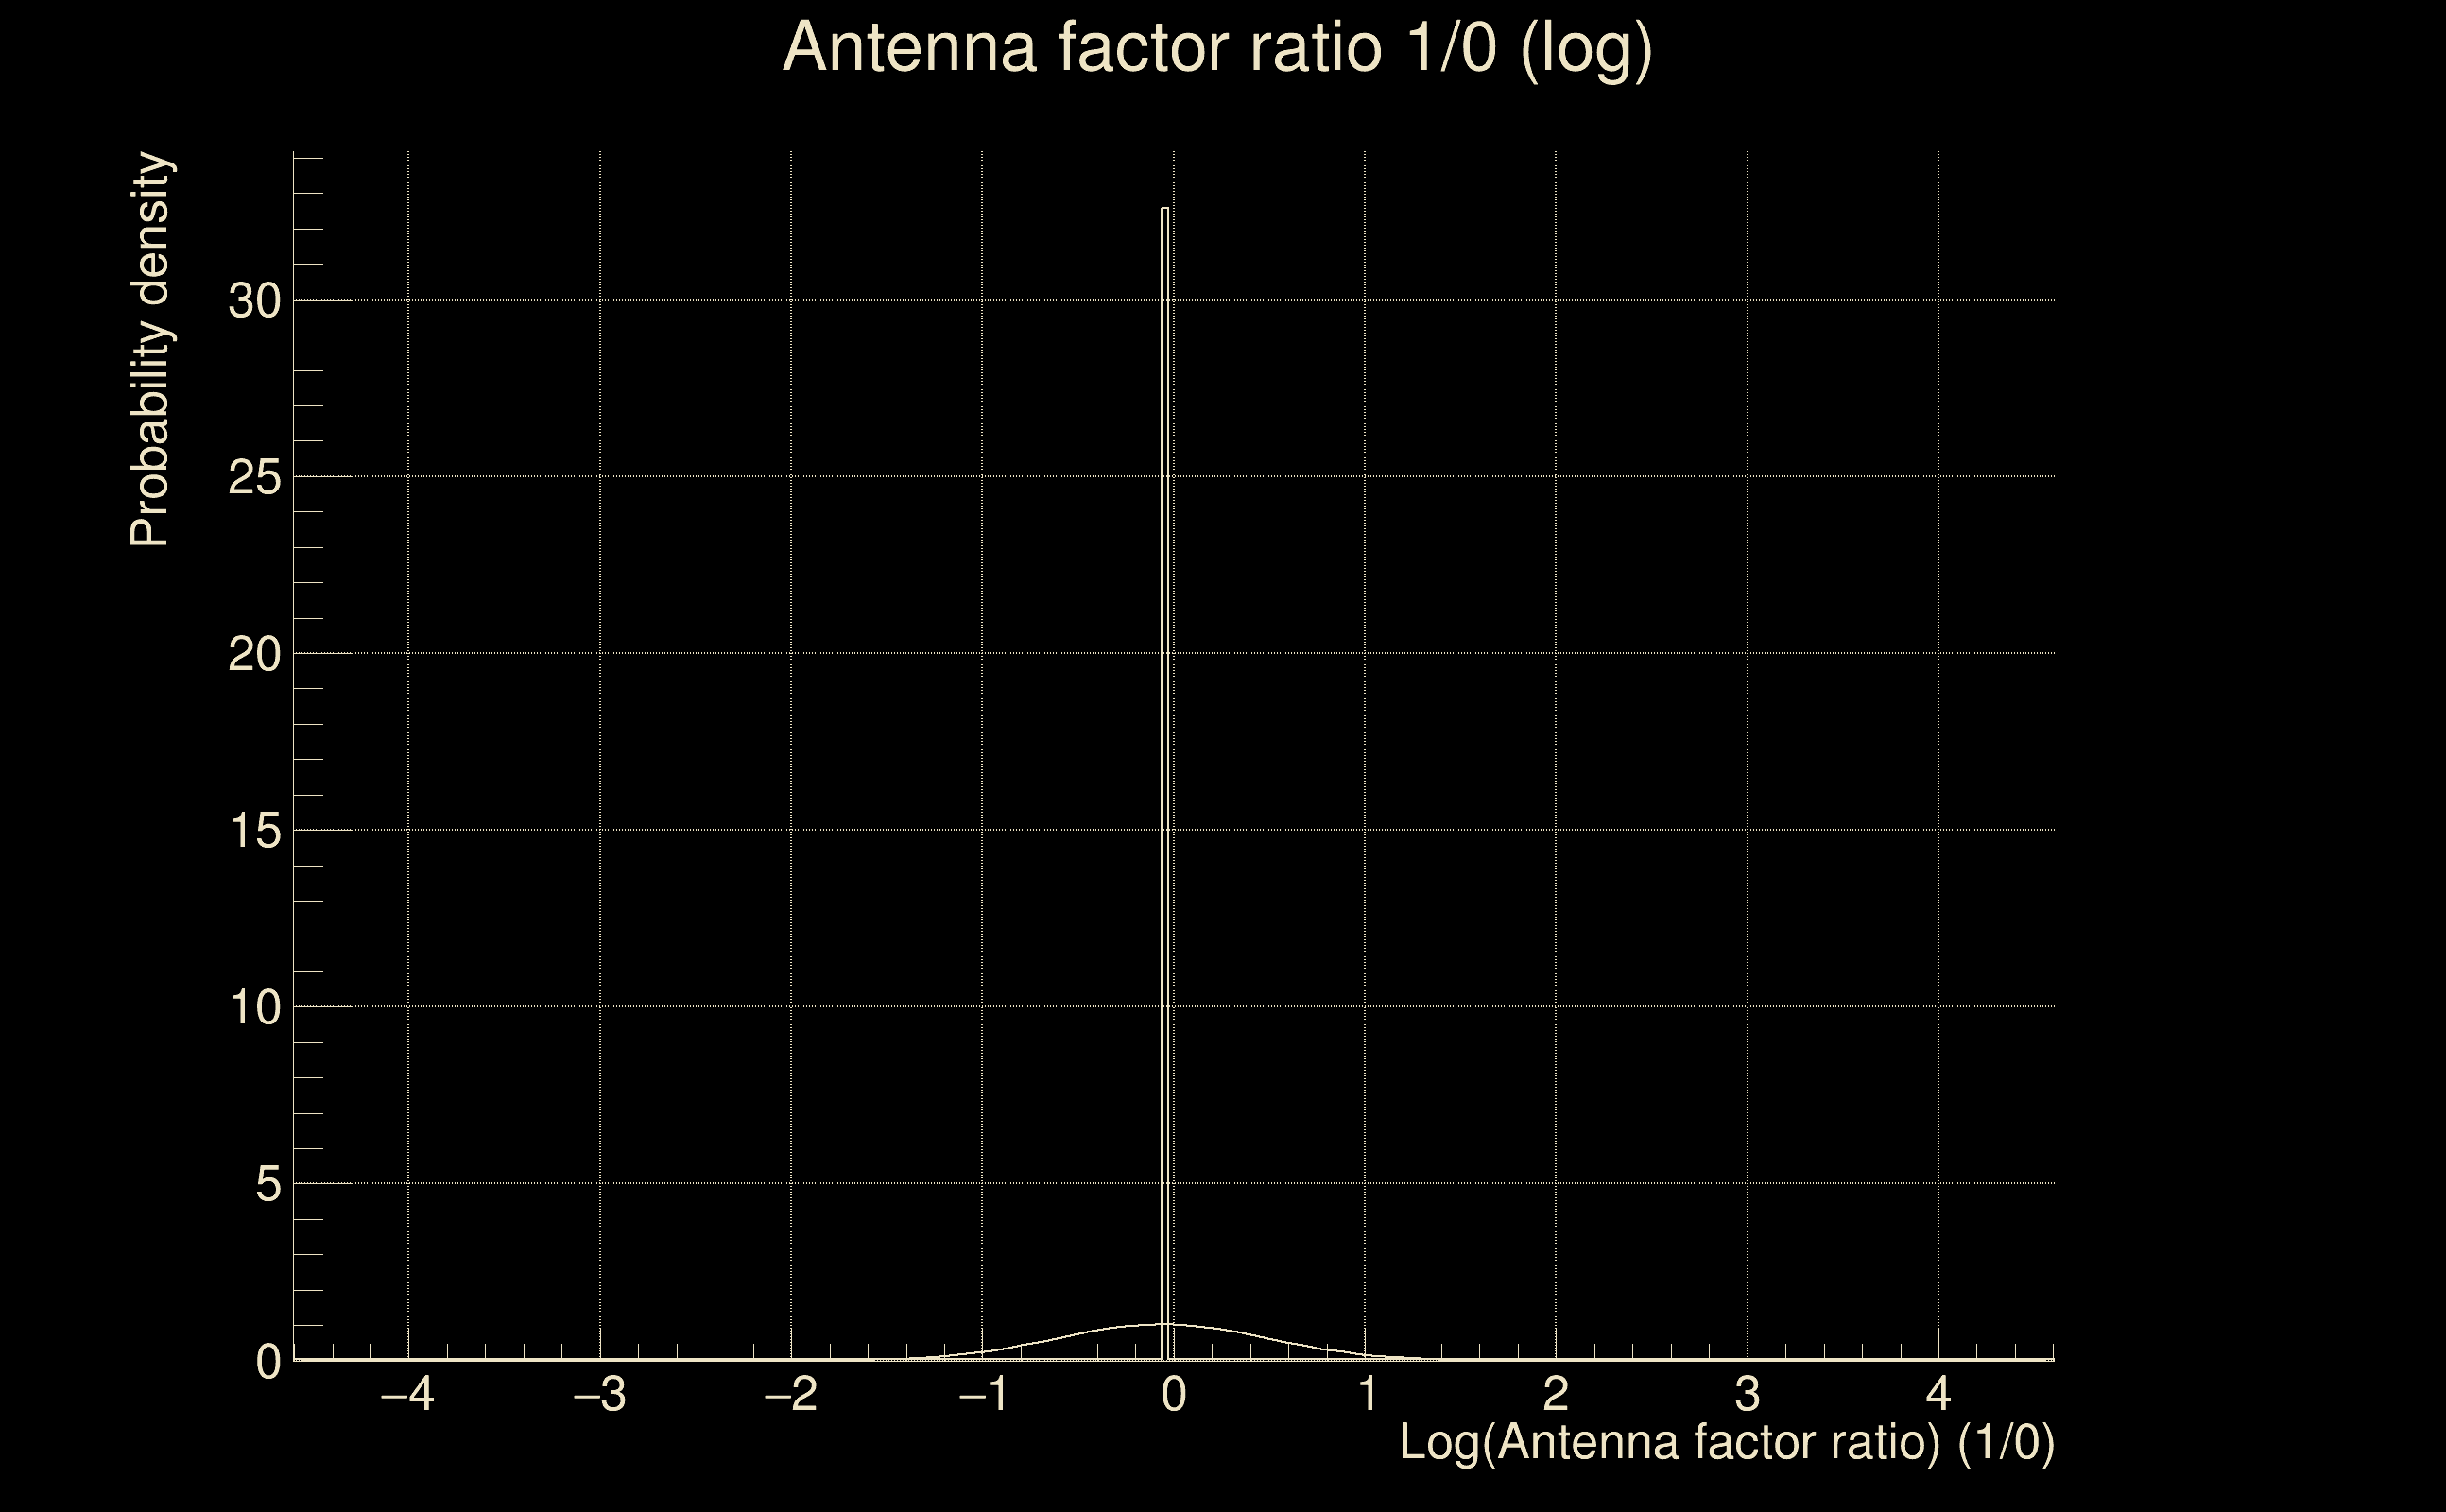
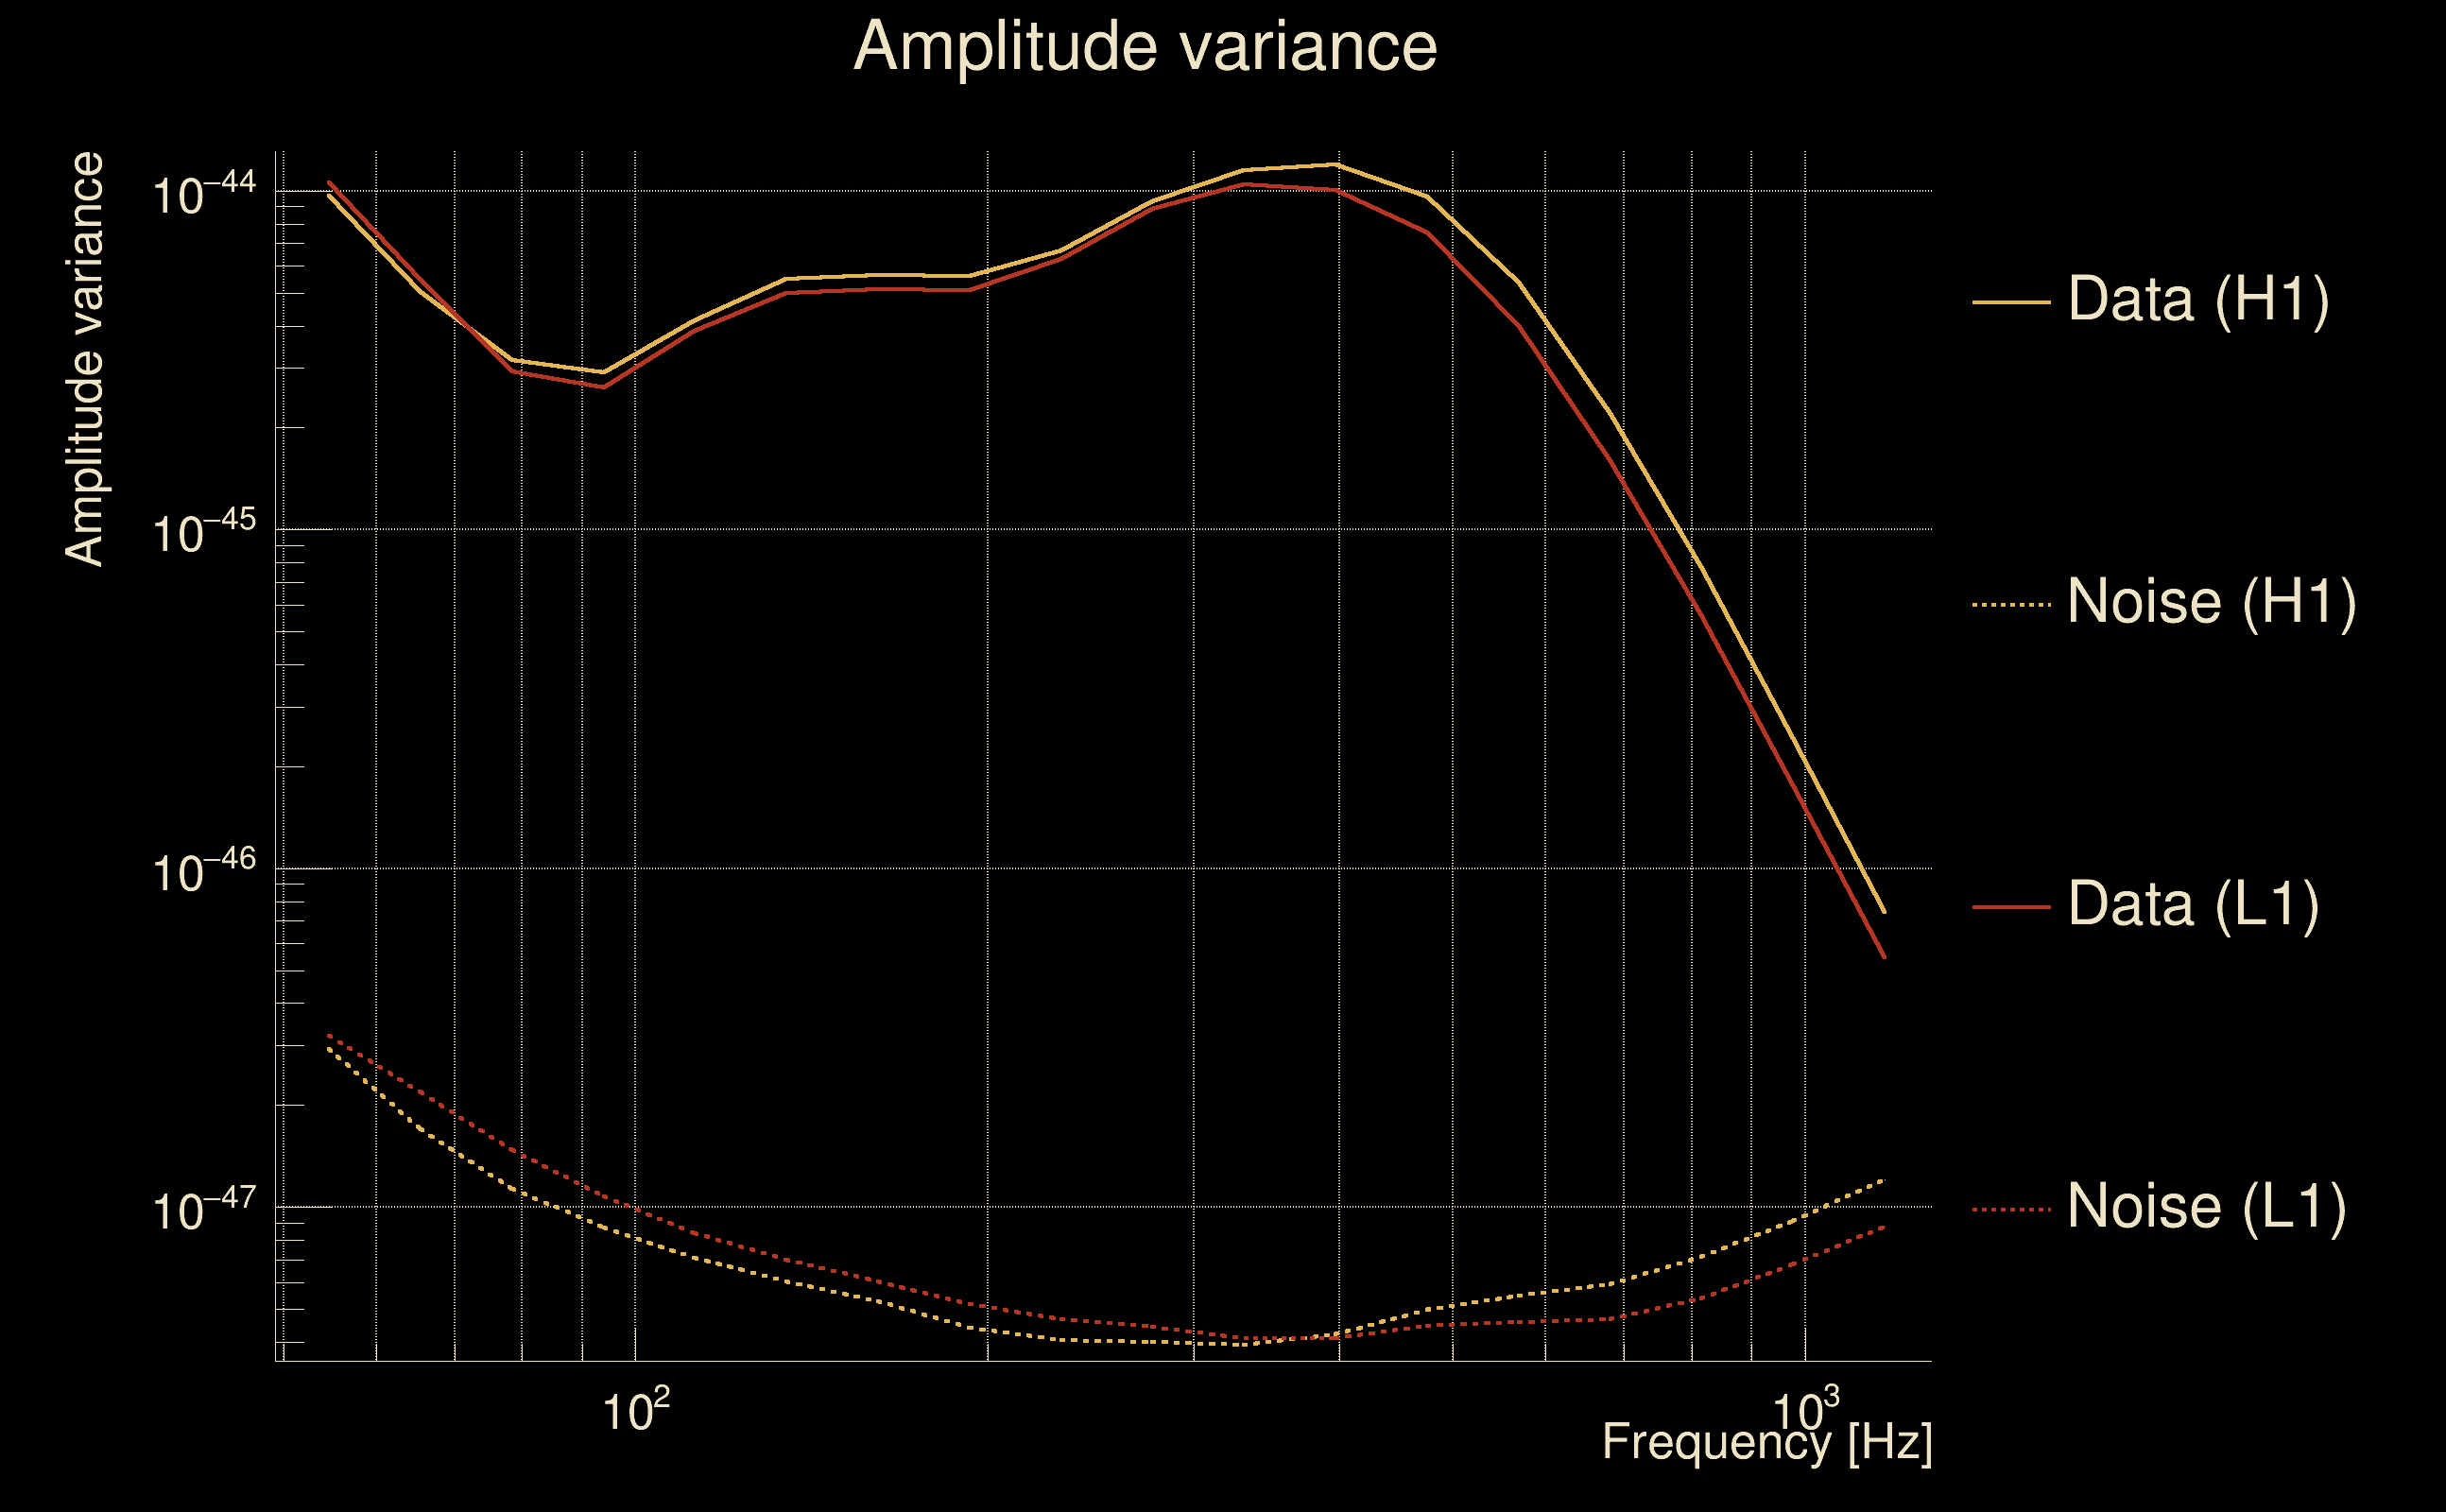
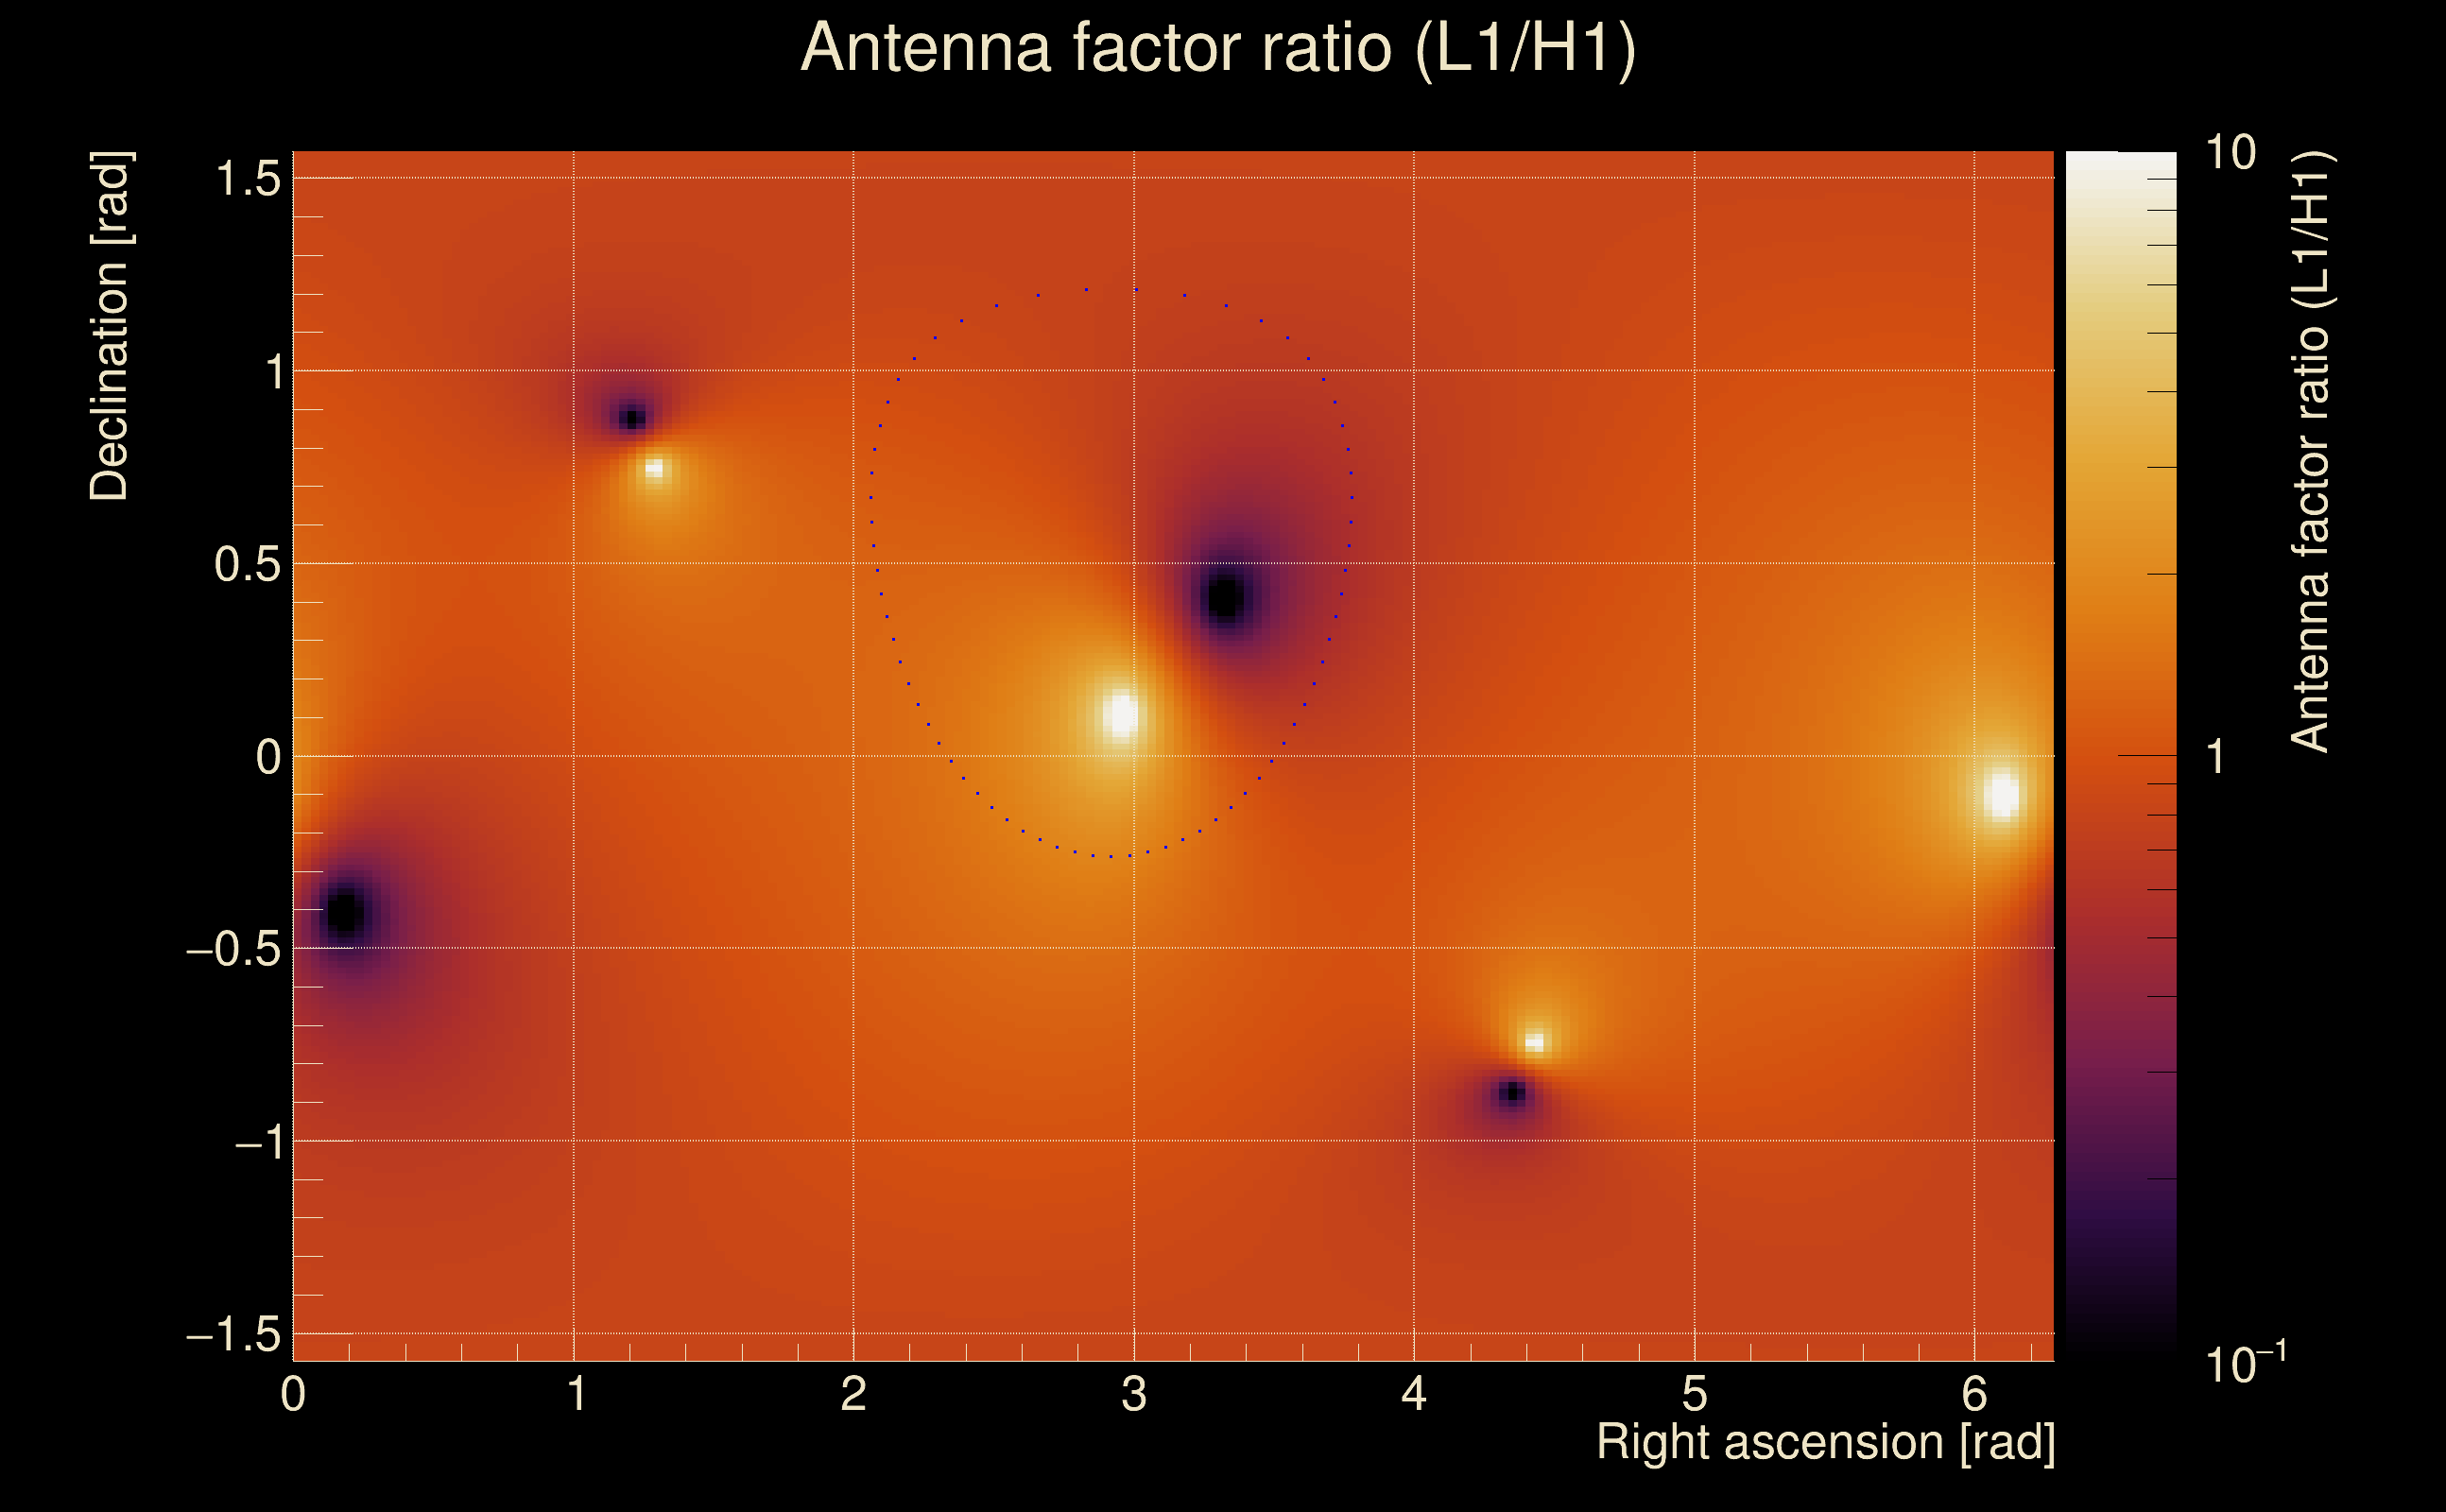
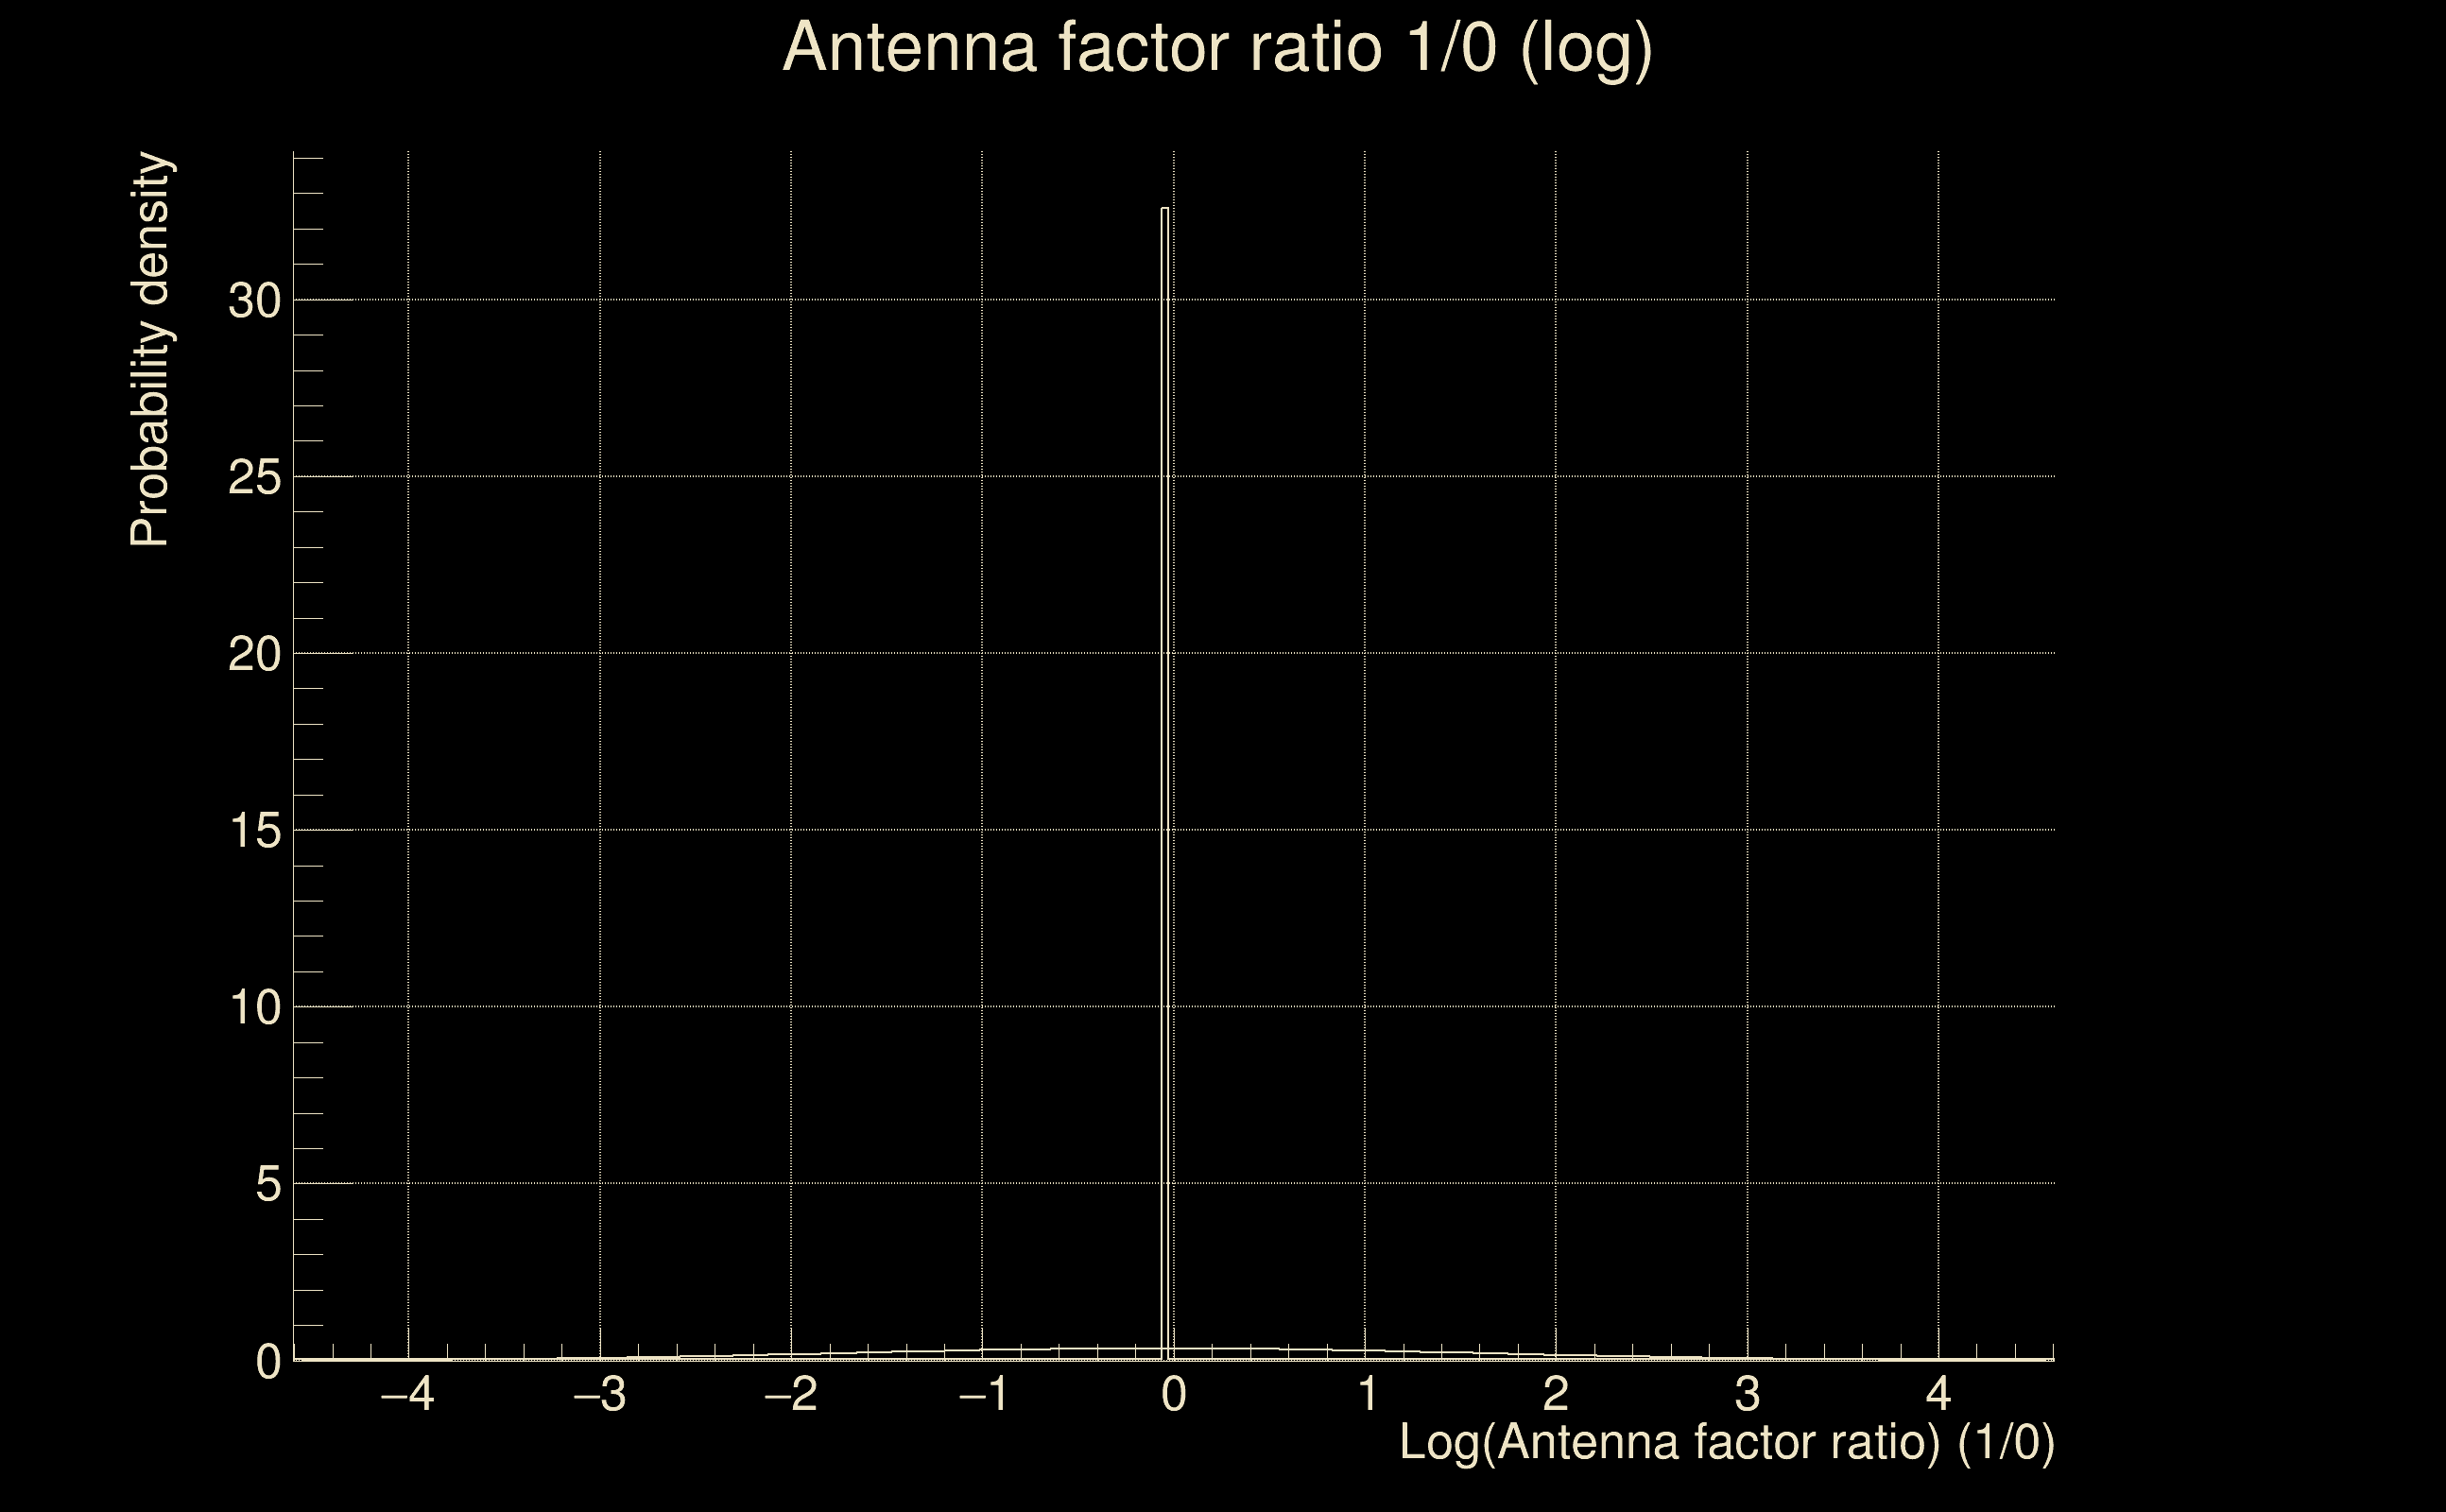
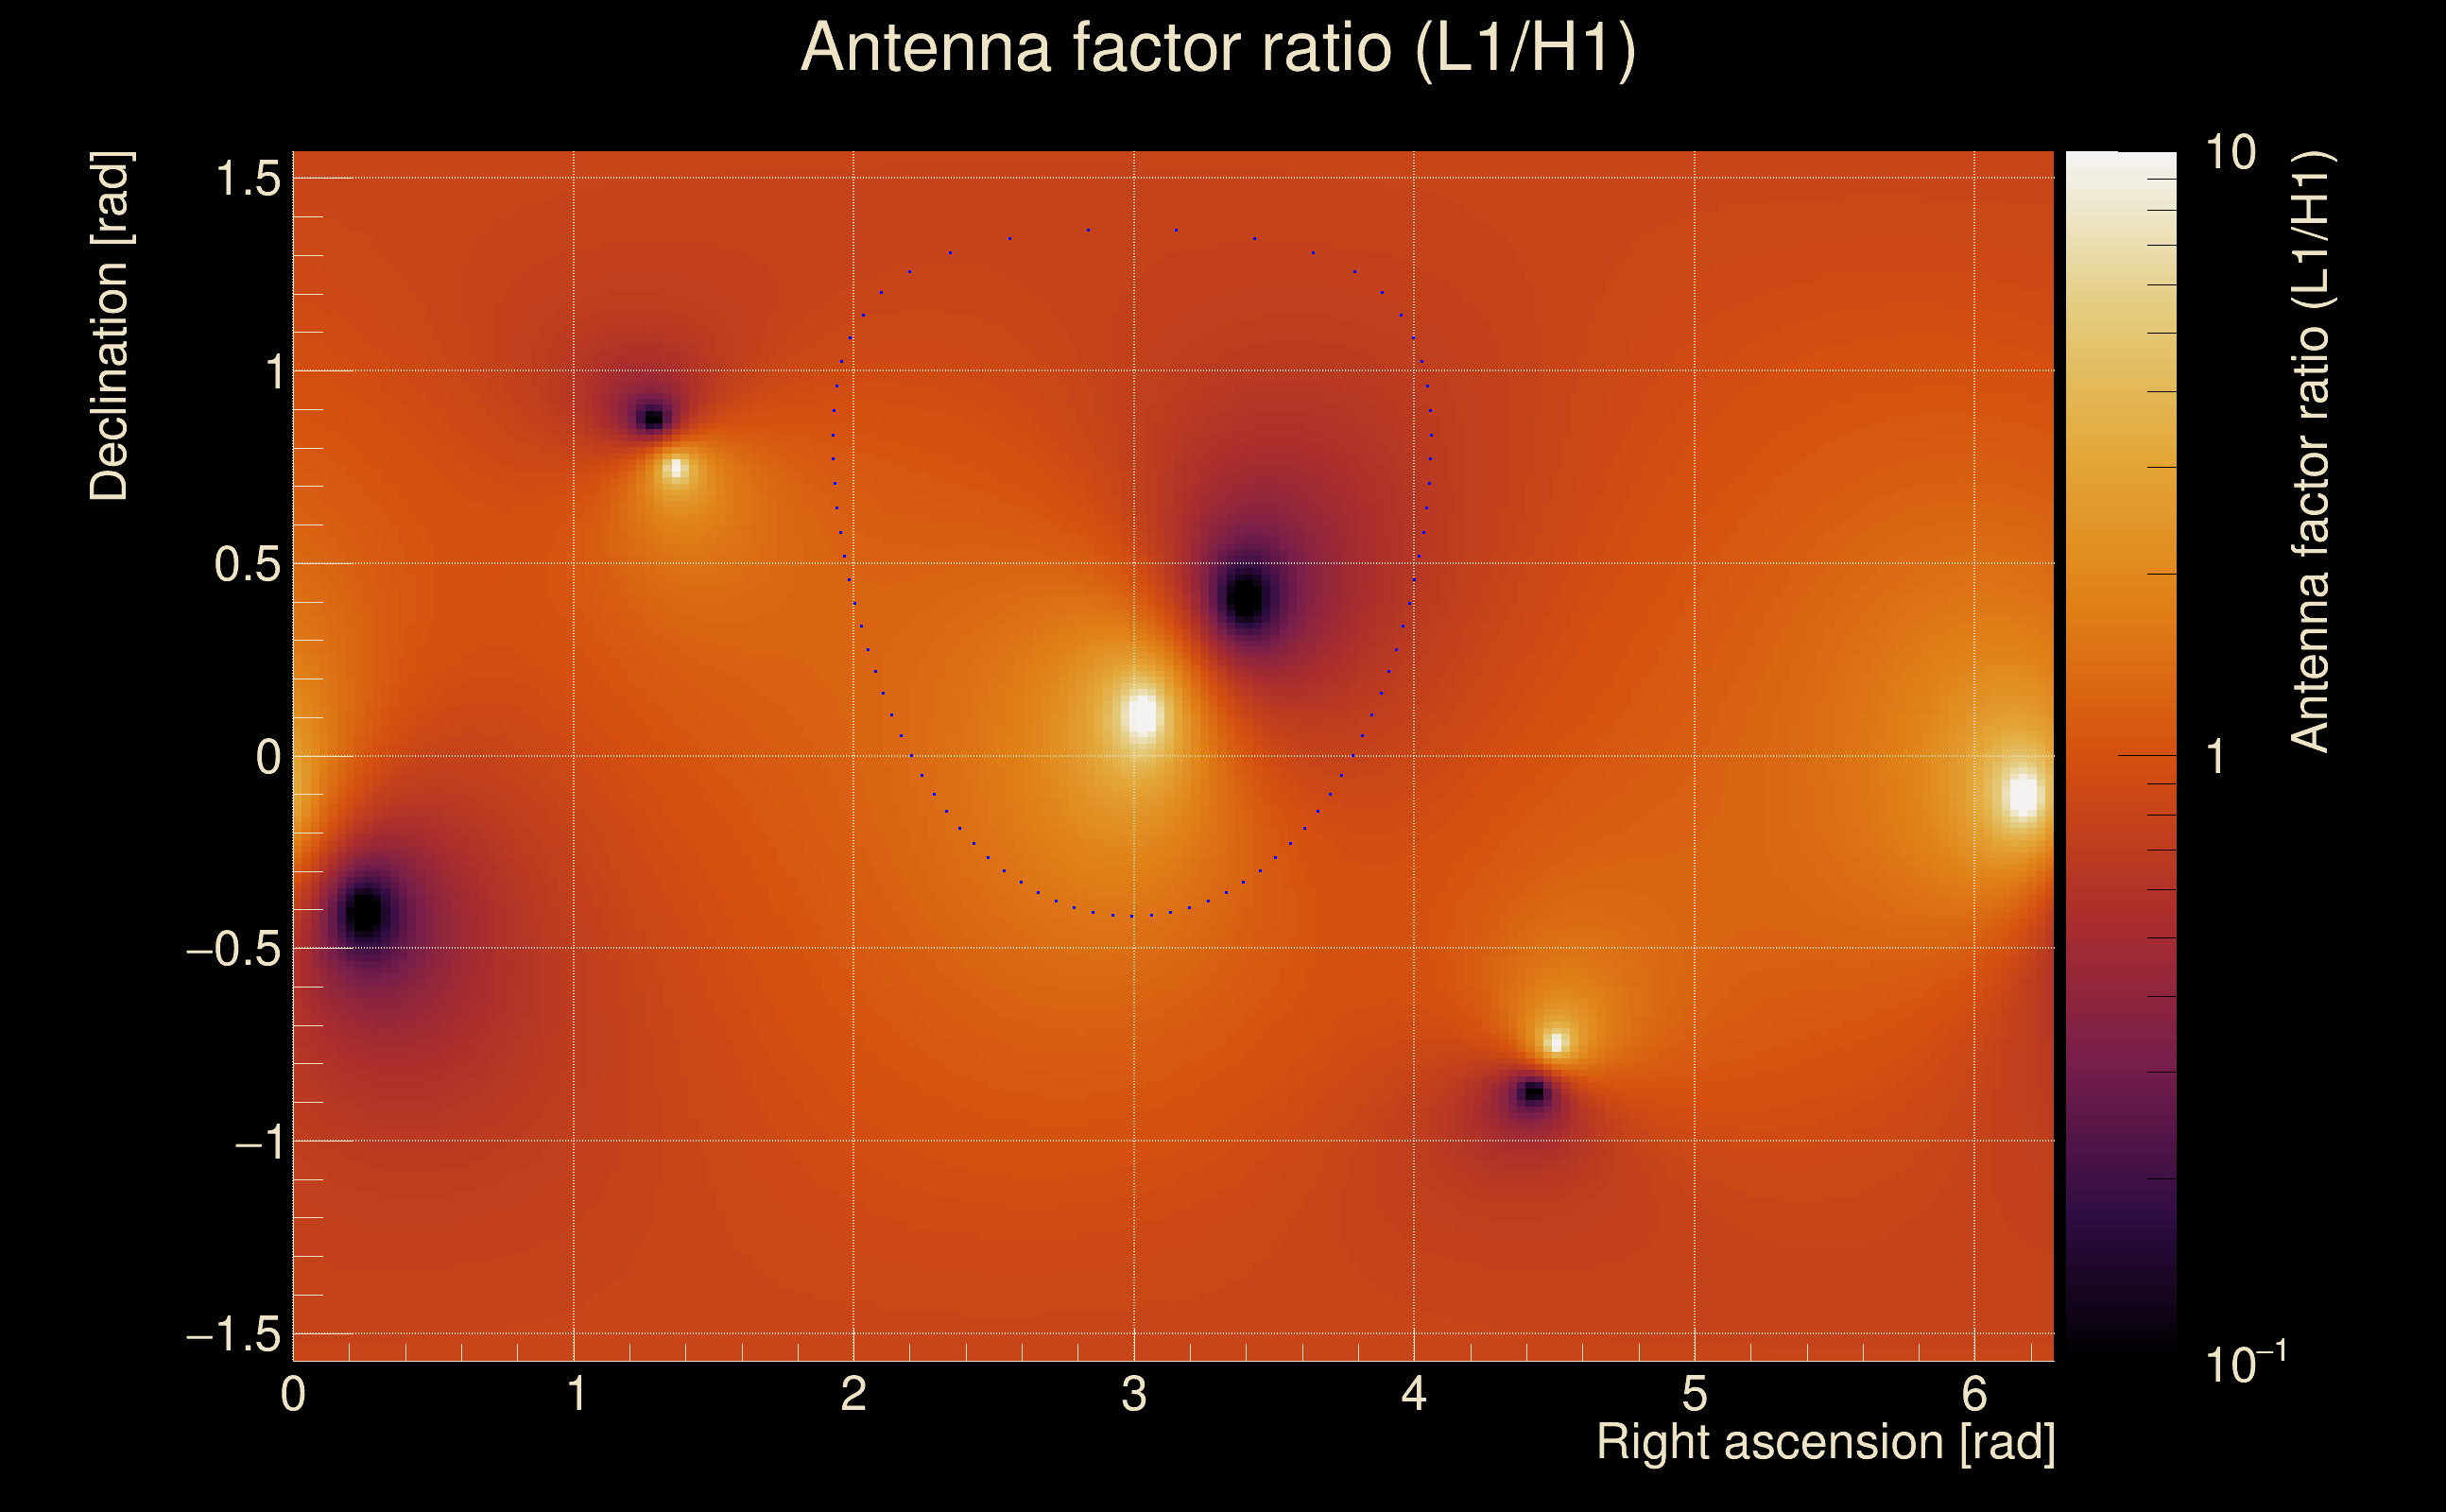
| Log of amplitude ratio (L1/H1): | -0.0593257, variance = 0.151044 (L1/H1: -0.0736076, variance = 0.301869, H1/L1: 0.0446887, variance = 0.302227) |
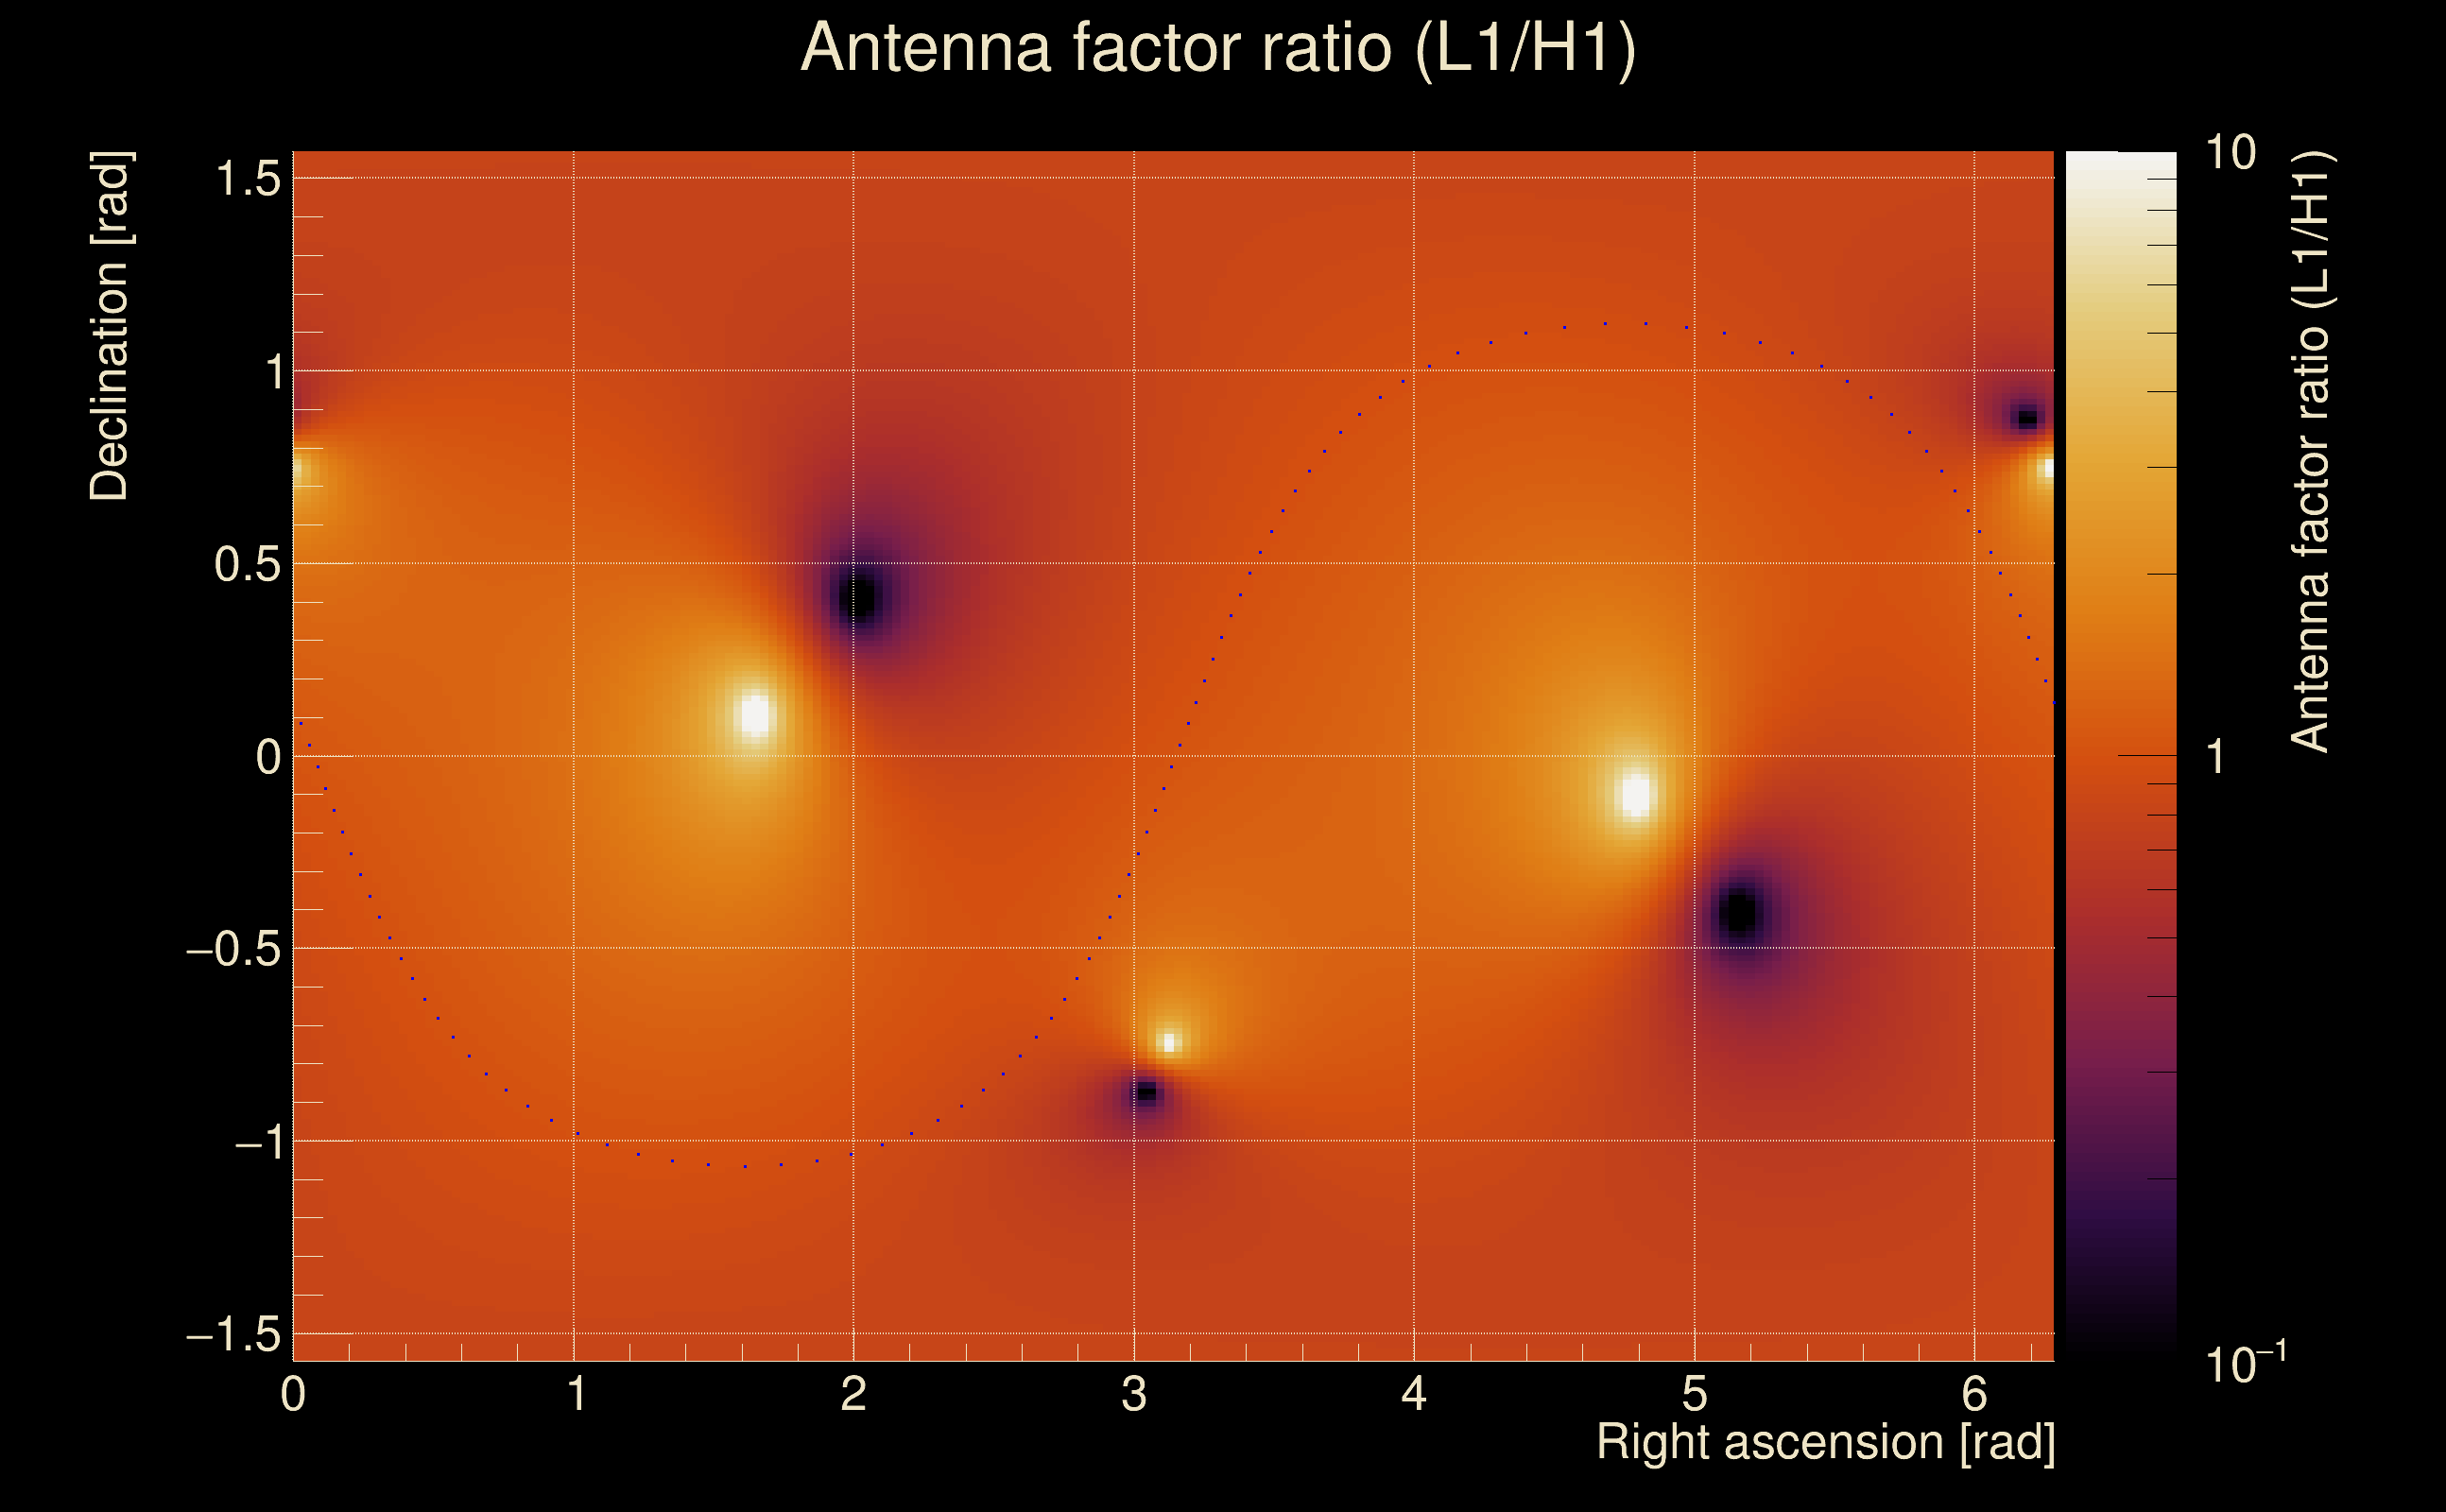
| Amplitude ratio (L1/H1): | 0.9424 ⋇ 1.47498 (L1/H1: 0.929036 ⋇ 1.73226, H1/L1: 1.0457 ⋇ 1.73282) |
| Amplitude ratio H1|L1 compatibility (probability): | 0.97032 |
| Antenna factor probability: | 0.964266 |
| Number of rejected frequency rows: | Q0: 0 / 18, Q1: 0 / 36, Q2: 2 / 70, Q3: 5 / 134, Q4: 16 / 258 |
| Maximum signal-to-noise ratio: | H1: 626.732, L1: 619.081 |
| SNR variance: | H1: 534.985, L1: 504.164 |
| Click here for a zoomed plot | Click here for a zoomed plot | Click here for a zoomed plot | Click here for a zoomed plot | Click here for a zoomed plot |
 |
 |
 |
 |
 |
 |
 |
 |
 |
 |
 |
 |
 |
 |
 |
 |
 |
 |
 |
 |
 |
 |
 |
 |
 |
 |
 |
 |
 |
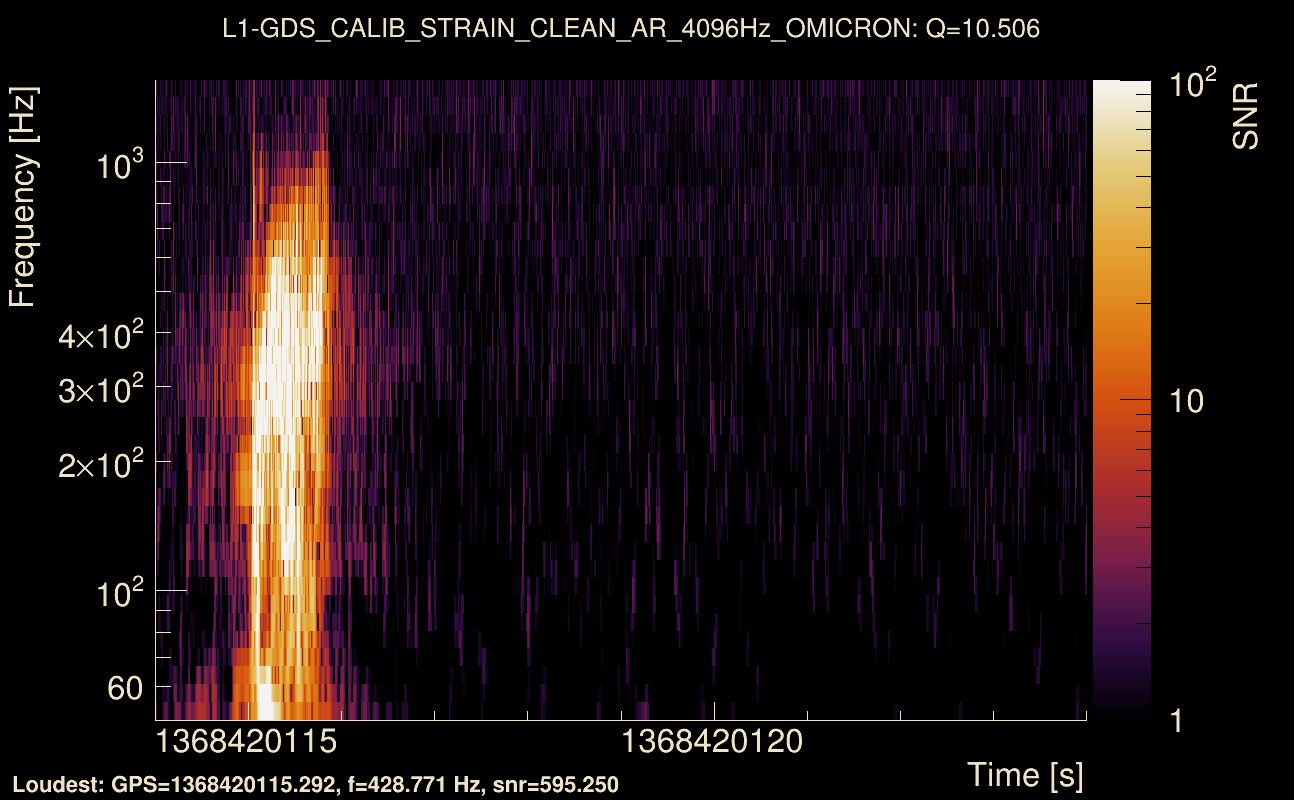
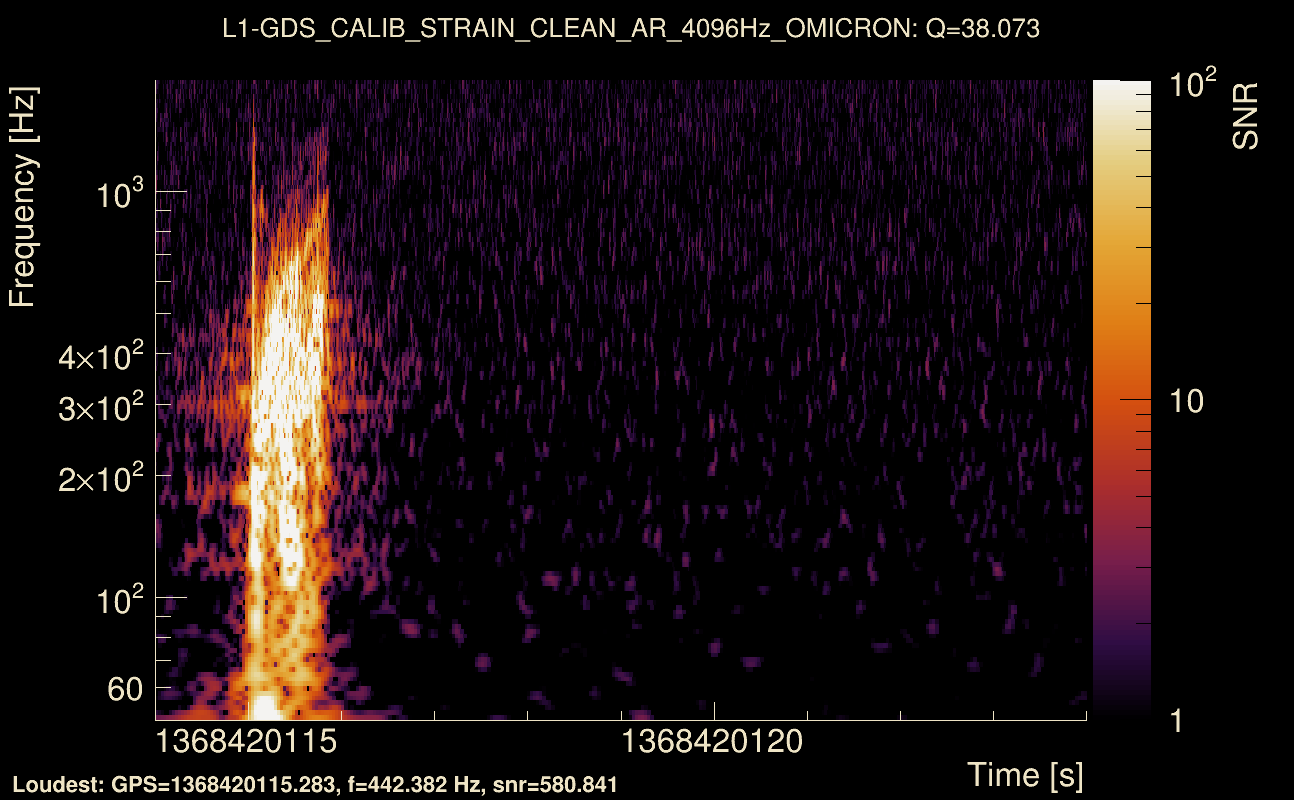
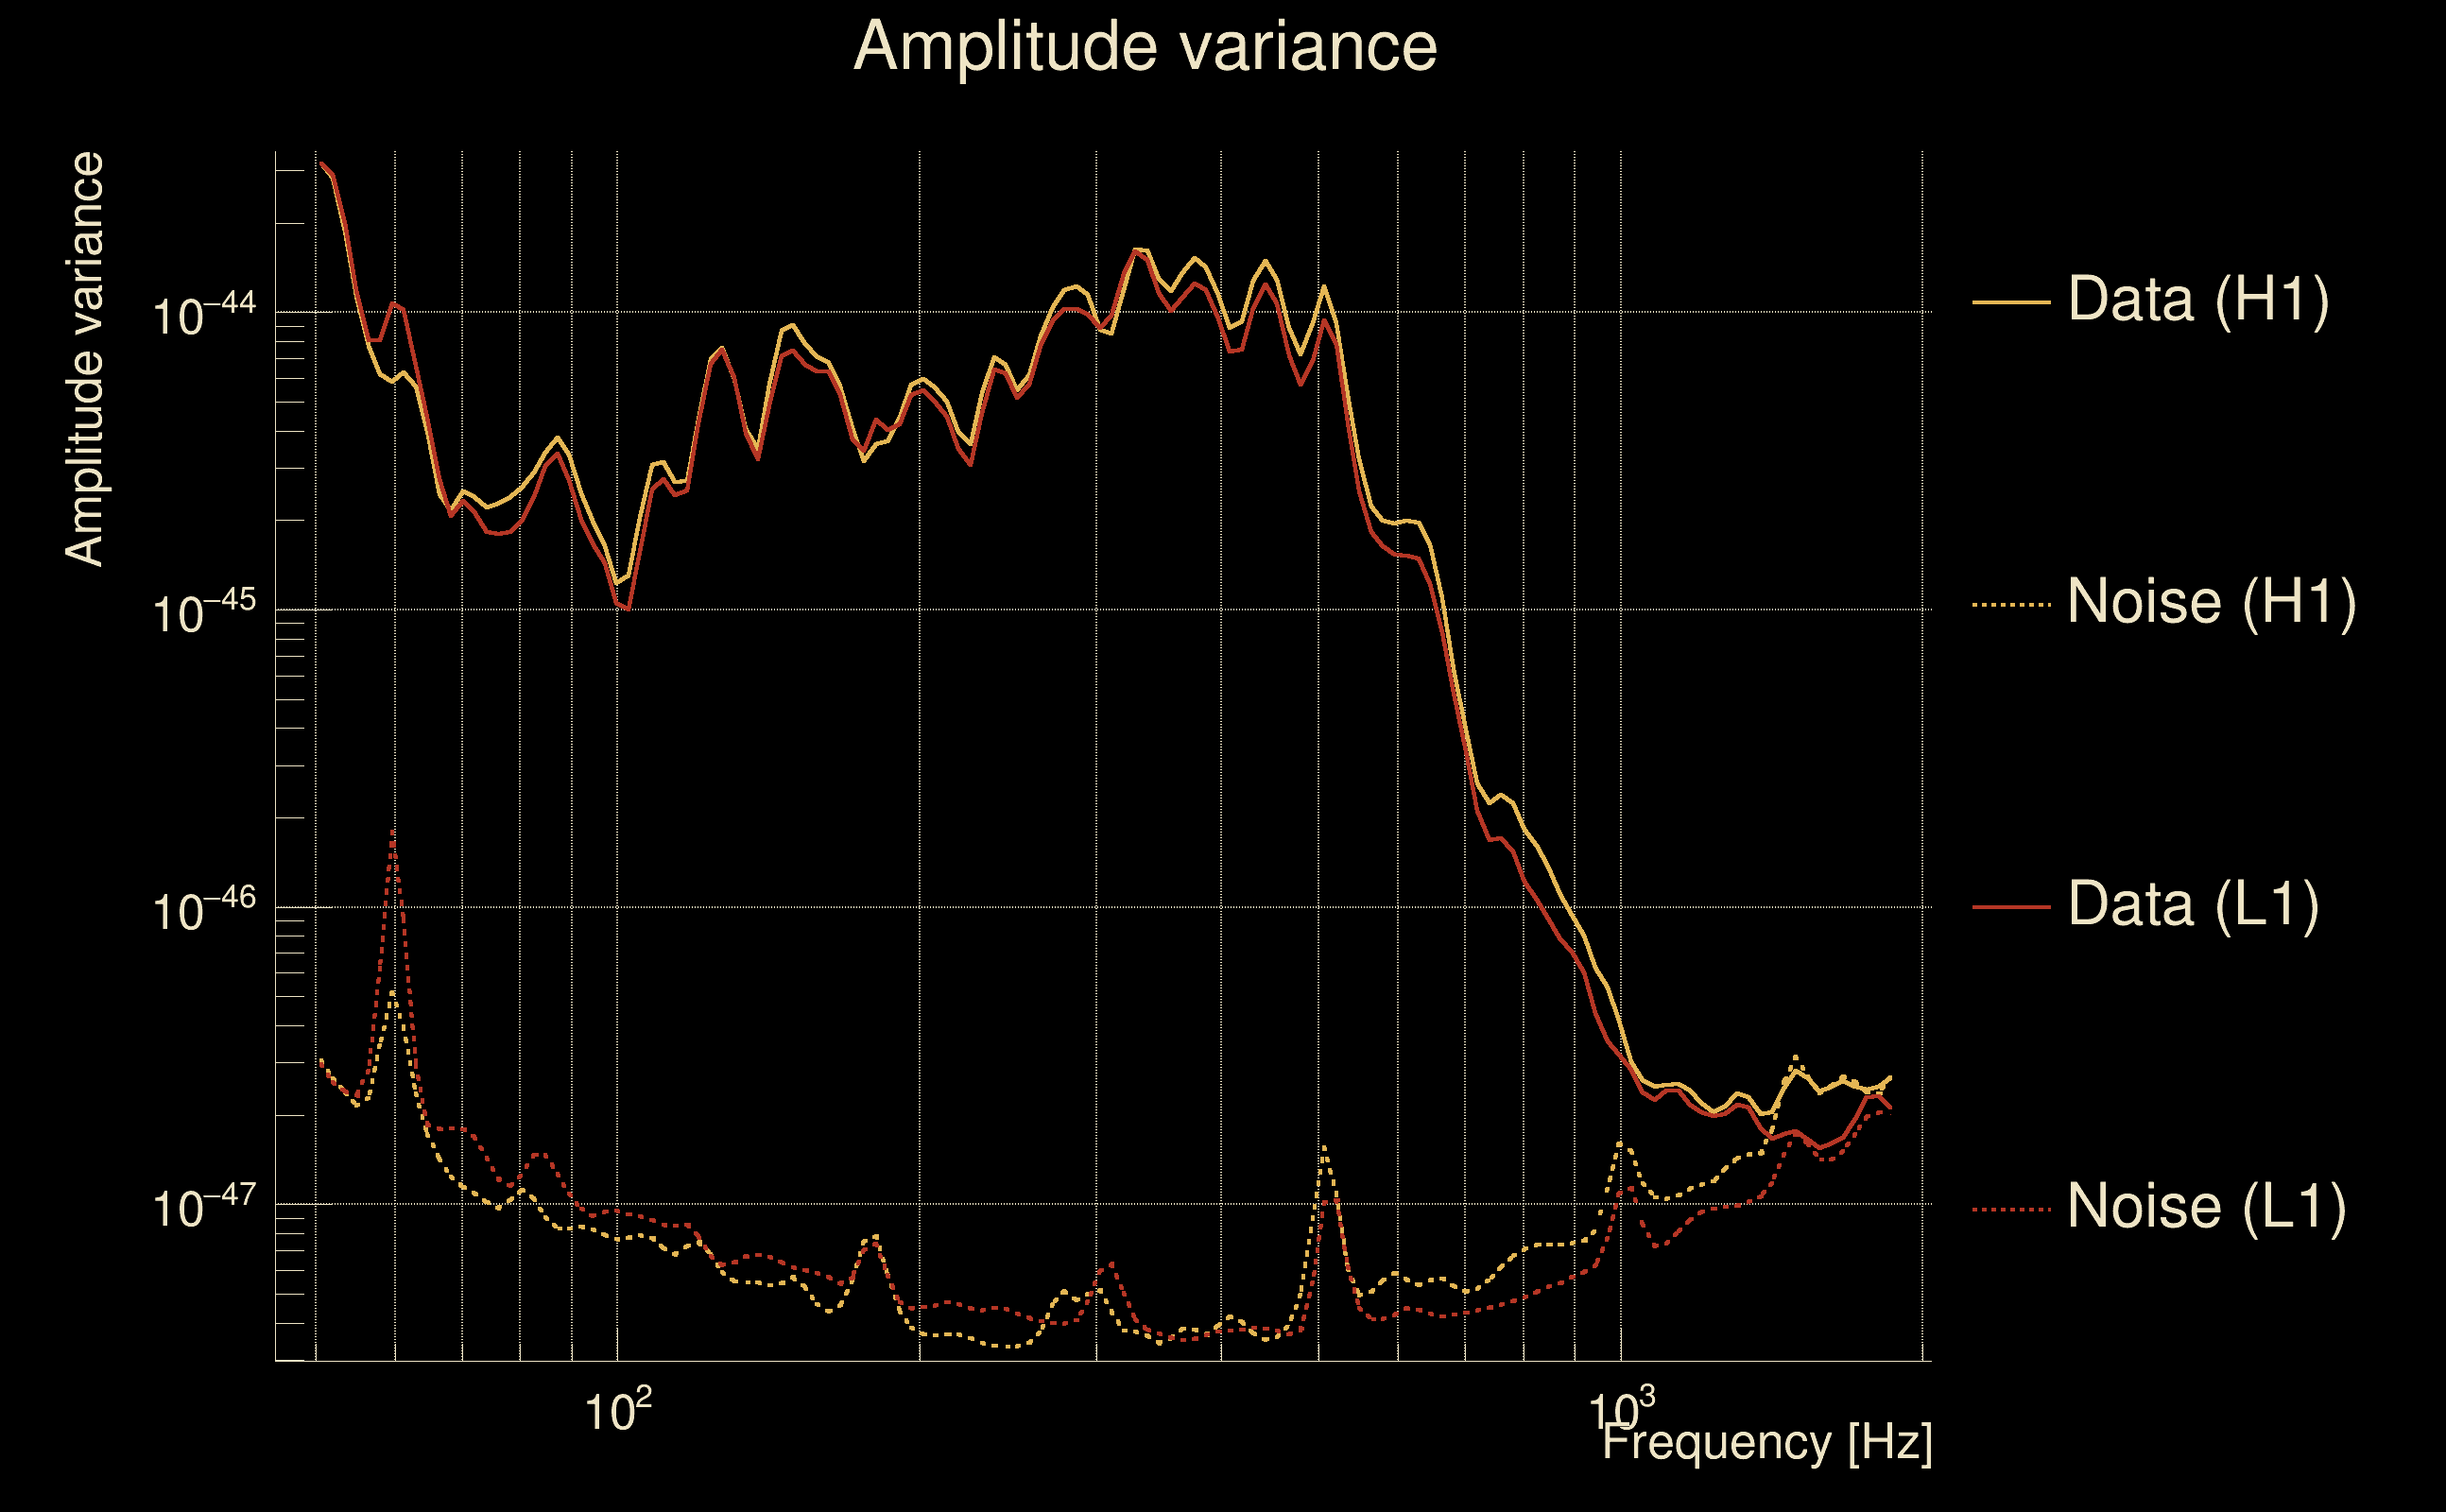
| Event time t(H1): | GPS = 1368420109 (Thu May 18 04:41:31 2023 ) → GPS = 1368420119 (Thu May 18 04:41:41 2023 ) |
| Event time t(L1): | GPS = 1368420109 (Thu May 18 04:41:41 2023 ) → GPS = 1368420119 (Thu May 18 04:41:41 2023 ) |
| Omicron analysis time window (H1): | GPS = 1368420106 → GPS = 1368420122 |
| Omicron analysis time window (L1): | GPS = 1368420106 → GPS = 1368420122 |
| Time delay between detectors t(L1) - t(H1): | 0.000885556 s (slice index = 108 / 217), δt_gw = 0.000885556 s |
| Time delay standard deviation: | 0.0193654 s |
| [targeted mode] Time delay probability: | 0.959796 (0.0504097 sigmas), δt_target = 0.00086832 s |
| Frequency: | 267.428 Hz |
| Ξ: | 0.962585 ± 0.00193905 (variance = 3.75993e-06): Q0: 0.968244, Q1: 0.972686, Q2: 0.966914, Q3: 0.969879, Q4: 0.970001 |
| Rank: | R_A = 0.866129 |
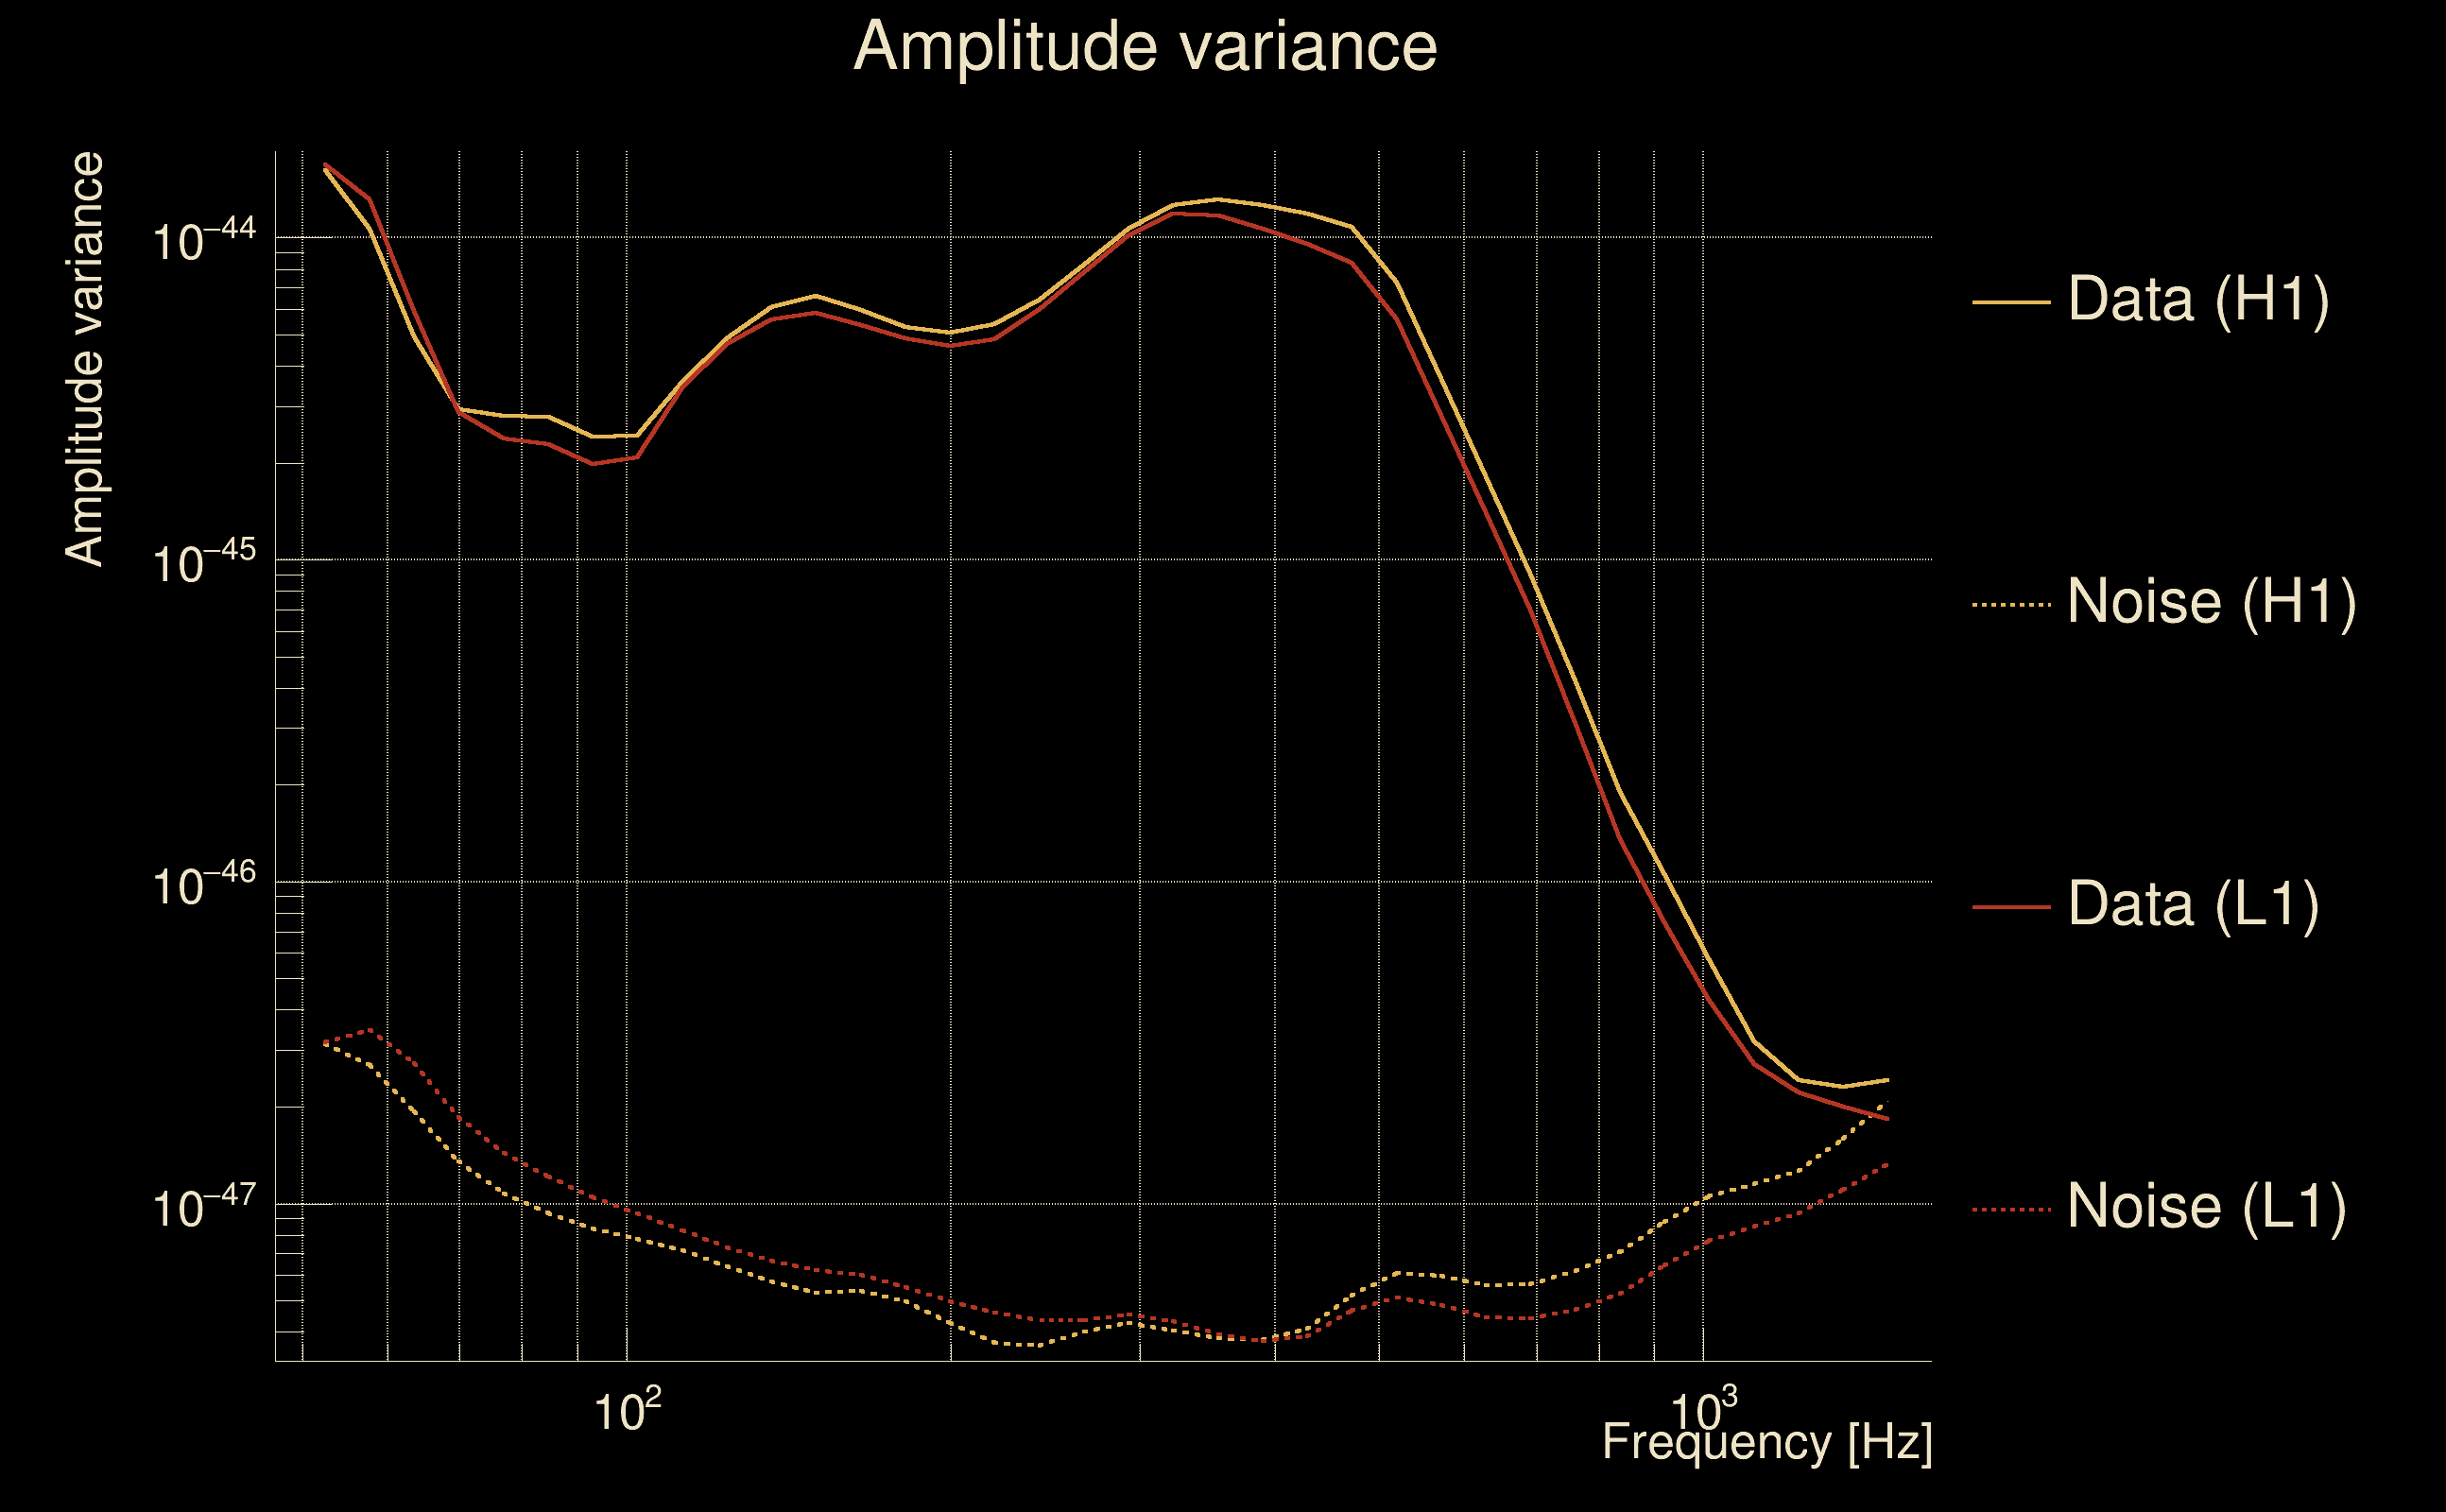
| Log of amplitude ratio (L1/H1): | -0.0582223, variance = 0.151052 (L1/H1: -0.0726437, variance = 0.301909, H1/L1: 0.0435058, variance = 0.302242) |
| Amplitude ratio (L1/H1): | 0.94344 ⋇ 1.47499 (L1/H1: 0.929932 ⋇ 1.73232, H1/L1: 1.04447 ⋇ 1.73285) |
| Amplitude ratio H1|L1 compatibility (probability): | 0.970096 |
| Antenna factor probability: | 0.966384 |
| Number of rejected frequency rows: | Q0: 0 / 18, Q1: 0 / 36, Q2: 1 / 70, Q3: 6 / 134, Q4: 15 / 258 |
| Maximum signal-to-noise ratio: | H1: 632.113, L1: 625.741 |
| SNR variance: | H1: 0.500361, L1: 0.529778 |
| Click here for a zoomed plot | Click here for a zoomed plot | Click here for a zoomed plot | Click here for a zoomed plot | Click here for a zoomed plot |
 |
 |
 |
 |
 |
 |
 |
 |
 |
 |
 |
 |
 |
 |
 |
 |
 |
 |
 |
 |
 |
 |
 |
 |
 |
 |
 |
 |
 |
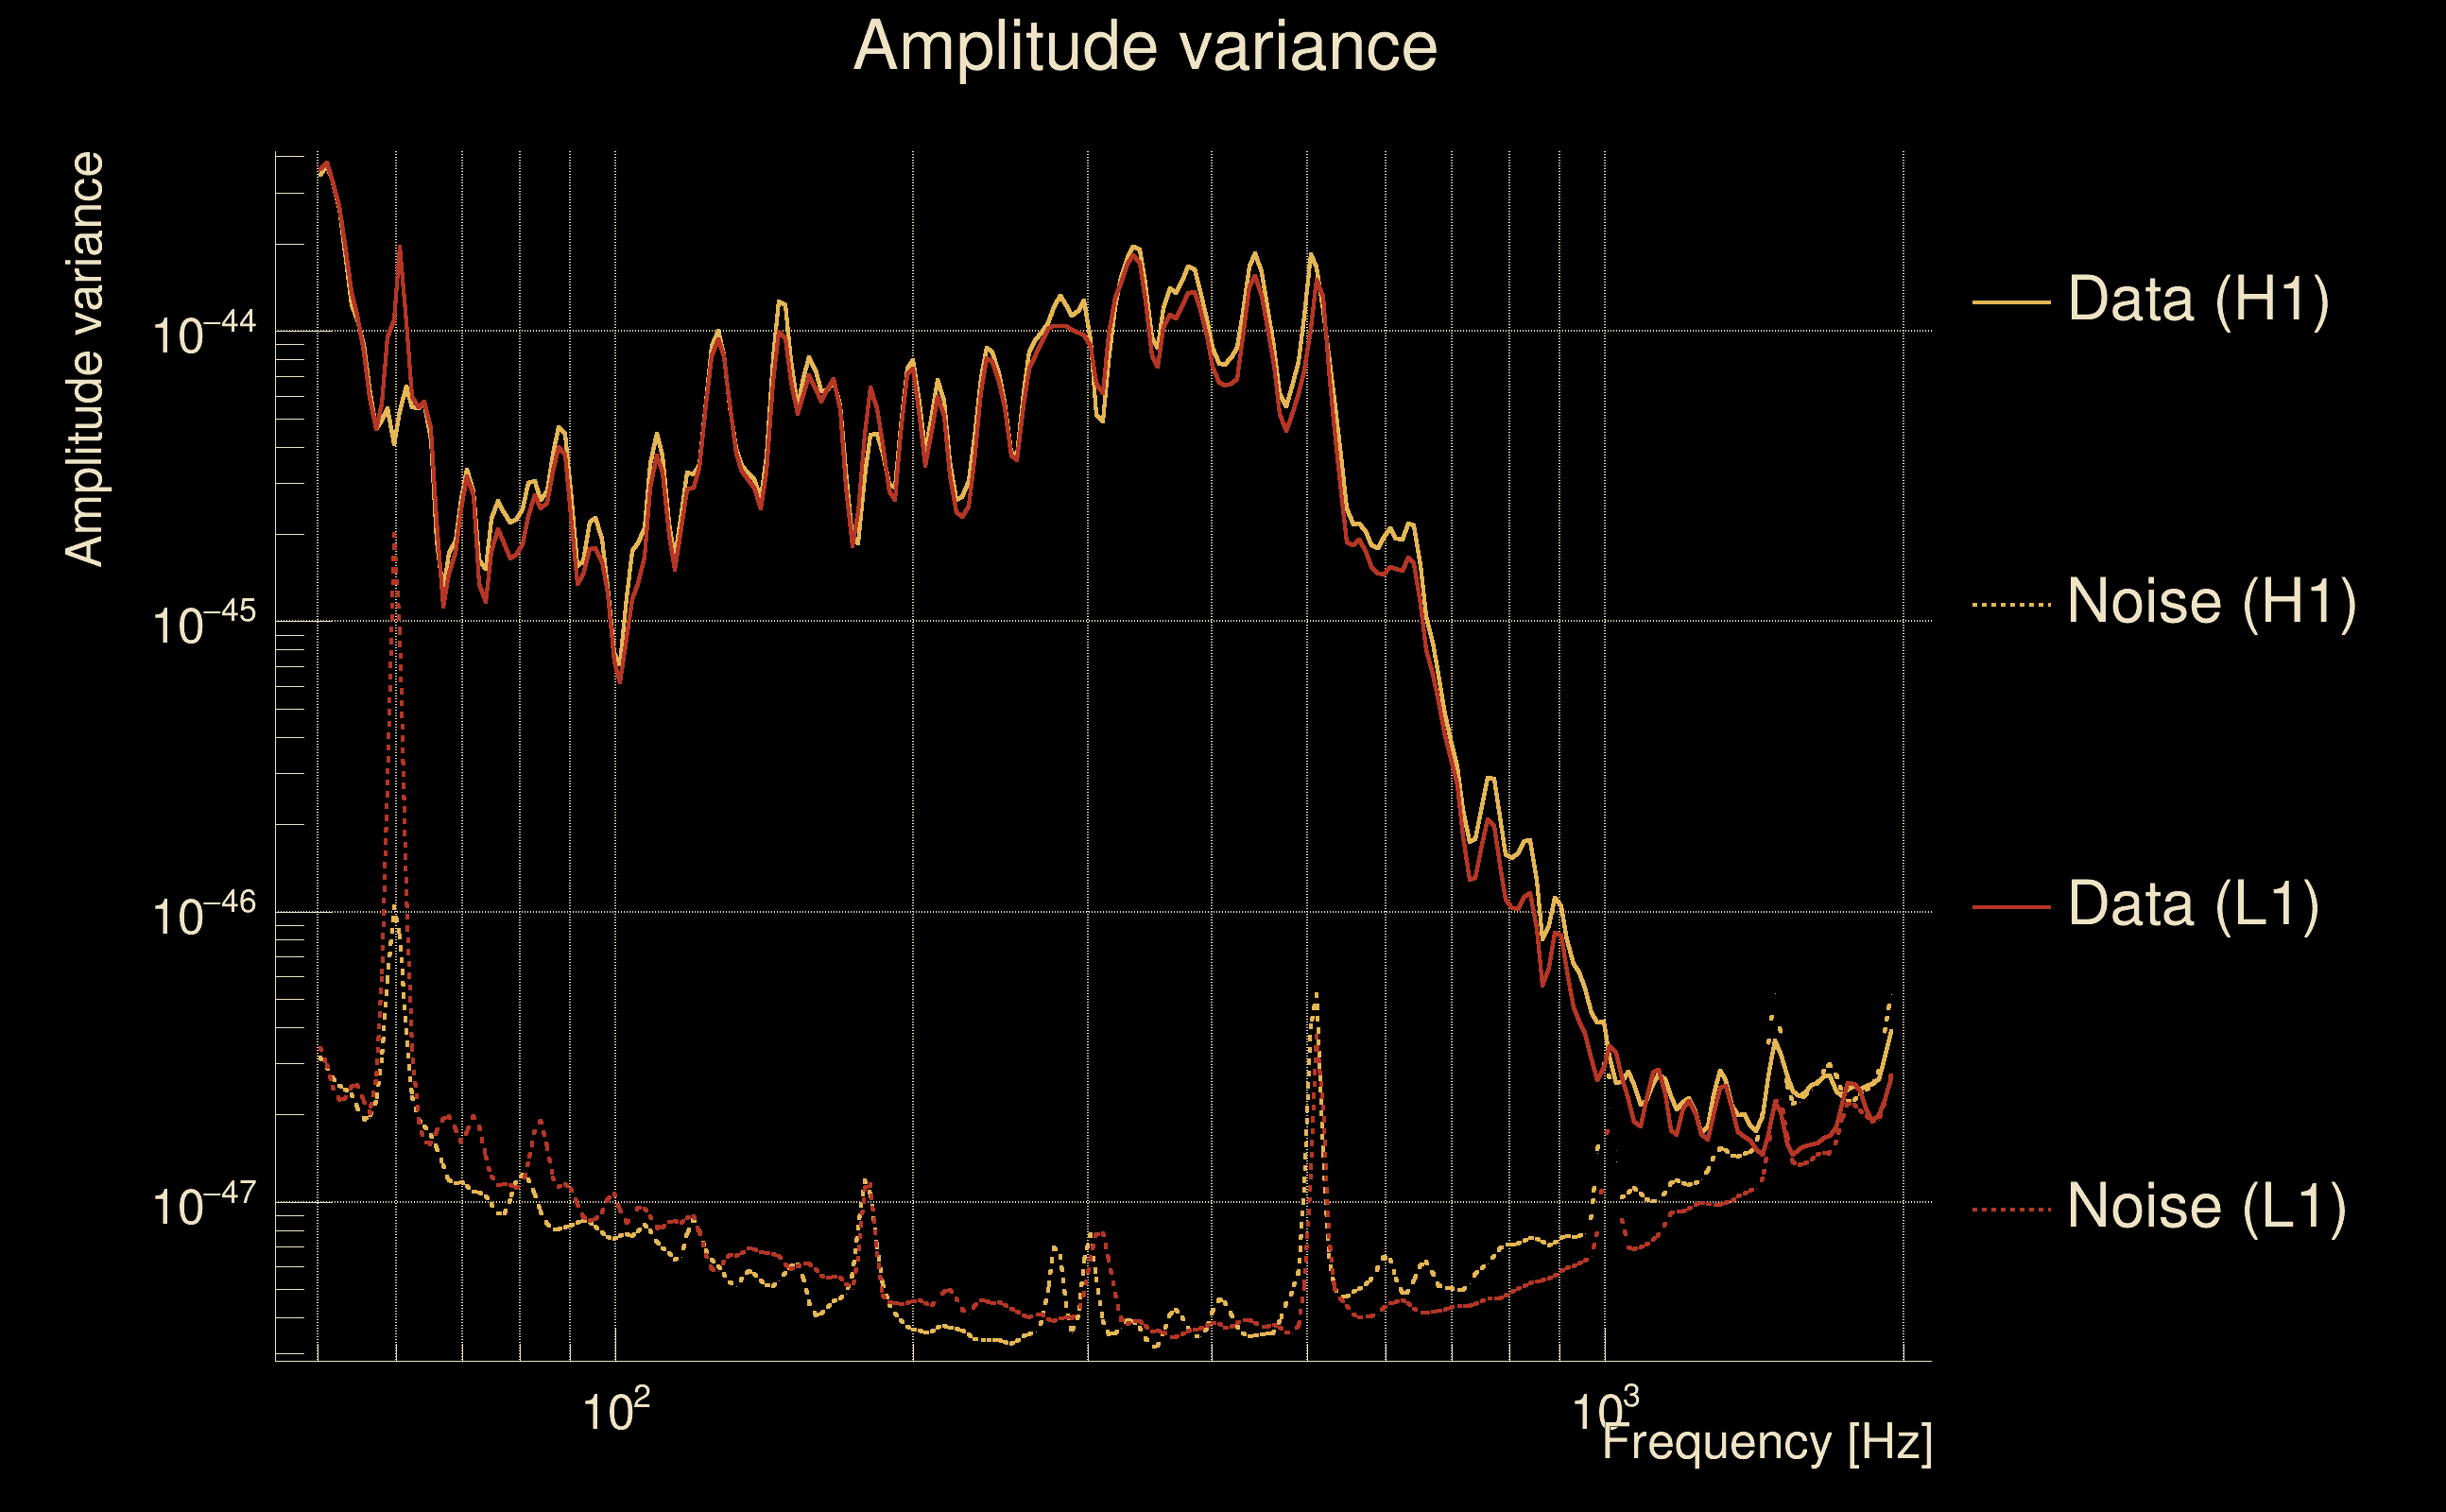
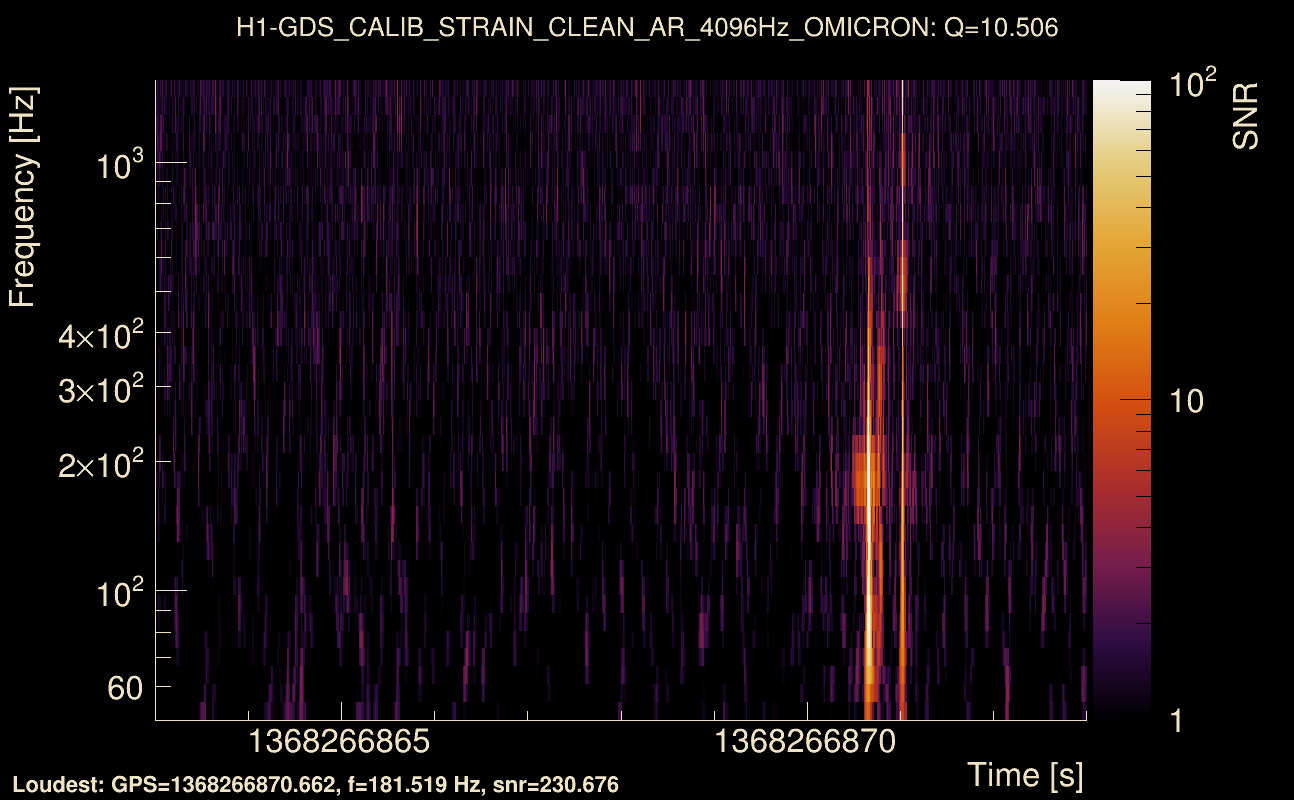
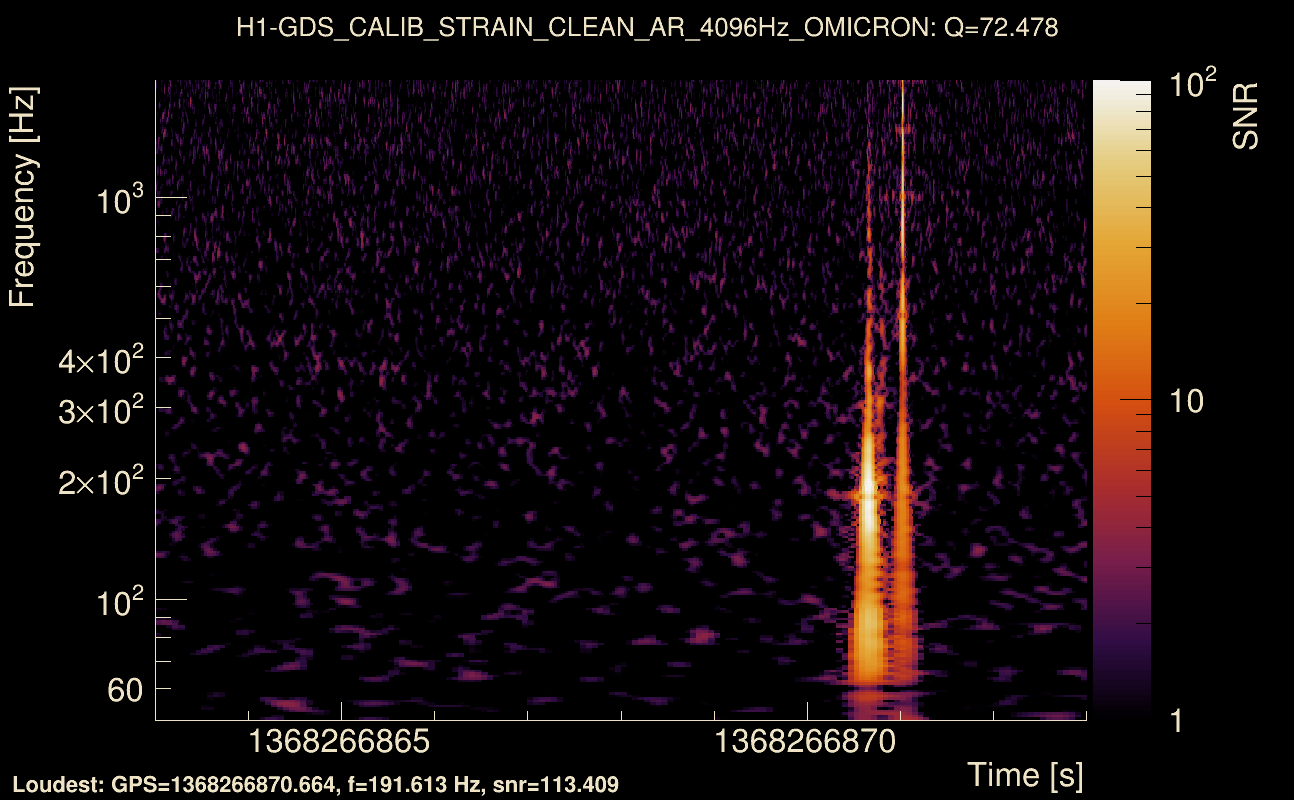
| Event time t(H1): | GPS = 1368266863 (Tue May 16 10:07:25 2023 ) → GPS = 1368266873 (Tue May 16 10:07:35 2023 ) |
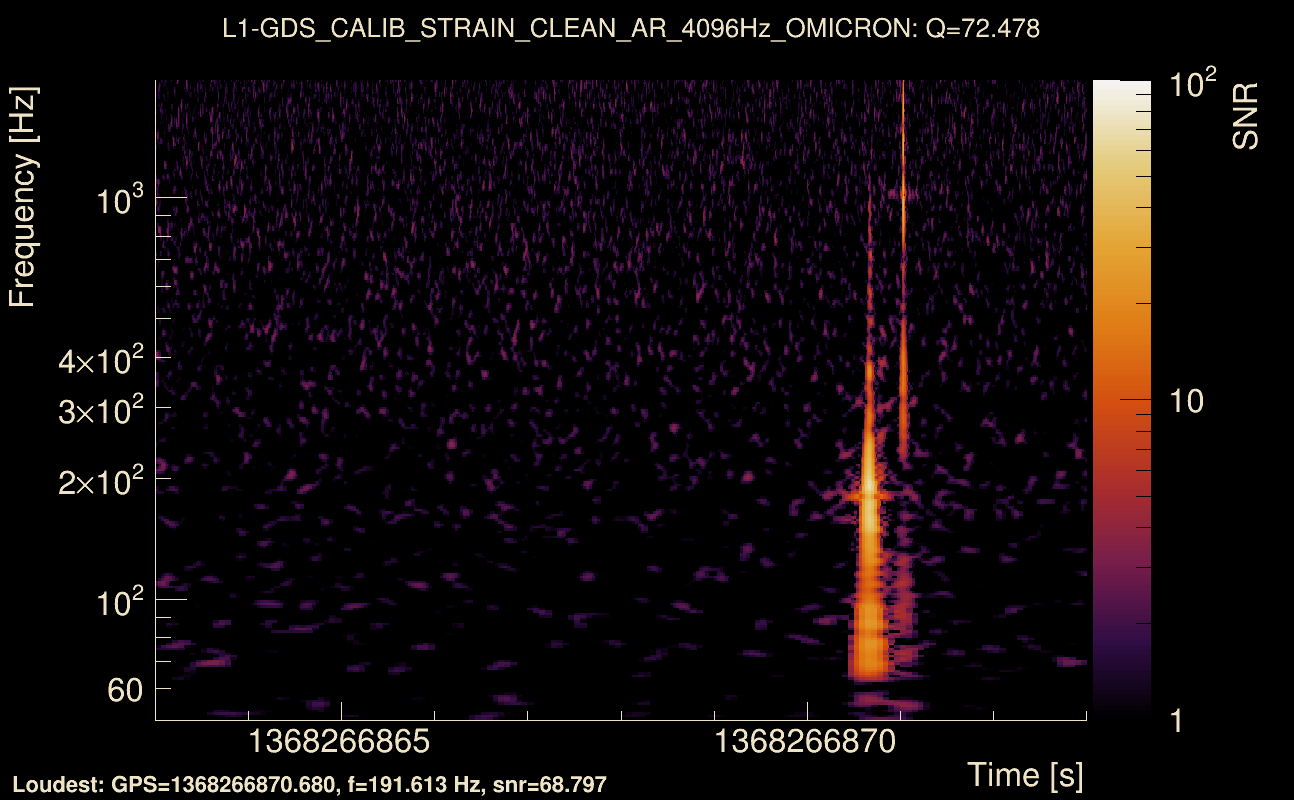
| Event time t(L1): | GPS = 1368266863 (Tue May 16 10:07:35 2023 ) → GPS = 1368266873 (Tue May 16 10:07:35 2023 ) |
| Omicron analysis time window (H1): | GPS = 1368266860 → GPS = 1368266876 |
| Omicron analysis time window (L1): | GPS = 1368266860 → GPS = 1368266876 |
| Time delay between detectors t(L1) - t(H1): | 0.00741815 s (slice index = 108 / 217), δt_gw = 0.00741815 s |
| Time delay standard deviation: | 0.027998 s |
| [targeted mode] Time delay probability: | 0.937206 (0.0787822 sigmas), δt_target = 0.000866652 s |
| Frequency: | 297.809 Hz |
| Ξ: | 0.915235 ± 0.00960299 (variance = 9.22175e-05): Q0: 0.958789, Q1: 0.941786, Q2: 0.932452, Q3: 0.932748, Q4: 0.93931 |
| Rank: | R_A = 0.758295 |
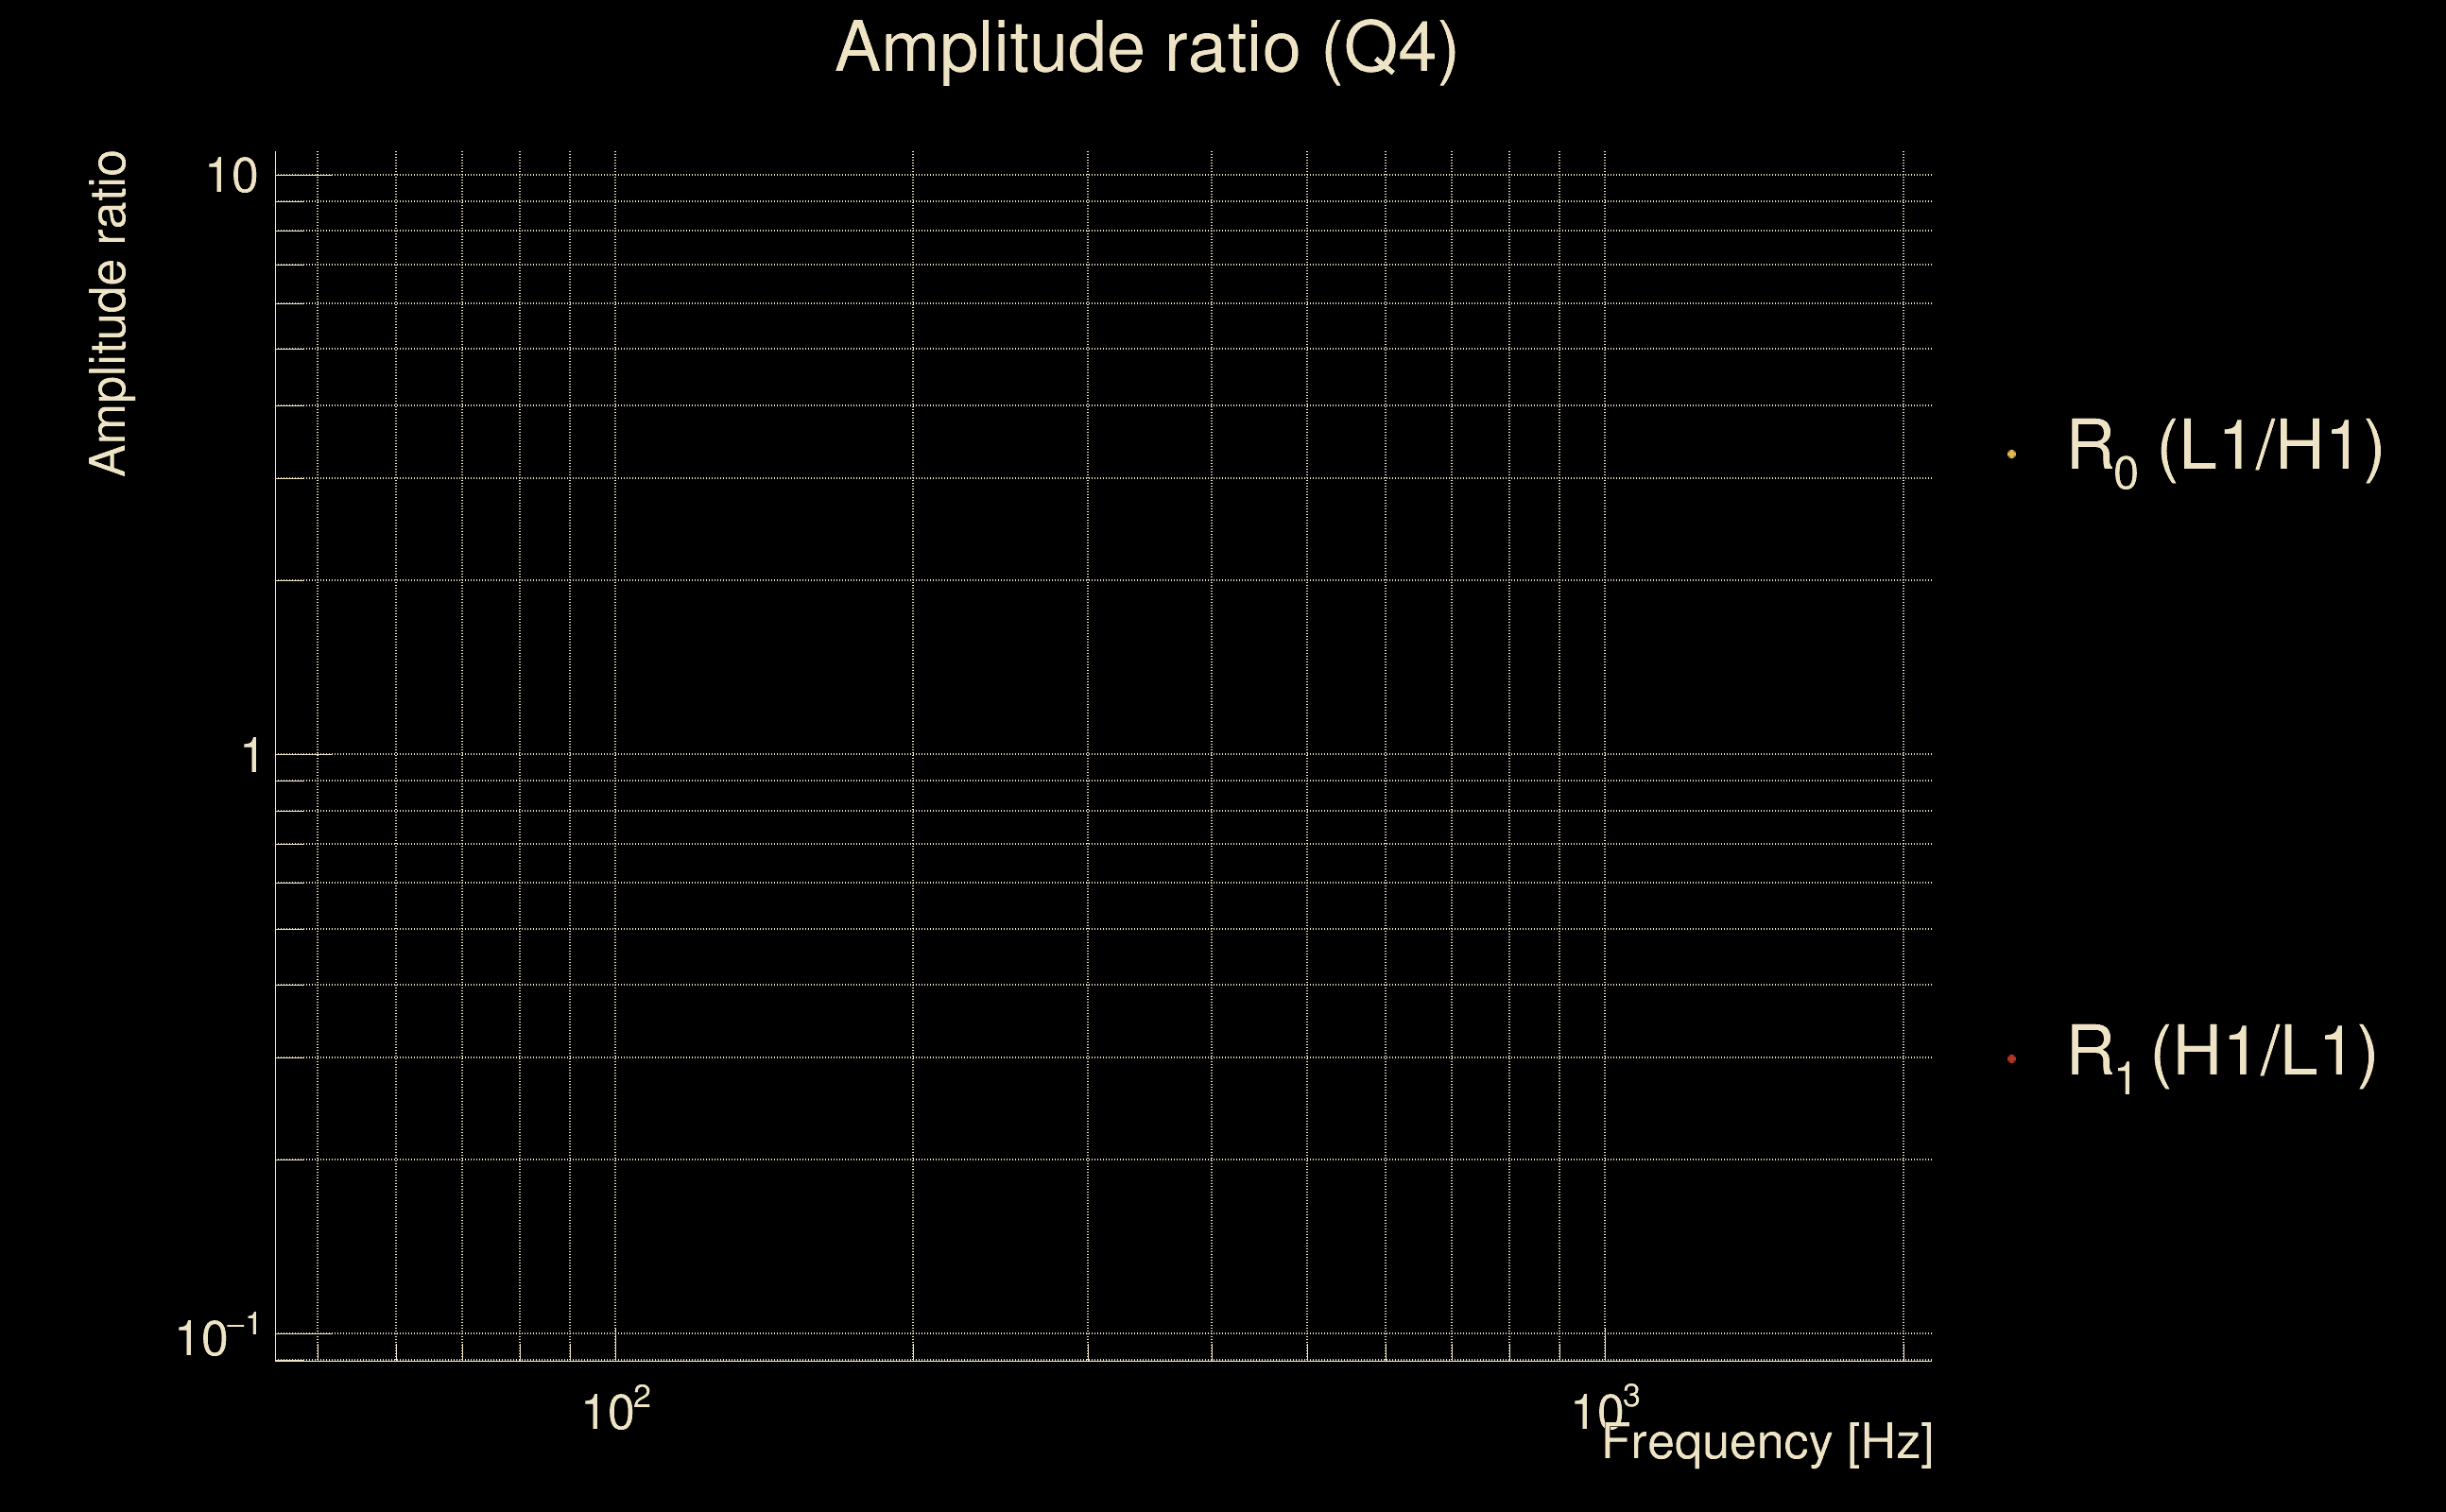
| Log of amplitude ratio (L1/H1): | -0.443812, variance = 0.196561 (L1/H1: -0.473737, variance = 0.350244, H1/L1: 0.377304, variance = 0.311145) |
| Amplitude ratio (L1/H1): | 0.641586 ⋇ 1.55792 (L1/H1: 0.622671 ⋇ 1.80726, H1/L1: 1.45835 ⋇ 1.74683) |
| Amplitude ratio H1|L1 compatibility (probability): | 0.905611 |
| Antenna factor probability: | 0.976177 |
| Number of rejected frequency rows: | Q0: 0 / 18, Q1: 1 / 36, Q2: 9 / 70, Q3: 12 / 134, Q4: 40 / 258 |
| Maximum signal-to-noise ratio: | H1: 244.081, L1: 163.722 |
| SNR variance: | H1: 0.51741, L1: 0.547523 |
| Click here for a zoomed plot | Click here for a zoomed plot | Click here for a zoomed plot | Click here for a zoomed plot | Click here for a zoomed plot |
 |
 |
 |
 |
 |
 |
 |
 |
 |
 |
 |
 |
 |
 |
 |
 |
 |
 |
 |
 |
 |
 |
 |
 |
 |
 |
 |
 |
 |
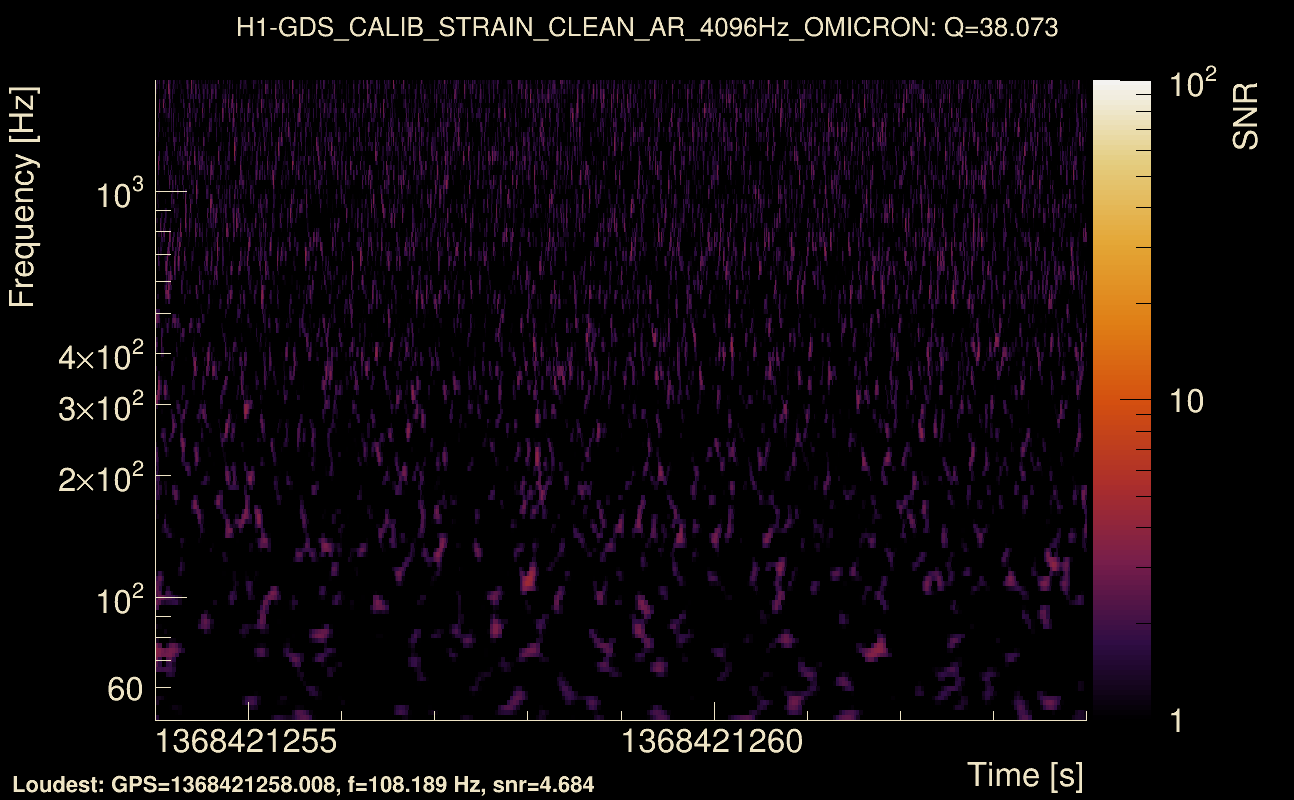
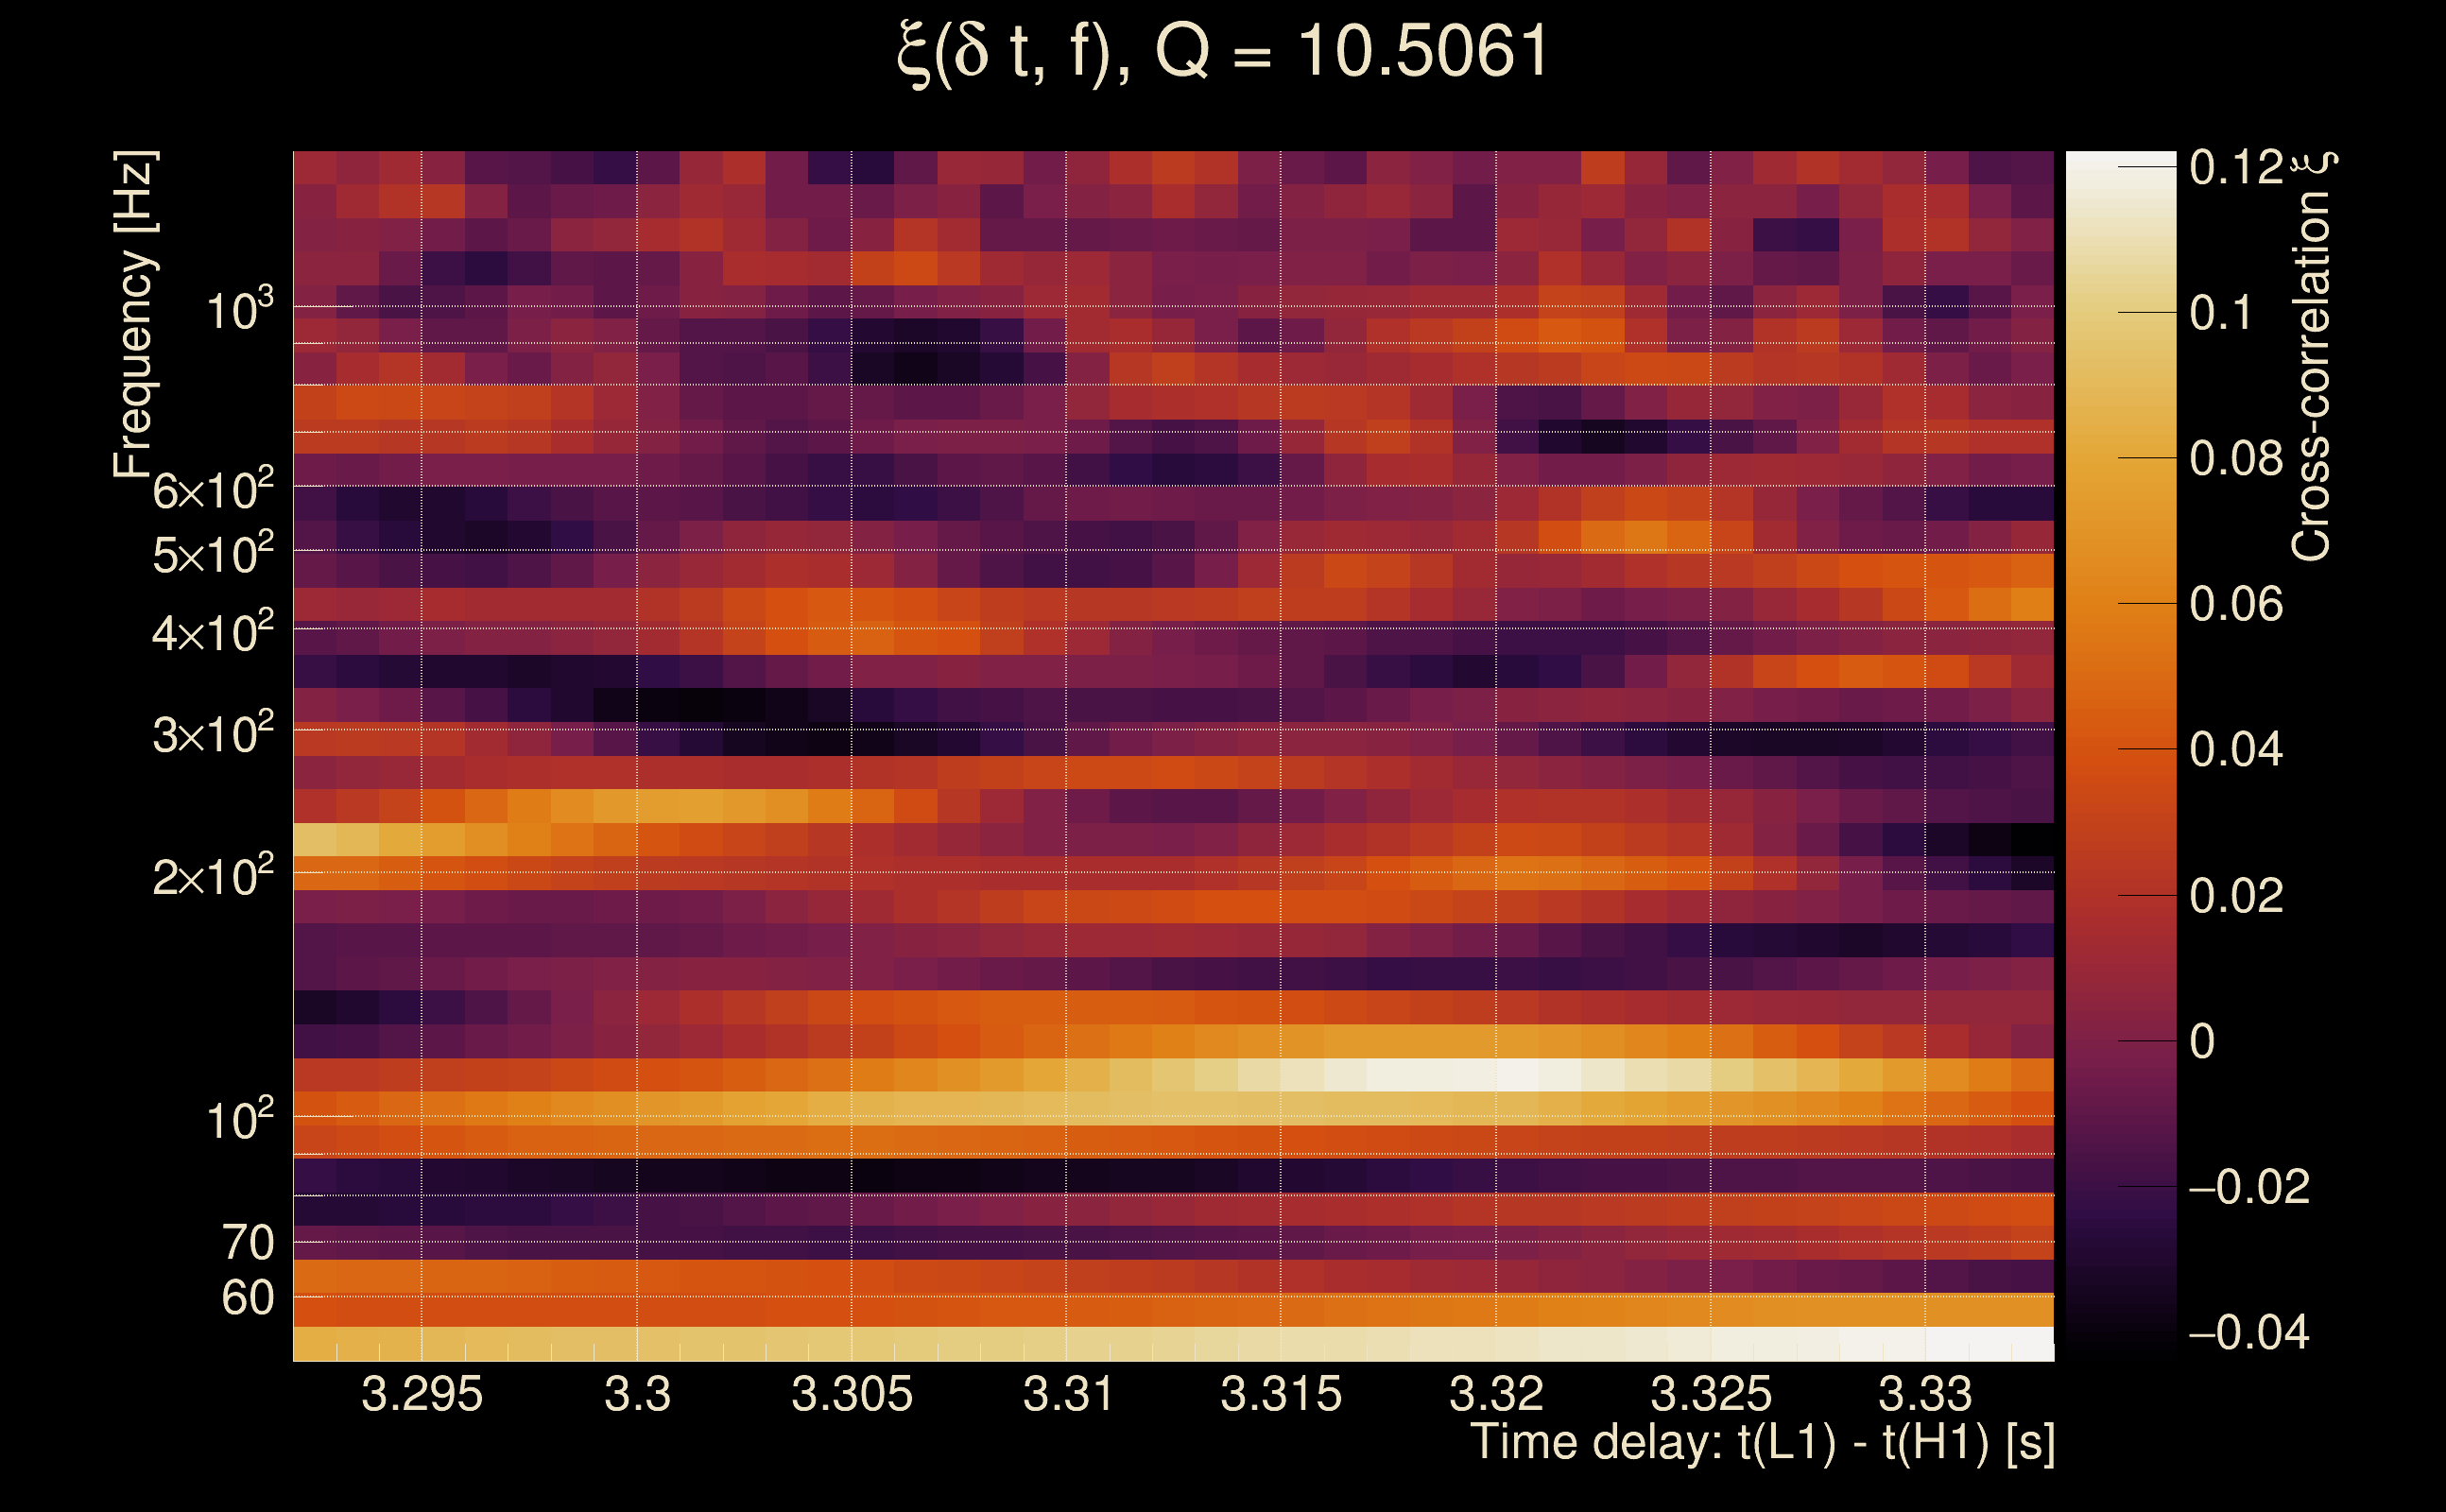
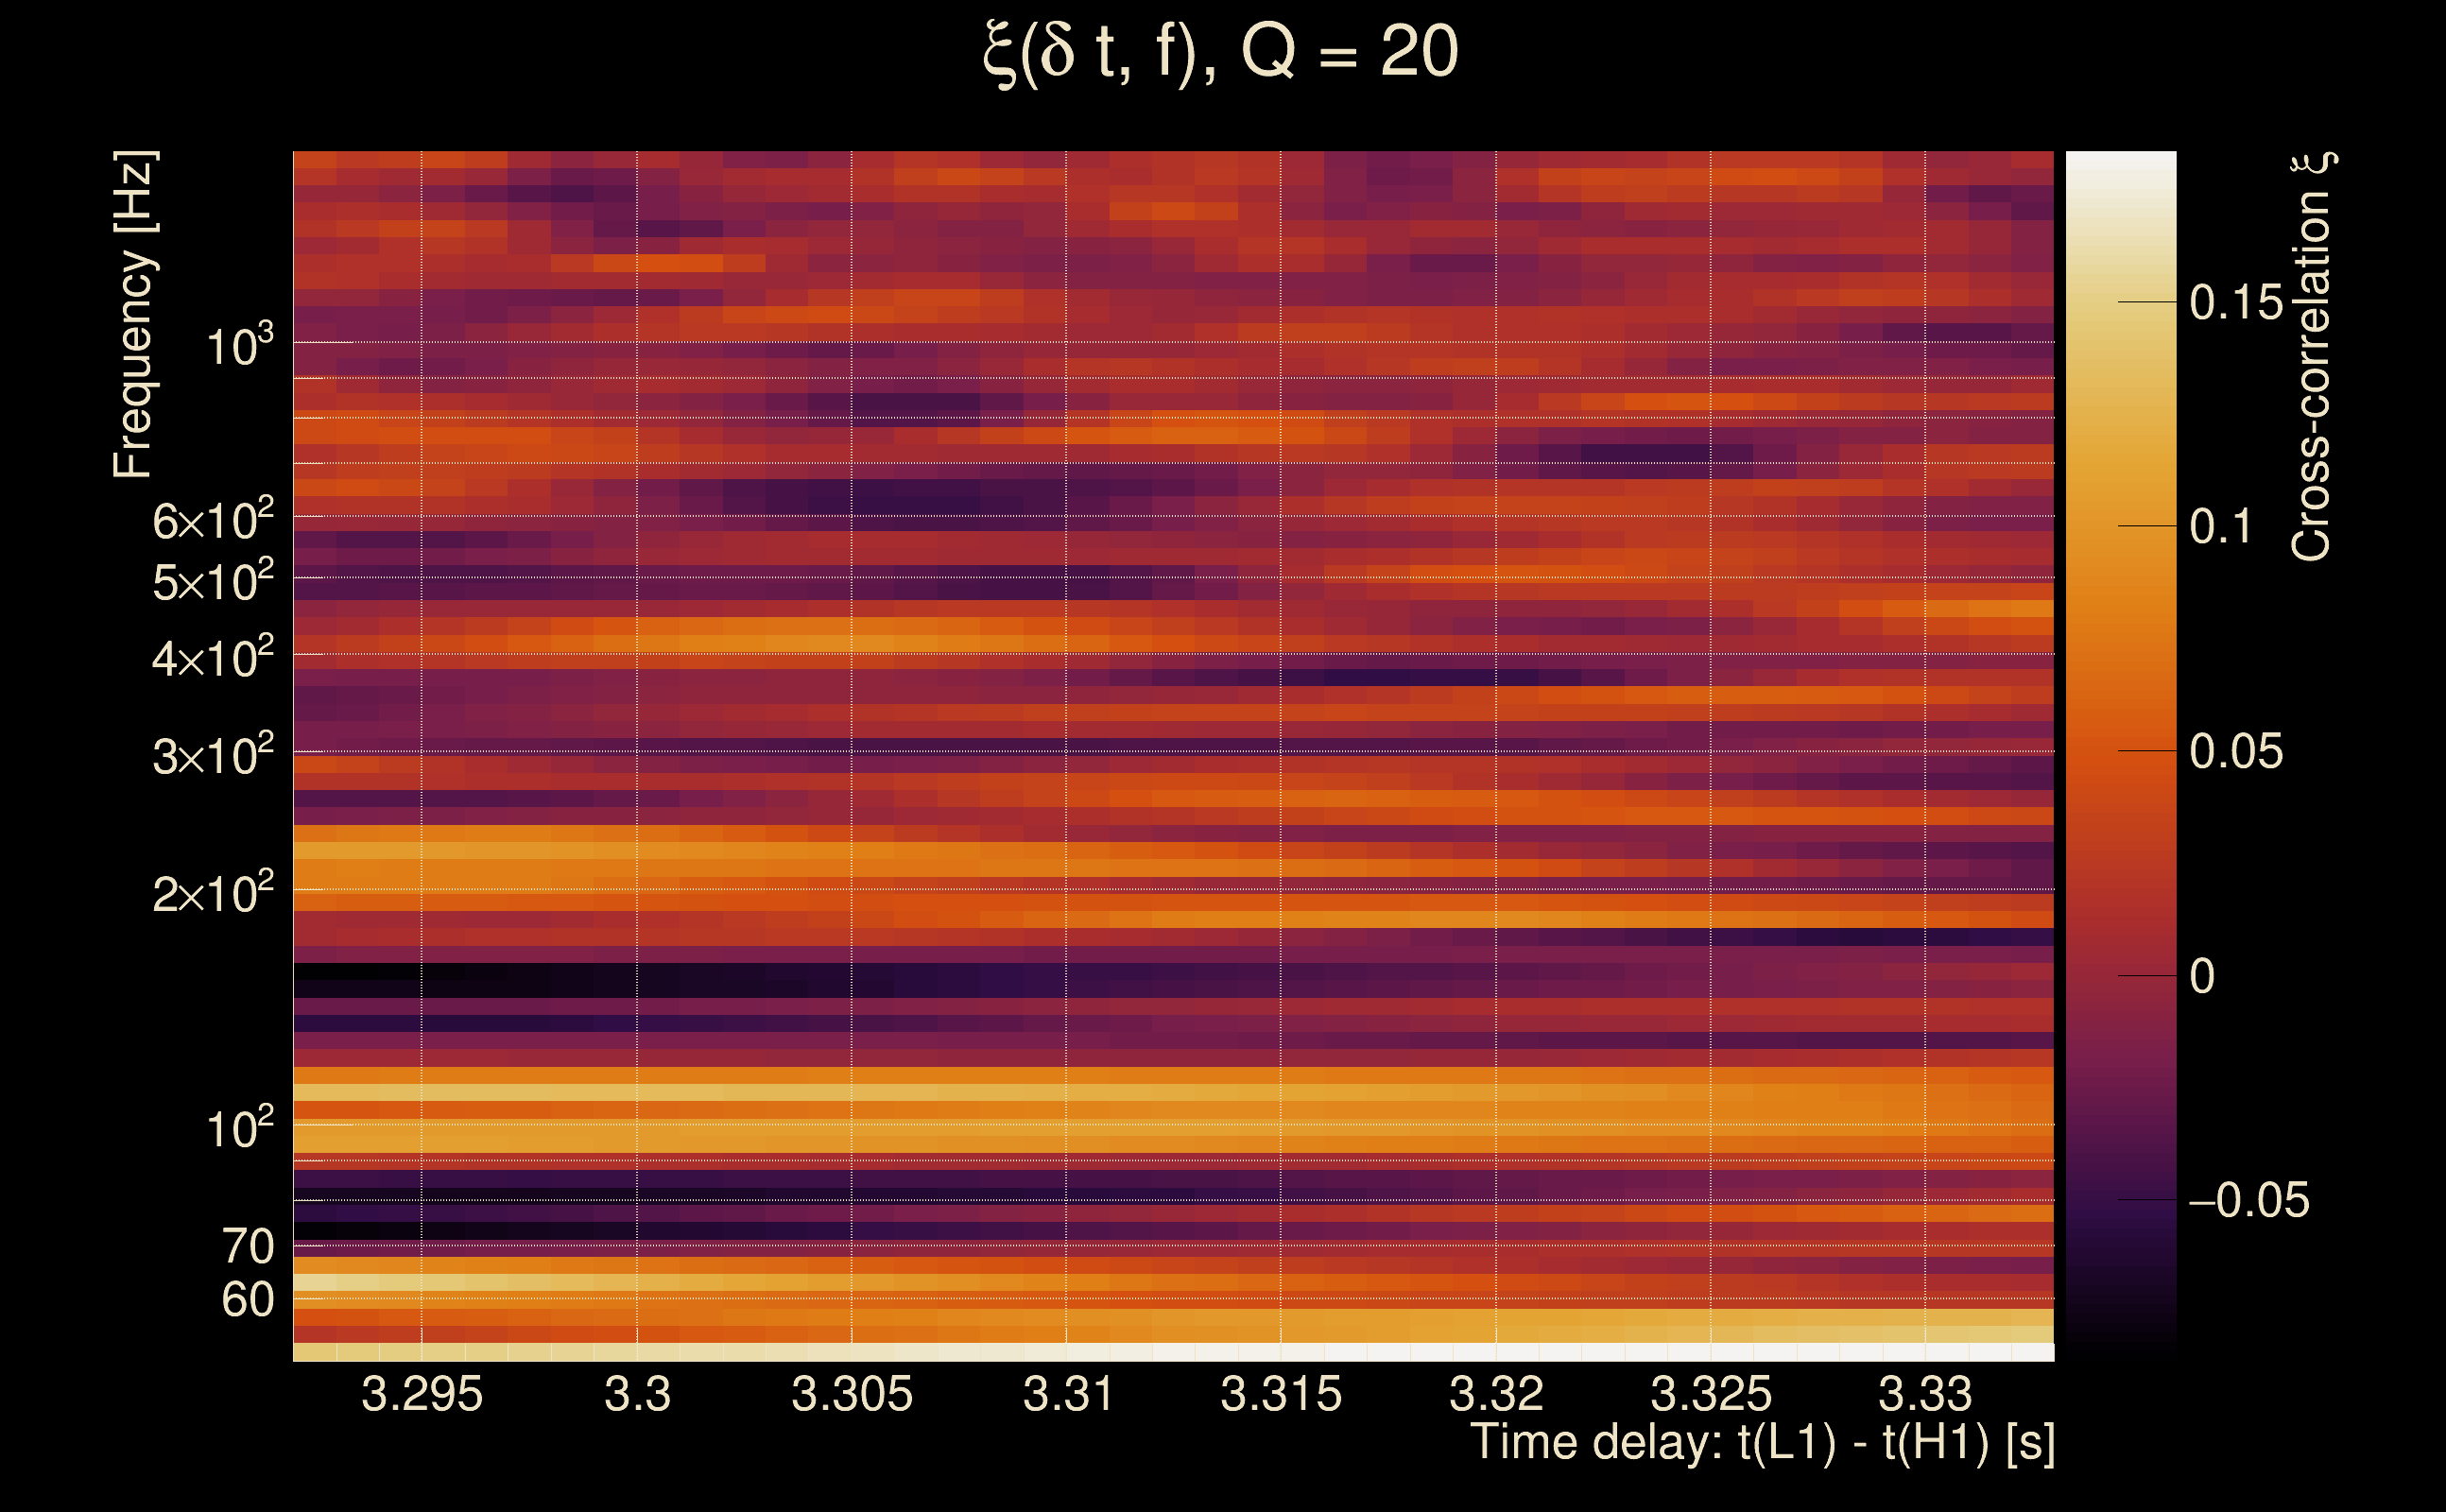
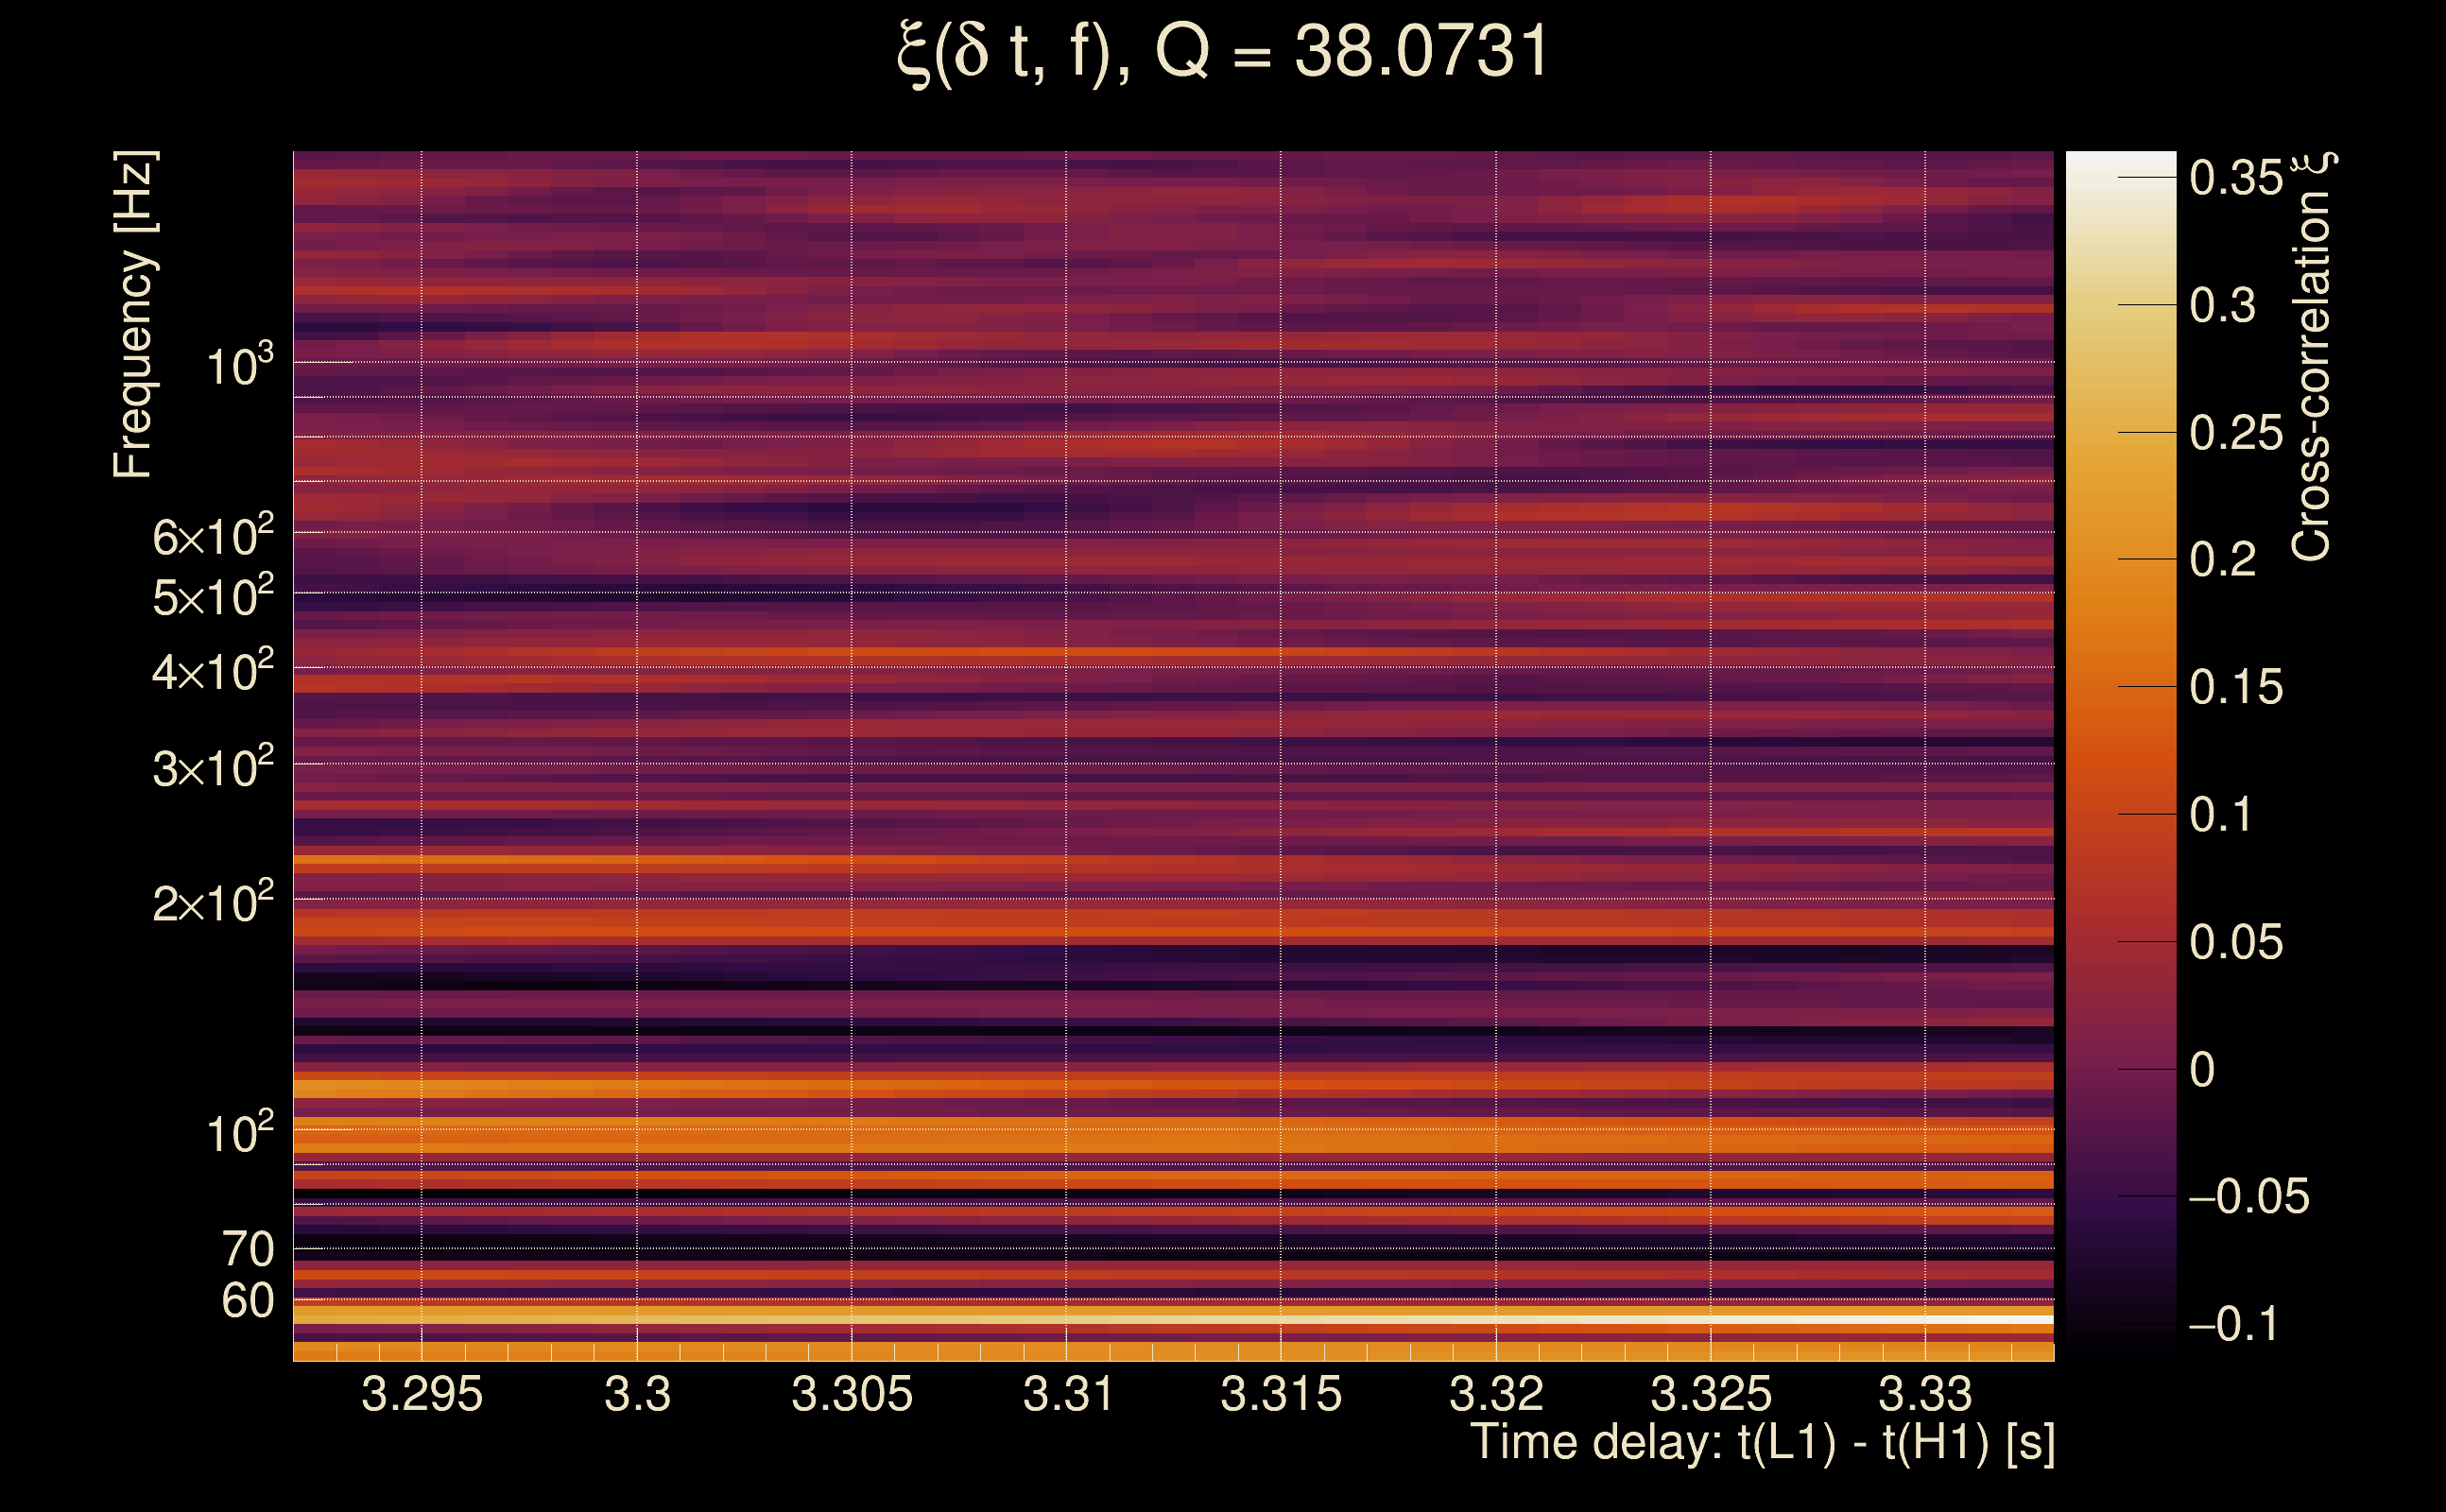
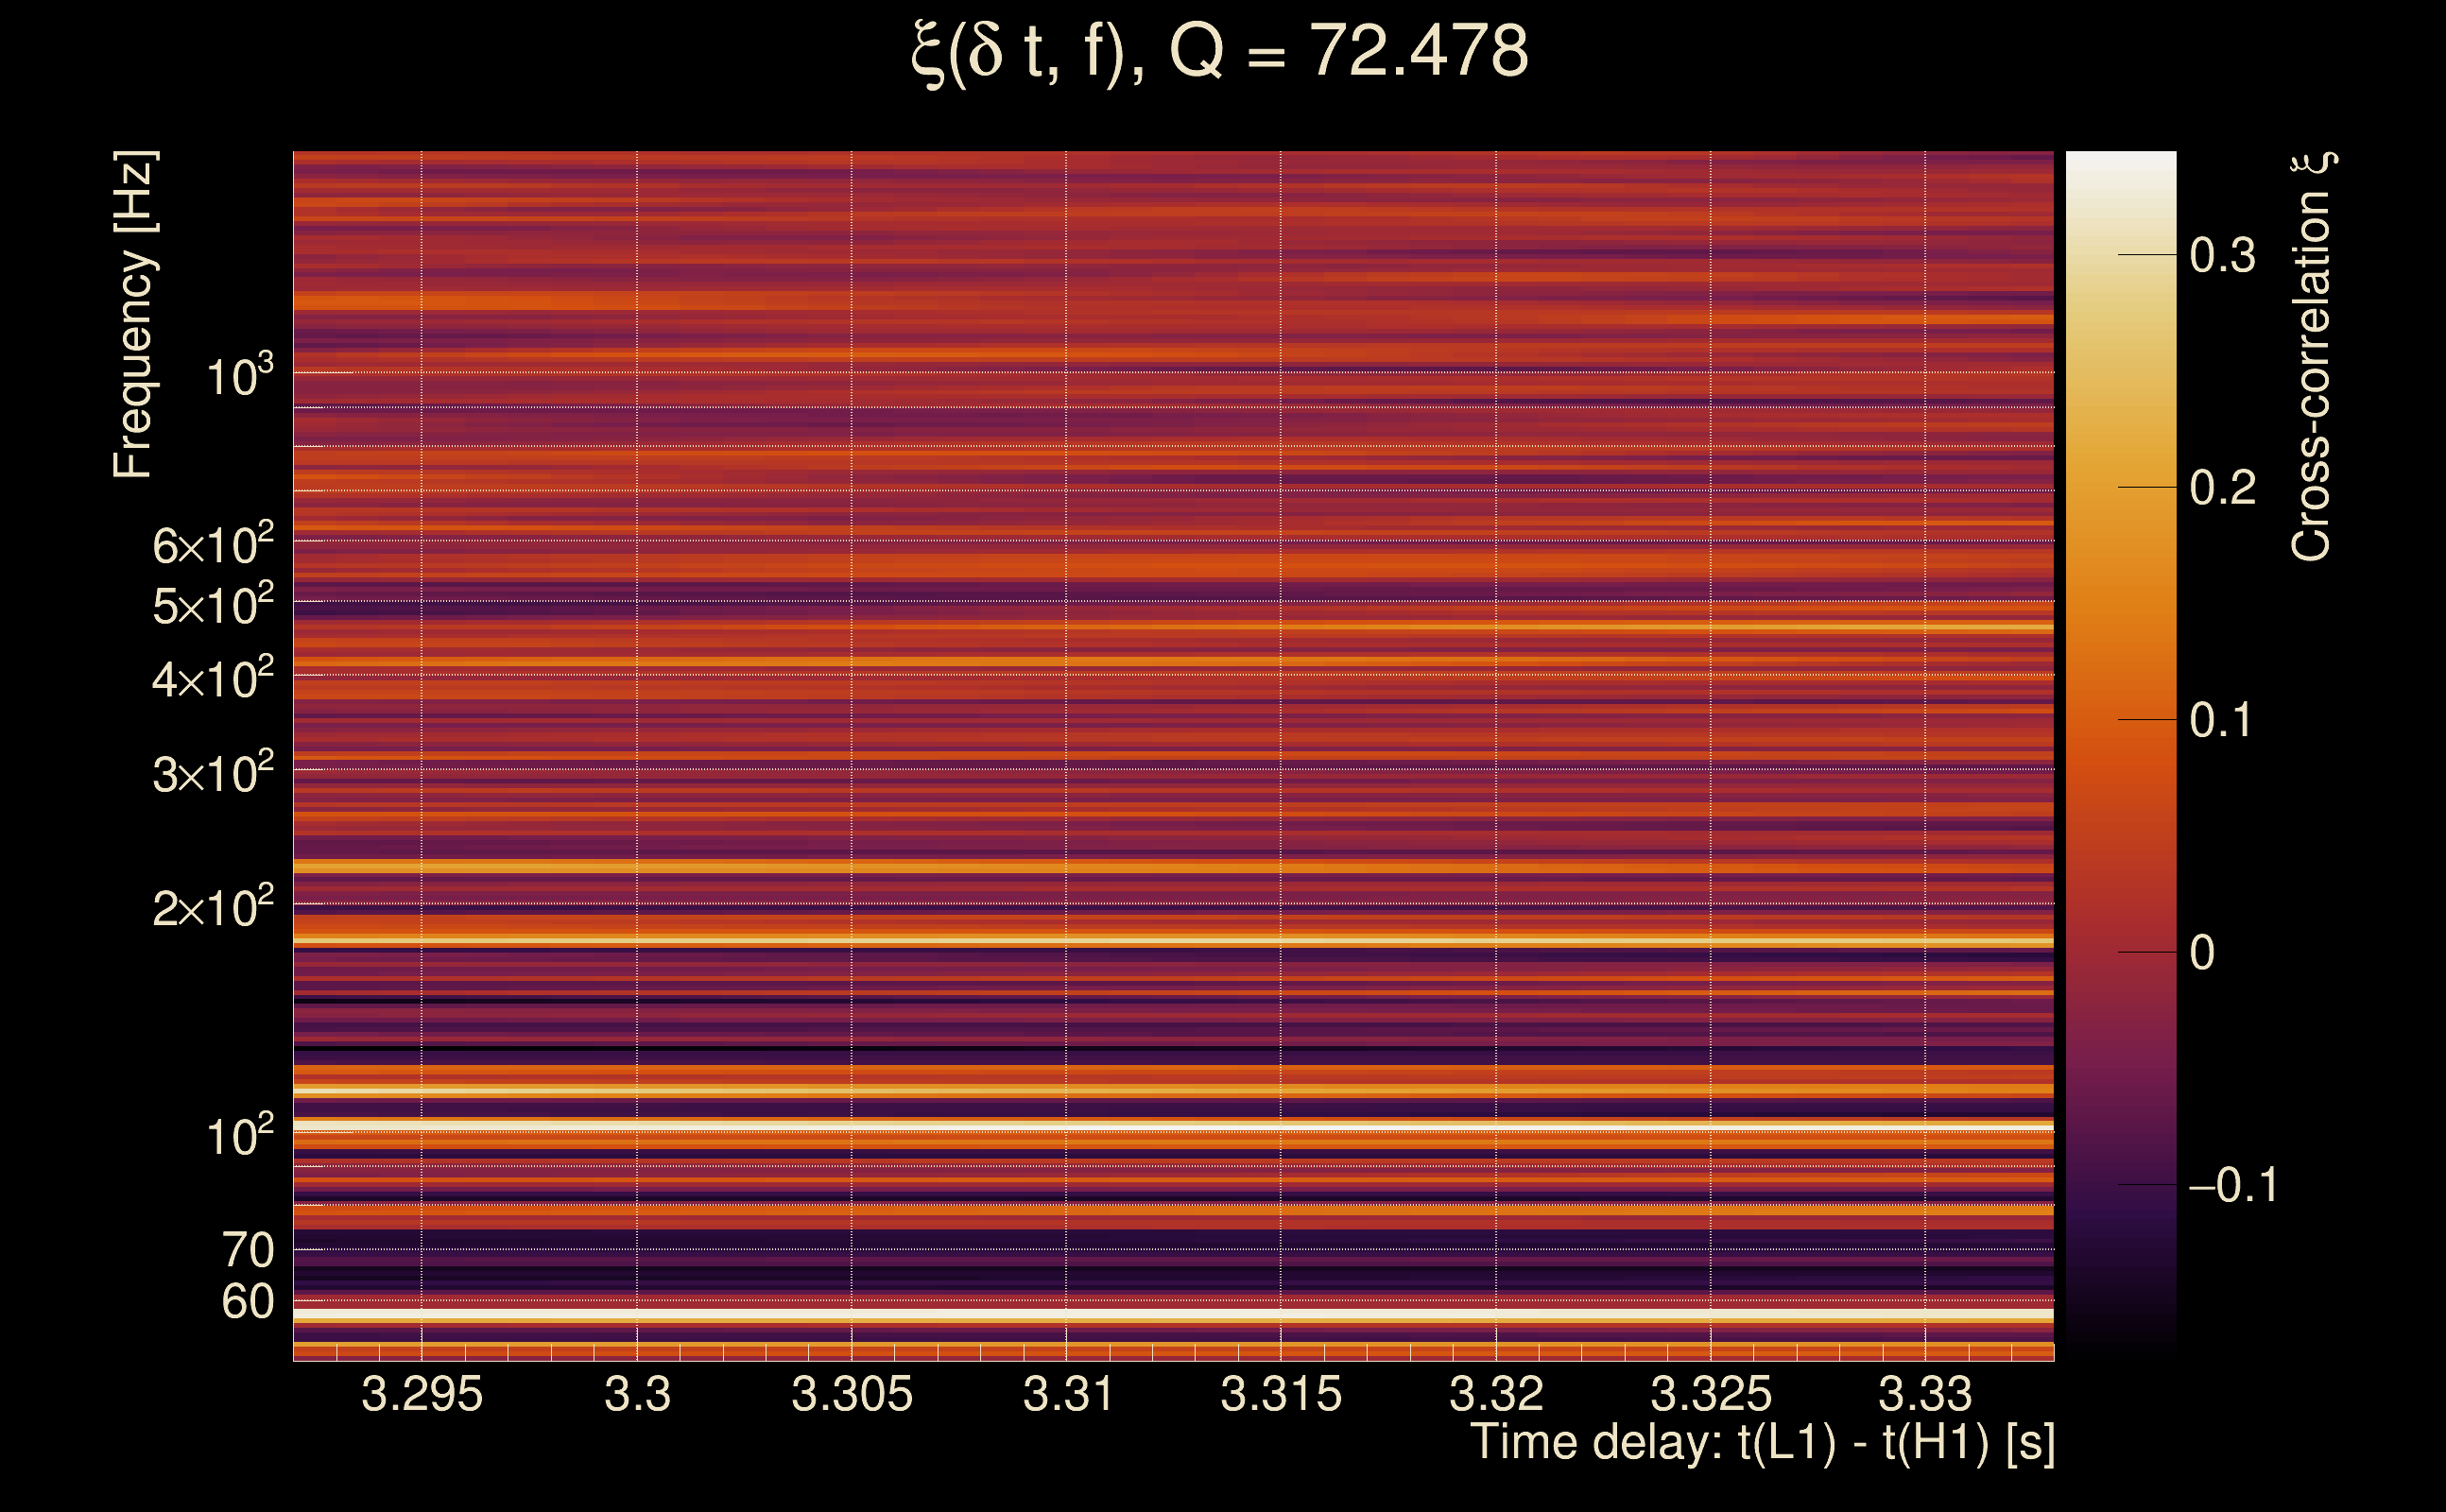
| Event time t(H1): | GPS = 1368421254 (Thu May 18 05:00:36 2023 ) → GPS = 1368421264 (Thu May 18 05:00:46 2023 ) |
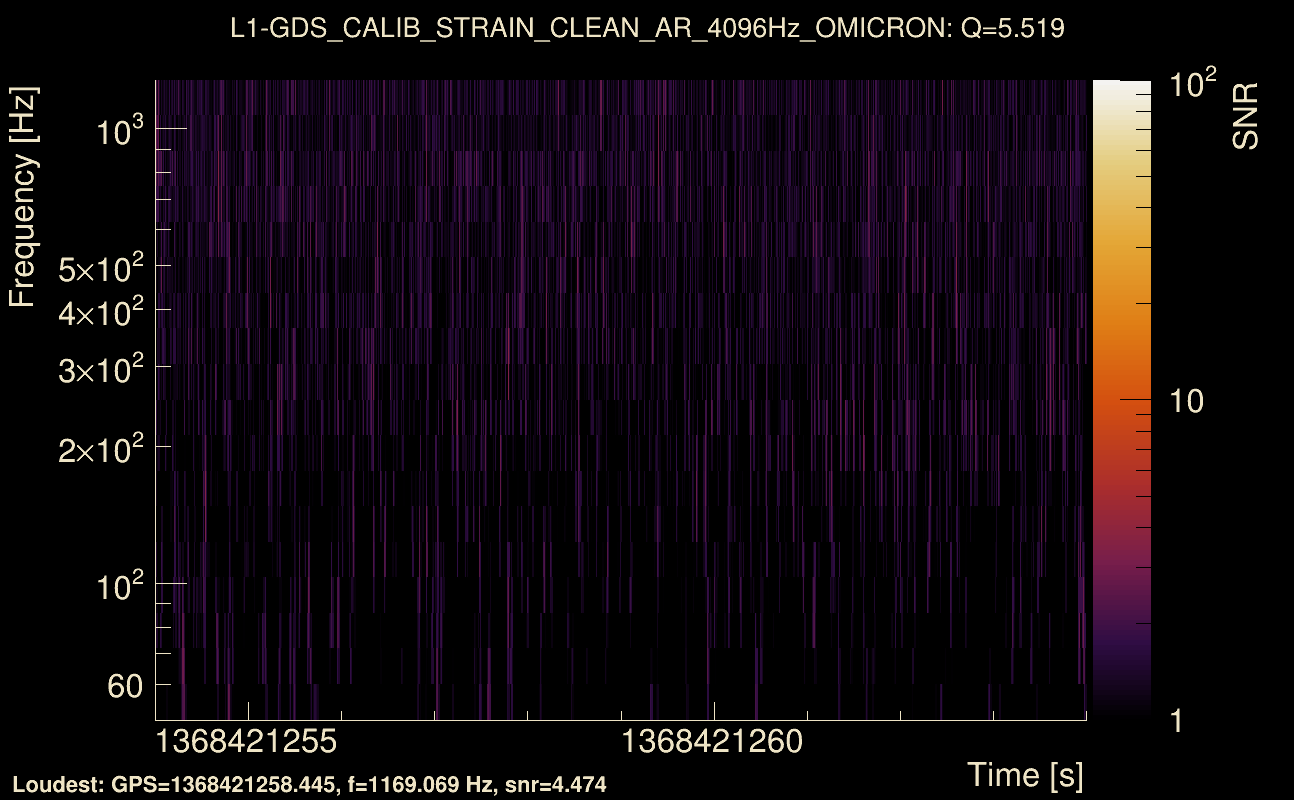
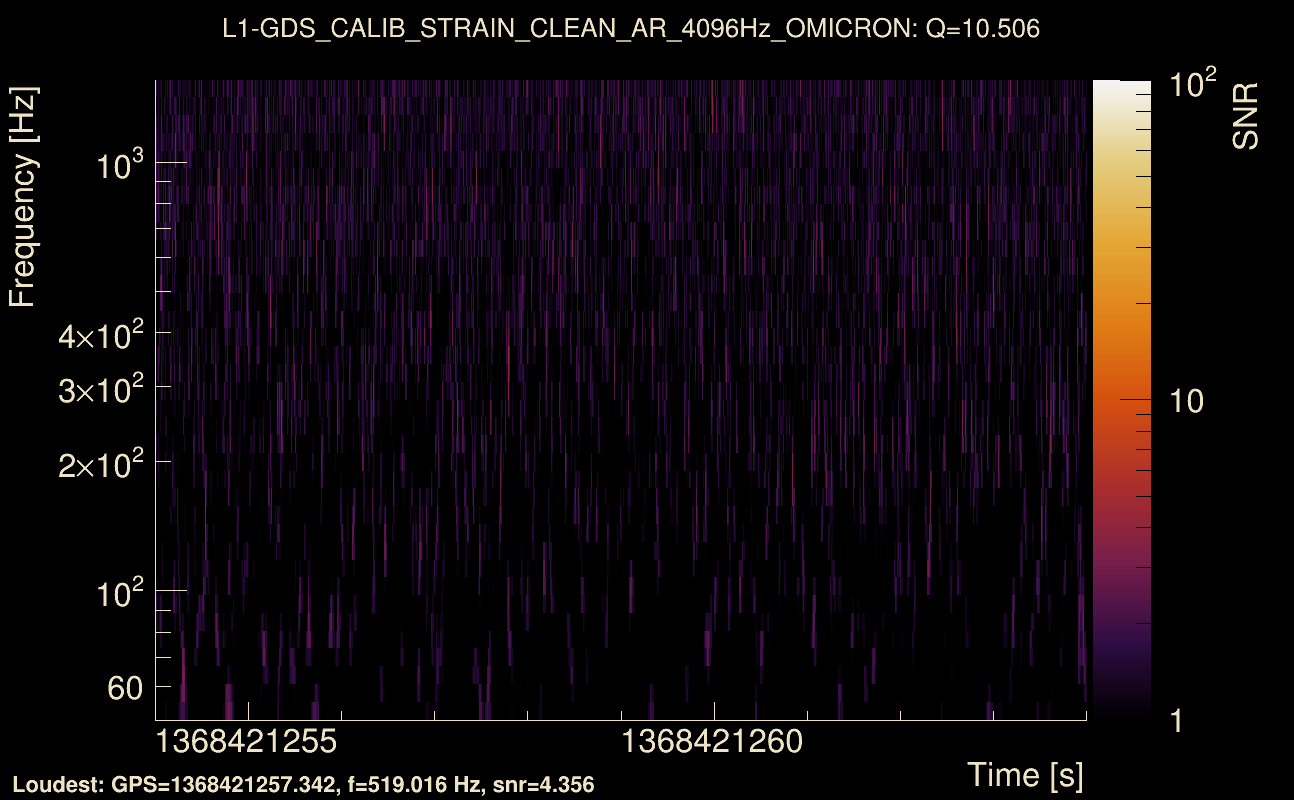
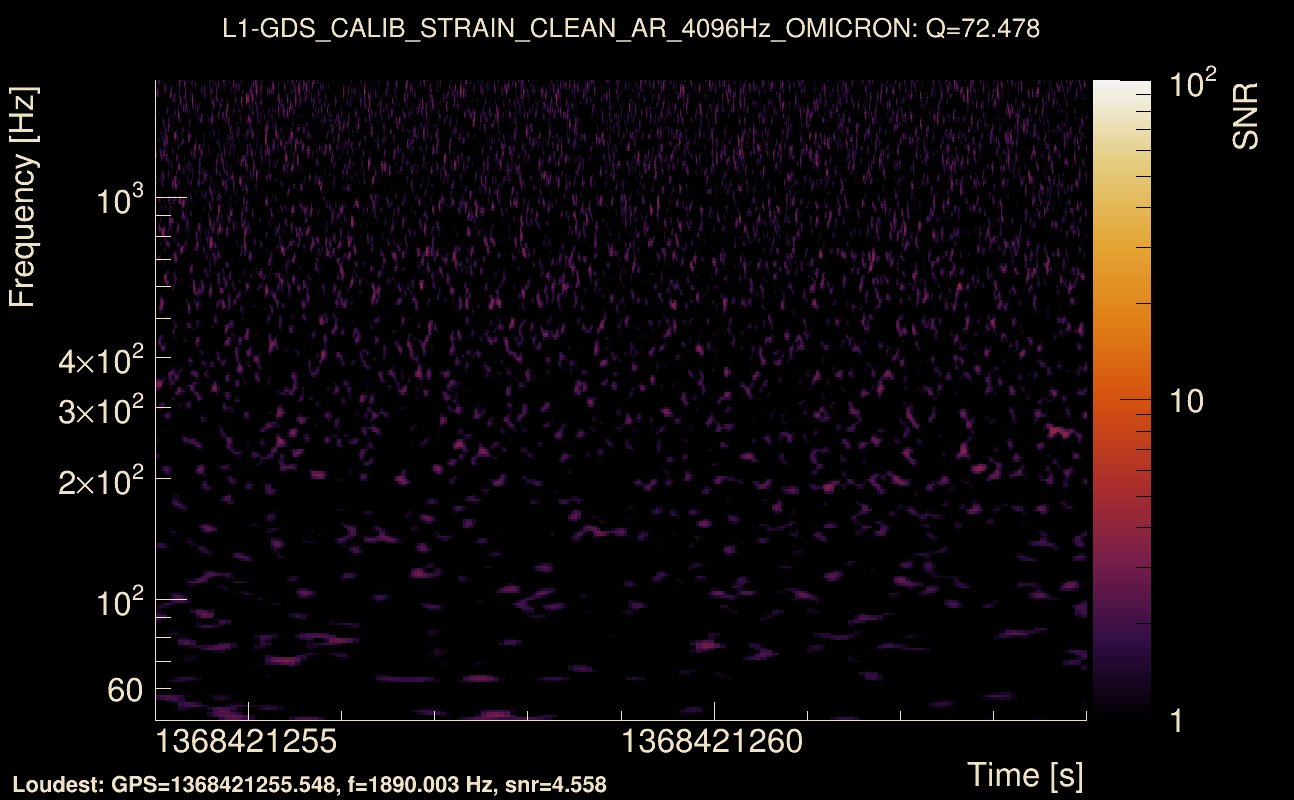
| Event time t(L1): | GPS = 1368421254 (Thu May 18 05:00:46 2023 ) → GPS = 1368421264 (Thu May 18 05:00:46 2023 ) |
| Omicron analysis time window (H1): | GPS = 1368421251 → GPS = 1368421267 |
| Omicron analysis time window (L1): | GPS = 1368421251 → GPS = 1368421267 |
| Time delay between detectors t(L1) - t(H1): | 3.31228 s (slice index = 36 / 217), δt_gw = 0.00028207 s |
| Time delay standard deviation: | 0.0793933 s |
| [targeted mode] Time delay probability: | 0.879475 (0.151635 sigmas), δt_target = 0.00747991 s |
| Frequency: | 138.224 Hz |
| Ξ: | 0.0113798 ± 0.04923 (variance = 0.0024236): Q0: 0.0903856, Q1: 0.0914056, Q2: 0.0774639, Q3: 0.0403058, Q4: 0.188921 |
| Rank: | R_A = 0.00852051 |
| Log of amplitude ratio (L1/H1): | -0.059372, variance = 1.3319 (L1/H1: -0.259773, variance = 3.08143, H1/L1: -0.166262, variance = 2.11324) |
| Amplitude ratio (L1/H1): | 0.942356 ⋇ 3.1711 (L1/H1: 0.771227 ⋇ 5.78576, H1/L1: 0.846824 ⋇ 4.27891) |
| Amplitude ratio H1|L1 compatibility (probability): | 0.85172 |
| Antenna factor probability: | 0.999566 |
| Number of rejected frequency rows: | Q0: 15 / 18, Q1: 32 / 36, Q2: 65 / 70, Q3: 128 / 134, Q4: 248 / 258 |
| Maximum signal-to-noise ratio: | H1: 4.96869, L1: 4.68262 |
| SNR variance: | H1: 0.508618, L1: 0.546748 |
| Click here for a zoomed plot | Click here for a zoomed plot | Click here for a zoomed plot | Click here for a zoomed plot | Click here for a zoomed plot |
 |
 |
 |
 |
 |
 |
 |
 |
 |
 |
 |
 |
 |
 |
 |
 |
 |
 |
 |
 |
 |
 |
 |
 |
 |
 |
 |
 |
 |
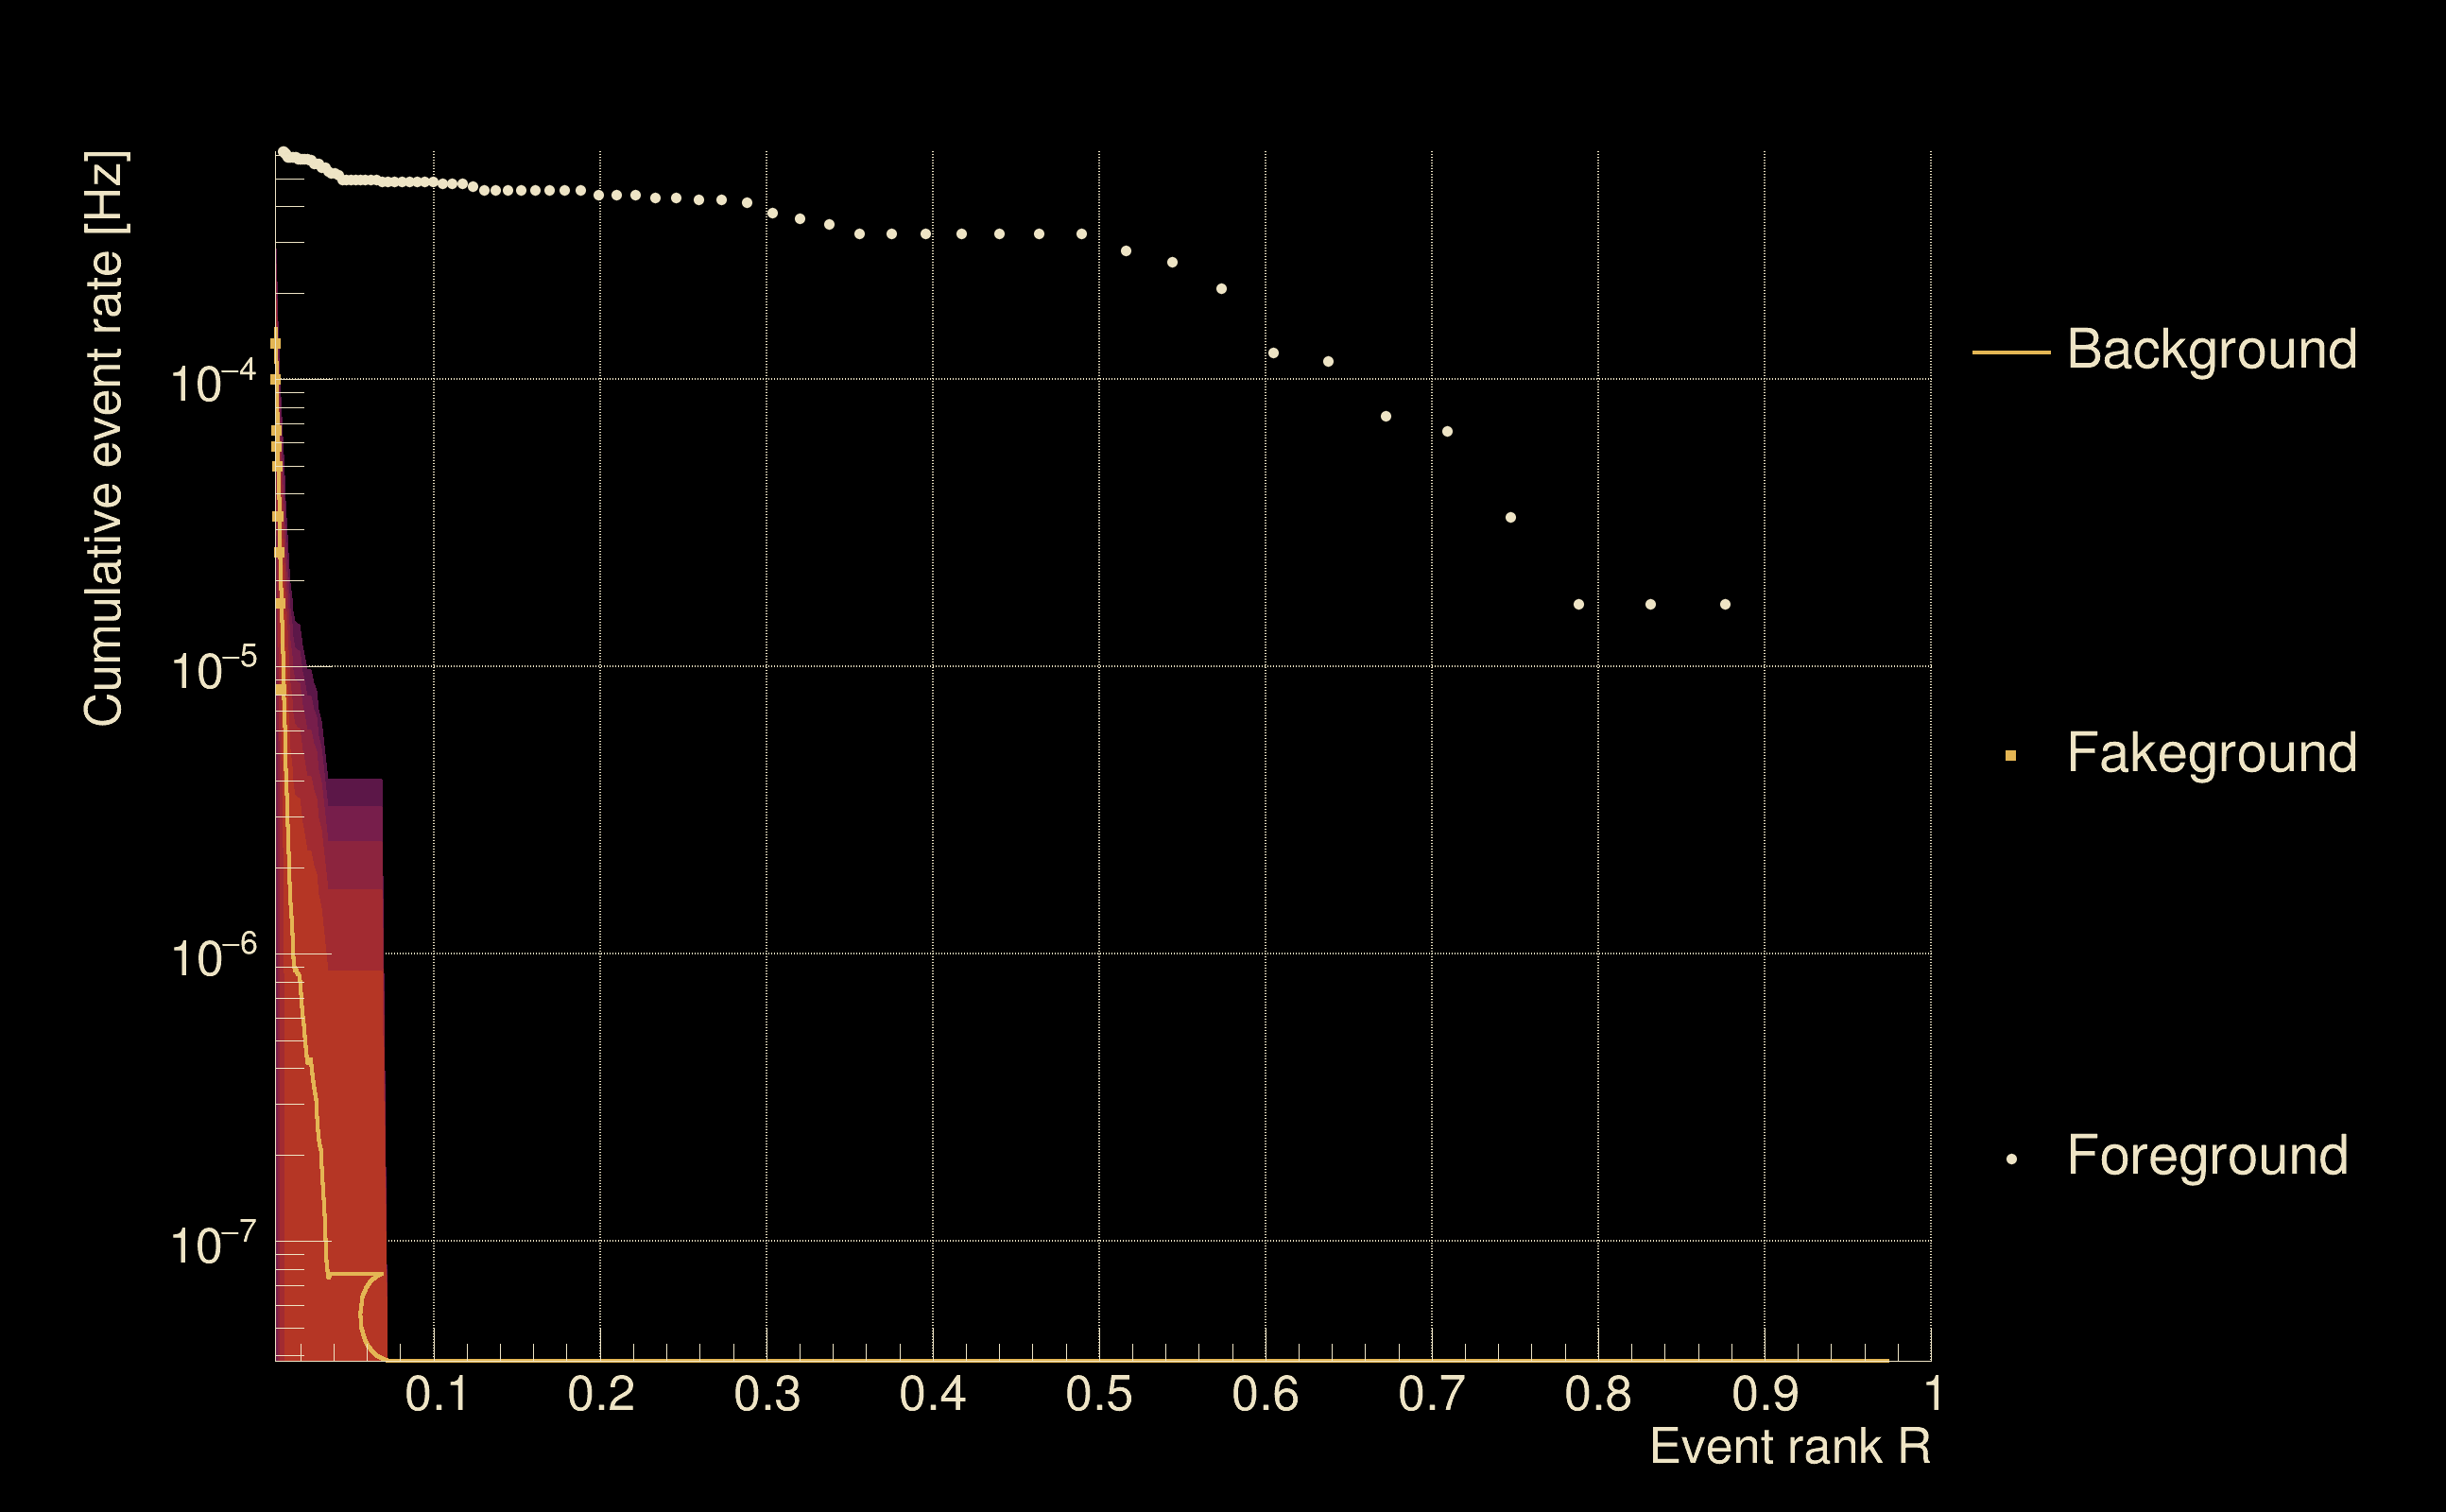
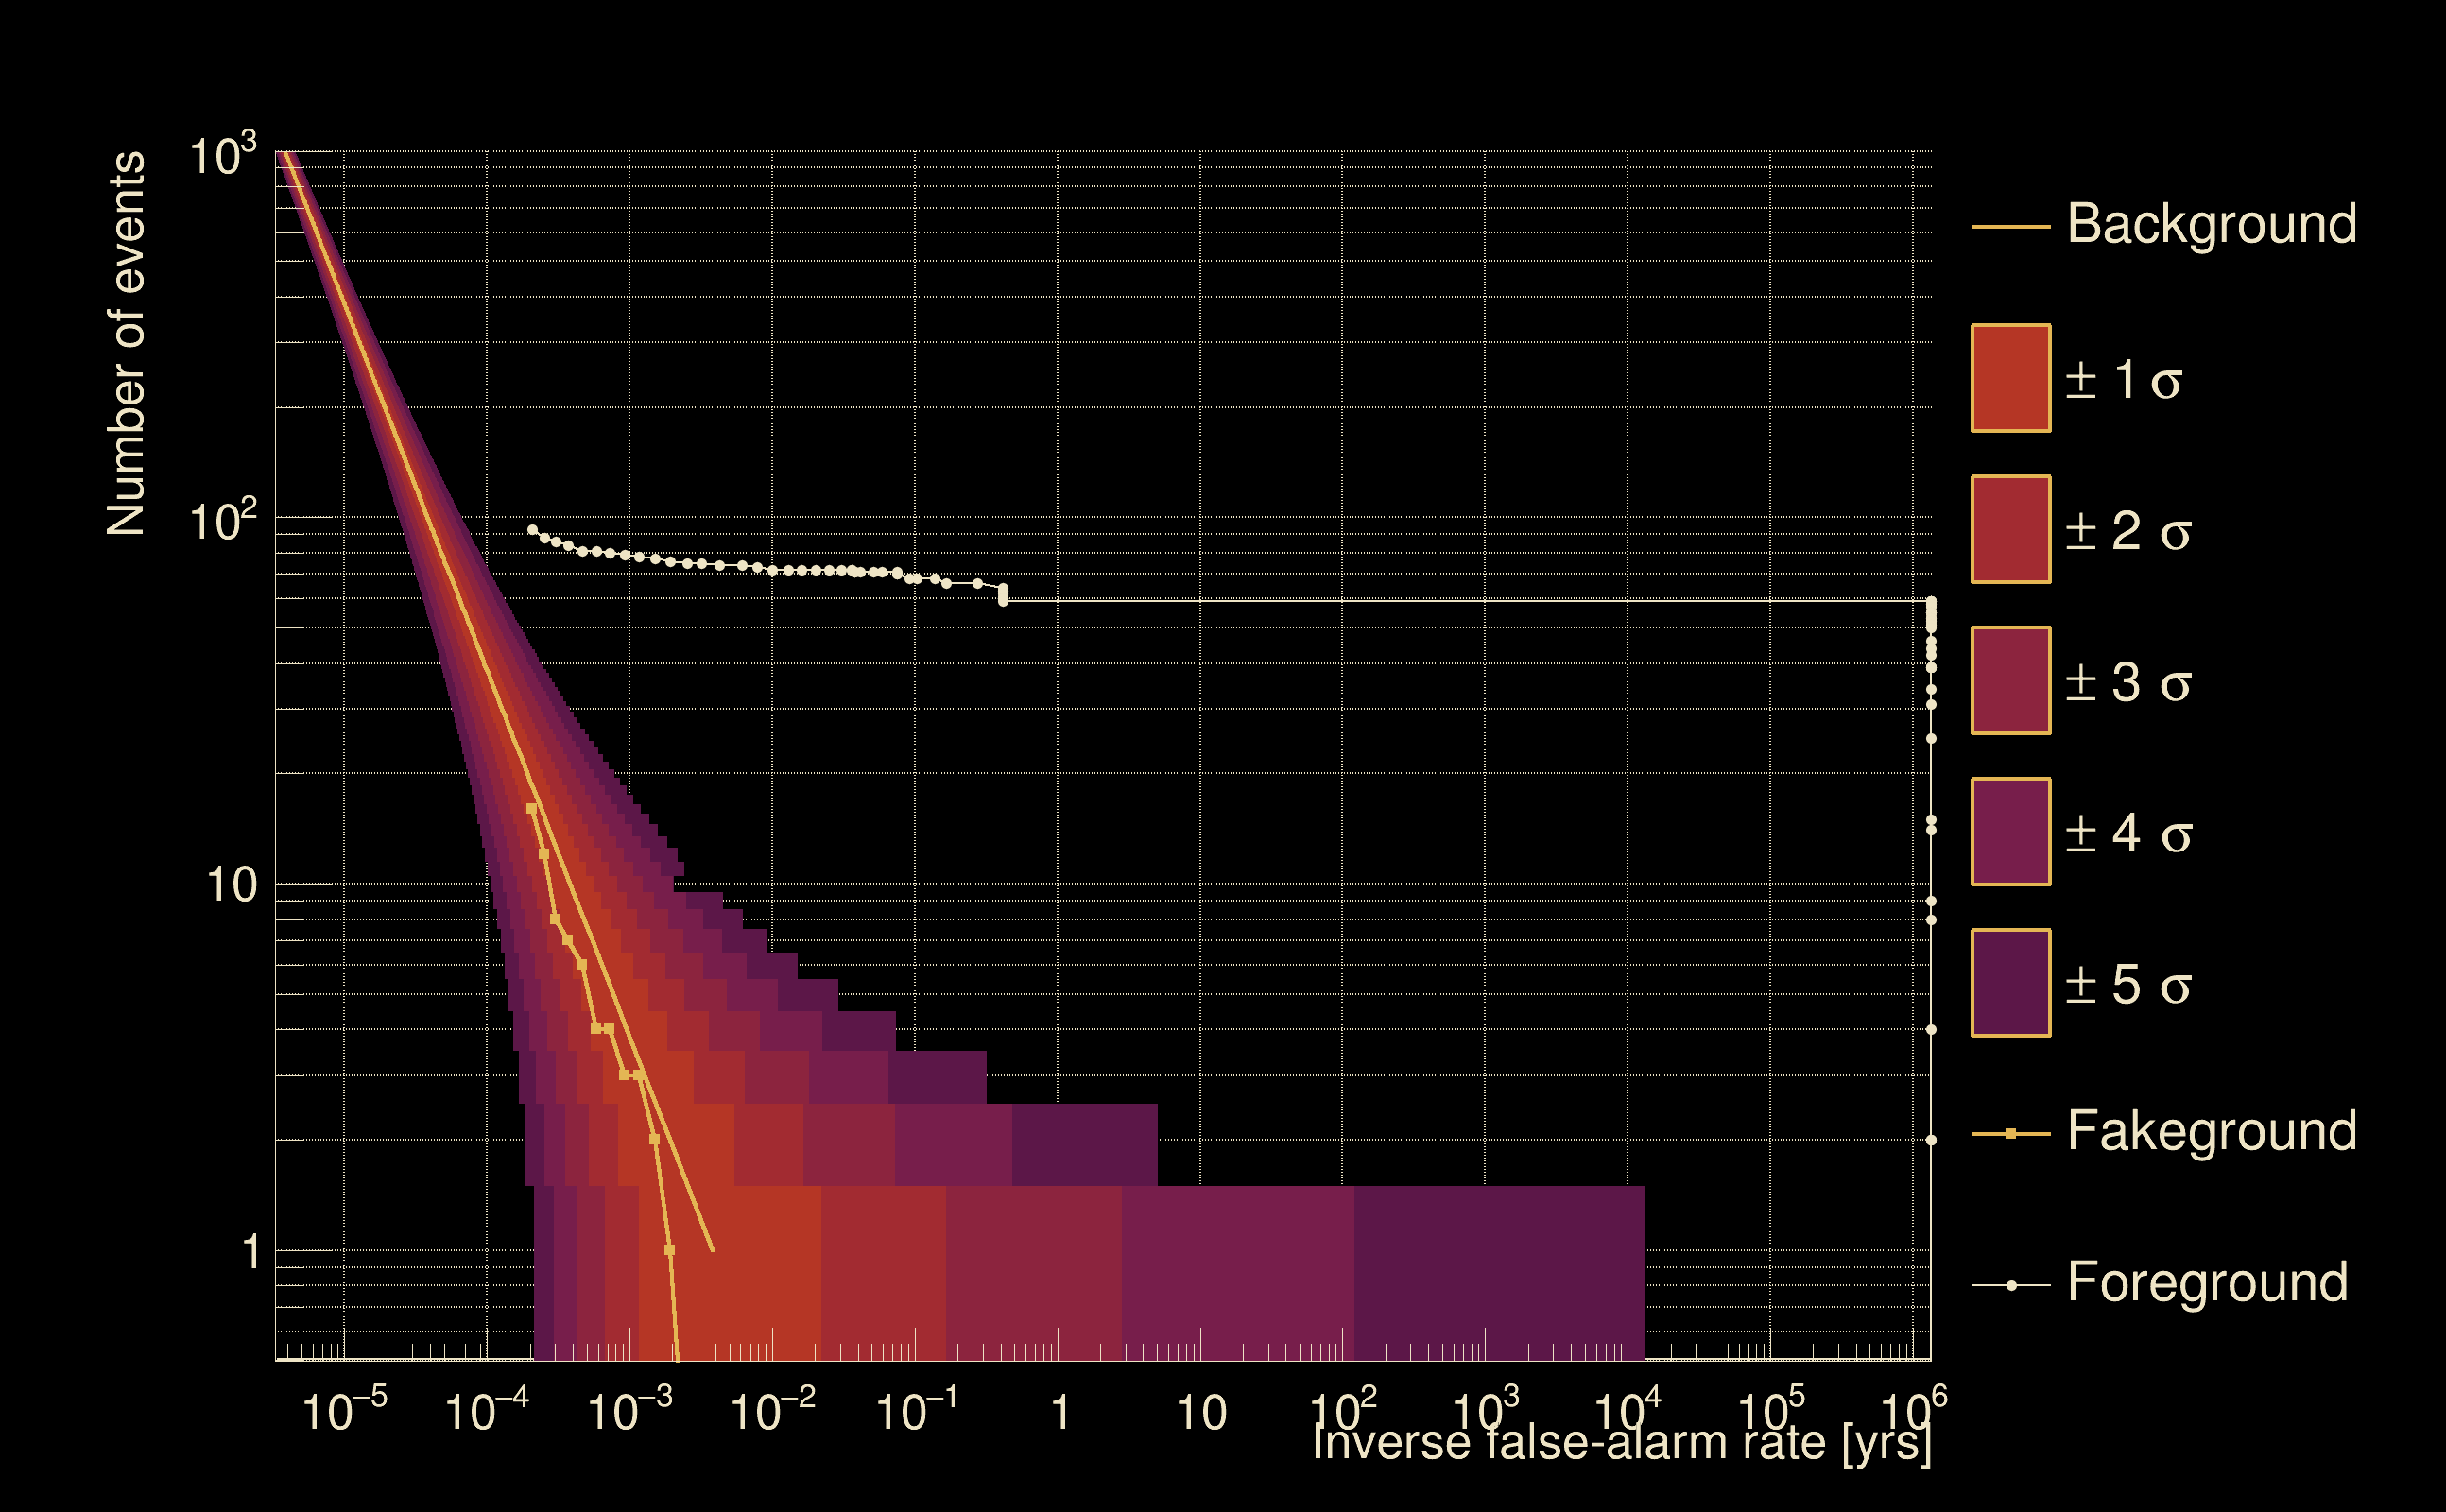
| Detection threshold: | R > 0.0314201 |
| False-alarm rate above that detection threshold: | 2.04129e-07 |
| Alternative threshold at 1/1000 yrs: | R > 0.0688862 |
| Alternative threshold at 1/100 yrs: | R > 0.0688862 |
| Alternative threshold at 1/10 yrs: | R > 0.0688862 |
| Alternative threshold at 1/1 yr: | R > 0.0688862 |
| Alternative threshold at 1/1 d: | R > 0.00920832 |
 |
|
 |
 |
 |
 |
 |
 |
 |
 |
 |
 |
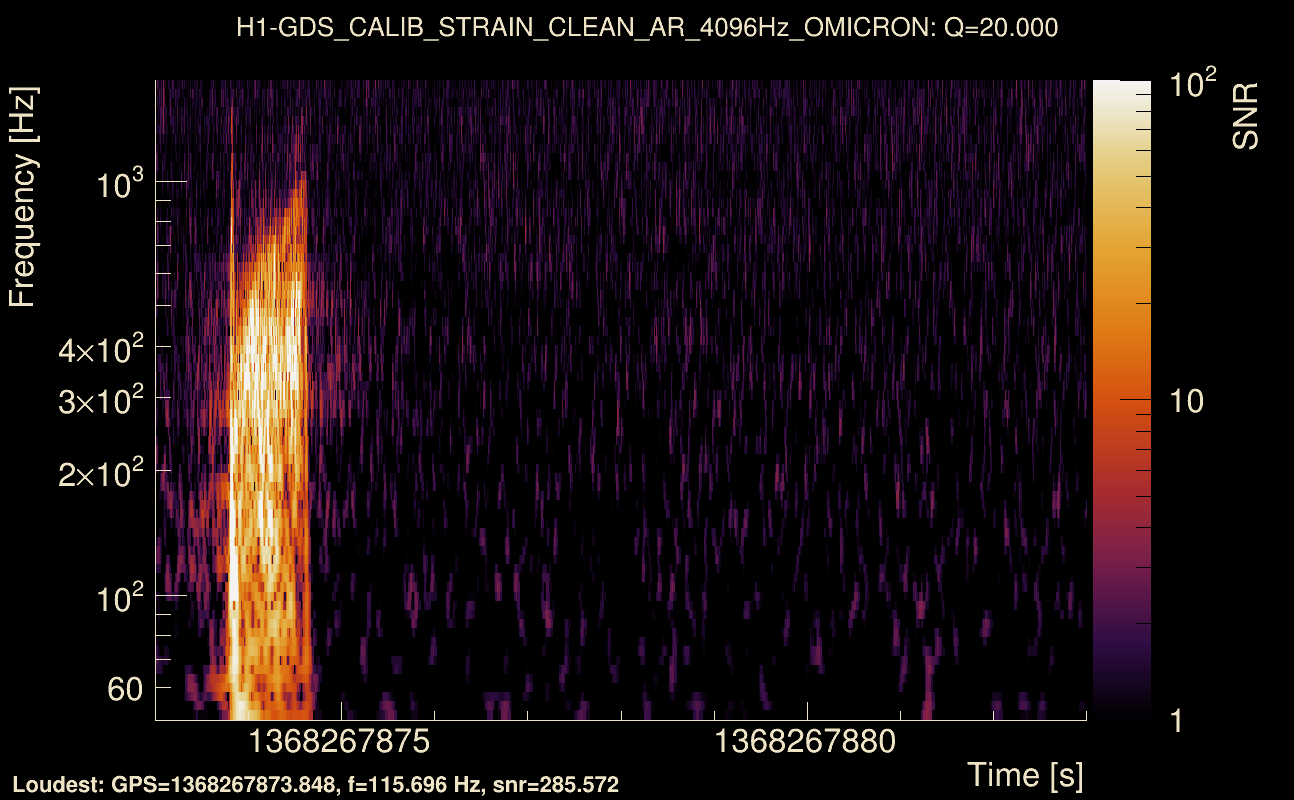
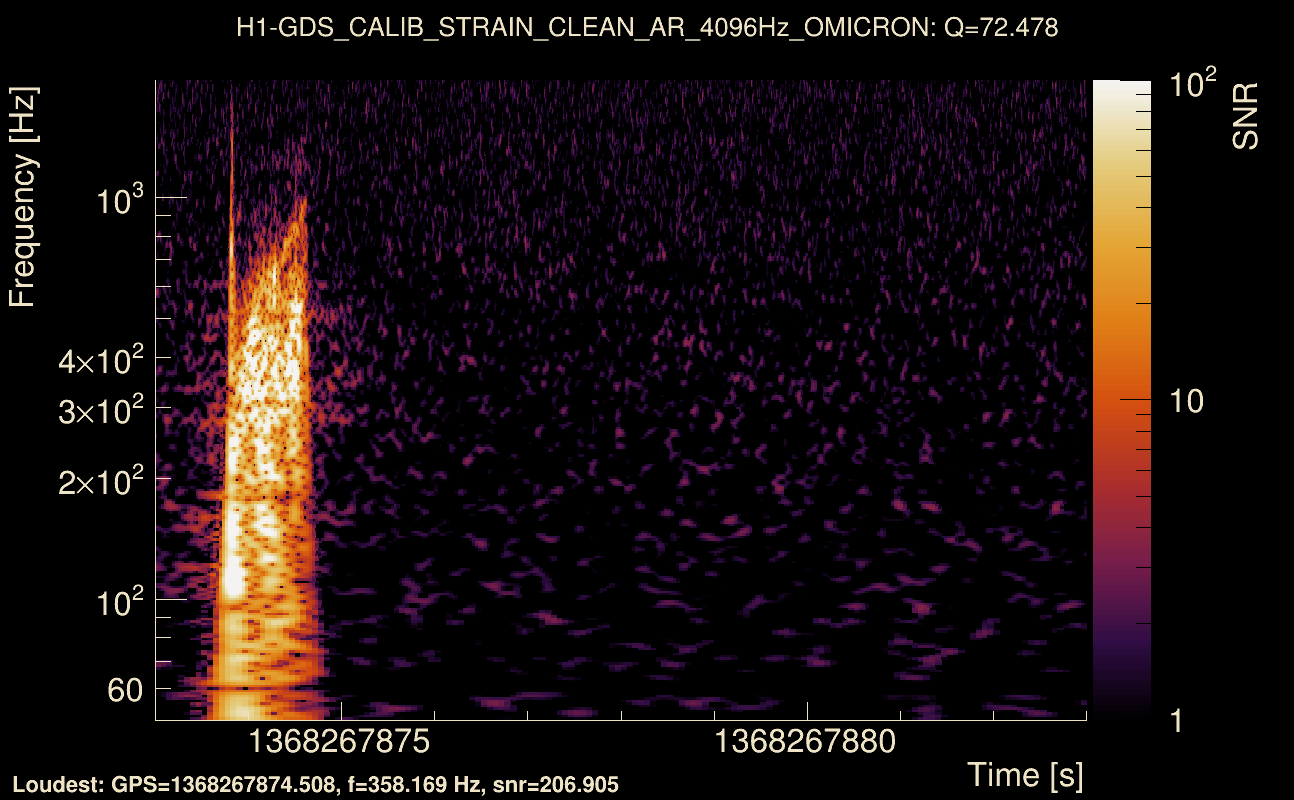
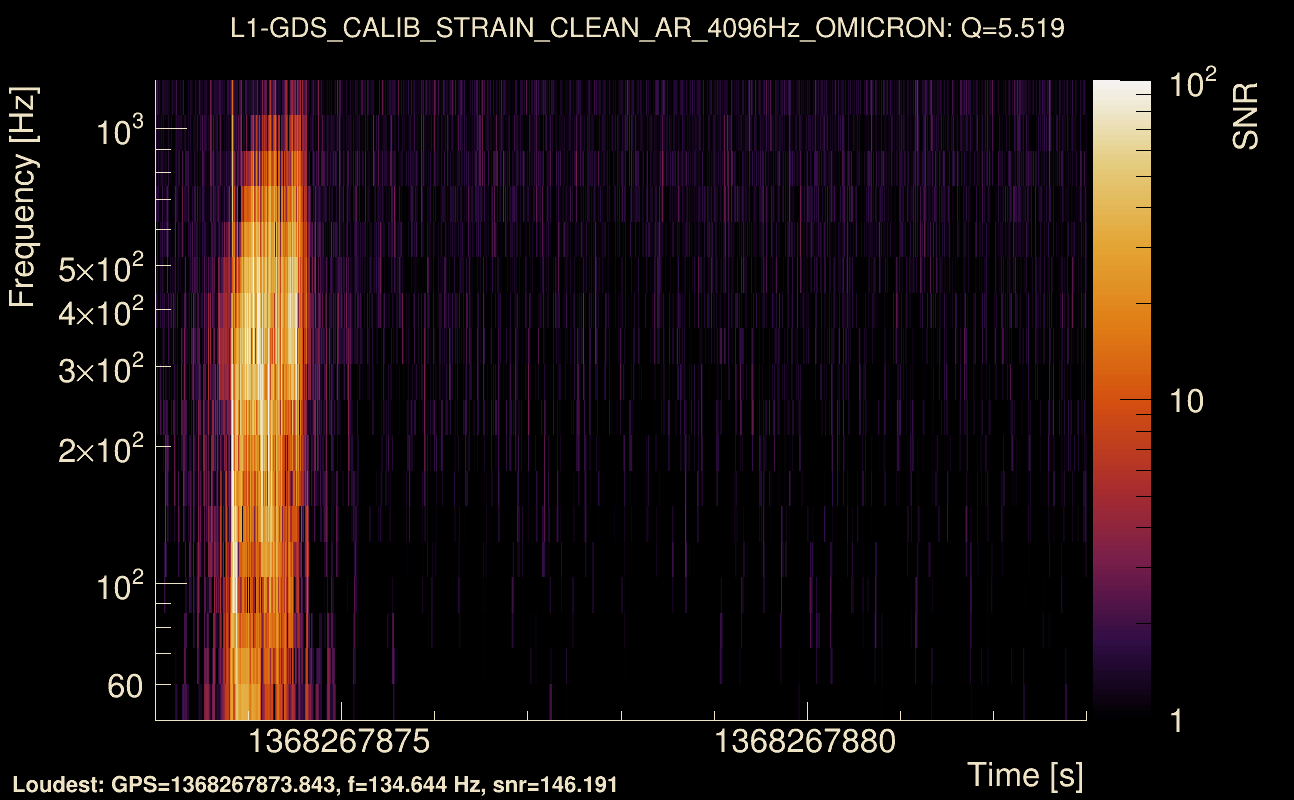
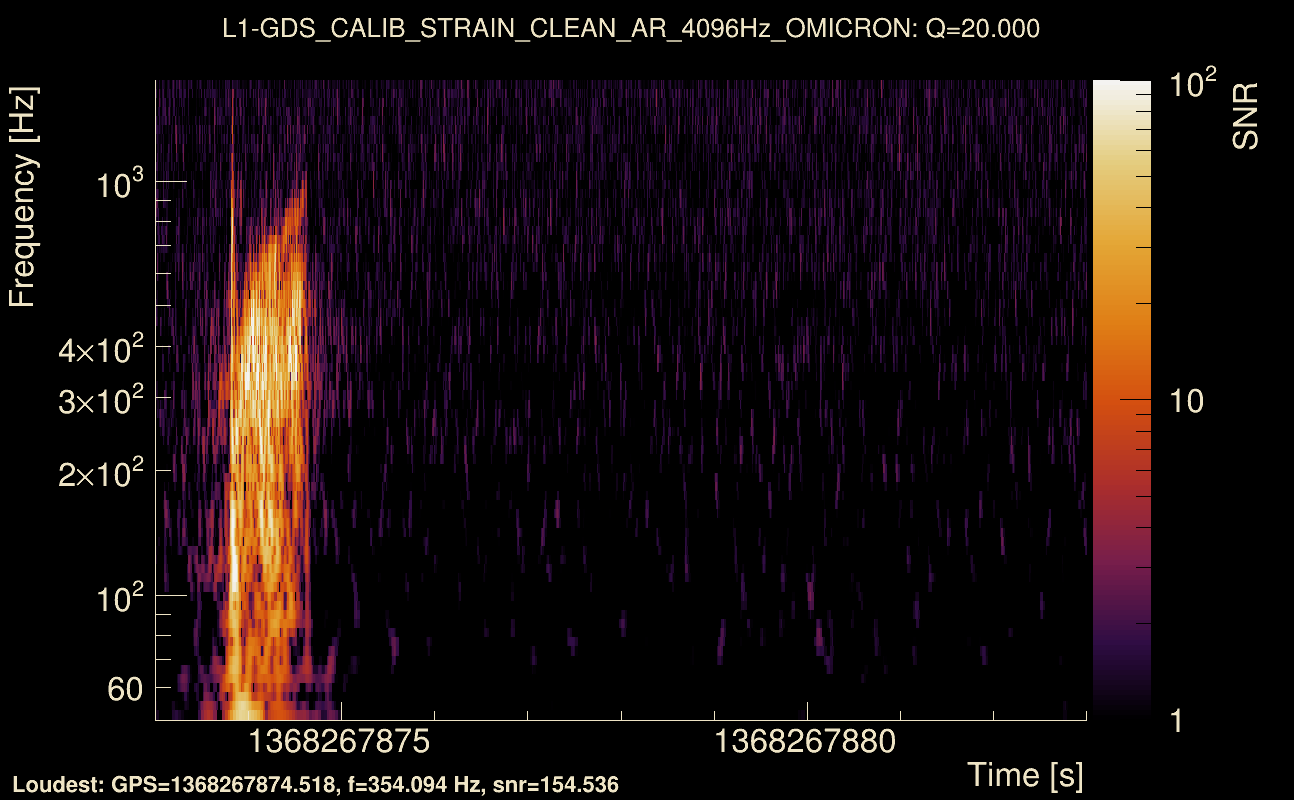
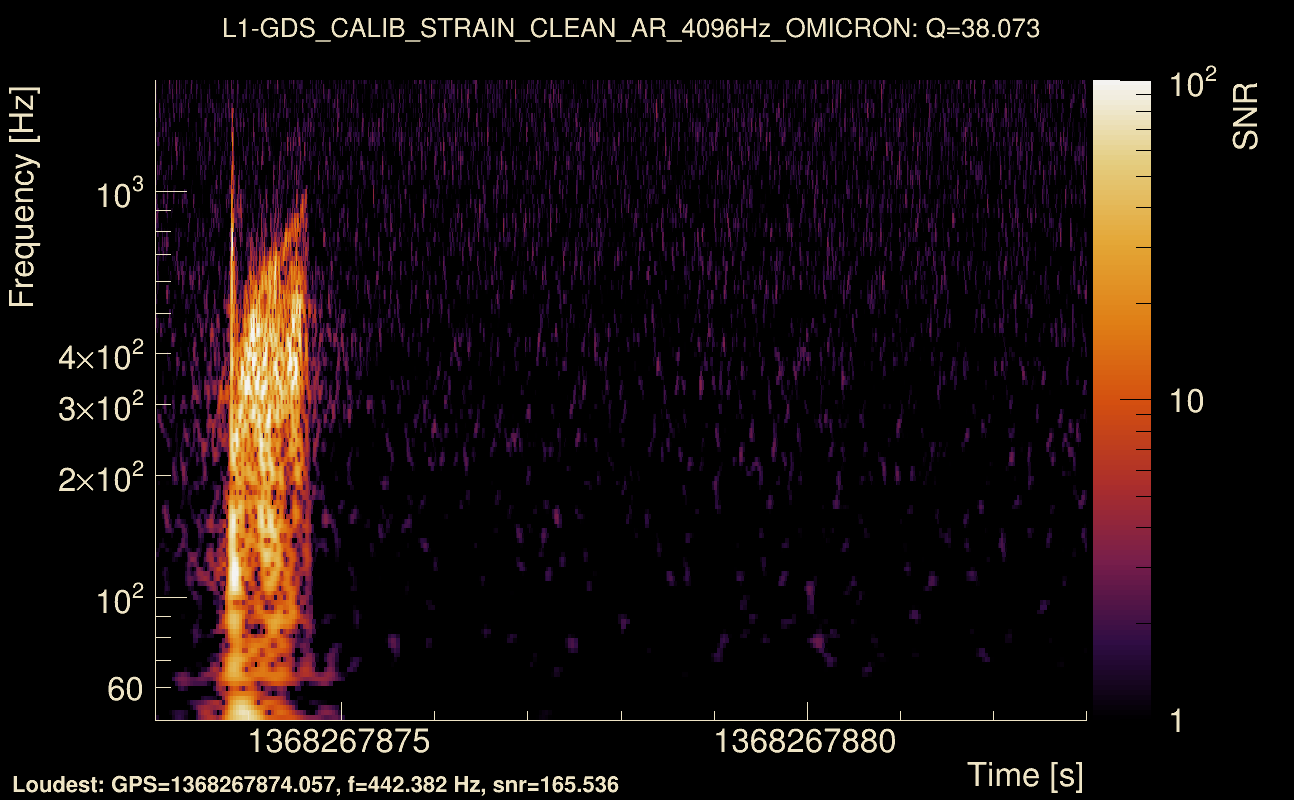
| Event time t(H1): | GPS = 1368267873 (Tue May 16 10:24:15 2023 ) → GPS = 1368267883 (Tue May 16 10:24:25 2023 ) |
| Event time t(L1): | GPS = 1368267873 (Tue May 16 10:24:25 2023 ) → GPS = 1368267883 (Tue May 16 10:24:25 2023 ) |
| Omicron analysis time window (H1): | GPS = 1368267870 → GPS = 1368267886 |
| Omicron analysis time window (L1): | GPS = 1368267870 → GPS = 1368267886 |
| Time delay between detectors t(L1) - t(H1): | -0.0397182 s (slice index = 109 / 217), δt_gw = 0.00628183 s |
| Time delay standard deviation: | 0.0831058 s |
| [targeted mode] Time delay probability: | 0.833512 (0.210199 sigmas), δt_target = 0.00123787 s |
| Frequency: | 339.536 Hz |
| Ξ: | 0.195544 ± 0.0156993 (variance = 0.00024647): Q0: 0.438823, Q1: 0.480313, Q2: 0.464128, Q3: 0.440116, Q4: 0.46175 |
| Rank: | R_A = 0.0679363 |
| Log of amplitude ratio (L1/H1): | -0.427536, variance = 0.191543 (L1/H1: -0.589291, variance = 0.310832, H1/L1: -0.0341777, variance = 0.3131) |
| Amplitude ratio (L1/H1): | 0.652114 ⋇ 1.54907 (L1/H1: 0.554721 ⋇ 1.74634, H1/L1: 0.9664 ⋇ 1.74989) |
| Amplitude ratio H1|L1 compatibility (probability): | 0.429933 |
| Antenna factor probability: | 0.969495 |
| Number of rejected frequency rows: | Q0: 7 / 18, Q1: 25 / 36, Q2: 50 / 70, Q3: 121 / 134, Q4: 241 / 258 |
| Maximum signal-to-noise ratio: | H1: 325.043, L1: 192.39 |
| SNR variance: | H1: 161.351, L1: 83.7555 |
| Click here for a zoomed plot | Click here for a zoomed plot | Click here for a zoomed plot | Click here for a zoomed plot | Click here for a zoomed plot |
 |
 |
 |
 |
 |
 |
 |
 |
 |
 |
 |
 |
 |
 |
 |
 |
 |
 |
 |
 |
 |
 |
 |
 |
 |
 |
 |
 |
 |
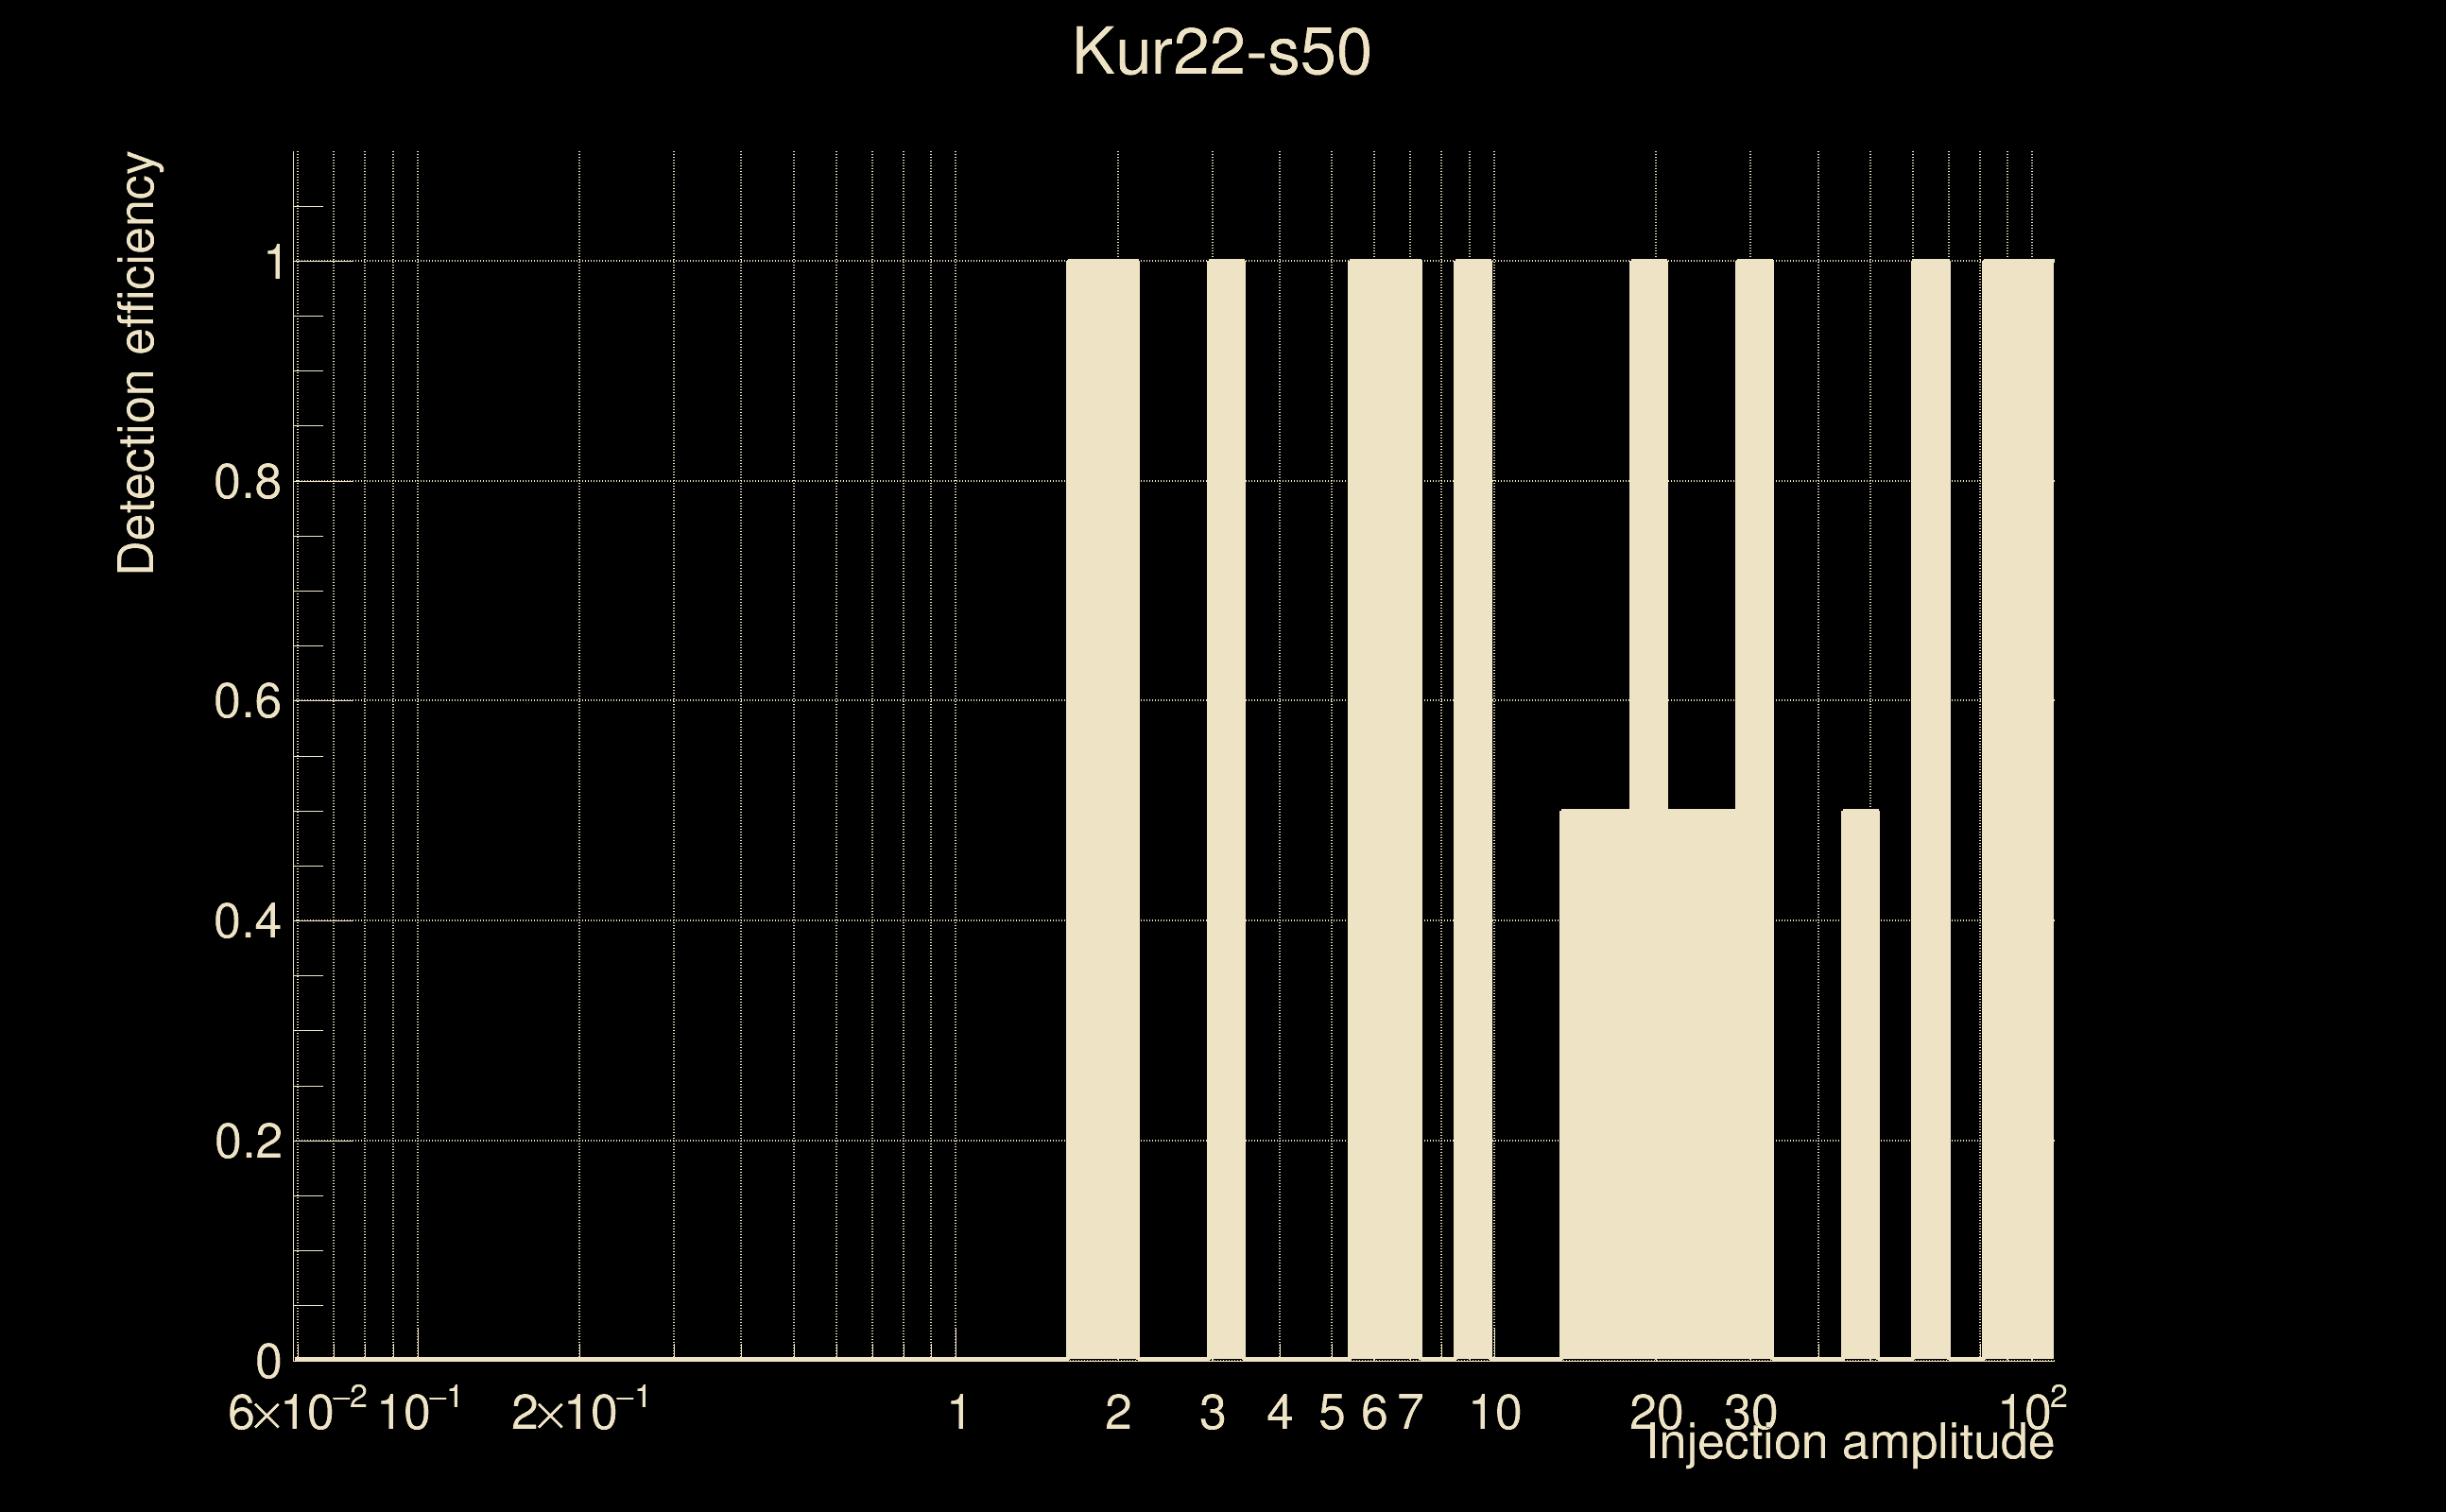
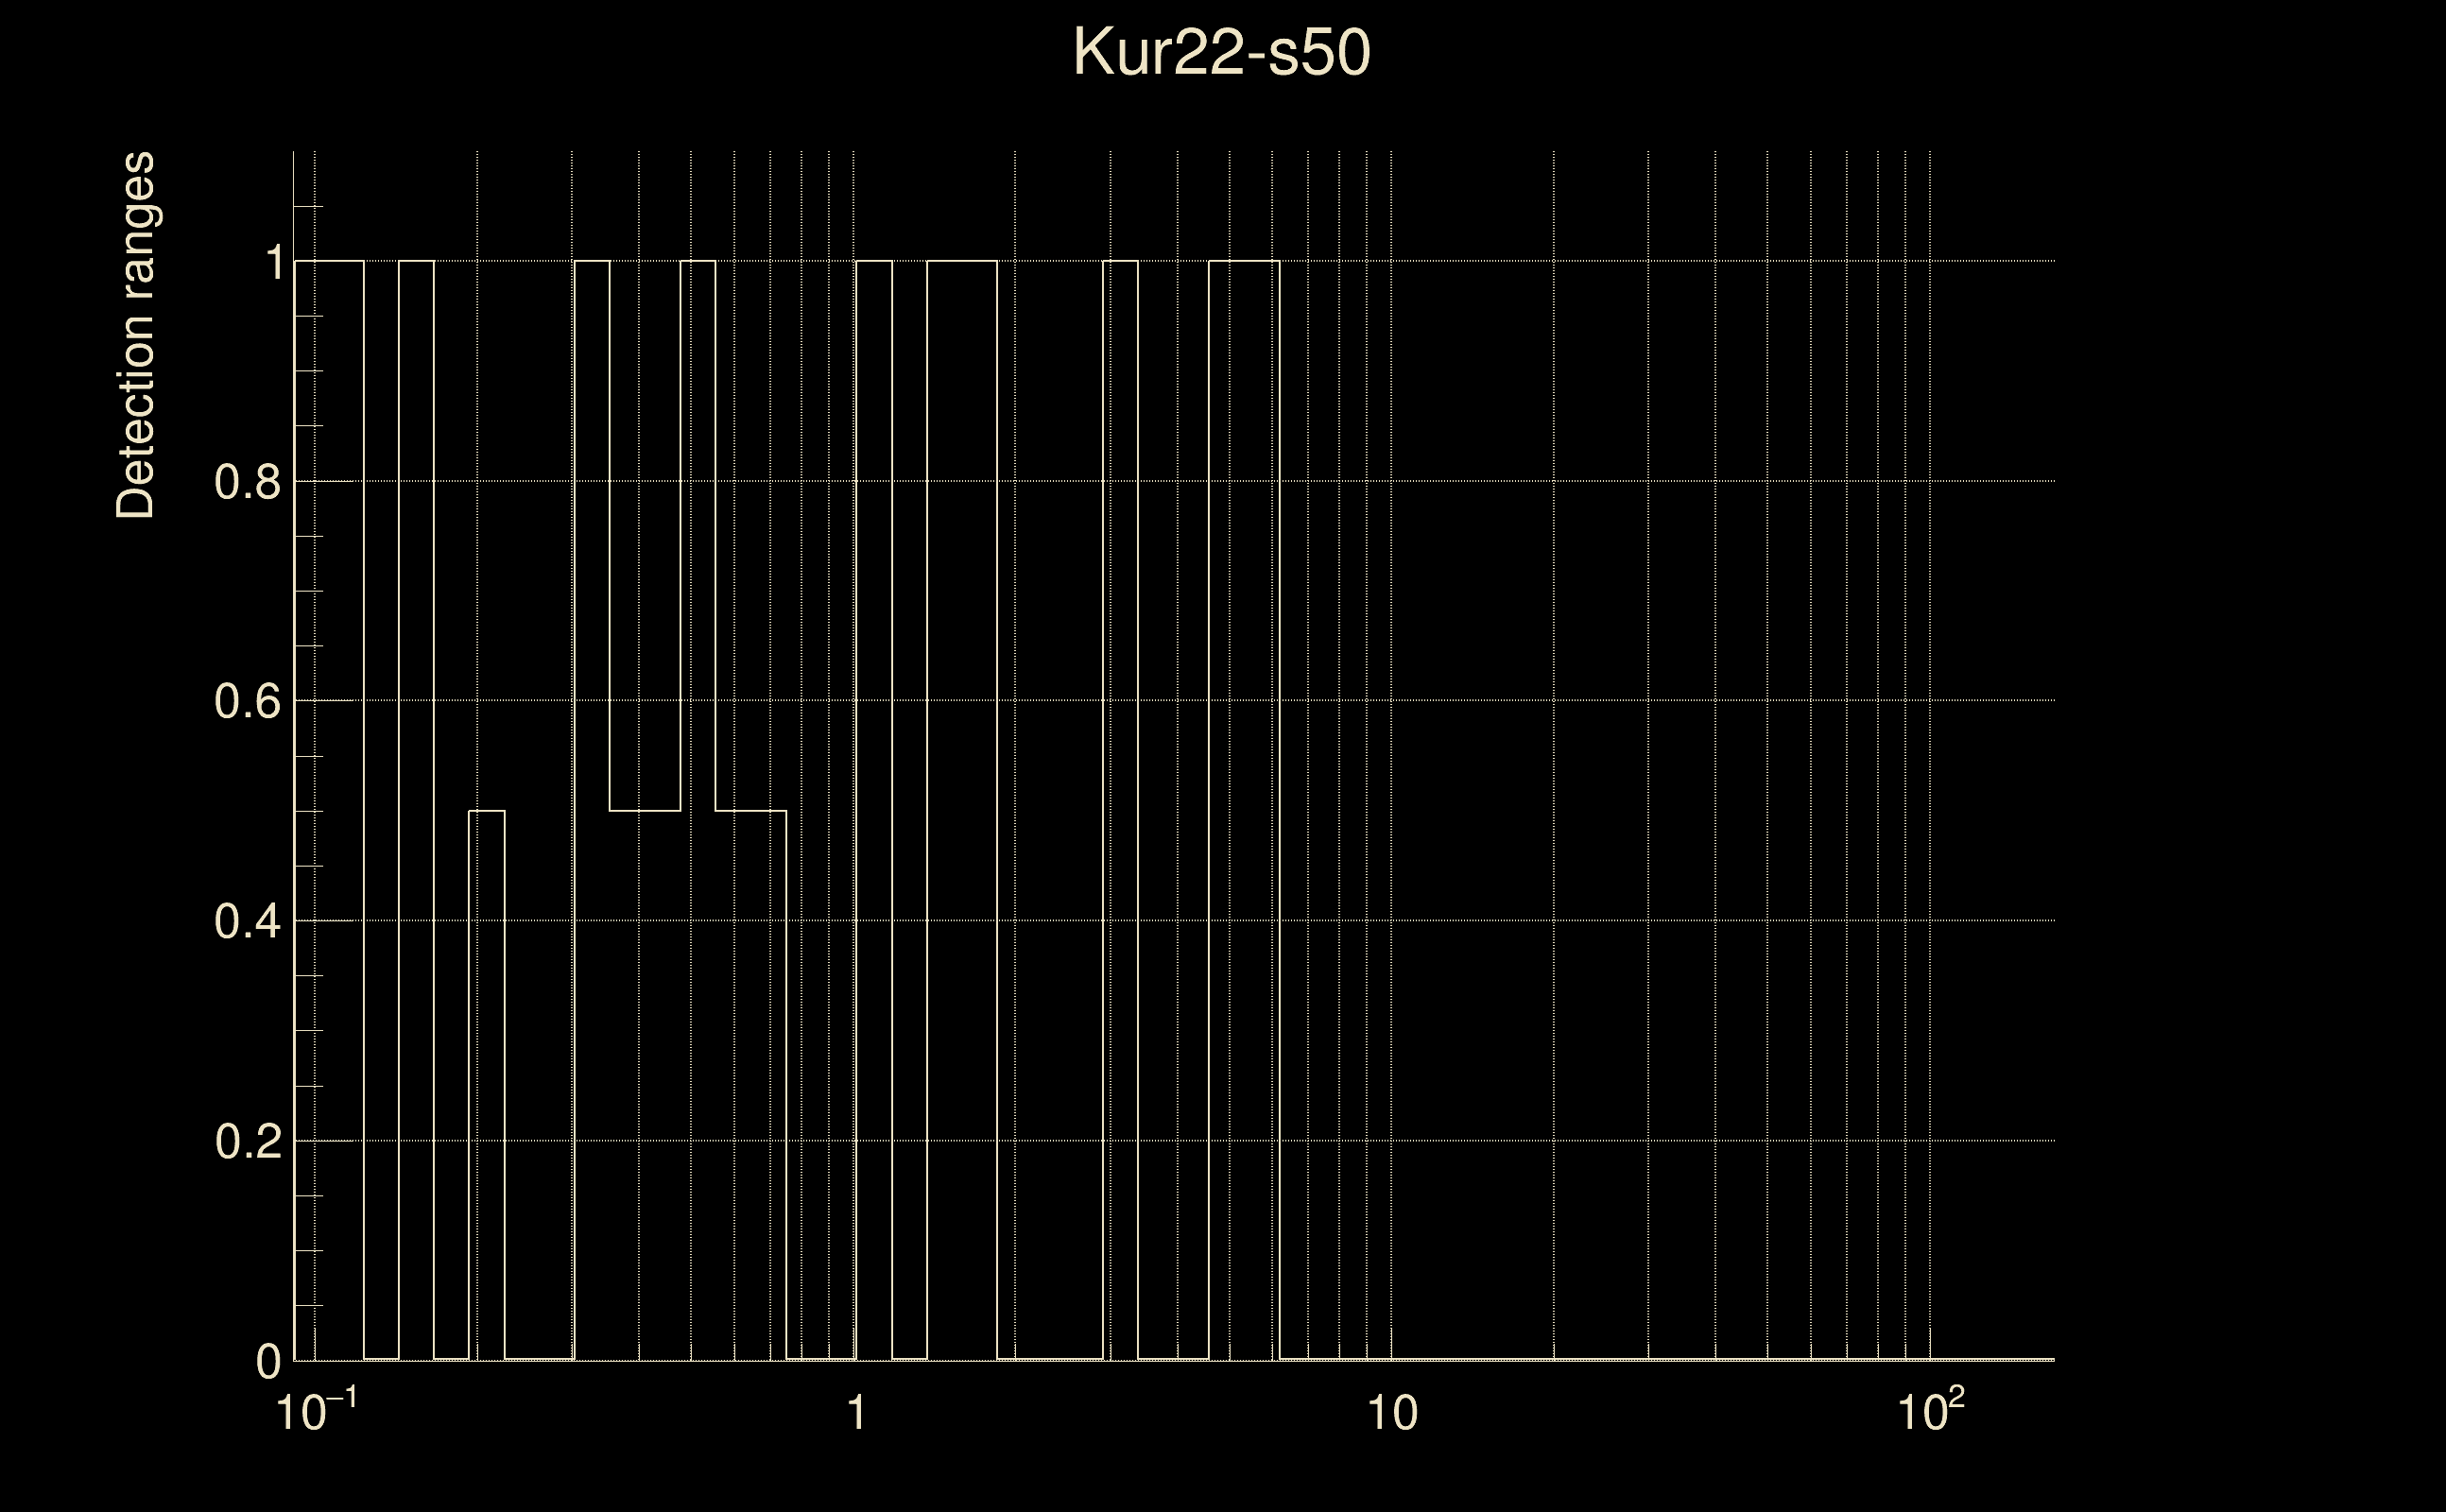
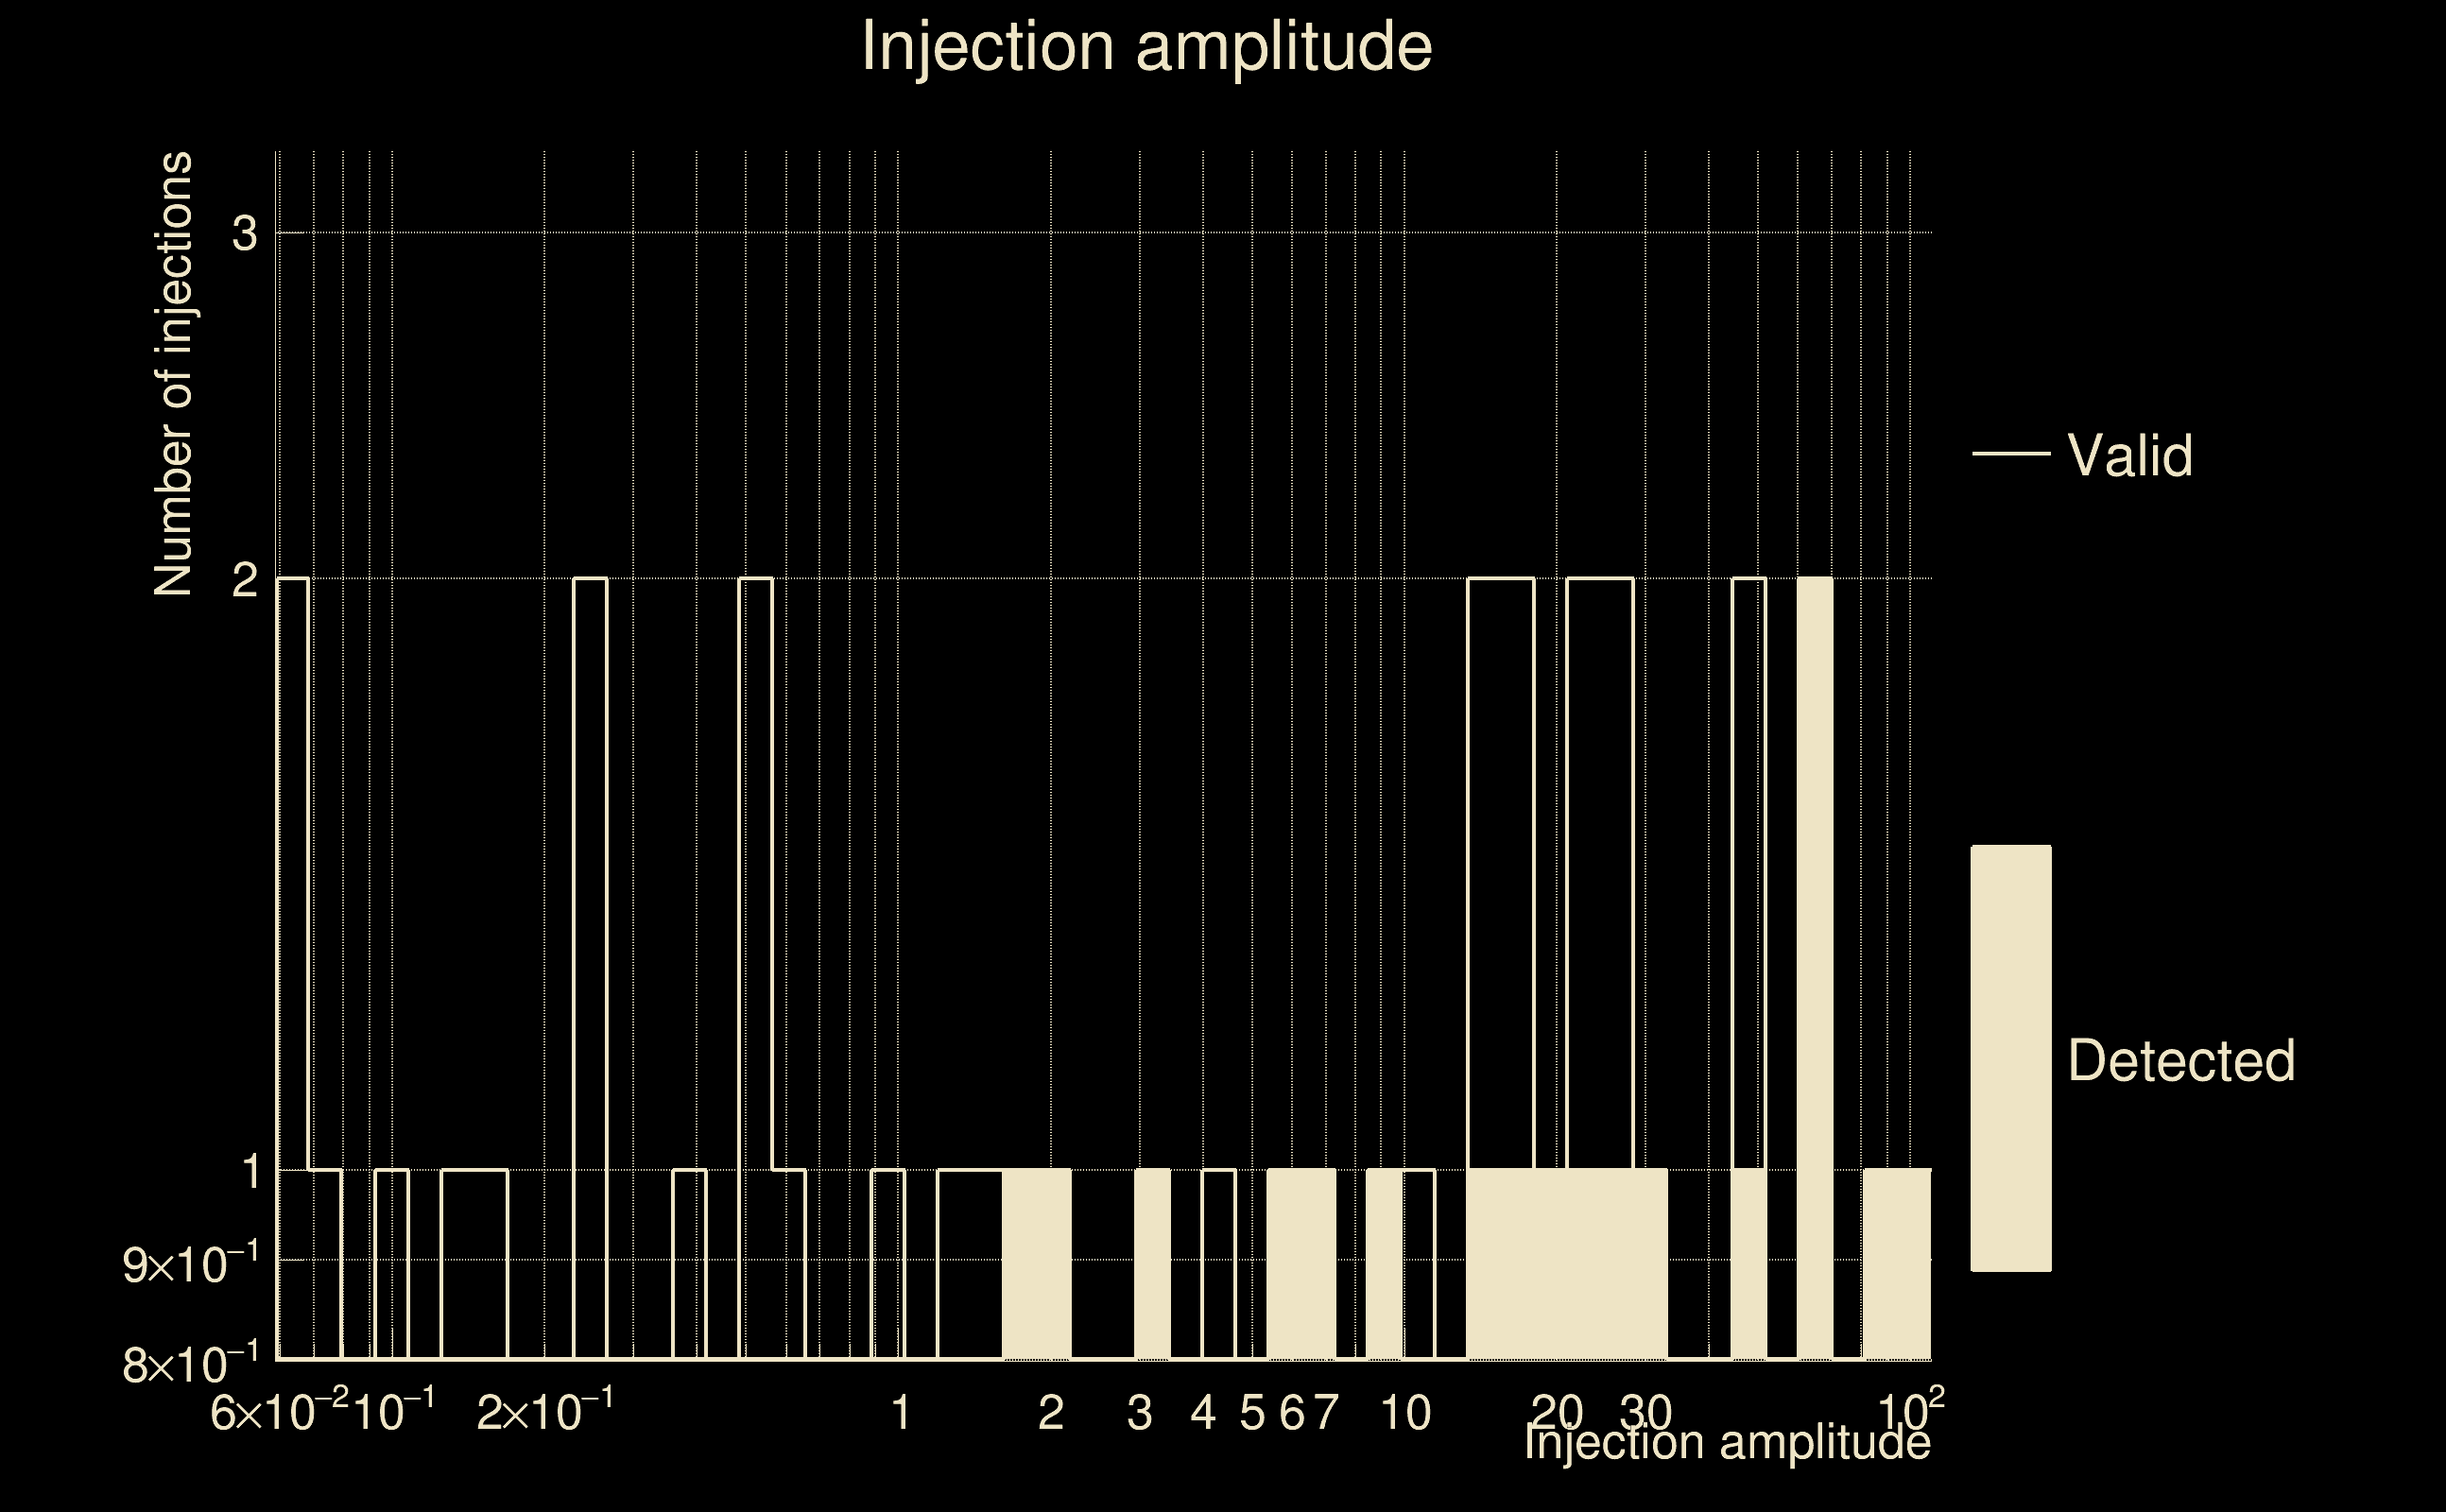
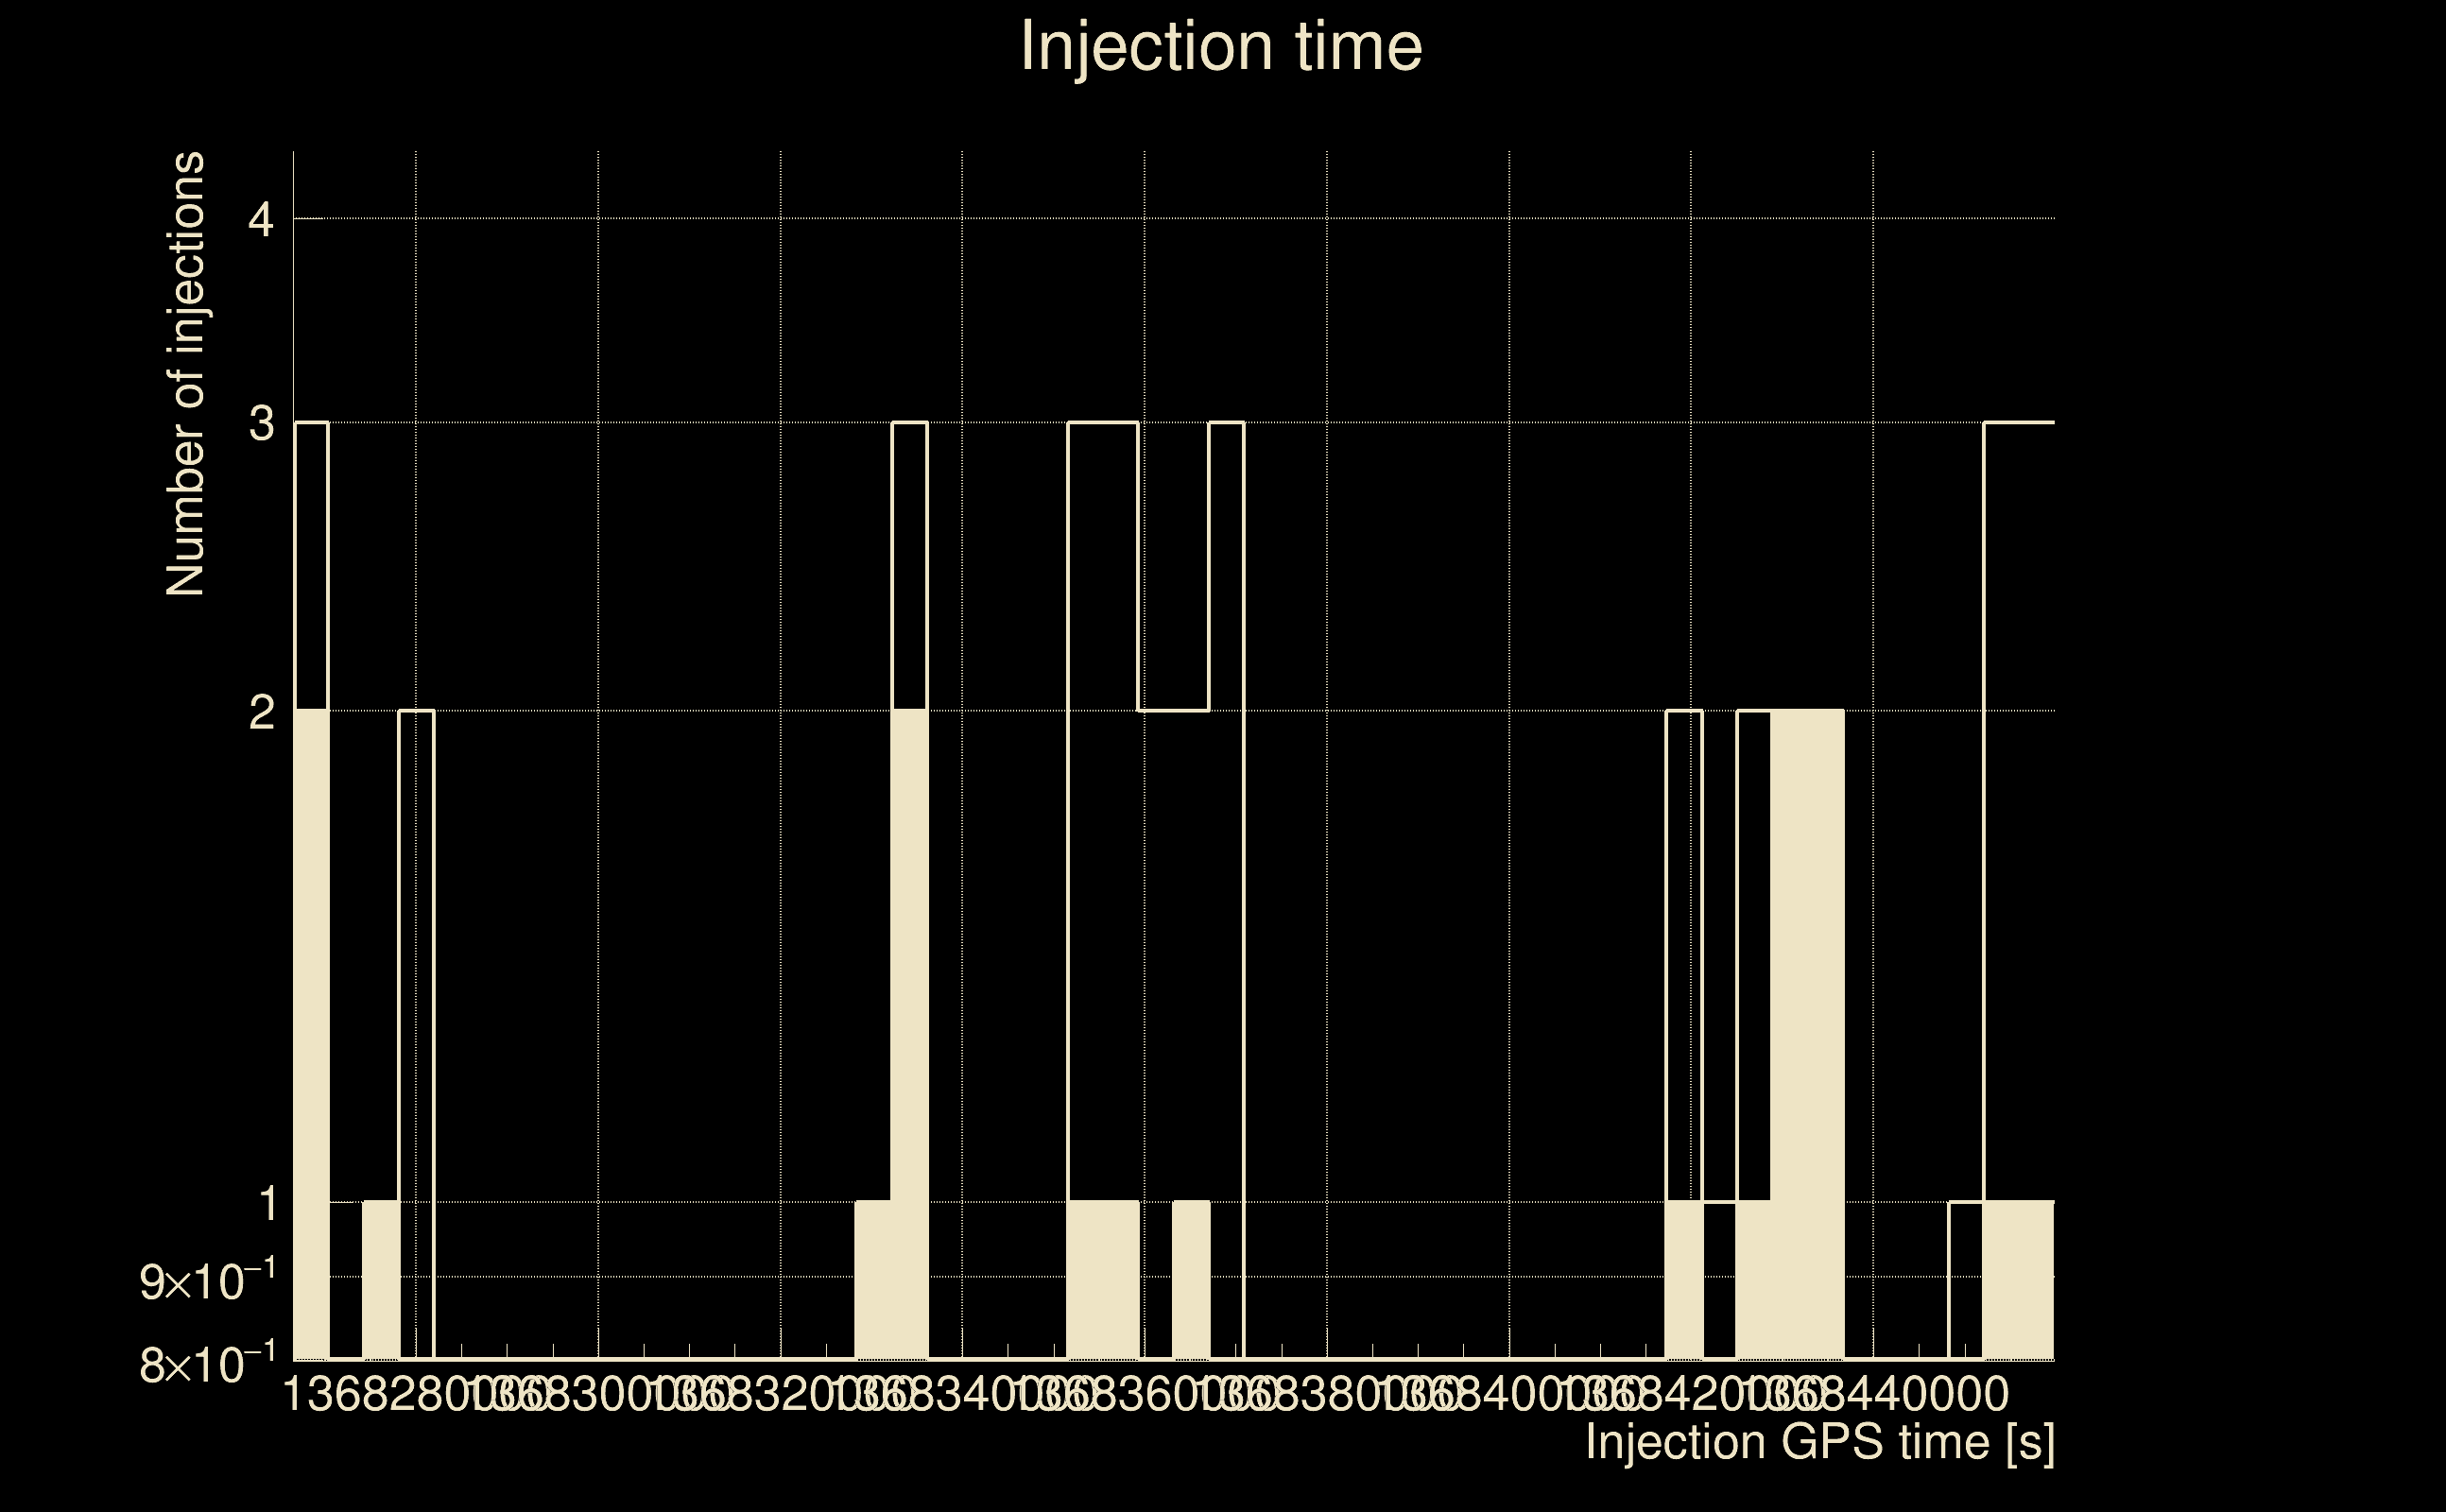
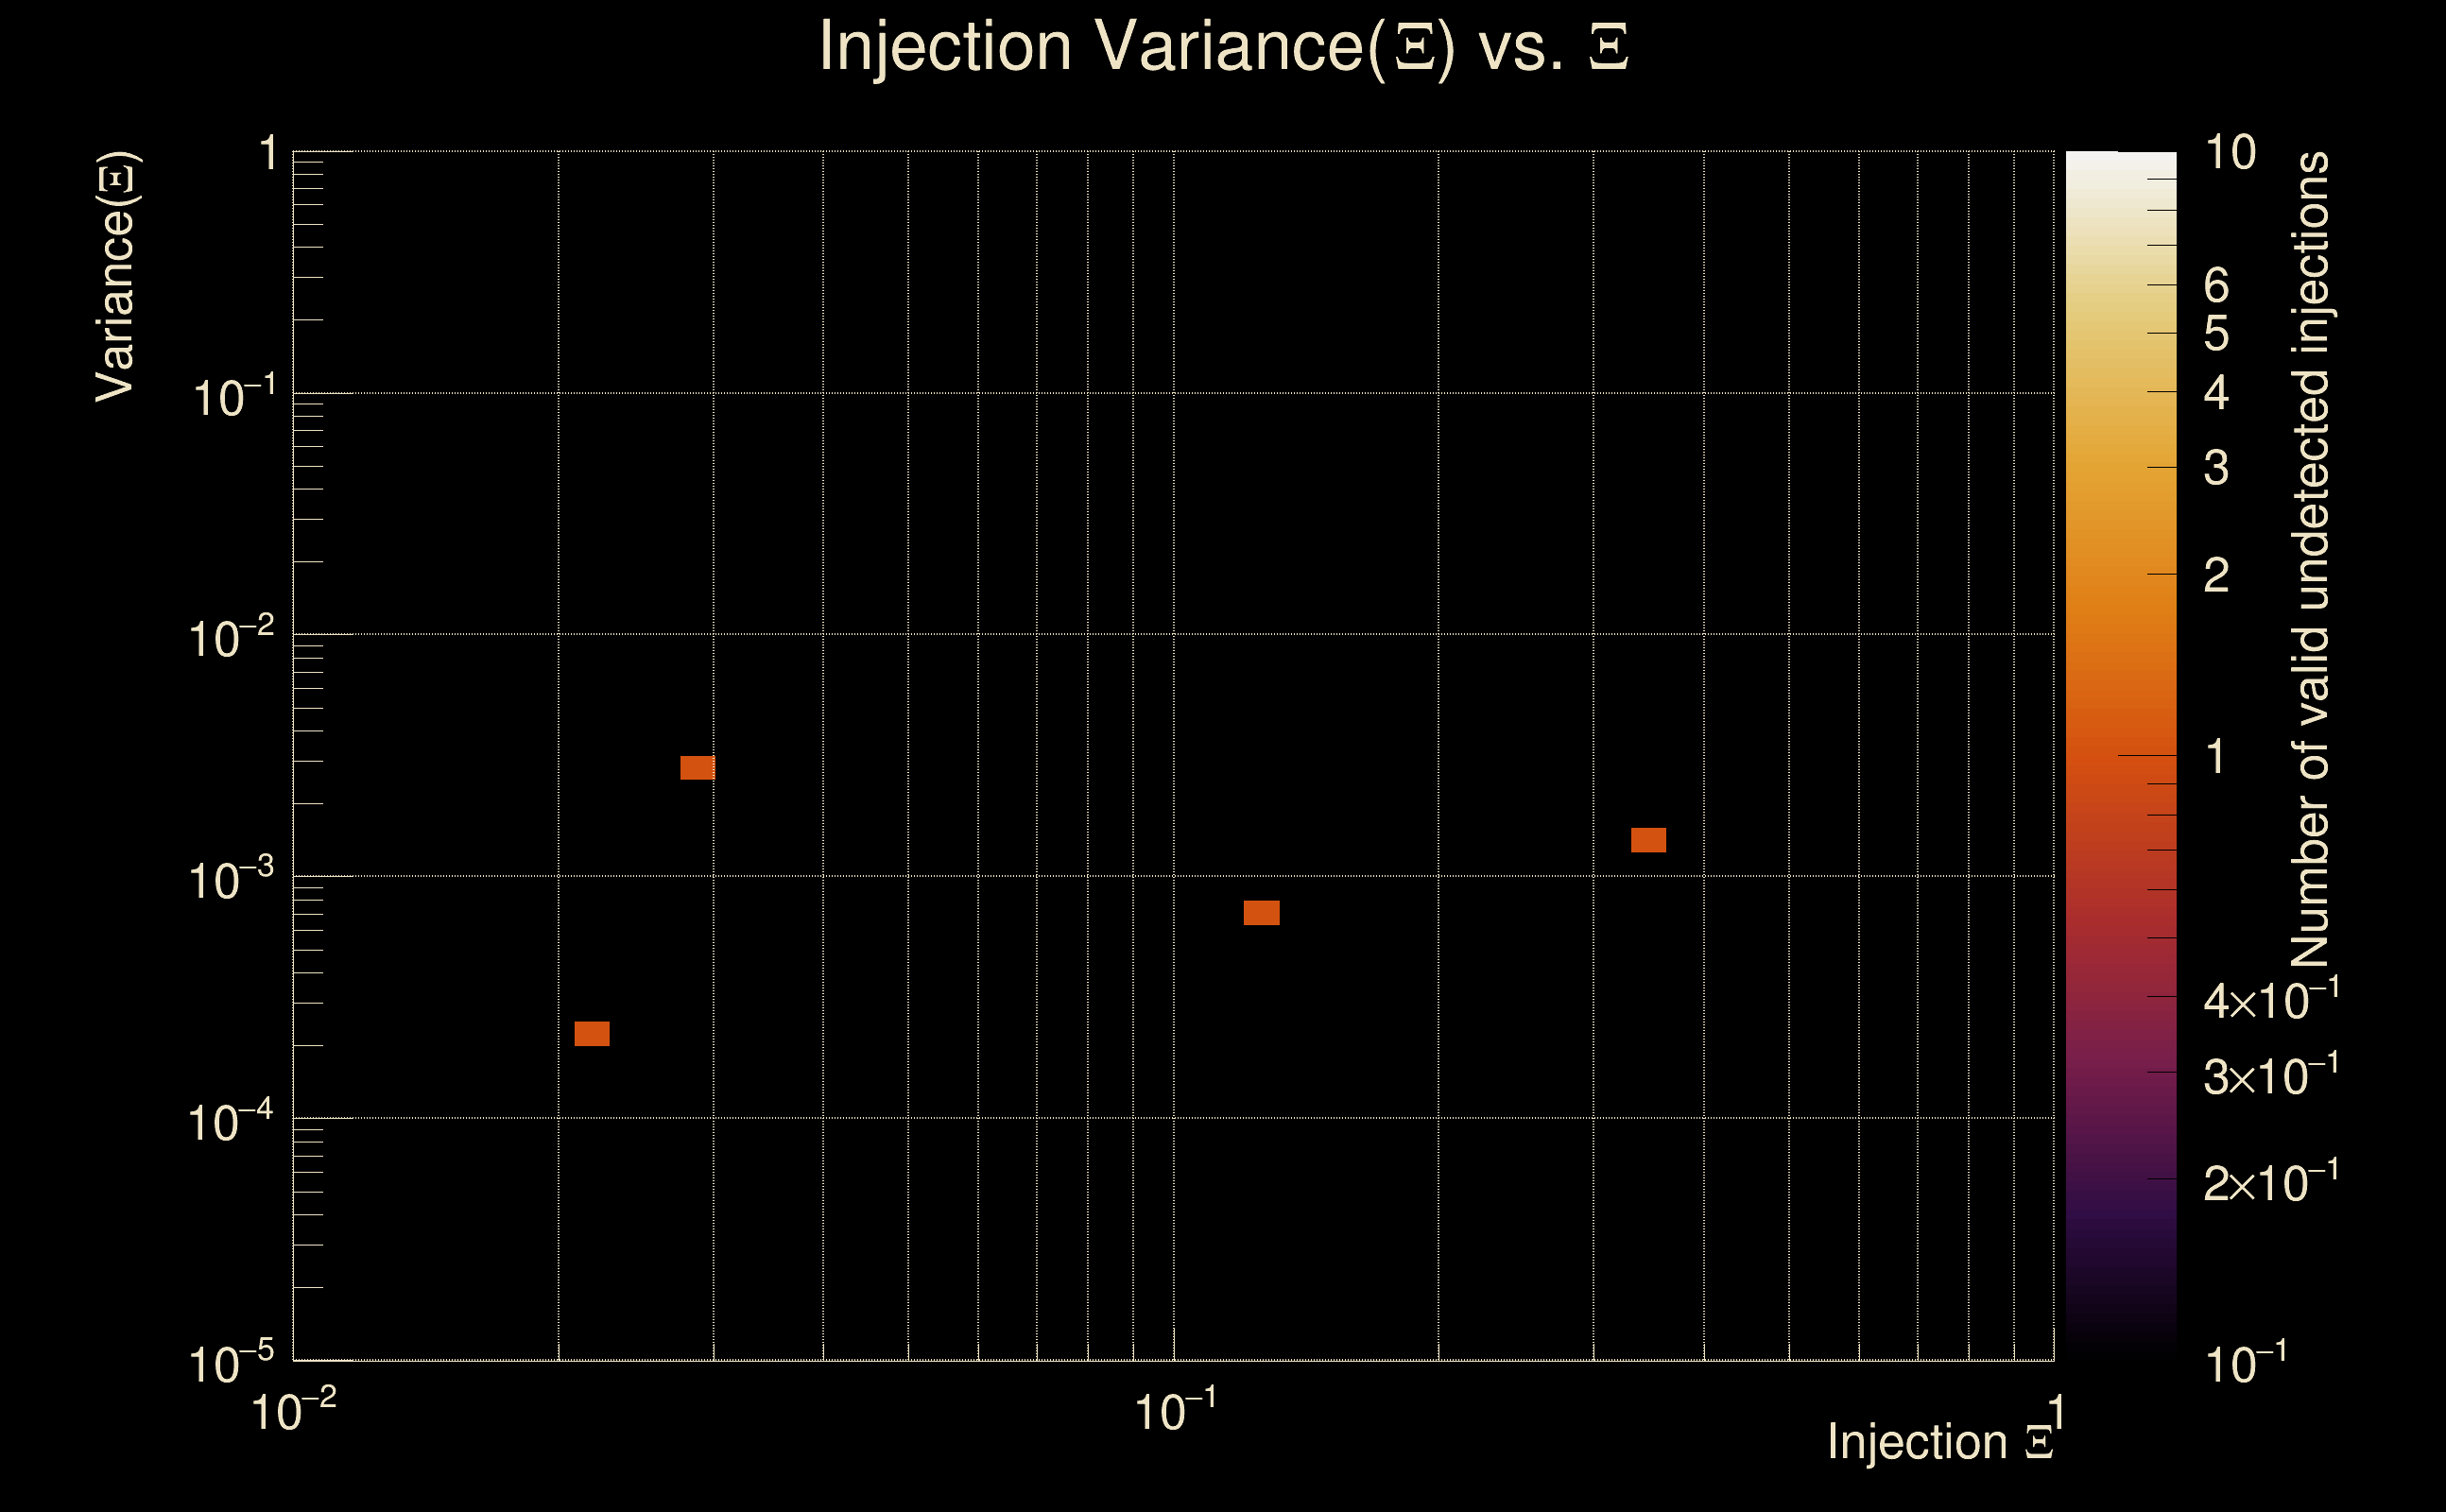
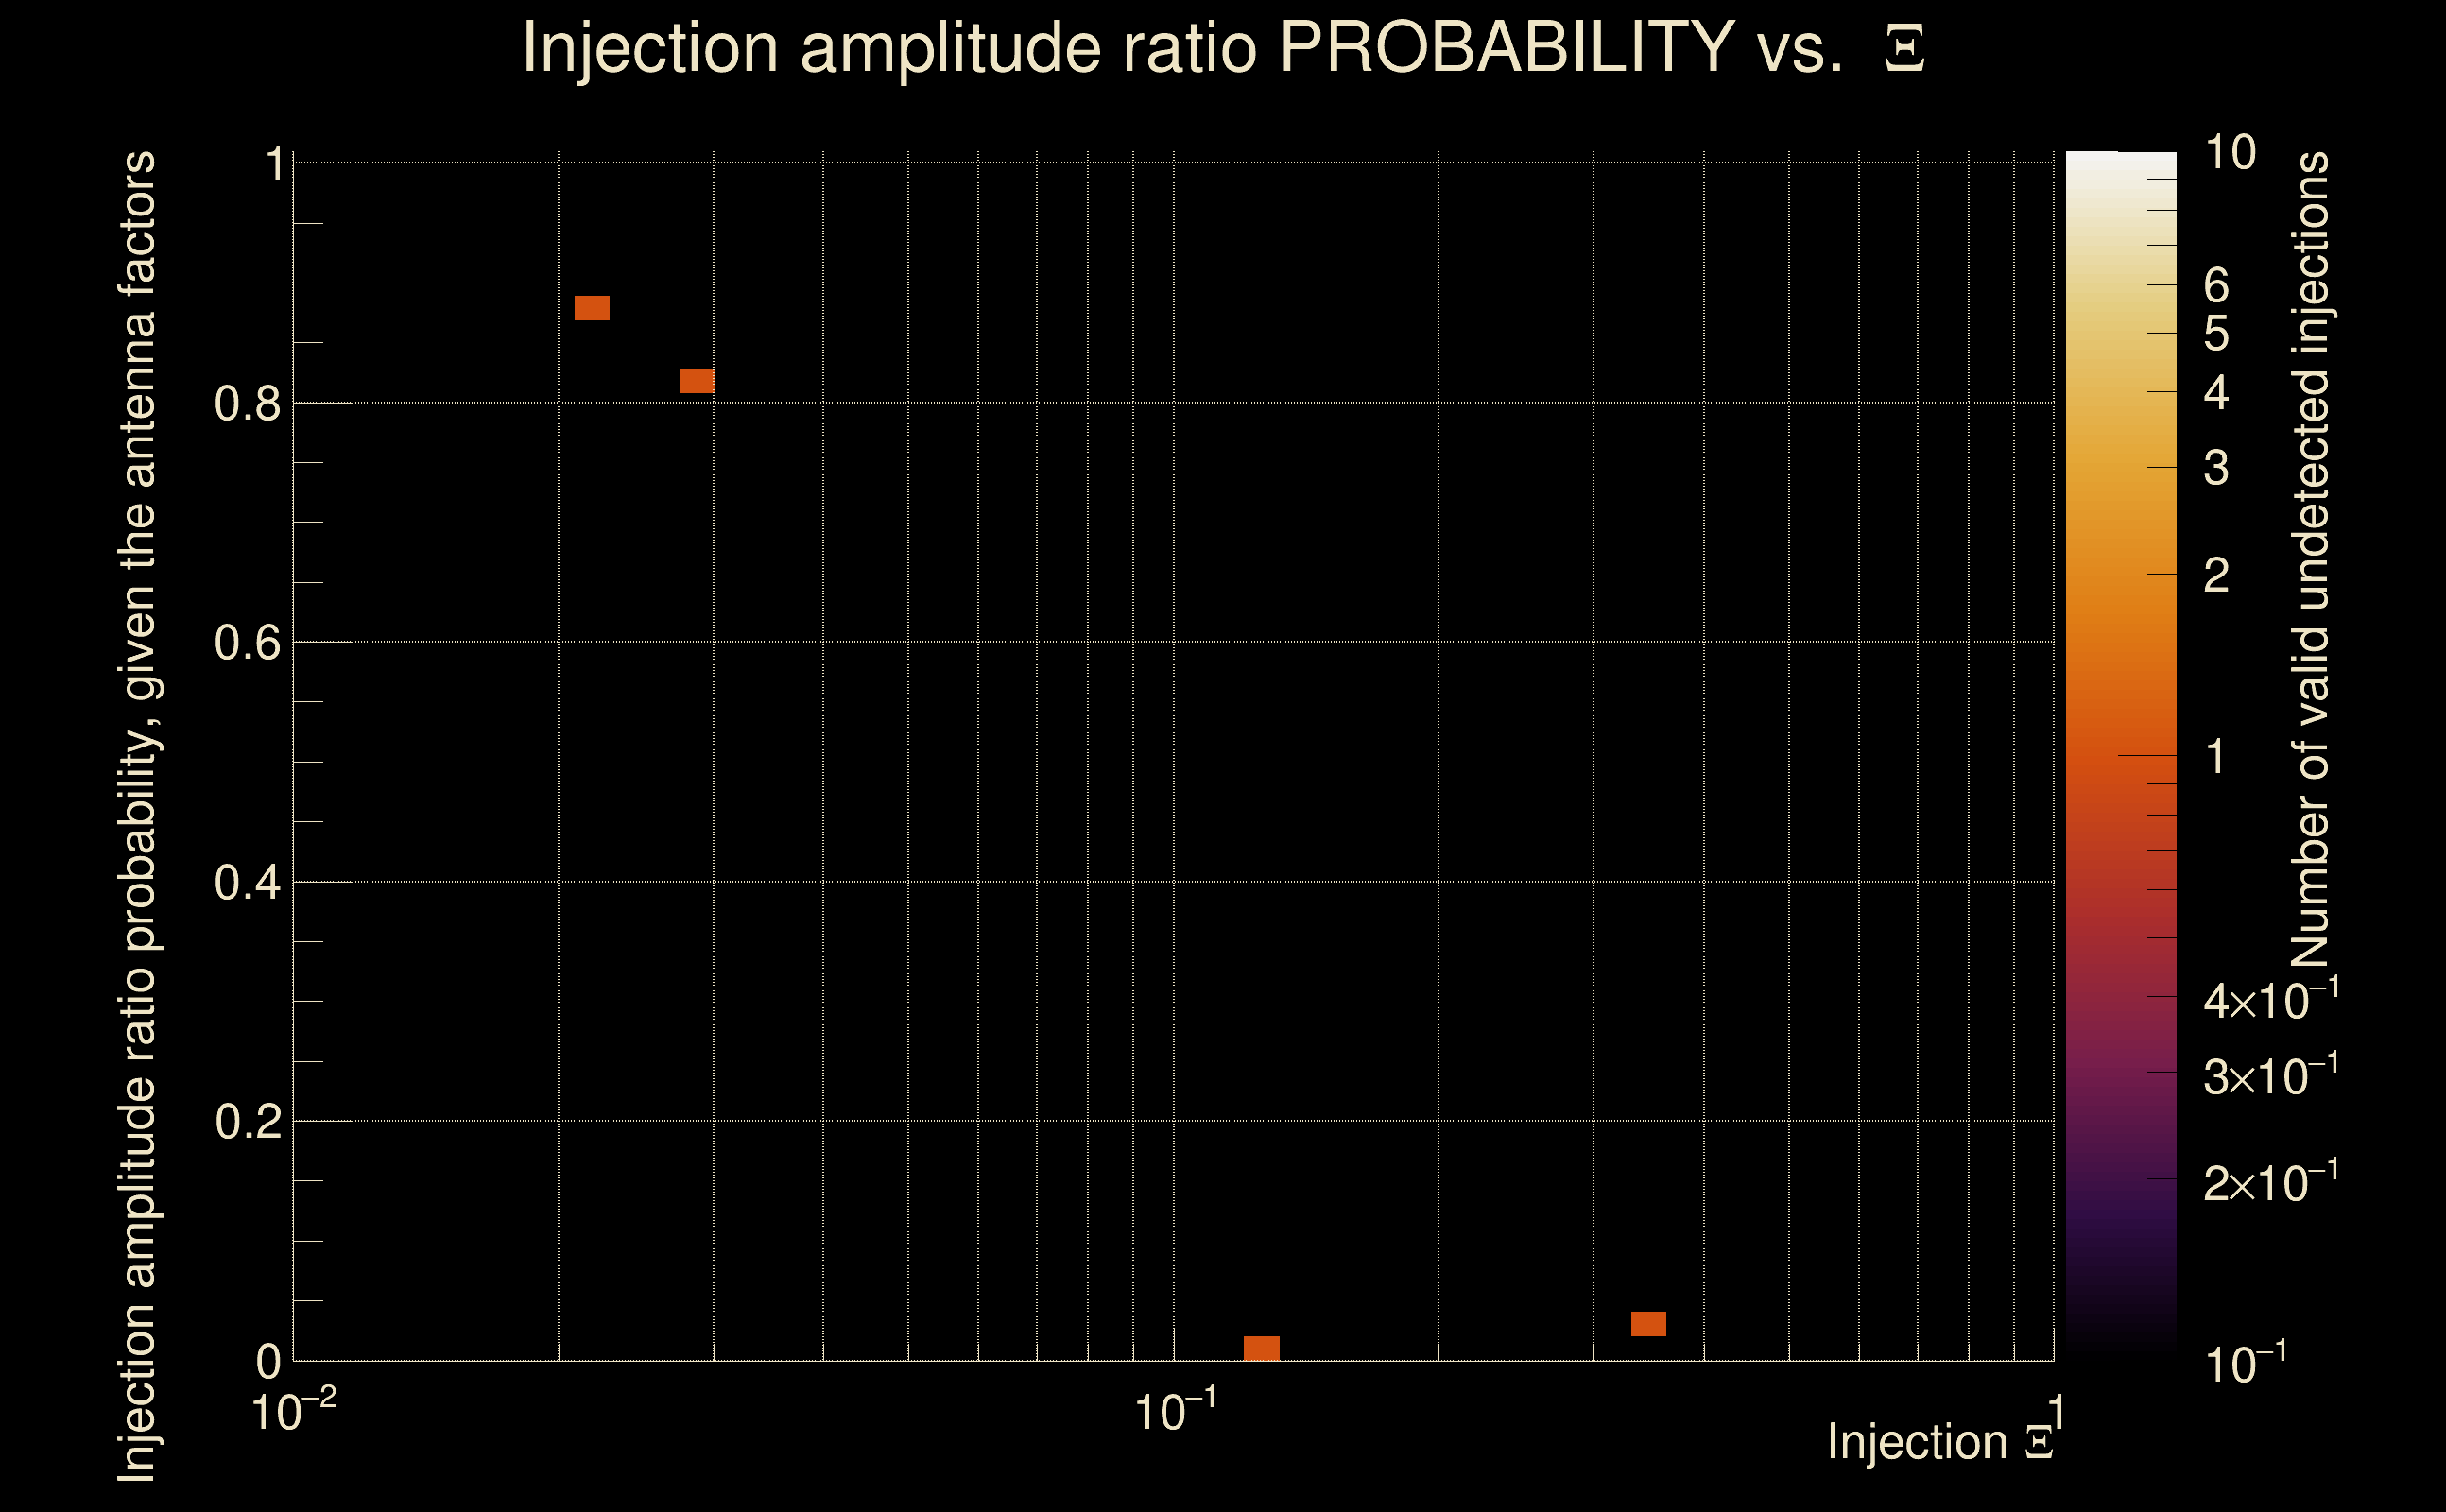
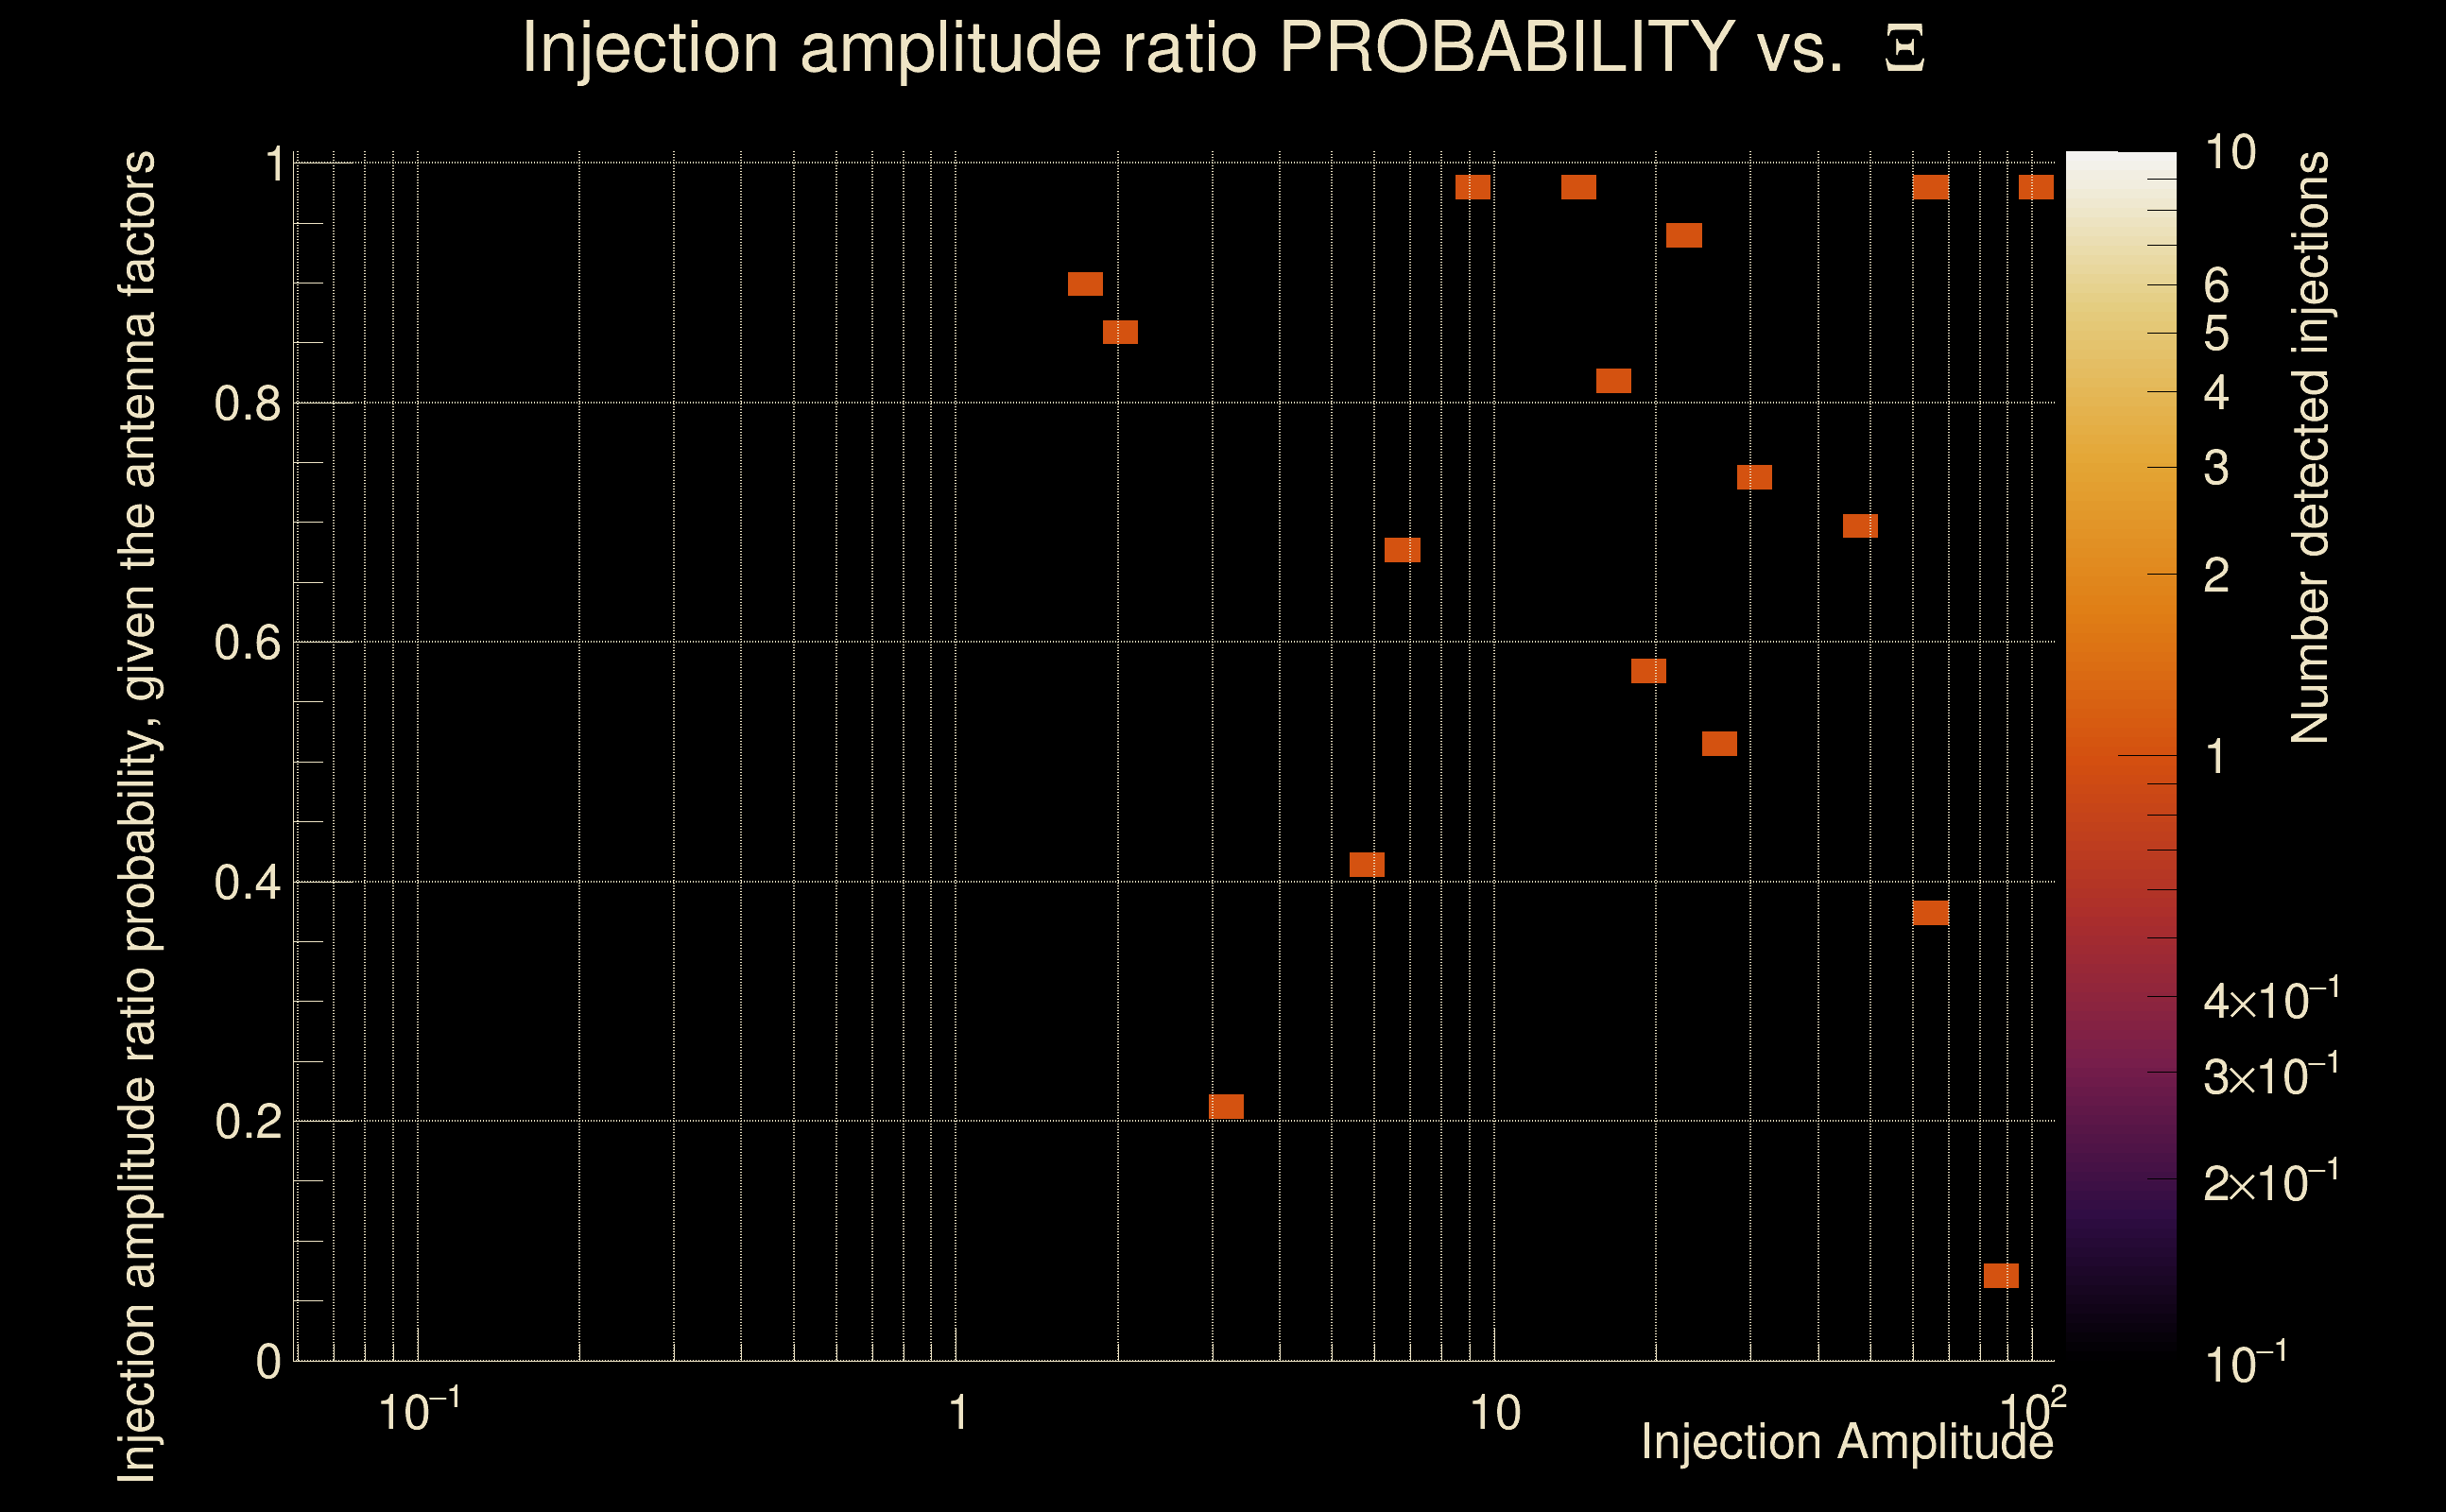
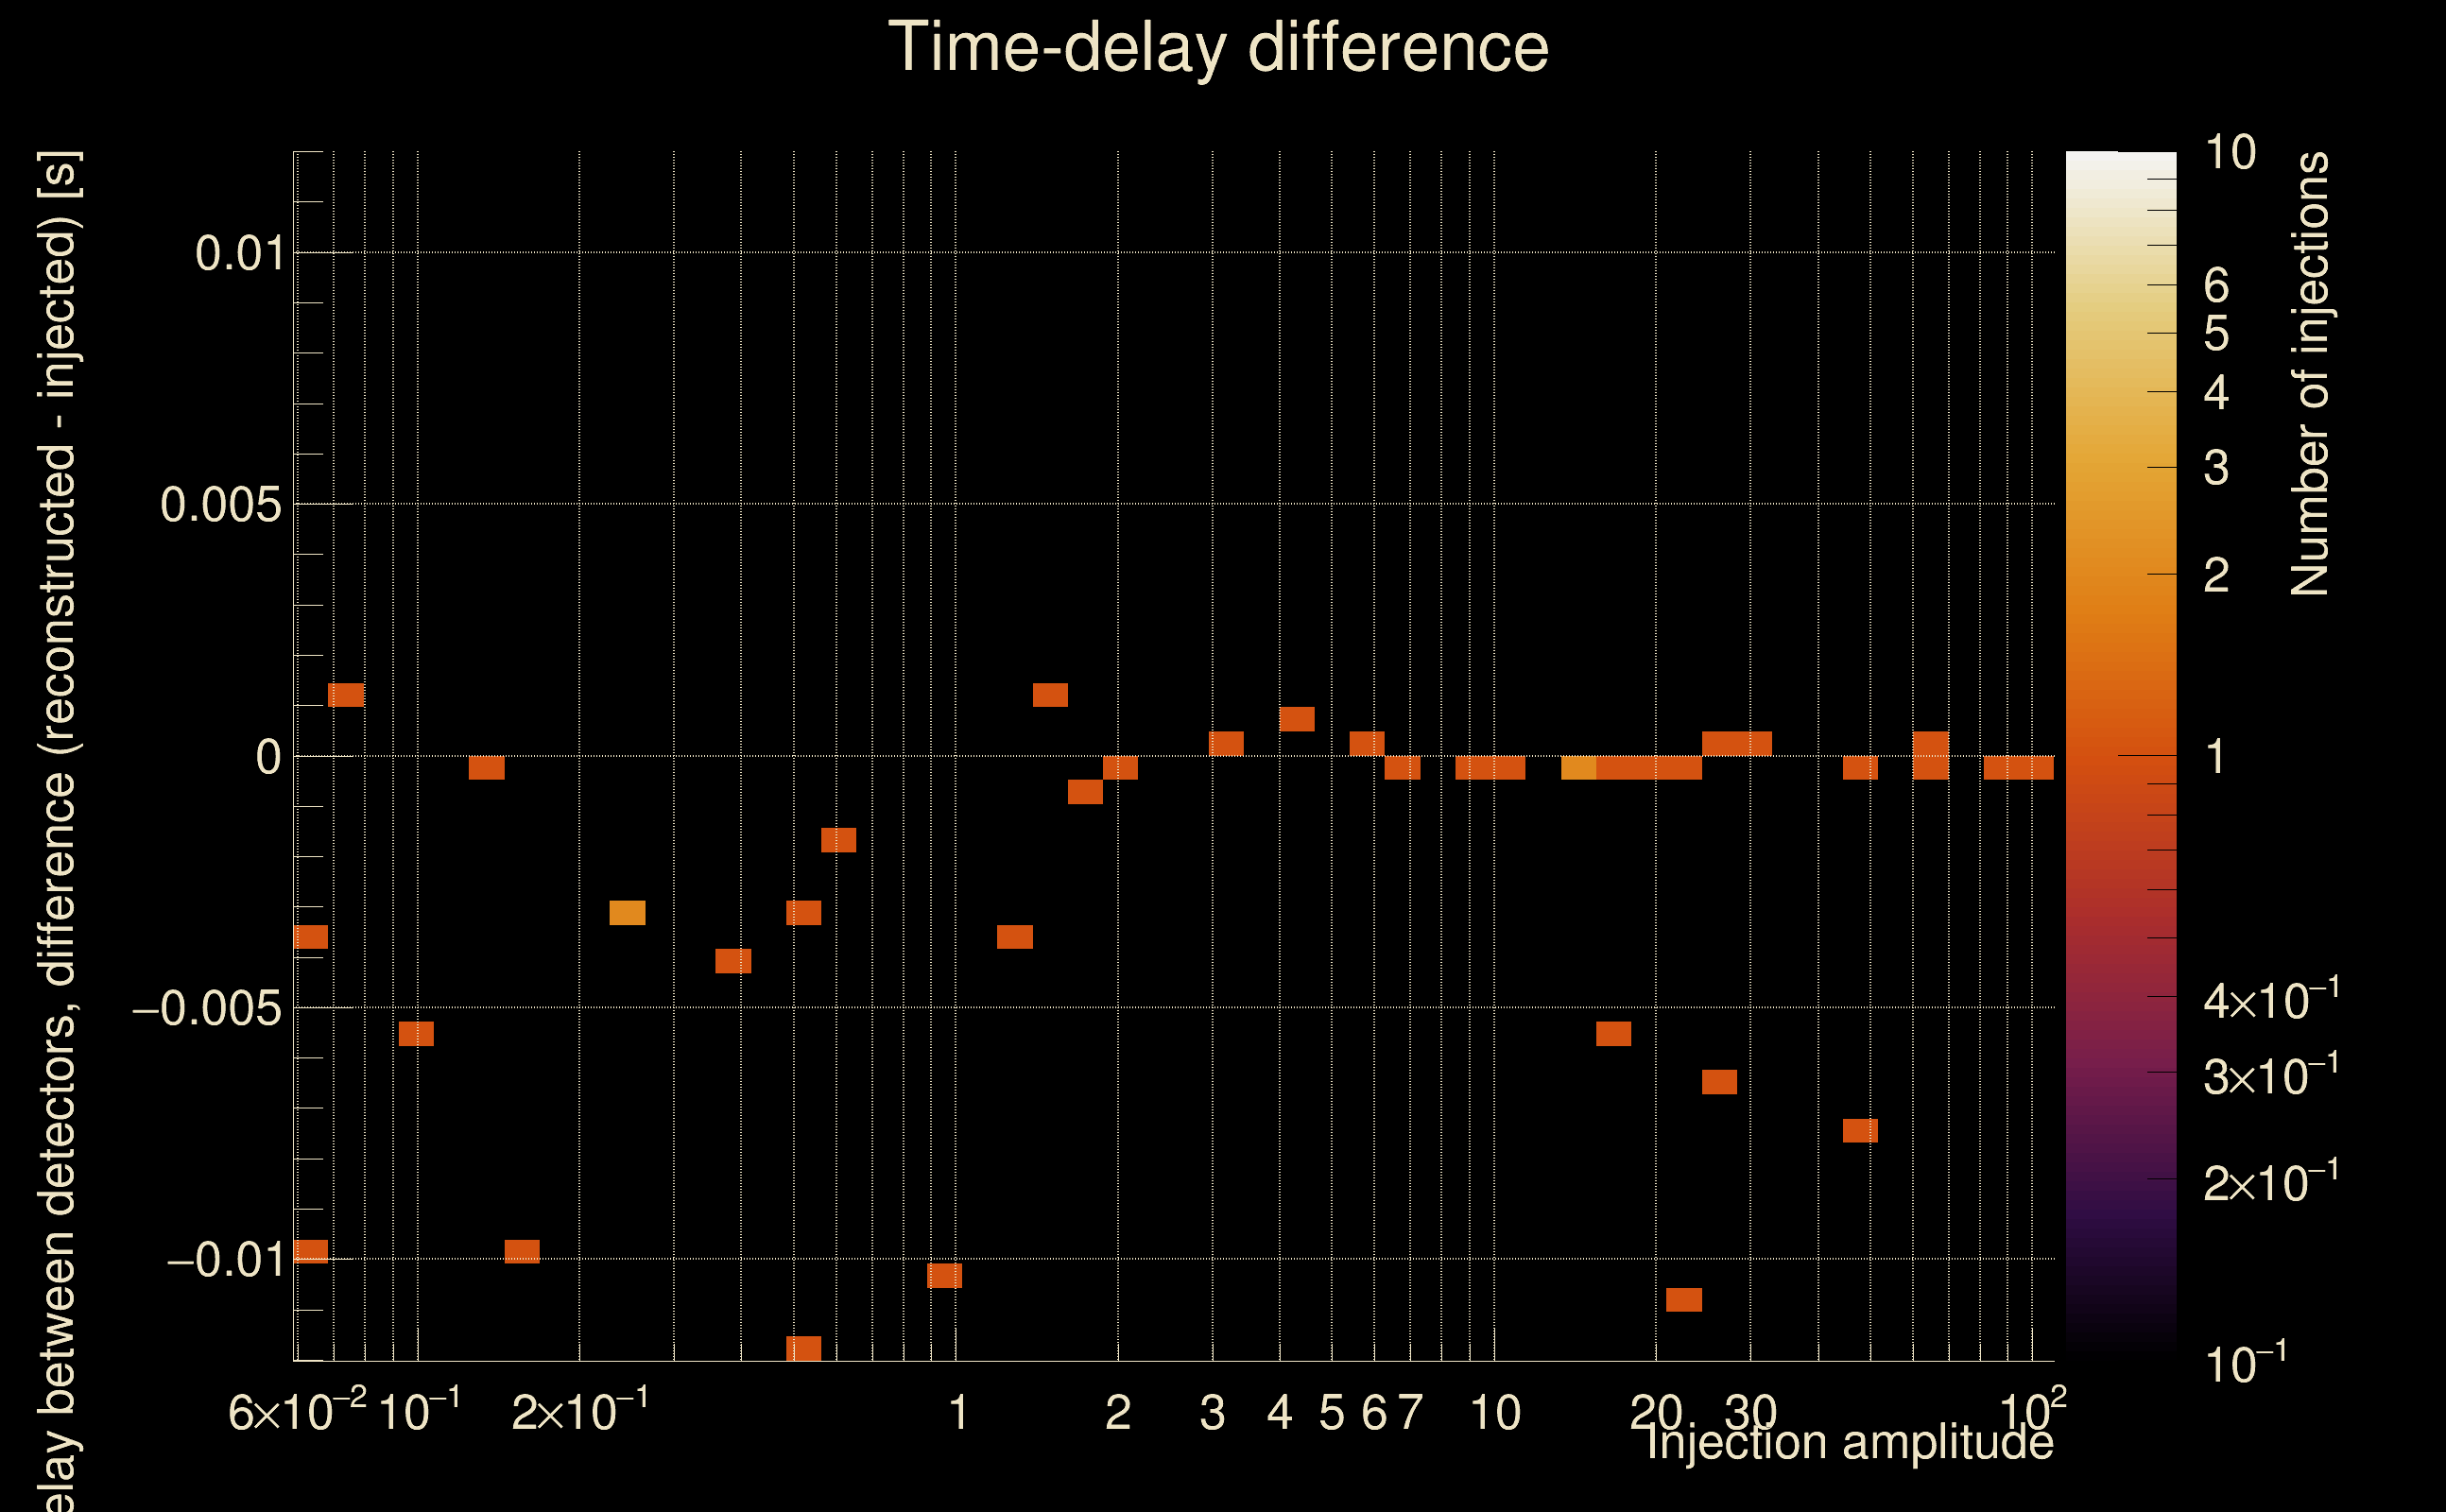
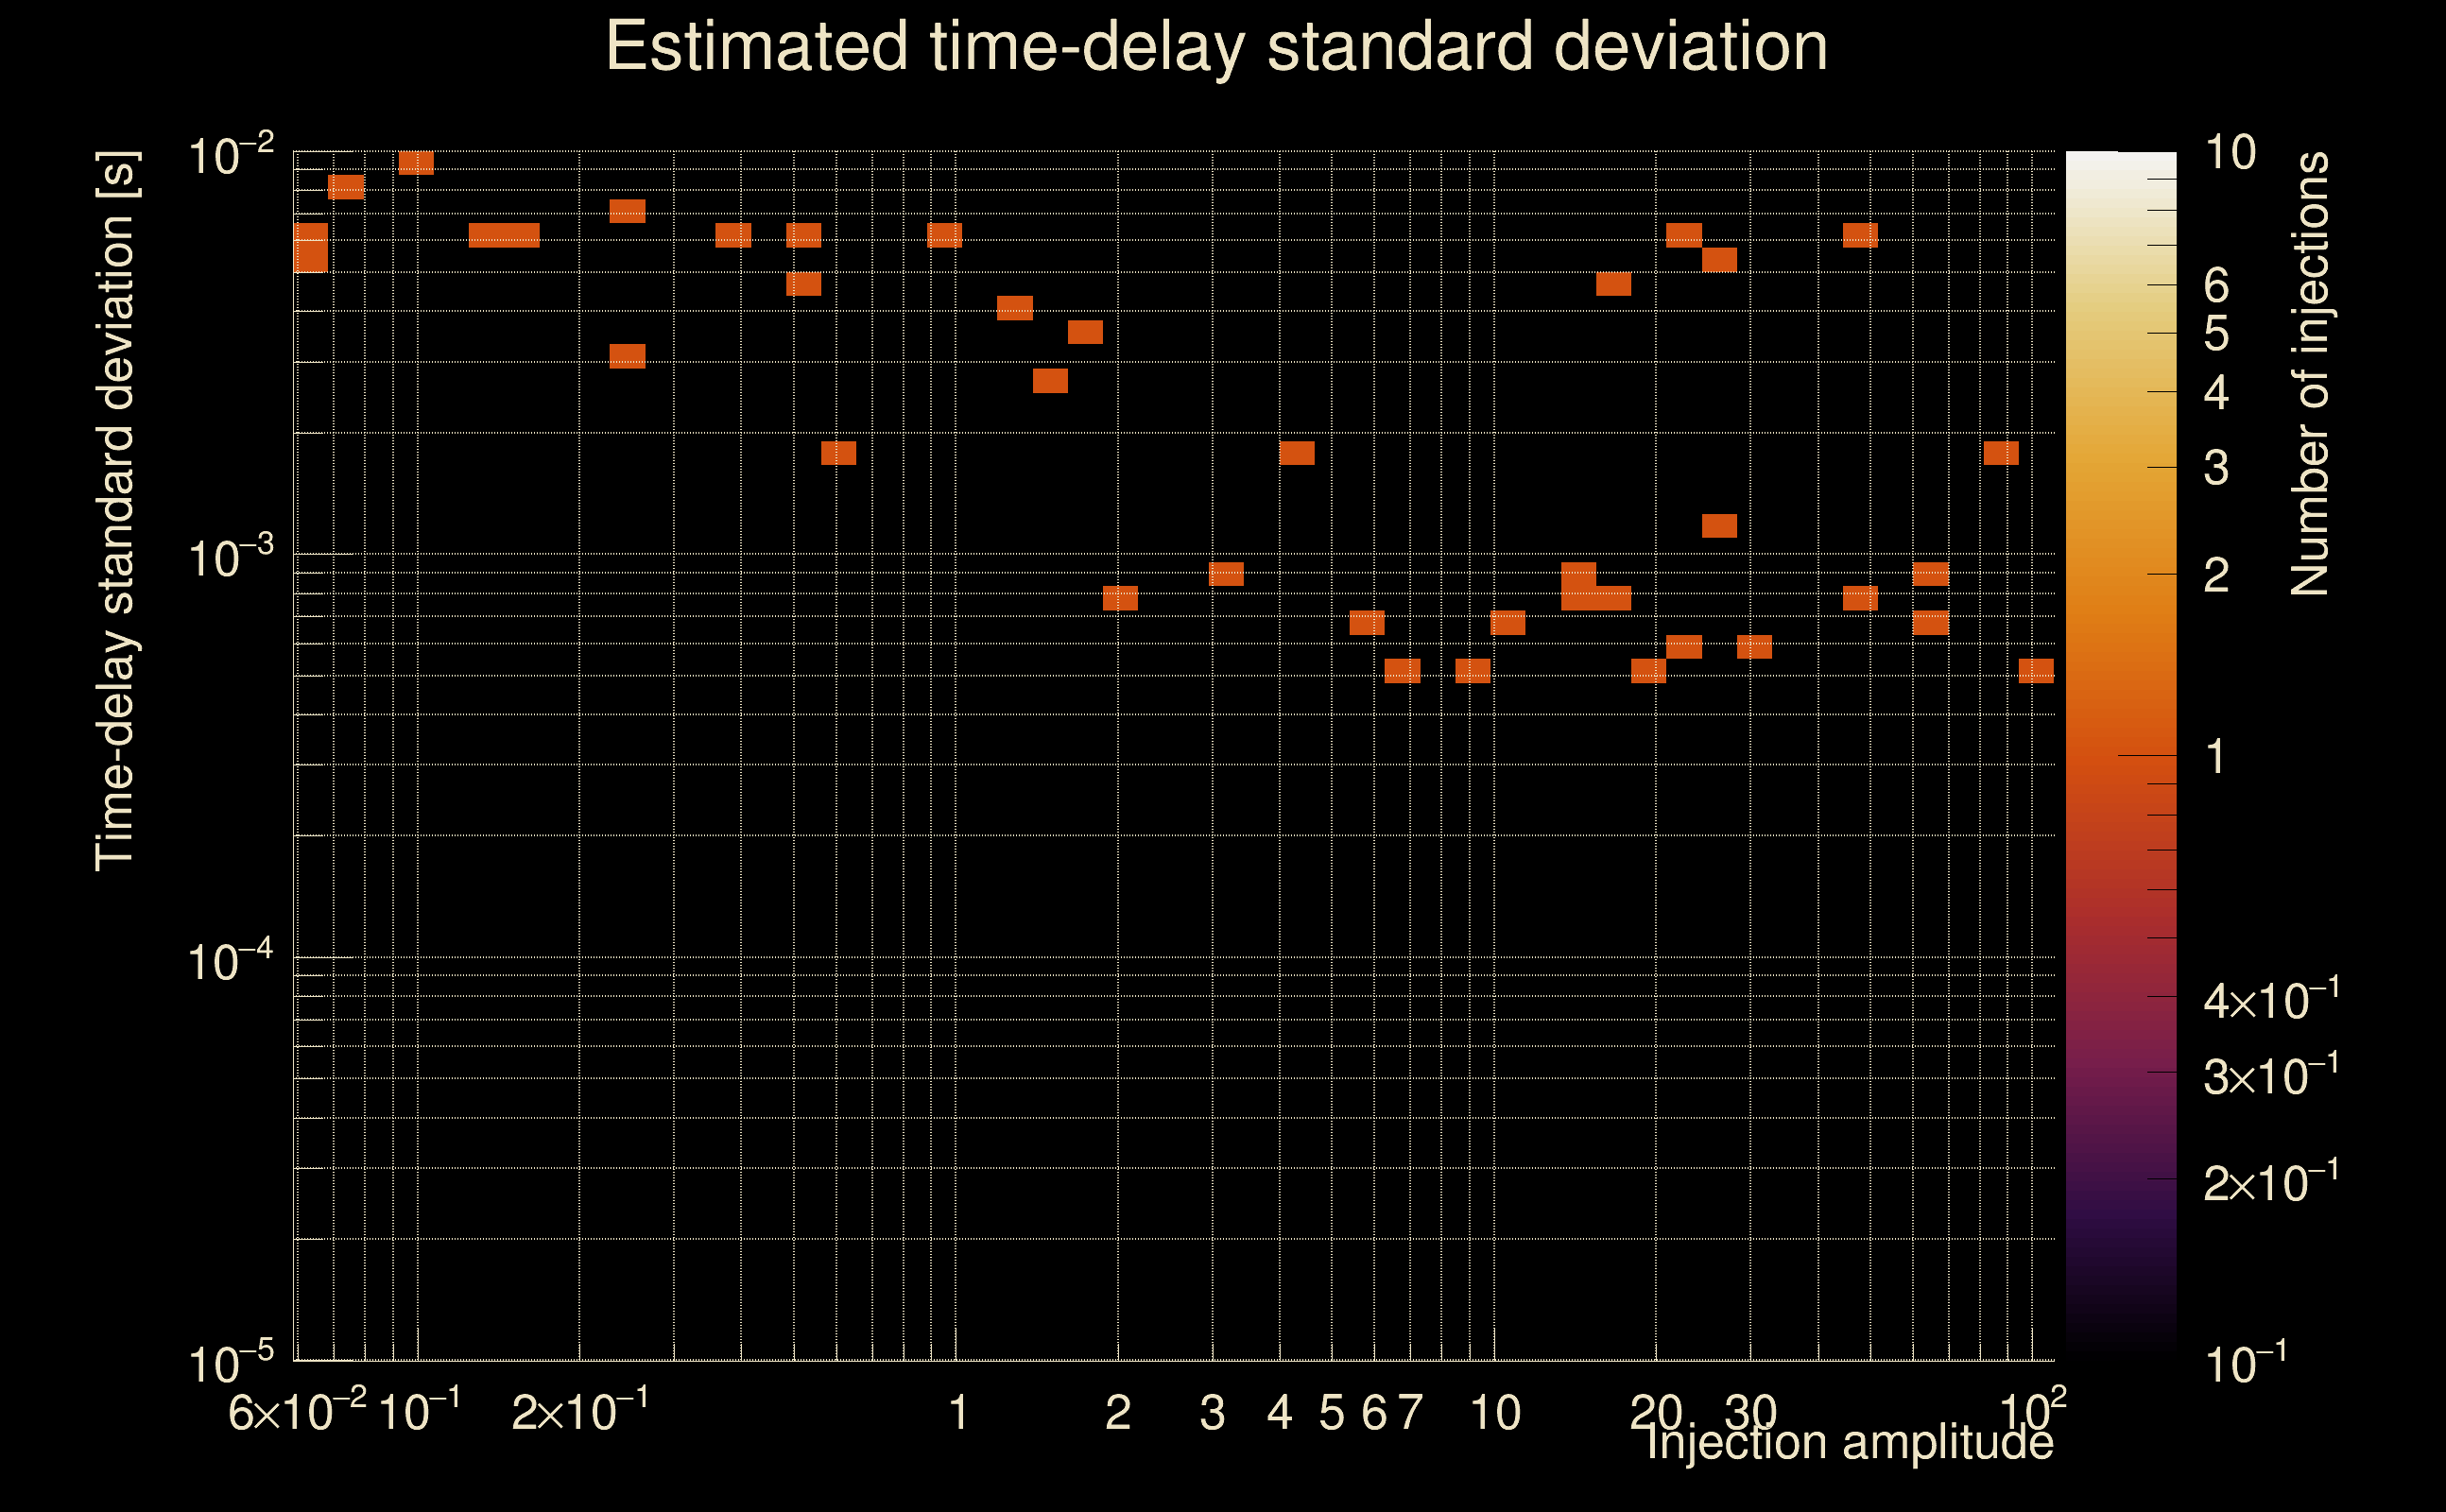
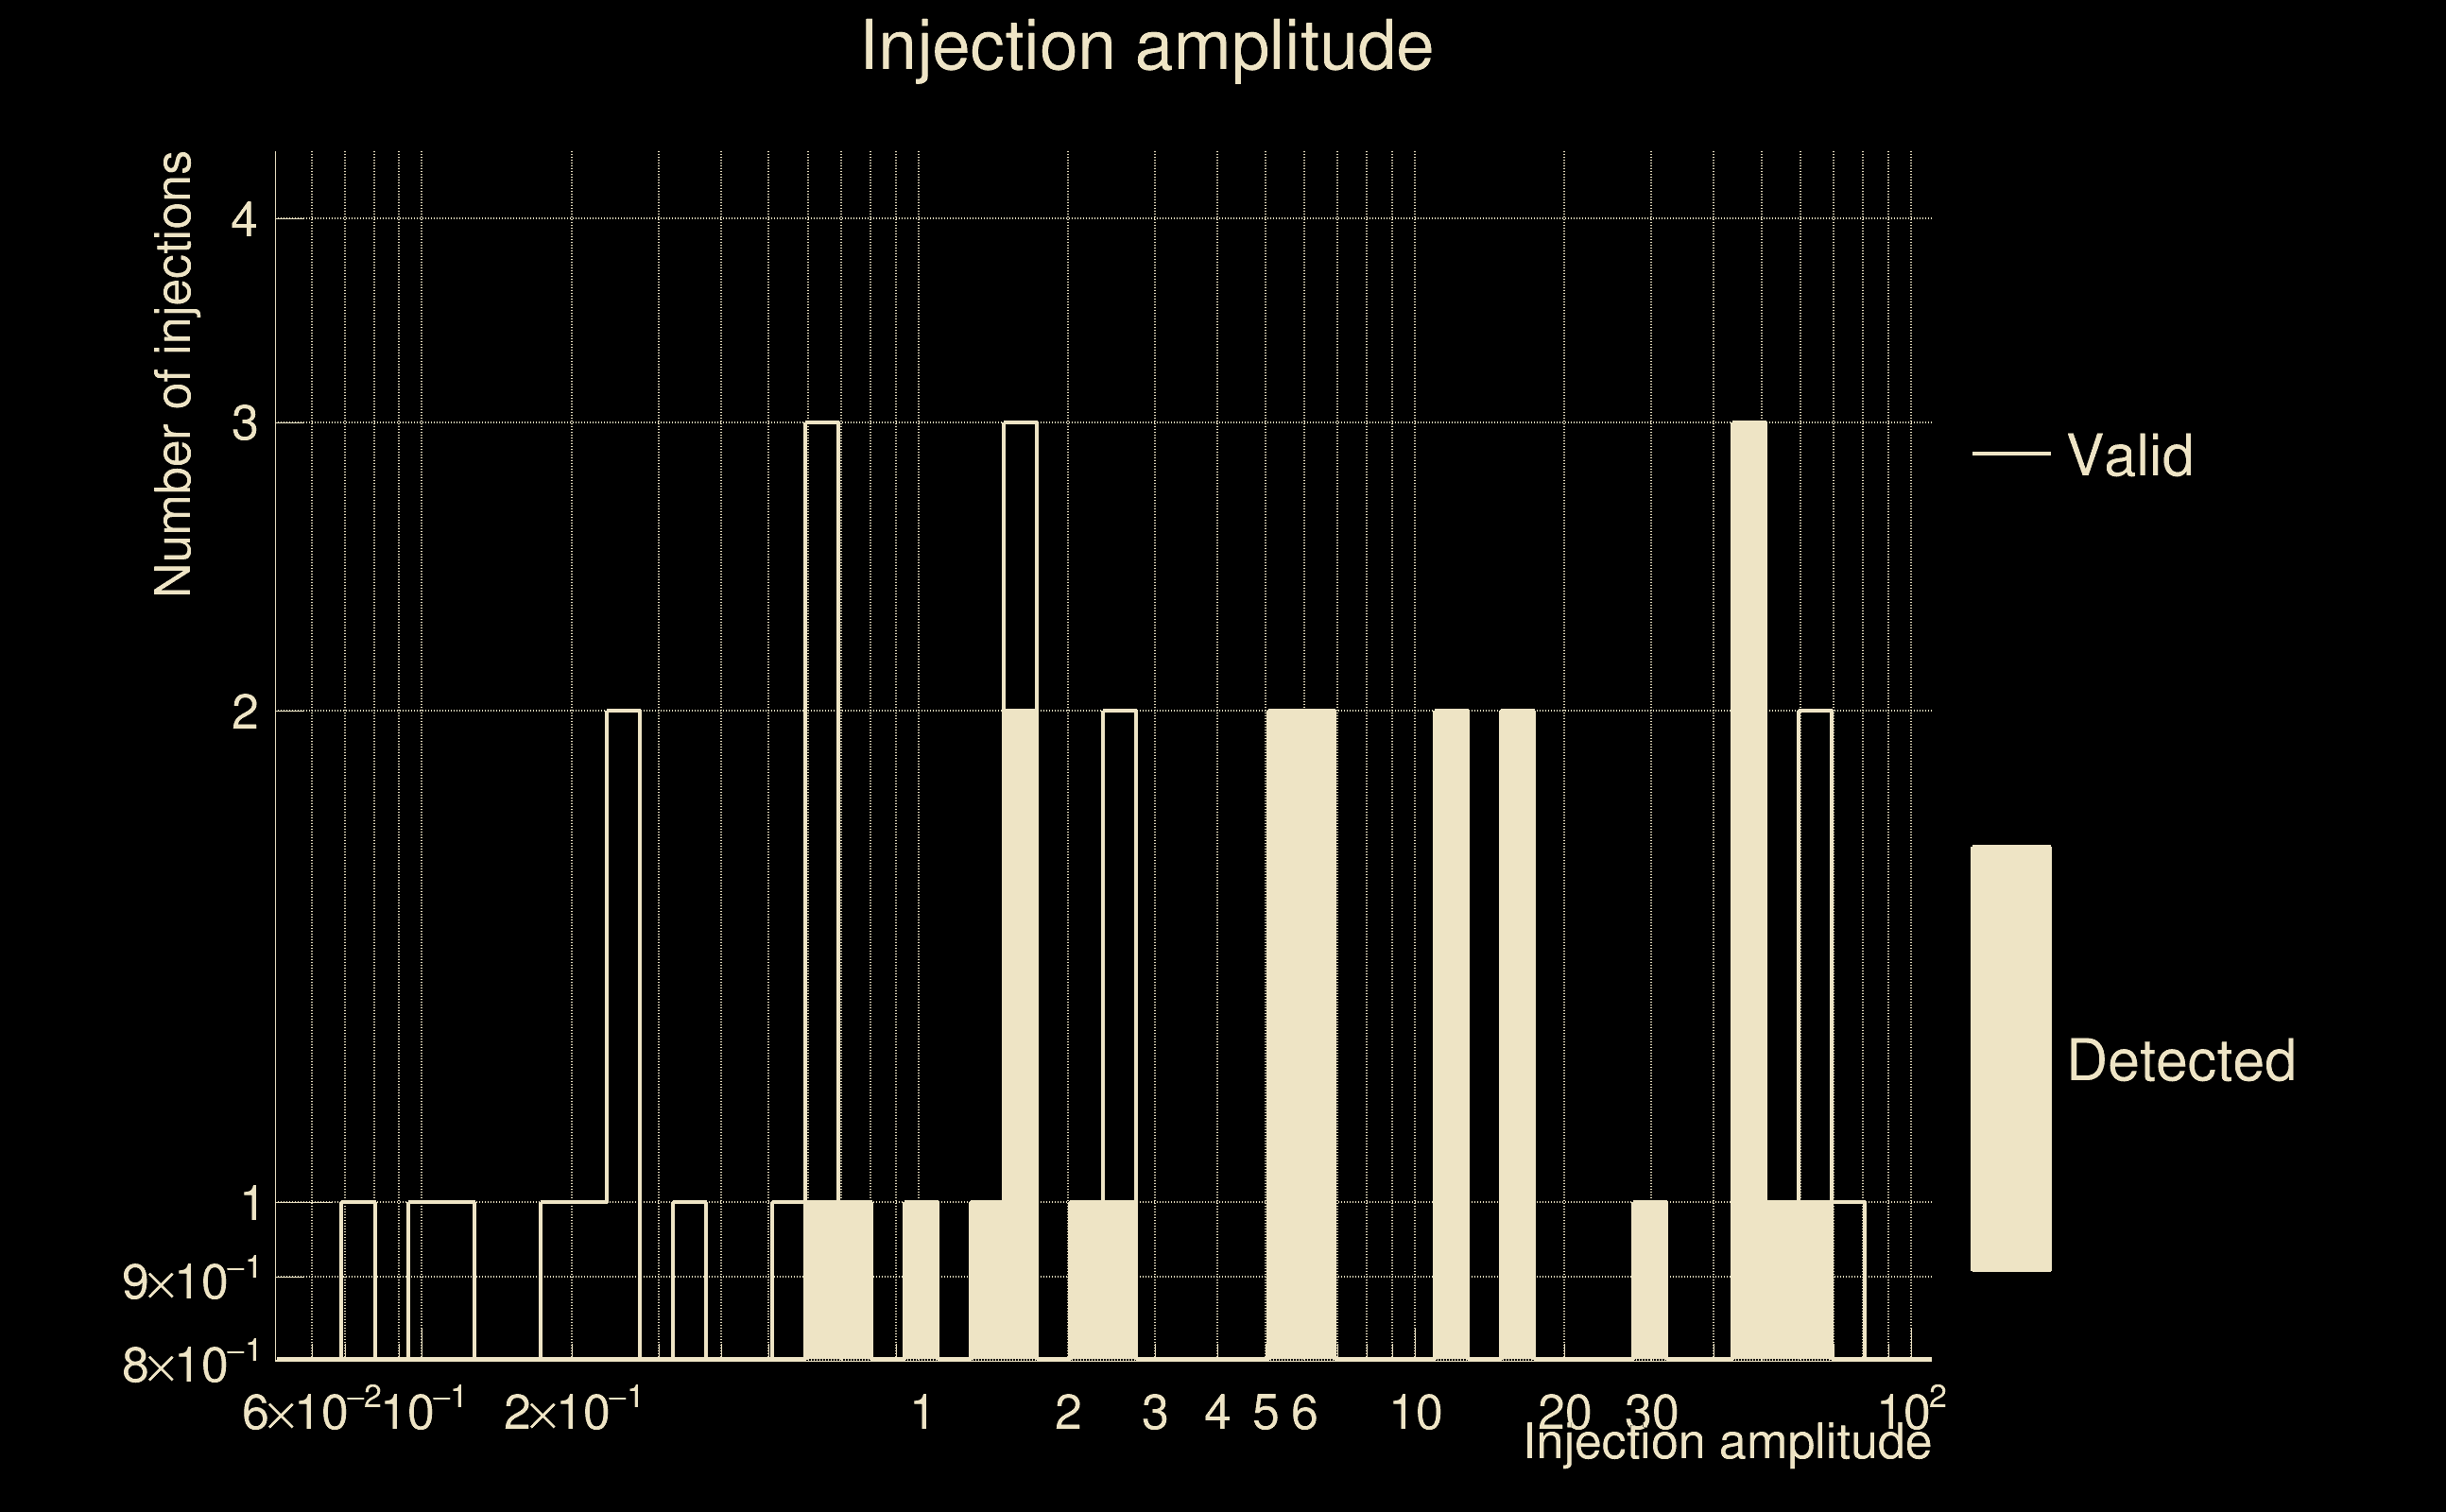
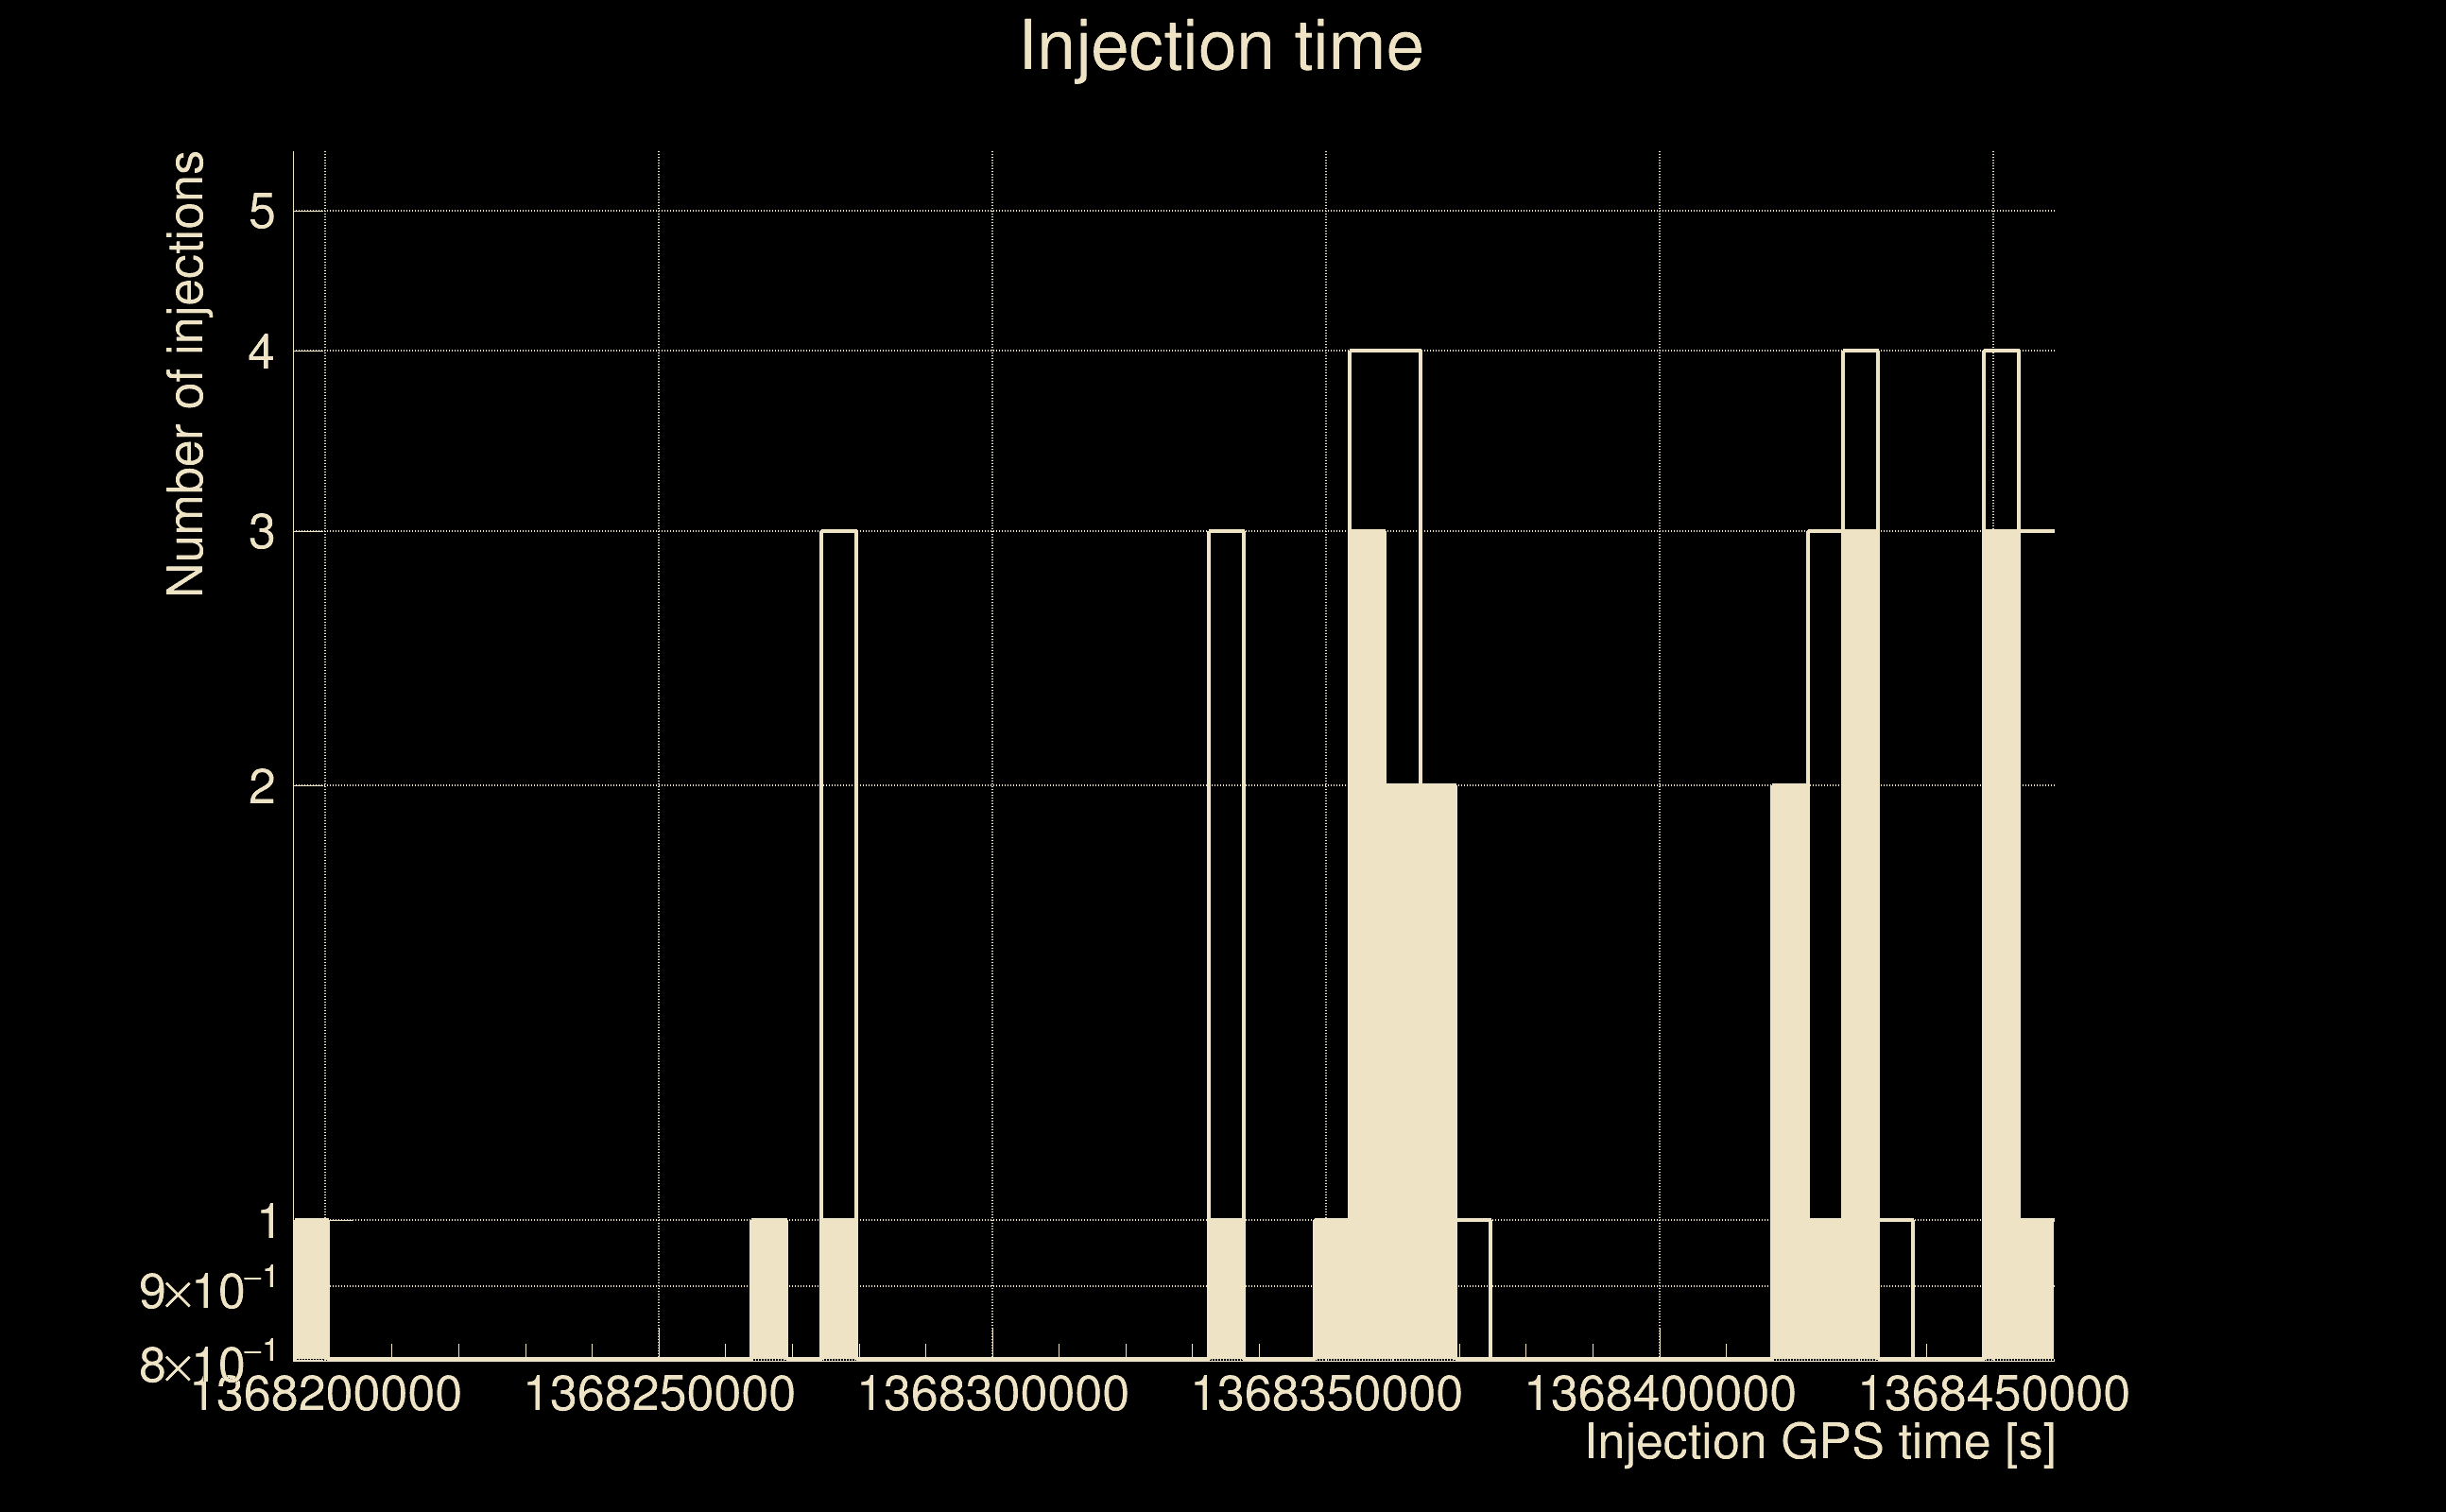
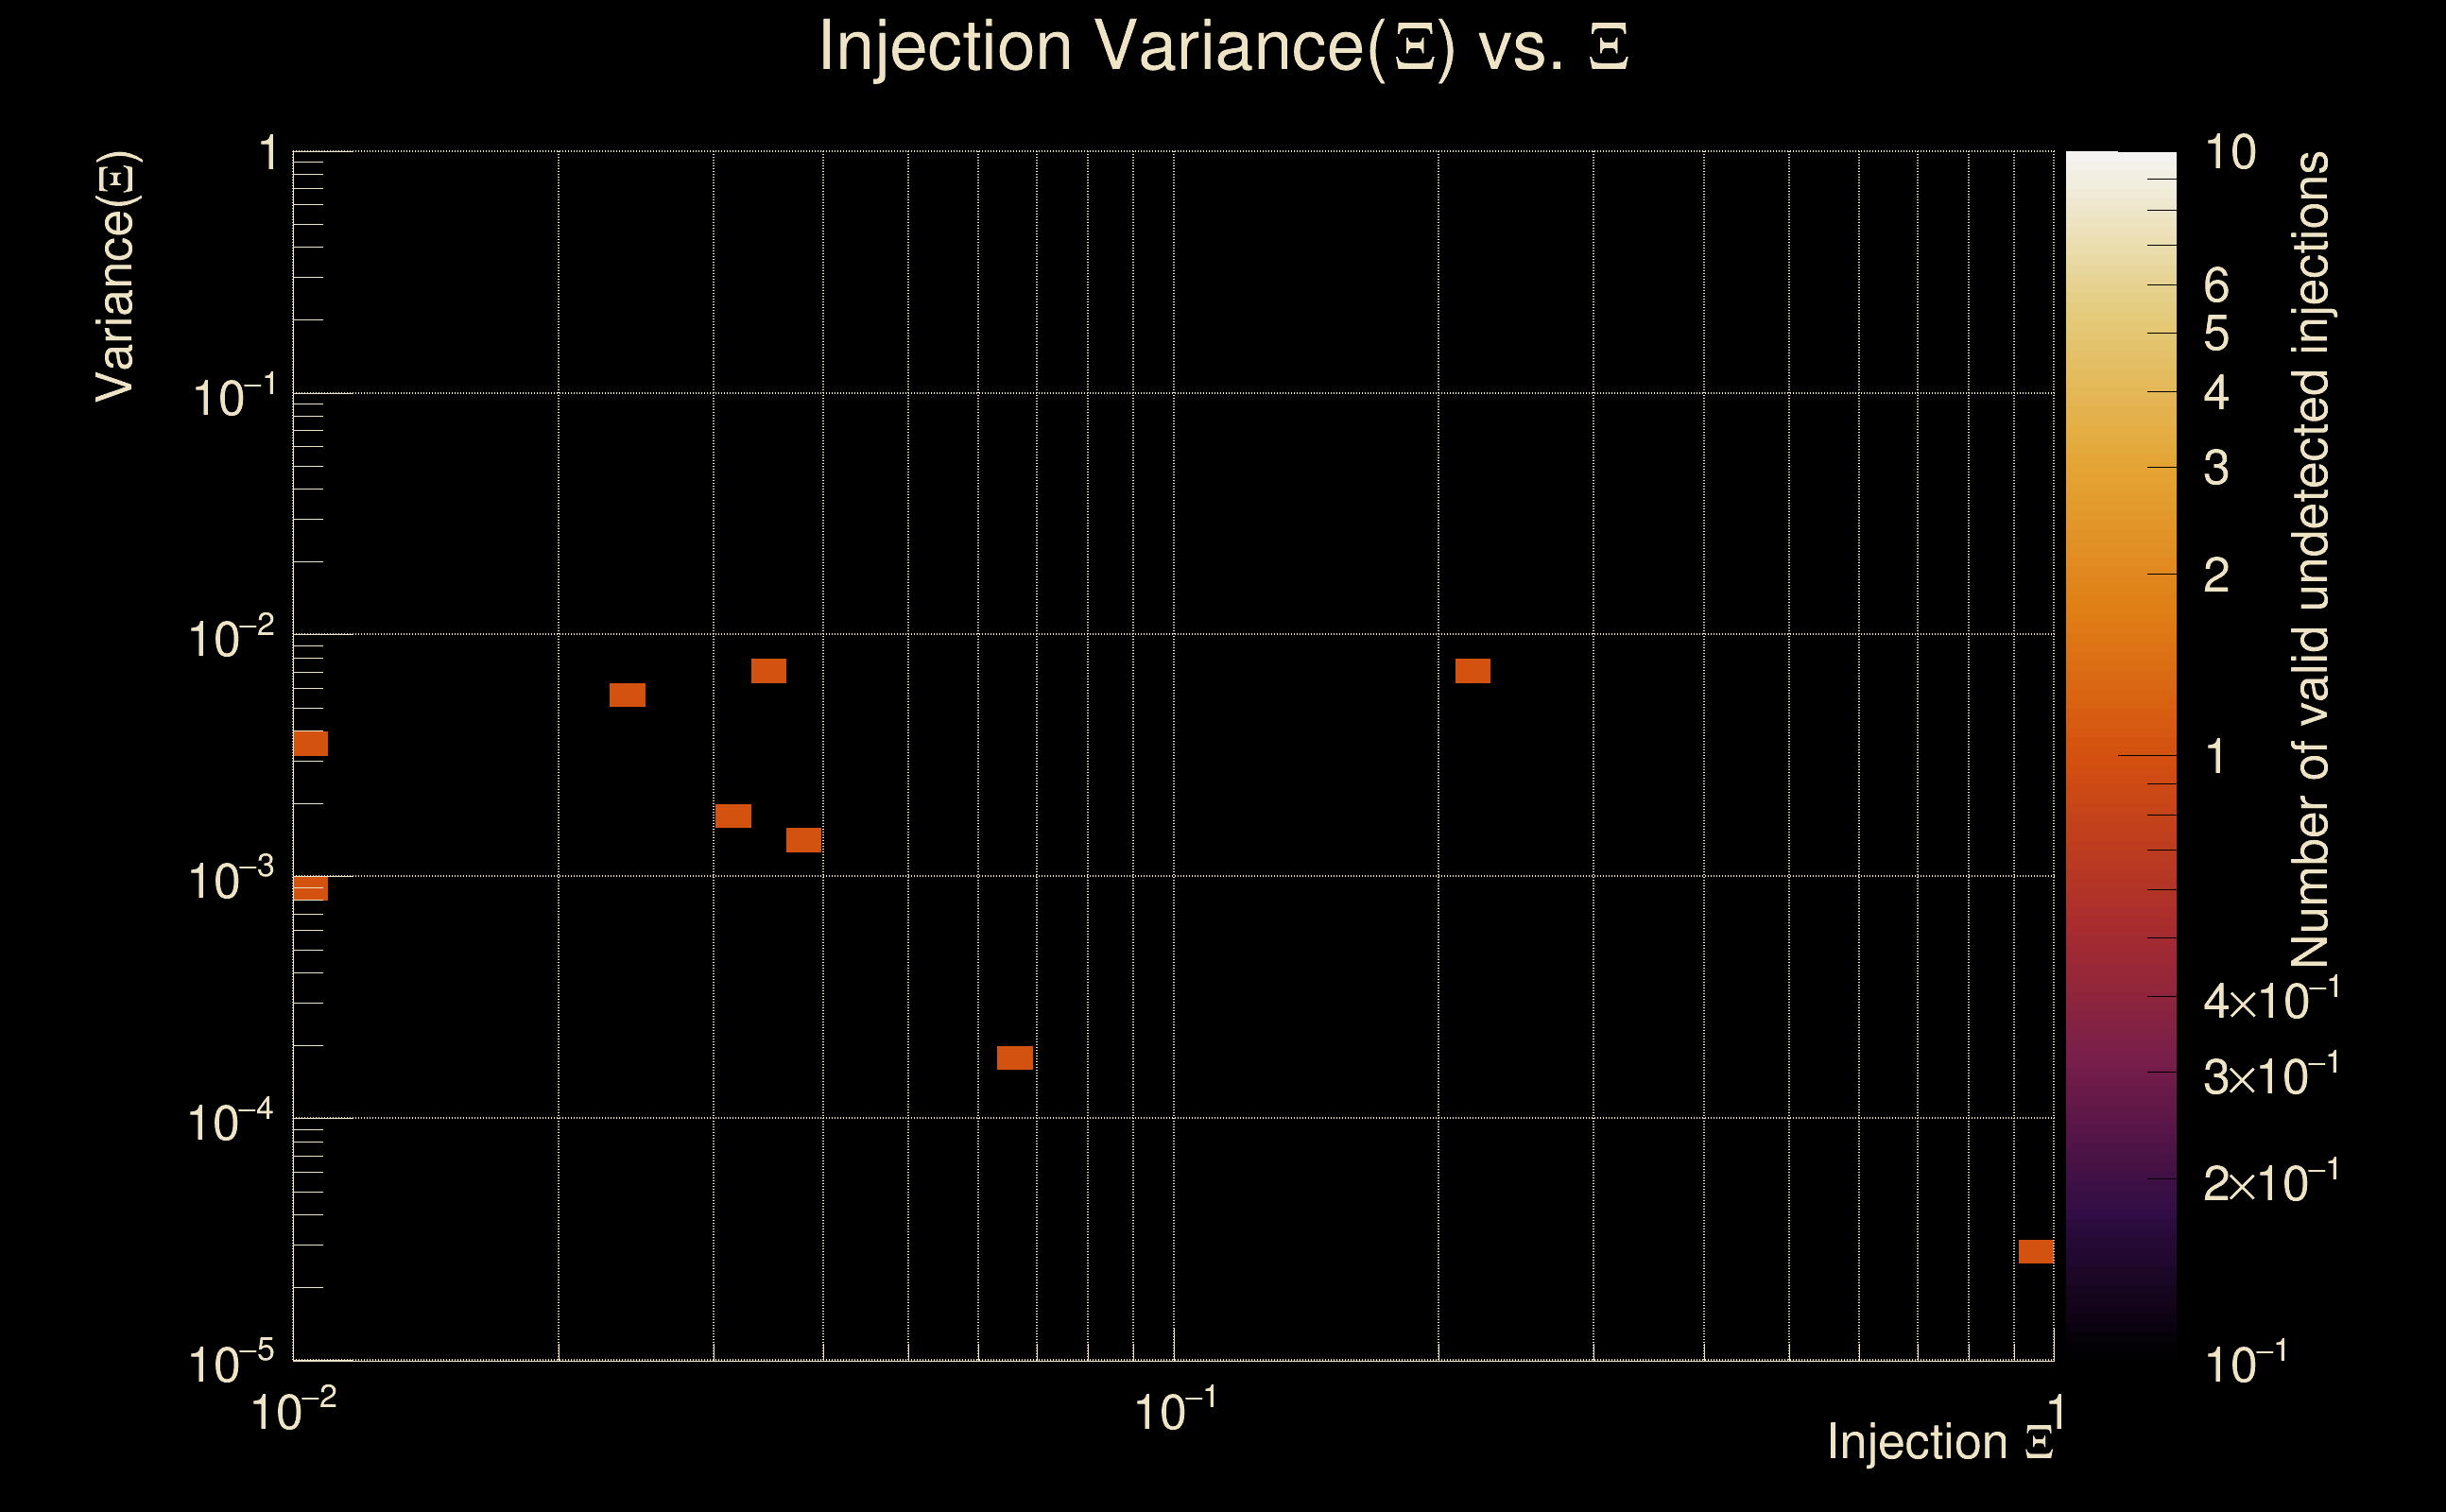
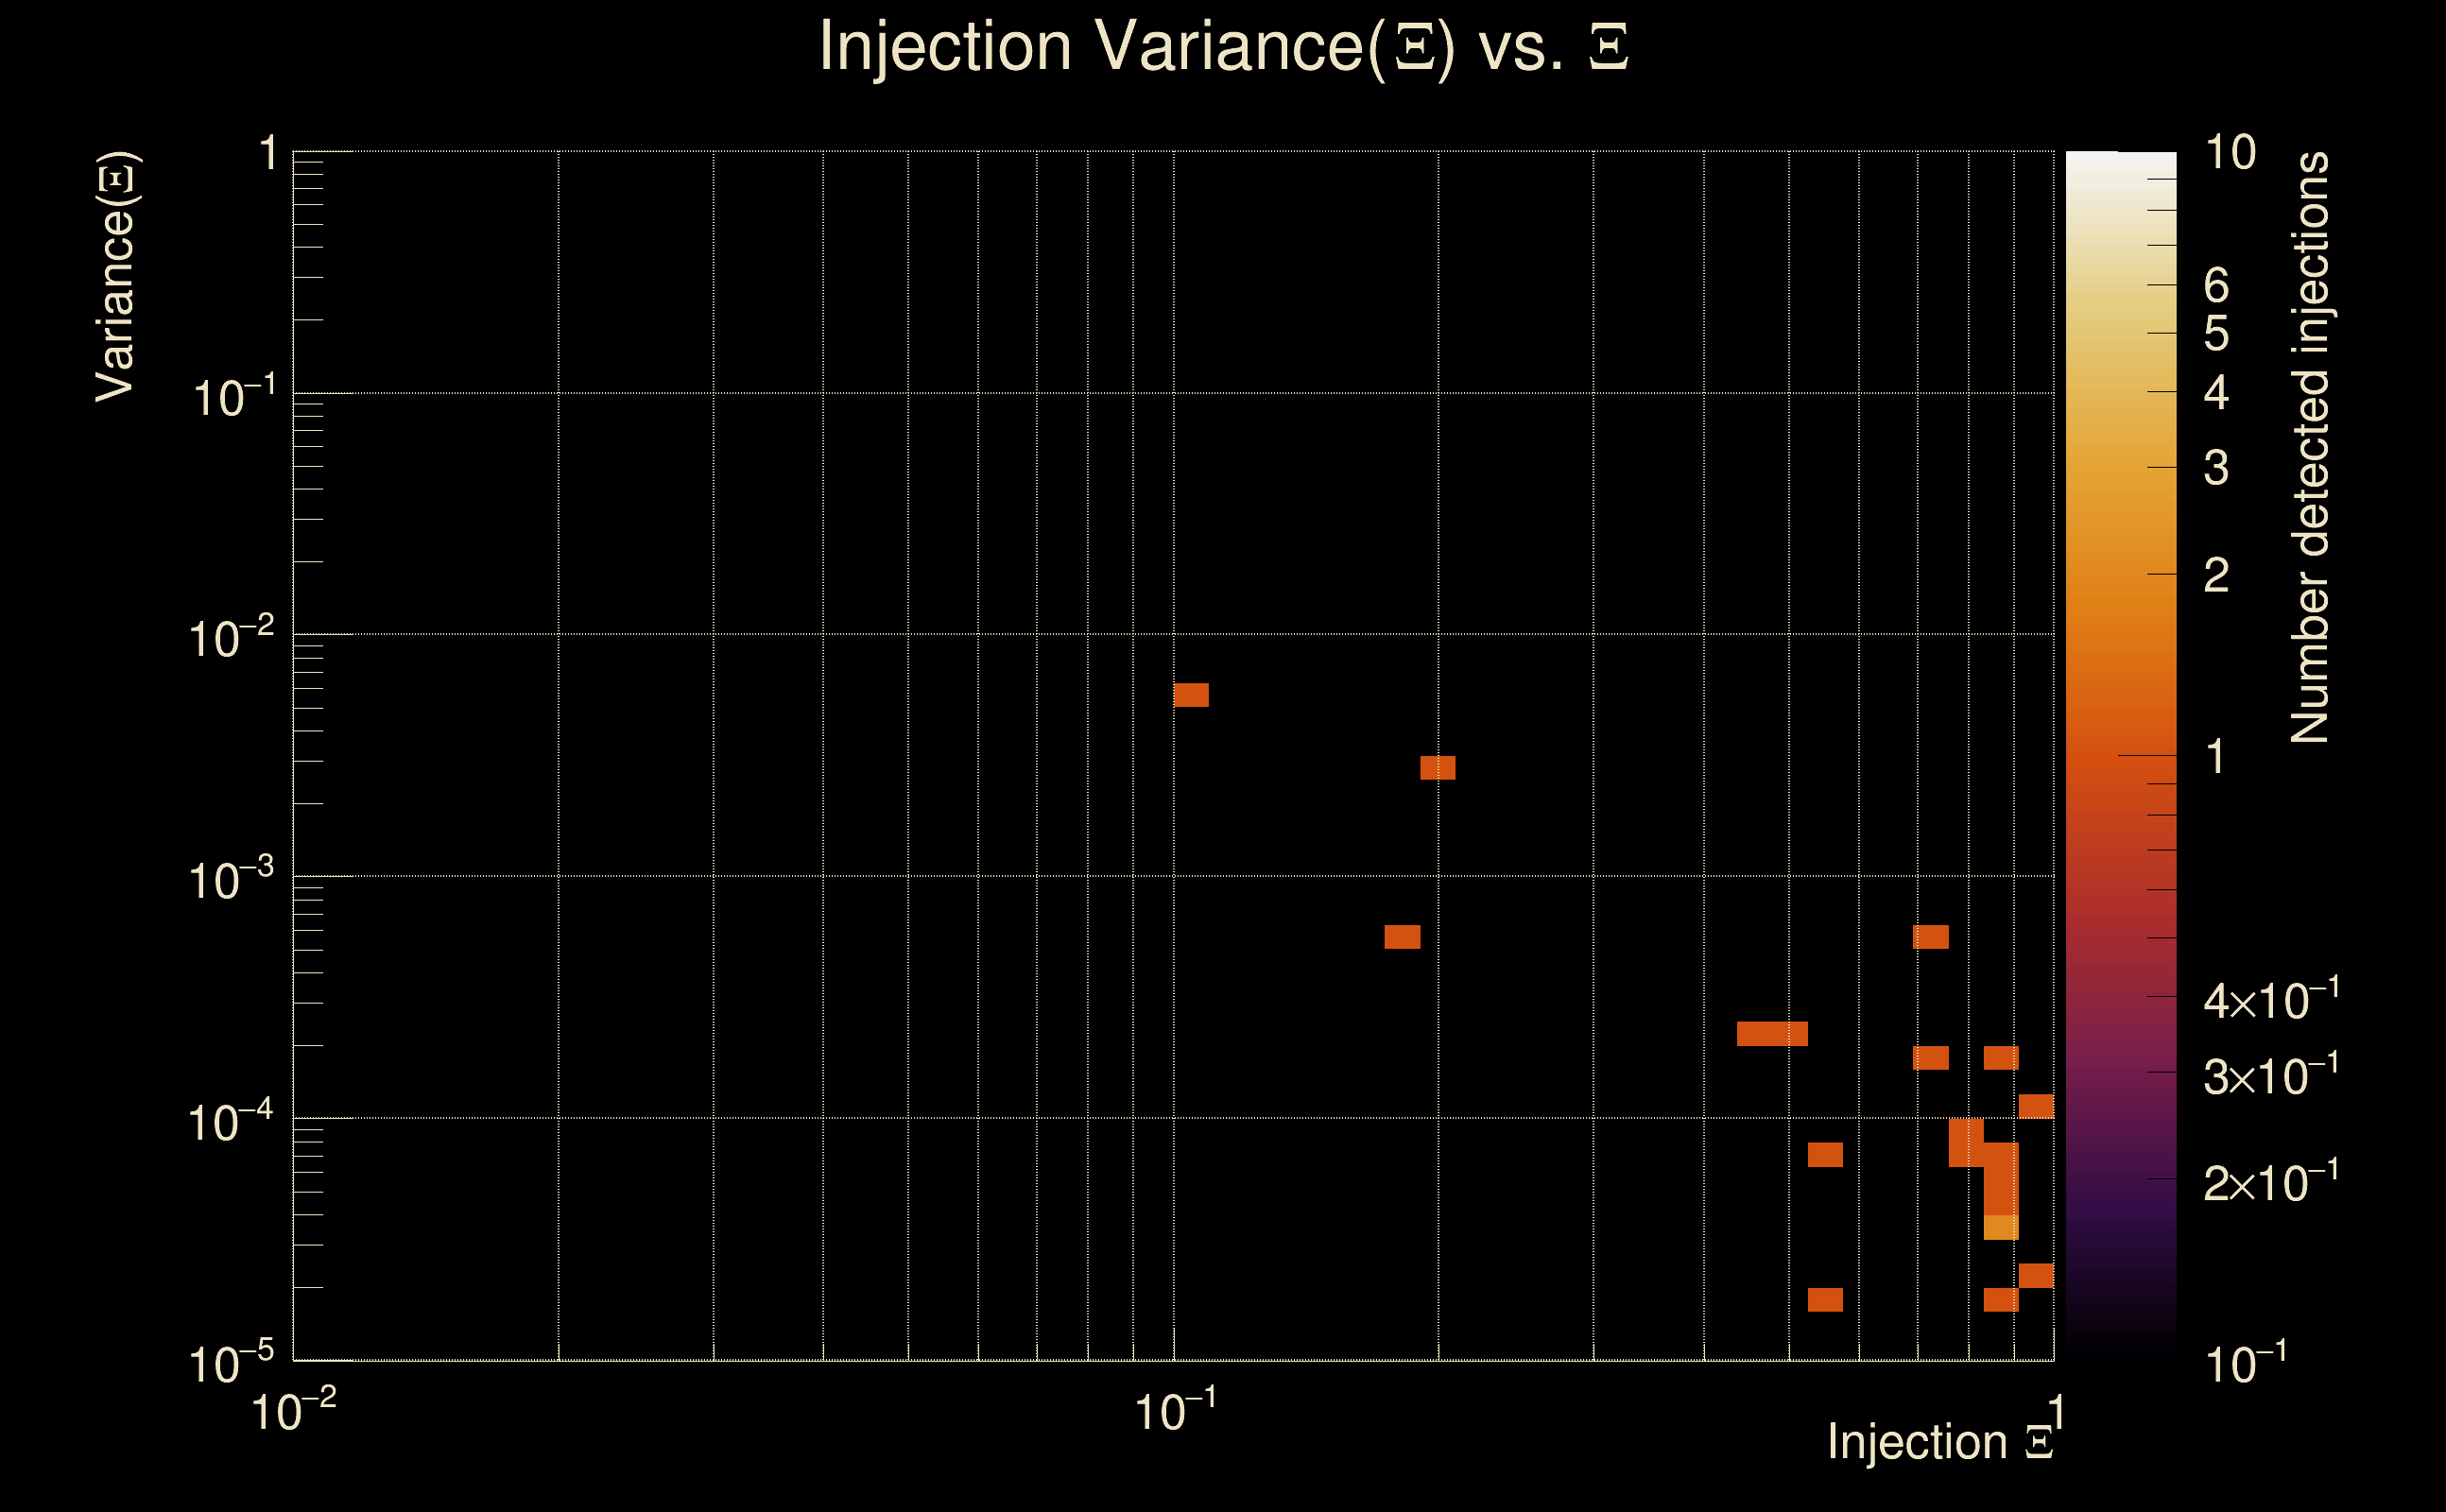
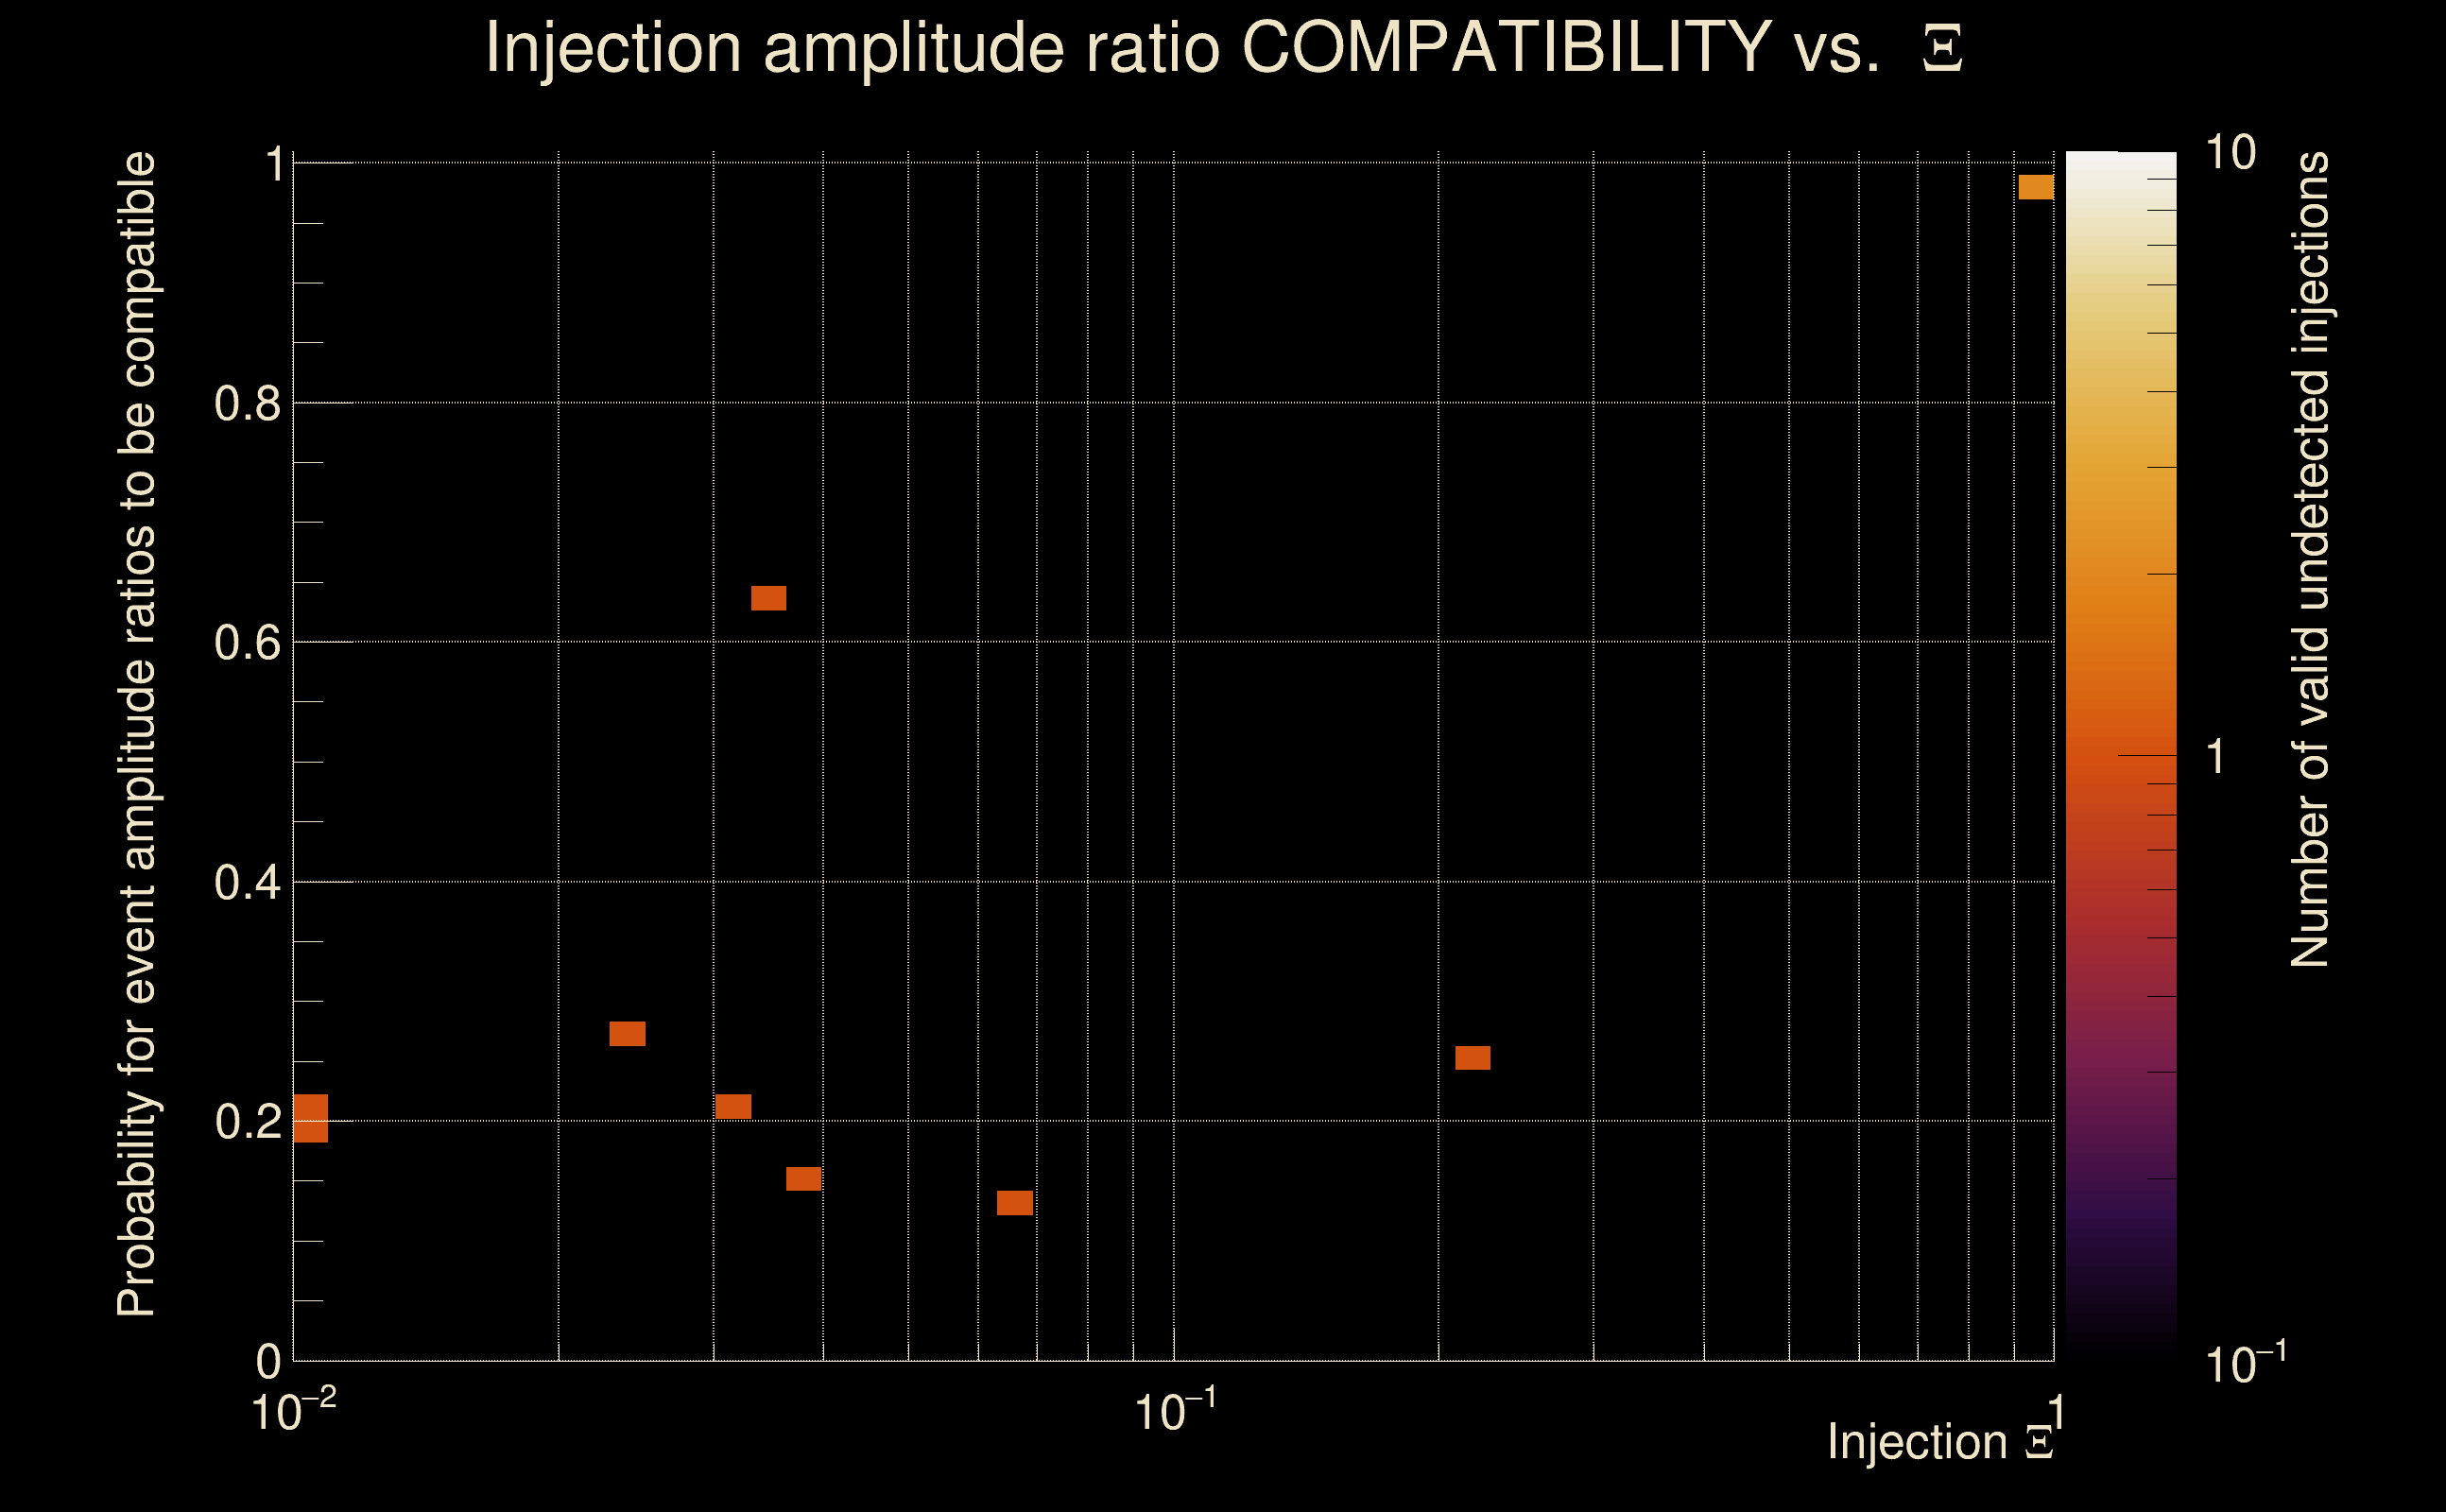
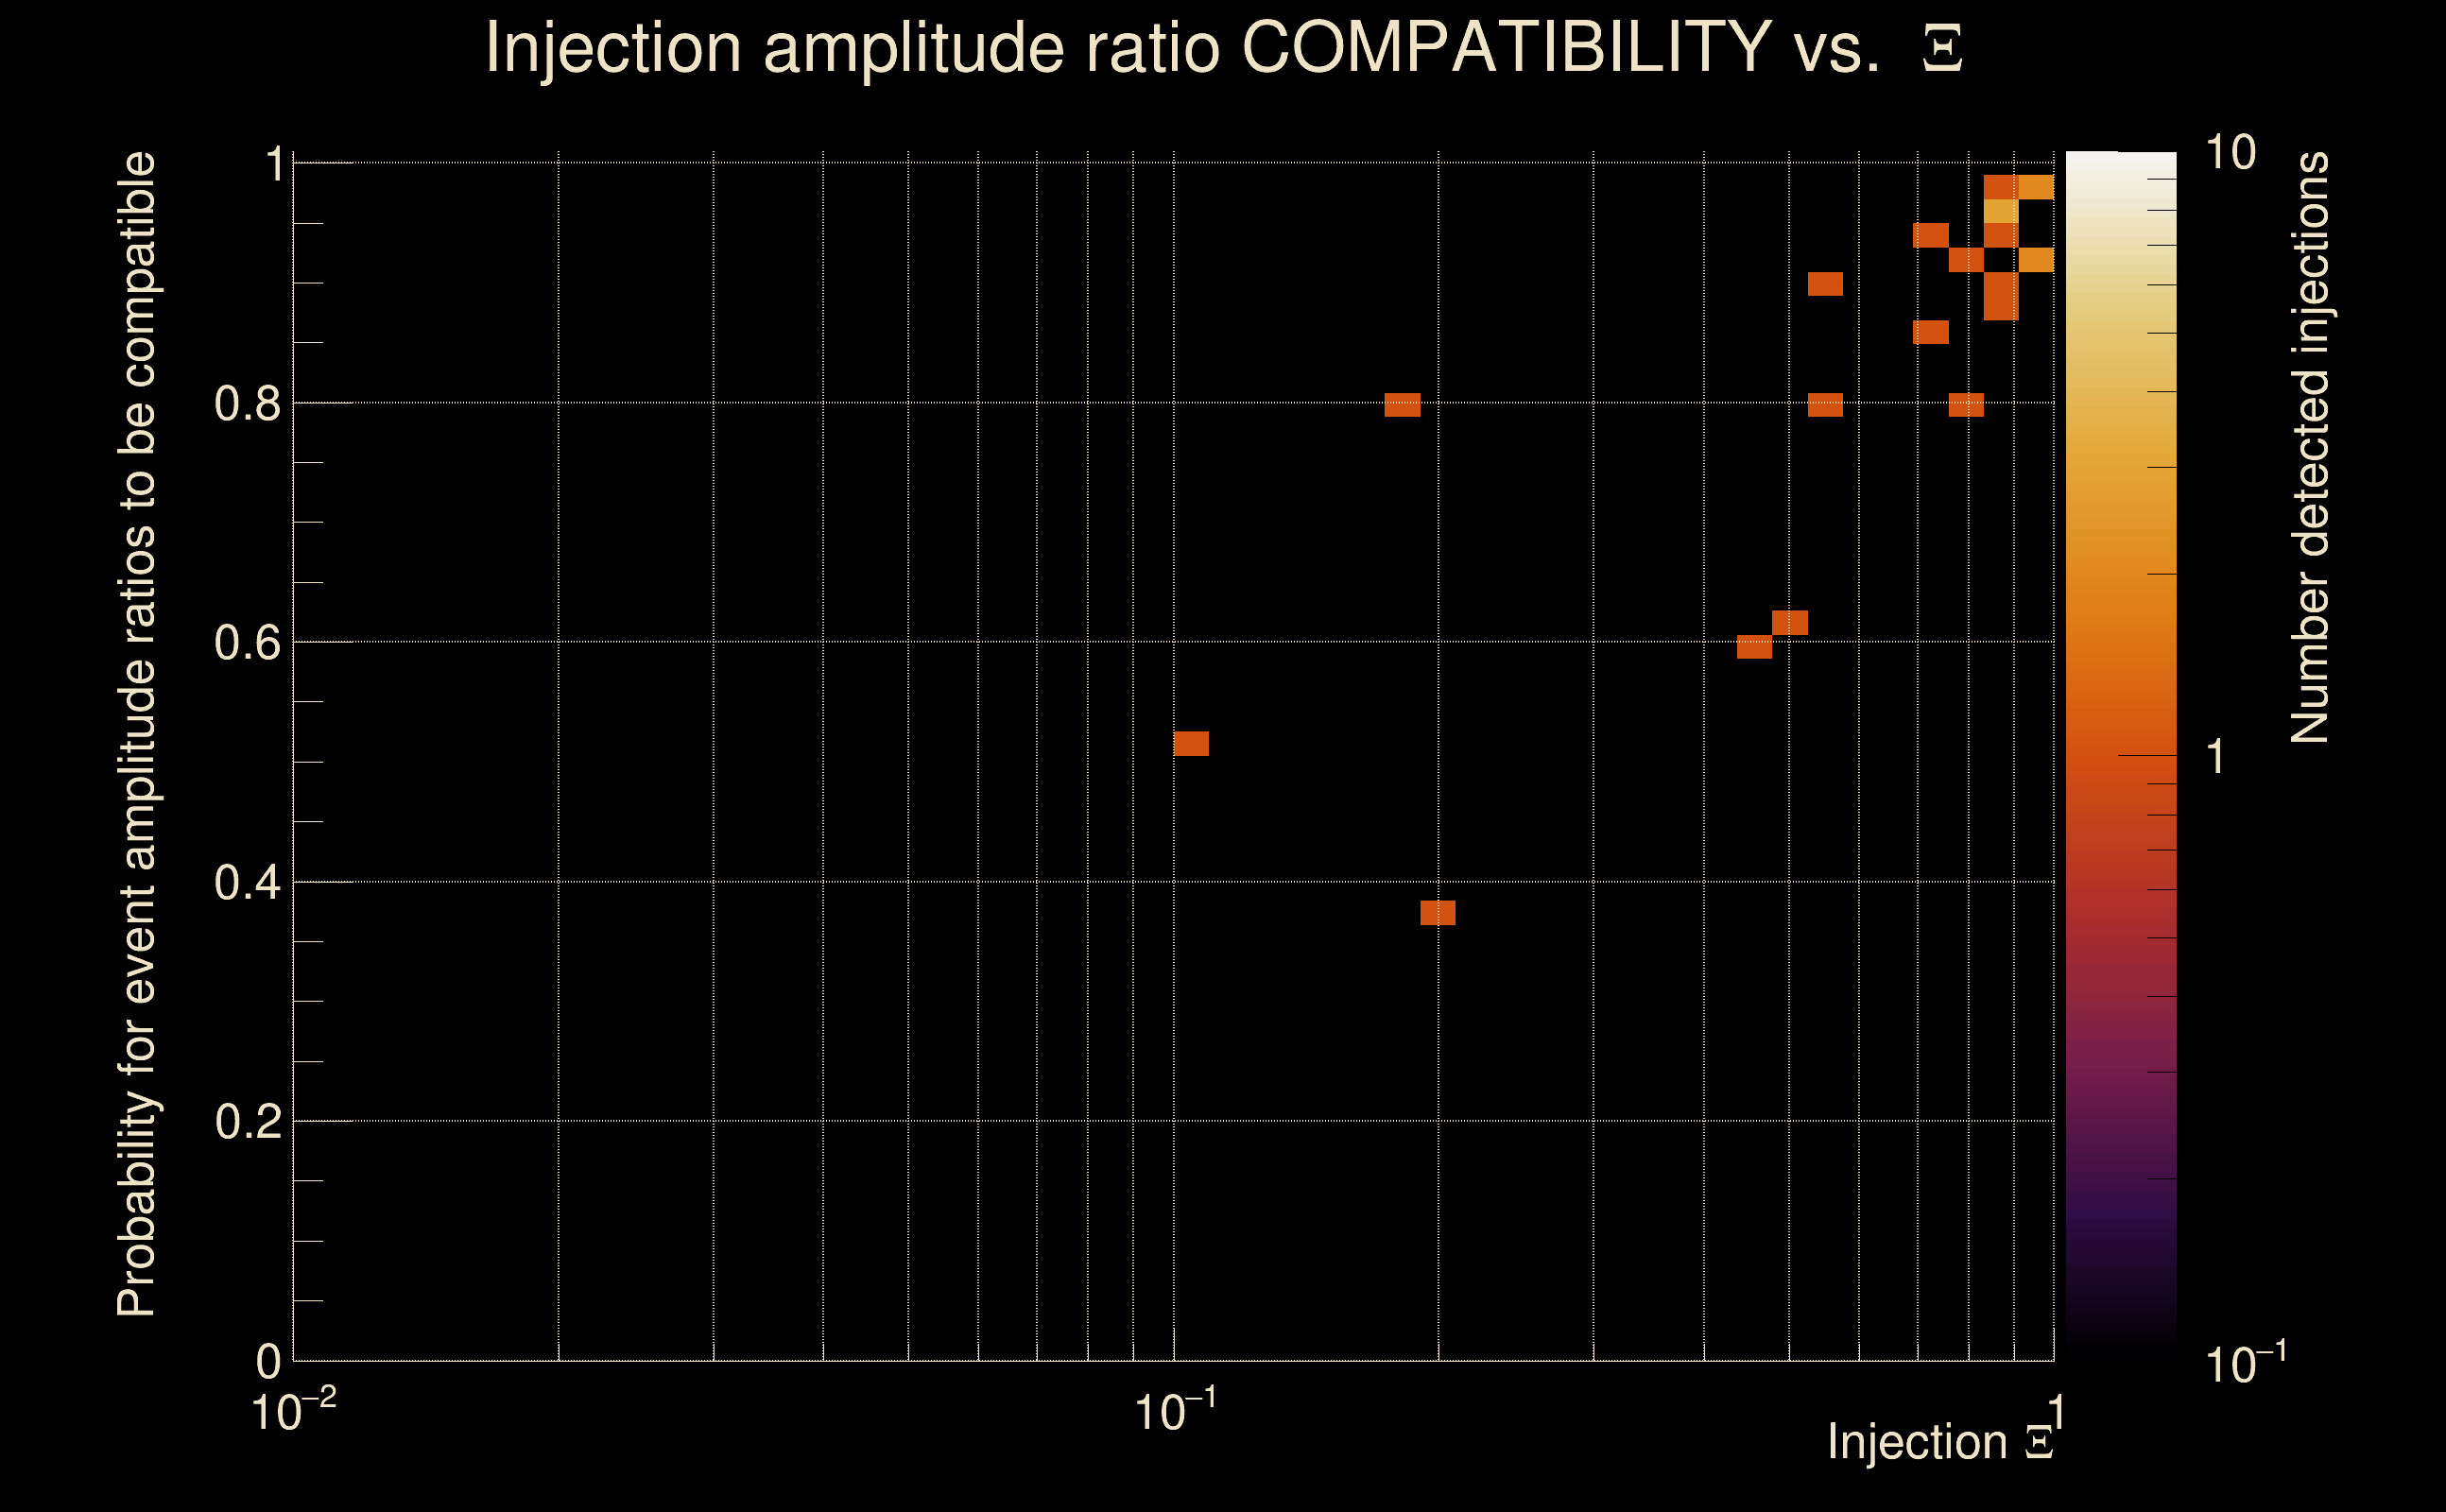
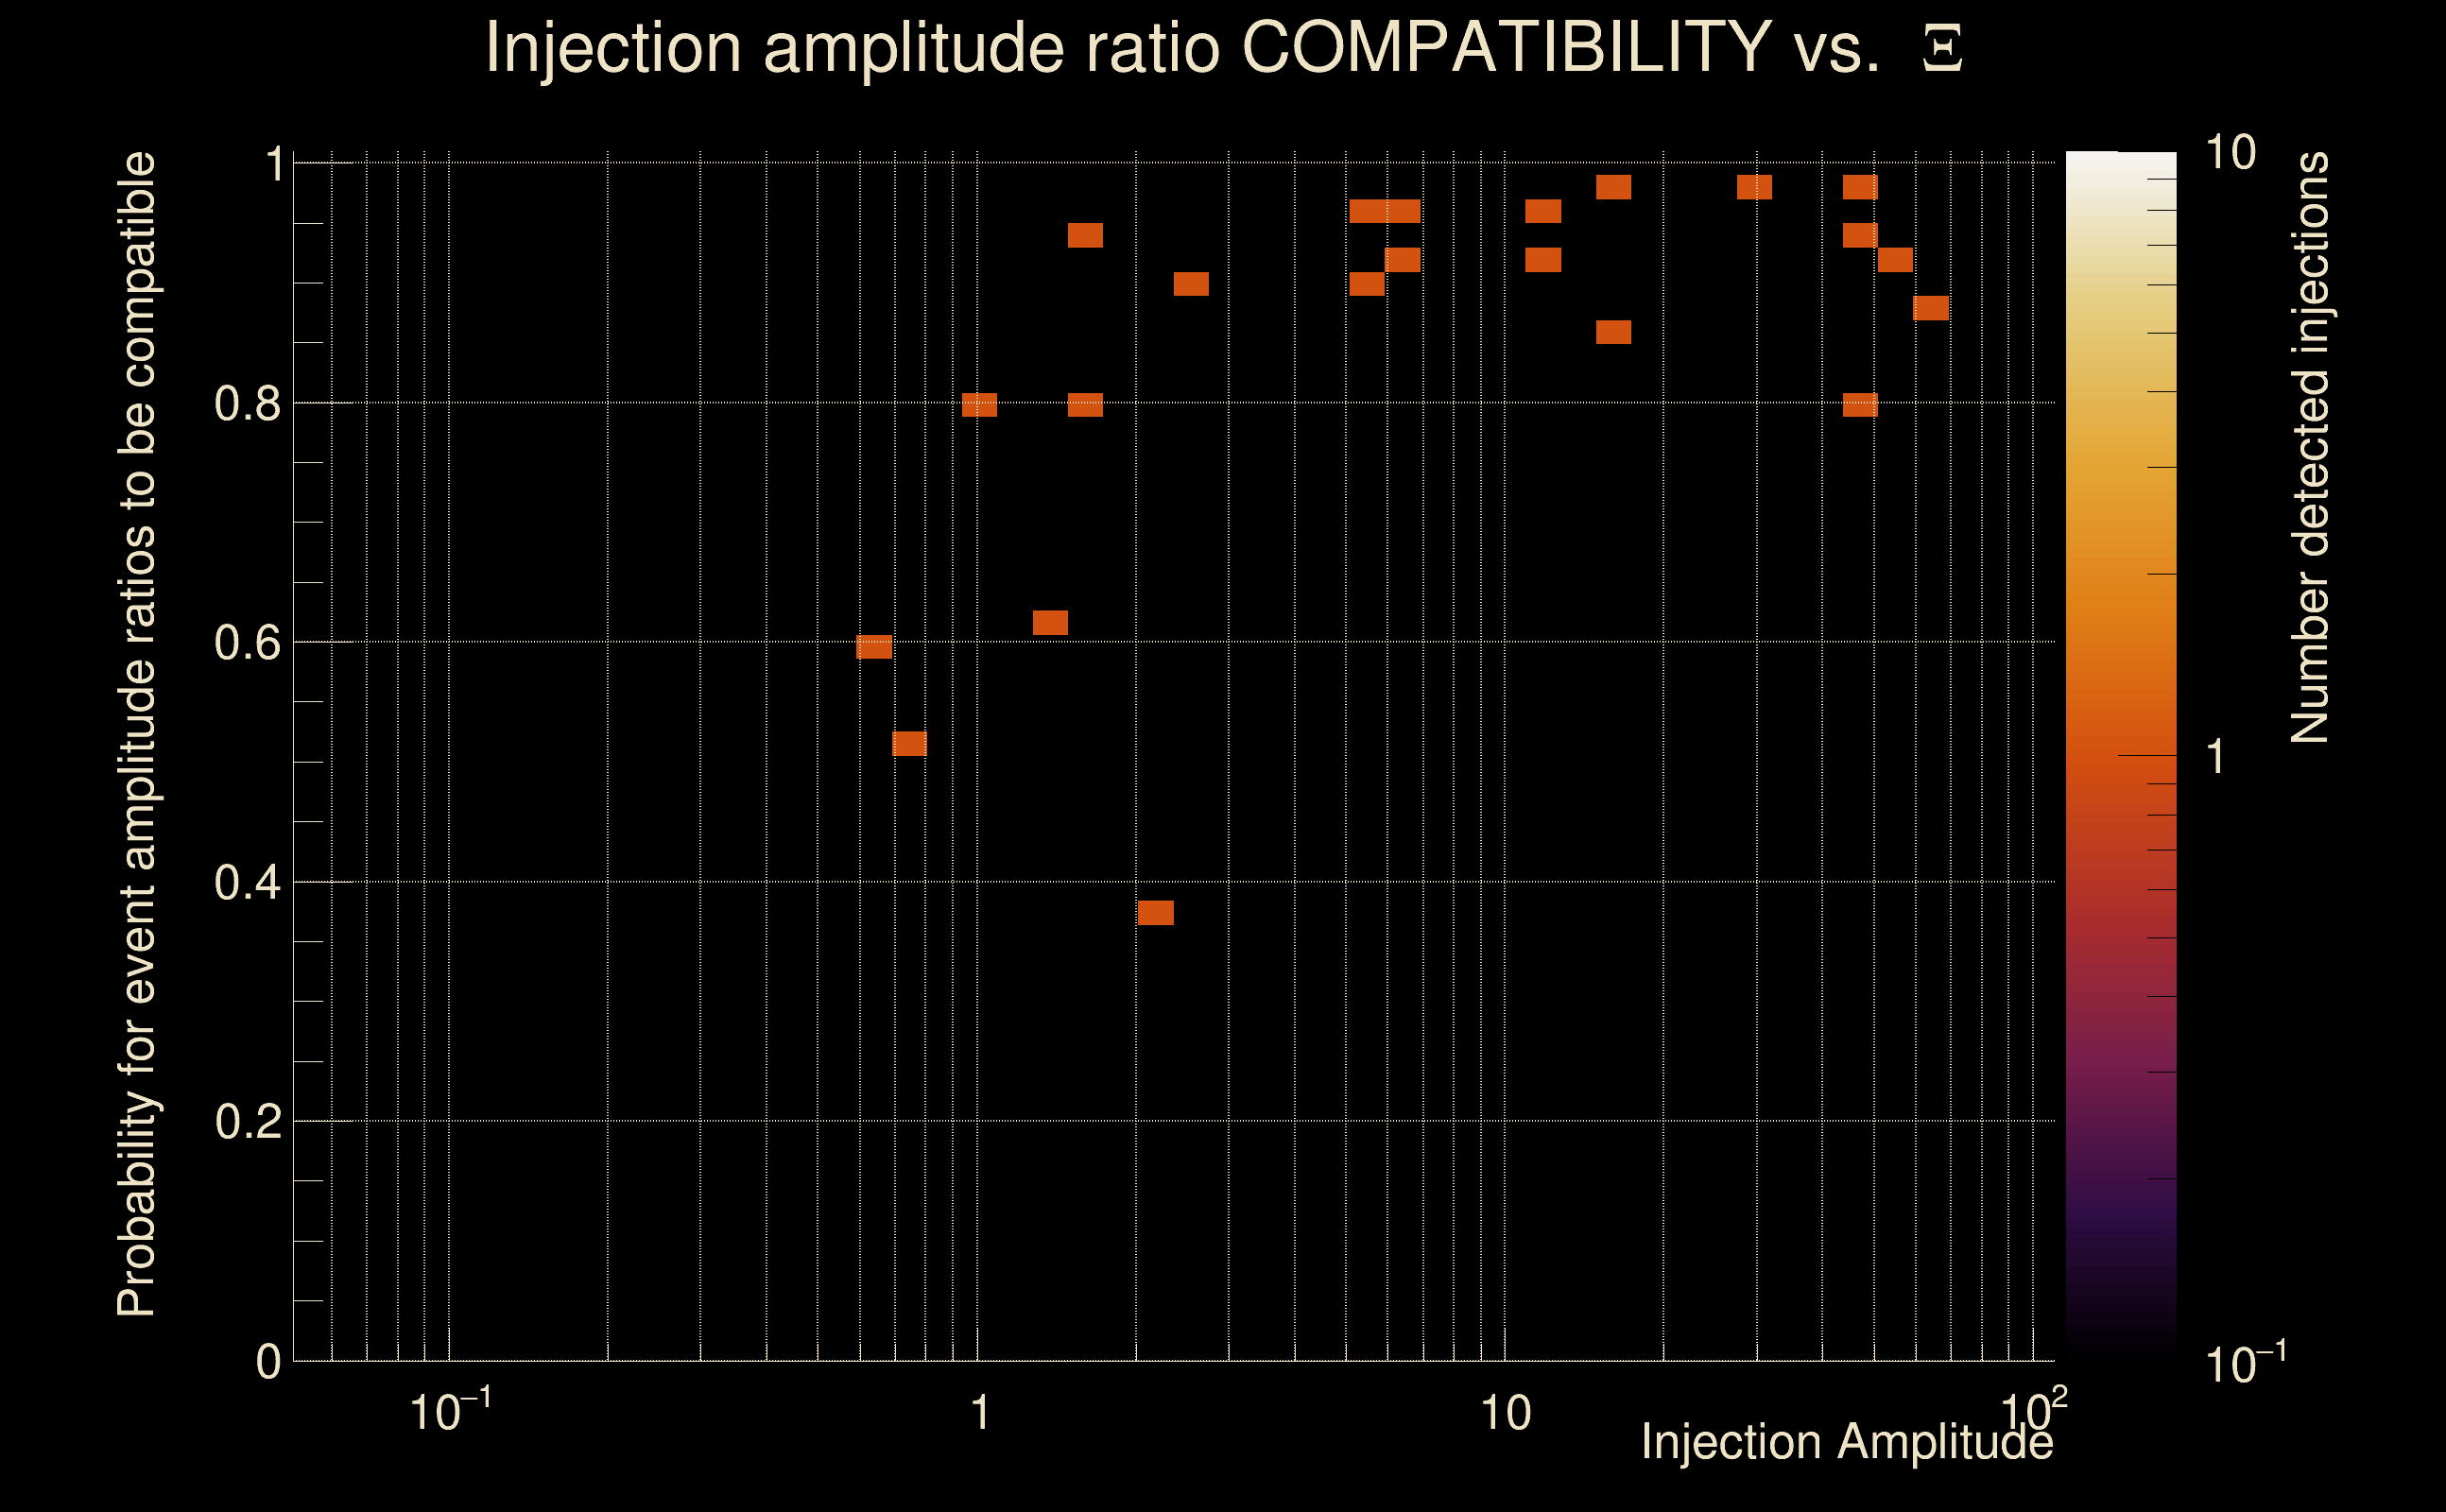
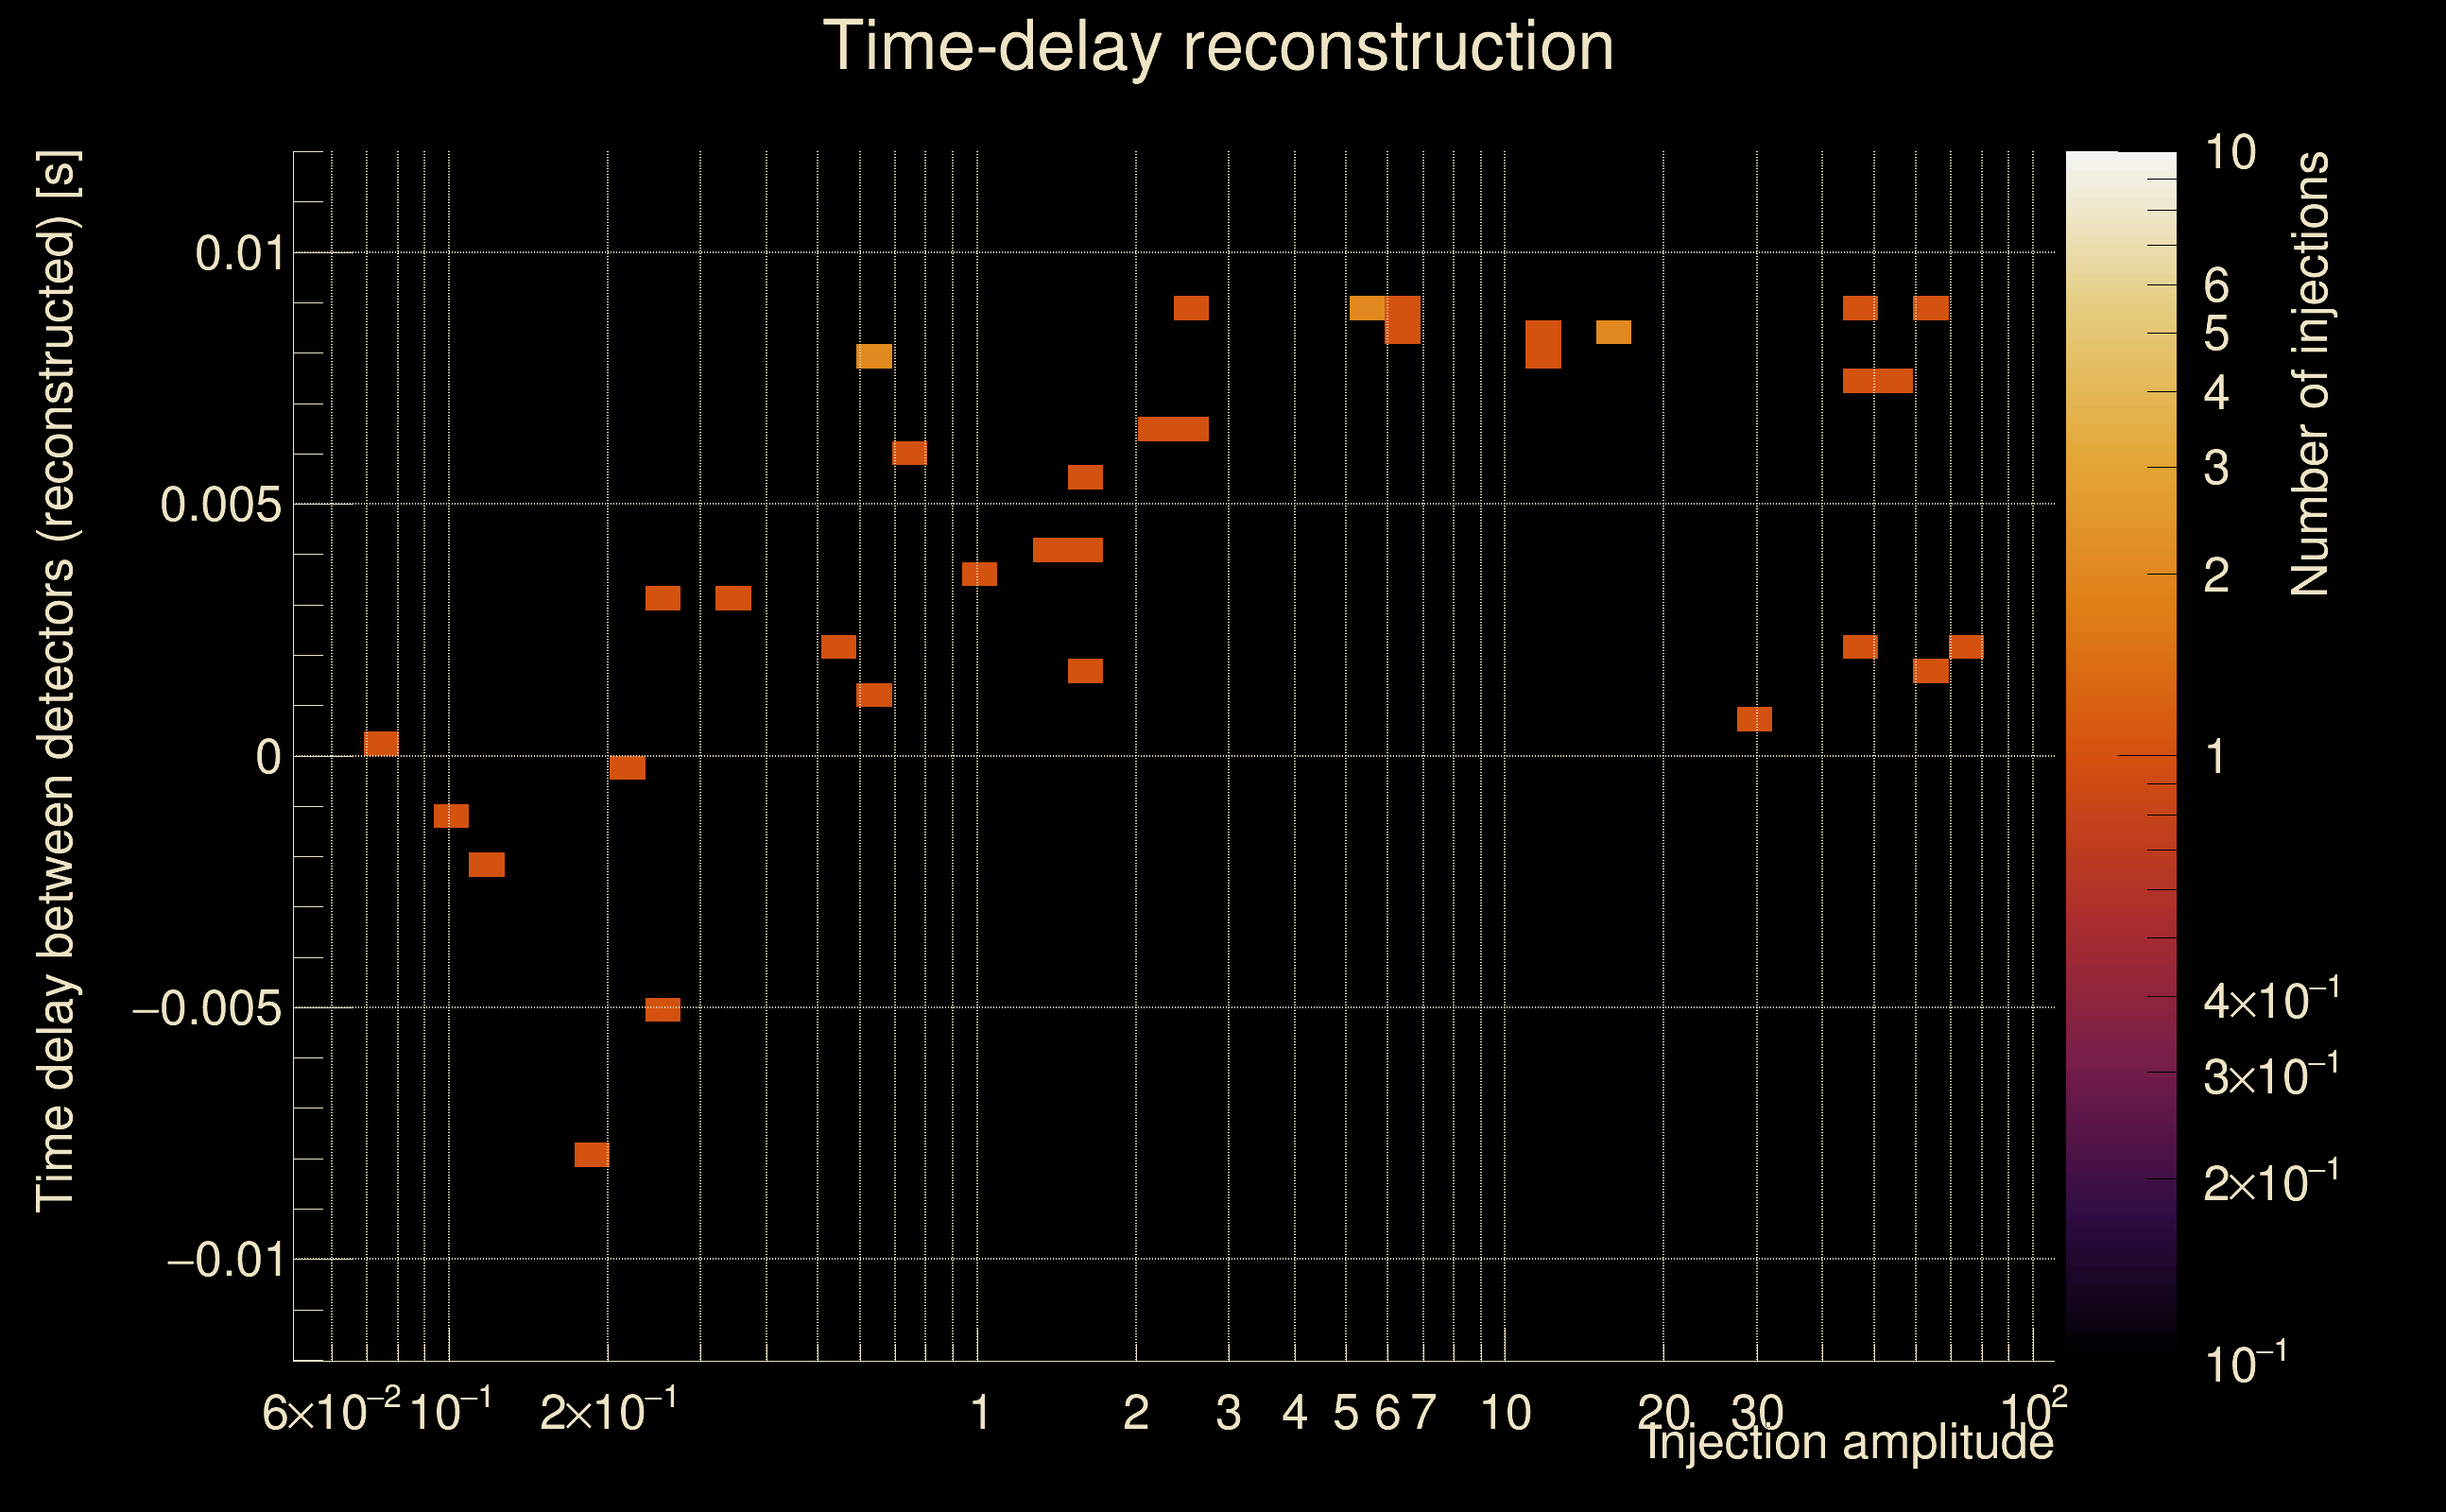
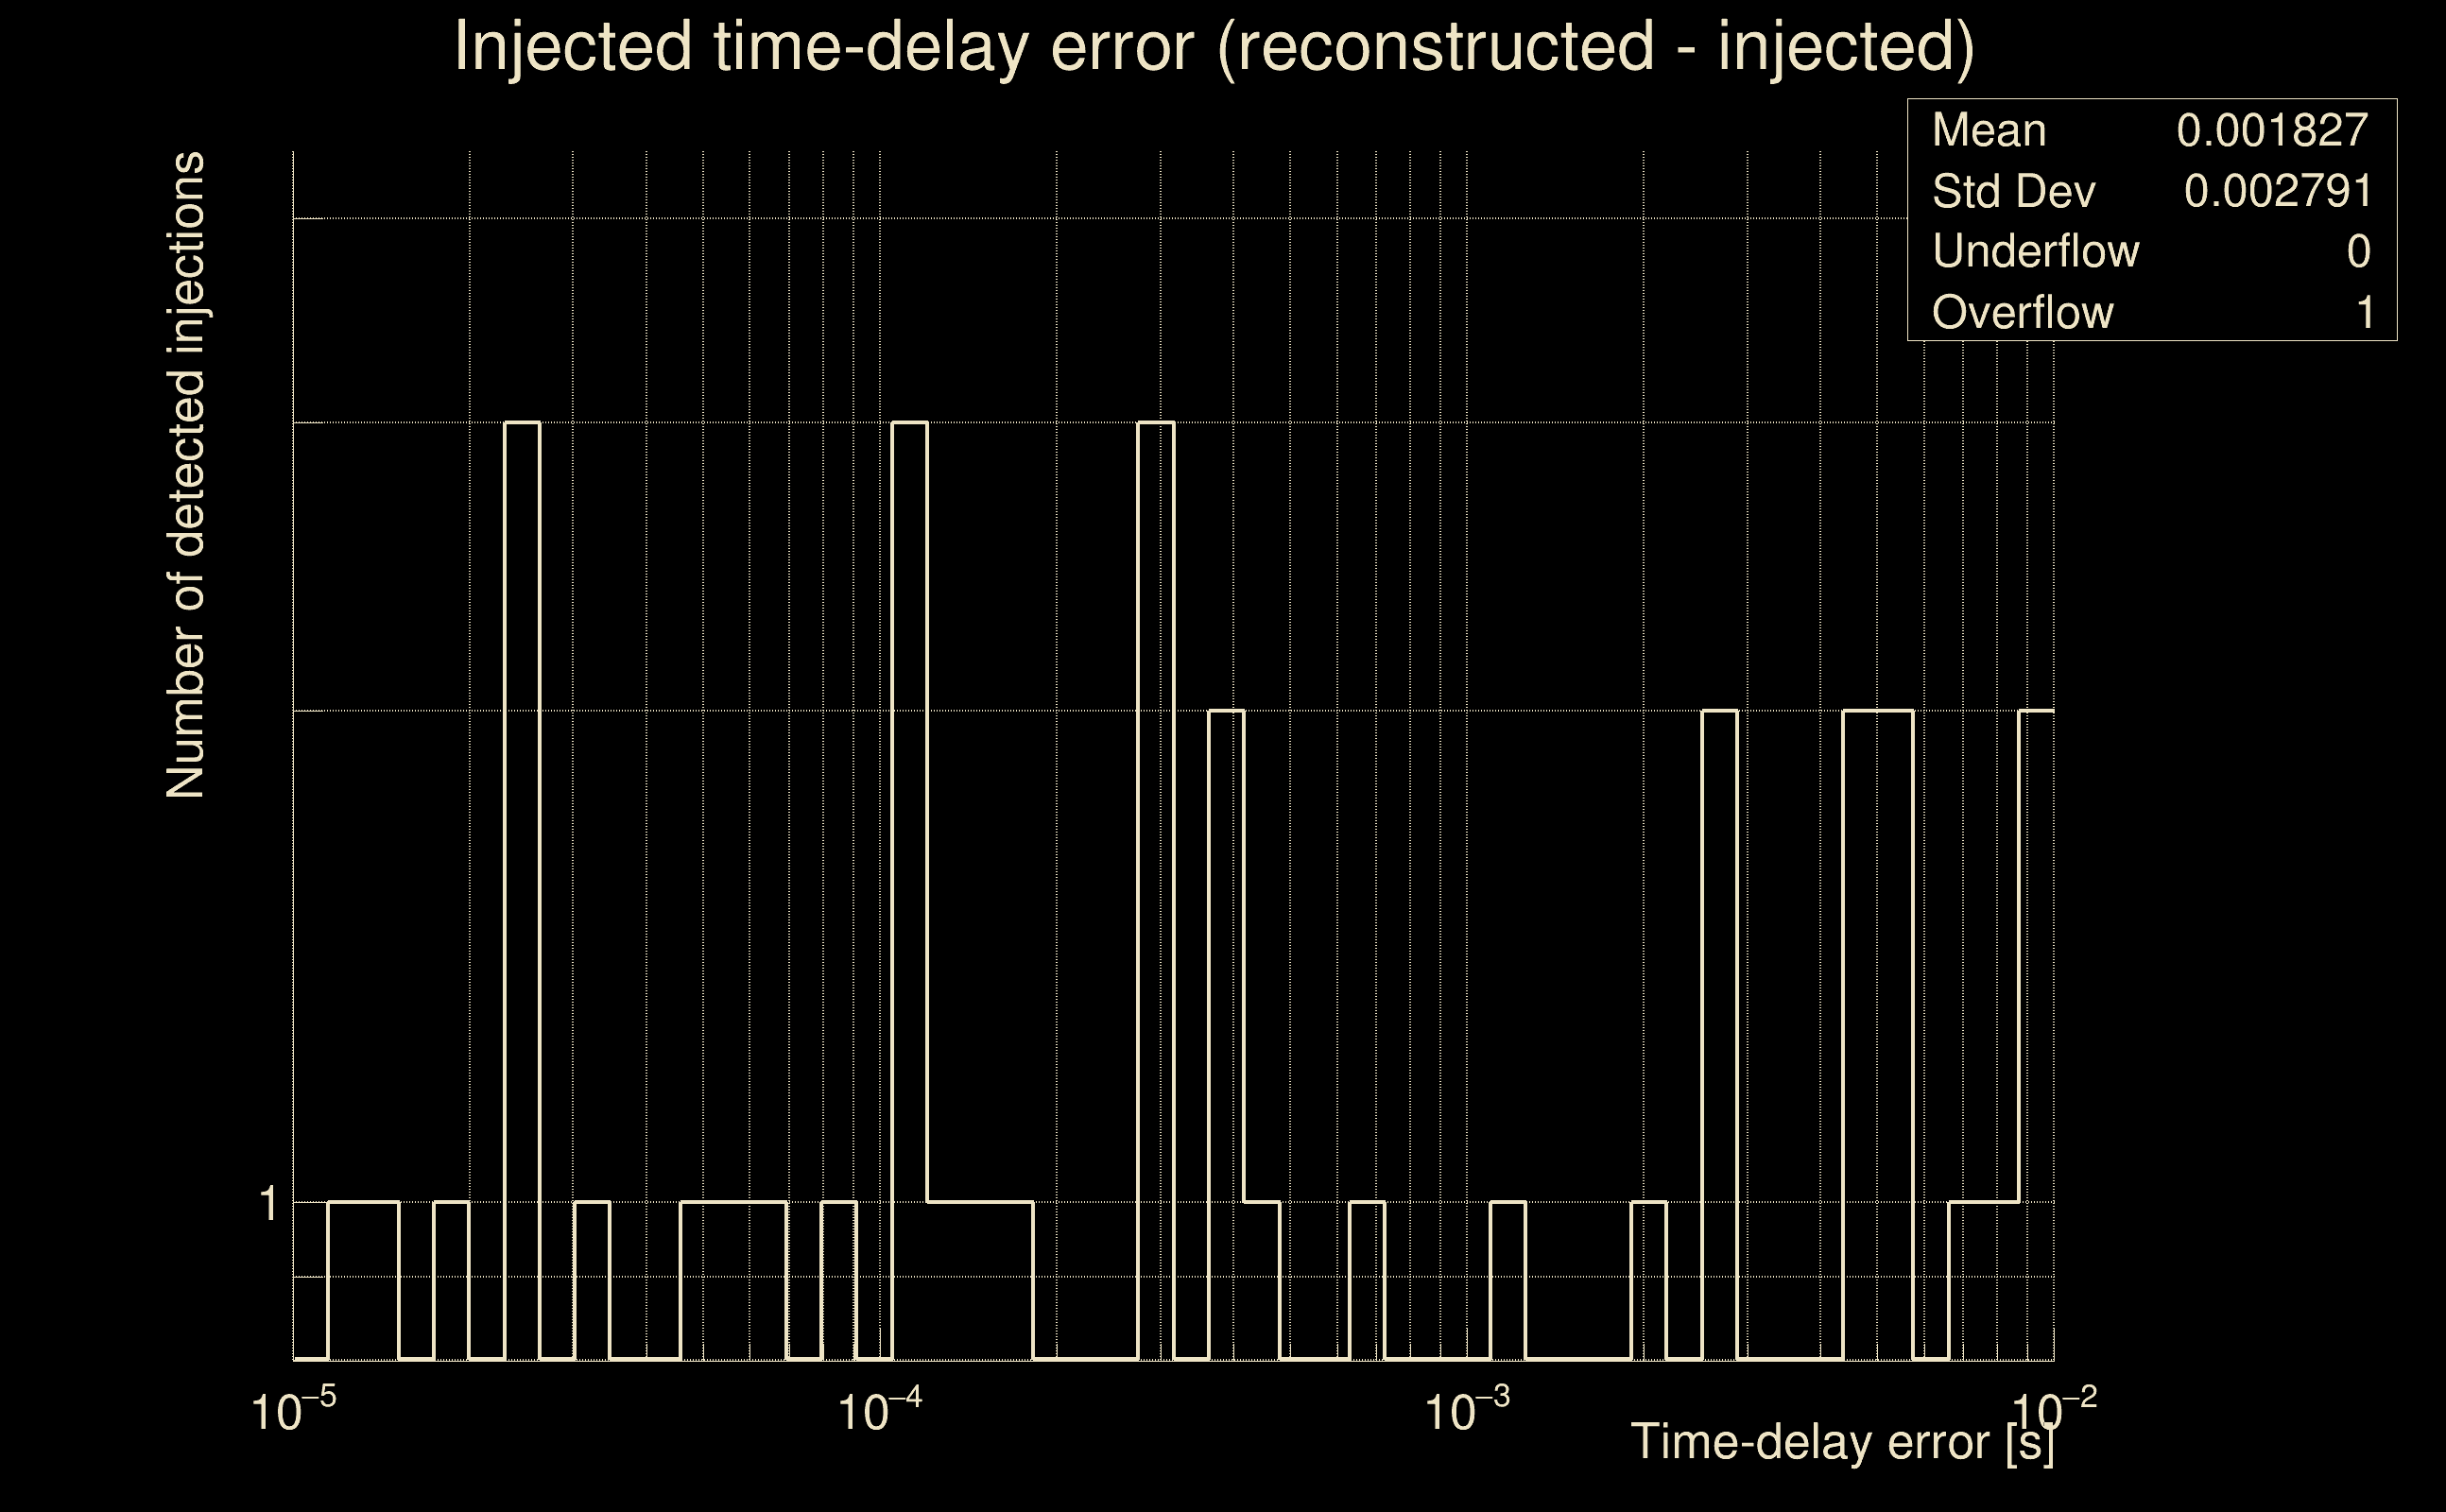
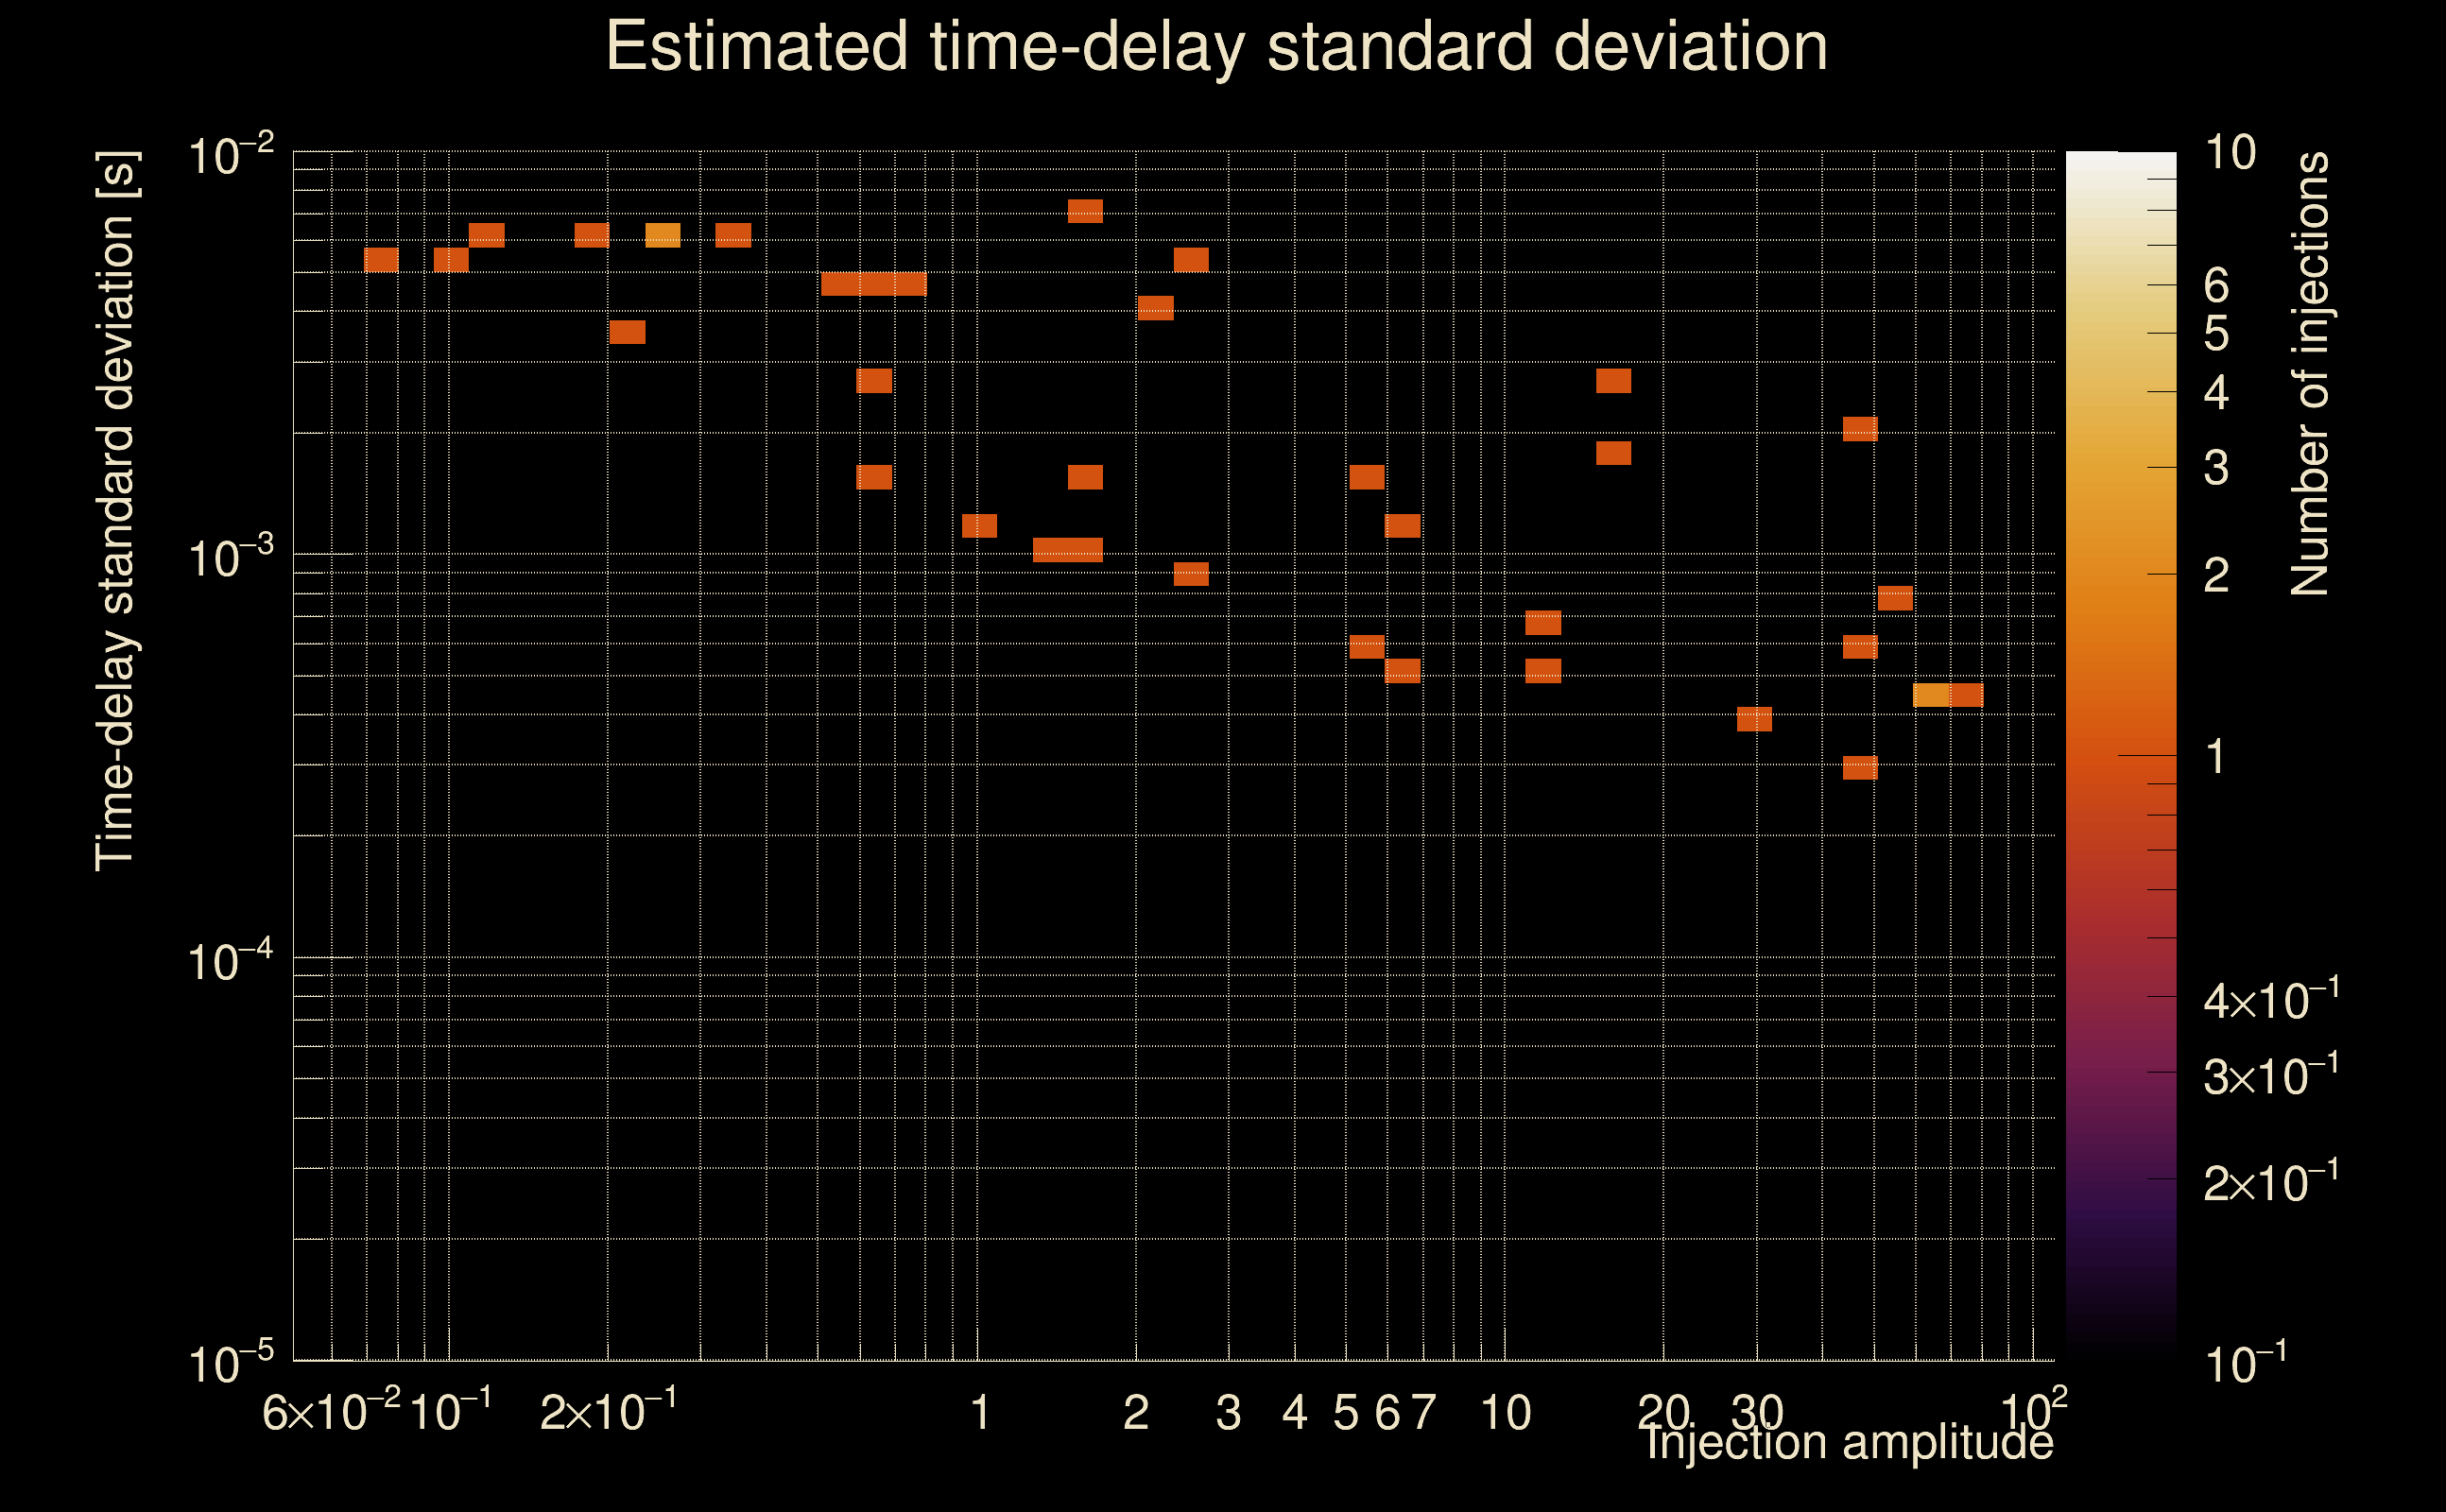
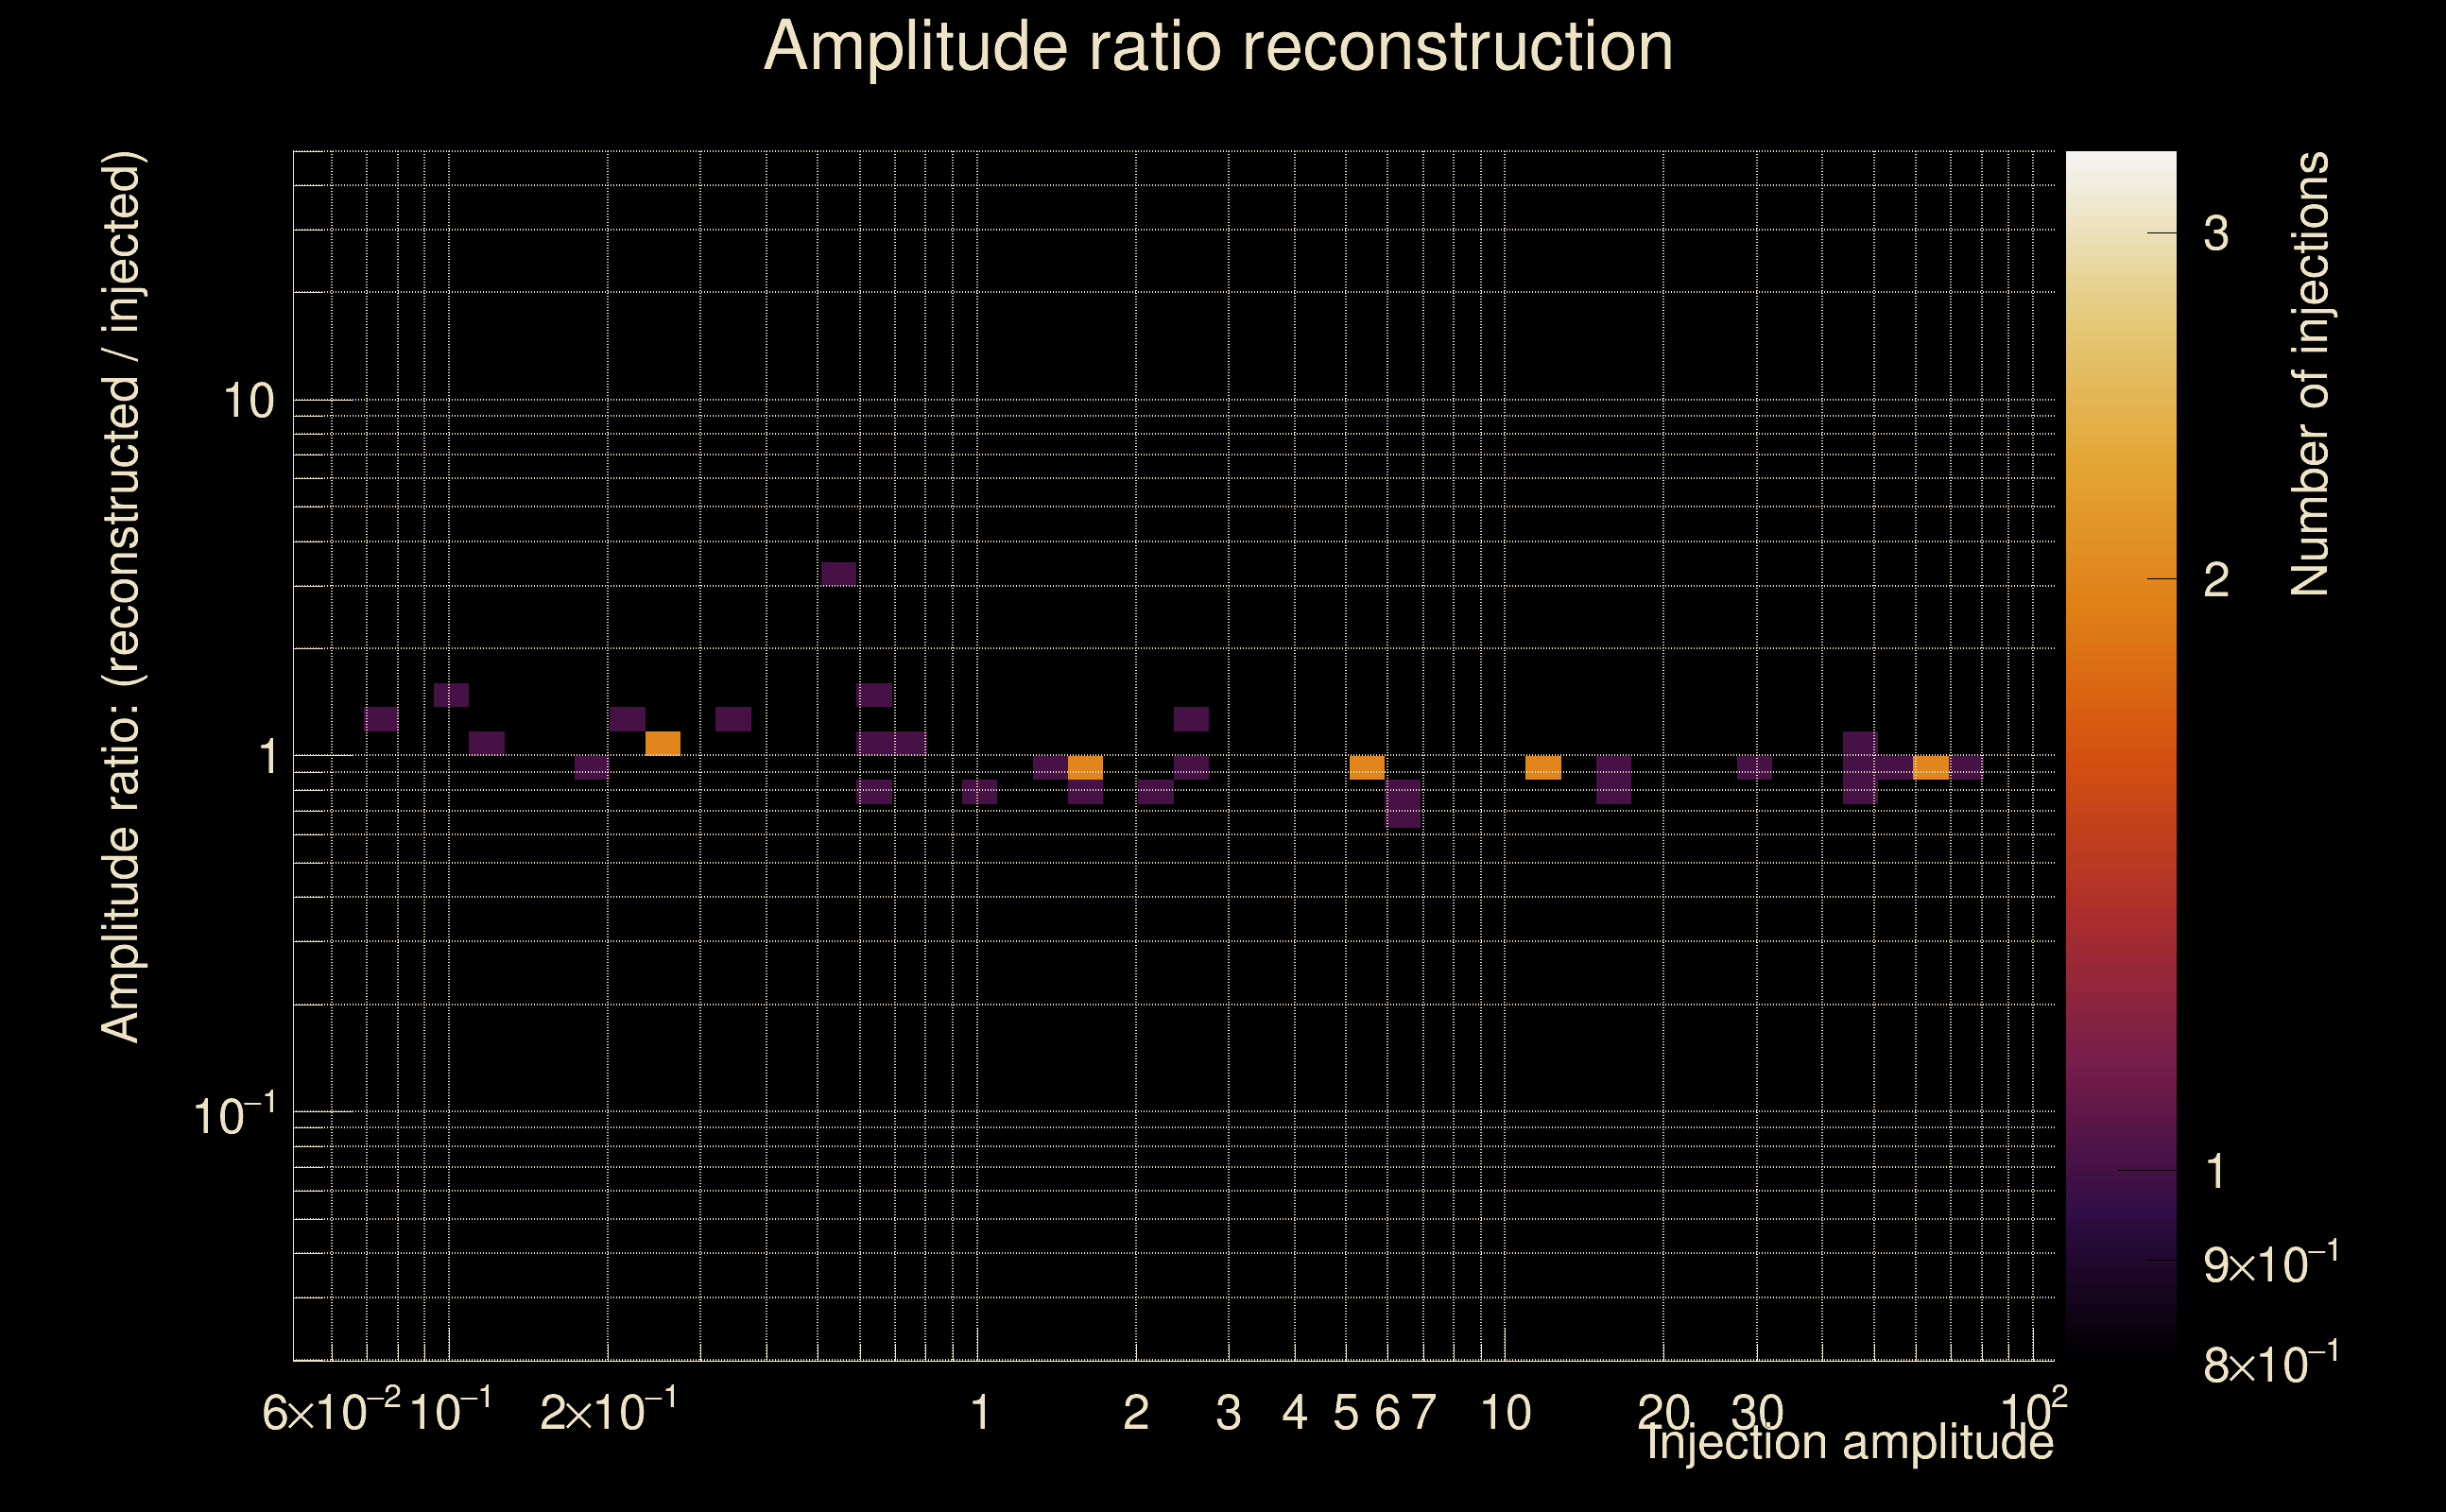
| Number of injections (total/valid/detected): | 70 / 39 / 17 |
| List of missed injections: | ./Kur22-s50_missed.txt |
| Injection amplitude at 90% detection efficiency: | 1.71888 |
| Injection amplitude at 50% detection efficiency: | 1.62135 |
| Injection amplitude at 10% detection efficiency: | 1.52381 |
 |
 |
 |
 |
 |
 |
 |
|
 |
 |
|
 |
 |
|
 |
 |
|
 |
 |
|
 |
 |
|
 |
 |
|
 |
 |
|
 |
 |
 |
 |
 |
 |
 |
 |
 |
 |
 |
 |
 |
 |
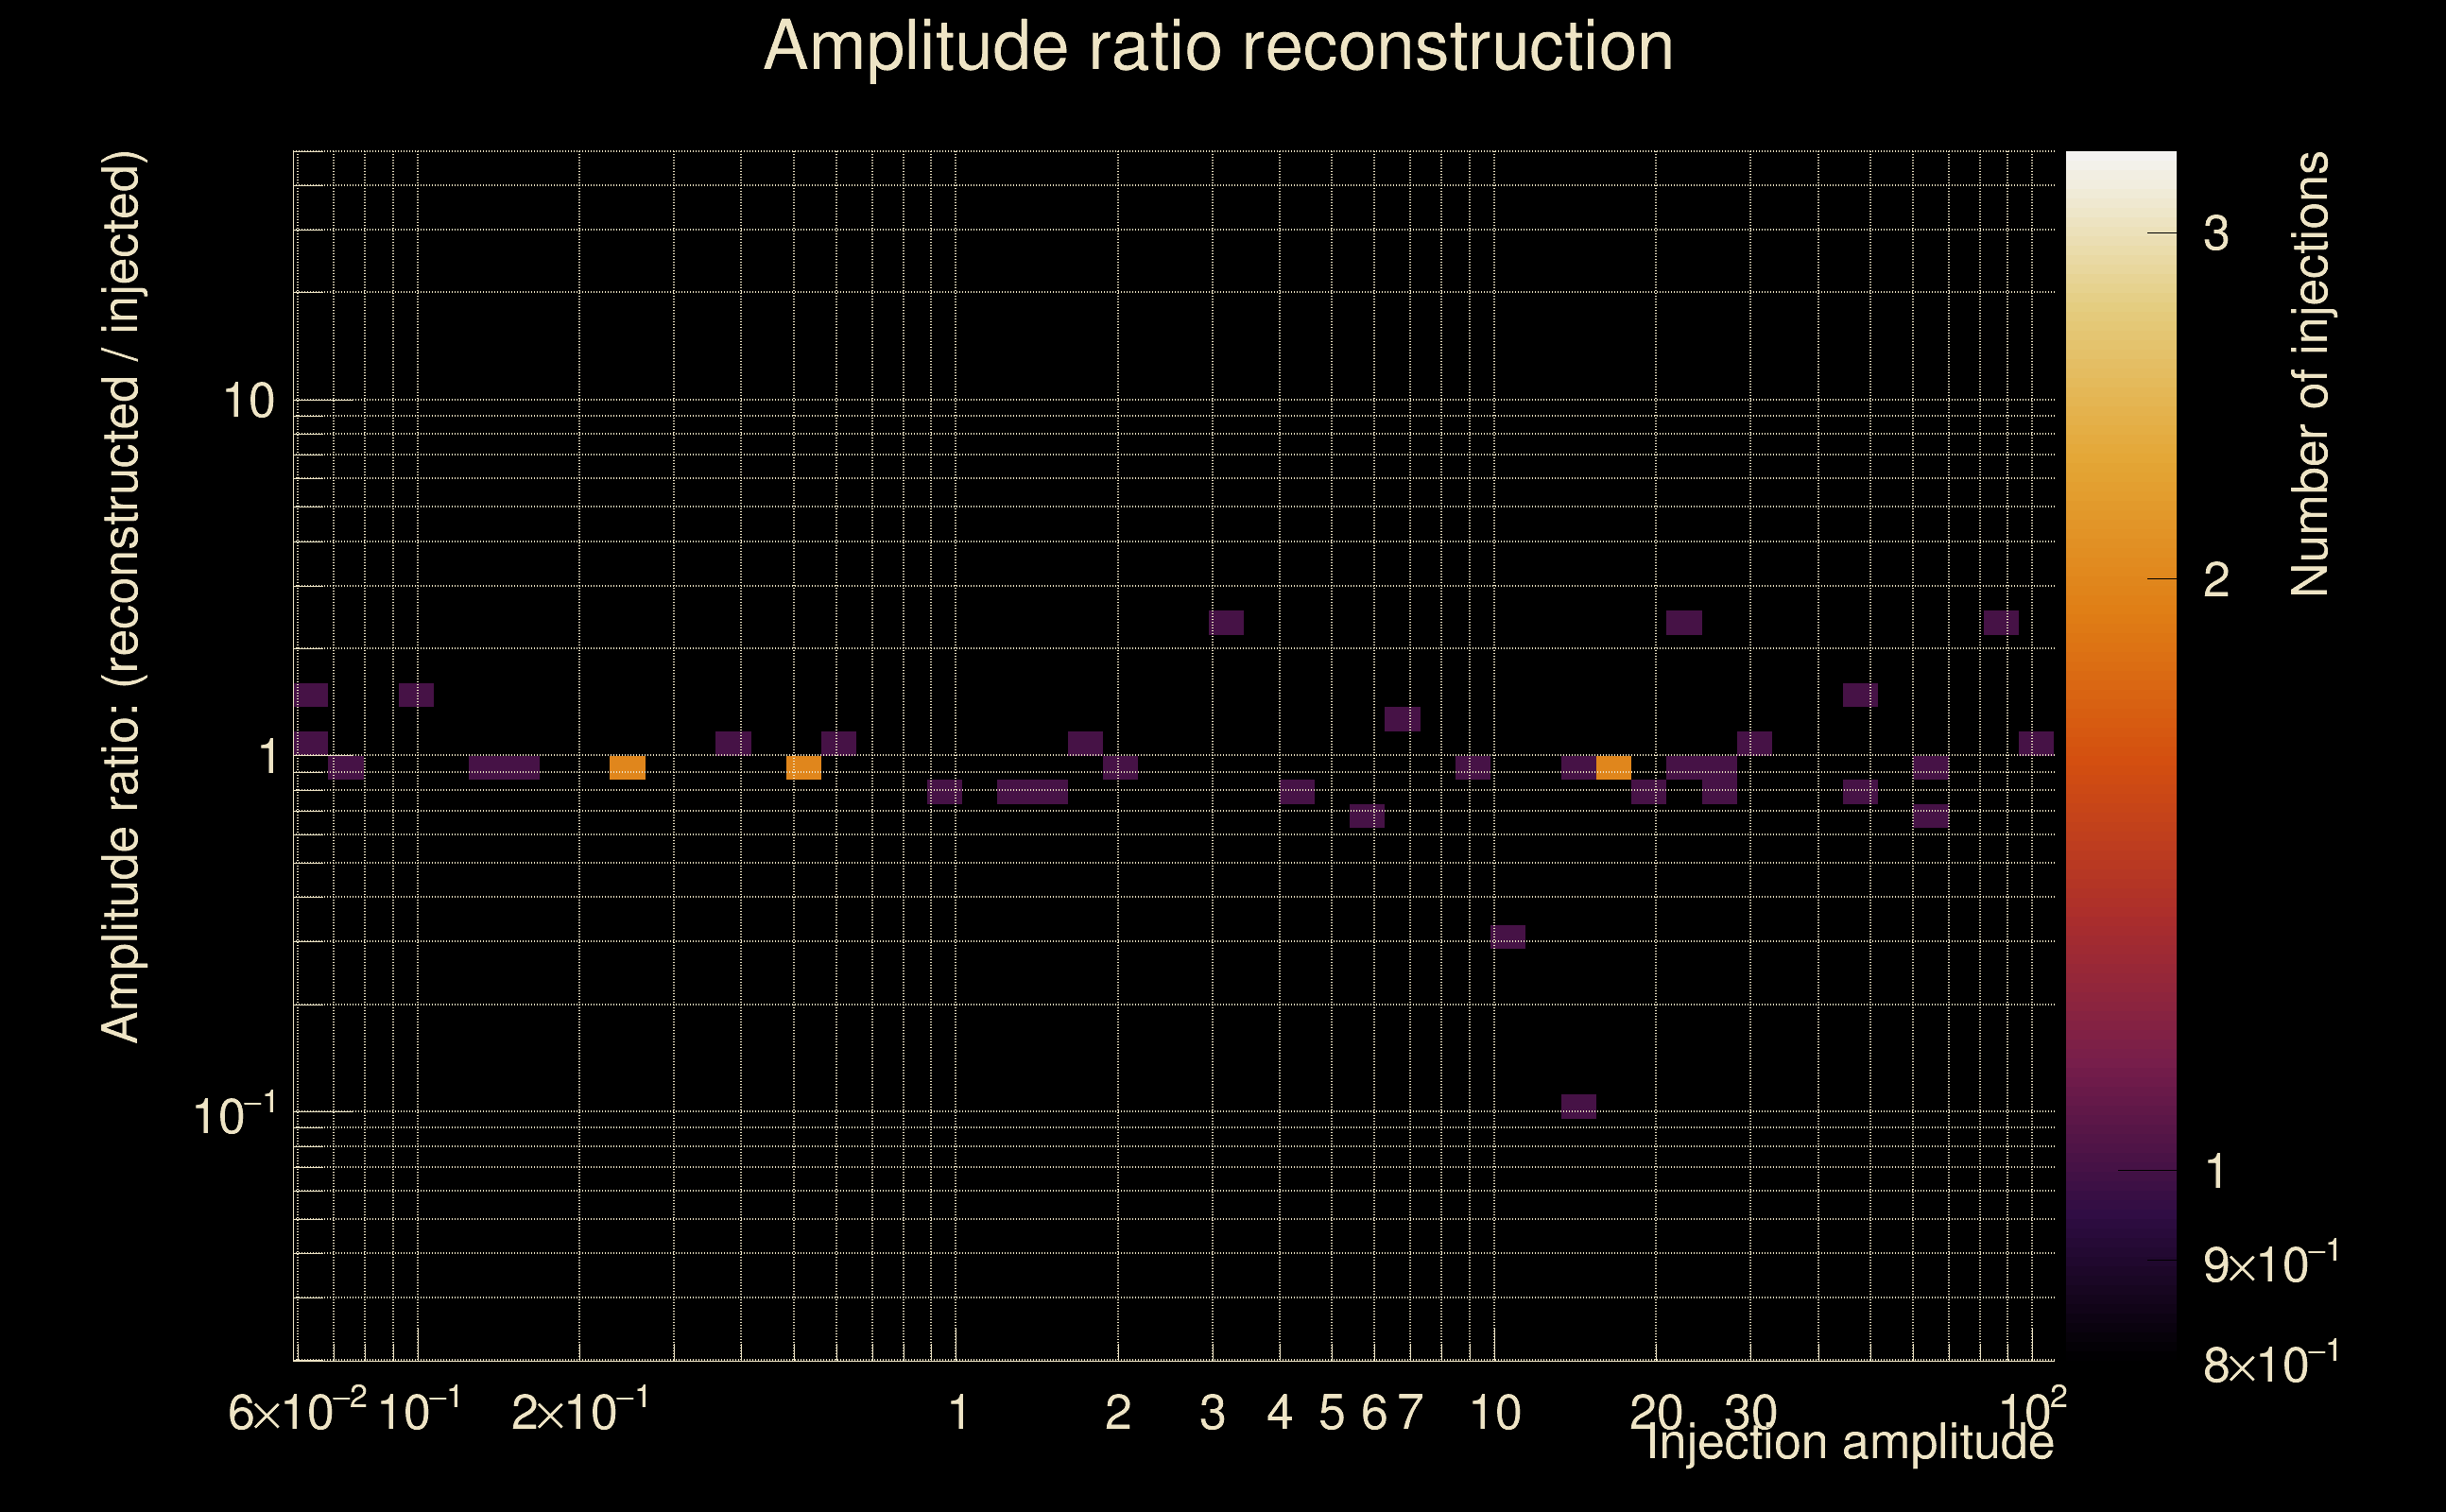 |
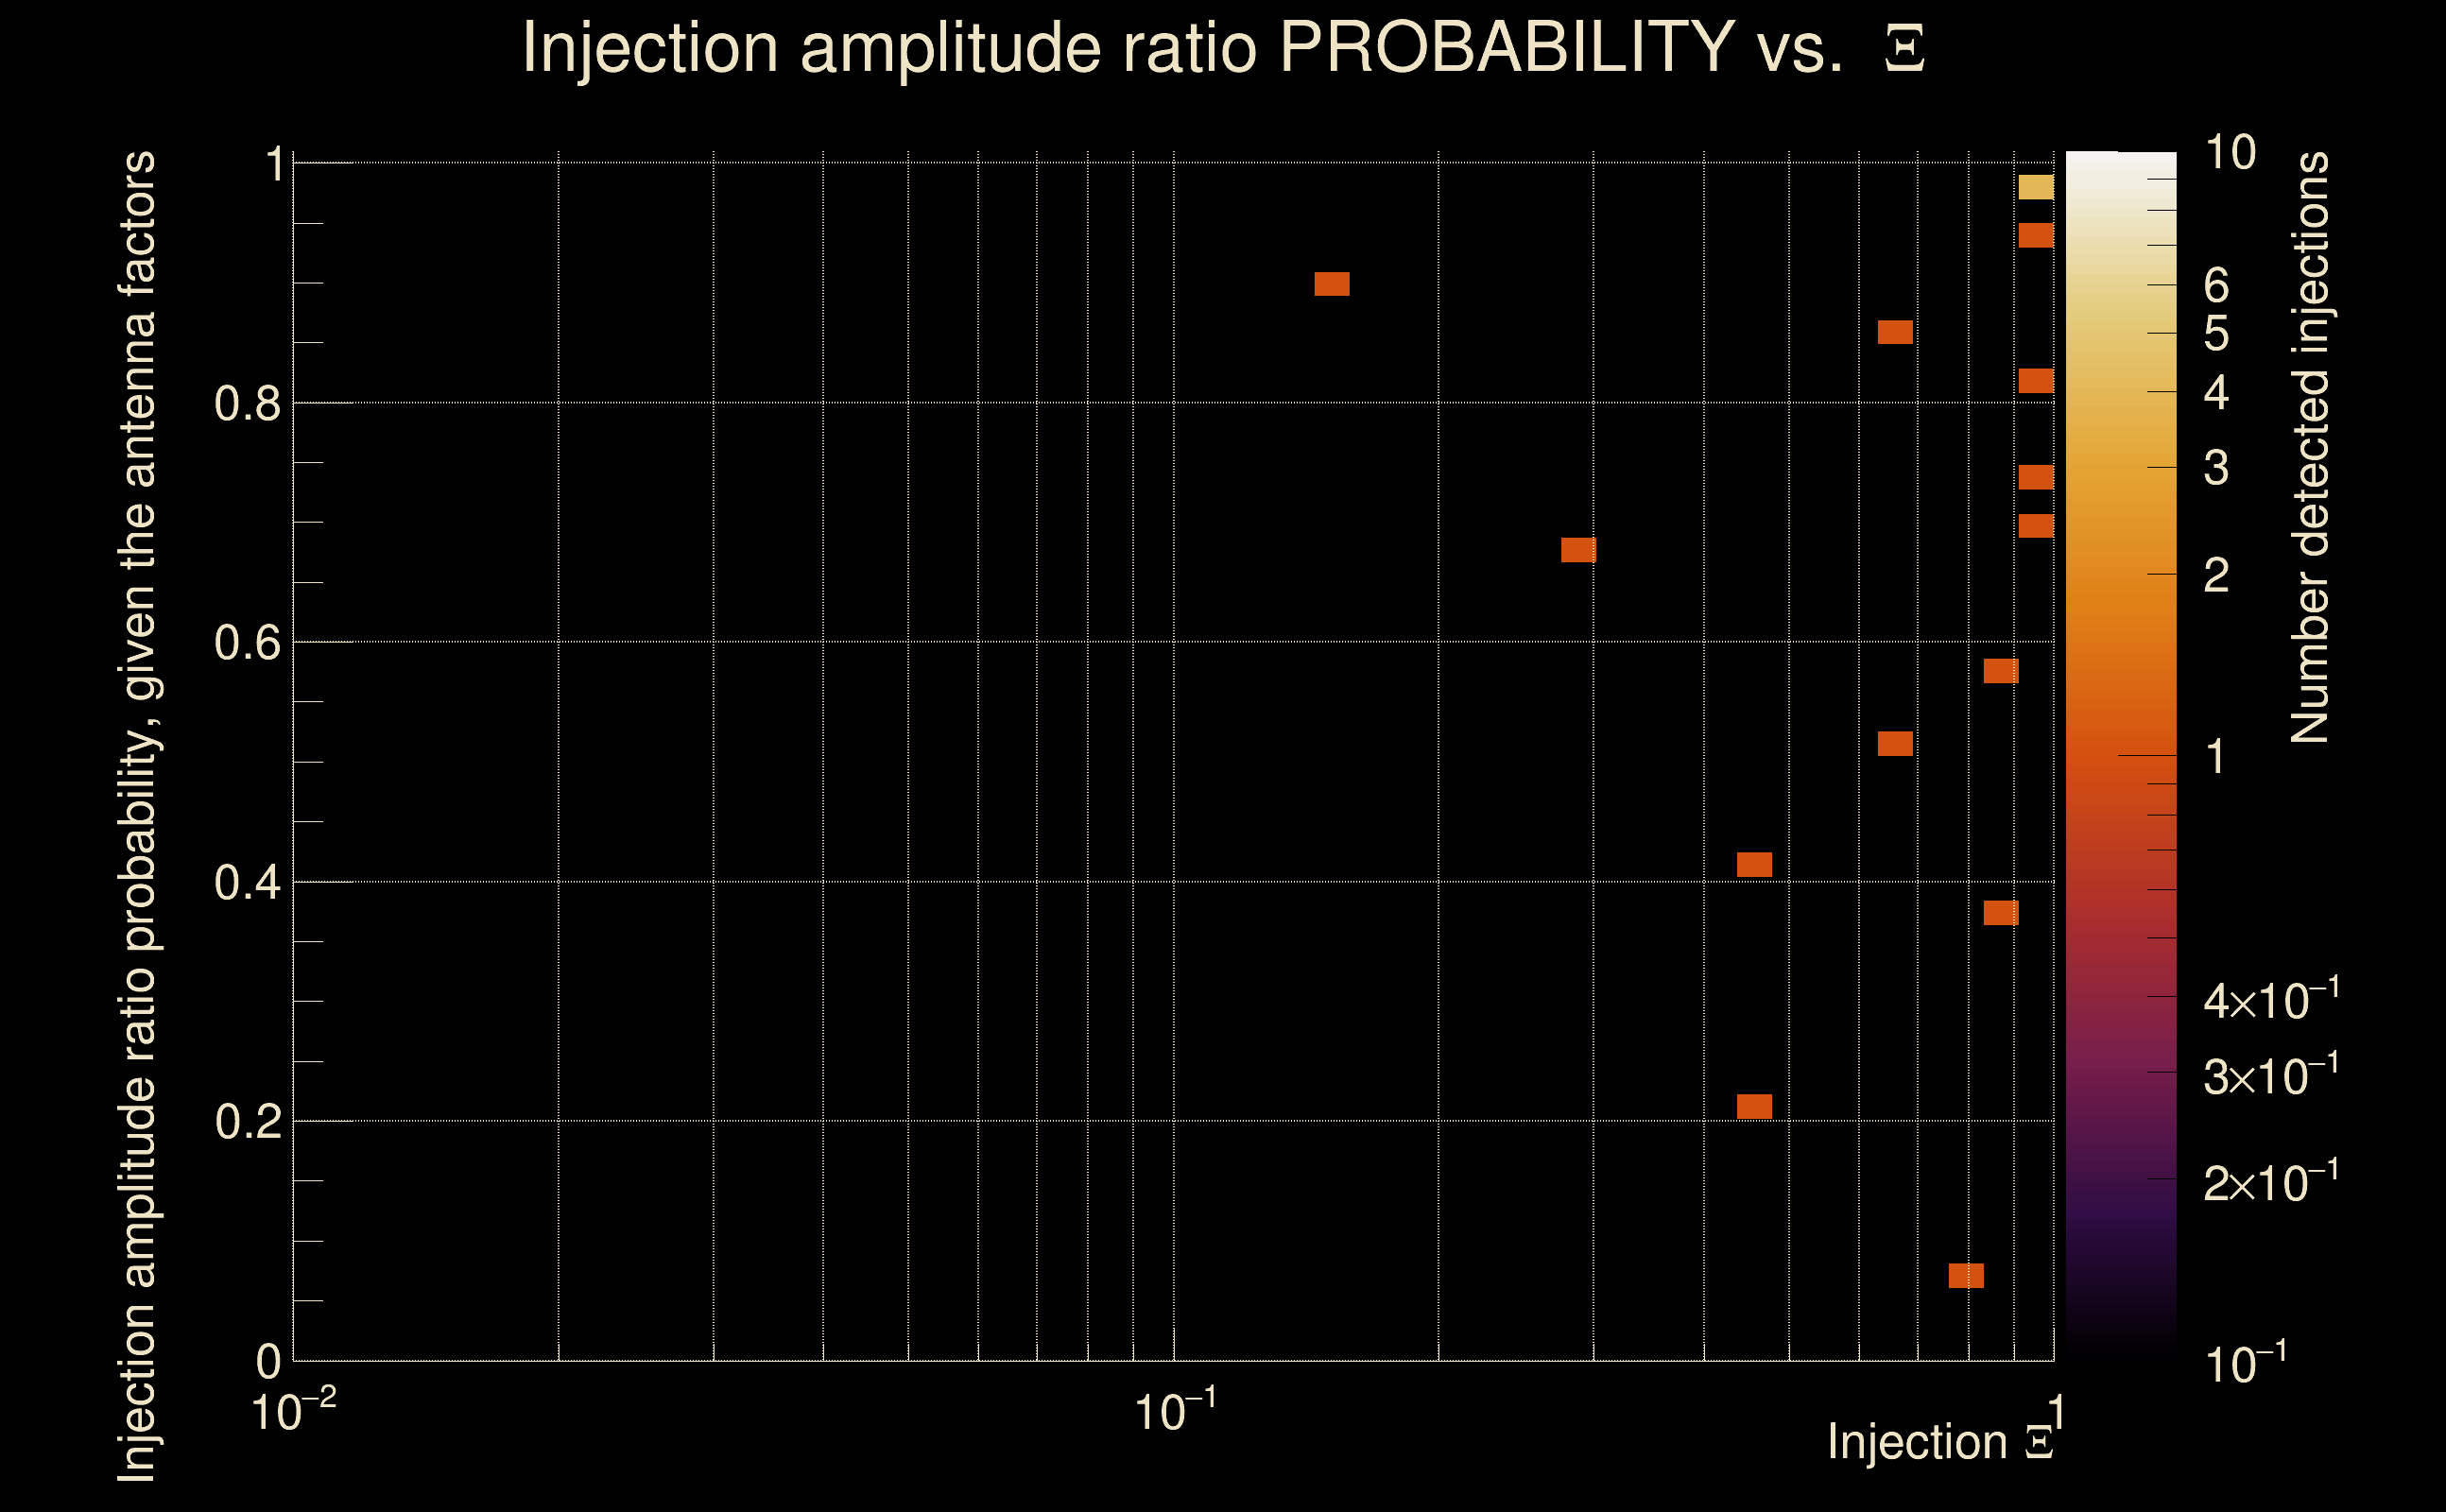
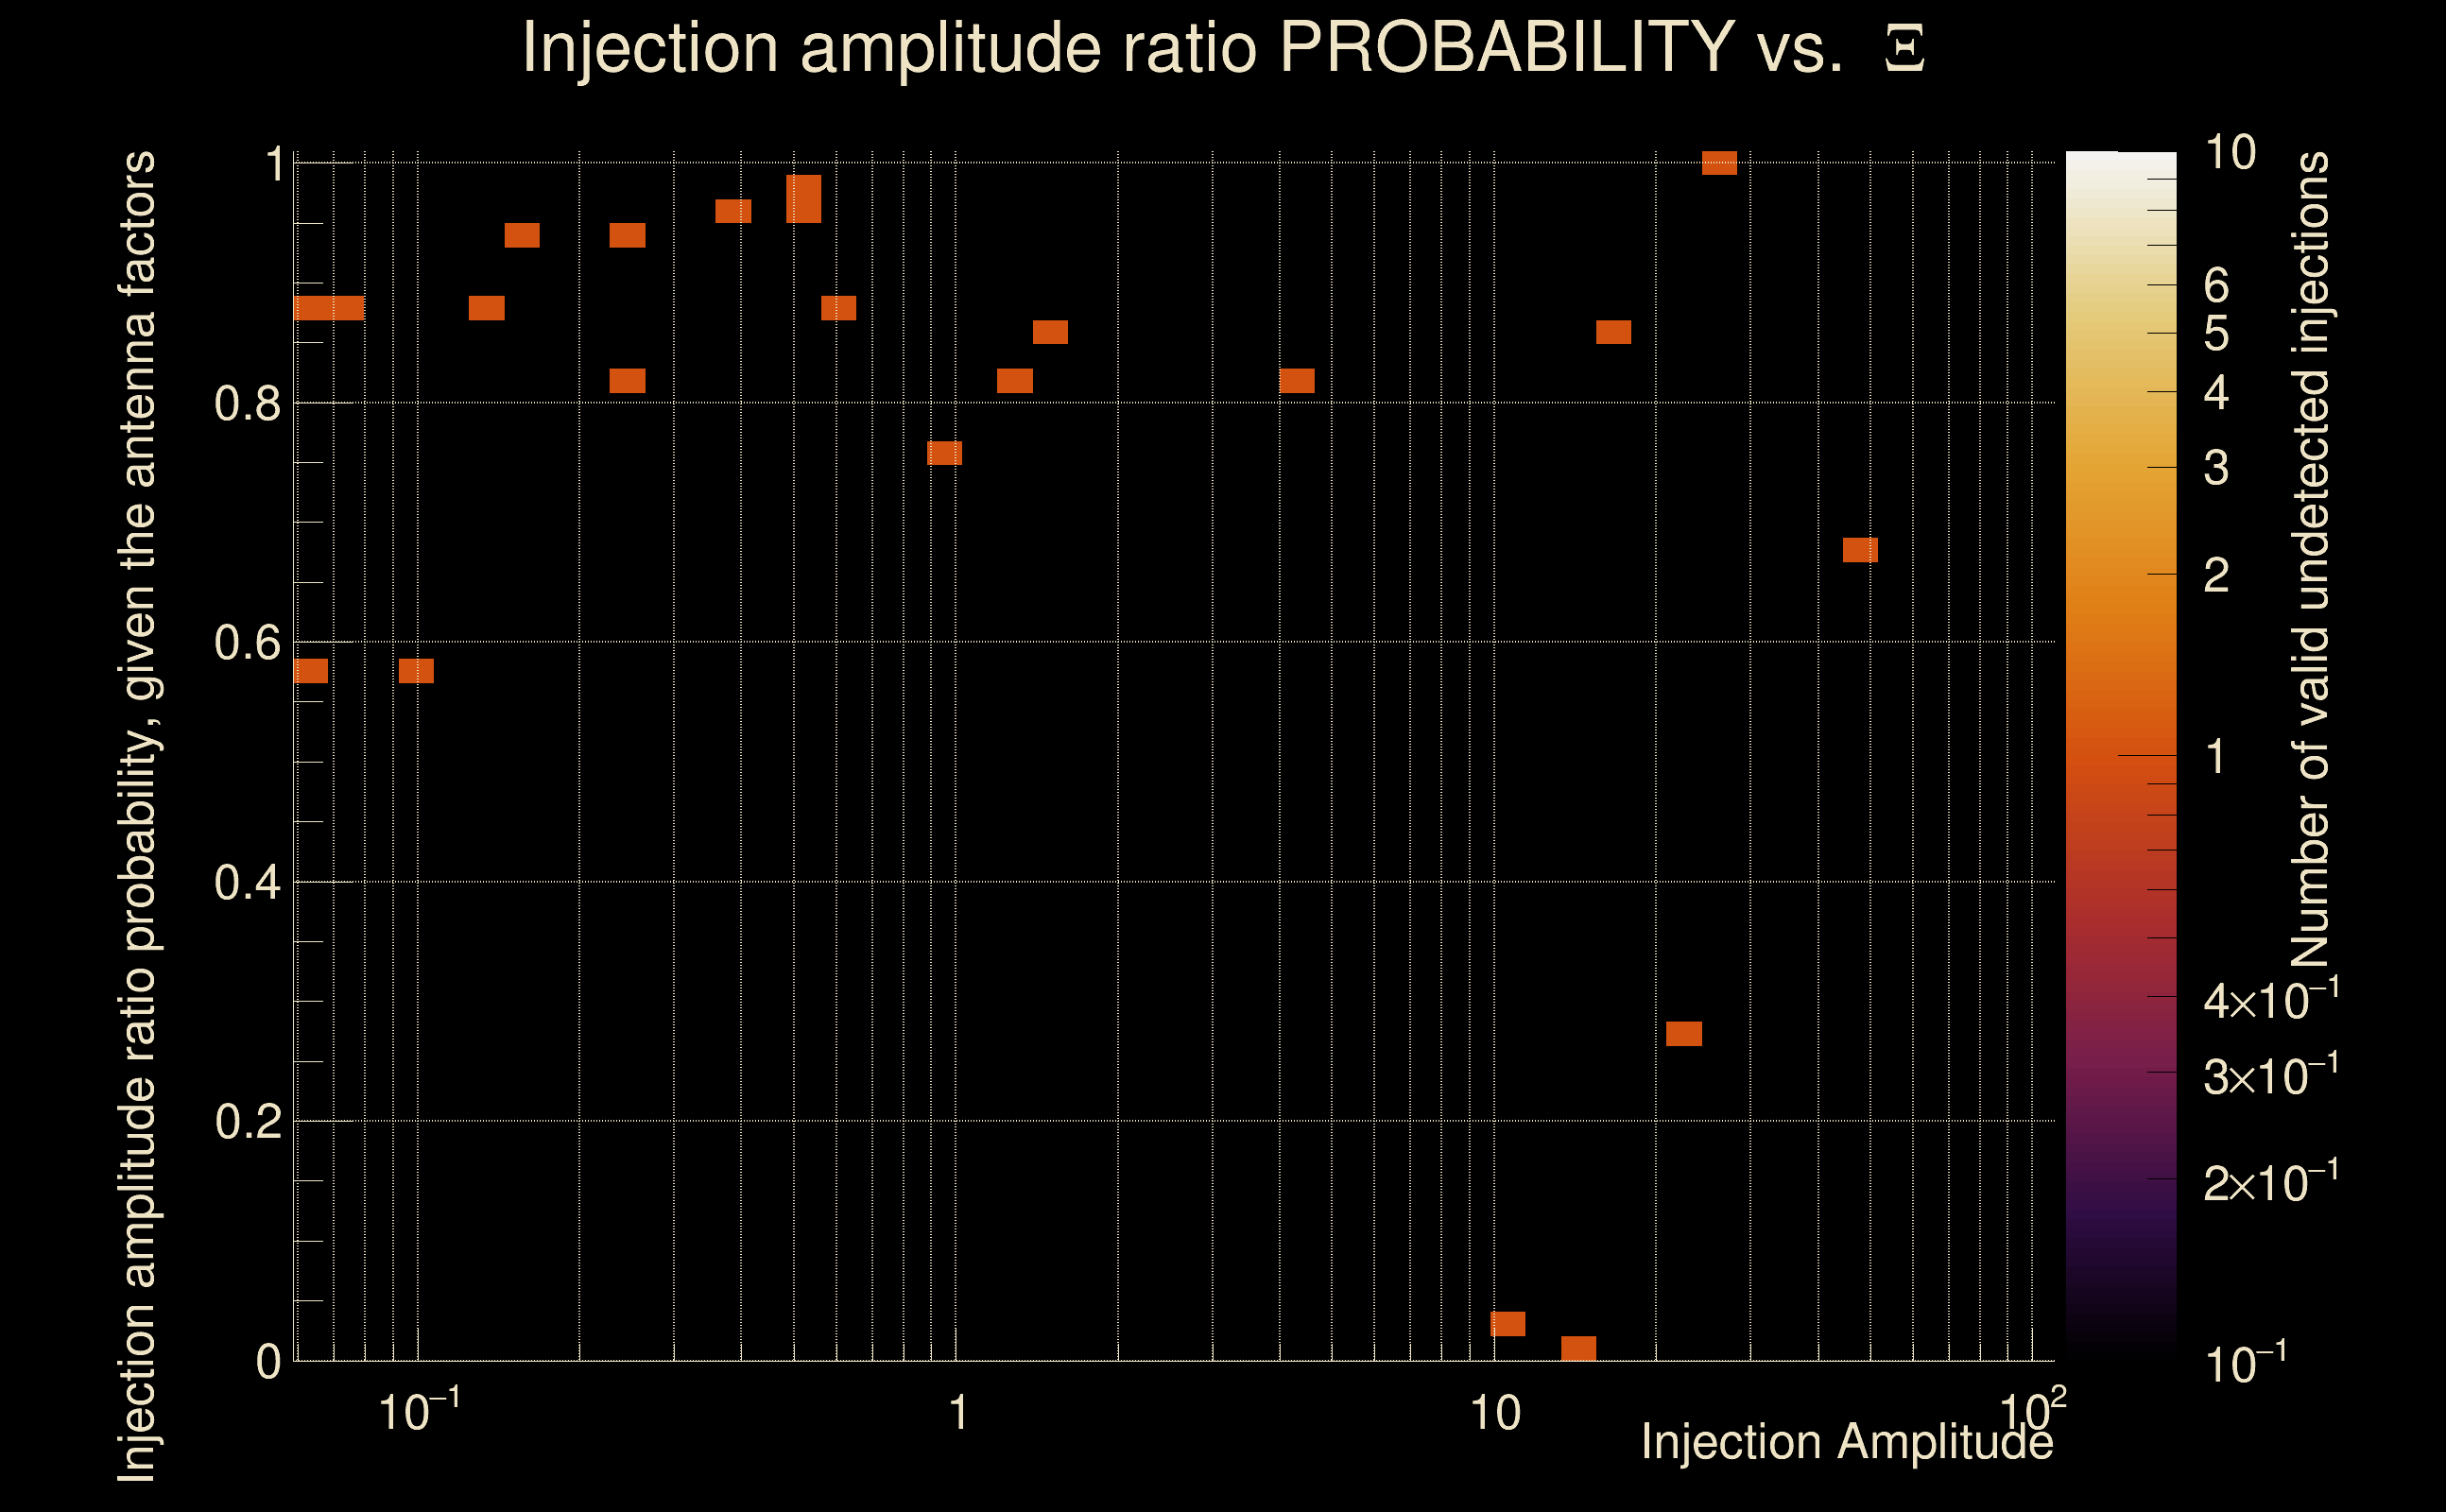
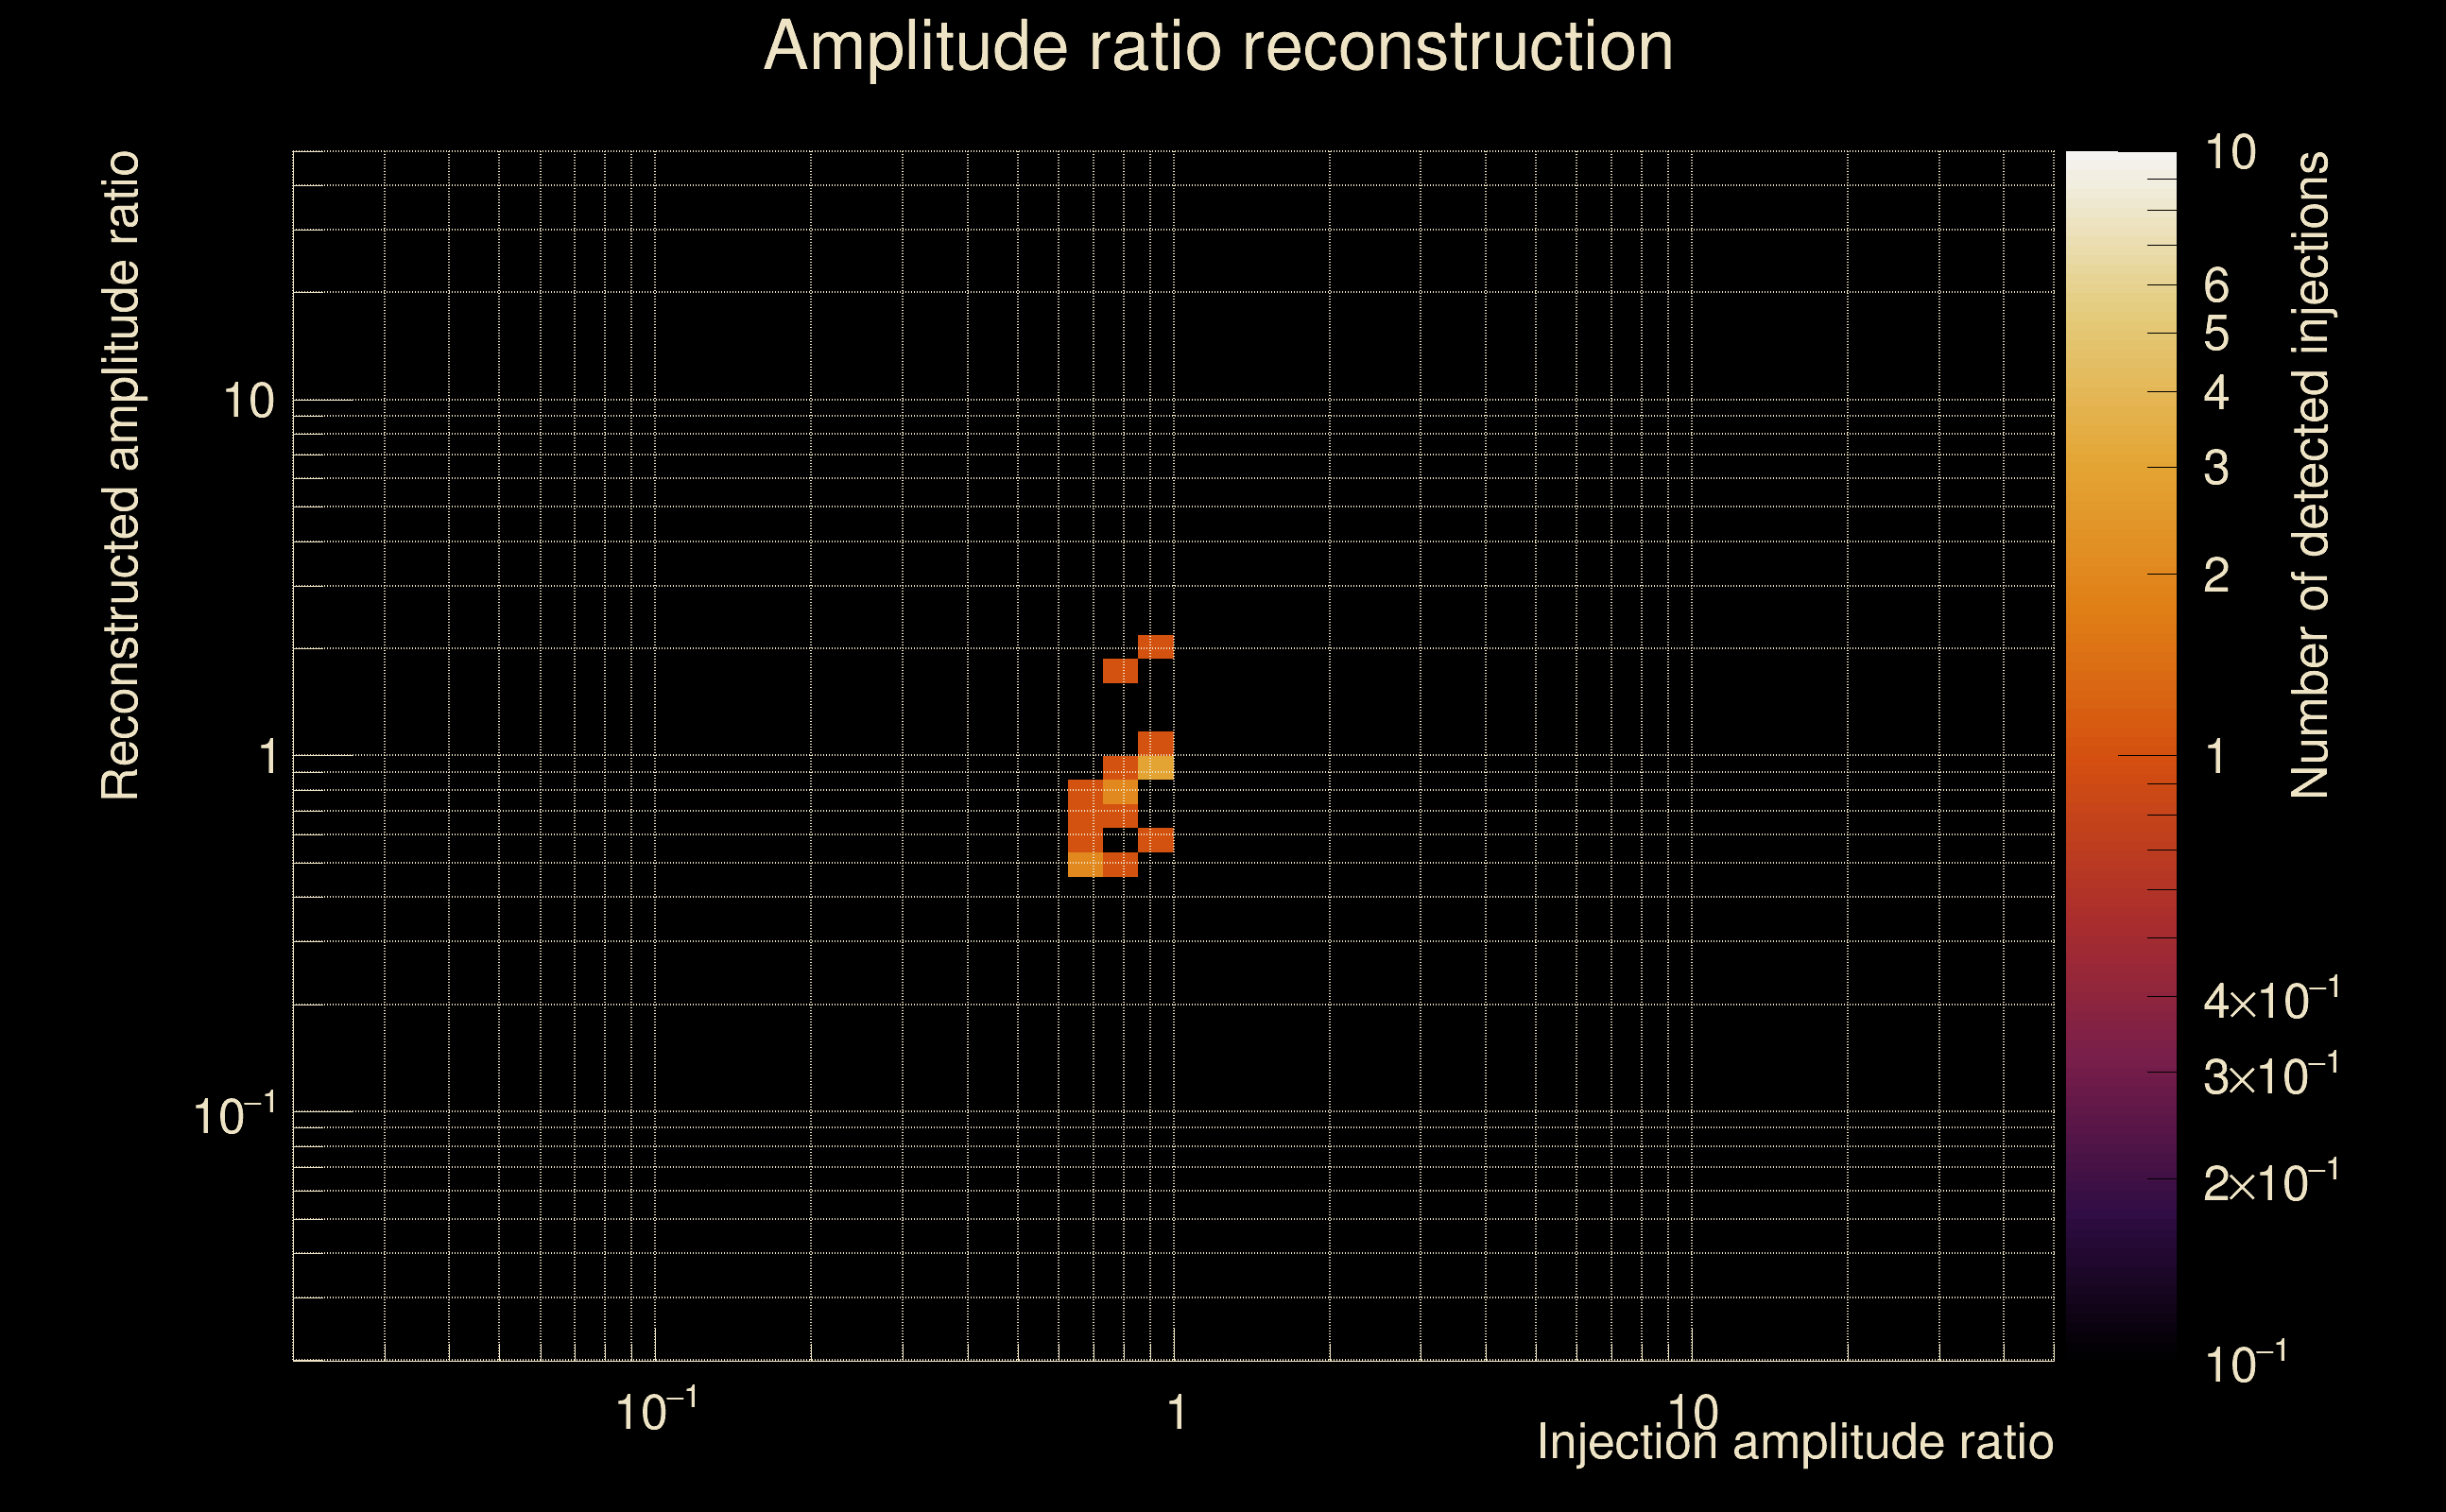
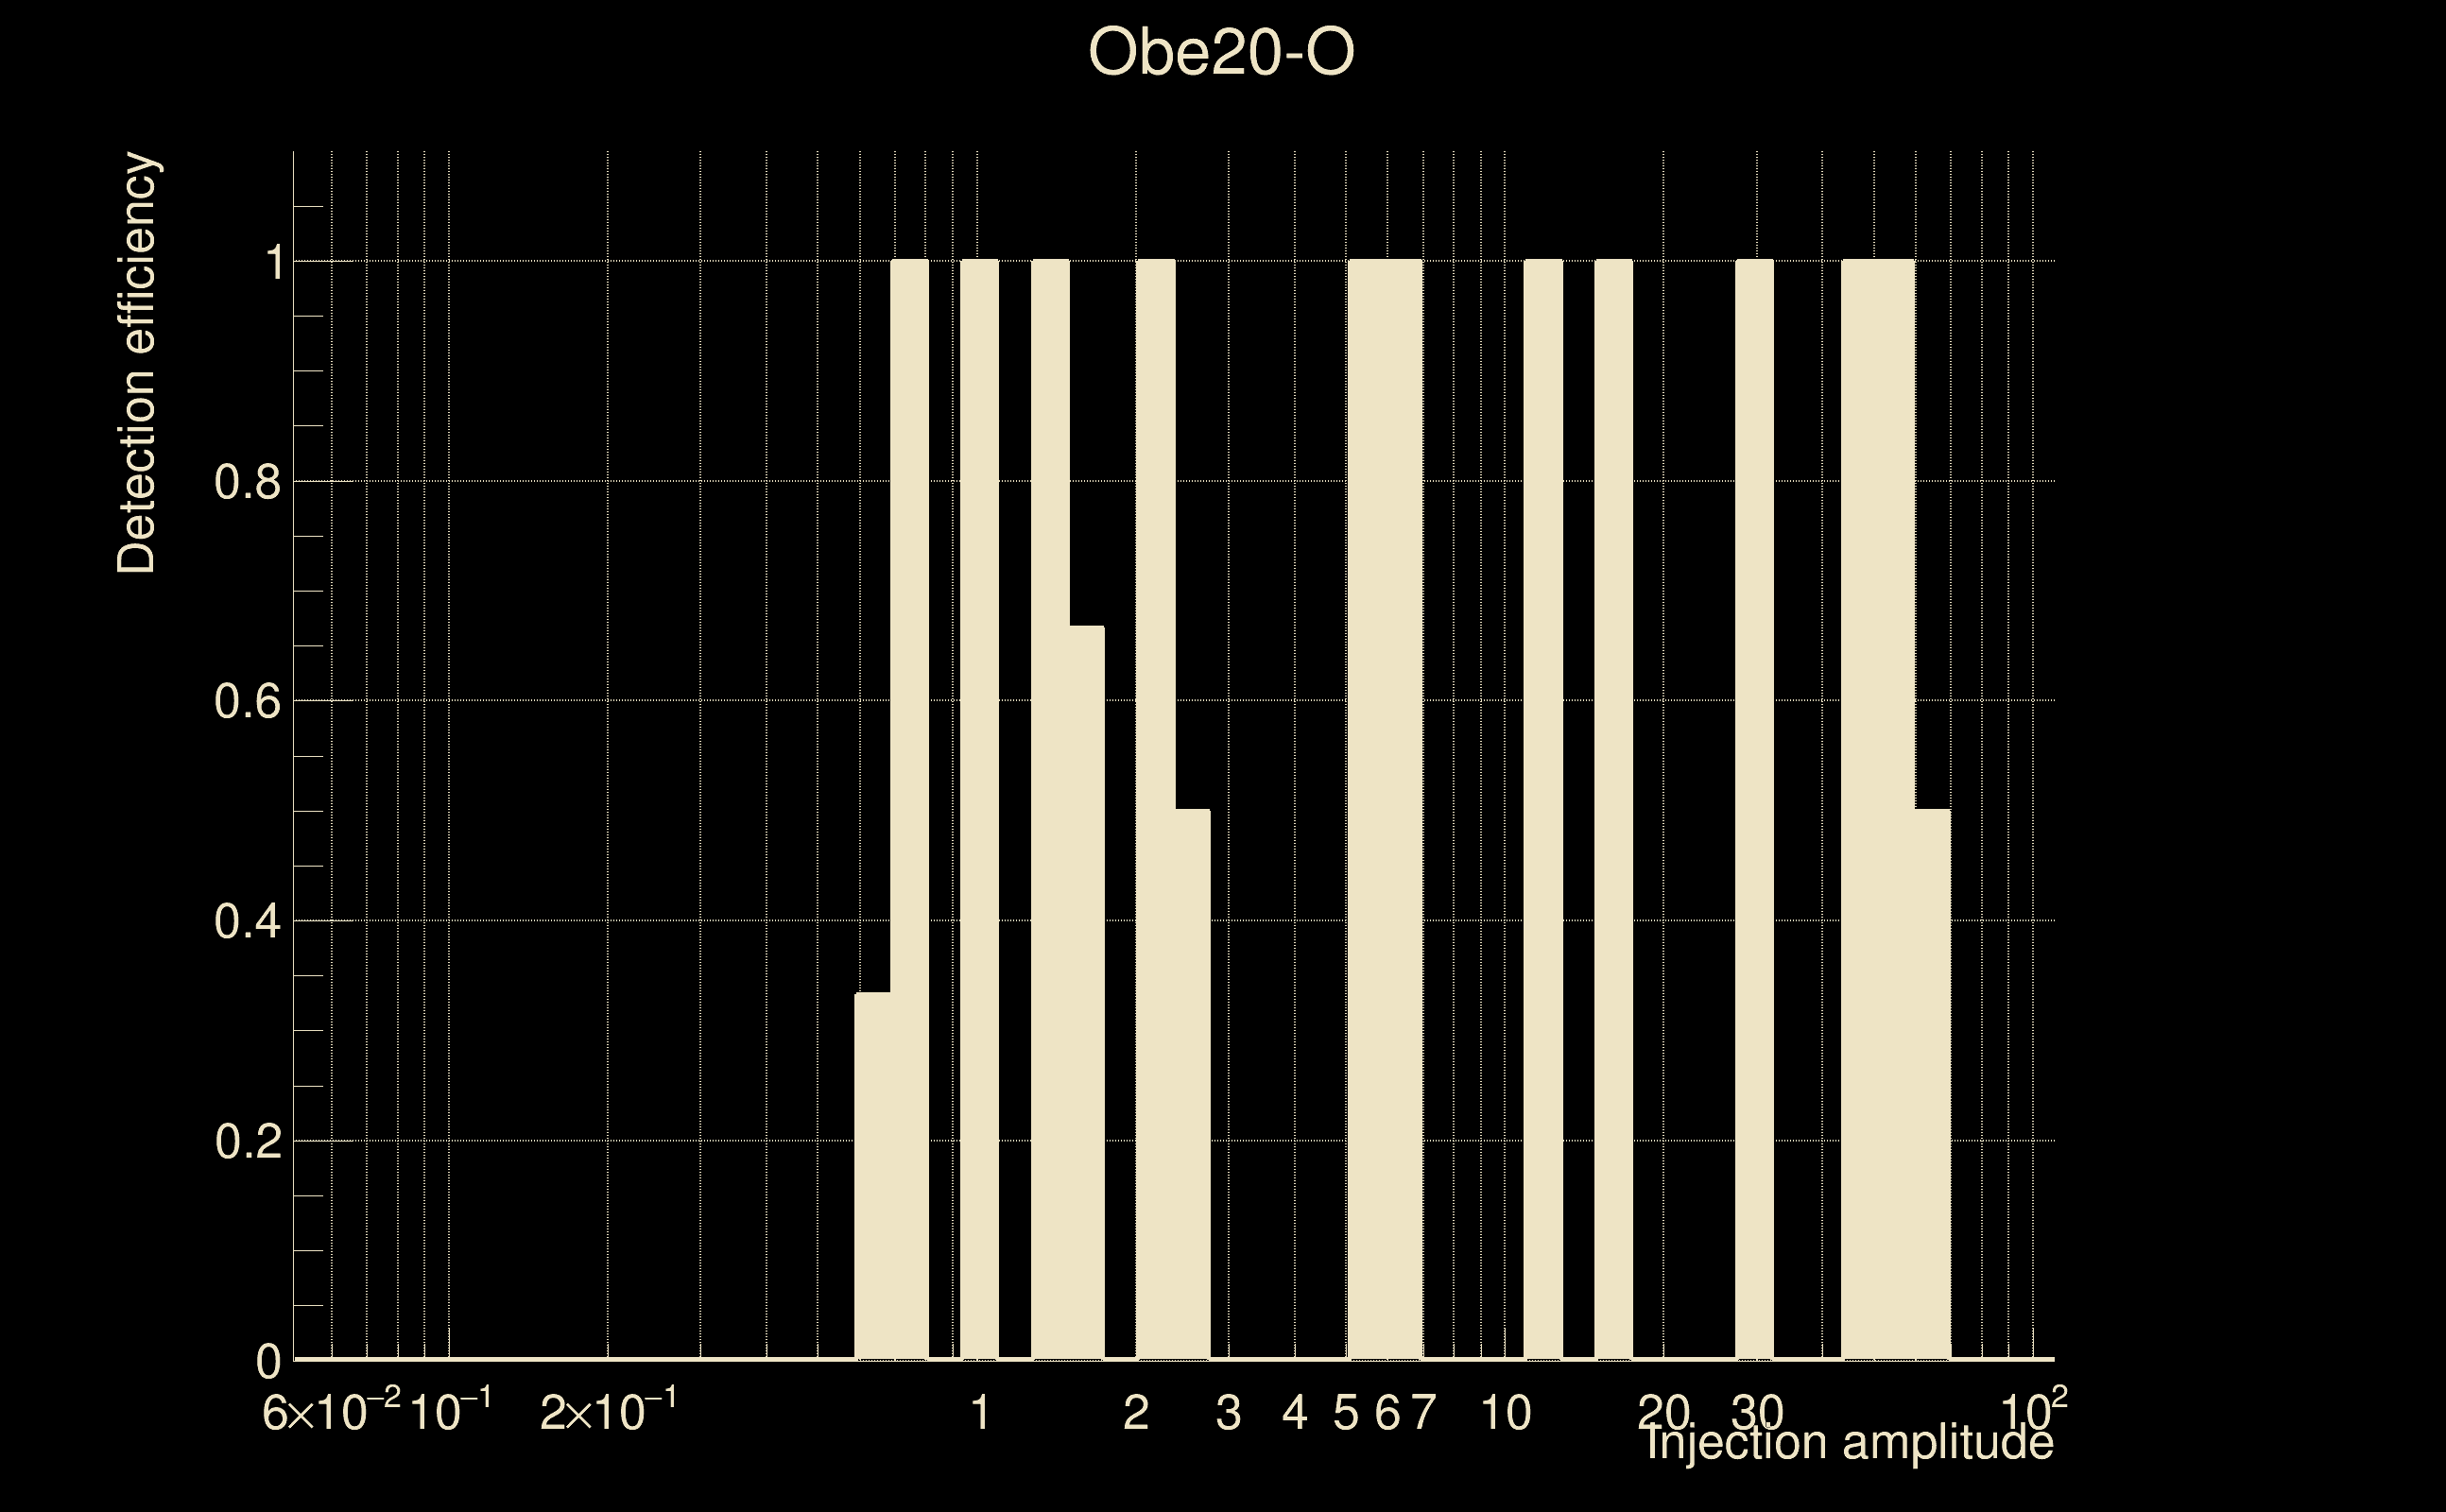
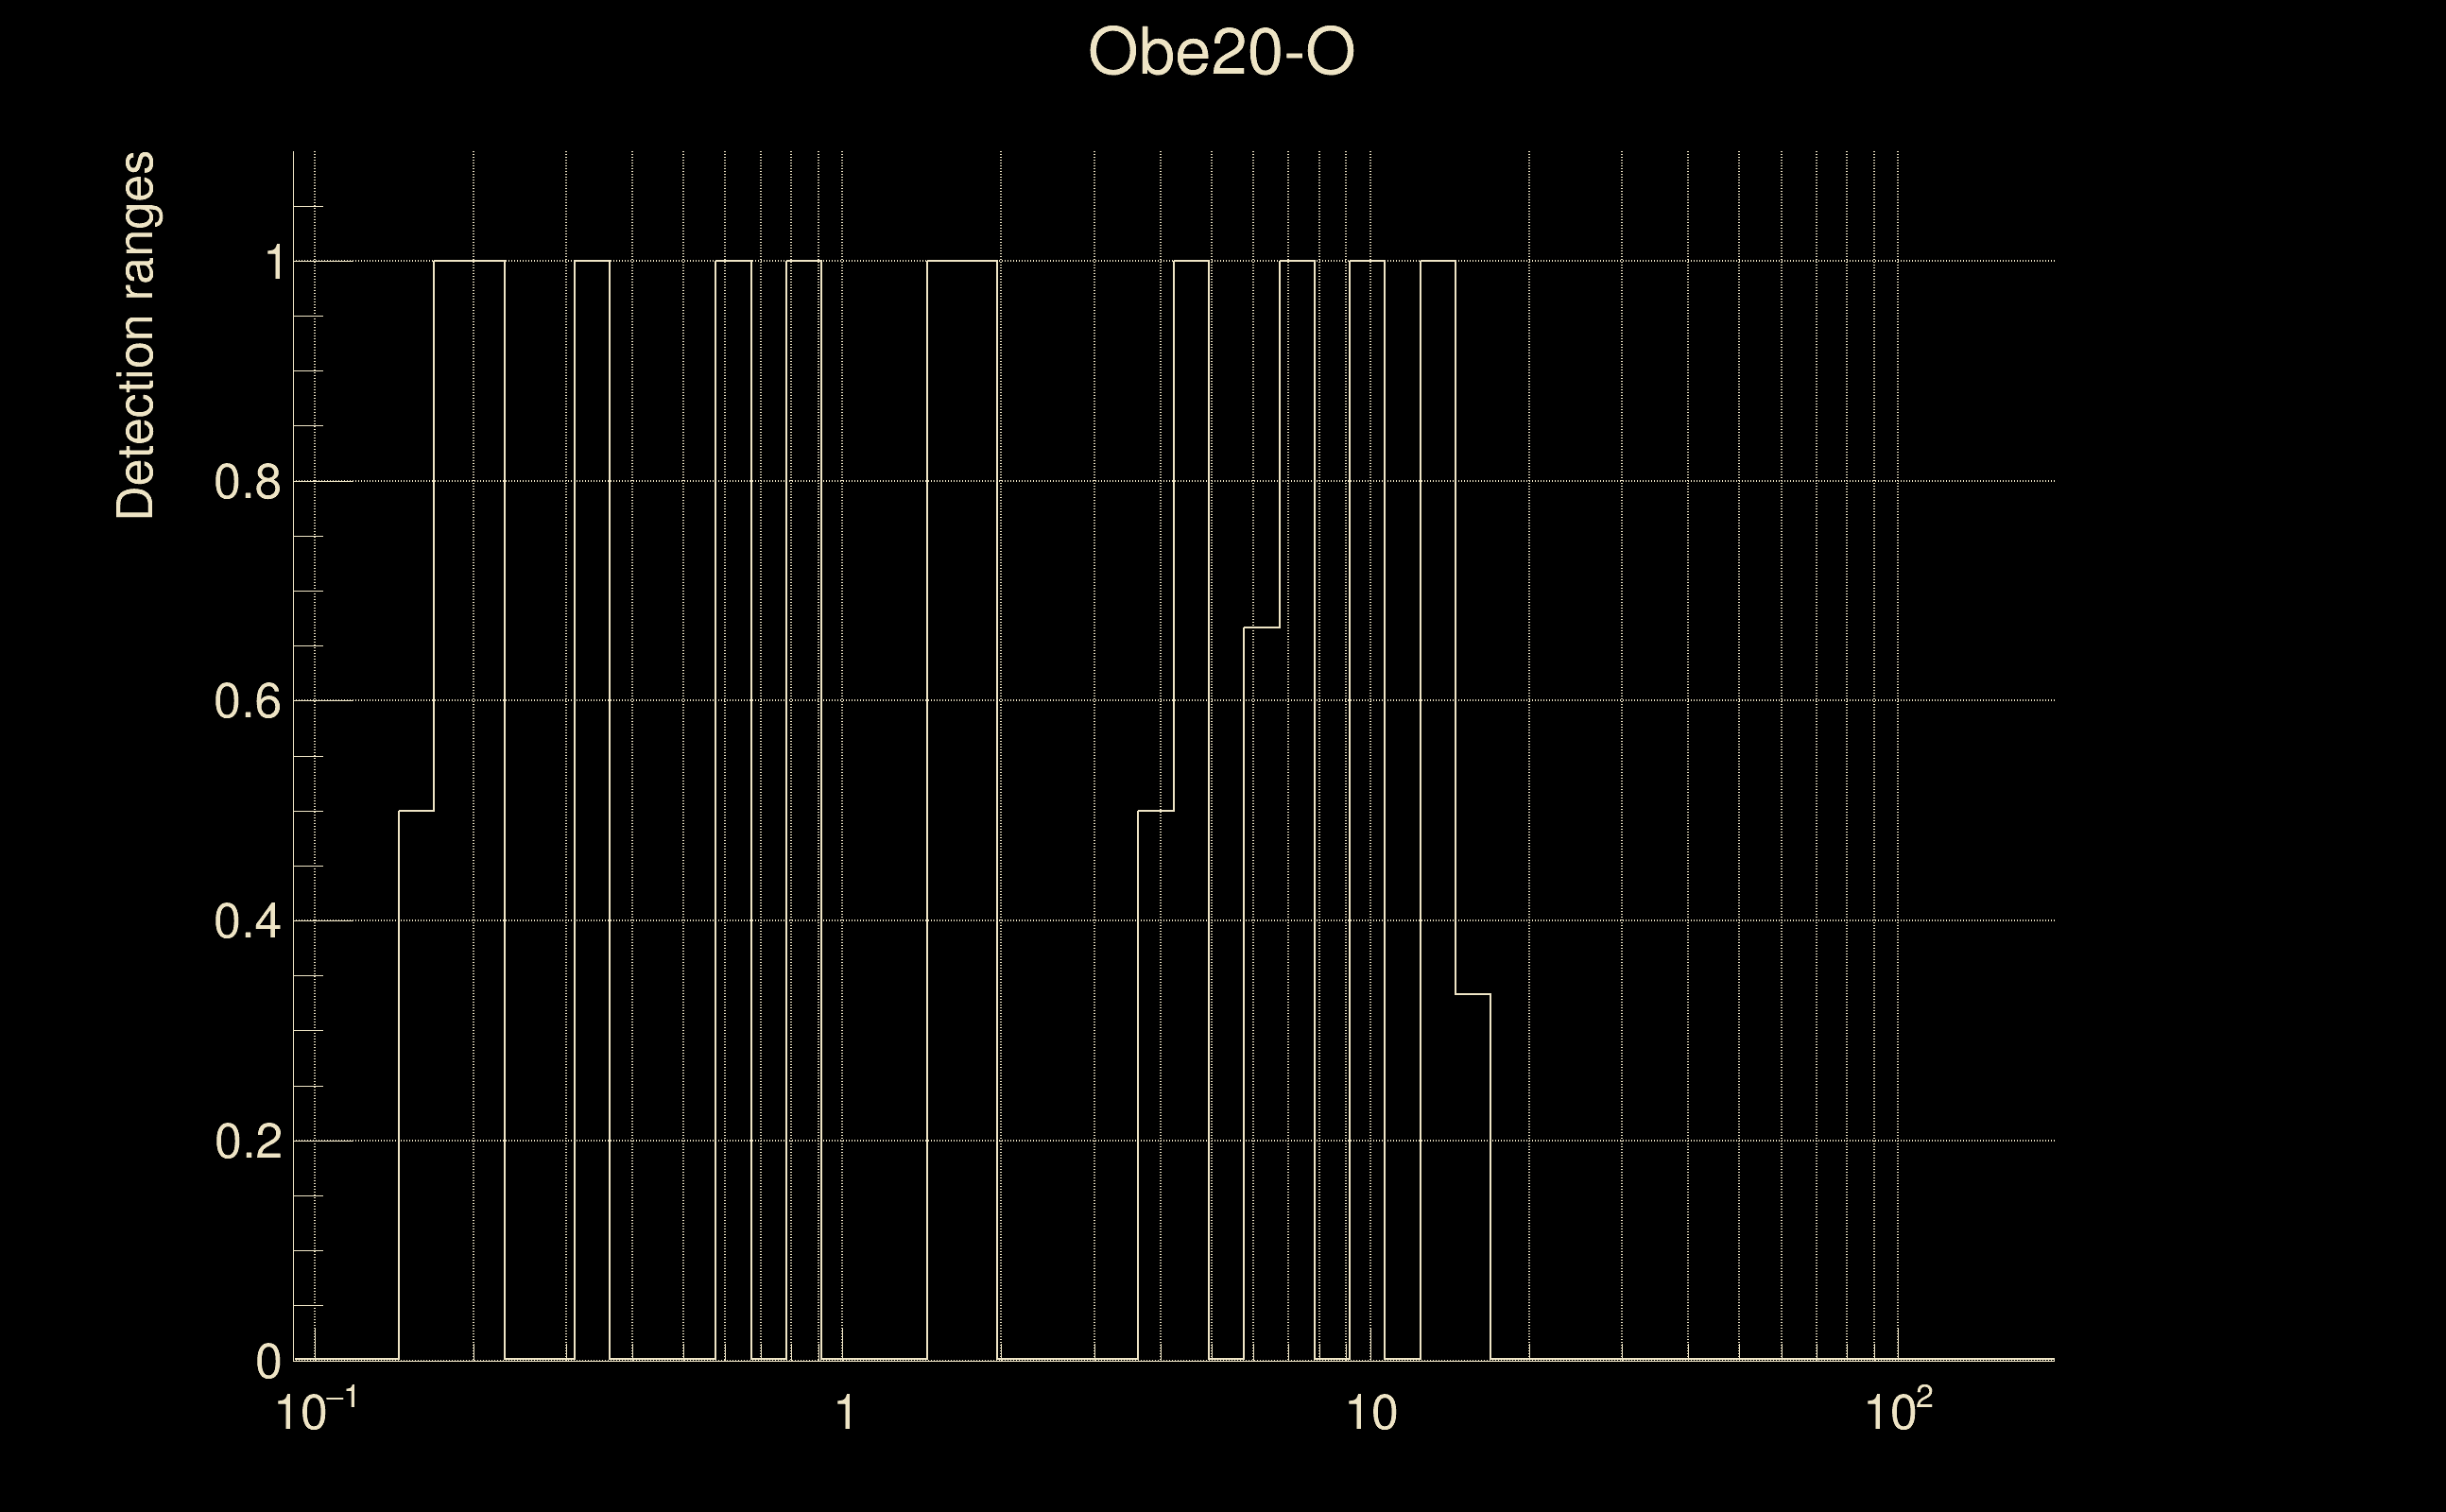
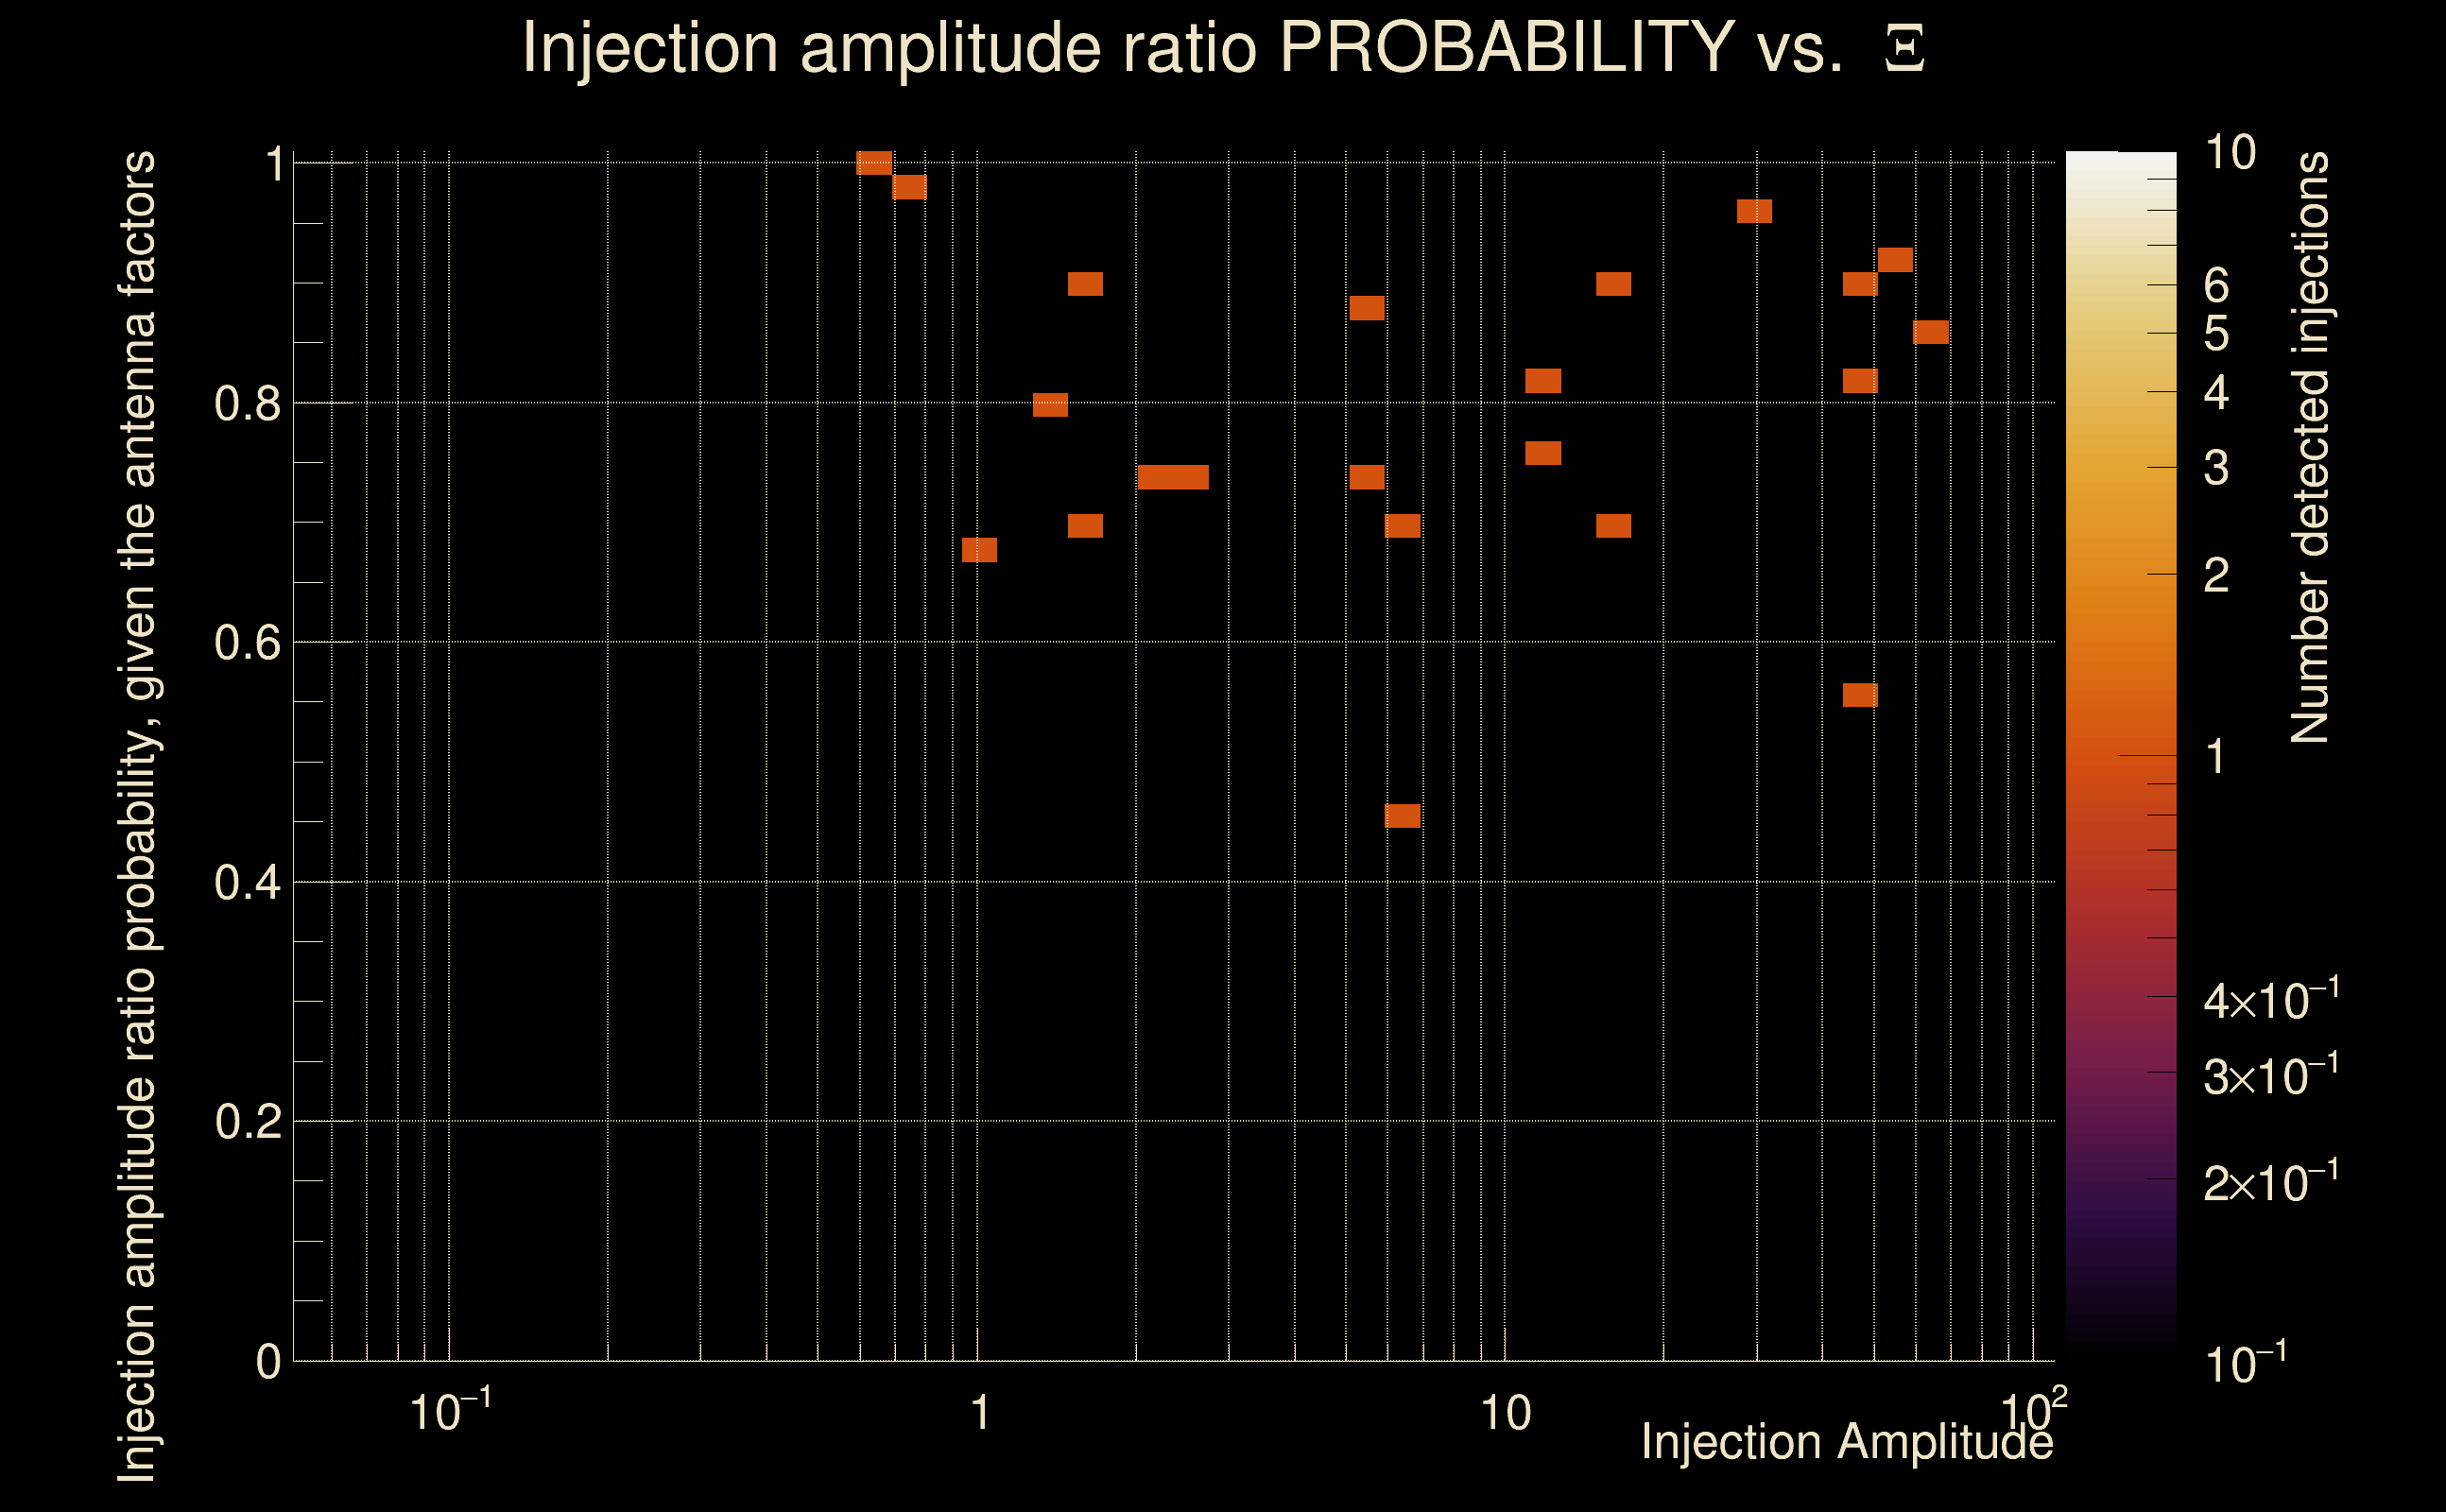
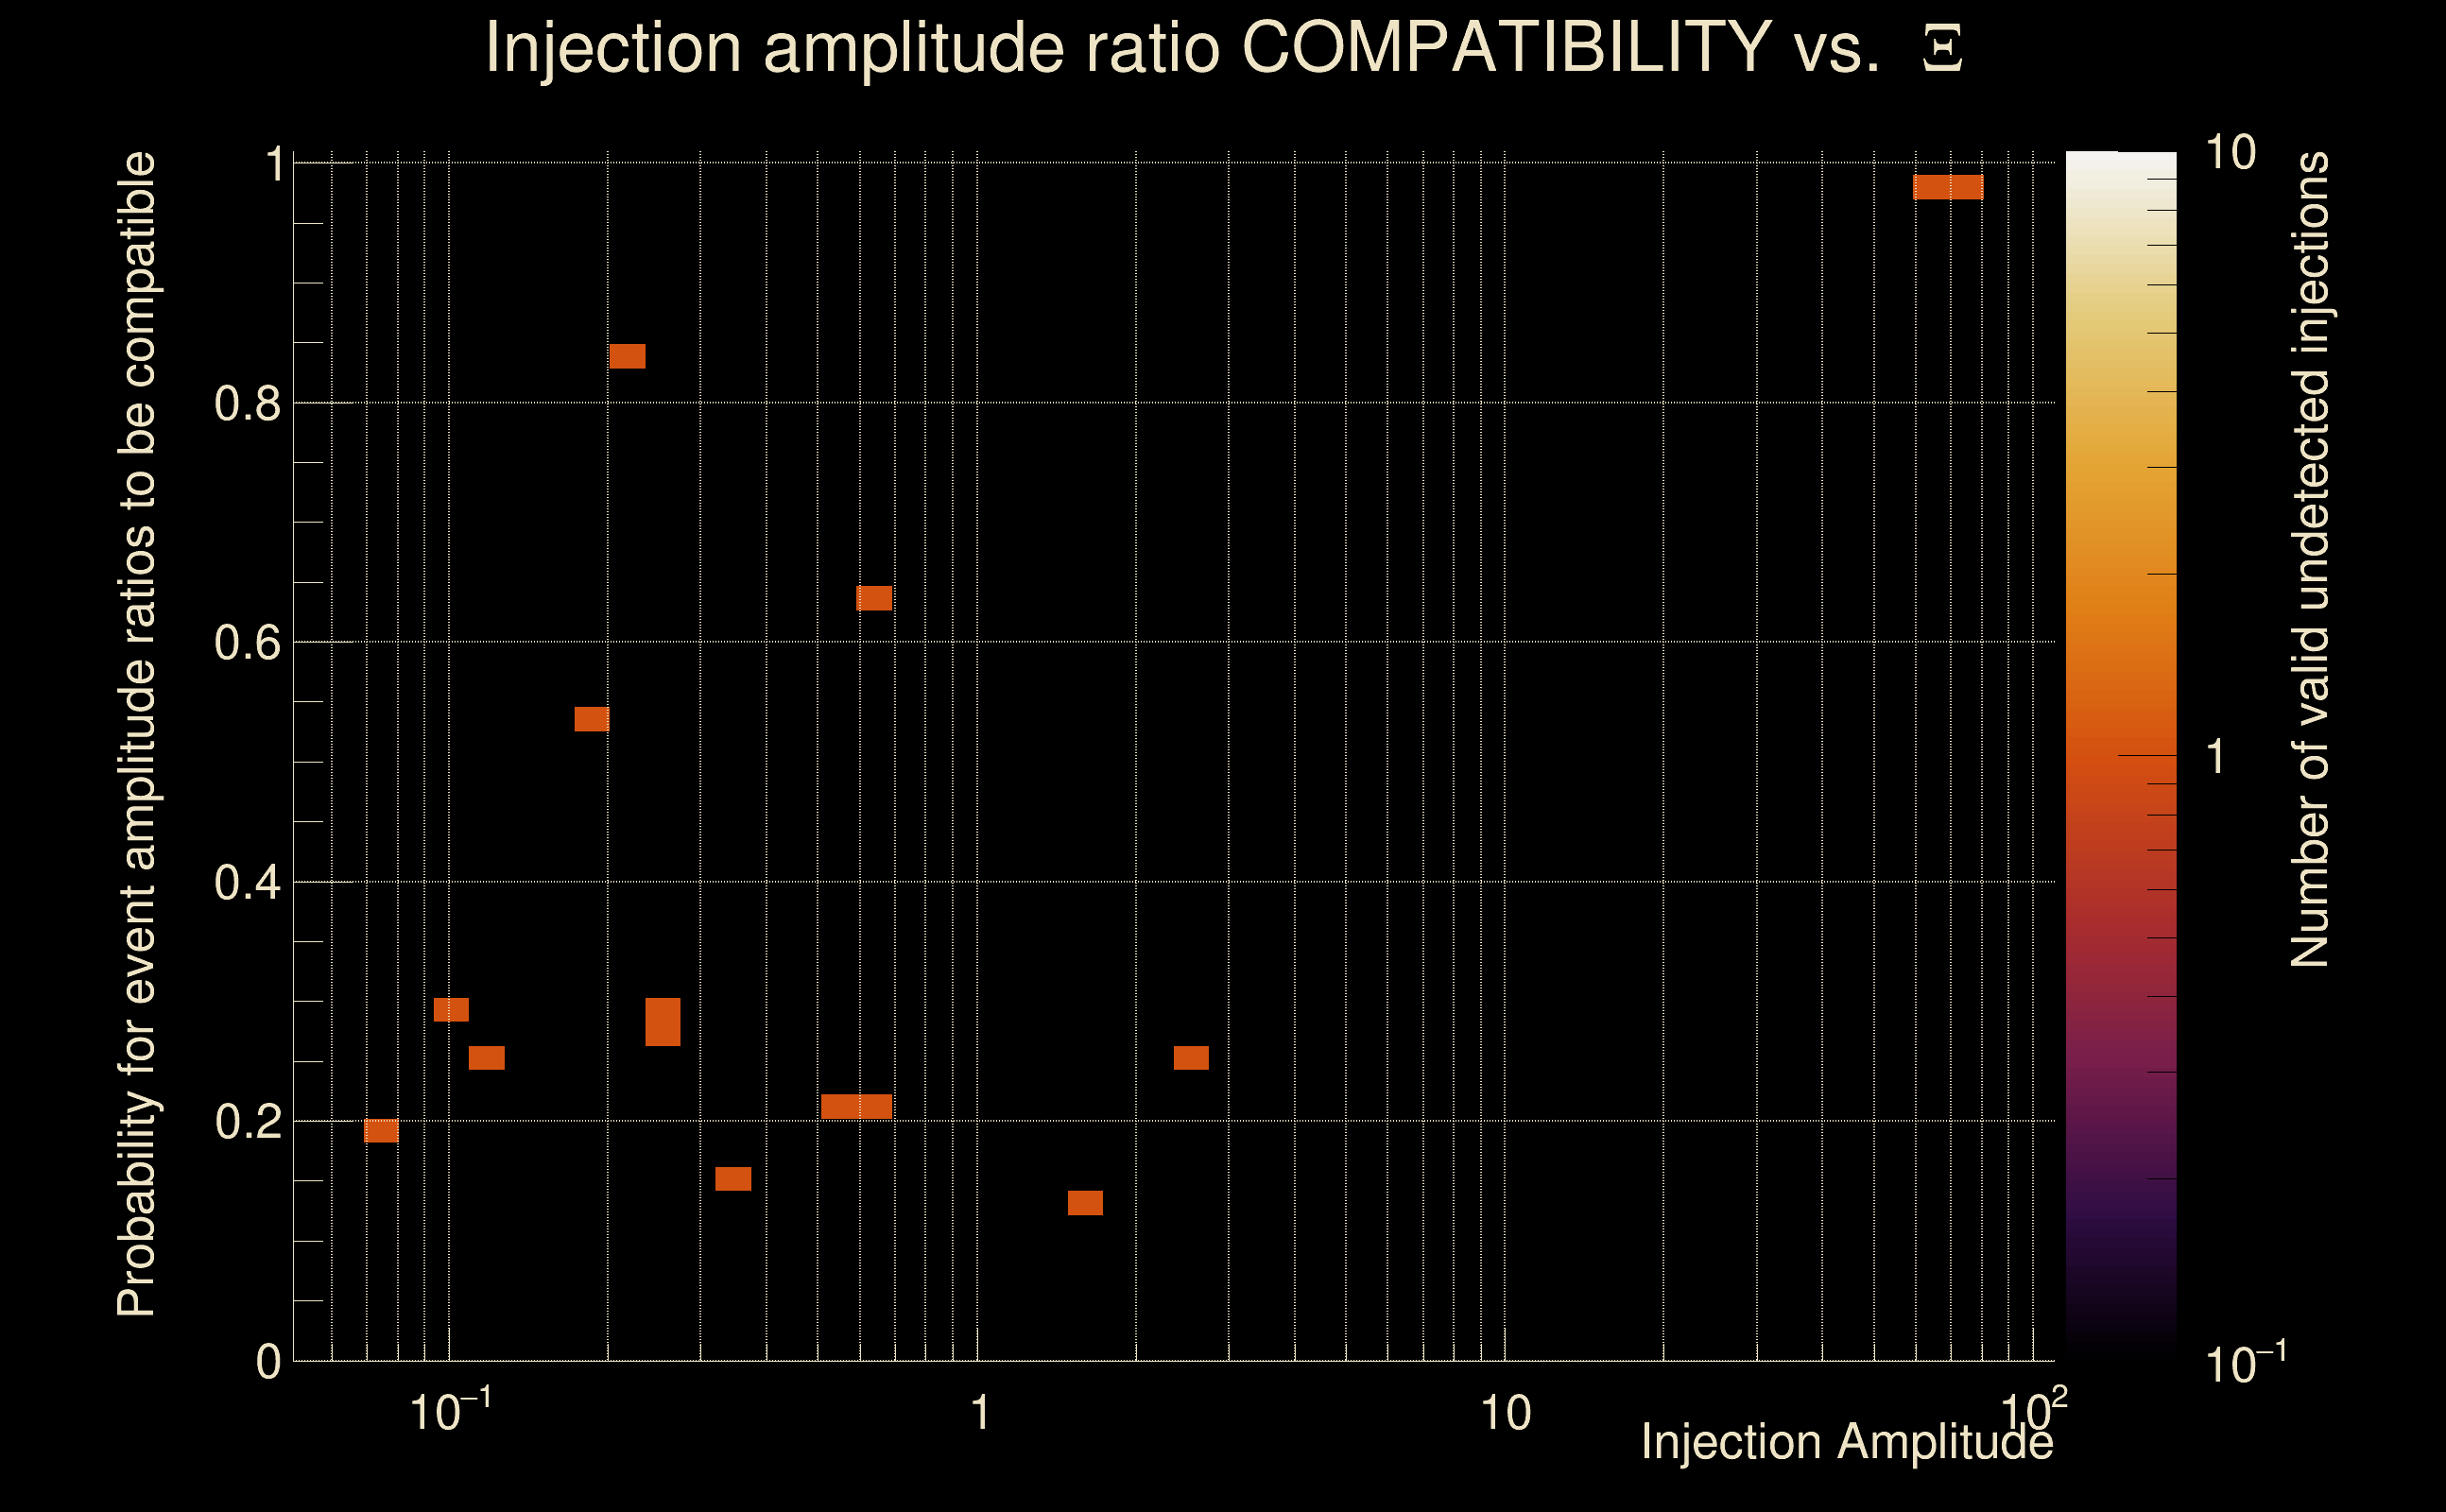
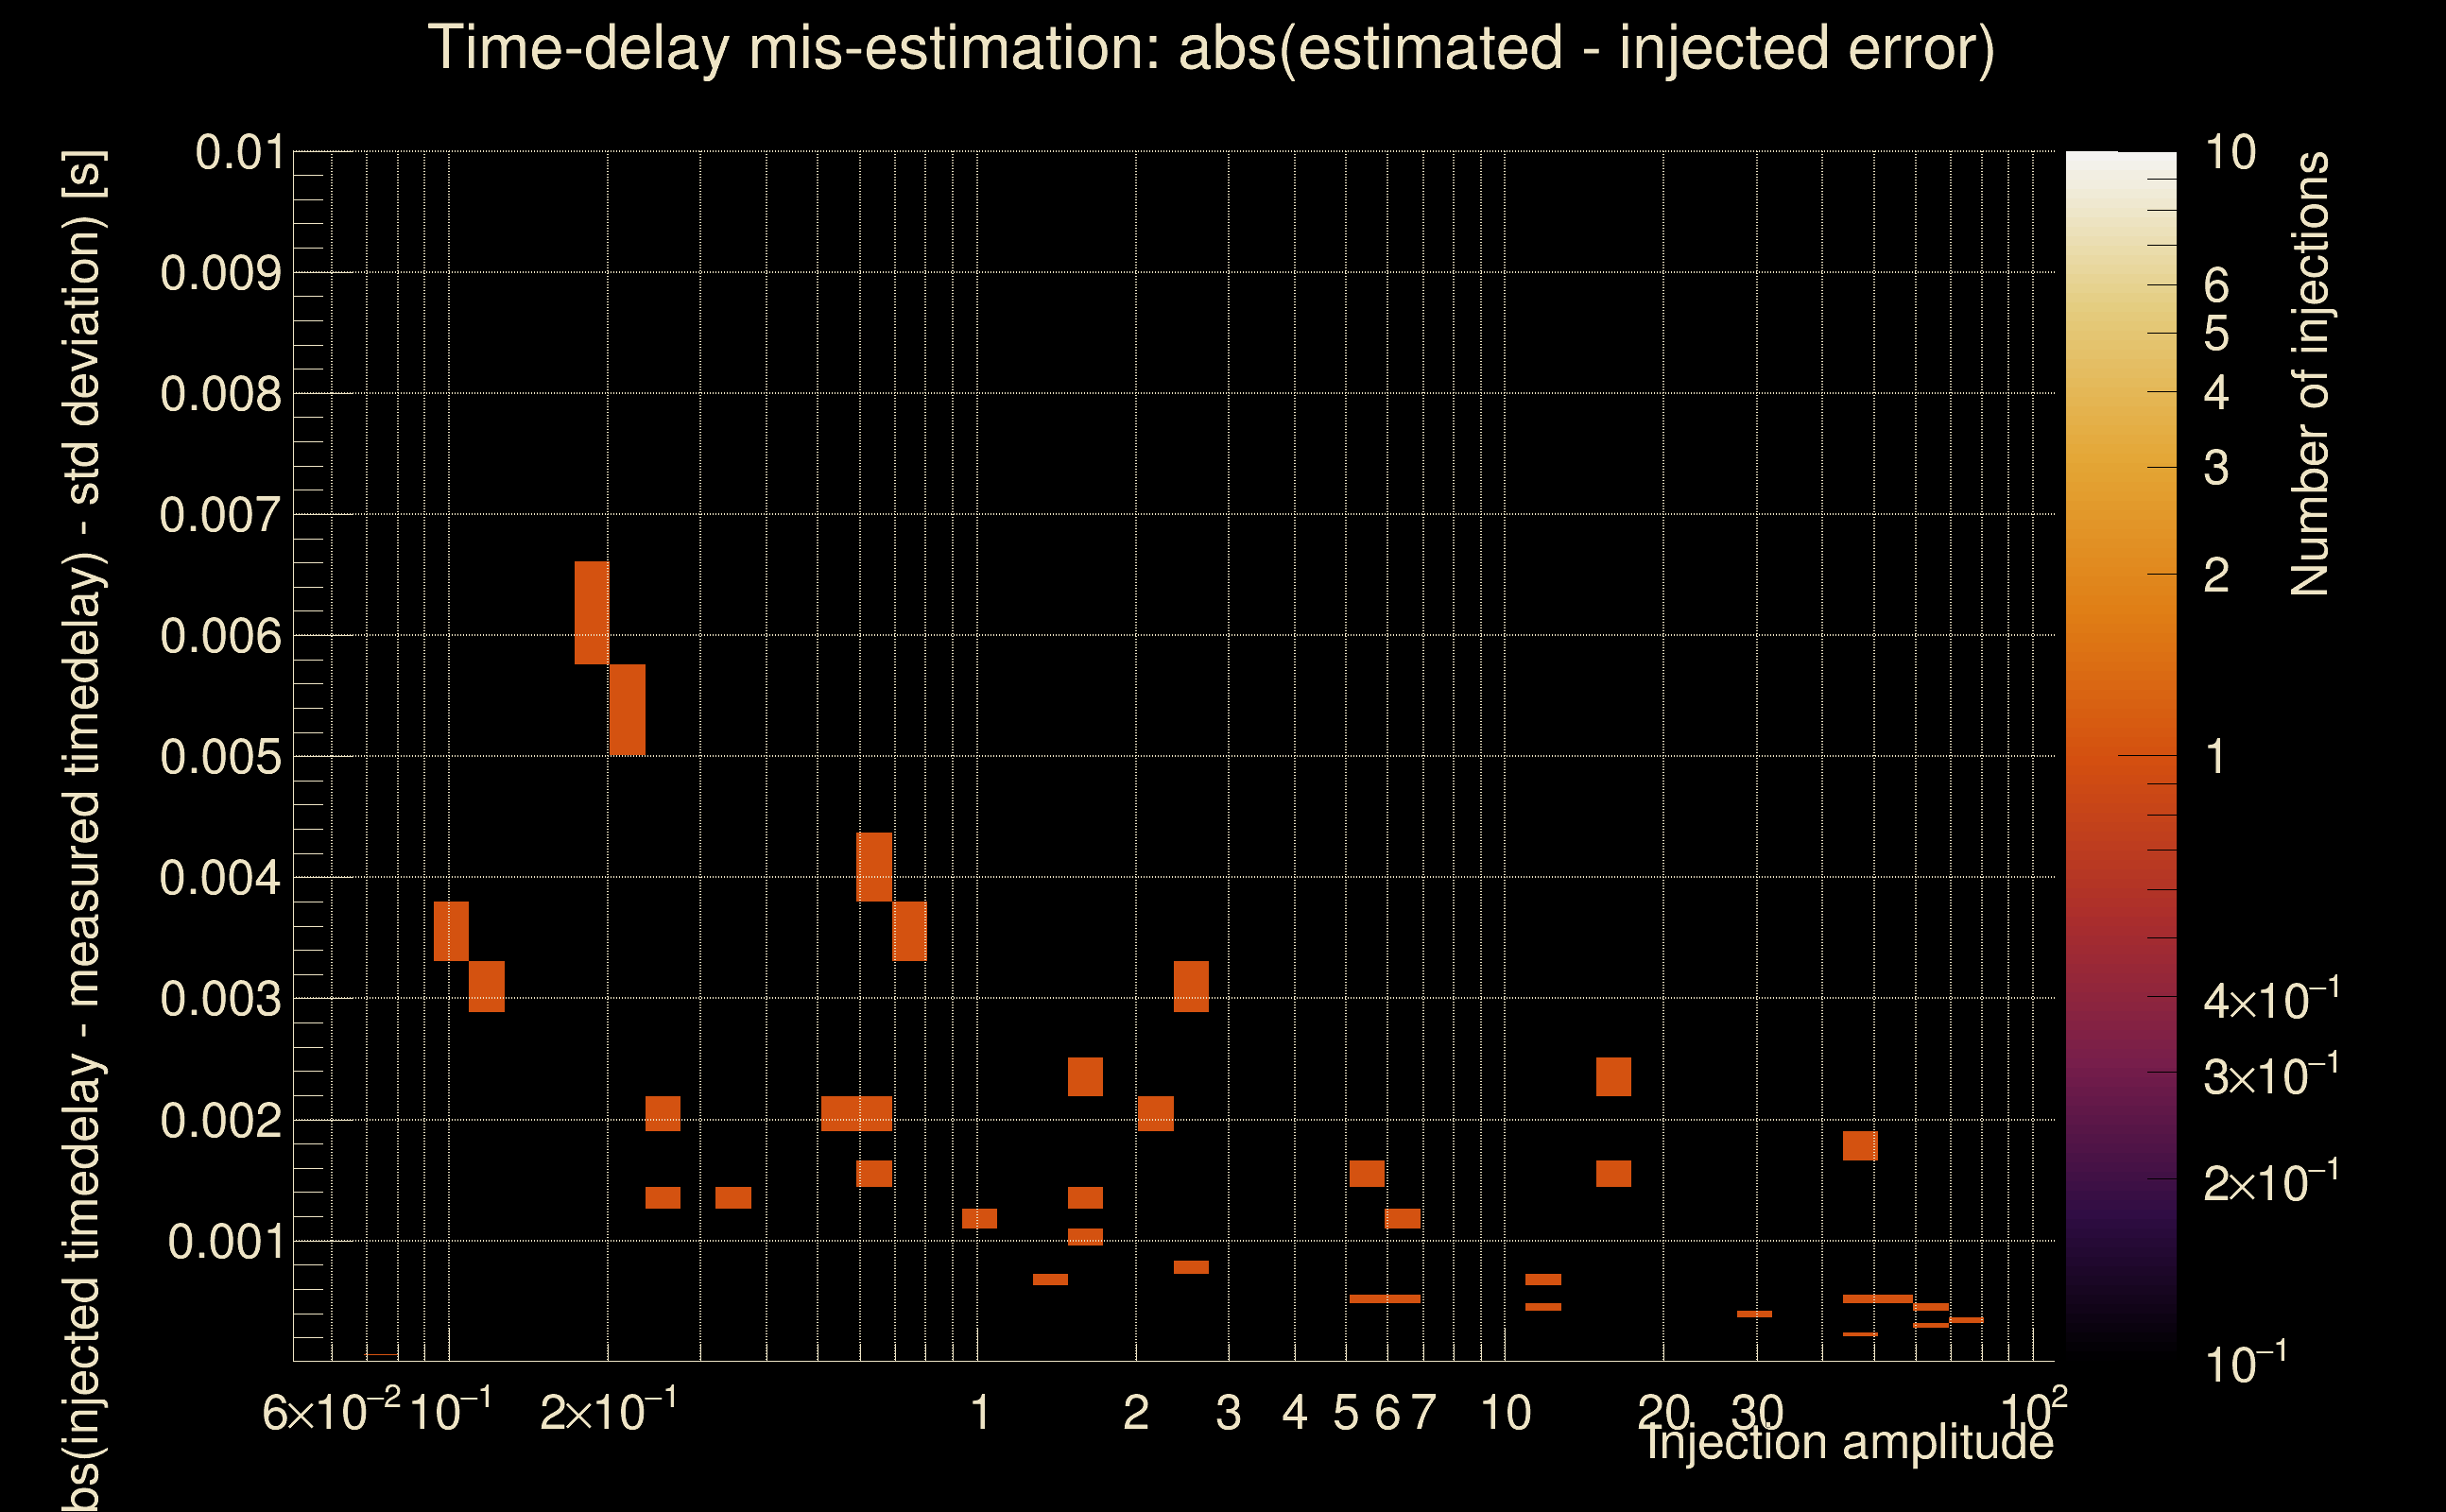
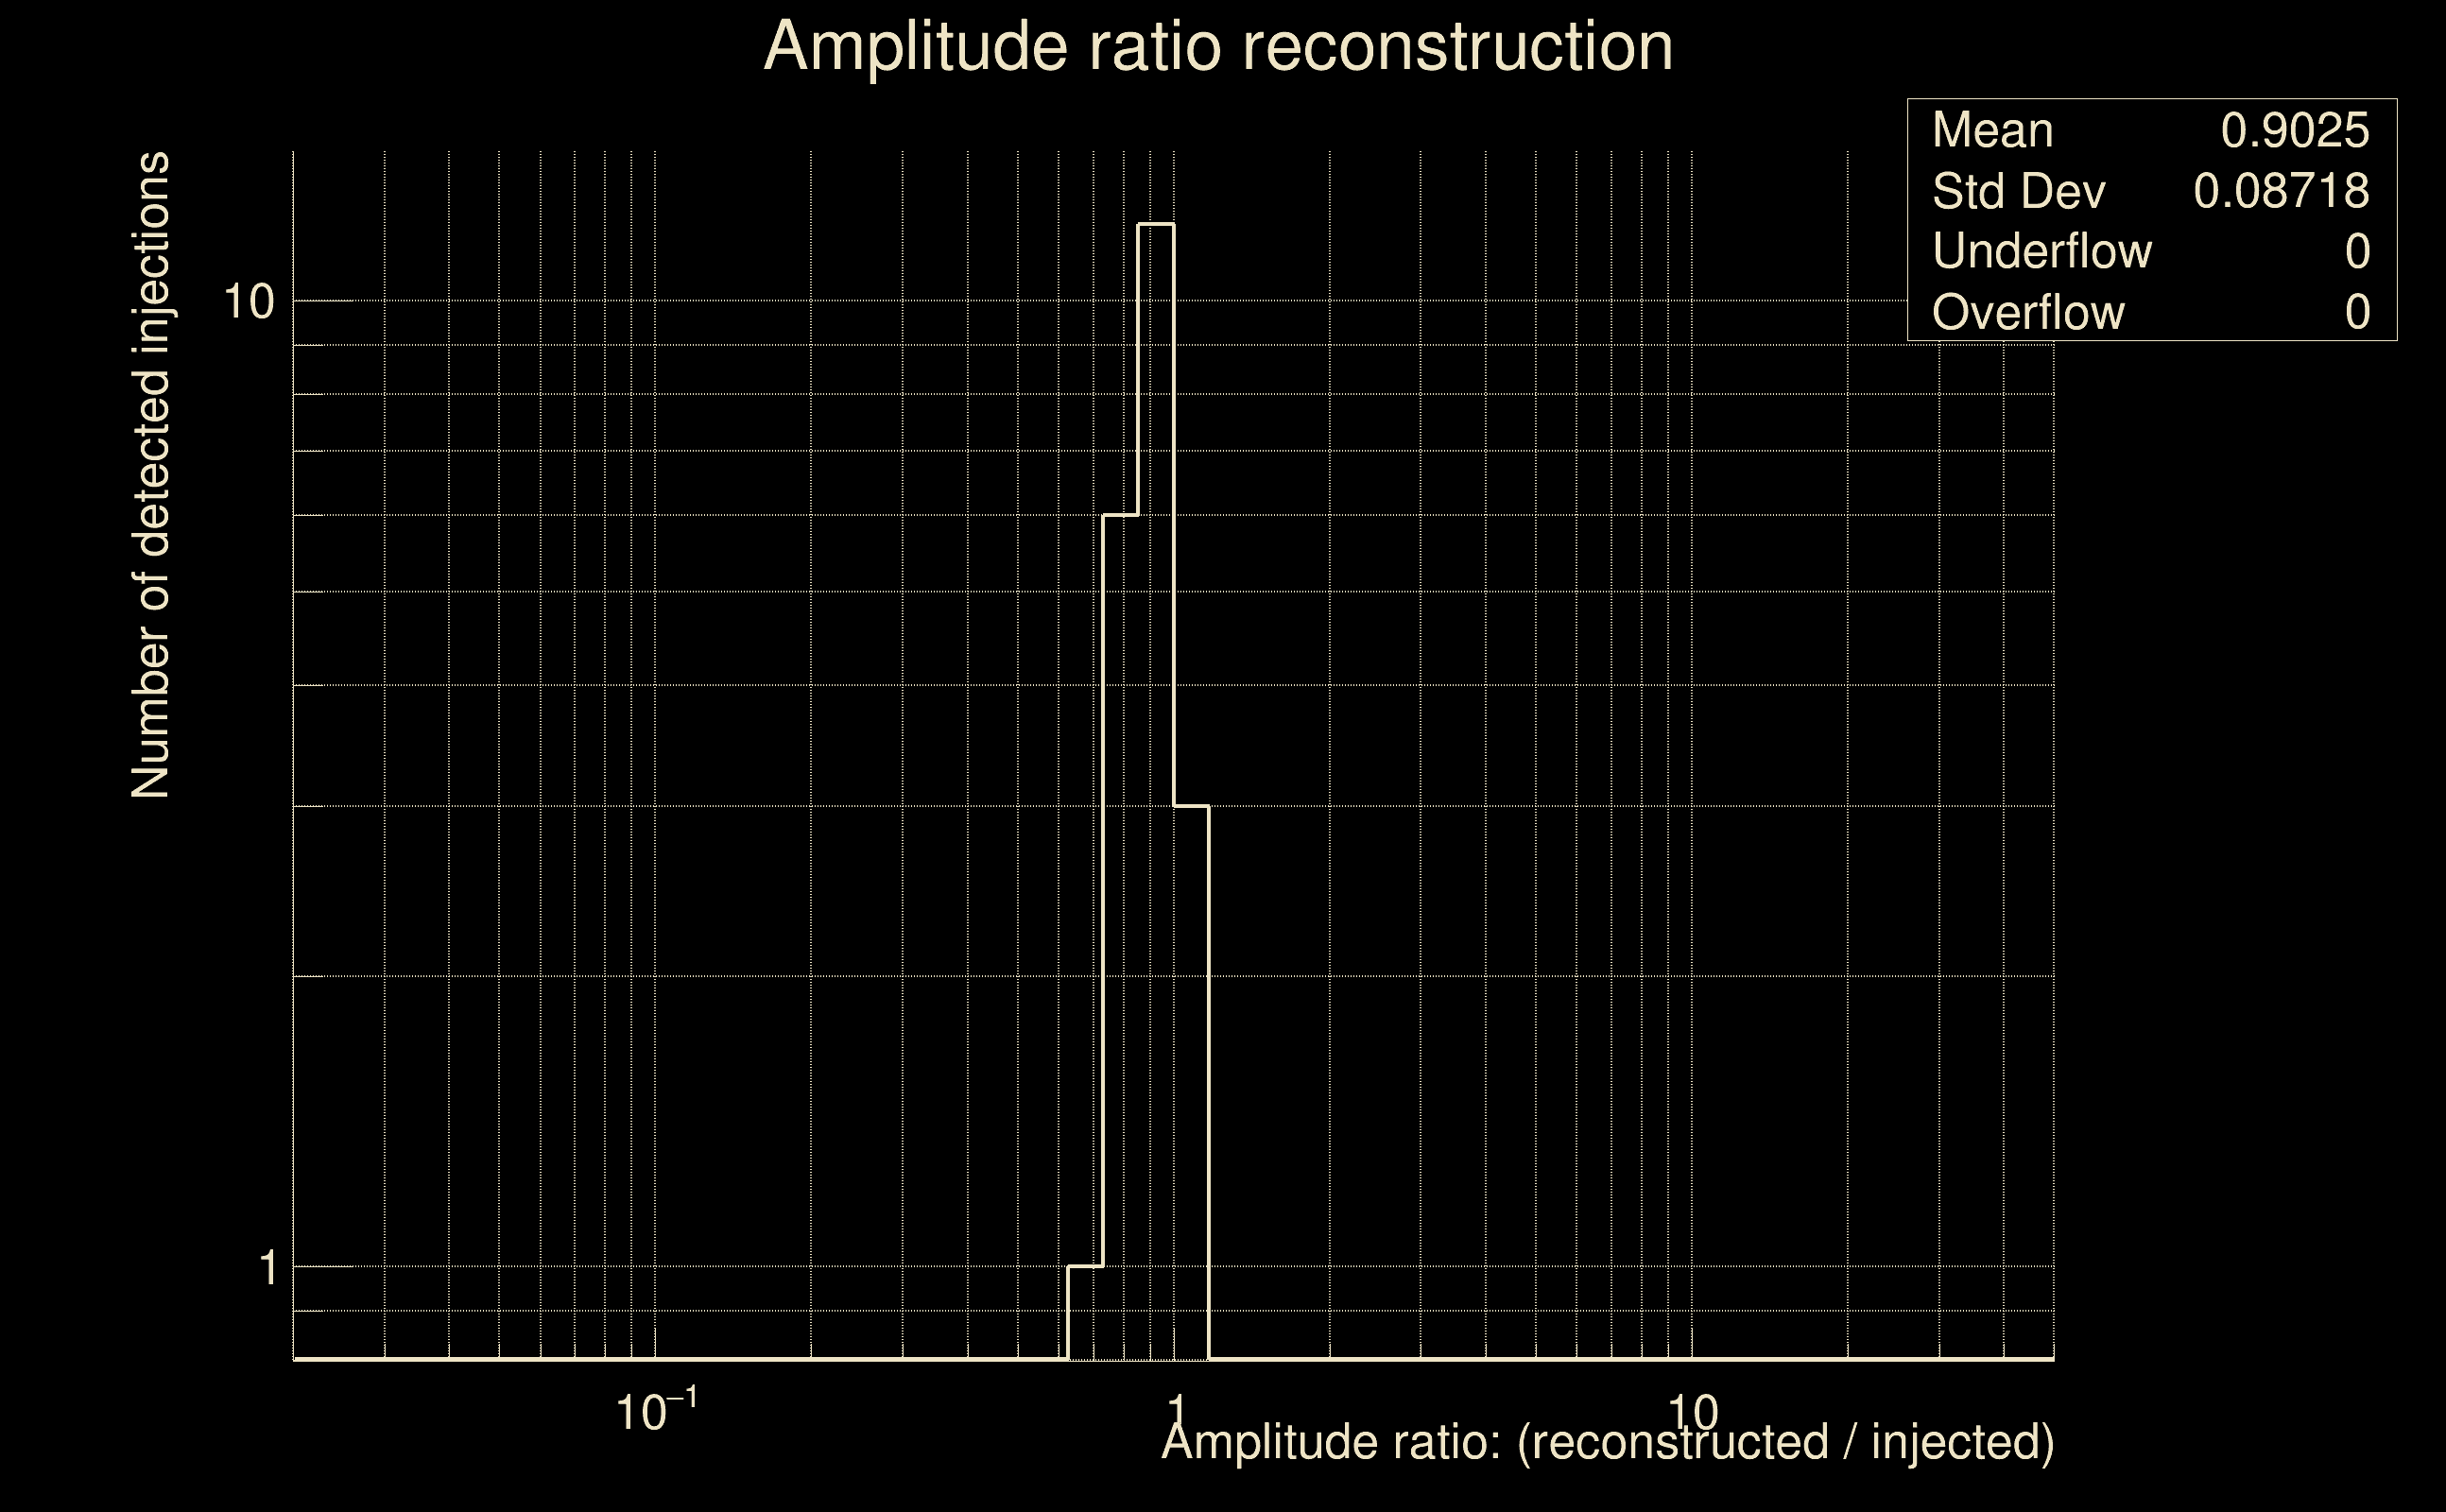
| Number of injections (total/valid/detected): | 68 / 37 / 22 |
| List of missed injections: | ./Obe20-O_missed.txt |
| Injection amplitude at 90% detection efficiency: | 0.729304 |
| Injection amplitude at 50% detection efficiency: | 0.665632 |
| Injection amplitude at 10% detection efficiency: | 0.575395 |
 |
 |
 |
 |
 |
 |
 |
|
 |
 |
|
 |
 |
|
 |
 |
|
 |
 |
|
 |
 |
|
 |
 |
|
 |
 |
|
 |
 |
 |
 |
 |
 |
 |
 |
 |
 |
 |
 |
 |
 |
 |
| florent.robinet@ijclab.in2p3.fr |