| Omicron version: | 4.2.0: documentation gitlab repository |
| Omicron run by: | unknown |
| Report produced on: | Mon Feb 23 13:21:43 2026 UTC |
| Ox option file: | TargIxf_feb2026_SN3_30s_options.txt |
| Omicron option files: | detector 0, detector 1 |
| Detector channel names: | H1:GDS-CALIB_STRAIN_CLEAN_AR_4096Hz, L1:GDS-CALIB_STRAIN_CLEAN_AR_4096Hz |
| Omicron analysis time window and overlap: | 16 s, 6 s |
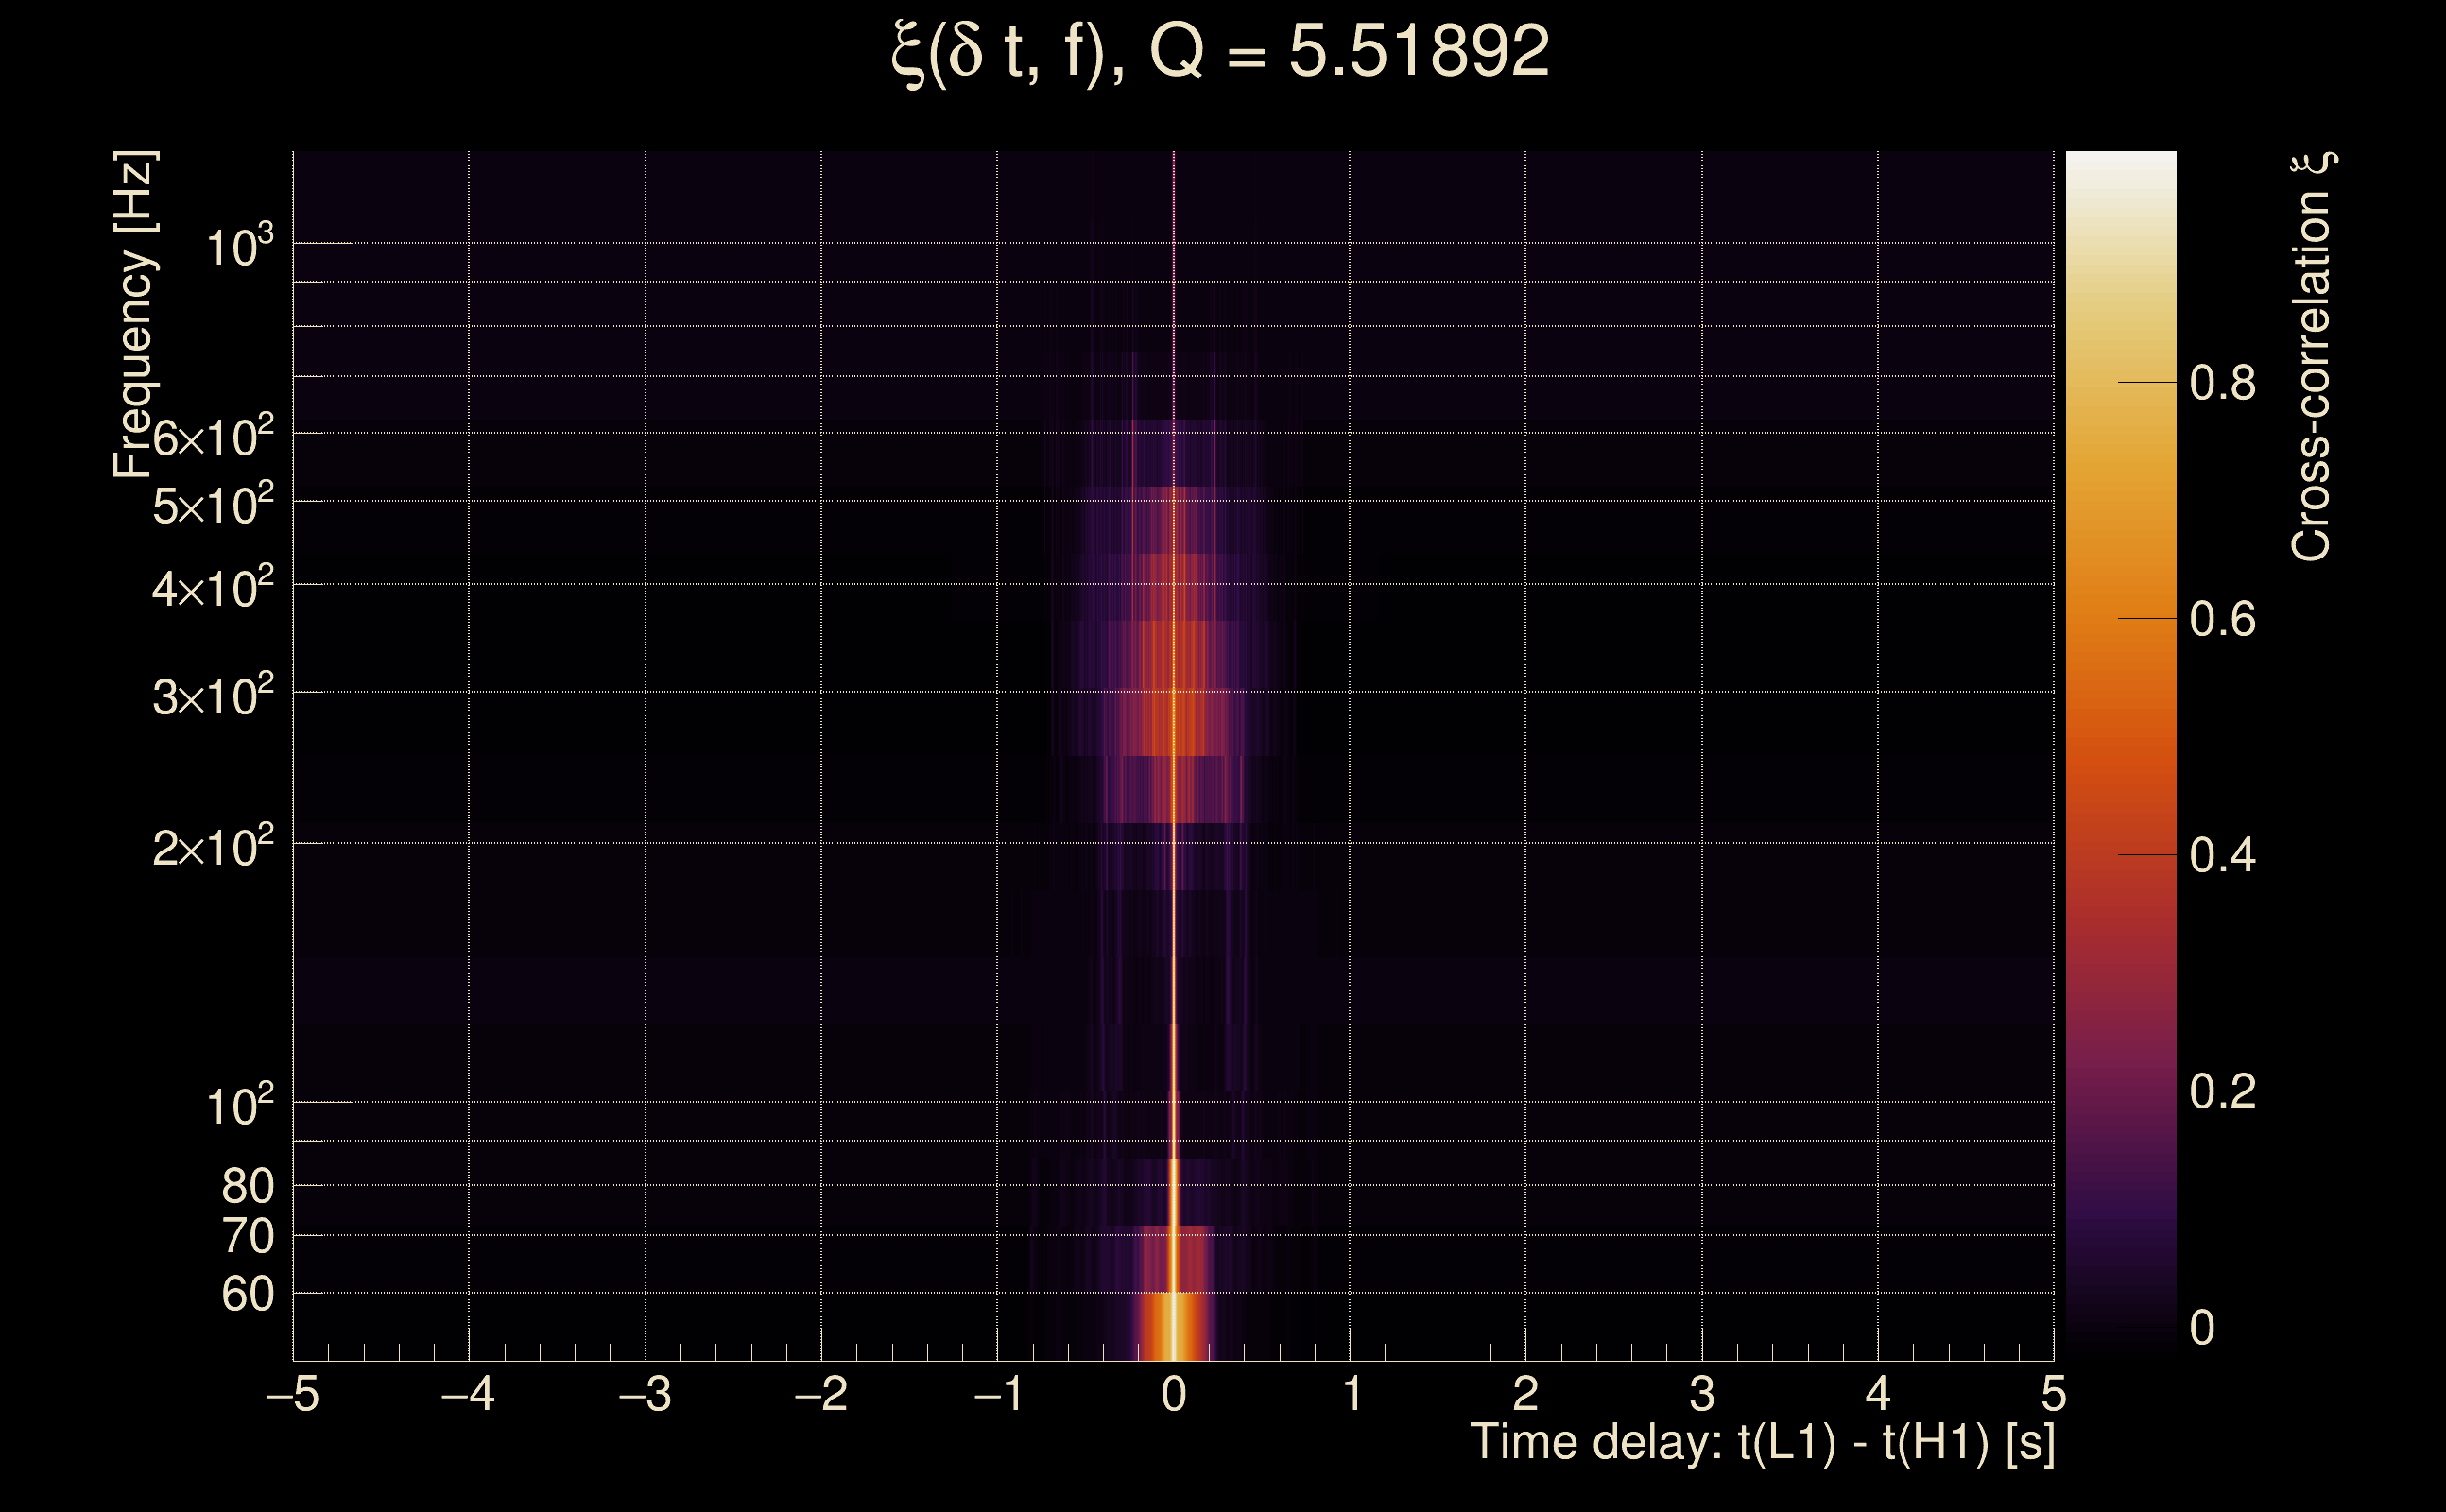
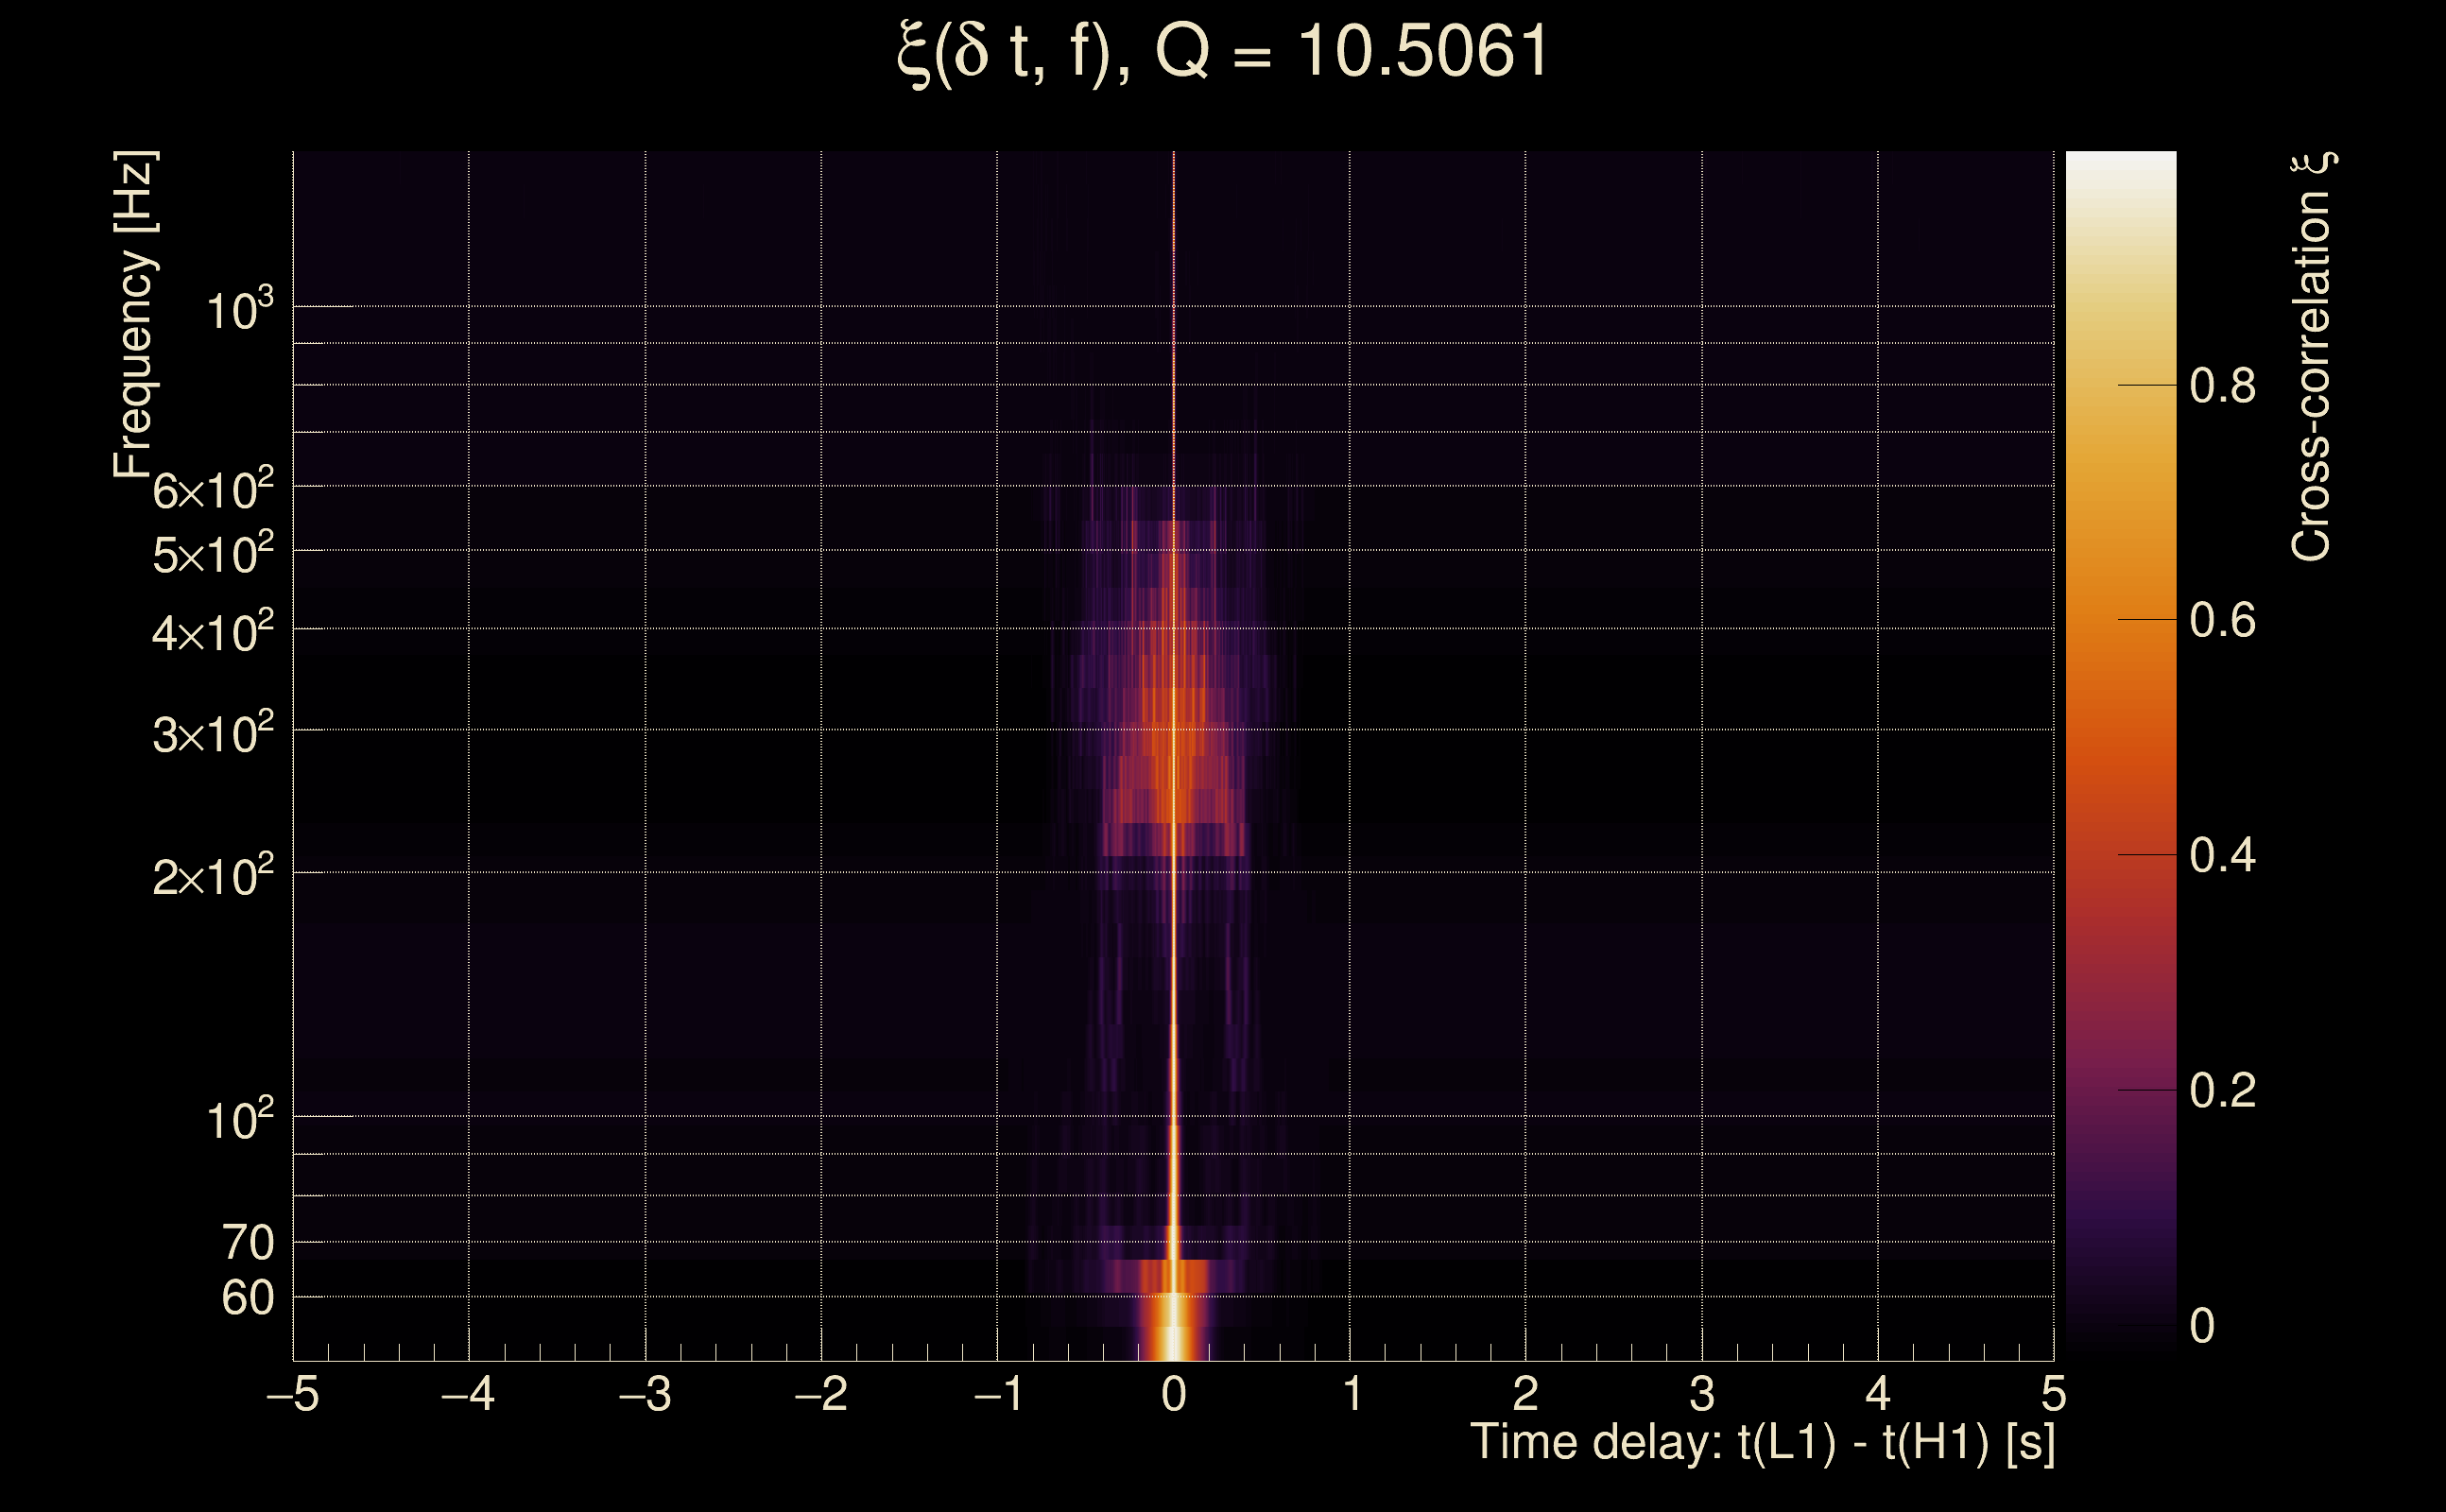
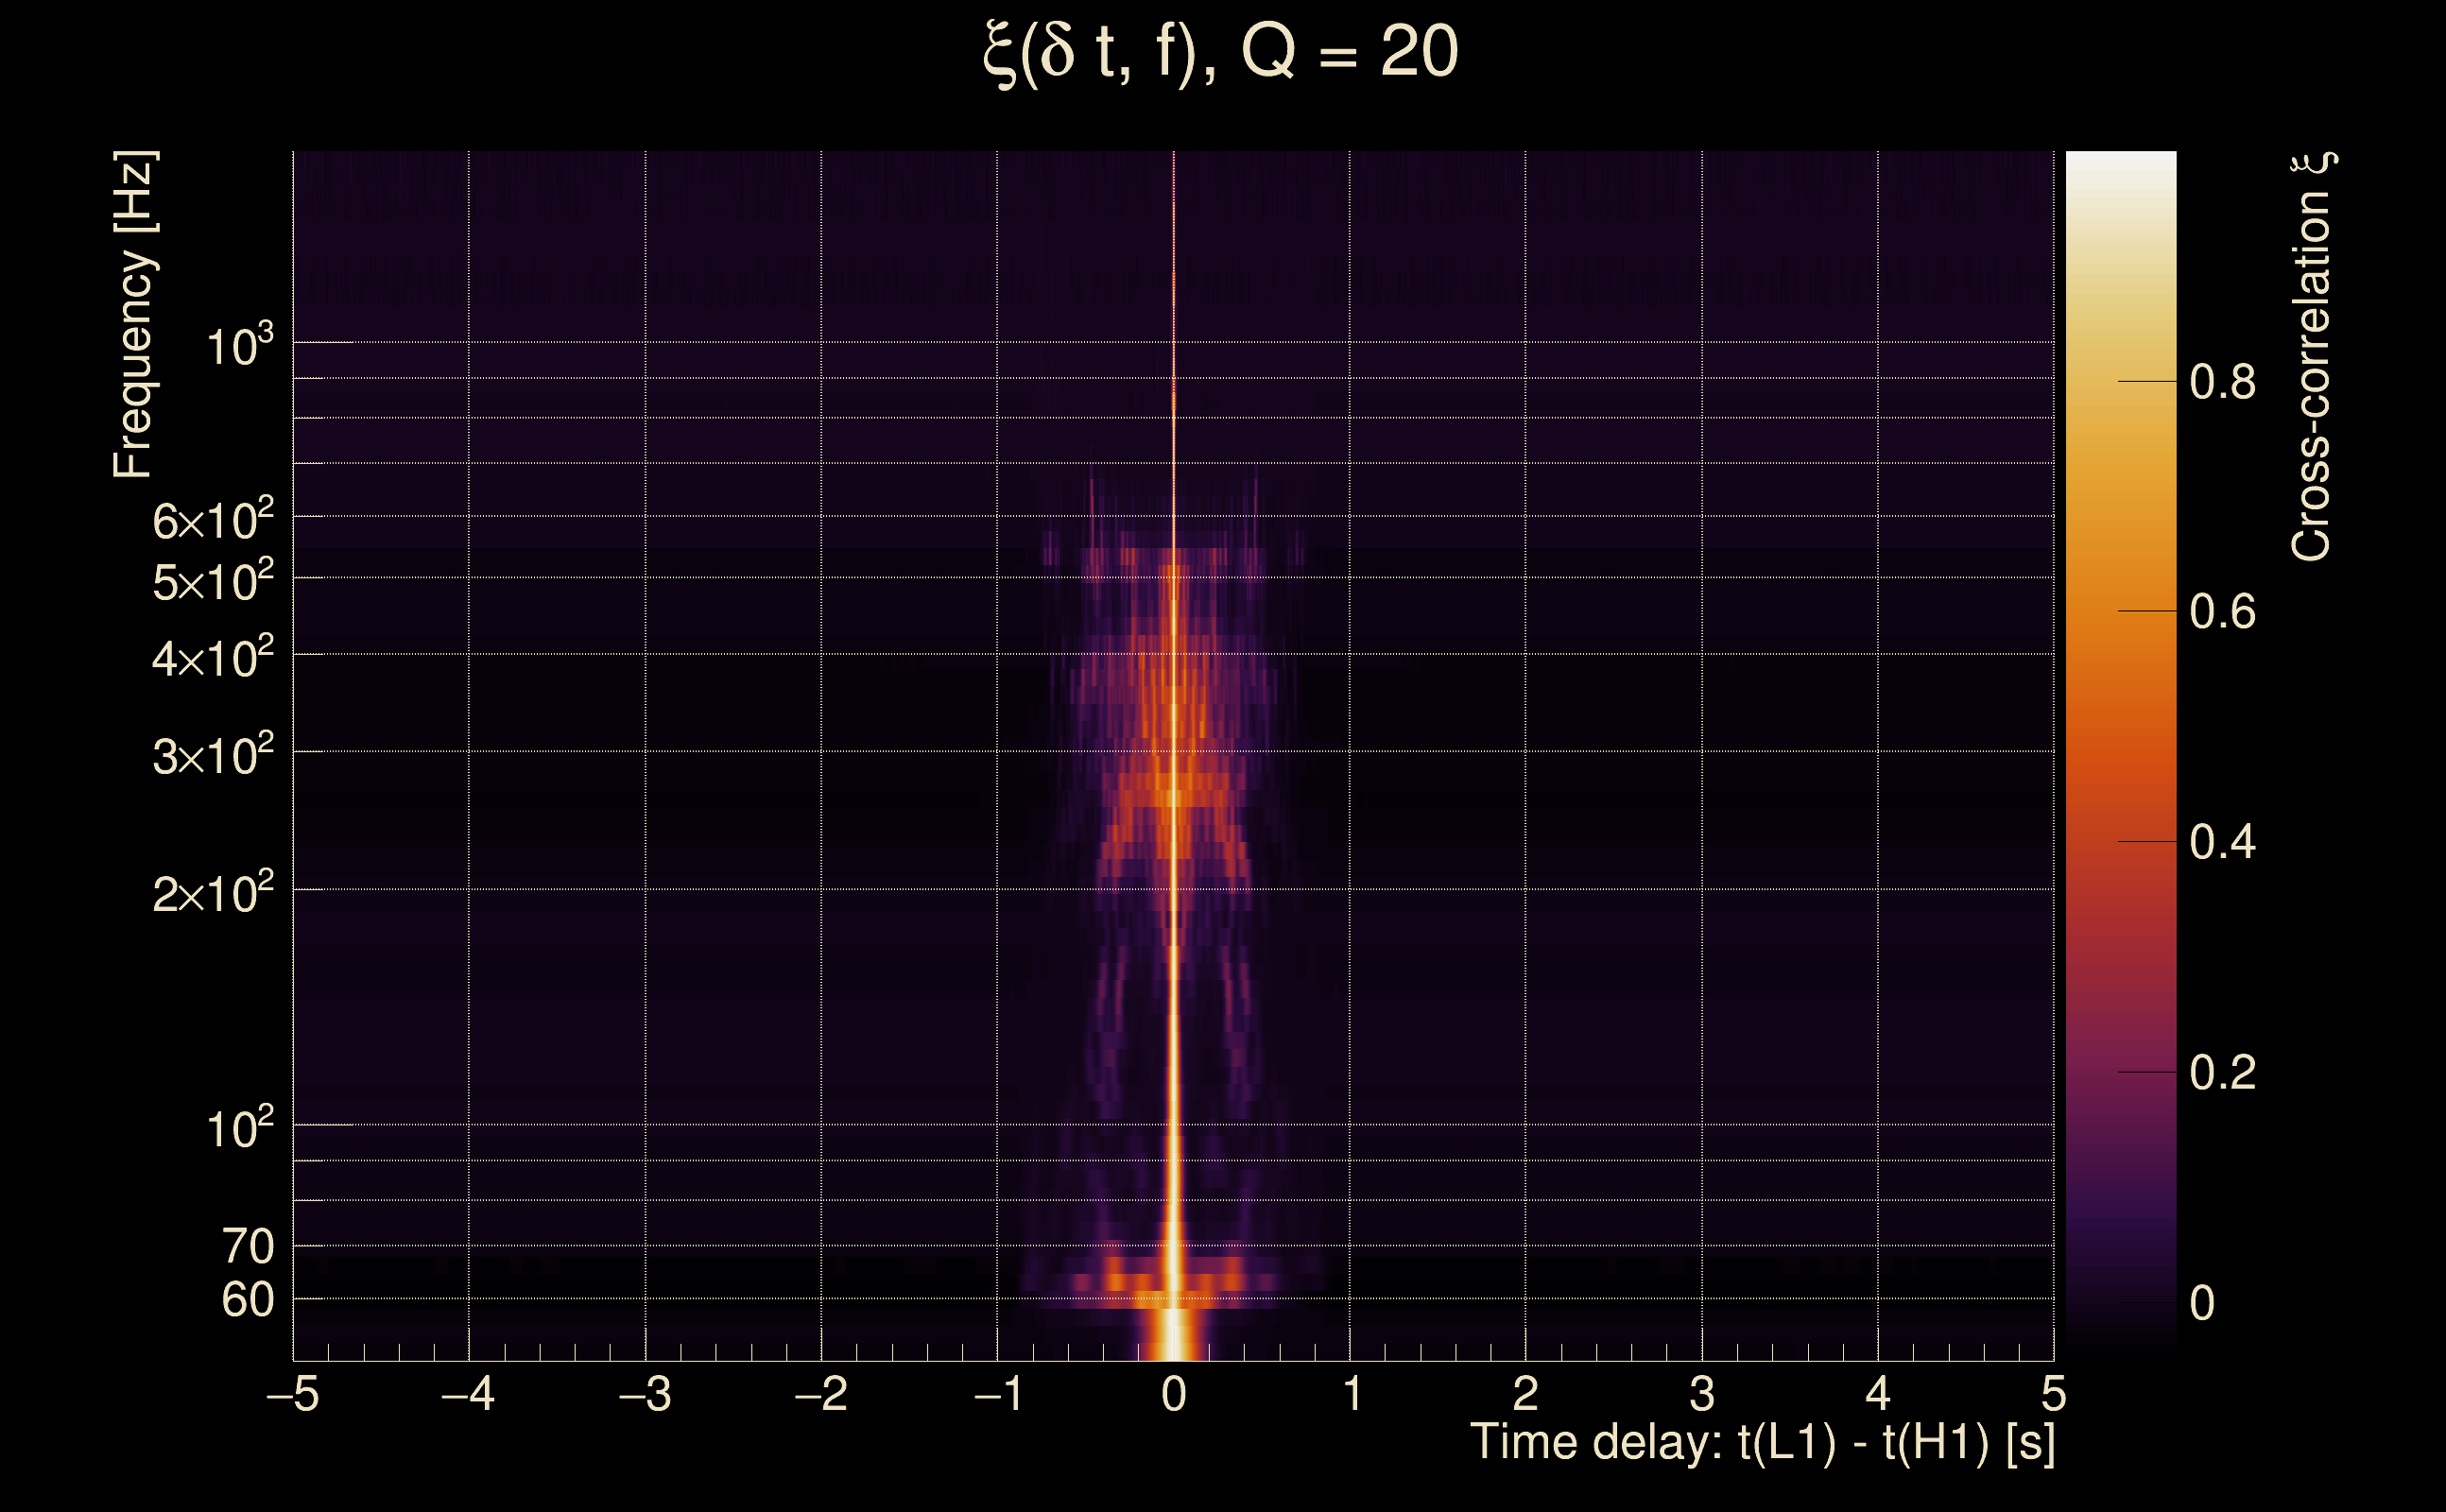
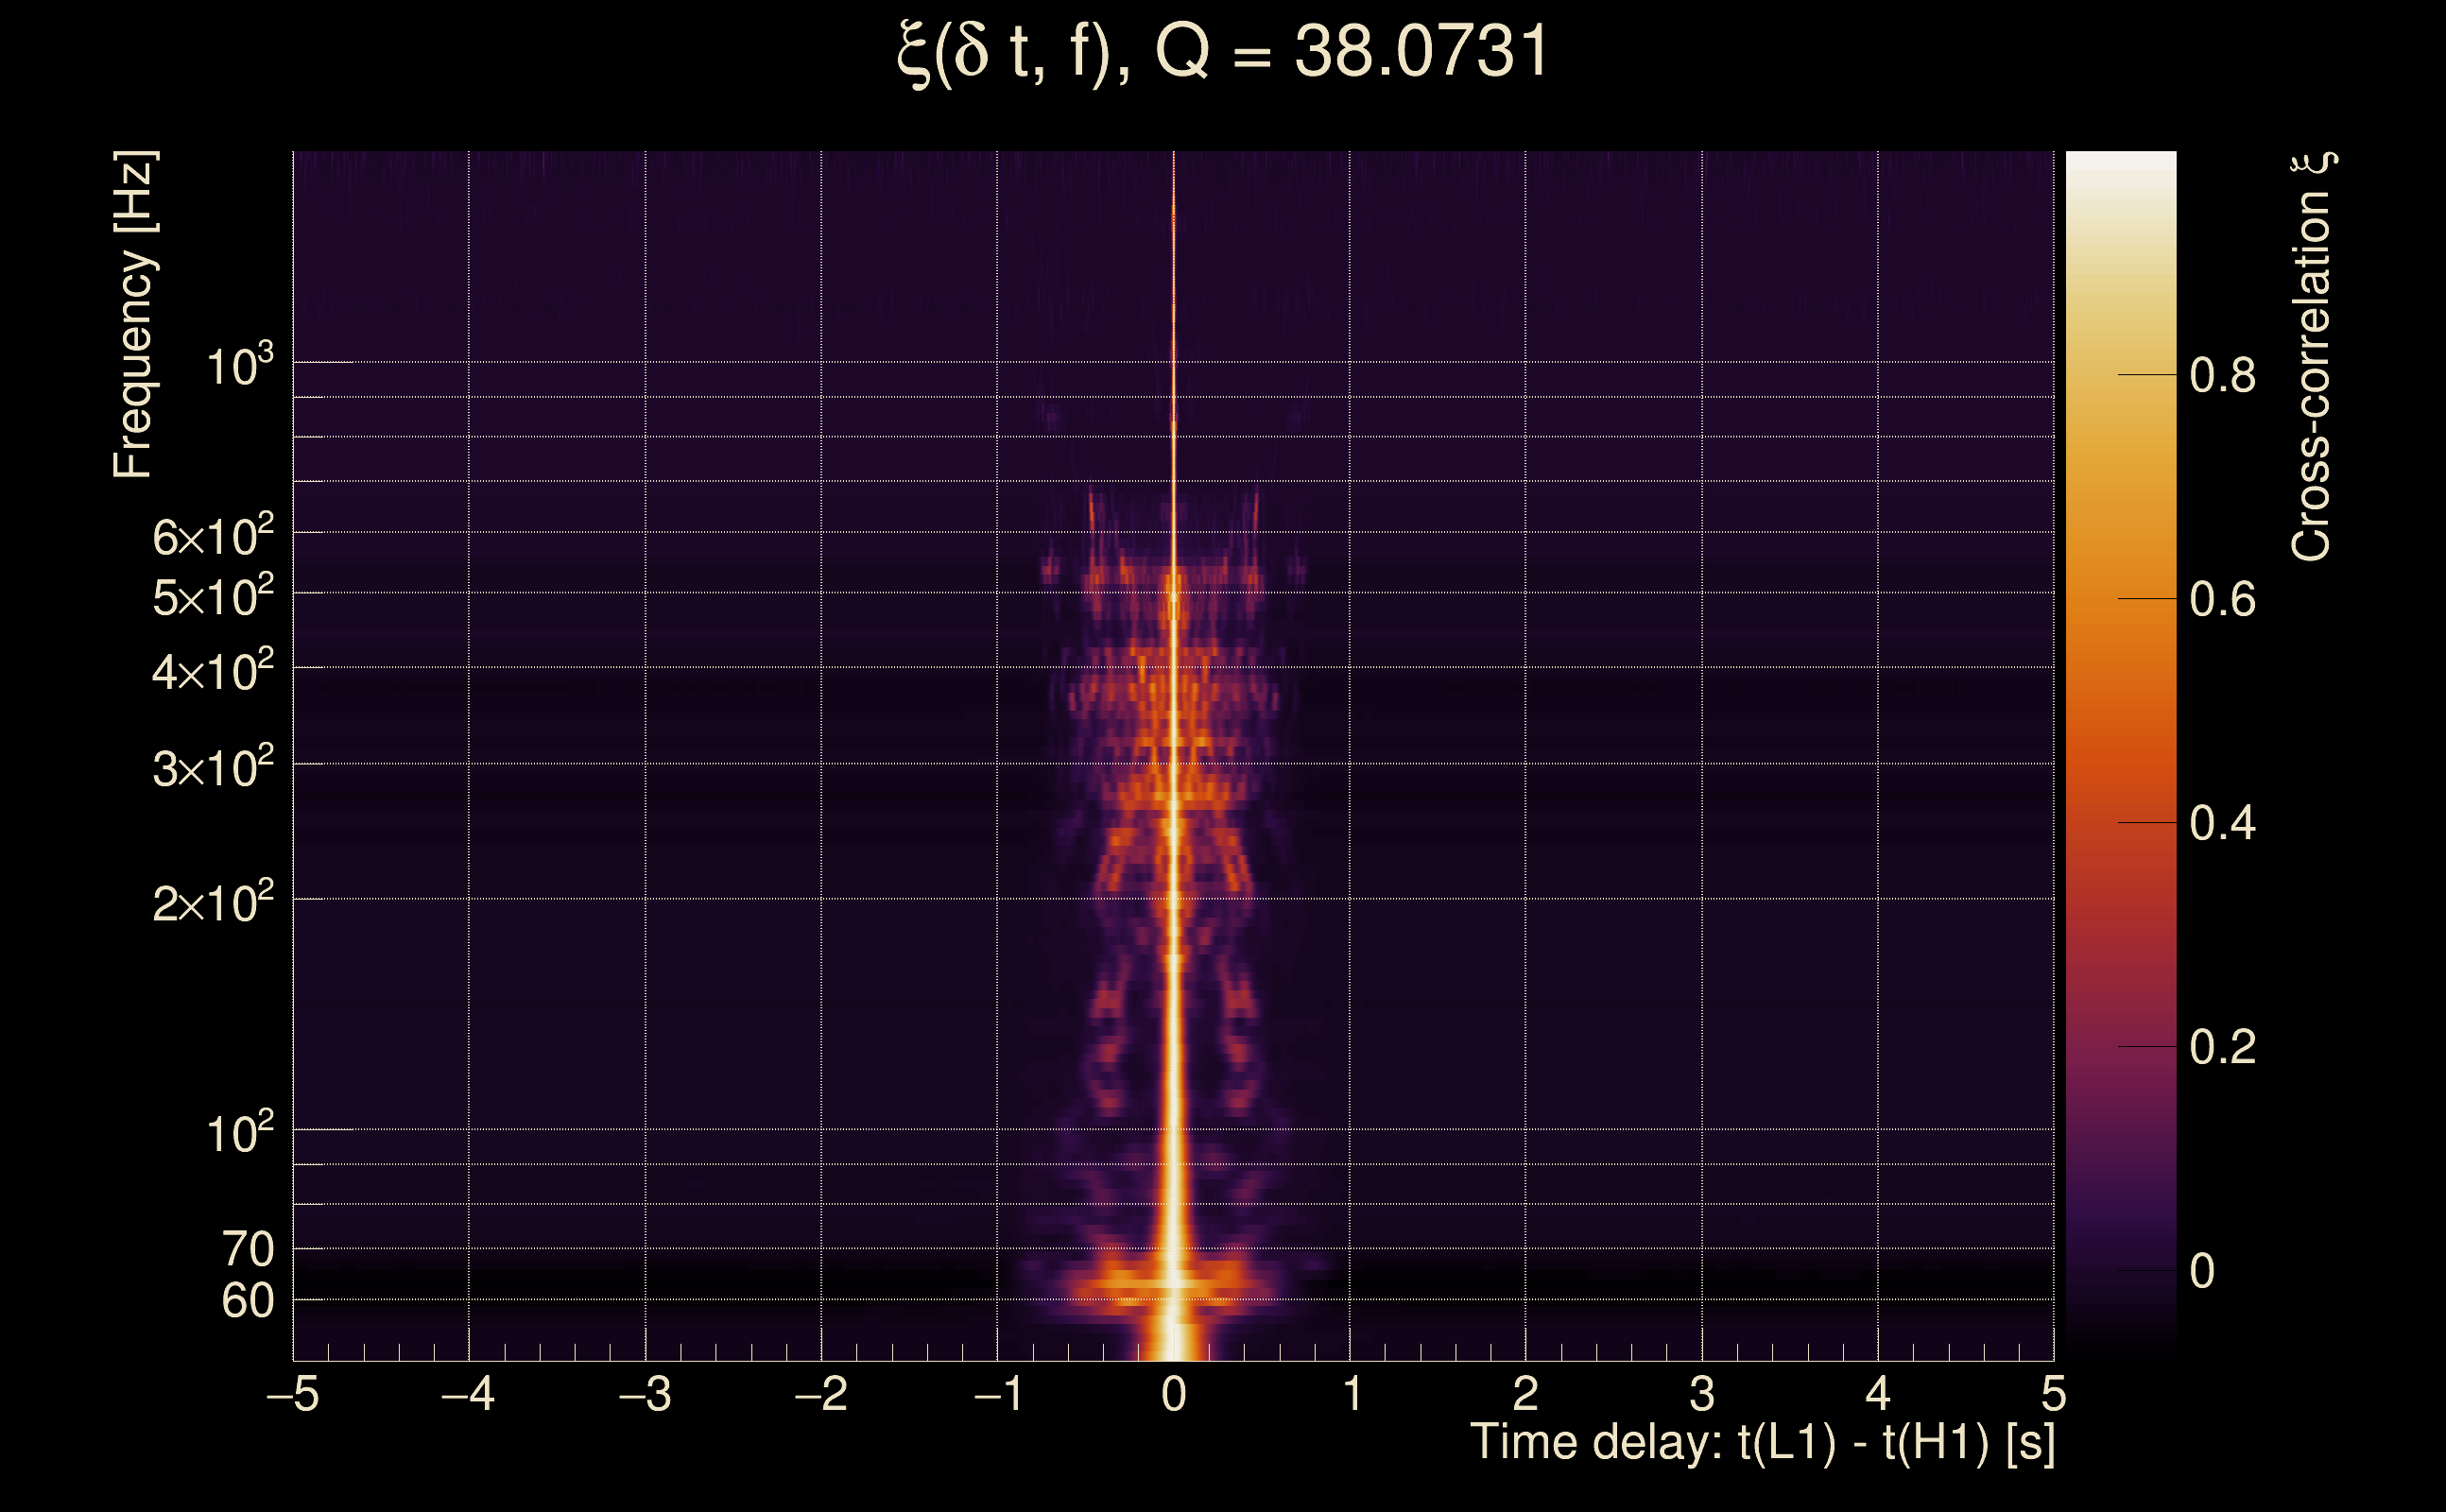
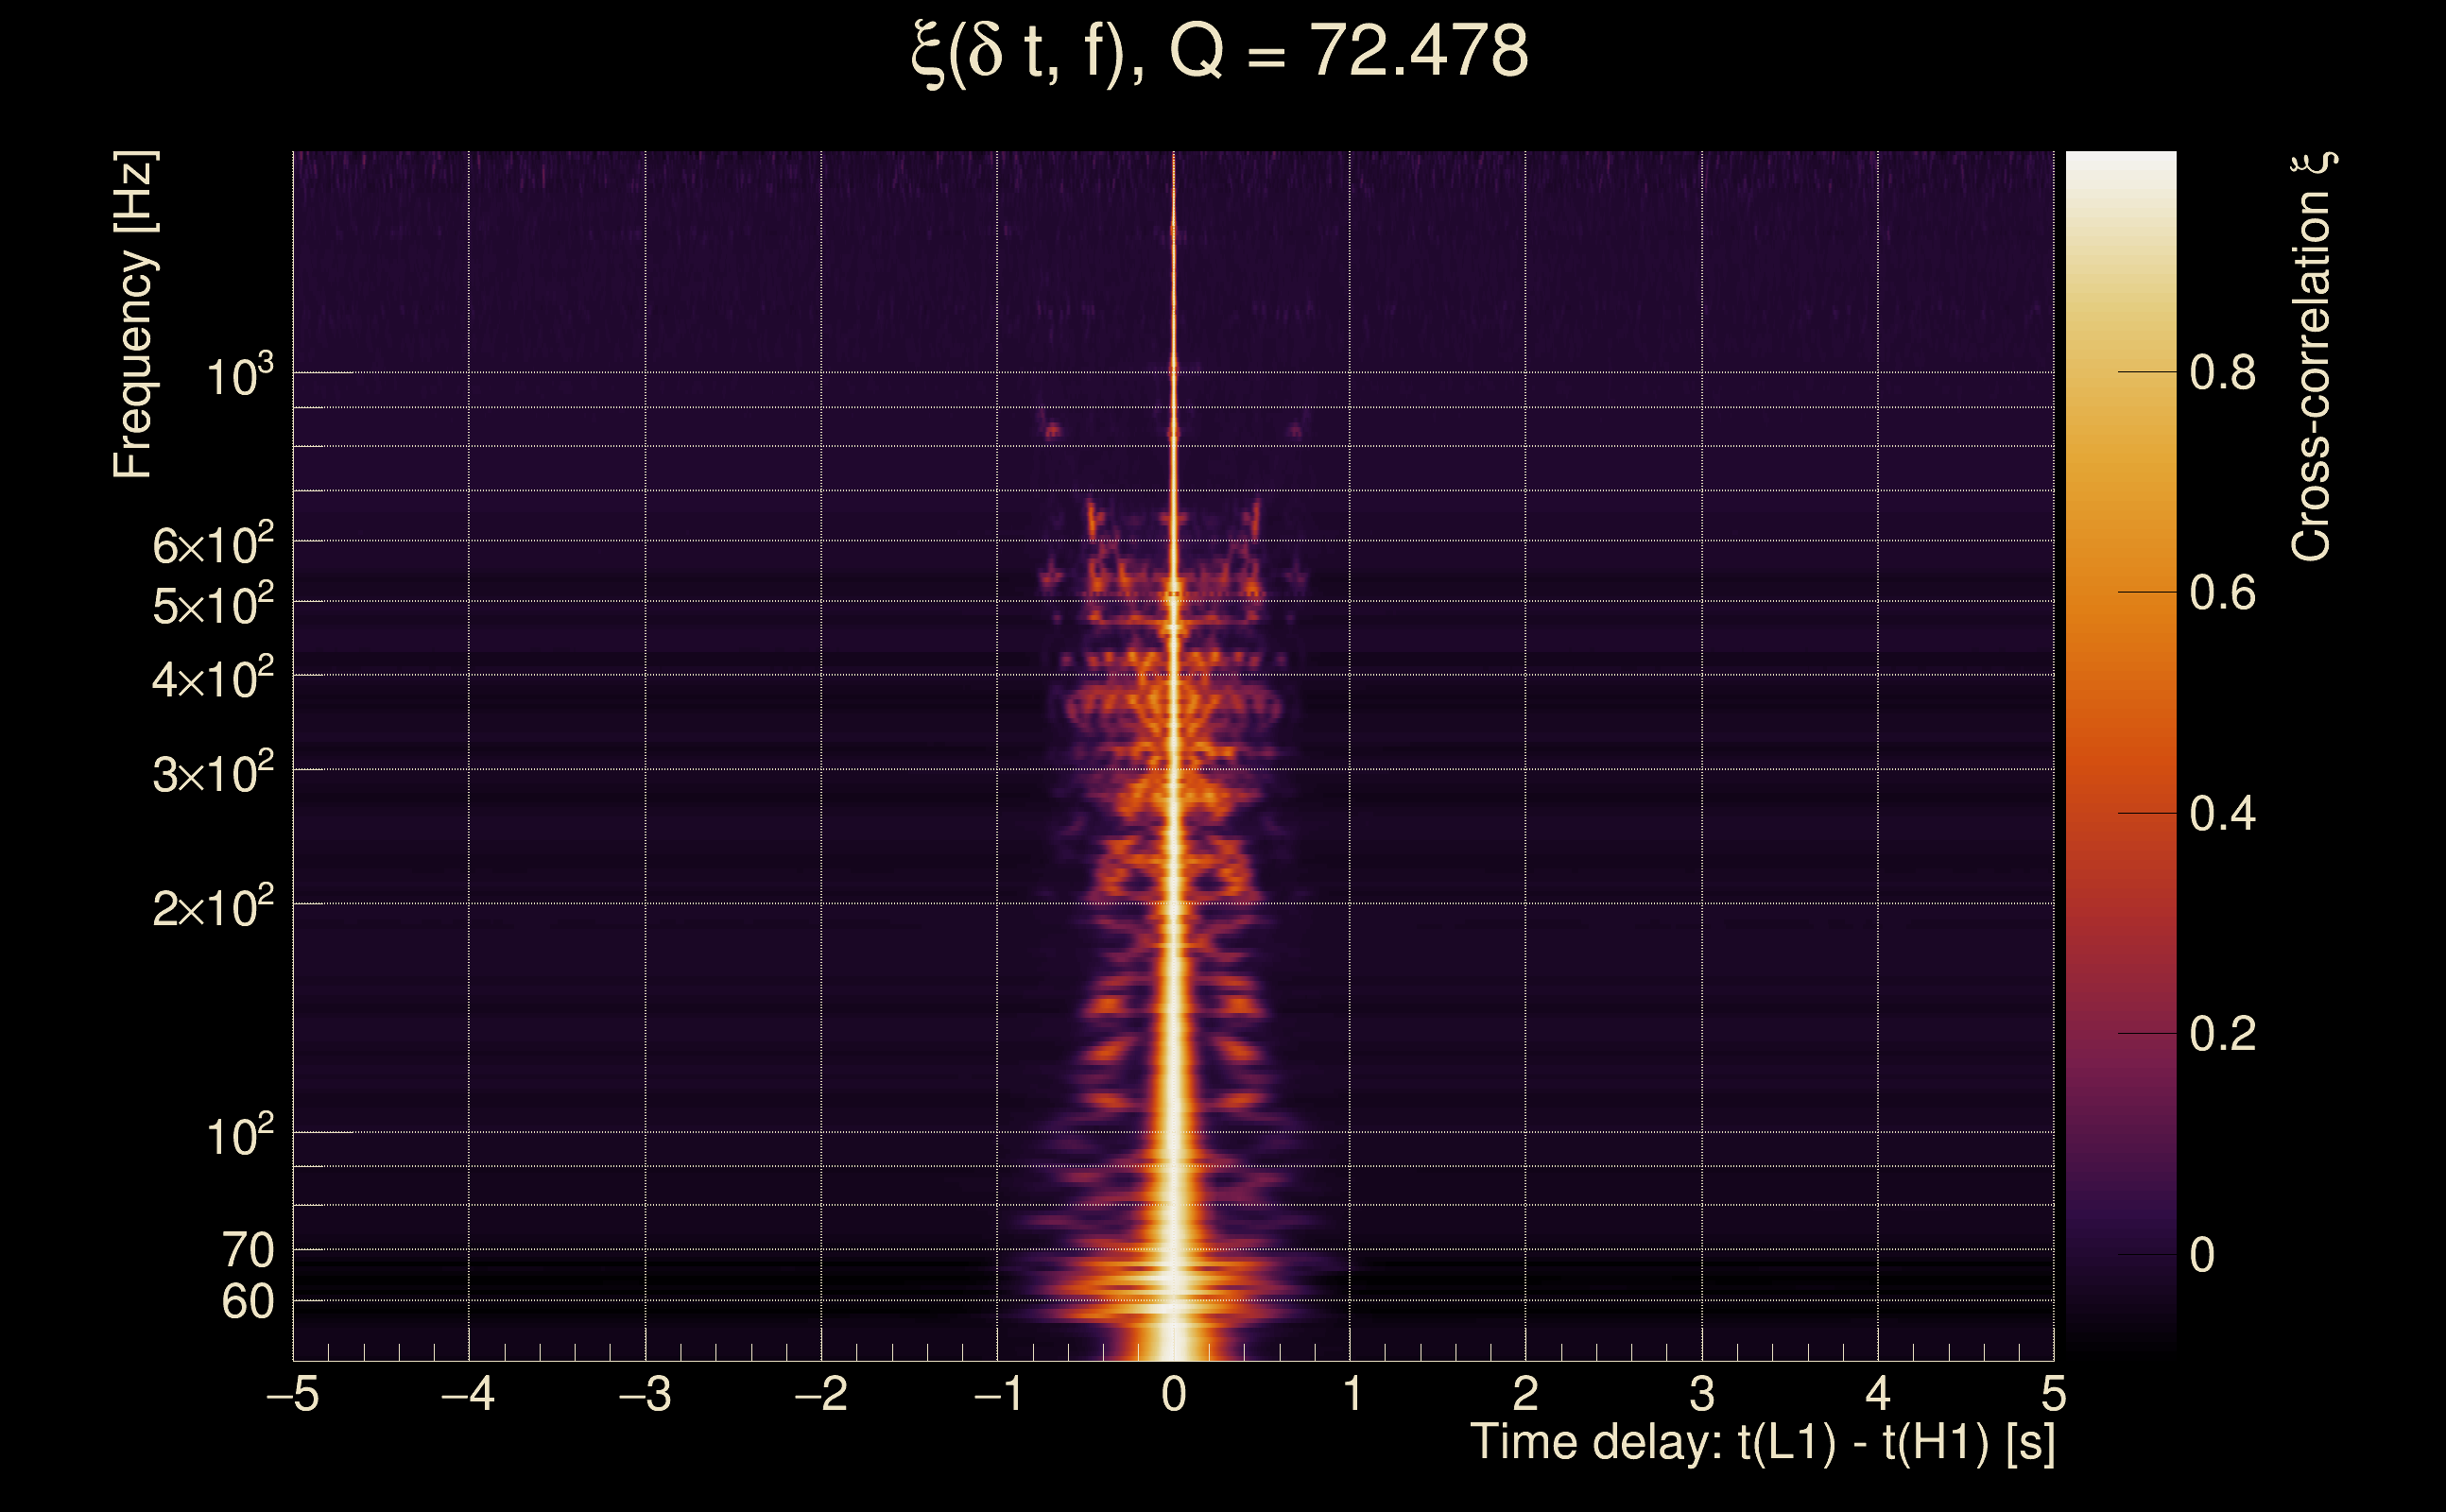
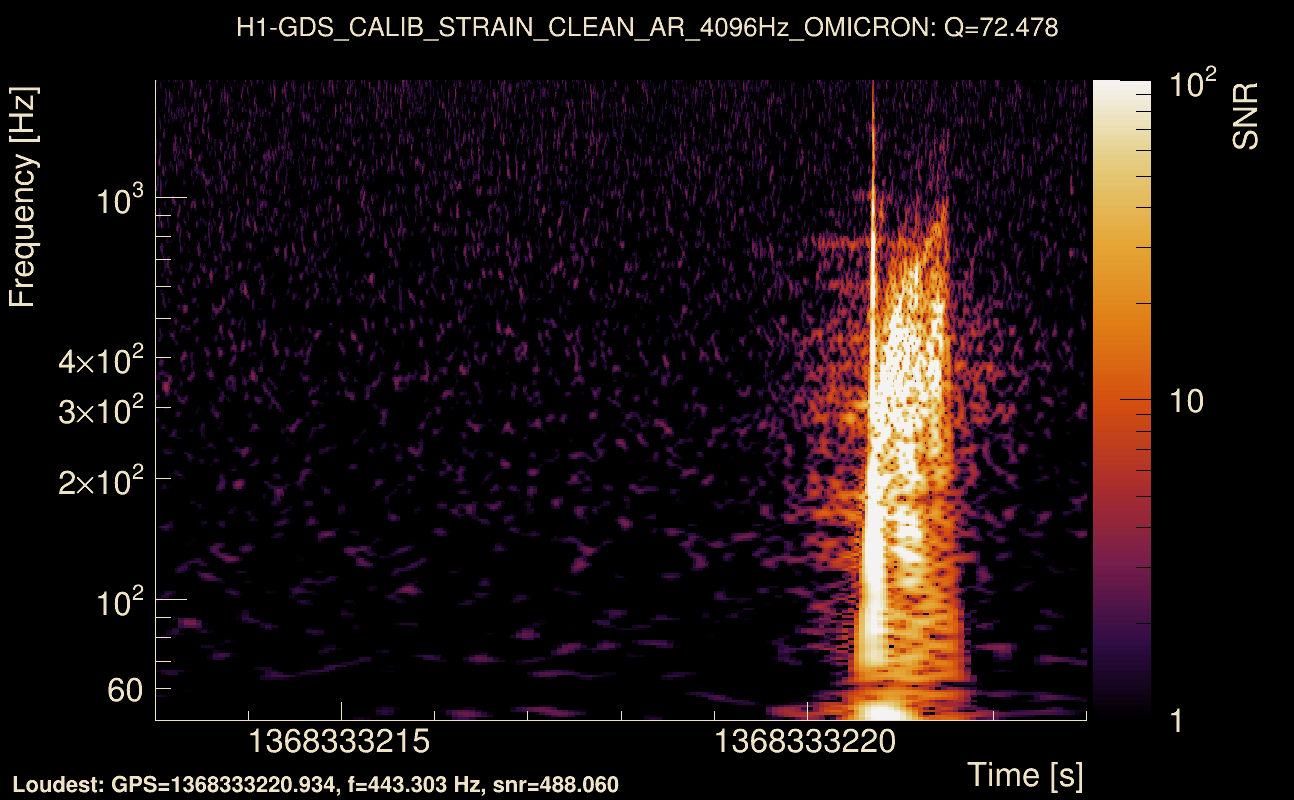
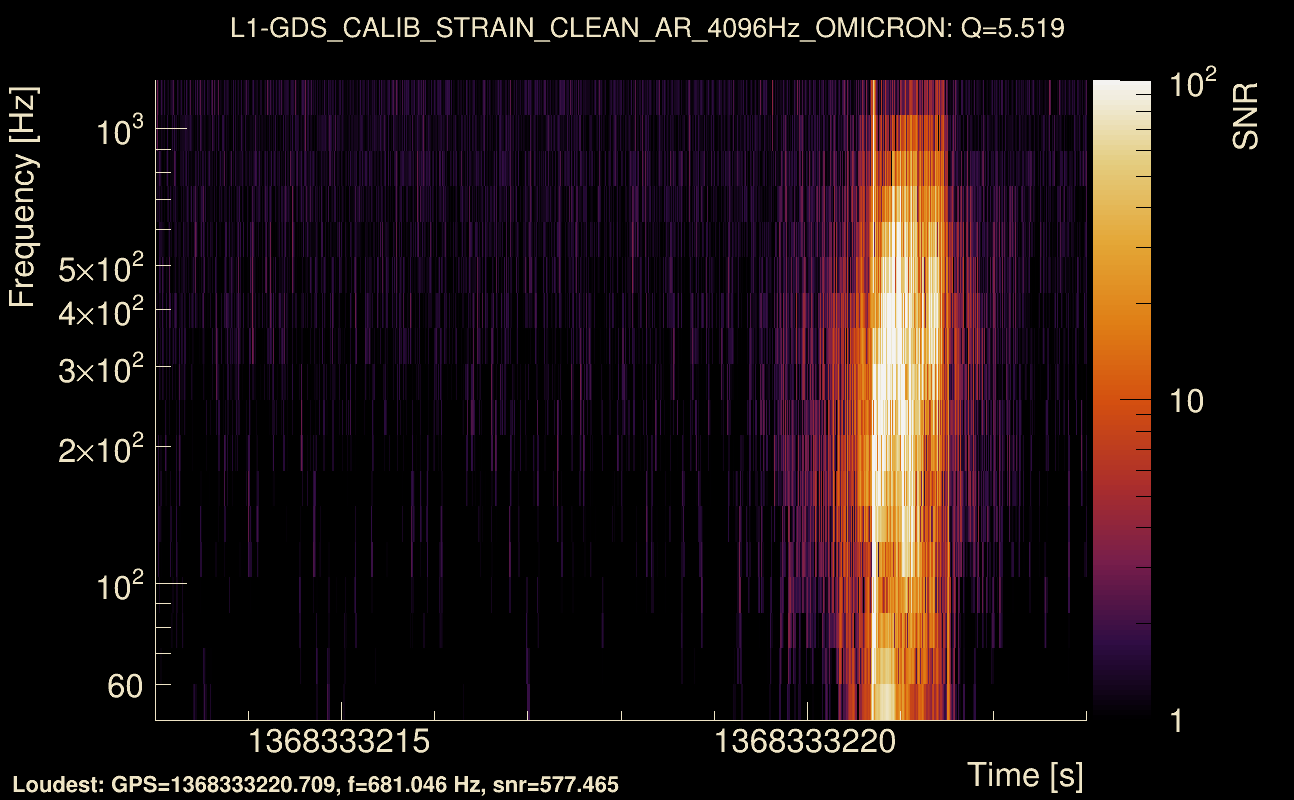
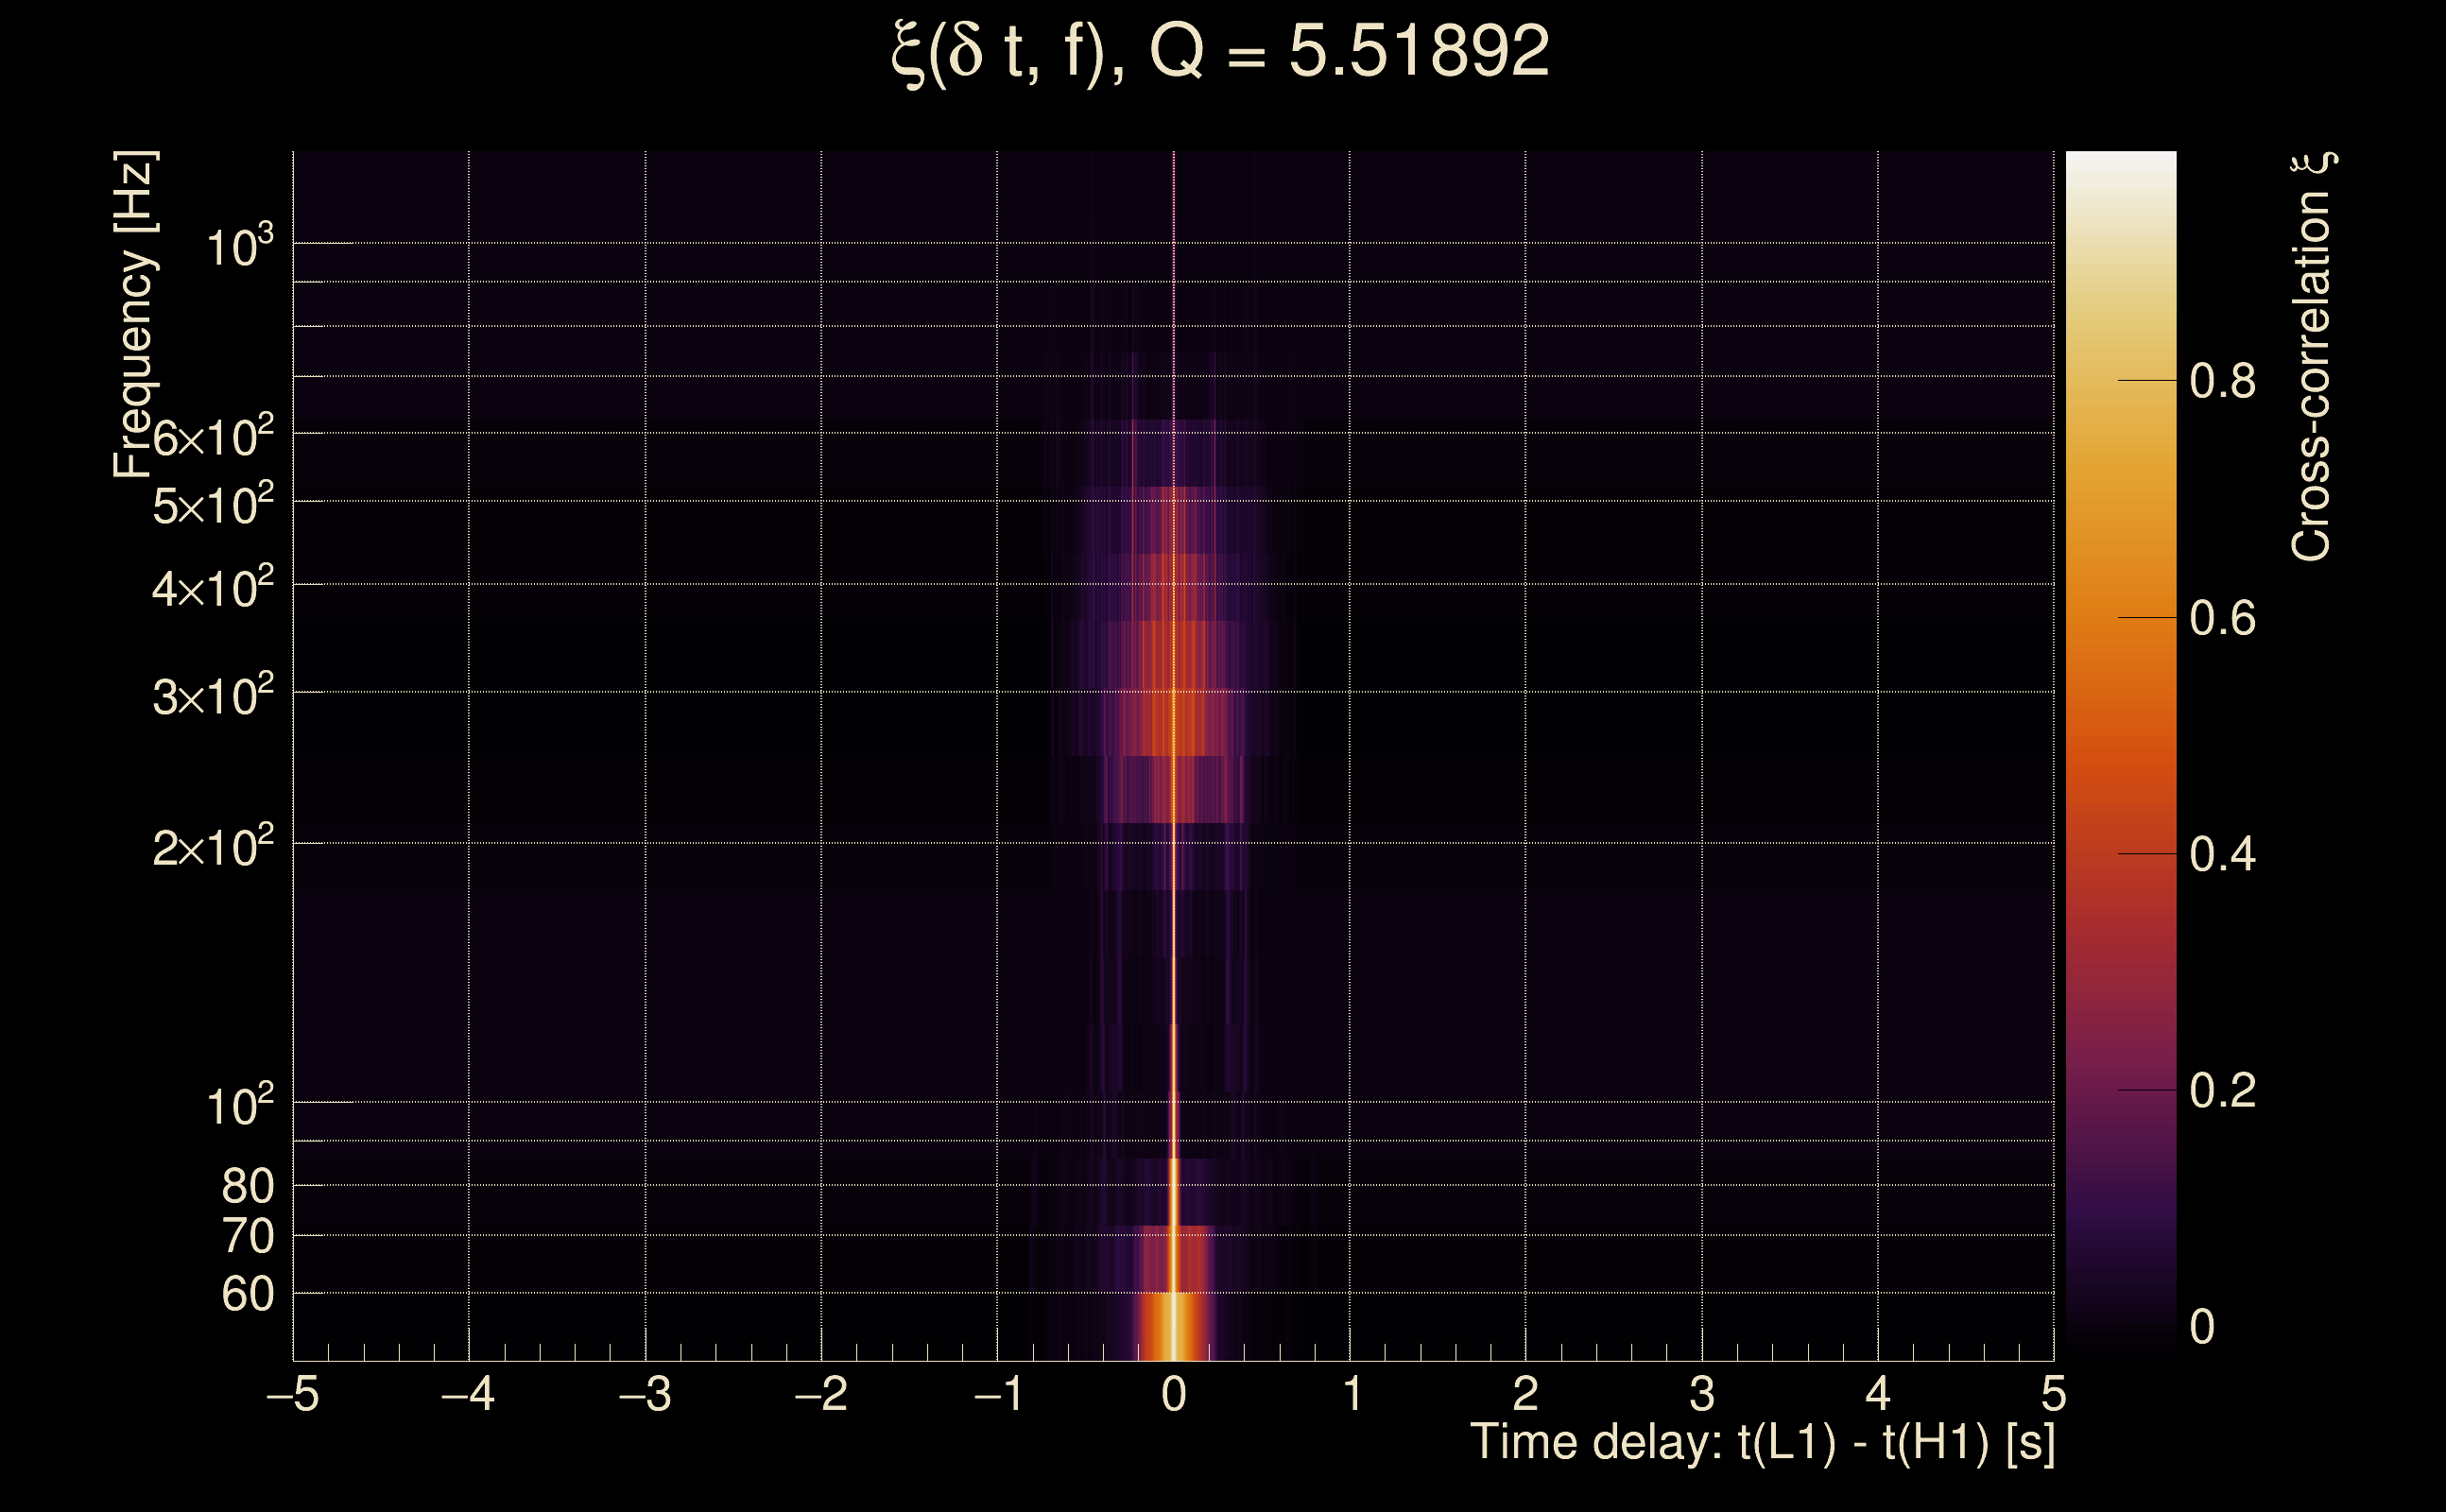
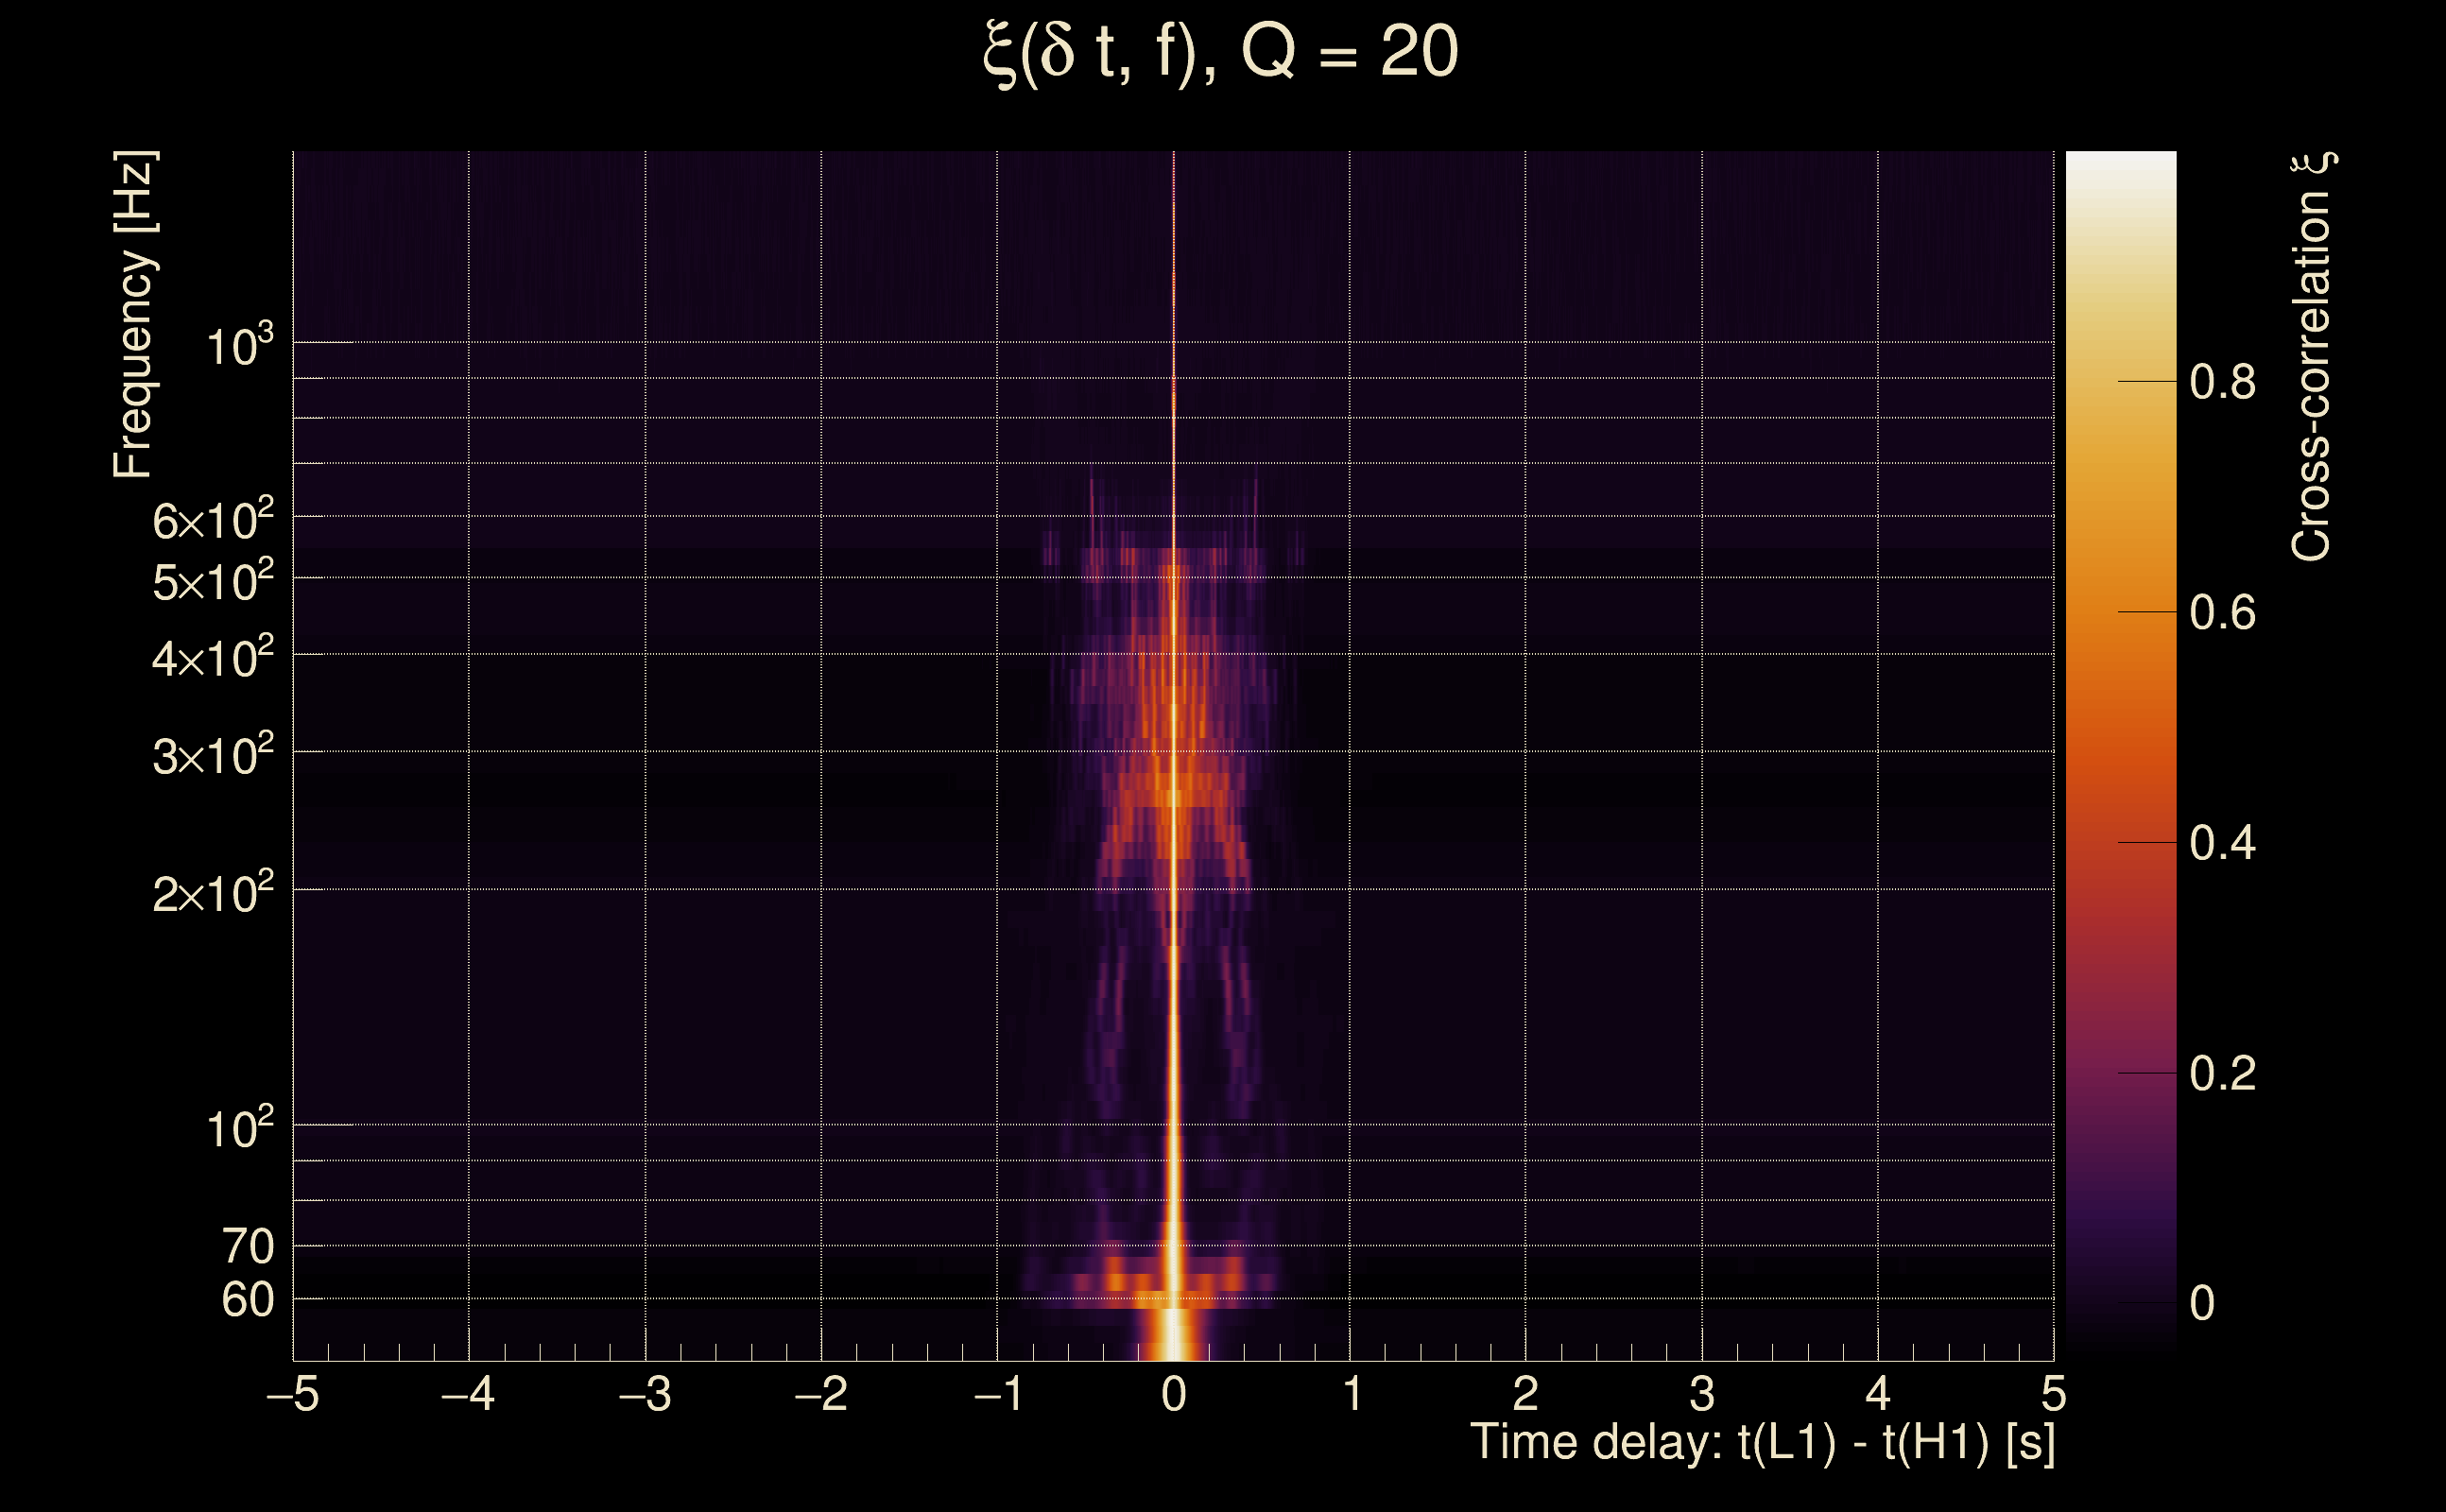
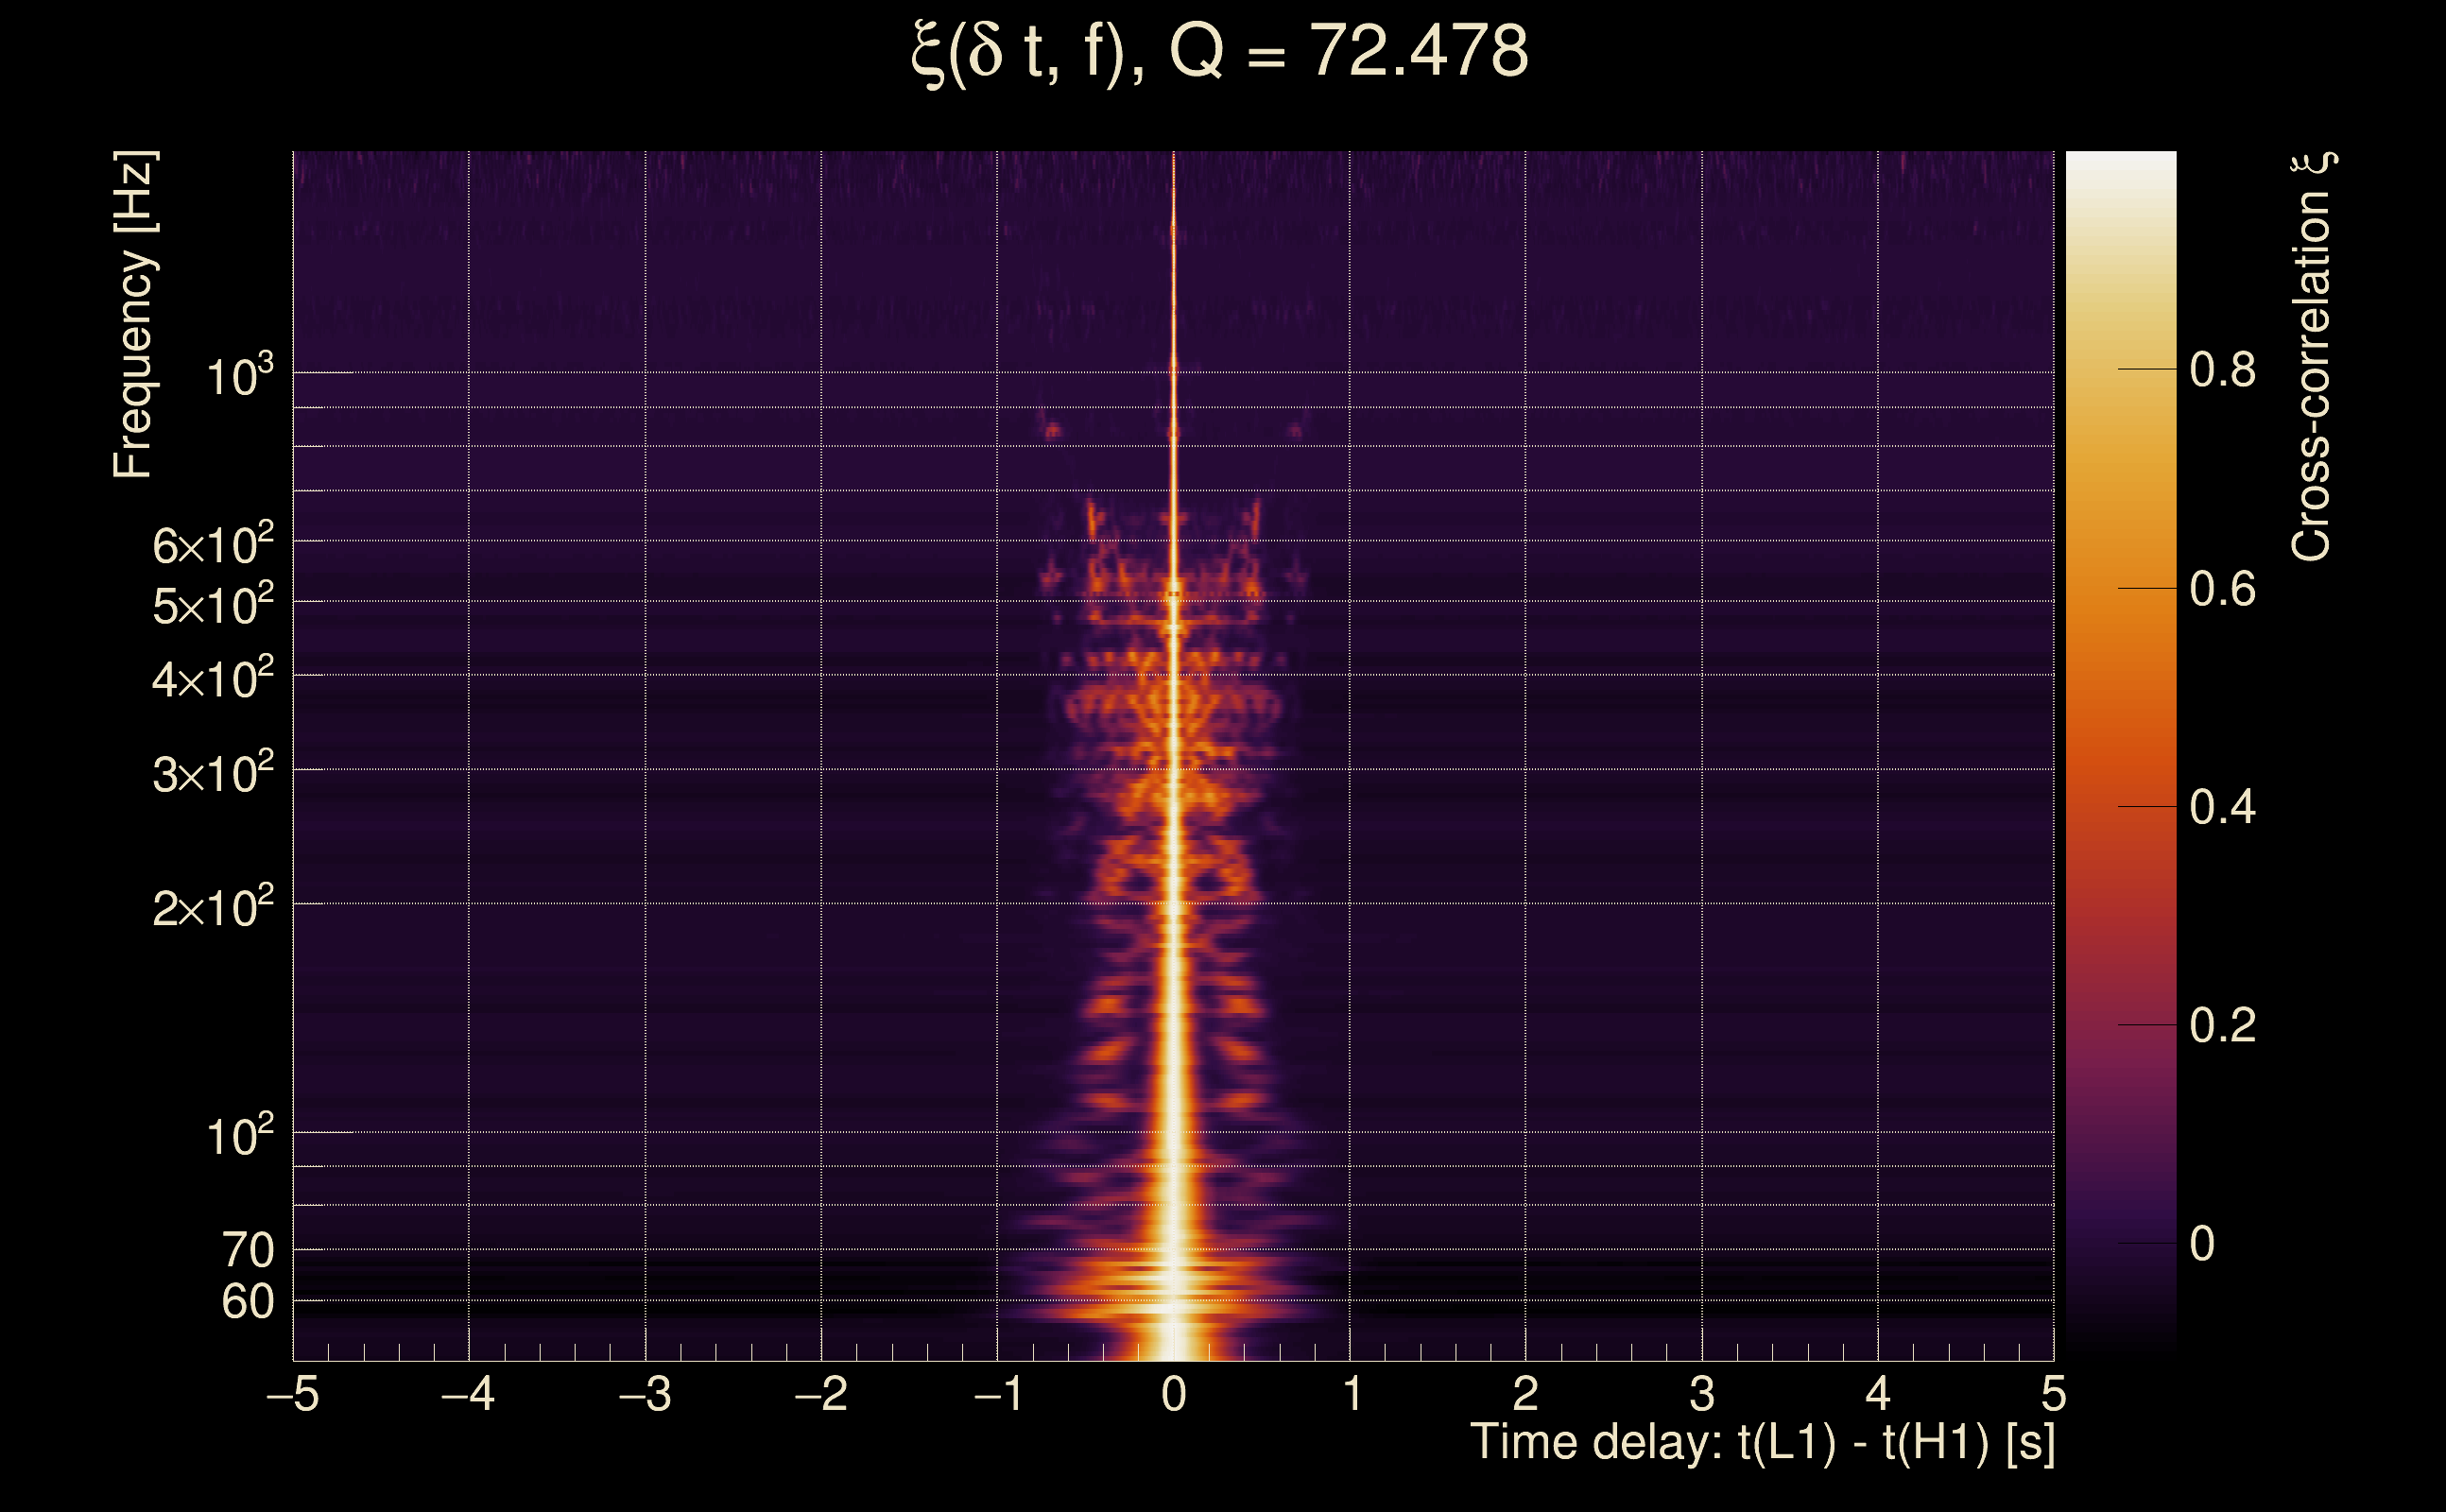
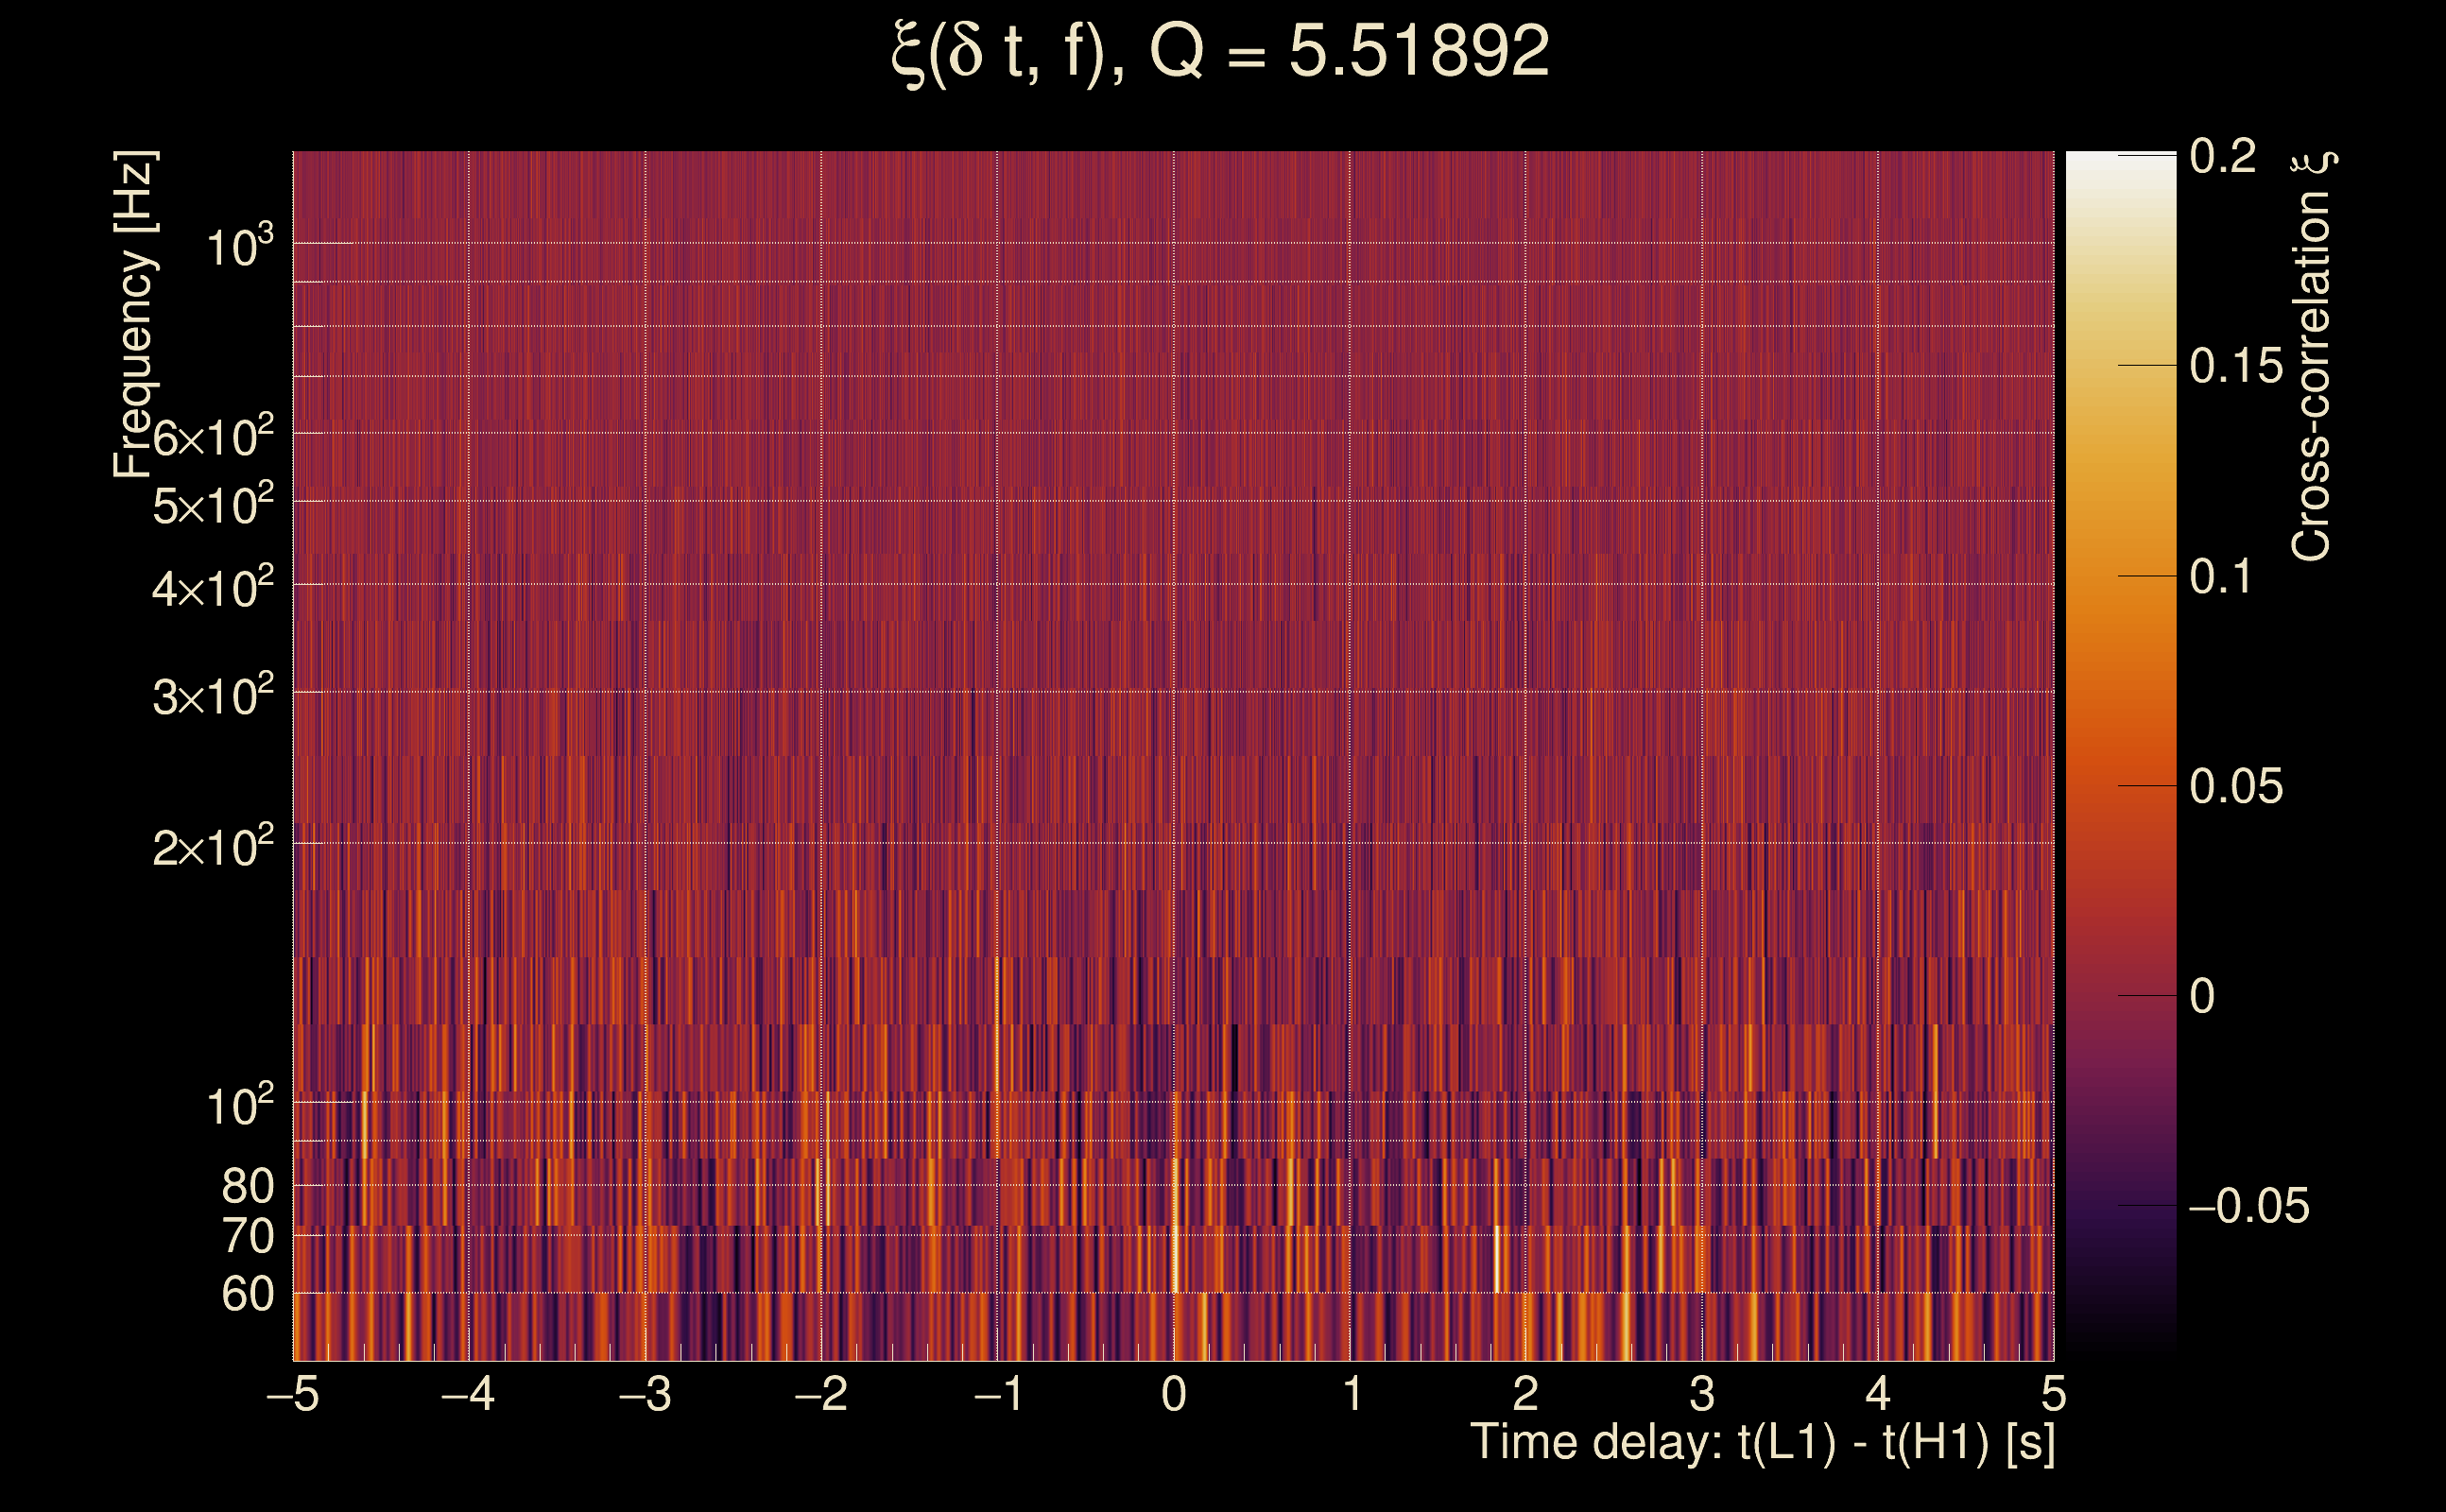
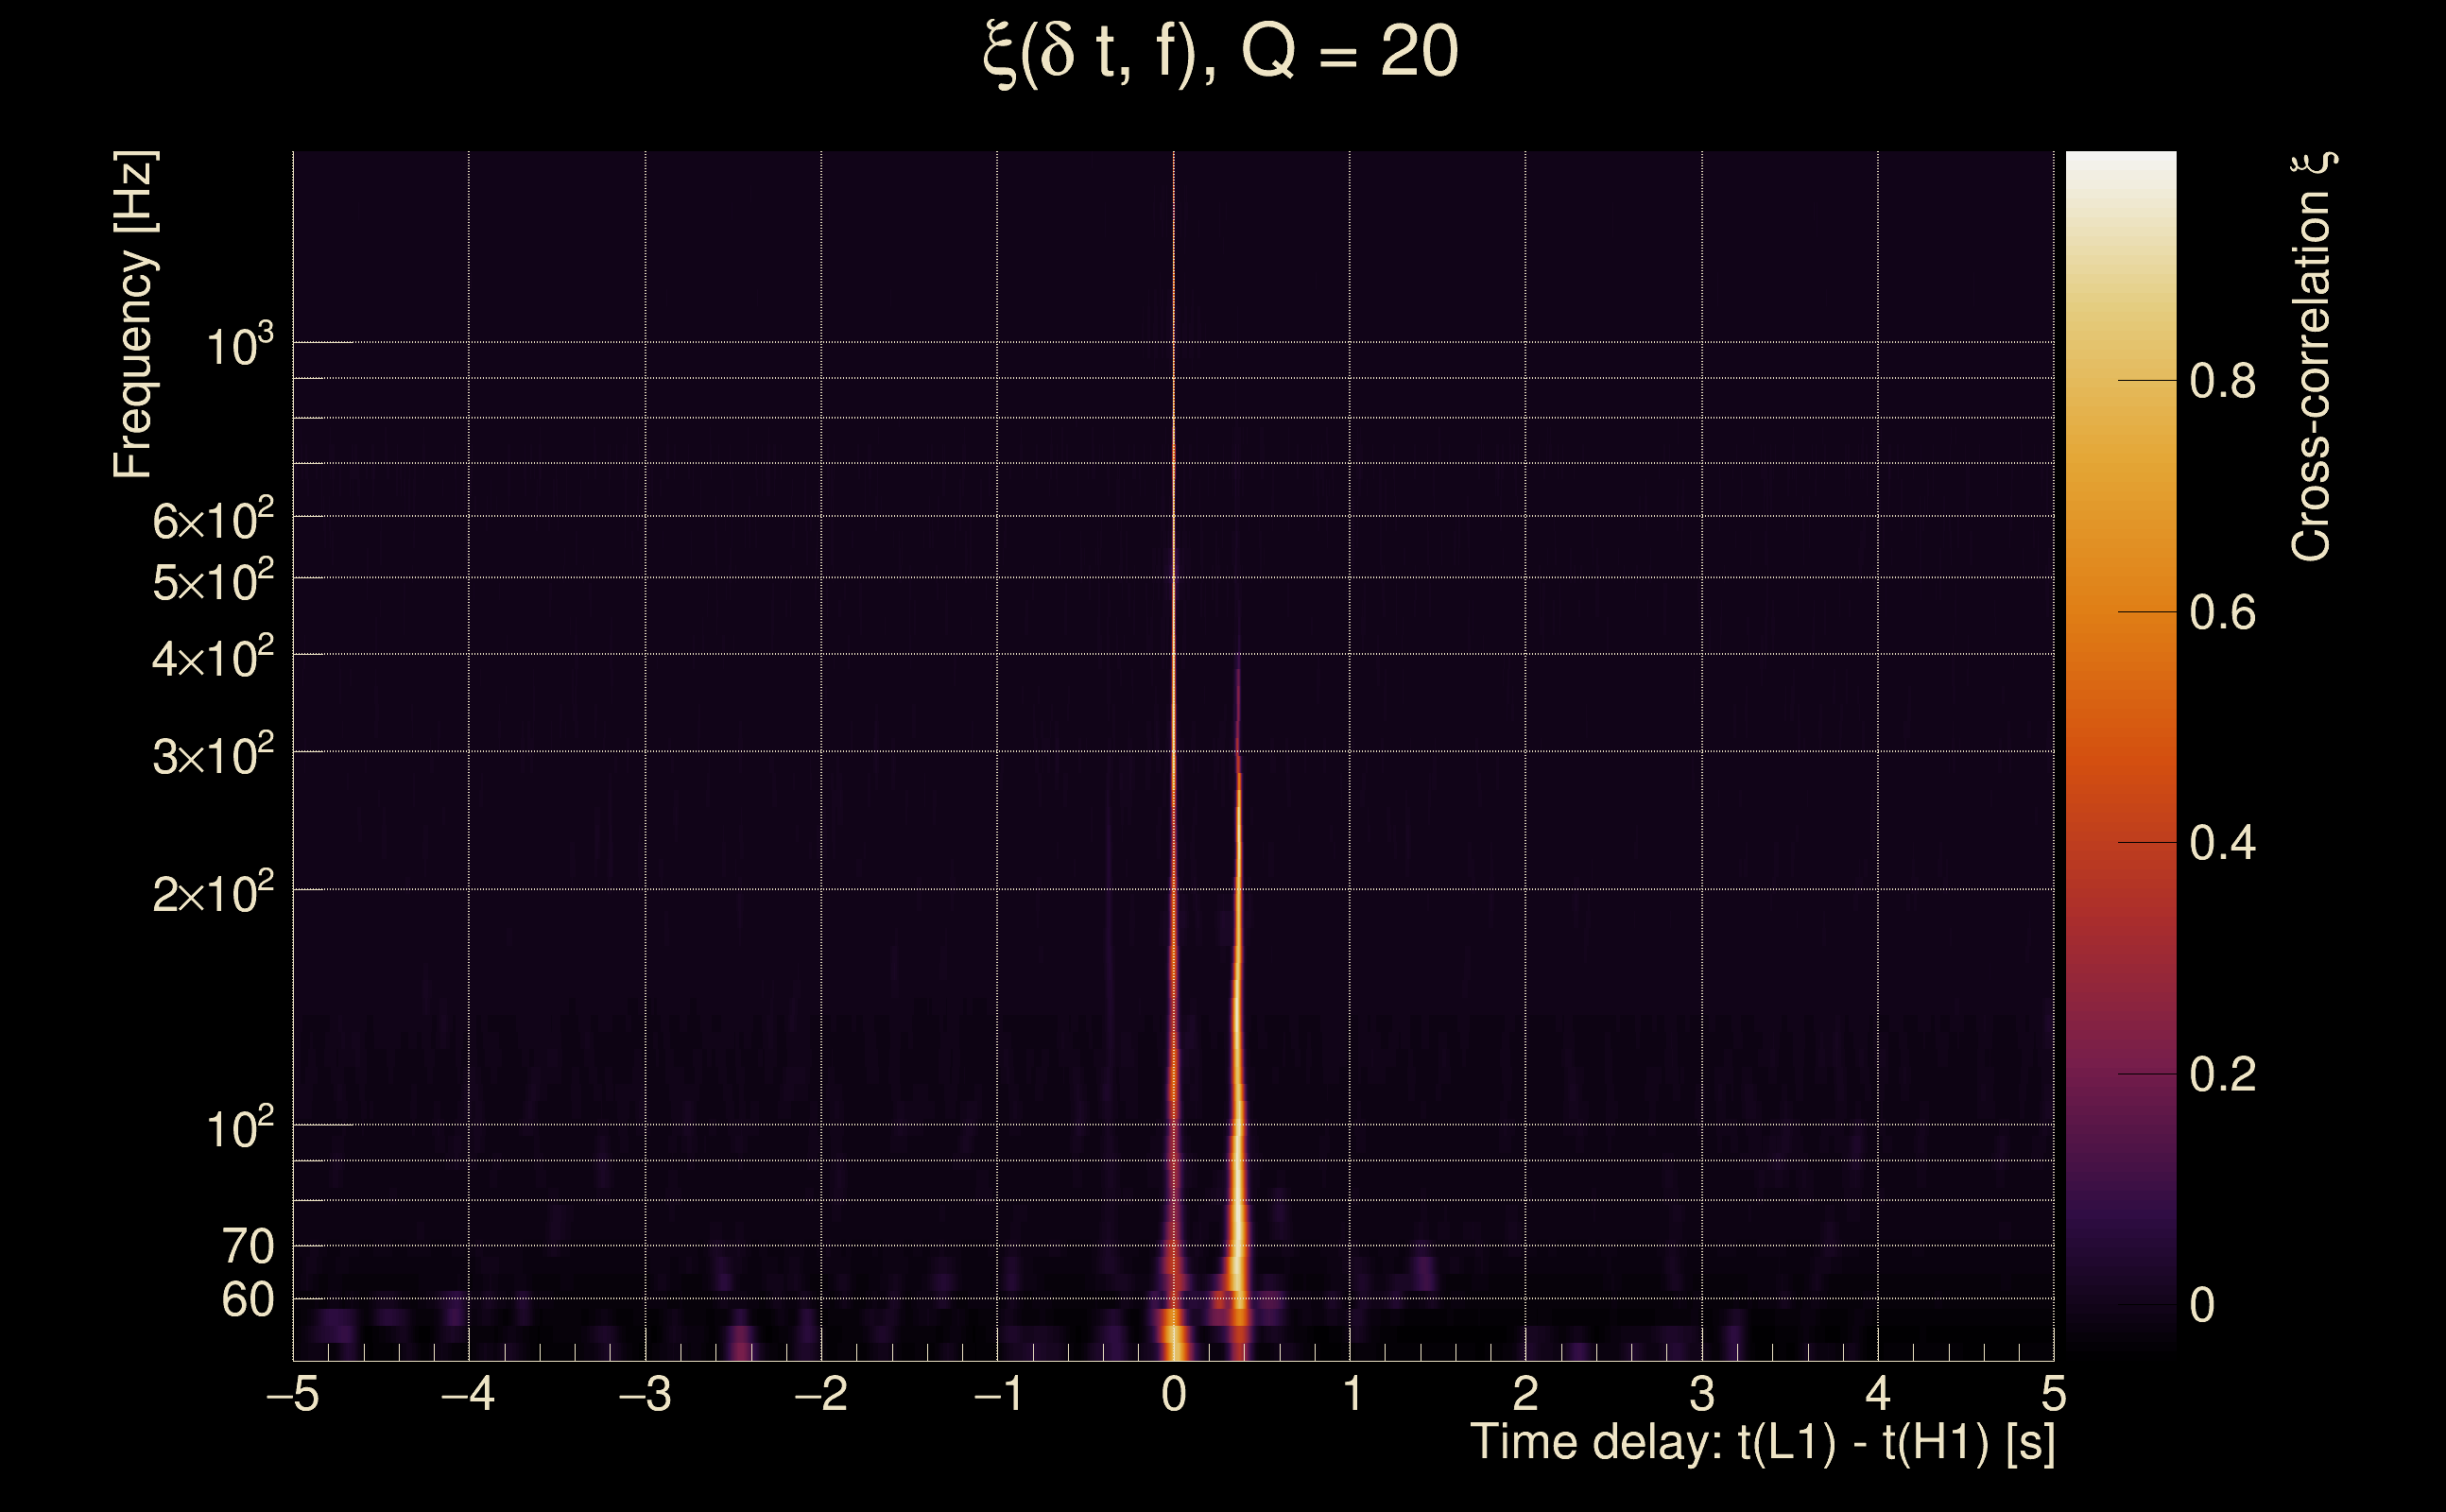
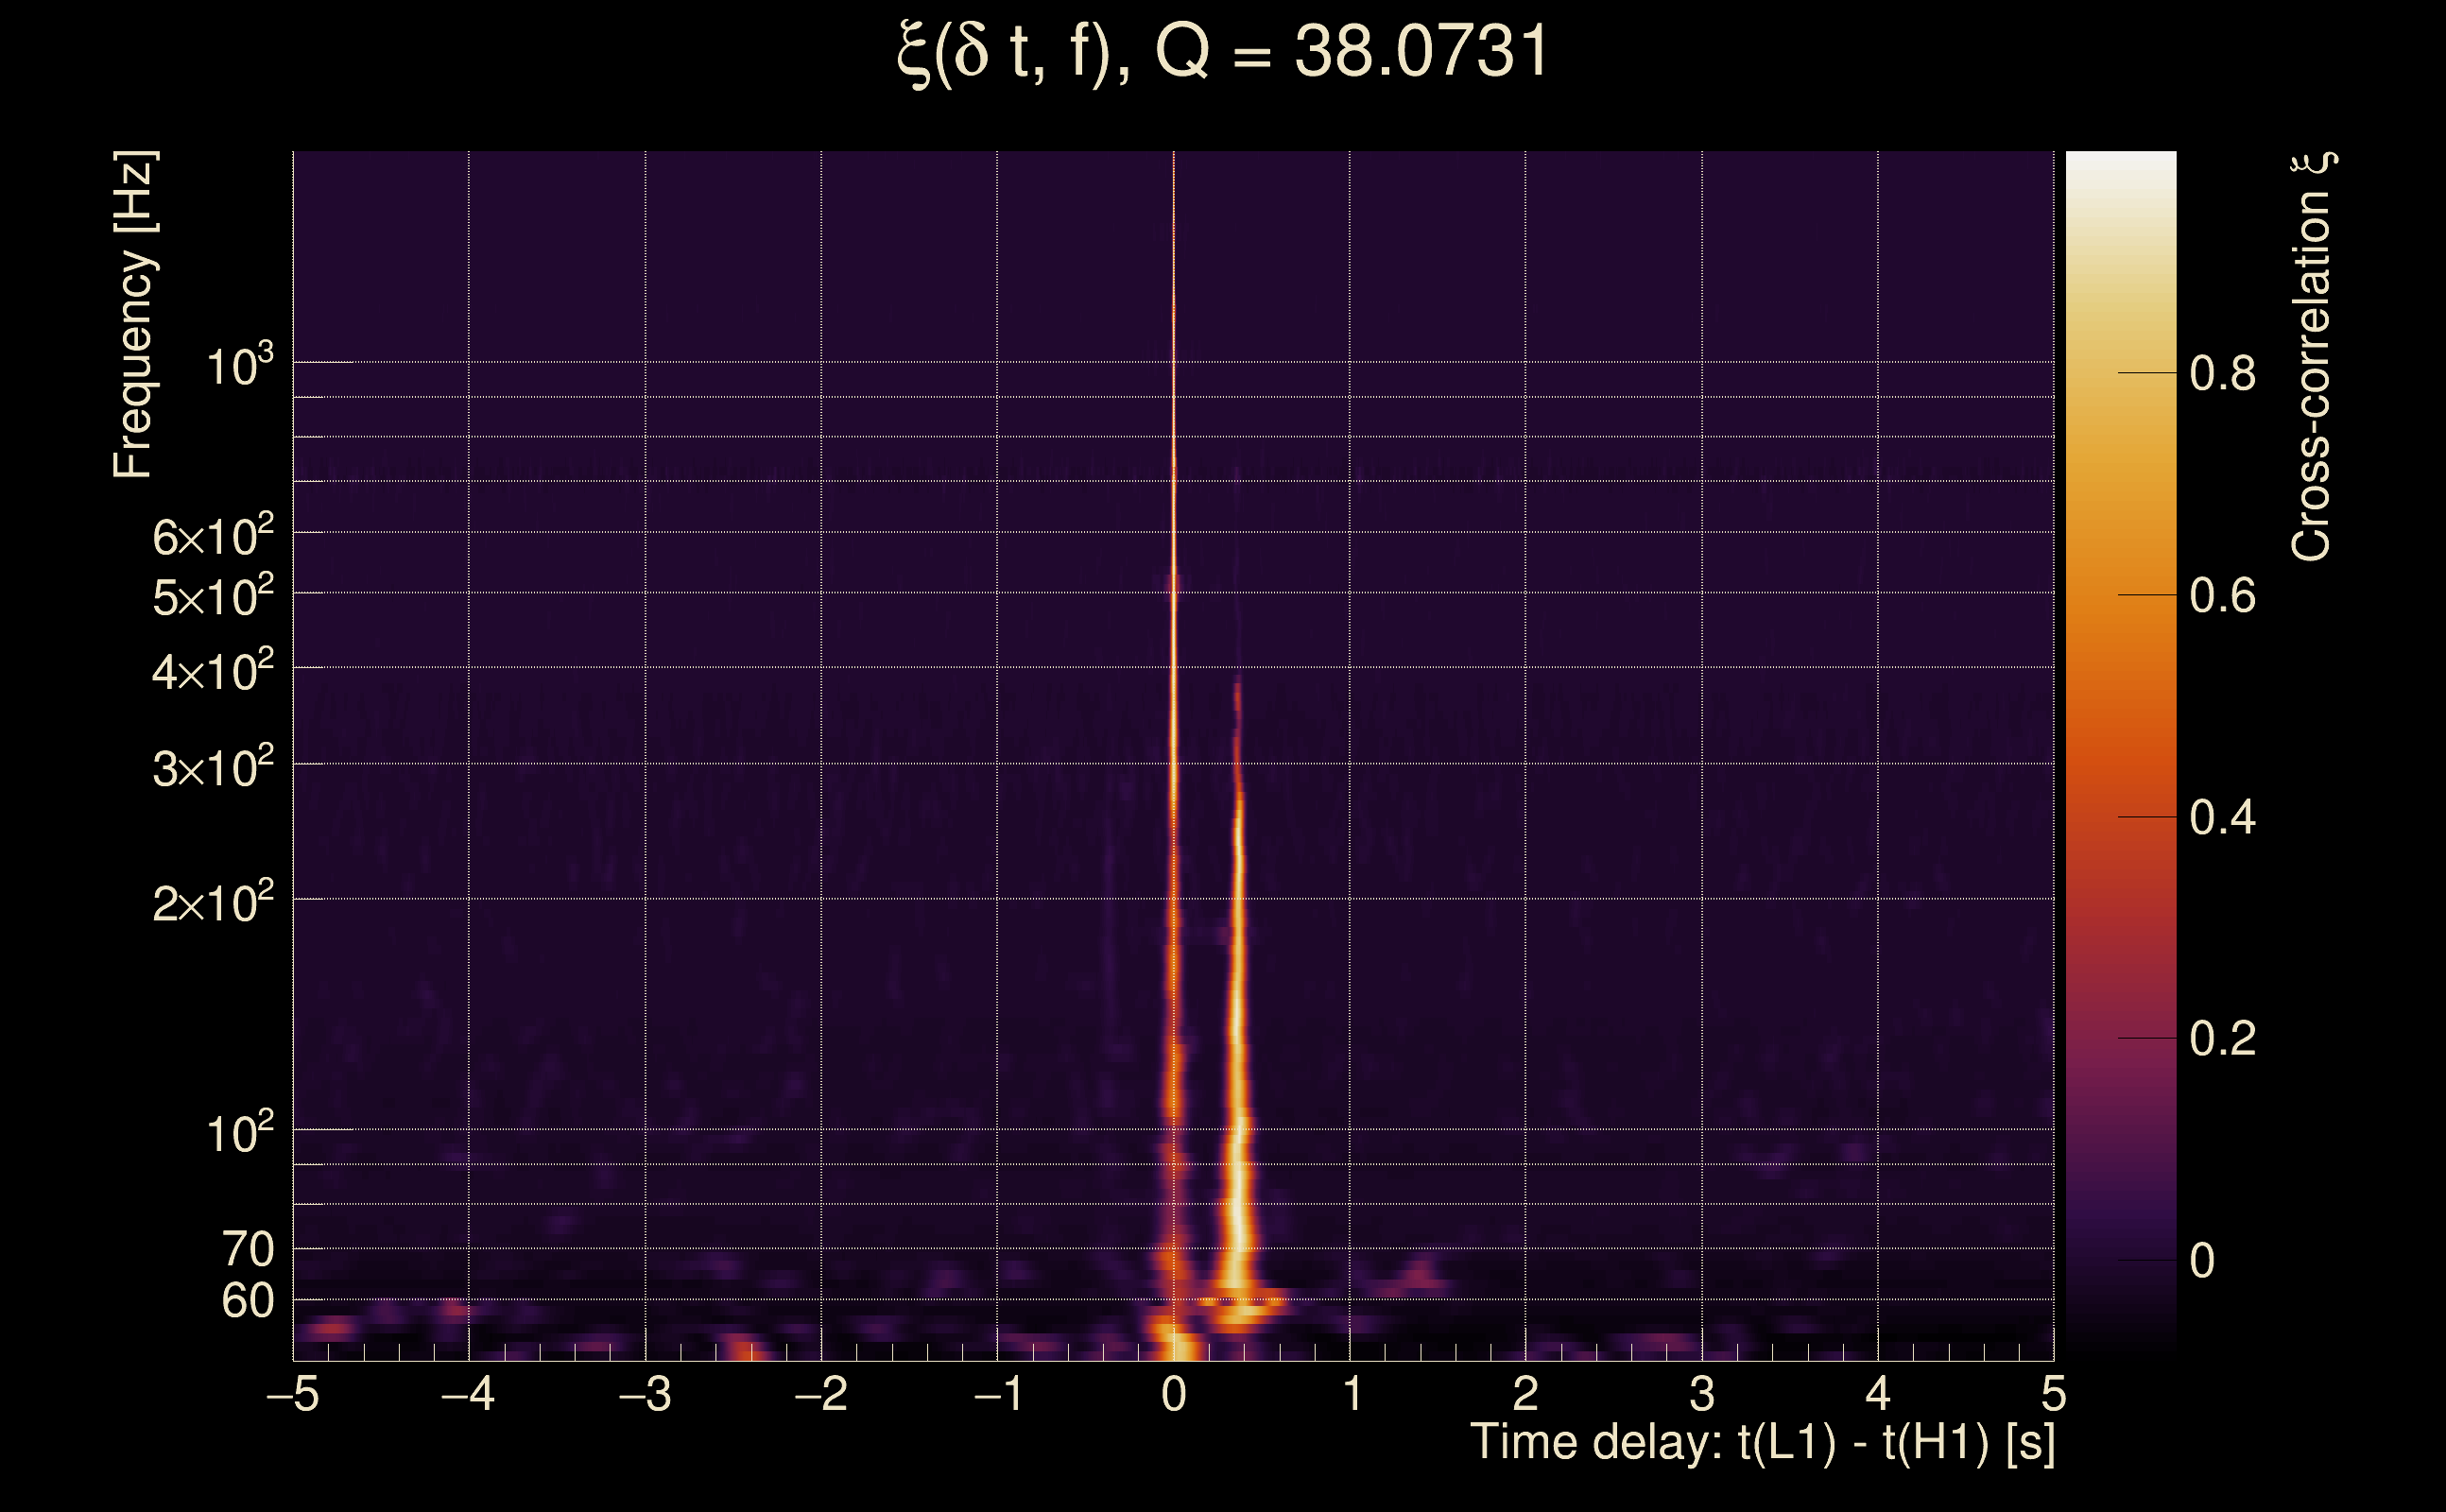
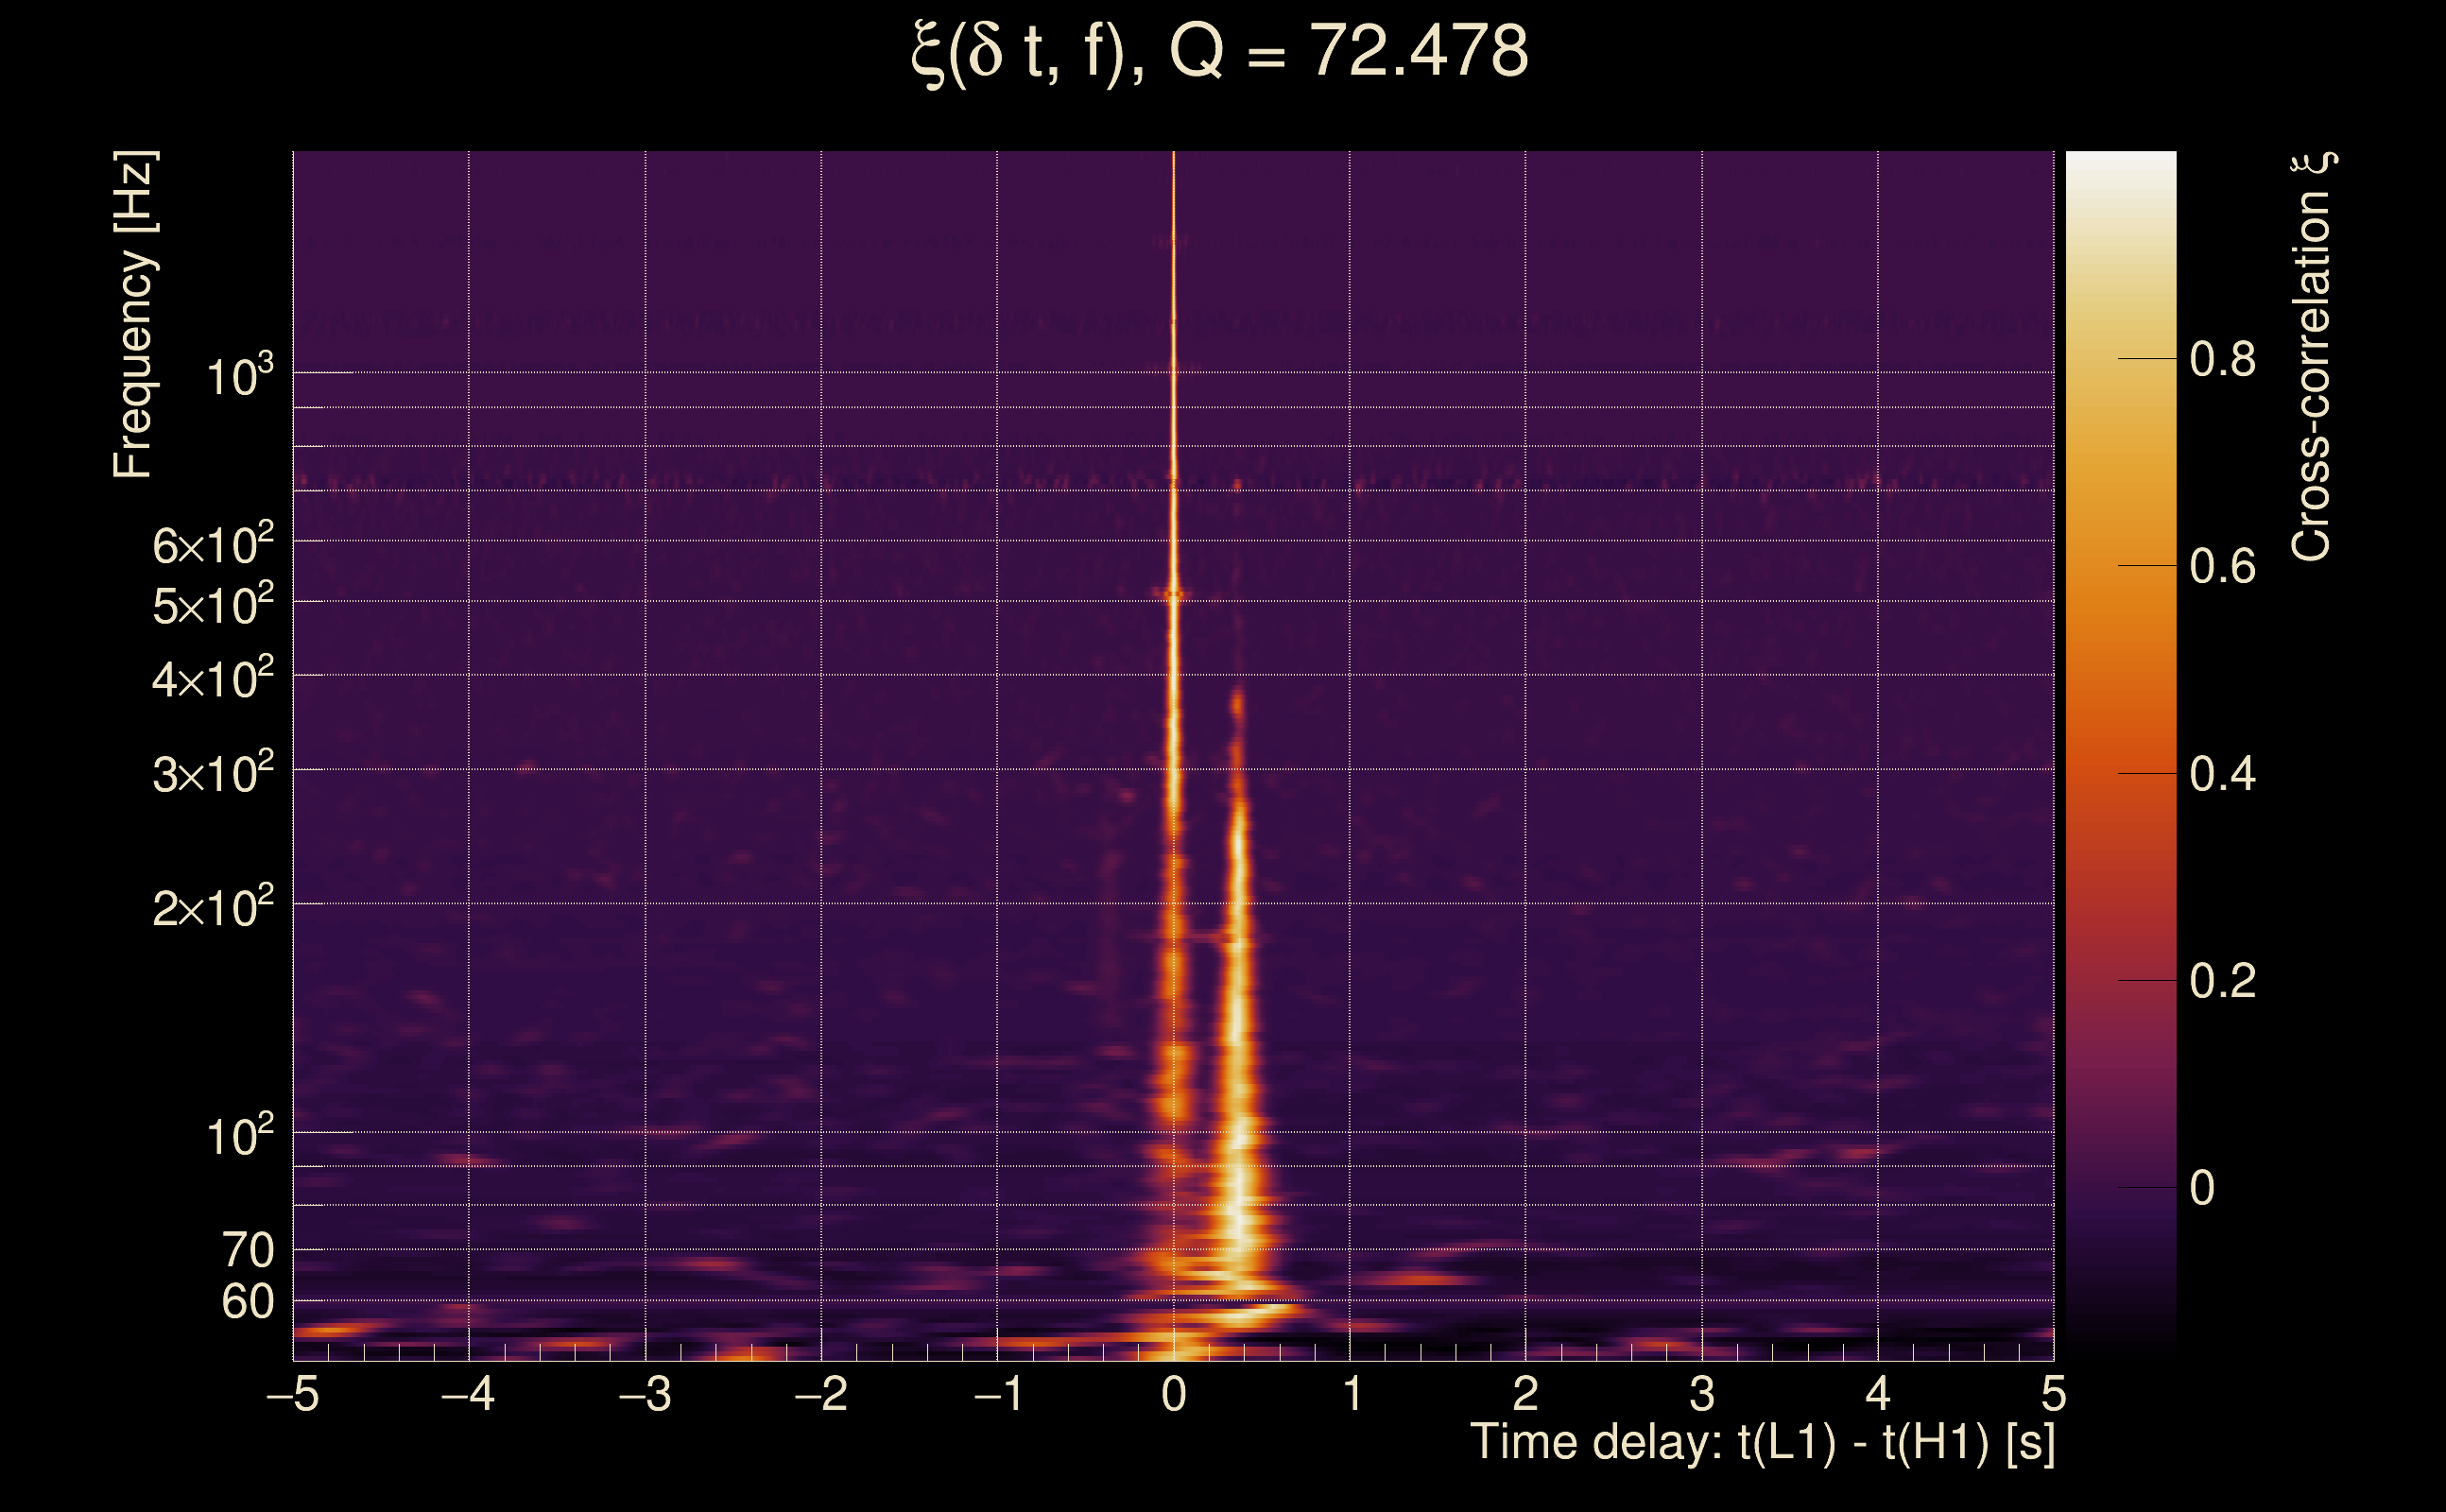
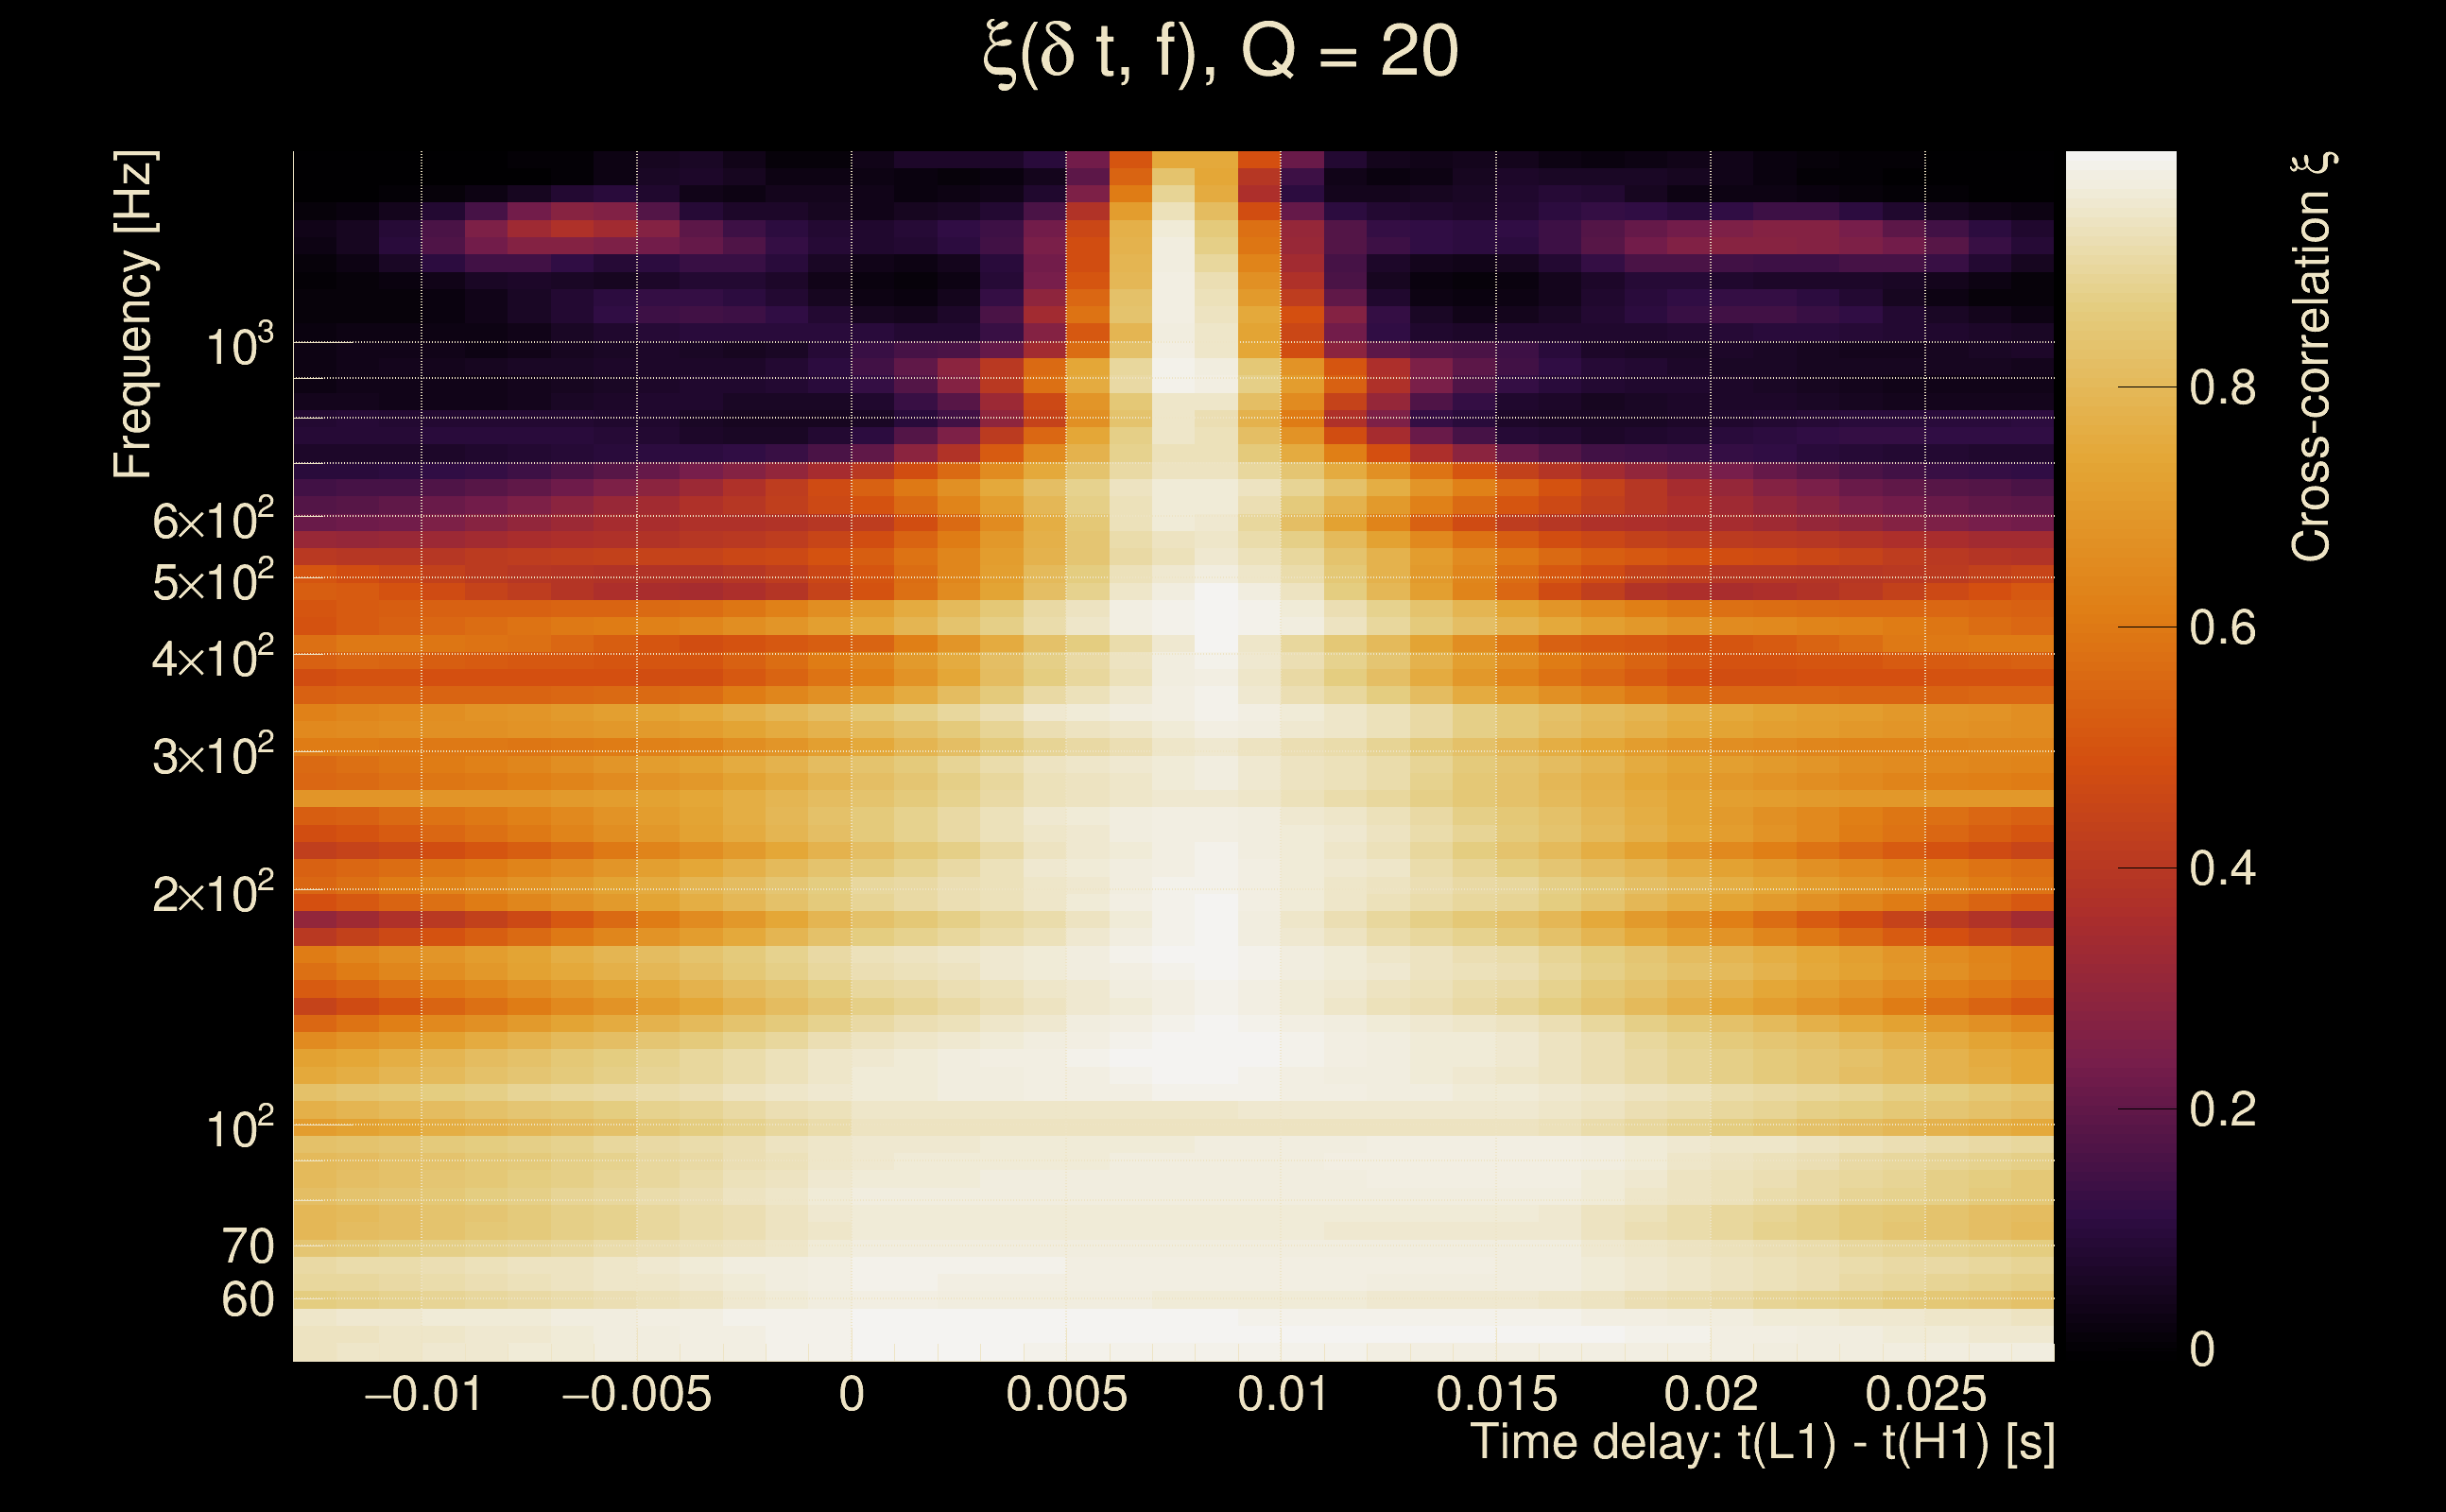
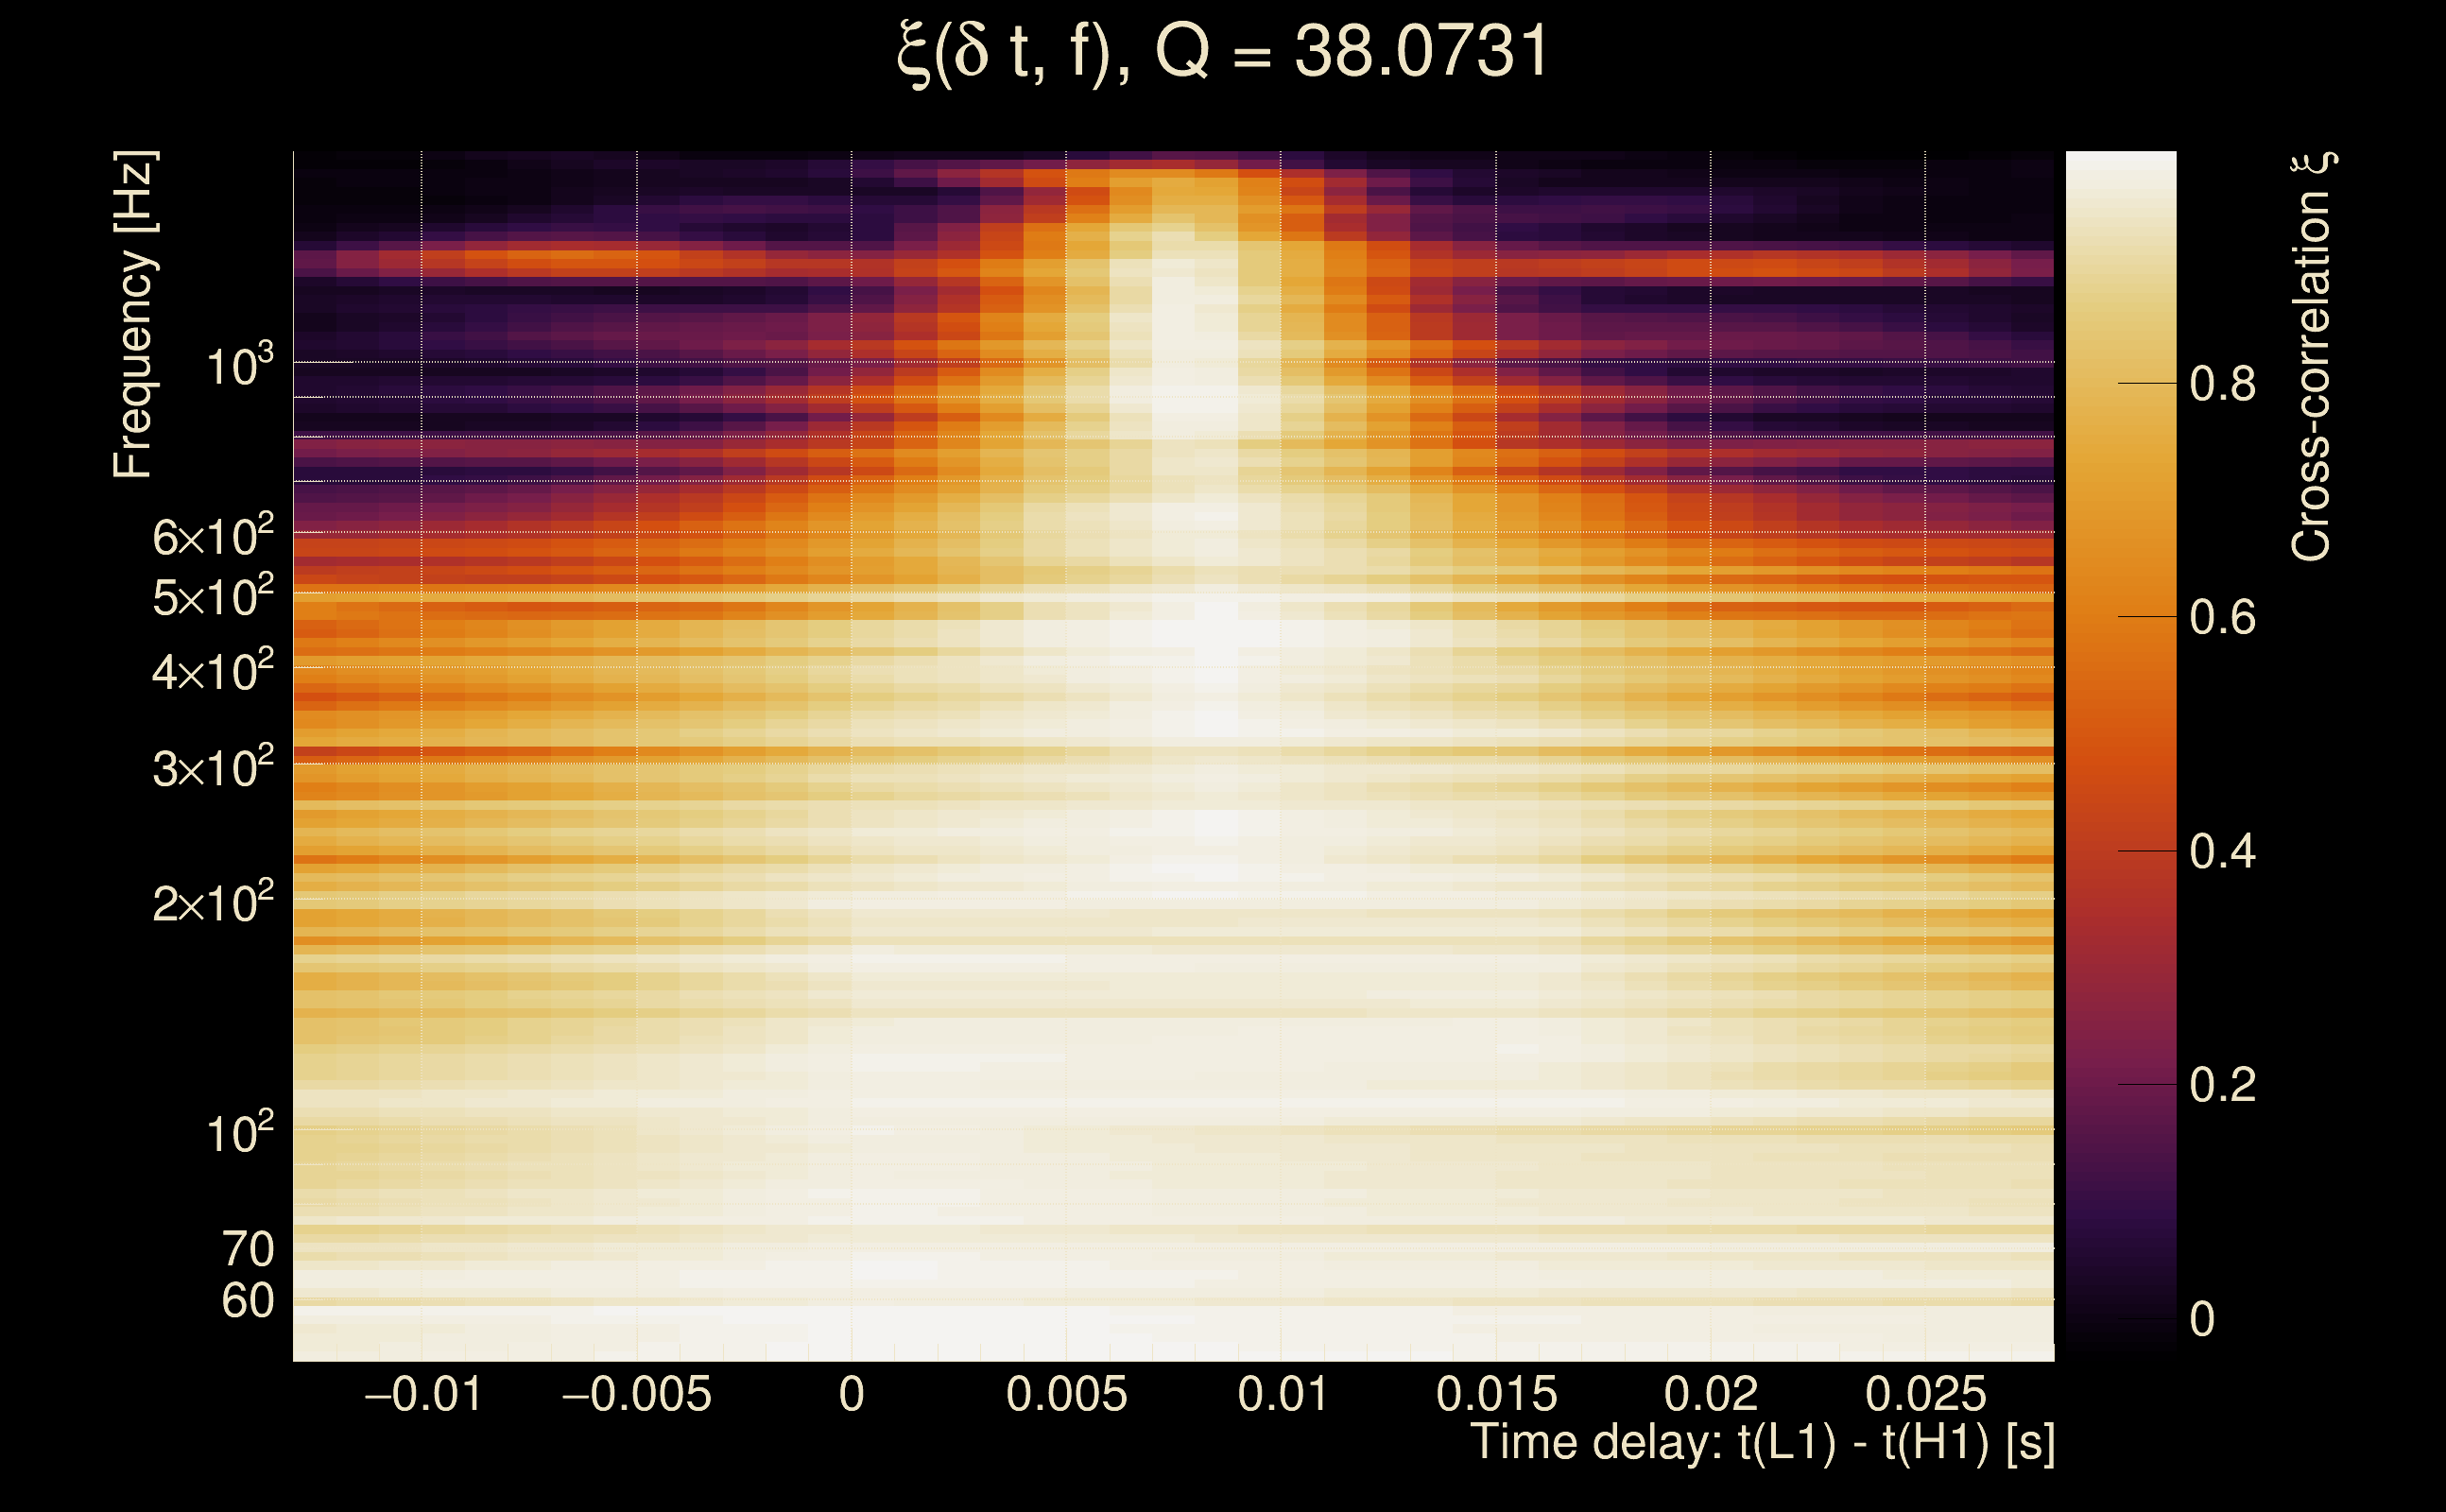
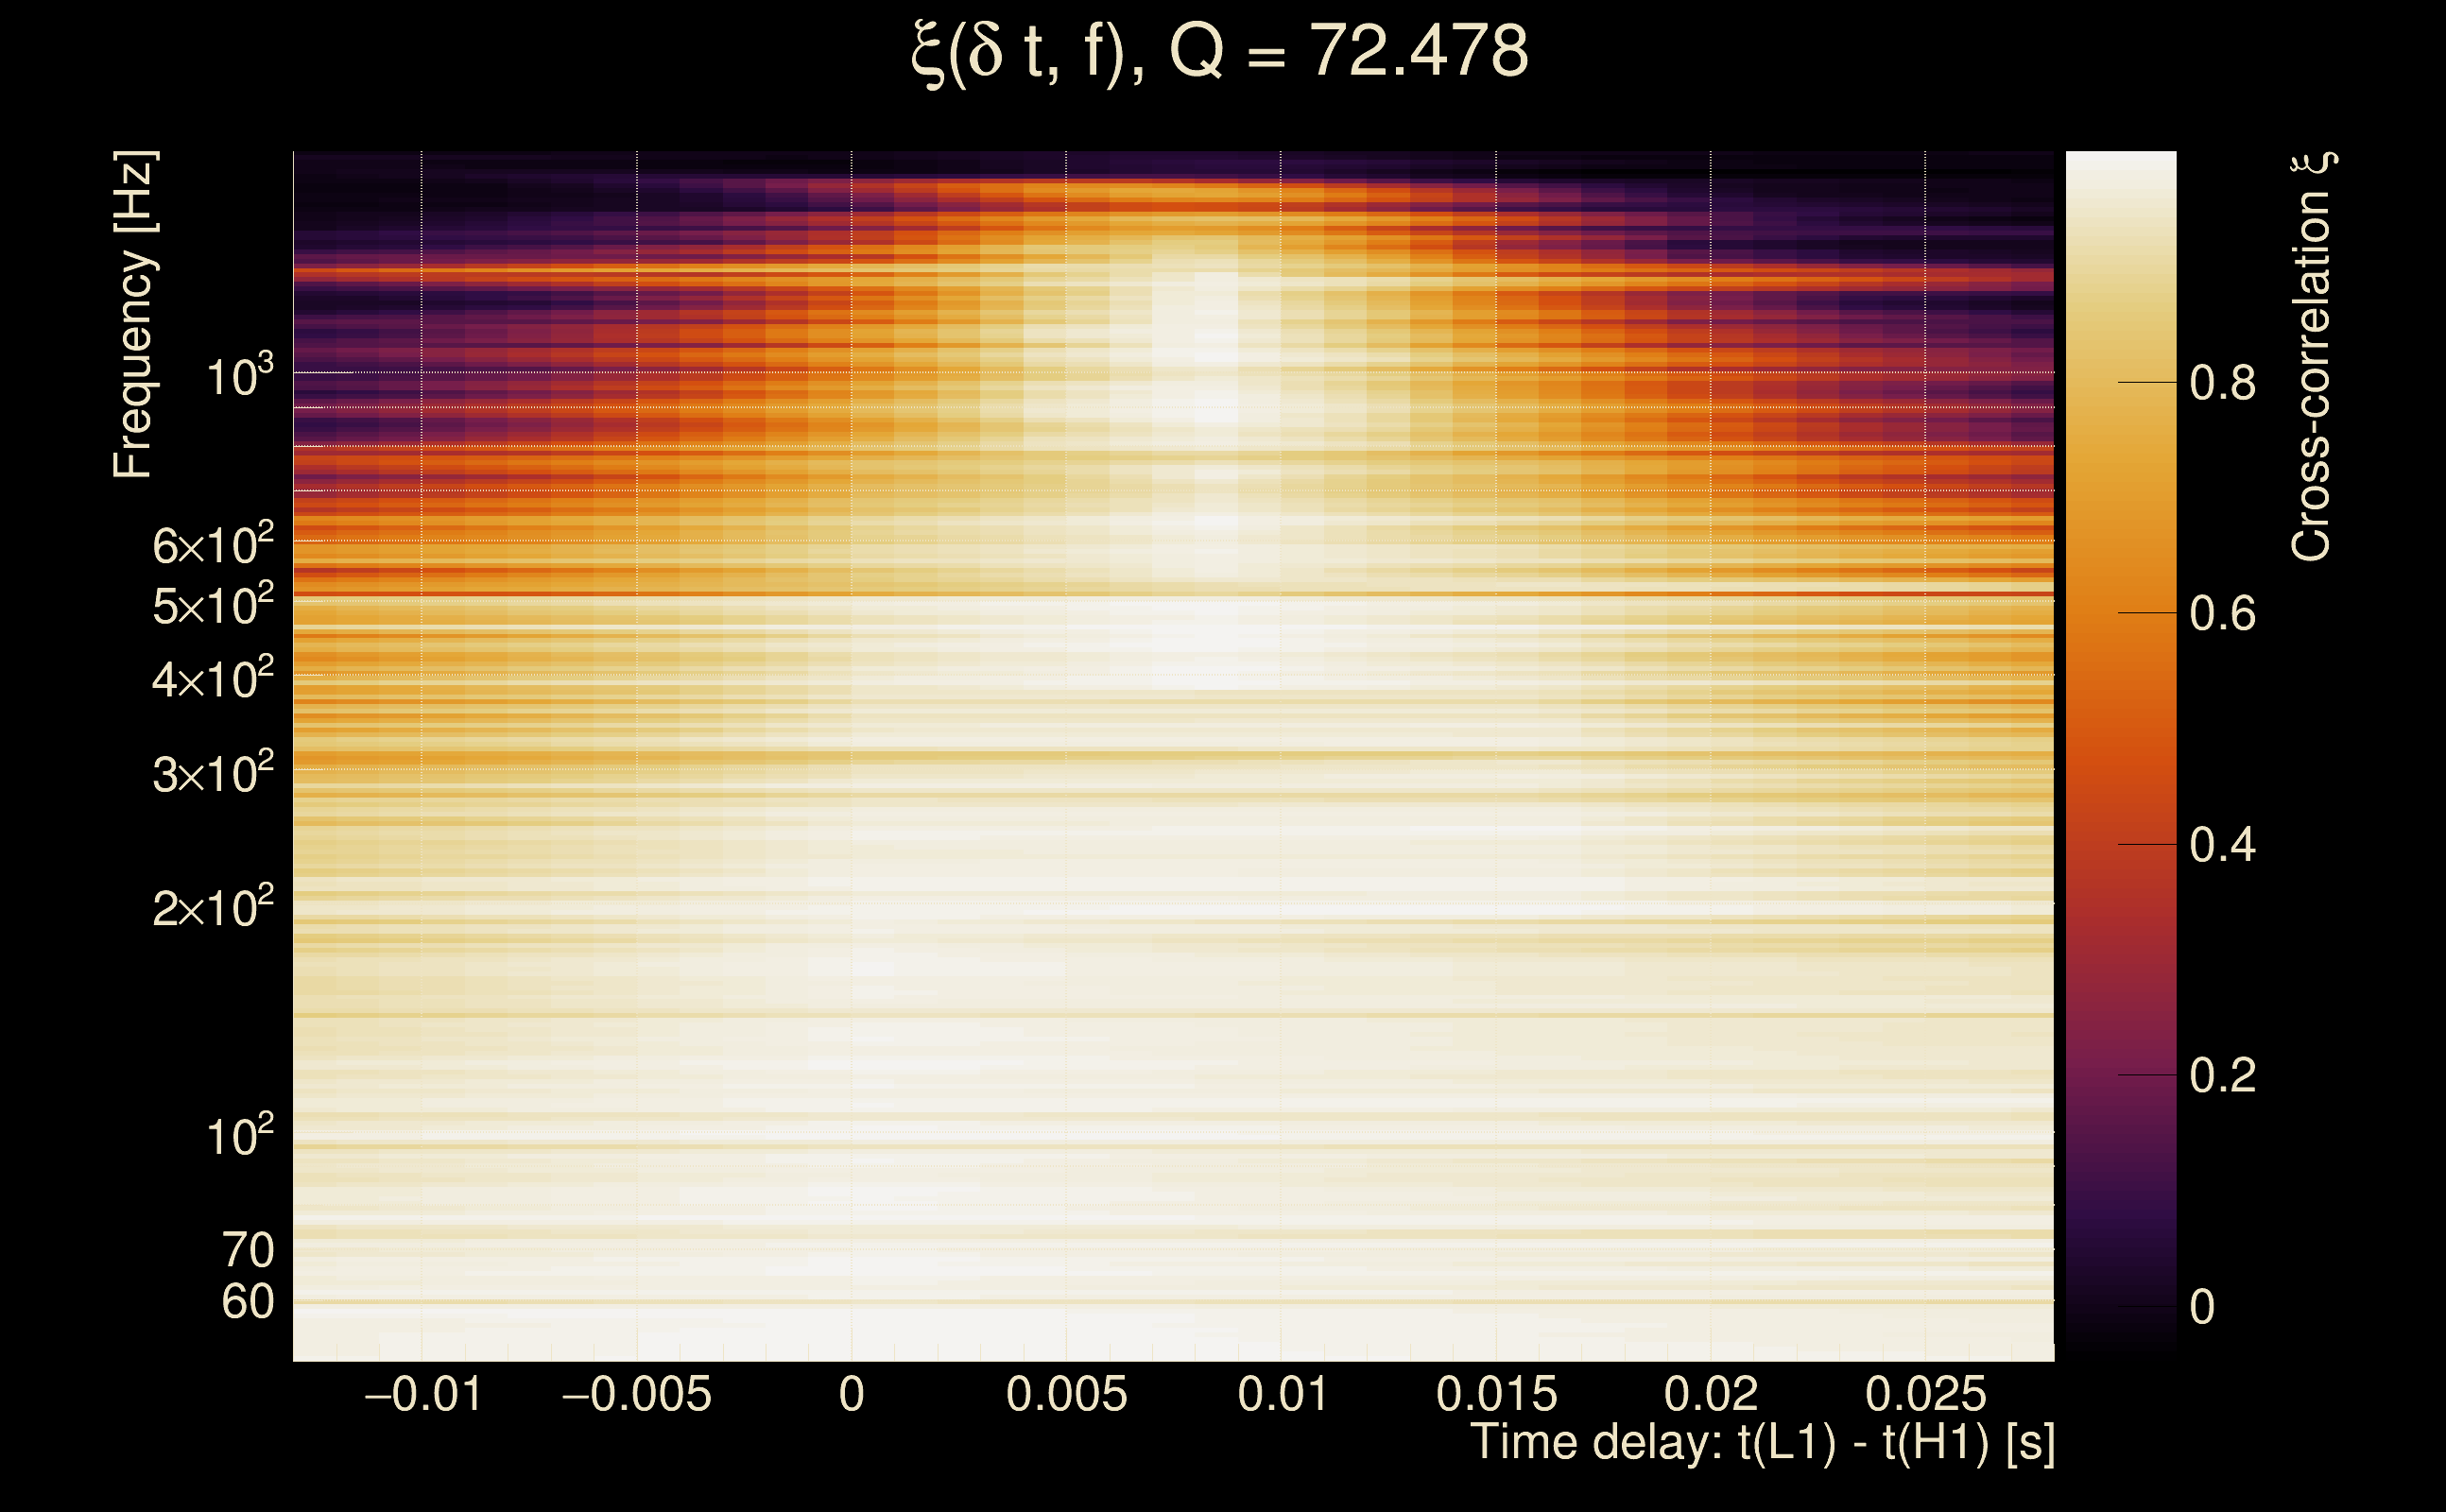
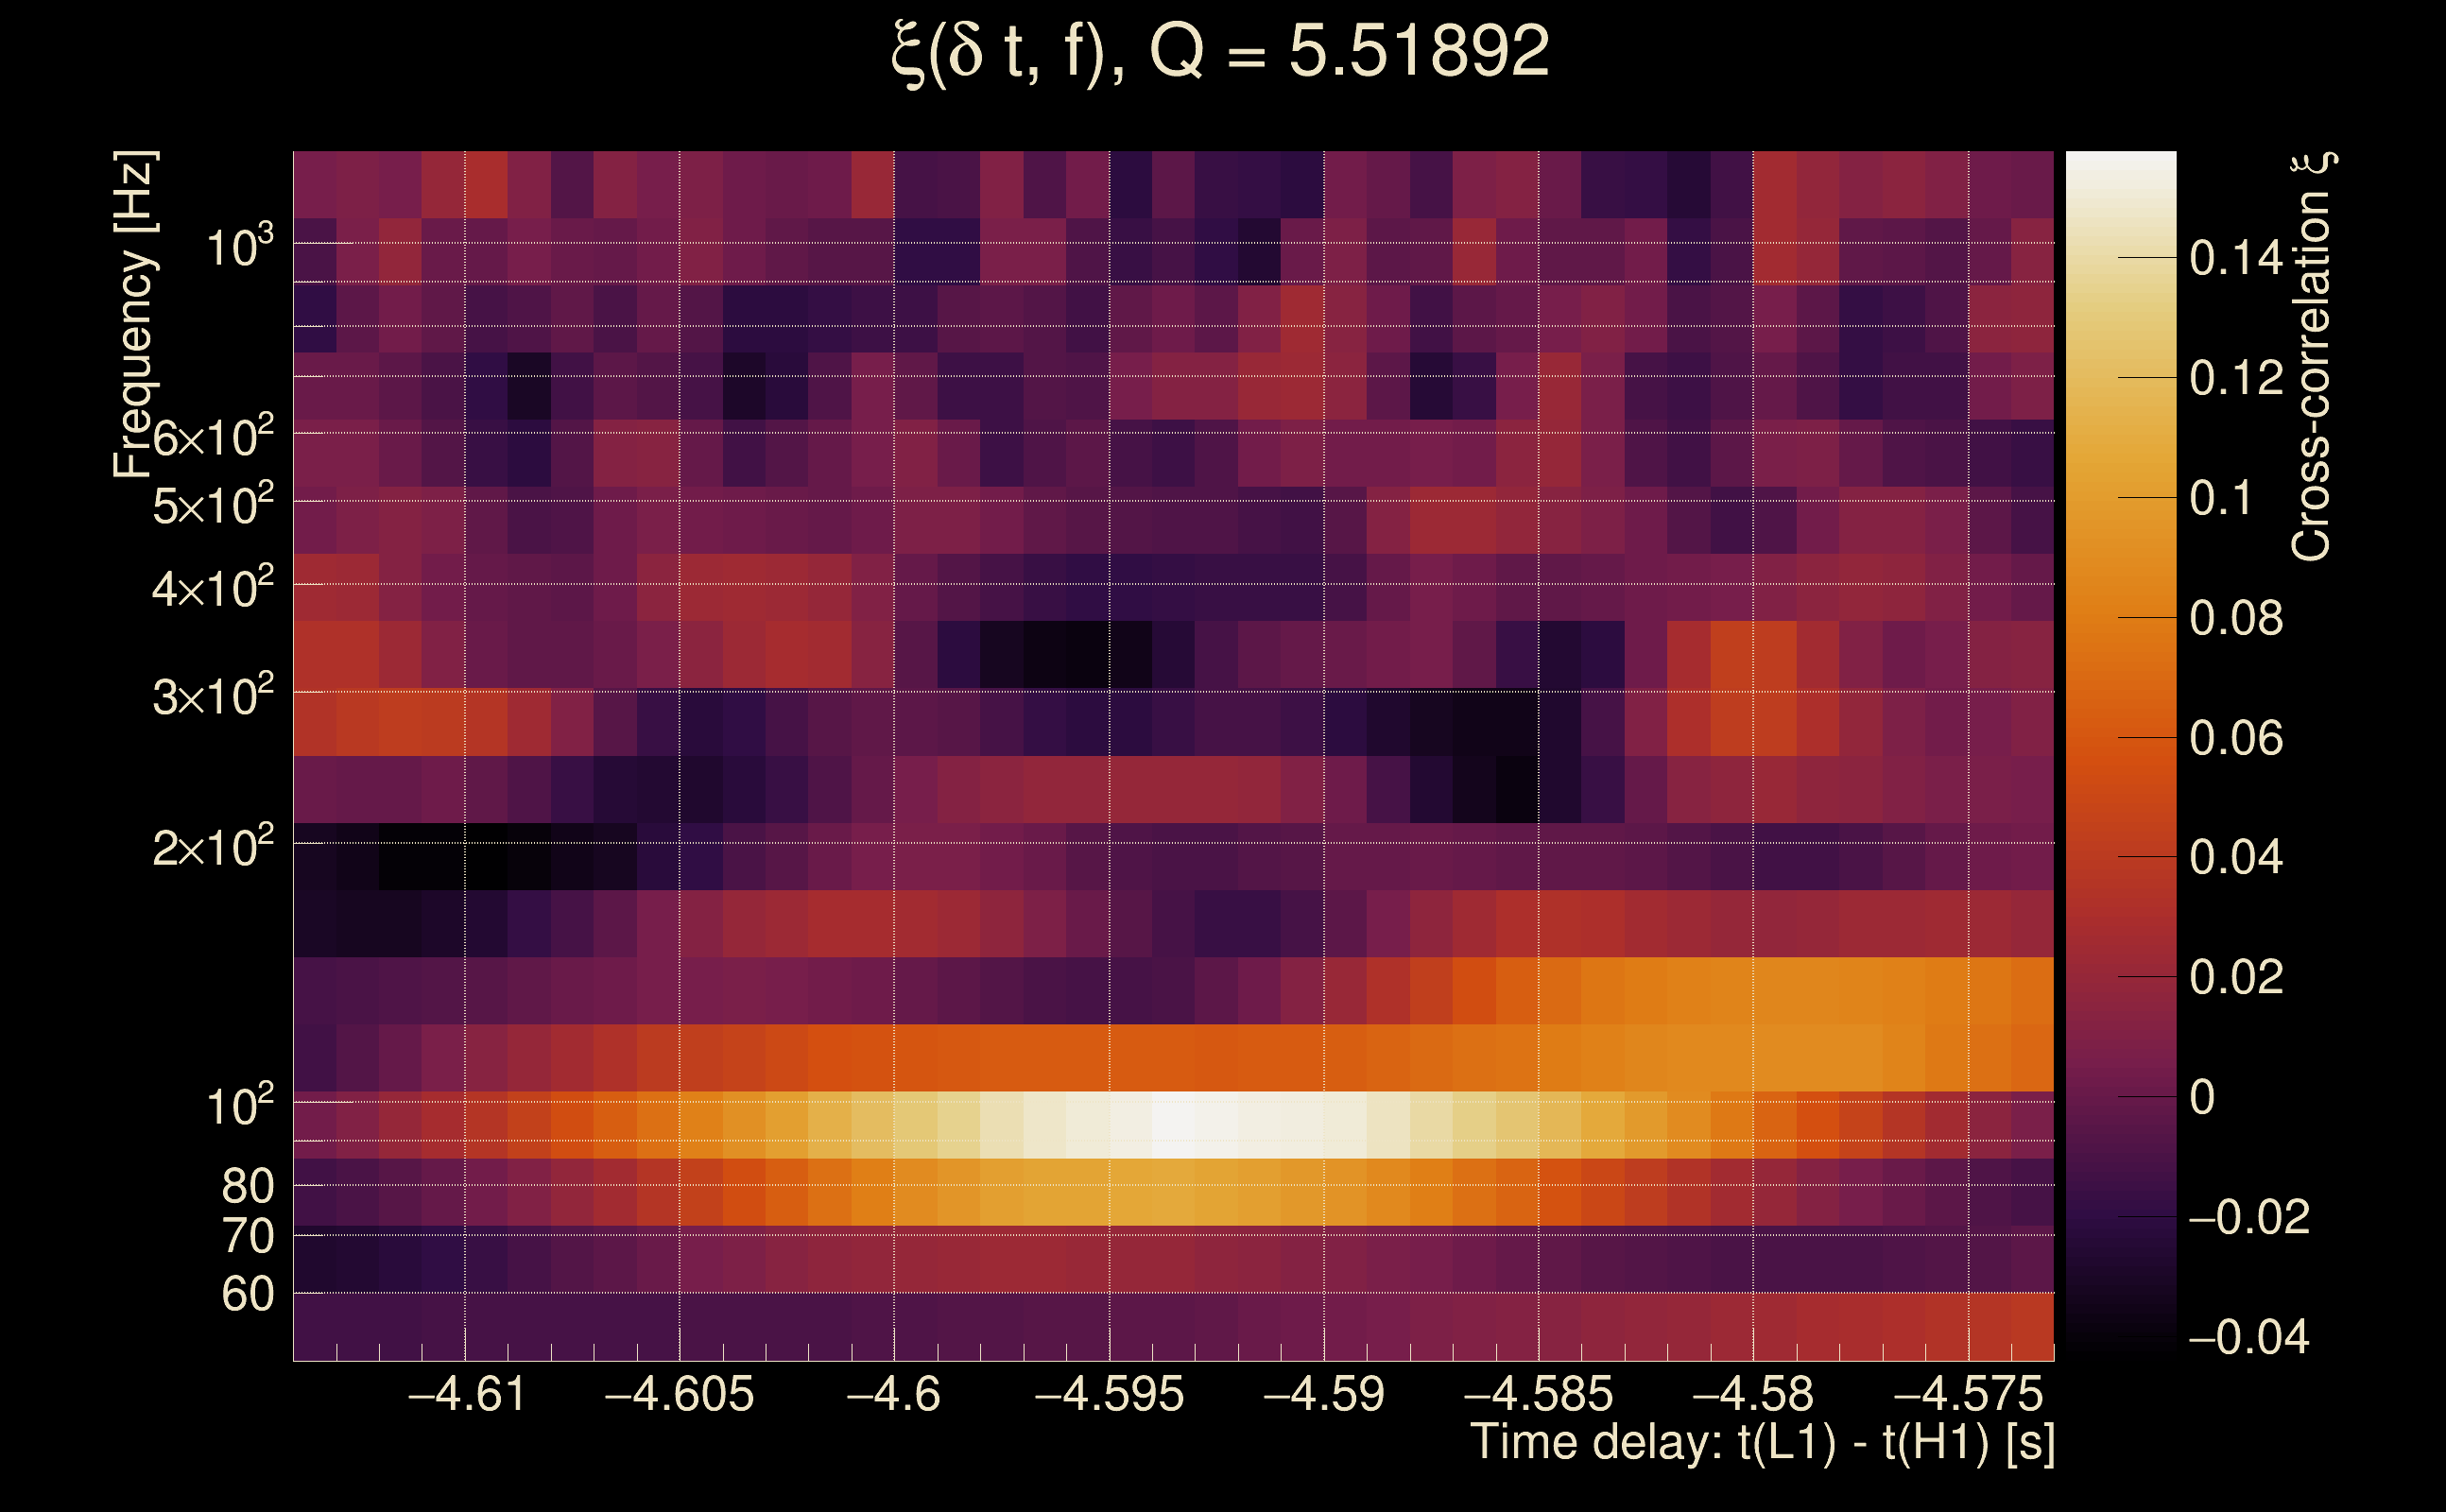
| Number of Q planes: | 5 (Q = 5.51892 → Q = 72.478) |
| Omicron frequency range: | 50 Hz → 1958.38 Hz |
| Light travel time between detectors: | 0.0100128 s |
| Slice extra-time (calibration uncertainty + slice veto): | 0.0129872 s |
| Number of time-delay bins in a cross-correlation map: | 10000 |
| Number of slices in a cross-correlation map: | 217 |
| Number of time-delay bins in a slice: | 46 |
| SNR gating: | < 1000 (detector 0), < 1000 (detector 1) |
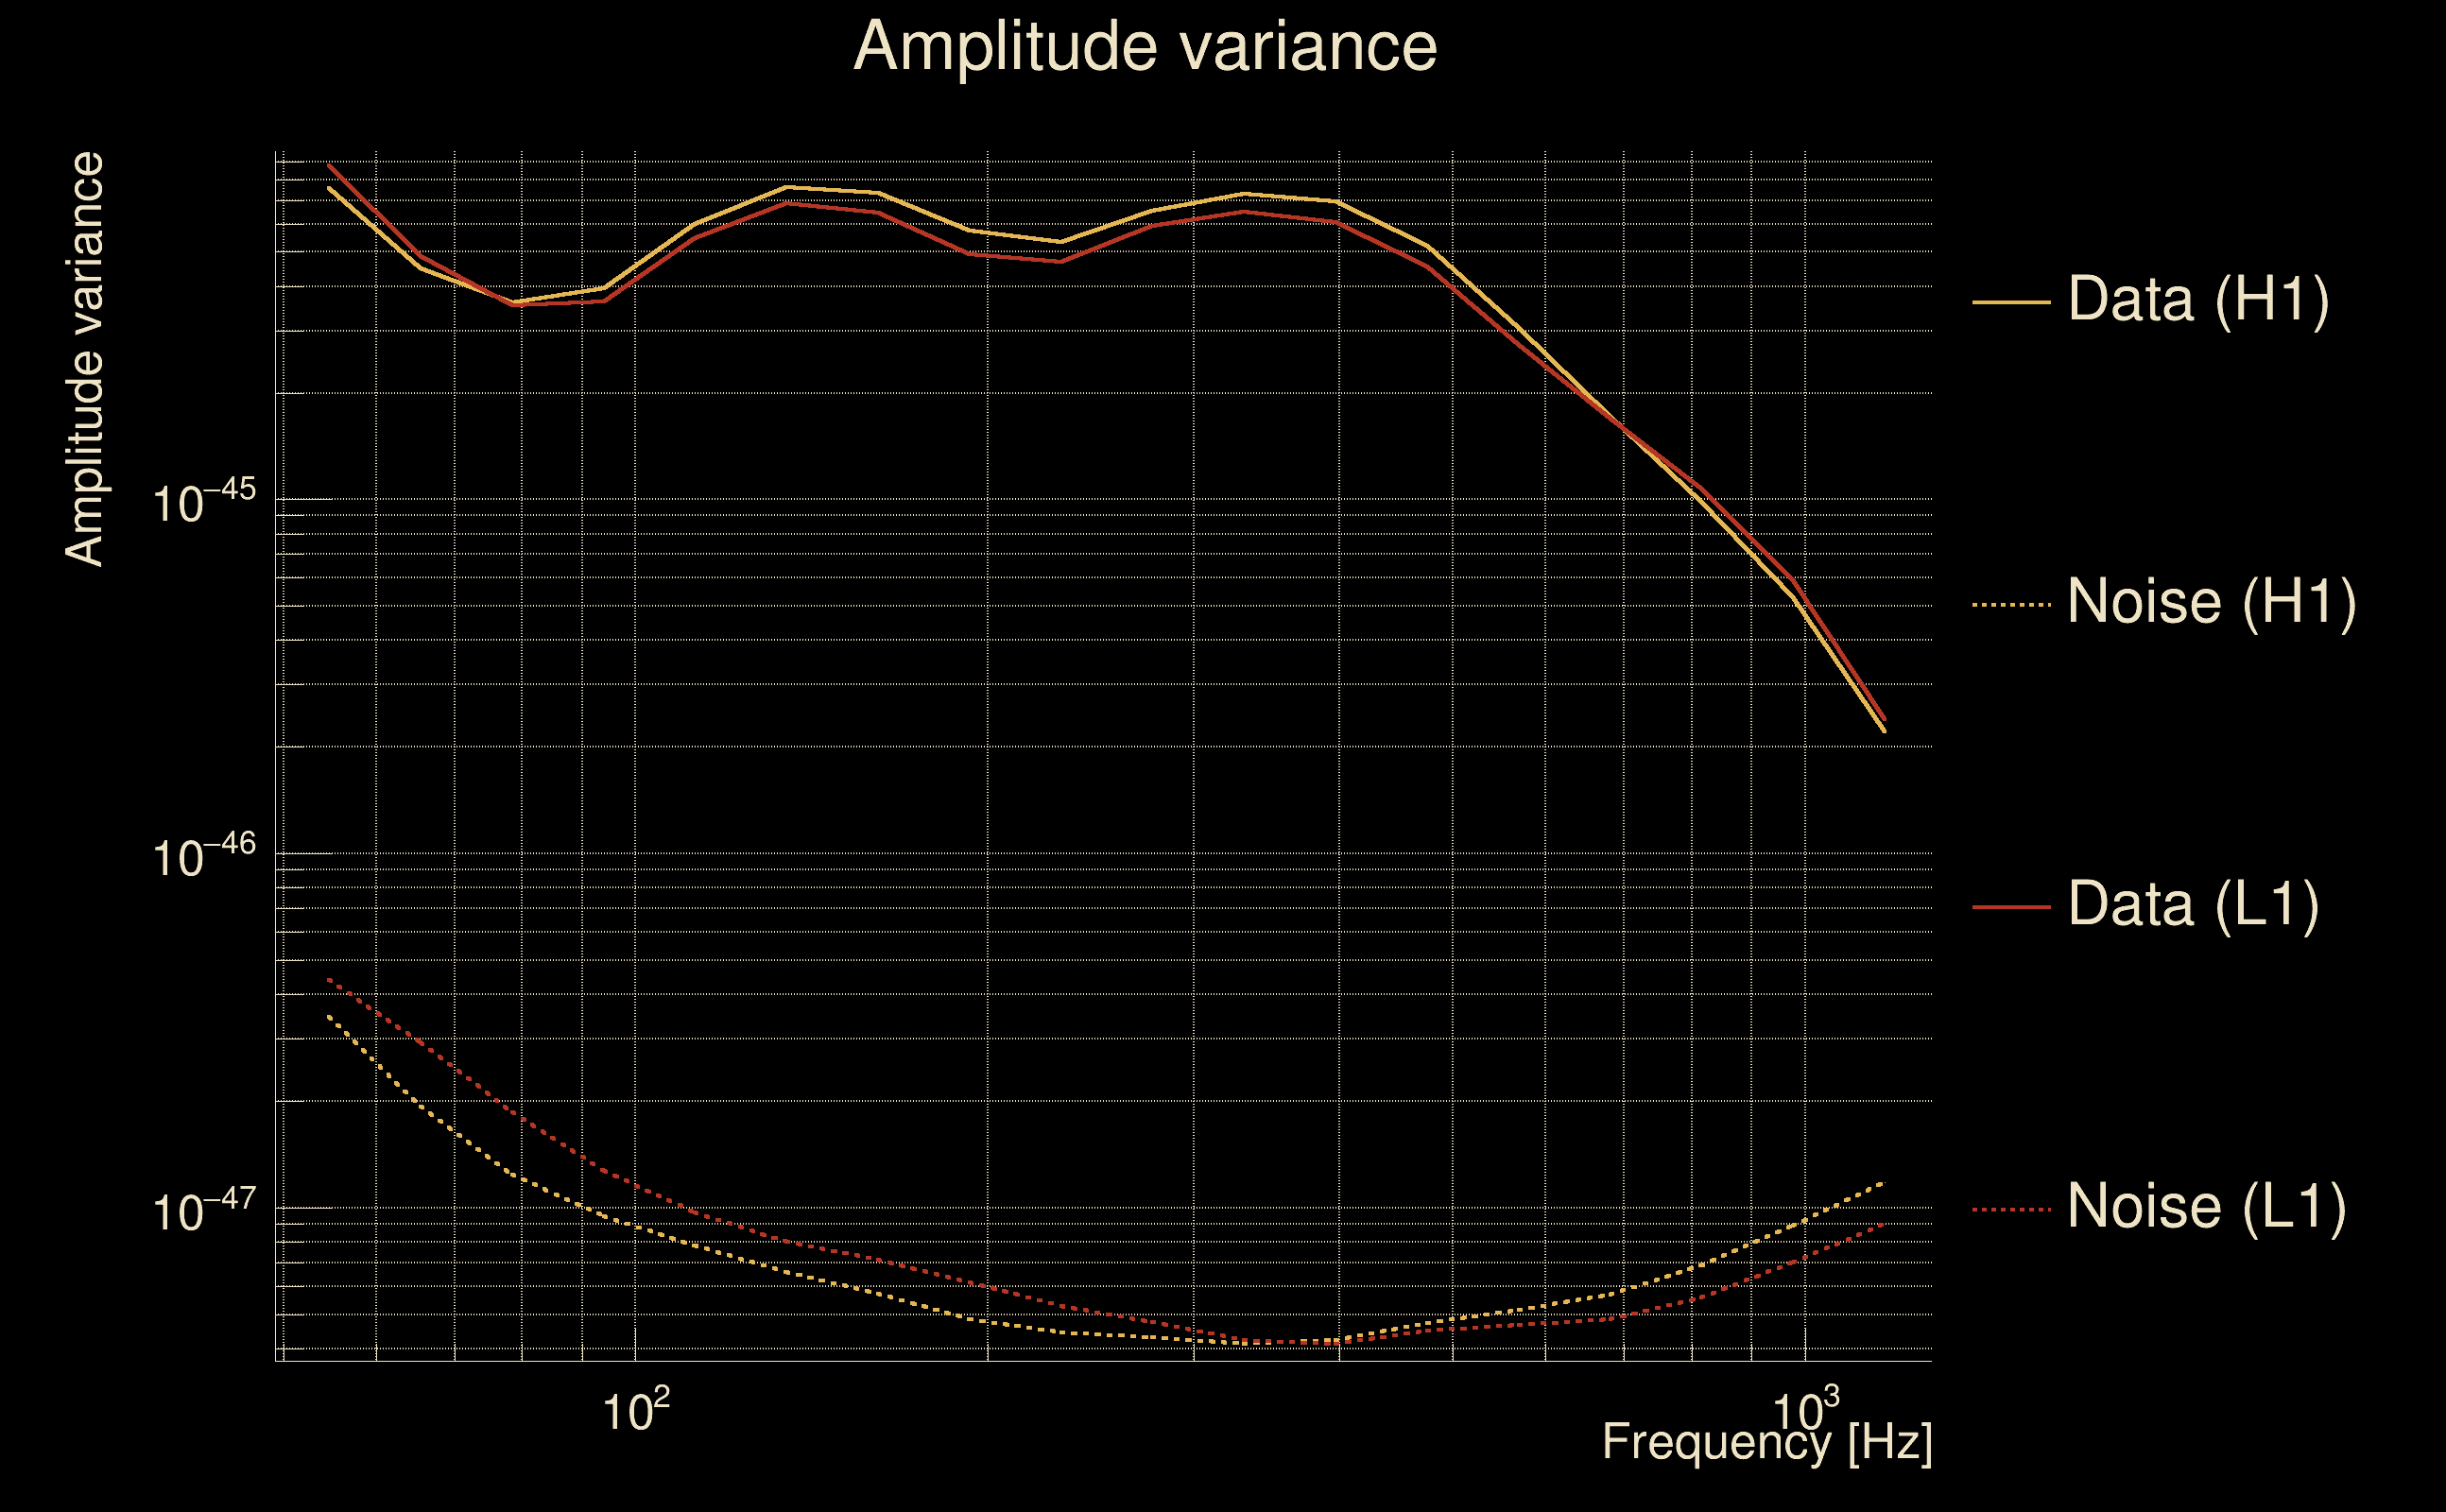
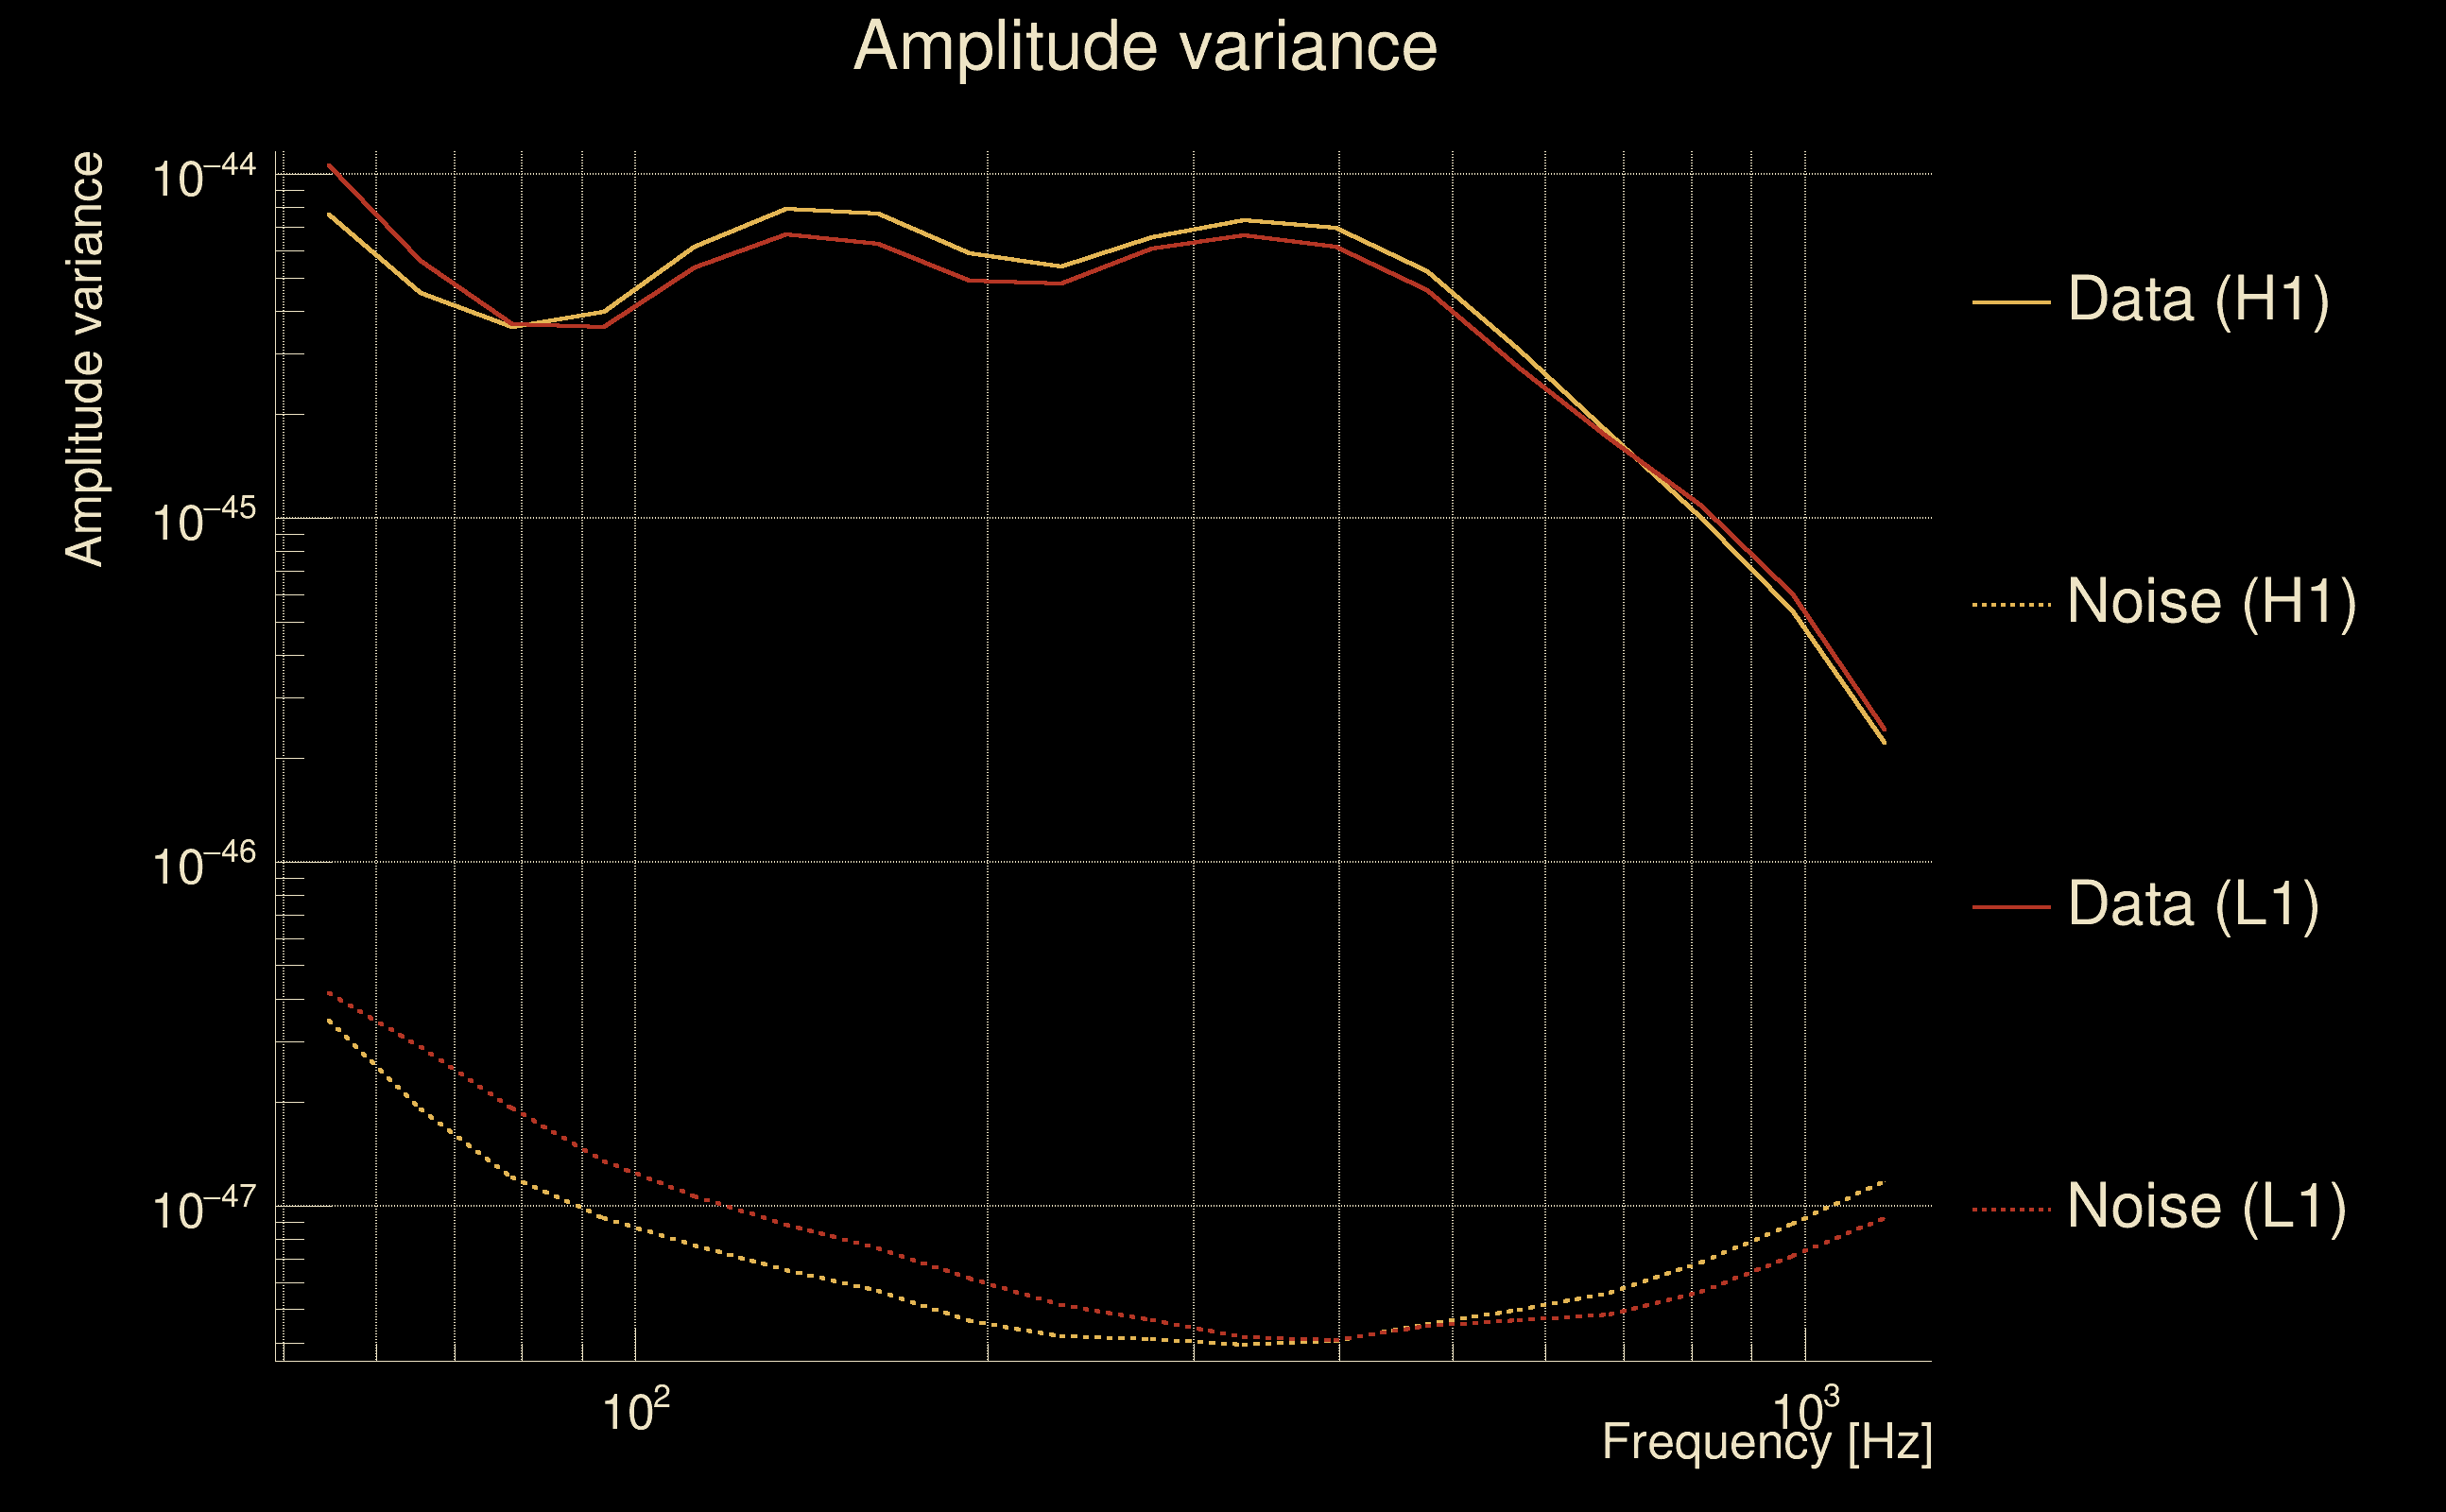
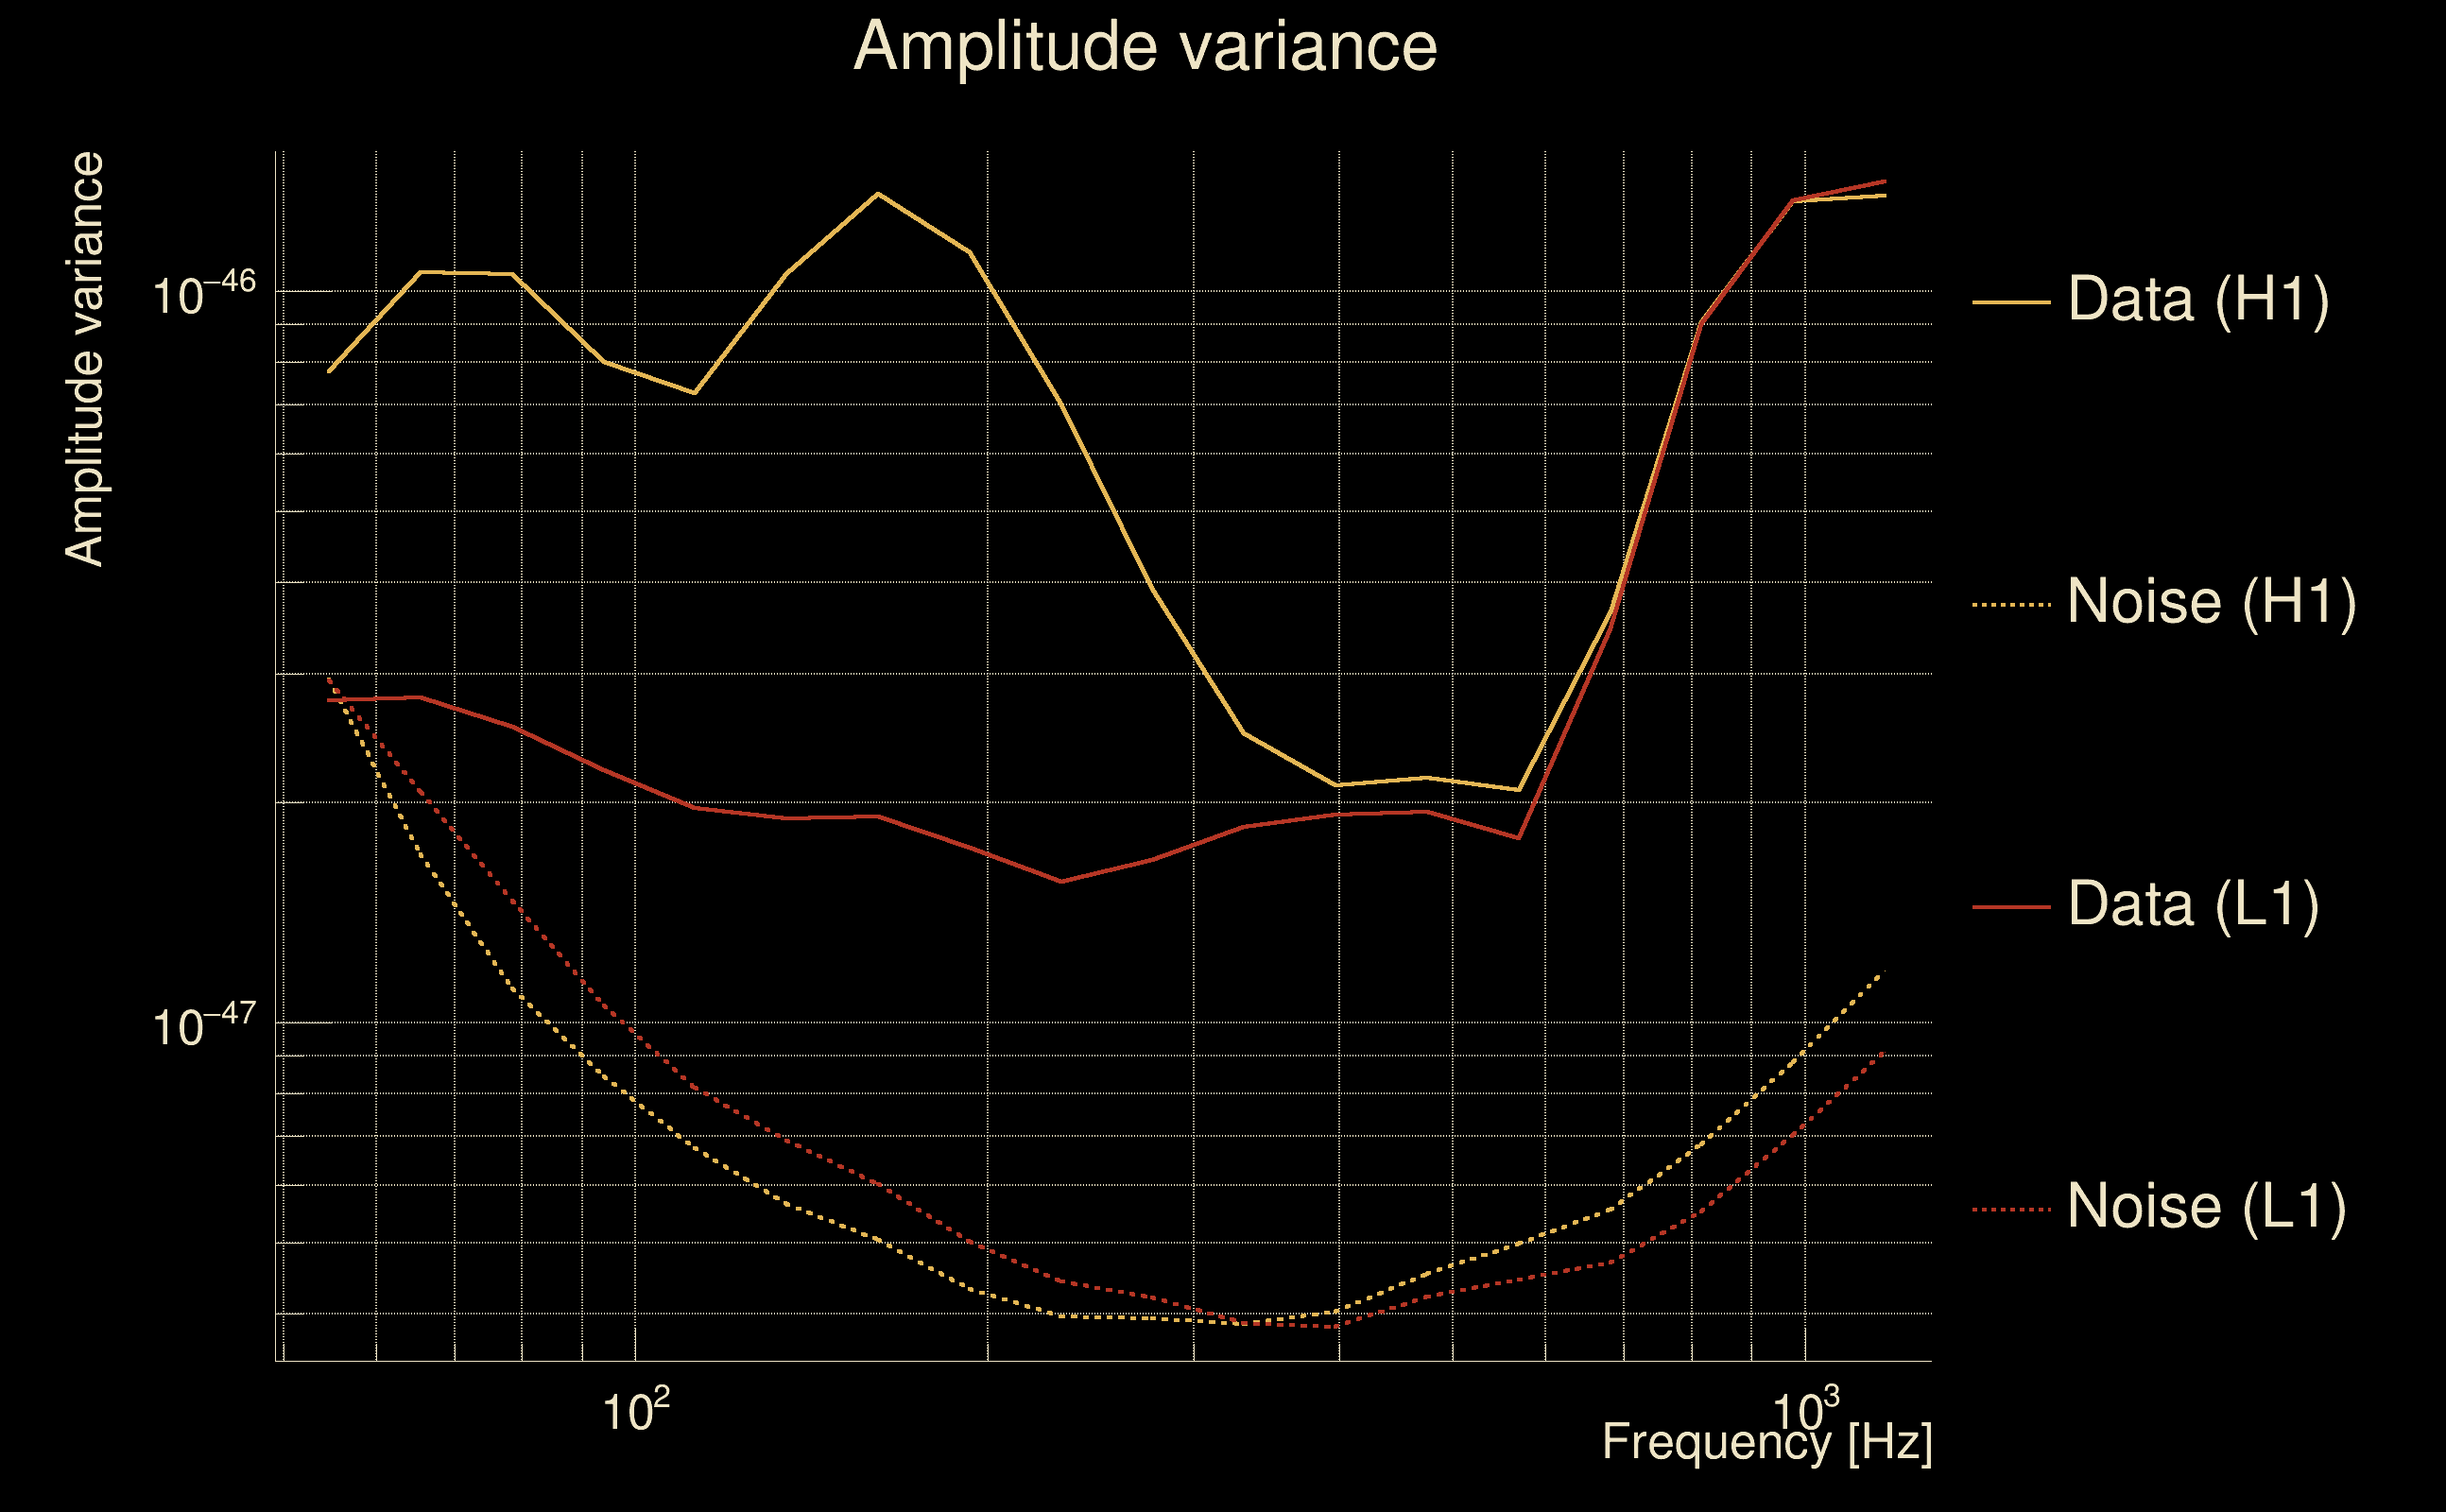
| Amplitude spectrograms: | normalization = 1e-22, power index = 2 |
| White noise SNR variance: | 0.523175 (after applying a correction factor = 1) |
| Amplitude ratio confidence level: | 3 sigma |
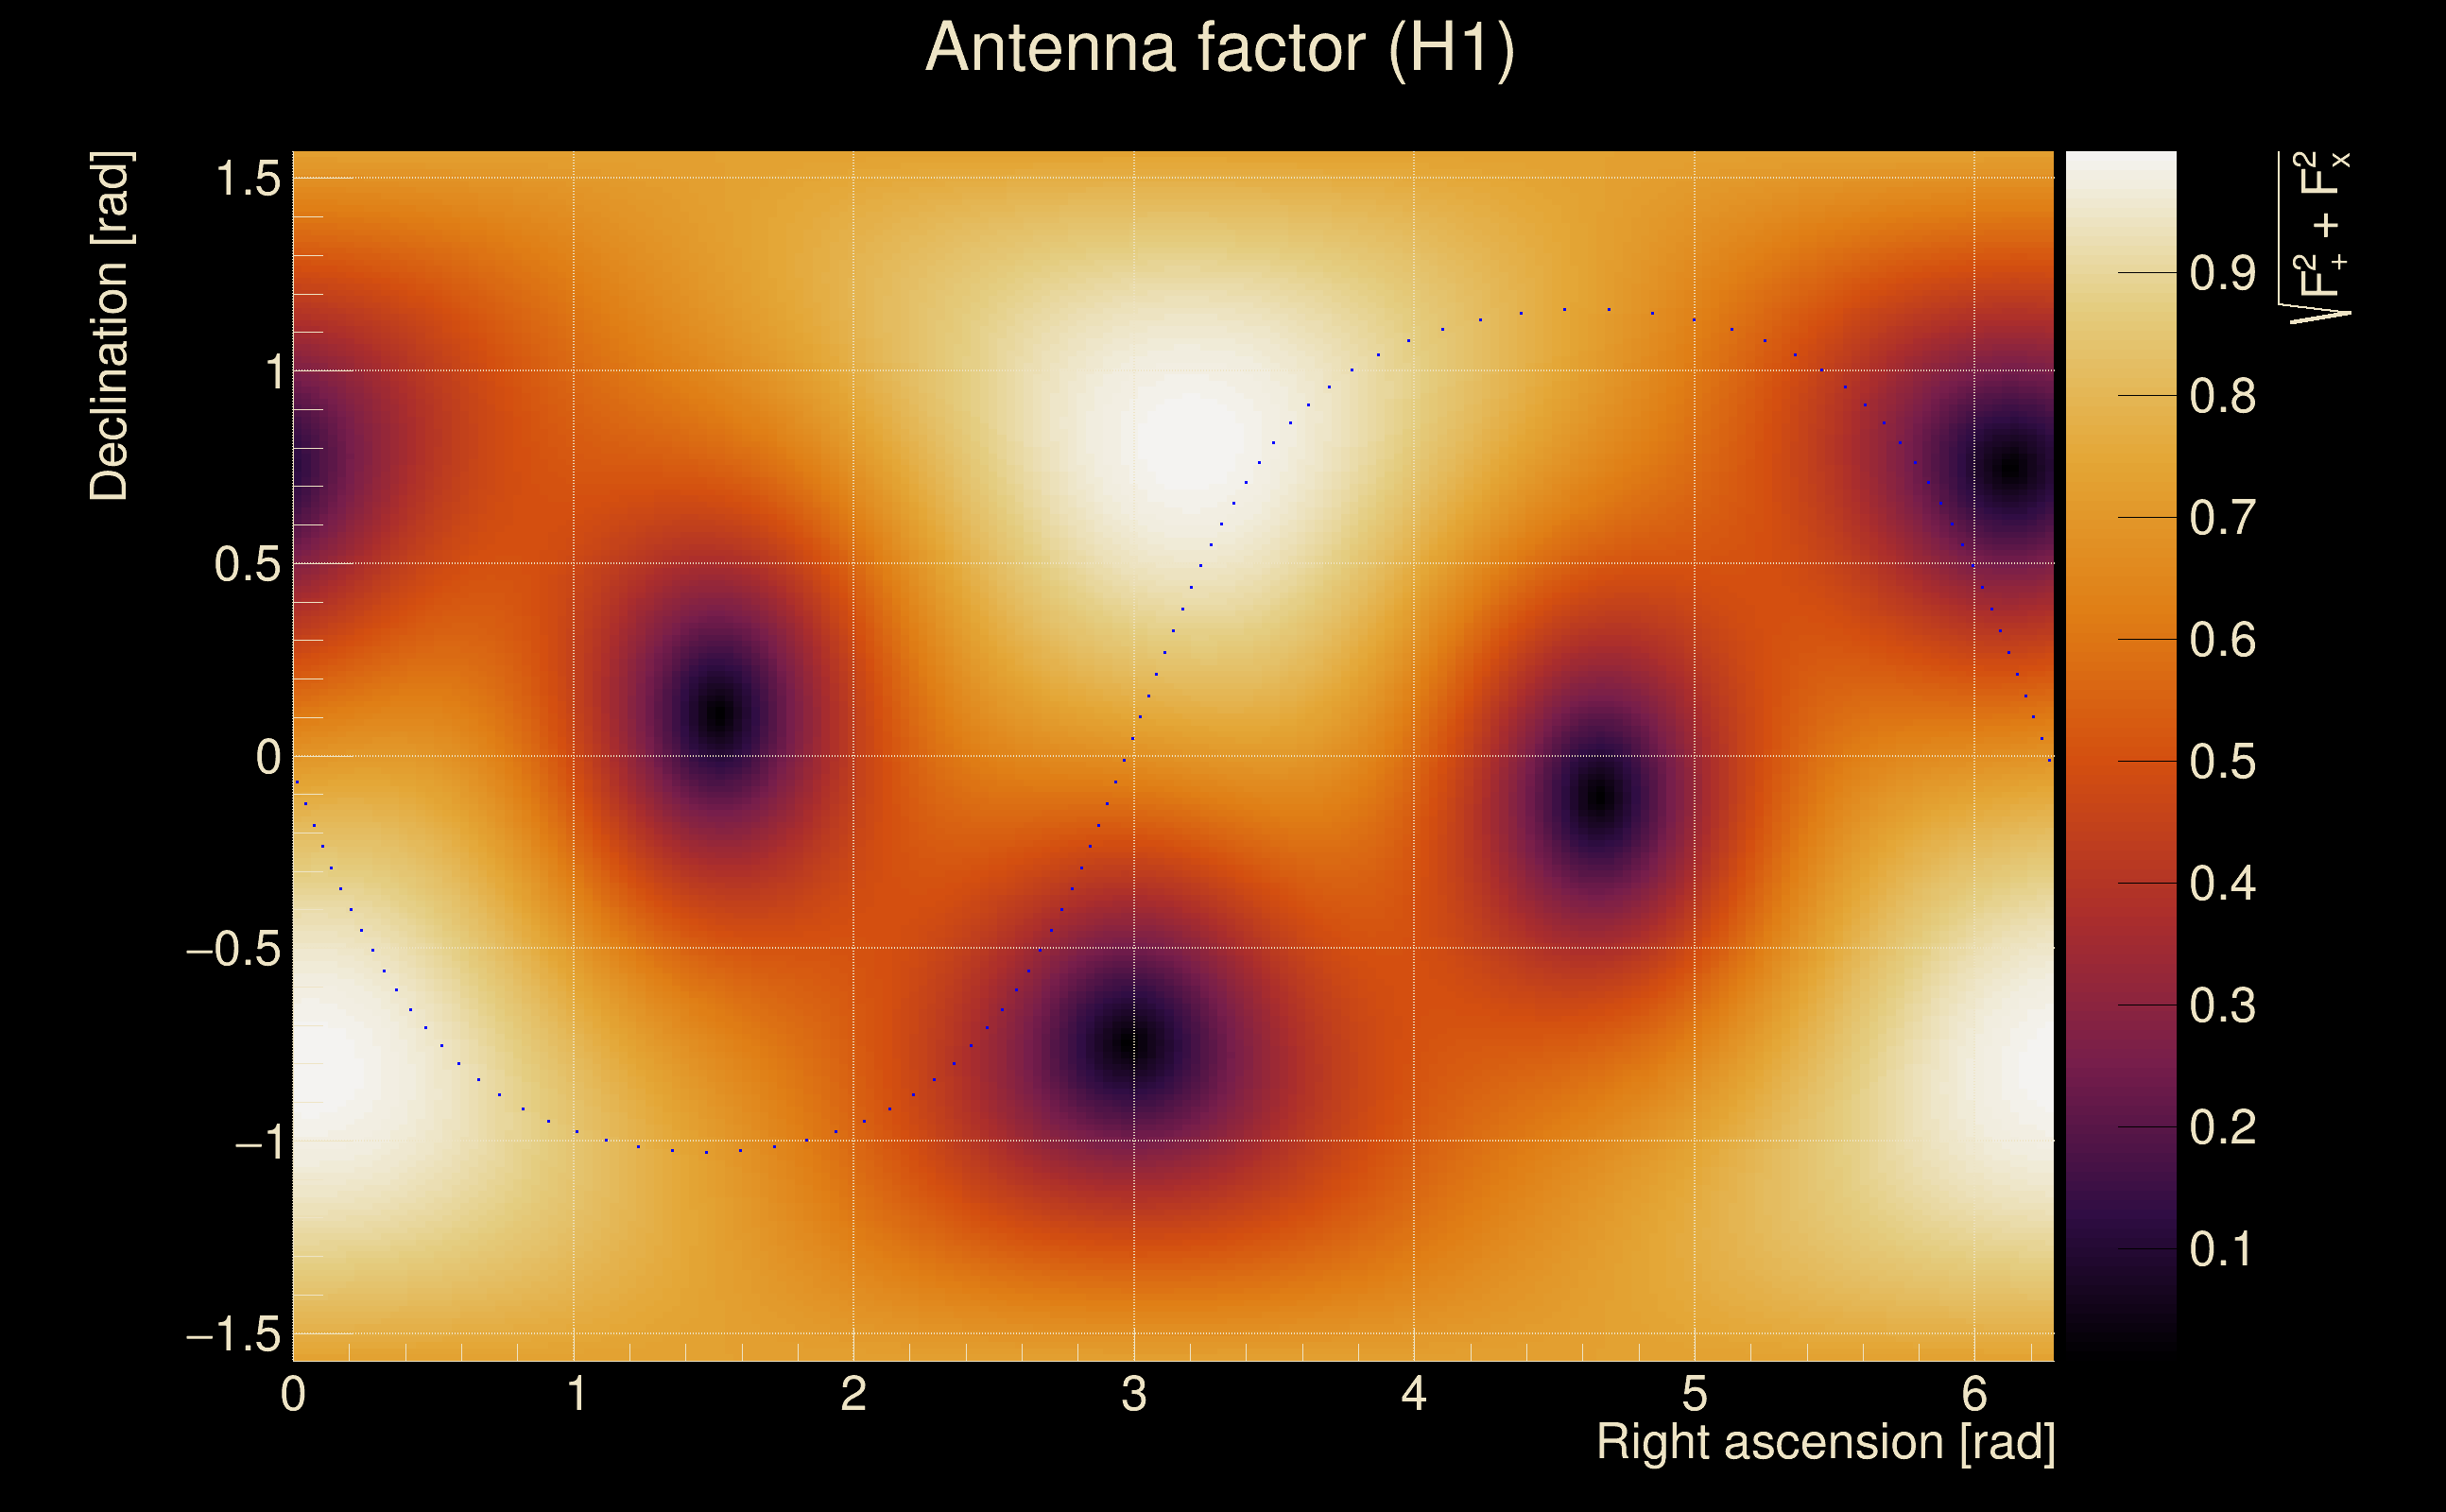
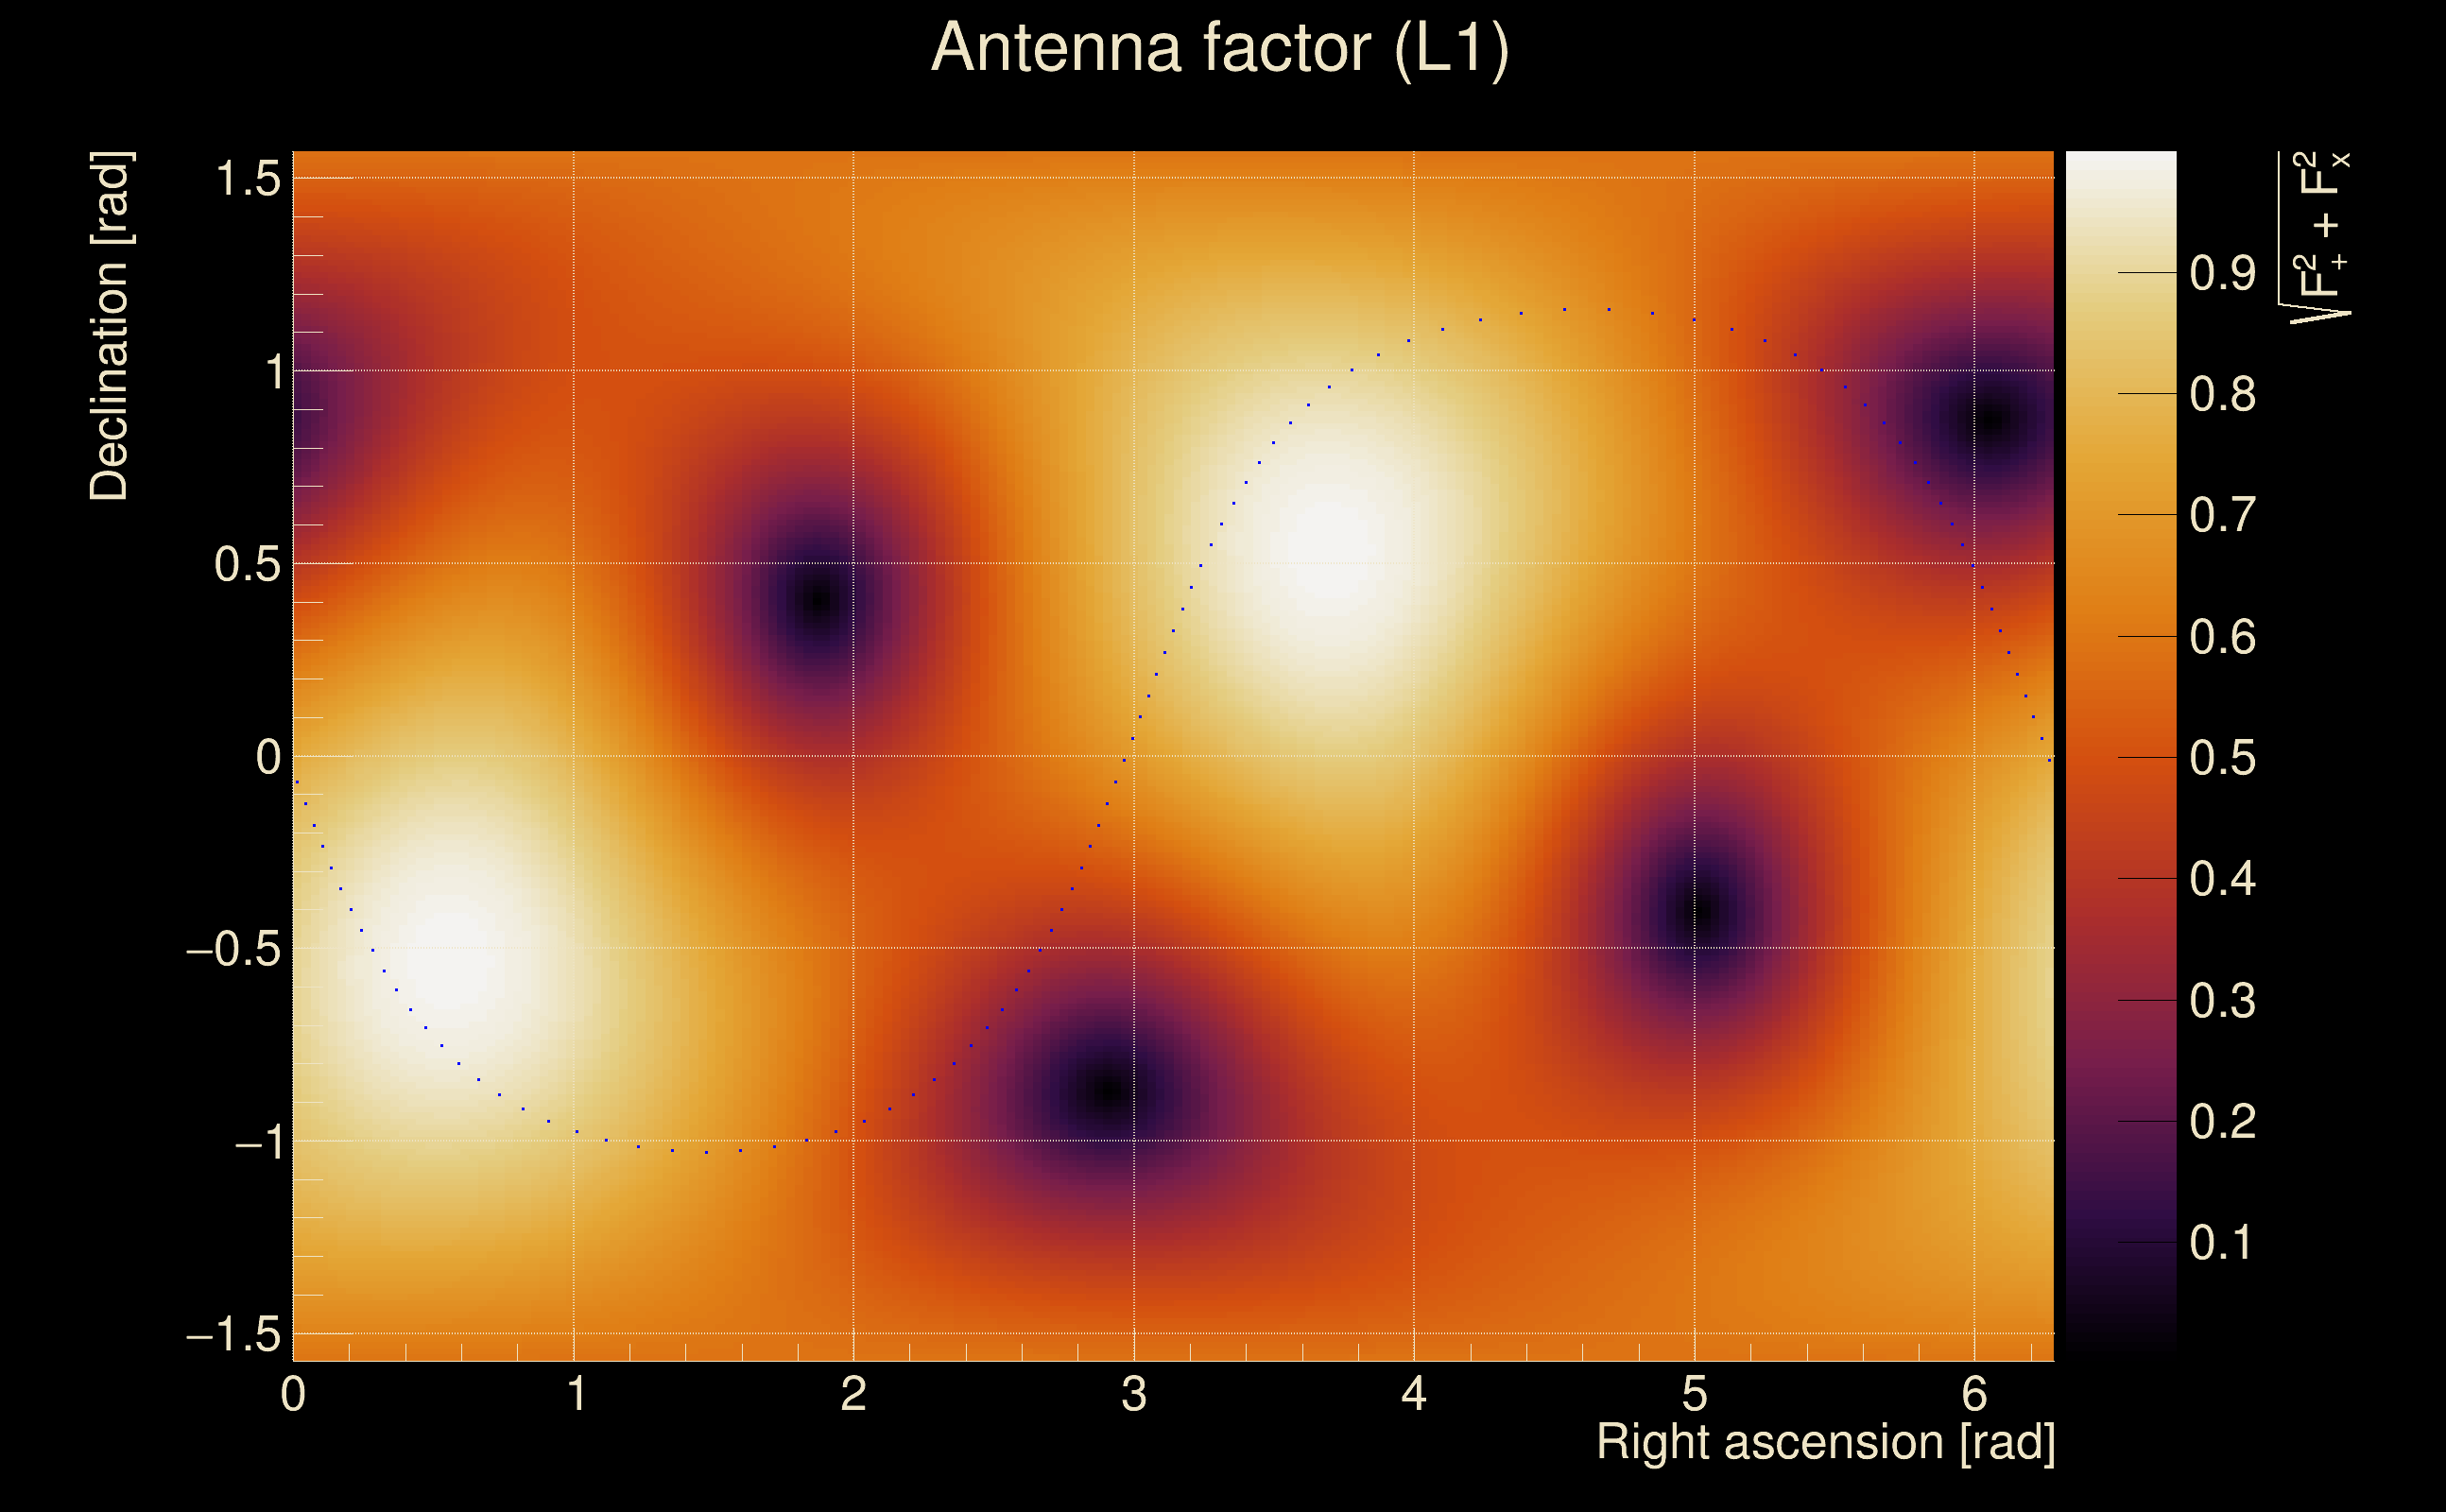
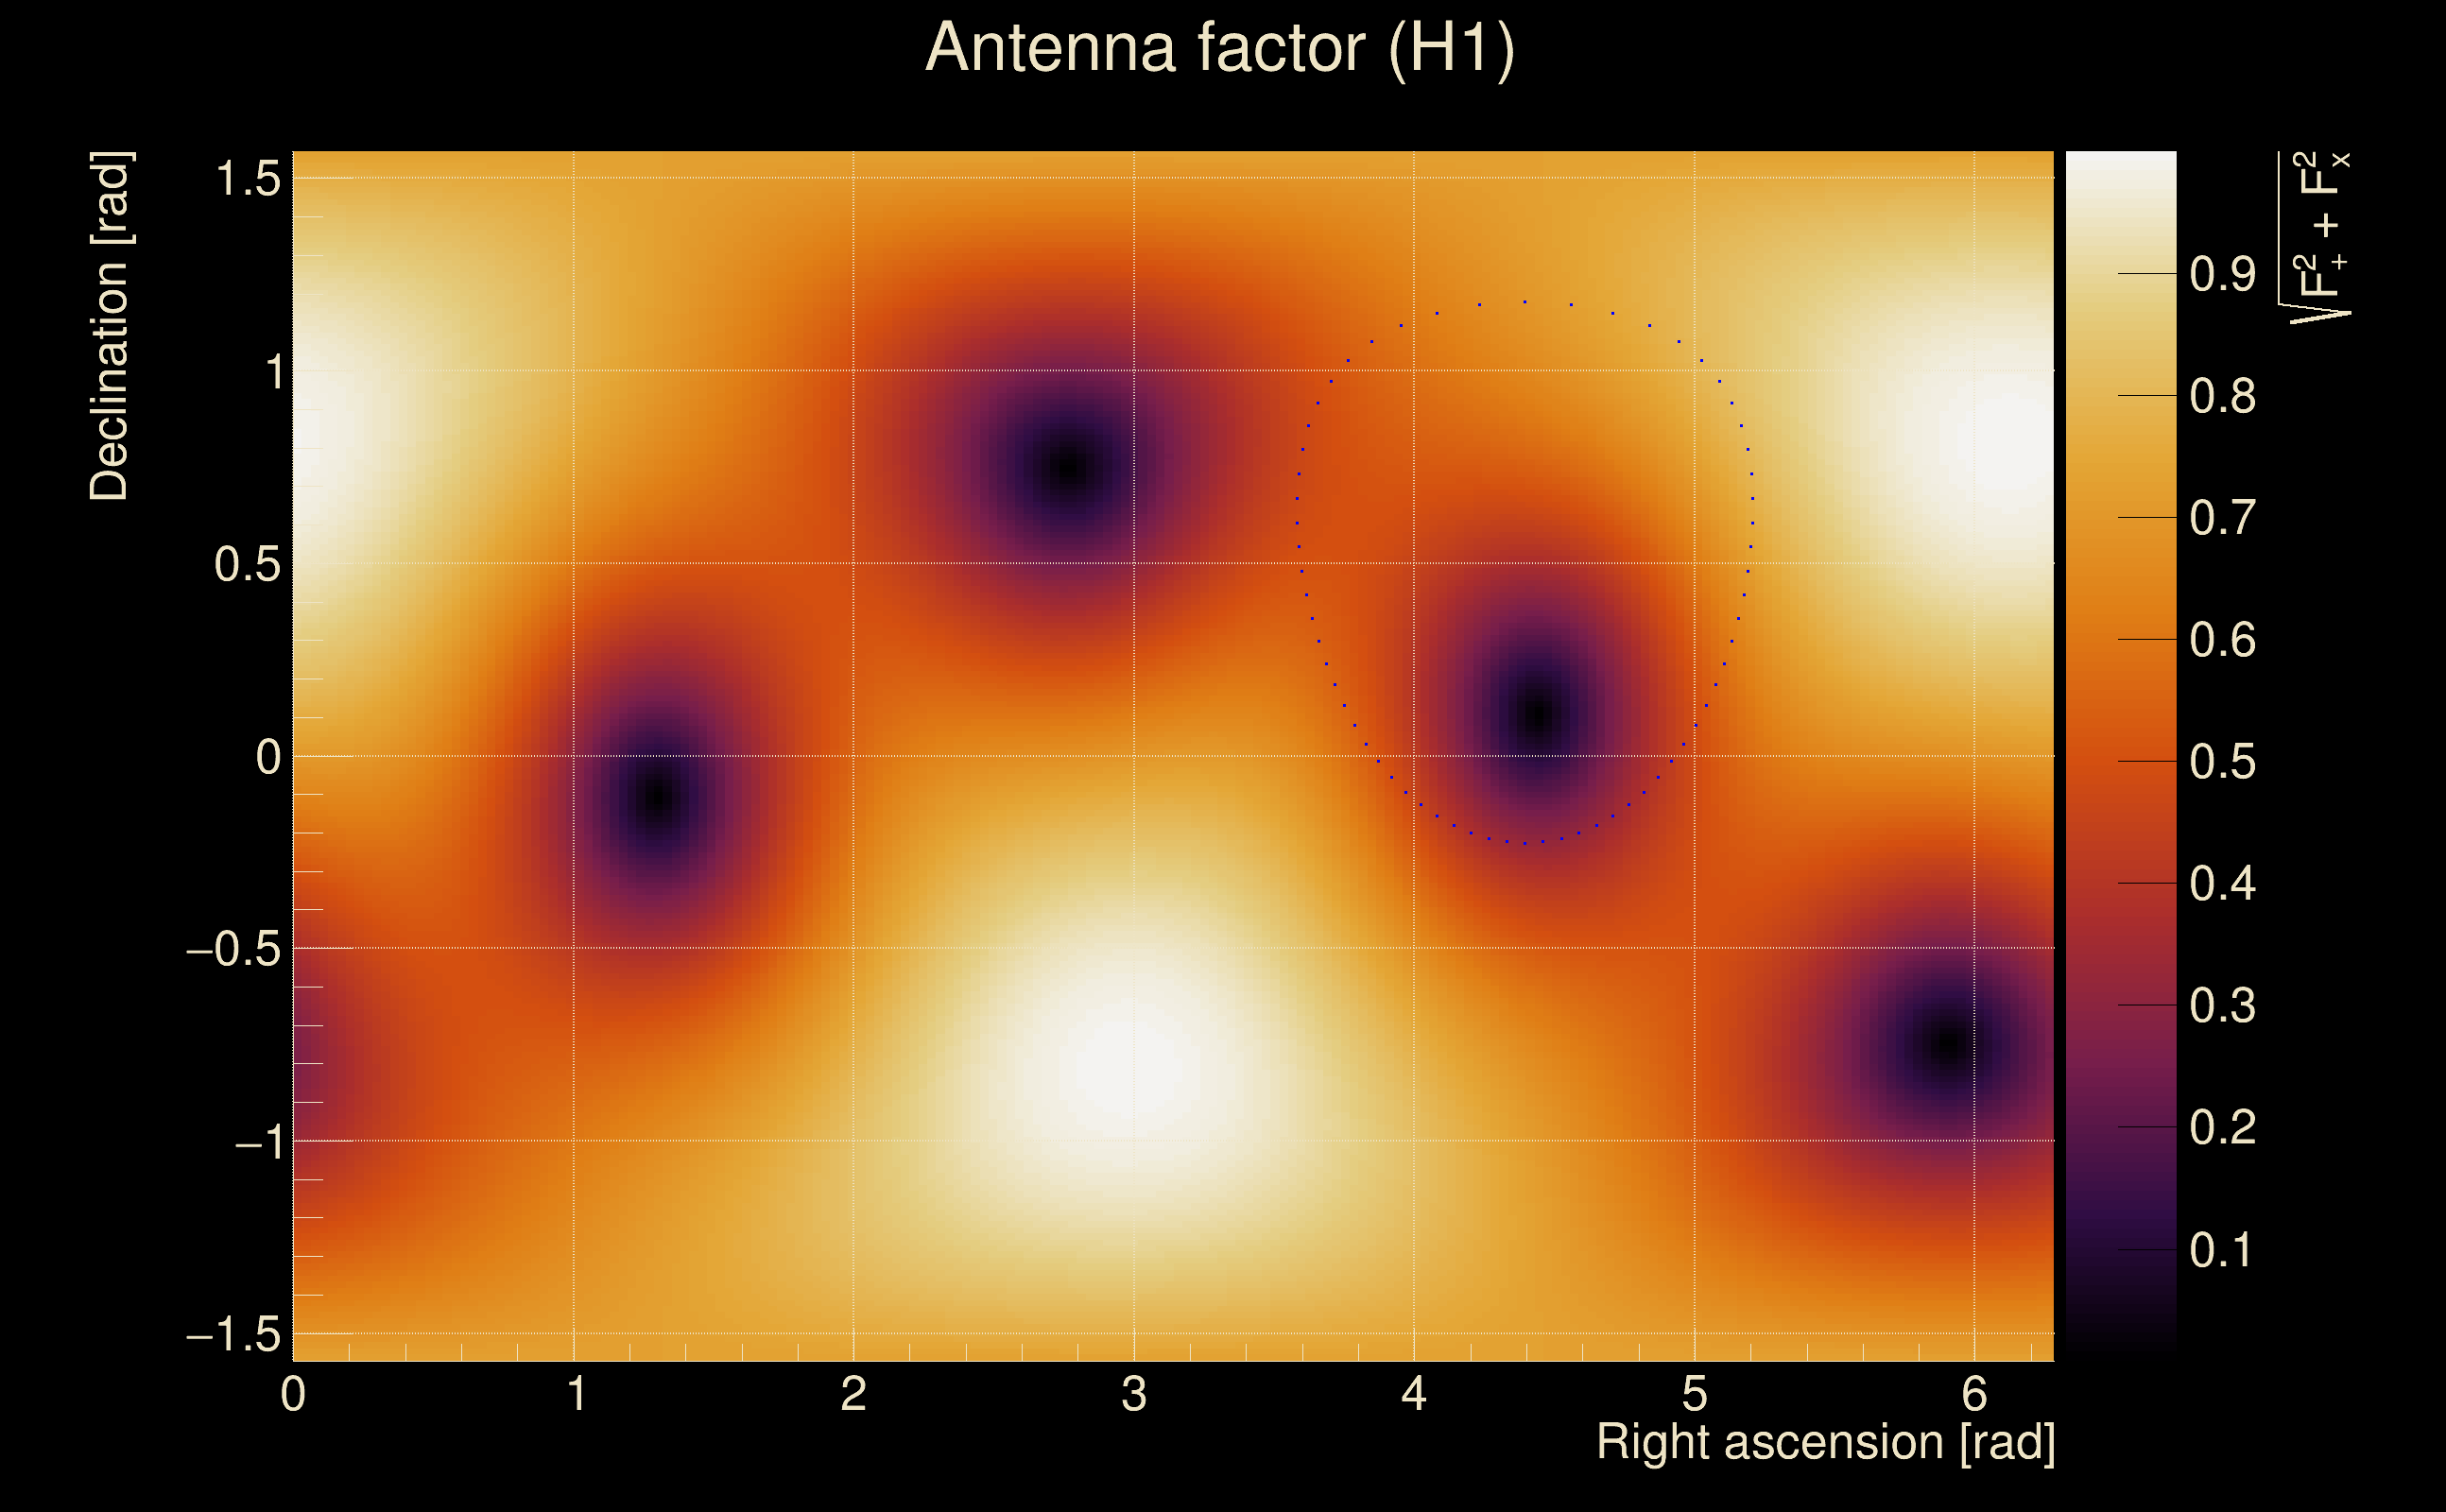
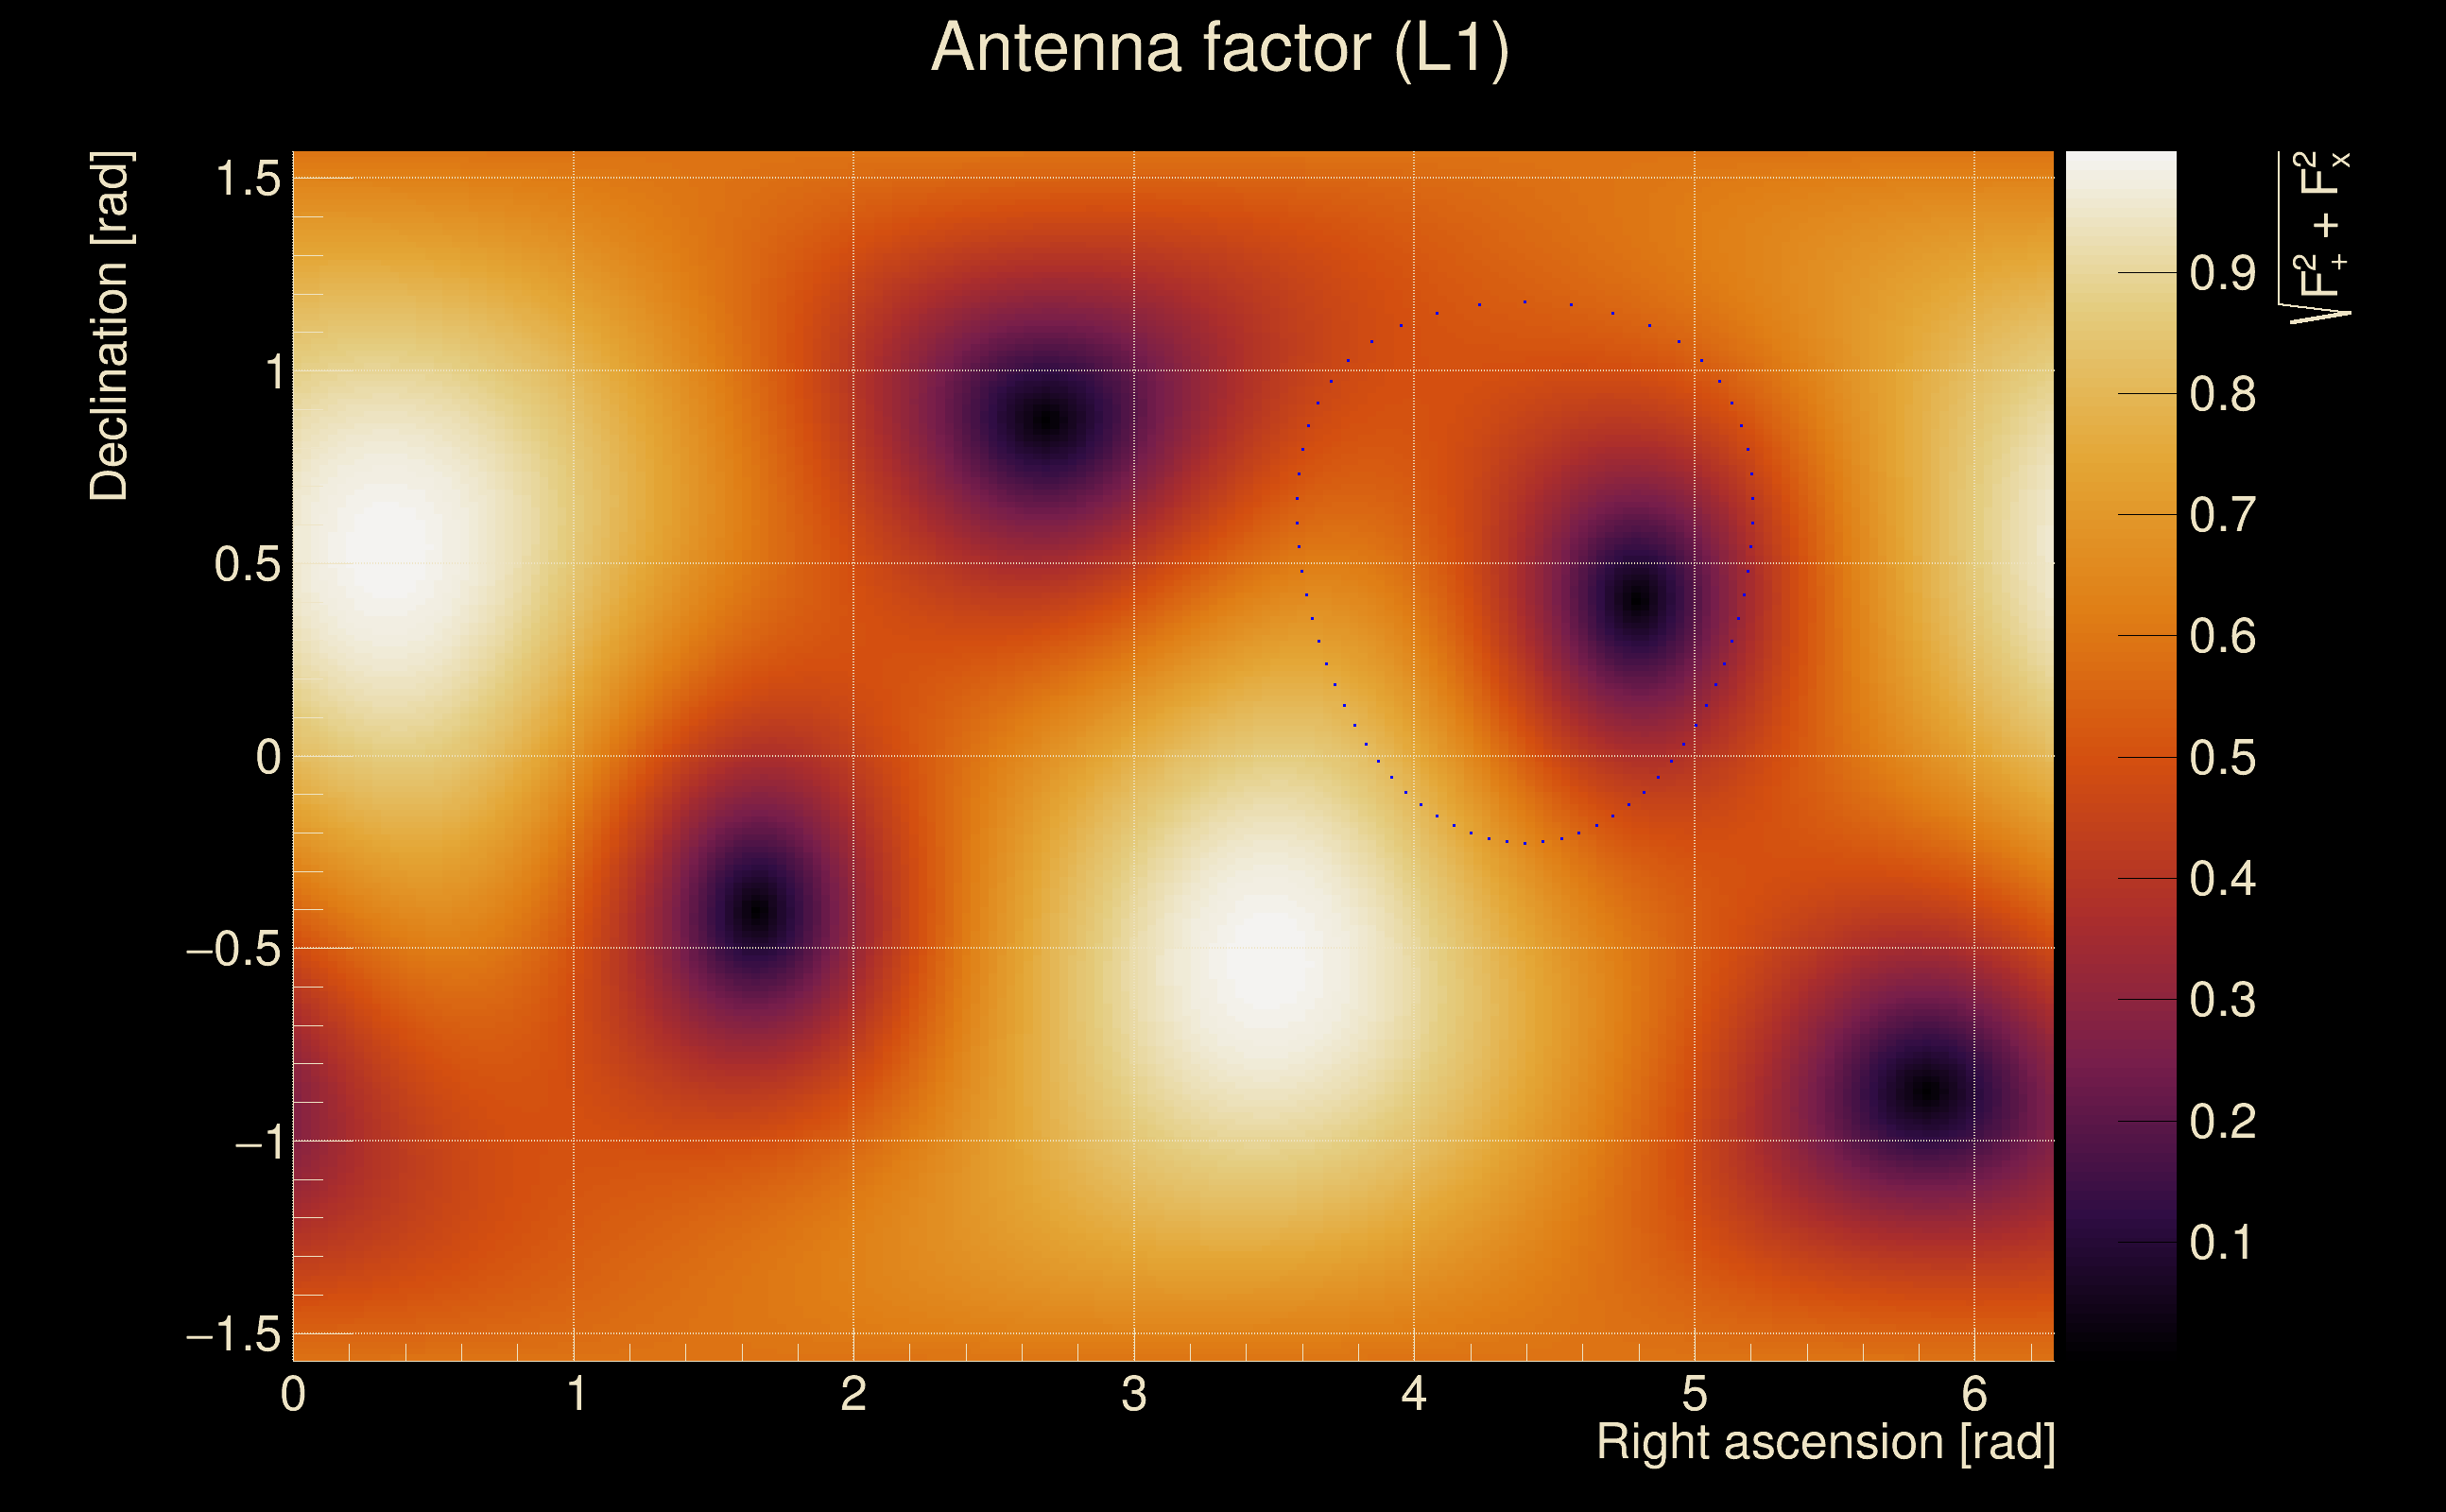
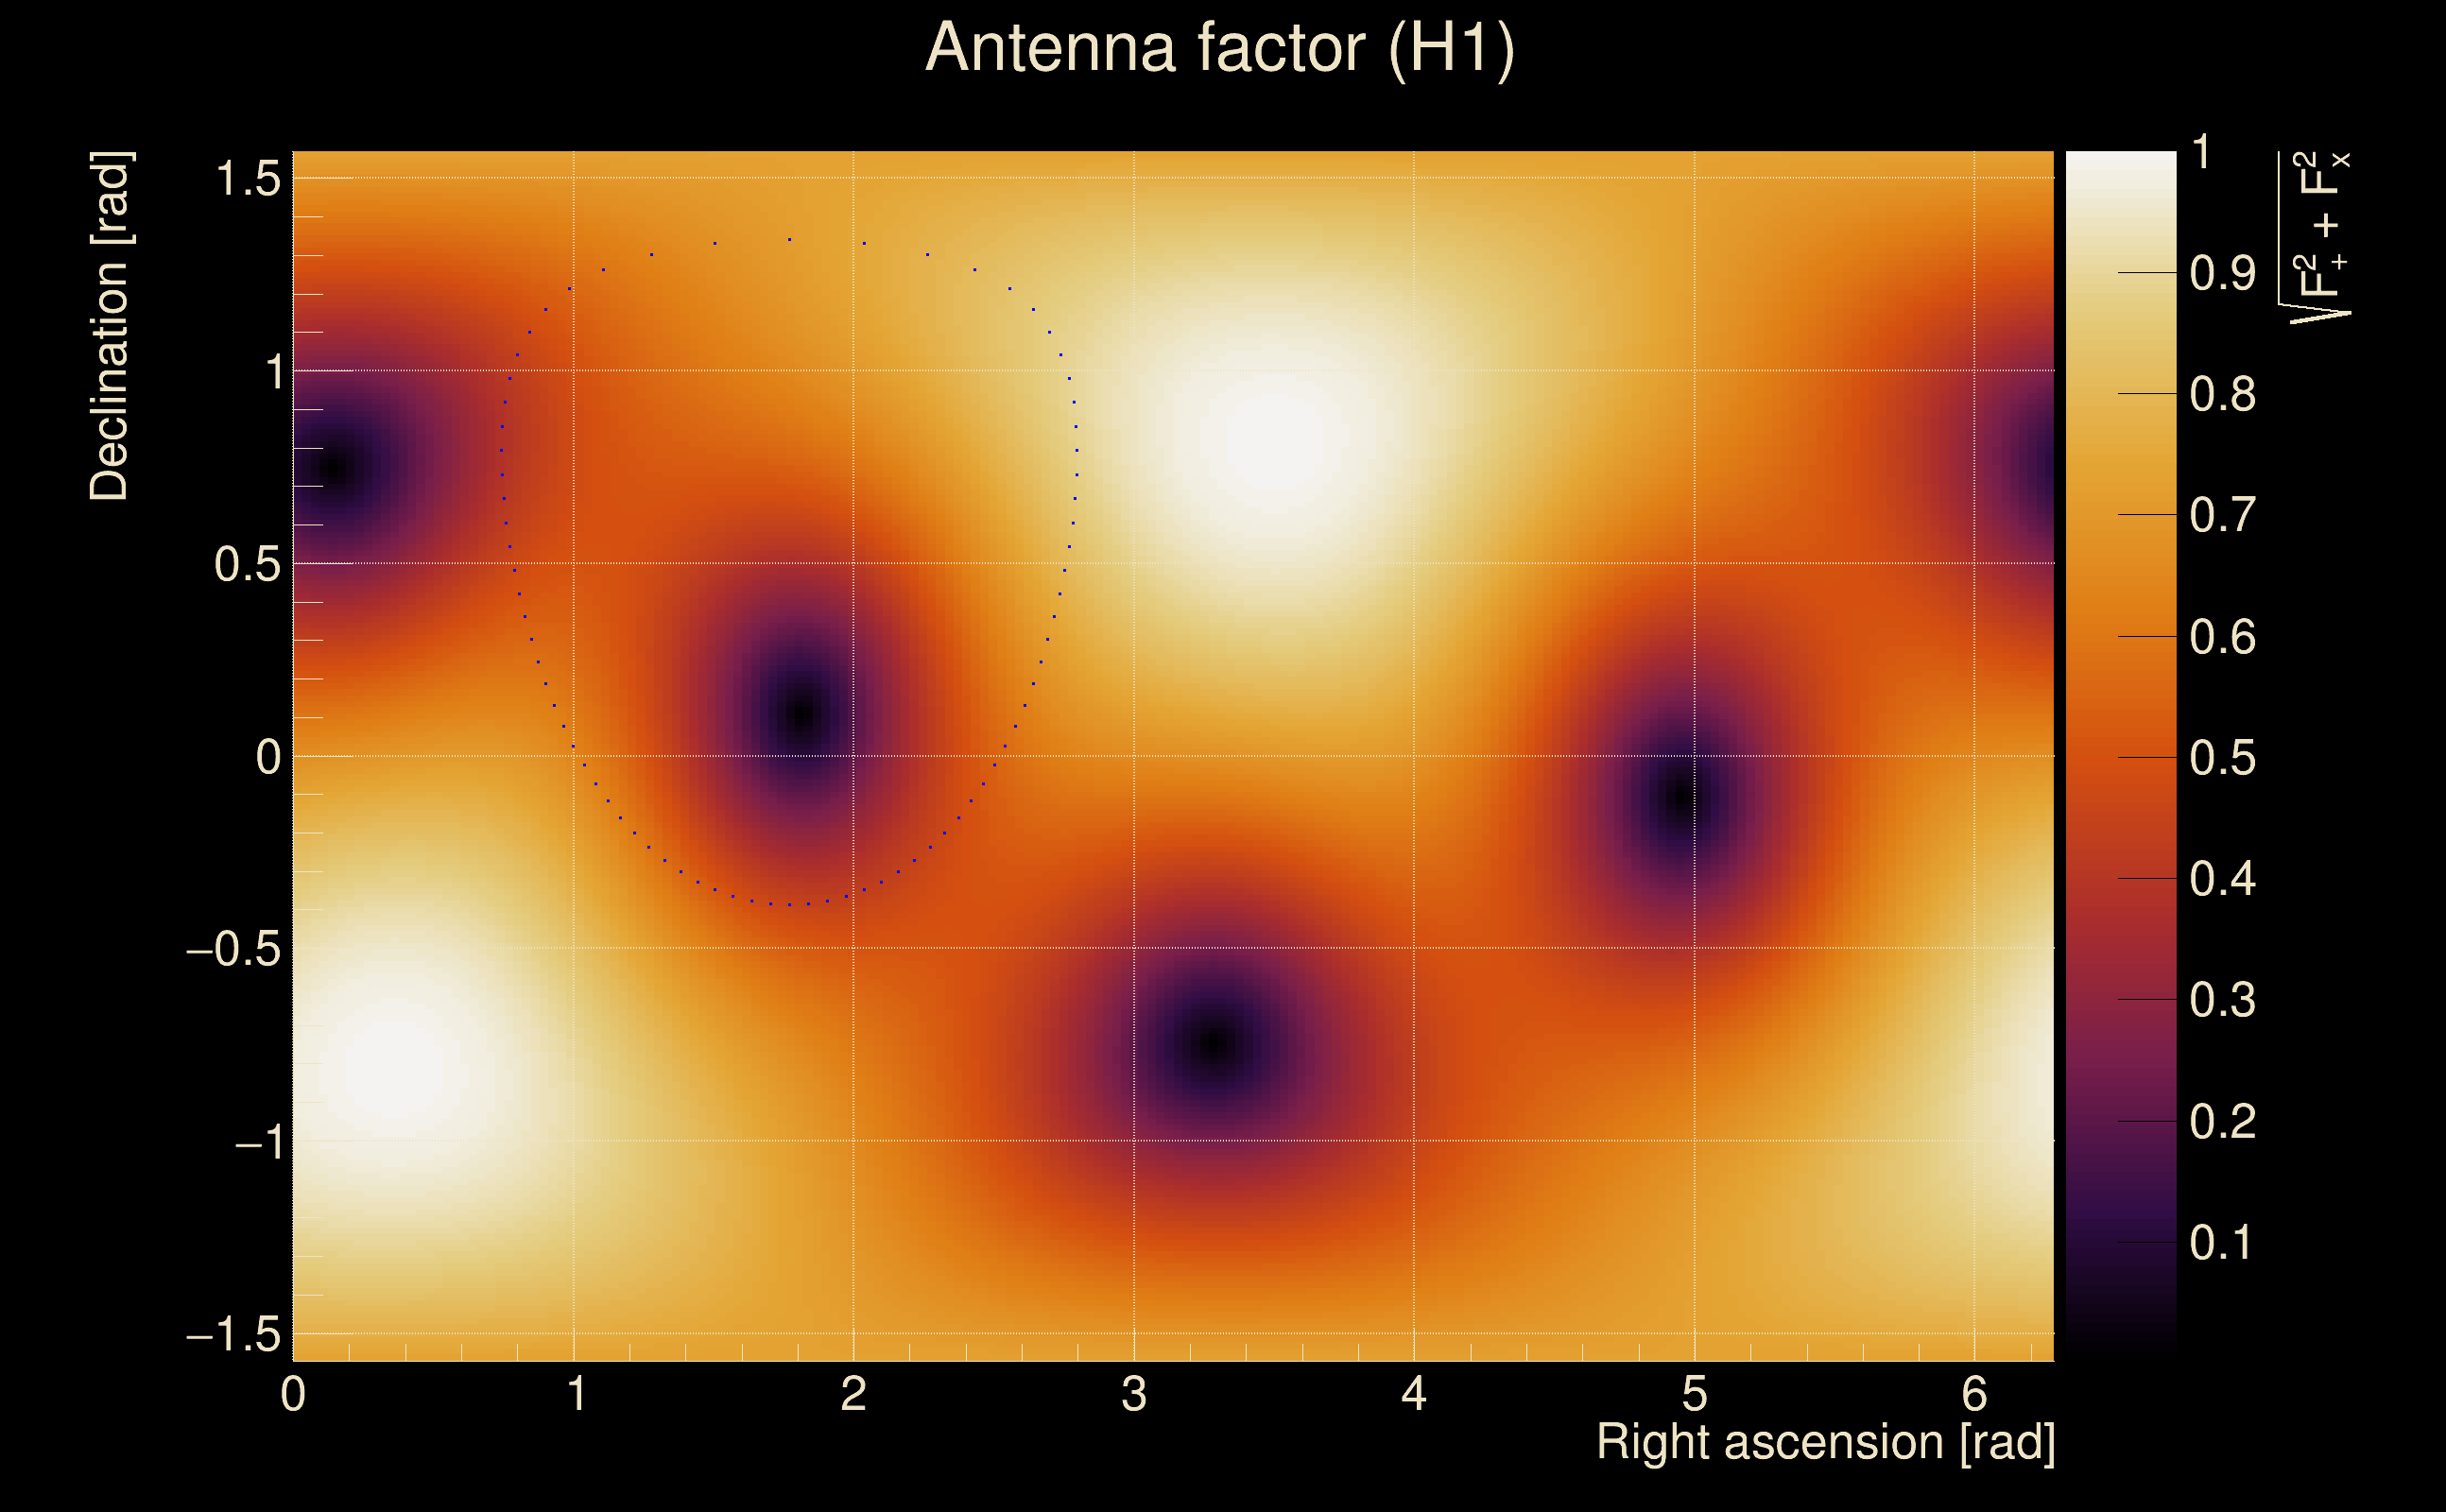
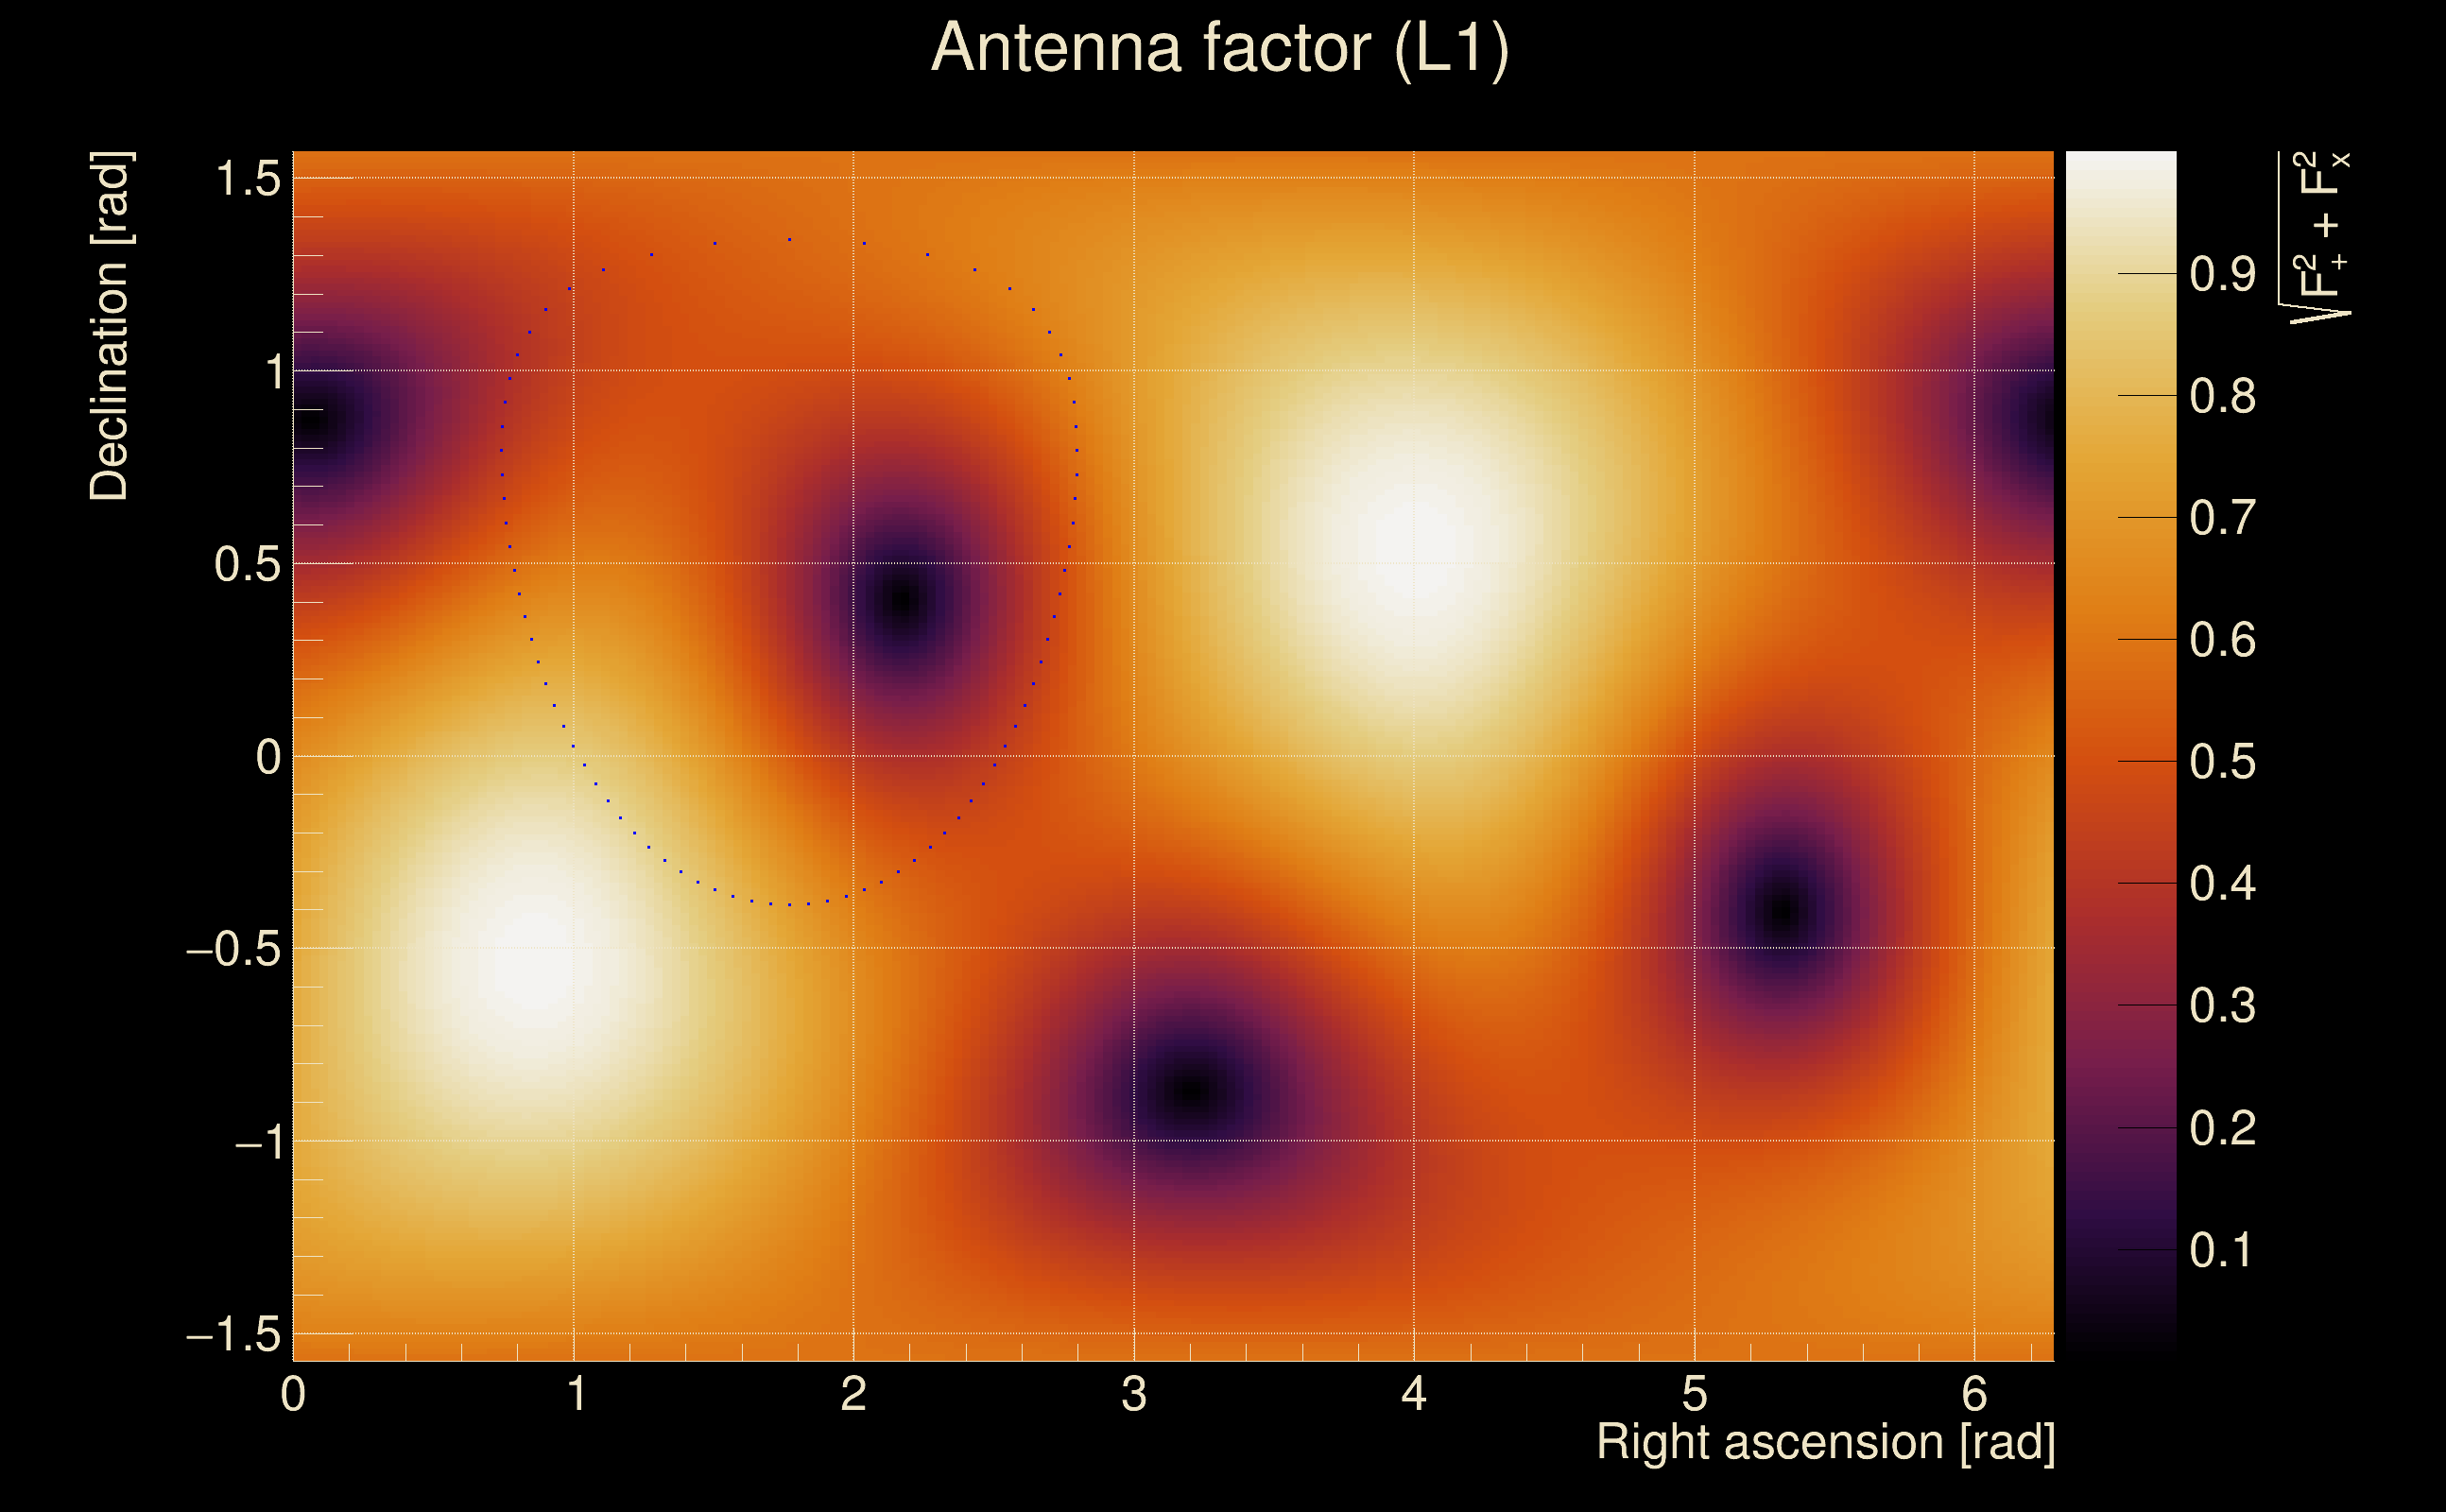
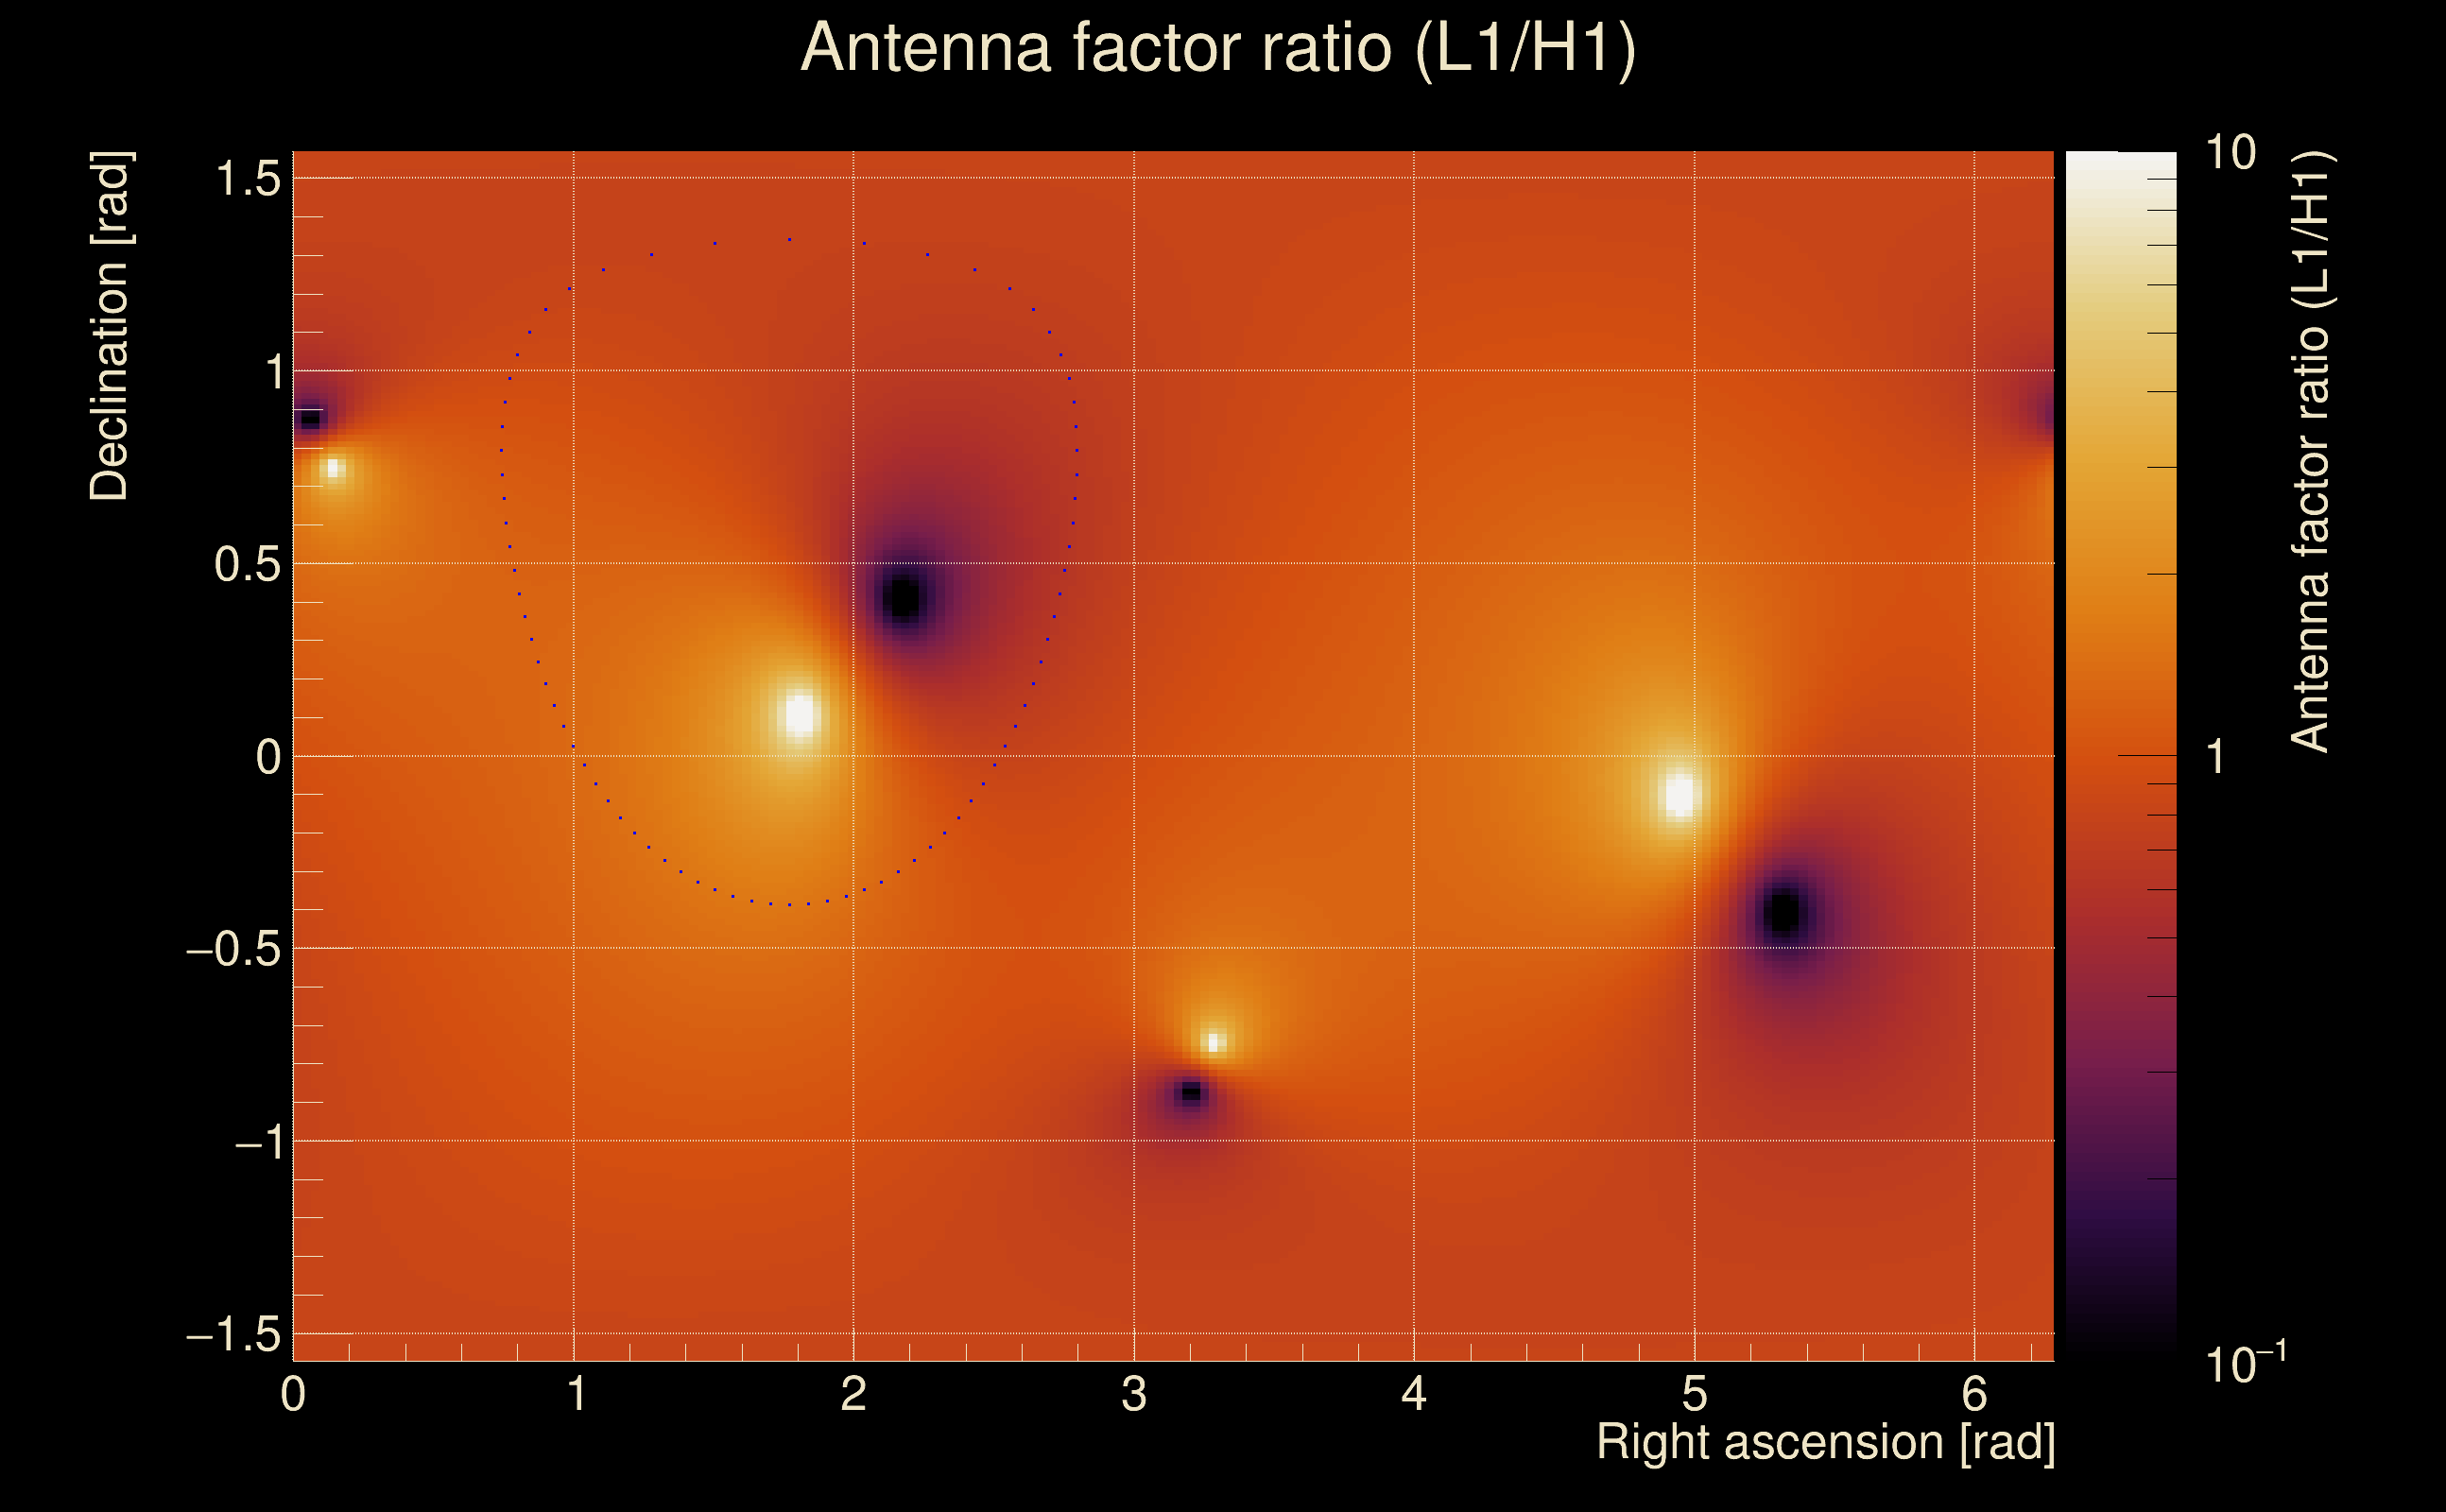
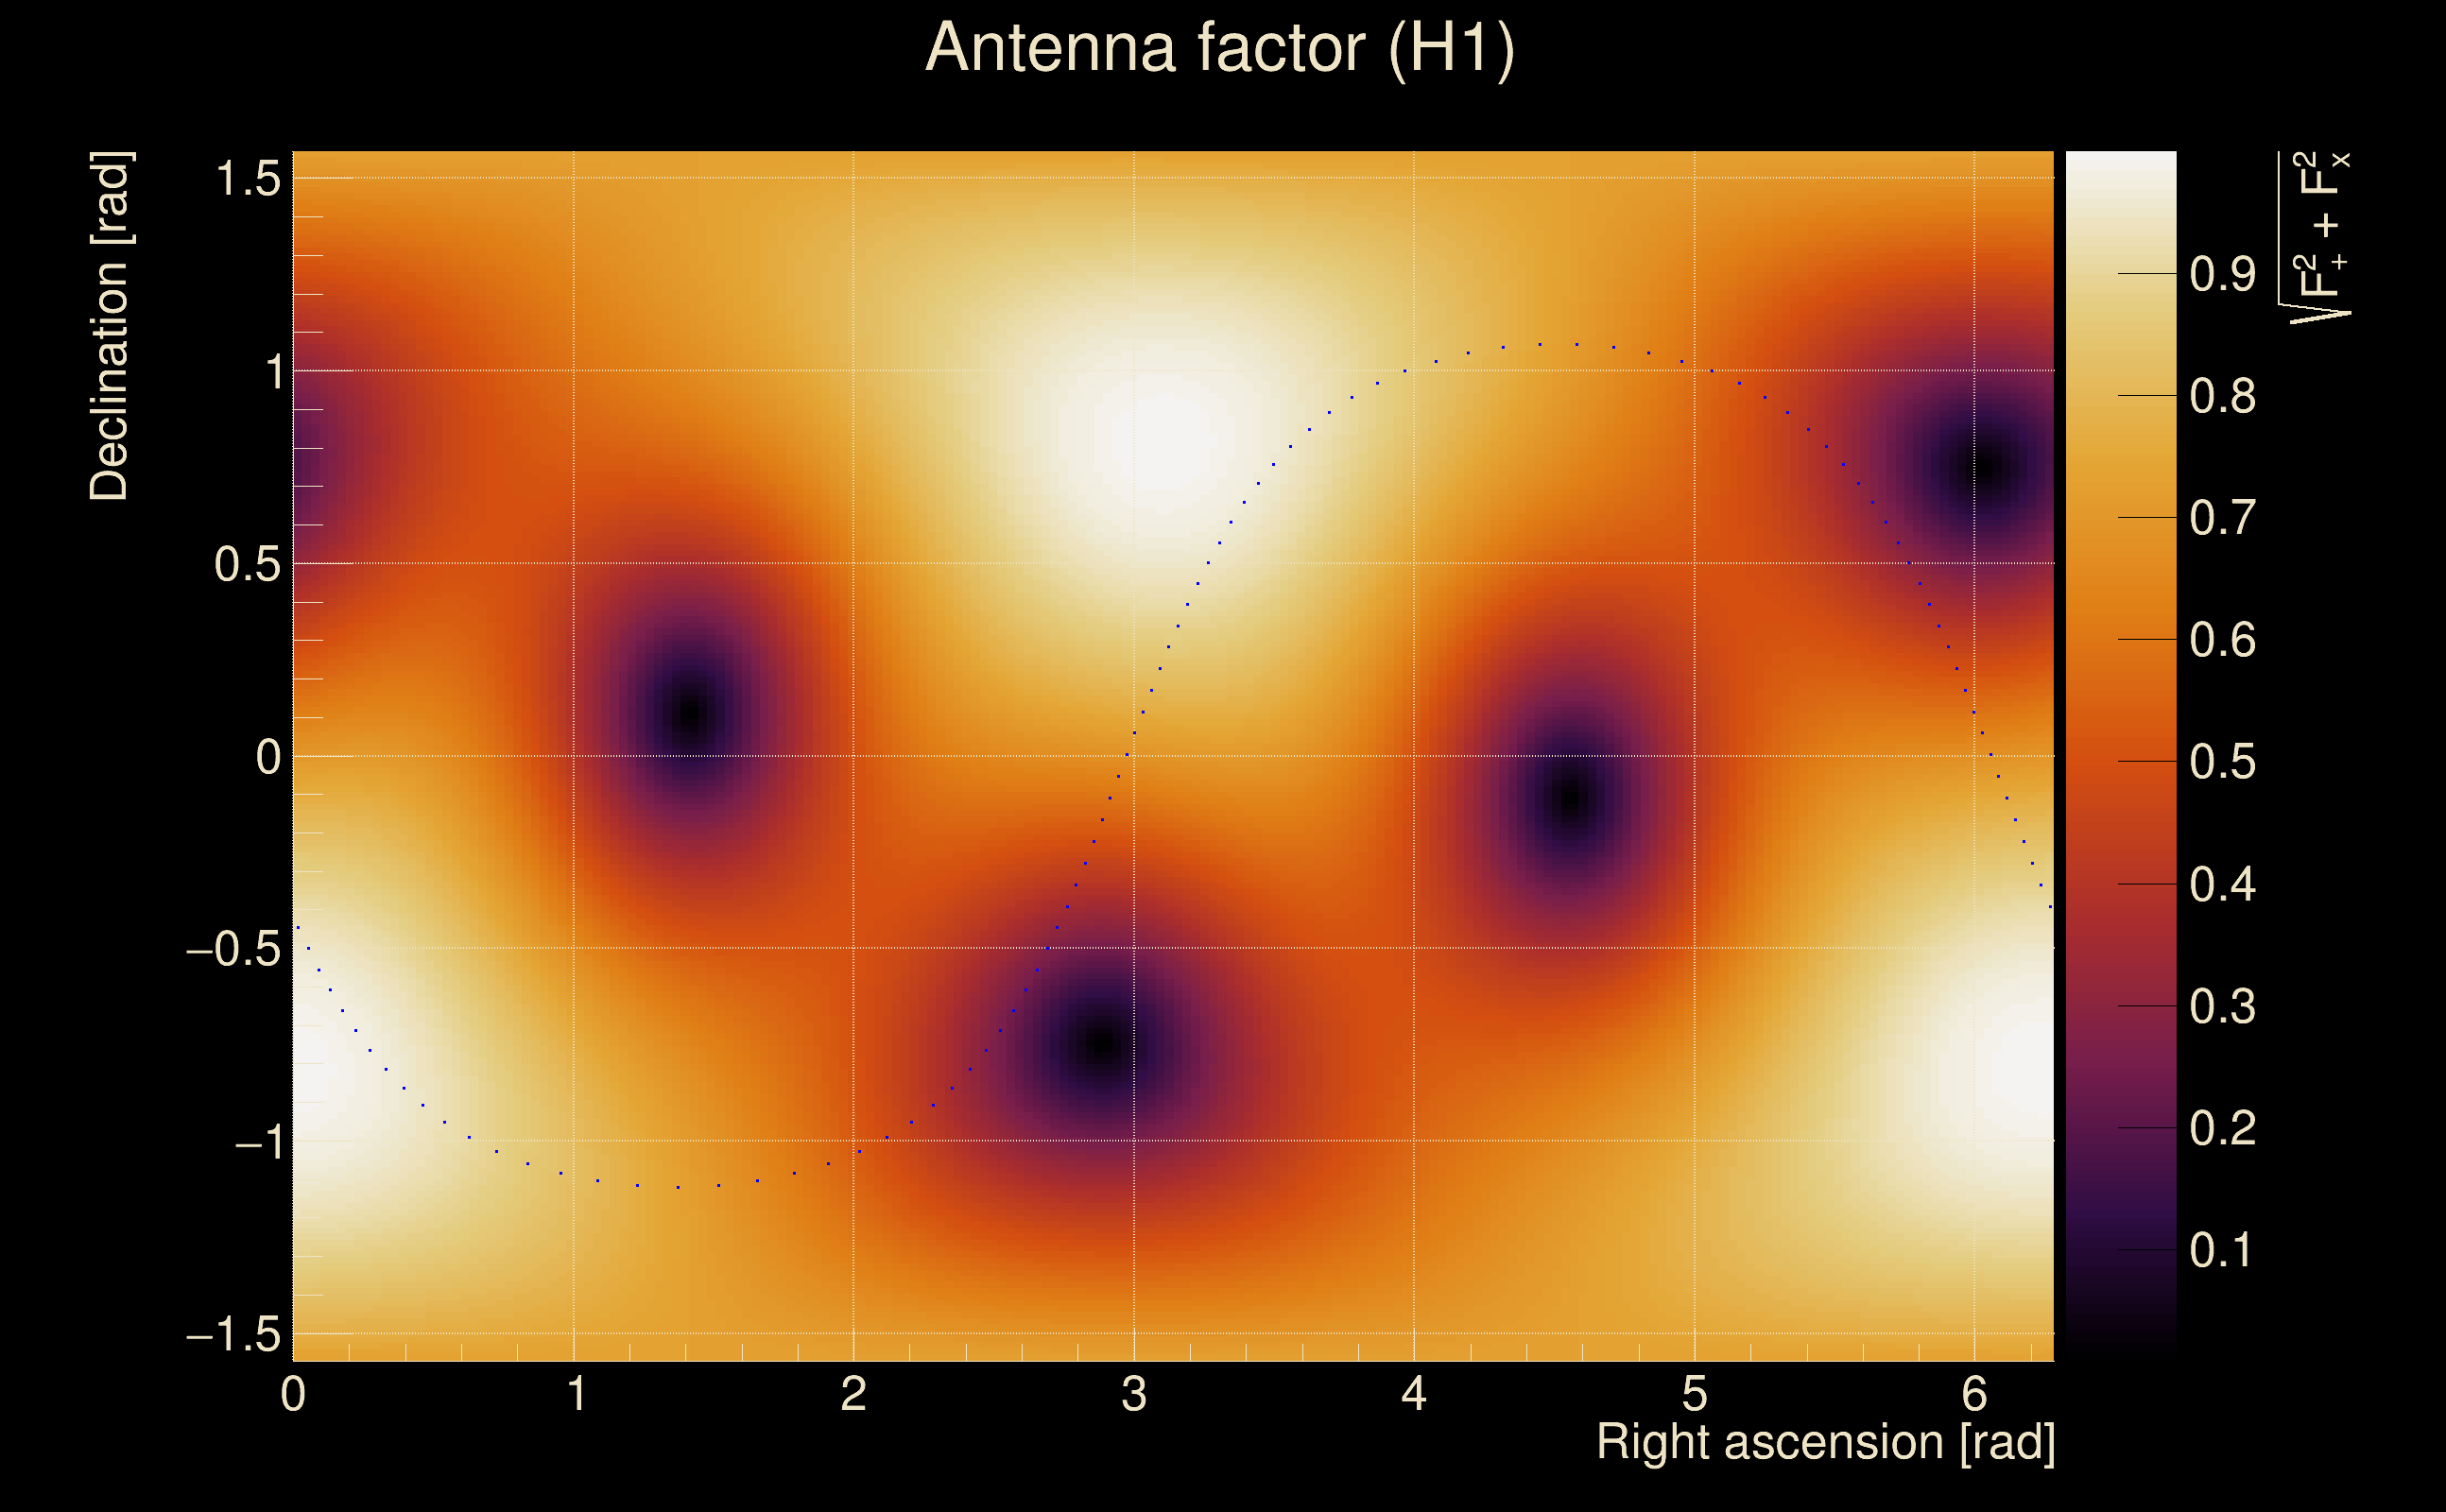
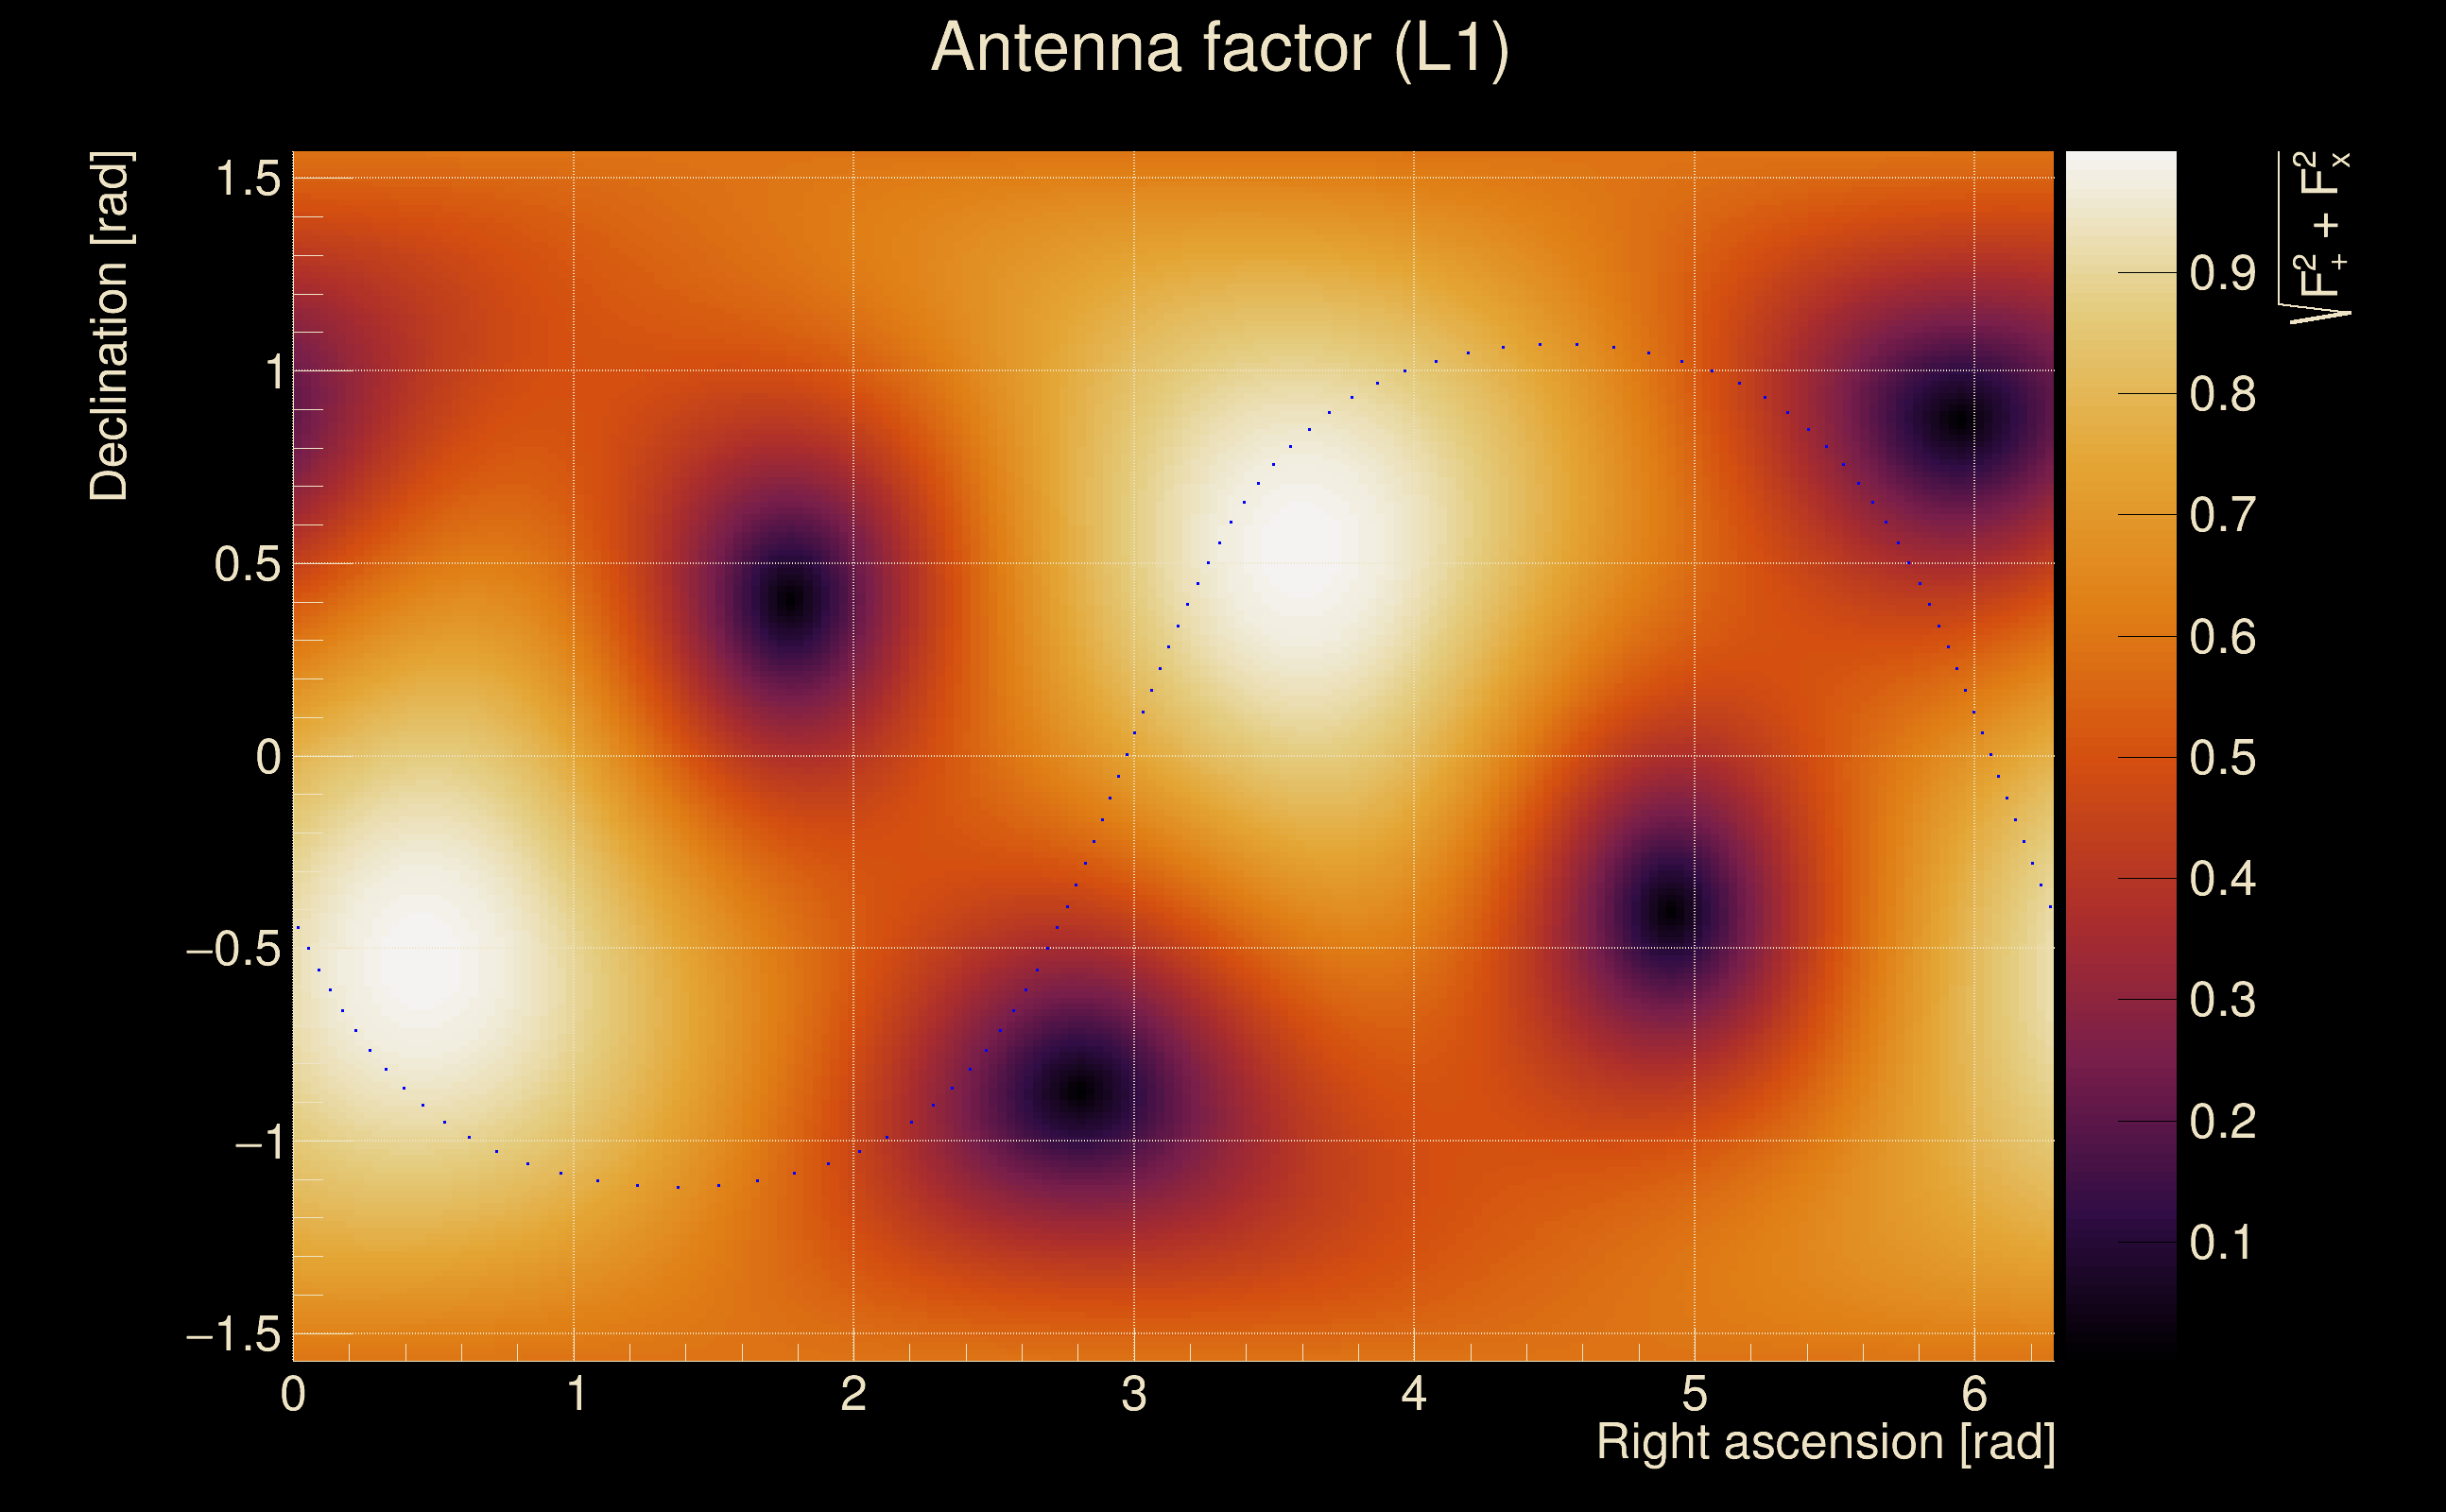
| Target sky positon: | Ra: 3.68109, Dec: 0.94792 [rad] |
| List of input Ox files: | TargIxf_feb2026_SN3_30s_file_list.txt (71 files) |
| Analysis result file: | TargIxf_feb2026_SN3_30s_results-0.root |
| Slice selected for the the fakeground: | slice index=208 (-4.6 s), time lag = 0 s |
| Foreground | Fakeground | Background | ||
|---|---|---|---|---|
| Number of processed ox events | 12111 | 12111 | 2603865 | |
| Start Date (detector 0) | Mon May 15 14:13:25 2023 UTC | Mon May 15 14:13:25 2023 UTC | Mon May 15 14:13:25 2023 UTC | |
| End Date (detector 0) | Thu May 18 15:54:40 2023 UTC | Thu May 18 15:54:40 2023 UTC | Thu May 18 15:54:40 2023 UTC | |
| Start GPS (detector 0) | 1368195223 | 1368195223 | 1368195223 | |
| End GPS (detector 0) | 1368460498 | 1368460498 | 1368460498 | |
| Used livetime (detector 0) | 60875 s | 60875 s | 60875 s | |
| Start Date (detector 1) | Mon May 15 14:13:25 2023 UTC | Mon May 15 14:13:25 2023 UTC | Mon May 15 14:13:25 2023 UTC | |
| End Date (detector 1) | Thu May 18 15:54:40 2023 UTC | Thu May 18 15:54:40 2023 UTC | Thu May 18 15:54:40 2023 UTC | |
| Start GPS (detector 1) | 1368195223 | 1368195223 | 1368195223 | |
| End GPS (detector 1) | 1368460498 | 1368460498 | 1368460498 | |
| Used livetime (detector 1) | 60875 s | 60875 s | 60875 s | |
| Cumulative livetime | 121110 s | 121110 s | 26038650 s | |
| 0 years, 1 days, 9 hours, 38 min, 30 s | 0 years, 1 days, 9 hours, 38 min, 30 s | 0 years, 301 days, 8 hours, 57 min, 30 s |
|
|
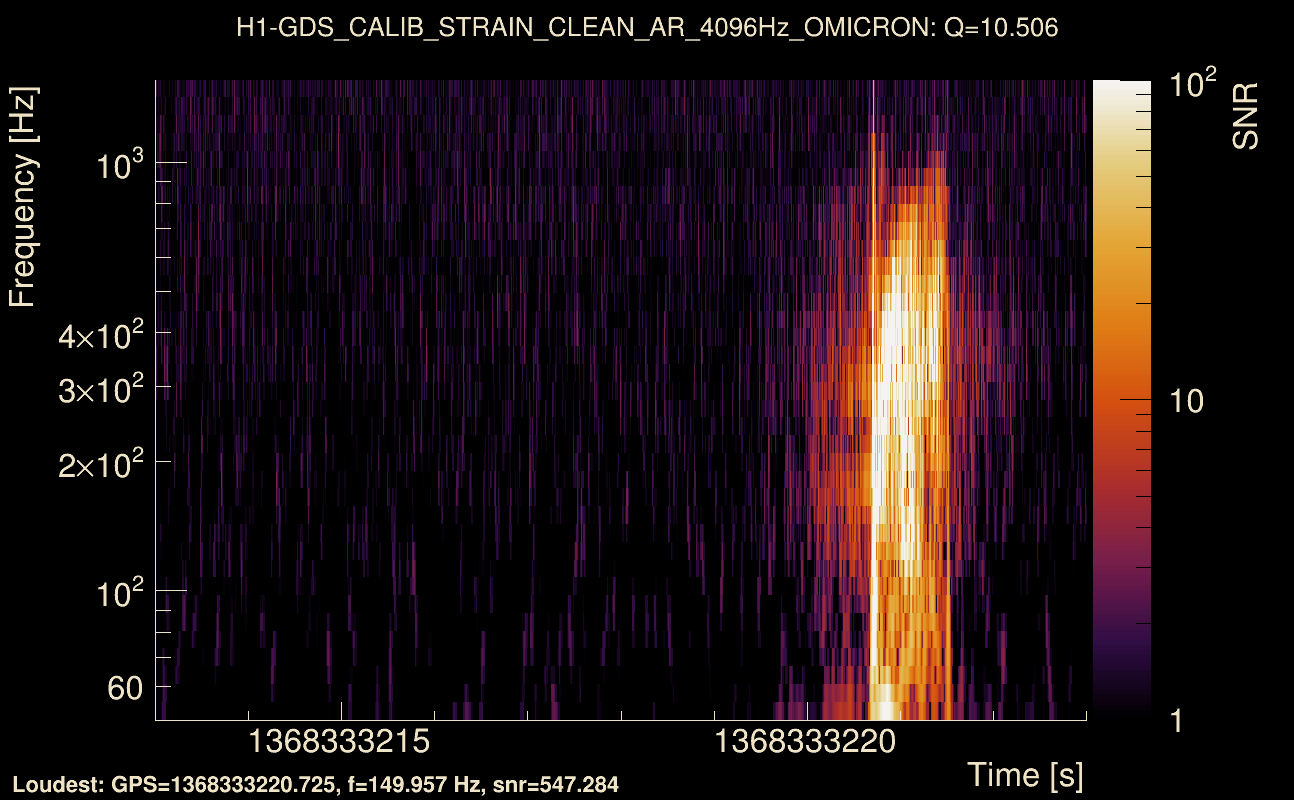
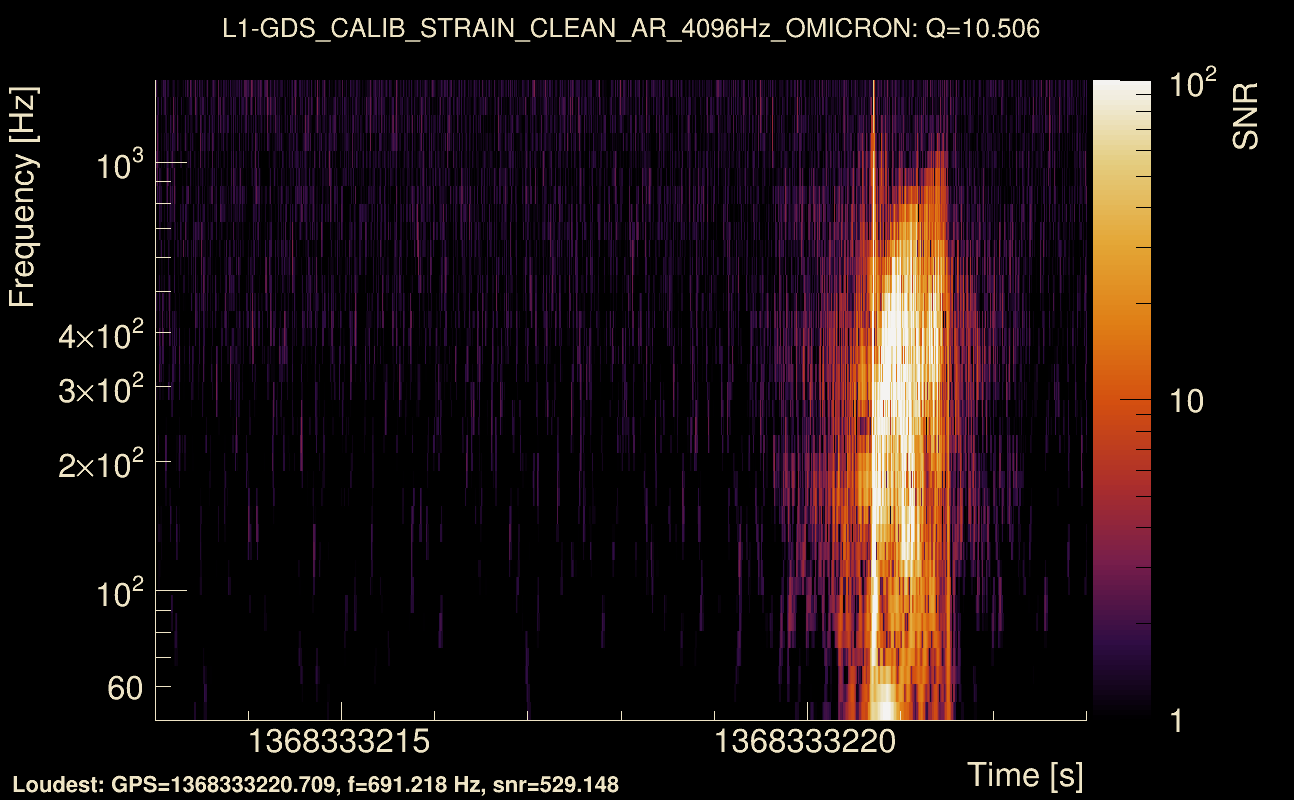
| Event time t(H1): | GPS = 1368333213 (Wed May 17 04:33:15 2023 ) → GPS = 1368333223 (Wed May 17 04:33:25 2023 ) |
| Event time t(L1): | GPS = 1368333213 (Wed May 17 04:33:25 2023 ) → GPS = 1368333223 (Wed May 17 04:33:25 2023 ) |
| Omicron analysis time window (H1): | GPS = 1368333210 → GPS = 1368333226 |
| Omicron analysis time window (L1): | GPS = 1368333210 → GPS = 1368333226 |
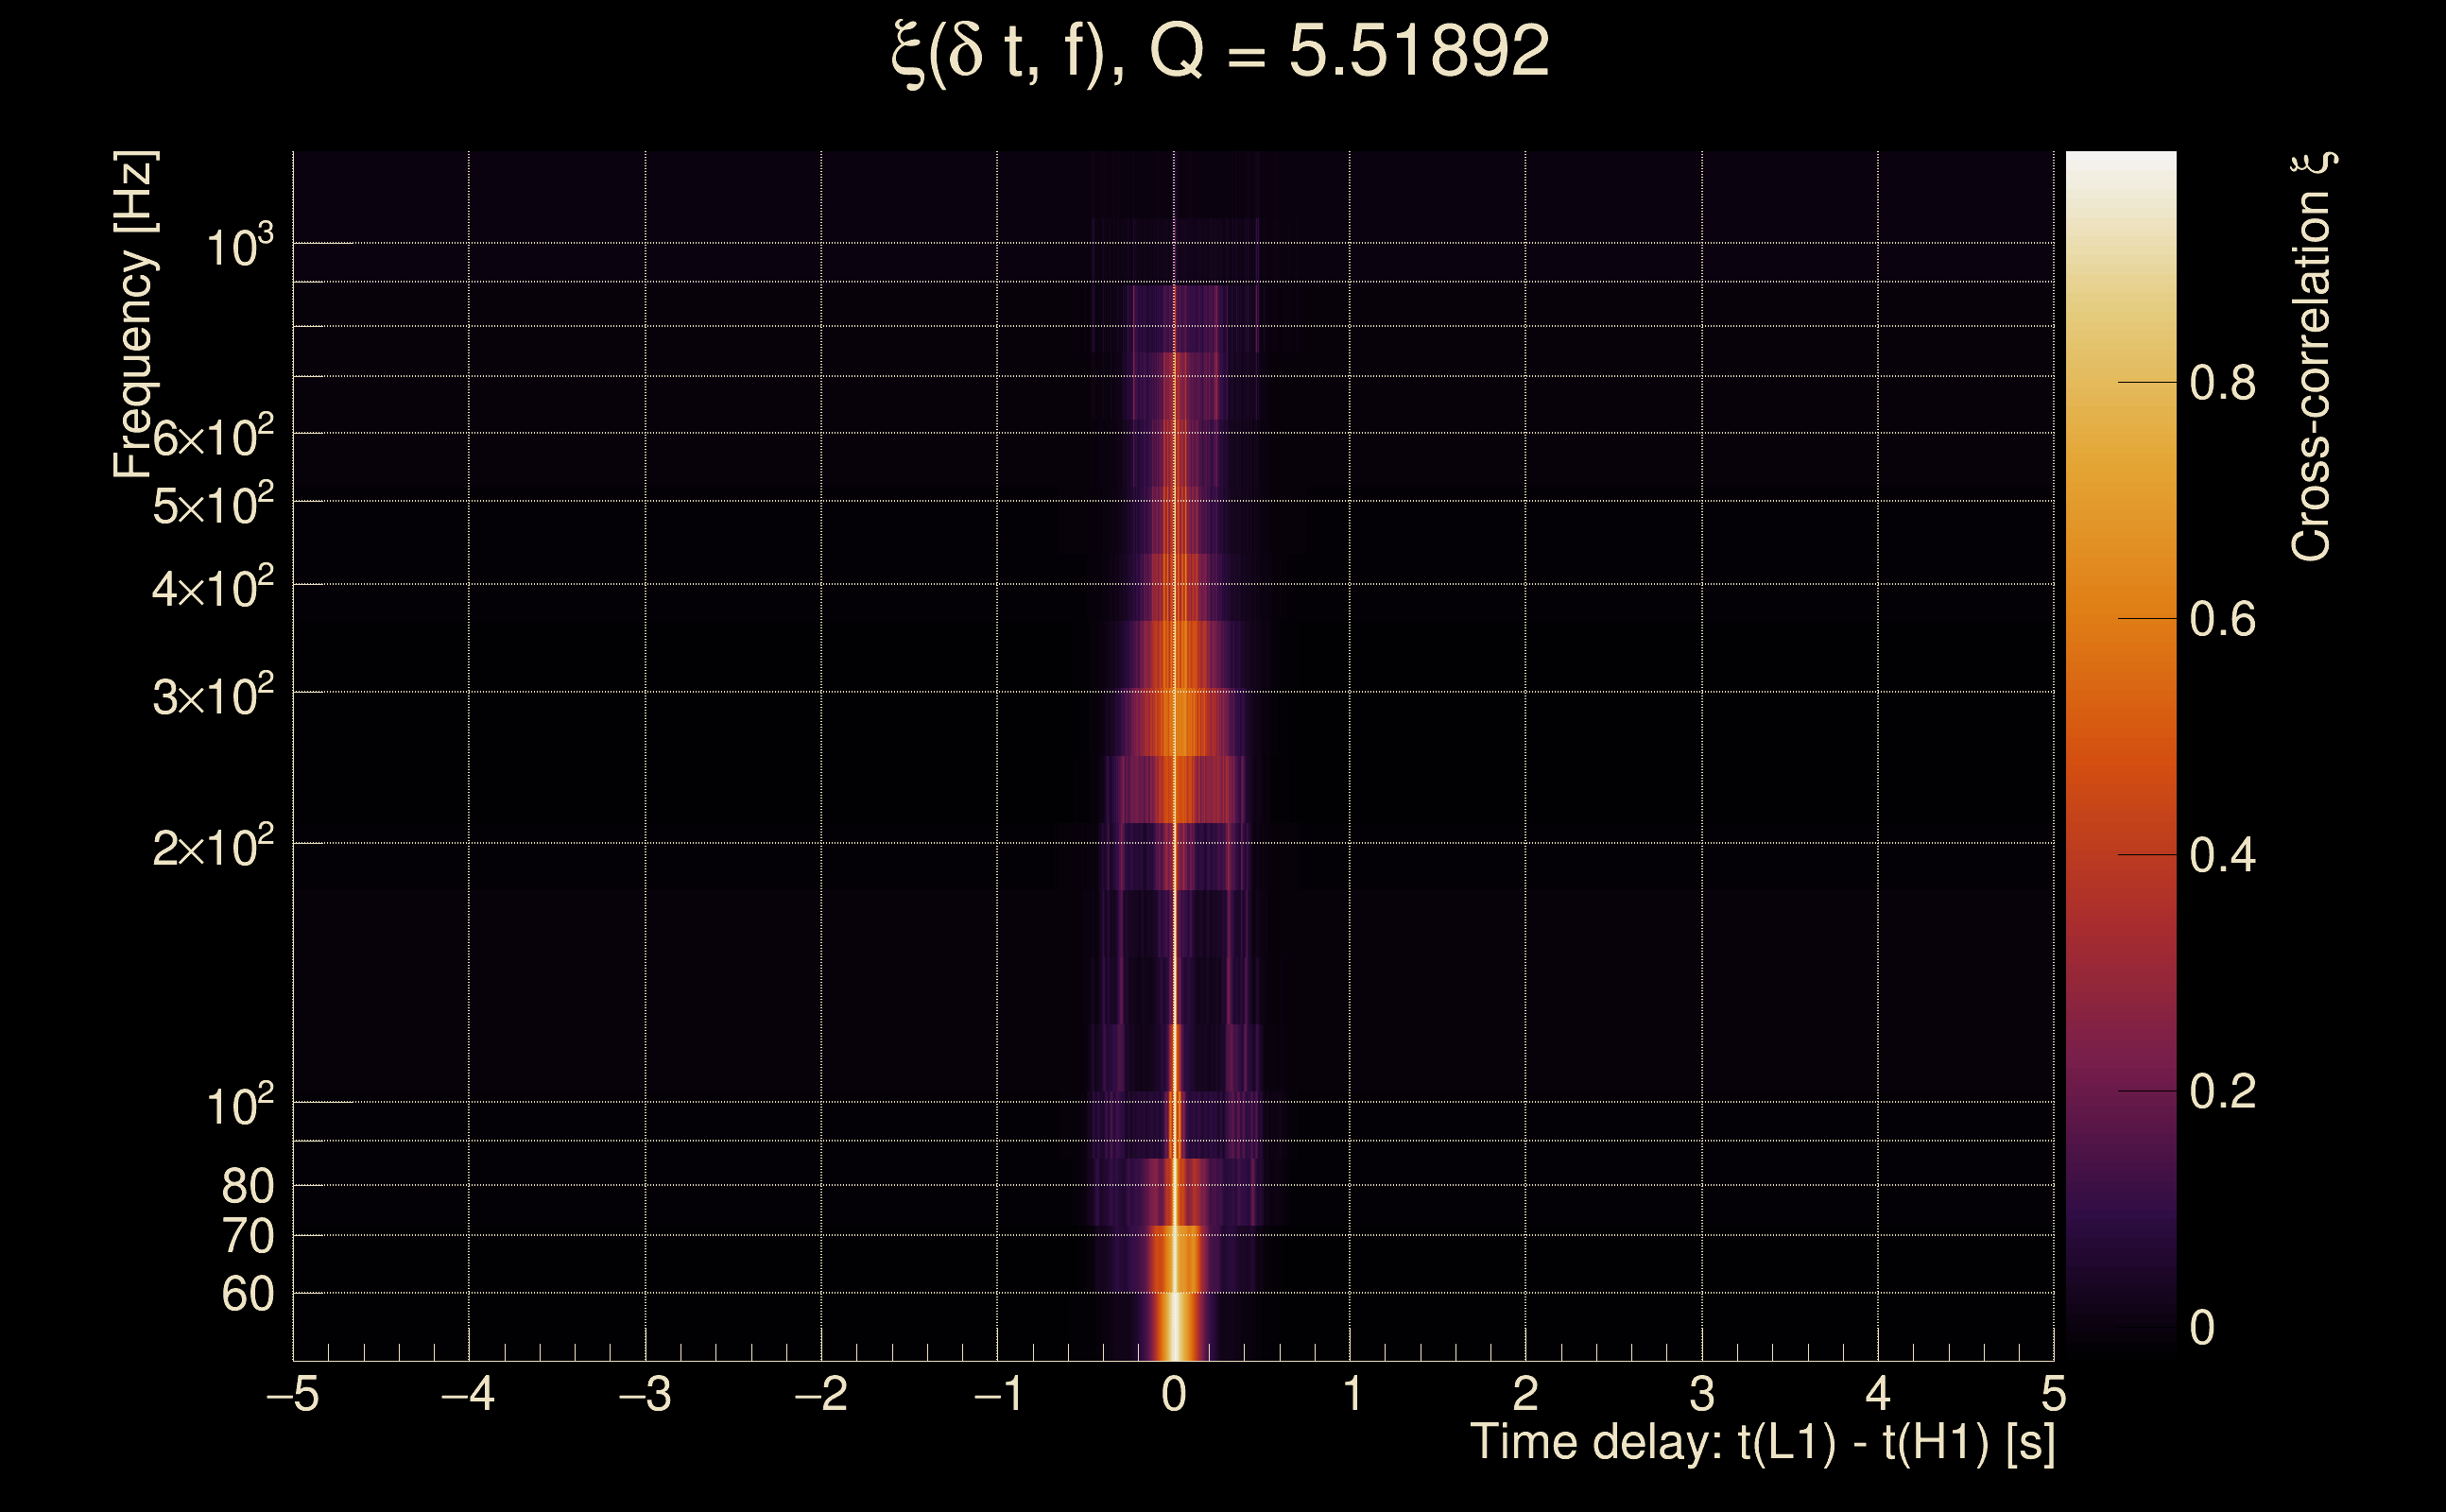
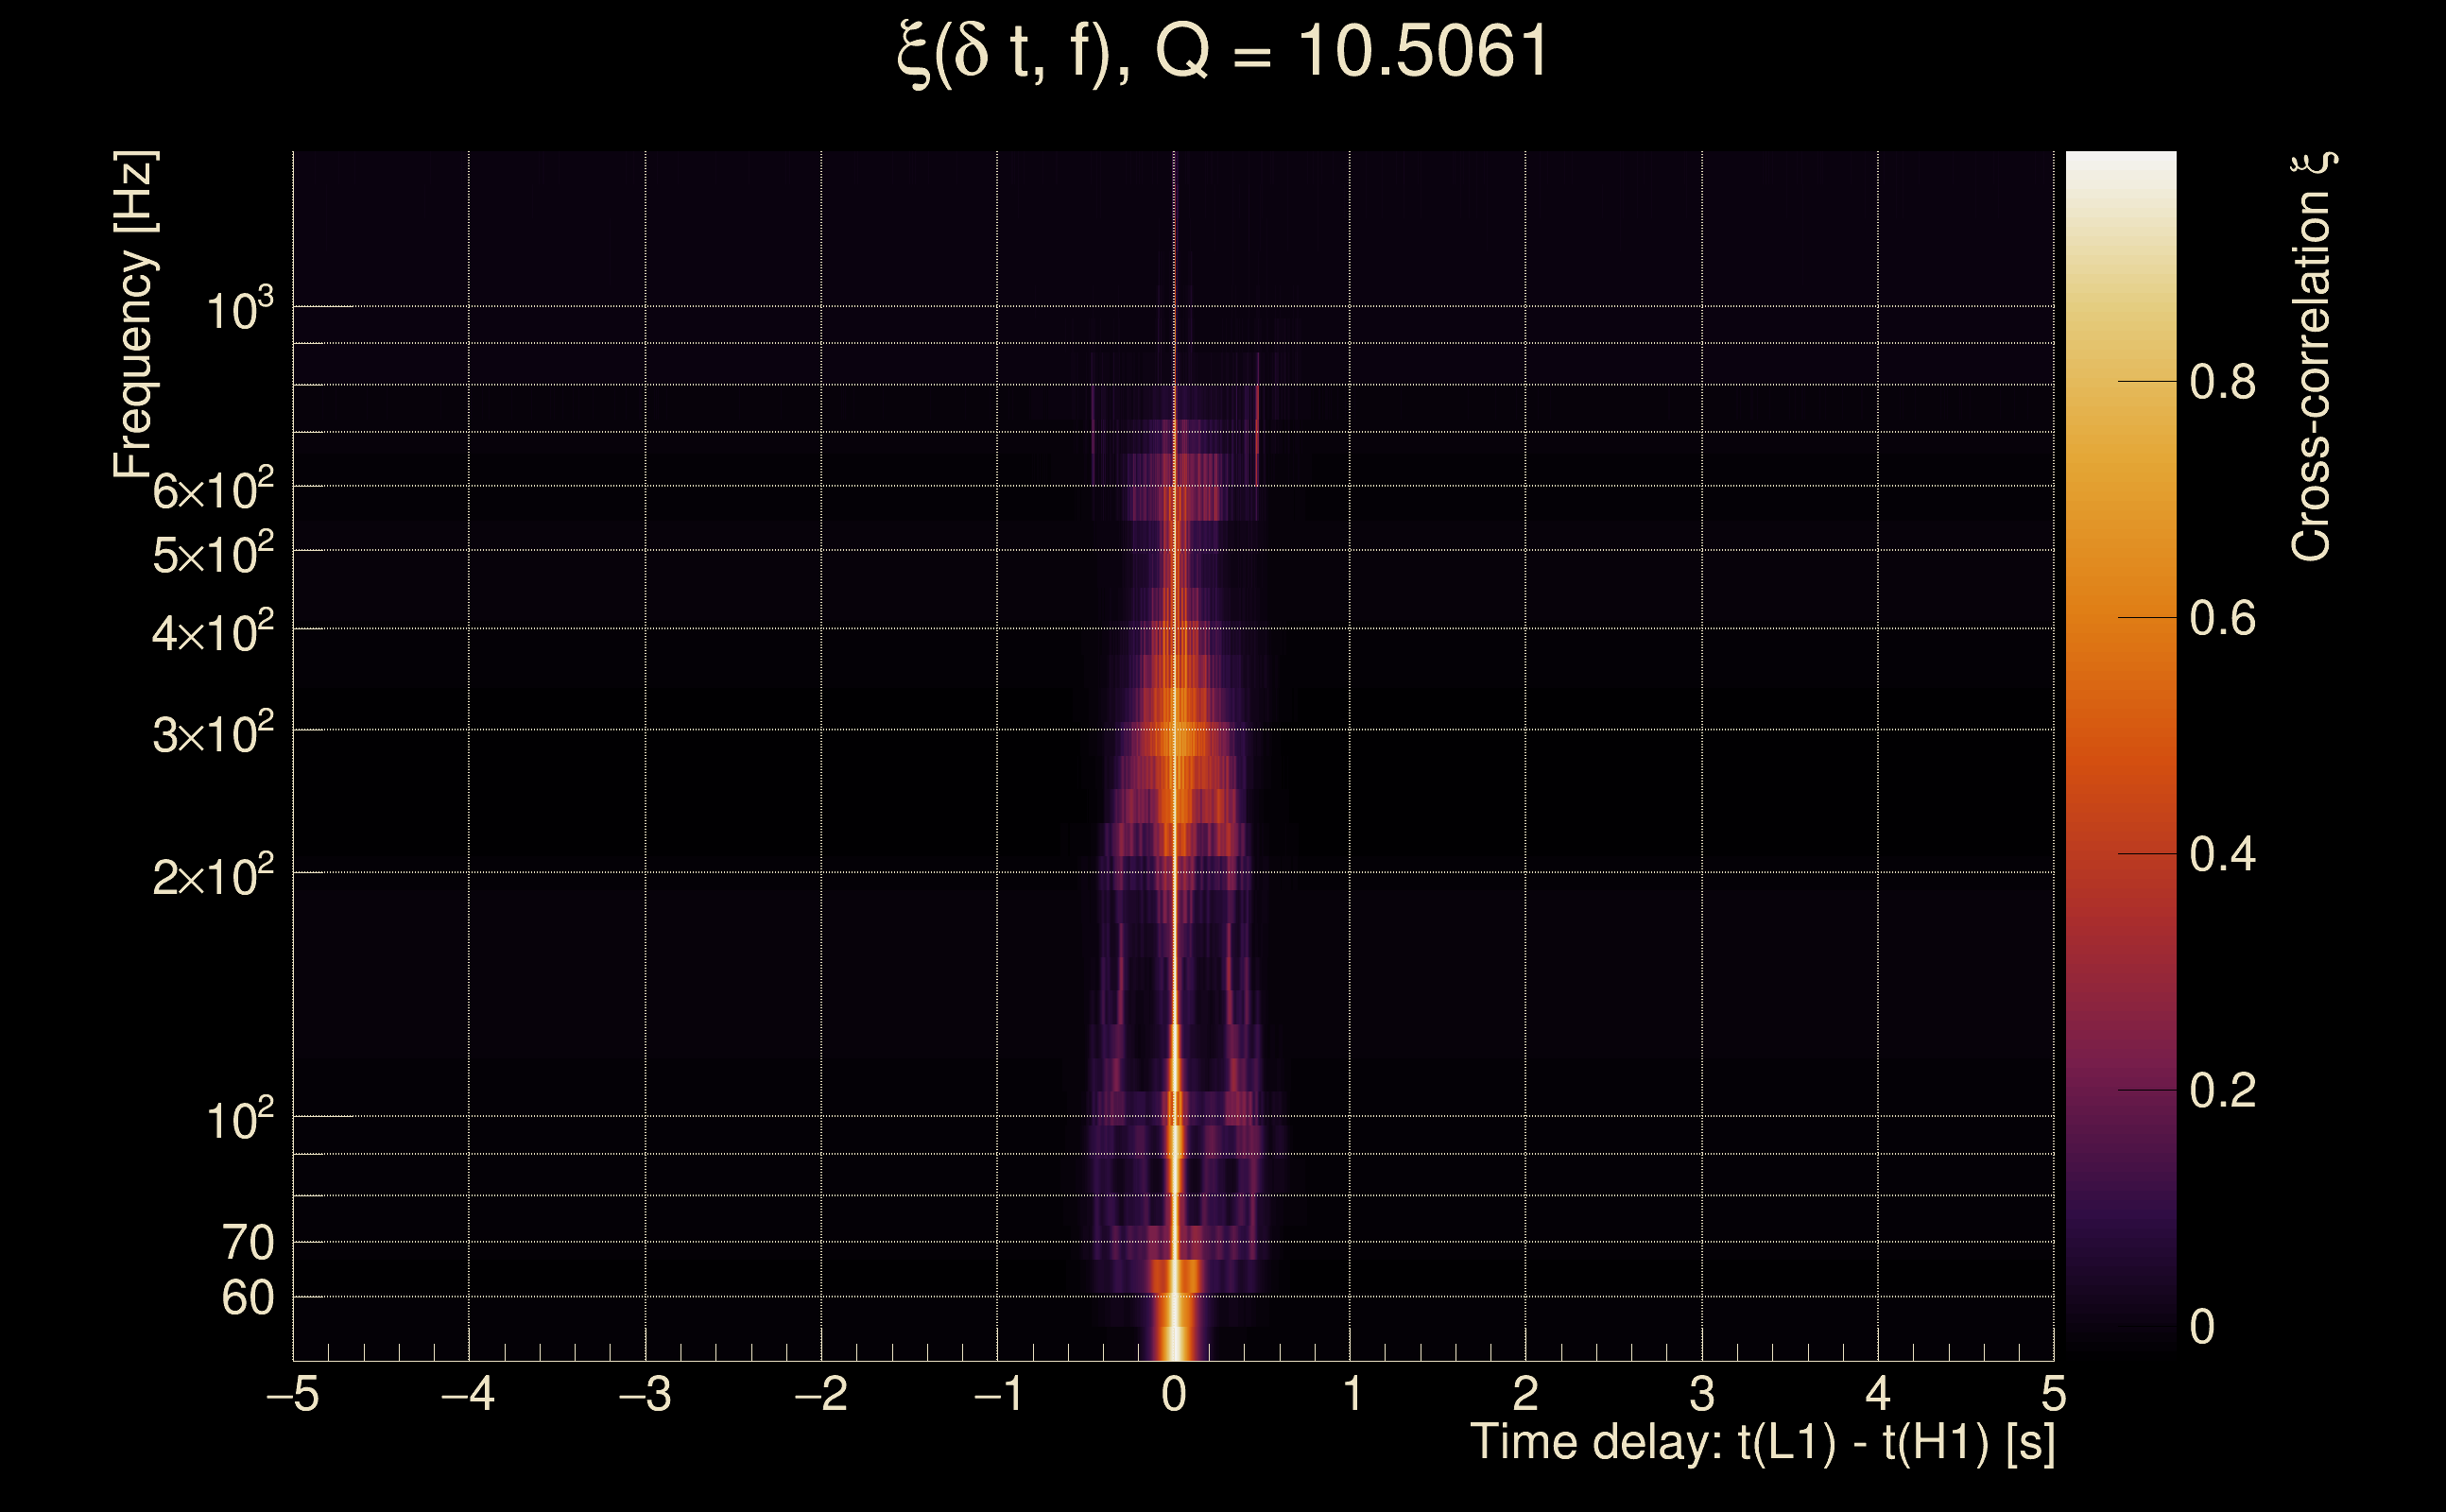
| Time delay between detectors t(L1) - t(H1): | 0.00066409 s (slice index = 108 / 217), δt_gw = 0.00066409 s |
| Time delay standard deviation: | 0.0218821 s |
| [targeted mode] Time delay probability: | 0.959338 (0.0509843 sigmas), δt_target = 1.72247e+45 s |
| Frequency: | 283.9 Hz |
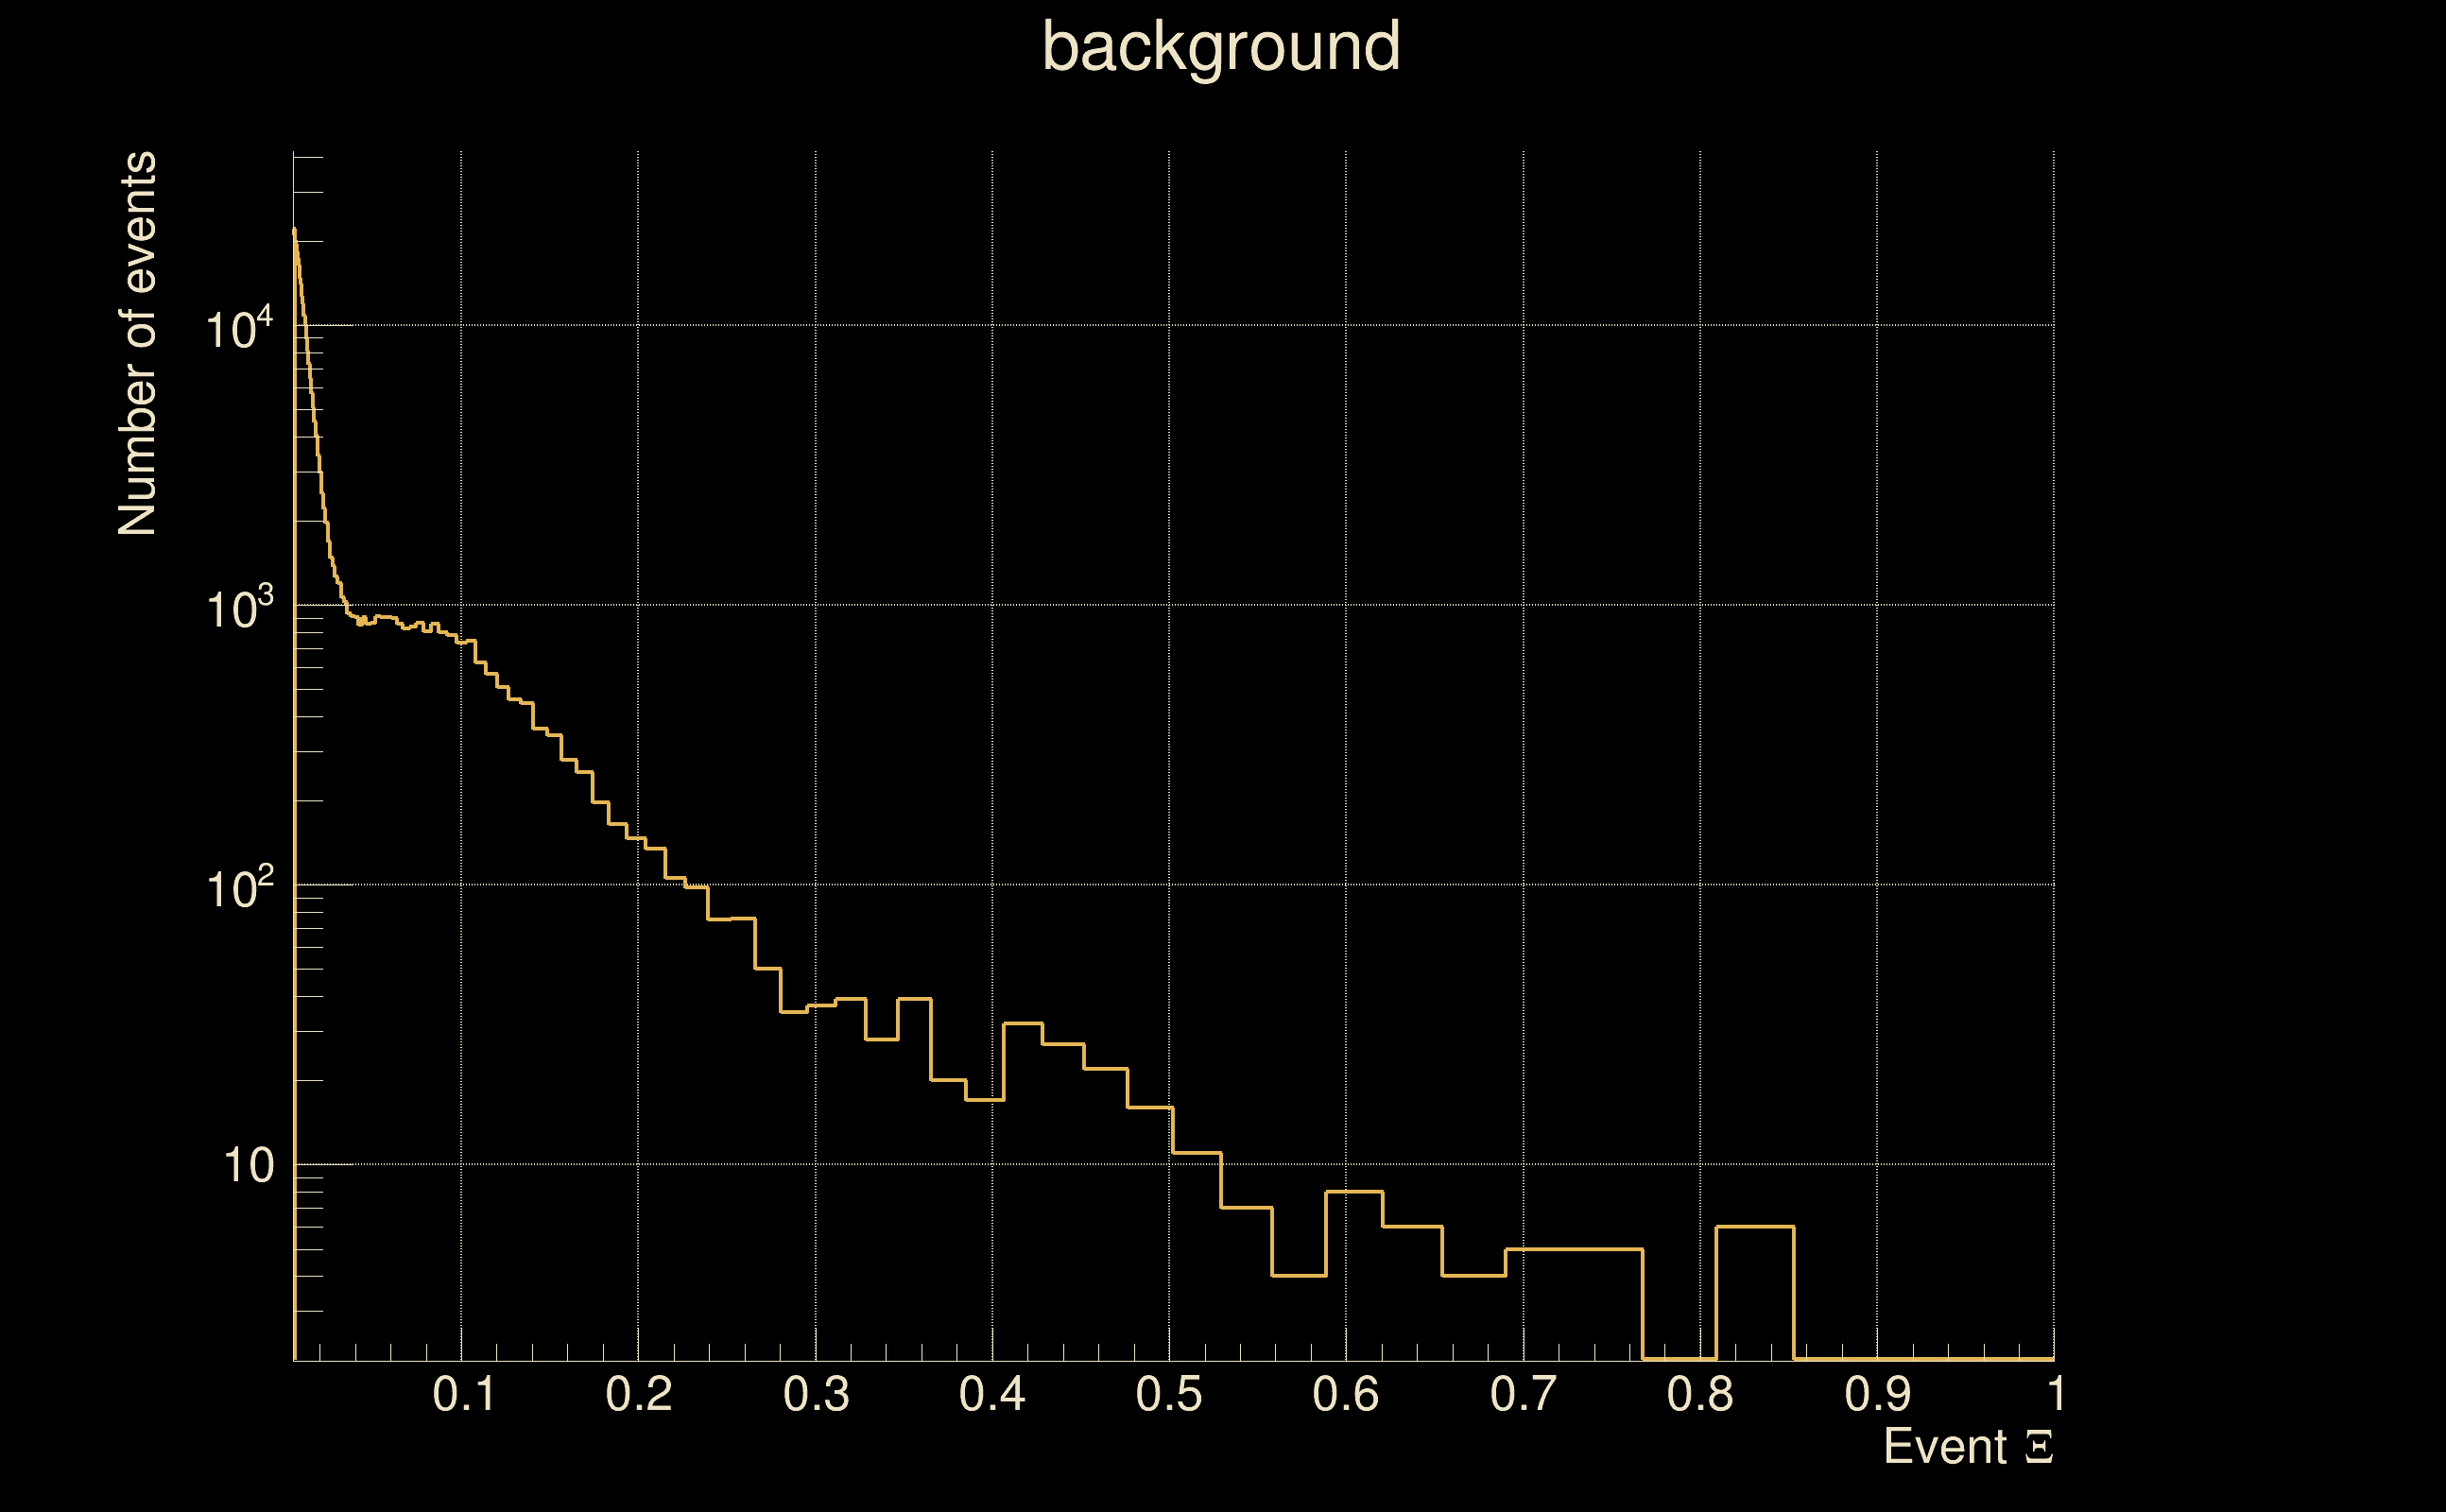
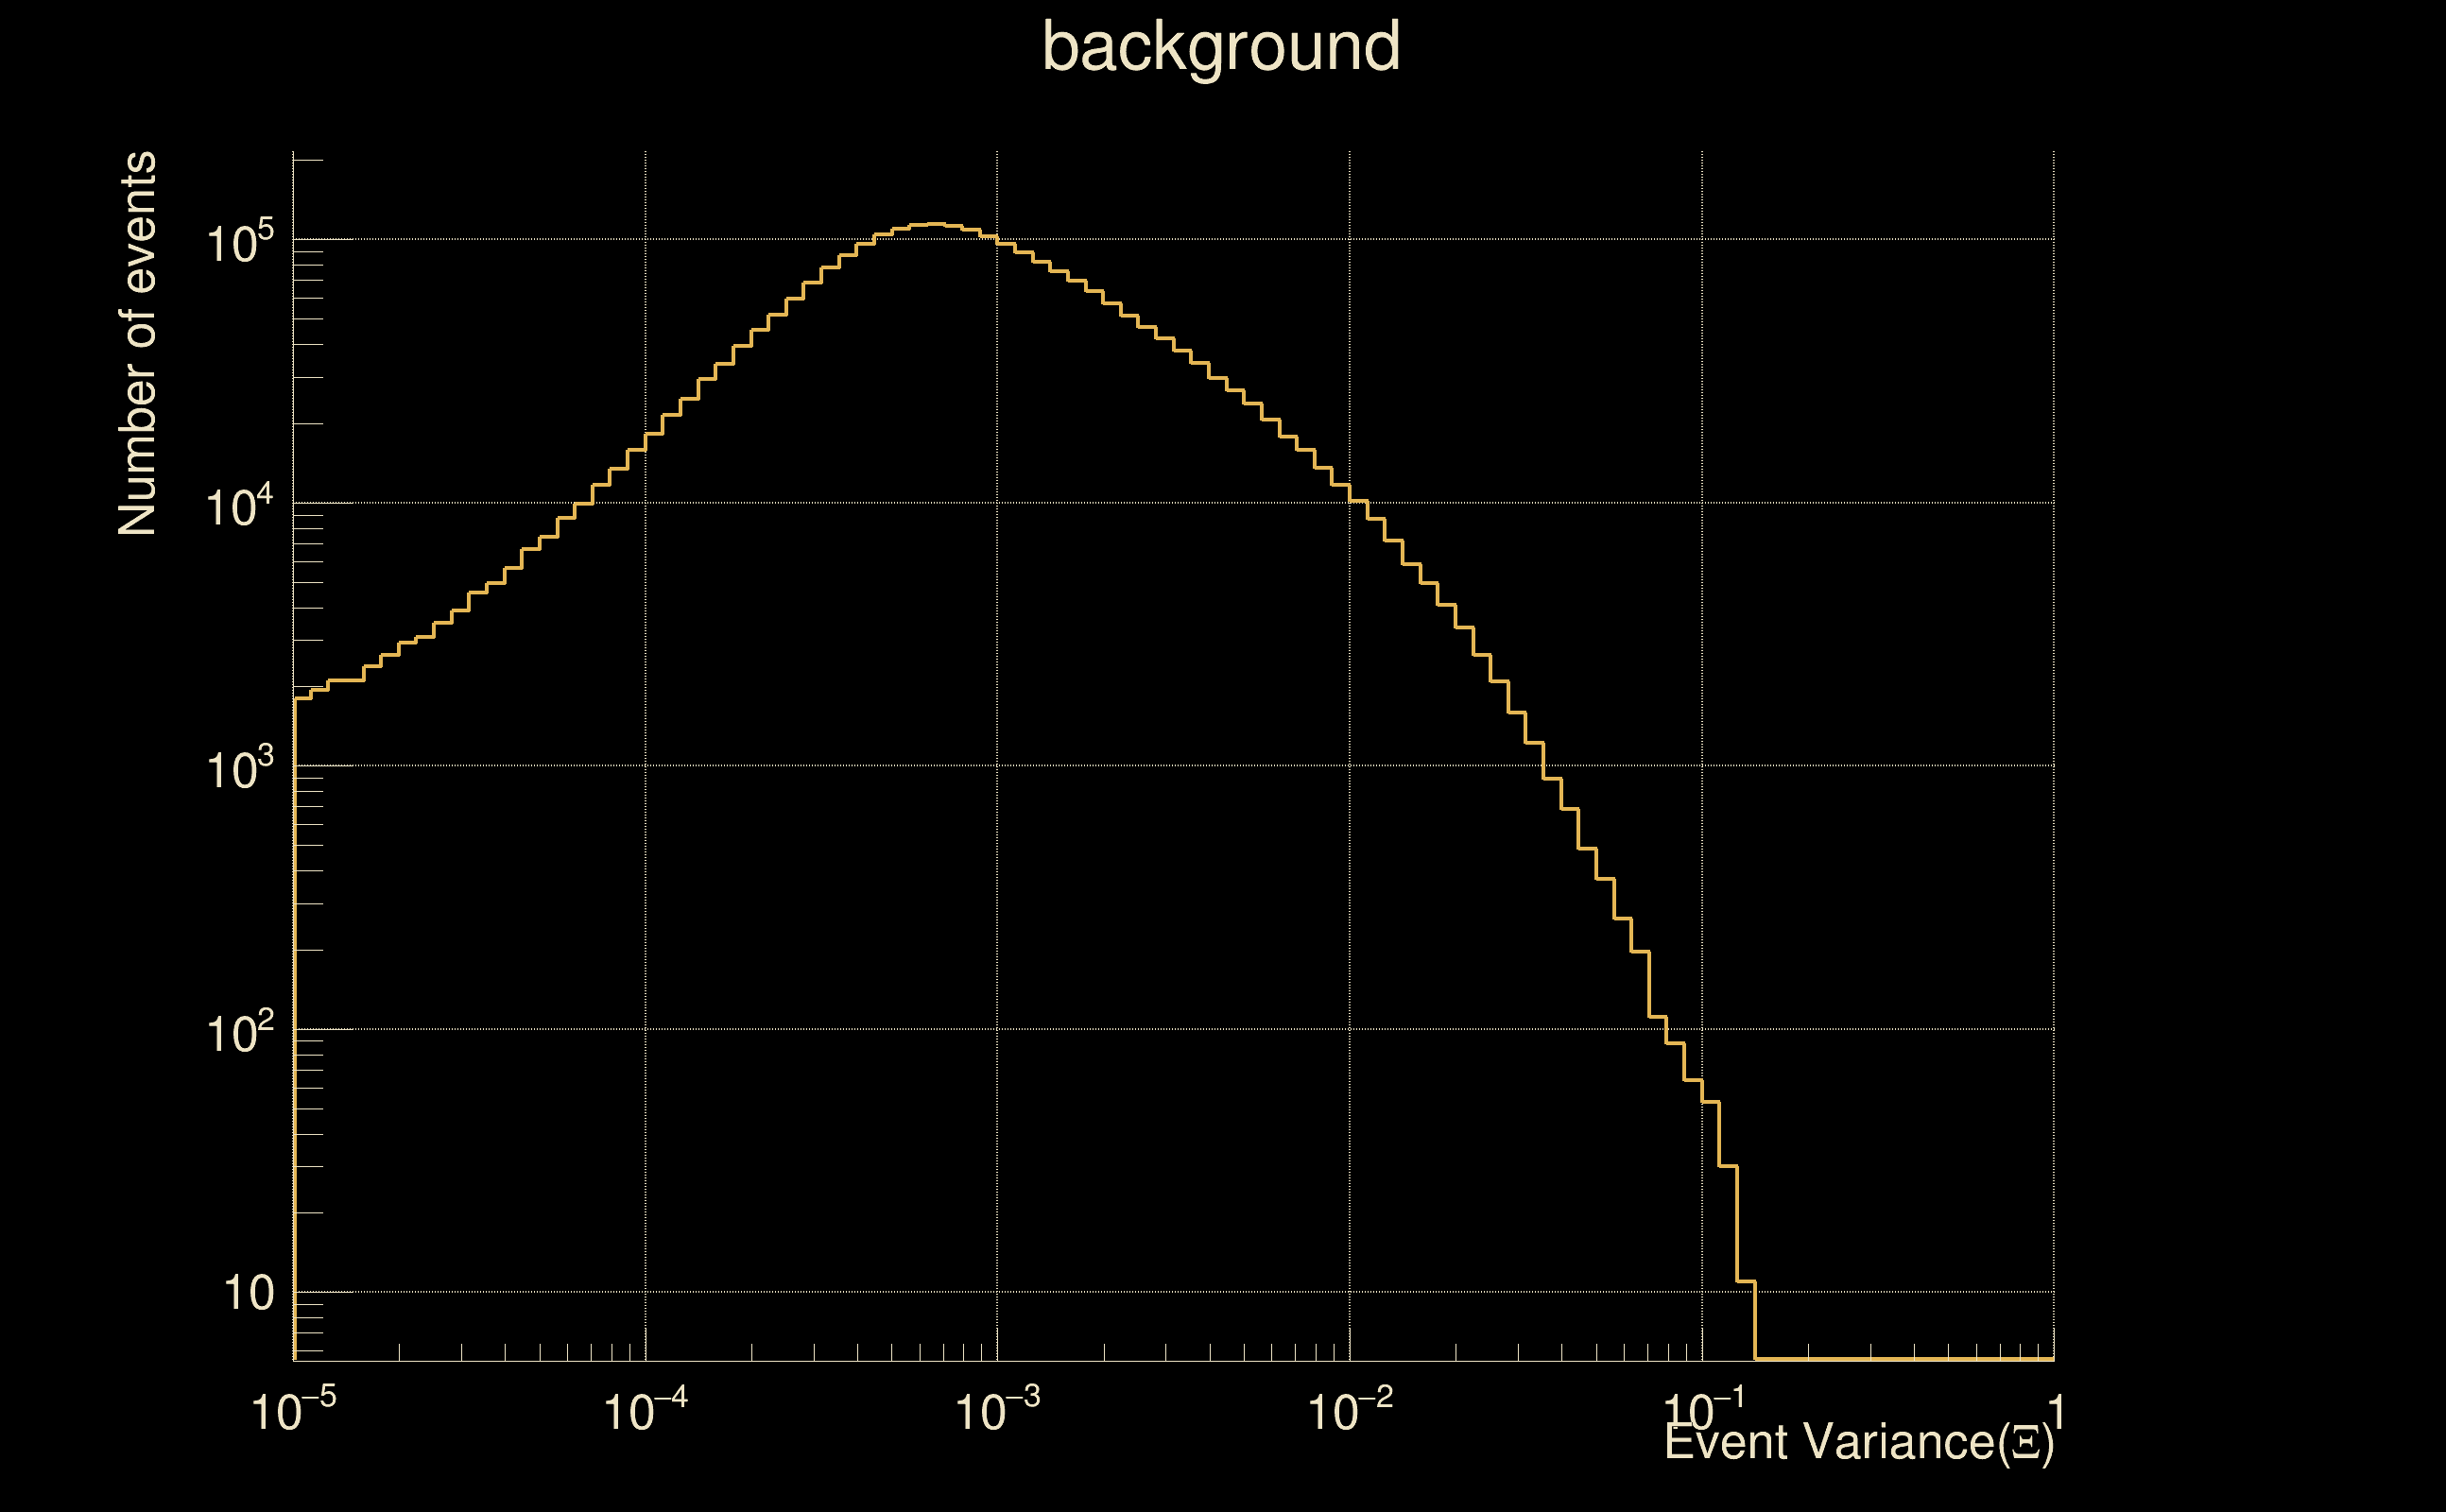
| Ξ: | 0.975524 ± 0.0089246 (variance = 7.96485e-05): Q0: 0.965643, Q1: 0.983198, Q2: 0.990134, Q3: 0.988863, Q4: 0.986434 |
| Rank: | R_A = 0.872263 |
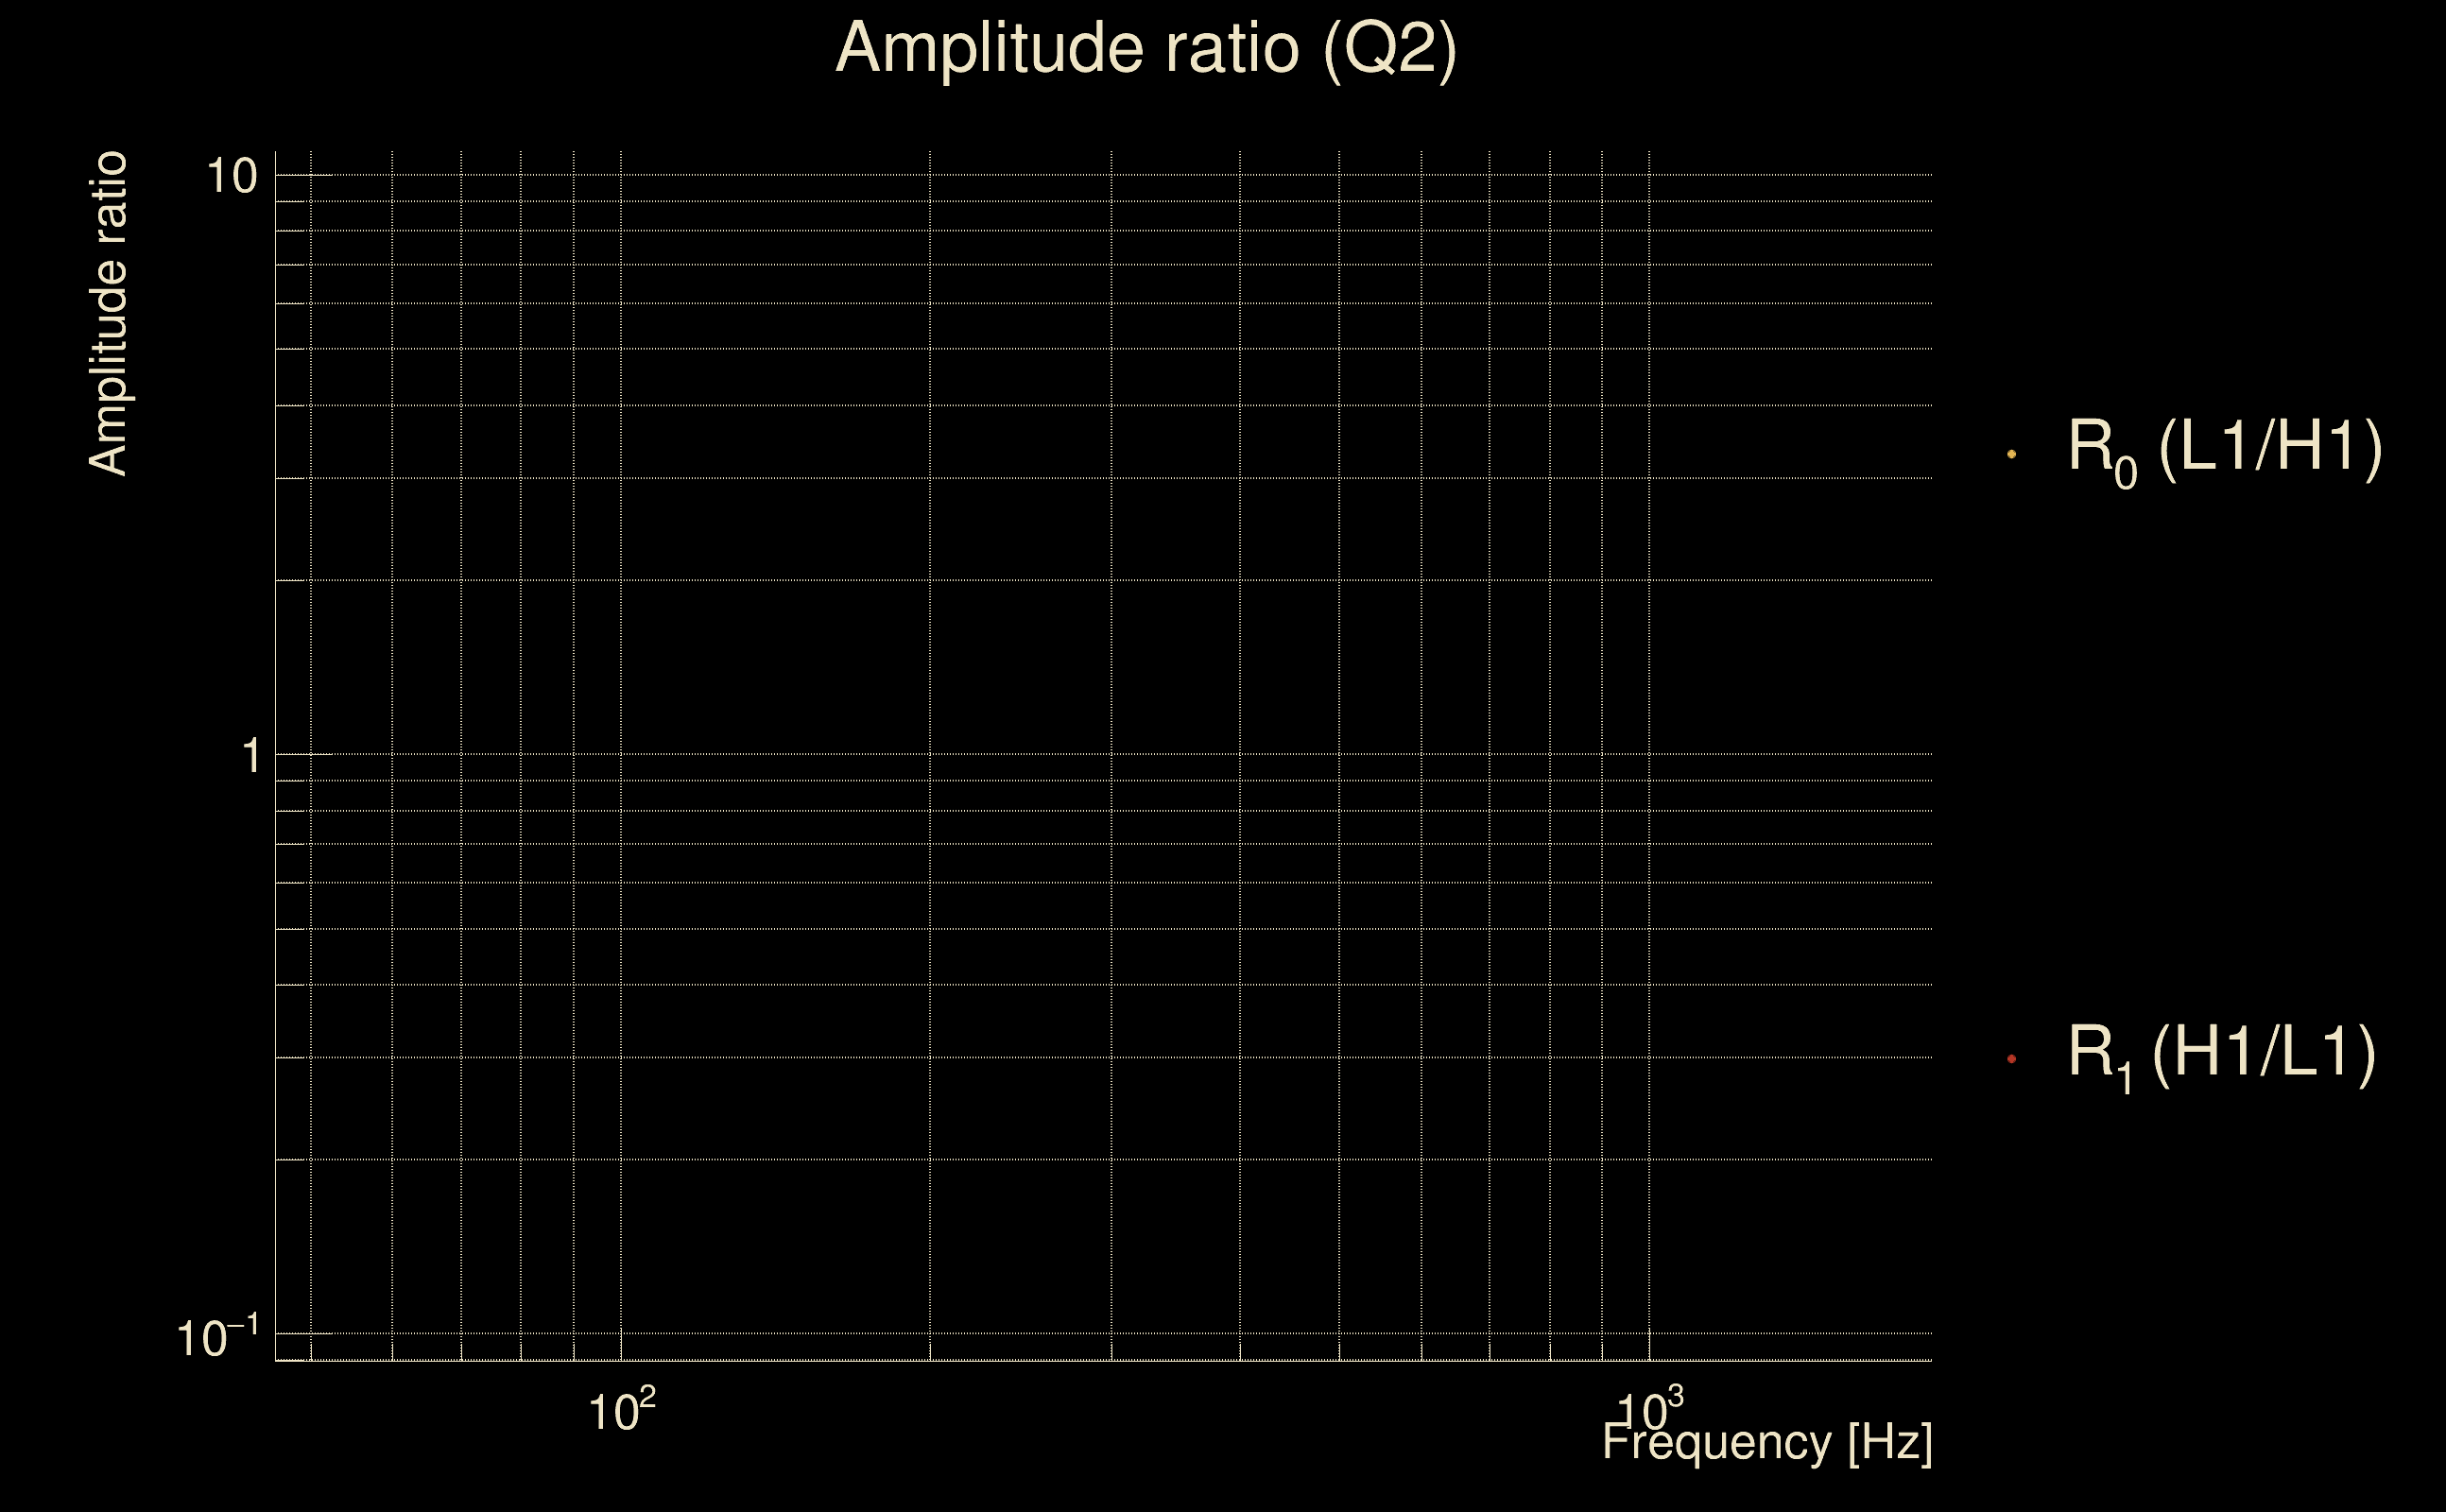
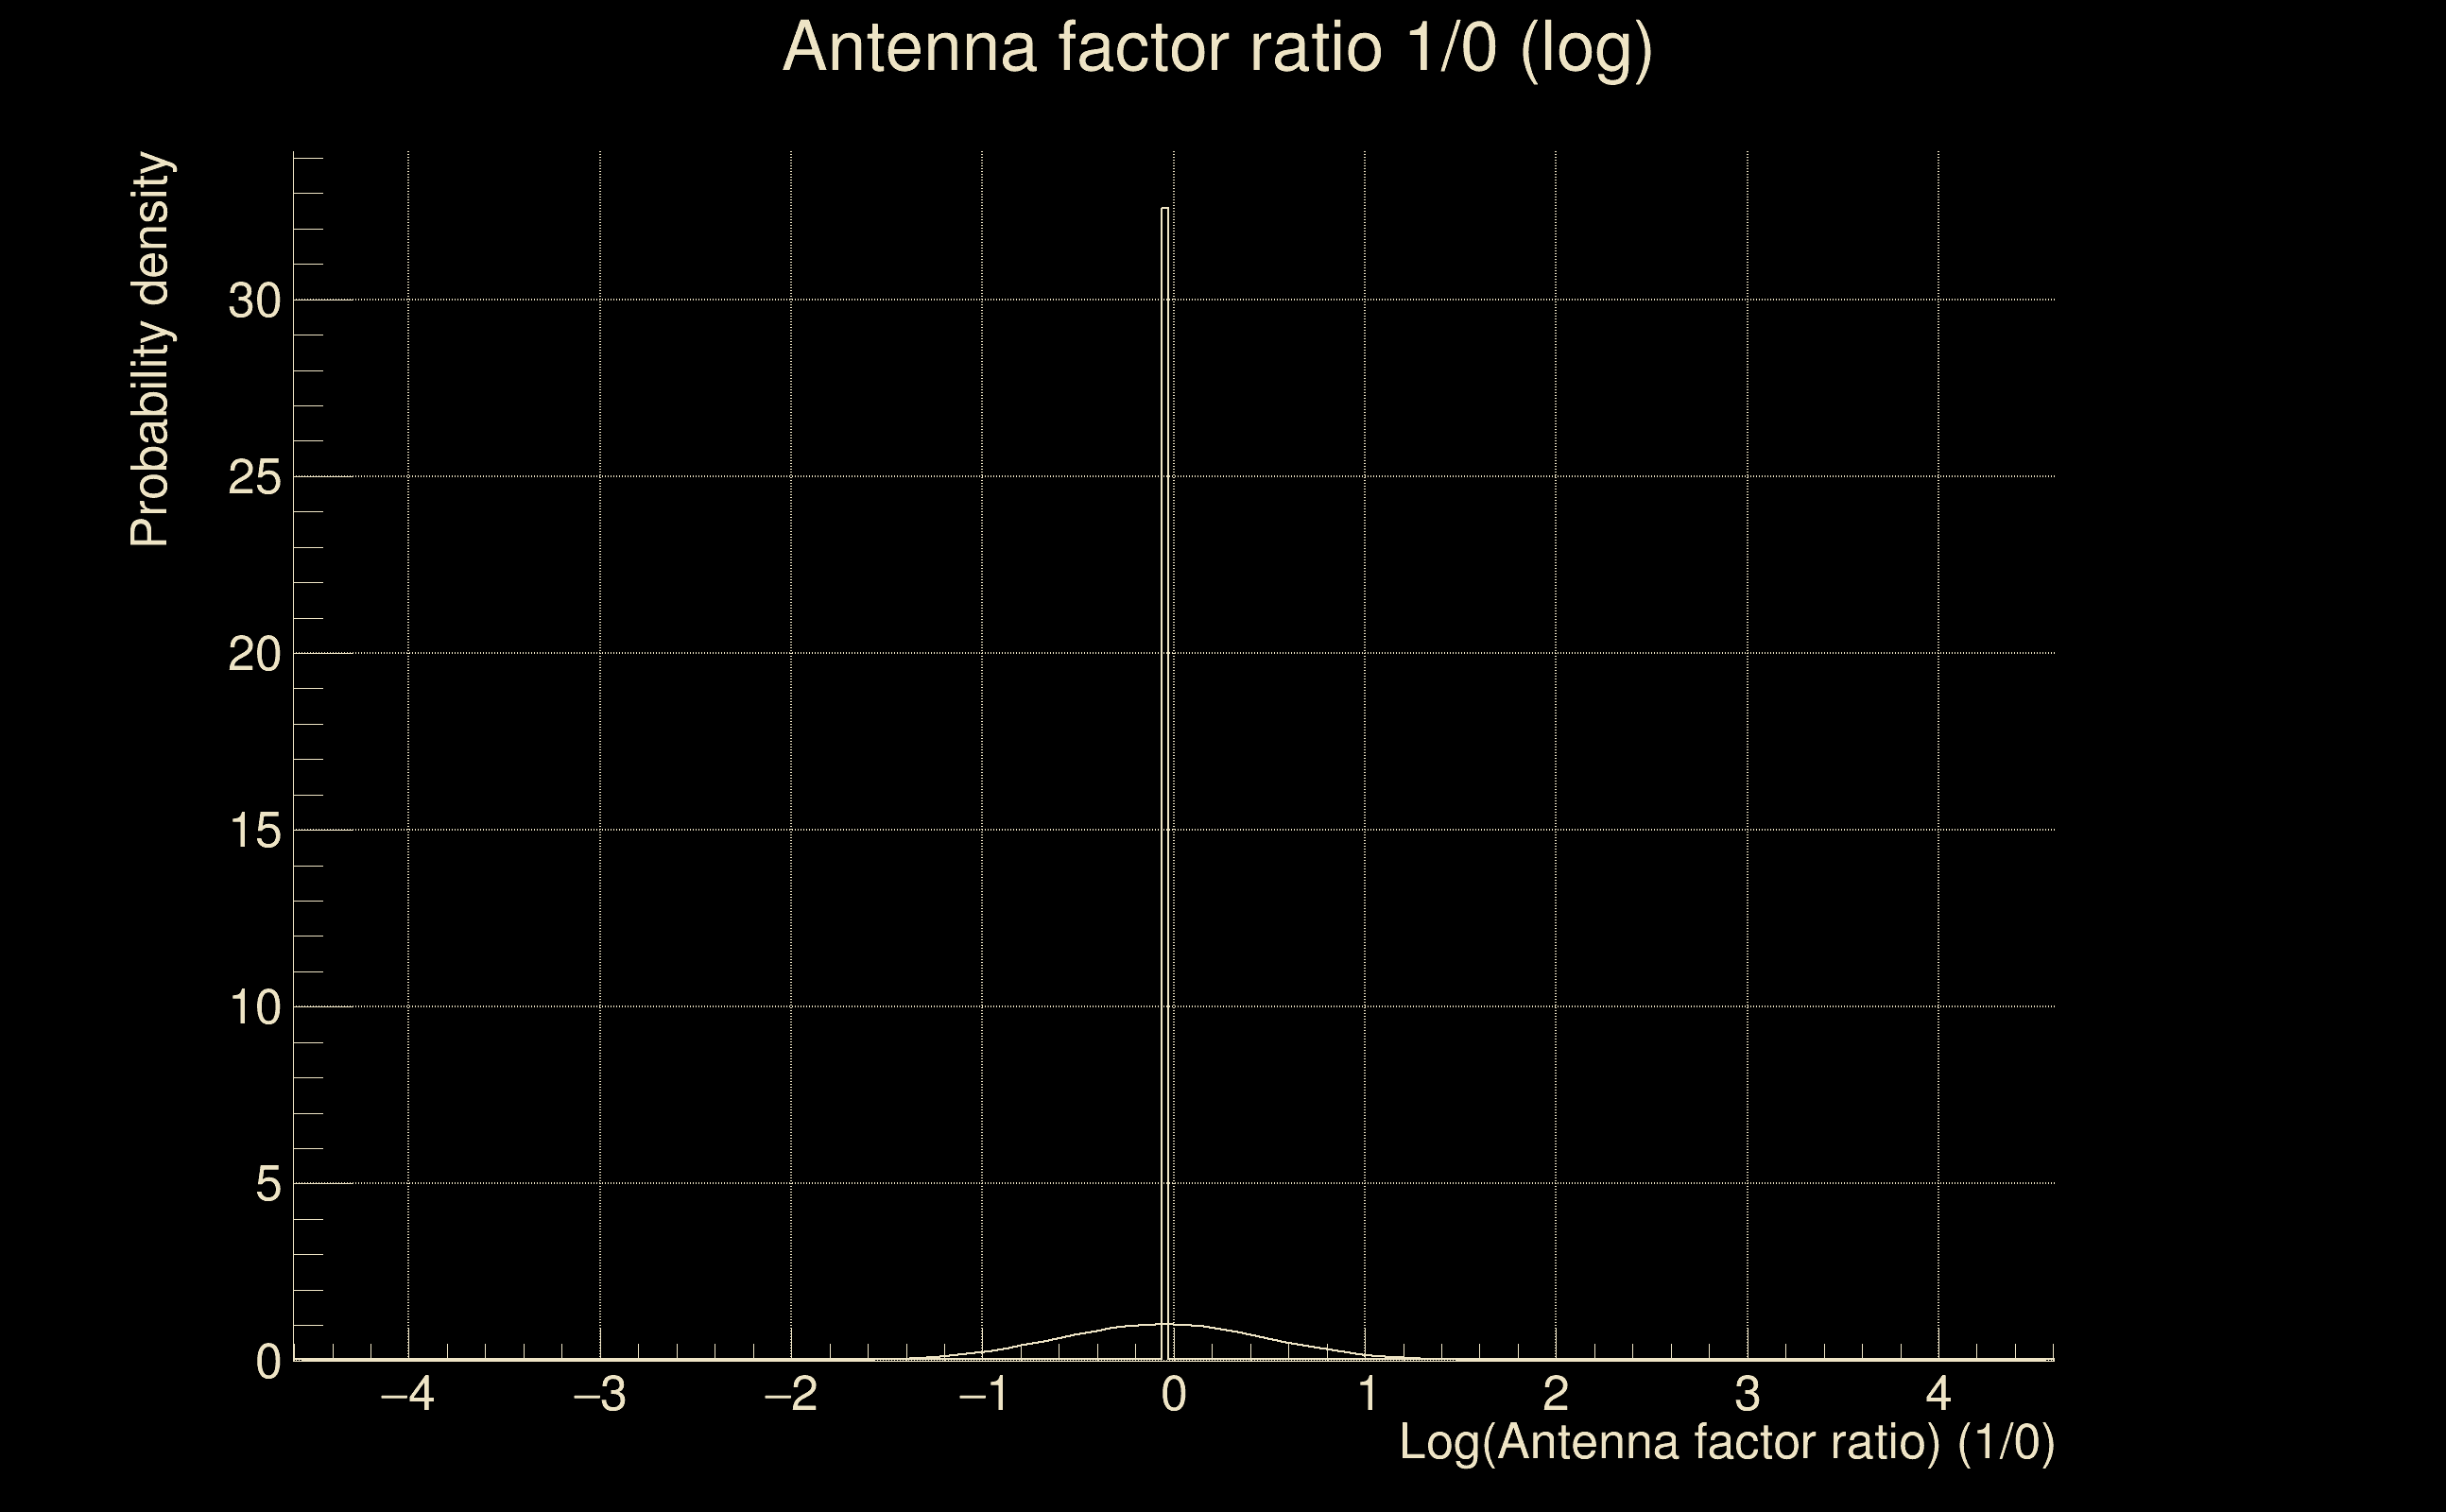
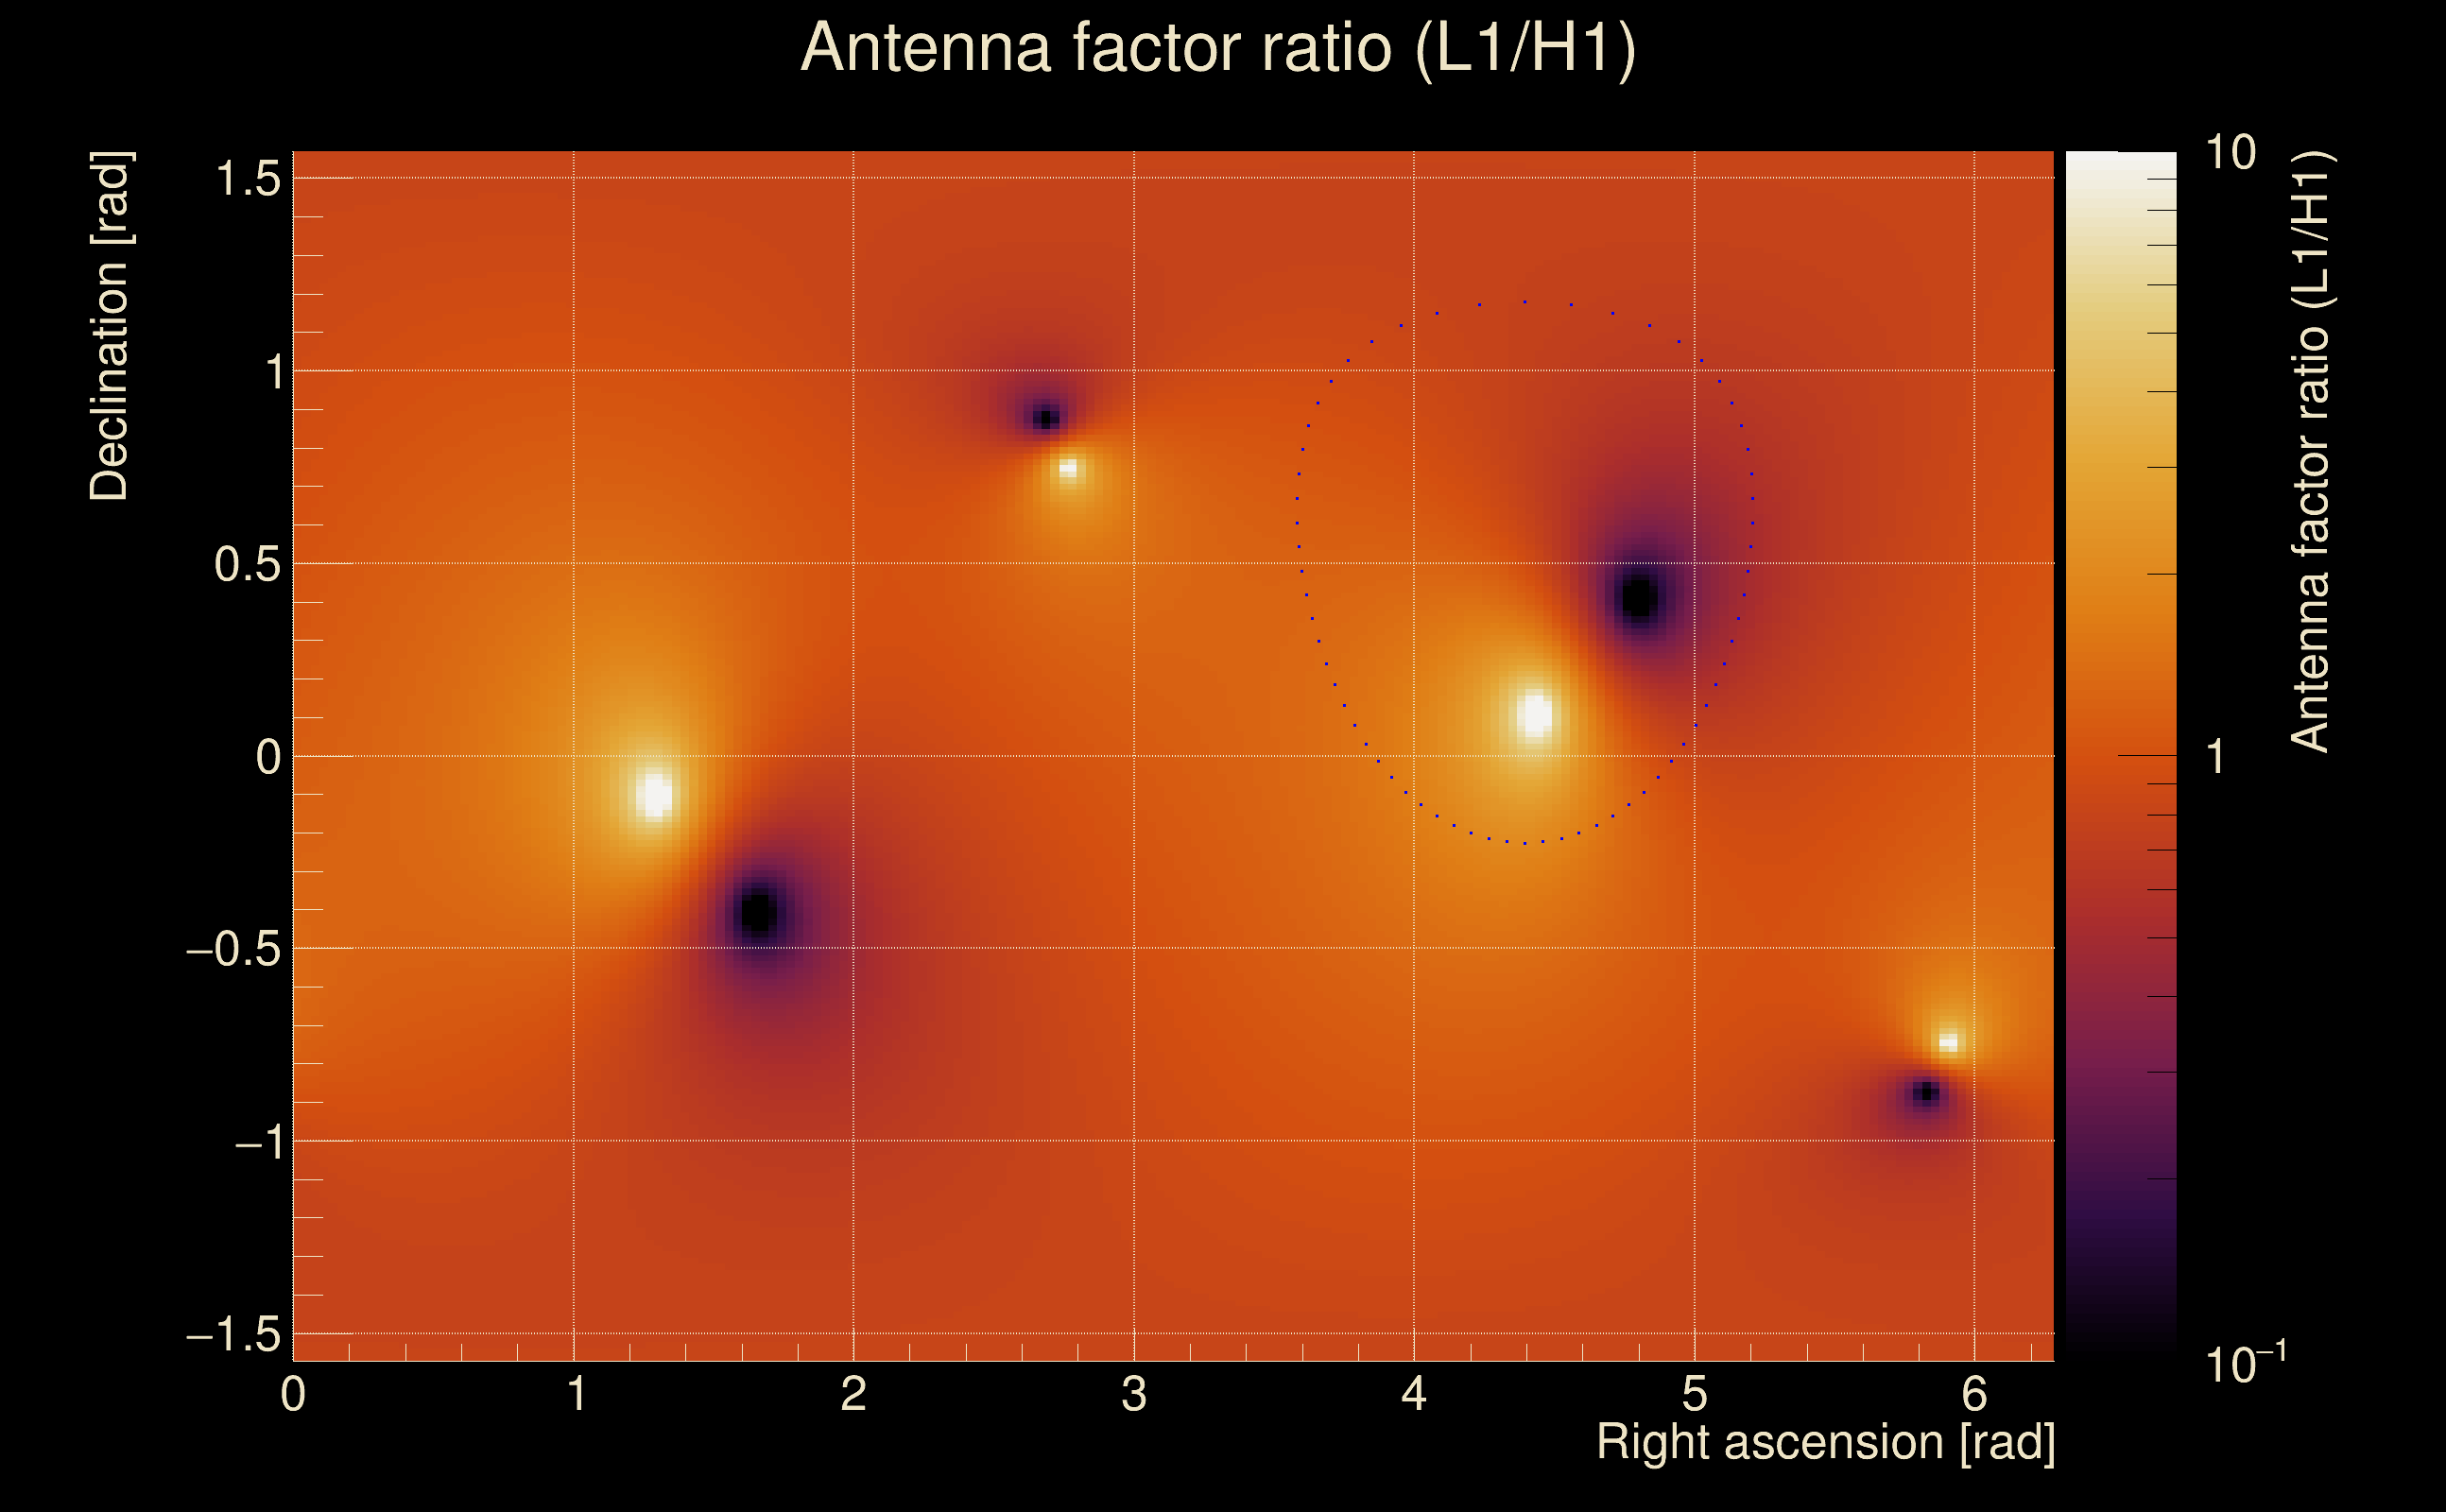
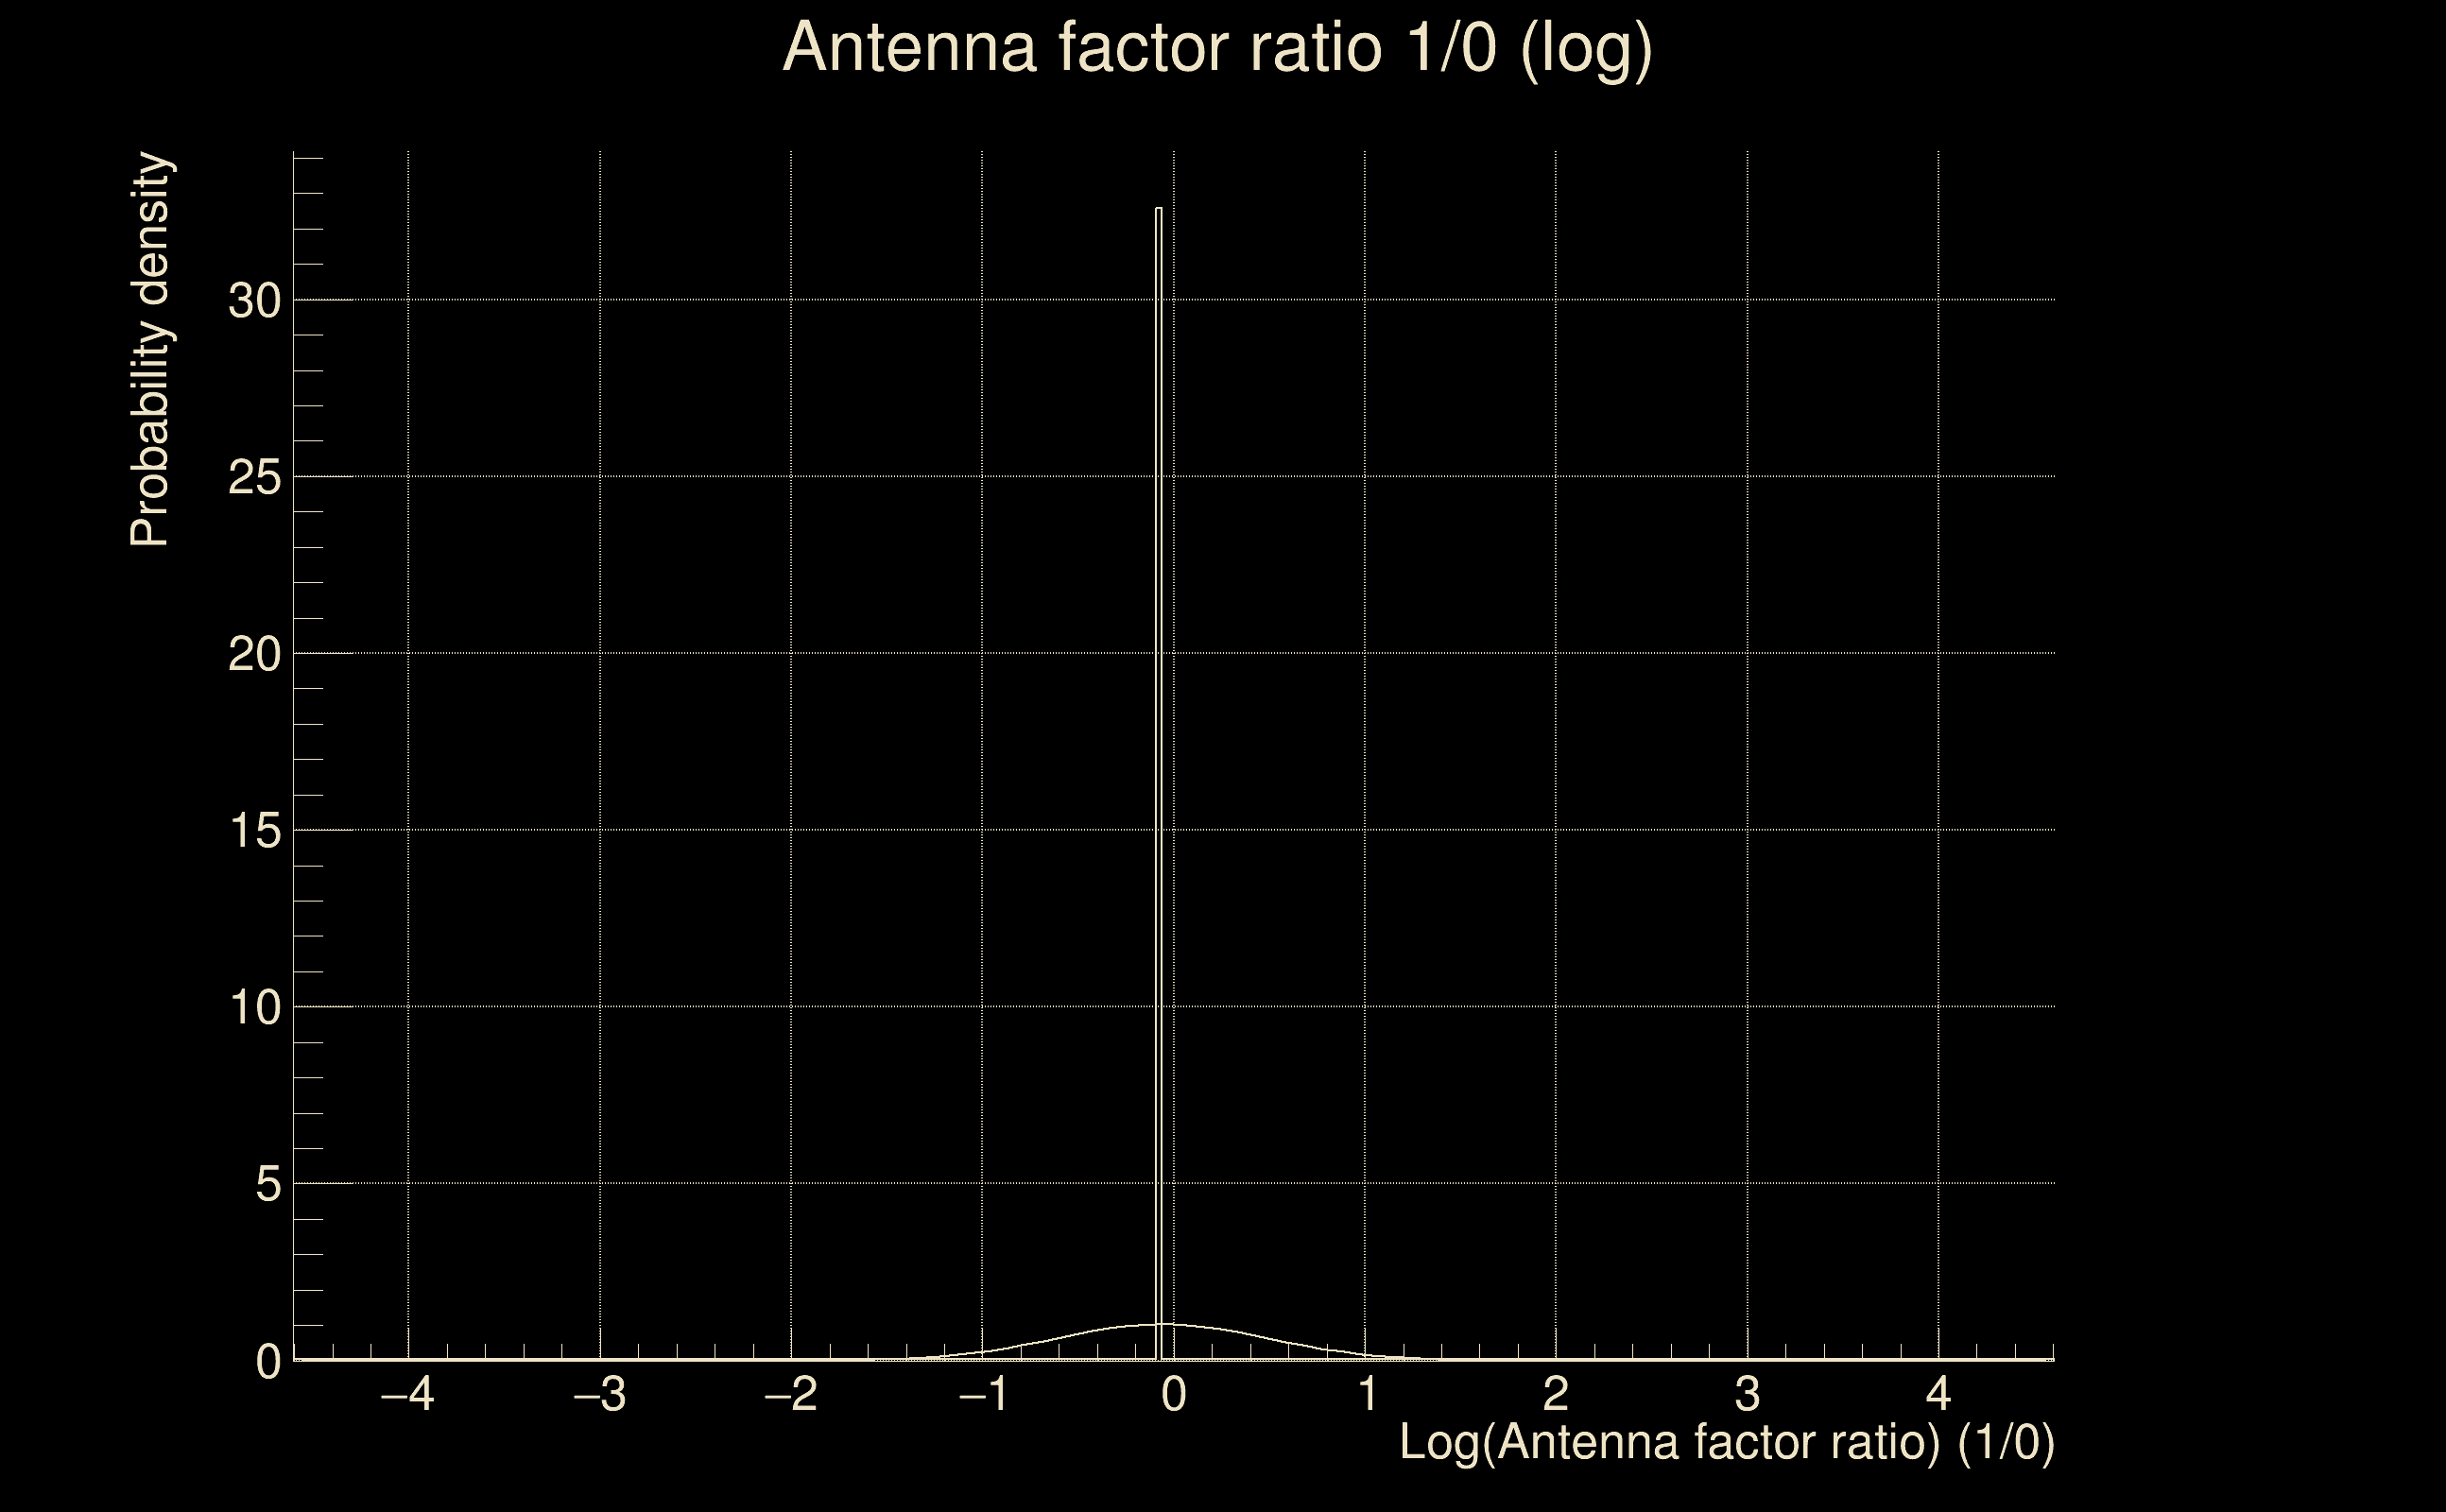
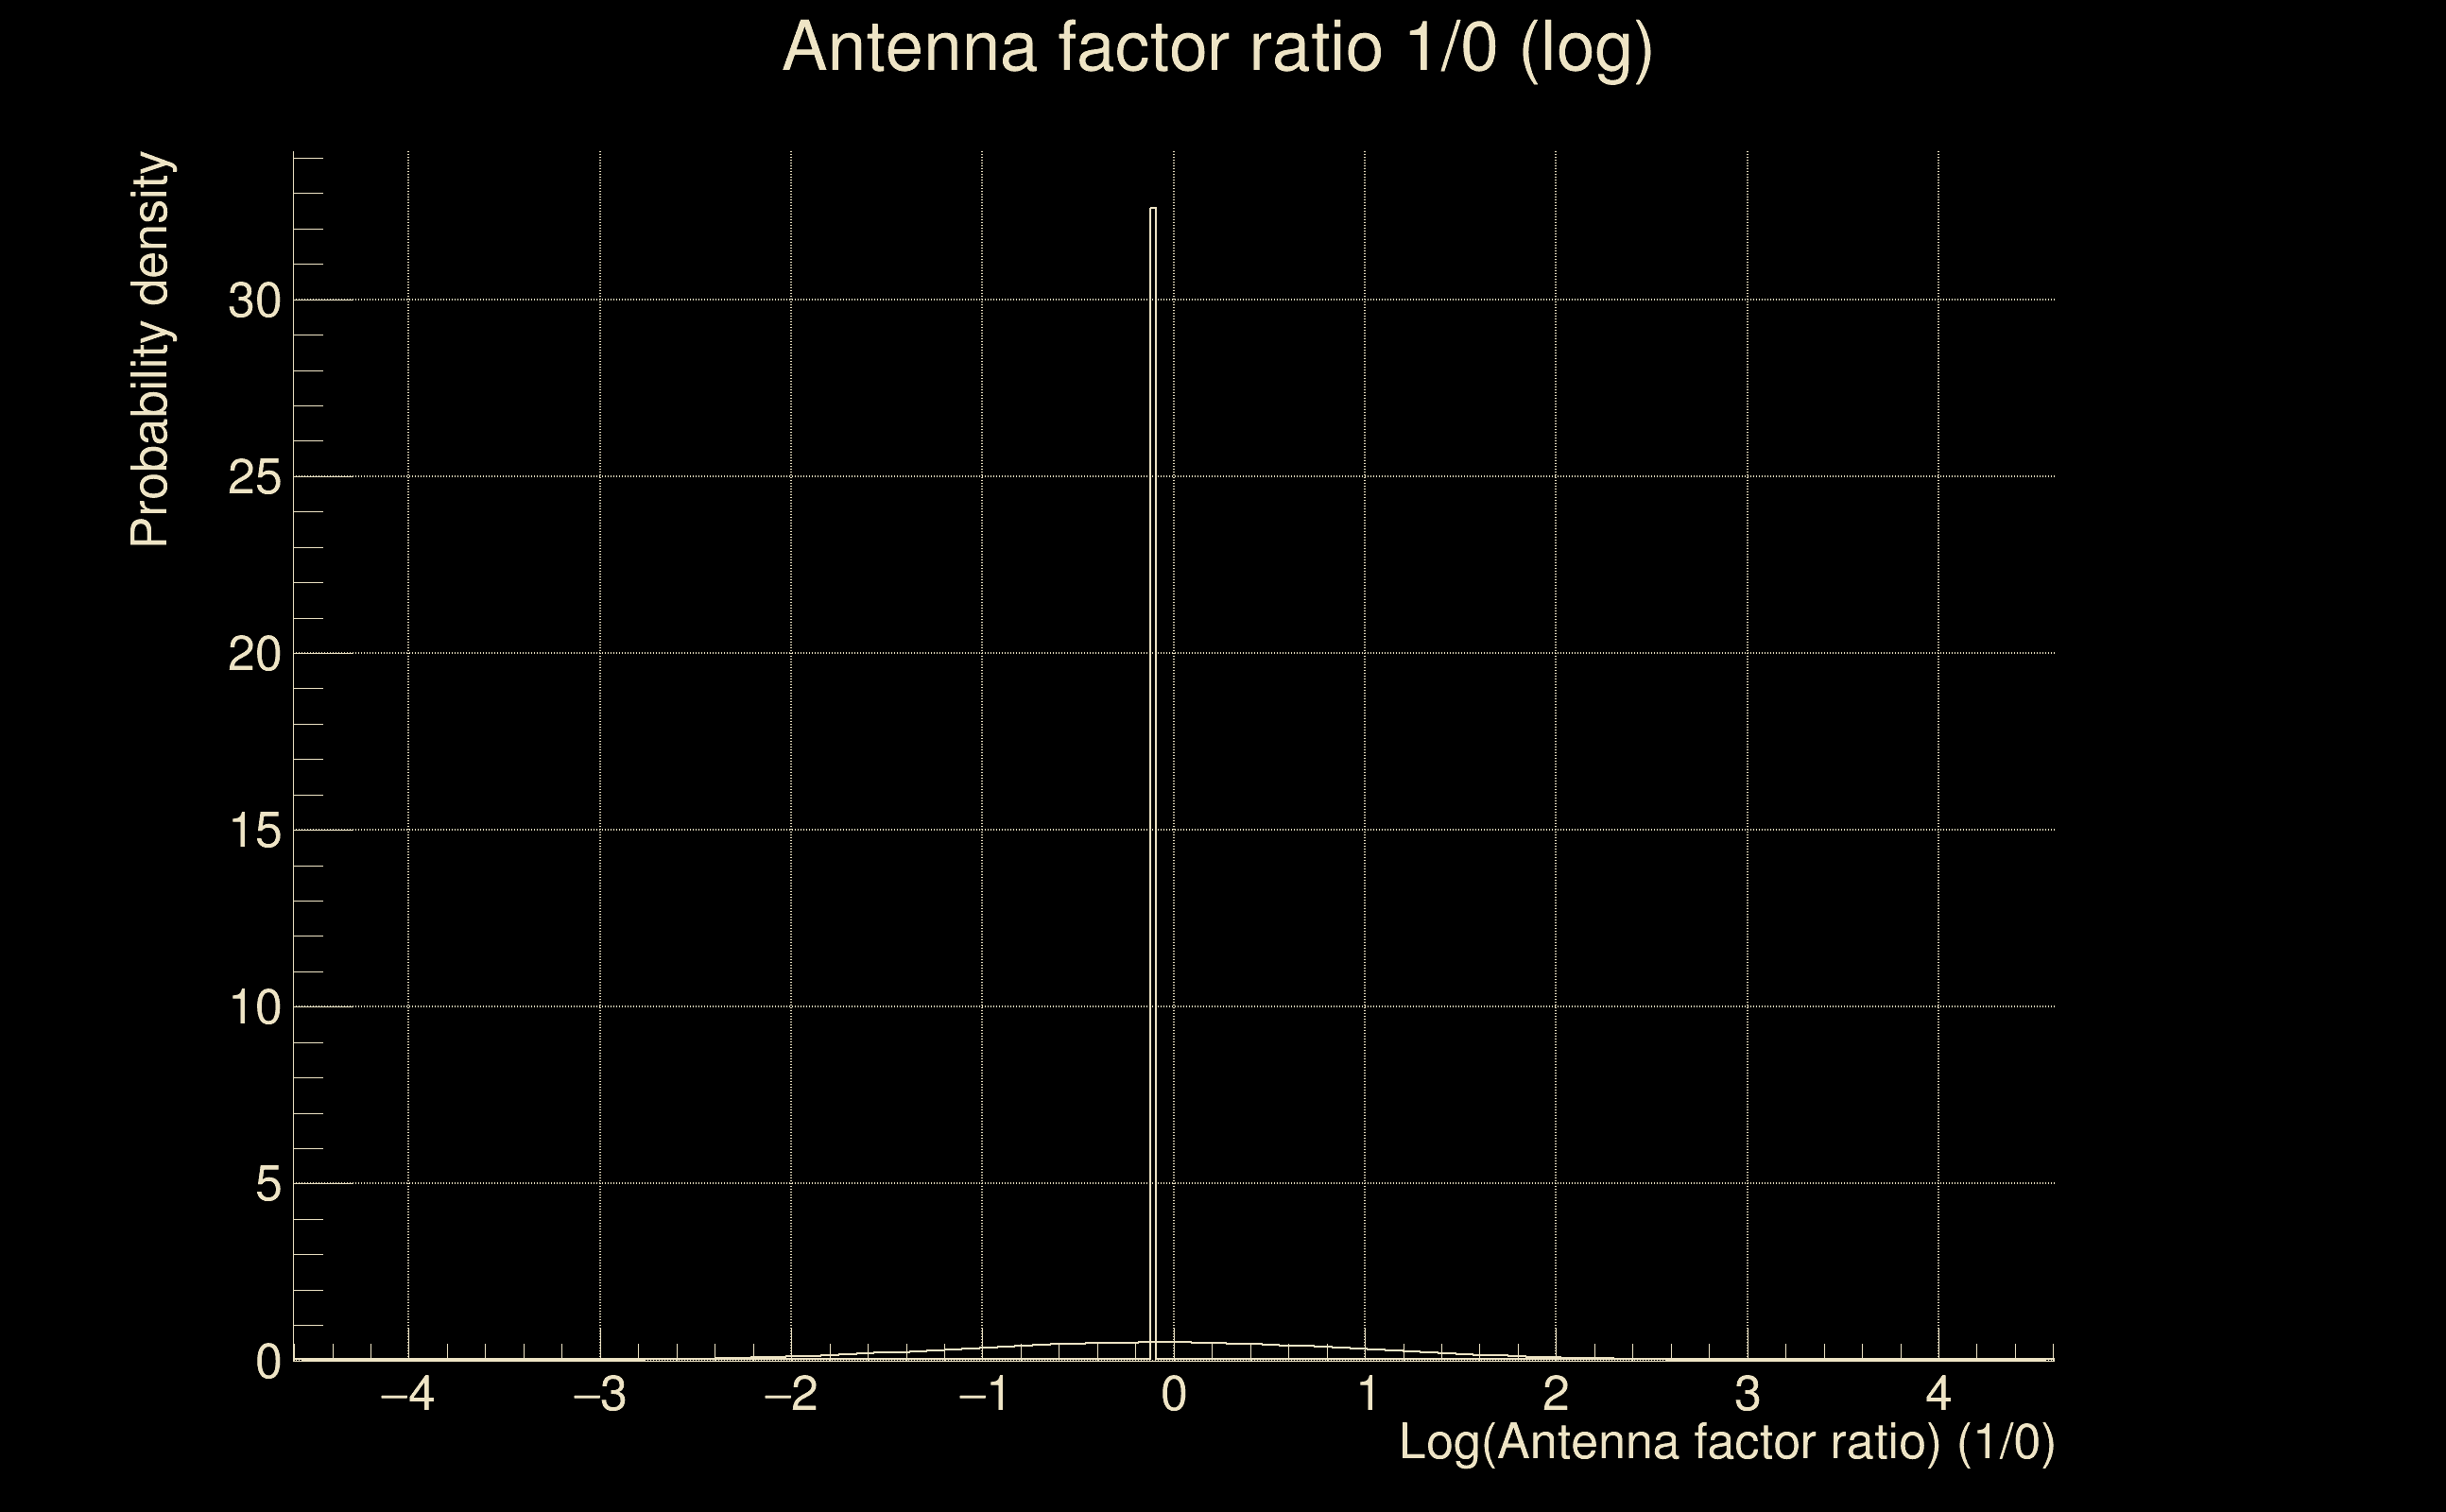
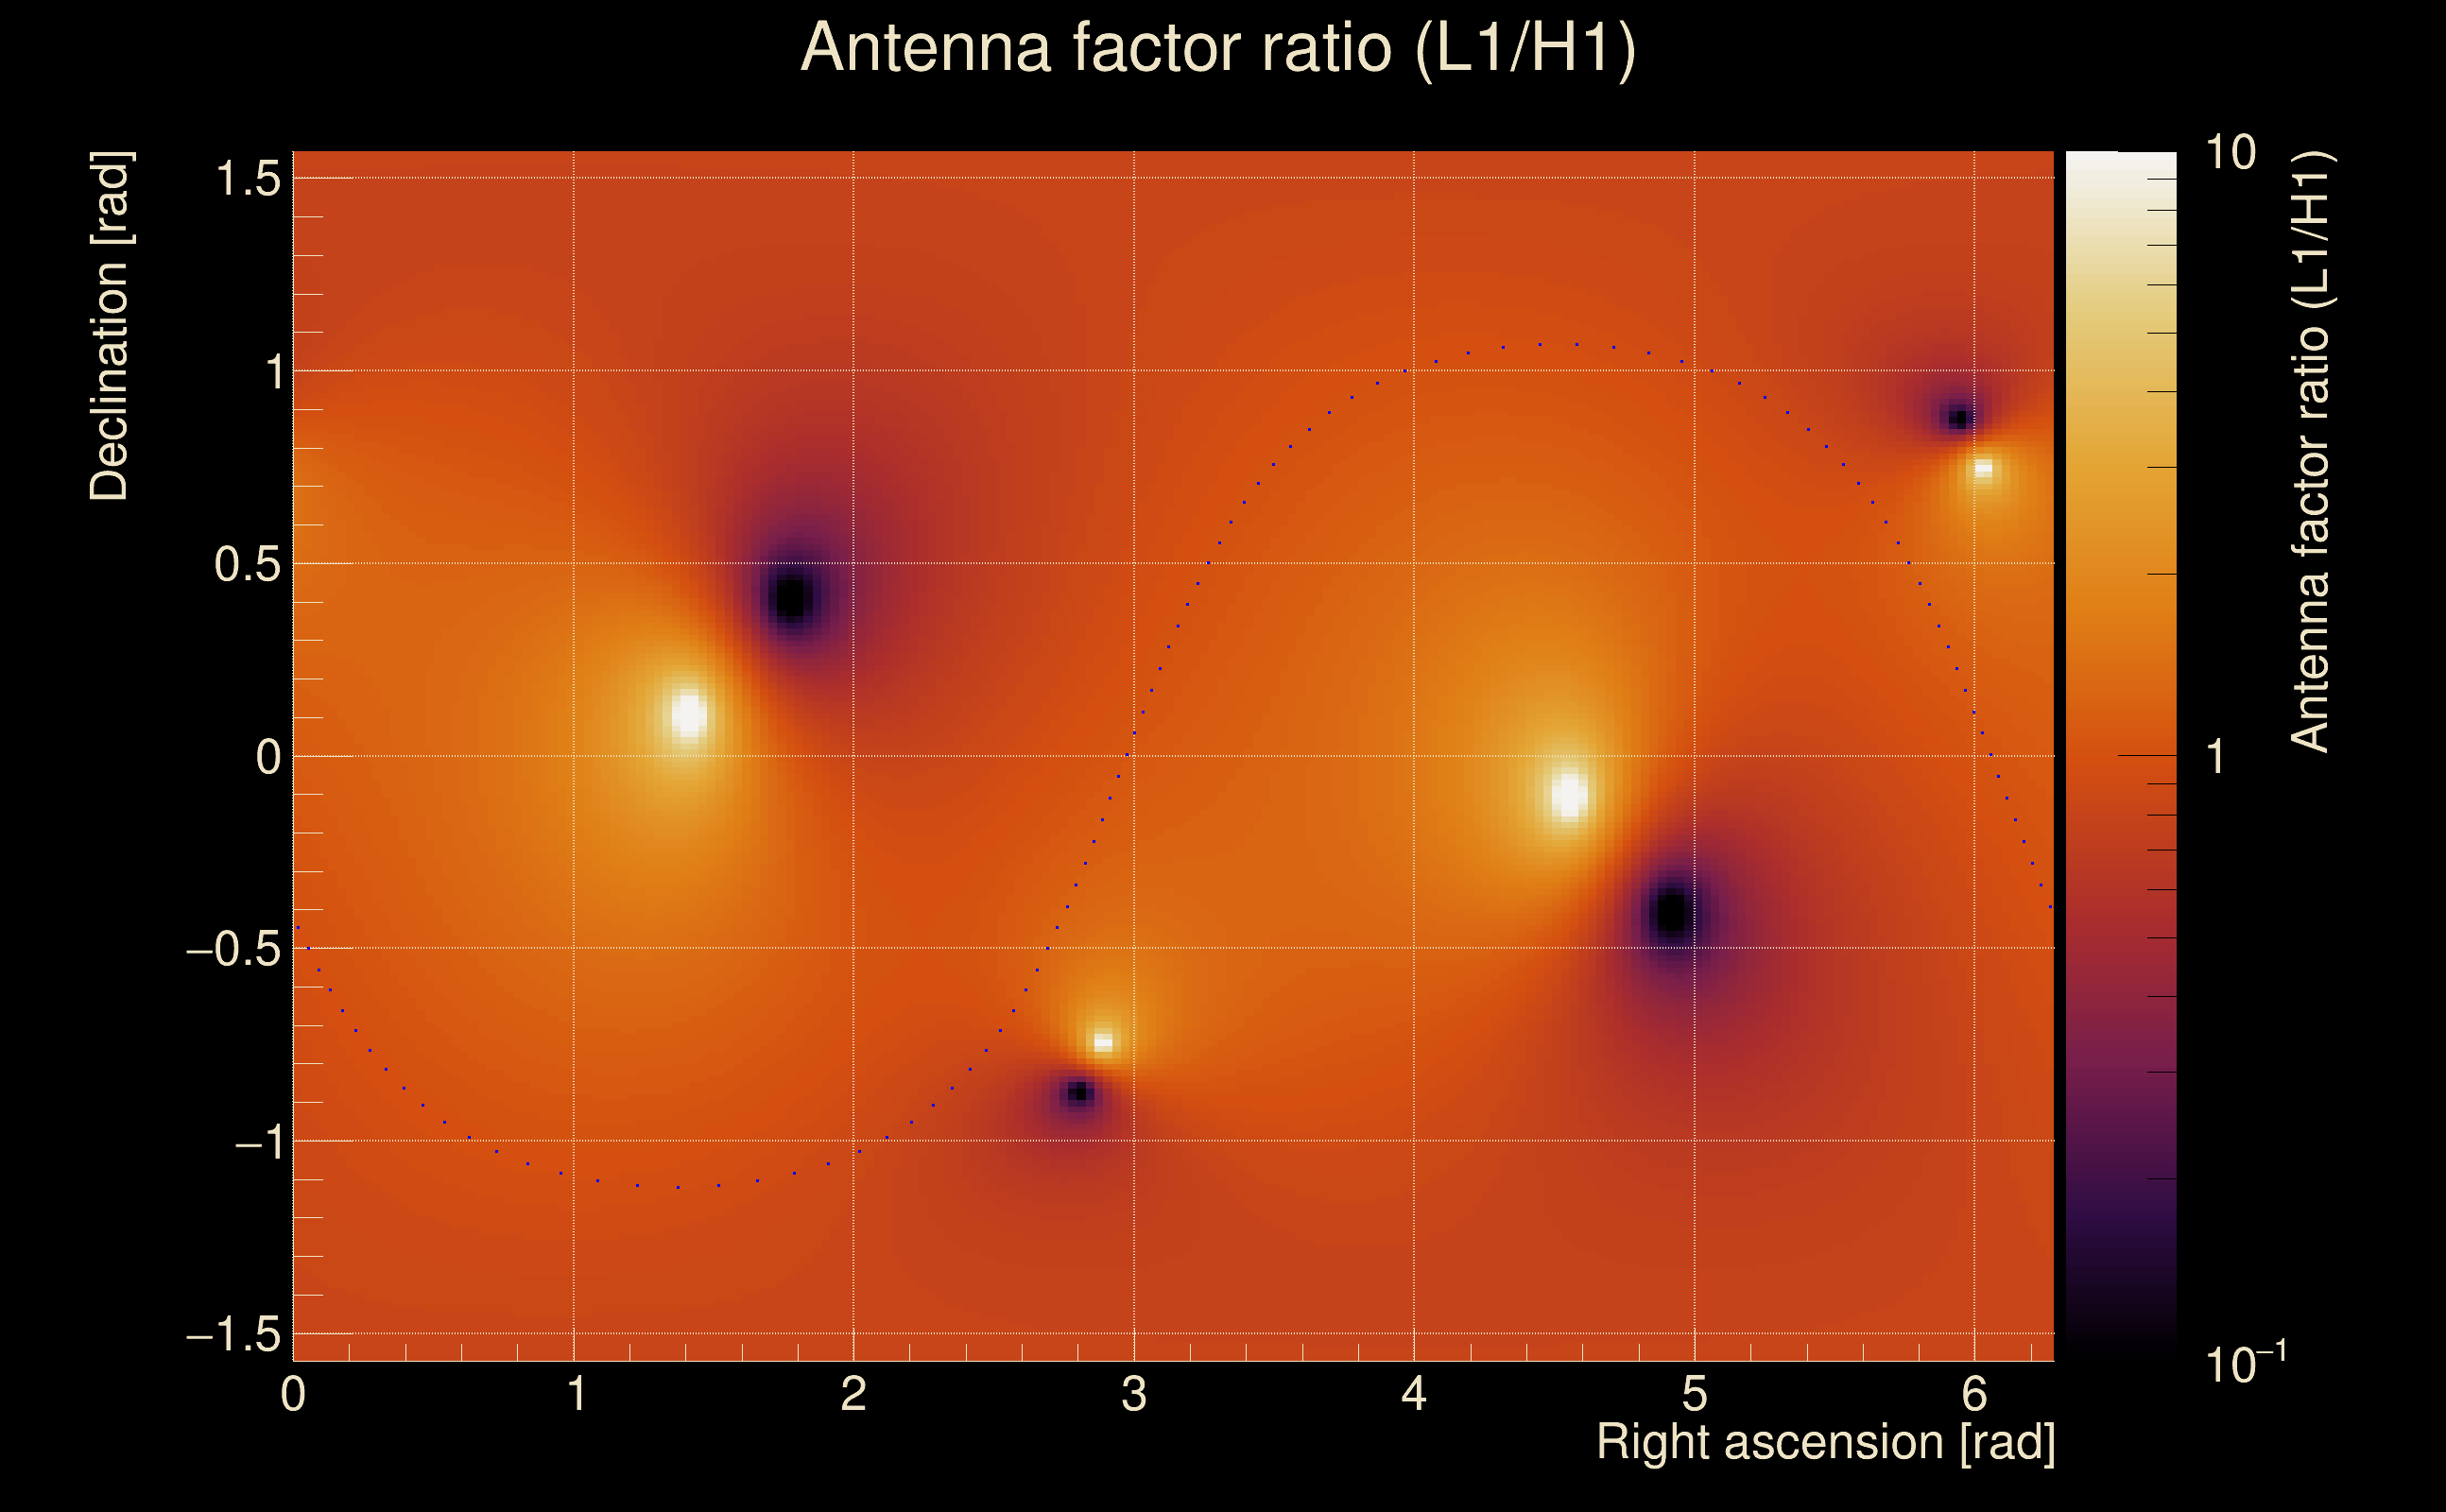
| Log of amplitude ratio (L1/H1): | -0.0550306, variance = 0.150761 (L1/H1: -0.0649615, variance = 0.301198, H1/L1: 0.0445407, variance = 0.301406) |
| Amplitude ratio (L1/H1): | 0.946456 ⋇ 1.47444 (L1/H1: 0.937104 ⋇ 1.7312, H1/L1: 1.04555 ⋇ 1.73153) |
| Amplitude ratio H1|L1 compatibility (probability): | 0.979013 |
| Antenna factor probability: | 0.952028 |
| Number of rejected frequency rows: | Q0: 0 / 18, Q1: 0 / 36, Q2: 0 / 70, Q3: 0 / 134, Q4: 1 / 258 |
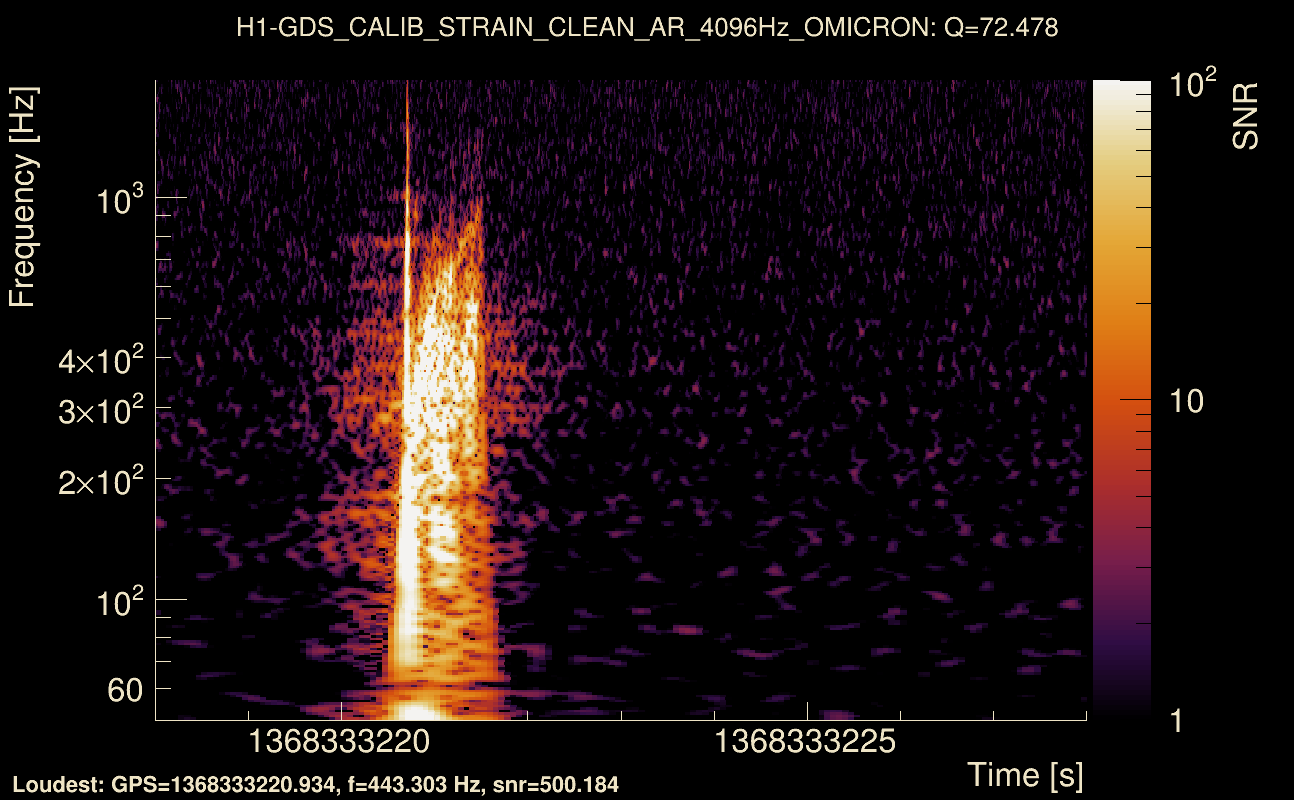
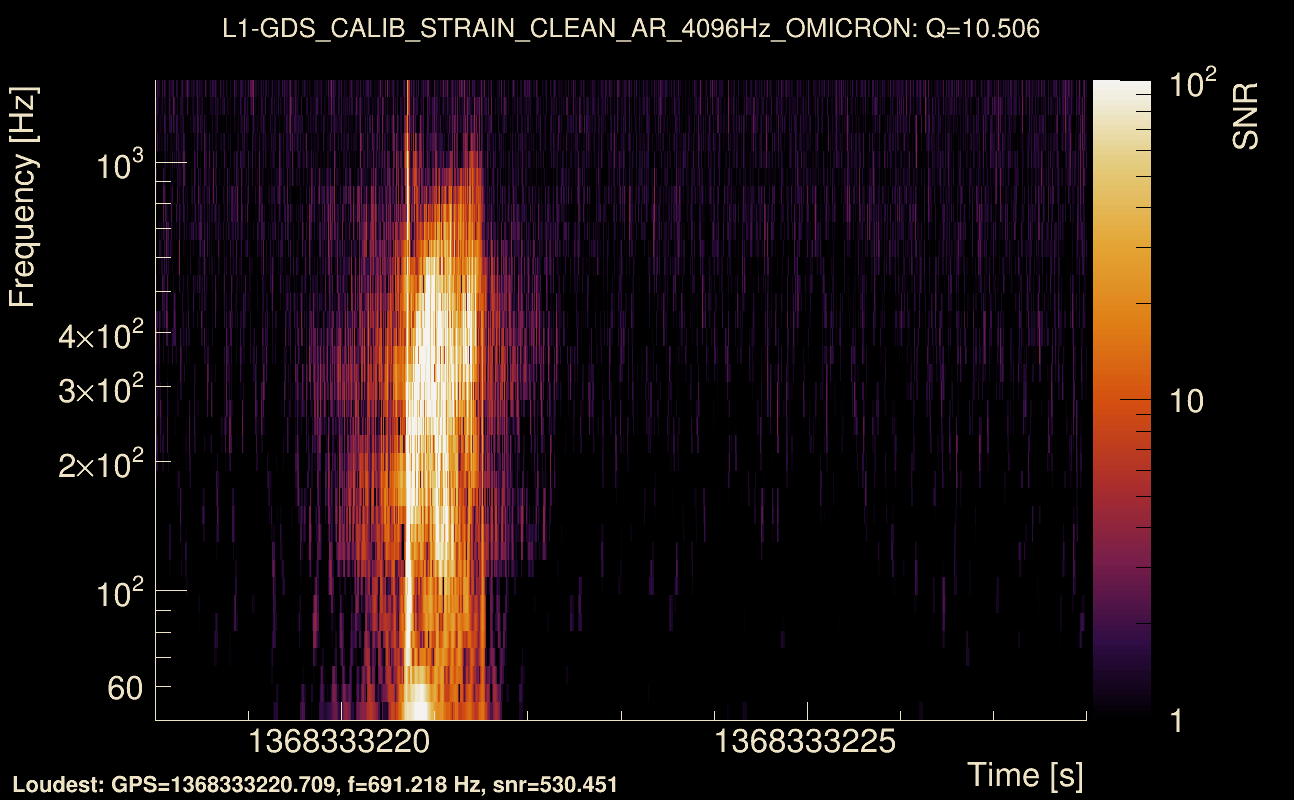
| Maximum signal-to-noise ratio: | H1: 680.781, L1: 662.389 |
| SNR variance: | H1: 0.480397, L1: 0.481462 |
| Click here for a zoomed plot | Click here for a zoomed plot | Click here for a zoomed plot | Click here for a zoomed plot | Click here for a zoomed plot |
 |
 |
 |
 |
 |
 |
 |
 |
 |
 |
 |
 |
 |
 |
 |
 |
 |
 |
 |
 |
 |
 |
 |
 |
 |
 |
 |
 |
 |
| Event time t(H1): | GPS = 1368333218 (Wed May 17 04:33:20 2023 ) → GPS = 1368333228 (Wed May 17 04:33:30 2023 ) |
| Event time t(L1): | GPS = 1368333218 (Wed May 17 04:33:30 2023 ) → GPS = 1368333228 (Wed May 17 04:33:30 2023 ) |
| Omicron analysis time window (H1): | GPS = 1368333215 → GPS = 1368333231 |
| Omicron analysis time window (L1): | GPS = 1368333215 → GPS = 1368333231 |
| Time delay between detectors t(L1) - t(H1): | 0.000664119 s (slice index = 108 / 217), δt_gw = 0.000664119 s |
| Time delay standard deviation: | 0.0218818 s |
| [targeted mode] Time delay probability: | 0.961669 (0.048059 sigmas), δt_target = 0.000639677 s |
| Frequency: | 283.942 Hz |
| Ξ: | 0.975583 ± 0.00892341 (variance = 7.96272e-05): Q0: 0.96571, Q1: 0.983241, Q2: 0.990173, Q3: 0.988941, Q4: 0.986525 |
| Rank: | R_A = 0.871746 |
| Log of amplitude ratio (L1/H1): | -0.0566282, variance = 0.150697 (L1/H1: -0.0665392, variance = 0.301202, H1/L1: 0.0463392, variance = 0.301383) |
| Amplitude ratio (L1/H1): | 0.944945 ⋇ 1.47432 (L1/H1: 0.935626 ⋇ 1.73121, H1/L1: 1.04743 ⋇ 1.73149) |
| Amplitude ratio H1|L1 compatibility (probability): | 0.97924 |
| Antenna factor probability: | 0.948879 |
| Number of rejected frequency rows: | Q0: 0 / 18, Q1: 0 / 36, Q2: 0 / 70, Q3: 0 / 134, Q4: 1 / 258 |
| Maximum signal-to-noise ratio: | H1: 674.884, L1: 662.367 |
| SNR variance: | H1: 414.506, L1: 421.094 |
| Click here for a zoomed plot | Click here for a zoomed plot | Click here for a zoomed plot | Click here for a zoomed plot | Click here for a zoomed plot |
 |
 |
 |
 |
 |
 |
 |
 |
 |
 |
 |
 |
 |
 |
 |
 |
 |
 |
 |
 |
 |
 |
 |
 |
 |
 |
 |
 |
 |
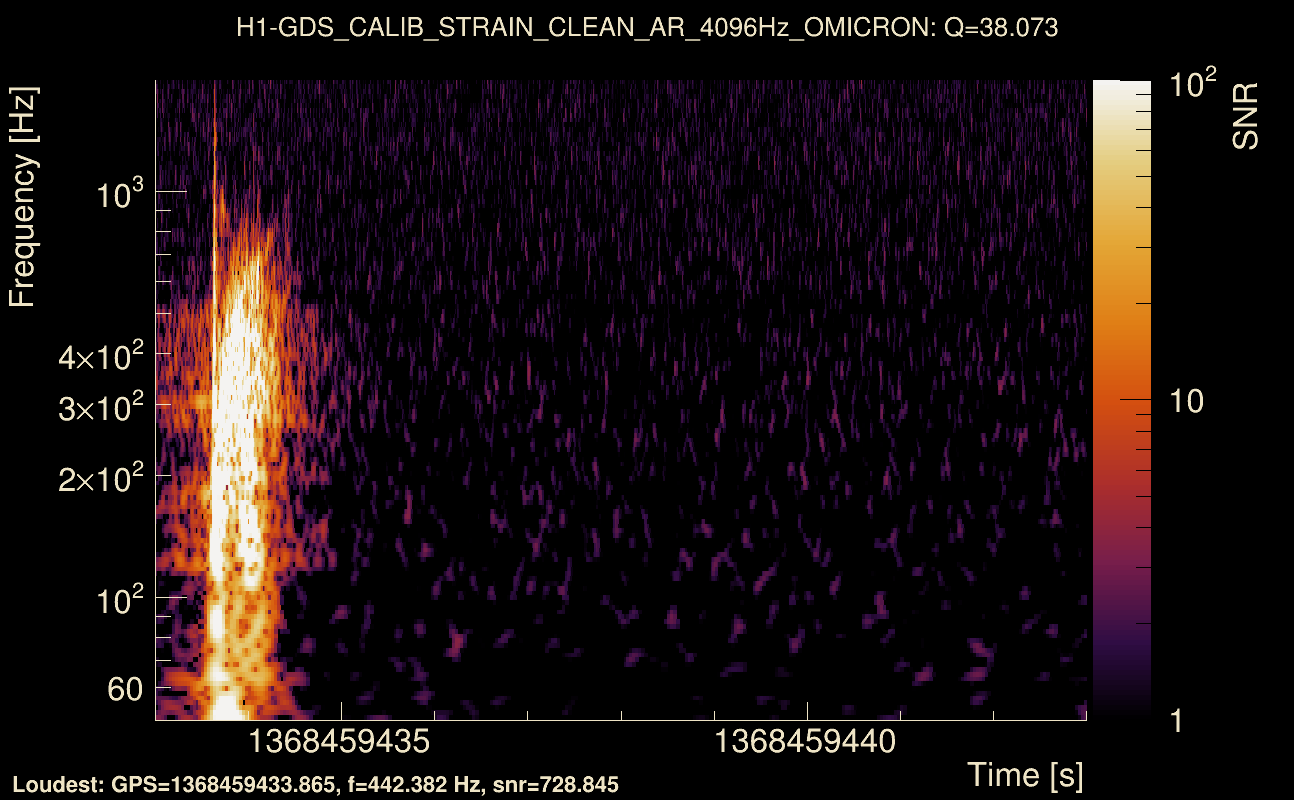
| Event time t(H1): | GPS = 1368459433 (Thu May 18 15:36:55 2023 ) → GPS = 1368459443 (Thu May 18 15:37:05 2023 ) |
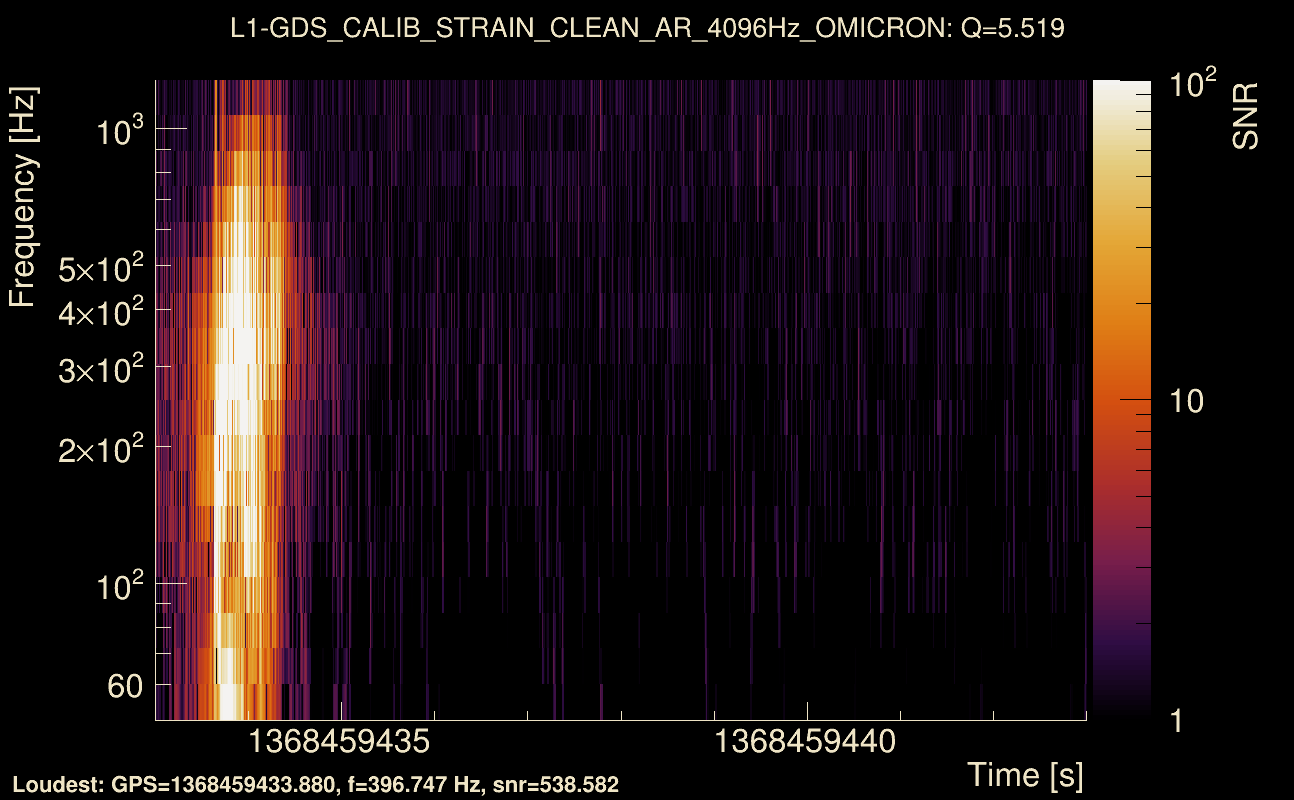
| Event time t(L1): | GPS = 1368459433 (Thu May 18 15:37:05 2023 ) → GPS = 1368459443 (Thu May 18 15:37:05 2023 ) |
| Omicron analysis time window (H1): | GPS = 1368459430 → GPS = 1368459446 |
| Omicron analysis time window (L1): | GPS = 1368459430 → GPS = 1368459446 |
| Time delay between detectors t(L1) - t(H1): | 0.00764119 s (slice index = 108 / 217), δt_gw = 0.00764119 s |
| Time delay standard deviation: | 0.0230928 s |
| [targeted mode] Time delay probability: | 0.979122 (0.0261692 sigmas), δt_target = 0.000641108 s |
| Frequency: | 291.051 Hz |
| Ξ: | 0.933709 ± 0.00213465 (variance = 4.55675e-06): Q0: 0.964568, Q1: 0.962793, Q2: 0.969213, Q3: 0.965355, Q4: 0.96647 |
| Rank: | R_A = 0.868351 |
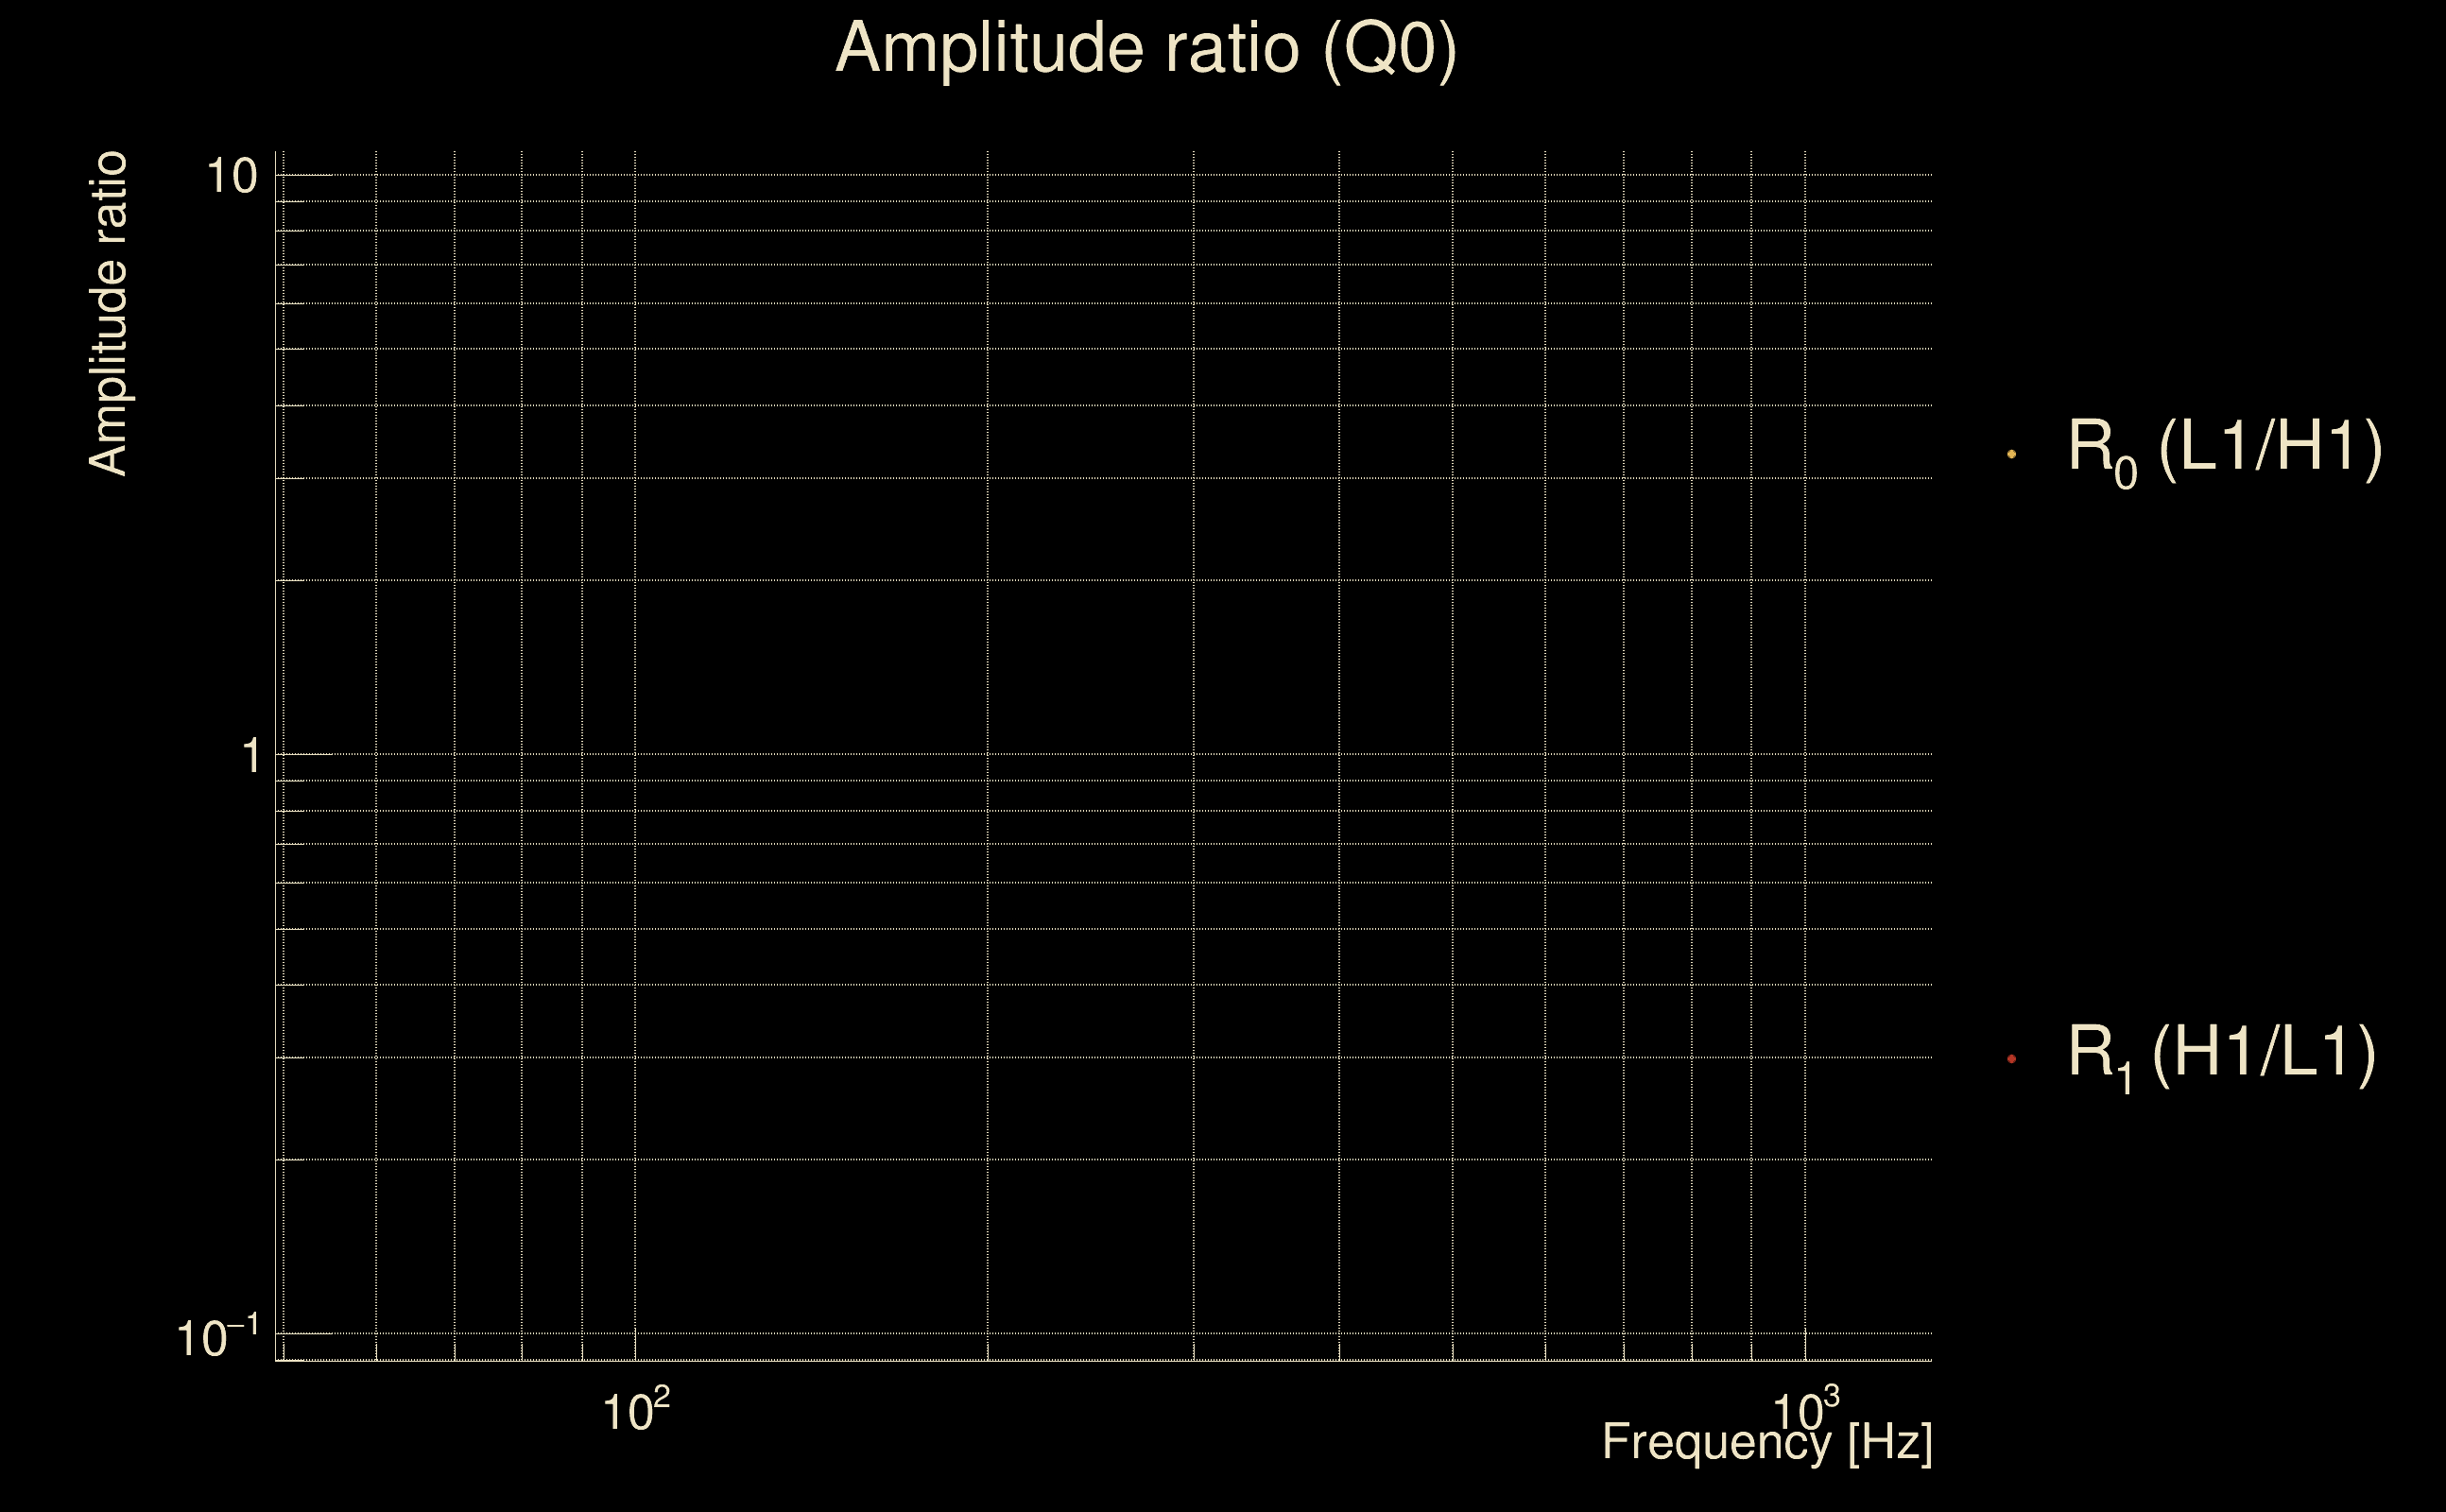
| Log of amplitude ratio (L1/H1): | -0.0614666, variance = 0.15064 (L1/H1: -0.0778347, variance = 0.300835, H1/L1: 0.0441223, variance = 0.301244) |
| Amplitude ratio (L1/H1): | 0.940384 ⋇ 1.47421 (L1/H1: 0.925117 ⋇ 1.73063, H1/L1: 1.04511 ⋇ 1.73127) |
| Amplitude ratio H1|L1 compatibility (probability): | 0.965345 |
| Antenna factor probability: | 0.983931 |
| Number of rejected frequency rows: | Q0: 0 / 18, Q1: 1 / 36, Q2: 7 / 70, Q3: 13 / 134, Q4: 39 / 258 |
| Maximum signal-to-noise ratio: | H1: 755.726, L1: 734.153 |
| SNR variance: | H1: 684.212, L1: 603.449 |
| Click here for a zoomed plot | Click here for a zoomed plot | Click here for a zoomed plot | Click here for a zoomed plot | Click here for a zoomed plot |
 |
 |
 |
 |
 |
 |
 |
 |
 |
 |
 |
 |
 |
 |
 |
 |
 |
 |
 |
 |
 |
 |
 |
 |
 |
 |
 |
 |
 |
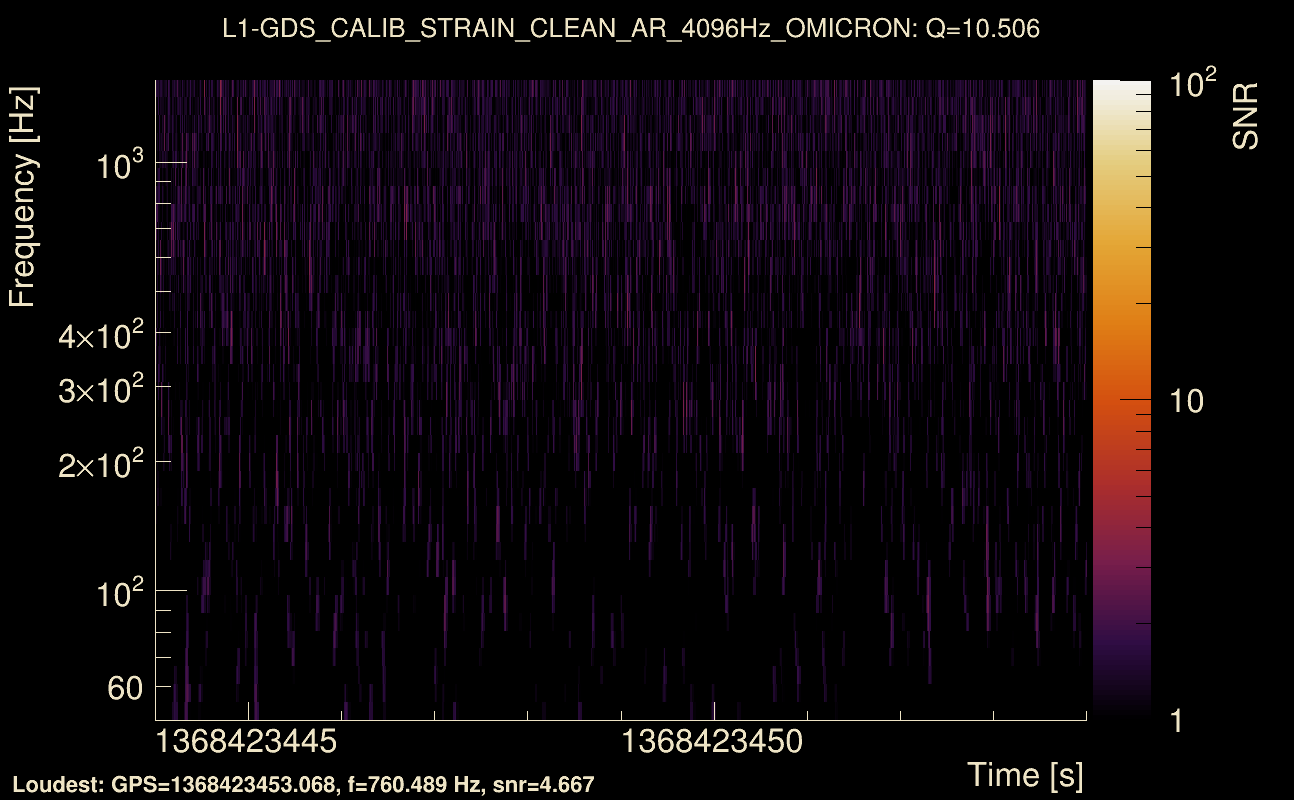
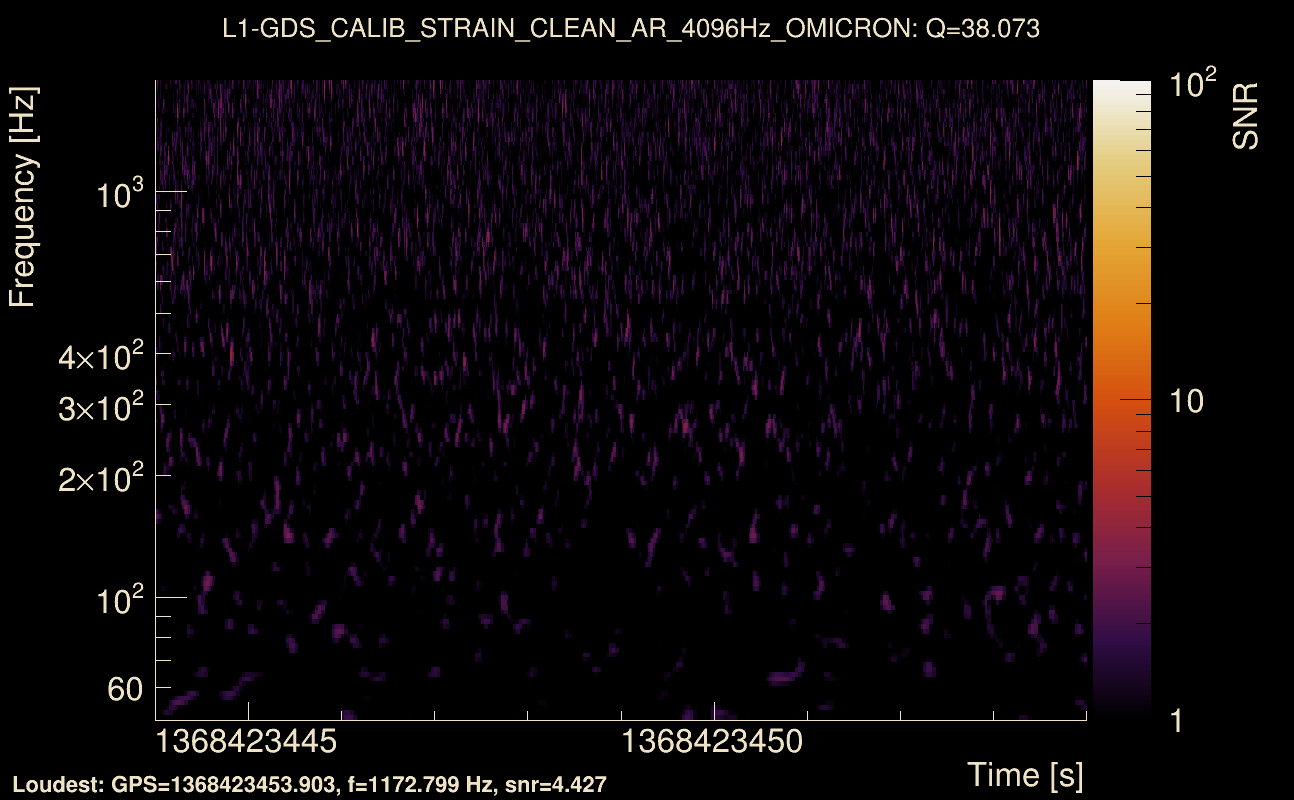
| Event time t(H1): | GPS = 1368423444 (Thu May 18 05:37:06 2023 ) → GPS = 1368423454 (Thu May 18 05:37:16 2023 ) |
| Event time t(L1): | GPS = 1368423444 (Thu May 18 05:37:16 2023 ) → GPS = 1368423454 (Thu May 18 05:37:16 2023 ) |
| Omicron analysis time window (H1): | GPS = 1368423441 → GPS = 1368423457 |
| Omicron analysis time window (L1): | GPS = 1368423441 → GPS = 1368423457 |
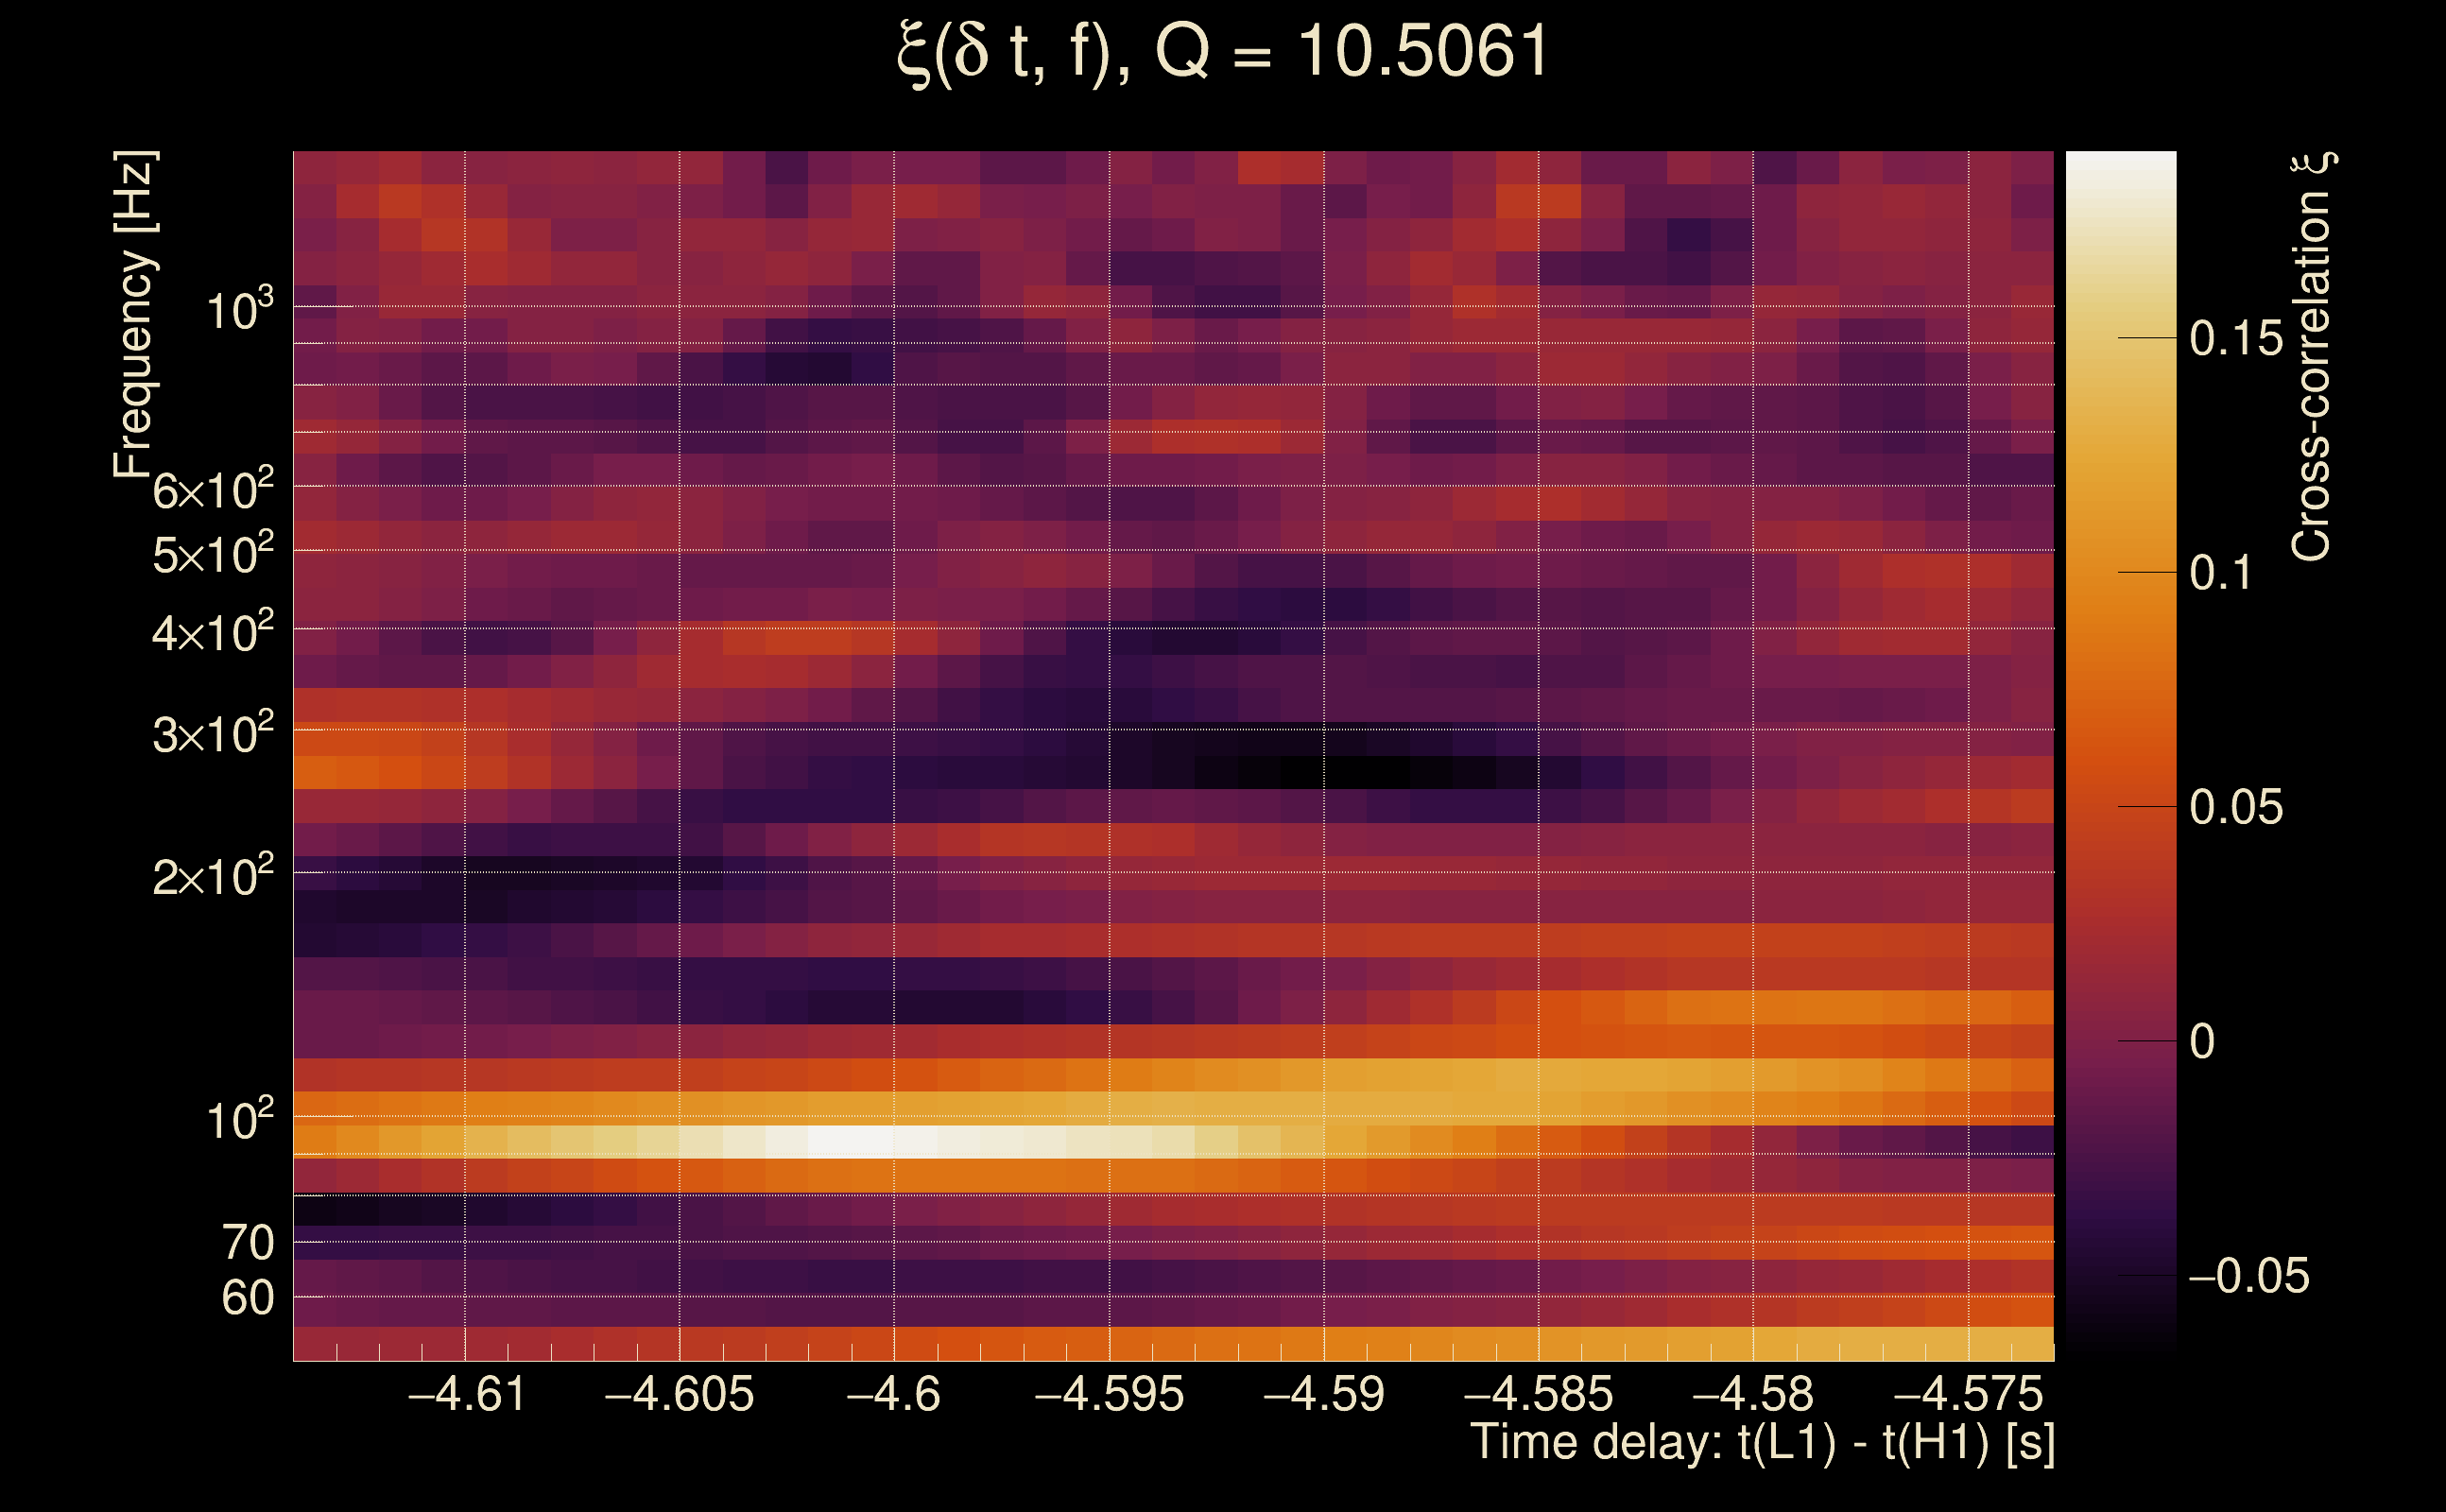
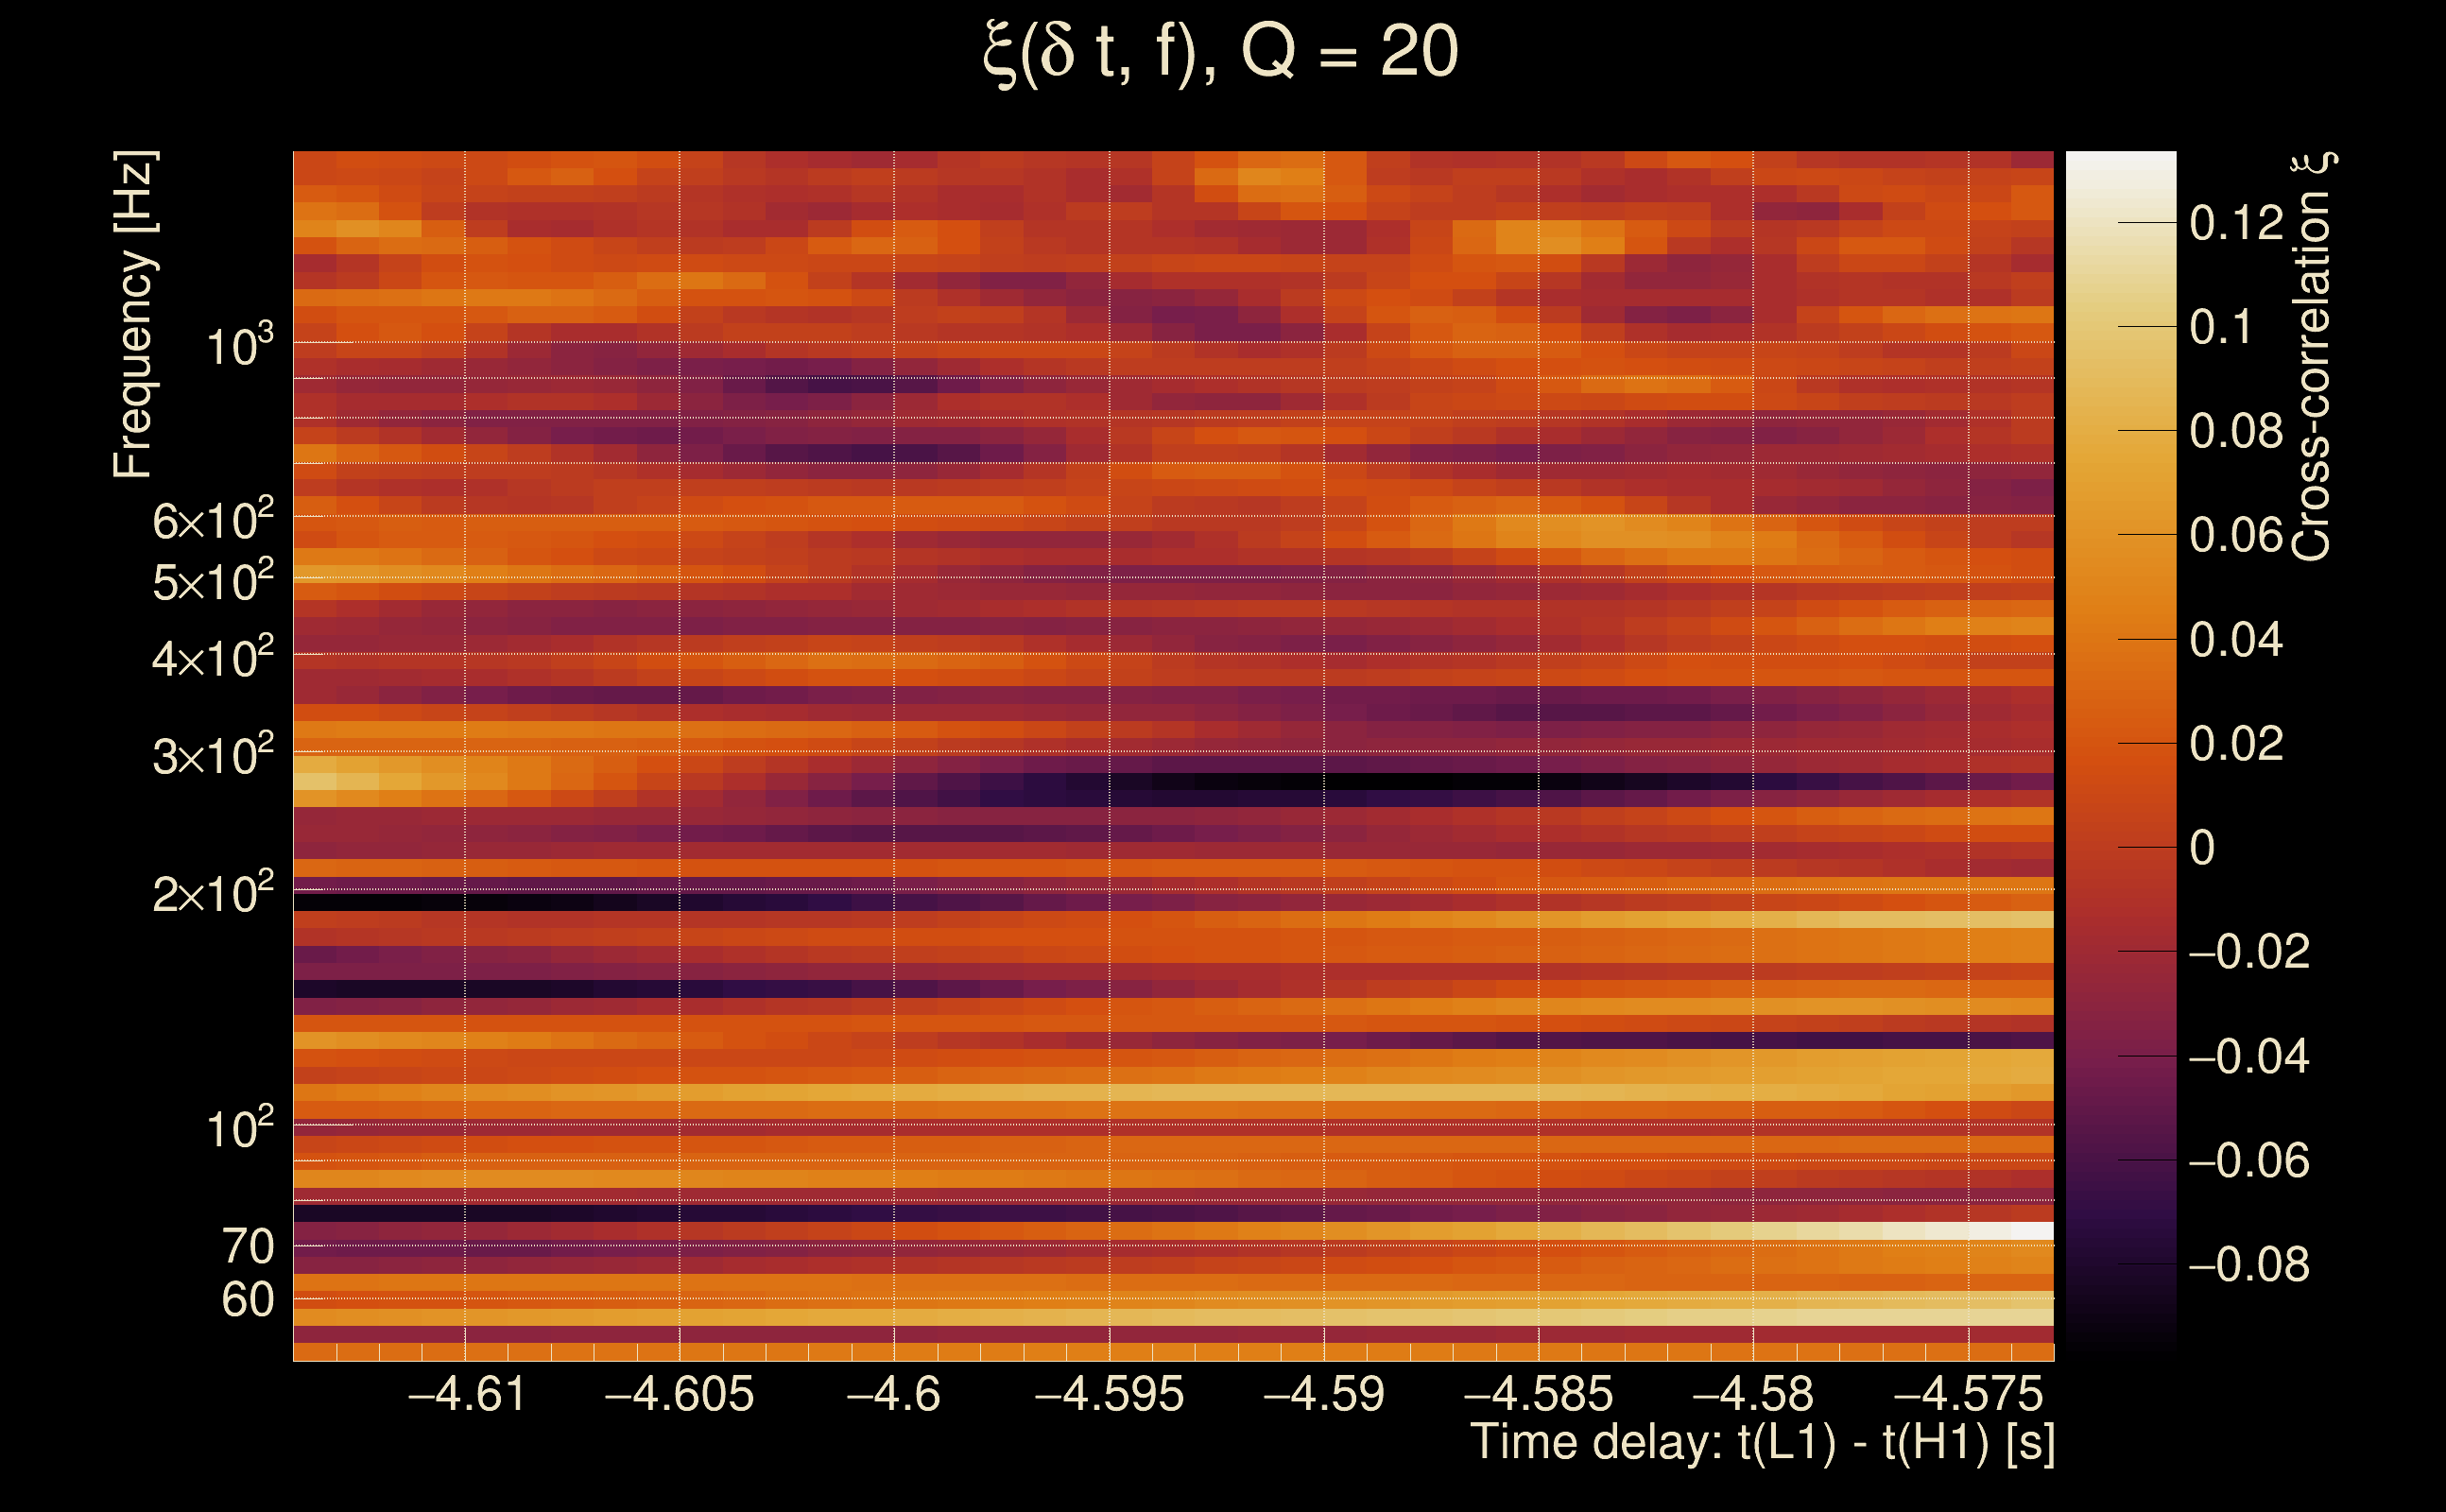
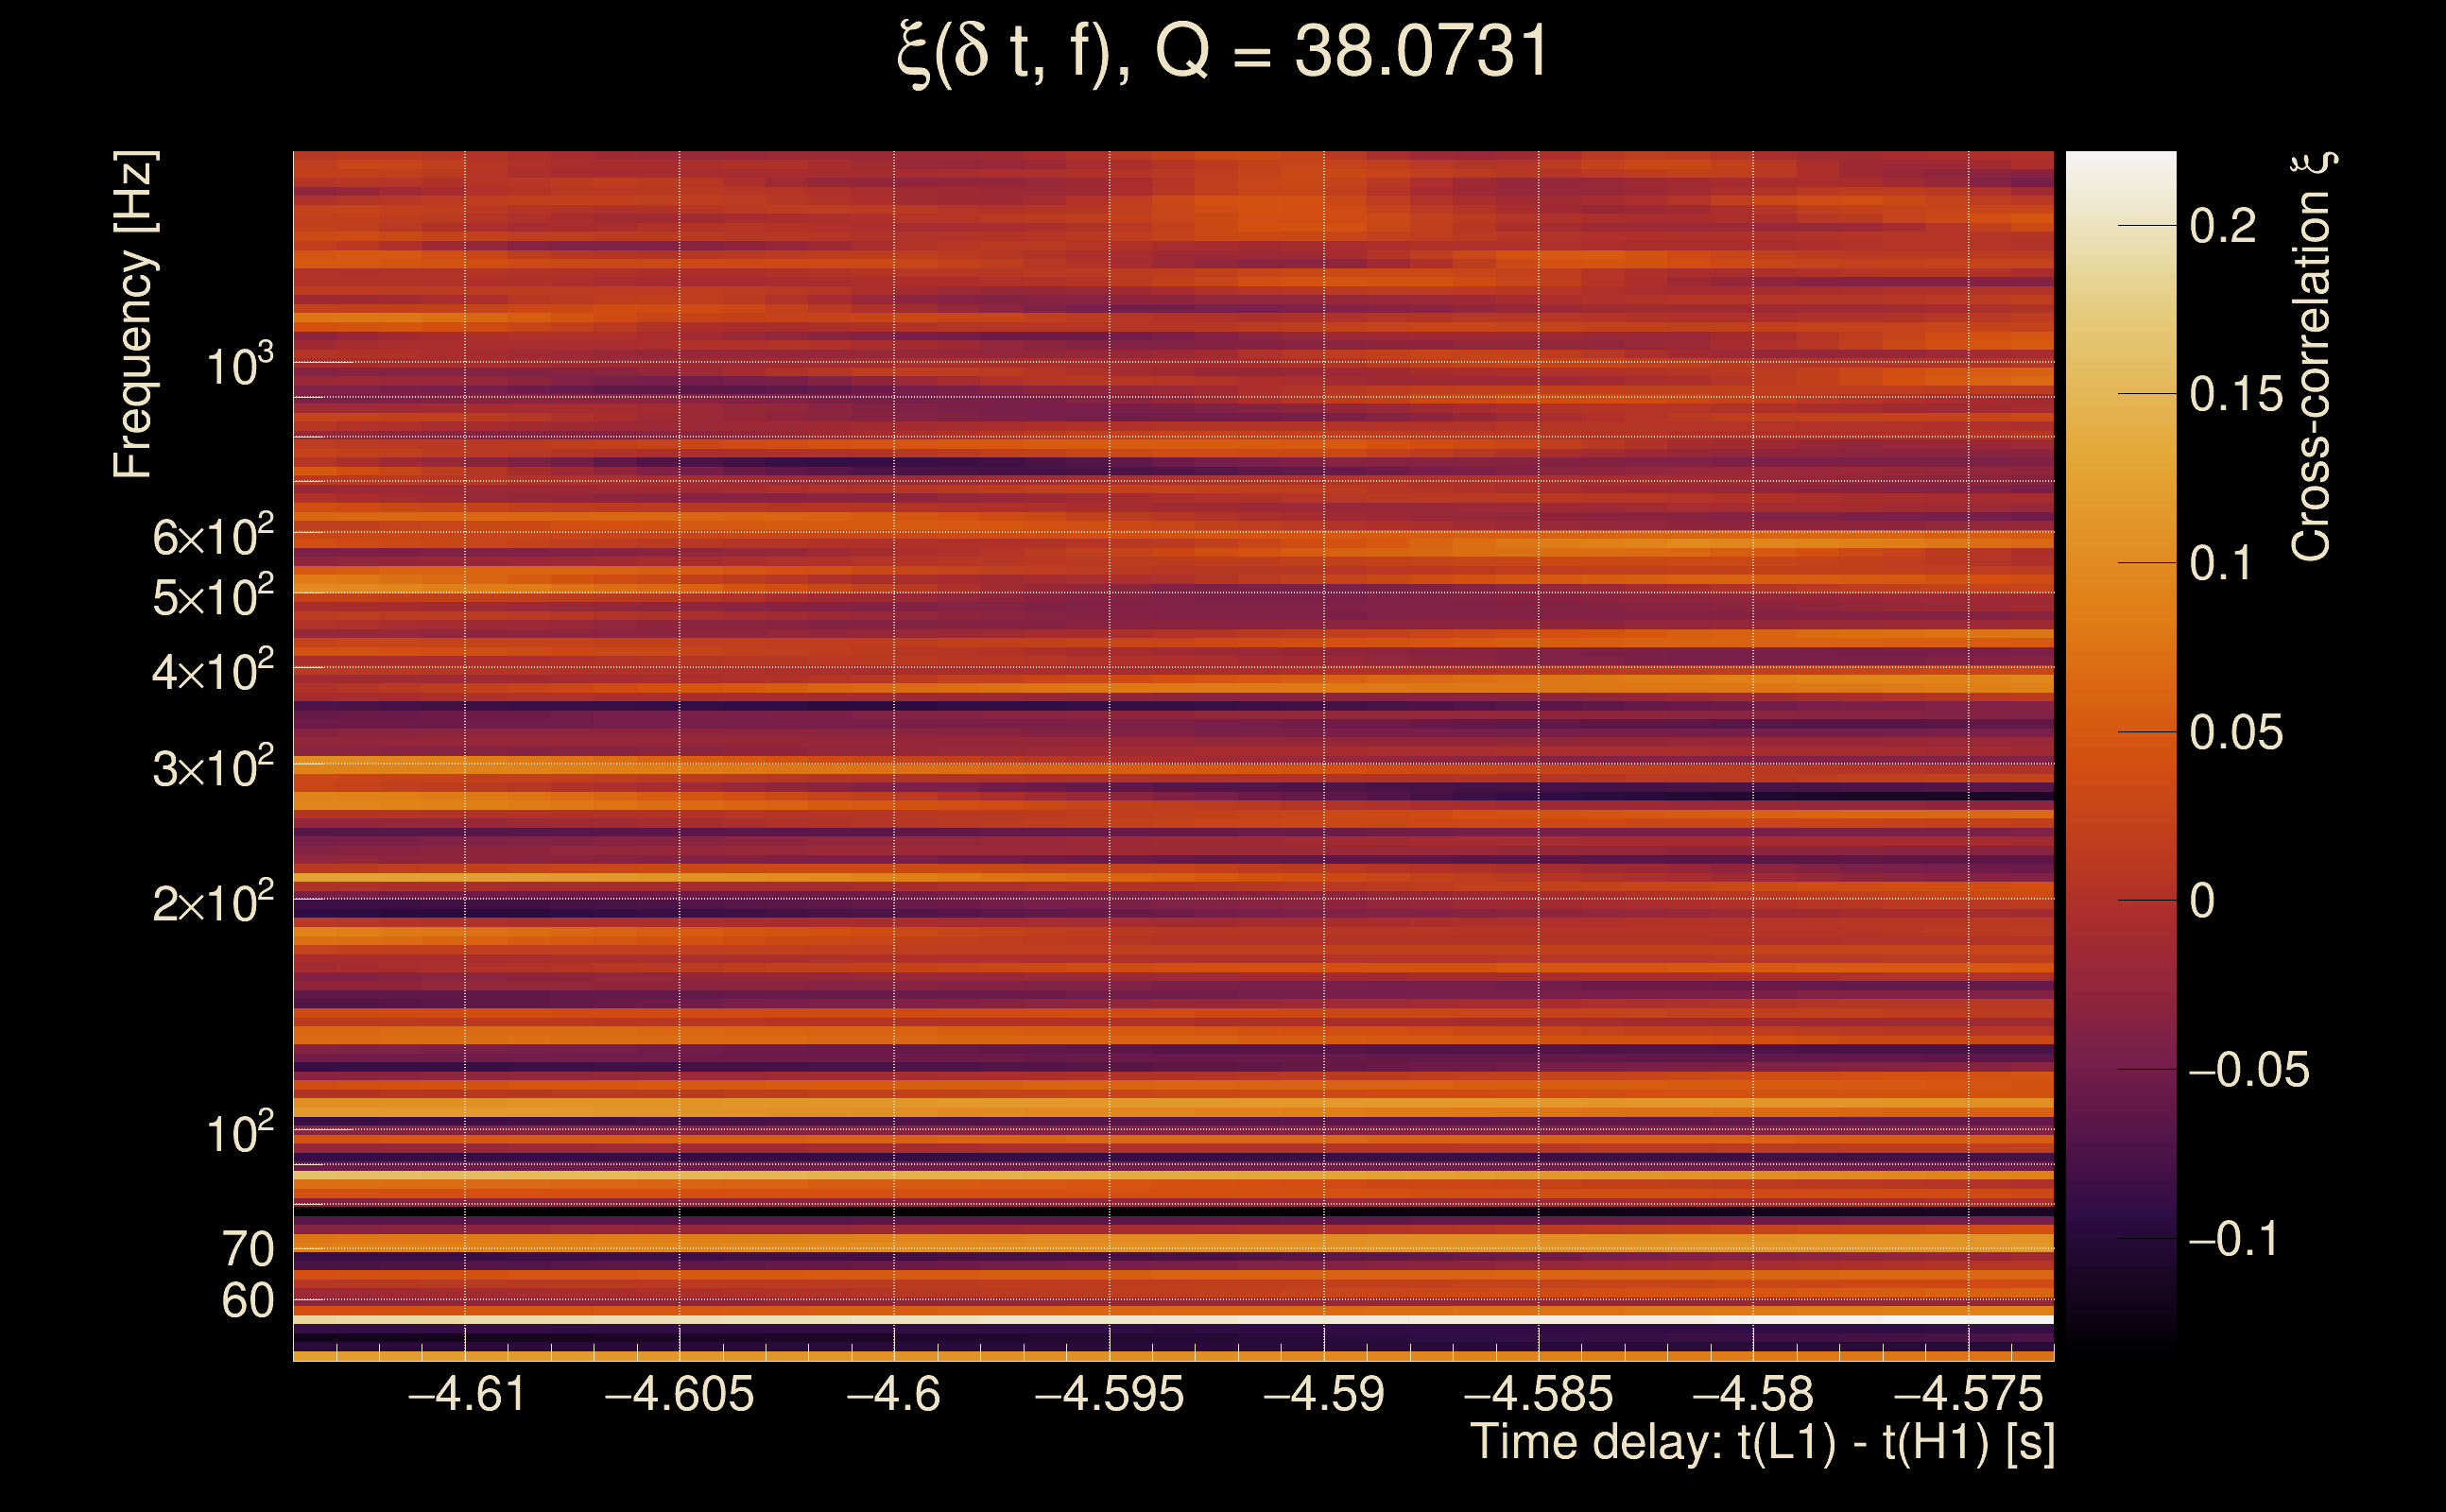
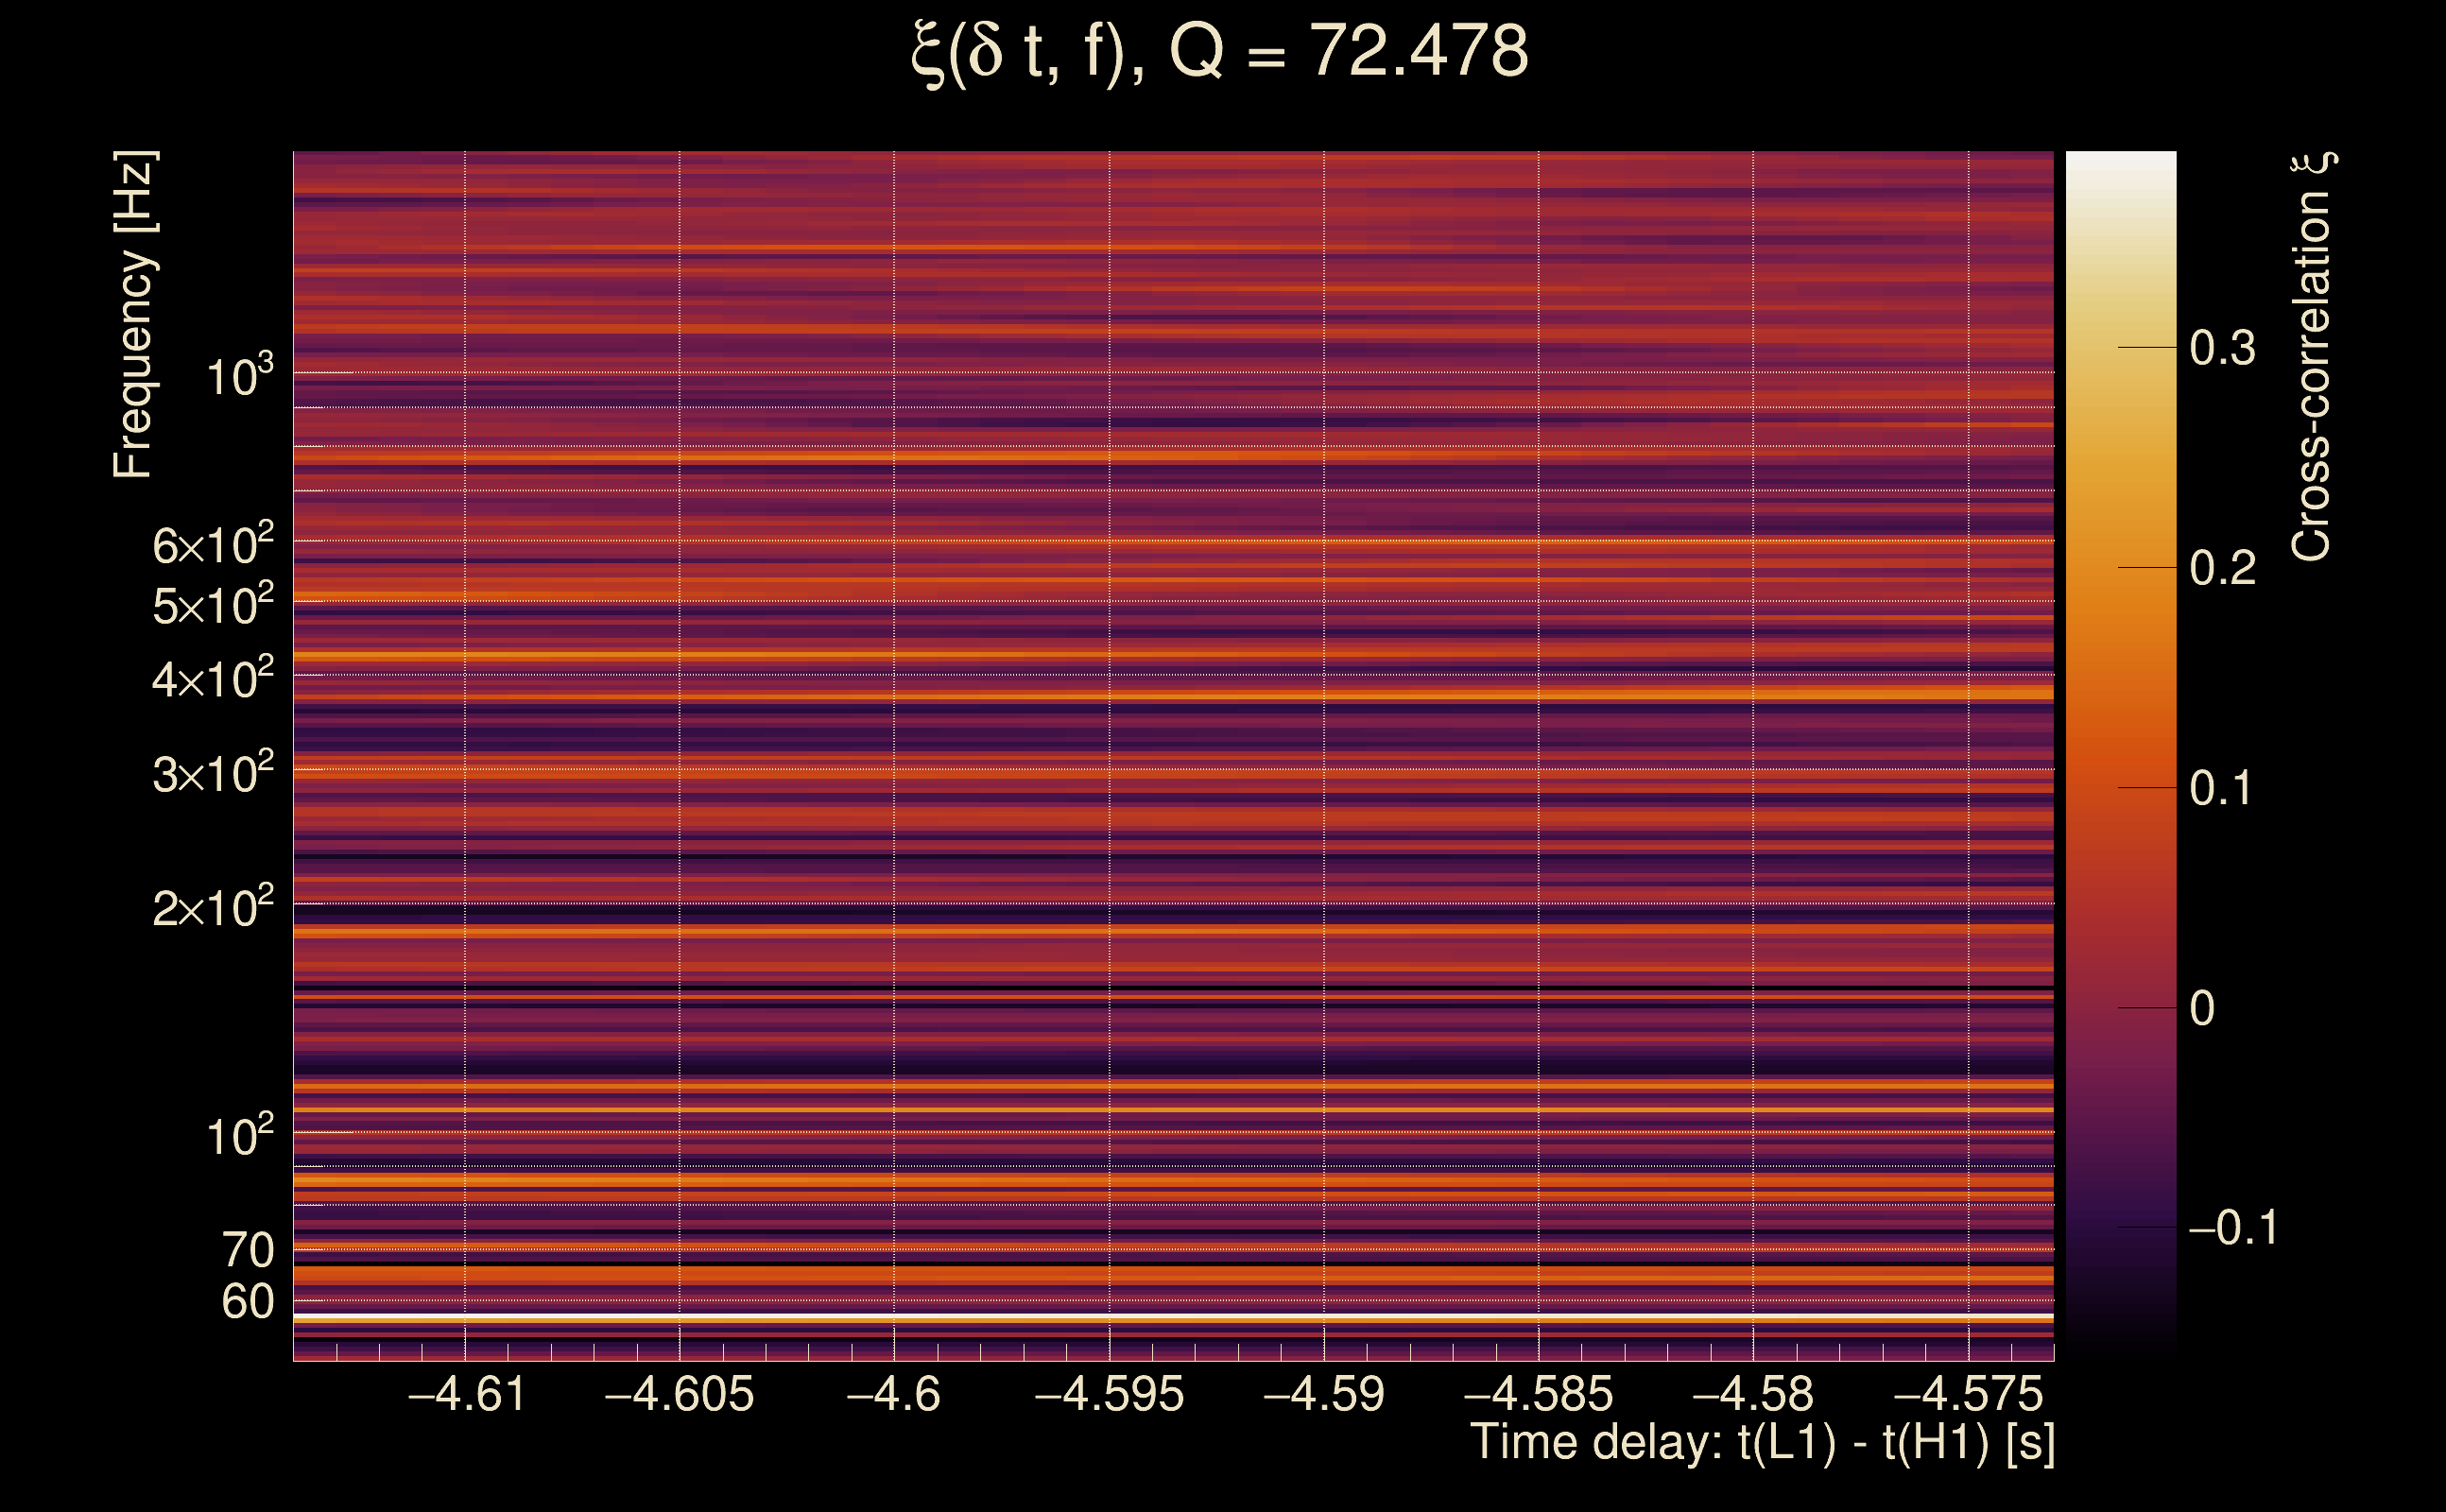
| Time delay between detectors t(L1) - t(H1): | -4.5935 s (slice index = 208 / 217), δt_gw = 0.00650109 s |
| Time delay standard deviation: | 0.0757941 s |
| [targeted mode] Time delay probability: | 0.432702 (0.784577 sigmas), δt_target = 0.00765514 s |
| Frequency: | 117.032 Hz |
| Ξ: | 0.0195658 ± 0.0361353 (variance = 0.00130576): Q0: 0.129005, Q1: 0.15369, Q2: 0.0936294, Q3: 0.0570221, Q4: 0.0696834 |
| Rank: | R_A = 0.00818094 |
| Log of amplitude ratio (L1/H1): | -0.0720941, variance = 0.60753 (L1/H1: -0.0818047, variance = 1.09518, H1/L1: 0.0596681, variance = 1.36385) |
| Amplitude ratio (L1/H1): | 0.930443 ⋇ 2.18026 (L1/H1: 0.921452 ⋇ 2.8477, H1/L1: 1.06148 ⋇ 3.21504) |
| Amplitude ratio H1|L1 compatibility (probability): | 0.988737 |
| Antenna factor probability: | 0.977318 |
| Number of rejected frequency rows: | Q0: 14 / 18, Q1: 33 / 36, Q2: 62 / 70, Q3: 128 / 134, Q4: 247 / 258 |
| Maximum signal-to-noise ratio: | H1: 5.35221, L1: 4.7314 |
| SNR variance: | H1: 0.538423, L1: 0.542487 |
| Click here for a zoomed plot | Click here for a zoomed plot | Click here for a zoomed plot | Click here for a zoomed plot | Click here for a zoomed plot |
 |
 |
 |
 |
 |
 |
 |
 |
 |
 |
 |
 |
 |
 |
 |
 |
 |
 |
 |
 |
 |
 |
 |
 |
 |
 |
 |
 |
 |
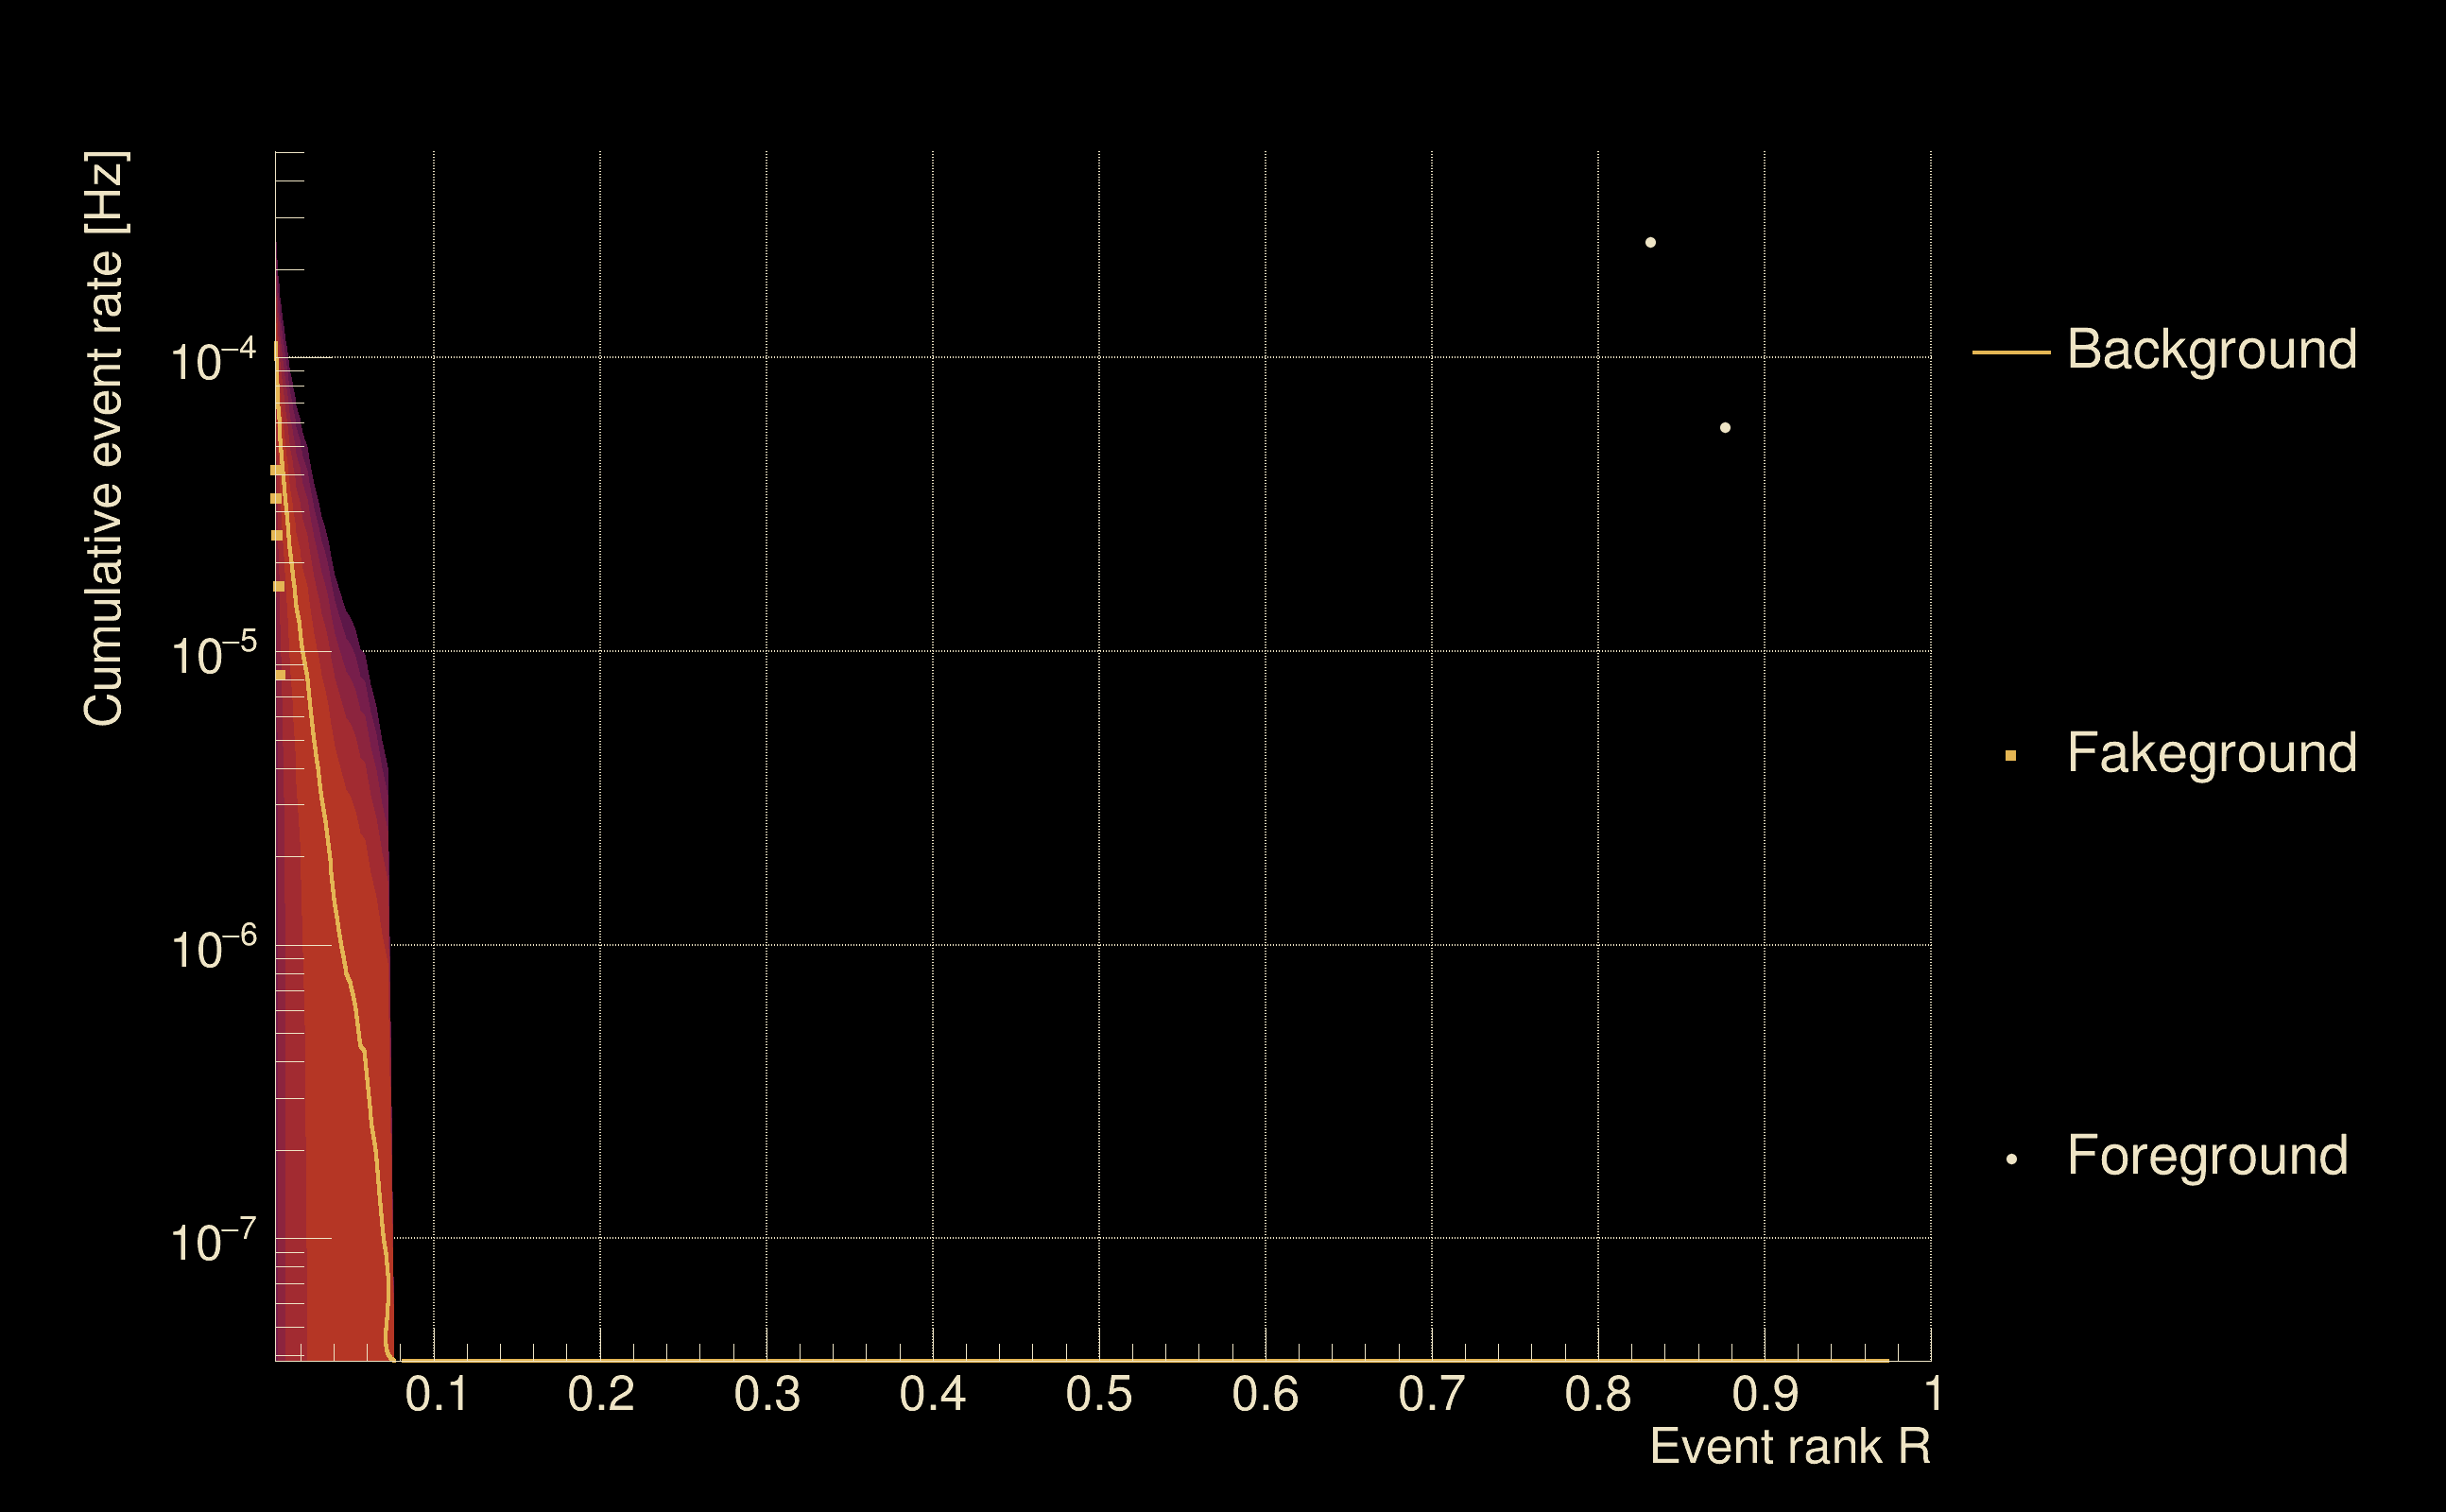
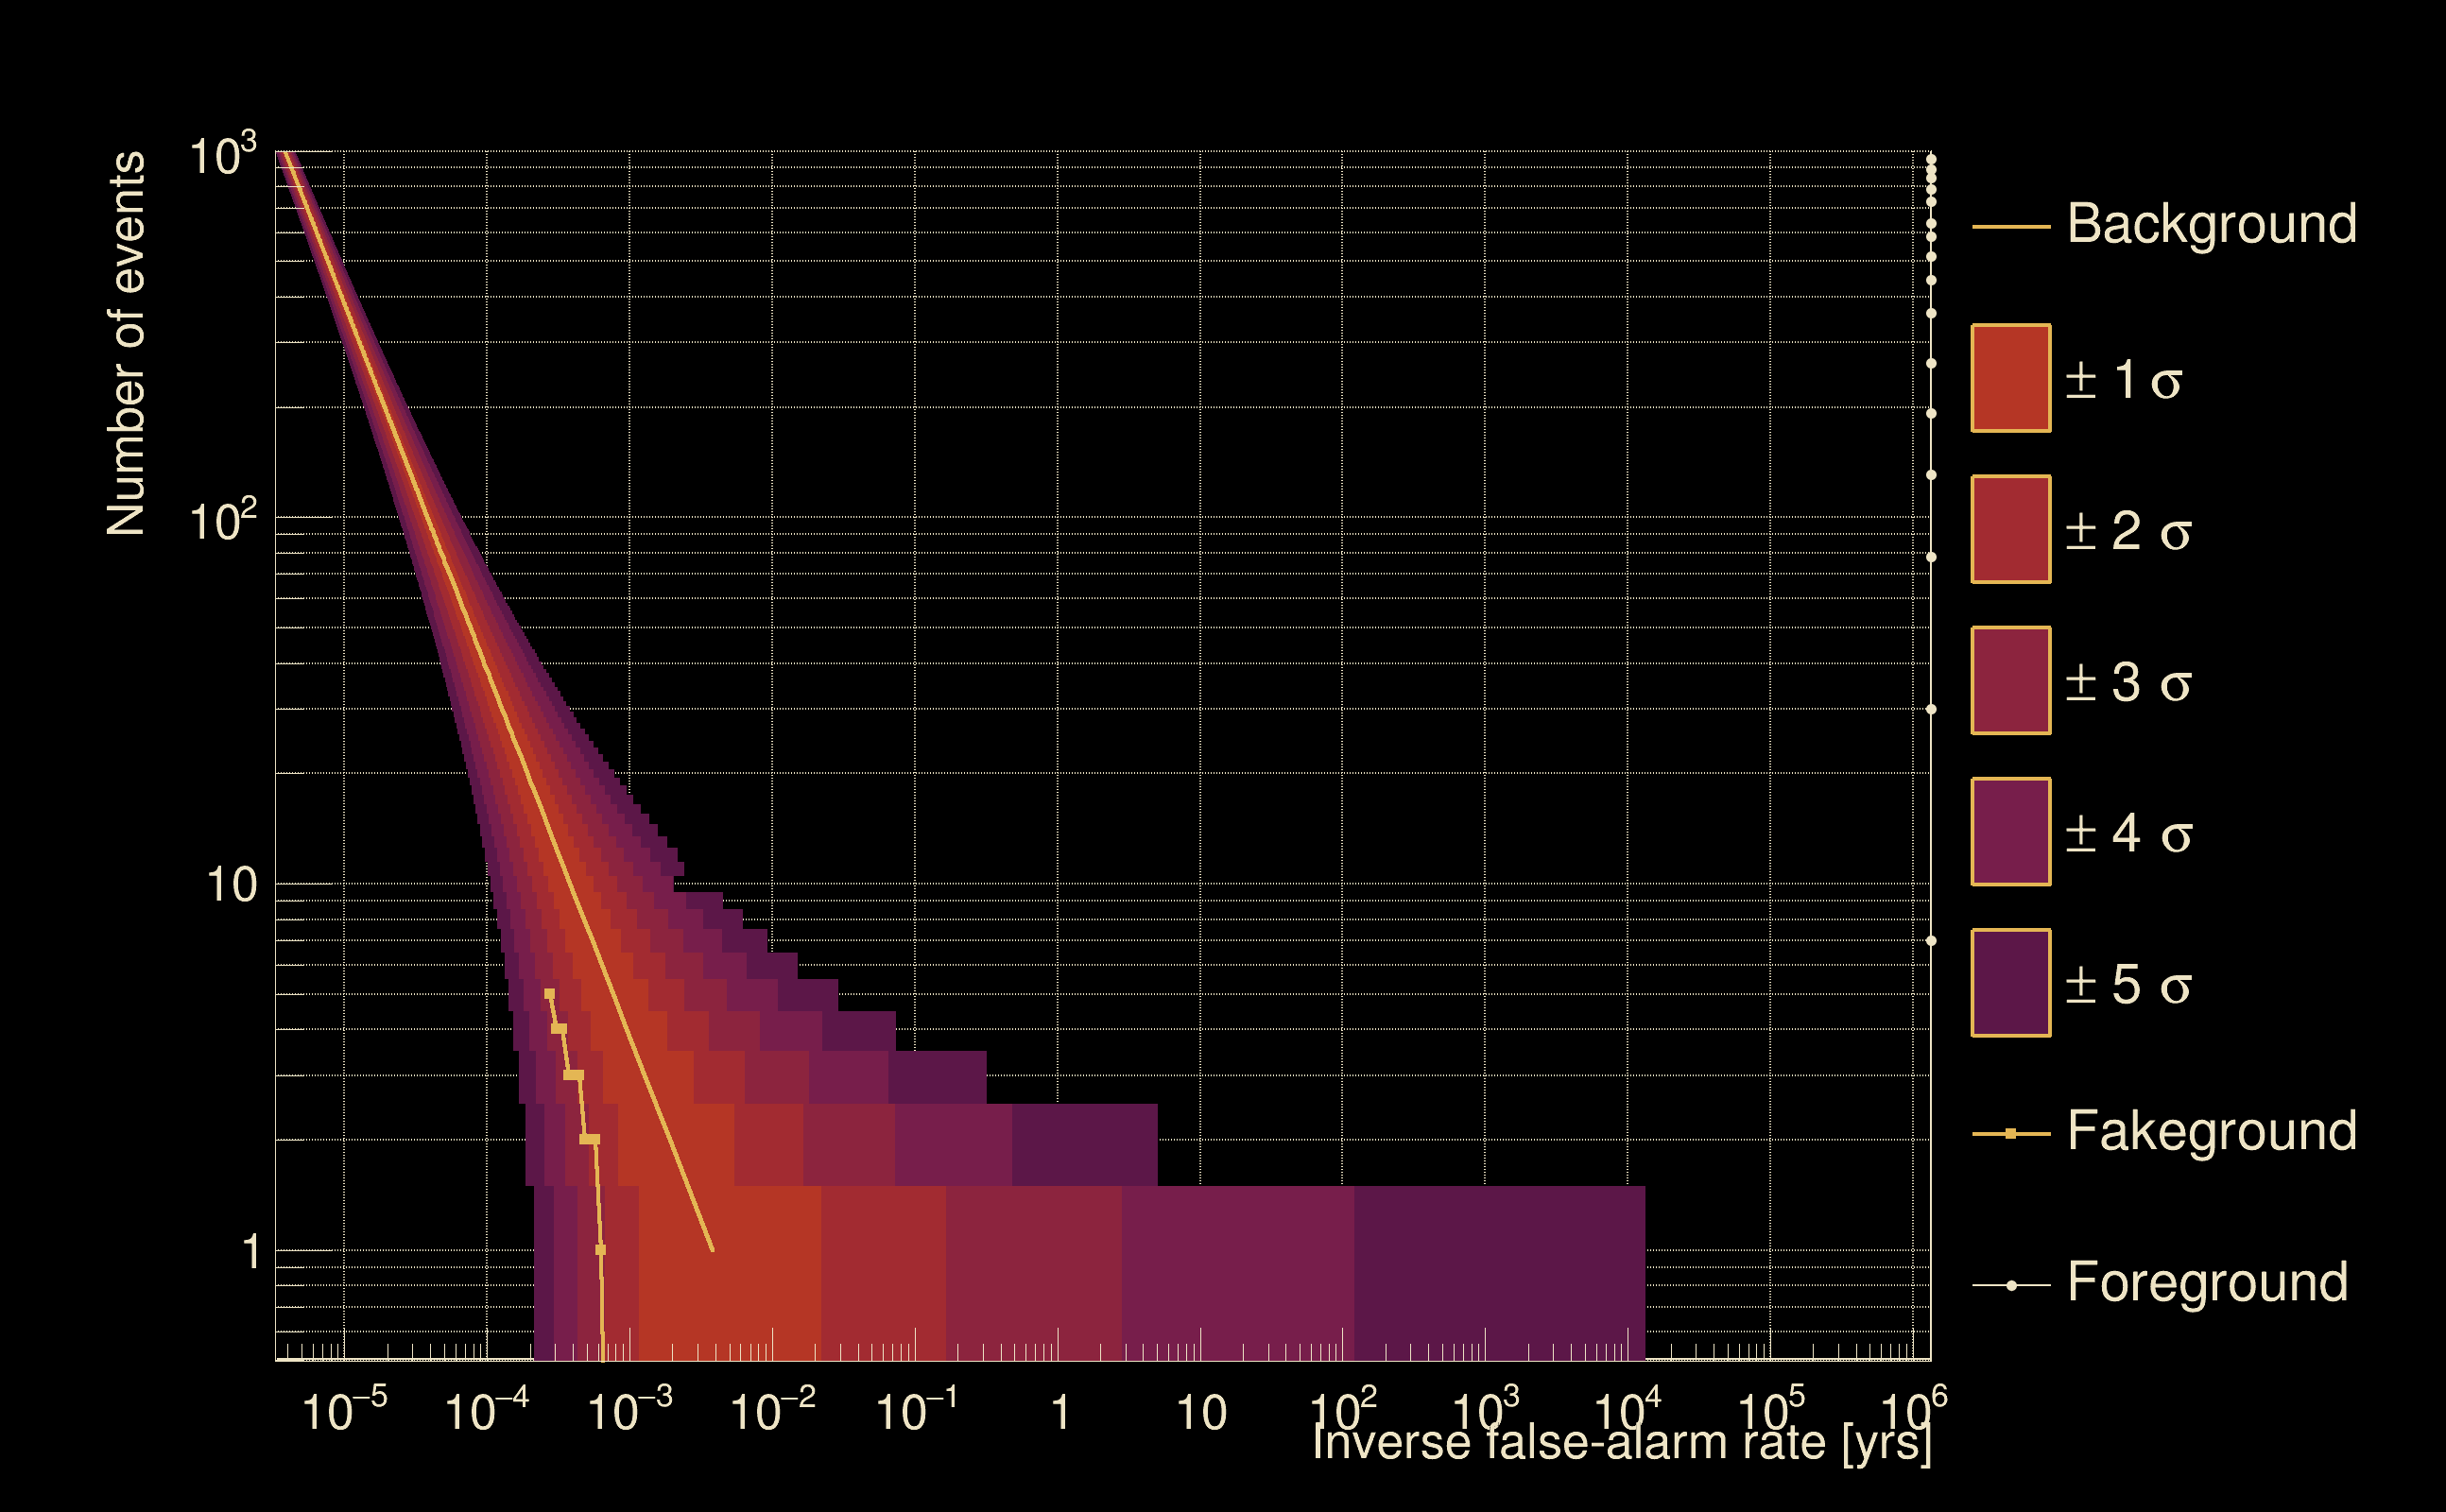
| Detection threshold: | R > 0.0314201 |
| False-alarm rate above that detection threshold: | 3.40549e-06 |
| Alternative threshold at 1/1000 yrs: | R > 0.0726344 |
| Alternative threshold at 1/100 yrs: | R > 0.0726344 |
| Alternative threshold at 1/10 yrs: | R > 0.0726344 |
| Alternative threshold at 1/1 yr: | R > 0.0726344 |
| Alternative threshold at 1/1 d: | R > 0.0193359 |
 |
|
 |
 |
 |
 |
 |
 |
 |
 |
 |
 |
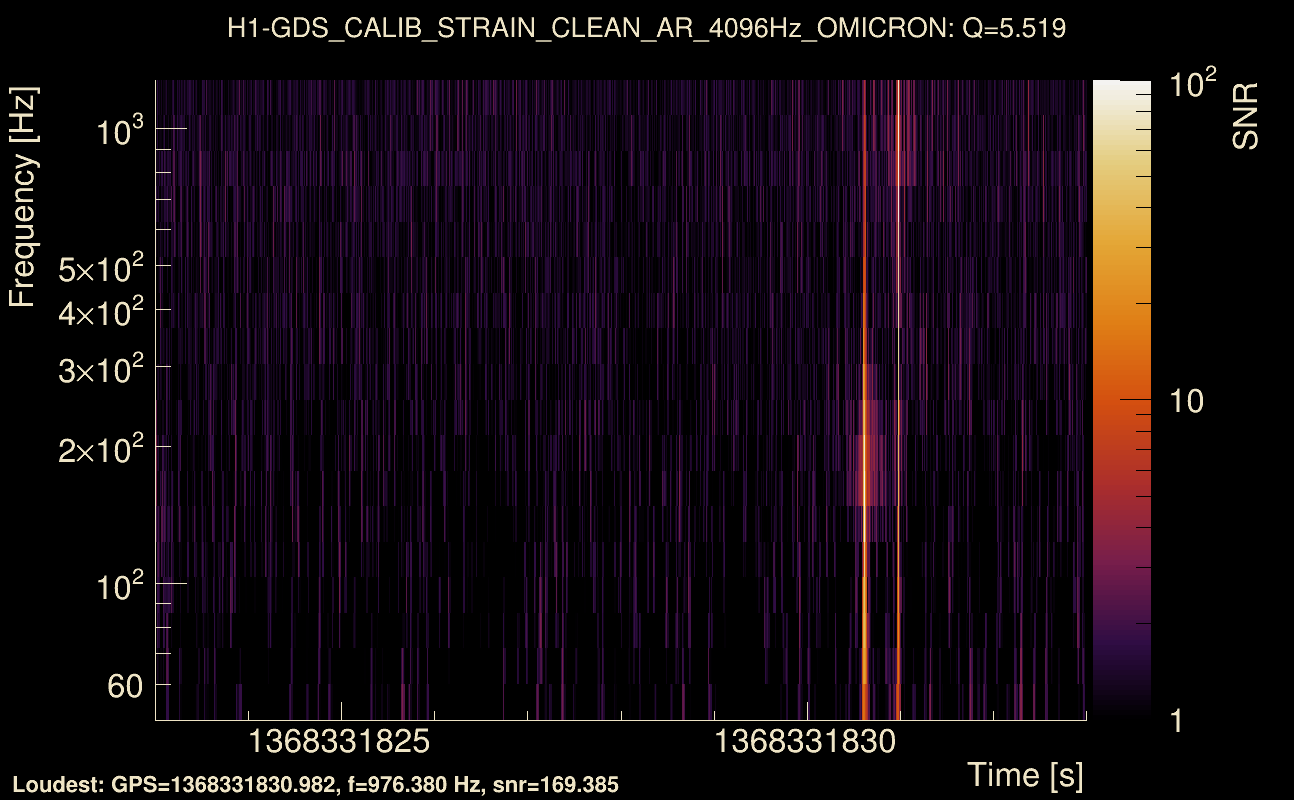
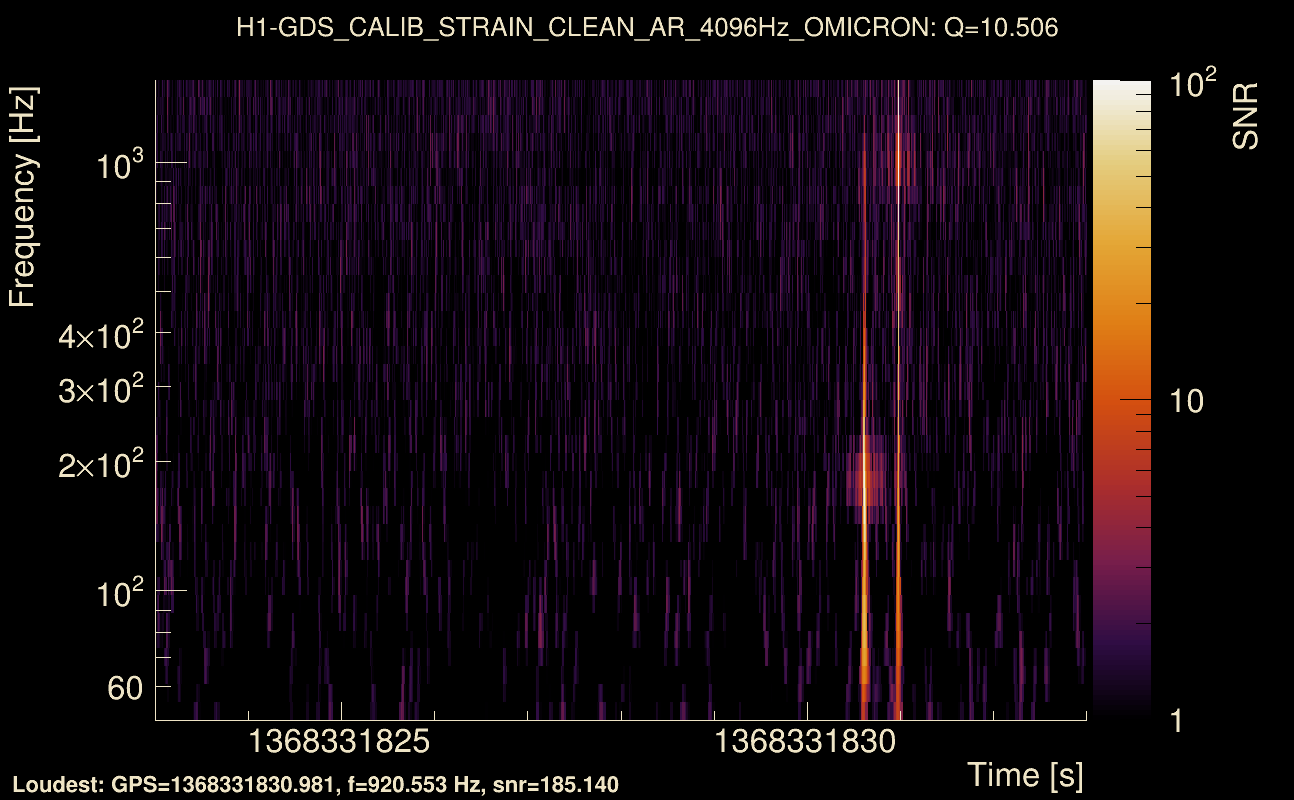
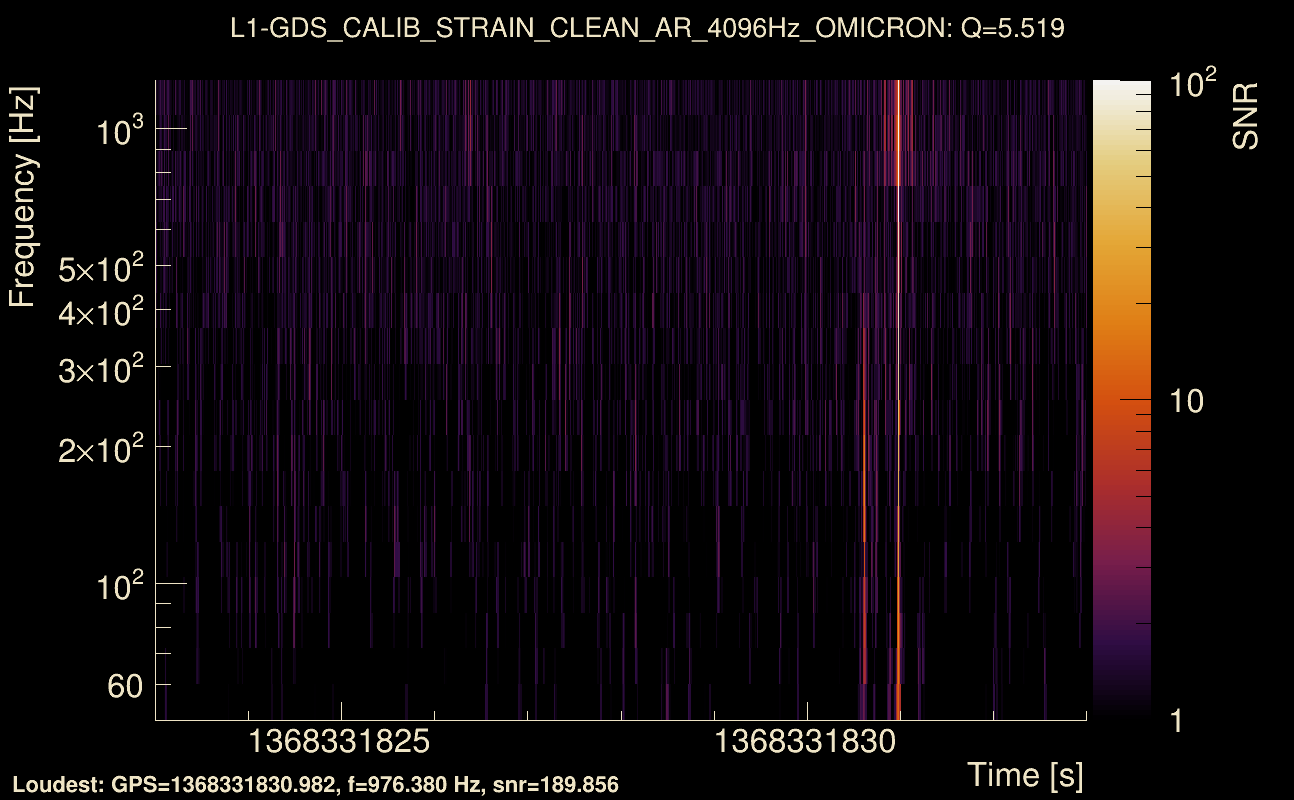
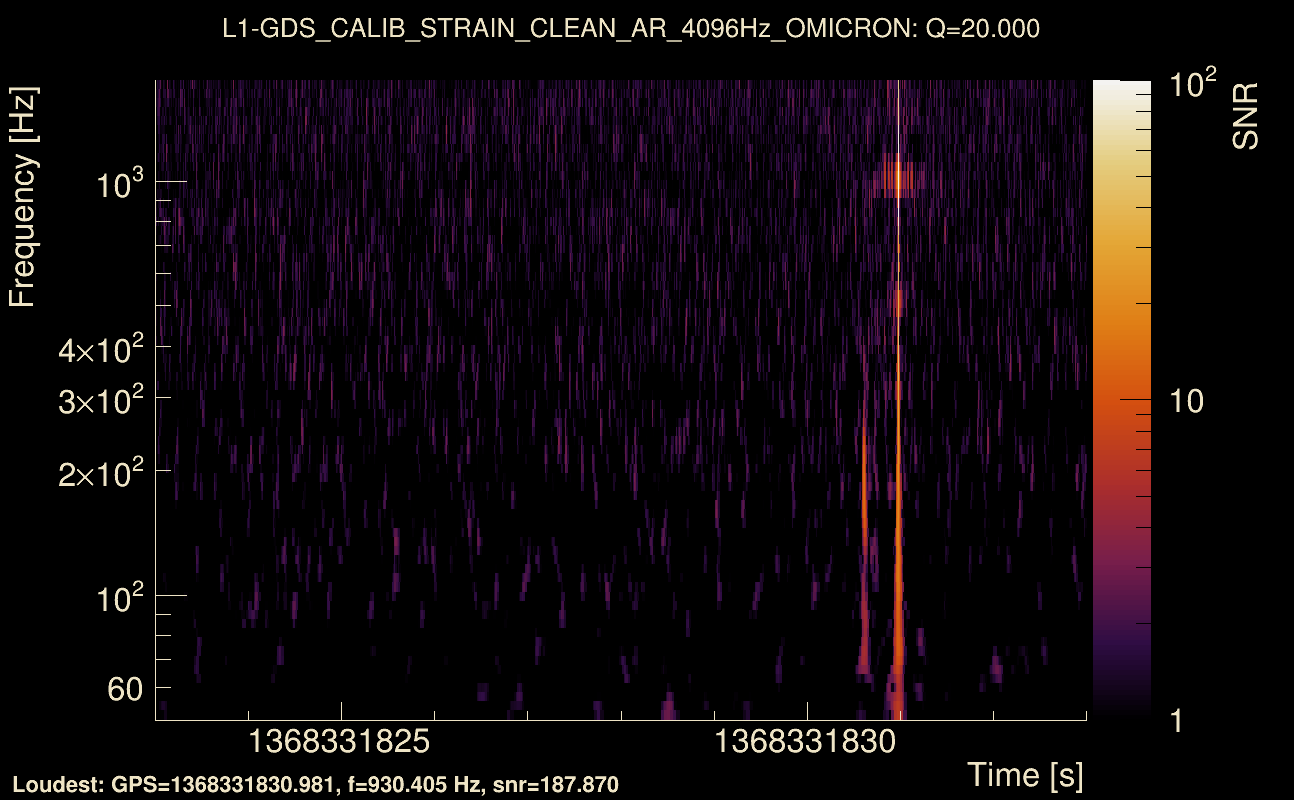
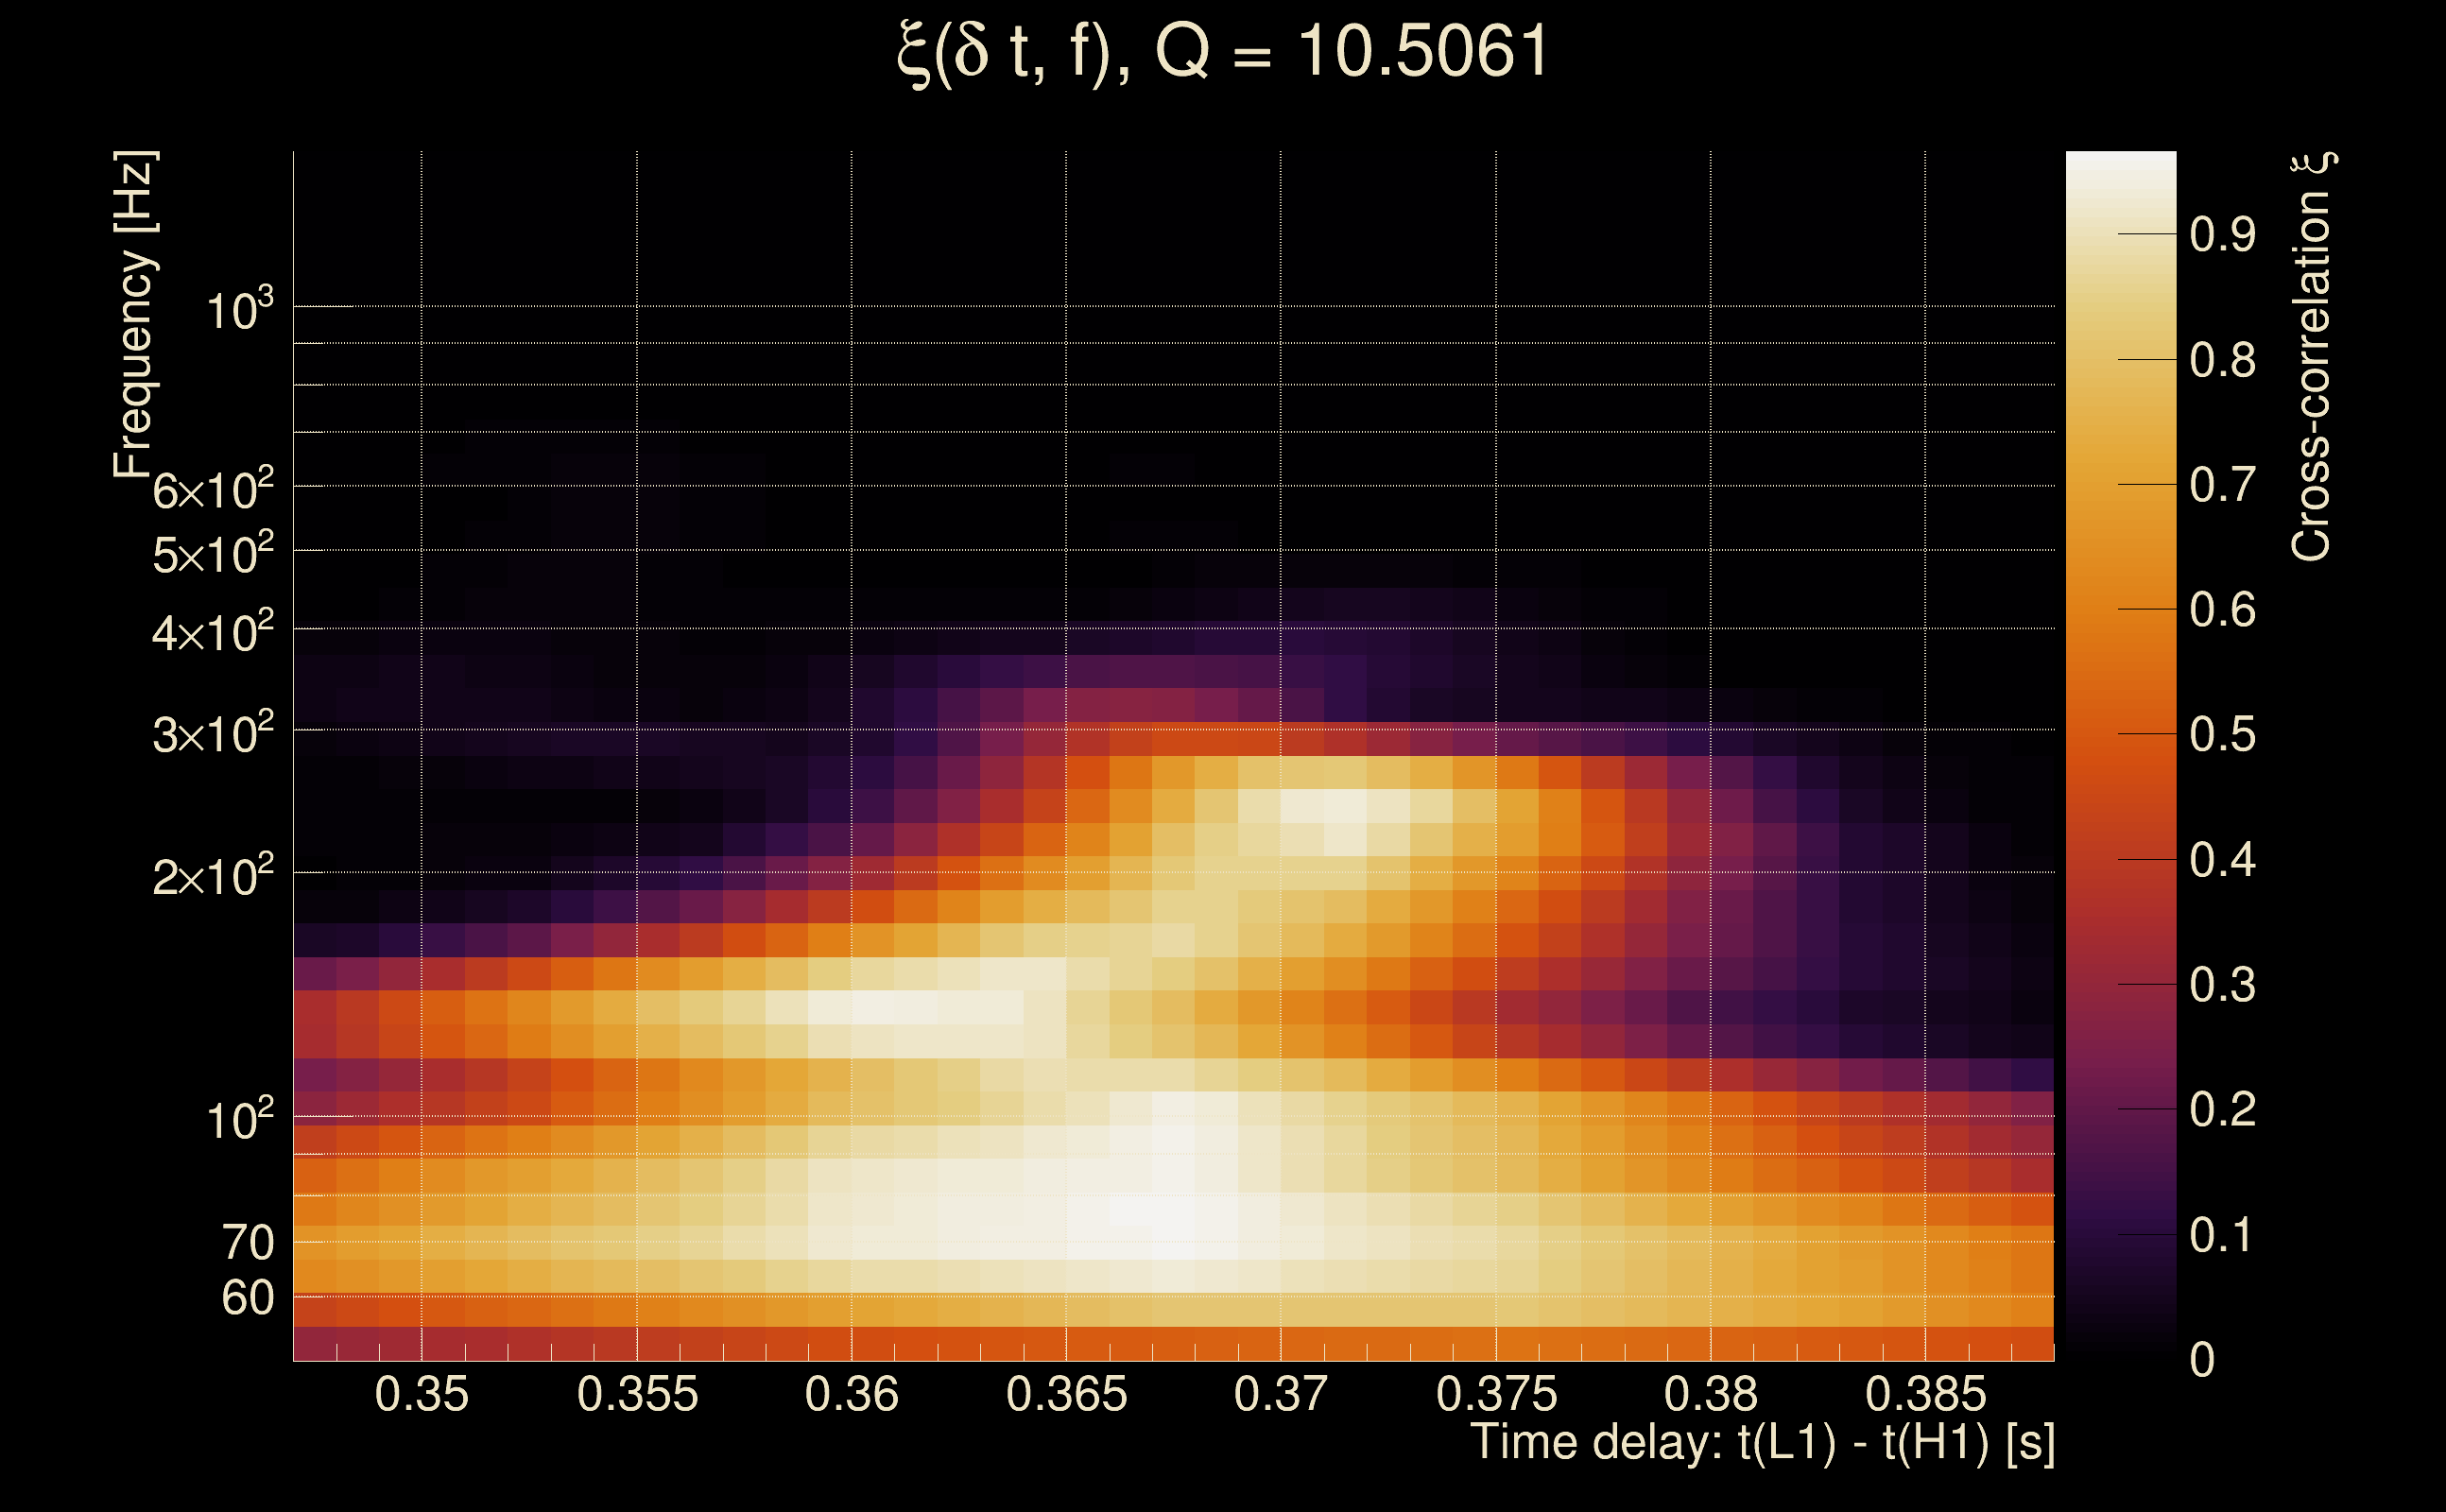
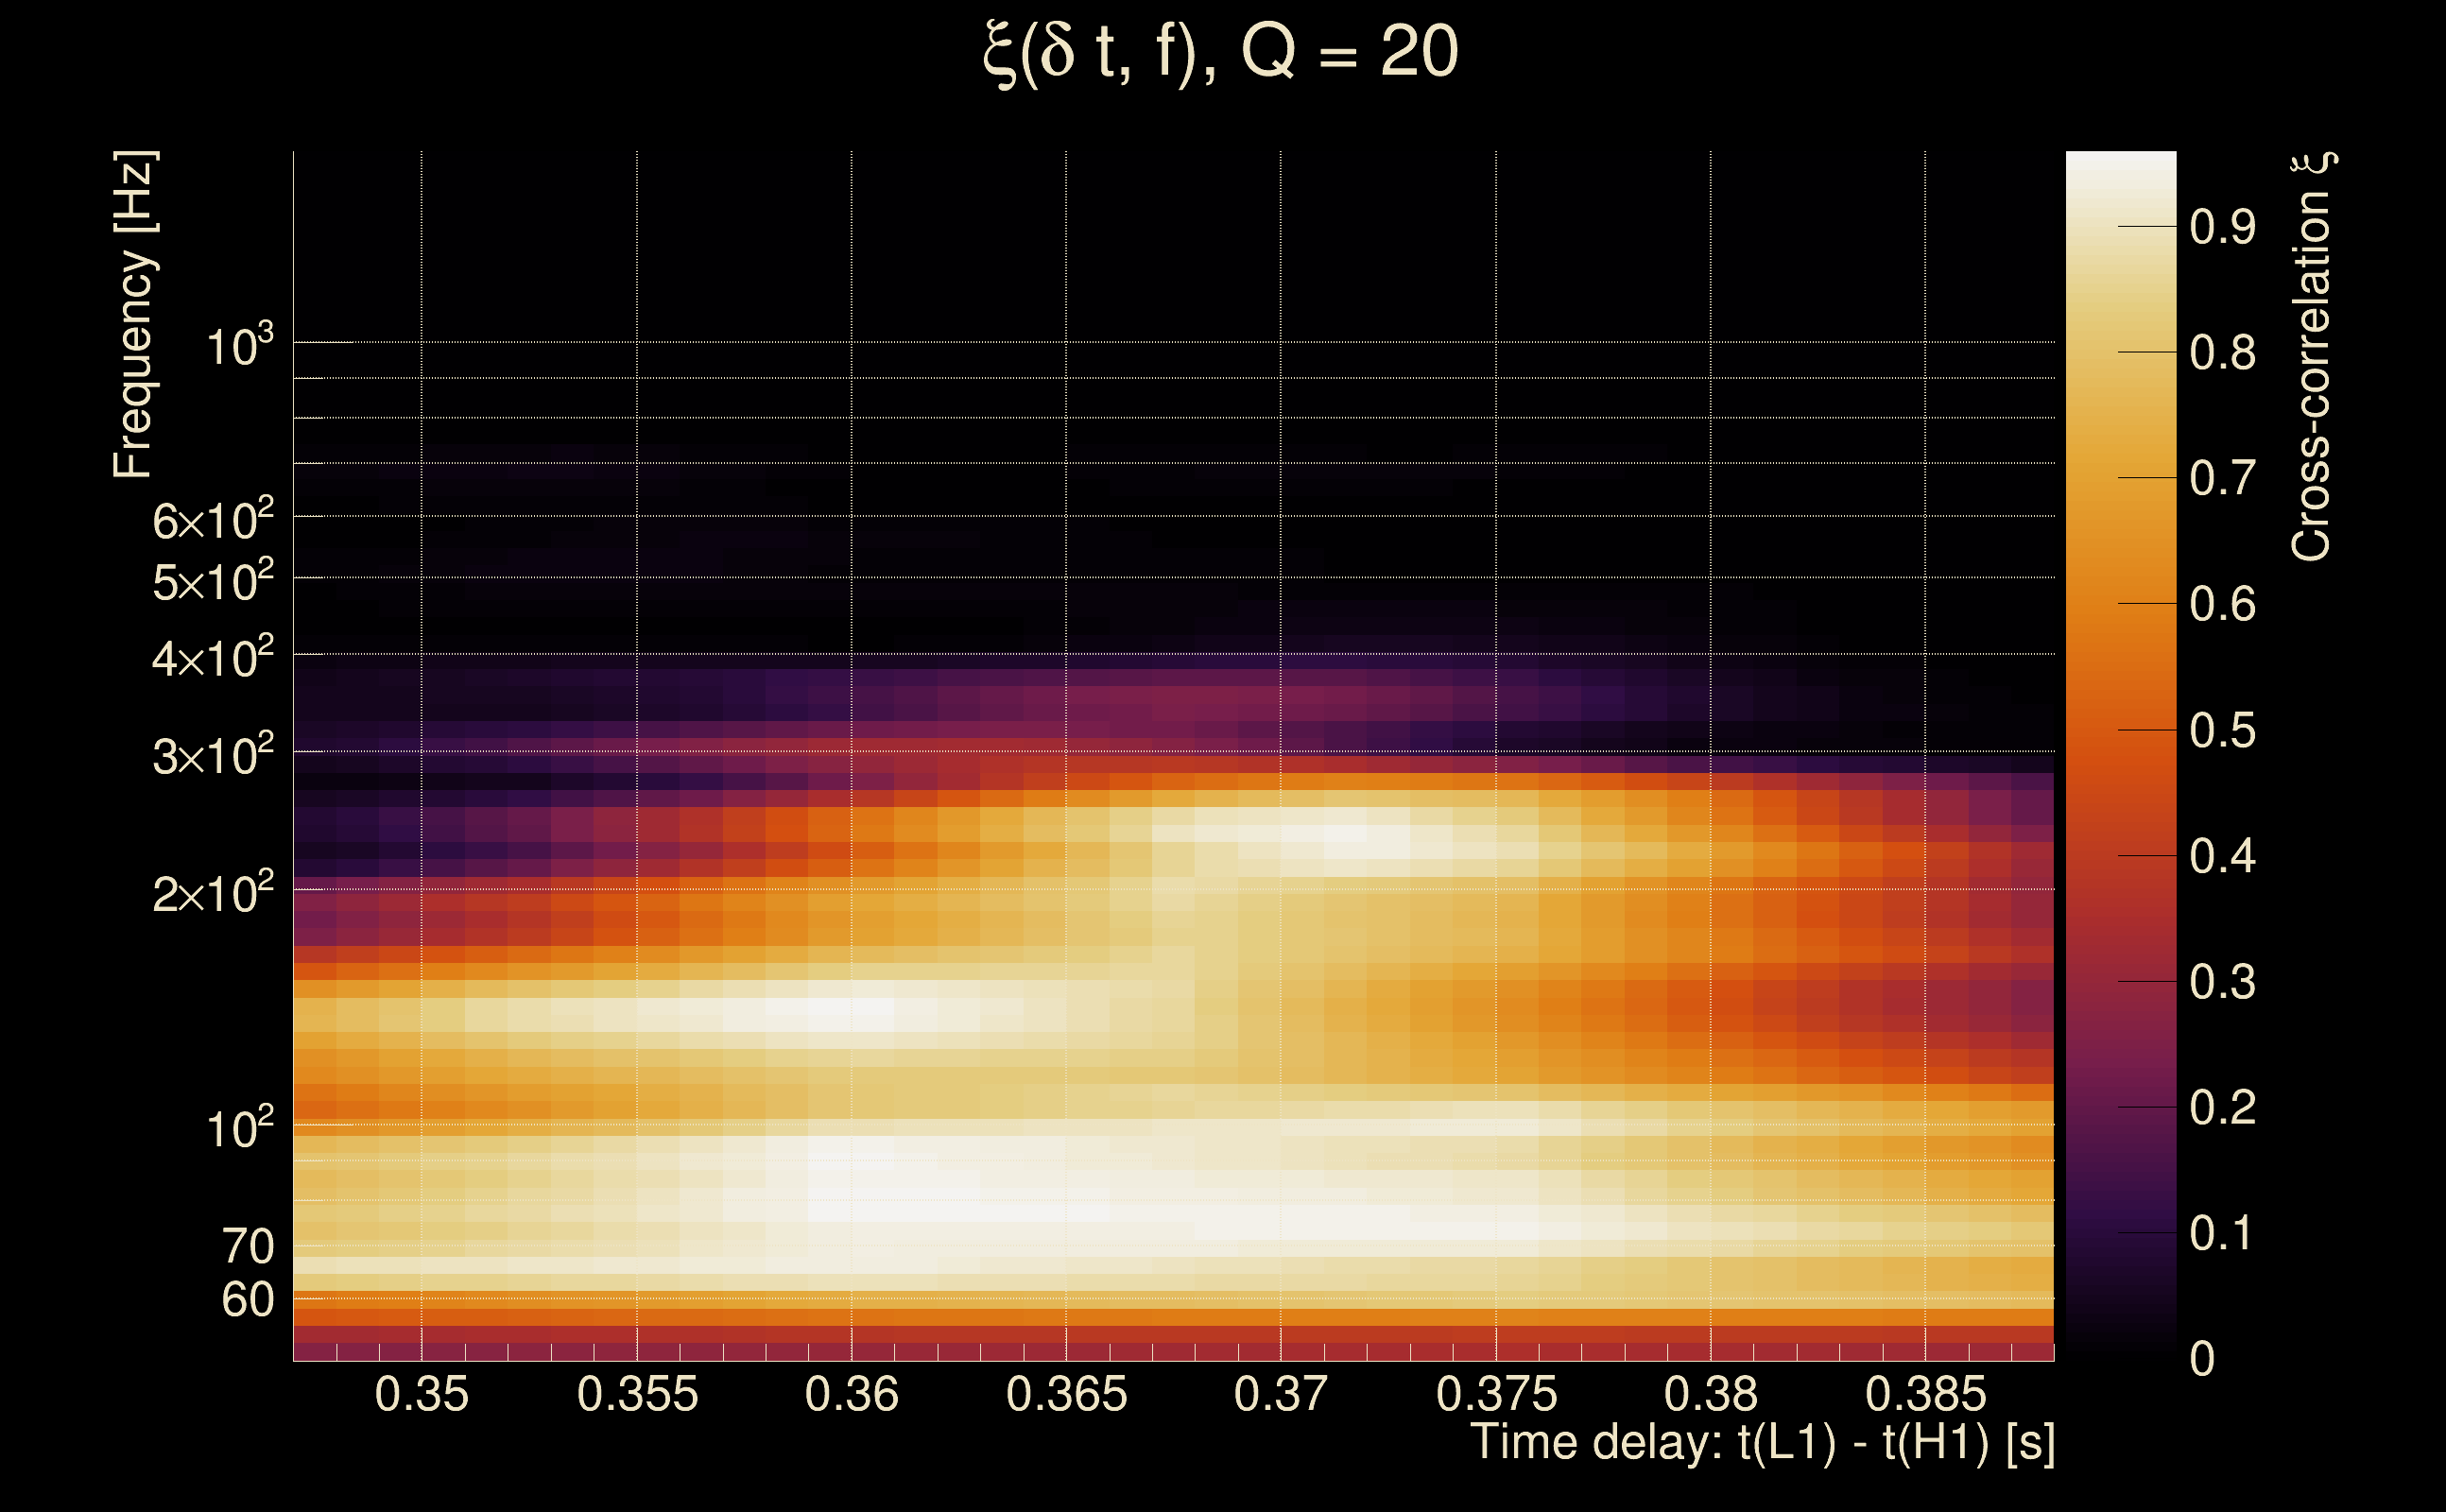
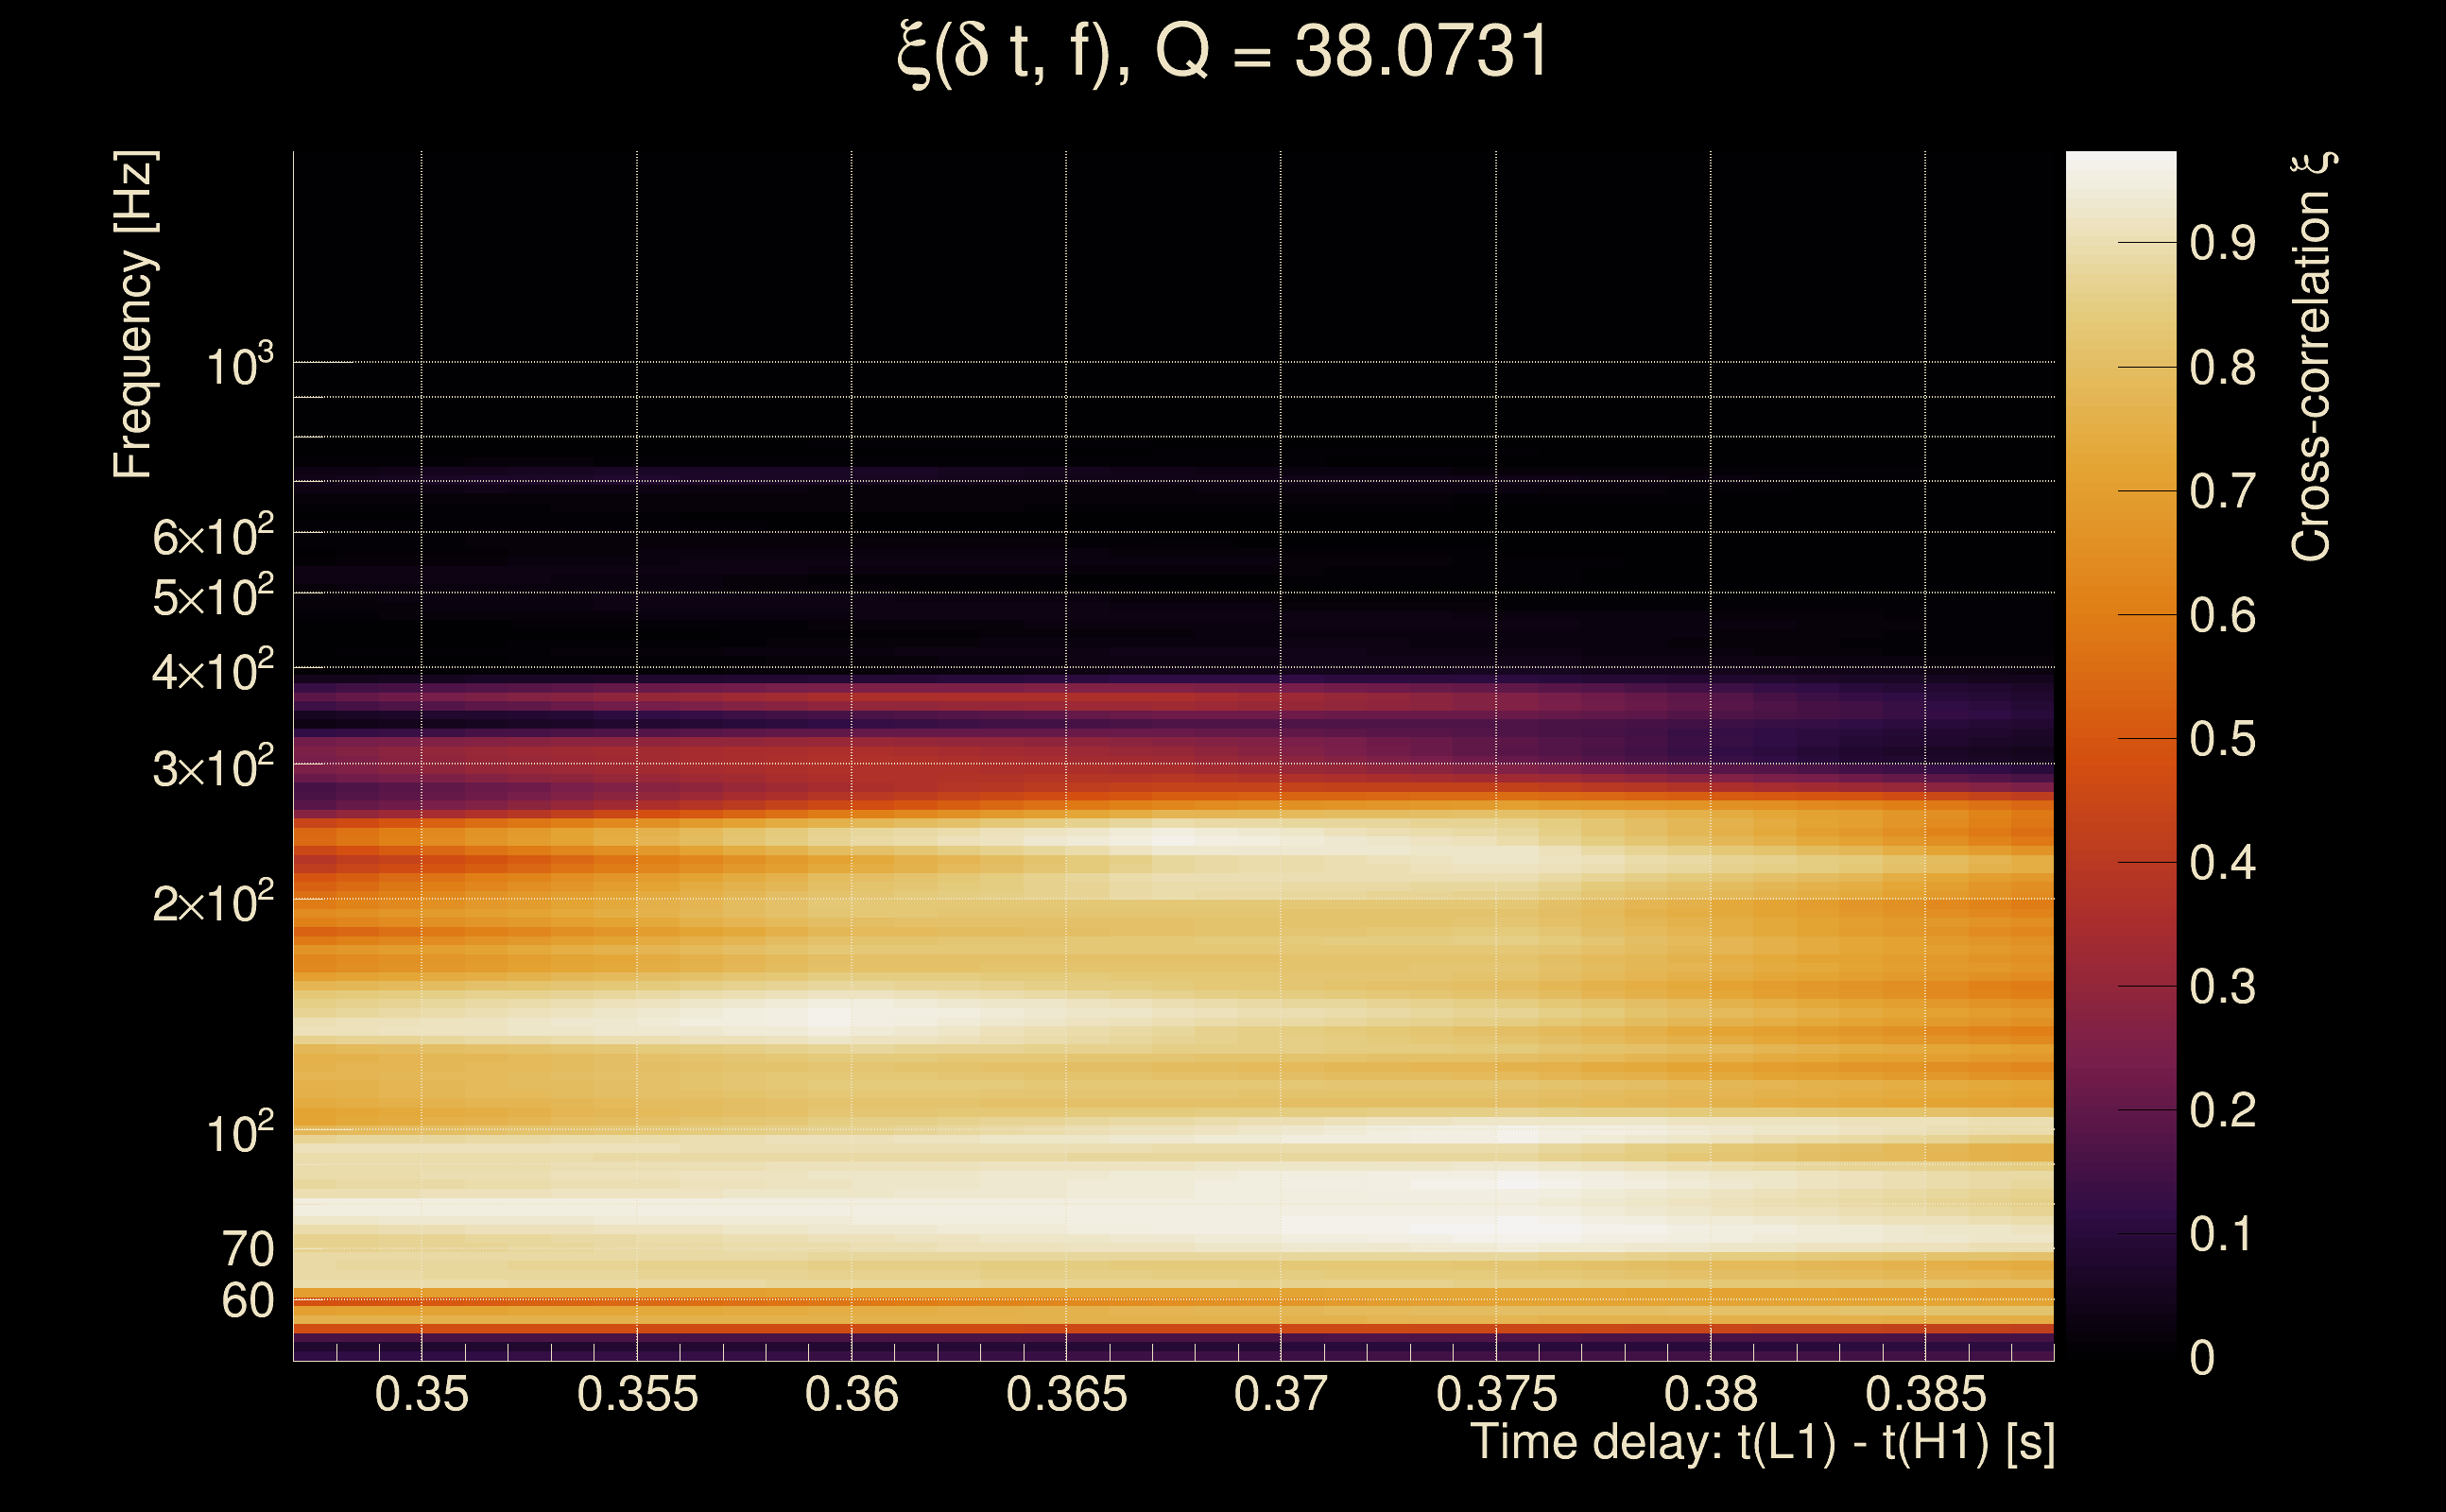
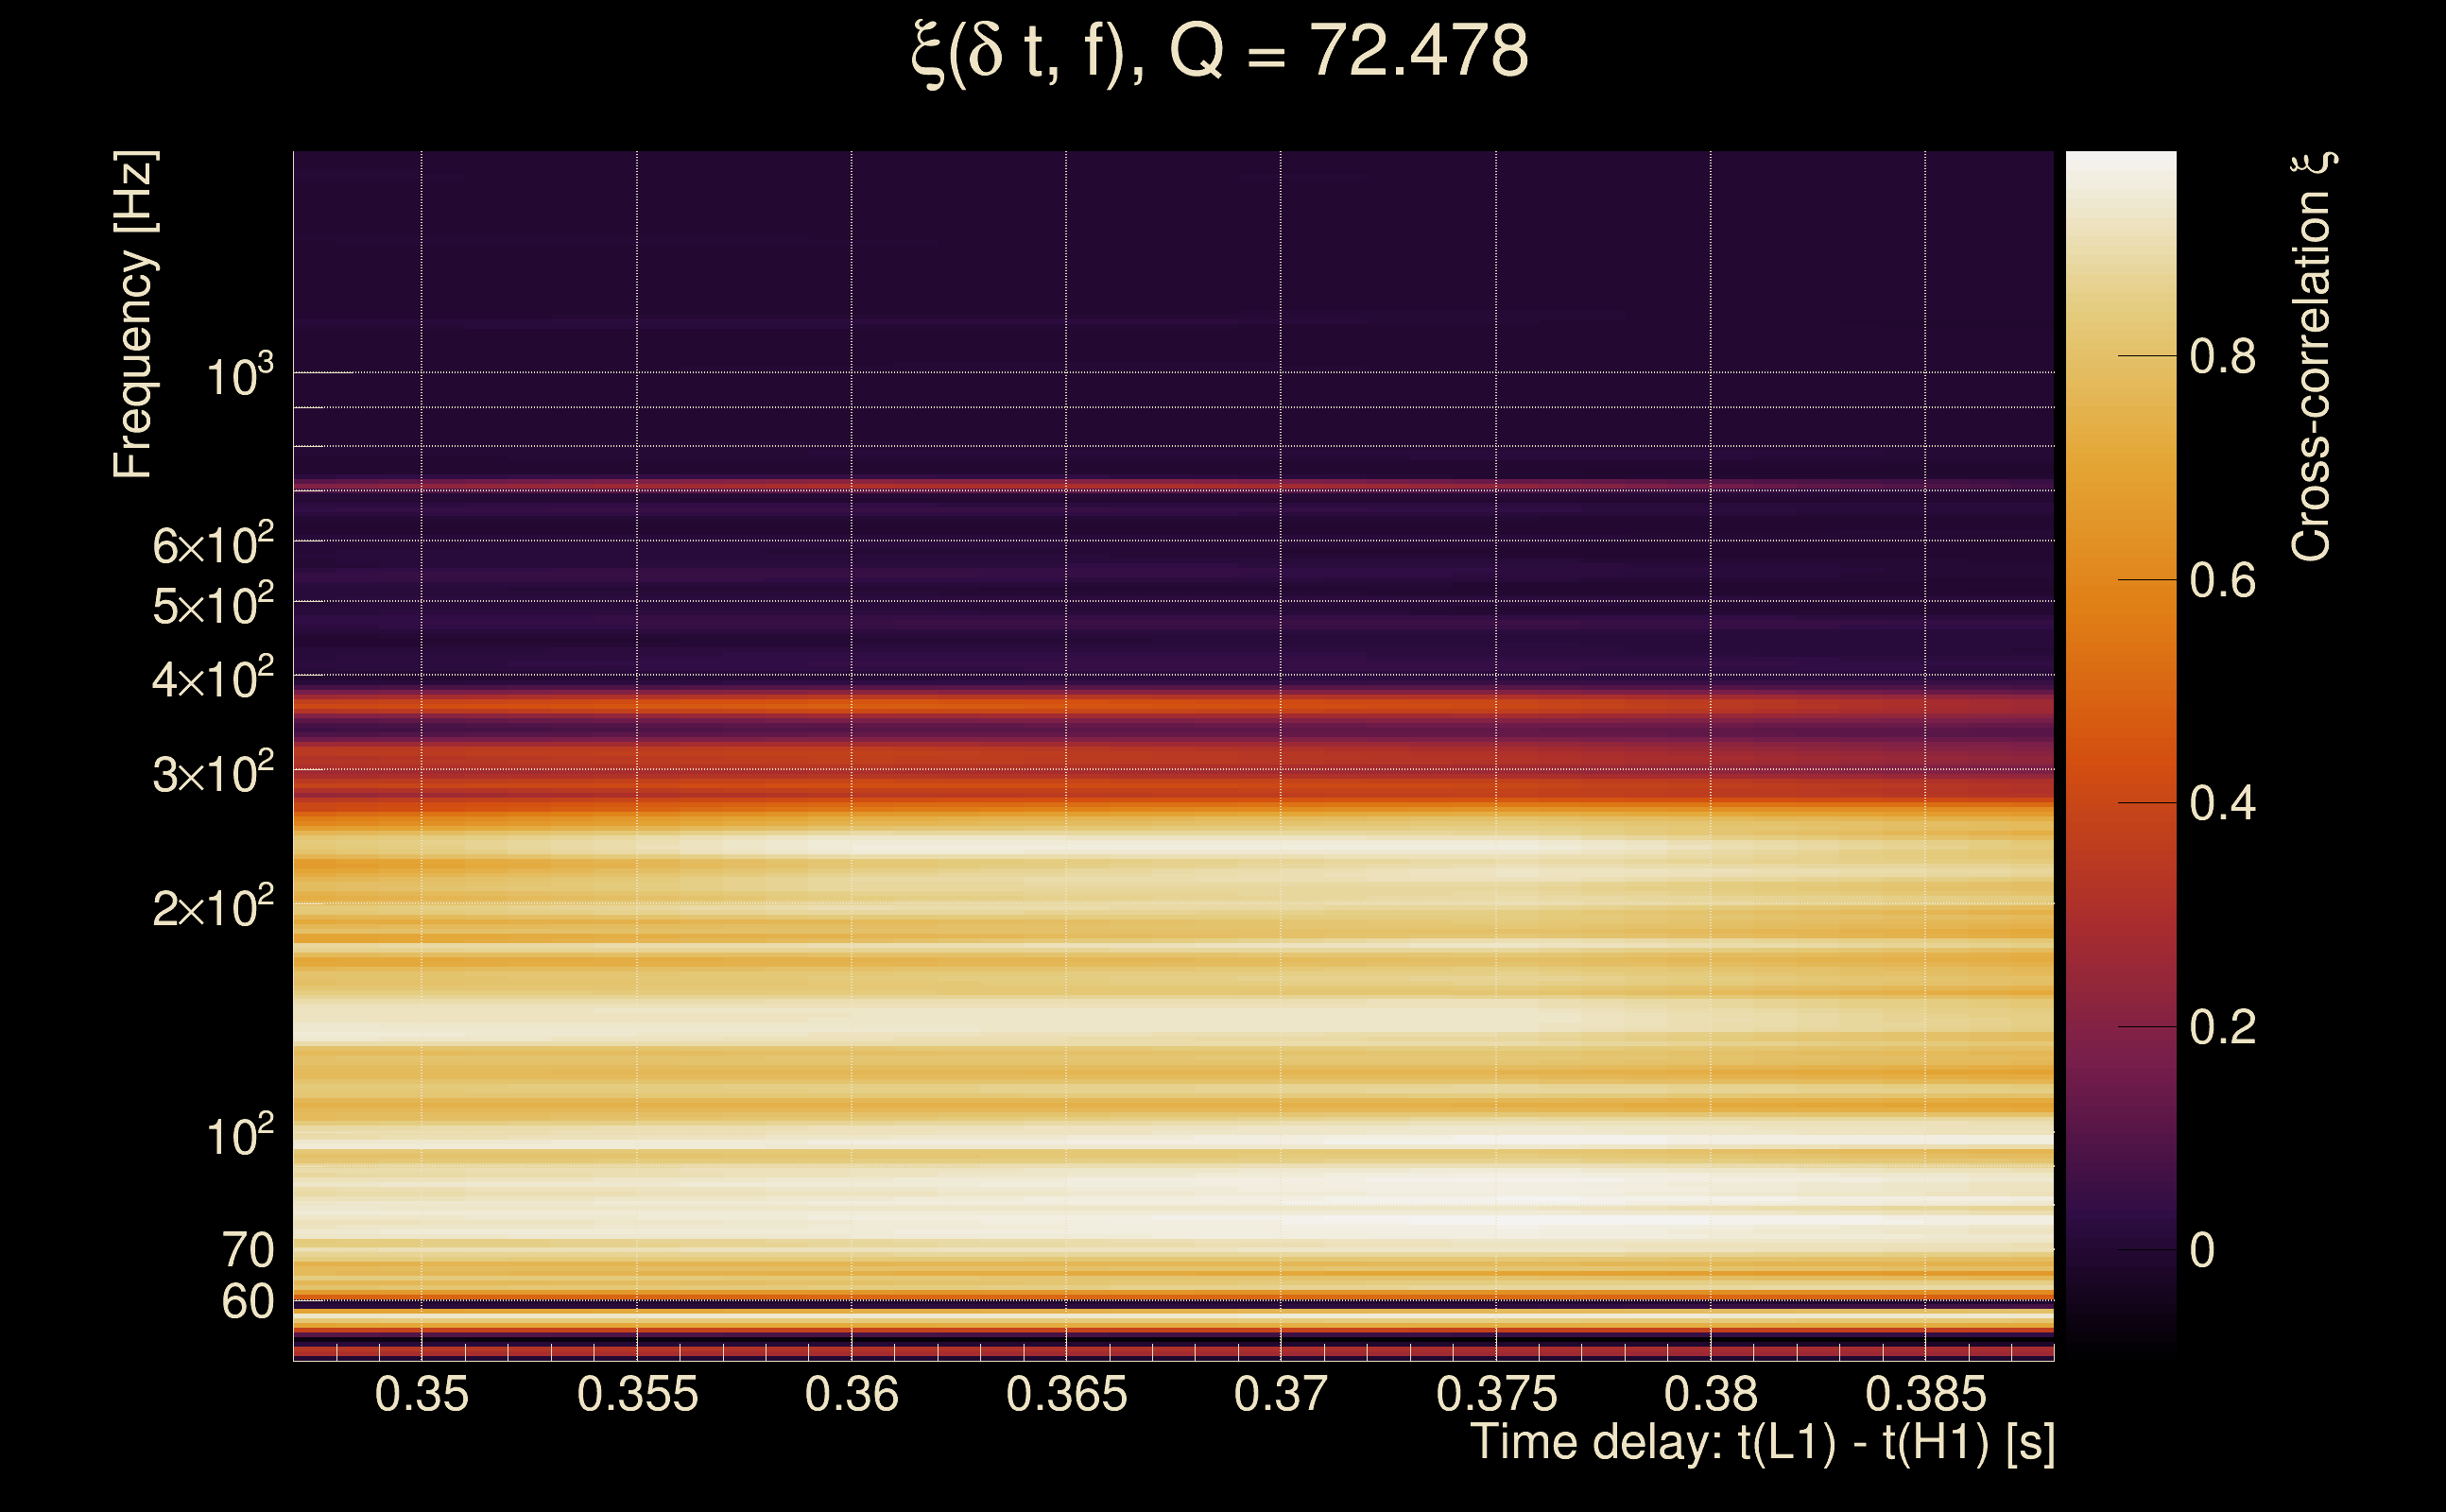
| Event time t(H1): | GPS = 1368331823 (Wed May 17 04:10:05 2023 ) → GPS = 1368331833 (Wed May 17 04:10:15 2023 ) |
| Event time t(L1): | GPS = 1368331823 (Wed May 17 04:10:15 2023 ) → GPS = 1368331833 (Wed May 17 04:10:15 2023 ) |
| Omicron analysis time window (H1): | GPS = 1368331820 → GPS = 1368331836 |
| Omicron analysis time window (L1): | GPS = 1368331820 → GPS = 1368331836 |
| Time delay between detectors t(L1) - t(H1): | 0.367743 s (slice index = 100 / 217), δt_gw = -0.000256617 s |
| Time delay standard deviation: | 0.0560516 s |
| [targeted mode] Time delay probability: | 0.876055 (0.155972 sigmas), δt_target = 0.00199389 s |
| Frequency: | 134.508 Hz |
| Ξ: | 0.674548 ± 0.0149697 (variance = 0.000224092): Q0: 0.863849, Q1: 0.863827, Q2: 0.850034, Q3: 0.839341, Q4: 0.824755 |
| Rank: | R_A = 0.071889 |
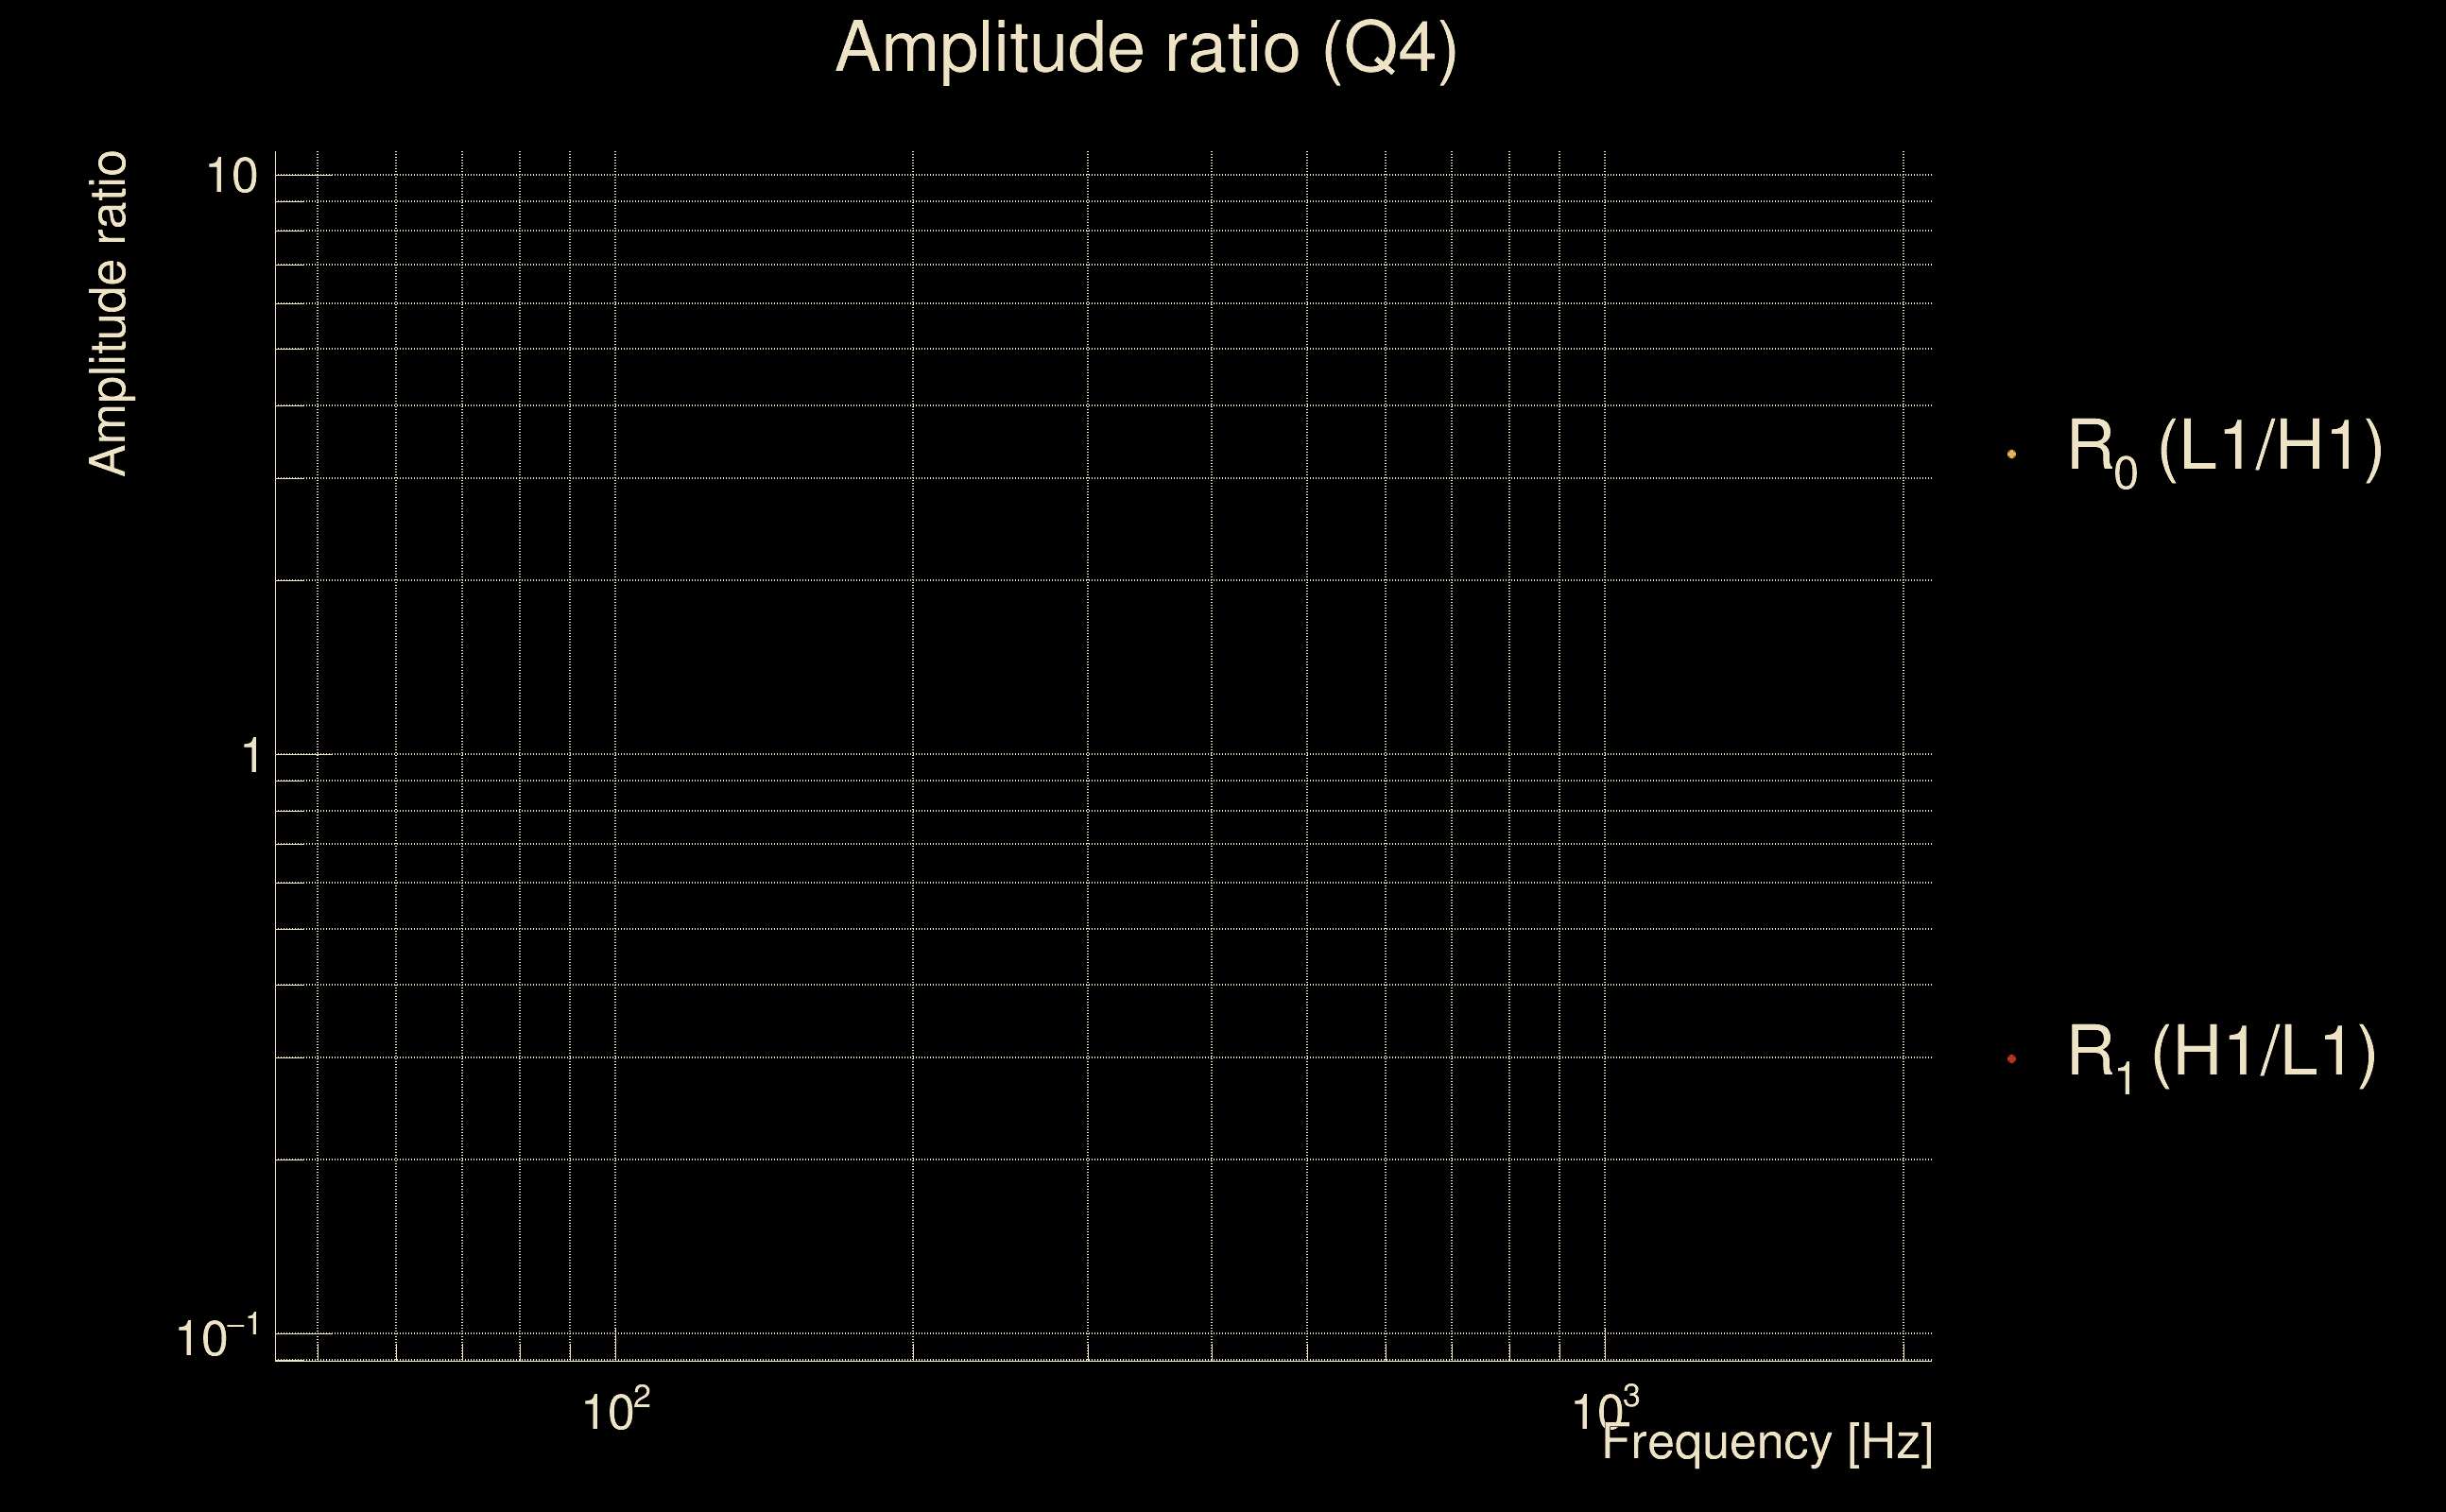
| Log of amplitude ratio (L1/H1): | 0.0989644, variance = 0.971424 (L1/H1: -1.43163, variance = 0.783469, H1/L1: -1.37515, variance = 2.722) |
| Amplitude ratio (L1/H1): | 1.10403 ⋇ 2.67944 (L1/H1: 0.238919 ⋇ 2.42332, H1/L1: 0.252802 ⋇ 5.2062) |
| Amplitude ratio H1|L1 compatibility (probability): | 0.133844 |
| Antenna factor probability: | 0.908907 |
| Number of rejected frequency rows: | Q0: 3 / 18, Q1: 8 / 36, Q2: 20 / 70, Q3: 45 / 134, Q4: 96 / 258 |
| Maximum signal-to-noise ratio: | H1: 188.107, L1: 206.005 |
| SNR variance: | H1: 0.483147, L1: 0.477566 |
| Click here for a zoomed plot | Click here for a zoomed plot | Click here for a zoomed plot | Click here for a zoomed plot | Click here for a zoomed plot |
 |
 |
 |
 |
 |
 |
 |
 |
 |
 |
 |
 |
 |
 |
 |
 |
 |
 |
 |
 |
 |
 |
 |
 |
 |
 |
 |
 |
 |
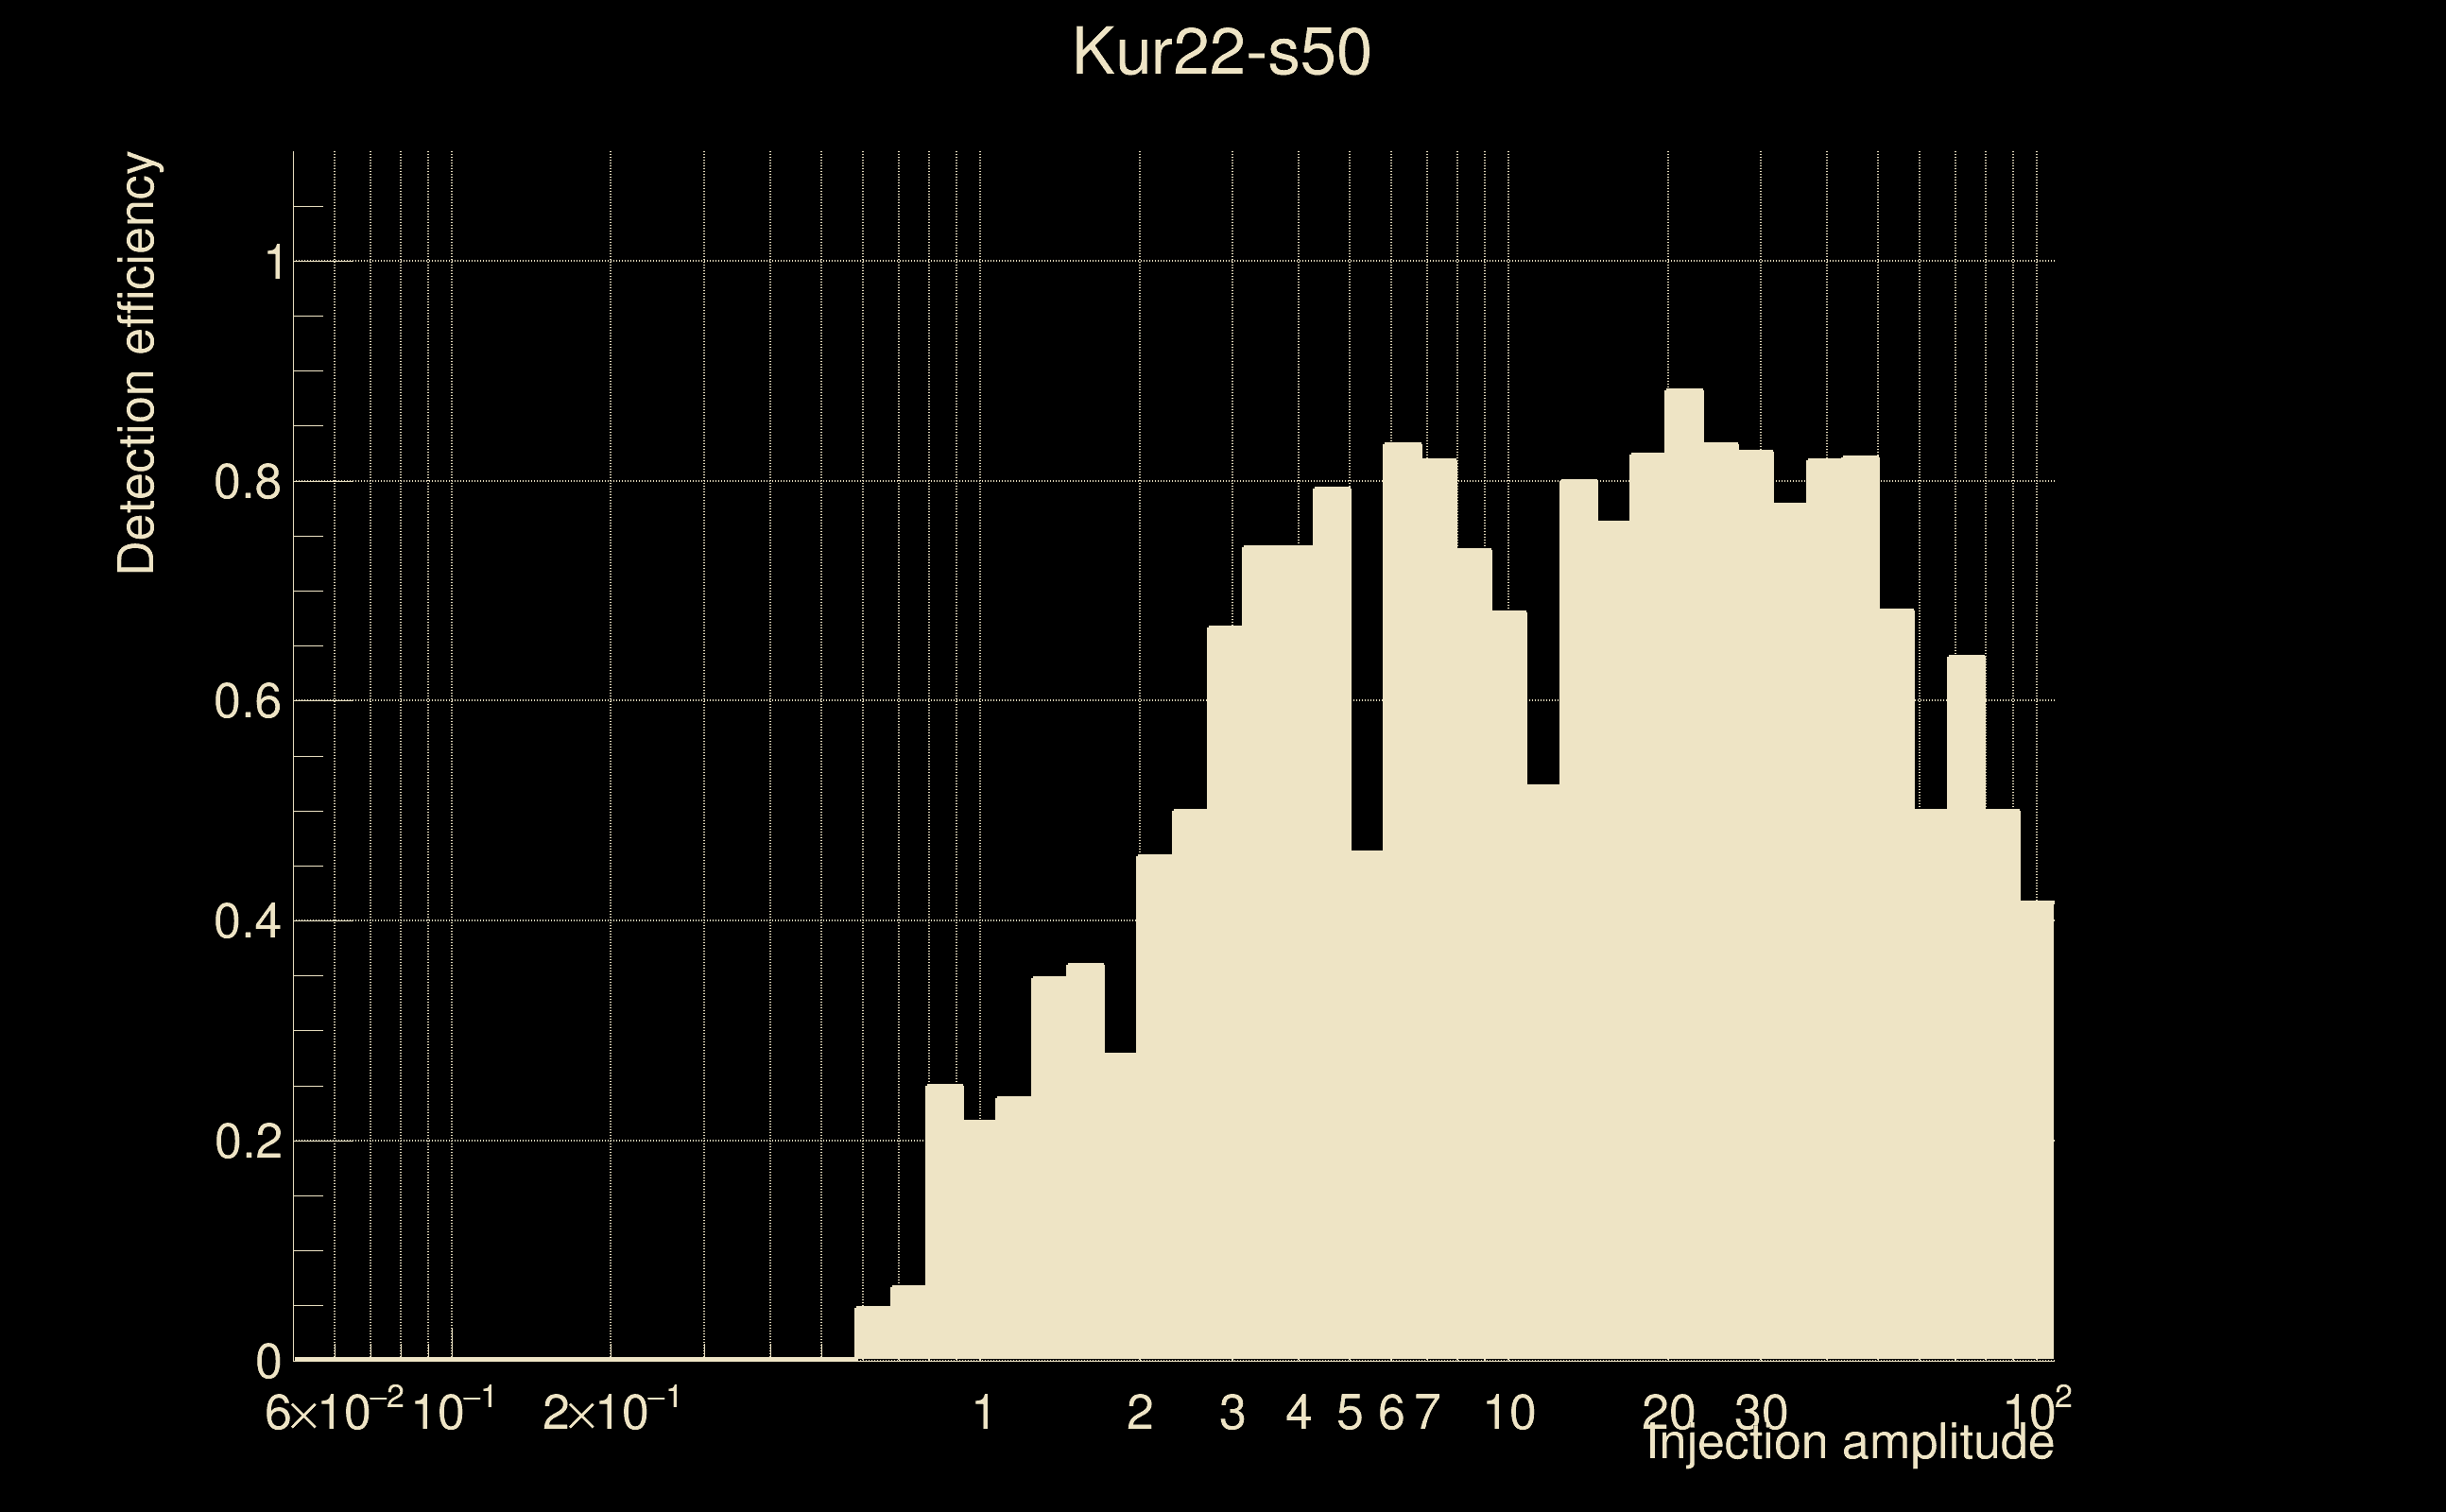
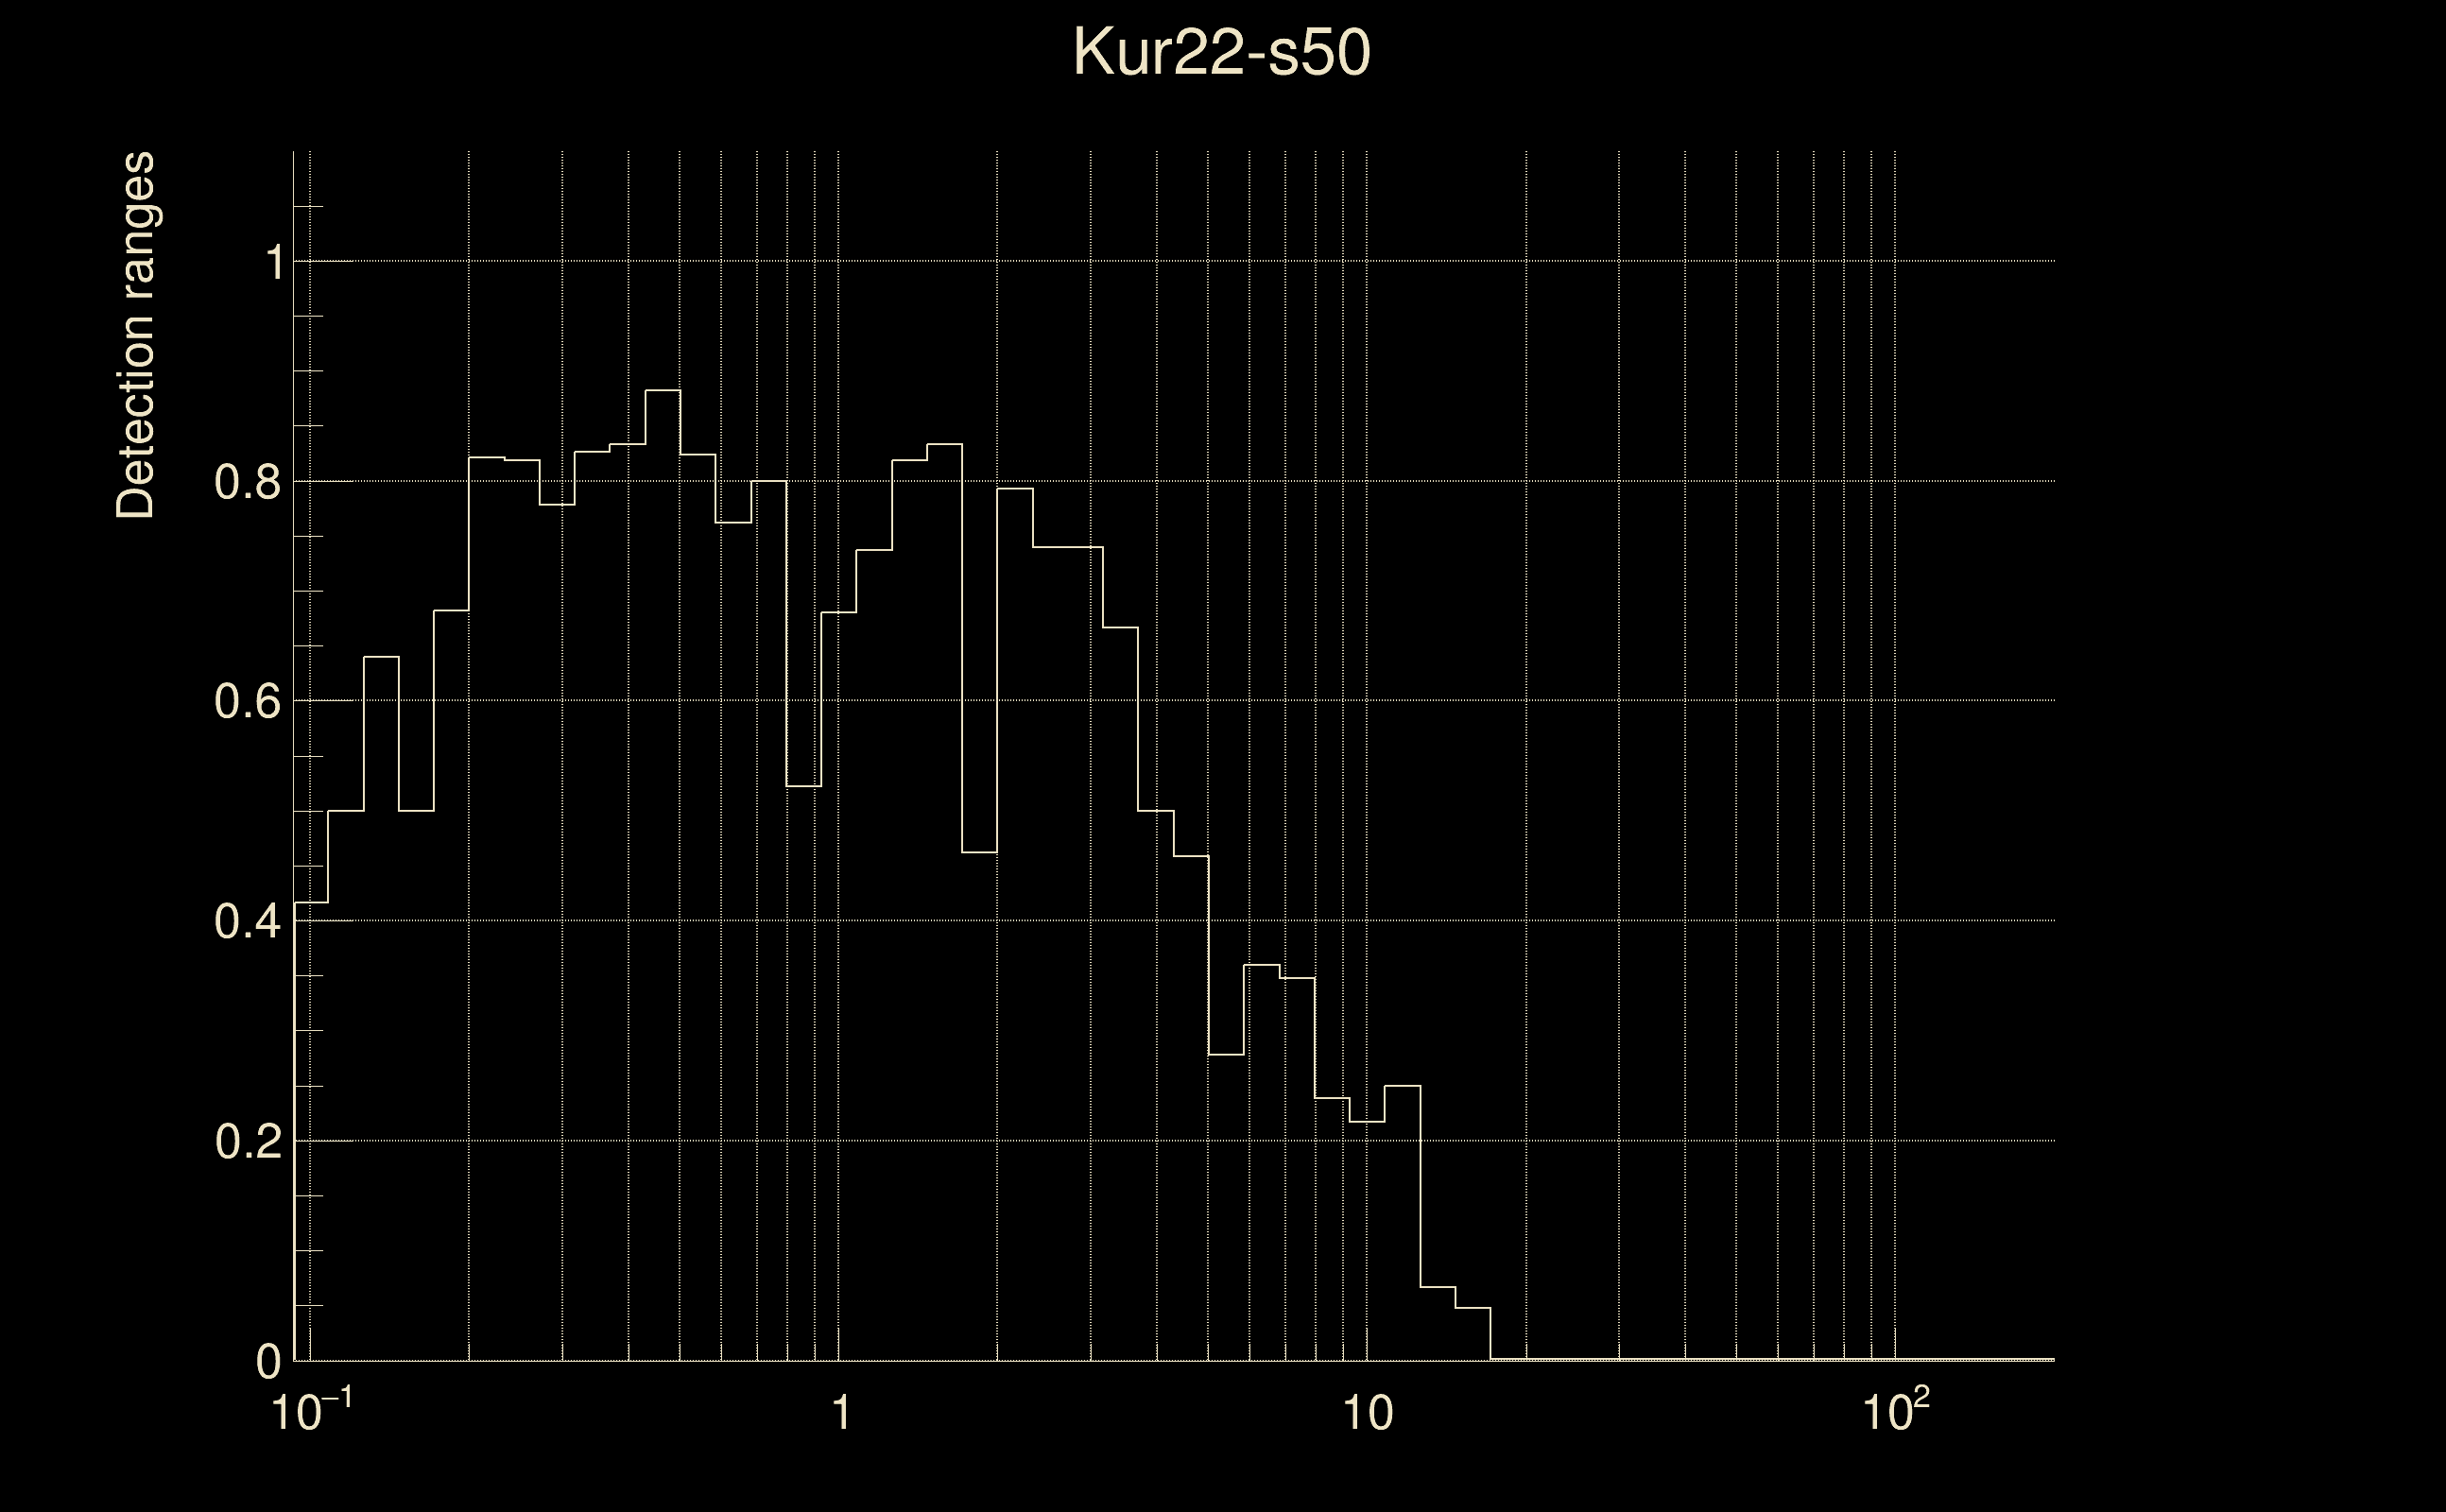
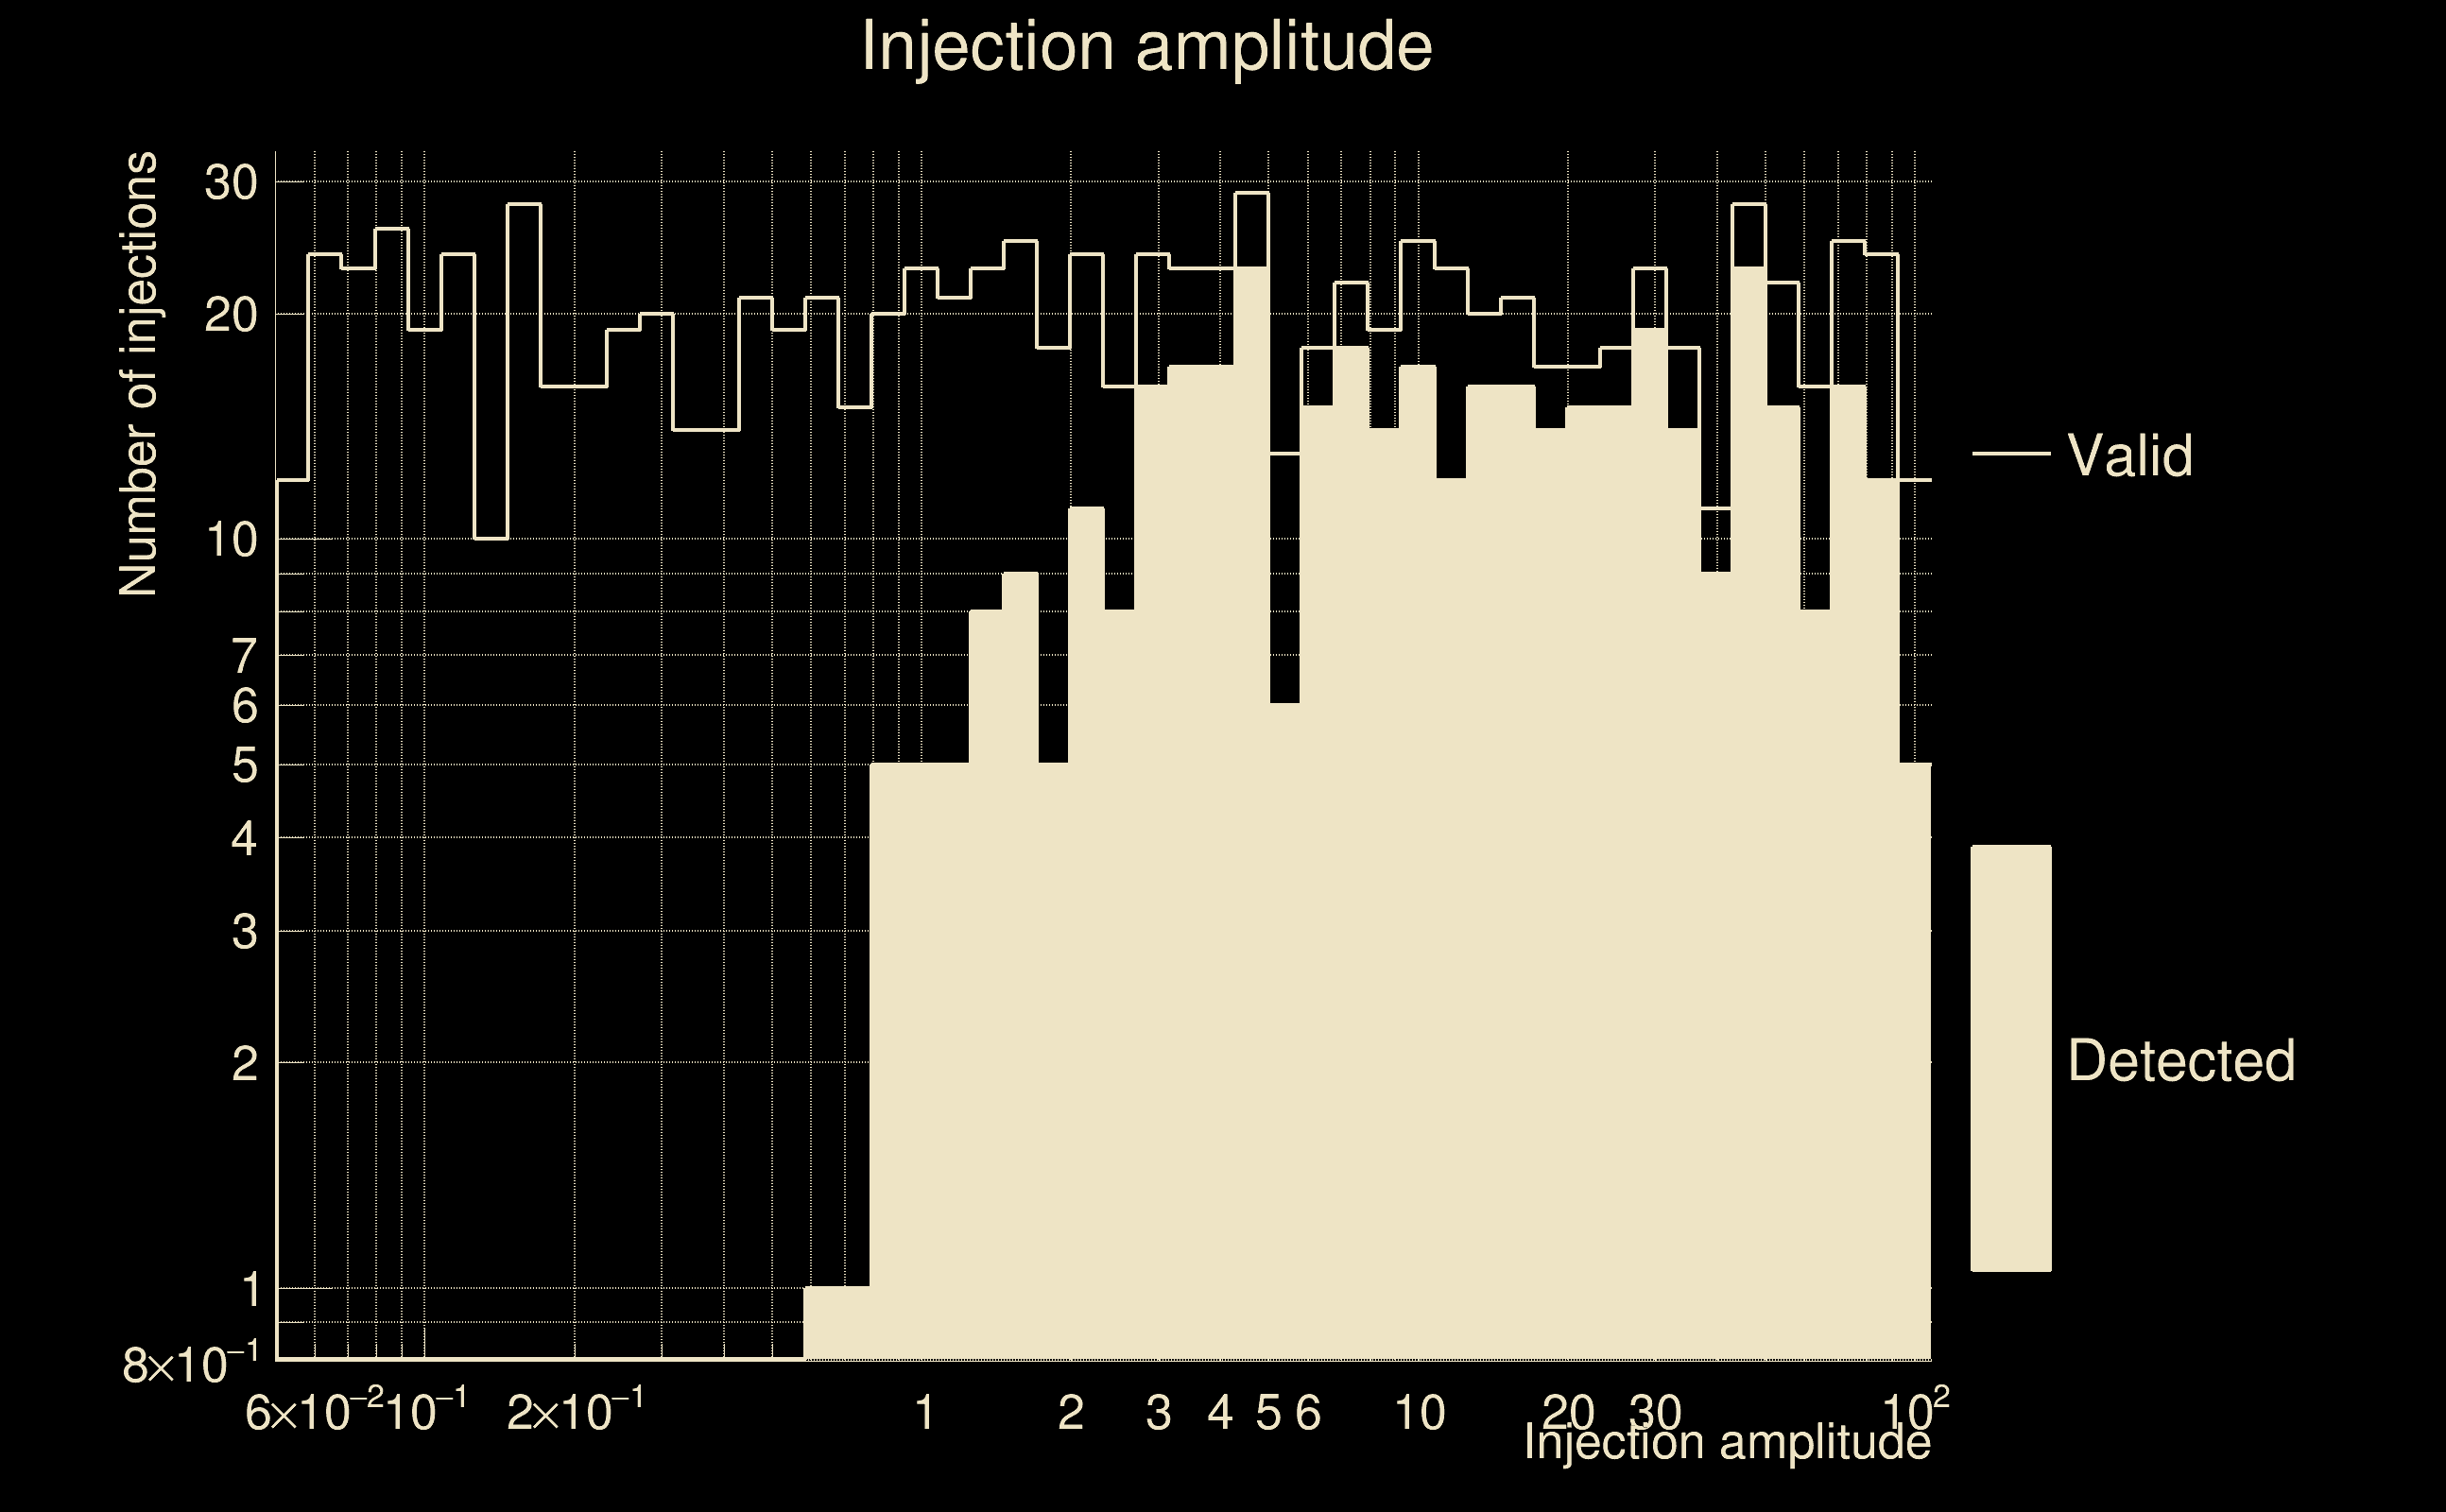
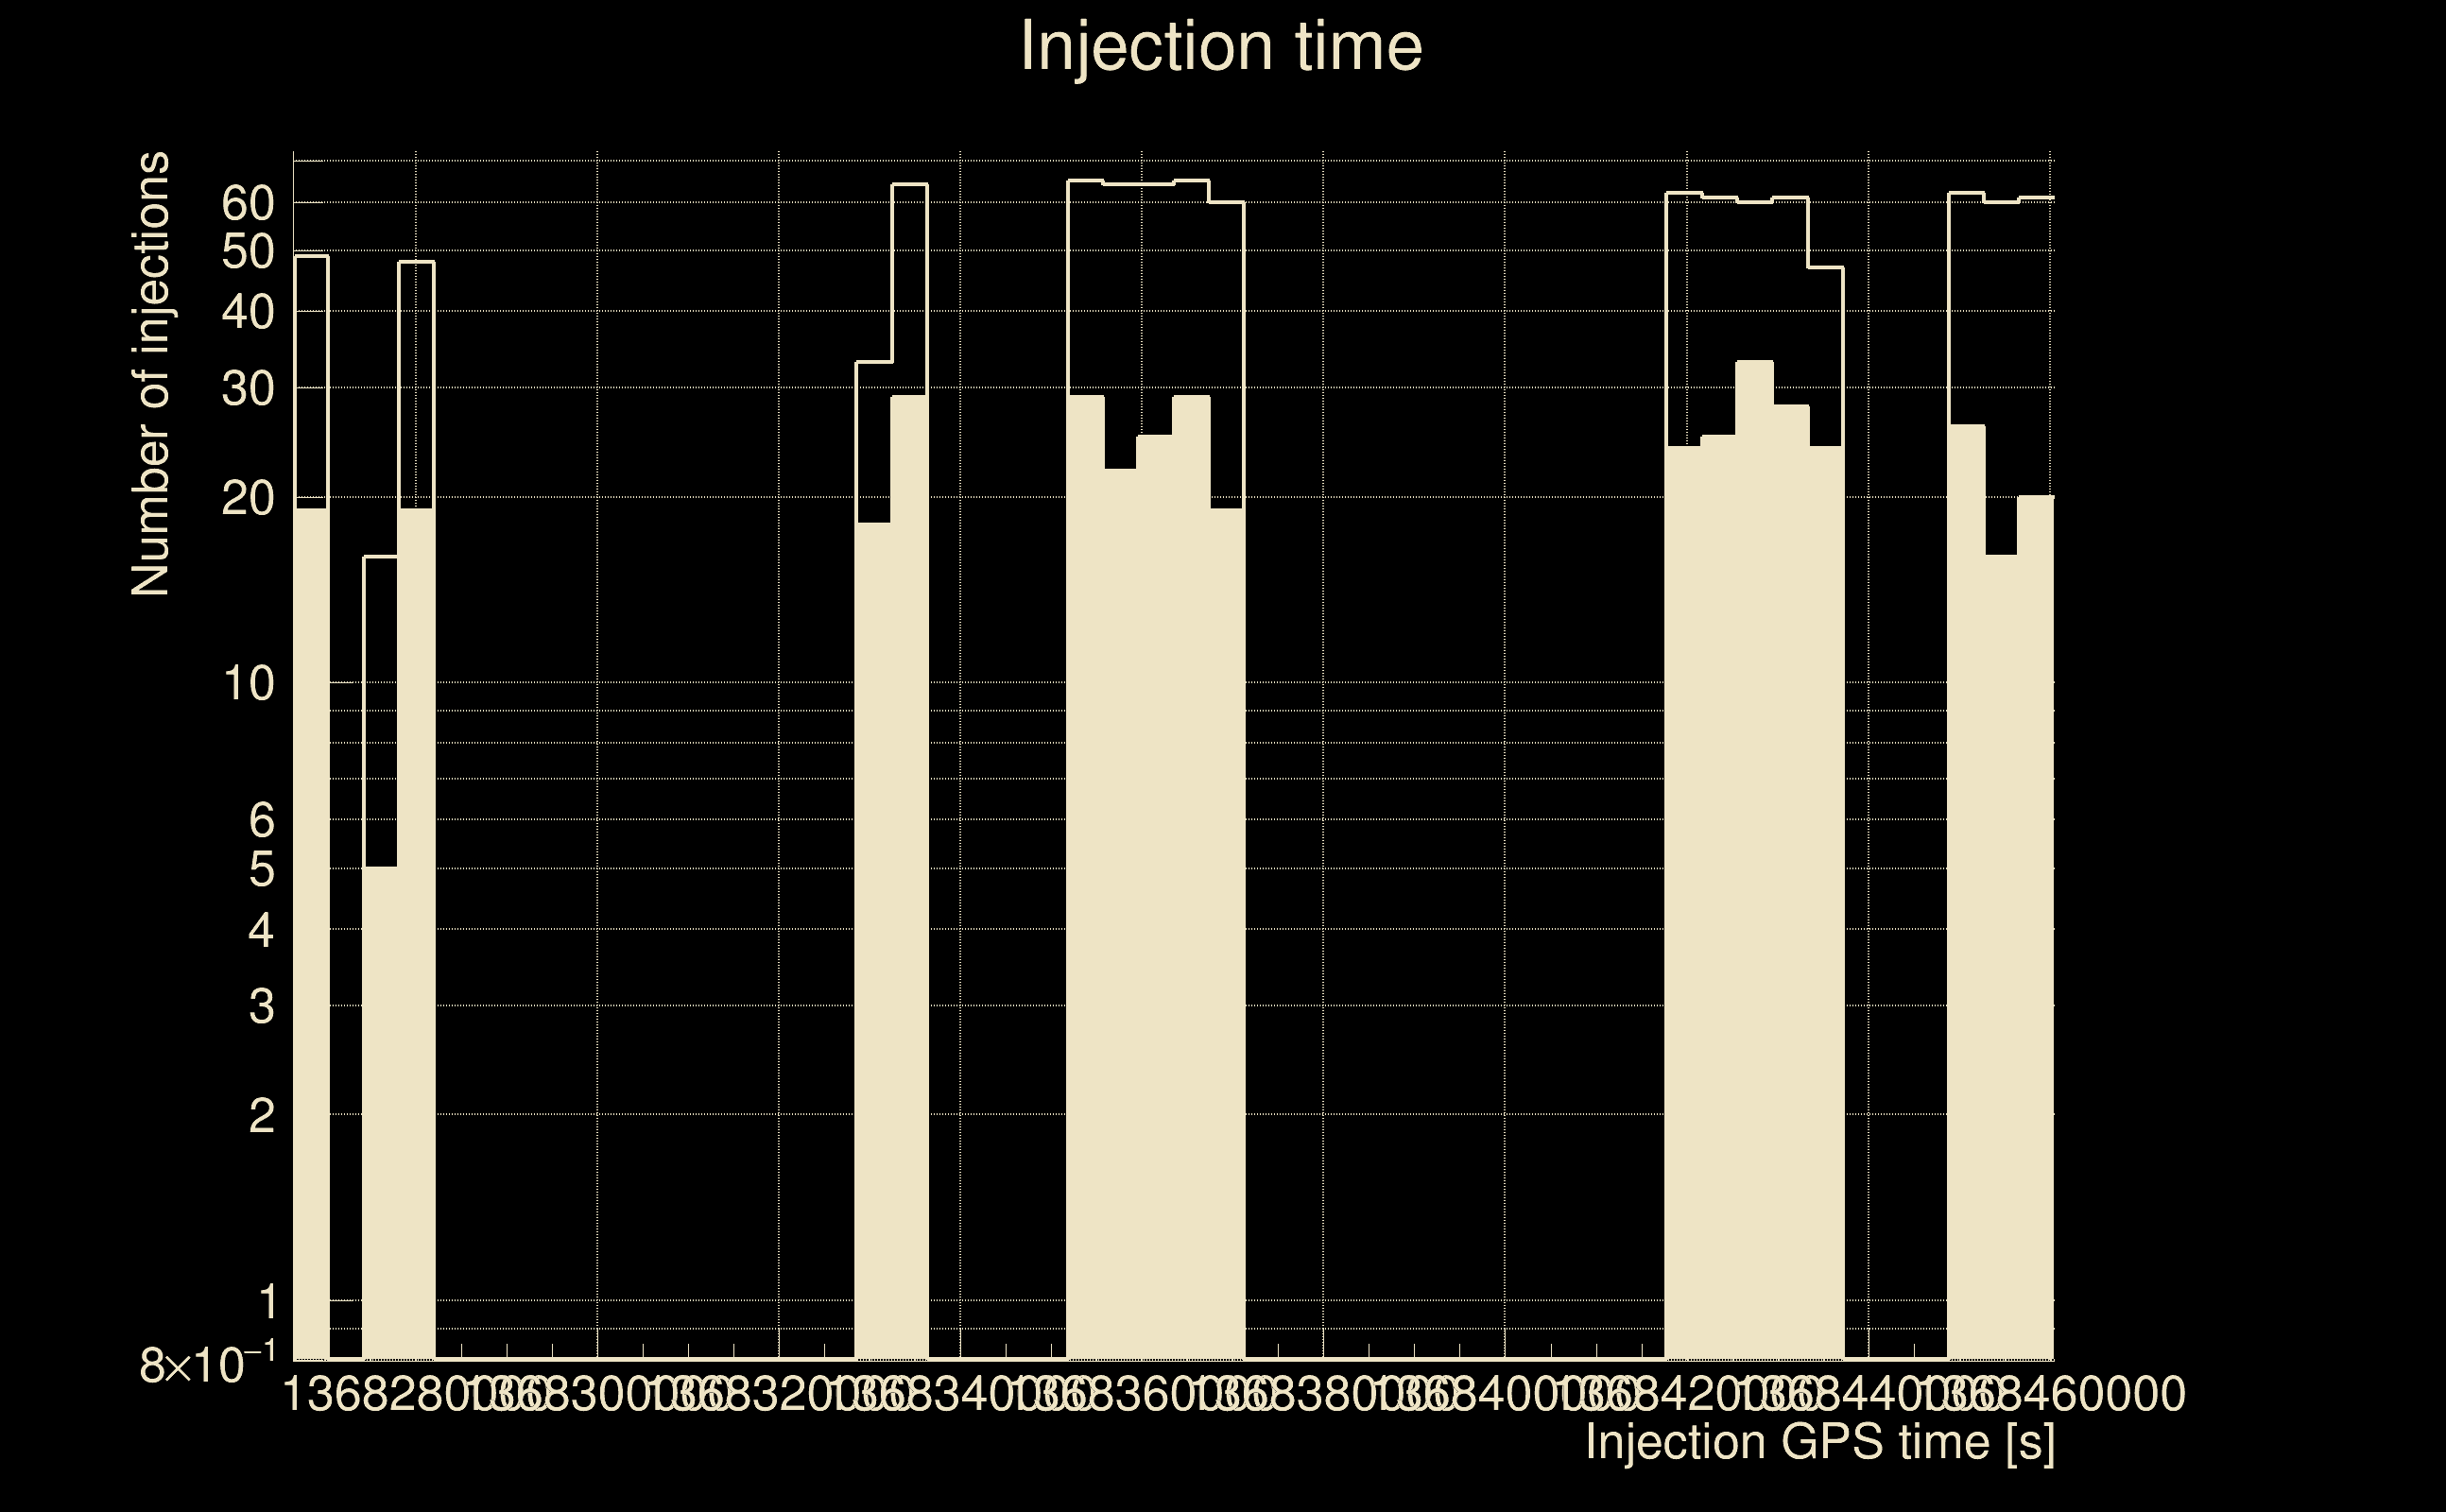
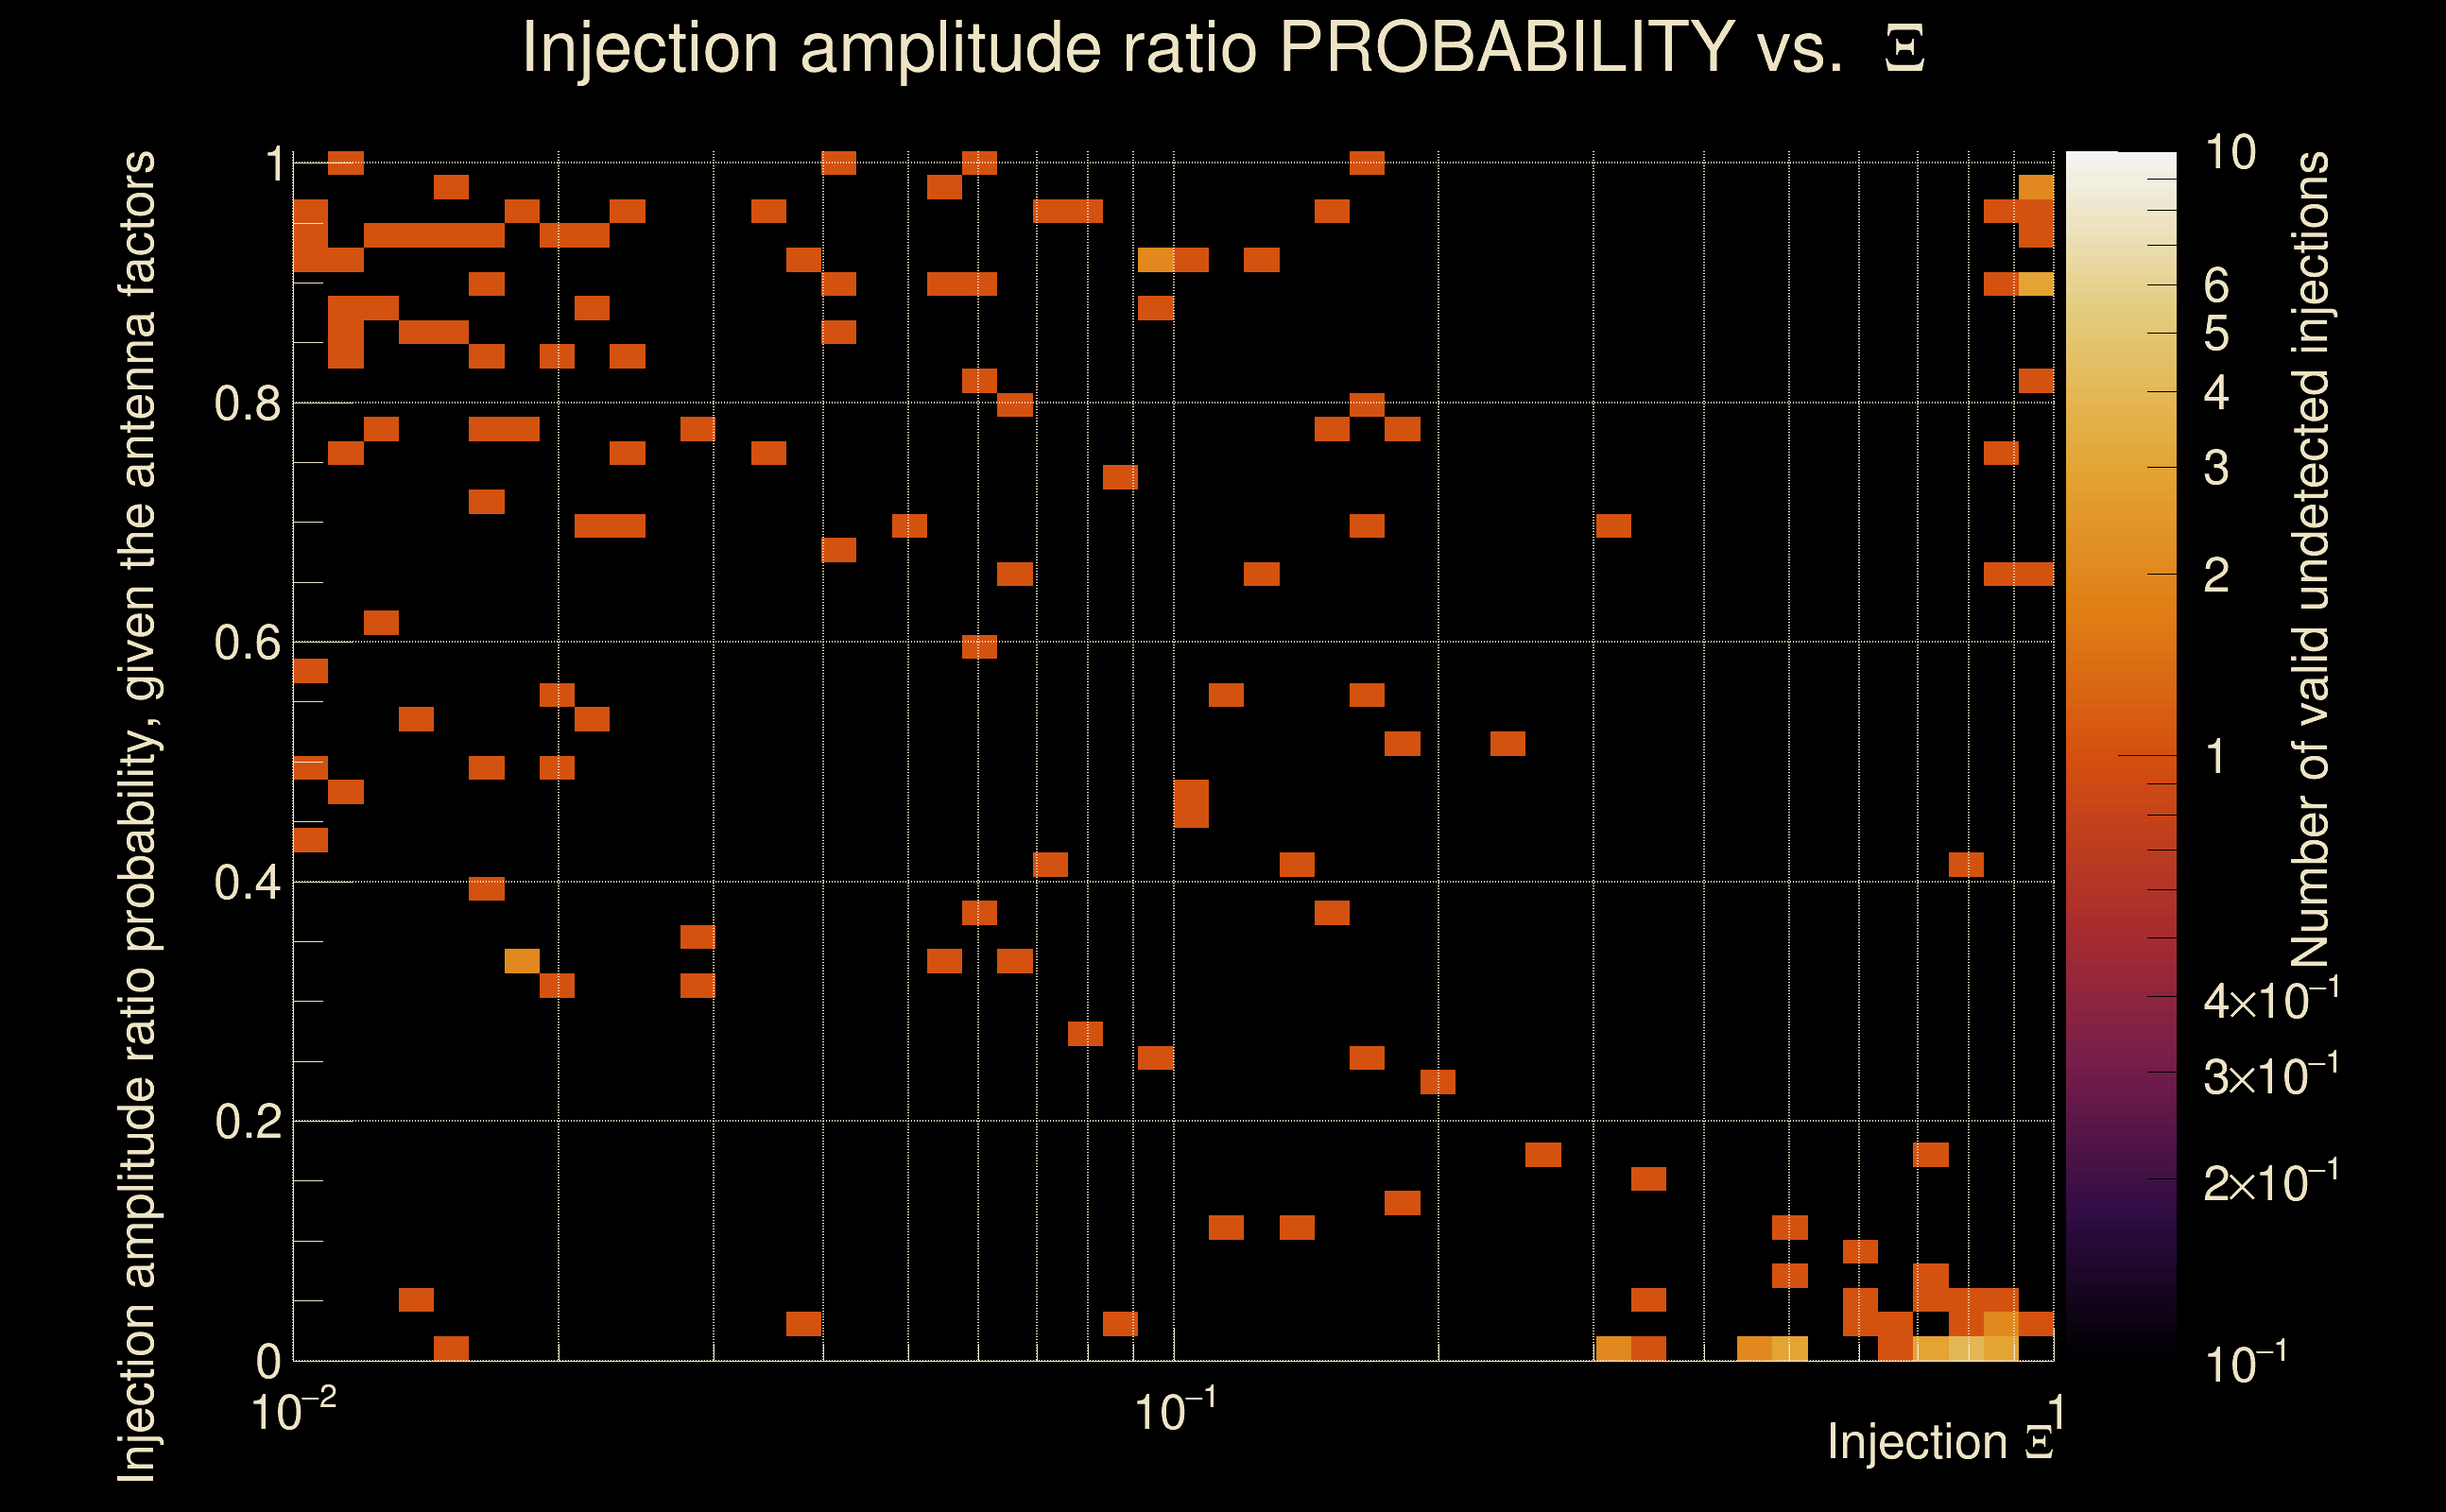
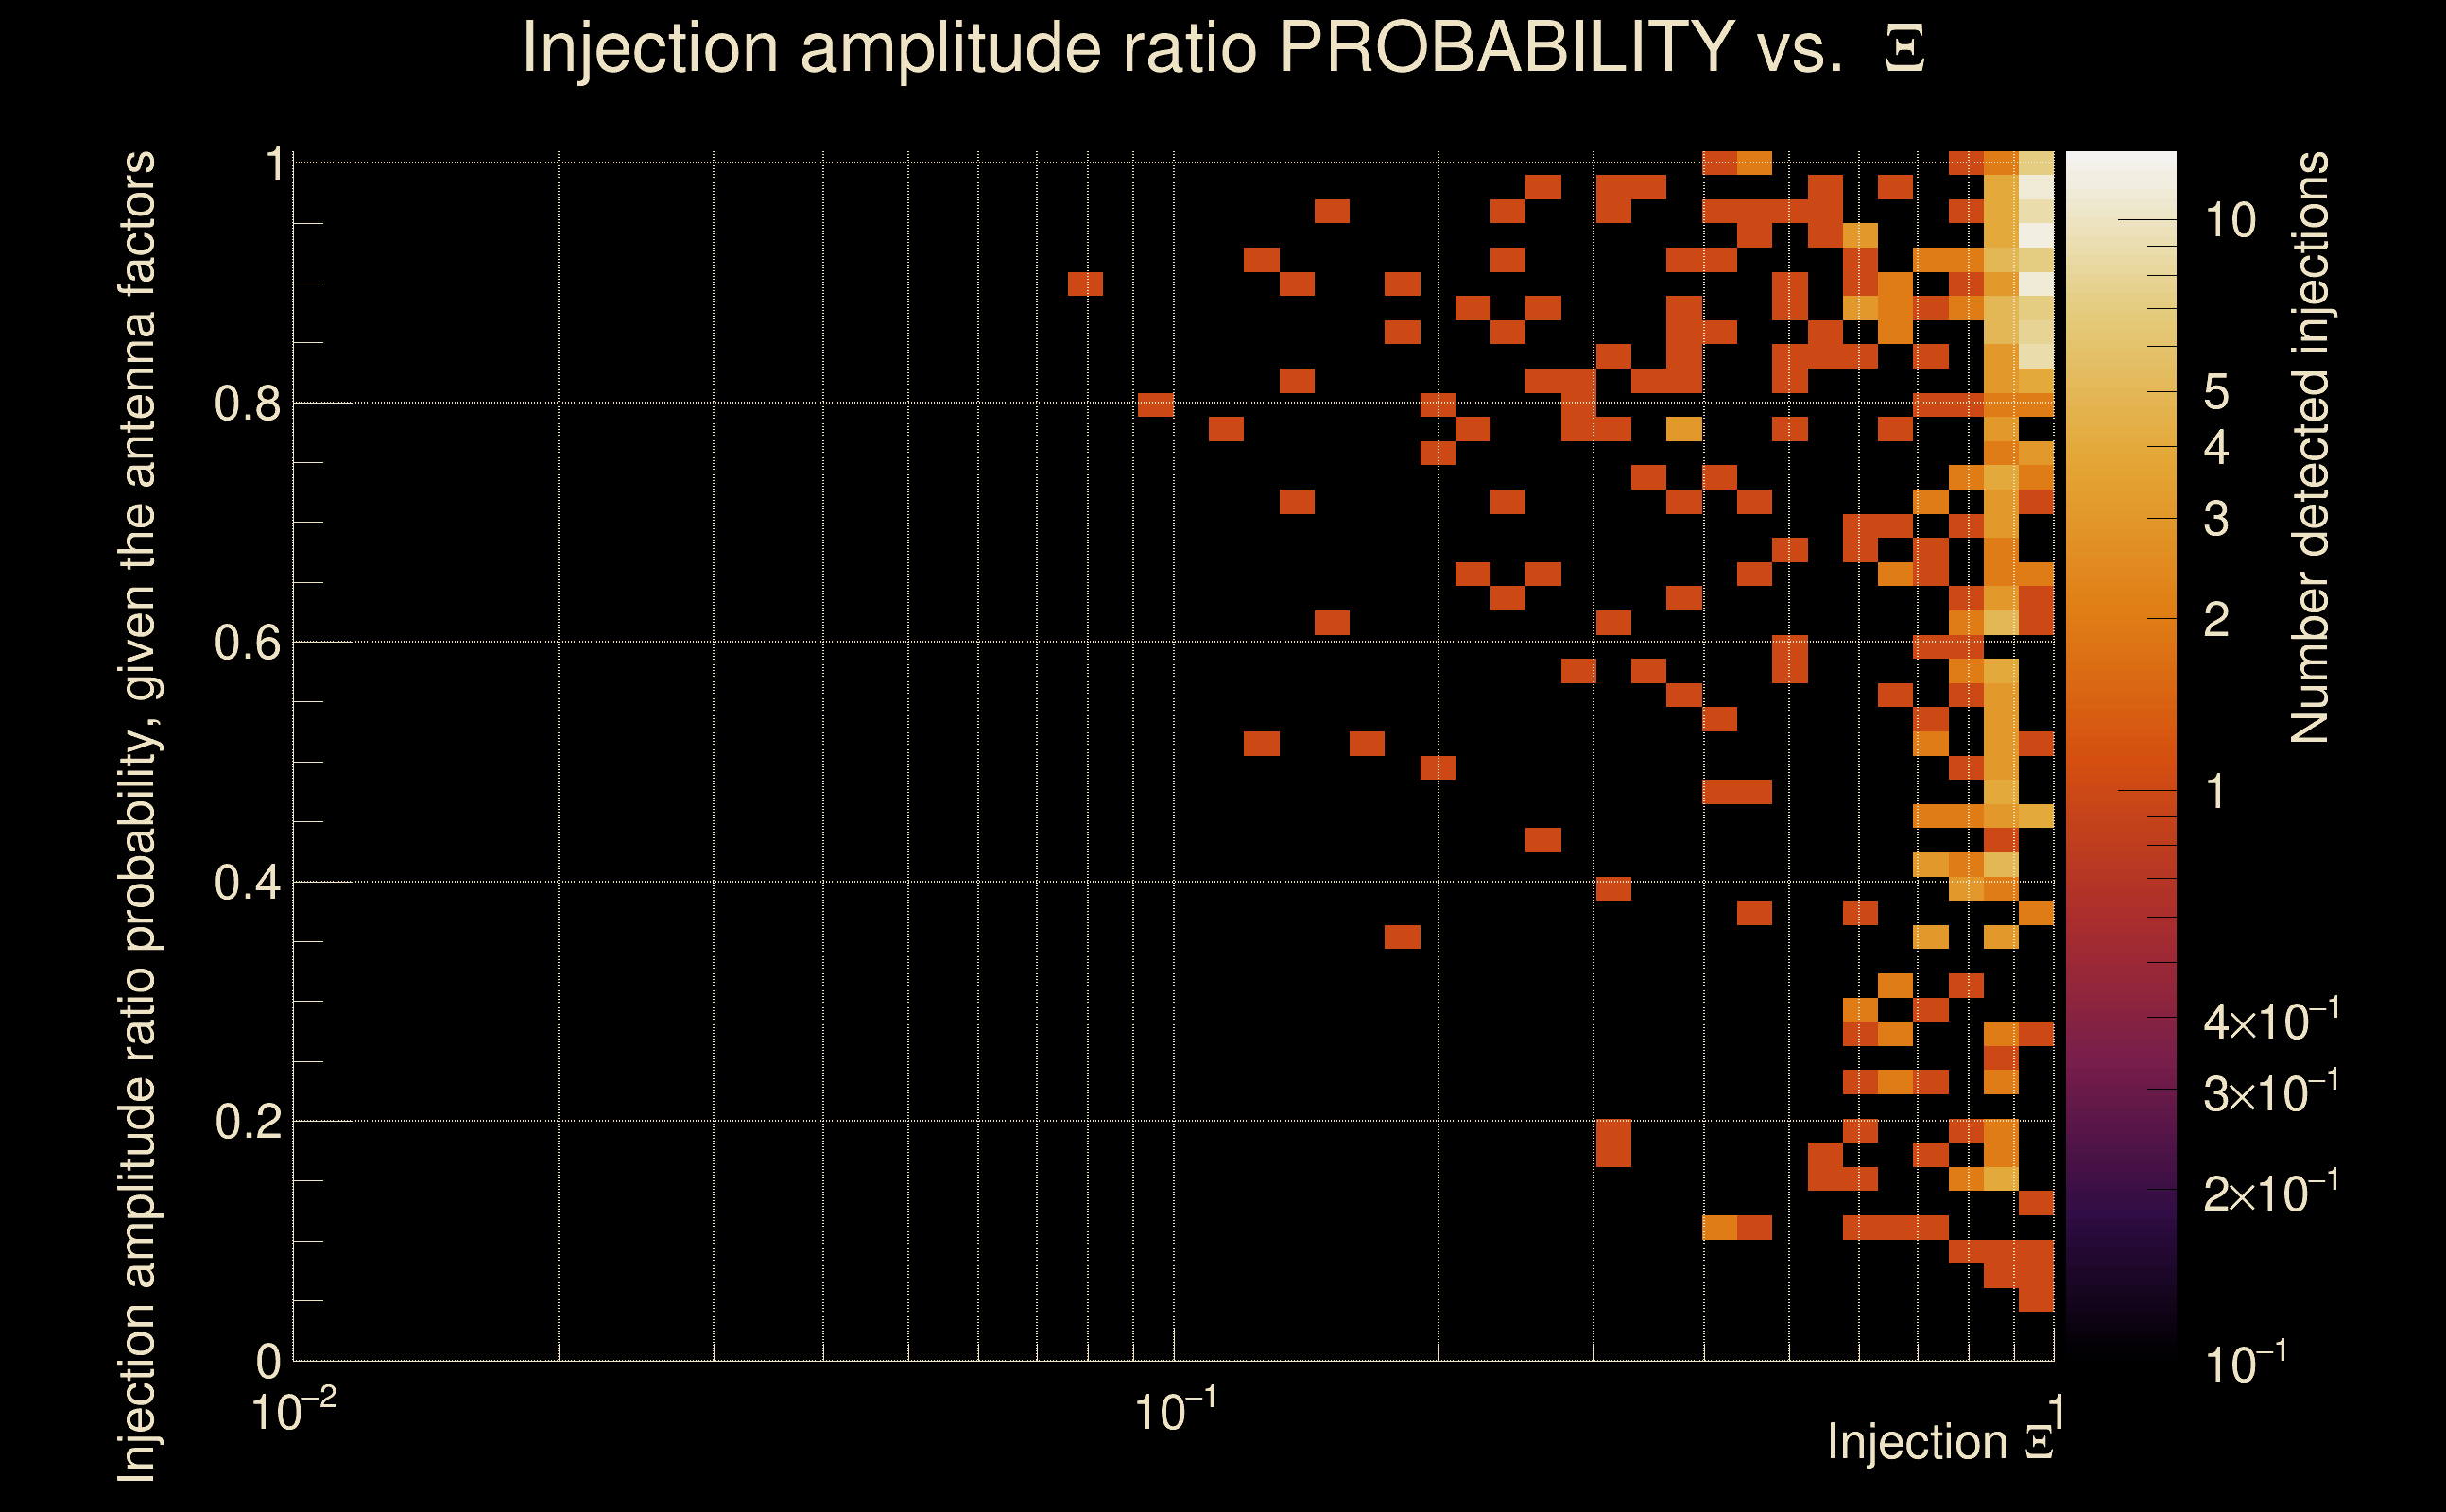
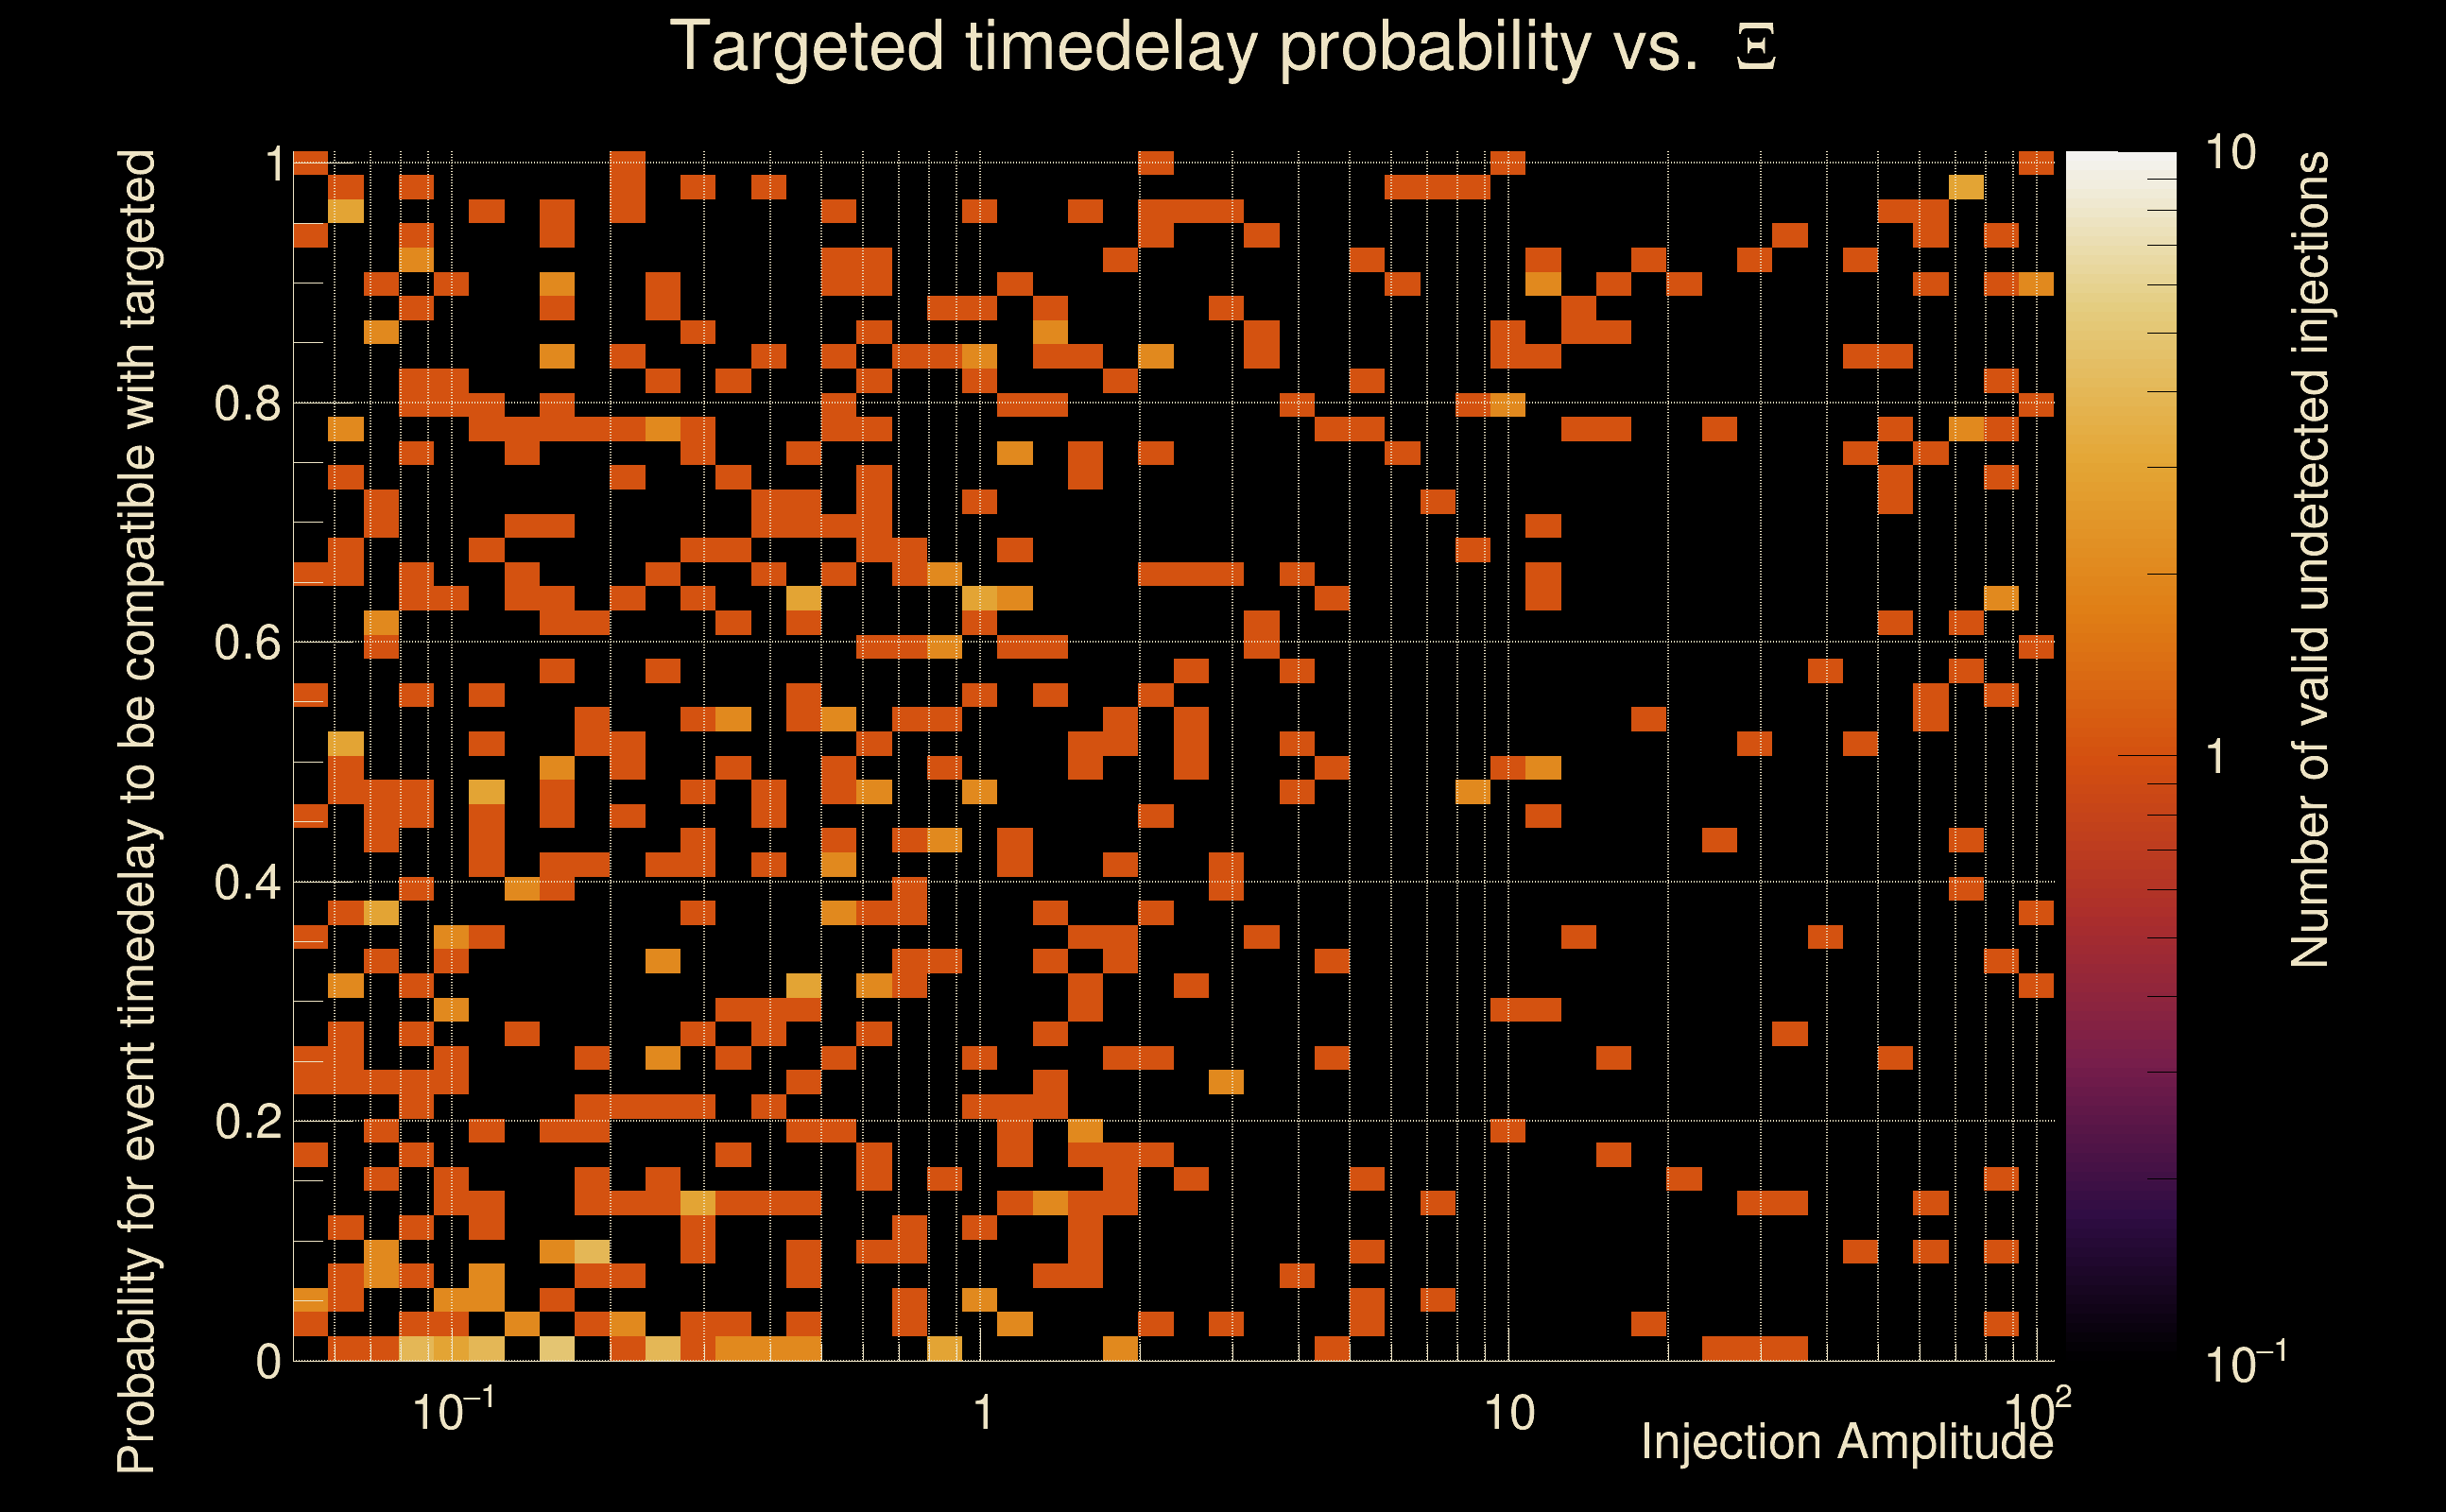
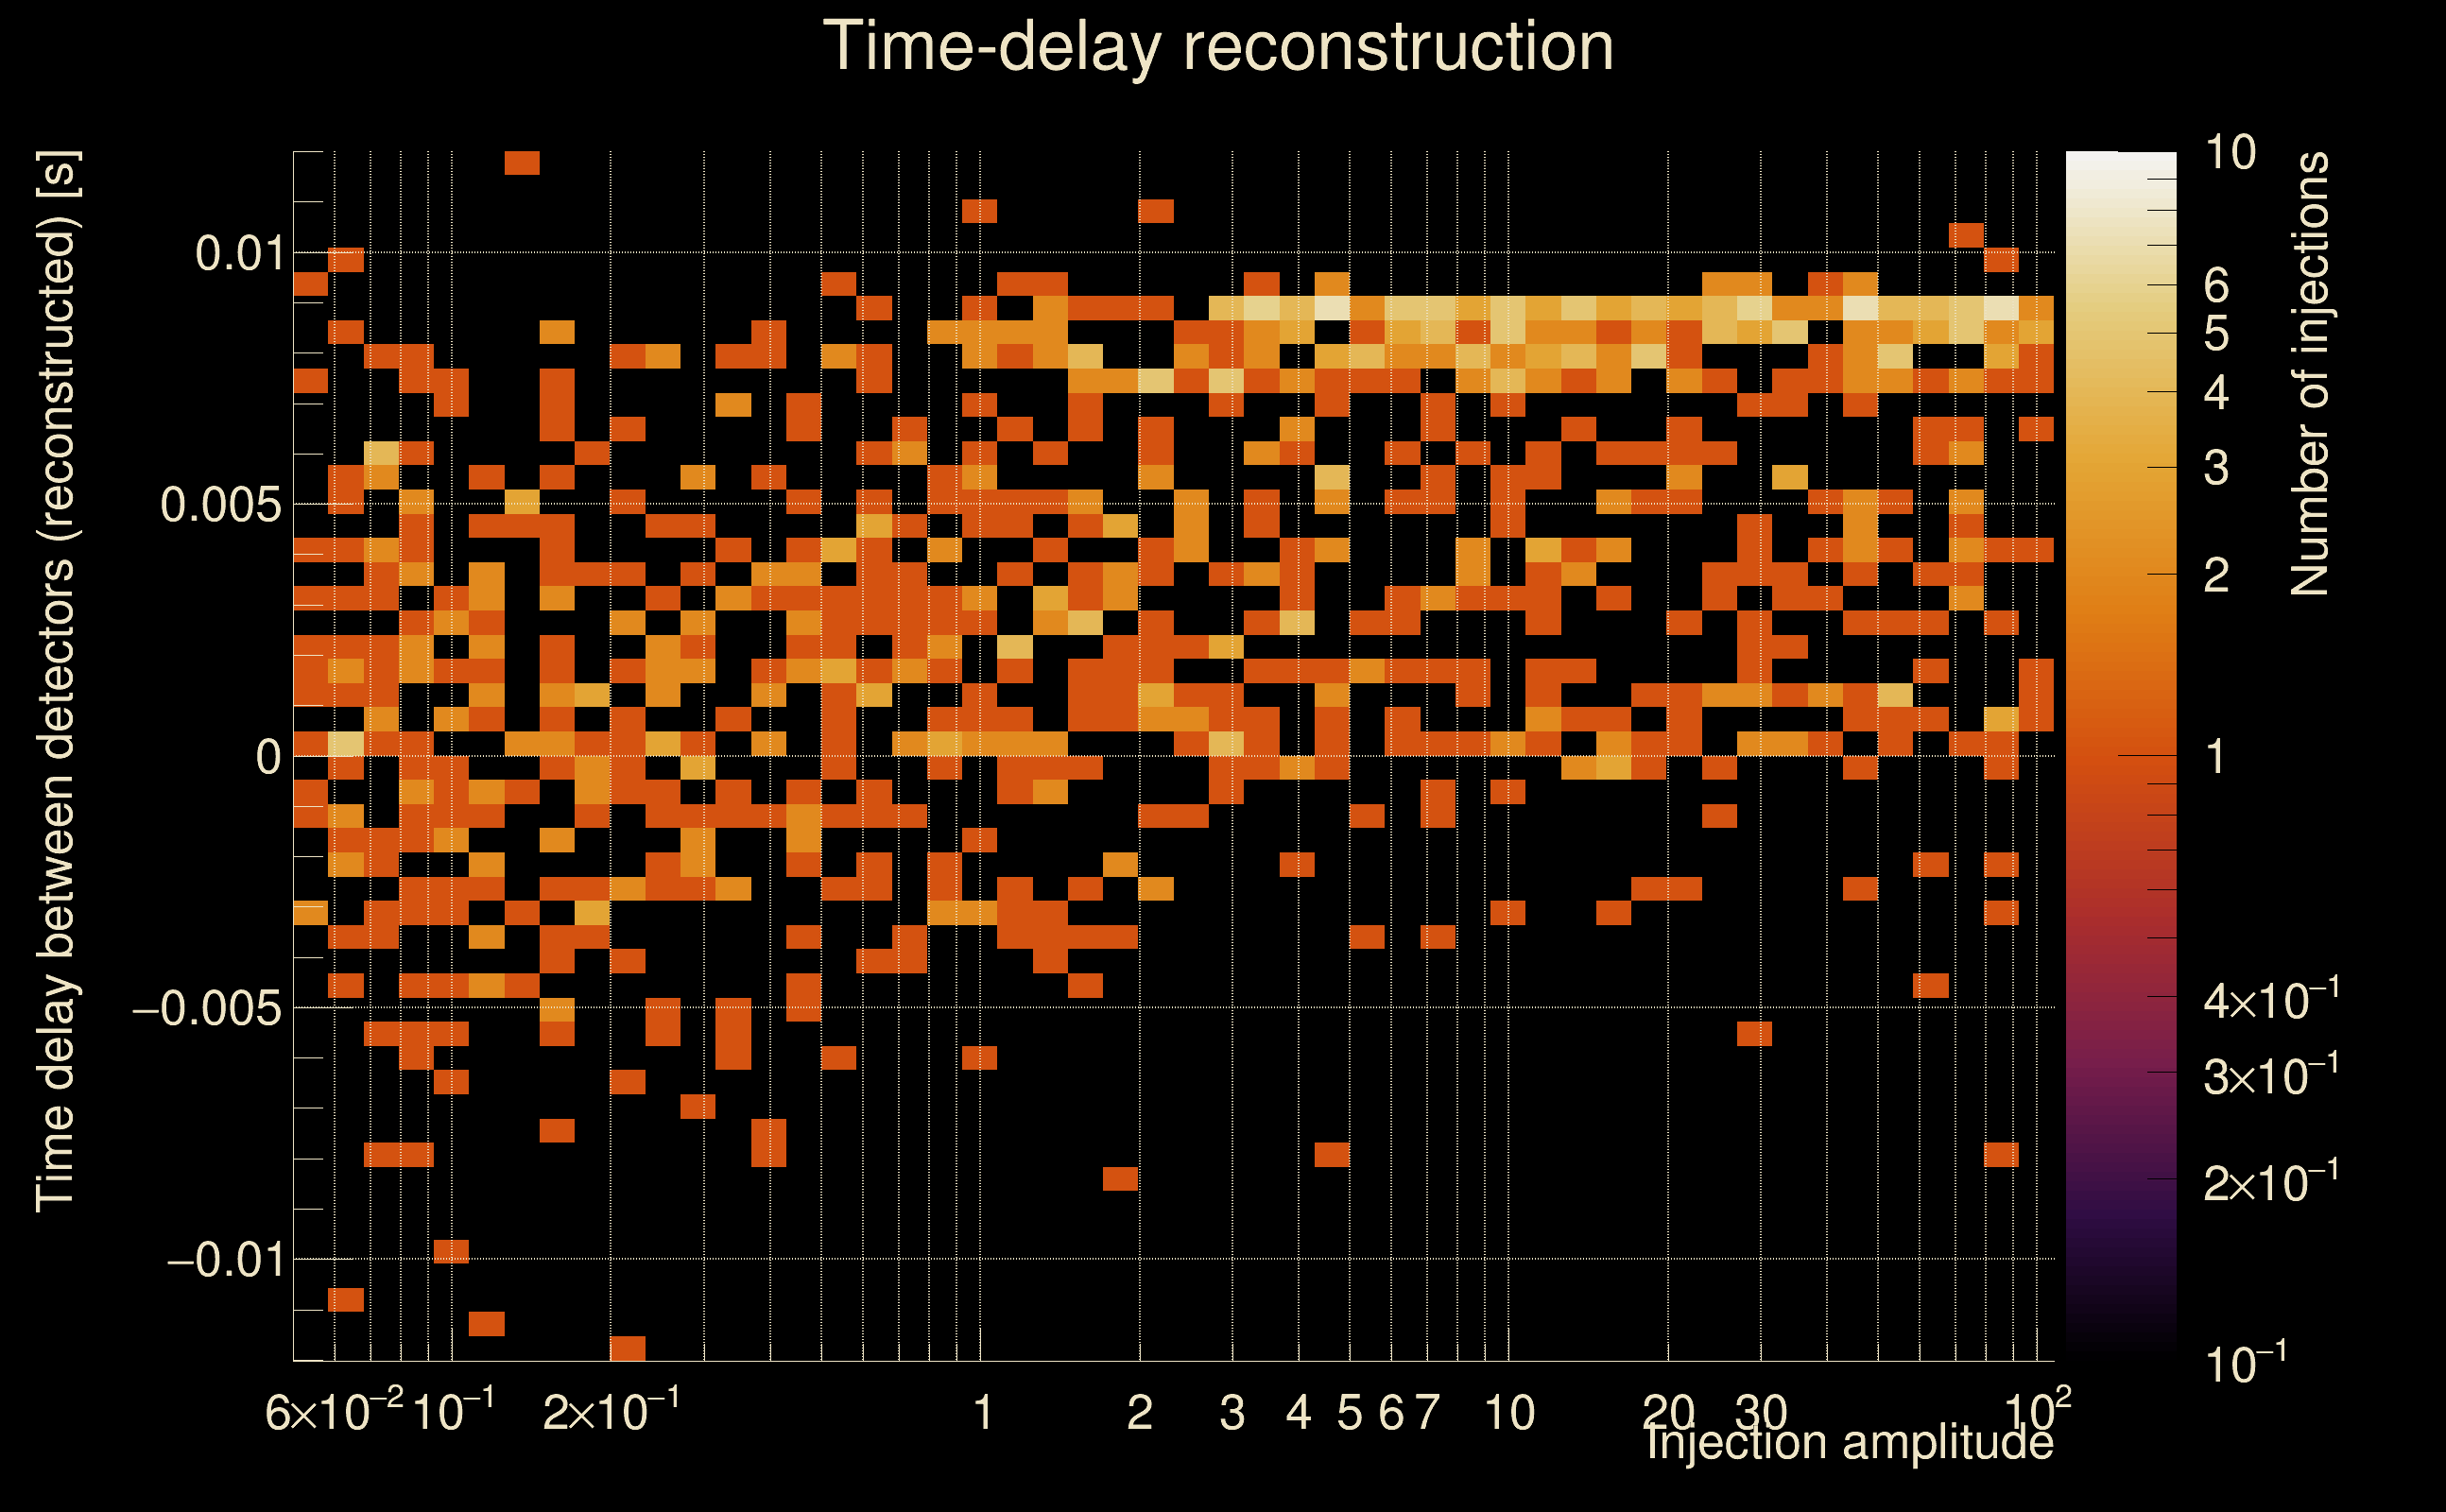
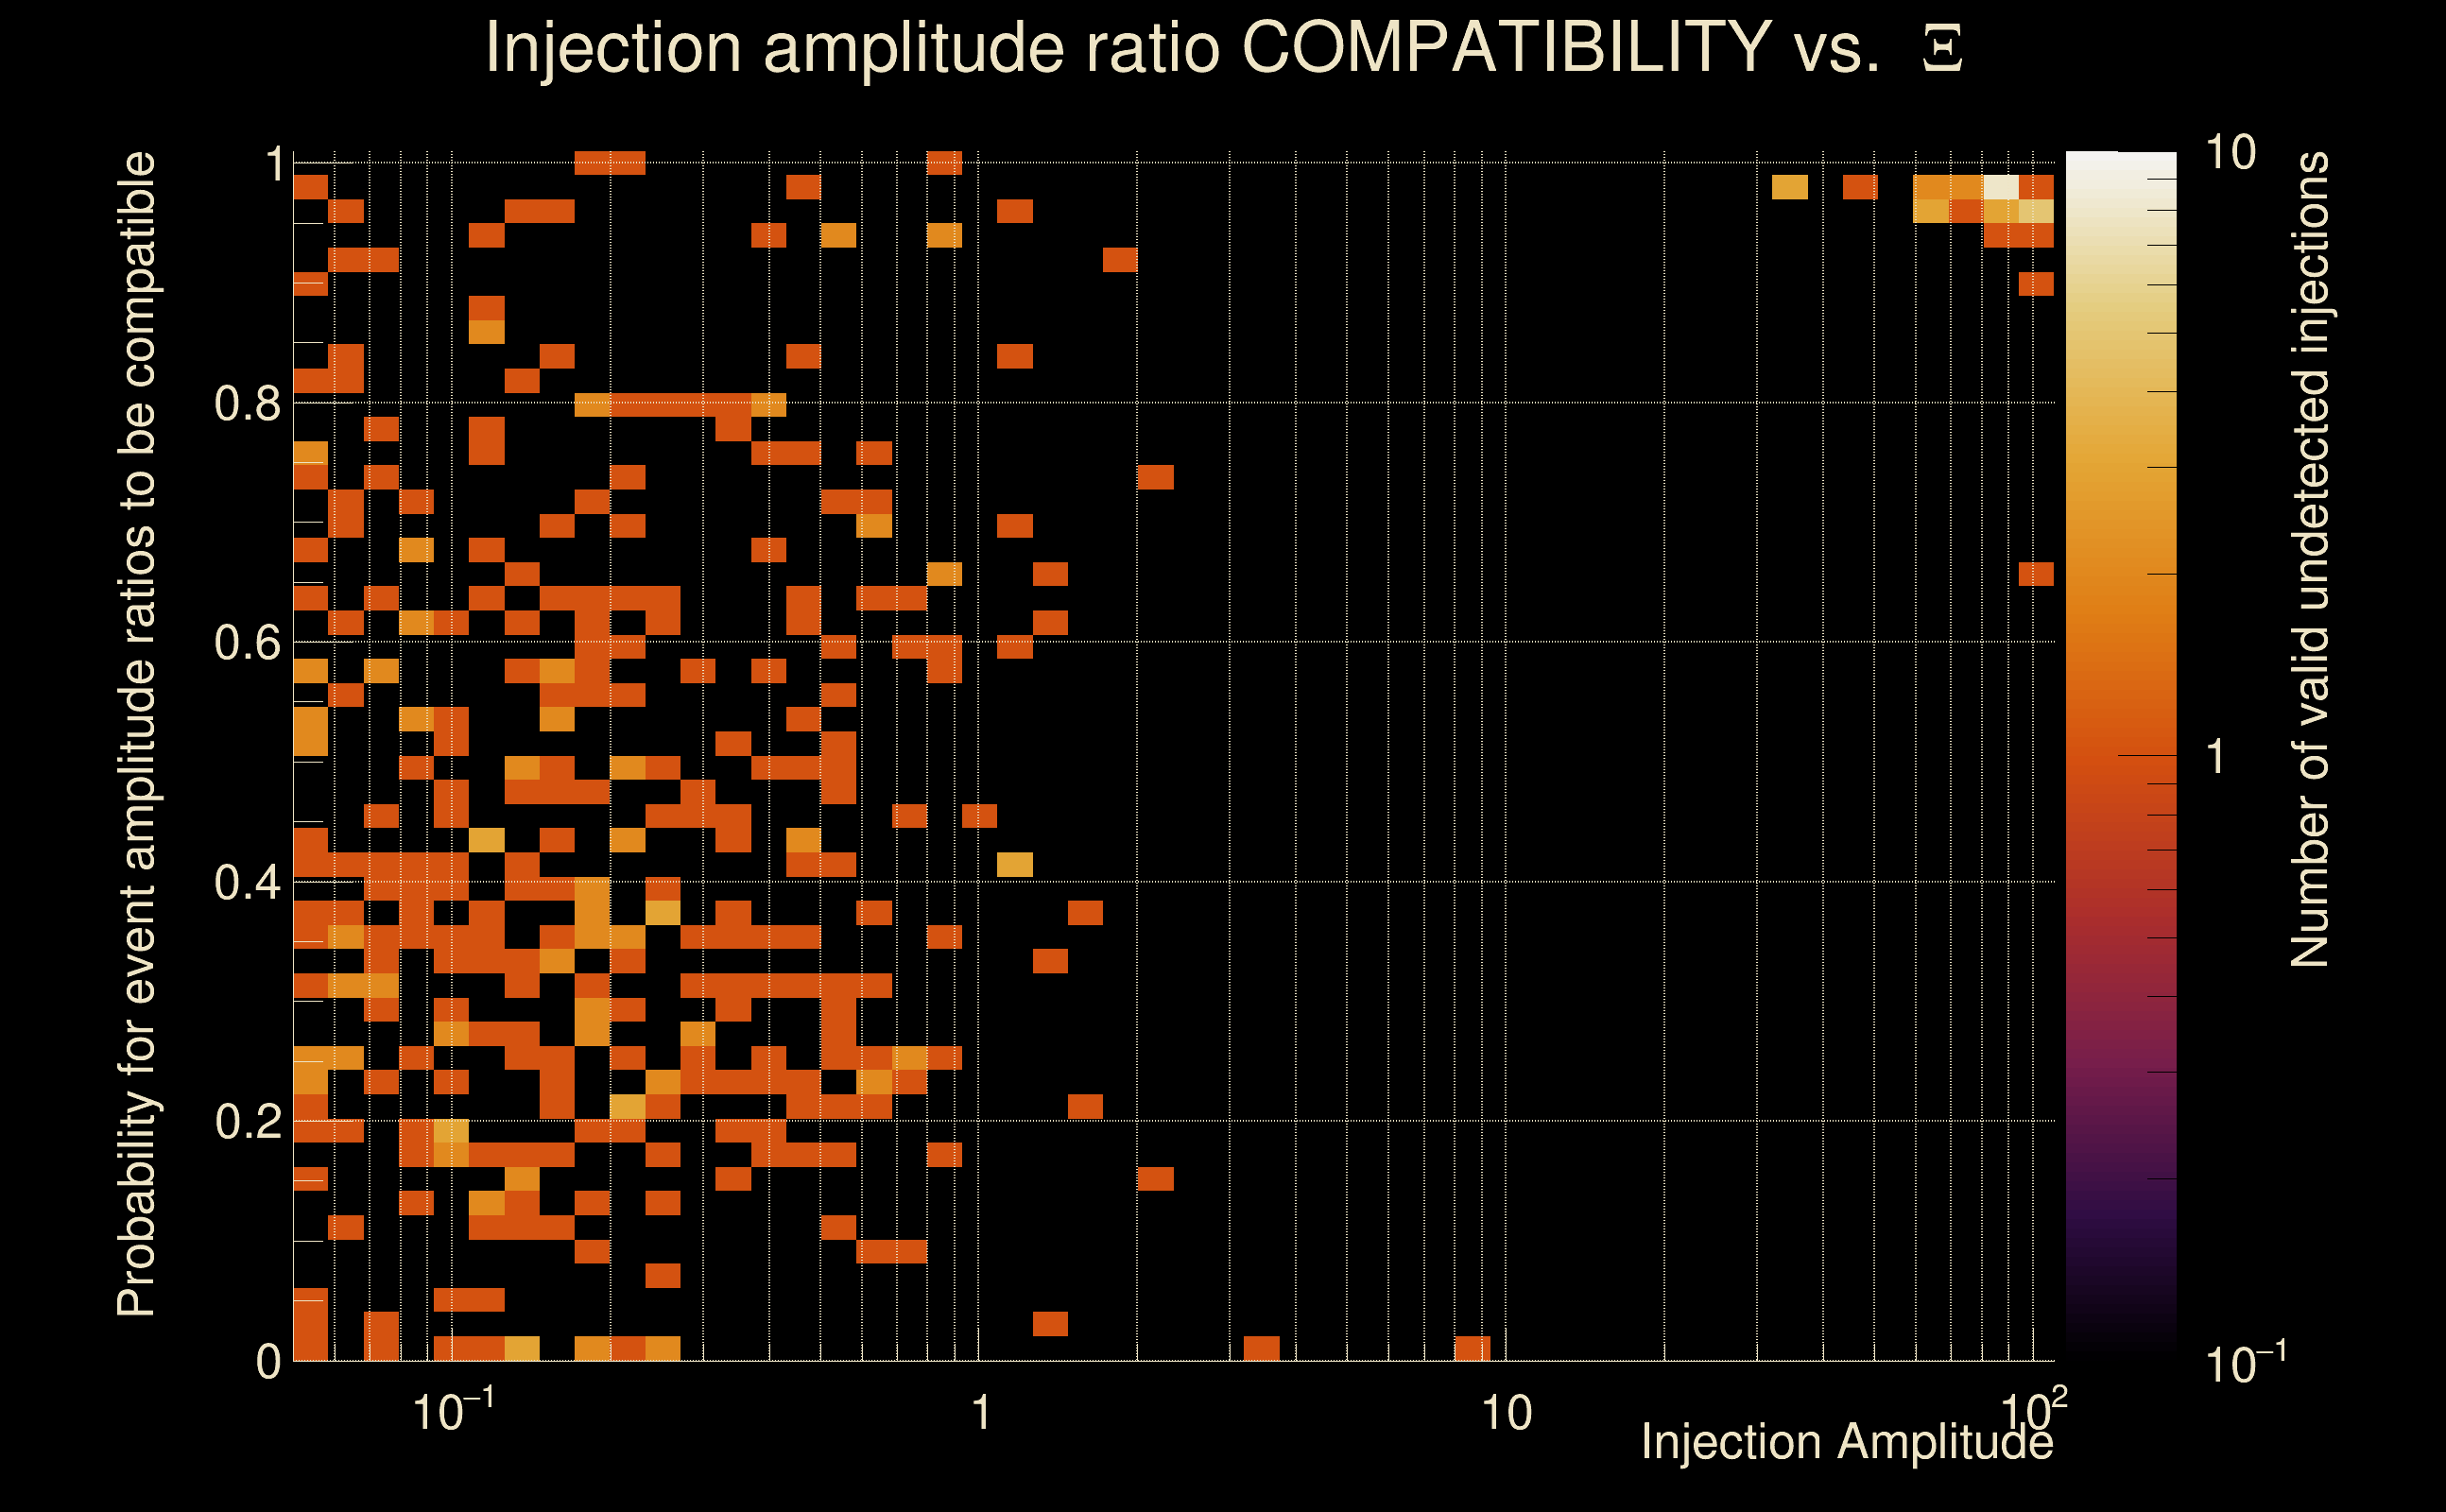
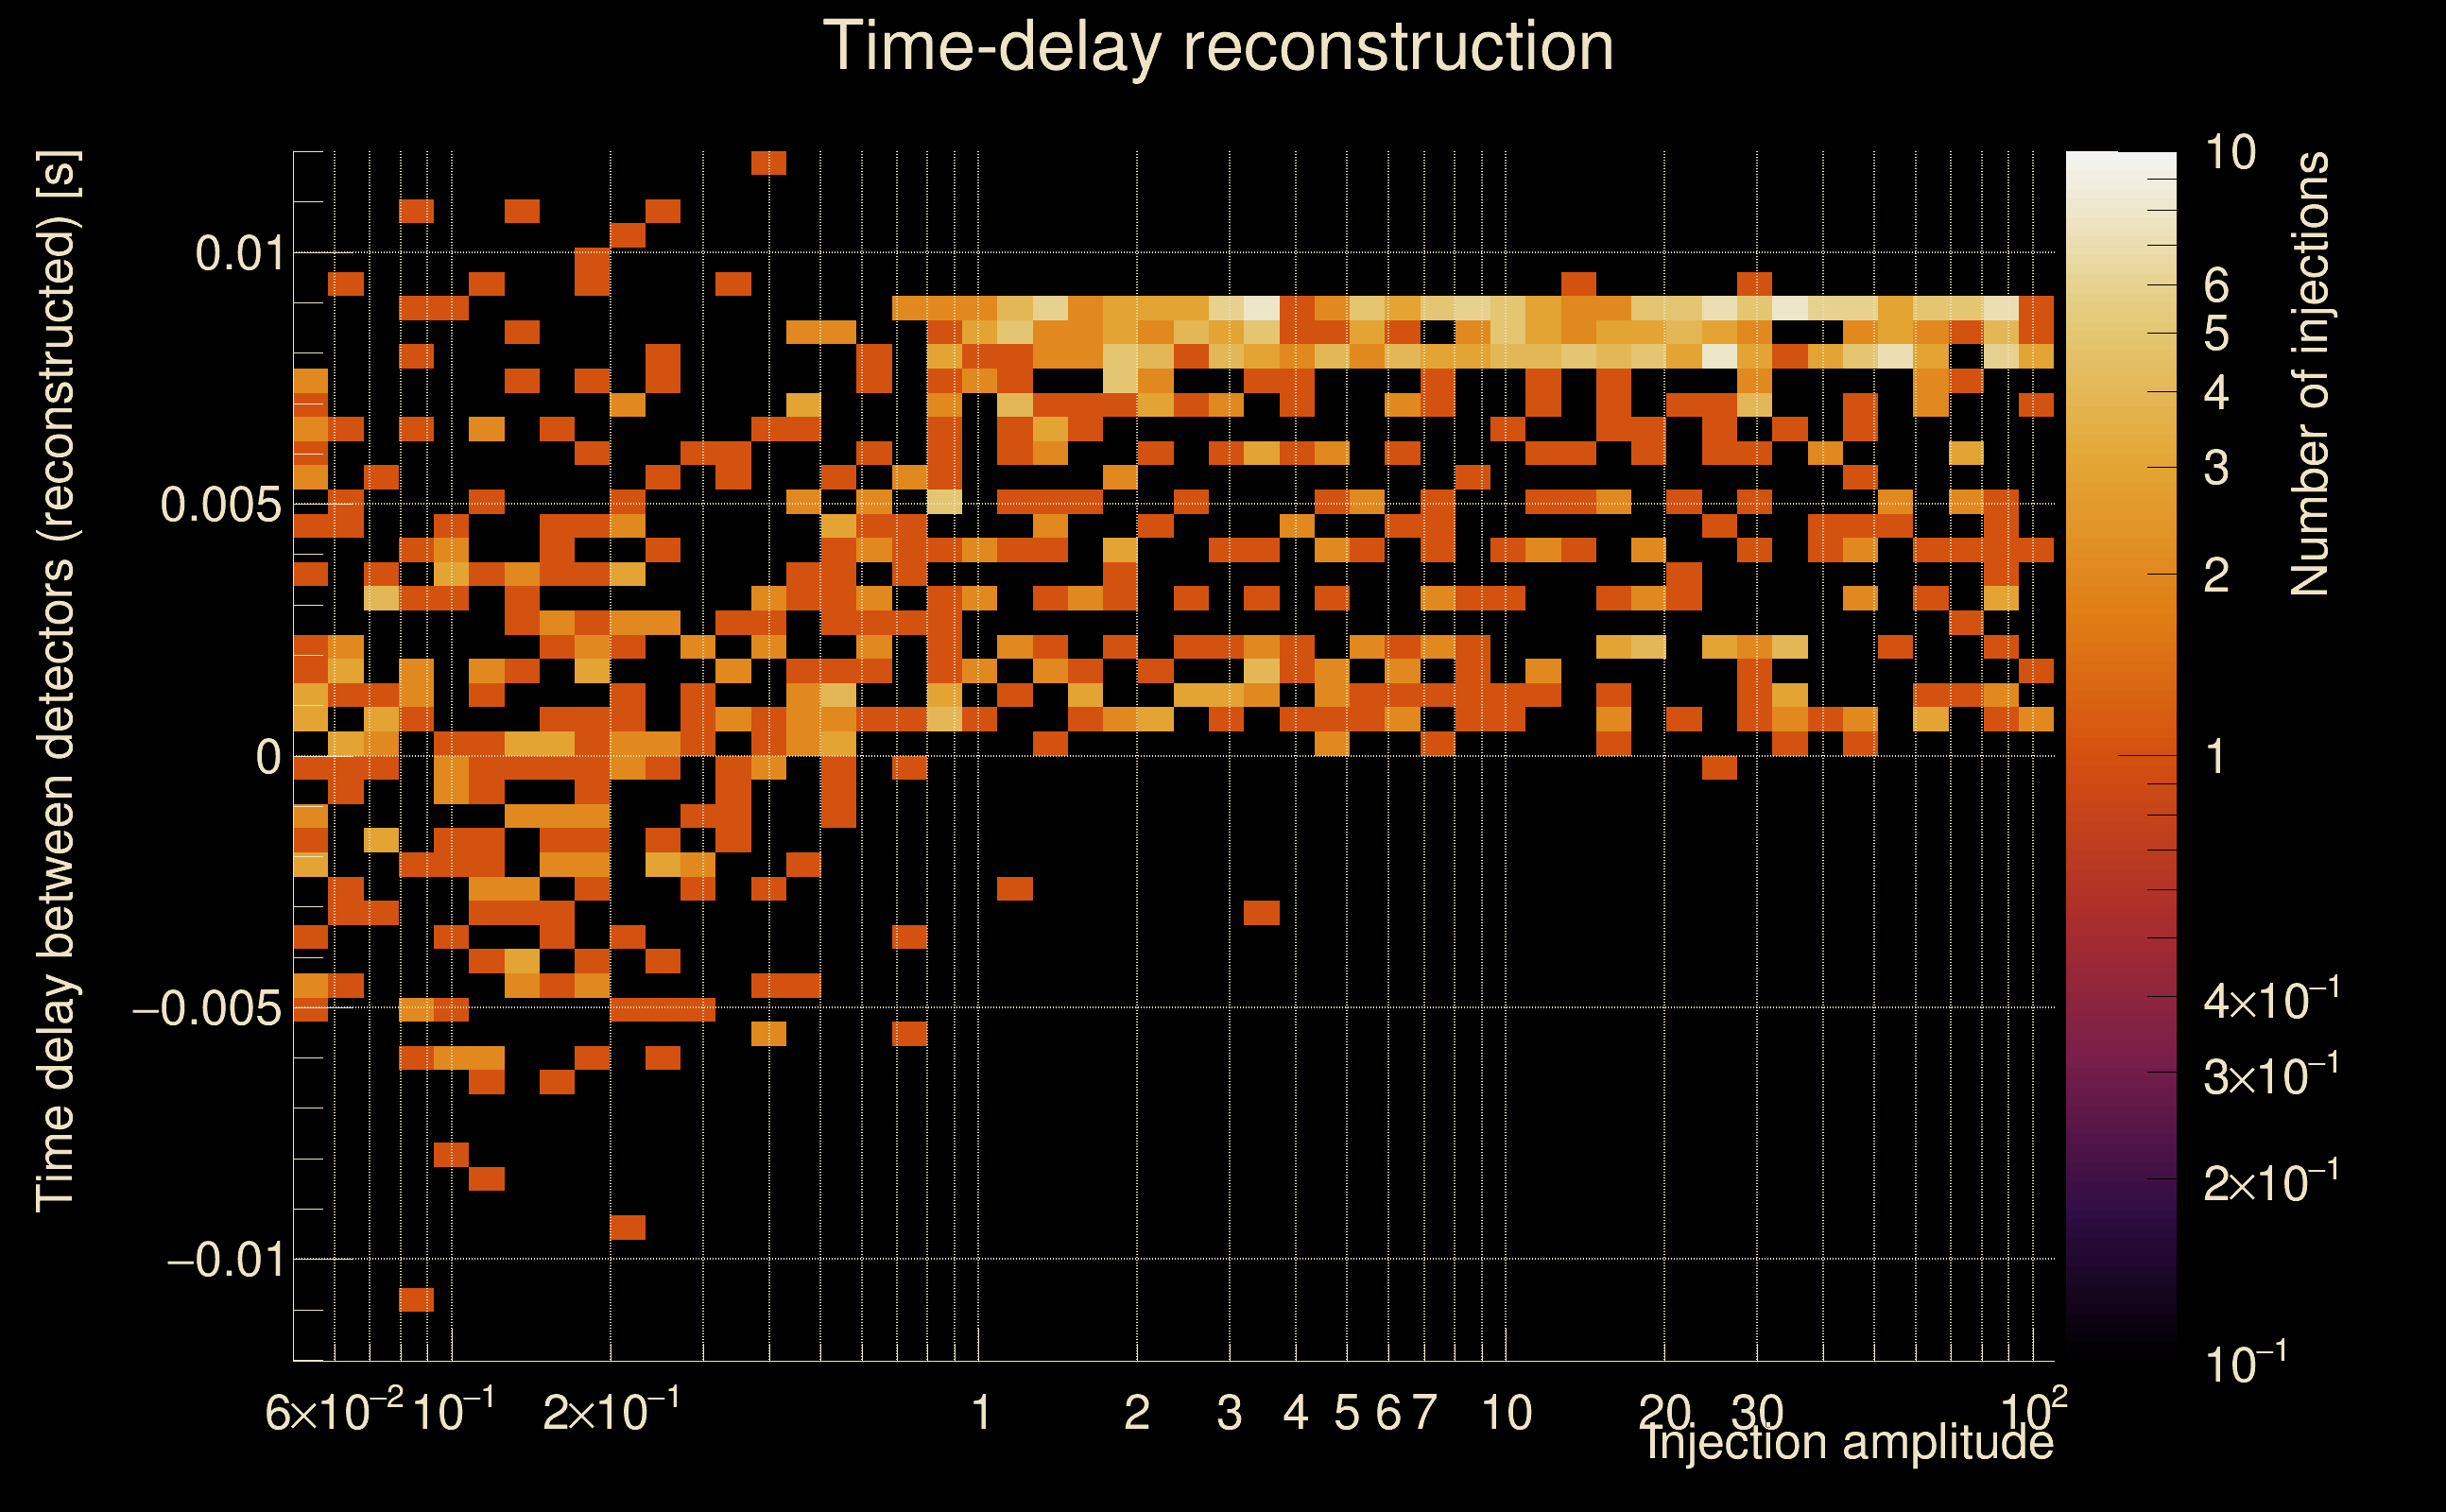
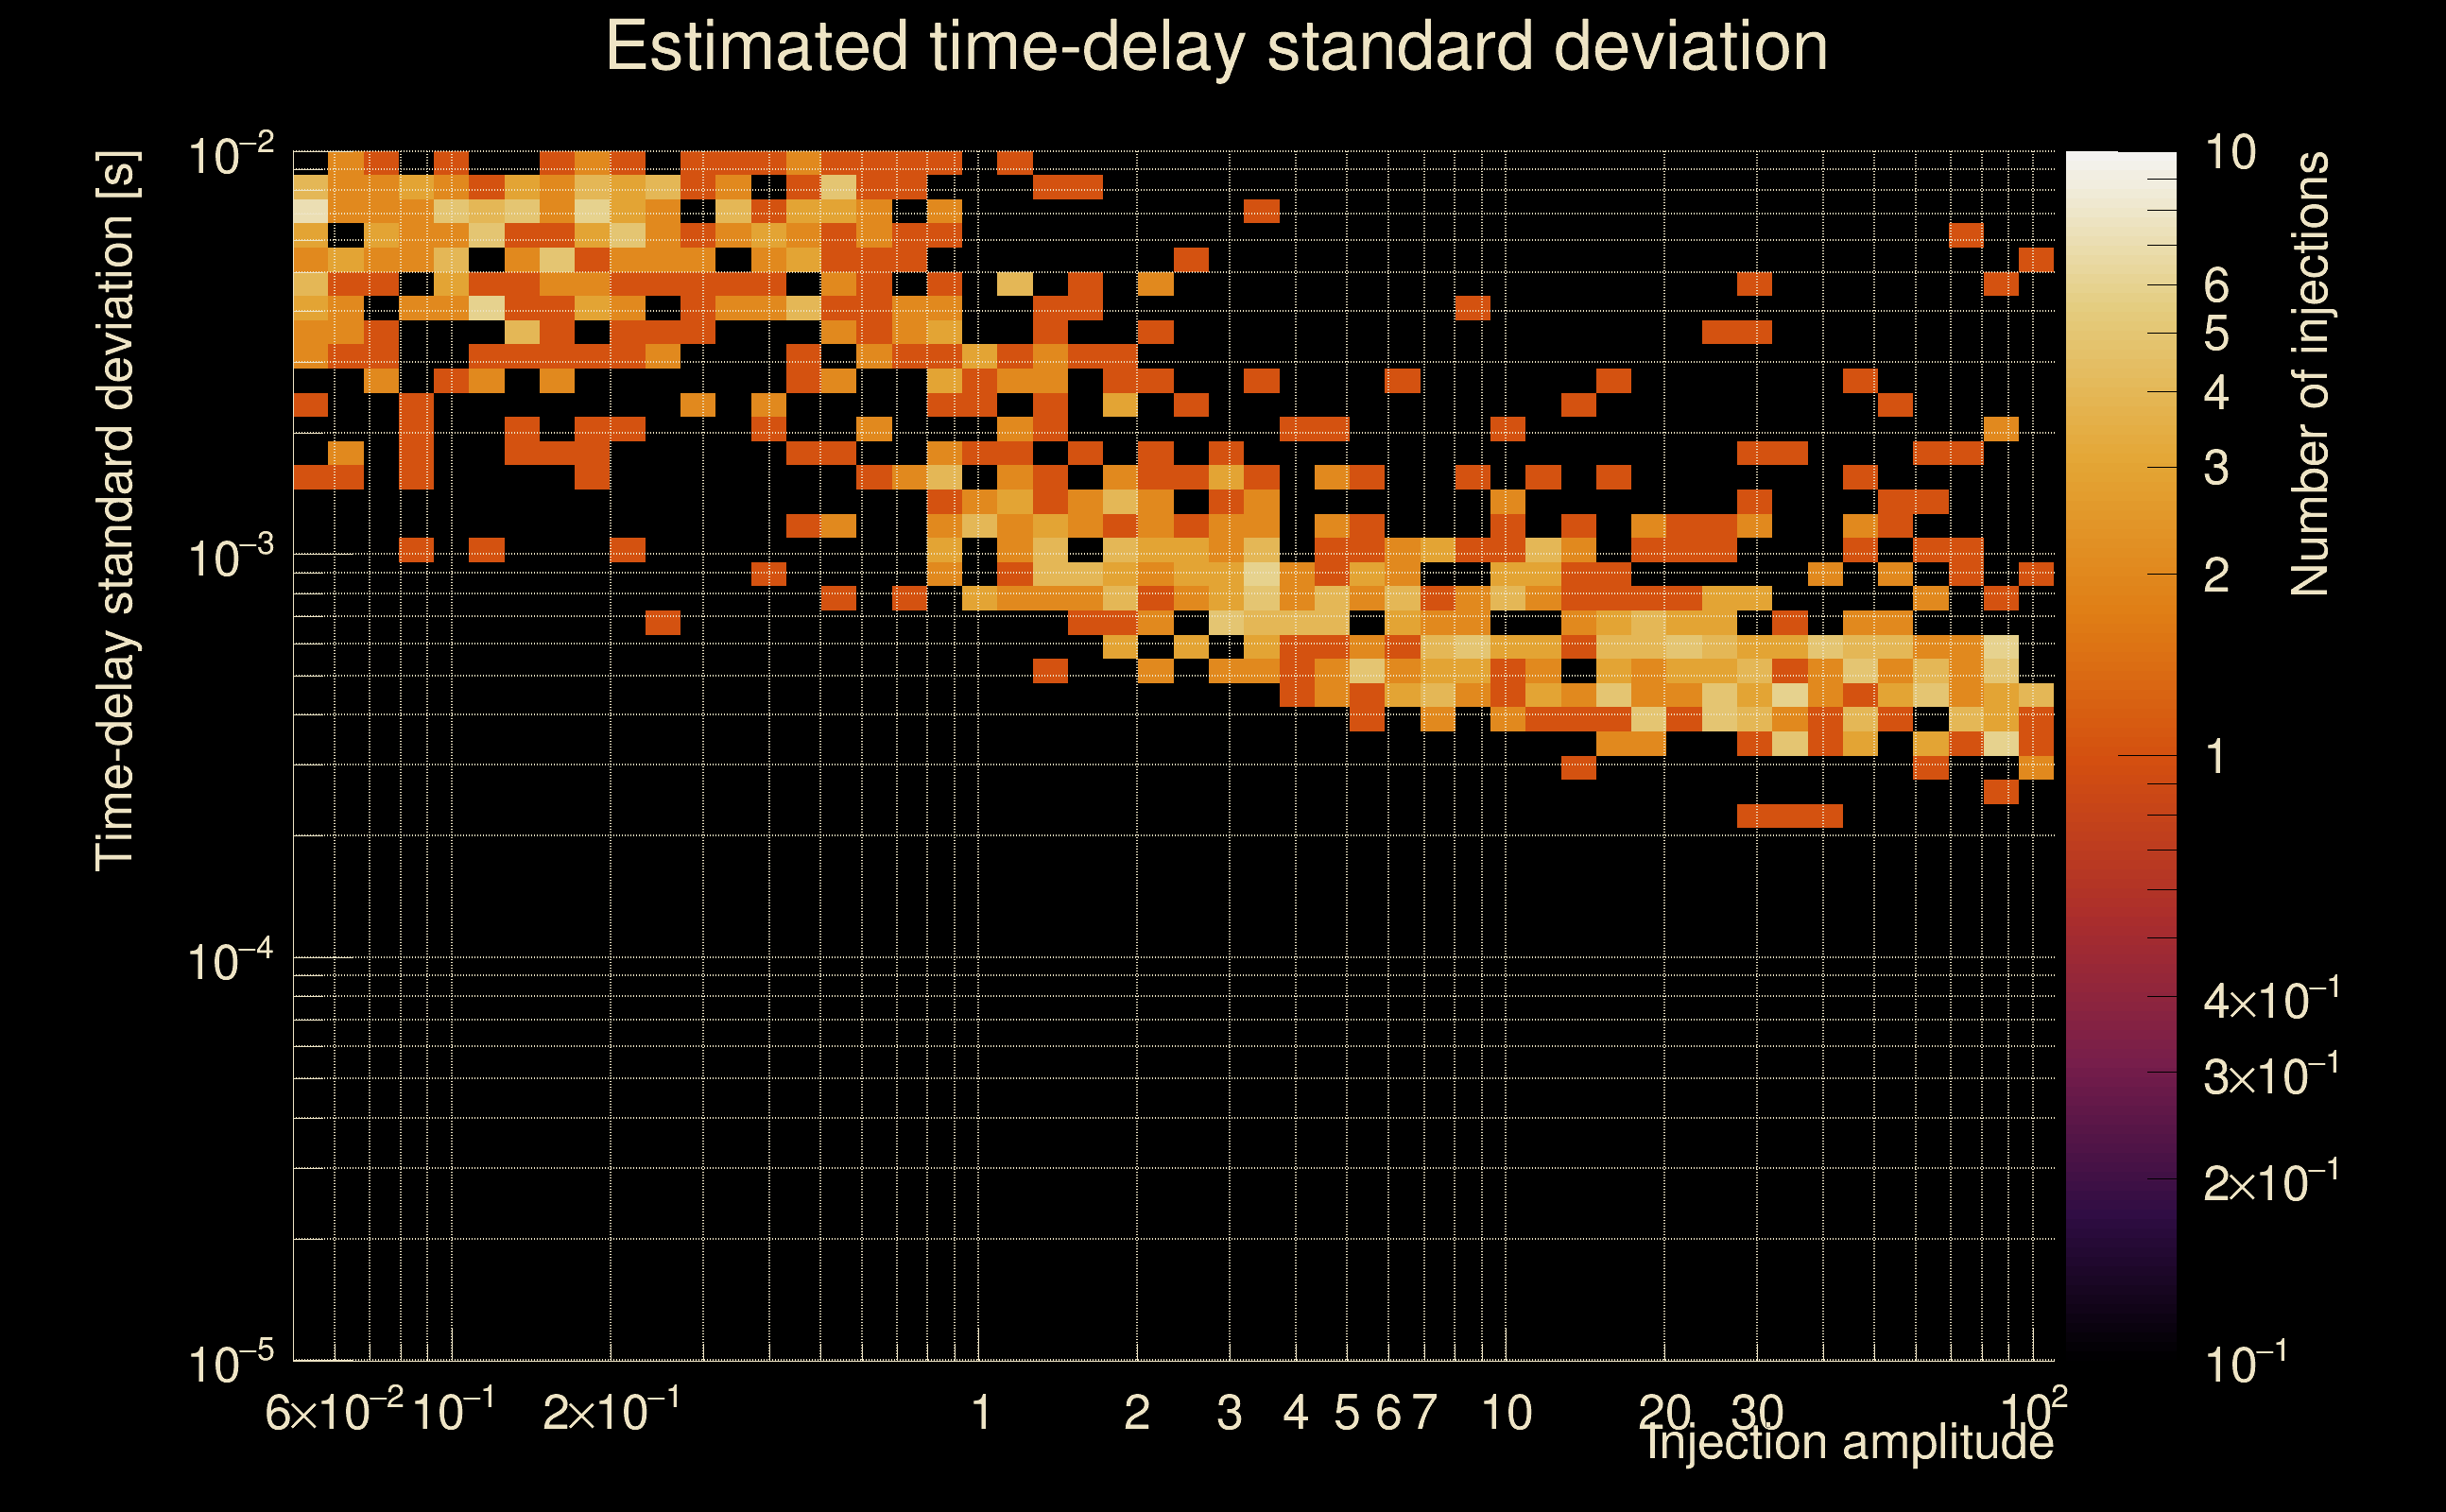
| Number of injections (total/valid/detected): | 1162 / 1002 / 410 |
| List of missed injections: | ./Kur22-s50_missed.txt |
| Injection amplitude at 90% detection efficiency: | -1 |
| Injection amplitude at 50% detection efficiency: | 5.49261 |
| Injection amplitude at 10% detection efficiency: | 0.756461 |
 |
 |
 |
 |
 |
 |
 |
|
 |
 |
|
 |
 |
|
 |
 |
|
 |
 |
|
 |
 |
|
 |
 |
|
 |
 |
|
 |
 |
 |
 |
 |
 |
 |
 |
 |
 |
 |
 |
 |
 |
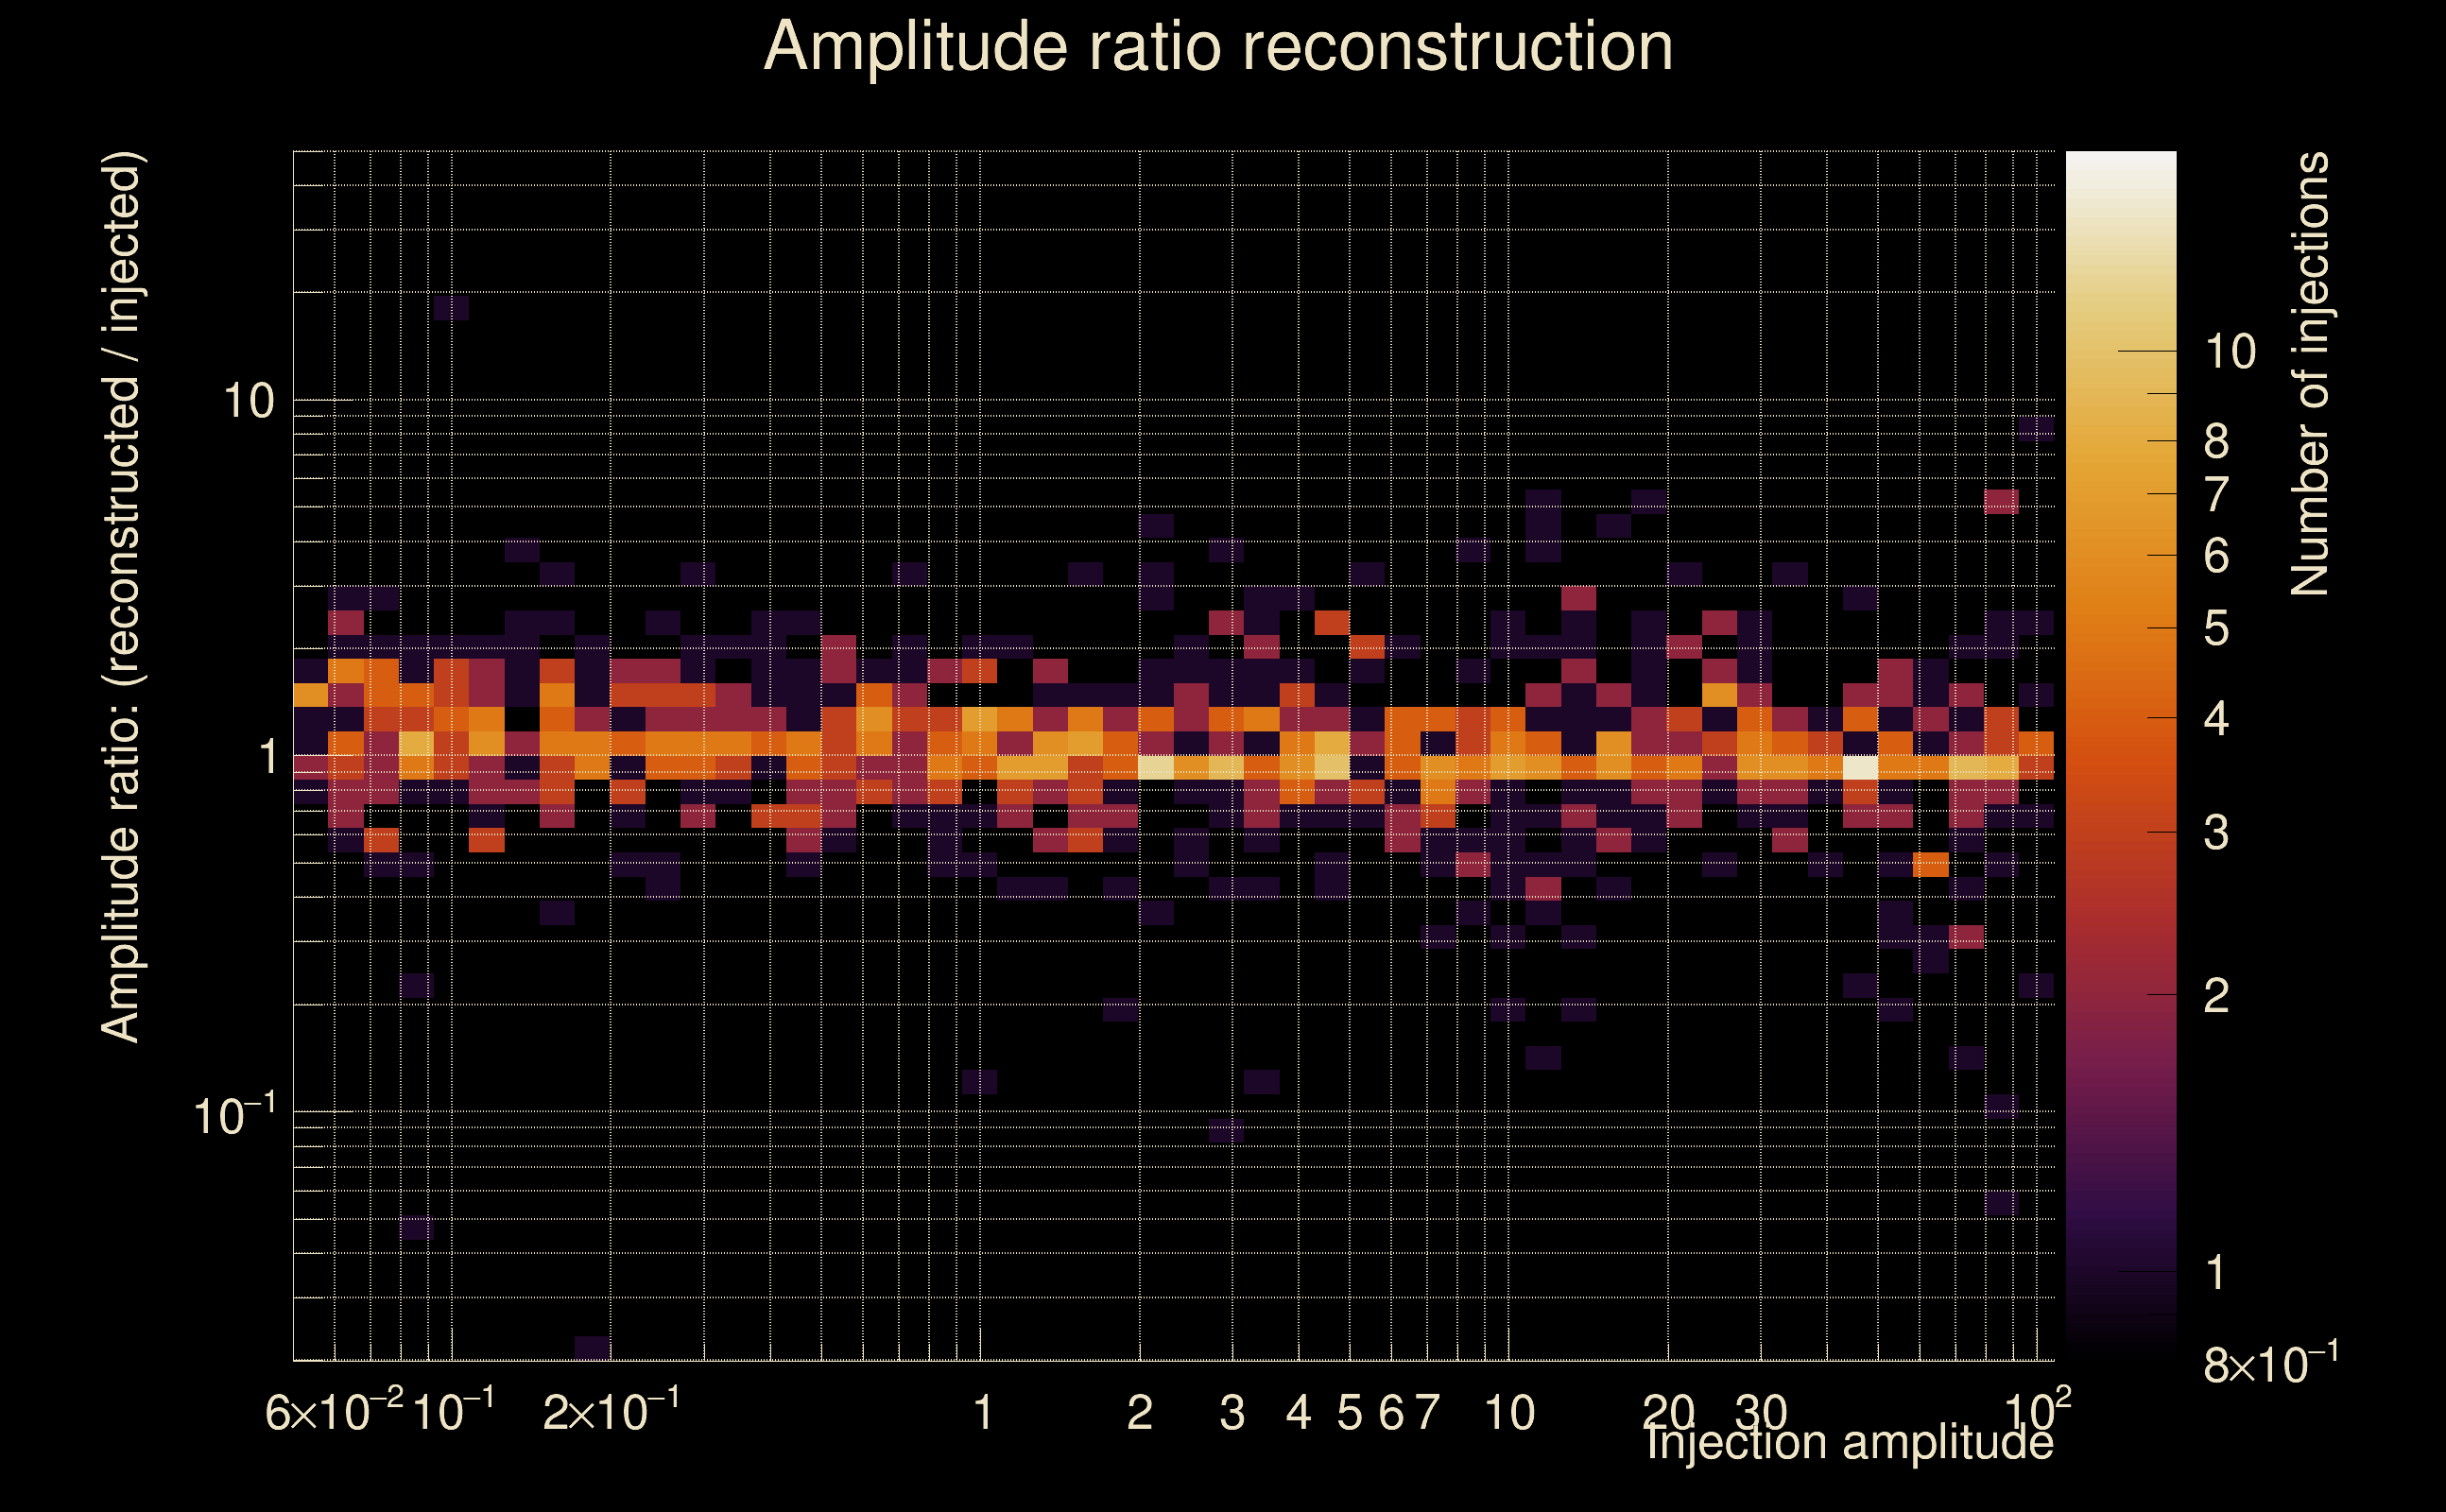 |
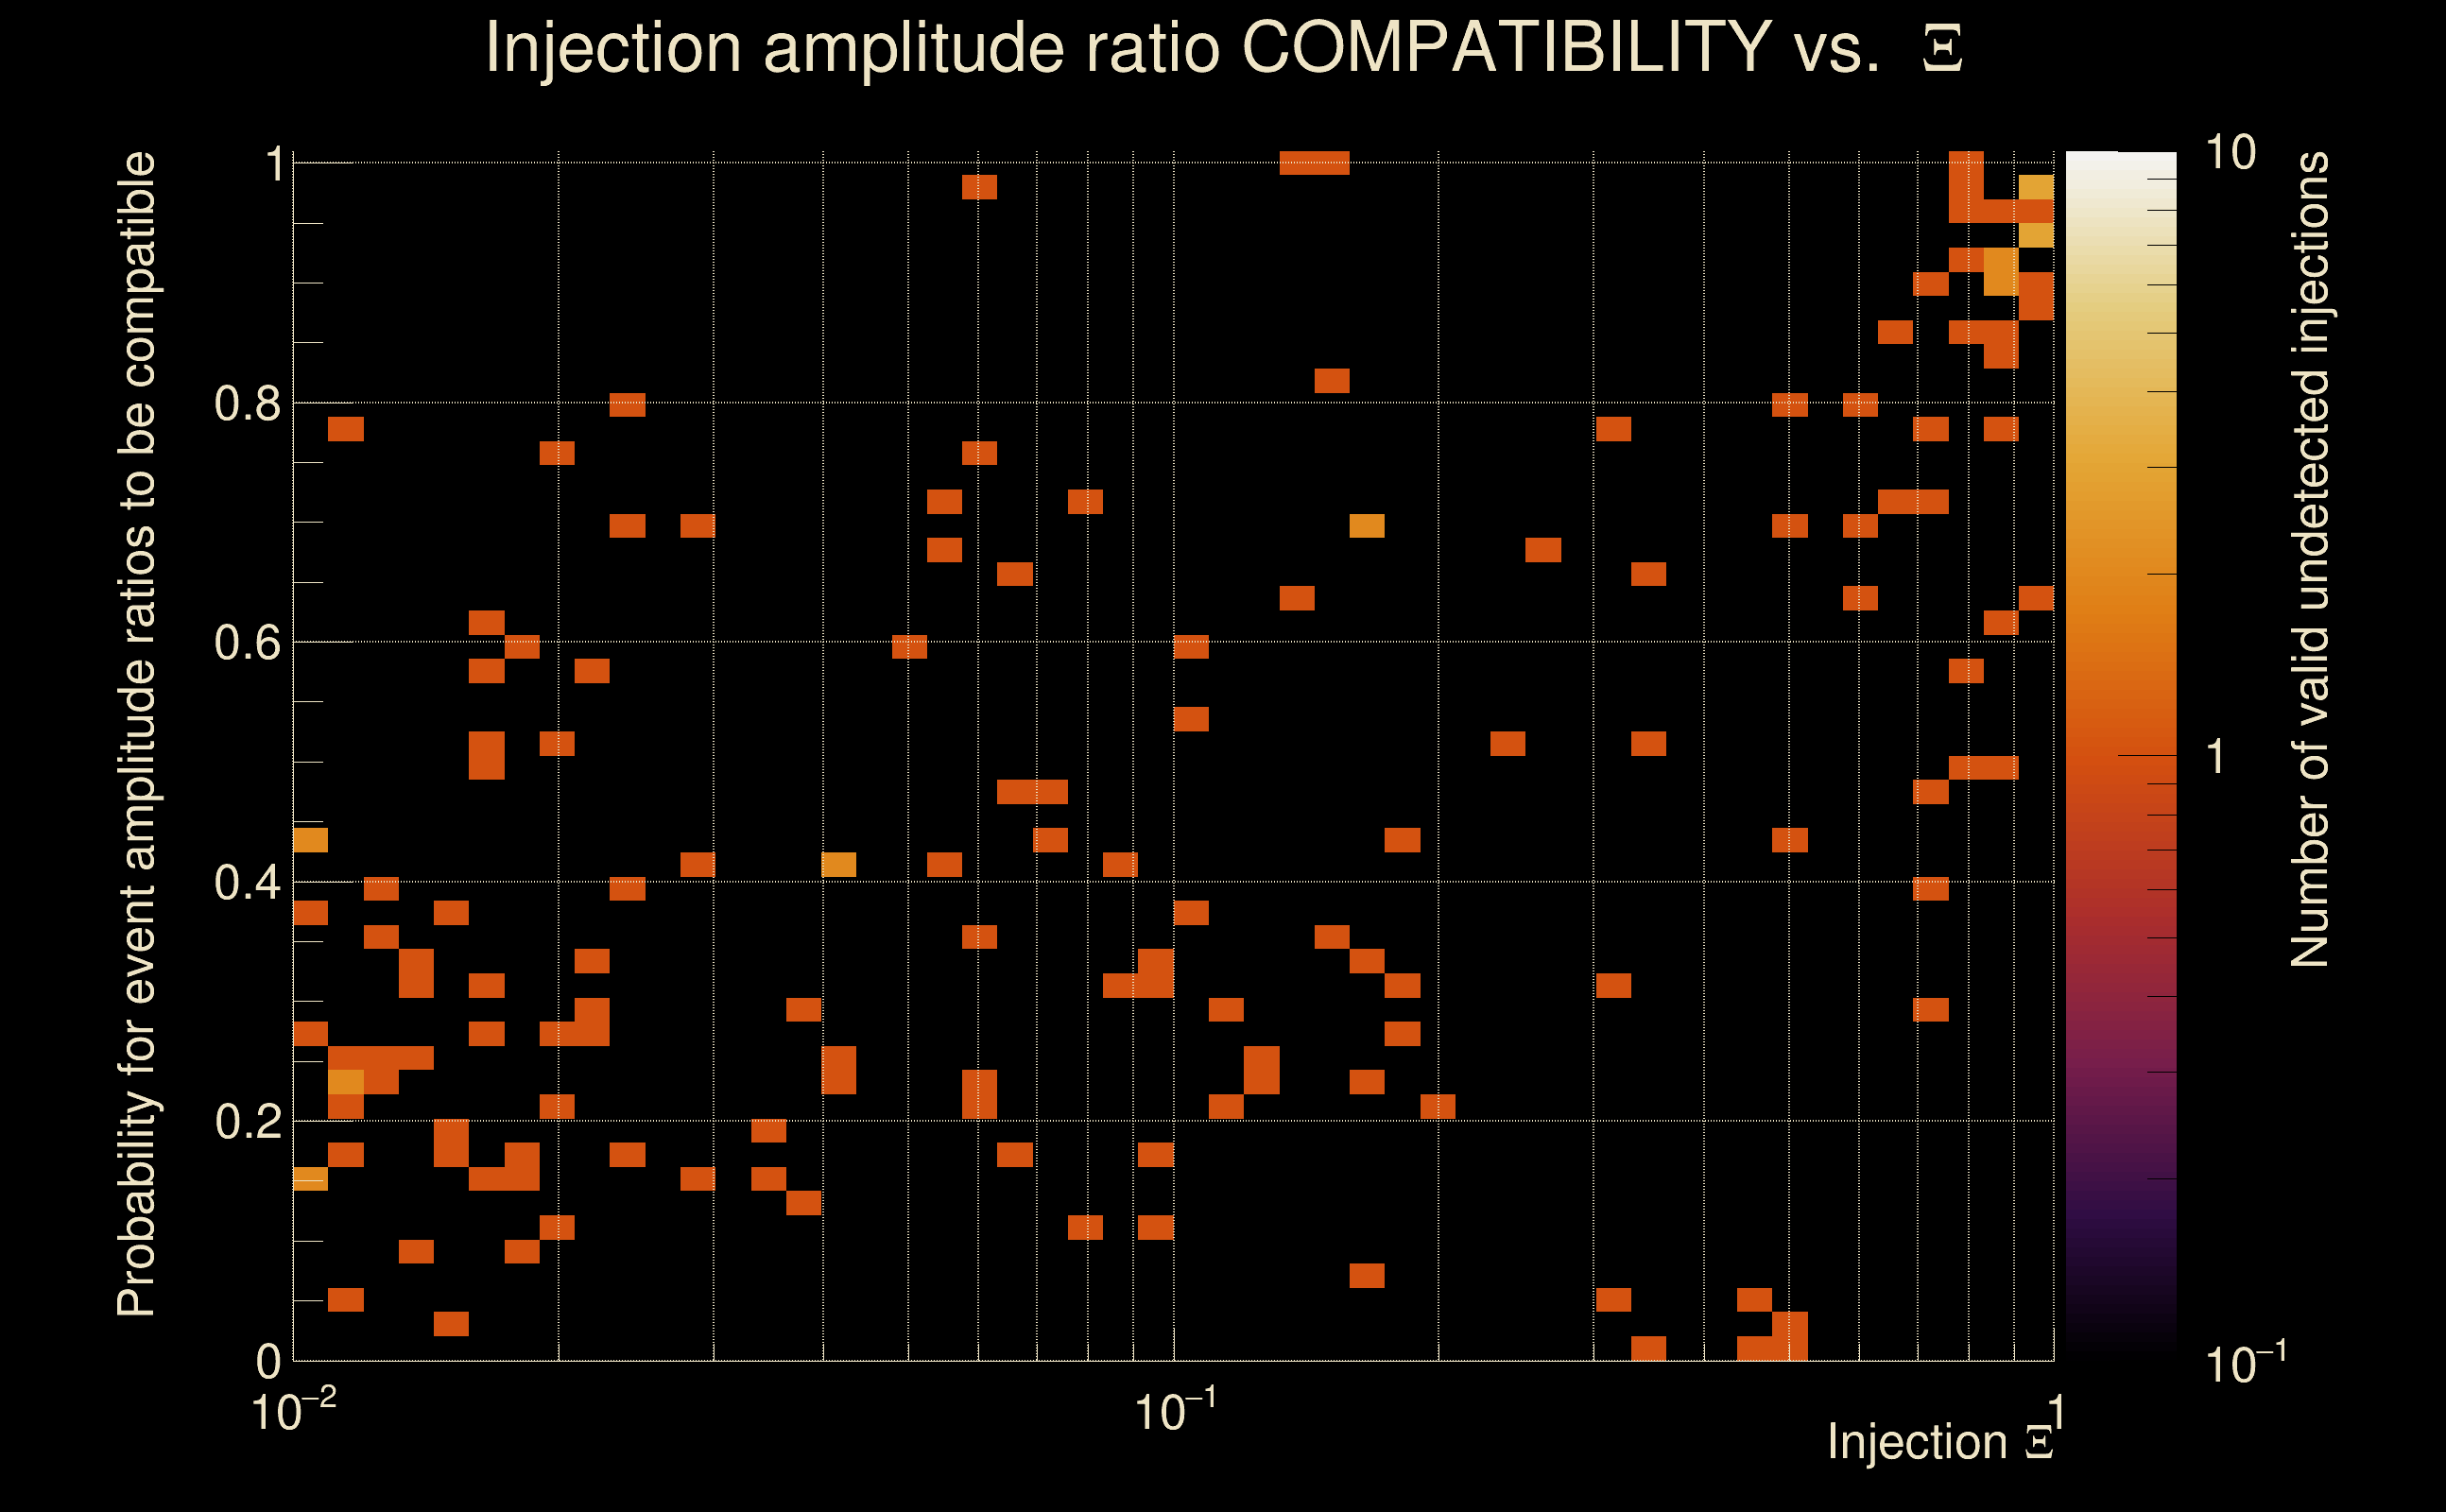
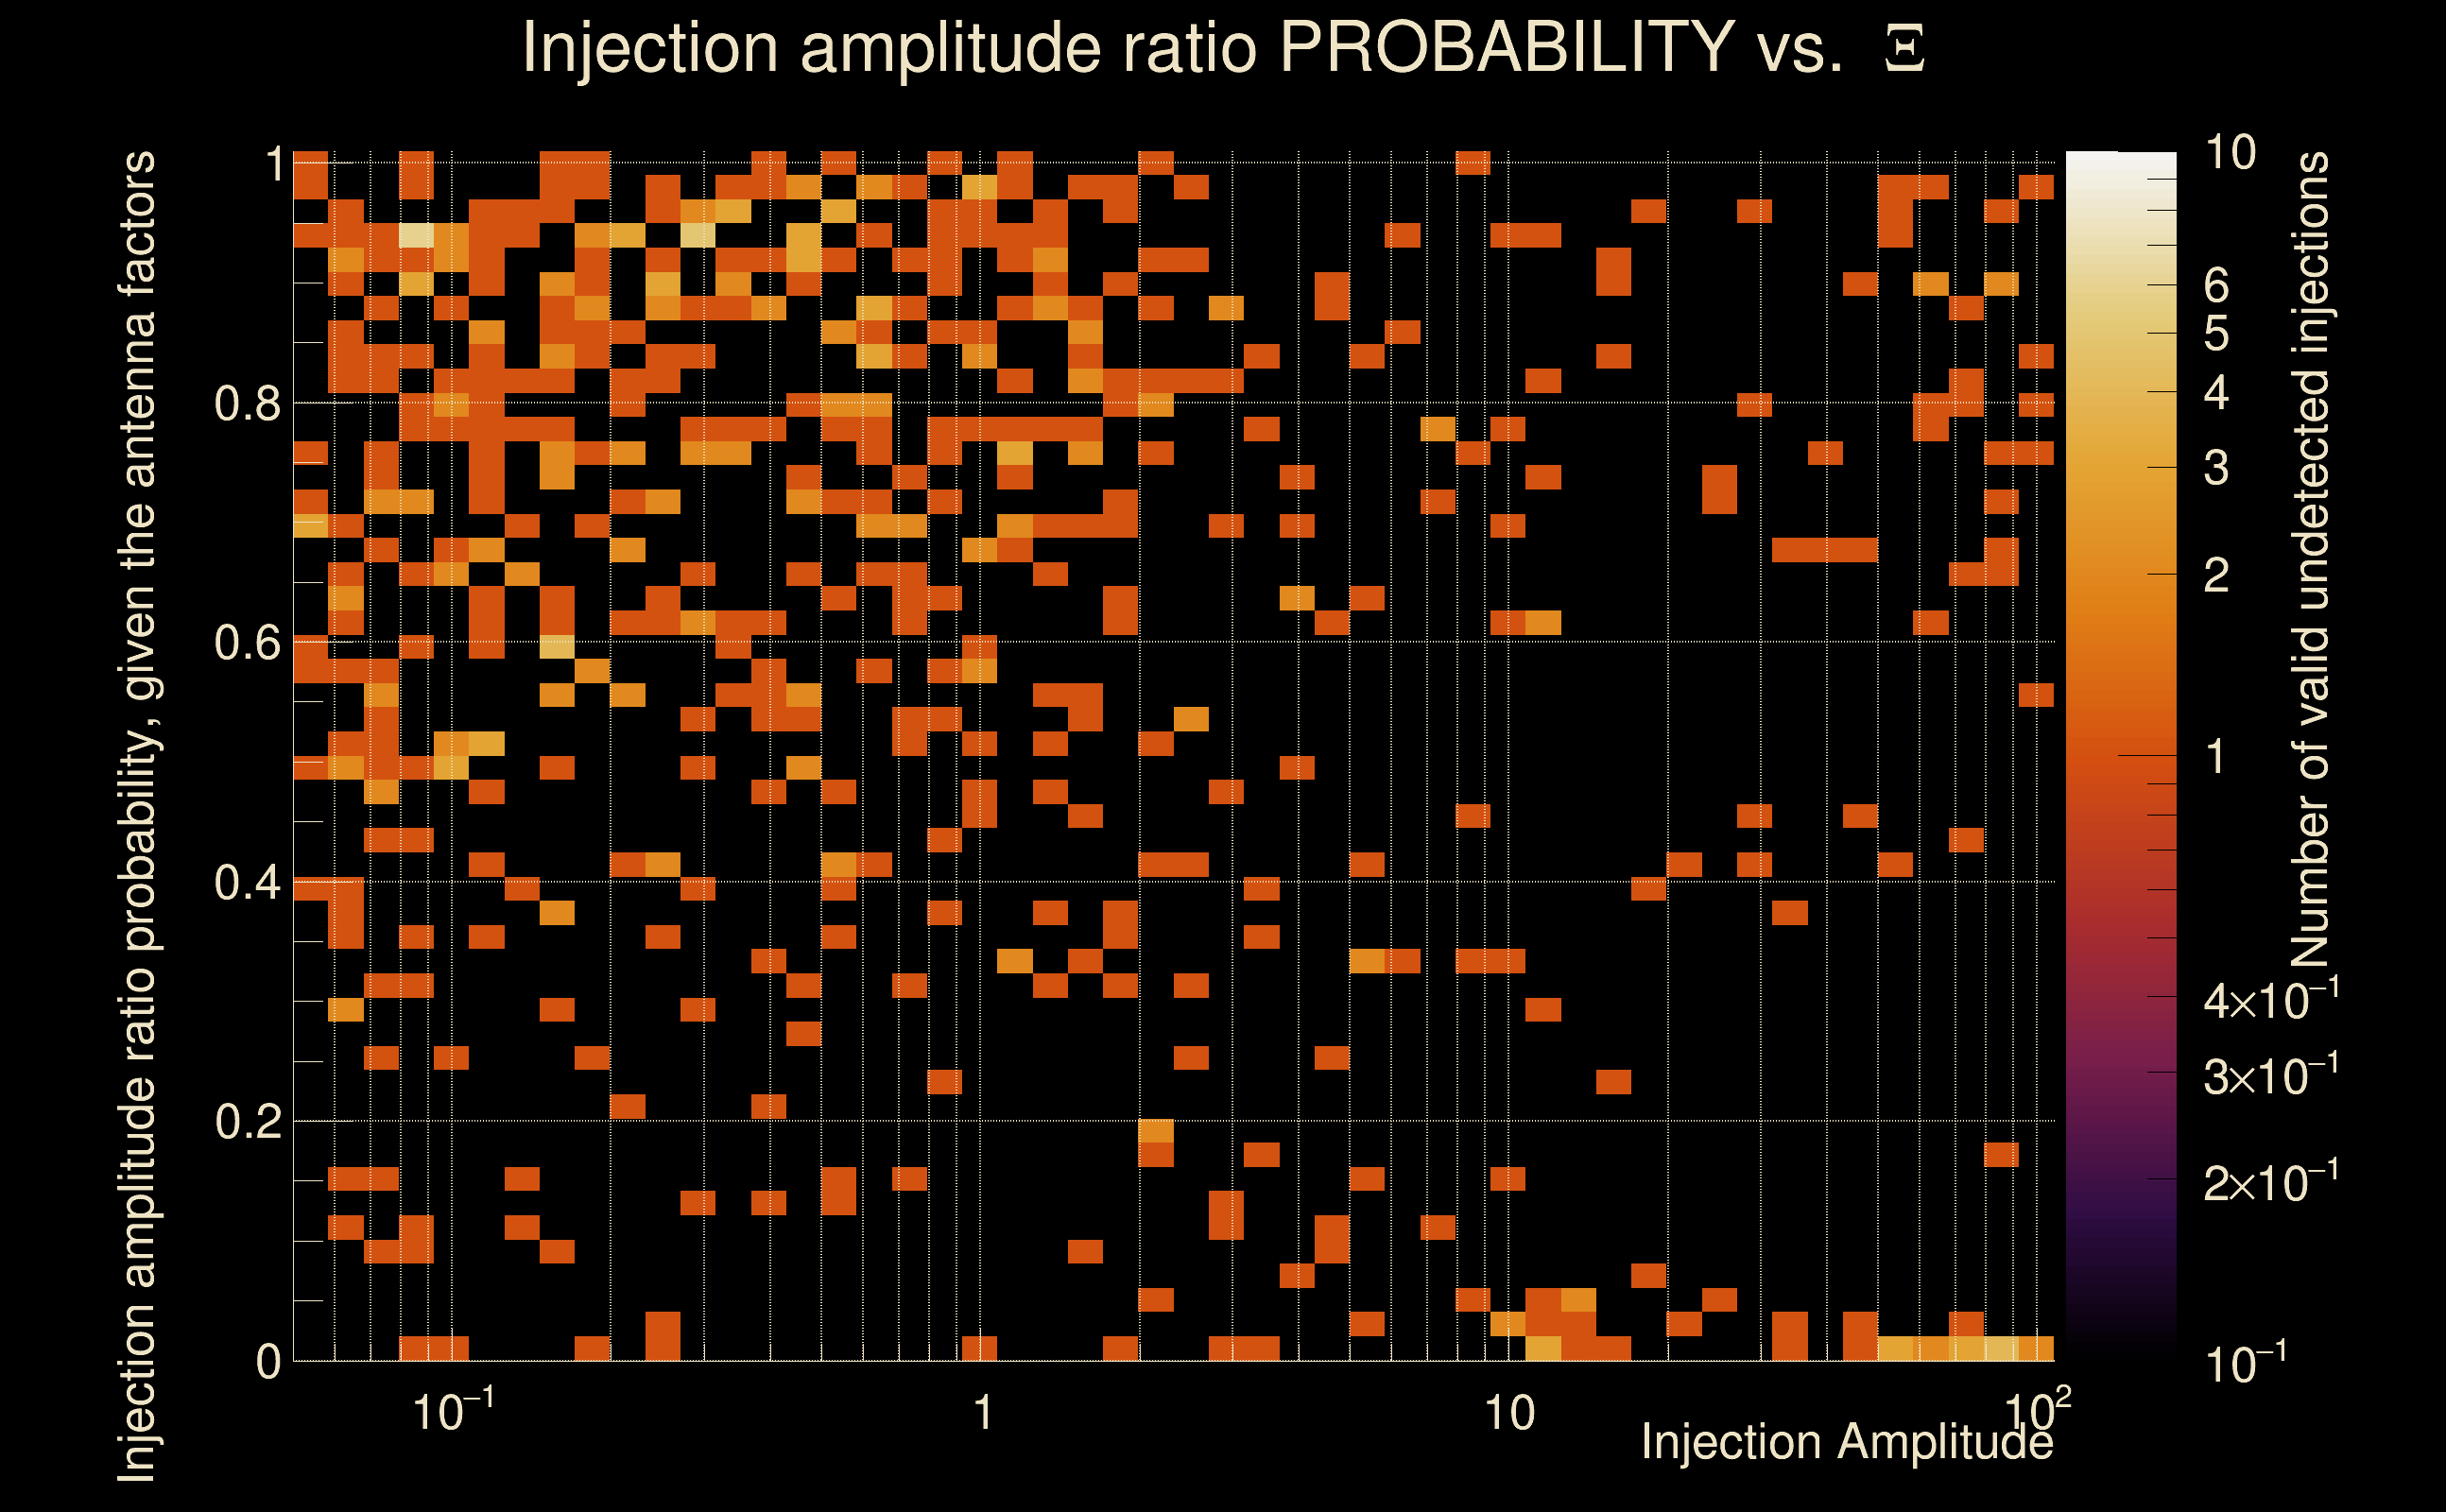
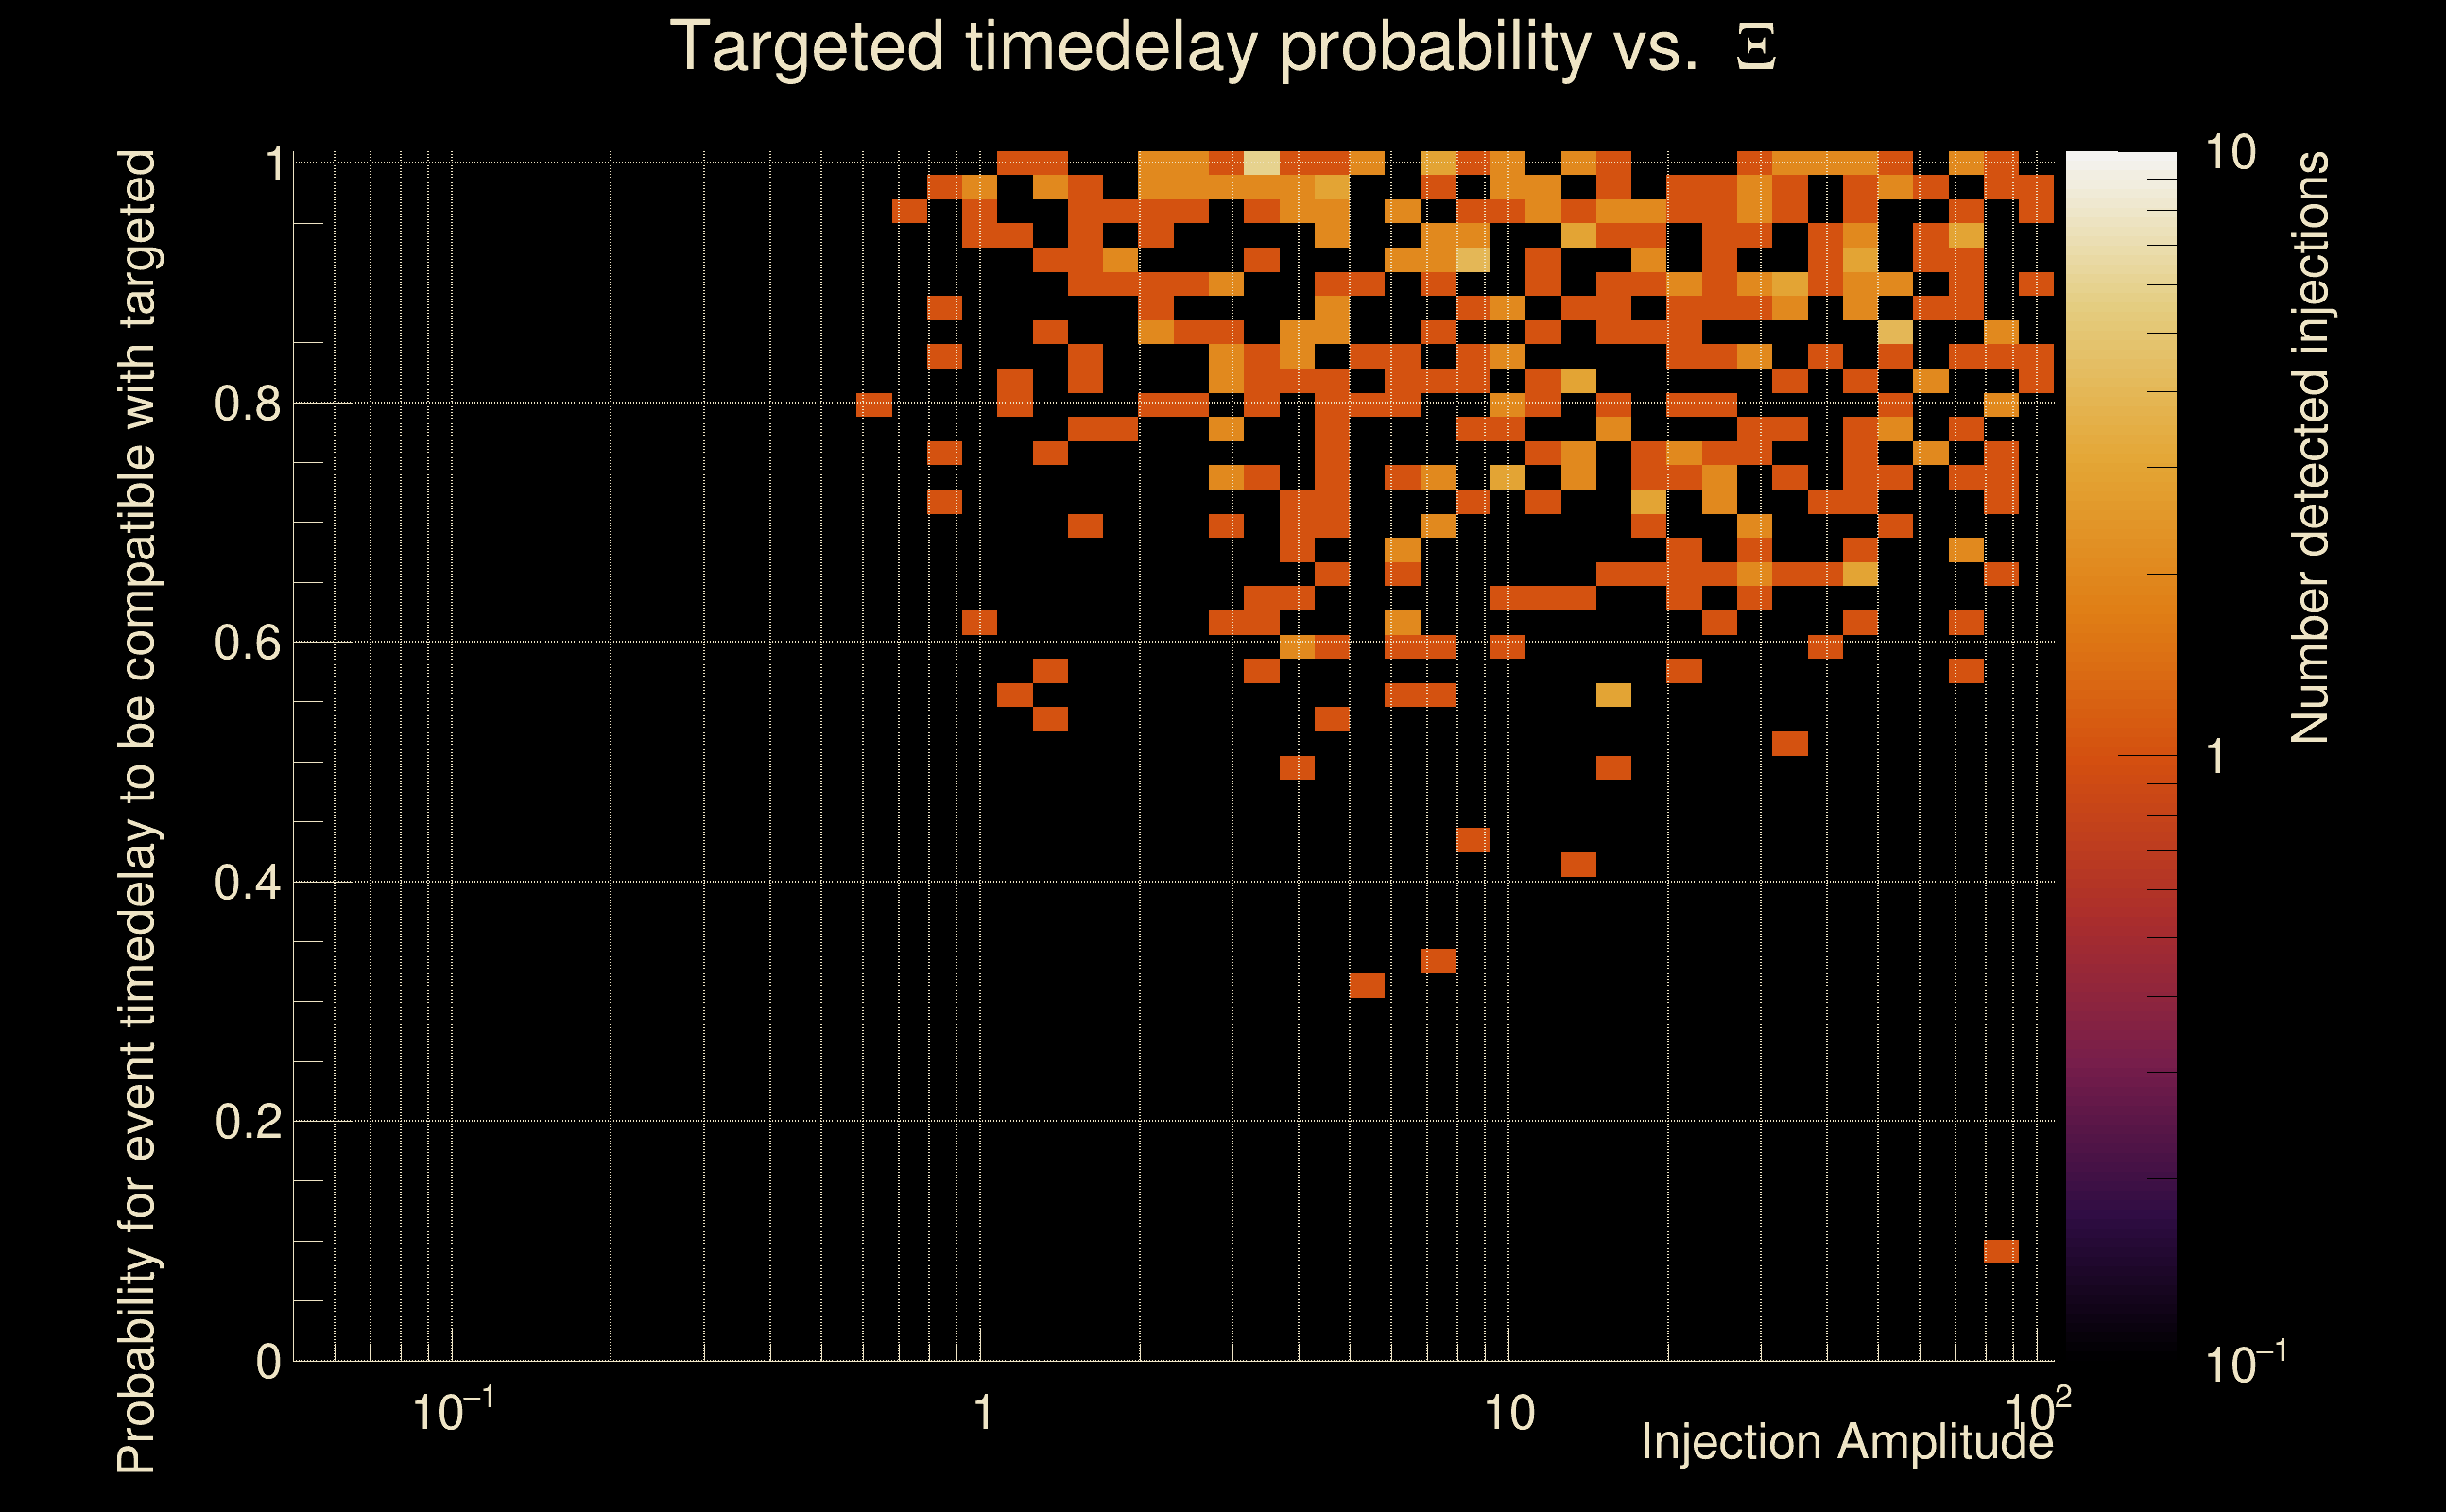
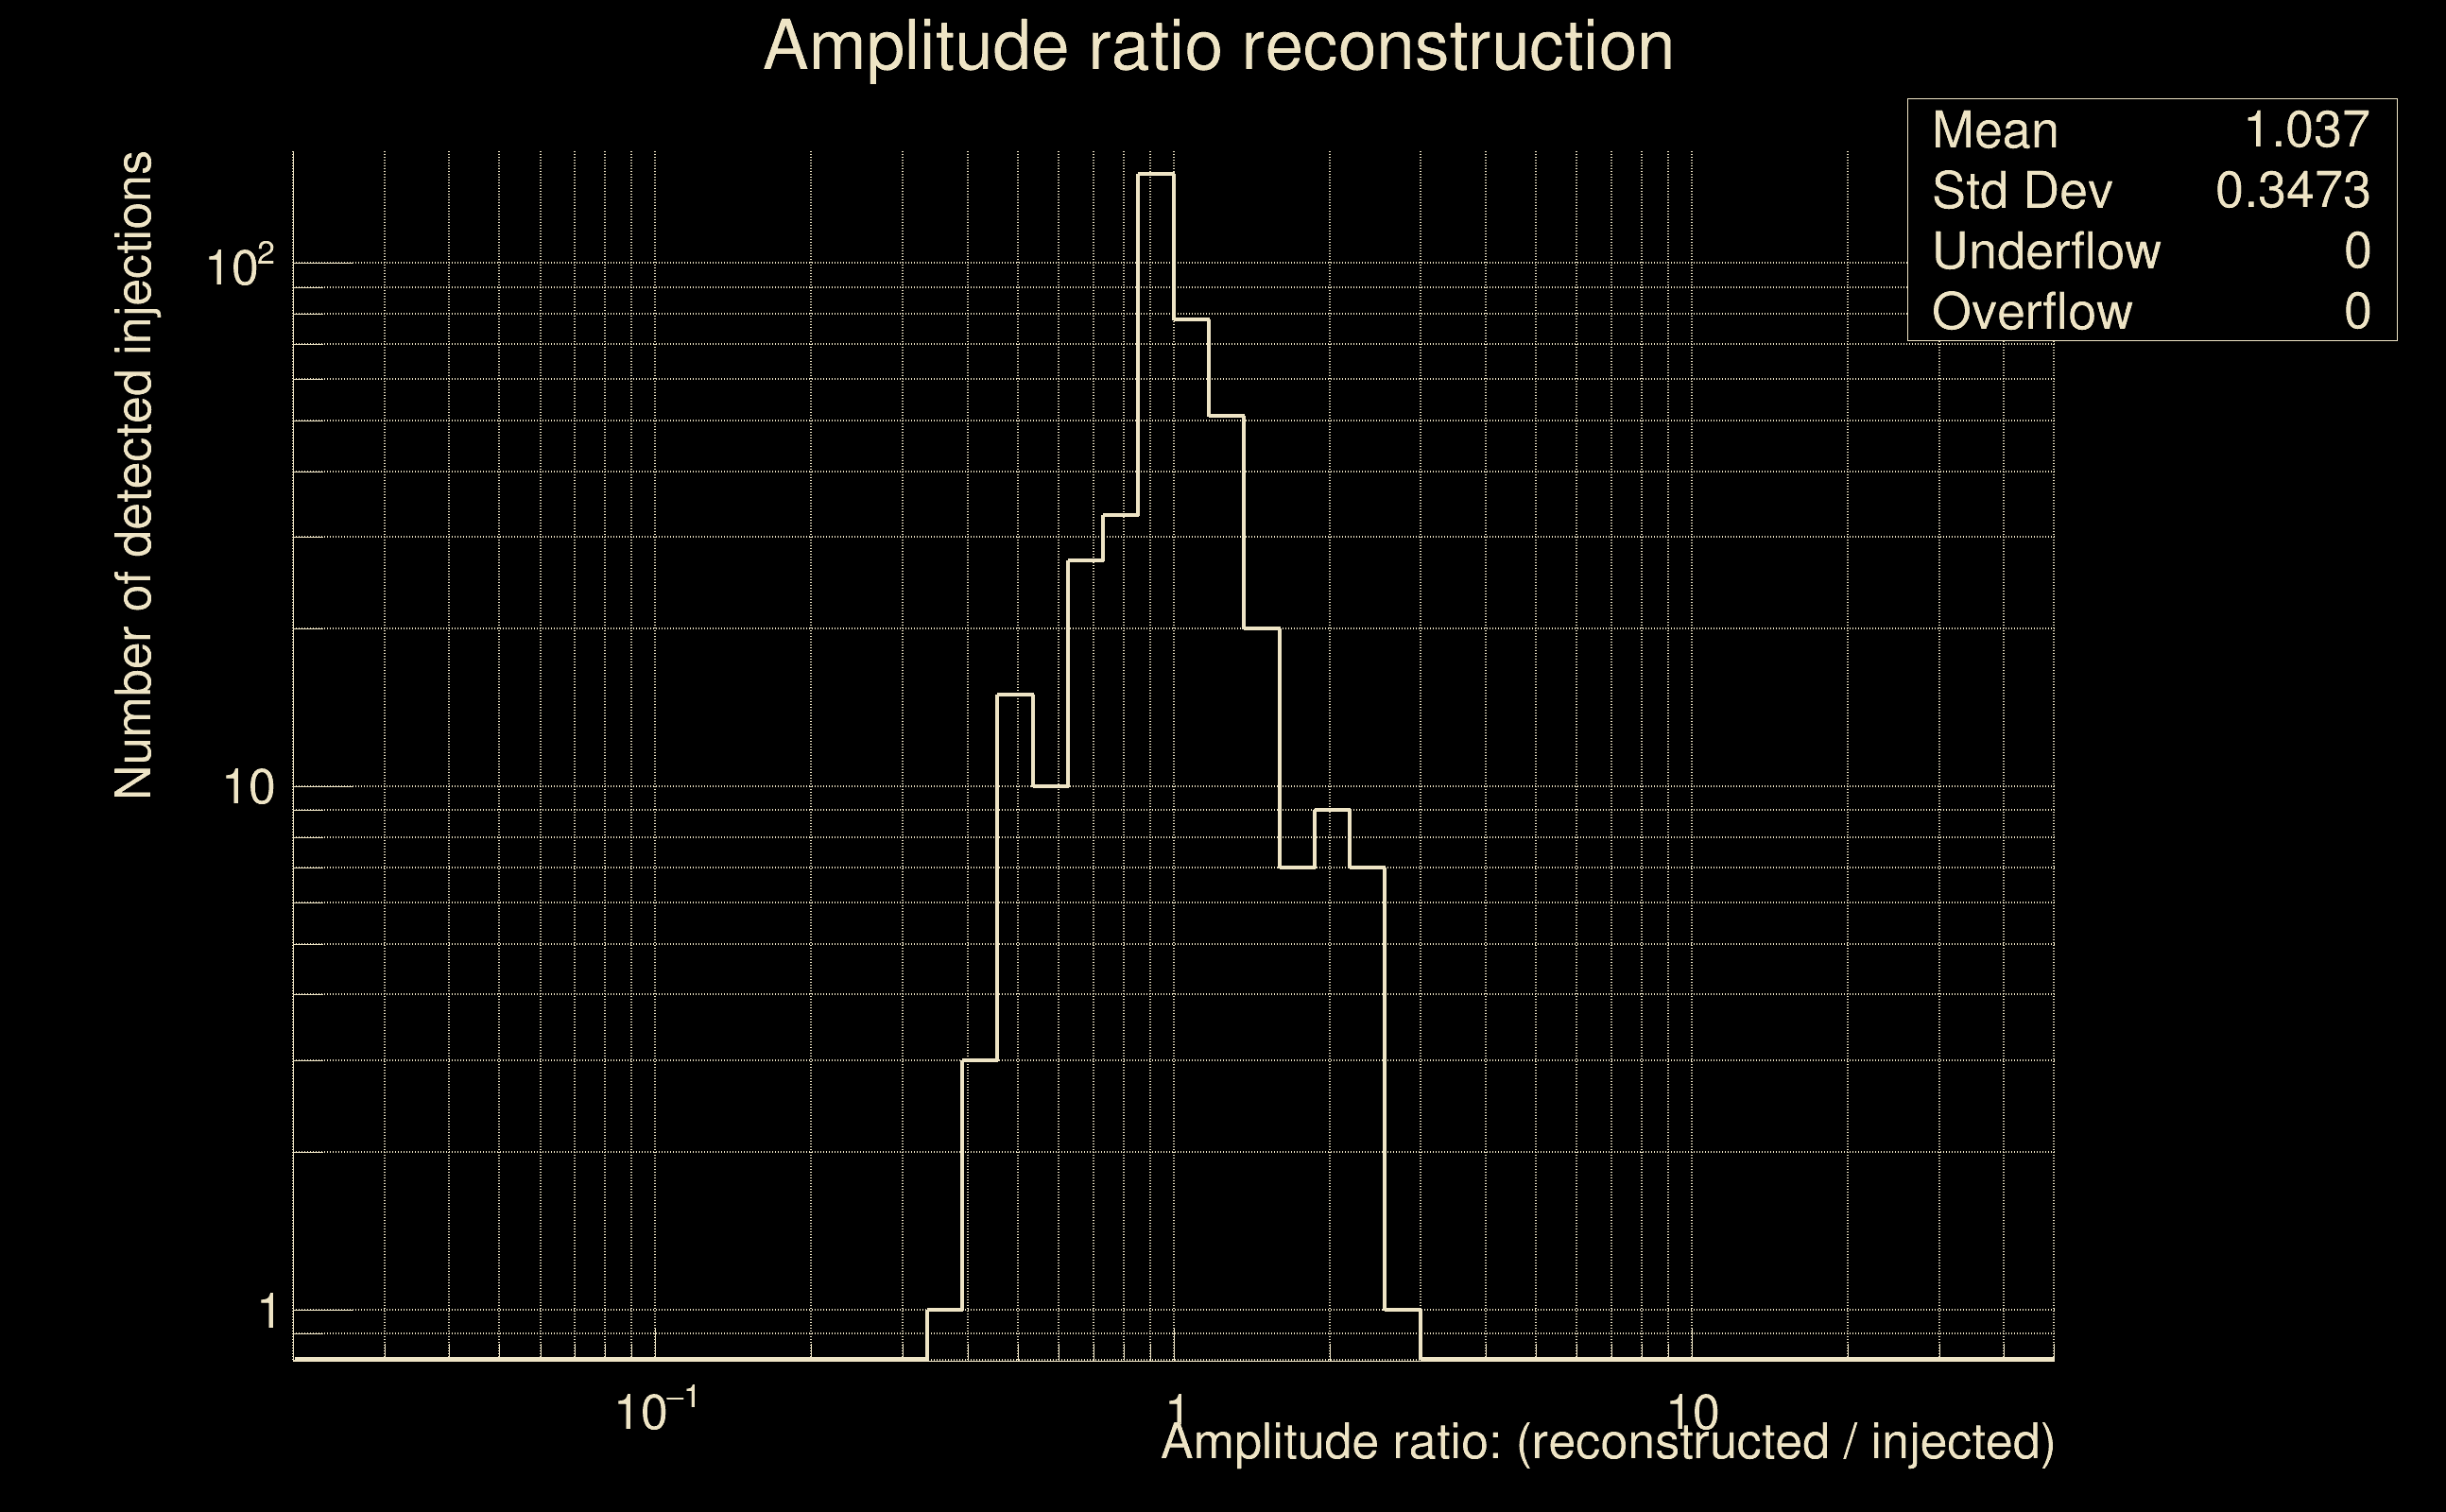
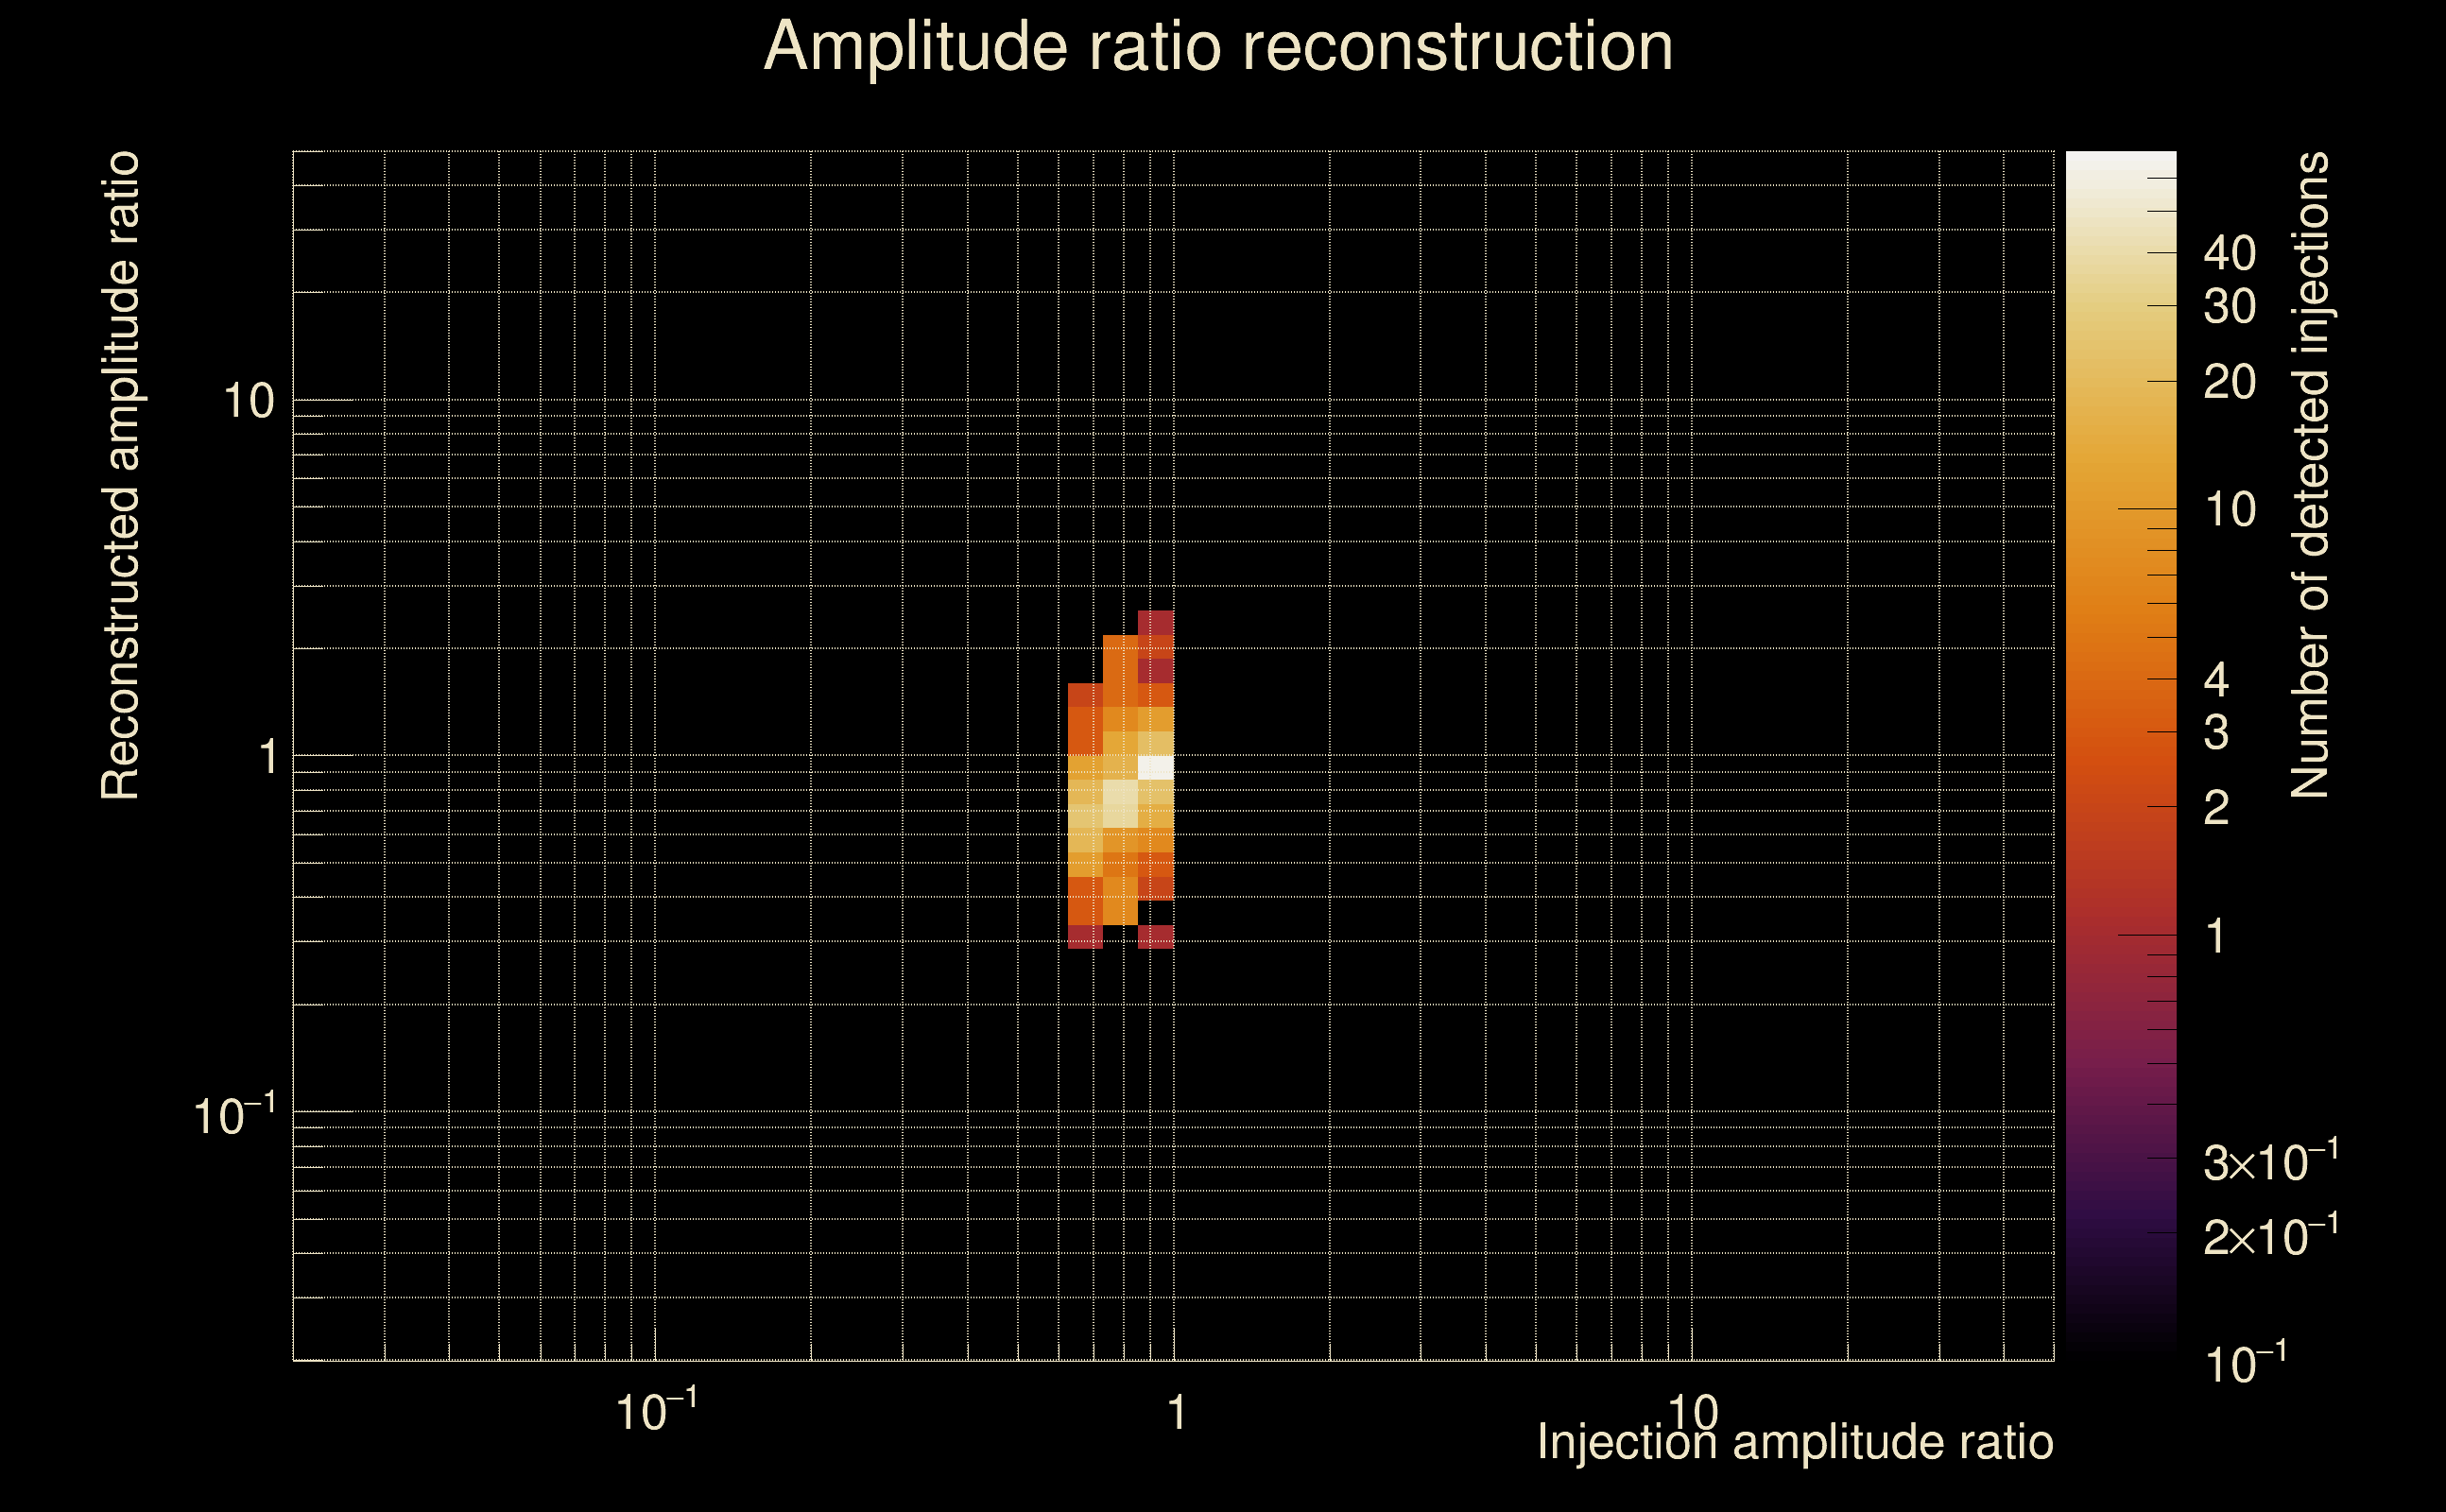
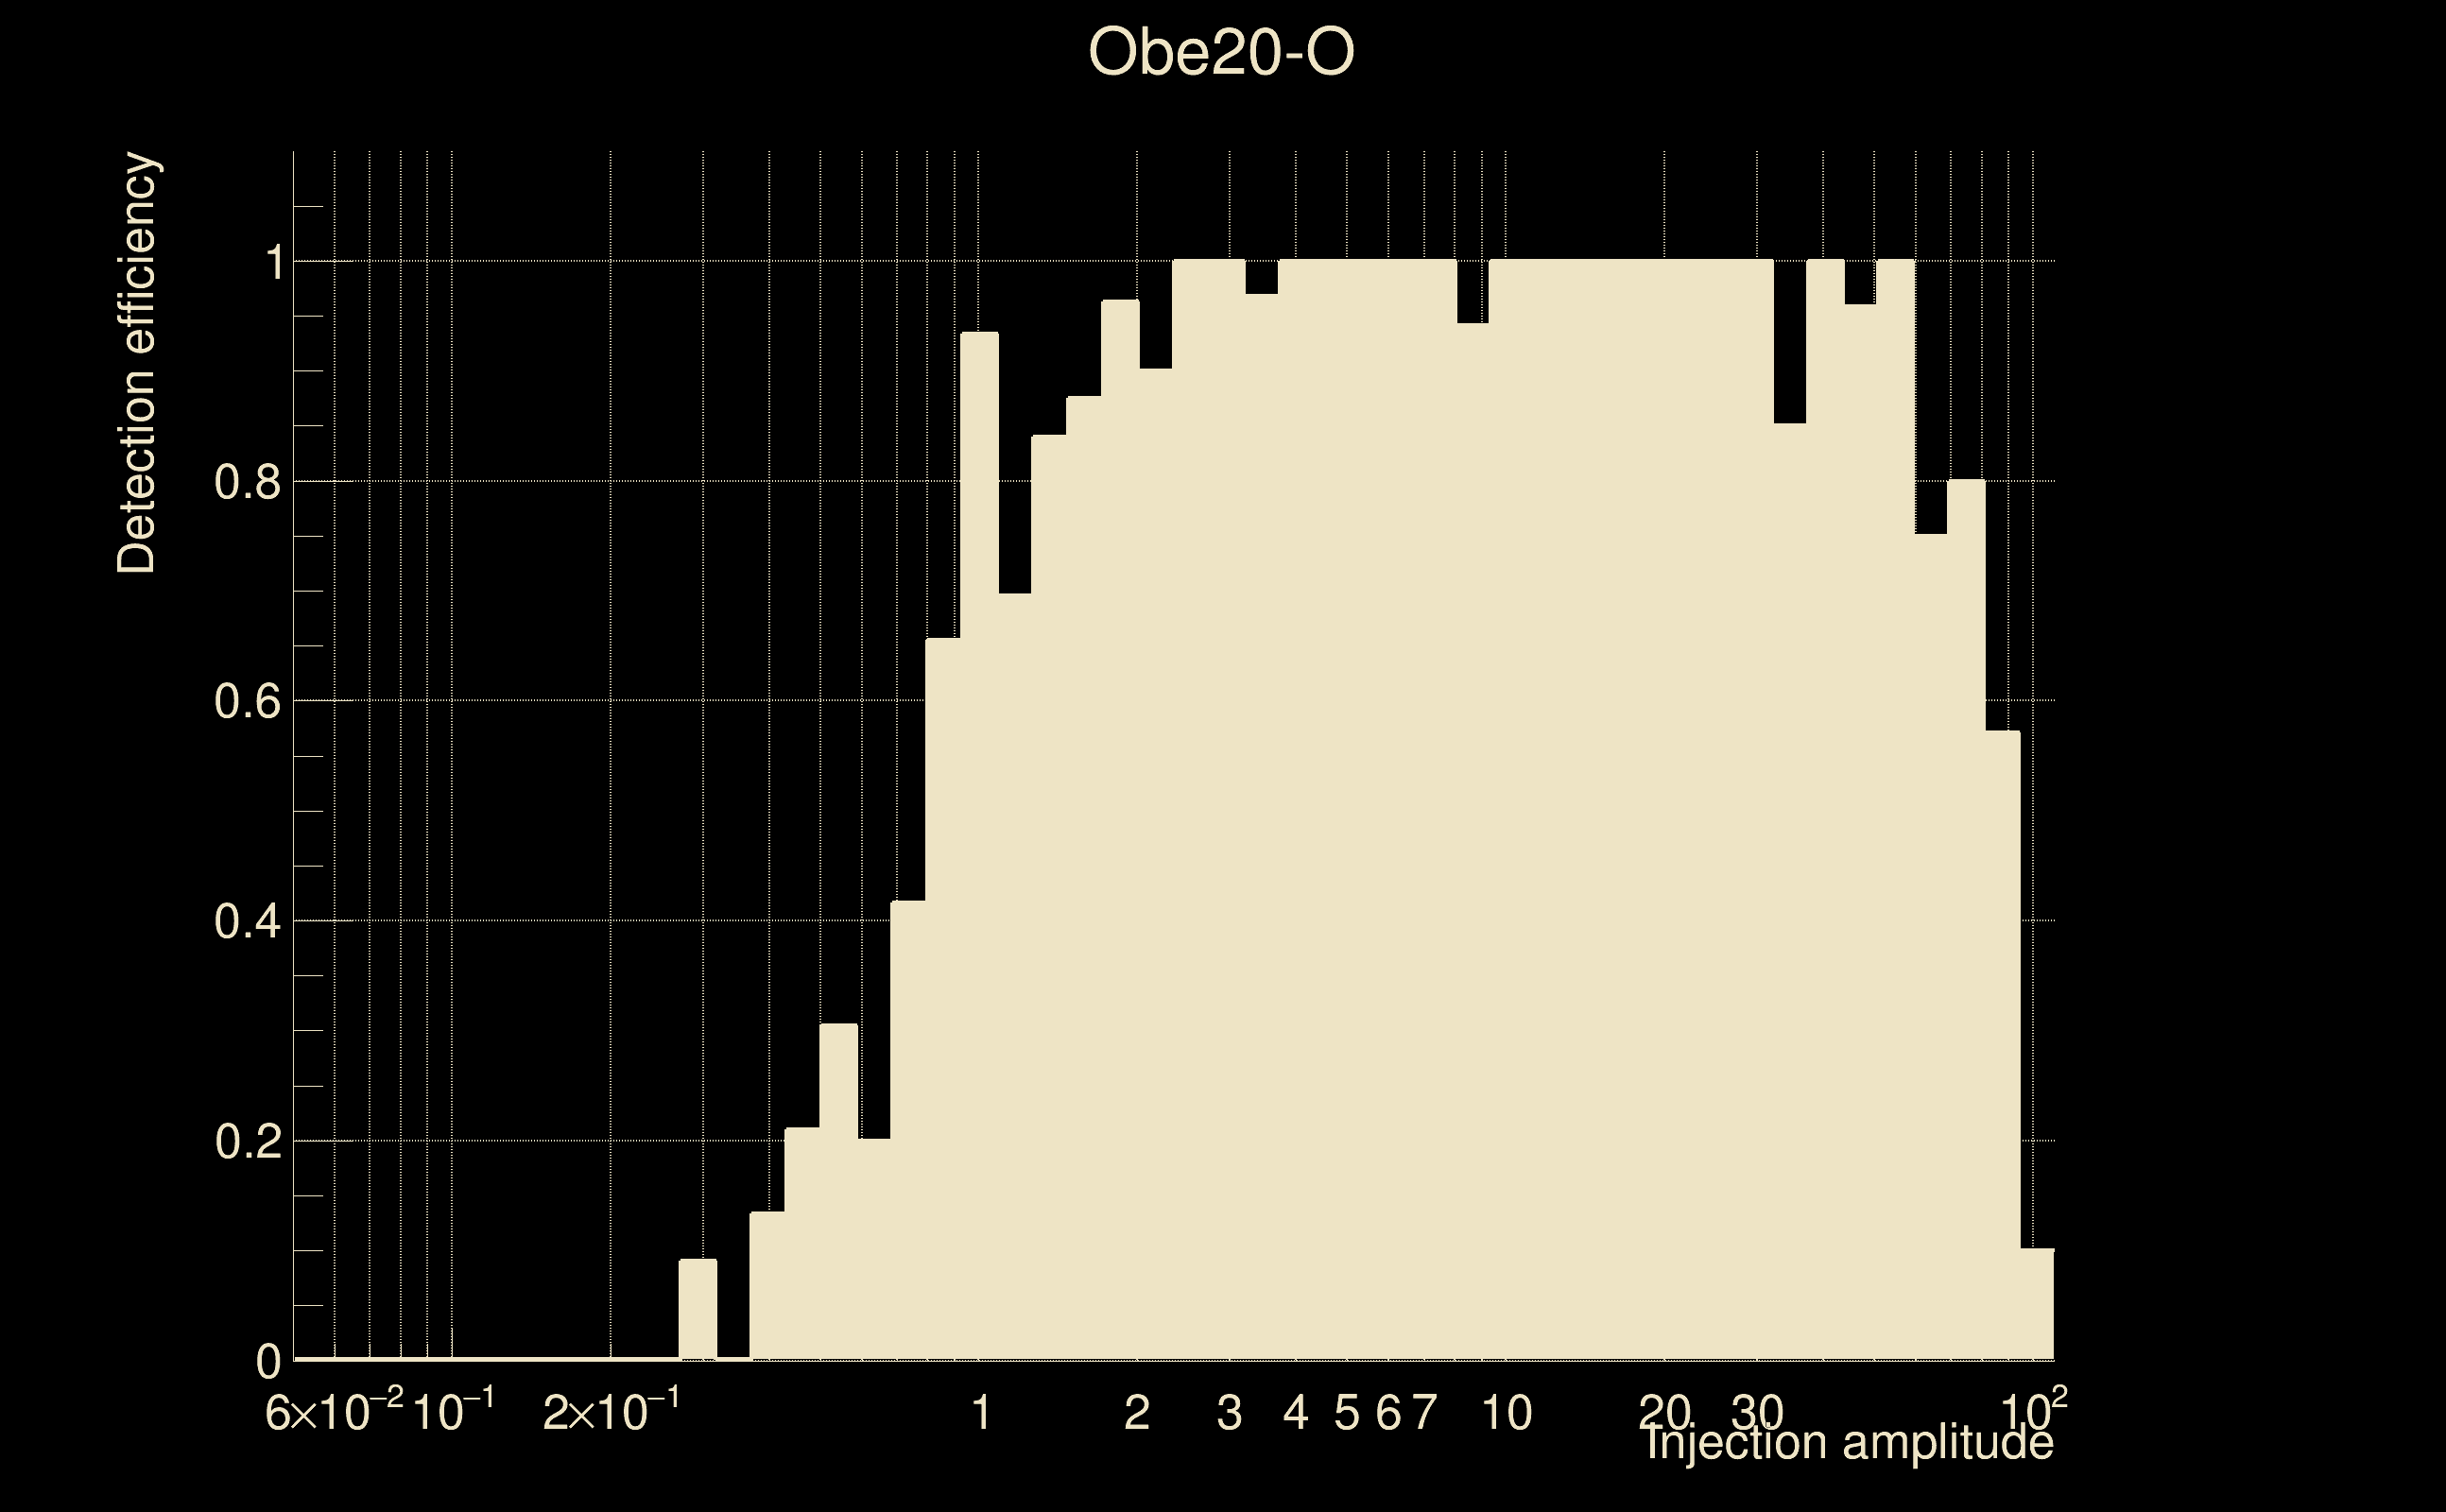
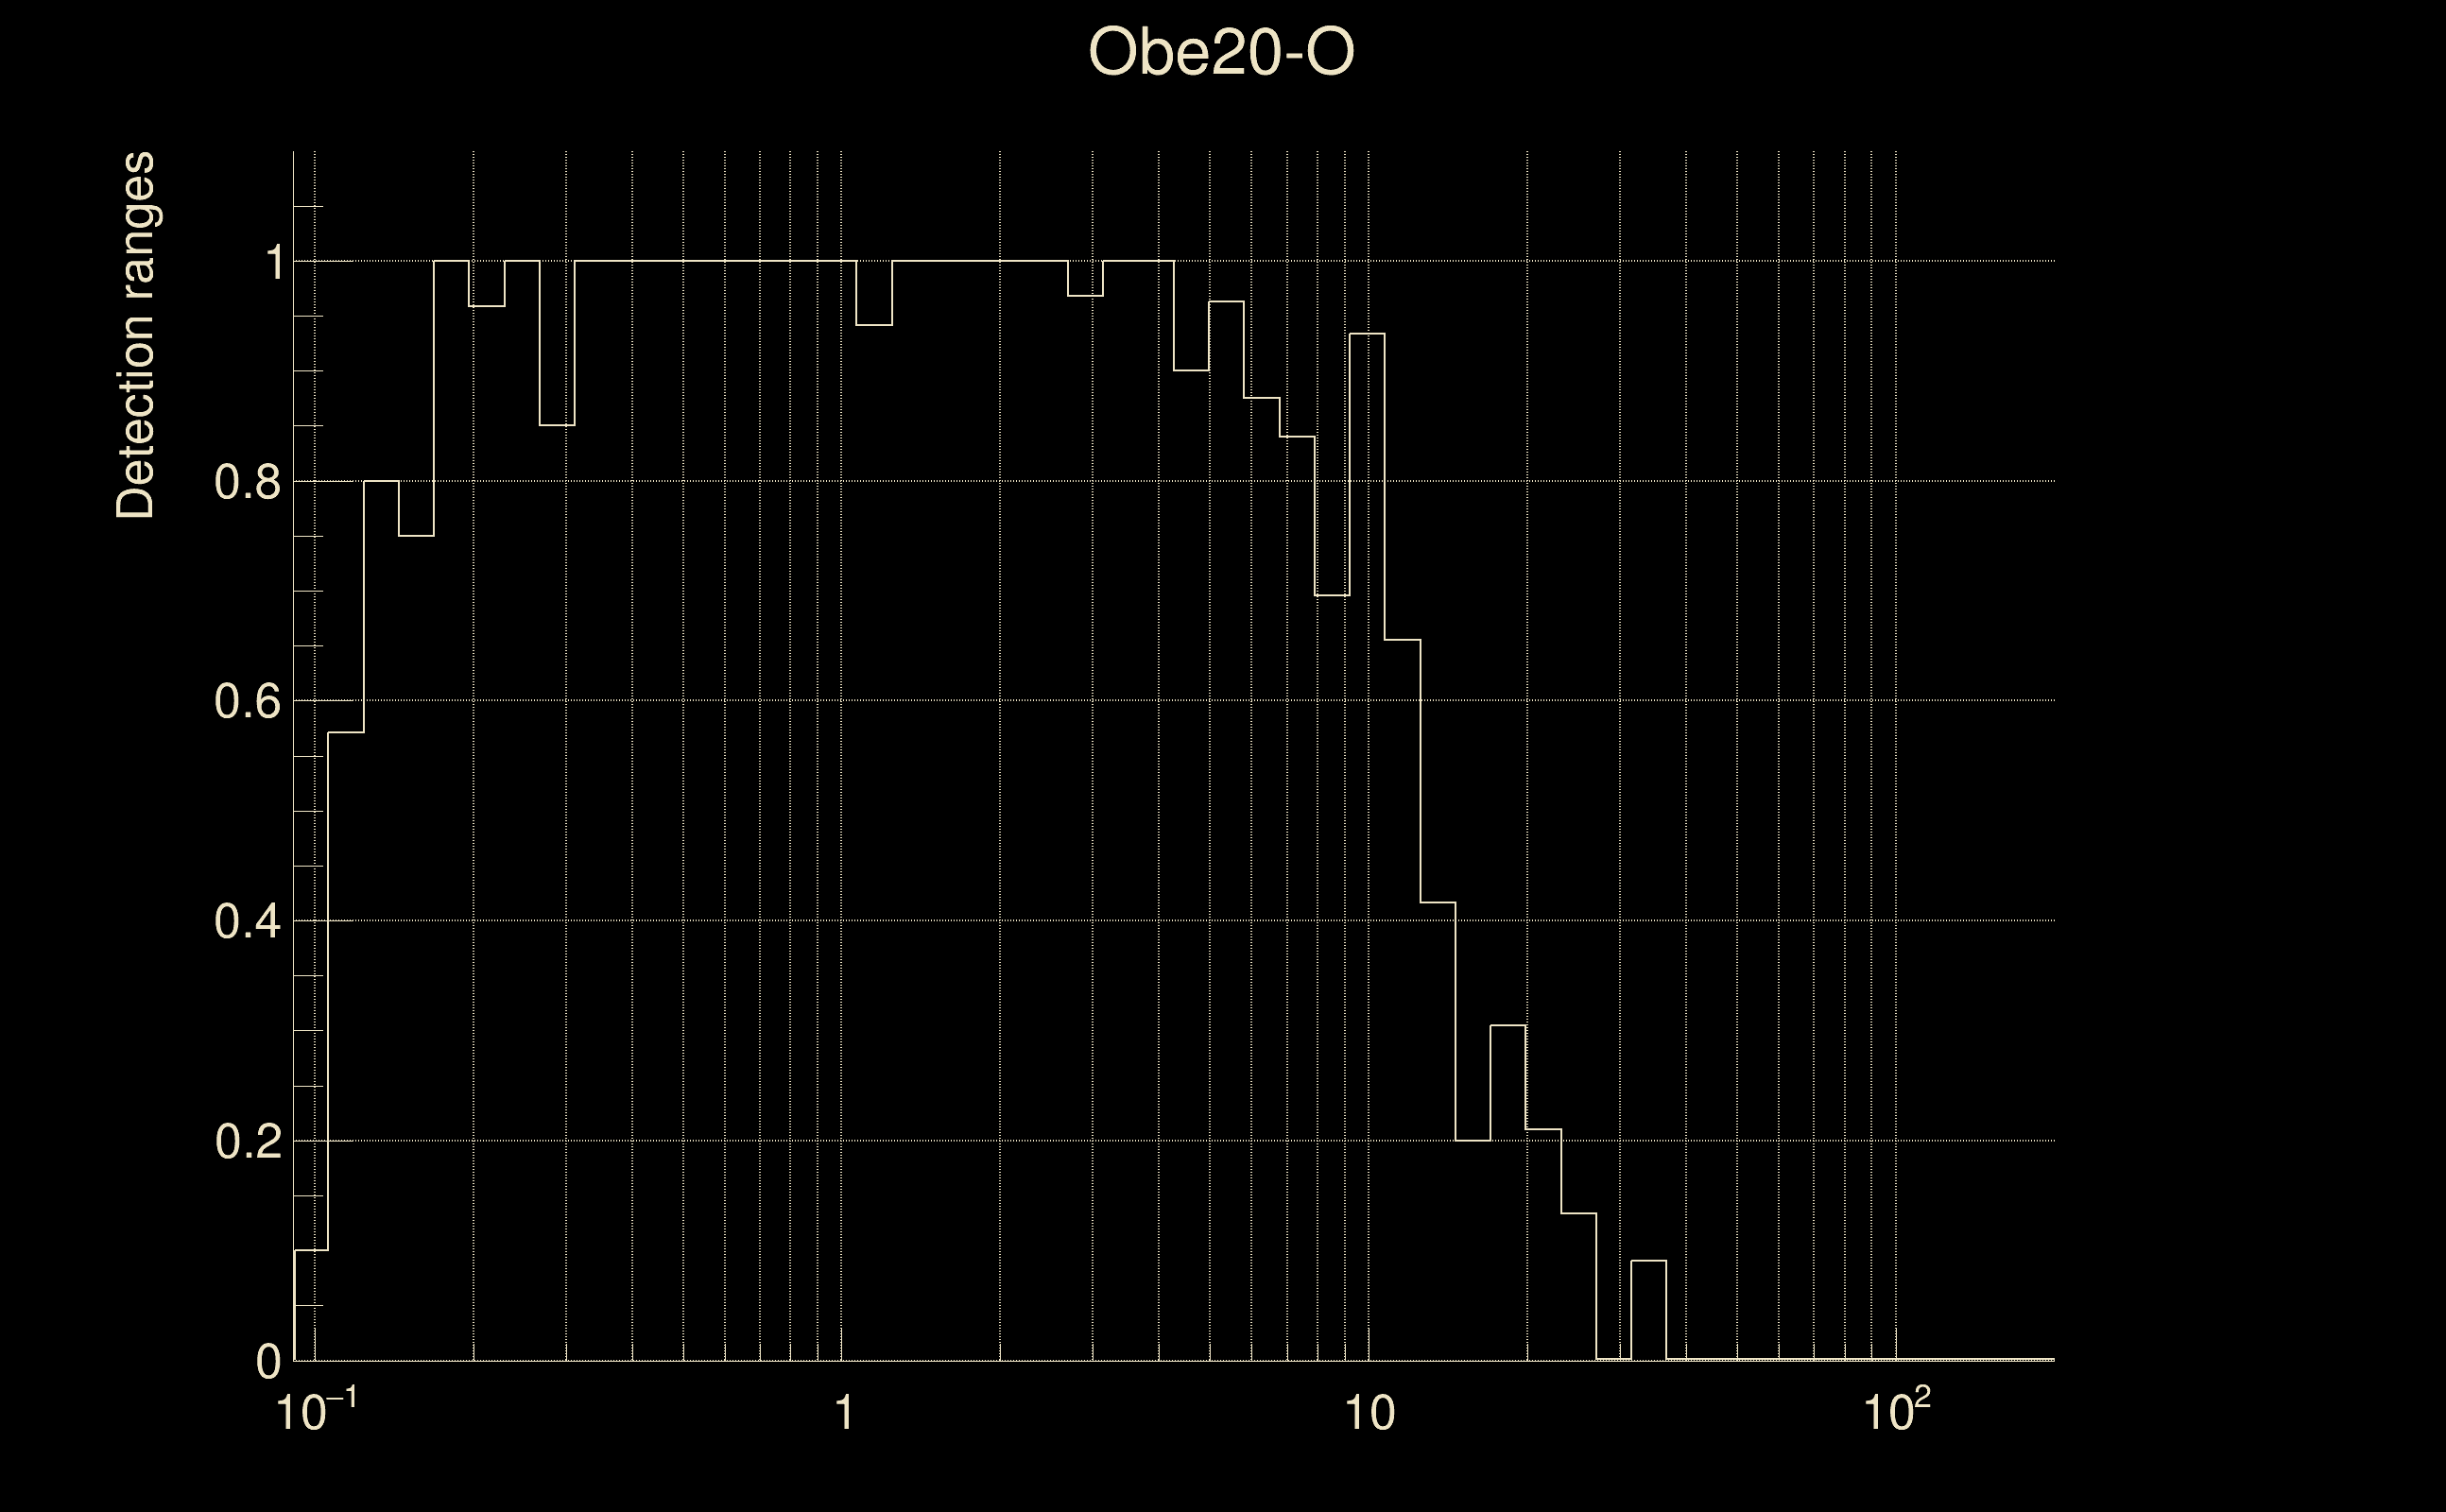
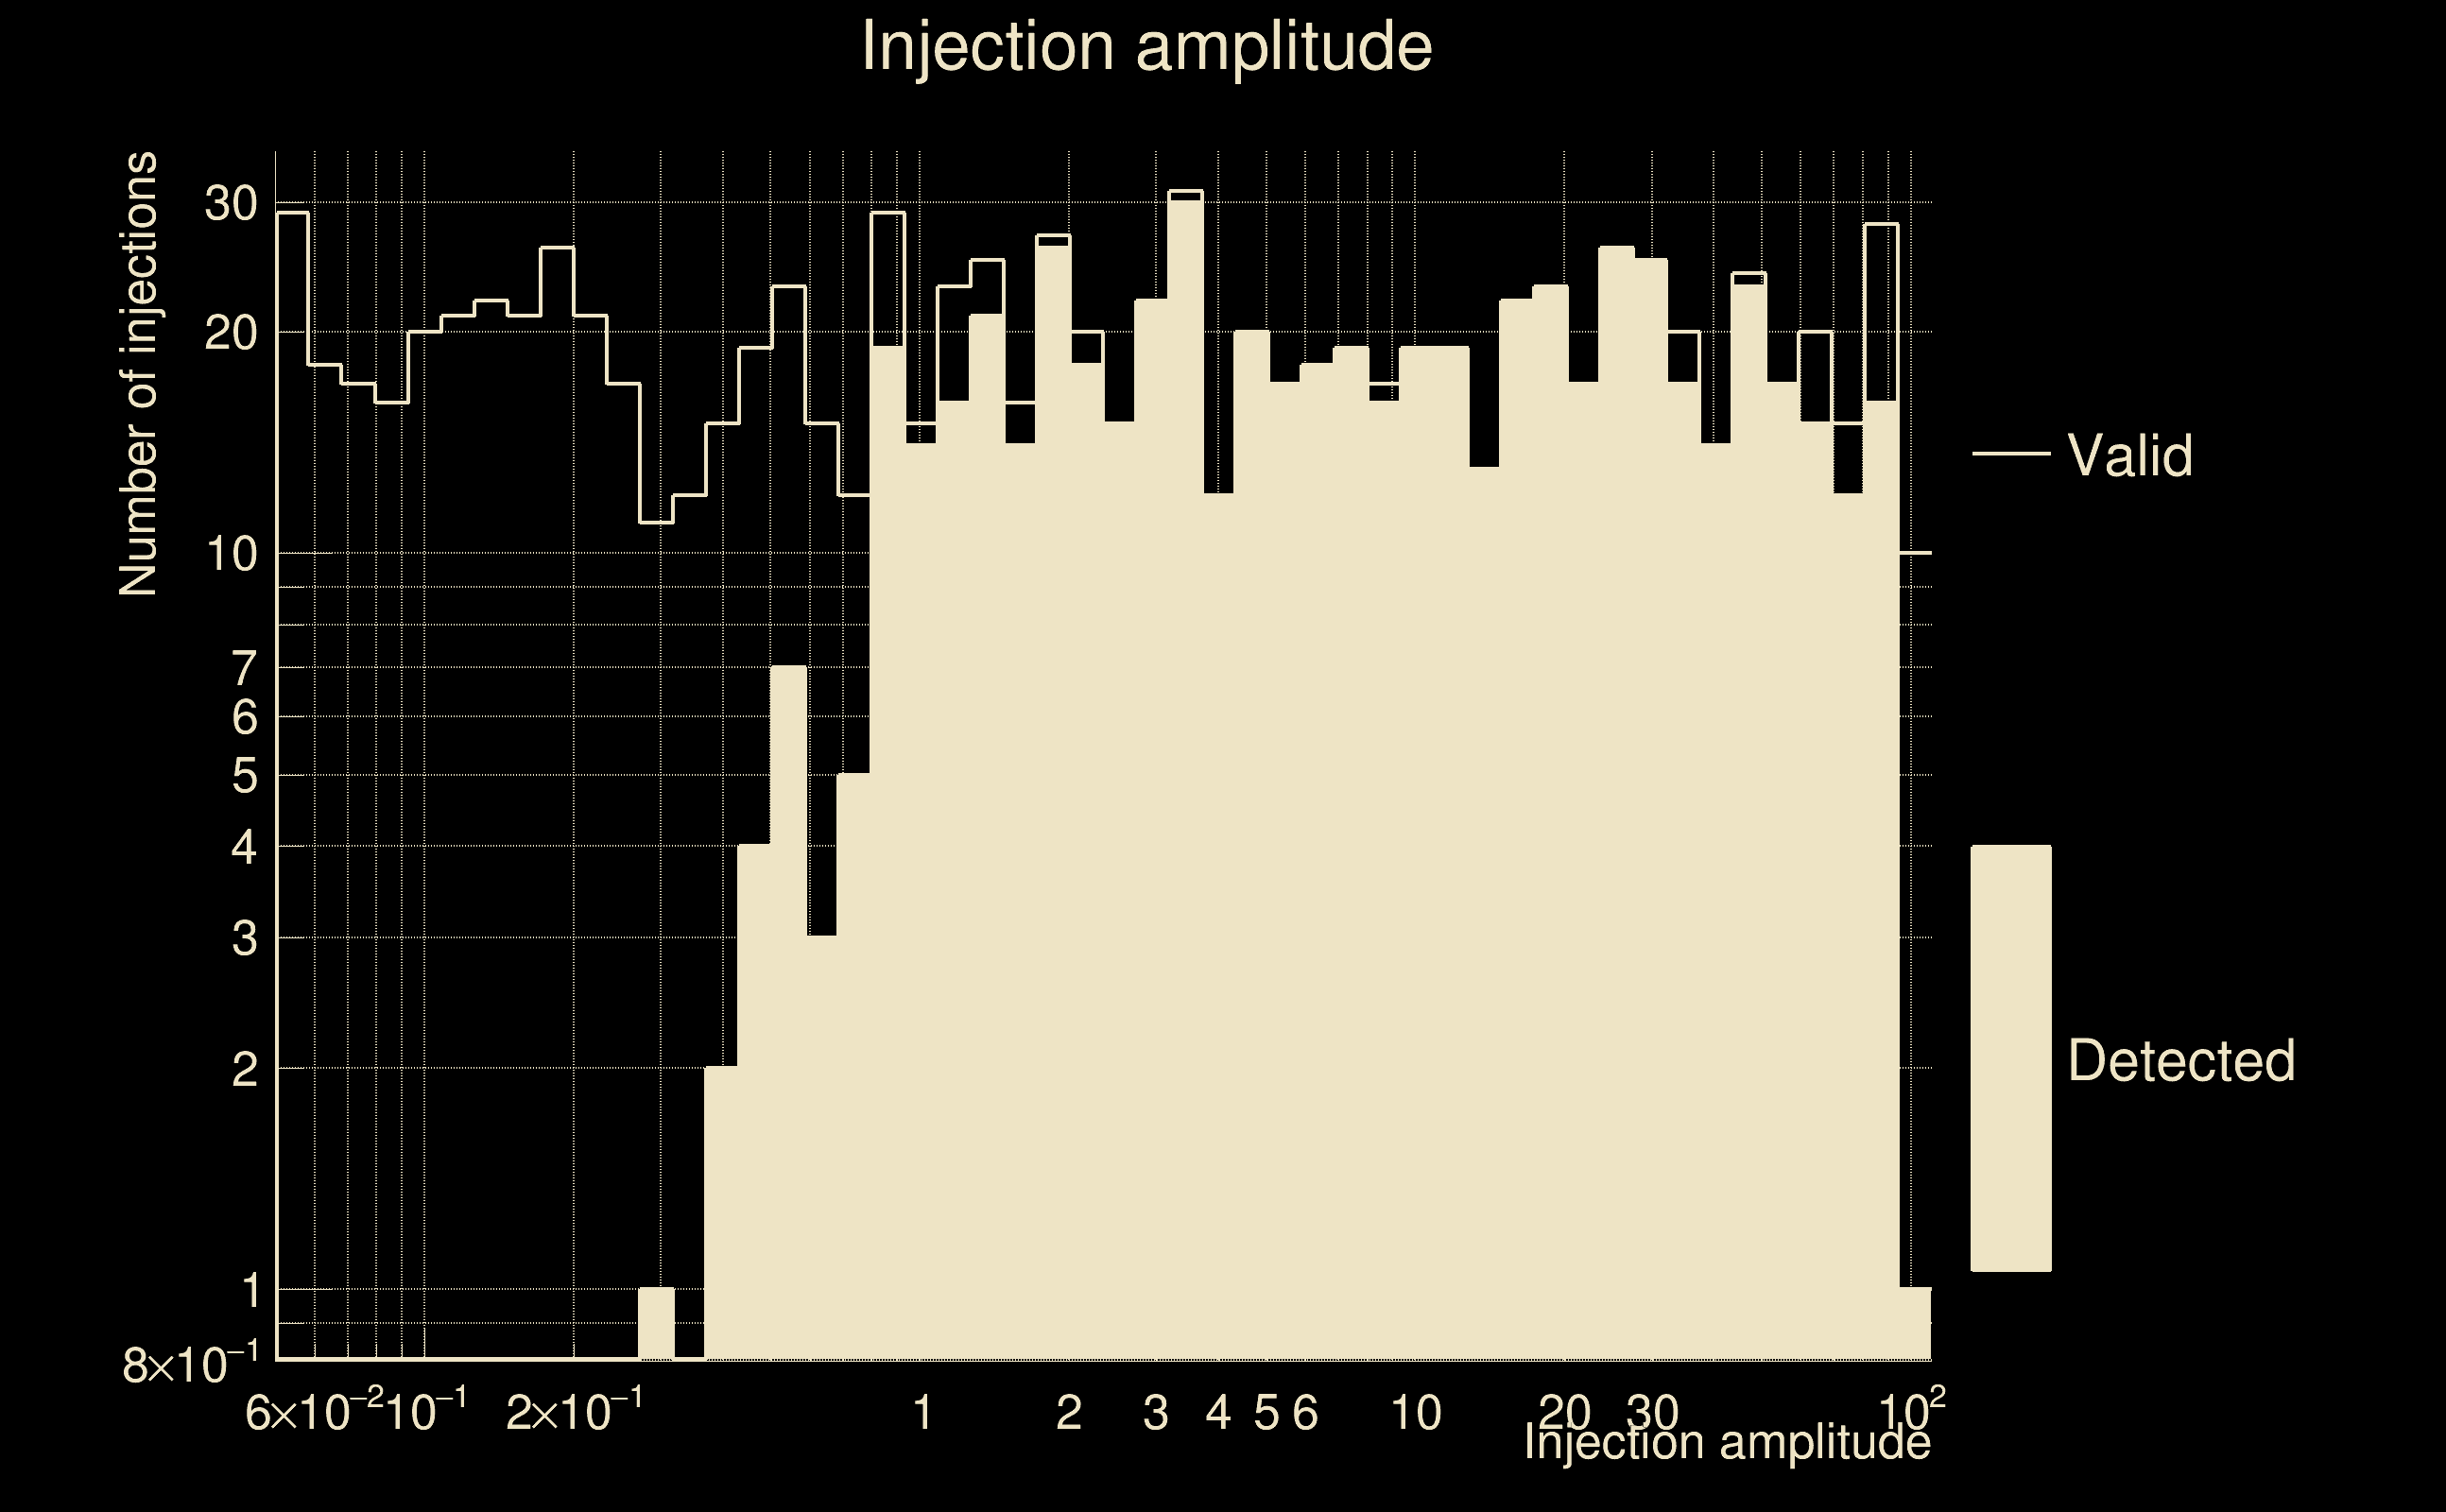
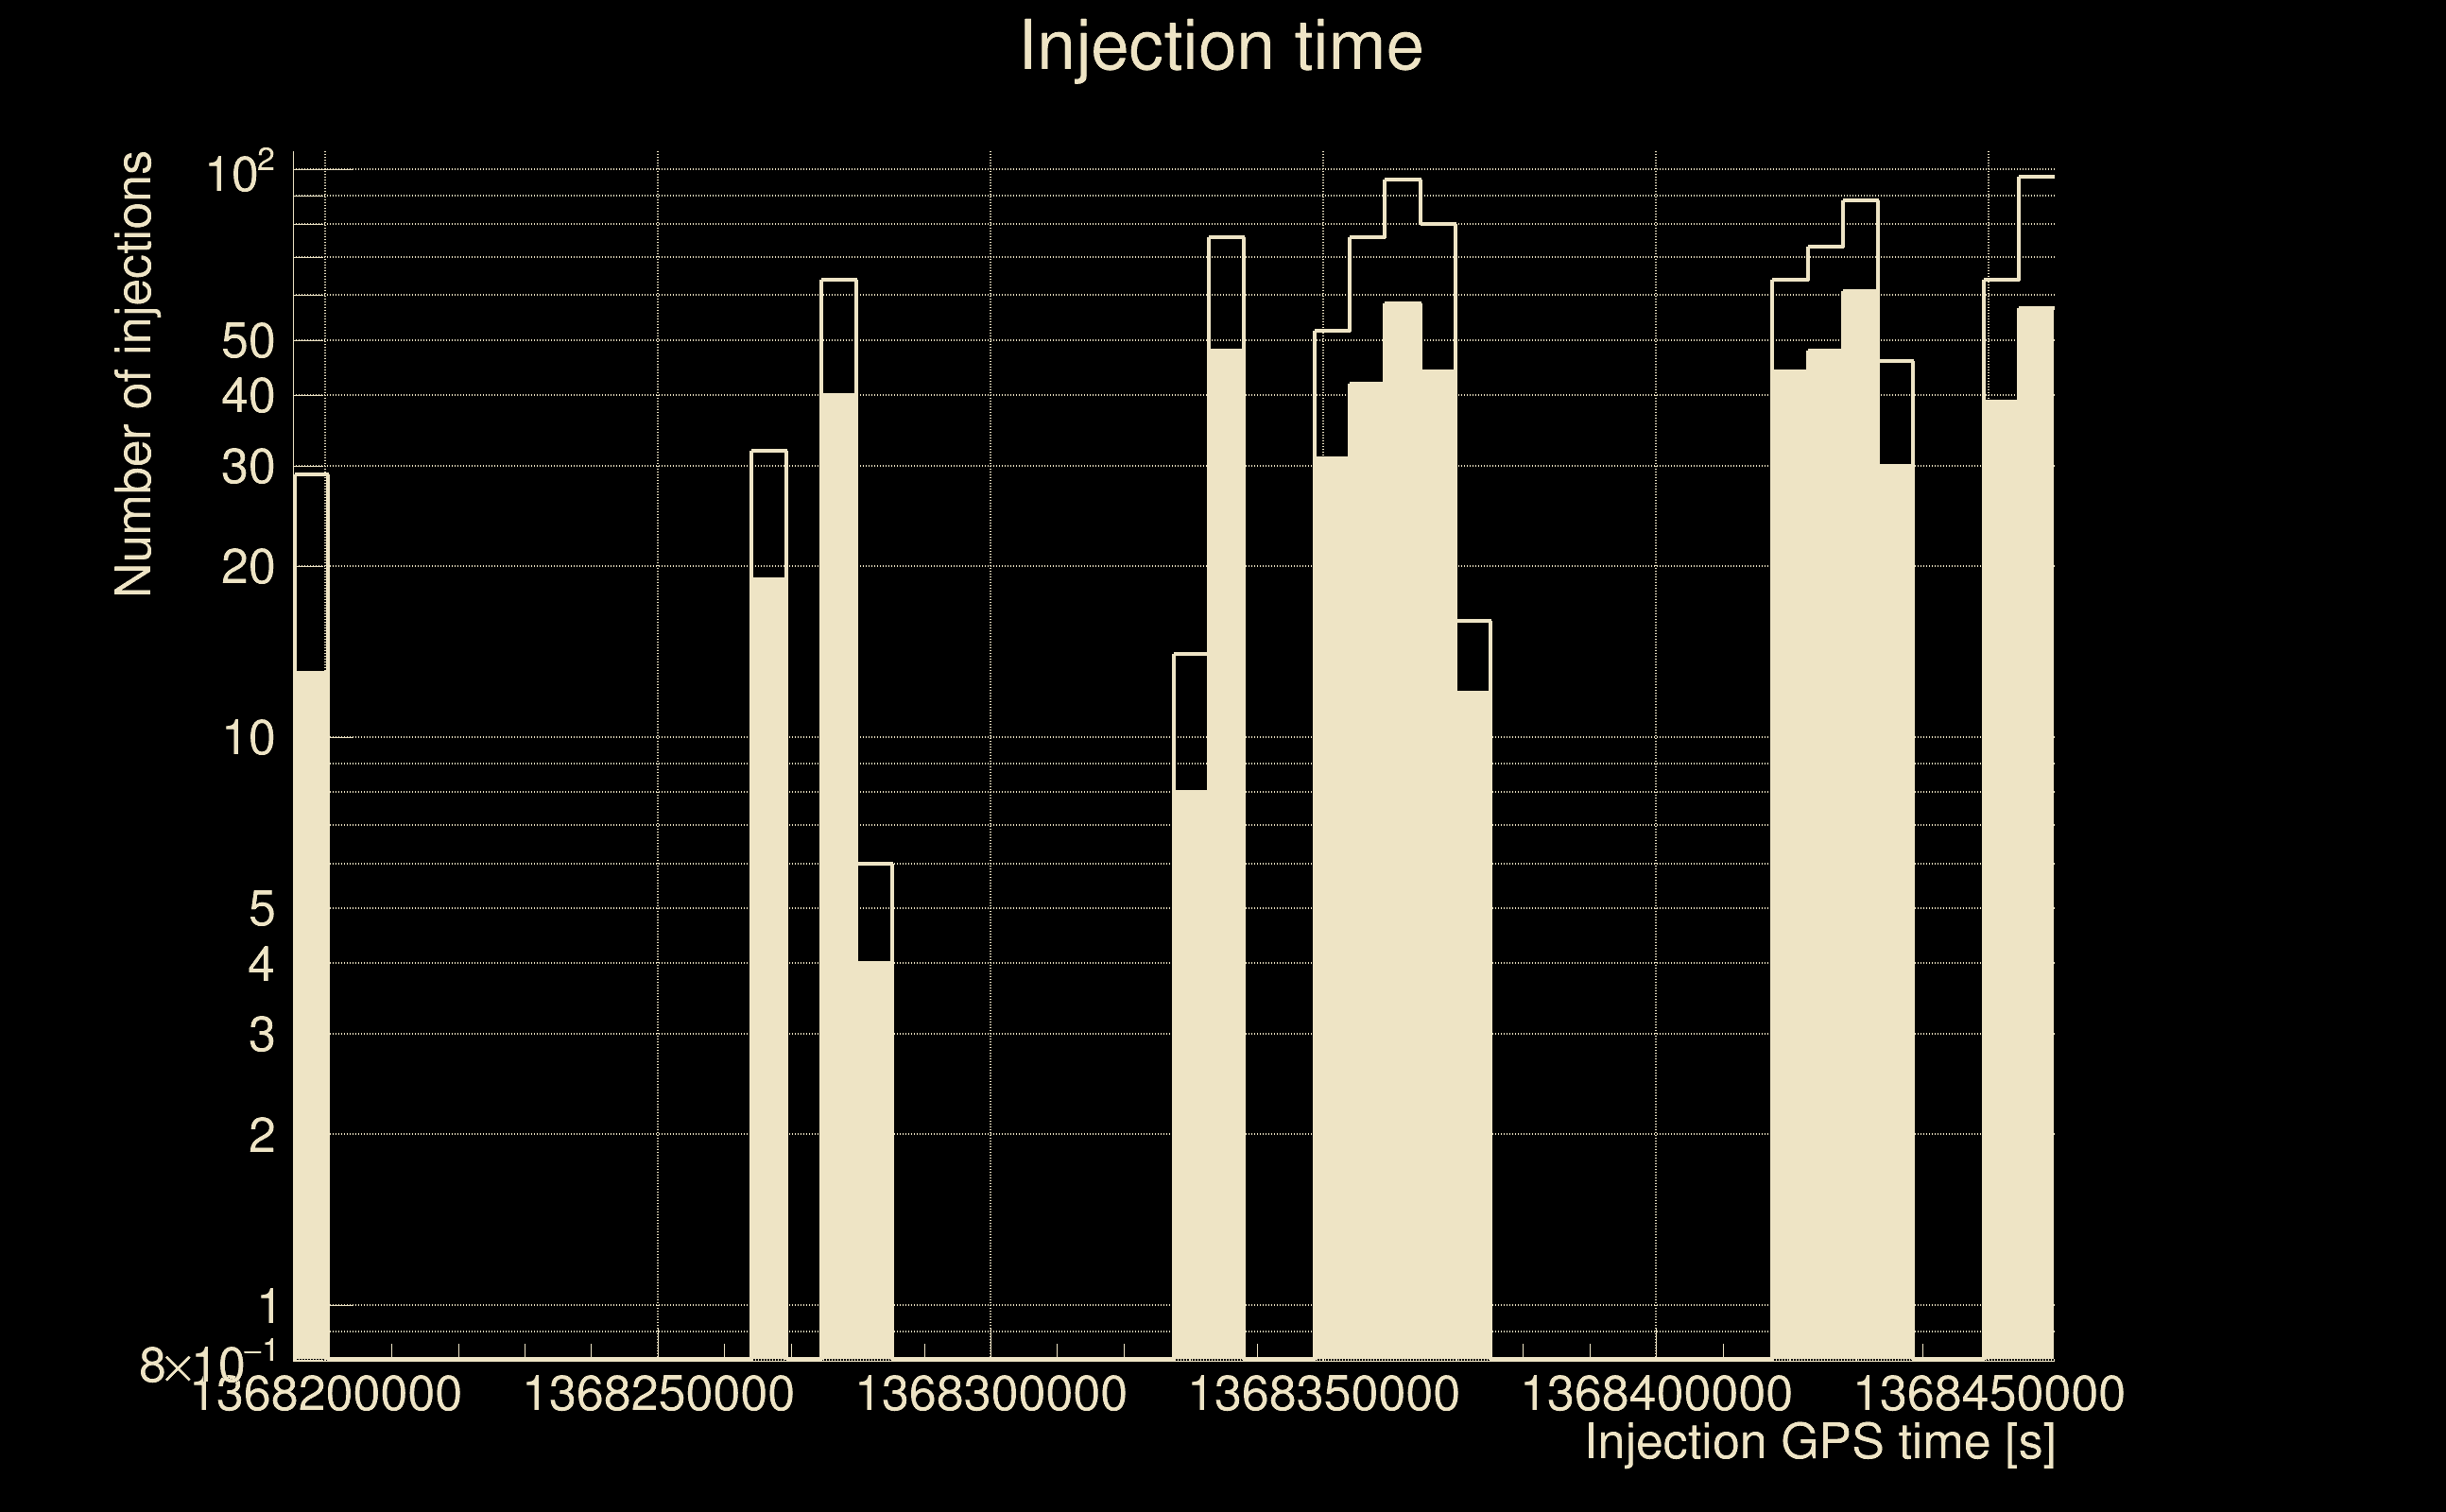
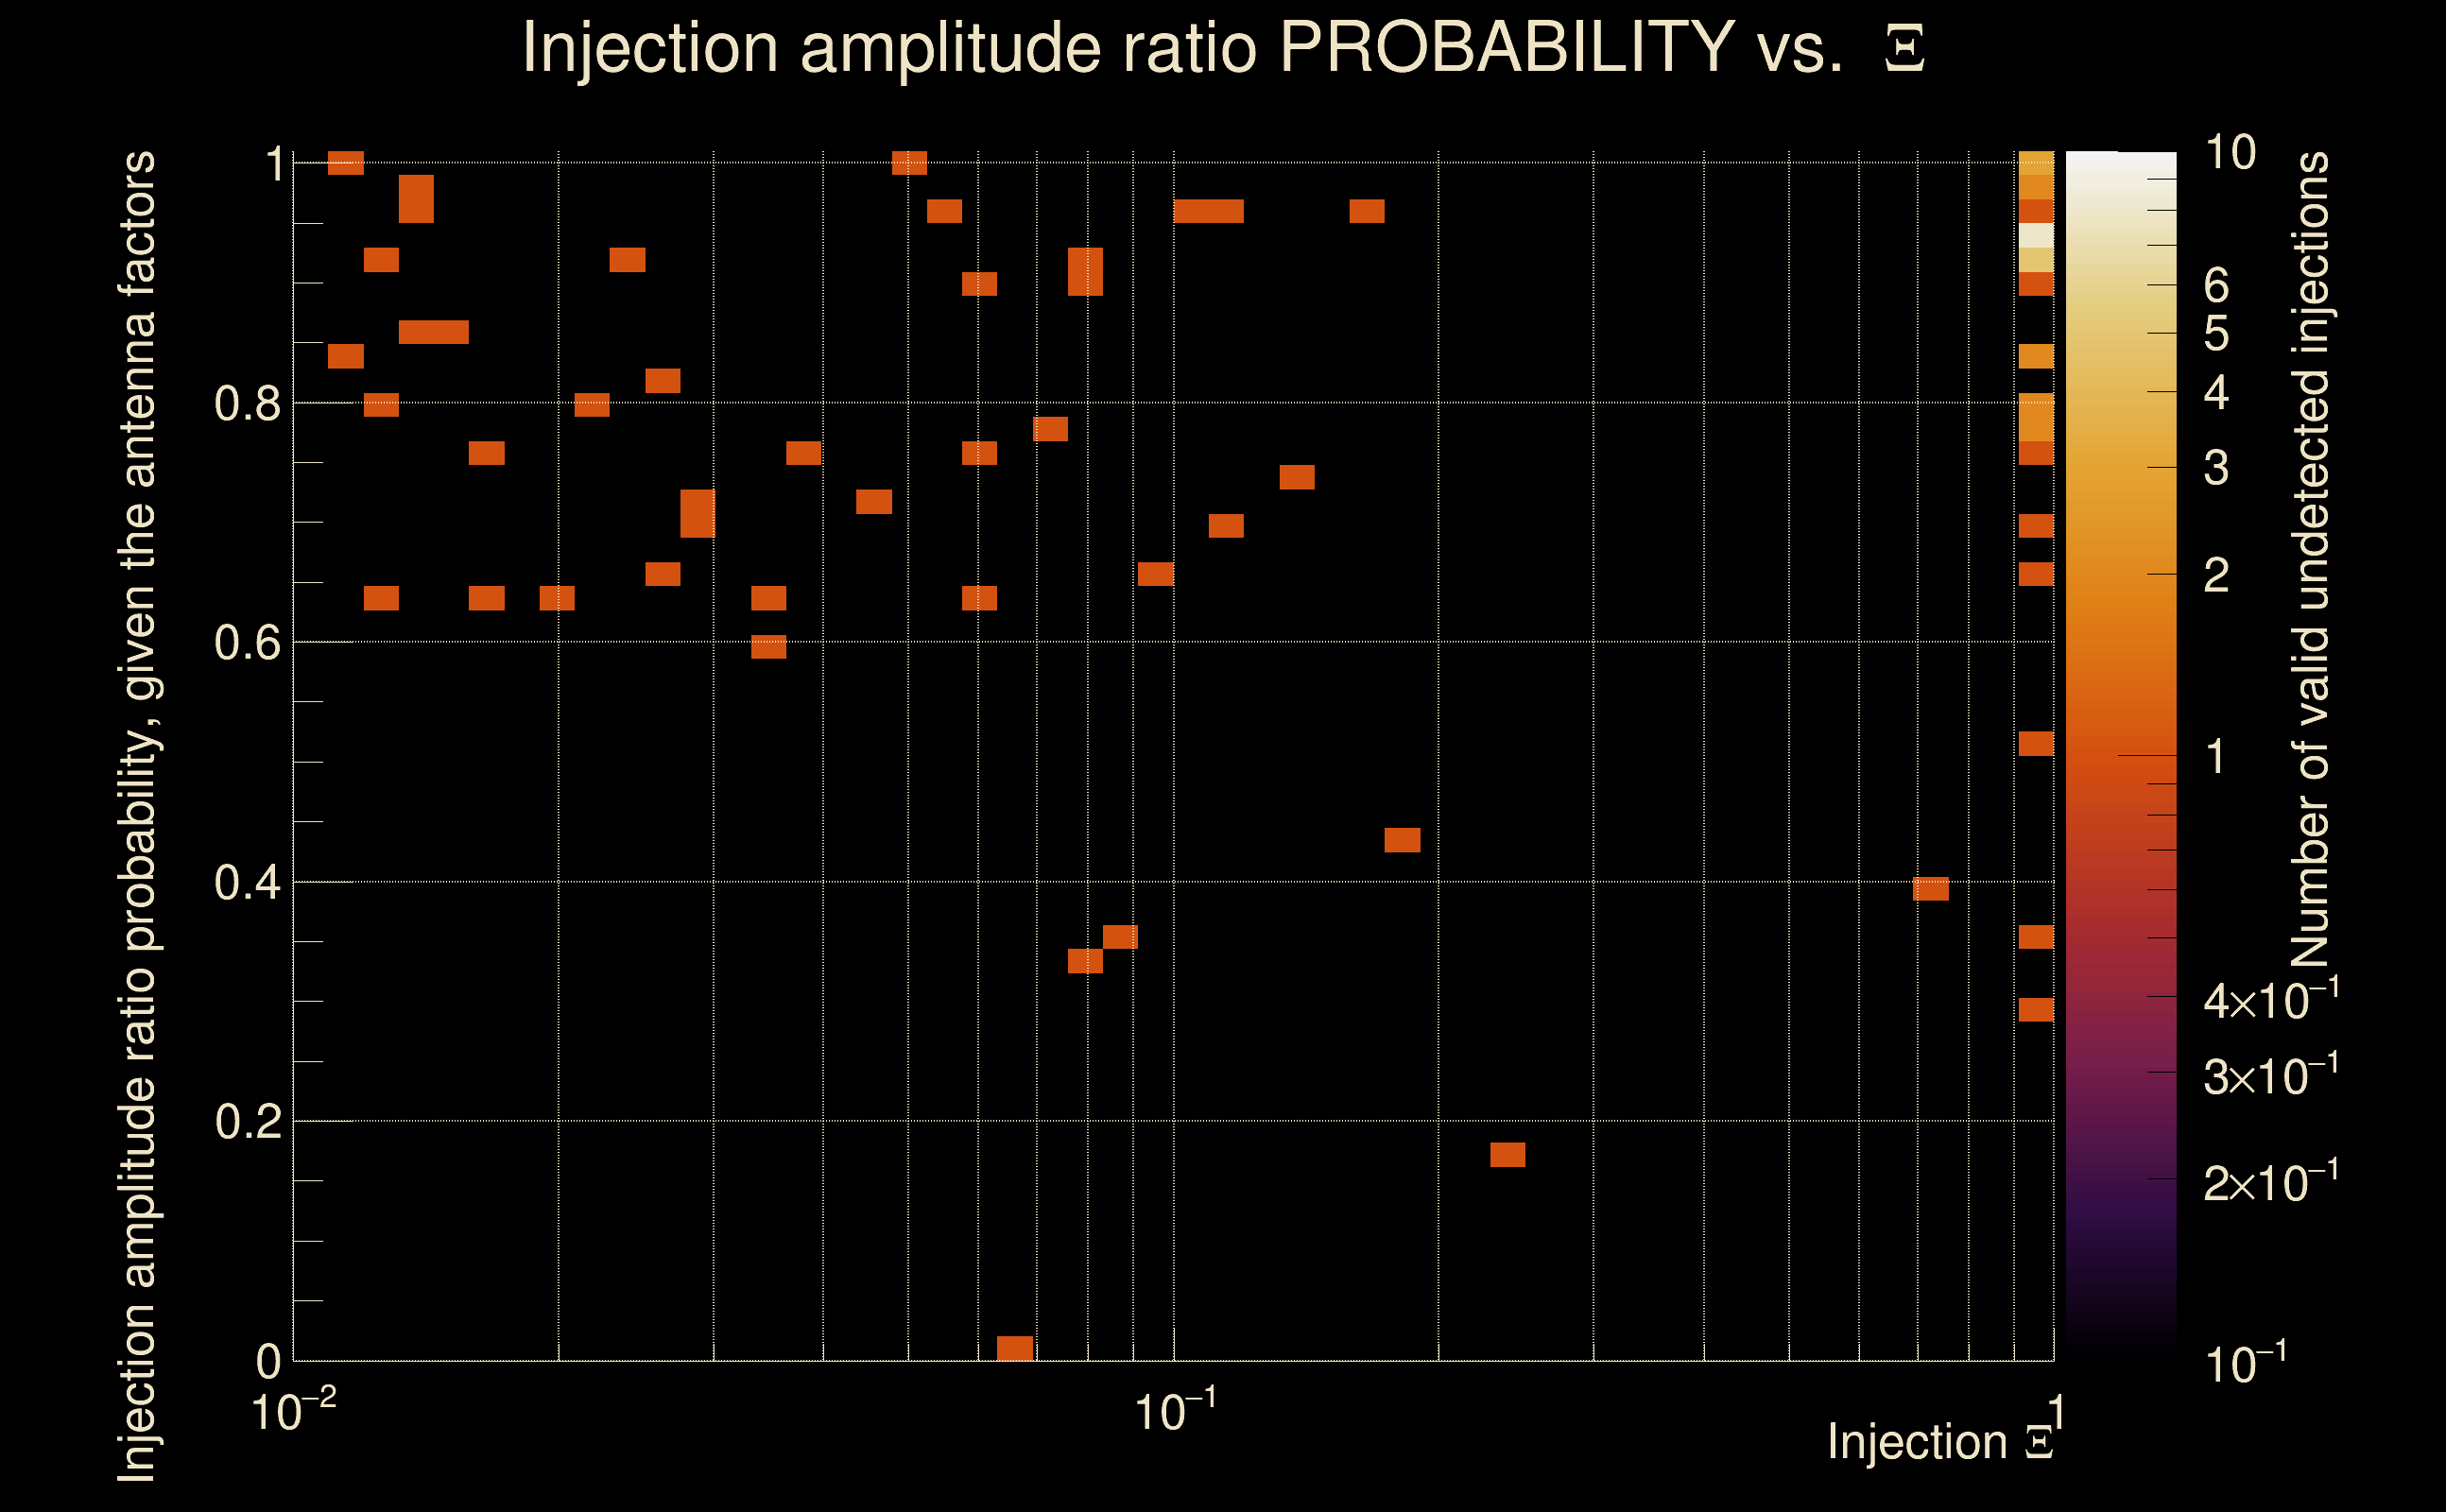
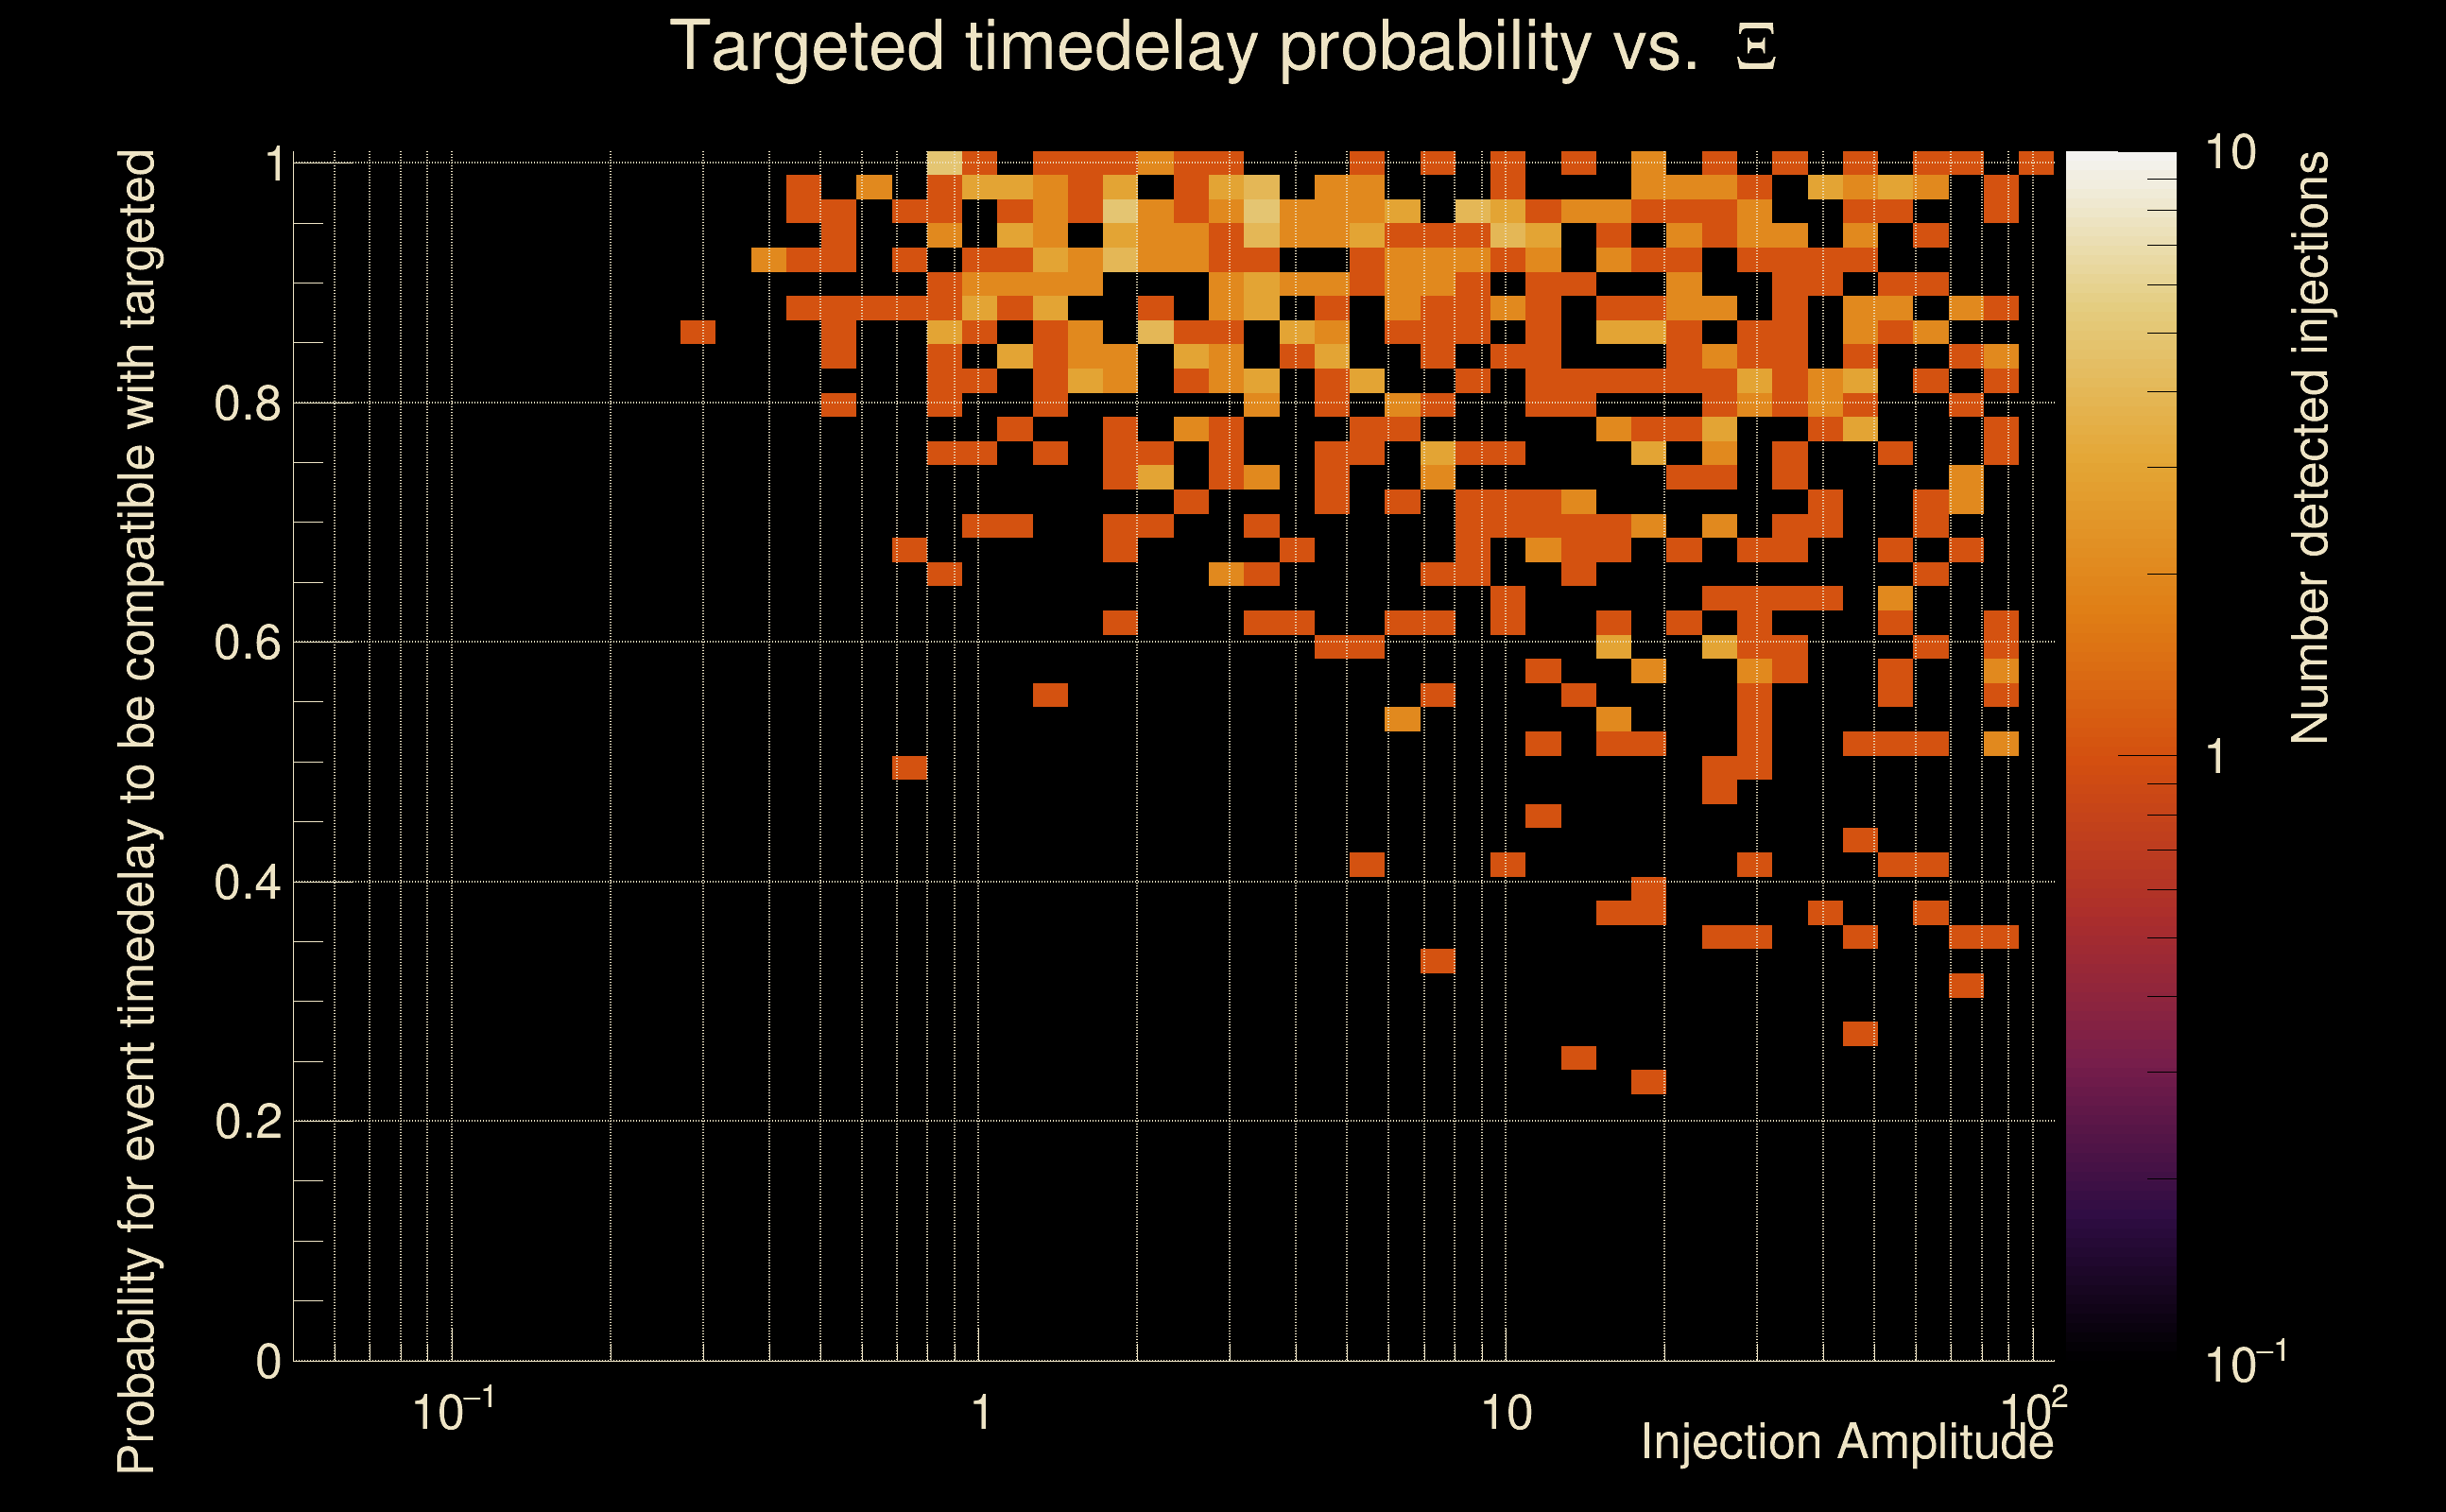
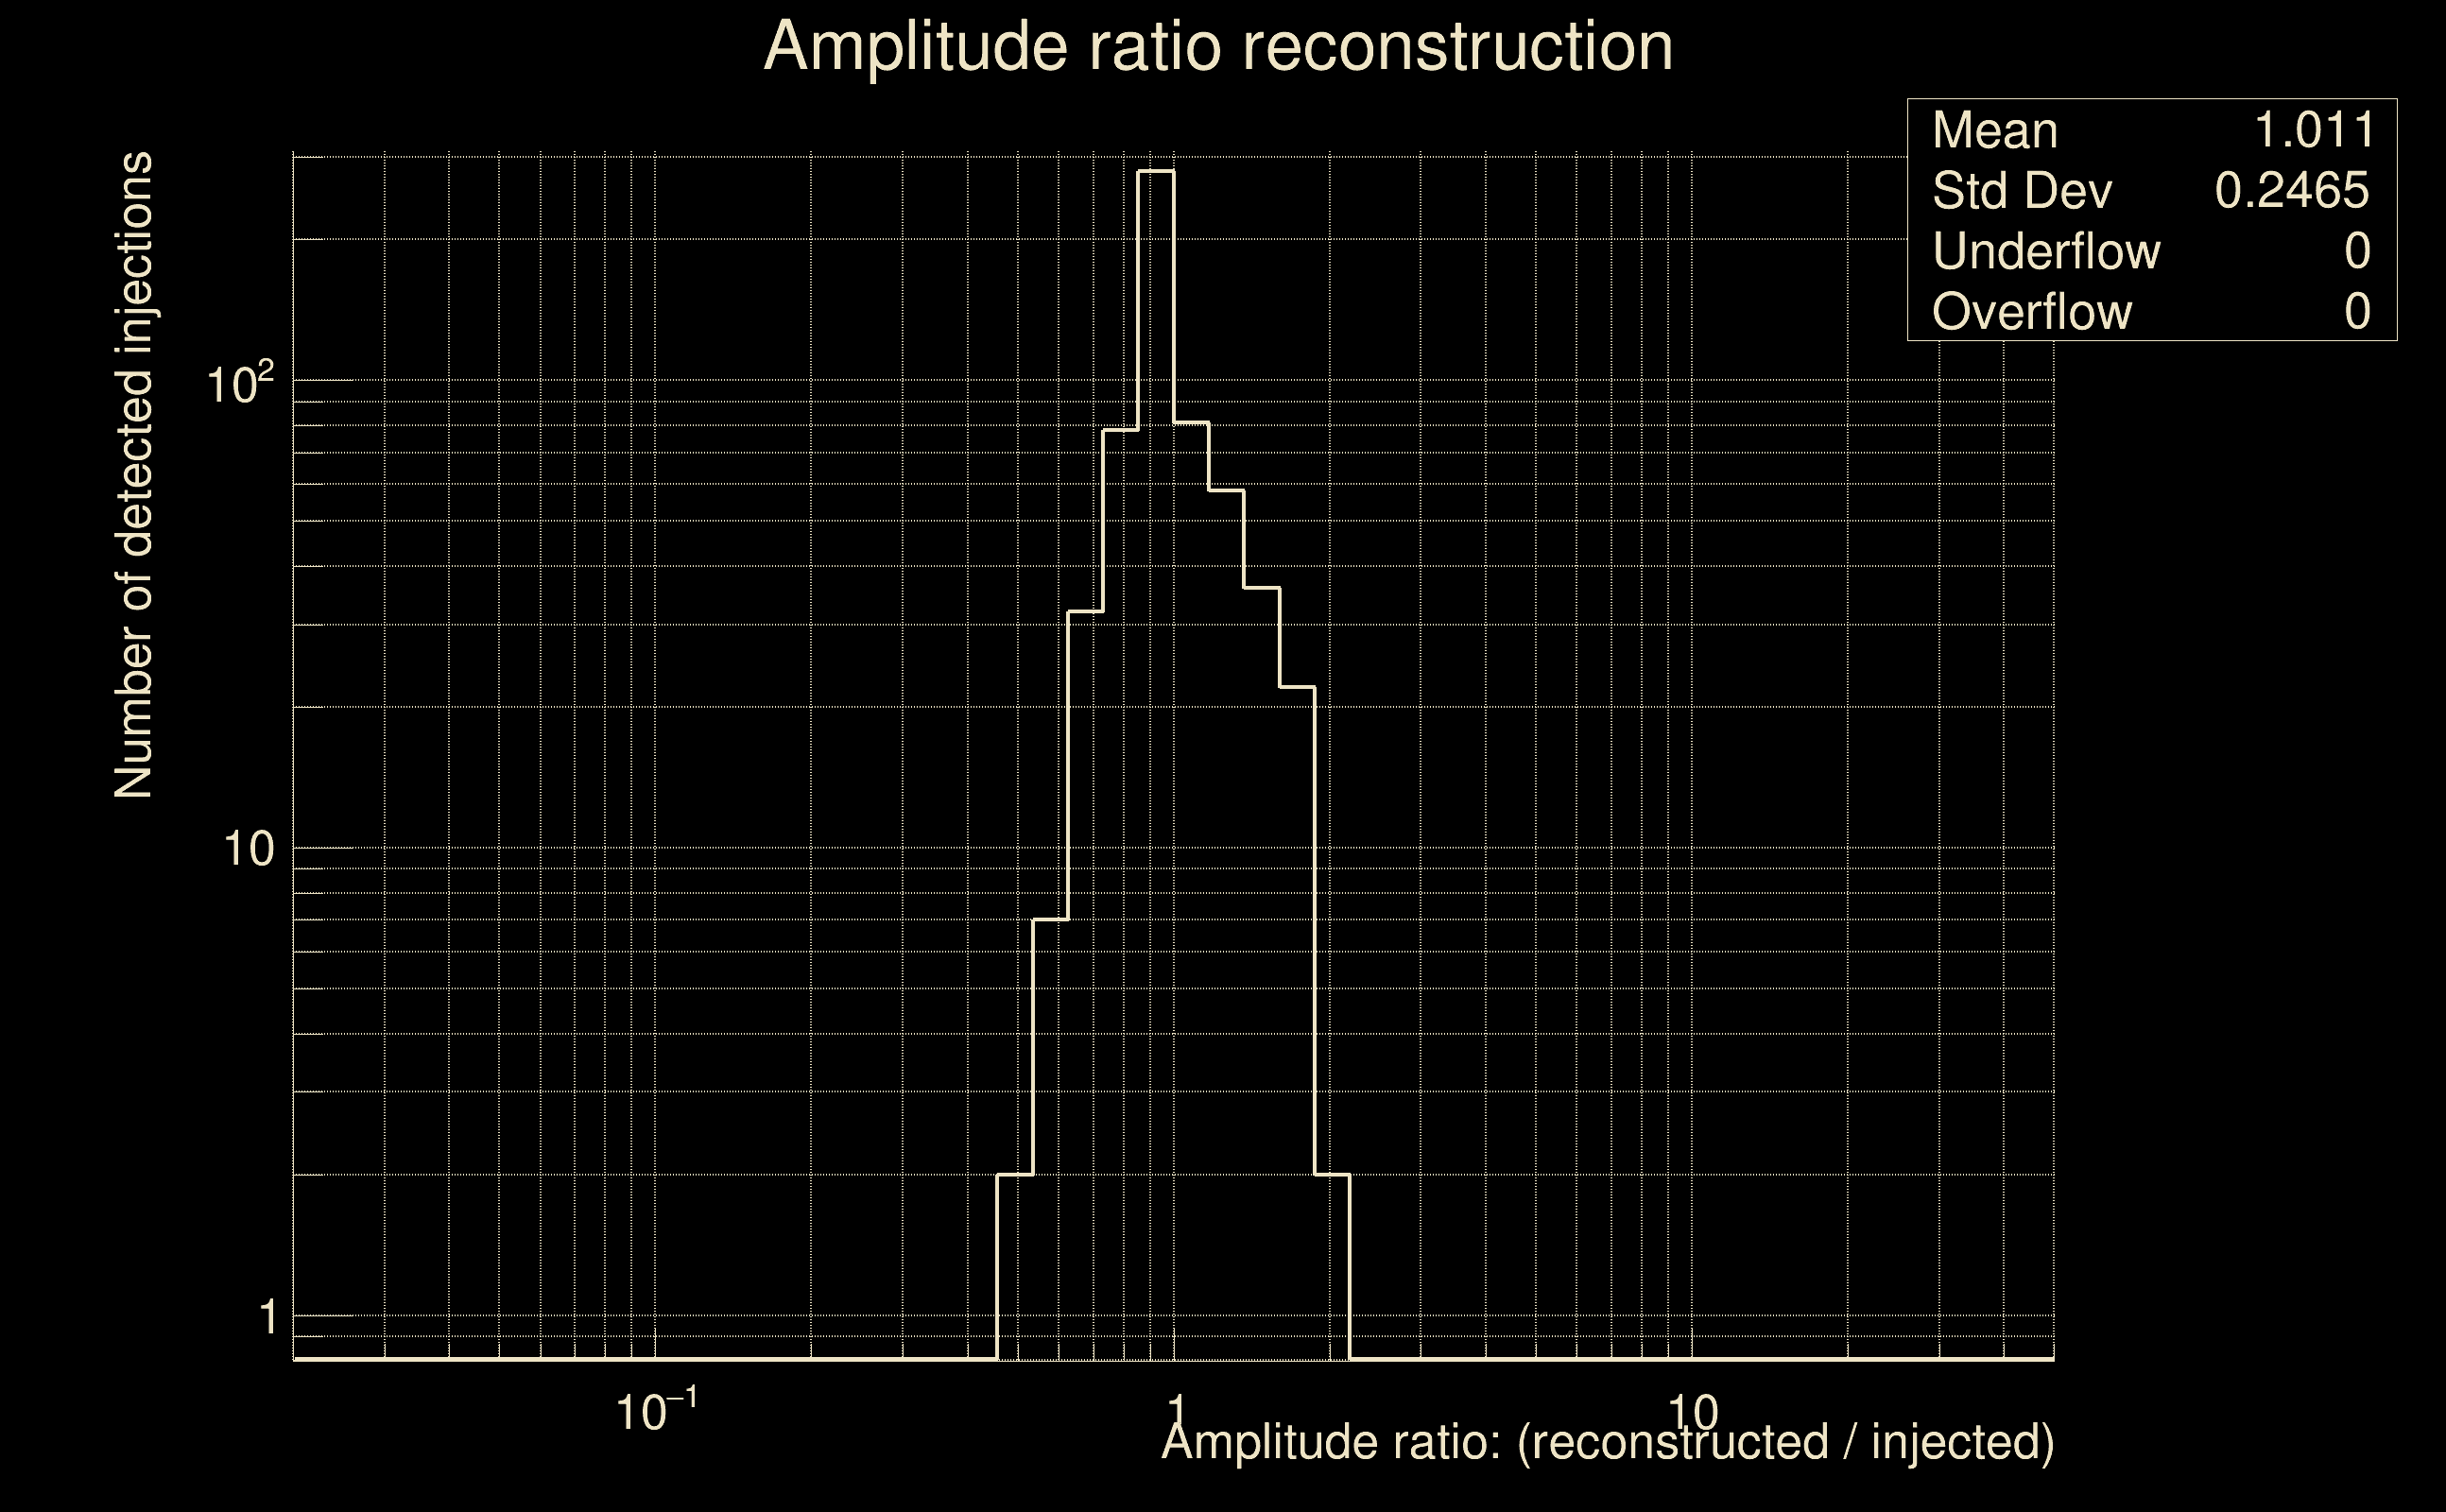
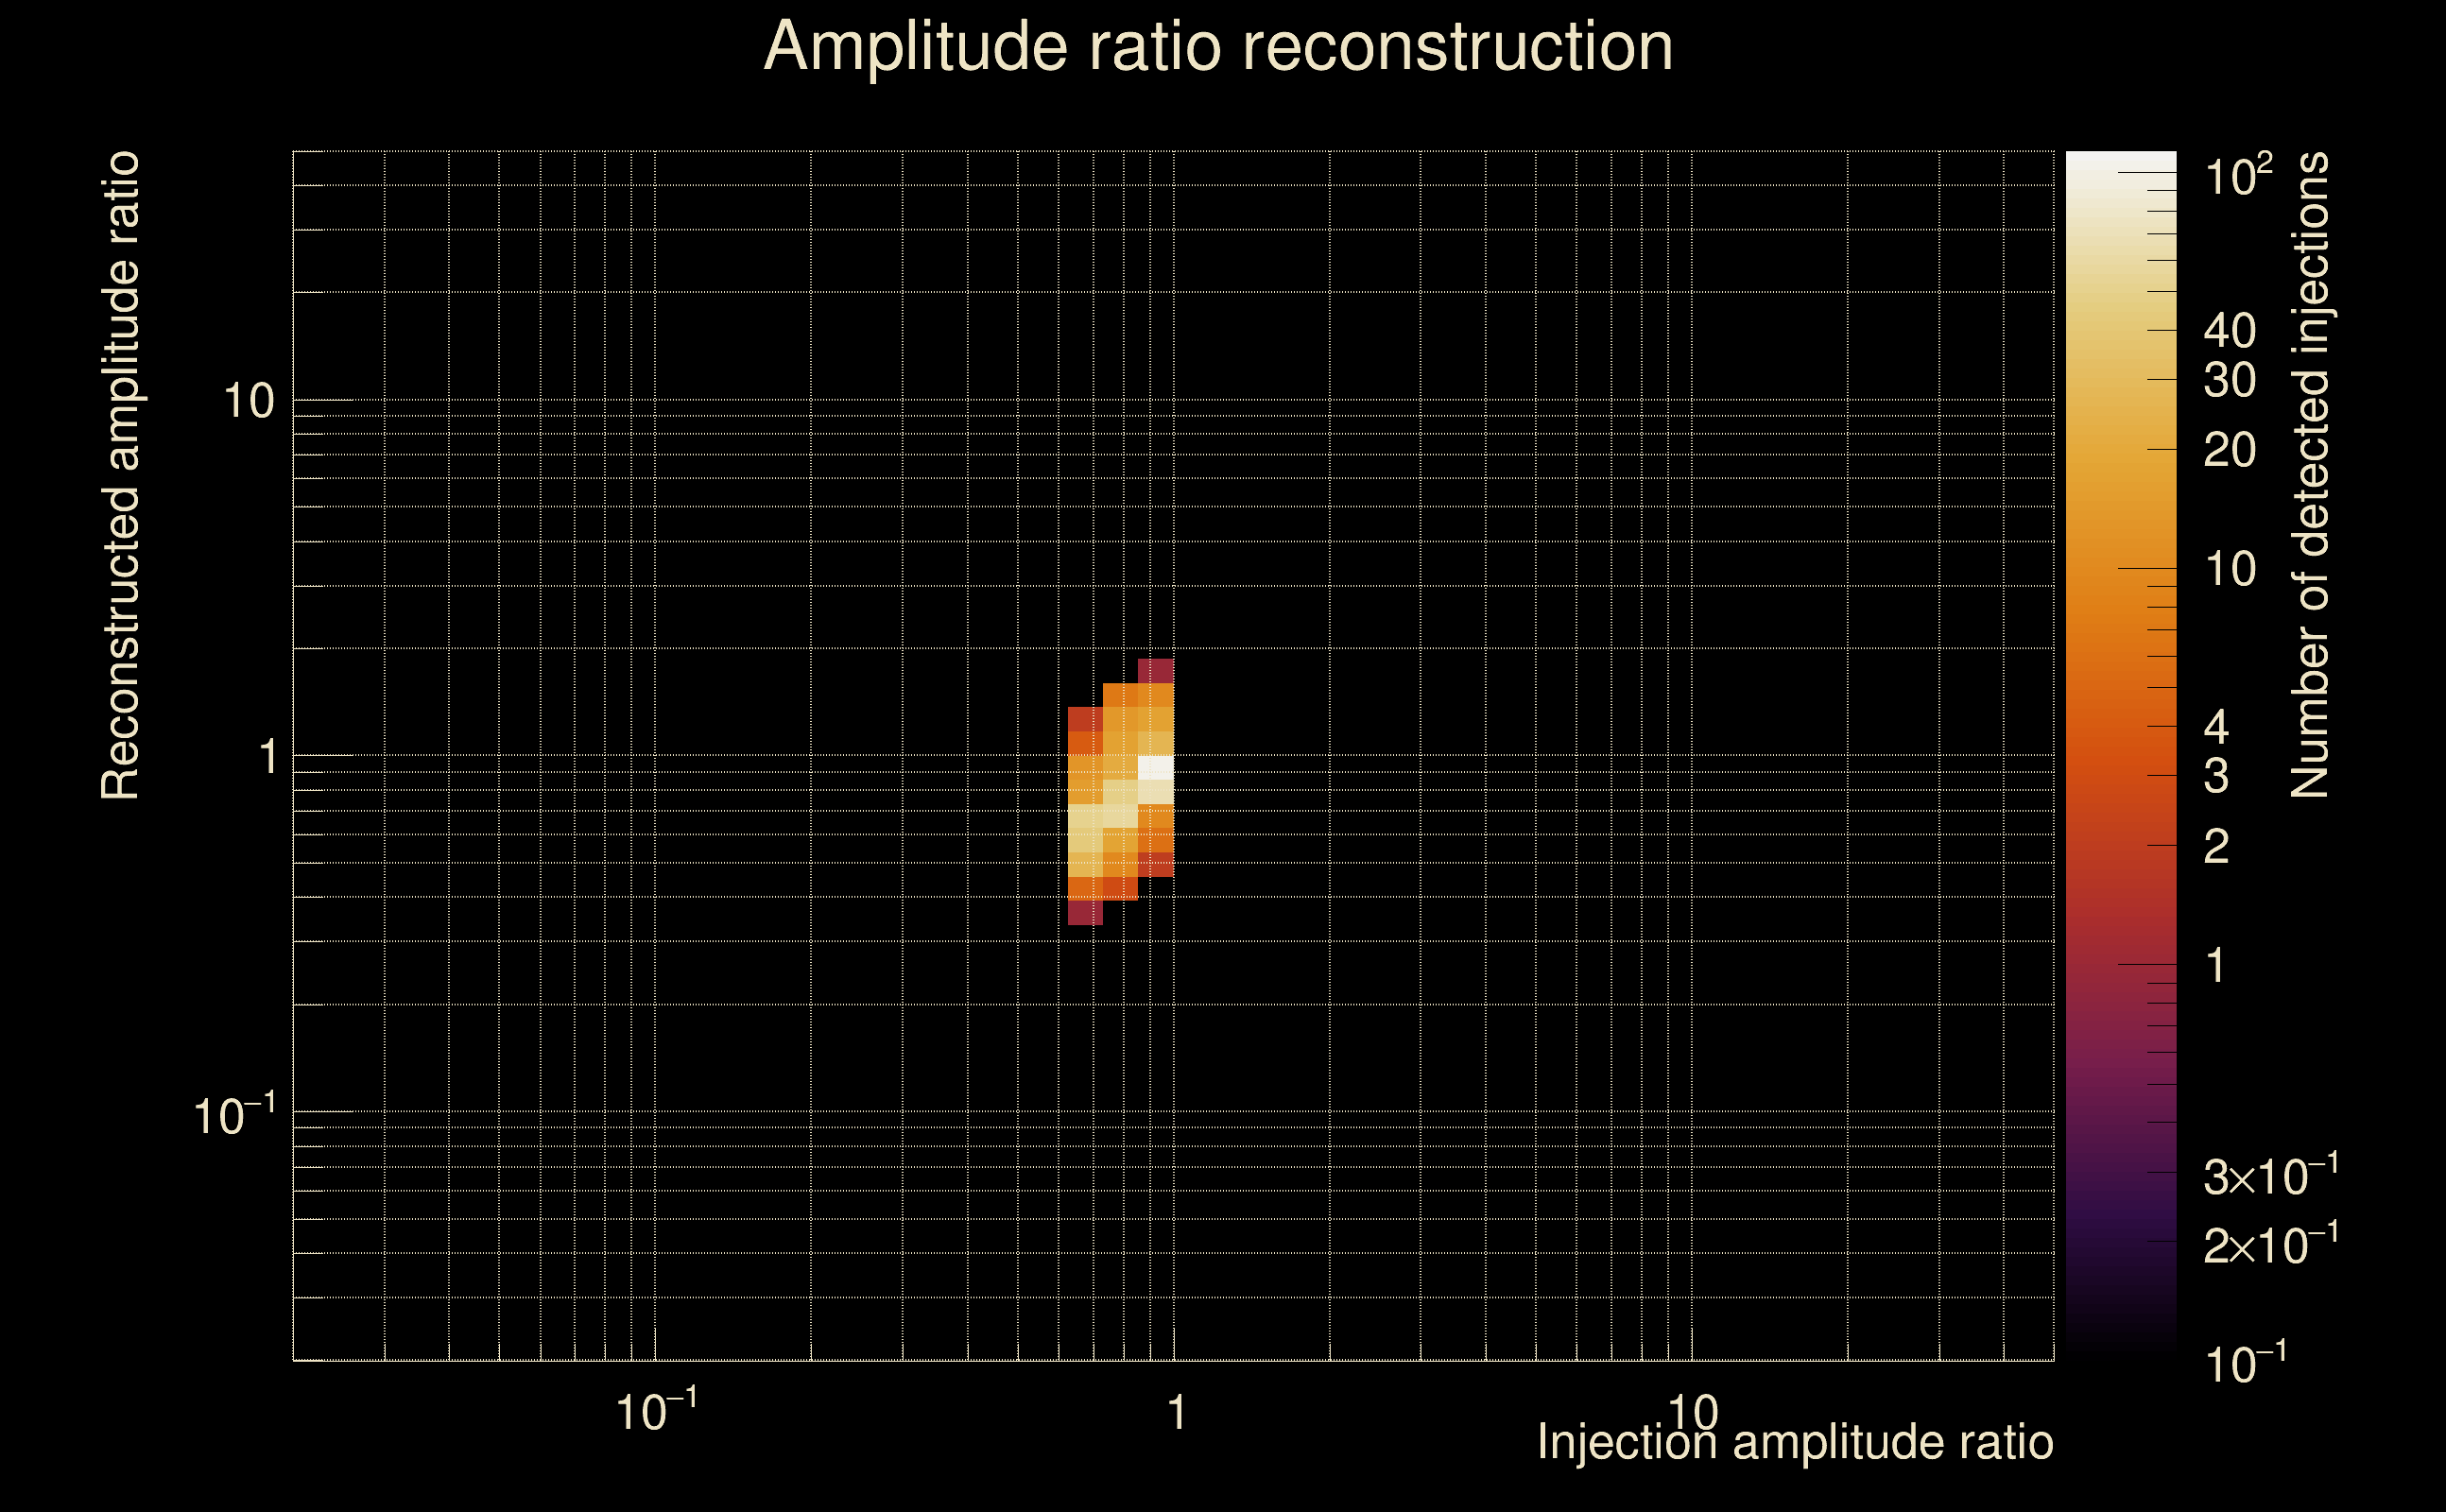
| Number of injections (total/valid/detected): | 1116 / 973 / 598 |
| List of missed injections: | ./Obe20-O_missed.txt |
| Injection amplitude at 90% detection efficiency: | 1.67088 |
| Injection amplitude at 50% detection efficiency: | 0.782096 |
| Injection amplitude at 10% detection efficiency: | 0.385147 |
 |
 |
 |
 |
 |
 |
 |
|
 |
 |
|
 |
 |
|
 |
 |
|
 |
 |
|
 |
 |
|
 |
 |
|
 |
 |
|
 |
 |
 |
 |
 |
 |
 |
 |
 |
 |
 |
 |
 |
 |
 |
| florent.robinet@ijclab.in2p3.fr |