| Omicron version: | 4.2.0: documentation gitlab repository |
| Omicron run by: | unknown |
| Report produced on: | Mon Feb 23 09:19:05 2026 UTC |
| Ox option file: | TargIxf_feb2026_SN3_30s_options.txt |
| Omicron option files: | detector 0, detector 1 |
| Detector channel names: | H1:GDS-CALIB_STRAIN_CLEAN_AR_4096Hz, L1:GDS-CALIB_STRAIN_CLEAN_AR_4096Hz |
| Omicron analysis time window and overlap: | 16 s, 6 s |
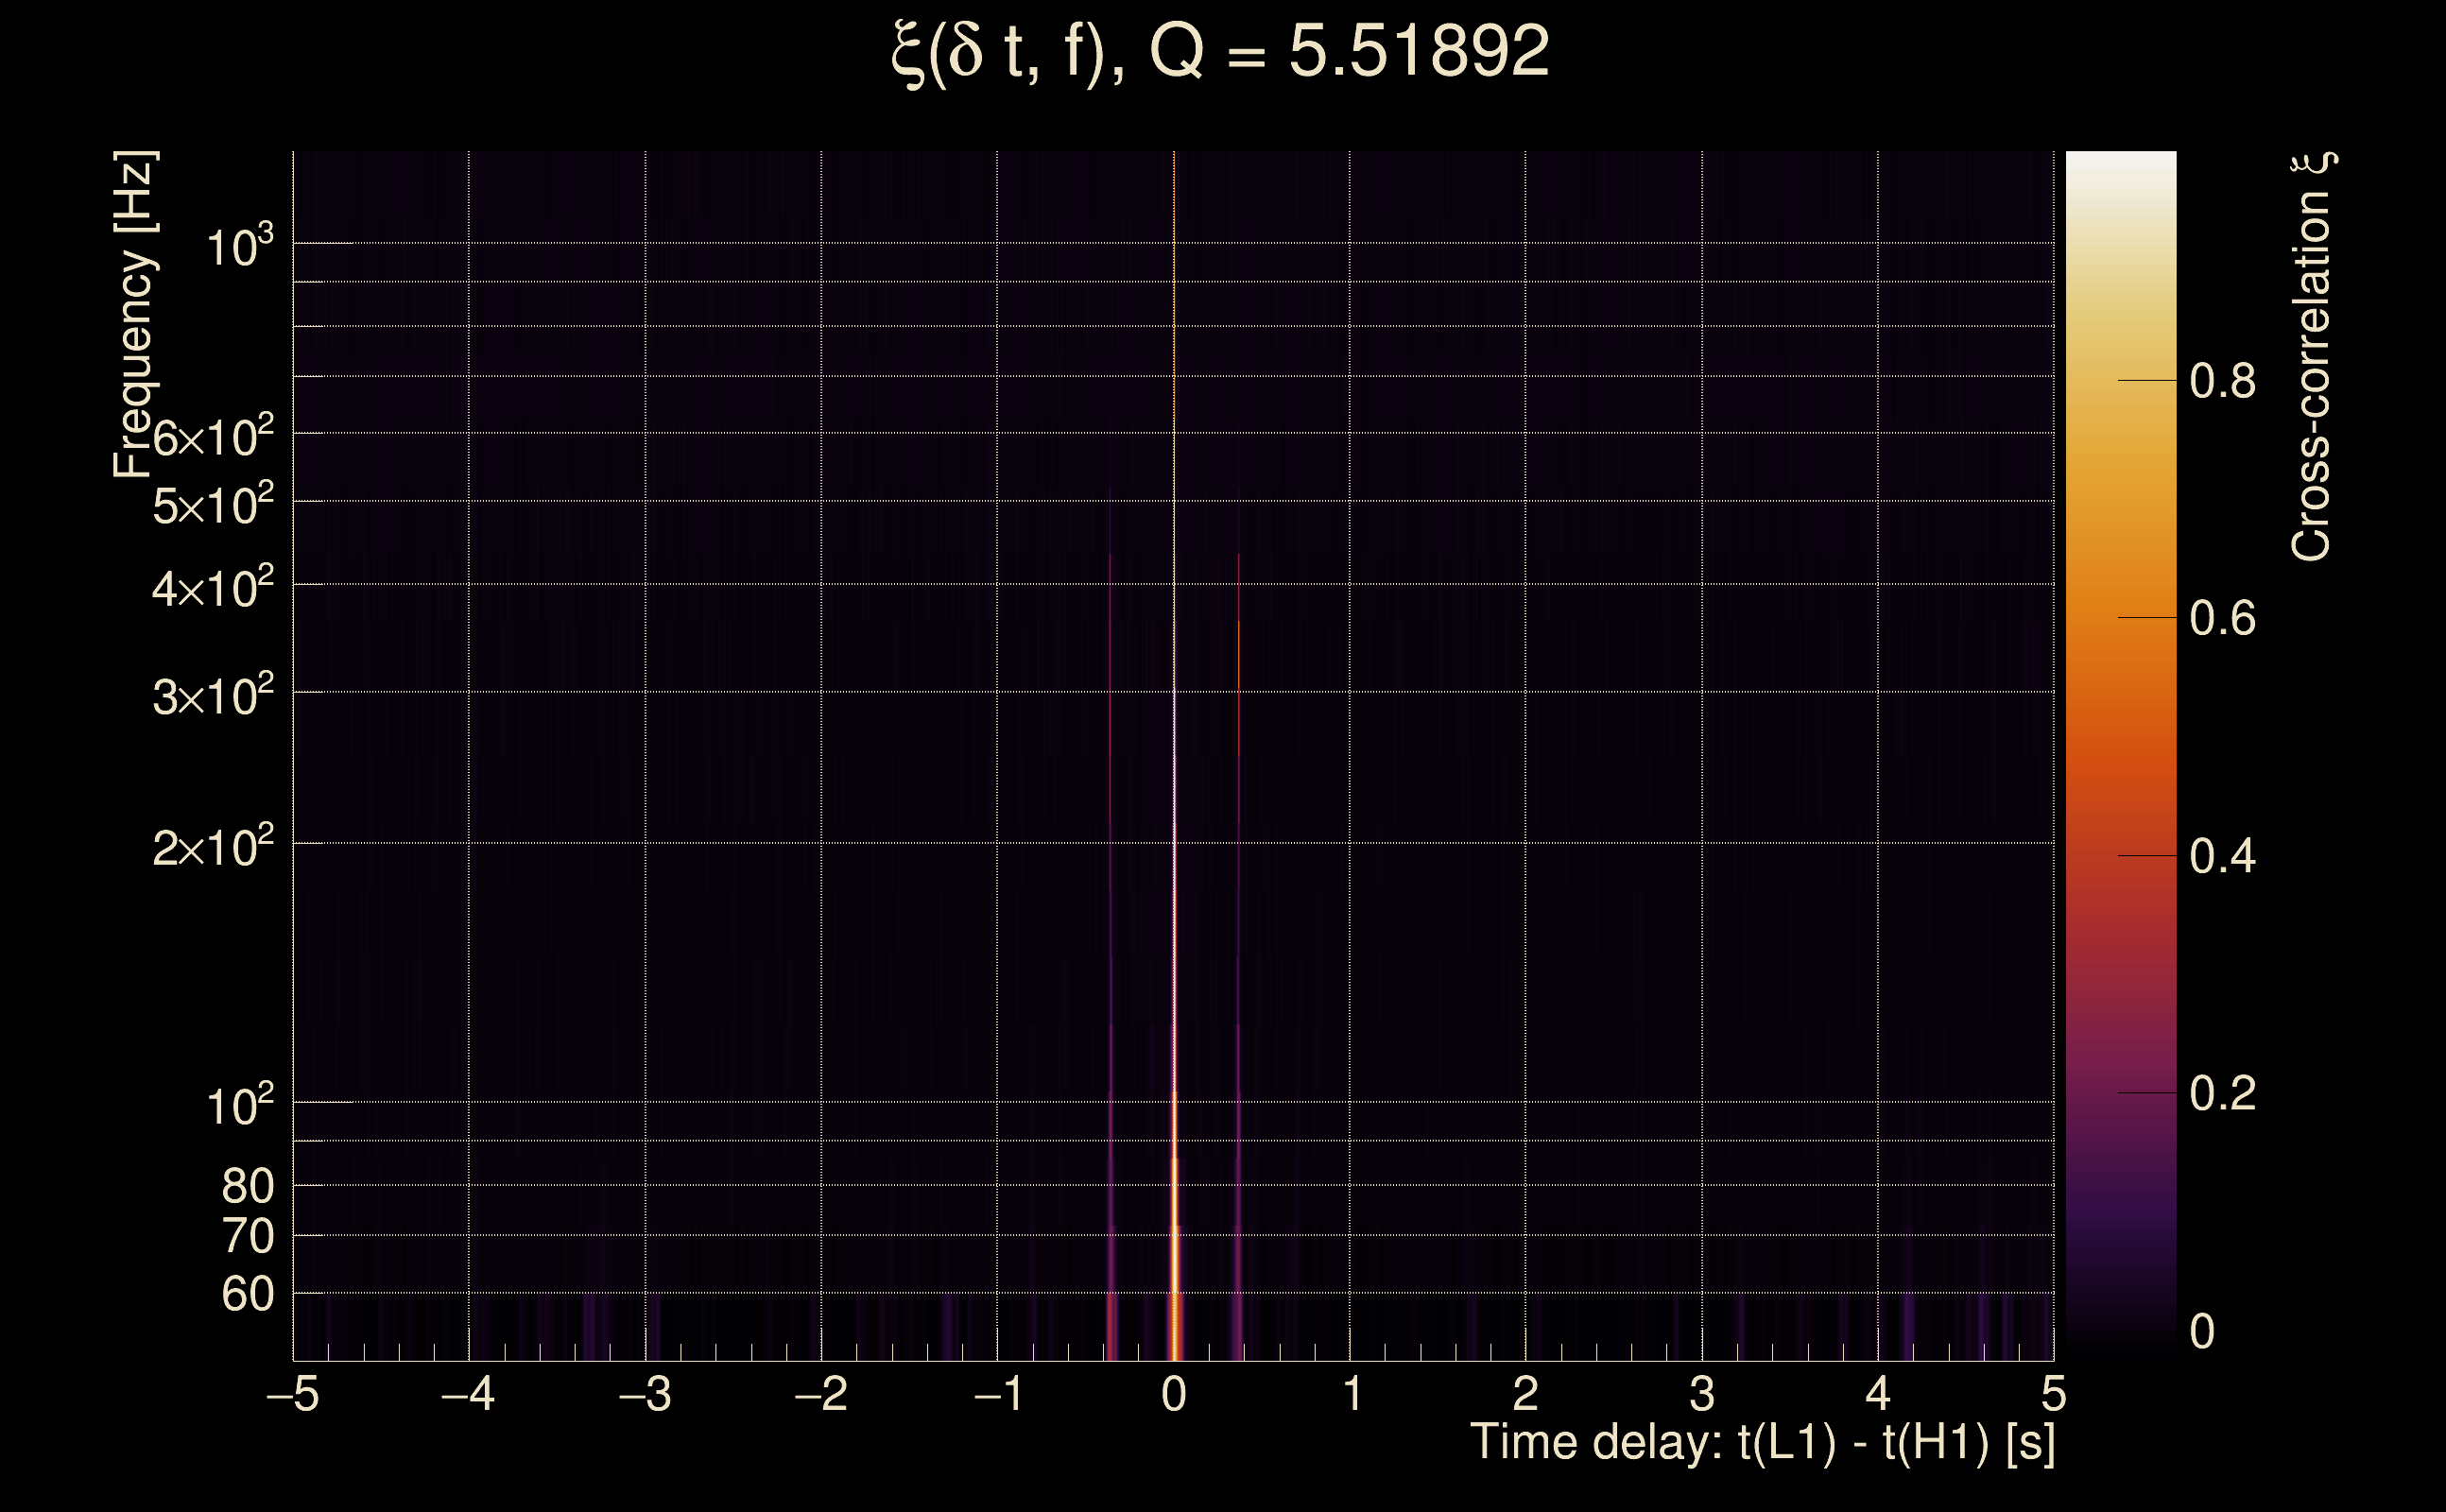
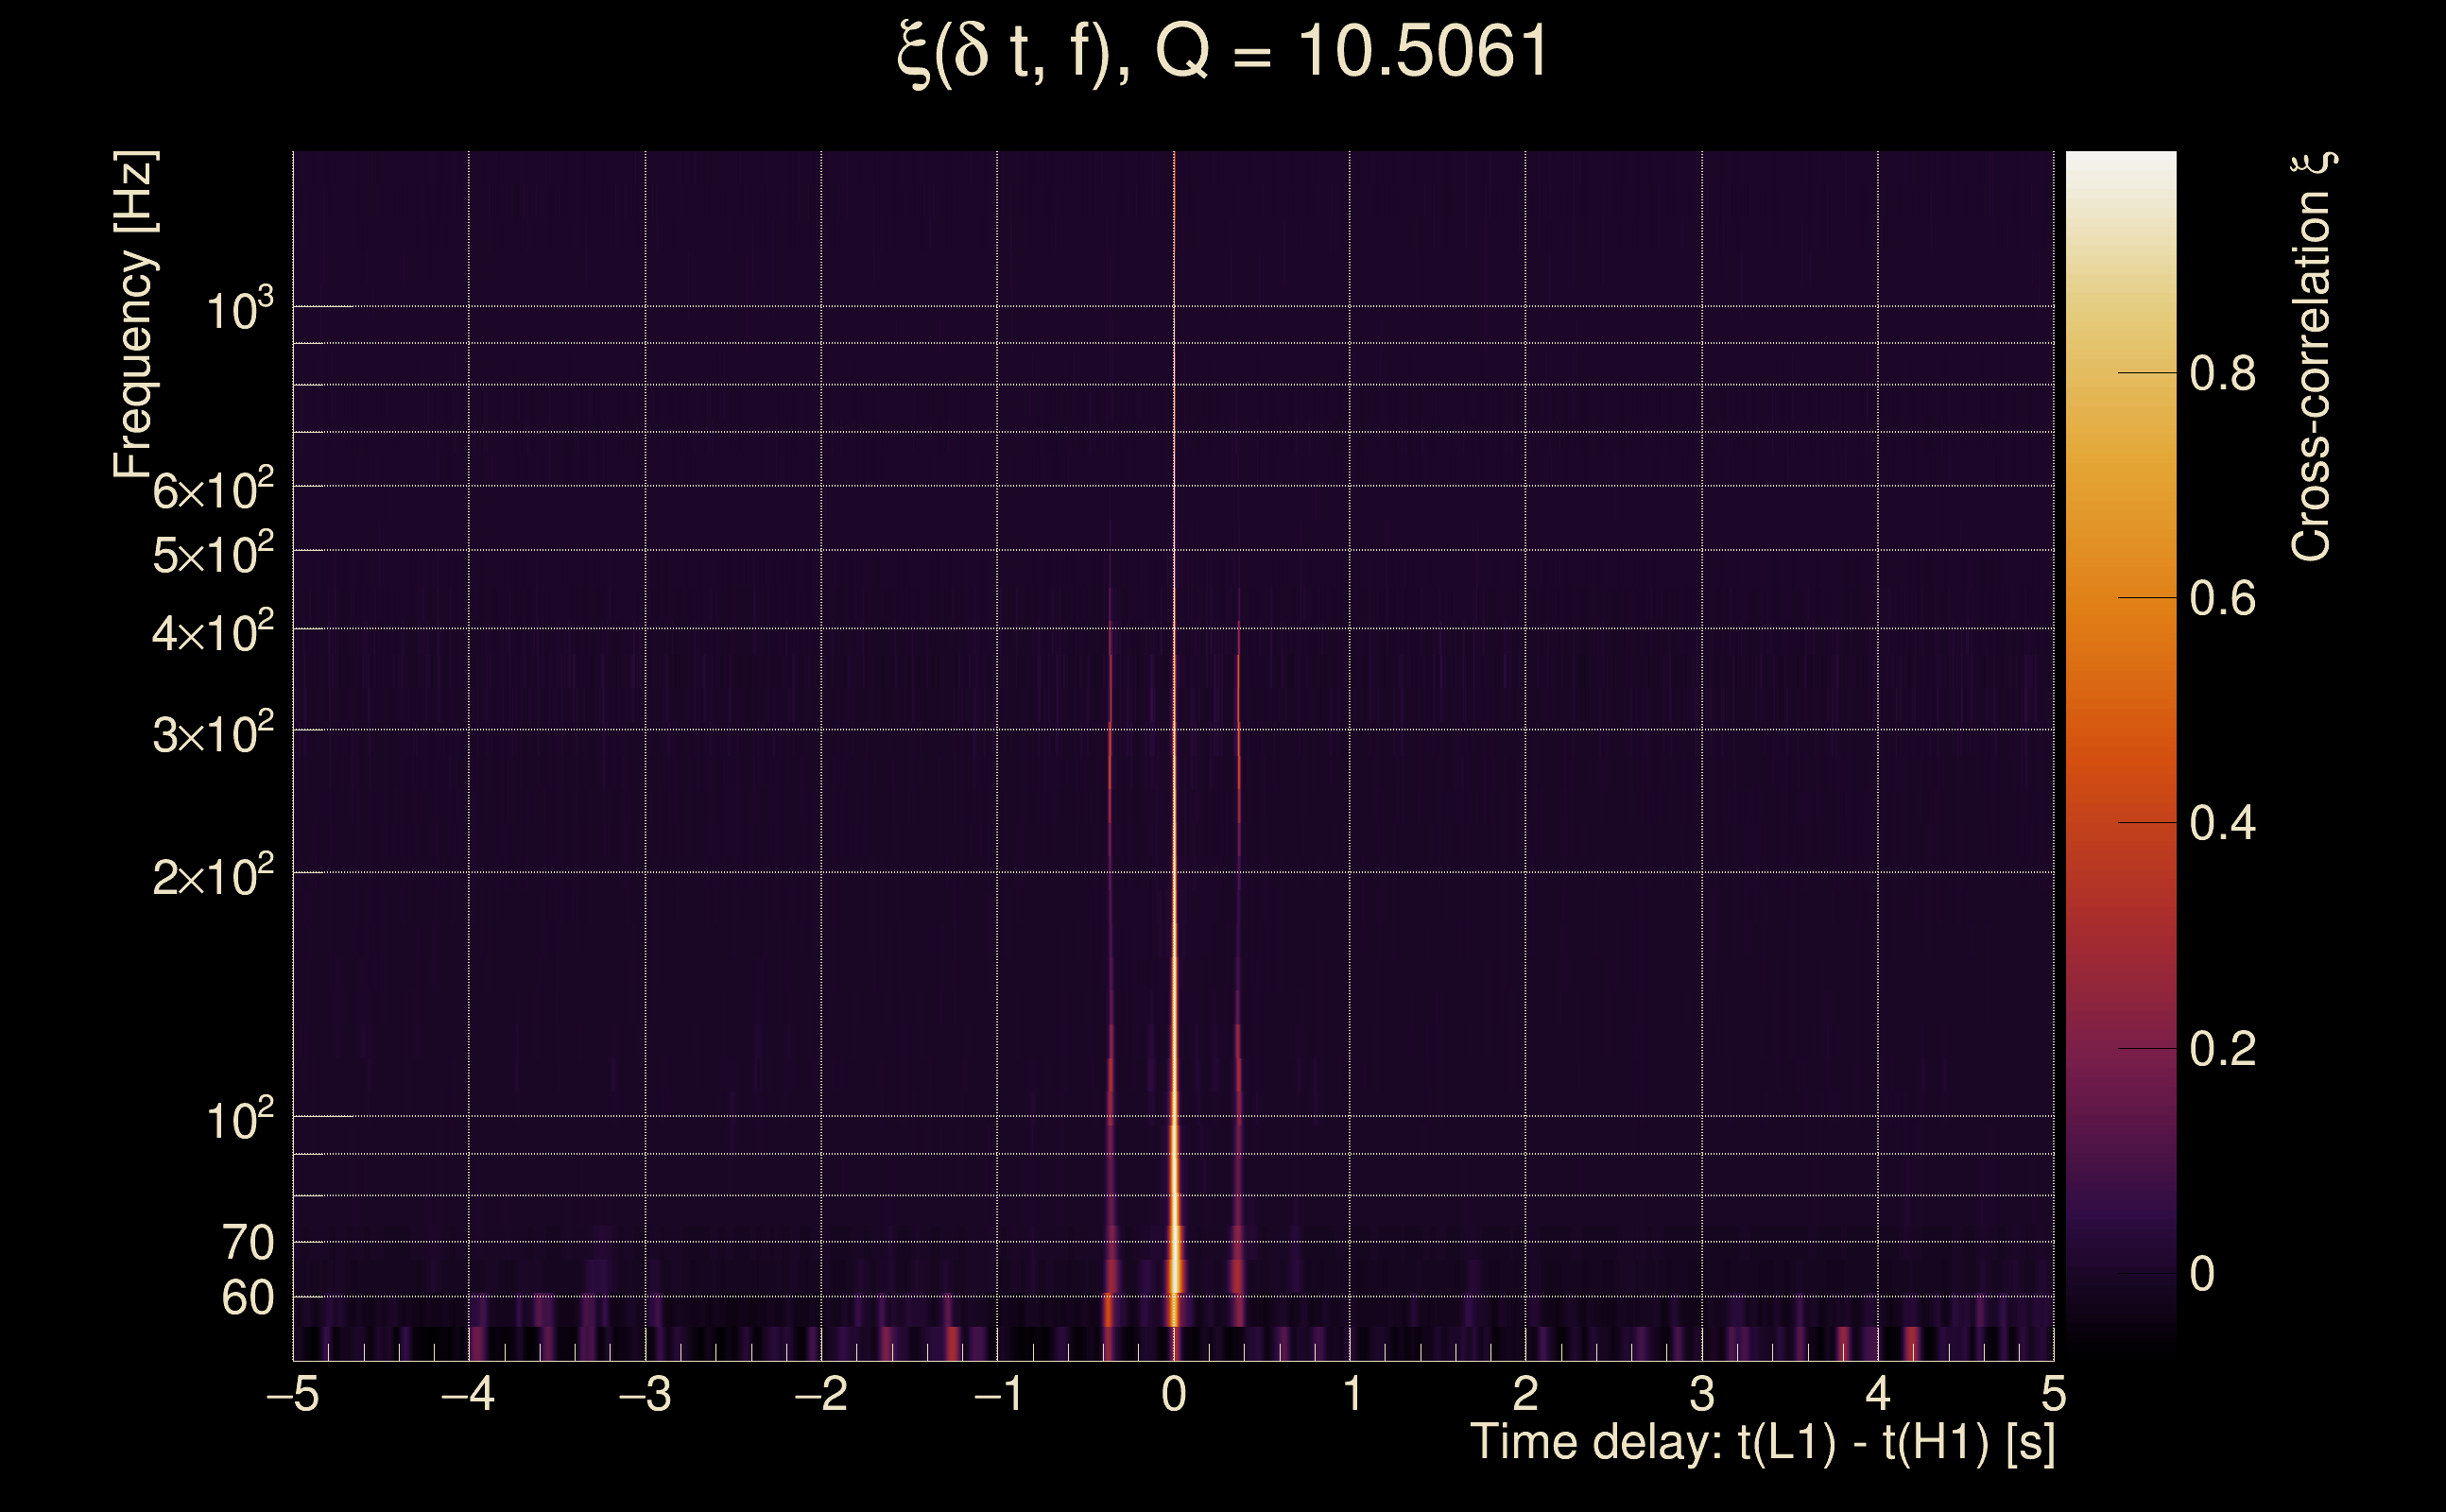
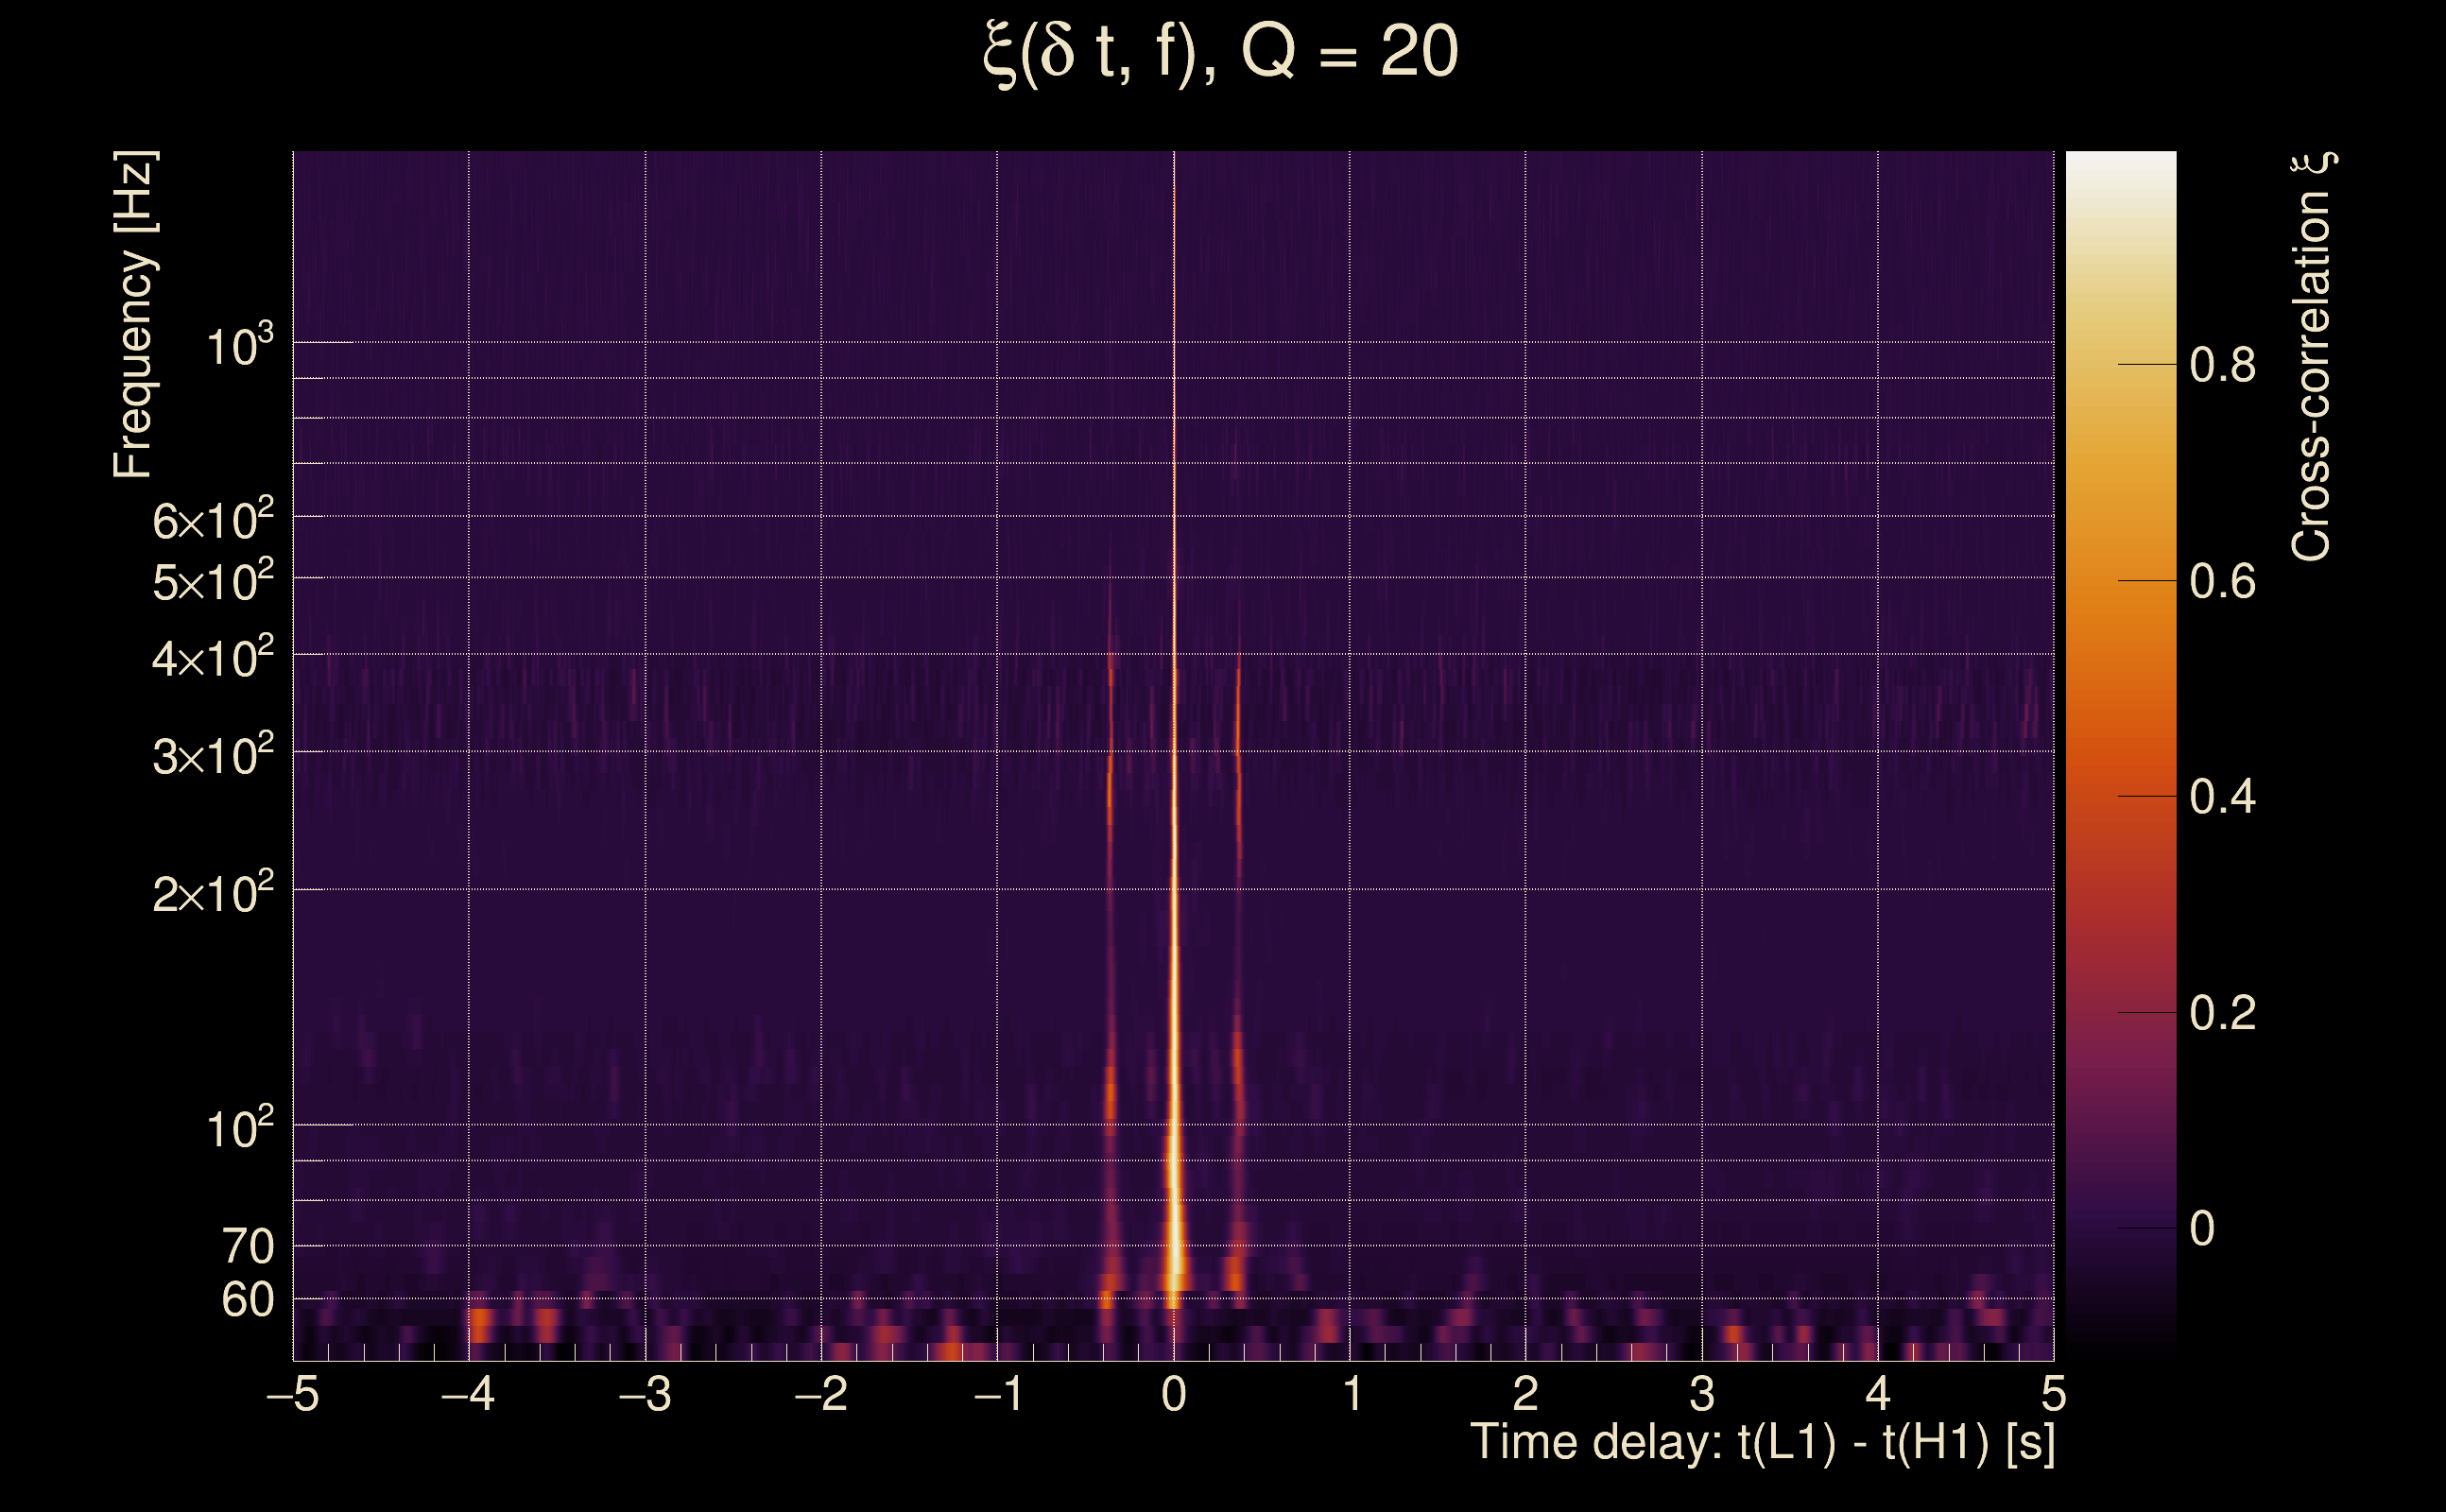
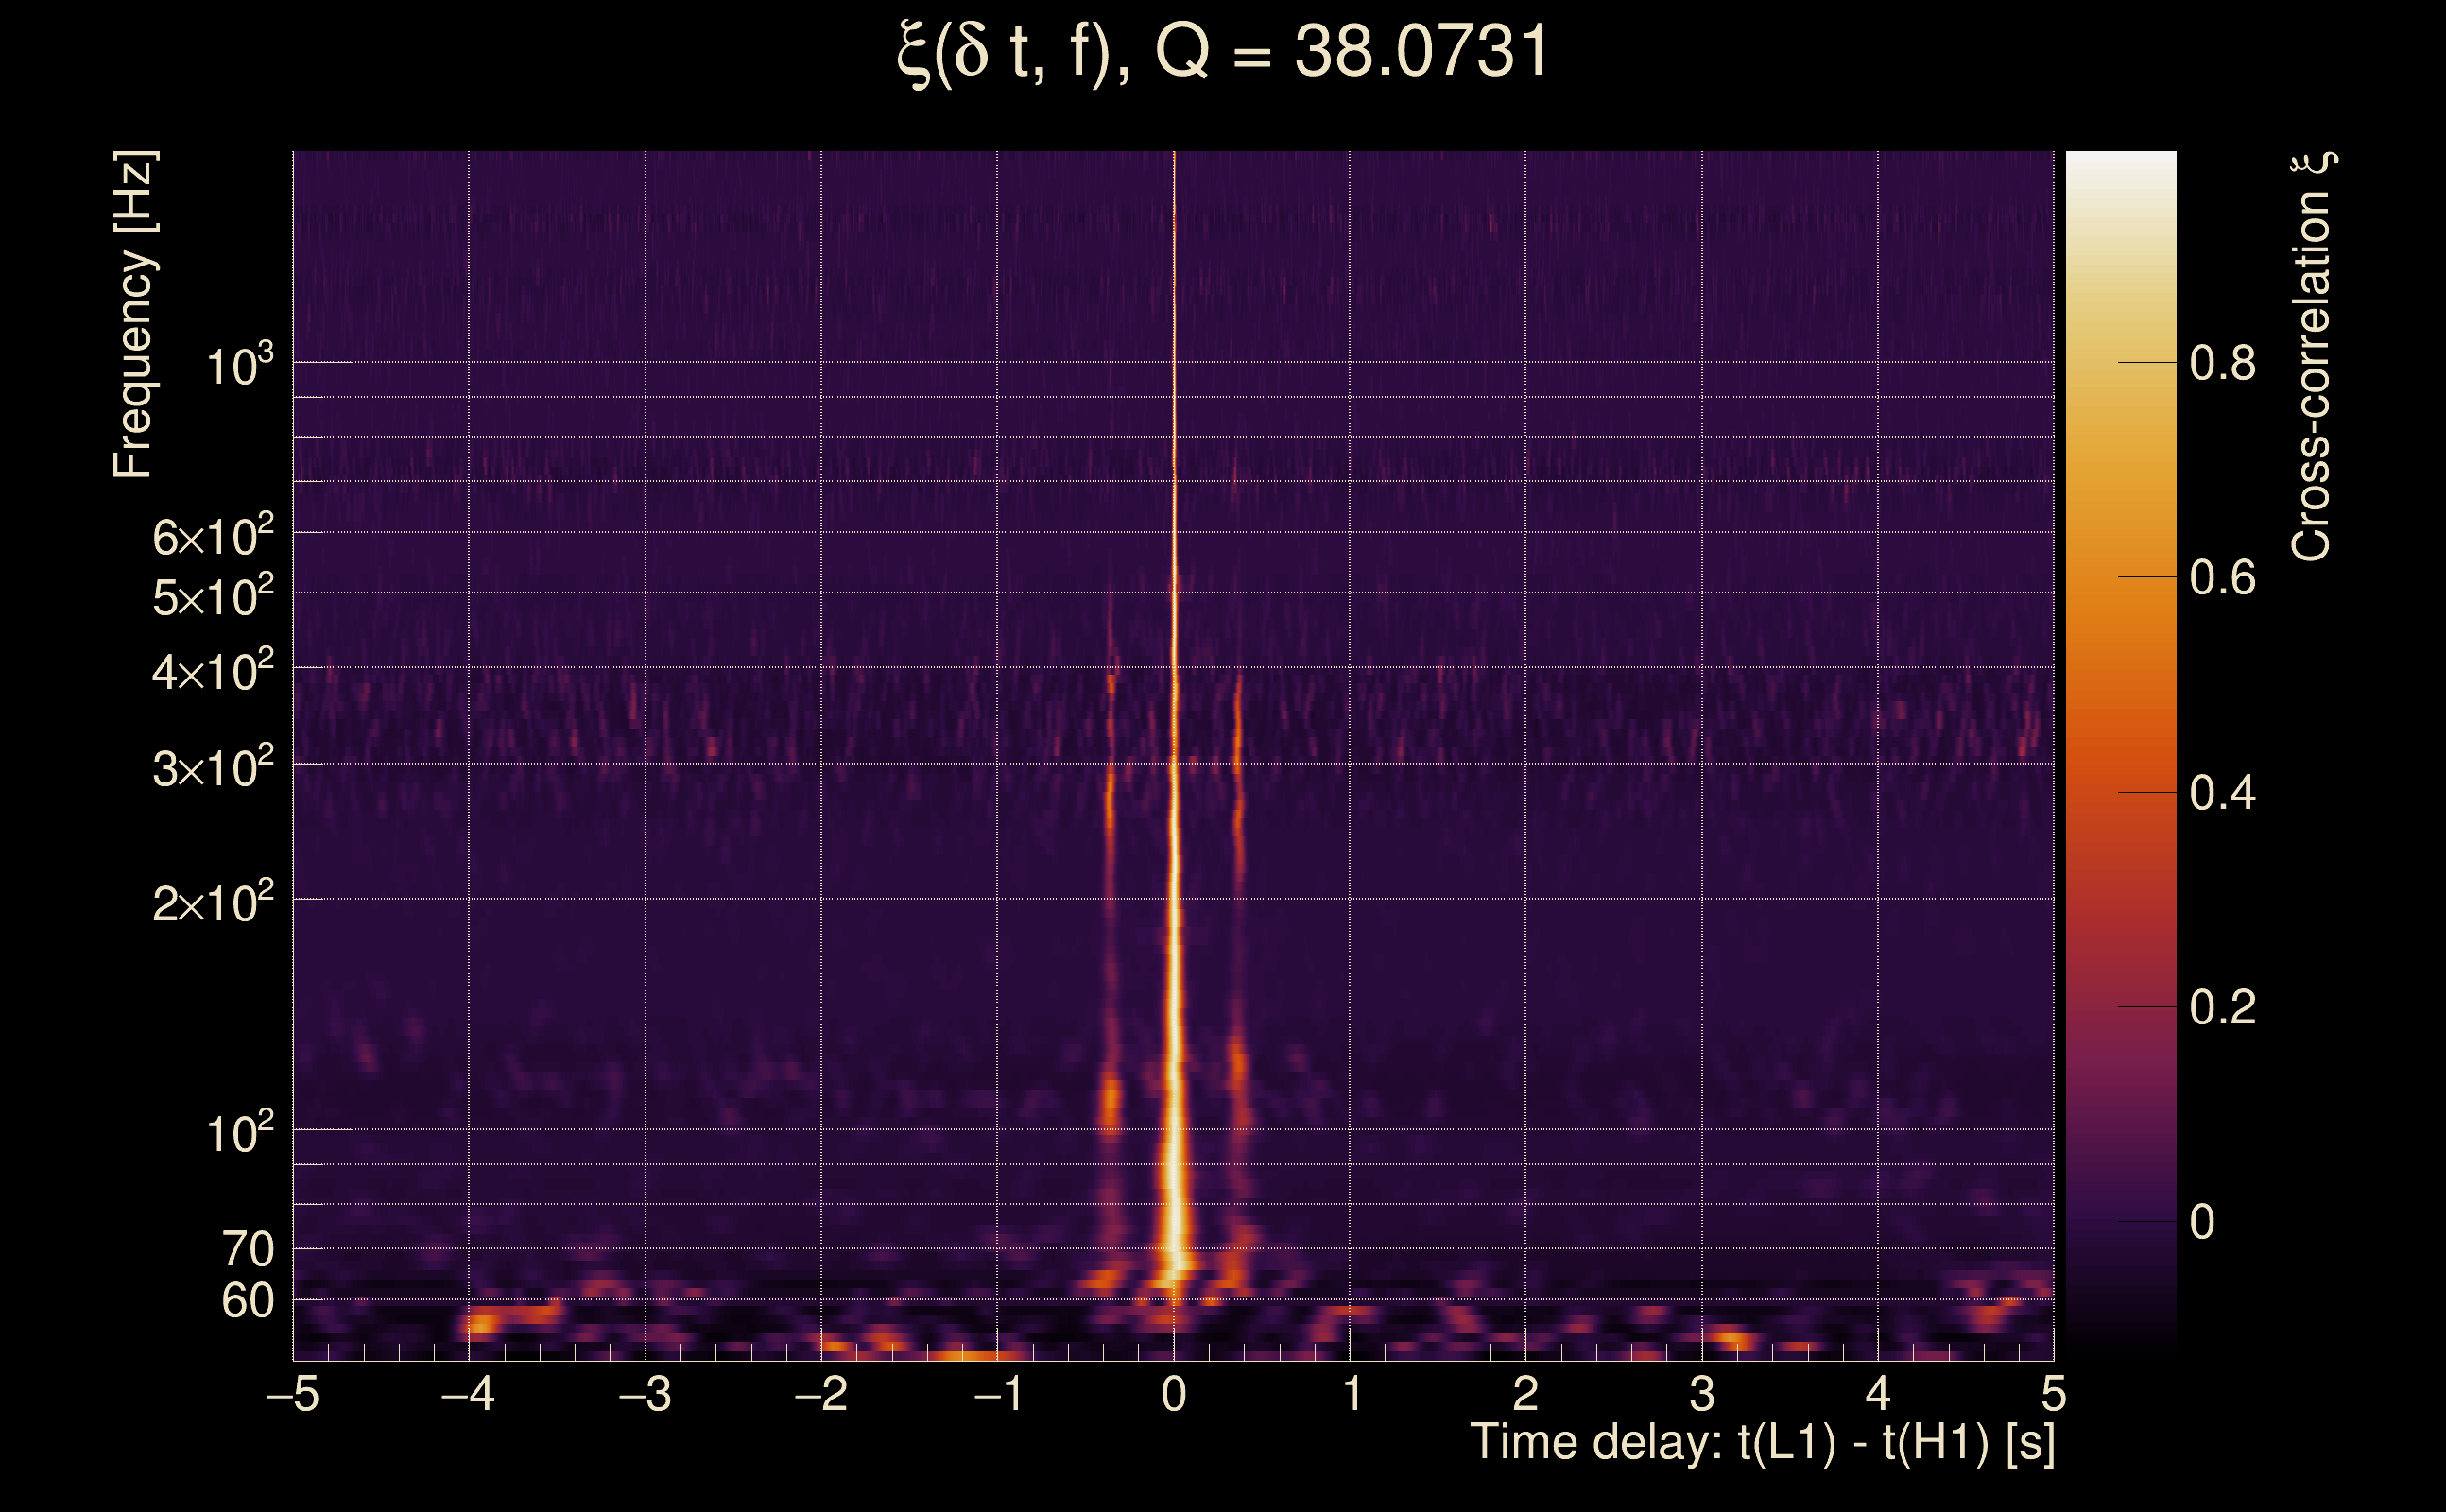
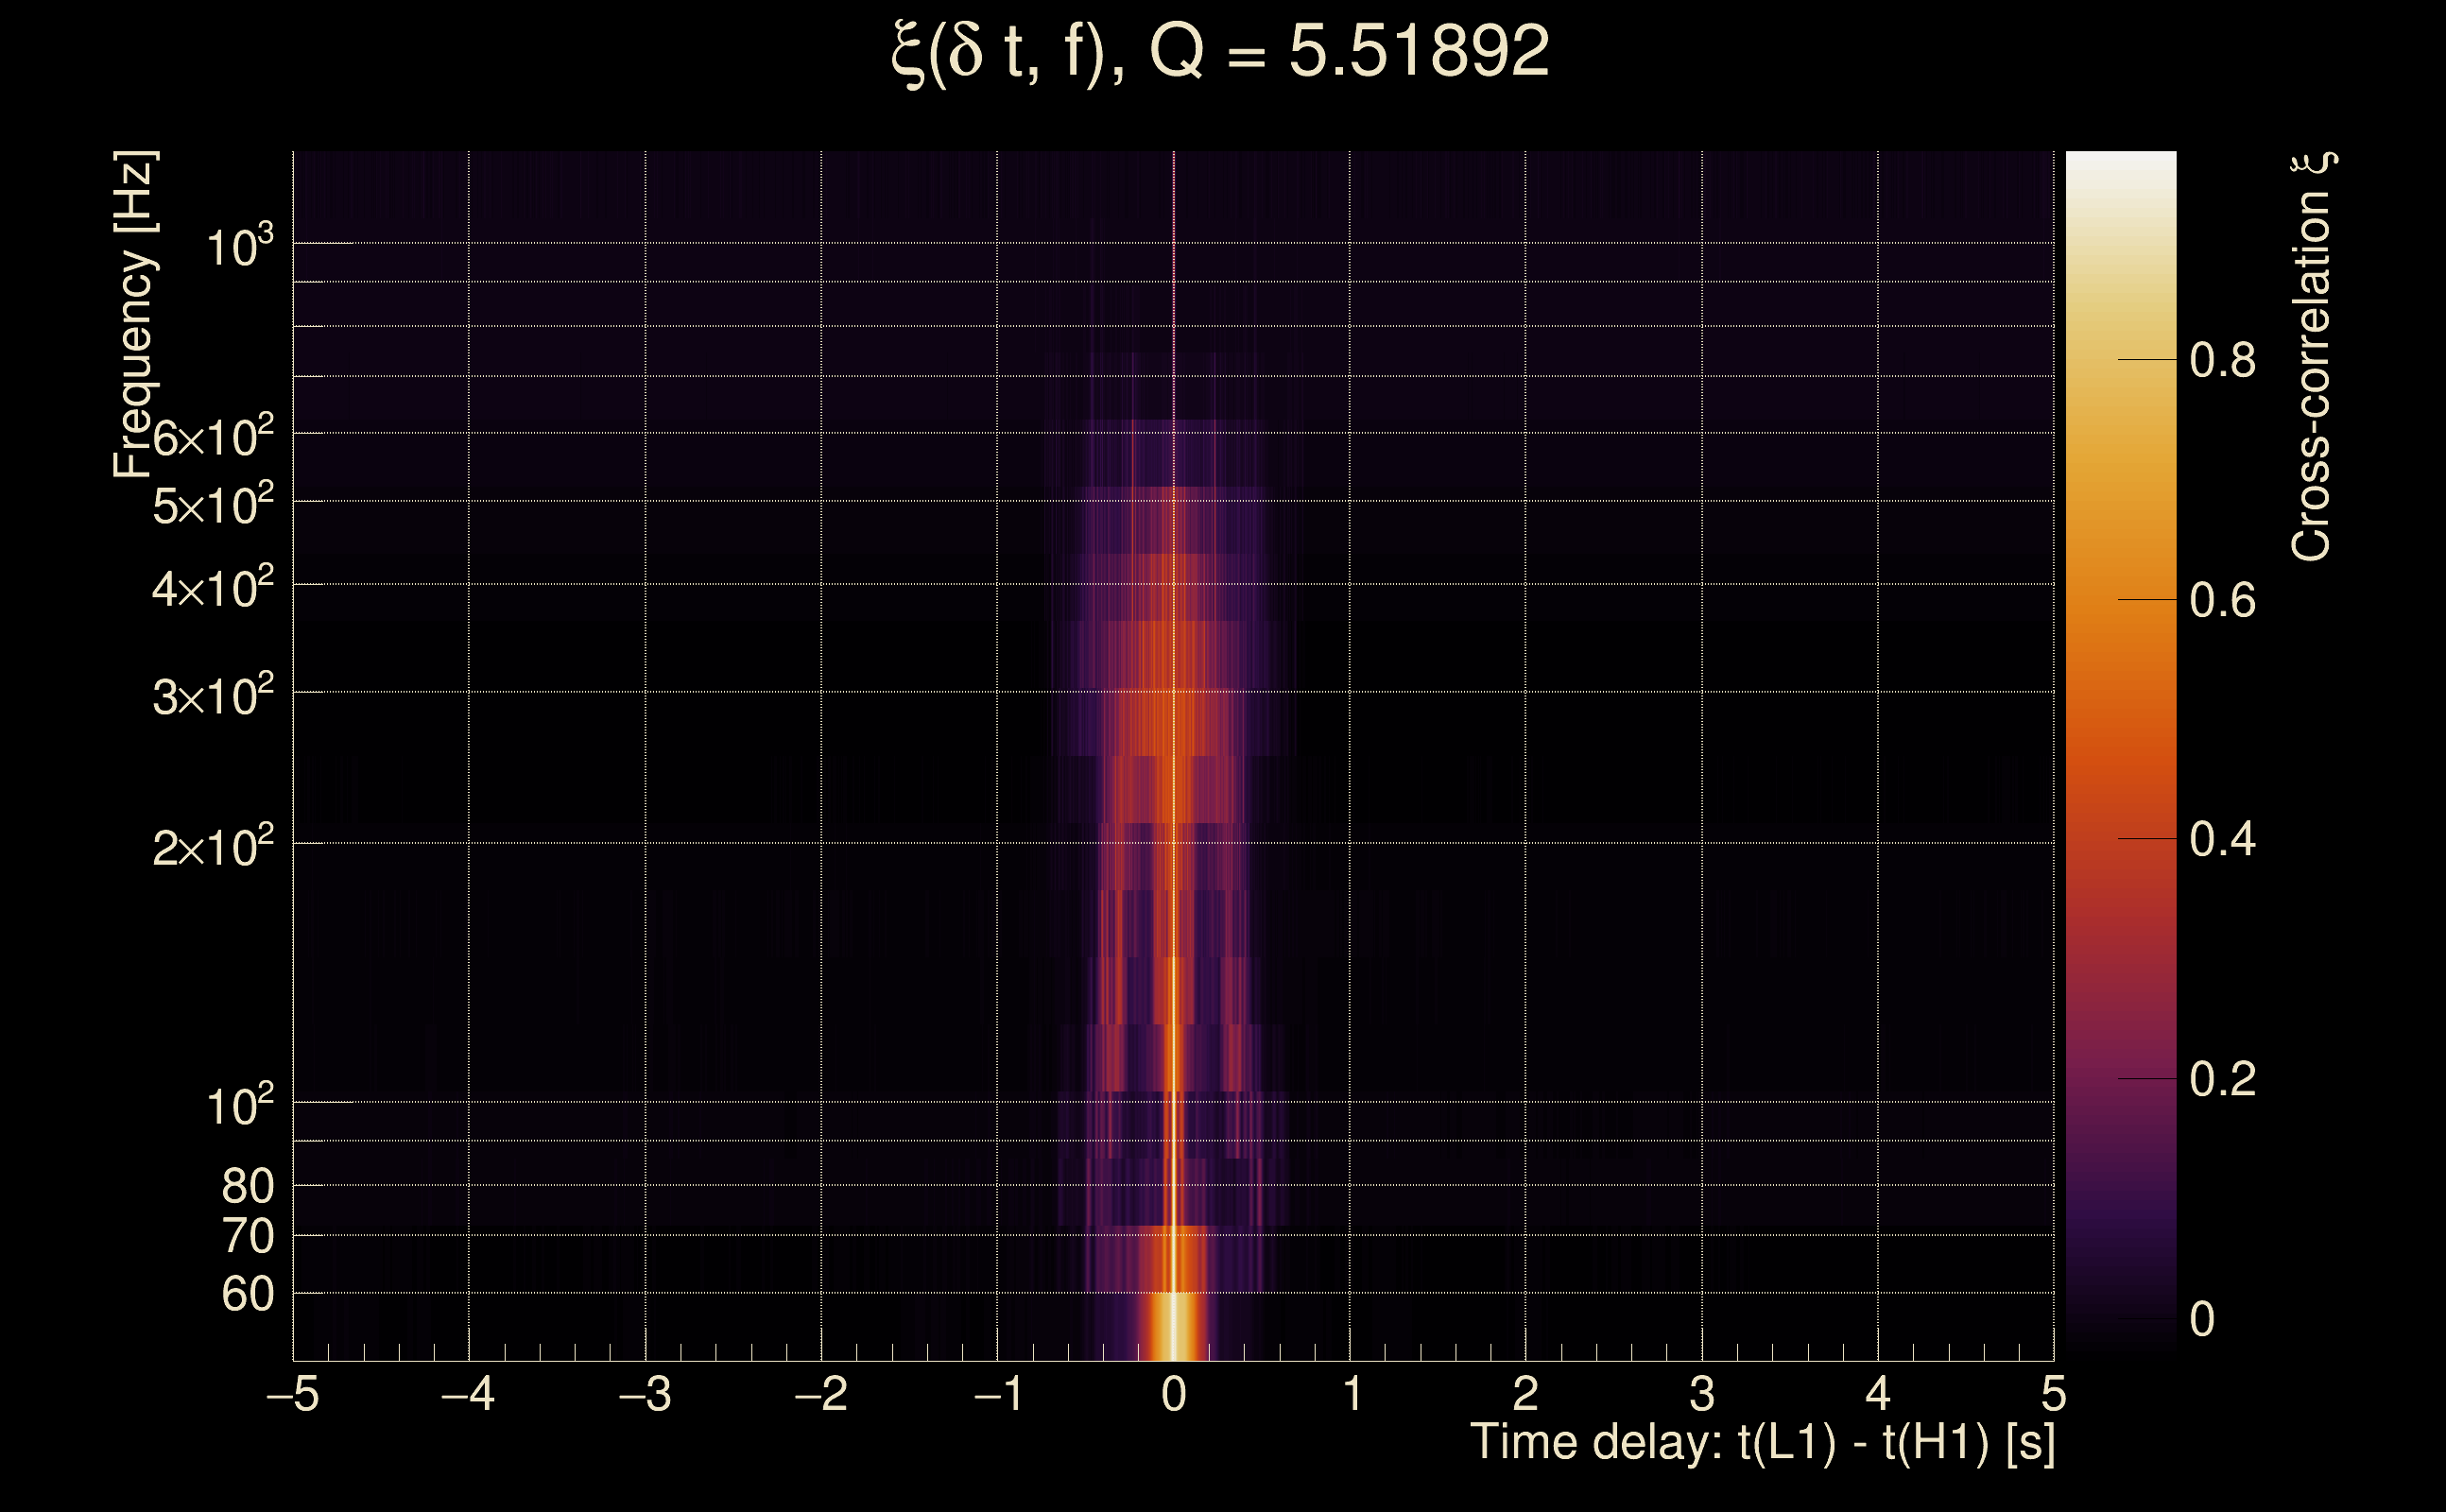
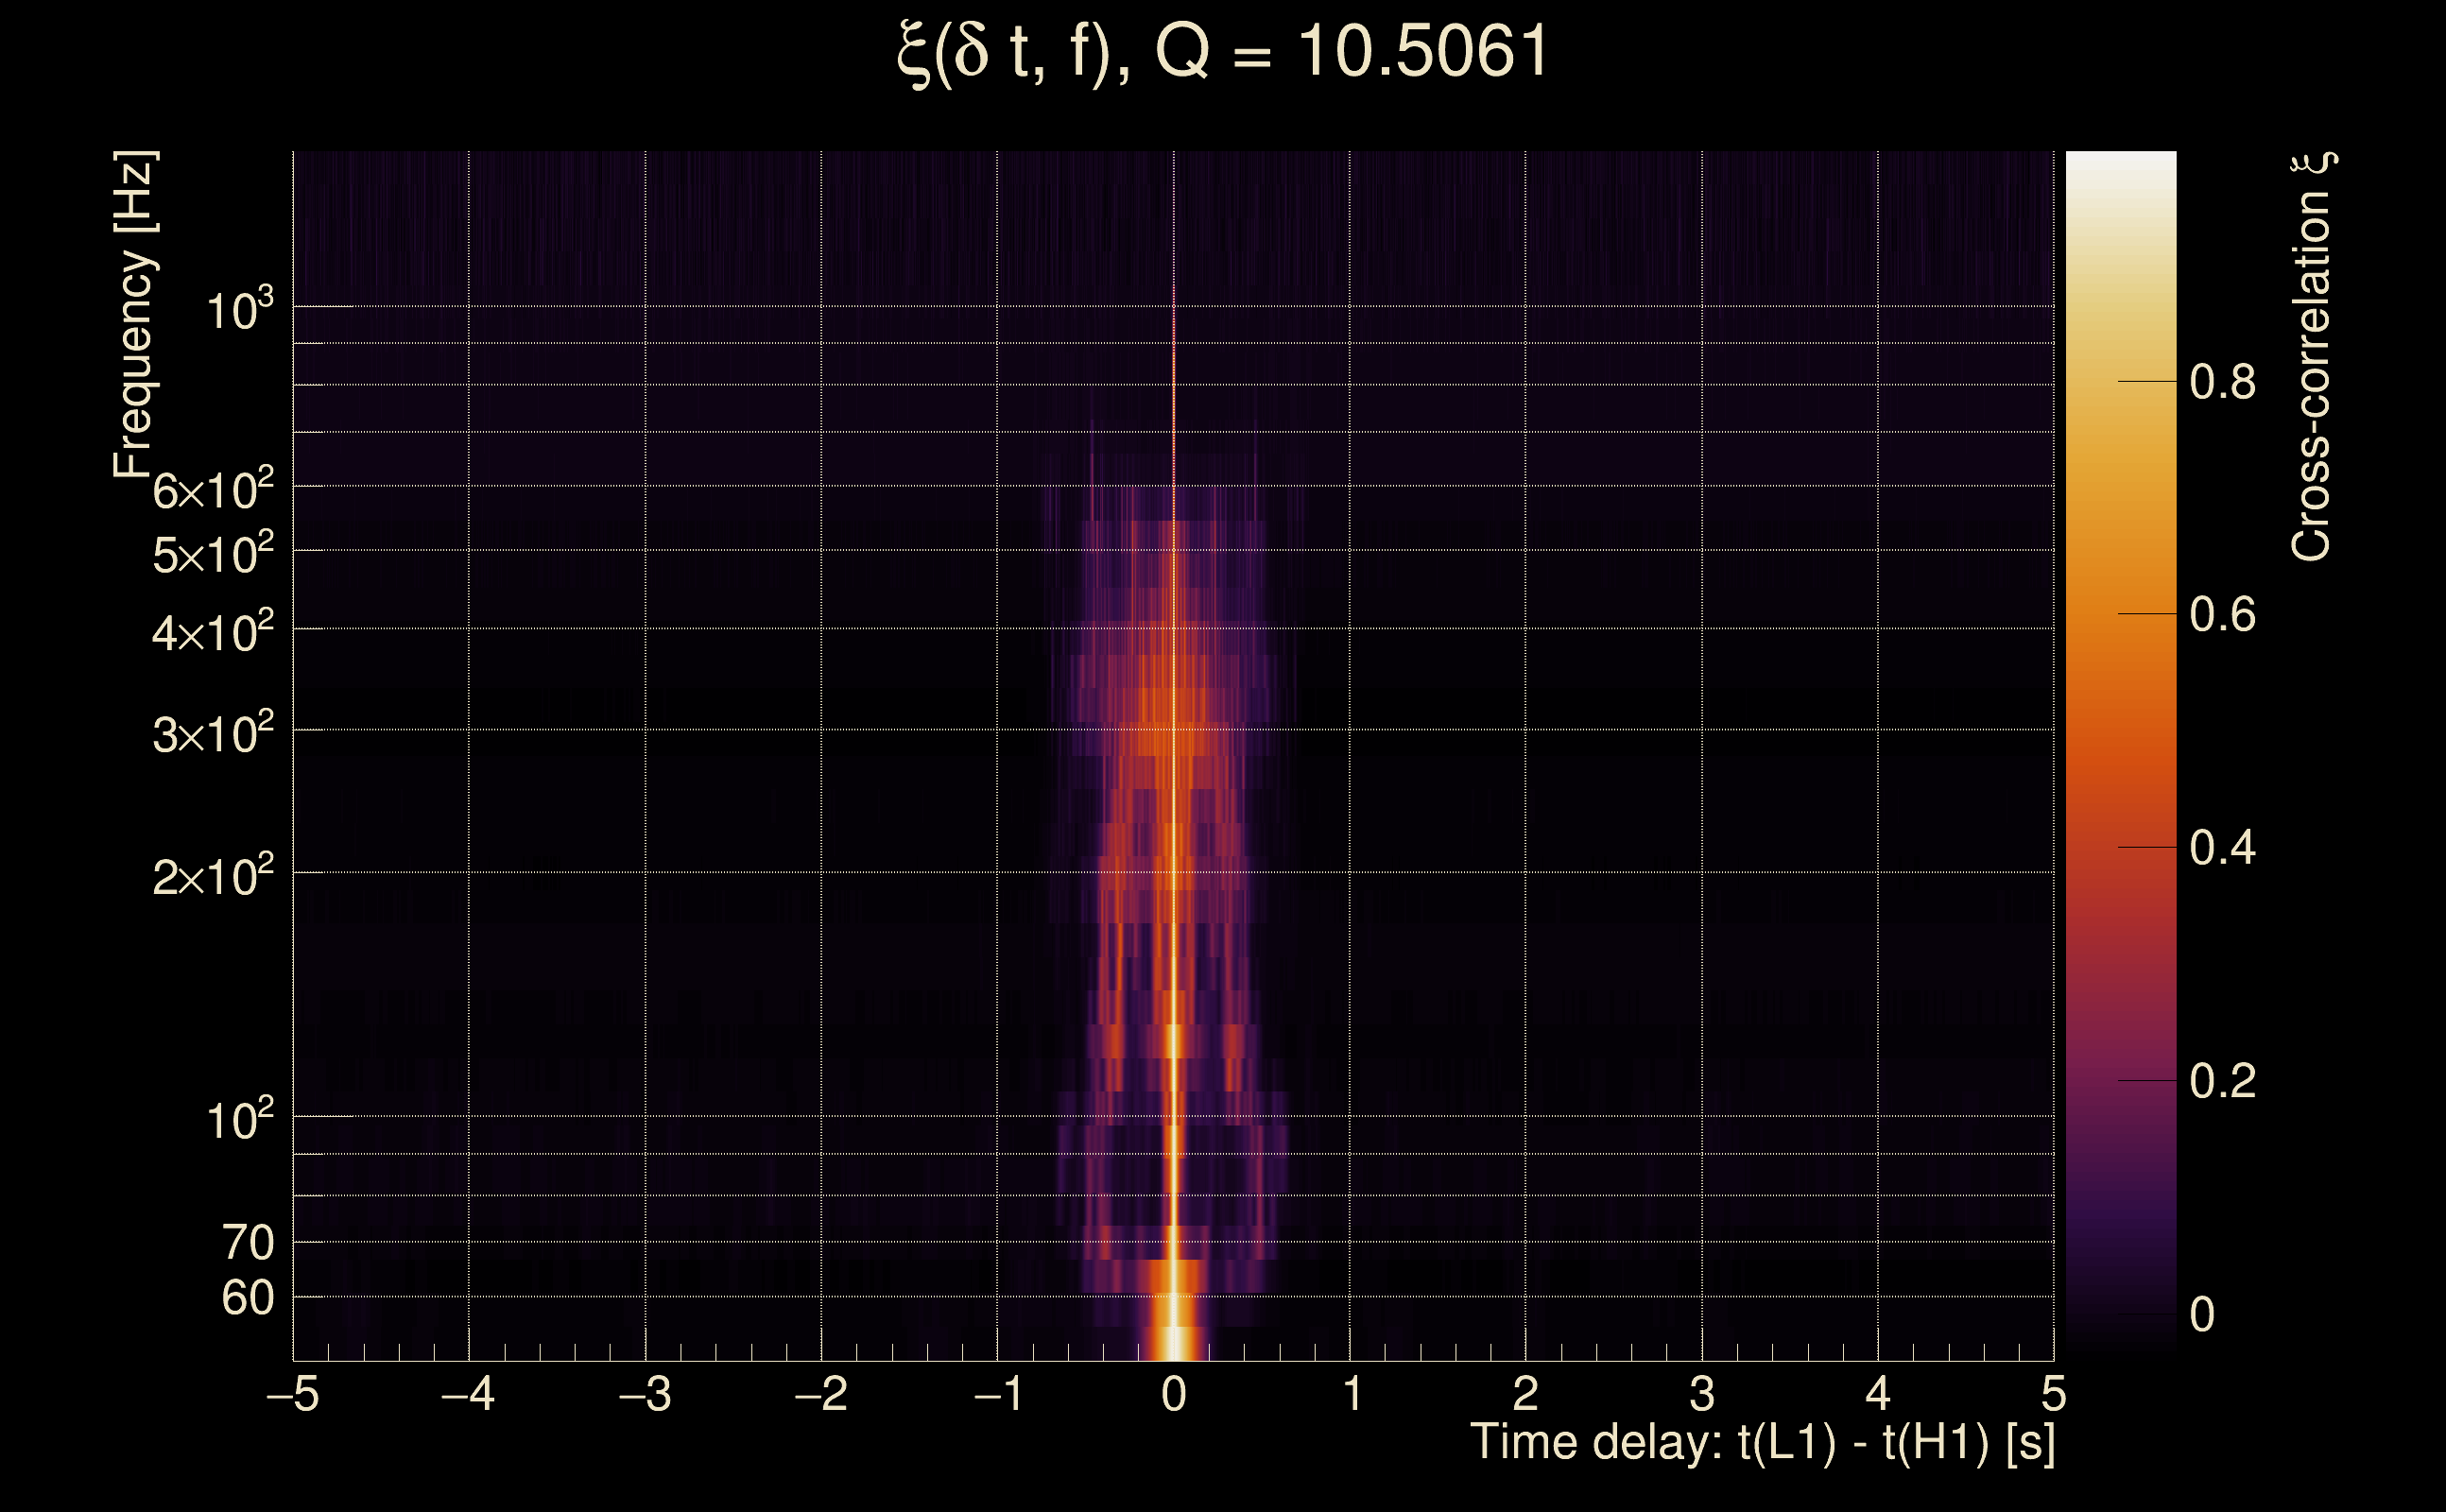
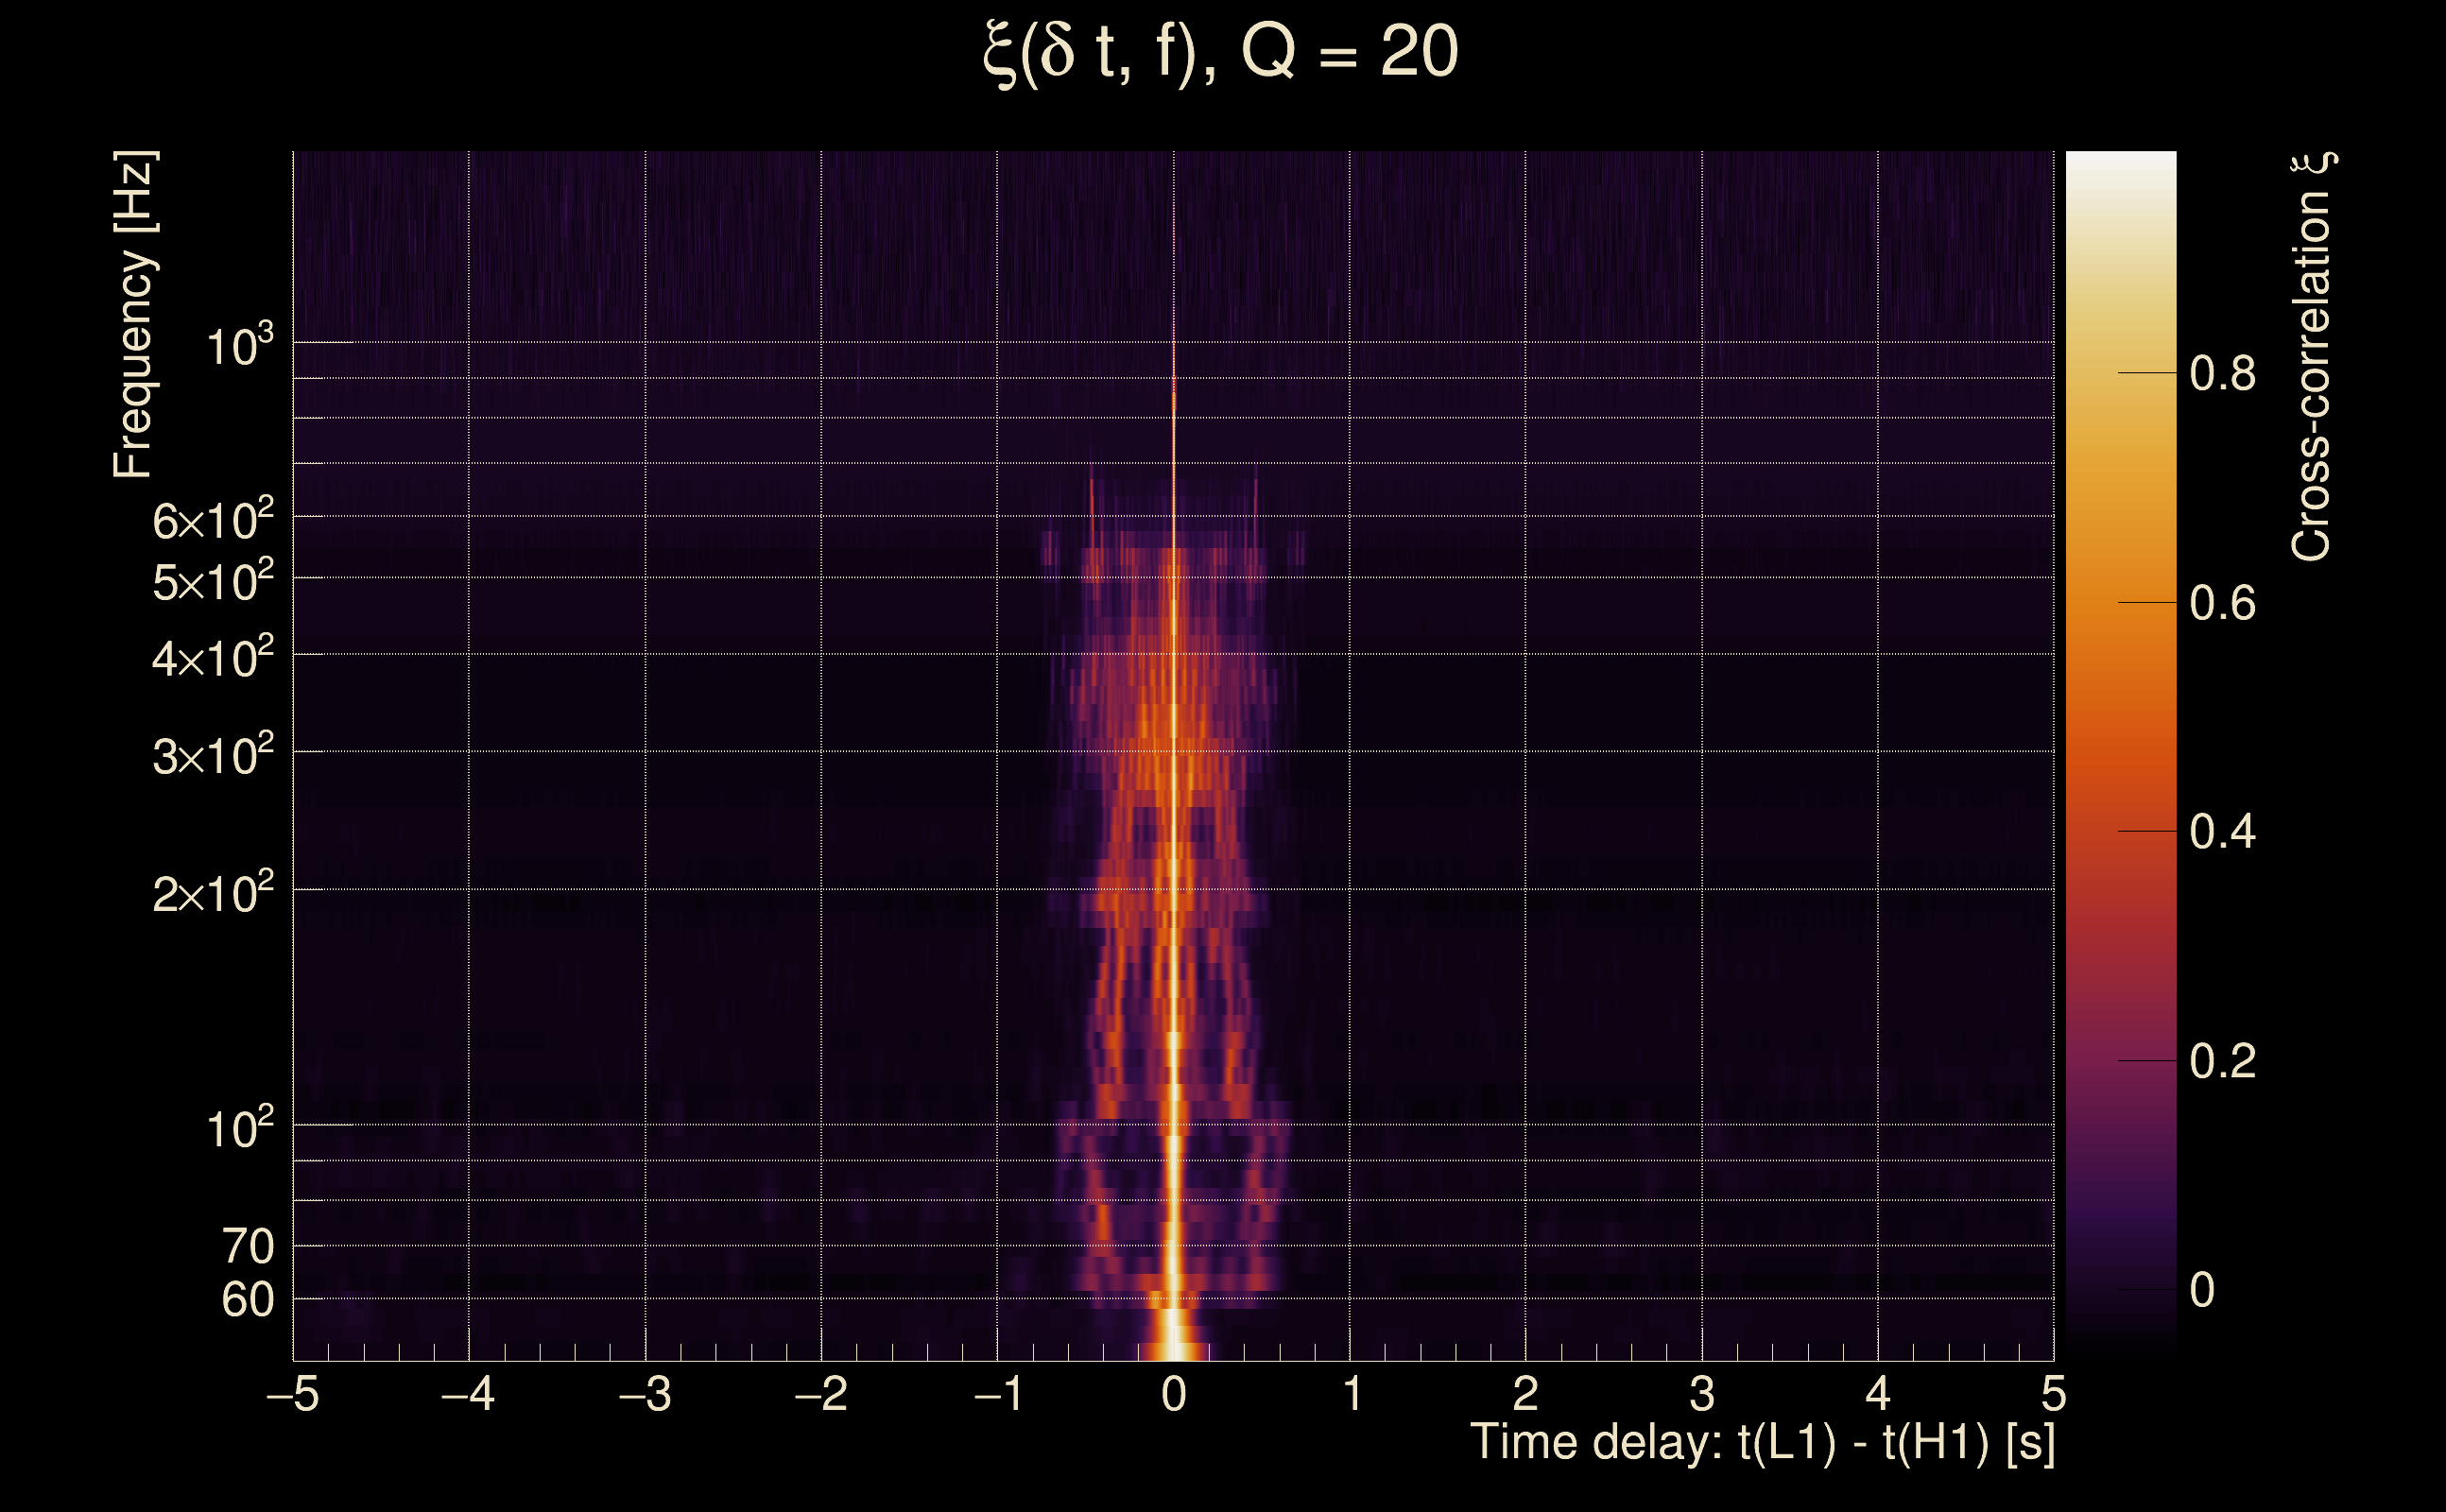
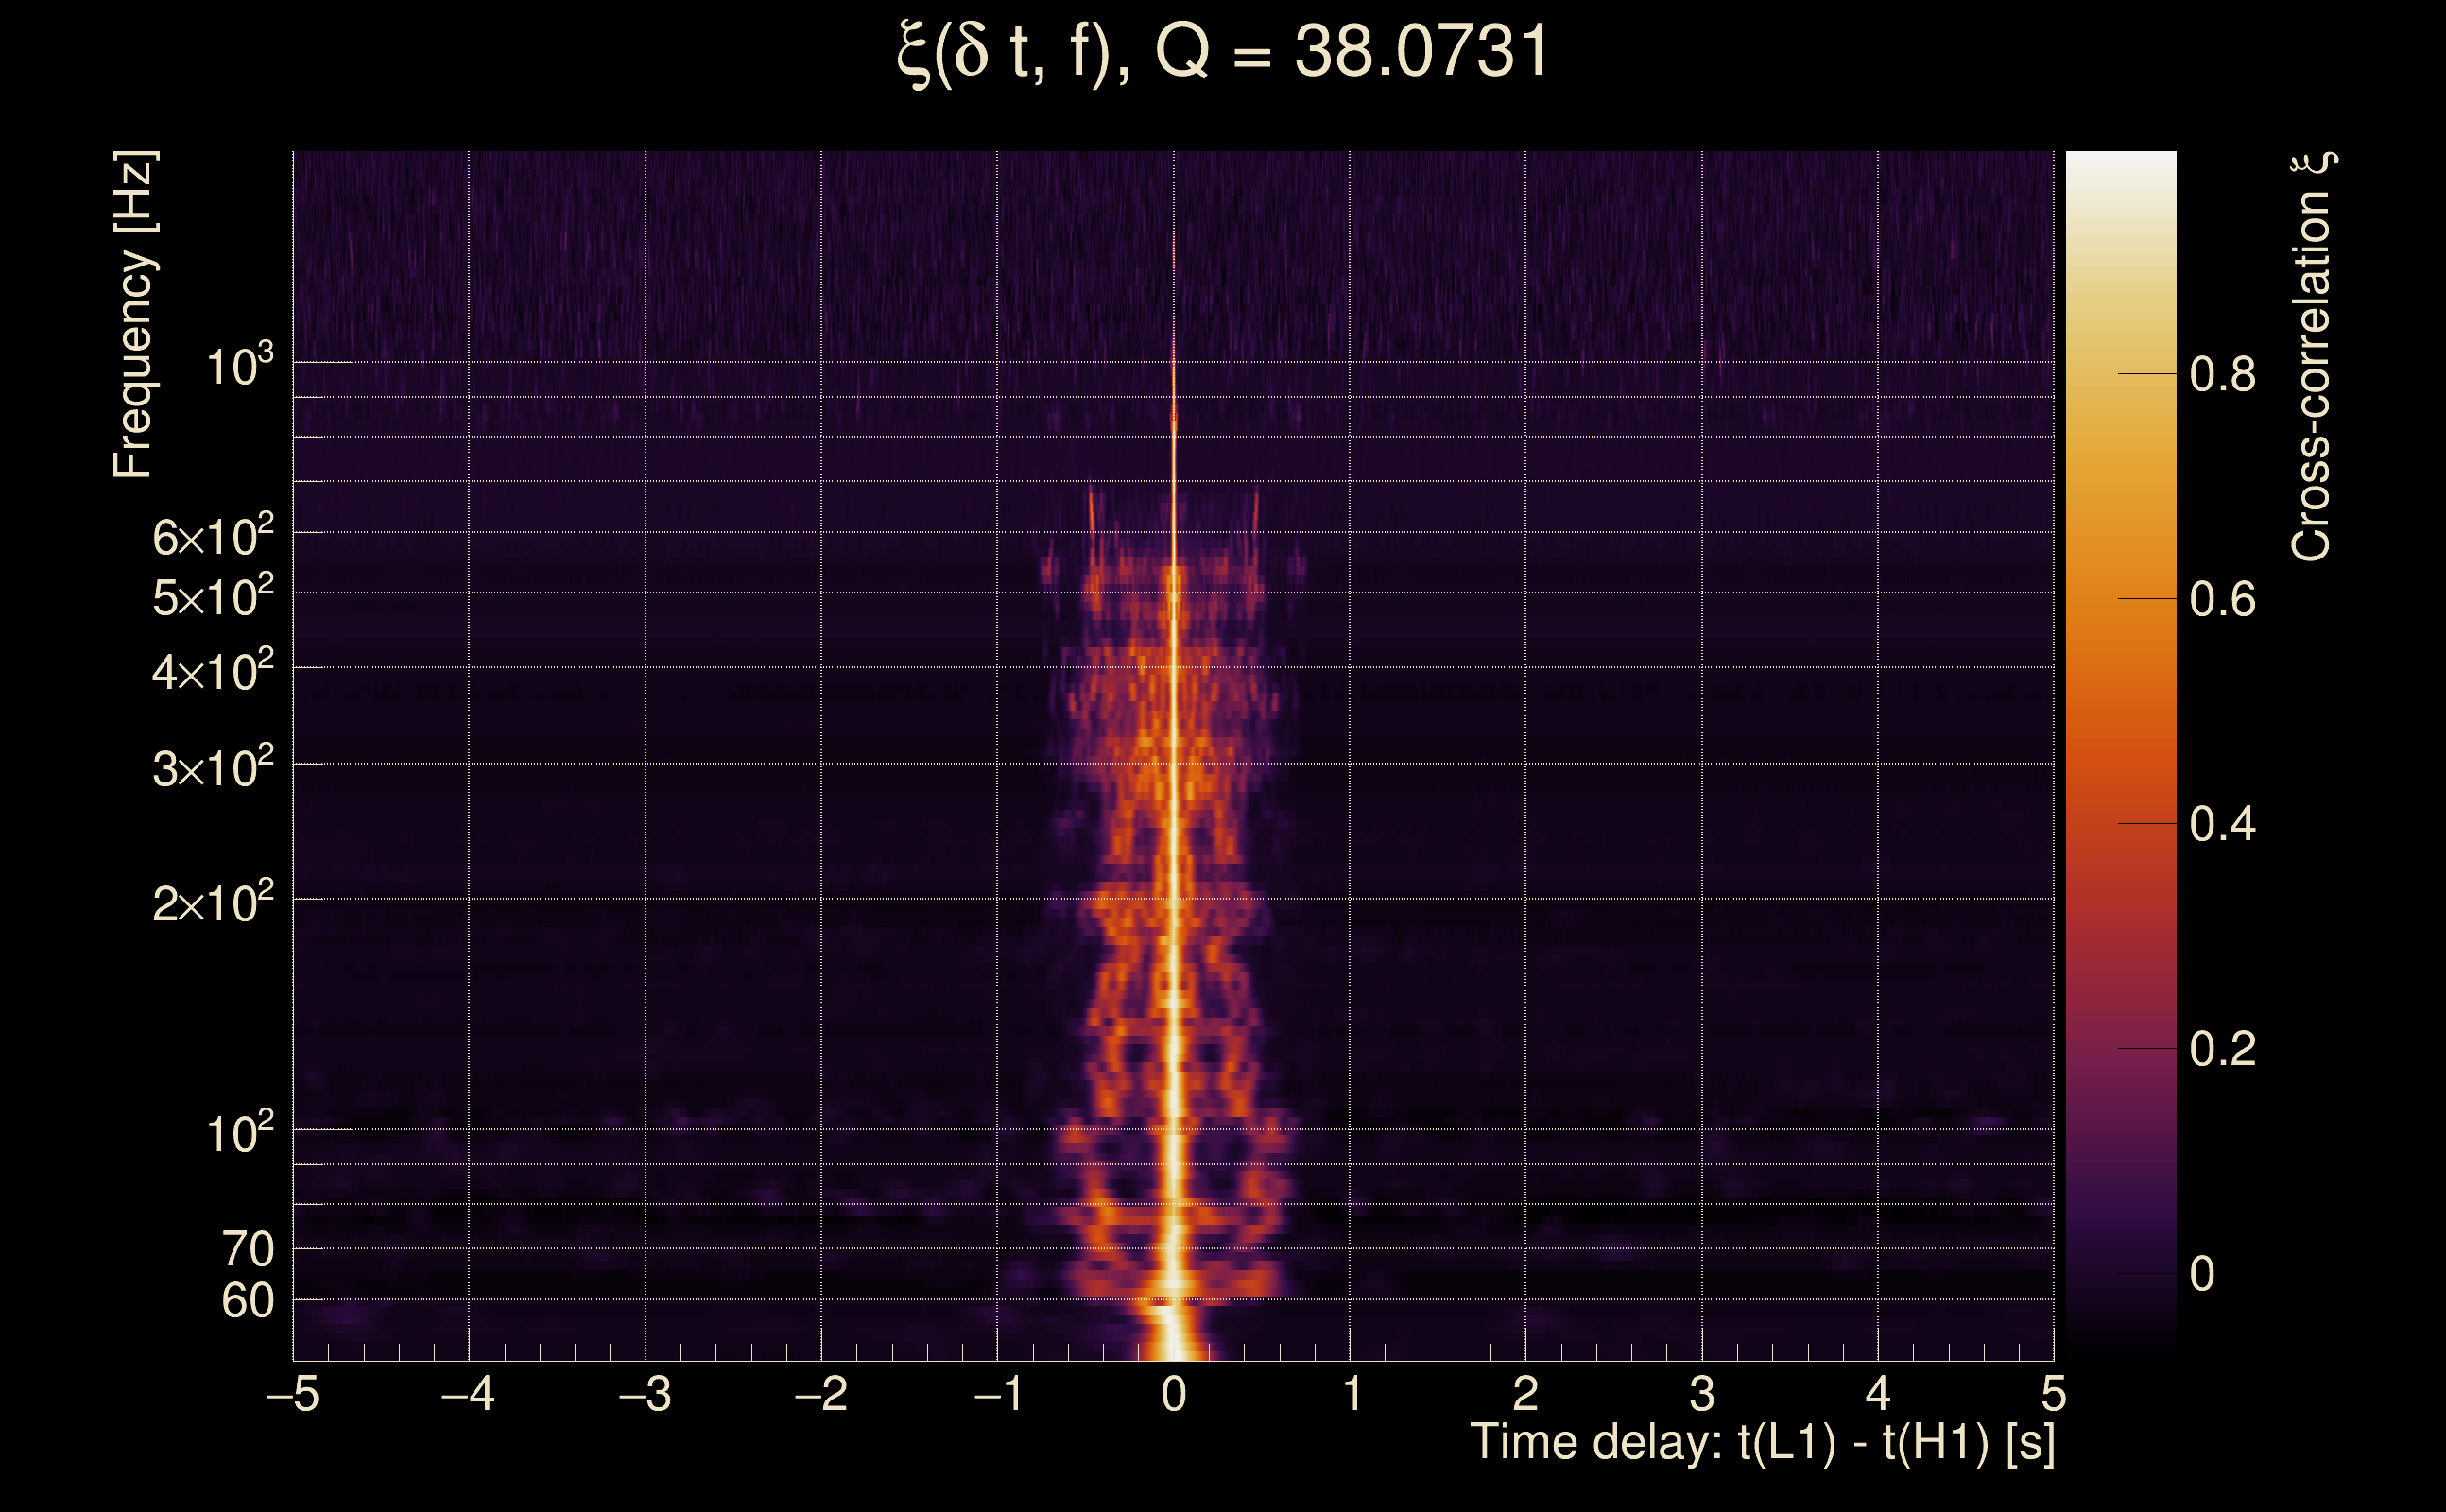
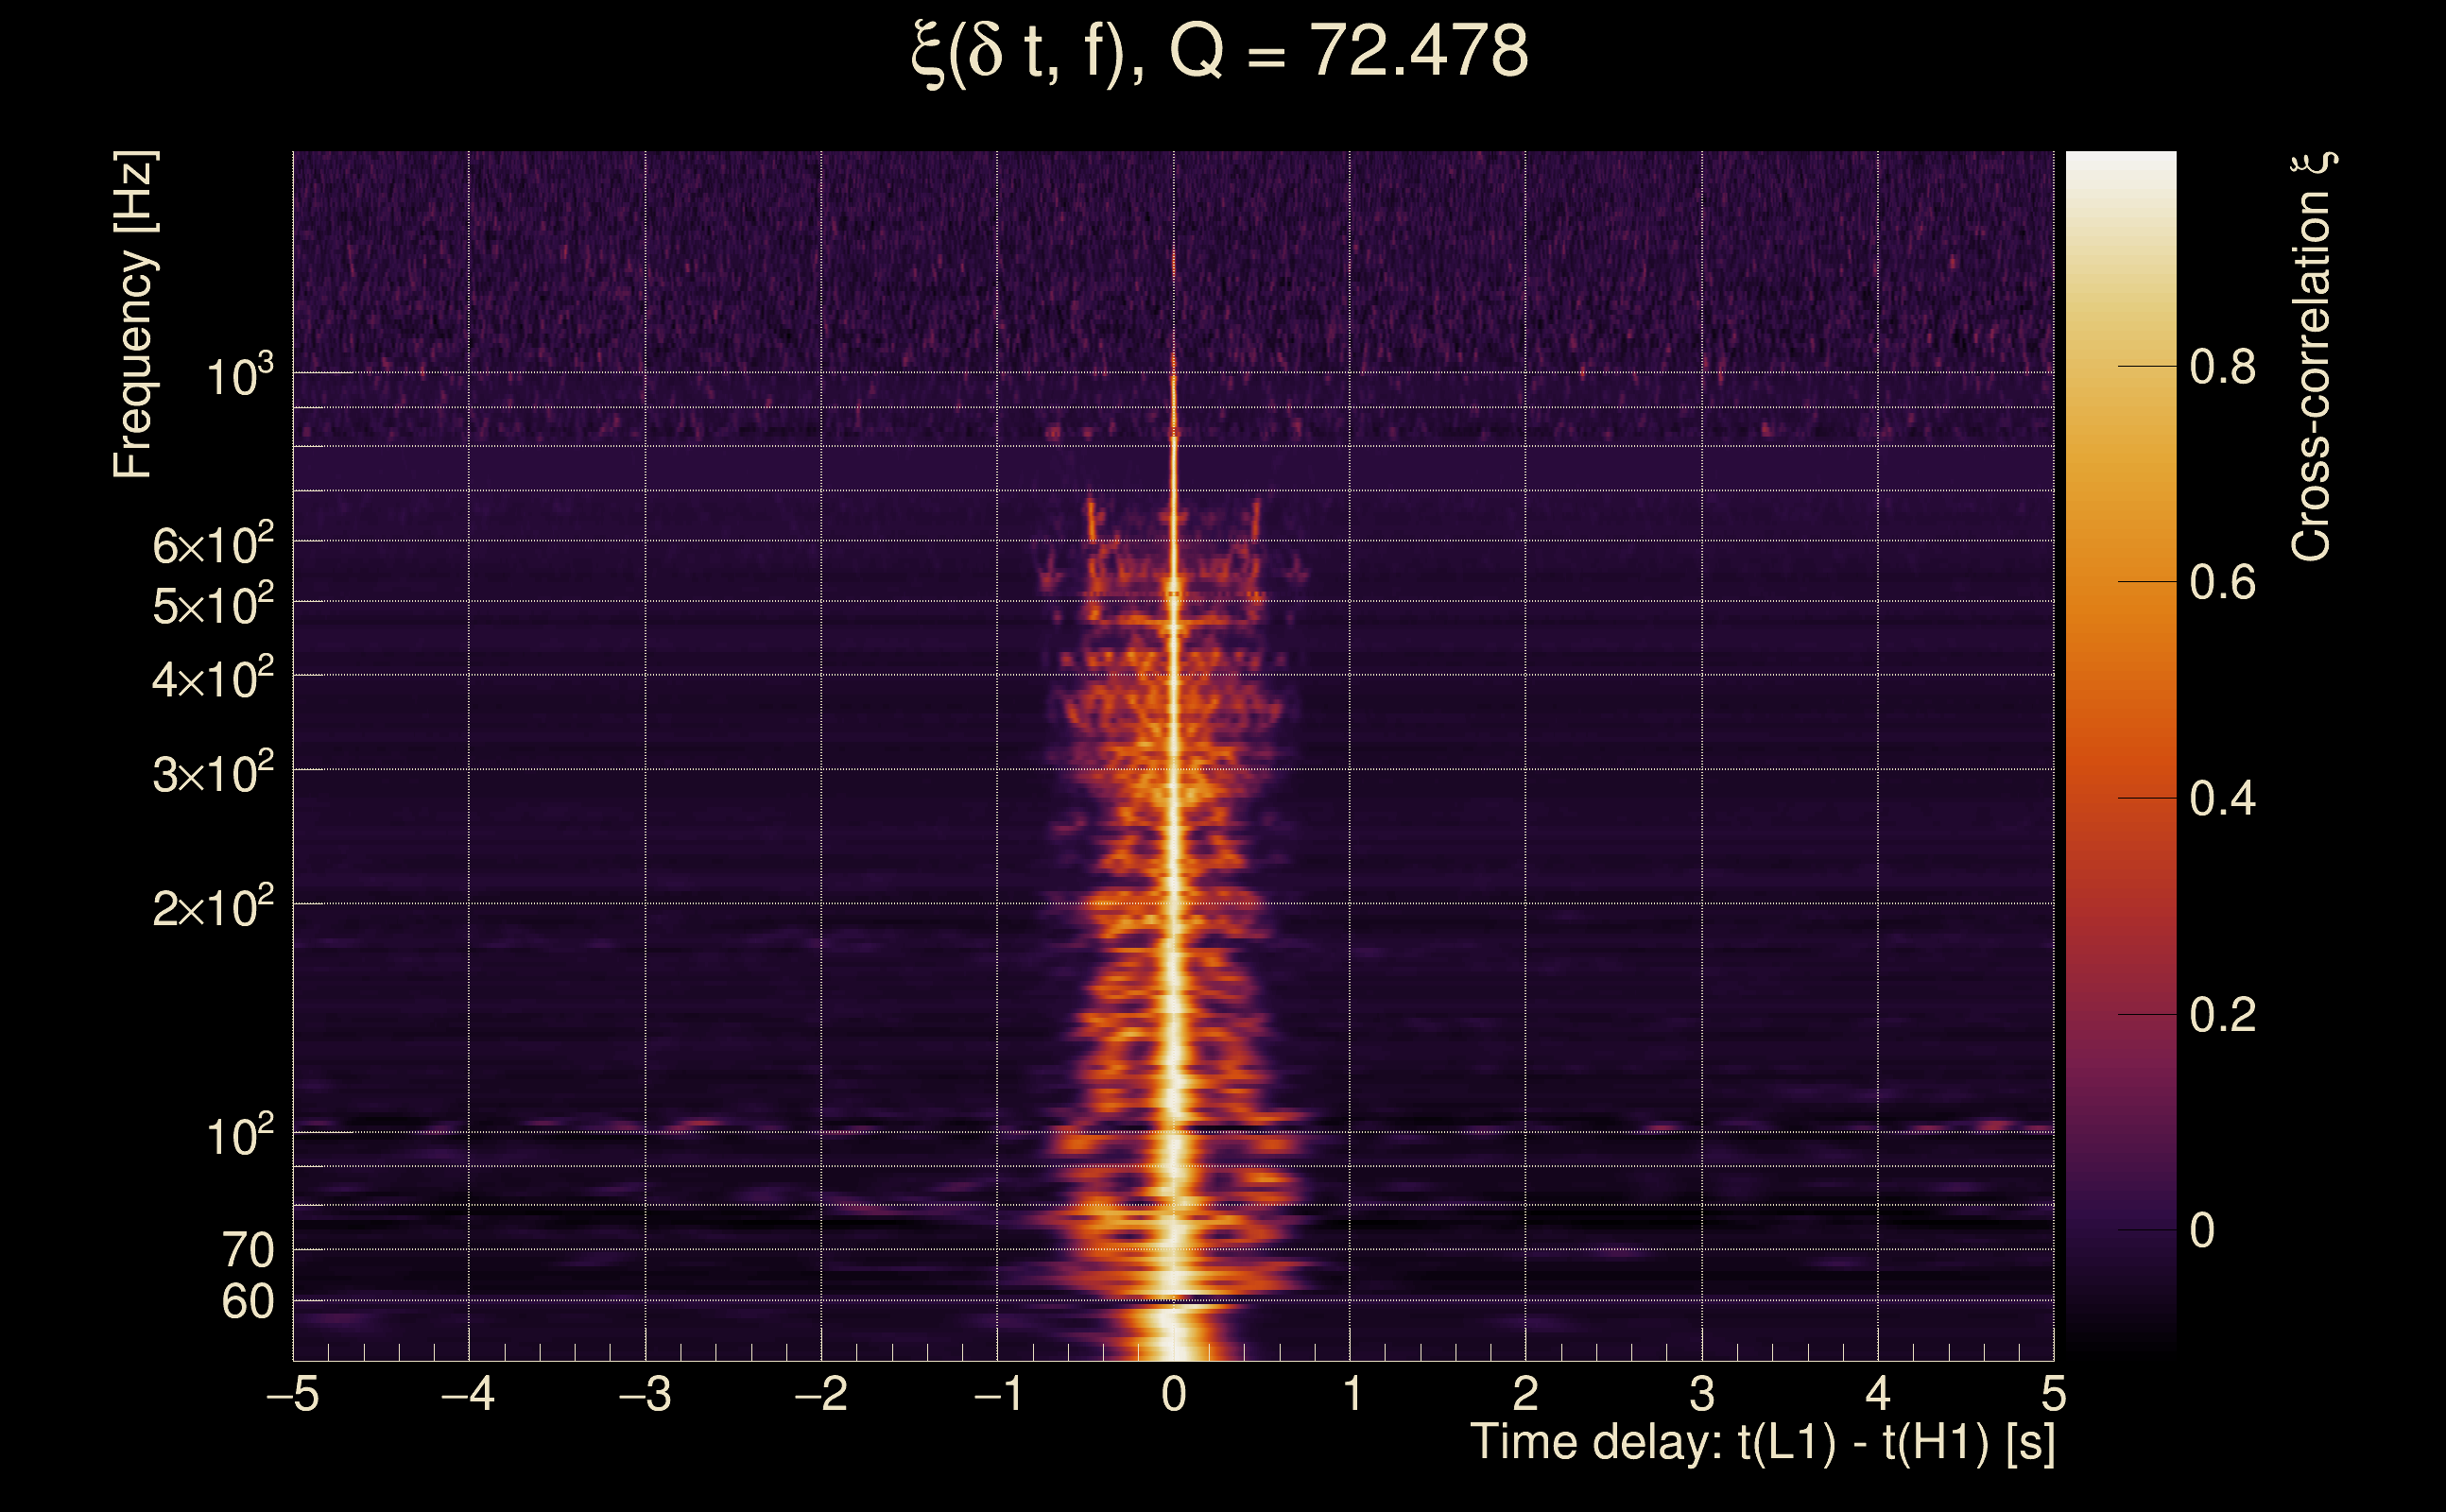
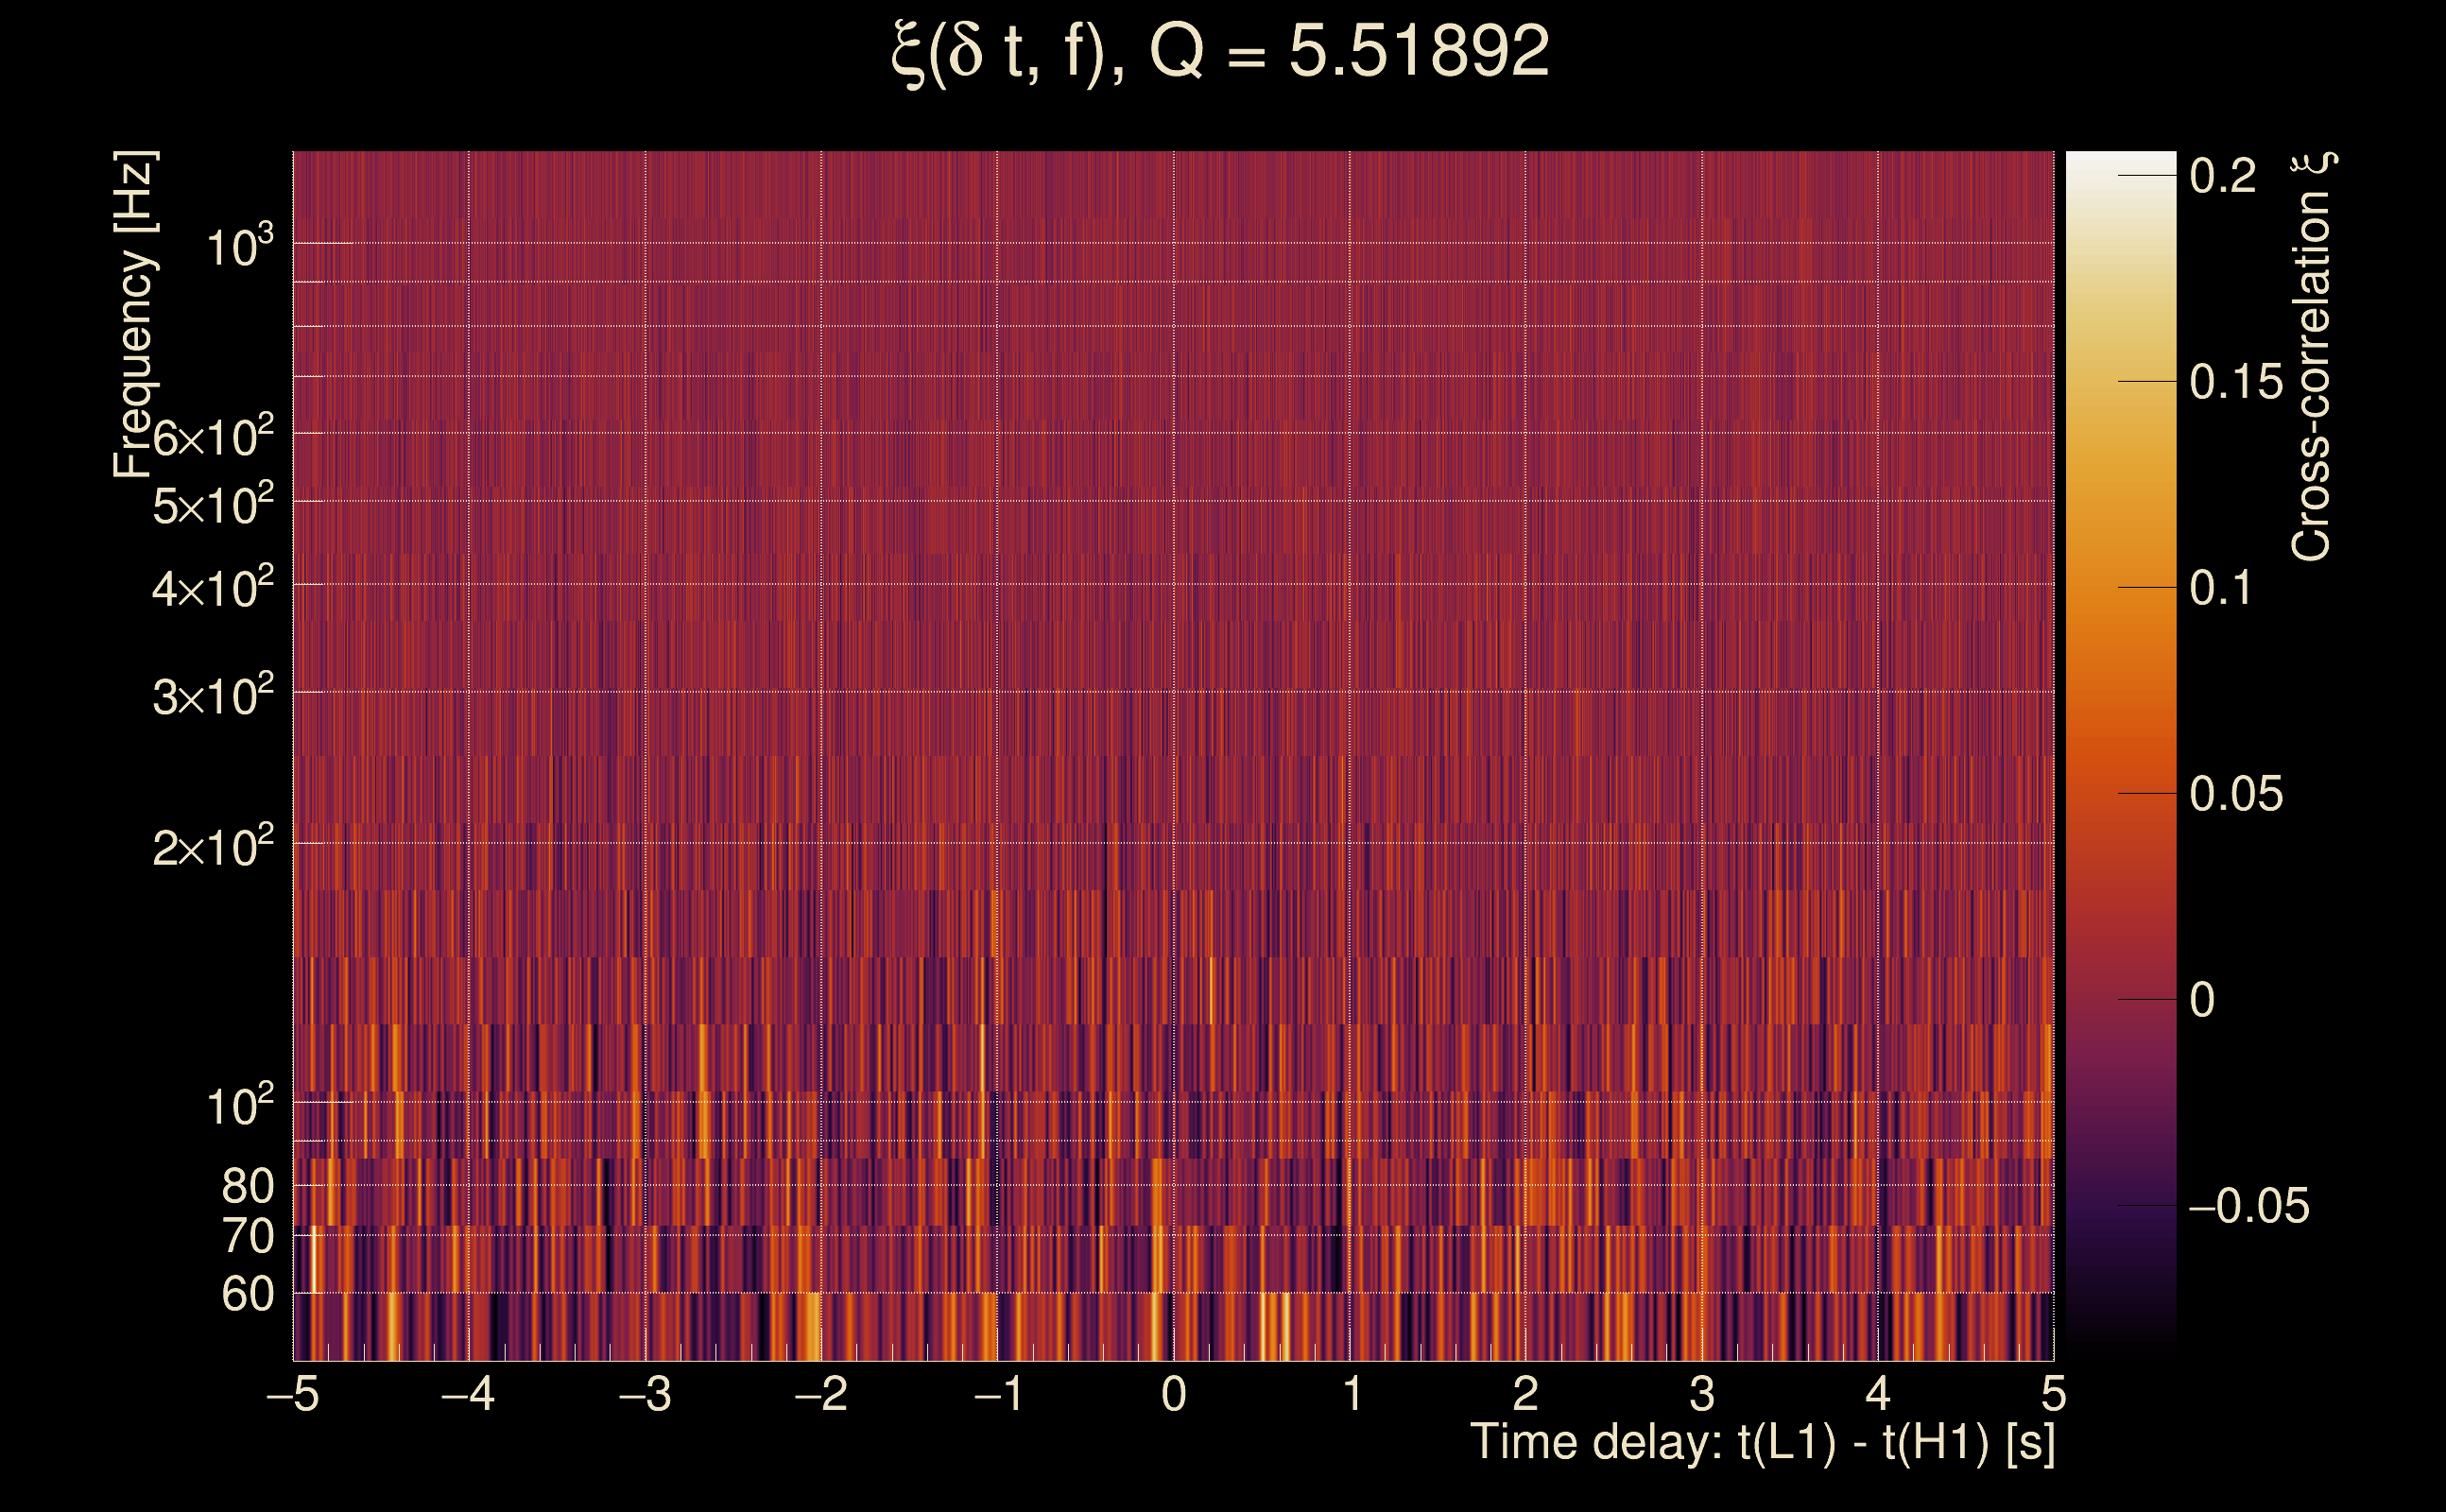
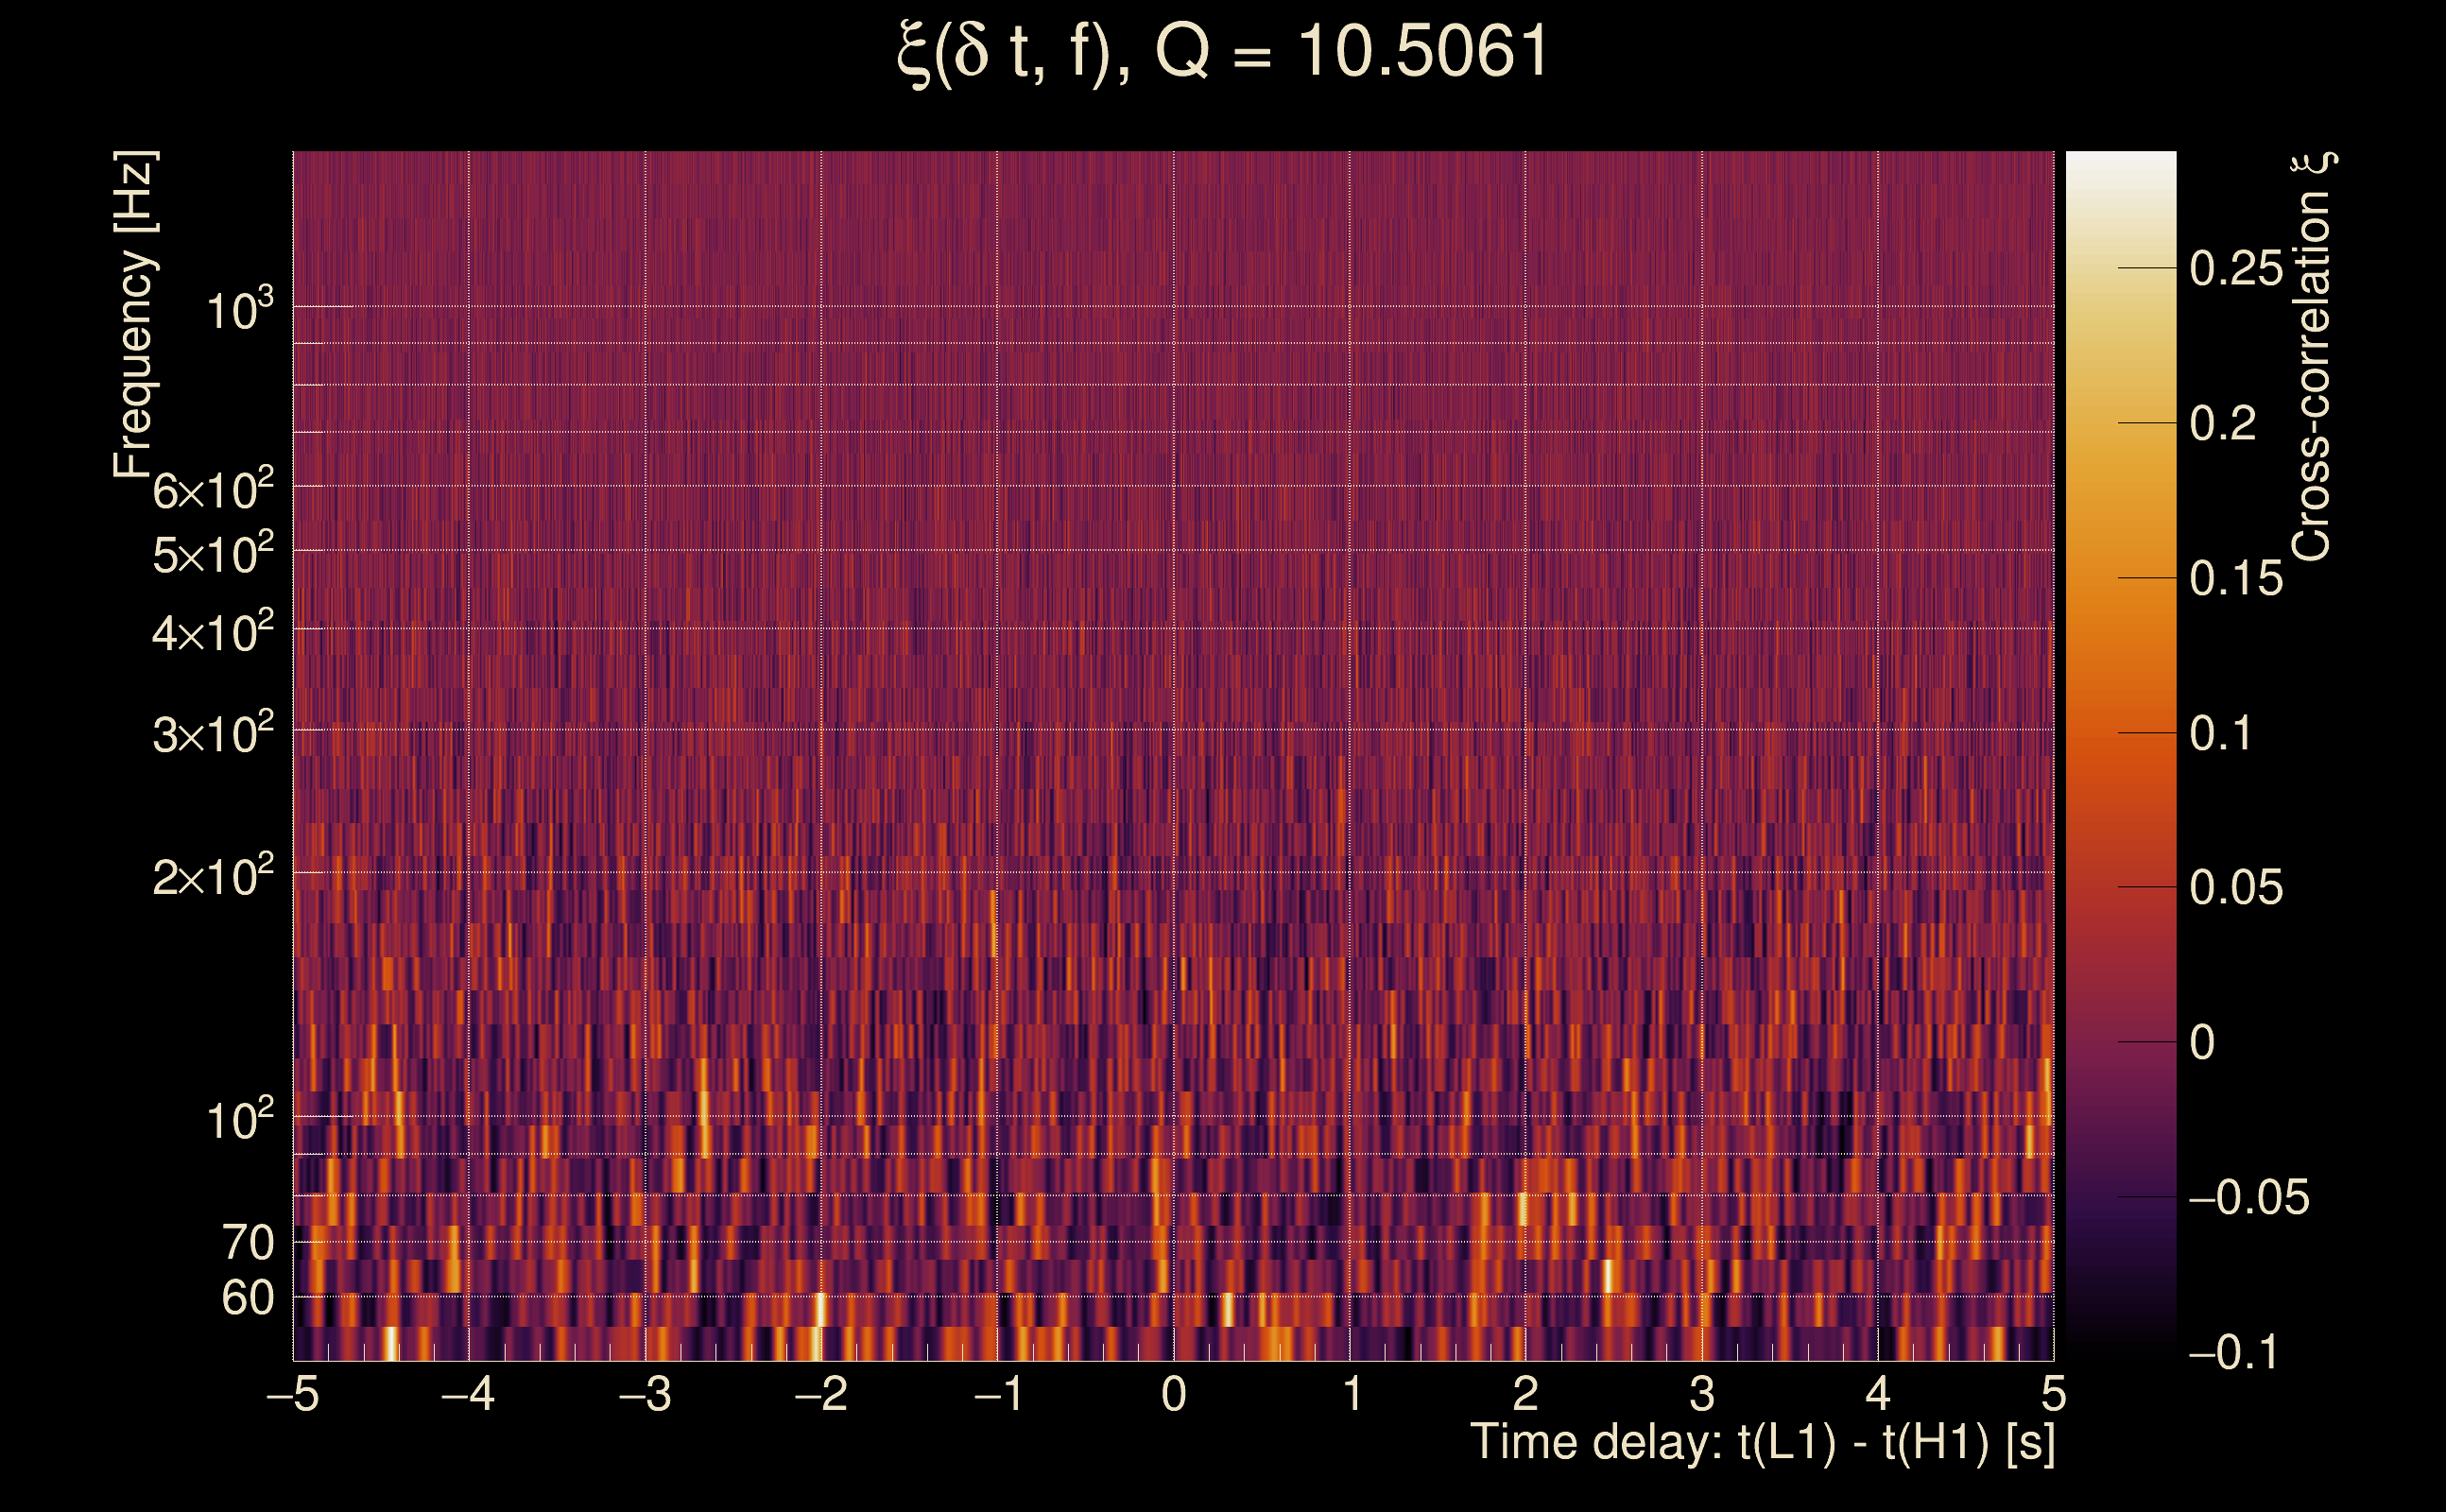
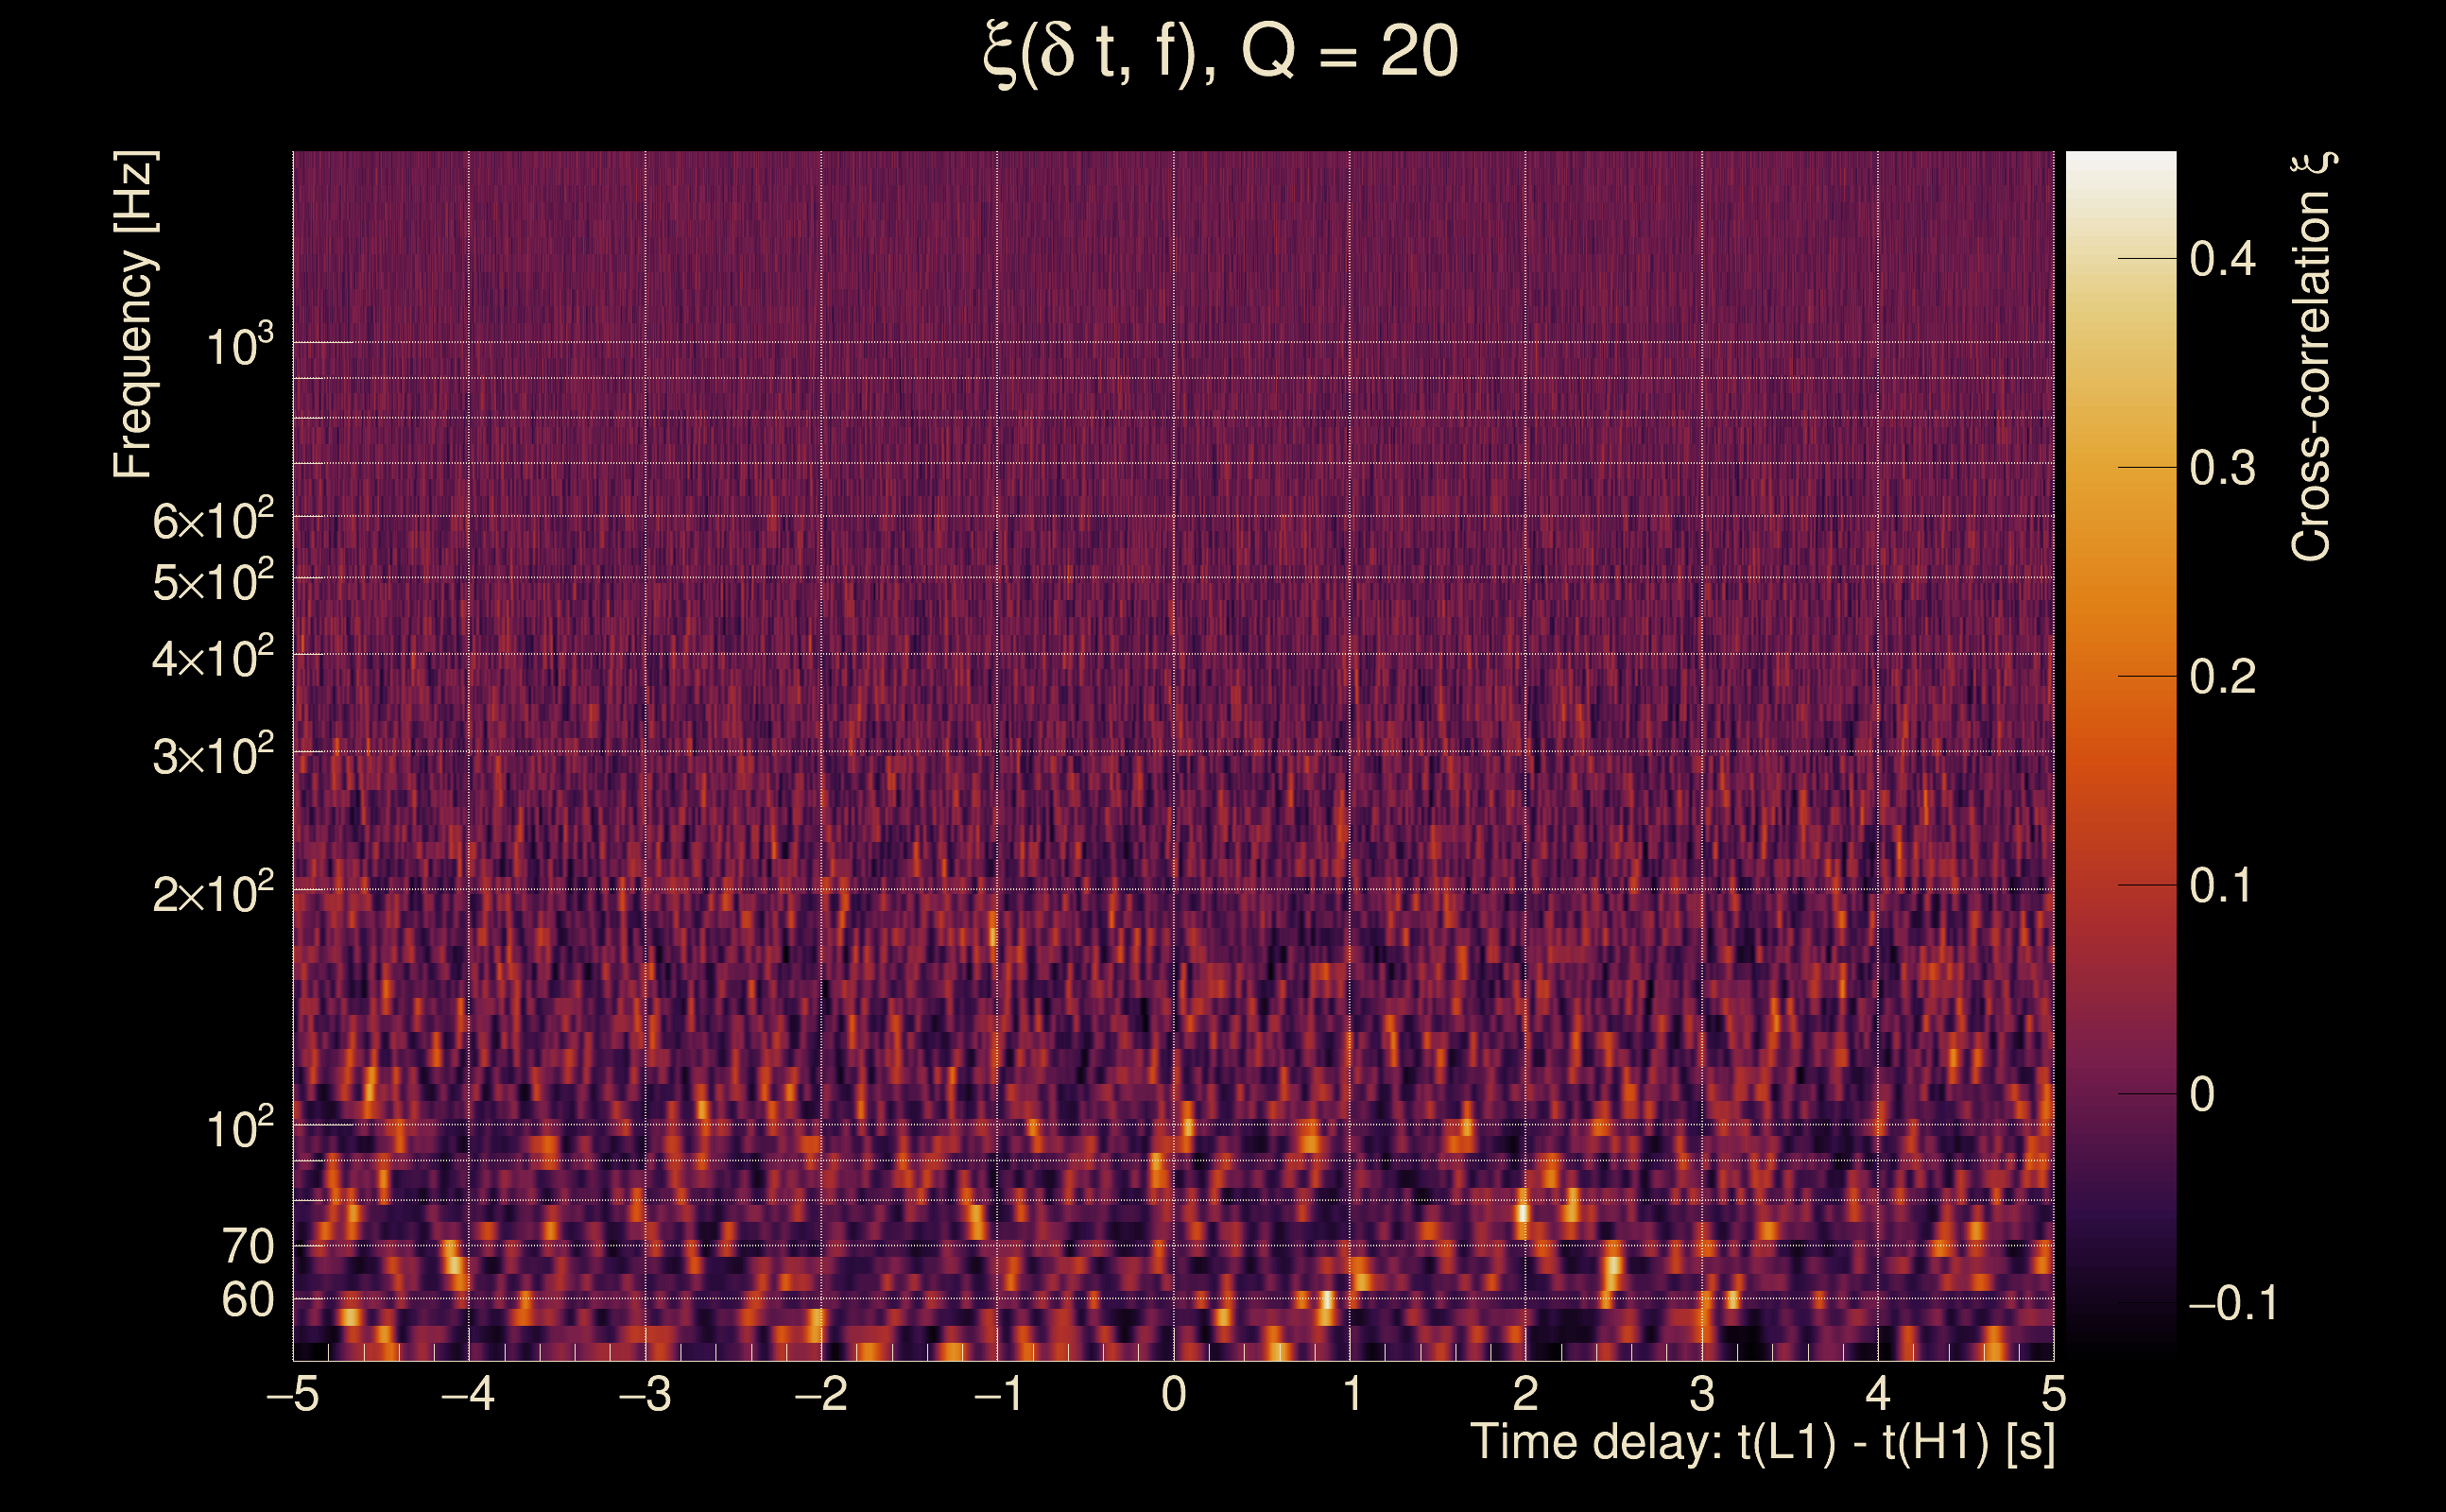
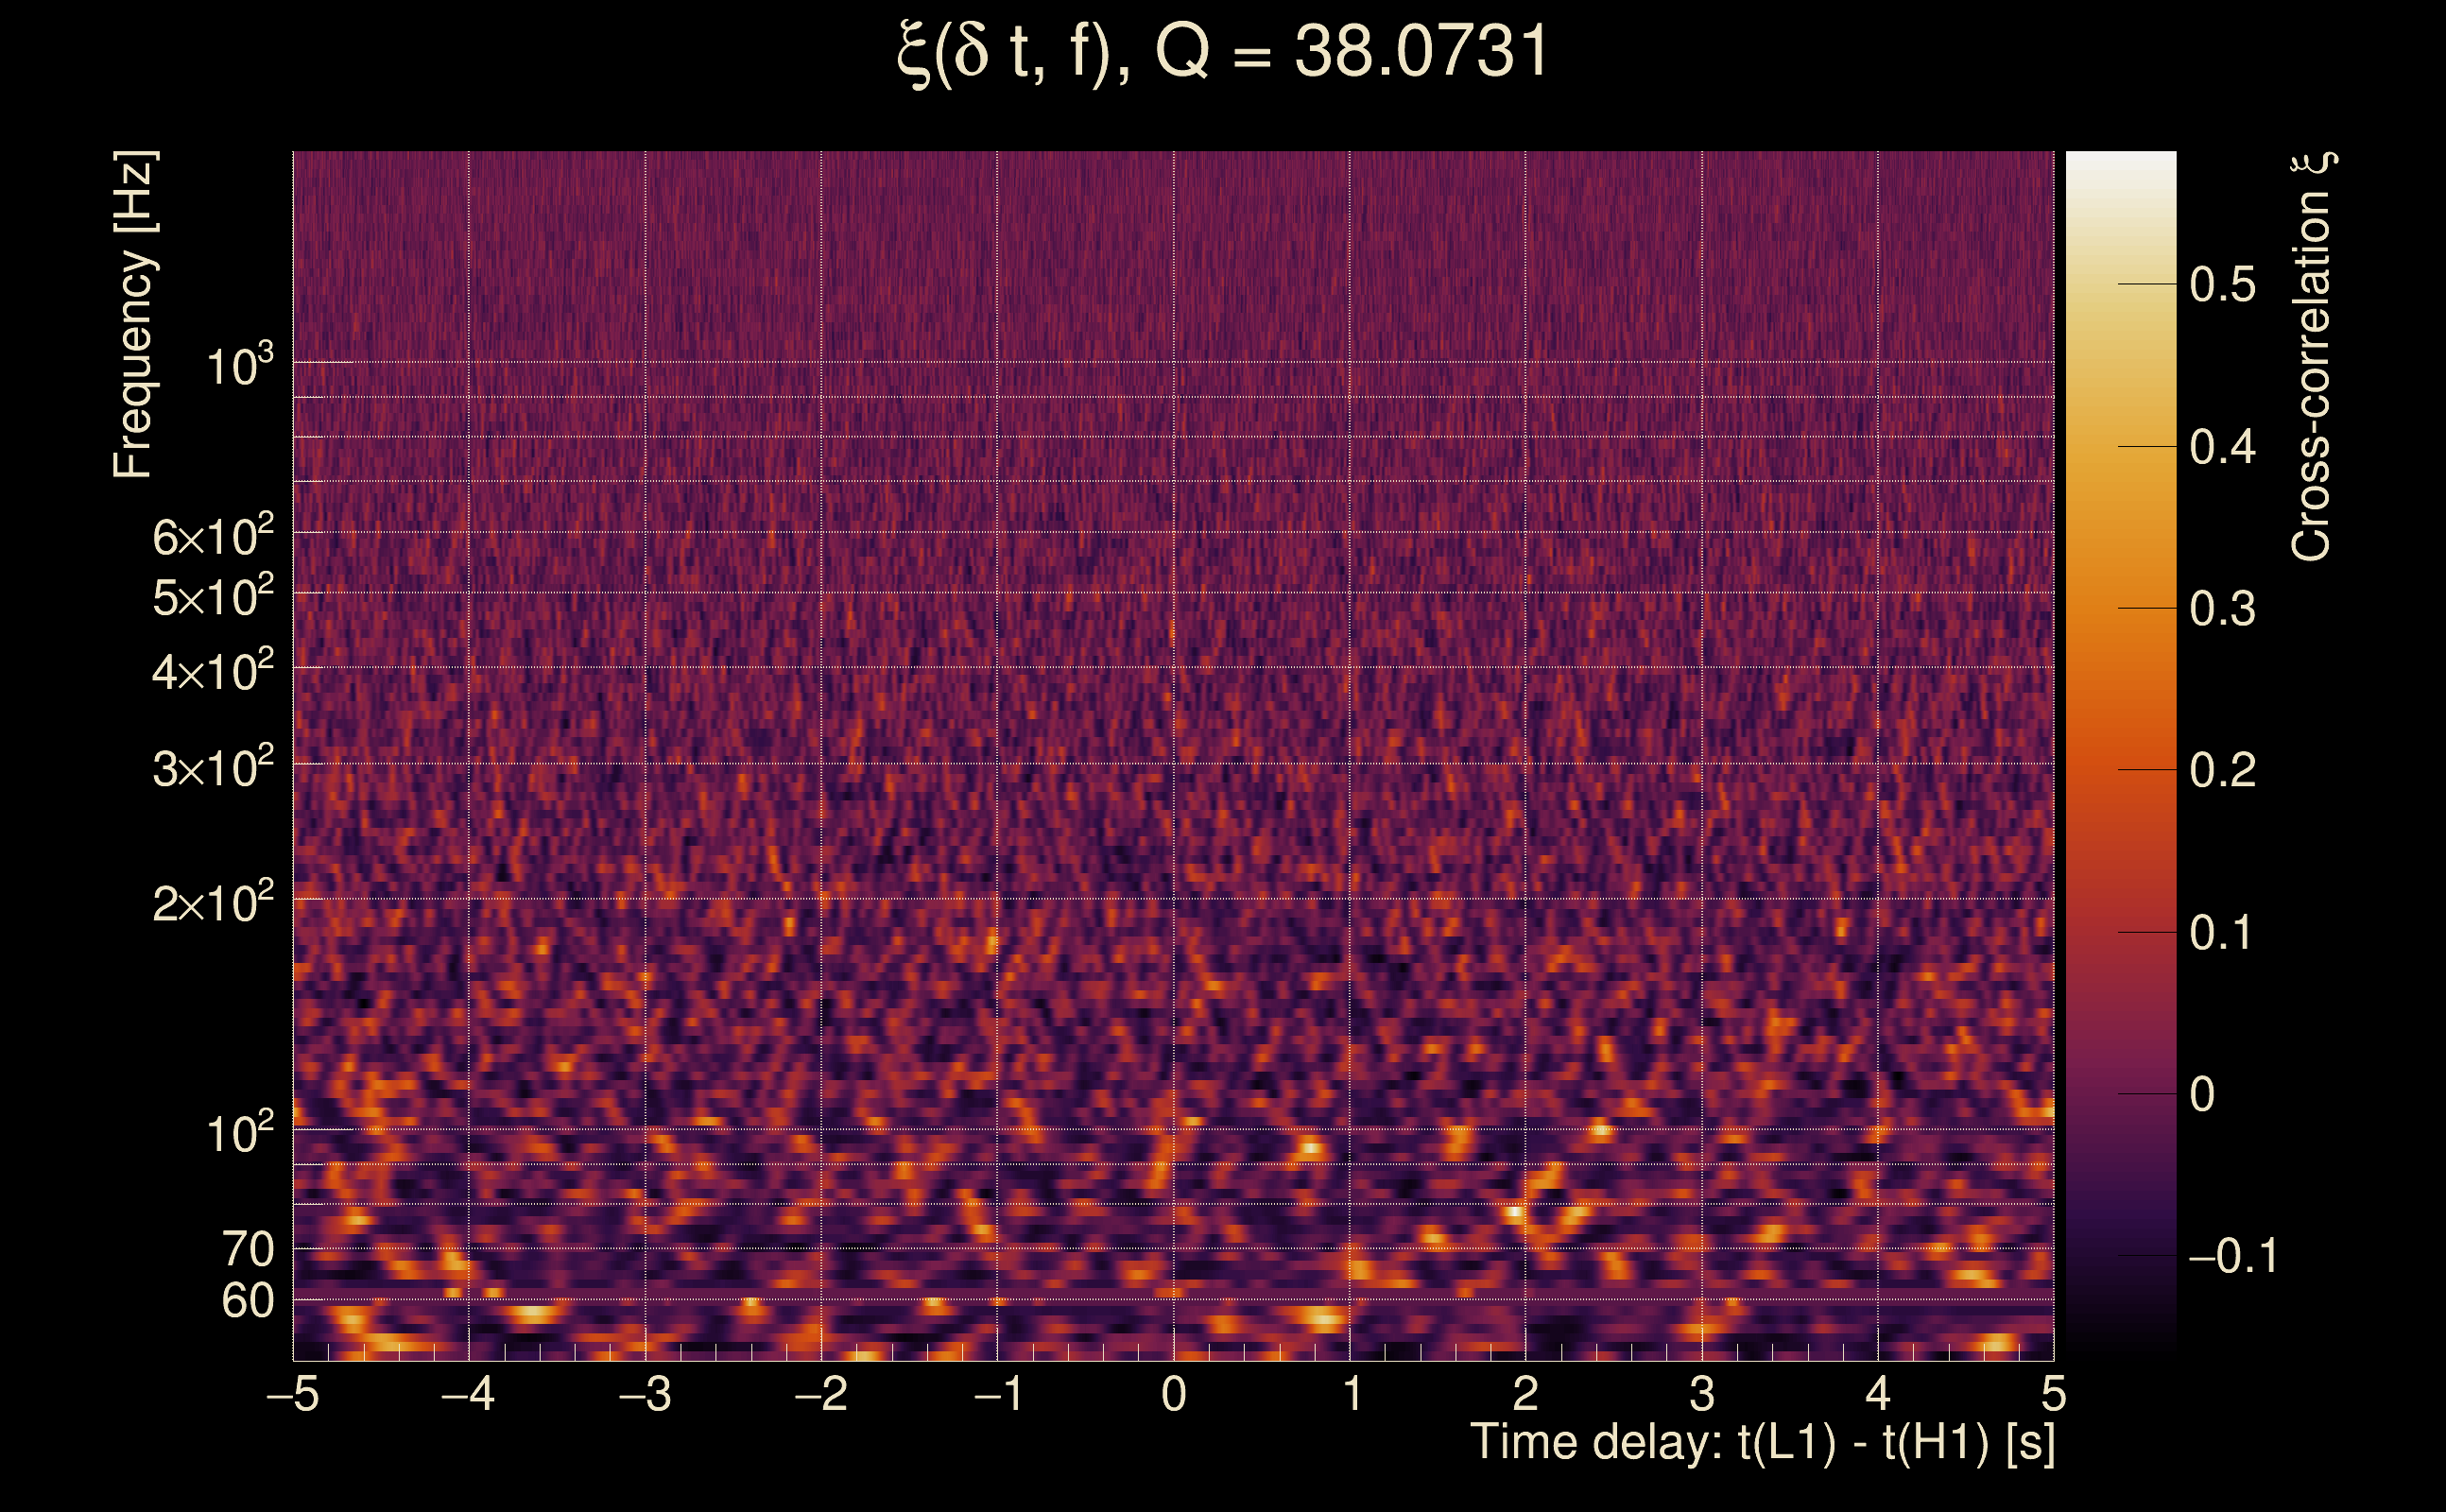
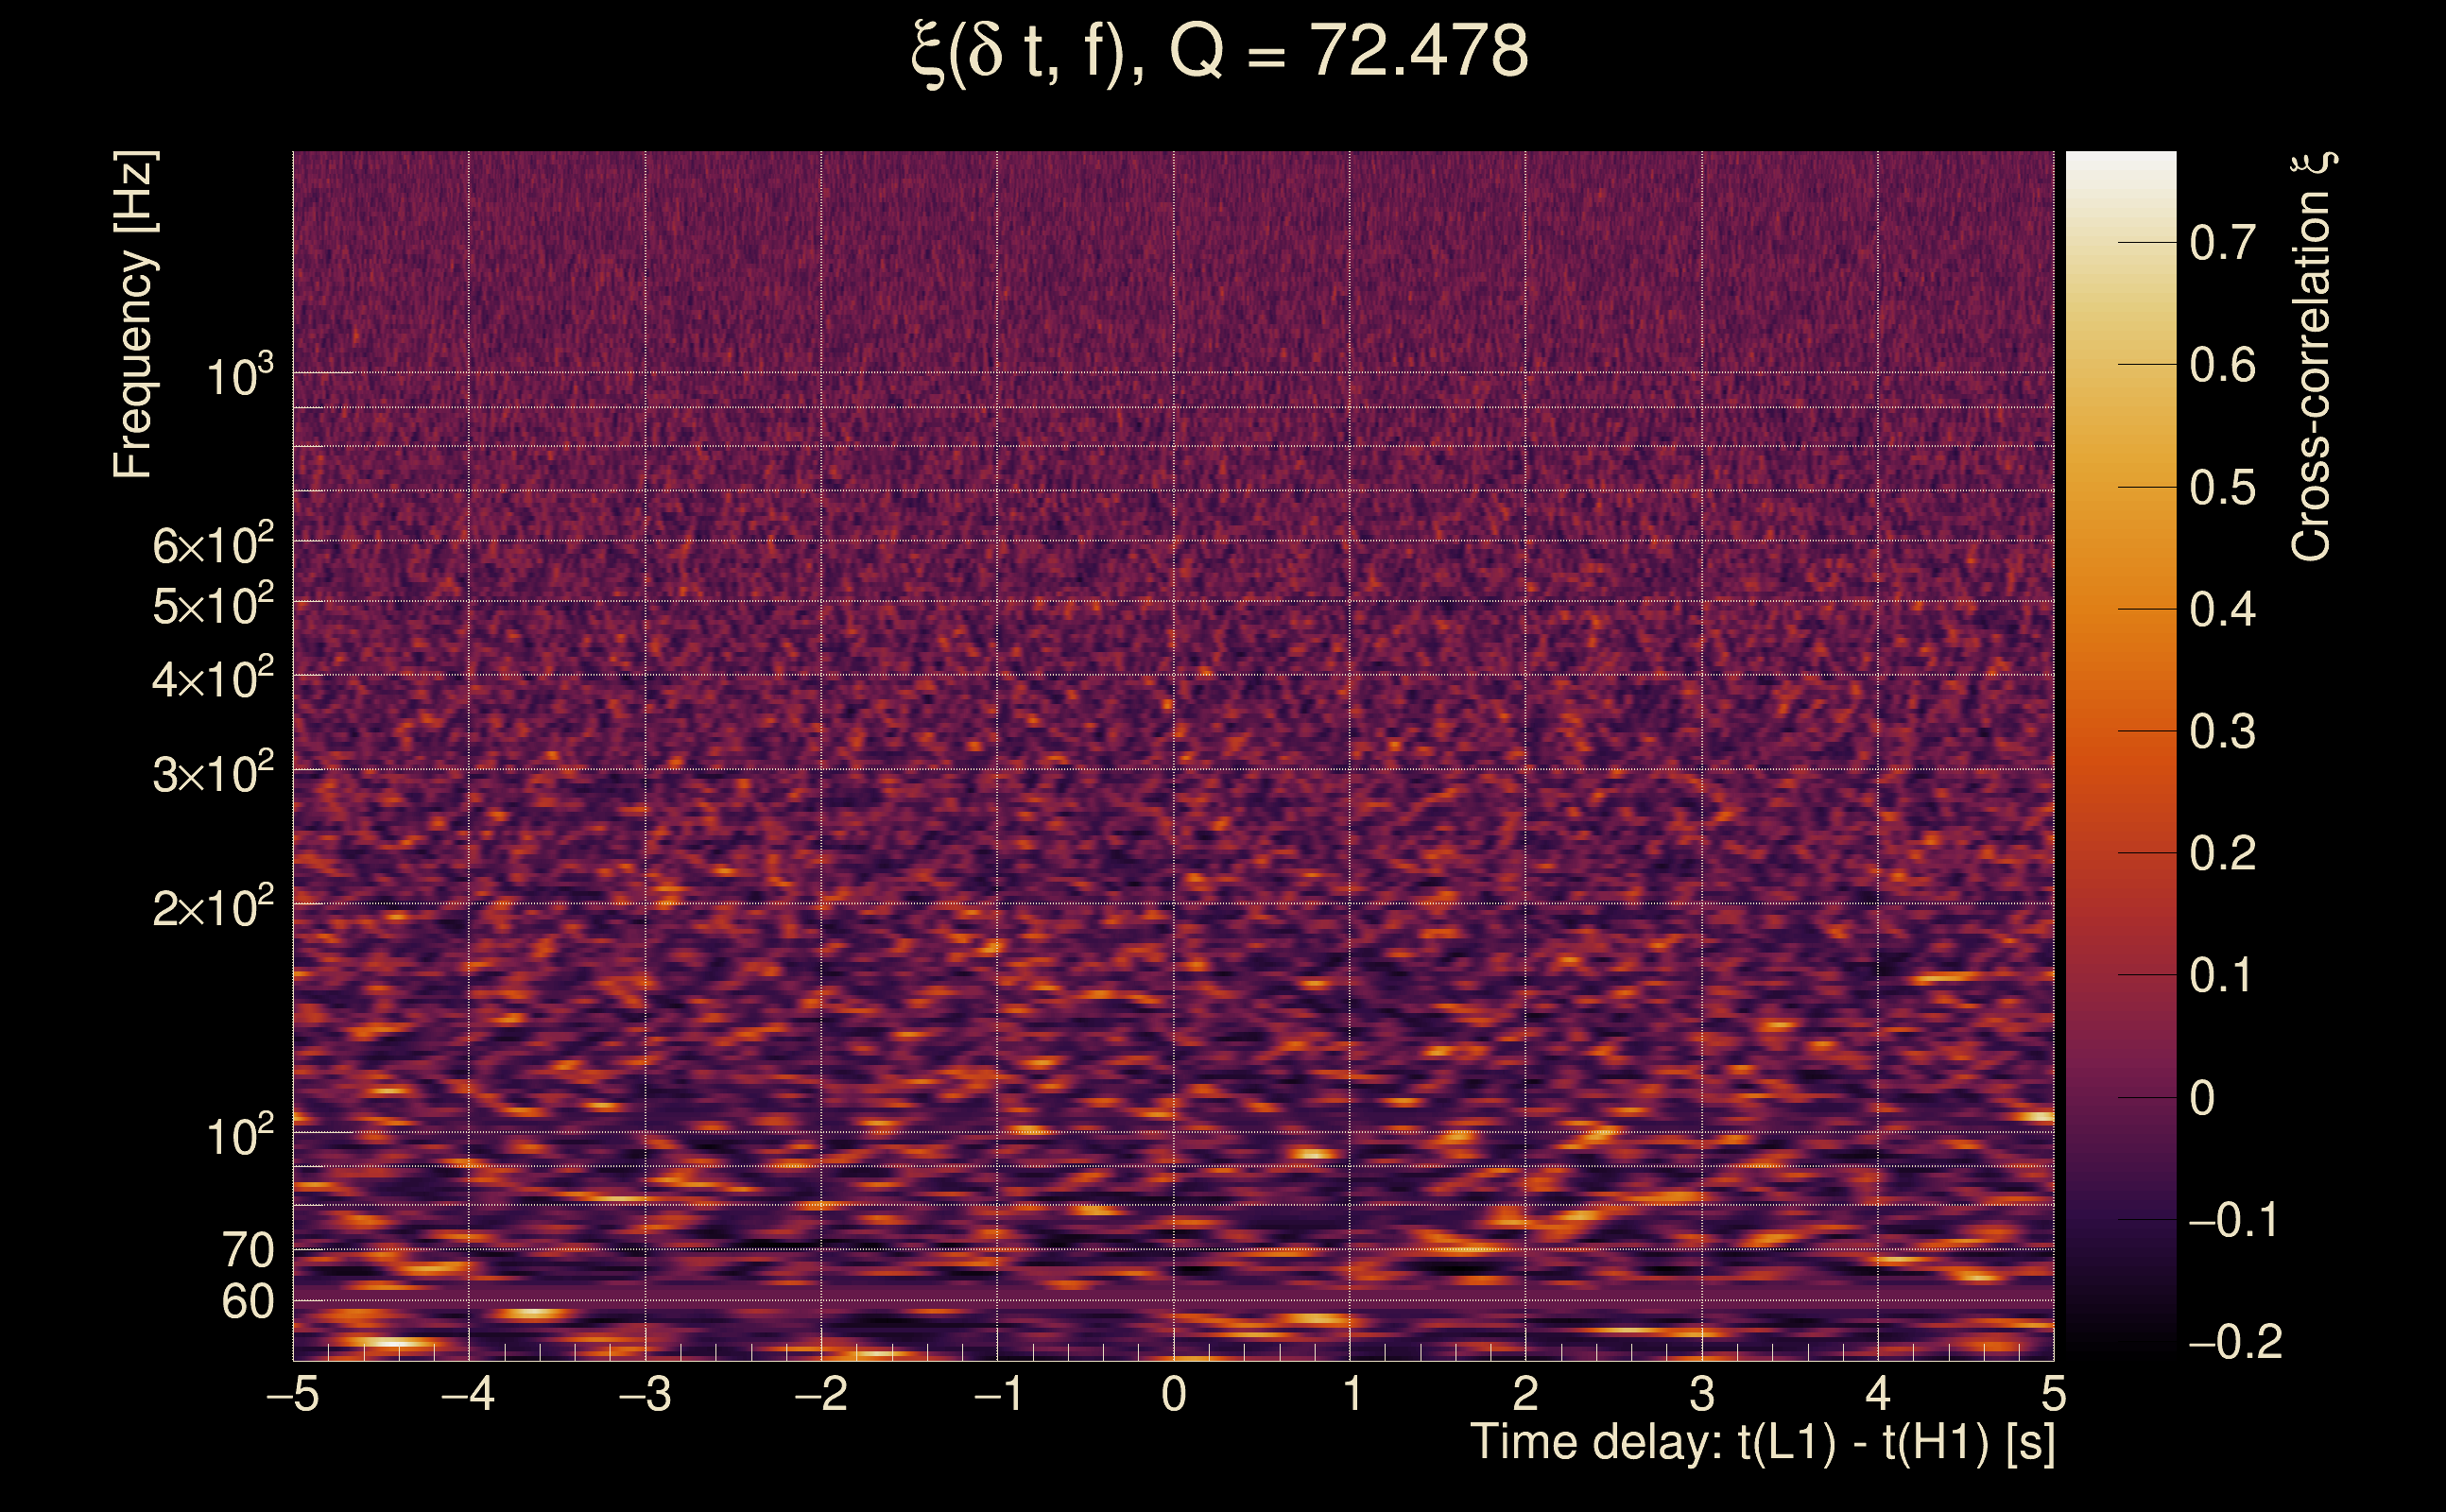
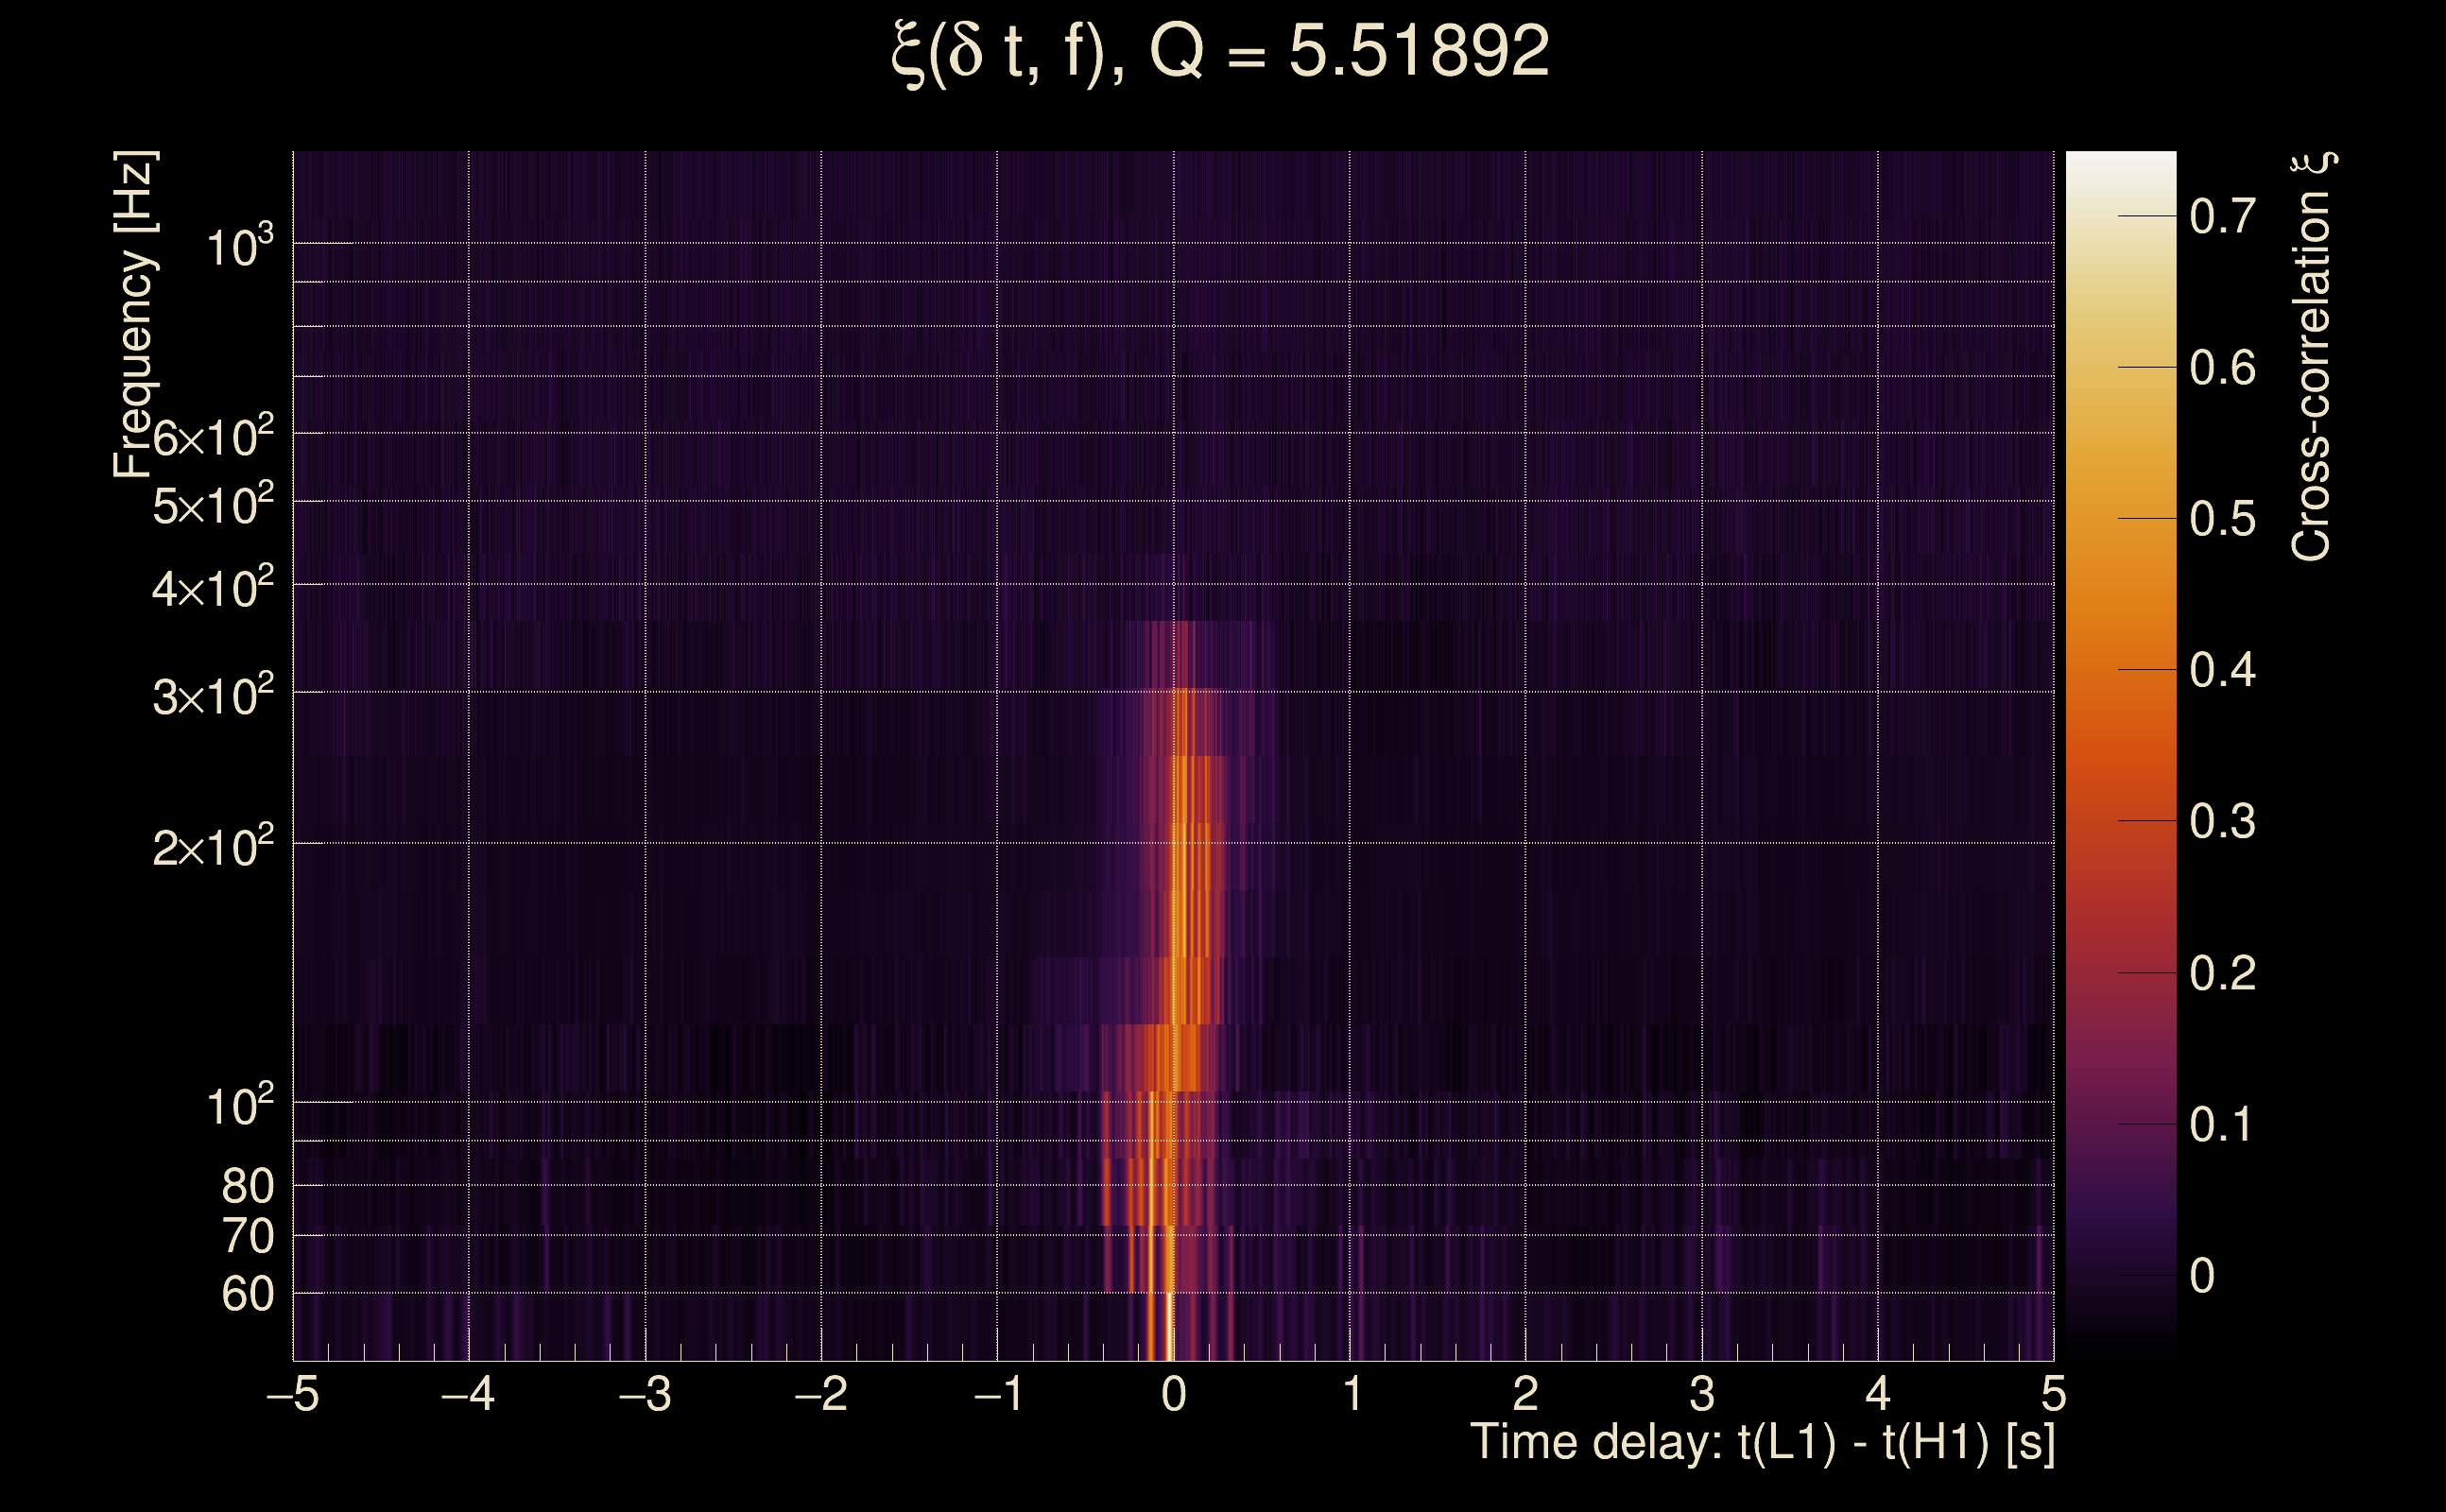
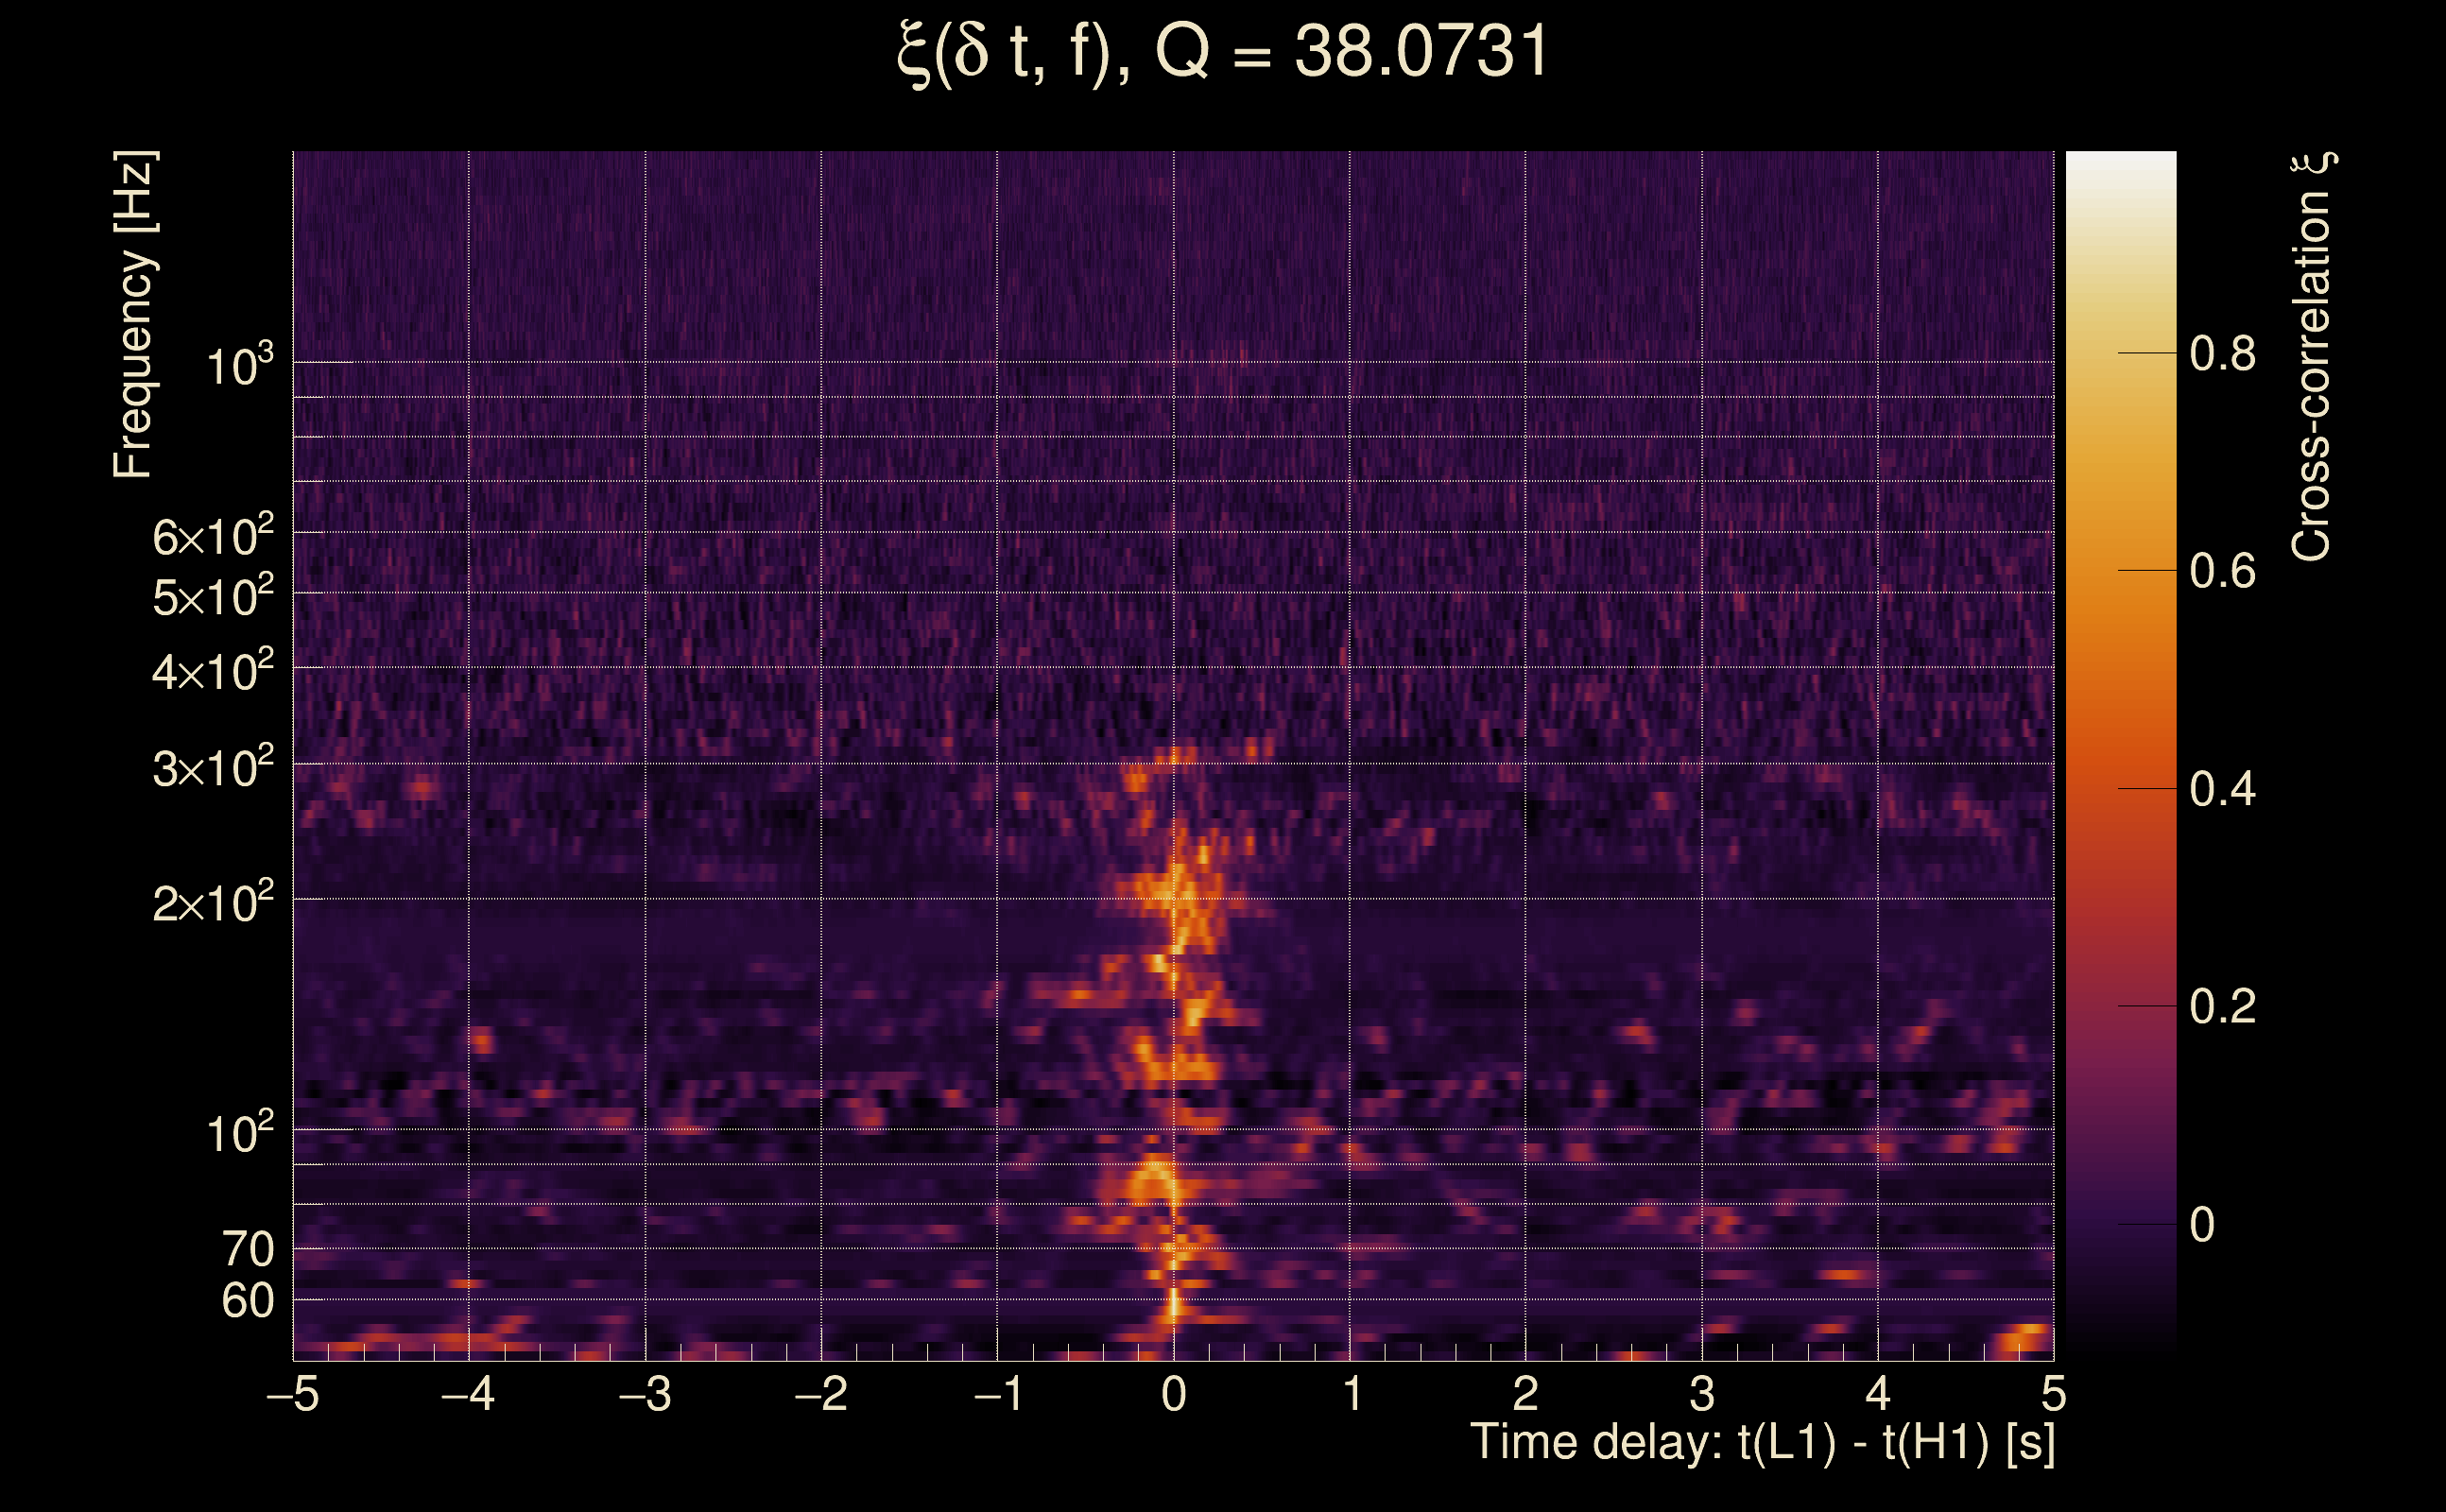
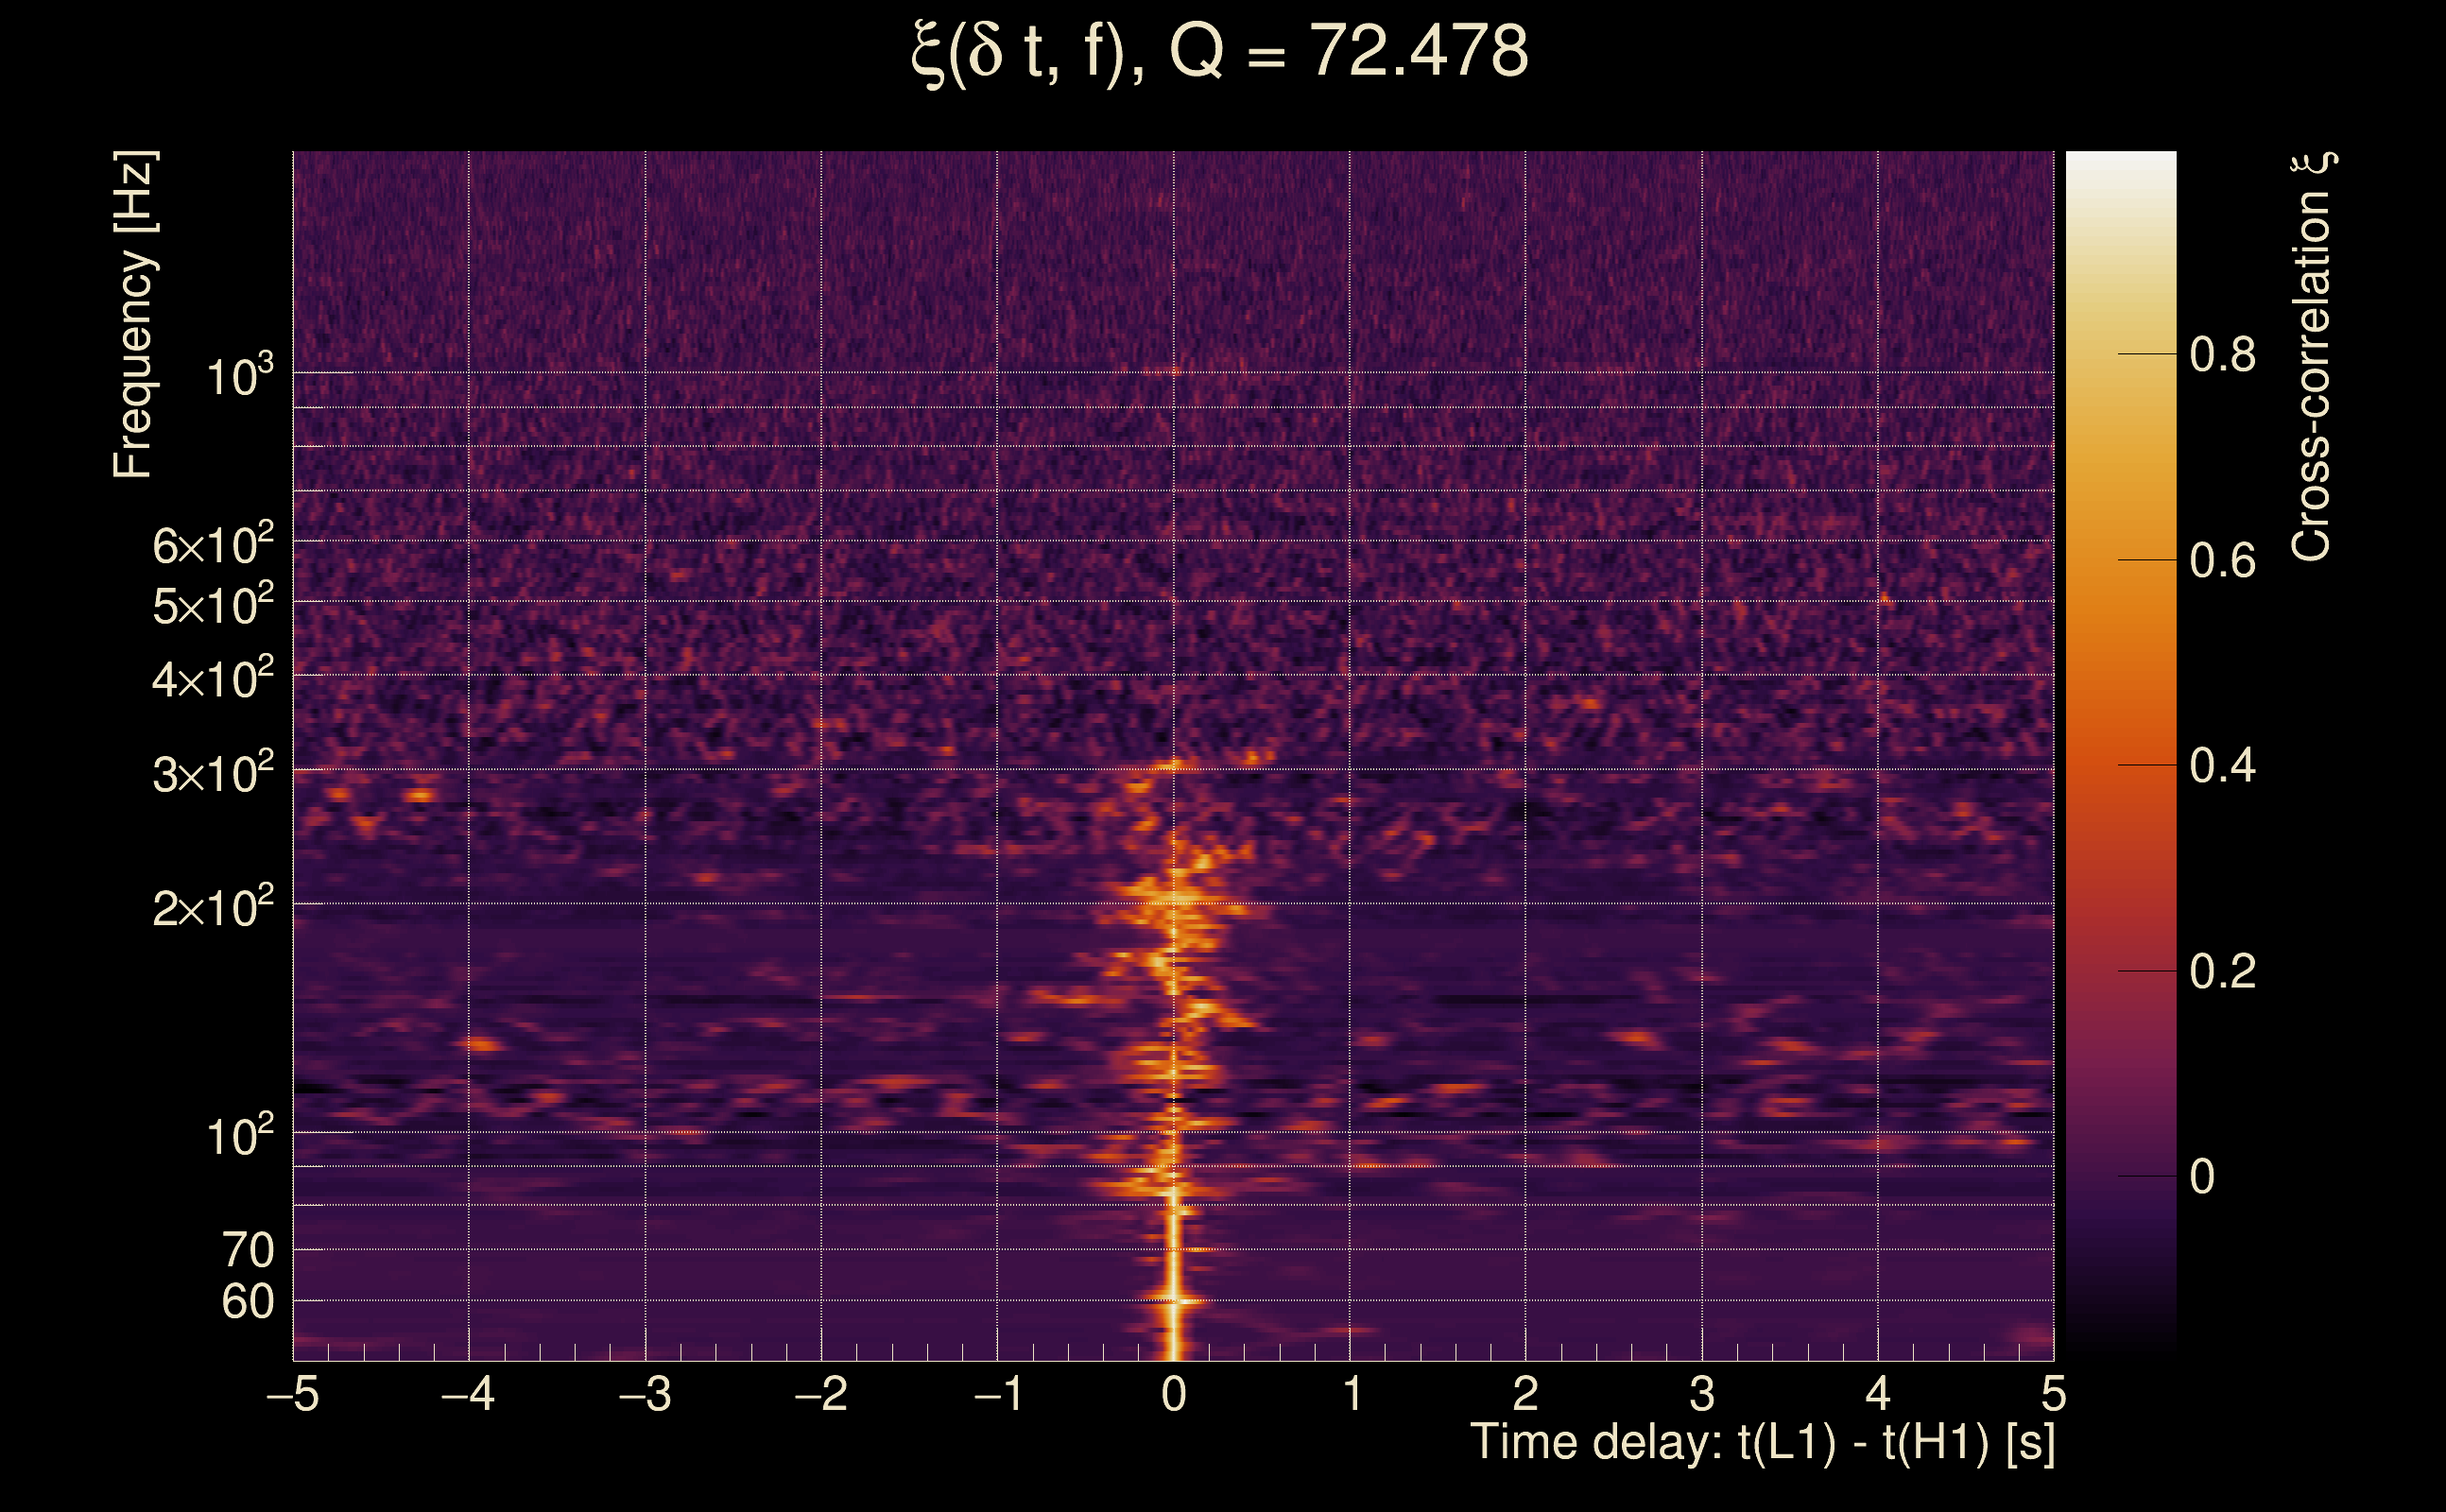
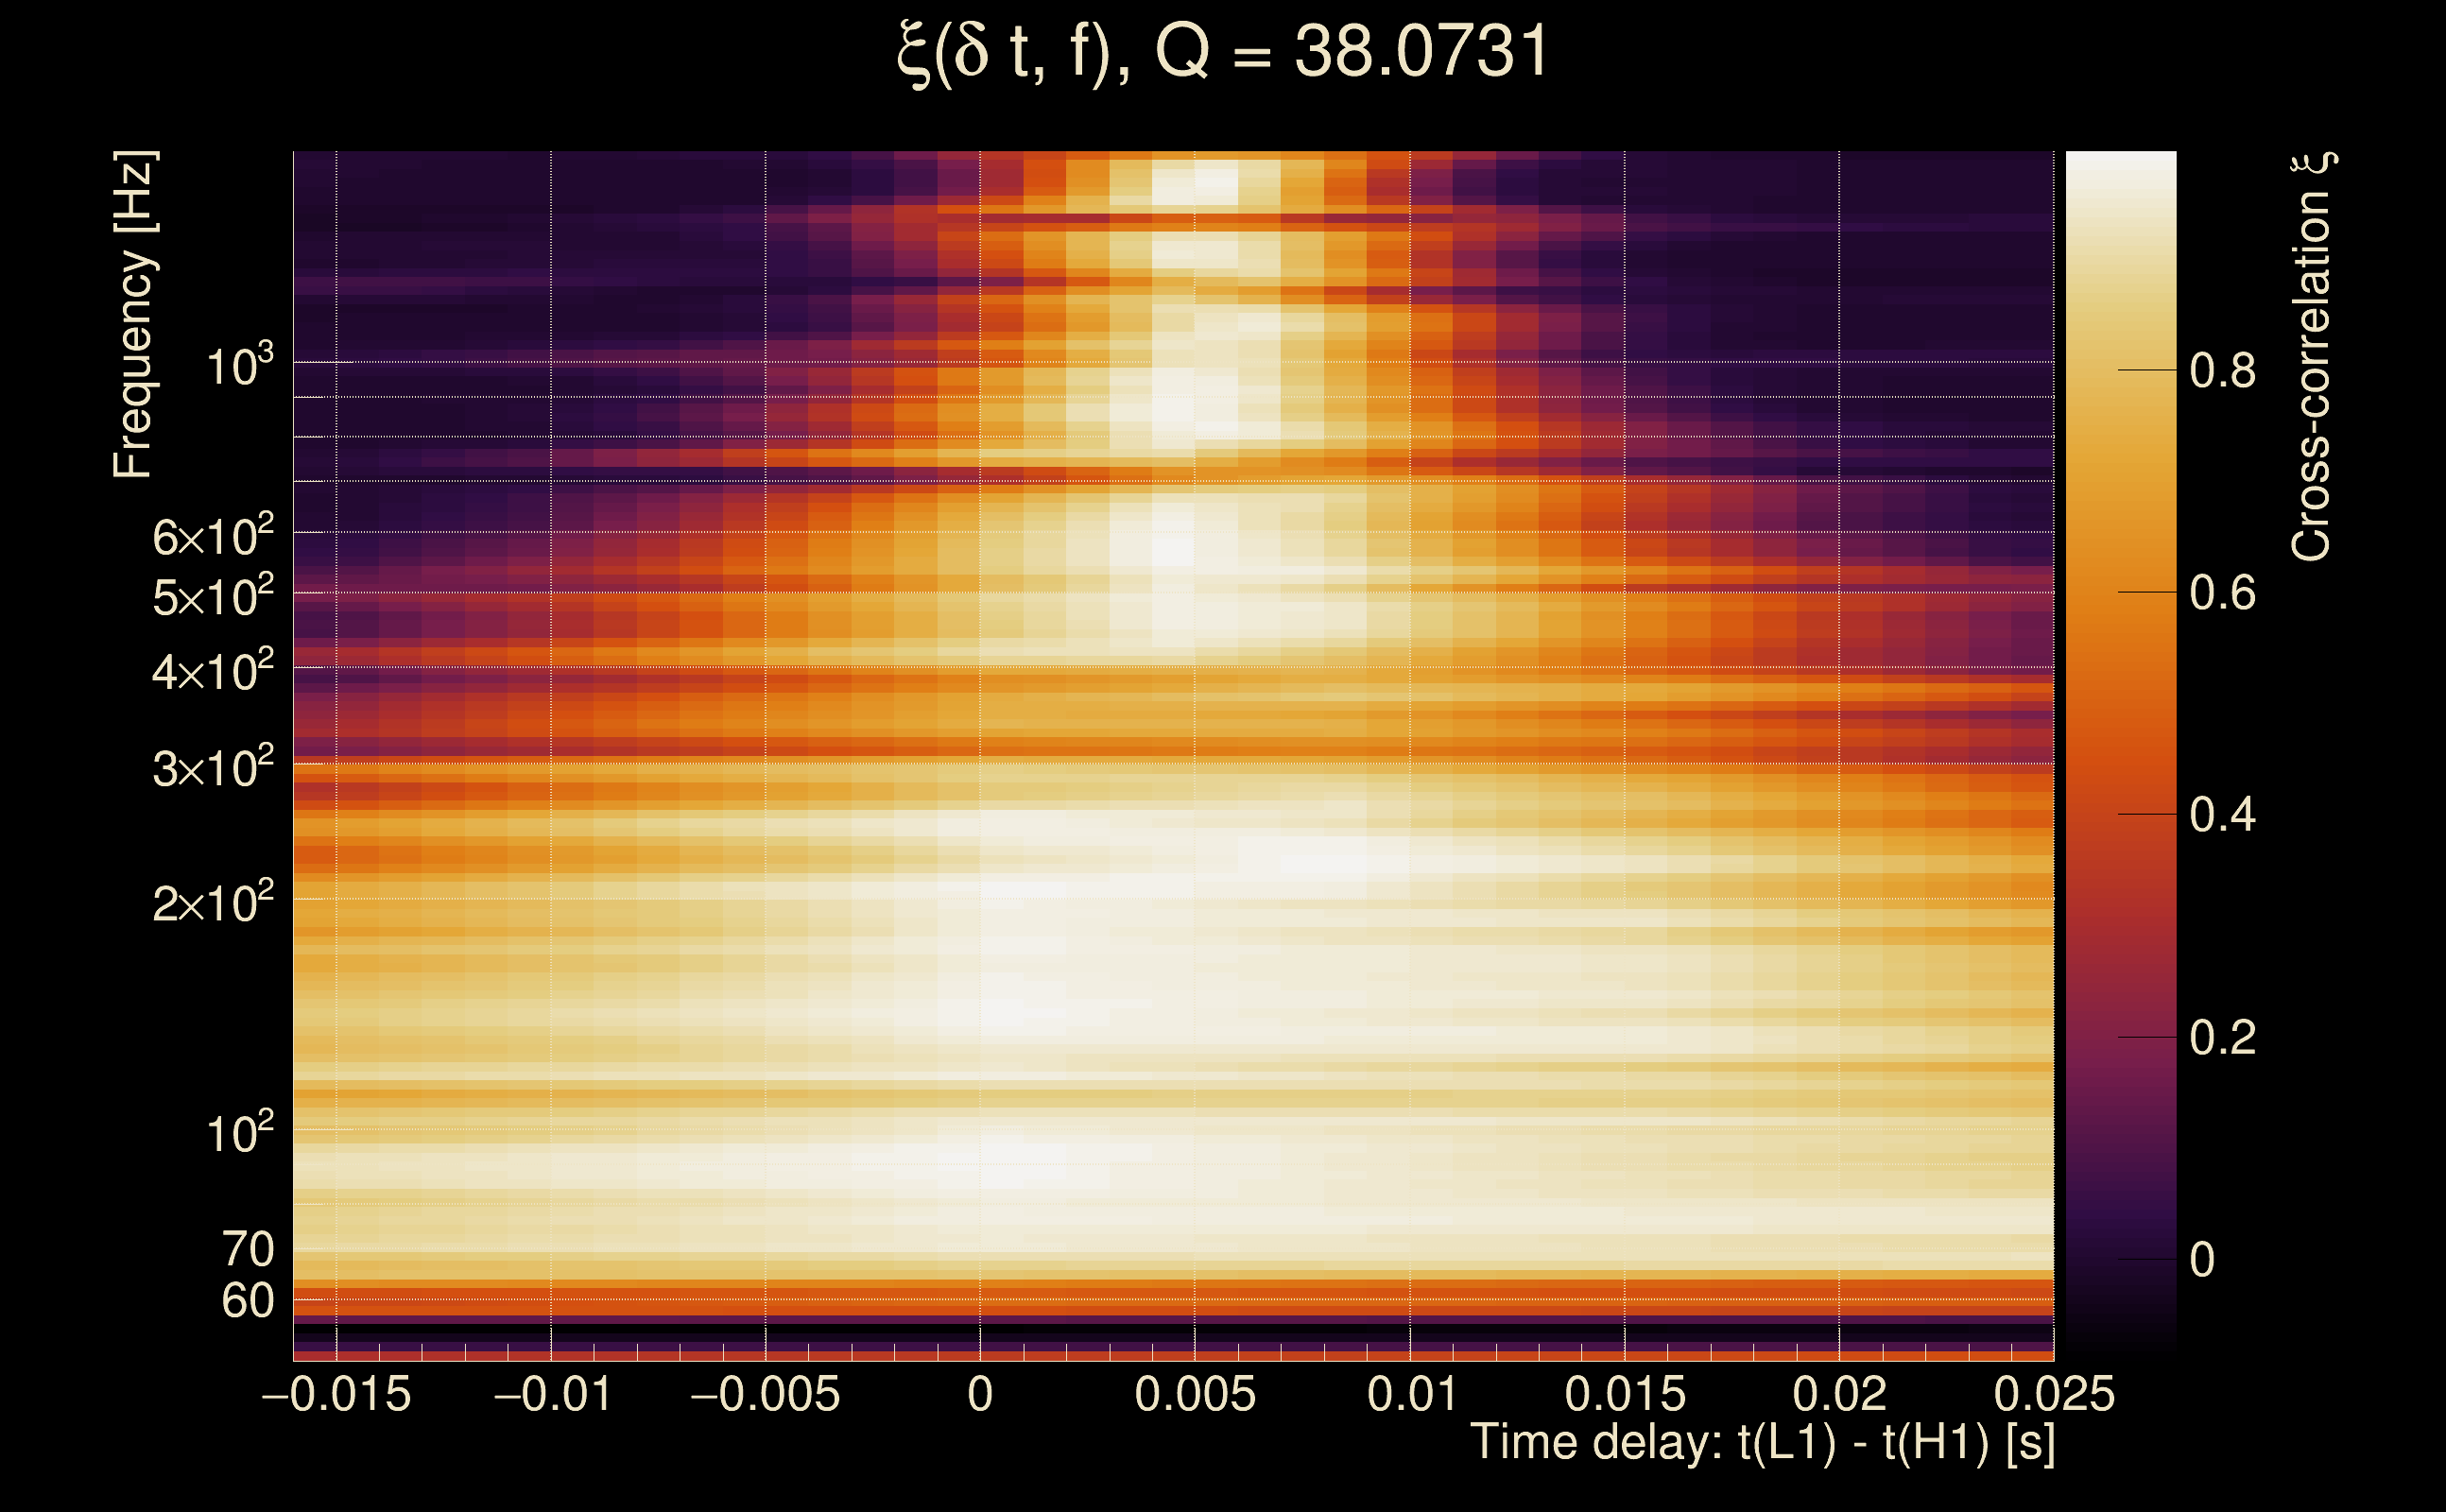
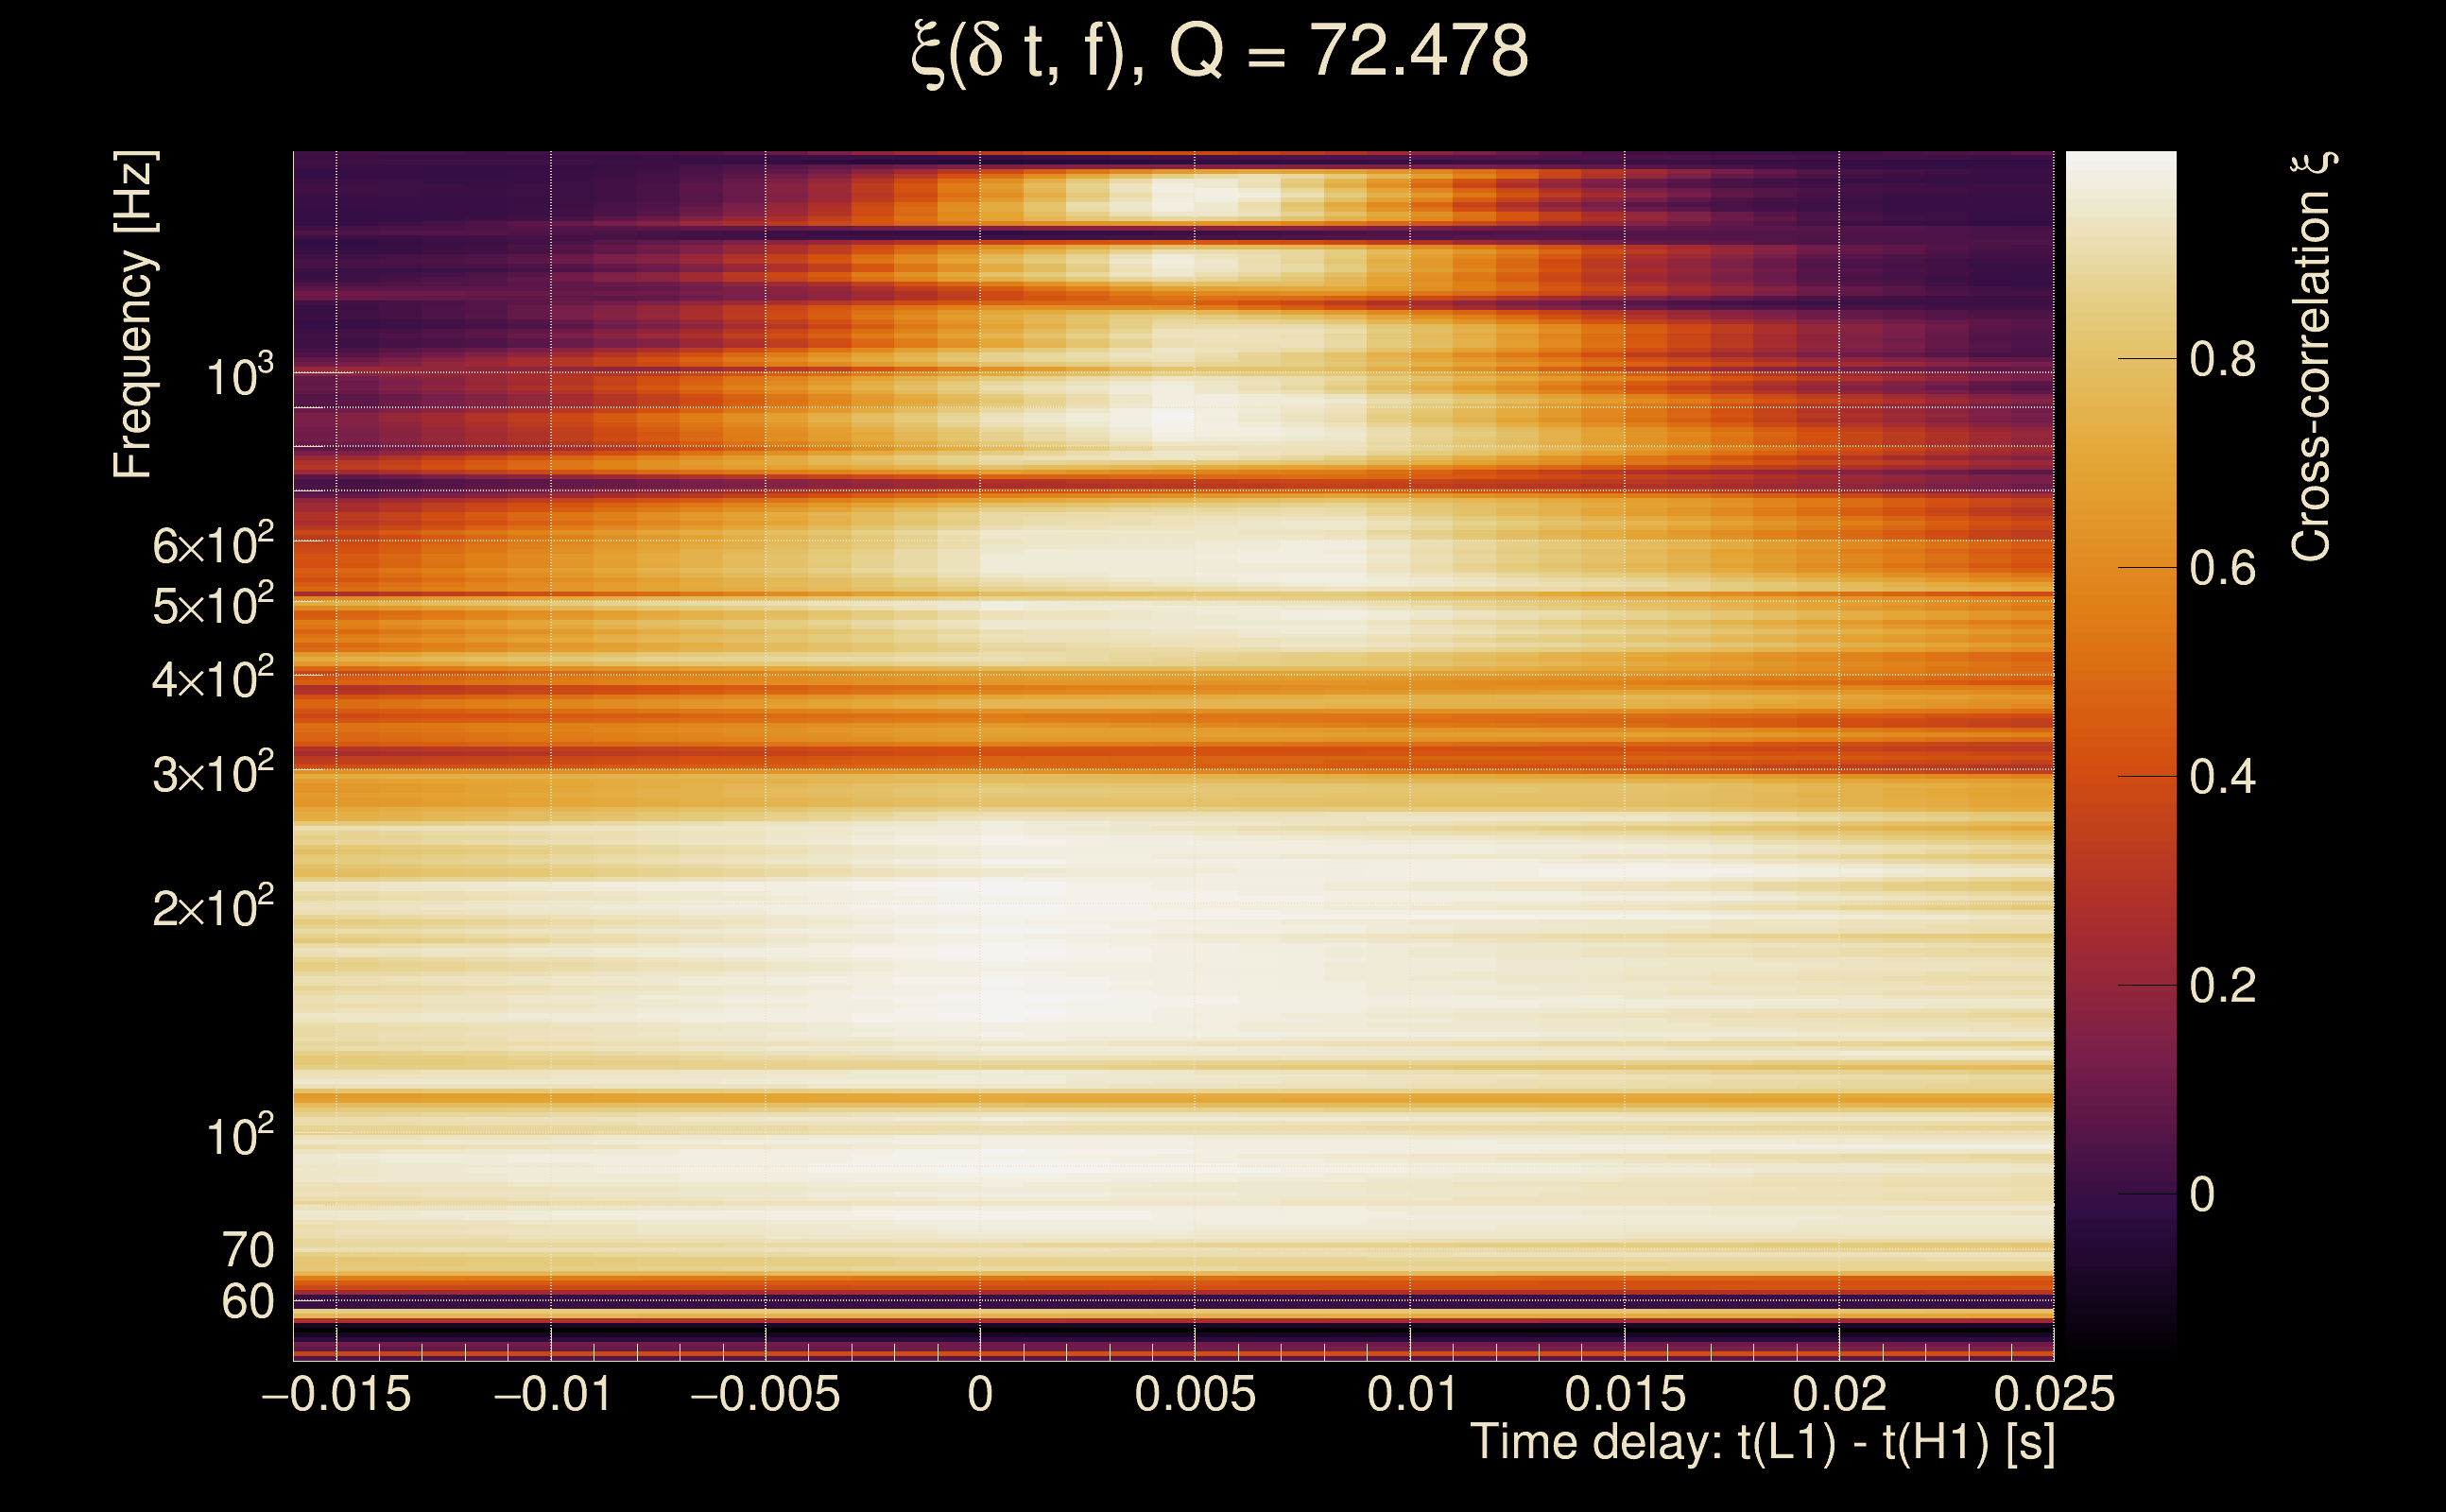
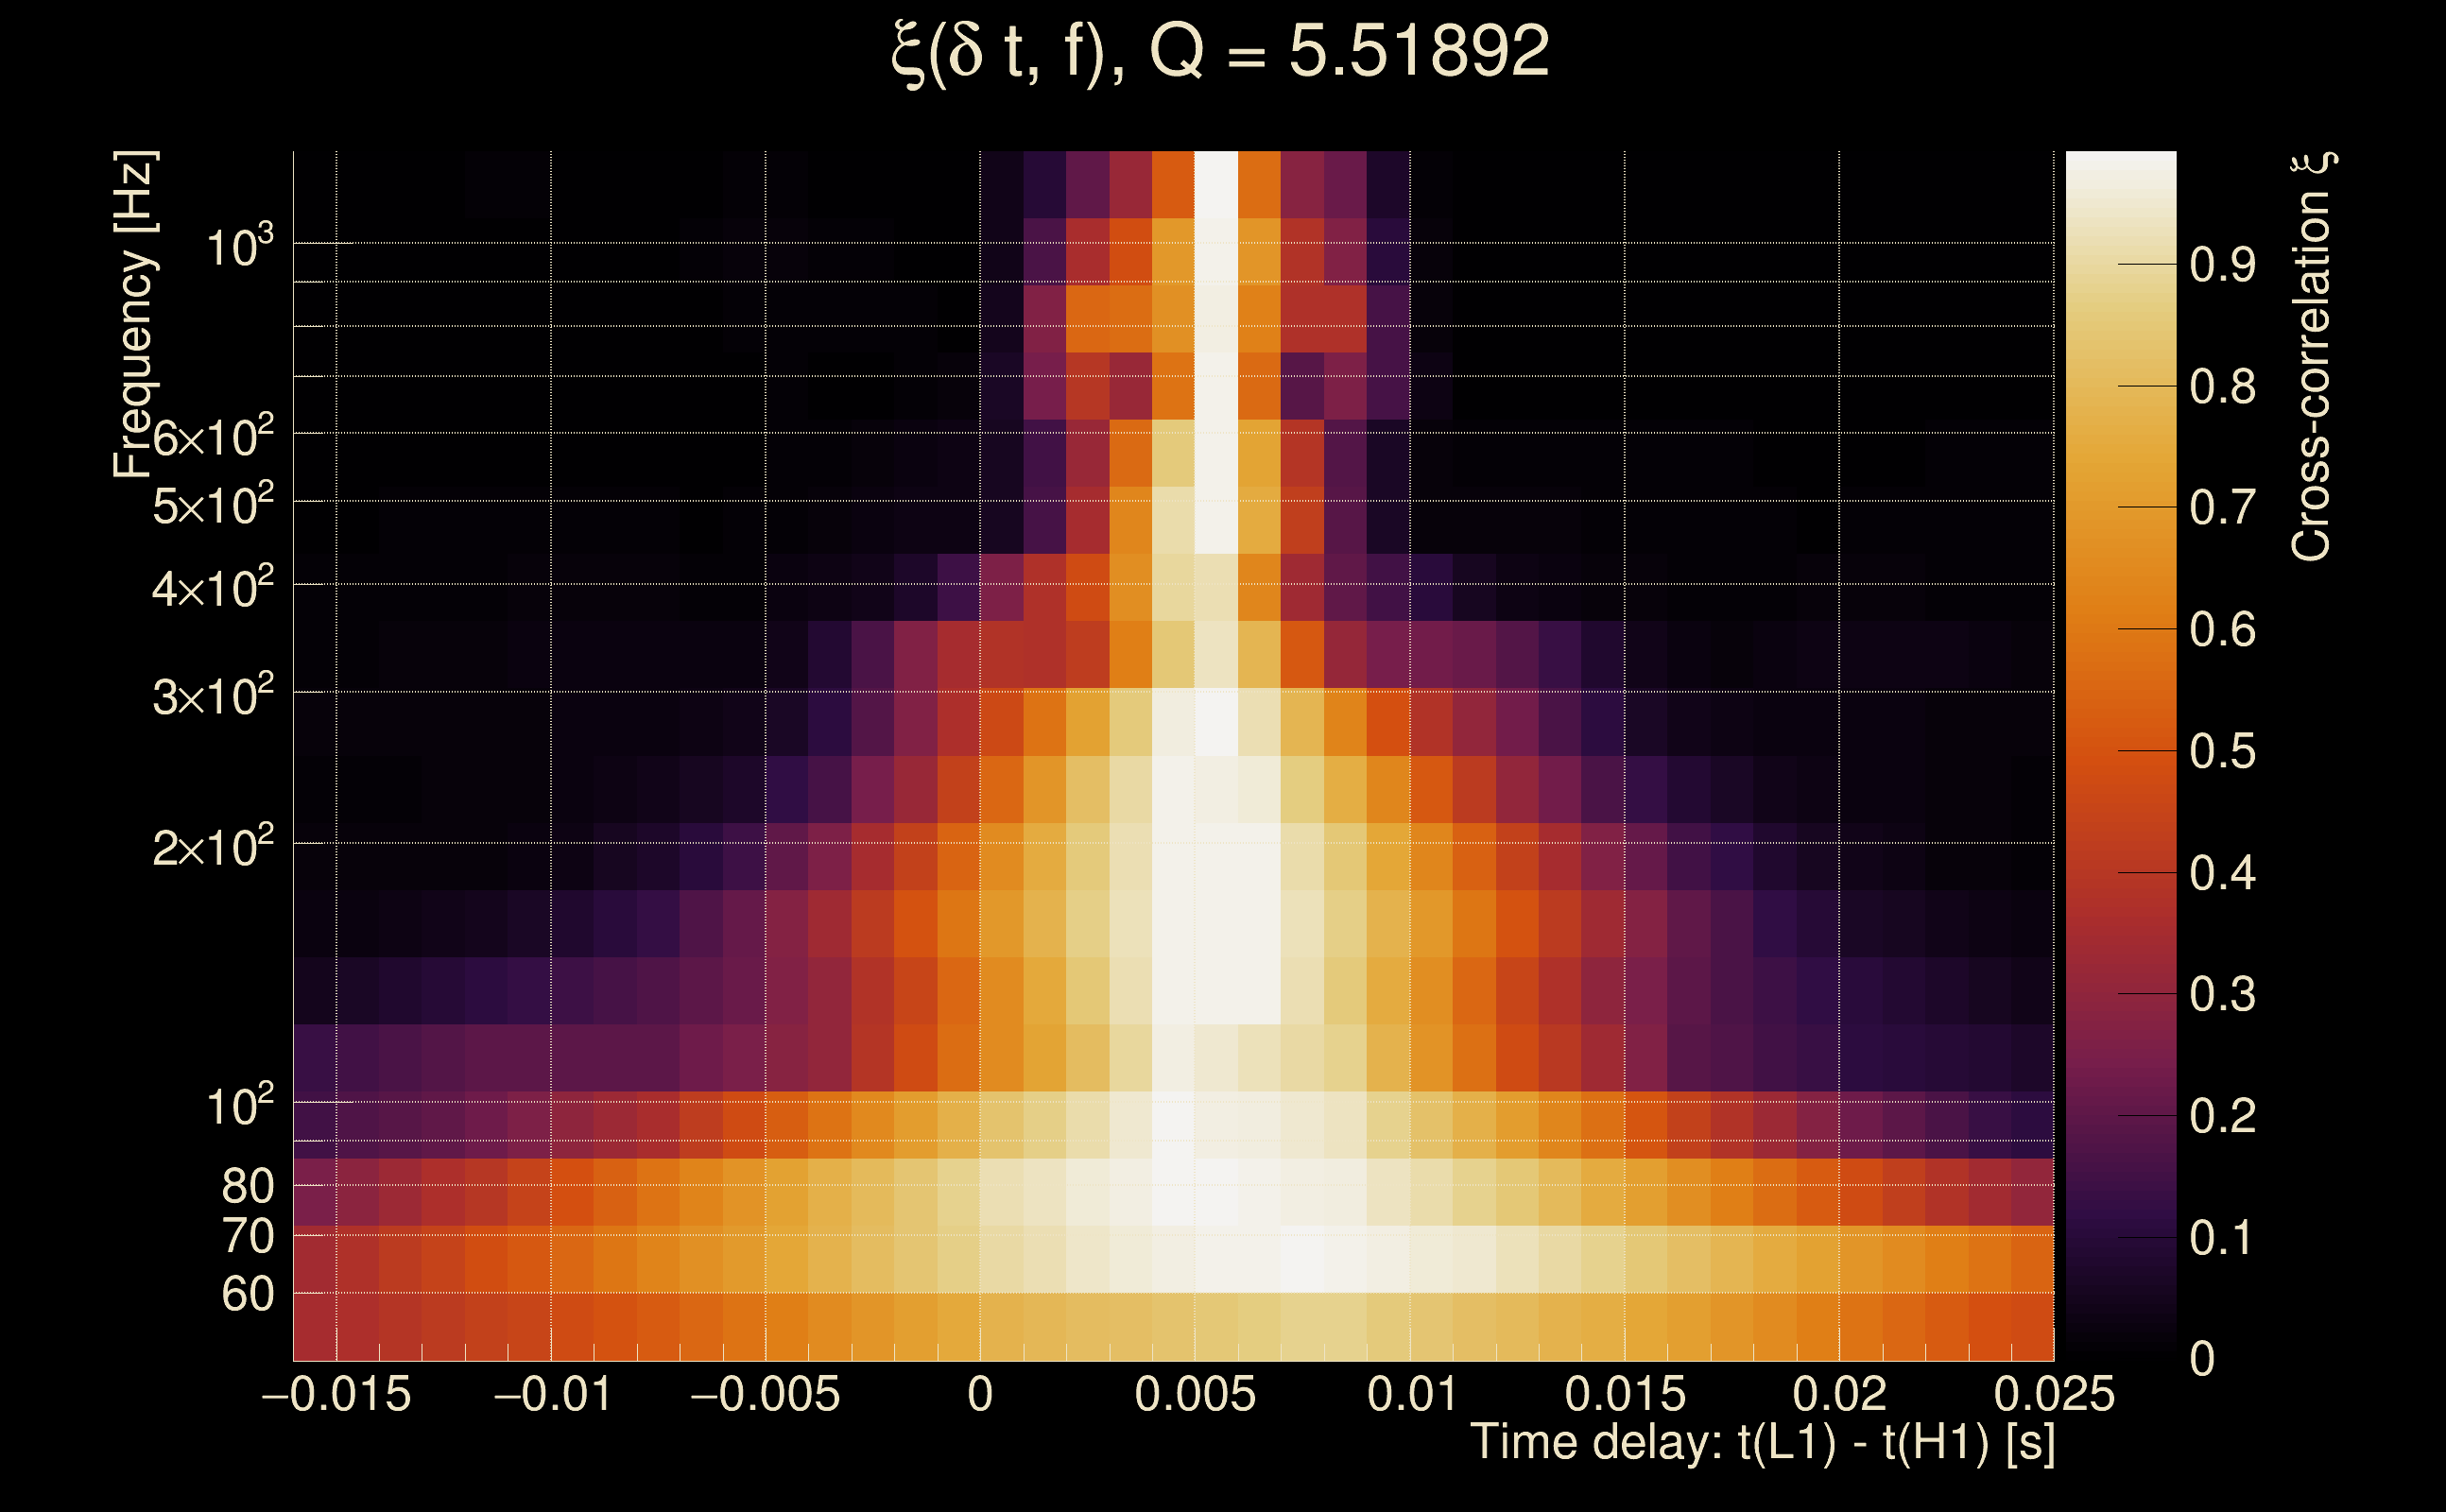
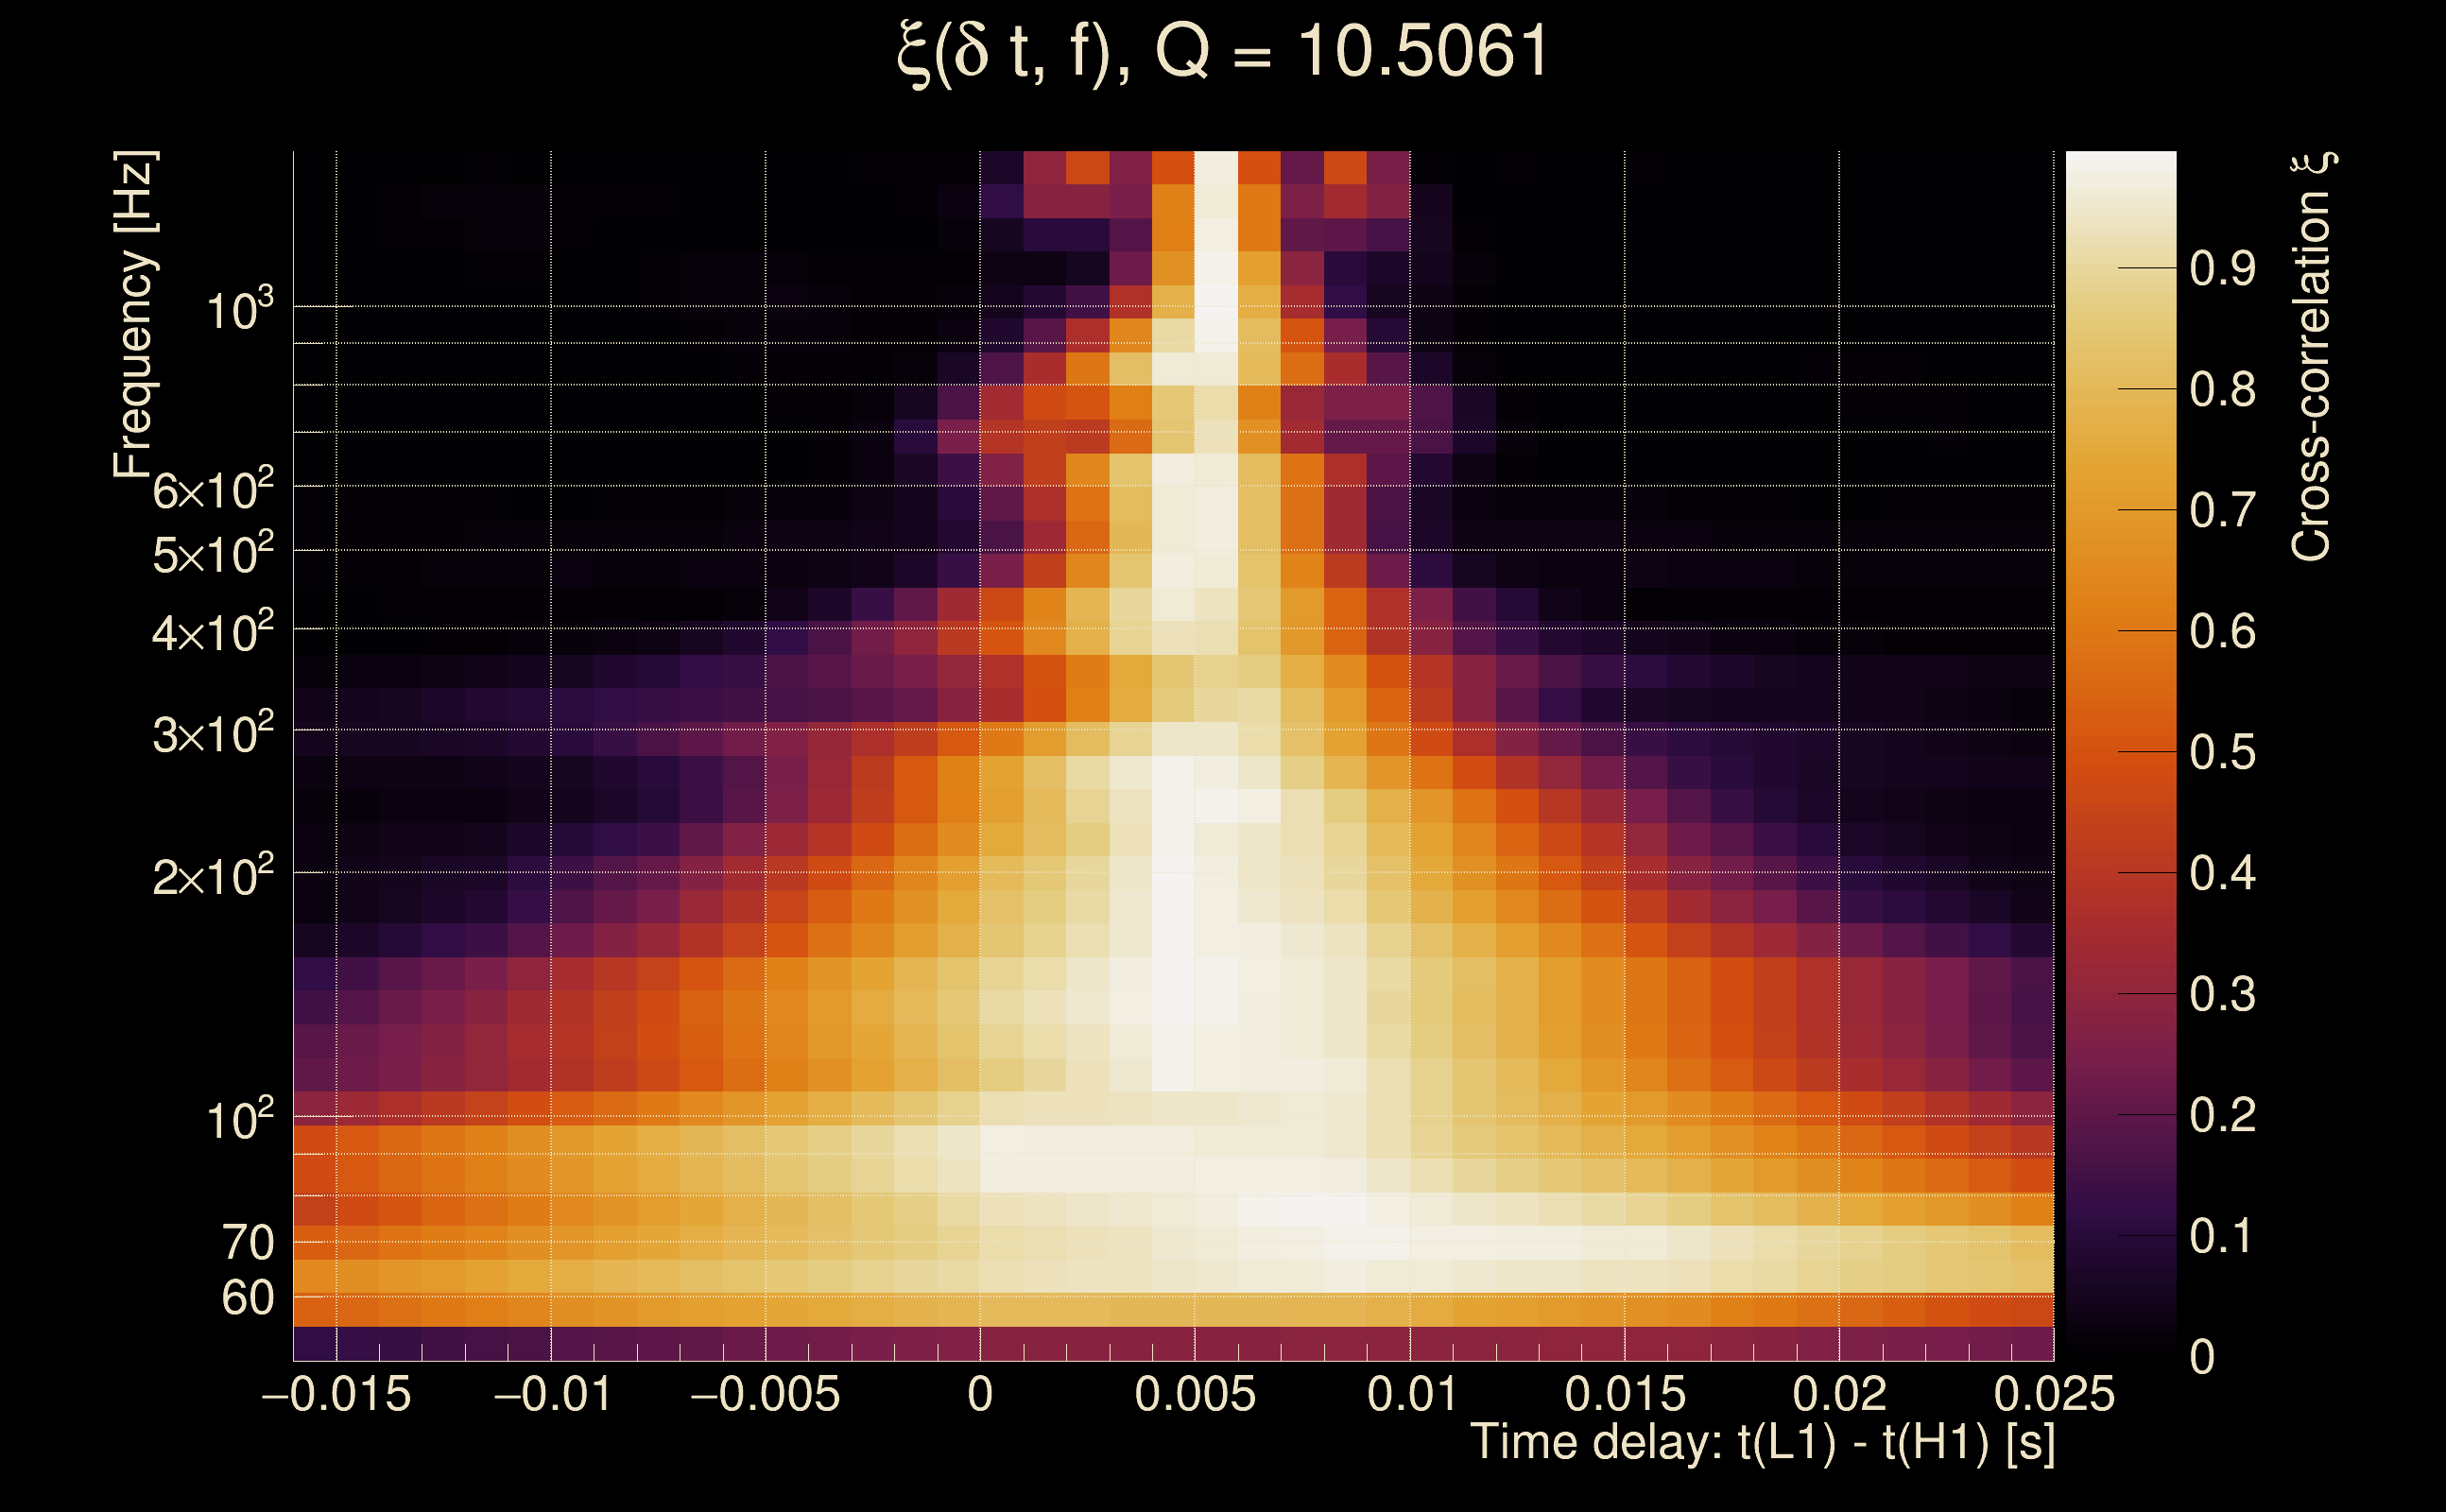
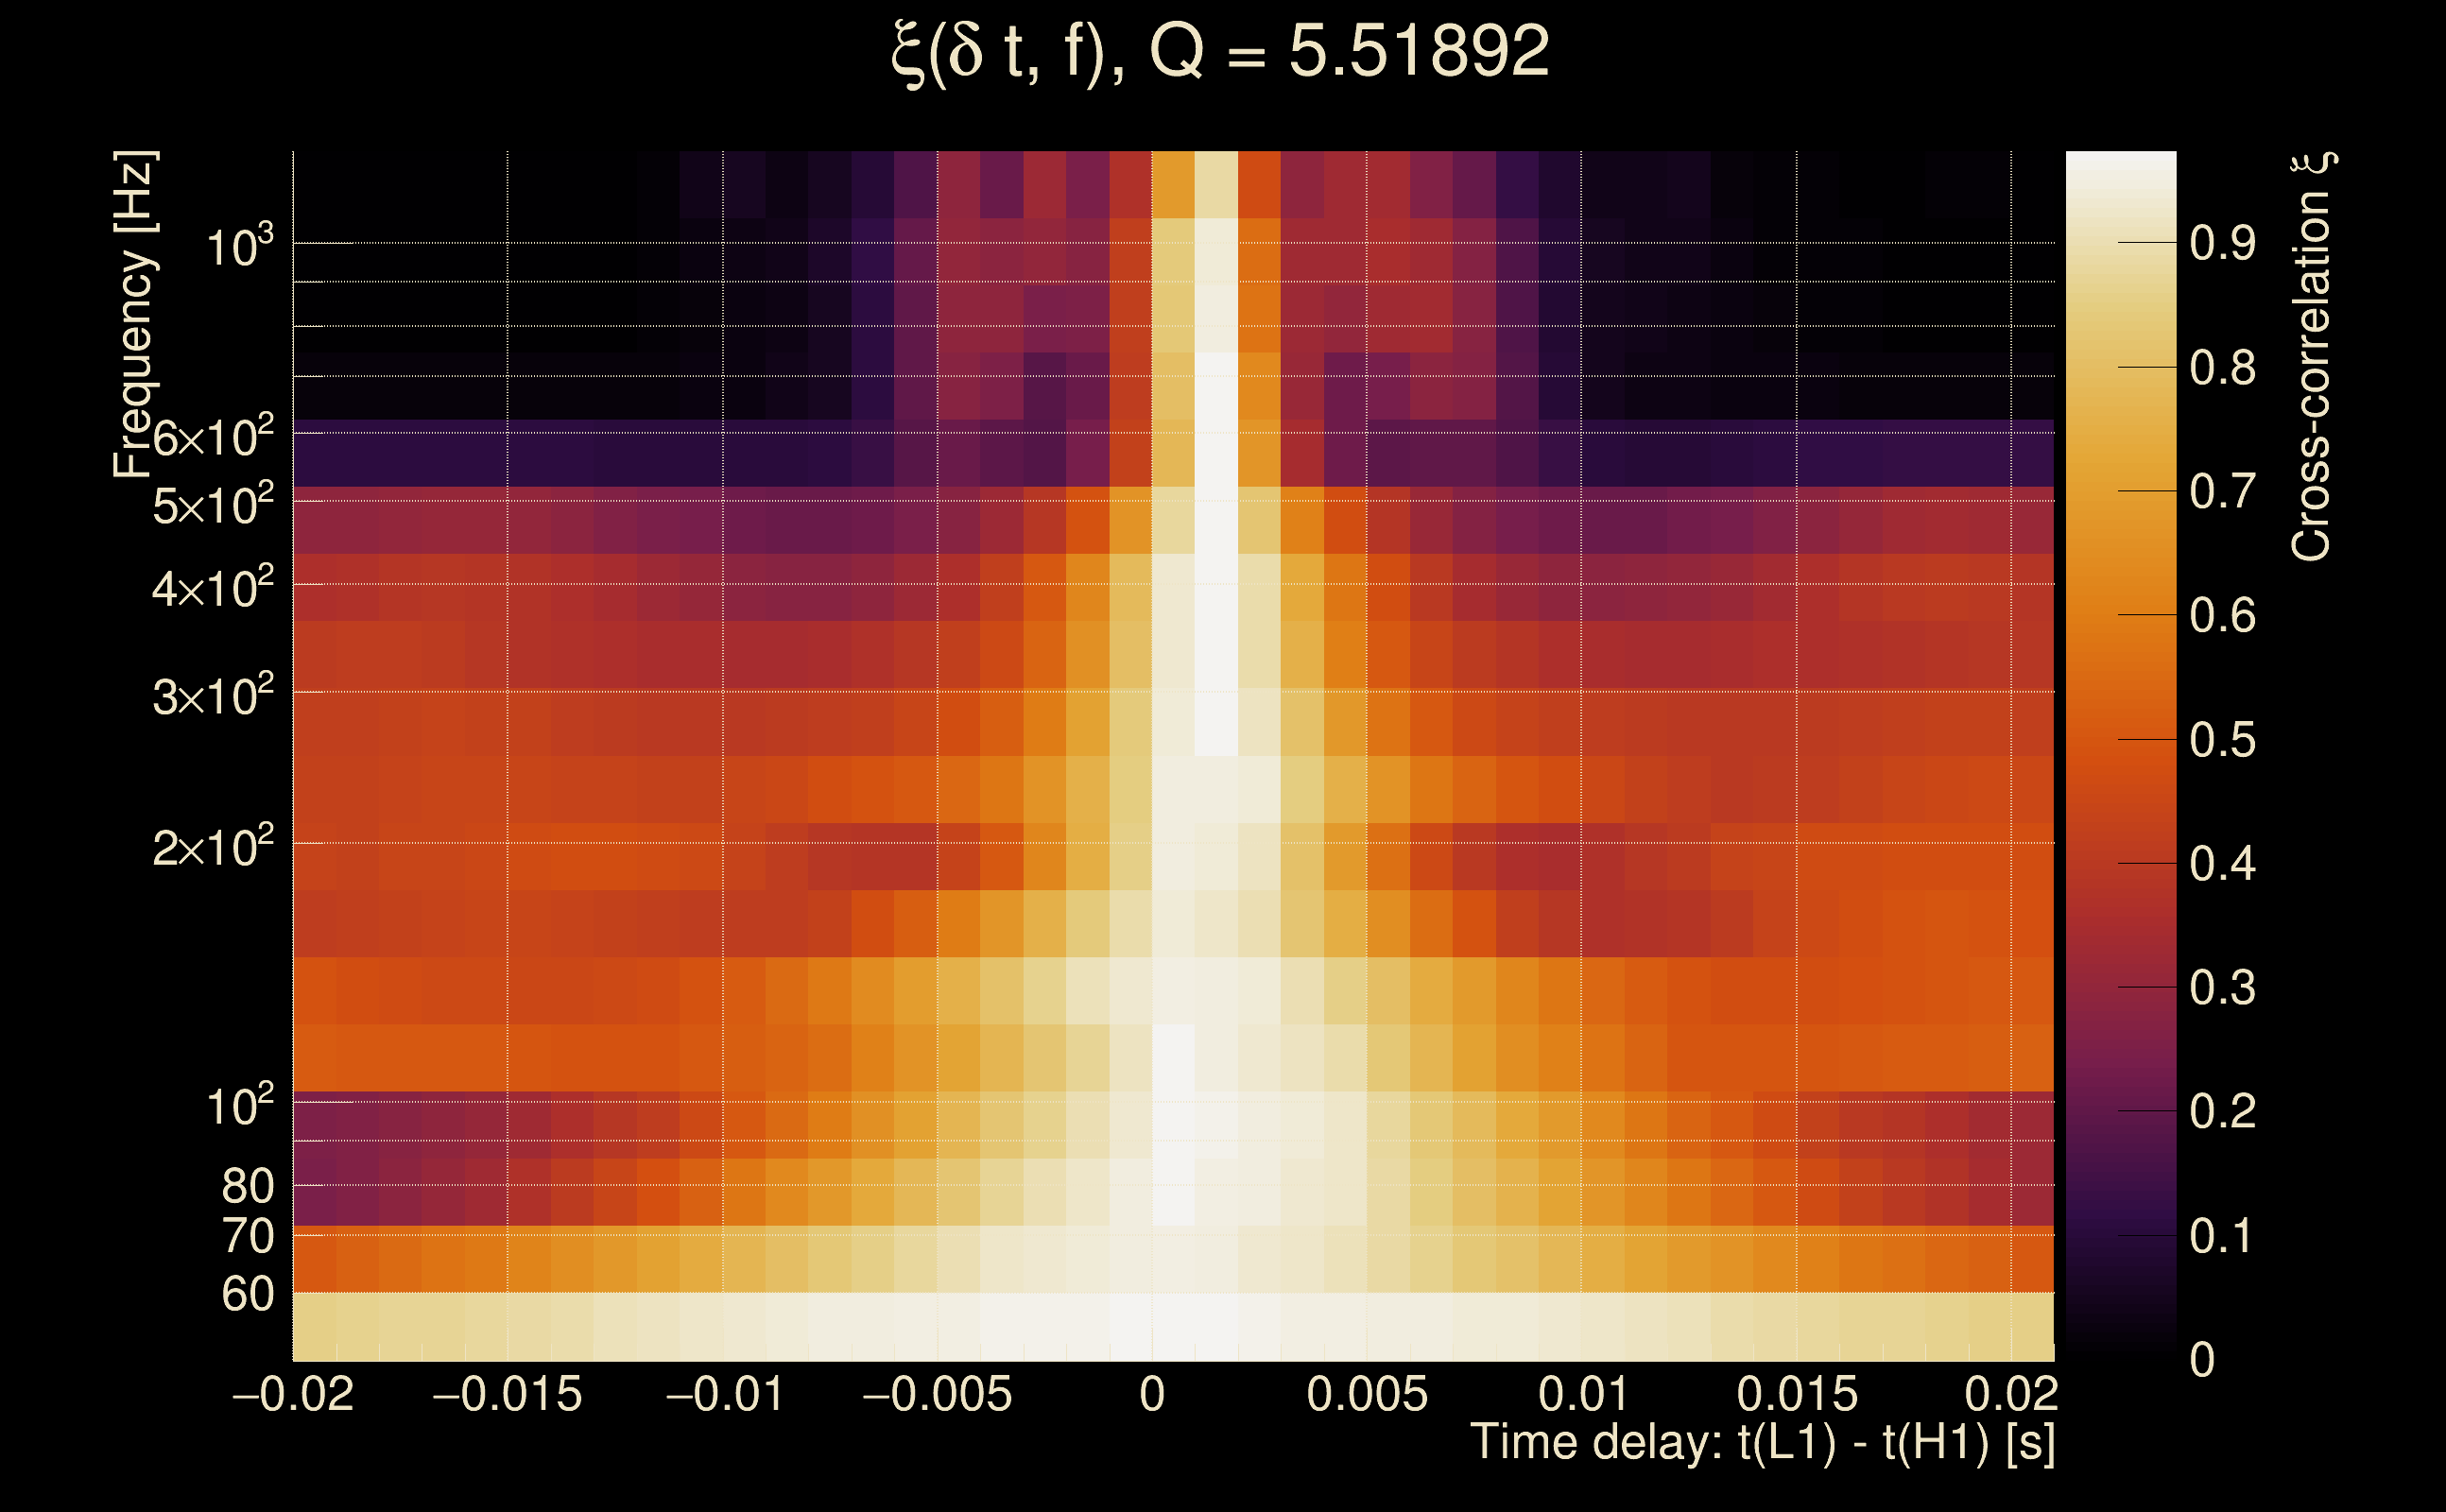
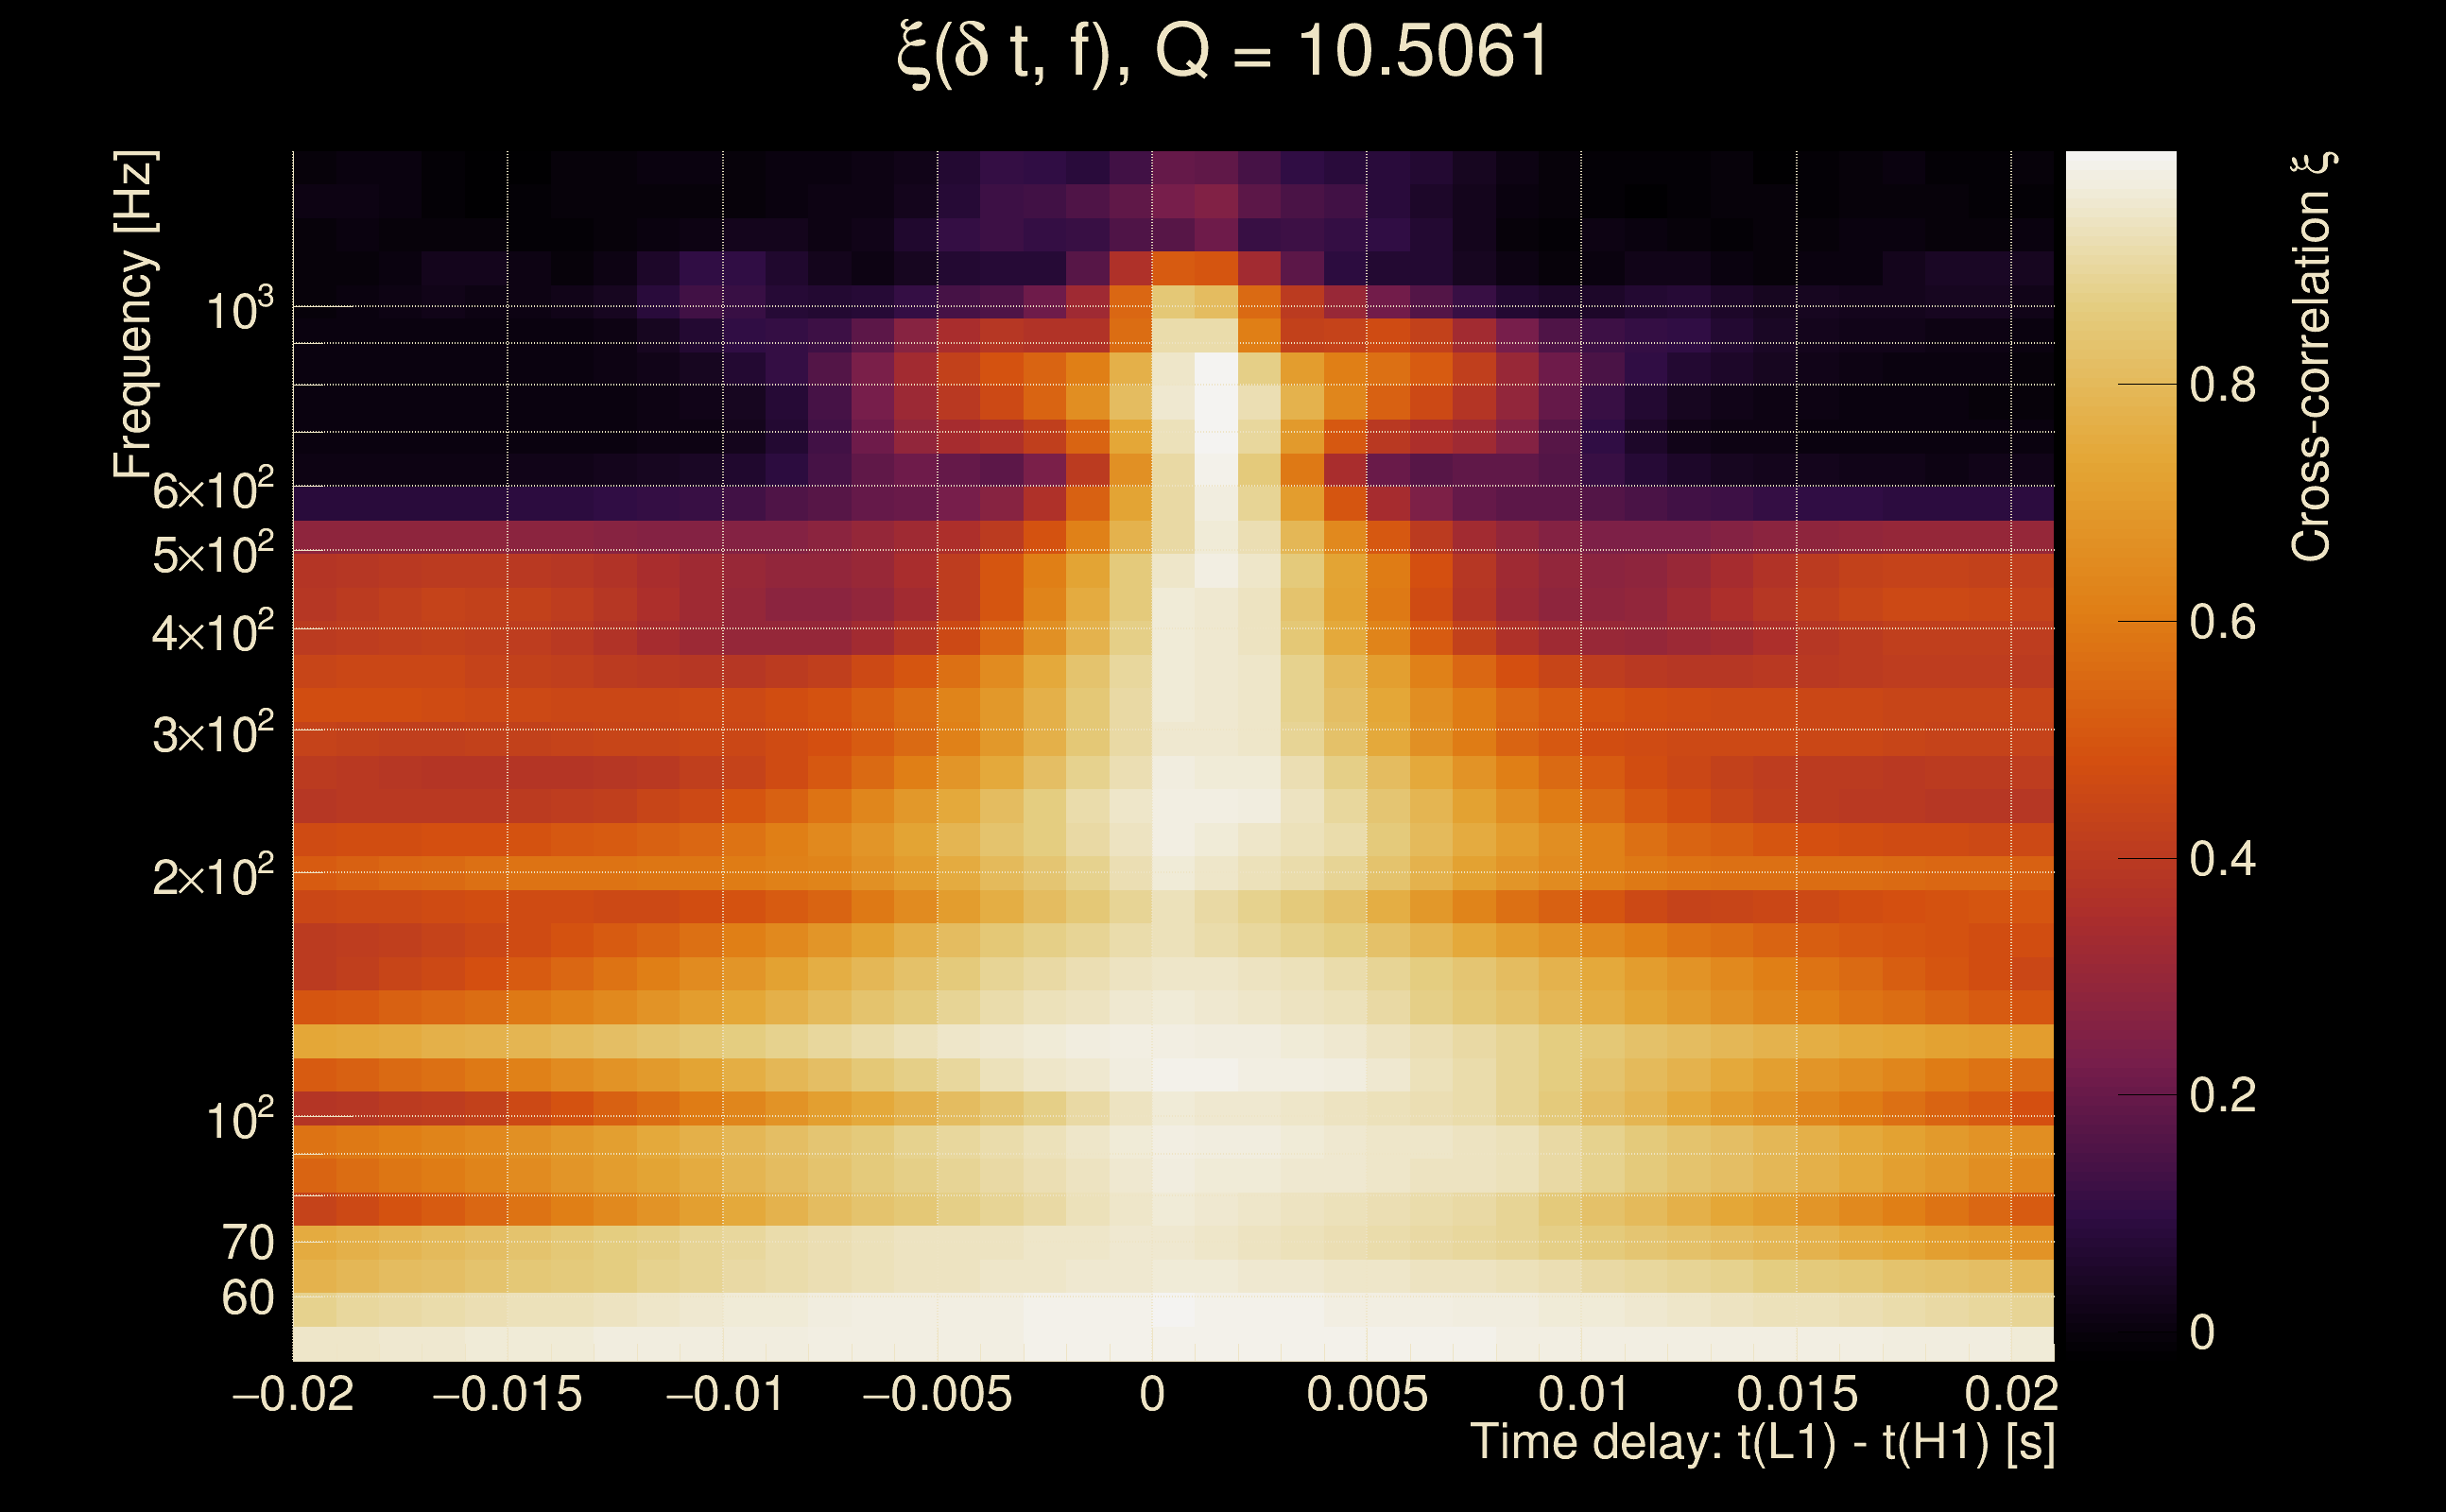
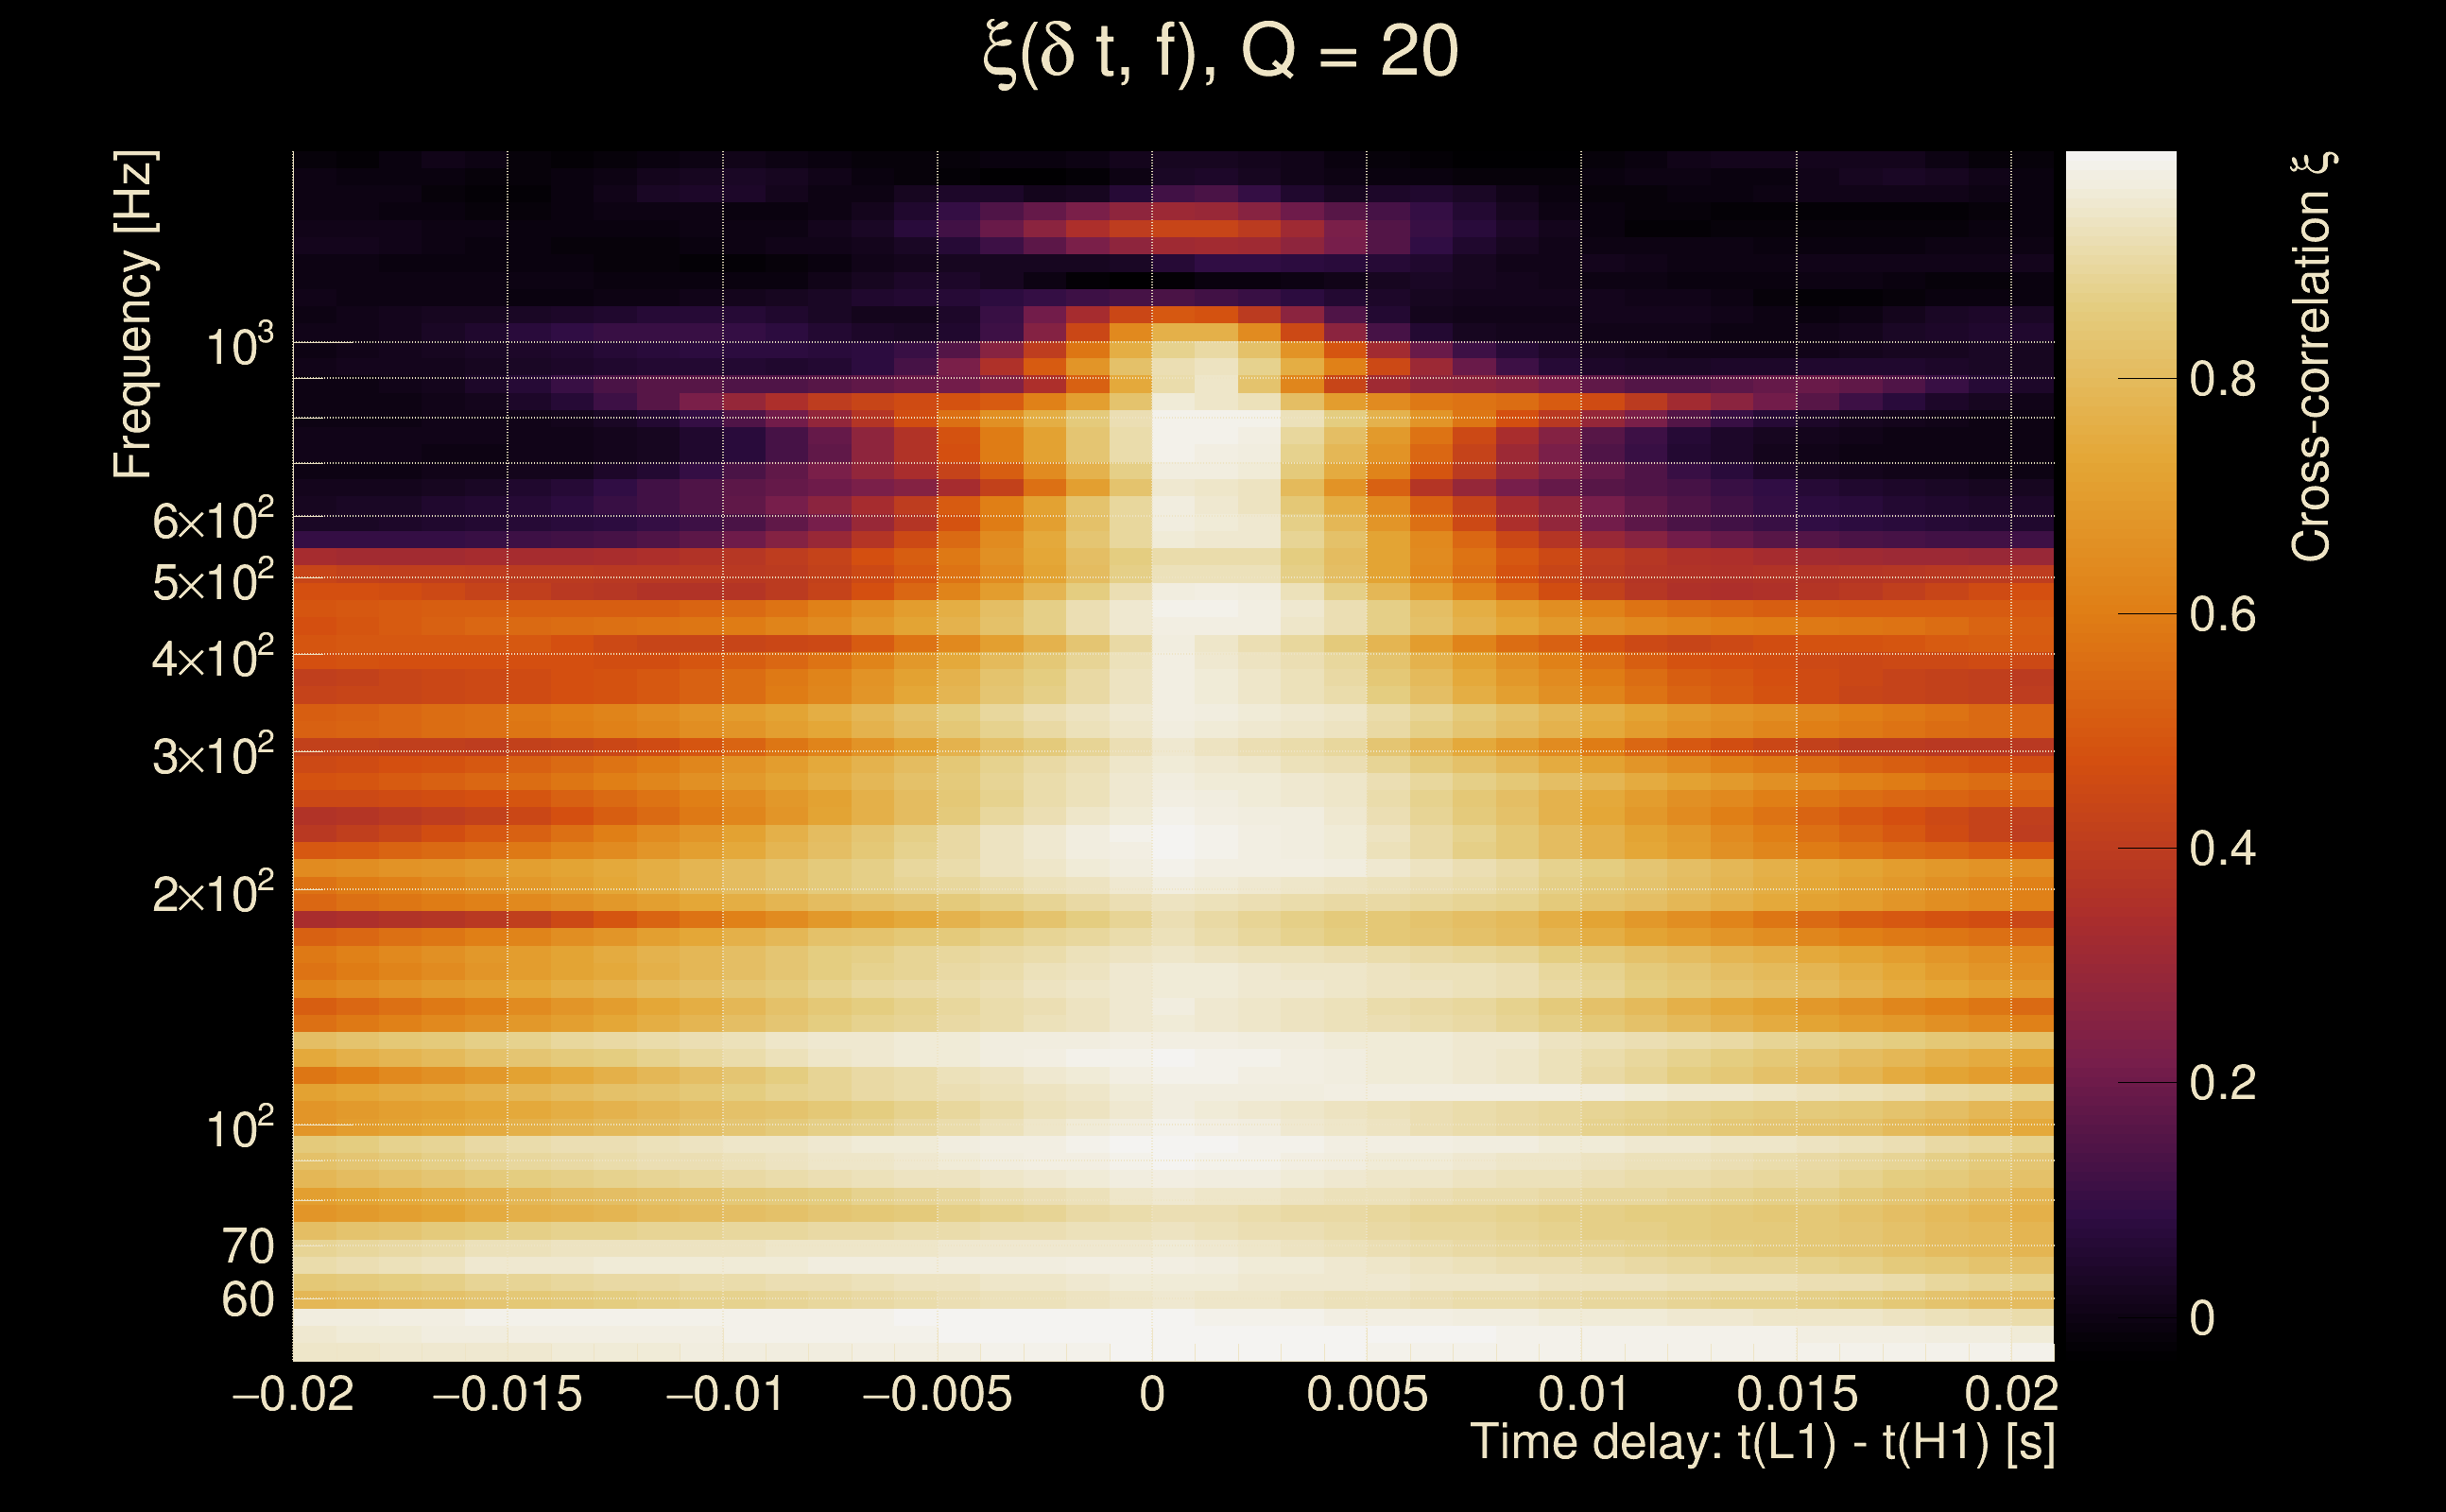
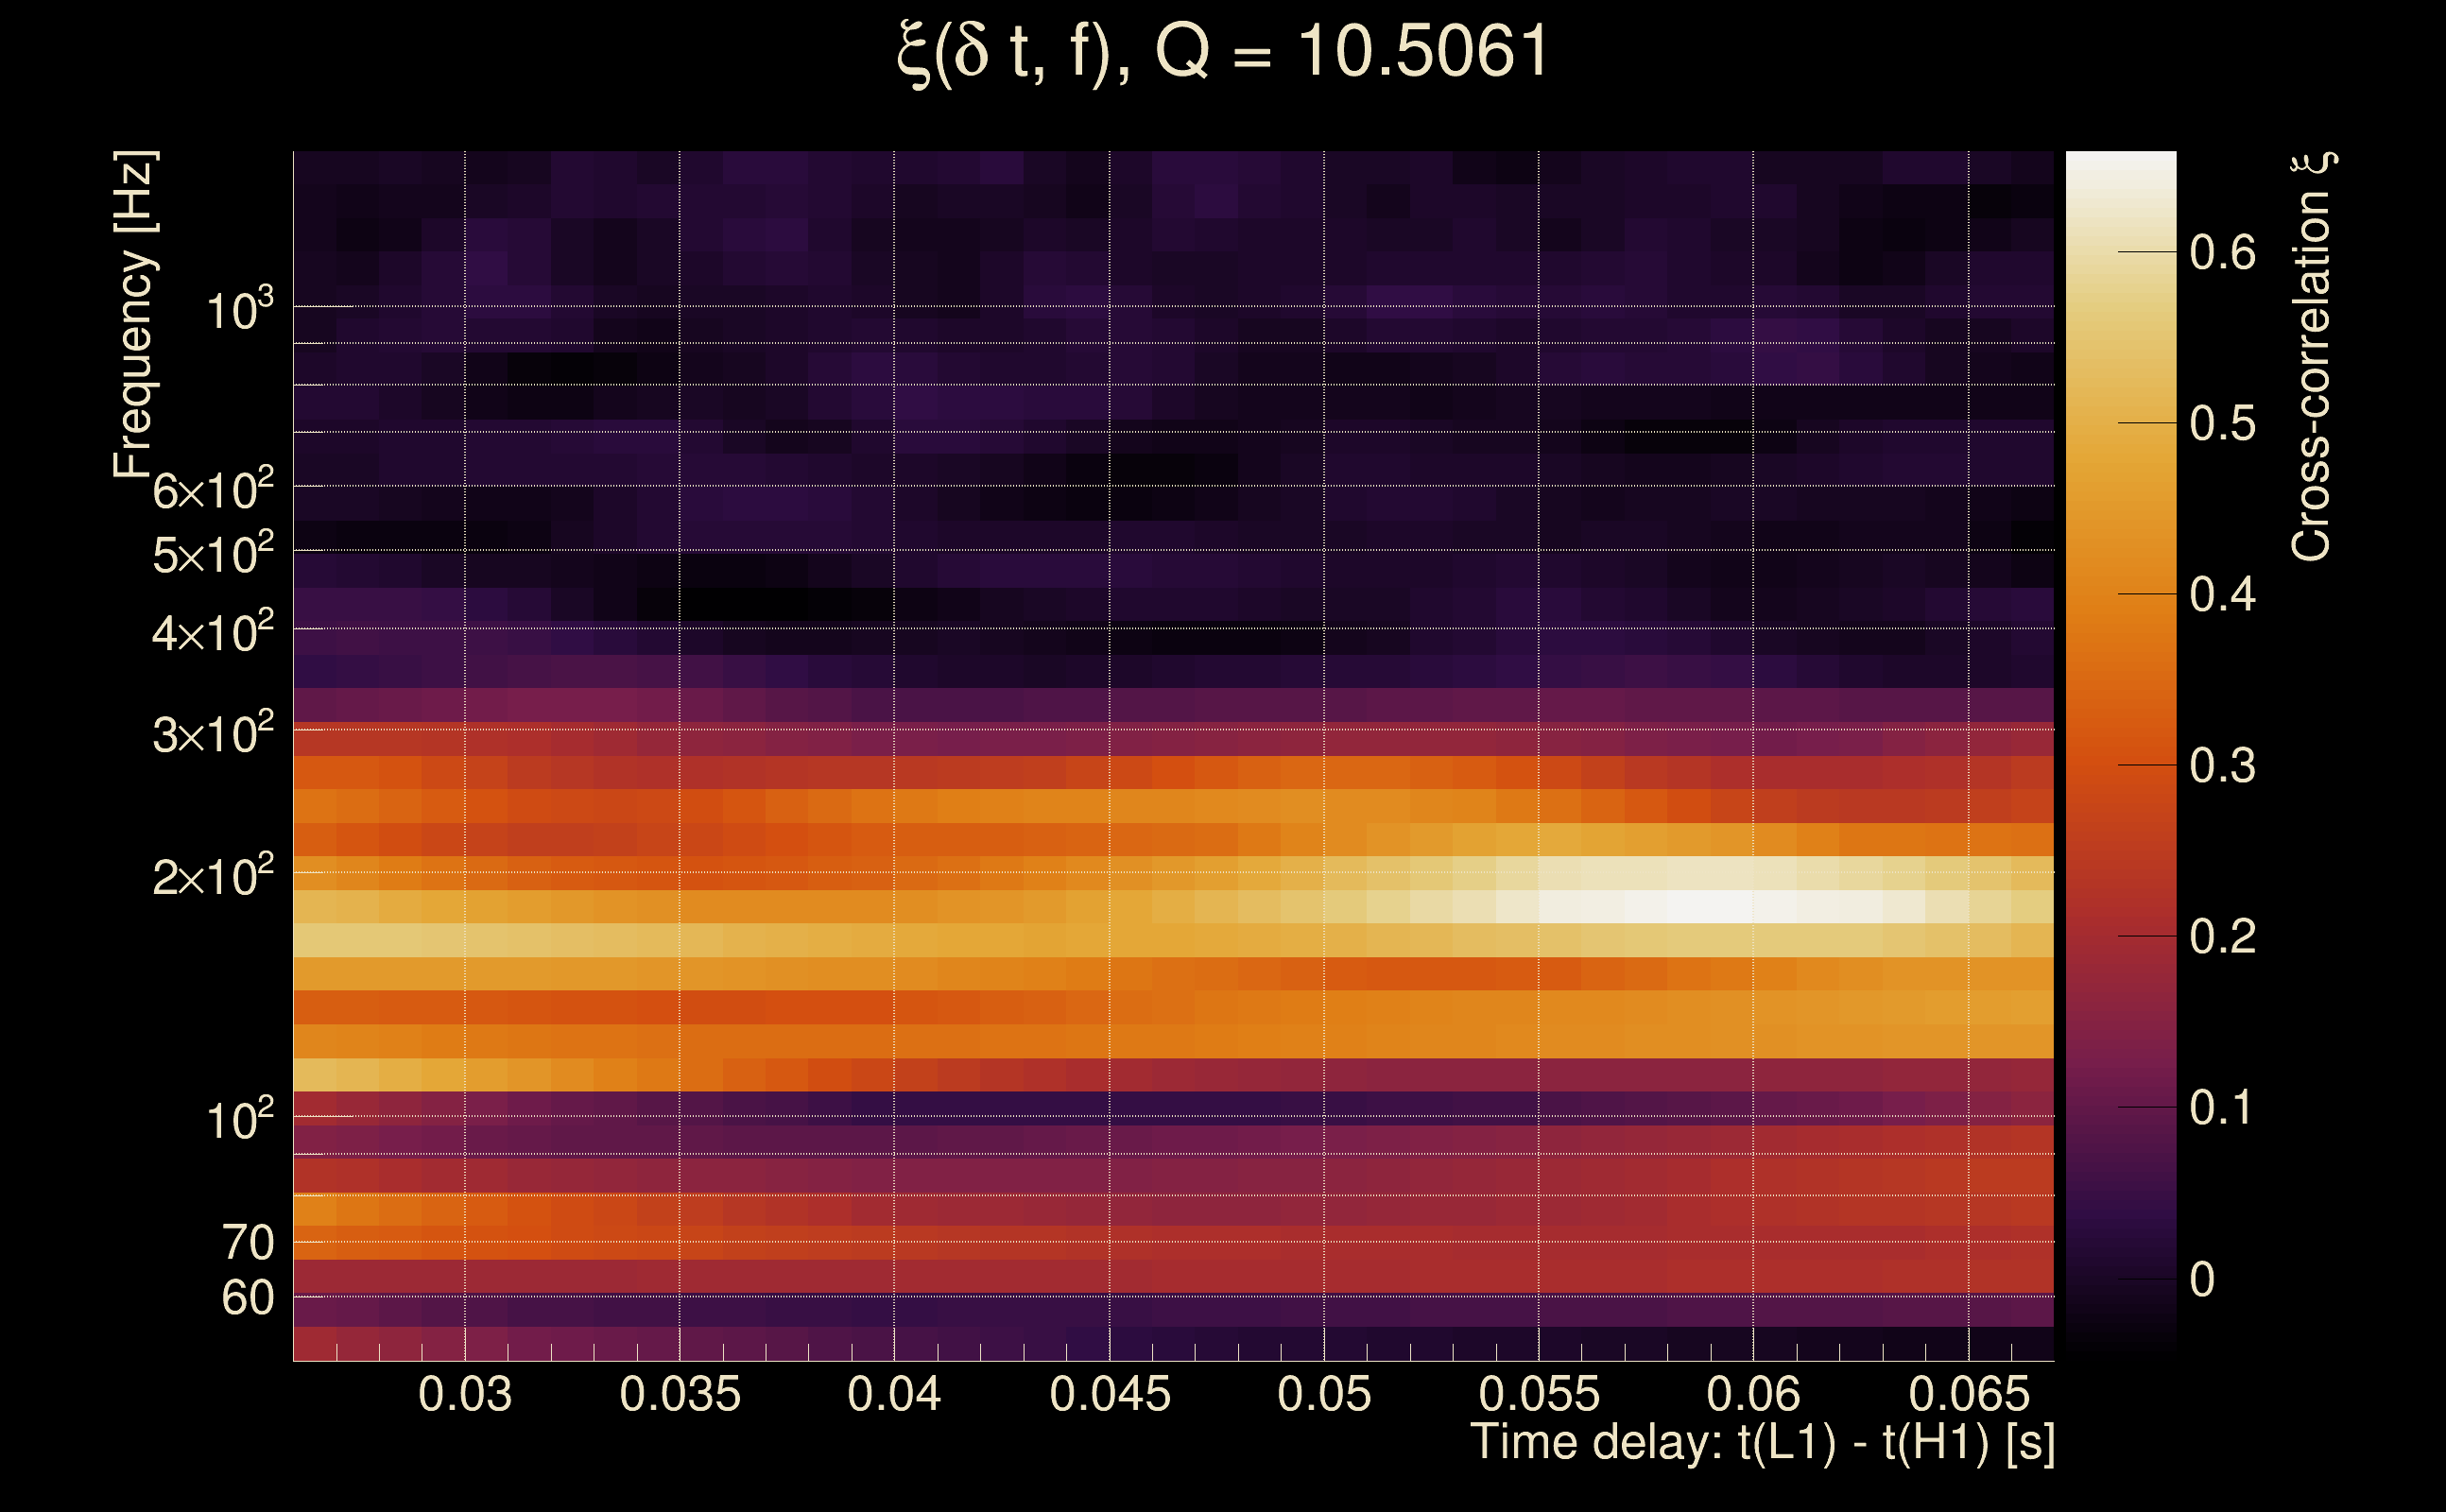
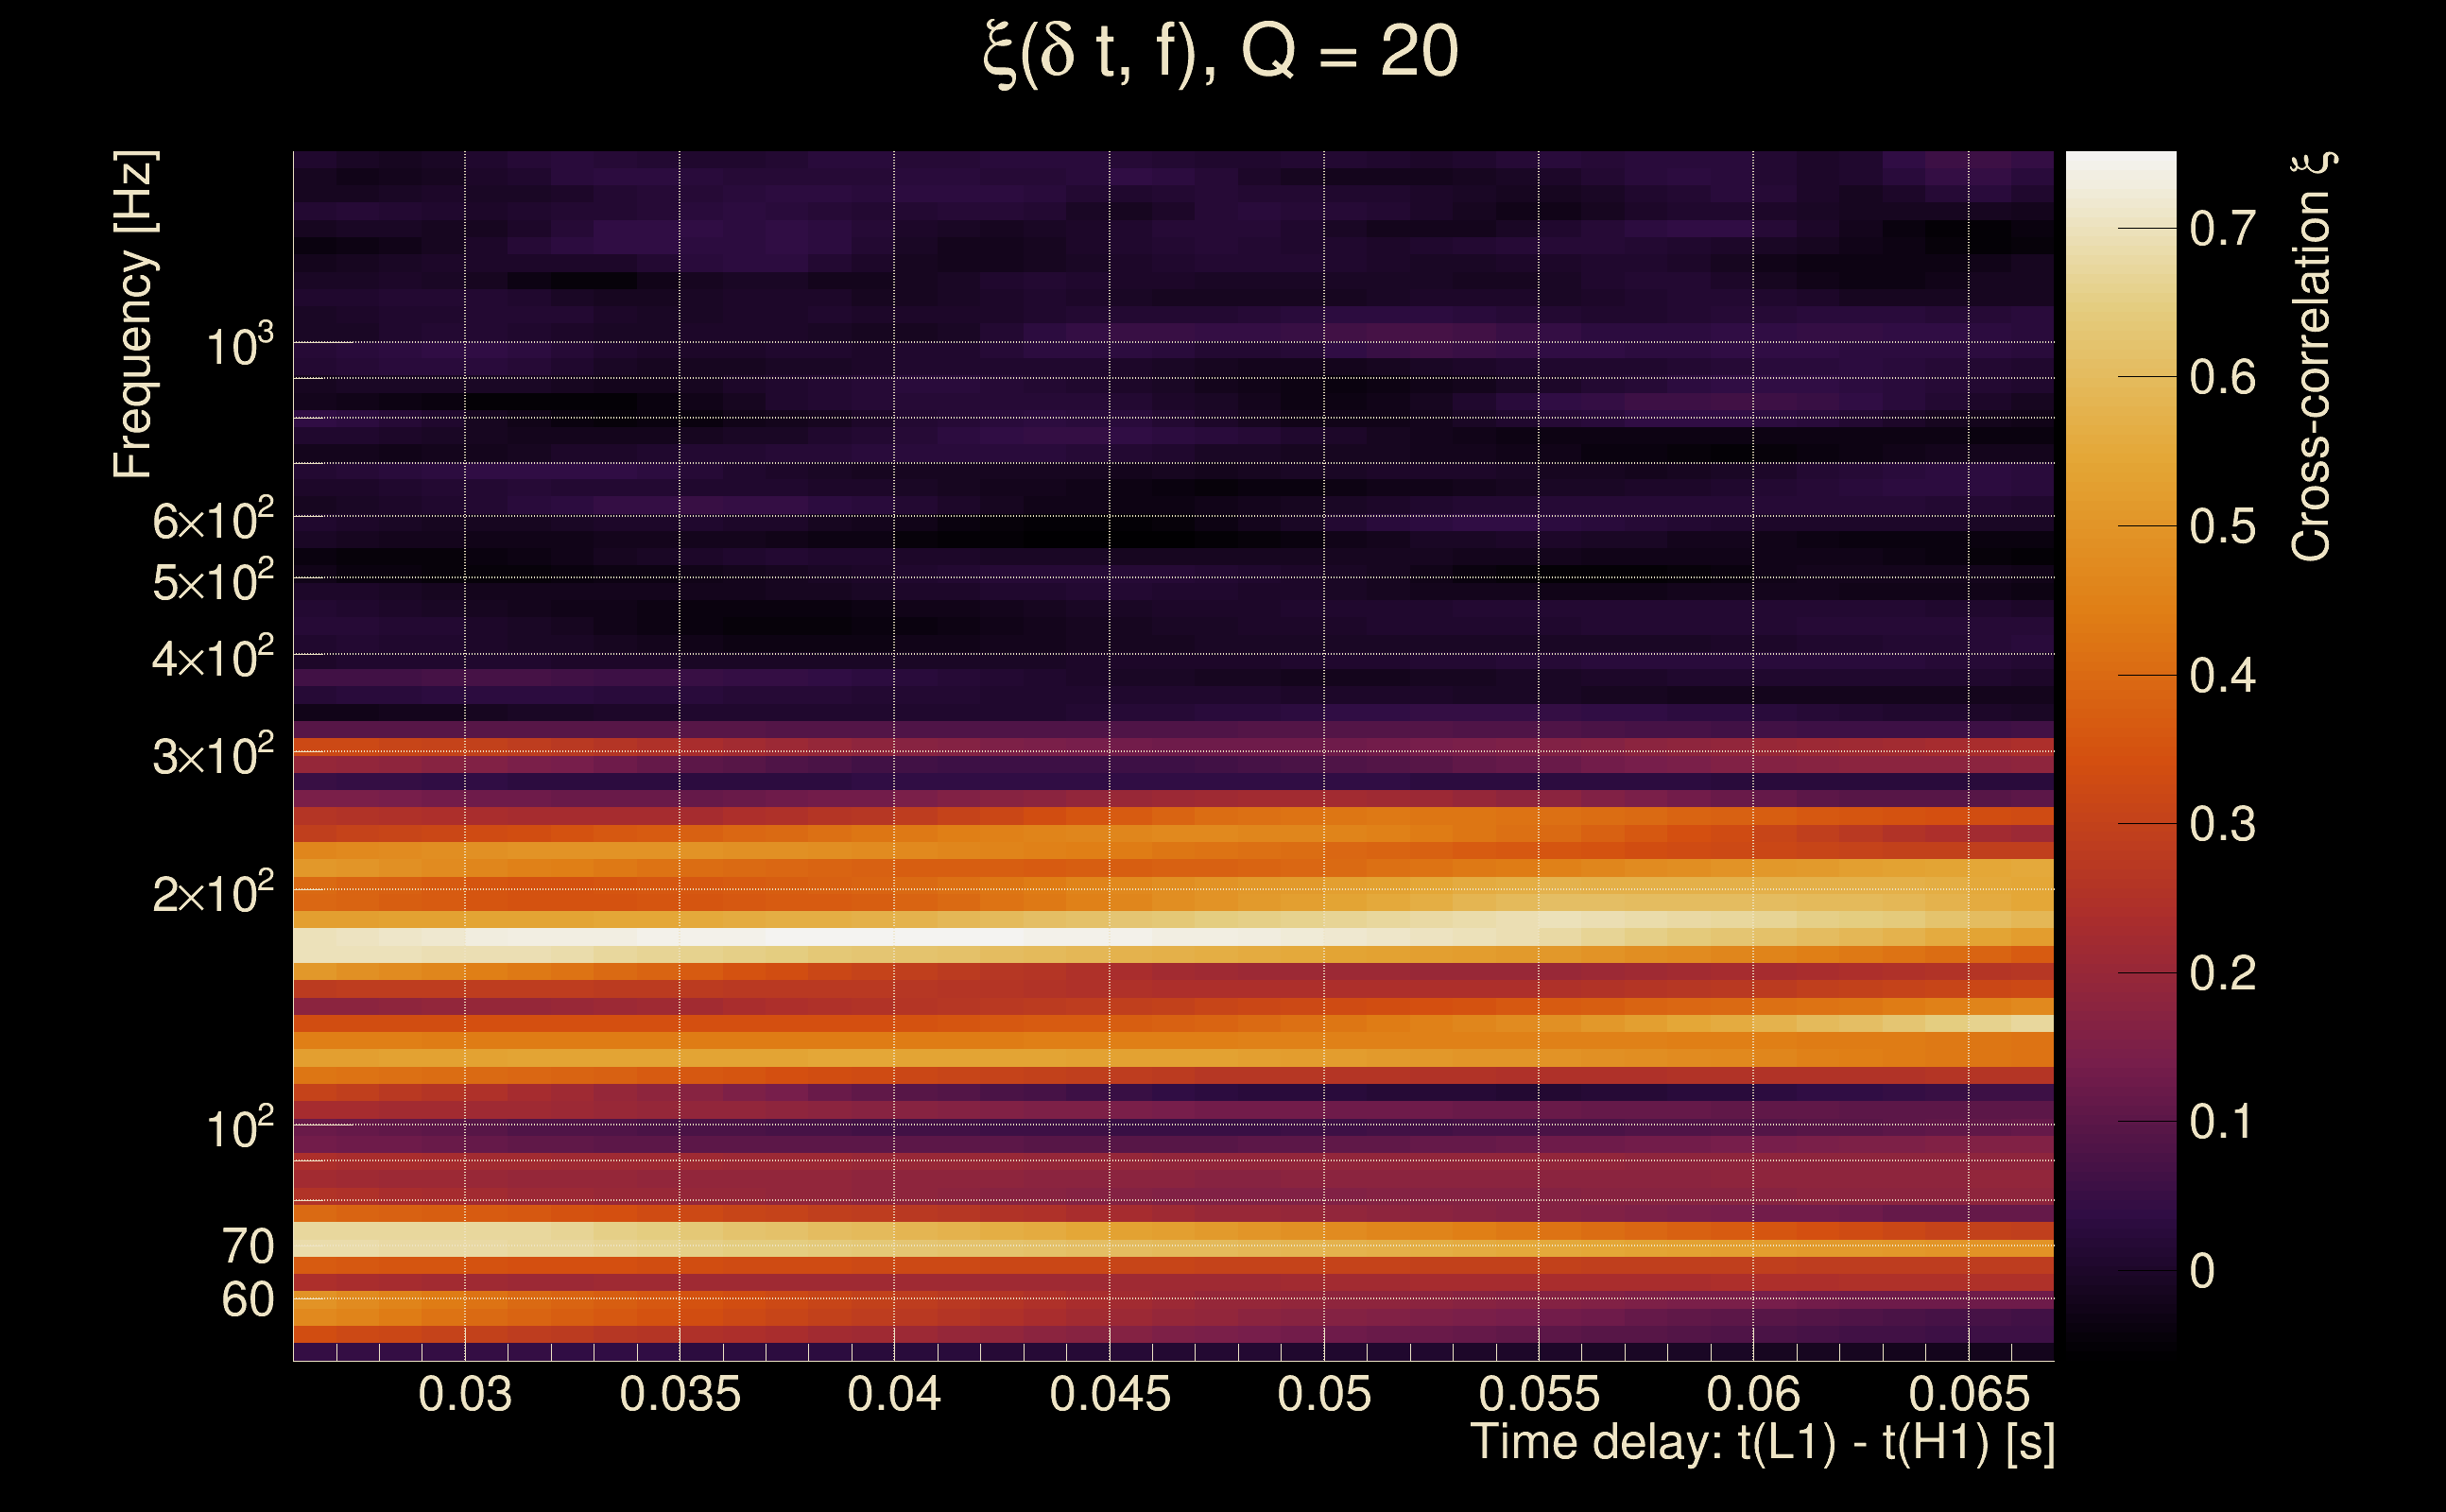
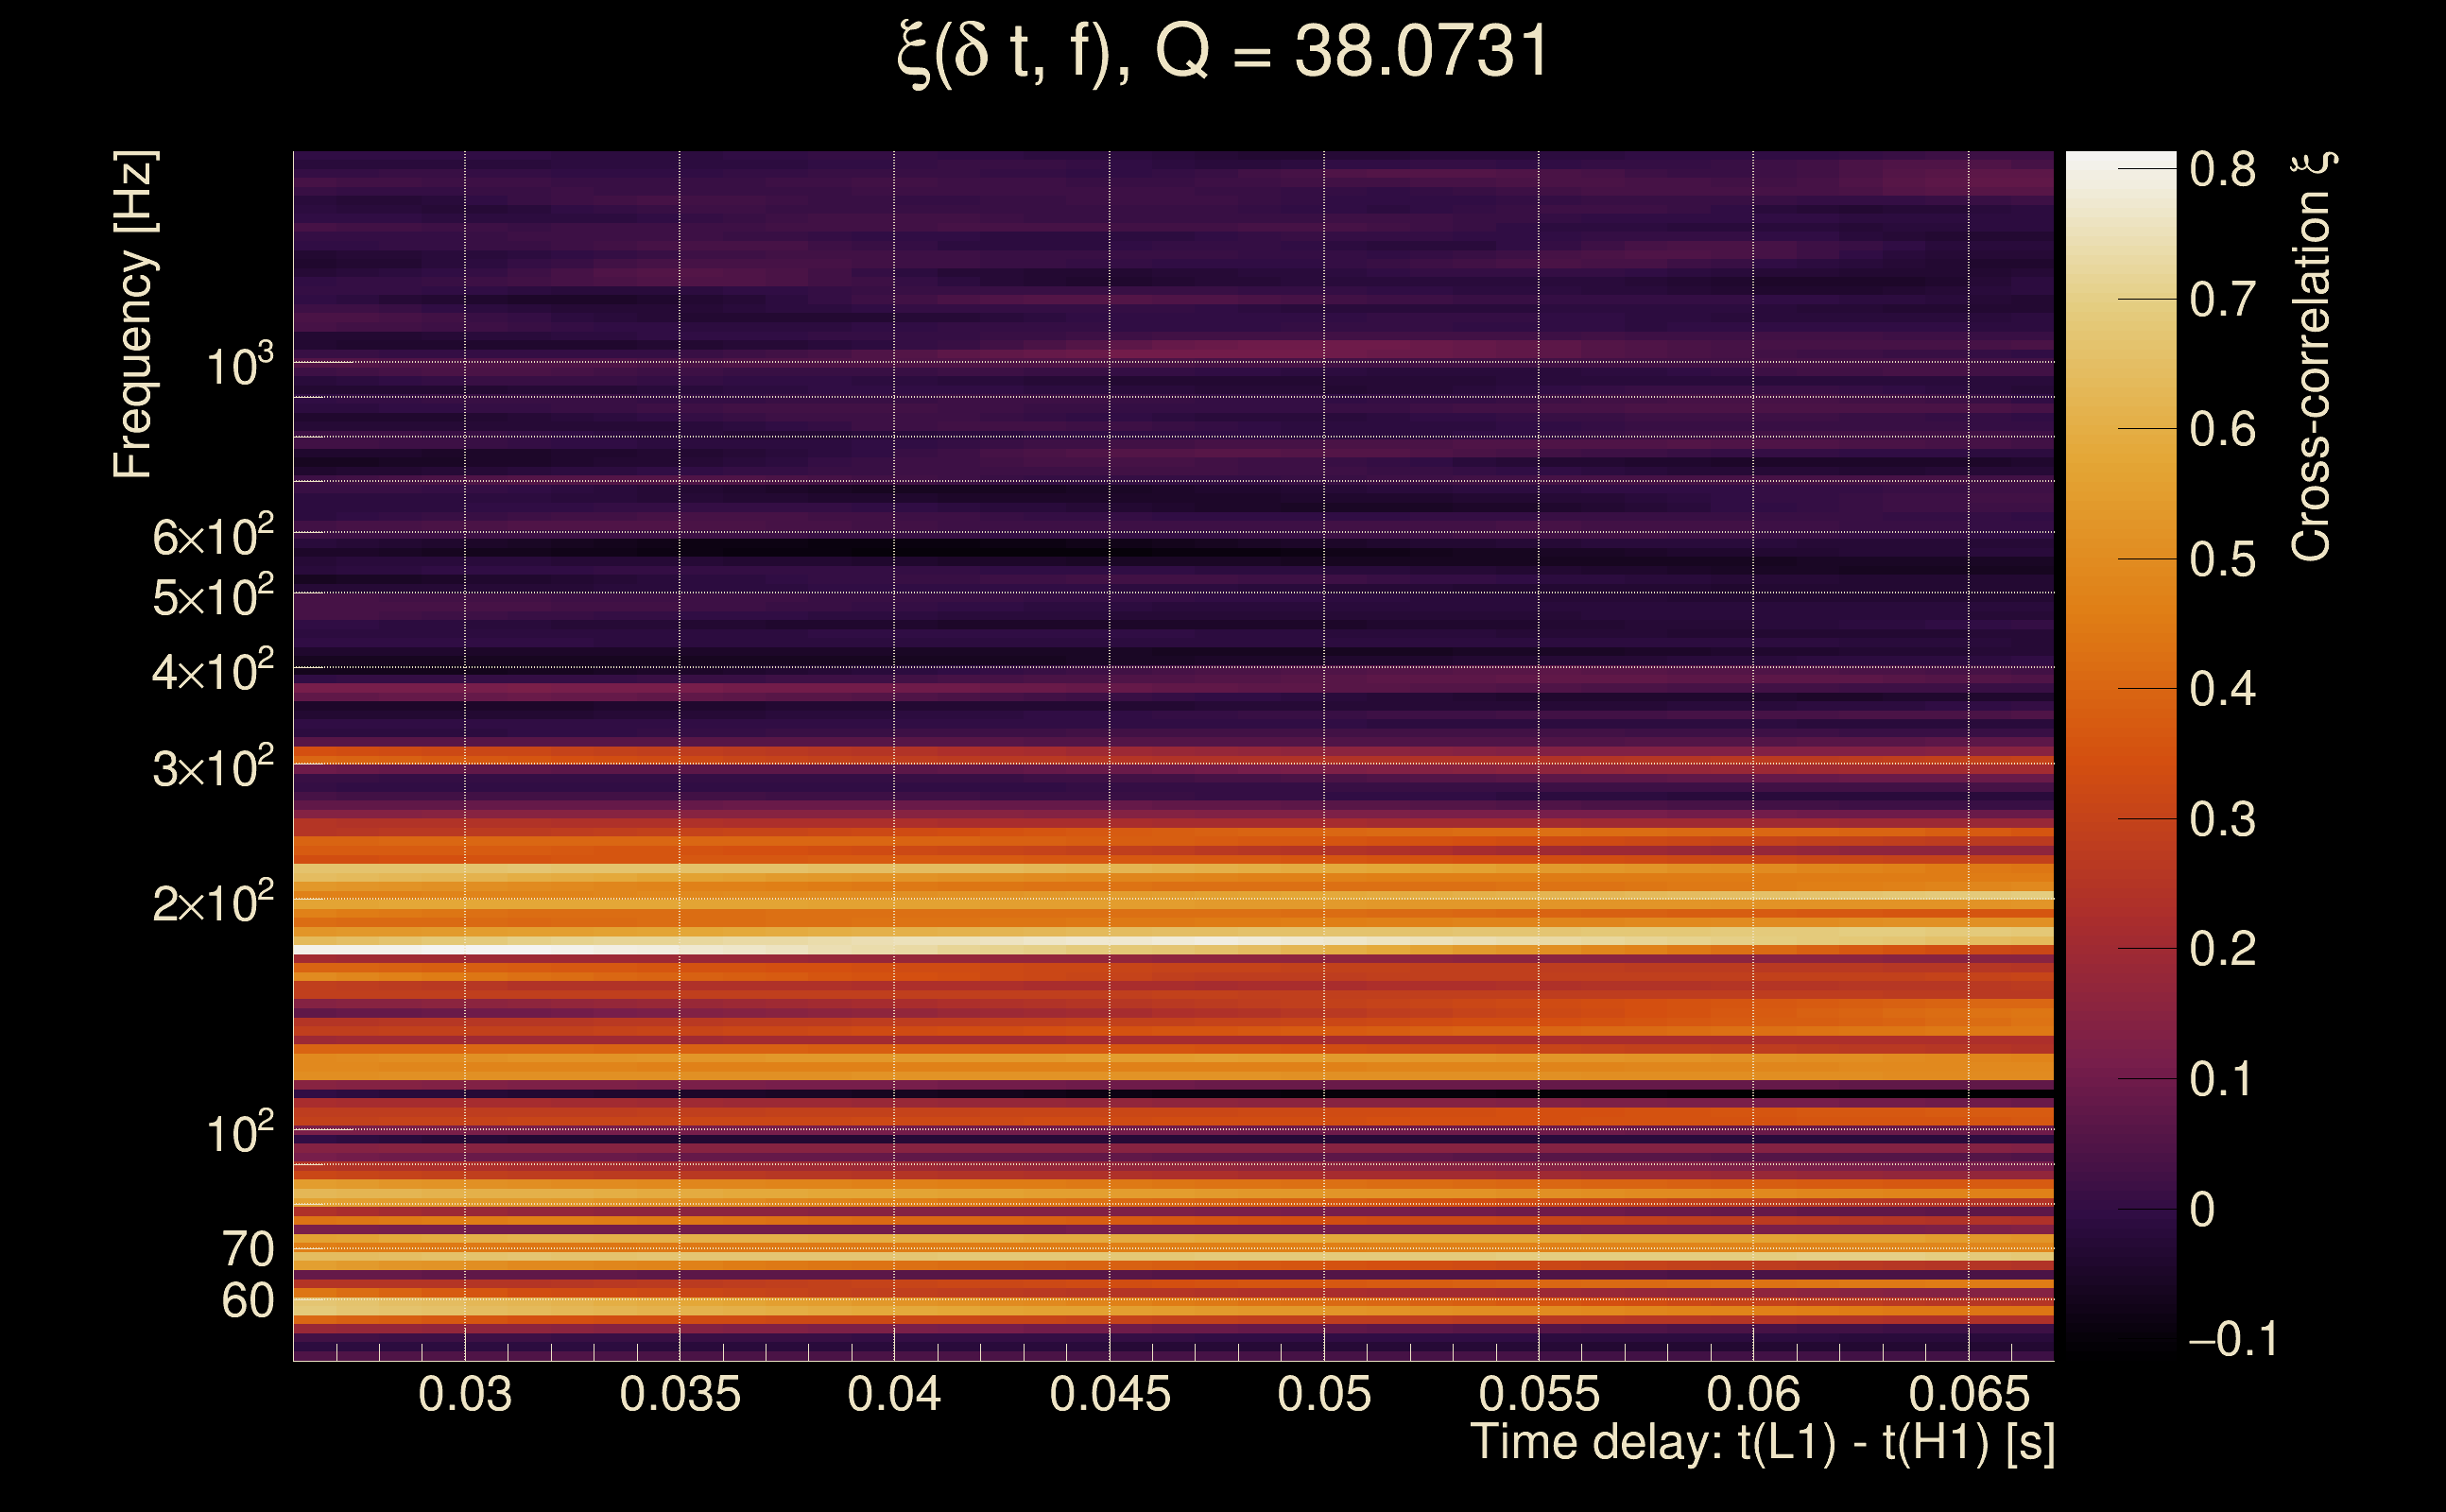
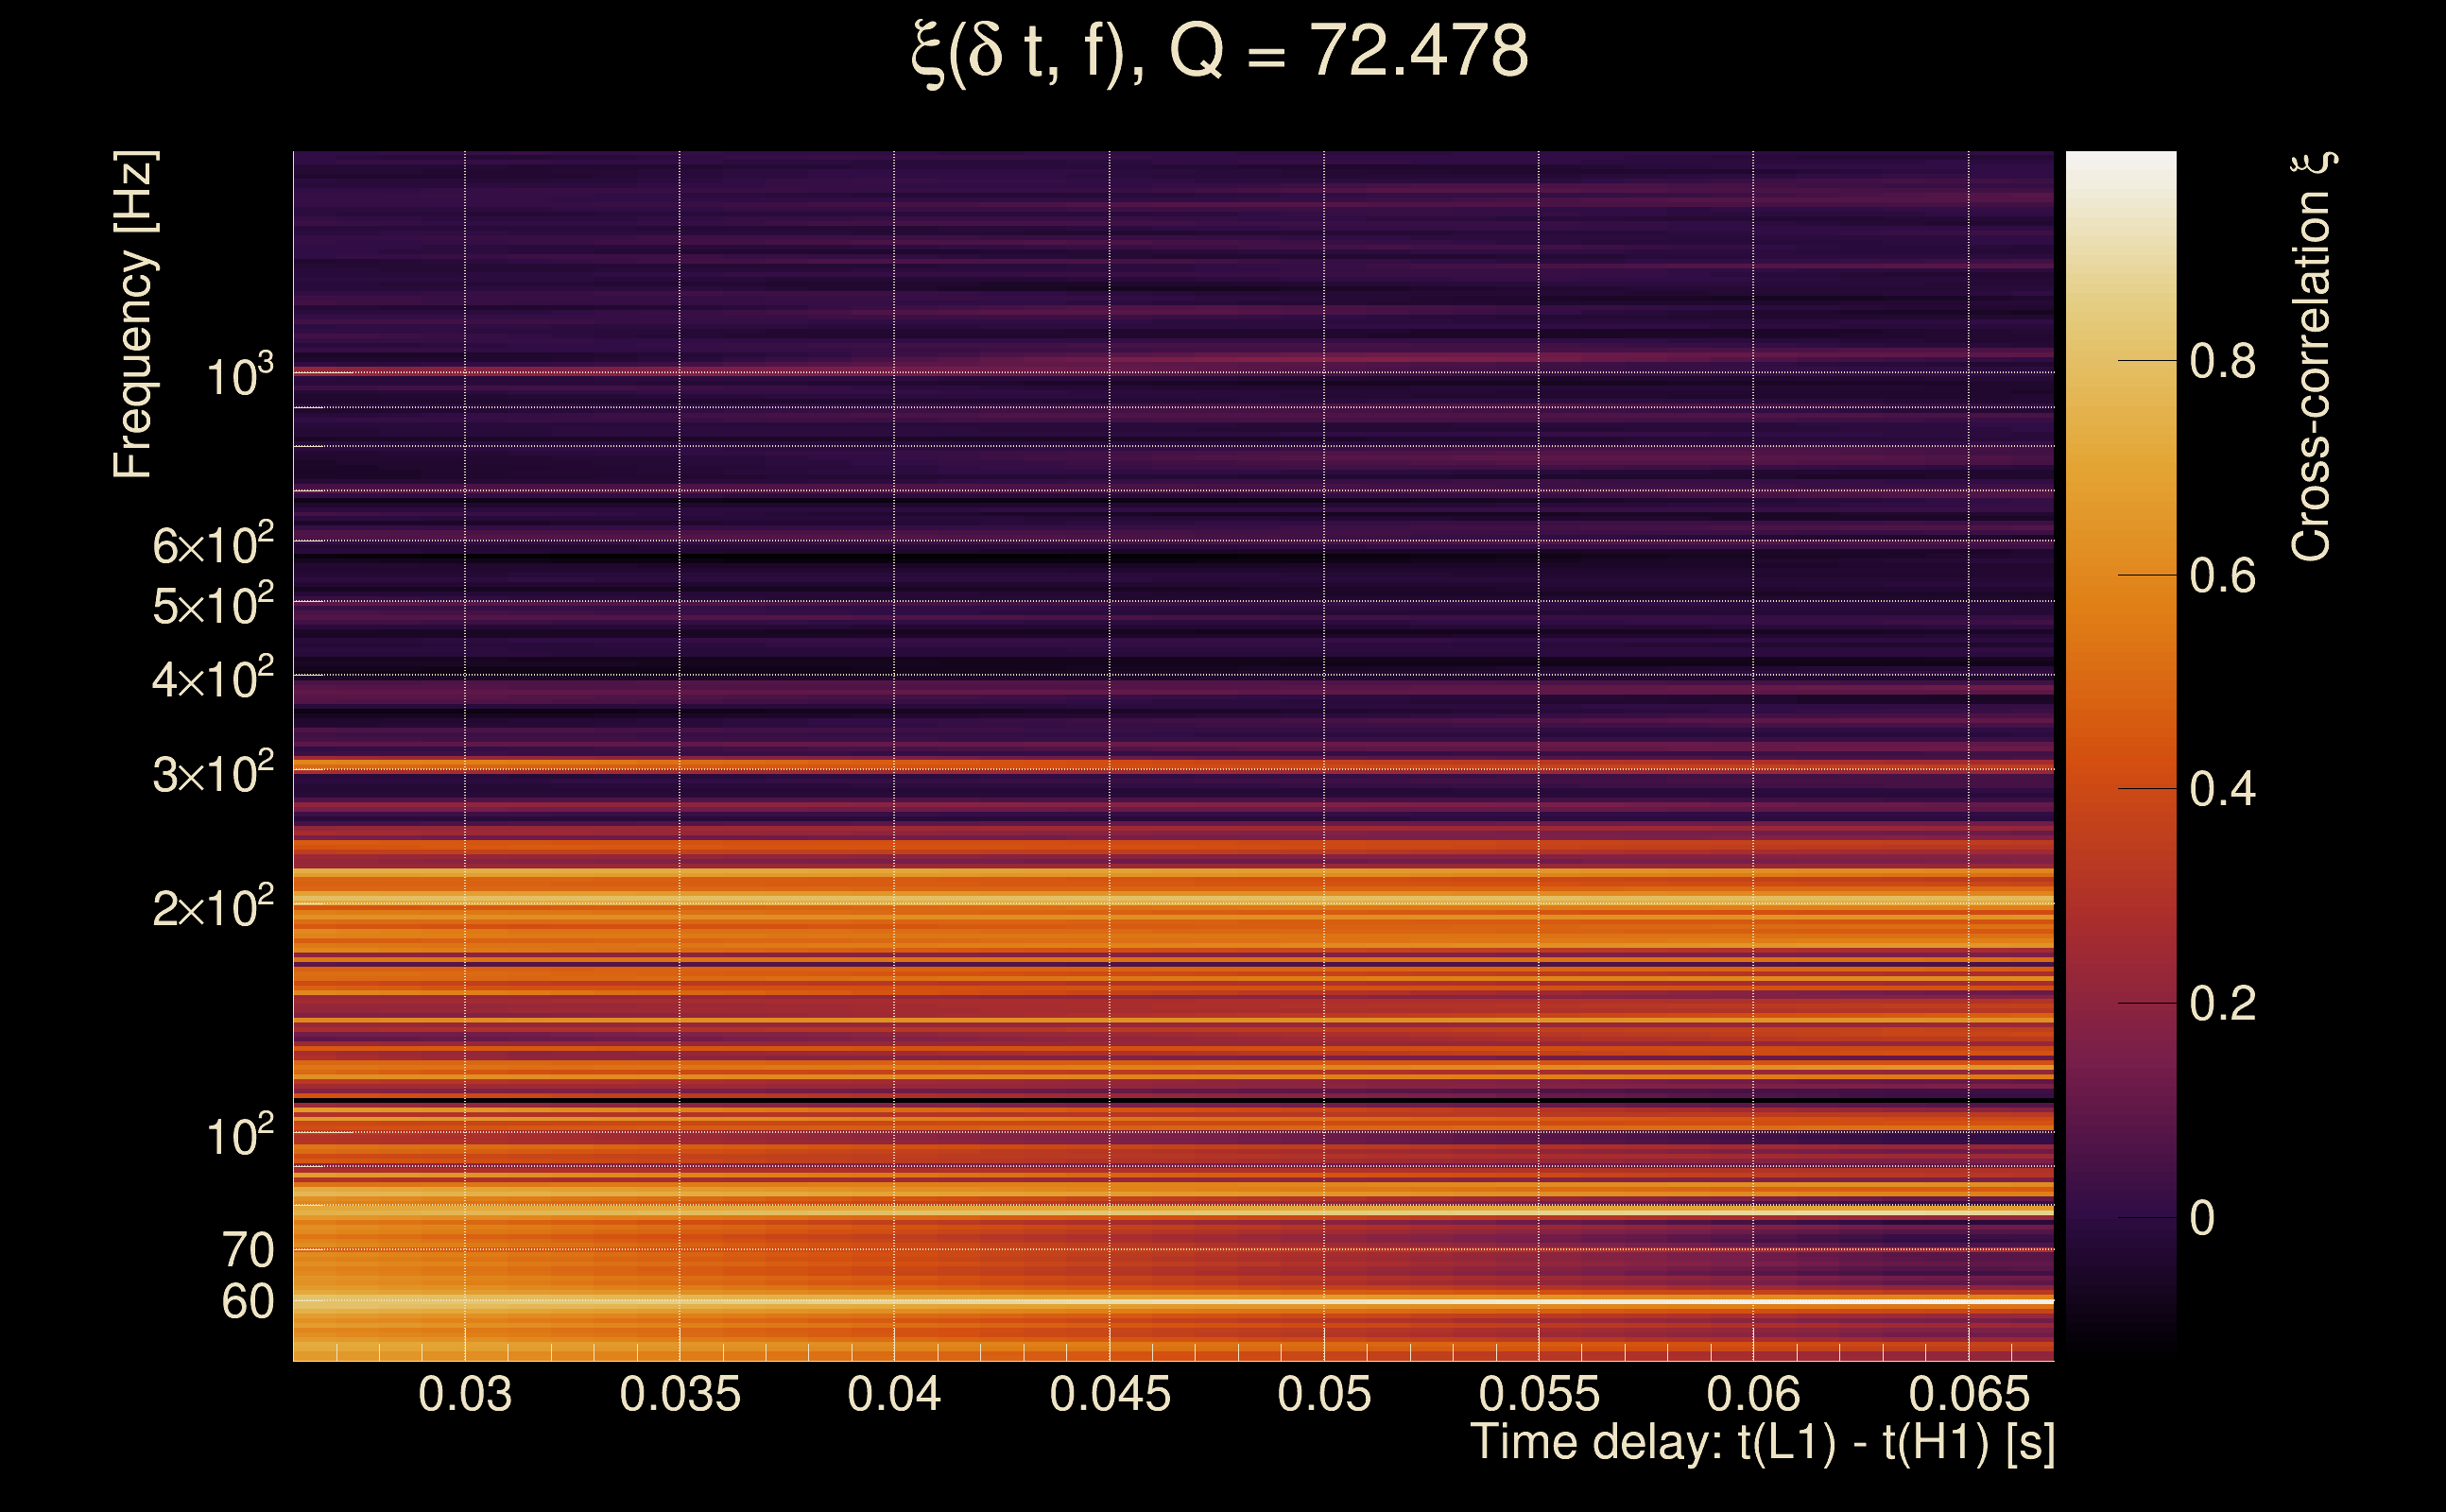
| Number of Q planes: | 5 (Q = 5.51892 → Q = 72.478) |
| Omicron frequency range: | 50 Hz → 1958.38 Hz |
| Light travel time between detectors: | 0.0100128 s |
| Slice extra-time (calibration uncertainty + slice veto): | 0.0129872 s |
| Number of time-delay bins in a cross-correlation map: | 10000 |
| Number of slices in a cross-correlation map: | 217 |
| Number of time-delay bins in a slice: | 46 |
| SNR gating: | < 100 (detector 0), < 100 (detector 1) |
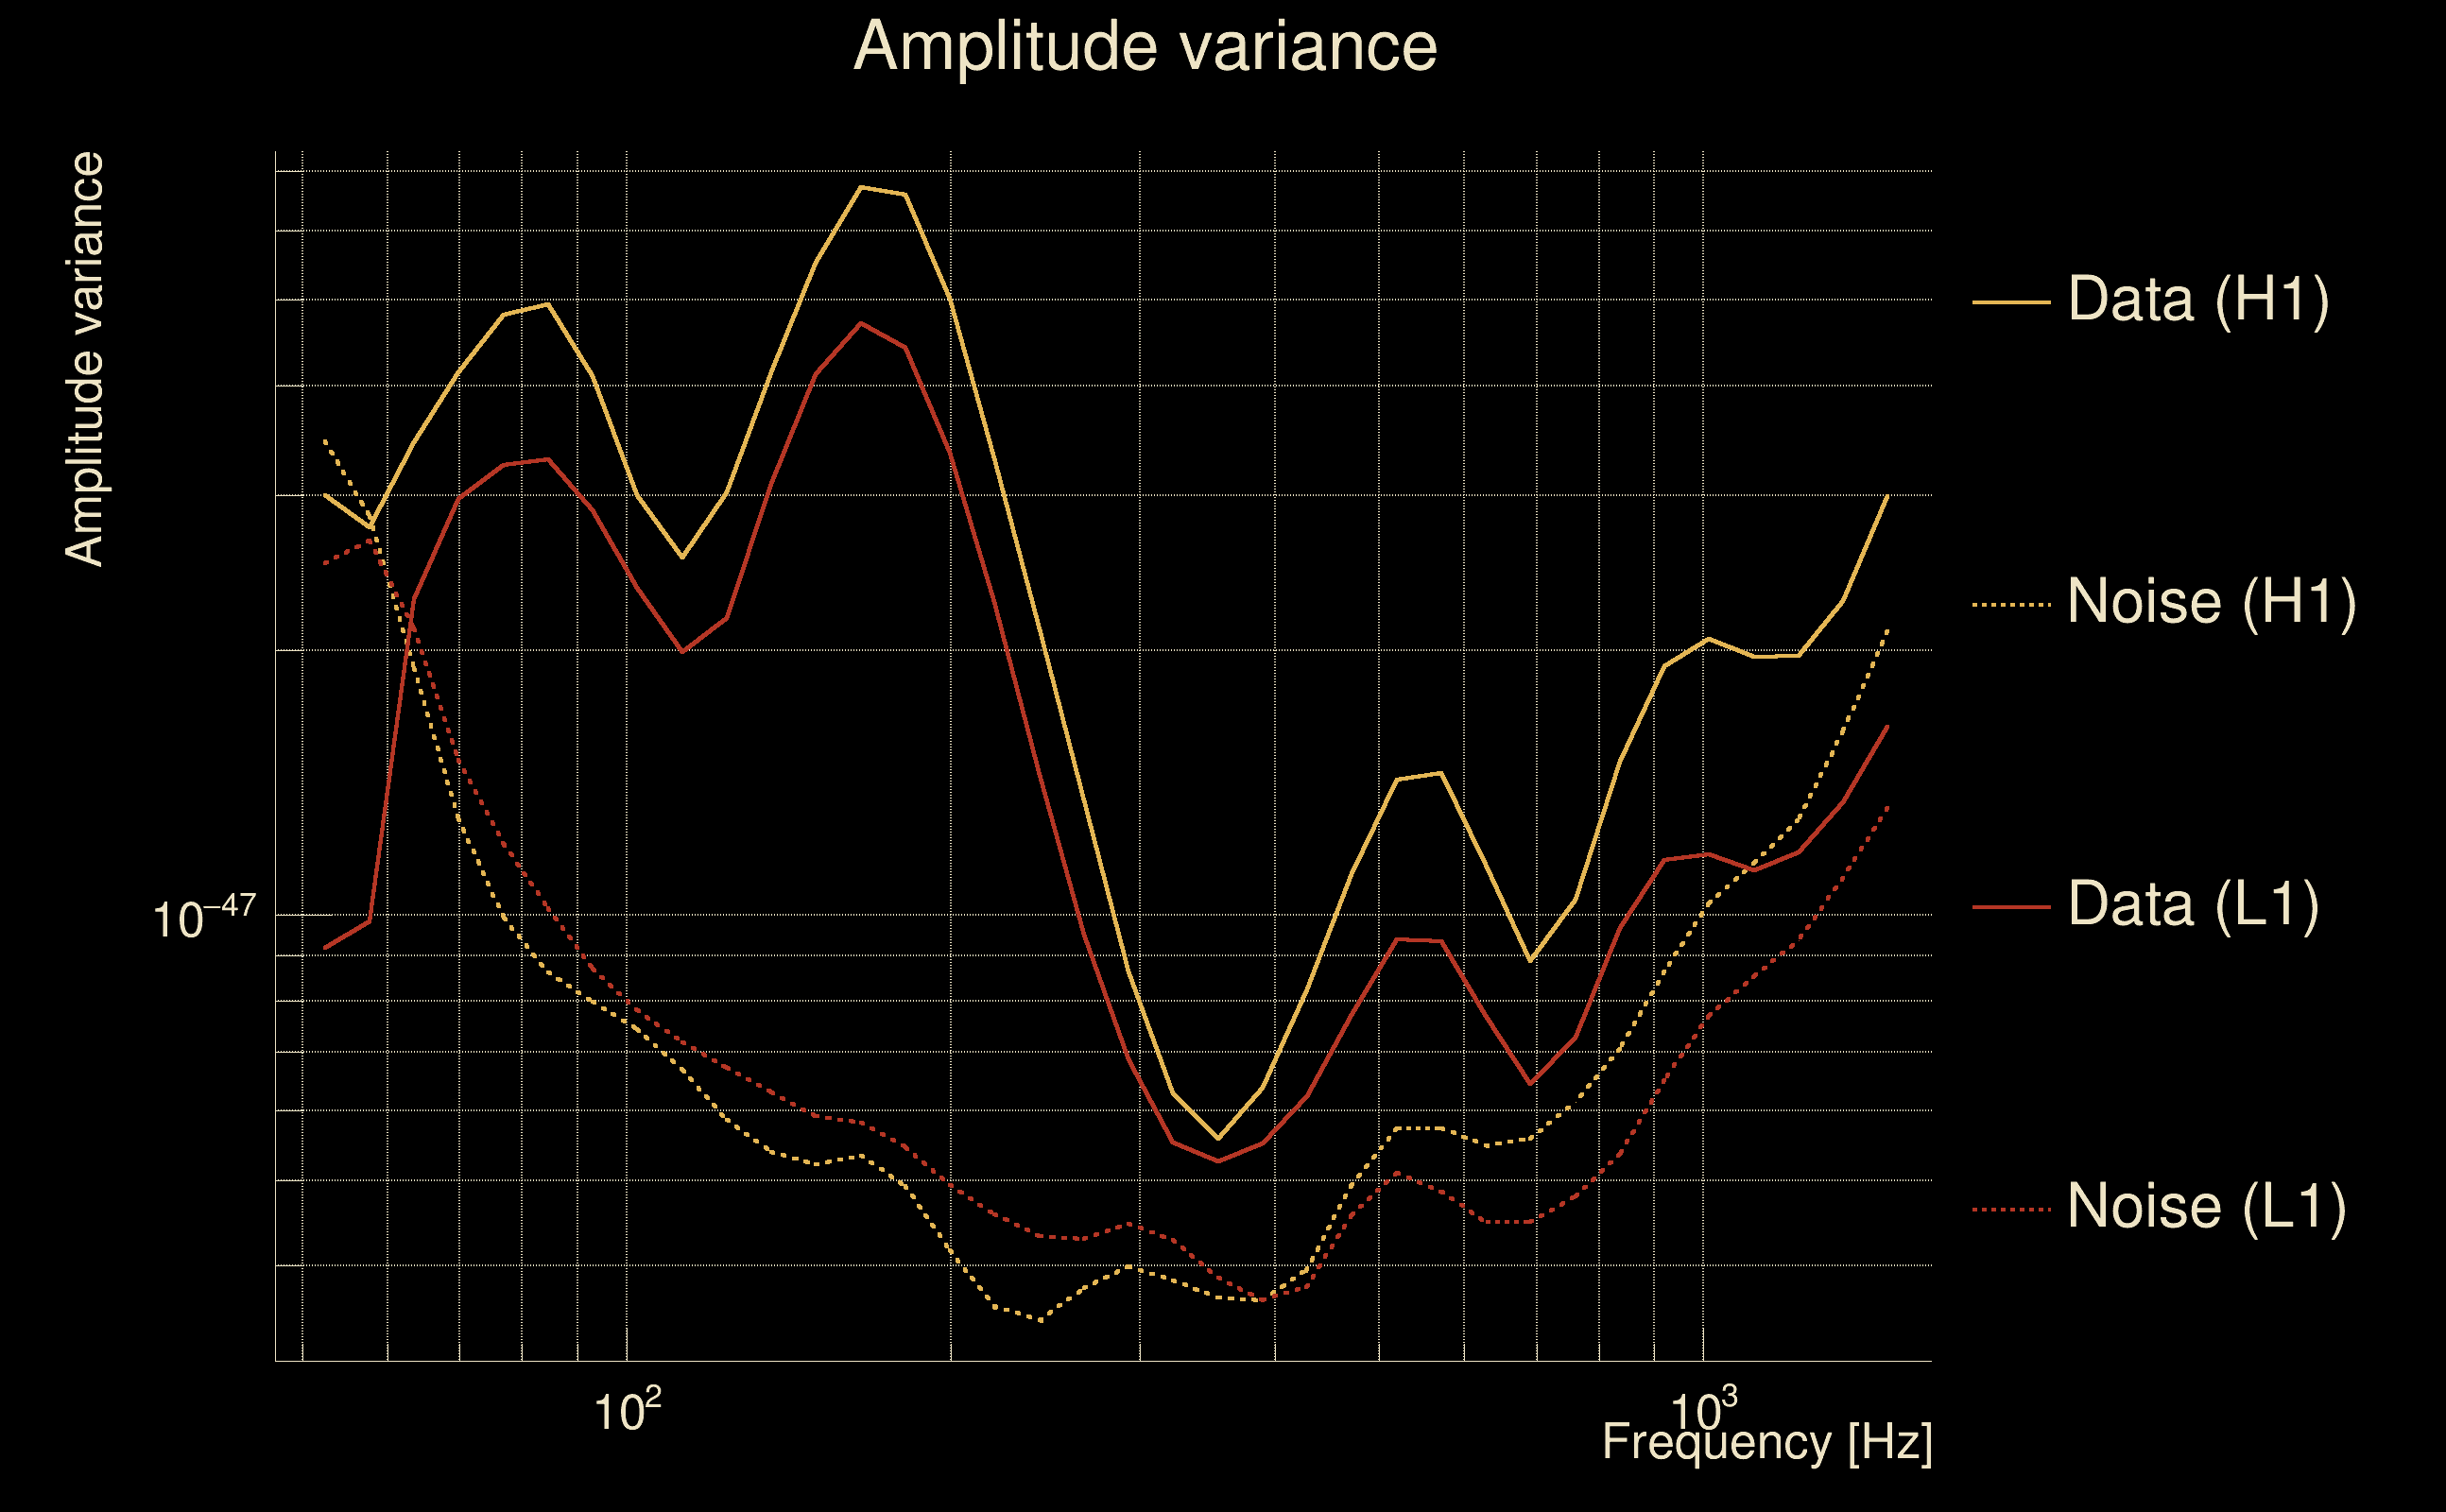
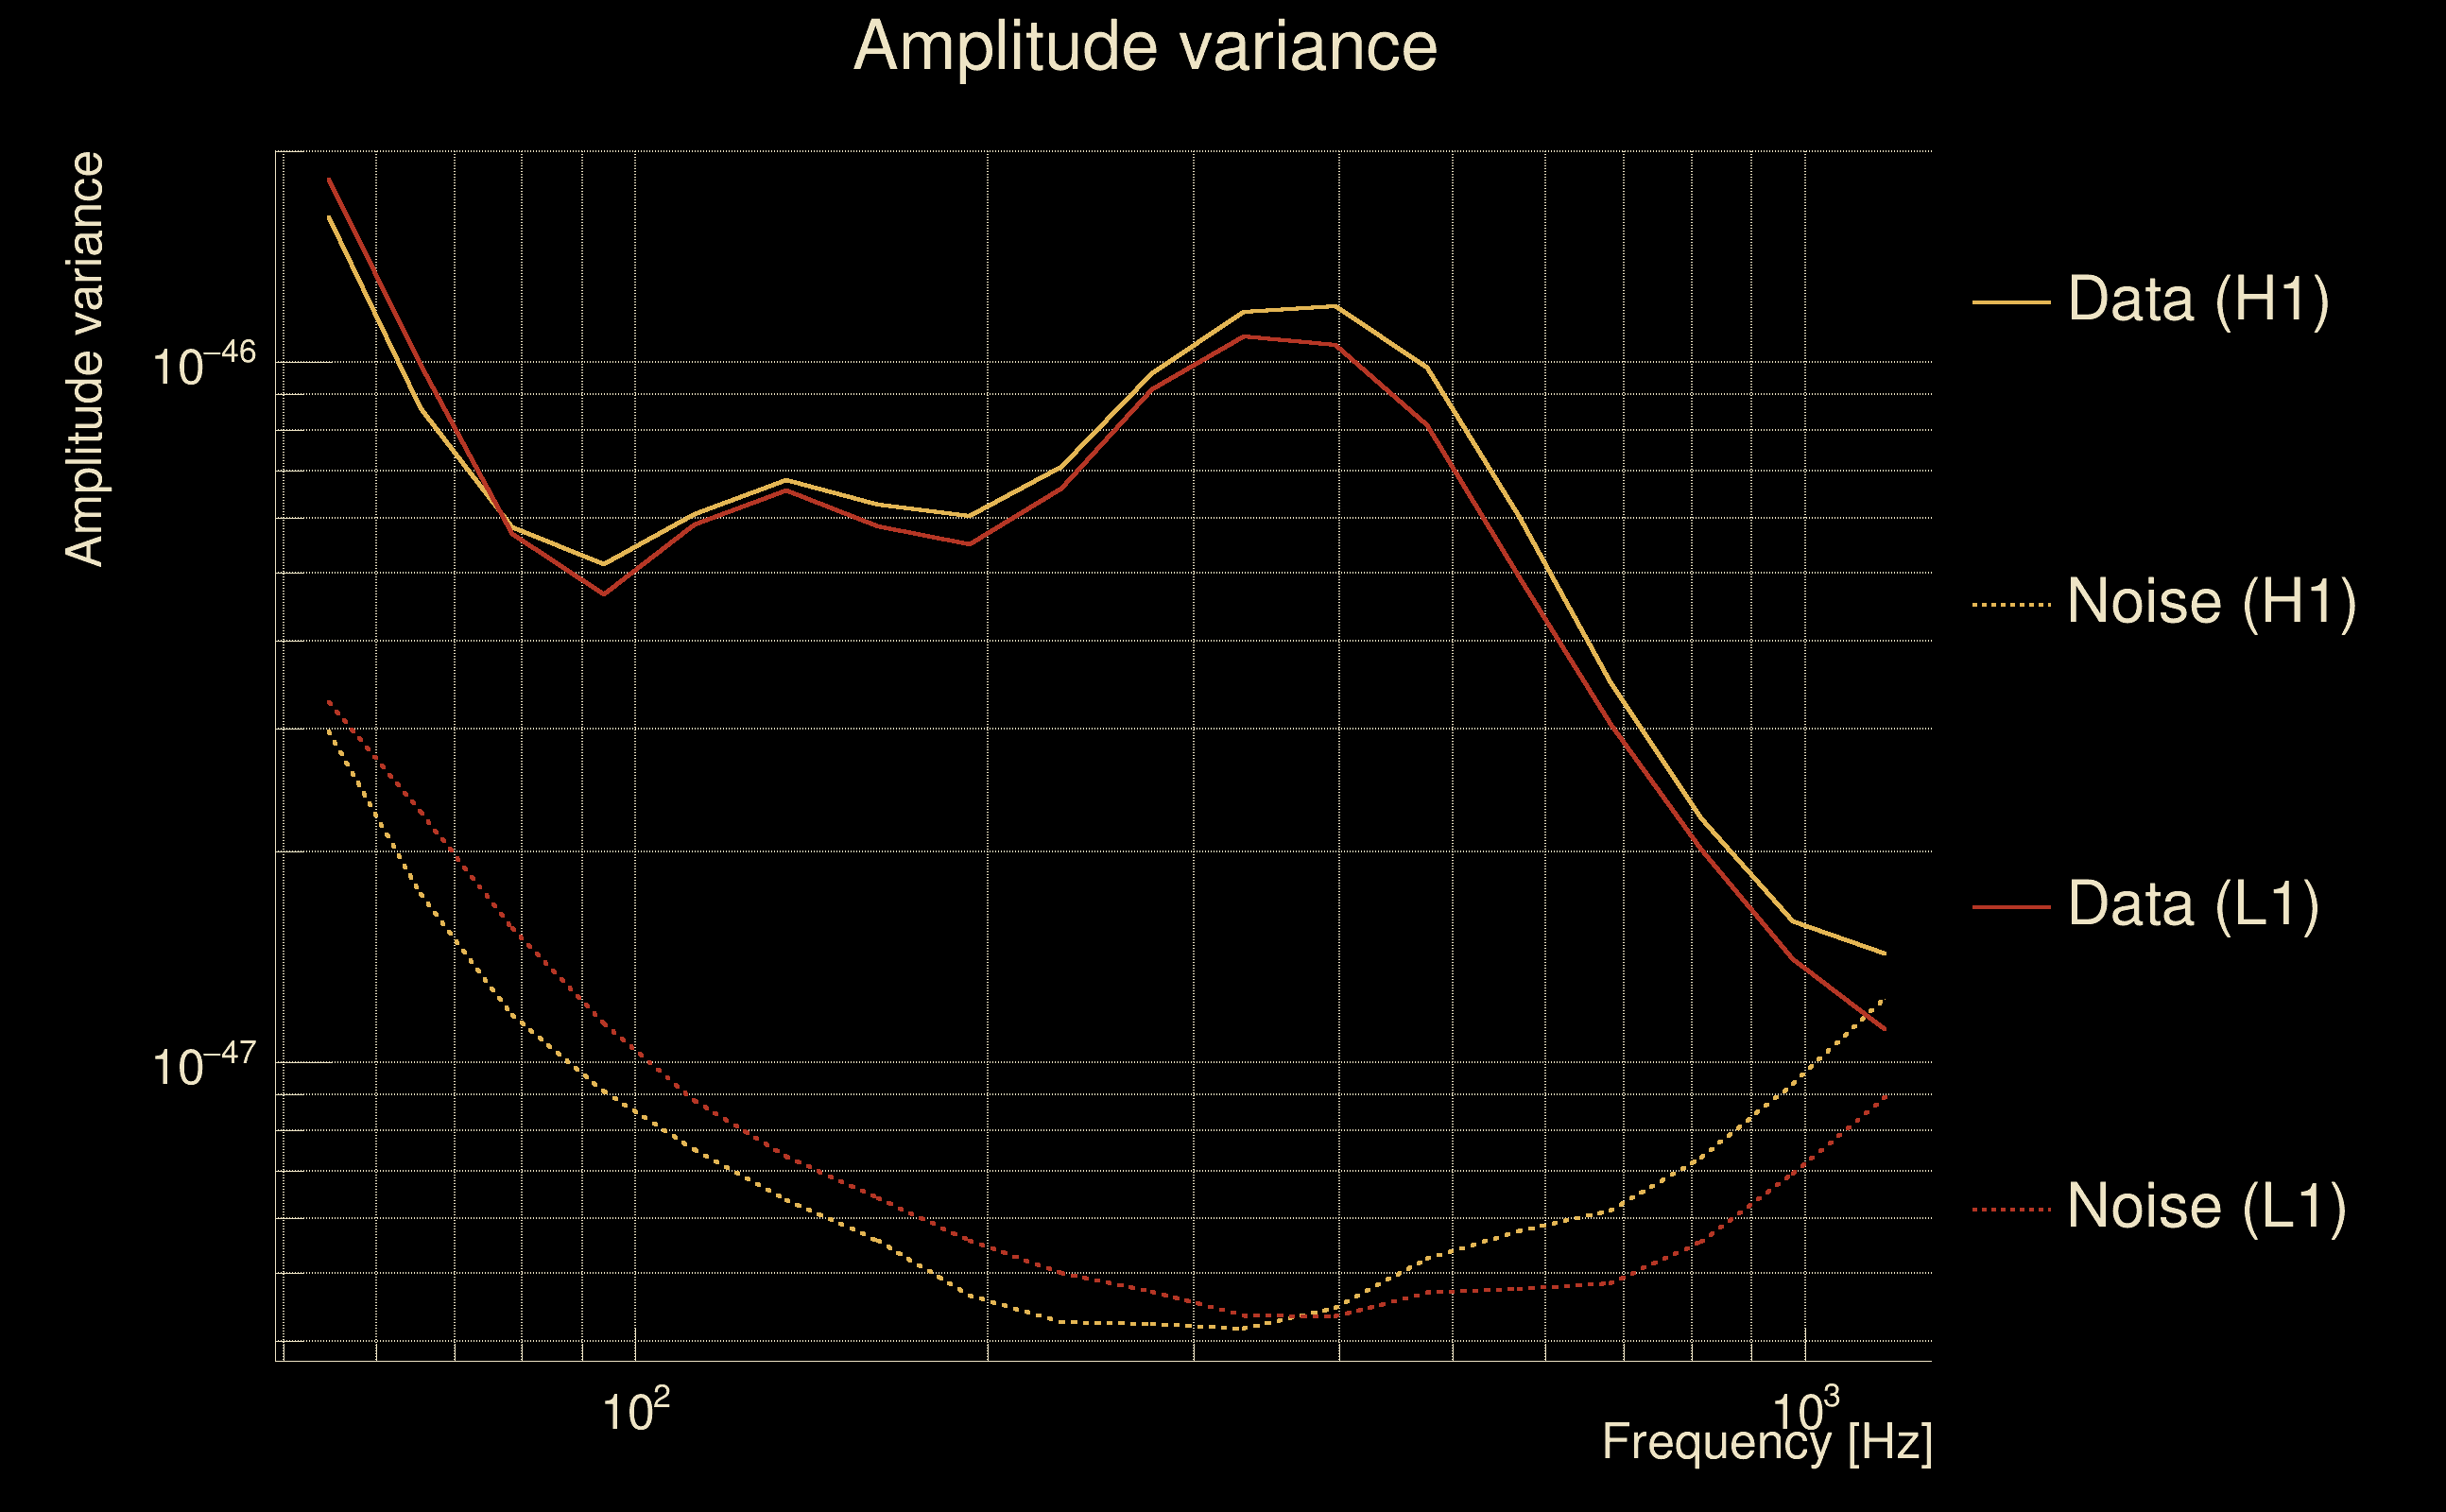
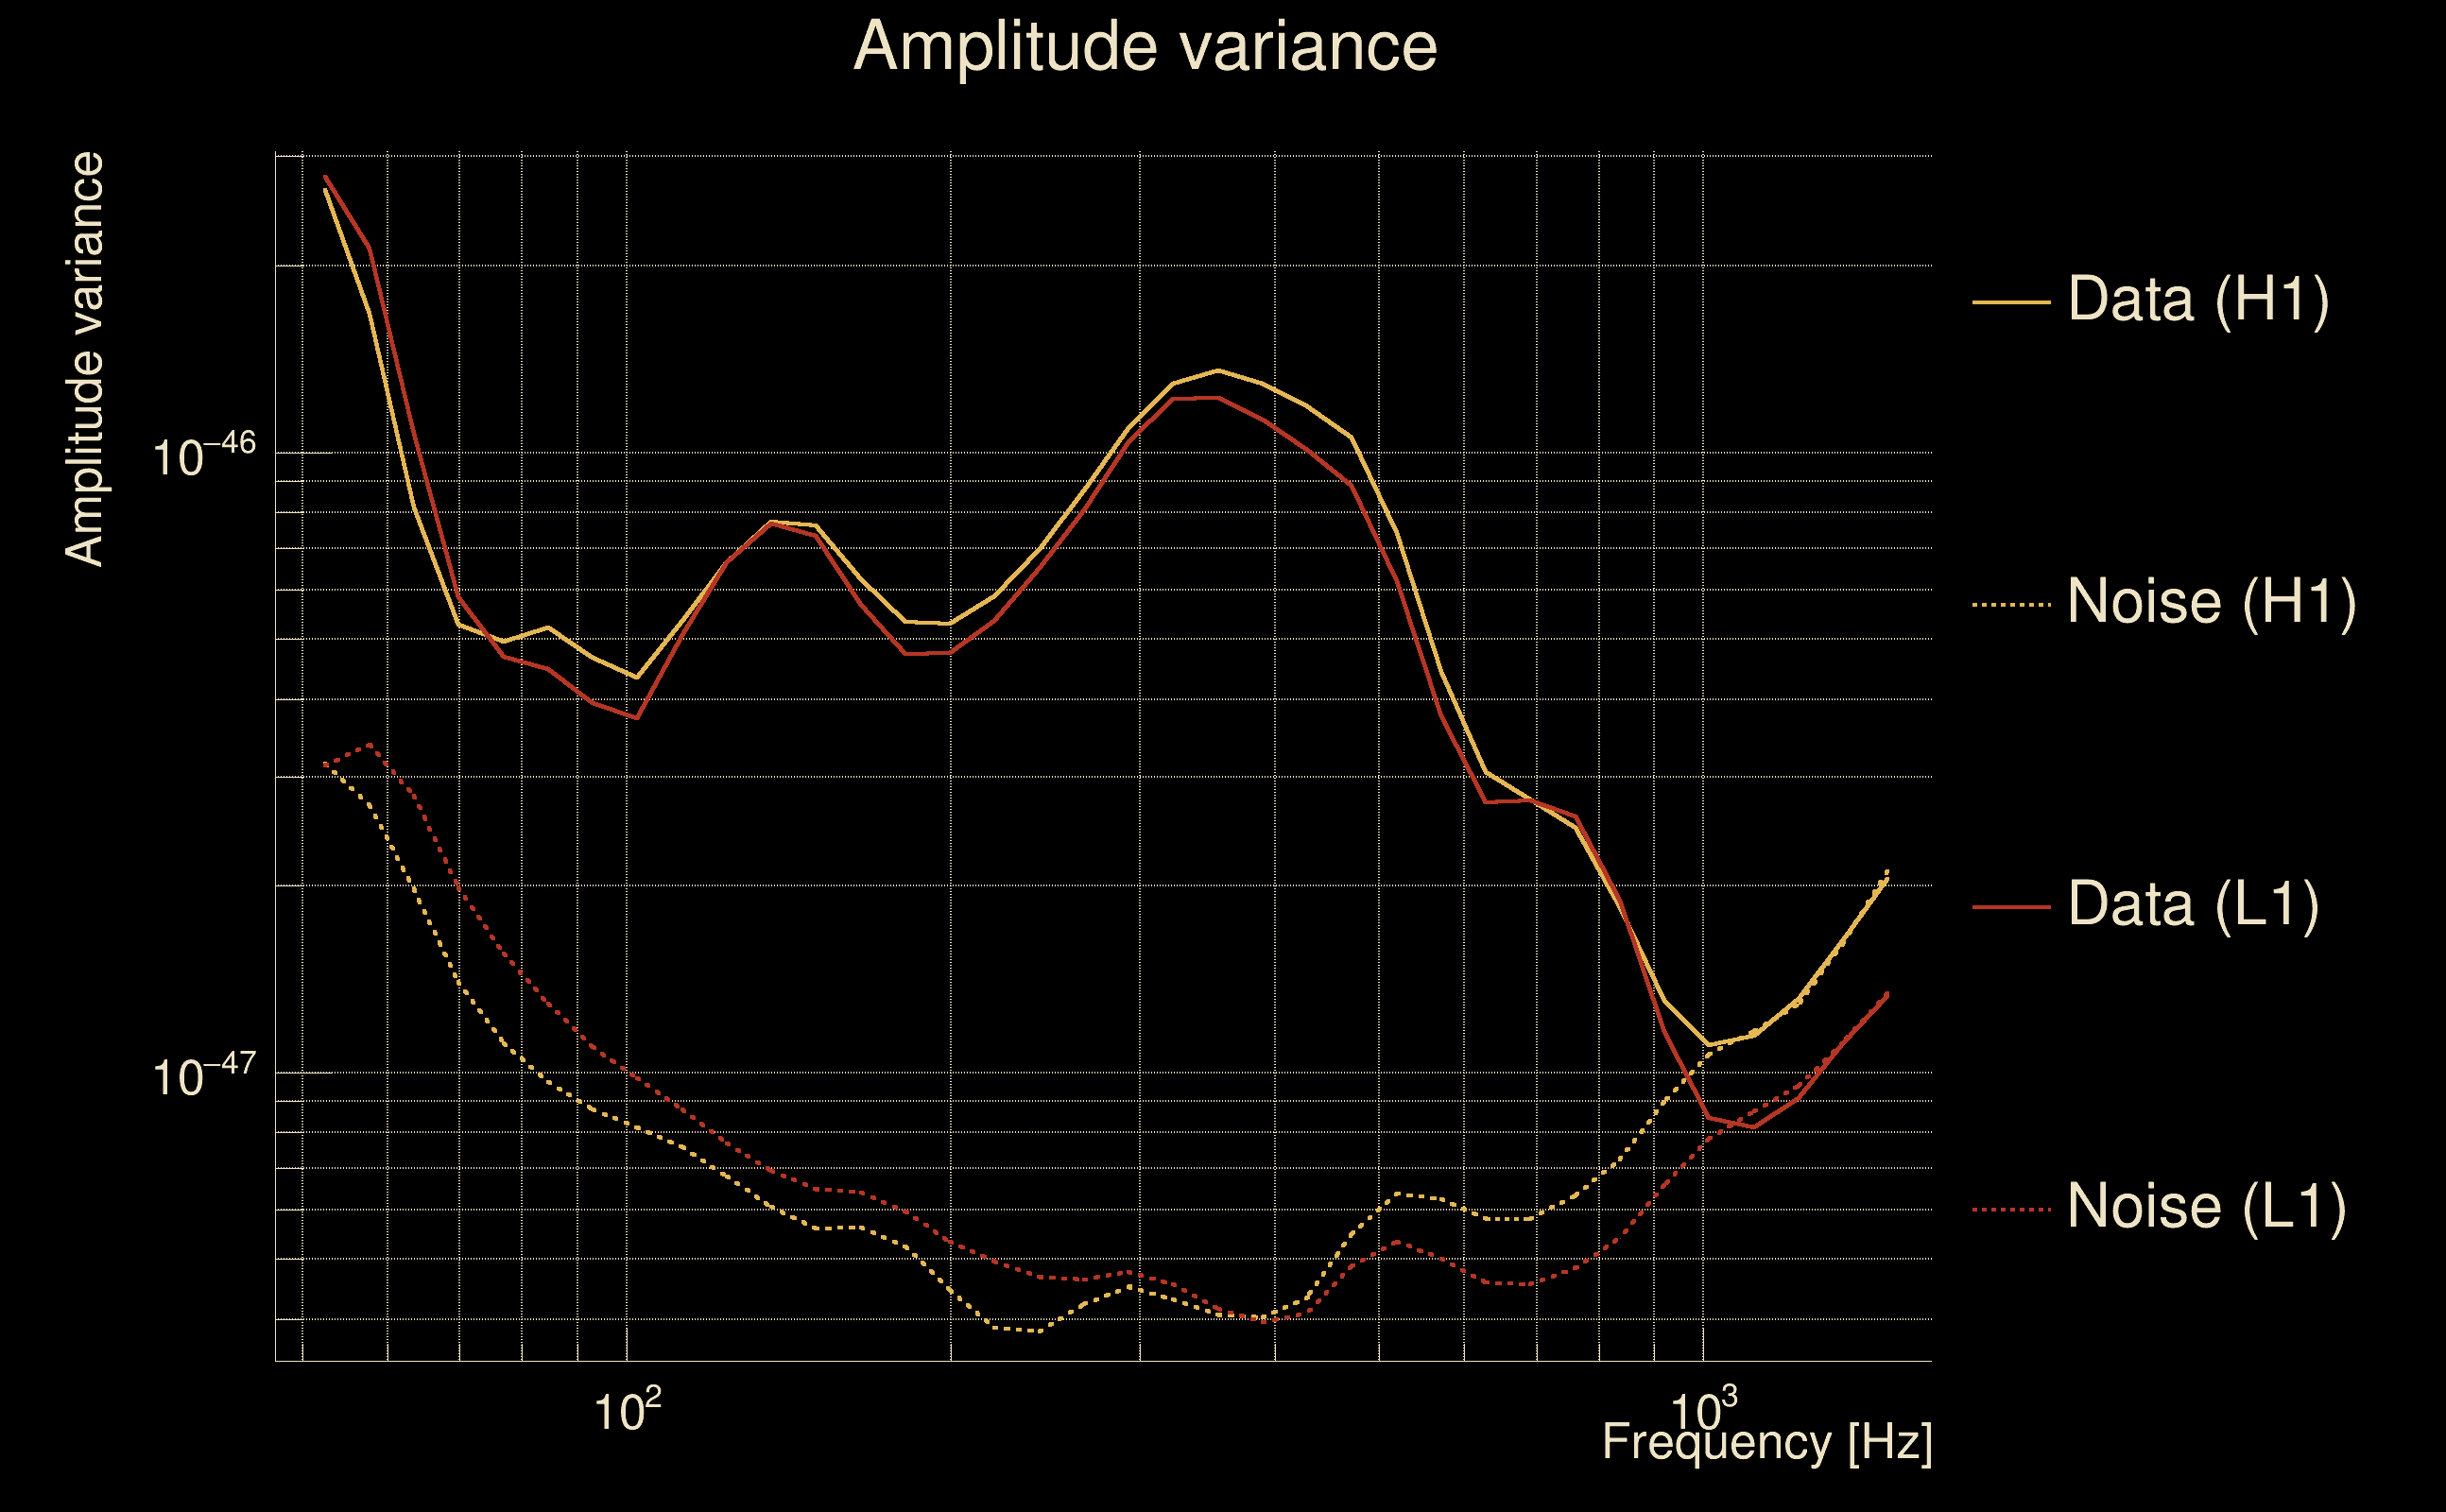
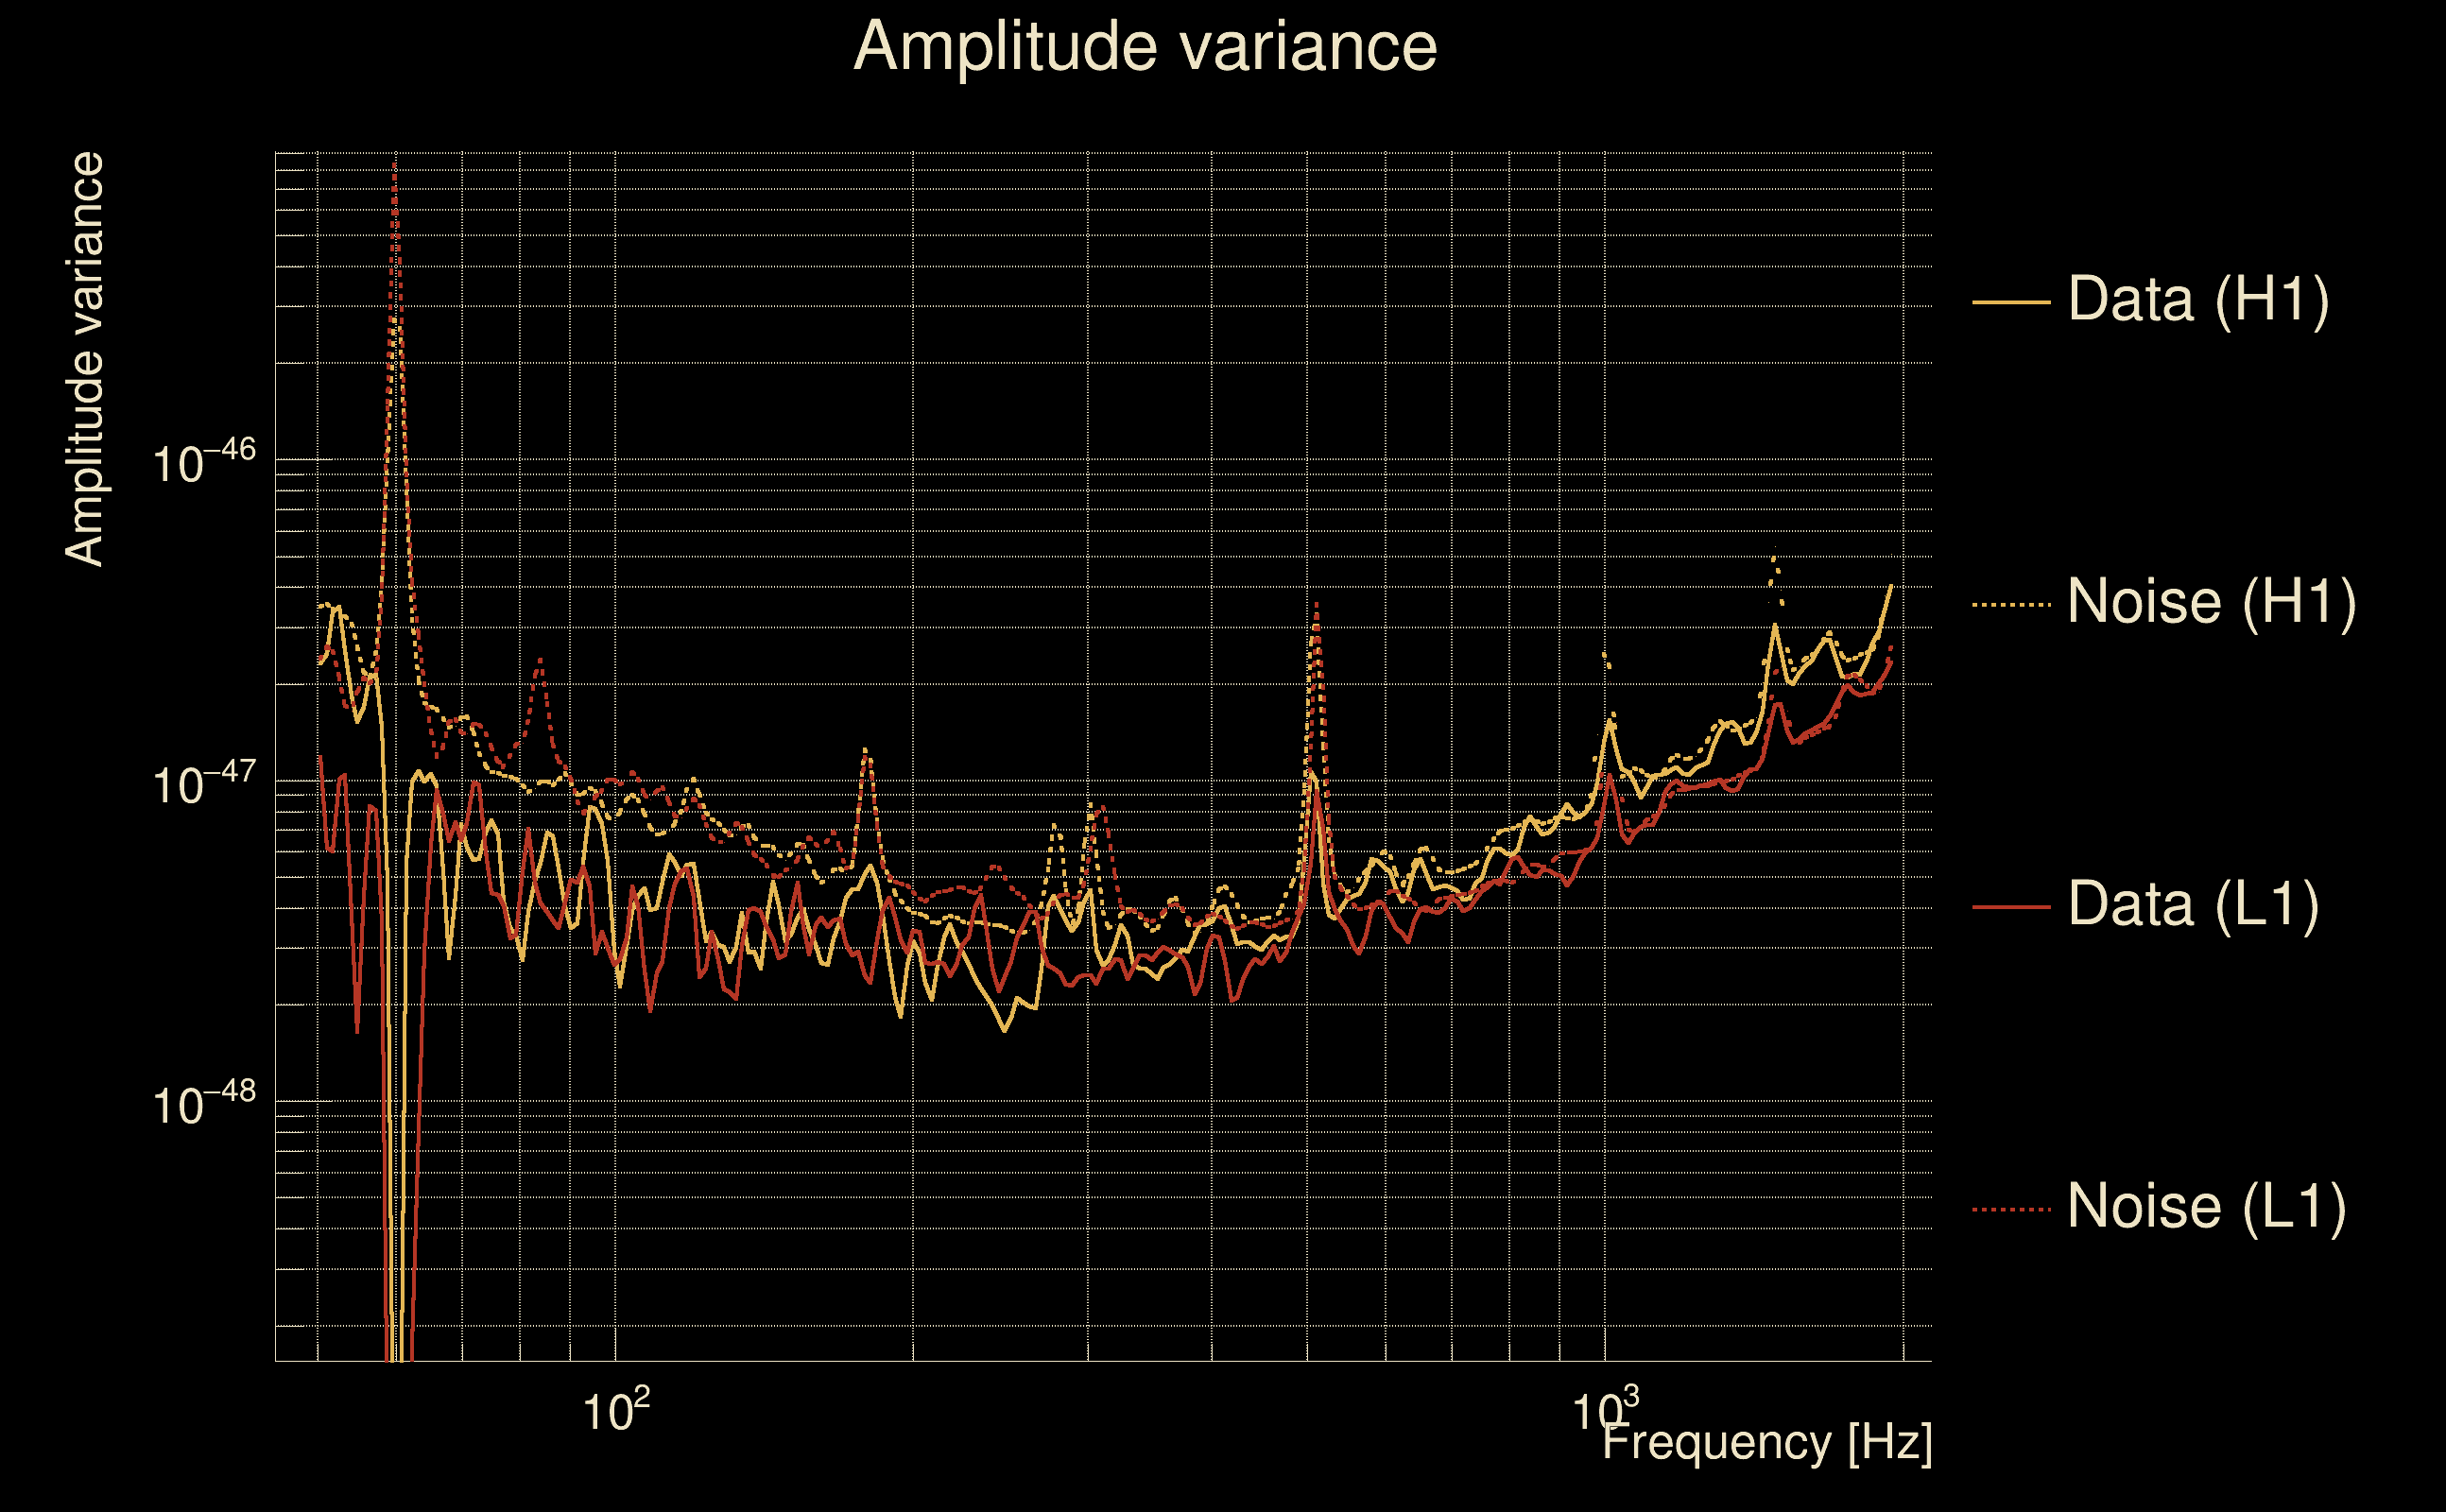
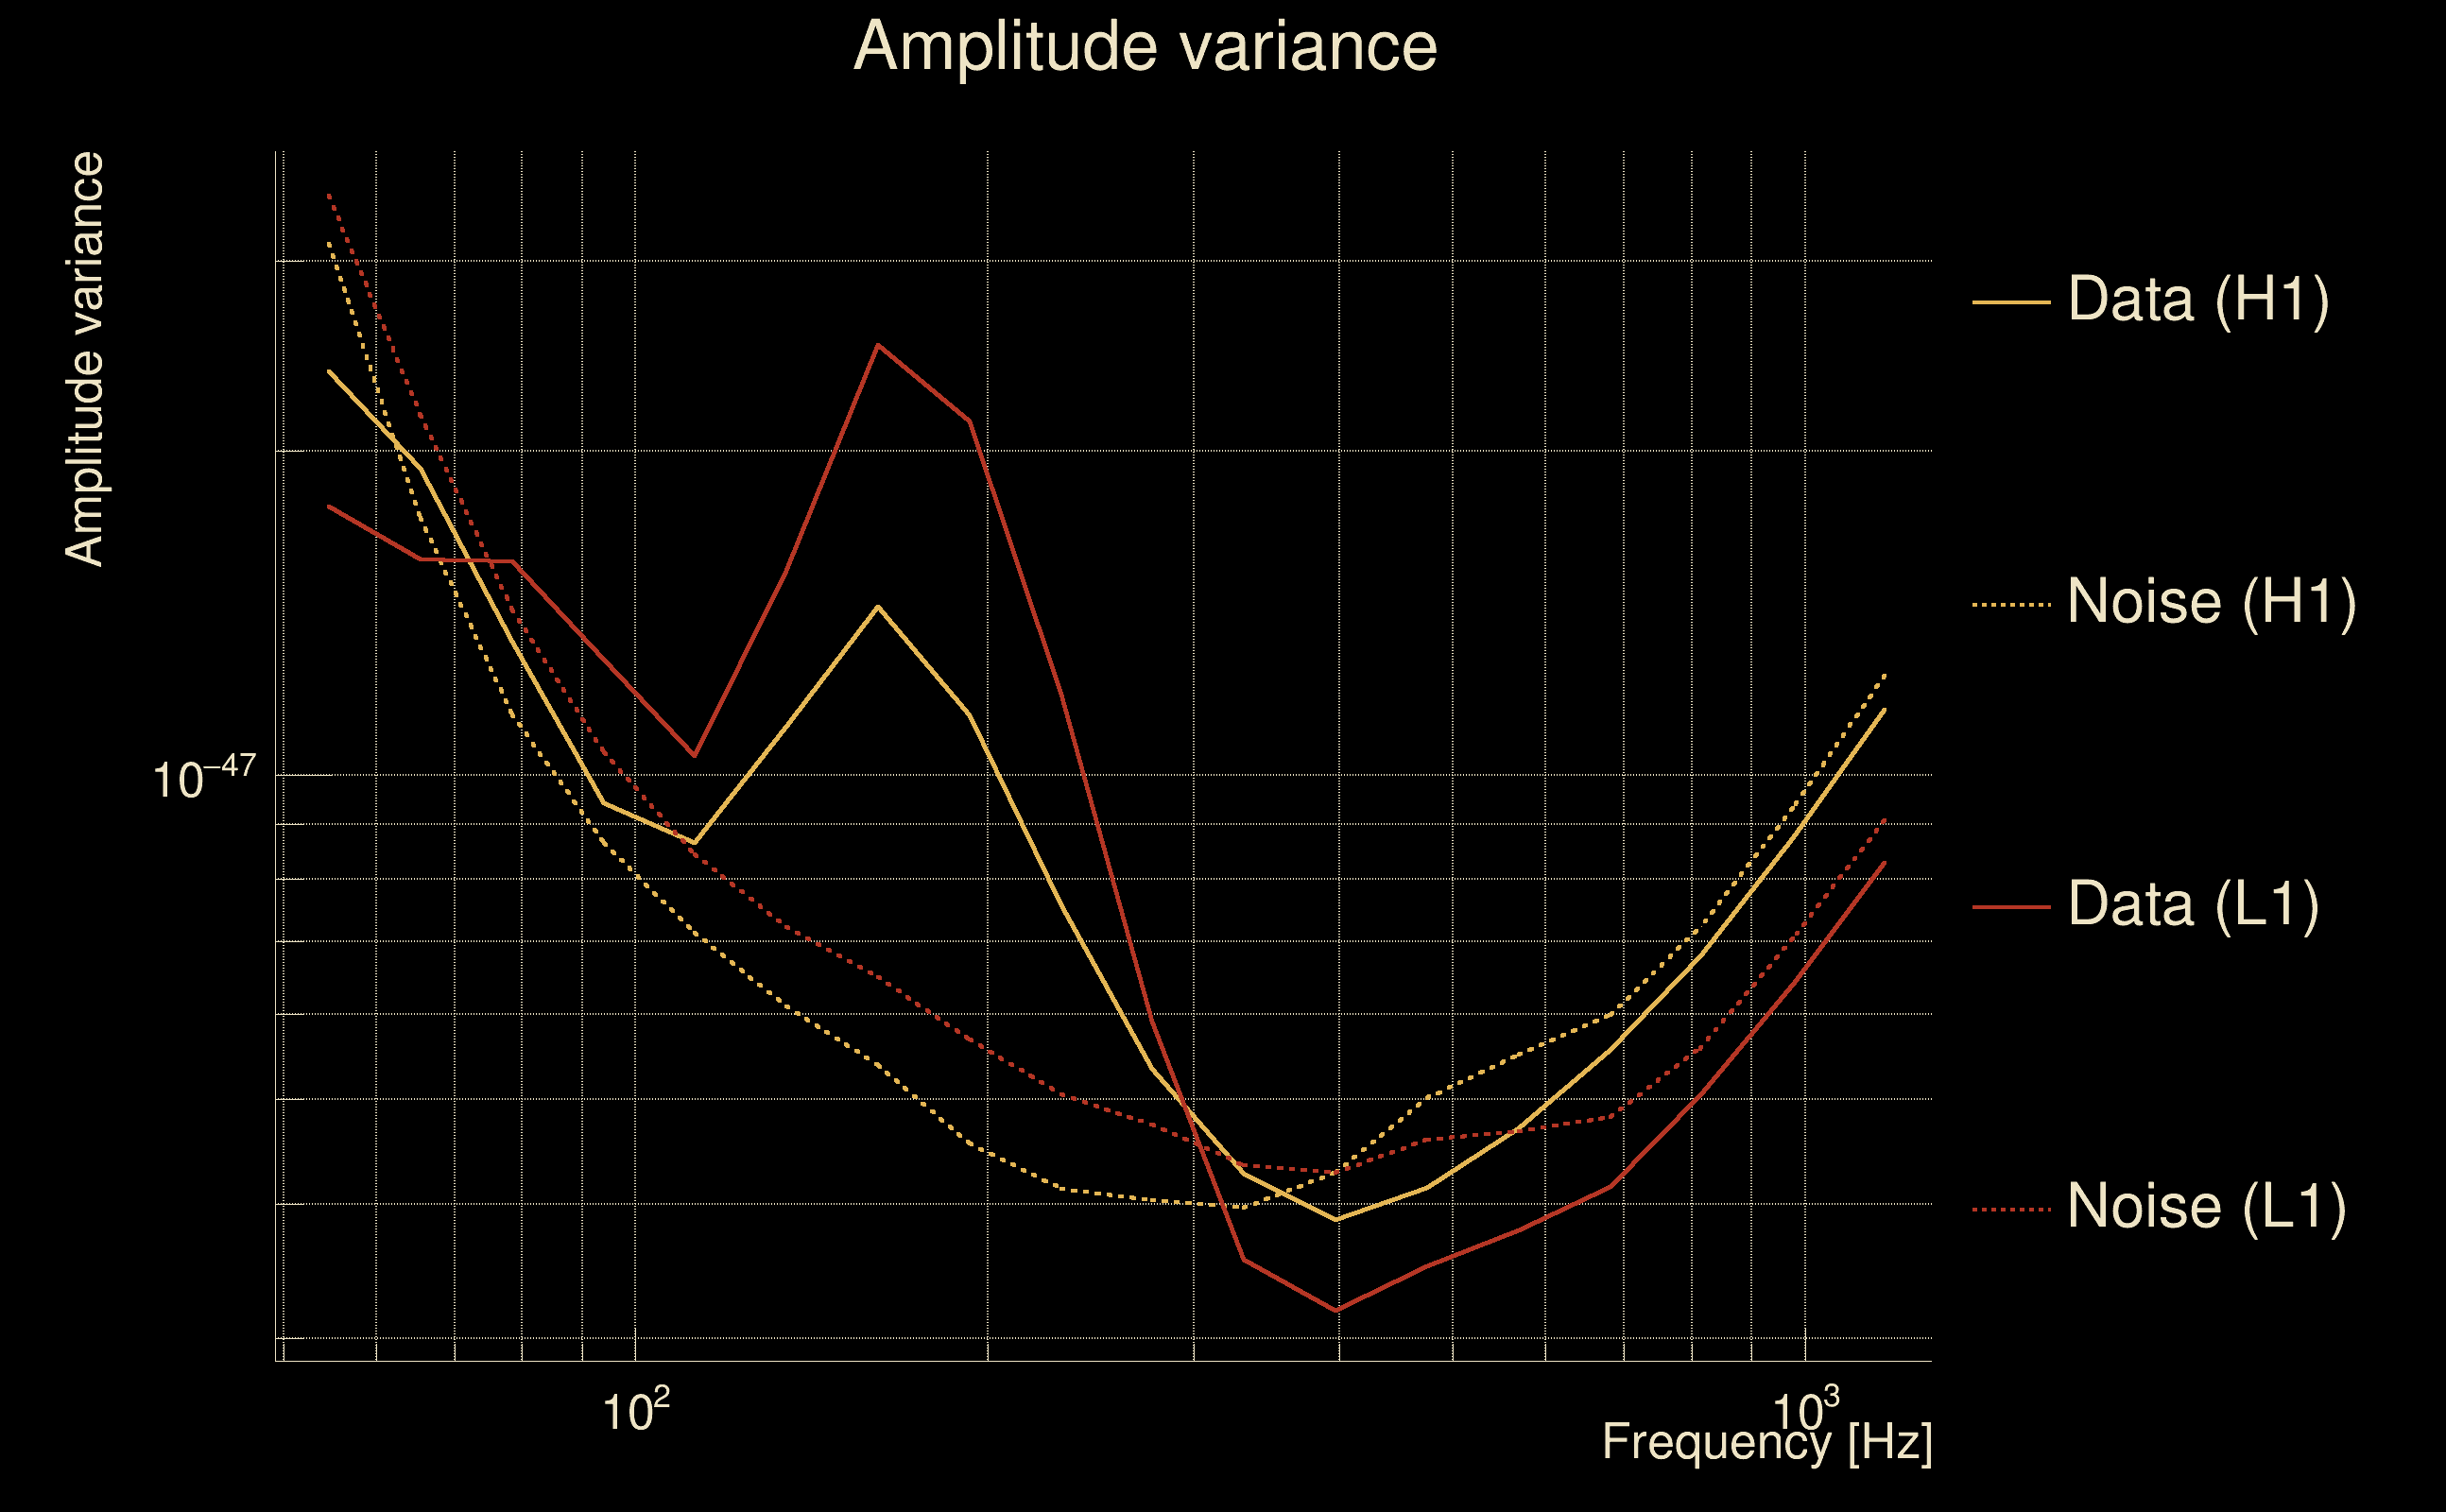
| Amplitude spectrograms: | normalization = 1e-22, power index = 2 |
| White noise SNR variance: | 0.523175 (after applying a correction factor = 1) |
| Amplitude ratio confidence level: | 3 sigma |
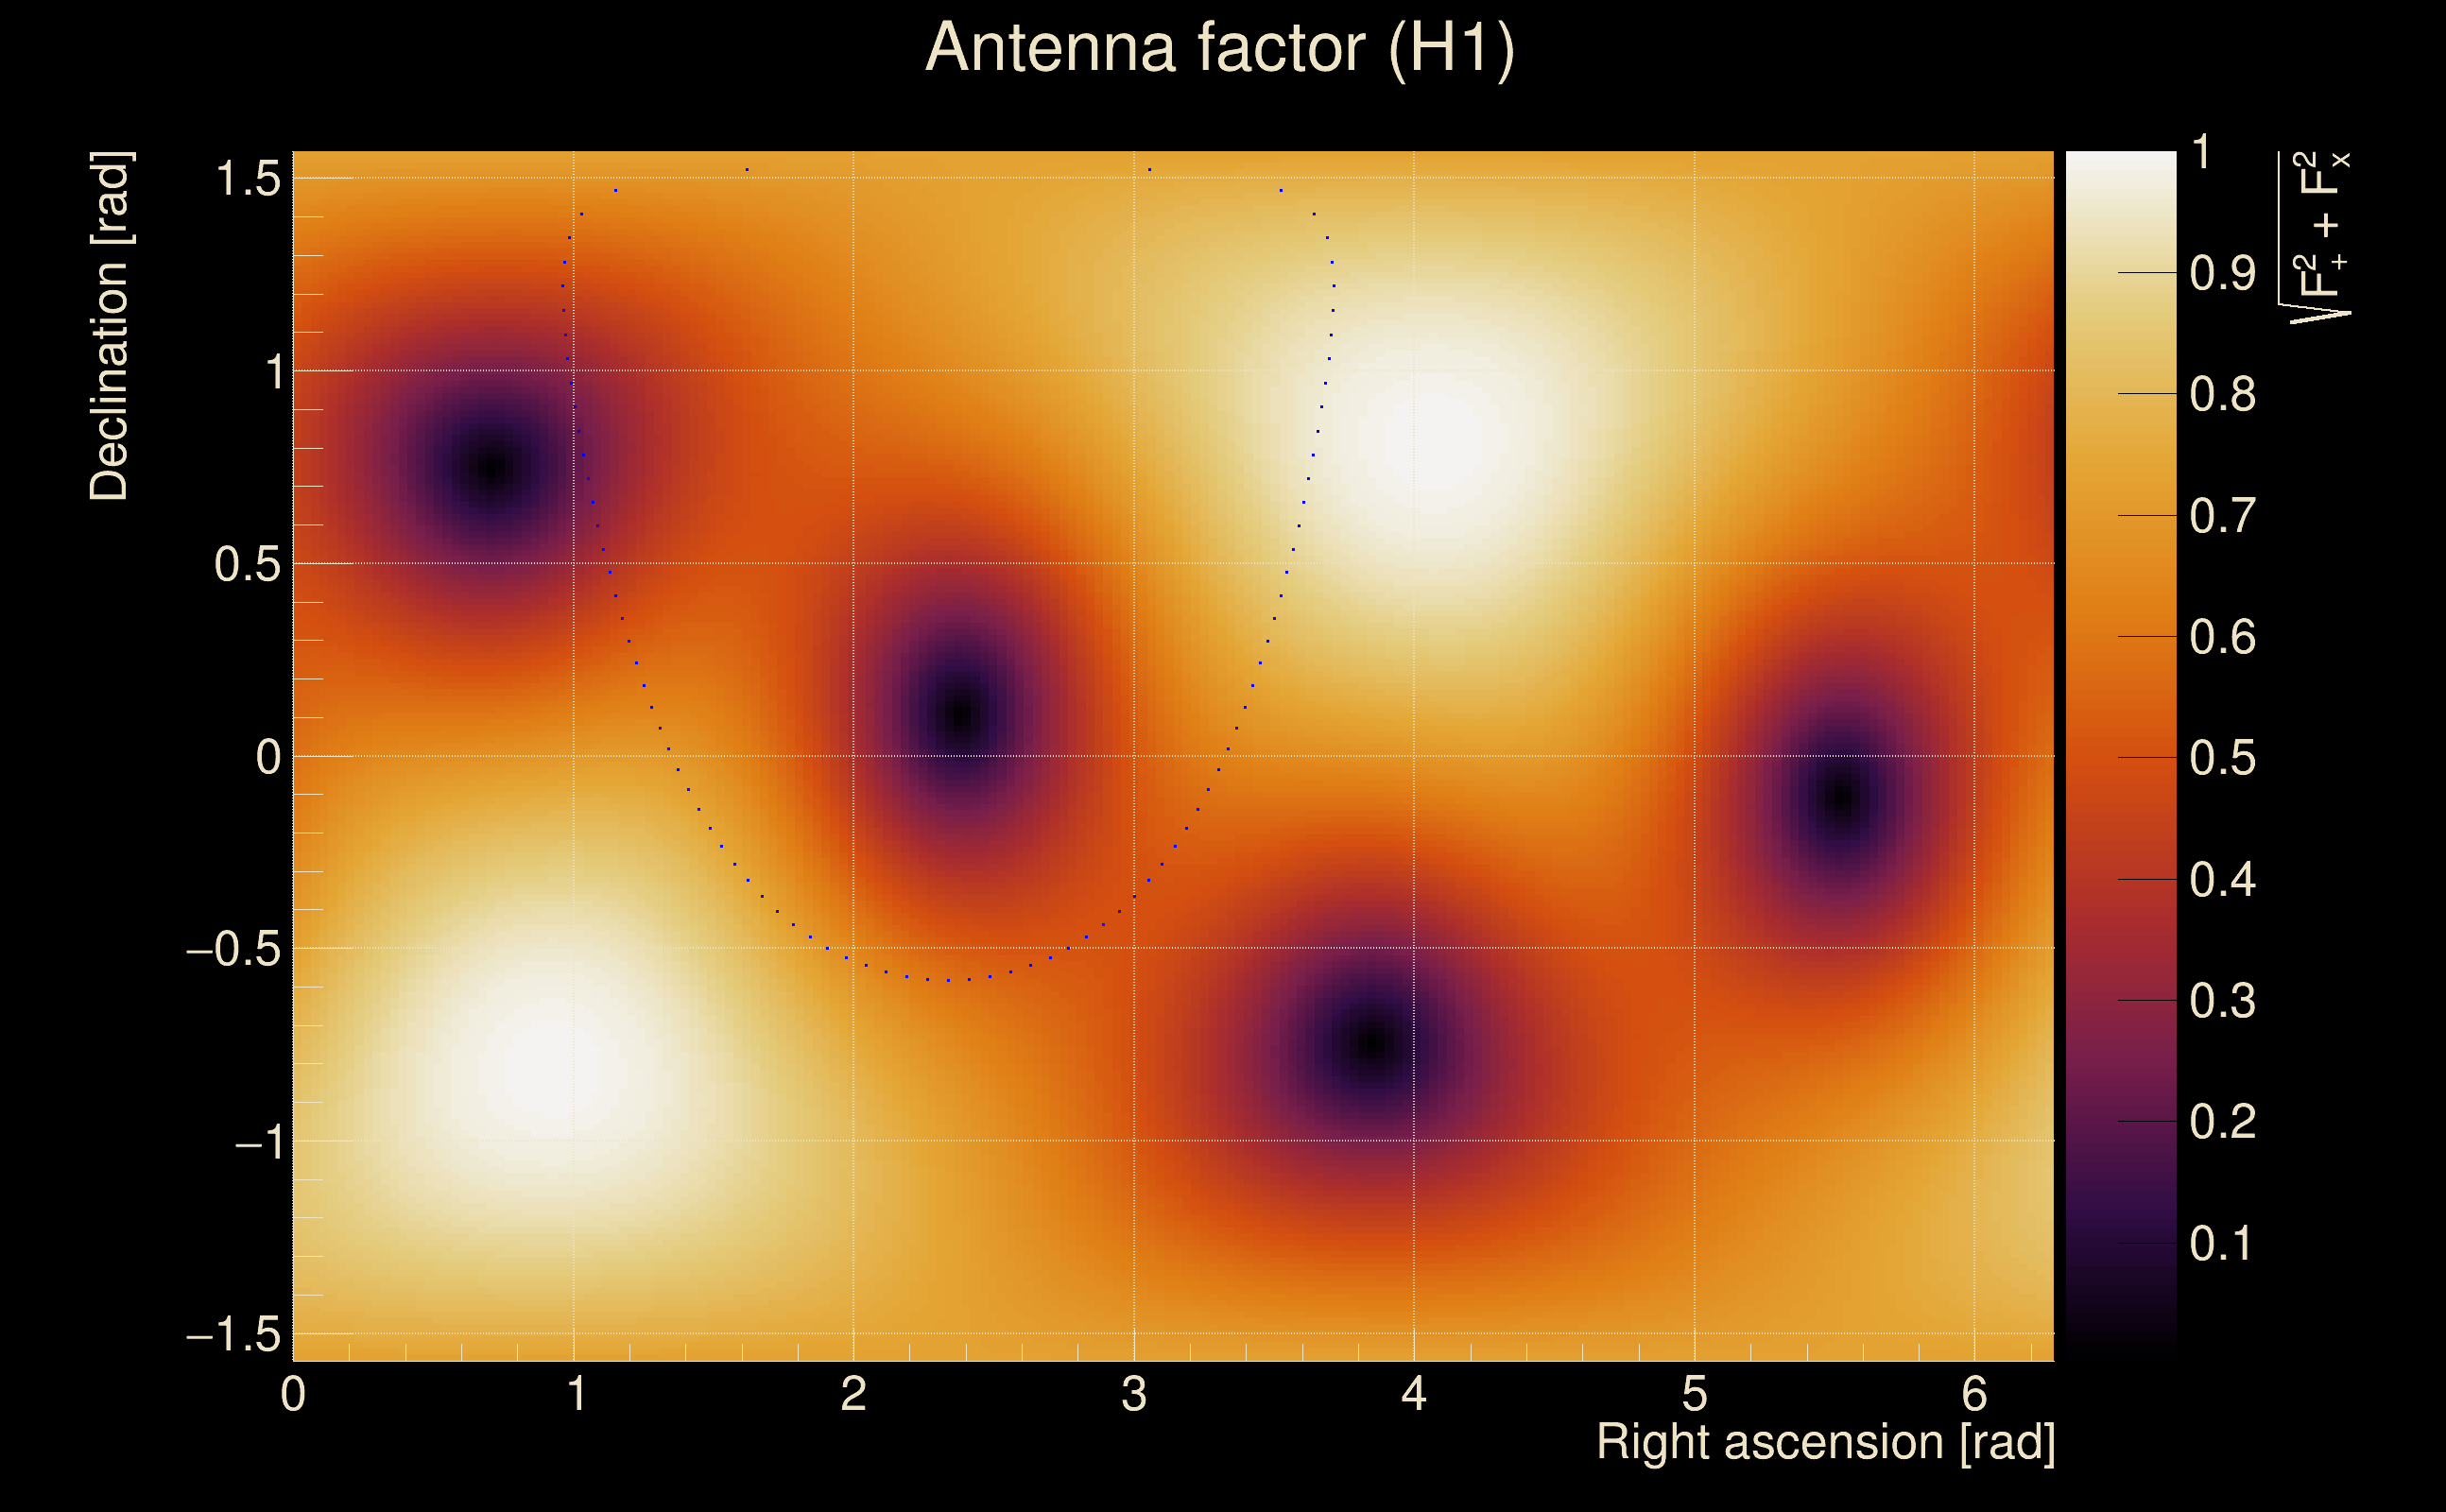
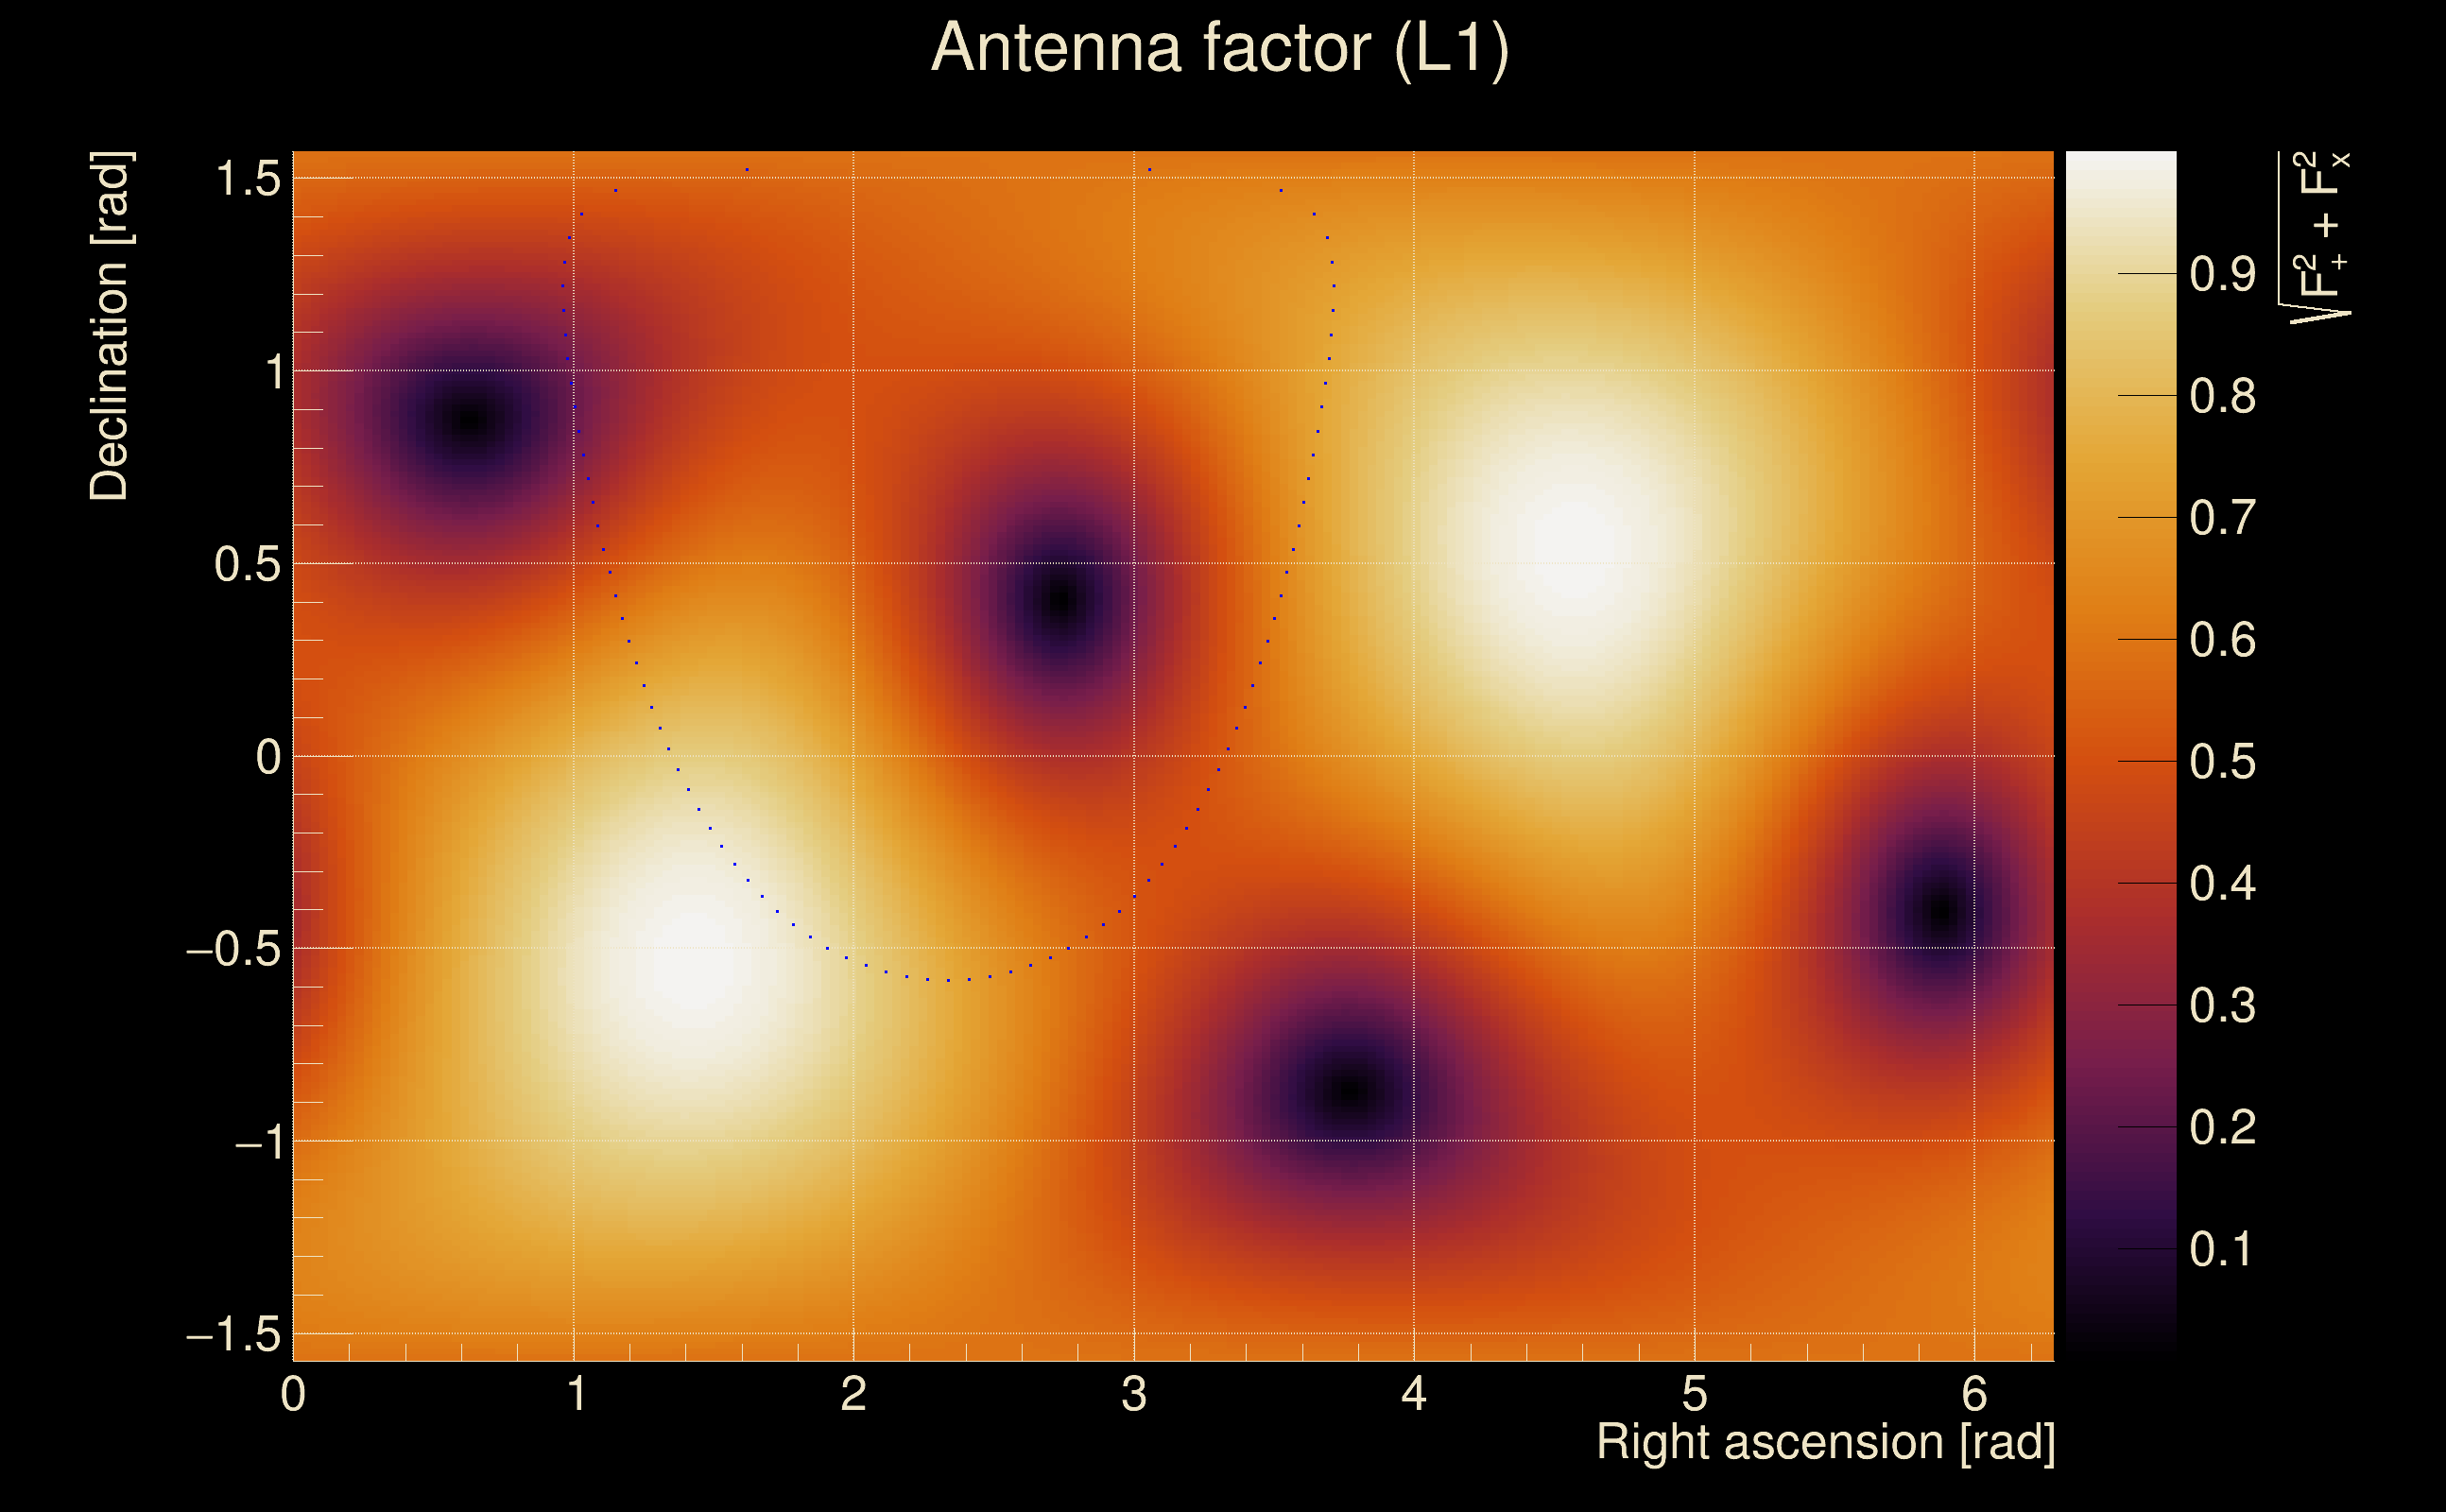
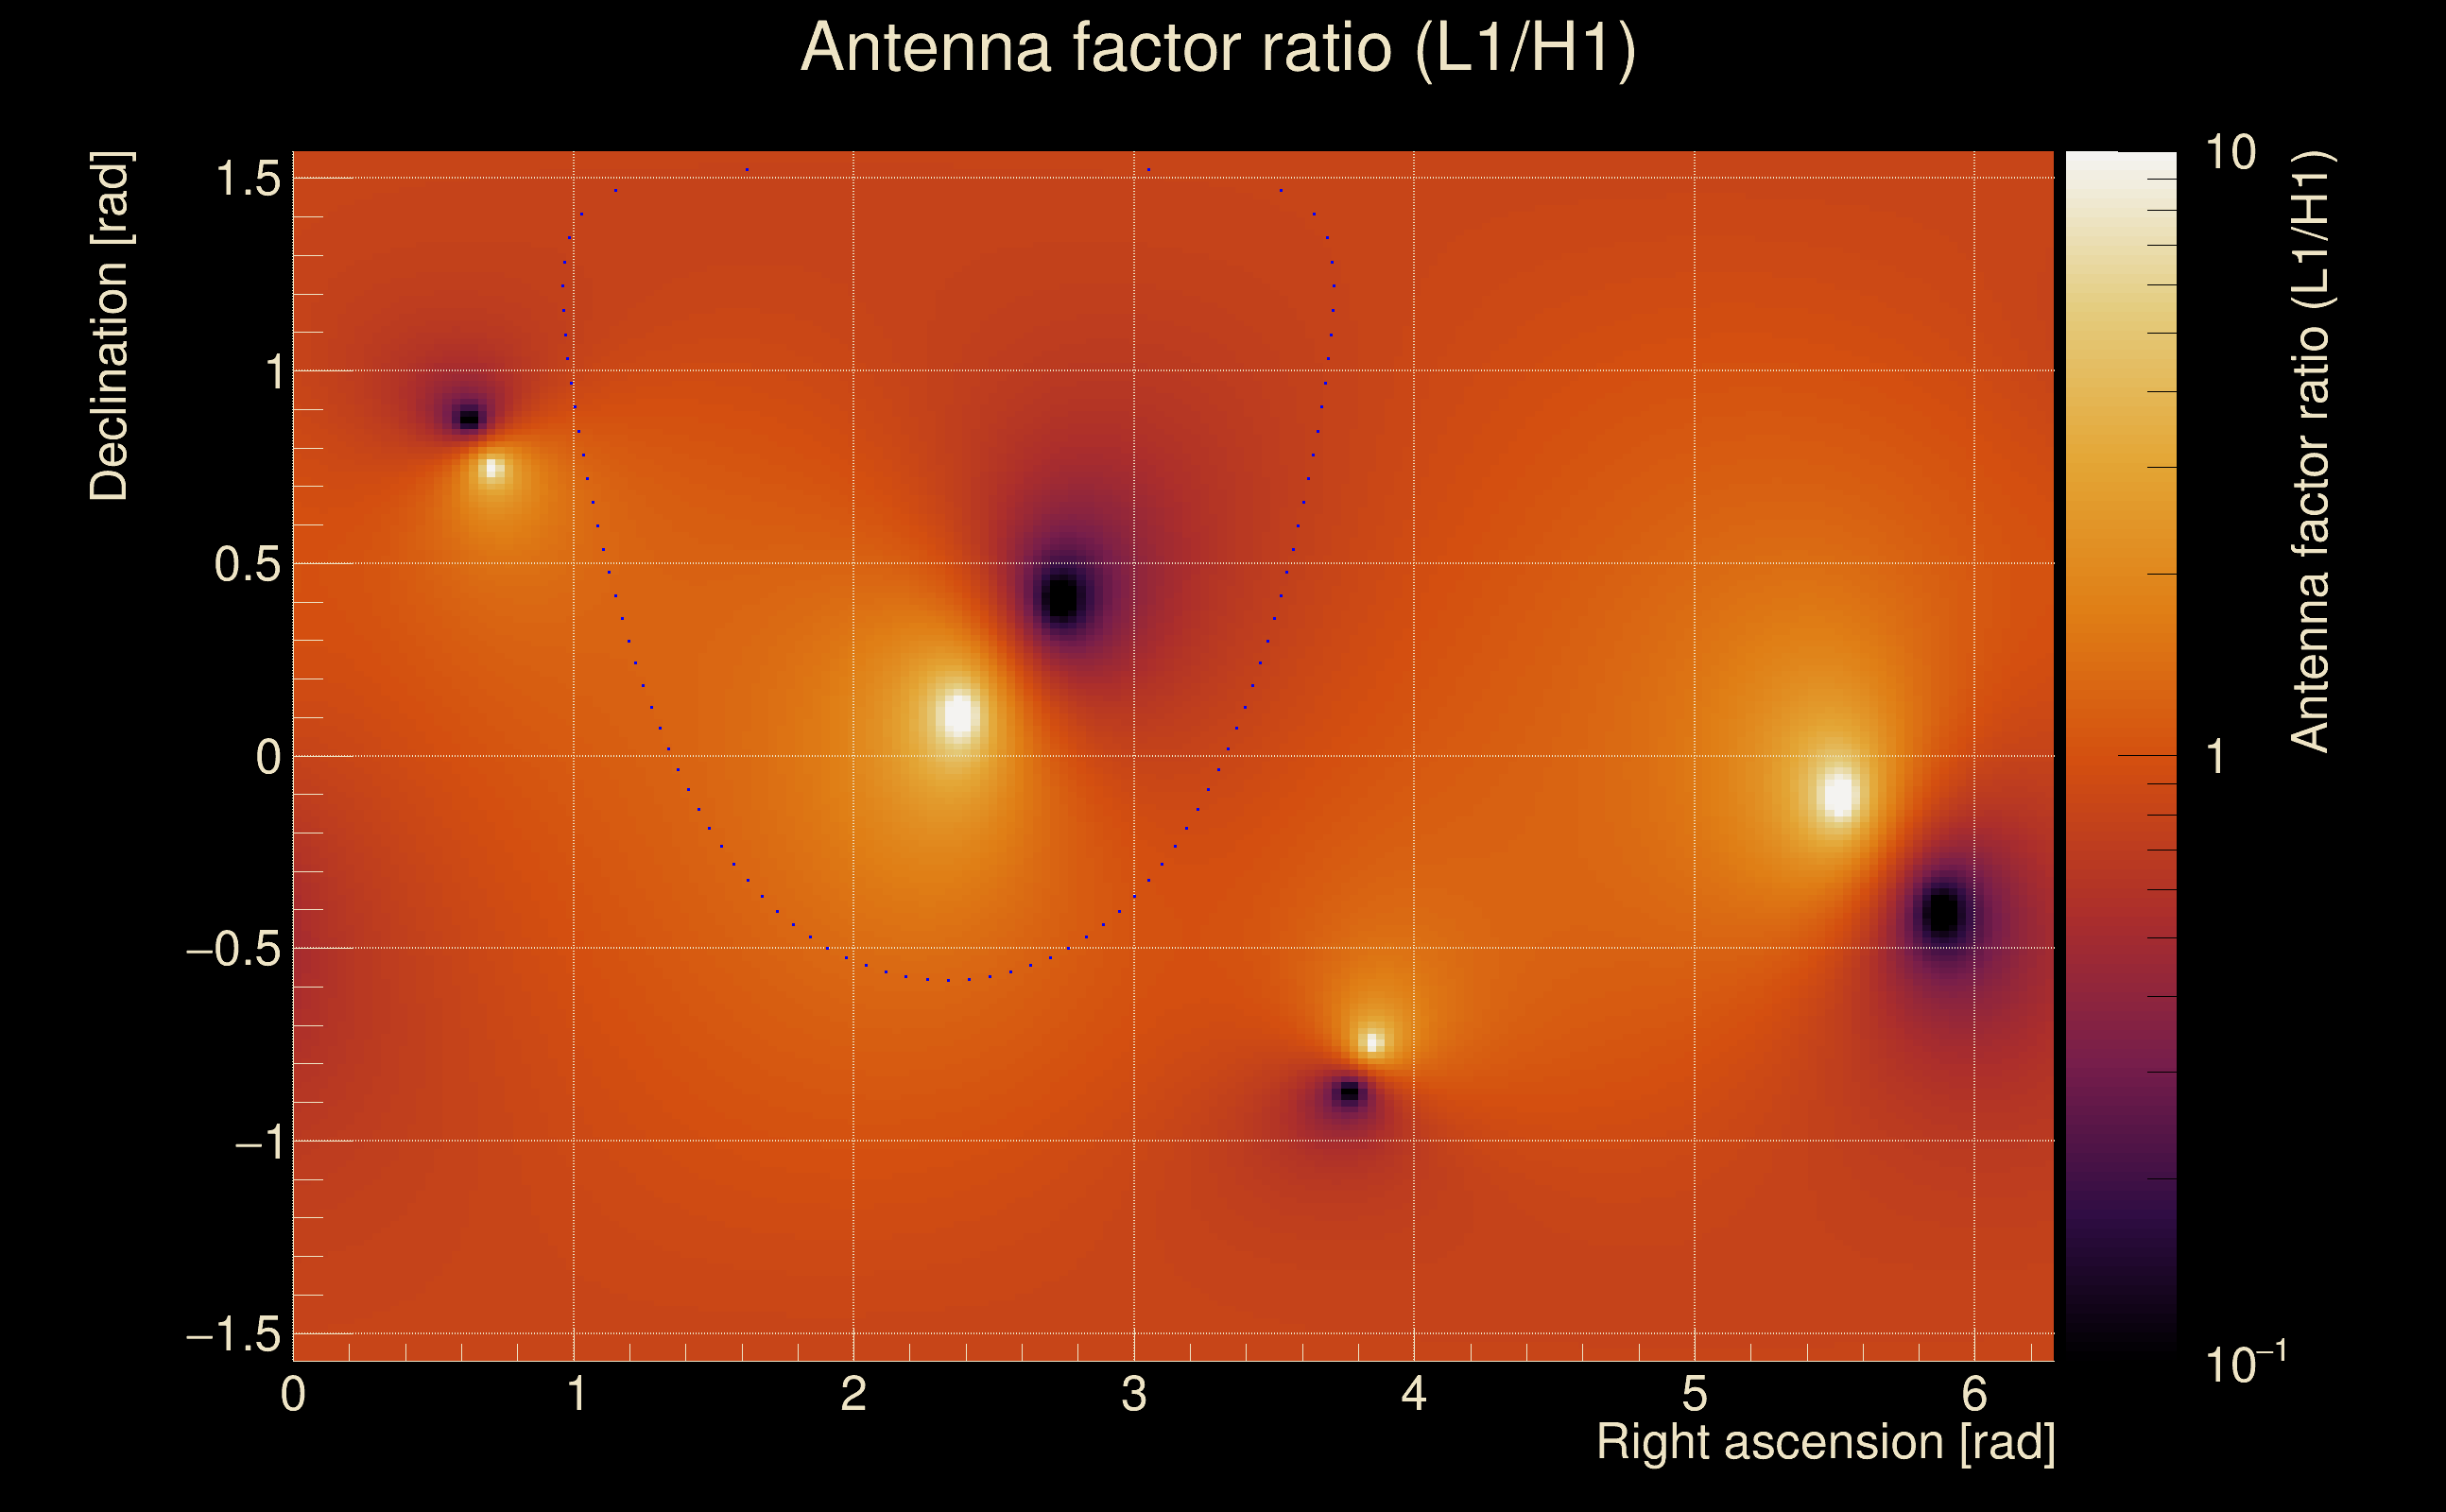
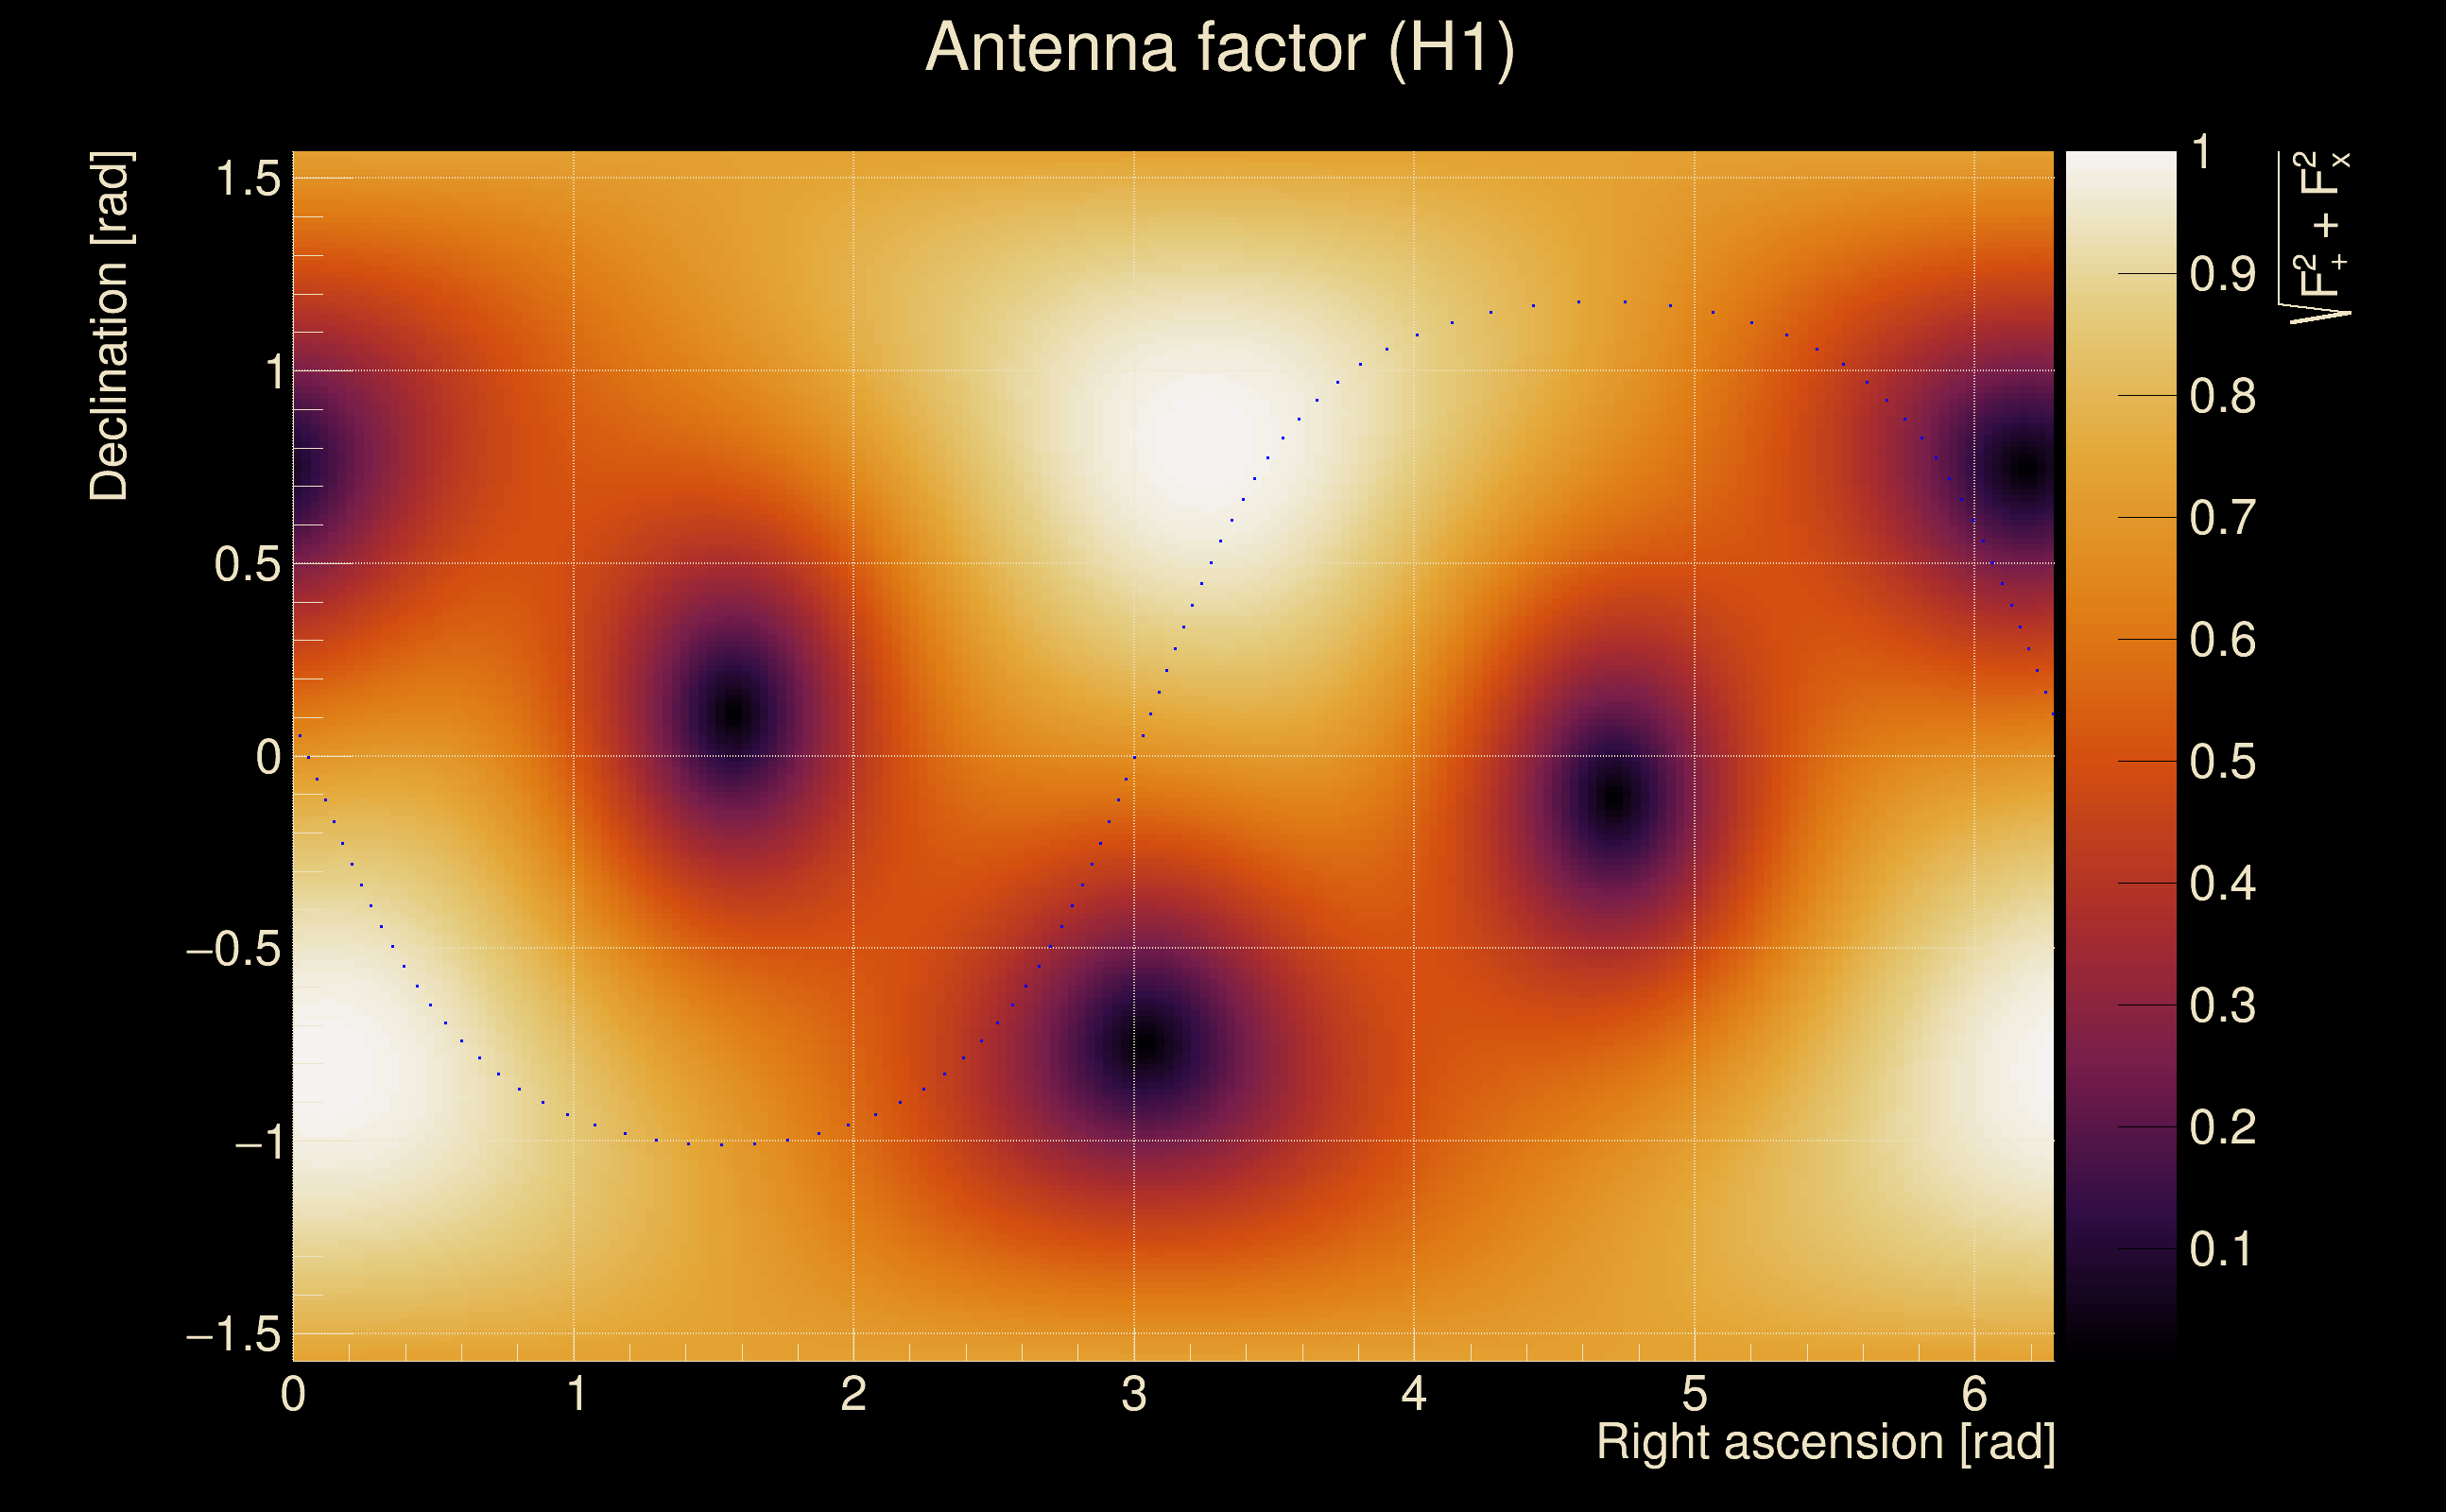
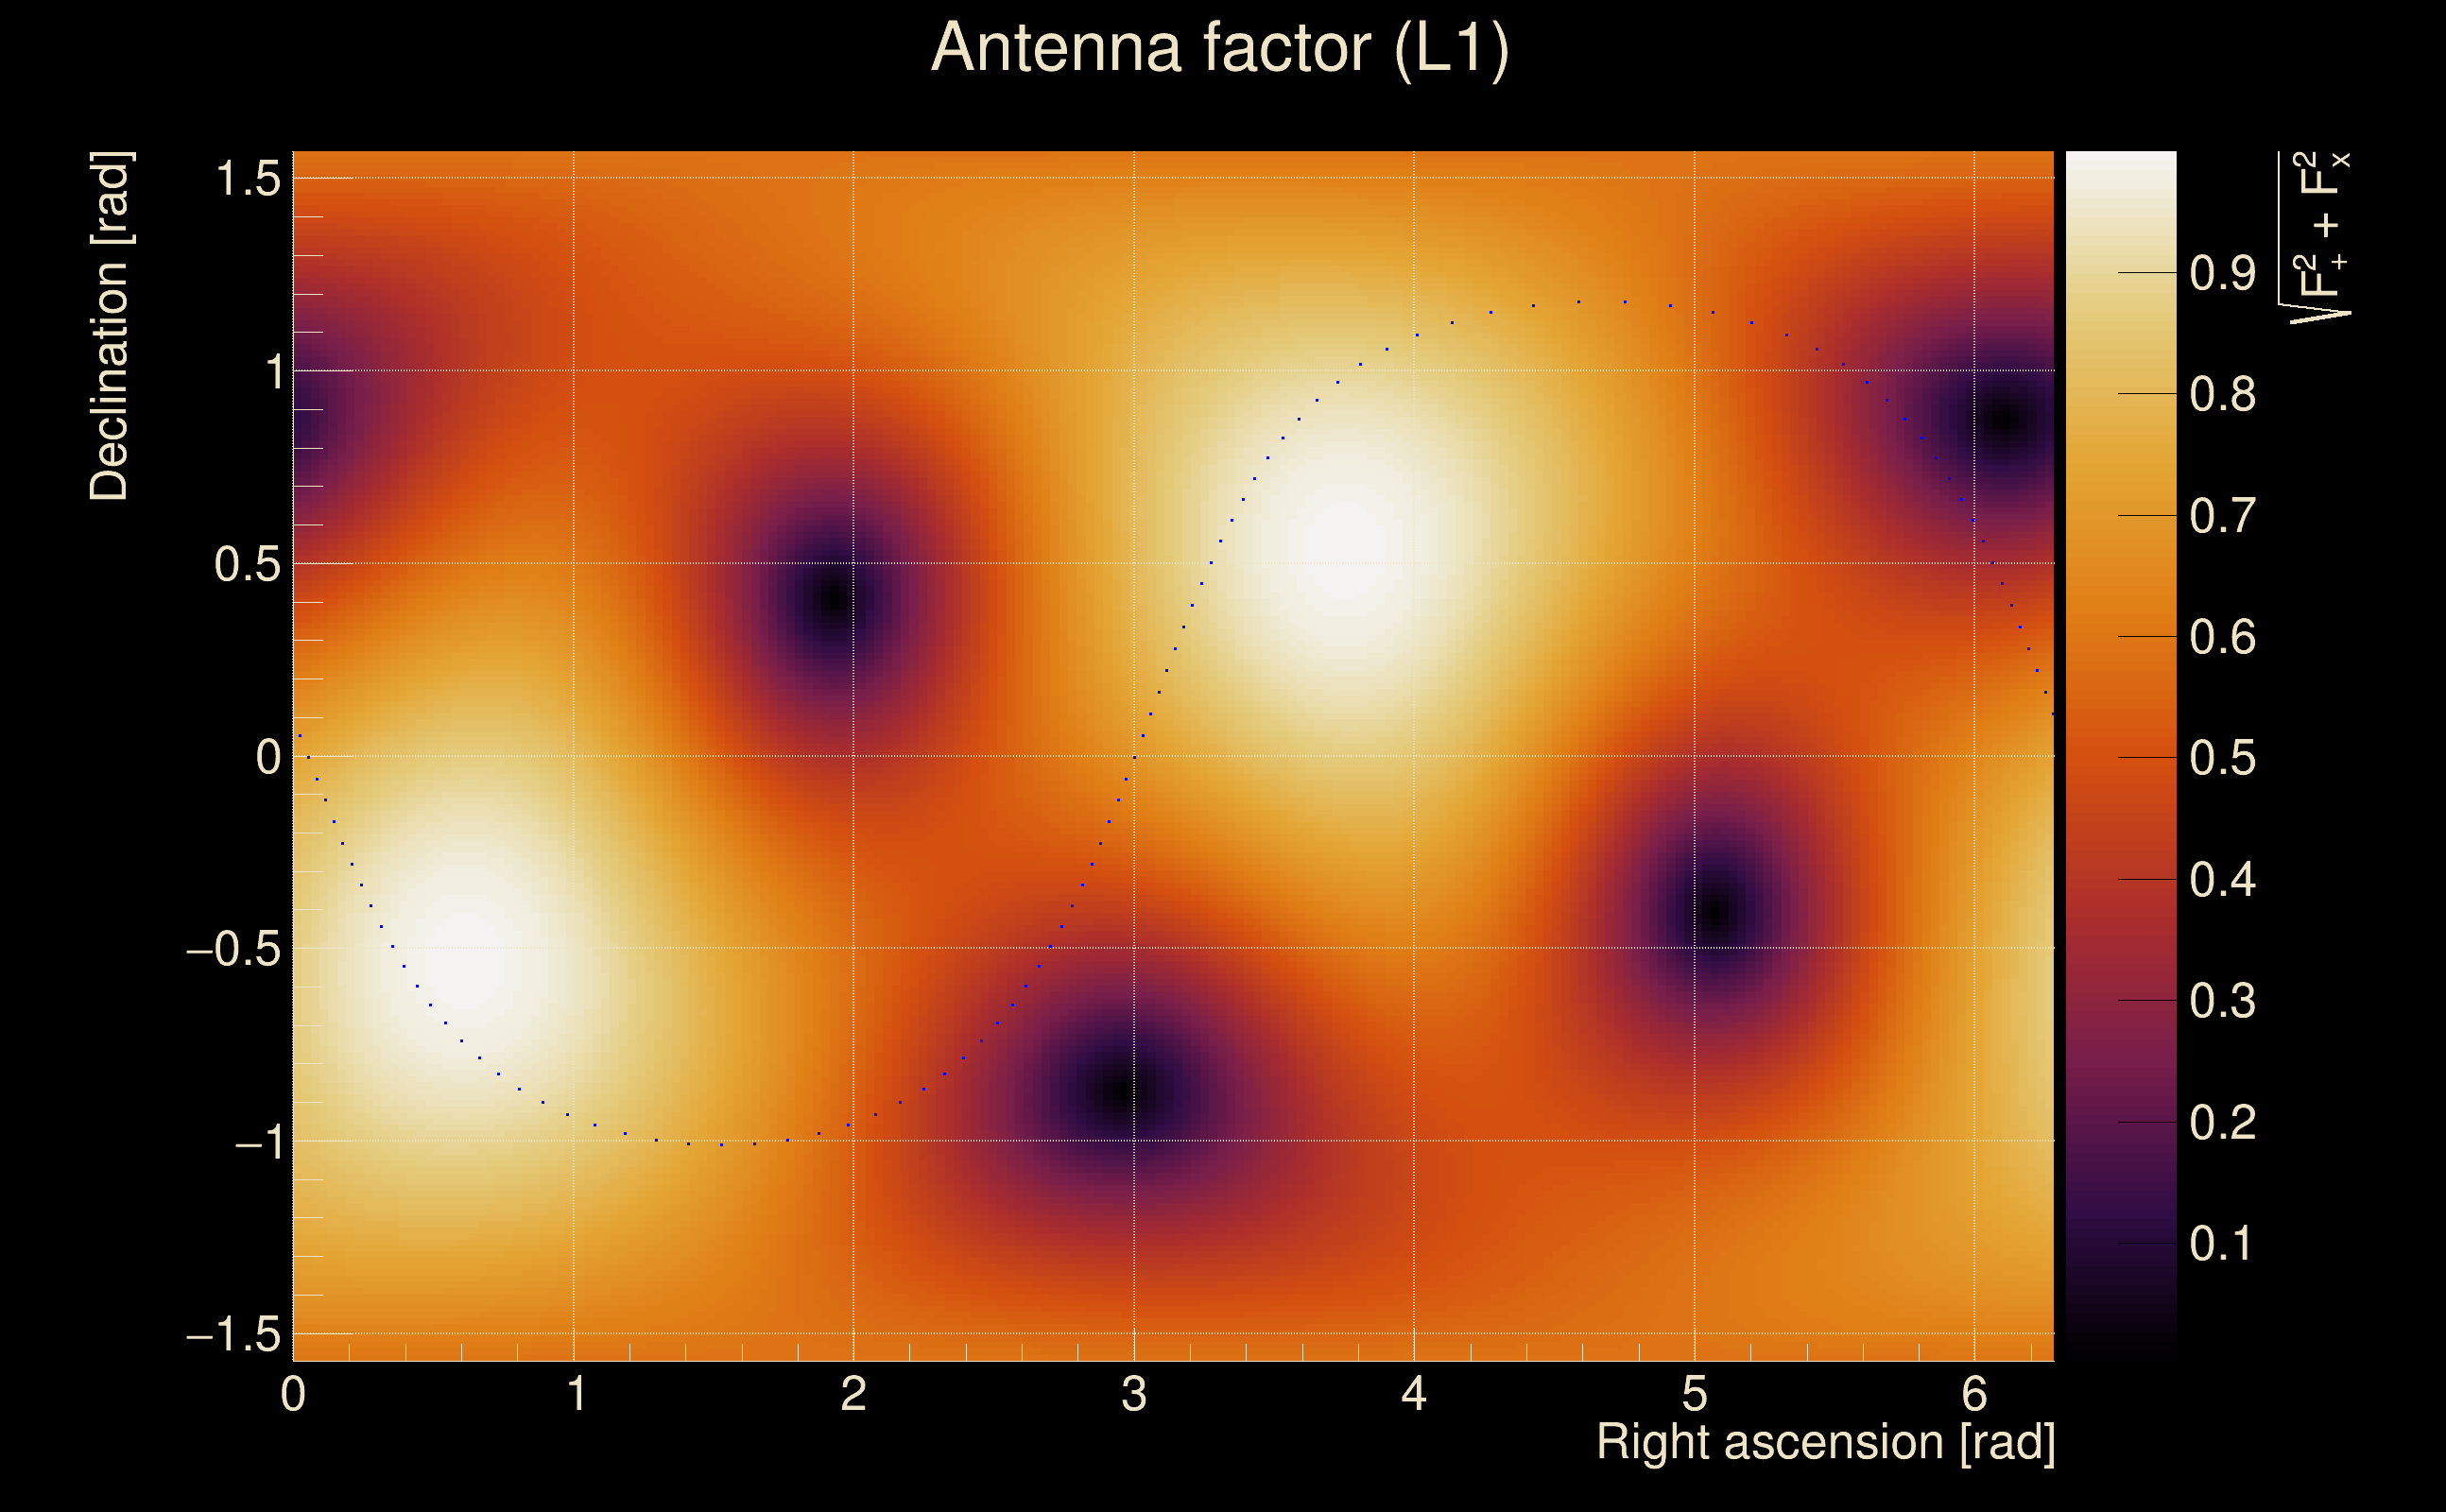
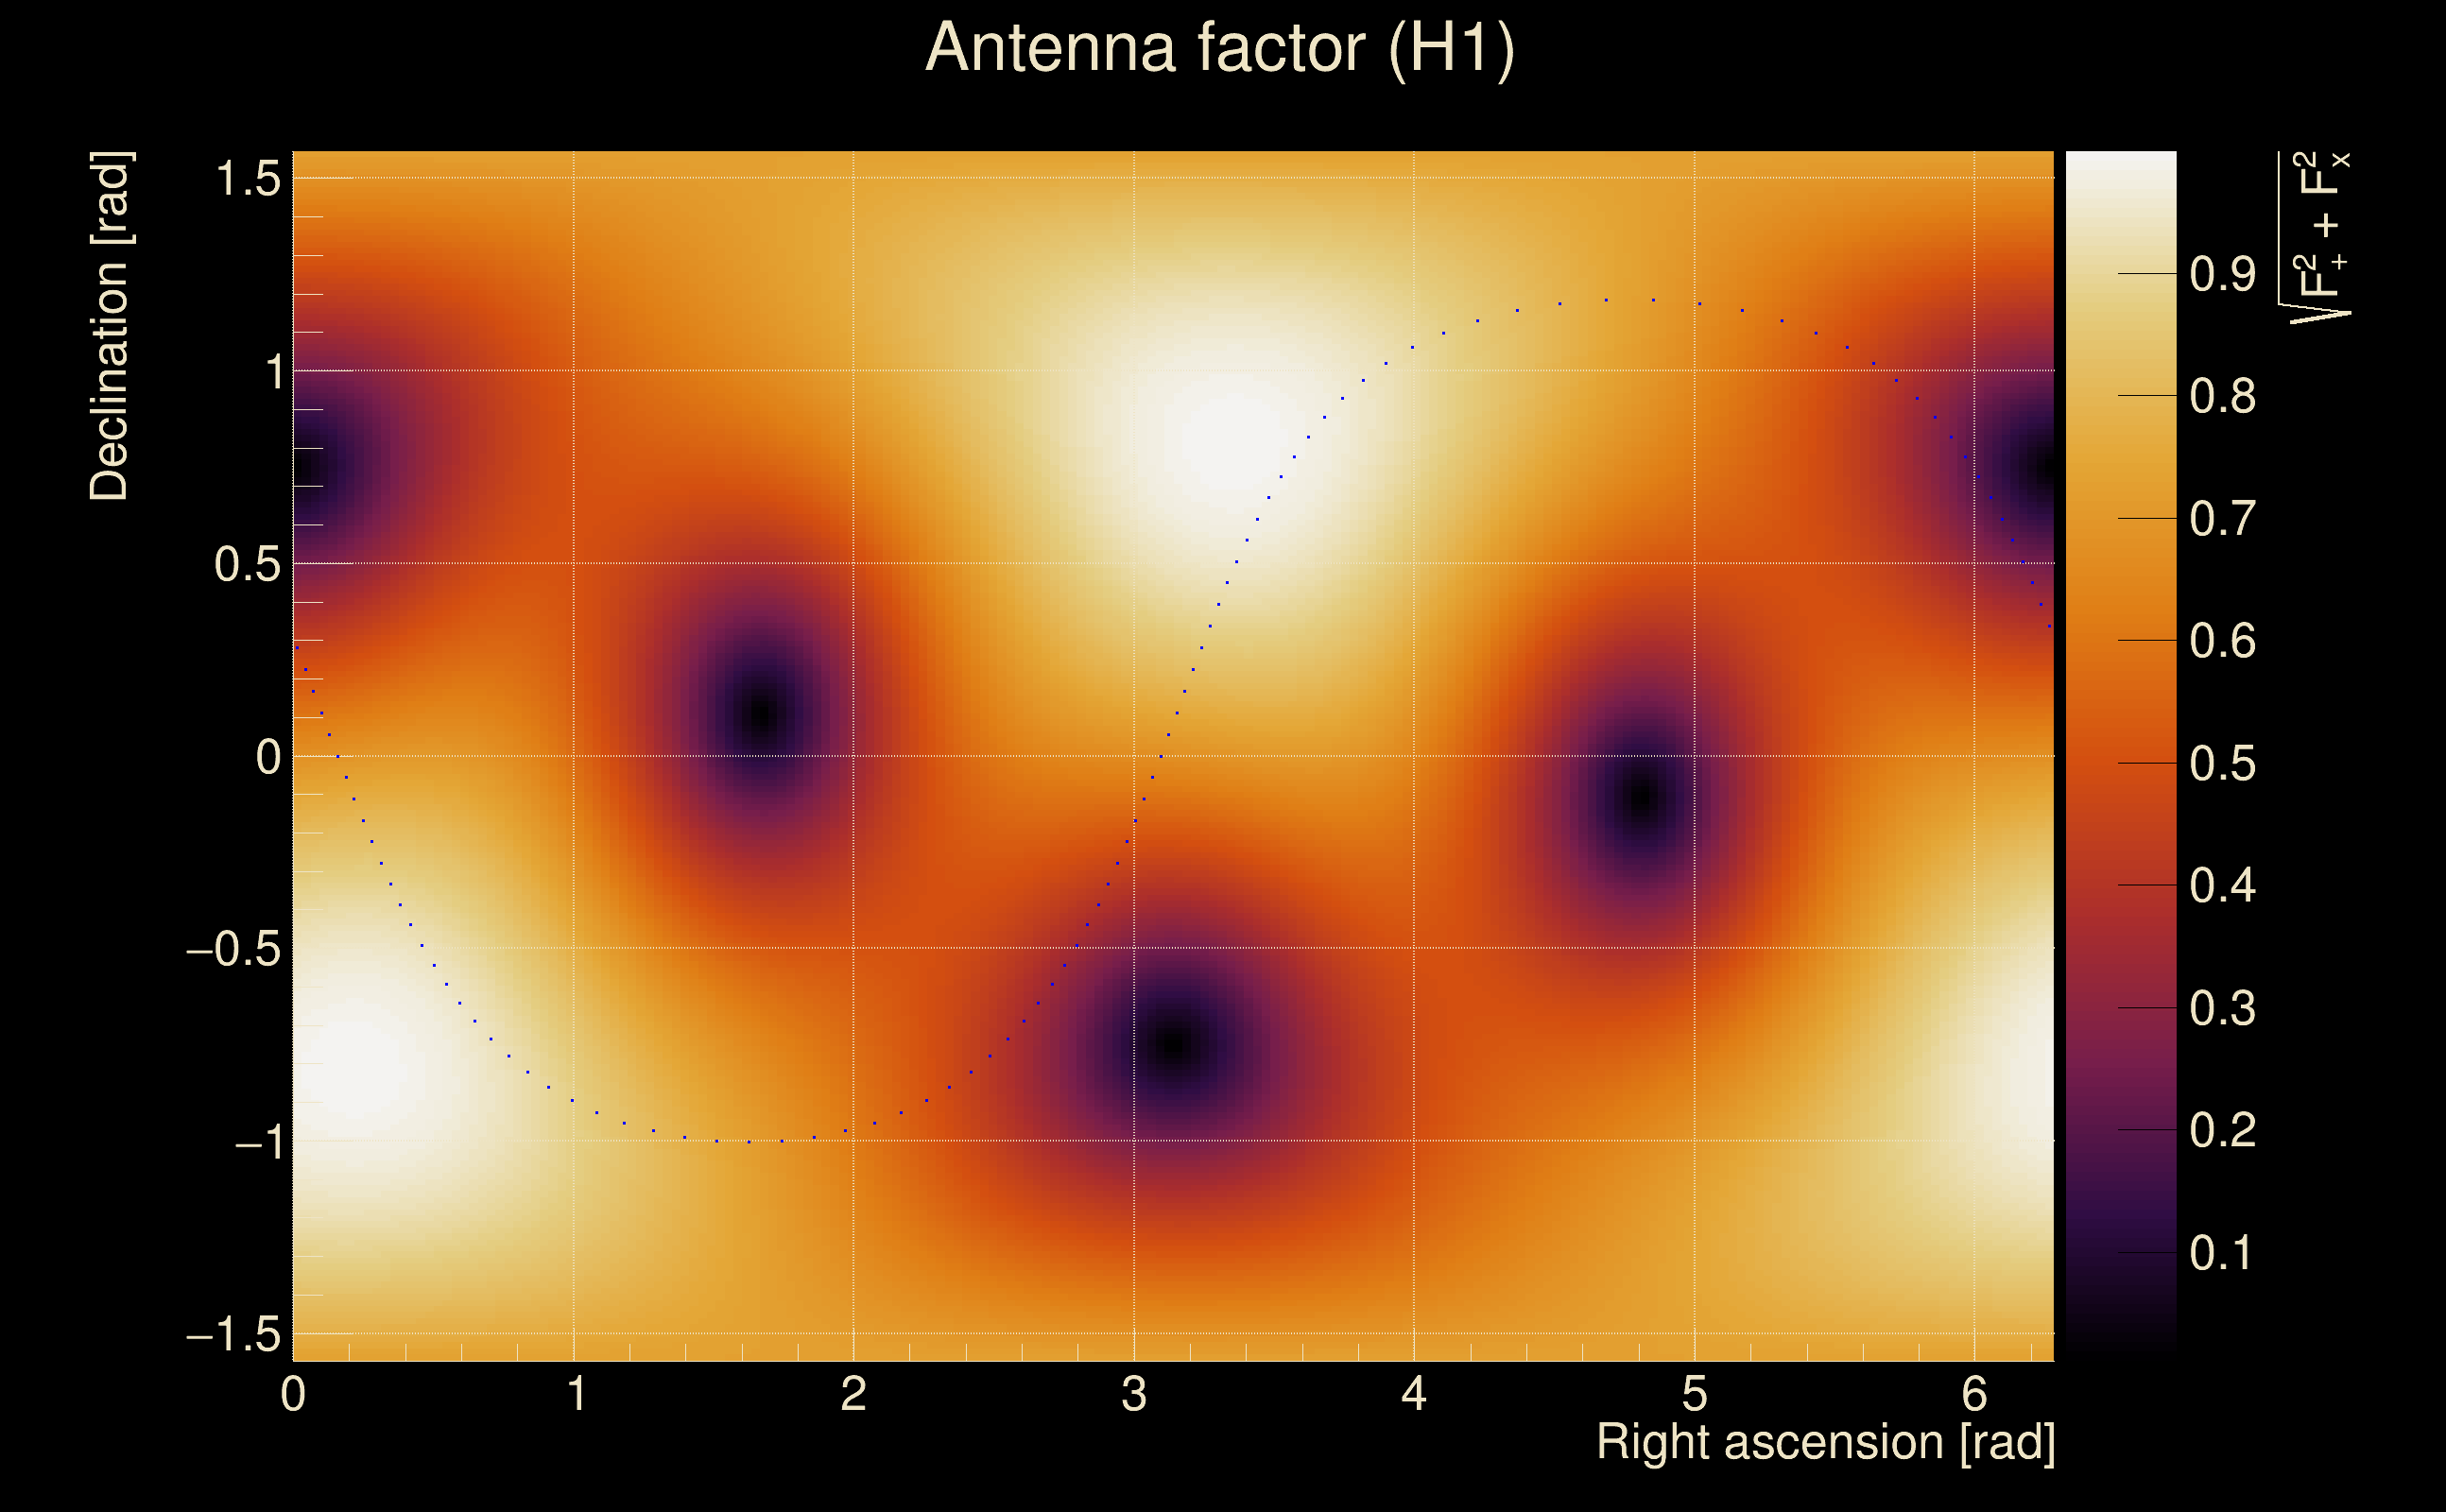
| Target sky positon: | Ra: 3.68109, Dec: 0.94792 [rad] |
| List of input Ox files: | TargIxf_feb2026_SN3_30s_file_list.txt (71 files) |
| Analysis result file: | TargIxf_feb2026_SN3_30s_results-0.root |
| Slice selected for the the fakeground: | slice index=94 (0.644 s), time lag = 0 s |
| Foreground | Fakeground | Background | ||
|---|---|---|---|---|
| Number of processed ox events | 12111 | 12111 | 2603865 | |
| Start Date (detector 0) | Mon May 15 14:13:25 2023 UTC | Mon May 15 14:13:25 2023 UTC | Mon May 15 14:13:25 2023 UTC | |
| End Date (detector 0) | Thu May 18 15:54:40 2023 UTC | Thu May 18 15:54:40 2023 UTC | Thu May 18 15:54:40 2023 UTC | |
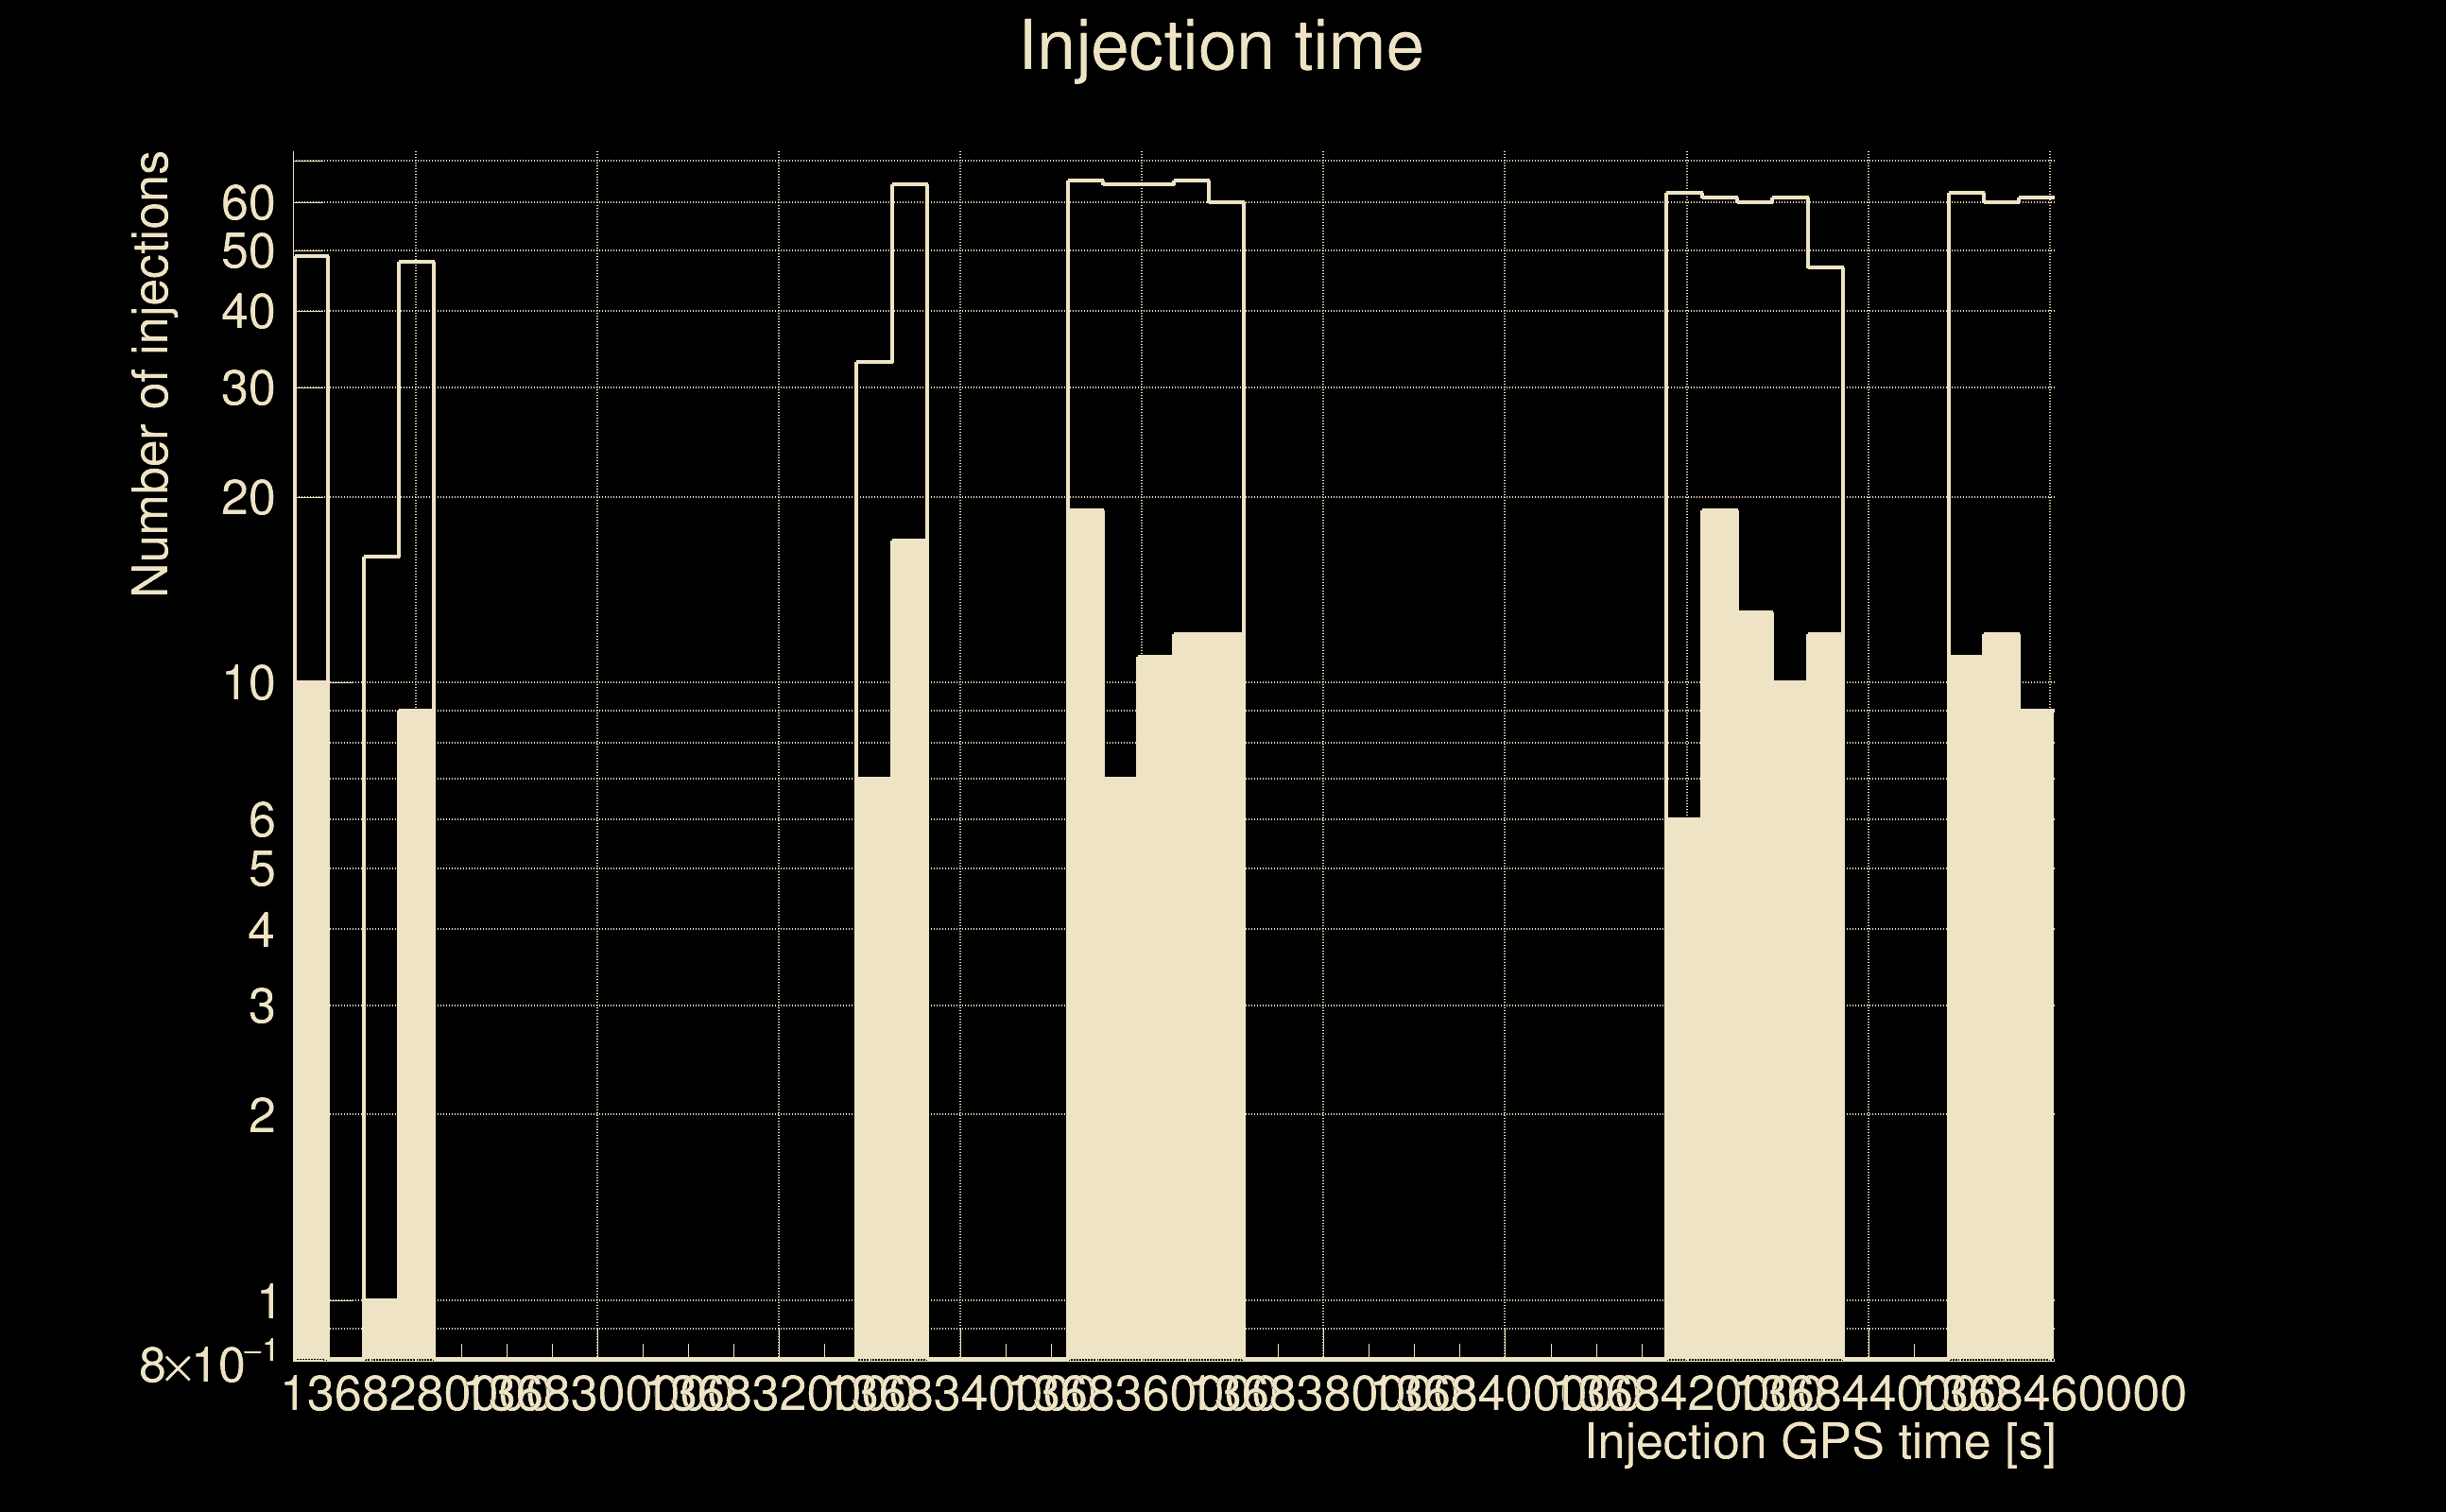
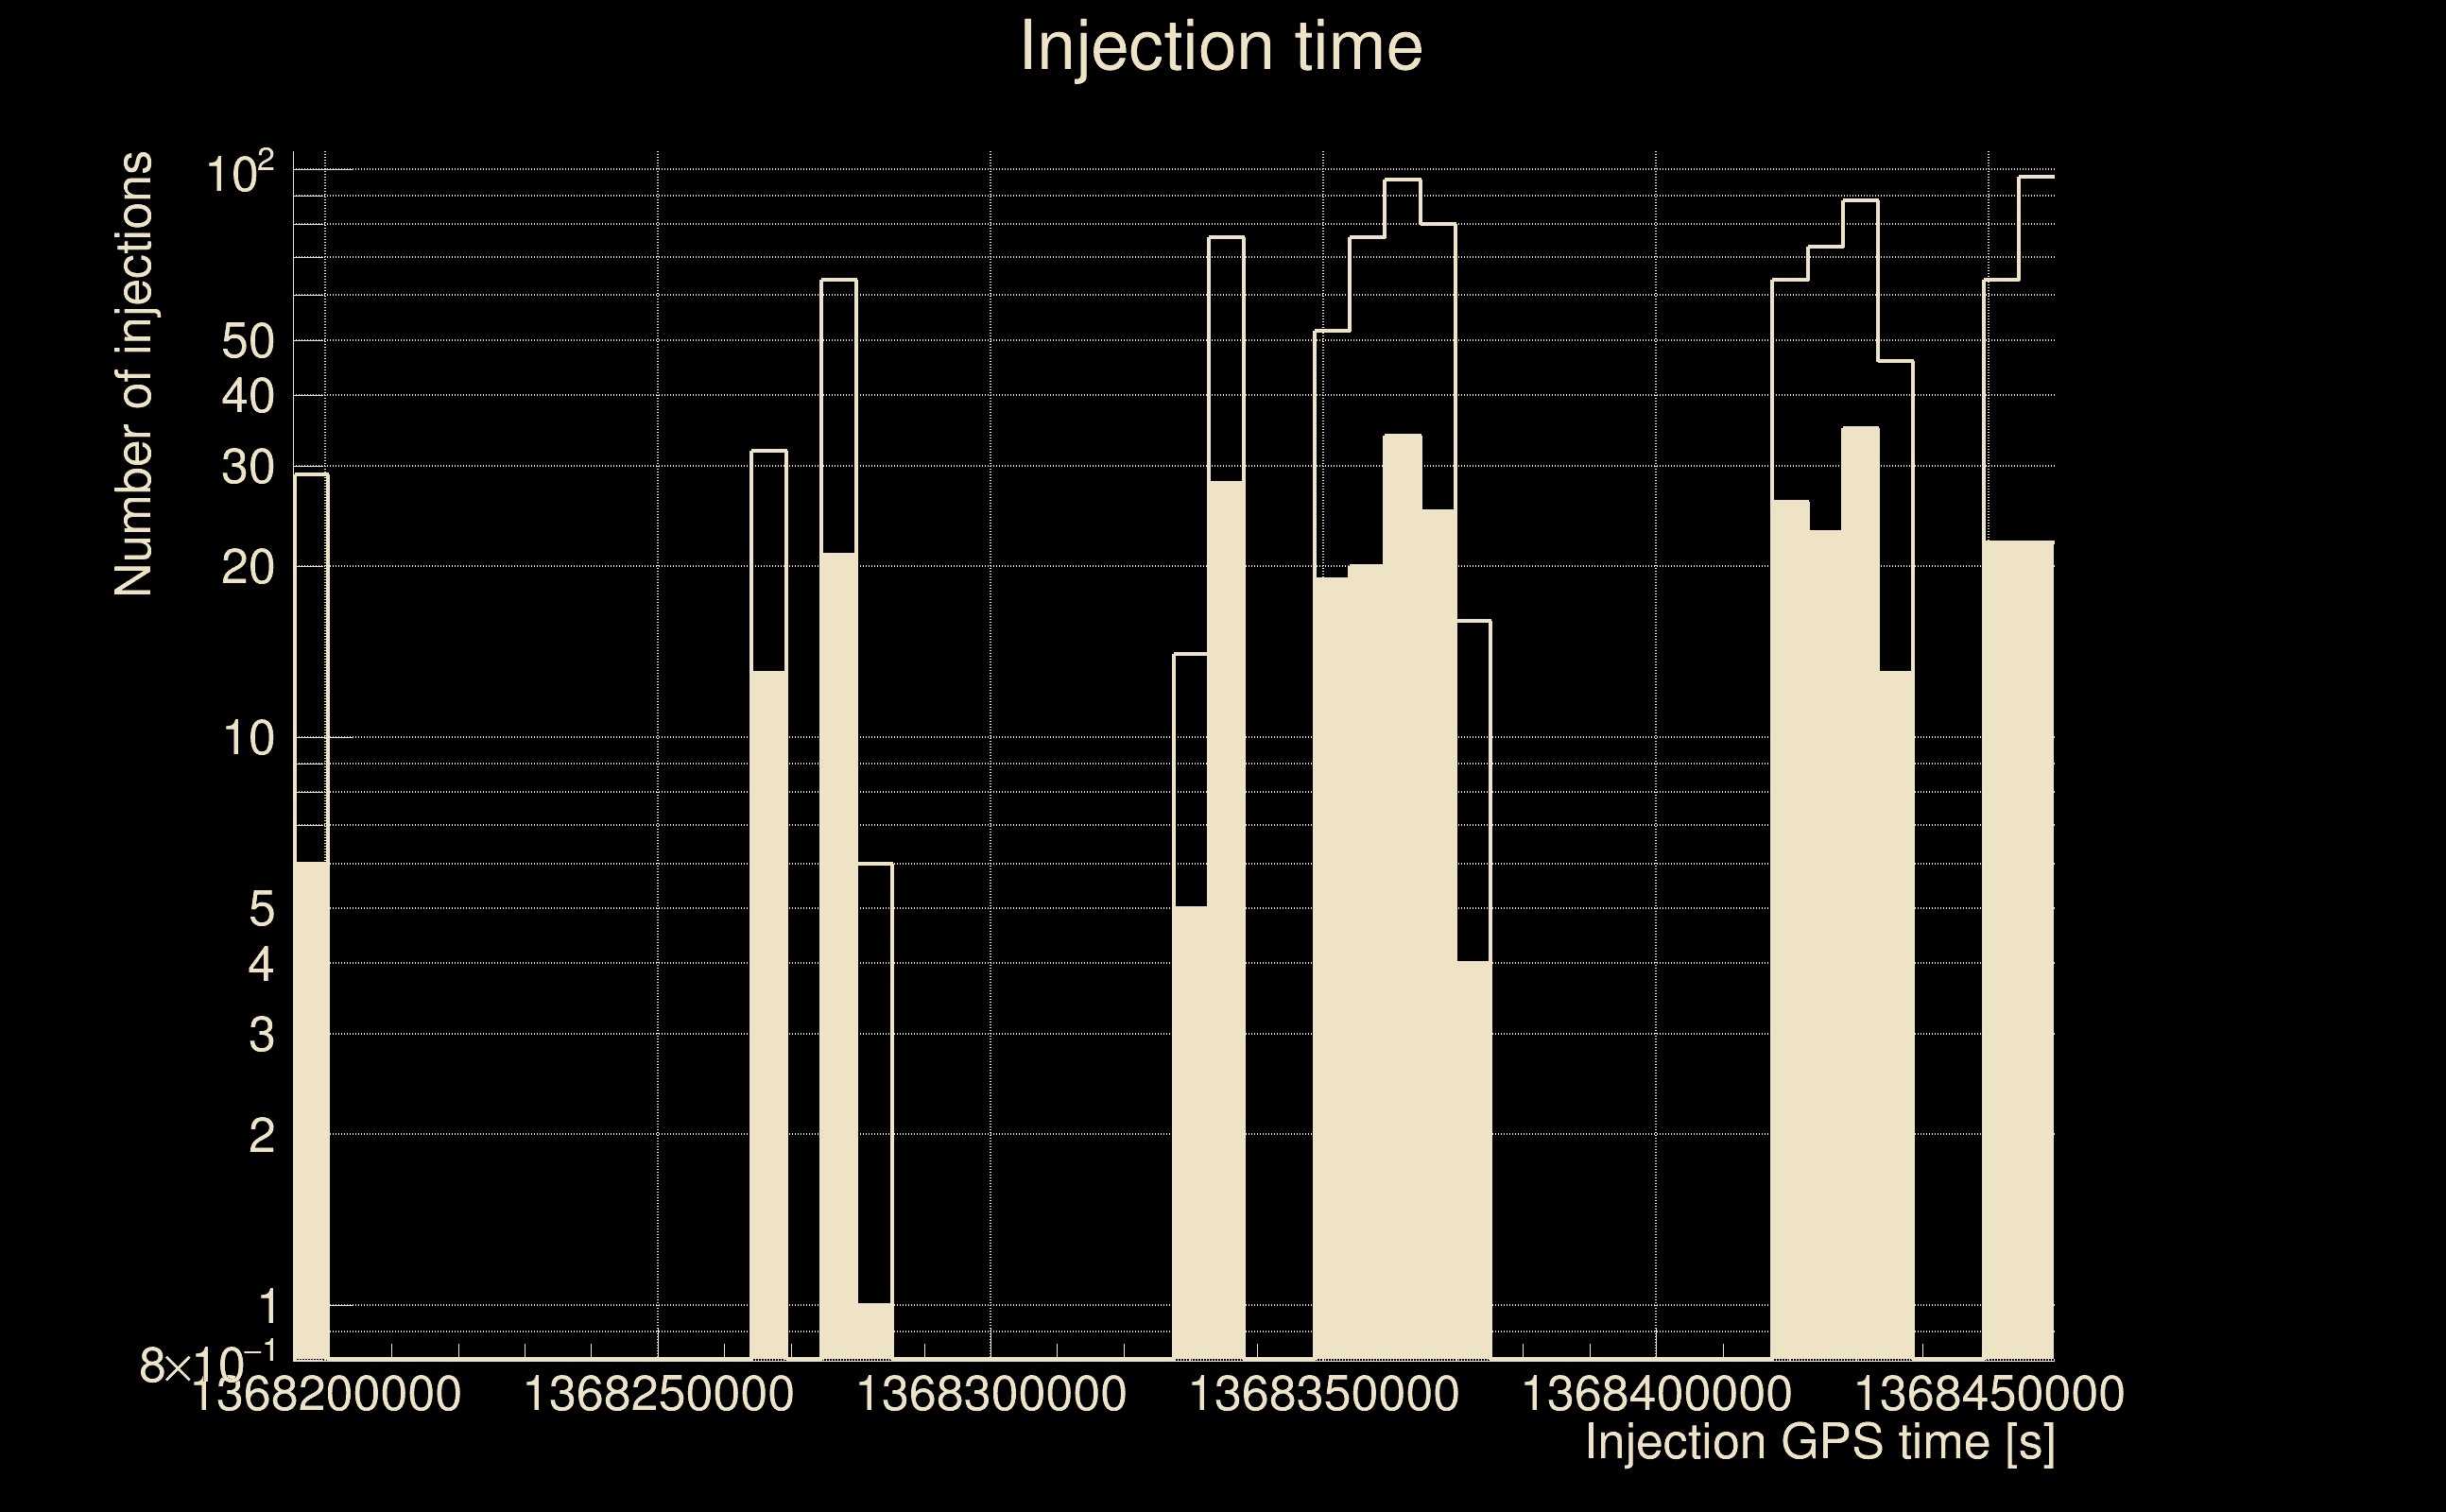
| Start GPS (detector 0) | 1368195223 | 1368195223 | 1368195223 | |
| End GPS (detector 0) | 1368460498 | 1368460498 | 1368460498 | |
| Used livetime (detector 0) | 60875 s | 60875 s | 60875 s | |
| Start Date (detector 1) | Mon May 15 14:13:25 2023 UTC | Mon May 15 14:13:25 2023 UTC | Mon May 15 14:13:25 2023 UTC | |
| End Date (detector 1) | Thu May 18 15:54:40 2023 UTC | Thu May 18 15:54:40 2023 UTC | Thu May 18 15:54:40 2023 UTC | |
| Start GPS (detector 1) | 1368195223 | 1368195223 | 1368195223 | |
| End GPS (detector 1) | 1368460498 | 1368460498 | 1368460498 | |
| Used livetime (detector 1) | 60875 s | 60875 s | 60875 s | |
| Cumulative livetime | 121110 s | 121110 s | 26038650 s | |
| 0 years, 1 days, 9 hours, 38 min, 30 s | 0 years, 1 days, 9 hours, 38 min, 30 s | 0 years, 301 days, 8 hours, 57 min, 30 s |
|
|
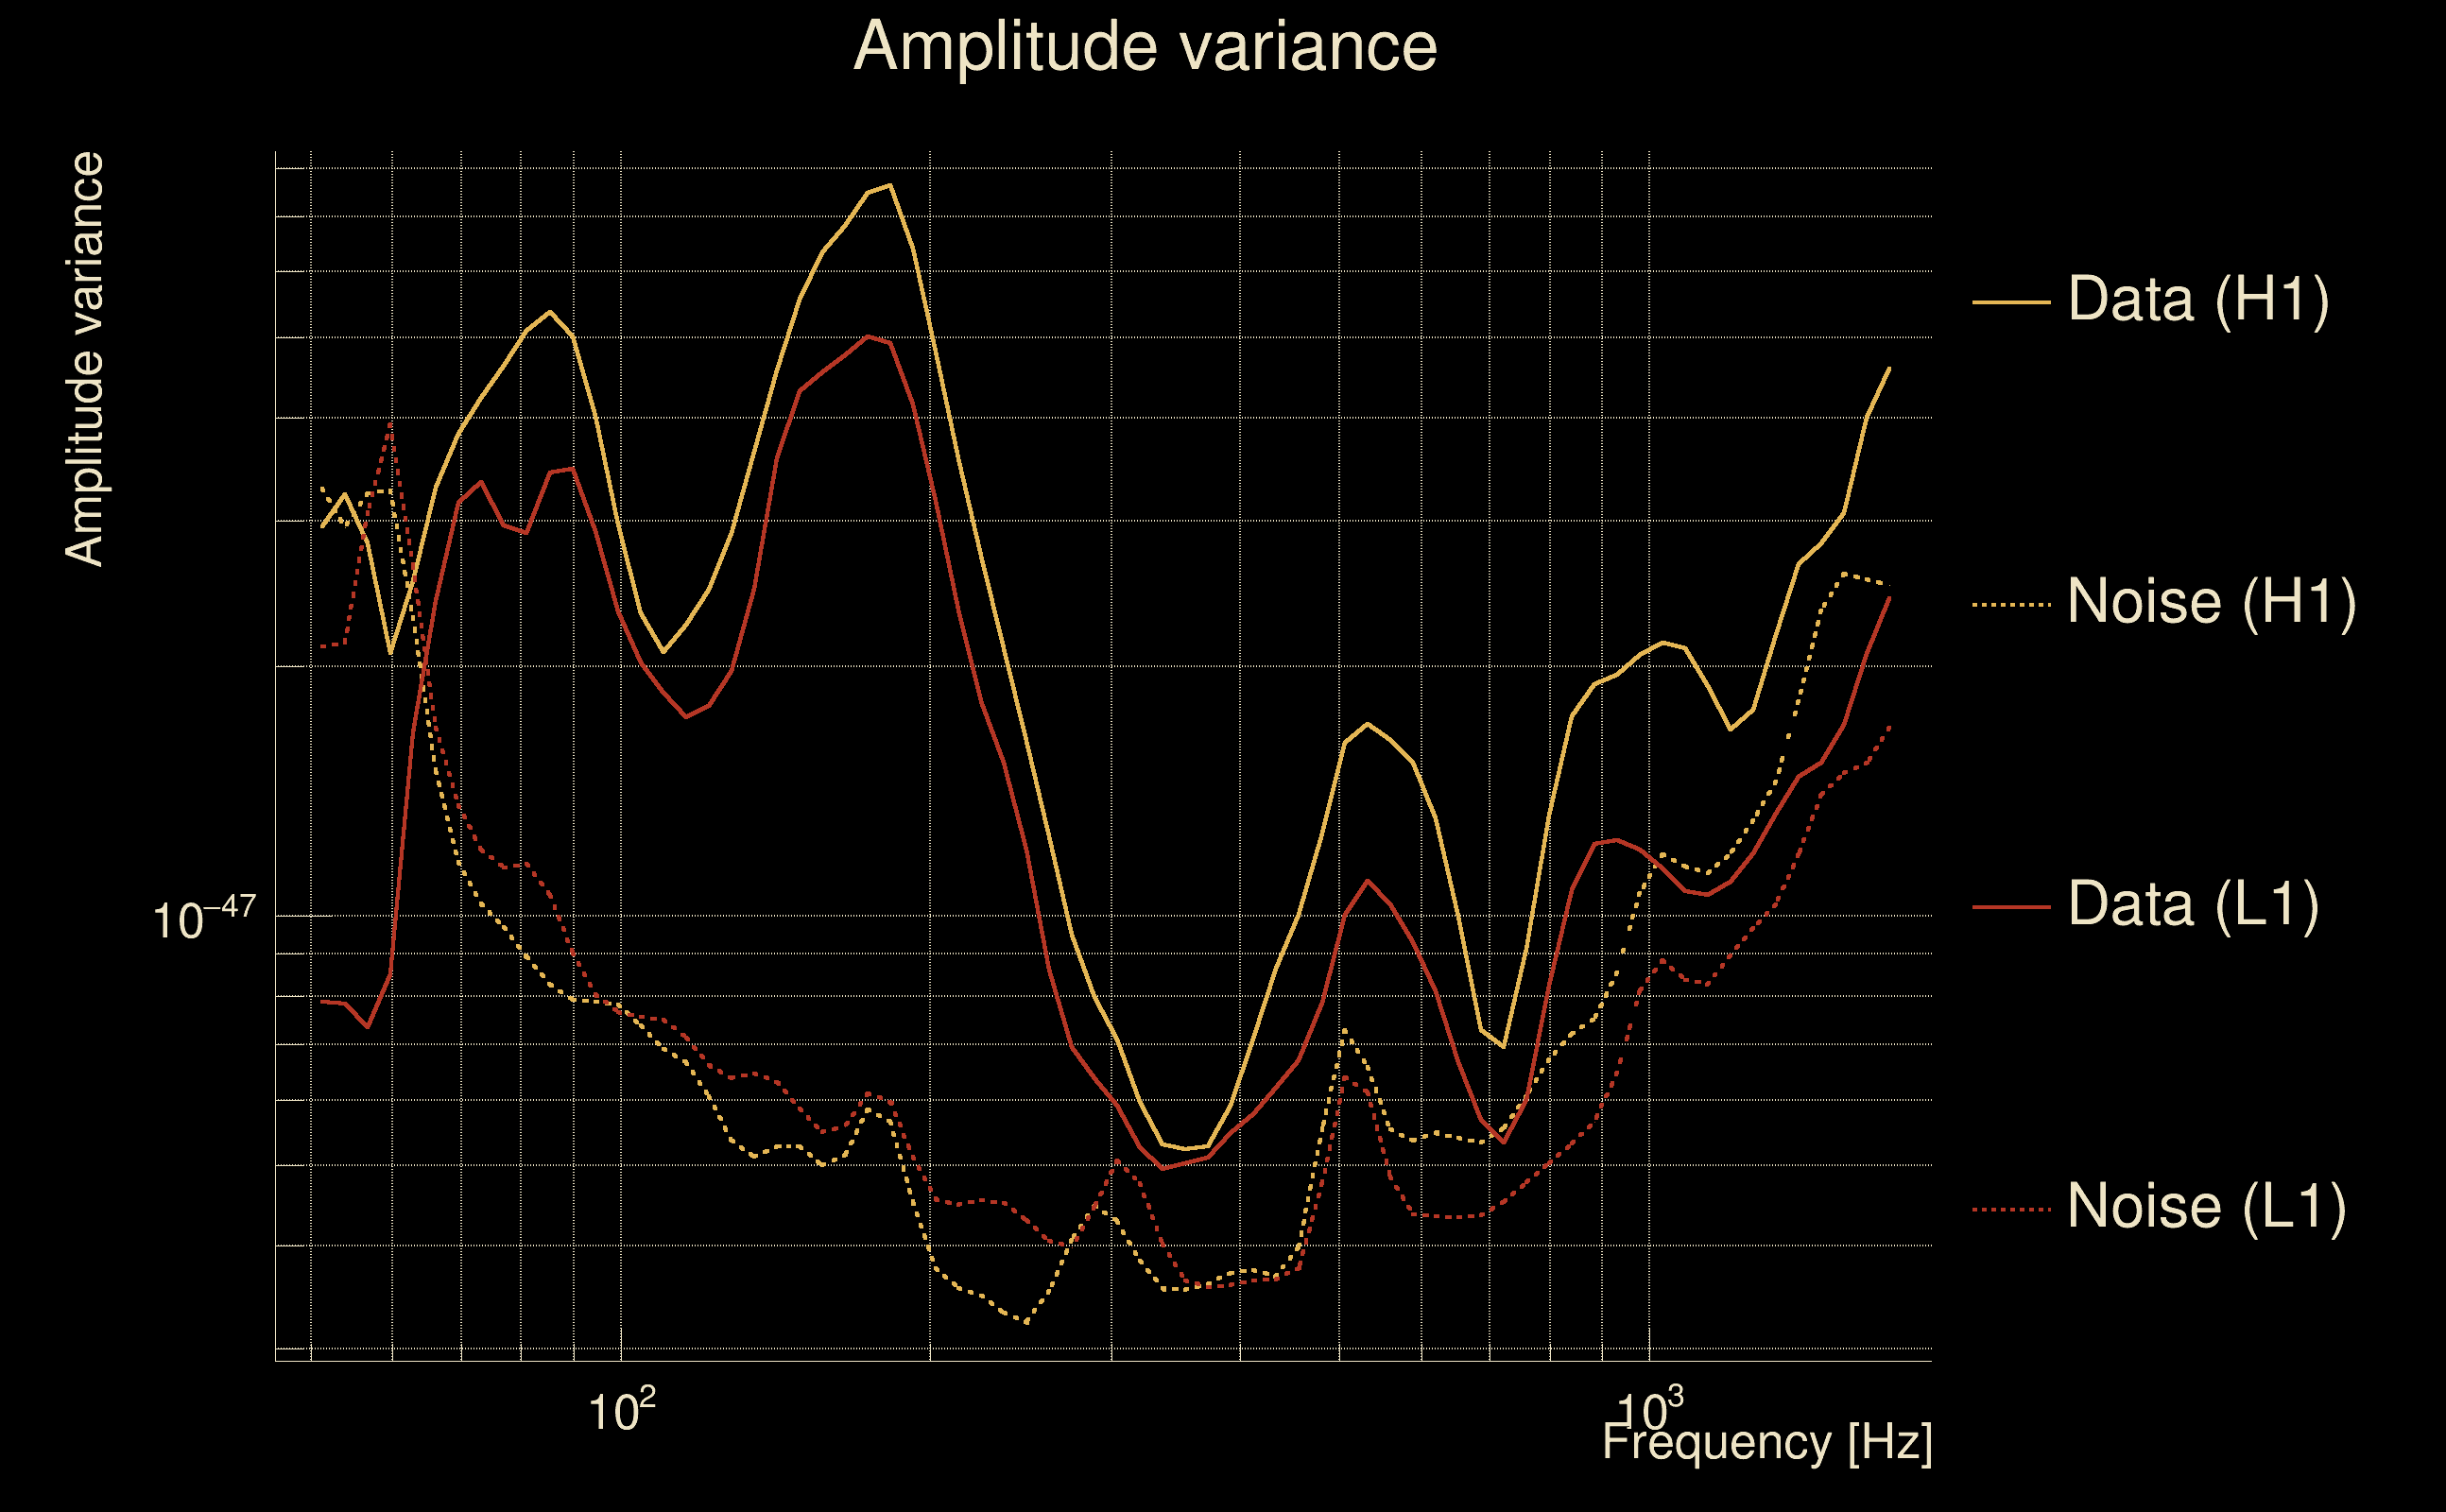
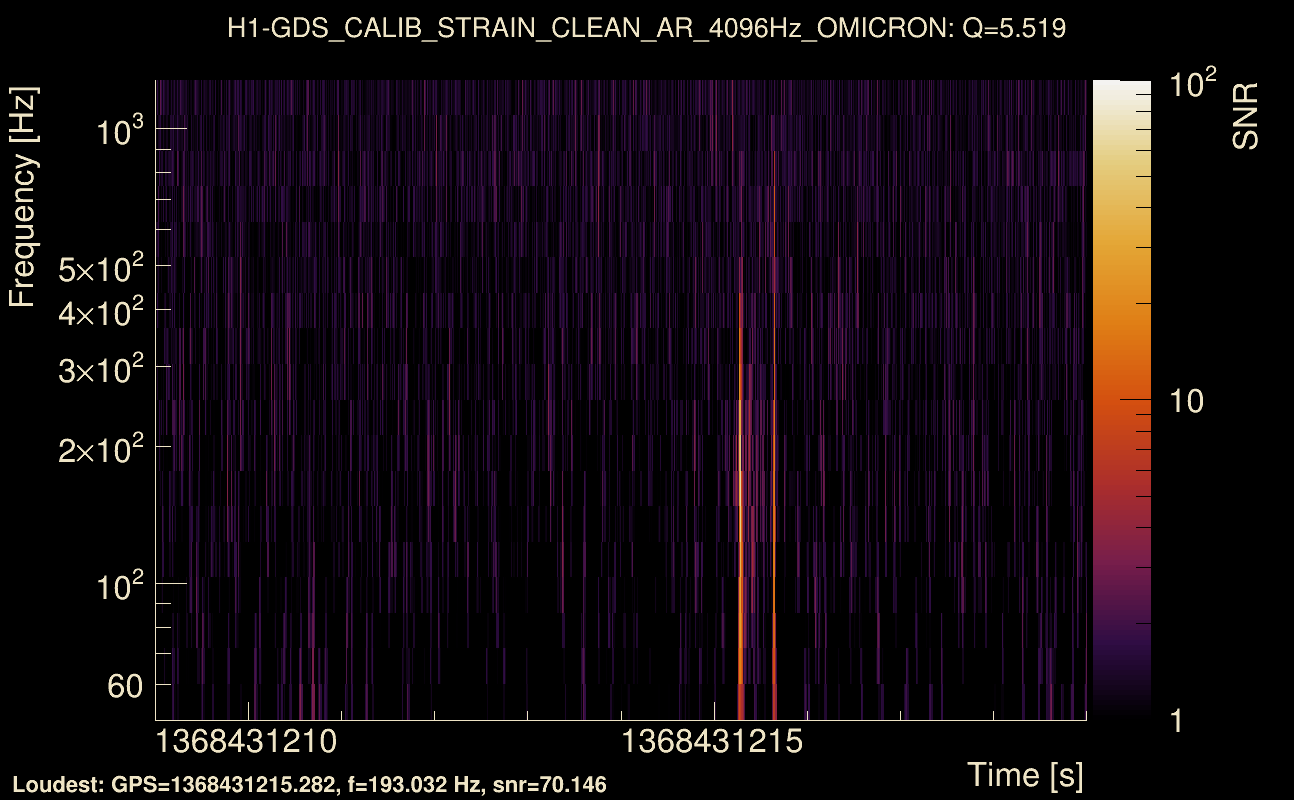
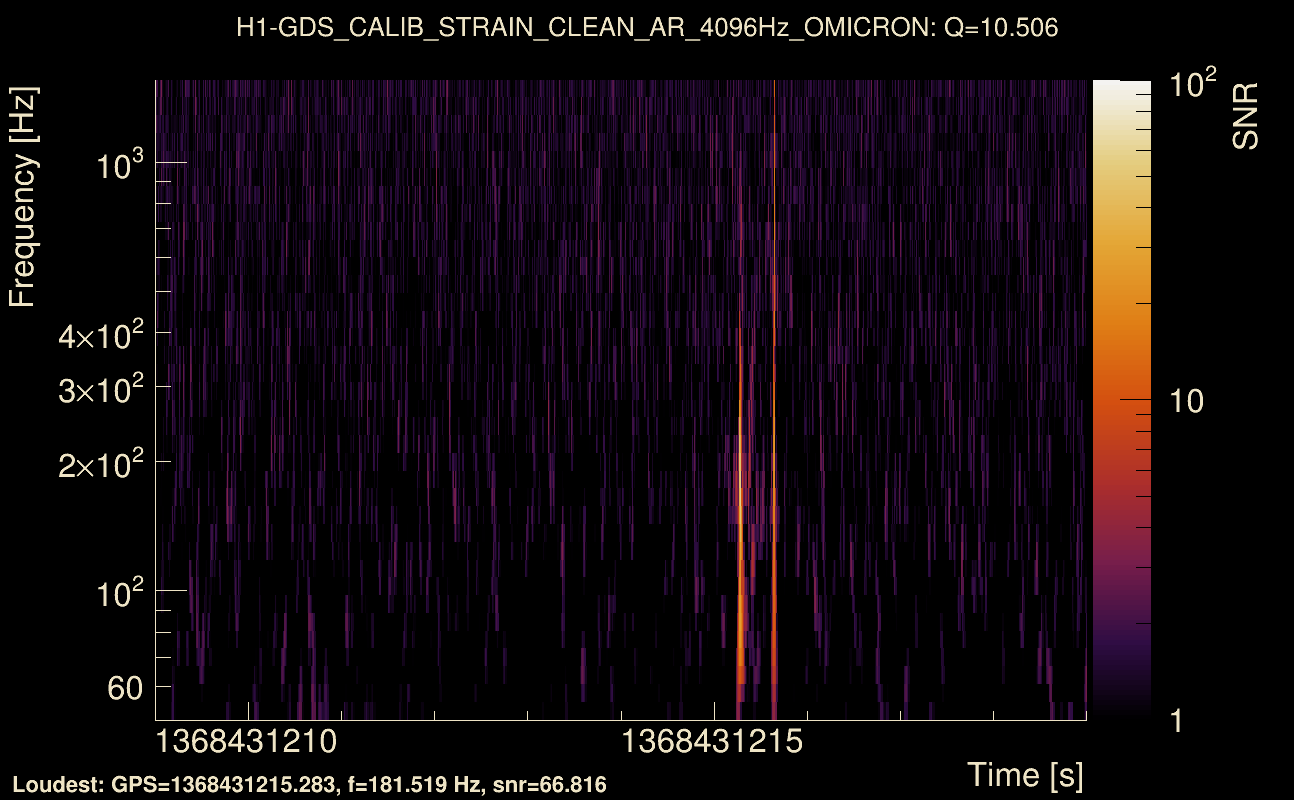
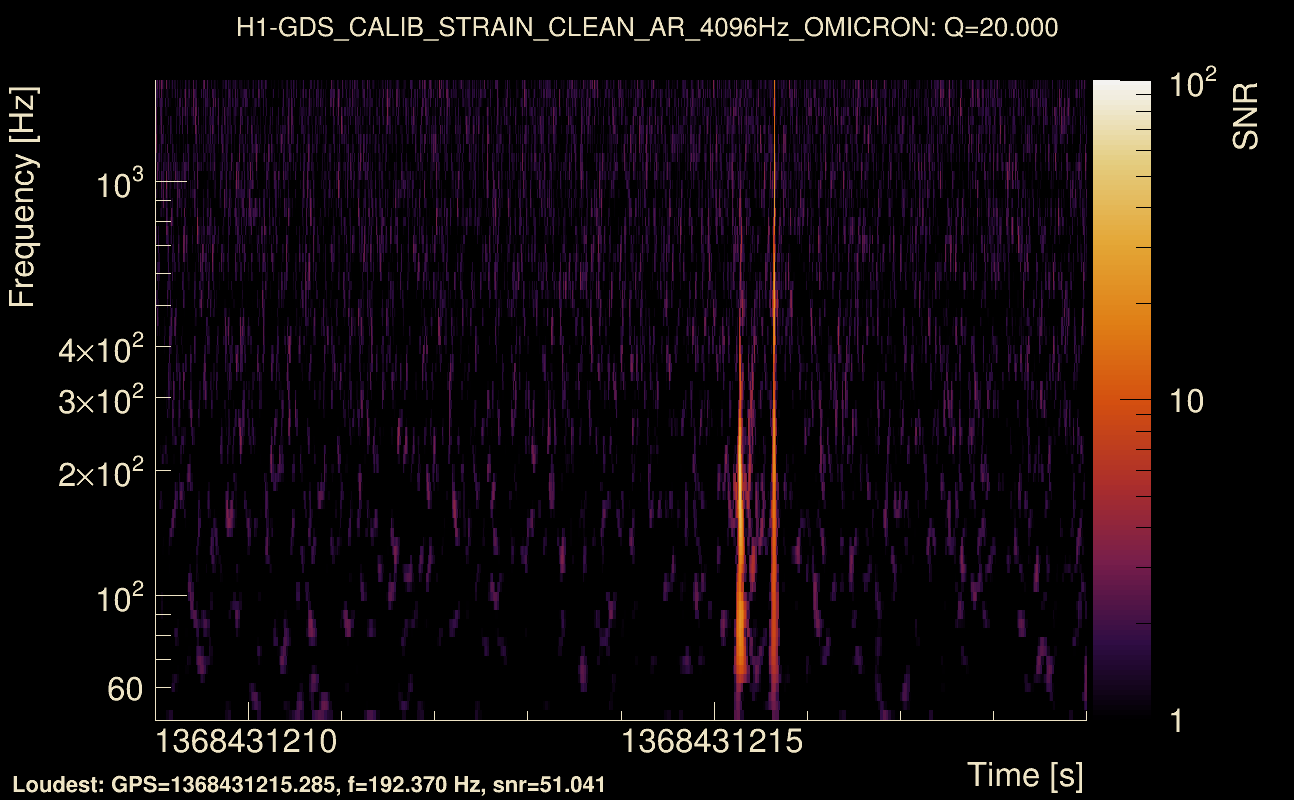
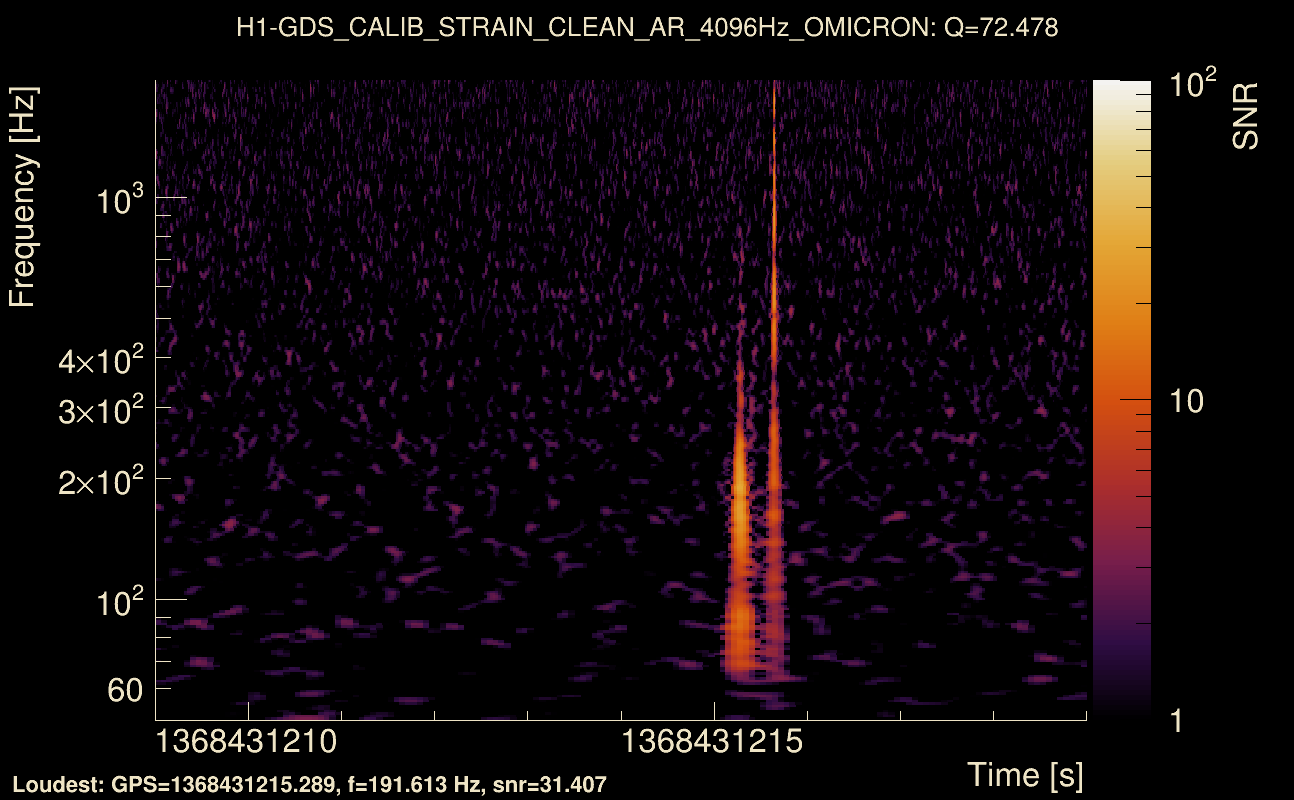
| Event time t(H1): | GPS = 1368431214 (Thu May 18 07:46:36 2023 ) → GPS = 1368431224 (Thu May 18 07:46:46 2023 ) |
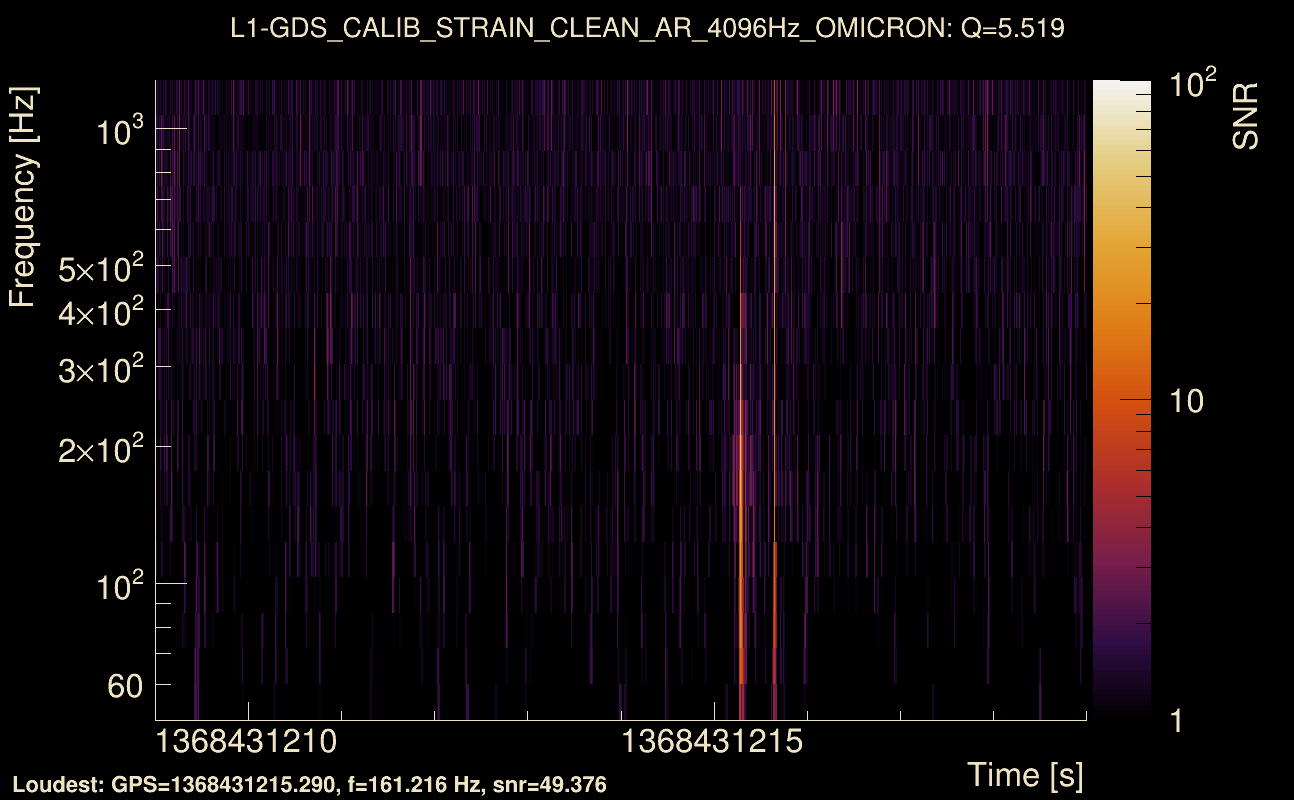
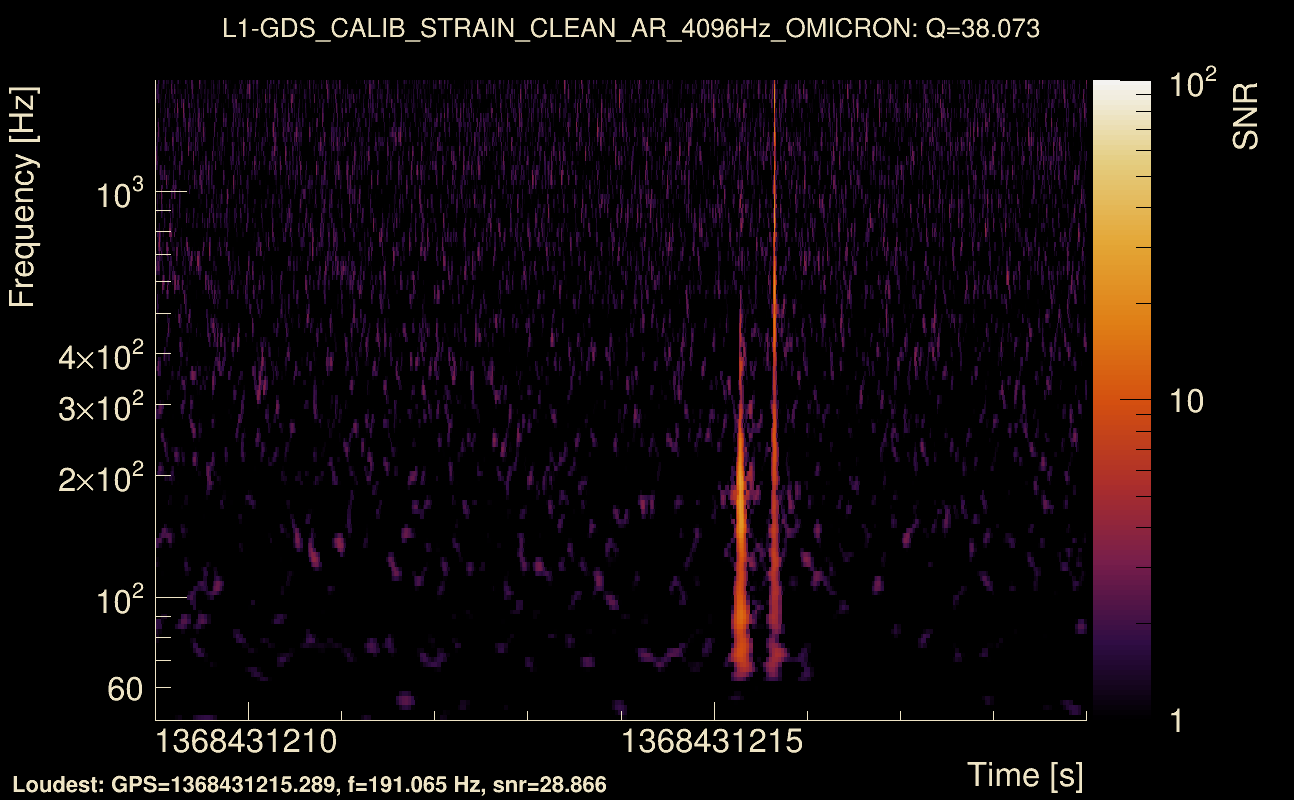
| Event time t(L1): | GPS = 1368431214 (Thu May 18 07:46:46 2023 ) → GPS = 1368431224 (Thu May 18 07:46:46 2023 ) |
| Omicron analysis time window (H1): | GPS = 1368431211 → GPS = 1368431227 |
| Omicron analysis time window (L1): | GPS = 1368431211 → GPS = 1368431227 |
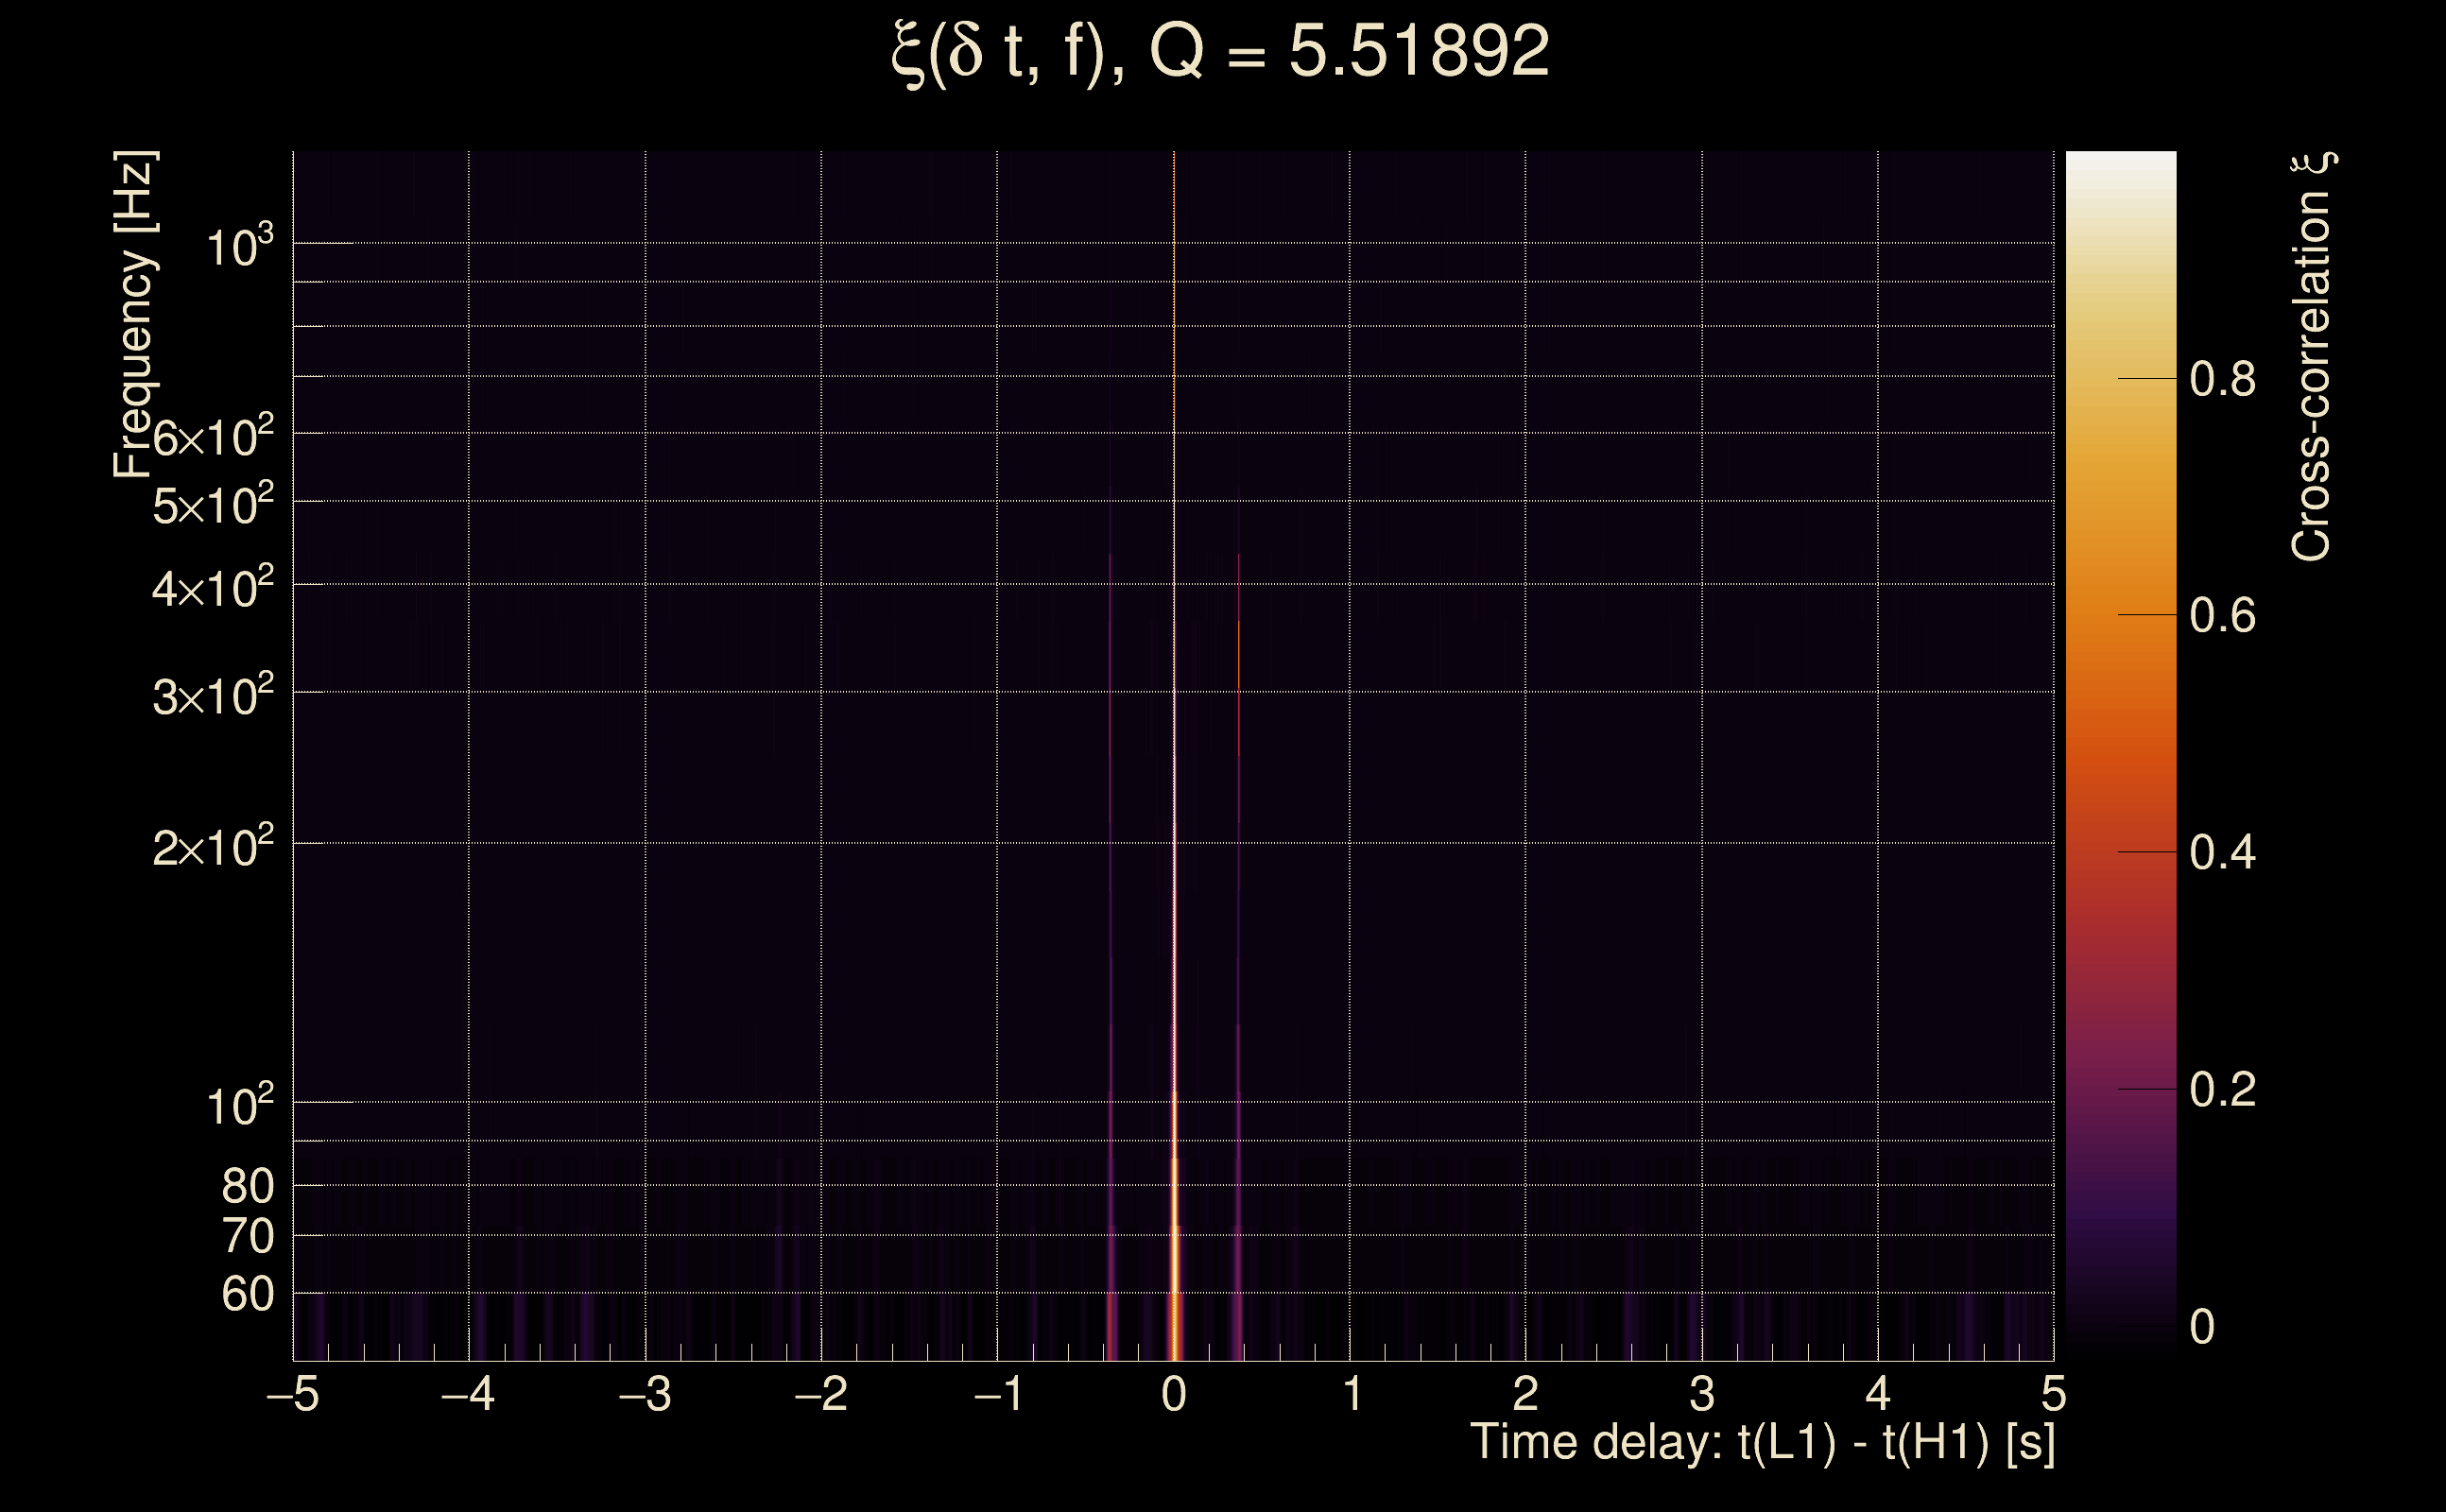
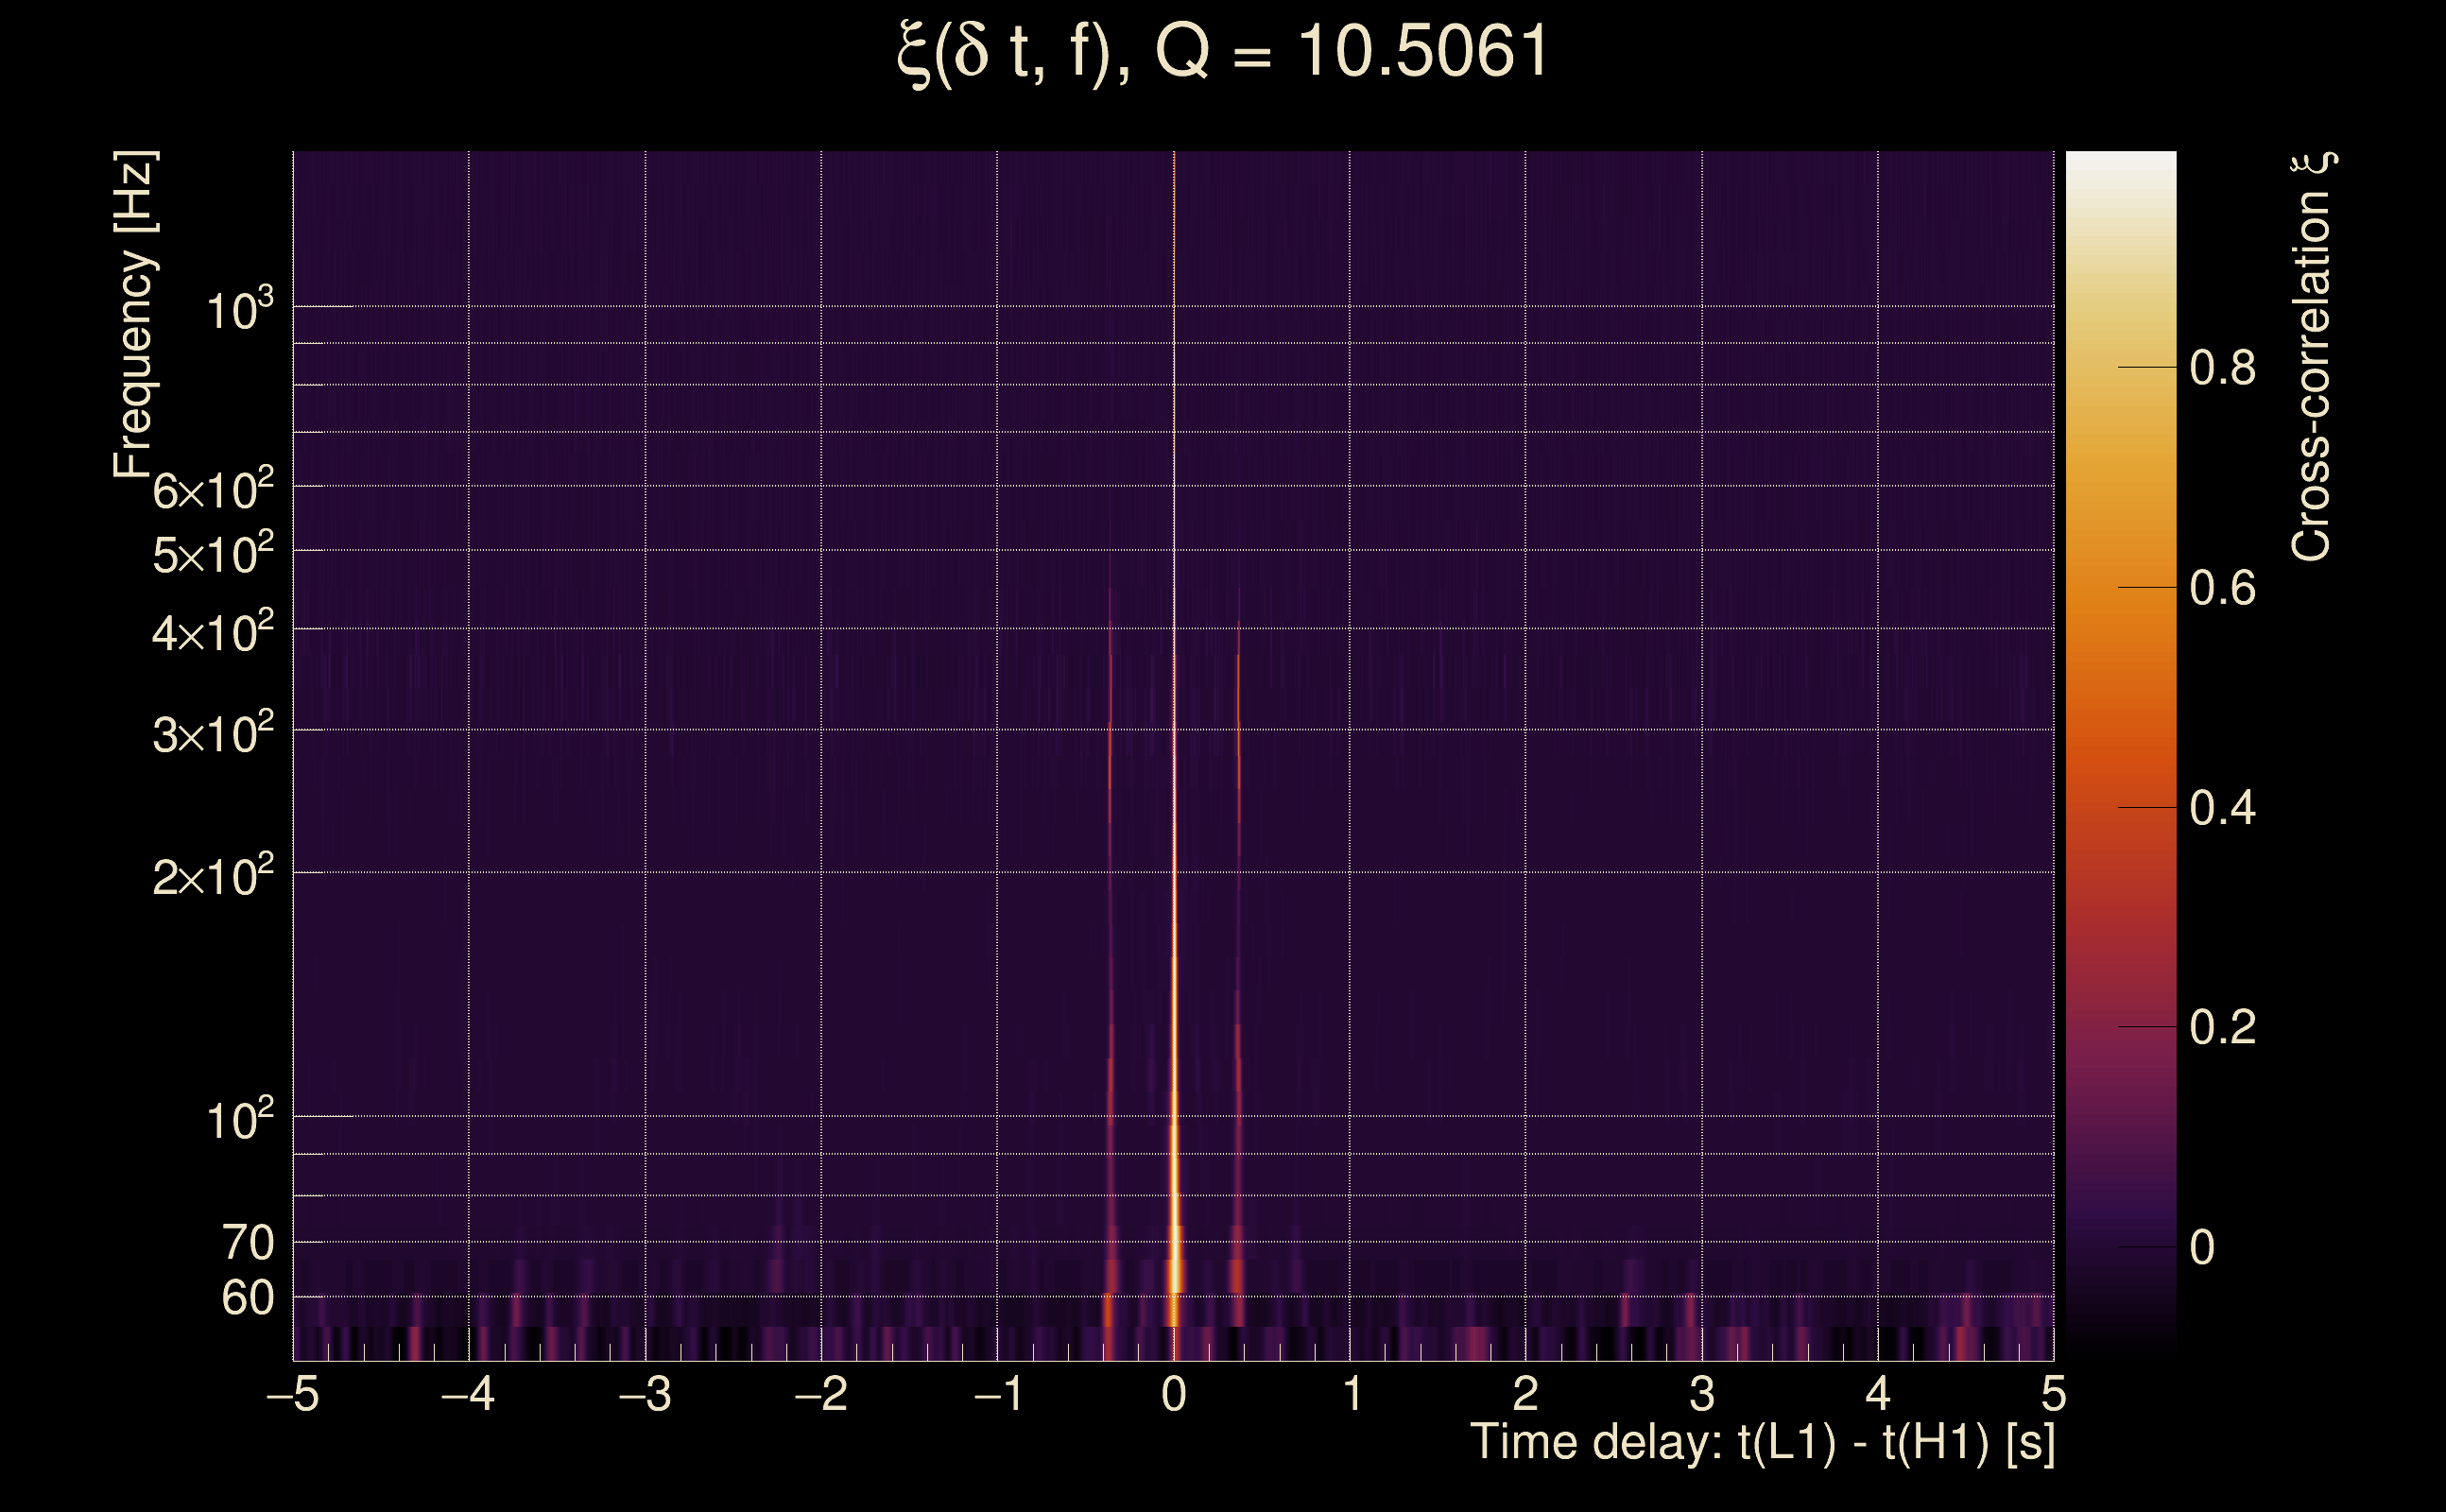
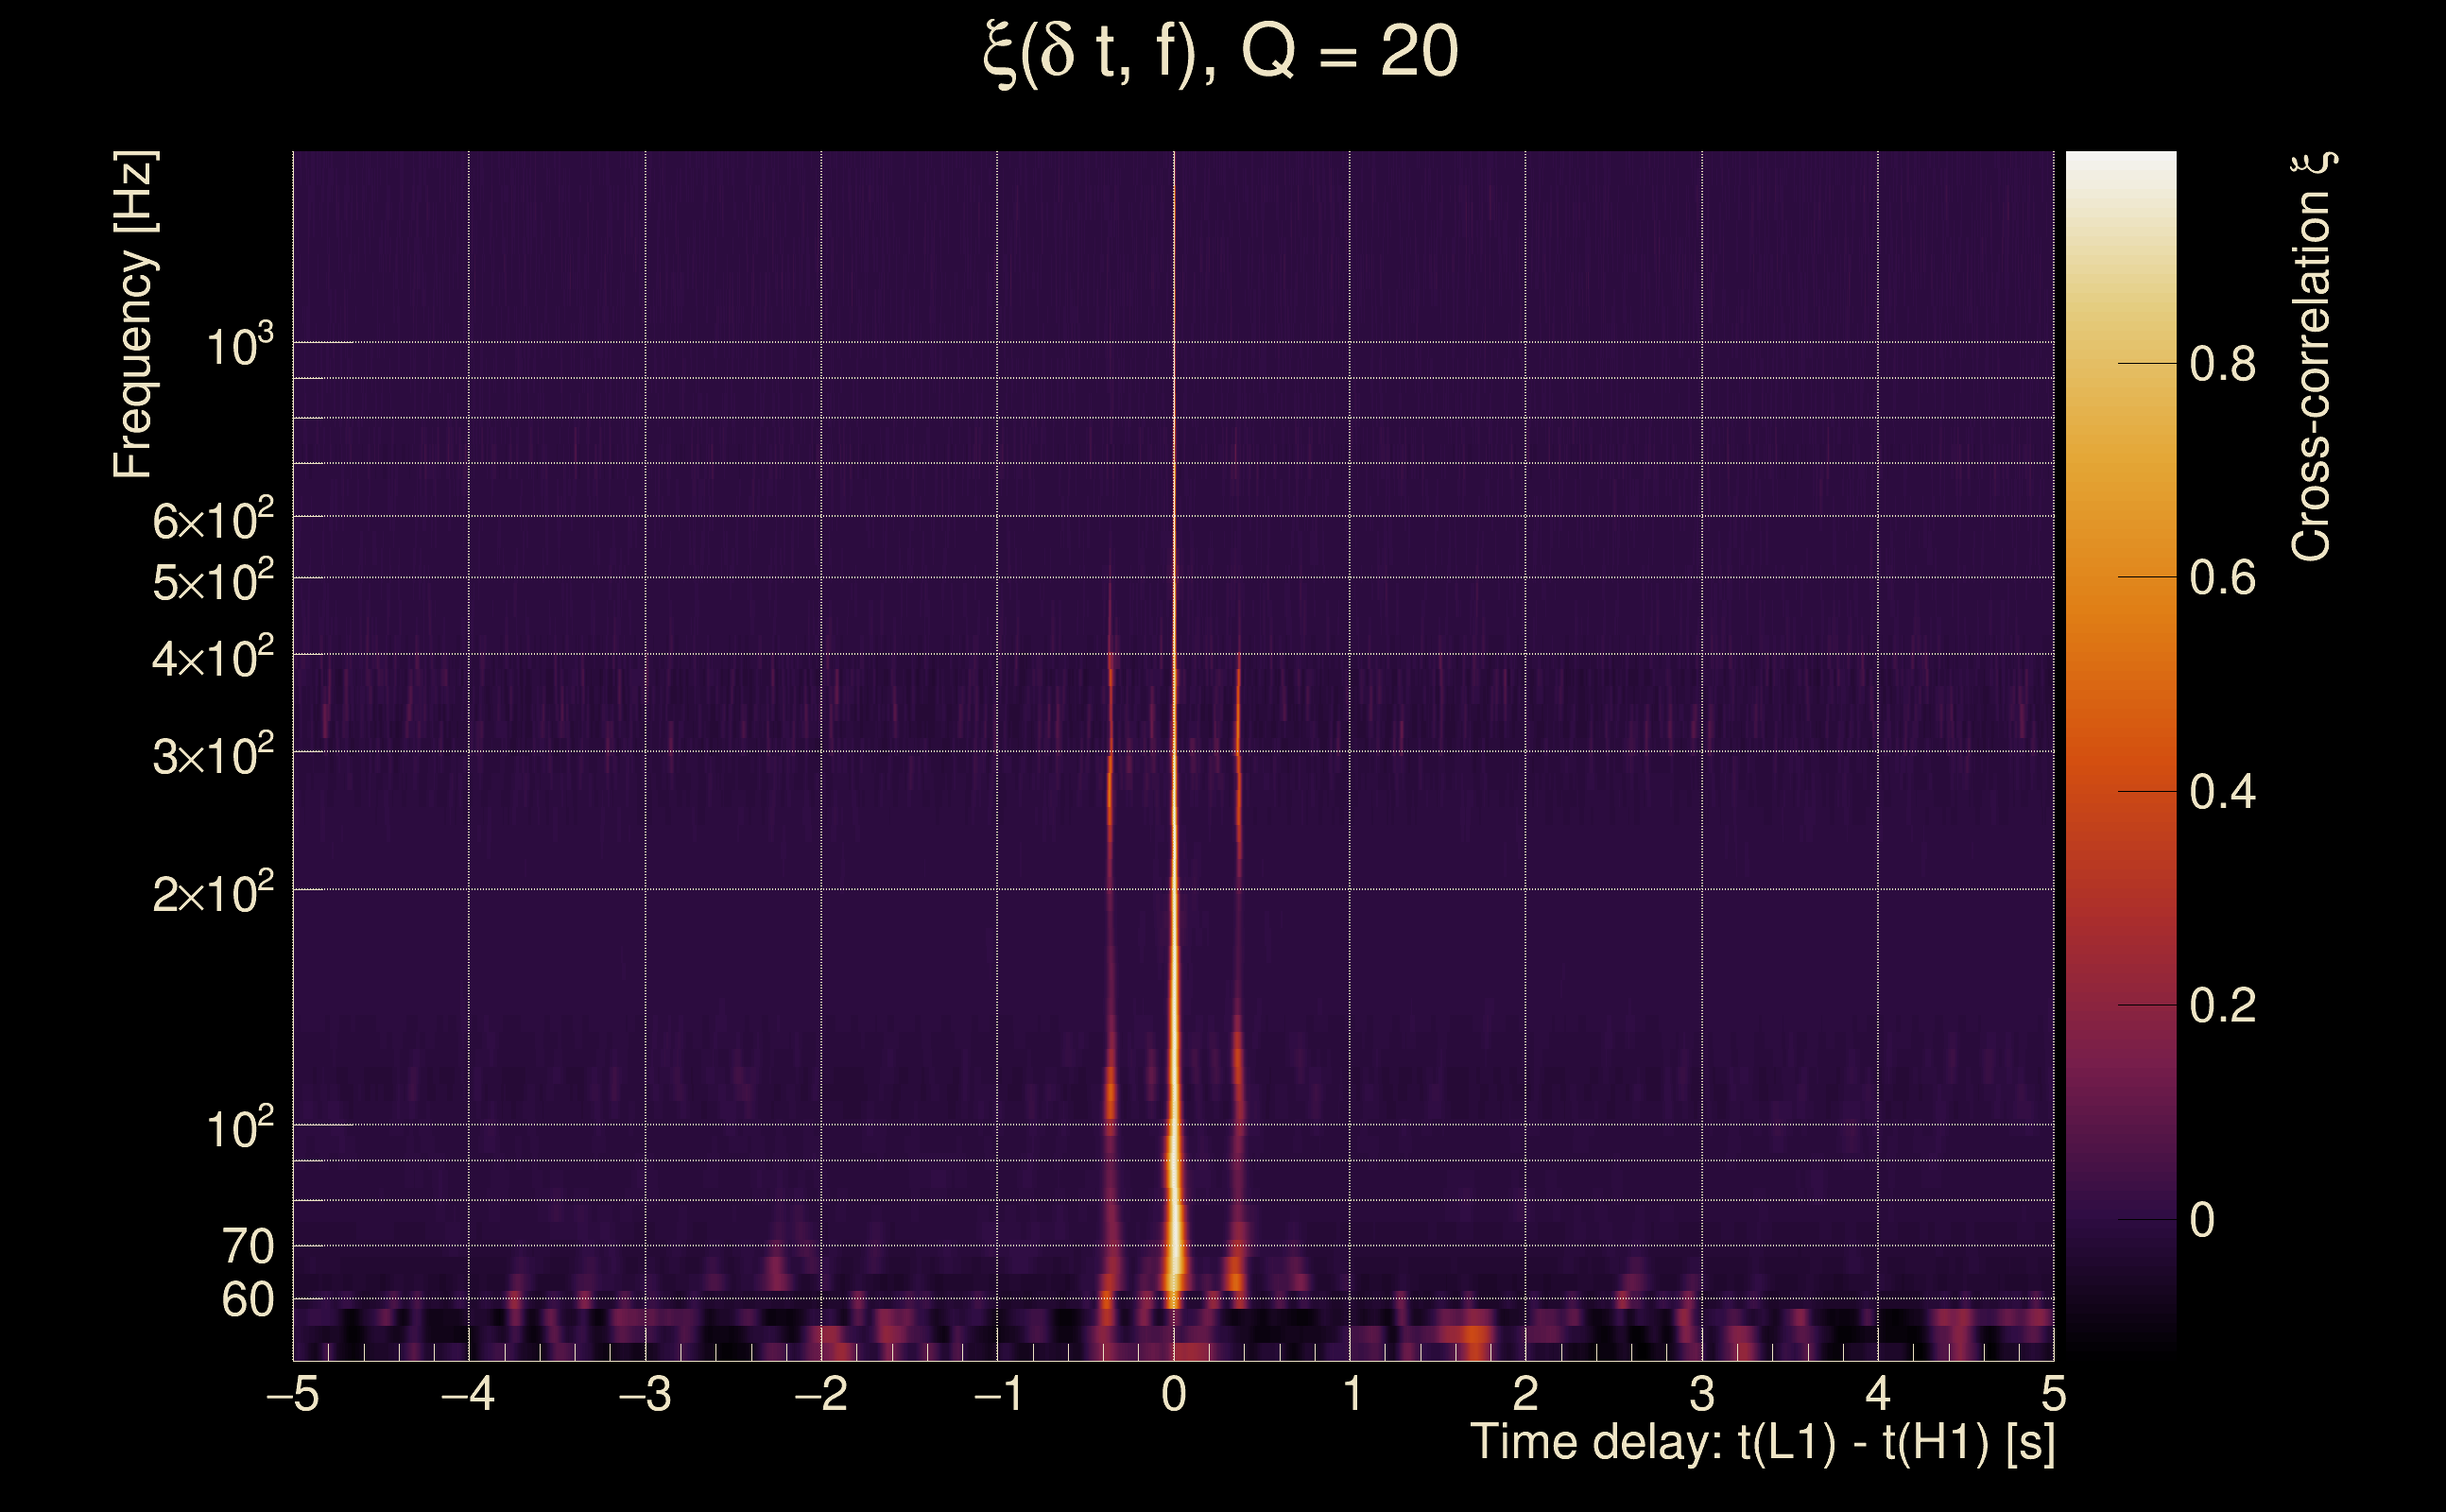
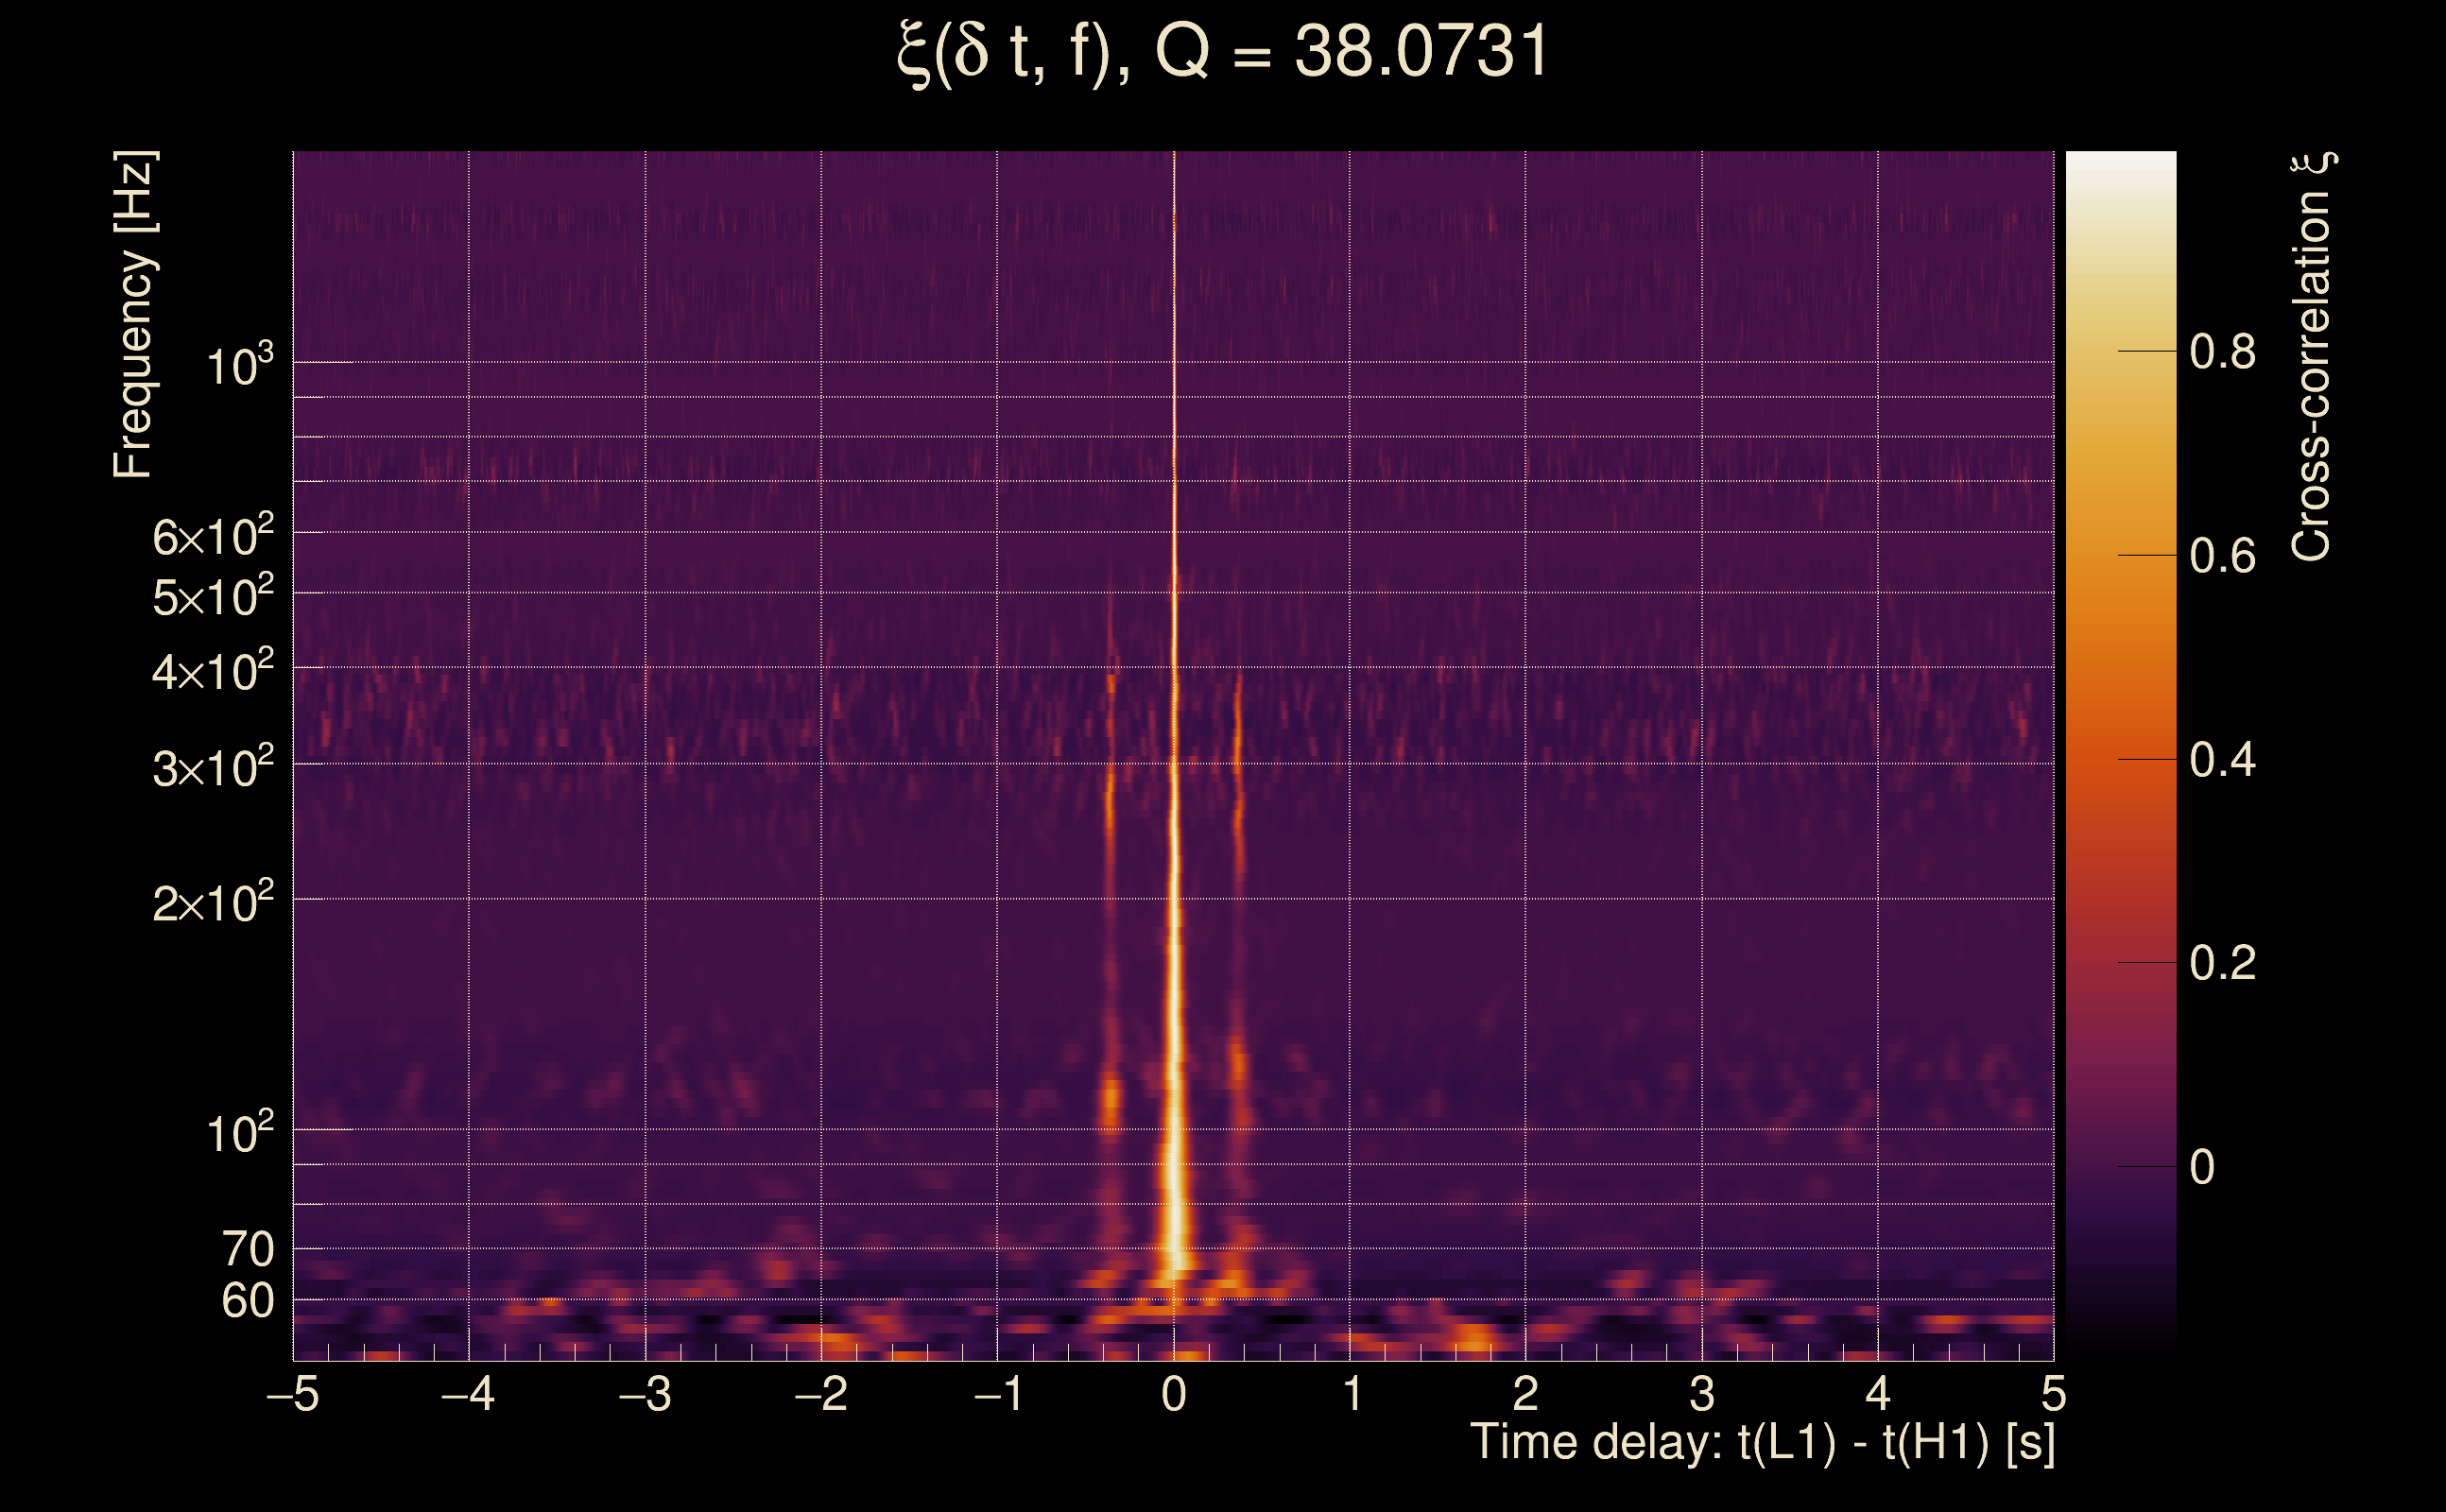
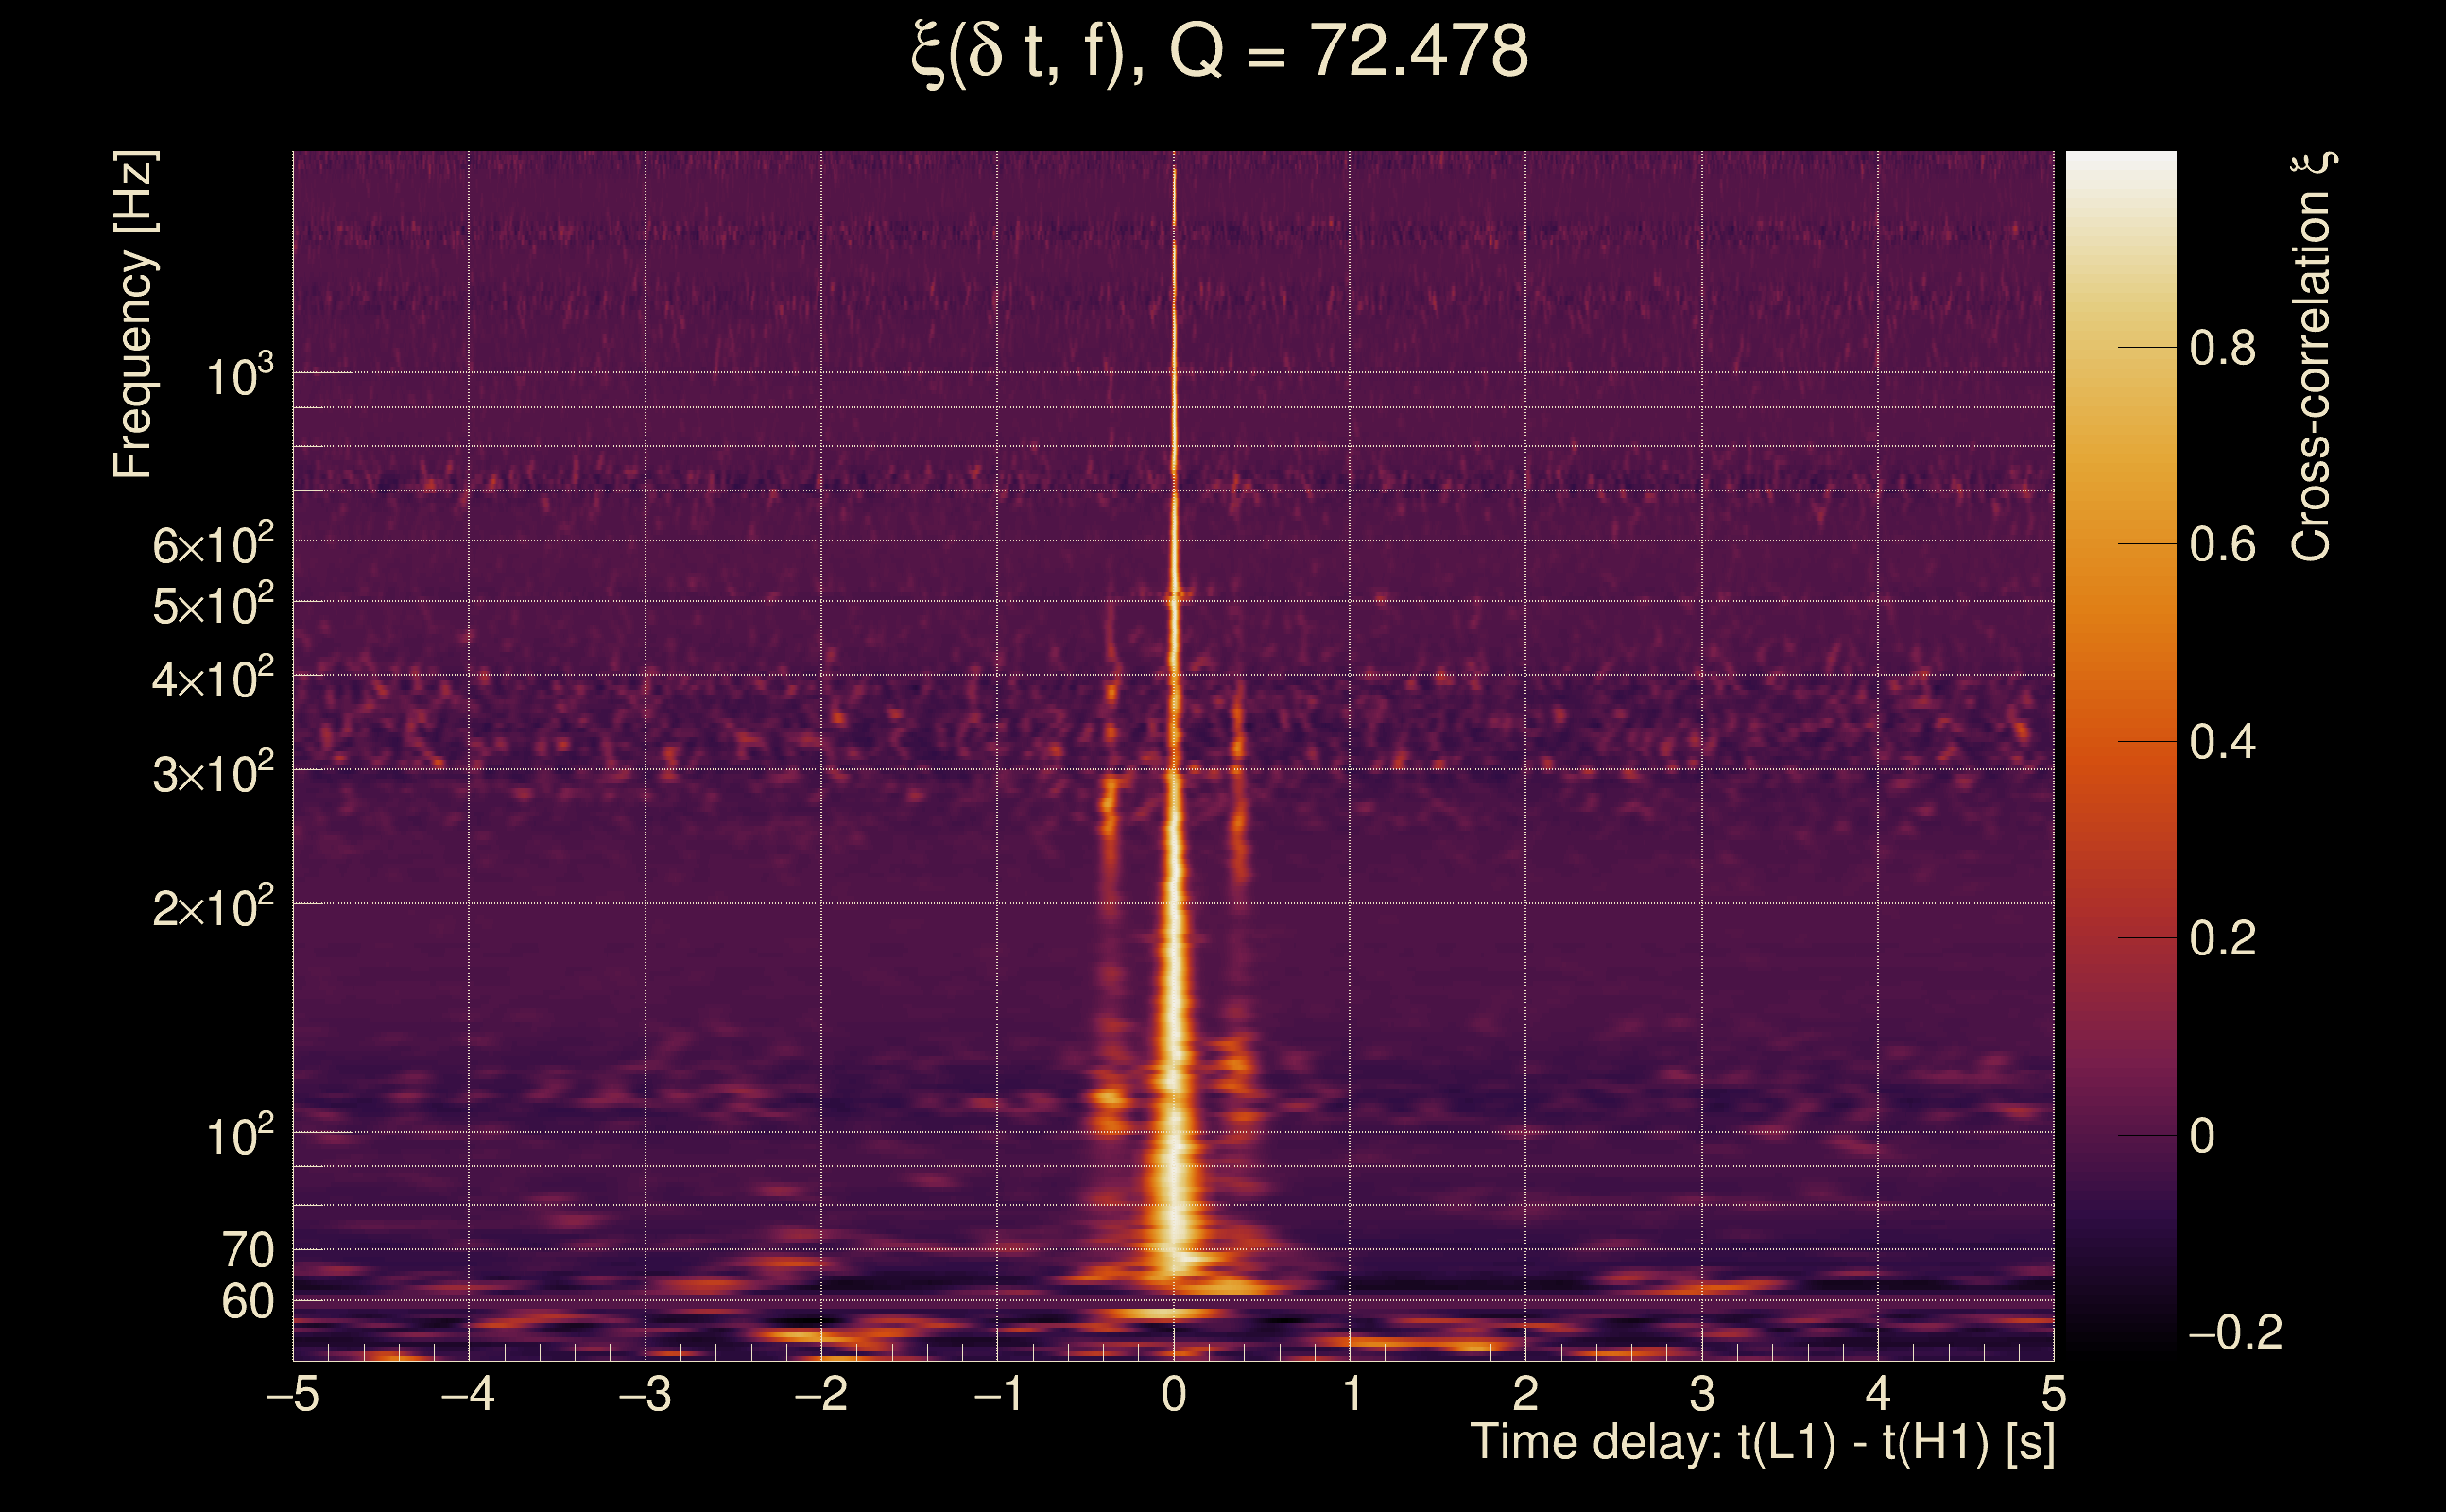
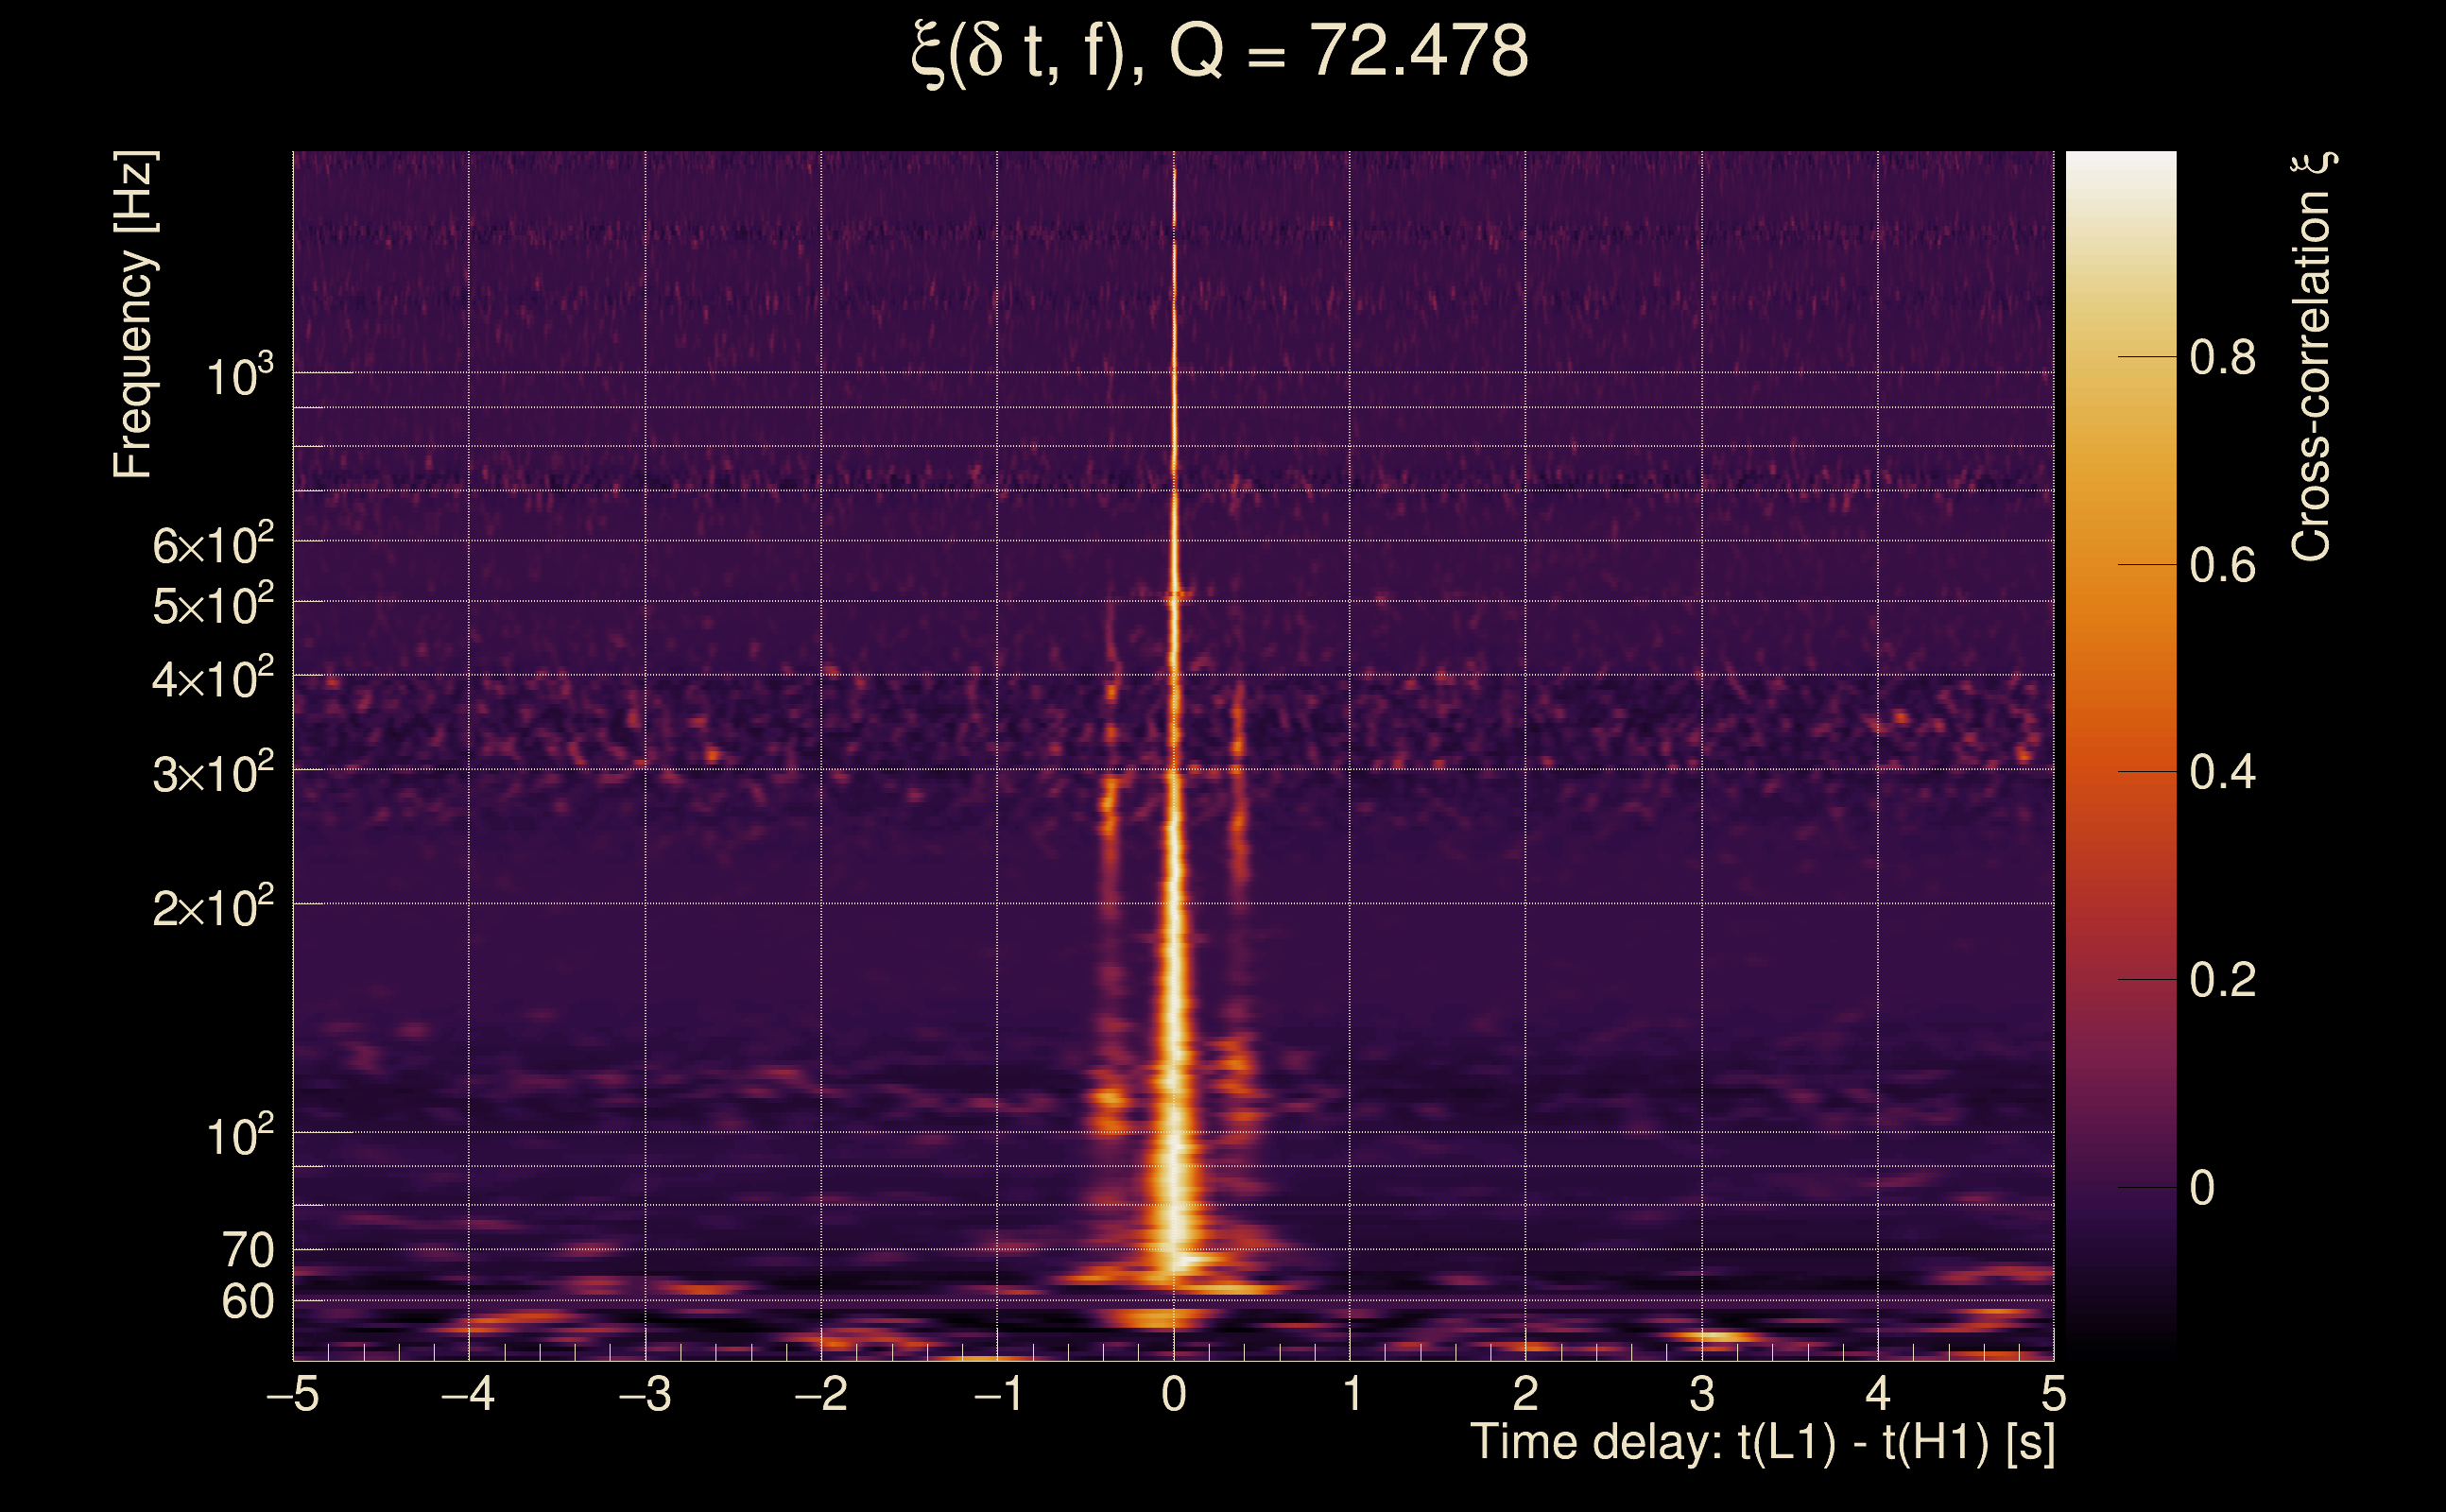
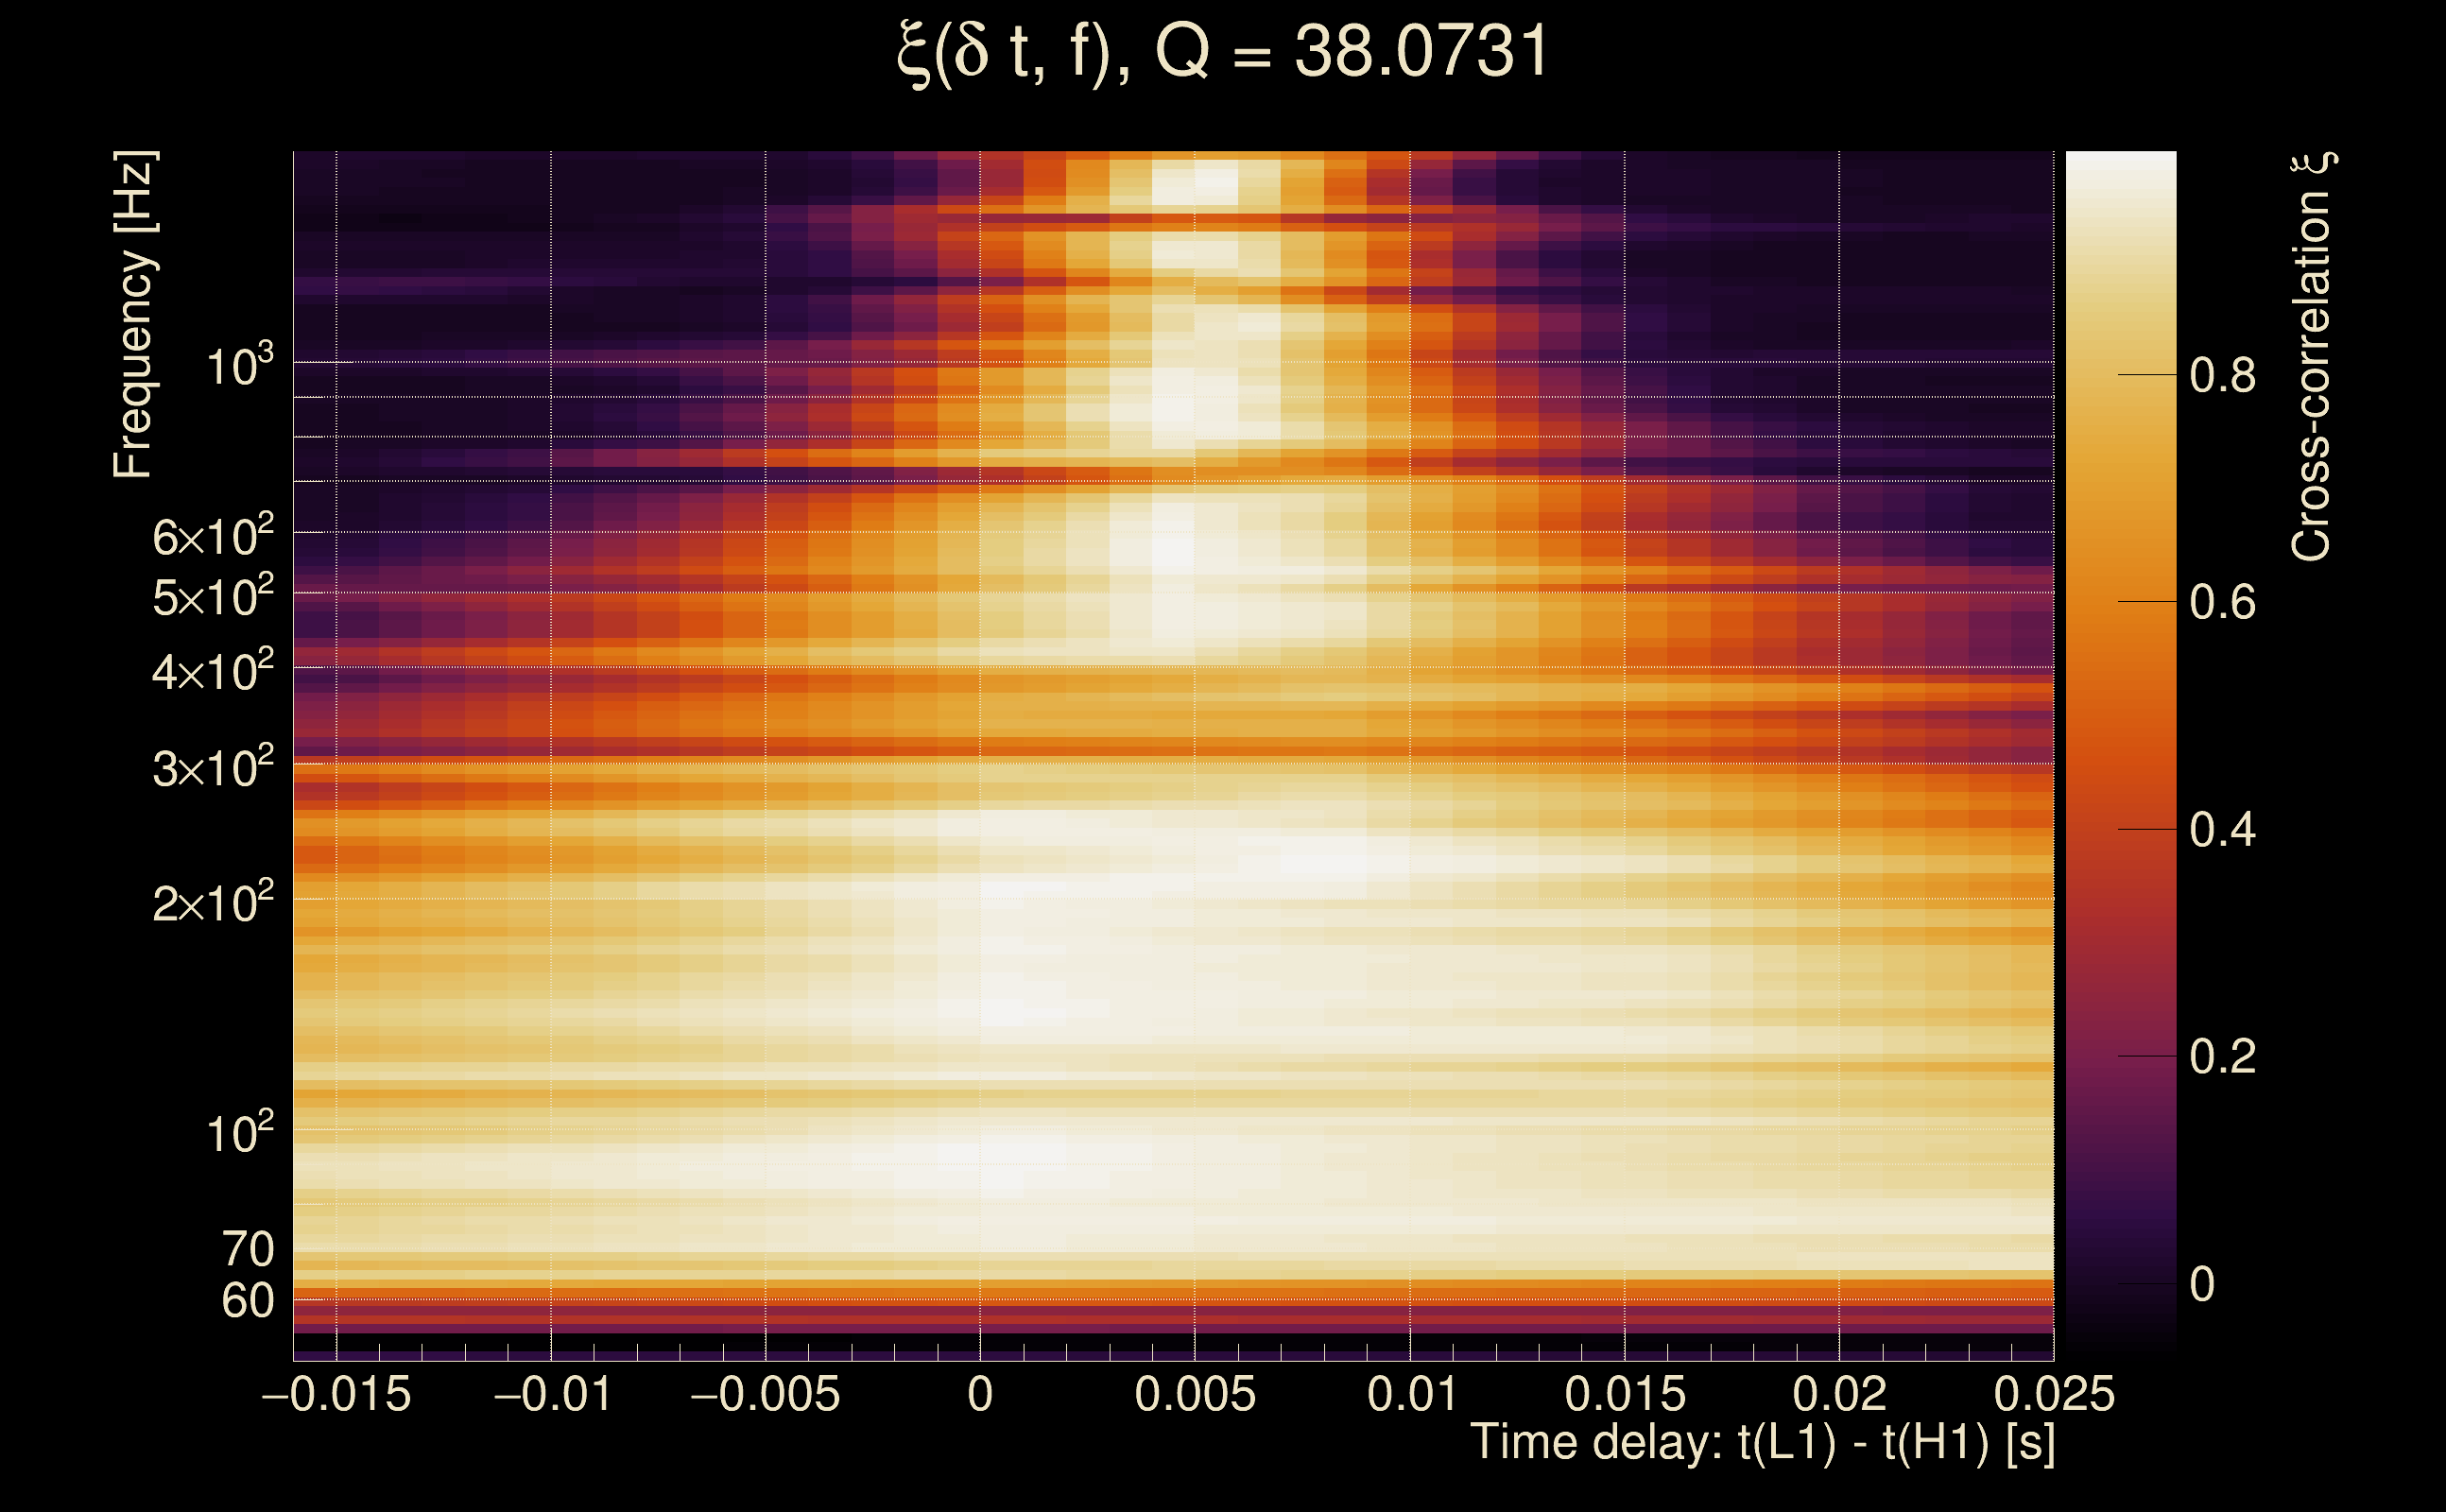
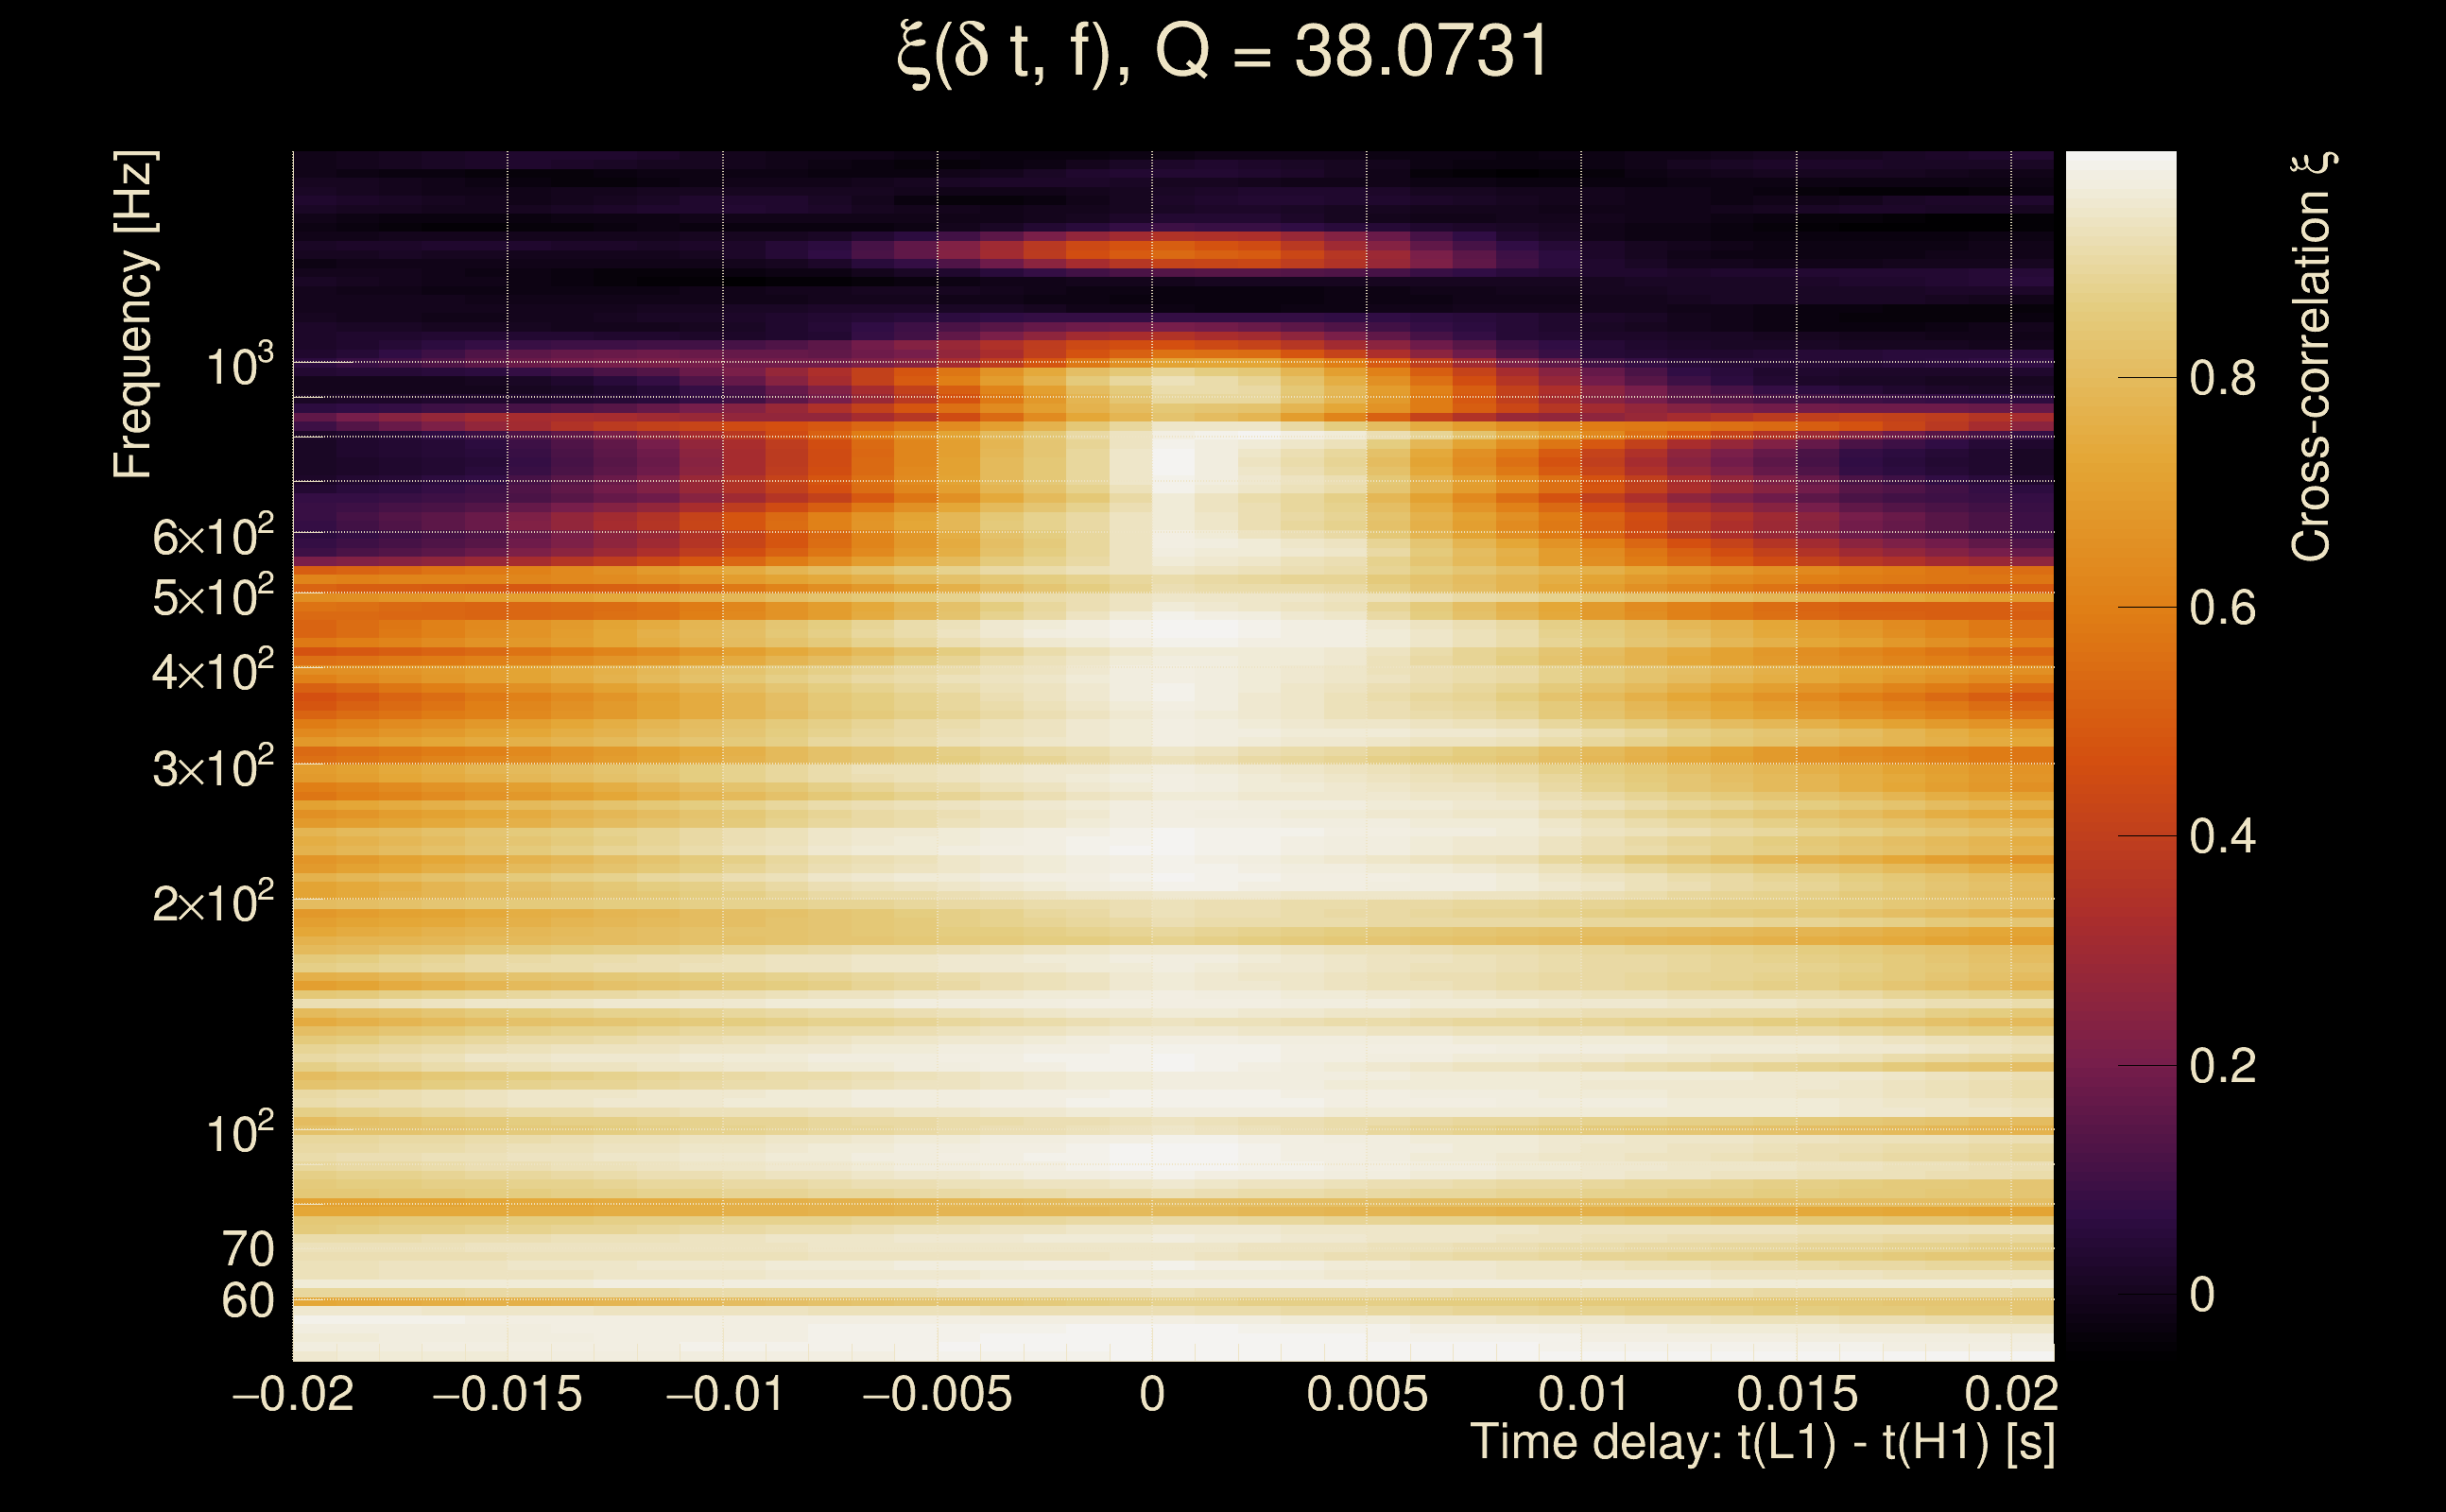
| Time delay between detectors t(L1) - t(H1): | 0.00490869 s (slice index = 108 / 217), δt_gw = 0.00490869 s |
| Time delay standard deviation: | 0.0215934 s |
| [targeted mode] Time delay probability: | 0.970004 (0.0376033 sigmas), δt_target = 1.72247e+45 s |
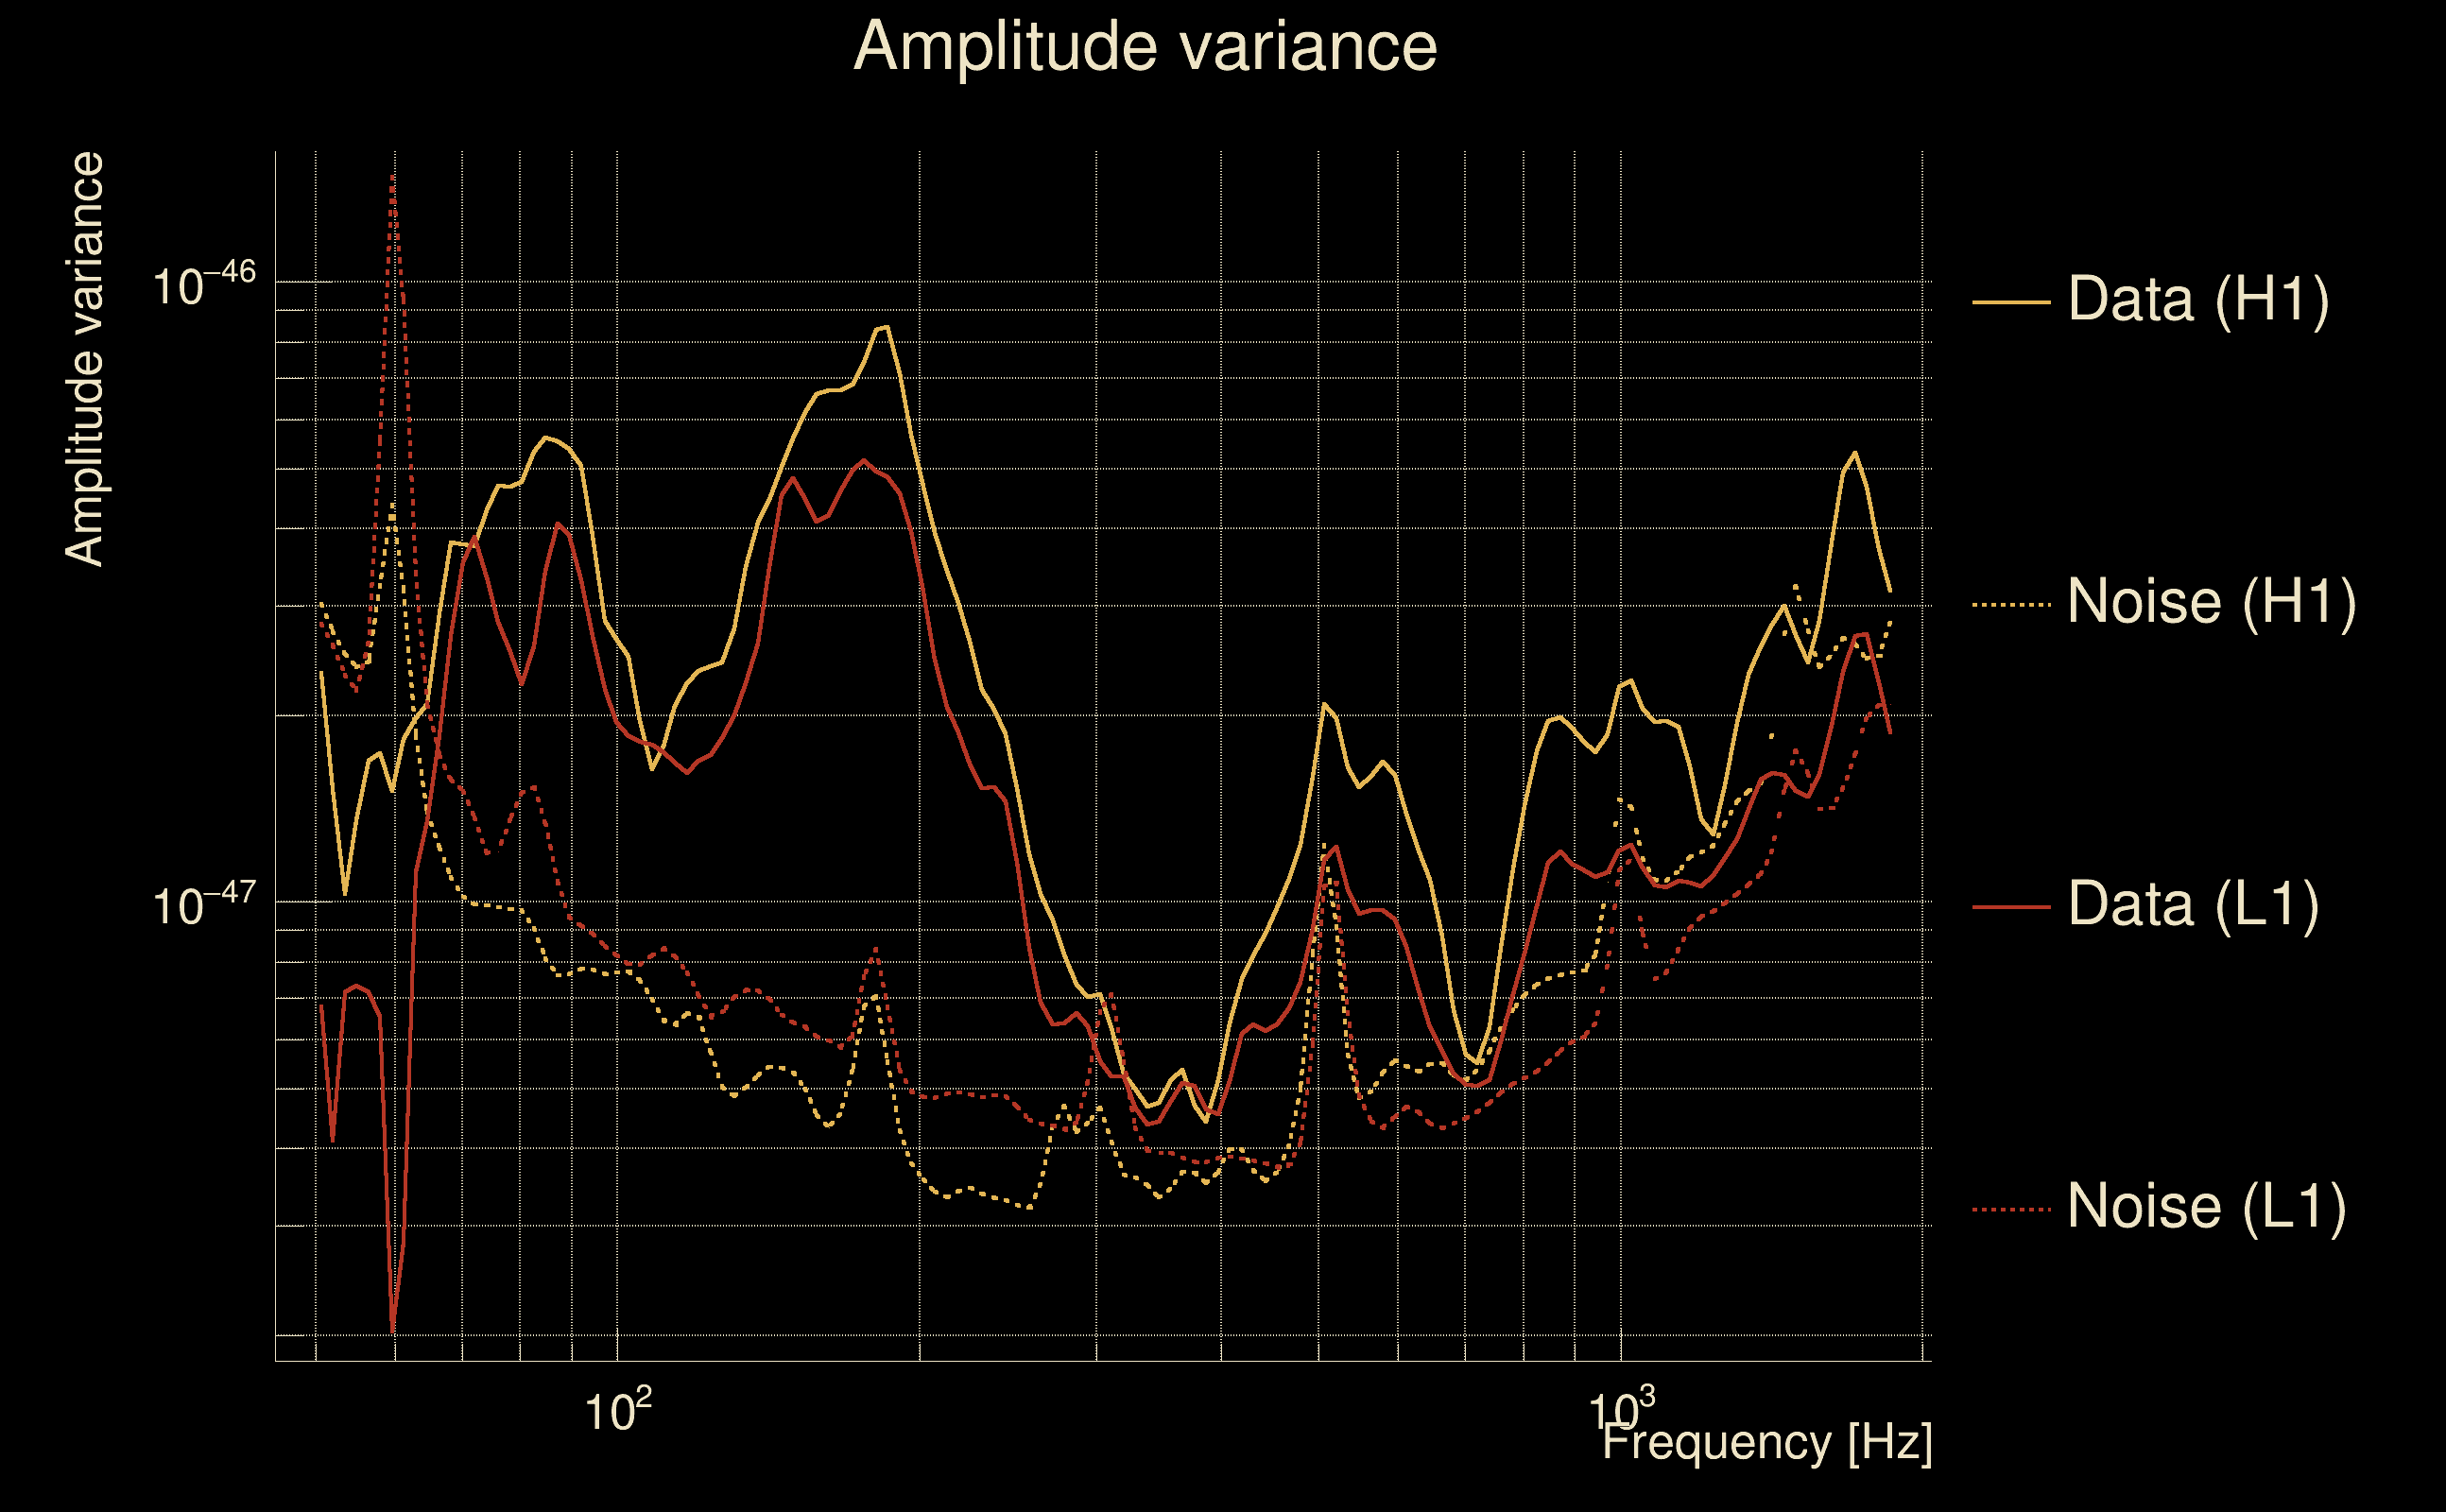
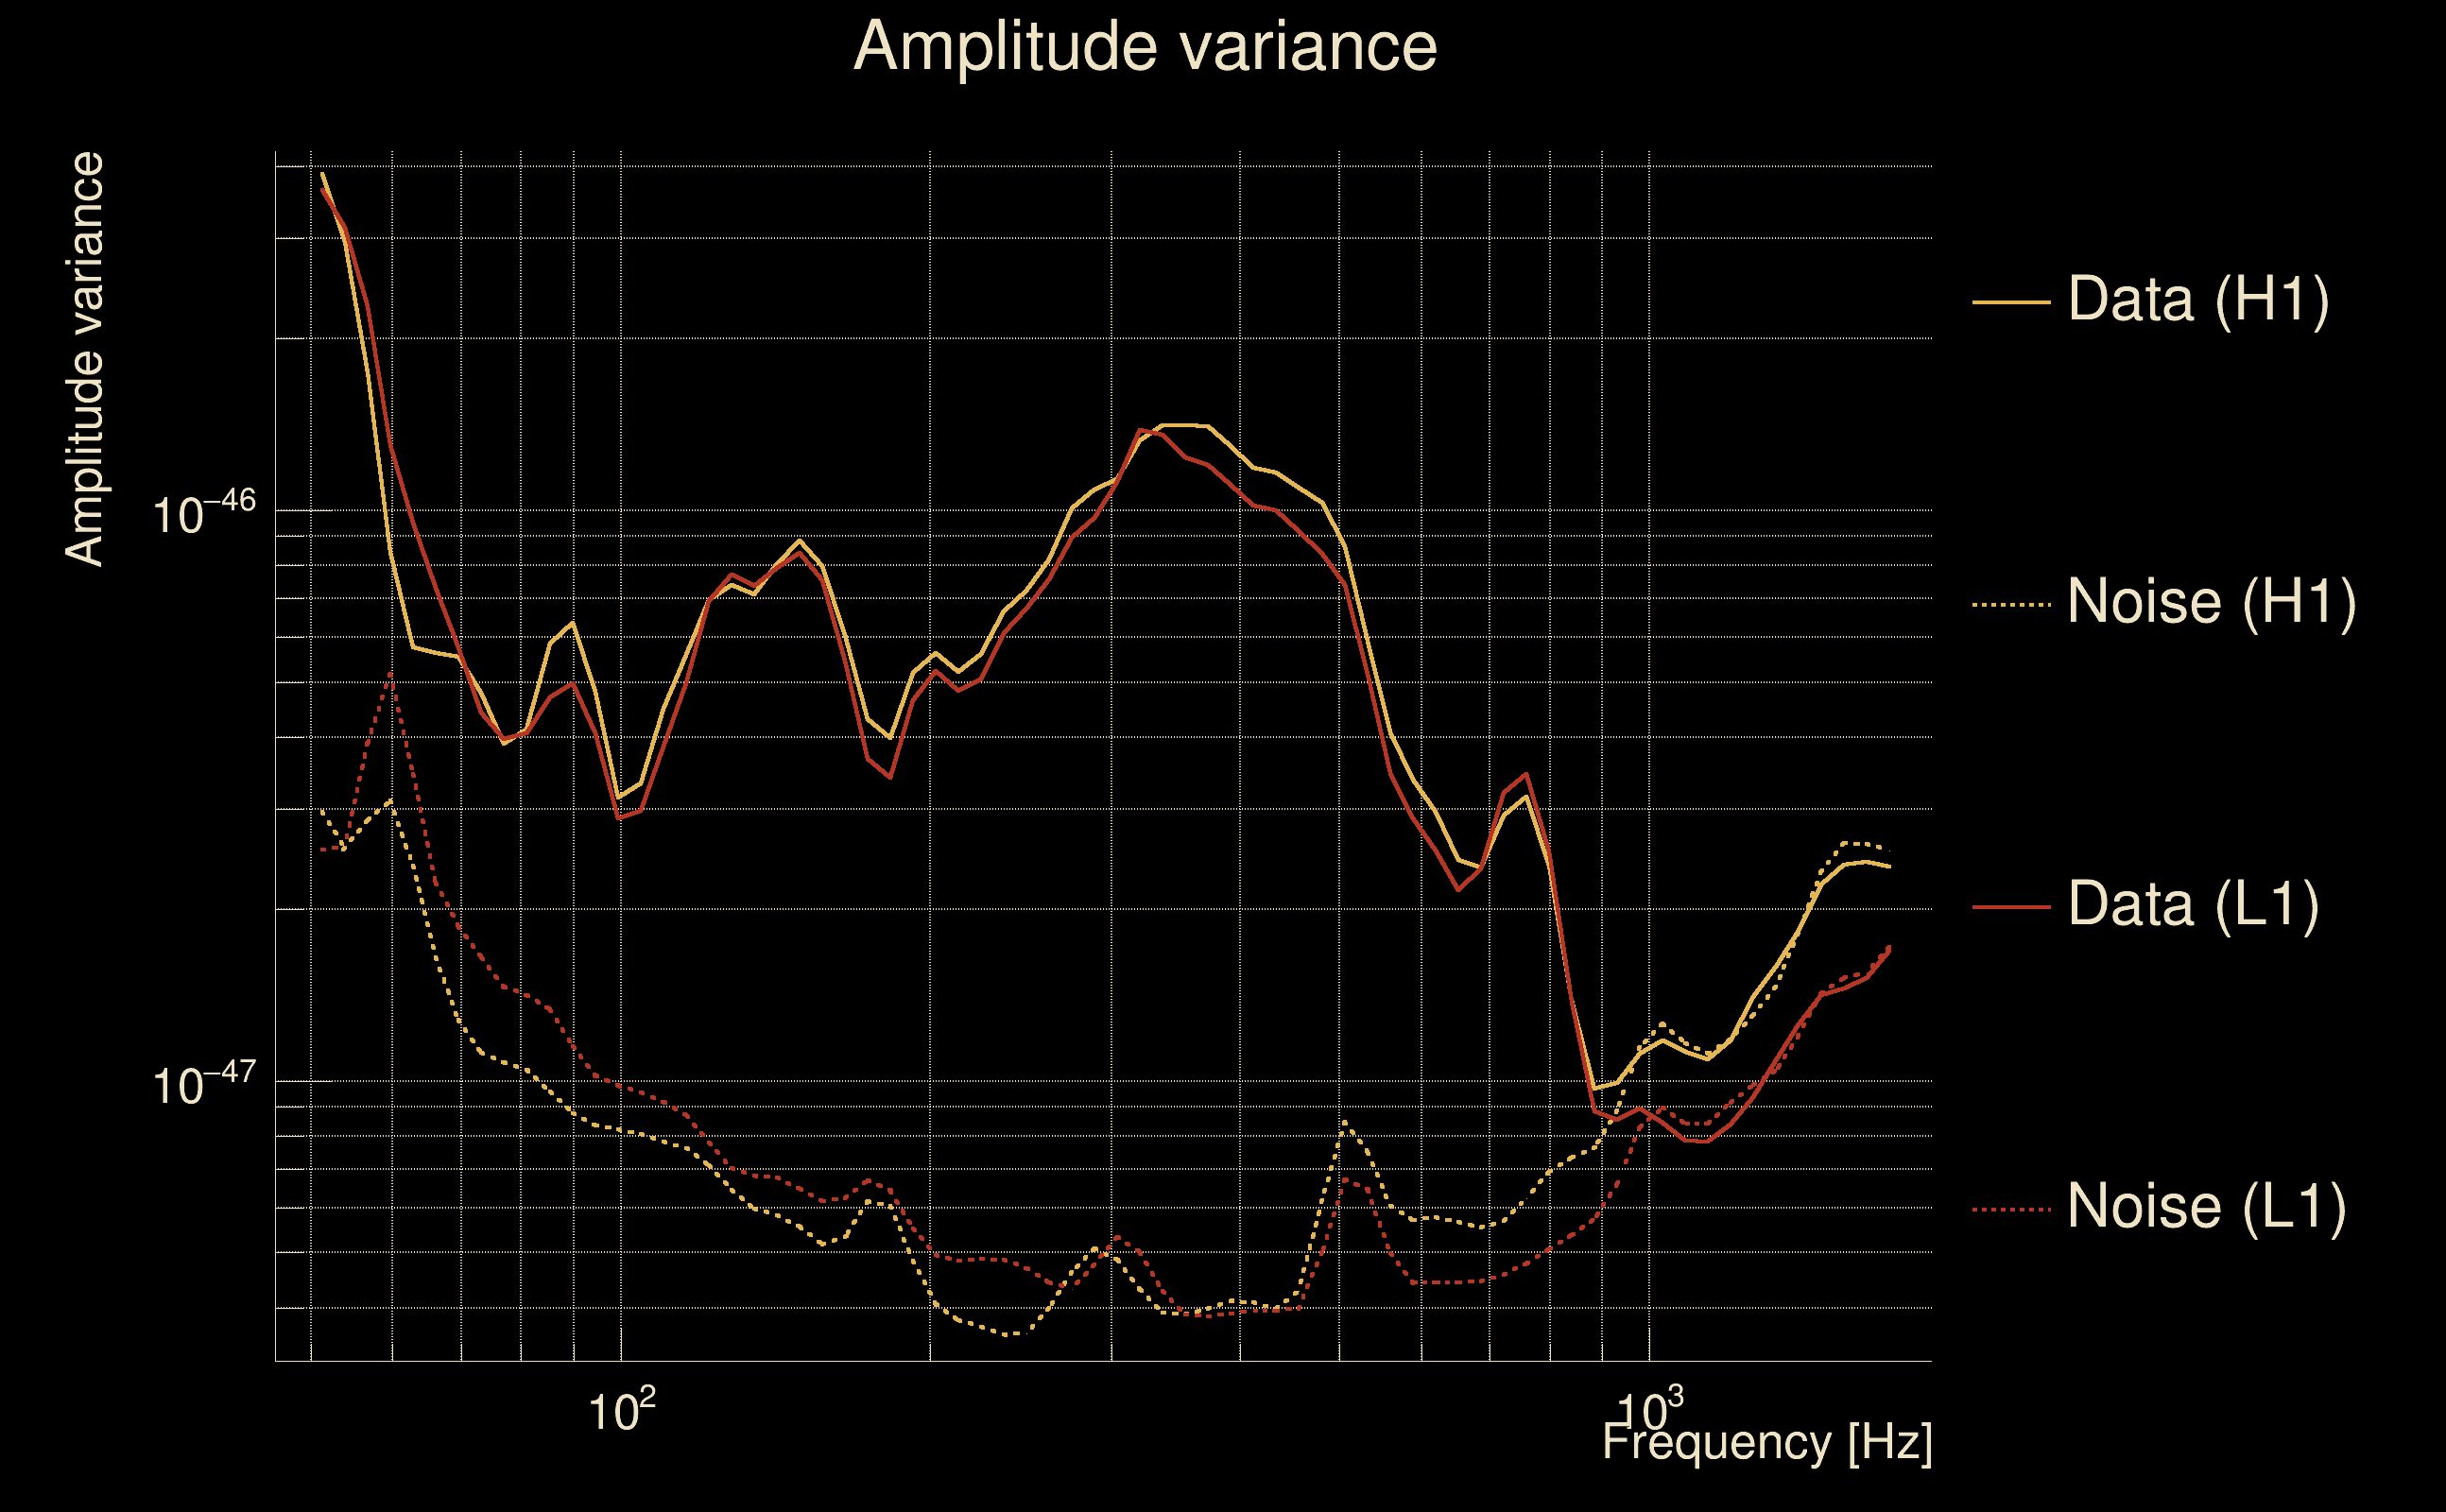
| Frequency: | 315.969 Hz |
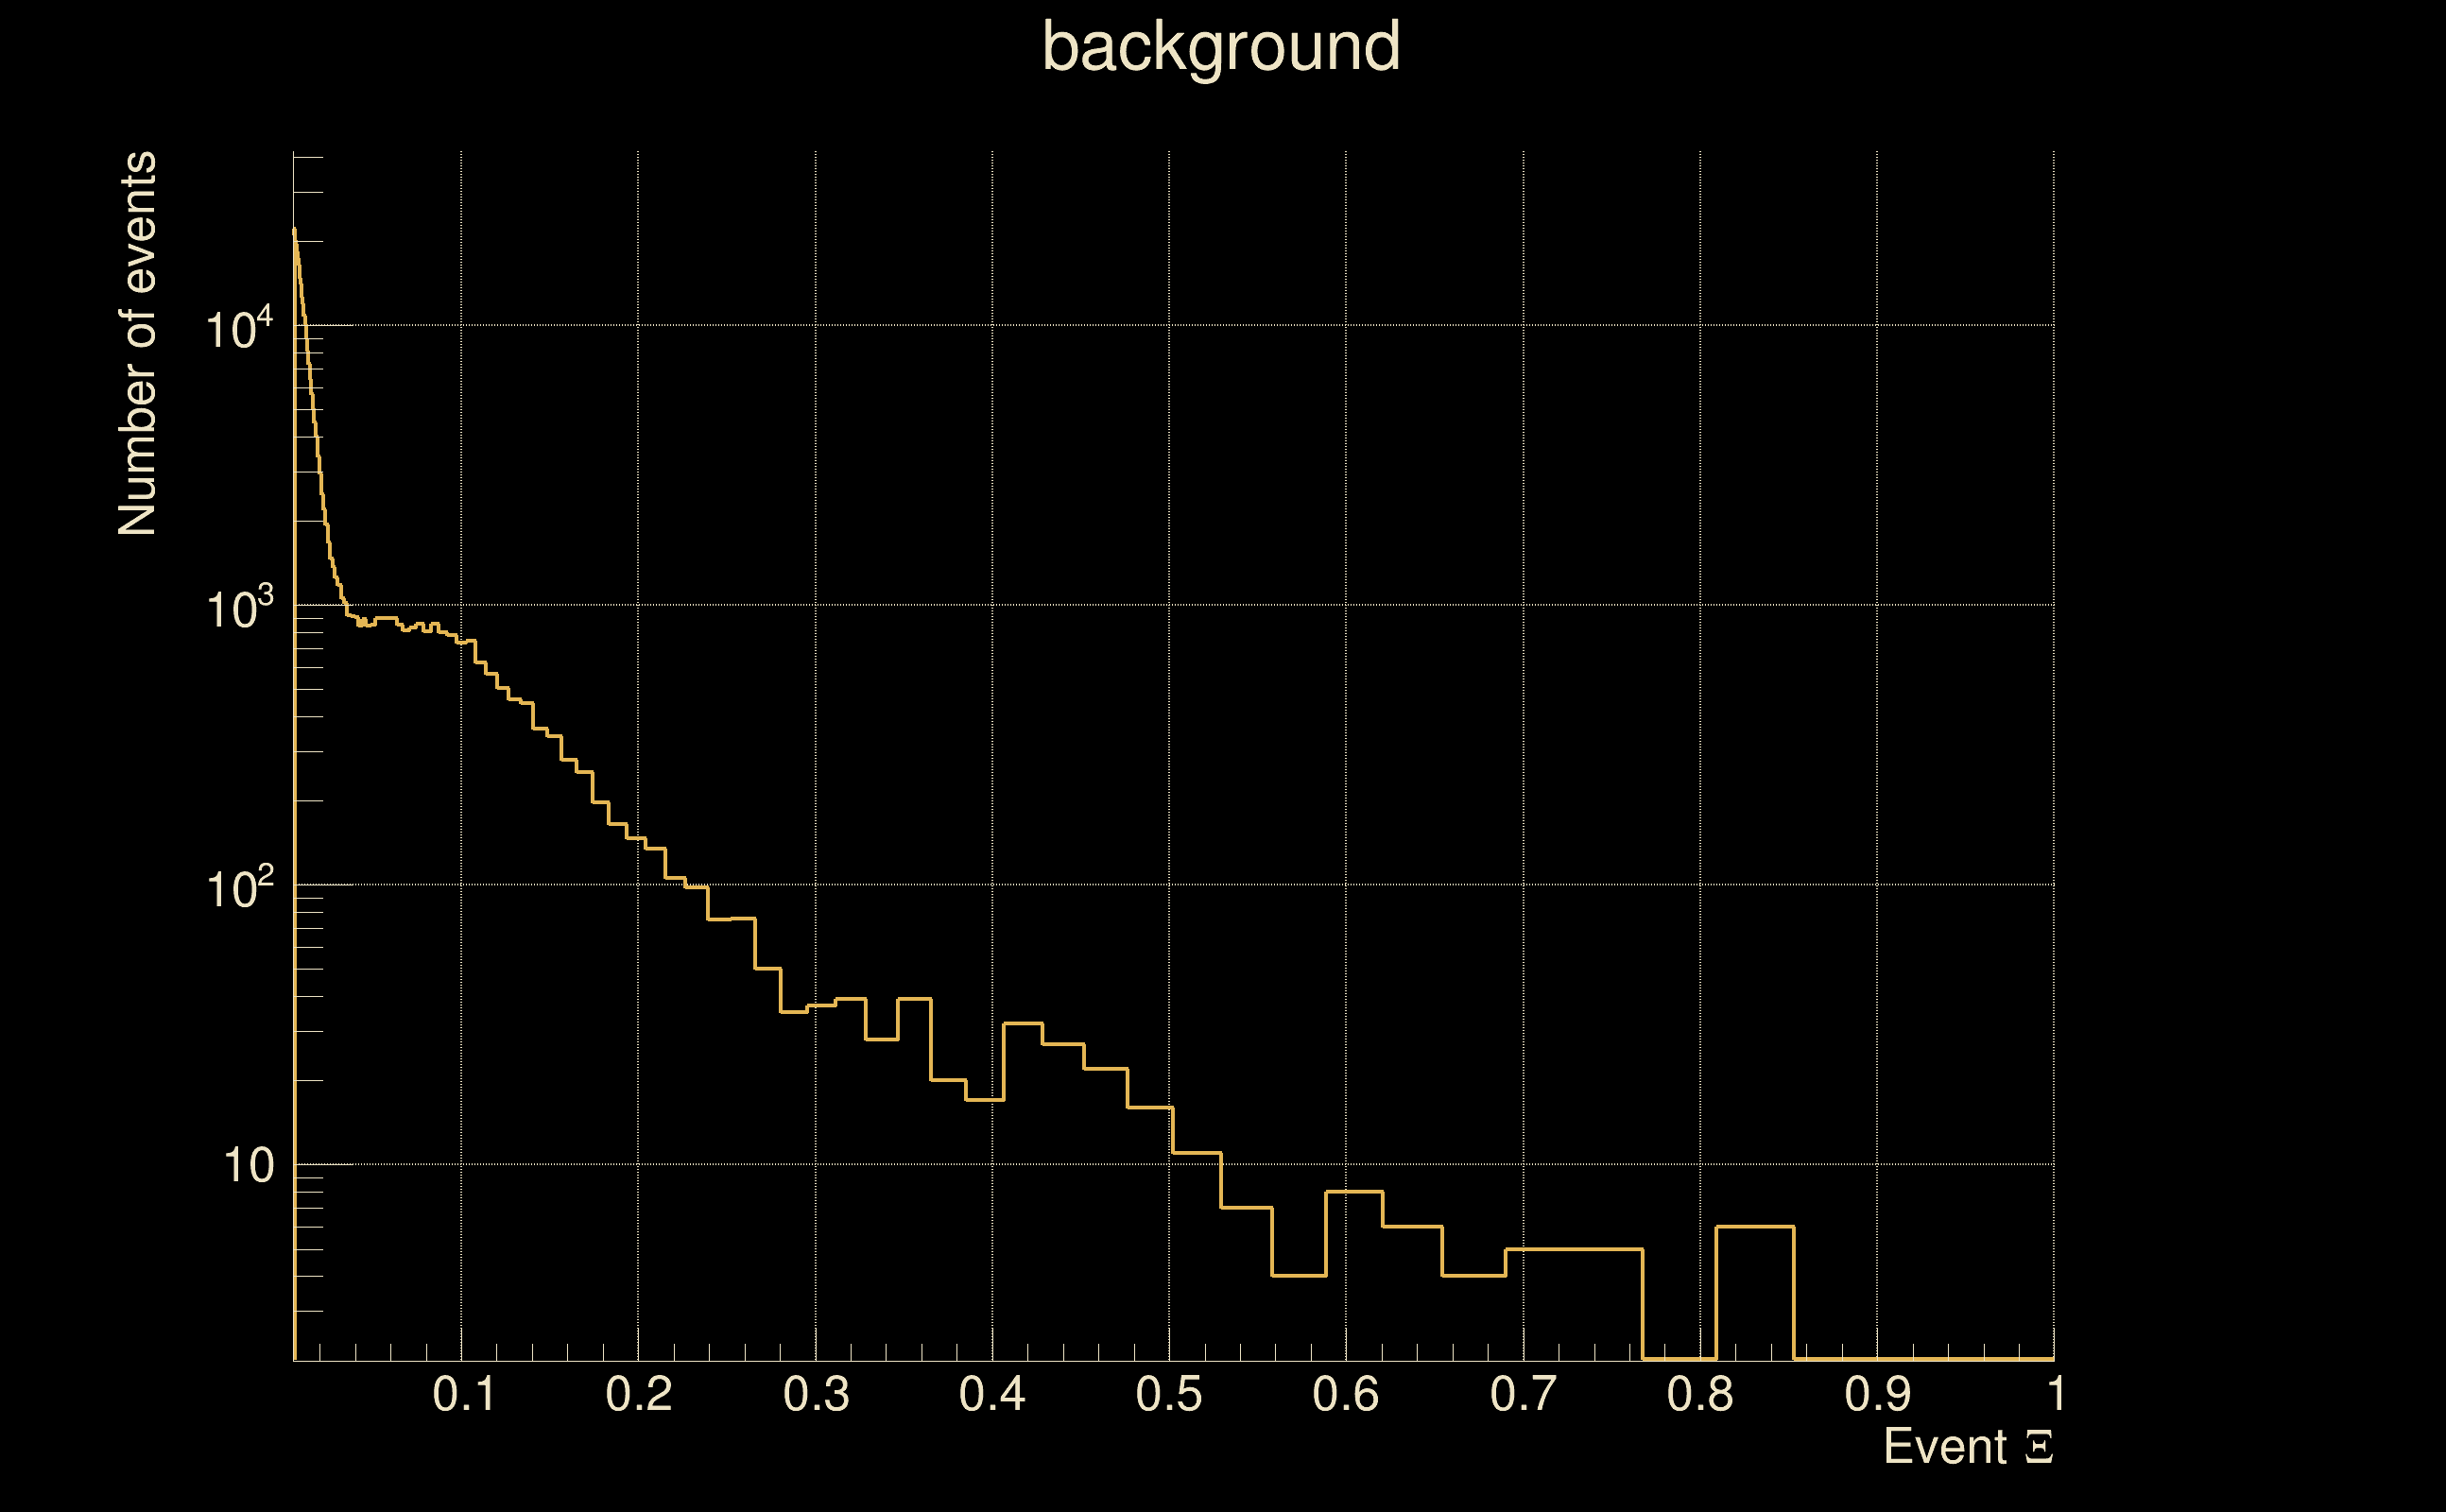
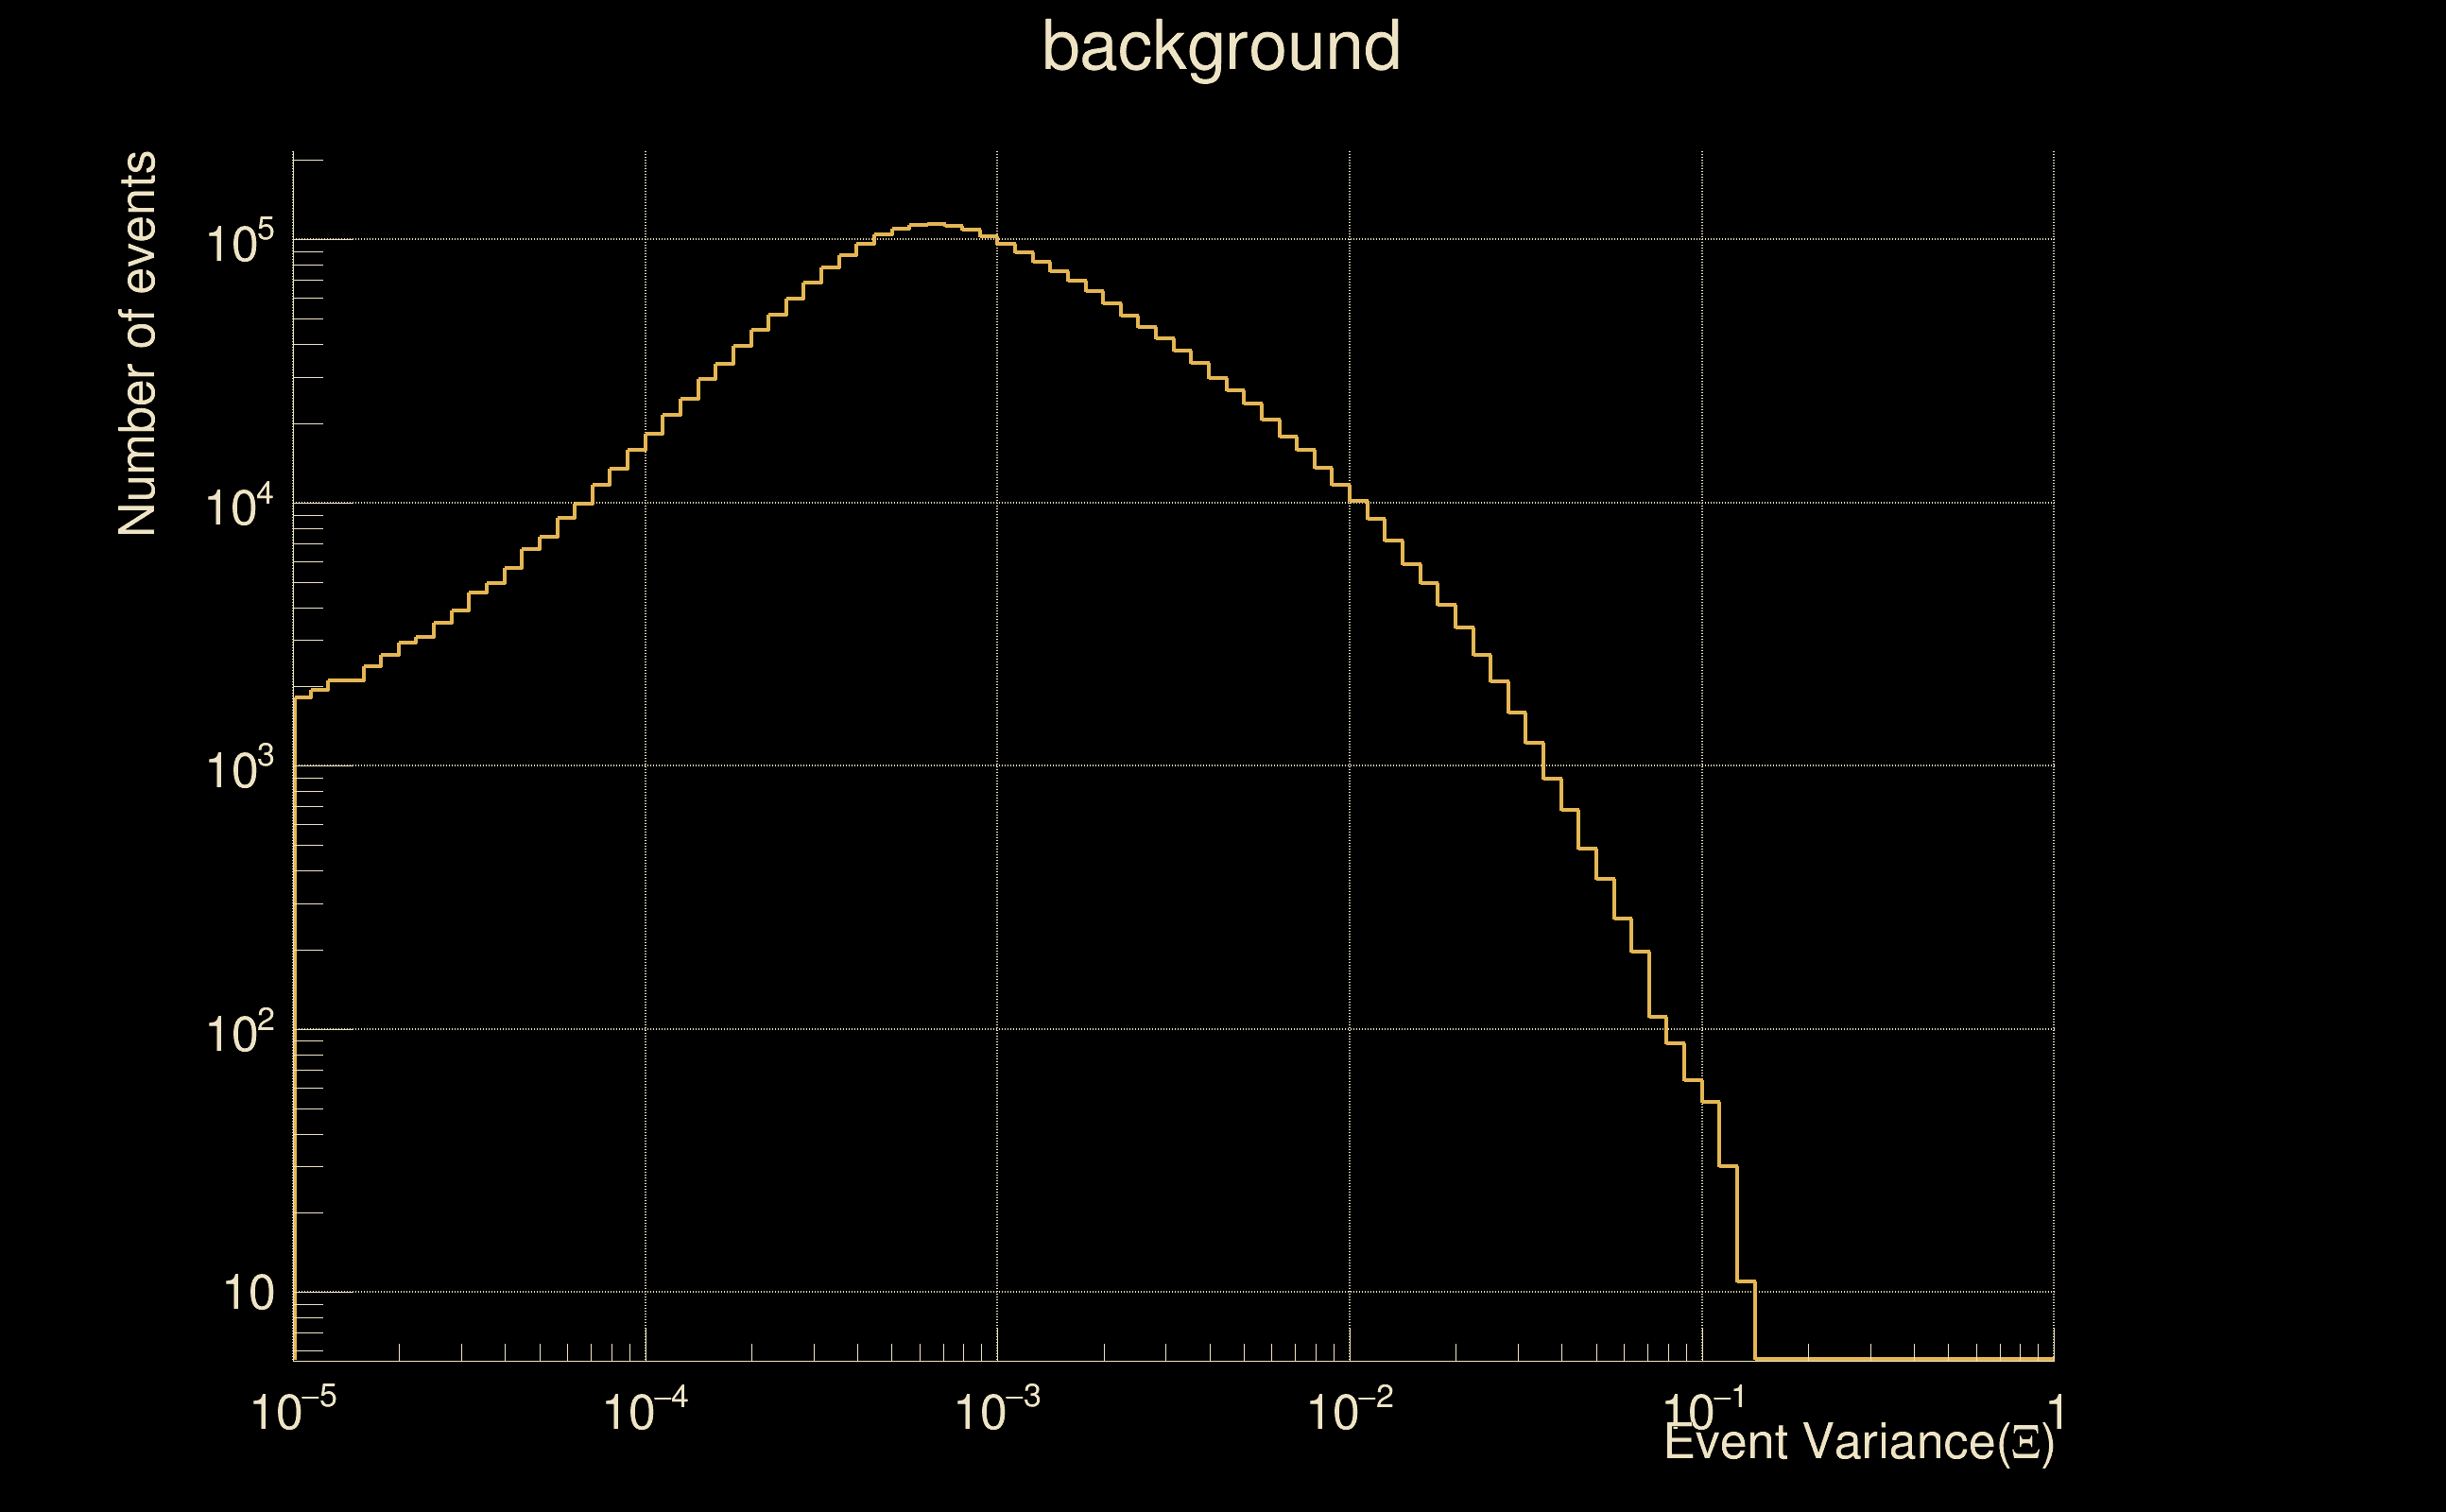
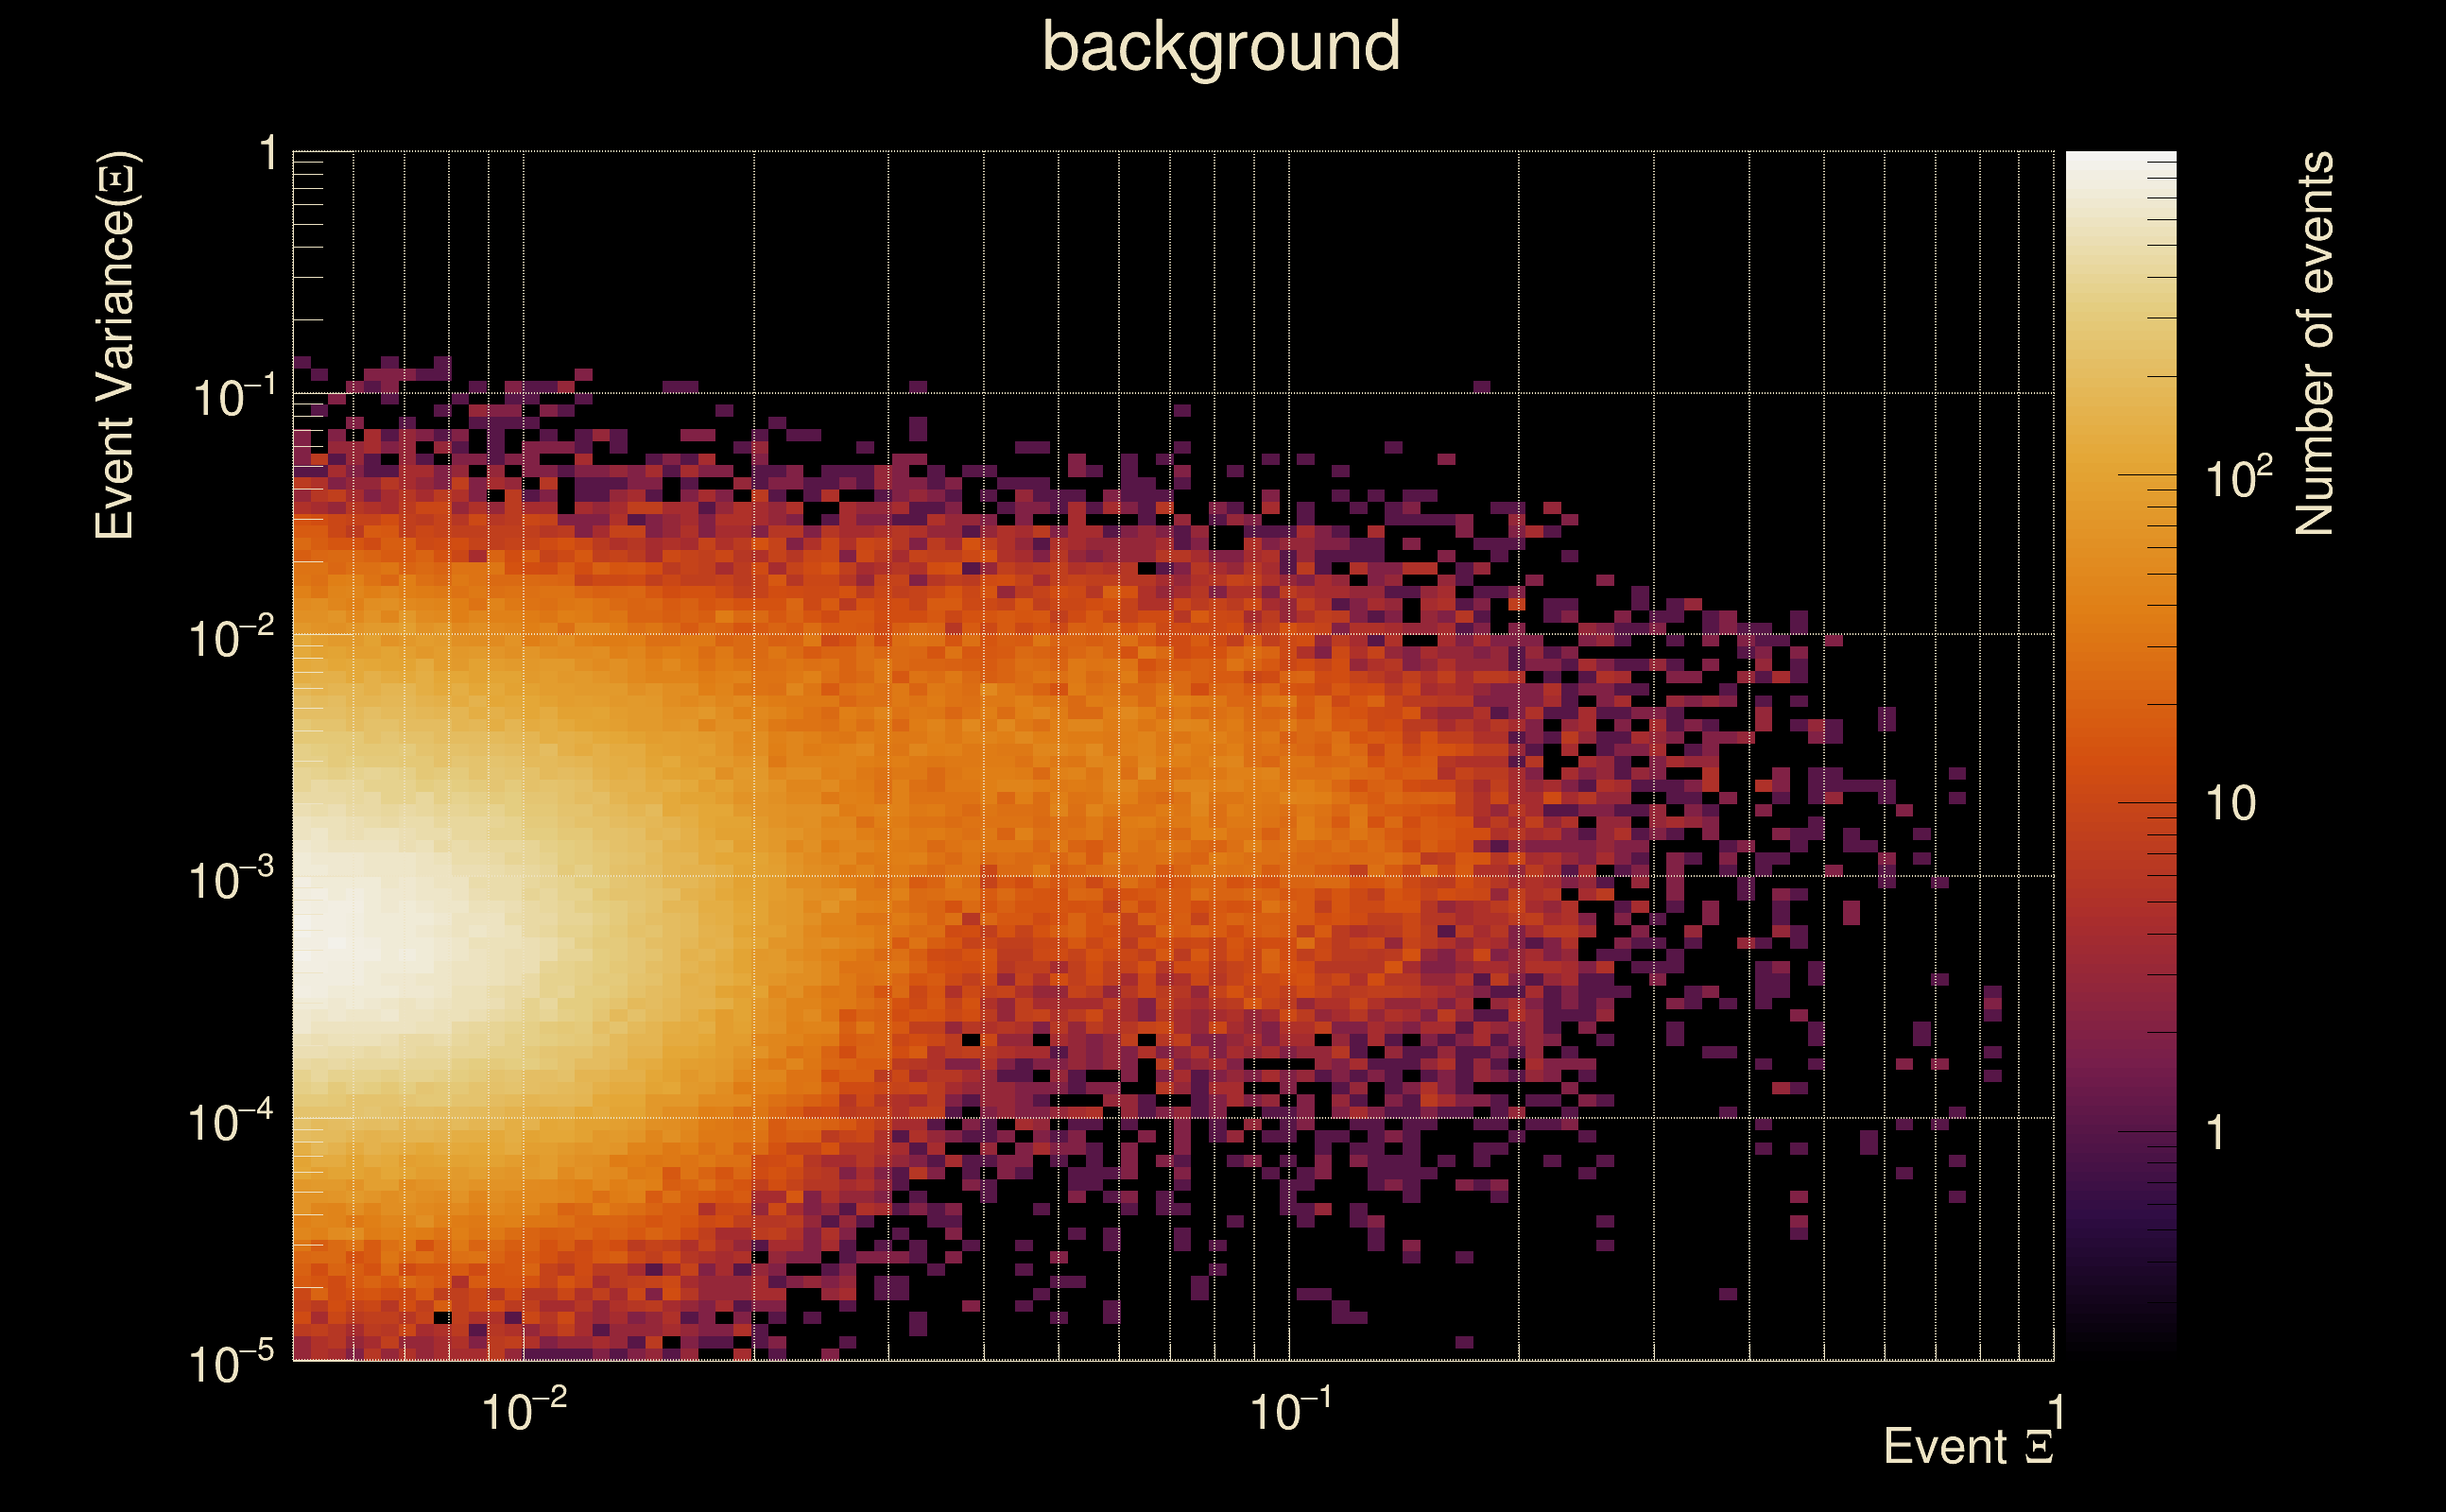
| Ξ: | 0.920869 ± 0.0199947 (variance = 0.000399787): Q0: 0.968098, Q1: 0.968004, Q2: 0.953273, Q3: 0.936465, Q4: 0.915836 |
| Rank: | R_A = 0.844812 |
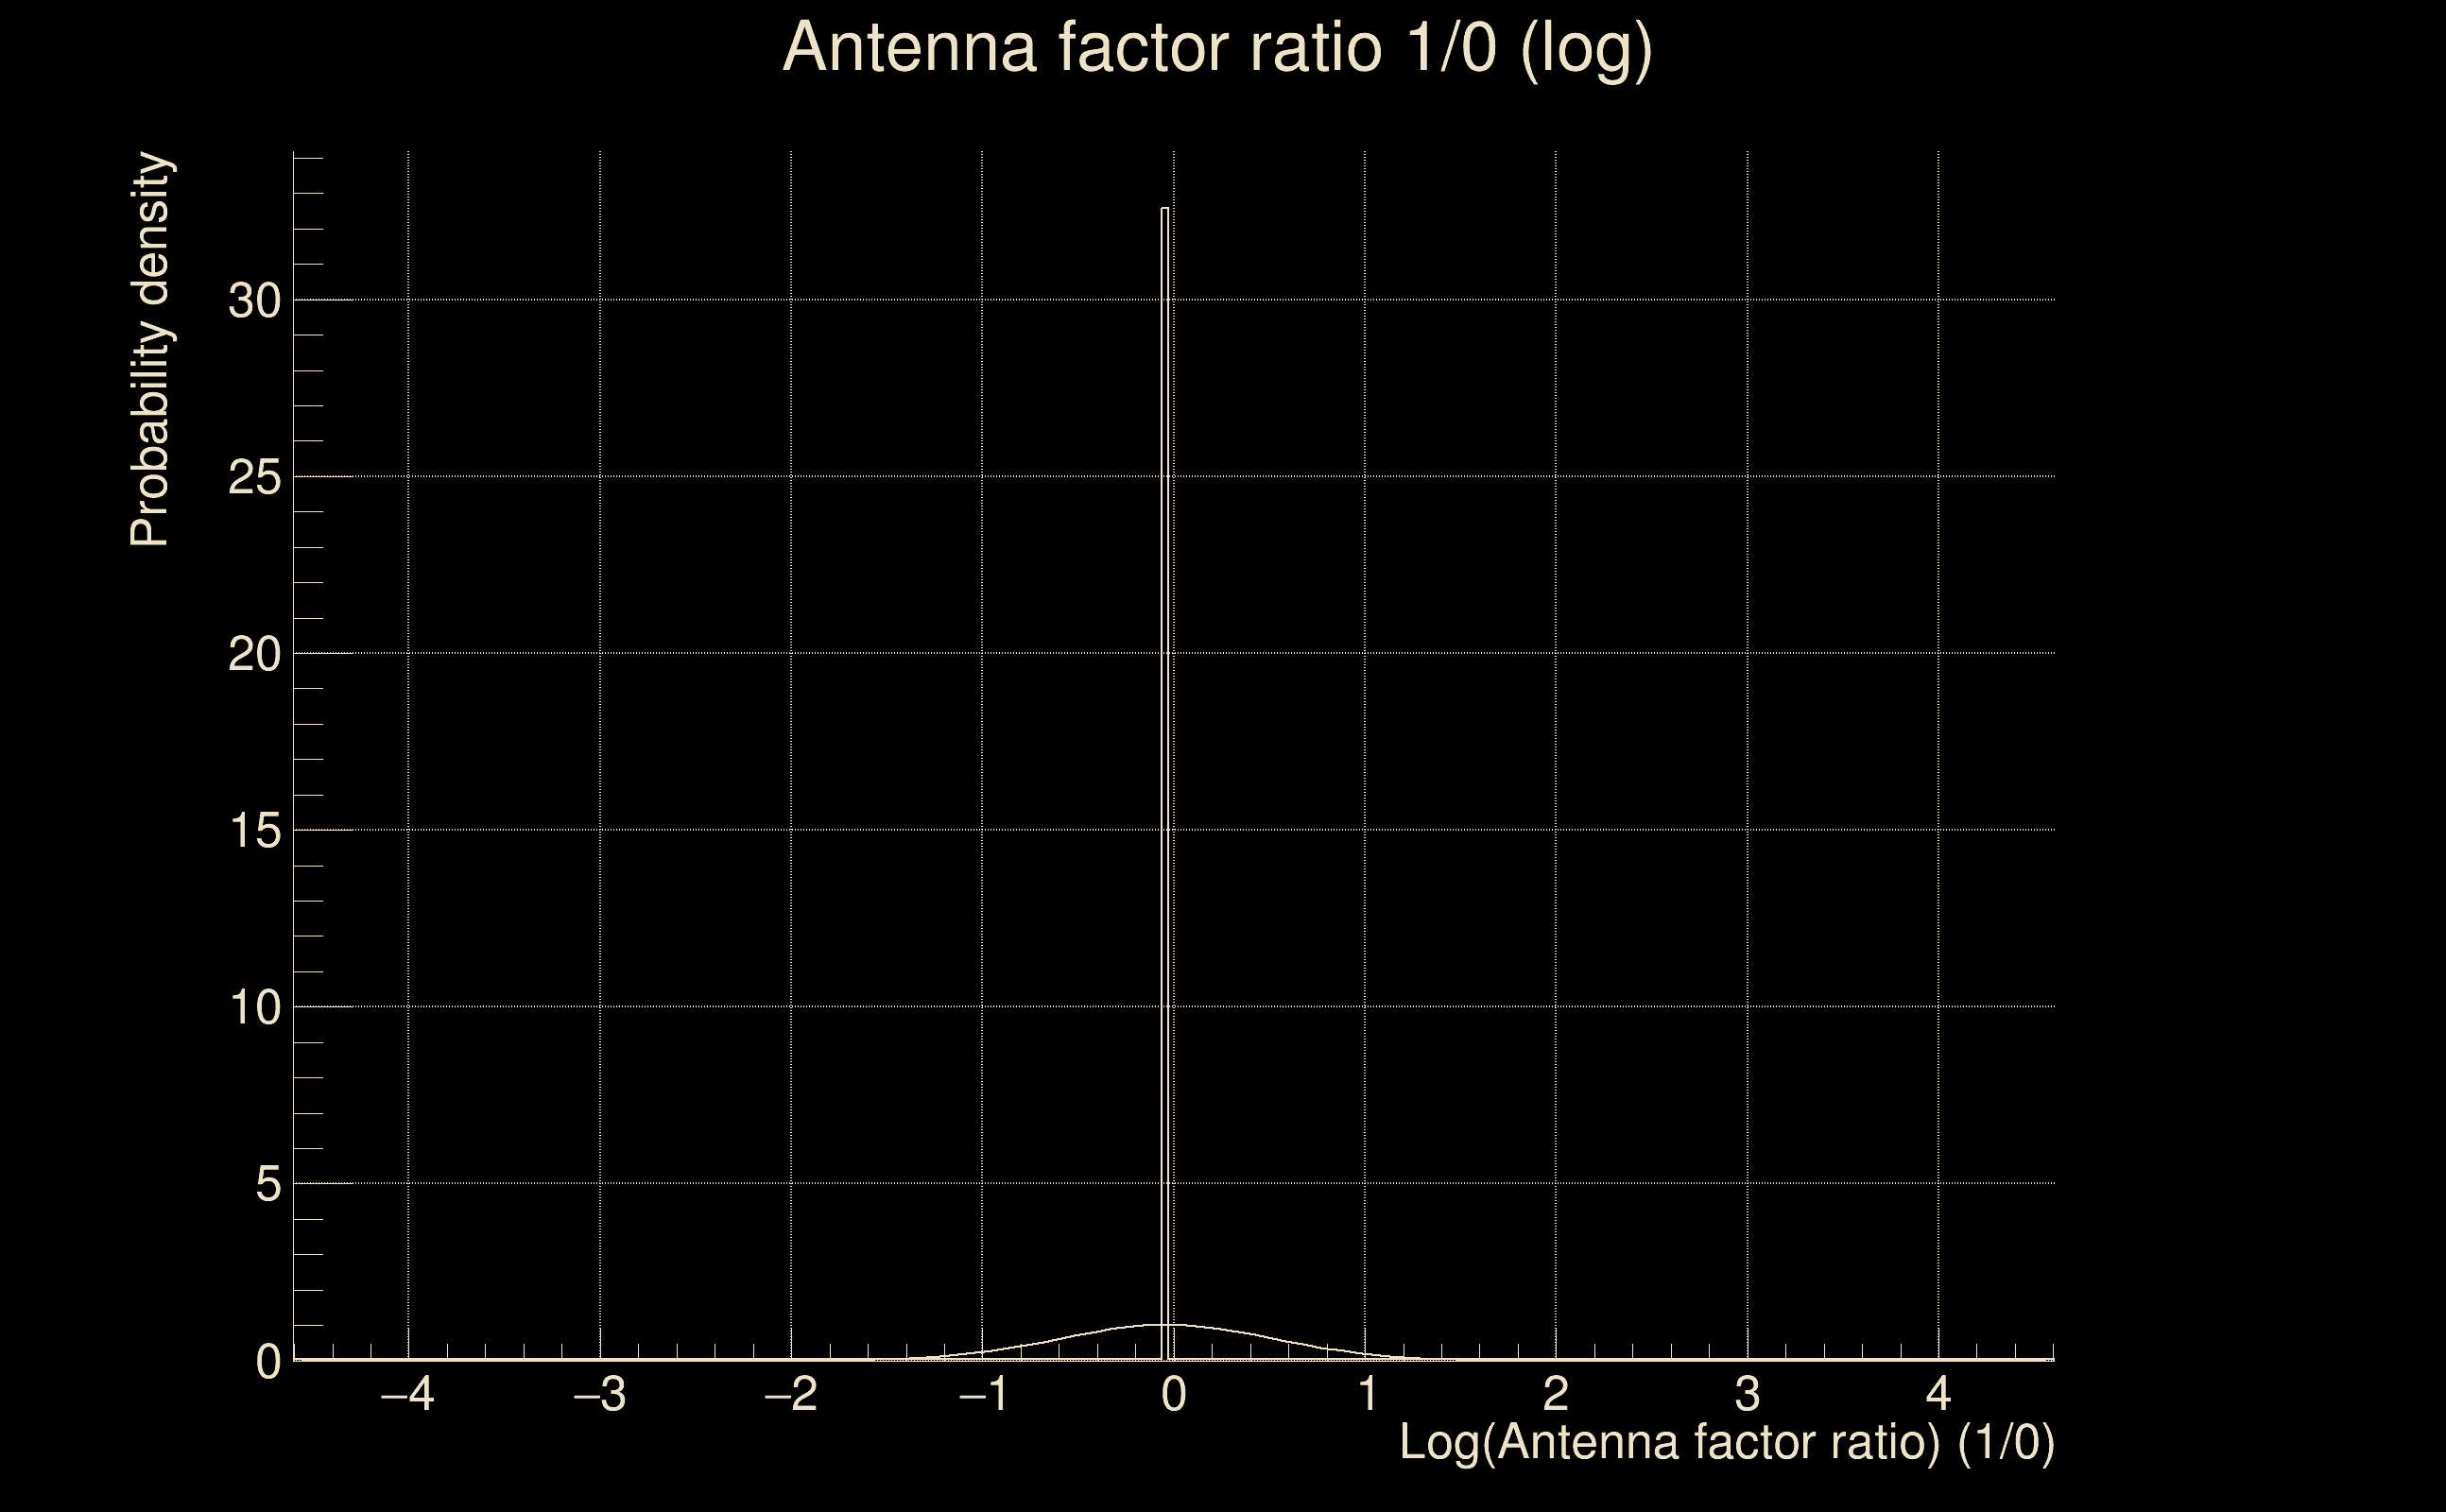
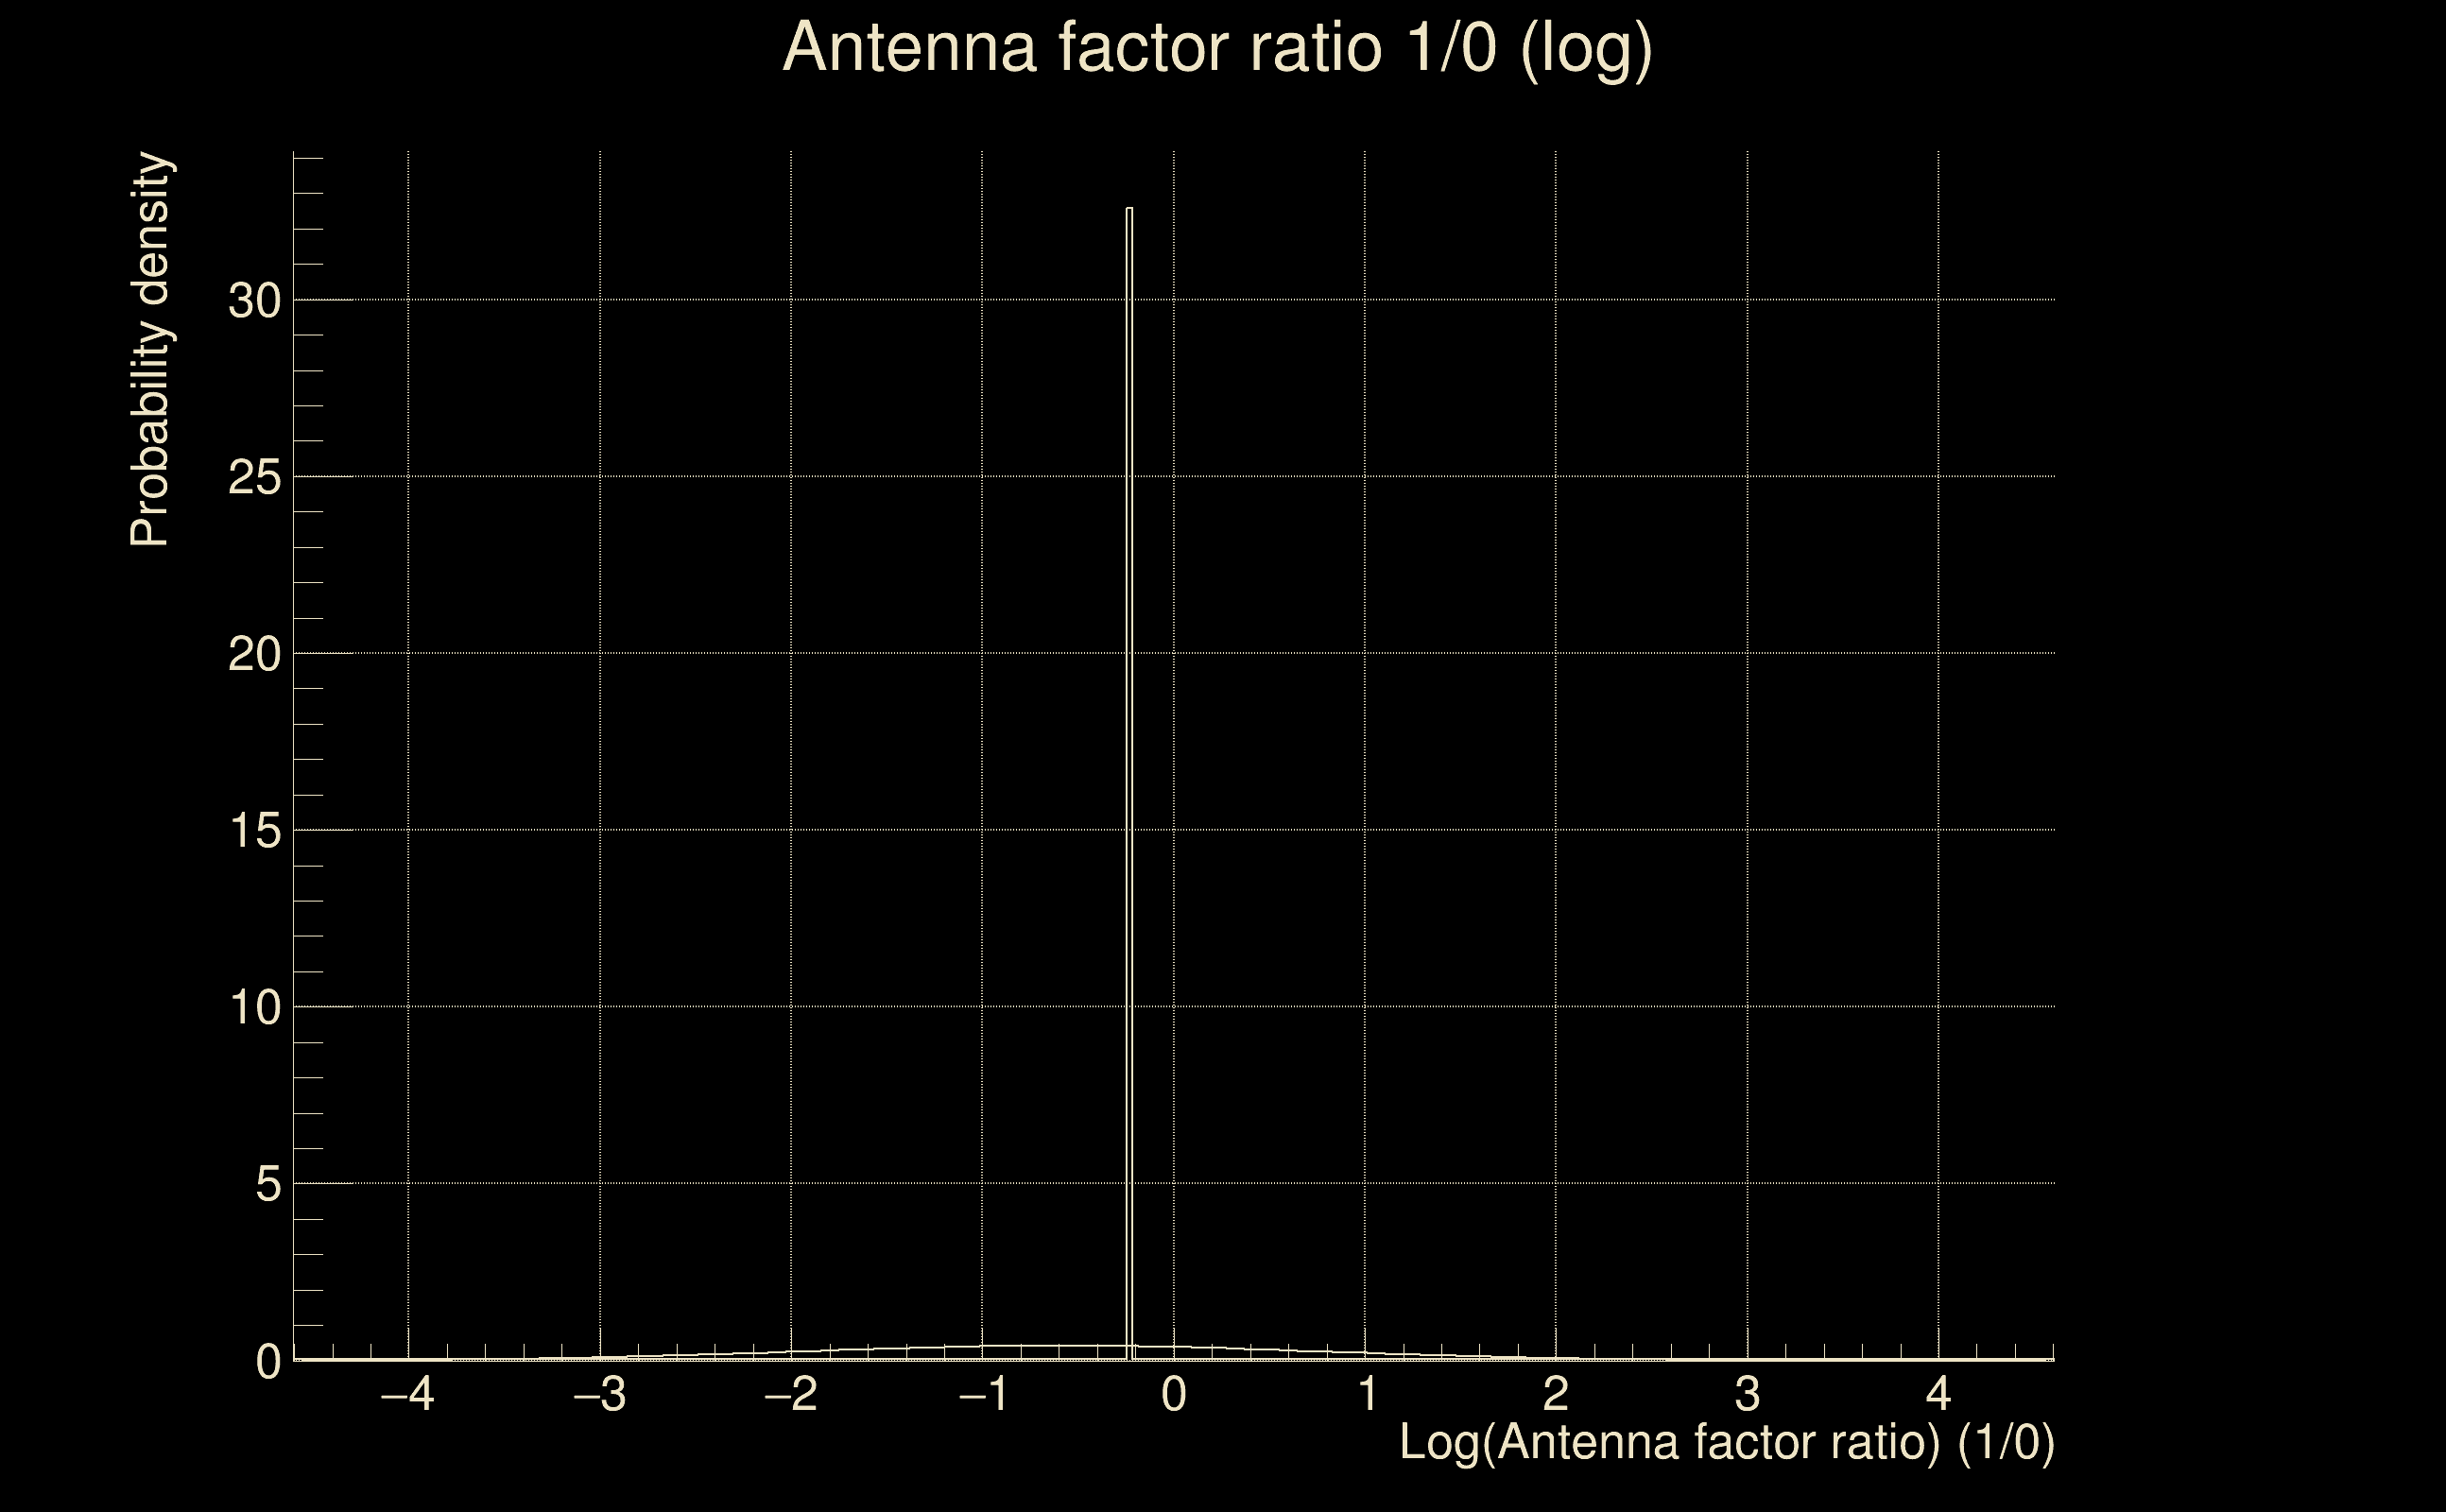
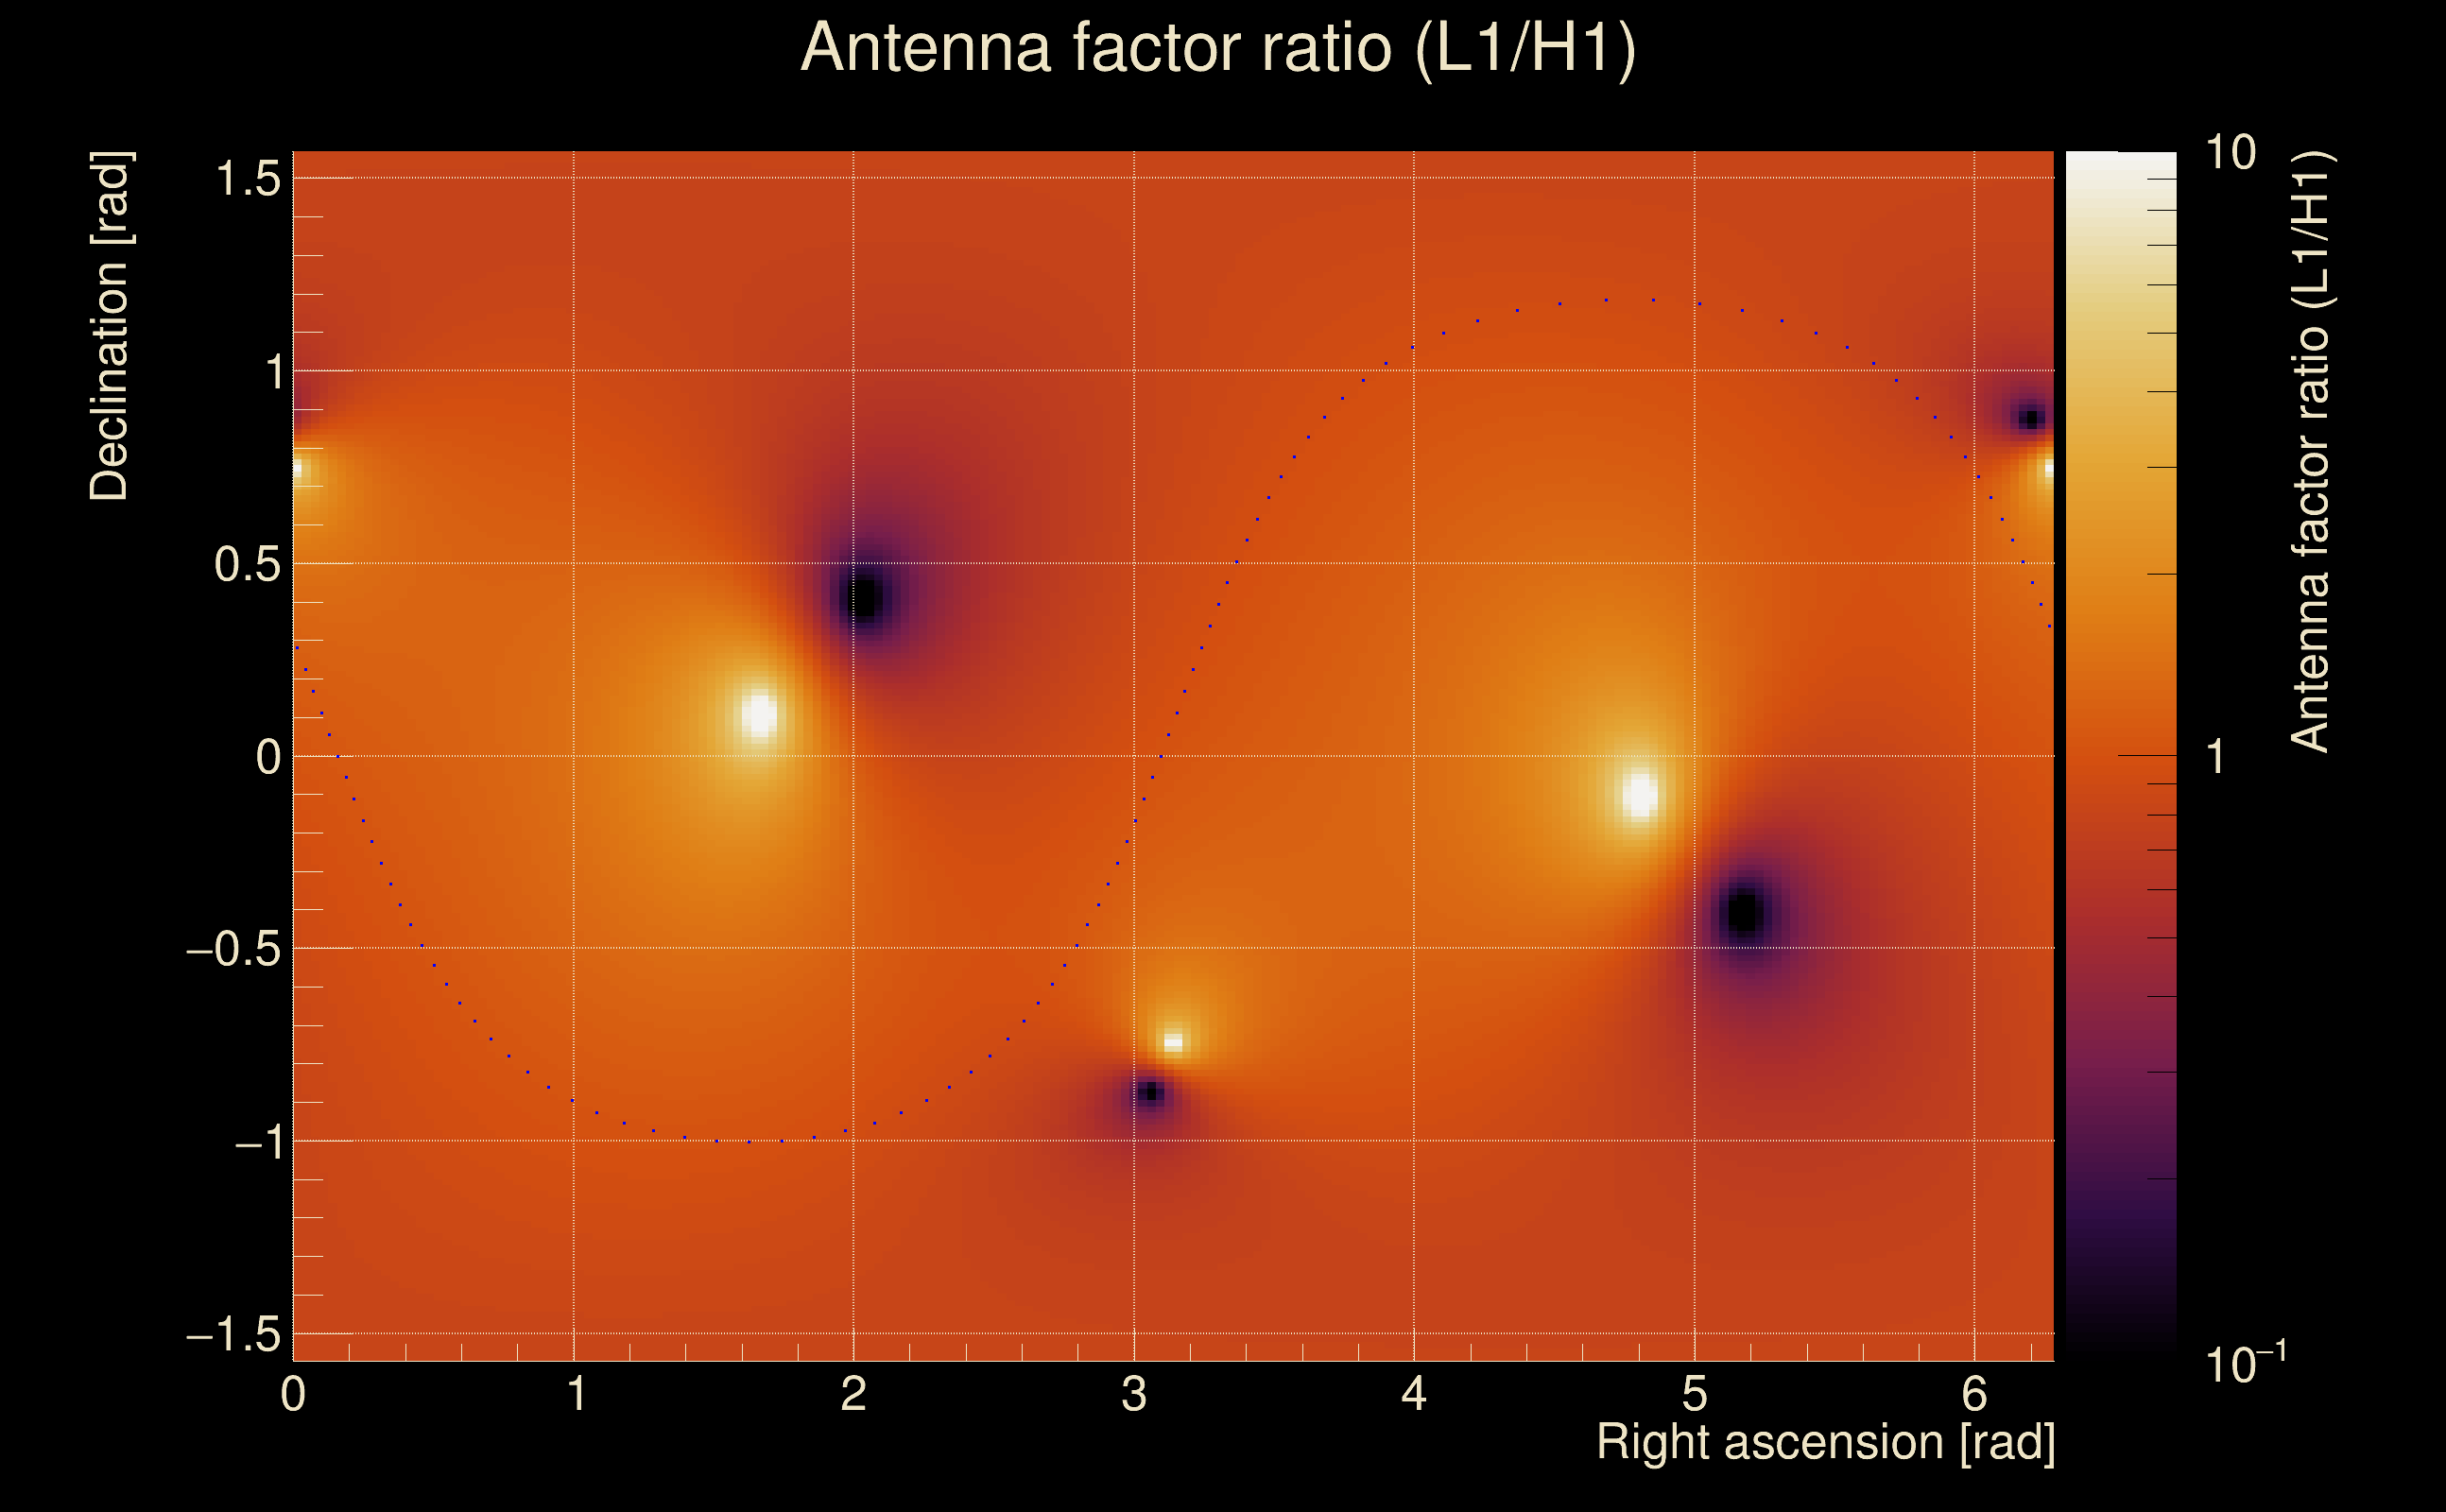
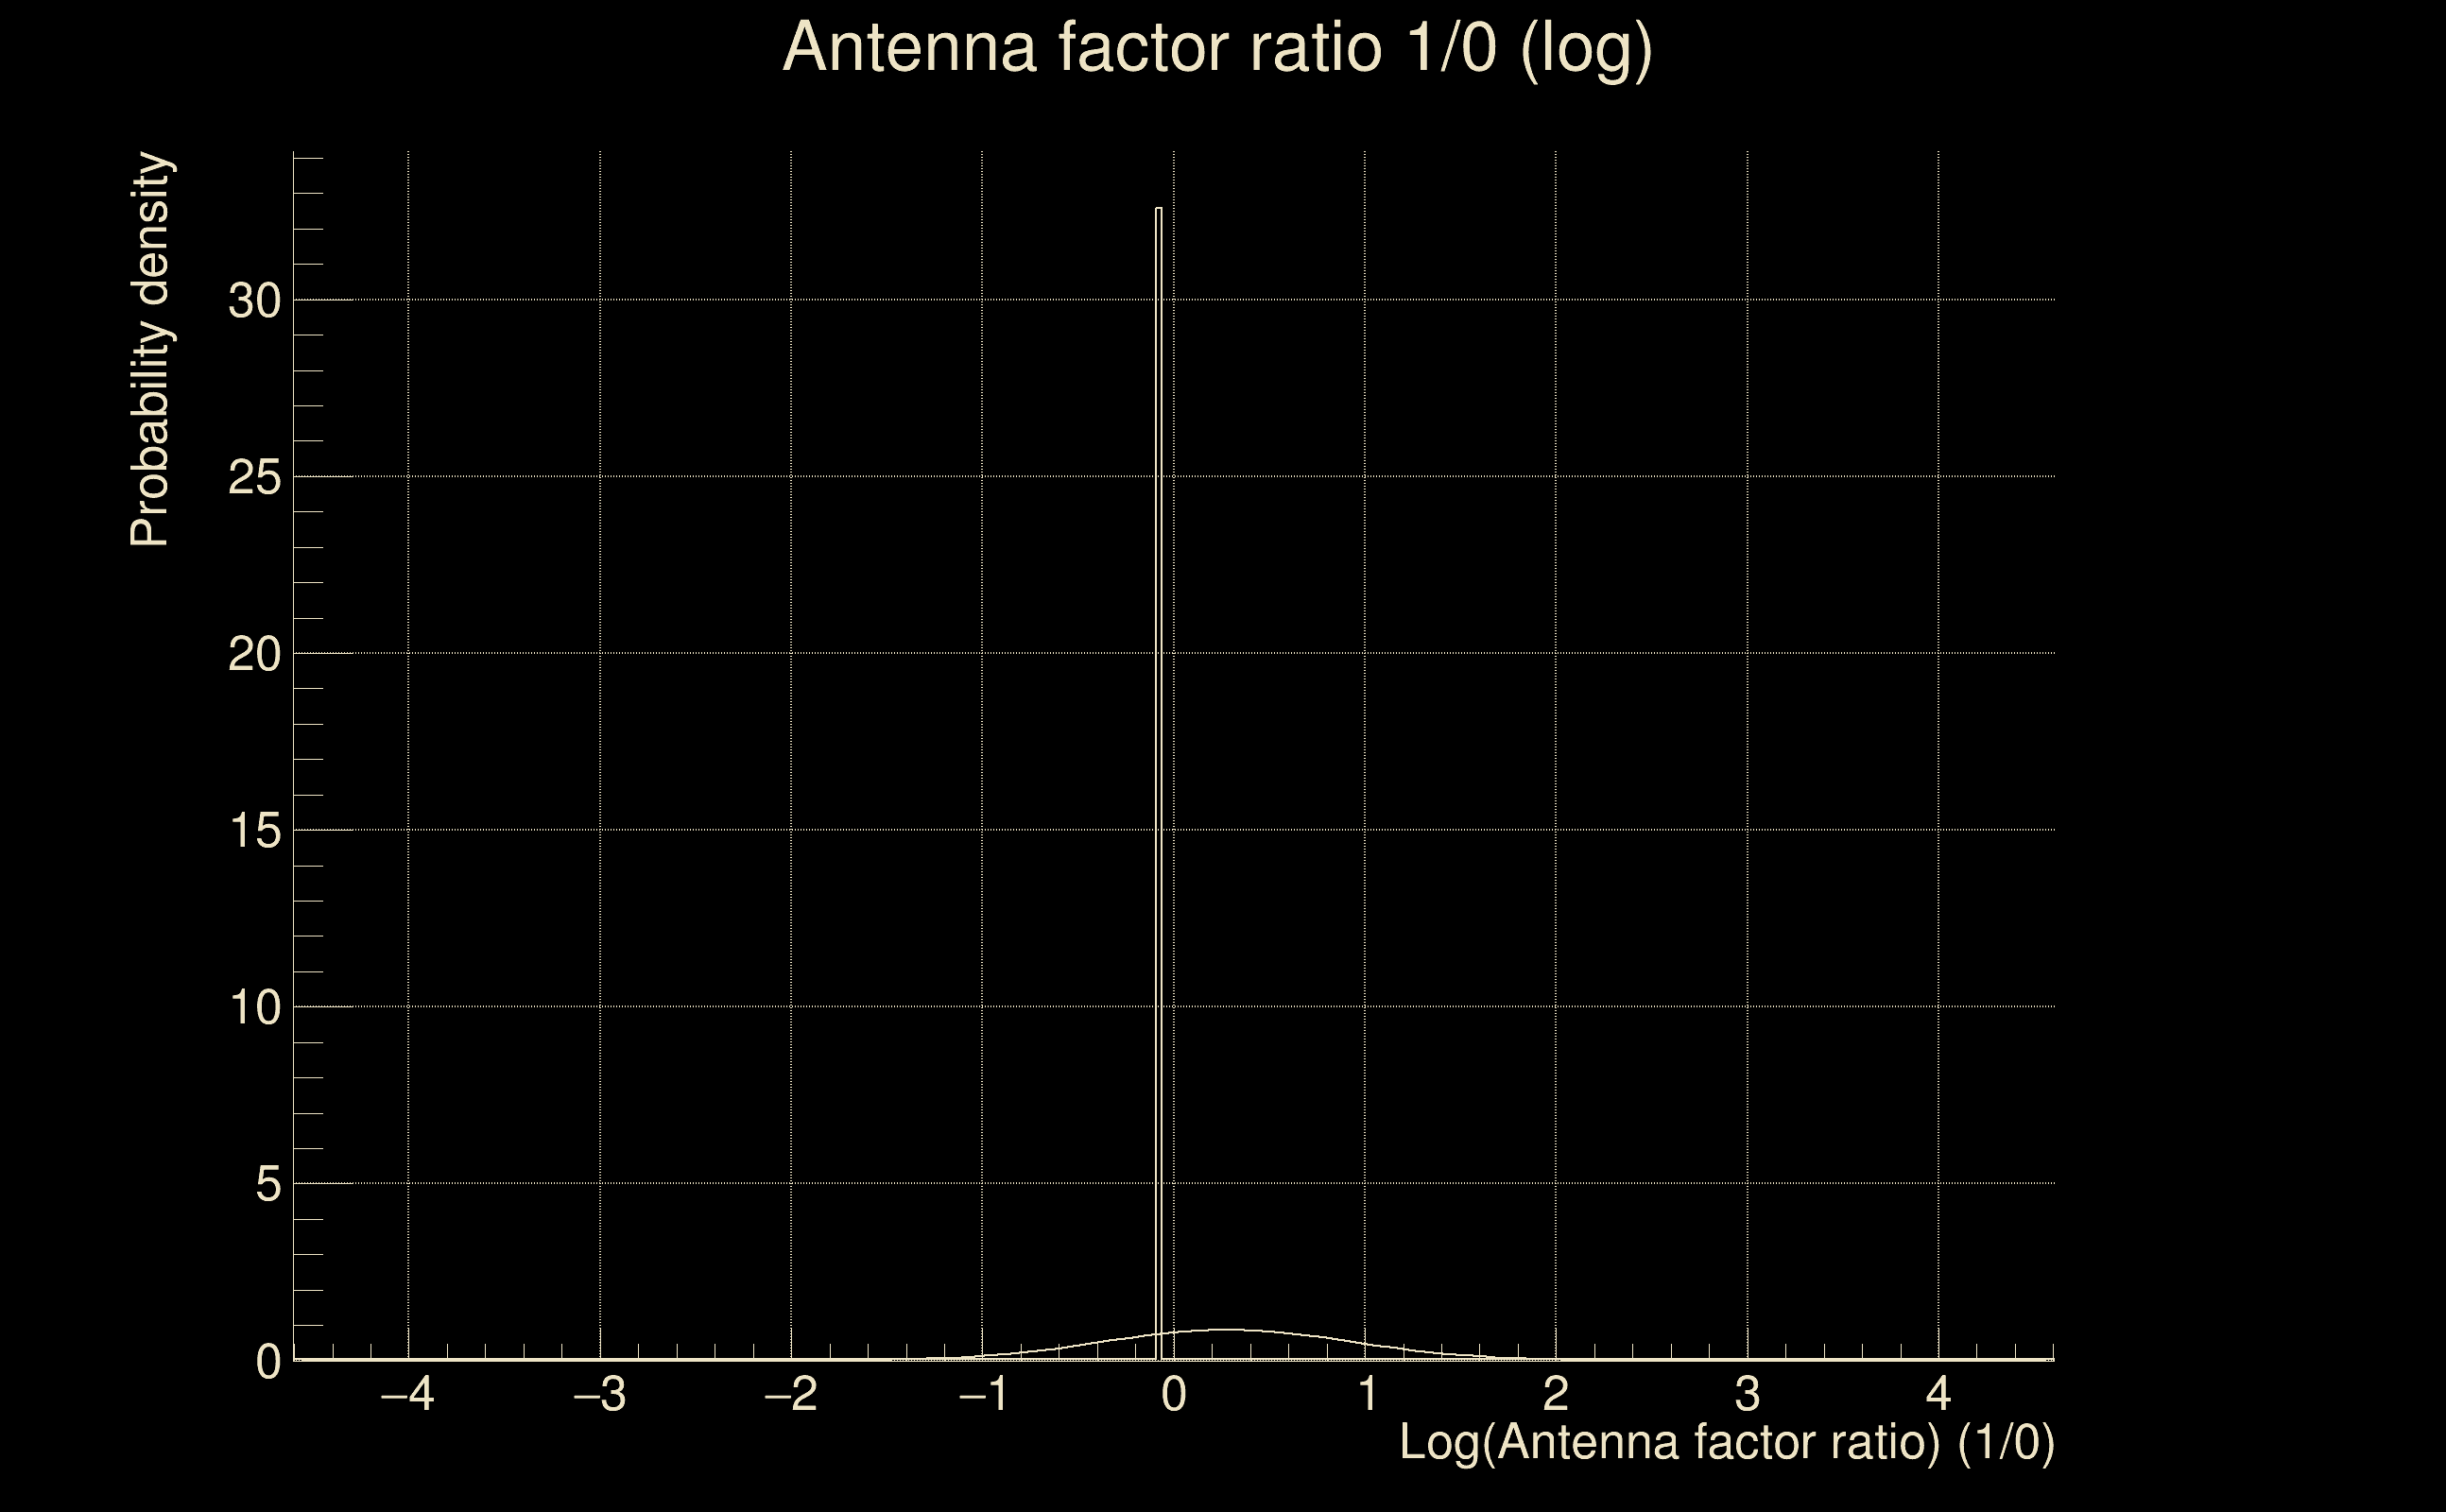
| Log of amplitude ratio (L1/H1): | -0.241127, variance = 0.165196 (L1/H1: -0.228377, variance = 0.309587, H1/L1: 0.261937, variance = 0.319781) |
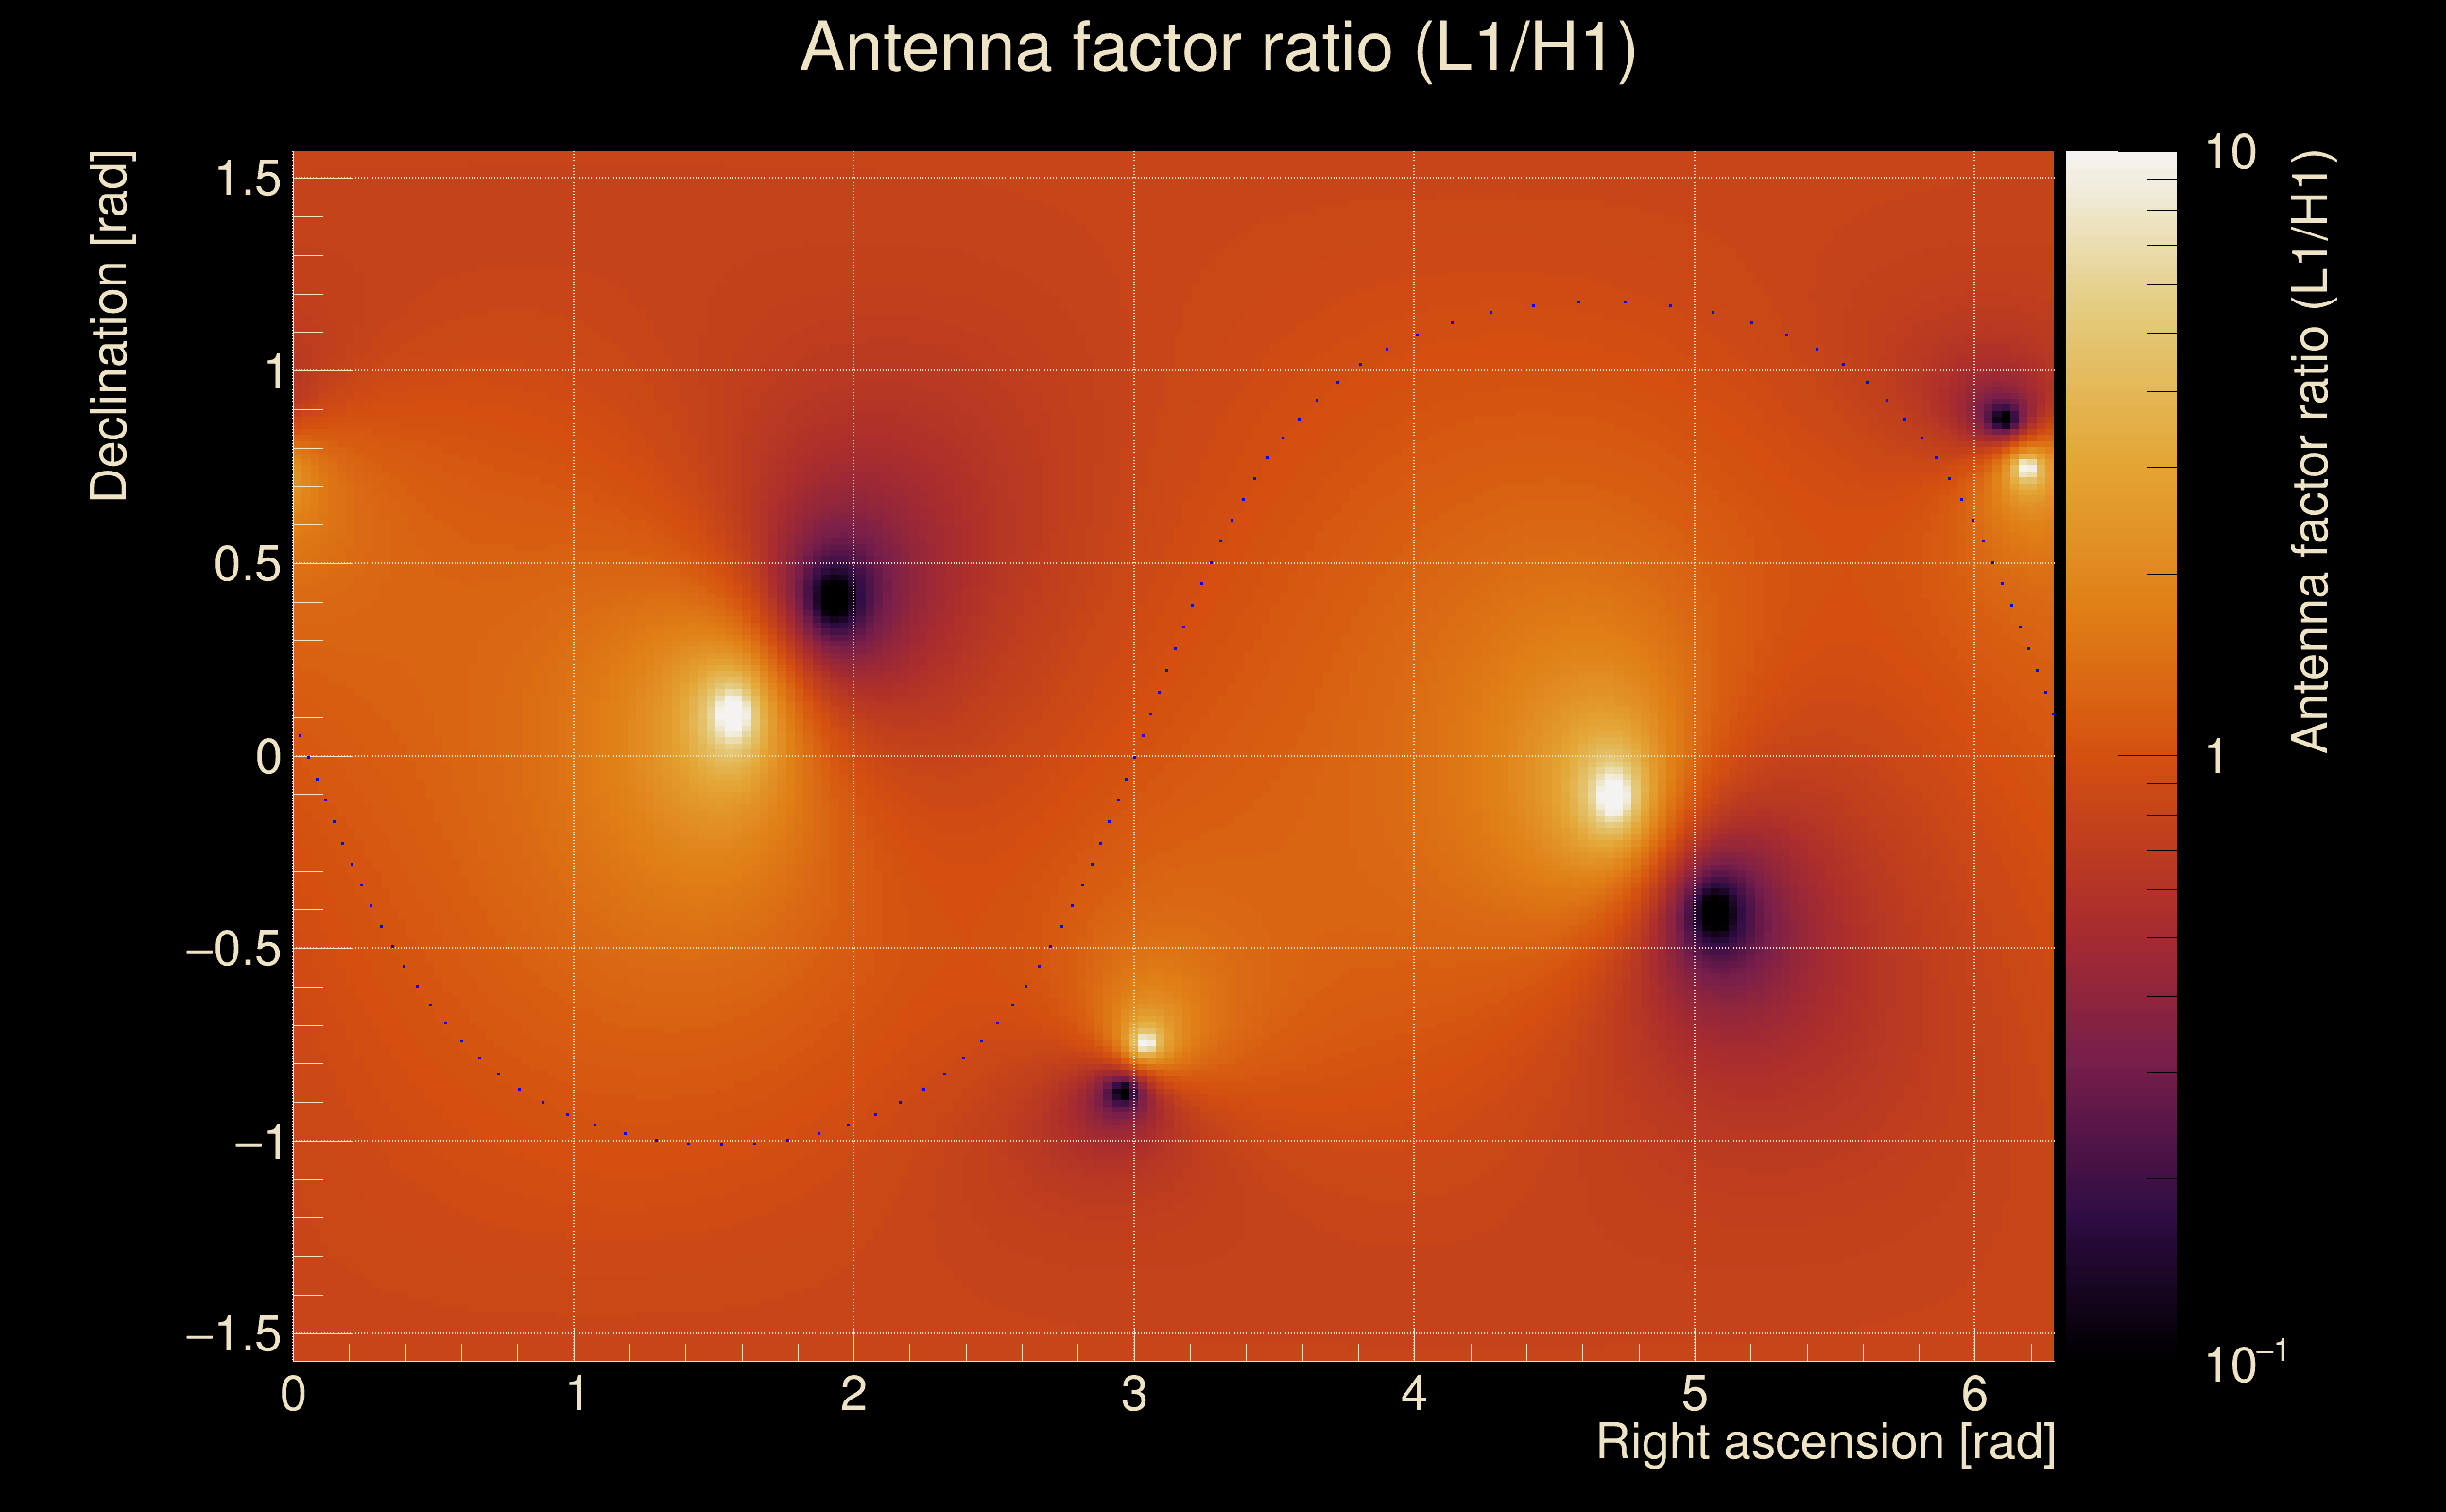
| Amplitude ratio (L1/H1): | 0.785742 ⋇ 1.50147 (L1/H1: 0.795824 ⋇ 1.74439, H1/L1: 1.29945 ⋇ 1.76031) |
| Amplitude ratio H1|L1 compatibility (probability): | 0.966257 |
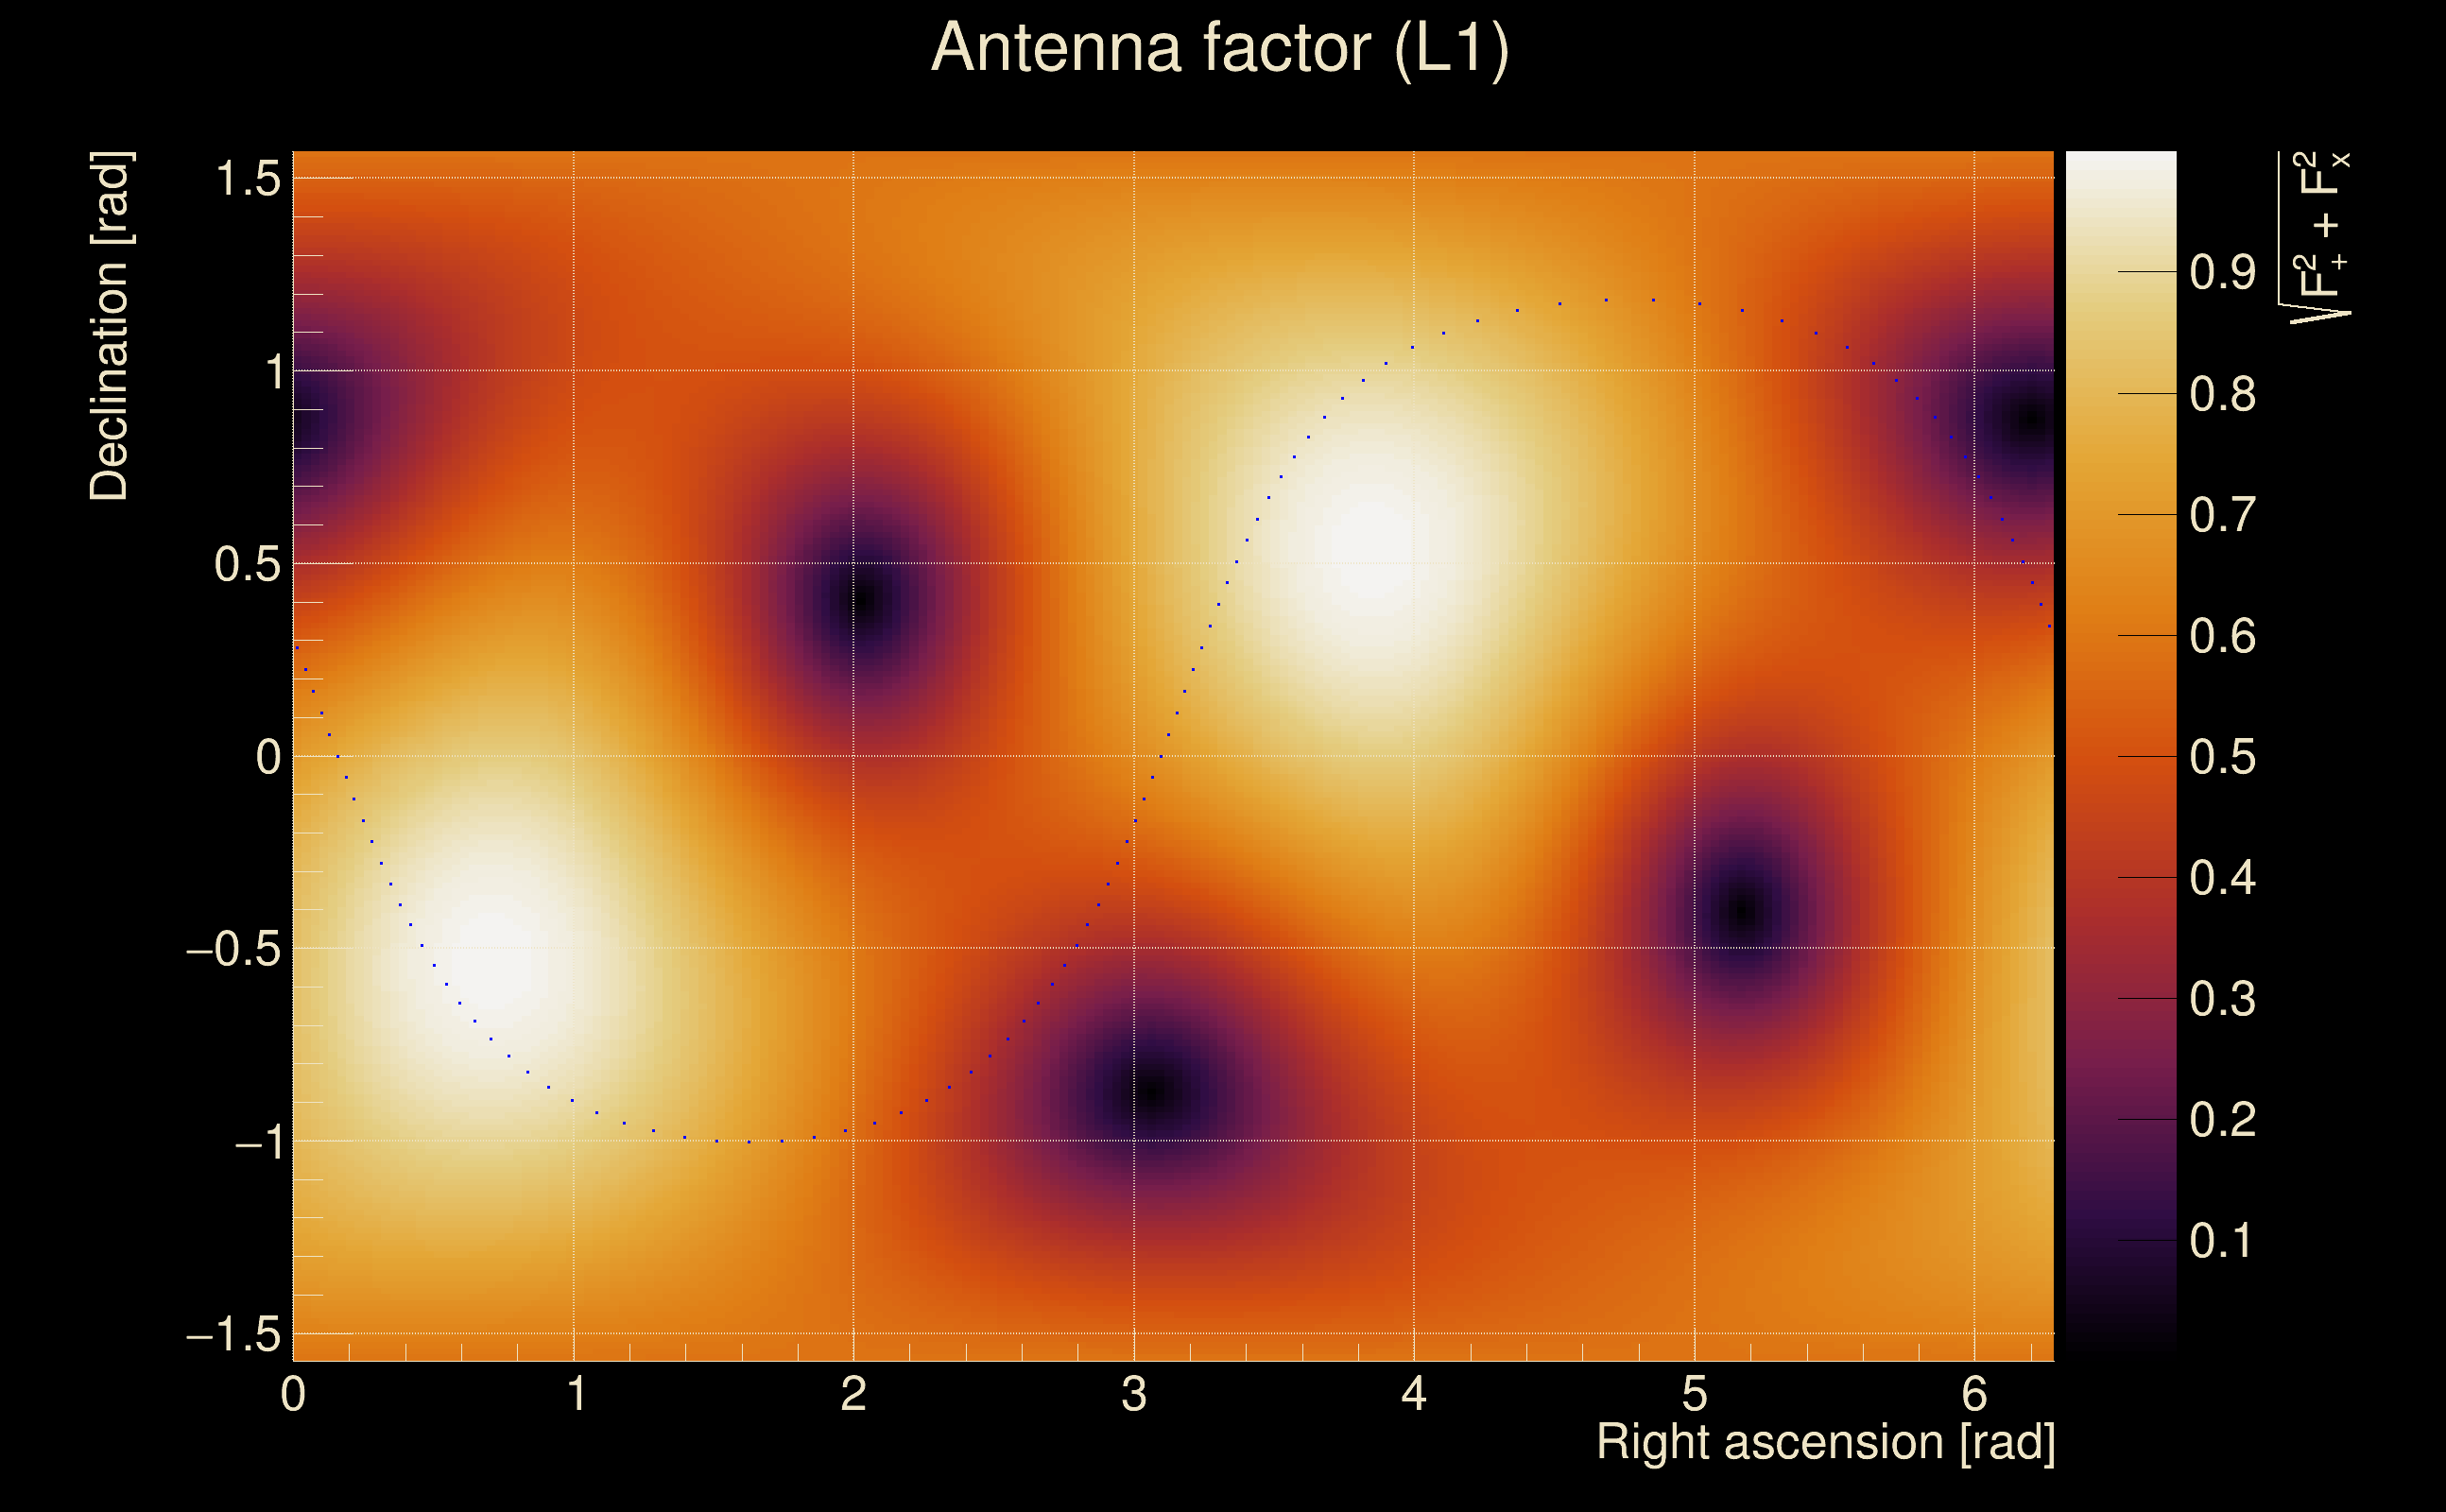
| Antenna factor probability: | 0.978804 |
| Number of rejected frequency rows: | Q0: 0 / 18, Q1: 2 / 36, Q2: 8 / 70, Q3: 15 / 134, Q4: 48 / 258 |
| Maximum signal-to-noise ratio: | H1: 71.1222, L1: 55.6685 |
| SNR variance: | H1: 2.09222, L1: 1.47415 |
| Click here for a zoomed plot | Click here for a zoomed plot | Click here for a zoomed plot | Click here for a zoomed plot | Click here for a zoomed plot |
 |
 |
 |
 |
 |
 |
 |
 |
 |
 |
 |
 |
 |
 |
 |
 |
 |
 |
 |
 |
 |
 |
 |
 |
 |
 |
 |
 |
 |
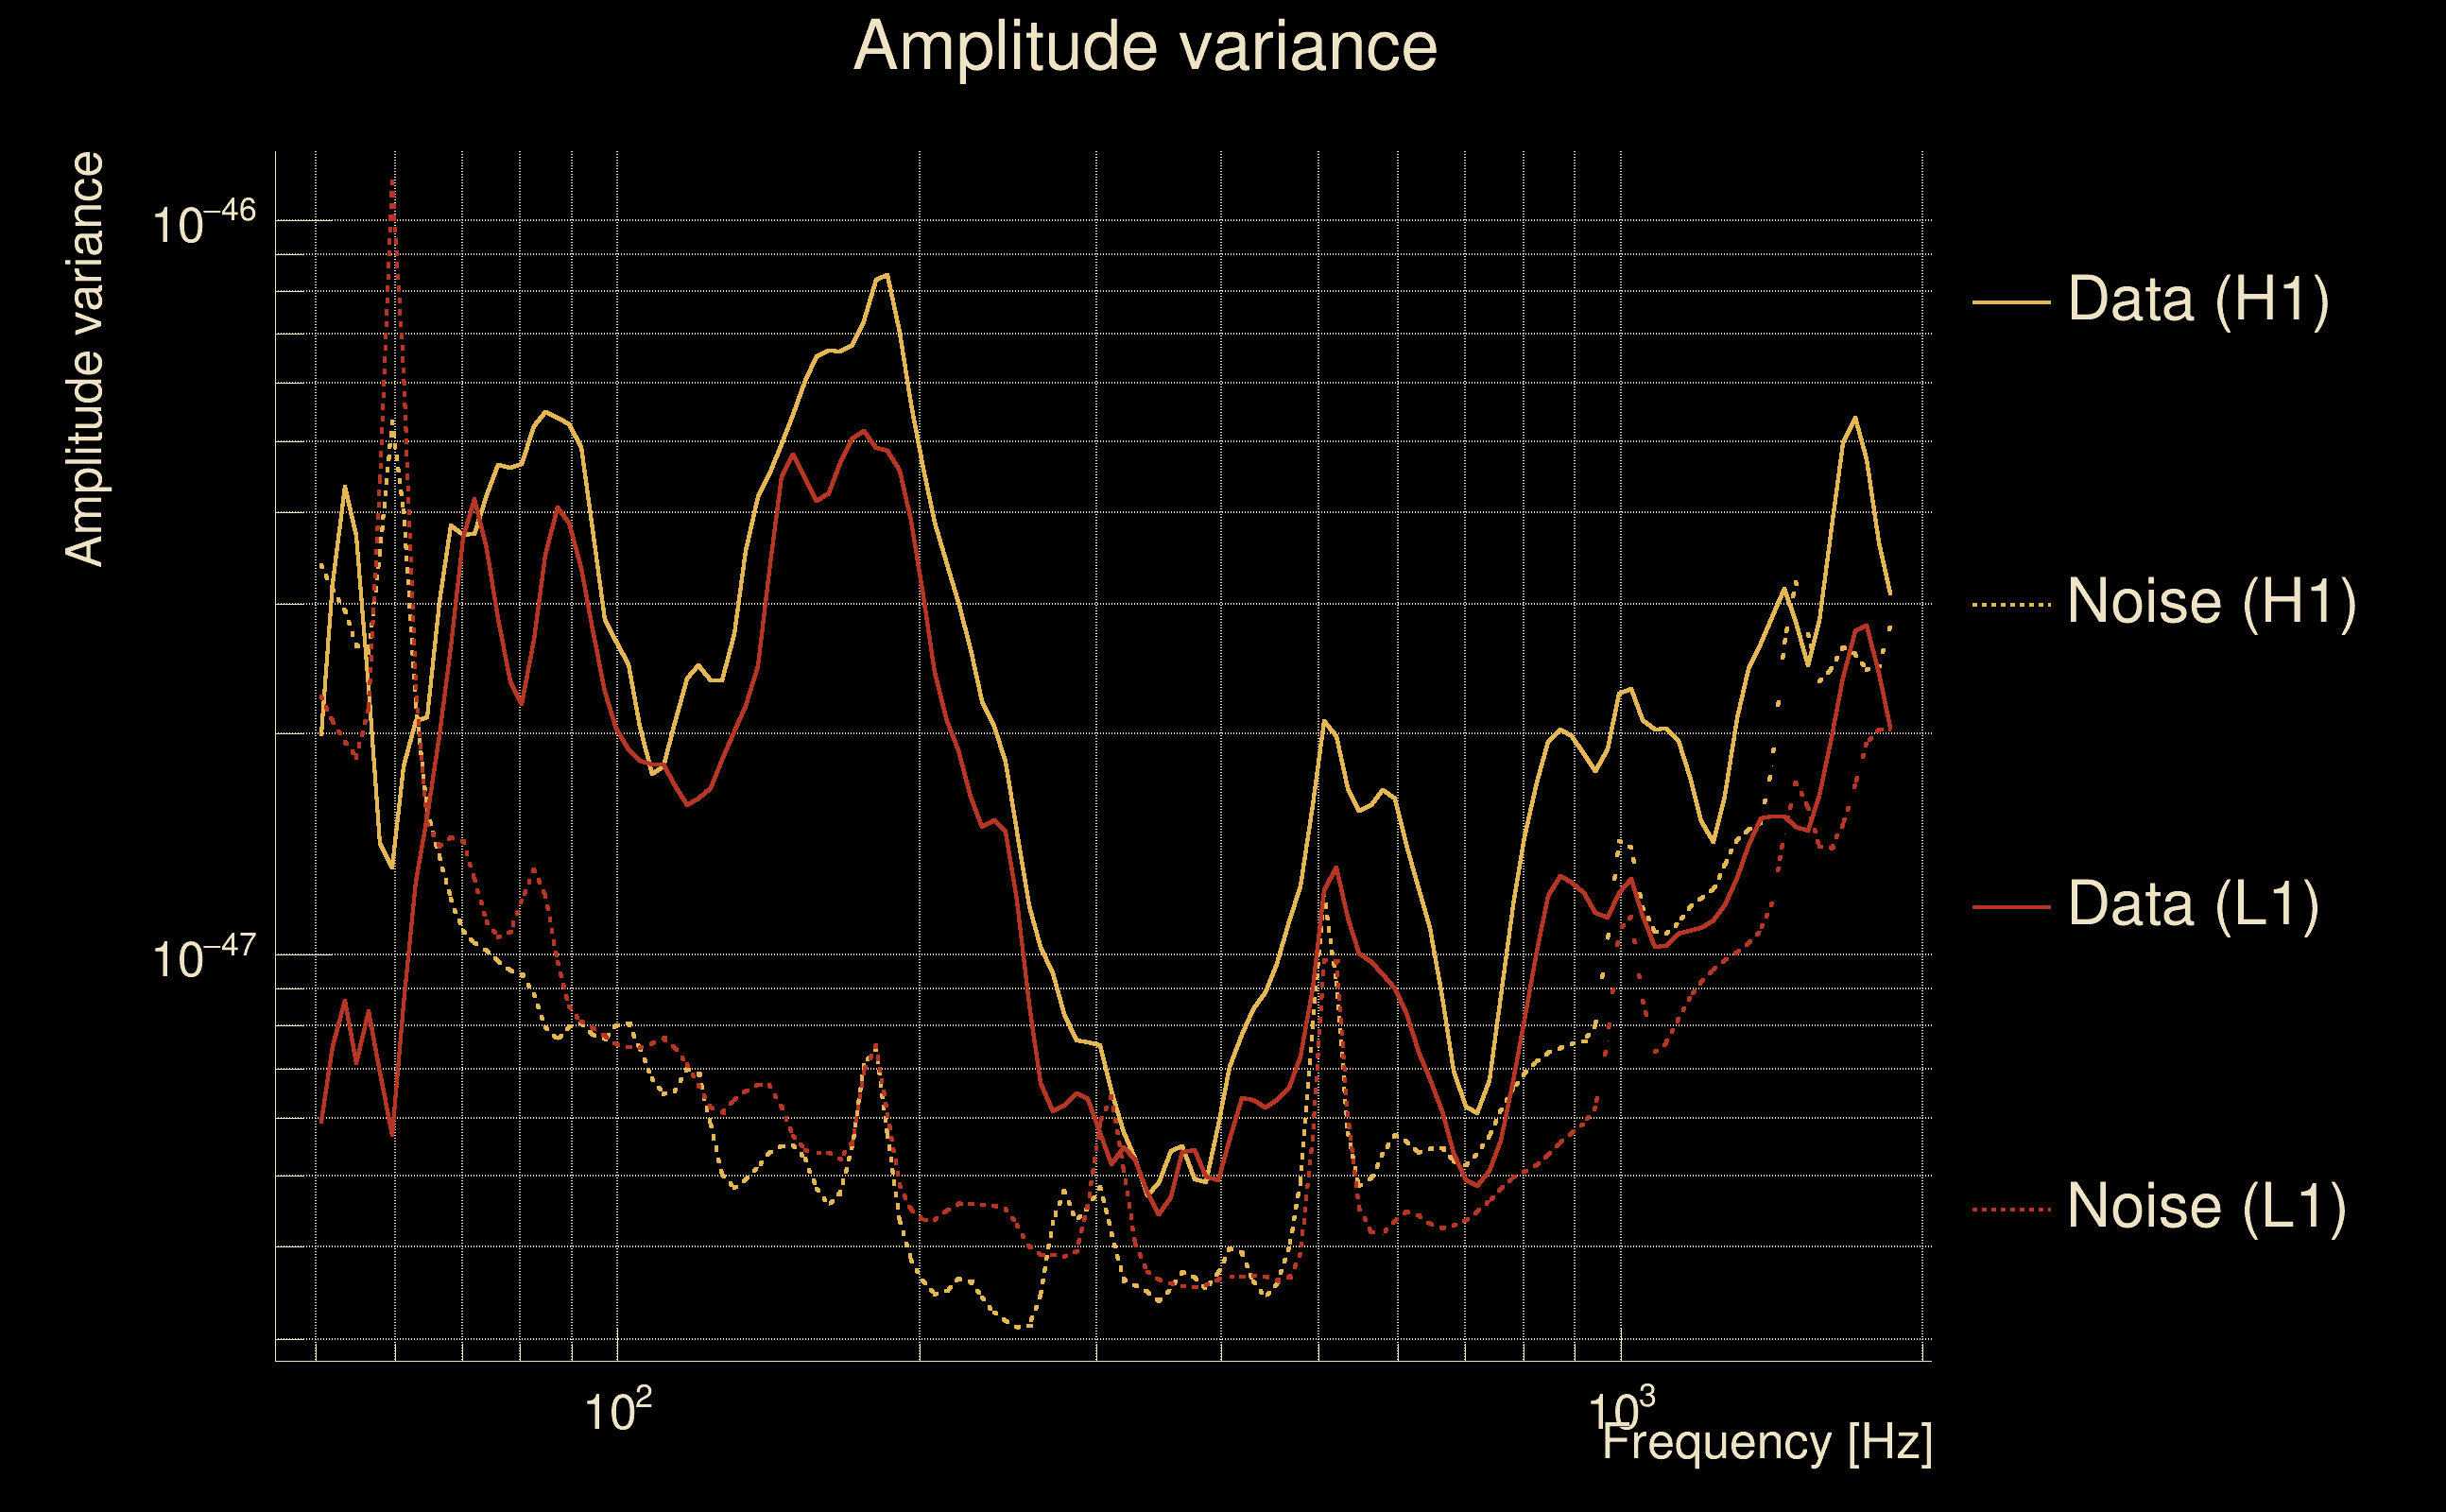
| Event time t(H1): | GPS = 1368431209 (Thu May 18 07:46:31 2023 ) → GPS = 1368431219 (Thu May 18 07:46:41 2023 ) |
| Event time t(L1): | GPS = 1368431209 (Thu May 18 07:46:41 2023 ) → GPS = 1368431219 (Thu May 18 07:46:41 2023 ) |
| Omicron analysis time window (H1): | GPS = 1368431206 → GPS = 1368431222 |
| Omicron analysis time window (L1): | GPS = 1368431206 → GPS = 1368431222 |
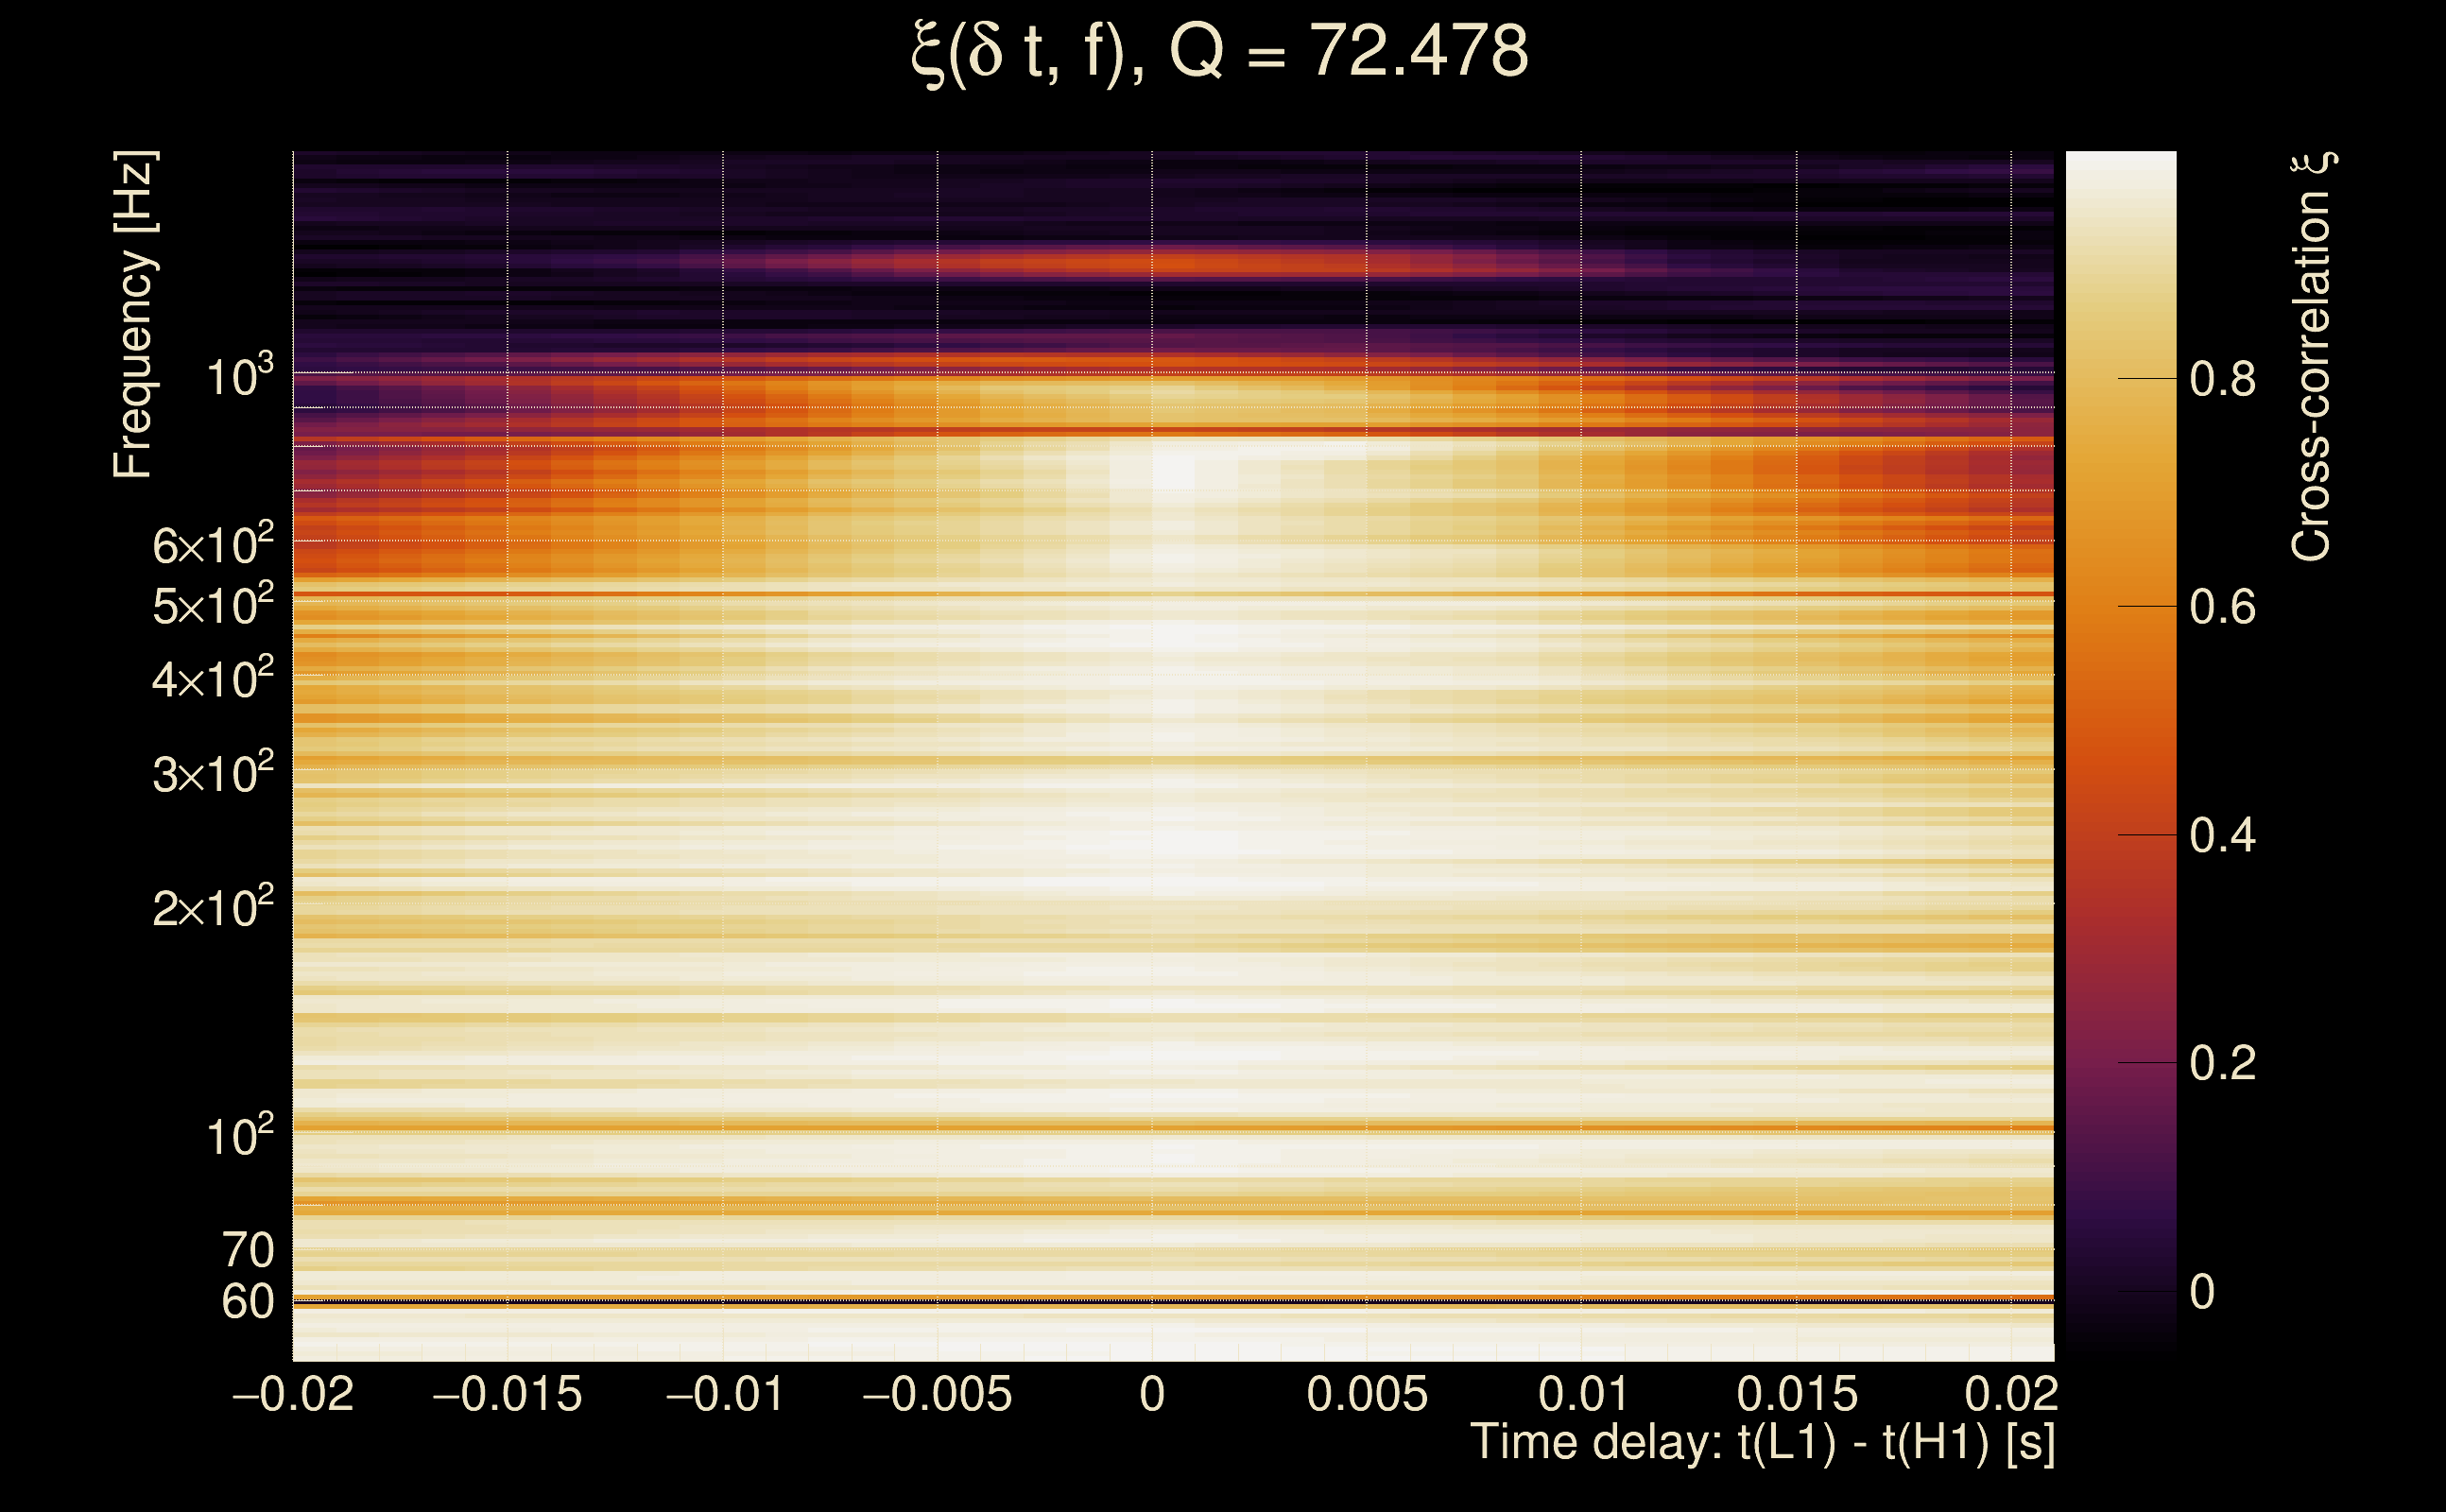
| Time delay between detectors t(L1) - t(H1): | 0.00490901 s (slice index = 108 / 217), δt_gw = 0.00490901 s |
| Time delay standard deviation: | 0.021568 s |
| [targeted mode] Time delay probability: | 0.966115 (0.0424814 sigmas), δt_target = 0.00489116 s |
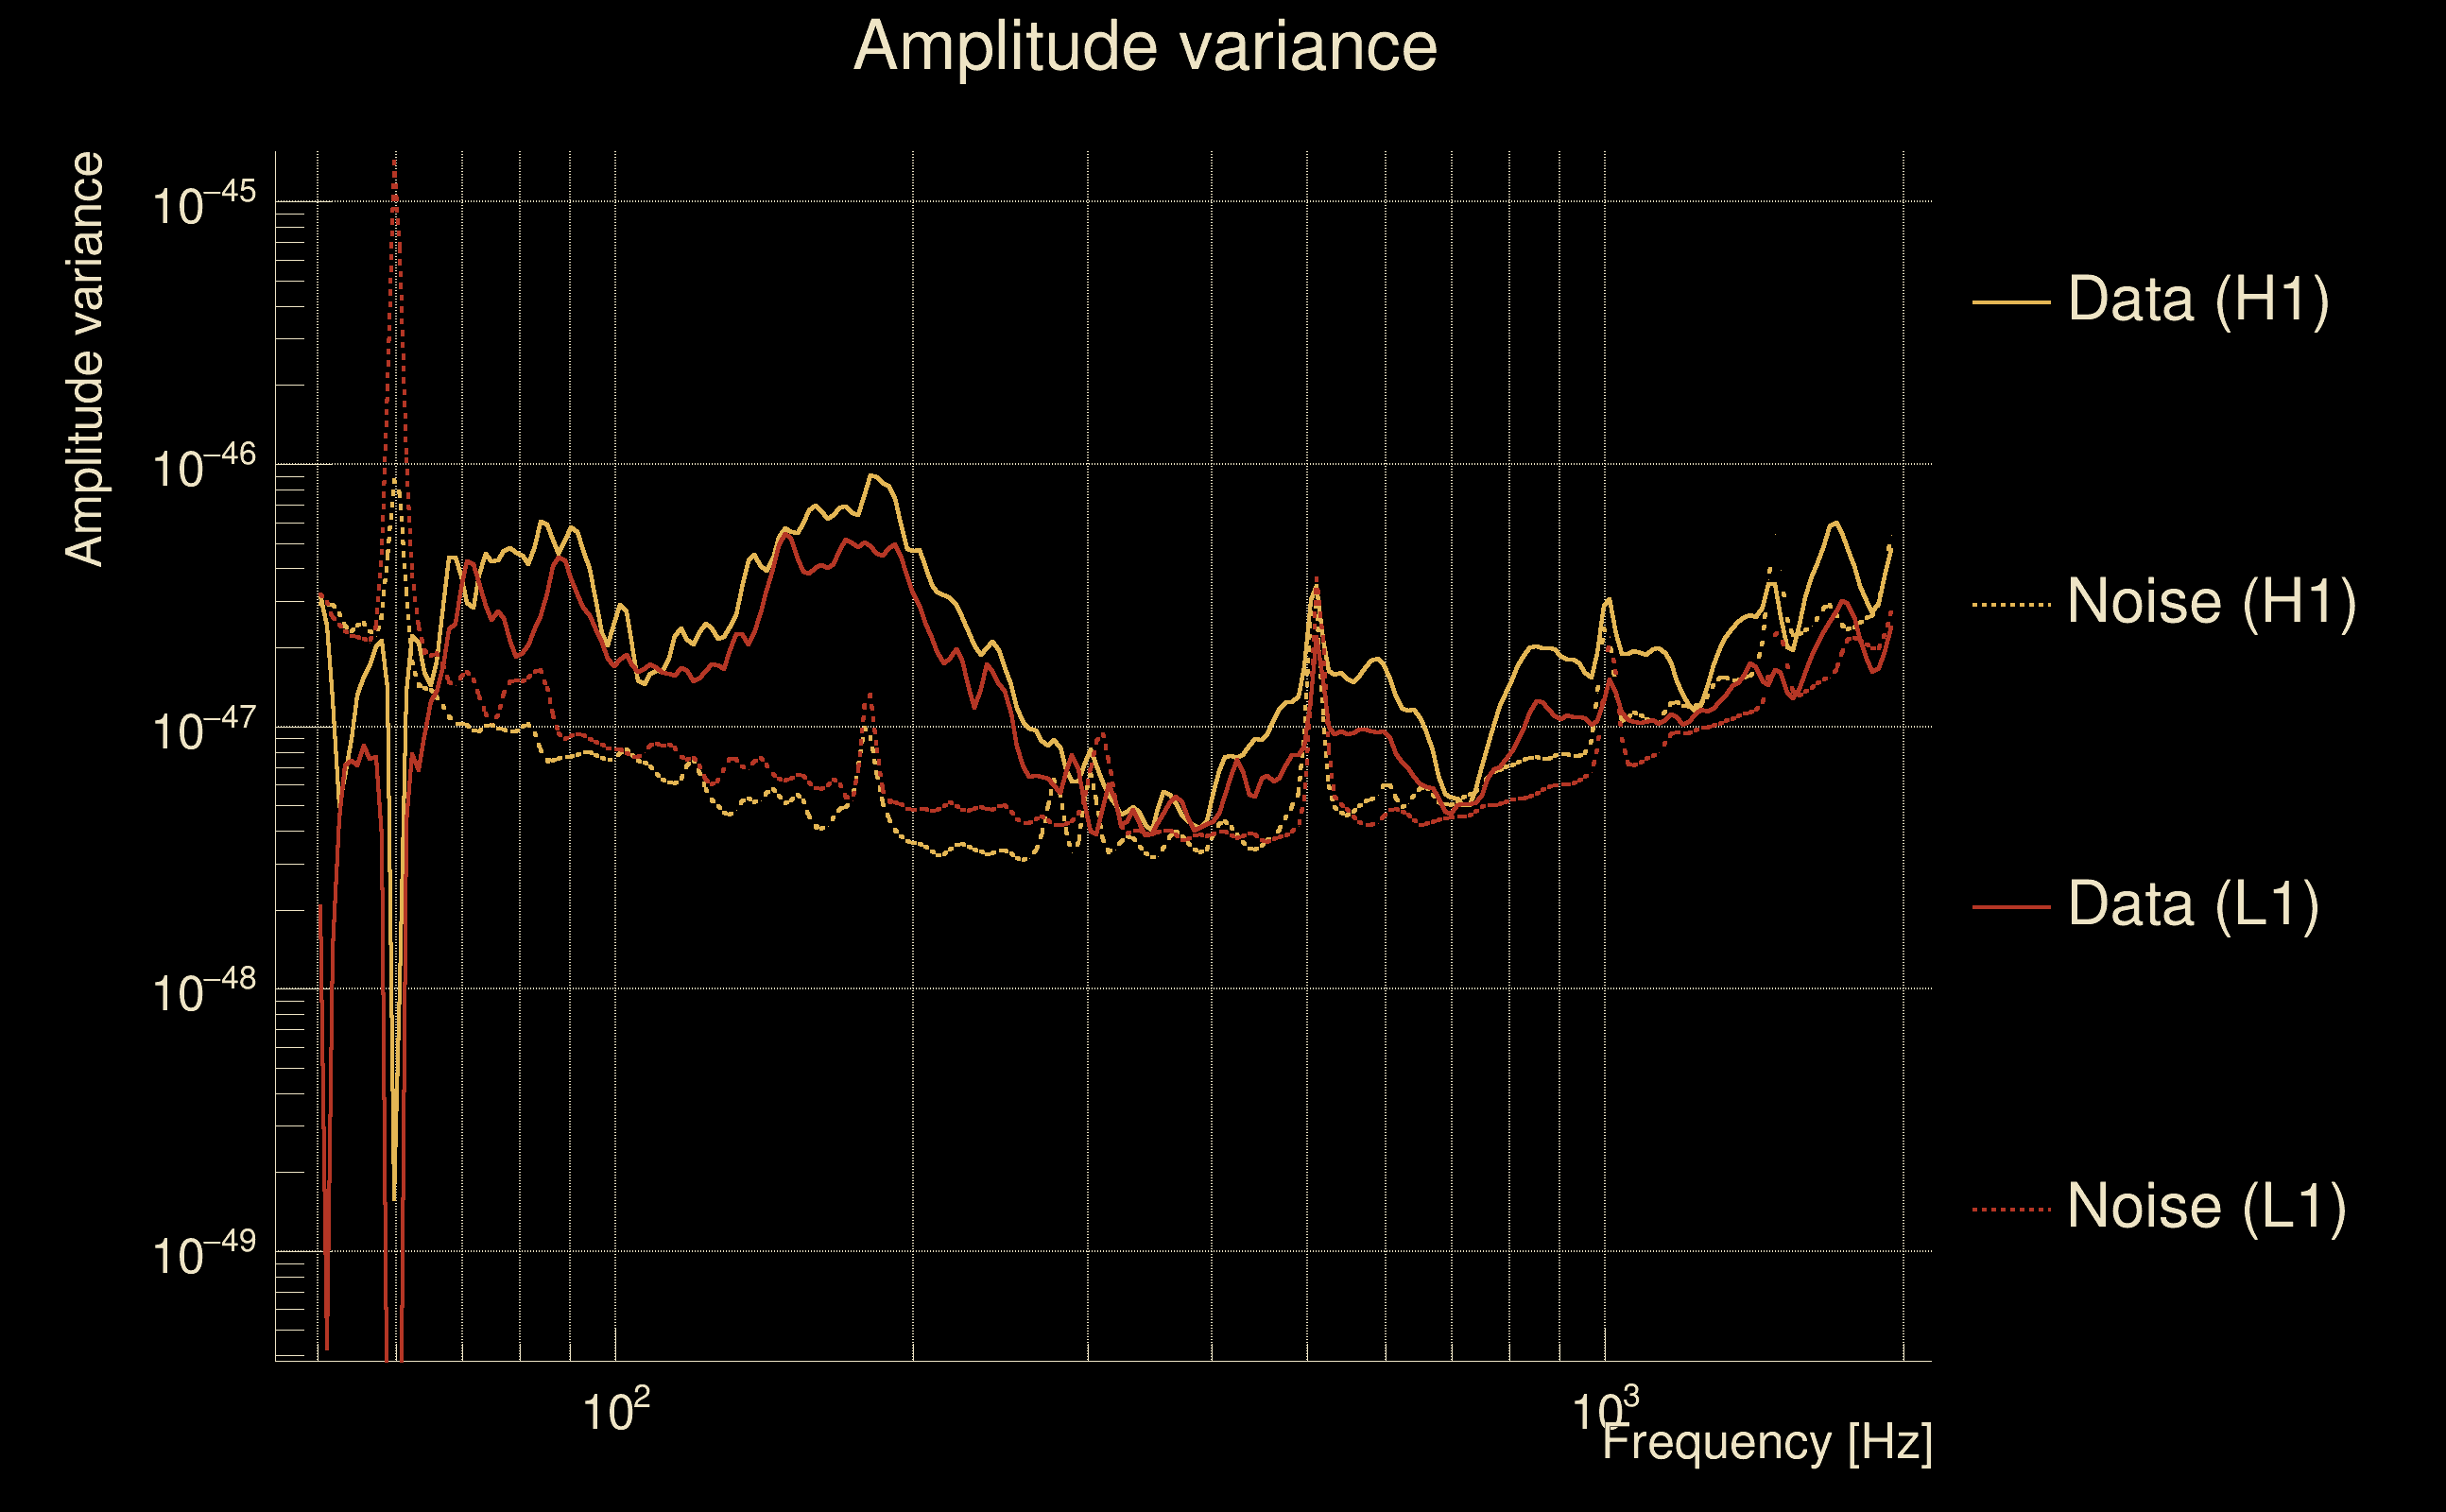
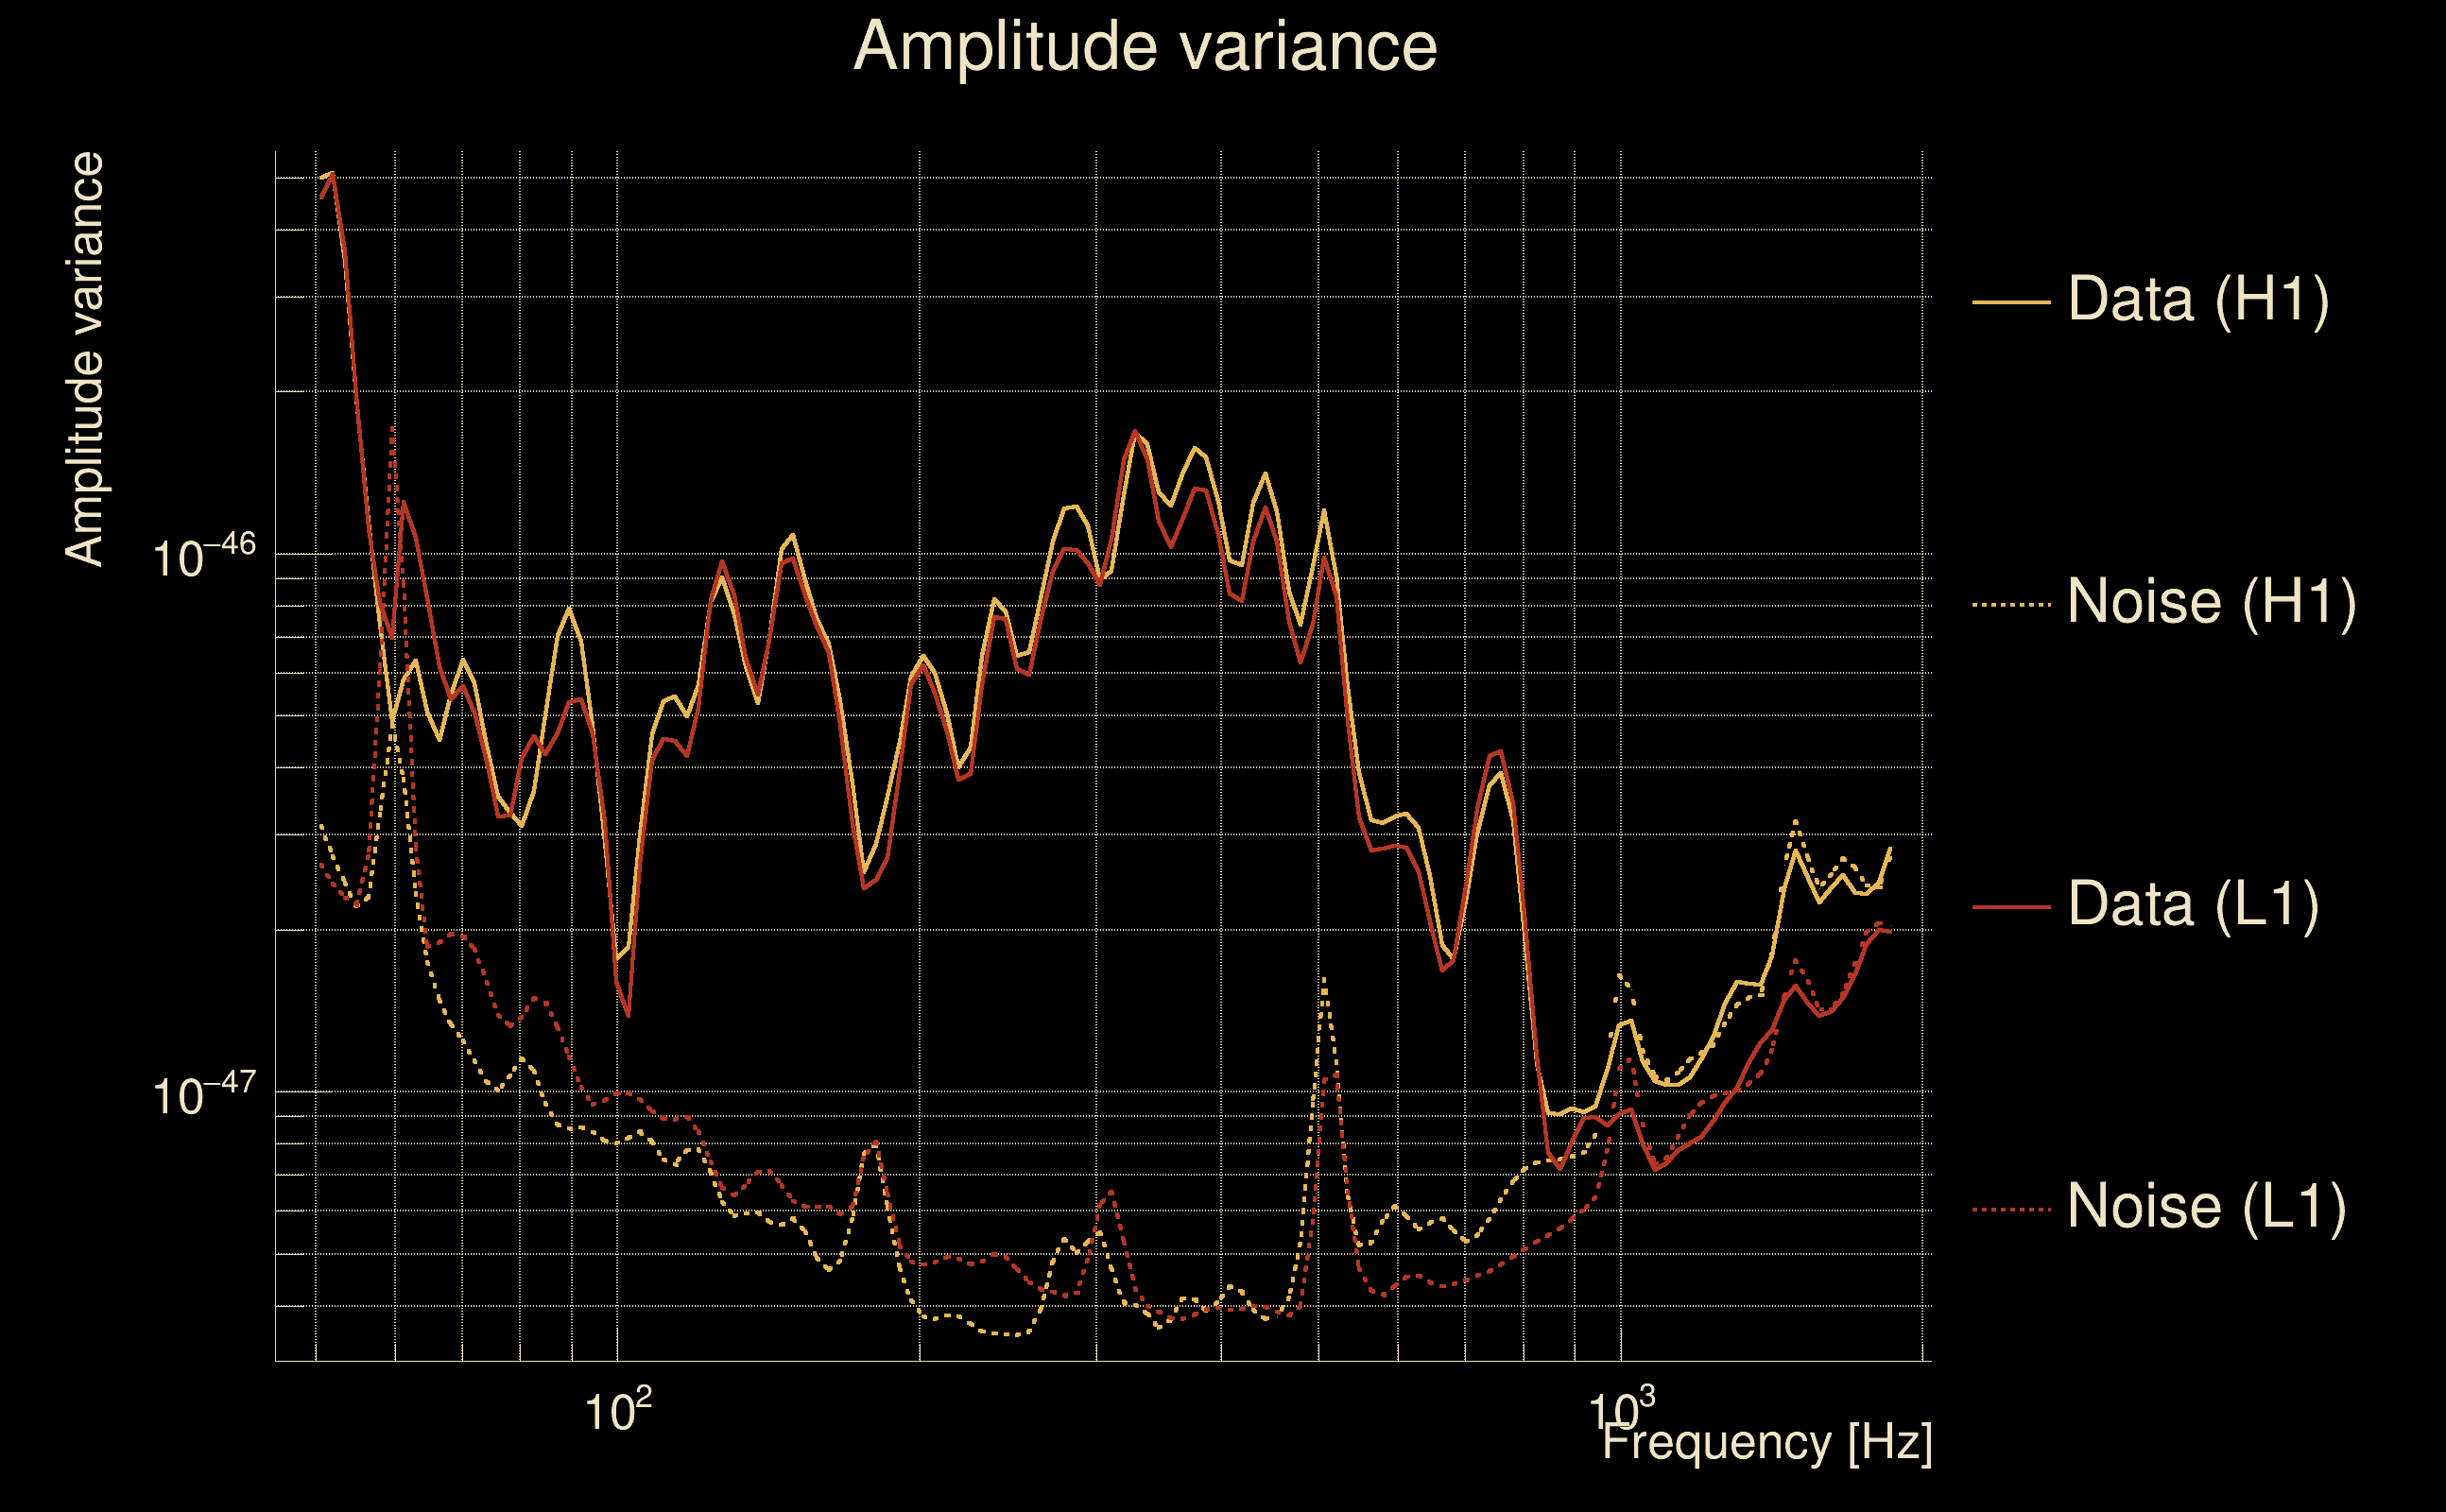
| Frequency: | 314.379 Hz |
| Ξ: | 0.920297 ± 0.0174759 (variance = 0.000305408): Q0: 0.968259, Q1: 0.968542, Q2: 0.953868, Q3: 0.93945, Q4: 0.923063 |
| Rank: | R_A = 0.829737 |
| Log of amplitude ratio (L1/H1): | -0.23428, variance = 0.164973 (L1/H1: -0.221587, variance = 0.30988, H1/L1: 0.254892, variance = 0.318645) |
| Amplitude ratio (L1/H1): | 0.79114 ⋇ 1.50106 (L1/H1: 0.801246 ⋇ 1.74485, H1/L1: 1.29032 ⋇ 1.75854) |
| Amplitude ratio H1|L1 compatibility (probability): | 0.966491 |
| Antenna factor probability: | 0.965575 |
| Number of rejected frequency rows: | Q0: 0 / 18, Q1: 2 / 36, Q2: 8 / 70, Q3: 16 / 134, Q4: 54 / 258 |
| Maximum signal-to-noise ratio: | H1: 71.1899, L1: 55.8648 |
| SNR variance: | H1: 0.4543, L1: 0.493394 |
| Click here for a zoomed plot | Click here for a zoomed plot | Click here for a zoomed plot | Click here for a zoomed plot | Click here for a zoomed plot |
 |
 |
 |
 |
 |
 |
 |
 |
 |
 |
 |
 |
 |
 |
 |
 |
 |
 |
 |
 |
 |
 |
 |
 |
 |
 |
 |
 |
 |
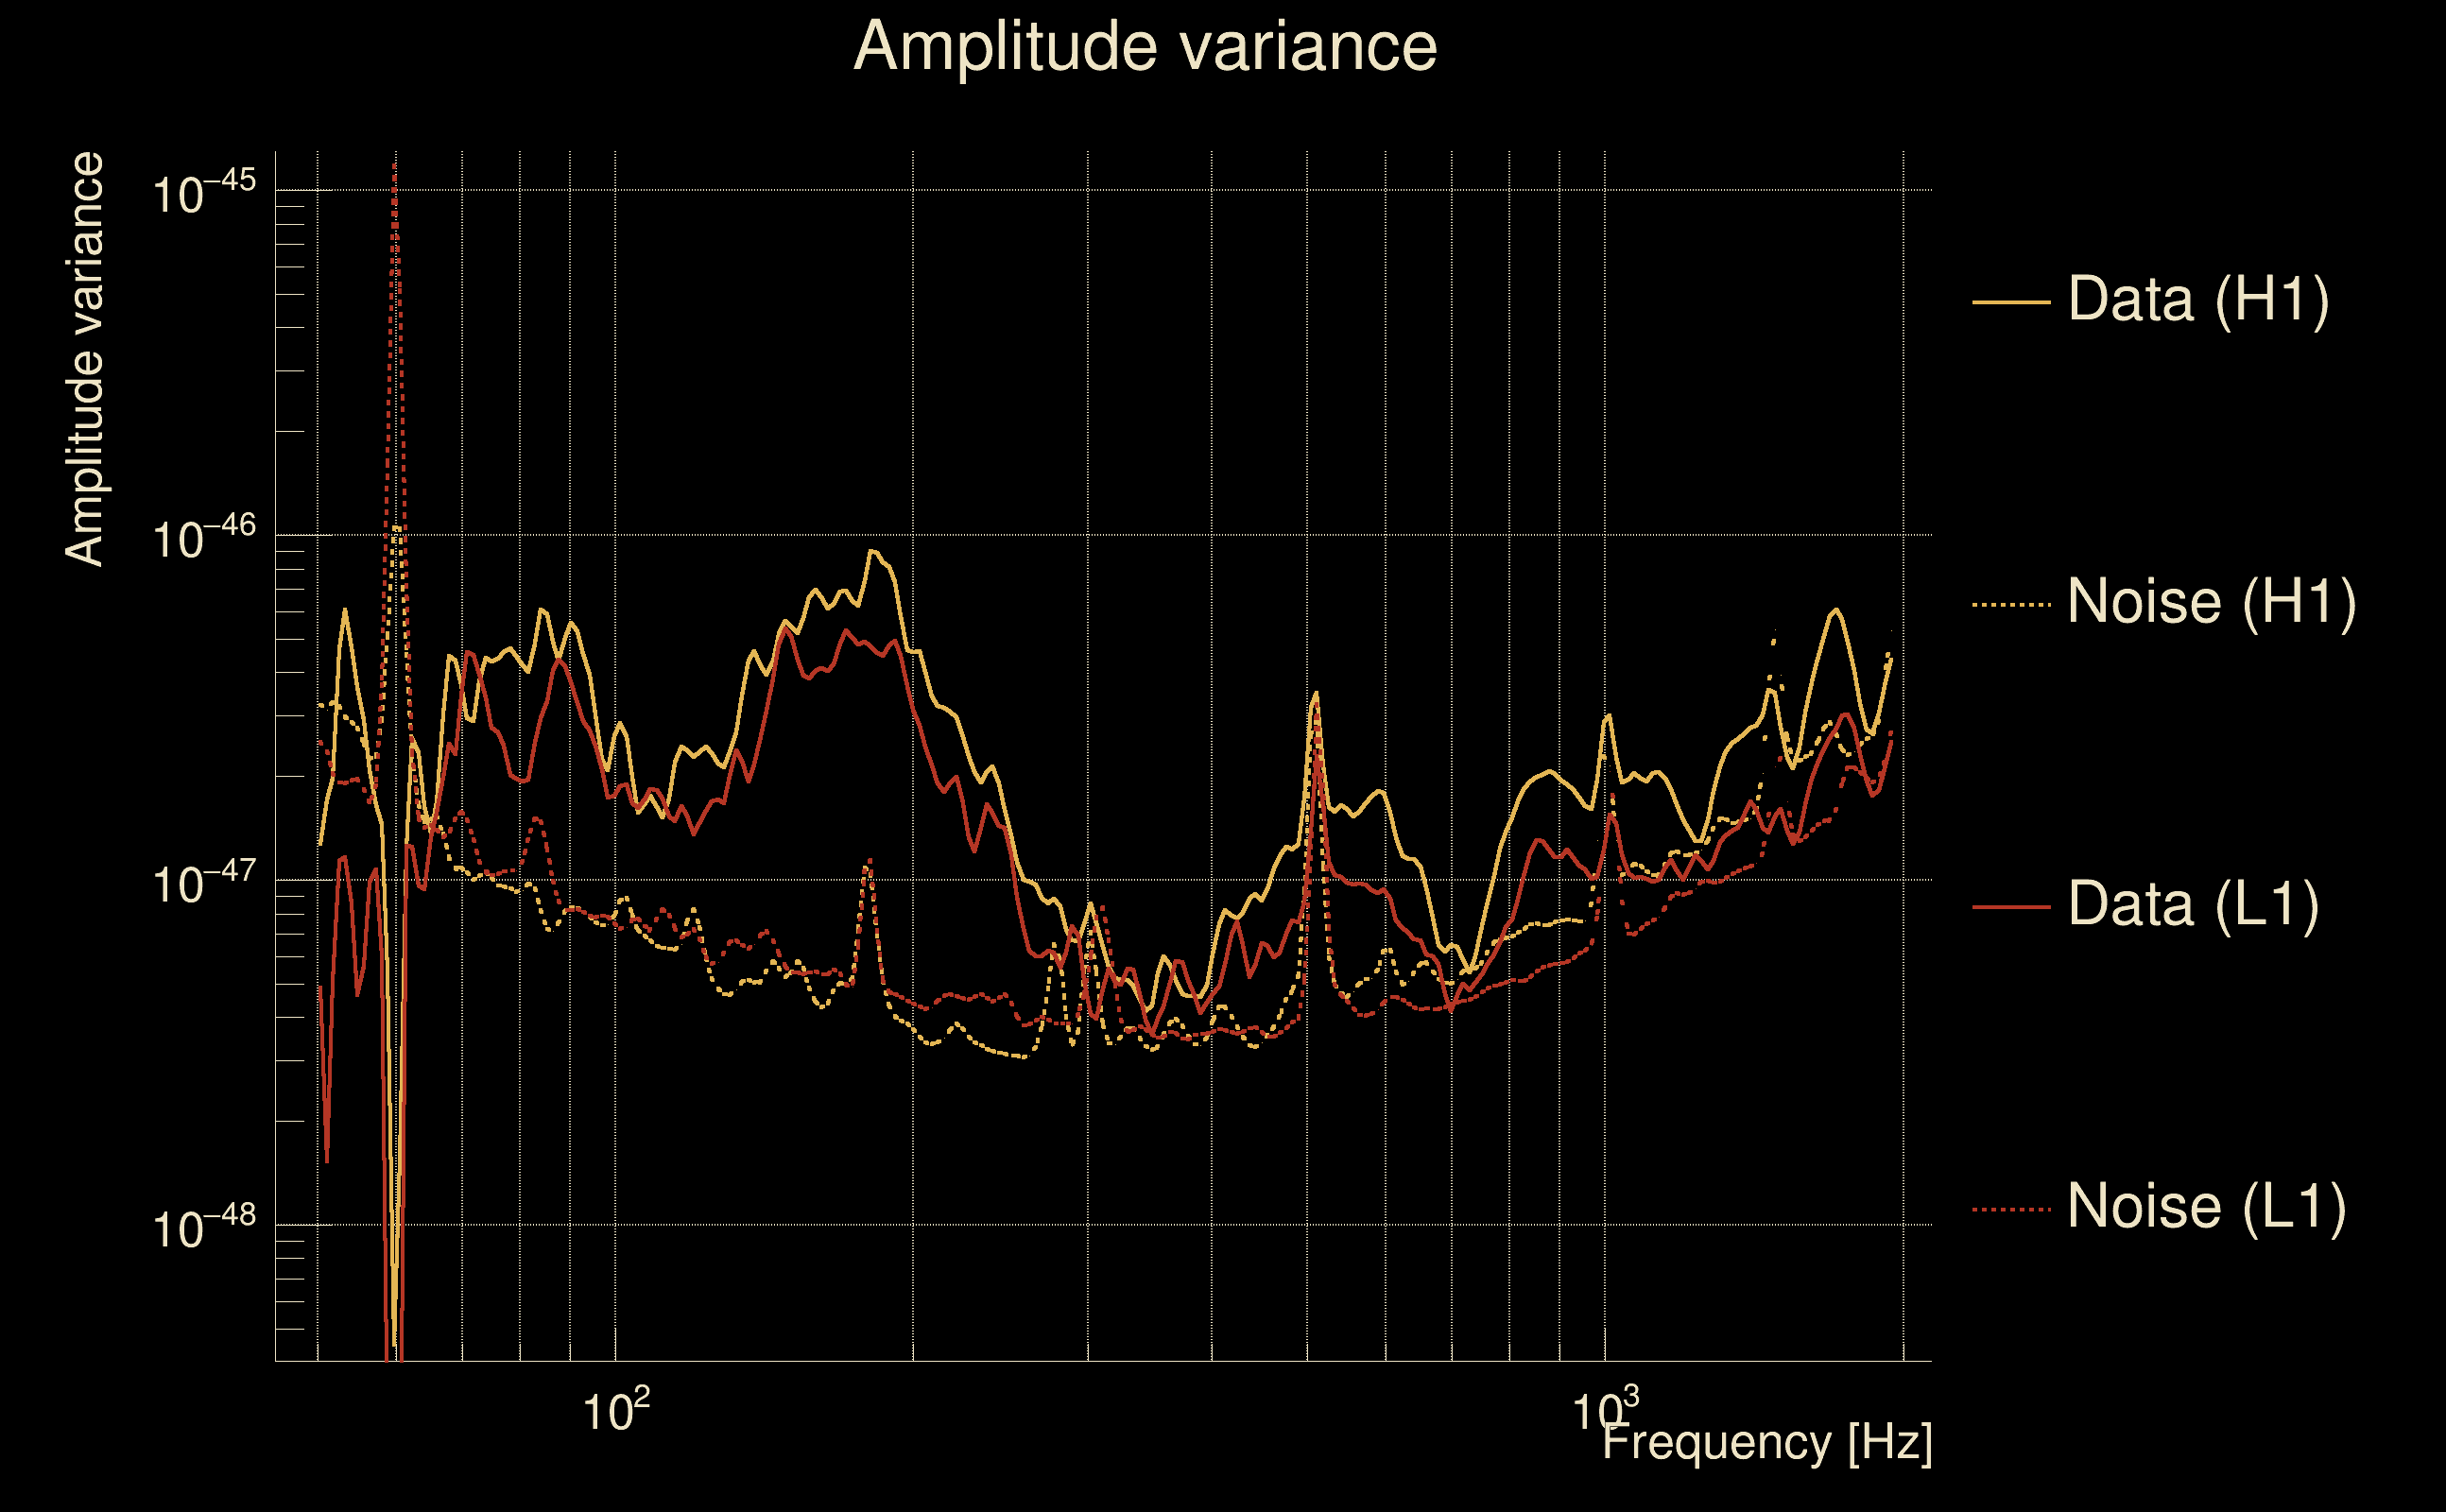
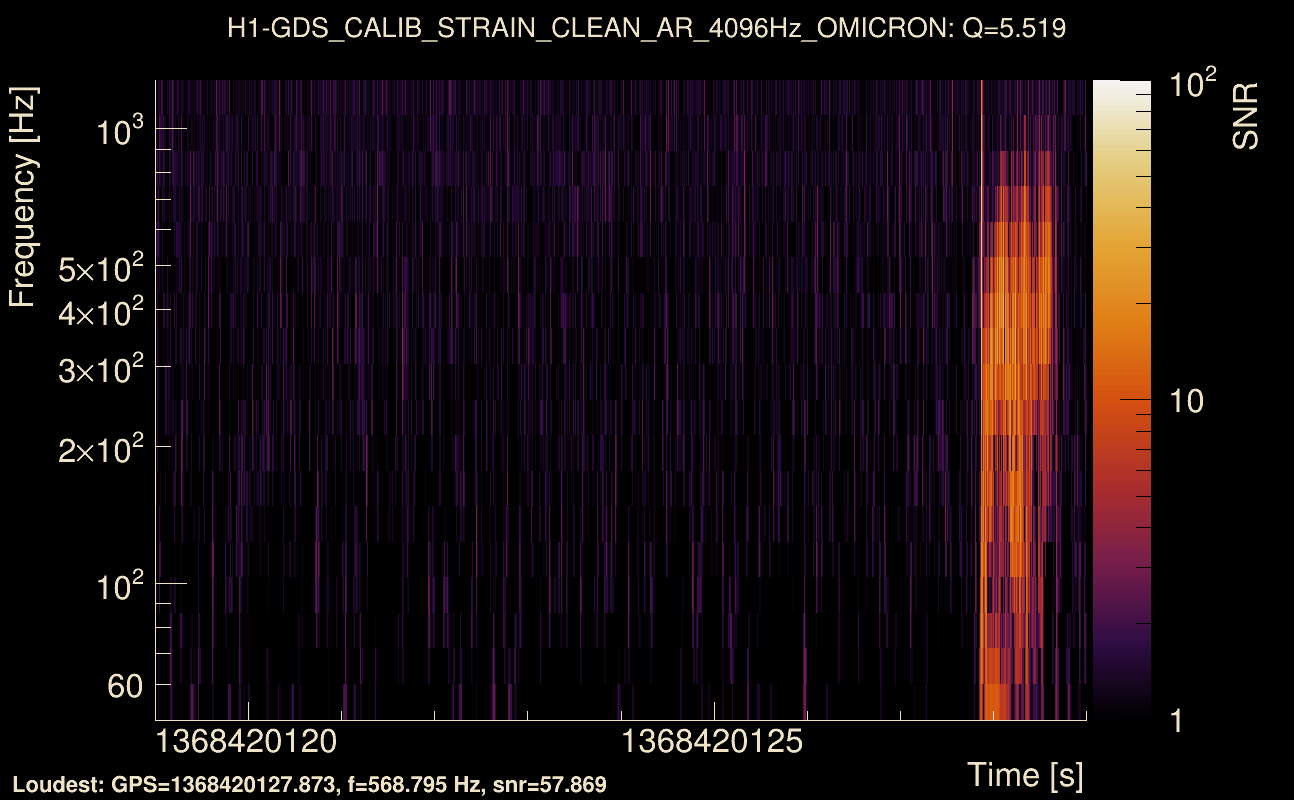
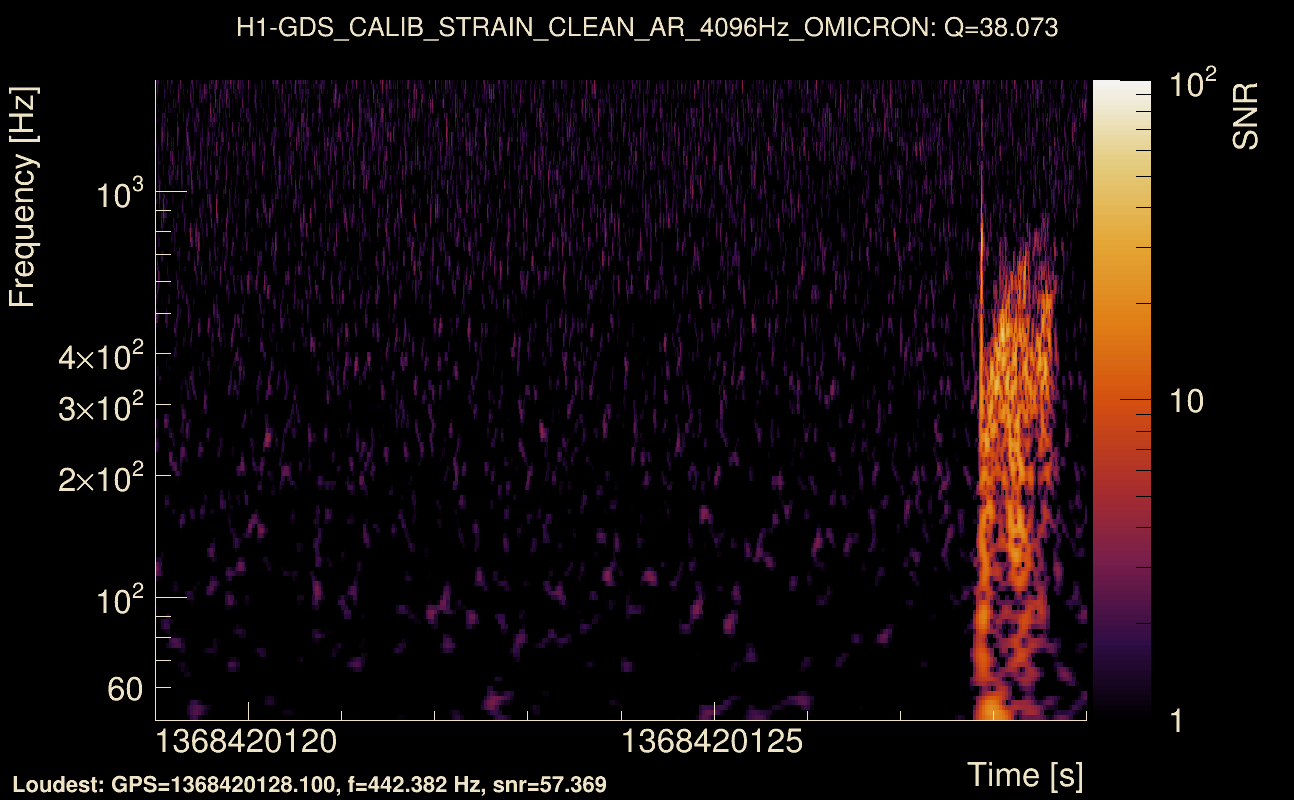
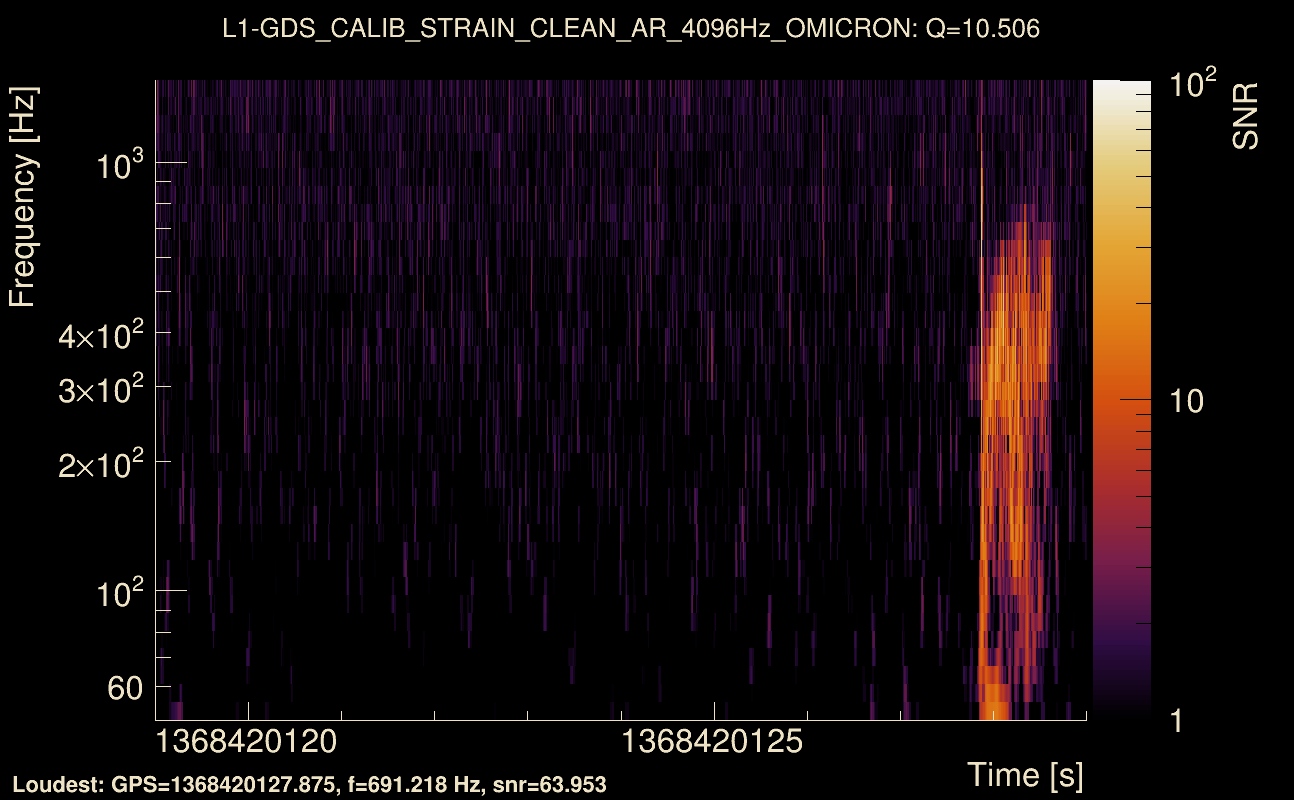
| Event time t(H1): | GPS = 1368420119 (Thu May 18 04:41:41 2023 ) → GPS = 1368420129 (Thu May 18 04:41:51 2023 ) |
| Event time t(L1): | GPS = 1368420119 (Thu May 18 04:41:51 2023 ) → GPS = 1368420129 (Thu May 18 04:41:51 2023 ) |
| Omicron analysis time window (H1): | GPS = 1368420116 → GPS = 1368420132 |
| Omicron analysis time window (L1): | GPS = 1368420116 → GPS = 1368420132 |
| Time delay between detectors t(L1) - t(H1): | 0.000845035 s (slice index = 108 / 217), δt_gw = 0.000845035 s |
| Time delay standard deviation: | 0.0208571 s |
| [targeted mode] Time delay probability: | 0.954692 (0.0568151 sigmas), δt_target = 0.00488925 s |
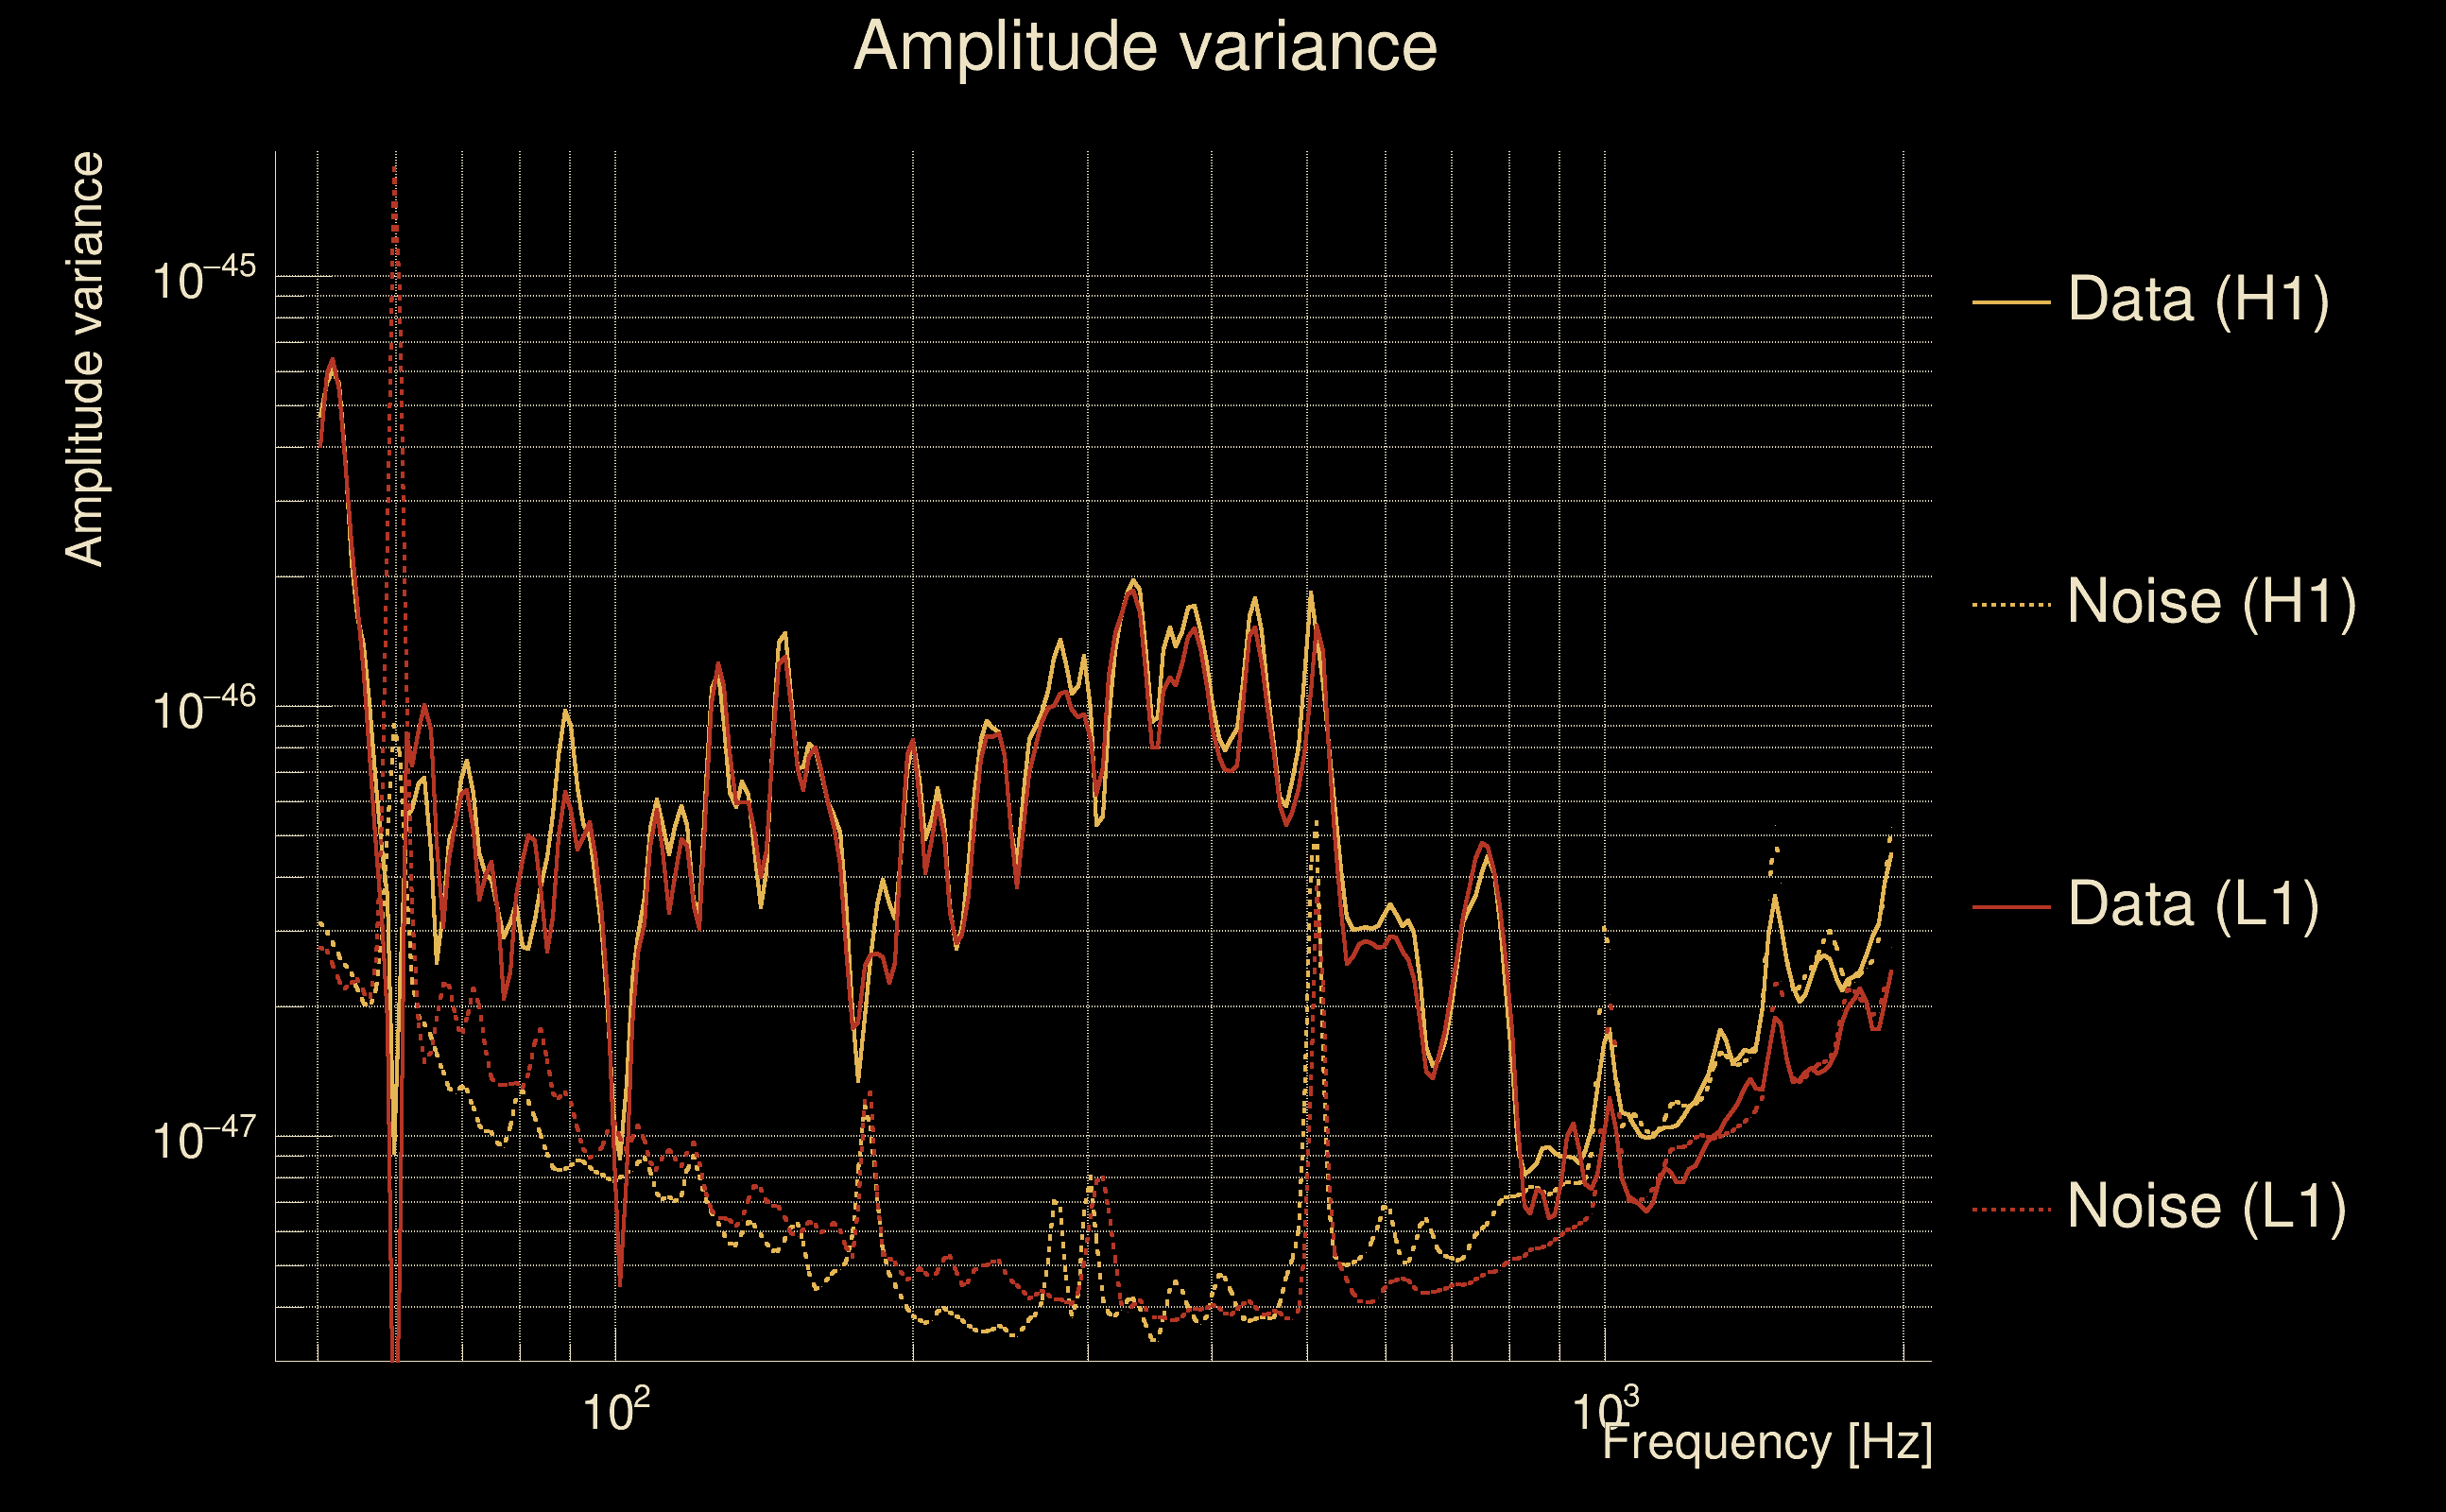
| Frequency: | 234.608 Hz |
| Ξ: | 0.890966 ± 0.00289699 (variance = 8.39258e-06): Q0: 0.95339, Q1: 0.959995, Q2: 0.954342, Q3: 0.954887, Q4: 0.951226 |
| Rank: | R_A = 0.827465 |
| Log of amplitude ratio (L1/H1): | -0.0348336, variance = 0.158383 (L1/H1: -0.0425129, variance = 0.304155, H1/L1: 0.0297609, variance = 0.30402) |
| Amplitude ratio (L1/H1): | 0.965766 ⋇ 1.4888 (L1/H1: 0.958378 ⋇ 1.73586, H1/L1: 1.03021 ⋇ 1.73565) |
| Amplitude ratio H1|L1 compatibility (probability): | 0.986954 |
| Antenna factor probability: | 0.985663 |
| Number of rejected frequency rows: | Q0: 0 / 18, Q1: 4 / 36, Q2: 10 / 70, Q3: 24 / 134, Q4: 57 / 258 |
| Maximum signal-to-noise ratio: | H1: 57.5497, L1: 70.8082 |
| SNR variance: | H1: 0.409589, L1: 0.430587 |
| Click here for a zoomed plot | Click here for a zoomed plot | Click here for a zoomed plot | Click here for a zoomed plot | Click here for a zoomed plot |
 |
 |
 |
 |
 |
 |
 |
 |
 |
 |
 |
 |
 |
 |
 |
 |
 |
 |
 |
 |
 |
 |
 |
 |
 |
 |
 |
 |
 |
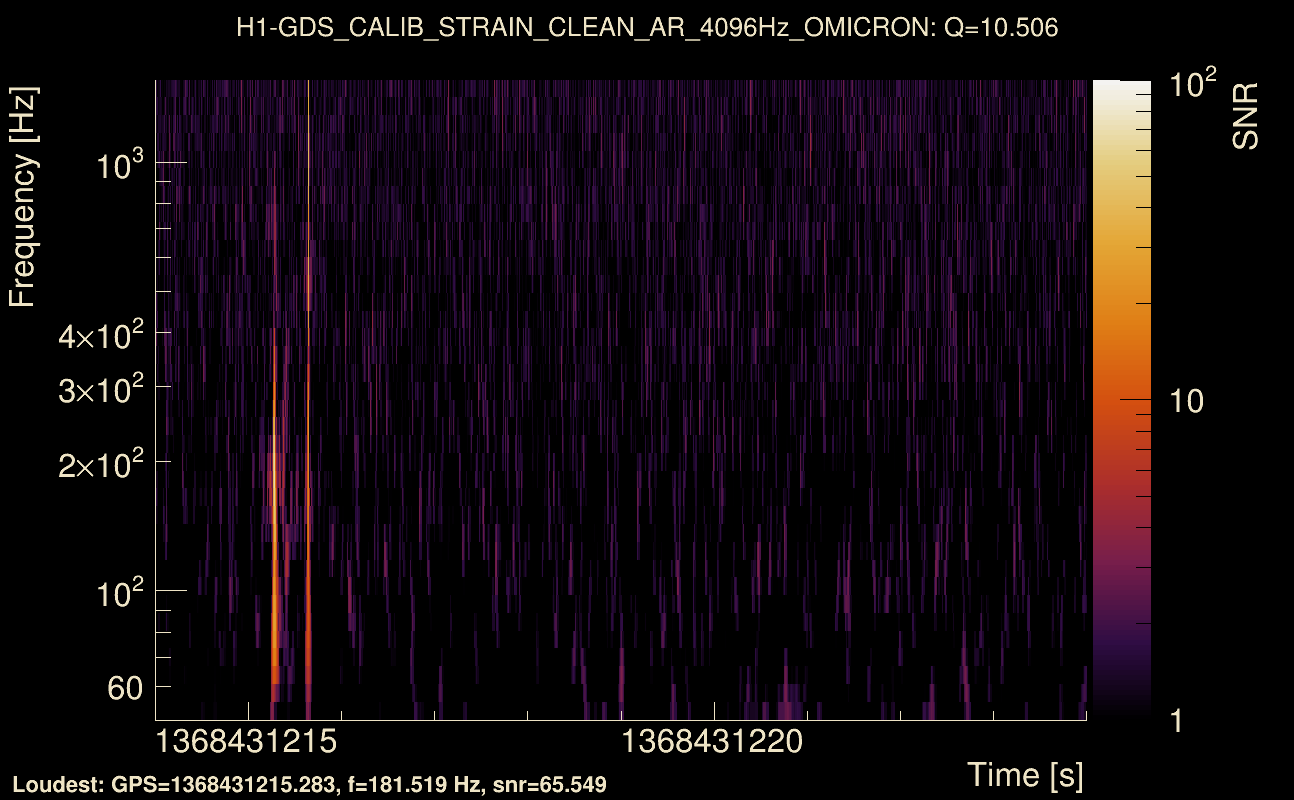
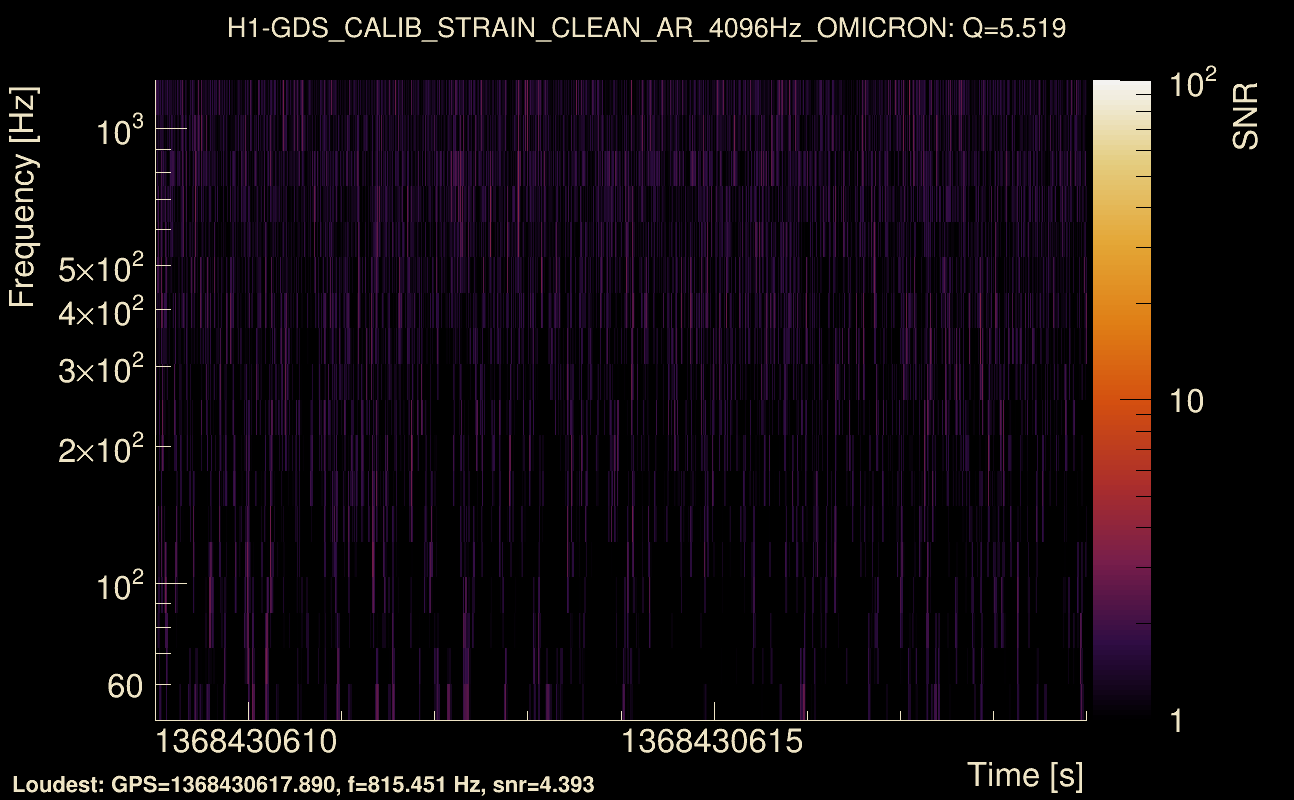
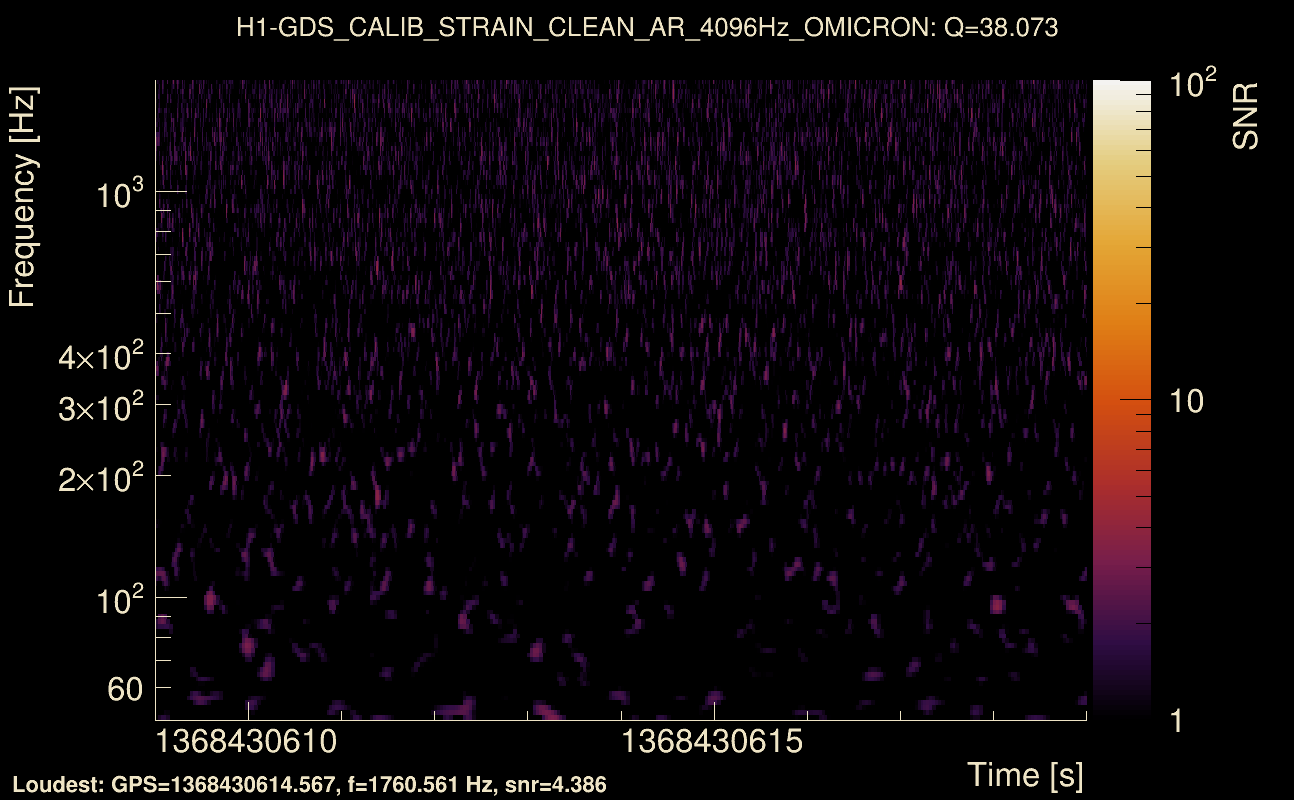
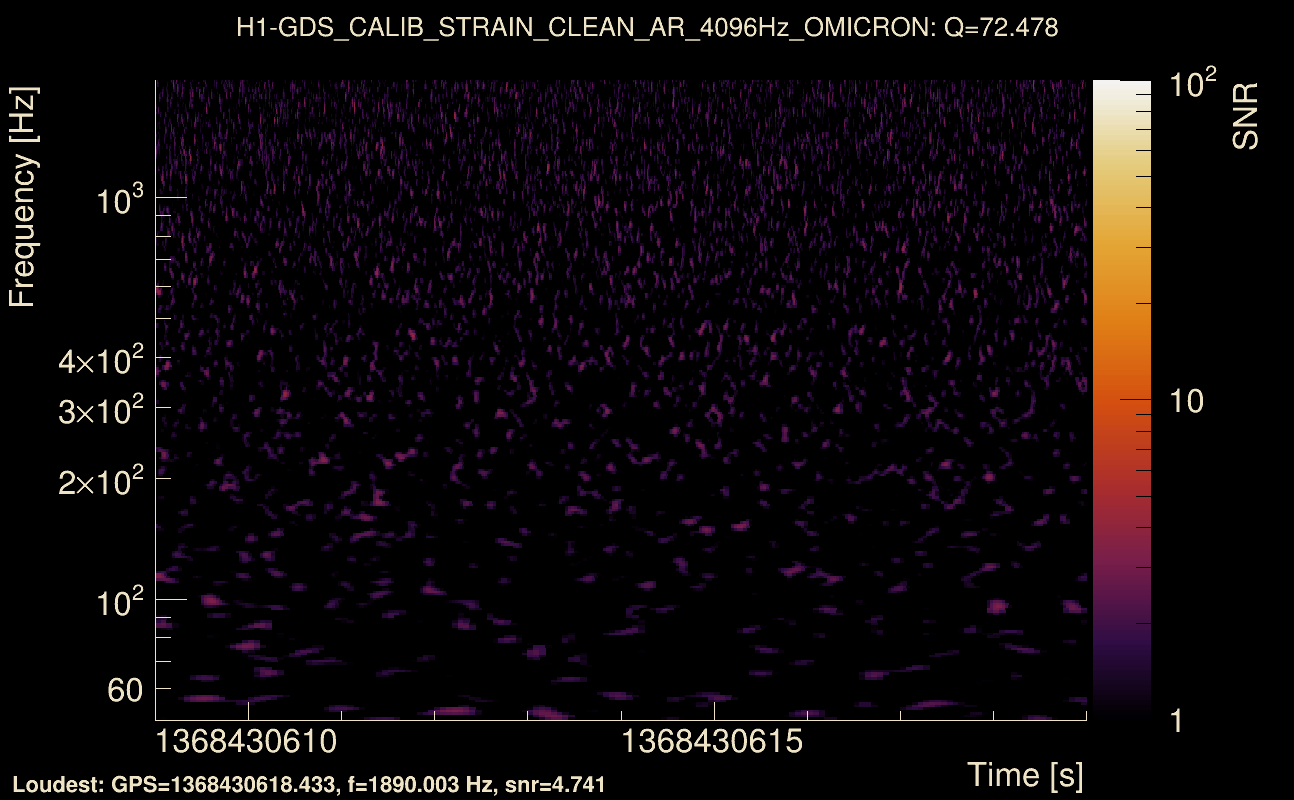
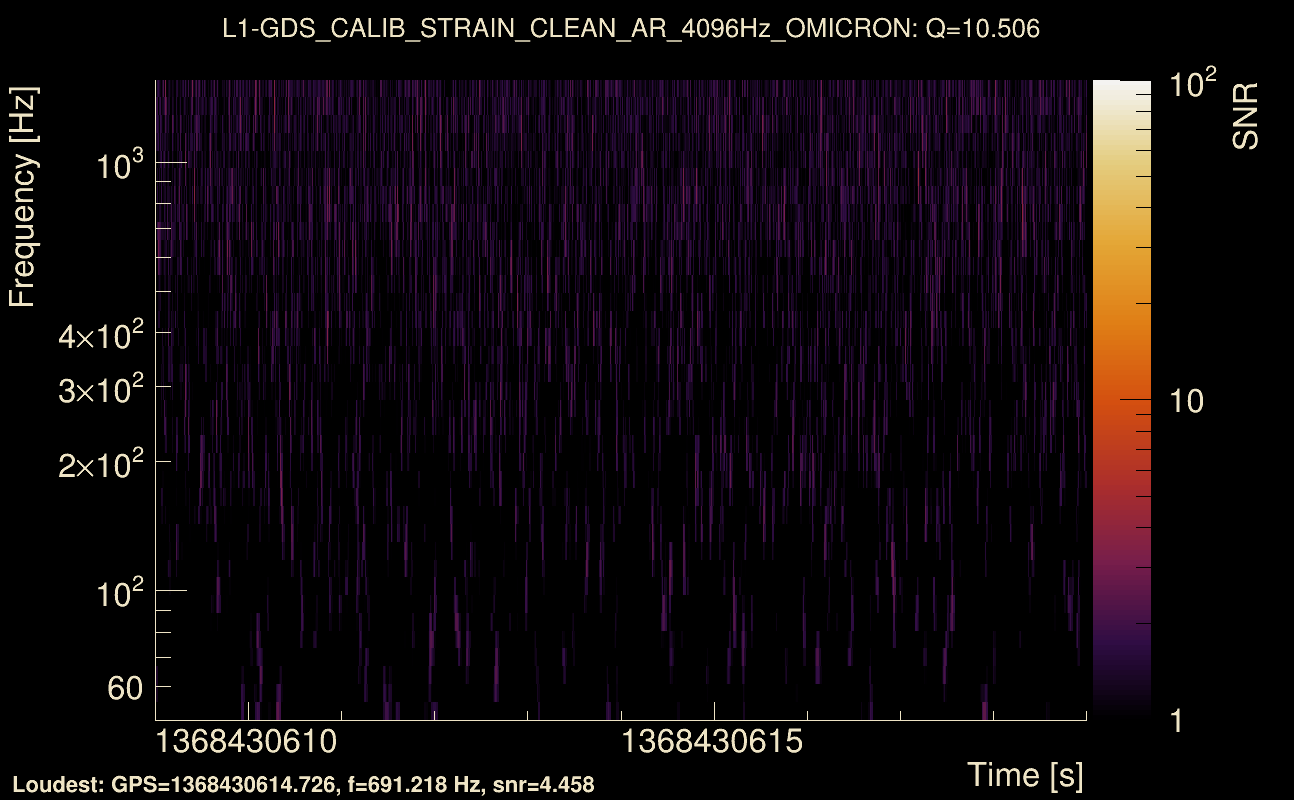
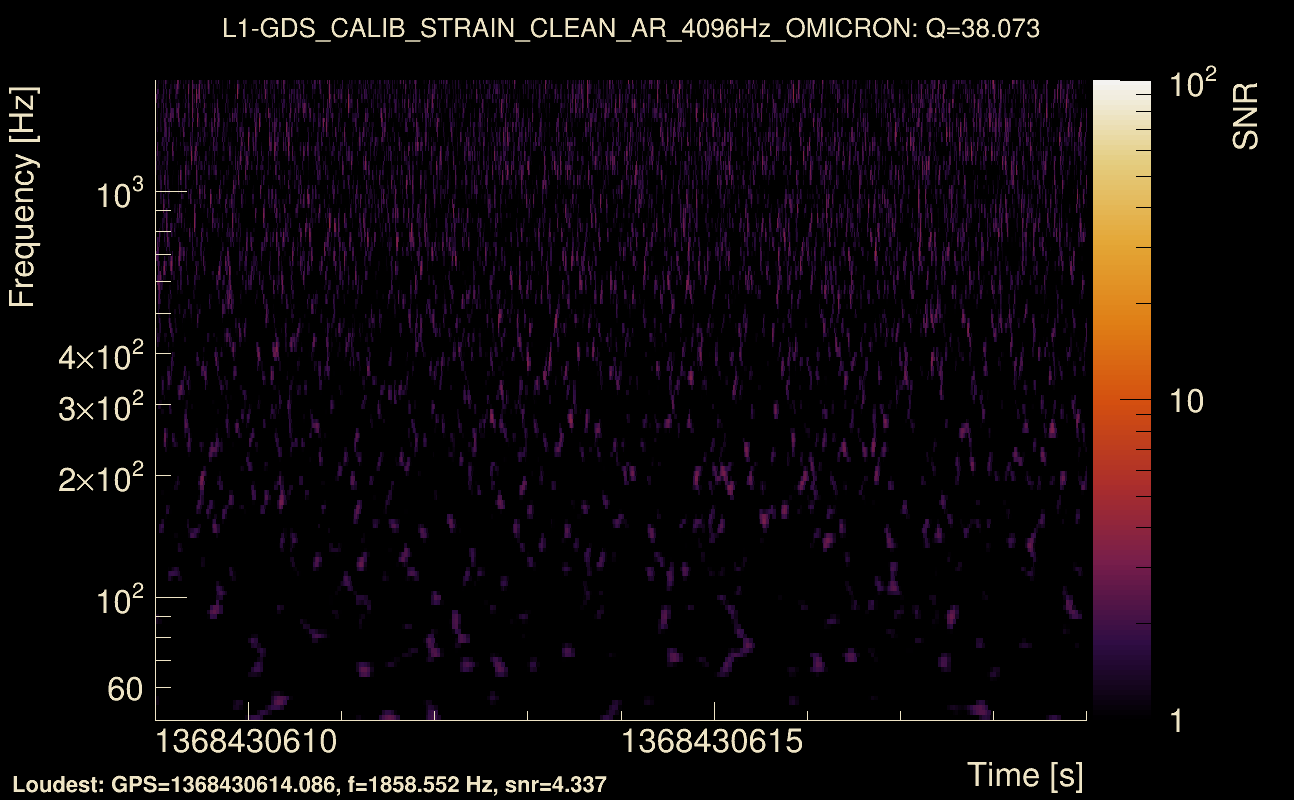
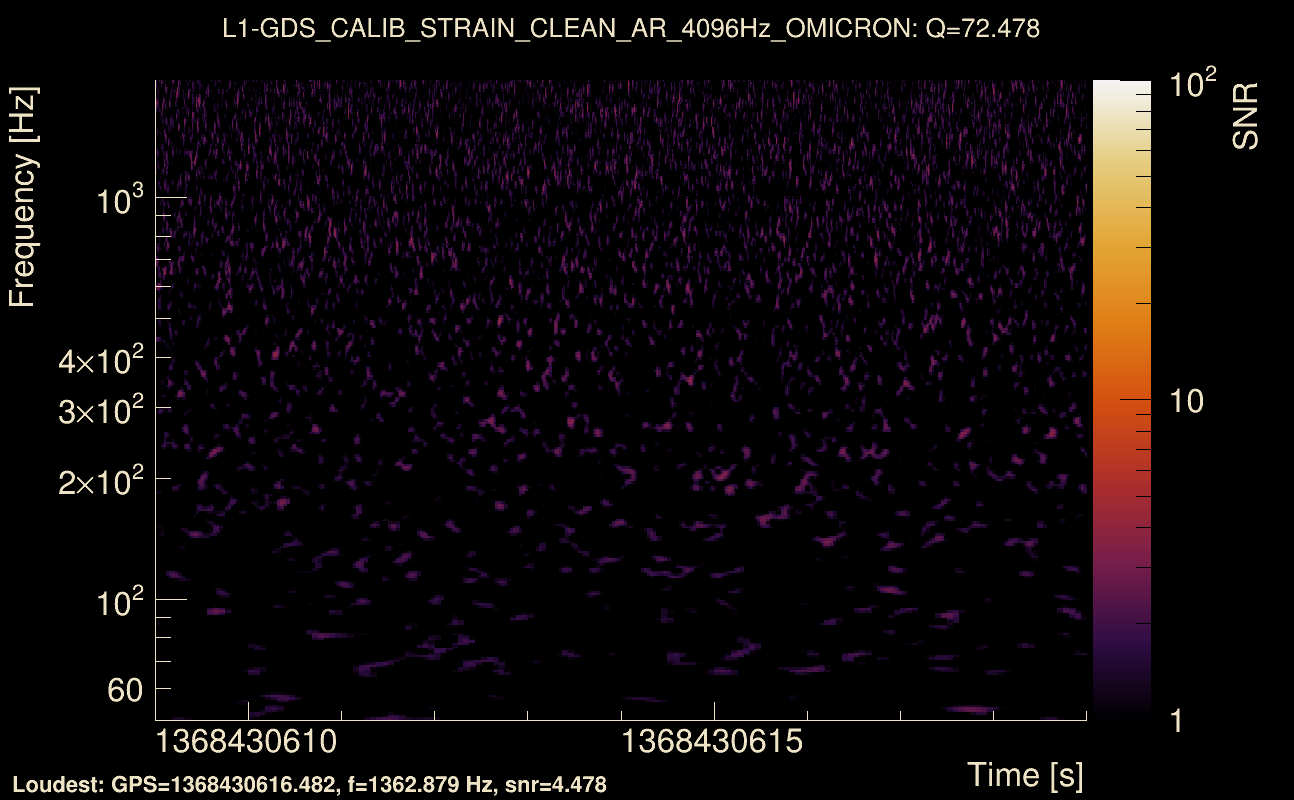
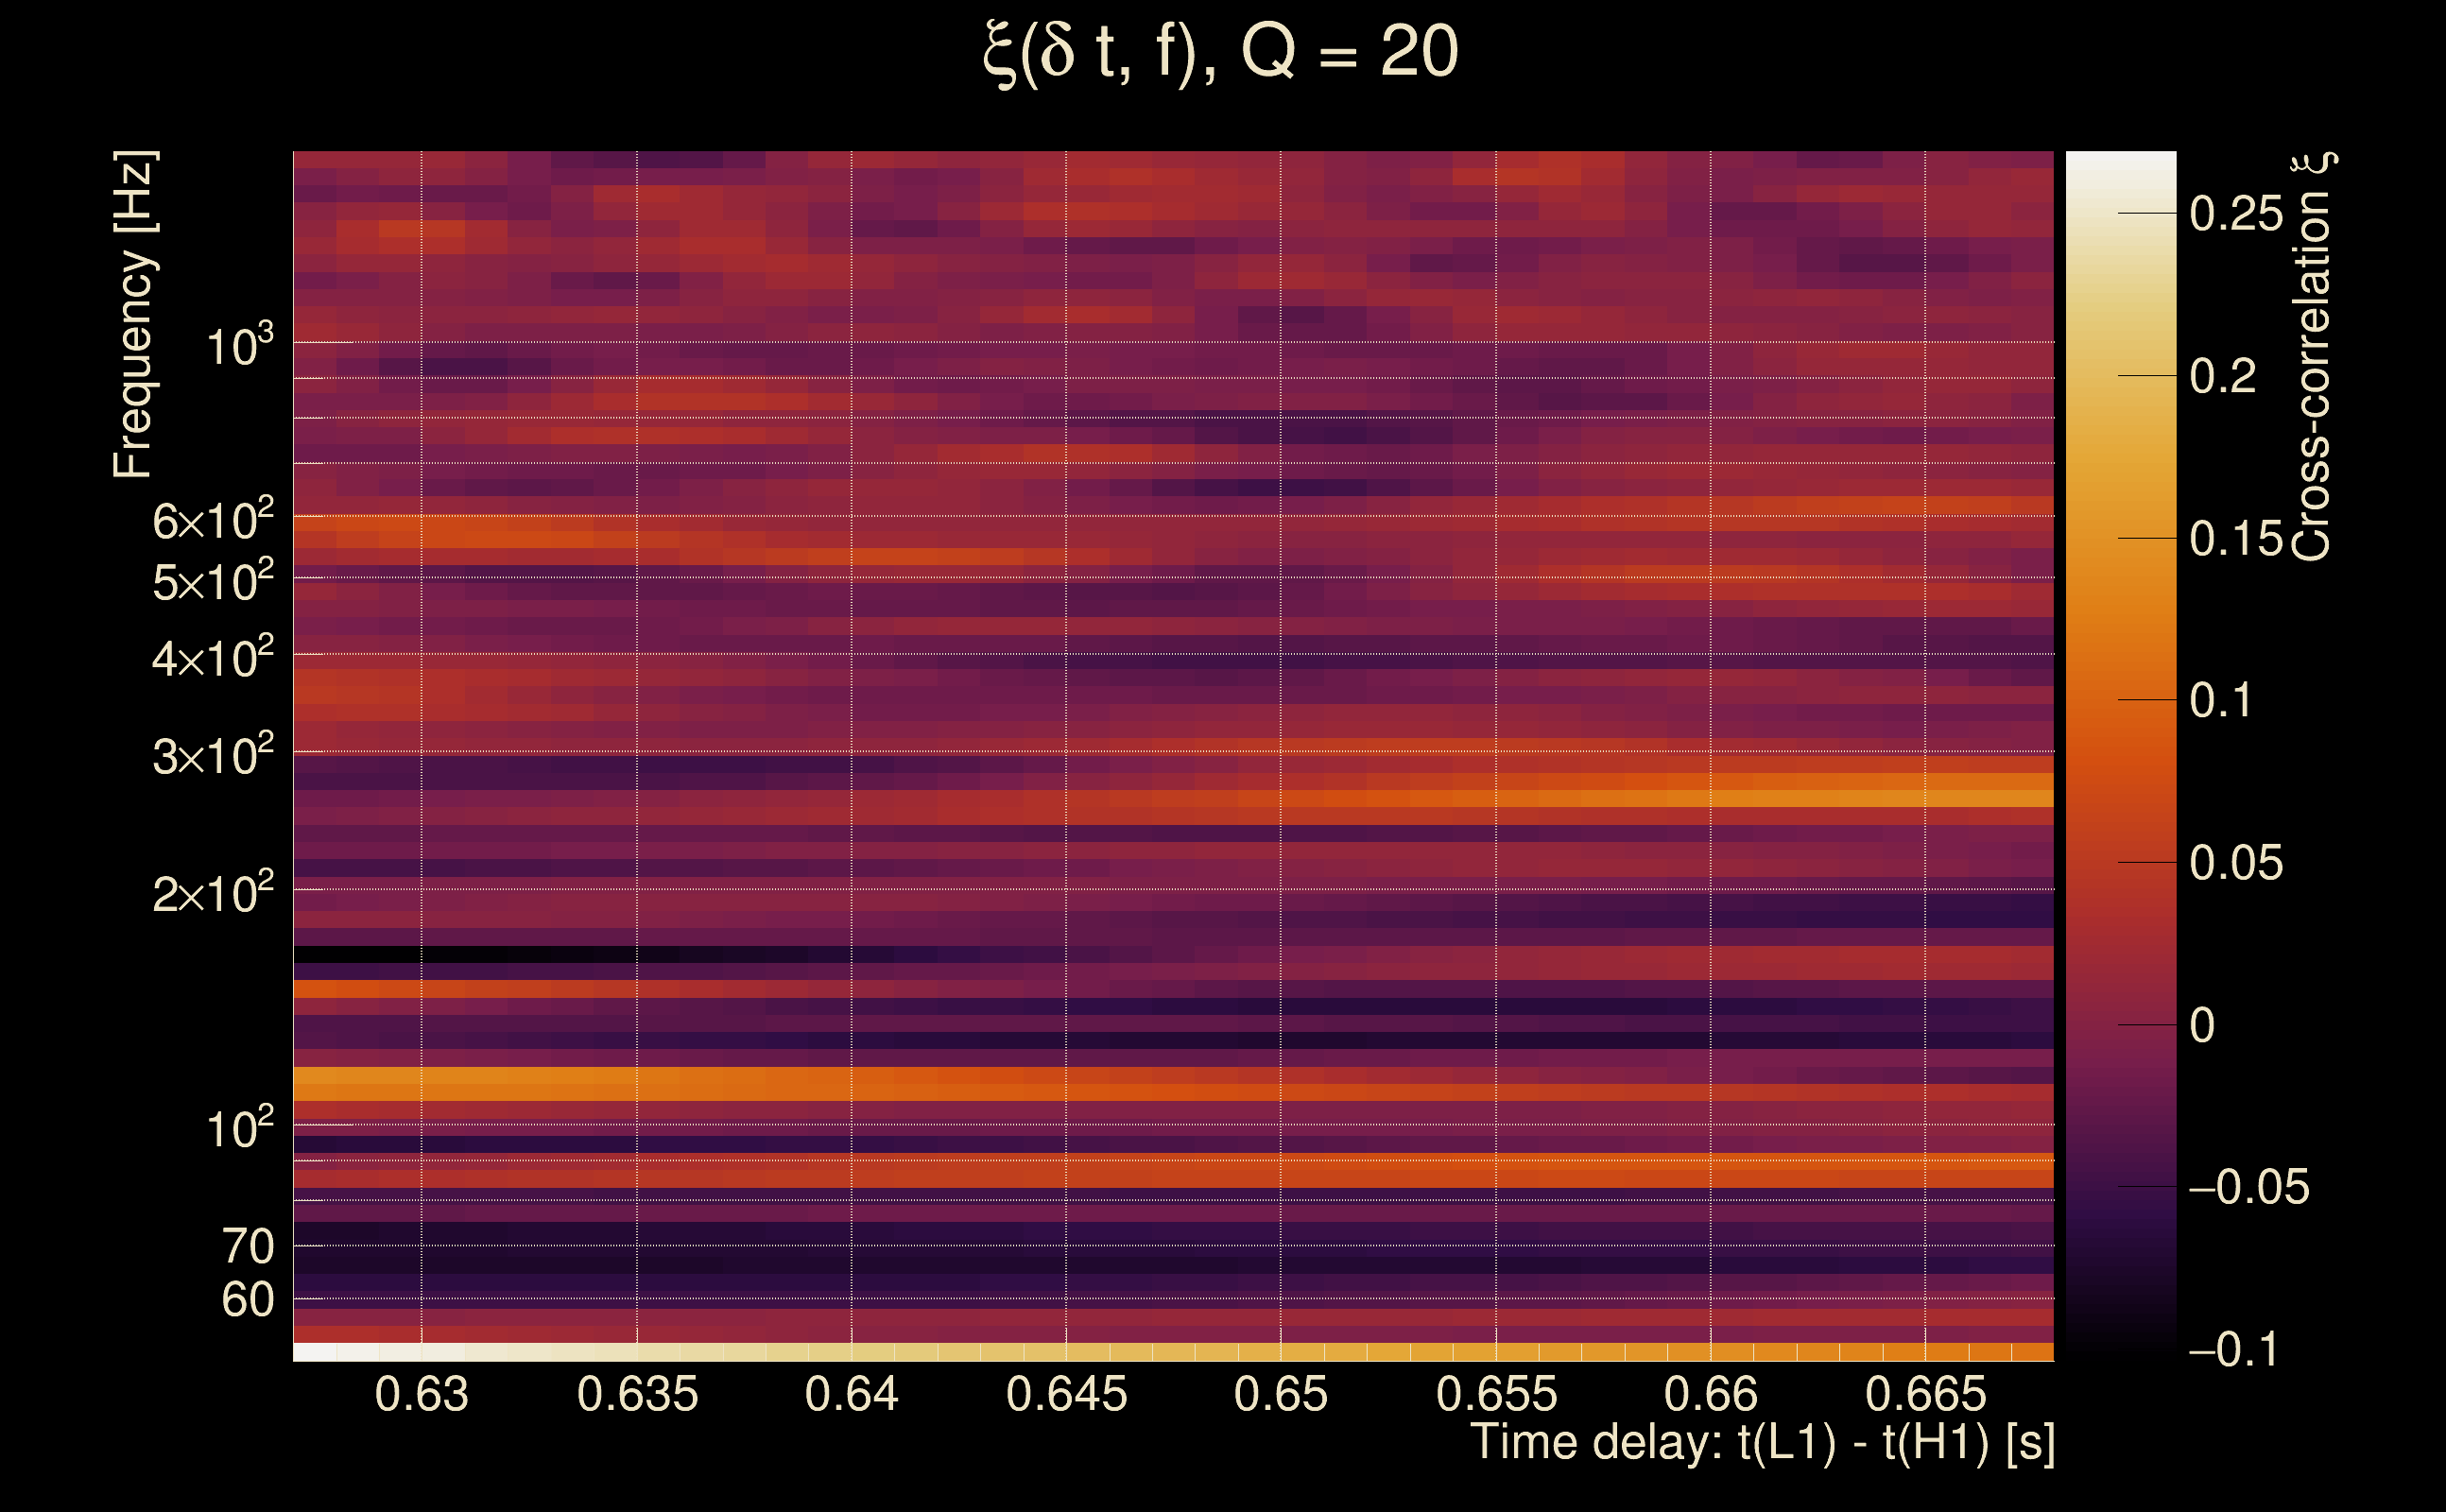
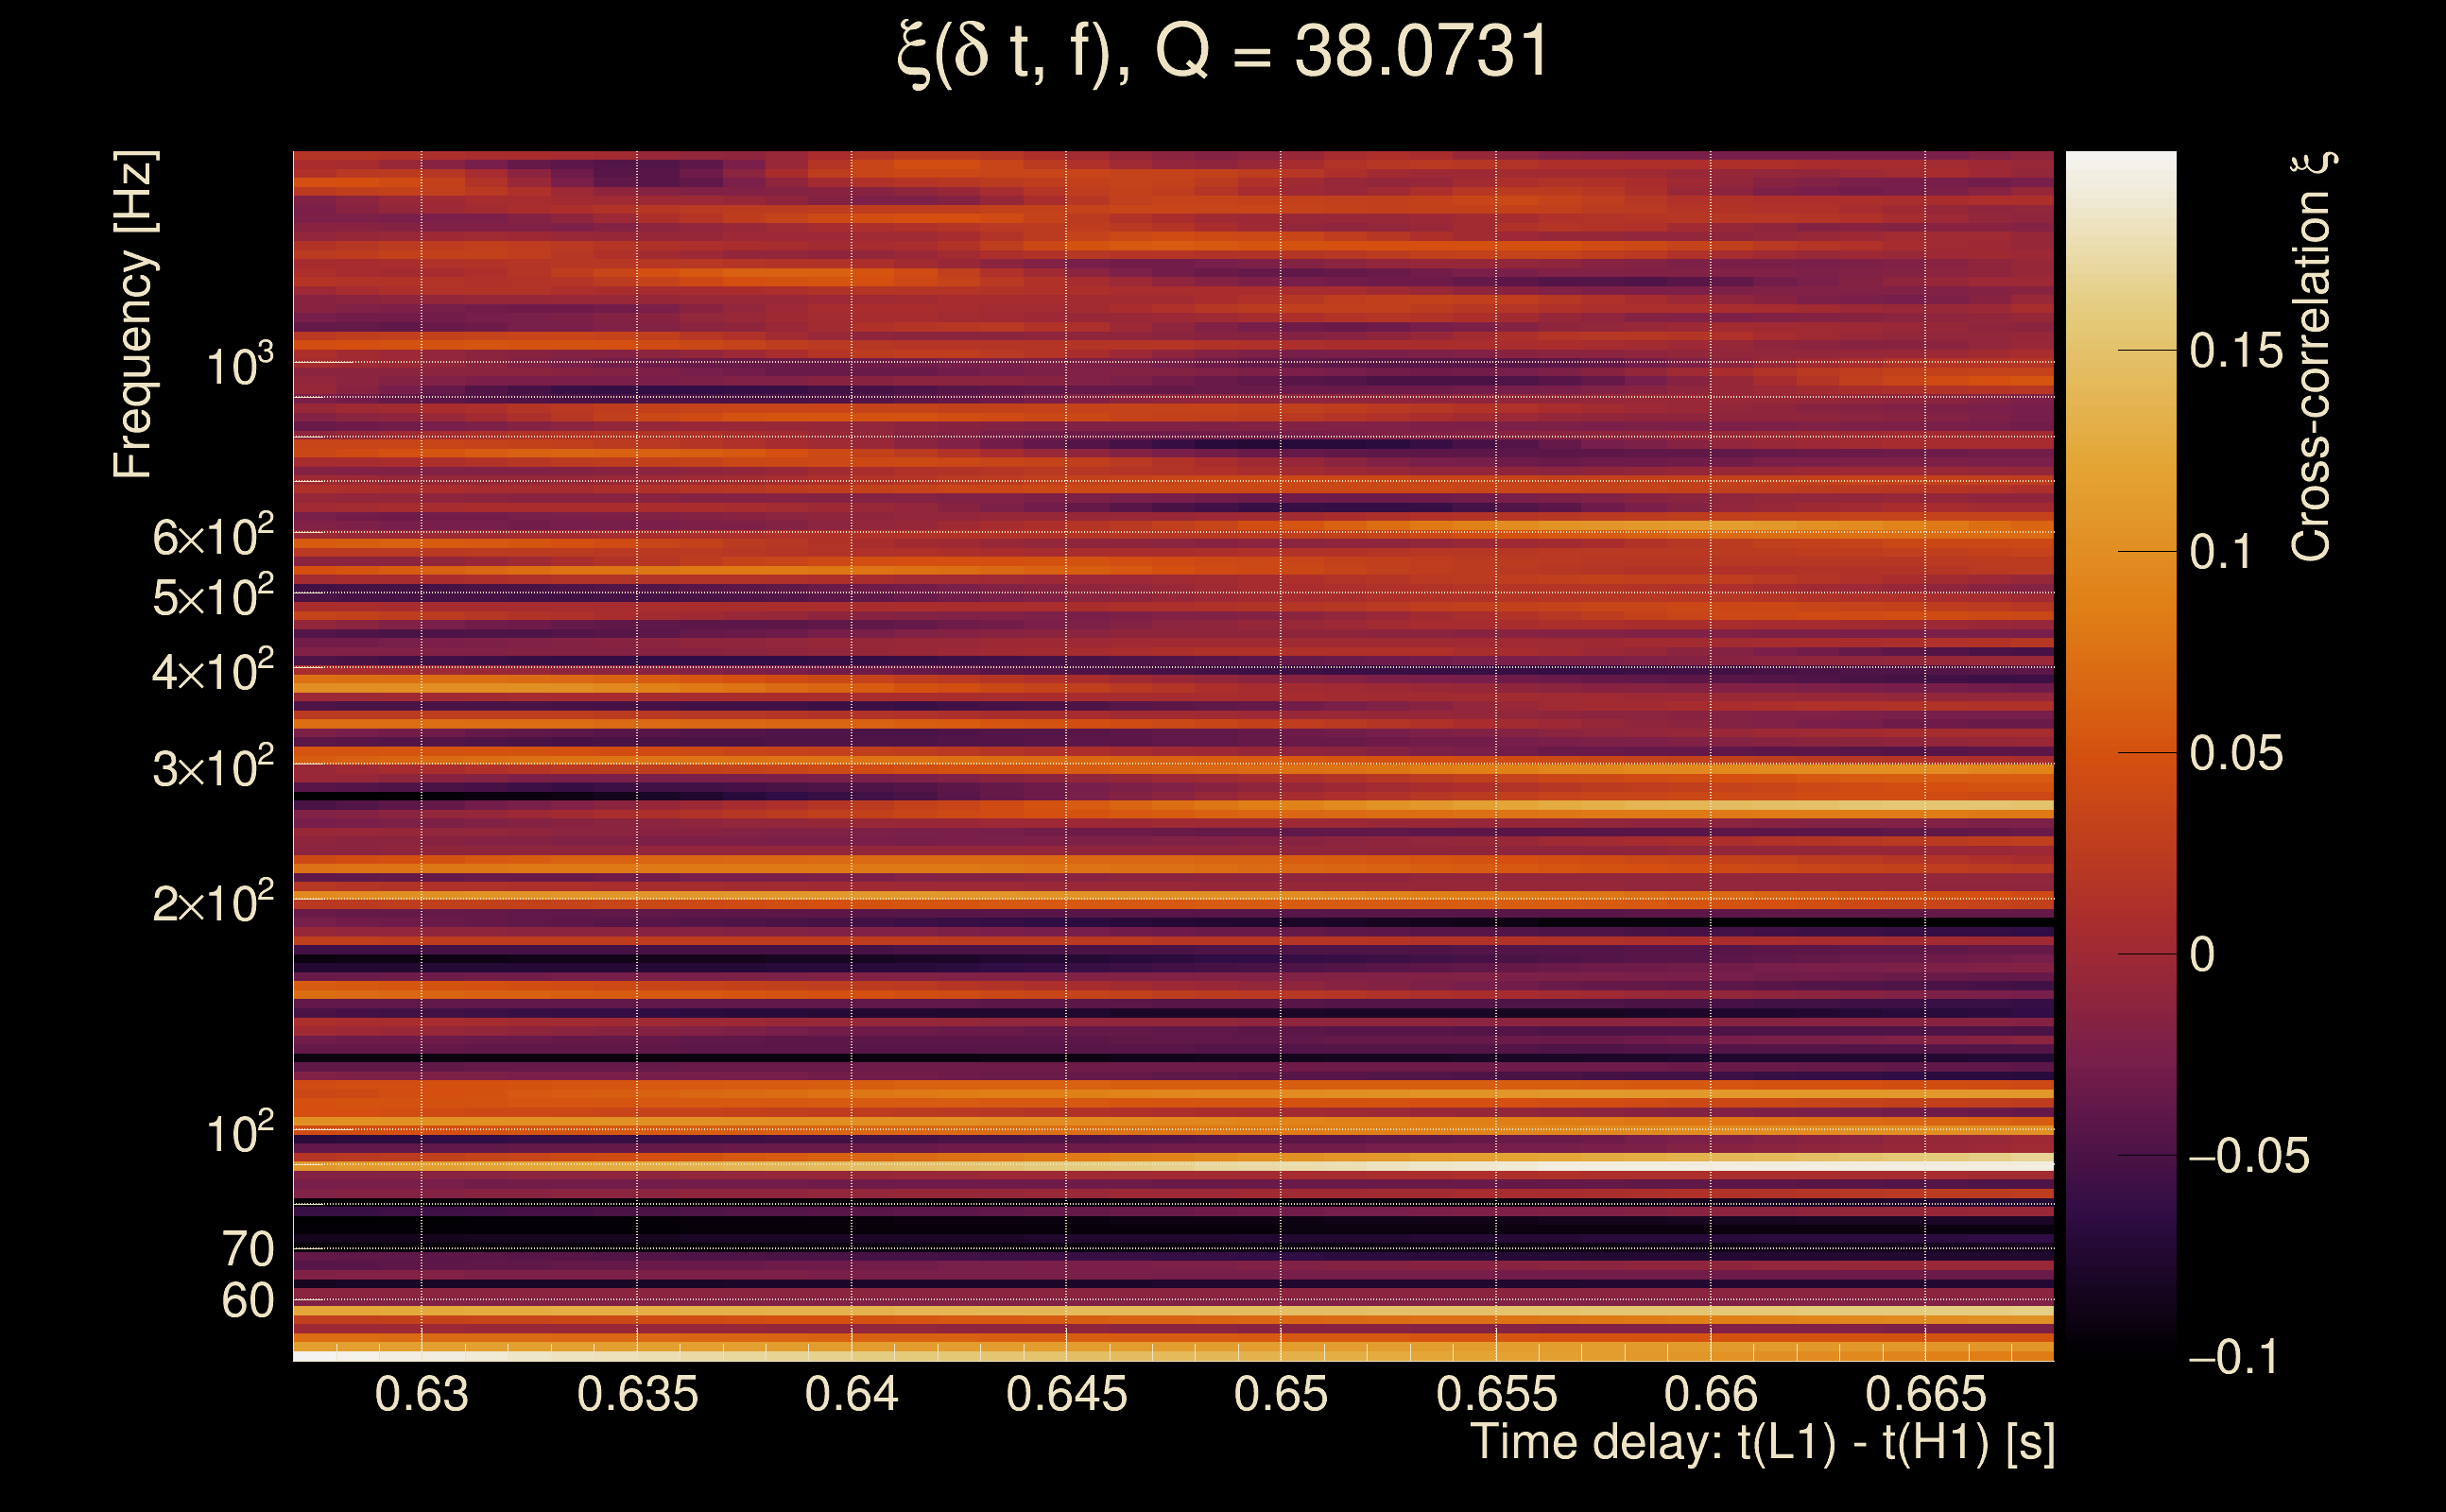
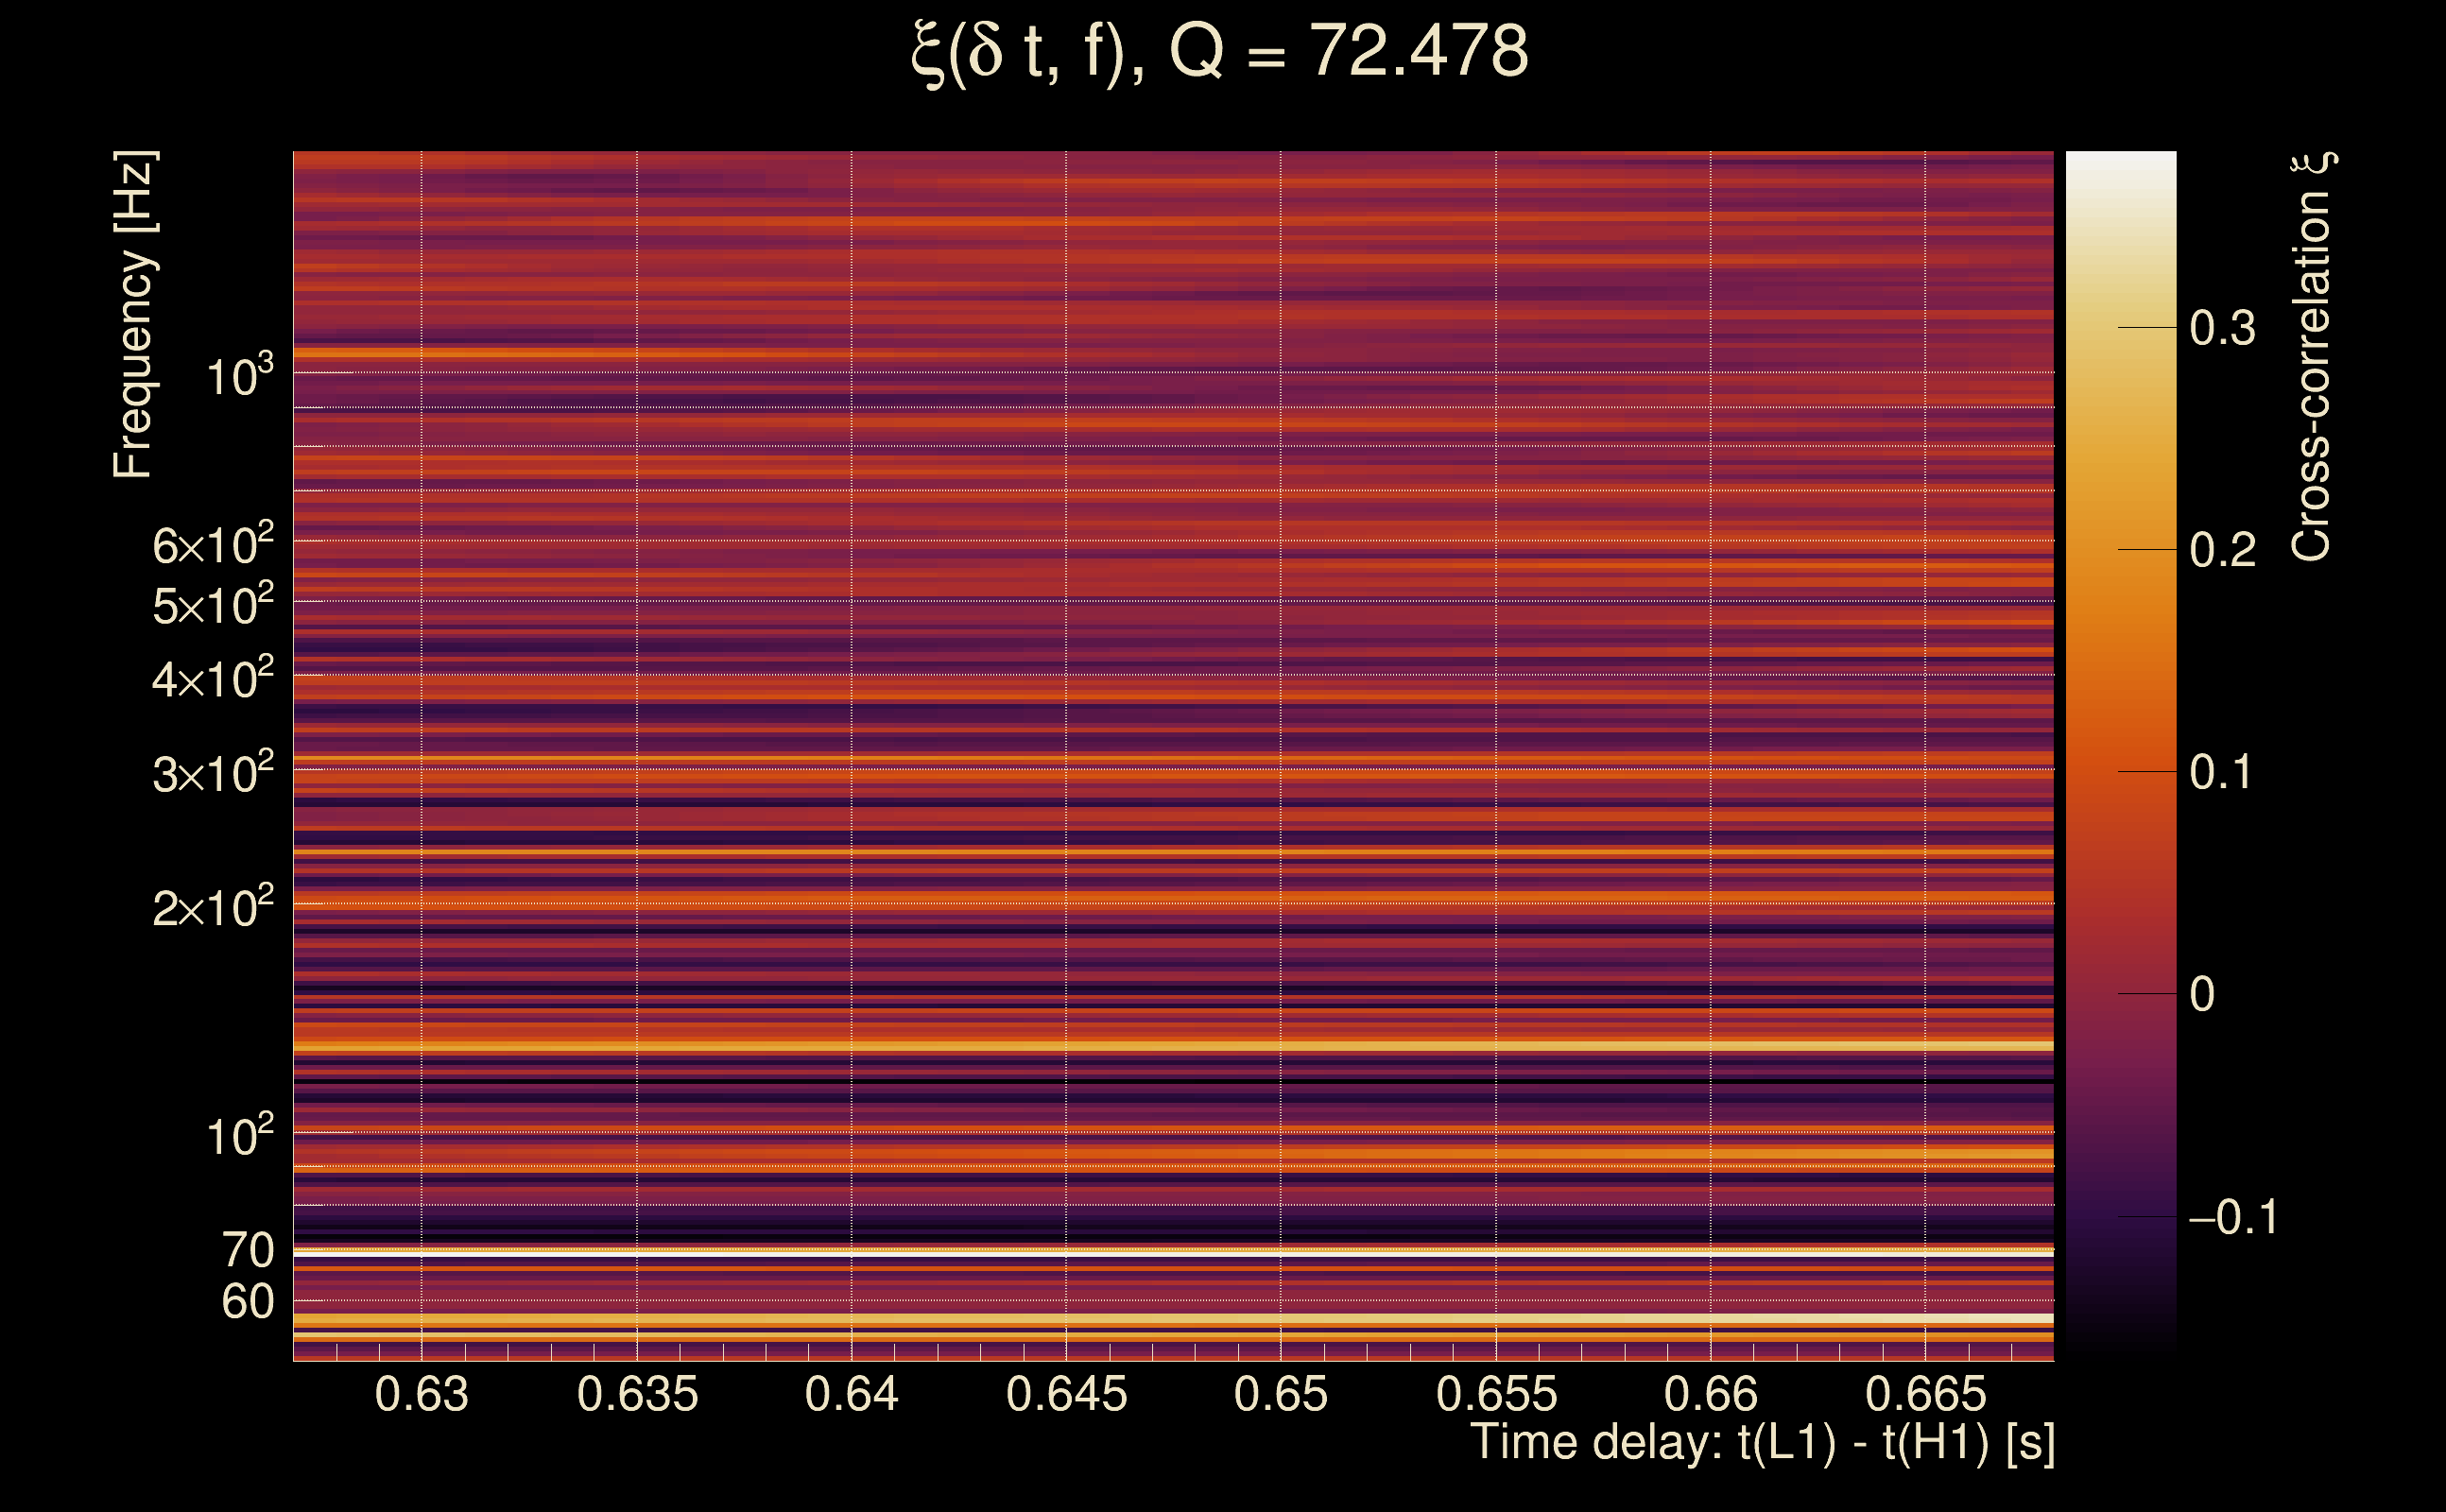
| Event time t(H1): | GPS = 1368430609 (Thu May 18 07:36:31 2023 ) → GPS = 1368430619 (Thu May 18 07:36:41 2023 ) |
| Event time t(L1): | GPS = 1368430609 (Thu May 18 07:36:41 2023 ) → GPS = 1368430619 (Thu May 18 07:36:41 2023 ) |
| Omicron analysis time window (H1): | GPS = 1368430606 → GPS = 1368430622 |
| Omicron analysis time window (L1): | GPS = 1368430606 → GPS = 1368430622 |
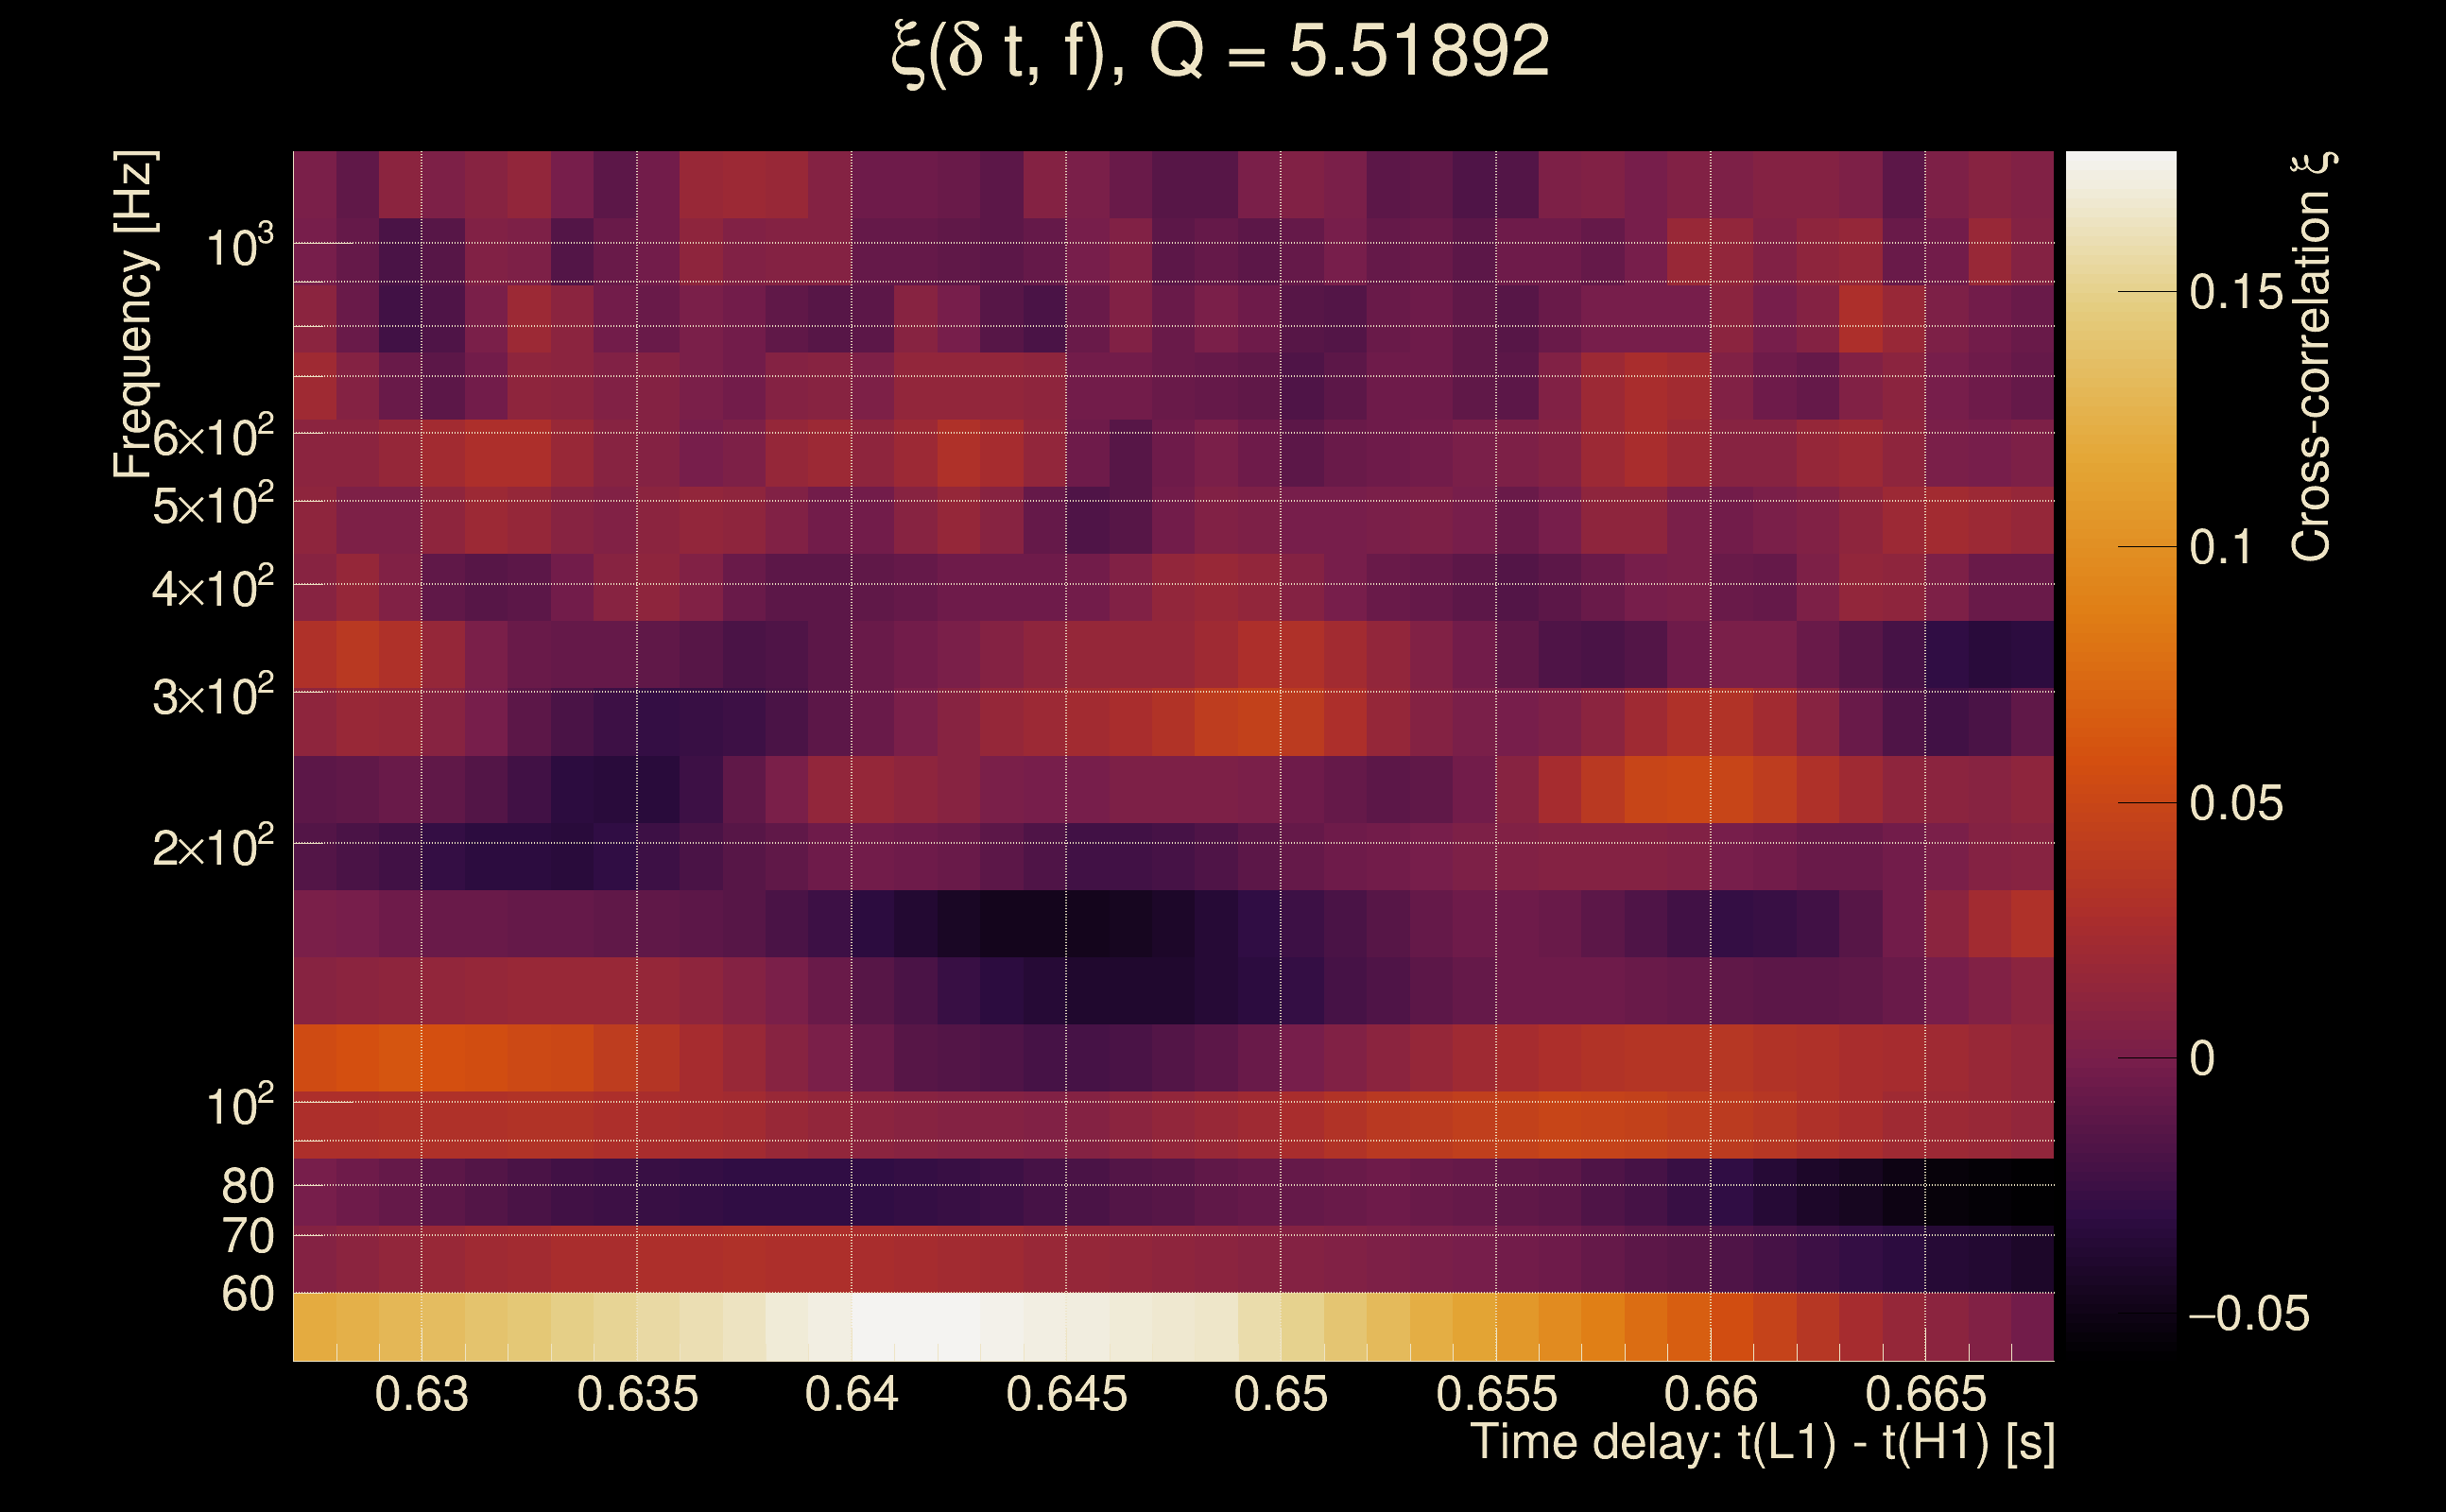
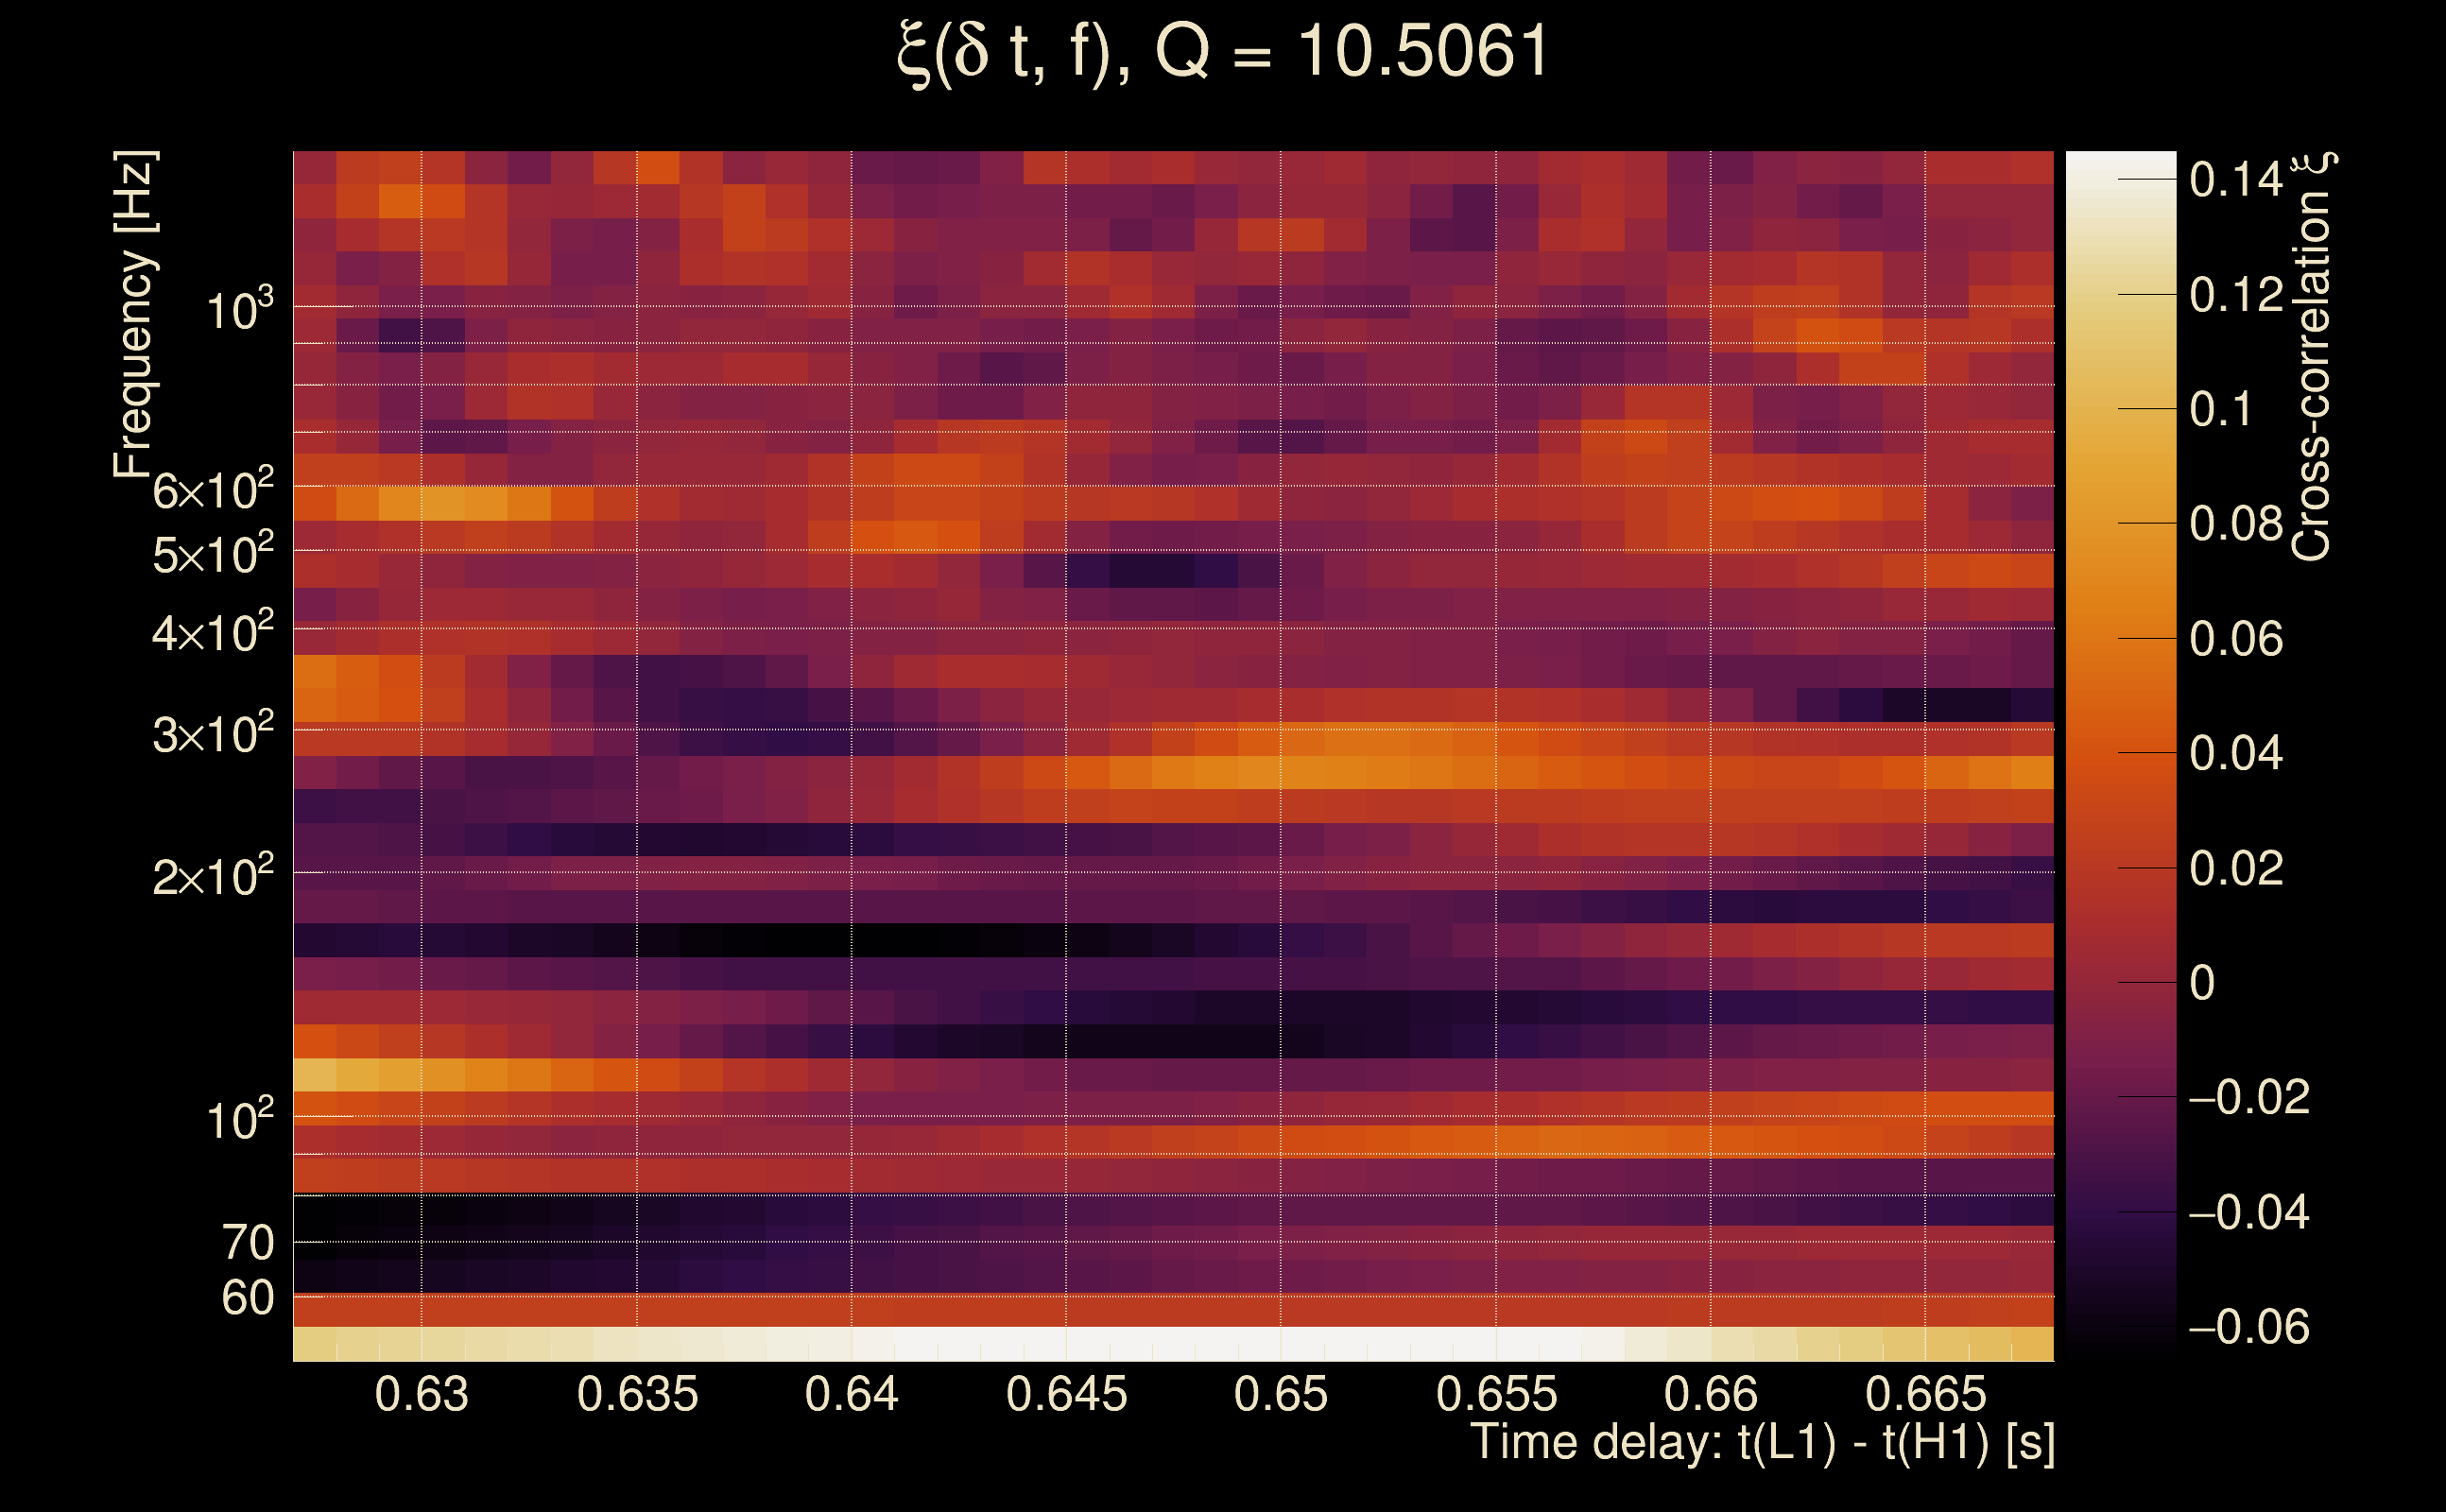
| Time delay between detectors t(L1) - t(H1): | 0.647973 s (slice index = 94 / 217), δt_gw = 0.00397328 s |
| Time delay standard deviation: | 0.0810423 s |
| [targeted mode] Time delay probability: | 0.915876 (0.10563 sigmas), δt_target = 0.000869751 s |
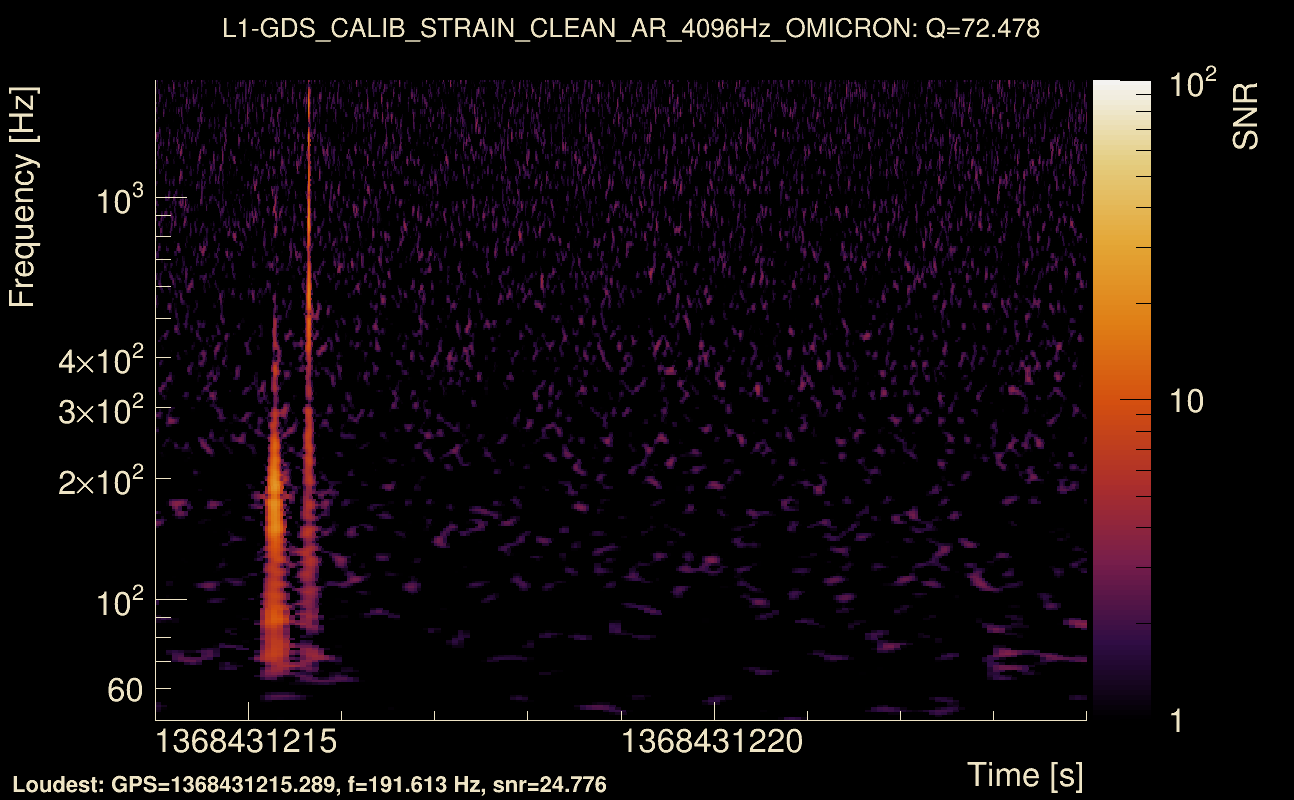
| Frequency: | 77.4707 Hz |
| Ξ: | 0.0107613 ± 0.0664601 (variance = 0.00441694): Q0: 0.159307, Q1: 0.176397, Q2: 0, Q3: 0.141607, Q4: 0.0634938 |
| Rank: | R_A = 0.00671807 |
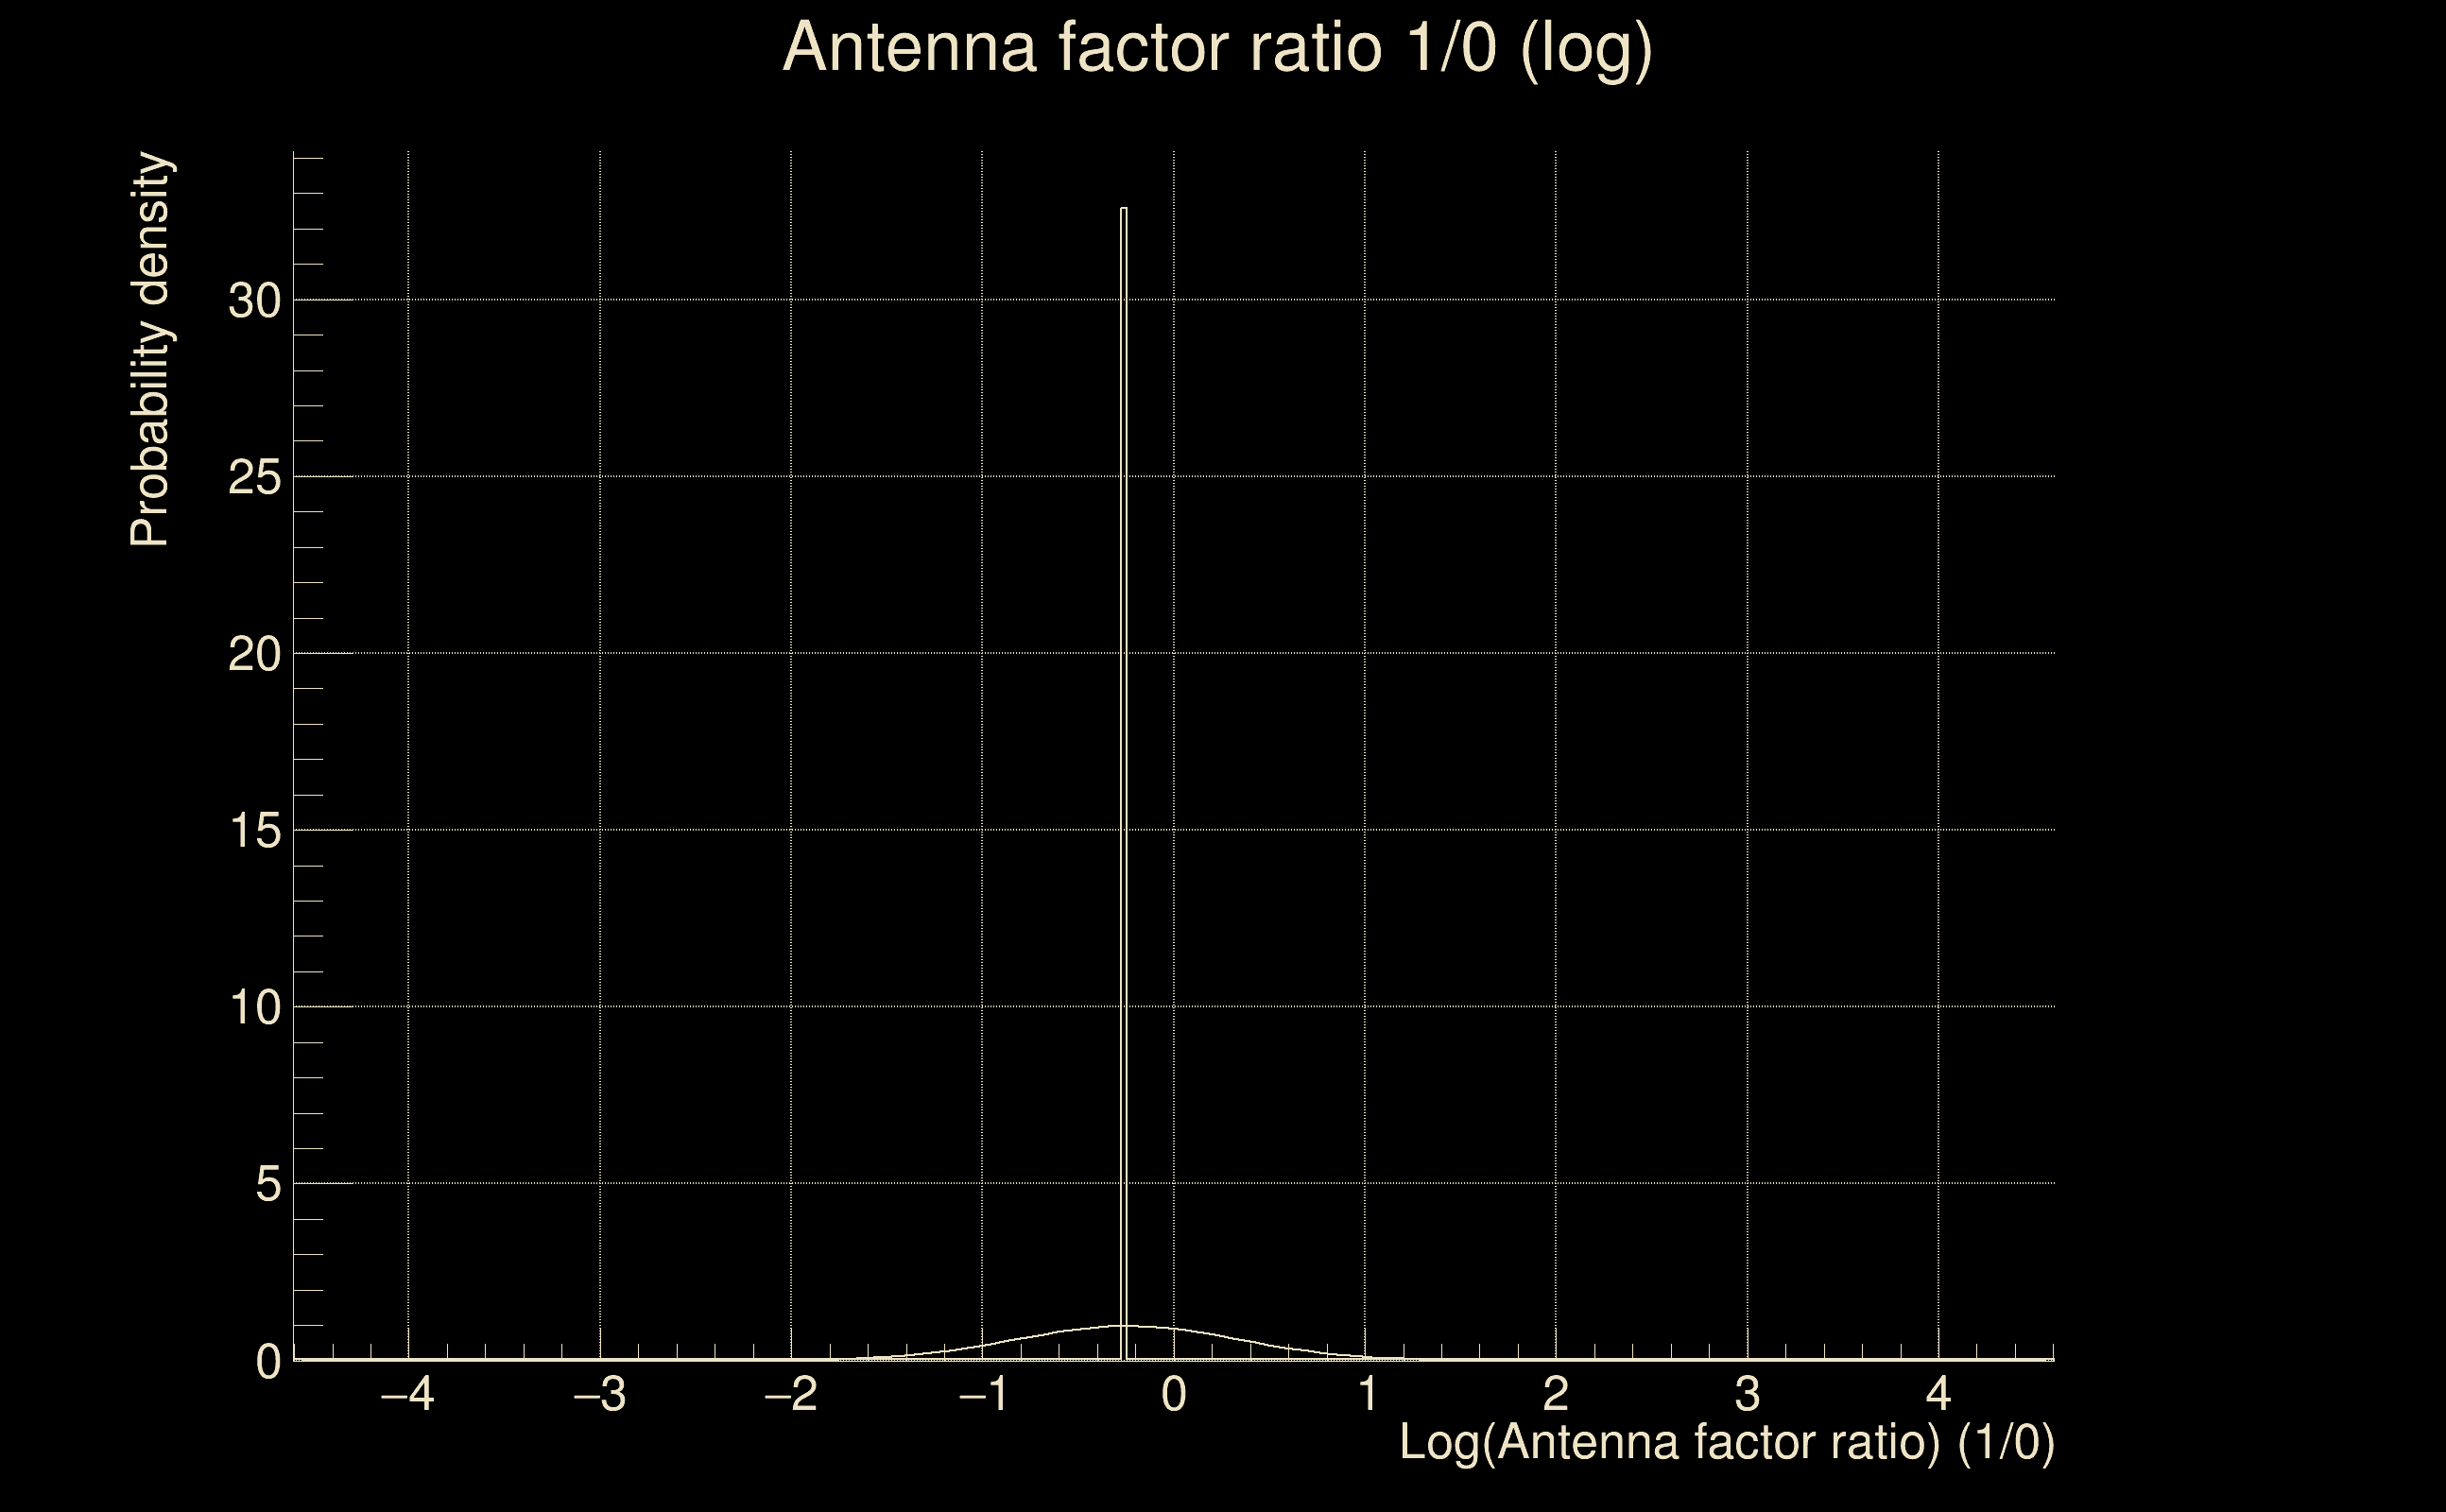
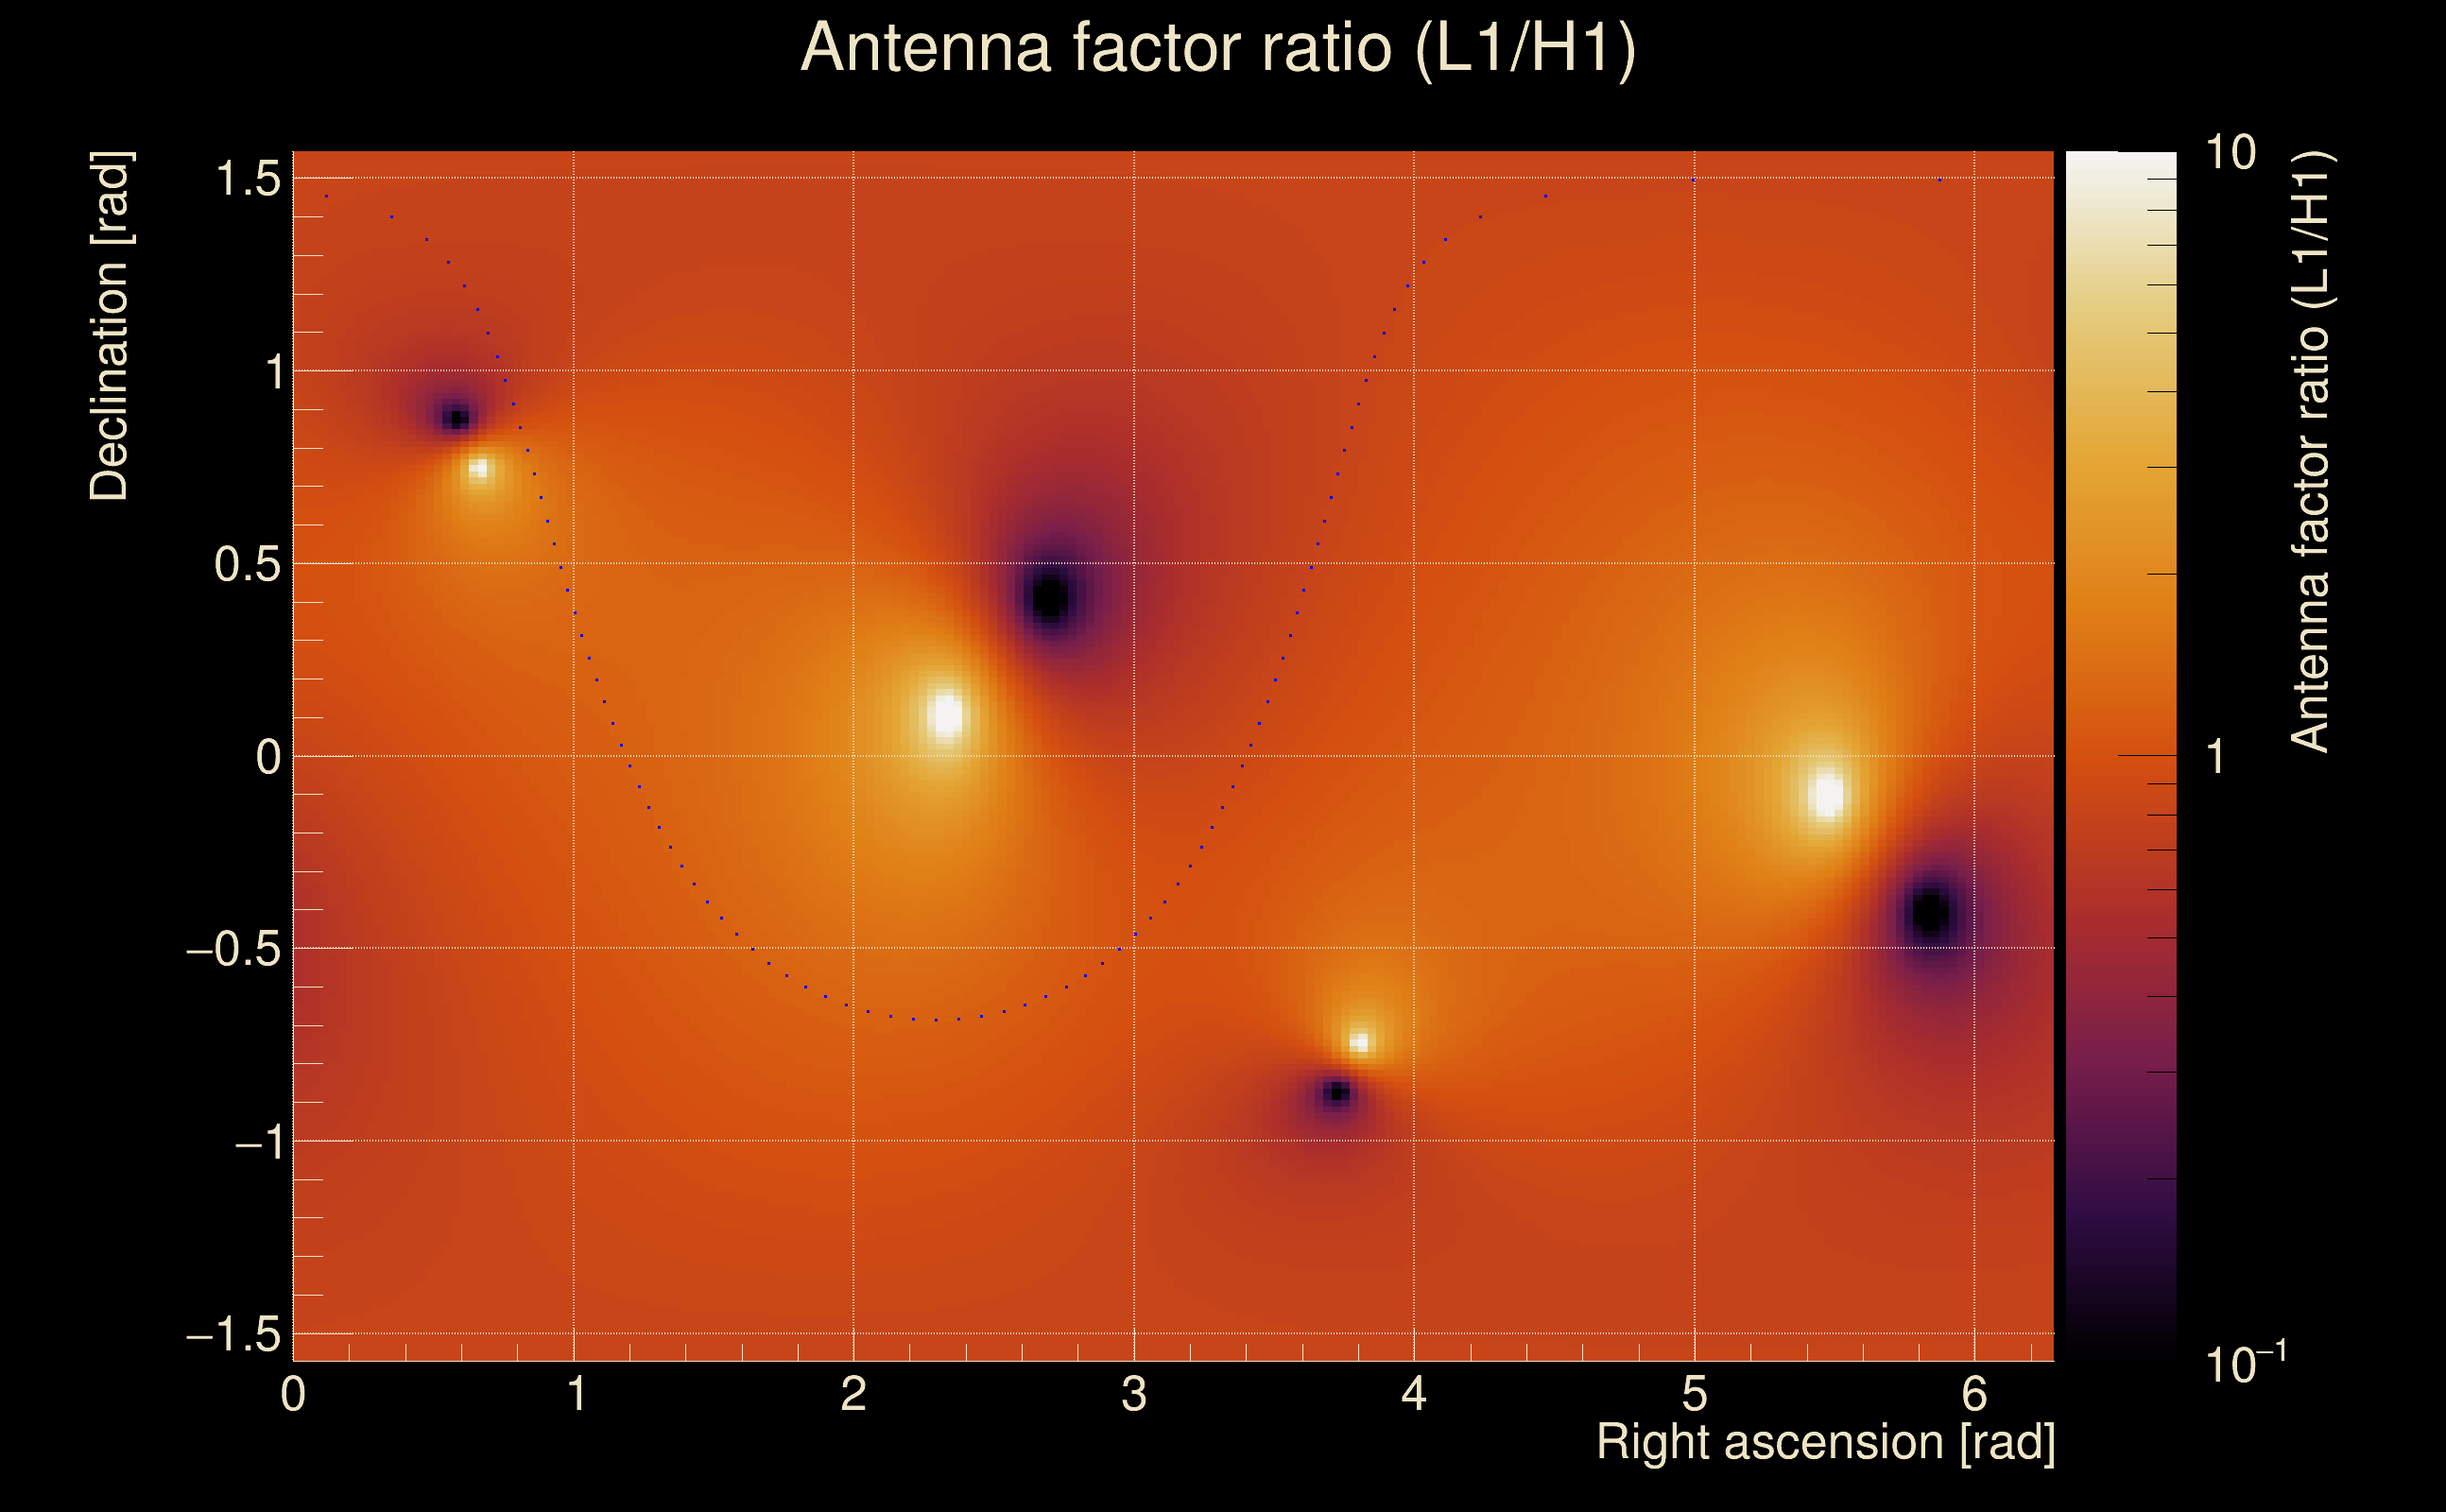
| Log of amplitude ratio (L1/H1): | -0.59179, variance = 0.836832 (L1/H1: -0.563858, variance = 0.483898, H1/L1: 0.62318, variance = 3.16342) |
| Amplitude ratio (L1/H1): | 0.553336 ⋇ 2.49624 (L1/H1: 0.56901 ⋇ 2.00497, H1/L1: 1.86485 ⋇ 5.92157) |
| Amplitude ratio H1|L1 compatibility (probability): | 0.97522 |
| Antenna factor probability: | 0.69894 |
| Number of rejected frequency rows: | Q0: 16 / 18, Q1: 35 / 36, Q2: 70 / 70, Q3: 128 / 134, Q4: 252 / 258 |
| Maximum signal-to-noise ratio: | H1: 4.85474, L1: 4.57953 |
| SNR variance: | H1: 0.5213, L1: 0.502932 |
| Click here for a zoomed plot | Click here for a zoomed plot | Click here for a zoomed plot | Click here for a zoomed plot | Click here for a zoomed plot |
 |
 |
 |
 |
 |
 |
 |
 |
 |
 |
 |
 |
 |
 |
 |
 |
 |
 |
 |
 |
 |
 |
 |
 |
 |
 |
 |
 |
 |
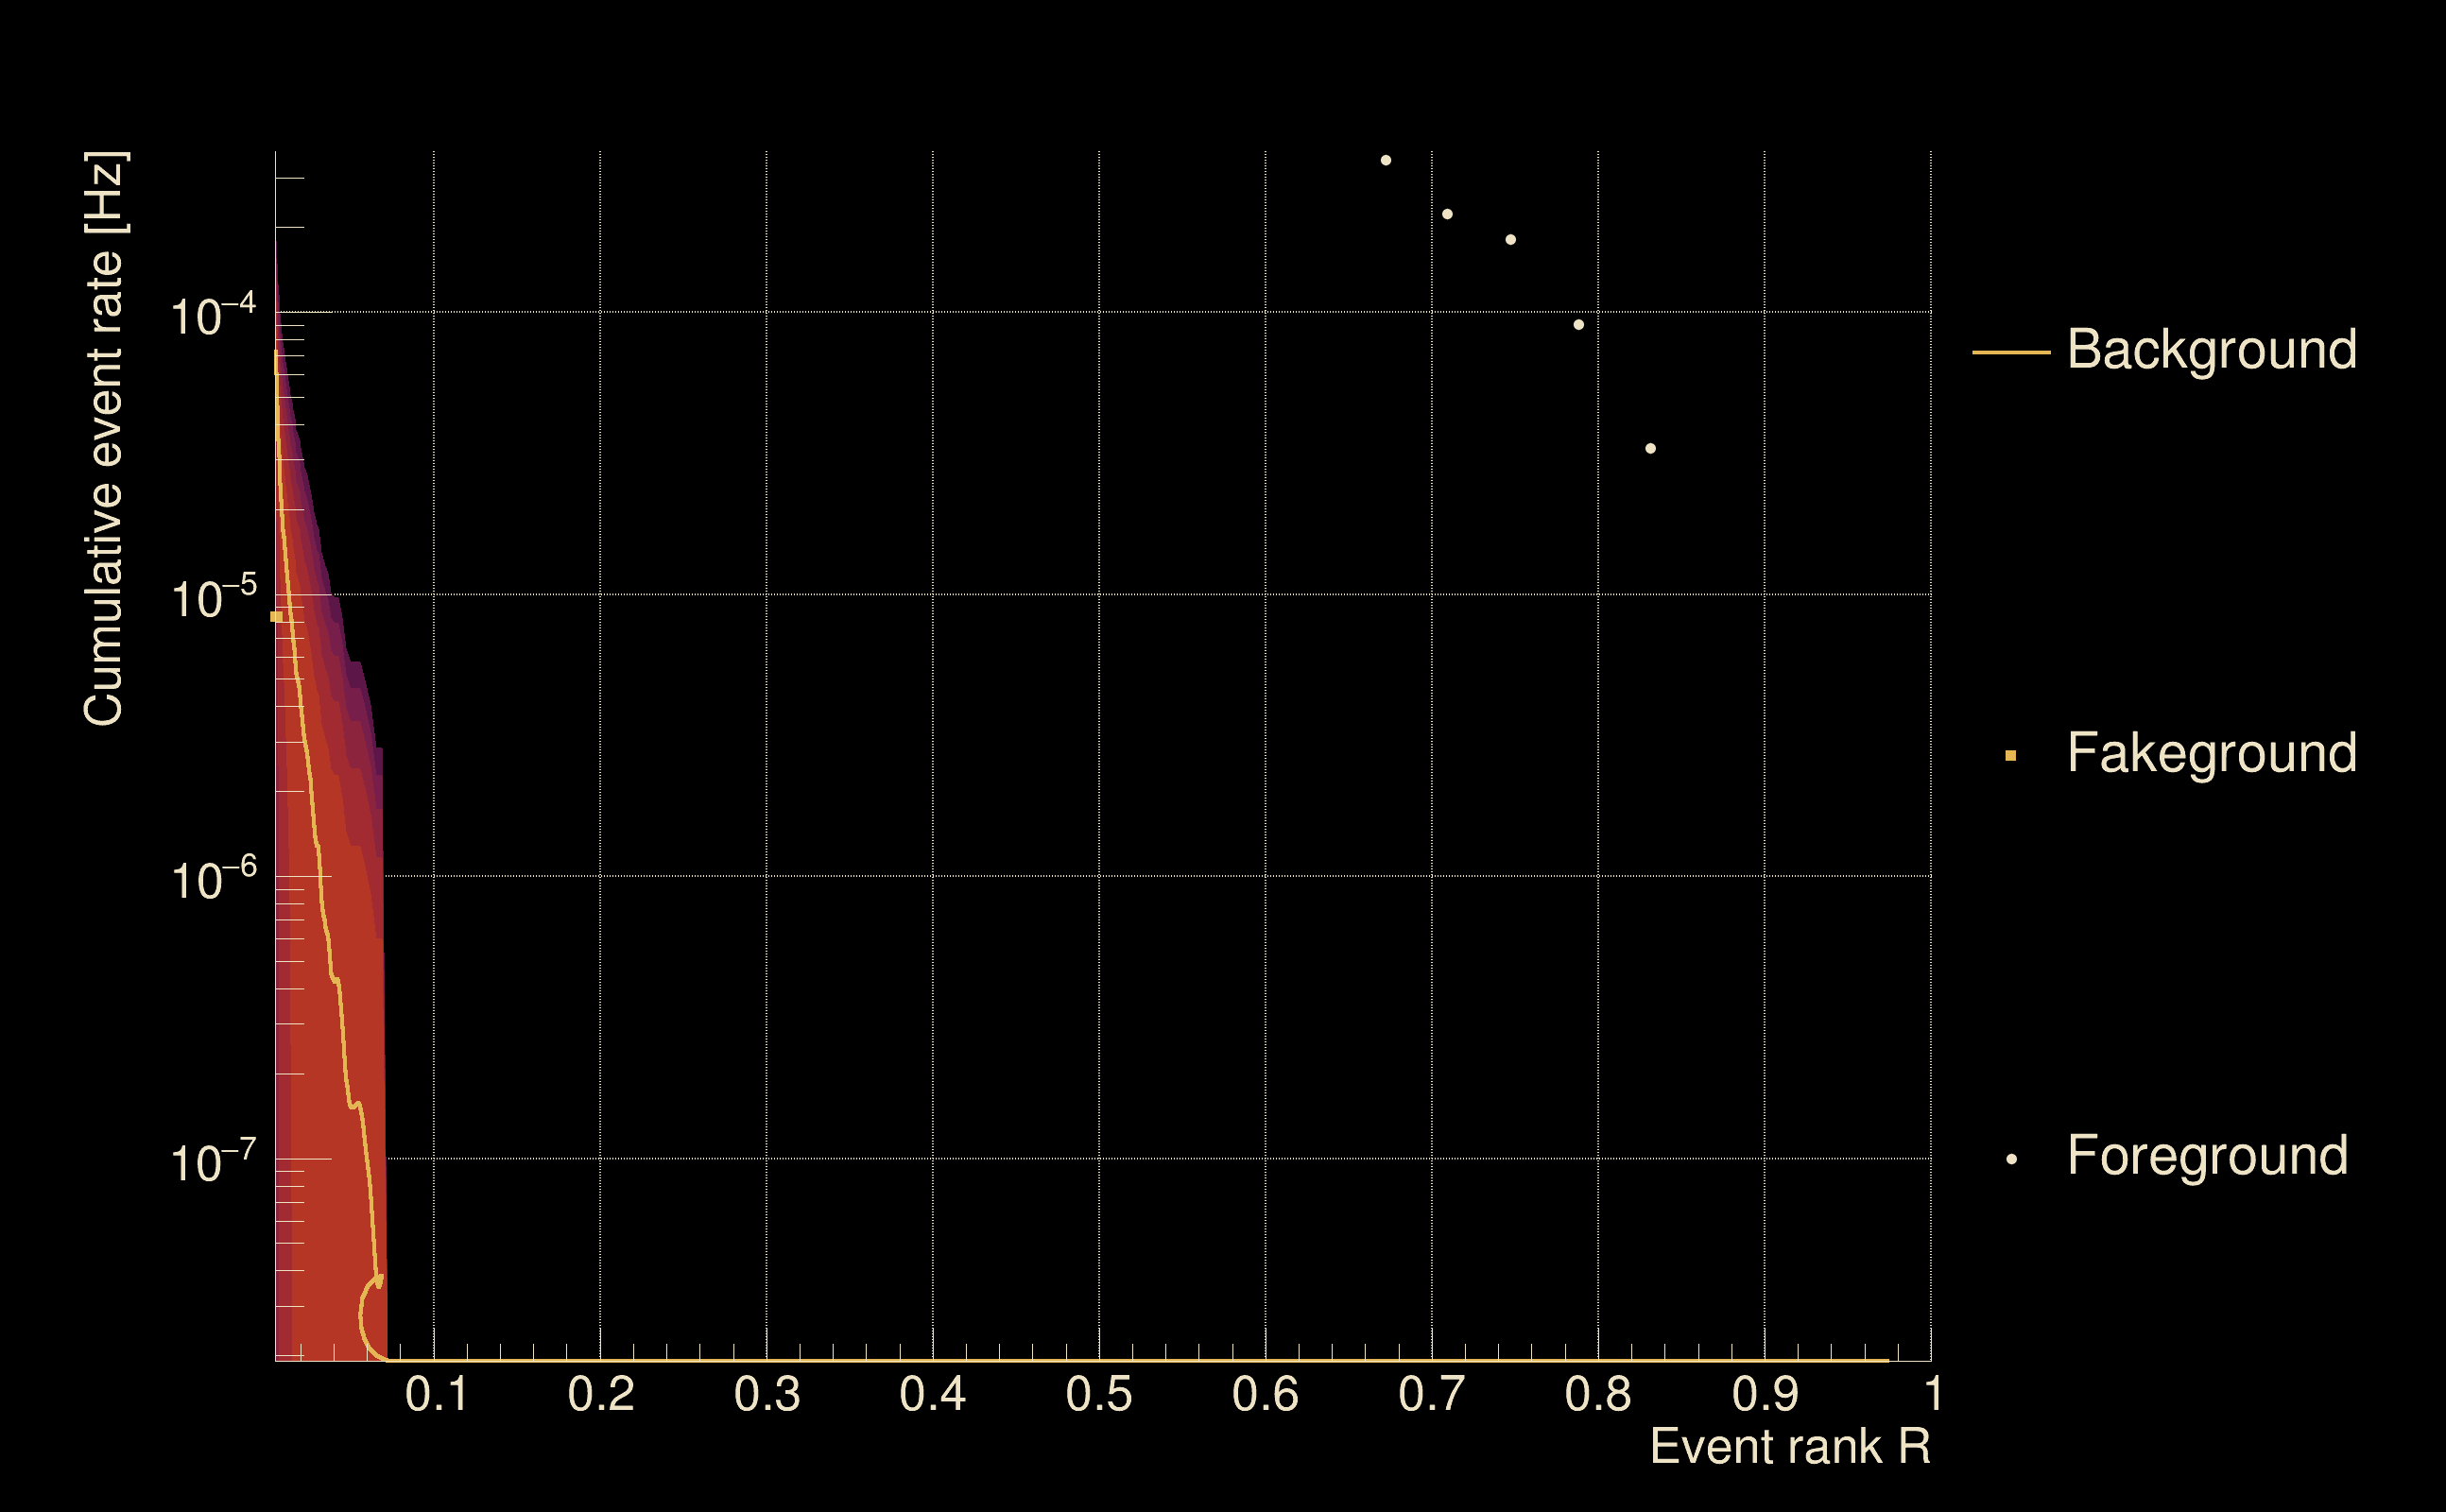
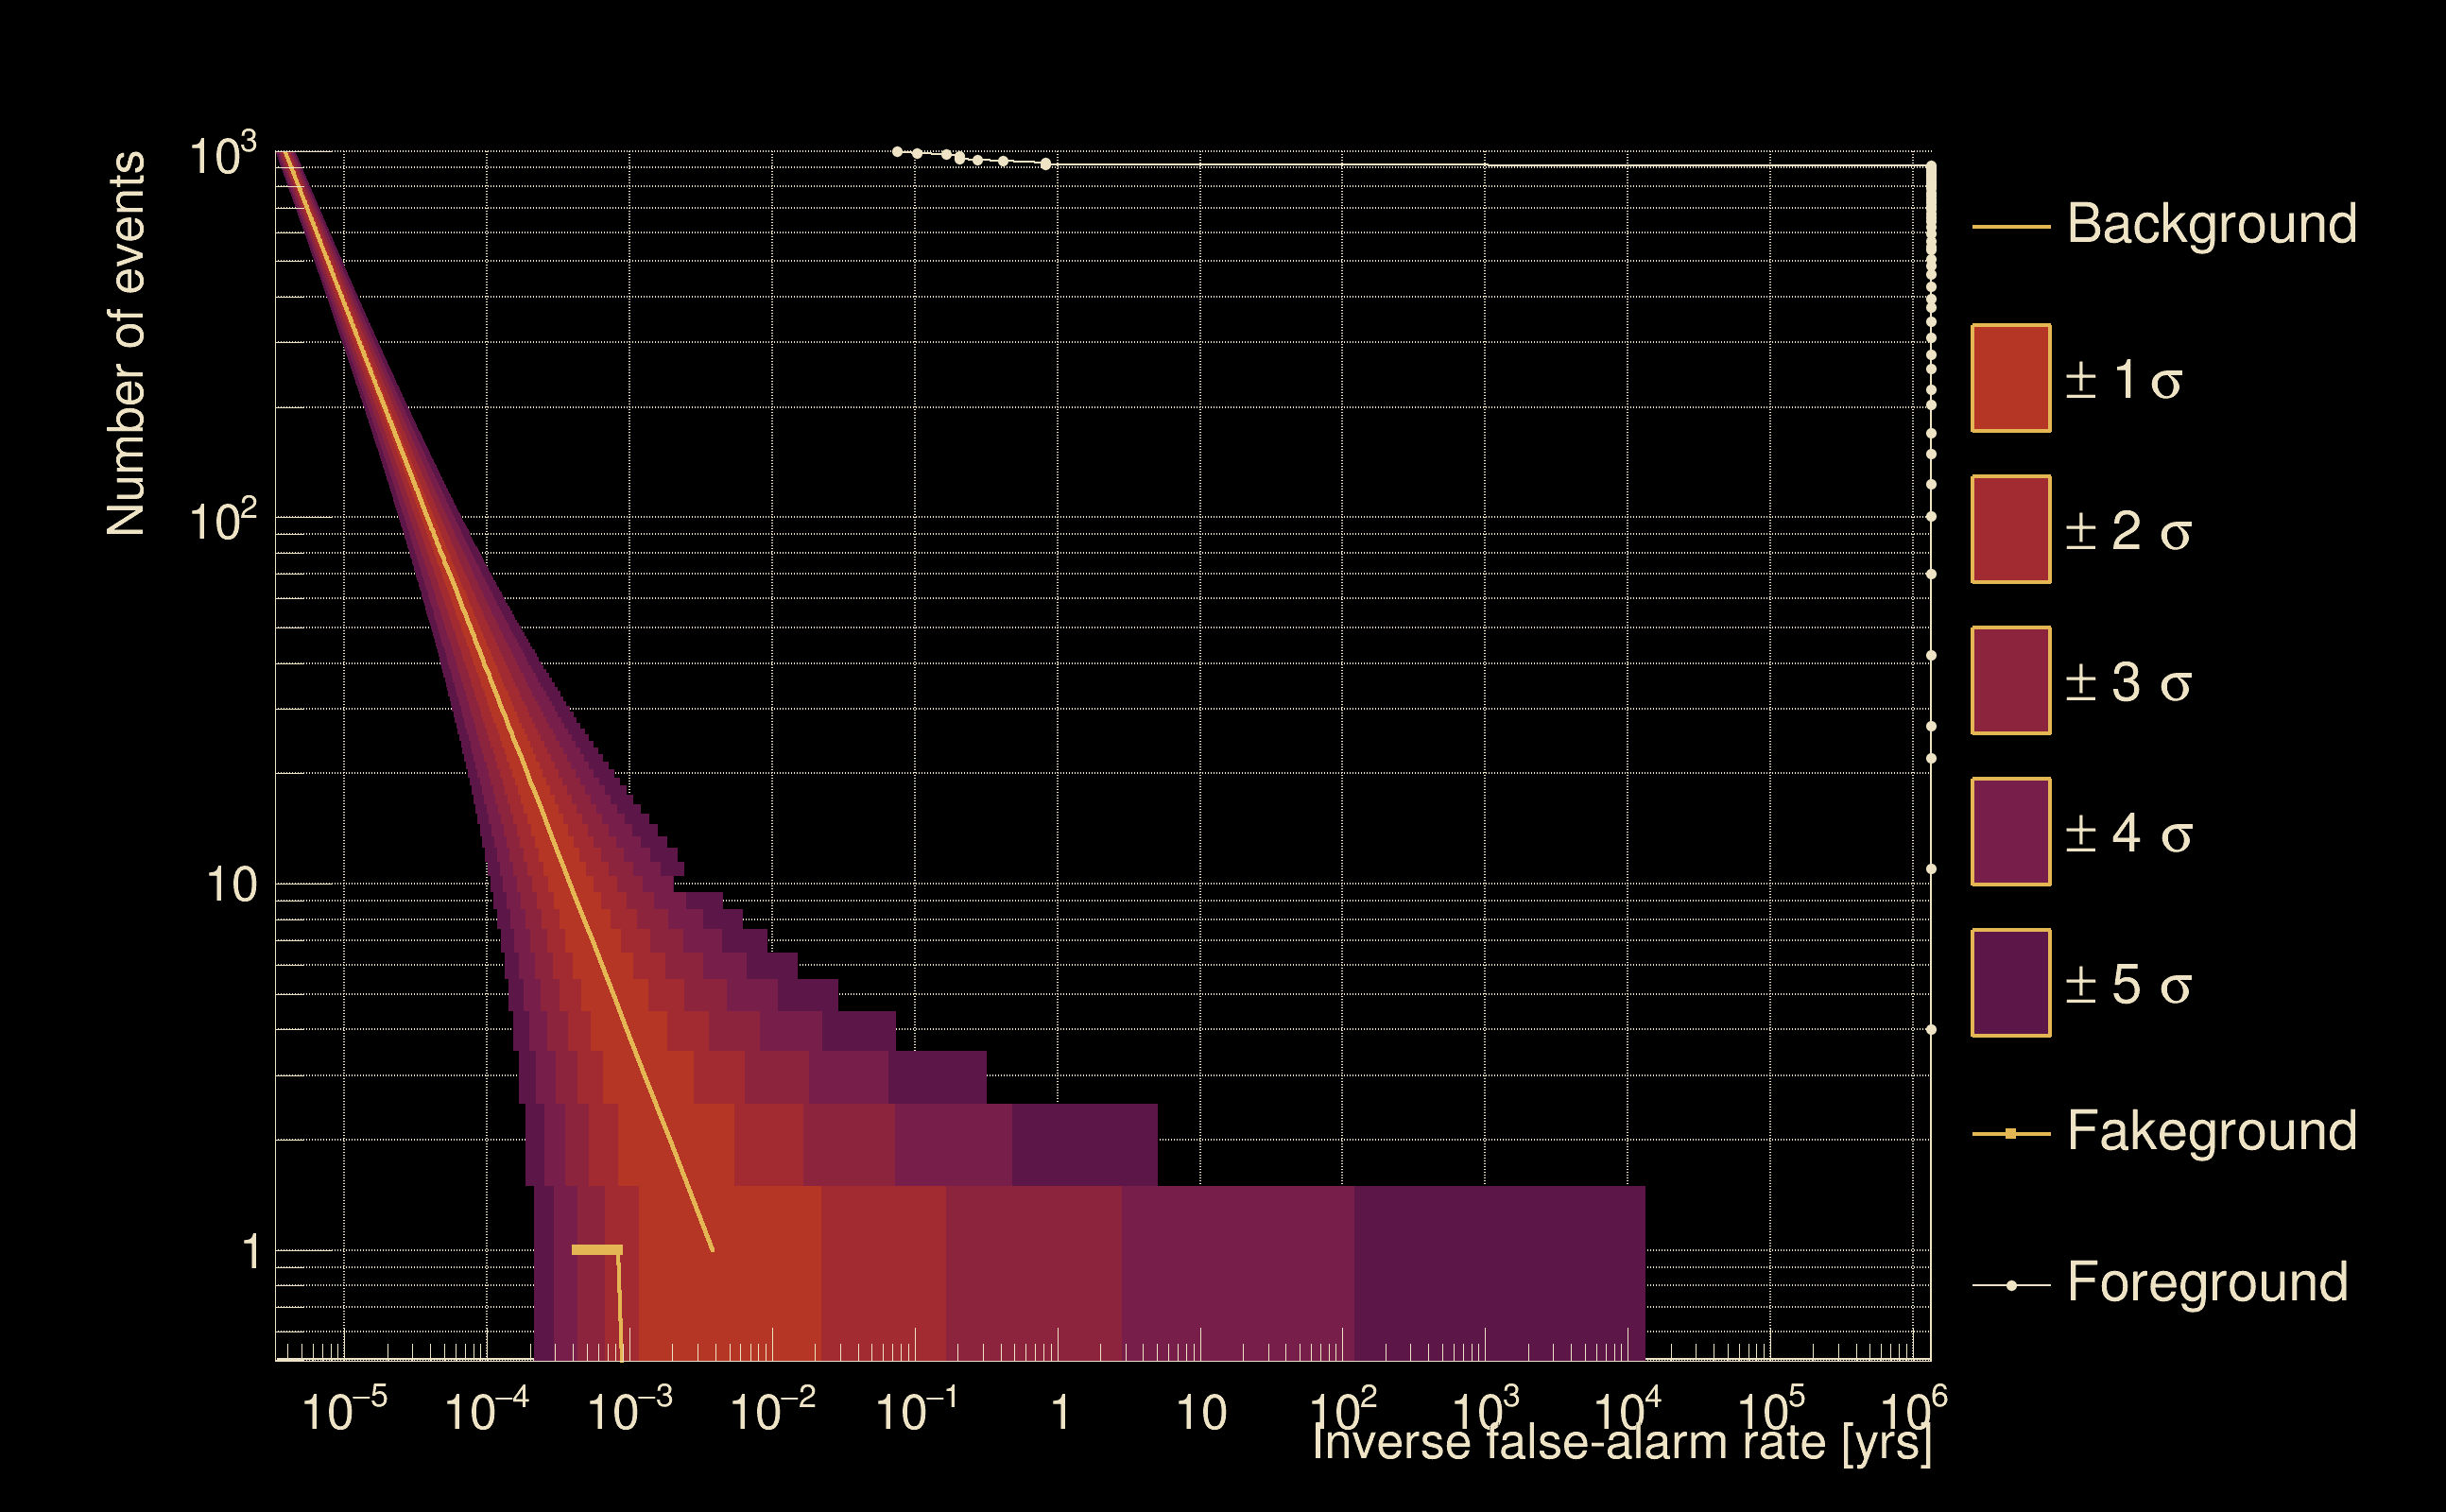
| Detection threshold: | R > 0.0314201 |
| False-alarm rate above that detection threshold: | 9.65962e-07 |
| Alternative threshold at 1/1000 yrs: | R > 0.0688862 |
| Alternative threshold at 1/100 yrs: | R > 0.0688862 |
| Alternative threshold at 1/10 yrs: | R > 0.0688862 |
| Alternative threshold at 1/1 yr: | R > 0.0688862 |
| Alternative threshold at 1/1 d: | R > 0.0113871 |
 |
|
 |
 |
 |
 |
 |
 |
 |
 |
 |
 |
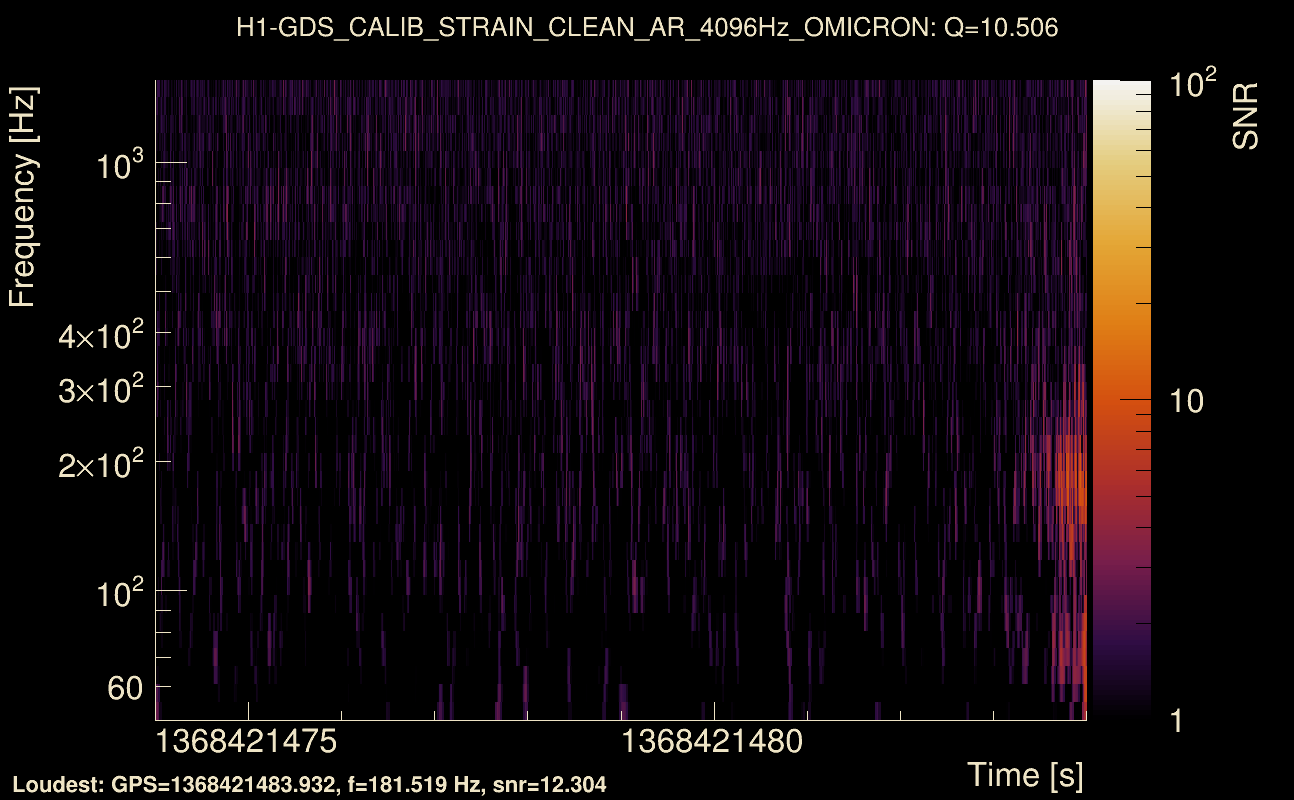
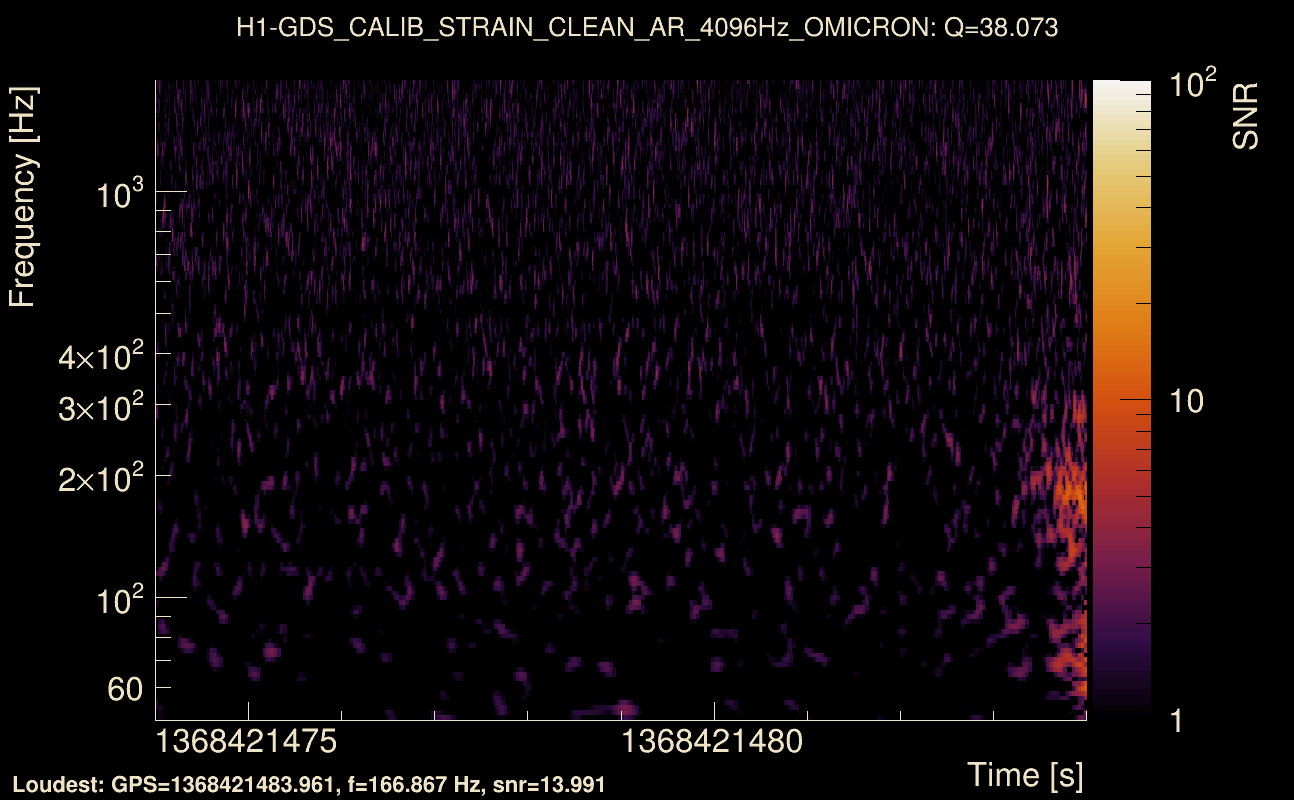
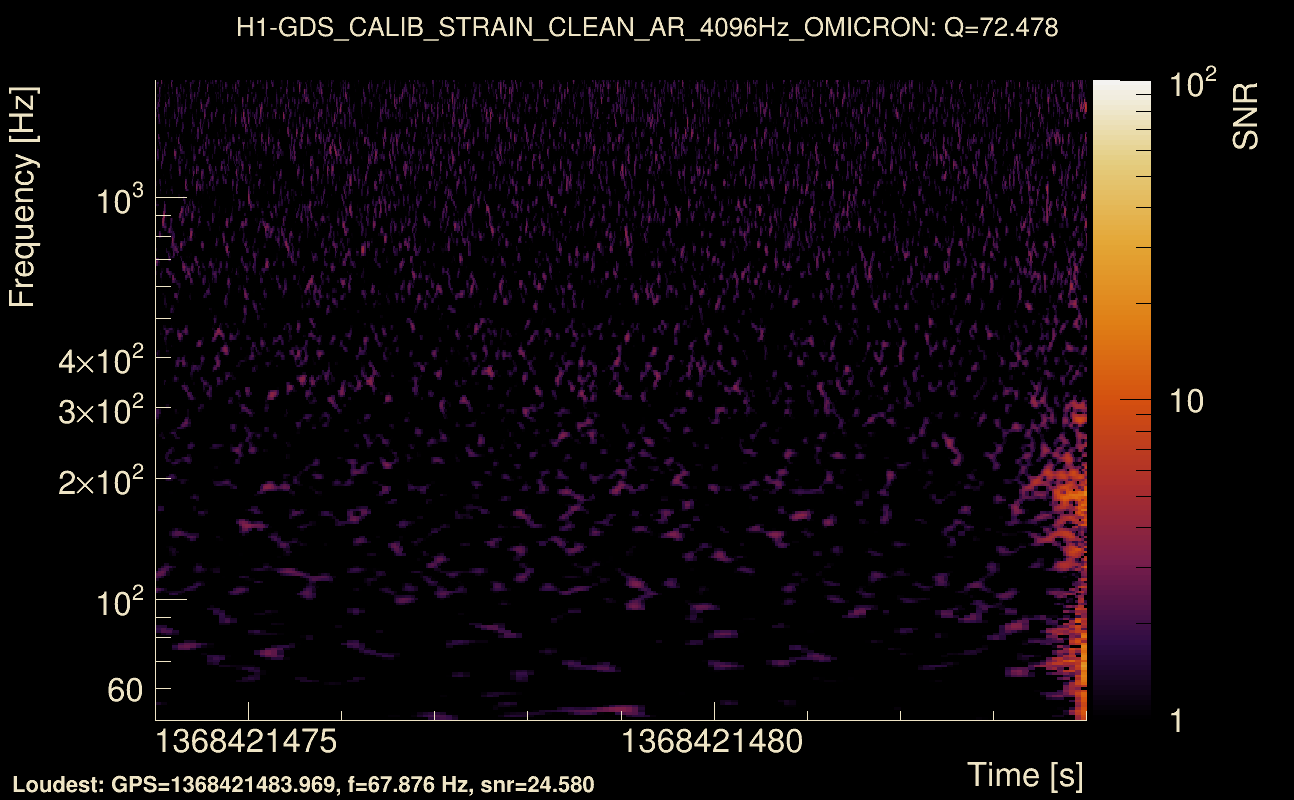
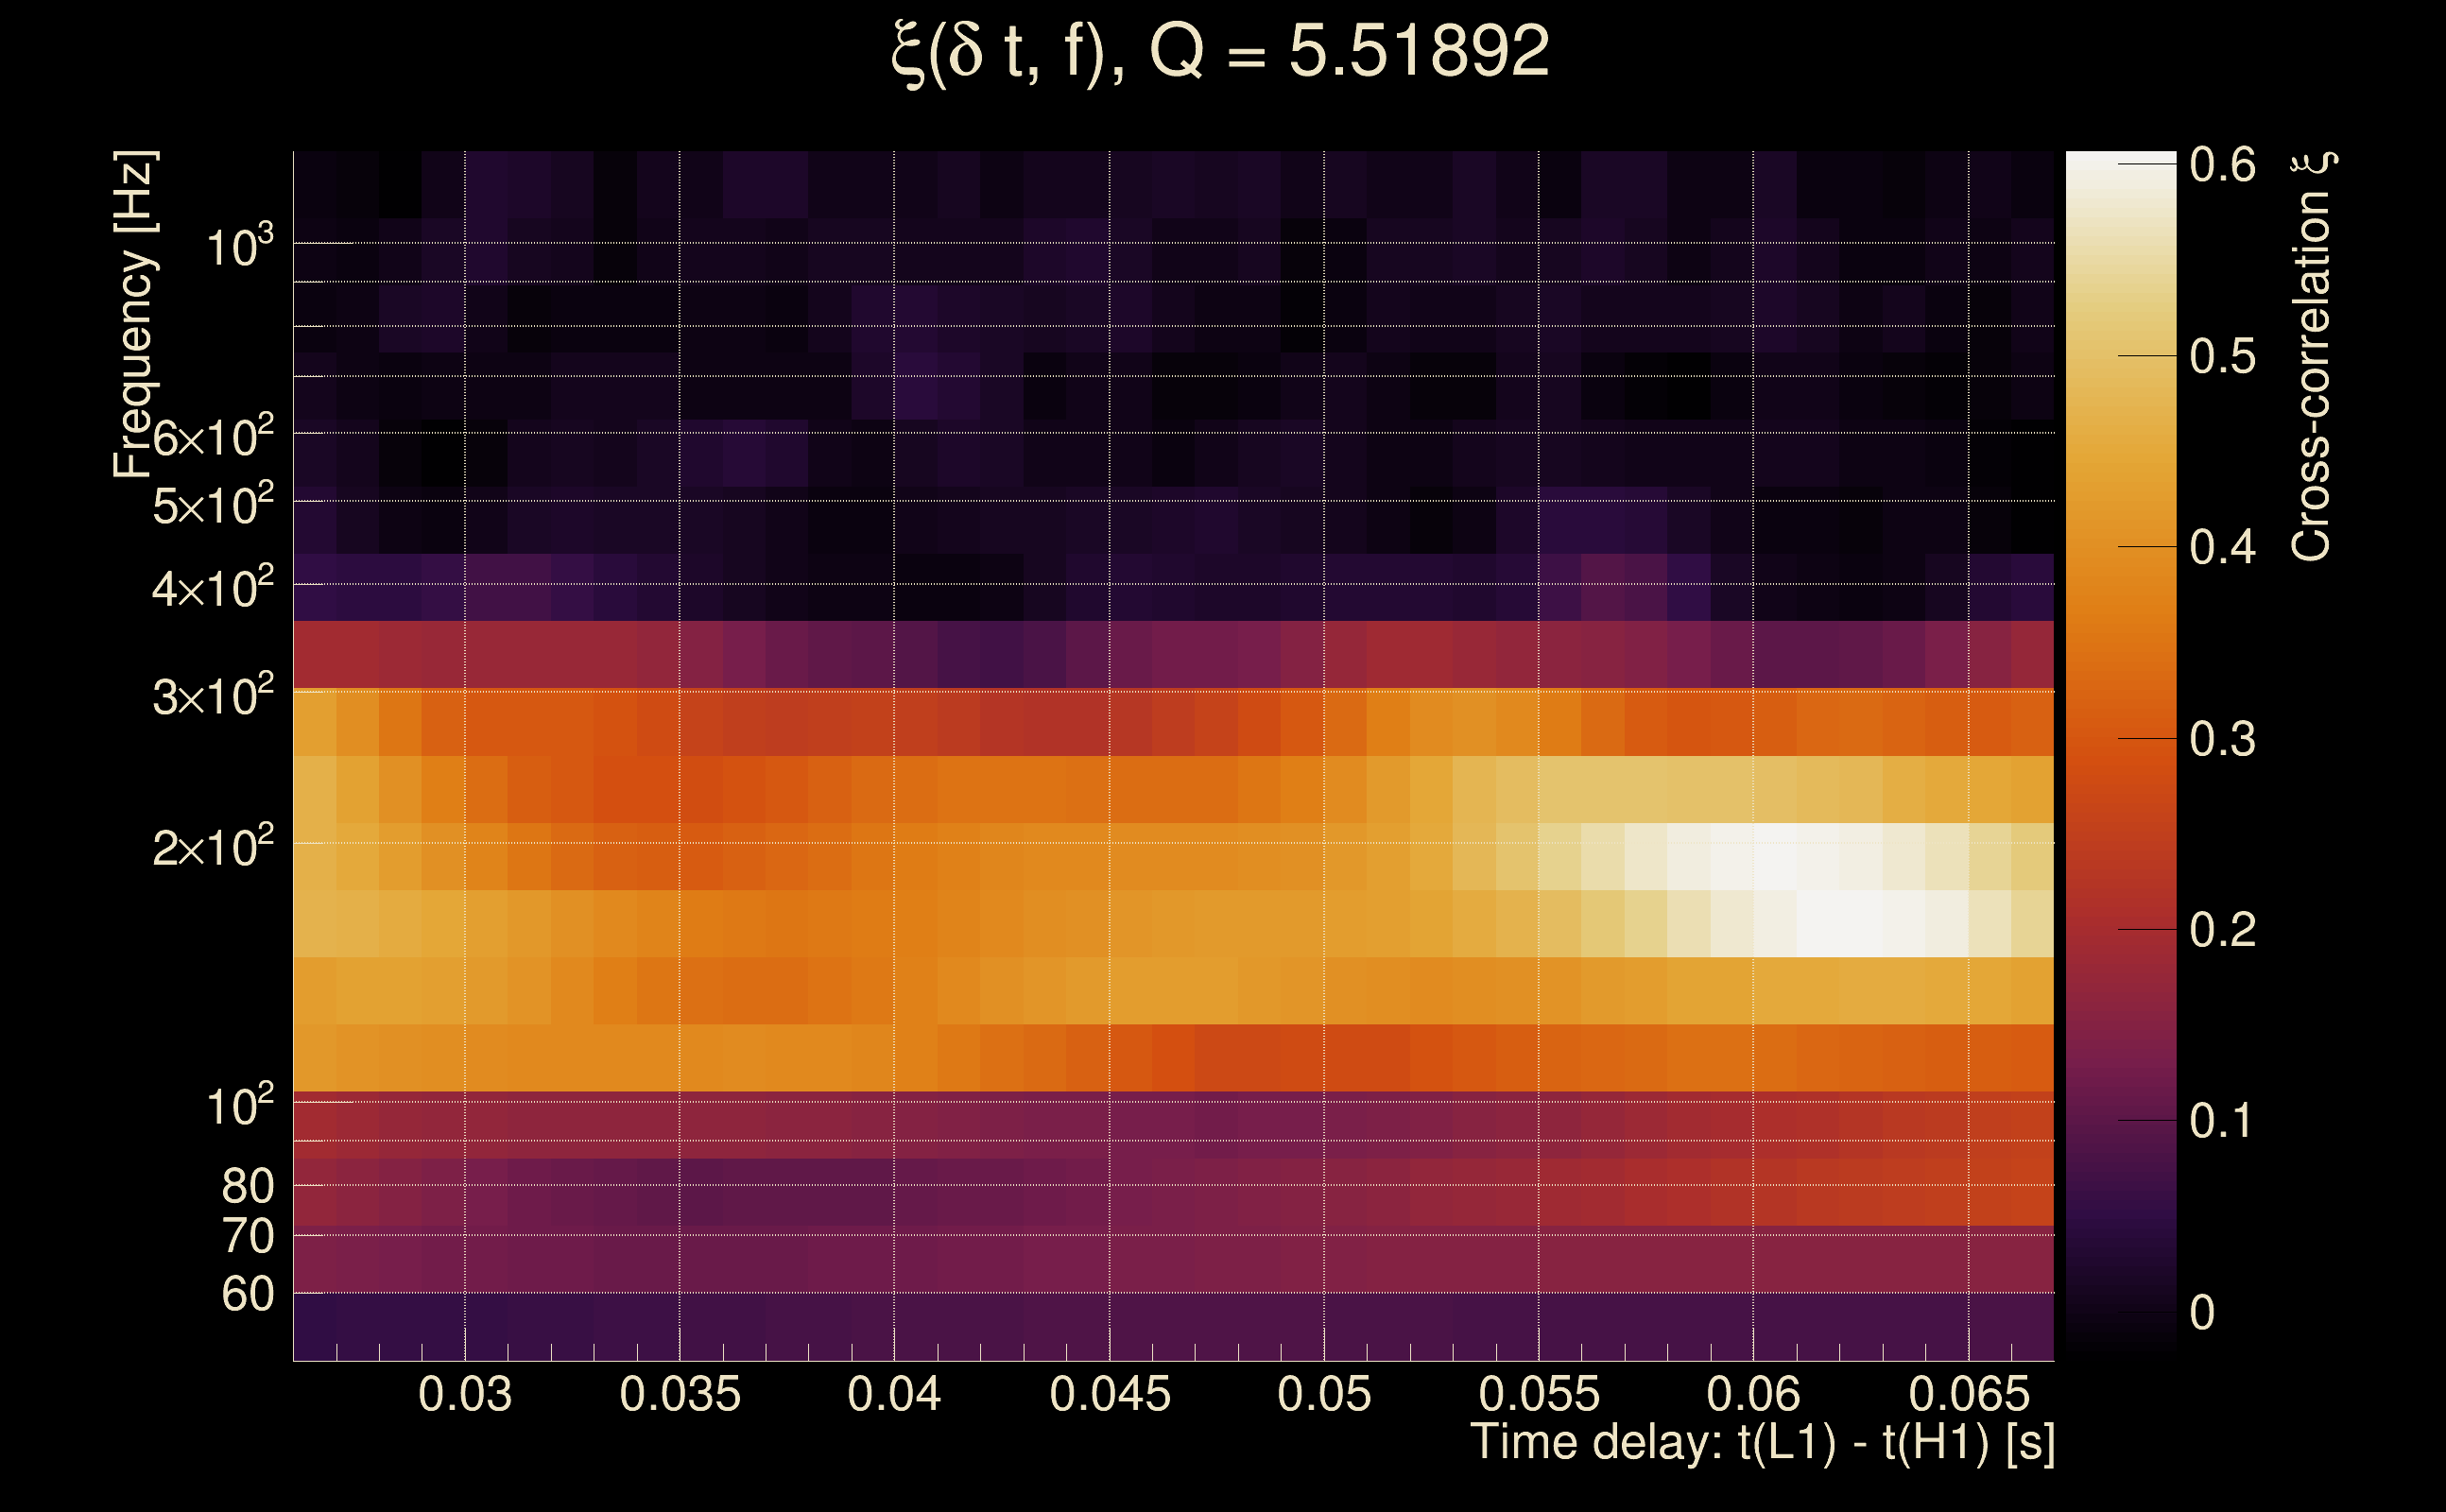
| Event time t(H1): | GPS = 1368421474 (Thu May 18 05:04:16 2023 ) → GPS = 1368421484 (Thu May 18 05:04:26 2023 ) |
| Event time t(L1): | GPS = 1368421474 (Thu May 18 05:04:26 2023 ) → GPS = 1368421484 (Thu May 18 05:04:26 2023 ) |
| Omicron analysis time window (H1): | GPS = 1368421471 → GPS = 1368421487 |
| Omicron analysis time window (L1): | GPS = 1368421471 → GPS = 1368421487 |
| Time delay between detectors t(L1) - t(H1): | 0.0469064 s (slice index = 107 / 217), δt_gw = 0.000906446 s |
| Time delay standard deviation: | 0.080716 s |
| [targeted mode] Time delay probability: | 0.95045 (0.0621415 sigmas), δt_target = 0.00466704 s |
| Frequency: | 186.171 Hz |
| Ξ: | 0.284174 ± 0.0765419 (variance = 0.00585866): Q0: 0.5617, Q1: 0.594959, Q2: 0.553963, Q3: 0.602027, Q4: 0.392471 |
| Rank: | R_A = 0.0700733 |
| Log of amplitude ratio (L1/H1): | 0.276605, variance = 0.205817 (L1/H1: -0.0806613, variance = 0.36453, H1/L1: -0.389525, variance = 0.320065) |
| Amplitude ratio (L1/H1): | 1.31865 ⋇ 1.57408 (L1/H1: 0.922506 ⋇ 1.82899, H1/L1: 0.677379 ⋇ 1.76076) |
| Amplitude ratio H1|L1 compatibility (probability): | 0.569853 |
| Antenna factor probability: | 0.455277 |
| Number of rejected frequency rows: | Q0: 6 / 18, Q1: 21 / 36, Q2: 49 / 70, Q3: 110 / 134, Q4: 242 / 258 |
| Maximum signal-to-noise ratio: | H1: 29.1975, L1: 51.9347 |
| SNR variance: | H1: 0.477293, L1: 0.498858 |
| Click here for a zoomed plot | Click here for a zoomed plot | Click here for a zoomed plot | Click here for a zoomed plot | Click here for a zoomed plot |
 |
 |
 |
 |
 |
 |
 |
 |
 |
 |
 |
 |
 |
 |
 |
 |
 |
 |
 |
 |
 |
 |
 |
 |
 |
 |
 |
 |
 |
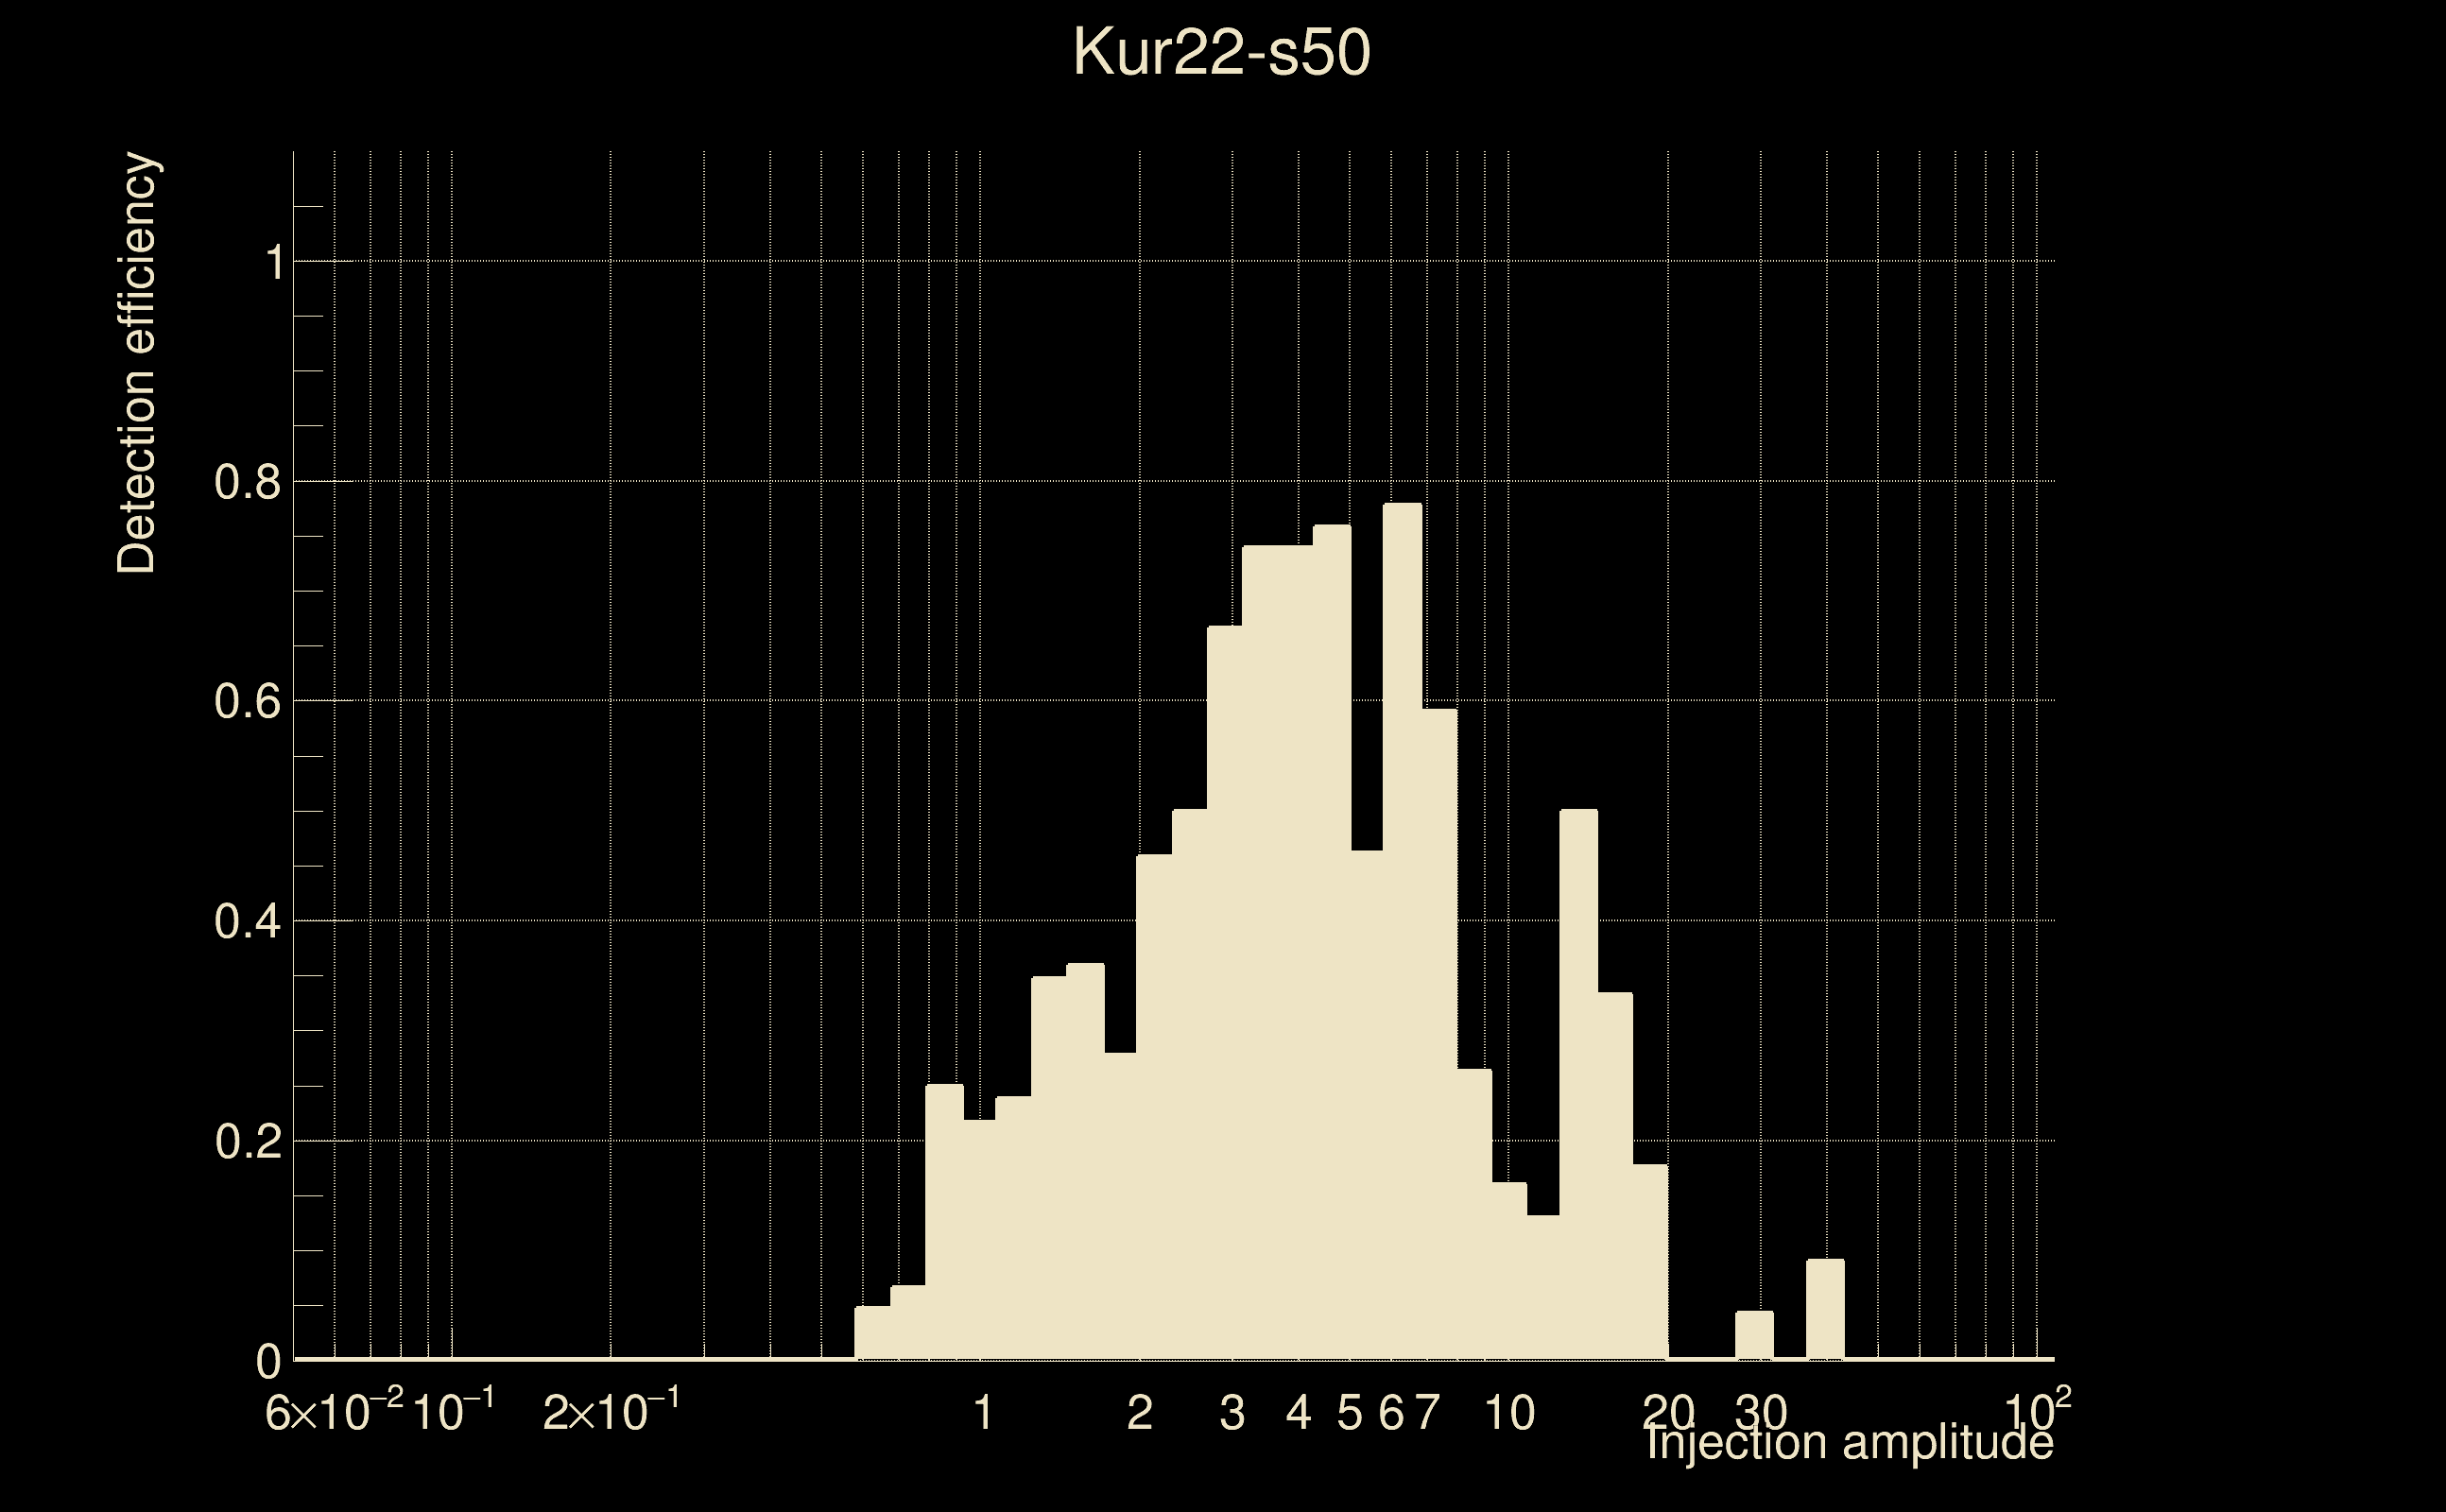
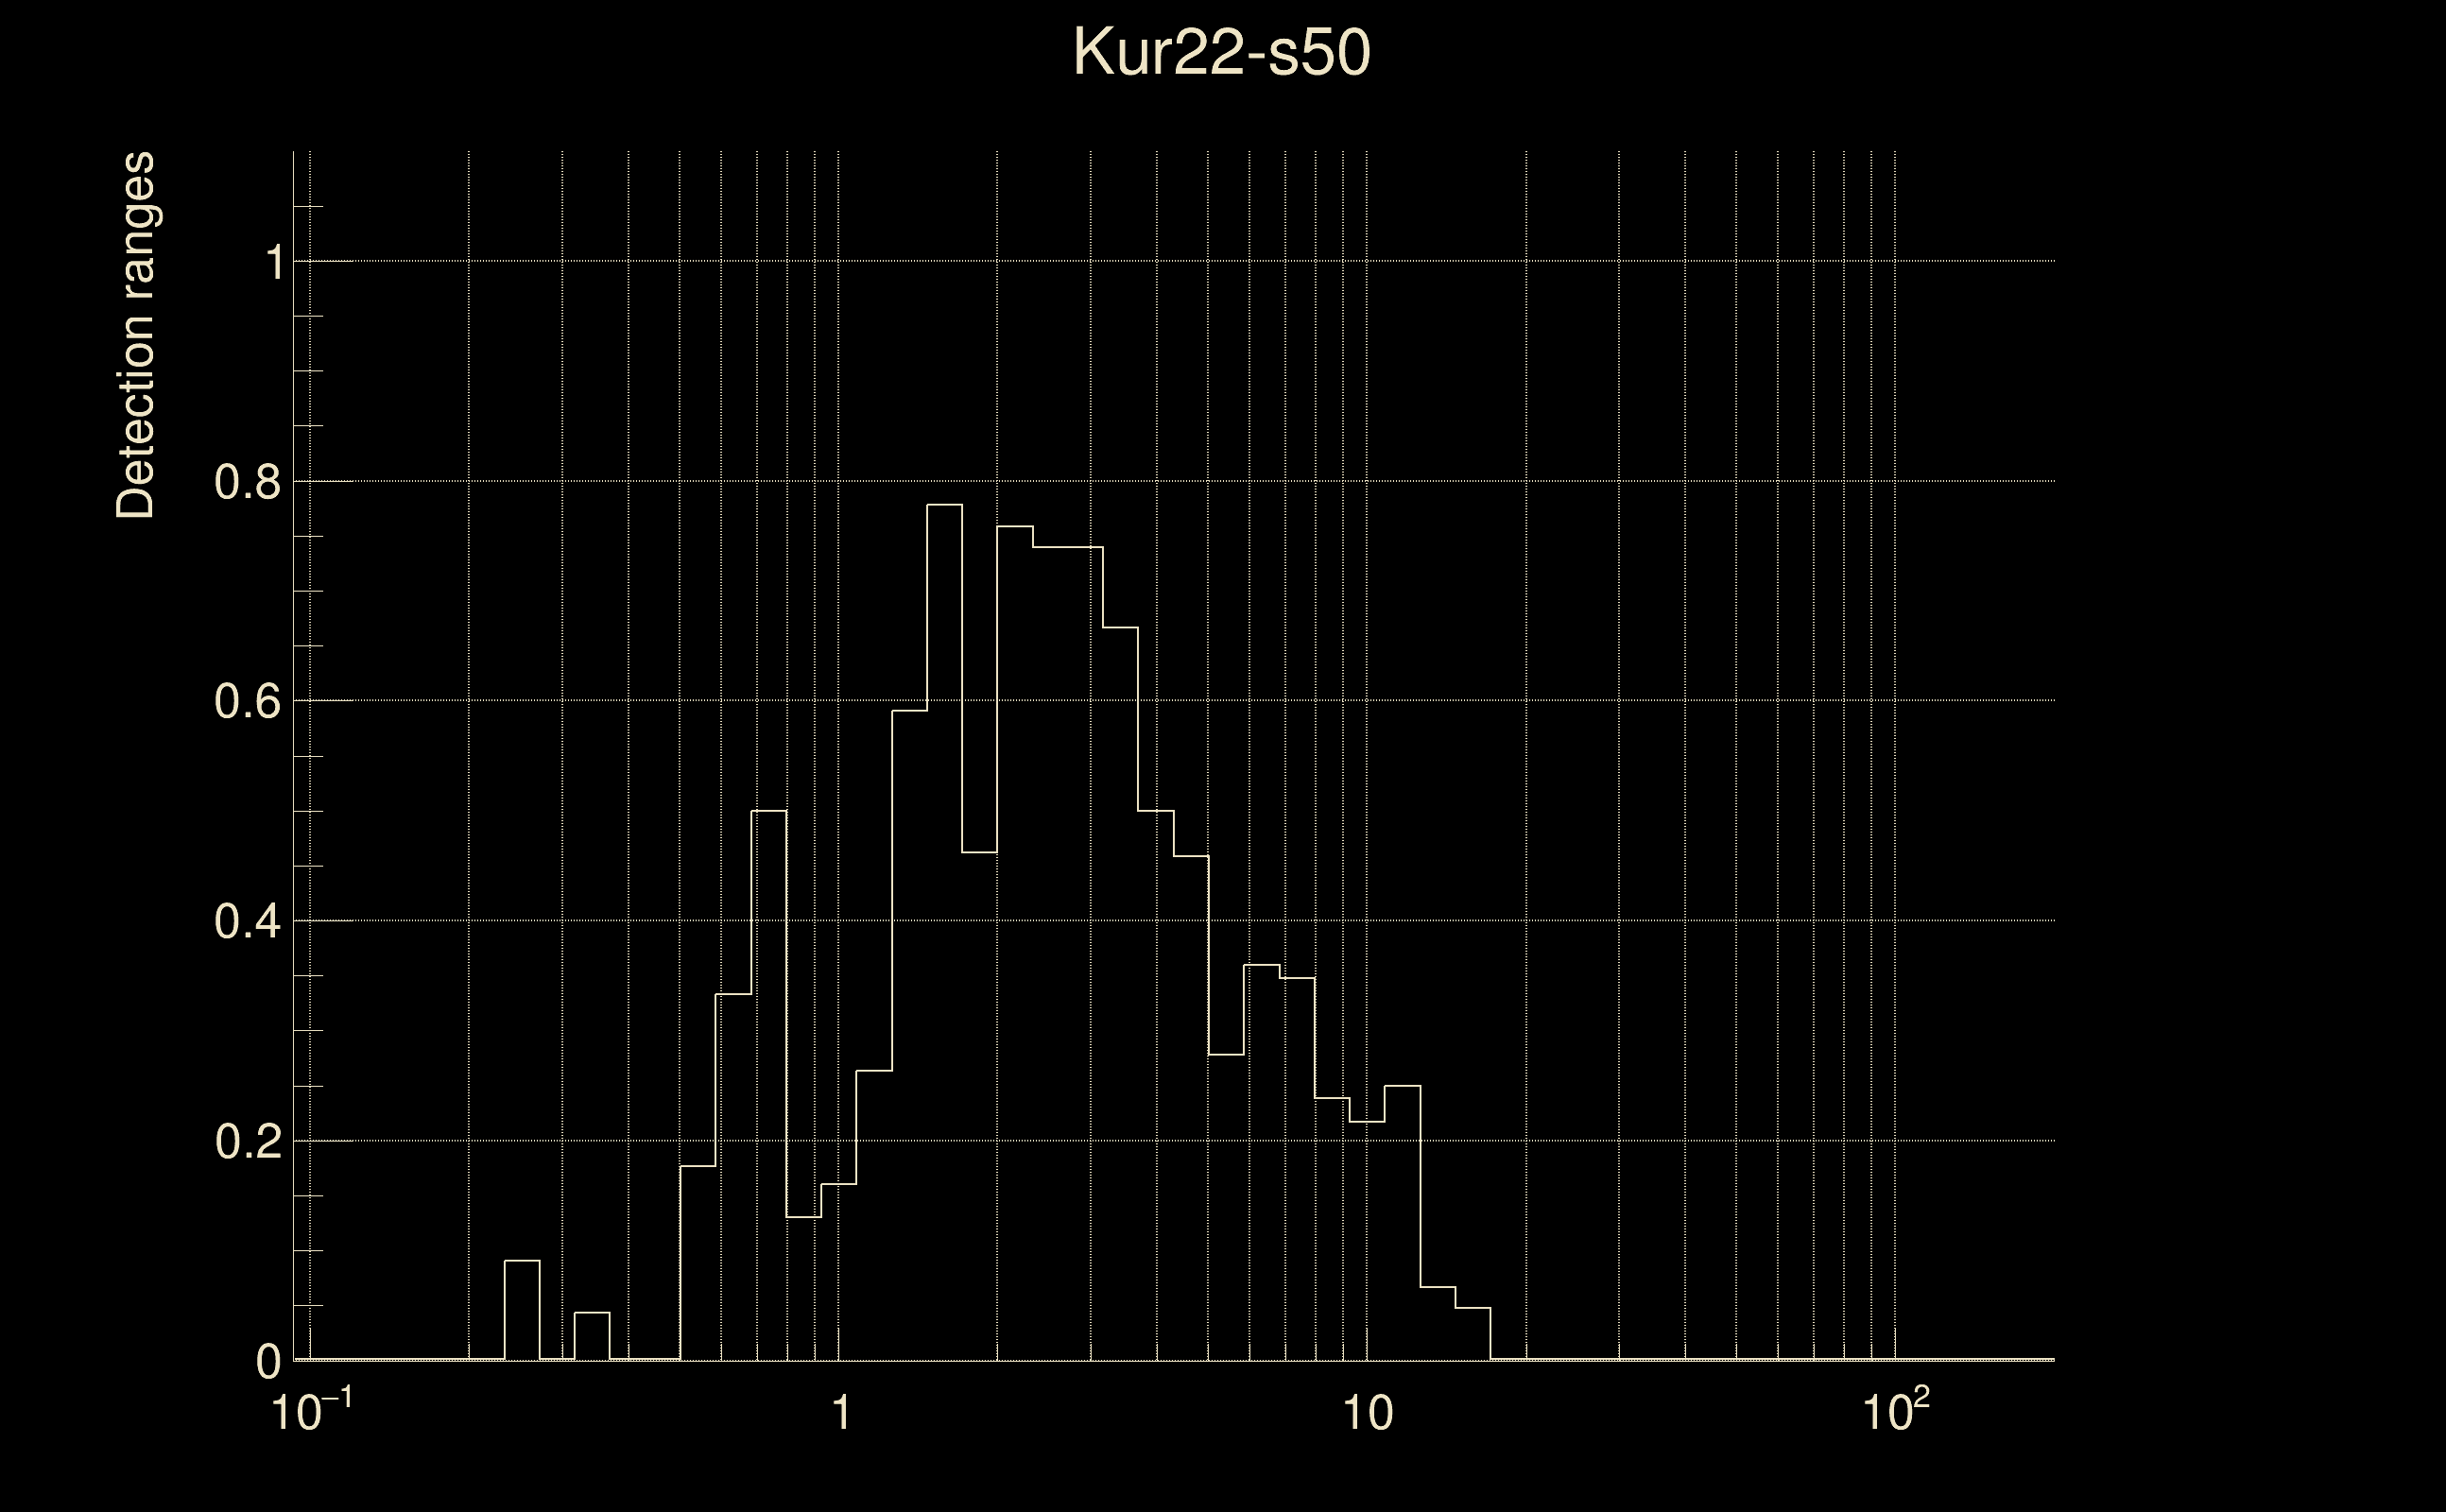
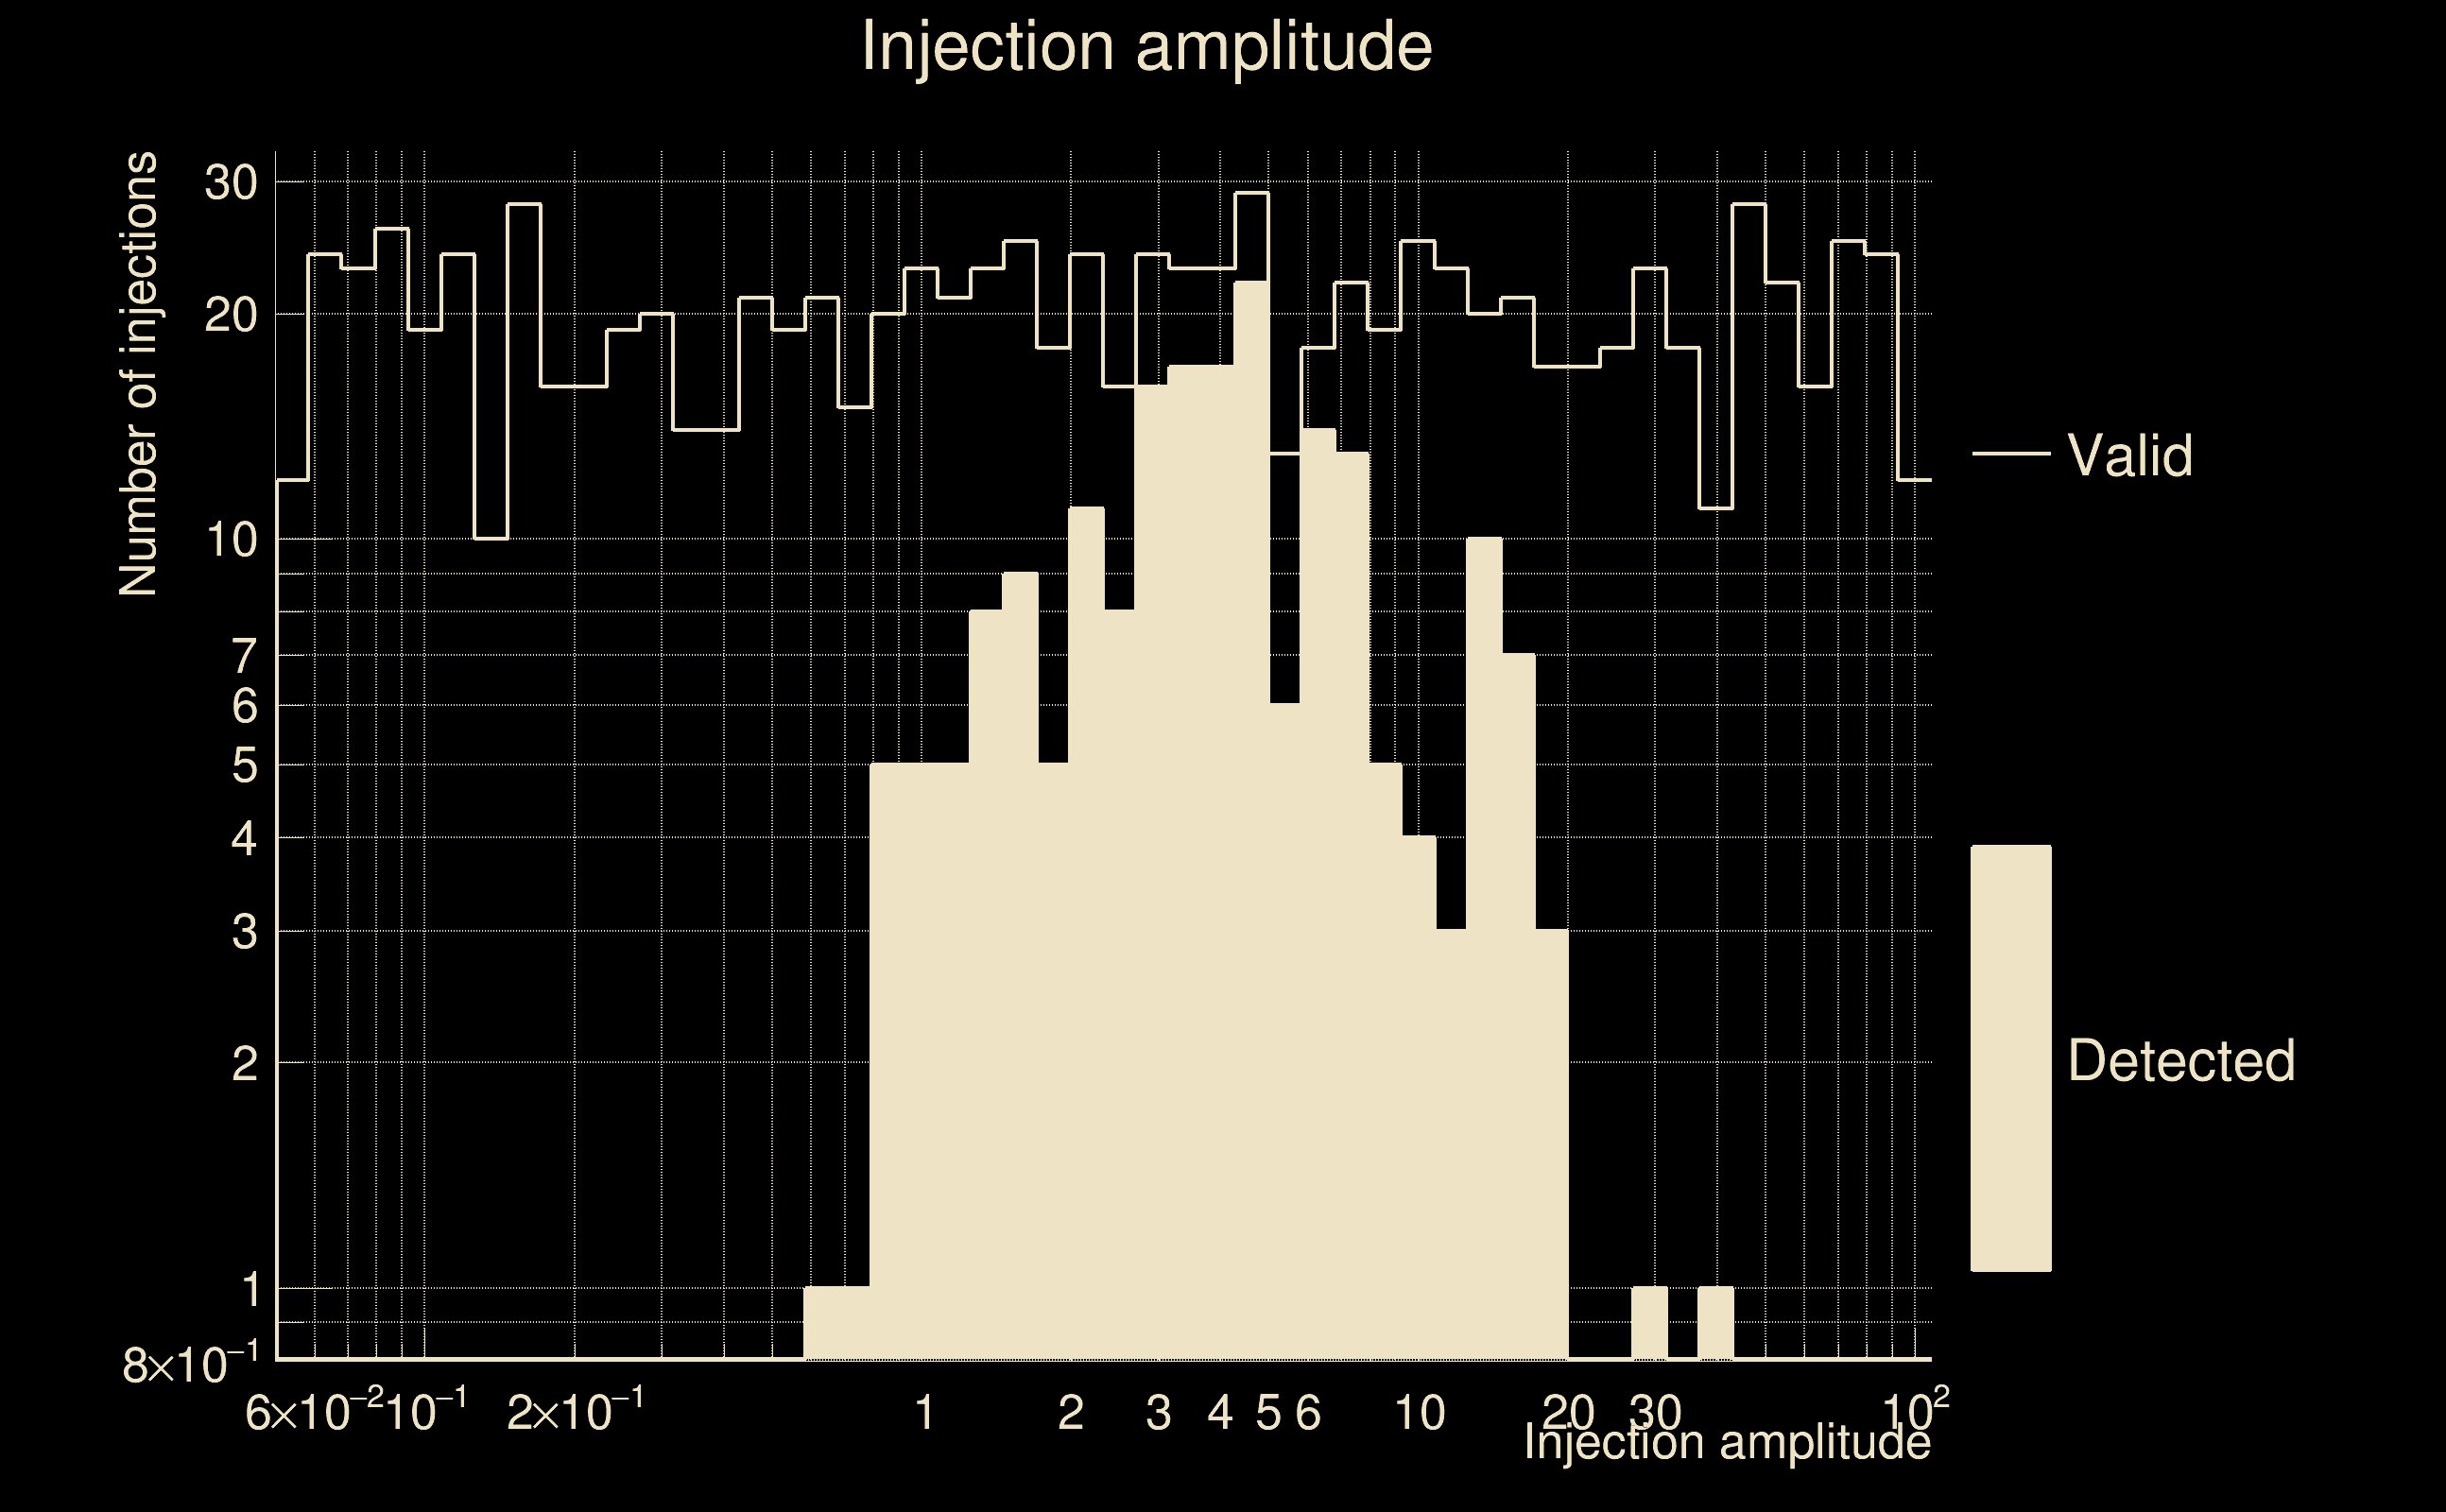
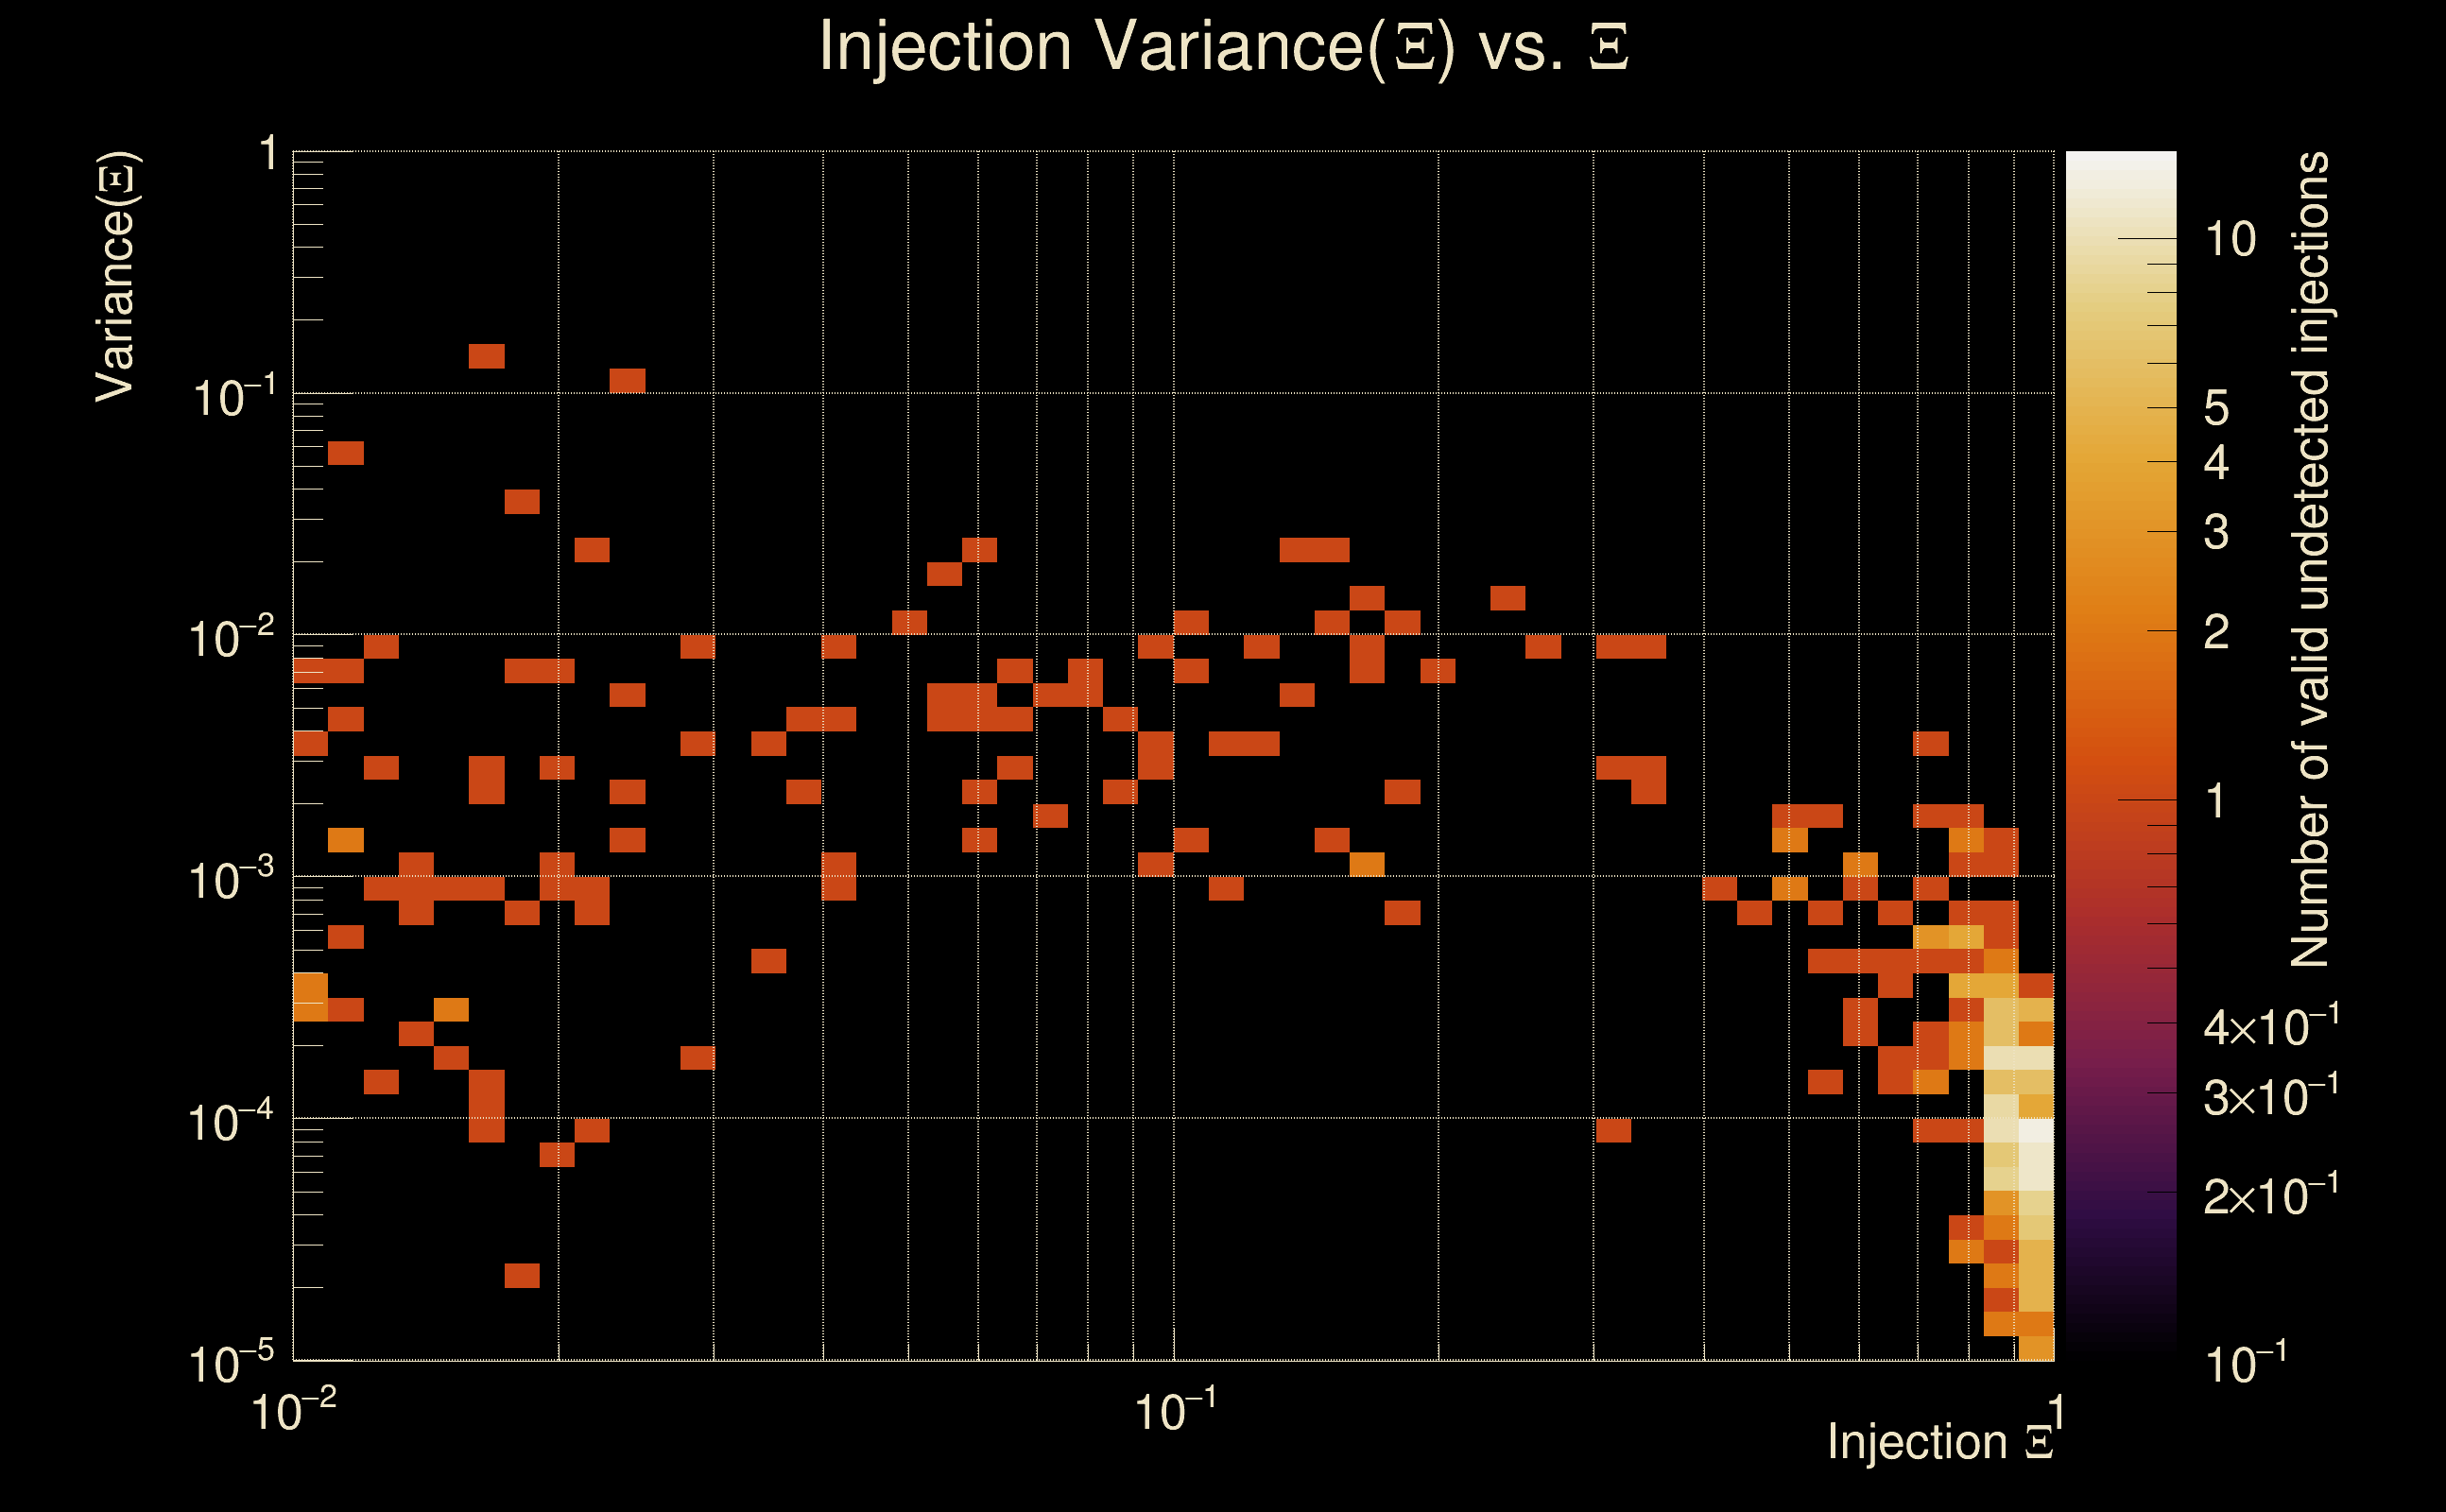
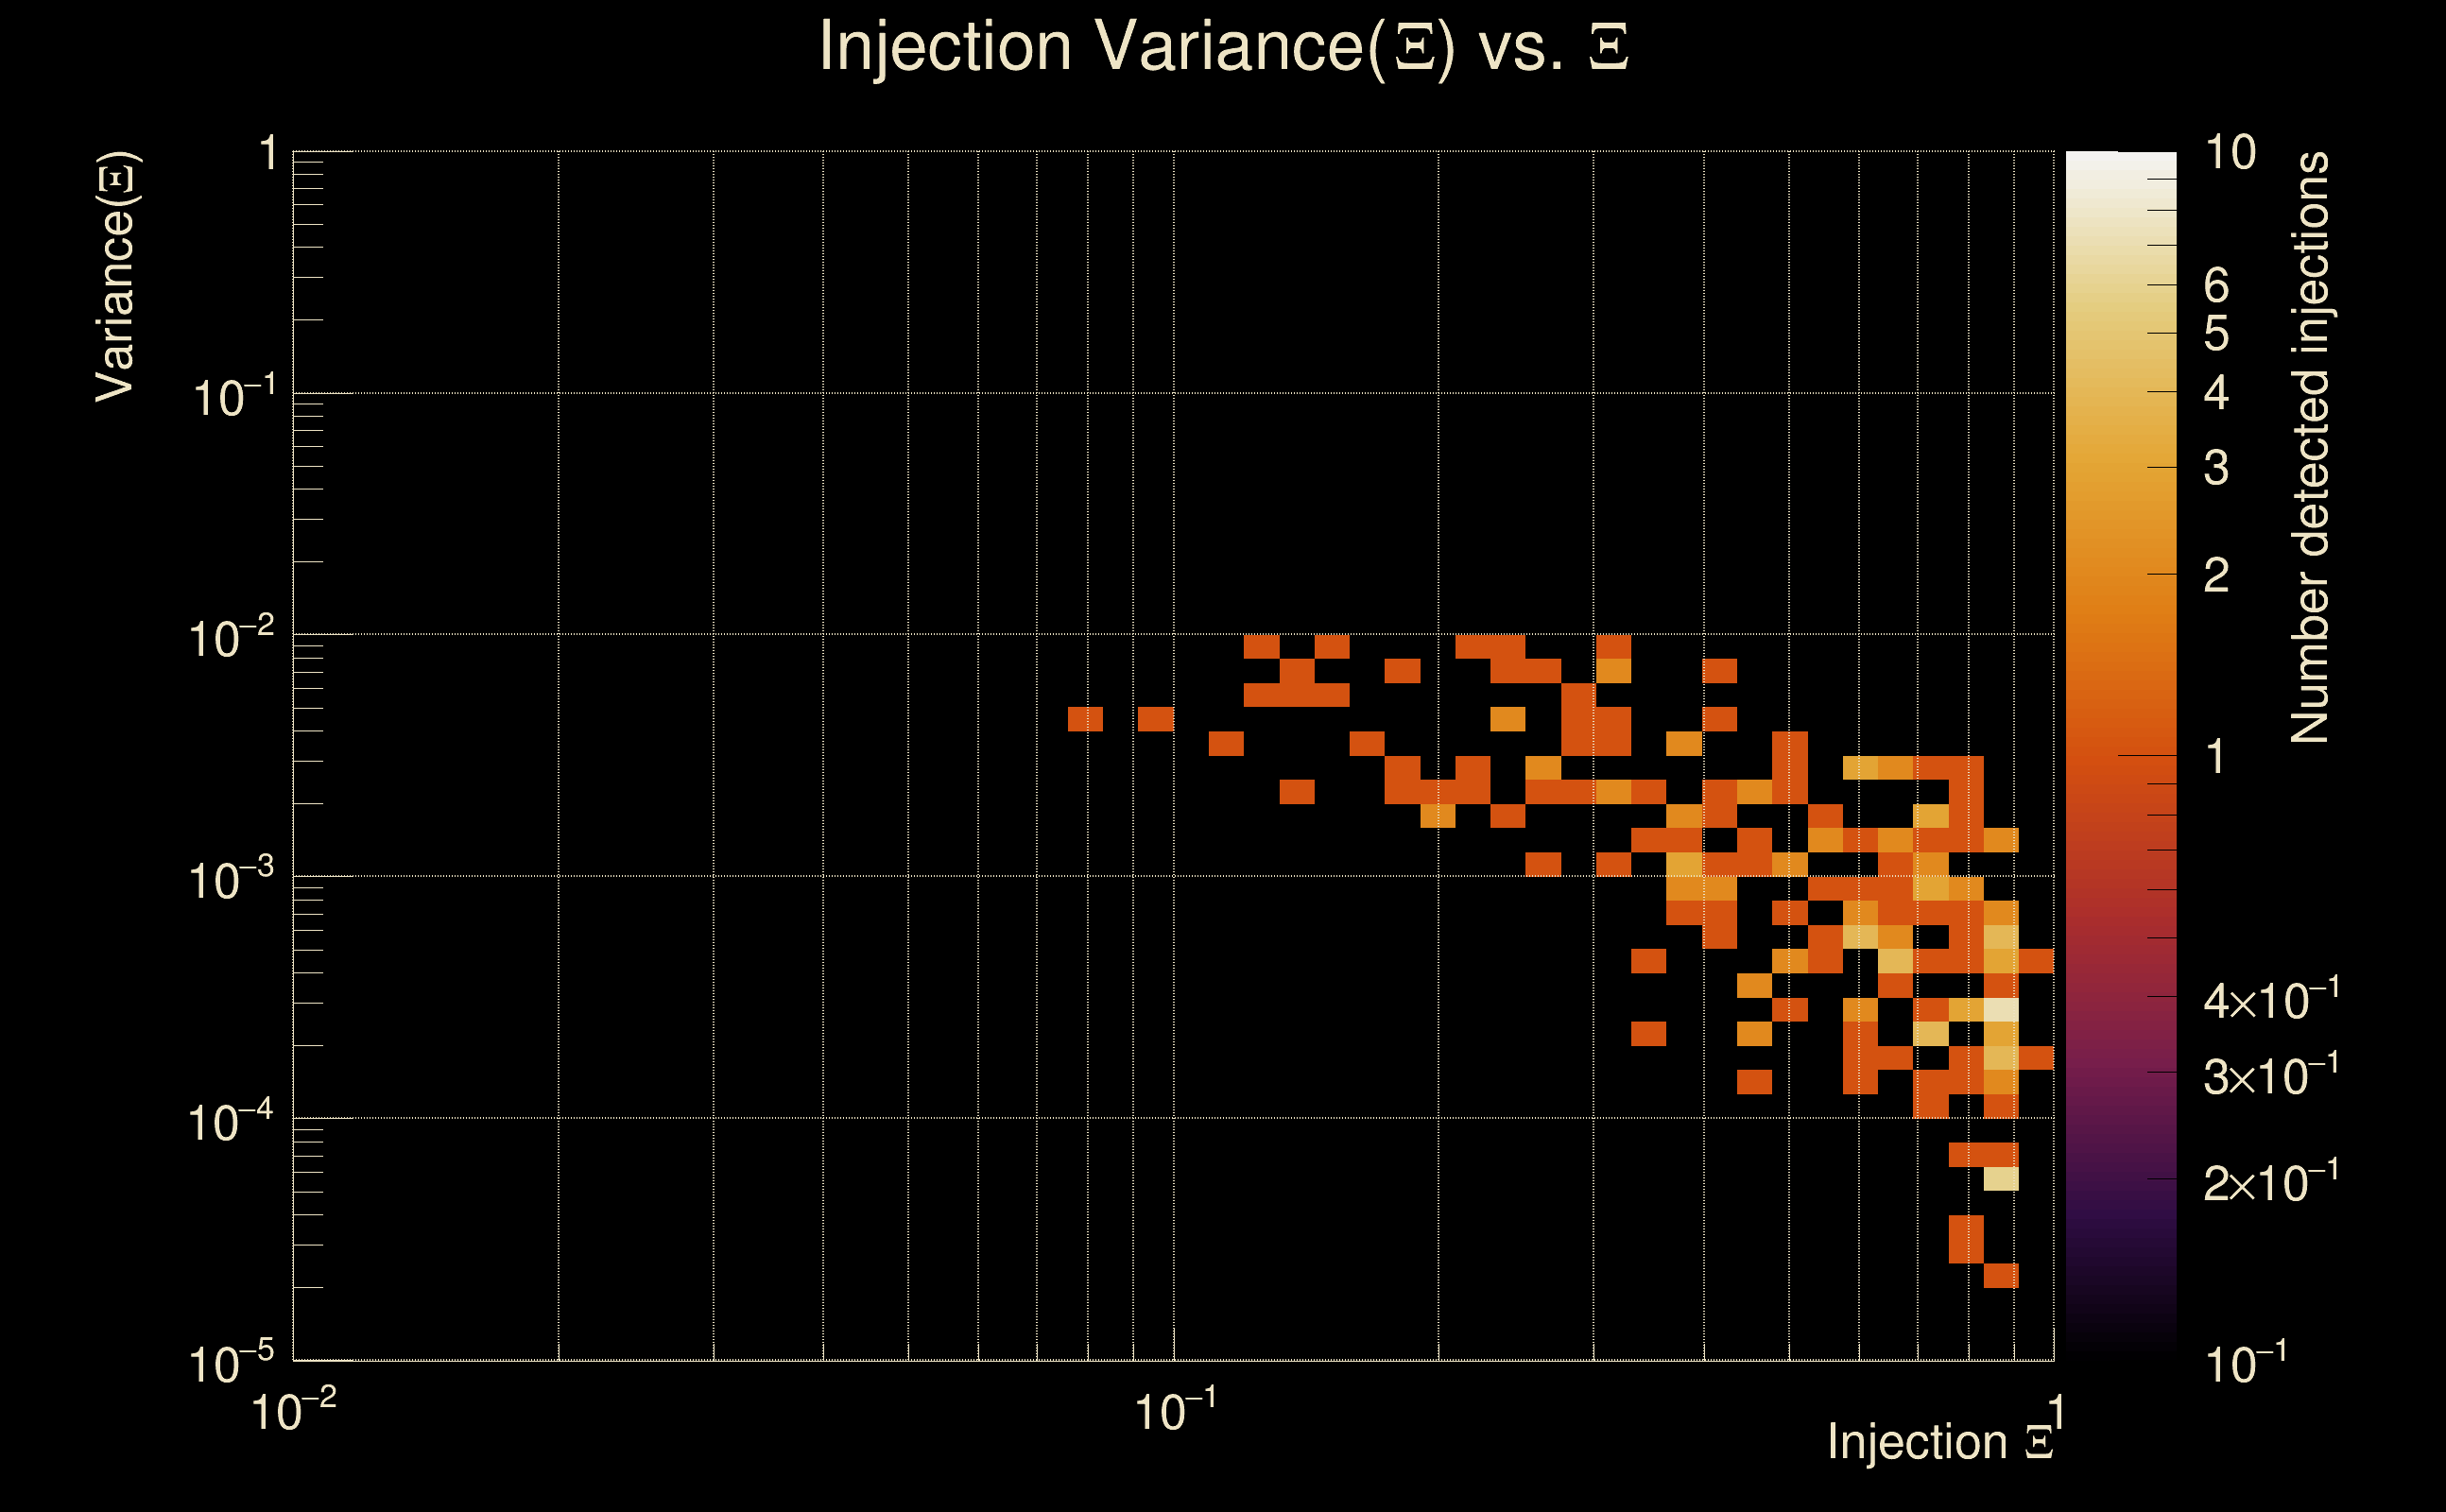
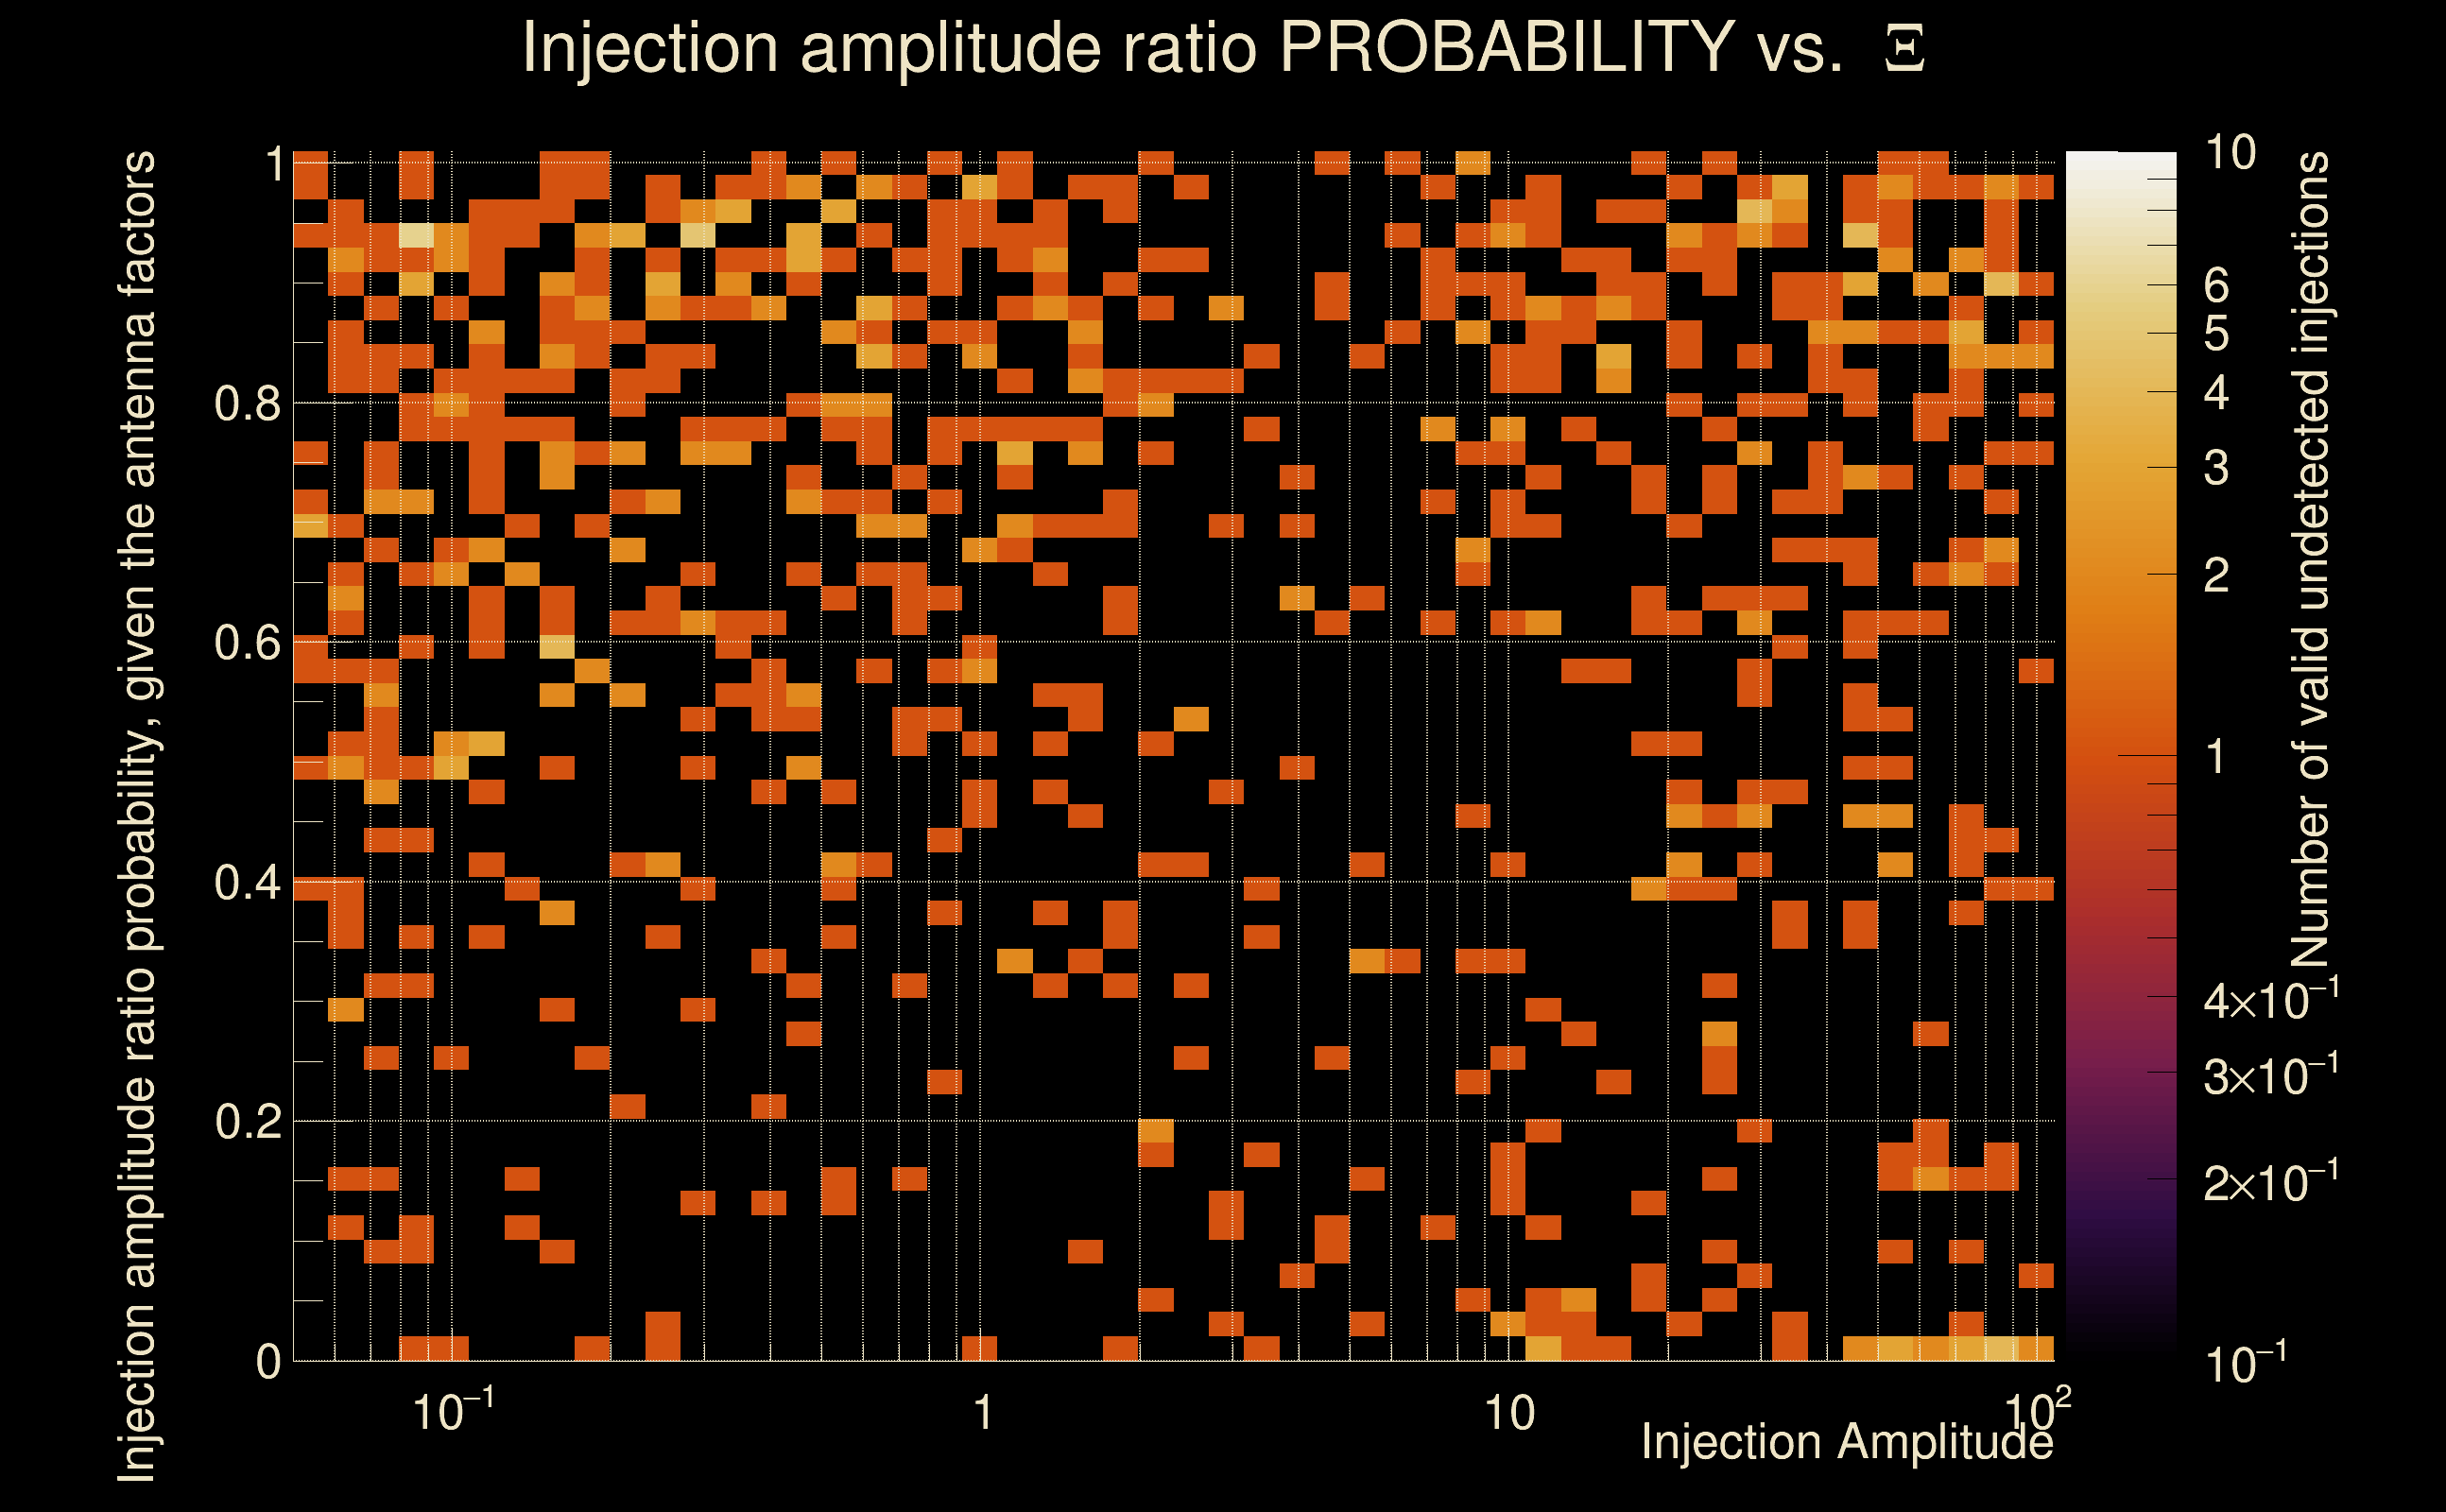
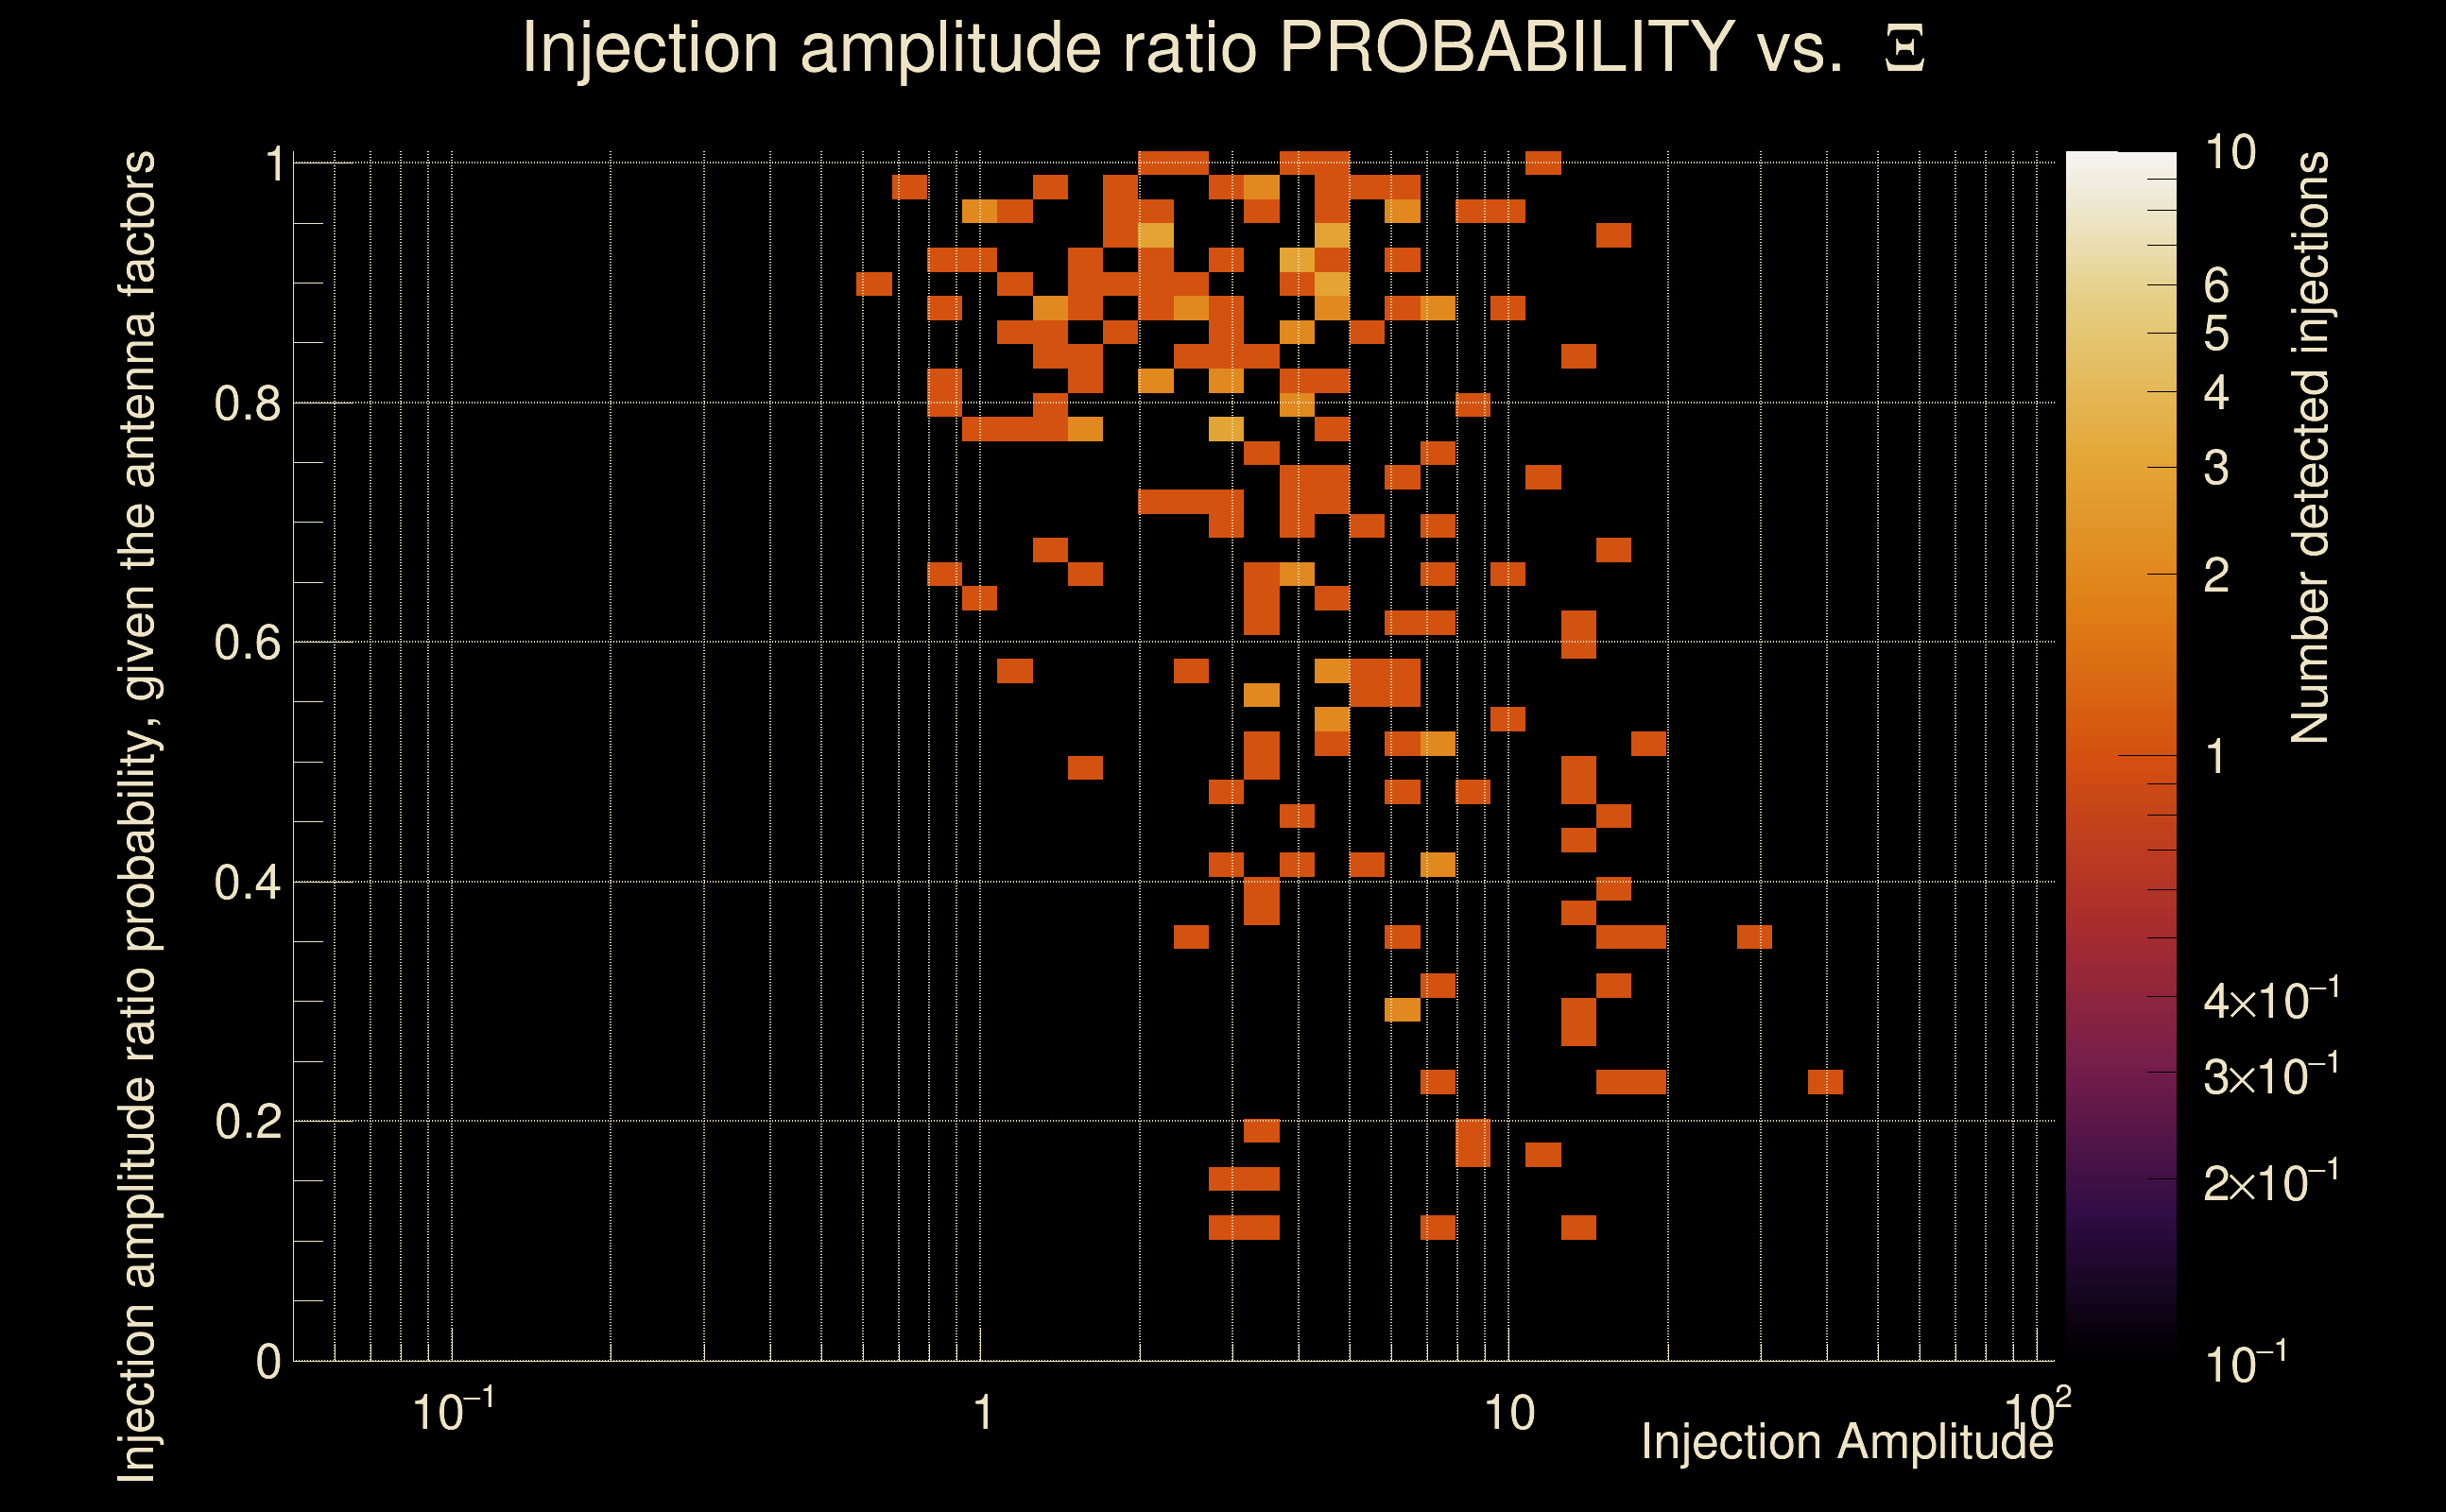
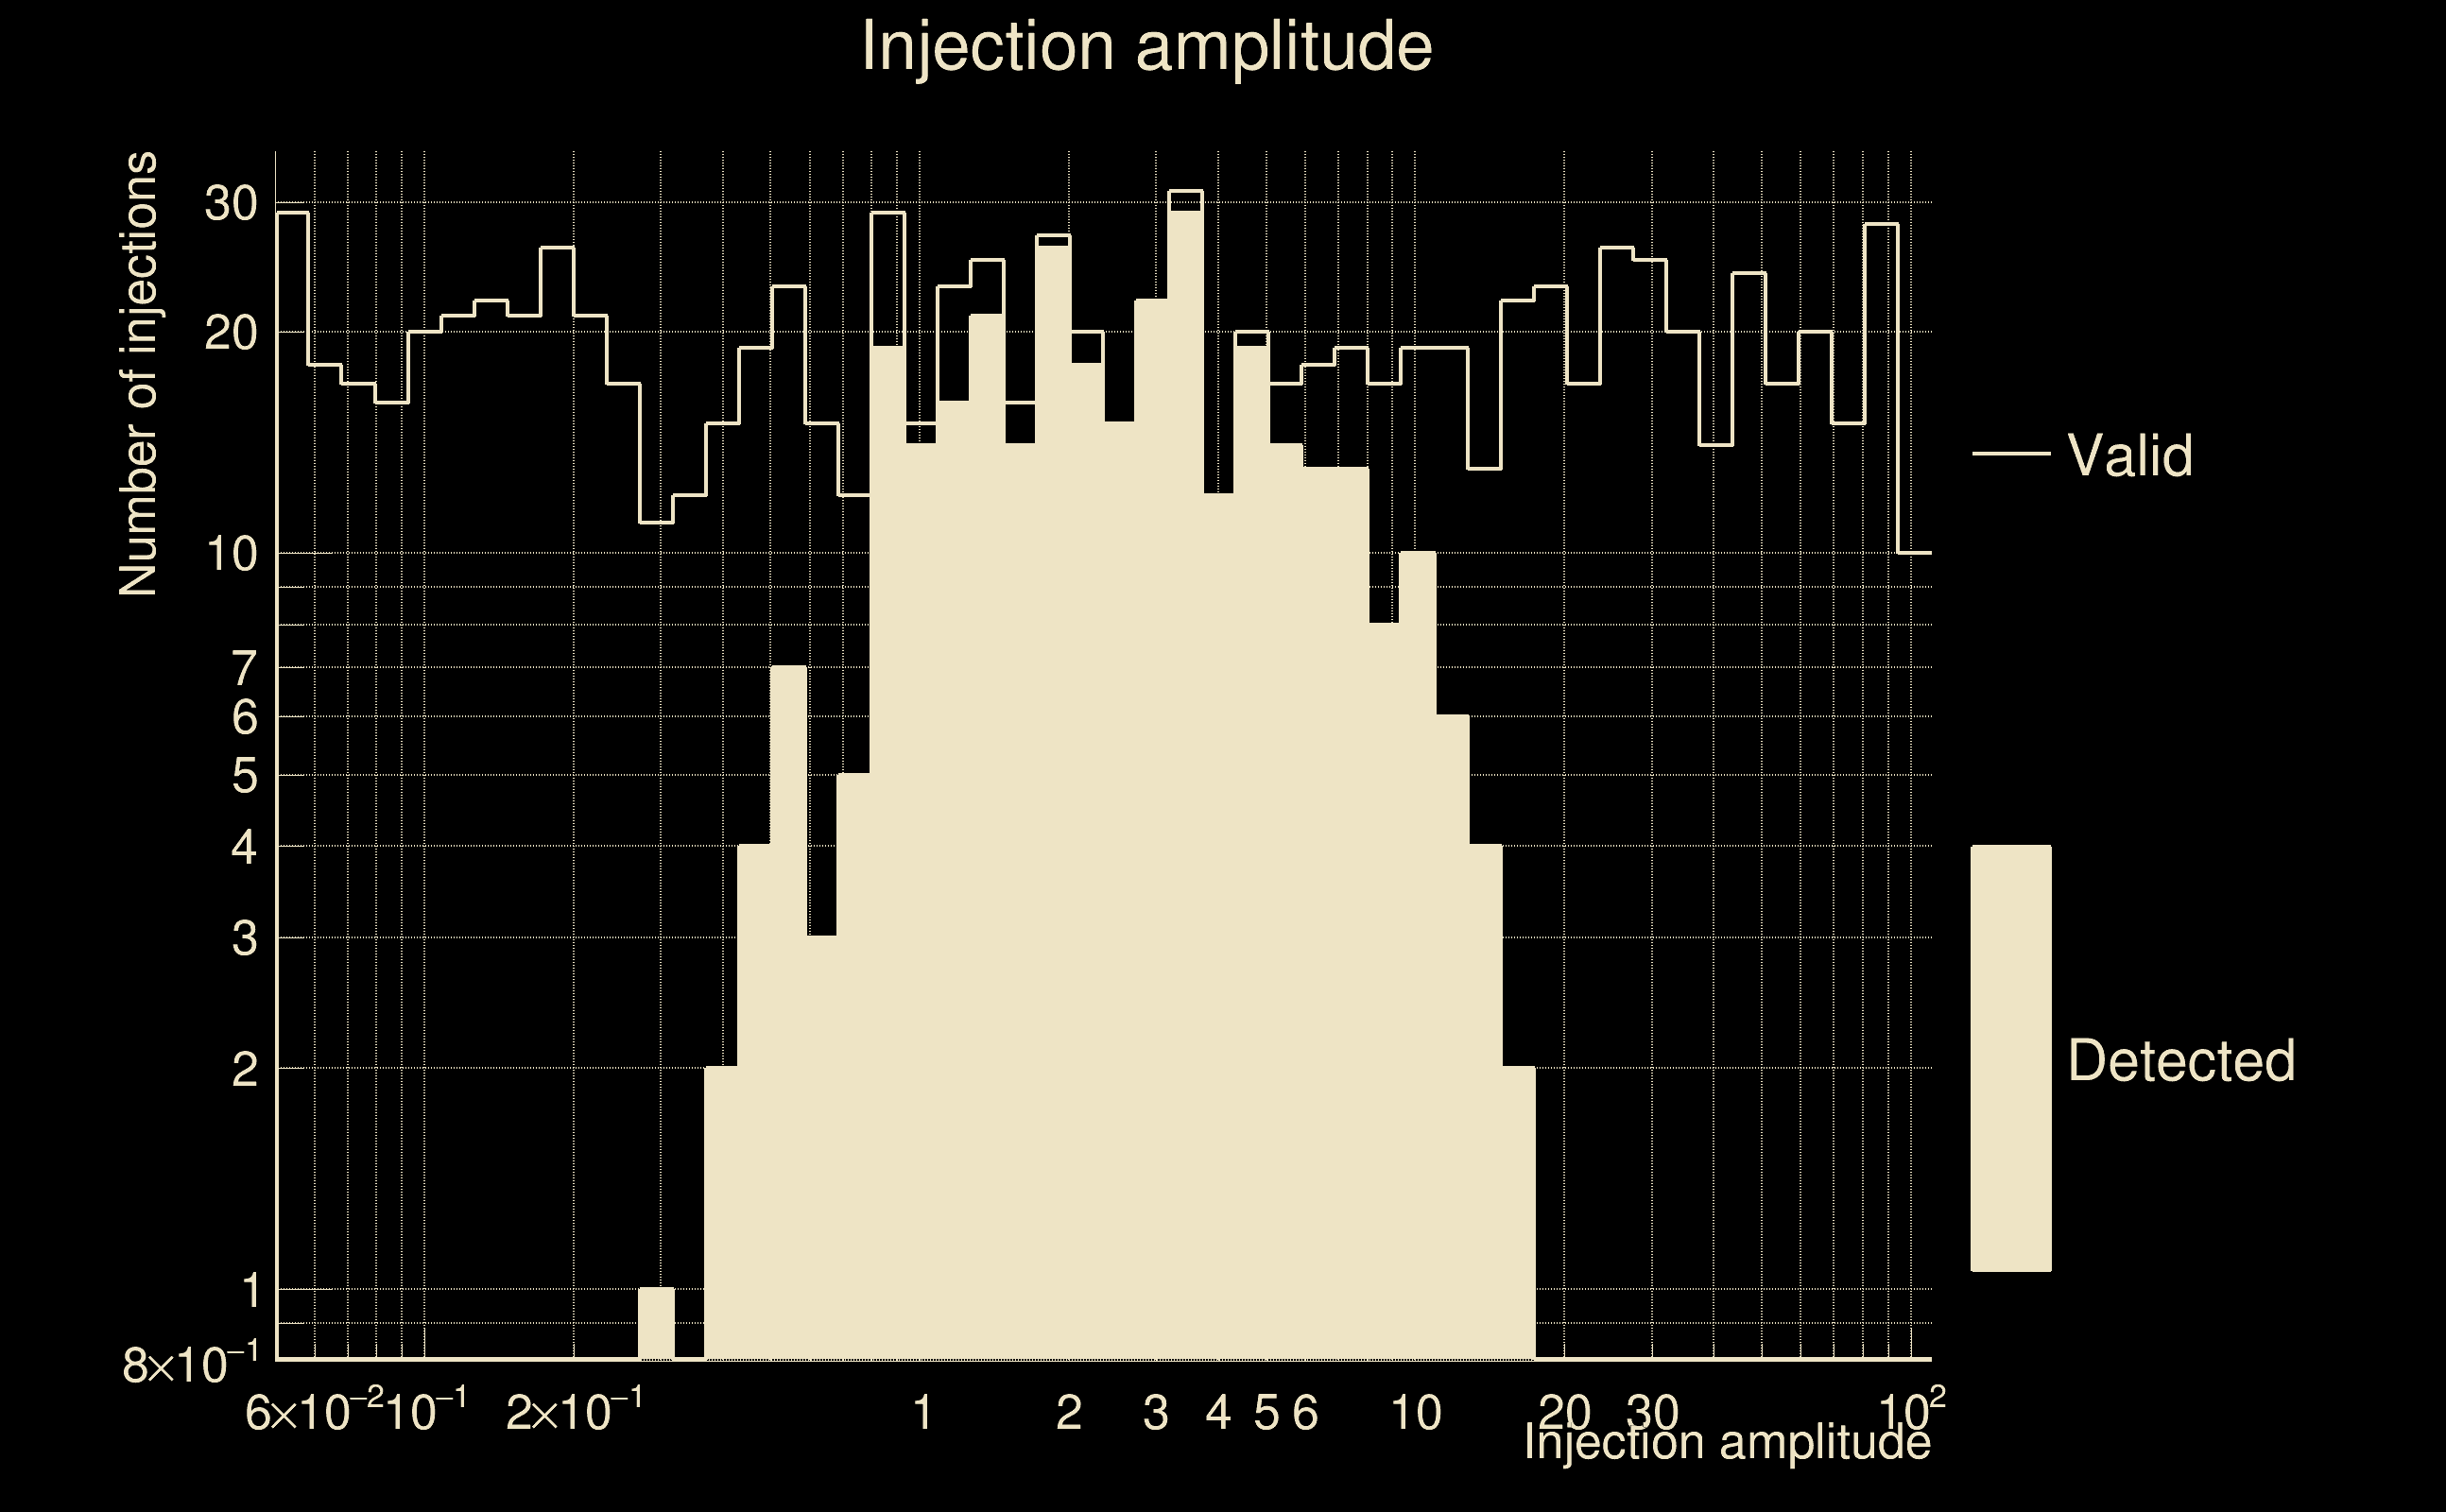
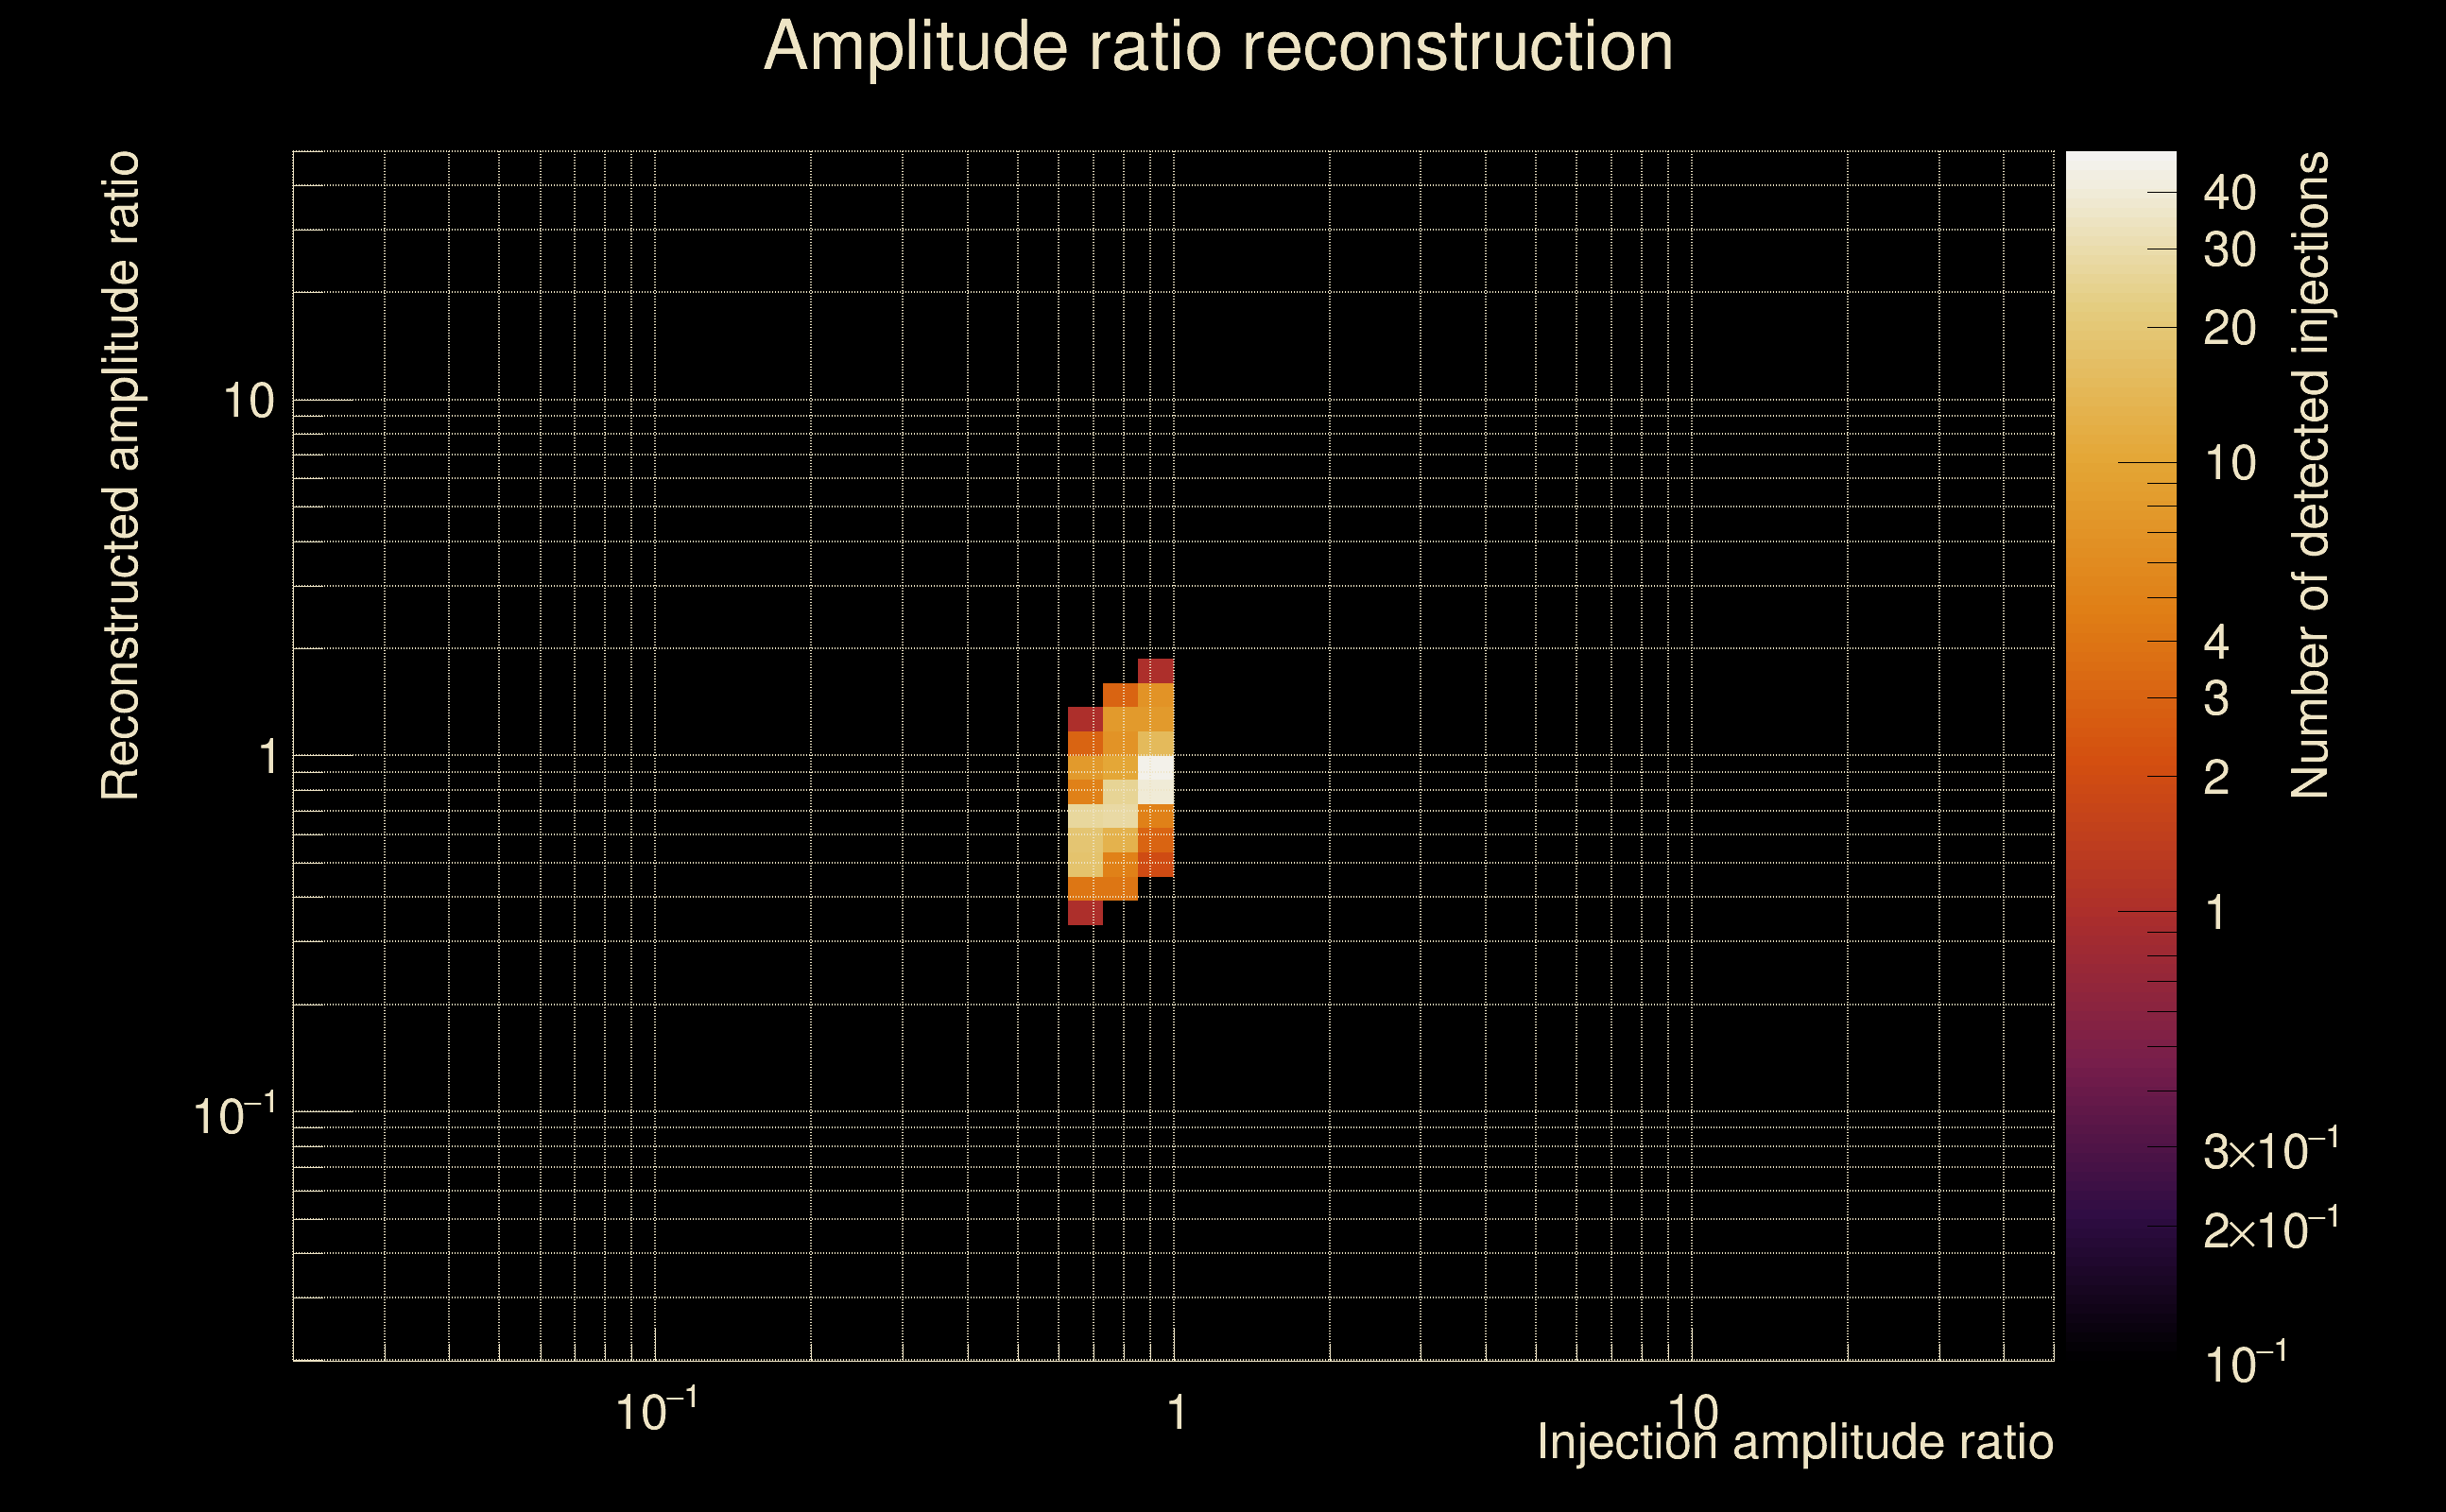
| Number of injections (total/valid/detected): | 1162 / 1002 / 197 |
| List of missed injections: | ./Kur22-s50_missed.txt |
| Injection amplitude at 90% detection efficiency: | -1 |
| Injection amplitude at 50% detection efficiency: | 5.50889 |
| Injection amplitude at 10% detection efficiency: | 0.756461 |
 |
 |
 |
 |
 |
 |
 |
|
 |
 |
|
 |
 |
|
 |
 |
|
 |
 |
|
 |
 |
|
 |
 |
|
 |
 |
|
 |
 |
 |
 |
 |
 |
 |
 |
 |
 |
 |
 |
 |
 |
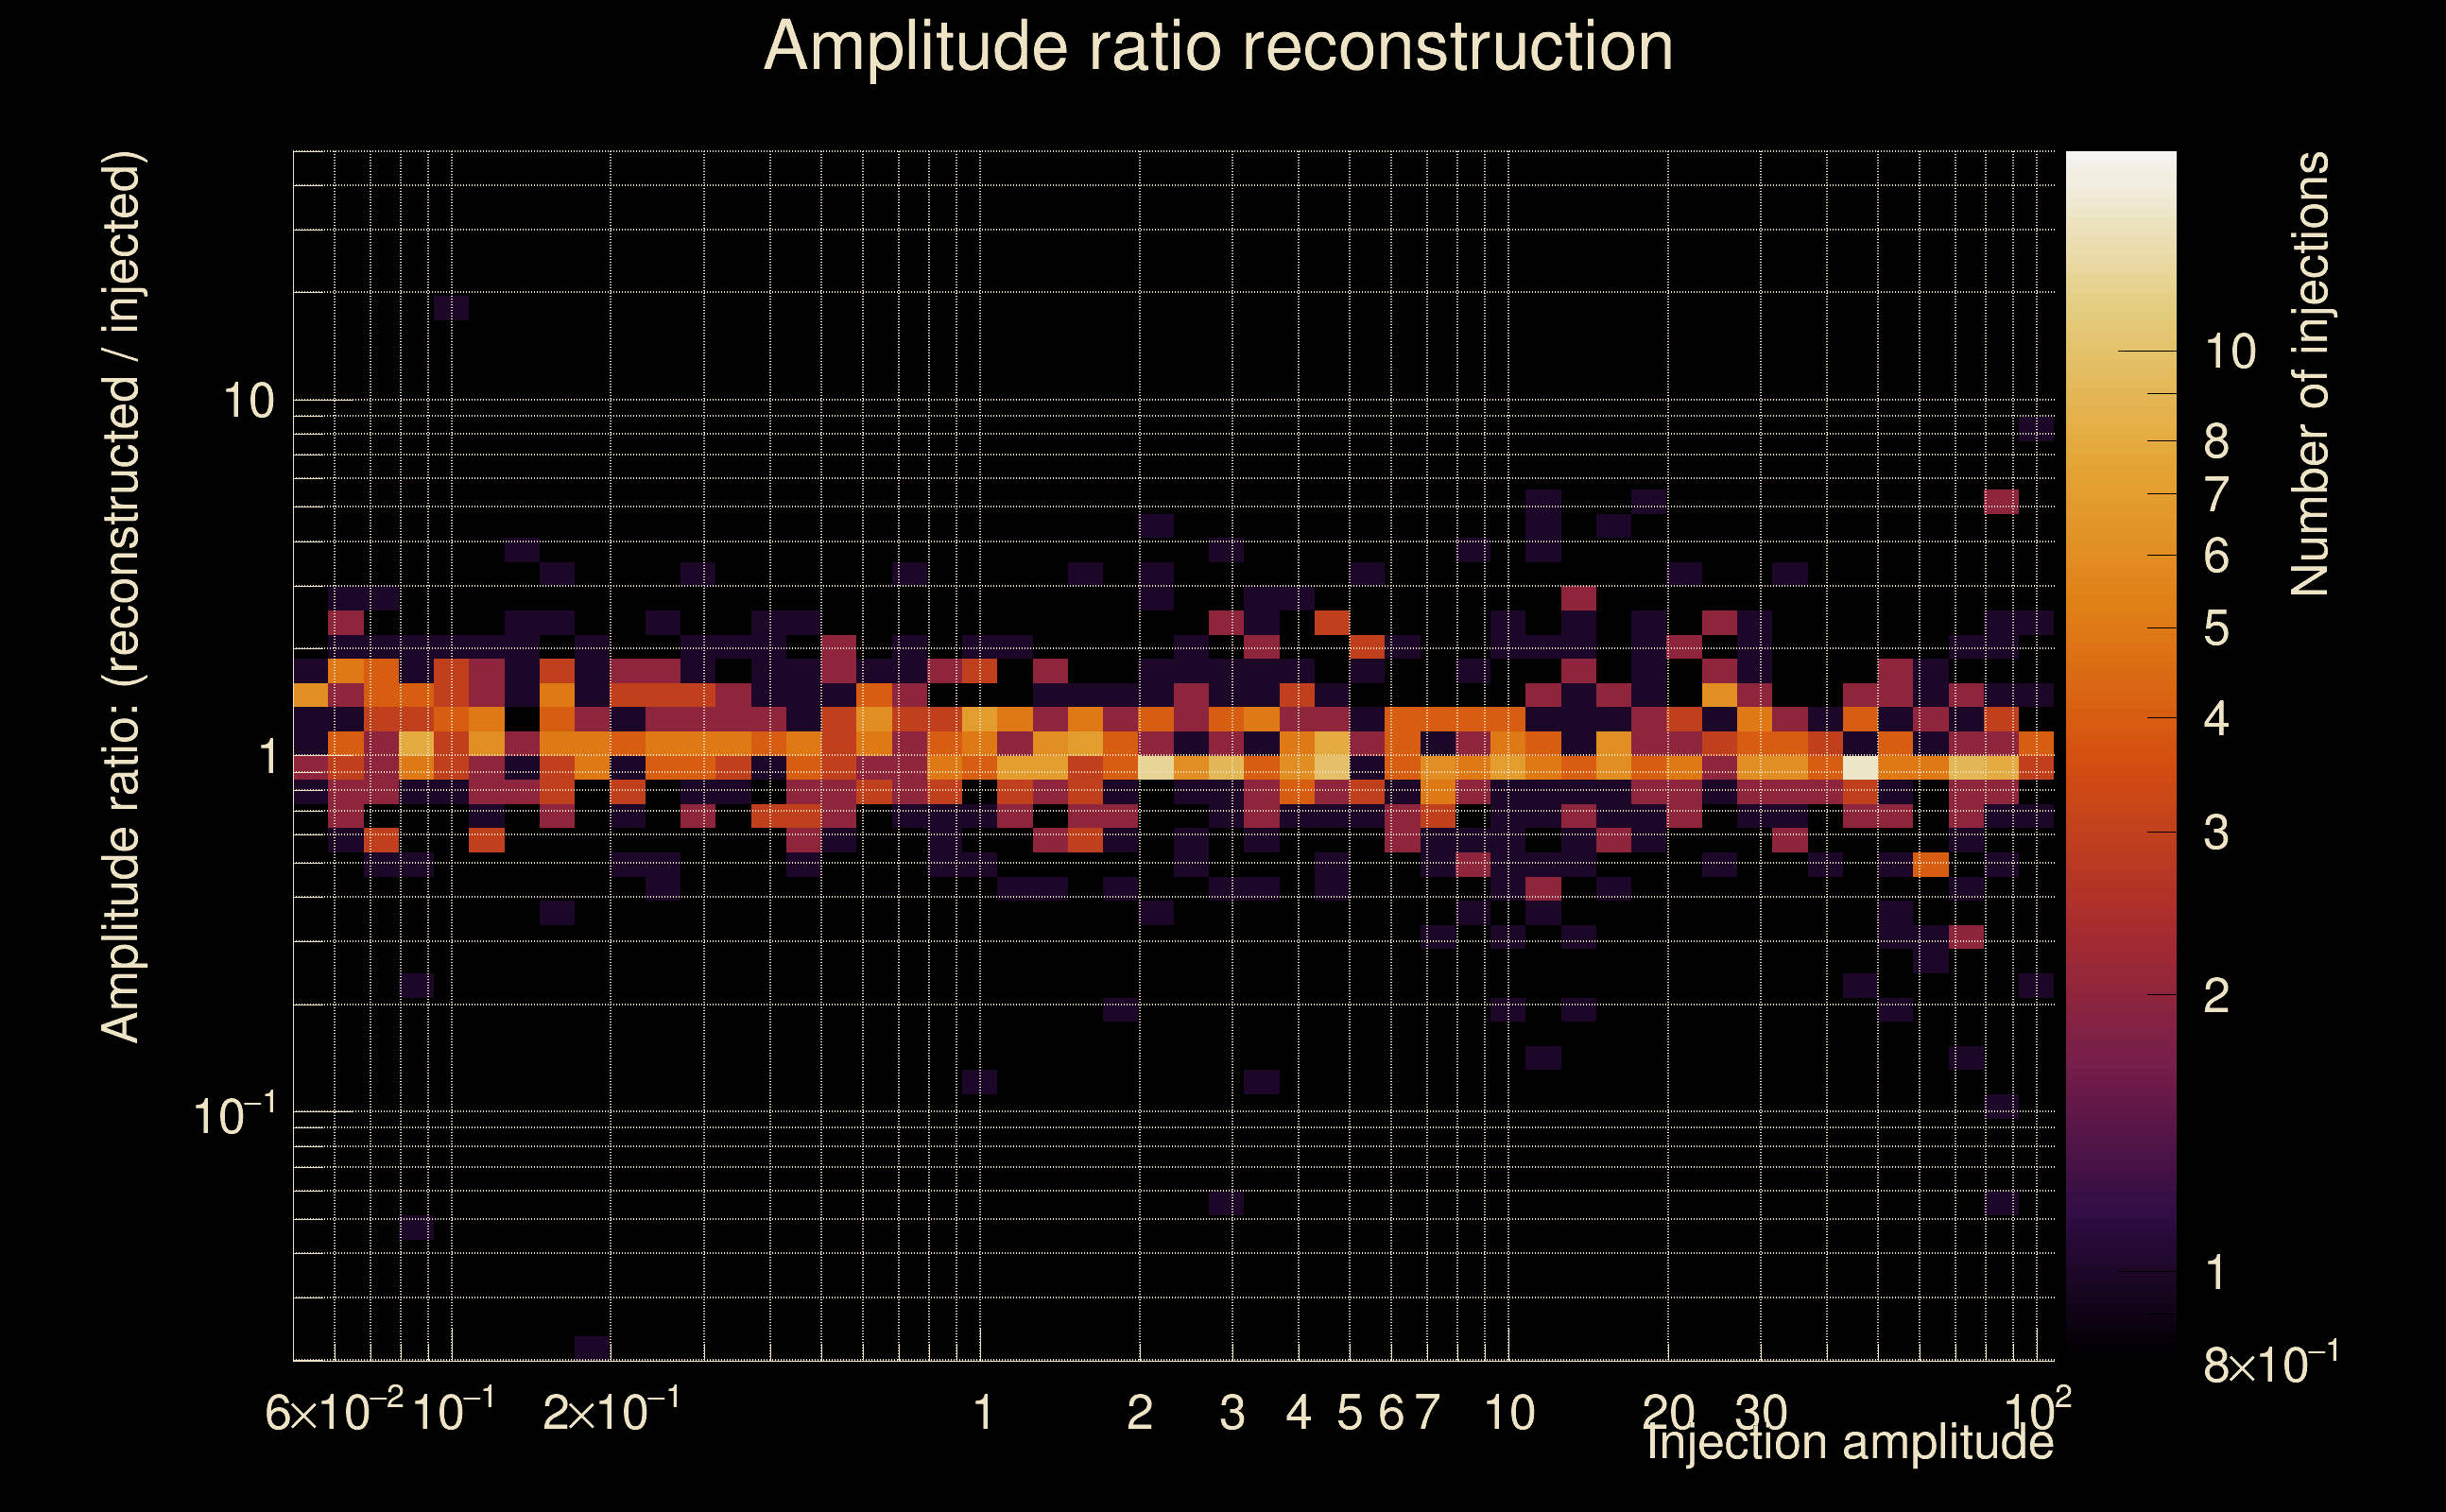 |
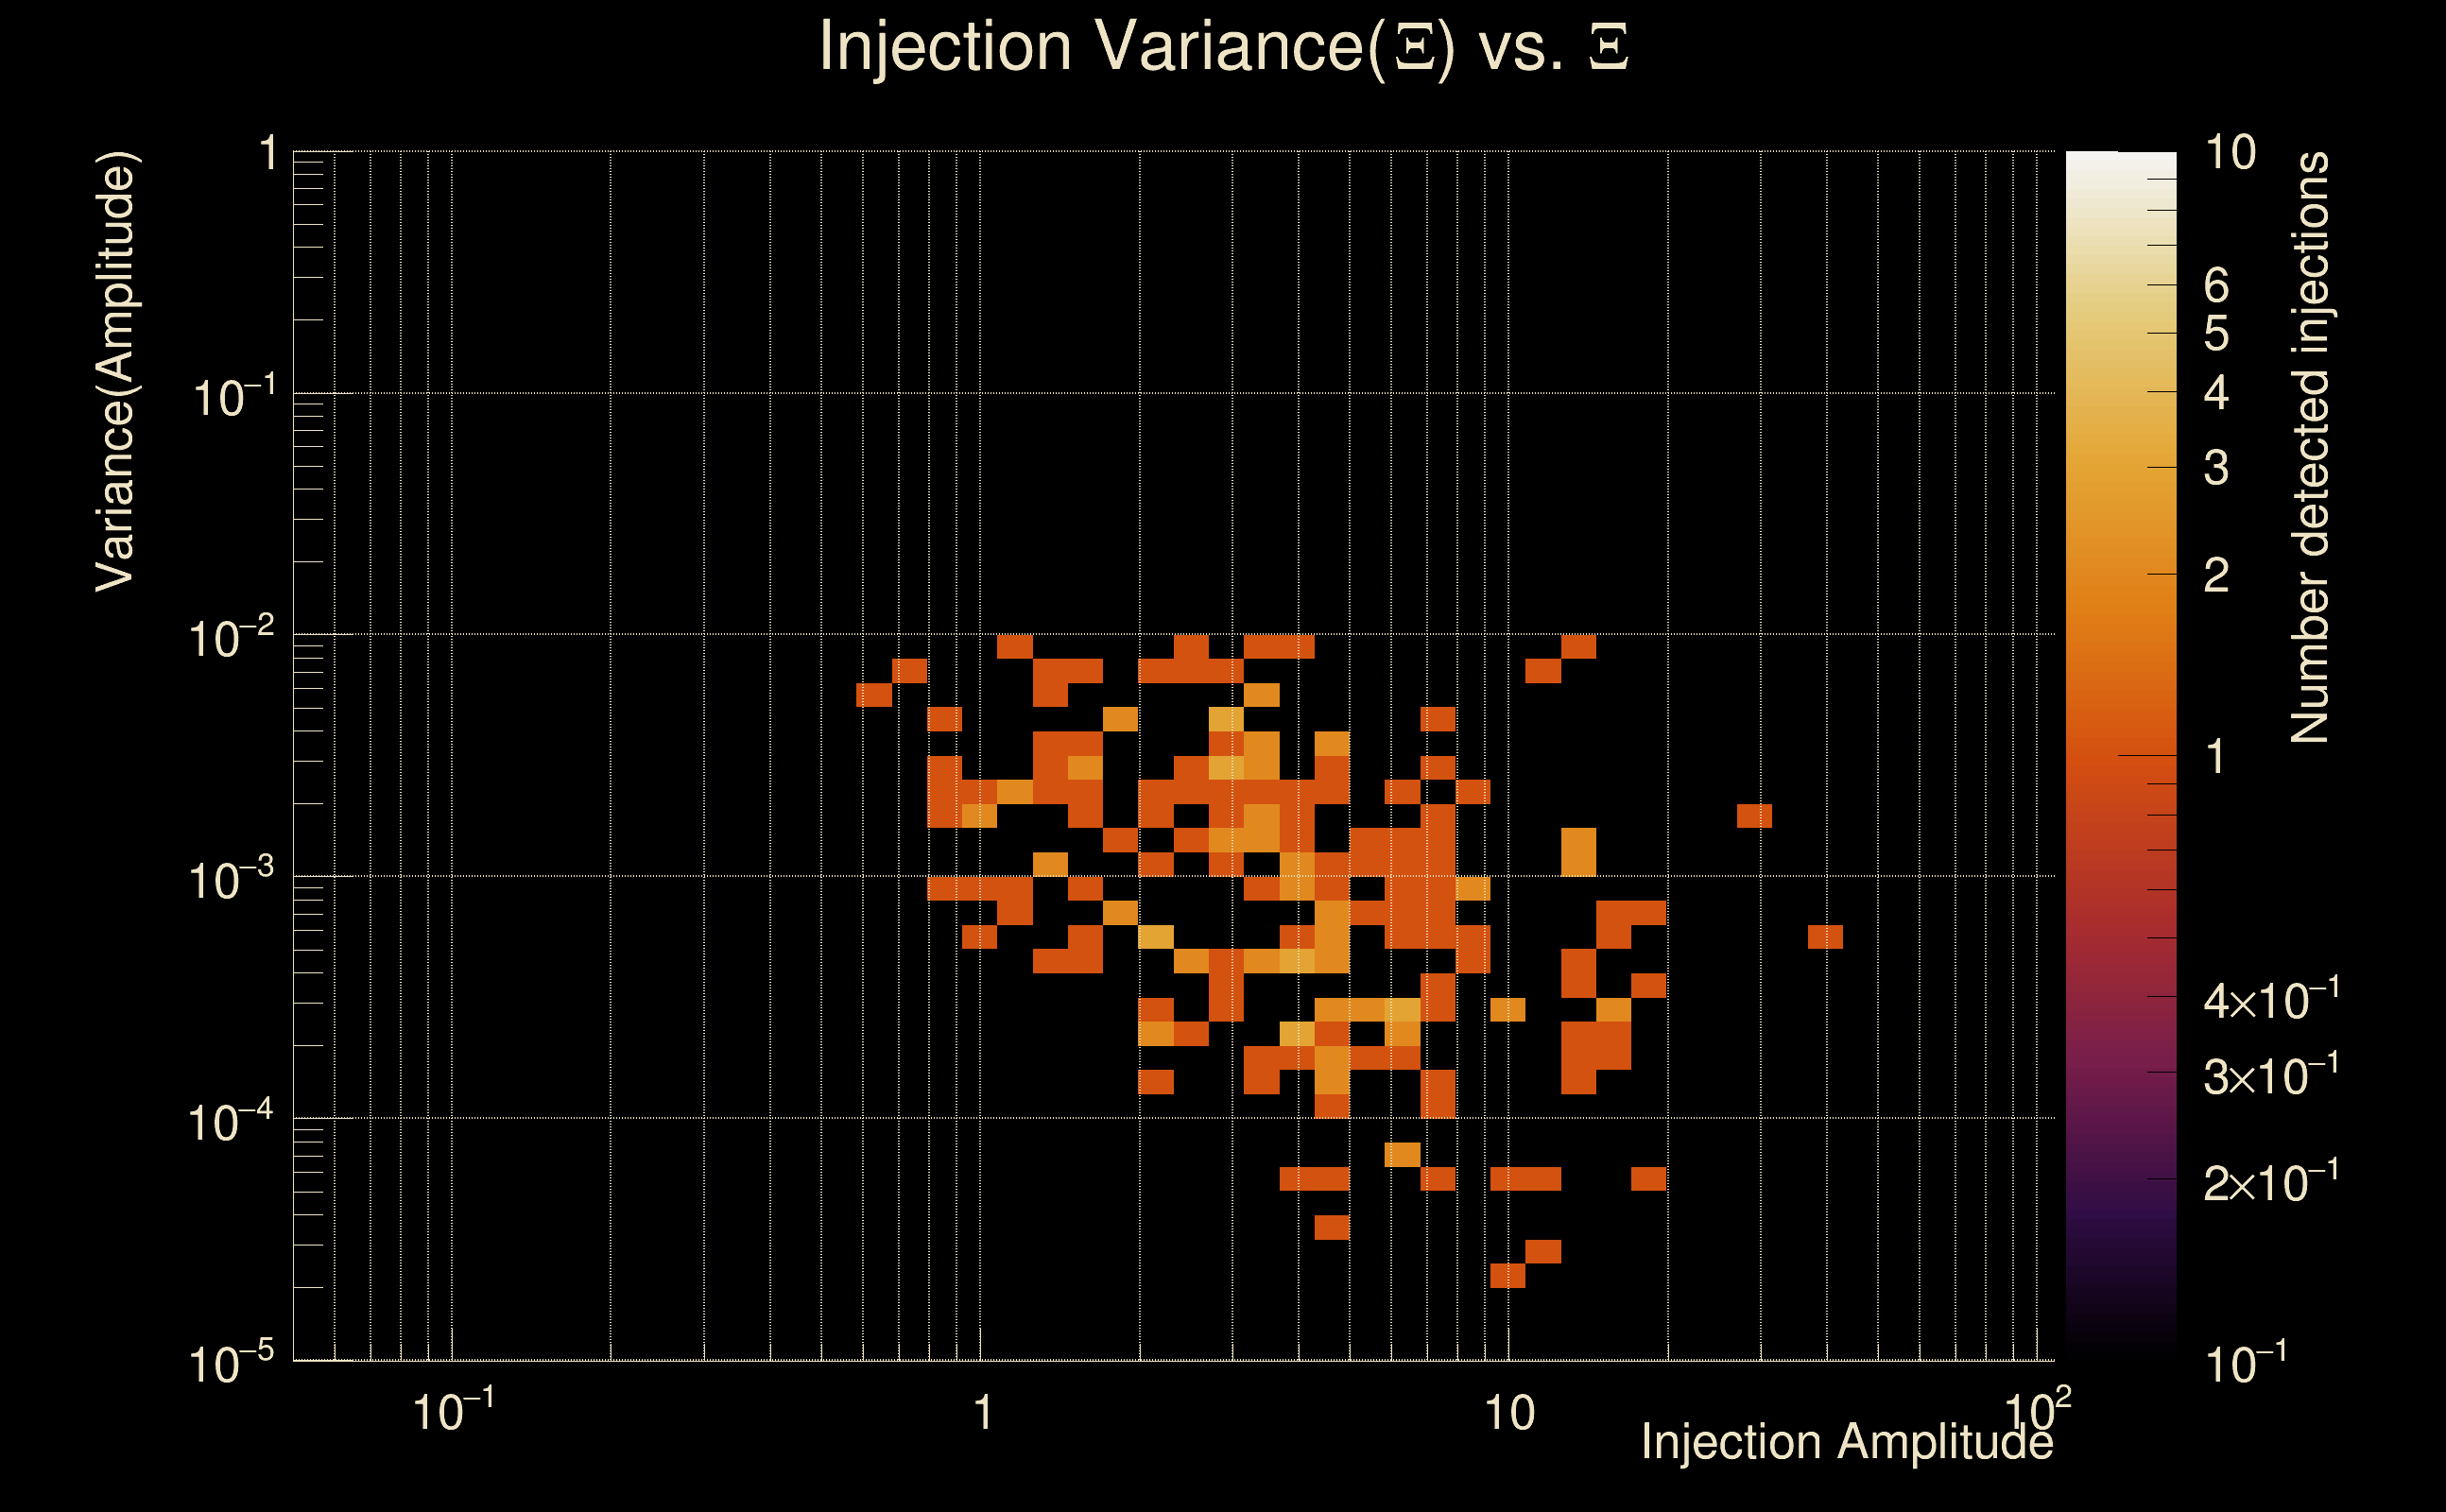
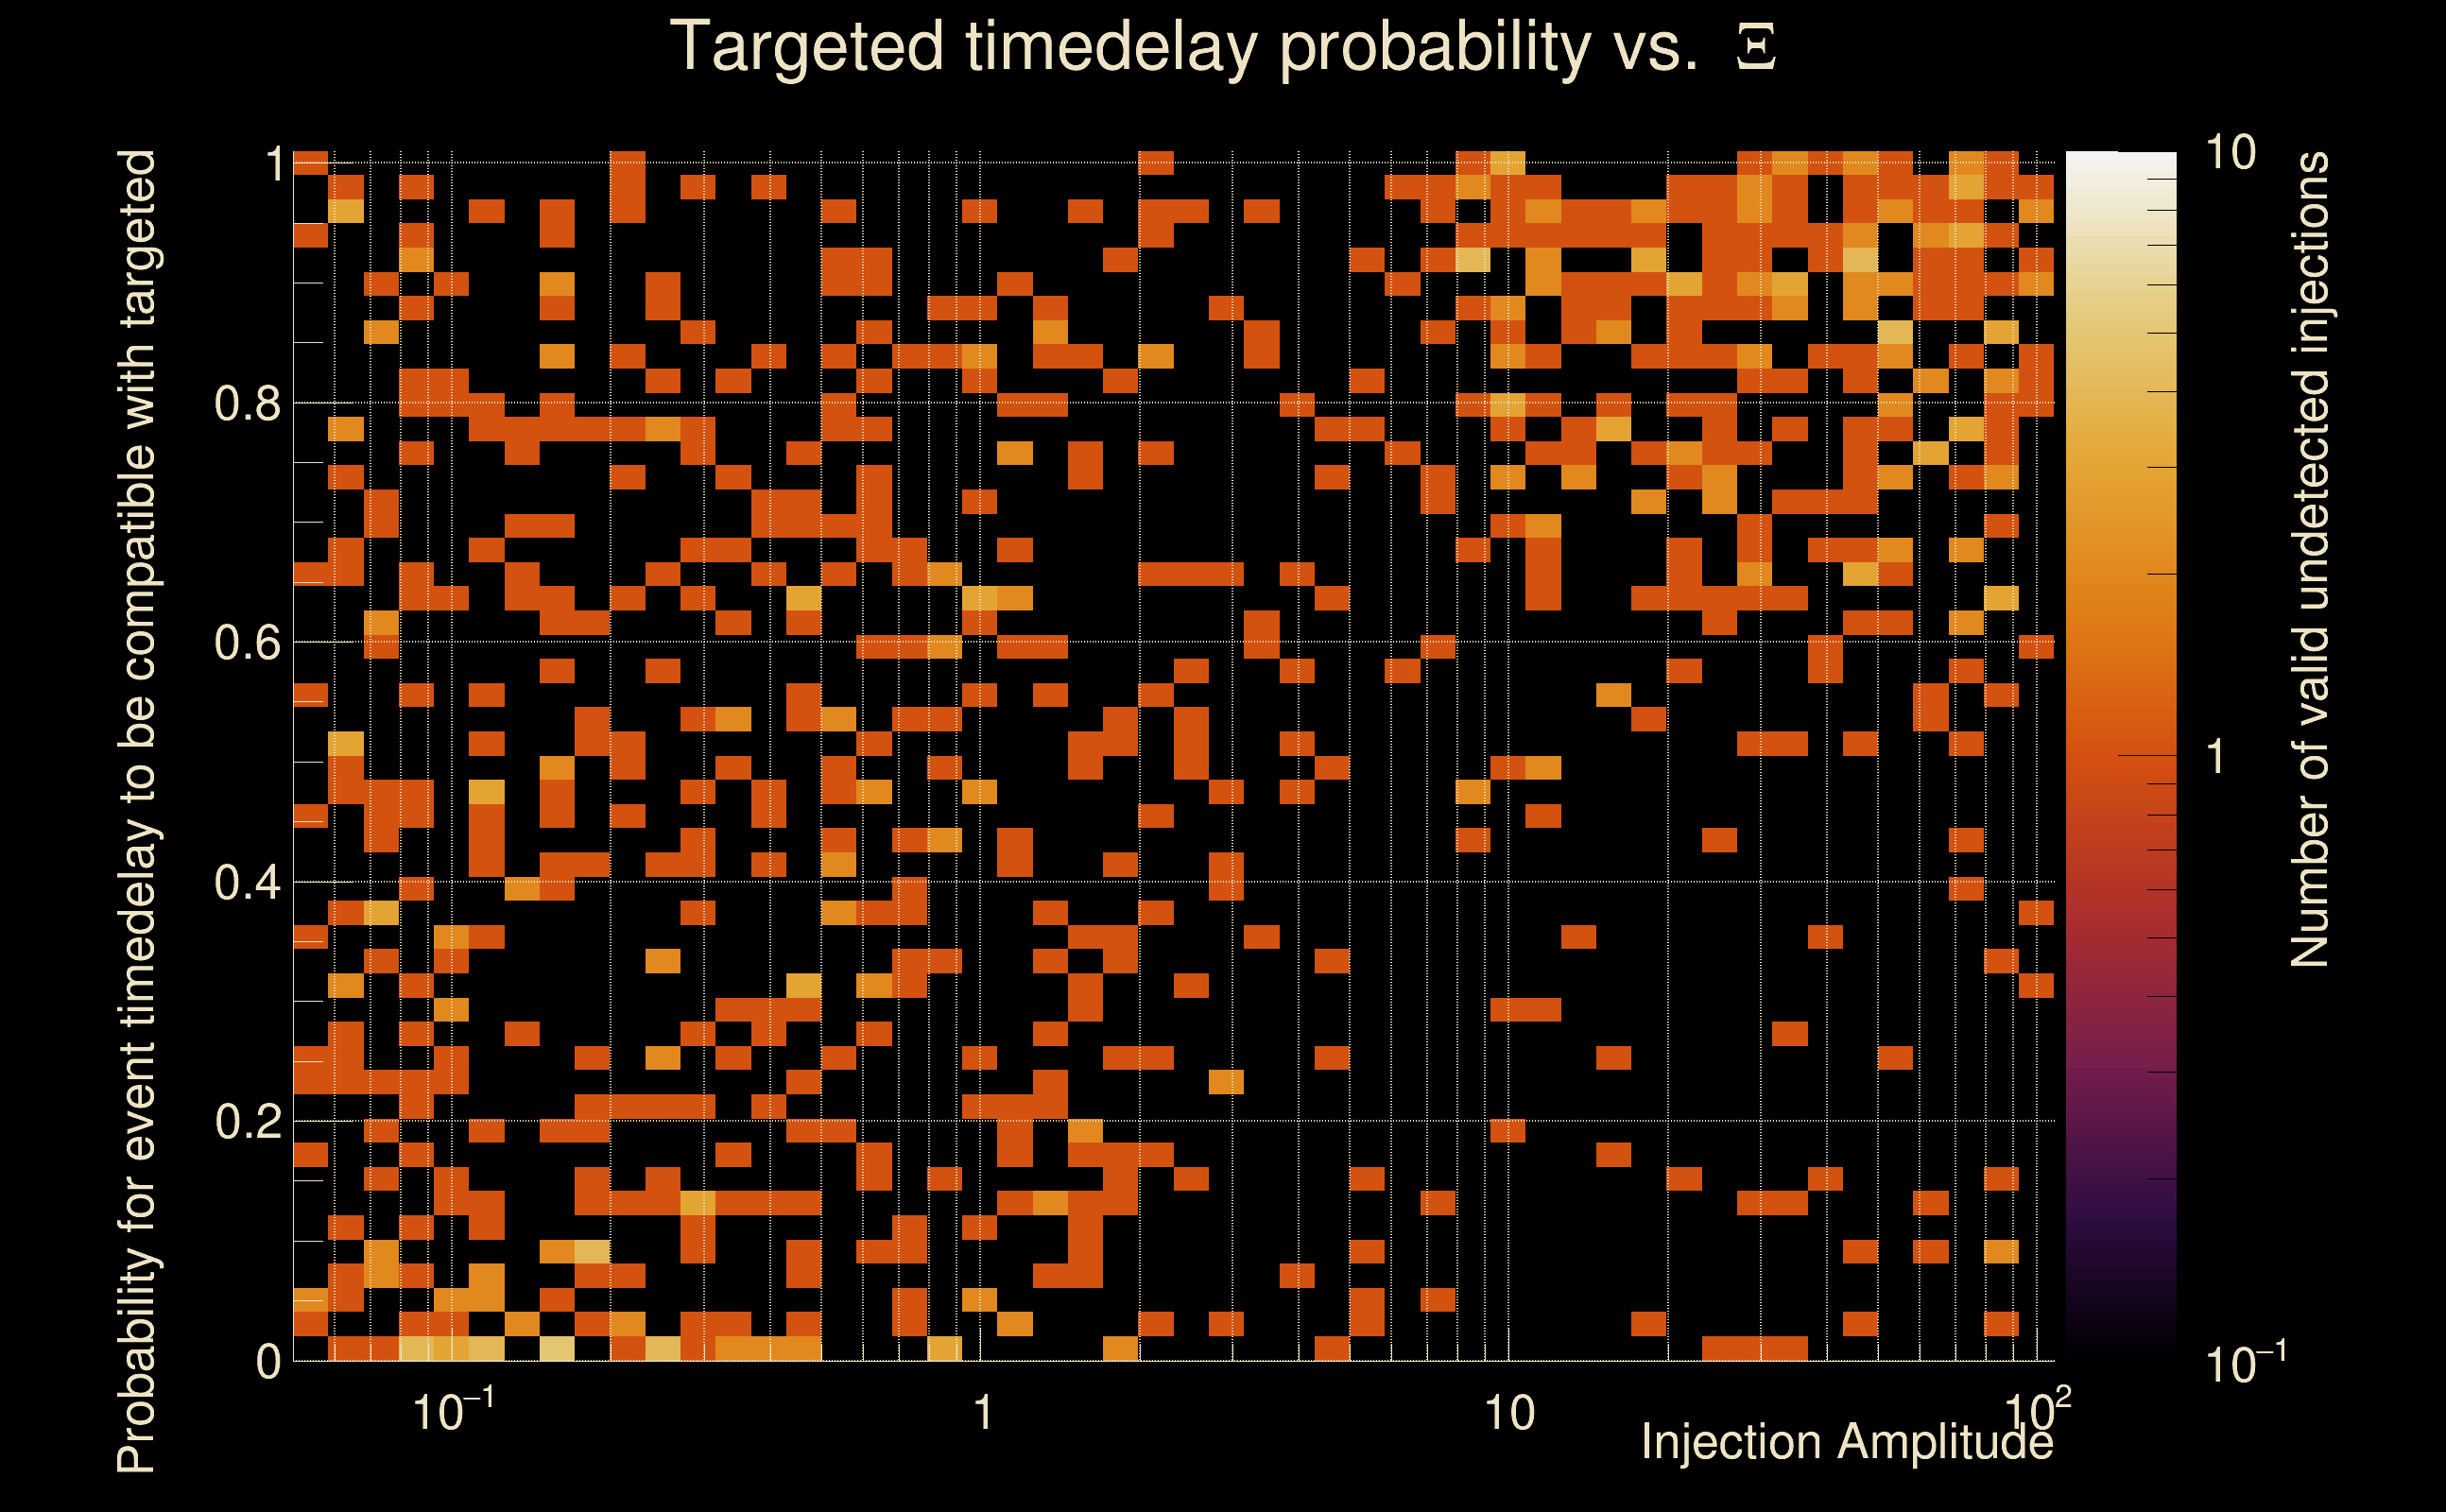
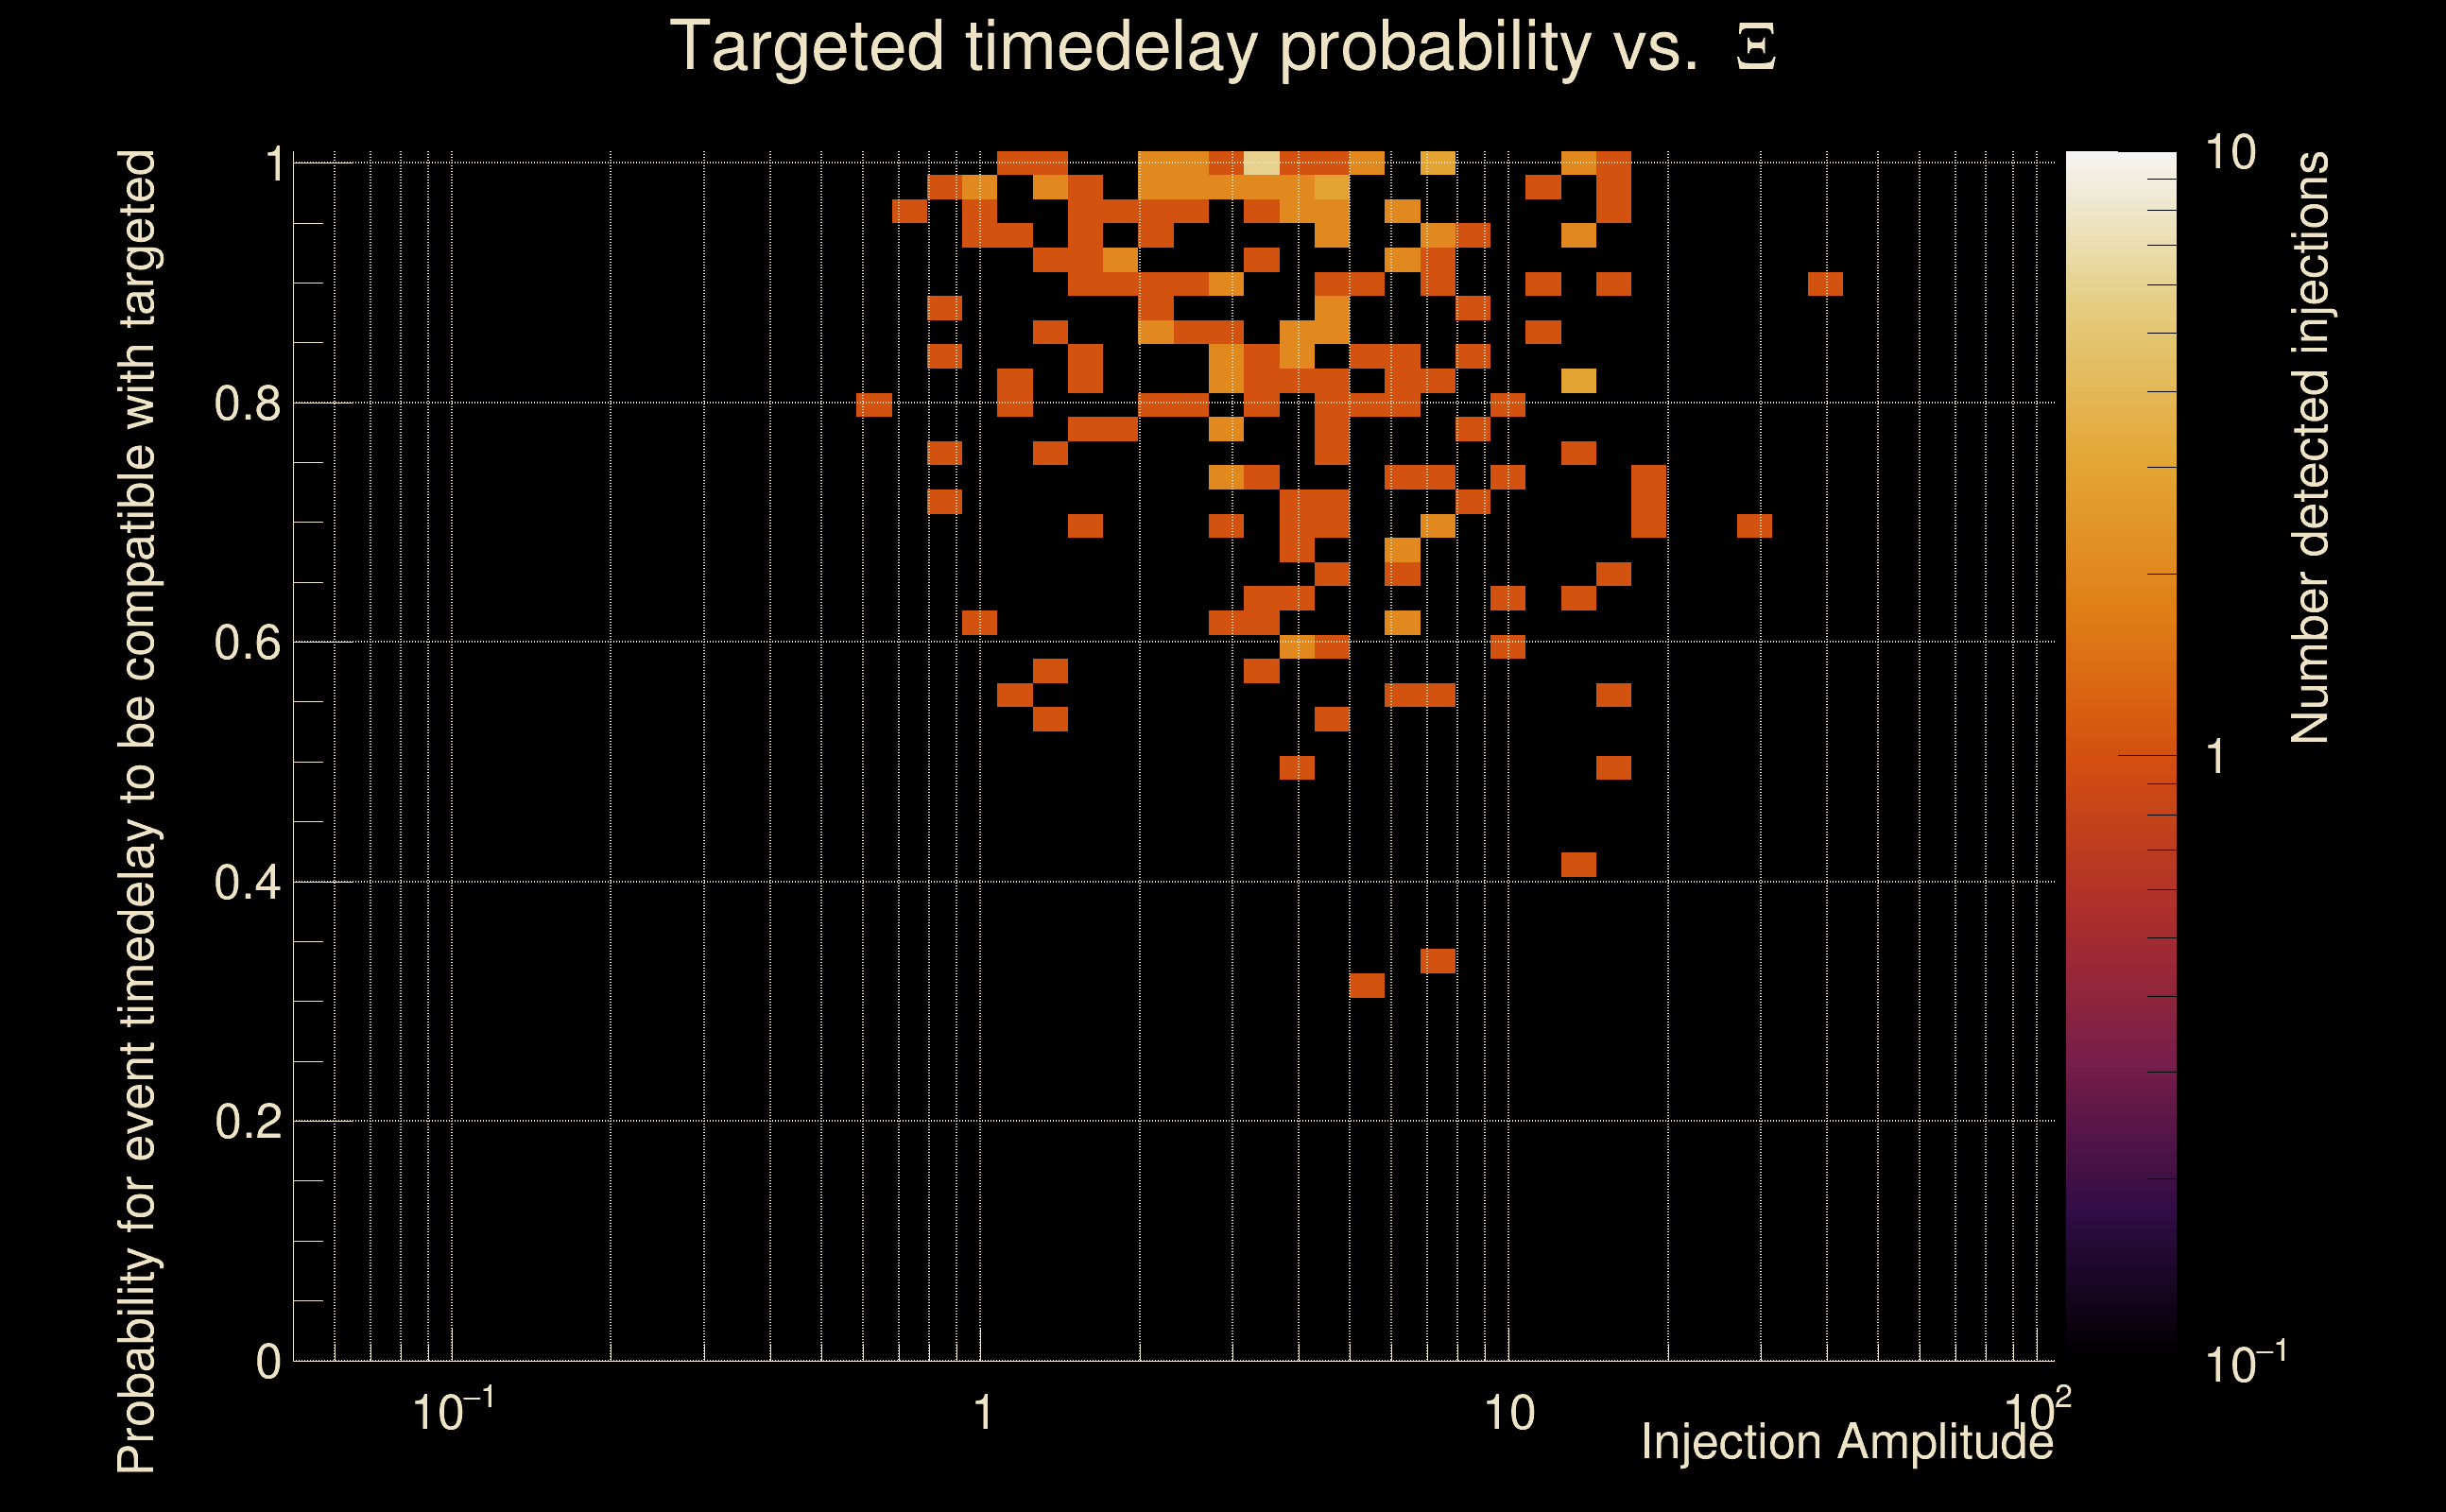
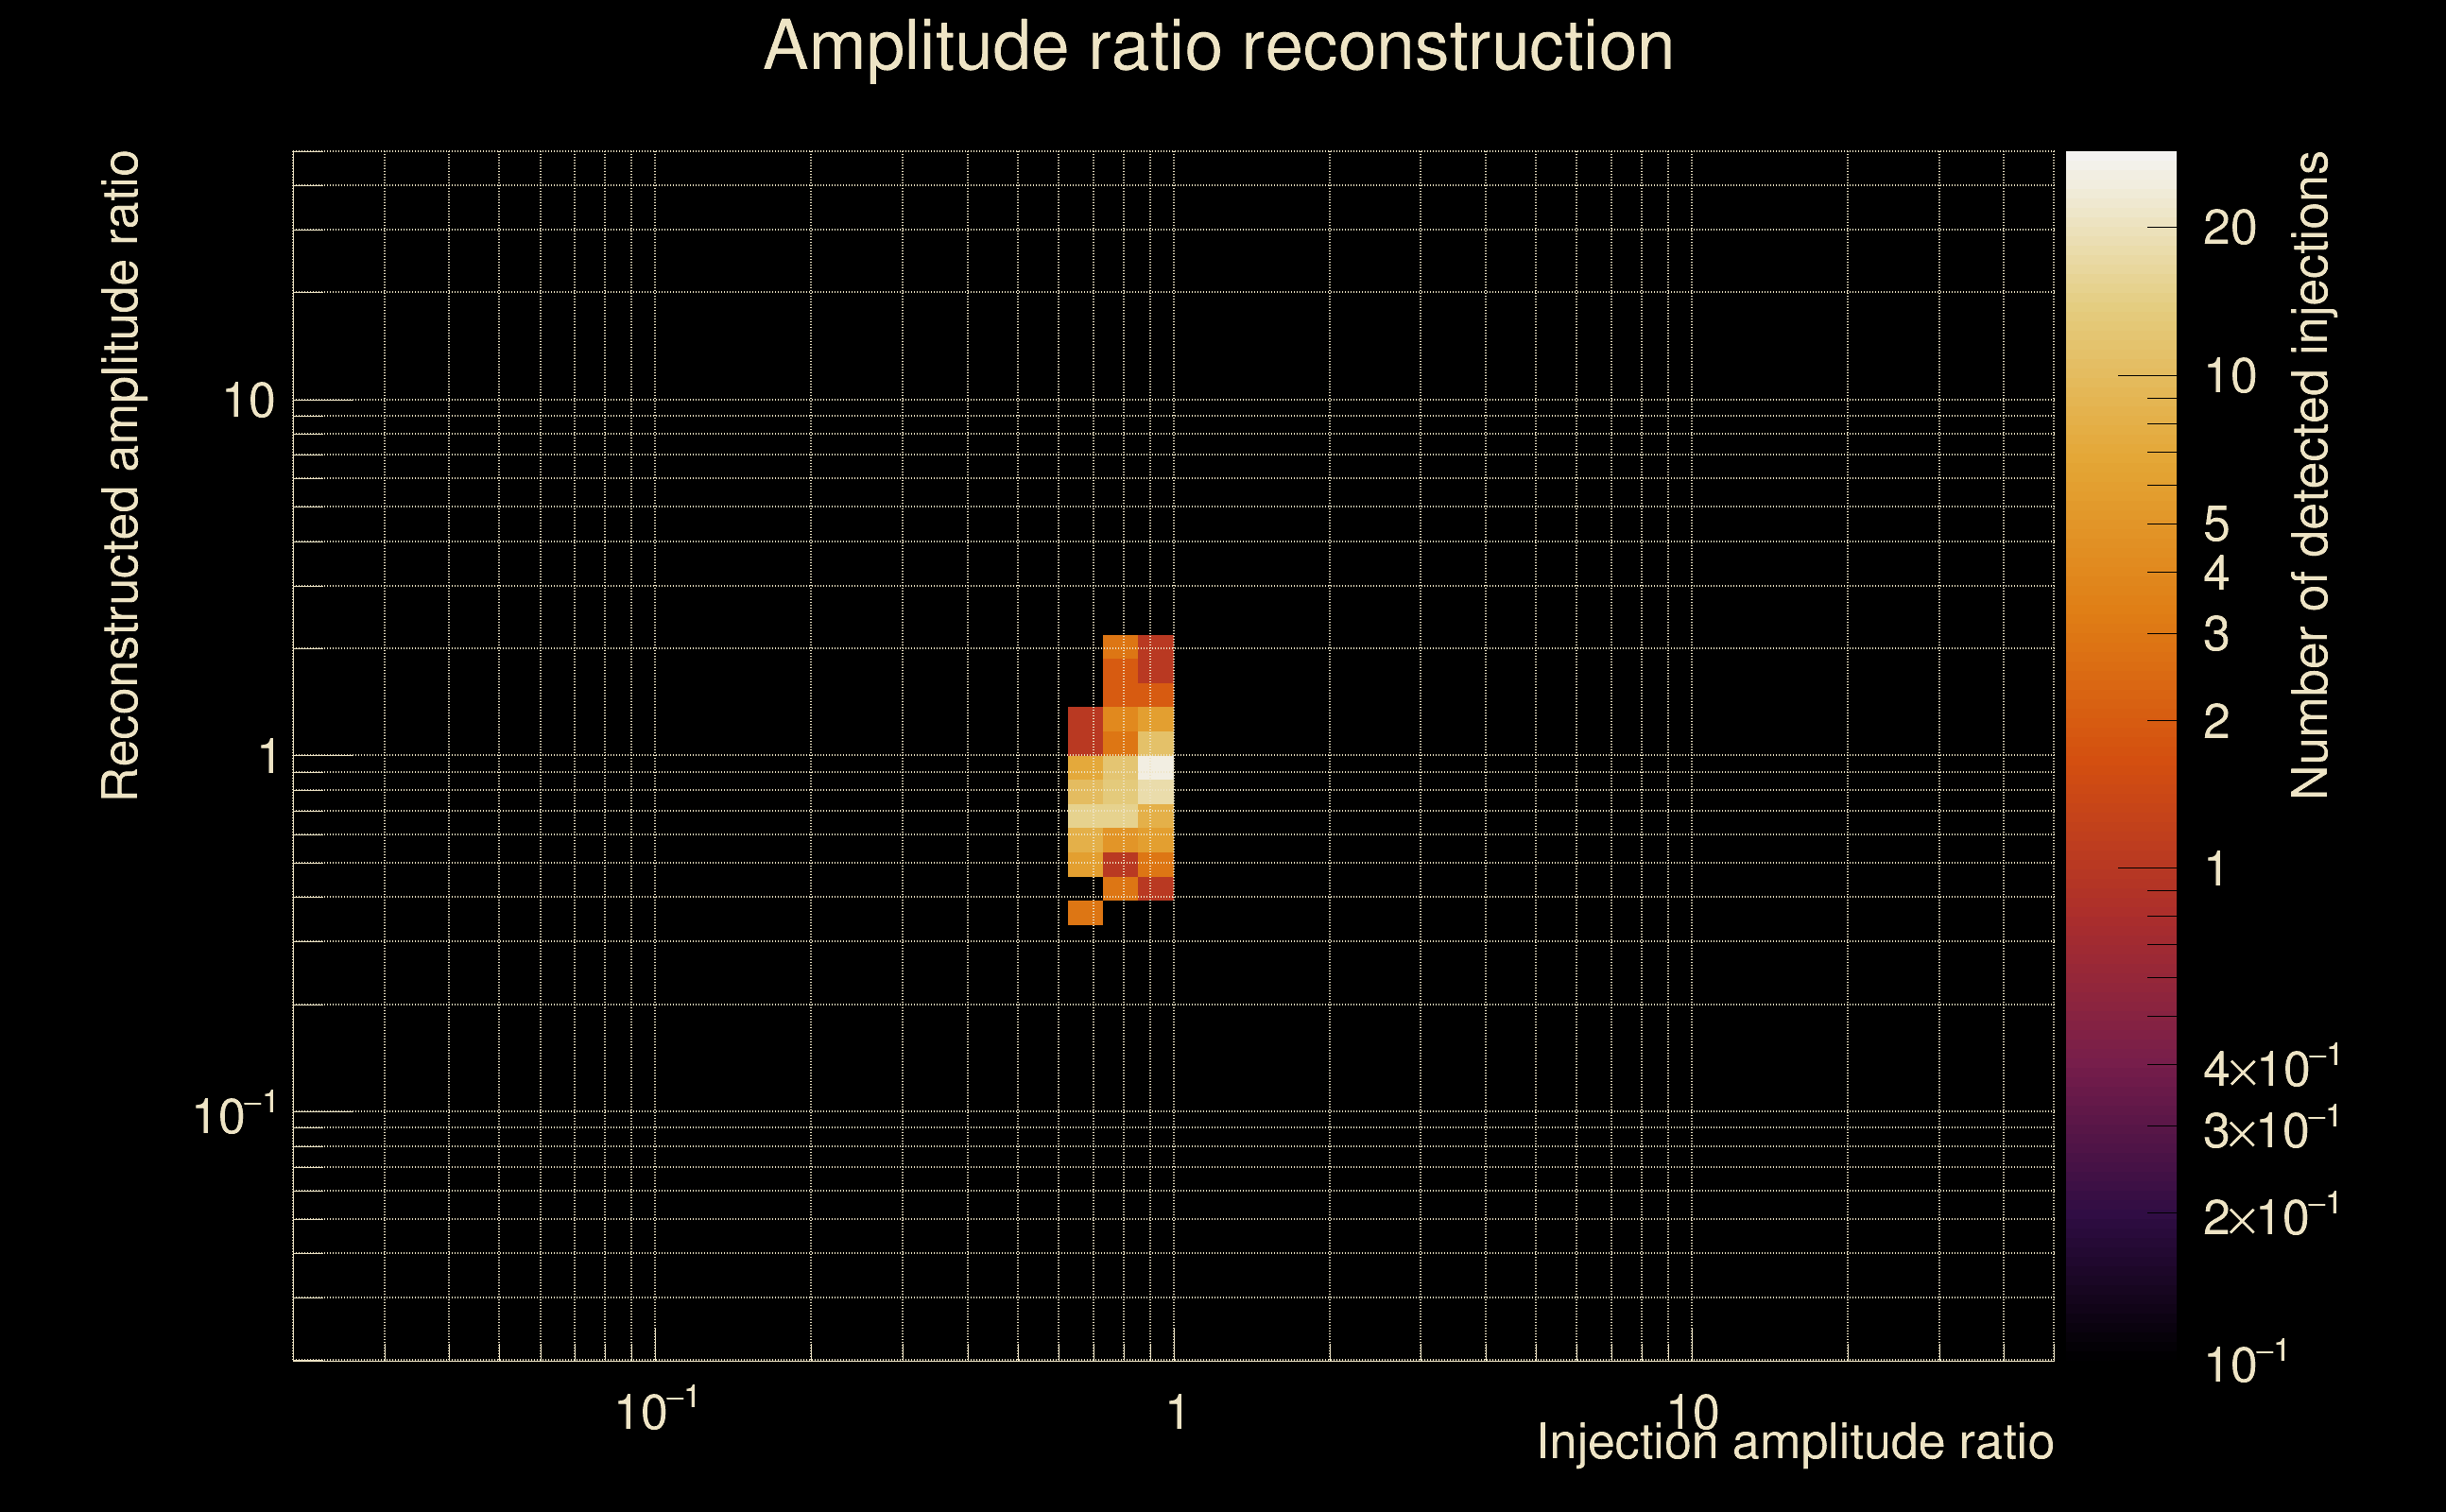
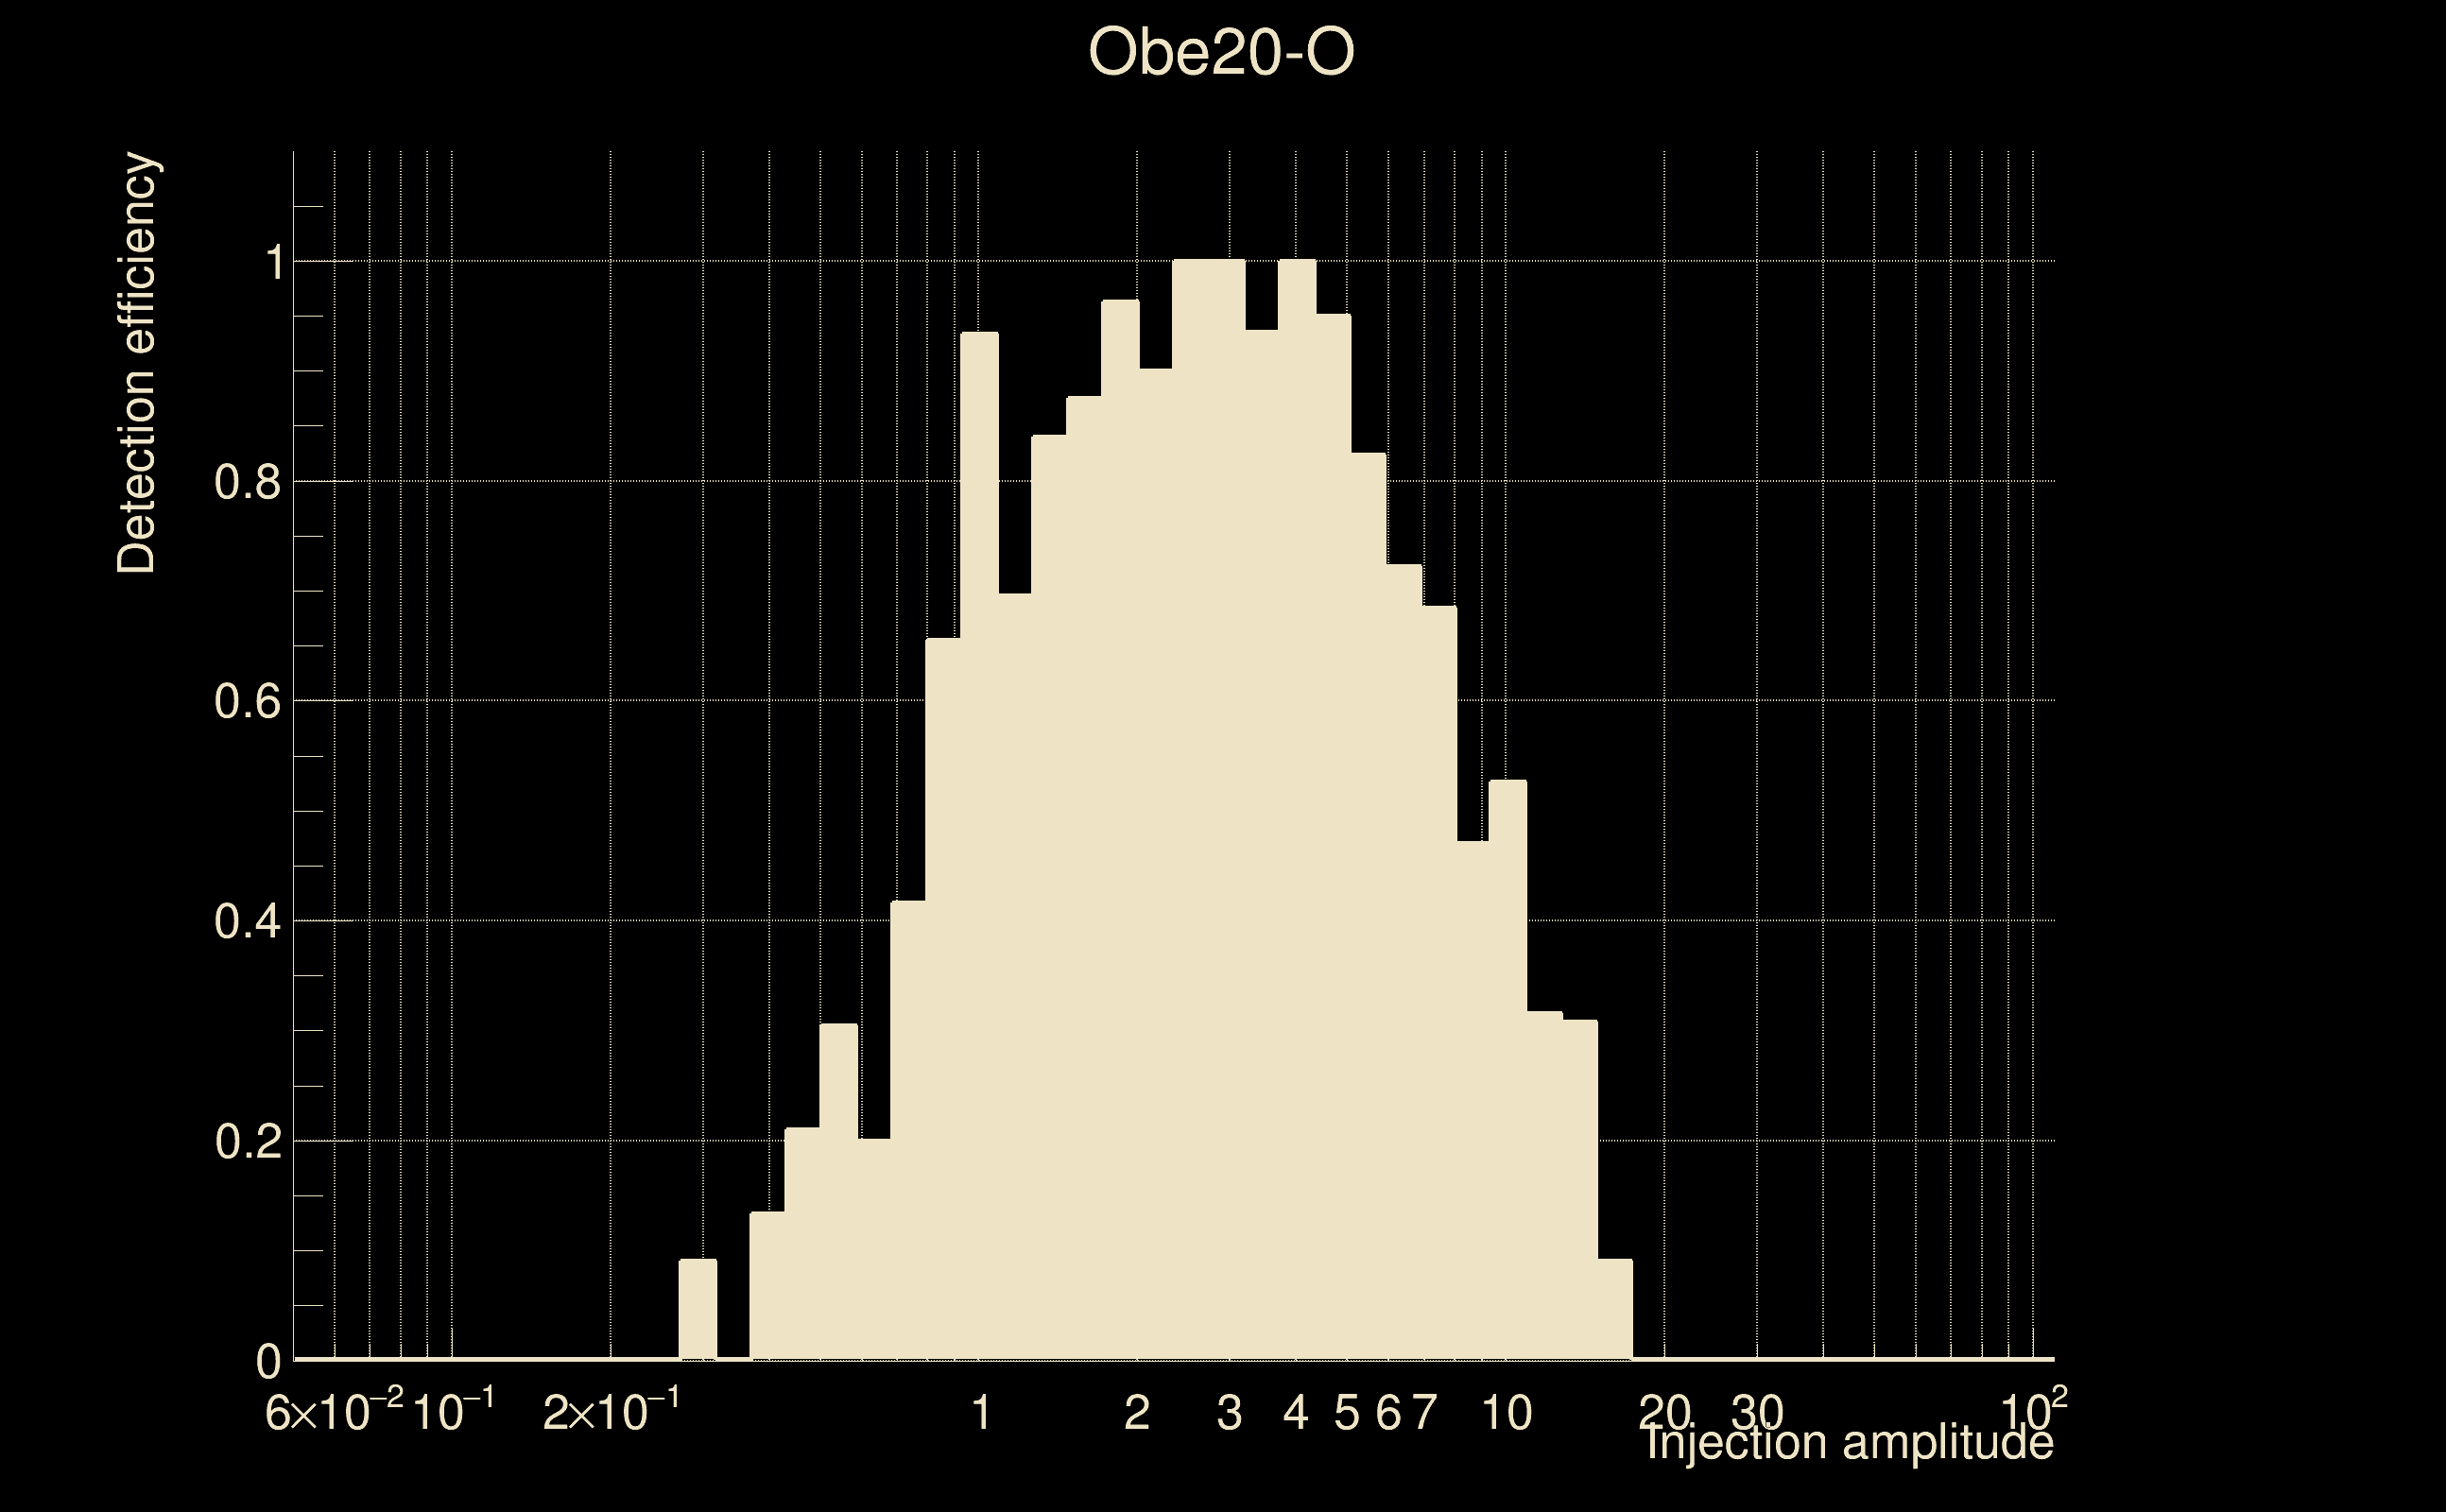
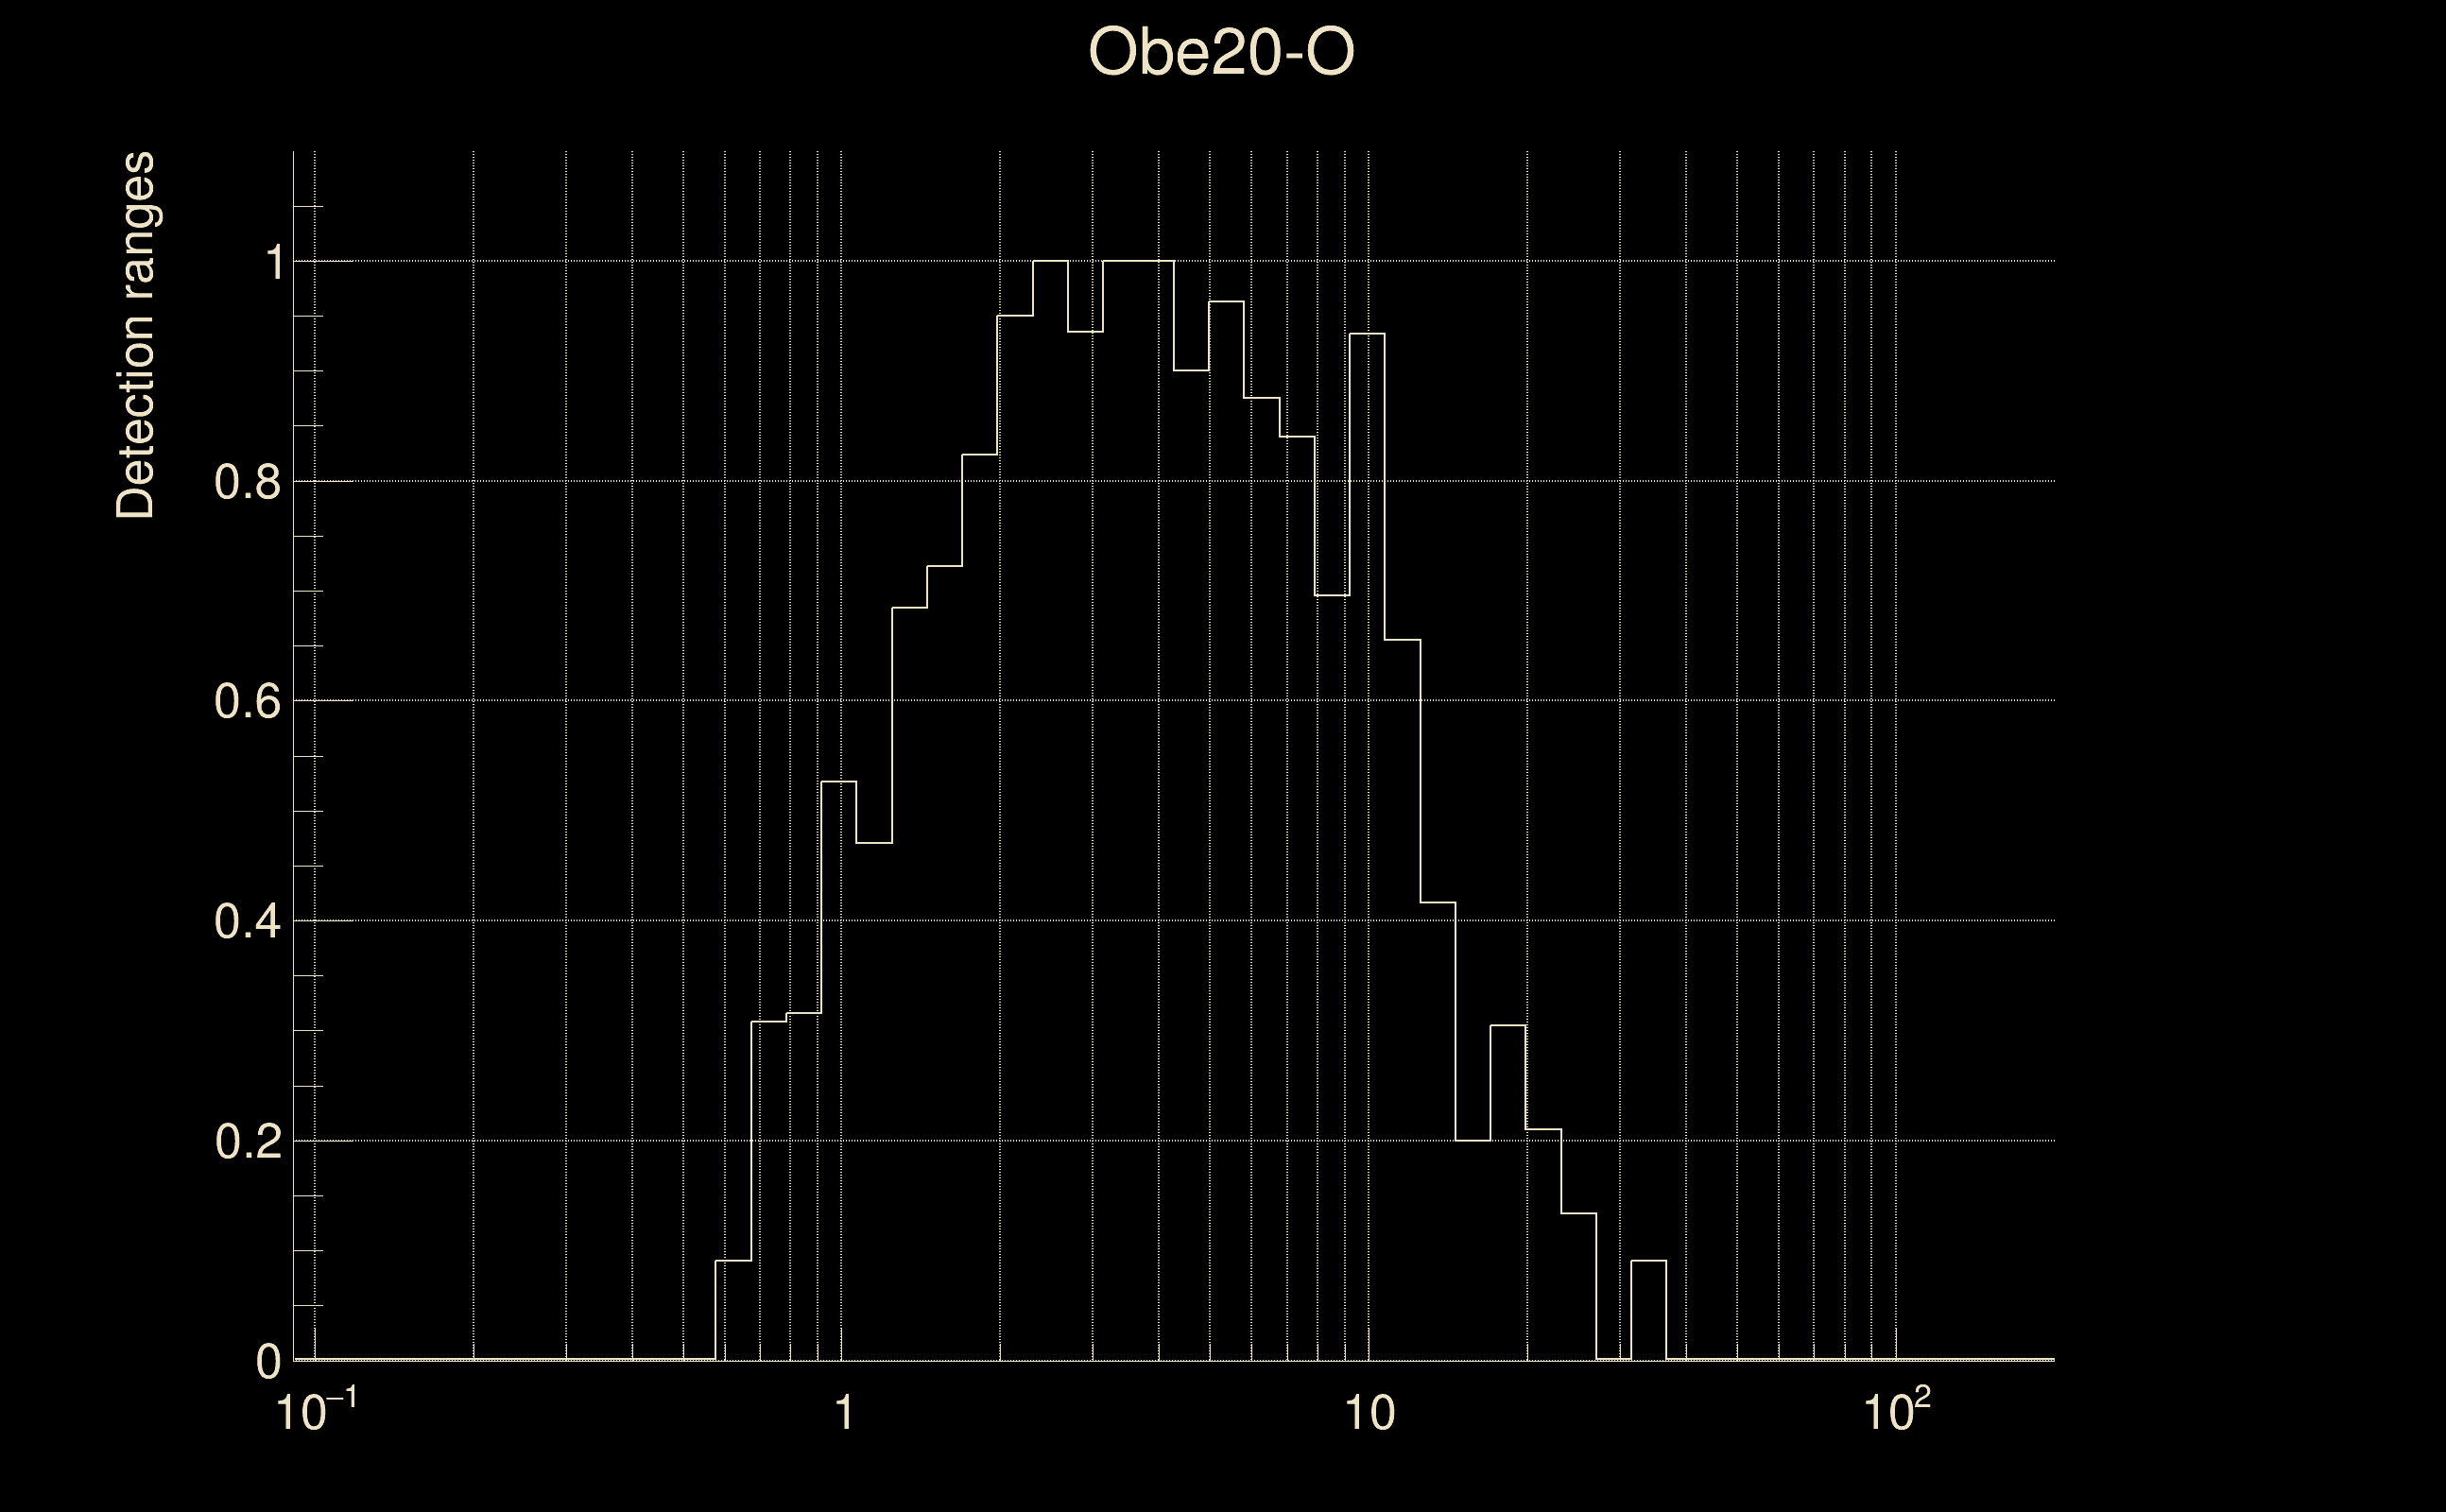
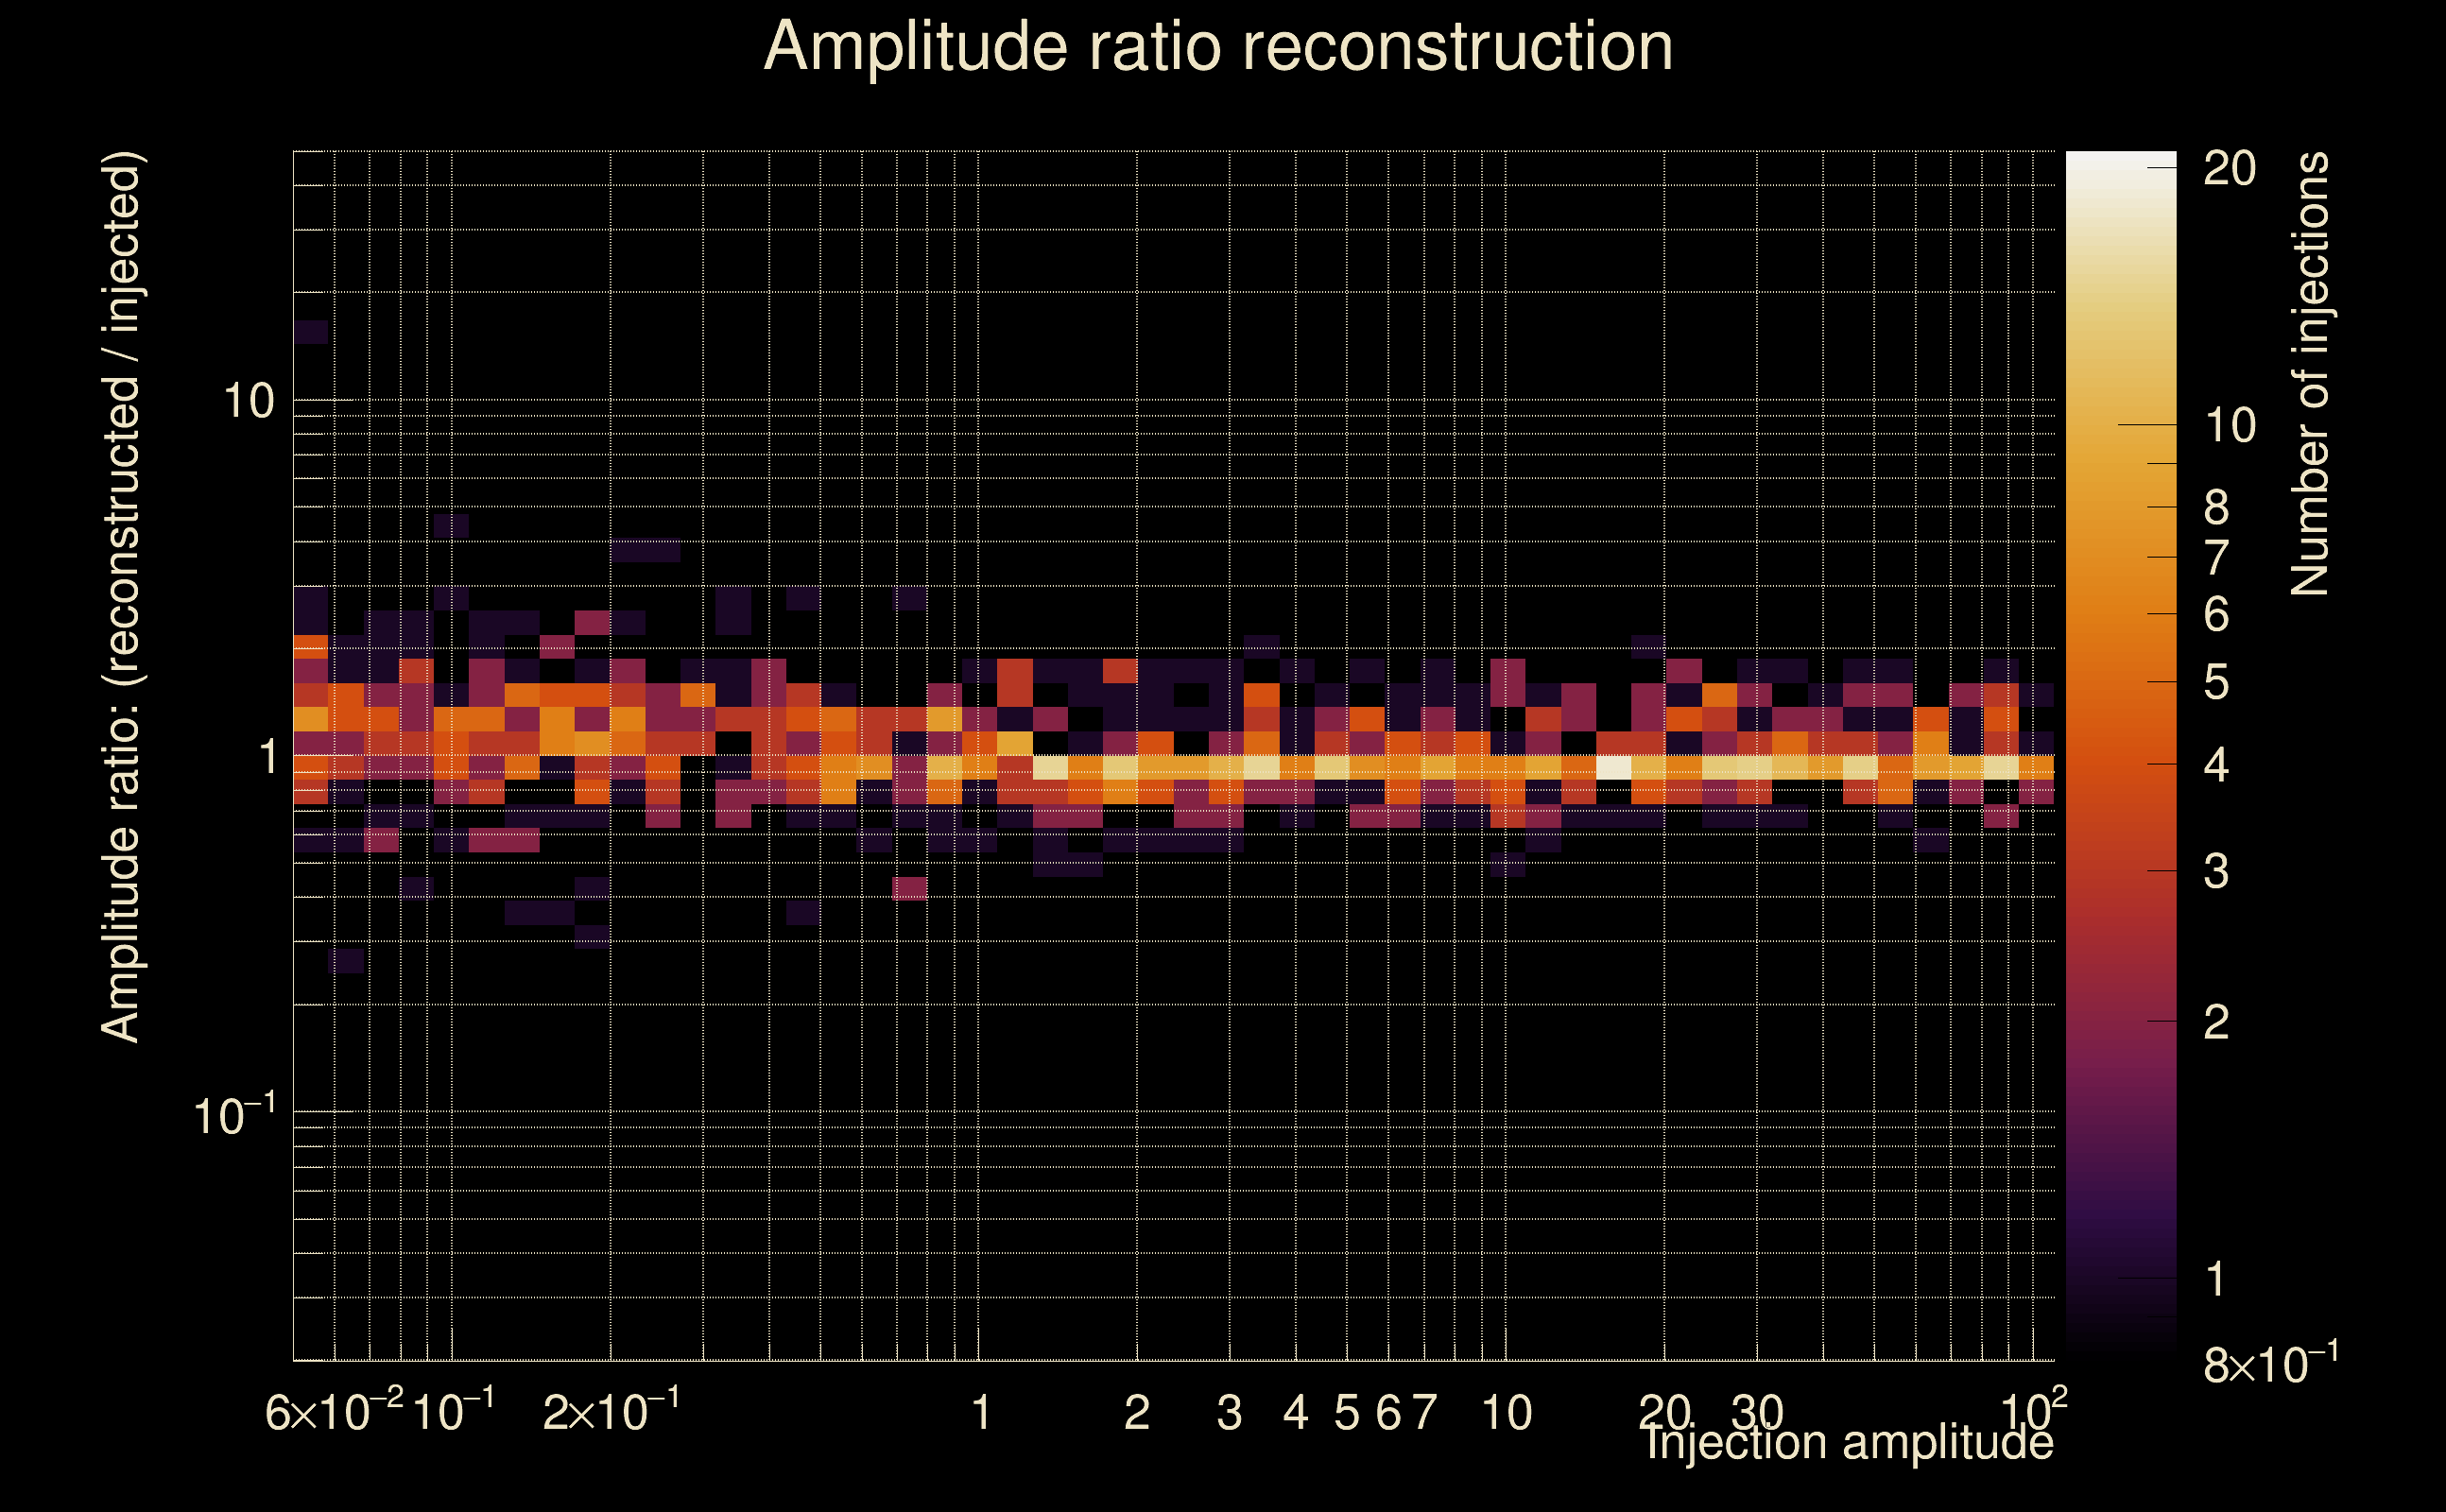
| Number of injections (total/valid/detected): | 1116 / 973 / 317 |
| List of missed injections: | ./Obe20-O_missed.txt |
| Injection amplitude at 90% detection efficiency: | 1.67088 |
| Injection amplitude at 50% detection efficiency: | 0.782096 |
| Injection amplitude at 10% detection efficiency: | 0.385147 |
 |
 |
 |
 |
 |
 |
 |
|
 |
 |
|
 |
 |
|
 |
 |
|
 |
 |
|
 |
 |
|
 |
 |
|
 |
 |
|
 |
 |
 |
 |
 |
 |
 |
 |
 |
 |
 |
 |
 |
 |
 |
| florent.robinet@ijclab.in2p3.fr |